cancer burden in belgium
TRANSCRIPT
2004-2017
Cancer Burden in Belgium
CA
NC
ER B
UR
DEN
IN B
ELG
IUM
202
0
3
B
ELG
IAN
CA
NC
ER R
EGIS
TRY
© 2020 Belgian Cancer Registry Stichting Kankerregister – Fondation Registre du Cancer – Stiftung Krebsregister
Staff at the Belgian Cancer Registry: Caroline Androgé, Hélène Antoine-Poirel, Lien Asselman, Leen Boesmans, Joanna Bouchat, Frédéric Calay, Aïcha Chihi, Isabel De Brabander, Annelies Debucquoy, Cindy De Gendt, Anke De Geyndt, Petra Denolf, Jonathan De Ro, Harlinde De Schutter, Jeroen Eeckhaut, Katia Emmerechts, Julie Francart, Annelies Goossens, Annemie Haelens, Kris Henau, Marie-José Hoovelts, Méric Klein, Oscar Liessens, Gilles Macq, Lee Mbambu Maswaku, Alice Mertens, Michael Rosskamp, Viki Schillemans, Geert Silversmit, Tim Tambuyzer, Linda Thibaut, Inge Truyen, Nancy Van Damme, Kim Vande Loock, Danny Vandenberghe, Eva Van der Stock, Jessica Vandeven, Liesbet Van Eycken, Bart Van Gool, Chris Van Hove, Katrijn Vanschoenbeek, Lien van Walle, Julie Verbeeck, Freija Verdoodt, Jérôme Xicluna D/2020/11.846/1
Responsible editor: Dr. Liesbet Van Eycken, Koningsstraat 215, 1210 Brussels
Editorial team:
Tim Tambuyzer, Kris Henau, Frédéric Calay, Bart Van Gool, Geert Silversmit, Liesbet Van Eycken
Use of data:
The information in this publication may be used freely on condition of correct
quotation of the source and reference.
Design adapted from(7). Original design: www.magelaan.be
Recommended reference:
Cancer burden in Belgium 2004-2017, Belgian Cancer Registry, Brussels, 2020
Additional Information can be requested at:
Tel. 0032-2-250 10 10
Fax 0032-2-250 10 11
E-mail: [email protected] – [email protected]
The Belgian Cancer Registry receives financial support of:
CA
NC
ER B
UR
DEN
IN B
ELG
IUM
202
0
3
B
ELG
IAN
CA
NC
ER R
EGIS
TRY
1 Methods and calculations................................................................................................................................. 5
2 Quality of incidence data ................................................................................................................................. 10
2.1 Completeness of the Cancer Registry............................................................................................. 10
2.2 Validity.............................................................................................................................................. 11
3 Cancer Burden in Belgium................................................................................................................................. 15
3.1 Invasive tumours (excl. non-melanoma skin cancer)......................................................................... 15
3.2 Head and Neck (ICD10: C00-C14, C30-C32)....................................................................................... 22
3.3 Digestive tract................................................................................................................................... 30
3.3.1 Oesophagus (ICD10: C15-C16.0)...................................................................................... 30
3.3.2 Stomach (ICD10: C16.1-C16.9)........................................................................................ 38
3.3.3 Colon (ICD10: C18-C19) ....................................................................................................44
3.3.4 Rectum (ICD10: C20) ....................................................................................................... 53
3.3.5 Liver (ICD10: C22) ............................................................................................................ 63
3.3.6 Gallbladder and biliary tract (ICD10: C23-C24)....................................................... ..........70
3.3.7 Pancreas (ICD10: C25) ..................................................................................................... 76
3.4 Respiratory tract ............................................................................................................................... 83
3.4.1 Lung (ICD10: C34) ........................................................................................................... 83
3.4.2 Mesothelioma (ICD10: C45)............................................................................................ 91
3.5 Melanoma (ICD10: C43)................................................................................................................... 97
3.6 Breast (ICD10: C50) ..........................................................................................................................105
3.7 Female genital organs .....................................................................................................................115
3.7.1 Cervix (ICD10: C53) .........................................................................................................115
3.7.2 Corpus Uteri (ICD10: C54) ..............................................................................................123
3.7.3 Ovary (ICD10: C56) .........................................................................................................130
3.8 Male genital organs.........................................................................................................................137
3.8.1 Prostate (ICD10: C61) .....................................................................................................137
3.8.2 Testis (ICD10: C62)……....................................................................................................144
3.9 Urinary tract ...................................................................................................................................151
3.9.1 Kidney (ICD10: C64) ........................................................................................................151
3.9.2 Bladder (ICD10: C67) ......................................................................................................159
3.10 Central nervous system (ICD10: C71-C72) .....................................................................................167
3.11 Thyroid (ICD10: C73) .....................................................................................................................172
4 Reference list ................................................................................................................................................... 181
CONTENTS

CA
NC
ER B
UR
DEN
IN B
ELG
IUM
202
0
3
B
ELG
IAN
CA
NC
ER R
EGIS
TRY
CA
NC
ER B
UR
DEN
IN B
ELG
IUM
202
0
5
BEL
GIA
N C
AN
CER
REG
ISTR
Y
Incidence is the number of new cases occurring in a given time period in a specific population. It can be used to
estimate the probability or risk of illness, and can be expressed in different ways. The incidence data presented
in the current publication encompass the time period 2004-2017.
• The crude incidence rate (CR) is calculated by dividing the number of new cases observed during a given
time period by the corresponding population time at risk in that time period. The crude rate is expressed
as the number of new cases per 100,000 person years.
• The age-specific incidence rate is the crude incidence rate in a particular 5-year age group and
expressed per 100,000 person years.
• The age-standardised incidence rate is a weighted average of the individual age-specific rates using an
external standard population. It is the incidence that would be observed if the population had the age
structure of the standard population (European or World Standard Population). Since age has a powerful
influence on the risk of cancer, this standardisation is necessary when comparing several populations
that differ with respect to their age structure. In this publication, the World Standard Population is used
for standardisation and consequently World Standardised incidence Rates (WSR) are reported. These
are expressed as the number of new cases per 100,000 person years.
The same principles are applied to calculate mortality data. Mortality represents the number of persons who
died due to a malignancy in a given time period in a specific population.
Mortality statistics in Belgium are collected and treated by the three regions (Flemish Region: Agentschap Zorg
en Gezondheid (1), Brussels-Capital Region: Observatorium voor Gezondheid en Welzijn van Brussel-Hoofdstad /
l’Observatoire de la Santé et du Social de Bruxelles-Capitale (2), Walloon Region: Agence wallonne de la santé, de
la protection sociale, du handicap et des familles (AViQ) (3). The Directorate General Statistics Belgium (4) is
responsible to collect and merge the data coming from the regional agencies. Mortality data used in this
publication are collected from the Directorate General Statistics Belgium, and encompasses the time period
2004-2016.
A comparison of our Belgian incidence data with a selection of European countries is included. Whenever
possible, national estimates of cancer incidence in 2018 have been retrieved from the website of ECIS (European
Cancer Information System) (5) and compared with the real data for Belgium in 2017.
For selected tumour sites, a brief overview is presented of the incidence of stage at diagnosis (by sex, histology,
age group, …). Unless otherwise stated, the results are always based on combining information from the clinical
and the pathological stage.
When the proportion of unknown stage (X) is represented, it refers to the number of diagnoses with stage X
divided by the total number of diagnoses (Stage I, II, III, IV and X). The proportion of diagnoses with unknown
clinical stage is shown as a measure for data completeness, since this type of information should, for almost
every cancer patient, be registered by the clinical network. The proportion of unknown pathological stage is not
shown in the publication because it is not a measure of missing information. The pTNM (6) only applies to the
patients who received surgery as part of their main cancer treatment, which means that patients who received
only radiotherapy or chemotherapy as main treatment cannot have a pathological stage. Since we do not know
the treatment for all patients, we cannot differentiate between patients with missing pTNM and patients without
surgery.
1.1 INCIDENCE AND MORTALITY
1 METHODS AND CALCULATIONS
CA
NC
ER B
UR
DEN
IN B
ELG
IUM
202
0
6
BEL
GIA
N C
AN
CER
REG
ISTR
Y
The cancer registry validates the data quality on a regular basis (7). In the context of several specific projects, BCR
performed a thorough analysis of the proportion of unknown pathological stage for several tumour categories
(lung, rectum, colon, prostate, head and neck) (8-10). Based on the obtained results, it is expected that the
proportion of unknown pathological stage is minimal for patients who underwent surgery. This was confirmed
by linking the BCR dataset with treatment information from administrative data gathered by the InterMutualistic
Agency (IMA-AIM) (10).
Prevalence is the number of persons who are still alive at a given index date, and who received a cancer diagnosis
during a specified time period preceding the index date. For example, 5-year prevalence is the number of persons
who received at least one new diagnosis of cancer during a specific five year period and who are still alive at the
end of the five year period. The 5-year prevalence data in this publication were estimated with an index date of
31st December 2017, representing people living in Belgium who were diagnosed with at least one invasive
malignancy in the period from 1st January 2013 to 31st December 2017 and who were still alive at the end of 2017
(index date). Persons with more than one malignancy were included as prevalent cases in each cancer type, but
were counted only once in analyses regrouping multiple tumour sites.
The methodology used was described in detail in our publication ‘Cancer Prevalence in Belgium 2010’ (12).
Incidence maps for Belgium were created using the methodology developed at the Finnish Cancer Registry (13).
The algorithm for this methodology was incorporated into an in house developed software application of the
BCR. The geographic representations use municipality specific age standardised rates (WSR). Cities with at least
100,000 inhabitants are directly represented on the map as circles with a diameter relative to the population size
and a colour shading indicating the actual calculated WSR in that city. The 19 municipalities of the Brussels Capital
Region (more than 1,000,000 inhabitants) were divided in three separate circles. This division was based on socio-
economic parameters (14). The socio-economic status is lowest in the westernmost circle and highest in the
easternmost circle. Rates (WSR) from the remaining municipalities were smoothed. For each grid (0.25 km²) on
the map, a rate was calculated as a weighted average of the WSR in all neighbouring municipalities within 150
km from the centre of the grid. The weights were inversely associated with the distance, the weight being halved
at a distance of 25 km. In addition, the weights were directly proportional to the sizes of populations of the
municipalities within the radius of 150 km. A relative scale was applied. A change in colour level corresponds to
a 1.05 fold change in the WSR.
The incidence maps presented in the current publication encompass the period 2013-2017. The cancer maps
provided in this publication have to be considered additional to the tables with the incidence data per region as
they also unveil small or large incidence patterns within the Belgian regions. Although these maps may generate
numerous hypotheses, their discussion is beyond the scope of this publication.
Trends in age-standardised incidence and mortality rate (WSR) were quantified by the Annual Percentage Change
(APC), which expresses a mean multiplicative change per year. Trends and APC calculations are given by sex and
age group. Stratification by stage, localisation or morphology is given for some selected cancer sites. The APC is
estimated from a least squares regression on the logarithm of the age-standardised rate (WSR) versus incidence
year. Due to the log transformation, no APC can be obtained if the WSR is zero for at least one year. In cases
where the relation of the WSR with incidence year cannot be adequately fit with a log-linear model (i.e. a
constant APC for the full data range cannot be assumed), a piecewise log-linear model was estimated in which
1.2 PREVALENCE
1.4 INCIDENCE TRENDS
1.3 CANCER MAPS
CA
NC
ER B
UR
DEN
IN B
ELG
IUM
202
0
7
BEL
GIA
N C
AN
CER
REG
ISTR
Y
the different linear segments are connected at certain joinpoints. This model results in an estimated APC per
time segment of which an Average Annual Percentage Change (AAPC) is calculated as the average of the APC
estimates per segment weighted by the corresponding segment length (15).
The model building process on the logarithm of the WSR was fully automated in SAS (version 9.3) and consists of
the following steps:
1. The simple linear regression model, assuming a normal error structure, was compared with a non-
parametric smoother fit (PROC REG and PROC LOESS respectively) using an F-test on the residual sets
for both models. When the linear regression model was not significantly different from the smoother at
the 5% level, the linear model was accepted as final model and a single APC value resulted to quantify
the trend over the full time range.
2. When the linear model at the log scale was rejected, a piecewise model with one joinpoint was fitted.
The optimal position of the joinpoint was determined using a non-linear optimisation procedure (PROC
NLIN). Joinpoints were not allowed to be the first or second time point or the before last and last time
point, as those endpoints can be influential points and induce spurious segments. The estimated
joinpoint position was rounded to the nearest integer value and fixed in a re-estimation of the piecewise
model with PROC GENMOD. As in the previous step, an F-test was used to accept or reject the piecewise
model against the smoother. When the regression model was accepted, the final model consisted of a
piecewise model with two connected linear segments each quantified by their own APC and a weighted
overall AAPC.
3. When the piecewise model with one joinpoint was not accepted, the process continues to evaluate two
joinpoints in the same way as described in step 2. As an additional restriction, the difference in position
between the two joinpoints should be at least three years. If the two joinpoints were closer, the
piecewise model with only one joinpoint from the previous step was retained.
A 95% confidence interval (CI) and p-value for the individual segments and the overall AAPC were calculated from
the final regression model. The loss in degrees of freedom due to the optimisation of the joinpoint position(s)
was not taken into account for the construction of the CI and final p-values. When the 95% CI for the AAPC
contains the value zero, no significant trend with incidence year is observed.
Combined changes in trends of incidence, mortality and survival can have various causes and are often difficult
to interpret and are not considered as an objective of this publication. However, a manuscript by Karim-Kos et
al. on trends of cancer in Europe provides an excellent framework to help gaining insights and provide possible
explanations for the observed trends (16).
The relative survival ratio gives an estimate of the net survival, which is the survival when causes of death not
related to the cancer have been eliminated. The relative survival is calculated as the ratio of the observed survival
and the expected survival for a comparable group of the general population matched for age, sex, region and
calendar period. The expected survival was obtained with the Ederer II method (17).
In this publication, 5-year and 10-year relative survival ratios are reported stratified by age group, sex and tumour
type. For all survival analyses cases with age younger than 15 years were excluded (Exception: Table 2 in chapter
3.1). The methodology was described in detail in our publication 'Cancer Survival in Belgium' (18).
The empirical life tables (by sex, age, region and calendar-year) (4), used in the calculation for expected survival,
vary considerably by year of age for young (<30 years) and old ages (>90 years). To reduce the sampling variability
and to ensure that death probabilities evolve consistently from one age and calendar year to another, the life
tables were smoothed on age and calendar year using the LOESS-method (19-22).
All relative survival results are shown with the corresponding 95% confidence intervals (95% CI).
1.5 RELATIVE SURVIVAL
CA
NC
ER B
UR
DEN
IN B
ELG
IUM
202
0
8
BEL
GIA
N C
AN
CER
REG
ISTR
Y
Relative survival between the cohorts 2004-2007, 2008-2012 and 2013-2017 has been compared. Remark that
the follow-up period for the cohorts is not the same, as with a last date of follow-up at the 1st of July 2019. In
addition, it should also be noted that the time period 2004-2007 consists of 4 years, whereas it is 5 years for the
other time periods (2008-2012 and 2013-2017).
1.6 RELATIVE SURVIVAL TRENDS

CA
NC
ER B
UR
DEN
IN B
ELG
IUM
202
0
9
BEL
GIA
N C
AN
CER
REG
ISTR
Y
CA
NC
ER B
UR
DEN
IN B
ELG
IUM
202
0
10
BEL
GIA
N C
AN
CER
REG
ISTR
Y
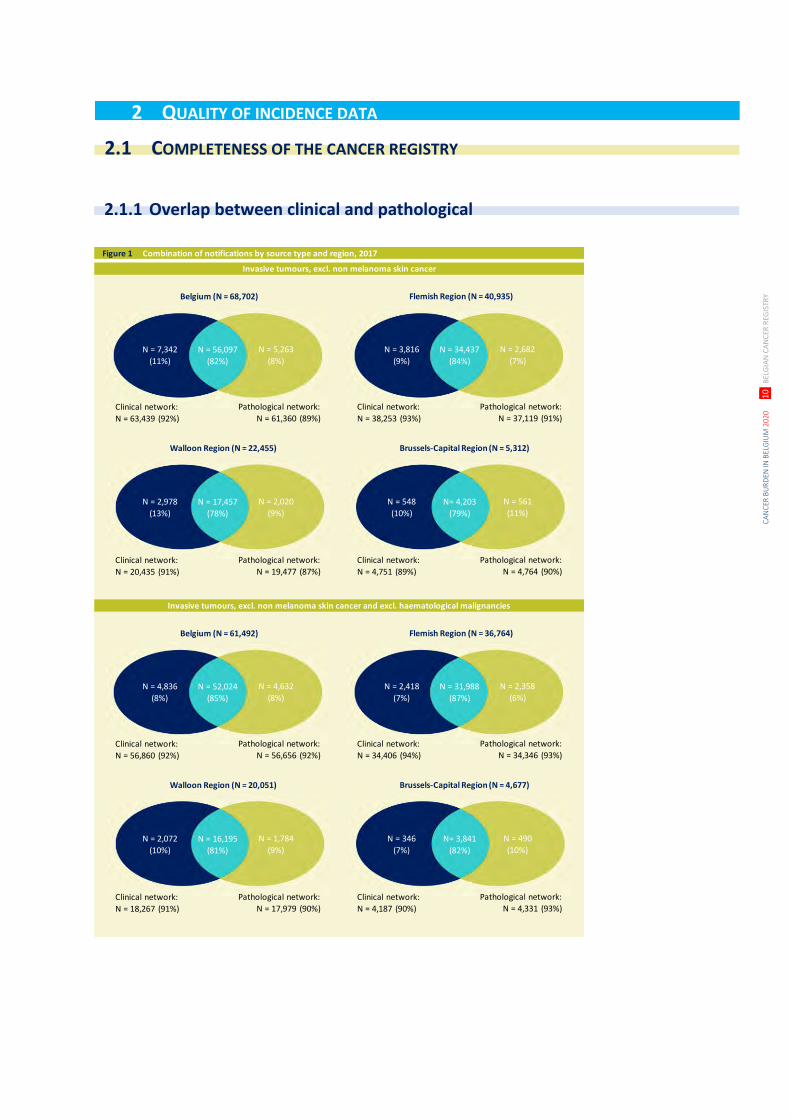
Figure 1 Combination of notifications by source type and region, 2017
9659;9650;9661;9651;9663;9664;9665;9667;9652;9653;9662;9654;9655;9650;9661;9662;9651;9653;9654;9655;9670;9823;9671;9760;9761;9762;9764;9673;9597;9690;9691;9695;9698;9675;9678;9679;9680;9684;9688;9712;9735;9738;9737;9687;9826;9689;9699;9833;9940;9731;9732;9733;9734;9700;9701;9708;9709;9718;9702;9705;9714;9716;9717;9719;9827;9831;9834;9948;9728;9811;9836;9813;9812;9814;9815;9816;9817;9818;9729;9837;9727;9835;9590;9591;9820;9832;9596;9970;9971;9840;9861;9867;9870;9872;9873;9874;9891;9910;9930;9898;9866;9869;9871;9896;9897;9865;9911;9895;9984;9931;9920;9987;9863;9875;9950;9961;9962;9963;9964;9960;9740;9741;9742;9950;9961;9962;9963;9964;9960;9740;9741;9742;9980;9982;9983;9985;9986;9989;9991;9984;9992;9975;9876;9945;9946;9800;9801;9805;9806;9808;9860;9807;9809;9965;9966;9967;9751;9752;9753;9750;9754;9755;9756;9757;9758;9759
Invasive tumours, excl. non melanoma skin cancer
Invasive tumours, excl. non melanoma skin cancer and excl. haematological malignancies
N = 56,097
(82%)
N = 7,342
(11%)
N = 5,263
(8%)
Clinical network:
N = 63,439 (92%)
Pathological network:
N = 61,360 (89%)
Belgium (N = 68,702)
N = 34,437
(84%)
N = 3,816
(9%)
N = 2,682
(7%)
Clinical network:
N = 38,253 (93%)
Pathological network:
N = 37,119 (91%)
Flemish Region (N = 40,935)
N = 17,457
(78%)
N = 2,978
(13%)
N = 2,020
(9%)
Clinical network:
N = 20,435 (91%)
Pathological network:
N = 19,477 (87%)
Walloon Region (N = 22,455)
N= 4,203
(79%)
N = 548
(10%)
N = 561
(11%)
Clinical network:
N = 4,751 (89%)
Pathological network:
N = 4,764 (90%)
Brussels-Capital Region (N = 5,312)
N = 52,024
(85%)
N = 4,836
(8%)
N = 4,632
(8%)
Clinical network:
N = 56,860 (92%)
Pathological network:
N = 56,656 (92%)
Belgium (N = 61,492)
N = 31,988
(87%)
N = 2,418
(7%)
N = 2,358
(6%)
Clinical network:
N = 34,406 (94%)
Pathological network:
N = 34,346 (93%)
Flemish Region (N = 36,764)
N = 16,195
(81%)
N = 2,072
(10%)
N = 1,784
(9%)
Clinical network:
N = 18,267 (91%)
Pathological network:
N = 17,979 (90%)
Walloon Region (N = 20,051)
N= 3,841
(82%)
N = 346
(7%)
N = 490
(10%)
Clinical network:
N = 4,187 (90%)
Pathological network:
N = 4,331 (93%)
Brussels-Capital Region (N = 4,677)
2.1 COMPLETENESS OF THE CANCER REGISTRY
2.1.1 Overlap between clinical and pathological
network
2 QUALITY OF INCIDENCE DATA
CA
NC
ER B
UR
DEN
IN B
ELG
IUM
202
0
11
BEL
GIA
N C
AN
CER
REG
ISTR
Y
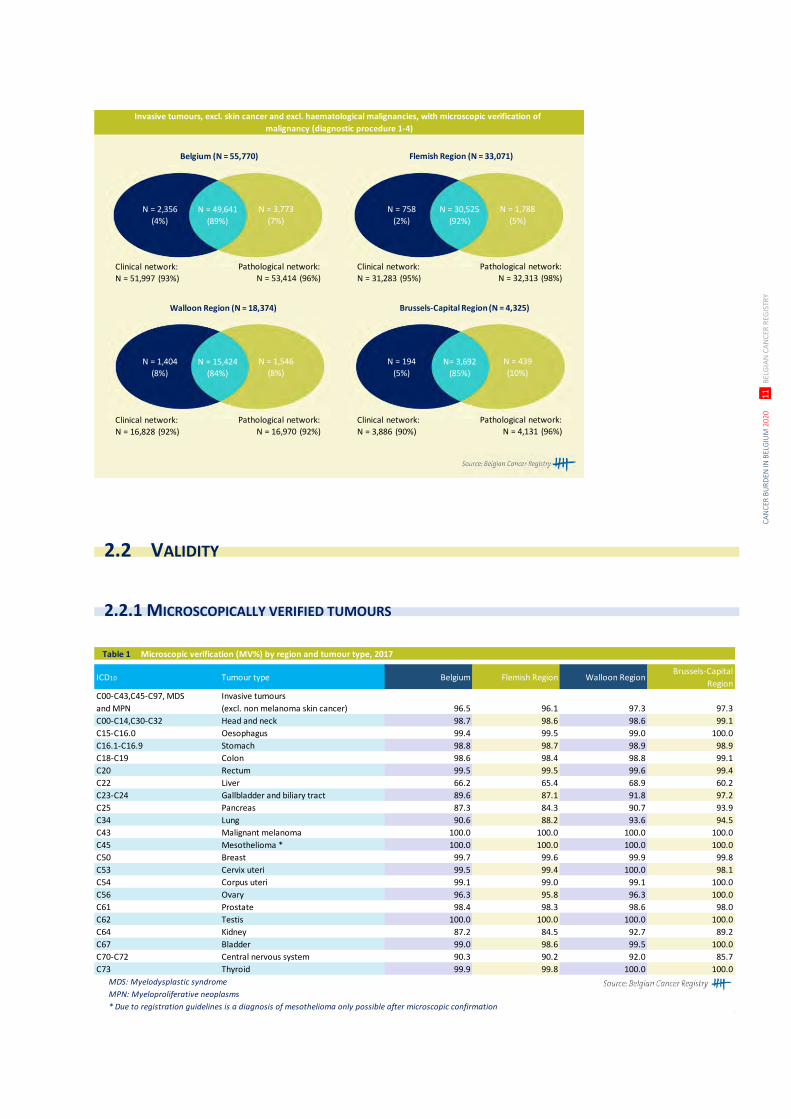
Invasive tumours, excl. skin cancer and excl. haematological malignancies, with microscopic verification of
malignancy (diagnostic procedure 1-4)
N = 49,641
(89%)
N = 2,356
(4%)
N = 3,773
(7%)
Clinical network:
N = 51,997 (93%)
Pathological network:
N = 53,414 (96%)
Belgium (N = 55,770)
N = 30,525
(92%)
N = 758
(2%)
N = 1,788
(5%)
Clinical network:
N = 31,283 (95%)
Pathological network:
N = 32,313 (98%)
Flemish Region (N = 33,071)
N = 15,424
(84%)
N = 1,404
(8%)
N = 1,546
(8%)
Clinical network:
N = 16,828 (92%)
Pathological network:
N = 16,970 (92%)
Walloon Region (N = 18,374)
N= 3,692
(85%)
N = 194
(5%)
N = 439
(10%)
Clinical network:
N = 3,886 (90%)
Pathological network:
N = 4,131 (96%)
Brussels-Capital Region (N = 4,325)
Table 1 Microscopic verification (MV%) by region and tumour type, 2017
ICD10 Tumour type Belgium Flemish Region Walloon RegionBrussels-Capital
Region
C00-C43,C45-C97, MDS
and MPN
Invasive tumours
(excl. non melanoma skin cancer) 96.5 96.1 97.3 97.3
C00-C14,C30-C32 Head and neck 98.7 98.6 98.6 99.1
C15-C16.0 Oesophagus 99.4 99.5 99.0 100.0
C16.1-C16.9 Stomach 98.8 98.7 98.9 98.9
C18-C19 Colon 98.6 98.4 98.8 99.1
C20 Rectum 99.5 99.5 99.6 99.4
C22 Liver 66.2 65.4 68.9 60.2
C23-C24 Gallbladder and biliary tract 89.6 87.1 91.8 97.2
C25 Pancreas 87.3 84.3 90.7 93.9
C34 Lung 90.6 88.2 93.6 94.5
C43 Malignant melanoma 100.0 100.0 100.0 100.0
C45 Mesothelioma * 100.0 100.0 100.0 100.0
C50 Breast 99.7 99.6 99.9 99.8
C53 Cervix uteri 99.5 99.4 100.0 98.1
C54 Corpus uteri 99.1 99.0 99.1 100.0
C56 Ovary 96.3 95.8 96.3 100.0
C61 Prostate 98.4 98.3 98.6 98.0
C62 Testis 100.0 100.0 100.0 100.0
C64 Kidney 87.2 84.5 92.7 89.2
C67 Bladder 99.0 98.6 99.5 100.0
C70-C72 Central nervous system 90.3 90.2 92.0 85.7
C73 Thyroid 99.9 99.8 100.0 100.0
MDS: Myelodysplastic syndrome
MPN: Myeloproliferative neoplasms
* Due to registration guidelines is a diagnosis of mesothelioma only possible after microscopic confirmation
2.2.1 MICROSCOPICALLY VERIFIED TUMOURS
2.2 VALIDITY
CA
NC
ER B
UR
DEN
IN B
ELG
IUM
202
0
12
BEL
GIA
N C
AN
CER
REG
ISTR
Y
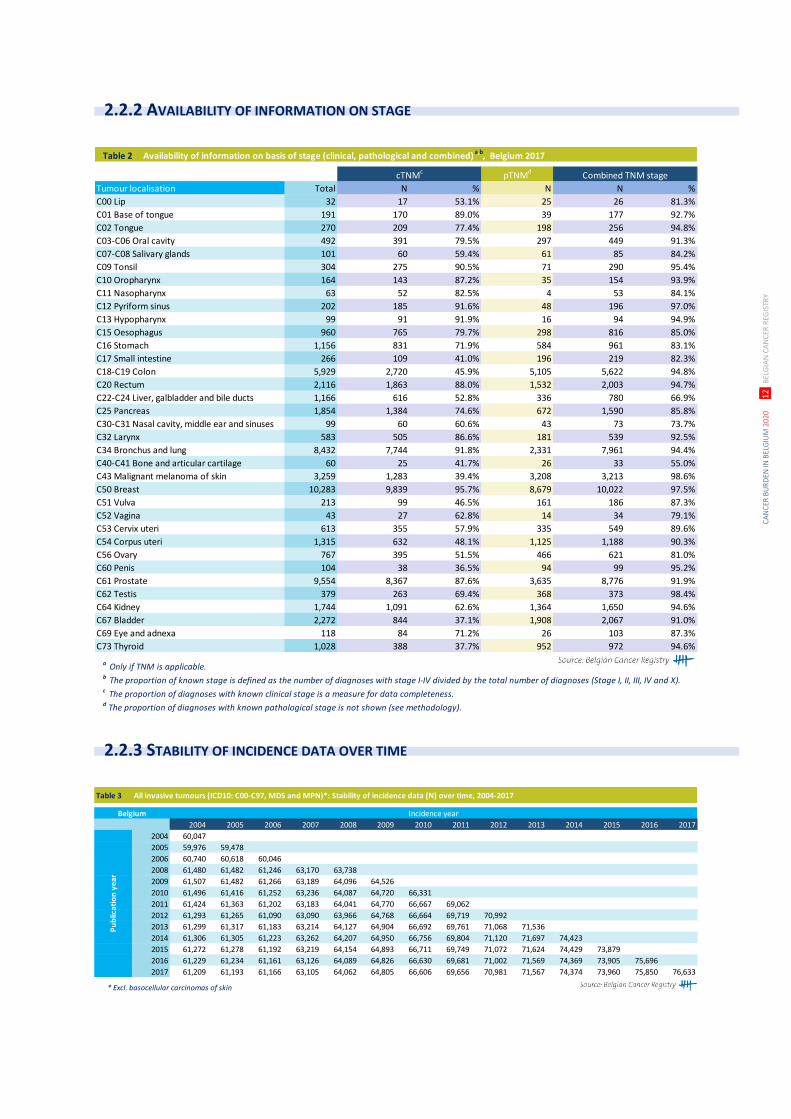
Table 2 Availability of information on basis of stage (clinical, pathological and combined)a,b
, Belgium 2017
pTNMd
Tumour localisation Total N % N N %
C00 Lip 32 17 53.1% 25 26 81.3%
C01 Base of tongue 191 170 89.0% 39 177 92.7%
C02 Tongue 270 209 77.4% 198 256 94.8%
C03-C06 Oral cavity 492 391 79.5% 297 449 91.3%
C07-C08 Salivary glands 101 60 59.4% 61 85 84.2%
C09 Tonsil 304 275 90.5% 71 290 95.4%
C10 Oropharynx 164 143 87.2% 35 154 93.9%
C11 Nasopharynx 63 52 82.5% 4 53 84.1%
C12 Pyriform sinus 202 185 91.6% 48 196 97.0%
C13 Hypopharynx 99 91 91.9% 16 94 94.9%
C15 Oesophagus 960 765 79.7% 298 816 85.0%
C16 Stomach 1,156 831 71.9% 584 961 83.1%
C17 Small intestine 266 109 41.0% 196 219 82.3%
C18-C19 Colon 5,929 2,720 45.9% 5,105 5,622 94.8%
C20 Rectum 2,116 1,863 88.0% 1,532 2,003 94.7%
C22-C24 Liver, galbladder and bile ducts 1,166 616 52.8% 336 780 66.9%
C25 Pancreas 1,854 1,384 74.6% 672 1,590 85.8%
C30-C31 Nasal cavity, middle ear and sinuses 99 60 60.6% 43 73 73.7%
C32 Larynx 583 505 86.6% 181 539 92.5%
C34 Bronchus and lung 8,432 7,744 91.8% 2,331 7,961 94.4%
C40-C41 Bone and articular cartilage 60 25 41.7% 26 33 55.0%
C43 Malignant melanoma of skin 3,259 1,283 39.4% 3,208 3,213 98.6%
C50 Breast 10,283 9,839 95.7% 8,679 10,022 97.5%
C51 Vulva 213 99 46.5% 161 186 87.3%
C52 Vagina 43 27 62.8% 14 34 79.1%
C53 Cervix uteri 613 355 57.9% 335 549 89.6%
C54 Corpus uteri 1,315 632 48.1% 1,125 1,188 90.3%
C56 Ovary 767 395 51.5% 466 621 81.0%
C60 Penis 104 38 36.5% 94 99 95.2%
C61 Prostate 9,554 8,367 87.6% 3,635 8,776 91.9%
C62 Testis 379 263 69.4% 368 373 98.4%
C64 Kidney 1,744 1,091 62.6% 1,364 1,650 94.6%
C67 Bladder 2,272 844 37.1% 1,908 2,067 91.0%
C69 Eye and adnexa 118 84 71.2% 26 103 87.3%
C73 Thyroid 1,028 388 37.7% 952 972 94.6%
a Only if TNM is applicable. b The proportion of known stage is defined as the number of diagnoses with stage I-IV divided by the total number of diagnoses (Stage I, II, III, IV and X).c The proportion of diagnoses with known clinical stage is a measure for data completeness.d The proportion of diagnoses with known pathological stage is not shown (see methodology).
cTNMc
Combined TNM stage
Table 3 All invasive tumours (ICD10: C00-C97, MDS and MPN)*: Stability of incidence data (N) over time, 2004-2017
2004 2005 2006 2007 2008 2009 2010 2011 2012 2013 2014 2015 2016 2017
2004 60,047
2005 59,976 59,478
2006 60,740 60,618 60,046
2008 61,480 61,482 61,246 63,170 63,738
2009 61,507 61,482 61,266 63,189 64,096 64,526
2010 61,496 61,416 61,252 63,236 64,087 64,720 66,331
2011 61,424 61,363 61,202 63,183 64,041 64,770 66,667 69,062
2012 61,293 61,265 61,090 63,090 63,966 64,768 66,664 69,719 70,992
2013 61,299 61,317 61,183 63,214 64,127 64,904 66,692 69,761 71,068 71,536
2014 61,306 61,305 61,223 63,262 64,207 64,950 66,756 69,804 71,120 71,697 74,423
2015 61,272 61,278 61,192 63,219 64,154 64,893 66,711 69,749 71,072 71,624 74,429 73,879
2016 61,229 61,234 61,161 63,126 64,089 64,826 66,630 69,681 71,002 71,569 74,369 73,905 75,696
2017 61,209 61,193 61,166 63,105 64,062 64,805 66,606 69,656 70,981 71,567 74,374 73,960 75,850 76,633
* Excl. basocellular carcinomas of skin
Belgium
Pu
blic
atio
n y
ear
Incidence year
2.2.2 AVAILABILITY OF INFORMATION ON STAGE
2.2.3 STABILITY OF INCIDENCE DATA OVER TIME
CA
NC
ER B
UR
DEN
IN B
ELG
IUM
202
0
13
BEL
GIA
N C
AN
CER
REG
ISTR
Y

CA
NC
ER B
UR
DEN
IN B
ELG
IUM
202
0
14
BEL
GIA
N C
AN
CER
REG
ISTR
Y
CA
NC
ER B
UR
DEN
IN B
ELG
IUM
202
0
15
BEL
GIA
N C
AN
CER
REG
ISTR
Y
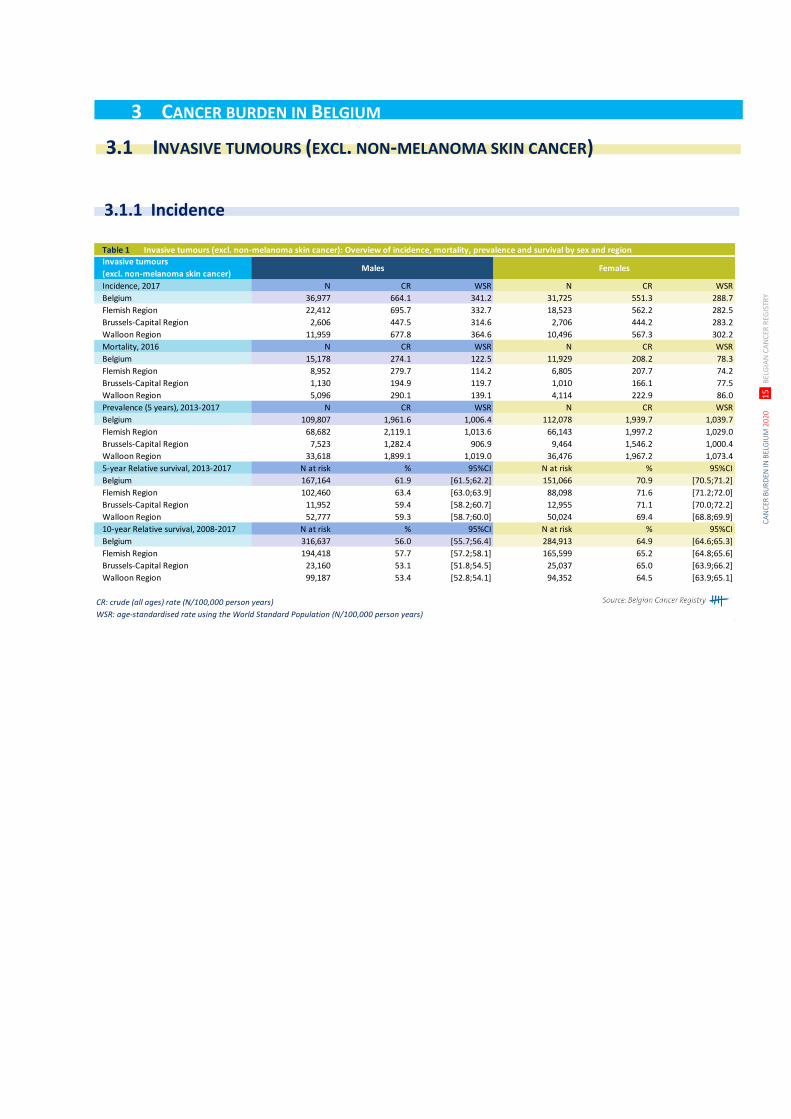
Table 1 Invasive tumours (excl. non-melanoma skin cancer): Overview of incidence, mortality, prevalence and survival by sex and region
Invasive tumours
(excl. non-melanoma skin cancer)Males Females
Incidence, 2017 N CR WSR N CR WSR
Belgium 36,977 664.1 341.2 31,725 551.3 288.7
Flemish Region 22,412 695.7 332.7 18,523 562.2 282.5
Brussels-Capital Region 2,606 447.5 314.6 2,706 444.2 283.2
Walloon Region 11,959 677.8 364.6 10,496 567.3 302.2
Mortality, 2016 N CR WSR N CR WSR
Belgium 15,178 274.1 122.5 11,929 208.2 78.3
Flemish Region 8,952 279.7 114.2 6,805 207.7 74.2
Brussels-Capital Region 1,130 194.9 119.7 1,010 166.1 77.5
Walloon Region 5,096 290.1 139.1 4,114 222.9 86.0
Prevalence (5 years), 2013-2017 N CR WSR N CR WSR
Belgium 109,807 1,961.6 1,006.4 112,078 1,939.7 1,039.7
Flemish Region 68,682 2,119.1 1,013.6 66,143 1,997.2 1,029.0
Brussels-Capital Region 7,523 1,282.4 906.9 9,464 1,546.2 1,000.4
Walloon Region 33,618 1,899.1 1,019.0 36,476 1,967.2 1,073.4
5-year Relative survival, 2013-2017 N at risk % 95%CI N at risk % 95%CI
Belgium 167,164 61.9 [61.5;62.2] 151,066 70.9 [70.5;71.2]
Flemish Region 102,460 63.4 [63.0;63.9] 88,098 71.6 [71.2;72.0]
Brussels-Capital Region 11,952 59.4 [58.2;60.7] 12,955 71.1 [70.0;72.2]
Walloon Region 52,777 59.3 [58.7;60.0] 50,024 69.4 [68.8;69.9]
10-year Relative survival, 2008-2017 N at risk % 95%CI N at risk % 95%CI
Belgium 316,637 56.0 [55.7;56.4] 284,913 64.9 [64.6;65.3]
Flemish Region 194,418 57.7 [57.2;58.1] 165,599 65.2 [64.8;65.6]
Brussels-Capital Region 23,160 53.1 [51.8;54.5] 25,037 65.0 [63.9;66.2]
Walloon Region 99,187 53.4 [52.8;54.1] 94,352 64.5 [63.9;65.1]
CR: crude (all ages) rate (N/100,000 person years)
WSR: age-standardised rate using the World Standard Population (N/100,000 person years)
3.1 INVASIVE TUMOURS (EXCL. NON-MELANOMA SKIN CANCER)
3 CANCER BURDEN IN BELGIUM
3.1.1 Incidence
CA
NC
ER B
UR
DEN
IN B
ELG
IUM
202
0
16
BEL
GIA
N C
AN
CER
REG
ISTR
Y
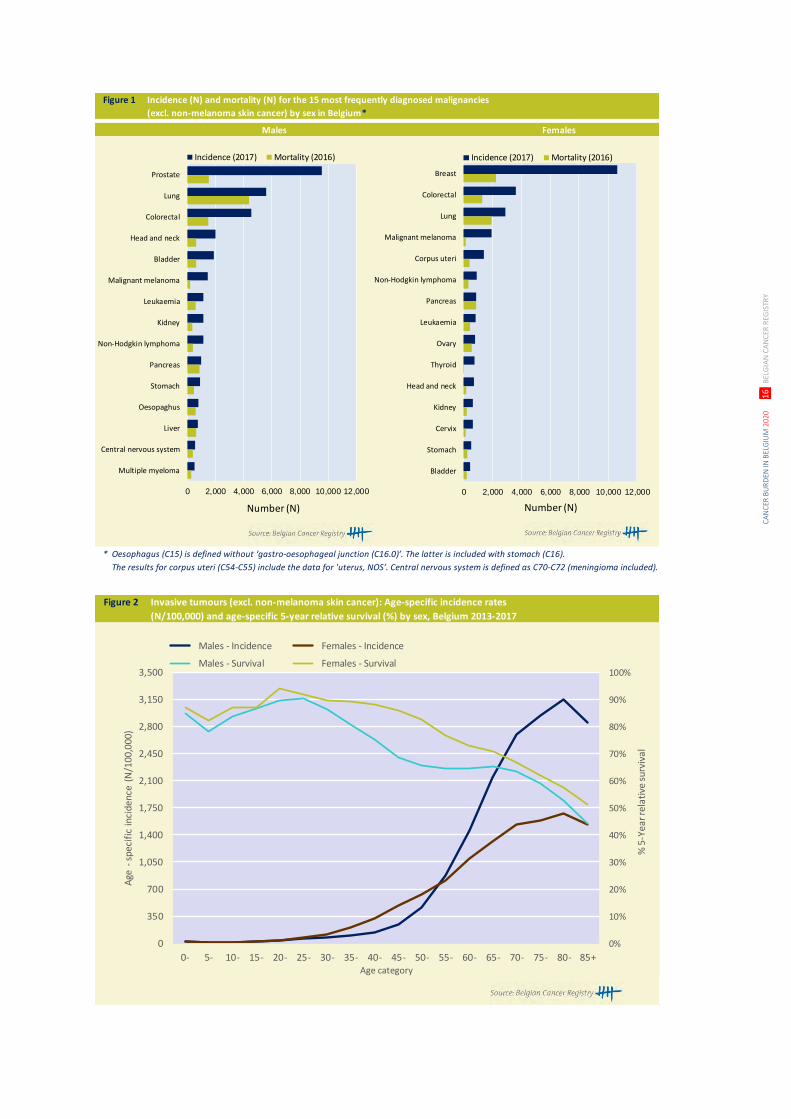
Figure 1 Incidence (N) and mortality (N) for the 15 most frequently diagnosed malignanciesIncidence (N) and mortality (N) for the 15 most frequently diagnosed malignancies
(excl. non-melanoma skin cancer) by sex in Belgium*
* Oesophagus (C15) is defined without ‘gastro-oesophageal junction (C16.0)’. The latter is included with stomach (C16).
The results for corpus uteri (C54-C55) include the data for 'uterus, NOS’. Central nervous system is defined as C70-C72 (meningioma included).
Males Females
0 2,000 4,000 6,000 8,000 10,000 12,000
Prostate
Lung
Colorectal
Head and neck
Bladder
Malignant melanoma
Leukaemia
Kidney
Non-Hodgkin lymphoma
Pancreas
Stomach
Oesopaghus
Liver
Central nervous system
Multiple myeloma
Number (N)
Incidence (2017) Mortality (2016)
0 2,000 4,000 6,000 8,000 10,000 12,000
Breast
Colorectal
Lung
Malignant melanoma
Corpus uteri
Non-Hodgkin lymphoma
Pancreas
Leukaemia
Ovary
Thyroid
Head and neck
Kidney
Cervix
Stomach
Bladder
Number (N)
Incidence (2017) Mortality (2016)
Figure 2 Stomach cancer: Age-specific incidence rates (N/100,000) by sex, Belgium 2013-2017Invasive tumours (excl. non-melanoma skin cancer): Age-specific incidence rates
(N/100,000) and age-specific 5-year relative survival (%) by sex, Belgium 2013-2017
0%
10%
20%
30%
40%
50%
60%
70%
80%
90%
100%
0
350
700
1,050
1,400
1,750
2,100
2,450
2,800
3,150
3,500
0- 5- 10- 15- 20- 25- 30- 35- 40- 45- 50- 55- 60- 65- 70- 75- 80- 85+
% 5
-Yea
r rel
ativ
e su
rviv
al
Age
-sp
ecif
ic in
cide
nce
(N
/100
,000
)
Age category
Males - Incidence Females - Incidence
Males - Survival Females - Survival
CA
NC
ER B
UR
DEN
IN B
ELG
IUM
202
0
17
BEL
GIA
N C
AN
CER
REG
ISTR
Y
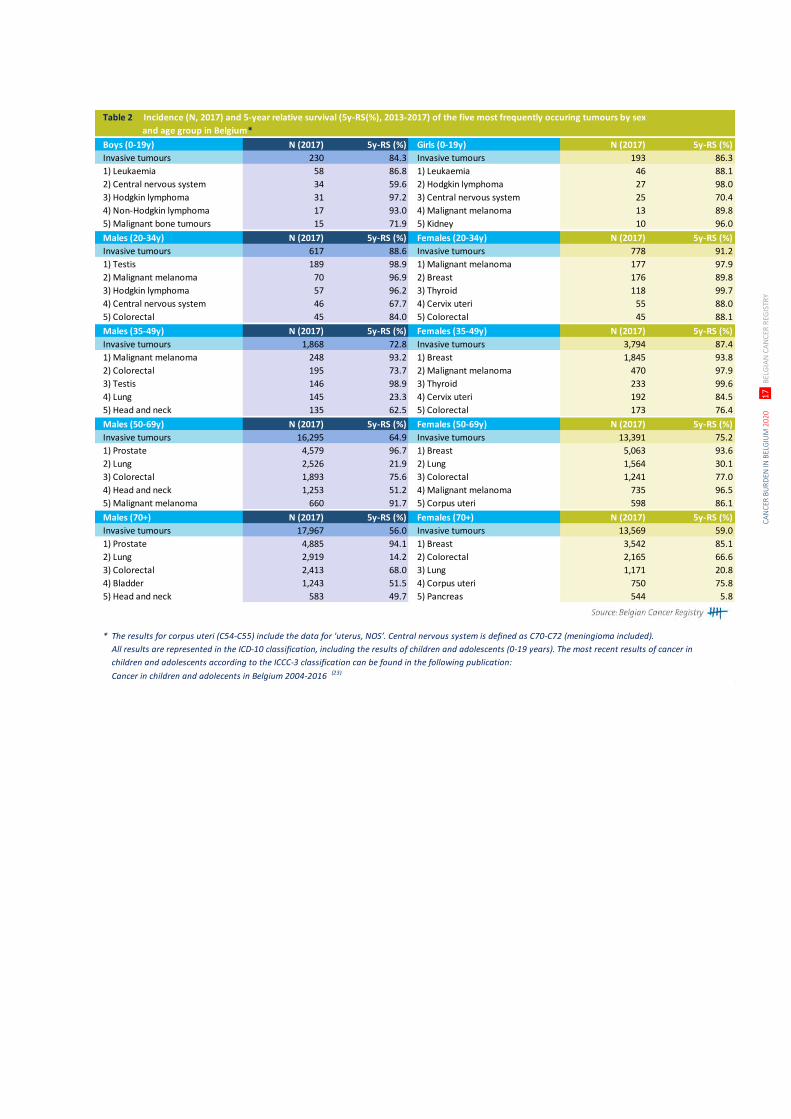
Table 2 Incidence (N, 2017) and 5-year relative survival (5y-RS(%), 2013-2017) of the five most frequently occuring tumours by sex
and age group in Belgium*
Boys (0-19y) N (2017) 5y-RS (%) Girls (0-19y) N (2017) 5y-RS (%)
Invasive tumours 230 84.3 Invasive tumours 193 86.3
1) Leukaemia 58 86.8 1) Leukaemia 46 88.1
2) Central nervous system 34 59.6 2) Hodgkin lymphoma 27 98.0
3) Hodgkin lymphoma 31 97.2 3) Central nervous system 25 70.4
4) Non-Hodgkin lymphoma 17 93.0 4) Malignant melanoma 13 89.8
5) Malignant bone tumours 15 71.9 5) Kidney 10 96.0
Males (20-34y) N (2017) 5y-RS (%) Females (20-34y) N (2017) 5y-RS (%)
Invasive tumours 617 88.6 Invasive tumours 778 91.2
1) Testis 189 98.9 1) Malignant melanoma 177 97.9
2) Malignant melanoma 70 96.9 2) Breast 176 89.8
3) Hodgkin lymphoma 57 96.2 3) Thyroid 118 99.7
4) Central nervous system 46 67.7 4) Cervix uteri 55 88.0
5) Colorectal 45 84.0 5) Colorectal 45 88.1
Males (35-49y) N (2017) 5y-RS (%) Females (35-49y) N (2017) 5y-RS (%)
Invasive tumours 1,868 72.8 Invasive tumours 3,794 87.4
1) Malignant melanoma 248 93.2 1) Breast 1,845 93.8
2) Colorectal 195 73.7 2) Malignant melanoma 470 97.9
3) Testis 146 98.9 3) Thyroid 233 99.6
4) Lung 145 23.3 4) Cervix uteri 192 84.5
5) Head and neck 135 62.5 5) Colorectal 173 76.4
Males (50-69y) N (2017) 5y-RS (%) Females (50-69y) N (2017) 5y-RS (%)
Invasive tumours 16,295 64.9 Invasive tumours 13,391 75.2
1) Prostate 4,579 96.7 1) Breast 5,063 93.6
2) Lung 2,526 21.9 2) Lung 1,564 30.1
3) Colorectal 1,893 75.6 3) Colorectal 1,241 77.0
4) Head and neck 1,253 51.2 4) Malignant melanoma 735 96.5
5) Malignant melanoma 660 91.7 5) Corpus uteri 598 86.1
Males (70+) N (2017) 5y-RS (%) Females (70+) N (2017) 5y-RS (%)
Invasive tumours 17,967 56.0 Invasive tumours 13,569 59.0
1) Prostate 4,885 94.1 1) Breast 3,542 85.1
2) Lung 2,919 14.2 2) Colorectal 2,165 66.6
3) Colorectal 2,413 68.0 3) Lung 1,171 20.8
4) Bladder 1,243 51.5 4) Corpus uteri 750 75.8
5) Head and neck 583 49.7 5) Pancreas 544 5.8
* The results for corpus uteri (C54-C55) include the data for 'uterus, NOS’. Central nervous system is defined as C70-C72 (meningioma included).
All results are represented in the ICD-10 classification, including the results of children and adolescents (0-19 years). The most recent results of cancer in
children and adolescents according to the ICCC-3 classification can be found in the following publication:
Cancer in children and adolecents in Belgium 2004-2016 (23)
CA
NC
ER B
UR
DEN
IN B
ELG
IUM
202
0
18
BEL
GIA
N C
AN
CER
REG
ISTR
Y
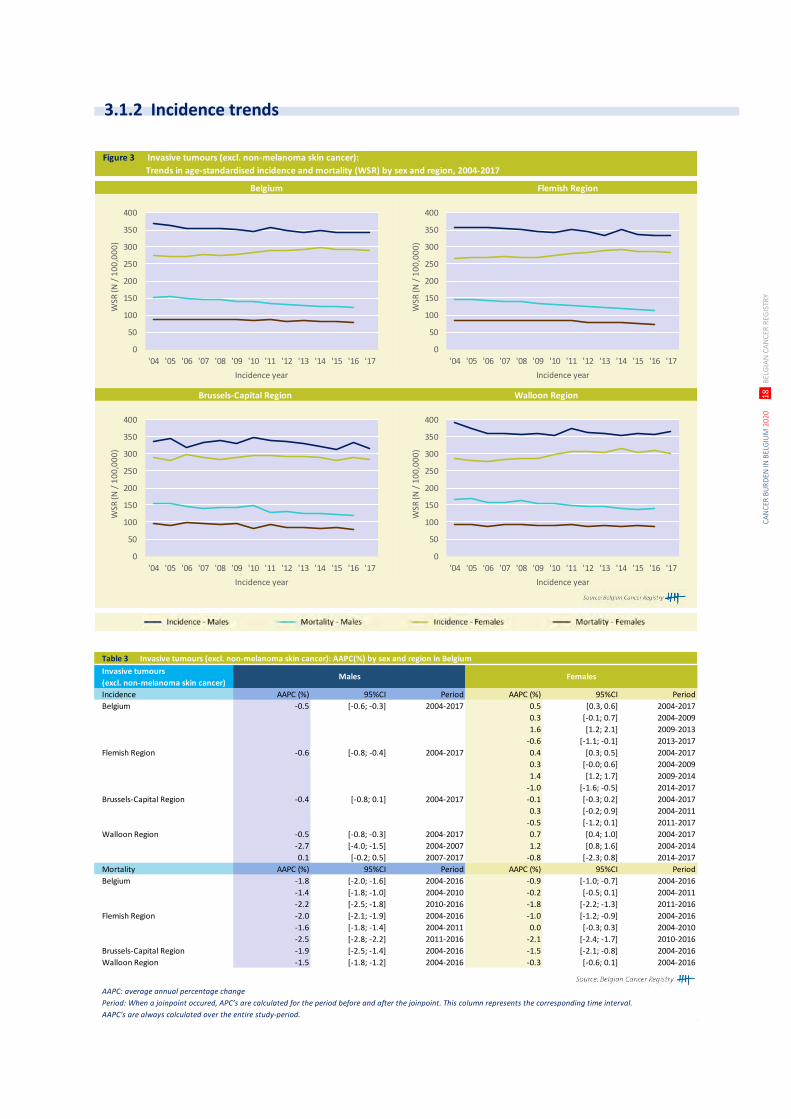
Figure 3 Invasive tumours (excl. non-melanoma skin cancer):
Trends in age-standardised incidence and mortality (WSR) by sex and region, 2004-2017
Brussels-Capital Region Walloon Region
Belgium Flemish Region
0
50
100
150
200
250
300
350
400
'04 '05 '06 '07 '08 '09 '10 '11 '12 '13 '14 '15 '16 '17
WSR
(N /
10
0,0
00
)
Incidence year
0
50
100
150
200
250
300
350
400
'04 '05 '06 '07 '08 '09 '10 '11 '12 '13 '14 '15 '16 '17
WSR
(N /
10
0,0
00
)
Incidence year
0
50
100
150
200
250
300
350
400
'04 '05 '06 '07 '08 '09 '10 '11 '12 '13 '14 '15 '16 '17
WSR
(N /
10
0,0
00
)
Incidence year
0
50
100
150
200
250
300
350
400
'04 '05 '06 '07 '08 '09 '10 '11 '12 '13 '14 '15 '16 '17
WSR
(N /
10
0,0
00
)
Incidence year
Table 3 Invasive tumours (excl. non-melanoma skin cancer): AAPC(%) by sex and region in Belgium
Invasive tumours
(excl. non-melanoma skin cancer)Males Females
Incidence AAPC (%) 95%CI Period AAPC (%) 95%CI Period
Belgium -0.5 [-0.6; -0.3] 2004-2017 0.5 [0.3, 0.6] 2004-2017
0.3 [-0.1; 0.7] 2004-2009
1.6 [1.2; 2.1] 2009-2013
-0.6 [-1.1; -0.1] 2013-2017
Flemish Region -0.6 [-0.8; -0.4] 2004-2017 0.4 [0.3; 0.5] 2004-2017
0.3 [-0.0; 0.6] 2004-2009
1.4 [1.2; 1.7] 2009-2014
-1.0 [-1.6; -0.5] 2014-2017
Brussels-Capital Region -0.4 [-0.8; 0.1] 2004-2017 -0.1 [-0.3; 0.2] 2004-2017
0.3 [-0.2; 0.9] 2004-2011
-0.5 [-1.2; 0.1] 2011-2017
Walloon Region -0.5 [-0.8; -0.3] 2004-2017 0.7 [0.4; 1.0] 2004-2017
-2.7 [-4.0; -1.5] 2004-2007 1.2 [0.8; 1.6] 2004-2014
0.1 [-0.2; 0.5] 2007-2017 -0.8 [-2.3; 0.8] 2014-2017
Mortality AAPC (%) 95%CI Period AAPC (%) 95%CI Period
Belgium -1.8 [-2.0; -1.6] 2004-2016 -0.9 [-1.0; -0.7] 2004-2016
-1.4 [-1.8; -1.0] 2004-2010 -0.2 [-0.5; 0.1] 2004-2011
-2.2 [-2.5; -1.8] 2010-2016 -1.8 [-2.2; -1.3] 2011-2016
Flemish Region -2.0 [-2.1; -1.9] 2004-2016 -1.0 [-1.2; -0.9] 2004-2016
-1.6 [-1.8; -1.4] 2004-2011 0.0 [-0.3; 0.3] 2004-2010
-2.5 [-2.8; -2.2] 2011-2016 -2.1 [-2.4; -1.7] 2010-2016
Brussels-Capital Region -1.9 [-2.5; -1.4] 2004-2016 -1.5 [-2.1; -0.8] 2004-2016
Walloon Region -1.5 [-1.8; -1.2] 2004-2016 -0.3 [-0.6; 0.1] 2004-2016
AAPC: average annual percentage change
Period: When a joinpoint occured, APC’s are calculated for the period before and after the joinpoint. This column represents the corresponding time interval.
AAPC’s are always calculated over the entire study-period.
3.1.2 Incidence trends
CA
NC
ER B
UR
DEN
IN B
ELG
IUM
202
0
19
BEL
GIA
N C
AN
CER
REG
ISTR
Y
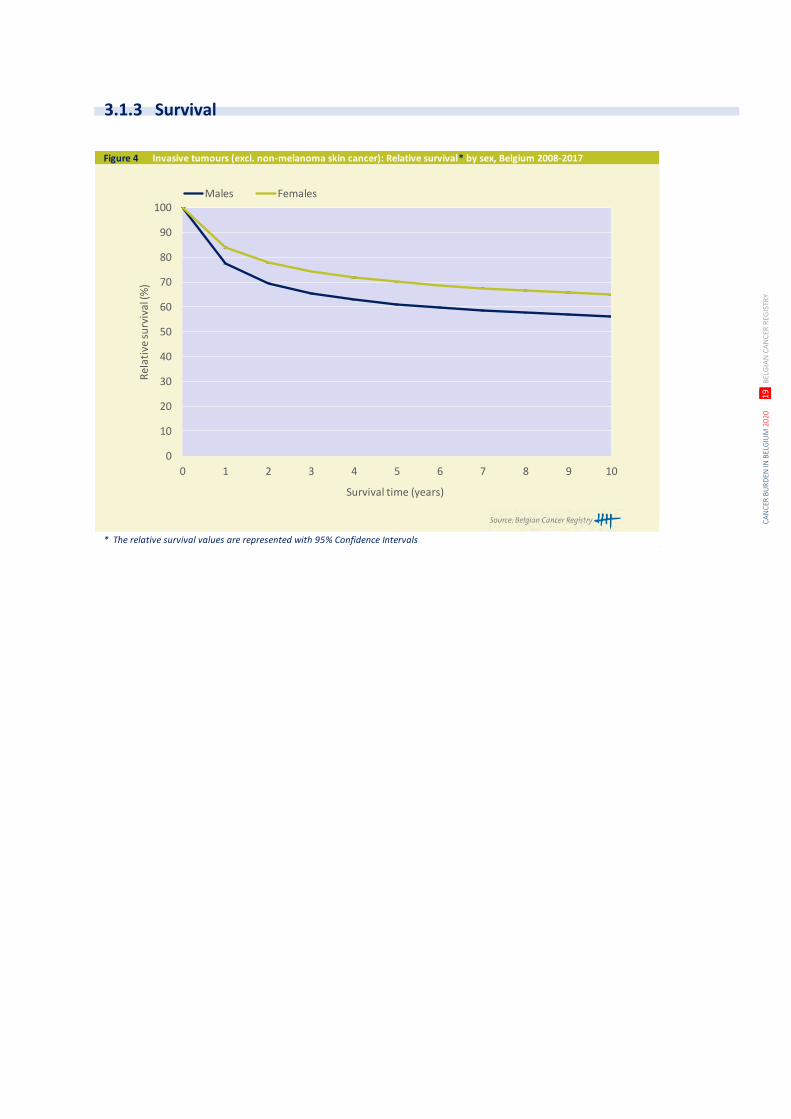
Figure 4 Invasive tumours (excl. non-melanoma skin cancer): Relative survival* by sex, Belgium 2008-2017
* The relative survival values are represented with 95% Confidence Intervals
0
10
20
30
40
50
60
70
80
90
100
0 1 2 3 4 5 6 7 8 9 10
Rel
ativ
e su
rviv
al (%
)
Survival time (years)
Males Females
3.1.3 Survival
CA
NC
ER B
UR
DEN
IN B
ELG
IUM
202
0
20
BEL
GIA
N C
AN
CER
REG
ISTR
Y
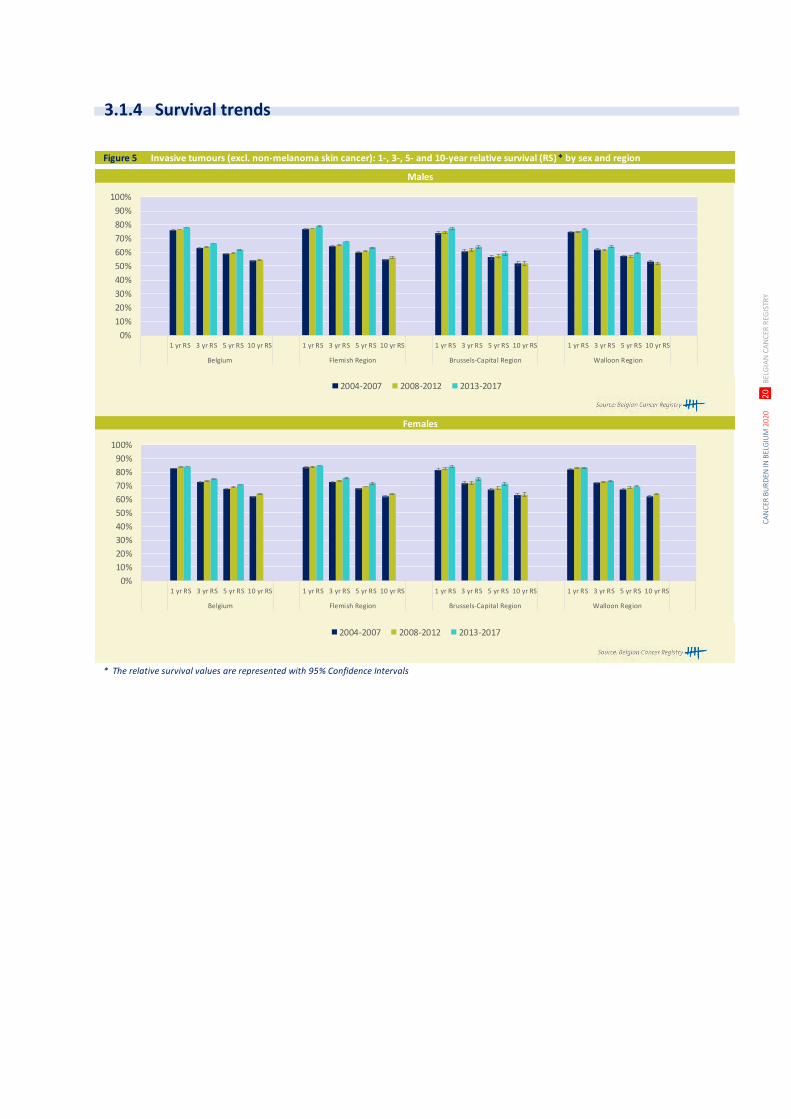
Figure 5 Invasive tumours (excl. non-melanoma skin cancer): 1-, 3-, 5- and 10-year relative survival (RS)* by sex and region
* The relative survival values are represented with 95% Confidence Intervals
Males
Females
0%
10%
20%
30%
40%
50%
60%
70%
80%
90%
100%
1 yr RS 3 yr RS 5 yr RS 10 yr RS 1 yr RS 3 yr RS 5 yr RS 10 yr RS 1 yr RS 3 yr RS 5 yr RS 10 yr RS 1 yr RS 3 yr RS 5 yr RS 10 yr RS
Belgium Flemish Region Brussels-Capital Region Walloon Region
2004-2007 2008-2012 2013-2017
0%
10%
20%
30%
40%
50%
60%
70%
80%
90%
100%
1 yr RS 3 yr RS 5 yr RS 10 yr RS 1 yr RS 3 yr RS 5 yr RS 10 yr RS 1 yr RS 3 yr RS 5 yr RS 10 yr RS 1 yr RS 3 yr RS 5 yr RS 10 yr RS
Belgium Flemish Region Brussels-Capital Region Walloon Region
2004-2007 2008-2012 2013-2017
3.1.4 Survival trends

CA
NC
ER B
UR
DEN
IN B
ELG
IUM
202
0
21
BEL
GIA
N C
AN
CER
REG
ISTR
Y
CA
NC
ER B
UR
DEN
IN B
ELG
IUM
202
0
22
BEL
GIA
N C
AN
CER
REG
ISTR
Y
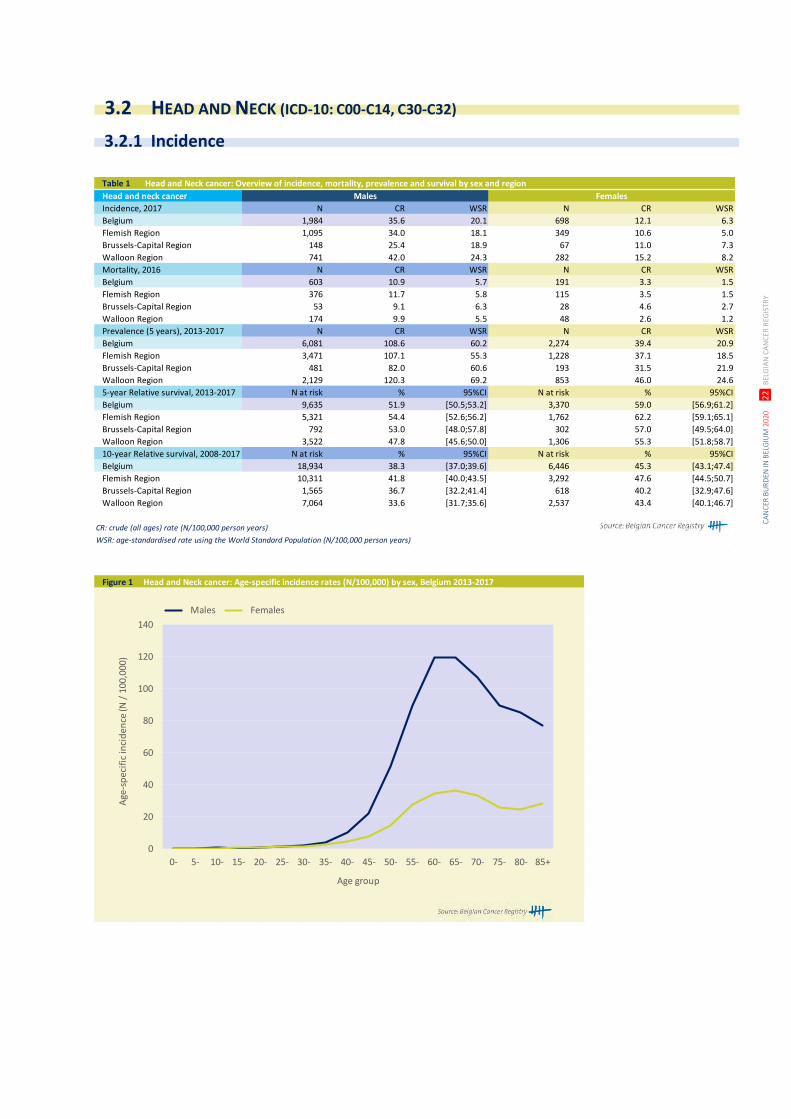
Table 1 Head and Neck cancer: Overview of incidence, mortality, prevalence and survival by sex and region
Head and neck cancer Males Females
Incidence, 2017 N CR WSR N CR WSR
Belgium 1,984 35.6 20.1 698 12.1 6.3
Flemish Region 1,095 34.0 18.1 349 10.6 5.0
Brussels-Capital Region 148 25.4 18.9 67 11.0 7.3
Walloon Region 741 42.0 24.3 282 15.2 8.2
Mortality, 2016 N CR WSR N CR WSR
Belgium 603 10.9 5.7 191 3.3 1.5
Flemish Region 376 11.7 5.8 115 3.5 1.5
Brussels-Capital Region 53 9.1 6.3 28 4.6 2.7
Walloon Region 174 9.9 5.5 48 2.6 1.2
Prevalence (5 years), 2013-2017 N CR WSR N CR WSR
Belgium 6,081 108.6 60.2 2,274 39.4 20.9
Flemish Region 3,471 107.1 55.3 1,228 37.1 18.5
Brussels-Capital Region 481 82.0 60.6 193 31.5 21.9
Walloon Region 2,129 120.3 69.2 853 46.0 24.6
5-year Relative survival, 2013-2017 N at risk % 95%CI N at risk % 95%CI
Belgium 9,635 51.9 [50.5;53.2] 3,370 59.0 [56.9;61.2]
Flemish Region 5,321 54.4 [52.6;56.2] 1,762 62.2 [59.1;65.1]
Brussels-Capital Region 792 53.0 [48.0;57.8] 302 57.0 [49.5;64.0]
Walloon Region 3,522 47.8 [45.6;50.0] 1,306 55.3 [51.8;58.7]
10-year Relative survival, 2008-2017 N at risk % 95%CI N at risk % 95%CI
Belgium 18,934 38.3 [37.0;39.6] 6,446 45.3 [43.1;47.4]
Flemish Region 10,311 41.8 [40.0;43.5] 3,292 47.6 [44.5;50.7]
Brussels-Capital Region 1,565 36.7 [32.2;41.4] 618 40.2 [32.9;47.6]
Walloon Region 7,064 33.6 [31.7;35.6] 2,537 43.4 [40.1;46.7]
CR: crude (all ages) rate (N/100,000 person years)
WSR: age-standardised rate using the World Standard Population (N/100,000 person years)
Figure 1 Head and Neck cancer: Age-specific incidence rates (N/100,000) by sex, Belgium 2013-2017
0
20
40
60
80
100
120
140
0- 5- 10- 15- 20- 25- 30- 35- 40- 45- 50- 55- 60- 65- 70- 75- 80- 85+
Age
-sp
ecif
ic in
cid
ence
(N /
100
,000
)
Age group
Males Females
3.2 HEAD AND NECK (ICD-10: C00-C14, C30-C32)
3.2.1 Incidence
CA
NC
ER B
UR
DEN
IN B
ELG
IUM
202
0
23
BEL
GIA
N C
AN
CER
REG
ISTR
Y
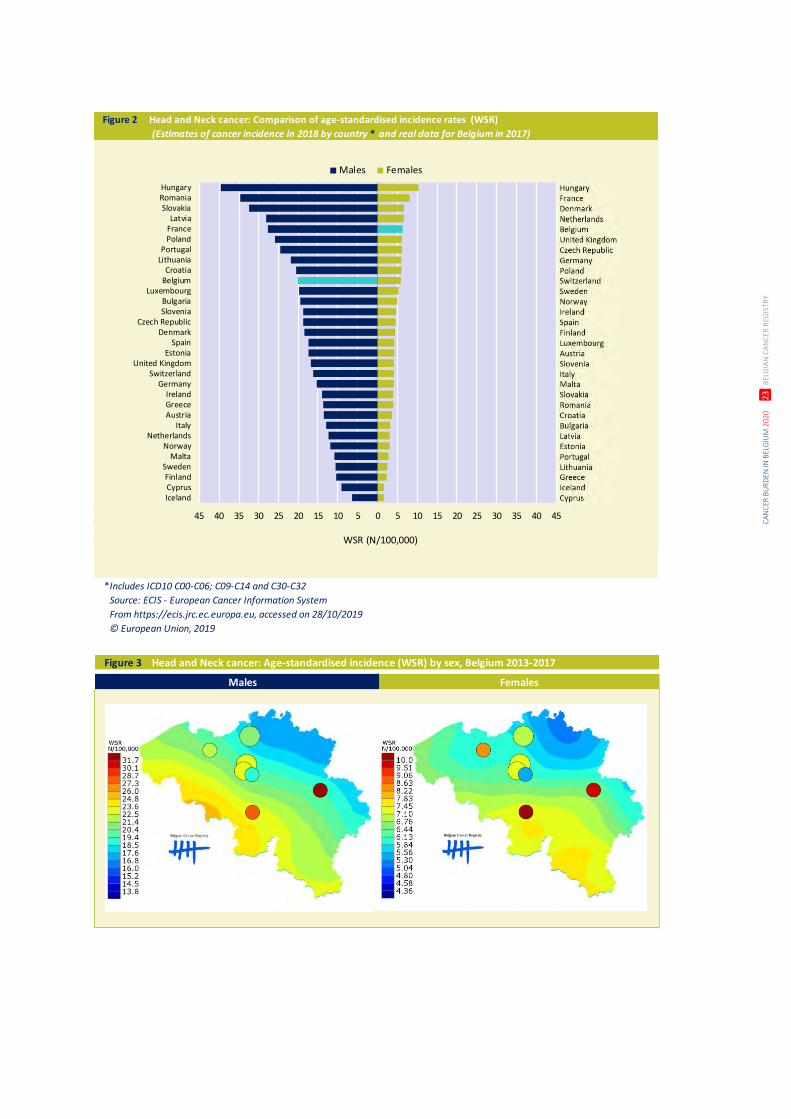
Figure 2 Head and Neck cancer: Comparison of age-standardised incidence rates (WSR)
(Estimates of cancer incidence in 2018 by country * and real data for Belgium in 2017)
Includes ICD10 C00-C06; C09-C14 and C30-C32
Source: ECIS - European Cancer Information System
From https://ecis.jrc.ec.europa.eu, accessed on 28/10/2019
© European Union, 2019
45 40 35 30 25 20 15 10 5 0 5 10 15 20 25 30 35 40 45
IcelandCyprusFinland
SwedenMalta
NorwayNetherlands
ItalyAustriaGreeceIreland
GermanySwitzerland
United KingdomEstonia
SpainDenmark
Czech RepublicSloveniaBulgaria
LuxembourgBelgiumCroatia
LithuaniaPortugal
PolandFranceLatvia
SlovakiaRomaniaHungary
Males Females
WSR (N/100,000)
*
Figure 3 Head and Neck cancer: Age-standardised incidence (WSR) by sex, Belgium 2013-2017
Males Females
CA
NC
ER B
UR
DEN
IN B
ELG
IUM
202
0
24
BEL
GIA
N C
AN
CER
REG
ISTR
Y
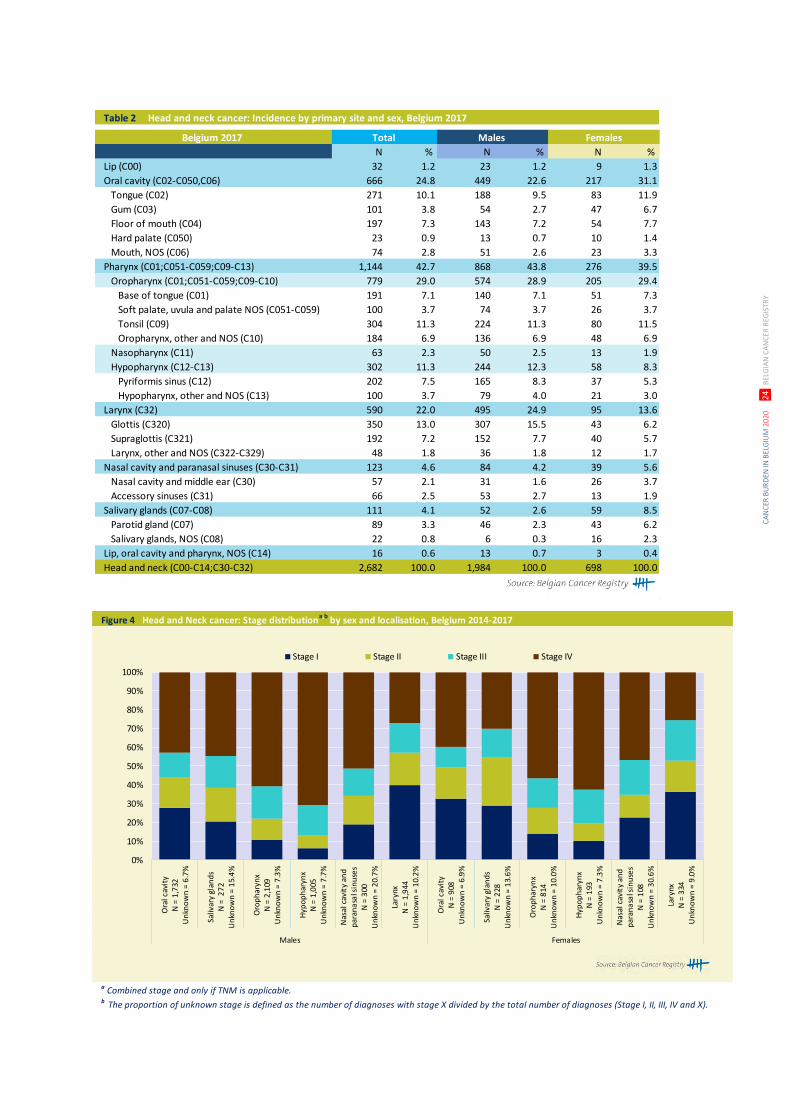
Table 2 Head and neck cancer: Incidence by primary site and sex, Belgium 2017
N % N % N %
Lip (C00) 32 1.2 23 1.2 9 1.3
Oral cavity (C02-C050,C06) 666 24.8 449 22.6 217 31.1
Tongue (C02) 271 10.1 188 9.5 83 11.9
Gum (C03) 101 3.8 54 2.7 47 6.7
Floor of mouth (C04) 197 7.3 143 7.2 54 7.7
Hard palate (C050) 23 0.9 13 0.7 10 1.4
Mouth, NOS (C06) 74 2.8 51 2.6 23 3.3
Pharynx (C01;C051-C059;C09-C13) 1,144 42.7 868 43.8 276 39.5
Oropharynx (C01;C051-C059;C09-C10) 779 29.0 574 28.9 205 29.4
Base of tongue (C01) 191 7.1 140 7.1 51 7.3
Soft palate, uvula and palate NOS (C051-C059) 100 3.7 74 3.7 26 3.7
Tonsil (C09) 304 11.3 224 11.3 80 11.5
Oropharynx, other and NOS (C10) 184 6.9 136 6.9 48 6.9
Nasopharynx (C11) 63 2.3 50 2.5 13 1.9
Hypopharynx (C12-C13) 302 11.3 244 12.3 58 8.3
Pyriformis sinus (C12) 202 7.5 165 8.3 37 5.3
Hypopharynx, other and NOS (C13) 100 3.7 79 4.0 21 3.0
Larynx (C32) 590 22.0 495 24.9 95 13.6
Glottis (C320) 350 13.0 307 15.5 43 6.2
Supraglottis (C321) 192 7.2 152 7.7 40 5.7
Larynx, other and NOS (C322-C329) 48 1.8 36 1.8 12 1.7
Nasal cavity and paranasal sinuses (C30-C31) 123 4.6 84 4.2 39 5.6
Nasal cavity and middle ear (C30) 57 2.1 31 1.6 26 3.7
Accessory sinuses (C31) 66 2.5 53 2.7 13 1.9
Salivary glands (C07-C08) 111 4.1 52 2.6 59 8.5
Parotid gland (C07) 89 3.3 46 2.3 43 6.2
Salivary glands, NOS (C08) 22 0.8 6 0.3 16 2.3
Lip, oral cavity and pharynx, NOS (C14) 16 0.6 13 0.7 3 0.4
Head and neck (C00-C14;C30-C32) 2,682 100.0 1,984 100.0 698 100.0
FemalesMales Total Belgium 2017
Figure 4 Head and Neck cancer: Stage distributiona,b
by sex and localisation, Belgium 2014-2017
a Combined stage and only if TNM is applicable. b The proportion of unknown stage is defined as the number of diagnoses with stage X divided by the total number of diagnoses (Stage I, II, III, IV and X).
0%
10%
20%
30%
40%
50%
60%
70%
80%
90%
100%
Ora
l cav
ity
N =
1,7
32U
nkn
ow
n =
6.7
%
Saliv
ary
glan
ds
N =
27
2U
nkn
ow
n =
15.
4%
Oro
ph
aryn
xN
= 2
,109
Un
kno
wn
= 7
.3%
Hyp
op
har
ynx
N =
1,0
05U
nkn
ow
n =
7.7
%
Nas
al c
avit
y an
dp
aran
asa
l sin
use
sN
= 3
00U
nkn
ow
n =
20.
7%
Lary
nxN
= 1
,944
Un
kno
wn
= 1
0.2
%
Ora
l cav
ity
N =
908
Un
kno
wn
= 6
.9%
Saliv
ary
glan
ds
N =
228
Un
kno
wn
= 1
3.6
%
Oro
ph
aryn
xN
= 8
14U
nkn
ow
n =
10.
0%
Hyp
op
har
ynx
N =
193
Un
kno
wn
= 7
.3%
Nas
al c
avit
y an
dp
aran
asa
l sin
use
sN
= 1
08U
nkn
ow
n =
30.
6%
Lary
nxN
= 3
34U
nkn
ow
n =
9.0
%
Males Females
Stage I Stage II Stage III Stage IV
CA
NC
ER B
UR
DEN
IN B
ELG
IUM
202
0
25
BEL
GIA
N C
AN
CER
REG
ISTR
Y
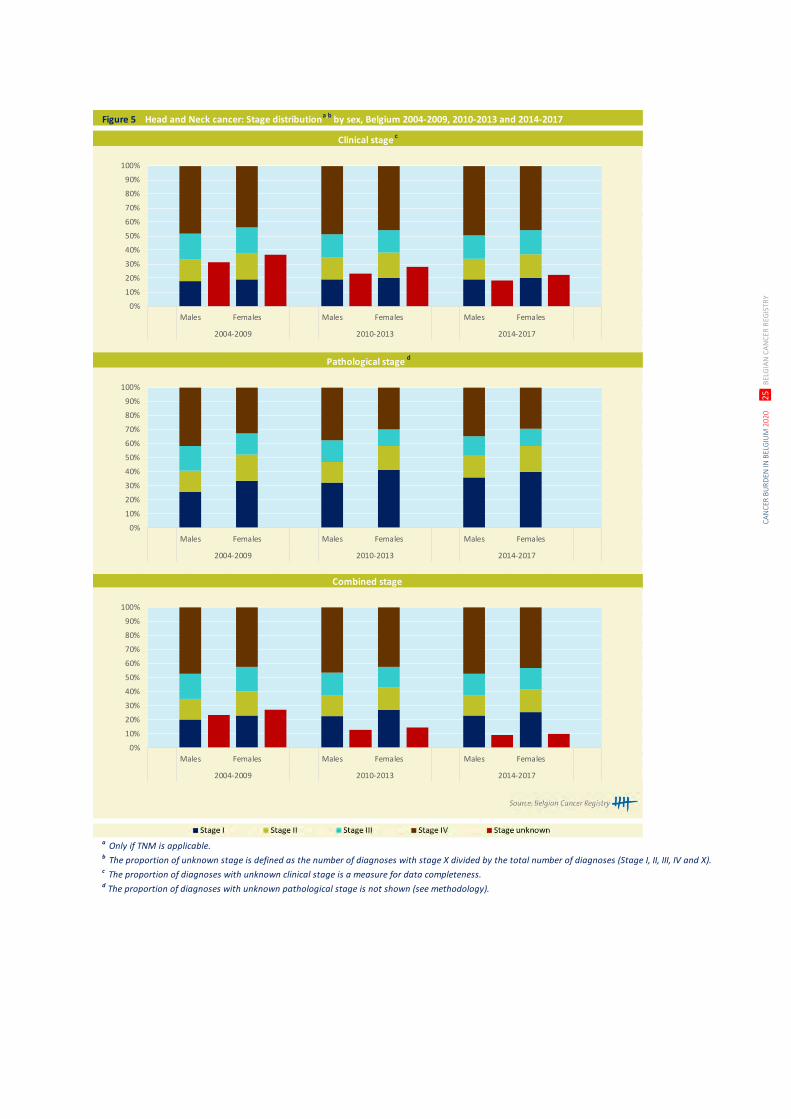
Figure 5 Head and Neck cancer: Stage distributiona,b by sex, Belgium 2004-2009, 2010-2013 and 2014-2017
a Only if TNM is applicable. b The proportion of unknown stage is defined as the number of diagnoses with stage X divided by the total number of diagnoses (Stage I, II, III, IV and X).c The proportion of diagnoses with unknown clinical stage is a measure for data completeness.d The proportion of diagnoses with unknown pathological stage is not shown (see methodology).
Clinical stage c
Pathological stage d
Combined stage
0%
10%
20%
30%
40%
50%
60%
70%
80%
90%
100%
Males Females Males Females Males Females
2004-2009 2010-2013 2014-2017
0%
10%
20%
30%
40%
50%
60%
70%
80%
90%
100%
Males Females Males Females Males Females
2004-2009 2010-2013 2014-2017
0%
10%
20%
30%
40%
50%
60%
70%
80%
90%
100%
Males Females Males Females Males Females
2004-2009 2010-2013 2014-2017
CA
NC
ER B
UR
DEN
IN B
ELG
IUM
202
0
26
BEL
GIA
N C
AN
CER
REG
ISTR
Y
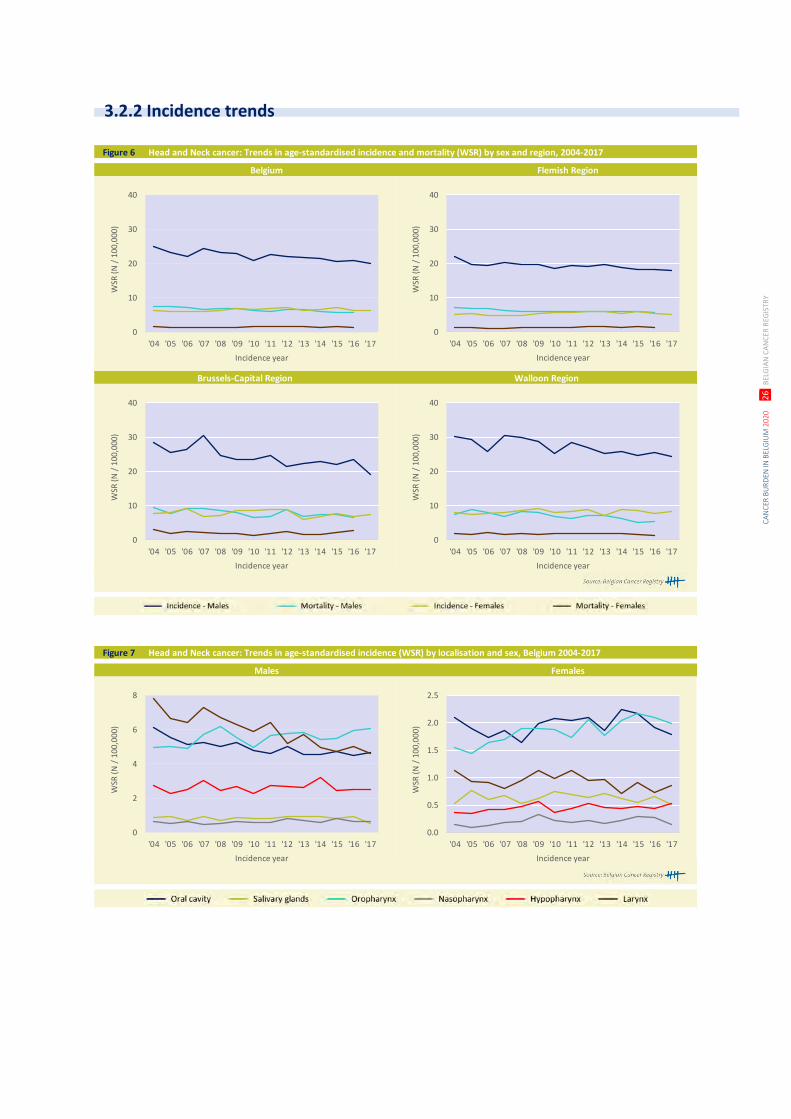
Figure 6 Head and Neck cancer: Trends in age-standardised incidence and mortality (WSR) by sex and region, 2004-2017
Brussels-Capital Region Walloon Region
Belgium Flemish Region
0
10
20
30
40
'04 '05 '06 '07 '08 '09 '10 '11 '12 '13 '14 '15 '16 '17
WSR
(N
/ 1
00,0
00)
Incidence year
0
10
20
30
40
'04 '05 '06 '07 '08 '09 '10 '11 '12 '13 '14 '15 '16 '17
WSR
(N
/ 1
00,0
00)
Incidence year
0
10
20
30
40
'04 '05 '06 '07 '08 '09 '10 '11 '12 '13 '14 '15 '16 '17
WSR
(N
/ 1
00,0
00)
Incidence year
0
10
20
30
40
'04 '05 '06 '07 '08 '09 '10 '11 '12 '13 '14 '15 '16 '17
WSR
(N
/ 1
00,0
00)
Incidence year
Figure 7 Head and Neck cancer: Trends in age-standardised incidence (WSR) by localisation and sex, Belgium 2004-2017
Males Females
0
2
4
6
8
'04 '05 '06 '07 '08 '09 '10 '11 '12 '13 '14 '15 '16 '17
WSR
(N
/ 1
00
,00
0)
Incidence year
0.0
0.5
1.0
1.5
2.0
2.5
'04 '05 '06 '07 '08 '09 '10 '11 '12 '13 '14 '15 '16 '17
WSR
(N
/ 1
00
,00
0)
Incidence year
3.2.2 Incidence trends
CA
NC
ER B
UR
DEN
IN B
ELG
IUM
202
0
27
BEL
GIA
N C
AN
CER
REG
ISTR
Y
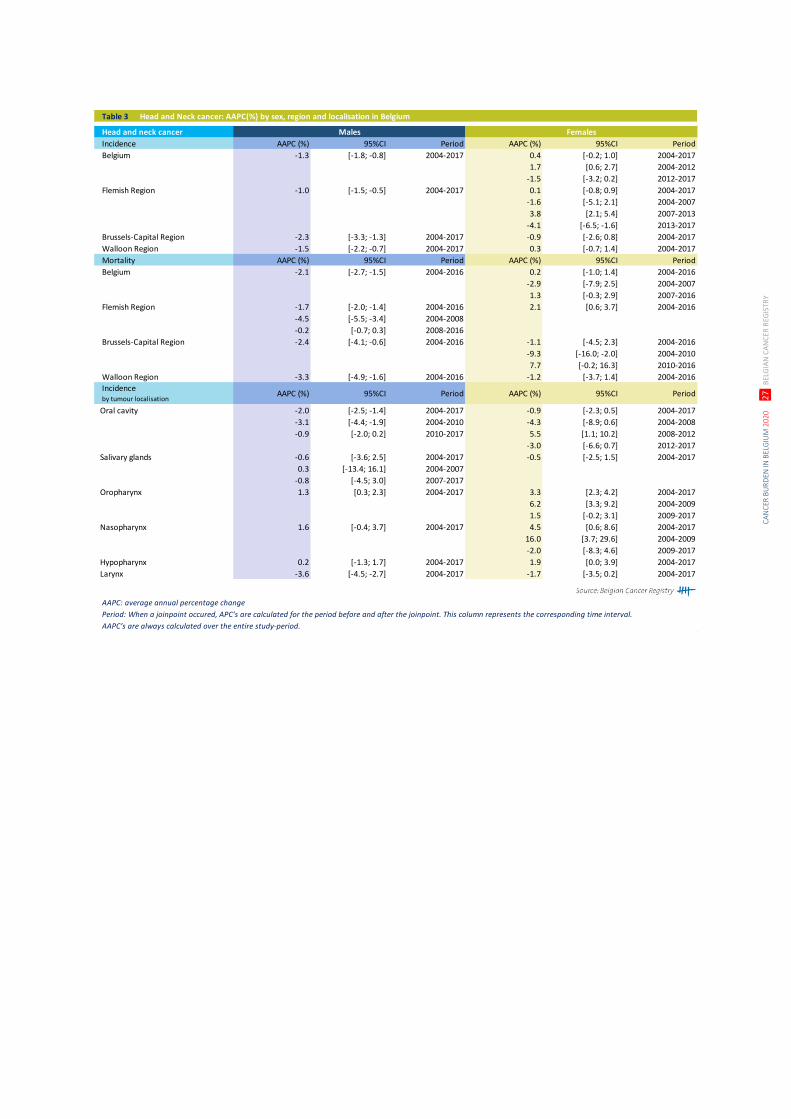
Table 3 Head and Neck cancer: AAPC(%) by sex, region and localisation in Belgium
Head and neck cancer Males Females
Incidence AAPC (%) 95%CI Period AAPC (%) 95%CI Period
Belgium -1.3 [-1.8; -0.8] 2004-2017 0.4 [-0.2; 1.0] 2004-2017
1.7 [0.6; 2.7] 2004-2012
-1.5 [-3.2; 0.2] 2012-2017
Flemish Region -1.0 [-1.5; -0.5] 2004-2017 0.1 [-0.8; 0.9] 2004-2017
-1.6 [-5.1; 2.1] 2004-2007
3.8 [2.1; 5.4] 2007-2013
-4.1 [-6.5; -1.6] 2013-2017
Brussels-Capital Region -2.3 [-3.3; -1.3] 2004-2017 -0.9 [-2.6; 0.8] 2004-2017
Walloon Region -1.5 [-2.2; -0.7] 2004-2017 0.3 [-0.7; 1.4] 2004-2017
Mortality AAPC (%) 95%CI Period AAPC (%) 95%CI Period
Belgium -2.1 [-2.7; -1.5] 2004-2016 0.2 [-1.0; 1.4] 2004-2016
-2.9 [-7.9; 2.5] 2004-2007
1.3 [-0.3; 2.9] 2007-2016
Flemish Region -1.7 [-2.0; -1.4] 2004-2016 2.1 [0.6; 3.7] 2004-2016
-4.5 [-5.5; -3.4] 2004-2008
-0.2 [-0.7; 0.3] 2008-2016
Brussels-Capital Region -2.4 [-4.1; -0.6] 2004-2016 -1.1 [-4.5; 2.3] 2004-2016
-9.3 [-16.0; -2.0] 2004-2010
7.7 [-0.2; 16.3] 2010-2016
Walloon Region -3.3 [-4.9; -1.6] 2004-2016 -1.2 [-3.7; 1.4] 2004-2016
Incidenceby tumour localisation
AAPC (%) 95%CI Period AAPC (%) 95%CI Period
Oral cavity -2.0 [-2.5; -1.4] 2004-2017 -0.9 [-2.3; 0.5] 2004-2017
-3.1 [-4.4; -1.9] 2004-2010 -4.3 [-8.9; 0.6] 2004-2008
-0.9 [-2.0; 0.2] 2010-2017 5.5 [1.1; 10.2] 2008-2012
-3.0 [-6.6; 0.7] 2012-2017
Salivary glands -0.6 [-3.6; 2.5] 2004-2017 -0.5 [-2.5; 1.5] 2004-2017
0.3 [-13.4; 16.1] 2004-2007
-0.8 [-4.5; 3.0] 2007-2017
Oropharynx 1.3 [0.3; 2.3] 2004-2017 3.3 [2.3; 4.2] 2004-2017
6.2 [3.3; 9.2] 2004-2009
1.5 [-0.2; 3.1] 2009-2017
Nasopharynx 1.6 [-0.4; 3.7] 2004-2017 4.5 [0.6; 8.6] 2004-2017
16.0 [3.7; 29.6] 2004-2009
-2.0 [-8.3; 4.6] 2009-2017
Hypopharynx 0.2 [-1.3; 1.7] 2004-2017 1.9 [0.0; 3.9] 2004-2017
Larynx -3.6 [-4.5; -2.7] 2004-2017 -1.7 [-3.5; 0.2] 2004-2017
AAPC: average annual percentage change
Period: When a joinpoint occured, APC’s are calculated for the period before and after the joinpoint. This column represents the corresponding time interval.
AAPC’s are always calculated over the entire study-period.
CA
NC
ER B
UR
DEN
IN B
ELG
IUM
202
0
28
BEL
GIA
N C
AN
CER
REG
ISTR
Y
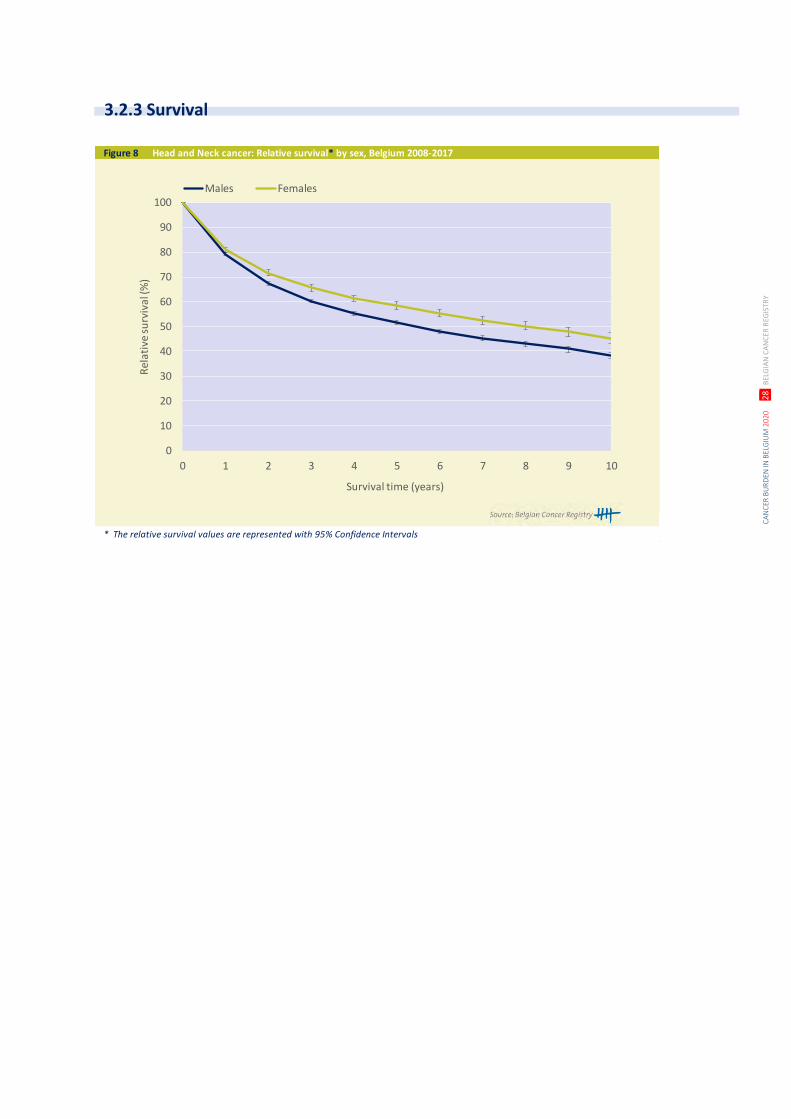
Figure 8 Head and Neck cancer: Relative survival* by sex, Belgium 2008-2017
* The relative survival values are represented with 95% Confidence Intervals
0
10
20
30
40
50
60
70
80
90
100
0 1 2 3 4 5 6 7 8 9 10
Rel
ativ
e su
rviv
al (%
)
Survival time (years)
Males Females
3.2.3 Survival
CA
NC
ER B
UR
DEN
IN B
ELG
IUM
202
0
29
BEL
GIA
N C
AN
CER
REG
ISTR
Y
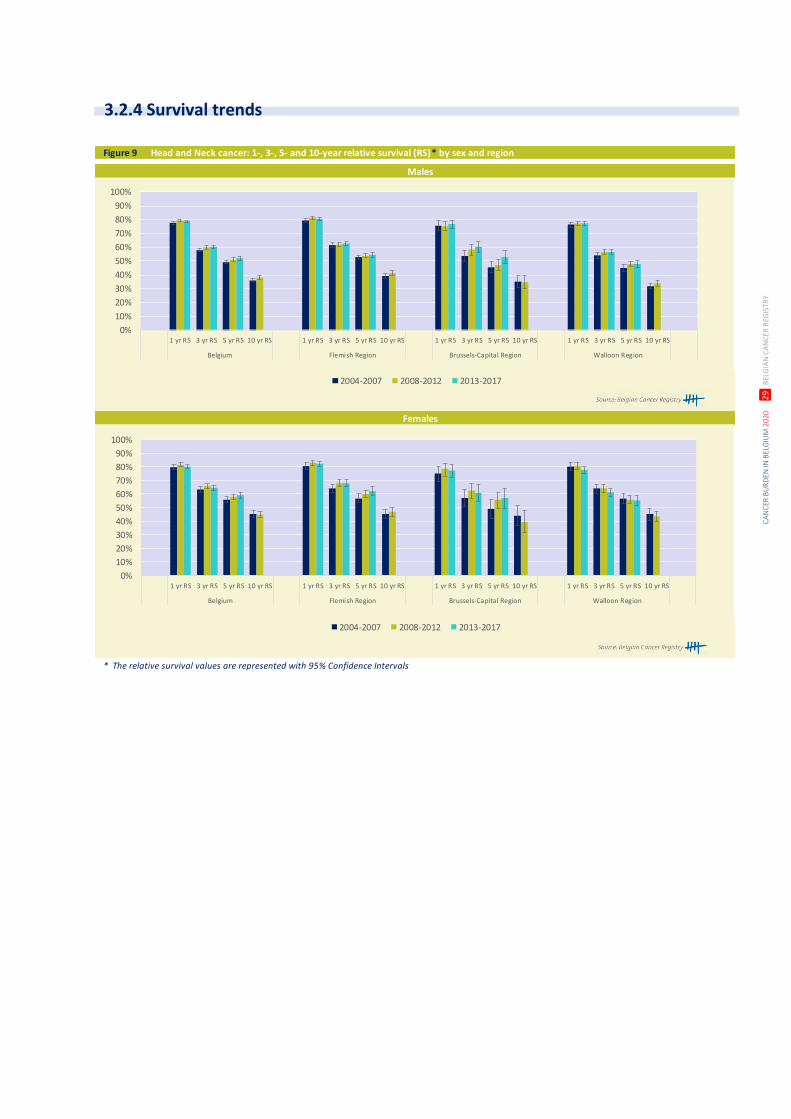
Figure 9 Head and Neck cancer: 1-, 3-, 5- and 10-year relative survival (RS)* by sex and region
* The relative survival values are represented with 95% Confidence Intervals
Males
Females
0%
10%
20%
30%
40%
50%
60%
70%
80%
90%
100%
1 yr RS 3 yr RS 5 yr RS 10 yr RS 1 yr RS 3 yr RS 5 yr RS 10 yr RS 1 yr RS 3 yr RS 5 yr RS 10 yr RS 1 yr RS 3 yr RS 5 yr RS 10 yr RS
Belgium Flemish Region Brussels-Capital Region Walloon Region
2004-2007 2008-2012 2013-2017
0%
10%
20%
30%
40%
50%
60%
70%
80%
90%
100%
1 yr RS 3 yr RS 5 yr RS 10 yr RS 1 yr RS 3 yr RS 5 yr RS 10 yr RS 1 yr RS 3 yr RS 5 yr RS 10 yr RS 1 yr RS 3 yr RS 5 yr RS 10 yr RS
Belgium Flemish Region Brussels-Capital Region Walloon Region
2004-2007 2008-2012 2013-2017
3.2.4 Survival trends
CA
NC
ER B
UR
DEN
IN B
ELG
IUM
202
0
30
BEL
GIA
N C
AN
CER
REG
ISTR
Y
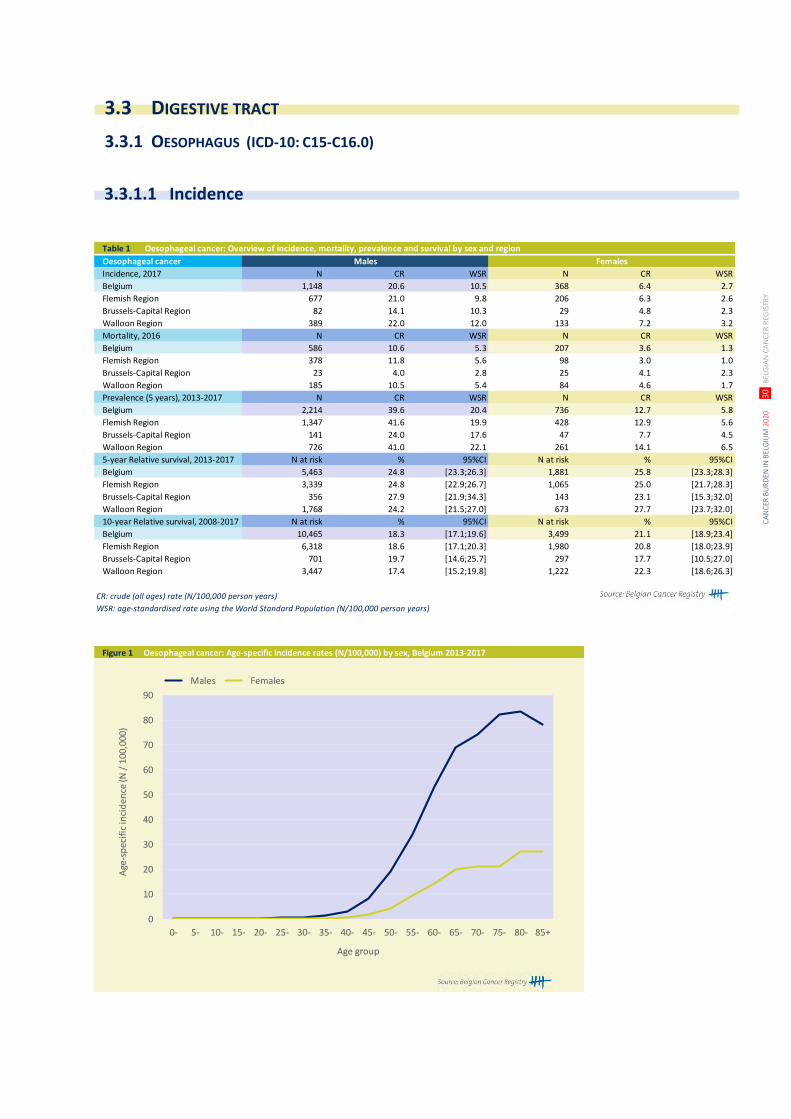
Table 1 Oesophageal cancer: Overview of incidence, mortality, prevalence and survival by sex and region
Oesophageal cancer Males Females
Incidence, 2017 N CR WSR N CR WSR
Belgium 1,148 20.6 10.5 368 6.4 2.7
Flemish Region 677 21.0 9.8 206 6.3 2.6
Brussels-Capital Region 82 14.1 10.3 29 4.8 2.3
Walloon Region 389 22.0 12.0 133 7.2 3.2
Mortality, 2016 N CR WSR N CR WSR
Belgium 586 10.6 5.3 207 3.6 1.3
Flemish Region 378 11.8 5.6 98 3.0 1.0
Brussels-Capital Region 23 4.0 2.8 25 4.1 2.3
Walloon Region 185 10.5 5.4 84 4.6 1.7
Prevalence (5 years), 2013-2017 N CR WSR N CR WSR
Belgium 2,214 39.6 20.4 736 12.7 5.8
Flemish Region 1,347 41.6 19.9 428 12.9 5.6
Brussels-Capital Region 141 24.0 17.6 47 7.7 4.5
Walloon Region 726 41.0 22.1 261 14.1 6.5
5-year Relative survival, 2013-2017 N at risk % 95%CI N at risk % 95%CI
Belgium 5,463 24.8 [23.3;26.3] 1,881 25.8 [23.3;28.3]
Flemish Region 3,339 24.8 [22.9;26.7] 1,065 25.0 [21.7;28.3]
Brussels-Capital Region 356 27.9 [21.9;34.3] 143 23.1 [15.3;32.0]
Walloon Region 1,768 24.2 [21.5;27.0] 673 27.7 [23.7;32.0]
10-year Relative survival, 2008-2017 N at risk % 95%CI N at risk % 95%CI
Belgium 10,465 18.3 [17.1;19.6] 3,499 21.1 [18.9;23.4]
Flemish Region 6,318 18.6 [17.1;20.3] 1,980 20.8 [18.0;23.9]
Brussels-Capital Region 701 19.7 [14.6;25.7] 297 17.7 [10.5;27.0]
Walloon Region 3,447 17.4 [15.2;19.8] 1,222 22.3 [18.6;26.3]
CR: crude (all ages) rate (N/100,000 person years)
WSR: age-standardised rate using the World Standard Population (N/100,000 person years)
Figure 1 Oesophageal cancer: Age-specific incidence rates (N/100,000) by sex, Belgium 2013-2017
0
10
20
30
40
50
60
70
80
90
0- 5- 10- 15- 20- 25- 30- 35- 40- 45- 50- 55- 60- 65- 70- 75- 80- 85+
Age
-sp
ecif
ic in
cid
ence
(N /
100
,000
)
Age group
Males Females
3.3 DIGESTIVE TRACT
3.3.1 OESOPHAGUS (ICD-10: C15-C16.0)
3.3.1.1 Incidence
CA
NC
ER B
UR
DEN
IN B
ELG
IUM
202
0
31
BEL
GIA
N C
AN
CER
REG
ISTR
Y
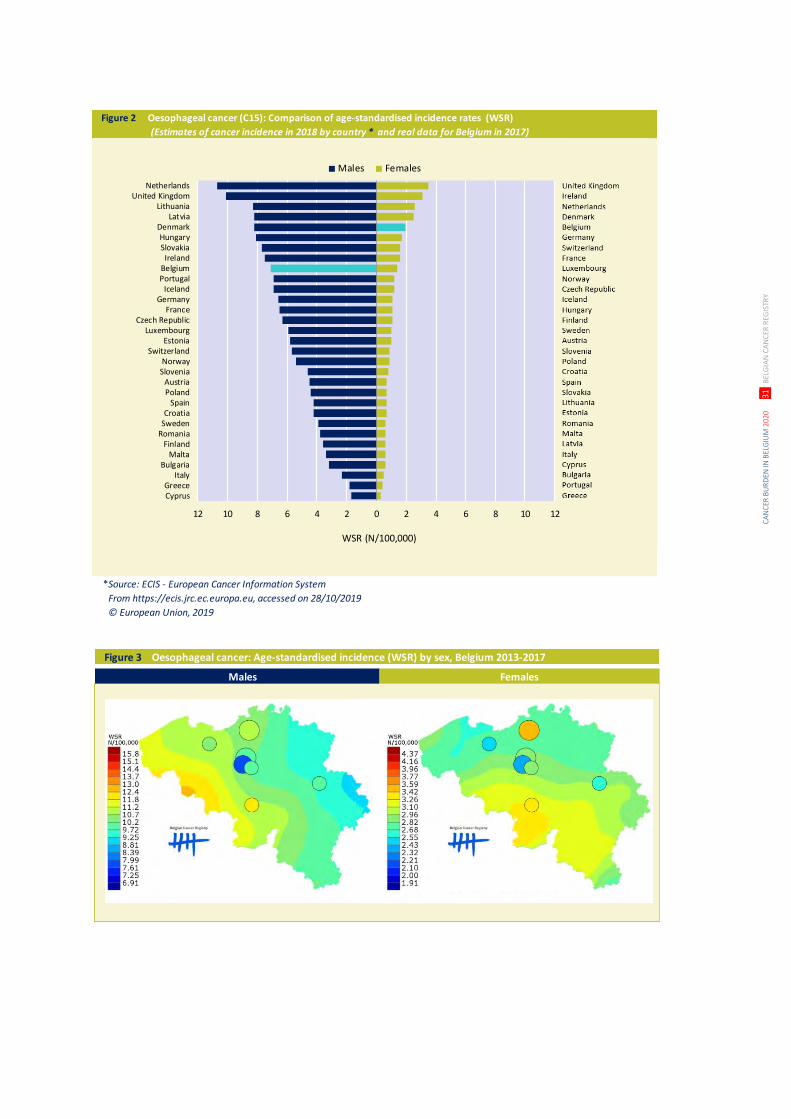
Figure 2 Oesophageal cancer (C15): Comparison of age-standardised incidence rates (WSR)
(Estimates of cancer incidence in 2018 by country * and real data for Belgium in 2017)
Source: ECIS - European Cancer Information System
From https://ecis.jrc.ec.europa.eu, accessed on 28/10/2019
© European Union, 2019
12 10 8 6 4 2 0 2 4 6 8 10 12
CyprusGreece
ItalyBulgaria
MaltaFinland
RomaniaSwedenCroatia
SpainPolandAustria
SloveniaNorway
SwitzerlandEstonia
LuxembourgCzech Republic
FranceGermany
IcelandPortugalBelgiumIreland
SlovakiaHungary
DenmarkLatvia
LithuaniaUnited Kingdom
Netherlands
Males Females
WSR (N/100,000)
*
Figure 3 Oesophageal cancer: Age-standardised incidence (WSR) by sex, Belgium 2013-2017
Males Females
CA
NC
ER B
UR
DEN
IN B
ELG
IUM
202
0
32
BEL
GIA
N C
AN
CER
REG
ISTR
Y
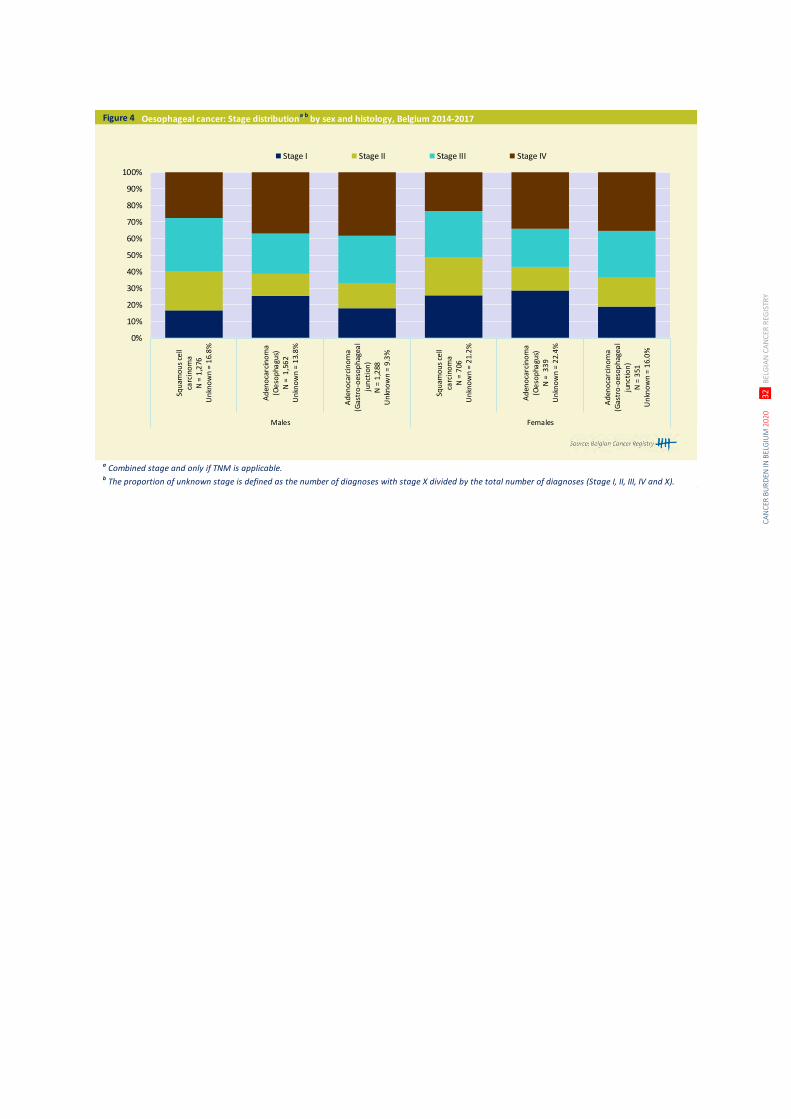
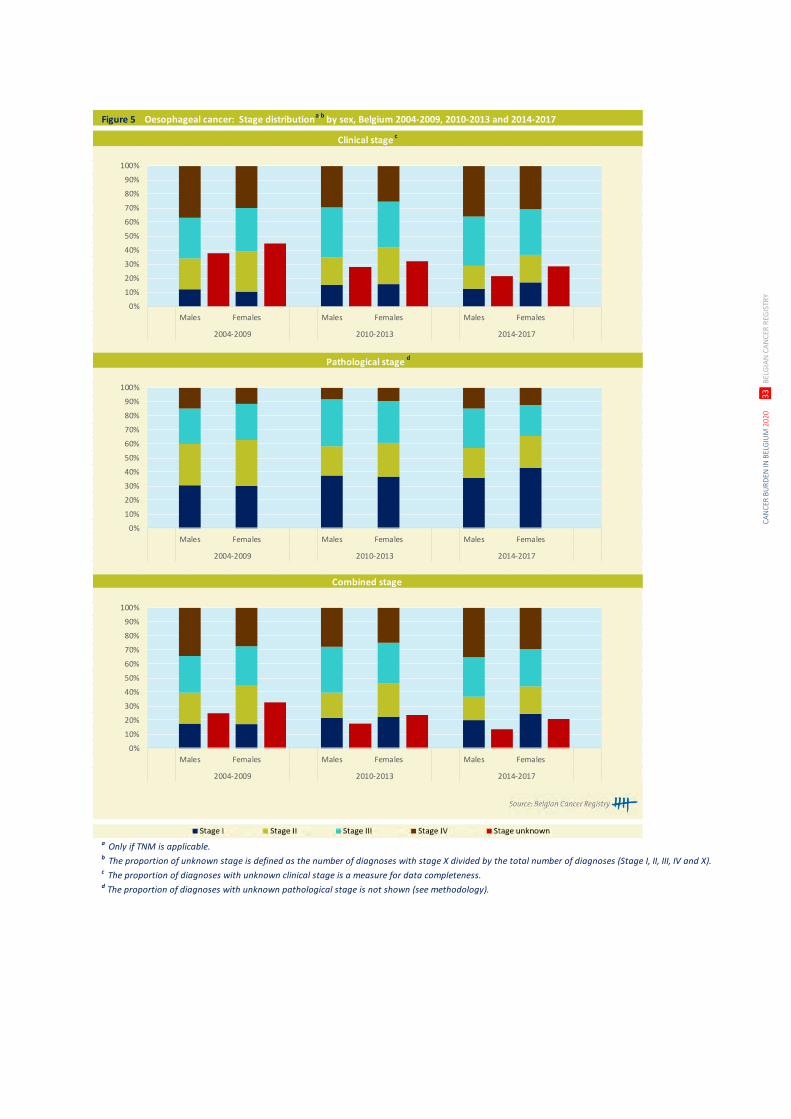
Figure 4 Oesophageal cancer: Stage distributiona,b
by sex and histology, Belgium 2014-2017
a Combined stage and only if TNM is applicable. b The proportion of unknown stage is defined as the number of diagnoses with stage X divided by the total number of diagnoses (Stage I, II, III, IV and X).
0%
10%
20%
30%
40%
50%
60%
70%
80%
90%
100%Sq
uam
ou
s ce
llca
rcin
om
aN
= 1
,276
Un
kno
wn
= 1
6.8
%
Ad
eno
carc
ino
ma
(Oe
sop
hagu
s)N
= 1
,56
2U
nkn
ow
n =
13.
8%
Ad
eno
carc
ino
ma
(Gas
tro
-oes
op
hag
eal
jun
ctio
n)
N =
1,2
88U
nkn
ow
n =
9.3
%
Squ
amo
us
cell
carc
ino
ma
N =
706
Un
kno
wn
= 2
1.2
%
Ad
eno
carc
ino
ma
(Oe
sop
hagu
s)N
= 3
39
Un
kno
wn
= 2
2.4
%
Ad
eno
carc
ino
ma
(Gas
tro
-oes
op
hag
eal
jun
ctio
n)
N =
351
Un
kno
wn
= 1
6.0
%
Males Females
Stage I Stage II Stage III Stage IV
CA
NC
ER B
UR
DEN
IN B
ELG
IUM
202
0
33
BEL
GIA
N C
AN
CER
REG
ISTR
Y
Figure 5 Oesophageal cancer: Stage distributiona,b by sex, Belgium 2004-2009, 2010-2013 and 2014-2017
a Only if TNM is applicable. b The proportion of unknown stage is defined as the number of diagnoses with stage X divided by the total number of diagnoses (Stage I, II, III, IV and X).c The proportion of diagnoses with unknown clinical stage is a measure for data completeness.d The proportion of diagnoses with unknown pathological stage is not shown (see methodology).
Clinical stage c
Pathological stage d
Combined stage
0%
10%
20%
30%
40%
50%
60%
70%
80%
90%
100%
Males Females Males Females Males Females
2004-2009 2010-2013 2014-2017
0%
10%
20%
30%
40%
50%
60%
70%
80%
90%
100%
Males Females Males Females Males Females
2004-2009 2010-2013 2014-2017
0%
10%
20%
30%
40%
50%
60%
70%
80%
90%
100%
Males Females Males Females Males Females
2004-2009 2010-2013 2014-2017
CA
NC
ER B
UR
DEN
IN B
ELG
IUM
202
0
34
BEL
GIA
N C
AN
CER
REG
ISTR
Y
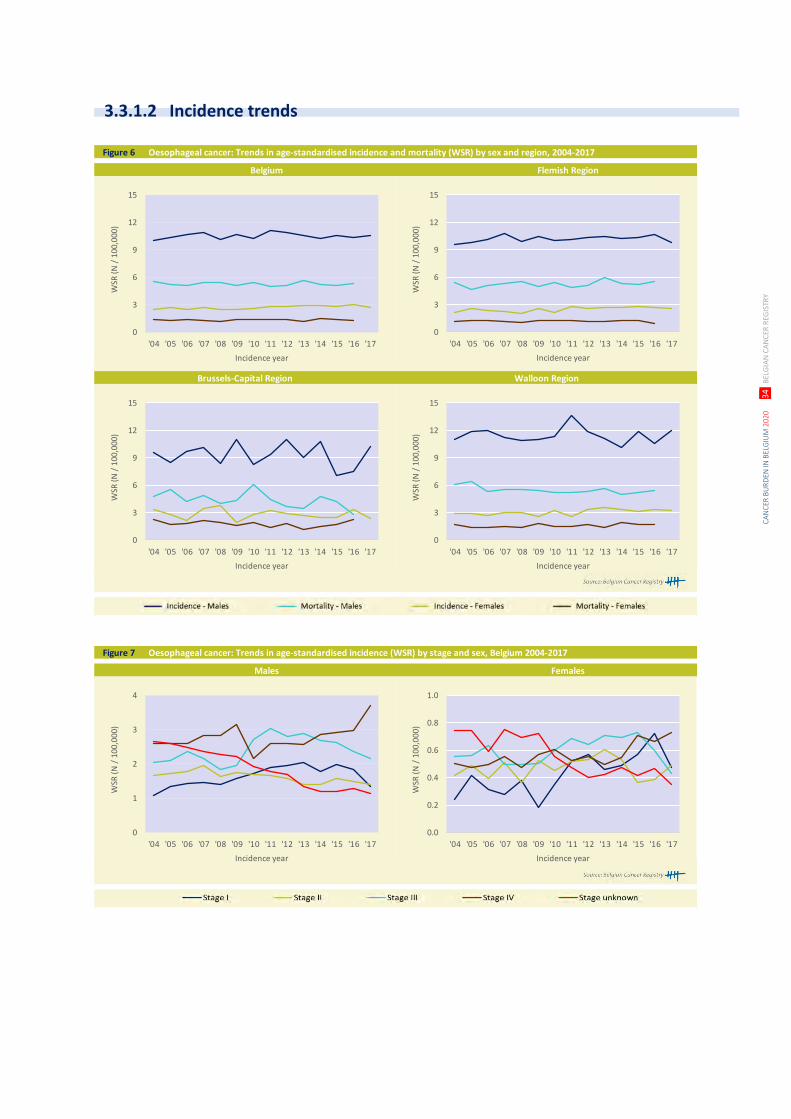
Figure 6 Oesophageal cancer: Trends in age-standardised incidence and mortality (WSR) by sex and region, 2004-2017
Brussels-Capital Region Walloon Region
Belgium Flemish Region
0
3
6
9
12
15
'04 '05 '06 '07 '08 '09 '10 '11 '12 '13 '14 '15 '16 '17
WSR
(N
/ 1
00,0
00)
Incidence year
0
3
6
9
12
15
'04 '05 '06 '07 '08 '09 '10 '11 '12 '13 '14 '15 '16 '17
WSR
(N
/ 1
00,0
00)
Incidence year
0
3
6
9
12
15
'04 '05 '06 '07 '08 '09 '10 '11 '12 '13 '14 '15 '16 '17
WSR
(N
/ 1
00,0
00)
Incidence year
0
3
6
9
12
15
'04 '05 '06 '07 '08 '09 '10 '11 '12 '13 '14 '15 '16 '17
WSR
(N
/ 1
00,0
00)
Incidence year
Figure 7 Oesophageal cancer: Trends in age-standardised incidence (WSR) by stage and sex, Belgium 2004-2017
Males Females
0
1
2
3
4
'04 '05 '06 '07 '08 '09 '10 '11 '12 '13 '14 '15 '16 '17
WSR
(N
/ 1
00
,00
0)
Incidence year
0.0
0.2
0.4
0.6
0.8
1.0
'04 '05 '06 '07 '08 '09 '10 '11 '12 '13 '14 '15 '16 '17
WSR
(N
/ 1
00
,00
0)
Incidence year
3.3.1.2 Incidence trends
CA
NC
ER B
UR
DEN
IN B
ELG
IUM
202
0
35
BEL
GIA
N C
AN
CER
REG
ISTR
Y
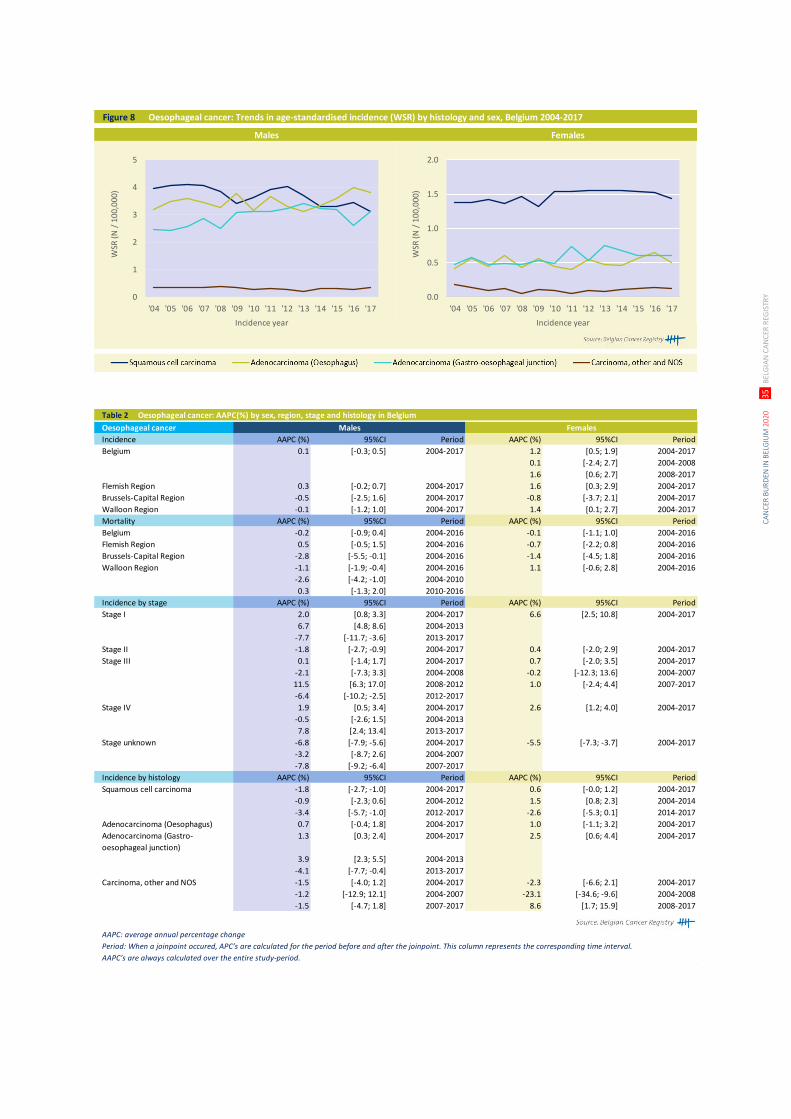
Figure 8 Oesophageal cancer: Trends in age-standardised incidence (WSR) by histology and sex, Belgium 2004-2017
Males Females
0
1
2
3
4
5
'04 '05 '06 '07 '08 '09 '10 '11 '12 '13 '14 '15 '16 '17
WSR
(N
/ 1
00
,00
0)
Incidence year
0.0
0.5
1.0
1.5
2.0
'04 '05 '06 '07 '08 '09 '10 '11 '12 '13 '14 '15 '16 '17
WSR
(N
/ 1
00
,00
0)
Incidence year
Table 2 Oesophageal cancer: AAPC(%) by sex, region, stage and histology in Belgium
Oesophageal cancer Males Females
Incidence AAPC (%) 95%CI Period AAPC (%) 95%CI Period
Belgium 0.1 [-0.3; 0.5] 2004-2017 1.2 [0.5; 1.9] 2004-2017
0.1 [-2.4; 2.7] 2004-2008
1.6 [0.6; 2.7] 2008-2017
Flemish Region 0.3 [-0.2; 0.7] 2004-2017 1.6 [0.3; 2.9] 2004-2017
Brussels-Capital Region -0.5 [-2.5; 1.6] 2004-2017 -0.8 [-3.7; 2.1] 2004-2017
Walloon Region -0.1 [-1.2; 1.0] 2004-2017 1.4 [0.1; 2.7] 2004-2017
Mortality AAPC (%) 95%CI Period AAPC (%) 95%CI Period
Belgium -0.2 [-0.9; 0.4] 2004-2016 -0.1 [-1.1; 1.0] 2004-2016
Flemish Region 0.5 [-0.5; 1.5] 2004-2016 -0.7 [-2.2; 0.8] 2004-2016
Brussels-Capital Region -2.8 [-5.5; -0.1] 2004-2016 -1.4 [-4.5; 1.8] 2004-2016
Walloon Region -1.1 [-1.9; -0.4] 2004-2016 1.1 [-0.6; 2.8] 2004-2016
-2.6 [-4.2; -1.0] 2004-2010
0.3 [-1.3; 2.0] 2010-2016
Incidence by stage AAPC (%) 95%CI Period AAPC (%) 95%CI Period
Stage I 2.0 [0.8; 3.3] 2004-2017 6.6 [2.5; 10.8] 2004-2017
6.7 [4.8; 8.6] 2004-2013
-7.7 [-11.7; -3.6] 2013-2017
Stage II -1.8 [-2.7; -0.9] 2004-2017 0.4 [-2.0; 2.9] 2004-2017
Stage III 0.1 [-1.4; 1.7] 2004-2017 0.7 [-2.0; 3.5] 2004-2017
-2.1 [-7.3; 3.3] 2004-2008 -0.2 [-12.3; 13.6] 2004-2007
11.5 [6.3; 17.0] 2008-2012 1.0 [-2.4; 4.4] 2007-2017
-6.4 [-10.2; -2.5] 2012-2017
Stage IV 1.9 [0.5; 3.4] 2004-2017 2.6 [1.2; 4.0] 2004-2017
-0.5 [-2.6; 1.5] 2004-2013
7.8 [2.4; 13.4] 2013-2017
Stage unknown -6.8 [-7.9; -5.6] 2004-2017 -5.5 [-7.3; -3.7] 2004-2017
-3.2 [-8.7; 2.6] 2004-2007
-7.8 [-9.2; -6.4] 2007-2017
Incidence by histology AAPC (%) 95%CI Period AAPC (%) 95%CI Period
Squamous cell carcinoma -1.8 [-2.7; -1.0] 2004-2017 0.6 [-0.0; 1.2] 2004-2017
-0.9 [-2.3; 0.6] 2004-2012 1.5 [0.8; 2.3] 2004-2014
-3.4 [-5.7; -1.0] 2012-2017 -2.6 [-5.3; 0.1] 2014-2017
Adenocarcinoma (Oesophagus) 0.7 [-0.4; 1.8] 2004-2017 1.0 [-1.1; 3.2] 2004-2017
Adenocarcinoma (Gastro-
oesophageal junction)
1.3 [0.3; 2.4] 2004-2017 2.5 [0.6; 4.4] 2004-2017
3.9 [2.3; 5.5] 2004-2013
-4.1 [-7.7; -0.4] 2013-2017
Carcinoma, other and NOS -1.5 [-4.0; 1.2] 2004-2017 -2.3 [-6.6; 2.1] 2004-2017
-1.2 [-12.9; 12.1] 2004-2007 -23.1 [-34.6; -9.6] 2004-2008
-1.5 [-4.7; 1.8] 2007-2017 8.6 [1.7; 15.9] 2008-2017
AAPC: average annual percentage change
Period: When a joinpoint occured, APC’s are calculated for the period before and after the joinpoint. This column represents the corresponding time interval.
AAPC’s are always calculated over the entire study-period.
CA
NC
ER B
UR
DEN
IN B
ELG
IUM
202
0
36
BEL
GIA
N C
AN
CER
REG
ISTR
Y
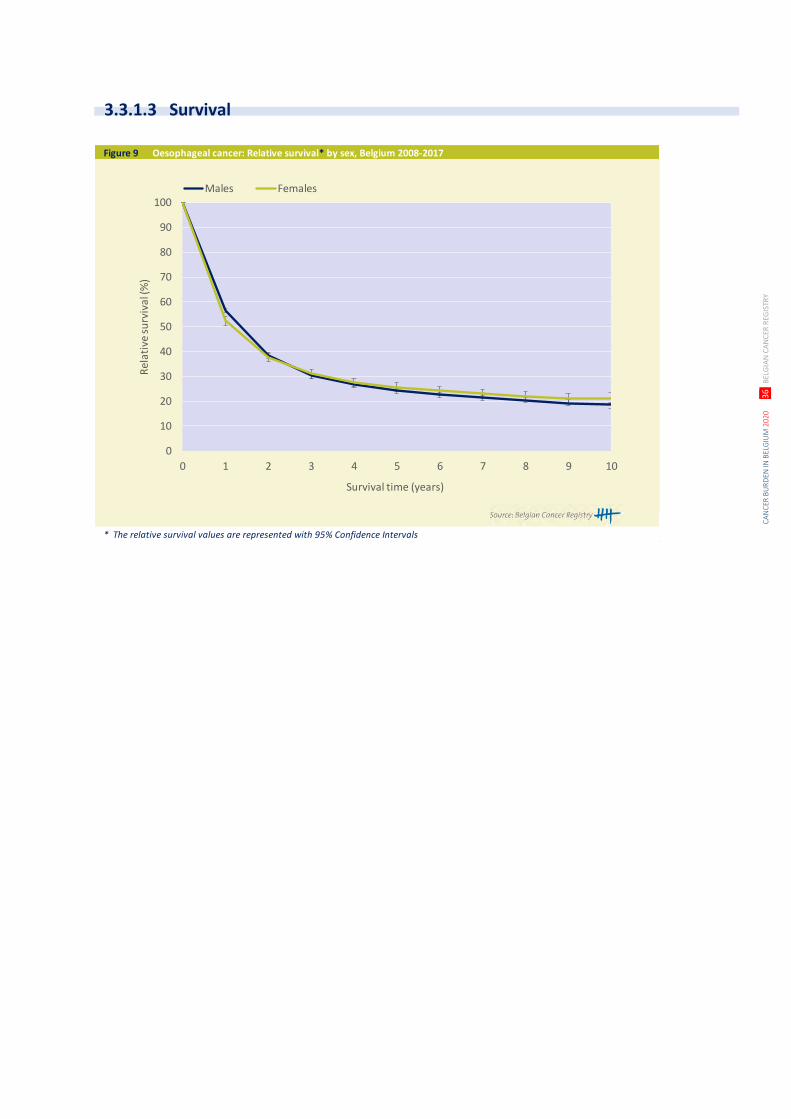
Figure 9 Oesophageal cancer: Relative survival* by sex, Belgium 2008-2017
* The relative survival values are represented with 95% Confidence Intervals
0
10
20
30
40
50
60
70
80
90
100
0 1 2 3 4 5 6 7 8 9 10
Rel
ativ
e su
rviv
al (%
)
Survival time (years)
Males Females
3.3.1.3 Survival
CA
NC
ER B
UR
DEN
IN B
ELG
IUM
202
0
37
BEL
GIA
N C
AN
CER
REG
ISTR
Y
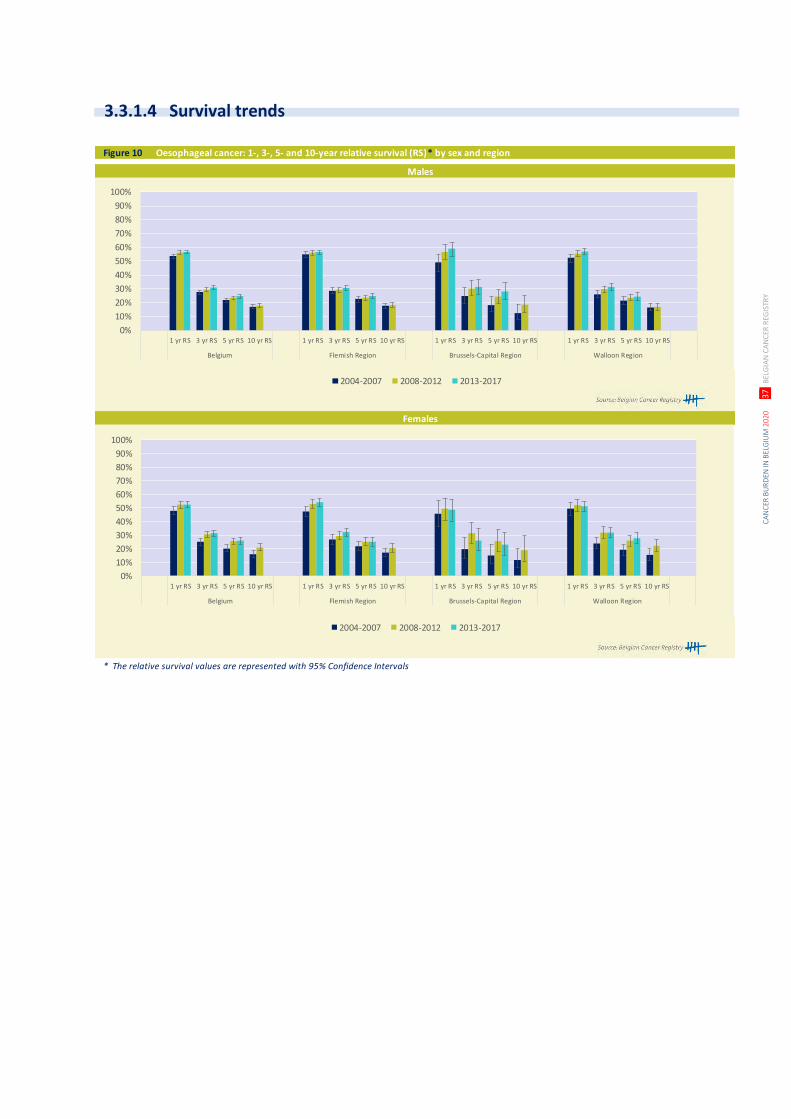
Figure 10 Oesophageal cancer: 1-, 3-, 5- and 10-year relative survival (RS)* by sex and region
* The relative survival values are represented with 95% Confidence Intervals
Males
Females
0%
10%
20%
30%
40%
50%
60%
70%
80%
90%
100%
1 yr RS 3 yr RS 5 yr RS 10 yr RS 1 yr RS 3 yr RS 5 yr RS 10 yr RS 1 yr RS 3 yr RS 5 yr RS 10 yr RS 1 yr RS 3 yr RS 5 yr RS 10 yr RS
Belgium Flemish Region Brussels-Capital Region Walloon Region
2004-2007 2008-2012 2013-2017
0%
10%
20%
30%
40%
50%
60%
70%
80%
90%
100%
1 yr RS 3 yr RS 5 yr RS 10 yr RS 1 yr RS 3 yr RS 5 yr RS 10 yr RS 1 yr RS 3 yr RS 5 yr RS 10 yr RS 1 yr RS 3 yr RS 5 yr RS 10 yr RS
Belgium Flemish Region Brussels-Capital Region Walloon Region
2004-2007 2008-2012 2013-2017
3.3.1.4 Survival trends

CA
NC
ER B
UR
DEN
IN B
ELG
IUM
202
0
38
BEL
GIA
N C
AN
CER
REG
ISTR
Y
Table 1 Stomach cancer: Overview of incidence, mortality, prevalence and survival by sex and region
Stomach cancer Males Females
Incidence, 2017 N CR WSR N CR WSR
Belgium 536 9.6 4.6 396 6.9 2.9
Flemish Region 321 10.0 4.2 233 7.1 2.7
Brussels-Capital Region 47 8.1 5.9 47 7.7 4.8
Walloon Region 168 9.5 4.9 116 6.3 2.8
Mortality, 2016 N CR WSR N CR WSR
Belgium 443 8.0 3.7 270 4.7 1.6
Flemish Region 257 8.0 3.4 171 5.2 1.6
Brussels-Capital Region 50 8.6 5.7 16 2.6 1.0
Walloon Region 136 7.7 3.7 83 4.5 1.7
Prevalence (5 years), 2013-2017 N CR WSR N CR WSR
Belgium 1,284 22.9 11.1 1,144 19.8 9.1
Flemish Region 753 23.2 10.2 676 20.4 8.6
Brussels-Capital Region 105 17.9 13.1 117 19.1 12.2
Walloon Region 426 24.1 12.4 351 18.9 9.1
5-year Relative survival, 2013-2017 N at risk % 95%CI N at risk % 95%CI
Belgium 2,713 40.9 [38.3;43.4] 2,174 47.6 [44.9;50.4]
Flemish Region 1,680 36.7 [33.6;39.9] 1,298 46.5 [42.9;50.1]
Brussels-Capital Region 253 33.7 [26.2;41.6] 222 52.6 [44.3;60.5]
Walloon Region 780 52.6 [47.6;57.6] 654 48.5 [43.6;53.5]
10-year Relative survival, 2008-2017 N at risk % 95%CI N at risk % 95%CI
Belgium 5,674 32.1 [29.8;34.5] 4,504 41.3 [38.6;43.9]
Flemish Region 3,549 29.5 [26.7;32.4] 2,717 40.6 [37.2;44.0]
Brussels-Capital Region 506 27.1 [20.2;34.9] 450 45.9 [37.5;54.5]
Walloon Region 1,619 40.0 [35.1;45.0] 1,337 41.1 [36.3;46.1]
CR: crude (all ages) rate (N/100,000 person years)
WSR: age-standardised rate using the World Standard Population (N/100,000 person years)
Figure 1 Stomach cancer: Age-specific incidence rates (N/100,000) by sex, Belgium 2013-2017
0
10
20
30
40
50
60
70
80
90
0- 5- 10- 15- 20- 25- 30- 35- 40- 45- 50- 55- 60- 65- 70- 75- 80- 85+
Age
-sp
ecif
ic in
cid
ence
(N /
100
,000
)
Age group
Males Females
3.3.2 STOMACH (ICD-10: C16.1-C16.9)
3.3.2.1 Incidence
CA
NC
ER B
UR
DEN
IN B
ELG
IUM
202
0
39
BEL
GIA
N C
AN
CER
REG
ISTR
Y
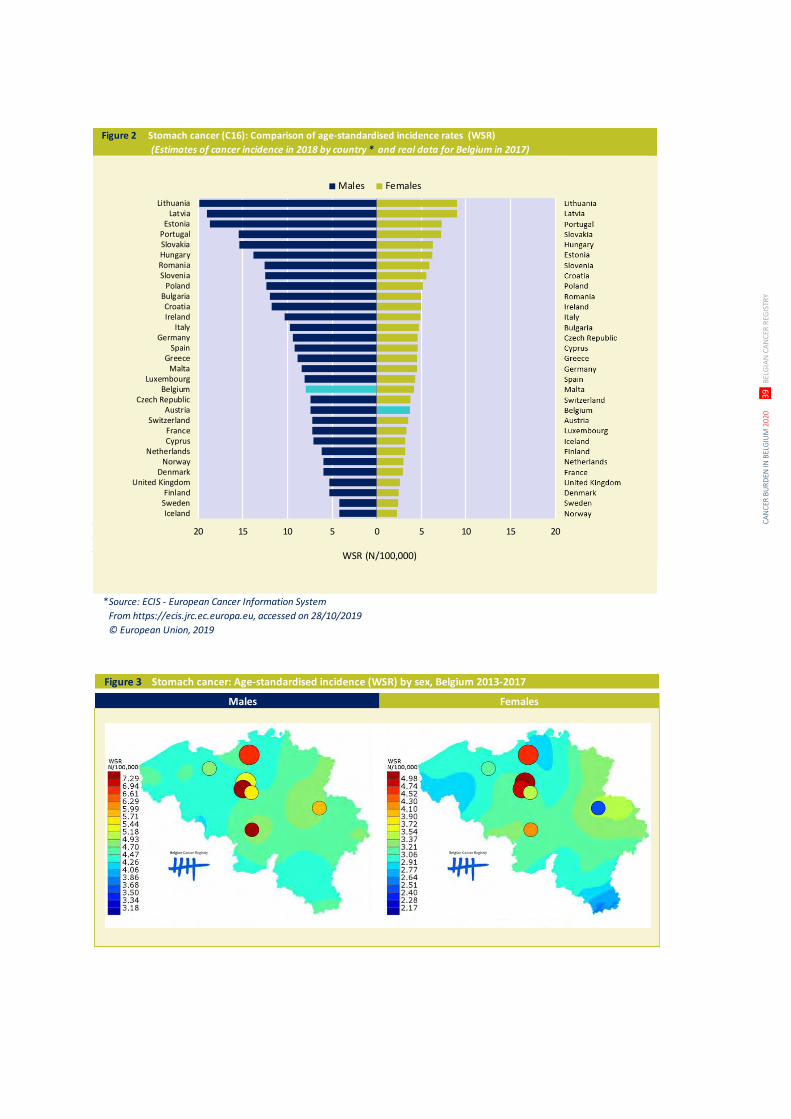
Figure 2 Stomach cancer (C16): Comparison of age-standardised incidence rates (WSR)
(Estimates of cancer incidence in 2018 by country * and real data for Belgium in 2017)
Source: ECIS - European Cancer Information System
From https://ecis.jrc.ec.europa.eu, accessed on 28/10/2019
© European Union, 2019
20 15 10 5 0 5 10 15 20
IcelandSwedenFinland
United KingdomDenmark
NorwayNetherlands
CyprusFrance
SwitzerlandAustria
Czech RepublicBelgium
LuxembourgMalta
GreeceSpain
GermanyItaly
IrelandCroatia
BulgariaPoland
SloveniaRomaniaHungarySlovakiaPortugal
EstoniaLatvia
Lithuania
Males Females
WSR (N/100,000)
*
Figure 3 Stomach cancer: Age-standardised incidence (WSR) by sex, Belgium 2013-2017
Males Females
CA
NC
ER B
UR
DEN
IN B
ELG
IUM
202
0
40
BEL
GIA
N C
AN
CER
REG
ISTR
Y
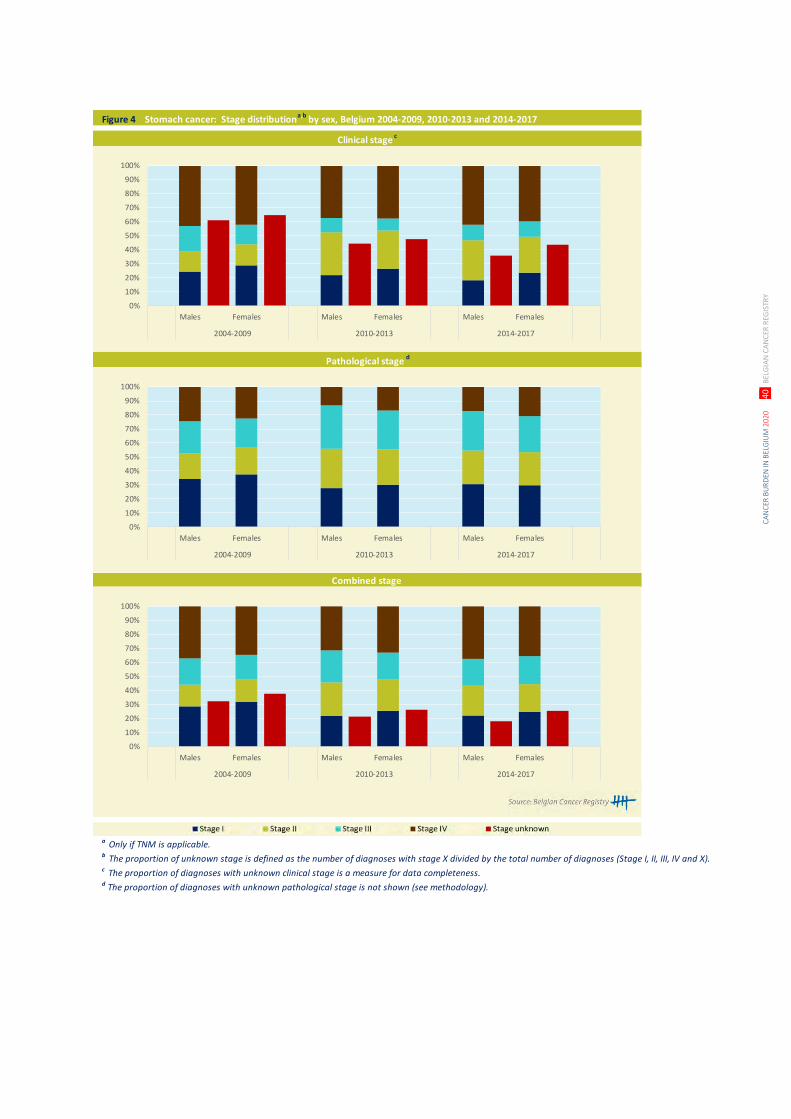
Figure 4 Stomach cancer: Stage distributiona,b
by sex, Belgium 2004-2009, 2010-2013 and 2014-2017
a Only if TNM is applicable. b The proportion of unknown stage is defined as the number of diagnoses with stage X divided by the total number of diagnoses (Stage I, II, III, IV and X).c The proportion of diagnoses with unknown clinical stage is a measure for data completeness.d The proportion of diagnoses with unknown pathological stage is not shown (see methodology).
Clinical stage c
Pathological stage d
Combined stage
0%
10%
20%
30%
40%
50%
60%
70%
80%
90%
100%
Males Females Males Females Males Females
2004-2009 2010-2013 2014-2017
0%
10%
20%
30%
40%
50%
60%
70%
80%
90%
100%
Males Females Males Females Males Females
2004-2009 2010-2013 2014-2017
0%
10%
20%
30%
40%
50%
60%
70%
80%
90%
100%
Males Females Males Females Males Females
2004-2009 2010-2013 2014-2017
CA
NC
ER B
UR
DEN
IN B
ELG
IUM
202
0
41
BEL
GIA
N C
AN
CER
REG
ISTR
Y
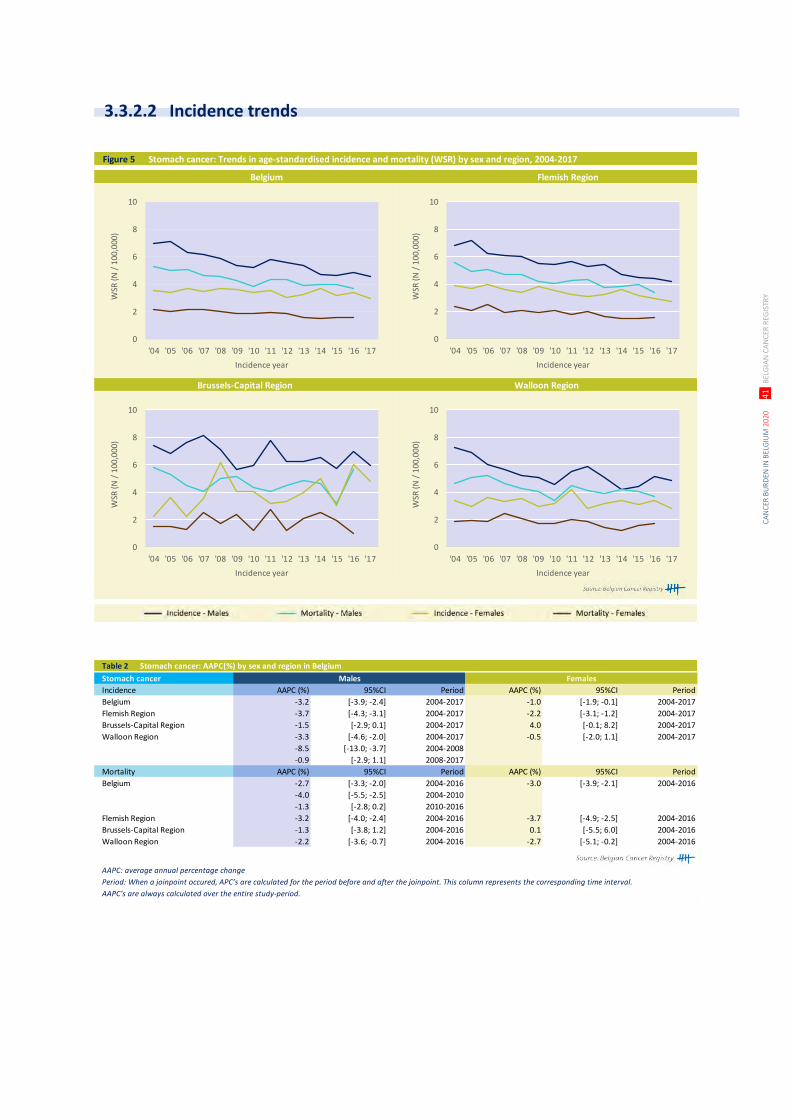
Figure 5 Stomach cancer: Trends in age-standardised incidence and mortality (WSR) by sex and region, 2004-2017
Brussels-Capital Region Walloon Region
Belgium Flemish Region
0
2
4
6
8
10
'04 '05 '06 '07 '08 '09 '10 '11 '12 '13 '14 '15 '16 '17
WSR
(N
/ 1
00
,00
0)
Incidence year
0
2
4
6
8
10
'04 '05 '06 '07 '08 '09 '10 '11 '12 '13 '14 '15 '16 '17
WSR
(N
/ 1
00,
00
0)
Incidence year
0
2
4
6
8
10
'04 '05 '06 '07 '08 '09 '10 '11 '12 '13 '14 '15 '16 '17
WSR
(N
/ 1
00
,00
0)
Incidence year
0
2
4
6
8
10
'04 '05 '06 '07 '08 '09 '10 '11 '12 '13 '14 '15 '16 '17
WSR
(N
/ 1
00
,00
0)
Incidence year
Table 2 Stomach cancer: AAPC(%) by sex and region in Belgium
Stomach cancer Males Females
Incidence AAPC (%) 95%CI Period AAPC (%) 95%CI Period
Belgium -3.2 [-3.9; -2.4] 2004-2017 -1.0 [-1.9; -0.1] 2004-2017
Flemish Region -3.7 [-4.3; -3.1] 2004-2017 -2.2 [-3.1; -1.2] 2004-2017
Brussels-Capital Region -1.5 [-2.9; 0.1] 2004-2017 4.0 [-0.1; 8.2] 2004-2017
Walloon Region -3.3 [-4.6; -2.0] 2004-2017 -0.5 [-2.0; 1.1] 2004-2017
-8.5 [-13.0; -3.7] 2004-2008
-0.9 [-2.9; 1.1] 2008-2017
Mortality AAPC (%) 95%CI Period AAPC (%) 95%CI Period
Belgium -2.7 [-3.3; -2.0] 2004-2016 -3.0 [-3.9; -2.1] 2004-2016
-4.0 [-5.5; -2.5] 2004-2010
-1.3 [-2.8; 0.2] 2010-2016
Flemish Region -3.2 [-4.0; -2.4] 2004-2016 -3.7 [-4.9; -2.5] 2004-2016
Brussels-Capital Region -1.3 [-3.8; 1.2] 2004-2016 0.1 [-5.5; 6.0] 2004-2016
Walloon Region -2.2 [-3.6; -0.7] 2004-2016 -2.7 [-5.1; -0.2] 2004-2016
AAPC: average annual percentage change
Period: When a joinpoint occured, APC’s are calculated for the period before and after the joinpoint. This column represents the corresponding time interval.
AAPC’s are always calculated over the entire study-period.
3.3.2.2 Incidence trends
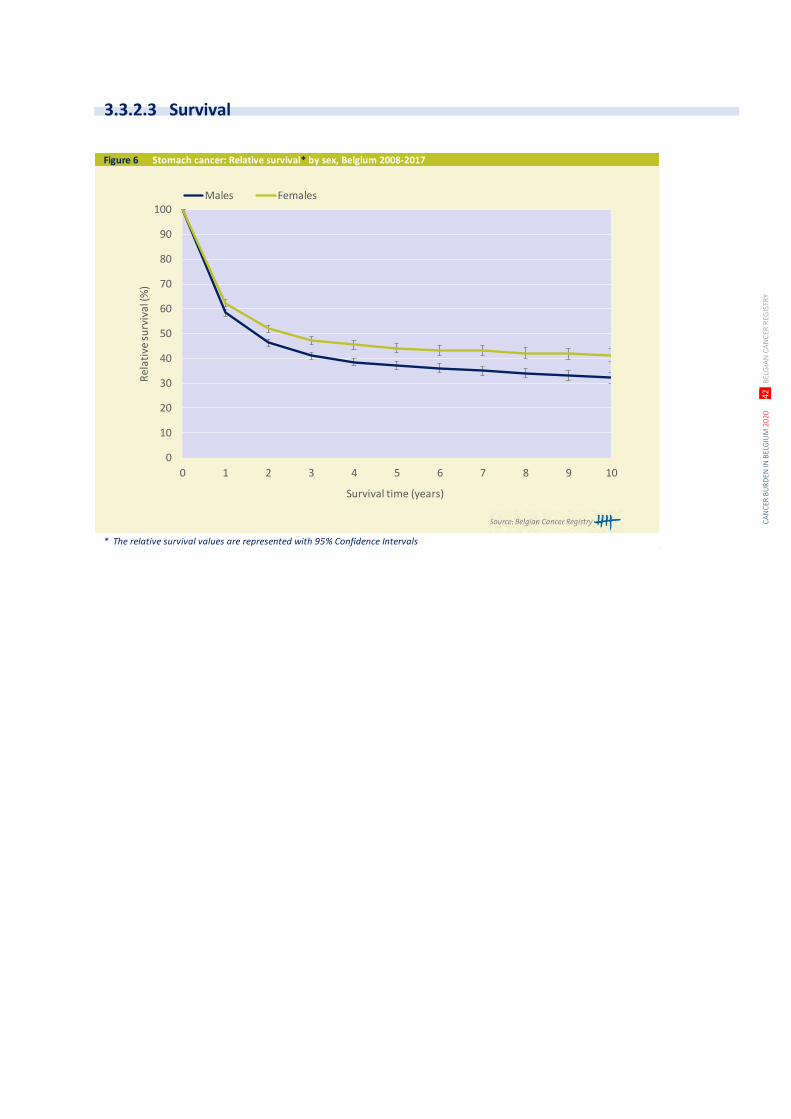
CA
NC
ER B
UR
DEN
IN B
ELG
IUM
202
0
42
BEL
GIA
N C
AN
CER
REG
ISTR
Y
Figure 6 Stomach cancer: Relative survival* by sex, Belgium 2008-2017
* The relative survival values are represented with 95% Confidence Intervals
0
10
20
30
40
50
60
70
80
90
100
0 1 2 3 4 5 6 7 8 9 10
Rel
ativ
e su
rviv
al (%
)
Survival time (years)
Males Females
3.3.2.3 Survival
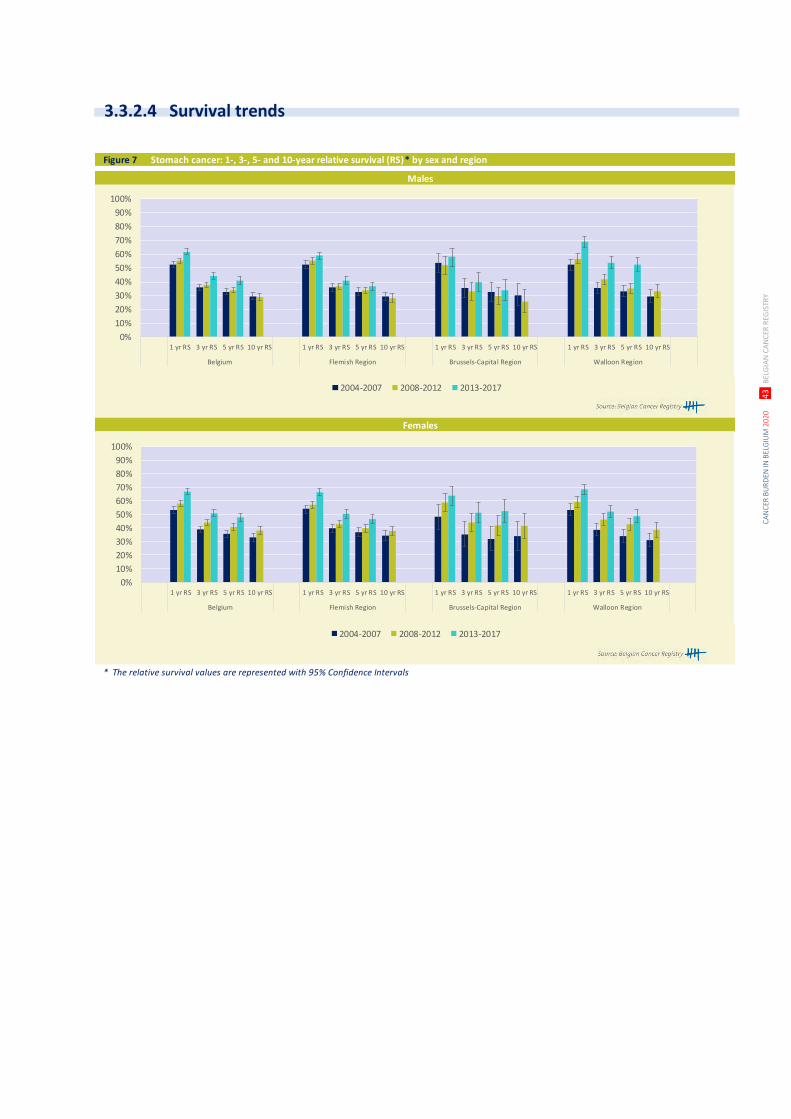
CA
NC
ER B
UR
DEN
IN B
ELG
IUM
202
0
43
BEL
GIA
N C
AN
CER
REG
ISTR
Y
Figure 7 Stomach cancer: 1-, 3-, 5- and 10-year relative survival (RS)* by sex and region
* The relative survival values are represented with 95% Confidence Intervals
Males
Females
0%
10%
20%
30%
40%
50%
60%
70%
80%
90%
100%
1 yr RS 3 yr RS 5 yr RS 10 yr RS 1 yr RS 3 yr RS 5 yr RS 10 yr RS 1 yr RS 3 yr RS 5 yr RS 10 yr RS 1 yr RS 3 yr RS 5 yr RS 10 yr RS
Belgium Flemish Region Brussels-Capital Region Walloon Region
2004-2007 2008-2012 2013-2017
0%
10%
20%
30%
40%
50%
60%
70%
80%
90%
100%
1 yr RS 3 yr RS 5 yr RS 10 yr RS 1 yr RS 3 yr RS 5 yr RS 10 yr RS 1 yr RS 3 yr RS 5 yr RS 10 yr RS 1 yr RS 3 yr RS 5 yr RS 10 yr RS
Belgium Flemish Region Brussels-Capital Region Walloon Region
2004-2007 2008-2012 2013-2017
3.3.2.4 Survival trends

CA
NC
ER B
UR
DEN
IN B
ELG
IUM
202
0
44
BEL
GIA
N C
AN
CER
REG
ISTR
Y
Table 1 Colon cancer: Overview of incidence, mortality, prevalence and survival by sex and region
Colon cancer Males Females
Incidence, 2017 N CR WSR N CR WSR
Belgium 3,157 56.7 27.1 2,788 48.5 19.4
Flemish Region 1,919 59.6 26.3 1,675 50.8 19.8
Brussels-Capital Region 226 38.8 24.6 230 37.8 18.6
Walloon Region 1,012 57.4 29.3 883 47.7 19.2
Mortality, 2016 N CR WSR N CR WSR
Belgium 1,165 21.0 8.8 1,045 18.2 5.7
Flemish Region 684 21.4 8.1 609 18.6 5.6
Brussels-Capital Region 94 16.2 9.1 68 11.2 3.9
Walloon Region 387 22.0 10.1 368 19.9 6.3
Prevalence (5 years), 2013-2017 N CR WSR N CR WSR
Belgium 11,802 210.8 97.7 10,150 175.7 71.2
Flemish Region 7,928 244.6 105.2 6,550 197.8 76.8
Brussels-Capital Region 725 123.6 81.1 766 125.1 63.7
Walloon Region 3,149 177.9 86.6 2,834 152.8 63.0
5-year Relative survival, 2013-2017 N at risk % 95%CI N at risk % 95%CI
Belgium 16,495 71.6 [70.5;72.7] 14,258 70.8 [69.7;72.0]
Flemish Region 10,812 74.0 [72.6;75.3] 8,939 73.9 [72.4;75.3]
Brussels-Capital Region 1,097 62.4 [57.8;67.0] 1,115 68.2 [63.5;72.7]
Walloon Region 4,586 67.8 [65.5;70.0] 4,204 64.8 [62.5;67.0]
10-year Relative survival, 2008-2017 N at risk % 95%CI N at risk % 95%CI
Belgium 31,740 63.4 [62.1;64.7] 27,877 64.8 [63.4;66.1]
Flemish Region 20,608 65.6 [64.0;67.2] 17,366 65.8 [64.1;67.5]
Brussels-Capital Region 2,252 51.1 [46.1;56.1] 2,267 67.4 [62.6;72.1]
Walloon Region 8,881 61.3 [58.7;63.8] 8,246 62.1 [59.6;64.6]
CR: crude (all ages) rate (N/100,000 person years)
WSR: age-standardised rate using the World Standard Population (N/100,000 person years)
Figure 1 Colon cancer: Age-specific incidence rates (N/100,000) by sex, Belgium 2013-2017
0
50
100
150
200
250
300
350
400
450
0- 5- 10- 15- 20- 25- 30- 35- 40- 45- 50- 55- 60- 65- 70- 75- 80- 85+
Age
-sp
ecif
ic in
cid
ence
(N /
100
,000
)
Age group
Males Females
3.3.3 COLON (ICD-10: C18-C19)
3.3.3.1 Incidence
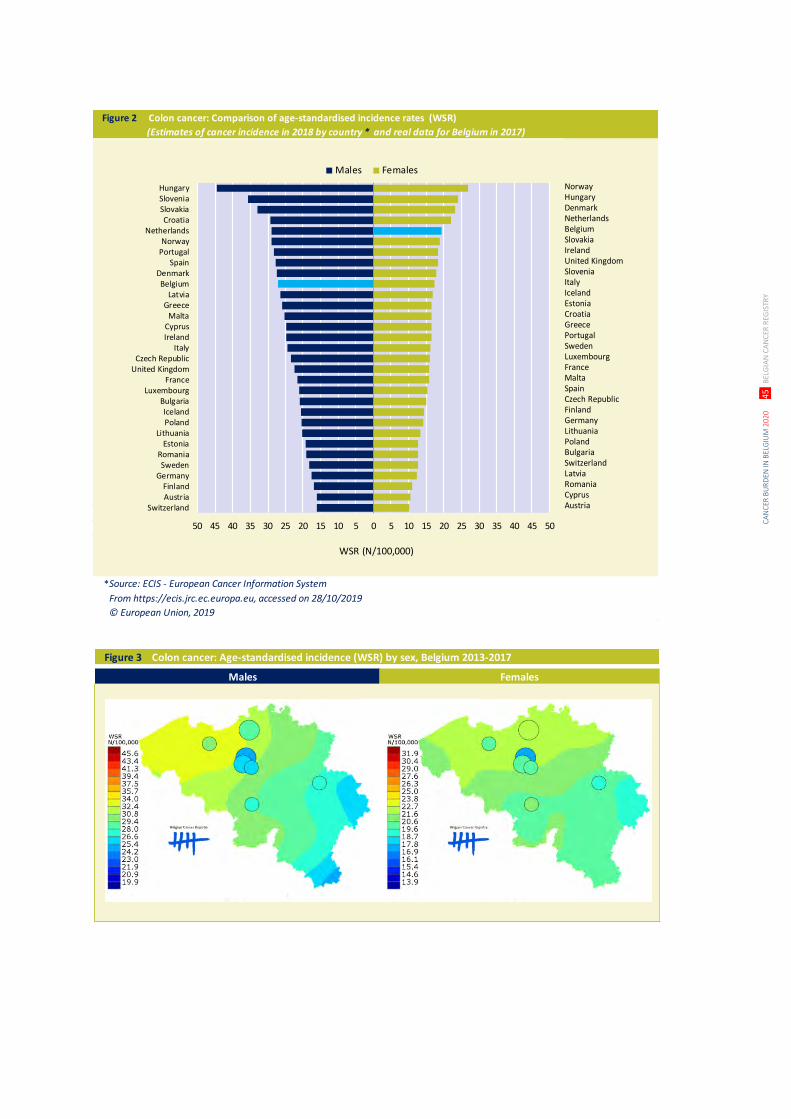
CA
NC
ER B
UR
DEN
IN B
ELG
IUM
202
0
45
BEL
GIA
N C
AN
CER
REG
ISTR
Y
Figure 2 Colon cancer: Comparison of age-standardised incidence rates (WSR)
(Estimates of cancer incidence in 2018 by country * and real data for Belgium in 2017)
Source: ECIS - European Cancer Information System
From https://ecis.jrc.ec.europa.eu, accessed on 28/10/2019
© European Union, 2019
50 45 40 35 30 25 20 15 10 5 0 5 10 15 20 25 30 35 40 45 50
HungarySloveniaSlovakiaCroatia
NetherlandsNorway
PortugalSpain
DenmarkBelgium
LatviaGreece
MaltaCyprusIreland
ItalyCzech Republic
United KingdomFrance
LuxembourgBulgariaIcelandPoland
LithuaniaEstonia
RomaniaSweden
GermanyFinlandAustria
Switzerland
Males Females
WSR (N/100,000)
*
NorwayHungaryDenmarkNetherlandsBelgiumSlovakiaIrelandUnited KingdomSloveniaItalyIcelandEstoniaCroatiaGreecePortugalSwedenLuxembourgFranceMaltaSpainCzech RepublicFinlandGermanyLithuaniaPolandBulgariaSwitzerlandLatviaRomaniaCyprusAustria
Figure 3 Colon cancer: Age-standardised incidence (WSR) by sex, Belgium 2013-2017
Males Females
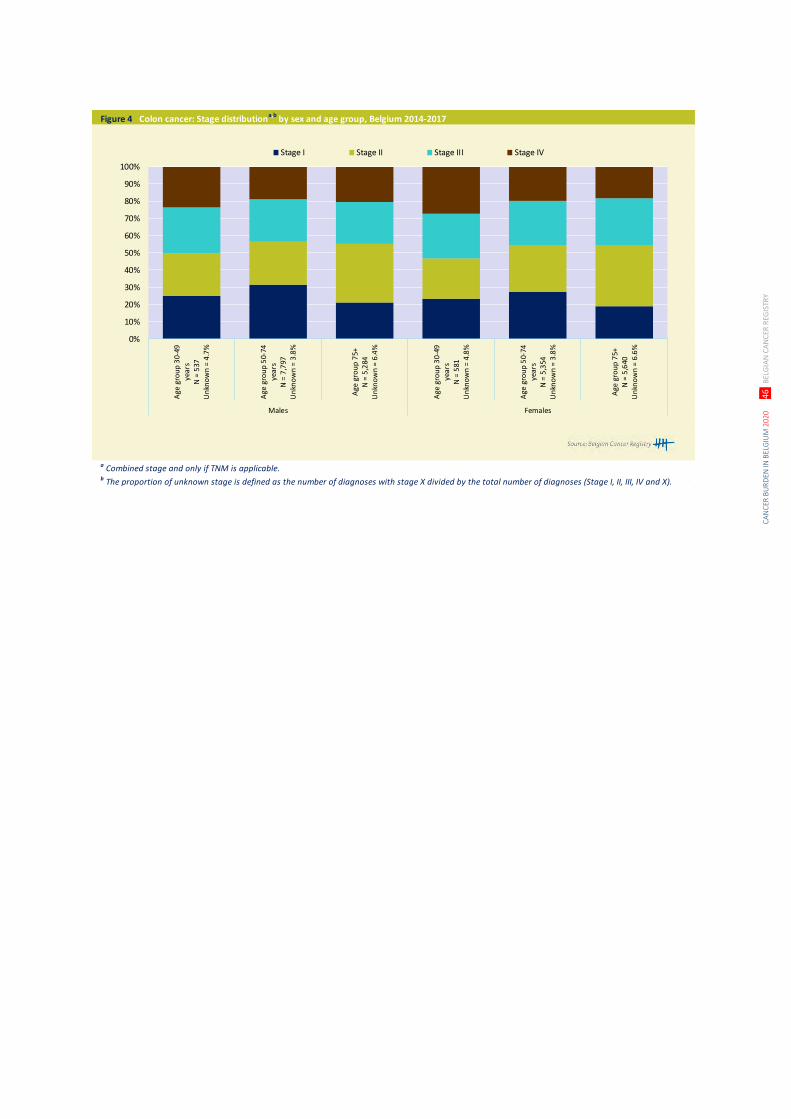
CA
NC
ER B
UR
DEN
IN B
ELG
IUM
202
0
46
BEL
GIA
N C
AN
CER
REG
ISTR
Y
Figure 4 Colon cancer: Stage distributiona,b
by sex and age group, Belgium 2014-2017
a Combined stage and only if TNM is applicable. b The proportion of unknown stage is defined as the number of diagnoses with stage X divided by the total number of diagnoses (Stage I, II, III, IV and X).
0%
10%
20%
30%
40%
50%
60%
70%
80%
90%
100%A
ge g
rou
p 3
0-49
year
sN
= 5
37U
nkn
ow
n =
4.7
%
Age
gro
up
50-
74ye
ars
N =
7,7
97U
nkn
ow
n =
3.8
%
Age
gro
up
75+
N =
5,2
84U
nkn
ow
n =
6.4
%
Age
gro
up
30-
49ye
ars
N =
581
Un
kno
wn
= 4
.8%
Age
gro
up
50-
74ye
ars
N =
5,3
54U
nkn
ow
n =
3.8
%
Age
gro
up
75+
N =
5,6
40U
nkn
ow
n =
6.6
%
Males Females
Stage I Stage II Stage III Stage IV
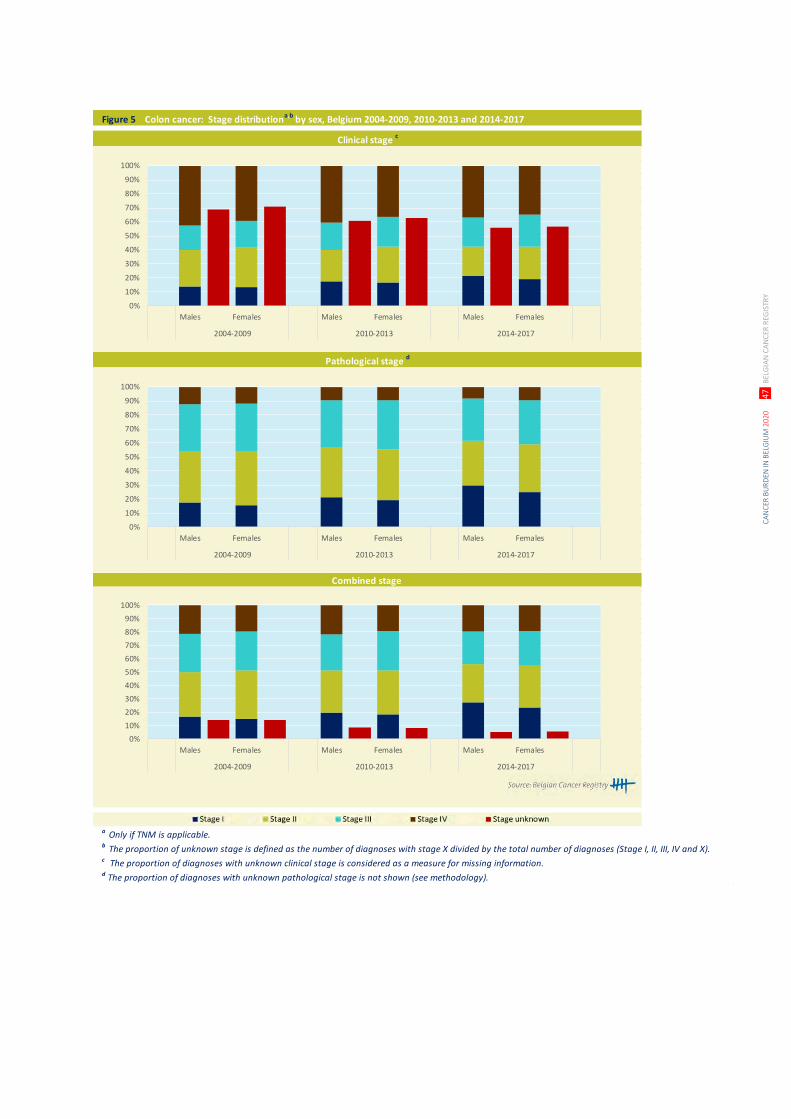
CA
NC
ER B
UR
DEN
IN B
ELG
IUM
202
0
47
BEL
GIA
N C
AN
CER
REG
ISTR
Y
Figure 5 Colon cancer: Stage distributiona,b by sex, Belgium 2004-2009, 2010-2013 and 2014-2017
a Only if TNM is applicable. b The proportion of unknown stage is defined as the number of diagnoses with stage X divided by the total number of diagnoses (Stage I, II, III, IV and X).c The proportion of diagnoses with unknown clinical stage is considered as a measure for missing information.d The proportion of diagnoses with unknown pathological stage is not shown (see methodology).
Pathological stage d
Combined stage
Clinical stage c
0%
10%
20%
30%
40%
50%
60%
70%
80%
90%
100%
Males Females Males Females Males Females
2004-2009 2010-2013 2014-2017
0%
10%
20%
30%
40%
50%
60%
70%
80%
90%
100%
Males Females Males Females Males Females
2004-2009 2010-2013 2014-2017
0%
10%
20%
30%
40%
50%
60%
70%
80%
90%
100%
Males Females Males Females Males Females
2004-2009 2010-2013 2014-2017
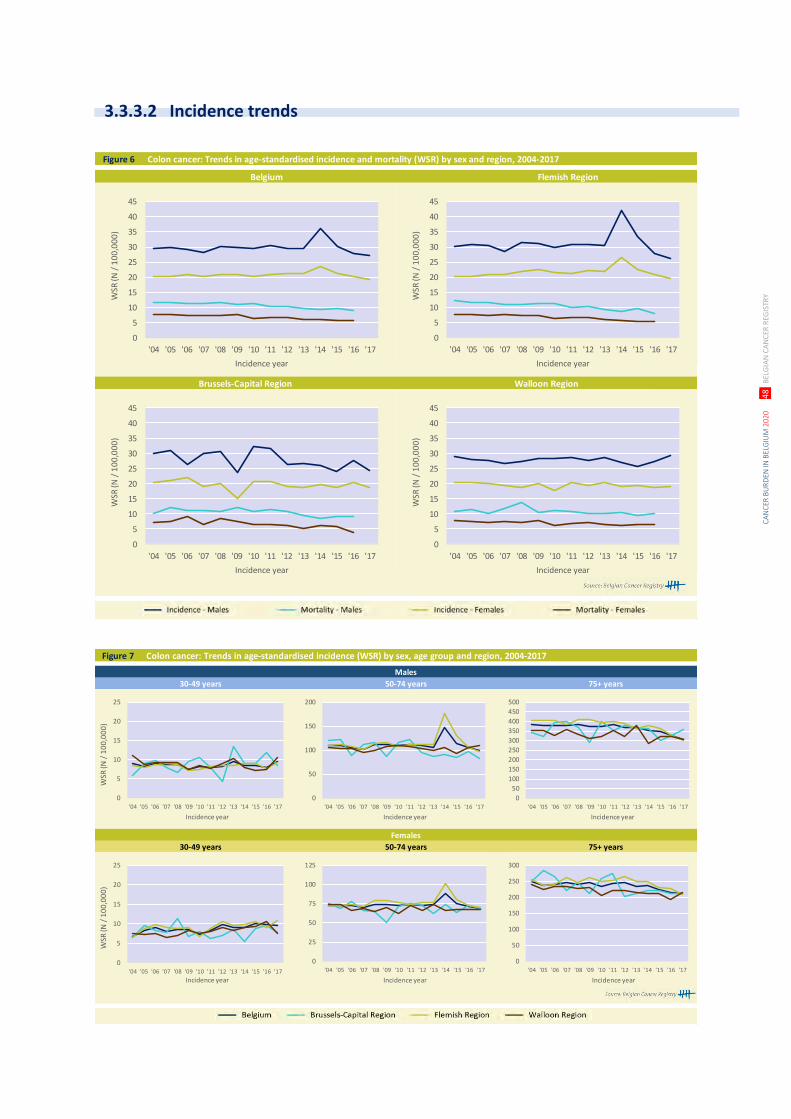
CA
NC
ER B
UR
DEN
IN B
ELG
IUM
202
0
48
BEL
GIA
N C
AN
CER
REG
ISTR
Y
Figure 6 Colon cancer: Trends in age-standardised incidence and mortality (WSR) by sex and region, 2004-2017
Brussels-Capital Region Walloon Region
Belgium Flemish Region
0
5
10
15
20
25
30
35
40
45
'04 '05 '06 '07 '08 '09 '10 '11 '12 '13 '14 '15 '16 '17
WSR
(N /
10
0,0
00
)
Incidence year
0
5
10
15
20
25
30
35
40
45
'04 '05 '06 '07 '08 '09 '10 '11 '12 '13 '14 '15 '16 '17
WSR
(N /
10
0,0
00
)
Incidence year
0
5
10
15
20
25
30
35
40
45
'04 '05 '06 '07 '08 '09 '10 '11 '12 '13 '14 '15 '16 '17
WSR
(N /
10
0,0
00
)
Incidence year
0
5
10
15
20
25
30
35
40
45
'04 '05 '06 '07 '08 '09 '10 '11 '12 '13 '14 '15 '16 '17
WSR
(N /
10
0,0
00
)
Incidence year
Figure 7 Colon cancer: Trends in age-standardised incidence (WSR) by sex, age group and region, 2004-2017
Males
Females
30-49 years 50-74 years 75+ years
30-49 years 50-74 years 75+ years
0
50
100
150
200
'04 '05 '06 '07 '08 '09 '10 '11 '12 '13 '14 '15 '16 '17
Incidence year
0
50
100
150
200
250
300
350
400
450
500
'04 '05 '06 '07 '08 '09 '10 '11 '12 '13 '14 '15 '16 '17
Incidence year
0
25
50
75
100
125
'04 '05 '06 '07 '08 '09 '10 '11 '12 '13 '14 '15 '16 '17
Incidence year
0
50
100
150
200
250
300
'04 '05 '06 '07 '08 '09 '10 '11 '12 '13 '14 '15 '16 '17
Incidence year
0
5
10
15
20
25
'04 '05 '06 '07 '08 '09 '10 '11 '12 '13 '14 '15 '16 '17
WSR
(N /
10
0,0
00
)
Incidence year
0
5
10
15
20
25
'04 '05 '06 '07 '08 '09 '10 '11 '12 '13 '14 '15 '16 '17
WSR
(N /
10
0,0
00
)
Incidence year
3.3.3.2 Incidence trends
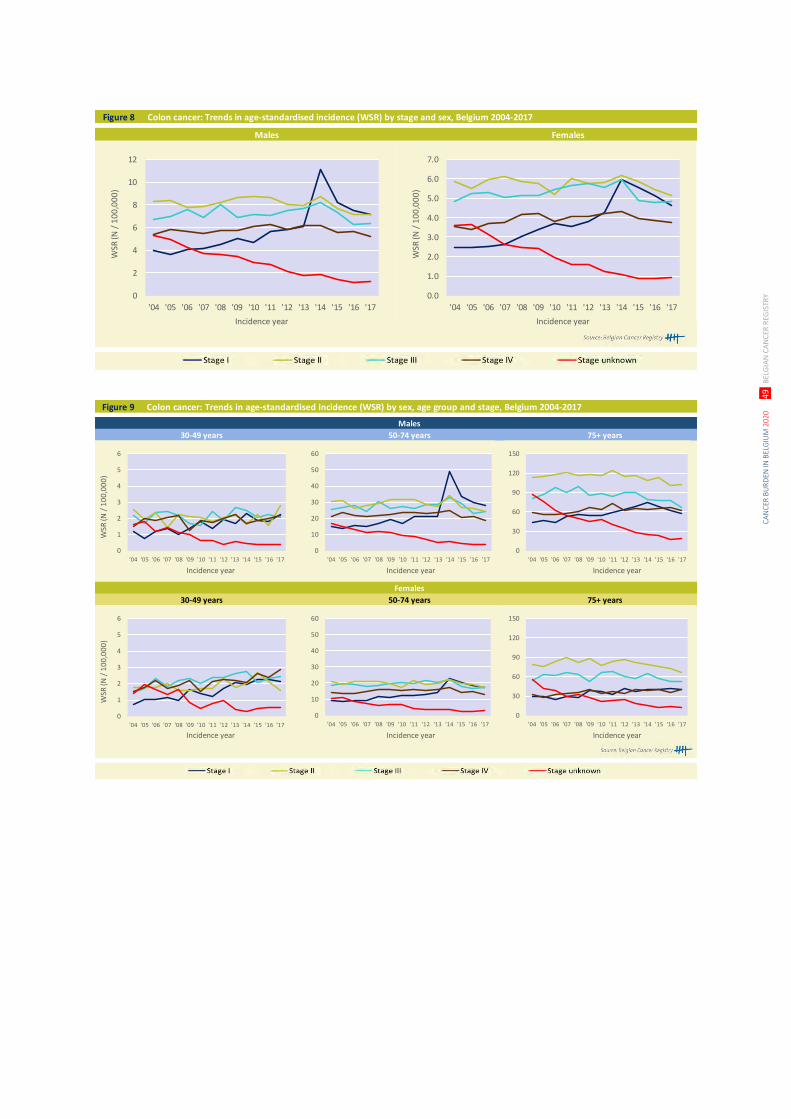
CA
NC
ER B
UR
DEN
IN B
ELG
IUM
202
0
49
BEL
GIA
N C
AN
CER
REG
ISTR
Y
Figure 8 Colon cancer: Trends in age-standardised incidence (WSR) by stage and sex, Belgium 2004-2017
Males Females
0
2
4
6
8
10
12
'04 '05 '06 '07 '08 '09 '10 '11 '12 '13 '14 '15 '16 '17
WSR
(N /
10
0,0
00
)
Incidence year
0.0
1.0
2.0
3.0
4.0
5.0
6.0
7.0
'04 '05 '06 '07 '08 '09 '10 '11 '12 '13 '14 '15 '16 '17
WSR
(N /
10
0,0
00
)
Incidence year
Figure 9 Colon cancer: Trends in age-standardised incidence (WSR) by sex, age group and stage, Belgium 2004-2017
Males
Females
30-49 years 50-74 years 75+ years
30-49 years 50-74 years 75+ years
0
10
20
30
40
50
60
'04 '05 '06 '07 '08 '09 '10 '11 '12 '13 '14 '15 '16 '17
Incidence year
0
30
60
90
120
150
'04 '05 '06 '07 '08 '09 '10 '11 '12 '13 '14 '15 '16 '17
Incidence year
0
10
20
30
40
50
60
'04 '05 '06 '07 '08 '09 '10 '11 '12 '13 '14 '15 '16 '17
Incidence year
0
30
60
90
120
150
'04 '05 '06 '07 '08 '09 '10 '11 '12 '13 '14 '15 '16 '17
Incidence year
0
1
2
3
4
5
6
'04 '05 '06 '07 '08 '09 '10 '11 '12 '13 '14 '15 '16 '17
WSR
(N /
10
0,0
00
)
Incidence year
0
1
2
3
4
5
6
'04 '05 '06 '07 '08 '09 '10 '11 '12 '13 '14 '15 '16 '17
WSR
(N /
10
0,0
00
)
Incidence year
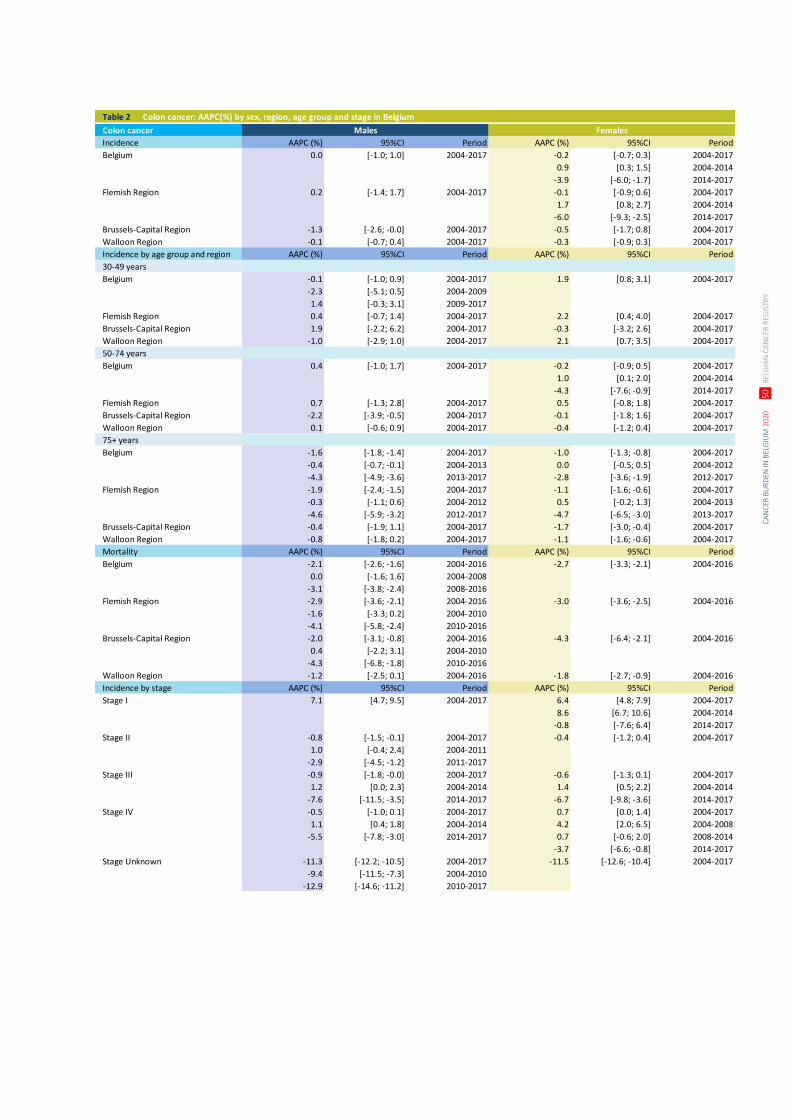
CA
NC
ER B
UR
DEN
IN B
ELG
IUM
202
0
50
BEL
GIA
N C
AN
CER
REG
ISTR
Y
Table 2 Colon cancer: AAPC(%) by sex, region, age group and stage in Belgium
Colon cancer Males Females
Incidence AAPC (%) 95%CI Period AAPC (%) 95%CI Period
Belgium 0.0 [-1.0; 1.0] 2004-2017 -0.2 [-0.7; 0.3] 2004-2017
0.9 [0.3; 1.5] 2004-2014
-3.9 [-6.0; -1.7] 2014-2017
Flemish Region 0.2 [-1.4; 1.7] 2004-2017 -0.1 [-0.9; 0.6] 2004-2017
1.7 [0.8; 2.7] 2004-2014
-6.0 [-9.3; -2.5] 2014-2017
Brussels-Capital Region -1.3 [-2.6; -0.0] 2004-2017 -0.5 [-1.7; 0.8] 2004-2017
Walloon Region -0.1 [-0.7; 0.4] 2004-2017 -0.3 [-0.9; 0.3] 2004-2017
Incidence by age group and region AAPC (%) 95%CI Period AAPC (%) 95%CI Period
30-49 years
Belgium -0.1 [-1.0; 0.9] 2004-2017 1.9 [0.8; 3.1] 2004-2017
-2.3 [-5.1; 0.5] 2004-2009
1.4 [-0.3; 3.1] 2009-2017
Flemish Region 0.4 [-0.7; 1.4] 2004-2017 2.2 [0.4; 4.0] 2004-2017
Brussels-Capital Region 1.9 [-2.2; 6.2] 2004-2017 -0.3 [-3.2; 2.6] 2004-2017
Walloon Region -1.0 [-2.9; 1.0] 2004-2017 2.1 [0.7; 3.5] 2004-2017
50-74 years
Belgium 0.4 [-1.0; 1.7] 2004-2017 -0.2 [-0.9; 0.5] 2004-2017
1.0 [0.1; 2.0] 2004-2014
-4.3 [-7.6; -0.9] 2014-2017
Flemish Region 0.7 [-1.3; 2.8] 2004-2017 0.5 [-0.8; 1.8] 2004-2017
Brussels-Capital Region -2.2 [-3.9; -0.5] 2004-2017 -0.1 [-1.8; 1.6] 2004-2017
Walloon Region 0.1 [-0.6; 0.9] 2004-2017 -0.4 [-1.2; 0.4] 2004-2017
75+ years
Belgium -1.6 [-1.8; -1.4] 2004-2017 -1.0 [-1.3; -0.8] 2004-2017
-0.4 [-0.7; -0.1] 2004-2013 0.0 [-0.5; 0.5] 2004-2012
-4.3 [-4.9; -3.6] 2013-2017 -2.8 [-3.6; -1.9] 2012-2017
Flemish Region -1.9 [-2.4; -1.5] 2004-2017 -1.1 [-1.6; -0.6] 2004-2017
-0.3 [-1.1; 0.6] 2004-2012 0.5 [-0.2; 1.3] 2004-2013
-4.6 [-5.9; -3.2] 2012-2017 -4.7 [-6.5; -3.0] 2013-2017
Brussels-Capital Region -0.4 [-1.9; 1.1] 2004-2017 -1.7 [-3.0; -0.4] 2004-2017
Walloon Region -0.8 [-1.8; 0.2] 2004-2017 -1.1 [-1.6; -0.6] 2004-2017
Mortality AAPC (%) 95%CI Period AAPC (%) 95%CI Period
Belgium -2.1 [-2.6; -1.6] 2004-2016 -2.7 [-3.3; -2.1] 2004-2016
0.0 [-1.6; 1.6] 2004-2008
-3.1 [-3.8; -2.4] 2008-2016
Flemish Region -2.9 [-3.6; -2.1] 2004-2016 -3.0 [-3.6; -2.5] 2004-2016
-1.6 [-3.3; 0.2] 2004-2010
-4.1 [-5.8; -2.4] 2010-2016
Brussels-Capital Region -2.0 [-3.1; -0.8] 2004-2016 -4.3 [-6.4; -2.1] 2004-2016
0.4 [-2.2; 3.1] 2004-2010
-4.3 [-6.8; -1.8] 2010-2016
Walloon Region -1.2 [-2.5; 0.1] 2004-2016 -1.8 [-2.7; -0.9] 2004-2016
Incidence by stage AAPC (%) 95%CI Period AAPC (%) 95%CI Period
Stage I 7.1 [4.7; 9.5] 2004-2017 6.4 [4.8; 7.9] 2004-2017
8.6 [6.7; 10.6] 2004-2014
-0.8 [-7.6; 6.4] 2014-2017
Stage II -0.8 [-1.5; -0.1] 2004-2017 -0.4 [-1.2; 0.4] 2004-2017
1.0 [-0.4; 2.4] 2004-2011
-2.9 [-4.5; -1.2] 2011-2017
Stage III -0.9 [-1.8; -0.0] 2004-2017 -0.6 [-1.3; 0.1] 2004-2017
1.2 [0.0; 2.3] 2004-2014 1.4 [0.5; 2.2] 2004-2014
-7.6 [-11.5; -3.5] 2014-2017 -6.7 [-9.8; -3.6] 2014-2017
Stage IV -0.5 [-1.0; 0.1] 2004-2017 0.7 [0.0; 1.4] 2004-2017
1.1 [0.4; 1.8] 2004-2014 4.2 [2.0; 6.5] 2004-2008
-5.5 [-7.8; -3.0] 2014-2017 0.7 [-0.6; 2.0] 2008-2014
-3.7 [-6.6; -0.8] 2014-2017
Stage Unknown -11.3 [-12.2; -10.5] 2004-2017 -11.5 [-12.6; -10.4] 2004-2017
-9.4 [-11.5; -7.3] 2004-2010
-12.9 [-14.6; -11.2] 2010-2017
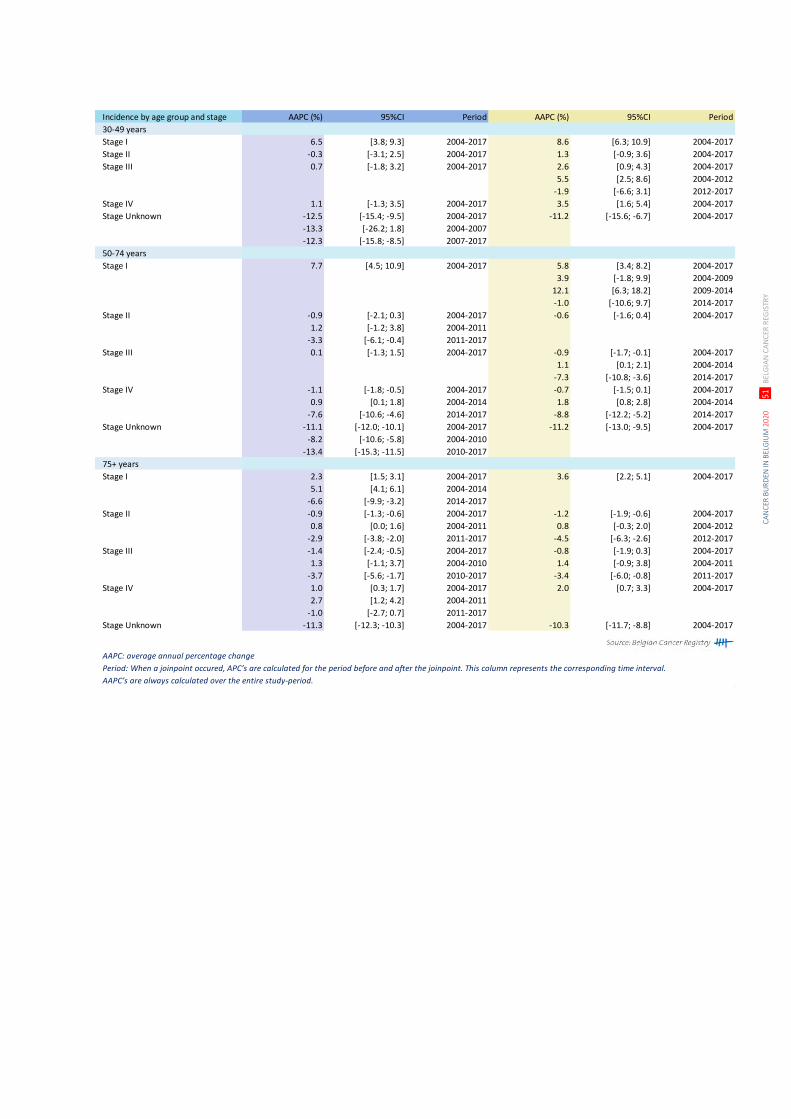
CA
NC
ER B
UR
DEN
IN B
ELG
IUM
202
0
51
BEL
GIA
N C
AN
CER
REG
ISTR
Y
Incidence by age group and stage AAPC (%) 95%CI Period AAPC (%) 95%CI Period
30-49 years
Stage I 6.5 [3.8; 9.3] 2004-2017 8.6 [6.3; 10.9] 2004-2017
Stage II -0.3 [-3.1; 2.5] 2004-2017 1.3 [-0.9; 3.6] 2004-2017
Stage III 0.7 [-1.8; 3.2] 2004-2017 2.6 [0.9; 4.3] 2004-2017
5.5 [2.5; 8.6] 2004-2012
-1.9 [-6.6; 3.1] 2012-2017
Stage IV 1.1 [-1.3; 3.5] 2004-2017 3.5 [1.6; 5.4] 2004-2017
Stage Unknown -12.5 [-15.4; -9.5] 2004-2017 -11.2 [-15.6; -6.7] 2004-2017
-13.3 [-26.2; 1.8] 2004-2007
-12.3 [-15.8; -8.5] 2007-2017
50-74 years
Stage I 7.7 [4.5; 10.9] 2004-2017 5.8 [3.4; 8.2] 2004-2017
3.9 [-1.8; 9.9] 2004-2009
12.1 [6.3; 18.2] 2009-2014
-1.0 [-10.6; 9.7] 2014-2017
Stage II -0.9 [-2.1; 0.3] 2004-2017 -0.6 [-1.6; 0.4] 2004-2017
1.2 [-1.2; 3.8] 2004-2011
-3.3 [-6.1; -0.4] 2011-2017
Stage III 0.1 [-1.3; 1.5] 2004-2017 -0.9 [-1.7; -0.1] 2004-2017
1.1 [0.1; 2.1] 2004-2014
-7.3 [-10.8; -3.6] 2014-2017
Stage IV -1.1 [-1.8; -0.5] 2004-2017 -0.7 [-1.5; 0.1] 2004-2017
0.9 [0.1; 1.8] 2004-2014 1.8 [0.8; 2.8] 2004-2014
-7.6 [-10.6; -4.6] 2014-2017 -8.8 [-12.2; -5.2] 2014-2017
Stage Unknown -11.1 [-12.0; -10.1] 2004-2017 -11.2 [-13.0; -9.5] 2004-2017
-8.2 [-10.6; -5.8] 2004-2010
-13.4 [-15.3; -11.5] 2010-2017
75+ years
Stage I 2.3 [1.5; 3.1] 2004-2017 3.6 [2.2; 5.1] 2004-2017
5.1 [4.1; 6.1] 2004-2014
-6.6 [-9.9; -3.2] 2014-2017
Stage II -0.9 [-1.3; -0.6] 2004-2017 -1.2 [-1.9; -0.6] 2004-2017
0.8 [0.0; 1.6] 2004-2011 0.8 [-0.3; 2.0] 2004-2012
-2.9 [-3.8; -2.0] 2011-2017 -4.5 [-6.3; -2.6] 2012-2017
Stage III -1.4 [-2.4; -0.5] 2004-2017 -0.8 [-1.9; 0.3] 2004-2017
1.3 [-1.1; 3.7] 2004-2010 1.4 [-0.9; 3.8] 2004-2011
-3.7 [-5.6; -1.7] 2010-2017 -3.4 [-6.0; -0.8] 2011-2017
Stage IV 1.0 [0.3; 1.7] 2004-2017 2.0 [0.7; 3.3] 2004-2017
2.7 [1.2; 4.2] 2004-2011
-1.0 [-2.7; 0.7] 2011-2017
Stage Unknown -11.3 [-12.3; -10.3] 2004-2017 -10.3 [-11.7; -8.8] 2004-2017
AAPC: average annual percentage change
Period: When a joinpoint occured, APC’s are calculated for the period before and after the joinpoint. This column represents the corresponding time interval.
AAPC’s are always calculated over the entire study-period.
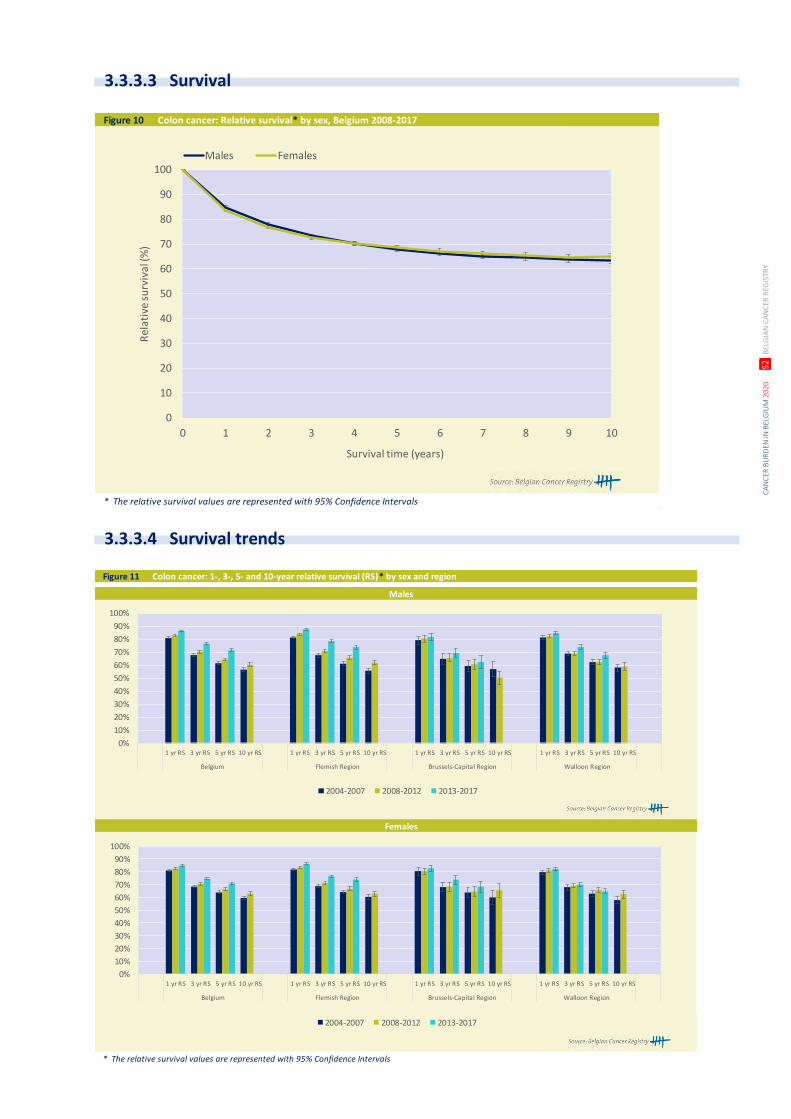
CA
NC
ER B
UR
DEN
IN B
ELG
IUM
202
0
52
BEL
GIA
N C
AN
CER
REG
ISTR
Y
Figure 10 Colon cancer: Relative survival* by sex, Belgium 2008-2017
* The relative survival values are represented with 95% Confidence Intervals
0
10
20
30
40
50
60
70
80
90
100
0 1 2 3 4 5 6 7 8 9 10
Rel
ativ
e su
rviv
al (%
)
Survival time (years)
Males Females
Figure 11 Colon cancer: 1-, 3-, 5- and 10-year relative survival (RS)* by sex and region
* The relative survival values are represented with 95% Confidence Intervals
Males
Females
0%
10%
20%
30%
40%
50%
60%
70%
80%
90%
100%
1 yr RS 3 yr RS 5 yr RS 10 yr RS 1 yr RS 3 yr RS 5 yr RS 10 yr RS 1 yr RS 3 yr RS 5 yr RS 10 yr RS 1 yr RS 3 yr RS 5 yr RS 10 yr RS
Belgium Flemish Region Brussels-Capital Region Walloon Region
2004-2007 2008-2012 2013-2017
0%
10%
20%
30%
40%
50%
60%
70%
80%
90%
100%
1 yr RS 3 yr RS 5 yr RS 10 yr RS 1 yr RS 3 yr RS 5 yr RS 10 yr RS 1 yr RS 3 yr RS 5 yr RS 10 yr RS 1 yr RS 3 yr RS 5 yr RS 10 yr RS
Belgium Flemish Region Brussels-Capital Region Walloon Region
2004-2007 2008-2012 2013-2017
3.3.3.3 Survival
3.3.3.4 Survival trends

CA
NC
ER B
UR
DEN
IN B
ELG
IUM
202
0
53
BEL
GIA
N C
AN
CER
REG
ISTR
Y
Table 1 Rectal cancer: Overview of incidence, mortality, prevalence and survival by sex and region
Rectal cancer Males Females
Incidence, 2017 N CR WSR N CR WSR
Belgium 1,402 25.2 12.6 844 14.7 6.7
Flemish Region 844 26.2 12.2 504 15.3 6.7
Brussels-Capital Region 97 16.7 12.0 60 9.8 6.2
Walloon Region 461 26.1 13.6 280 15.1 6.9
Mortality, 2016 N CR WSR N CR WSR
Belgium 317 5.7 2.6 227 4.0 1.3
Flemish Region 200 6.2 2.6 129 3.9 1.2
Brussels-Capital Region 22 3.8 2.3 22 3.6 1.9
Walloon Region 95 5.4 2.6 76 4.1 1.4
Prevalence (5 years), 2013-2017 N CR WSR N CR WSR
Belgium 5,563 99.4 48.8 3,401 58.9 26.5
Flemish Region 3,667 113.1 51.4 2,097 63.3 27.6
Brussels-Capital Region 303 51.7 36.7 239 39.0 22.6
Walloon Region 1,593 90.0 46.4 1,065 57.4 25.7
5-year Relative survival, 2013-2017 N at risk % 95%CI N at risk % 95%CI
Belgium 7,538 71.2 [69.5;72.7] 4,599 71.3 [69.3;73.2]
Flemish Region 4,833 74.3 [72.3;76.2] 2,780 73.6 [71.1;75.9]
Brussels-Capital Region 440 64.5 [57.5;71.0] 336 70.2 [62.4;77.3]
Walloon Region 2,265 65.5 [62.4;68.6] 1,483 67.1 [63.5;70.6]
10-year Relative survival, 2008-2017 N at risk % 95%CI N at risk % 95%CI
Belgium 14,852 61.3 [59.5;63.0] 9,310 62.9 [60.9;64.9]
Flemish Region 9,591 64.4 [62.3;66.6] 5,643 65.2 [62.7;67.7]
Brussels-Capital Region 888 55.8 [48.3;63.2] 674 60.2 [51.8;68.4]
Walloon Region 4,373 55.1 [51.7;58.5] 2,993 59.0 [55.3;62.6]
CR: crude (all ages) rate (N/100,000 person years)
WSR: age-standardised rate using the World Standard Population (N/100,000 person years)
Figure 1 Rectal cancer: Age-specific incidence rates (N/100,000) by sex, Belgium 2013-2017
0
20
40
60
80
100
120
140
0- 5- 10- 15- 20- 25- 30- 35- 40- 45- 50- 55- 60- 65- 70- 75- 80- 85+
Age
-sp
ecif
ic in
cid
ence
(N /
100
,000
)
Age group
Males Females
3.3.4 RECTUM (ICD-10: C20)
3.3.4.1 Incidence
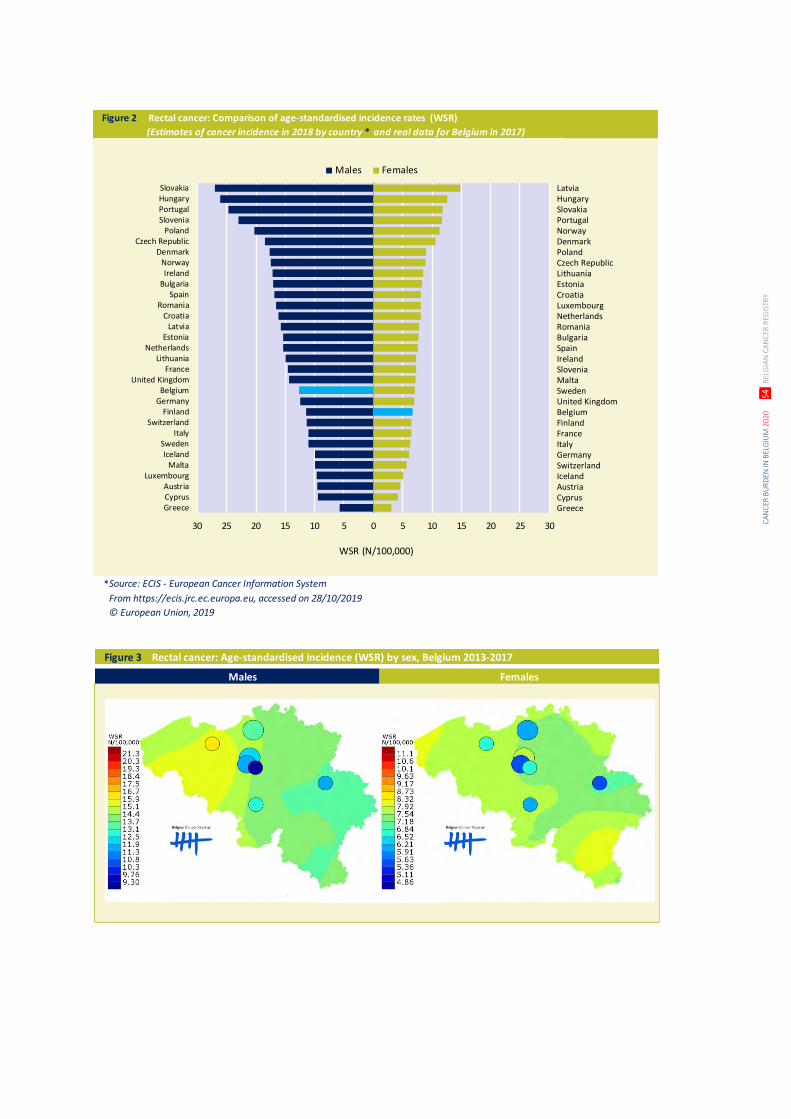
CA
NC
ER B
UR
DEN
IN B
ELG
IUM
202
0
54
BEL
GIA
N C
AN
CER
REG
ISTR
Y
Figure 2 Rectal cancer: Comparison of age-standardised incidence rates (WSR)
(Estimates of cancer incidence in 2018 by country * and real data for Belgium in 2017)
Source: ECIS - European Cancer Information System
From https://ecis.jrc.ec.europa.eu, accessed on 28/10/2019
© European Union, 2019
30 25 20 15 10 5 0 5 10 15 20 25 30
SlovakiaHungaryPortugalSlovenia
PolandCzech Republic
DenmarkNorwayIreland
BulgariaSpain
RomaniaCroatia
LatviaEstonia
NetherlandsLithuania
FranceUnited Kingdom
BelgiumGermany
FinlandSwitzerland
ItalySwedenIceland
MaltaLuxembourg
AustriaCyprusGreece
Males Females
WSR (N/100,000)
*
LatviaHungarySlovakiaPortugalNorwayDenmarkPolandCzech RepublicLithuaniaEstoniaCroatiaLuxembourgNetherlandsRomaniaBulgariaSpainIrelandSloveniaMaltaSwedenUnited KingdomBelgiumFinlandFranceItalyGermanySwitzerlandIcelandAustriaCyprusGreece
Figure 3 Rectal cancer: Age-standardised incidence (WSR) by sex, Belgium 2013-2017
Males Females
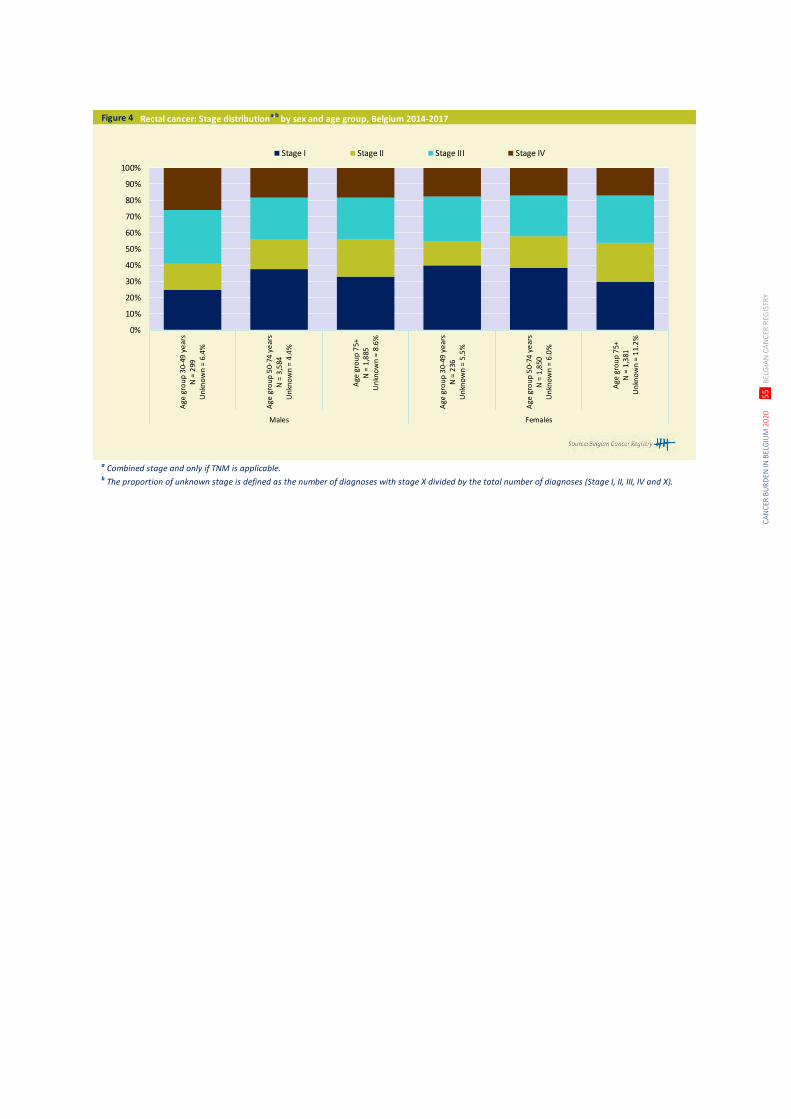
CA
NC
ER B
UR
DEN
IN B
ELG
IUM
202
0
55
BEL
GIA
N C
AN
CER
REG
ISTR
Y
Figure 4 Rectal cancer: Stage distributiona,b
by sex and age group, Belgium 2014-2017
a Combined stage and only if TNM is applicable. b The proportion of unknown stage is defined as the number of diagnoses with stage X divided by the total number of diagnoses (Stage I, II, III, IV and X).
0%
10%
20%
30%
40%
50%
60%
70%
80%
90%
100%
Age
gro
up
30-
49 y
ear
sN
= 2
99U
nkn
ow
n =
6.4
%
Age
gro
up
50-
74 y
ear
sN
= 3
,584
Un
kno
wn
= 4
.4%
Age
gro
up
75+
N =
1,8
85U
nkn
ow
n =
8.6
%
Age
gro
up
30-
49 y
ear
sN
= 2
36U
nkn
ow
n =
5.5
%
Age
gro
up
50-
74 y
ear
sN
= 1
,850
Un
kno
wn
= 6
.0%
Age
gro
up
75+
N =
1,3
81U
nkn
ow
n =
11.
2%
Males Females
Stage I Stage II Stage III Stage IV
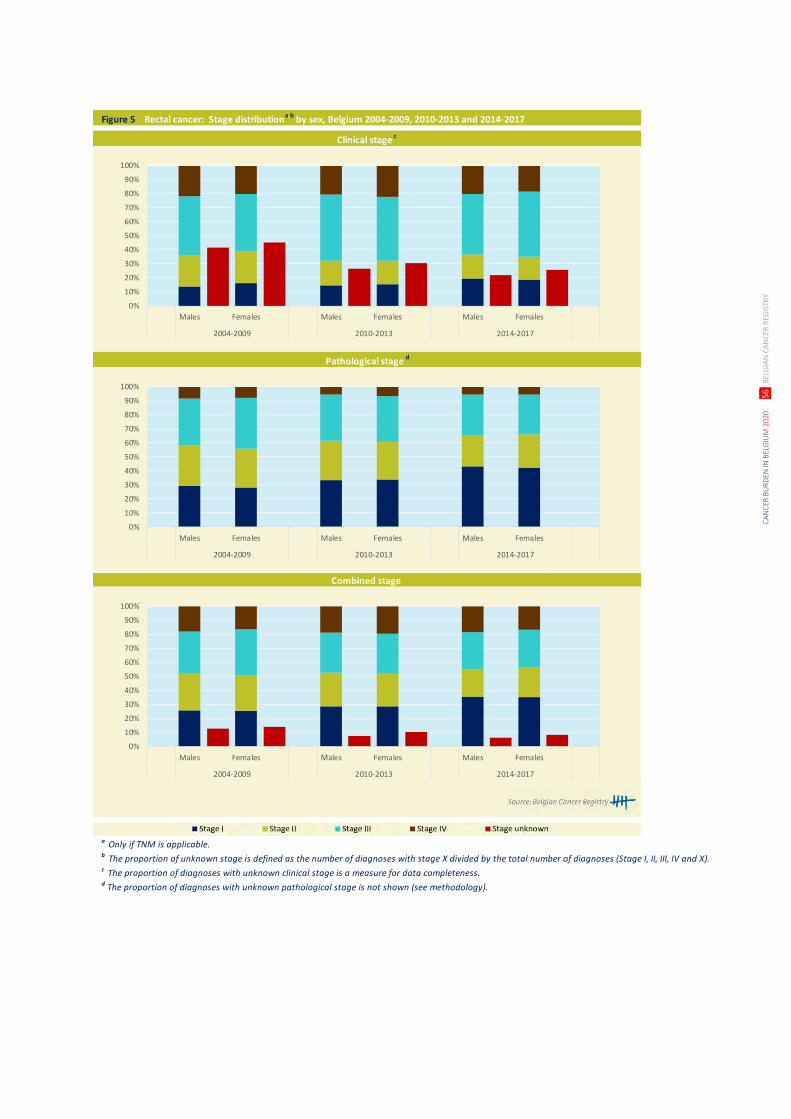
CA
NC
ER B
UR
DEN
IN B
ELG
IUM
202
0
56
BEL
GIA
N C
AN
CER
REG
ISTR
Y
Figure 5 Rectal cancer: Stage distributiona,b
by sex, Belgium 2004-2009, 2010-2013 and 2014-2017
a Only if TNM is applicable. b The proportion of unknown stage is defined as the number of diagnoses with stage X divided by the total number of diagnoses (Stage I, II, III, IV and X).c The proportion of diagnoses with unknown clinical stage is a measure for data completeness.d The proportion of diagnoses with unknown pathological stage is not shown (see methodology).
Pathological stage d
Combined stage
Clinical stage c
0%
10%
20%
30%
40%
50%
60%
70%
80%
90%
100%
Males Females Males Females Males Females
2004-2009 2010-2013 2014-2017
0%
10%
20%
30%
40%
50%
60%
70%
80%
90%
100%
Males Females Males Females Males Females
2004-2009 2010-2013 2014-2017
0%
10%
20%
30%
40%
50%
60%
70%
80%
90%
100%
Males Females Males Females Males Females
2004-2009 2010-2013 2014-2017
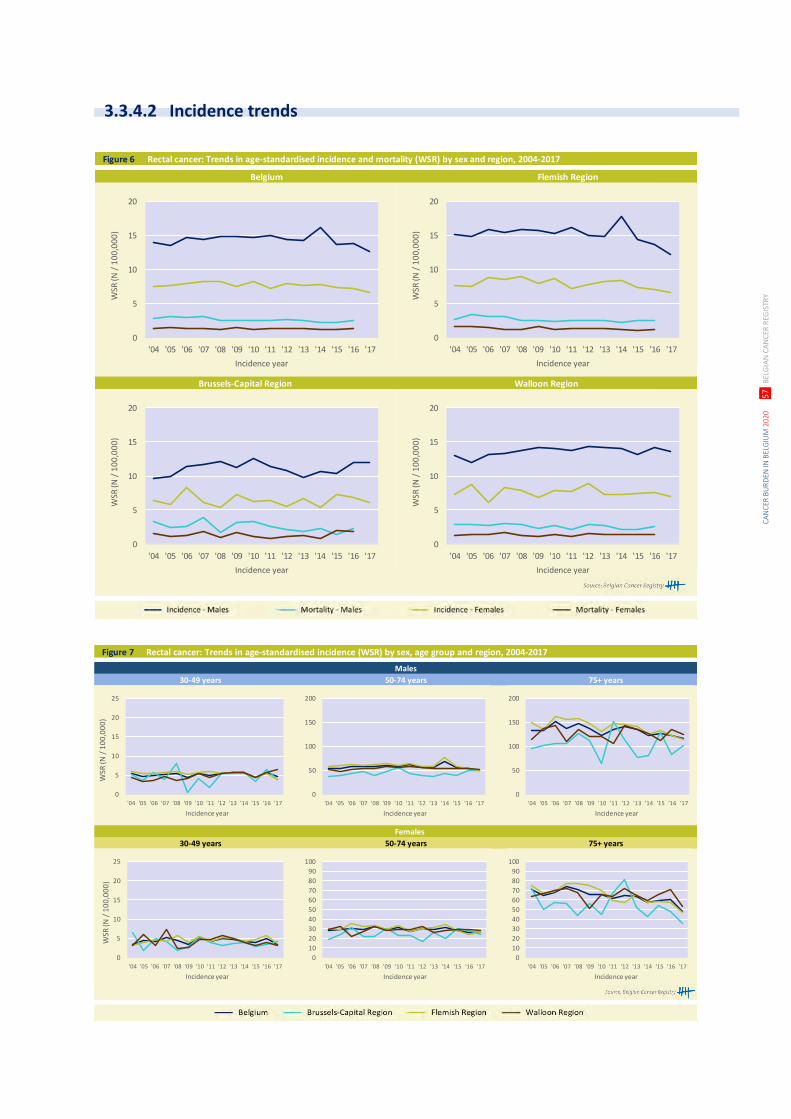
CA
NC
ER B
UR
DEN
IN B
ELG
IUM
202
0
57
BEL
GIA
N C
AN
CER
REG
ISTR
Y
Figure 6 Rectal cancer: Trends in age-standardised incidence and mortality (WSR) by sex and region, 2004-2017
Brussels-Capital Region Walloon Region
Belgium Flemish Region
0
5
10
15
20
'04 '05 '06 '07 '08 '09 '10 '11 '12 '13 '14 '15 '16 '17
WSR
(N /
10
0,0
00
)
Incidence year
0
5
10
15
20
'04 '05 '06 '07 '08 '09 '10 '11 '12 '13 '14 '15 '16 '17
WSR
(N /
10
0,0
00
)
Incidence year
0
5
10
15
20
'04 '05 '06 '07 '08 '09 '10 '11 '12 '13 '14 '15 '16 '17
WSR
(N /
10
0,0
00
)
Incidence year
0
5
10
15
20
'04 '05 '06 '07 '08 '09 '10 '11 '12 '13 '14 '15 '16 '17
WSR
(N /
10
0,0
00
)
Incidence year
Figure 7 Rectal cancer: Trends in age-standardised incidence (WSR) by sex, age group and region, 2004-2017
Males
Females
30-49 years 50-74 years 75+ years
30-49 years 50-74 years 75+ years
0
50
100
150
200
'04 '05 '06 '07 '08 '09 '10 '11 '12 '13 '14 '15 '16 '17
Incidence year
0
50
100
150
200
'04 '05 '06 '07 '08 '09 '10 '11 '12 '13 '14 '15 '16 '17
Incidence year
0
10
20
30
40
50
60
70
80
90
100
'04 '05 '06 '07 '08 '09 '10 '11 '12 '13 '14 '15 '16 '17
Incidence year
0
10
20
30
40
50
60
70
80
90
100
'04 '05 '06 '07 '08 '09 '10 '11 '12 '13 '14 '15 '16 '17
Incidence year
0
5
10
15
20
25
'04 '05 '06 '07 '08 '09 '10 '11 '12 '13 '14 '15 '16 '17
WSR
(N /
10
0,0
00
)
Incidence year
0
5
10
15
20
25
'04 '05 '06 '07 '08 '09 '10 '11 '12 '13 '14 '15 '16 '17
WSR
(N /
10
0,0
00
)
Incidence year
3.3.4.2 Incidence trends
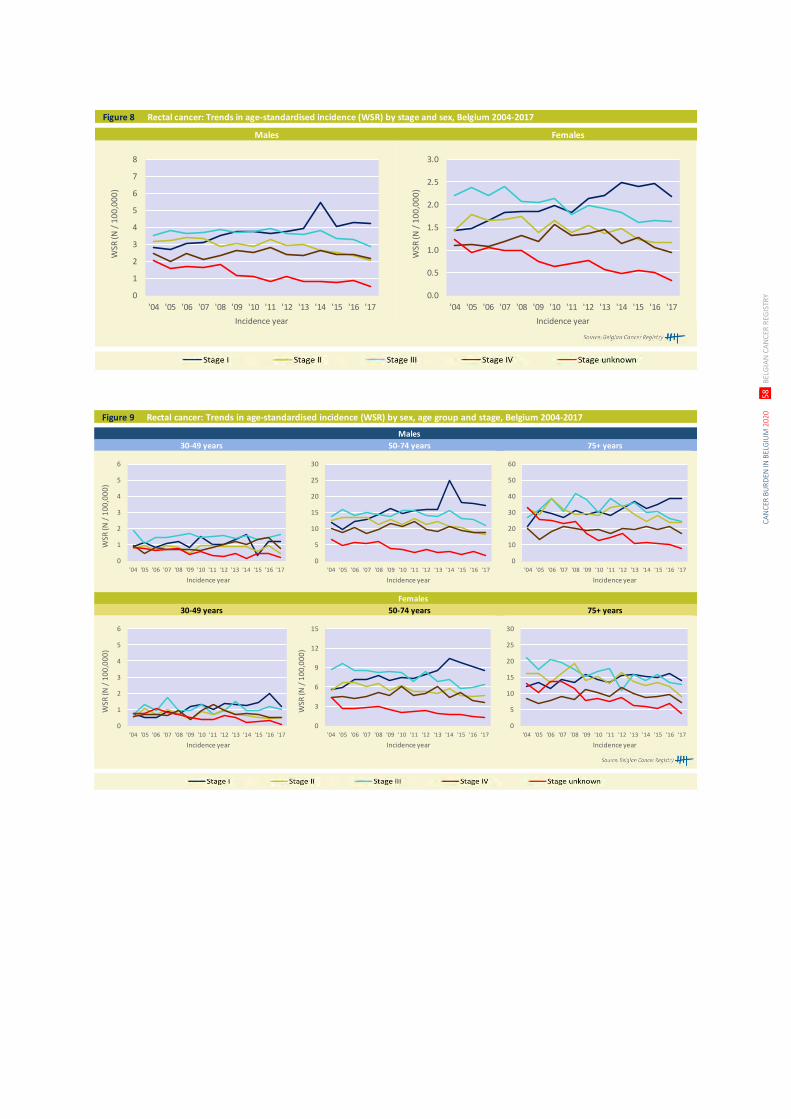
CA
NC
ER B
UR
DEN
IN B
ELG
IUM
202
0
58
BEL
GIA
N C
AN
CER
REG
ISTR
Y
Figure 8 Rectal cancer: Trends in age-standardised incidence (WSR) by stage and sex, Belgium 2004-2017
Males Females
0
1
2
3
4
5
6
7
8
'04 '05 '06 '07 '08 '09 '10 '11 '12 '13 '14 '15 '16 '17
WSR
(N /
10
0,0
00
)
Incidence year
0.0
0.5
1.0
1.5
2.0
2.5
3.0
'04 '05 '06 '07 '08 '09 '10 '11 '12 '13 '14 '15 '16 '17
WSR
(N /
10
0,0
00
)
Incidence year
Figure 9 Rectal cancer: Trends in age-standardised incidence (WSR) by sex, age group and stage, Belgium 2004-2017
Males
Females
30-49 years 50-74 years 75+ years
30-49 years 50-74 years 75+ years
0
5
10
15
20
25
30
'04 '05 '06 '07 '08 '09 '10 '11 '12 '13 '14 '15 '16 '17
Incidence year
0
10
20
30
40
50
60
'04 '05 '06 '07 '08 '09 '10 '11 '12 '13 '14 '15 '16 '17
Incidence year
0
3
6
9
12
15
'04 '05 '06 '07 '08 '09 '10 '11 '12 '13 '14 '15 '16 '17
WSR
(N /
10
0,0
00
)
Incidence year
0
5
10
15
20
25
30
'04 '05 '06 '07 '08 '09 '10 '11 '12 '13 '14 '15 '16 '17
Incidence year
0
1
2
3
4
5
6
'04 '05 '06 '07 '08 '09 '10 '11 '12 '13 '14 '15 '16 '17
WSR
(N /
10
0,0
00
)
Incidence year
0
1
2
3
4
5
6
'04 '05 '06 '07 '08 '09 '10 '11 '12 '13 '14 '15 '16 '17
WSR
(N /
10
0,0
00
)
Incidence year
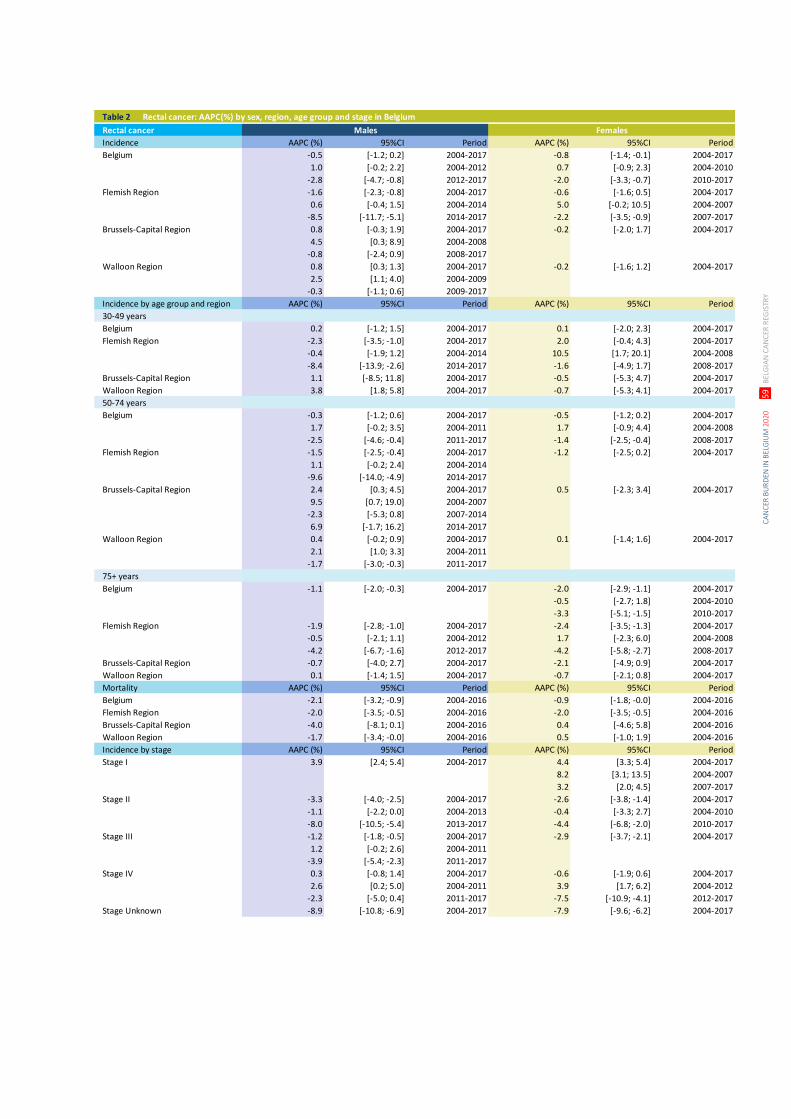
CA
NC
ER B
UR
DEN
IN B
ELG
IUM
202
0
59
BEL
GIA
N C
AN
CER
REG
ISTR
Y
Table 2 Rectal cancer: AAPC(%) by sex, region, age group and stage in Belgium
Rectal cancer Males Females
Incidence AAPC (%) 95%CI Period AAPC (%) 95%CI Period
Belgium -0.5 [-1.2; 0.2] 2004-2017 -0.8 [-1.4; -0.1] 2004-2017
1.0 [-0.2; 2.2] 2004-2012 0.7 [-0.9; 2.3] 2004-2010
-2.8 [-4.7; -0.8] 2012-2017 -2.0 [-3.3; -0.7] 2010-2017
Flemish Region -1.6 [-2.3; -0.8] 2004-2017 -0.6 [-1.6; 0.5] 2004-2017
0.6 [-0.4; 1.5] 2004-2014 5.0 [-0.2; 10.5] 2004-2007
-8.5 [-11.7; -5.1] 2014-2017 -2.2 [-3.5; -0.9] 2007-2017
Brussels-Capital Region 0.8 [-0.3; 1.9] 2004-2017 -0.2 [-2.0; 1.7] 2004-2017
4.5 [0.3; 8.9] 2004-2008
-0.8 [-2.4; 0.9] 2008-2017
Walloon Region 0.8 [0.3; 1.3] 2004-2017 -0.2 [-1.6; 1.2] 2004-2017
2.5 [1.1; 4.0] 2004-2009
-0.3 [-1.1; 0.6] 2009-2017
Incidence by age group and region AAPC (%) 95%CI Period AAPC (%) 95%CI Period
30-49 years
Belgium 0.2 [-1.2; 1.5] 2004-2017 0.1 [-2.0; 2.3] 2004-2017
Flemish Region -2.3 [-3.5; -1.0] 2004-2017 2.0 [-0.4; 4.3] 2004-2017
-0.4 [-1.9; 1.2] 2004-2014 10.5 [1.7; 20.1] 2004-2008
-8.4 [-13.9; -2.6] 2014-2017 -1.6 [-4.9; 1.7] 2008-2017
Brussels-Capital Region 1.1 [-8.5; 11.8] 2004-2017 -0.5 [-5.3; 4.7] 2004-2017
Walloon Region 3.8 [1.8; 5.8] 2004-2017 -0.7 [-5.3; 4.1] 2004-2017
50-74 years
Belgium -0.3 [-1.2; 0.6] 2004-2017 -0.5 [-1.2; 0.2] 2004-2017
1.7 [-0.2; 3.5] 2004-2011 1.7 [-0.9; 4.4] 2004-2008
-2.5 [-4.6; -0.4] 2011-2017 -1.4 [-2.5; -0.4] 2008-2017
Flemish Region -1.5 [-2.5; -0.4] 2004-2017 -1.2 [-2.5; 0.2] 2004-2017
1.1 [-0.2; 2.4] 2004-2014
-9.6 [-14.0; -4.9] 2014-2017
Brussels-Capital Region 2.4 [0.3; 4.5] 2004-2017 0.5 [-2.3; 3.4] 2004-2017
9.5 [0.7; 19.0] 2004-2007
-2.3 [-5.3; 0.8] 2007-2014
6.9 [-1.7; 16.2] 2014-2017
Walloon Region 0.4 [-0.2; 0.9] 2004-2017 0.1 [-1.4; 1.6] 2004-2017
2.1 [1.0; 3.3] 2004-2011
-1.7 [-3.0; -0.3] 2011-2017
75+ years
Belgium -1.1 [-2.0; -0.3] 2004-2017 -2.0 [-2.9; -1.1] 2004-2017
-0.5 [-2.7; 1.8] 2004-2010
-3.3 [-5.1; -1.5] 2010-2017
Flemish Region -1.9 [-2.8; -1.0] 2004-2017 -2.4 [-3.5; -1.3] 2004-2017
-0.5 [-2.1; 1.1] 2004-2012 1.7 [-2.3; 6.0] 2004-2008
-4.2 [-6.7; -1.6] 2012-2017 -4.2 [-5.8; -2.7] 2008-2017
Brussels-Capital Region -0.7 [-4.0; 2.7] 2004-2017 -2.1 [-4.9; 0.9] 2004-2017
Walloon Region 0.1 [-1.4; 1.5] 2004-2017 -0.7 [-2.1; 0.8] 2004-2017
Mortality AAPC (%) 95%CI Period AAPC (%) 95%CI Period
Belgium -2.1 [-3.2; -0.9] 2004-2016 -0.9 [-1.8; -0.0] 2004-2016
Flemish Region -2.0 [-3.5; -0.5] 2004-2016 -2.0 [-3.5; -0.5] 2004-2016
Brussels-Capital Region -4.0 [-8.1; 0.1] 2004-2016 0.4 [-4.6; 5.8] 2004-2016
Walloon Region -1.7 [-3.4; -0.0] 2004-2016 0.5 [-1.0; 1.9] 2004-2016
Incidence by stage AAPC (%) 95%CI Period AAPC (%) 95%CI Period
Stage I 3.9 [2.4; 5.4] 2004-2017 4.4 [3.3; 5.4] 2004-2017
8.2 [3.1; 13.5] 2004-2007
3.2 [2.0; 4.5] 2007-2017
Stage II -3.3 [-4.0; -2.5] 2004-2017 -2.6 [-3.8; -1.4] 2004-2017
-1.1 [-2.2; 0.0] 2004-2013 -0.4 [-3.3; 2.7] 2004-2010
-8.0 [-10.5; -5.4] 2013-2017 -4.4 [-6.8; -2.0] 2010-2017
Stage III -1.2 [-1.8; -0.5] 2004-2017 -2.9 [-3.7; -2.1] 2004-2017
1.2 [-0.2; 2.6] 2004-2011
-3.9 [-5.4; -2.3] 2011-2017
Stage IV 0.3 [-0.8; 1.4] 2004-2017 -0.6 [-1.9; 0.6] 2004-2017
2.6 [0.2; 5.0] 2004-2011 3.9 [1.7; 6.2] 2004-2012
-2.3 [-5.0; 0.4] 2011-2017 -7.5 [-10.9; -4.1] 2012-2017
Stage Unknown -8.9 [-10.8; -6.9] 2004-2017 -7.9 [-9.6; -6.2] 2004-2017
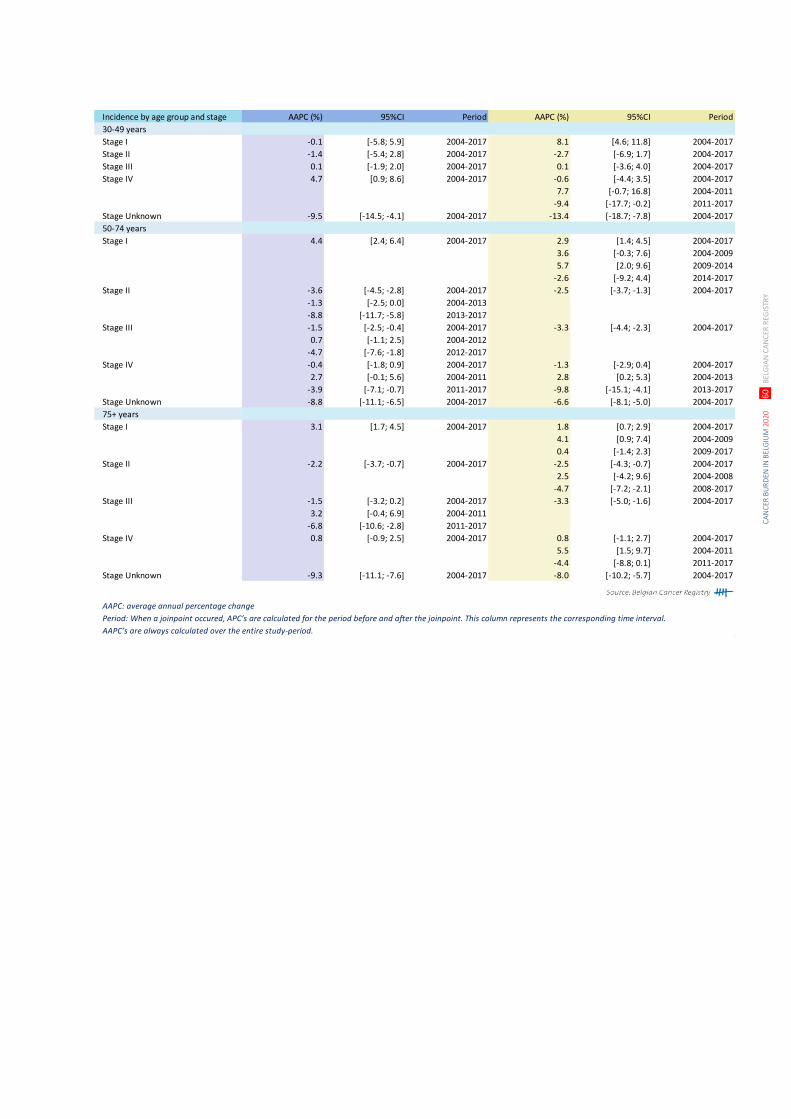
CA
NC
ER B
UR
DEN
IN B
ELG
IUM
202
0
60
BEL
GIA
N C
AN
CER
REG
ISTR
Y
Incidence by age group and stage AAPC (%) 95%CI Period AAPC (%) 95%CI Period
30-49 years
Stage I -0.1 [-5.8; 5.9] 2004-2017 8.1 [4.6; 11.8] 2004-2017
Stage II -1.4 [-5.4; 2.8] 2004-2017 -2.7 [-6.9; 1.7] 2004-2017
Stage III 0.1 [-1.9; 2.0] 2004-2017 0.1 [-3.6; 4.0] 2004-2017
Stage IV 4.7 [0.9; 8.6] 2004-2017 -0.6 [-4.4; 3.5] 2004-2017
7.7 [-0.7; 16.8] 2004-2011
-9.4 [-17.7; -0.2] 2011-2017
Stage Unknown -9.5 [-14.5; -4.1] 2004-2017 -13.4 [-18.7; -7.8] 2004-2017
50-74 years
Stage I 4.4 [2.4; 6.4] 2004-2017 2.9 [1.4; 4.5] 2004-2017
3.6 [-0.3; 7.6] 2004-2009
5.7 [2.0; 9.6] 2009-2014
-2.6 [-9.2; 4.4] 2014-2017
Stage II -3.6 [-4.5; -2.8] 2004-2017 -2.5 [-3.7; -1.3] 2004-2017
-1.3 [-2.5; 0.0] 2004-2013
-8.8 [-11.7; -5.8] 2013-2017
Stage III -1.5 [-2.5; -0.4] 2004-2017 -3.3 [-4.4; -2.3] 2004-2017
0.7 [-1.1; 2.5] 2004-2012
-4.7 [-7.6; -1.8] 2012-2017
Stage IV -0.4 [-1.8; 0.9] 2004-2017 -1.3 [-2.9; 0.4] 2004-2017
2.7 [-0.1; 5.6] 2004-2011 2.8 [0.2; 5.3] 2004-2013
-3.9 [-7.1; -0.7] 2011-2017 -9.8 [-15.1; -4.1] 2013-2017
Stage Unknown -8.8 [-11.1; -6.5] 2004-2017 -6.6 [-8.1; -5.0] 2004-2017
75+ years
Stage I 3.1 [1.7; 4.5] 2004-2017 1.8 [0.7; 2.9] 2004-2017
4.1 [0.9; 7.4] 2004-2009
0.4 [-1.4; 2.3] 2009-2017
Stage II -2.2 [-3.7; -0.7] 2004-2017 -2.5 [-4.3; -0.7] 2004-2017
2.5 [-4.2; 9.6] 2004-2008
-4.7 [-7.2; -2.1] 2008-2017
Stage III -1.5 [-3.2; 0.2] 2004-2017 -3.3 [-5.0; -1.6] 2004-2017
3.2 [-0.4; 6.9] 2004-2011
-6.8 [-10.6; -2.8] 2011-2017
Stage IV 0.8 [-0.9; 2.5] 2004-2017 0.8 [-1.1; 2.7] 2004-2017
5.5 [1.5; 9.7] 2004-2011
-4.4 [-8.8; 0.1] 2011-2017
Stage Unknown -9.3 [-11.1; -7.6] 2004-2017 -8.0 [-10.2; -5.7] 2004-2017
AAPC: average annual percentage change
Period: When a joinpoint occured, APC’s are calculated for the period before and after the joinpoint. This column represents the corresponding time interval.
AAPC’s are always calculated over the entire study-period.

CA
NC
ER B
UR
DEN
IN B
ELG
IUM
202
0
61
BEL
GIA
N C
AN
CER
REG
ISTR
Y
Figure 10 Rectal cancer: Relative survival* by sex, Belgium 2008-2017
* The relative survival values are represented with 95% Confidence Intervals
0
10
20
30
40
50
60
70
80
90
100
0 1 2 3 4 5 6 7 8 9 10
Rel
ativ
e su
rviv
al (%
)
Survival time (years)
Males Females
3.3.4.3 Survival
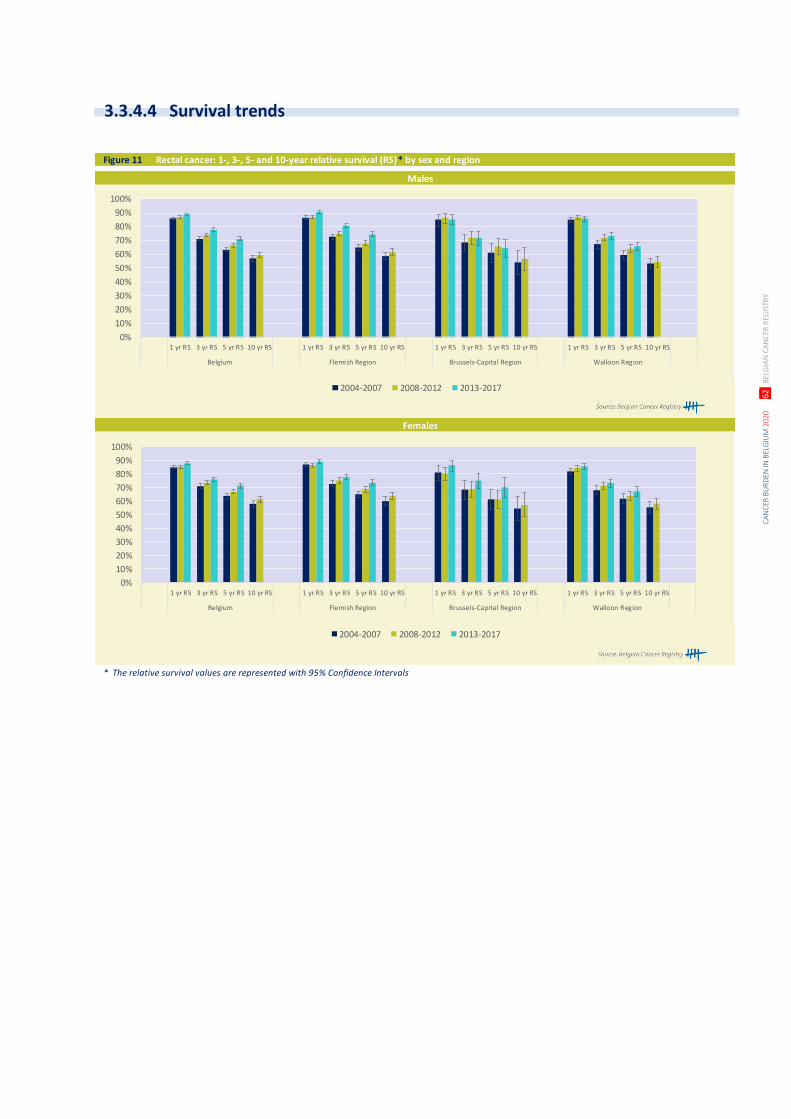
CA
NC
ER B
UR
DEN
IN B
ELG
IUM
202
0
62
BEL
GIA
N C
AN
CER
REG
ISTR
Y
Figure 11 Rectal cancer: 1-, 3-, 5- and 10-year relative survival (RS)* by sex and region
* The relative survival values are represented with 95% Confidence Intervals
Males
Females
0%
10%
20%
30%
40%
50%
60%
70%
80%
90%
100%
1 yr RS 3 yr RS 5 yr RS 10 yr RS 1 yr RS 3 yr RS 5 yr RS 10 yr RS 1 yr RS 3 yr RS 5 yr RS 10 yr RS 1 yr RS 3 yr RS 5 yr RS 10 yr RS
Belgium Flemish Region Brussels-Capital Region Walloon Region
2004-2007 2008-2012 2013-2017
0%
10%
20%
30%
40%
50%
60%
70%
80%
90%
100%
1 yr RS 3 yr RS 5 yr RS 10 yr RS 1 yr RS 3 yr RS 5 yr RS 10 yr RS 1 yr RS 3 yr RS 5 yr RS 10 yr RS 1 yr RS 3 yr RS 5 yr RS 10 yr RS
Belgium Flemish Region Brussels-Capital Region Walloon Region
2004-2007 2008-2012 2013-2017
3.3.4.4 Survival trends
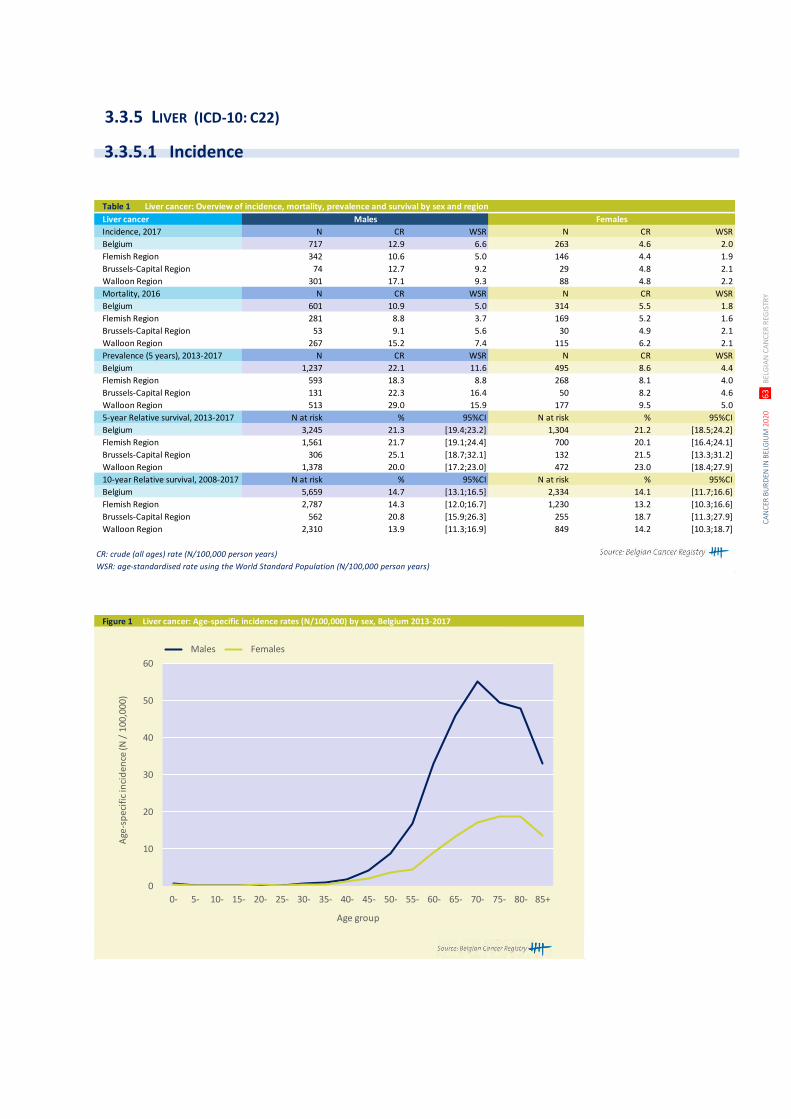
CA
NC
ER B
UR
DEN
IN B
ELG
IUM
202
0
63
BEL
GIA
N C
AN
CER
REG
ISTR
Y
Table 1 Liver cancer: Overview of incidence, mortality, prevalence and survival by sex and region
Liver cancer Males Females
Incidence, 2017 N CR WSR N CR WSR
Belgium 717 12.9 6.6 263 4.6 2.0
Flemish Region 342 10.6 5.0 146 4.4 1.9
Brussels-Capital Region 74 12.7 9.2 29 4.8 2.1
Walloon Region 301 17.1 9.3 88 4.8 2.2
Mortality, 2016 N CR WSR N CR WSR
Belgium 601 10.9 5.0 314 5.5 1.8
Flemish Region 281 8.8 3.7 169 5.2 1.6
Brussels-Capital Region 53 9.1 5.6 30 4.9 2.1
Walloon Region 267 15.2 7.4 115 6.2 2.1
Prevalence (5 years), 2013-2017 N CR WSR N CR WSR
Belgium 1,237 22.1 11.6 495 8.6 4.4
Flemish Region 593 18.3 8.8 268 8.1 4.0
Brussels-Capital Region 131 22.3 16.4 50 8.2 4.6
Walloon Region 513 29.0 15.9 177 9.5 5.0
5-year Relative survival, 2013-2017 N at risk % 95%CI N at risk % 95%CI
Belgium 3,245 21.3 [19.4;23.2] 1,304 21.2 [18.5;24.2]
Flemish Region 1,561 21.7 [19.1;24.4] 700 20.1 [16.4;24.1]
Brussels-Capital Region 306 25.1 [18.7;32.1] 132 21.5 [13.3;31.2]
Walloon Region 1,378 20.0 [17.2;23.0] 472 23.0 [18.4;27.9]
10-year Relative survival, 2008-2017 N at risk % 95%CI N at risk % 95%CI
Belgium 5,659 14.7 [13.1;16.5] 2,334 14.1 [11.7;16.6]
Flemish Region 2,787 14.3 [12.0;16.7] 1,230 13.2 [10.3;16.6]
Brussels-Capital Region 562 20.8 [15.9;26.3] 255 18.7 [11.3;27.9]
Walloon Region 2,310 13.9 [11.3;16.9] 849 14.2 [10.3;18.7]
CR: crude (all ages) rate (N/100,000 person years)
WSR: age-standardised rate using the World Standard Population (N/100,000 person years)
Figure 1 Liver cancer: Age-specific incidence rates (N/100,000) by sex, Belgium 2013-2017
0
10
20
30
40
50
60
0- 5- 10- 15- 20- 25- 30- 35- 40- 45- 50- 55- 60- 65- 70- 75- 80- 85+
Age
-sp
ecif
ic in
cid
ence
(N /
10
0,0
00
)
Age group
Males Females
3.3.5 LIVER (ICD-10: C22)
3.3.5.1 Incidence
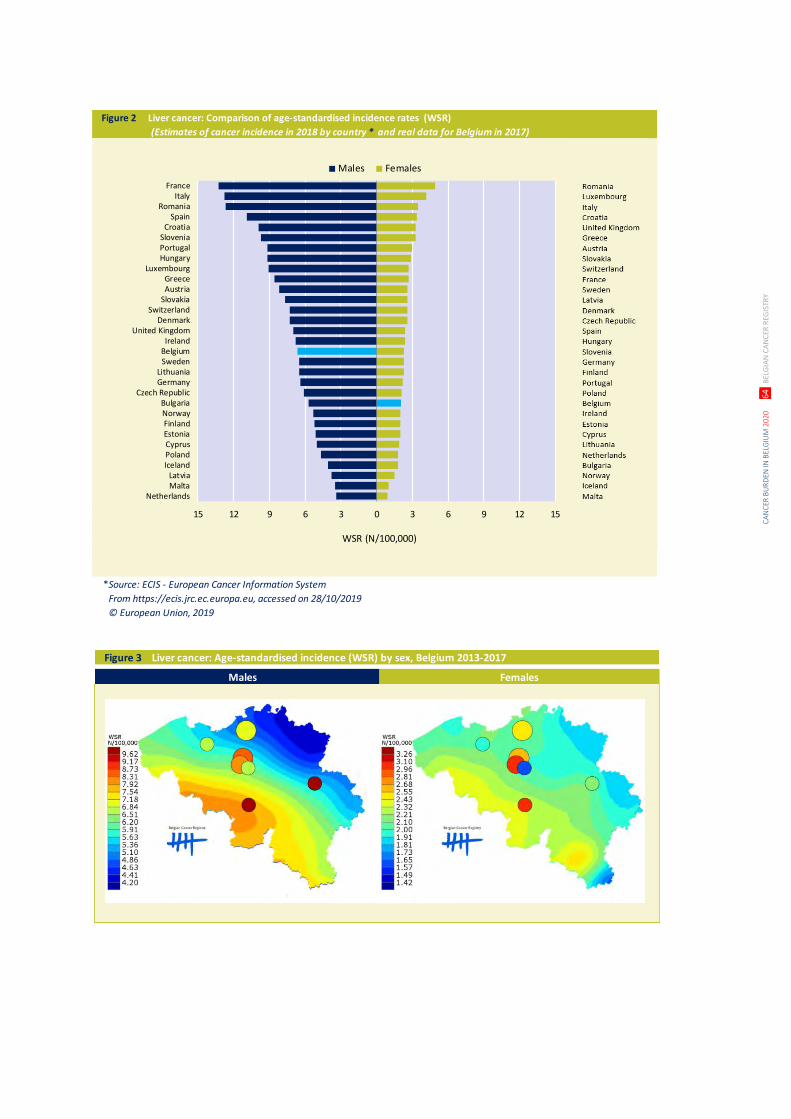
CA
NC
ER B
UR
DEN
IN B
ELG
IUM
202
0
64
BEL
GIA
N C
AN
CER
REG
ISTR
Y
Figure 2 Liver cancer: Comparison of age-standardised incidence rates (WSR)
(Estimates of cancer incidence in 2018 by country * and real data for Belgium in 2017)
Source: ECIS - European Cancer Information System
From https://ecis.jrc.ec.europa.eu, accessed on 28/10/2019
© European Union, 2019
15 12 9 6 3 0 3 6 9 12 15
NetherlandsMaltaLatvia
IcelandPolandCyprusEstoniaFinlandNorwayBulgaria
Czech RepublicGermanyLithuania
SwedenBelgiumIreland
United KingdomDenmark
SwitzerlandSlovakiaAustriaGreece
LuxembourgHungaryPortugalSlovenia
CroatiaSpain
RomaniaItaly
France
Males Females
WSR (N/100,000)
*
Figure 3 Liver cancer: Age-standardised incidence (WSR) by sex, Belgium 2013-2017
Males Females
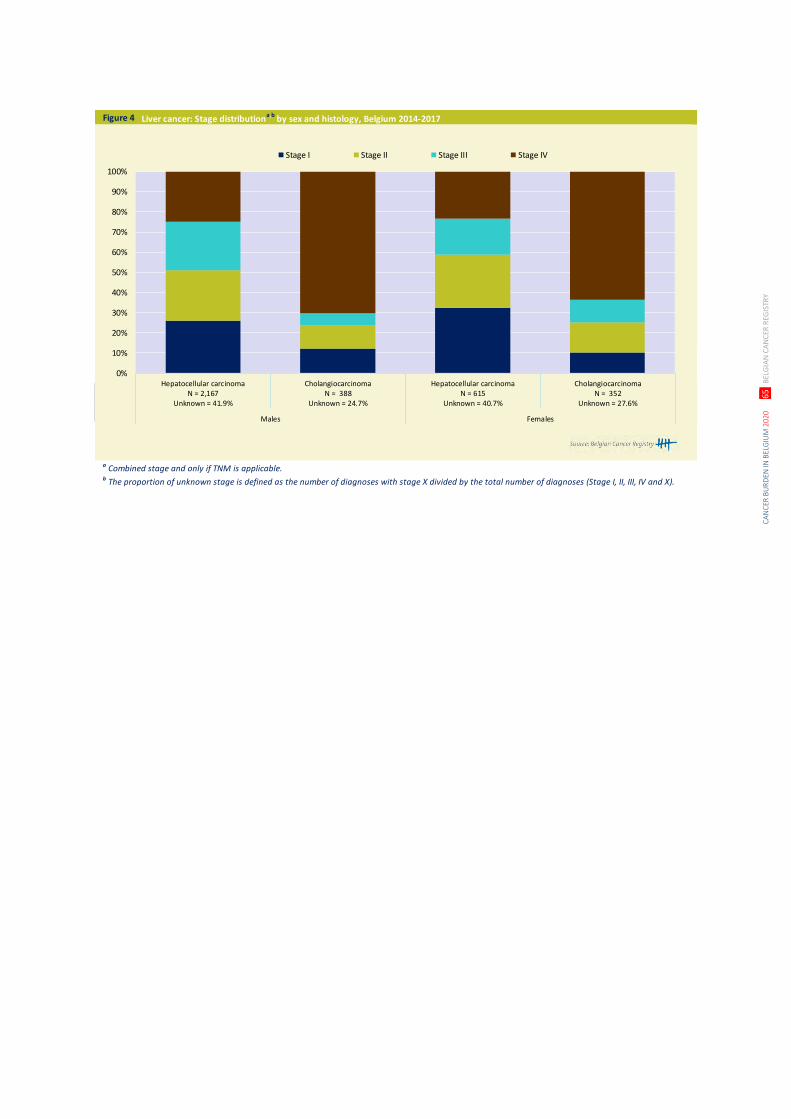
CA
NC
ER B
UR
DEN
IN B
ELG
IUM
202
0
65
BEL
GIA
N C
AN
CER
REG
ISTR
Y
Figure 4 Liver cancer: Stage distributiona,b
by sex and histology, Belgium 2014-2017
a Combined stage and only if TNM is applicable. b The proportion of unknown stage is defined as the number of diagnoses with stage X divided by the total number of diagnoses (Stage I, II, III, IV and X).
0%
10%
20%
30%
40%
50%
60%
70%
80%
90%
100%
Hepatocellular carcinomaN = 2,167
Unknown = 41.9%
CholangiocarcinomaN = 388
Unknown = 24.7%
Hepatocellular carcinomaN = 615
Unknown = 40.7%
CholangiocarcinomaN = 352
Unknown = 27.6%
Males Females
Stage I Stage II Stage III Stage IV
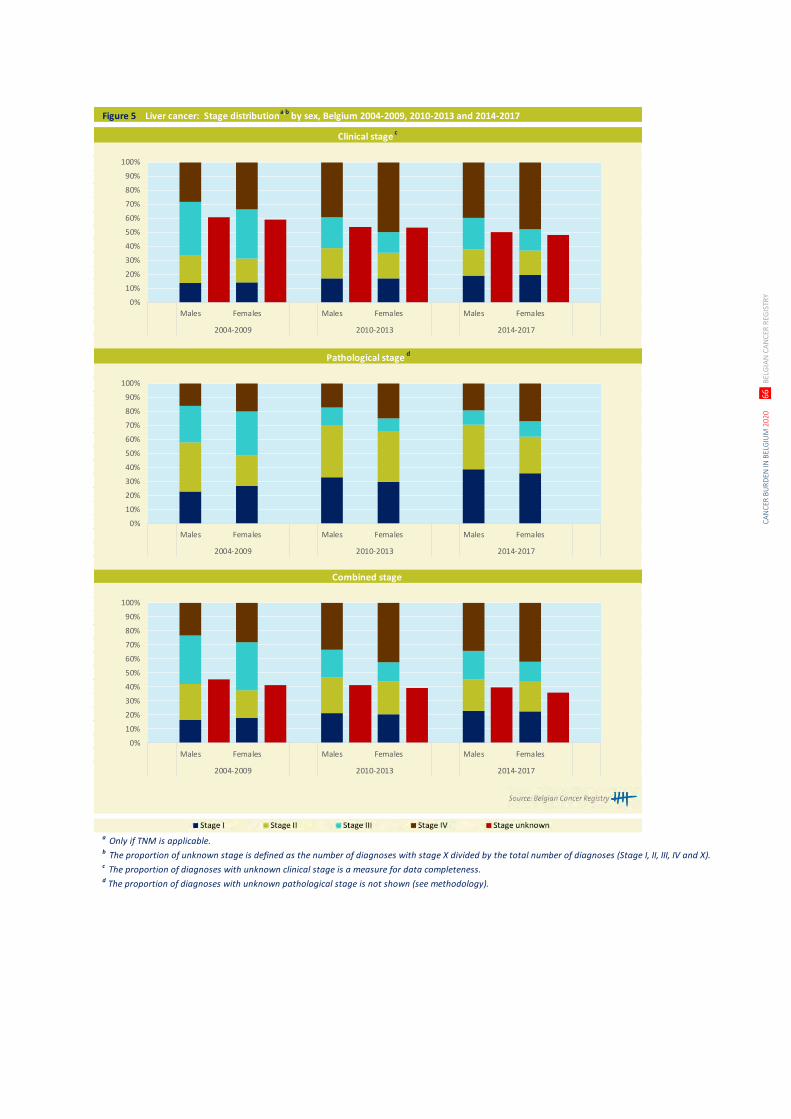
CA
NC
ER B
UR
DEN
IN B
ELG
IUM
202
0
66
BEL
GIA
N C
AN
CER
REG
ISTR
Y
Figure 5 Liver cancer: Stage distributiona,b
by sex, Belgium 2004-2009, 2010-2013 and 2014-2017
a Only if TNM is applicable. b The proportion of unknown stage is defined as the number of diagnoses with stage X divided by the total number of diagnoses (Stage I, II, III, IV and X).c The proportion of diagnoses with unknown clinical stage is a measure for data completeness.d The proportion of diagnoses with unknown pathological stage is not shown (see methodology).
Clinical stage c
Pathological stage d
Combined stage
0%
10%
20%
30%
40%
50%
60%
70%
80%
90%
100%
Males Females Males Females Males Females
2004-2009 2010-2013 2014-2017
0%
10%
20%
30%
40%
50%
60%
70%
80%
90%
100%
Males Females Males Females Males Females
2004-2009 2010-2013 2014-2017
0%
10%
20%
30%
40%
50%
60%
70%
80%
90%
100%
Males Females Males Females Males Females
2004-2009 2010-2013 2014-2017
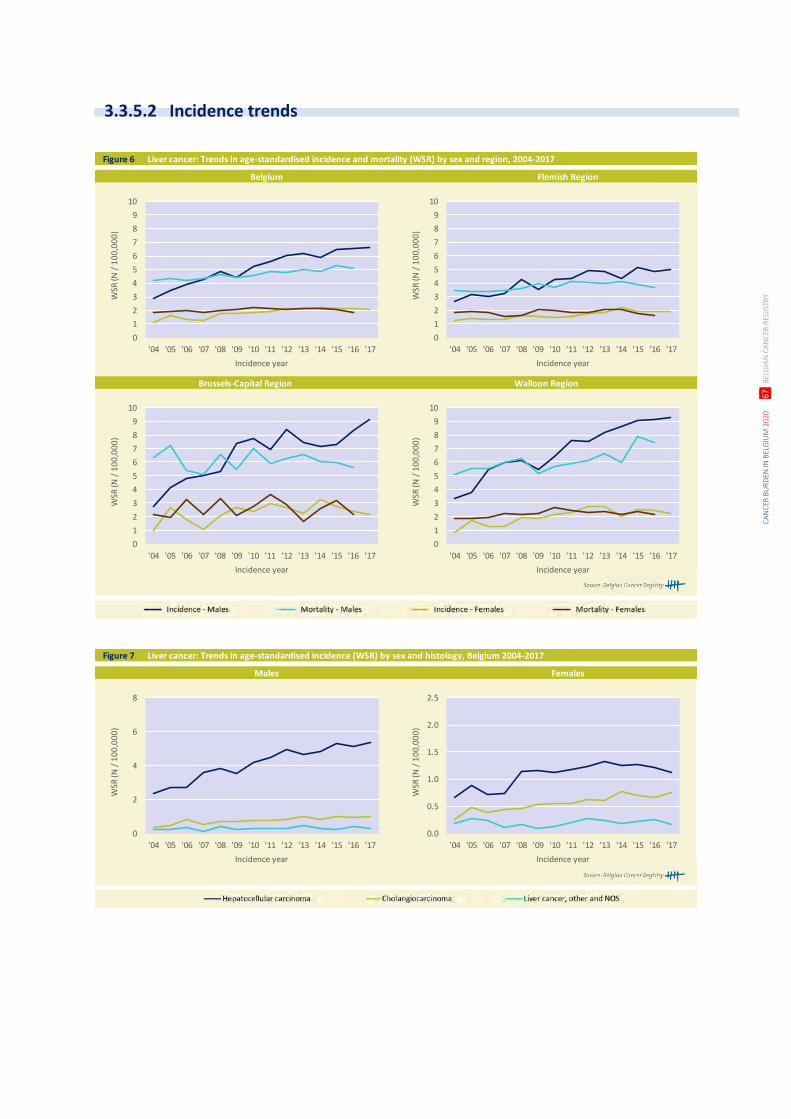
CA
NC
ER B
UR
DEN
IN B
ELG
IUM
202
0
67
BEL
GIA
N C
AN
CER
REG
ISTR
Y
Figure 6 Liver cancer: Trends in age-standardised incidence and mortality (WSR) by sex and region, 2004-2017
Brussels-Capital Region Walloon Region
Belgium Flemish Region
0
1
2
3
4
5
6
7
8
9
10
'04 '05 '06 '07 '08 '09 '10 '11 '12 '13 '14 '15 '16 '17
WSR
(N /
10
0,0
00
)
Incidence year
0
1
2
3
4
5
6
7
8
9
10
'04 '05 '06 '07 '08 '09 '10 '11 '12 '13 '14 '15 '16 '17
WSR
(N /
10
0,0
00
)
Incidence year
0
1
2
3
4
5
6
7
8
9
10
'04 '05 '06 '07 '08 '09 '10 '11 '12 '13 '14 '15 '16 '17
WSR
(N /
10
0,0
00
)
Incidence year
0
1
2
3
4
5
6
7
8
9
10
'04 '05 '06 '07 '08 '09 '10 '11 '12 '13 '14 '15 '16 '17
WSR
(N /
10
0,0
00
)
Incidence year
Figure 7 Liver cancer: Trends in age-standardised incidence (WSR) by sex and histology, Belgium 2004-2017
Males Females
0
2
4
6
8
'04 '05 '06 '07 '08 '09 '10 '11 '12 '13 '14 '15 '16 '17
WSR
(N /
10
0,0
00
)
Incidence year
0.0
0.5
1.0
1.5
2.0
2.5
'04 '05 '06 '07 '08 '09 '10 '11 '12 '13 '14 '15 '16 '17
WSR
(N /
10
0,0
00
)
Incidence year
3.3.5.2 Incidence trends
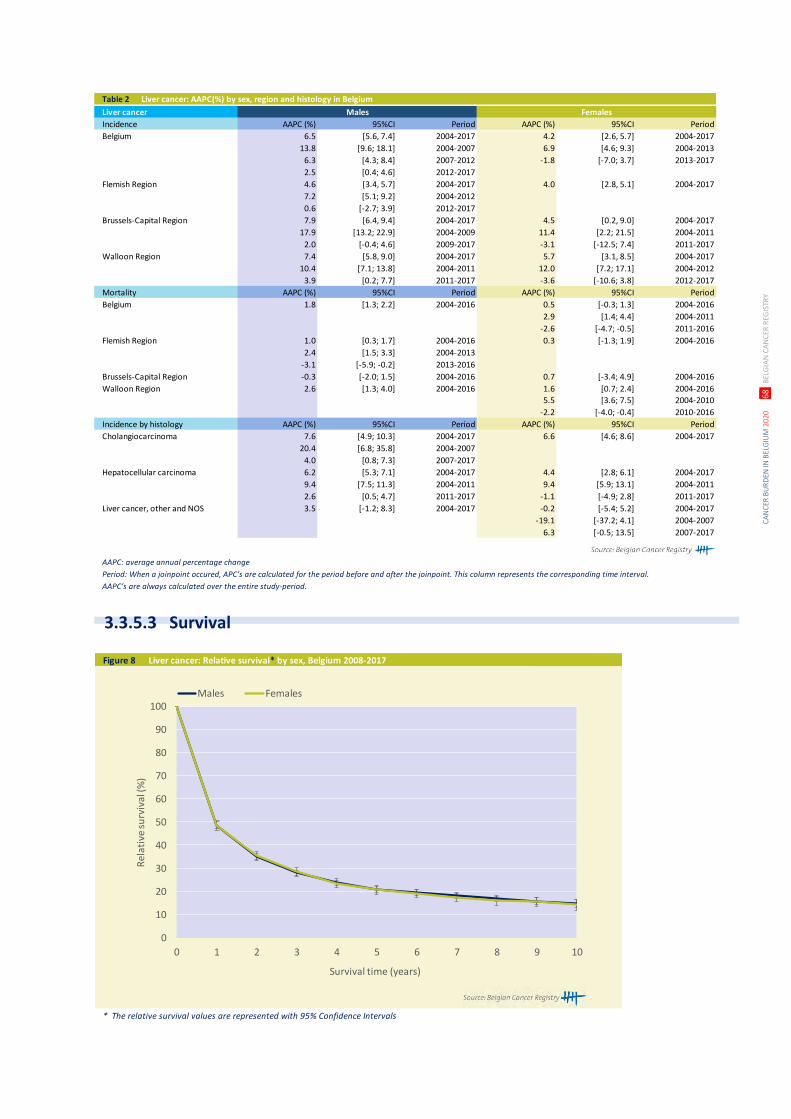
CA
NC
ER B
UR
DEN
IN B
ELG
IUM
202
0
68
BEL
GIA
N C
AN
CER
REG
ISTR
Y
Table 2 Liver cancer: AAPC(%) by sex, region and histology in Belgium
Liver cancer Males Females
Incidence AAPC (%) 95%CI Period AAPC (%) 95%CI Period
Belgium 6.5 [5.6, 7.4] 2004-2017 4.2 [2.6, 5.7] 2004-2017
13.8 [9.6; 18.1] 2004-2007 6.9 [4.6; 9.3] 2004-2013
6.3 [4.3; 8.4] 2007-2012 -1.8 [-7.0; 3.7] 2013-2017
2.5 [0.4; 4.6] 2012-2017
Flemish Region 4.6 [3.4, 5.7] 2004-2017 4.0 [2.8, 5.1] 2004-2017
7.2 [5.1; 9.2] 2004-2012
0.6 [-2.7; 3.9] 2012-2017
Brussels-Capital Region 7.9 [6.4, 9.4] 2004-2017 4.5 [0.2, 9.0] 2004-2017
17.9 [13.2; 22.9] 2004-2009 11.4 [2.2; 21.5] 2004-2011
2.0 [-0.4; 4.6] 2009-2017 -3.1 [-12.5; 7.4] 2011-2017
Walloon Region 7.4 [5.8, 9.0] 2004-2017 5.7 [3.1, 8.5] 2004-2017
10.4 [7.1; 13.8] 2004-2011 12.0 [7.2; 17.1] 2004-2012
3.9 [0.2; 7.7] 2011-2017 -3.6 [-10.6; 3.8] 2012-2017
Mortality AAPC (%) 95%CI Period AAPC (%) 95%CI Period
Belgium 1.8 [1.3; 2.2] 2004-2016 0.5 [-0.3; 1.3] 2004-2016
2.9 [1.4; 4.4] 2004-2011
-2.6 [-4.7; -0.5] 2011-2016
Flemish Region 1.0 [0.3; 1.7] 2004-2016 0.3 [-1.3; 1.9] 2004-2016
2.4 [1.5; 3.3] 2004-2013
-3.1 [-5.9; -0.2] 2013-2016
Brussels-Capital Region -0.3 [-2.0; 1.5] 2004-2016 0.7 [-3.4; 4.9] 2004-2016
Walloon Region 2.6 [1.3; 4.0] 2004-2016 1.6 [0.7; 2.4] 2004-2016
5.5 [3.6; 7.5] 2004-2010
-2.2 [-4.0; -0.4] 2010-2016
Incidence by histology AAPC (%) 95%CI Period AAPC (%) 95%CI Period
Cholangiocarcinoma 7.6 [4.9; 10.3] 2004-2017 6.6 [4.6; 8.6] 2004-2017
20.4 [6.8; 35.8] 2004-2007
4.0 [0.8; 7.3] 2007-2017
Hepatocellular carcinoma 6.2 [5.3; 7.1] 2004-2017 4.4 [2.8; 6.1] 2004-2017
9.4 [7.5; 11.3] 2004-2011 9.4 [5.9; 13.1] 2004-2011
2.6 [0.5; 4.7] 2011-2017 -1.1 [-4.9; 2.8] 2011-2017
Liver cancer, other and NOS 3.5 [-1.2; 8.3] 2004-2017 -0.2 [-5.4; 5.2] 2004-2017
-19.1 [-37.2; 4.1] 2004-2007
6.3 [-0.5; 13.5] 2007-2017
AAPC: average annual percentage change
Period: When a joinpoint occured, APC’s are calculated for the period before and after the joinpoint. This column represents the corresponding time interval.
AAPC’s are always calculated over the entire study-period.
Figure 8 Liver cancer: Relative survival* by sex, Belgium 2008-2017
* The relative survival values are represented with 95% Confidence Intervals
0
10
20
30
40
50
60
70
80
90
100
0 1 2 3 4 5 6 7 8 9 10
Rel
ativ
e su
rviv
al (%
)
Survival time (years)
Males Females
3.3.5.3 Survival
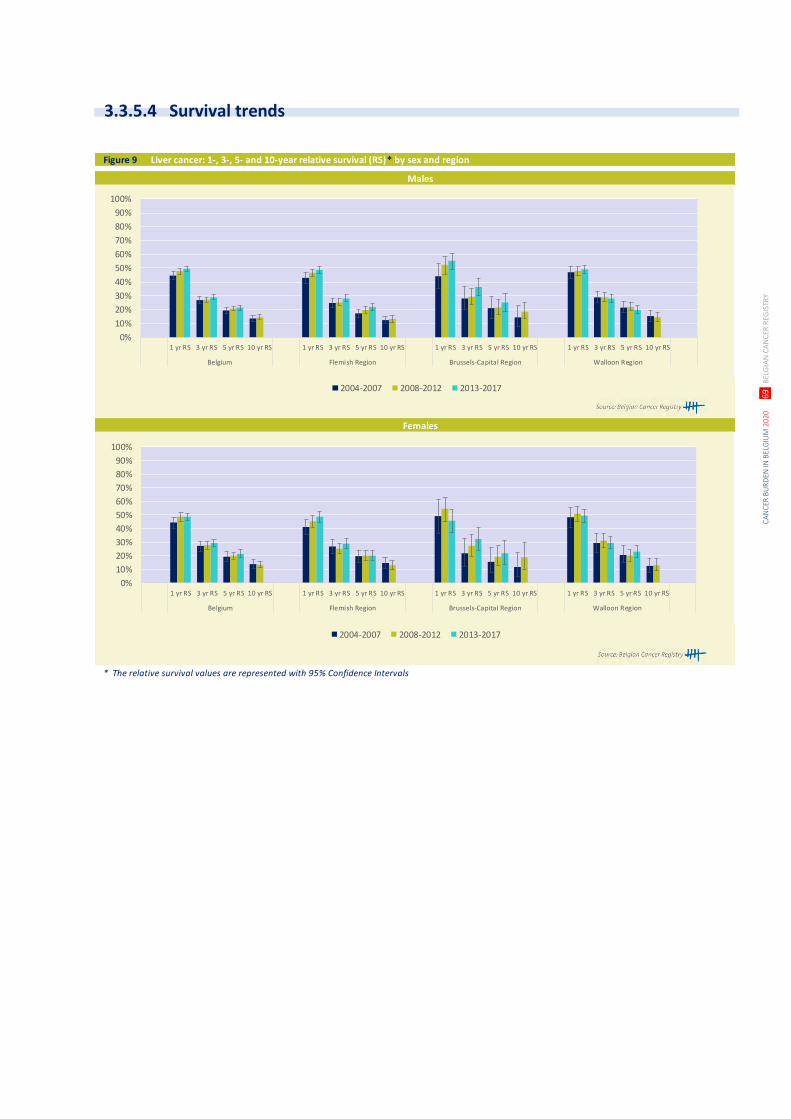
CA
NC
ER B
UR
DEN
IN B
ELG
IUM
202
0
69
BEL
GIA
N C
AN
CER
REG
ISTR
Y
Figure 9 Liver cancer: 1-, 3-, 5- and 10-year relative survival (RS)* by sex and region
* The relative survival values are represented with 95% Confidence Intervals
Males
Females
0%
10%
20%
30%
40%
50%
60%
70%
80%
90%
100%
1 yr RS 3 yr RS 5 yr RS 10 yr RS 1 yr RS 3 yr RS 5 yr RS 10 yr RS 1 yr RS 3 yr RS 5 yr RS 10 yr RS 1 yr RS 3 yr RS 5 yr RS 10 yr RS
Belgium Flemish Region Brussels-Capital Region Walloon Region
2004-2007 2008-2012 2013-2017
0%
10%
20%
30%
40%
50%
60%
70%
80%
90%
100%
1 yr RS 3 yr RS 5 yr RS 10 yr RS 1 yr RS 3 yr RS 5 yr RS 10 yr RS 1 yr RS 3 yr RS 5 yr RS 10 yr RS 1 yr RS 3 yr RS 5 yr RS 10 yr RS
Belgium Flemish Region Brussels-Capital Region Walloon Region
2004-2007 2008-2012 2013-2017
3.3.5.4 Survival trends

CA
NC
ER B
UR
DEN
IN B
ELG
IUM
202
0
70
BEL
GIA
N C
AN
CER
REG
ISTR
Y
Table 1 Cancer of the gallbladder and biliary tract: Overview of incidence, mortality, prevalence and survival by sex and region
Cancer of the gallbladder and biliary tract Males Females
Incidence, 2017 N CR WSR N CR WSR
Belgium 222 4.0 1.8 202 3.5 1.4
Flemish Region 128 4.0 1.7 113 3.4 1.2
Brussels-Capital Region 18 3.1 2.1 18 3.0 1.9
Walloon Region 76 4.3 2.1 71 3.8 1.4
Mortality, 2016 N CR WSR N CR WSR
Belgium 68 1.2 0.5 96 1.7 0.5
Flemish Region 40 1.2 0.5 54 1.6 0.5
Brussels-Capital Region 7 1.2 0.7 9 1.5 0.6
Walloon Region 21 1.2 0.6 33 1.8 0.4
Prevalence (5 years), 2013-2017 N CR WSR N CR WSR
Belgium 407 7.3 3.5 319 5.5 2.3
Flemish Region 257 7.9 3.6 196 5.9 2.3
Brussels-Capital Region 28 4.8 3.2 33 5.4 3.5
Walloon Region 122 6.9 3.6 90 4.9 2.0
5-year Relative survival, 2013-2017 N at risk % 95%CI N at risk % 95%CI
Belgium 1,051 22.4 [19.1;26.0] 1,025 18.7 [15.9;21.9]
Flemish Region 630 23.1 [18.7;27.8] 601 17.9 [14.2;22.0]
Brussels-Capital Region 76 19.0 [8.9;32.7] 98 21.3 [12.6;31.9]
Walloon Region 345 22.1 [16.6;28.3] 326 19.3 [14.4;25.0]
10-year Relative survival, 2008-2017 N at risk % 95%CI N at risk % 95%CI
Belgium 1,977 17.0 [14.1;20.1] 2,060 15.6 [13.2;18.2]
Flemish Region 1,192 16.8 [13.3;20.9] 1,231 16.0 [12.9;19.3]
Brussels-Capital Region 152 13.1 [6.2;23.3] 188 15.7 [9.3;23.8]
Walloon Region 633 19.1 [14.3;24.7] 641 15.2 [11.0;20.3]
CR: crude (all ages) rate (N/100,000 person years)
WSR: age-standardised rate using the World Standard Population (N/100,000 person years)
Figure 1 Cancer of the gallbladder and biliary tract: Age-specific incidence rates (N/100,000) by sex, Belgium 2013-2017
0
5
10
15
20
25
30
0- 5- 10- 15- 20- 25- 30- 35- 40- 45- 50- 55- 60- 65- 70- 75- 80- 85+
Age
-sp
ecif
ic in
cid
ence
(N /
100
,000
)
Age group
Males Females
3.3.6 GALLBLADDER AND BILIARY TRACT (ICD-10: C23-C24)
3.3.6.1 Incidence
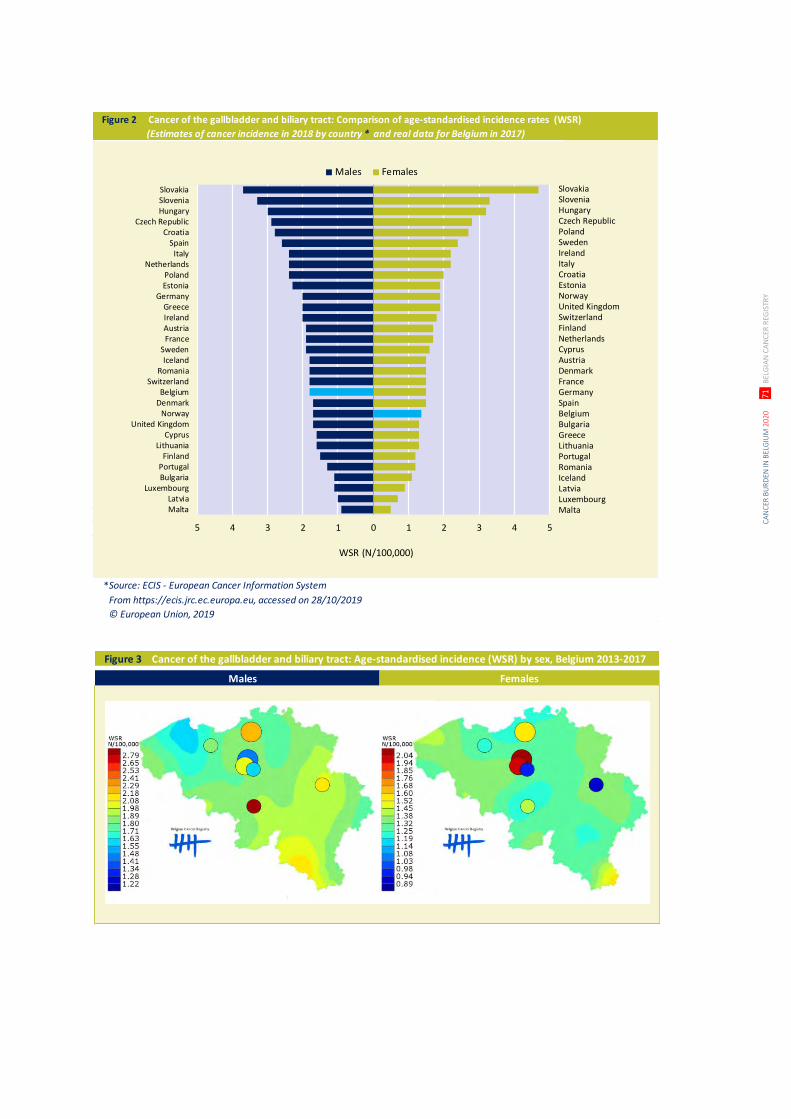
CA
NC
ER B
UR
DEN
IN B
ELG
IUM
202
0
71
BEL
GIA
N C
AN
CER
REG
ISTR
Y
Figure 2 Cancer of the gallbladder and biliary tract: Comparison of age-standardised incidence rates (WSR)
(Estimates of cancer incidence in 2018 by country * and real data for Belgium in 2017)
Source: ECIS - European Cancer Information System
From https://ecis.jrc.ec.europa.eu, accessed on 28/10/2019
© European Union, 2019
5 4 3 2 1 0 1 2 3 4 5
SlovakiaSloveniaHungary
Czech RepublicCroatia
SpainItaly
NetherlandsPolandEstonia
GermanyGreeceIrelandAustriaFrance
SwedenIceland
RomaniaSwitzerland
BelgiumDenmark
NorwayUnited Kingdom
CyprusLithuania
FinlandPortugalBulgaria
LuxembourgLatviaMalta
Males Females
WSR (N/100,000)
*
SlovakiaSloveniaHungaryCzech RepublicPolandSwedenIrelandItalyCroatiaEstoniaNorwayUnited KingdomSwitzerlandFinlandNetherlandsCyprusAustriaDenmarkFranceGermanySpainBelgiumBulgariaGreeceLithuaniaPortugalRomaniaIcelandLatviaLuxembourgMalta
Figure 3 Cancer of the gallbladder and biliary tract: Age-standardised incidence (WSR) by sex, Belgium 2013-2017
Males Females
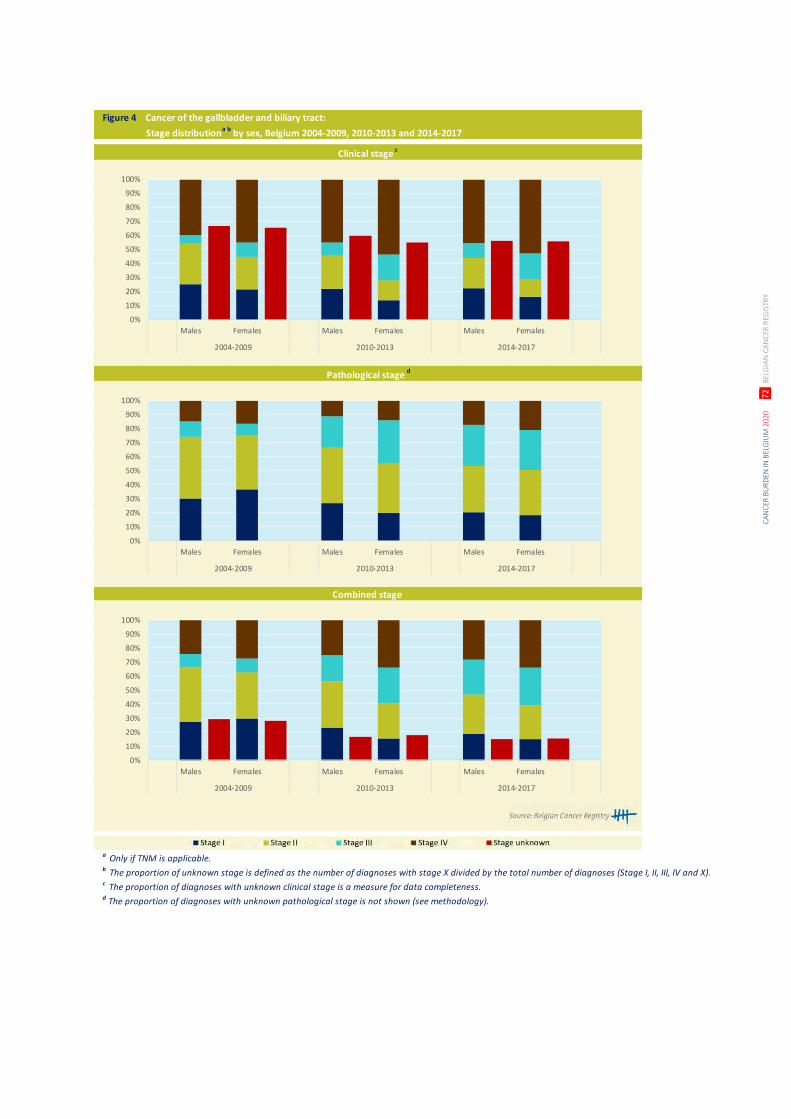
CA
NC
ER B
UR
DEN
IN B
ELG
IUM
202
0
72
BEL
GIA
N C
AN
CER
REG
ISTR
Y
Figure 4 Cancer of the gallbladder and biliary tract:
Stage distributiona,b
by sex, Belgium 2004-2009, 2010-2013 and 2014-2017
a Only if TNM is applicable. b The proportion of unknown stage is defined as the number of diagnoses with stage X divided by the total number of diagnoses (Stage I, II, III, IV and X).c The proportion of diagnoses with unknown clinical stage is a measure for data completeness.d The proportion of diagnoses with unknown pathological stage is not shown (see methodology).
Clinical stage c
Pathological stage d
Combined stage
0%
10%
20%
30%
40%
50%
60%
70%
80%
90%
100%
Males Females Males Females Males Females
2004-2009 2010-2013 2014-2017
0%
10%
20%
30%
40%
50%
60%
70%
80%
90%
100%
Males Females Males Females Males Females
2004-2009 2010-2013 2014-2017
0%
10%
20%
30%
40%
50%
60%
70%
80%
90%
100%
Males Females Males Females Males Females
2004-2009 2010-2013 2014-2017
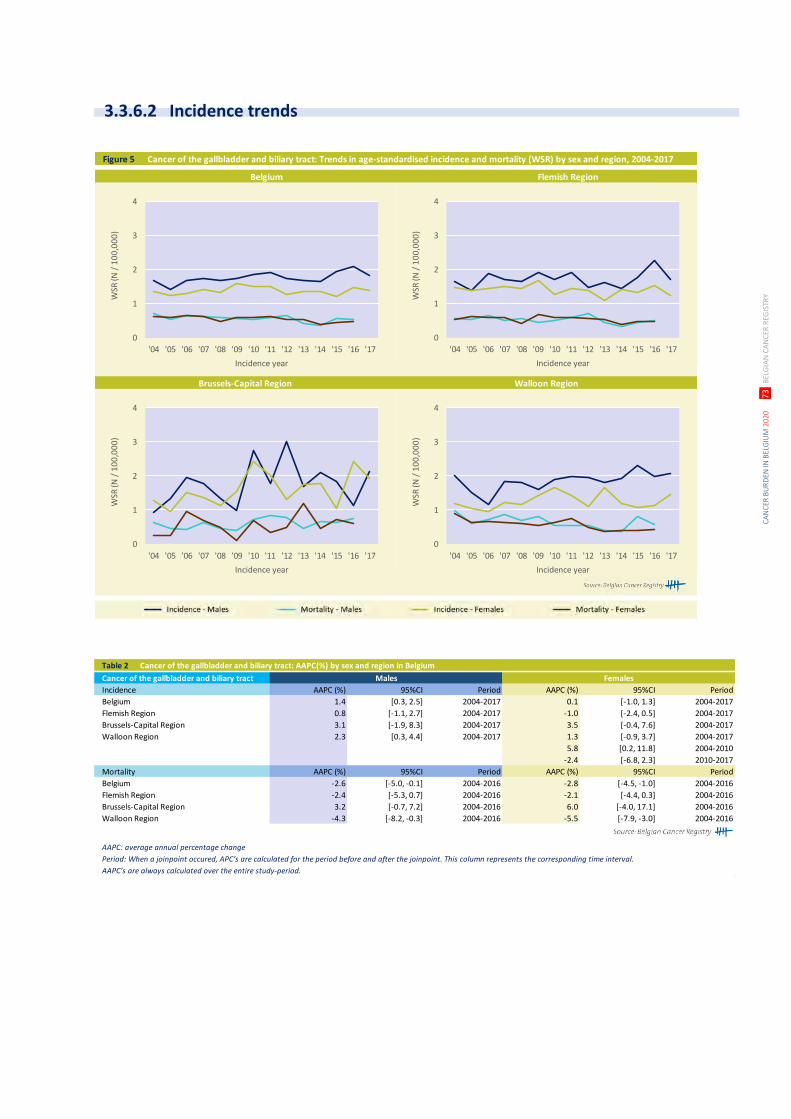
CA
NC
ER B
UR
DEN
IN B
ELG
IUM
202
0
73
BEL
GIA
N C
AN
CER
REG
ISTR
Y
Figure 5 Cancer of the gallbladder and biliary tract: Trends in age-standardised incidence and mortality (WSR) by sex and region, 2004-2017
Brussels-Capital Region Walloon Region
Belgium Flemish Region
0
1
2
3
4
'04 '05 '06 '07 '08 '09 '10 '11 '12 '13 '14 '15 '16 '17
WSR
(N /
10
0,0
00
)
Incidence year
0
1
2
3
4
'04 '05 '06 '07 '08 '09 '10 '11 '12 '13 '14 '15 '16 '17
WSR
(N /
10
0,0
00
)
Incidence year
0
1
2
3
4
'04 '05 '06 '07 '08 '09 '10 '11 '12 '13 '14 '15 '16 '17
WSR
(N /
10
0,0
00
)
Incidence year
0
1
2
3
4
'04 '05 '06 '07 '08 '09 '10 '11 '12 '13 '14 '15 '16 '17
WSR
(N /
10
0,0
00
)
Incidence year
Table 2 Cancer of the gallbladder and biliary tract: AAPC(%) by sex and region in Belgium
Cancer of the gallbladder and biliary tract Males Females
Incidence AAPC (%) 95%CI Period AAPC (%) 95%CI Period
Belgium 1.4 [0.3, 2.5] 2004-2017 0.1 [-1.0, 1.3] 2004-2017
Flemish Region 0.8 [-1.1, 2.7] 2004-2017 -1.0 [-2.4, 0.5] 2004-2017
Brussels-Capital Region 3.1 [-1.9, 8.3] 2004-2017 3.5 [-0.4, 7.6] 2004-2017
Walloon Region 2.3 [0.3, 4.4] 2004-2017 1.3 [-0.9, 3.7] 2004-2017
5.8 [0.2, 11.8] 2004-2010
-2.4 [-6.8, 2.3] 2010-2017
Mortality AAPC (%) 95%CI Period AAPC (%) 95%CI Period
Belgium -2.6 [-5.0, -0.1] 2004-2016 -2.8 [-4.5, -1.0] 2004-2016
Flemish Region -2.4 [-5.3, 0.7] 2004-2016 -2.1 [-4.4, 0.3] 2004-2016
Brussels-Capital Region 3.2 [-0.7, 7.2] 2004-2016 6.0 [-4.0, 17.1] 2004-2016
Walloon Region -4.3 [-8.2, -0.3] 2004-2016 -5.5 [-7.9, -3.0] 2004-2016
AAPC: average annual percentage change
Period: When a joinpoint occured, APC’s are calculated for the period before and after the joinpoint. This column represents the corresponding time interval.
AAPC’s are always calculated over the entire study-period.
3.3.6.2 Incidence trends
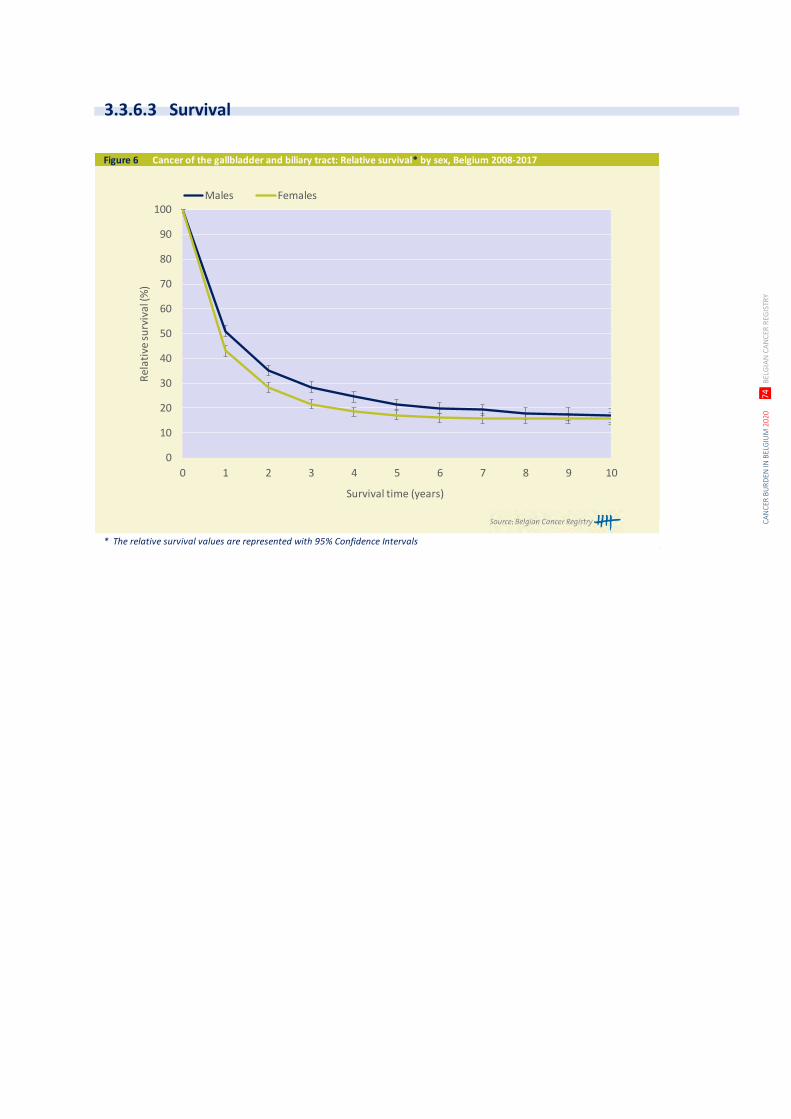
CA
NC
ER B
UR
DEN
IN B
ELG
IUM
202
0
74
BEL
GIA
N C
AN
CER
REG
ISTR
Y
Figure 6 Cancer of the gallbladder and biliary tract: Relative survival* by sex, Belgium 2008-2017
* The relative survival values are represented with 95% Confidence Intervals
0
10
20
30
40
50
60
70
80
90
100
0 1 2 3 4 5 6 7 8 9 10
Rel
ativ
e su
rviv
al (%
)
Survival time (years)
Males Females
3.3.6.3 Survival
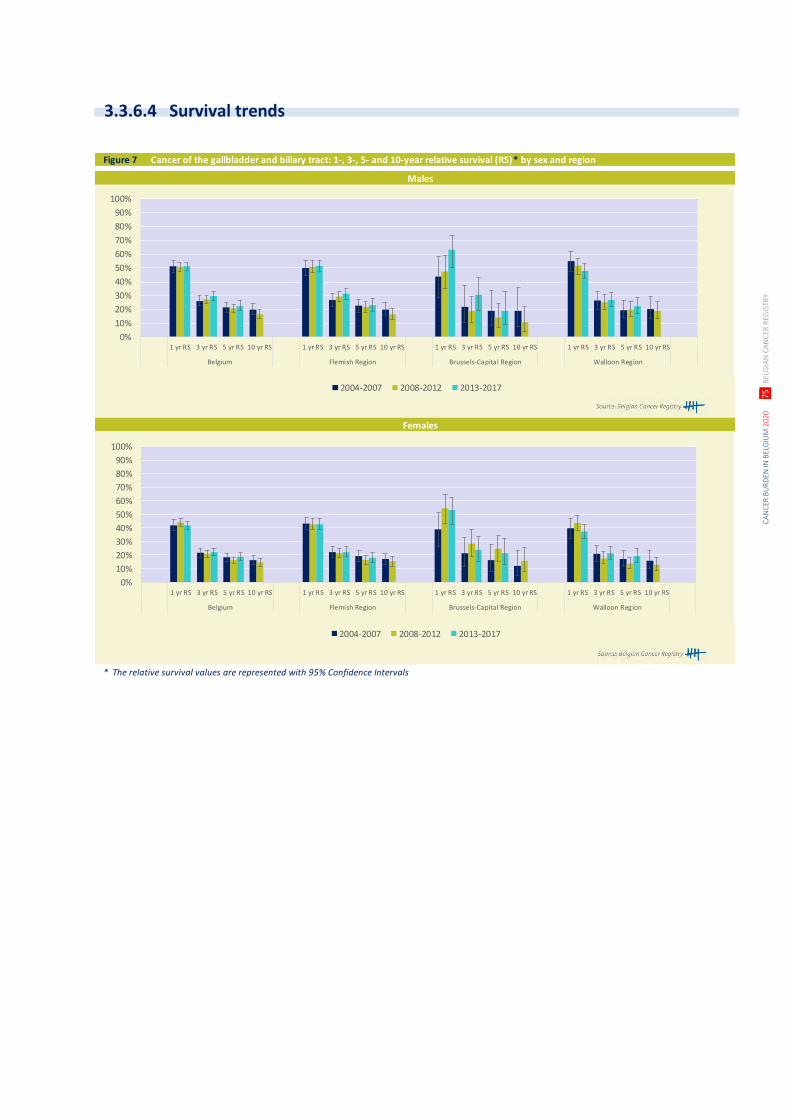
CA
NC
ER B
UR
DEN
IN B
ELG
IUM
202
0
75
BEL
GIA
N C
AN
CER
REG
ISTR
Y
Figure 7 Cancer of the gallbladder and biliary tract: 1-, 3-, 5- and 10-year relative survival (RS)* by sex and region
* The relative survival values are represented with 95% Confidence Intervals
Males
Females
0%
10%
20%
30%
40%
50%
60%
70%
80%
90%
100%
1 yr RS 3 yr RS 5 yr RS 10 yr RS 1 yr RS 3 yr RS 5 yr RS 10 yr RS 1 yr RS 3 yr RS 5 yr RS 10 yr RS 1 yr RS 3 yr RS 5 yr RS 10 yr RS
Belgium Flemish Region Brussels-Capital Region Walloon Region
2004-2007 2008-2012 2013-2017
0%
10%
20%
30%
40%
50%
60%
70%
80%
90%
100%
1 yr RS 3 yr RS 5 yr RS 10 yr RS 1 yr RS 3 yr RS 5 yr RS 10 yr RS 1 yr RS 3 yr RS 5 yr RS 10 yr RS 1 yr RS 3 yr RS 5 yr RS 10 yr RS
Belgium Flemish Region Brussels-Capital Region Walloon Region
2004-2007 2008-2012 2013-2017
3.3.6.4 Survival trends

CA
NC
ER B
UR
DEN
IN B
ELG
IUM
202
0
76
BEL
GIA
N C
AN
CER
REG
ISTR
Y
Table 1 Pancreatic cancer: Overview of incidence, mortality, prevalence and survival by sex and region
Pancreatic cancer Males Females
Incidence, 2017 N CR WSR N CR WSR
Belgium 971 17.4 8.6 884 15.4 6.3
Flemish Region 563 17.5 8.0 504 15.3 5.9
Brussels-Capital Region 81 13.9 9.7 83 13.6 7.7
Walloon Region 327 18.5 9.5 297 16.1 6.7
Mortality, 2016 N CR WSR N CR WSR
Belgium 856 15.5 7.1 855 14.9 5.3
Flemish Region 486 15.2 6.3 506 15.4 5.3
Brussels-Capital Region 73 12.6 8.7 70 11.5 5.1
Walloon Region 297 16.9 8.4 279 15.1 5.6
Prevalence (5 years), 2013-2017 N CR WSR N CR WSR
Belgium 1,171 20.9 10.8 1,149 19.9 9.8
Flemish Region 721 22.2 10.7 682 20.6 9.6
Brussels-Capital Region 80 13.6 10.4 94 15.4 10.0
Walloon Region 370 20.9 11.2 373 20.1 10.1
5-year Relative survival, 2013-2017 N at risk % 95%CI N at risk % 95%CI
Belgium 4,449 10.7 [9.6;11.9] 4,304 11.5 [10.4;12.7]
Flemish Region 2,588 12.2 [10.7;13.9] 2,459 12.0 [10.5;13.6]
Brussels-Capital Region 355 7.4 [4.6;11.2] 383 10.2 [6.9;14.3]
Walloon Region 1,506 8.9 [7.1;11.0] 1,462 11.0 [9.1;13.1]
10-year Relative survival, 2008-2017 N at risk % 95%CI N at risk % 95%CI
Belgium 8,086 8.6 [7.7;9.7] 7,760 8.5 [7.6;9.5]
Flemish Region 4,672 9.2 [7.8;10.6] 4,414 8.9 [7.6;10.3]
Brussels-Capital Region 679 5.5 [3.5;8.3] 705 9.8 [7.3;12.8]
Walloon Region 2,735 8.5 [6.9;10.4] 2,641 7.8 [6.4;9.4]
CR: crude (all ages) rate (N/100,000 person years)
WSR: age-standardised rate using the World Standard Population (N/100,000 person years)
Figure 1 Pancreatic cancer: Age-specific incidence rates (N/100,000) by sex, Belgium 2013-2017
0
10
20
30
40
50
60
70
80
90
100
0- 5- 10- 15- 20- 25- 30- 35- 40- 45- 50- 55- 60- 65- 70- 75- 80- 85+
Age
-sp
ecif
ic in
cid
ence
(N /
100
,000
)
Age group
Males Females
3.3.7 PANCREAS (ICD-10: C25)
3.3.7.1 Incidence
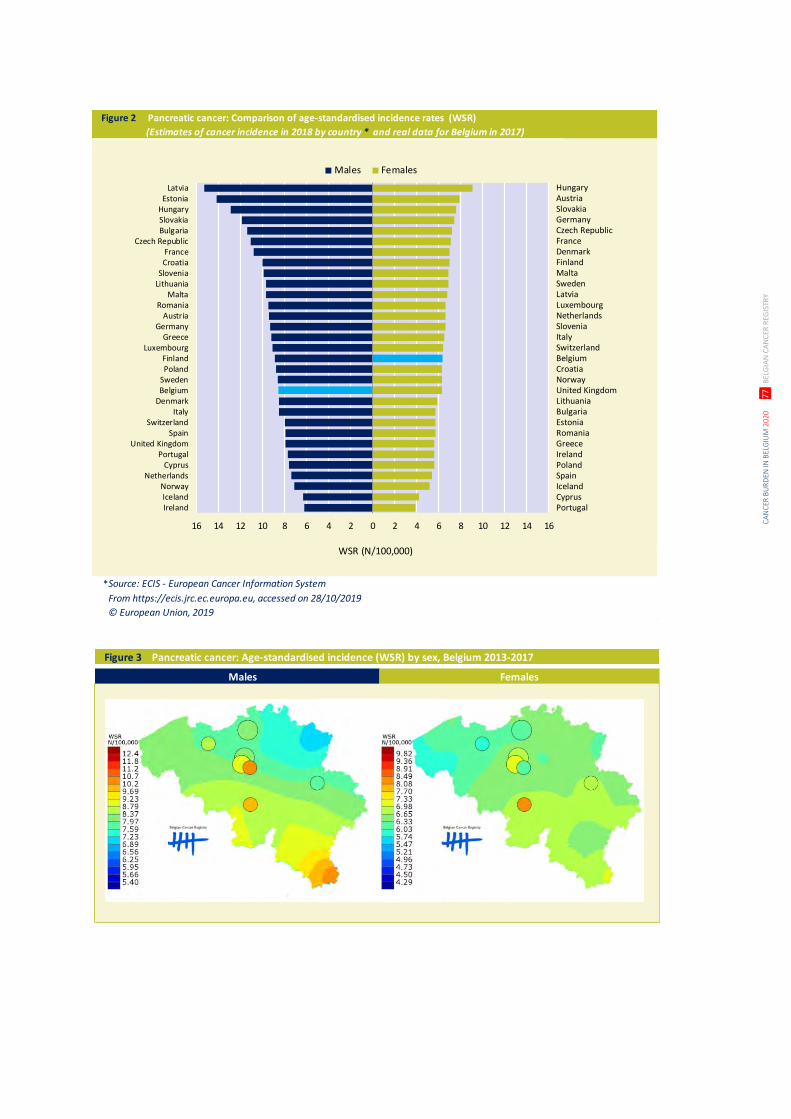
CA
NC
ER B
UR
DEN
IN B
ELG
IUM
202
0
77
BEL
GIA
N C
AN
CER
REG
ISTR
Y
Figure 2 Pancreatic cancer: Comparison of age-standardised incidence rates (WSR)
(Estimates of cancer incidence in 2018 by country * and real data for Belgium in 2017)
Source: ECIS - European Cancer Information System
From https://ecis.jrc.ec.europa.eu, accessed on 28/10/2019
© European Union, 2019
16 14 12 10 8 6 4 2 0 2 4 6 8 10 12 14 16
LatviaEstonia
HungarySlovakiaBulgaria
Czech RepublicFranceCroatia
SloveniaLithuania
MaltaRomania
AustriaGermany
GreeceLuxembourg
FinlandPoland
SwedenBelgium
DenmarkItaly
SwitzerlandSpain
United KingdomPortugal
CyprusNetherlands
NorwayIcelandIreland
Males Females
WSR (N/100,000)
*
HungaryAustriaSlovakiaGermanyCzech RepublicFranceDenmarkFinlandMaltaSwedenLatviaLuxembourgNetherlandsSloveniaItalySwitzerlandBelgiumCroatiaNorwayUnited KingdomLithuaniaBulgariaEstoniaRomaniaGreeceIrelandPolandSpainIcelandCyprusPortugal
Figure 3 Pancreatic cancer: Age-standardised incidence (WSR) by sex, Belgium 2013-2017
Males Females
00
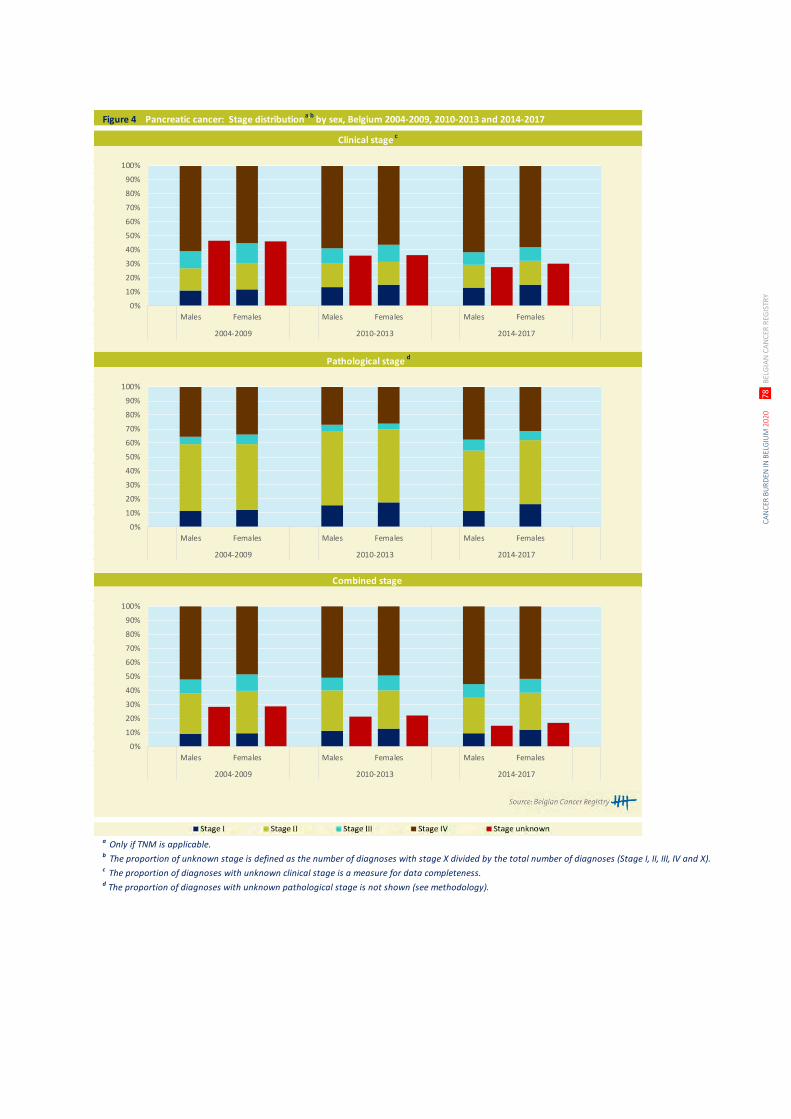
CA
NC
ER B
UR
DEN
IN B
ELG
IUM
202
0
78
BEL
GIA
N C
AN
CER
REG
ISTR
Y
Figure 4 Pancreatic cancer: Stage distributiona,b
by sex, Belgium 2004-2009, 2010-2013 and 2014-2017
a Only if TNM is applicable. b The proportion of unknown stage is defined as the number of diagnoses with stage X divided by the total number of diagnoses (Stage I, II, III, IV and X).c The proportion of diagnoses with unknown clinical stage is a measure for data completeness.d The proportion of diagnoses with unknown pathological stage is not shown (see methodology).
Clinical stage c
Pathological stage d
Combined stage
0%
10%
20%
30%
40%
50%
60%
70%
80%
90%
100%
Males Females Males Females Males Females
2004-2009 2010-2013 2014-2017
0%
10%
20%
30%
40%
50%
60%
70%
80%
90%
100%
Males Females Males Females Males Females
2004-2009 2010-2013 2014-2017
0%
10%
20%
30%
40%
50%
60%
70%
80%
90%
100%
Males Females Males Females Males Females
2004-2009 2010-2013 2014-2017
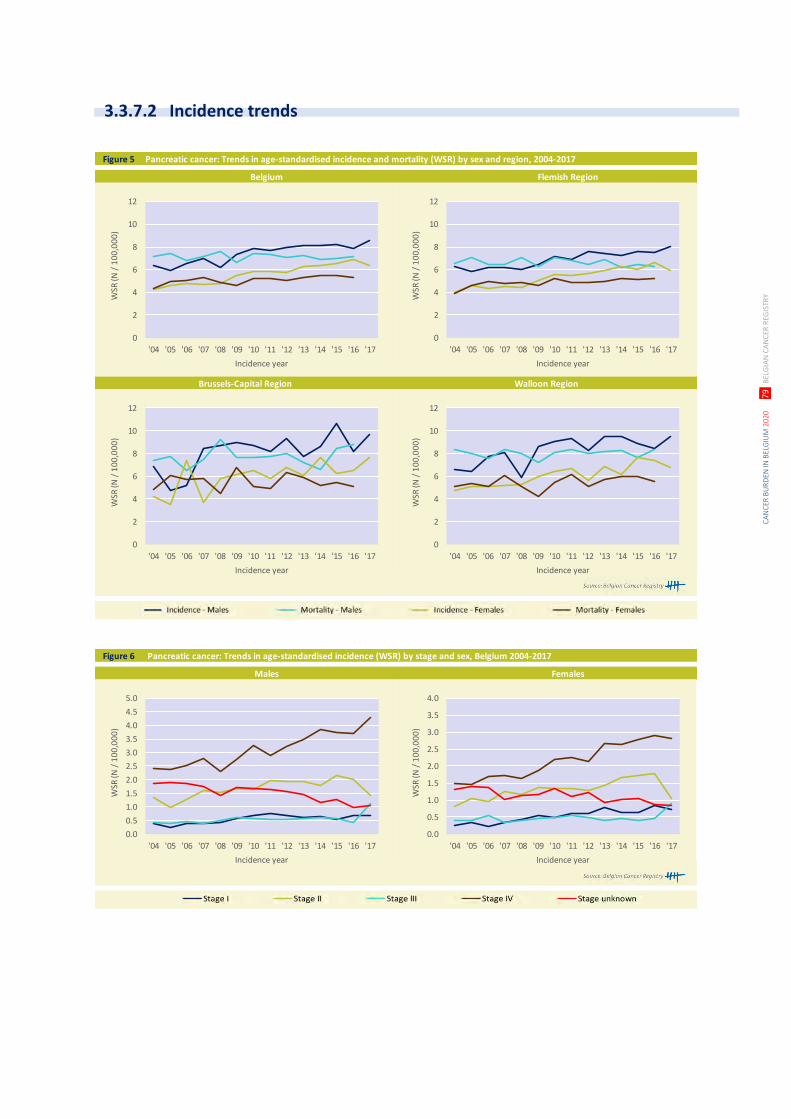
CA
NC
ER B
UR
DEN
IN B
ELG
IUM
202
0
79
BEL
GIA
N C
AN
CER
REG
ISTR
Y
Figure 5 Pancreatic cancer: Trends in age-standardised incidence and mortality (WSR) by sex and region, 2004-2017
Brussels-Capital Region Walloon Region
Belgium Flemish Region
0
2
4
6
8
10
12
'04 '05 '06 '07 '08 '09 '10 '11 '12 '13 '14 '15 '16 '17
WSR
(N /
10
0,0
00
)
Incidence year
0
2
4
6
8
10
12
'04 '05 '06 '07 '08 '09 '10 '11 '12 '13 '14 '15 '16 '17
WSR
(N /
10
0,0
00
)
Incidence year
0
2
4
6
8
10
12
'04 '05 '06 '07 '08 '09 '10 '11 '12 '13 '14 '15 '16 '17
WSR
(N /
10
0,0
00
)
Incidence year
0
2
4
6
8
10
12
'04 '05 '06 '07 '08 '09 '10 '11 '12 '13 '14 '15 '16 '17
WSR
(N /
10
0,0
00
)
Incidence year
Figure 6 Pancreatic cancer: Trends in age-standardised incidence (WSR) by stage and sex, Belgium 2004-2017
Males Females
0.0
0.5
1.0
1.5
2.0
2.5
3.0
3.5
4.0
4.5
5.0
'04 '05 '06 '07 '08 '09 '10 '11 '12 '13 '14 '15 '16 '17
WSR
(N /
10
0,0
00
)
Incidence year
0.0
0.5
1.0
1.5
2.0
2.5
3.0
3.5
4.0
'04 '05 '06 '07 '08 '09 '10 '11 '12 '13 '14 '15 '16 '17
WSR
(N /
10
0,0
00
)
Incidence year
3.3.7.2 Incidence trends
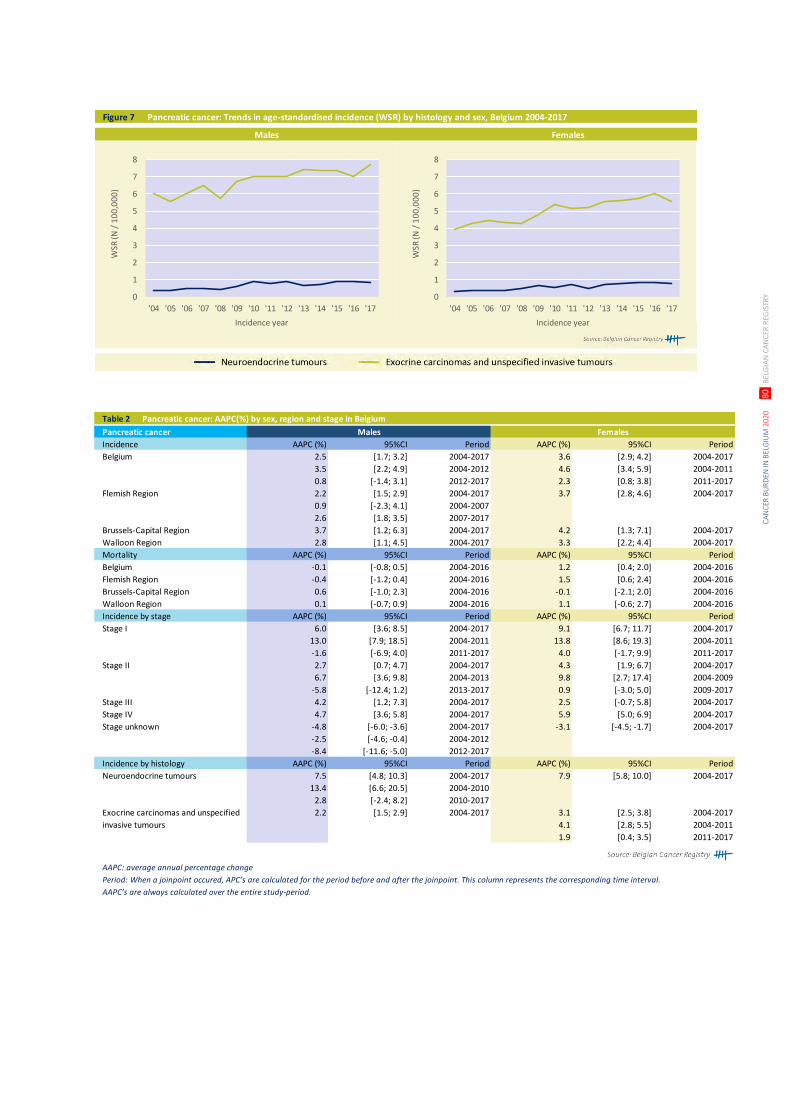
CA
NC
ER B
UR
DEN
IN B
ELG
IUM
202
0
80
BEL
GIA
N C
AN
CER
REG
ISTR
Y
Figure 7 Pancreatic cancer: Trends in age-standardised incidence (WSR) by histology and sex, Belgium 2004-2017
Males Females
0
1
2
3
4
5
6
7
8
'04 '05 '06 '07 '08 '09 '10 '11 '12 '13 '14 '15 '16 '17
WSR
(N /
10
0,0
00
)
Incidence year
0
1
2
3
4
5
6
7
8
'04 '05 '06 '07 '08 '09 '10 '11 '12 '13 '14 '15 '16 '17
WSR
(N /
10
0,0
00
)
Incidence year
Table 2 Pancreatic cancer: AAPC(%) by sex, region and stage in Belgium
Pancreatic cancer Males Females
Incidence AAPC (%) 95%CI Period AAPC (%) 95%CI Period
Belgium 2.5 [1.7; 3.2] 2004-2017 3.6 [2.9; 4.2] 2004-2017
3.5 [2.2; 4.9] 2004-2012 4.6 [3.4; 5.9] 2004-2011
0.8 [-1.4; 3.1] 2012-2017 2.3 [0.8; 3.8] 2011-2017
Flemish Region 2.2 [1.5; 2.9] 2004-2017 3.7 [2.8; 4.6] 2004-2017
0.9 [-2.3; 4.1] 2004-2007
2.6 [1.8; 3.5] 2007-2017
Brussels-Capital Region 3.7 [1.2; 6.3] 2004-2017 4.2 [1.3; 7.1] 2004-2017
Walloon Region 2.8 [1.1; 4.5] 2004-2017 3.3 [2.2; 4.4] 2004-2017
Mortality AAPC (%) 95%CI Period AAPC (%) 95%CI Period
Belgium -0.1 [-0.8; 0.5] 2004-2016 1.2 [0.4; 2.0] 2004-2016
Flemish Region -0.4 [-1.2; 0.4] 2004-2016 1.5 [0.6; 2.4] 2004-2016
Brussels-Capital Region 0.6 [-1.0; 2.3] 2004-2016 -0.1 [-2.1; 2.0] 2004-2016
Walloon Region 0.1 [-0.7; 0.9] 2004-2016 1.1 [-0.6; 2.7] 2004-2016
Incidence by stage AAPC (%) 95%CI Period AAPC (%) 95%CI Period
Stage I 6.0 [3.6; 8.5] 2004-2017 9.1 [6.7; 11.7] 2004-2017
13.0 [7.9; 18.5] 2004-2011 13.8 [8.6; 19.3] 2004-2011
-1.6 [-6.9; 4.0] 2011-2017 4.0 [-1.7; 9.9] 2011-2017
Stage II 2.7 [0.7; 4.7] 2004-2017 4.3 [1.9; 6.7] 2004-2017
6.7 [3.6; 9.8] 2004-2013 9.8 [2.7; 17.4] 2004-2009
-5.8 [-12.4; 1.2] 2013-2017 0.9 [-3.0; 5.0] 2009-2017
Stage III 4.2 [1.2; 7.3] 2004-2017 2.5 [-0.7; 5.8] 2004-2017
Stage IV 4.7 [3.6; 5.8] 2004-2017 5.9 [5.0; 6.9] 2004-2017
Stage unknown -4.8 [-6.0; -3.6] 2004-2017 -3.1 [-4.5; -1.7] 2004-2017
-2.5 [-4.6; -0.4] 2004-2012
-8.4 [-11.6; -5.0] 2012-2017
Incidence by histology AAPC (%) 95%CI Period AAPC (%) 95%CI Period
Neuroendocrine tumours 7.5 [4.8; 10.3] 2004-2017 7.9 [5.8; 10.0] 2004-2017
13.4 [6.6; 20.5] 2004-2010
2.8 [-2.4; 8.2] 2010-2017
Exocrine carcinomas and unspecified 2.2 [1.5; 2.9] 2004-2017 3.1 [2.5; 3.8] 2004-2017
invasive tumours 4.1 [2.8; 5.5] 2004-2011
1.9 [0.4; 3.5] 2011-2017
AAPC: average annual percentage change
Period: When a joinpoint occured, APC’s are calculated for the period before and after the joinpoint. This column represents the corresponding time interval.
AAPC’s are always calculated over the entire study-period.
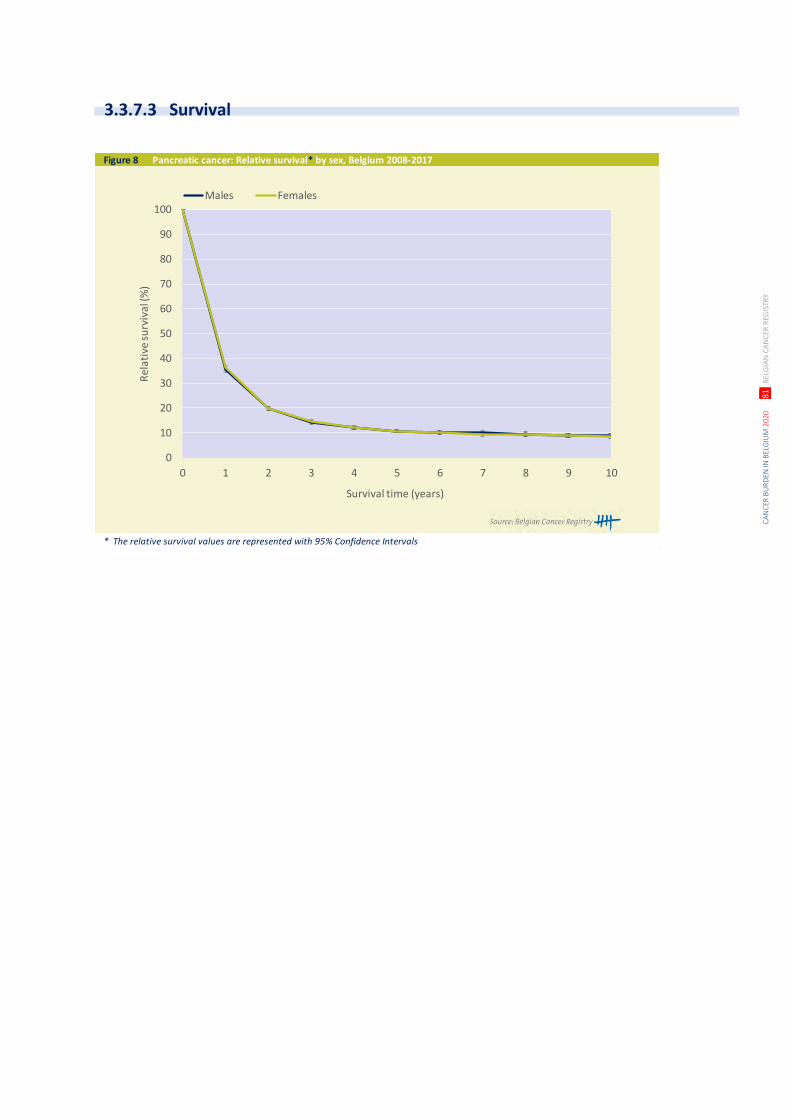
CA
NC
ER B
UR
DEN
IN B
ELG
IUM
202
0
81
BEL
GIA
N C
AN
CER
REG
ISTR
Y
Figure 8 Pancreatic cancer: Relative survival* by sex, Belgium 2008-2017
* The relative survival values are represented with 95% Confidence Intervals
0
10
20
30
40
50
60
70
80
90
100
0 1 2 3 4 5 6 7 8 9 10
Rel
ativ
e su
rviv
al (%
)
Survival time (years)
Males Females
3.3.7.3 Survival
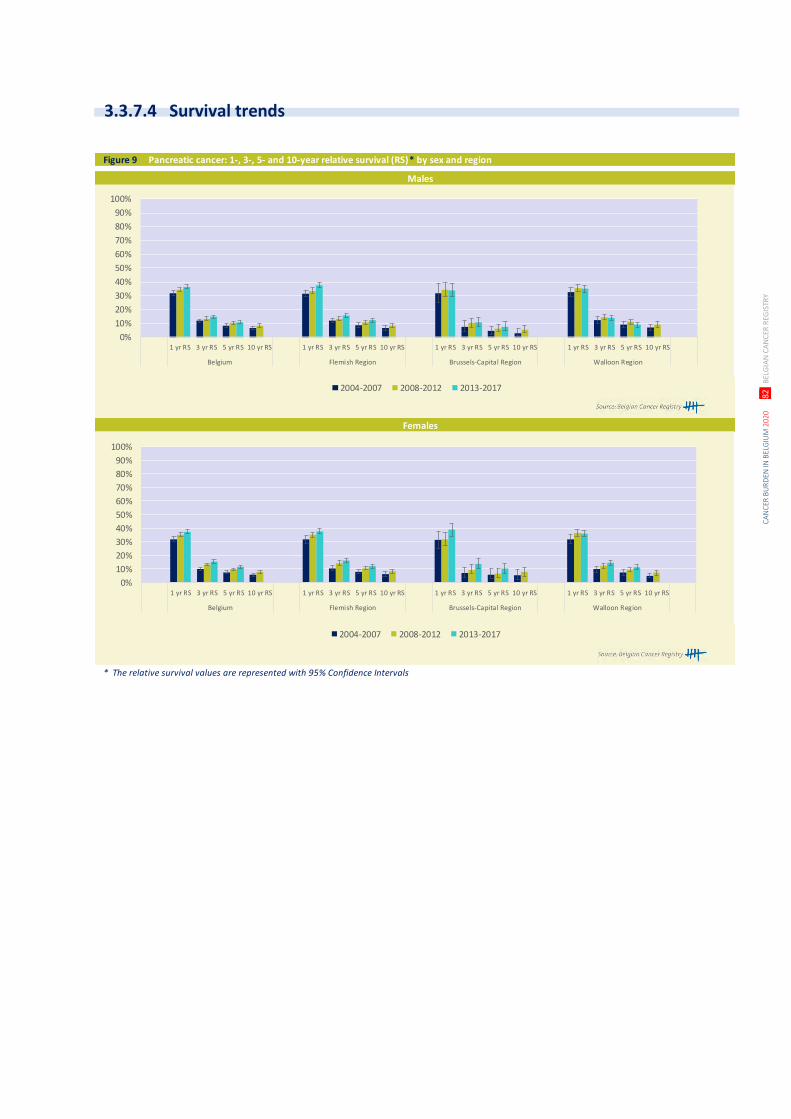
CA
NC
ER B
UR
DEN
IN B
ELG
IUM
202
0
82
BEL
GIA
N C
AN
CER
REG
ISTR
Y
Figure 9 Pancreatic cancer: 1-, 3-, 5- and 10-year relative survival (RS)* by sex and region
* The relative survival values are represented with 95% Confidence Intervals
Males
Females
0%
10%
20%
30%
40%
50%
60%
70%
80%
90%
100%
1 yr RS 3 yr RS 5 yr RS 10 yr RS 1 yr RS 3 yr RS 5 yr RS 10 yr RS 1 yr RS 3 yr RS 5 yr RS 10 yr RS 1 yr RS 3 yr RS 5 yr RS 10 yr RS
Belgium Flemish Region Brussels-Capital Region Walloon Region
2004-2007 2008-2012 2013-2017
0%
10%
20%
30%
40%
50%
60%
70%
80%
90%
100%
1 yr RS 3 yr RS 5 yr RS 10 yr RS 1 yr RS 3 yr RS 5 yr RS 10 yr RS 1 yr RS 3 yr RS 5 yr RS 10 yr RS 1 yr RS 3 yr RS 5 yr RS 10 yr RS
Belgium Flemish Region Brussels-Capital Region Walloon Region
2004-2007 2008-2012 2013-2017
3.3.7.4 Survival trends
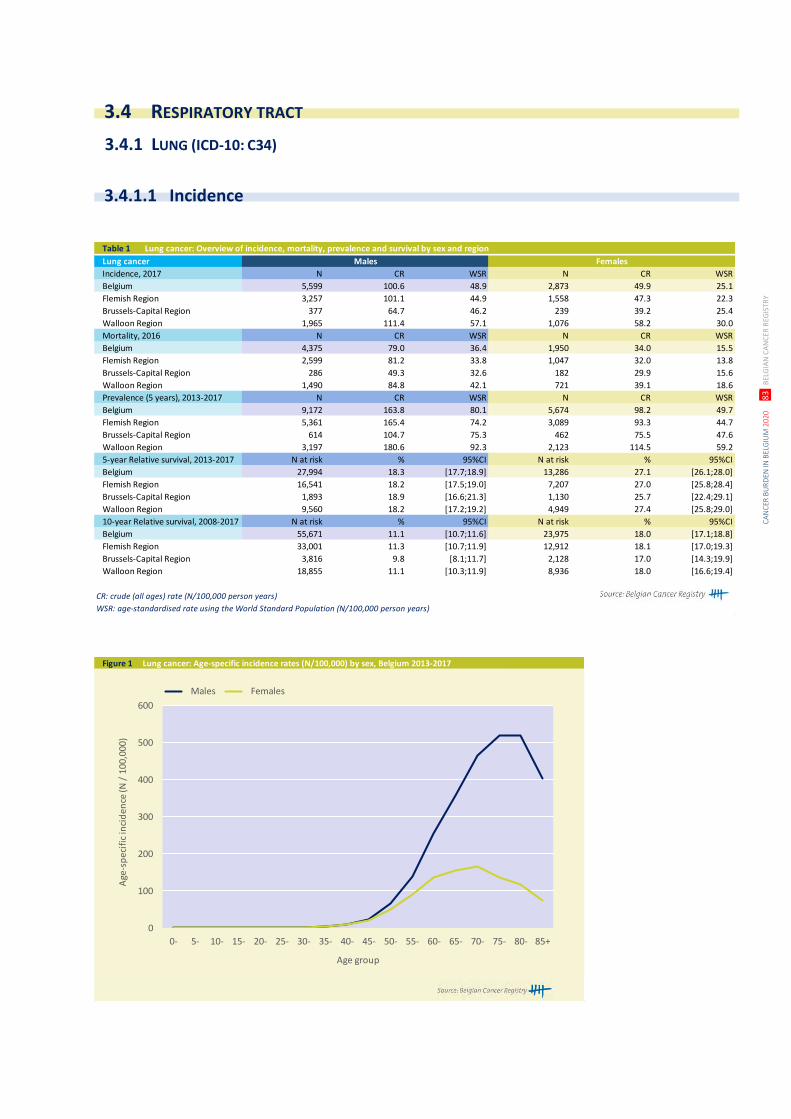
CA
NC
ER B
UR
DEN
IN B
ELG
IUM
202
0
83
BEL
GIA
N C
AN
CER
REG
ISTR
Y
Table 1 Lung cancer: Overview of incidence, mortality, prevalence and survival by sex and region
Lung cancer Males Females
Incidence, 2017 N CR WSR N CR WSR
Belgium 5,599 100.6 48.9 2,873 49.9 25.1
Flemish Region 3,257 101.1 44.9 1,558 47.3 22.3
Brussels-Capital Region 377 64.7 46.2 239 39.2 25.4
Walloon Region 1,965 111.4 57.1 1,076 58.2 30.0
Mortality, 2016 N CR WSR N CR WSR
Belgium 4,375 79.0 36.4 1,950 34.0 15.5
Flemish Region 2,599 81.2 33.8 1,047 32.0 13.8
Brussels-Capital Region 286 49.3 32.6 182 29.9 15.6
Walloon Region 1,490 84.8 42.1 721 39.1 18.6
Prevalence (5 years), 2013-2017 N CR WSR N CR WSR
Belgium 9,172 163.8 80.1 5,674 98.2 49.7
Flemish Region 5,361 165.4 74.2 3,089 93.3 44.7
Brussels-Capital Region 614 104.7 75.3 462 75.5 47.6
Walloon Region 3,197 180.6 92.3 2,123 114.5 59.2
5-year Relative survival, 2013-2017 N at risk % 95%CI N at risk % 95%CI
Belgium 27,994 18.3 [17.7;18.9] 13,286 27.1 [26.1;28.0]
Flemish Region 16,541 18.2 [17.5;19.0] 7,207 27.0 [25.8;28.4]
Brussels-Capital Region 1,893 18.9 [16.6;21.3] 1,130 25.7 [22.4;29.1]
Walloon Region 9,560 18.2 [17.2;19.2] 4,949 27.4 [25.8;29.0]
10-year Relative survival, 2008-2017 N at risk % 95%CI N at risk % 95%CI
Belgium 55,671 11.1 [10.7;11.6] 23,975 18.0 [17.1;18.8]
Flemish Region 33,001 11.3 [10.7;11.9] 12,912 18.1 [17.0;19.3]
Brussels-Capital Region 3,816 9.8 [8.1;11.7] 2,128 17.0 [14.3;19.9]
Walloon Region 18,855 11.1 [10.3;11.9] 8,936 18.0 [16.6;19.4]
CR: crude (all ages) rate (N/100,000 person years)
WSR: age-standardised rate using the World Standard Population (N/100,000 person years)
Figure 1 Lung cancer: Age-specific incidence rates (N/100,000) by sex, Belgium 2013-2017
0
100
200
300
400
500
600
0- 5- 10- 15- 20- 25- 30- 35- 40- 45- 50- 55- 60- 65- 70- 75- 80- 85+
Age
-sp
ecif
ic in
cid
ence
(N /
10
0,0
00
)
Age group
Males Females
3.4.1 LUNG (ICD-10: C34)
3.4.1.1 Incidence
3.4 RESPIRATORY TRACT
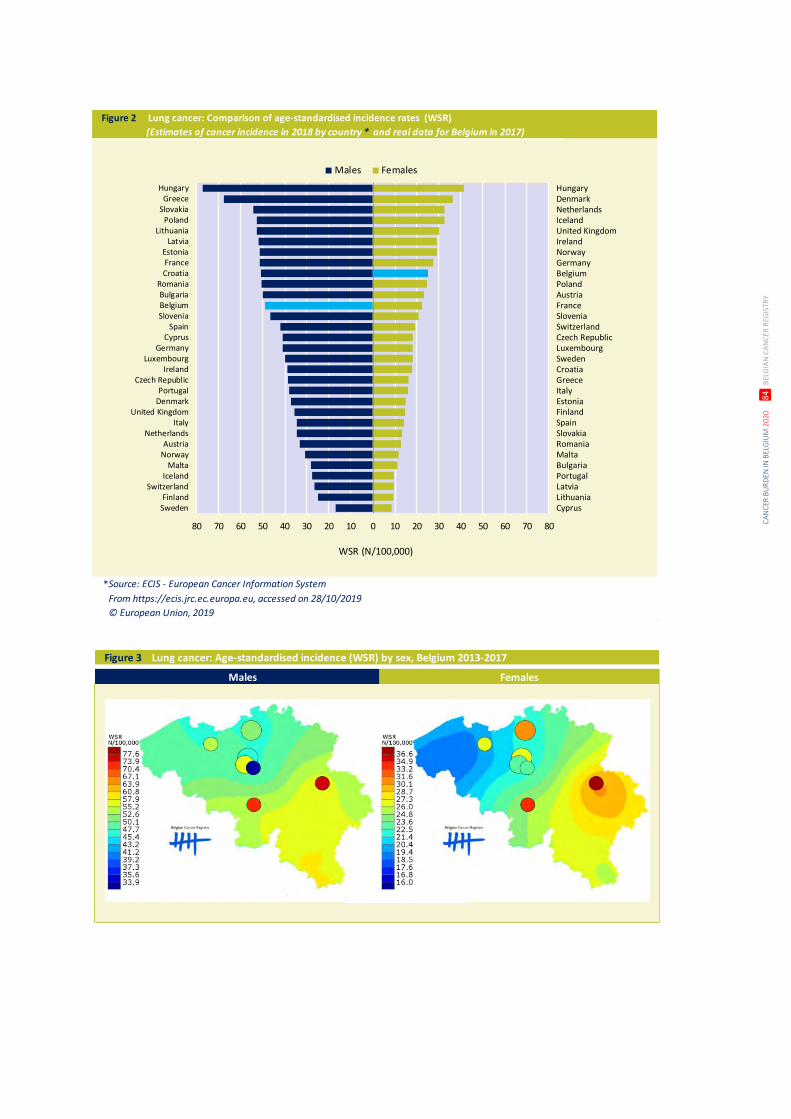
CA
NC
ER B
UR
DEN
IN B
ELG
IUM
202
0
84
BEL
GIA
N C
AN
CER
REG
ISTR
Y
Figure 2 Lung cancer: Comparison of age-standardised incidence rates (WSR)
(Estimates of cancer incidence in 2018 by country * and real data for Belgium in 2017)
Source: ECIS - European Cancer Information System
From https://ecis.jrc.ec.europa.eu, accessed on 28/10/2019
© European Union, 2019
80 70 60 50 40 30 20 10 0 10 20 30 40 50 60 70 80
HungaryGreece
SlovakiaPoland
LithuaniaLatvia
EstoniaFranceCroatia
RomaniaBulgariaBelgiumSlovenia
SpainCyprus
GermanyLuxembourg
IrelandCzech Republic
PortugalDenmark
United KingdomItaly
NetherlandsAustria
NorwayMalta
IcelandSwitzerland
FinlandSweden
Males Females
WSR (N/100,000)
*
HungaryDenmarkNetherlandsIcelandUnited KingdomIrelandNorwayGermanyBelgiumPolandAustriaFranceSloveniaSwitzerlandCzech RepublicLuxembourgSwedenCroatiaGreeceItalyEstoniaFinlandSpainSlovakiaRomaniaMaltaBulgariaPortugalLatviaLithuaniaCyprus
Figure 3 Lung cancer: Age-standardised incidence (WSR) by sex, Belgium 2013-2017
Males Females
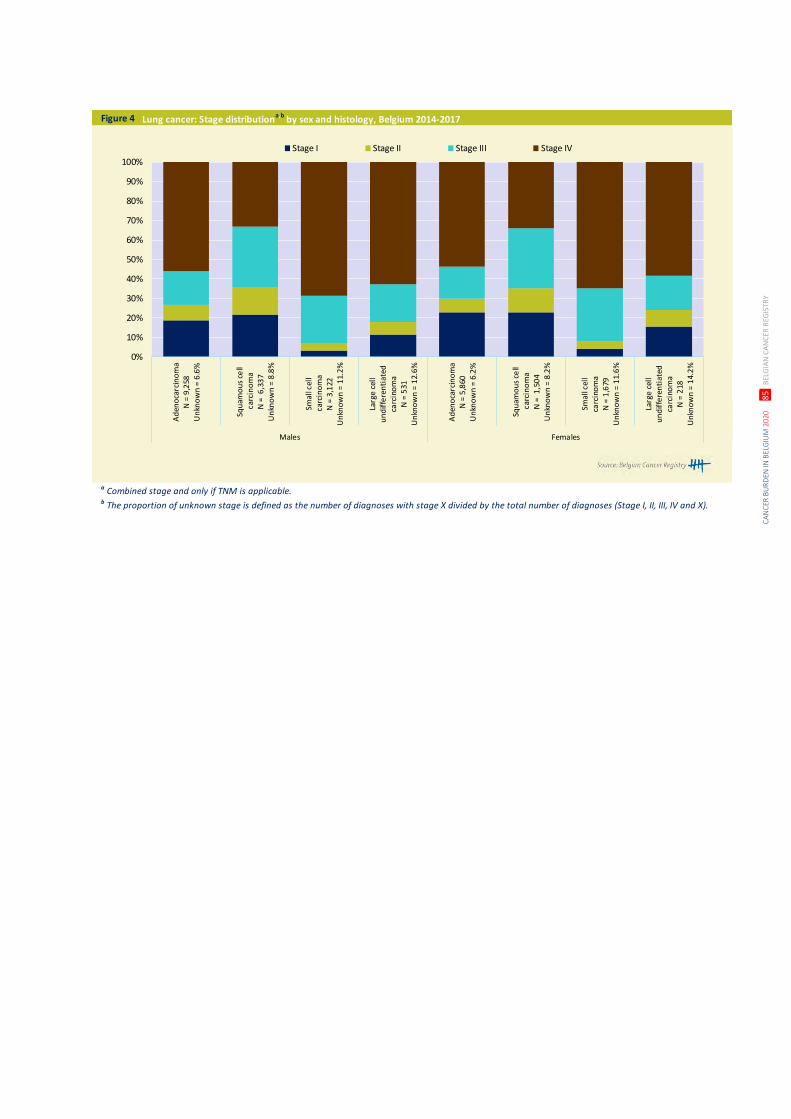
CA
NC
ER B
UR
DEN
IN B
ELG
IUM
202
0
85
BEL
GIA
N C
AN
CER
REG
ISTR
Y
Figure 4 Lung cancer: Stage distributiona,b
by sex and histology, Belgium 2014-2017
a Combined stage and only if TNM is applicable. b The proportion of unknown stage is defined as the number of diagnoses with stage X divided by the total number of diagnoses (Stage I, II, III, IV and X).
0%
10%
20%
30%
40%
50%
60%
70%
80%
90%
100%A
den
oca
rcin
om
aN
= 9
,258
Un
kno
wn
= 6
.6%
Squ
amo
us
cell
car
cin
om
aN
= 6
,33
7U
nkn
ow
n =
8.8
%
Smal
l cel
l c
arci
no
ma
N =
3,1
22U
nkn
ow
n =
11.
2%
Larg
e ce
llu
nd
iffe
ren
tiat
edca
rcin
om
aN
= 5
31U
nkn
ow
n =
12.
6%
Ad
eno
carc
ino
ma
N =
5,8
60U
nkn
ow
n =
6.2
%
Squ
amo
us
cell
car
cin
om
aN
= 1
,50
4U
nkn
ow
n =
8.2
%
Smal
l cel
lca
rcin
om
aN
= 1
,679
Un
kno
wn
= 1
1.6
%
Larg
e ce
llu
nd
iffe
ren
tiat
edca
rcin
om
aN
= 2
18U
nkn
ow
n =
14.
2%
Males Females
Stage I Stage II Stage III Stage IV
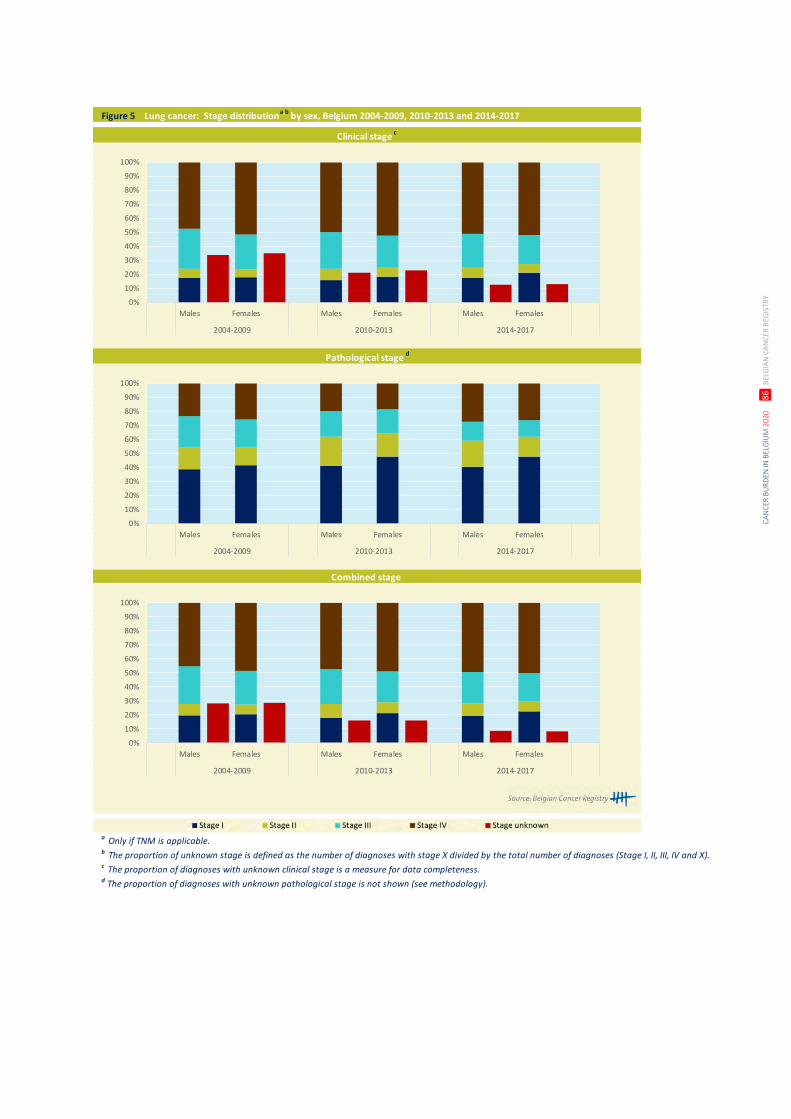
CA
NC
ER B
UR
DEN
IN B
ELG
IUM
202
0
86
BEL
GIA
N C
AN
CER
REG
ISTR
Y
Figure 5 Lung cancer: Stage distributiona,b
by sex, Belgium 2004-2009, 2010-2013 and 2014-2017
a Only if TNM is applicable. b The proportion of unknown stage is defined as the number of diagnoses with stage X divided by the total number of diagnoses (Stage I, II, III, IV and X).c The proportion of diagnoses with unknown clinical stage is a measure for data completeness.d The proportion of diagnoses with unknown pathological stage is not shown (see methodology).
Clinical stage c
Pathological stage d
Combined stage
0%
10%
20%
30%
40%
50%
60%
70%
80%
90%
100%
Males Females Males Females Males Females
2004-2009 2010-2013 2014-2017
0%
10%
20%
30%
40%
50%
60%
70%
80%
90%
100%
Males Females Males Females Males Females
2004-2009 2010-2013 2014-2017
0%
10%
20%
30%
40%
50%
60%
70%
80%
90%
100%
Males Females Males Females Males Females
2004-2009 2010-2013 2014-2017
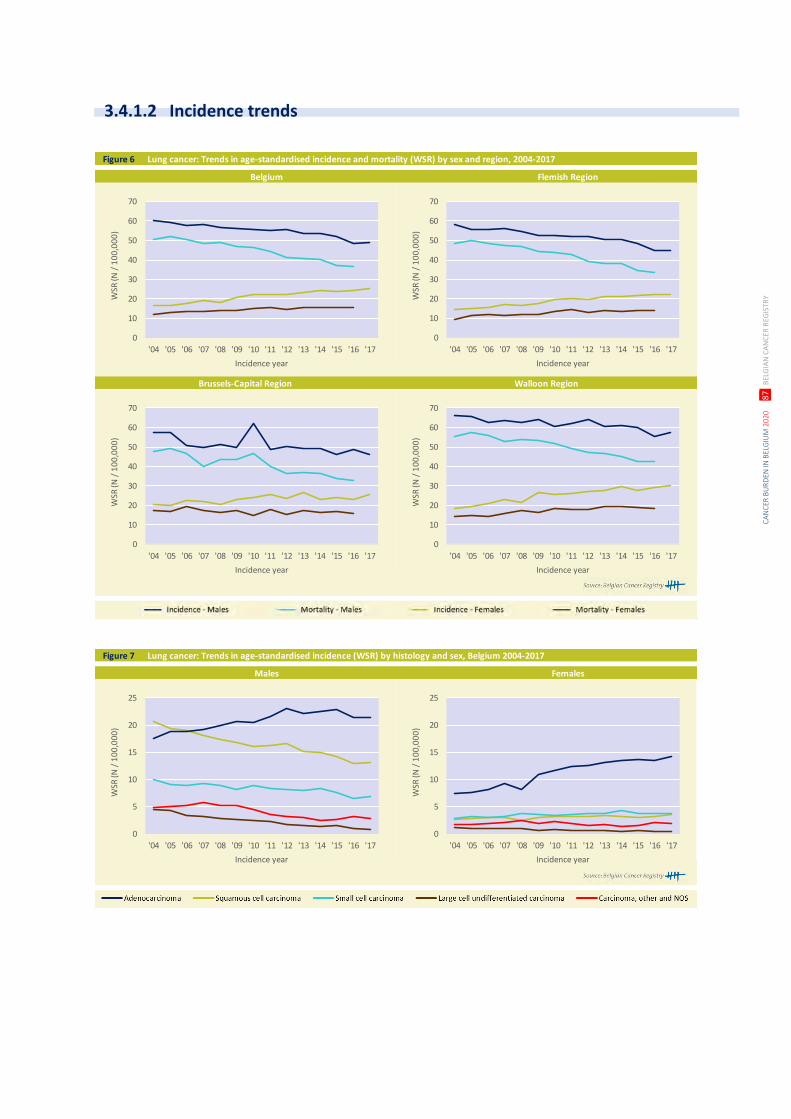
CA
NC
ER B
UR
DEN
IN B
ELG
IUM
202
0
87
BEL
GIA
N C
AN
CER
REG
ISTR
Y
Figure 6 Lung cancer: Trends in age-standardised incidence and mortality (WSR) by sex and region, 2004-2017
Brussels-Capital Region Walloon Region
Belgium Flemish Region
0
10
20
30
40
50
60
70
'04 '05 '06 '07 '08 '09 '10 '11 '12 '13 '14 '15 '16 '17
WSR
(N /
10
0,0
00
)
Incidence year
0
10
20
30
40
50
60
70
'04 '05 '06 '07 '08 '09 '10 '11 '12 '13 '14 '15 '16 '17
WSR
(N /
10
0,0
00
)
Incidence year
0
10
20
30
40
50
60
70
'04 '05 '06 '07 '08 '09 '10 '11 '12 '13 '14 '15 '16 '17
WSR
(N /
10
0,0
00
)
Incidence year
0
10
20
30
40
50
60
70
'04 '05 '06 '07 '08 '09 '10 '11 '12 '13 '14 '15 '16 '17
WSR
(N /
10
0,0
00
)
Incidence year
Figure 7 Lung cancer: Trends in age-standardised incidence (WSR) by histology and sex, Belgium 2004-2017
Males Females
0
5
10
15
20
25
'04 '05 '06 '07 '08 '09 '10 '11 '12 '13 '14 '15 '16 '17
WSR
(N /
10
0,0
00
)
Incidence year
0
5
10
15
20
25
'04 '05 '06 '07 '08 '09 '10 '11 '12 '13 '14 '15 '16 '17
WSR
(N /
10
0,0
00
)
Incidence year
3.4.1.2 Incidence trends
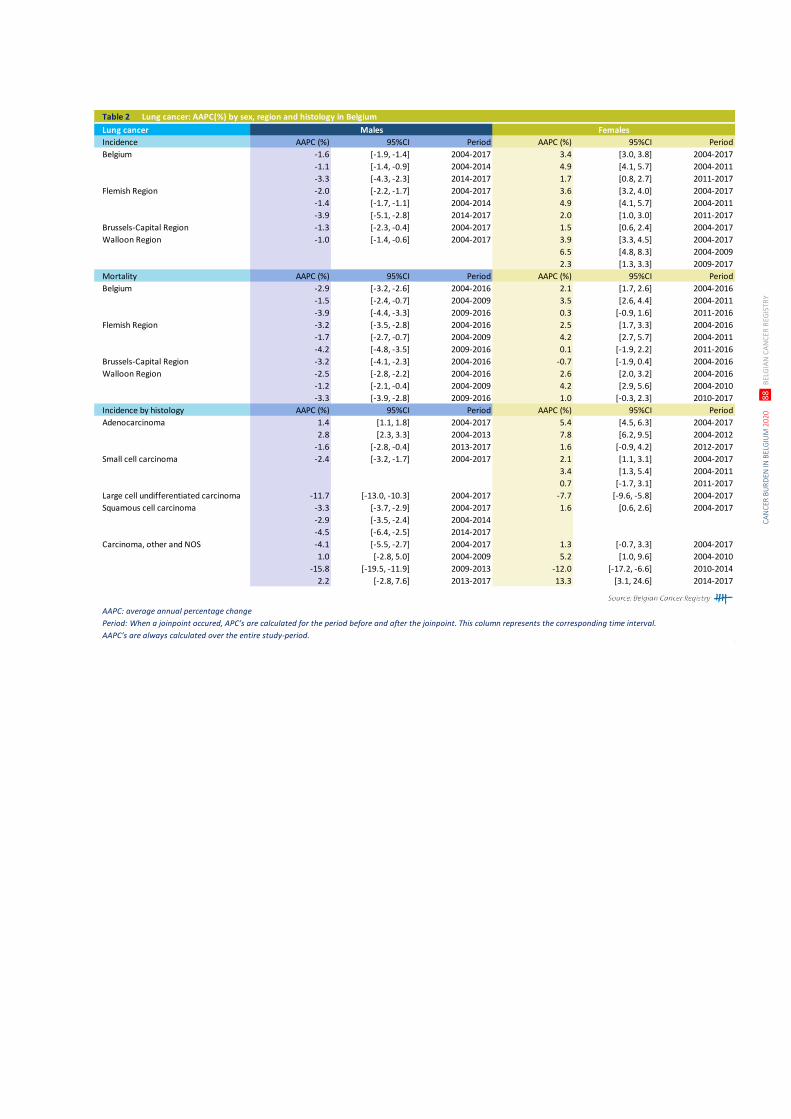
CA
NC
ER B
UR
DEN
IN B
ELG
IUM
202
0
88
BEL
GIA
N C
AN
CER
REG
ISTR
Y
Table 2 Lung cancer: AAPC(%) by sex, region and histology in Belgium
Lung cancer Males Females
Incidence AAPC (%) 95%CI Period AAPC (%) 95%CI Period
Belgium -1.6 [-1.9, -1.4] 2004-2017 3.4 [3.0, 3.8] 2004-2017
-1.1 [-1.4, -0.9] 2004-2014 4.9 [4.1, 5.7] 2004-2011
-3.3 [-4.3, -2.3] 2014-2017 1.7 [0.8, 2.7] 2011-2017
Flemish Region -2.0 [-2.2, -1.7] 2004-2017 3.6 [3.2, 4.0] 2004-2017
-1.4 [-1.7, -1.1] 2004-2014 4.9 [4.1, 5.7] 2004-2011
-3.9 [-5.1, -2.8] 2014-2017 2.0 [1.0, 3.0] 2011-2017
Brussels-Capital Region -1.3 [-2.3, -0.4] 2004-2017 1.5 [0.6, 2.4] 2004-2017
Walloon Region -1.0 [-1.4, -0.6] 2004-2017 3.9 [3.3, 4.5] 2004-2017
6.5 [4.8, 8.3] 2004-2009
2.3 [1.3, 3.3] 2009-2017
Mortality AAPC (%) 95%CI Period AAPC (%) 95%CI Period
Belgium -2.9 [-3.2, -2.6] 2004-2016 2.1 [1.7, 2.6] 2004-2016
-1.5 [-2.4, -0.7] 2004-2009 3.5 [2.6, 4.4] 2004-2011
-3.9 [-4.4, -3.3] 2009-2016 0.3 [-0.9, 1.6] 2011-2016
Flemish Region -3.2 [-3.5, -2.8] 2004-2016 2.5 [1.7, 3.3] 2004-2016
-1.7 [-2.7, -0.7] 2004-2009 4.2 [2.7, 5.7] 2004-2011
-4.2 [-4.8, -3.5] 2009-2016 0.1 [-1.9, 2.2] 2011-2016
Brussels-Capital Region -3.2 [-4.1, -2.3] 2004-2016 -0.7 [-1.9, 0.4] 2004-2016
Walloon Region -2.5 [-2.8, -2.2] 2004-2016 2.6 [2.0, 3.2] 2004-2016
-1.2 [-2.1, -0.4] 2004-2009 4.2 [2.9, 5.6] 2004-2010
-3.3 [-3.9, -2.8] 2009-2016 1.0 [-0.3, 2.3] 2010-2017
Incidence by histology AAPC (%) 95%CI Period AAPC (%) 95%CI Period
Adenocarcinoma 1.4 [1.1, 1.8] 2004-2017 5.4 [4.5, 6.3] 2004-2017
2.8 [2.3, 3.3] 2004-2013 7.8 [6.2, 9.5] 2004-2012
-1.6 [-2.8, -0.4] 2013-2017 1.6 [-0.9, 4.2] 2012-2017
Small cell carcinoma -2.4 [-3.2, -1.7] 2004-2017 2.1 [1.1, 3.1] 2004-2017
3.4 [1.3, 5.4] 2004-2011
0.7 [-1.7, 3.1] 2011-2017
Large cell undifferentiated carcinoma -11.7 [-13.0, -10.3] 2004-2017 -7.7 [-9.6, -5.8] 2004-2017
Squamous cell carcinoma -3.3 [-3.7, -2.9] 2004-2017 1.6 [0.6, 2.6] 2004-2017
-2.9 [-3.5, -2.4] 2004-2014
-4.5 [-6.4, -2.5] 2014-2017
Carcinoma, other and NOS -4.1 [-5.5, -2.7] 2004-2017 1.3 [-0.7, 3.3] 2004-2017
1.0 [-2.8, 5.0] 2004-2009 5.2 [1.0, 9.6] 2004-2010
-15.8 [-19.5, -11.9] 2009-2013 -12.0 [-17.2, -6.6] 2010-2014
2.2 [-2.8, 7.6] 2013-2017 13.3 [3.1, 24.6] 2014-2017
AAPC: average annual percentage change
Period: When a joinpoint occured, APC’s are calculated for the period before and after the joinpoint. This column represents the corresponding time interval.
AAPC’s are always calculated over the entire study-period.
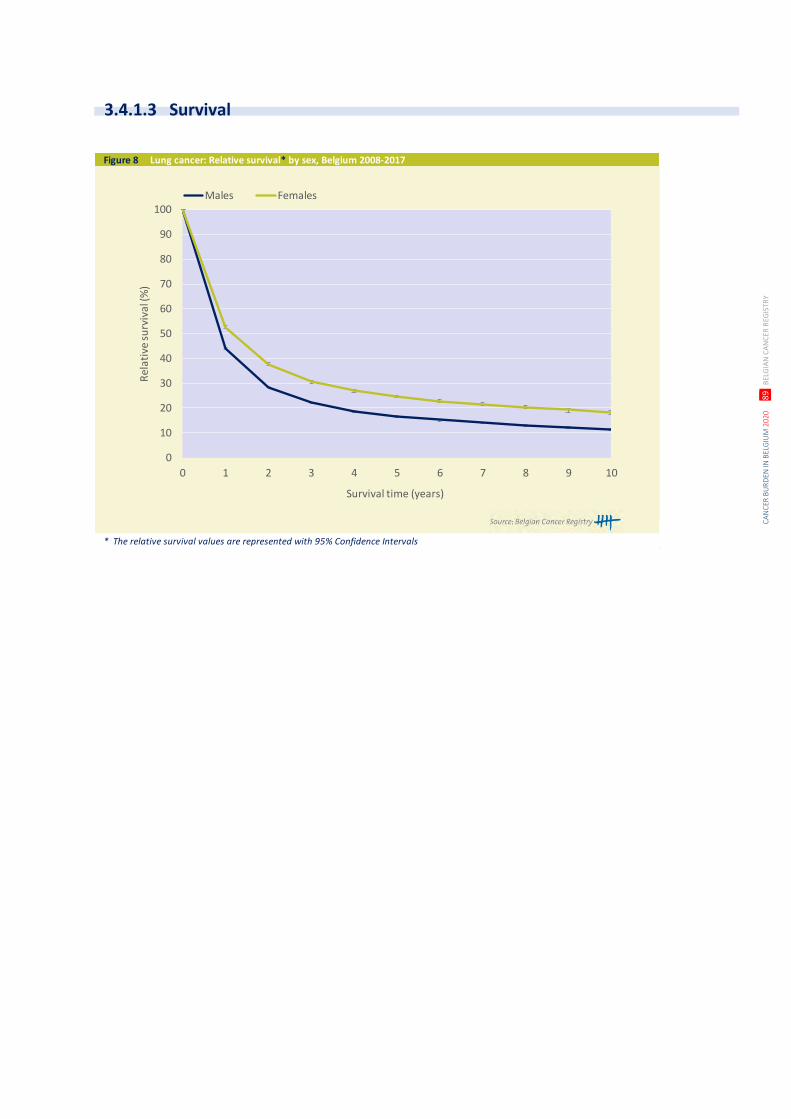
CA
NC
ER B
UR
DEN
IN B
ELG
IUM
202
0
89
BEL
GIA
N C
AN
CER
REG
ISTR
Y
Figure 8 Lung cancer: Relative survival* by sex, Belgium 2008-2017
* The relative survival values are represented with 95% Confidence Intervals
0
10
20
30
40
50
60
70
80
90
100
0 1 2 3 4 5 6 7 8 9 10
Rel
ativ
e su
rviv
al (%
)
Survival time (years)
Males Females
3.4.1.3 Survival
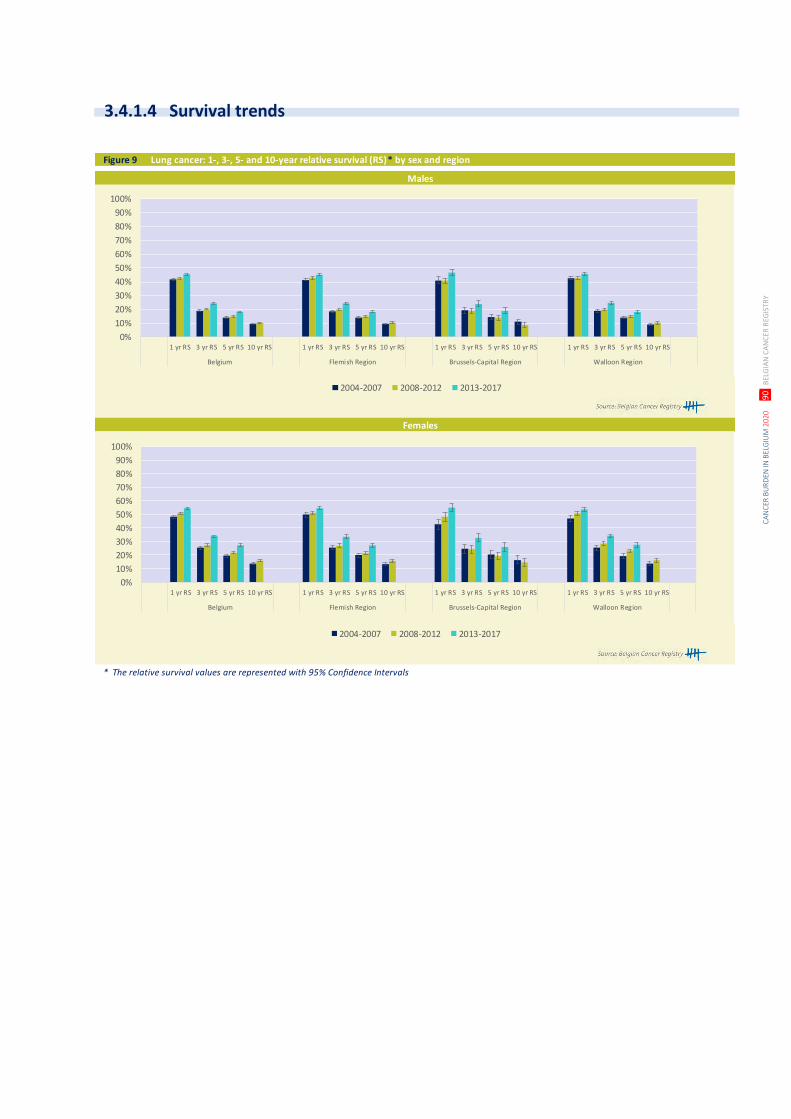
CA
NC
ER B
UR
DEN
IN B
ELG
IUM
202
0
90
BEL
GIA
N C
AN
CER
REG
ISTR
Y
Figure 9 Lung cancer: 1-, 3-, 5- and 10-year relative survival (RS)* by sex and region
* The relative survival values are represented with 95% Confidence Intervals
Males
Females
0%
10%
20%
30%
40%
50%
60%
70%
80%
90%
100%
1 yr RS 3 yr RS 5 yr RS 10 yr RS 1 yr RS 3 yr RS 5 yr RS 10 yr RS 1 yr RS 3 yr RS 5 yr RS 10 yr RS 1 yr RS 3 yr RS 5 yr RS 10 yr RS
Belgium Flemish Region Brussels-Capital Region Walloon Region
2004-2007 2008-2012 2013-2017
0%
10%
20%
30%
40%
50%
60%
70%
80%
90%
100%
1 yr RS 3 yr RS 5 yr RS 10 yr RS 1 yr RS 3 yr RS 5 yr RS 10 yr RS 1 yr RS 3 yr RS 5 yr RS 10 yr RS 1 yr RS 3 yr RS 5 yr RS 10 yr RS
Belgium Flemish Region Brussels-Capital Region Walloon Region
2004-2007 2008-2012 2013-2017
3.4.1.4 Survival trends
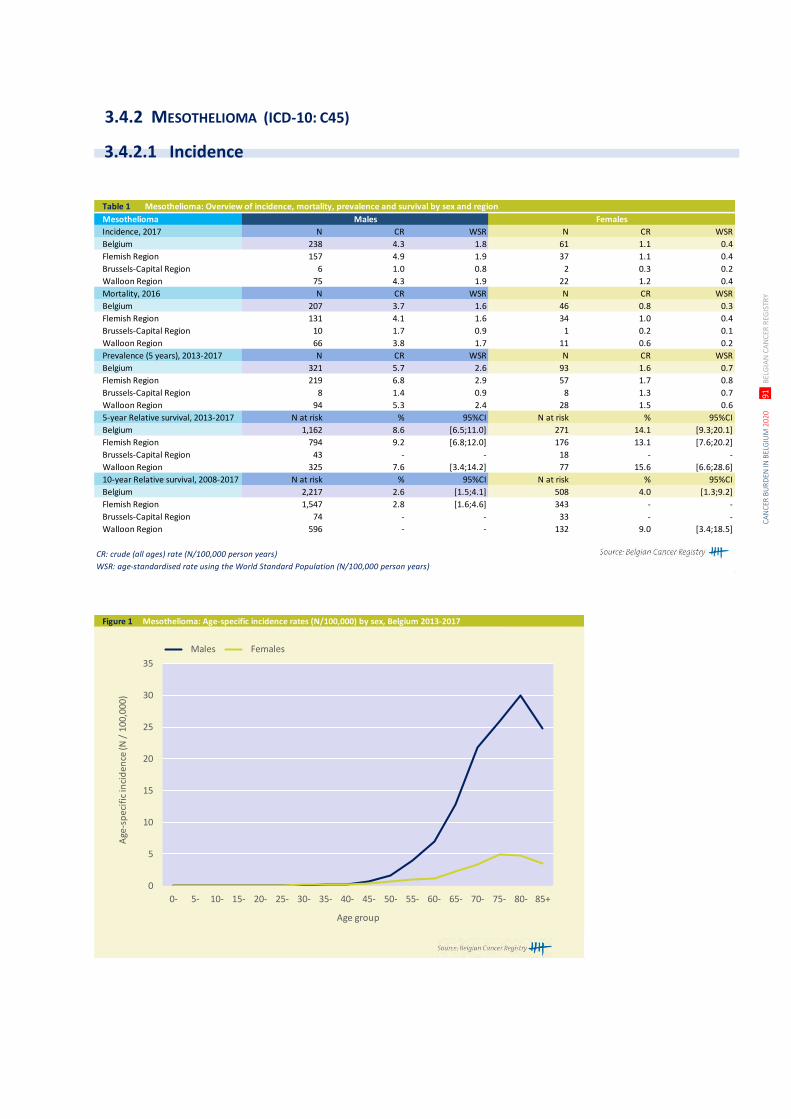
CA
NC
ER B
UR
DEN
IN B
ELG
IUM
202
0
91
BEL
GIA
N C
AN
CER
REG
ISTR
Y
Table 1 Mesothelioma: Overview of incidence, mortality, prevalence and survival by sex and region
Mesothelioma Males Females
Incidence, 2017 N CR WSR N CR WSR
Belgium 238 4.3 1.8 61 1.1 0.4
Flemish Region 157 4.9 1.9 37 1.1 0.4
Brussels-Capital Region 6 1.0 0.8 2 0.3 0.2
Walloon Region 75 4.3 1.9 22 1.2 0.4
Mortality, 2016 N CR WSR N CR WSR
Belgium 207 3.7 1.6 46 0.8 0.3
Flemish Region 131 4.1 1.6 34 1.0 0.4
Brussels-Capital Region 10 1.7 0.9 1 0.2 0.1
Walloon Region 66 3.8 1.7 11 0.6 0.2
Prevalence (5 years), 2013-2017 N CR WSR N CR WSR
Belgium 321 5.7 2.6 93 1.6 0.7
Flemish Region 219 6.8 2.9 57 1.7 0.8
Brussels-Capital Region 8 1.4 0.9 8 1.3 0.7
Walloon Region 94 5.3 2.4 28 1.5 0.6
5-year Relative survival, 2013-2017 N at risk % 95%CI N at risk % 95%CI
Belgium 1,162 8.6 [6.5;11.0] 271 14.1 [9.3;20.1]
Flemish Region 794 9.2 [6.8;12.0] 176 13.1 [7.6;20.2]
Brussels-Capital Region 43 - - 18 - -
Walloon Region 325 7.6 [3.4;14.2] 77 15.6 [6.6;28.6]
10-year Relative survival, 2008-2017 N at risk % 95%CI N at risk % 95%CI
Belgium 2,217 2.6 [1.5;4.1] 508 4.0 [1.3;9.2]
Flemish Region 1,547 2.8 [1.6;4.6] 343 - -
Brussels-Capital Region 74 - - 33 - -
Walloon Region 596 - - 132 9.0 [3.4;18.5]
CR: crude (all ages) rate (N/100,000 person years)
WSR: age-standardised rate using the World Standard Population (N/100,000 person years)
Figure 1 Mesothelioma: Age-specific incidence rates (N/100,000) by sex, Belgium 2013-2017
0
5
10
15
20
25
30
35
0- 5- 10- 15- 20- 25- 30- 35- 40- 45- 50- 55- 60- 65- 70- 75- 80- 85+
Age
-sp
ecif
ic in
cid
ence
(N /
100
,000
)
Age group
Males Females
3.4.2 MESOTHELIOMA (ICD-10: C45)
3.4.2.1 Incidence
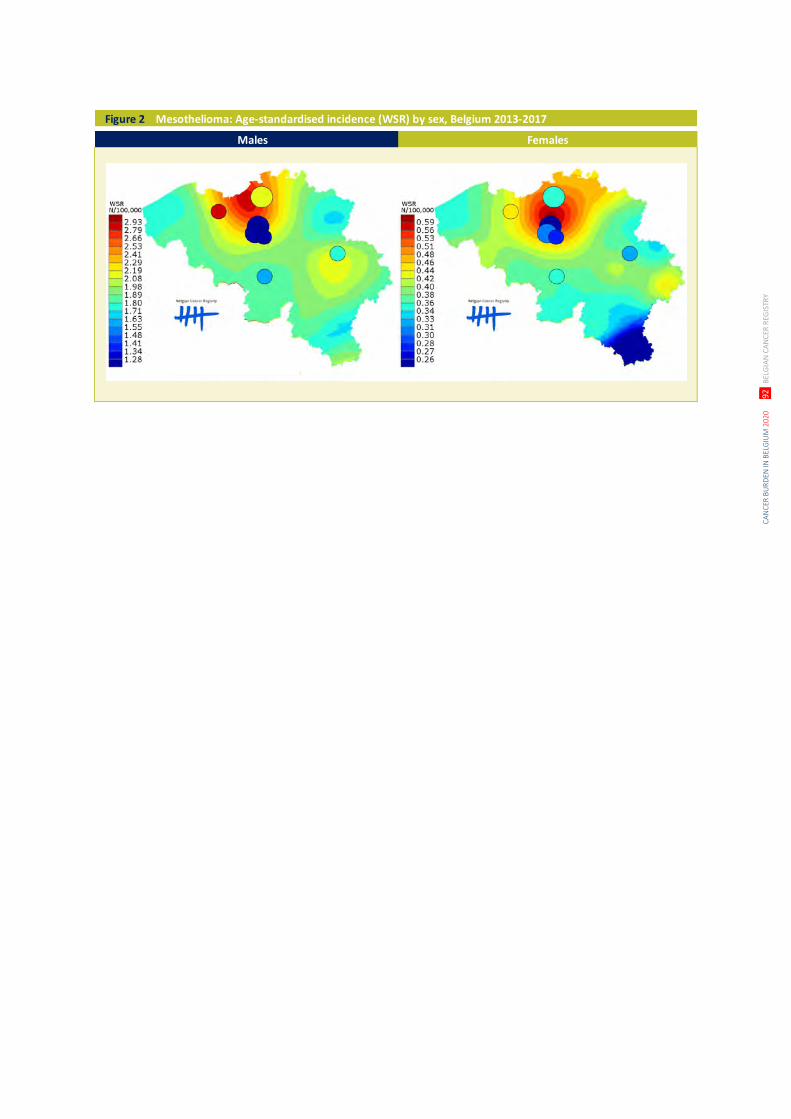
CA
NC
ER B
UR
DEN
IN B
ELG
IUM
202
0
92
BEL
GIA
N C
AN
CER
REG
ISTR
Y
Figure 2 Mesothelioma: Age-standardised incidence (WSR) by sex, Belgium 2013-2017
Males Females
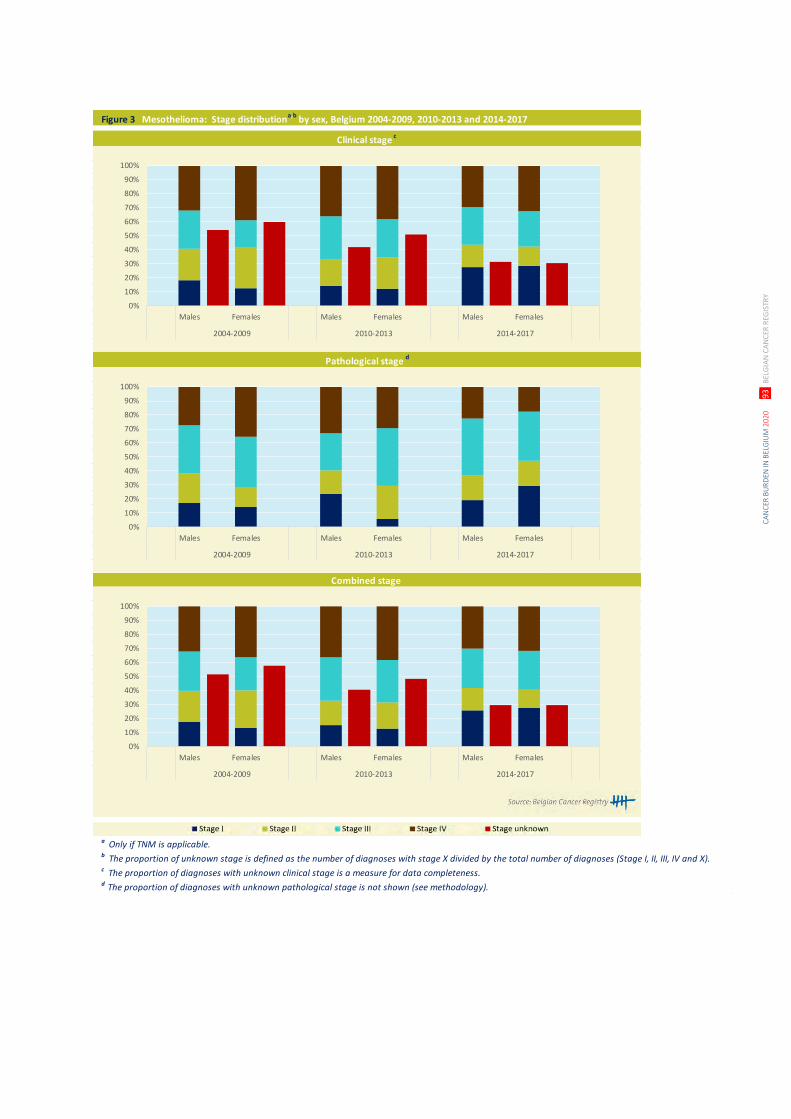
CA
NC
ER B
UR
DEN
IN B
ELG
IUM
202
0
93
BEL
GIA
N C
AN
CER
REG
ISTR
Y
Figure 3 Mesothelioma: Stage distributiona,b
by sex, Belgium 2004-2009, 2010-2013 and 2014-2017
a Only if TNM is applicable. b The proportion of unknown stage is defined as the number of diagnoses with stage X divided by the total number of diagnoses (Stage I, II, III, IV and X).c The proportion of diagnoses with unknown clinical stage is a measure for data completeness.d The proportion of diagnoses with unknown pathological stage is not shown (see methodology).
Clinical stage c
Pathological stage d
Combined stage
0%
10%
20%
30%
40%
50%
60%
70%
80%
90%
100%
Males Females Males Females Males Females
2004-2009 2010-2013 2014-2017
0%
10%
20%
30%
40%
50%
60%
70%
80%
90%
100%
Males Females Males Females Males Females
2004-2009 2010-2013 2014-2017
0%
10%
20%
30%
40%
50%
60%
70%
80%
90%
100%
Males Females Males Females Males Females
2004-2009 2010-2013 2014-2017
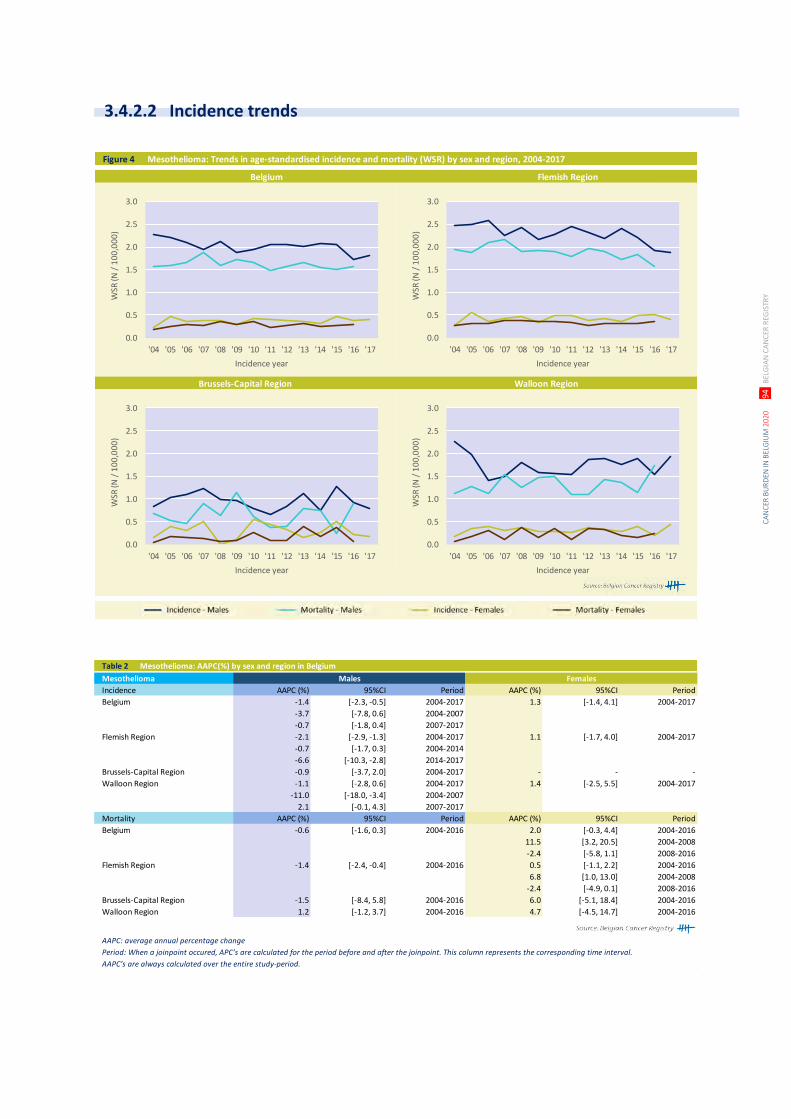
CA
NC
ER B
UR
DEN
IN B
ELG
IUM
202
0
94
BEL
GIA
N C
AN
CER
REG
ISTR
Y
Figure 4 Mesothelioma: Trends in age-standardised incidence and mortality (WSR) by sex and region, 2004-2017
Brussels-Capital Region Walloon Region
Belgium Flemish Region
0.0
0.5
1.0
1.5
2.0
2.5
3.0
'04 '05 '06 '07 '08 '09 '10 '11 '12 '13 '14 '15 '16 '17
WSR
(N /
10
0,0
00
)
Incidence year
0.0
0.5
1.0
1.5
2.0
2.5
3.0
'04 '05 '06 '07 '08 '09 '10 '11 '12 '13 '14 '15 '16 '17
WSR
(N /
10
0,0
00
)
Incidence year
0.0
0.5
1.0
1.5
2.0
2.5
3.0
'04 '05 '06 '07 '08 '09 '10 '11 '12 '13 '14 '15 '16 '17
WSR
(N /
10
0,0
00
)
Incidence year
0.0
0.5
1.0
1.5
2.0
2.5
3.0
'04 '05 '06 '07 '08 '09 '10 '11 '12 '13 '14 '15 '16 '17
WSR
(N /
10
0,0
00
)
Incidence year
Table 2 Mesothelioma: AAPC(%) by sex and region in Belgium
Mesothelioma Males Females
Incidence AAPC (%) 95%CI Period AAPC (%) 95%CI Period
Belgium -1.4 [-2.3, -0.5] 2004-2017 1.3 [-1.4, 4.1] 2004-2017
-3.7 [-7.8, 0.6] 2004-2007
-0.7 [-1.8, 0.4] 2007-2017
Flemish Region -2.1 [-2.9, -1.3] 2004-2017 1.1 [-1.7, 4.0] 2004-2017
-0.7 [-1.7, 0.3] 2004-2014
-6.6 [-10.3, -2.8] 2014-2017
Brussels-Capital Region -0.9 [-3.7, 2.0] 2004-2017 - - -
Walloon Region -1.1 [-2.8, 0.6] 2004-2017 1.4 [-2.5, 5.5] 2004-2017
-11.0 [-18.0, -3.4] 2004-2007
2.1 [-0.1, 4.3] 2007-2017
Mortality AAPC (%) 95%CI Period AAPC (%) 95%CI Period
Belgium -0.6 [-1.6, 0.3] 2004-2016 2.0 [-0.3, 4.4] 2004-2016
11.5 [3.2, 20.5] 2004-2008
-2.4 [-5.8, 1.1] 2008-2016
Flemish Region -1.4 [-2.4, -0.4] 2004-2016 0.5 [-1.1, 2.2] 2004-2016
6.8 [1.0, 13.0] 2004-2008
-2.4 [-4.9, 0.1] 2008-2016
Brussels-Capital Region -1.5 [-8.4, 5.8] 2004-2016 6.0 [-5.1, 18.4] 2004-2016
Walloon Region 1.2 [-1.2, 3.7] 2004-2016 4.7 [-4.5, 14.7] 2004-2016
AAPC: average annual percentage change
Period: When a joinpoint occured, APC’s are calculated for the period before and after the joinpoint. This column represents the corresponding time interval.
AAPC’s are always calculated over the entire study-period.
3.4.2.2 Incidence trends
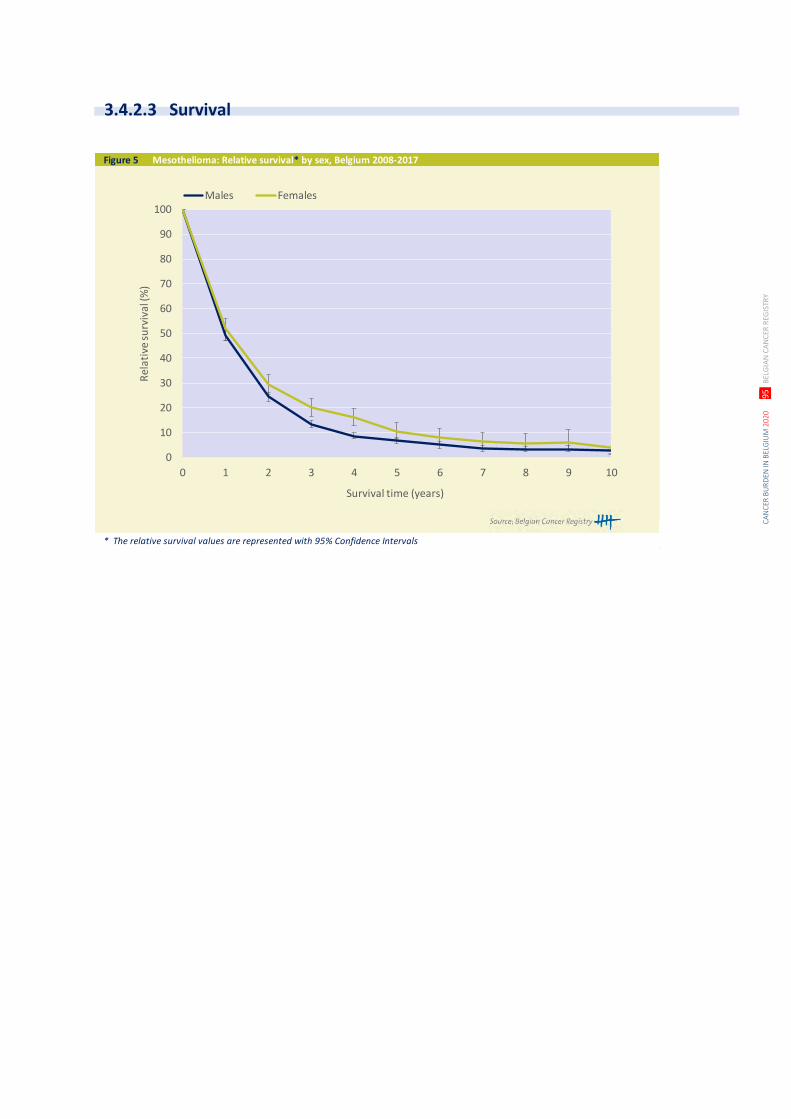
CA
NC
ER B
UR
DEN
IN B
ELG
IUM
202
0
95
BEL
GIA
N C
AN
CER
REG
ISTR
Y
Figure 5 Mesothelioma: Relative survival* by sex, Belgium 2008-2017
* The relative survival values are represented with 95% Confidence Intervals
0
10
20
30
40
50
60
70
80
90
100
0 1 2 3 4 5 6 7 8 9 10
Rel
ativ
e su
rviv
al (%
)
Survival time (years)
Males Females
3.4.2.3 Survival
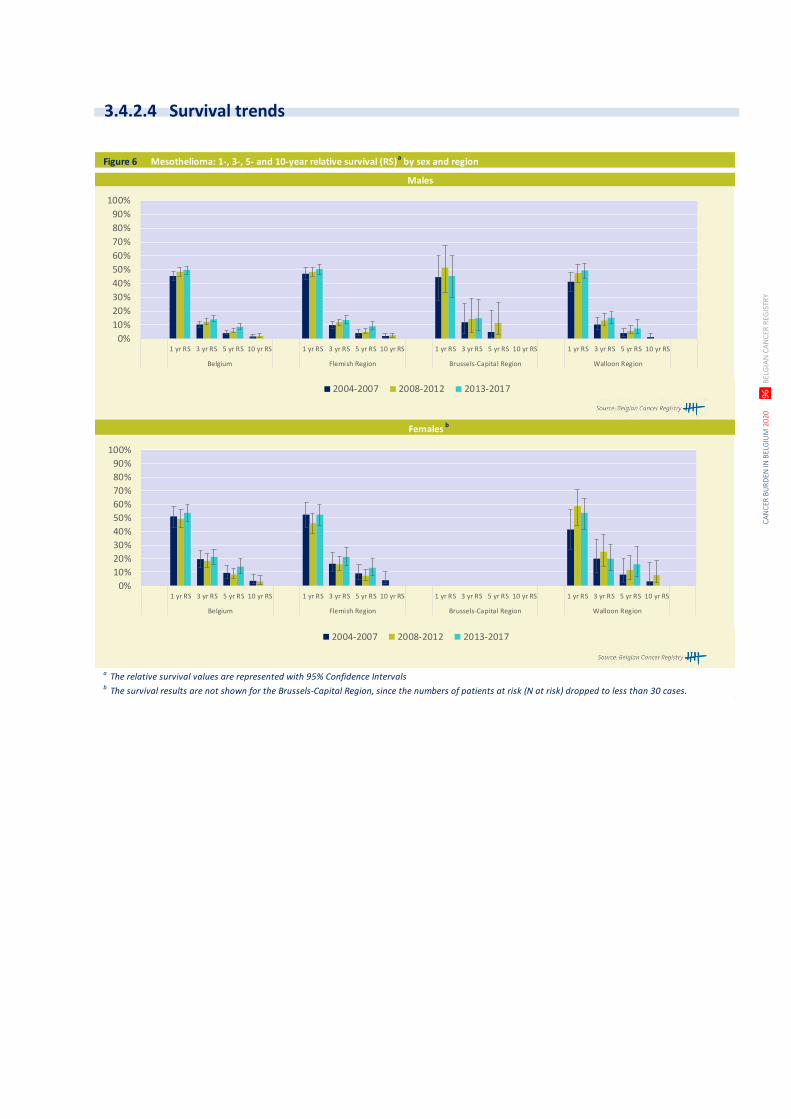
CA
NC
ER B
UR
DEN
IN B
ELG
IUM
202
0
96
BEL
GIA
N C
AN
CER
REG
ISTR
Y
Figure 6 Mesothelioma: 1-, 3-, 5- and 10-year relative survival (RS)a by sex and region
a The relative survival values are represented with 95% Confidence Intervals b The survival results are not shown for the Brussels-Capital Region, since the numbers of patients at risk (N at risk) dropped to less than 30 cases.
Males
Females b
0%
10%
20%
30%
40%
50%
60%
70%
80%
90%
100%
1 yr RS 3 yr RS 5 yr RS 10 yr RS 1 yr RS 3 yr RS 5 yr RS 10 yr RS 1 yr RS 3 yr RS 5 yr RS 10 yr RS 1 yr RS 3 yr RS 5 yr RS 10 yr RS
Belgium Flemish Region Brussels-Capital Region Walloon Region
2004-2007 2008-2012 2013-2017
0%
10%
20%
30%
40%
50%
60%
70%
80%
90%
100%
1 yr RS 3 yr RS 5 yr RS 10 yr RS 1 yr RS 3 yr RS 5 yr RS 10 yr RS 1 yr RS 3 yr RS 5 yr RS 10 yr RS 1 yr RS 3 yr RS 5 yr RS 10 yr RS
Belgium Flemish Region Brussels-Capital Region Walloon Region
2004-2007 2008-2012 2013-2017
3.4.2.4 Survival trends
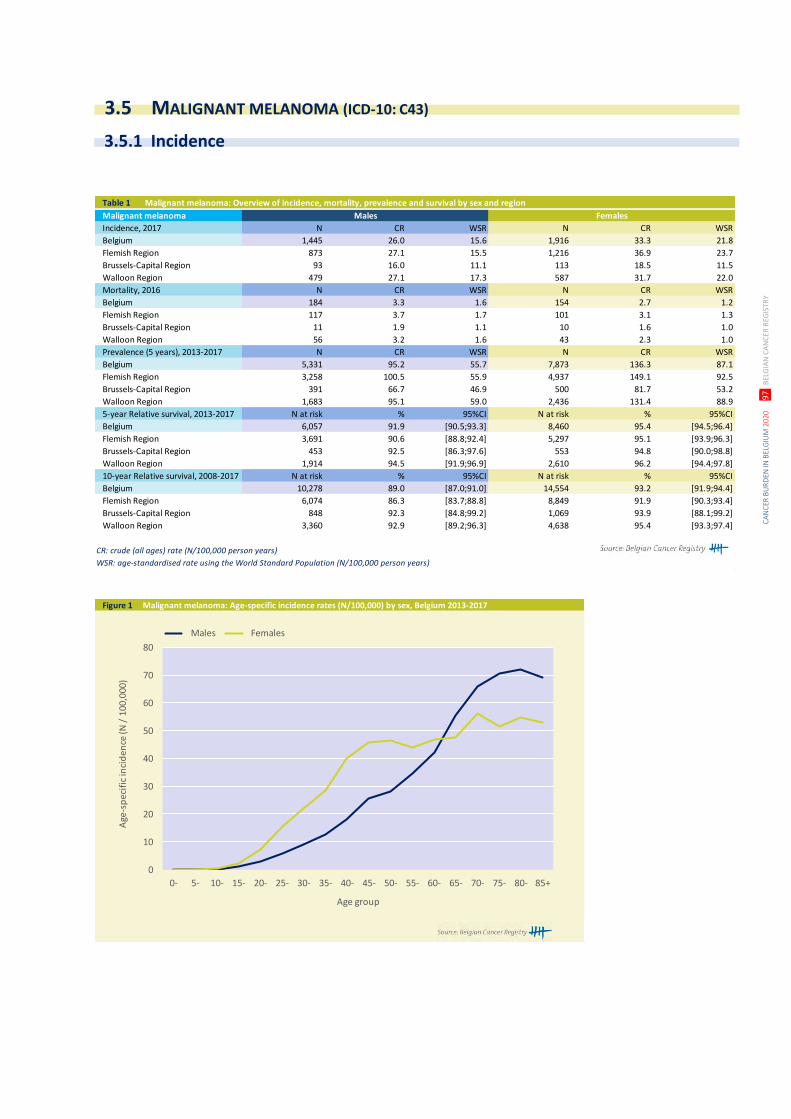
CA
NC
ER B
UR
DEN
IN B
ELG
IUM
202
0
97
BEL
GIA
N C
AN
CER
REG
ISTR
Y
Table 1 Malignant melanoma: Overview of incidence, mortality, prevalence and survival by sex and region
Malignant melanoma Males Females
Incidence, 2017 N CR WSR N CR WSR
Belgium 1,445 26.0 15.6 1,916 33.3 21.8
Flemish Region 873 27.1 15.5 1,216 36.9 23.7
Brussels-Capital Region 93 16.0 11.1 113 18.5 11.5
Walloon Region 479 27.1 17.3 587 31.7 22.0
Mortality, 2016 N CR WSR N CR WSR
Belgium 184 3.3 1.6 154 2.7 1.2
Flemish Region 117 3.7 1.7 101 3.1 1.3
Brussels-Capital Region 11 1.9 1.1 10 1.6 1.0
Walloon Region 56 3.2 1.6 43 2.3 1.0
Prevalence (5 years), 2013-2017 N CR WSR N CR WSR
Belgium 5,331 95.2 55.7 7,873 136.3 87.1
Flemish Region 3,258 100.5 55.9 4,937 149.1 92.5
Brussels-Capital Region 391 66.7 46.9 500 81.7 53.2
Walloon Region 1,683 95.1 59.0 2,436 131.4 88.9
5-year Relative survival, 2013-2017 N at risk % 95%CI N at risk % 95%CI
Belgium 6,057 91.9 [90.5;93.3] 8,460 95.4 [94.5;96.4]
Flemish Region 3,691 90.6 [88.8;92.4] 5,297 95.1 [93.9;96.3]
Brussels-Capital Region 453 92.5 [86.3;97.6] 553 94.8 [90.0;98.8]
Walloon Region 1,914 94.5 [91.9;96.9] 2,610 96.2 [94.4;97.8]
10-year Relative survival, 2008-2017 N at risk % 95%CI N at risk % 95%CI
Belgium 10,278 89.0 [87.0;91.0] 14,554 93.2 [91.9;94.4]
Flemish Region 6,074 86.3 [83.7;88.8] 8,849 91.9 [90.3;93.4]
Brussels-Capital Region 848 92.3 [84.8;99.2] 1,069 93.9 [88.1;99.2]
Walloon Region 3,360 92.9 [89.2;96.3] 4,638 95.4 [93.3;97.4]
CR: crude (all ages) rate (N/100,000 person years)
WSR: age-standardised rate using the World Standard Population (N/100,000 person years)
Figure 1 Malignant melanoma: Age-specific incidence rates (N/100,000) by sex, Belgium 2013-2017
0
10
20
30
40
50
60
70
80
0- 5- 10- 15- 20- 25- 30- 35- 40- 45- 50- 55- 60- 65- 70- 75- 80- 85+
Age
-sp
ecif
ic in
cid
ence
(N /
100
,000
)
Age group
Males Females
3.5 MALIGNANT MELANOMA (ICD-10: C43)
3.5.1 Incidence
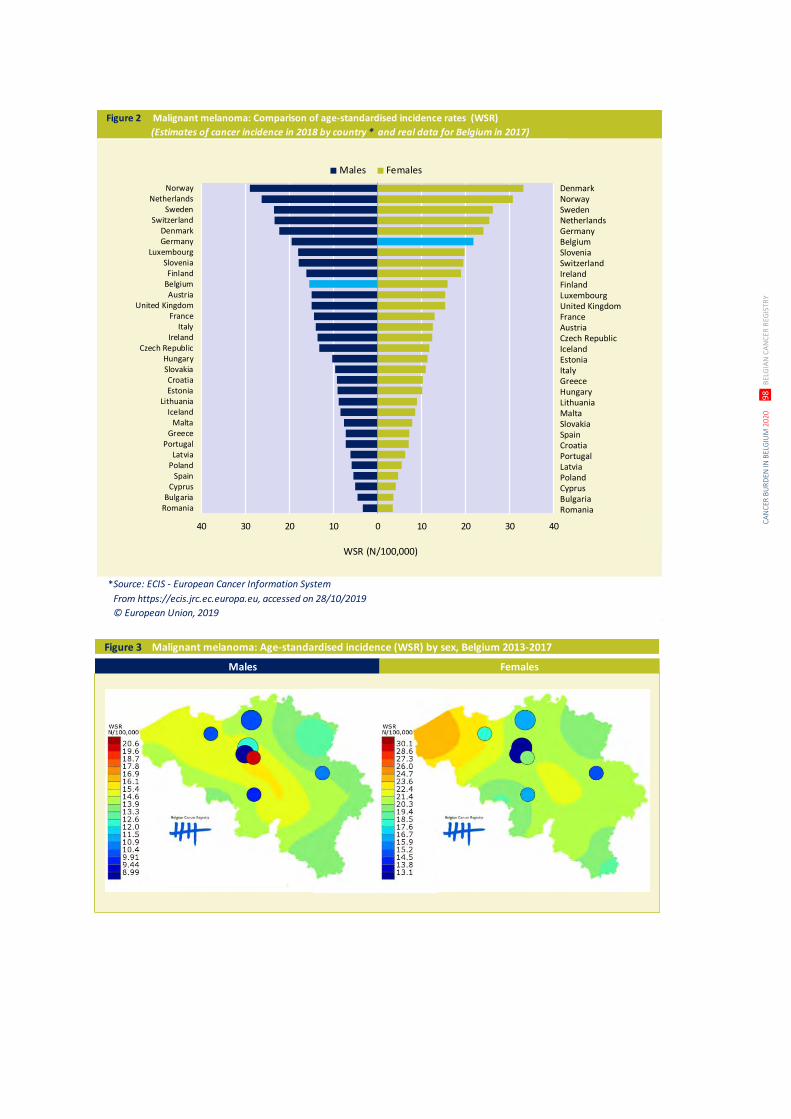
CA
NC
ER B
UR
DEN
IN B
ELG
IUM
202
0
98
BEL
GIA
N C
AN
CER
REG
ISTR
Y
Figure 2 Malignant melanoma: Comparison of age-standardised incidence rates (WSR)
(Estimates of cancer incidence in 2018 by country * and real data for Belgium in 2017)
Source: ECIS - European Cancer Information System
From https://ecis.jrc.ec.europa.eu, accessed on 28/10/2019
© European Union, 2019
40 30 20 10 0 10 20 30 40
NorwayNetherlands
SwedenSwitzerland
DenmarkGermany
LuxembourgSloveniaFinland
BelgiumAustria
United KingdomFrance
ItalyIreland
Czech RepublicHungarySlovakiaCroatiaEstonia
LithuaniaIceland
MaltaGreece
PortugalLatvia
PolandSpain
CyprusBulgaria
Romania
Males Females
WSR (N/100,000)
*
DenmarkNorwaySwedenNetherlandsGermanyBelgiumSloveniaSwitzerlandIrelandFinlandLuxembourgUnited KingdomFranceAustriaCzech RepublicIcelandEstoniaItalyGreeceHungaryLithuaniaMaltaSlovakiaSpainCroatiaPortugalLatviaPolandCyprusBulgariaRomania
Figure 3 Malignant melanoma: Age-standardised incidence (WSR) by sex, Belgium 2013-2017
Males Females
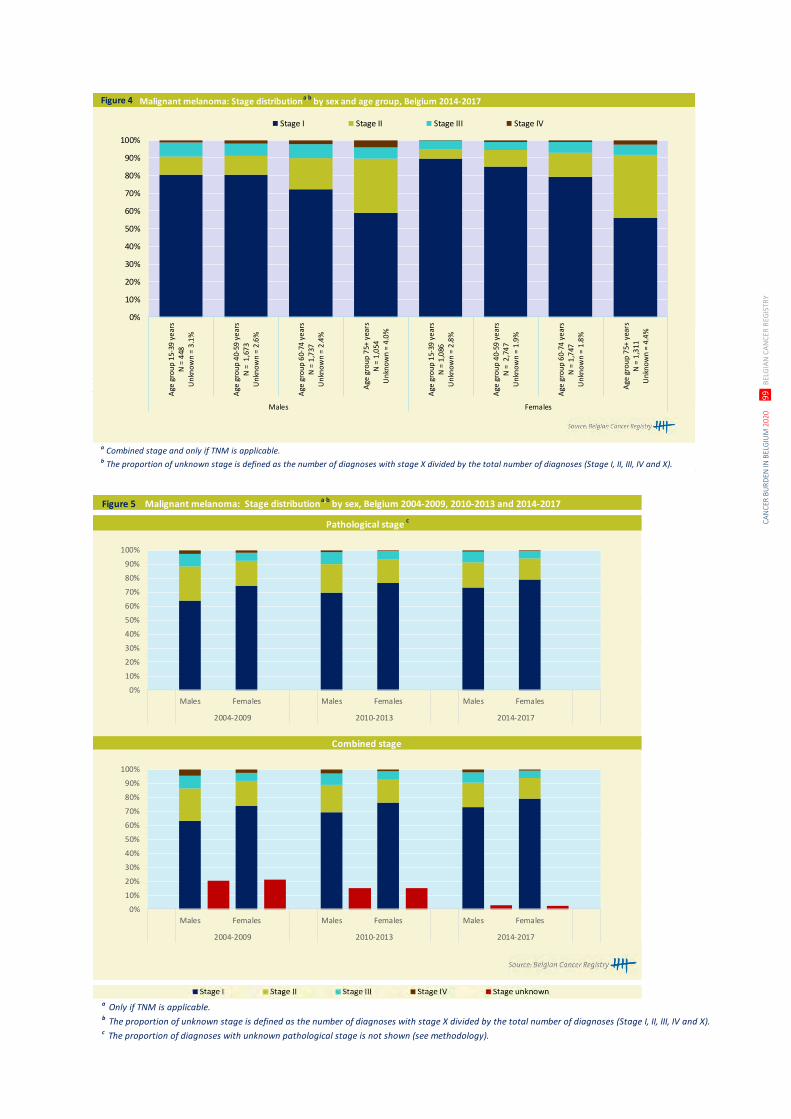
CA
NC
ER B
UR
DEN
IN B
ELG
IUM
202
0
99
BEL
GIA
N C
AN
CER
REG
ISTR
Y
Figure 4 Malignant melanoma: Stage distributiona,b
by sex and age group, Belgium 2014-2017
a Combined stage and only if TNM is applicable. b The proportion of unknown stage is defined as the number of diagnoses with stage X divided by the total number of diagnoses (Stage I, II, III, IV and X).
0%
10%
20%
30%
40%
50%
60%
70%
80%
90%
100%
Age
gro
up
15-
39 y
ear
sN
= 4
48U
nkn
ow
n =
3.1
%
Age
gro
up
40-
59 y
ear
sN
= 1
,67
3U
nkn
ow
n =
2.6
%
Age
gro
up
60-
74 y
ear
sN
= 1
,737
Un
kno
wn
= 2
.4%
Age
gro
up
75+
yea
rsN
= 1
,054
Un
kno
wn
= 4
.0%
Age
gro
up
15-
39 y
ear
sN
= 1
,086
Un
kno
wn
= 2
.8%
Age
gro
up
40-
59 y
ear
sN
= 2
,74
7U
nkn
ow
n =
1.9
%
Age
gro
up
60-
74 y
ear
sN
= 1
,747
Un
kno
wn
= 1
.8%
Age
gro
up
75+
yea
rsN
= 1
,311
Un
kno
wn
= 4
.4%
Males Females
Stage I Stage II Stage III Stage IV
Figure 5 Malignant melanoma: Stage distributiona,b
by sex, Belgium 2004-2009, 2010-2013 and 2014-2017
a Only if TNM is applicable. b The proportion of unknown stage is defined as the number of diagnoses with stage X divided by the total number of diagnoses (Stage I, II, III, IV and X).c The proportion of diagnoses with unknown pathological stage is not shown (see methodology).
Pathological stage c
Combined stage
0%
10%
20%
30%
40%
50%
60%
70%
80%
90%
100%
Males Females Males Females Males Females
2004-2009 2010-2013 2014-2017
0%
10%
20%
30%
40%
50%
60%
70%
80%
90%
100%
Males Females Males Females Males Females
2004-2009 2010-2013 2014-2017
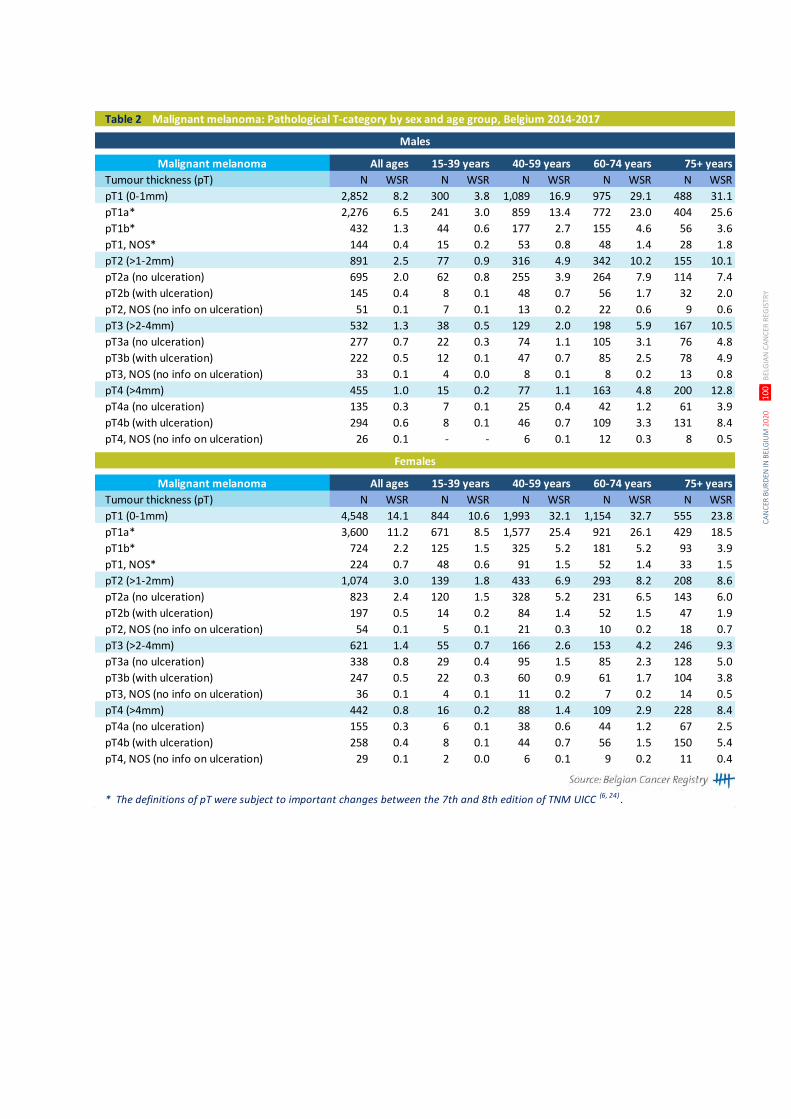
CA
NC
ER B
UR
DEN
IN B
ELG
IUM
202
0
10
0 B
ELG
IAN
CA
NC
ER R
EGIS
TRY
Table 2 Malignant melanoma: Pathological T-category by sex and age group, Belgium 2014-2017
Tumour thickness (pT) N WSR N WSR N WSR N WSR N WSR
pT1 (0-1mm) 2,852 8.2 300 3.8 1,089 16.9 975 29.1 488 31.1
pT1a* 2,276 6.5 241 3.0 859 13.4 772 23.0 404 25.6
pT1b* 432 1.3 44 0.6 177 2.7 155 4.6 56 3.6
pT1, NOS* 144 0.4 15 0.2 53 0.8 48 1.4 28 1.8
pT2 (>1-2mm) 891 2.5 77 0.9 316 4.9 342 10.2 155 10.1
pT2a (no ulceration) 695 2.0 62 0.8 255 3.9 264 7.9 114 7.4
pT2b (with ulceration) 145 0.4 8 0.1 48 0.7 56 1.7 32 2.0
pT2, NOS (no info on ulceration) 51 0.1 7 0.1 13 0.2 22 0.6 9 0.6
pT3 (>2-4mm) 532 1.3 38 0.5 129 2.0 198 5.9 167 10.5
pT3a (no ulceration) 277 0.7 22 0.3 74 1.1 105 3.1 76 4.8
pT3b (with ulceration) 222 0.5 12 0.1 47 0.7 85 2.5 78 4.9
pT3, NOS (no info on ulceration) 33 0.1 4 0.0 8 0.1 8 0.2 13 0.8
pT4 (>4mm) 455 1.0 15 0.2 77 1.1 163 4.8 200 12.8
pT4a (no ulceration) 135 0.3 7 0.1 25 0.4 42 1.2 61 3.9
pT4b (with ulceration) 294 0.6 8 0.1 46 0.7 109 3.3 131 8.4
pT4, NOS (no info on ulceration) 26 0.1 - - 6 0.1 12 0.3 8 0.5
Tumour thickness (pT) N WSR N WSR N WSR N WSR N WSR
pT1 (0-1mm) 4,548 14.1 844 10.6 1,993 32.1 1,154 32.7 555 23.8
pT1a* 3,600 11.2 671 8.5 1,577 25.4 921 26.1 429 18.5
pT1b* 724 2.2 125 1.5 325 5.2 181 5.2 93 3.9
pT1, NOS* 224 0.7 48 0.6 91 1.5 52 1.4 33 1.5
pT2 (>1-2mm) 1,074 3.0 139 1.8 433 6.9 293 8.2 208 8.6
pT2a (no ulceration) 823 2.4 120 1.5 328 5.2 231 6.5 143 6.0
pT2b (with ulceration) 197 0.5 14 0.2 84 1.4 52 1.5 47 1.9
pT2, NOS (no info on ulceration) 54 0.1 5 0.1 21 0.3 10 0.2 18 0.7
pT3 (>2-4mm) 621 1.4 55 0.7 166 2.6 153 4.2 246 9.3
pT3a (no ulceration) 338 0.8 29 0.4 95 1.5 85 2.3 128 5.0
pT3b (with ulceration) 247 0.5 22 0.3 60 0.9 61 1.7 104 3.8
pT3, NOS (no info on ulceration) 36 0.1 4 0.1 11 0.2 7 0.2 14 0.5
pT4 (>4mm) 442 0.8 16 0.2 88 1.4 109 2.9 228 8.4
pT4a (no ulceration) 155 0.3 6 0.1 38 0.6 44 1.2 67 2.5
pT4b (with ulceration) 258 0.4 8 0.1 44 0.7 56 1.5 150 5.4
pT4, NOS (no info on ulceration) 29 0.1 2 0.0 6 0.1 9 0.2 11 0.4
* The definitions of pT were subject to important changes between the 7th and 8th edition of TNM UICC (6, 24) .
All agesMalignant melanoma
40-59 years 60-74 years 75+ years
40-59 years15-39 years 60-74 years 75+ years
Males
Females
Malignant melanoma All ages 15-39 years
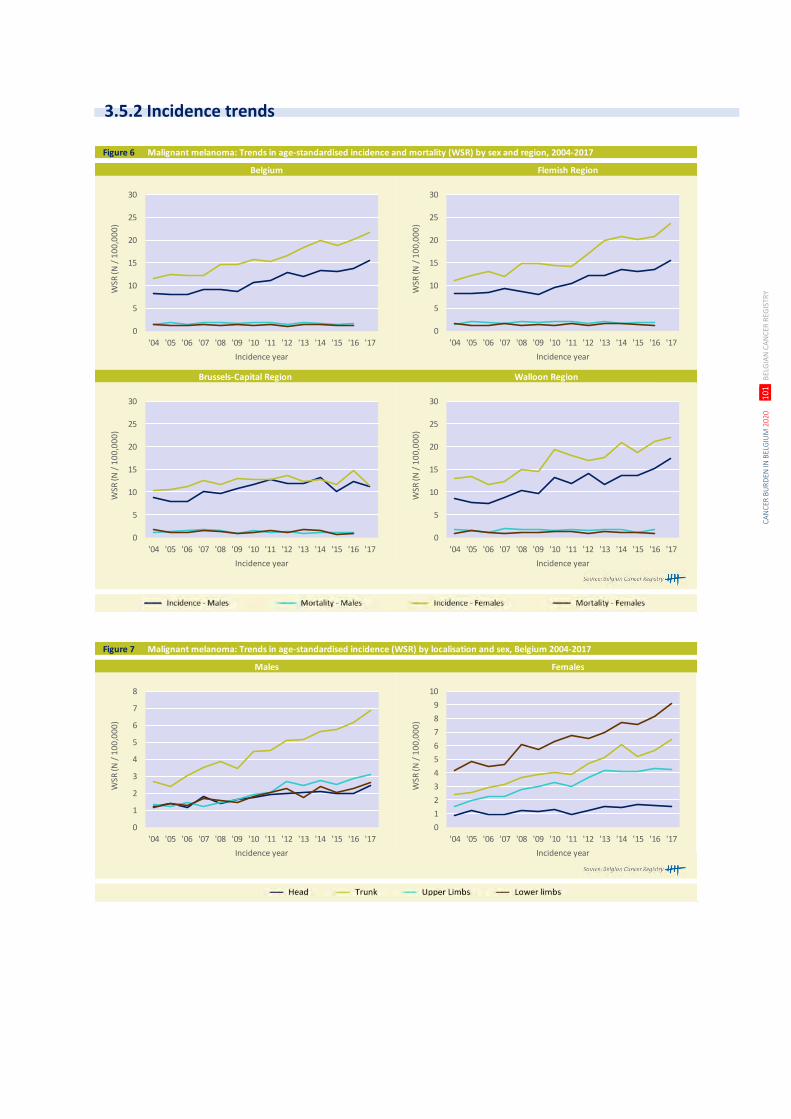
CA
NC
ER B
UR
DEN
IN B
ELG
IUM
202
0
10
1 B
ELG
IAN
CA
NC
ER R
EGIS
TRY
Figure 6 Malignant melanoma: Trends in age-standardised incidence and mortality (WSR) by sex and region, 2004-2017
Brussels-Capital Region Walloon Region
Belgium Flemish Region
0
5
10
15
20
25
30
'04 '05 '06 '07 '08 '09 '10 '11 '12 '13 '14 '15 '16 '17
WSR
(N /
10
0,0
00
)
Incidence year
0
5
10
15
20
25
30
'04 '05 '06 '07 '08 '09 '10 '11 '12 '13 '14 '15 '16 '17
WSR
(N /
10
0,0
00
)
Incidence year
0
5
10
15
20
25
30
'04 '05 '06 '07 '08 '09 '10 '11 '12 '13 '14 '15 '16 '17
WSR
(N /
10
0,0
00
)
Incidence year
0
5
10
15
20
25
30
'04 '05 '06 '07 '08 '09 '10 '11 '12 '13 '14 '15 '16 '17
WSR
(N /
10
0,0
00
)
Incidence year
Figure 7 Malignant melanoma: Trends in age-standardised incidence (WSR) by localisation and sex, Belgium 2004-2017
Males Females
0
1
2
3
4
5
6
7
8
'04 '05 '06 '07 '08 '09 '10 '11 '12 '13 '14 '15 '16 '17
WSR
(N /
10
0,0
00
)
Incidence year
0
1
2
3
4
5
6
7
8
9
10
'04 '05 '06 '07 '08 '09 '10 '11 '12 '13 '14 '15 '16 '17
WSR
(N /
10
0,0
00
)
Incidence year
3.5.2 Incidence trends
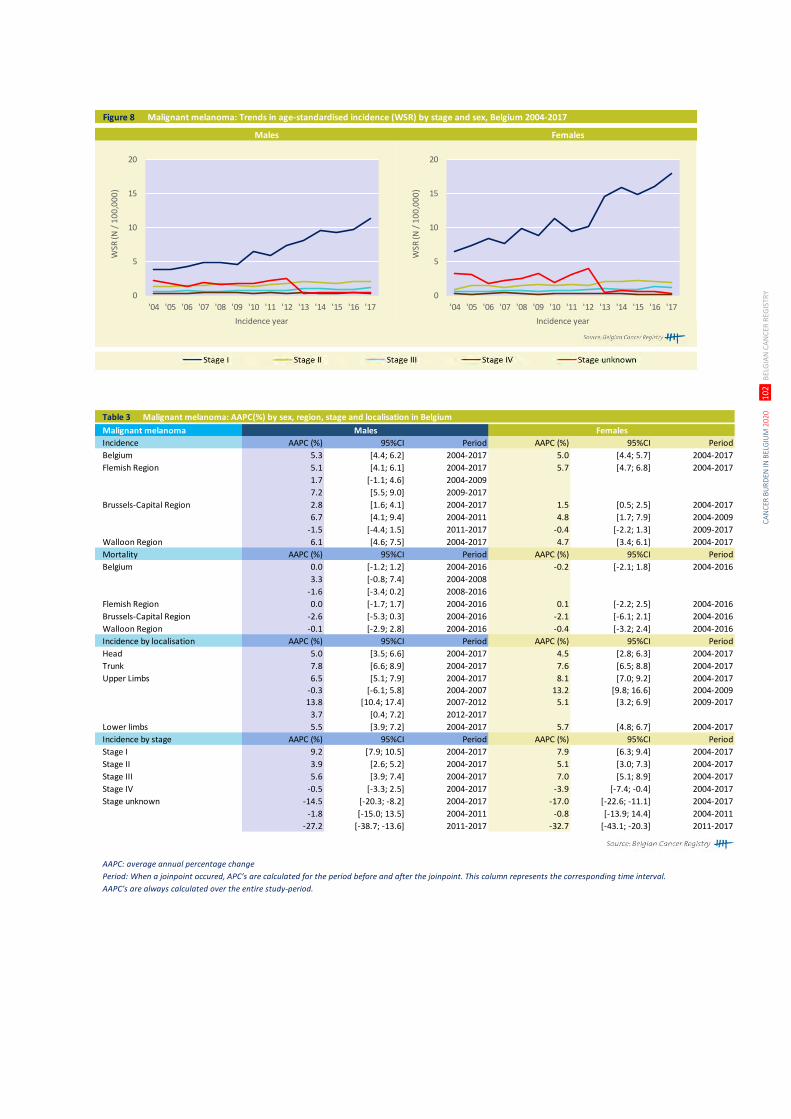
CA
NC
ER B
UR
DEN
IN B
ELG
IUM
202
0
10
2 B
ELG
IAN
CA
NC
ER R
EGIS
TRY
Figure 8 Malignant melanoma: Trends in age-standardised incidence (WSR) by stage and sex, Belgium 2004-2017
Males Females
0
5
10
15
20
'04 '05 '06 '07 '08 '09 '10 '11 '12 '13 '14 '15 '16 '17
WSR
(N /
10
0,0
00
)
Incidence year
0
5
10
15
20
'04 '05 '06 '07 '08 '09 '10 '11 '12 '13 '14 '15 '16 '17
WSR
(N /
10
0,0
00
)
Incidence year
Table 3 Malignant melanoma: AAPC(%) by sex, region, stage and localisation in Belgium
Malignant melanoma Males Females
Incidence AAPC (%) 95%CI Period AAPC (%) 95%CI Period
Belgium 5.3 [4.4; 6.2] 2004-2017 5.0 [4.4; 5.7] 2004-2017
Flemish Region 5.1 [4.1; 6.1] 2004-2017 5.7 [4.7; 6.8] 2004-2017
1.7 [-1.1; 4.6] 2004-2009
7.2 [5.5; 9.0] 2009-2017
Brussels-Capital Region 2.8 [1.6; 4.1] 2004-2017 1.5 [0.5; 2.5] 2004-2017
6.7 [4.1; 9.4] 2004-2011 4.8 [1.7; 7.9] 2004-2009
-1.5 [-4.4; 1.5] 2011-2017 -0.4 [-2.2; 1.3] 2009-2017
Walloon Region 6.1 [4.6; 7.5] 2004-2017 4.7 [3.4; 6.1] 2004-2017
Mortality AAPC (%) 95%CI Period AAPC (%) 95%CI Period
Belgium 0.0 [-1.2; 1.2] 2004-2016 -0.2 [-2.1; 1.8] 2004-2016
3.3 [-0.8; 7.4] 2004-2008
-1.6 [-3.4; 0.2] 2008-2016
Flemish Region 0.0 [-1.7; 1.7] 2004-2016 0.1 [-2.2; 2.5] 2004-2016
Brussels-Capital Region -2.6 [-5.3; 0.3] 2004-2016 -2.1 [-6.1; 2.1] 2004-2016
Walloon Region -0.1 [-2.9; 2.8] 2004-2016 -0.4 [-3.2; 2.4] 2004-2016
Incidence by localisation AAPC (%) 95%CI Period AAPC (%) 95%CI Period
Head 5.0 [3.5; 6.6] 2004-2017 4.5 [2.8; 6.3] 2004-2017
Trunk 7.8 [6.6; 8.9] 2004-2017 7.6 [6.5; 8.8] 2004-2017
Upper Limbs 6.5 [5.1; 7.9] 2004-2017 8.1 [7.0; 9.2] 2004-2017
-0.3 [-6.1; 5.8] 2004-2007 13.2 [9.8; 16.6] 2004-2009
13.8 [10.4; 17.4] 2007-2012 5.1 [3.2; 6.9] 2009-2017
3.7 [0.4; 7.2] 2012-2017
Lower limbs 5.5 [3.9; 7.2] 2004-2017 5.7 [4.8; 6.7] 2004-2017
Incidence by stage AAPC (%) 95%CI Period AAPC (%) 95%CI Period
Stage I 9.2 [7.9; 10.5] 2004-2017 7.9 [6.3; 9.4] 2004-2017
Stage II 3.9 [2.6; 5.2] 2004-2017 5.1 [3.0; 7.3] 2004-2017
Stage III 5.6 [3.9; 7.4] 2004-2017 7.0 [5.1; 8.9] 2004-2017
Stage IV -0.5 [-3.3; 2.5] 2004-2017 -3.9 [-7.4; -0.4] 2004-2017
Stage unknown -14.5 [-20.3; -8.2] 2004-2017 -17.0 [-22.6; -11.1] 2004-2017
-1.8 [-15.0; 13.5] 2004-2011 -0.8 [-13.9; 14.4] 2004-2011
-27.2 [-38.7; -13.6] 2011-2017 -32.7 [-43.1; -20.3] 2011-2017
AAPC: average annual percentage change
Period: When a joinpoint occured, APC’s are calculated for the period before and after the joinpoint. This column represents the corresponding time interval.
AAPC’s are always calculated over the entire study-period.
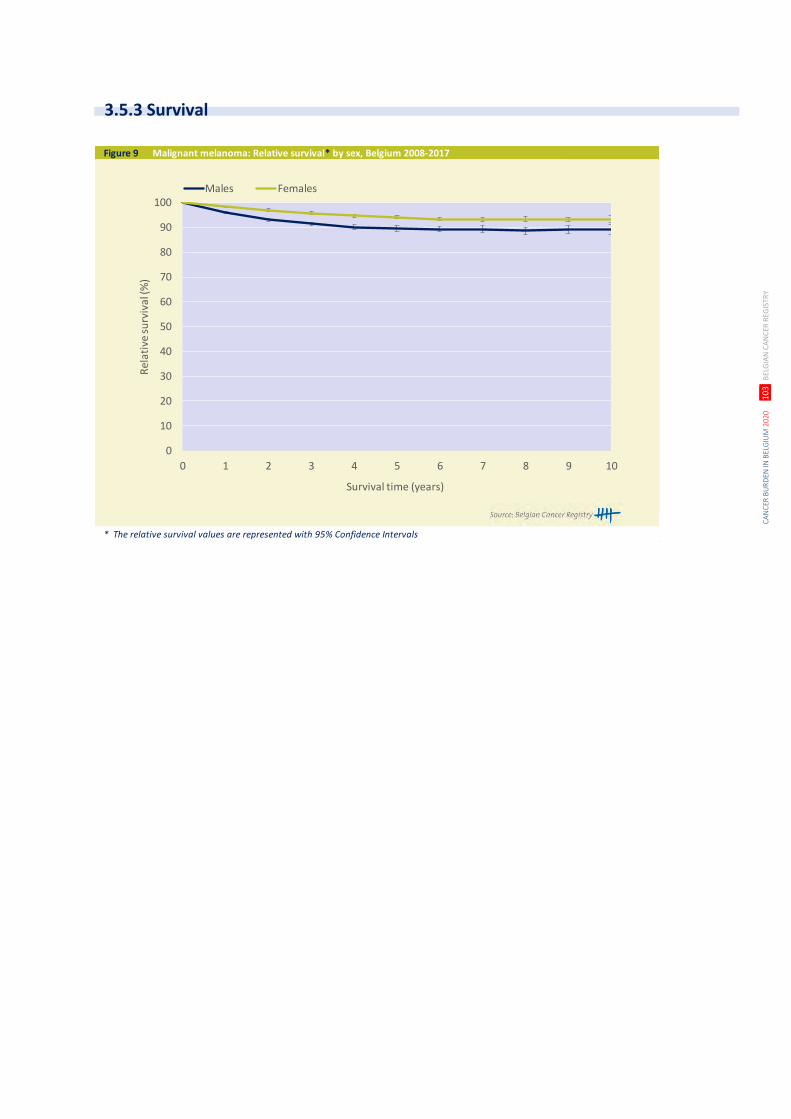
CA
NC
ER B
UR
DEN
IN B
ELG
IUM
202
0
10
3 B
ELG
IAN
CA
NC
ER R
EGIS
TRY
Figure 9 Malignant melanoma: Relative survival* by sex, Belgium 2008-2017
* The relative survival values are represented with 95% Confidence Intervals
0
10
20
30
40
50
60
70
80
90
100
0 1 2 3 4 5 6 7 8 9 10
Rel
ativ
e su
rviv
al (%
)
Survival time (years)
Males Females
3.5.3 Survival
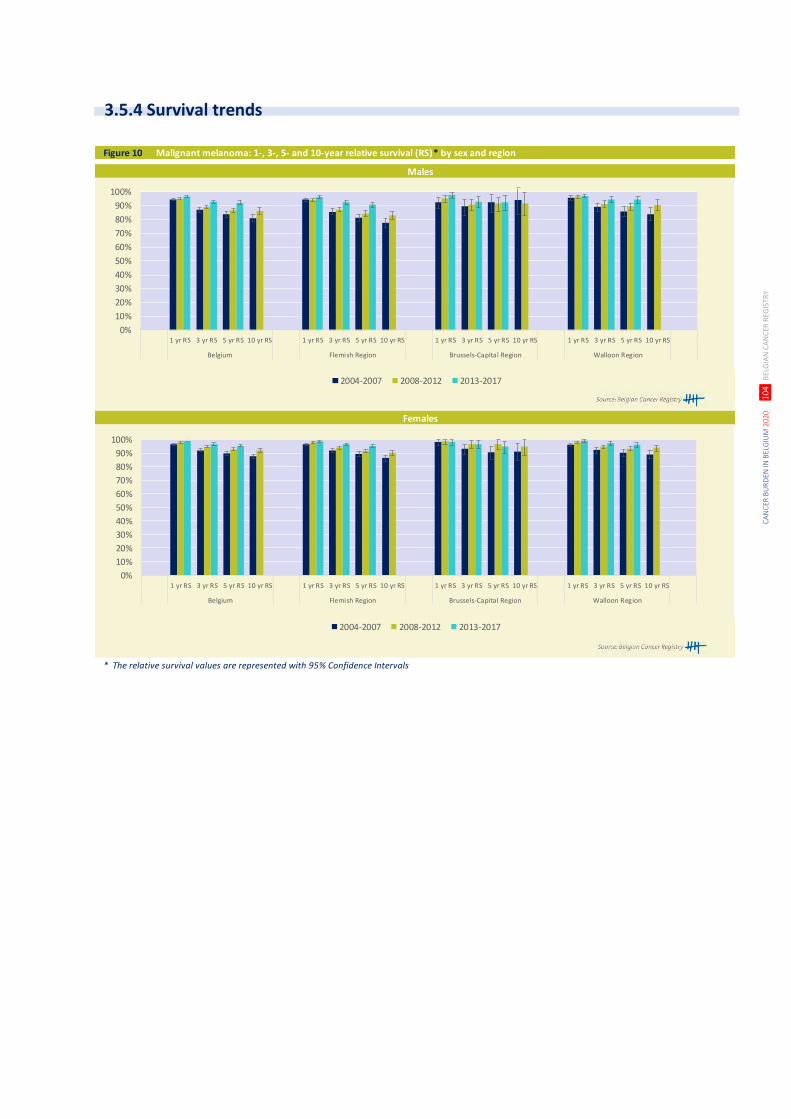
CA
NC
ER B
UR
DEN
IN B
ELG
IUM
202
0
10
4 B
ELG
IAN
CA
NC
ER R
EGIS
TRY
Figure 10 Malignant melanoma: 1-, 3-, 5- and 10-year relative survival (RS)* by sex and region
* The relative survival values are represented with 95% Confidence Intervals
Males
Females
0%
10%
20%
30%
40%
50%
60%
70%
80%
90%
100%
1 yr RS 3 yr RS 5 yr RS 10 yr RS 1 yr RS 3 yr RS 5 yr RS 10 yr RS 1 yr RS 3 yr RS 5 yr RS 10 yr RS 1 yr RS 3 yr RS 5 yr RS 10 yr RS
Belgium Flemish Region Brussels-Capital Region Walloon Region
2004-2007 2008-2012 2013-2017
0%
10%
20%
30%
40%
50%
60%
70%
80%
90%
100%
1 yr RS 3 yr RS 5 yr RS 10 yr RS 1 yr RS 3 yr RS 5 yr RS 10 yr RS 1 yr RS 3 yr RS 5 yr RS 10 yr RS 1 yr RS 3 yr RS 5 yr RS 10 yr RS
Belgium Flemish Region Brussels-Capital Region Walloon Region
2004-2007 2008-2012 2013-2017
3.5.4 Survival trends
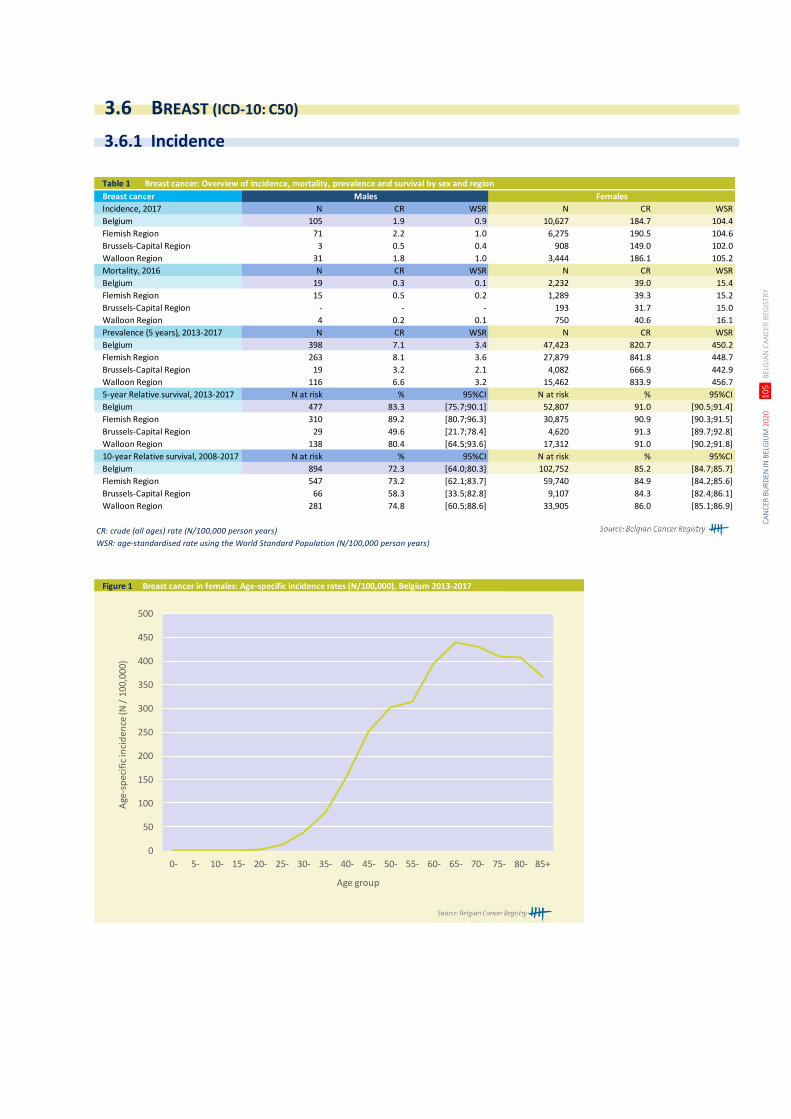
CA
NC
ER B
UR
DEN
IN B
ELG
IUM
202
0
10
5 B
ELG
IAN
CA
NC
ER R
EGIS
TRY
Table 1 Breast cancer: Overview of incidence, mortality, prevalence and survival by sex and region
Breast cancer Males Females
Incidence, 2017 N CR WSR N CR WSR
Belgium 105 1.9 0.9 10,627 184.7 104.4
Flemish Region 71 2.2 1.0 6,275 190.5 104.6
Brussels-Capital Region 3 0.5 0.4 908 149.0 102.0
Walloon Region 31 1.8 1.0 3,444 186.1 105.2
Mortality, 2016 N CR WSR N CR WSR
Belgium 19 0.3 0.1 2,232 39.0 15.4
Flemish Region 15 0.5 0.2 1,289 39.3 15.2
Brussels-Capital Region - - - 193 31.7 15.0
Walloon Region 4 0.2 0.1 750 40.6 16.1
Prevalence (5 years), 2013-2017 N CR WSR N CR WSR
Belgium 398 7.1 3.4 47,423 820.7 450.2
Flemish Region 263 8.1 3.6 27,879 841.8 448.7
Brussels-Capital Region 19 3.2 2.1 4,082 666.9 442.9
Walloon Region 116 6.6 3.2 15,462 833.9 456.7
5-year Relative survival, 2013-2017 N at risk % 95%CI N at risk % 95%CI
Belgium 477 83.3 [75.7;90.1] 52,807 91.0 [90.5;91.4]
Flemish Region 310 89.2 [80.7;96.3] 30,875 90.9 [90.3;91.5]
Brussels-Capital Region 29 49.6 [21.7;78.4] 4,620 91.3 [89.7;92.8]
Walloon Region 138 80.4 [64.5;93.6] 17,312 91.0 [90.2;91.8]
10-year Relative survival, 2008-2017 N at risk % 95%CI N at risk % 95%CI
Belgium 894 72.3 [64.0;80.3] 102,752 85.2 [84.7;85.7]
Flemish Region 547 73.2 [62.1;83.7] 59,740 84.9 [84.2;85.6]
Brussels-Capital Region 66 58.3 [33.5;82.8] 9,107 84.3 [82.4;86.1]
Walloon Region 281 74.8 [60.5;88.6] 33,905 86.0 [85.1;86.9]
CR: crude (all ages) rate (N/100,000 person years)
WSR: age-standardised rate using the World Standard Population (N/100,000 person years)
Figure 1 Breast cancer in females: Age-specific incidence rates (N/100,000), Belgium 2013-2017
0
50
100
150
200
250
300
350
400
450
500
0- 5- 10- 15- 20- 25- 30- 35- 40- 45- 50- 55- 60- 65- 70- 75- 80- 85+
Age
-sp
ecif
ic in
cid
ence
(N /
10
0,0
00
)
Age group
3.6 BREAST (ICD-10: C50)
3.6.1 Incidence
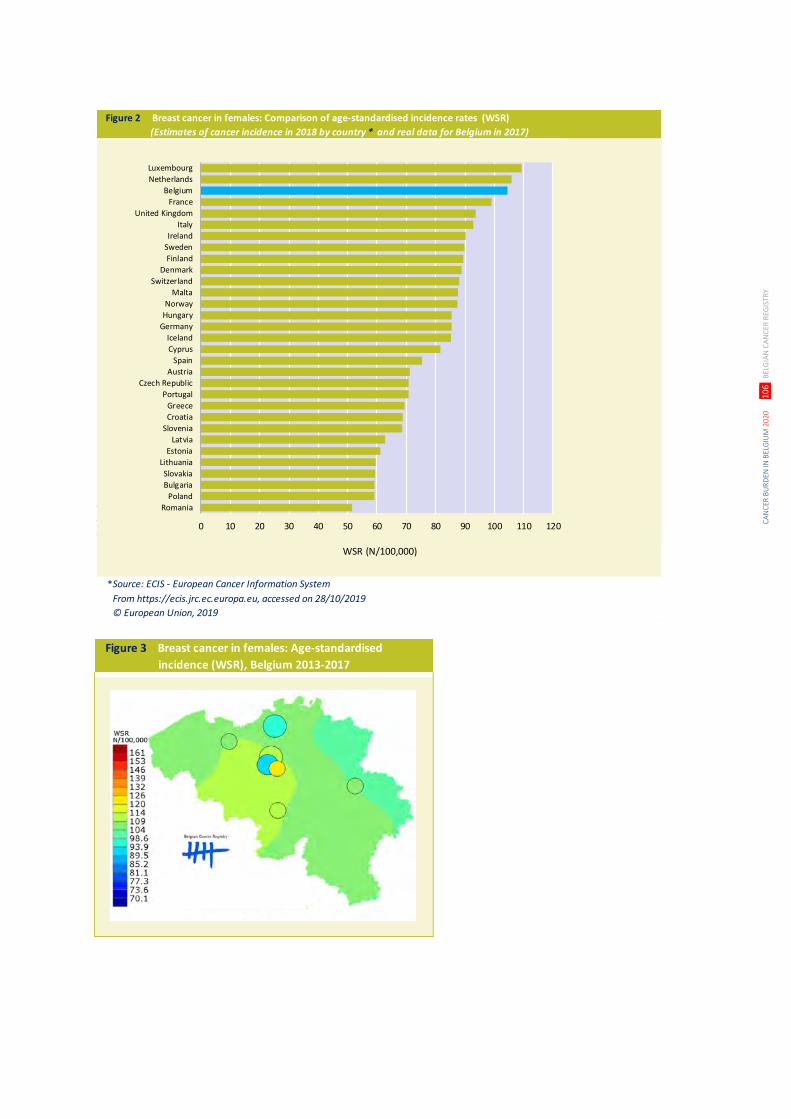
CA
NC
ER B
UR
DEN
IN B
ELG
IUM
202
0
10
6 B
ELG
IAN
CA
NC
ER R
EGIS
TRY
Figure 2 Breast cancer in females: Comparison of age-standardised incidence rates (WSR)
(Estimates of cancer incidence in 2018 by country * and real data for Belgium in 2017)
Source: ECIS - European Cancer Information System
From https://ecis.jrc.ec.europa.eu, accessed on 28/10/2019
© European Union, 2019
0 10 20 30 40 50 60 70 80 90 100 110 120
Luxembourg
Netherlands
Belgium
France
United Kingdom
Italy
Ireland
Sweden
Finland
Denmark
Switzerland
Malta
Norway
Hungary
Germany
Iceland
Cyprus
Spain
Austria
Czech Republic
Portugal
Greece
Croatia
Slovenia
Latvia
Estonia
Lithuania
Slovakia
Bulgaria
Poland
Romania
WSR (N/100,000)
*
Figure 3 Breast cancer in females: Age-standardised
incidence (WSR), Belgium 2013-2017
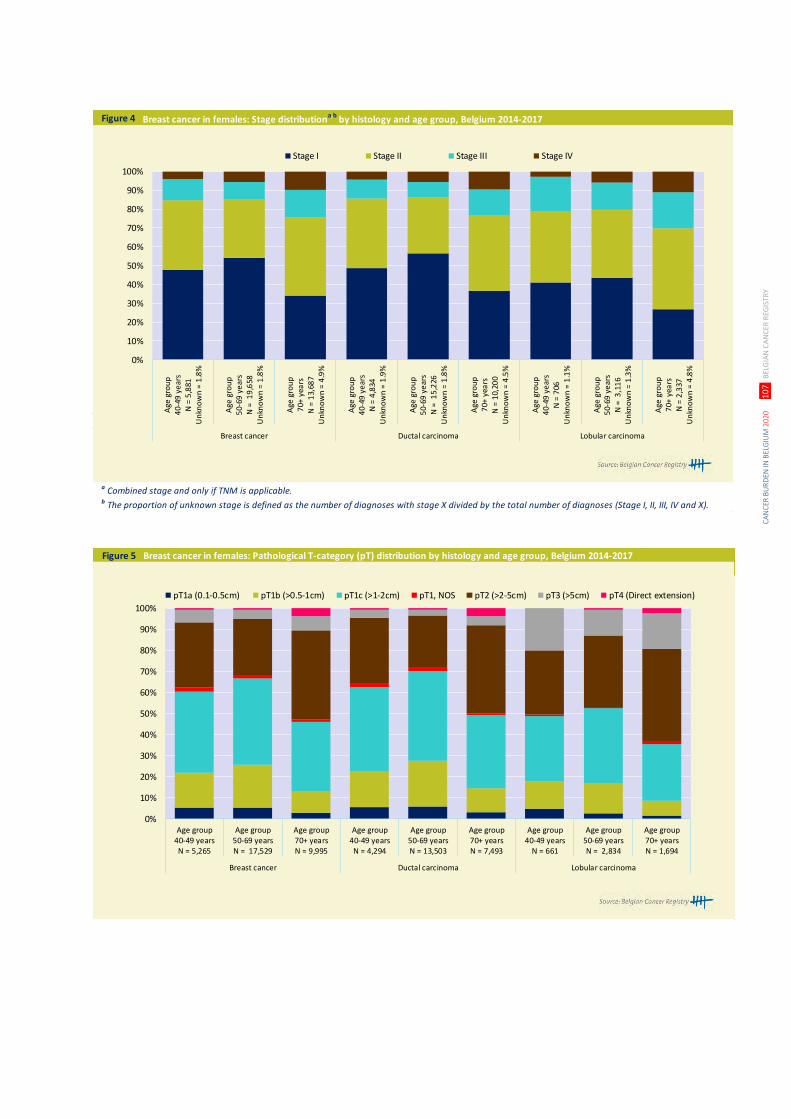
CA
NC
ER B
UR
DEN
IN B
ELG
IUM
202
0
10
7 B
ELG
IAN
CA
NC
ER R
EGIS
TRY
Figure 4 Breast cancer in females: Stage distributiona,b
by histology and age group, Belgium 2014-2017
a Combined stage and only if TNM is applicable. b The proportion of unknown stage is defined as the number of diagnoses with stage X divided by the total number of diagnoses (Stage I, II, III, IV and X).
0%
10%
20%
30%
40%
50%
60%
70%
80%
90%
100%A
ge g
rou
p4
0-49
ye
ars
N =
5,8
81U
nkn
ow
n =
1.8
%
Age
gro
up
50-
69 y
ear
sN
= 1
9,6
58U
nkn
ow
n =
1.8
%
Age
gro
up
70+
yea
rsN
= 1
3,68
7U
nkn
ow
n =
4.9
%
Age
gro
up
40-
49 y
ear
sN
= 4
,834
Un
kno
wn
= 1
.9%
Age
gro
up
50-
69 y
ear
sN
= 1
5,2
26U
nkn
ow
n =
1.8
%
Age
gro
up
70+
yea
rsN
= 1
0,20
0U
nkn
ow
n =
4.5
%
Age
gro
up
40-
49 y
ear
sN
= 7
06U
nkn
ow
n =
1.1
%
Age
gro
up
50-
69 y
ear
sN
= 3
,11
6U
nkn
ow
n =
1.3
%
Age
gro
up
70+
yea
rsN
= 2
,337
Un
kno
wn
= 4
.8%
Breast cancer Ductal carcinoma Lobular carcinoma
Stage I Stage II Stage III Stage IV
Figure 5 Breast cancer in females: Pathological T-category (pT) distribution by histology and age group, Belgium 2014-2017
Figure 4 Breast cancer in females: Stage distribution by histology and age group (only combined stage for stageable tumours), Belgium 2014-2017
0%
10%
20%
30%
40%
50%
60%
70%
80%
90%
100%
Age group40-49 yearsN = 5,265
Age group50-69 yearsN = 17,529
Age group70+ yearsN = 9,995
Age group40-49 yearsN = 4,294
Age group50-69 yearsN = 13,503
Age group70+ yearsN = 7,493
Age group40-49 years
N = 661
Age group50-69 yearsN = 2,834
Age group70+ yearsN = 1,694
Breast cancer Ductal carcinoma Lobular carcinoma
pT1a (0.1-0.5cm) pT1b (>0.5-1cm) pT1c (>1-2cm) pT1, NOS pT2 (>2-5cm) pT3 (>5cm) pT4 (Direct extension)
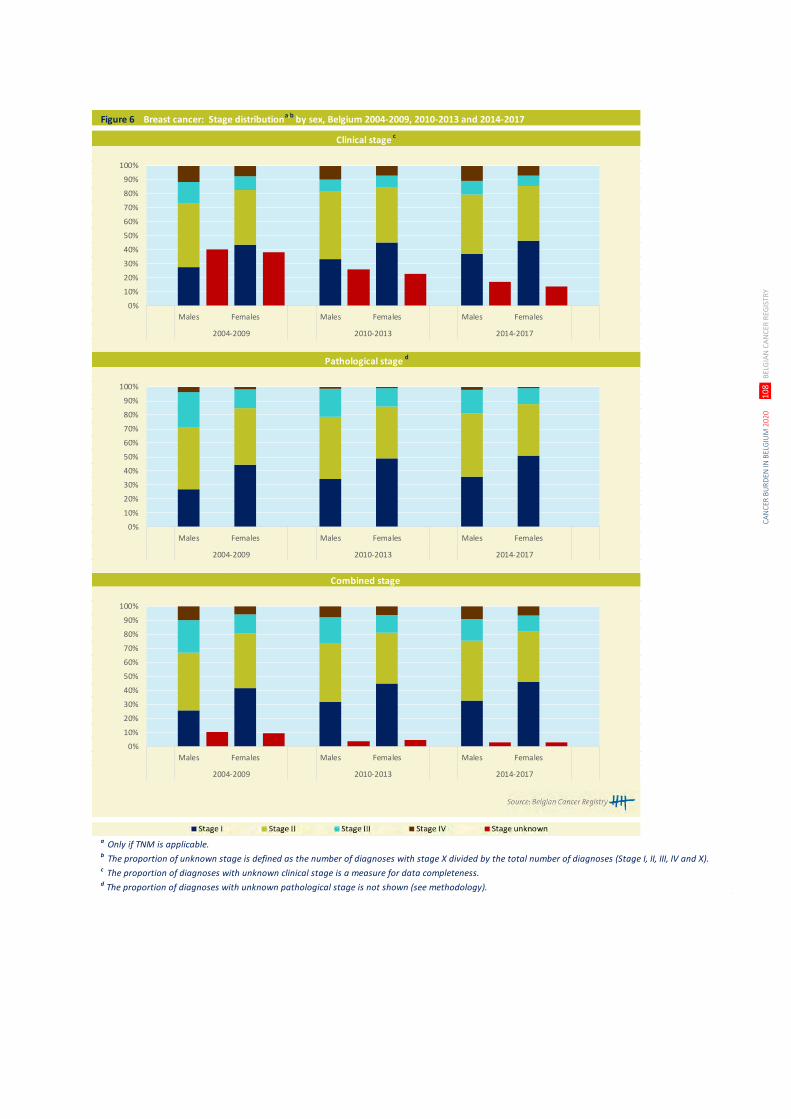
CA
NC
ER B
UR
DEN
IN B
ELG
IUM
202
0
10
8 B
ELG
IAN
CA
NC
ER R
EGIS
TRY
Figure 6 Breast cancer: Stage distributiona,b
by sex, Belgium 2004-2009, 2010-2013 and 2014-2017
a Only if TNM is applicable. b The proportion of unknown stage is defined as the number of diagnoses with stage X divided by the total number of diagnoses (Stage I, II, III, IV and X).c The proportion of diagnoses with unknown clinical stage is a measure for data completeness.d The proportion of diagnoses with unknown pathological stage is not shown (see methodology).
Clinical stage c
Pathological stage d
Combined stage
0%
10%
20%
30%
40%
50%
60%
70%
80%
90%
100%
Males Females Males Females Males Females
2004-2009 2010-2013 2014-2017
0%
10%
20%
30%
40%
50%
60%
70%
80%
90%
100%
Males Females Males Females Males Females
2004-2009 2010-2013 2014-2017
0%
10%
20%
30%
40%
50%
60%
70%
80%
90%
100%
Males Females Males Females Males Females
2004-2009 2010-2013 2014-2017
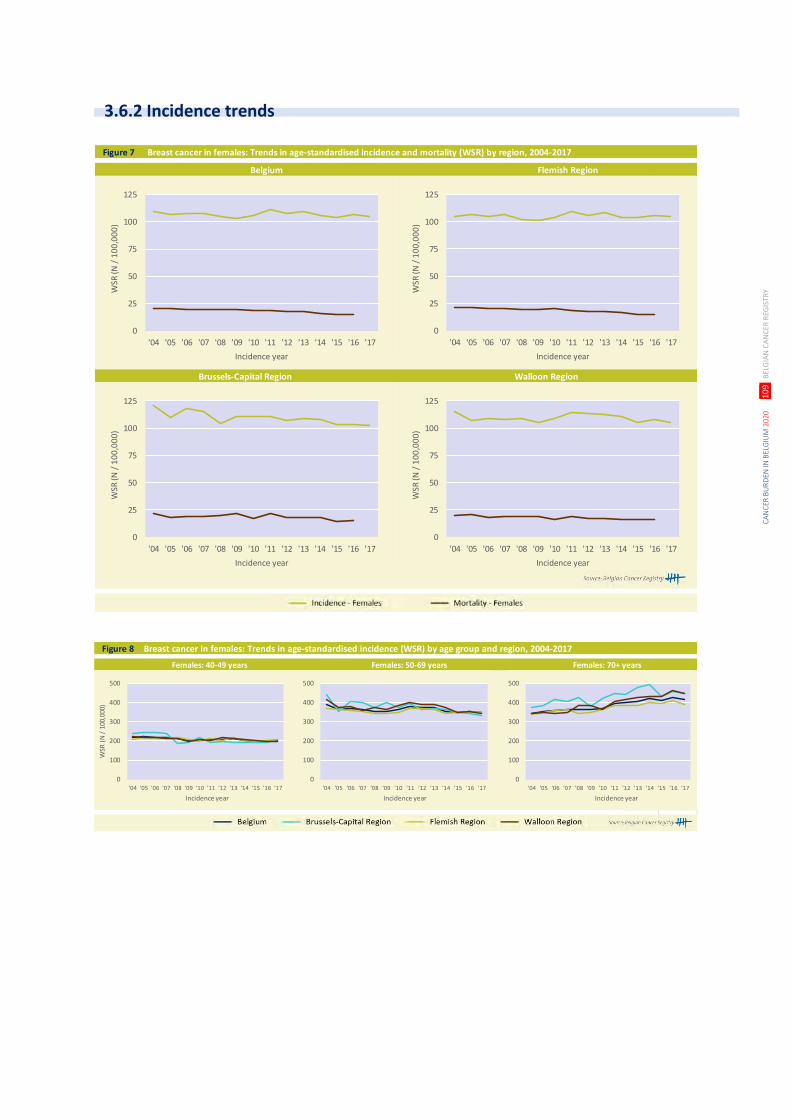
CA
NC
ER B
UR
DEN
IN B
ELG
IUM
202
0
10
9 B
ELG
IAN
CA
NC
ER R
EGIS
TRY
Figure 7 Breast cancer in females: Trends in age-standardised incidence and mortality (WSR) by region, 2004-2017
Brussels-Capital Region Walloon Region
Belgium Flemish Region
0
25
50
75
100
125
'04 '05 '06 '07 '08 '09 '10 '11 '12 '13 '14 '15 '16 '17
WSR
(N /
10
0,0
00
)
Incidence year
0
25
50
75
100
125
'04 '05 '06 '07 '08 '09 '10 '11 '12 '13 '14 '15 '16 '17
WSR
(N /
10
0,0
00
)
Incidence year
0
25
50
75
100
125
'04 '05 '06 '07 '08 '09 '10 '11 '12 '13 '14 '15 '16 '17
WSR
(N /
10
0,0
00
)
Incidence year
0
25
50
75
100
125
'04 '05 '06 '07 '08 '09 '10 '11 '12 '13 '14 '15 '16 '17
WSR
(N /
10
0,0
00
)
Incidence year
Figure 8 Breast cancer in females: Trends in age-standardised incidence (WSR) by age group and region, 2004-2017
Females: 40-49 years Females: 50-69 years Females: 70+ years
0
100
200
300
400
500
'04 '05 '06 '07 '08 '09 '10 '11 '12 '13 '14 '15 '16 '17
WSR
(N
/ 1
00,0
00)
Incidence year
0
100
200
300
400
500
'04 '05 '06 '07 '08 '09 '10 '11 '12 '13 '14 '15 '16 '17
Incidence year
0
100
200
300
400
500
'04 '05 '06 '07 '08 '09 '10 '11 '12 '13 '14 '15 '16 '17
Incidence year
3.6.2 Incidence trends
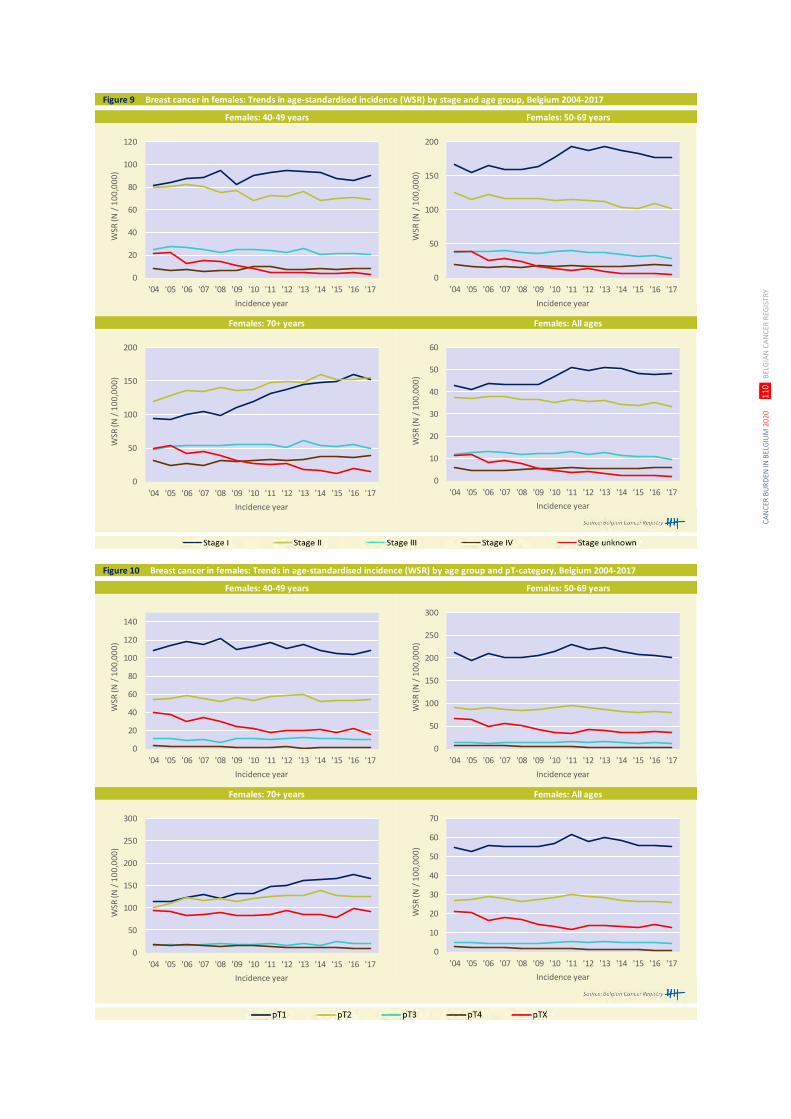
CA
NC
ER B
UR
DEN
IN B
ELG
IUM
202
0
11
0 B
ELG
IAN
CA
NC
ER R
EGIS
TRY
Figure 9 Breast cancer in females: Trends in age-standardised incidence (WSR) by stage and age group, Belgium 2004-2017
Females: 70+ years Females: All ages
Females: 40-49 years Females: 50-69 years
0
20
40
60
80
100
120
'04 '05 '06 '07 '08 '09 '10 '11 '12 '13 '14 '15 '16 '17
WSR
(N /
10
0,0
00
)
Incidence year
0
50
100
150
200
'04 '05 '06 '07 '08 '09 '10 '11 '12 '13 '14 '15 '16 '17
WSR
(N /
10
0,0
00
)
Incidence year
0
50
100
150
200
'04 '05 '06 '07 '08 '09 '10 '11 '12 '13 '14 '15 '16 '17
WSR
(N /
10
0,0
00
)
Incidence year
0
10
20
30
40
50
60
'04 '05 '06 '07 '08 '09 '10 '11 '12 '13 '14 '15 '16 '17
WSR
(N /
10
0,0
00
)
Incidence year
Figure 10 Breast cancer in females: Trends in age-standardised incidence (WSR) by age group and pT-category, Belgium 2004-2017
Females: 40-49 years Females: 50-69 years
Females: 70+ years Females: All ages
0
20
40
60
80
100
120
140
'04 '05 '06 '07 '08 '09 '10 '11 '12 '13 '14 '15 '16 '17
WSR
(N /
10
0,0
00
)
Incidence year
0
50
100
150
200
250
300
'04 '05 '06 '07 '08 '09 '10 '11 '12 '13 '14 '15 '16 '17
WSR
(N /
10
0,0
00
)
Incidence year
0
50
100
150
200
250
300
'04 '05 '06 '07 '08 '09 '10 '11 '12 '13 '14 '15 '16 '17
WSR
(N /
10
0,0
00
)
Incidence year
0
10
20
30
40
50
60
70
'04 '05 '06 '07 '08 '09 '10 '11 '12 '13 '14 '15 '16 '17
WSR
(N /
10
0,0
00
)
Incidence year
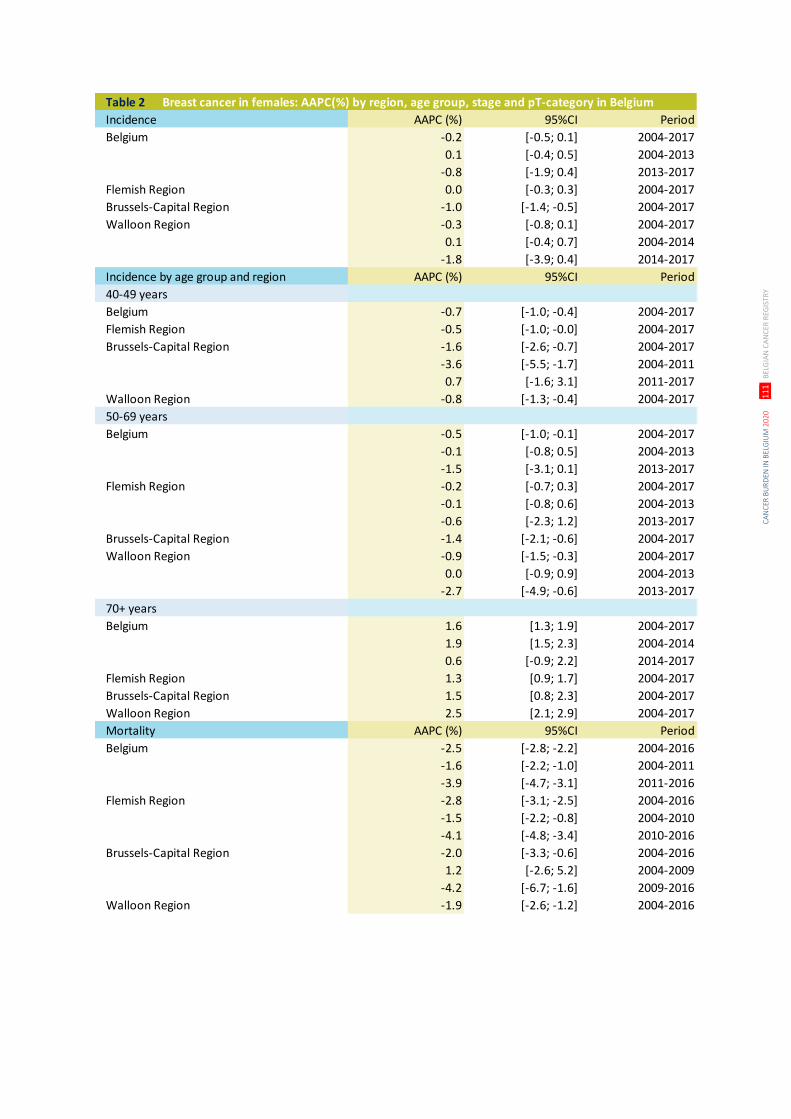
CA
NC
ER B
UR
DEN
IN B
ELG
IUM
202
0
11
1 B
ELG
IAN
CA
NC
ER R
EGIS
TRY
Table 2 Breast cancer in females: AAPC(%) by region, age group, stage and pT-category in Belgium
Incidence AAPC (%) 95%CI Period
Belgium -0.2 [-0.5; 0.1] 2004-2017
0.1 [-0.4; 0.5] 2004-2013
-0.8 [-1.9; 0.4] 2013-2017
Flemish Region 0.0 [-0.3; 0.3] 2004-2017
Brussels-Capital Region -1.0 [-1.4; -0.5] 2004-2017
Walloon Region -0.3 [-0.8; 0.1] 2004-2017
0.1 [-0.4; 0.7] 2004-2014
-1.8 [-3.9; 0.4] 2014-2017
Incidence by age group and region AAPC (%) 95%CI Period
40-49 years
Belgium -0.7 [-1.0; -0.4] 2004-2017
Flemish Region -0.5 [-1.0; -0.0] 2004-2017
Brussels-Capital Region -1.6 [-2.6; -0.7] 2004-2017
-3.6 [-5.5; -1.7] 2004-2011
0.7 [-1.6; 3.1] 2011-2017
Walloon Region -0.8 [-1.3; -0.4] 2004-2017
50-69 years
Belgium -0.5 [-1.0; -0.1] 2004-2017
-0.1 [-0.8; 0.5] 2004-2013
-1.5 [-3.1; 0.1] 2013-2017
Flemish Region -0.2 [-0.7; 0.3] 2004-2017
-0.1 [-0.8; 0.6] 2004-2013
-0.6 [-2.3; 1.2] 2013-2017
Brussels-Capital Region -1.4 [-2.1; -0.6] 2004-2017
Walloon Region -0.9 [-1.5; -0.3] 2004-2017
0.0 [-0.9; 0.9] 2004-2013
-2.7 [-4.9; -0.6] 2013-2017
70+ years
Belgium 1.6 [1.3; 1.9] 2004-2017
1.9 [1.5; 2.3] 2004-2014
0.6 [-0.9; 2.2] 2014-2017
Flemish Region 1.3 [0.9; 1.7] 2004-2017
Brussels-Capital Region 1.5 [0.8; 2.3] 2004-2017
Walloon Region 2.5 [2.1; 2.9] 2004-2017
Mortality AAPC (%) 95%CI Period
Belgium -2.5 [-2.8; -2.2] 2004-2016
-1.6 [-2.2; -1.0] 2004-2011
-3.9 [-4.7; -3.1] 2011-2016
Flemish Region -2.8 [-3.1; -2.5] 2004-2016
-1.5 [-2.2; -0.8] 2004-2010
-4.1 [-4.8; -3.4] 2010-2016
Brussels-Capital Region -2.0 [-3.3; -0.6] 2004-2016
1.2 [-2.6; 5.2] 2004-2009
-4.2 [-6.7; -1.6] 2009-2016
Walloon Region -1.9 [-2.6; -1.2] 2004-2016
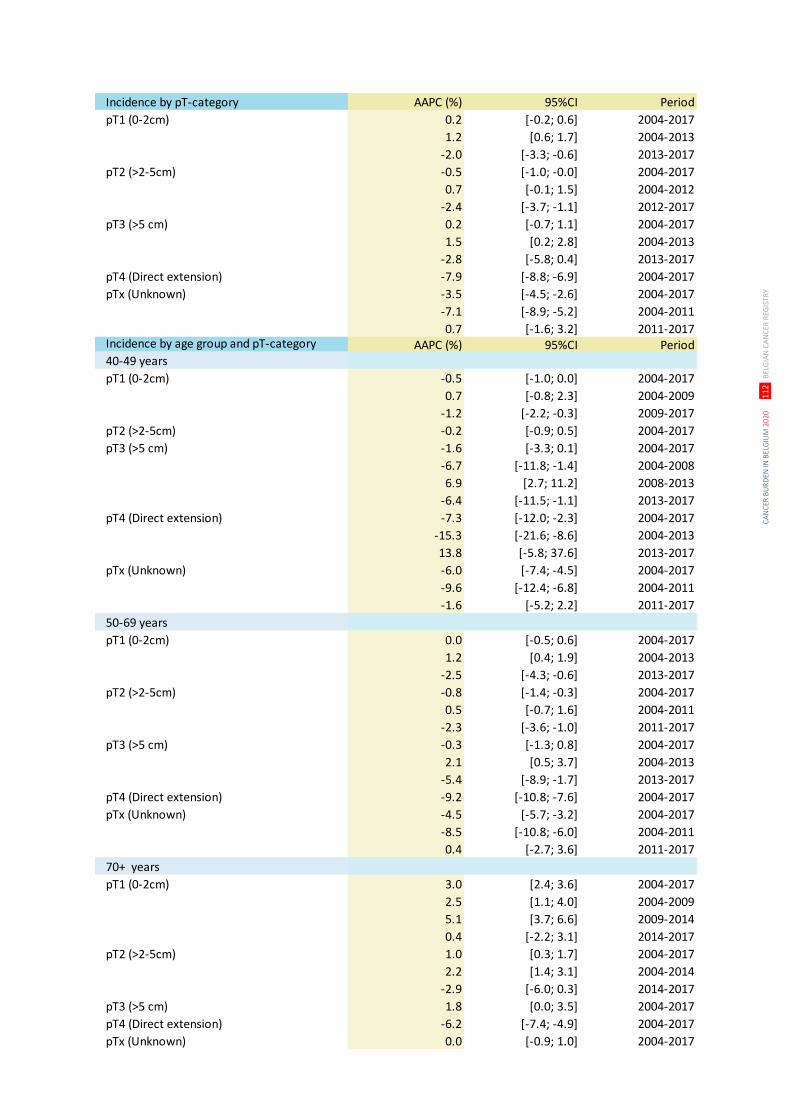
CA
NC
ER B
UR
DEN
IN B
ELG
IUM
202
0
11
2 B
ELG
IAN
CA
NC
ER R
EGIS
TRY
Incidence by pT-category AAPC (%) 95%CI Period
pT1 (0-2cm) 0.2 [-0.2; 0.6] 2004-2017
1.2 [0.6; 1.7] 2004-2013
-2.0 [-3.3; -0.6] 2013-2017
pT2 (>2-5cm) -0.5 [-1.0; -0.0] 2004-2017
0.7 [-0.1; 1.5] 2004-2012
-2.4 [-3.7; -1.1] 2012-2017
pT3 (>5 cm) 0.2 [-0.7; 1.1] 2004-2017
1.5 [0.2; 2.8] 2004-2013
-2.8 [-5.8; 0.4] 2013-2017
pT4 (Direct extension) -7.9 [-8.8; -6.9] 2004-2017
pTx (Unknown) -3.5 [-4.5; -2.6] 2004-2017
-7.1 [-8.9; -5.2] 2004-2011
0.7 [-1.6; 3.2] 2011-2017Incidence by age group and pT-category AAPC (%) 95%CI Period40-49 years
pT1 (0-2cm) -0.5 [-1.0; 0.0] 2004-2017
0.7 [-0.8; 2.3] 2004-2009
-1.2 [-2.2; -0.3] 2009-2017
pT2 (>2-5cm) -0.2 [-0.9; 0.5] 2004-2017
pT3 (>5 cm) -1.6 [-3.3; 0.1] 2004-2017
-6.7 [-11.8; -1.4] 2004-2008
6.9 [2.7; 11.2] 2008-2013
-6.4 [-11.5; -1.1] 2013-2017
pT4 (Direct extension) -7.3 [-12.0; -2.3] 2004-2017
-15.3 [-21.6; -8.6] 2004-2013
13.8 [-5.8; 37.6] 2013-2017
pTx (Unknown) -6.0 [-7.4; -4.5] 2004-2017
-9.6 [-12.4; -6.8] 2004-2011
-1.6 [-5.2; 2.2] 2011-2017
50-69 years
pT1 (0-2cm) 0.0 [-0.5; 0.6] 2004-2017
1.2 [0.4; 1.9] 2004-2013
-2.5 [-4.3; -0.6] 2013-2017
pT2 (>2-5cm) -0.8 [-1.4; -0.3] 2004-2017
0.5 [-0.7; 1.6] 2004-2011
-2.3 [-3.6; -1.0] 2011-2017
pT3 (>5 cm) -0.3 [-1.3; 0.8] 2004-2017
2.1 [0.5; 3.7] 2004-2013
-5.4 [-8.9; -1.7] 2013-2017
pT4 (Direct extension) -9.2 [-10.8; -7.6] 2004-2017
pTx (Unknown) -4.5 [-5.7; -3.2] 2004-2017
-8.5 [-10.8; -6.0] 2004-2011
0.4 [-2.7; 3.6] 2011-2017
70+ years
pT1 (0-2cm) 3.0 [2.4; 3.6] 2004-2017
2.5 [1.1; 4.0] 2004-2009
5.1 [3.7; 6.6] 2009-2014
0.4 [-2.2; 3.1] 2014-2017
pT2 (>2-5cm) 1.0 [0.3; 1.7] 2004-2017
2.2 [1.4; 3.1] 2004-2014
-2.9 [-6.0; 0.3] 2014-2017
pT3 (>5 cm) 1.8 [0.0; 3.5] 2004-2017
pT4 (Direct extension) -6.2 [-7.4; -4.9] 2004-2017
pTx (Unknown) 0.0 [-0.9; 1.0] 2004-2017
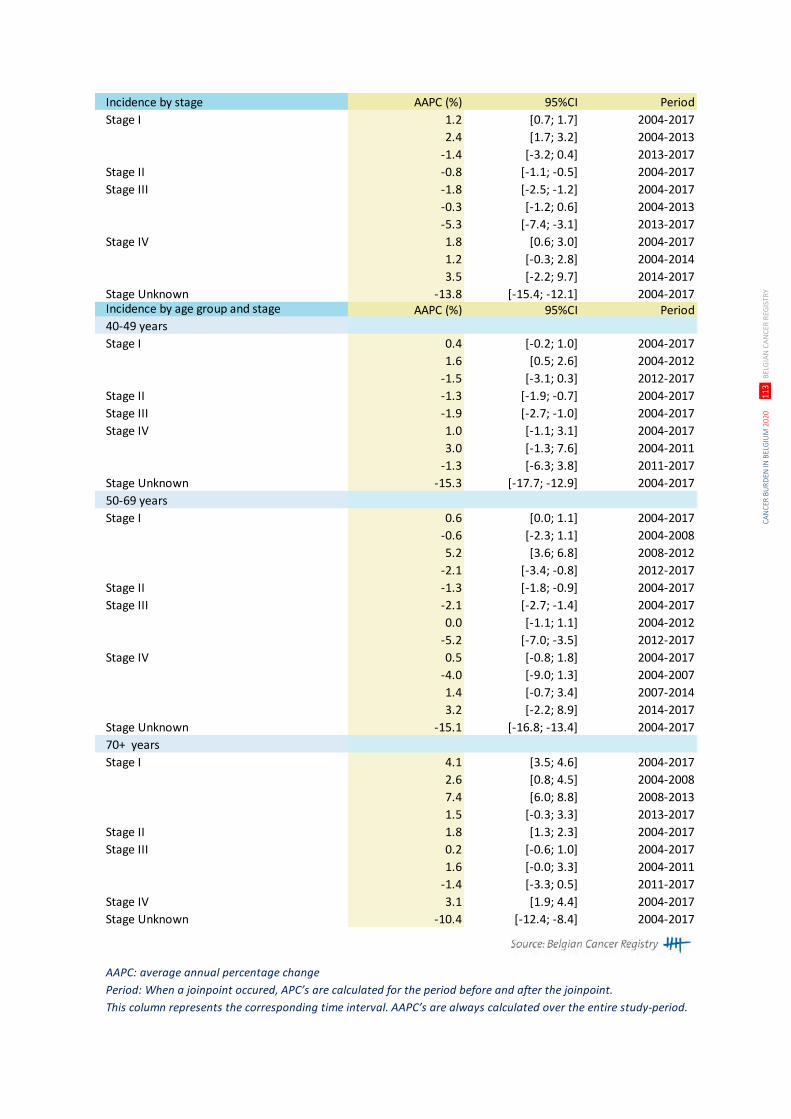
CA
NC
ER B
UR
DEN
IN B
ELG
IUM
202
0
11
3 B
ELG
IAN
CA
NC
ER R
EGIS
TRY
Incidence by stage AAPC (%) 95%CI Period
Stage I 1.2 [0.7; 1.7] 2004-2017
2.4 [1.7; 3.2] 2004-2013
-1.4 [-3.2; 0.4] 2013-2017
Stage II -0.8 [-1.1; -0.5] 2004-2017
Stage III -1.8 [-2.5; -1.2] 2004-2017
-0.3 [-1.2; 0.6] 2004-2013
-5.3 [-7.4; -3.1] 2013-2017
Stage IV 1.8 [0.6; 3.0] 2004-2017
1.2 [-0.3; 2.8] 2004-2014
3.5 [-2.2; 9.7] 2014-2017
Stage Unknown -13.8 [-15.4; -12.1] 2004-2017Incidence by age group and stage AAPC (%) 95%CI Period40-49 years
Stage I 0.4 [-0.2; 1.0] 2004-2017
1.6 [0.5; 2.6] 2004-2012
-1.5 [-3.1; 0.3] 2012-2017
Stage II -1.3 [-1.9; -0.7] 2004-2017
Stage III -1.9 [-2.7; -1.0] 2004-2017
Stage IV 1.0 [-1.1; 3.1] 2004-2017
3.0 [-1.3; 7.6] 2004-2011
-1.3 [-6.3; 3.8] 2011-2017
Stage Unknown -15.3 [-17.7; -12.9] 2004-2017
50-69 years
Stage I 0.6 [0.0; 1.1] 2004-2017
-0.6 [-2.3; 1.1] 2004-2008
5.2 [3.6; 6.8] 2008-2012
-2.1 [-3.4; -0.8] 2012-2017
Stage II -1.3 [-1.8; -0.9] 2004-2017
Stage III -2.1 [-2.7; -1.4] 2004-2017
0.0 [-1.1; 1.1] 2004-2012
-5.2 [-7.0; -3.5] 2012-2017
Stage IV 0.5 [-0.8; 1.8] 2004-2017
-4.0 [-9.0; 1.3] 2004-2007
1.4 [-0.7; 3.4] 2007-2014
3.2 [-2.2; 8.9] 2014-2017
Stage Unknown -15.1 [-16.8; -13.4] 2004-2017
70+ years
Stage I 4.1 [3.5; 4.6] 2004-2017
2.6 [0.8; 4.5] 2004-2008
7.4 [6.0; 8.8] 2008-2013
1.5 [-0.3; 3.3] 2013-2017
Stage II 1.8 [1.3; 2.3] 2004-2017
Stage III 0.2 [-0.6; 1.0] 2004-2017
1.6 [-0.0; 3.3] 2004-2011
-1.4 [-3.3; 0.5] 2011-2017
Stage IV 3.1 [1.9; 4.4] 2004-2017
Stage Unknown -10.4 [-12.4; -8.4] 2004-2017
AAPC: average annual percentage change
Period: When a joinpoint occured, APC’s are calculated for the period before and after the joinpoint.
This column represents the corresponding time interval. AAPC’s are always calculated over the entire study-period.
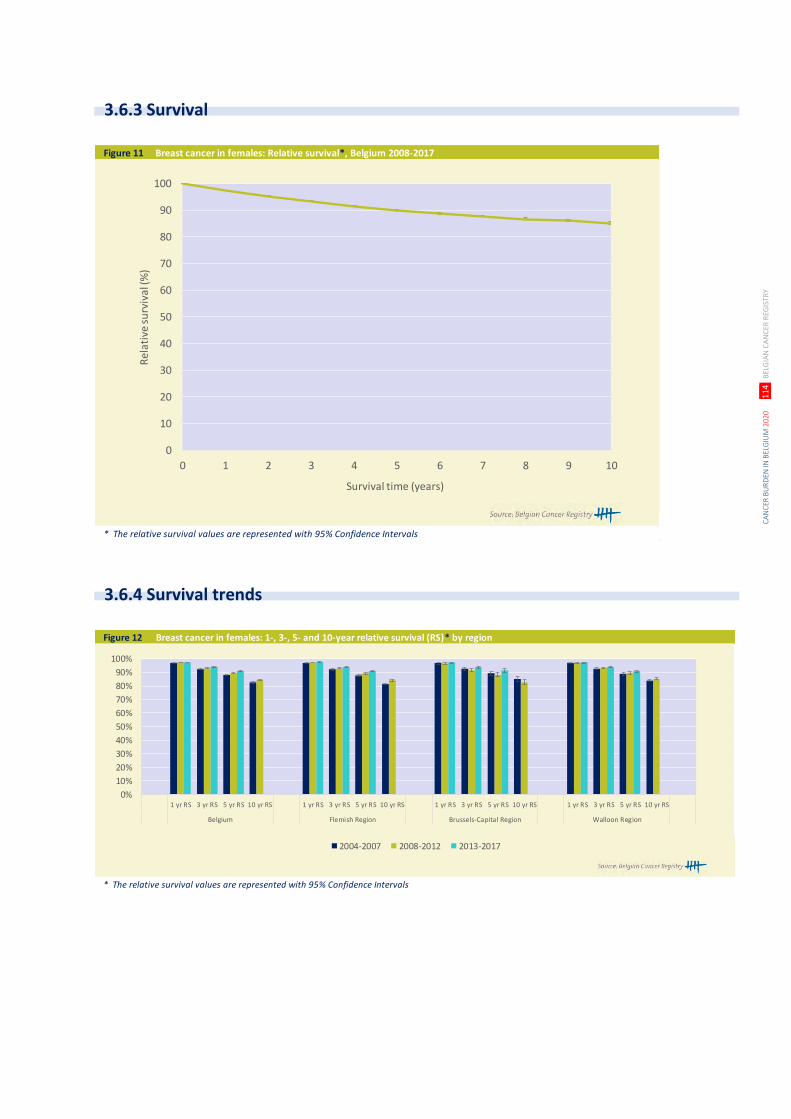
CA
NC
ER B
UR
DEN
IN B
ELG
IUM
202
0
11
4 B
ELG
IAN
CA
NC
ER R
EGIS
TRY
Figure 11 Breast cancer in females: Relative survival*, Belgium 2008-2017
* The relative survival values are represented with 95% Confidence Intervals
0
10
20
30
40
50
60
70
80
90
100
0 1 2 3 4 5 6 7 8 9 10
Rel
ativ
e su
rviv
al (%
)
Survival time (years)
Figure 12 Breast cancer in females: 1-, 3-, 5- and 10-year relative survival (RS)* by region
* The relative survival values are represented with 95% Confidence Intervals
0%
10%
20%
30%
40%
50%
60%
70%
80%
90%
100%
1 yr RS 3 yr RS 5 yr RS 10 yr RS 1 yr RS 3 yr RS 5 yr RS 10 yr RS 1 yr RS 3 yr RS 5 yr RS 10 yr RS 1 yr RS 3 yr RS 5 yr RS 10 yr RS
Belgium Flemish Region Brussels-Capital Region Walloon Region
2004-2007 2008-2012 2013-2017
3.6.3 Survival
3.6.4 Survival trends
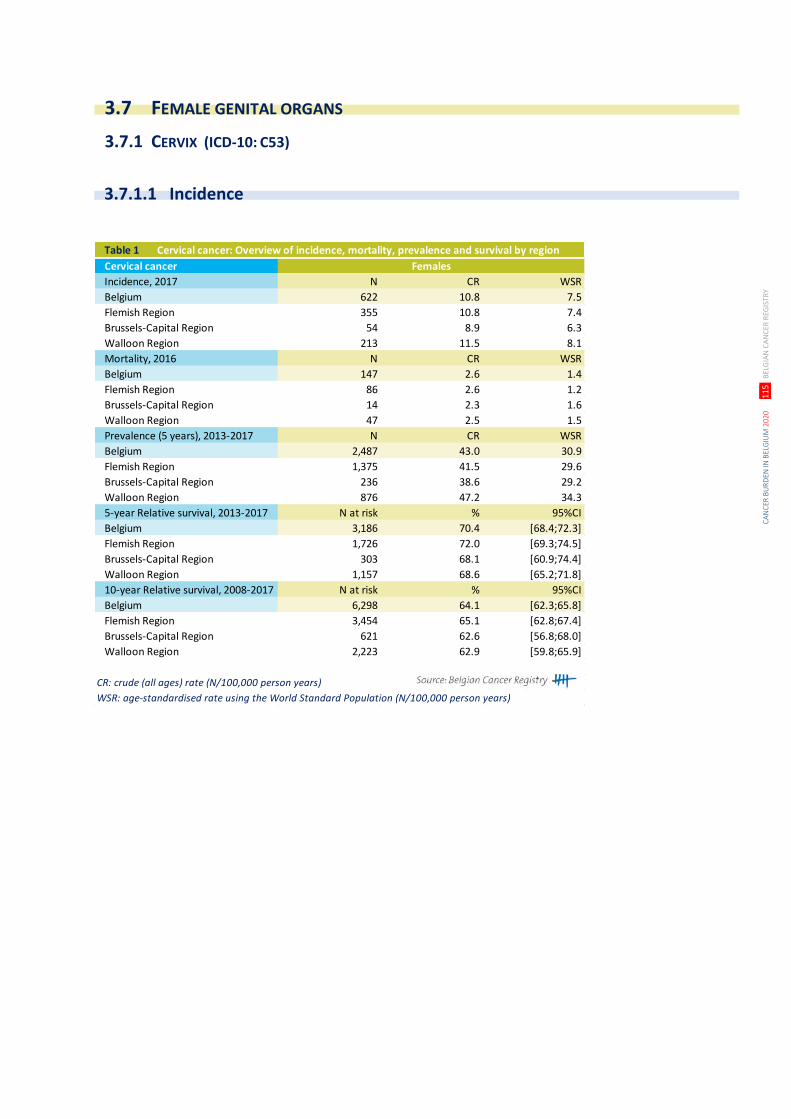
CA
NC
ER B
UR
DEN
IN B
ELG
IUM
202
0
11
5 B
ELG
IAN
CA
NC
ER R
EGIS
TRY
Table 1 Cervical cancer: Overview of incidence, mortality, prevalence and survival by region
Cervical cancer Females
Incidence, 2017 N CR WSR
Belgium 622 10.8 7.5
Flemish Region 355 10.8 7.4
Brussels-Capital Region 54 8.9 6.3
Walloon Region 213 11.5 8.1
Mortality, 2016 N CR WSR
Belgium 147 2.6 1.4
Flemish Region 86 2.6 1.2
Brussels-Capital Region 14 2.3 1.6
Walloon Region 47 2.5 1.5
Prevalence (5 years), 2013-2017 N CR WSR
Belgium 2,487 43.0 30.9
Flemish Region 1,375 41.5 29.6
Brussels-Capital Region 236 38.6 29.2
Walloon Region 876 47.2 34.3
5-year Relative survival, 2013-2017 N at risk % 95%CI
Belgium 3,186 70.4 [68.4;72.3]
Flemish Region 1,726 72.0 [69.3;74.5]
Brussels-Capital Region 303 68.1 [60.9;74.4]
Walloon Region 1,157 68.6 [65.2;71.8]
10-year Relative survival, 2008-2017 N at risk % 95%CI
Belgium 6,298 64.1 [62.3;65.8]
Flemish Region 3,454 65.1 [62.8;67.4]
Brussels-Capital Region 621 62.6 [56.8;68.0]
Walloon Region 2,223 62.9 [59.8;65.9]
CR: crude (all ages) rate (N/100,000 person years)
WSR: age-standardised rate using the World Standard Population (N/100,000 person years)
3.7 FEMALE GENITAL ORGANS
3.7.1 CERVIX (ICD-10: C53)
3.7.1.1 Incidence
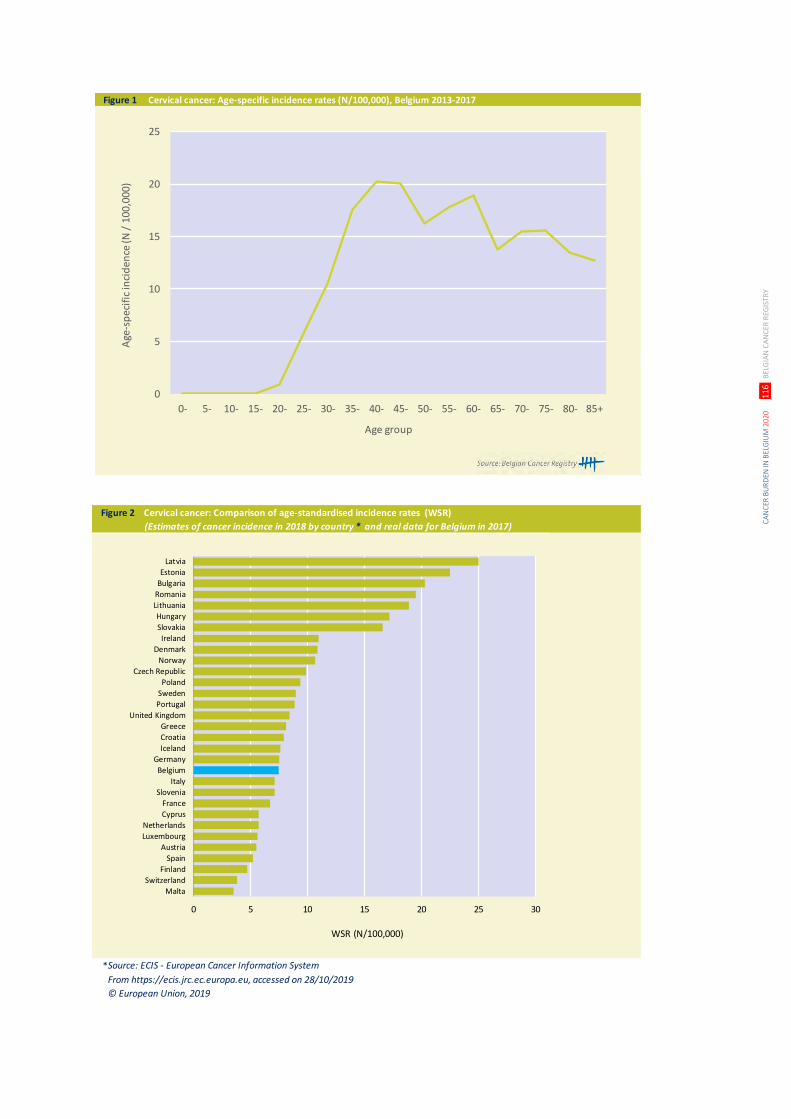
CA
NC
ER B
UR
DEN
IN B
ELG
IUM
202
0
11
6 B
ELG
IAN
CA
NC
ER R
EGIS
TRY
Figure 1 Cervical cancer: Age-specific incidence rates (N/100,000), Belgium 2013-2017
0
5
10
15
20
25
0- 5- 10- 15- 20- 25- 30- 35- 40- 45- 50- 55- 60- 65- 70- 75- 80- 85+
Age
-sp
ecif
ic in
cid
ence
(N /
100
,000
)
Age group
Figure 2 Cervical cancer: Comparison of age-standardised incidence rates (WSR)
(Estimates of cancer incidence in 2018 by country * and real data for Belgium in 2017)
Source: ECIS - European Cancer Information System
From https://ecis.jrc.ec.europa.eu, accessed on 28/10/2019
© European Union, 2019
0 5 10 15 20 25 30
Latvia
Estonia
Bulgaria
Romania
Lithuania
Hungary
Slovakia
Ireland
Denmark
Norway
Czech Republic
Poland
Sweden
Portugal
United Kingdom
Greece
Croatia
Iceland
Germany
Belgium
Italy
Slovenia
France
Cyprus
Netherlands
Luxembourg
Austria
Spain
Finland
Switzerland
Malta
WSR (N/100,000)
*
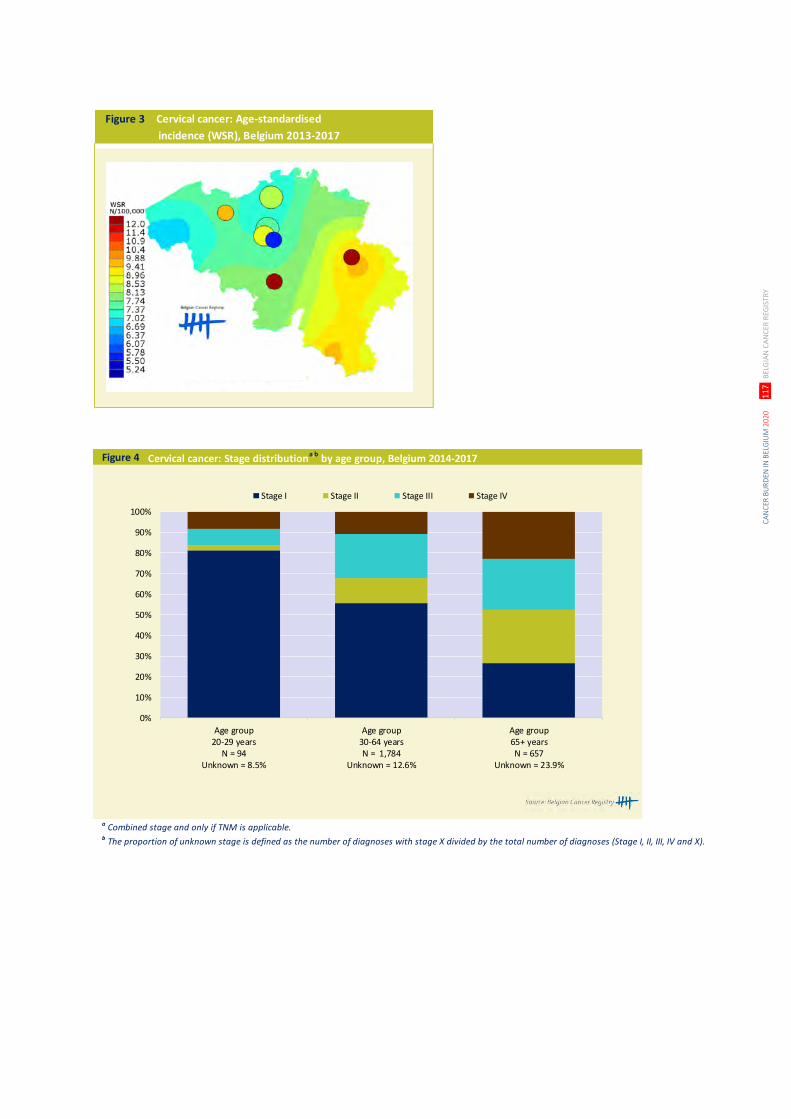
CA
NC
ER B
UR
DEN
IN B
ELG
IUM
202
0
11
7 B
ELG
IAN
CA
NC
ER R
EGIS
TRY
Figure 3 Cervical cancer: Age-standardised
incidence (WSR), Belgium 2013-2017
Figure 4 Cervical cancer: Stage distributiona,b
by age group, Belgium 2014-2017
a Combined stage and only if TNM is applicable. b The proportion of unknown stage is defined as the number of diagnoses with stage X divided by the total number of diagnoses (Stage I, II, III, IV and X).
0%
10%
20%
30%
40%
50%
60%
70%
80%
90%
100%
Age group20-29 years
N = 94Unknown = 8.5%
Age group30-64 yearsN = 1,784
Unknown = 12.6%
Age group65+ yearsN = 657
Unknown = 23.9%
Stage I Stage II Stage III Stage IV
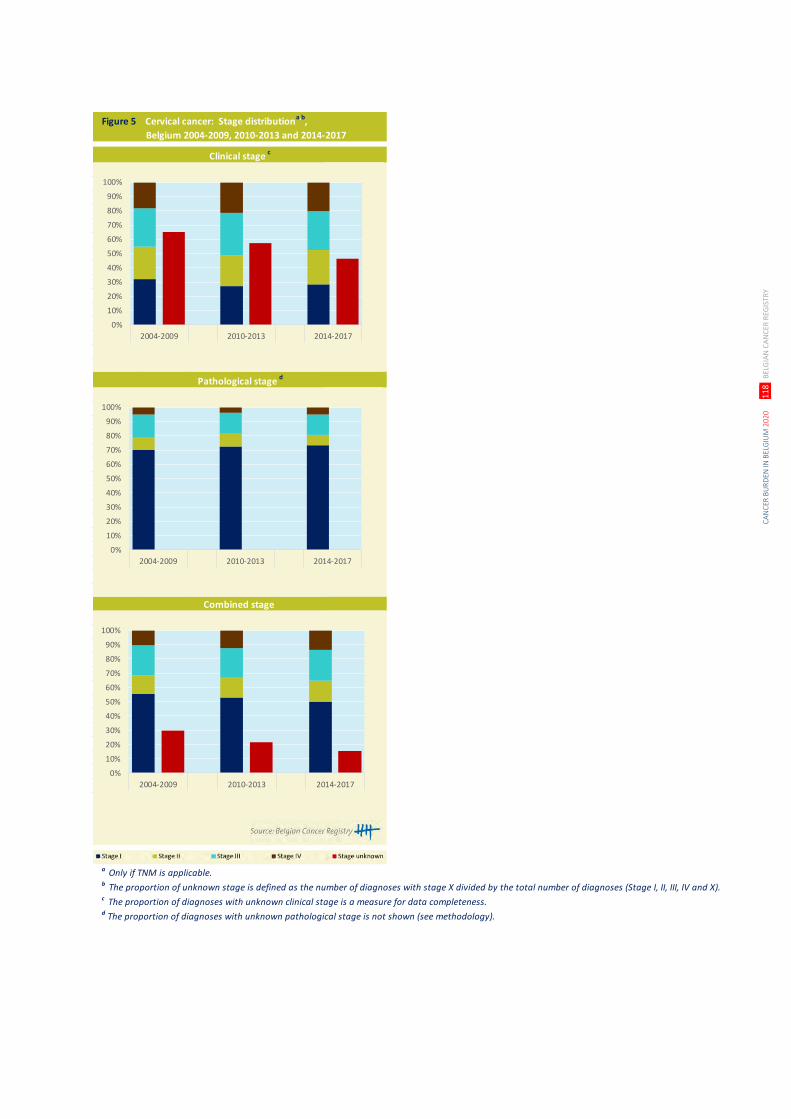
CA
NC
ER B
UR
DEN
IN B
ELG
IUM
202
0
11
8 B
ELG
IAN
CA
NC
ER R
EGIS
TRY
Figure 5 Cervical cancer: Stage distributiona,b,
Belgium 2004-2009, 2010-2013 and 2014-2017
a Only if TNM is applicable. b The proportion of unknown stage is defined as the number of diagnoses with stage X divided by the total number of diagnoses (Stage I, II, III, IV and X).c The proportion of diagnoses with unknown clinical stage is a measure for data completeness.d The proportion of diagnoses with unknown pathological stage is not shown (see methodology).
Clinical stage c
Pathological stage d
Combined stage
0%
10%
20%
30%
40%
50%
60%
70%
80%
90%
100%
2004-2009 2010-2013 2014-2017
0%
10%
20%
30%
40%
50%
60%
70%
80%
90%
100%
2004-2009 2010-2013 2014-2017
0%
10%
20%
30%
40%
50%
60%
70%
80%
90%
100%
2004-2009 2010-2013 2014-2017
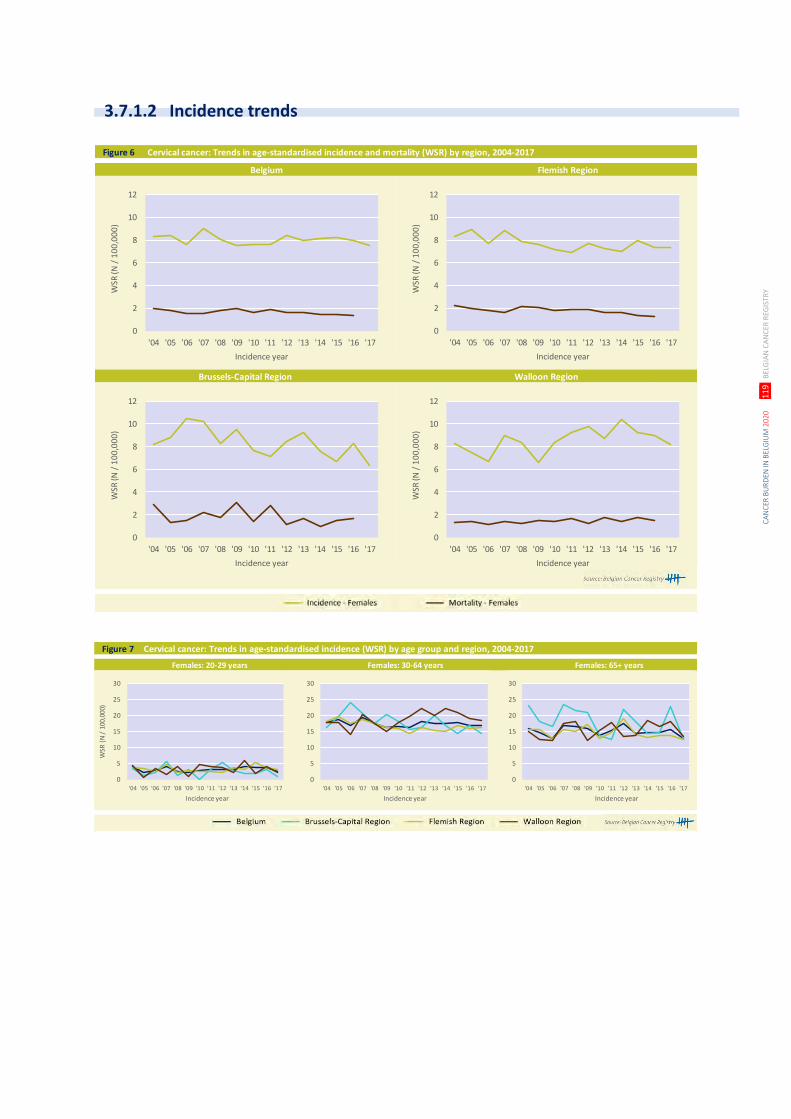
CA
NC
ER B
UR
DEN
IN B
ELG
IUM
202
0
11
9 B
ELG
IAN
CA
NC
ER R
EGIS
TRY
Figure 6 Cervical cancer: Trends in age-standardised incidence and mortality (WSR) by region, 2004-2017
Brussels-Capital Region Walloon Region
Belgium Flemish Region
0
2
4
6
8
10
12
'04 '05 '06 '07 '08 '09 '10 '11 '12 '13 '14 '15 '16 '17
WSR
(N /
10
0,0
00
)
Incidence year
0
2
4
6
8
10
12
'04 '05 '06 '07 '08 '09 '10 '11 '12 '13 '14 '15 '16 '17
WSR
(N /
10
0,0
00
)
Incidence year
0
2
4
6
8
10
12
'04 '05 '06 '07 '08 '09 '10 '11 '12 '13 '14 '15 '16 '17
WSR
(N /
10
0,0
00
)
Incidence year
0
2
4
6
8
10
12
'04 '05 '06 '07 '08 '09 '10 '11 '12 '13 '14 '15 '16 '17
WSR
(N /
10
0,0
00
)
Incidence year
Figure 7 Cervical cancer: Trends in age-standardised incidence (WSR) by age group and region, 2004-2017
Females: 20-29 years Females: 30-64 years Females: 65+ years
0
5
10
15
20
25
30
'04 '05 '06 '07 '08 '09 '10 '11 '12 '13 '14 '15 '16 '17
WSR
(N
/ 1
00,0
00)
Incidence year
0
5
10
15
20
25
30
'04 '05 '06 '07 '08 '09 '10 '11 '12 '13 '14 '15 '16 '17
Incidence year
0
5
10
15
20
25
30
'04 '05 '06 '07 '08 '09 '10 '11 '12 '13 '14 '15 '16 '17
Incidence year
3.7.1.2 Incidence trends
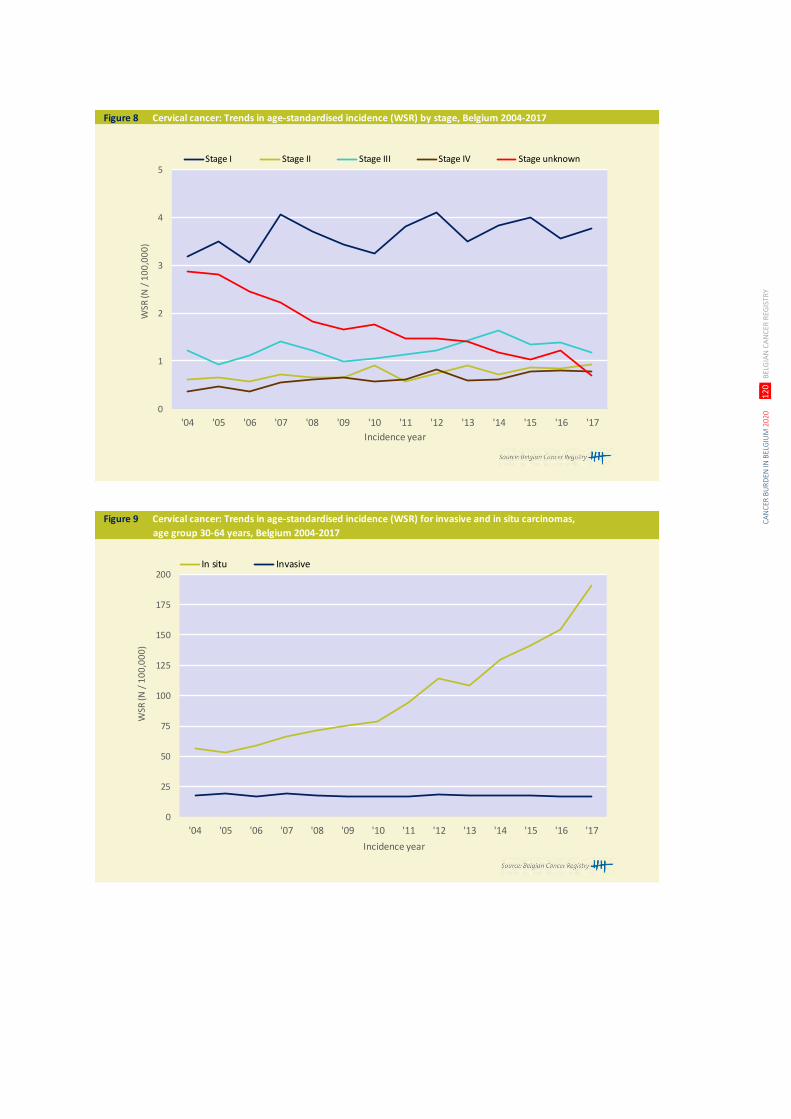
CA
NC
ER B
UR
DEN
IN B
ELG
IUM
202
0
12
0 B
ELG
IAN
CA
NC
ER R
EGIS
TRY
Figure 8 Cervical cancer: Trends in age-standardised incidence (WSR) by stage, Belgium 2004-2017
0
1
2
3
4
5
'04 '05 '06 '07 '08 '09 '10 '11 '12 '13 '14 '15 '16 '17
WSR
(N /
10
0,0
00
)
Incidence year
Stage I Stage II Stage III Stage IV Stage unknown
Figure 9 Cervical cancer: Trends in age-standardised incidence (WSR) for invasive and in situ carcinomas,
age group 30-64 years, Belgium 2004-2017
0
25
50
75
100
125
150
175
200
'04 '05 '06 '07 '08 '09 '10 '11 '12 '13 '14 '15 '16 '17
WSR
(N /
10
0,0
00
)
Incidence year
In situ Invasive
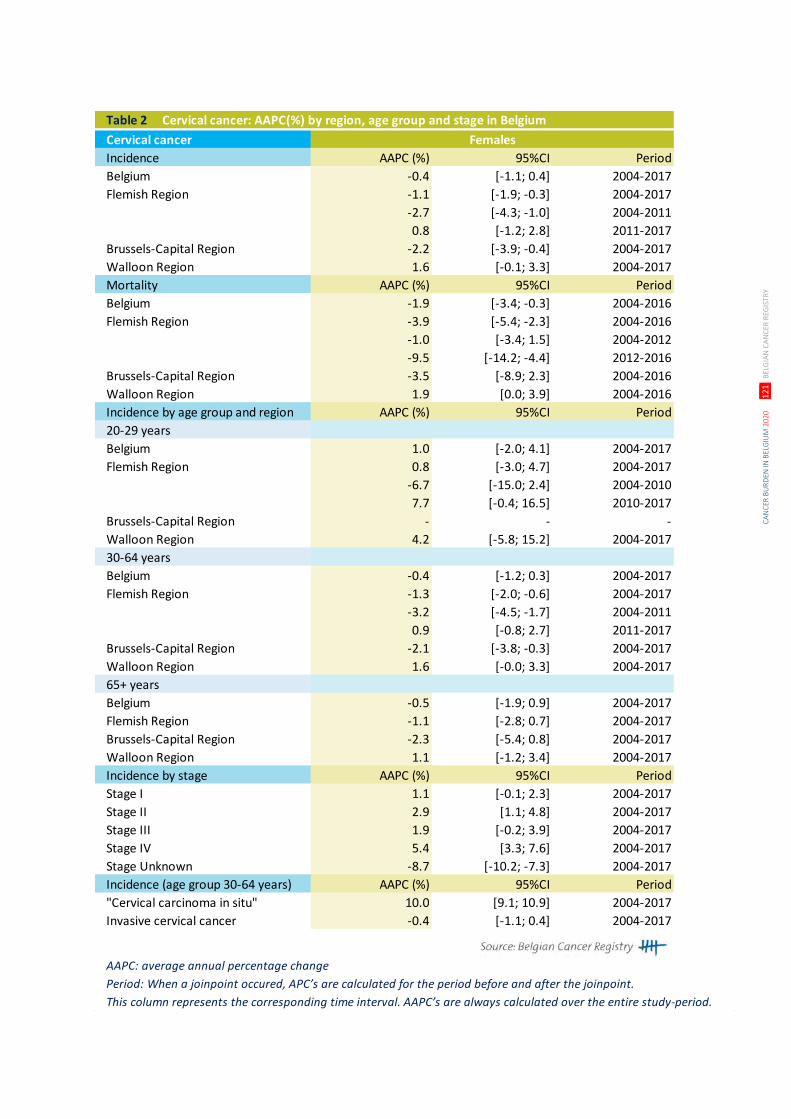
CA
NC
ER B
UR
DEN
IN B
ELG
IUM
202
0
12
1 B
ELG
IAN
CA
NC
ER R
EGIS
TRY
Table 2 Cervical cancer: AAPC(%) by region, age group and stage in Belgium
Cervical cancer Females
Incidence AAPC (%) 95%CI Period
Belgium -0.4 [-1.1; 0.4] 2004-2017
Flemish Region -1.1 [-1.9; -0.3] 2004-2017
-2.7 [-4.3; -1.0] 2004-2011
0.8 [-1.2; 2.8] 2011-2017
Brussels-Capital Region -2.2 [-3.9; -0.4] 2004-2017
Walloon Region 1.6 [-0.1; 3.3] 2004-2017
Mortality AAPC (%) 95%CI Period
Belgium -1.9 [-3.4; -0.3] 2004-2016
Flemish Region -3.9 [-5.4; -2.3] 2004-2016
-1.0 [-3.4; 1.5] 2004-2012
-9.5 [-14.2; -4.4] 2012-2016
Brussels-Capital Region -3.5 [-8.9; 2.3] 2004-2016
Walloon Region 1.9 [0.0; 3.9] 2004-2016
Incidence by age group and region AAPC (%) 95%CI Period
20-29 years
Belgium 1.0 [-2.0; 4.1] 2004-2017
Flemish Region 0.8 [-3.0; 4.7] 2004-2017
-6.7 [-15.0; 2.4] 2004-2010
7.7 [-0.4; 16.5] 2010-2017
Brussels-Capital Region - - -
Walloon Region 4.2 [-5.8; 15.2] 2004-2017
30-64 years
Belgium -0.4 [-1.2; 0.3] 2004-2017
Flemish Region -1.3 [-2.0; -0.6] 2004-2017
-3.2 [-4.5; -1.7] 2004-2011
0.9 [-0.8; 2.7] 2011-2017
Brussels-Capital Region -2.1 [-3.8; -0.3] 2004-2017
Walloon Region 1.6 [-0.0; 3.3] 2004-2017
65+ years
Belgium -0.5 [-1.9; 0.9] 2004-2017
Flemish Region -1.1 [-2.8; 0.7] 2004-2017
Brussels-Capital Region -2.3 [-5.4; 0.8] 2004-2017
Walloon Region 1.1 [-1.2; 3.4] 2004-2017
Incidence by stage AAPC (%) 95%CI Period
Stage I 1.1 [-0.1; 2.3] 2004-2017
Stage II 2.9 [1.1; 4.8] 2004-2017
Stage III 1.9 [-0.2; 3.9] 2004-2017
Stage IV 5.4 [3.3; 7.6] 2004-2017
Stage Unknown -8.7 [-10.2; -7.3] 2004-2017
Incidence (age group 30-64 years) AAPC (%) 95%CI Period
"Cervical carcinoma in situ" 10.0 [9.1; 10.9] 2004-2017
Invasive cervical cancer -0.4 [-1.1; 0.4] 2004-2017
AAPC: average annual percentage change
Period: When a joinpoint occured, APC’s are calculated for the period before and after the joinpoint.
This column represents the corresponding time interval. AAPC’s are always calculated over the entire study-period.
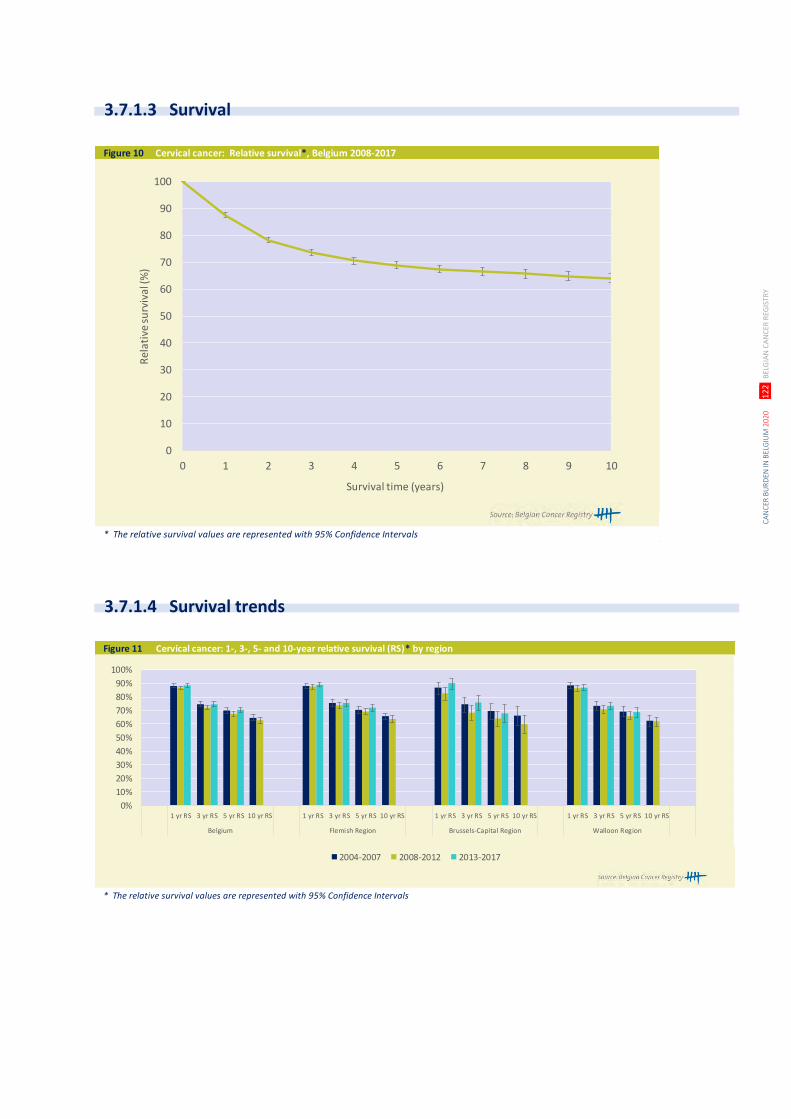
CA
NC
ER B
UR
DEN
IN B
ELG
IUM
202
0
12
2 B
ELG
IAN
CA
NC
ER R
EGIS
TRY
Figure 10 Cervical cancer: Relative survival*, Belgium 2008-2017
* The relative survival values are represented with 95% Confidence Intervals
0
10
20
30
40
50
60
70
80
90
100
0 1 2 3 4 5 6 7 8 9 10
Rel
ativ
e su
rviv
al (%
)
Survival time (years)
Figure 11 Cervical cancer: 1-, 3-, 5- and 10-year relative survival (RS)* by region
* The relative survival values are represented with 95% Confidence Intervals
0%
10%
20%
30%
40%
50%
60%
70%
80%
90%
100%
1 yr RS 3 yr RS 5 yr RS 10 yr RS 1 yr RS 3 yr RS 5 yr RS 10 yr RS 1 yr RS 3 yr RS 5 yr RS 10 yr RS 1 yr RS 3 yr RS 5 yr RS 10 yr RS
Belgium Flemish Region Brussels-Capital Region Walloon Region
2004-2007 2008-2012 2013-2017
3.7.1.3 Survival
3.7.1.4 Survival trends
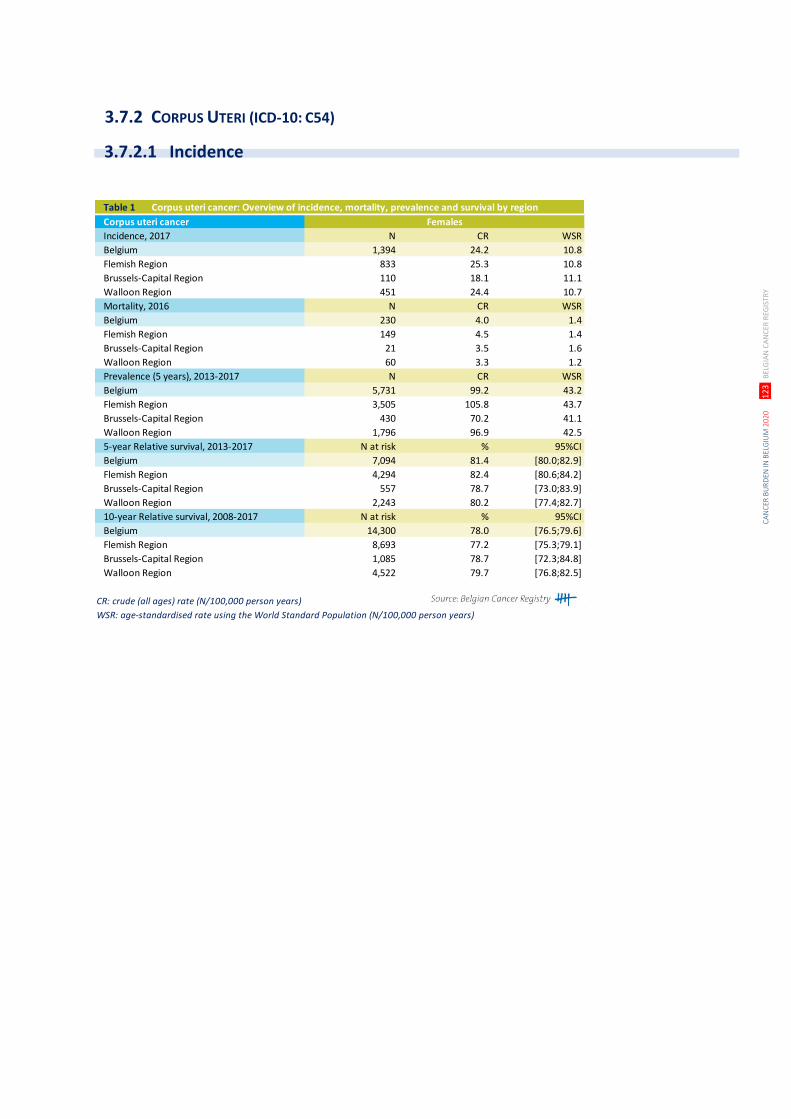
CA
NC
ER B
UR
DEN
IN B
ELG
IUM
202
0
12
3 B
ELG
IAN
CA
NC
ER R
EGIS
TRY
Table 1 Corpus uteri cancer: Overview of incidence, mortality, prevalence and survival by region
Corpus uteri cancer Females
Incidence, 2017 N CR WSR
Belgium 1,394 24.2 10.8
Flemish Region 833 25.3 10.8
Brussels-Capital Region 110 18.1 11.1
Walloon Region 451 24.4 10.7
Mortality, 2016 N CR WSR
Belgium 230 4.0 1.4
Flemish Region 149 4.5 1.4
Brussels-Capital Region 21 3.5 1.6
Walloon Region 60 3.3 1.2
Prevalence (5 years), 2013-2017 N CR WSR
Belgium 5,731 99.2 43.2
Flemish Region 3,505 105.8 43.7
Brussels-Capital Region 430 70.2 41.1
Walloon Region 1,796 96.9 42.5
5-year Relative survival, 2013-2017 N at risk % 95%CI
Belgium 7,094 81.4 [80.0;82.9]
Flemish Region 4,294 82.4 [80.6;84.2]
Brussels-Capital Region 557 78.7 [73.0;83.9]
Walloon Region 2,243 80.2 [77.4;82.7]
10-year Relative survival, 2008-2017 N at risk % 95%CI
Belgium 14,300 78.0 [76.5;79.6]
Flemish Region 8,693 77.2 [75.3;79.1]
Brussels-Capital Region 1,085 78.7 [72.3;84.8]
Walloon Region 4,522 79.7 [76.8;82.5]
CR: crude (all ages) rate (N/100,000 person years)
WSR: age-standardised rate using the World Standard Population (N/100,000 person years)
3.7.2 CORPUS UTERI (ICD-10: C54)
3.7.2.1 Incidence
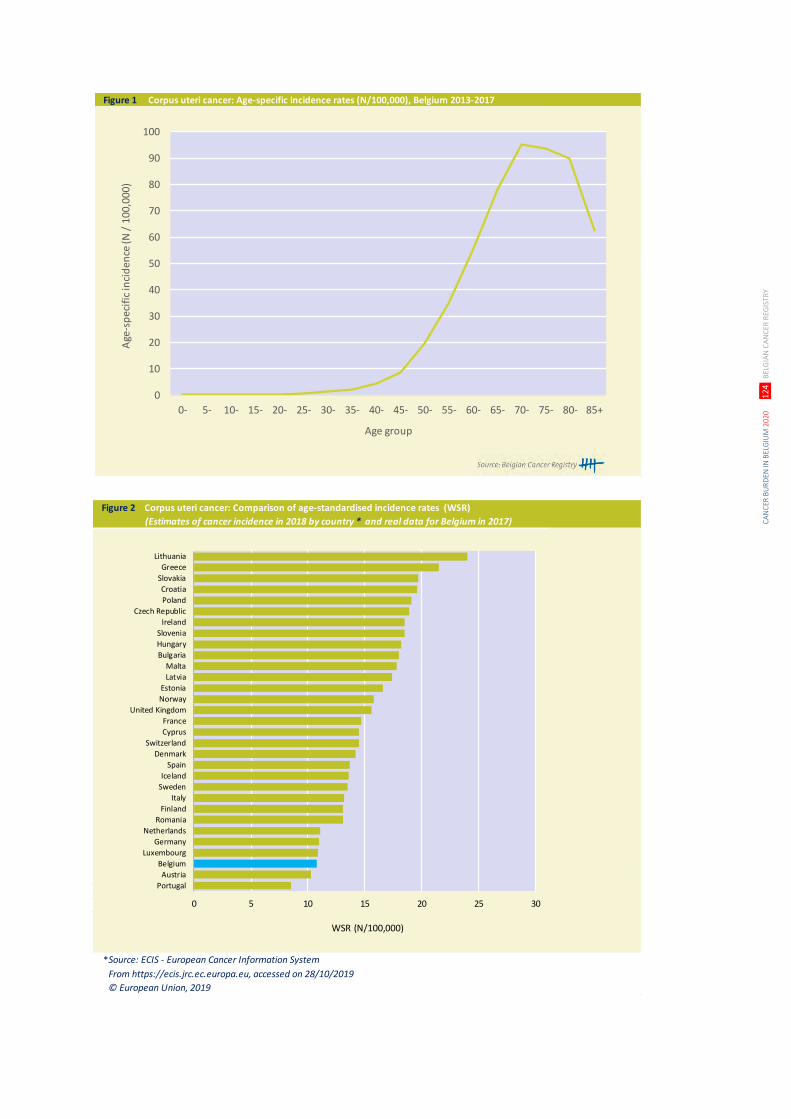
CA
NC
ER B
UR
DEN
IN B
ELG
IUM
202
0
12
4 B
ELG
IAN
CA
NC
ER R
EGIS
TRY
Figure 1 Corpus uteri cancer: Age-specific incidence rates (N/100,000), Belgium 2013-2017
0
10
20
30
40
50
60
70
80
90
100
0- 5- 10- 15- 20- 25- 30- 35- 40- 45- 50- 55- 60- 65- 70- 75- 80- 85+
Age
-sp
ecif
ic in
cid
ence
(N /
10
0,0
00
)
Age group
Figure 2 Corpus uteri cancer: Comparison of age-standardised incidence rates (WSR)
(Estimates of cancer incidence in 2018 by country * and real data for Belgium in 2017)
Source: ECIS - European Cancer Information System
From https://ecis.jrc.ec.europa.eu, accessed on 28/10/2019
© European Union, 2019
0 5 10 15 20 25 30
Lithuania
Greece
Slovakia
Croatia
Poland
Czech Republic
Ireland
Slovenia
Hungary
Bulgaria
Malta
Latvia
Estonia
Norway
United Kingdom
France
Cyprus
Switzerland
Denmark
Spain
Iceland
Sweden
Italy
Finland
Romania
Netherlands
Germany
Luxembourg
Belgium
Austria
Portugal
WSR (N/100,000)
*
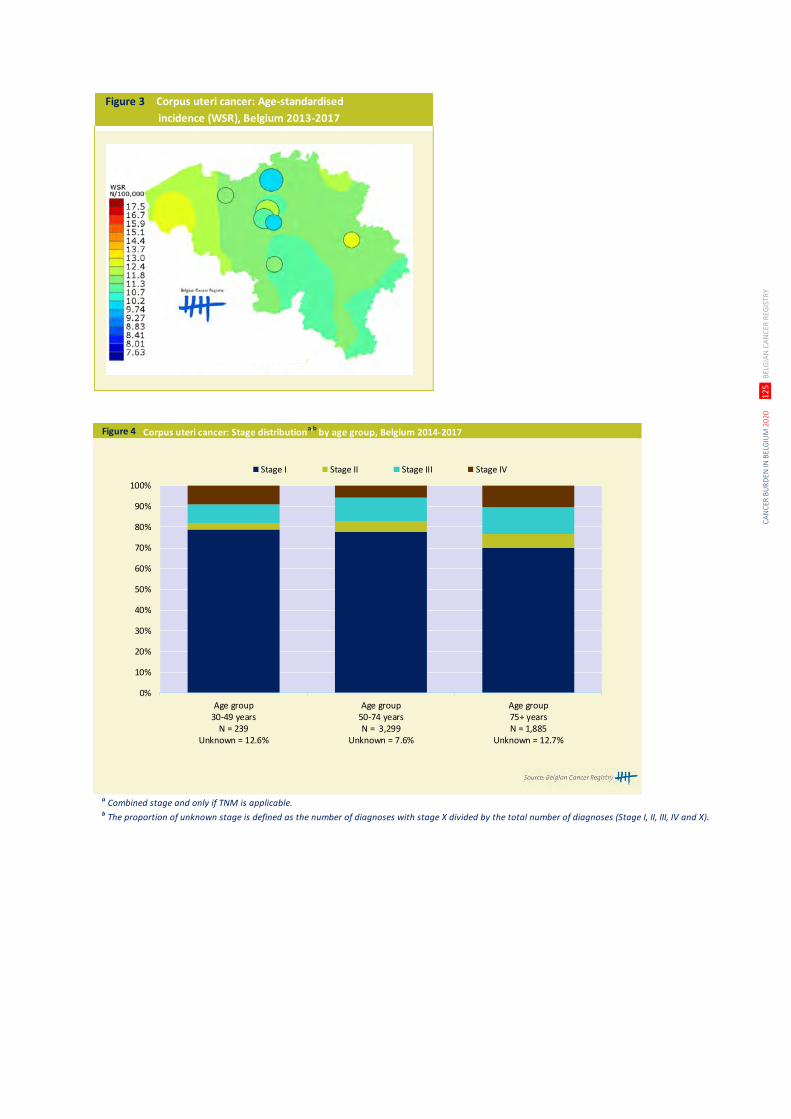
CA
NC
ER B
UR
DEN
IN B
ELG
IUM
202
0
12
5 B
ELG
IAN
CA
NC
ER R
EGIS
TRY
Figure 3 Corpus uteri cancer: Age-standardised
incidence (WSR), Belgium 2013-2017
Figure 4 Corpus uteri cancer: Stage distributiona,b
by age group, Belgium 2014-2017
a Combined stage and only if TNM is applicable. b The proportion of unknown stage is defined as the number of diagnoses with stage X divided by the total number of diagnoses (Stage I, II, III, IV and X).
0%
10%
20%
30%
40%
50%
60%
70%
80%
90%
100%
Age group30-49 years
N = 239Unknown = 12.6%
Age group50-74 yearsN = 3,299
Unknown = 7.6%
Age group75+ yearsN = 1,885
Unknown = 12.7%
Stage I Stage II Stage III Stage IV
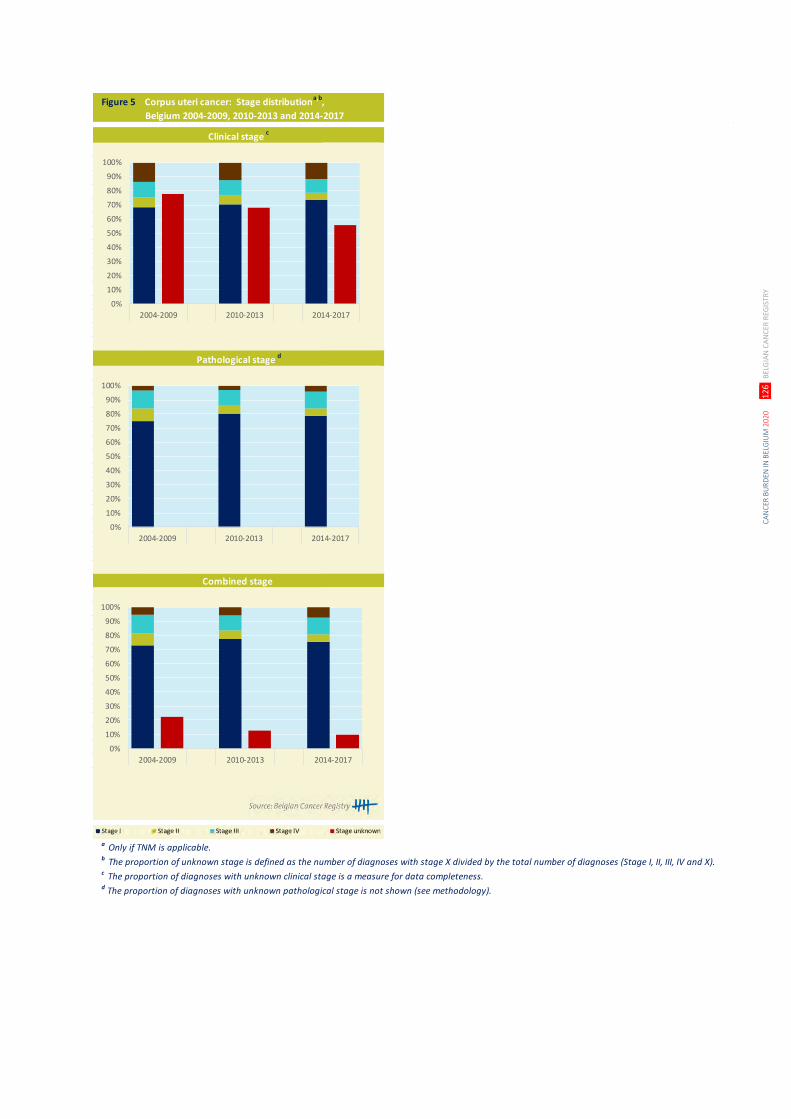
CA
NC
ER B
UR
DEN
IN B
ELG
IUM
202
0
12
6 B
ELG
IAN
CA
NC
ER R
EGIS
TRY
Figure 5 Corpus uteri cancer: Stage distributiona,b
,
Belgium 2004-2009, 2010-2013 and 2014-2017
a Only if TNM is applicable. b The proportion of unknown stage is defined as the number of diagnoses with stage X divided by the total number of diagnoses (Stage I, II, III, IV and X).c The proportion of diagnoses with unknown clinical stage is a measure for data completeness.d The proportion of diagnoses with unknown pathological stage is not shown (see methodology).
Clinical stage c
Pathological stage d
Combined stage
0%
10%
20%
30%
40%
50%
60%
70%
80%
90%
100%
2004-2009 2010-2013 2014-2017
0%
10%
20%
30%
40%
50%
60%
70%
80%
90%
100%
2004-2009 2010-2013 2014-2017
0%
10%
20%
30%
40%
50%
60%
70%
80%
90%
100%
2004-2009 2010-2013 2014-2017
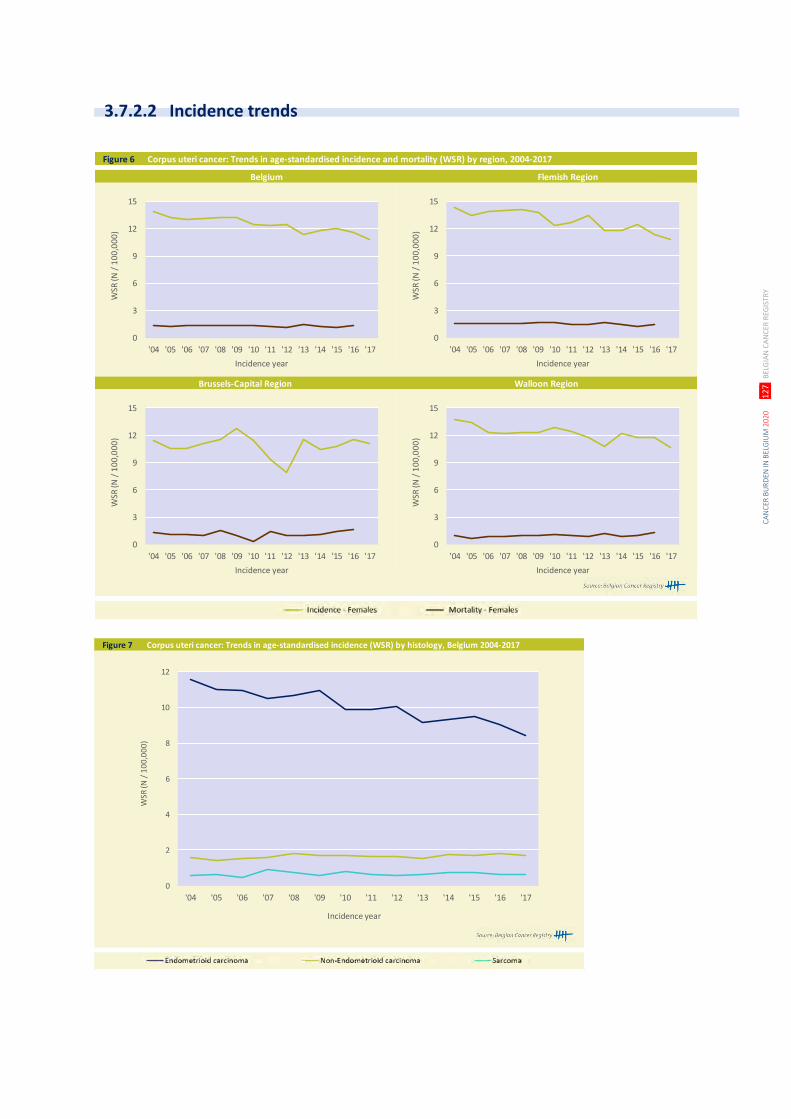
CA
NC
ER B
UR
DEN
IN B
ELG
IUM
202
0
12
7 B
ELG
IAN
CA
NC
ER R
EGIS
TRY
Figure 6 Corpus uteri cancer: Trends in age-standardised incidence and mortality (WSR) by region, 2004-2017
Brussels-Capital Region Walloon Region
Belgium Flemish Region
0
3
6
9
12
15
'04 '05 '06 '07 '08 '09 '10 '11 '12 '13 '14 '15 '16 '17
WSR
(N /
10
0,0
00
)
Incidence year
0
3
6
9
12
15
'04 '05 '06 '07 '08 '09 '10 '11 '12 '13 '14 '15 '16 '17
WSR
(N /
10
0,0
00
)
Incidence year
0
3
6
9
12
15
'04 '05 '06 '07 '08 '09 '10 '11 '12 '13 '14 '15 '16 '17
WSR
(N /
10
0,0
00
)
Incidence year
0
3
6
9
12
15
'04 '05 '06 '07 '08 '09 '10 '11 '12 '13 '14 '15 '16 '17
WSR
(N /
10
0,0
00
)
Incidence year
Figure 7 Corpus uteri cancer: Trends in age-standardised incidence (WSR) by histology, Belgium 2004-2017
0
2
4
6
8
10
12
'04 '05 '06 '07 '08 '09 '10 '11 '12 '13 '14 '15 '16 '17
WSR
(N /
10
0,0
00
)
Incidence year
3.7.2.2 Incidence trends
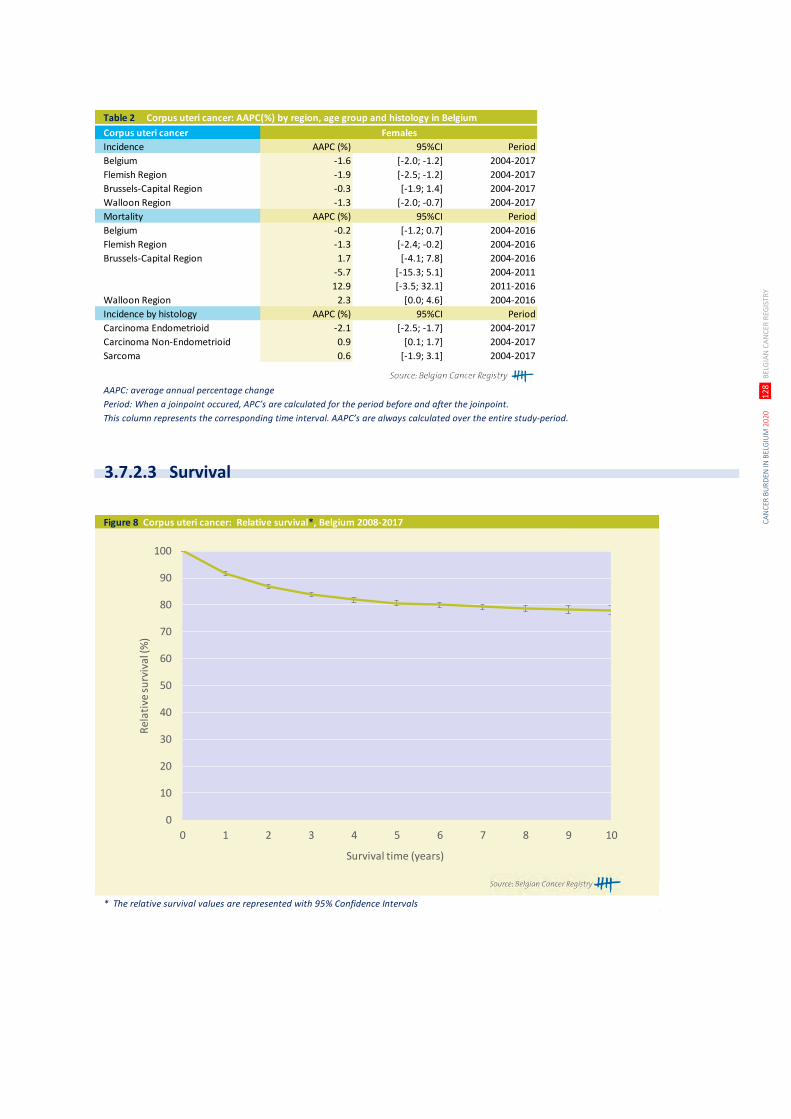
CA
NC
ER B
UR
DEN
IN B
ELG
IUM
202
0
12
8 B
ELG
IAN
CA
NC
ER R
EGIS
TRY
Table 2 Corpus uteri cancer: AAPC(%) by region, age group and histology in Belgium
Corpus uteri cancer Females
Incidence AAPC (%) 95%CI Period
Belgium -1.6 [-2.0; -1.2] 2004-2017
Flemish Region -1.9 [-2.5; -1.2] 2004-2017
Brussels-Capital Region -0.3 [-1.9; 1.4] 2004-2017
Walloon Region -1.3 [-2.0; -0.7] 2004-2017
Mortality AAPC (%) 95%CI Period
Belgium -0.2 [-1.2; 0.7] 2004-2016
Flemish Region -1.3 [-2.4; -0.2] 2004-2016
Brussels-Capital Region 1.7 [-4.1; 7.8] 2004-2016
-5.7 [-15.3; 5.1] 2004-2011
12.9 [-3.5; 32.1] 2011-2016
Walloon Region 2.3 [0.0; 4.6] 2004-2016
Incidence by histology AAPC (%) 95%CI Period
Carcinoma Endometrioid -2.1 [-2.5; -1.7] 2004-2017
Carcinoma Non-Endometrioid 0.9 [0.1; 1.7] 2004-2017
Sarcoma 0.6 [-1.9; 3.1] 2004-2017
AAPC: average annual percentage change
Period: When a joinpoint occured, APC’s are calculated for the period before and after the joinpoint.
This column represents the corresponding time interval. AAPC’s are always calculated over the entire study-period.
Figure 8 Corpus uteri cancer: Relative survival*, Belgium 2008-2017
* The relative survival values are represented with 95% Confidence Intervals
0
10
20
30
40
50
60
70
80
90
100
0 1 2 3 4 5 6 7 8 9 10
Rel
ativ
e su
rviv
al (%
)
Survival time (years)
3.7.2.3 Survival
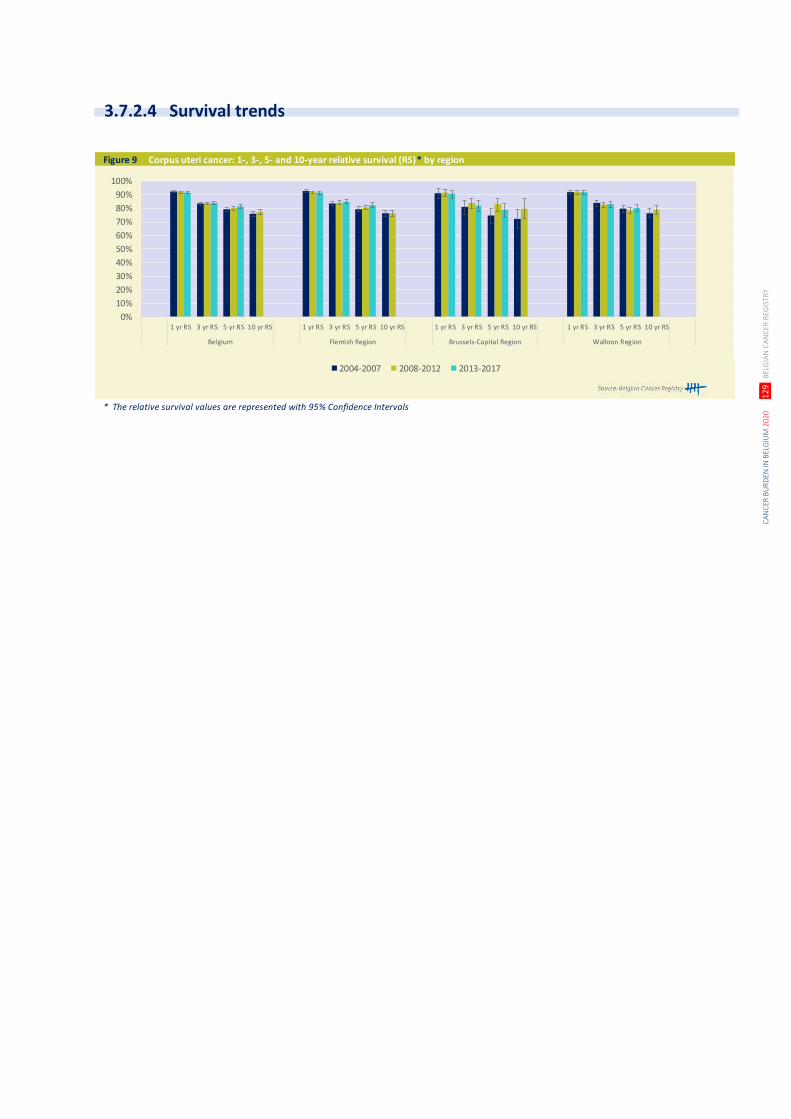
CA
NC
ER B
UR
DEN
IN B
ELG
IUM
202
0
12
9 B
ELG
IAN
CA
NC
ER R
EGIS
TRY
Figure 9 Corpus uteri cancer: 1-, 3-, 5- and 10-year relative survival (RS)* by region
* The relative survival values are represented with 95% Confidence Intervals
0%
10%
20%
30%
40%
50%
60%
70%
80%
90%
100%
1 yr RS 3 yr RS 5 yr RS 10 yr RS 1 yr RS 3 yr RS 5 yr RS 10 yr RS 1 yr RS 3 yr RS 5 yr RS 10 yr RS 1 yr RS 3 yr RS 5 yr RS 10 yr RS
Belgium Flemish Region Brussels-Capital Region Walloon Region
2004-2007 2008-2012 2013-2017
3.7.2.4 Survival trends

CA
NC
ER B
UR
DEN
IN B
ELG
IUM
202
0
13
0 B
ELG
IAN
CA
NC
ER R
EGIS
TRY
Table 1 Ovarian cancer: Overview of incidence, mortality, prevalence and survival by region
Ovarian cancer Females
Incidence, 2017 N CR WSR
Belgium 784 13.6 6.9
Flemish Region 480 14.6 6.8
Brussels-Capital Region 61 10.0 6.6
Walloon Region 243 13.1 7.0
Mortality, 2016 N CR WSR
Belgium 565 9.9 3.8
Flemish Region 360 11.0 3.9
Brussels-Capital Region 41 6.7 3.5
Walloon Region 164 8.9 3.6
Prevalence (5 years), 2013-2017 N CR WSR
Belgium 2,373 41.1 22.3
Flemish Region 1,438 43.4 22.4
Brussels-Capital Region 198 32.3 21.0
Walloon Region 737 39.7 22.6
5-year Relative survival, 2013-2017 N at risk % 95%CI
Belgium 3,918 45.0 [42.9;47.1]
Flemish Region 2,345 45.6 [42.9;48.3]
Brussels-Capital Region 308 51.2 [43.0;59.1]
Walloon Region 1,265 42.5 [38.8;46.1]
10-year Relative survival, 2008-2017 N at risk % 95%CI
Belgium 8,019 33.9 [32.2;35.5]
Flemish Region 4,826 35.6 [33.6;37.7]
Brussels-Capital Region 655 35.7 [29.4;42.3]
Walloon Region 2,538 30.0 [27.2;32.9]
CR: crude (all ages) rate (N/100,000 person years)
WSR: age-standardised rate using the World Standard Population (N/100,000 person years)
3.7.3 OVARY (ICD-10: C56)
3.7.3.1 Incidence
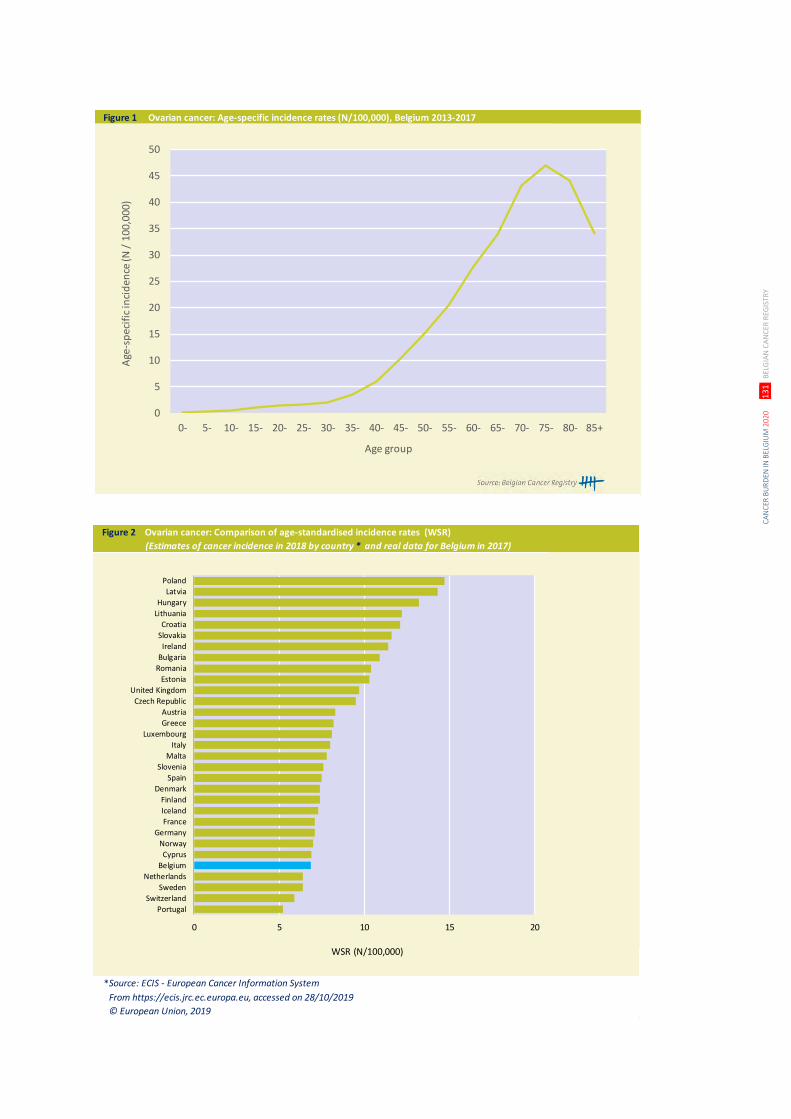
CA
NC
ER B
UR
DEN
IN B
ELG
IUM
202
0
13
1 B
ELG
IAN
CA
NC
ER R
EGIS
TRY
Figure 1 Ovarian cancer: Age-specific incidence rates (N/100,000), Belgium 2013-2017
0
5
10
15
20
25
30
35
40
45
50
0- 5- 10- 15- 20- 25- 30- 35- 40- 45- 50- 55- 60- 65- 70- 75- 80- 85+
Age
-sp
ecif
ic in
cid
ence
(N /
10
0,0
00
)
Age group
Figure 2 Ovarian cancer: Comparison of age-standardised incidence rates (WSR)
(Estimates of cancer incidence in 2018 by country * and real data for Belgium in 2017)
Source: ECIS - European Cancer Information System
From https://ecis.jrc.ec.europa.eu, accessed on 28/10/2019
© European Union, 2019
0 5 10 15 20
Poland
Latvia
Hungary
Lithuania
Croatia
Slovakia
Ireland
Bulgaria
Romania
Estonia
United Kingdom
Czech Republic
Austria
Greece
Luxembourg
Italy
Malta
Slovenia
Spain
Denmark
Finland
Iceland
France
Germany
Norway
Cyprus
Belgium
Netherlands
Sweden
Switzerland
Portugal
WSR (N/100,000)
*
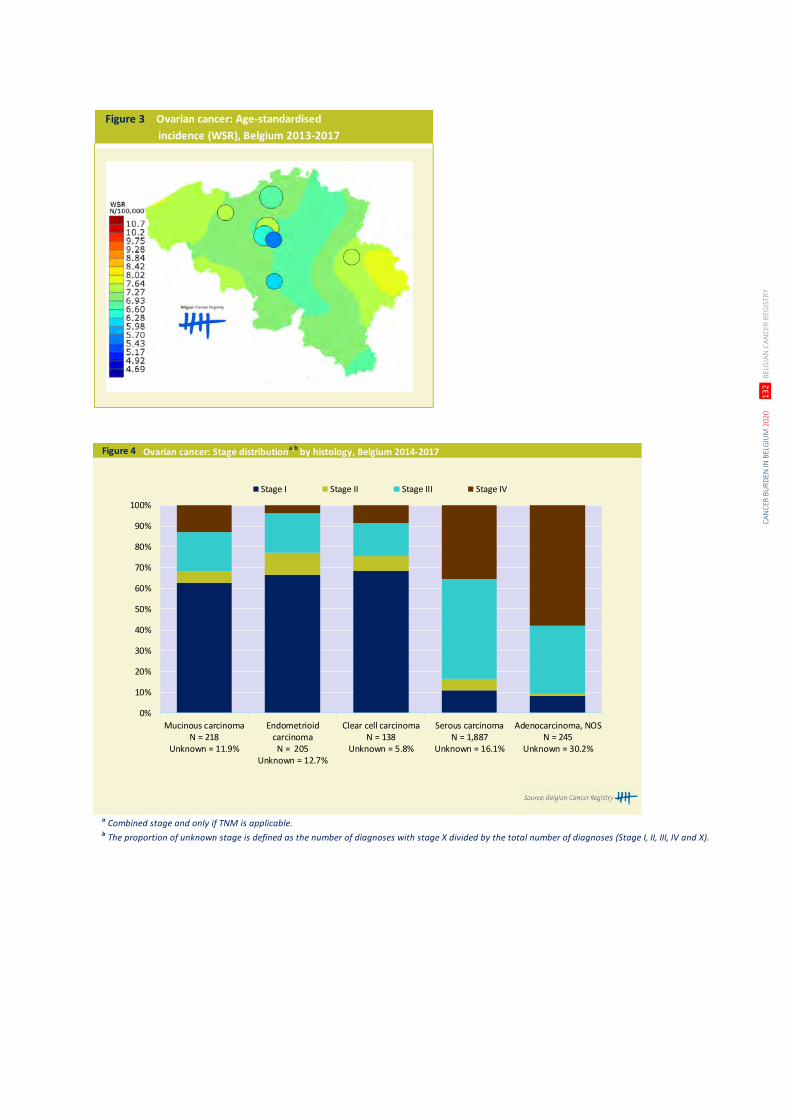
CA
NC
ER B
UR
DEN
IN B
ELG
IUM
202
0
13
2 B
ELG
IAN
CA
NC
ER R
EGIS
TRY
Figure 3 Ovarian cancer: Age-standardised
incidence (WSR), Belgium 2013-2017
Figure 4 Ovarian cancer: Stage distributiona,b
by histology, Belgium 2014-2017
a Combined stage and only if TNM is applicable. b The proportion of unknown stage is defined as the number of diagnoses with stage X divided by the total number of diagnoses (Stage I, II, III, IV and X).
0%
10%
20%
30%
40%
50%
60%
70%
80%
90%
100%
Mucinous carcinomaN = 218
Unknown = 11.9%
EndometrioidcarcinomaN = 205
Unknown = 12.7%
Clear cell carcinomaN = 138
Unknown = 5.8%
Serous carcinomaN = 1,887
Unknown = 16.1%
Adenocarcinoma, NOSN = 245
Unknown = 30.2%
Stage I Stage II Stage III Stage IV
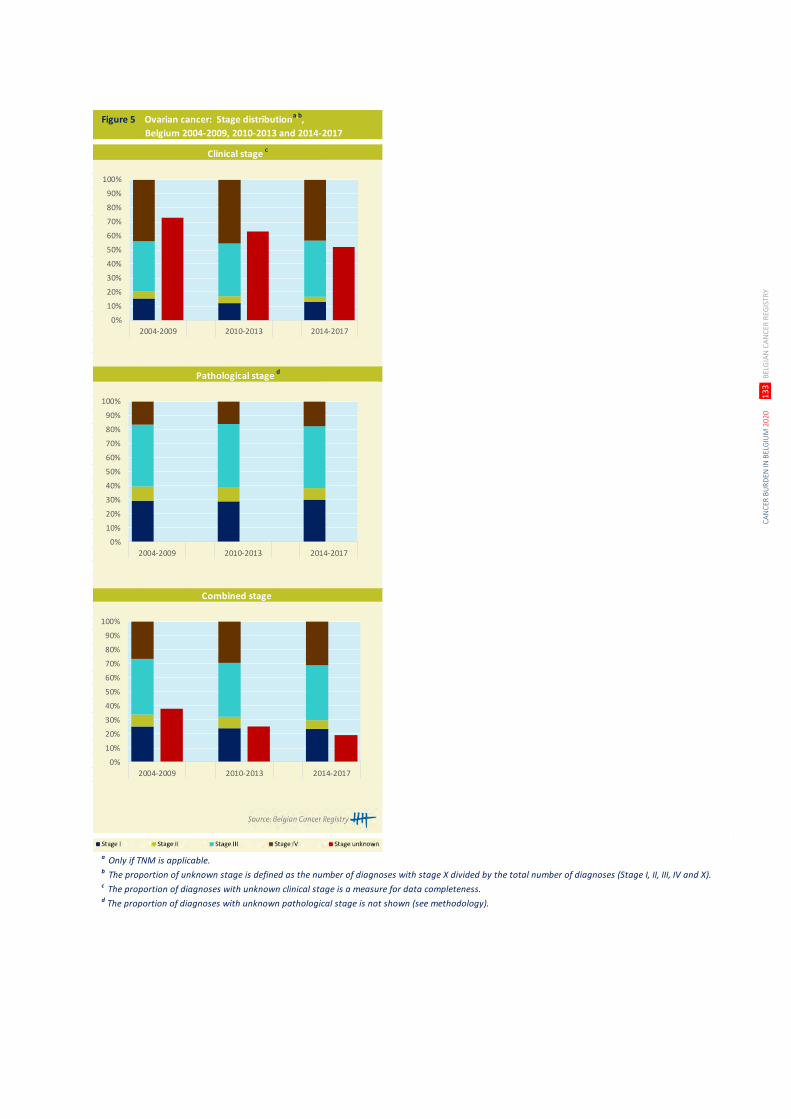
CA
NC
ER B
UR
DEN
IN B
ELG
IUM
202
0
13
3 B
ELG
IAN
CA
NC
ER R
EGIS
TRY
Figure 5 Ovarian cancer: Stage distributiona,b,
Belgium 2004-2009, 2010-2013 and 2014-2017
a Only if TNM is applicable. b The proportion of unknown stage is defined as the number of diagnoses with stage X divided by the total number of diagnoses (Stage I, II, III, IV and X).c The proportion of diagnoses with unknown clinical stage is a measure for data completeness.d The proportion of diagnoses with unknown pathological stage is not shown (see methodology).
Clinical stage c
Pathological stage d
Combined stage
0%
10%
20%
30%
40%
50%
60%
70%
80%
90%
100%
2004-2009 2010-2013 2014-2017
0%
10%
20%
30%
40%
50%
60%
70%
80%
90%
100%
2004-2009 2010-2013 2014-2017
0%
10%
20%
30%
40%
50%
60%
70%
80%
90%
100%
2004-2009 2010-2013 2014-2017
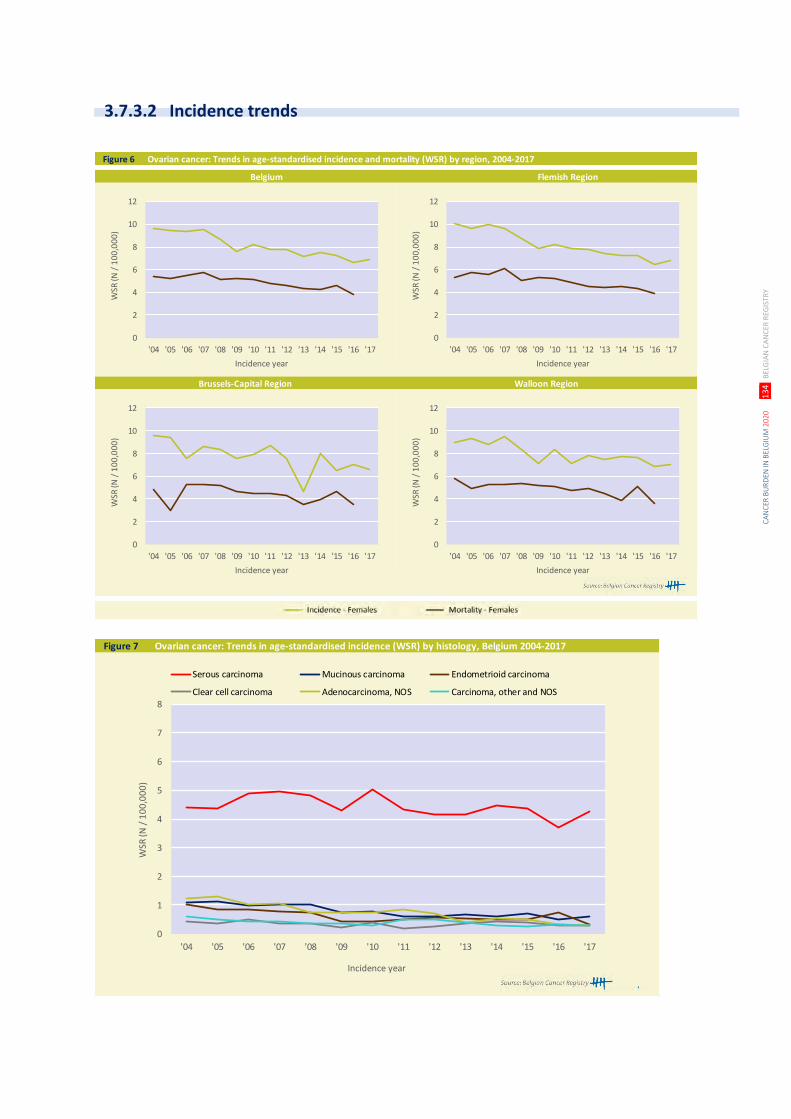
CA
NC
ER B
UR
DEN
IN B
ELG
IUM
202
0
13
4 B
ELG
IAN
CA
NC
ER R
EGIS
TRY
Figure 6 Ovarian cancer: Trends in age-standardised incidence and mortality (WSR) by region, 2004-2017
Brussels-Capital Region Walloon Region
Belgium Flemish Region
0
2
4
6
8
10
12
'04 '05 '06 '07 '08 '09 '10 '11 '12 '13 '14 '15 '16 '17
WSR
(N /
10
0,0
00
)
Incidence year
0
2
4
6
8
10
12
'04 '05 '06 '07 '08 '09 '10 '11 '12 '13 '14 '15 '16 '17
WSR
(N /
10
0,0
00
)
Incidence year
0
2
4
6
8
10
12
'04 '05 '06 '07 '08 '09 '10 '11 '12 '13 '14 '15 '16 '17
WSR
(N /
10
0,0
00
)
Incidence year
0
2
4
6
8
10
12
'04 '05 '06 '07 '08 '09 '10 '11 '12 '13 '14 '15 '16 '17
WSR
(N /
10
0,0
00
)
Incidence year
Figure 7 Ovarian cancer: Trends in age-standardised incidence (WSR) by histology, Belgium 2004-2017
0
1
2
3
4
5
6
7
8
'04 '05 '06 '07 '08 '09 '10 '11 '12 '13 '14 '15 '16 '17
WSR
(N /
10
0,0
00
)
Incidence year
Serous carcinoma Mucinous carcinoma Endometrioid carcinoma
Clear cell carcinoma Adenocarcinoma, NOS Carcinoma, other and NOS
3.7.3.2 Incidence trends
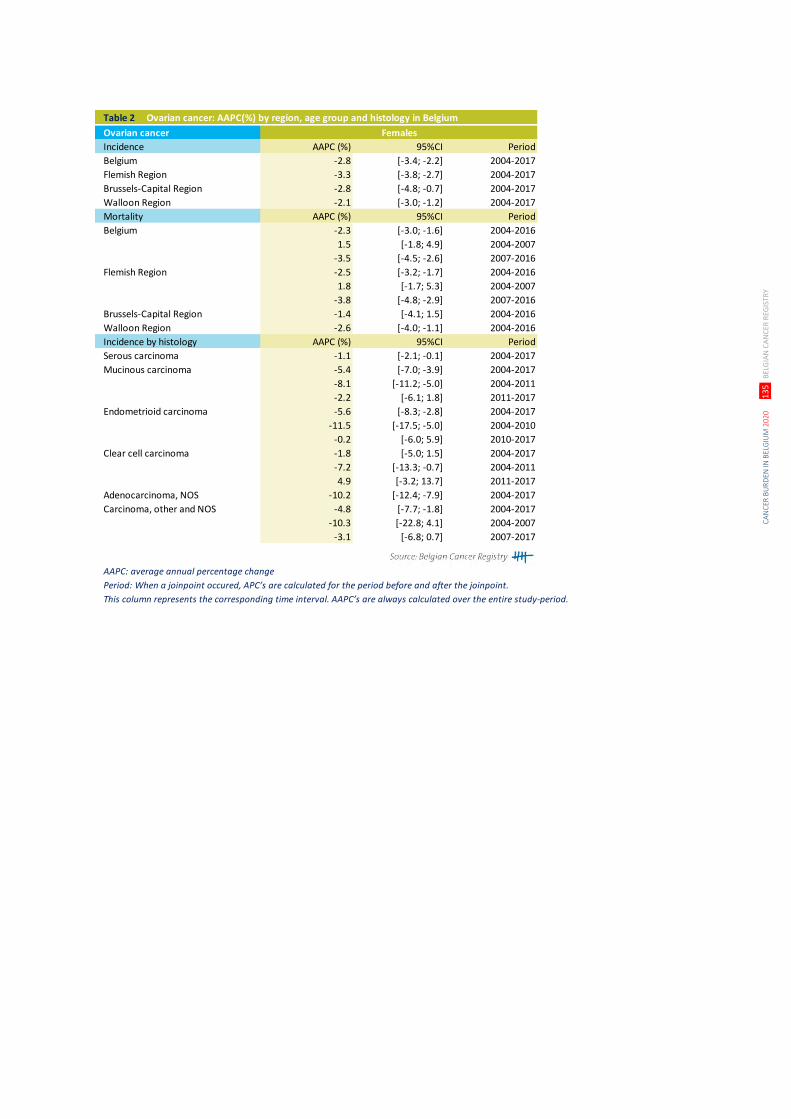
CA
NC
ER B
UR
DEN
IN B
ELG
IUM
202
0
13
5 B
ELG
IAN
CA
NC
ER R
EGIS
TRY
Table 2 Ovarian cancer: AAPC(%) by region, age group and histology in Belgium
Ovarian cancer Females
Incidence AAPC (%) 95%CI Period
Belgium -2.8 [-3.4; -2.2] 2004-2017
Flemish Region -3.3 [-3.8; -2.7] 2004-2017
Brussels-Capital Region -2.8 [-4.8; -0.7] 2004-2017
Walloon Region -2.1 [-3.0; -1.2] 2004-2017
Mortality AAPC (%) 95%CI Period
Belgium -2.3 [-3.0; -1.6] 2004-2016
1.5 [-1.8; 4.9] 2004-2007
-3.5 [-4.5; -2.6] 2007-2016
Flemish Region -2.5 [-3.2; -1.7] 2004-2016
1.8 [-1.7; 5.3] 2004-2007
-3.8 [-4.8; -2.9] 2007-2016
Brussels-Capital Region -1.4 [-4.1; 1.5] 2004-2016
Walloon Region -2.6 [-4.0; -1.1] 2004-2016
Incidence by histology AAPC (%) 95%CI Period
Serous carcinoma -1.1 [-2.1; -0.1] 2004-2017
Mucinous carcinoma -5.4 [-7.0; -3.9] 2004-2017
-8.1 [-11.2; -5.0] 2004-2011
-2.2 [-6.1; 1.8] 2011-2017
Endometrioid carcinoma -5.6 [-8.3; -2.8] 2004-2017
-11.5 [-17.5; -5.0] 2004-2010
-0.2 [-6.0; 5.9] 2010-2017
Clear cell carcinoma -1.8 [-5.0; 1.5] 2004-2017
-7.2 [-13.3; -0.7] 2004-2011
4.9 [-3.2; 13.7] 2011-2017
Adenocarcinoma, NOS -10.2 [-12.4; -7.9] 2004-2017
Carcinoma, other and NOS -4.8 [-7.7; -1.8] 2004-2017
-10.3 [-22.8; 4.1] 2004-2007
-3.1 [-6.8; 0.7] 2007-2017
AAPC: average annual percentage change
Period: When a joinpoint occured, APC’s are calculated for the period before and after the joinpoint.
This column represents the corresponding time interval. AAPC’s are always calculated over the entire study-period.
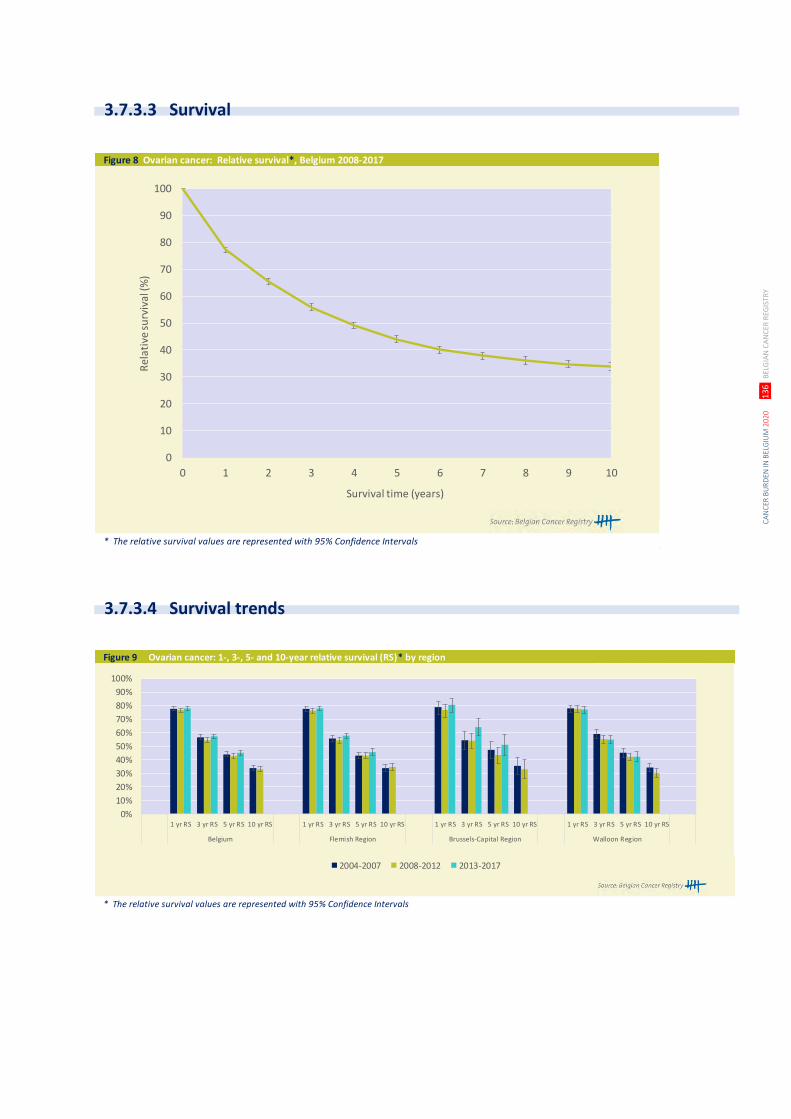
CA
NC
ER B
UR
DEN
IN B
ELG
IUM
202
0
13
6 B
ELG
IAN
CA
NC
ER R
EGIS
TRY
Figure 8 Ovarian cancer: Relative survival*, Belgium 2008-2017
* The relative survival values are represented with 95% Confidence Intervals
0
10
20
30
40
50
60
70
80
90
100
0 1 2 3 4 5 6 7 8 9 10
Rel
ativ
e su
rviv
al (%
)
Survival time (years)
Figure 9 Ovarian cancer: 1-, 3-, 5- and 10-year relative survival (RS)* by region
* The relative survival values are represented with 95% Confidence Intervals
0%
10%
20%
30%
40%
50%
60%
70%
80%
90%
100%
1 yr RS 3 yr RS 5 yr RS 10 yr RS 1 yr RS 3 yr RS 5 yr RS 10 yr RS 1 yr RS 3 yr RS 5 yr RS 10 yr RS 1 yr RS 3 yr RS 5 yr RS 10 yr RS
Belgium Flemish Region Brussels-Capital Region Walloon Region
2004-2007 2008-2012 2013-2017
3.7.3.3 Survival
3.7.3.4 Survival trends
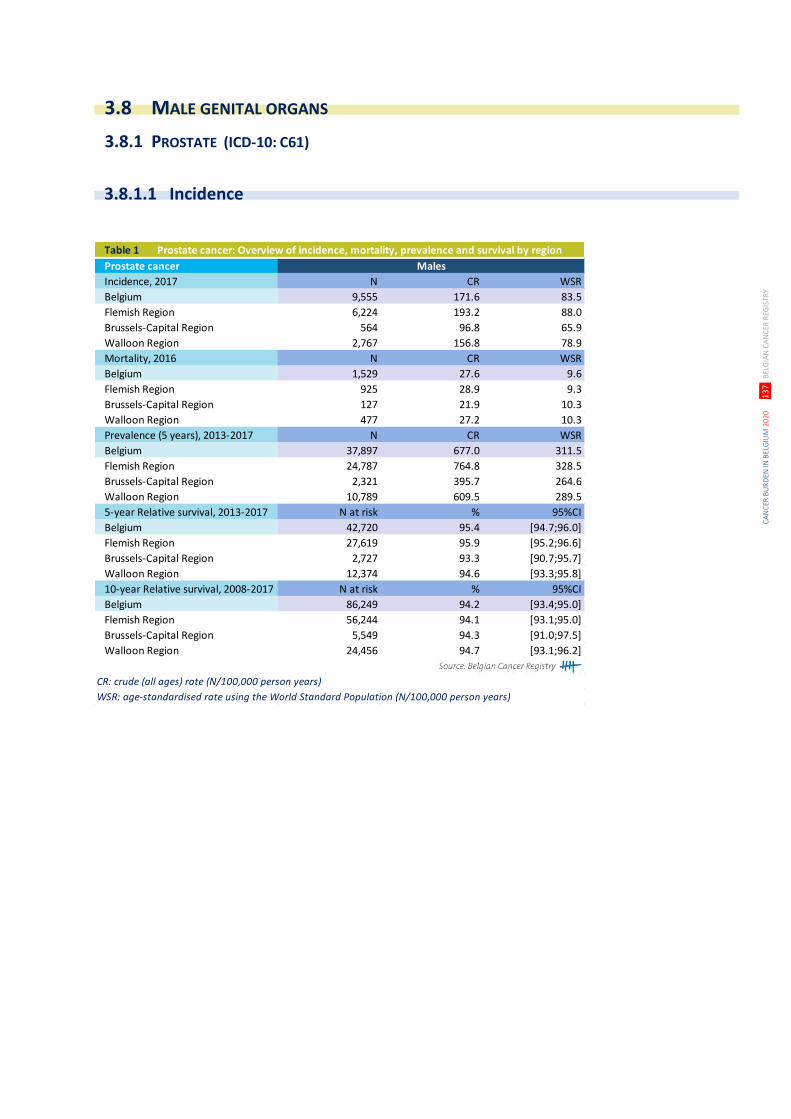
CA
NC
ER B
UR
DEN
IN B
ELG
IUM
202
0
13
7 B
ELG
IAN
CA
NC
ER R
EGIS
TRY
Table 1 Prostate cancer: Overview of incidence, mortality, prevalence and survival by region
Prostate cancer Males
Incidence, 2017 N CR WSR
Belgium 9,555 171.6 83.5
Flemish Region 6,224 193.2 88.0
Brussels-Capital Region 564 96.8 65.9
Walloon Region 2,767 156.8 78.9
Mortality, 2016 N CR WSR
Belgium 1,529 27.6 9.6
Flemish Region 925 28.9 9.3
Brussels-Capital Region 127 21.9 10.3
Walloon Region 477 27.2 10.3
Prevalence (5 years), 2013-2017 N CR WSR
Belgium 37,897 677.0 311.5
Flemish Region 24,787 764.8 328.5
Brussels-Capital Region 2,321 395.7 264.6
Walloon Region 10,789 609.5 289.5
5-year Relative survival, 2013-2017 N at risk % 95%CI
Belgium 42,720 95.4 [94.7;96.0]
Flemish Region 27,619 95.9 [95.2;96.6]
Brussels-Capital Region 2,727 93.3 [90.7;95.7]
Walloon Region 12,374 94.6 [93.3;95.8]
10-year Relative survival, 2008-2017 N at risk % 95%CI
Belgium 86,249 94.2 [93.4;95.0]
Flemish Region 56,244 94.1 [93.1;95.0]
Brussels-Capital Region 5,549 94.3 [91.0;97.5]
Walloon Region 24,456 94.7 [93.1;96.2]
CR: crude (all ages) rate (N/100,000 person years)
WSR: age-standardised rate using the World Standard Population (N/100,000 person years)
3.8 MALE GENITAL ORGANS
3.8.1 PROSTATE (ICD-10: C61)
3.8.1.1 Incidence
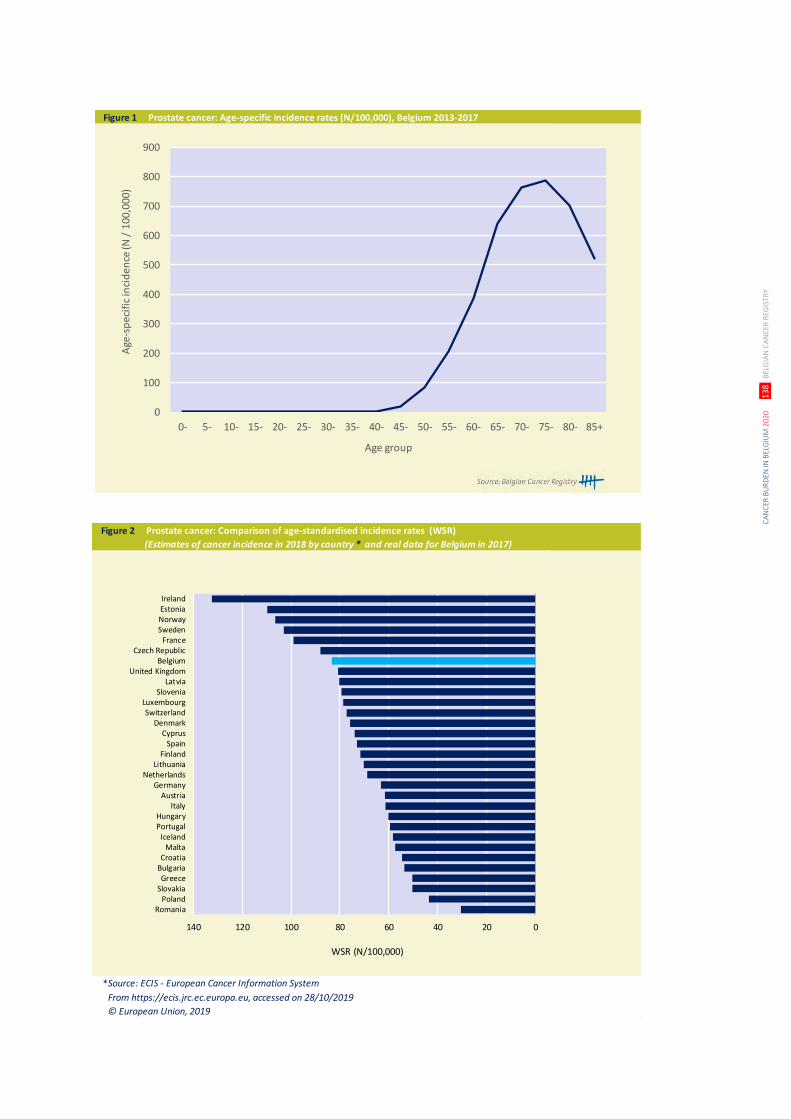
CA
NC
ER B
UR
DEN
IN B
ELG
IUM
202
0
13
8 B
ELG
IAN
CA
NC
ER R
EGIS
TRY
Figure 1 Prostate cancer: Age-specific incidence rates (N/100,000), Belgium 2013-2017
0
100
200
300
400
500
600
700
800
900
0- 5- 10- 15- 20- 25- 30- 35- 40- 45- 50- 55- 60- 65- 70- 75- 80- 85+
Age
-sp
ecif
ic in
cid
ence
(N /
100
,000
)
Age group
Figure 2 Prostate cancer: Comparison of age-standardised incidence rates (WSR)
(Estimates of cancer incidence in 2018 by country * and real data for Belgium in 2017)
Source: ECIS - European Cancer Information System
From https://ecis.jrc.ec.europa.eu, accessed on 28/10/2019
© European Union, 2019
140 120 100 80 60 40 20 0
IrelandEstoniaNorwaySweden
FranceCzech Republic
BelgiumUnited Kingdom
LatviaSlovenia
LuxembourgSwitzerland
DenmarkCyprus
SpainFinland
LithuaniaNetherlands
GermanyAustria
ItalyHungaryPortugal
IcelandMalta
CroatiaBulgariaGreece
SlovakiaPoland
Romania
WSR (N/100,000)
*
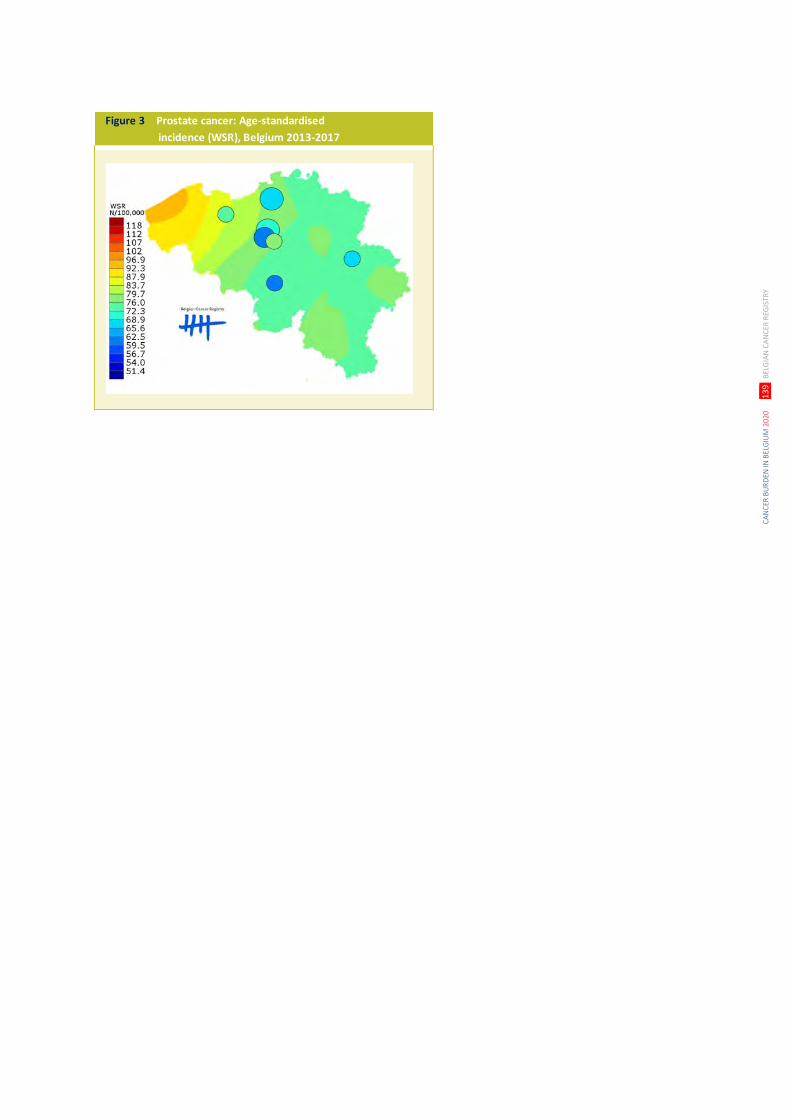
CA
NC
ER B
UR
DEN
IN B
ELG
IUM
202
0
13
9 B
ELG
IAN
CA
NC
ER R
EGIS
TRY
Figure 3 Prostate cancer: Age-standardised
incidence (WSR), Belgium 2013-2017
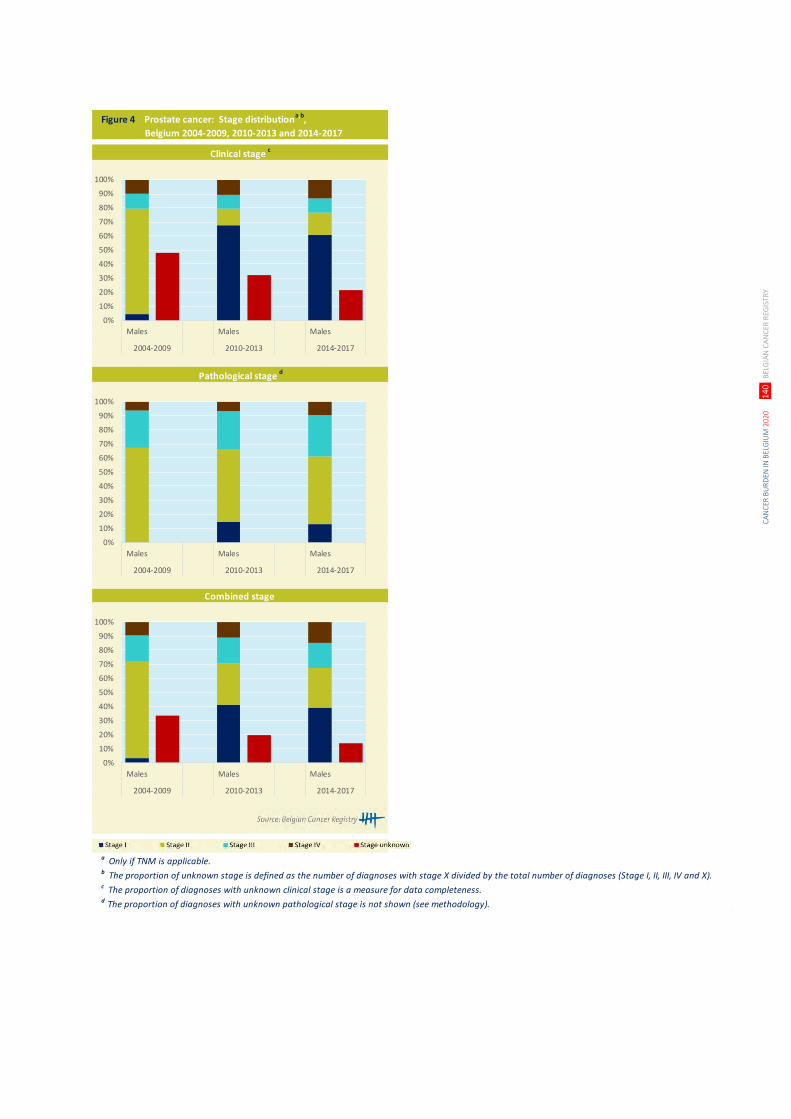
CA
NC
ER B
UR
DEN
IN B
ELG
IUM
202
0
14
0 B
ELG
IAN
CA
NC
ER R
EGIS
TRY
Figure 4 Prostate cancer: Stage distributiona,b
,
Belgium 2004-2009, 2010-2013 and 2014-2017
a Only if TNM is applicable. b The proportion of unknown stage is defined as the number of diagnoses with stage X divided by the total number of diagnoses (Stage I, II, III, IV and X).c The proportion of diagnoses with unknown clinical stage is a measure for data completeness.d The proportion of diagnoses with unknown pathological stage is not shown (see methodology).
Clinical stage c
Pathological stage d
Combined stage
0%
10%
20%
30%
40%
50%
60%
70%
80%
90%
100%
Males Males Males
2004-2009 2010-2013 2014-2017
0%
10%
20%
30%
40%
50%
60%
70%
80%
90%
100%
Males Males Males
2004-2009 2010-2013 2014-2017
0%
10%
20%
30%
40%
50%
60%
70%
80%
90%
100%
Males Males Males
2004-2009 2010-2013 2014-2017
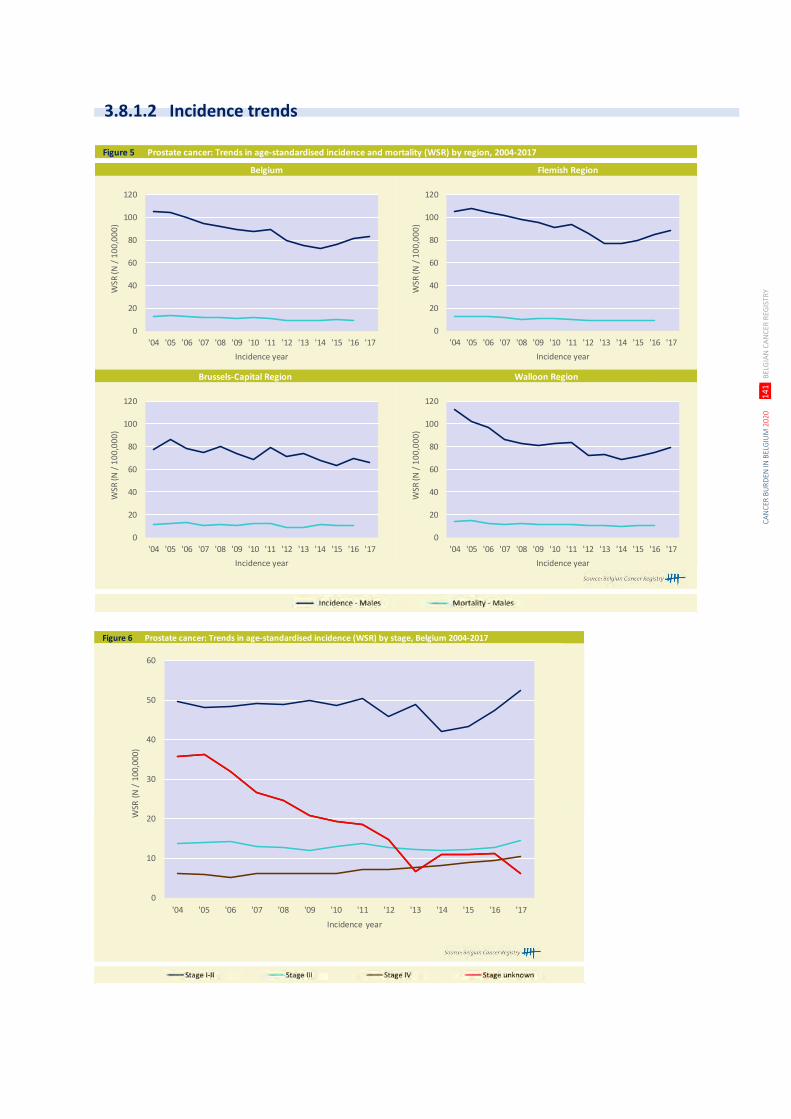
CA
NC
ER B
UR
DEN
IN B
ELG
IUM
202
0
14
1 B
ELG
IAN
CA
NC
ER R
EGIS
TRY
Figure 5 Prostate cancer: Trends in age-standardised incidence and mortality (WSR) by region, 2004-2017
Brussels-Capital Region Walloon Region
Belgium Flemish Region
0
20
40
60
80
100
120
'04 '05 '06 '07 '08 '09 '10 '11 '12 '13 '14 '15 '16 '17
WSR
(N /
10
0,0
00
)
Incidence year
0
20
40
60
80
100
120
'04 '05 '06 '07 '08 '09 '10 '11 '12 '13 '14 '15 '16 '17
WSR
(N /
10
0,0
00
)
Incidence year
0
20
40
60
80
100
120
'04 '05 '06 '07 '08 '09 '10 '11 '12 '13 '14 '15 '16 '17
WSR
(N /
10
0,0
00
)
Incidence year
0
20
40
60
80
100
120
'04 '05 '06 '07 '08 '09 '10 '11 '12 '13 '14 '15 '16 '17
WSR
(N /
10
0,0
00
)
Incidence year
Figure 6 Prostate cancer: Trends in age-standardised incidence (WSR) by stage, Belgium 2004-2017
0
10
20
30
40
50
60
'04 '05 '06 '07 '08 '09 '10 '11 '12 '13 '14 '15 '16 '17
WSR
(N
/ 1
00,0
00)
Incidence year
3.8.1.2 Incidence trends
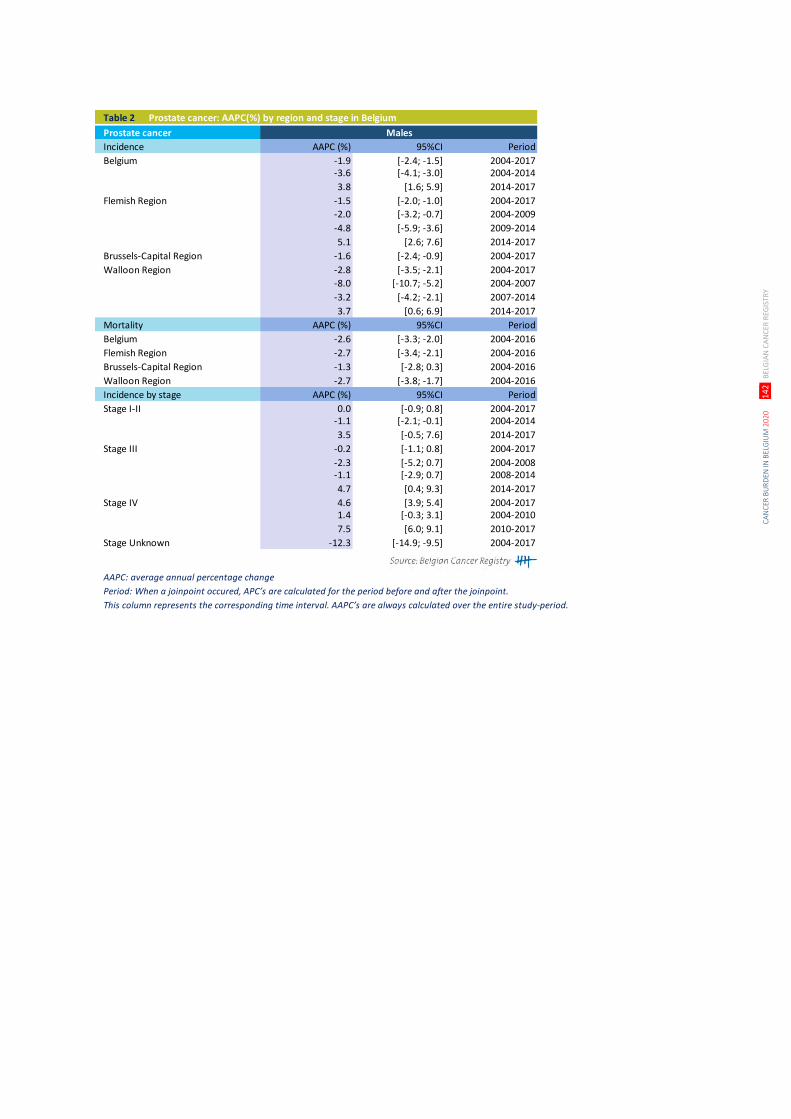
CA
NC
ER B
UR
DEN
IN B
ELG
IUM
202
0
14
2 B
ELG
IAN
CA
NC
ER R
EGIS
TRY
Table 2 Prostate cancer: AAPC(%) by region and stage in Belgium
Prostate cancer Males
Incidence AAPC (%) 95%CI Period
Belgium -1.9 [-2.4; -1.5] 2004-2017-3.6 [-4.1; -3.0] 2004-2014
3.8 [1.6; 5.9] 2014-2017
Flemish Region -1.5 [-2.0; -1.0] 2004-2017
-2.0 [-3.2; -0.7] 2004-2009
-4.8 [-5.9; -3.6] 2009-2014
5.1 [2.6; 7.6] 2014-2017
Brussels-Capital Region -1.6 [-2.4; -0.9] 2004-2017
Walloon Region -2.8 [-3.5; -2.1] 2004-2017
-8.0 [-10.7; -5.2] 2004-2007
-3.2 [-4.2; -2.1] 2007-2014
3.7 [0.6; 6.9] 2014-2017
Mortality AAPC (%) 95%CI Period
Belgium -2.6 [-3.3; -2.0] 2004-2016
Flemish Region -2.7 [-3.4; -2.1] 2004-2016
Brussels-Capital Region -1.3 [-2.8; 0.3] 2004-2016
Walloon Region -2.7 [-3.8; -1.7] 2004-2016
Incidence by stage AAPC (%) 95%CI Period
Stage I-II 0.0 [-0.9; 0.8] 2004-2017-1.1 [-2.1; -0.1] 2004-2014
3.5 [-0.5; 7.6] 2014-2017
Stage III -0.2 [-1.1; 0.8] 2004-2017
-2.3 [-5.2; 0.7] 2004-2008-1.1 [-2.9; 0.7] 2008-2014
4.7 [0.4; 9.3] 2014-2017
Stage IV 4.6 [3.9; 5.4] 2004-20171.4 [-0.3; 3.1] 2004-2010
7.5 [6.0; 9.1] 2010-2017
Stage Unknown -12.3 [-14.9; -9.5] 2004-2017
AAPC: average annual percentage change
Period: When a joinpoint occured, APC’s are calculated for the period before and after the joinpoint.
This column represents the corresponding time interval. AAPC’s are always calculated over the entire study-period.
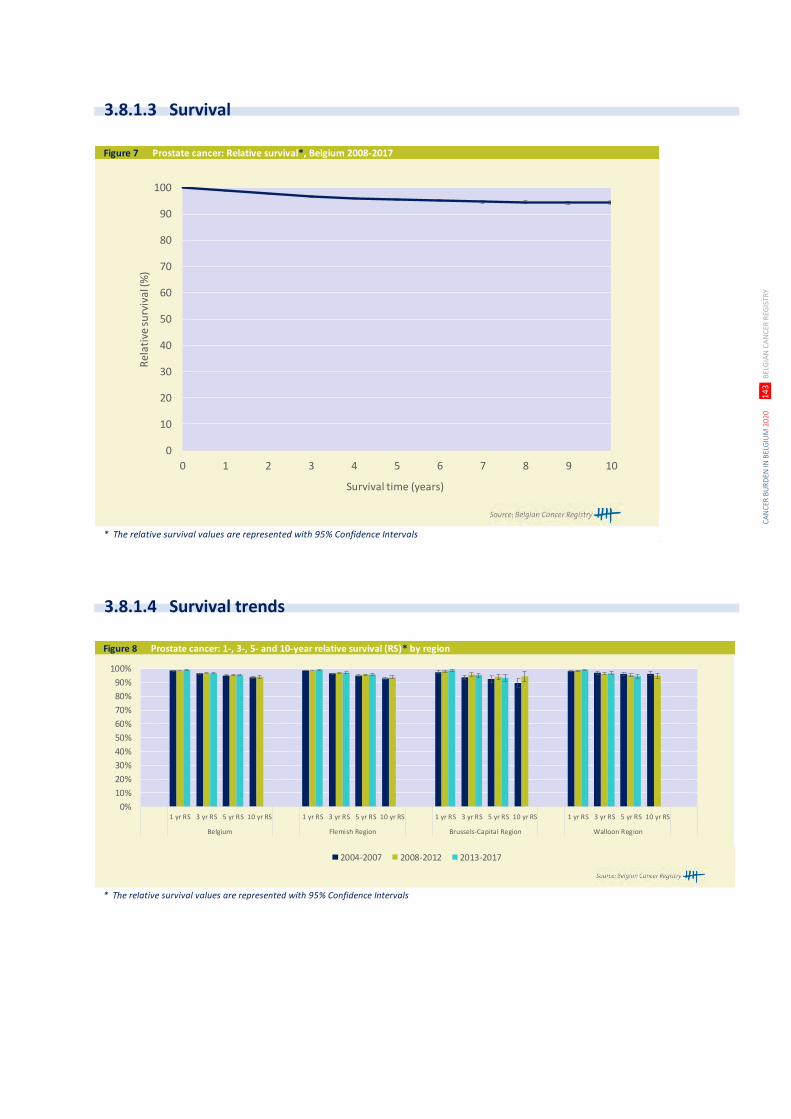
CA
NC
ER B
UR
DEN
IN B
ELG
IUM
202
0
14
3 B
ELG
IAN
CA
NC
ER R
EGIS
TRY
Figure 7 Prostate cancer: Relative survival*, Belgium 2008-2017
* The relative survival values are represented with 95% Confidence Intervals
0
10
20
30
40
50
60
70
80
90
100
0 1 2 3 4 5 6 7 8 9 10
Rel
ativ
e su
rviv
al (%
)
Survival time (years)
Figure 8 Prostate cancer: 1-, 3-, 5- and 10-year relative survival (RS)* by region
* The relative survival values are represented with 95% Confidence Intervals
0%
10%
20%
30%
40%
50%
60%
70%
80%
90%
100%
1 yr RS 3 yr RS 5 yr RS 10 yr RS 1 yr RS 3 yr RS 5 yr RS 10 yr RS 1 yr RS 3 yr RS 5 yr RS 10 yr RS 1 yr RS 3 yr RS 5 yr RS 10 yr RS
Belgium Flemish Region Brussels-Capital Region Walloon Region
2004-2007 2008-2012 2013-2017
3.8.1.3 Survival
3.8.1.4 Survival trends
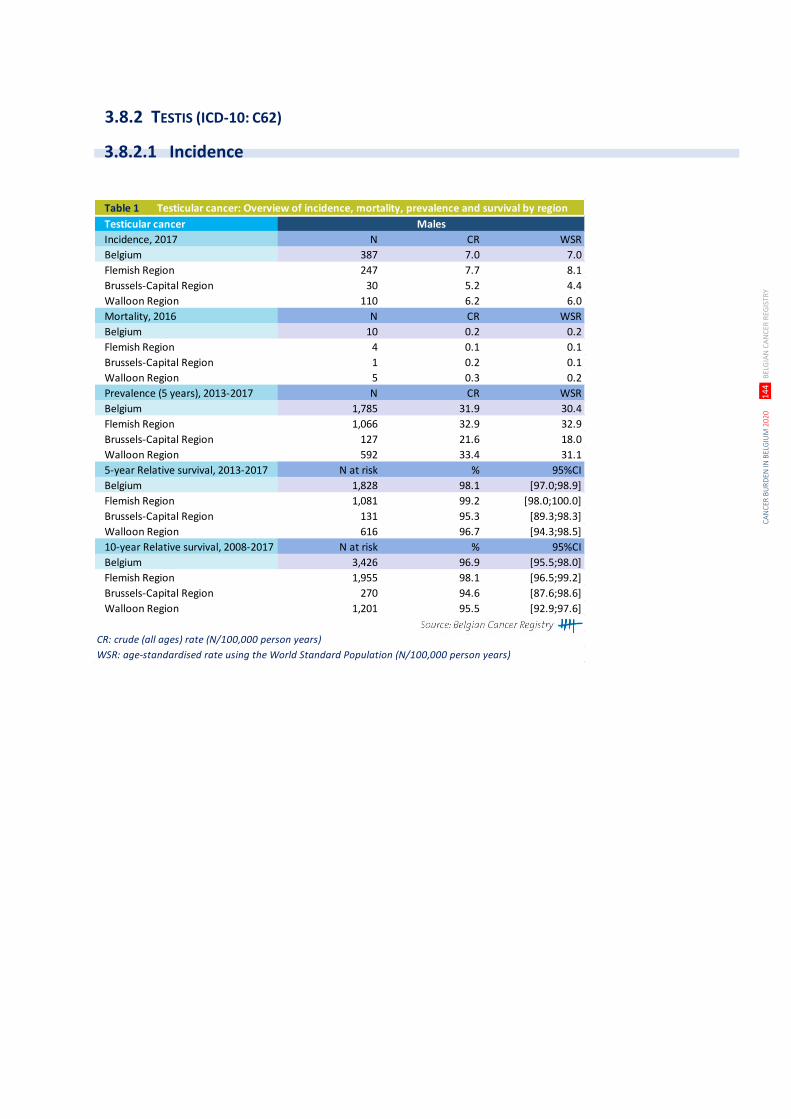
CA
NC
ER B
UR
DEN
IN B
ELG
IUM
202
0
14
4 B
ELG
IAN
CA
NC
ER R
EGIS
TRY
Table 1 Testicular cancer: Overview of incidence, mortality, prevalence and survival by region
Testicular cancer Males
Incidence, 2017 N CR WSR
Belgium 387 7.0 7.0
Flemish Region 247 7.7 8.1
Brussels-Capital Region 30 5.2 4.4
Walloon Region 110 6.2 6.0
Mortality, 2016 N CR WSR
Belgium 10 0.2 0.2
Flemish Region 4 0.1 0.1
Brussels-Capital Region 1 0.2 0.1
Walloon Region 5 0.3 0.2
Prevalence (5 years), 2013-2017 N CR WSR
Belgium 1,785 31.9 30.4
Flemish Region 1,066 32.9 32.9
Brussels-Capital Region 127 21.6 18.0
Walloon Region 592 33.4 31.1
5-year Relative survival, 2013-2017 N at risk % 95%CI
Belgium 1,828 98.1 [97.0;98.9]
Flemish Region 1,081 99.2 [98.0;100.0]
Brussels-Capital Region 131 95.3 [89.3;98.3]
Walloon Region 616 96.7 [94.3;98.5]
10-year Relative survival, 2008-2017 N at risk % 95%CI
Belgium 3,426 96.9 [95.5;98.0]
Flemish Region 1,955 98.1 [96.5;99.2]
Brussels-Capital Region 270 94.6 [87.6;98.6]
Walloon Region 1,201 95.5 [92.9;97.6]
CR: crude (all ages) rate (N/100,000 person years)
WSR: age-standardised rate using the World Standard Population (N/100,000 person years)
3.8.2 TESTIS (ICD-10: C62)
3.8.2.1 Incidence
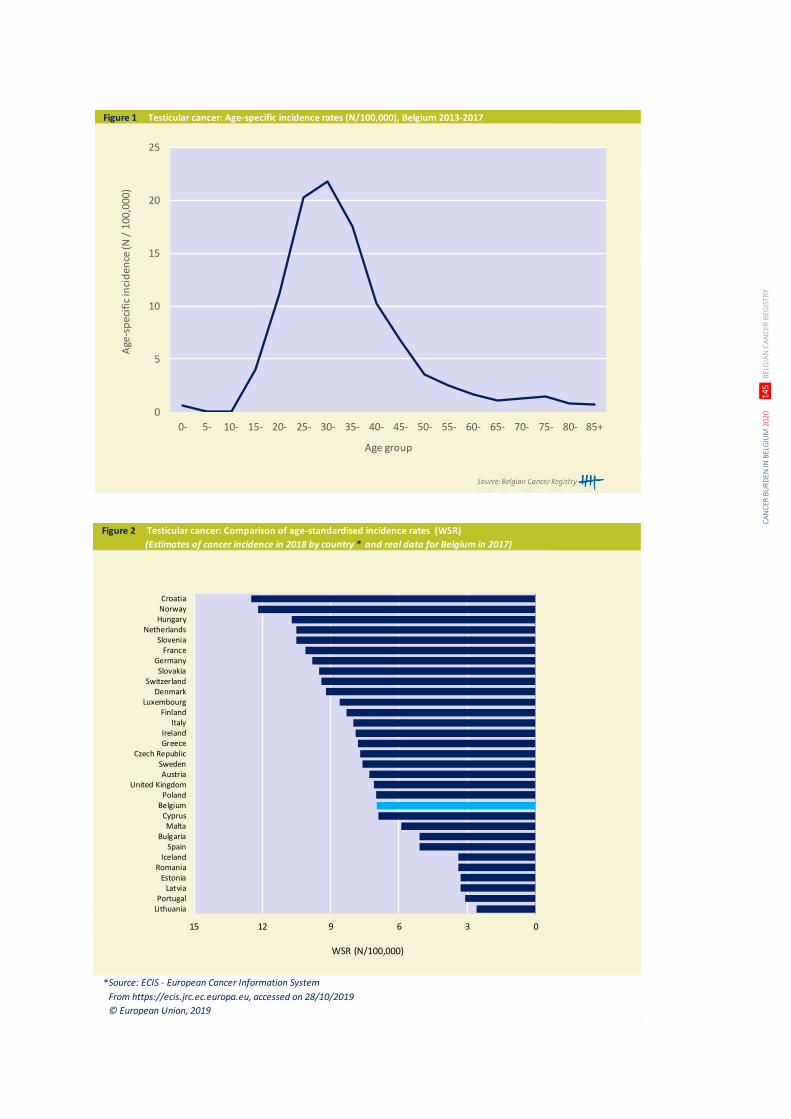
CA
NC
ER B
UR
DEN
IN B
ELG
IUM
202
0
14
5 B
ELG
IAN
CA
NC
ER R
EGIS
TRY
Figure 1 Testicular cancer: Age-specific incidence rates (N/100,000), Belgium 2013-2017
0
5
10
15
20
25
0- 5- 10- 15- 20- 25- 30- 35- 40- 45- 50- 55- 60- 65- 70- 75- 80- 85+
Age
-sp
ecif
ic in
cid
ence
(N /
100
,000
)
Age group
Figure 2 Testicular cancer: Comparison of age-standardised incidence rates (WSR)
(Estimates of cancer incidence in 2018 by country * and real data for Belgium in 2017)
Source: ECIS - European Cancer Information System
From https://ecis.jrc.ec.europa.eu, accessed on 28/10/2019
© European Union, 2019
15 12 9 6 3 0
CroatiaNorway
HungaryNetherlands
SloveniaFrance
GermanySlovakia
SwitzerlandDenmark
LuxembourgFinland
ItalyIrelandGreece
Czech RepublicSwedenAustria
United KingdomPoland
BelgiumCyprusMalta
BulgariaSpain
IcelandRomania
EstoniaLatvia
PortugalLithuania
WSR (N/100,000)
*
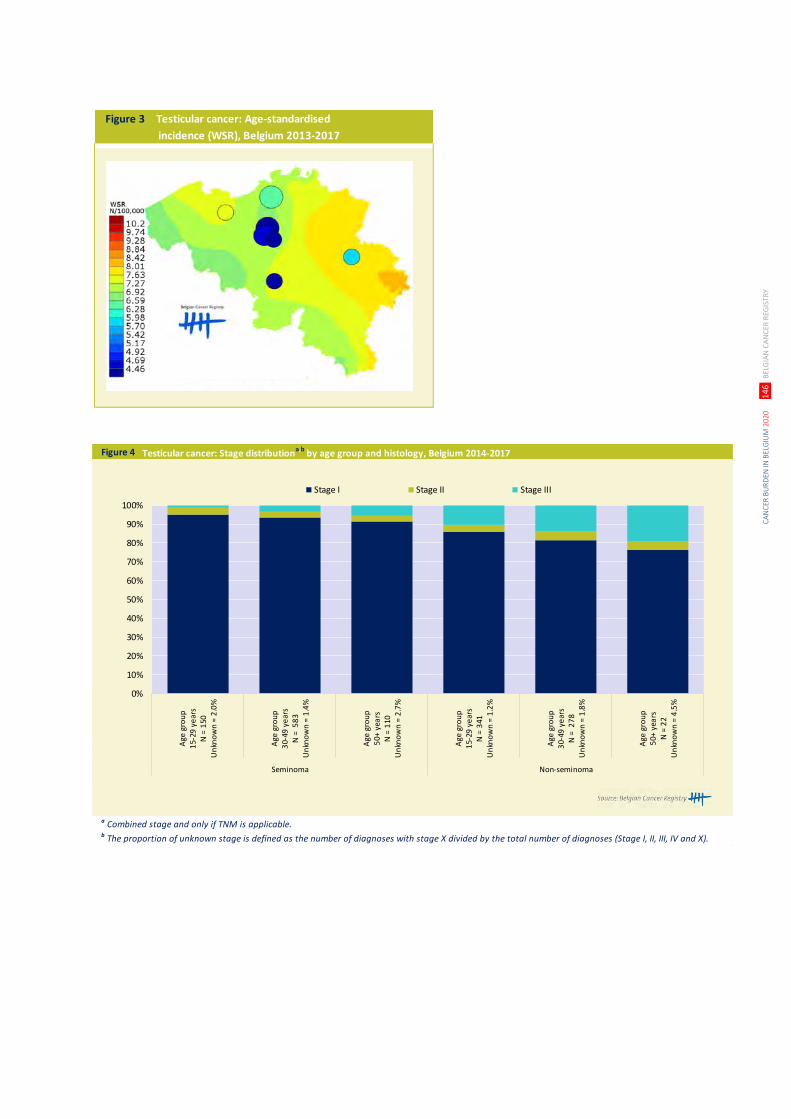
CA
NC
ER B
UR
DEN
IN B
ELG
IUM
202
0
14
6 B
ELG
IAN
CA
NC
ER R
EGIS
TRY
Figure 3 Testicular cancer: Age-standardised
incidence (WSR), Belgium 2013-2017
Figure 4 Testicular cancer: Stage distributiona,b
by age group and histology, Belgium 2014-2017
a Combined stage and only if TNM is applicable. b The proportion of unknown stage is defined as the number of diagnoses with stage X divided by the total number of diagnoses (Stage I, II, III, IV and X).
0%
10%
20%
30%
40%
50%
60%
70%
80%
90%
100%
Age
gro
up
15-
29 y
ear
sN
= 1
50U
nkn
ow
n =
2.0
%
Age
gro
up
30-
49 y
ear
sN
= 5
83
Un
kno
wn
= 1
.4%
Age
gro
up
50+
yea
rsN
= 1
10U
nkn
ow
n =
2.7
%
Age
gro
up
15-
29 y
ear
sN
= 3
41U
nkn
ow
n =
1.2
%
Age
gro
up
30-
49 y
ear
sN
= 2
78
Un
kno
wn
= 1
.8%
Age
gro
up
50+
yea
rsN
= 2
2U
nkn
ow
n =
4.5
%
Seminoma Non-seminoma
Stage I Stage II Stage III
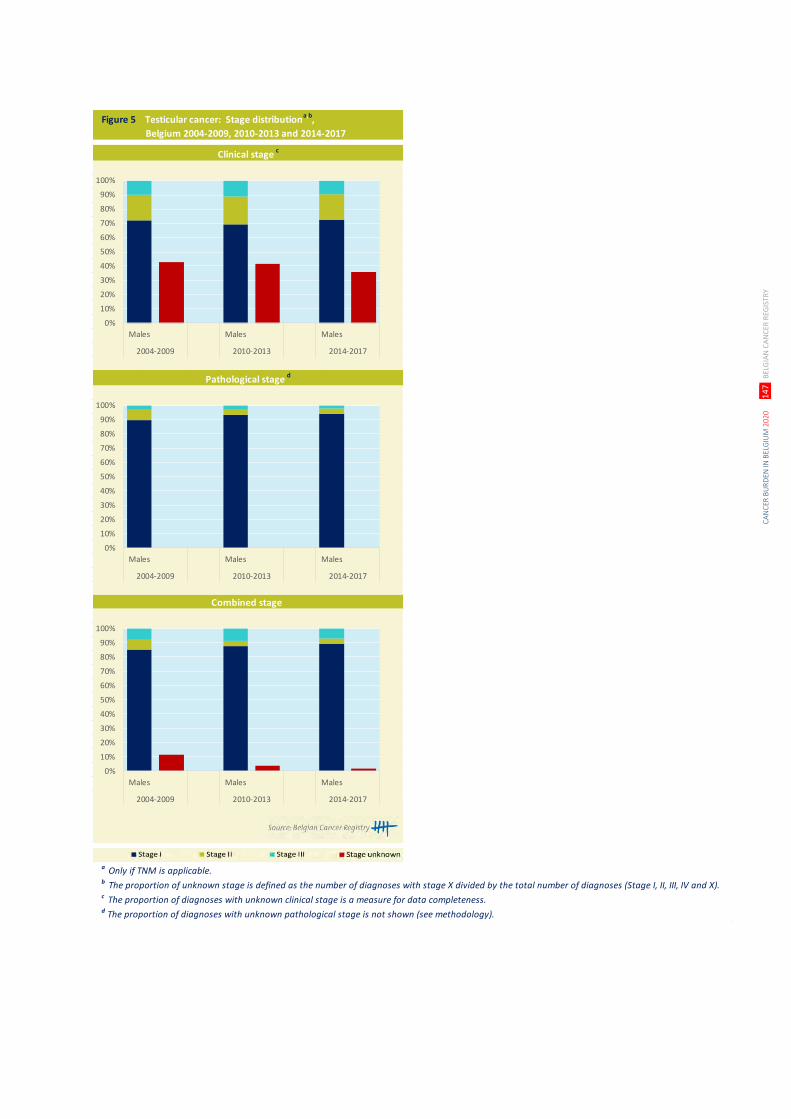
CA
NC
ER B
UR
DEN
IN B
ELG
IUM
202
0
14
7 B
ELG
IAN
CA
NC
ER R
EGIS
TRY
Figure 5 Testicular cancer: Stage distributiona,b,
Belgium 2004-2009, 2010-2013 and 2014-2017
a Only if TNM is applicable. b The proportion of unknown stage is defined as the number of diagnoses with stage X divided by the total number of diagnoses (Stage I, II, III, IV and X).c The proportion of diagnoses with unknown clinical stage is a measure for data completeness.d The proportion of diagnoses with unknown pathological stage is not shown (see methodology).
Clinical stage c
Pathological stage d
Combined stage
0%
10%
20%
30%
40%
50%
60%
70%
80%
90%
100%
Males Males Males
2004-2009 2010-2013 2014-2017
0%
10%
20%
30%
40%
50%
60%
70%
80%
90%
100%
Males Males Males
2004-2009 2010-2013 2014-2017
0%
10%
20%
30%
40%
50%
60%
70%
80%
90%
100%
Males Males Males
2004-2009 2010-2013 2014-2017
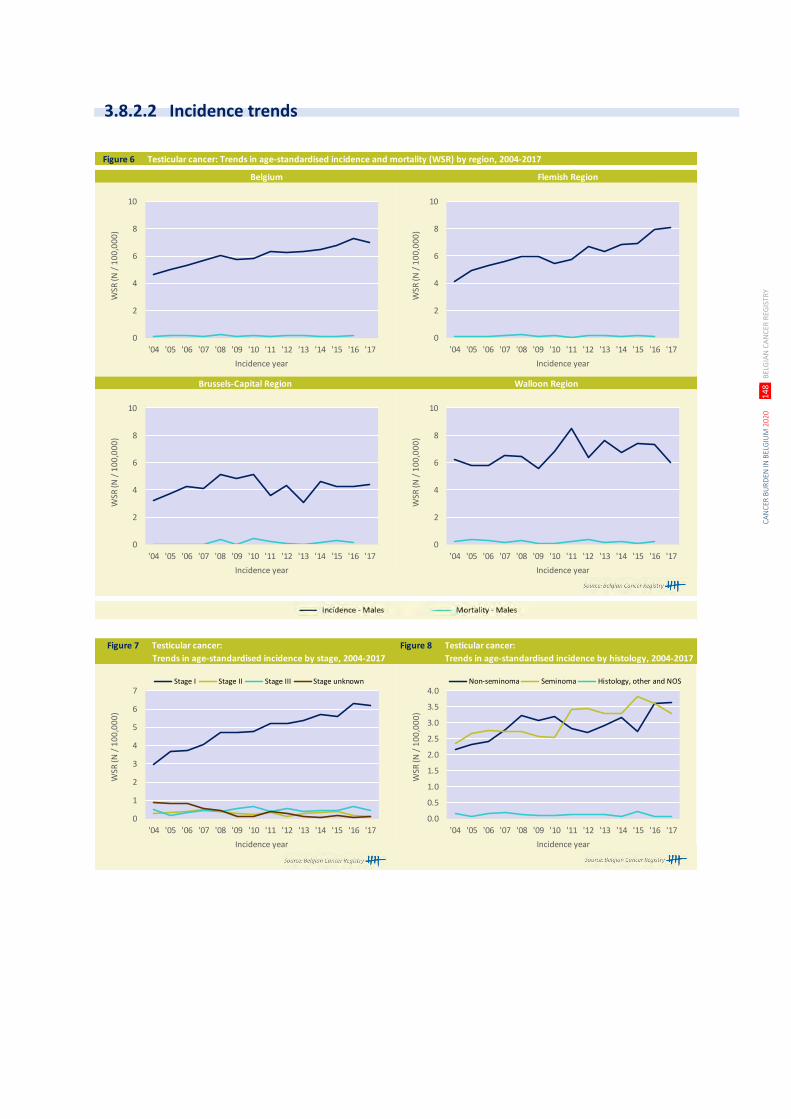
CA
NC
ER B
UR
DEN
IN B
ELG
IUM
202
0
14
8 B
ELG
IAN
CA
NC
ER R
EGIS
TRY
Figure 6 Testicular cancer: Trends in age-standardised incidence and mortality (WSR) by region, 2004-2017
Brussels-Capital Region Walloon Region
Belgium Flemish Region
0
2
4
6
8
10
'04 '05 '06 '07 '08 '09 '10 '11 '12 '13 '14 '15 '16 '17
WSR
(N /
10
0,0
00
)
Incidence year
0
2
4
6
8
10
'04 '05 '06 '07 '08 '09 '10 '11 '12 '13 '14 '15 '16 '17
WSR
(N /
10
0,0
00
)
Incidence year
0
2
4
6
8
10
'04 '05 '06 '07 '08 '09 '10 '11 '12 '13 '14 '15 '16 '17
WSR
(N /
10
0,0
00
)
Incidence year
0
2
4
6
8
10
'04 '05 '06 '07 '08 '09 '10 '11 '12 '13 '14 '15 '16 '17
WSR
(N /
10
0,0
00
)
Incidence year
Figure 7 Testicular cancer: Figure 8 Testicular cancer:
Trends in age-standardised incidence by stage, 2004-2017 Trends in age-standardised incidence by histology, 2004-2017
0
1
2
3
4
5
6
7
'04 '05 '06 '07 '08 '09 '10 '11 '12 '13 '14 '15 '16 '17
WSR
(N /
10
0,0
00
)
Incidence year
Stage I Stage II Stage III Stage unknown
0.0
0.5
1.0
1.5
2.0
2.5
3.0
3.5
4.0
'04 '05 '06 '07 '08 '09 '10 '11 '12 '13 '14 '15 '16 '17
WSR
(N /
10
0,0
00
)
Incidence year
Non-seminoma Seminoma Histology, other and NOS
3.8.2.2 Incidence trends
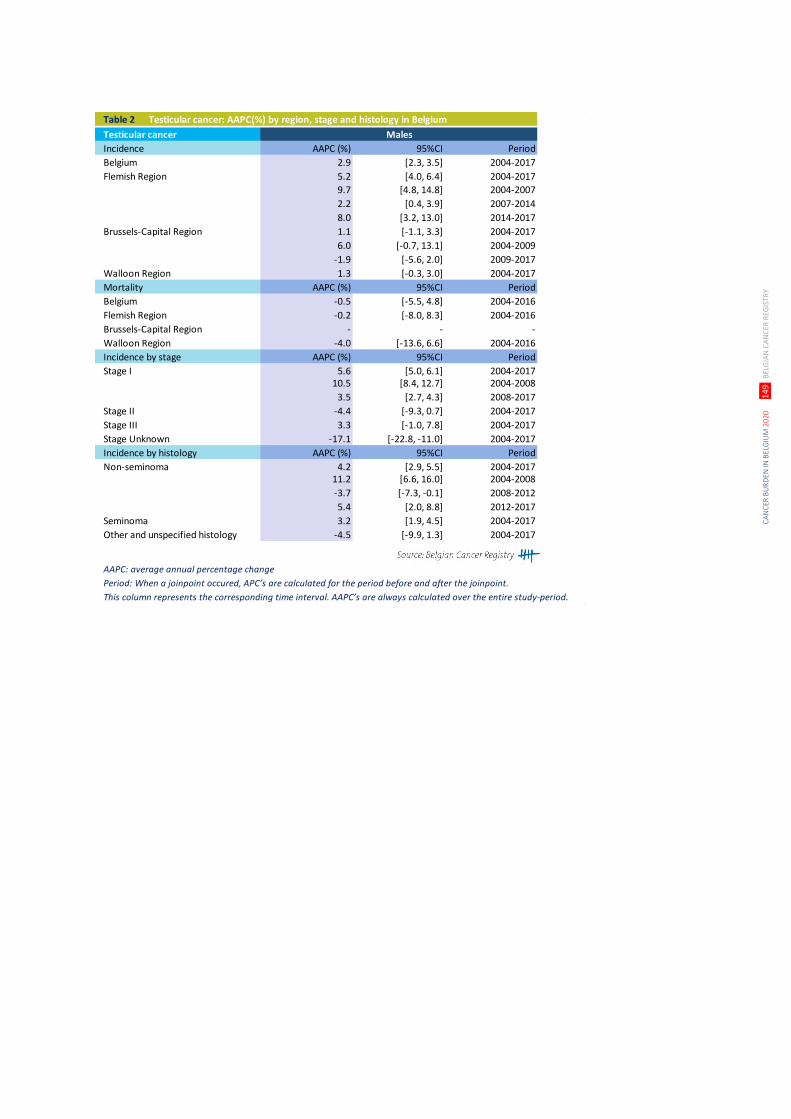
CA
NC
ER B
UR
DEN
IN B
ELG
IUM
202
0
14
9 B
ELG
IAN
CA
NC
ER R
EGIS
TRY
Table 2 Testicular cancer: AAPC(%) by region, stage and histology in Belgium
Testicular cancer Males
Incidence AAPC (%) 95%CI Period
Belgium 2.9 [2.3, 3.5] 2004-2017
Flemish Region 5.2 [4.0, 6.4] 2004-2017
9.7 [4.8, 14.8] 2004-2007
2.2 [0.4, 3.9] 2007-2014
8.0 [3.2, 13.0] 2014-2017
Brussels-Capital Region 1.1 [-1.1, 3.3] 2004-2017
6.0 [-0.7, 13.1] 2004-2009
-1.9 [-5.6, 2.0] 2009-2017
Walloon Region 1.3 [-0.3, 3.0] 2004-2017
Mortality AAPC (%) 95%CI Period
Belgium -0.5 [-5.5, 4.8] 2004-2016
Flemish Region -0.2 [-8.0, 8.3] 2004-2016
Brussels-Capital Region - - -
Walloon Region -4.0 [-13.6, 6.6] 2004-2016
Incidence by stage AAPC (%) 95%CI Period
Stage I 5.6 [5.0, 6.1] 2004-201710.5 [8.4, 12.7] 2004-2008
3.5 [2.7, 4.3] 2008-2017
Stage II -4.4 [-9.3, 0.7] 2004-2017
Stage III 3.3 [-1.0, 7.8] 2004-2017
Stage Unknown -17.1 [-22.8, -11.0] 2004-2017
Incidence by histology AAPC (%) 95%CI Period
Non-seminoma 4.2 [2.9, 5.5] 2004-201711.2 [6.6, 16.0] 2004-2008
-3.7 [-7.3, -0.1] 2008-2012
5.4 [2.0, 8.8] 2012-2017
Seminoma 3.2 [1.9, 4.5] 2004-2017
Other and unspecified histology -4.5 [-9.9, 1.3] 2004-2017
AAPC: average annual percentage change
Period: When a joinpoint occured, APC’s are calculated for the period before and after the joinpoint.
This column represents the corresponding time interval. AAPC’s are always calculated over the entire study-period.
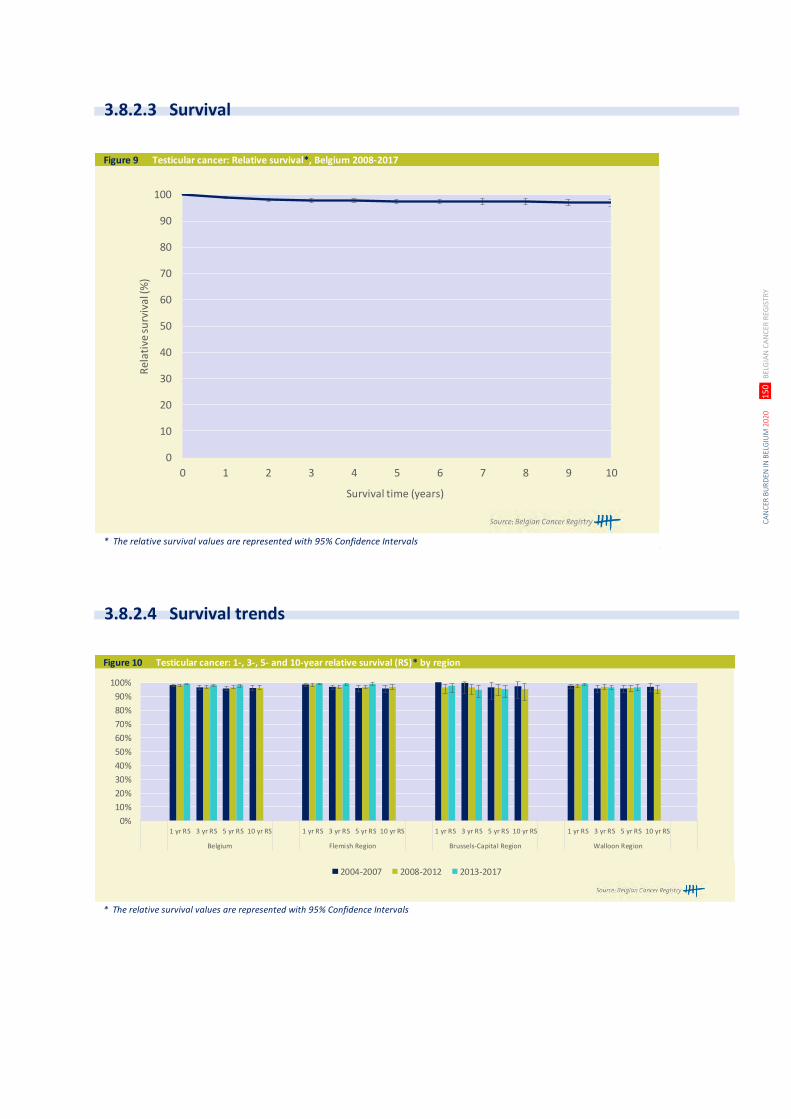
CA
NC
ER B
UR
DEN
IN B
ELG
IUM
202
0
15
0 B
ELG
IAN
CA
NC
ER R
EGIS
TRY
Figure 9 Testicular cancer: Relative survival*, Belgium 2008-2017
* The relative survival values are represented with 95% Confidence Intervals
0
10
20
30
40
50
60
70
80
90
100
0 1 2 3 4 5 6 7 8 9 10
Rel
ativ
e su
rviv
al (%
)
Survival time (years)
Figure 10 Testicular cancer: 1-, 3-, 5- and 10-year relative survival (RS)* by region
* The relative survival values are represented with 95% Confidence Intervals
0%
10%
20%
30%
40%
50%
60%
70%
80%
90%
100%
1 yr RS 3 yr RS 5 yr RS 10 yr RS 1 yr RS 3 yr RS 5 yr RS 10 yr RS 1 yr RS 3 yr RS 5 yr RS 10 yr RS 1 yr RS 3 yr RS 5 yr RS 10 yr RS
Belgium Flemish Region Brussels-Capital Region Walloon Region
2004-2007 2008-2012 2013-2017
3.8.2.3 Survival
3.8.2.4 Survival trends
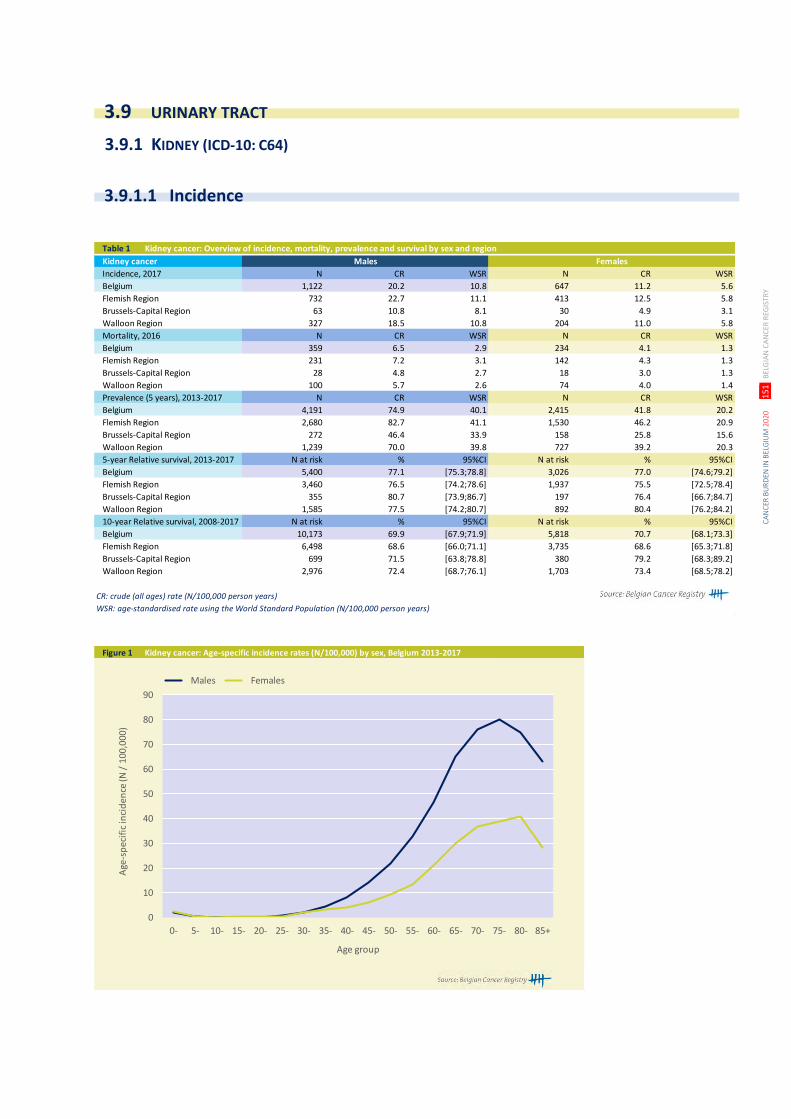
CA
NC
ER B
UR
DEN
IN B
ELG
IUM
202
0
15
1 B
ELG
IAN
CA
NC
ER R
EGIS
TRY
Table 1 Kidney cancer: Overview of incidence, mortality, prevalence and survival by sex and region
Kidney cancer Males Females
Incidence, 2017 N CR WSR N CR WSR
Belgium 1,122 20.2 10.8 647 11.2 5.6
Flemish Region 732 22.7 11.1 413 12.5 5.8
Brussels-Capital Region 63 10.8 8.1 30 4.9 3.1
Walloon Region 327 18.5 10.8 204 11.0 5.8
Mortality, 2016 N CR WSR N CR WSR
Belgium 359 6.5 2.9 234 4.1 1.3
Flemish Region 231 7.2 3.1 142 4.3 1.3
Brussels-Capital Region 28 4.8 2.7 18 3.0 1.3
Walloon Region 100 5.7 2.6 74 4.0 1.4
Prevalence (5 years), 2013-2017 N CR WSR N CR WSR
Belgium 4,191 74.9 40.1 2,415 41.8 20.2
Flemish Region 2,680 82.7 41.1 1,530 46.2 20.9
Brussels-Capital Region 272 46.4 33.9 158 25.8 15.6
Walloon Region 1,239 70.0 39.8 727 39.2 20.3
5-year Relative survival, 2013-2017 N at risk % 95%CI N at risk % 95%CI
Belgium 5,400 77.1 [75.3;78.8] 3,026 77.0 [74.6;79.2]
Flemish Region 3,460 76.5 [74.2;78.6] 1,937 75.5 [72.5;78.4]
Brussels-Capital Region 355 80.7 [73.9;86.7] 197 76.4 [66.7;84.7]
Walloon Region 1,585 77.5 [74.2;80.7] 892 80.4 [76.2;84.2]
10-year Relative survival, 2008-2017 N at risk % 95%CI N at risk % 95%CI
Belgium 10,173 69.9 [67.9;71.9] 5,818 70.7 [68.1;73.3]
Flemish Region 6,498 68.6 [66.0;71.1] 3,735 68.6 [65.3;71.8]
Brussels-Capital Region 699 71.5 [63.8;78.8] 380 79.2 [68.3;89.2]
Walloon Region 2,976 72.4 [68.7;76.1] 1,703 73.4 [68.5;78.2]
CR: crude (all ages) rate (N/100,000 person years)
WSR: age-standardised rate using the World Standard Population (N/100,000 person years)
Figure 1 Kidney cancer: Age-specific incidence rates (N/100,000) by sex, Belgium 2013-2017
0
10
20
30
40
50
60
70
80
90
0- 5- 10- 15- 20- 25- 30- 35- 40- 45- 50- 55- 60- 65- 70- 75- 80- 85+
Age
-sp
ecif
ic in
cid
ence
(N /
10
0,0
00
)
Age group
Males Females
3.9.1 KIDNEY (ICD-10: C64)
3.9.1.1 Incidence
3.9 URINARY TRACT
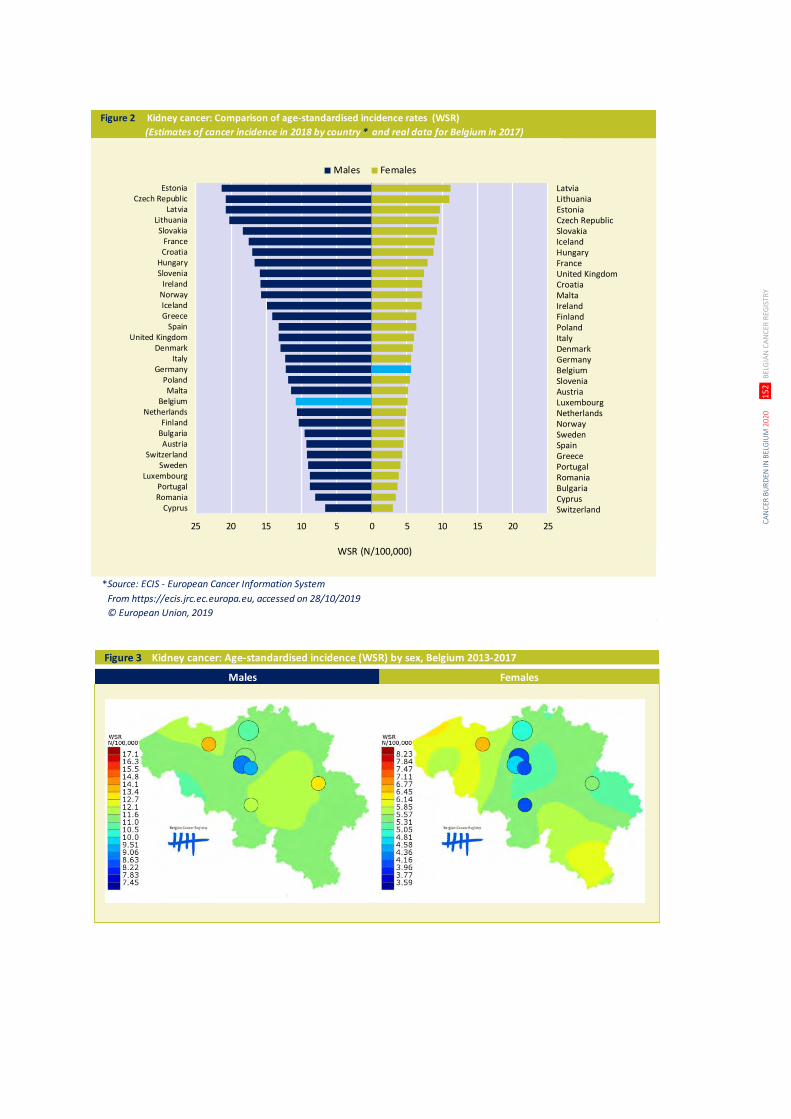
CA
NC
ER B
UR
DEN
IN B
ELG
IUM
202
0
15
2 B
ELG
IAN
CA
NC
ER R
EGIS
TRY
Figure 2 Kidney cancer: Comparison of age-standardised incidence rates (WSR)
(Estimates of cancer incidence in 2018 by country * and real data for Belgium in 2017)
Source: ECIS - European Cancer Information System
From https://ecis.jrc.ec.europa.eu, accessed on 28/10/2019
© European Union, 2019
25 20 15 10 5 0 5 10 15 20 25
EstoniaCzech Republic
LatviaLithuaniaSlovakia
FranceCroatia
HungarySlovenia
IrelandNorwayIcelandGreece
SpainUnited Kingdom
DenmarkItaly
GermanyPolandMalta
BelgiumNetherlands
FinlandBulgariaAustria
SwitzerlandSweden
LuxembourgPortugalRomania
Cyprus
Males Females
WSR (N/100,000)
*
LatviaLithuaniaEstoniaCzech RepublicSlovakiaIcelandHungaryFranceUnited KingdomCroatiaMaltaIrelandFinlandPolandItalyDenmarkGermanyBelgiumSloveniaAustriaLuxembourgNetherlandsNorwaySwedenSpainGreecePortugalRomaniaBulgariaCyprusSwitzerland
Figure 3 Kidney cancer: Age-standardised incidence (WSR) by sex, Belgium 2013-2017
Males Females
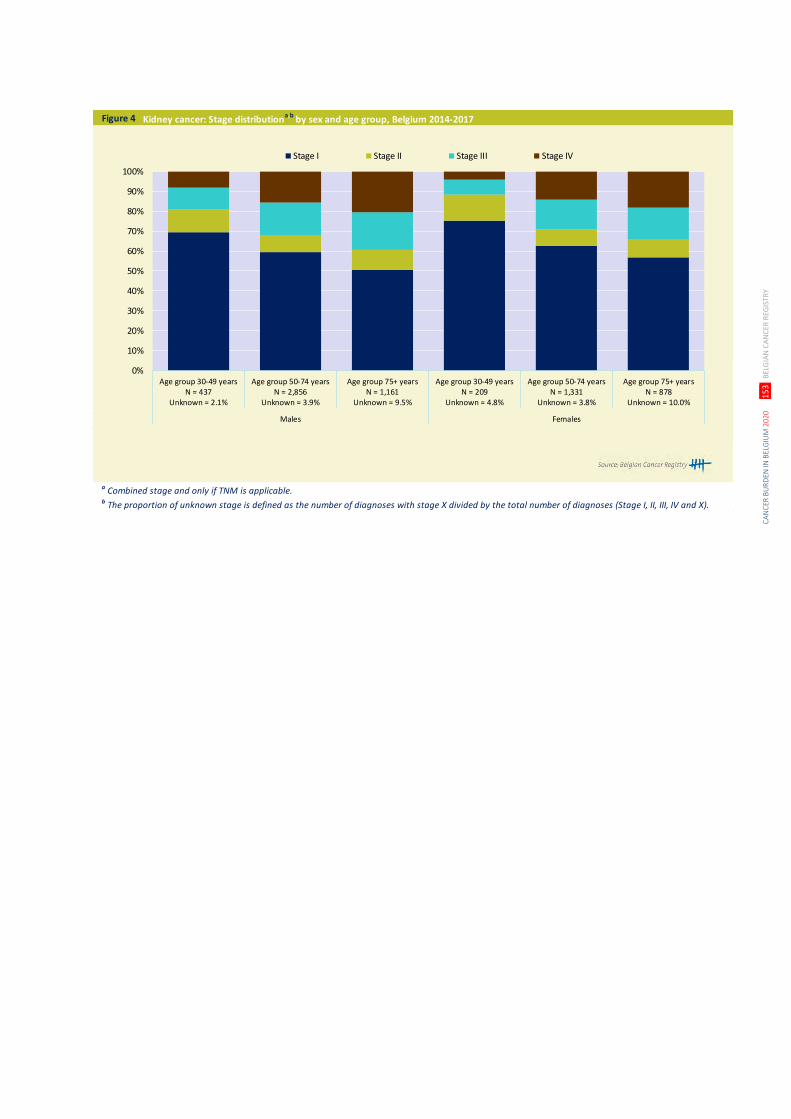
CA
NC
ER B
UR
DEN
IN B
ELG
IUM
202
0
15
3 B
ELG
IAN
CA
NC
ER R
EGIS
TRY
Figure 4 Kidney cancer: Stage distributiona,b
by sex and age group, Belgium 2014-2017
a Combined stage and only if TNM is applicable. b The proportion of unknown stage is defined as the number of diagnoses with stage X divided by the total number of diagnoses (Stage I, II, III, IV and X).
0%
10%
20%
30%
40%
50%
60%
70%
80%
90%
100%
Age group 30-49 yearsN = 437
Unknown = 2.1%
Age group 50-74 yearsN = 2,856
Unknown = 3.9%
Age group 75+ yearsN = 1,161
Unknown = 9.5%
Age group 30-49 yearsN = 209
Unknown = 4.8%
Age group 50-74 yearsN = 1,331
Unknown = 3.8%
Age group 75+ yearsN = 878
Unknown = 10.0%
Males Females
Stage I Stage II Stage III Stage IV
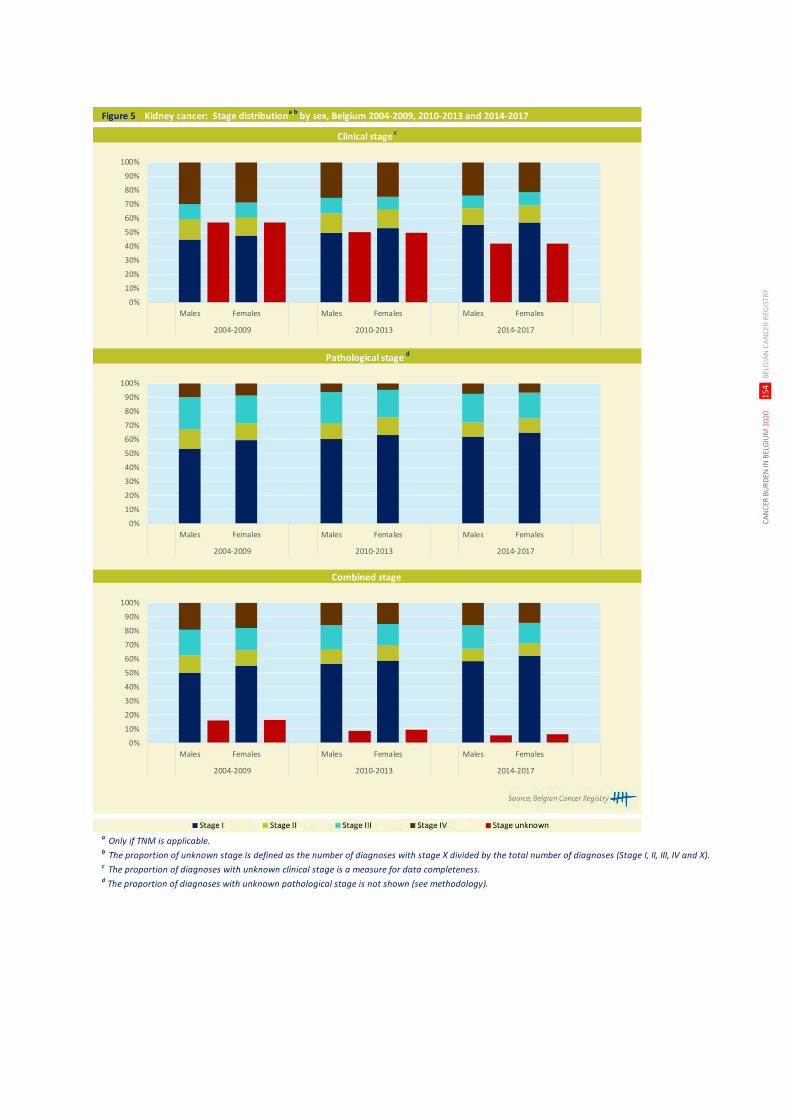
CA
NC
ER B
UR
DEN
IN B
ELG
IUM
202
0
15
4 B
ELG
IAN
CA
NC
ER R
EGIS
TRY
Figure 5 Kidney cancer: Stage distributiona,b
by sex, Belgium 2004-2009, 2010-2013 and 2014-2017
a Only if TNM is applicable. b The proportion of unknown stage is defined as the number of diagnoses with stage X divided by the total number of diagnoses (Stage I, II, III, IV and X).c The proportion of diagnoses with unknown clinical stage is a measure for data completeness.d The proportion of diagnoses with unknown pathological stage is not shown (see methodology).
Clinical stage c
Pathological stage d
Combined stage
0%
10%
20%
30%
40%
50%
60%
70%
80%
90%
100%
Males Females Males Females Males Females
2004-2009 2010-2013 2014-2017
0%
10%
20%
30%
40%
50%
60%
70%
80%
90%
100%
Males Females Males Females Males Females
2004-2009 2010-2013 2014-2017
0%
10%
20%
30%
40%
50%
60%
70%
80%
90%
100%
Males Females Males Females Males Females
2004-2009 2010-2013 2014-2017
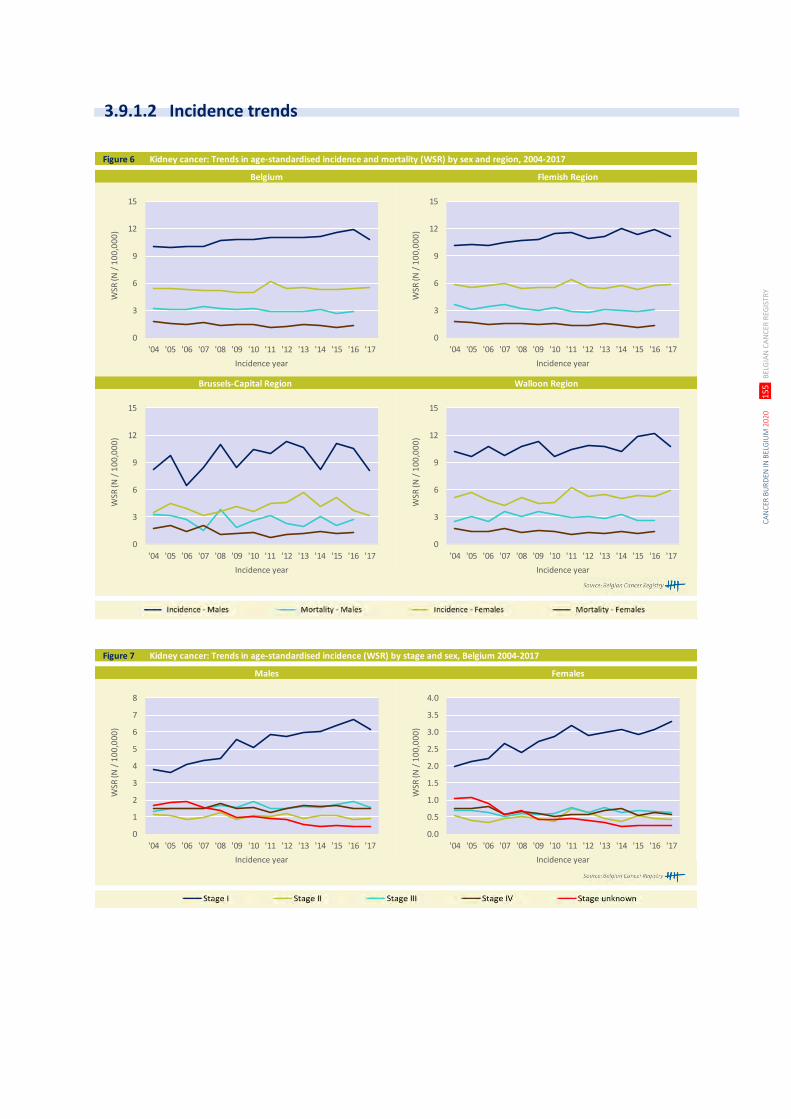
CA
NC
ER B
UR
DEN
IN B
ELG
IUM
202
0
15
5 B
ELG
IAN
CA
NC
ER R
EGIS
TRY
Figure 6 Kidney cancer: Trends in age-standardised incidence and mortality (WSR) by sex and region, 2004-2017
Brussels-Capital Region Walloon Region
Belgium Flemish Region
0
3
6
9
12
15
'04 '05 '06 '07 '08 '09 '10 '11 '12 '13 '14 '15 '16 '17
WSR
(N /
10
0,0
00
)
Incidence year
0
3
6
9
12
15
'04 '05 '06 '07 '08 '09 '10 '11 '12 '13 '14 '15 '16 '17
WSR
(N /
10
0,0
00
)
Incidence year
0
3
6
9
12
15
'04 '05 '06 '07 '08 '09 '10 '11 '12 '13 '14 '15 '16 '17
WSR
(N /
10
0,0
00
)
Incidence year
0
3
6
9
12
15
'04 '05 '06 '07 '08 '09 '10 '11 '12 '13 '14 '15 '16 '17
WSR
(N /
10
0,0
00
)
Incidence year
Figure 7 Kidney cancer: Trends in age-standardised incidence (WSR) by stage and sex, Belgium 2004-2017
Males Females
0
1
2
3
4
5
6
7
8
'04 '05 '06 '07 '08 '09 '10 '11 '12 '13 '14 '15 '16 '17
WSR
(N /
10
0,0
00
)
Incidence year
0.0
0.5
1.0
1.5
2.0
2.5
3.0
3.5
4.0
'04 '05 '06 '07 '08 '09 '10 '11 '12 '13 '14 '15 '16 '17
WSR
(N /
10
0,0
00
)
Incidence year
3.9.1.2 Incidence trends
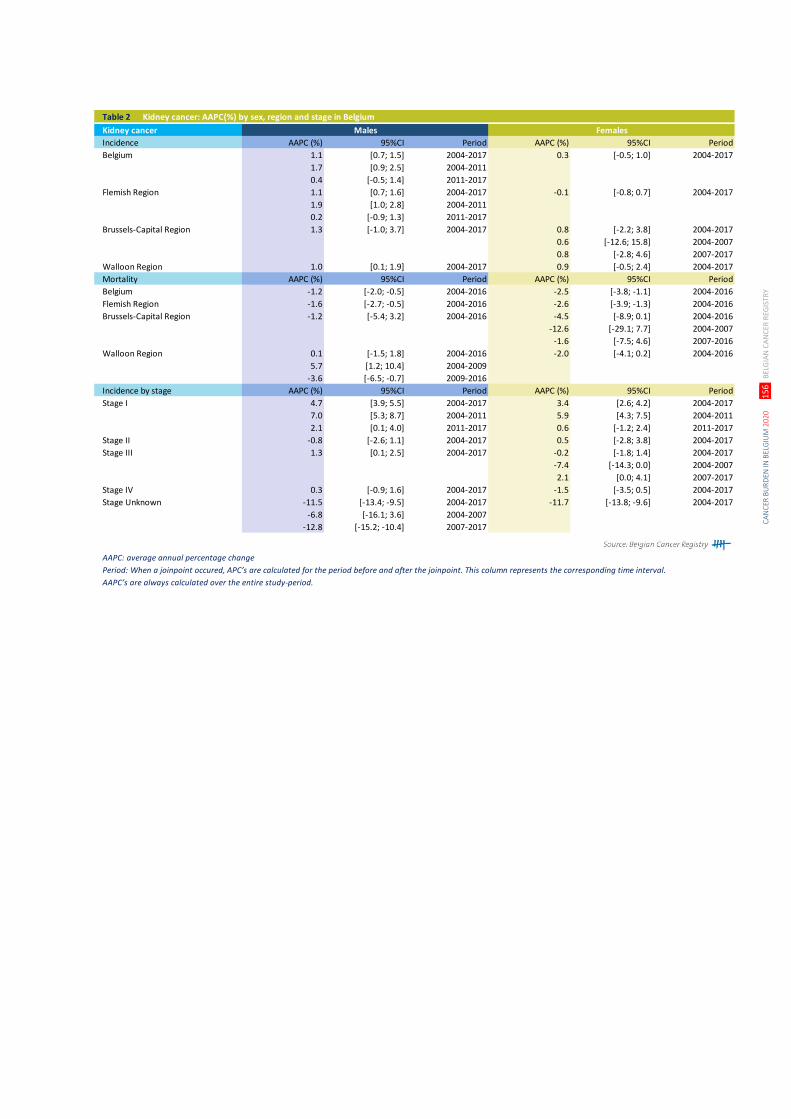
CA
NC
ER B
UR
DEN
IN B
ELG
IUM
202
0
15
6 B
ELG
IAN
CA
NC
ER R
EGIS
TRY
Table 2 Kidney cancer: AAPC(%) by sex, region and stage in Belgium
Kidney cancer Males Females
Incidence AAPC (%) 95%CI Period AAPC (%) 95%CI Period
Belgium 1.1 [0.7; 1.5] 2004-2017 0.3 [-0.5; 1.0] 2004-2017
1.7 [0.9; 2.5] 2004-2011
0.4 [-0.5; 1.4] 2011-2017
Flemish Region 1.1 [0.7; 1.6] 2004-2017 -0.1 [-0.8; 0.7] 2004-2017
1.9 [1.0; 2.8] 2004-2011
0.2 [-0.9; 1.3] 2011-2017
Brussels-Capital Region 1.3 [-1.0; 3.7] 2004-2017 0.8 [-2.2; 3.8] 2004-2017
0.6 [-12.6; 15.8] 2004-2007
0.8 [-2.8; 4.6] 2007-2017
Walloon Region 1.0 [0.1; 1.9] 2004-2017 0.9 [-0.5; 2.4] 2004-2017
Mortality AAPC (%) 95%CI Period AAPC (%) 95%CI Period
Belgium -1.2 [-2.0; -0.5] 2004-2016 -2.5 [-3.8; -1.1] 2004-2016
Flemish Region -1.6 [-2.7; -0.5] 2004-2016 -2.6 [-3.9; -1.3] 2004-2016
Brussels-Capital Region -1.2 [-5.4; 3.2] 2004-2016 -4.5 [-8.9; 0.1] 2004-2016
-12.6 [-29.1; 7.7] 2004-2007
-1.6 [-7.5; 4.6] 2007-2016
Walloon Region 0.1 [-1.5; 1.8] 2004-2016 -2.0 [-4.1; 0.2] 2004-2016
5.7 [1.2; 10.4] 2004-2009
-3.6 [-6.5; -0.7] 2009-2016
Incidence by stage AAPC (%) 95%CI Period AAPC (%) 95%CI Period
Stage I 4.7 [3.9; 5.5] 2004-2017 3.4 [2.6; 4.2] 2004-2017
7.0 [5.3; 8.7] 2004-2011 5.9 [4.3; 7.5] 2004-2011
2.1 [0.1; 4.0] 2011-2017 0.6 [-1.2; 2.4] 2011-2017
Stage II -0.8 [-2.6; 1.1] 2004-2017 0.5 [-2.8; 3.8] 2004-2017
Stage III 1.3 [0.1; 2.5] 2004-2017 -0.2 [-1.8; 1.4] 2004-2017
-7.4 [-14.3; 0.0] 2004-2007
2.1 [0.0; 4.1] 2007-2017
Stage IV 0.3 [-0.9; 1.6] 2004-2017 -1.5 [-3.5; 0.5] 2004-2017
Stage Unknown -11.5 [-13.4; -9.5] 2004-2017 -11.7 [-13.8; -9.6] 2004-2017
-6.8 [-16.1; 3.6] 2004-2007
-12.8 [-15.2; -10.4] 2007-2017
AAPC: average annual percentage change
Period: When a joinpoint occured, APC’s are calculated for the period before and after the joinpoint. This column represents the corresponding time interval.
AAPC’s are always calculated over the entire study-period.
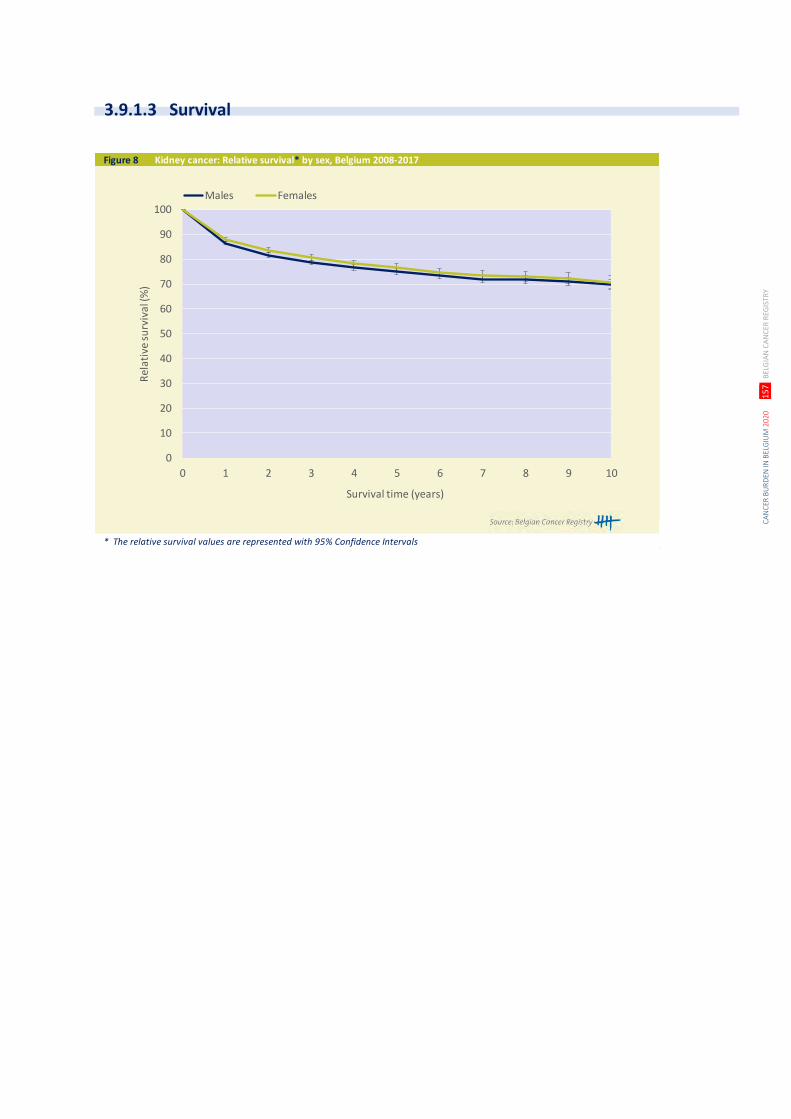
CA
NC
ER B
UR
DEN
IN B
ELG
IUM
202
0
15
7 B
ELG
IAN
CA
NC
ER R
EGIS
TRY
Figure 8 Kidney cancer: Relative survival* by sex, Belgium 2008-2017
* The relative survival values are represented with 95% Confidence Intervals
0
10
20
30
40
50
60
70
80
90
100
0 1 2 3 4 5 6 7 8 9 10
Rel
ativ
e su
rviv
al (%
)
Survival time (years)
Males Females
3.9.1.3 Survival
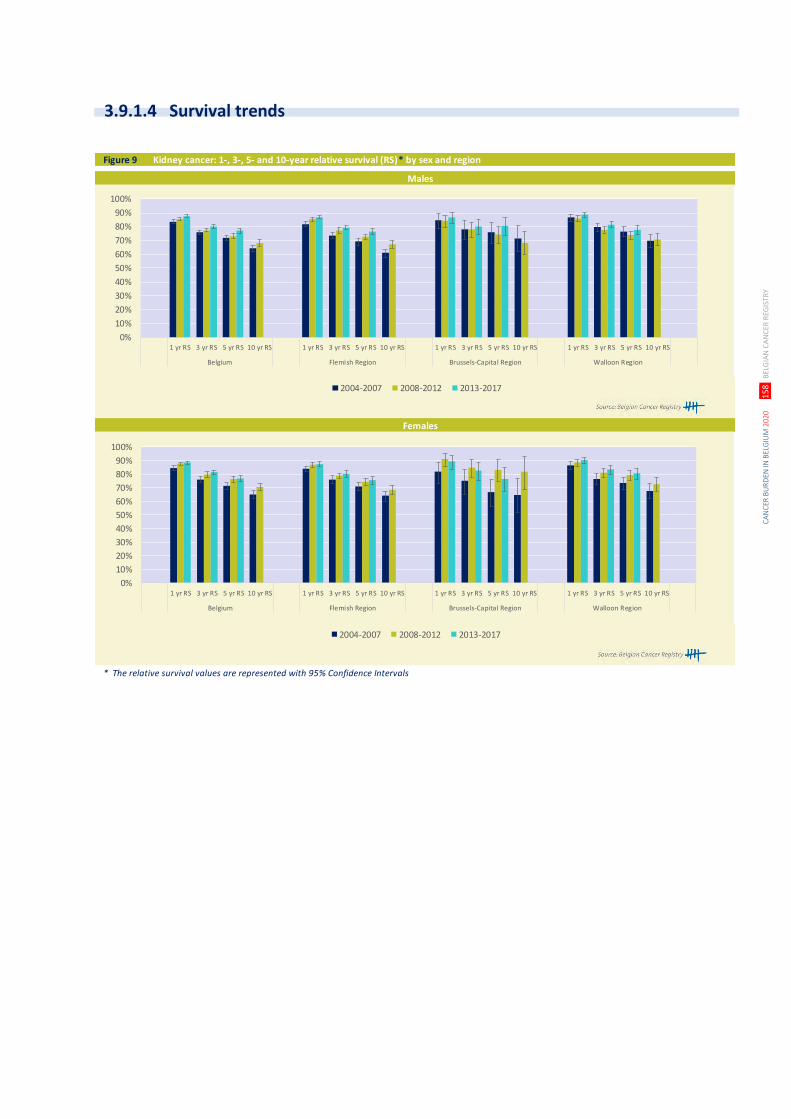
CA
NC
ER B
UR
DEN
IN B
ELG
IUM
202
0
15
8 B
ELG
IAN
CA
NC
ER R
EGIS
TRY
Figure 9 Kidney cancer: 1-, 3-, 5- and 10-year relative survival (RS)* by sex and region
* The relative survival values are represented with 95% Confidence Intervals
Males
Females
0%
10%
20%
30%
40%
50%
60%
70%
80%
90%
100%
1 yr RS 3 yr RS 5 yr RS 10 yr RS 1 yr RS 3 yr RS 5 yr RS 10 yr RS 1 yr RS 3 yr RS 5 yr RS 10 yr RS 1 yr RS 3 yr RS 5 yr RS 10 yr RS
Belgium Flemish Region Brussels-Capital Region Walloon Region
2004-2007 2008-2012 2013-2017
0%
10%
20%
30%
40%
50%
60%
70%
80%
90%
100%
1 yr RS 3 yr RS 5 yr RS 10 yr RS 1 yr RS 3 yr RS 5 yr RS 10 yr RS 1 yr RS 3 yr RS 5 yr RS 10 yr RS 1 yr RS 3 yr RS 5 yr RS 10 yr RS
Belgium Flemish Region Brussels-Capital Region Walloon Region
2004-2007 2008-2012 2013-2017
3.9.1.4 Survival trends
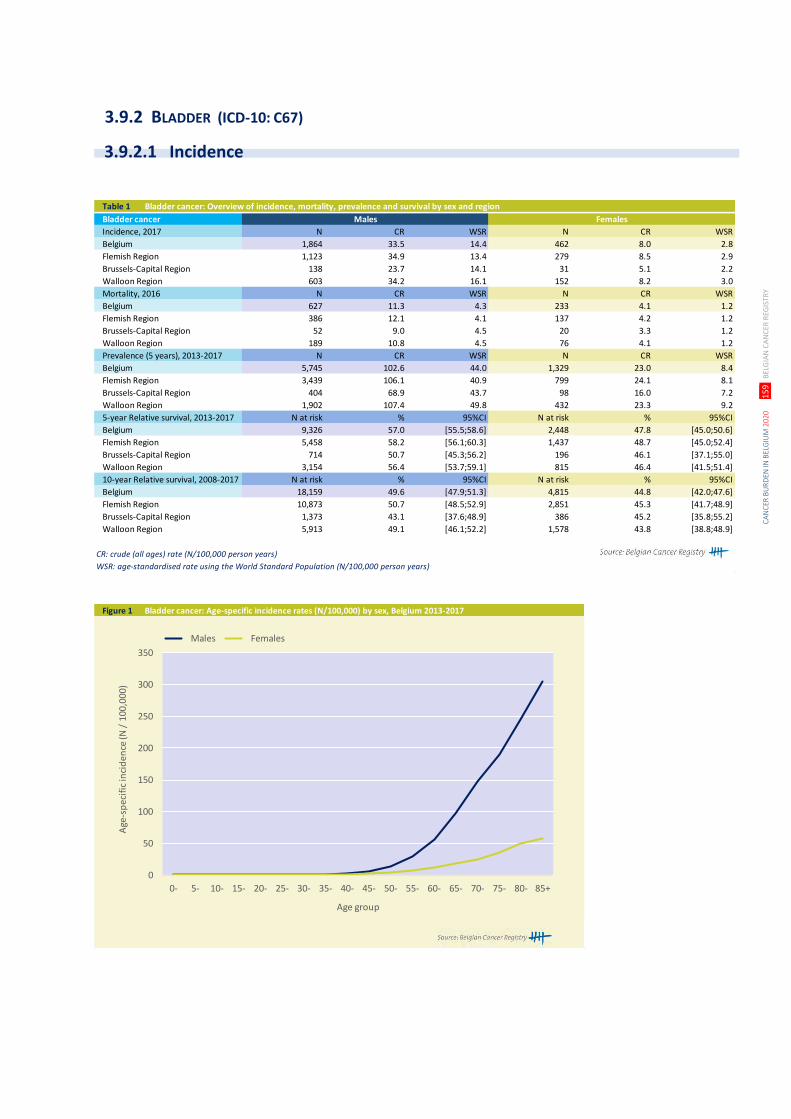
CA
NC
ER B
UR
DEN
IN B
ELG
IUM
202
0
15
9 B
ELG
IAN
CA
NC
ER R
EGIS
TRY
Table 1 Bladder cancer: Overview of incidence, mortality, prevalence and survival by sex and region
Bladder cancer Males Females
Incidence, 2017 N CR WSR N CR WSR
Belgium 1,864 33.5 14.4 462 8.0 2.8
Flemish Region 1,123 34.9 13.4 279 8.5 2.9
Brussels-Capital Region 138 23.7 14.1 31 5.1 2.2
Walloon Region 603 34.2 16.1 152 8.2 3.0
Mortality, 2016 N CR WSR N CR WSR
Belgium 627 11.3 4.3 233 4.1 1.2
Flemish Region 386 12.1 4.1 137 4.2 1.2
Brussels-Capital Region 52 9.0 4.5 20 3.3 1.2
Walloon Region 189 10.8 4.5 76 4.1 1.2
Prevalence (5 years), 2013-2017 N CR WSR N CR WSR
Belgium 5,745 102.6 44.0 1,329 23.0 8.4
Flemish Region 3,439 106.1 40.9 799 24.1 8.1
Brussels-Capital Region 404 68.9 43.7 98 16.0 7.2
Walloon Region 1,902 107.4 49.8 432 23.3 9.2
5-year Relative survival, 2013-2017 N at risk % 95%CI N at risk % 95%CI
Belgium 9,326 57.0 [55.5;58.6] 2,448 47.8 [45.0;50.6]
Flemish Region 5,458 58.2 [56.1;60.3] 1,437 48.7 [45.0;52.4]
Brussels-Capital Region 714 50.7 [45.3;56.2] 196 46.1 [37.1;55.0]
Walloon Region 3,154 56.4 [53.7;59.1] 815 46.4 [41.5;51.4]
10-year Relative survival, 2008-2017 N at risk % 95%CI N at risk % 95%CI
Belgium 18,159 49.6 [47.9;51.3] 4,815 44.8 [42.0;47.6]
Flemish Region 10,873 50.7 [48.5;52.9] 2,851 45.3 [41.7;48.9]
Brussels-Capital Region 1,373 43.1 [37.6;48.9] 386 45.2 [35.8;55.2]
Walloon Region 5,913 49.1 [46.1;52.2] 1,578 43.8 [38.8;48.9]
CR: crude (all ages) rate (N/100,000 person years)
WSR: age-standardised rate using the World Standard Population (N/100,000 person years)
Figure 1 Bladder cancer: Age-specific incidence rates (N/100,000) by sex, Belgium 2013-2017
0
50
100
150
200
250
300
350
0- 5- 10- 15- 20- 25- 30- 35- 40- 45- 50- 55- 60- 65- 70- 75- 80- 85+
Age
-sp
ecif
ic in
cid
ence
(N /
100
,000
)
Age group
Males Females
3.9.2 BLADDER (ICD-10: C67)
3.9.2.1 Incidence
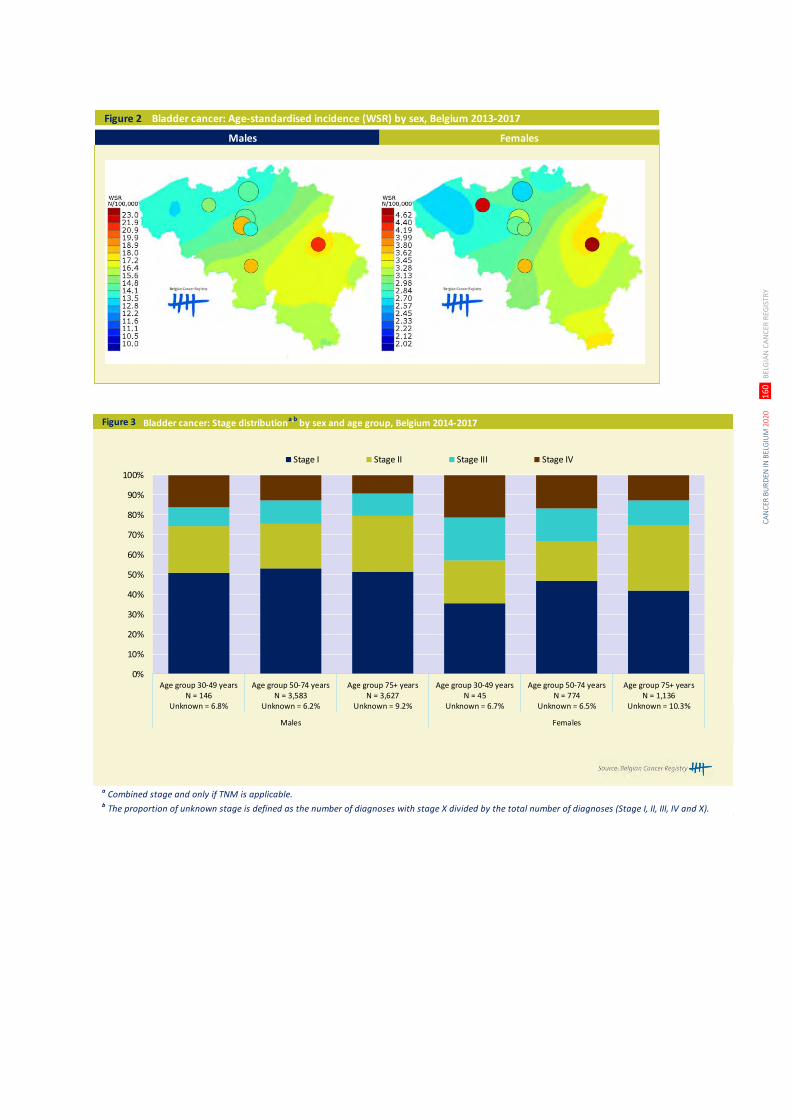
CA
NC
ER B
UR
DEN
IN B
ELG
IUM
202
0
16
0 B
ELG
IAN
CA
NC
ER R
EGIS
TRY
Figure 2 Bladder cancer: Age-standardised incidence (WSR) by sex, Belgium 2013-2017
Males Females
Figure 3 Bladder cancer: Stage distributiona,b
by sex and age group, Belgium 2014-2017
a Combined stage and only if TNM is applicable. b The proportion of unknown stage is defined as the number of diagnoses with stage X divided by the total number of diagnoses (Stage I, II, III, IV and X).
0%
10%
20%
30%
40%
50%
60%
70%
80%
90%
100%
Age group 30-49 yearsN = 146
Unknown = 6.8%
Age group 50-74 yearsN = 3,583
Unknown = 6.2%
Age group 75+ yearsN = 3,627
Unknown = 9.2%
Age group 30-49 yearsN = 45
Unknown = 6.7%
Age group 50-74 yearsN = 774
Unknown = 6.5%
Age group 75+ yearsN = 1,136
Unknown = 10.3%
Males Females
Stage I Stage II Stage III Stage IV
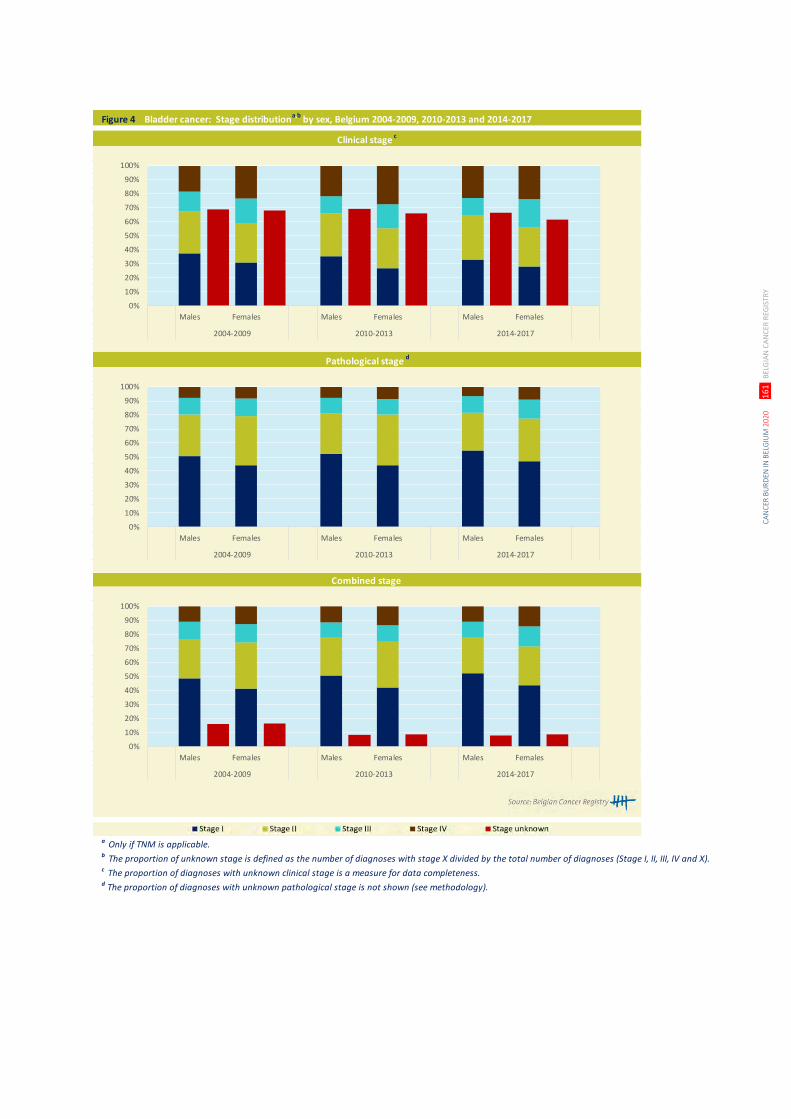
CA
NC
ER B
UR
DEN
IN B
ELG
IUM
202
0
16
1 B
ELG
IAN
CA
NC
ER R
EGIS
TRY
Figure 4 Bladder cancer: Stage distributiona,b
by sex, Belgium 2004-2009, 2010-2013 and 2014-2017
a Only if TNM is applicable. b The proportion of unknown stage is defined as the number of diagnoses with stage X divided by the total number of diagnoses (Stage I, II, III, IV and X).c The proportion of diagnoses with unknown clinical stage is a measure for data completeness.d The proportion of diagnoses with unknown pathological stage is not shown (see methodology).
Clinical stage c
Pathological stage d
Combined stage
0%
10%
20%
30%
40%
50%
60%
70%
80%
90%
100%
Males Females Males Females Males Females
2004-2009 2010-2013 2014-2017
0%
10%
20%
30%
40%
50%
60%
70%
80%
90%
100%
Males Females Males Females Males Females
2004-2009 2010-2013 2014-2017
0%
10%
20%
30%
40%
50%
60%
70%
80%
90%
100%
Males Females Males Females Males Females
2004-2009 2010-2013 2014-2017
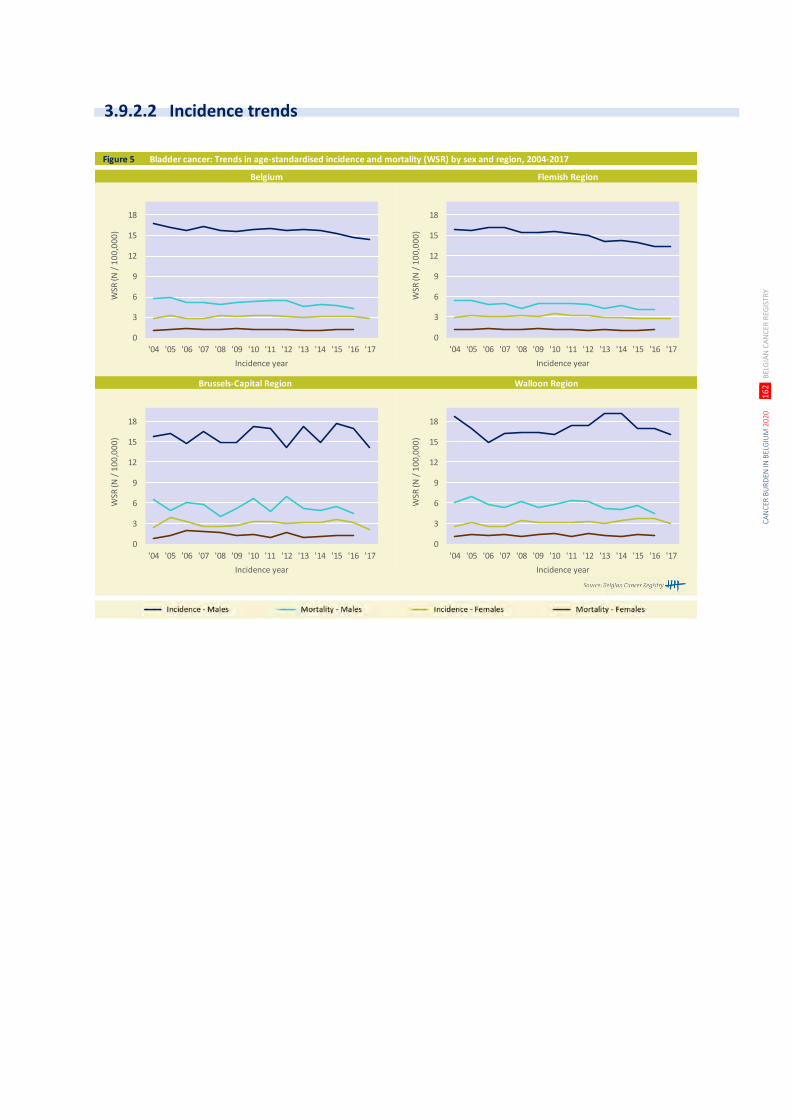
CA
NC
ER B
UR
DEN
IN B
ELG
IUM
202
0
16
2 B
ELG
IAN
CA
NC
ER R
EGIS
TRY
Figure 5 Bladder cancer: Trends in age-standardised incidence and mortality (WSR) by sex and region, 2004-2017
Brussels-Capital Region Walloon Region
Belgium Flemish Region
0
3
6
9
12
15
18
'04 '05 '06 '07 '08 '09 '10 '11 '12 '13 '14 '15 '16 '17
WSR
(N /
10
0,0
00
)
Incidence year
0
3
6
9
12
15
18
'04 '05 '06 '07 '08 '09 '10 '11 '12 '13 '14 '15 '16 '17
WSR
(N /
10
0,0
00
)
Incidence year
0
3
6
9
12
15
18
'04 '05 '06 '07 '08 '09 '10 '11 '12 '13 '14 '15 '16 '17
WSR
(N /
10
0,0
00
)
Incidence year
0
3
6
9
12
15
18
'04 '05 '06 '07 '08 '09 '10 '11 '12 '13 '14 '15 '16 '17
WSR
(N /
10
0,0
00
)
Incidence year
3.9.2.2 Incidence trends
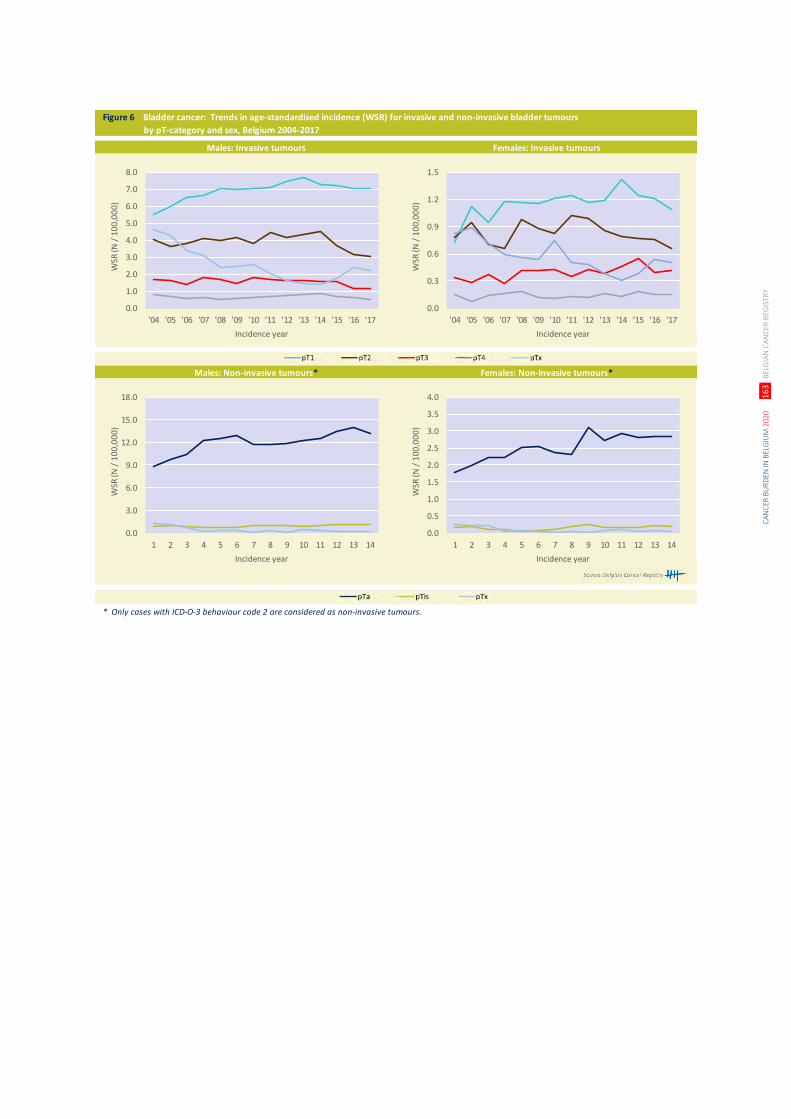
CA
NC
ER B
UR
DEN
IN B
ELG
IUM
202
0
16
3 B
ELG
IAN
CA
NC
ER R
EGIS
TRY
Figure 6 Bladder cancer: Trends in age-standardised incidence (WSR) for invasive and non-invasive bladder tumours
by pT-category and sex, Belgium 2004-2017
* Only cases with ICD-O-3 behaviour code 2 are considered as non-invasive tumours.
Males: Non-invasive tumours* Females: Non-invasive tumours*
Males: Invasive tumours Females: Invasive tumours
0.0
1.0
2.0
3.0
4.0
5.0
6.0
7.0
8.0
'04 '05 '06 '07 '08 '09 '10 '11 '12 '13 '14 '15 '16 '17
WSR
(N /
10
0,0
00
)
Incidence year
0.0
0.3
0.6
0.9
1.2
1.5
'04 '05 '06 '07 '08 '09 '10 '11 '12 '13 '14 '15 '16 '17
WSR
(N /
10
0,0
00
)
Incidence year
0.0
3.0
6.0
9.0
12.0
15.0
18.0
1 2 3 4 5 6 7 8 9 10 11 12 13 14
WSR
(N /
10
0,0
00
)
Incidence year
0.0
0.5
1.0
1.5
2.0
2.5
3.0
3.5
4.0
1 2 3 4 5 6 7 8 9 10 11 12 13 14
WSR
(N /
10
0,0
00
)
Incidence year
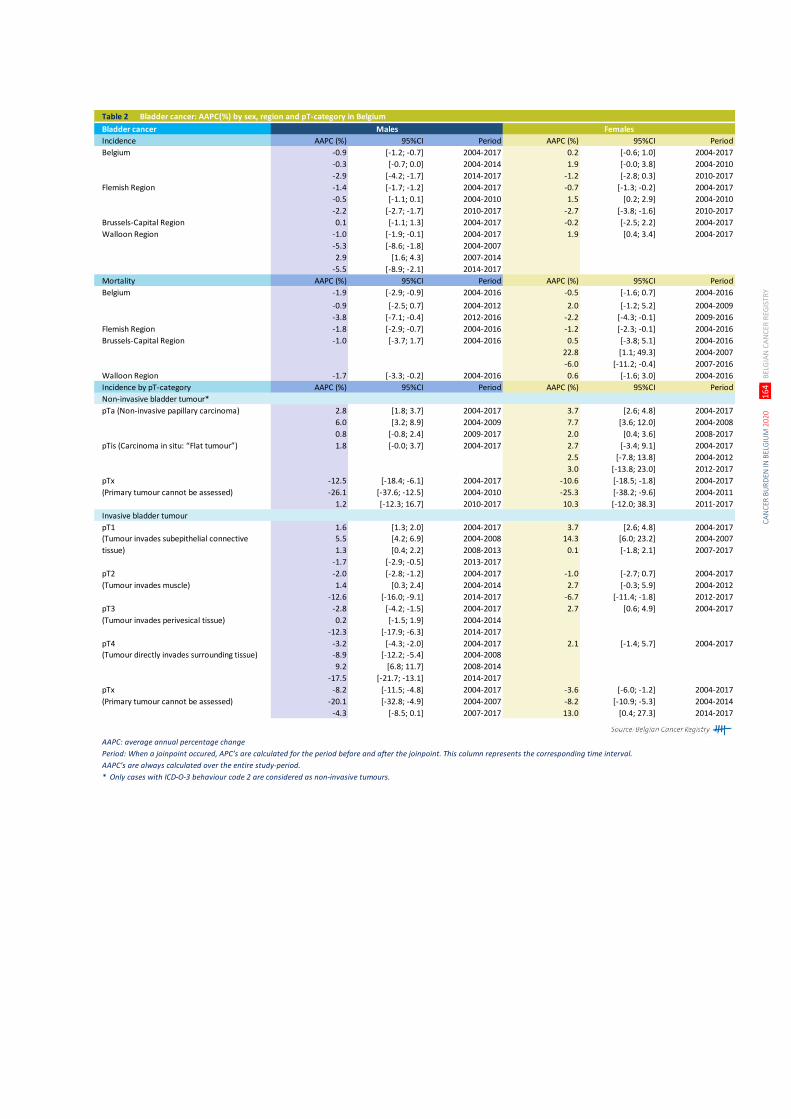
CA
NC
ER B
UR
DEN
IN B
ELG
IUM
202
0
16
4 B
ELG
IAN
CA
NC
ER R
EGIS
TRY
Table 2 Bladder cancer: AAPC(%) by sex, region and pT-category in Belgium
Bladder cancer Males Females
Incidence AAPC (%) 95%CI Period AAPC (%) 95%CI Period
Belgium -0.9 [-1.2; -0.7] 2004-2017 0.2 [-0.6; 1.0] 2004-2017
-0.3 [-0.7; 0.0] 2004-2014 1.9 [-0.0; 3.8] 2004-2010
-2.9 [-4.2; -1.7] 2014-2017 -1.2 [-2.8; 0.3] 2010-2017
Flemish Region -1.4 [-1.7; -1.2] 2004-2017 -0.7 [-1.3; -0.2] 2004-2017
-0.5 [-1.1; 0.1] 2004-2010 1.5 [0.2; 2.9] 2004-2010
-2.2 [-2.7; -1.7] 2010-2017 -2.7 [-3.8; -1.6] 2010-2017
Brussels-Capital Region 0.1 [-1.1; 1.3] 2004-2017 -0.2 [-2.5; 2.2] 2004-2017
Walloon Region -1.0 [-1.9; -0.1] 2004-2017 1.9 [0.4; 3.4] 2004-2017
-5.3 [-8.6; -1.8] 2004-2007
2.9 [1.6; 4.3] 2007-2014
-5.5 [-8.9; -2.1] 2014-2017
Mortality AAPC (%) 95%CI Period AAPC (%) 95%CI Period
Belgium -1.9 [-2.9; -0.9] 2004-2016 -0.5 [-1.6; 0.7] 2004-2016
-0.9 [-2.5; 0.7] 2004-2012 2.0 [-1.2; 5.2] 2004-2009
-3.8 [-7.1; -0.4] 2012-2016 -2.2 [-4.3; -0.1] 2009-2016
Flemish Region -1.8 [-2.9; -0.7] 2004-2016 -1.2 [-2.3; -0.1] 2004-2016
Brussels-Capital Region -1.0 [-3.7; 1.7] 2004-2016 0.5 [-3.8; 5.1] 2004-2016
22.8 [1.1; 49.3] 2004-2007
-6.0 [-11.2; -0.4] 2007-2016
Walloon Region -1.7 [-3.3; -0.2] 2004-2016 0.6 [-1.6; 3.0] 2004-2016
Incidence by pT-category AAPC (%) 95%CI Period AAPC (%) 95%CI Period
Non-invasive bladder tumour*
pTa (Non-invasive papillary carcinoma) 2.8 [1.8; 3.7] 2004-2017 3.7 [2.6; 4.8] 2004-2017
6.0 [3.2; 8.9] 2004-2009 7.7 [3.6; 12.0] 2004-2008
0.8 [-0.8; 2.4] 2009-2017 2.0 [0.4; 3.6] 2008-2017
pTis (Carcinoma in situ: “Flat tumour”) 1.8 [-0.0; 3.7] 2004-2017 2.7 [-3.4; 9.1] 2004-2017
2.5 [-7.8; 13.8] 2004-2012
3.0 [-13.8; 23.0] 2012-2017
pTx -12.5 [-18.4; -6.1] 2004-2017 -10.6 [-18.5; -1.8] 2004-2017
(Primary tumour cannot be assessed) -26.1 [-37.6; -12.5] 2004-2010 -25.3 [-38.2; -9.6] 2004-2011
1.2 [-12.3; 16.7] 2010-2017 10.3 [-12.0; 38.3] 2011-2017
Invasive bladder tumour
pT1 1.6 [1.3; 2.0] 2004-2017 3.7 [2.6; 4.8] 2004-2017
(Tumour invades subepithelial connective 5.5 [4.2; 6.9] 2004-2008 14.3 [6.0; 23.2] 2004-2007
tissue) 1.3 [0.4; 2.2] 2008-2013 0.1 [-1.8; 2.1] 2007-2017
-1.7 [-2.9; -0.5] 2013-2017
pT2 -2.0 [-2.8; -1.2] 2004-2017 -1.0 [-2.7; 0.7] 2004-2017
(Tumour invades muscle) 1.4 [0.3; 2.4] 2004-2014 2.7 [-0.3; 5.9] 2004-2012
-12.6 [-16.0; -9.1] 2014-2017 -6.7 [-11.4; -1.8] 2012-2017
pT3 -2.8 [-4.2; -1.5] 2004-2017 2.7 [0.6; 4.9] 2004-2017
(Tumour invades perivesical tissue) 0.2 [-1.5; 1.9] 2004-2014
-12.3 [-17.9; -6.3] 2014-2017
pT4 -3.2 [-4.3; -2.0] 2004-2017 2.1 [-1.4; 5.7] 2004-2017
(Tumour directly invades surrounding tissue) -8.9 [-12.2; -5.4] 2004-2008
9.2 [6.8; 11.7] 2008-2014
-17.5 [-21.7; -13.1] 2014-2017
pTx -8.2 [-11.5; -4.8] 2004-2017 -3.6 [-6.0; -1.2] 2004-2017
(Primary tumour cannot be assessed) -20.1 [-32.8; -4.9] 2004-2007 -8.2 [-10.9; -5.3] 2004-2014
-4.3 [-8.5; 0.1] 2007-2017 13.0 [0.4; 27.3] 2014-2017
AAPC: average annual percentage change
Period: When a joinpoint occured, APC’s are calculated for the period before and after the joinpoint. This column represents the corresponding time interval.
AAPC’s are always calculated over the entire study-period.
* Only cases with ICD-O-3 behaviour code 2 are considered as non-invasive tumours.
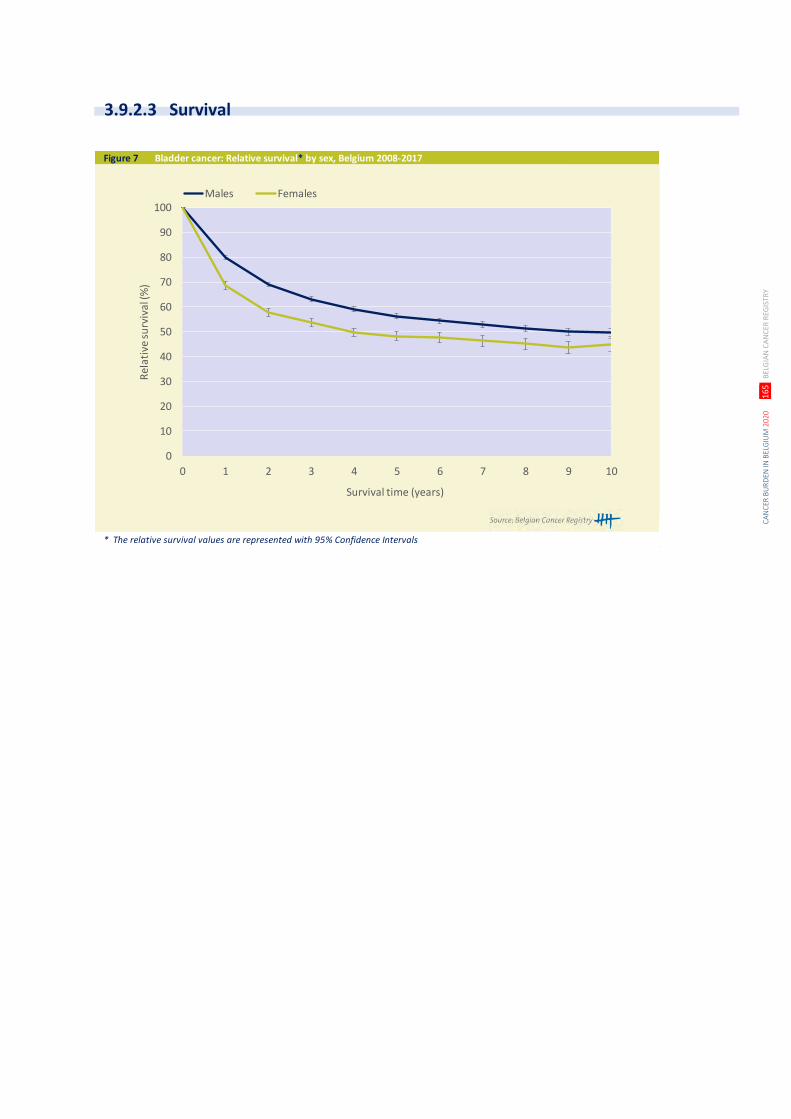
CA
NC
ER B
UR
DEN
IN B
ELG
IUM
202
0
16
5 B
ELG
IAN
CA
NC
ER R
EGIS
TRY
Figure 7 Bladder cancer: Relative survival* by sex, Belgium 2008-2017
* The relative survival values are represented with 95% Confidence Intervals
0
10
20
30
40
50
60
70
80
90
100
0 1 2 3 4 5 6 7 8 9 10
Rel
ativ
e su
rviv
al (%
)
Survival time (years)
Males Females
3.9.2.3 Survival
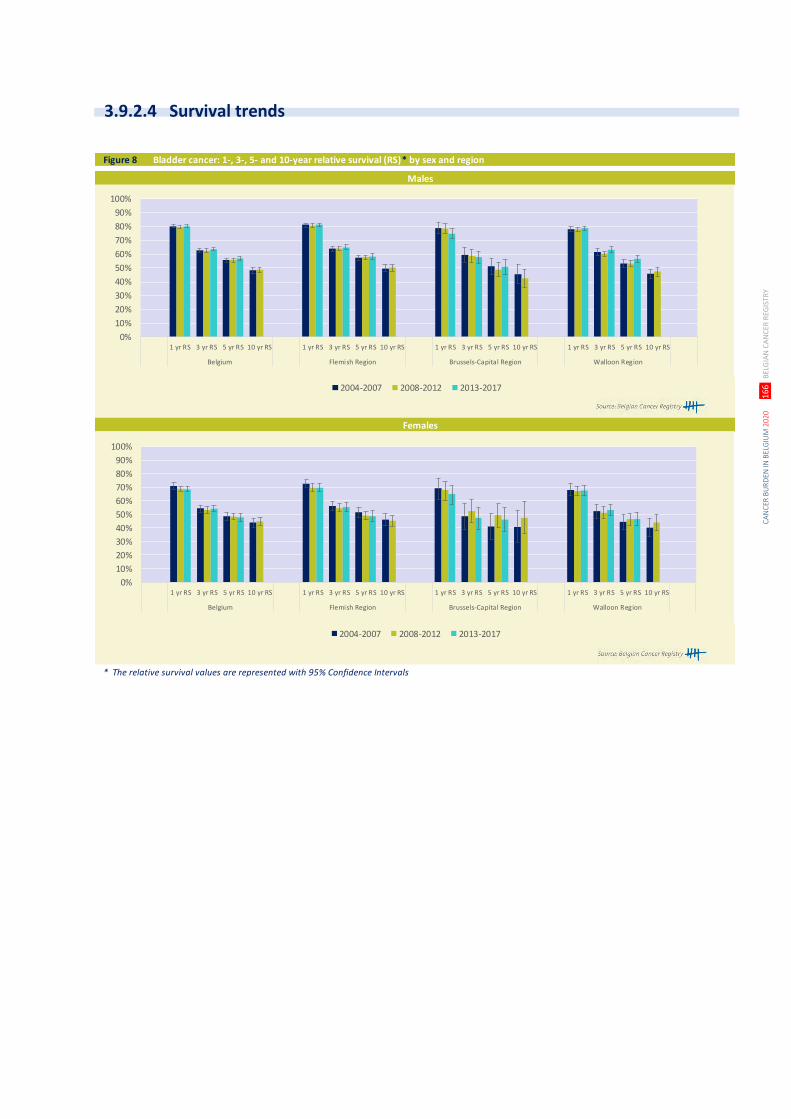
CA
NC
ER B
UR
DEN
IN B
ELG
IUM
202
0
16
6 B
ELG
IAN
CA
NC
ER R
EGIS
TRY
Figure 8 Bladder cancer: 1-, 3-, 5- and 10-year relative survival (RS)* by sex and region
* The relative survival values are represented with 95% Confidence Intervals
Males
Females
0%
10%
20%
30%
40%
50%
60%
70%
80%
90%
100%
1 yr RS 3 yr RS 5 yr RS 10 yr RS 1 yr RS 3 yr RS 5 yr RS 10 yr RS 1 yr RS 3 yr RS 5 yr RS 10 yr RS 1 yr RS 3 yr RS 5 yr RS 10 yr RS
Belgium Flemish Region Brussels-Capital Region Walloon Region
2004-2007 2008-2012 2013-2017
0%
10%
20%
30%
40%
50%
60%
70%
80%
90%
100%
1 yr RS 3 yr RS 5 yr RS 10 yr RS 1 yr RS 3 yr RS 5 yr RS 10 yr RS 1 yr RS 3 yr RS 5 yr RS 10 yr RS 1 yr RS 3 yr RS 5 yr RS 10 yr RS
Belgium Flemish Region Brussels-Capital Region Walloon Region
2004-2007 2008-2012 2013-2017
3.9.2.4 Survival trends
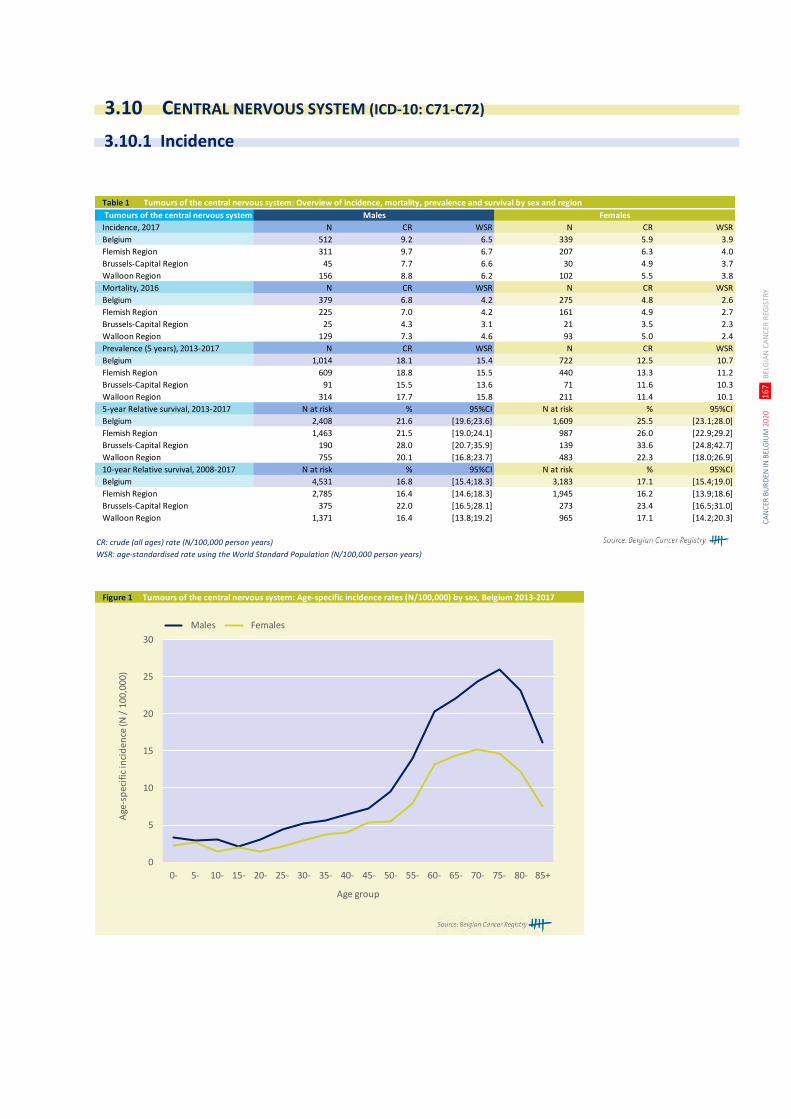
CA
NC
ER B
UR
DEN
IN B
ELG
IUM
202
0
16
7 B
ELG
IAN
CA
NC
ER R
EGIS
TRY
Table 1 Tumours of the central nervous system: Overview of incidence, mortality, prevalence and survival by sex and region
Tumours of the central nervous system Males Females
Incidence, 2017 N CR WSR N CR WSR
Belgium 512 9.2 6.5 339 5.9 3.9
Flemish Region 311 9.7 6.7 207 6.3 4.0
Brussels-Capital Region 45 7.7 6.6 30 4.9 3.7
Walloon Region 156 8.8 6.2 102 5.5 3.8
Mortality, 2016 N CR WSR N CR WSR
Belgium 379 6.8 4.2 275 4.8 2.6
Flemish Region 225 7.0 4.2 161 4.9 2.7
Brussels-Capital Region 25 4.3 3.1 21 3.5 2.3
Walloon Region 129 7.3 4.6 93 5.0 2.4
Prevalence (5 years), 2013-2017 N CR WSR N CR WSR
Belgium 1,014 18.1 15.4 722 12.5 10.7
Flemish Region 609 18.8 15.5 440 13.3 11.2
Brussels-Capital Region 91 15.5 13.6 71 11.6 10.3
Walloon Region 314 17.7 15.8 211 11.4 10.1
5-year Relative survival, 2013-2017 N at risk % 95%CI N at risk % 95%CI
Belgium 2,408 21.6 [19.6;23.6] 1,609 25.5 [23.1;28.0]
Flemish Region 1,463 21.5 [19.0;24.1] 987 26.0 [22.9;29.2]
Brussels-Capital Region 190 28.0 [20.7;35.9] 139 33.6 [24.8;42.7]
Walloon Region 755 20.1 [16.8;23.7] 483 22.3 [18.0;26.9]
10-year Relative survival, 2008-2017 N at risk % 95%CI N at risk % 95%CI
Belgium 4,531 16.8 [15.4;18.3] 3,183 17.1 [15.4;19.0]
Flemish Region 2,785 16.4 [14.6;18.3] 1,945 16.2 [13.9;18.6]
Brussels-Capital Region 375 22.0 [16.5;28.1] 273 23.4 [16.5;31.0]
Walloon Region 1,371 16.4 [13.8;19.2] 965 17.1 [14.2;20.3]
CR: crude (all ages) rate (N/100,000 person years)
WSR: age-standardised rate using the World Standard Population (N/100,000 person years)
Figure 1 Tumours of the central nervous system: Age-specific incidence rates (N/100,000) by sex, Belgium 2013-2017
0
5
10
15
20
25
30
0- 5- 10- 15- 20- 25- 30- 35- 40- 45- 50- 55- 60- 65- 70- 75- 80- 85+
Age
-sp
ecif
ic in
cid
ence
(N /
10
0,0
00
)
Age group
Males Females
3.10 CENTRAL NERVOUS SYSTEM (ICD-10: C71-C72)
3.10.1 Incidence
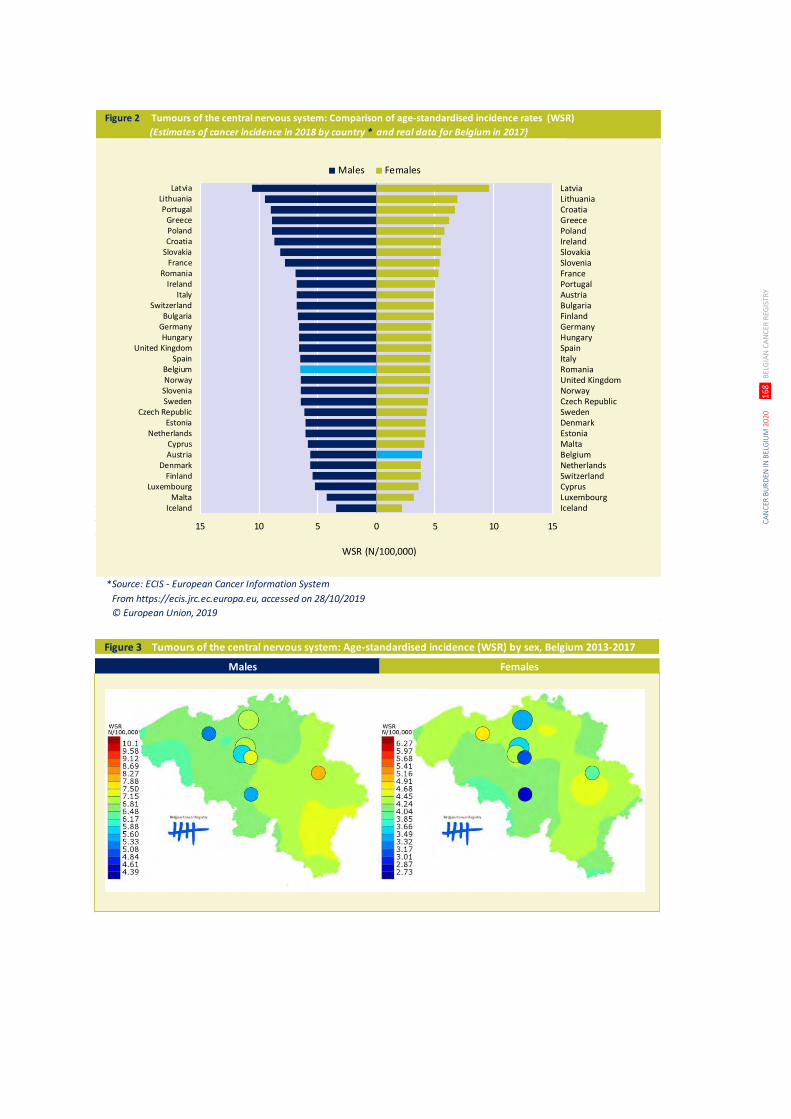
CA
NC
ER B
UR
DEN
IN B
ELG
IUM
202
0
16
8 B
ELG
IAN
CA
NC
ER R
EGIS
TRY
Figure 2 Tumours of the central nervous system: Comparison of age-standardised incidence rates (WSR)
(Estimates of cancer incidence in 2018 by country * and real data for Belgium in 2017)
Source: ECIS - European Cancer Information System
From https://ecis.jrc.ec.europa.eu, accessed on 28/10/2019
© European Union, 2019
15 10 5 0 5 10 15
LatviaLithuaniaPortugal
GreecePolandCroatia
SlovakiaFrance
RomaniaIreland
ItalySwitzerland
BulgariaGermanyHungary
United KingdomSpain
BelgiumNorway
SloveniaSweden
Czech RepublicEstonia
NetherlandsCyprusAustria
DenmarkFinland
LuxembourgMalta
Iceland
Males Females
WSR (N/100,000)
*
LatviaLithuaniaCroatiaGreecePolandIrelandSlovakiaSloveniaFrancePortugalAustriaBulgariaFinlandGermanyHungarySpainItalyRomaniaUnited KingdomNorwayCzech RepublicSwedenDenmarkEstoniaMaltaBelgiumNetherlandsSwitzerlandCyprusLuxembourgIceland
Figure 3 Tumours of the central nervous system: Age-standardised incidence (WSR) by sex, Belgium 2013-2017
Males Females
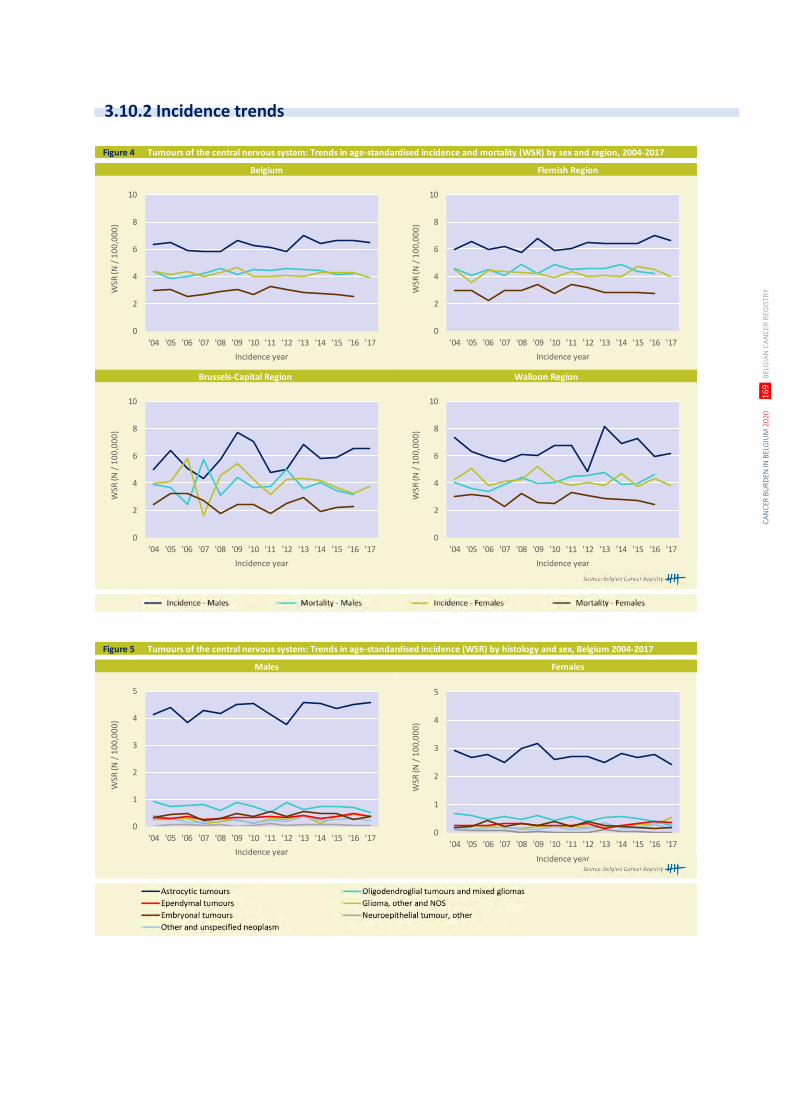
CA
NC
ER B
UR
DEN
IN B
ELG
IUM
202
0
16
9 B
ELG
IAN
CA
NC
ER R
EGIS
TRY
Figure 4 Tumours of the central nervous system: Trends in age-standardised incidence and mortality (WSR) by sex and region, 2004-2017
Brussels-Capital Region Walloon Region
Belgium Flemish Region
0
2
4
6
8
10
'04 '05 '06 '07 '08 '09 '10 '11 '12 '13 '14 '15 '16 '17
WSR
(N /
10
0,0
00
)
Incidence year
0
2
4
6
8
10
'04 '05 '06 '07 '08 '09 '10 '11 '12 '13 '14 '15 '16 '17
WSR
(N /
10
0,0
00
)
Incidence year
0
2
4
6
8
10
'04 '05 '06 '07 '08 '09 '10 '11 '12 '13 '14 '15 '16 '17
WSR
(N /
10
0,0
00
)
Incidence year
0
2
4
6
8
10
'04 '05 '06 '07 '08 '09 '10 '11 '12 '13 '14 '15 '16 '17
WSR
(N /
10
0,0
00
)
Incidence year
Figure 5 Tumours of the central nervous system: Trends in age-standardised incidence (WSR) by histology and sex, Belgium 2004-2017
Males Females
0
1
2
3
4
5
'04 '05 '06 '07 '08 '09 '10 '11 '12 '13 '14 '15 '16 '17
WSR
(N /
10
0,0
00
)
Incidence year
0
1
2
3
4
5
'04 '05 '06 '07 '08 '09 '10 '11 '12 '13 '14 '15 '16 '17
WSR
(N /
10
0,0
00
)
Incidence year
3.10.2 Incidence trends
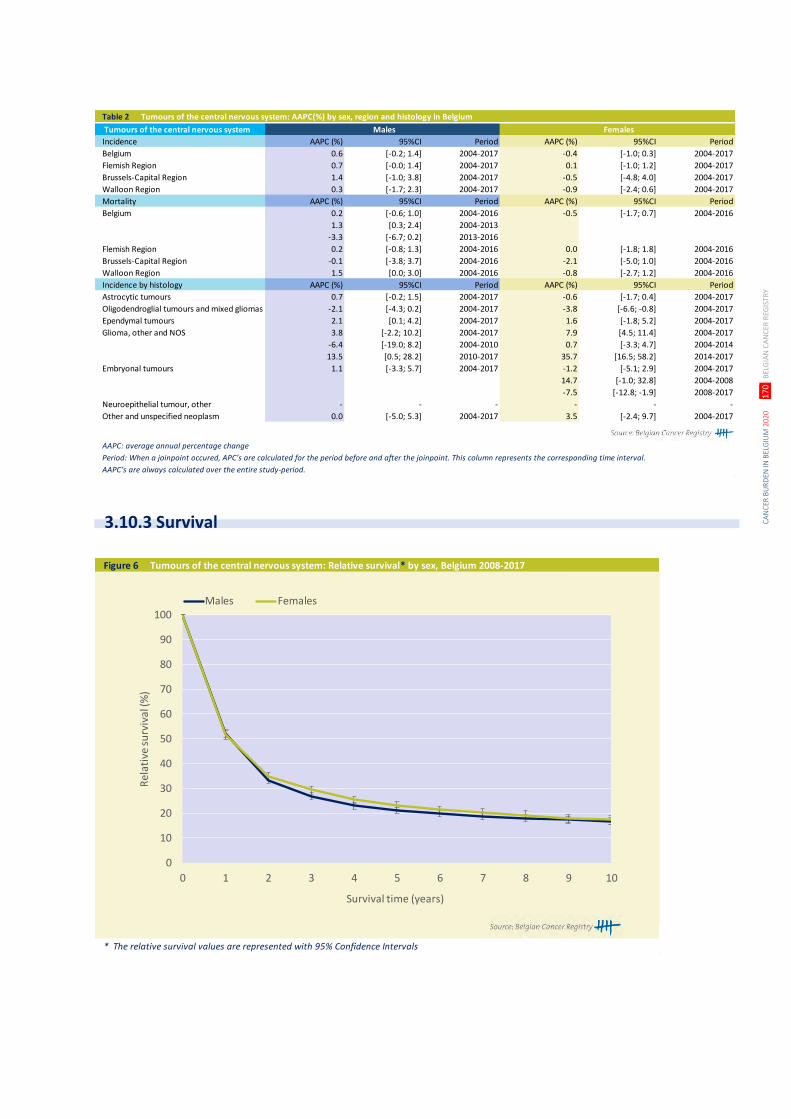
CA
NC
ER B
UR
DEN
IN B
ELG
IUM
202
0
17
0 B
ELG
IAN
CA
NC
ER R
EGIS
TRY
Table 2 Tumours of the central nervous system: AAPC(%) by sex, region and histology in Belgium
Tumours of the central nervous system Males Females
Incidence AAPC (%) 95%CI Period AAPC (%) 95%CI Period
Belgium 0.6 [-0.2; 1.4] 2004-2017 -0.4 [-1.0; 0.3] 2004-2017
Flemish Region 0.7 [-0.0; 1.4] 2004-2017 0.1 [-1.0; 1.2] 2004-2017
Brussels-Capital Region 1.4 [-1.0; 3.8] 2004-2017 -0.5 [-4.8; 4.0] 2004-2017
Walloon Region 0.3 [-1.7; 2.3] 2004-2017 -0.9 [-2.4; 0.6] 2004-2017
Mortality AAPC (%) 95%CI Period AAPC (%) 95%CI Period
Belgium 0.2 [-0.6; 1.0] 2004-2016 -0.5 [-1.7; 0.7] 2004-2016
1.3 [0.3; 2.4] 2004-2013
-3.3 [-6.7; 0.2] 2013-2016
Flemish Region 0.2 [-0.8; 1.3] 2004-2016 0.0 [-1.8; 1.8] 2004-2016
Brussels-Capital Region -0.1 [-3.8; 3.7] 2004-2016 -2.1 [-5.0; 1.0] 2004-2016
Walloon Region 1.5 [0.0; 3.0] 2004-2016 -0.8 [-2.7; 1.2] 2004-2016
Incidence by histology AAPC (%) 95%CI Period AAPC (%) 95%CI Period
Astrocytic tumours 0.7 [-0.2; 1.5] 2004-2017 -0.6 [-1.7; 0.4] 2004-2017
Oligodendroglial tumours and mixed gliomas -2.1 [-4.3; 0.2] 2004-2017 -3.8 [-6.6; -0.8] 2004-2017
Ependymal tumours 2.1 [0.1; 4.2] 2004-2017 1.6 [-1.8; 5.2] 2004-2017
Glioma, other and NOS 3.8 [-2.2; 10.2] 2004-2017 7.9 [4.5; 11.4] 2004-2017
-6.4 [-19.0; 8.2] 2004-2010 0.7 [-3.3; 4.7] 2004-2014
13.5 [0.5; 28.2] 2010-2017 35.7 [16.5; 58.2] 2014-2017
Embryonal tumours 1.1 [-3.3; 5.7] 2004-2017 -1.2 [-5.1; 2.9] 2004-2017
14.7 [-1.0; 32.8] 2004-2008
-7.5 [-12.8; -1.9] 2008-2017
Neuroepithelial tumour, other - - - - - -
Other and unspecified neoplasm 0.0 [-5.0; 5.3] 2004-2017 3.5 [-2.4; 9.7] 2004-2017
AAPC: average annual percentage change
Period: When a joinpoint occured, APC’s are calculated for the period before and after the joinpoint. This column represents the corresponding time interval.
AAPC’s are always calculated over the entire study-period.
Figure 6 Tumours of the central nervous system: Relative survival* by sex, Belgium 2008-2017
* The relative survival values are represented with 95% Confidence Intervals
0
10
20
30
40
50
60
70
80
90
100
0 1 2 3 4 5 6 7 8 9 10
Rel
ativ
e su
rviv
al (%
)
Survival time (years)
Males Females
3.10.3 Survival
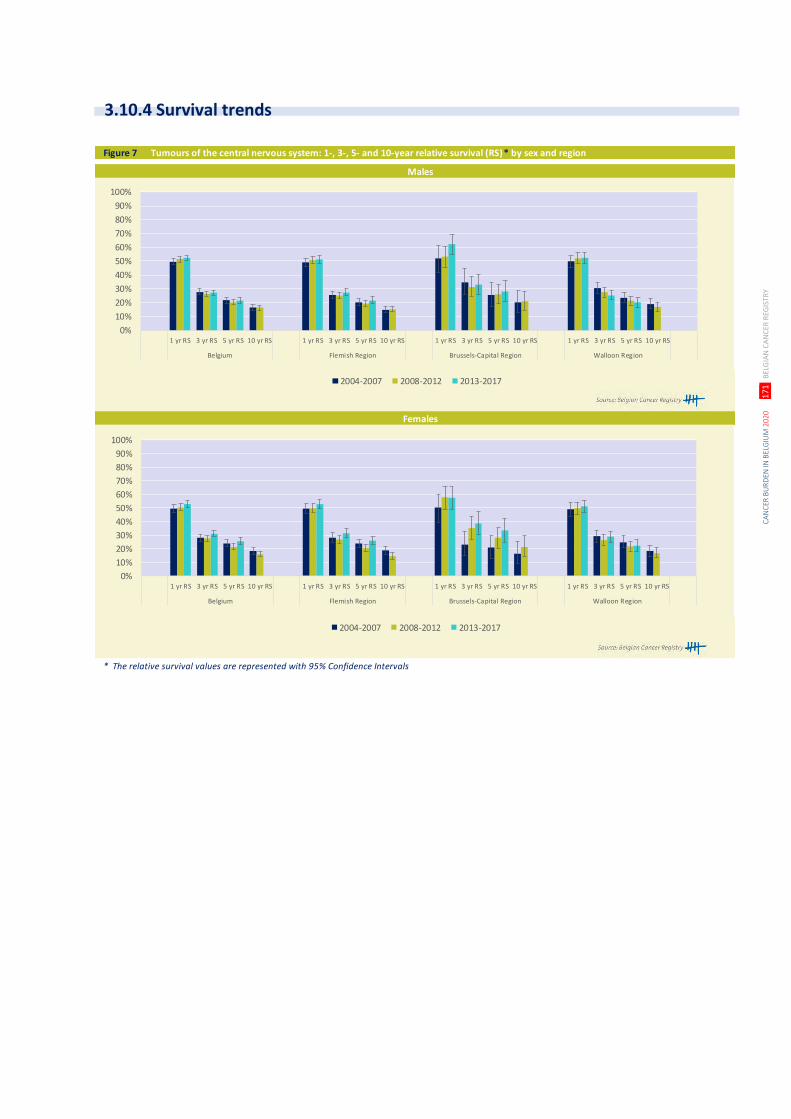
CA
NC
ER B
UR
DEN
IN B
ELG
IUM
202
0
17
1 B
ELG
IAN
CA
NC
ER R
EGIS
TRY
Figure 7 Tumours of the central nervous system: 1-, 3-, 5- and 10-year relative survival (RS)* by sex and region
* The relative survival values are represented with 95% Confidence Intervals
Males
Females
0%
10%
20%
30%
40%
50%
60%
70%
80%
90%
100%
1 yr RS 3 yr RS 5 yr RS 10 yr RS 1 yr RS 3 yr RS 5 yr RS 10 yr RS 1 yr RS 3 yr RS 5 yr RS 10 yr RS 1 yr RS 3 yr RS 5 yr RS 10 yr RS
Belgium Flemish Region Brussels-Capital Region Walloon Region
2004-2007 2008-2012 2013-2017
0%
10%
20%
30%
40%
50%
60%
70%
80%
90%
100%
1 yr RS 3 yr RS 5 yr RS 10 yr RS 1 yr RS 3 yr RS 5 yr RS 10 yr RS 1 yr RS 3 yr RS 5 yr RS 10 yr RS 1 yr RS 3 yr RS 5 yr RS 10 yr RS
Belgium Flemish Region Brussels-Capital Region Walloon Region
2004-2007 2008-2012 2013-2017
3.10.4 Survival trends
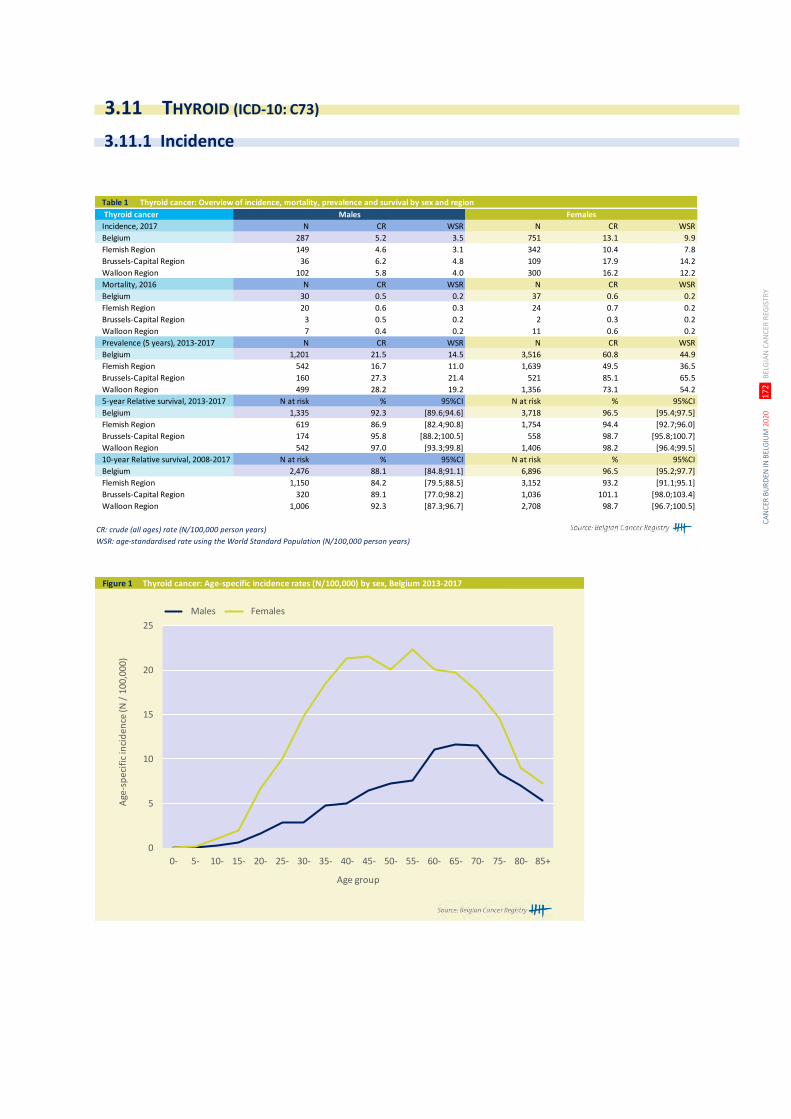
CA
NC
ER B
UR
DEN
IN B
ELG
IUM
202
0
17
2 B
ELG
IAN
CA
NC
ER R
EGIS
TRY
Table 1 Thyroid cancer: Overview of incidence, mortality, prevalence and survival by sex and region
Thyroid cancer Males Females
Incidence, 2017 N CR WSR N CR WSR
Belgium 287 5.2 3.5 751 13.1 9.9
Flemish Region 149 4.6 3.1 342 10.4 7.8
Brussels-Capital Region 36 6.2 4.8 109 17.9 14.2
Walloon Region 102 5.8 4.0 300 16.2 12.2
Mortality, 2016 N CR WSR N CR WSR
Belgium 30 0.5 0.2 37 0.6 0.2
Flemish Region 20 0.6 0.3 24 0.7 0.2
Brussels-Capital Region 3 0.5 0.2 2 0.3 0.2
Walloon Region 7 0.4 0.2 11 0.6 0.2
Prevalence (5 years), 2013-2017 N CR WSR N CR WSR
Belgium 1,201 21.5 14.5 3,516 60.8 44.9
Flemish Region 542 16.7 11.0 1,639 49.5 36.5
Brussels-Capital Region 160 27.3 21.4 521 85.1 65.5
Walloon Region 499 28.2 19.2 1,356 73.1 54.2
5-year Relative survival, 2013-2017 N at risk % 95%CI N at risk % 95%CI
Belgium 1,335 92.3 [89.6;94.6] 3,718 96.5 [95.4;97.5]
Flemish Region 619 86.9 [82.4;90.8] 1,754 94.4 [92.7;96.0]
Brussels-Capital Region 174 95.8 [88.2;100.5] 558 98.7 [95.8;100.7]
Walloon Region 542 97.0 [93.3;99.8] 1,406 98.2 [96.4;99.5]
10-year Relative survival, 2008-2017 N at risk % 95%CI N at risk % 95%CI
Belgium 2,476 88.1 [84.8;91.1] 6,896 96.5 [95.2;97.7]
Flemish Region 1,150 84.2 [79.5;88.5] 3,152 93.2 [91.1;95.1]
Brussels-Capital Region 320 89.1 [77.0;98.2] 1,036 101.1 [98.0;103.4]
Walloon Region 1,006 92.3 [87.3;96.7] 2,708 98.7 [96.7;100.5]
CR: crude (all ages) rate (N/100,000 person years)
WSR: age-standardised rate using the World Standard Population (N/100,000 person years)
Figure 1 Thyroid cancer: Age-specific incidence rates (N/100,000) by sex, Belgium 2013-2017
0
5
10
15
20
25
0- 5- 10- 15- 20- 25- 30- 35- 40- 45- 50- 55- 60- 65- 70- 75- 80- 85+
Age
-sp
ecif
ic in
cid
ence
(N /
100
,000
)
Age group
Males Females
3.11 THYROID (ICD-10: C73)
3.11.1 Incidence
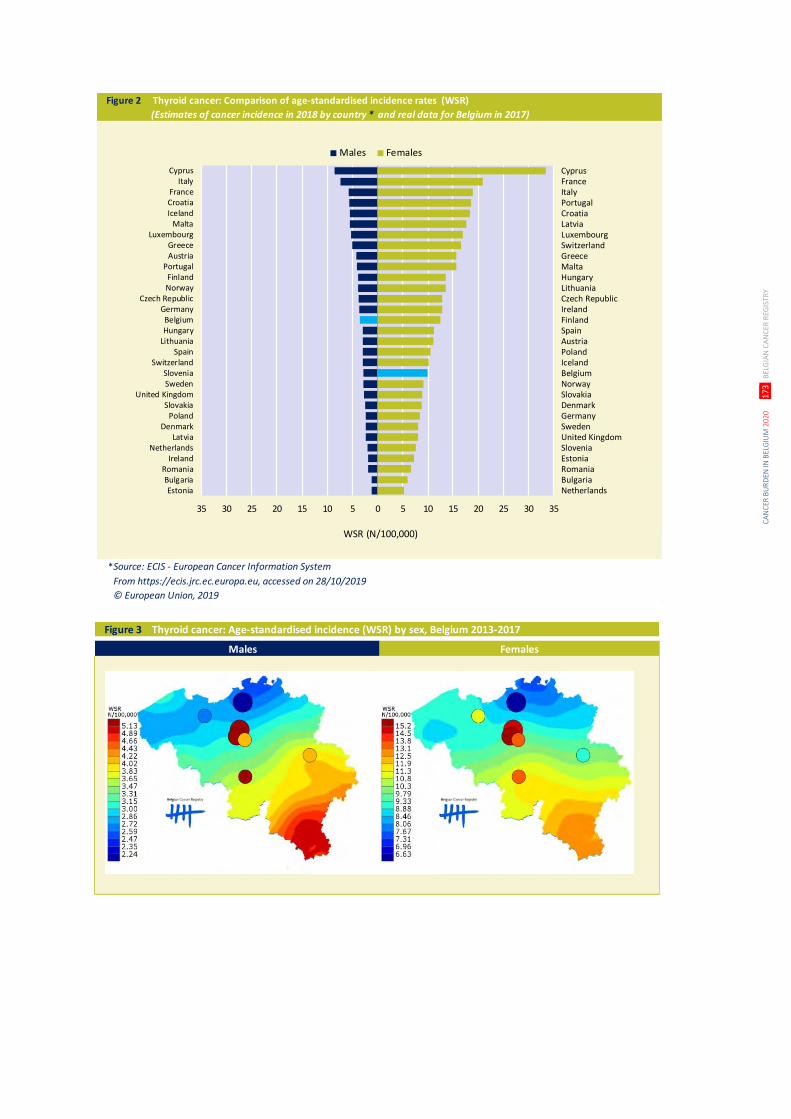
CA
NC
ER B
UR
DEN
IN B
ELG
IUM
202
0
17
3 B
ELG
IAN
CA
NC
ER R
EGIS
TRY
Figure 2 Thyroid cancer: Comparison of age-standardised incidence rates (WSR)
(Estimates of cancer incidence in 2018 by country * and real data for Belgium in 2017)
Source: ECIS - European Cancer Information System
From https://ecis.jrc.ec.europa.eu, accessed on 28/10/2019
© European Union, 2019
35 30 25 20 15 10 5 0 5 10 15 20 25 30 35
CyprusItaly
FranceCroatiaIceland
MaltaLuxembourg
GreeceAustria
PortugalFinlandNorway
Czech RepublicGermanyBelgiumHungary
LithuaniaSpain
SwitzerlandSloveniaSweden
United KingdomSlovakia
PolandDenmark
LatviaNetherlands
IrelandRomaniaBulgariaEstonia
Males Females
WSR (N/100,000)
*
CyprusFranceItalyPortugalCroatiaLatviaLuxembourgSwitzerlandGreeceMaltaHungaryLithuaniaCzech RepublicIrelandFinlandSpainAustriaPolandIcelandBelgiumNorwaySlovakiaDenmarkGermanySwedenUnited KingdomSloveniaEstoniaRomaniaBulgariaNetherlands
Figure 3 Thyroid cancer: Age-standardised incidence (WSR) by sex, Belgium 2013-2017
v
Males Females
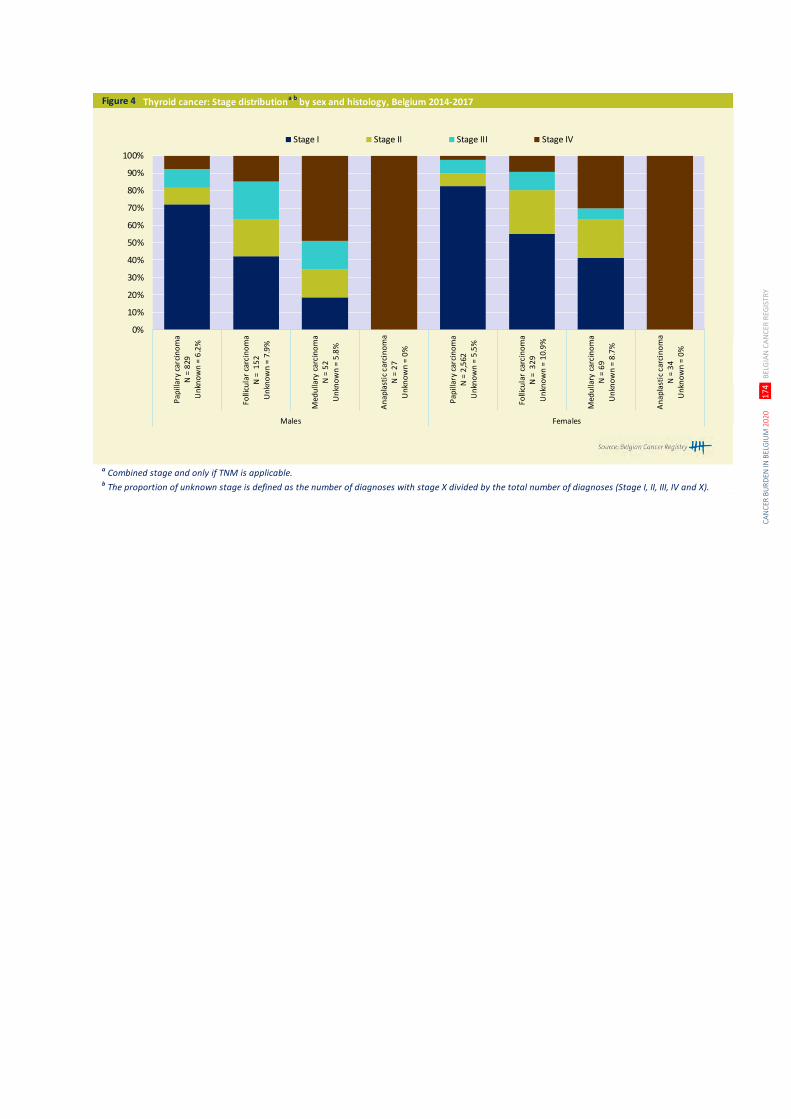
CA
NC
ER B
UR
DEN
IN B
ELG
IUM
202
0
17
4 B
ELG
IAN
CA
NC
ER R
EGIS
TRY
Figure 4 Thyroid cancer: Stage distributiona,b
by sex and histology, Belgium 2014-2017
a Combined stage and only if TNM is applicable. b The proportion of unknown stage is defined as the number of diagnoses with stage X divided by the total number of diagnoses (Stage I, II, III, IV and X).
0%
10%
20%
30%
40%
50%
60%
70%
80%
90%
100%
Pap
illar
y ca
rcin
om
aN
= 8
29U
nkn
ow
n =
6.2
%
Folli
cula
r ca
rcin
om
aN
= 1
52
Un
kno
wn
= 7
.9%
Med
ulla
ry c
arci
no
ma
N =
52
Un
kno
wn
= 5
.8%
An
apla
stic
car
cin
om
aN
= 2
7U
nkn
ow
n =
0%
Pap
illar
y ca
rcin
om
aN
= 2
,562
Un
kno
wn
= 5
.5%
Folli
cula
r ca
rcin
om
aN
= 3
29
Un
kno
wn
= 1
0.9
%
Med
ulla
ry c
arci
no
ma
N =
69
Un
kno
wn
= 8
.7%
An
apla
stic
car
cin
om
aN
= 3
4U
nkn
ow
n =
0%
Males Females
Stage I Stage II Stage III Stage IV
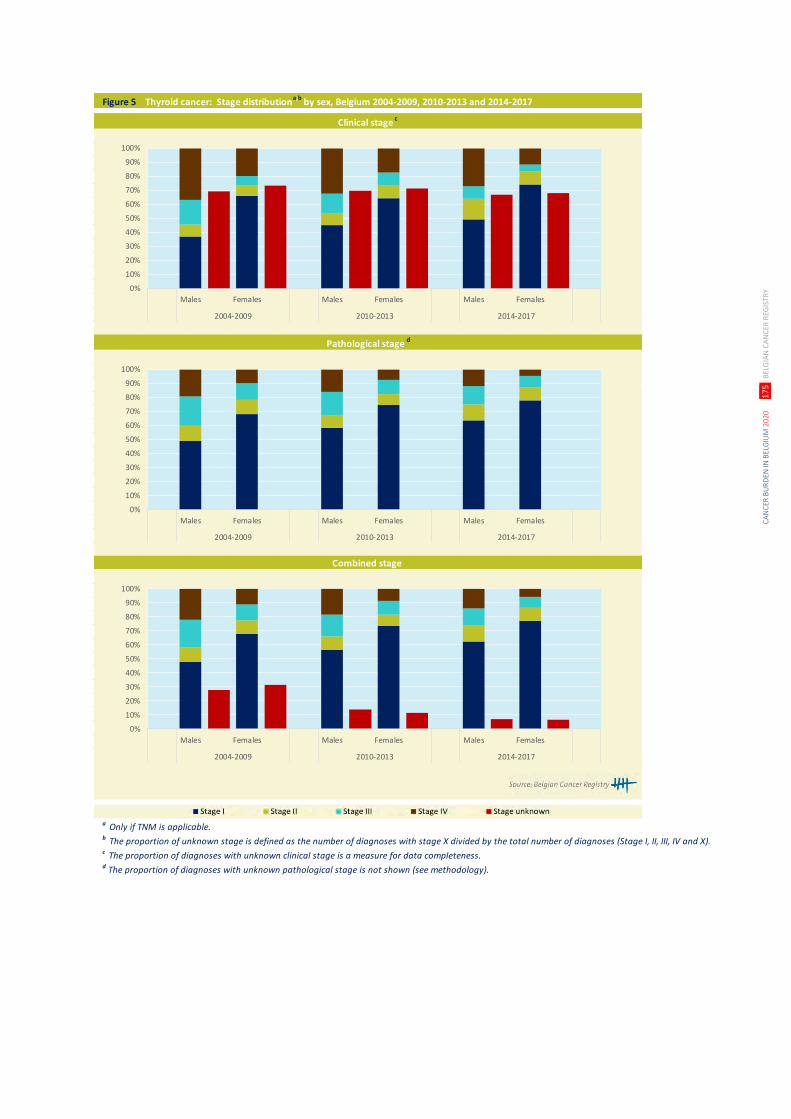
CA
NC
ER B
UR
DEN
IN B
ELG
IUM
202
0
17
5 B
ELG
IAN
CA
NC
ER R
EGIS
TRY
Figure 5 Thyroid cancer: Stage distributiona,b
by sex, Belgium 2004-2009, 2010-2013 and 2014-2017
a Only if TNM is applicable. b The proportion of unknown stage is defined as the number of diagnoses with stage X divided by the total number of diagnoses (Stage I, II, III, IV and X).c The proportion of diagnoses with unknown clinical stage is a measure for data completeness.d The proportion of diagnoses with unknown pathological stage is not shown (see methodology).
Clinical stage c
Pathological stage d
Combined stage
0%
10%
20%
30%
40%
50%
60%
70%
80%
90%
100%
Males Females Males Females Males Females
2004-2009 2010-2013 2014-2017
0%
10%
20%
30%
40%
50%
60%
70%
80%
90%
100%
Males Females Males Females Males Females
2004-2009 2010-2013 2014-2017
0%
10%
20%
30%
40%
50%
60%
70%
80%
90%
100%
Males Females Males Females Males Females
2004-2009 2010-2013 2014-2017
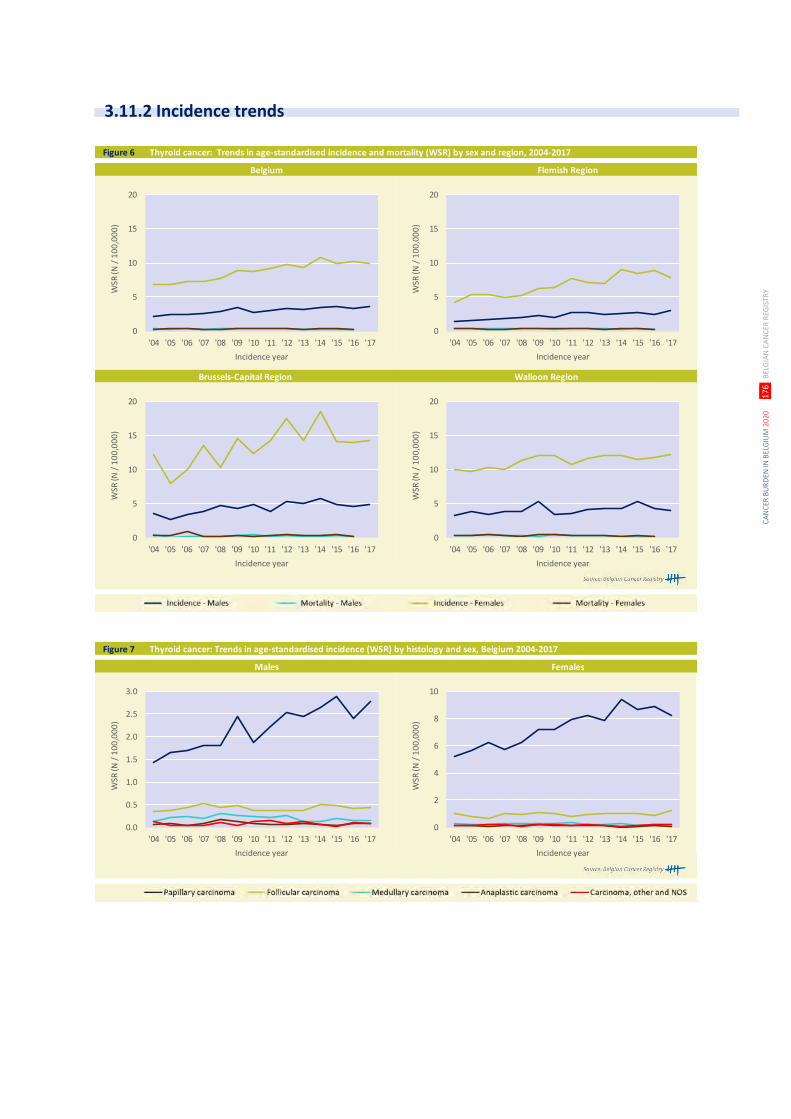
CA
NC
ER B
UR
DEN
IN B
ELG
IUM
202
0
17
6 B
ELG
IAN
CA
NC
ER R
EGIS
TRY
Figure 6 Thyroid cancer: Trends in age-standardised incidence and mortality (WSR) by sex and region, 2004-2017
Brussels-Capital Region Walloon Region
Belgium Flemish Region
0
5
10
15
20
'04 '05 '06 '07 '08 '09 '10 '11 '12 '13 '14 '15 '16 '17
WSR
(N /
10
0,0
00
)
Incidence year
0
5
10
15
20
'04 '05 '06 '07 '08 '09 '10 '11 '12 '13 '14 '15 '16 '17
WSR
(N /
10
0,0
00
)
Incidence year
0
5
10
15
20
'04 '05 '06 '07 '08 '09 '10 '11 '12 '13 '14 '15 '16 '17
WSR
(N /
10
0,0
00
)
Incidence year
0
5
10
15
20
'04 '05 '06 '07 '08 '09 '10 '11 '12 '13 '14 '15 '16 '17
WSR
(N /
10
0,0
00
)
Incidence year
Figure 7 Thyroid cancer: Trends in age-standardised incidence (WSR) by histology and sex, Belgium 2004-2017
Males Females
0.0
0.5
1.0
1.5
2.0
2.5
3.0
'04 '05 '06 '07 '08 '09 '10 '11 '12 '13 '14 '15 '16 '17
WSR
(N /
10
0,0
00
)
Incidence year
0
2
4
6
8
10
'04 '05 '06 '07 '08 '09 '10 '11 '12 '13 '14 '15 '16 '17
WSR
(N /
10
0,0
00
)
Incidence year
3.11.2 Incidence trends
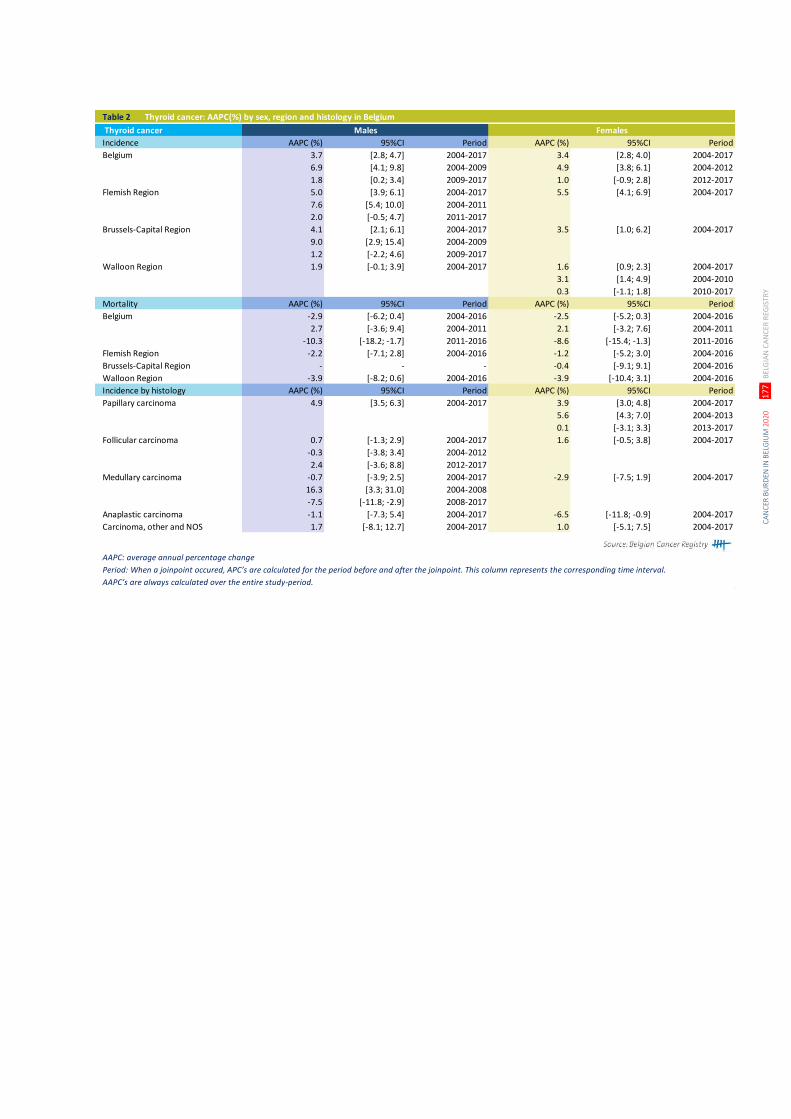
CA
NC
ER B
UR
DEN
IN B
ELG
IUM
202
0
17
7 B
ELG
IAN
CA
NC
ER R
EGIS
TRY
Table 2 Thyroid cancer: AAPC(%) by sex, region and histology in Belgium
Thyroid cancer Males Females
Incidence AAPC (%) 95%CI Period AAPC (%) 95%CI Period
Belgium 3.7 [2.8; 4.7] 2004-2017 3.4 [2.8; 4.0] 2004-2017
6.9 [4.1; 9.8] 2004-2009 4.9 [3.8; 6.1] 2004-2012
1.8 [0.2; 3.4] 2009-2017 1.0 [-0.9; 2.8] 2012-2017
Flemish Region 5.0 [3.9; 6.1] 2004-2017 5.5 [4.1; 6.9] 2004-2017
7.6 [5.4; 10.0] 2004-2011
2.0 [-0.5; 4.7] 2011-2017
Brussels-Capital Region 4.1 [2.1; 6.1] 2004-2017 3.5 [1.0; 6.2] 2004-2017
9.0 [2.9; 15.4] 2004-2009
1.2 [-2.2; 4.6] 2009-2017
Walloon Region 1.9 [-0.1; 3.9] 2004-2017 1.6 [0.9; 2.3] 2004-2017
3.1 [1.4; 4.9] 2004-2010
0.3 [-1.1; 1.8] 2010-2017
Mortality AAPC (%) 95%CI Period AAPC (%) 95%CI Period
Belgium -2.9 [-6.2; 0.4] 2004-2016 -2.5 [-5.2; 0.3] 2004-2016
2.7 [-3.6; 9.4] 2004-2011 2.1 [-3.2; 7.6] 2004-2011
-10.3 [-18.2; -1.7] 2011-2016 -8.6 [-15.4; -1.3] 2011-2016
Flemish Region -2.2 [-7.1; 2.8] 2004-2016 -1.2 [-5.2; 3.0] 2004-2016
Brussels-Capital Region - - - -0.4 [-9.1; 9.1] 2004-2016
Walloon Region -3.9 [-8.2; 0.6] 2004-2016 -3.9 [-10.4; 3.1] 2004-2016
Incidence by histology AAPC (%) 95%CI Period AAPC (%) 95%CI Period
Papillary carcinoma 4.9 [3.5; 6.3] 2004-2017 3.9 [3.0; 4.8] 2004-2017
5.6 [4.3; 7.0] 2004-2013
0.1 [-3.1; 3.3] 2013-2017
Follicular carcinoma 0.7 [-1.3; 2.9] 2004-2017 1.6 [-0.5; 3.8] 2004-2017
-0.3 [-3.8; 3.4] 2004-2012
2.4 [-3.6; 8.8] 2012-2017
Medullary carcinoma -0.7 [-3.9; 2.5] 2004-2017 -2.9 [-7.5; 1.9] 2004-2017
16.3 [3.3; 31.0] 2004-2008
-7.5 [-11.8; -2.9] 2008-2017
Anaplastic carcinoma -1.1 [-7.3; 5.4] 2004-2017 -6.5 [-11.8; -0.9] 2004-2017
Carcinoma, other and NOS 1.7 [-8.1; 12.7] 2004-2017 1.0 [-5.1; 7.5] 2004-2017
AAPC: average annual percentage change
Period: When a joinpoint occured, APC’s are calculated for the period before and after the joinpoint. This column represents the corresponding time interval.
AAPC’s are always calculated over the entire study-period.
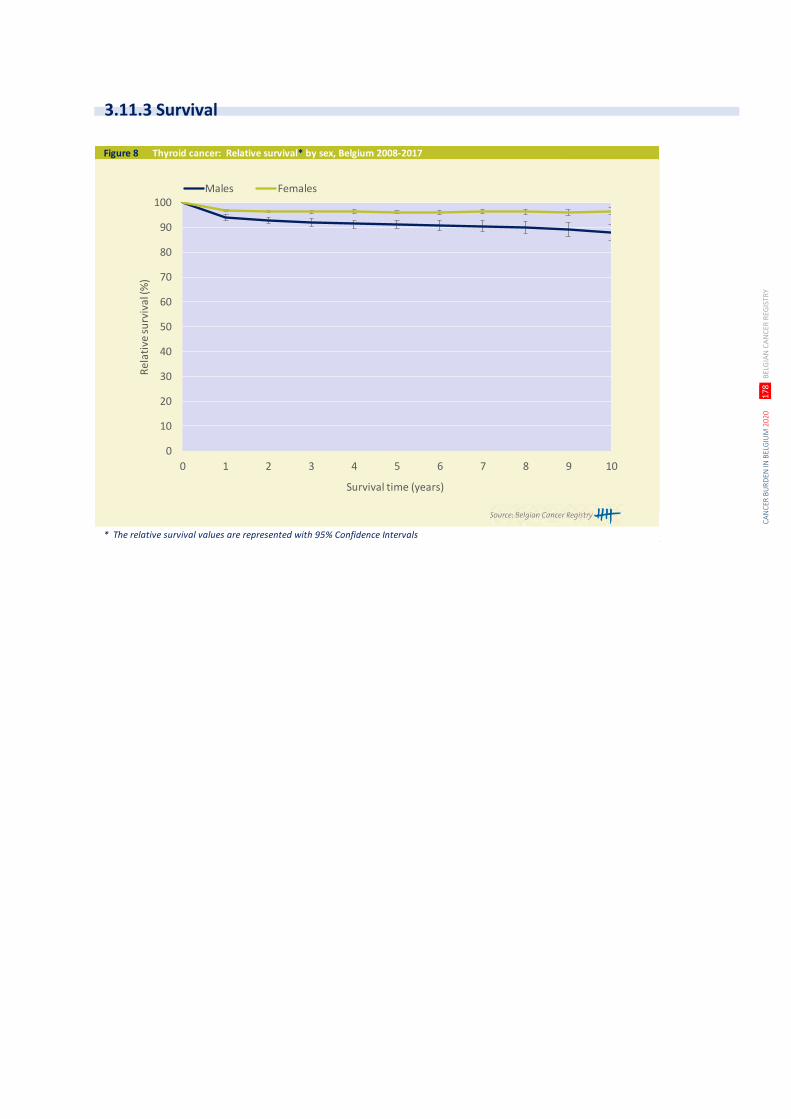
CA
NC
ER B
UR
DEN
IN B
ELG
IUM
202
0
17
8 B
ELG
IAN
CA
NC
ER R
EGIS
TRY
Figure 8 Thyroid cancer: Relative survival* by sex, Belgium 2008-2017
* The relative survival values are represented with 95% Confidence Intervals
0
10
20
30
40
50
60
70
80
90
100
0 1 2 3 4 5 6 7 8 9 10
Rel
ativ
e su
rviv
al (%
)
Survival time (years)
Males Females
3.11.3 Survival

CA
NC
ER B
UR
DEN
IN B
ELG
IUM
202
0
17
9 B
ELG
IAN
CA
NC
ER R
EGIS
TRY
Figure 9 Thyroid cancer: 1-, 3-, 5- and 10-year relative survival (RS)* by sex and region
* The relative survival values are represented with 95% Confidence Intervals
Males
Females
0%
10%
20%
30%
40%
50%
60%
70%
80%
90%
100%
1 yr RS 3 yr RS 5 yr RS 10 yr RS 1 yr RS 3 yr RS 5 yr RS 10 yr RS 1 yr RS 3 yr RS 5 yr RS 10 yr RS 1 yr RS 3 yr RS 5 yr RS 10 yr RS
Belgium Flemish Region Brussels-Capital Region Walloon Region
2004-2007 2008-2012 2013-2017
0%
10%
20%
30%
40%
50%
60%
70%
80%
90%
100%
1 yr RS 3 yr RS 5 yr RS 10 yr RS 1 yr RS 3 yr RS 5 yr RS 10 yr RS 1 yr RS 3 yr RS 5 yr RS 10 yr RS 1 yr RS 3 yr RS 5 yr RS 10 yr RS
Belgium Flemish Region Brussels-Capital Region Walloon Region
2004-2007 2008-2012 2013-2017
3.11.4 Survival trends

CA
NC
ER B
UR
DEN
IN B
ELG
IUM
202
0
18
0 B
ELG
IAN
CA
NC
ER R
EGIS
TRY
CA
NC
ER B
UR
DEN
IN B
ELG
IUM
202
0
18
1 B
ELG
IAN
CA
NC
ER R
EGIS
TRY
1. Agentschap Zorg & Gezondheid (www.zorg-en-gezondheid.be)
2. Observatorium voor Gezondheid en Welzijn van Brussel-Hoofdstad / l’Observatoire de la Santé et du Social
de Bruxelles-Capitale (http://www.ccc-ggc.brussels)
3. Agence wallonne de la santé, de la protection sociale, du handicap et des familles (AViQ)
(https://www.aviq.be)
4. Directorate-general Statistics Belgium (http://www.statbel.fgov.be/)
5. ECIS - European Cancer Information System (https://ecis.jrc.ec.europa.eu/)
6. Sobin LH, Gospodarowicz MK, Wittekind C, editors. TNM classification of malignant tumours. International
Union Against Cancer 8th Edition. John Wiley & Sons; 2017.
7. Cancer Burden in Belgium, 2004-2013. Brussels: Belgian Cancer Registry, 2015.
8. Vrijens F, Verleye L, De Gendt C, Schillemans V, Robays J, et al. Quality indicators for the management of
lung cancer. KCE Reports 266 (2016).
9. Leroy R, De Gendt C, Stordeur S, Silversmit G, Verleye L, et al. Quality indicators for the management of
head and neck cancer squamous cell carcinoma. KCE Reports 266 (2016).
10. Programme Pay for Performance (P4P) 2018 (https://www.health.belgium.be/fr/programme-pay-
performance-p4p-pourles-hopitaux-generaux)
11. Het InterMutualistisch Agentschap (IMA) – L’Agence InterMutualiste (AIM) (http://www.ima-aim.be)
12. Cancer Prevalence in Belgium, 2010. Brussels: Belgian Cancer Registry, 2014.
13. Henau K, Van Eycken E, Silversmit G, Pukkala E. Regional variation in incidence for smoking and alcohol
related cancers in Belgium. Cancer Epidemiology 2015; 39(1): 55-65.
14. Cancer Incidence in Belgium, 2008. Brussels: Belgian Cancer Registry, 2011.
15. Clegg LX, Hankey BF, Tiwari R, Feuer EJ, Edwards BK. Estimating average annual per cent change in trend
analysis. Statistics in Medicine 2009; 28(29): 3670-82.
16. Karim-Kos HE, de Vries E, Soerjomataram I, Lemmens V, Siesling S, Coebergh JW. Recent trends of cancer in
Europe: a combined approach of incidence, survival and mortality for 17 cancer sites since the 1990s.
European Journal of Cancer. 2008 Jul;44(10):1345-89.
17. Ederer F, Axtell LM, Cutler SJ. The relative survival rate: A statistical methodology. National Cancer Institute
Monograph 1962; 6:101-121.
18. Cancer Survival in Belgium. Brussels: Belgian Cancer Registry, 2012.
19. Cleveland WS. Robust locally weighted regression and smoothing scatterplots. J. Amer. Statist. Assn. 1979;
74: 829-833.
20. Cleveland WS, Devlin SJ. Locally weighted regression: an approach to regression analysis by local fitting. J.
Amer. Statist. Assn. 1988; 83: 596-610.
21. Cleveland WS, Grosse E. Computational Methods for Local Regression. Statistics and Computing 1991; 1:
47-62.
22. Cleveland WS, Grosse EH, Shyu MJ. Local regression models. In: Chambers JM, Hastie TJ.
(Editors).Statistical Models in S. New York: Chapman and Hall, 1992. 309-376.
23. Cancer in children and adolescents in Belgium, 2004-2016. Brussels: Belgian Cancer Registry, 2019.
24. Sobin LH, Gospodarowicz MK, Wittekind C, editors. TNM classification of malignant tumours. International
Union Against Cancer 7th Edition. John Wiley & Sons; 2009.
4 REFERENCE LIST

CA
NC
ER B
UR
DEN
IN B
ELG
IUM
202
0
18
2 B
ELG
IAN
CA
NC
ER R
EGIS
TRY

www.kankerregister.orgwww.registreducancer.org
Koningsstraat 215 / Rue Royale 2151210 Brussel / Bruxelles
T +32 2 250 10 10F +32 2 250 10 11