ethnicity, socioeconomic status, and social welfare in china
TRANSCRIPT
University of PennsylvaniaScholarlyCommonsAsia-Pacific Education, Language Minorities andMigration (ELMM) Network Working Paper Series Population Studies Center
1-1-2010
Ethnicity, Socioeconomic Status, and SocialWelfare in ChinaEmily C. HannumUniversity of Pennsylvania, [email protected]
Meiyan WangChinese Academy of Social Science
This paper is posted at ScholarlyCommons. http://repository.upenn.edu/elmm/2For more information, please contact [email protected].
Ethnicity, Socioeconomic Status, and Social Welfare in China1
Emily Hannum Department of Sociology and Population Studies Center
University of Pennsylvania
Meiyan Wang Institute of Population and Labor Economics
Chinese Academy of Social Sciences
1 Note: this is a full technical version, with all regression results, of the chapter ‘China: A
Case Study in Rapid Reduction,” forthcoming in shortened form as Chapter 5 in Indigenous
Peoples, Poverty and Development, ed.s. Gillette Hall and Harry Anthony Patrinos, 2010. The
report can be found at http://works.bepress.com/emily_hannum/25/ and at
http://www.worldbank.org/indigenouspeoples.
- 1 -
Introduction
This chapter investigates poverty and social welfare among China’s minority groups.
Focusing on the Zhuang, Manchu, Hui, Miao, and Uygur populations, China’s five largest
minority groups, as well as other minorities in the aggregate, this chapter will begin by providing
an introduction to the classification of ethnic groups in China. We consider the relationship of
this classification scheme to the concept of indigenous populations, and develop working
definitions of minority status and ethnic group for use in the chapter. We then discuss recent
economic trends and introduce some of the main government policies targeted toward ethnic
minorities. With this context established, we introduce the data employed in the chapter, namely
the 2002 rural sample of the Chinese Household Income Project and recent censuses and surveys.
We then proceed to the main body of the report. We present empirical evidence about
demographics and geography and investigate ethnic disparities in poverty rates, income and
employment, educational access and attainment, health care, and access to social programs. We
close with a summary of main findings and their implications for development activities in
minority areas and for further policy research on ethnic stratification.
Nationalities, Ethnic Groups, and the Concept of Indigenous Populations
We begin by providing background on the ethnic classifications used in this paper. As in
other countries, in China, concepts of ethnicity and the classification of ethnic groups have
fluctuated dramatically over the course of history. The name used to refer to ethnic groups in
China today, minzu (民族), is a 20th
century adaptation of the cognate Japanese term, minzoku
(民族), and is often translated as “ethnic nation,” “ethno-nation,” or “nationality” (Gladney
2004). The particular categories in use today were largely set in place after the People's
Republic of China was founded in 1949, as the State set out to identify and recognize as minority
nationalities those who qualified among the hundreds of groups applying for national minority
status. Decisions followed a Soviet model, and were based on the “four commons”: language,
territory, economic life, and psychological make-up, meaning that ethnic minorities were
identified as having common linguistic, economic, geographic, or cultural characteristics that
distinguished them from the so-called Han majority population (Fei 1981, cited in Gladney 2004).
While scholars have debated the procedures for and aptness of some of the original official
classifications, these classifications have become fairly set over time, with few new categories
created in the ensuing years (Gladney 2004). Today, the Chinese government officially
recognizes 55 minority nationalities (少数民族,shaoshu minzu), along with the Han majority
nationality (汉族, hanzu), a “naturalized” category, and an unknown category that encompasses
about 350 other ethnic groups not recognized individually (Wong 2000, p. 56). The officially-
designated minority population in China grew from 5.8 percent of the total in the 1964 census to
over 8 percent in 2000 (West 2004 and Table 1). China’s minority populations are culturally and
linguistically diverse, as suggested by the fact that they span the Sino-Tibetan, Indo-European,
Austro-Asiatic, and Altaic language families (see Map 1 for an ethno-linguistic map of China).
—Table 1 and Map 1 about here.—
Minzu categories do not map cleanly onto various notions of indigenous populations.
Globally, the term “indigenous” is not one with a widely agreed-upon definition. For purposes
- 2 -
of illustrating disconnects between the “indigenous” concept and the concept of minzu, we will
use one of several definitions proposed in a working paper by the United Nations Working
Group on Indigenous Populations, and again in a report by the United Nations Development
Group (Daes 1996, p. 22 and United Nations Development Group 2008, p. 9). This definition
lists several elements “considered relevant to” the definition of indigenous by international
organizations and legal experts (United Nations Development Group 2008, p. 9):
1. Priority in time, with respect to the occupation and use of a specific
territory;
2. The voluntary perpetuation of cultural distinctiveness, which may include
the aspects of language, social organization, religion and spiritual values,
modes of production, laws and institutions;
3. Self-identification, as well as recognition by other groups, or by State
authorities, as a distinct collectivity; and
4. An experience of subjugation, marginalization, dispossession, exclusion or
discrimination, whether or not these conditions persist.
According to Michaud (2009, p. 37), no organizations from China are found on the list of
members of the United Nations Forum on the World’s Indigenous People. While these
circumstances may be due in part to a political reluctance to label minorities in this way, the
notion of indigenous peoples is not wholly appropriate for other reasons (Michaud 2009, p. 37).
As Michaud (2009, p. 37) writes of the highland groups of southwest China, one issue is that
many groups are not actually indigenous to the region where they dwell today. More broadly,
while members of some minority groups do meet the above elements of the definition of
“indigenous,” with the exception of the third point above about official recognition, one could
argue that some groups designated as ethnic minorities in China fail to meet the elements of the
definition of indigenous populations. Conversely, some members of the group labeled as being
part of the ethnic majority Han population, especially some rural members, could be argued to
meet definitional elements. In fact, while the term for the majority, Han, has existed throughout
history in China, Gladney (2004) has argued that the promulgation and widespread acceptance of
an official Han label in the early 20th
century served a political purpose of unifying disparate
socio-cultural groups under a common national ethnic identity—groups with strong local
identities and cultures, and dialects as disparate as different romance languages.
Conceptually, there is room to debate the most appropriate boundaries with which to
classify groups for the purpose of investigating issues of ethnicity or indigenous status. However,
empirically, there is no option at present other than to employ the official minzu categories. To
follow conventional English usage, we will translate minzu categories as ethnic categories, rather
than ethno-nation or nationality categories. Where possible, we will discuss particular ethnic
groups, focusing on the largest ethnic minority groups—the Zhuang (Bouxcuengh) (壮族 ,
Zhuangzu), the Manchu (满族, Manzu), the Hui (回族, Huizu), the Miao or Hmong (苗族,
Miaozu), and the Uygur (sometimes also spelled Uighur, Uigur, or in transliteration of the
Mandarin ethnonym, Weiwuerzu or Weizu) (维吾尔族, Weiwuerzu) —along with an “Other”
category that encompasses all other groups than these and the Han majority. However, due to
limited data sources on ethnic minorities and small sample sizes, and due to the need for a
parsimonious summary of ethnic differences, some of the chapter will compare minorities as a
group to non-minorities as a group. Any summary statements about the overall situation of
- 3 -
minorities will necessarily gloss over the cultural and socioeconomic diversity across, and of
course also within, ethnic categories.
Economic History
Incomes in China have grown dramatically in recent decades, with mean household per
capita income growing from 272 Yuan in 1981 to 990 Yuan in 2001 (at 1980 prices) (Ravallion
and Chen 2007, Table 1). Measured by the new international poverty standard of 1.25 USD per
person per day, China’s poverty headcount index dropped from 85 percent in 1981 to 27 percent
in 2004, with rapid progress in the most recent period (World Bank 2009, p. iii; estimates using
2005 Purchasing Power Parity for China). Rates are much lower using China’s official poverty
line, but the reduction is similarly dramatic. At the same time, the impact of growth on the poor
has been mitigated by rising inequality (Ravallion and Chen 2007). According to a recent World
Bank report, estimates from national rural and urban household surveys indicate that the Gini
index of income inequality rose from 30.9 percent in 1981 to 45.3 percent by 2003 (World Bank
2009, p. 33).
Importantly for the purposes of this chapter, patterns of growth, poverty reduction, and
inequality have been uneven across regions. For example, using multi-province panel data, Goh,
Luo and Zhu (2009, p. 489) found that between 1989 and 2004, income in coastal provinces
more than tripled, while income in inland provinces doubled. By 2004, mean per capita
household income in inland provinces was barely two-thirds of the corresponding coastal
province figure. Ravallion and Chen (2007, p. 31) found that coastal provinces had significantly
higher trend rates of poverty reduction, compared to other provinces. Poverty is most severe in
remote mountainous and minority areas (World Bank 2009).
The urban-rural dimension of inequality is also important, with estimates of the ratio of
nominal mean urban income to rural income reaching as high as 3.3 by 2007 (World Bank 2009,
p. 35). The income gap between rural and urban areas fell after the initiation of market reforms
in 1978, then increased after the late 1980s, though when adjustments are made for inflation and
for cost-of living differences between rural and urban areas, the trend is less strong (Cai and
Wang 2008, p. 61; World Bank 2009). However, urban-rural income ratios still increased
significantly since the mid-1990s, and the absolute gap between urban and rural incomes
widened tremendously (World Bank 2009, p. 35). Sicular et al. (2007, table 1) correct for a
number of data limitations in earlier work that may have overstated the urban-rural gap, and still
estimate a substantial urban-rural income ratio in 2002, at 2.3. Other recent estimates indicate
that household income per capita incomes in urban areas have been roughly 2.5 to 2.7 times
those in rural areas in recent years (Cai and Wang 2008; Ravallion and Chen 2007; World Bank
2009).
Like levels of income, the urban-rural gap in income has a spatial dimension. Goh, Luo
and Zhu (2009, p. 489) found that the rural-urban gap in inland provinces was wider and rose
faster than in coastal provinces. Similarly, Sicular et al. (2007) found that urban–rural income
ratios in the western regions were higher, above three, than those in the center or eastern regions,
at about two. Moreover, between 1995 and 2002, the urban-rural gap rose in the west and center,
but declined in the east, suggesting that those parts of China where poverty is most concentrated
were falling farther behind, in relative terms (Sicular et al. 2007, pp.101-102). As we will
- 4 -
discuss further in the section on demographics and geography, for those minority groups who
live disproportionately in interior regions, rural areas, and remote and mountainous areas, while
growth and poverty reduction are likely to have ameliorated absolute economic disadvantage,
patterns of inequality are likely to have perpetuated relative disadvantage.
Policies Related to Ethnic Minorities
Government policies that shape the rights and opportunities of official minorities are also
important as context for understanding social and economic disparities by ethnic group. Being a
member of a recognized ethnic minority in China implies a set of statuses somewhat different
from those of non-minority members. One important element of minority status is access, at
least for groups in some regions, to political representation through regional autonomy policies.
According to a 2000 White Paper on minority policy in China (Information Office of the State
Council of the People’s Republic of China 2000, section 3), “Regional autonomy for ethnic
minorities means that under the unified leadership of the state[,] regional autonomy is practiced
in areas where people of ethnic minorities live in concentrated communities; in these areas[,]
[instruments] of self-government are established for the exercise of autonomy and for people of
ethnic minorities to become masters of their own areas and manage the internal affairs of their
own regions.”i There are several types of autonomous areas for ethnic minorities in China,
established under different demographic circumstances, including autonomous regions,
prefectures, counties, townships (Information Office of the State Council of the People’s
Republic of China 2000, section 3). At the highest administrative level, there are five province-
level autonomous regions: the Inner Mongolia Autonomous Region (内蒙古自治区,Nei
Menggu Zizhiqu), founded in 1947; the Xinjiang Uygur Autonomous Region (新疆维吾尔自治
区,Xinjiang Weiwuer Zizhiqu), founded in 1955; the Guangxi Zhuang Autonomous Region (广
西壮族自治区, Guangxi Zhuangzu Zizhiqu), founded in 1958; the Ningxia Hui Autonomous
Region (宁夏回族自治区,Ningxia Huizu Zizhiqu), also founded in 1958; and the Tibet
Autonomous Region (西藏自治区,Xizang Zizhiqu), founded in 1965.
Autonomous areas have the right to self-government. The instruments of self-
government of autonomous areas, as stipulated in the Constitution, are the people's congresses
and people's governments of autonomous regions, autonomous prefectures and autonomous
counties (Information Office of the State Council of the People’s Republic of China 2000,
section 3). The Law on Ethnic Regional Autonomy specifies that all ethnic groups in
autonomous areas shall elect appropriate numbers of deputies to take part in the people's
congresses at various levels (Information Office of the State Council of the People’s Republic of
China 2000, section 3). Specifically, among the chairman or vice-chairmen of the standing
committee of the people's congress of an autonomous area, there shall be one or more citizens of
the ethnic group or groups exercising regional autonomy in the area concerned; the head of an
autonomous region, autonomous prefecture or autonomous county shall be a citizen of the ethnic
group exercising regional autonomy in the area concerned, and the other members of the people's
governments of these regions, prefectures and counties shall include members of the ethnic
group exercising regional autonomy, as well as members of other ethnic minorities, as far as
possible. Instruments of self government in autonomous areas have a series of designated rights
and functions, which include legislative power, the power to “flexibly carry out, or halt the
carrying out of, some decisions”, the right to develop area economies and control local finances,
- 5 -
the power to train and employ ethnic minority cadres (government officials), the power to
develop education and minority cultures, the power to develop and employ local spoken and
written languages, and the power to develop technological, scientific and cultural and
undertakings.” (Information Office of the State Council of the People’s Republic of China 2000,
section 3). ii
Beyond policies on regional autonomy, the reform era dating from the late 1970s has
seen the emergence of a growing network of laws intended to advance the interests of
historically disadvantaged ethnic groups, with the intention of improving ethnic relations
(Sautman 1999). Policies confer specific benefits on minority groups, including the heightened
access to local political office already discussed, looser family planning restrictions, educational
benefits, and special economic assistance, including tax relief (Hoddie 1998, p. 120; Sautman
1999; Gladney 2004). These policies have contributed to a situation in which individuals have
moved across ethnic boundaries over time to claim minority status—a phenomenon particularly
pronounced in the early reform years immediately following the Cultural Revolution (Hoddie
1998; Gladney 2004, pp. 20-21).
Some of the most important incentives for claiming minority status have to do with
family planning policies and education policies. Fertility controls in China are less stringent for
many minority groups than for the Han majority (Gladney 2004, p. 81). Gu et al. (2007) recently
reviewed provincial fertility control policies in China, with a focus on provincial differences in
implementation of the one-child policy. The authors found that only 5 of China’s 31 provinces,
municipalities, and autonomous regions did not grant a second-child exemption to minority
couples, reportedly defined as a couple in which at least one member belongs to a recognized
minority group (see Table 1, pp. 134-135). In all of the 11 provinces, municipalities, and
autonomous regions where a third child exemption was granted under some conditions, minority
status was a criterion, though the details of the exemption varied considerably from place to
place (see Table 1, pp. 134-135).
In education, since the late 1970s, policy makers have supported the establishment of
minority boarding schools and affirmative action policies for matriculation into colleges and
universities, and subsidies for minority students (Ross 2006, p. 25; Lin 1997; Sautman 1999, p.
289). University admissions quotas reserve spots only for minorities at universities, and
minorities can be accepted with lower entrance scores on the Unified Examination for University
Entrance (gaokao, 高考) (Clothey 2005, p. 396). In addition to these benefits, 12 national
minority institutes and one national minority university have been established that are dedicated
specifically to the higher education of minority students (Clothey 2005, p. 396). Given the great
demand for higher education, these benefits are highly prized and offer significant incentives for
claiming minority status.
While not a central element of incentives for claiming minority status, an additional set of
important education policies have sought to address language of instruction issues critical for
enhancing minority educational participation. The Chinese constitution has two provisions
concerning language (Ma 2007, p. 15): Article 4 states that each ethnic group has the freedom to
use and develop its own language and writing system, and Article 19 states that the national
government will promote a common language to be used throughout the country. Article 6 of the
- 6 -
Compulsory Education Law specifies that schools should promote the use of Mandarin (the
national vernacular) (Ma 2007, p. 15). In a 1980 publication,iii
the Ministry of Education and the
China State Ethnic Affairs Commission required that every ethnic group with a language and
writing system should use that language for educational instruction, while also learning spoken
and written Mandarin (Ma 2007, p. 15).
Regional and local governments shape the ways in which bilingual and multicultural
education are incorporated into education across China (for a discussion of legislation from
different regional and local governments in China, see Zhou 2005; for in-depth case studies of
bilingual education in Yunnan and Sichuan, see Xiao 1998 and Teng 2002). Ma (2007, pp. 15-
16, quoting Zhou Wangyun 1989, p. 31) states that when governmental educational authorities
were planning and developing bilingual education, the principle they employed was
consideration of the existing local language environment, along with social and economic
development needs, pedagogical benefits, and preferences of residents. Scholars classify the
modes of bilingual education in China as falling into transition models (transitioning to
Mandarin) or maintenance models (maintaining the origin language), with the determination
between the two affected by the existence of a well-established writing system and the ethnic
composition of local areas (Feng 2005, p. 534; Lin 1997; Teng 2002; see Ross 2006 for a
discussion of language law in China).iv
There are significant practical challenges to developing minority-language materials for
instruction, especially for smaller minority groups and those without well-established writing
systems. Important and obvious among these challenges are the human and economic resource
constraints that pervade schools serving poor rural communities. Situations where there is no
minority written language, or where there are multiple, non-Han ethnic groups attending the
same school, present additional challenges. Another challenge to meaningful bilingual education
is that of developing curriculum when instructional concepts do not exist in the minority
language.v This practical linguistic challenge also represents an extreme example of the kind of
cultural discontinuity that children from some minority groups may experience in the school
system.
Despite these challenges, there is a significant commitment to minority language
maintenance and bilingual education (Ross 2006; see CERNET 2005a,b). The reform era dating
from the late 1970s has seen support by policy makers for the increased use of several minority
scripts in literacy education and for increased bilingual education, such that schools with a
majority of minority language users can use minority languages as the primary medium of
instruction (CERNET 2005a; Lin 1997; Ministry of Education 1986, Article 6: Ministry of
Education 1995, Article 12; Ross 2006, p. 25; Sautman 1999, p. 289).vi
Candidates for
nationalities institutes may sit the gaokao in their native language, though it is not clear that all
minority languages are available as options (Clothey 2005, p. 396). Some applicants to minority
region comprehensive universities and polytechnic institutes may also take the exam in their
native language, and minority students may take higher education courses in their region’s main
nationality language (Clothey 2005, pp. 397-398).
Many of the economic benefits accruing to minorities have to do with the fact that
poverty-stricken minority areas have figured prominently in China’s rural poverty alleviation
- 7 -
initiatives. A key characteristic of national poverty alleviation efforts has been regional
targeting—that poverty reduction funds from the government are targeted at defined regions and
not directly at poor populations (Wang 2004, pp. 19-20). Counties remained the basic units for
state poverty reduction investments until 2001 (Wang 2004, p. 19). The central government
designated national poor counties, beginning in 1986, and required that provincial governments
also designate and support with provincial funds “provincial poor counties”(Wang 2004, p. 22).
In principal, the standard for being selected as a nationally-designated poor county was
that the average net income per capita of all rural residents within the county was less than 150
Yuan in 1985, but less than one-third of counties actually met this standard (Wang 2004, p. 20;
Information Office of the State Council of the People's Republic of China 2001, section IV). In
part, the slippage in targeting was due to special treatment given to minority areas (Wang 2004, p.
20). For example, according to a White Paper on rural poverty reduction, the relief standard set
for autonomous counties could be 200 Yuan to 300 Yuan (Information Office of the State
Council of the People's Republic of China 2001, section IV). After the 1993 launch of the
“Eight-Seven Poverty Reduction Plan (1994-2000),” which had the goal of eliminating absolute
poverty by the end of the century, the government made adjustments to the designated poor
county list (Wang 2004, p. 20). Among the 592 impoverished counties on the State's adjusted
list, there were 257 ethnic minority counties, accounting for 43.4 percent (Information Office of
the State Council of the People's Republic of China 2001, section IV).
In addition to favoring autonomous regions and western provinces with large ethnic
minority populations such as Yunnan, Guizhou and Qinghai in allocating aid-the-poor funds, the
central government has also arranged special funds such as the "Ethnic Minority Development
Fund" to address specific problems facing minority areas (Information Office of the State
Council of the People's Republic of China 2001, section IV). According to government reports,
from 1994 to 2000, the State invested 43.253 billion Yuan in the Inner Mongolia, Guangxi, Tibet,
Ningxia and Xinjiang Autonomous Regions, and Guizhou, Yunnan and Qinghai provinces (State
Council of the People's Republic of China 2001, section IV). During one or two years during the
Eight-Seven Plan, poverty alleviation credit funds for six relatively economically developed
coastal provinces (Guangdong, Fujian, Zhejiang, Jiangsu, Shandong, and Liaoning) were pooled
for use among the central and western regions where the poverty problems were more severe
(Government of China 1993). The plan also specified that in nationally designated old military
base areas, minority areas, and border areas, new businesses could have a three year delay in
paying taxes, or pay only partial taxes (Government of China 1993). Minority areas remained a
focus of poverty alleviation and development strategies in the most recent plan, the “Poverty
Reduction Compendium, 2001-2010,” in which village targeting was proposed, though key
poverty reduction counties were still designated and the counties would still exercise overall
administration of poverty reduction funds (Government of China 2001; Wang 2004, p. 24).
Data Used
In the remainder of this chapter, we assess available evidence about the socioeconomic
circumstances of ethnic minorities in China. To do so, we draw on four sources of data. The
first source, referred to hereafter as the 1990 Census, is a one percent micro-sample of the
1990 China population census data. The second data source, referred to hereafter as the 2000
census, is a 0.95 per thousand micro-sample of the 2000 China population census data. The third
- 8 -
source of data, referred to hereafter as the 2005 mid-censal survey or mini-census, is a 20 percent
micro-sample of 2005 China 1% population sampling survey data. For these three data sources,
we dropped collective households from the sample and only analyze family households. These
sources cover all provinces. The 1990 and 2000 census forms were very limited, and do not
contain information on earnings. The 2005 mini-census does contain earnings information.
The fourth source of data employed here is the 2002 Rural Chinese Household Income
Project survey data, referred to hereafter as the 2002 CHIP. The 2002 CHIP rural sample is a
multi-stage sample that covers 22 provincial level administrative units of China: Beijing, Hebei,
Shanxi, Liaoning, Jilin, Jiangsu, Zhejiang, Anhui, Jiangxi, Shandong, Henan, Hubei, Hunan,
Guangdong, Guanxi, Chongqing, Sichuan, Guizhou, Yunnan, Shaanxi, Gansu and Xinjiang.
Sampled households are located in 961 villages located in 120 different counties (Gustafsson and
Ding 2004, p. 5).vii
In addition to household questionnaires, village questionnaires were
administered to cadres.
Demographics and Geography
—Map 2 about here.—
We turn next to a discussion of demographics and geography. In certain parts of China,
minorities constitute a much larger proportion of the population than their national share of 8
percent, and demographic differences across China’s regions and urban-rural divide are
significantly related to patterns of socioeconomic advantage and disadvantage by ethnic group.
There are three interrelated dimensions of geography—region, urbanicity, and topography—that
provide critical context for thinking about ethnic differences in many dimensions of social
welfare. First, for many groups, ethnic differences in social welfare indicators are tied closely to
China’s regional economic disparities, meaning coast-interior and inter-provincial economic
disparities. Many ethnic groups reside in the interior western parts of the country. As Table 1
and Map 2 illustrate, minorities are most heavily represented in the strategic, resource-rich
periphery in the portions of the northeast, central-south to southwest, and northwest (Schein
1997, p. 71-72). In 2000, the Autonomous Regions—Tibet, Xinjiang, Guangxi, Ningxia, and
Inner Mongolia—along with the provinces of Qinghai (青海), Guizhou (贵州), and Yunnan (云
南) contained the most county-level units with minority population shares exceeding 40 percent
(West 2004). These regions and provinces are among the poorest in terms of rural household
income (West 2004). Among villages sampled in the rural 2002 Chinese Household Income
Project (CHIP) survey, about one-fifth of non-minority villages were in nationally-designated
poor counties, compared to about one-third of minority villages (see Table 2).
—Table 2 and Figure 1 about here.—
However, the scope and nature of the disparity in geographic location compared to the
Han population varies considerably across specific ethnic groups. Figure 1, based on the 2000
census, depicts the distribution by ethnic group across China’s macro-regions. Distributions are
shown for the Han population, for each of the five largest minority groups, and for other
minorities, as a group. About 59 percent of the Han population is in the east and central south,
with just 14 percent and 7 percent in the poor regions of the southwest and northwest,
- 9 -
respectively. The picture is quite different for minorities. Nearly all Zhuang live in the central-
south region (92 percent), the location of the Guangxi Zhuang Autonomous Region, with the
remainder living in the southwest (8 percent). Nearly all Manchus live in the north (28 percent)
and northeast regions (69 percent); virtually all Miao live in the central-south (30 percent) and
southwest (68 percent); and virtually all Uygurs (close to 100 percent) live in the northwest, the
vast majority in their home Autonomous Region. Fully half of all Hui, who are among the most
dispersed of ethnic groups, live in the northwest, and 55 percent of other minorities live in the
southwest.
—Figure 2 about here.—
As noted earlier, the urban-rural line is also an important element of inequality, with
urban household income per capita incomes in urban areas far outpacing incomes in rural areas
in recent years (Cai and Wang 2008). Minorities, as a group, are less urbanized than the Han
population. Figure 2 illustrates this point by showing the percent urban by ethnic group and year,
based on the 2000 census and the 2005 mid-censal survey.
Figure 2 also shows two important exceptions among the largest ethnic minority groups.
One exception is the Manchus, descendants of the ruling class of the last imperial dynasty, the
Qing Dynasty. Manchus tend to live in the more industrialized north and northeast, and their
degree of urbanization approximates that of the Han. Manchus are a highly assimilated group,
most of whom do not speak the Manchu language. This point is related to the fact that Manchus
were among the groups with the highest rate of reclaiming minority status (moving from non-
minority to minority status) in the 1980s (Hoddie 1998; West 2004, Table 1).
The second exception is the Hui, sometimes known as ethnic Chinese Muslims to
distinguish them from other Muslim ethnic groups of Turkic, Persian, and Mongolian descent.
Hui are said to be descendents of Middle Eastern merchants, emissaries, soldiers, and traders
who began coming to China as early as the Tang and Song Dynasties (618 A.D. to 1279 A.D.),
and intermarried with local populations (Lipman 1997, p. 25; Gladney 2004, p. 161). Hui are
among the most urbanized ethnic groups in China, as well as being highly dispersed across the
country (Poston and Shu 1987, p. 25). Gladney (2004) has suggested that because the category
“Hui” has been defined mainly based on religion, it encompasses groups with very different
geographical ties and cultural practices.
All groups except the Uygur, a Turkic Muslim group that resides predominantly in an
Autonomous Region in the far Northwest of China, were notably more urbanized in 2005 than in
2000. However, the continuing low levels of urbanization among the Zhuang, but especially
among the Miao, Uygur and “Other” categories, suggest the disadvantaged context, in
infrastructure terms and in economic opportunities, faced by these groups.
Finally, and related to the regional and urbanization differences already mentioned,
minorities are more likely to live in more isolated, remote villages with difficult topography and
poor infrastructure. In villages surveyed as part of the 2002 CHIP, minority villages were about
twice as likely as non-minority villages to be located in mountainous areas—38 to 44 percent of
minority villages, depending on definition, were reported to be in mountainous areas (see Table
- 10 -
3). Related to these topographical differences, minority villages sampled in the 2002 CHIP
tended to be more isolated: further from seats of government and transportation; more recently
electrified; and more likely to still lack telephone access (see Table 4) (for a detailed description
of economic differences across minority and non-minority villages, see Gustaffson and Ding
2006). As will become clear in the following discussions, regional and urban-rural inequalities
and village remoteness and isolation play are important pieces of contextual information in
interpreting ethnic differences in poverty, income, and social welfare outcomes.
—Tables 3 and 4 about here.—
Poverty and Income Disparities
—Table 5 about here.—
We turn now to a discussion of poverty and income, in which we draw on survey data
from the 2002 CHIP rural sample. There is no official urban poverty line in China, and different
instruments are used to measure household income in rural and urban areas, so we restrict our
analyses to the rural sample. The CHIP data are the only publicly available data source that has
reasonable coverage of minority areas and comprehensive measures of household income.
However, the CHIP data in 2002 do have some limitations for our purposes. They cover 22
provinces out of 31, and do not cover some significant minority areas, including the Ningxia Hui,
Tibet, and Inner Mongolia Autonomous Regions.
Earlier analyses of CHIP data (Khan 2008, cited in Gustafsson and Ding 2008) have
shown that rural poverty decreased dramatically between 1995 and 2002. However, majority-
minority differences in poverty remain substantial. Table 5 shows the official rural poverty line;
official rural poverty headcount indices, and the same measures calculated from the 2002 rural
CHIP data.
The CHIP data contained household total income and size for the years from 1998 to
2002, for households that had been part of the rural household survey for those years. In the
2002 CHIP, 99 percent of the cases with valid data for 2002 also have valid data for the years
2000 and 2001; numbers are slightly lower for the earlier years for which data were collected and
data from these years should be viewed with caution, as they may have been collected
retrospectively. The upper panel shows poverty rates using the official poverty lines for each
year, and the lower panel shows poverty rates using somewhat higher “low income” lines
available for 2000 onward. By both measures, minorities in the rural CHIP sample have been
roughly twice as likely as their Han counterparts to be in poverty until the most recent year, 2002,
in which they were about one and a half times as likely to be in poverty, according to the official
poverty line, and a little over one and a half times according to the higher low income line. In
2002, by the lower official poverty line, about 3.5 percent of the Han sample was below the
poverty line, compared to about 5.4 percent of the minority sample. Using the higher low-
income line, the corresponding numbers were 8.9 percent for the Han sample and 15.2 percent
for the minority sample. Gustafsson and Ding’s (2008) analysis of the 2002 rural CHIP showed,
moreover, that using the low income line, almost one-third of ethnic minorities experienced
- 11 -
poverty during the three years 2000 to 2002, while the fraction experiencing poverty among the
ethnic majority was only about half as high.
—Table 6 about here. —
Can we generalize about ethnic differences or year to year changes from these estimates?
Table 6 shows estimates, standard errors, and 95 percent confidence intervalsviii
for the
headcount measures shown in Table 5, as well as for the other Foster-Greer-Thorbeckeix
indices
measuring depth of poverty—the poverty gap ratio and the squared poverty gap. Confidence
intervals for the headcount index do not overlap for Han and minorities within any year.
Comparing 2002 to 1998, headcount indices do not overlap for Han or minorities, suggesting a
significant reduction in poverty between those years. If we focus instead on 2000 as the initial
year for comparison, which may be warranted for data reasons described above, the confidence
interval does not overlap for minorities, but does for the Han, suggesting that poverty was
significantly reduced between 2000 and 2002 for minorities only between these years.
For the additional poverty measures shown in Table 6, different stories emerge. The
poverty gap ratio, signifying the mean shortfall from the poverty line (counting the nonpoor as
having zero shortfall) expressed as a percentage of the poverty line, ranges from 2.8 percent in
1998 to 2 percent in 2002 for minorities, and from 1.5 percent to .9 percent for the Han
subsample. The decline is not monotonic for minorities, and confidence intervals for most years
have some overlap. The indicator for minorities is about twice that for the Han in most years.
Confidence intervals for Han and minorities never overlap.
The squared poverty gap measure, which measures the squared distance from the poverty
line among the poor and measures severity of poverty, is also about twice as high for minorities
as for the majority, with non-overlapping confidence intervals by ethnic category. There is little
evidence of a consistent time trend. Point estimates diminish slightly among the Han;
confidence intervals for most years overlap for both groups.
Overall, the evidence available in the CHIP data suggests that minorities remain more
likely to be in poverty than the Han, but rates of poverty have declined for minorities. For those
who are poor, the poverty gap and squared poverty gap measures suggest that minorities are
likely to be poorer, and there is little evidence of a clear trend in depth of poverty.
What factors contribute to higher rates of poverty among ethnic minorities? Geography
plays an important role. It is important to reiterate that these figures pertain to rural China alone.
If the urban population were included here, observed majority-minority differences in poverty
rates would be exacerbated, because of the fact that minority groups are much more likely to live
in rural areas. Within rural areas, important contextual differences exist between Han and
minority populations. As noted earlier, minority villages are more likely to be poor, to be in
mountainous settings, and to be isolated; they are also located in different regions of China.
These geographic differences may also be related to differences in opportunities for educational
attainment, the acquisition of other individual characteristics with implications for income, and
the context within which to translate human capital into income.
- 12 -
—Table 7 about here.—
Table 7 presents an analysis of poverty status, conducted at the household level using the
rural CHIP 2002 sample. In this analysis, minority status is operationalized with a dummy
variable coded as “1” if the household has any members who report minority status. Other
household characteristics are whether there is a cadre (government official) in the household, the
years of schooling of the best-educated person in the household, and whether or not there is a
person with migration experience in the household. Community characteristics are also included.
These characteristics are whether or not the village is in a national poverty county, the
topography in the village, and distance to county seat and township government. Model 1 is a
base model with only demographic characteristics of the head controlled. Models 2 and 3 add
sequentially education and other household characteristics to the base. Models 4 to 6 add
community measures to the base. Model 7 adds all individual, household, and community
characteristics, and Model 8 adds community dummies. These models suggest that while
education and other household characteristics contribute to the ethnic gap in poverty, a key story
comes from community context. Accounting for national poverty county status (Model 4)
reduces the coefficient on minority status considerably, and accounting for topography (Model 5)
renders this coefficient insignificant. Minority status is insignificant in subsequent specifications.
This finding is consistent with Gustafsson and Ding’s (2008) conclusion that ethnic differences
in poverty can be attributed in large part to differences in regional distribution, given that poverty
in rural China is concentrated in the western region and villages with low average income.
—Figure 3 about here.—
This insight is also consistent with patterns of variability in poverty across individual
ethnic groups. Small sample sizes preclude any detailed analysis of this issue here. However,
Figure 3 shows a descriptive result—poverty headcounts, observations, and upper and lower
bounds of confidence intervals, disaggregated by ethnic category, with data for the Han, the five
largest minority groups, and another category. The Yi, another southwestern ethnic group, are
included as an individual group in the CHIP questionnaire, and are included in this figure as well.
The Manchu population, residing in the relatively developed north and northeast, has the
lowest poverty rates of any group in the sample, including the Han, with a confidence interval
that does not overlap with the Han. Point estimates for all other groups are higher than for the
Han; for some groups, substantially so. However, sample sizes for individual ethnic groups are
small, and confidence intervals in some cases, wide, and for this reason, estimates cannot be
distinguished statistically from those of the Han. This is true for the Zhuang, Hui, and Yi. The
Uygur, Miao and “Other” categories show higher rates and non-overlapping confidence intervals,
with the Miao highly disadvantaged at over ten percent poor using the official poverty line.
Virtually all of the Uygur live in Xinjiang; the Miao are also highly concentrated in the central-
south and southwest. As described earlier, The Uygur and the Miao are also among the least
urbanized of ethnic groups.
—Table 8 about here.—
- 13 -
We are able to look with a bit more refinement at economic disparities by considering
household income differences between minorities and the majority population using the CHIP
data. In the aggregate, the per capita household income for rural minorities is about 1,850 RMB,
about 69 percent of that the Han, at 2,691 RMB. Table 8 shows results from a household-level
analysis of per capita income. Minority households are defined as in Table 7. The baseline
model shows a substantial penalty of approximately 34 percent for minority households.
Accounting for differences in education of the best educated household member and other
household characteristics reduces the penalty to about 30 percent (models 2 and 3). Here, as in
the poverty models, the role of geography is important. Without controlling for any household
characteristics, adding to the baseline an indicator of whether the village of residence is in a
nationally-designated poverty county reduces the penalty from 34 percent (model 1) to 24
percent (model 4); adding controls for topography and then isolation reduce it a bit further to 22
percent (model 5) and 20 percent (model 6). Adding both household and community controls
brings the penalty down to 17 percent (model 7). Model 7 yields an R-squared measure of about
12 percent, compared to just about 6 percent for models with only household context. Finally, to
illustrate the importance of regional distribution, incorporating a series of dummy variables for
region of residence eradicates the penalty for minority status and brings the percent of variation
explained up to 16 percent.
Labor Market Analysis: Income, Employment, and Occupational Attainment
—Table 9 about here.—
For those who are employed, individual income differences by minority status are also of
interest. Table 9 shows average monthly and hourly income, overall, in urban and in rural areas,
as reported by individuals in the 2005 mid-censal survey. Looking first at totals, we see a pattern
that has emerged already: the Hui and the Manchu, more urbanized and less concentrated in poor
parts of the country than other minority groups, receive incomes (in hourly or monthly terms)
roughly comparable to those enjoyed by the Han population. The Zhuang and “Other” groups
receive just under two-thirds the income of the Han; the Miao and Uygur receive just over half
the income of the Han. A substantial fraction of the income penalty for most groups can be
attributed to differences in residence in rural or urban areas. Within urban areas, the Zhuang
receive 71 to 72 percent of the income of the Han; the Miao, about three-quarters; and the Uygur
and “Other” categories, 82 to 89 percent. In rural areas, the Manchu again earn comparably to
the Han, but the rural Hui population experiences a penalty not seen in the urban or overall
figures: they earn 81 to 83 percent of the income of the Han. Rural Zhuang, Miao and Uygur
earn about two thirds the income of the Han, and other minorities, just under three-fourths.
—Table 10 about here.—
Both location of residence and gaps in income are also tied to the kinds of work people
are able to secure. Table 10 shows occupational composition of the adult population by ethnic
group and residence status, based on the 2005 mid-censal survey. Looking first at the overall
numbers, it is clear that the Manchu and Hui are again exceptional among the largest minority
groups. Relative to the Han, these groups are comparably (or even favorably) distributed across
high status categories of head of government, party, or industrial unit; professional and technical
- 14 -
jobs; and also in clerical, service and sales jobs. All other groups are underrepresented among
these kinds of jobs and in labor jobs, and overrepresented in agriculture. In urban areas, the
under-representation of these groups in non-agricultural jobs is generally much less pronounced
than in rural areas.
—Table 11 about here.—
We investigate further income disparities using the CHIP rural sample and then using the
2005 dataset for rural and urban areas. Table 11 presents an analysis of logged individual wage
income, meaning income from primary and secondary jobs, for those reporting income ages 21
and older. Here, the penalty for minority status in the baseline model was about 58 percent
(model 1). Accounting for education and other human capital characteristics (models 2 and 3)
brings the number down to about 50 percent and more than doubles the explanatory power of the
model, though it is still small, at about 7 percent of variance explained. A substantial amount of
the remaining penalty has to do with differences in occupational sector and occupational
category; with these factors incorporated, the penalty drops to about 36 percent and the percent
of variance explained rises to 19 percent. Accounting for differences in community
characteristics reduces the minority penalty to about 16 percent, and increases the explanatory
power of the model to about 22 percent. Finally, in these models, if we account for regional
differences in income levels with a series of dummy variables, we eradicate the significance of
the minority status coefficient, and increase the R-squared measure slightly, to 24 percent.
In the last row, Table 11 also shows the percent of the Han-minority disparity due to
endowment differences. These numbers were calculated by running separate models containing
the displayed variables for the minority and majority subsamples, then implementing a
regression (Oaxaca) decomposition of the difference in income. The decomposition results show
that just 7 percent of the gap in income can be attributed to differences in education and other
indicators of “human capital”—cadre status and migration experience. The difference due to
endowments rises to 13 percent if we account for differences in the types of jobs people are able
to secure (which are likely to be related to where people live). Adding community controls
raises the percent due to endowments to 30 percent. Adding regional dummies raises the percent
to about 52 percent, though in the pooled model, the coefficient for ethnic minority turns
insignificant with this specification.
—Table 12 about here.—
Access to wage employment in rural areas is itself an important piece of the picture of
differentials in economic welfare by ethnic group. Table 12 shows an analysis, at the individual
level, of whether individuals report wage income from a primary or secondary job. Here, overall,
minorities’ odds of reporting employment wages at all are 56 percent lower for than those of Han
Chinese (based on model 1, odds reduction calculated as 100*{1-exp[-0.827]}). Substantial
reductions in the minority penalty are achieved less by accounting for human capital differences
and more by accounting for differences in community context and region of residence. Odds of
wage employment for minorities are 46 percent lower than for the Han in Model 4, which
accounts for community characteristics, and 25 percent lower in Model 5, which accounts for
regional location.
- 15 -
—Table 13 about here.—
Table 13 contains wage models based on data from the 2005 mid-censal survey, and with
separate models for urban and rural areas. These are similar to the models estimated using the
CHIP data in Table 11, though the measurement of income is slightly different in the two data
sources, and the sample coverage differs. Our goal in presenting the 2005 data is to investigate
urban-rural differences, rather than to compare the scope of the minority wage penalty across the
two surveys. The top panel shows totals for the combined urban and rural samples. Here, we
see a minority penalty in the baseline model of about 15 percent, and this penalty is reduced
slightly with the inclusion of controls for education and job type (models 2 and 3). The penalty
drops to just 5 percent in model 4 with the addition of province dummies. The middle panel
focuses on urban areas. Here, the minority penalty is smaller, about 8 percent, in the baseline
model. Accounting for education and job type in models 2 and 3 does not reduce the penalty at
all—in fact, the penalty is about 10 percent in these models. The penalty drops to just 3 percent
in model 4, with controls for province. Finally, the bottom panel shows models for rural areas.
Here, the minority penalty in the baseline model is higher, at about 24 percent. It drops almost
imperceptibly to 23 percent with controls for education (model 2) and to 17 percent with controls
for job type (model 3), but again, the big drop, to 7 percent, comes with controls for province.
This table underscores again the role of geography—ethnic disparities in income are smaller in
urban than in rural areas. Accounting for human capital and job type does not do much in urban
areas to explain the gap; in rural areas, job type matters a little. In both cases, penalties really
drop, however, with the inclusion of province.
Educational Access and Attainment by Ethnic Group
The Importance of Educational Attainment
In recent decades, education has become closely tied to earnings (Yang 2005; Zhang et al.
2005; Zhao and Zhou 2007). Analysis of data from National Bureau of Statistics surveys show
rapid increases in economic returns to a year of education in urban China: returns nearly tripled
during the period 1988 to 2003, rising from 4.0 to 11.4 percent (Zhang and Zhao 2007, Table
14.2). In rural areas, by the year 2000, an additional year of education increased wages by 6.4
percent among those engaged in wage employment, and education is becoming the dominant
factor that determines whether rural laborers are successful in finding more lucrative off-farm
jobs (de Brauw et al. 2002; de Brauw and Rozelle 2007; Zhao 1997).
In the 2002 rural CHIP data, models presented in Table 11 suggest returns ranging from 6
to 10 percent for those who report income, depending on specification, and models in Table 12
indicate that each additional year of schooling is associated with an 8 to 9 percent increase in the
odds of working for income.x Evidence from the 2005 mid-censal survey implies somewhat
lower returns of 4 percent in rural areas among those with wage income, and returns of 6 to 8
percent in urban areas (Table 13). It is important to acknowledge structural constraints facing
minorities: the geographic context and other factors such as potential discrimination may shape
- 16 -
ability to translate education into income. Yet, for those reporting wage income, separate
regressions of logged wages by minority status, gender, and urban-rural residence suggest that
returns to education may, if anything, be higher among minorities than among the Han Chinese,
especially in rural communities (Table 13a.). Thus, it is reasonable to say that those who lack
access to schooling face barriers to economic mobility.
—Table 13a about here.—
Educational Attainment in the Total Population
—Figure 4 about here.—
We next consider educational attainment trends by ethnic group in the national
population. At the base of the educational system, expansion is very evident across groups.
Figure 4 shows national illiteracy rates by ethnic group and year. In 1990, the Miao had the
highest illiteracy rates, at 44 percent, followed by the “other” category, at 40 percent, the Hui, at
35 percent, and the Uygur, at 28 percent. The figure for the Zhuang was 24 percent, and for the
Han, 23 percent. The Manchus had the lowest rate, at just 12 percent. By 2005, the ordering
was similar, but the rates, much lower: illiteracy rates among the Miao were 26 percent; among
“Other”, 24 percent; among Hui, 19 percent, and among Uygur, Zhuang and Han, 11 percent.
The rate among the Manchu population had dropped to 5 percent in 2005. Much of the literacy
reduction happened between 1990 and 2000.
—Figure 5 about here. —
At the top of the educational distribution, there is also evidence of significant expansion.
Figure 5 shows percent college educated by ethnic group and year. In 1990, just 1.59 percent of
the Han population was college educated. For the Manchu and Hui populations, the figures were
slightly higher, at 2.11 percent and 1.72 percent. The figure was 1.42 percent among the Uygur.
The figures were under one percent for other groups: .8 percent for the “Other” category; .51
percent for the Miao; and .41 percent for the Zhuang. Substantial expansion occurred between
1990 and 2000, and again between 2000 and 2005, such that by the latter year the figure was
8.46 percent for the Hui; 7.54 percent for the Manchu; 6.42 percent for the Han; and 6.27 percent
for the Uygur. For other groups, the figure was 4.26 percent for the “Other” category; 3.93
percent for the Zhuang, and 2.85 percent for the Miao. Interestingly, the Hui have both elevated
illiteracy rates and elevated college educated rates. This is likely related to the bifurcation of the
relatively urbanized Hui population between its urban and disadvantaged rural components.
—Table 14 about here. —
Table 14 shows the full educational distribution by year and ethnic group, and confirms
the picture of upgrading in educational attainment for all groups. In 1990, the modal educational
category was the illiterate category for the Hui, Miao, and “Other” categories and the primary
category for the Han, Zhuang, and Uygur groups. Only the Manchu population had a modal
category of junior high school. By 2005, the Han, Zhuang, and Hui, along with the Manchu
population, had this modal category; the Miao, Uygur, and Other categories had primary school
- 17 -
as the modal category (for Uygurs, this was nearly a tie). No groups continued to have illiteracy
as the modal category.
Compulsory Education Policy and Exclusion in Rural Communities
The pattern of continued disadvantage paired with substantial improvements in access is
also visible when considering the outcome of exclusion from compulsory education. A report
produced at the Northwest Normal University Center for the Educational Development of
Minorities indicated that by the end of 2002, there were 431 counties across China that had not
universalized the nine-year cycle of compulsory education (Wang, Jiayi 2006b, p. 1).xi
Among
these counties, 372 were in the western regions, and among the 372 counties, 83 percent were
counties where minorities lived. In Gansu Province at the end of 2004, 23 counties, constituting
20.71% of the provincial population, had not universalized nine years of compulsory education
(Wang, Jiayi 2006b, p. 1). Among these, 15 were national minority counties, out of a total of
just 21 minority counties in the province.xii
—Table 15 about here.—
Consistent with these reports, census data show that minorities have been
disproportionately vulnerable to exclusion from achievement of the national goal of a 9-year
cycle of compulsory education. At the same time, their absolute level of vulnerability has
lessened over time. Table 15 shows the percent excluded: not currently enrolled and with less
than a junior high school attainment among those ages 16 to 21, tabulated by different
characteristics. In 1990, 60 percent of minority youth fell into this category. By 2000, the figure
was down to 38 percent. By 2005, it had fallen to 28 percent. Exclusion was higher among
minority women than men (66 percent excluded for women in 1990 versus 53 percent excluded
for men), but the downward trend was the same, and by 2005, the difference between men and
women among minorities was just a few percentage points (30 percent for women versus 26
percent for men). The problem of exclusion was much higher in rural communities throughout
the years, though minorities in 2005 were about 3 times as likely as the Han to be excluded in
both urban and rural areas.
—Table 16 about here.—
While the absolute level of exclusion has dropped precipitously among minorities, their
relative vulnerability to exclusion has intensified as exclusion has dropped even faster among
non-minorities. In 1990, minorities were about 1.5 times as likely as Han to be excluded. By
2005, they were about 3.8 times as likely. The point of rising relative vulnerability is also made
in Table 16, which shows the percent of total youth ages 16 to 21 with given characteristics, and
the percent of excluded youth ages 16 to 21 with given characteristics. Among all youth in 2005,
about 10 percent were minority, but among excluded youth, about 30 percent were minority.
Fifteen years earlier, when many more youth overall were excluded, the overrepresentation of
minorities among excluded youth was much less pronounced: about 9 percent of all youth were
minority, as were about 12 percent of excluded youth. Ironically, China’s dramatic successes in
basic educational expansion have had the consequence that those currently excluded from the
system are much more dissimilar from the general population than was the case 15 years ago—
- 18 -
they are now much more likely to be poorer, to reside in hard-to-reach isolated regions, and, as
shown in table 16, to be members of ethnic minority groups.
The Context of Education for Majority and Majority Children
What factors might be educational barriers for minority children? Minorities’ higher
likelihood of living in impoverished remote areas mean that children from minority groups are
disproportionately susceptible to the kinds of problems of rural poverty faced by children,
regardless of ethnicity, in poor rural areas. Such problems include severe finance problems and
difficulty recruiting and retaining sufficient numbers of qualified, effective teachers (Wang, Jiayi
2006a, pp. 2-3).
—Table 17 about here.—
On average, minority children also face somewhat different family contexts from their
Han counterparts. Table 17 presents evidence from the 2002 rural CHIP data about family
circumstances of compulsory-aged children. Compared to rural Han children, rural minority
children were much less likely to live in a house with a phone or to live in a home made with
better-quality (brick or concrete) materials. About 11 percent of rural minority children were
below the poverty line, compared to just about 4 percent of rural Han children, and rural minority
children’s household incomes, on average, were just under two-thirds of the figure reported for
Han children. Minority children came from households that were slightly less educated, and
were less likely to have cadres or migrants as household members.
—Table 18 about here.—
Of course, family disadvantages do not apply across the board. Table 18 shows family
characteristics for compulsory-aged children from national census data. There is a general trend
of upgrading in head and spouse education, and movement out of agricultural occupations, but
there is still considerable variability along these lines by 2005. In 2005, the most educated
Manchu population showed 9 years of education for heads, and 8.41 years for spouses; both of
these figures outpaced corresponding Han averages. The least educated Miao population had
under 7 years as the average for heads, and just 4.7 years for spouses. With the exception of the
Manchu group, all groups had less education than the Han group. About 59 percent of Han
children came from households where the head was employed in agriculture, with very similar
figures for the Manchu and Hui children. Over three-fourths of Zhuang children and children in
the “Other” category came from households where the head was employed in agriculture, as did
over 81 percent of Uygur and Miao children. Thus, on average, rural minority children are
residing in poorer households with slightly less education than their rural Han counterparts.
Looking nationally at individual ethnic groups, much disparity across minority groups is
present. The family contexts of Manchu children are more advantaged than those of the Han.
Overall, head and spouse education gaps are narrowing, but children other than the Hui and
Manchu continue to reside in households headed by individuals with high levels of occupational
divergence from the Han.
- 19 -
Enrollment and Attainment in the Compulsory Ages
—Figure 6 about here. —
Do these contextual differences across groups matter for enrollment? Figure 6 shows
enrollment rates among 7 to 16 year-olds in 1990, 2000, and 2005. The figure makes clear that
enrollment rates are rising, and cross-group enrollment disparities, declining, over time. In 1990,
enrollment rates ranged from a low of 57 to 58 percent among the Miao and “Other” categories
to 65 percent among the Hui, to 68 percent among the Uygur, to 75 percent among the Zhuang,
to 78 percent among the Han, to a high of 84 percent among the Manchu. By 2005, the range
was from a low of 84 percent among the “Other” category to percentages in the high 80s for
Uygur, Miao and Hui, to 90 percent for the Manchu, 92 percent for the Zhuang, and 93 percent
for the Han.
—Table 19 about here. —
Table 19 shows enrollment rates among 7 to 16 year-olds tabulated by residence statusxiii
and census year. For all groups residing in urban areas, enrollment exceeded 90 percent by 2000,
with the exception of the Uygurs. In contrast, in rural areas, in 2000, enrollment rates range
from 76 percent for the “Other” category to nearly 90 percent for the Han. However, the
variability is dropping over time: by 2005, rural rates ranged from a low of 82 percent among the
Hui to 92 percent among the Han.
—Table 20 about here.—
Table 20 shows logistic regression models of enrollment among 7 to 16 year-olds using
the 2005 mid-censal survey data. A base model (model 1), a model controlling for household
head and spouse education (model 2), and a model controlling for provinces (model 3) are
estimated for the whole sample, for the urban sample, and for the rural sample. All of these
results show significant minority penalties that are reduced in models that control for human
capital in the household, but also when controls for province are incorporated. The urban models
show a minority-Han odds ratio of enrollment of about .62 (exp[-0.485]) in the baseline; the rural
models show a lower corresponding odds-ratio of about .35 (exp[-1.053]). These patterns are
consistent with findings that disparities are lower in urban areas, and that regional differences are
critical for understanding ethnic disparities.
—Table 21 about here.—
In the 2002 rural CHIP data, the rate of enrollment among 7 to 16 year-olds does not
differ significantly between Han and minority children, though minority children in this age
group appear to be progressing through school at a slower pace (See Table 21). The difference
between the rural mid-censal survey enrollment results and the CHIP enrollment results likely
has to do with sample coverage differences—the CHIP survey covers 22 province-level units,
and does not include three Autonomous Regions: Ningxia, Inner Mongolia, and Tibet, which
tends to have the worst educational indicators. The census covers all province-level units. In
- 20 -
bivariate tables, minorities are about a half-year behind Han children in attainment, and are less
likely to have made the transition to junior high school (about two-thirds of minority children
have done so, compared to over three-fourths of Han children) (see Table 21).
—Table 22 about here.—
The rural CHIP data, unlike the mid-censal survey data, allow us to look directly at years
of schooling attained—to gain a summary measure of progress through the school system. Table
22 shows regression models of attainment estimated using the rural CHIP data. Here, we find
that, net of age composition effects, minority children are about a third of a year behind in
attainment (.29 years), but this figure drops to .158 years once household income is accounted
for, and down to under a tenth of a year (and only marginal significance) with controls for other
dimensions of family socioeconomic status (education of the best educated member in the
household; whether there is a cadre in the household; and whether there is a migrant in the
household, though the latter measure is not significant). Adding controls for village poverty
status, village topography, and village isolation reduces the coefficient to insignificance.
However, models that account further for regional differences yield estimates of a significant
minority penalty of .179 years.
Health Care
Data with which to assess national health care disparities by ethnic group are hard to
come by. Self-rated health measures of the sort typically available in surveys show few
differences by ethnic category in China. Table 23 shows measures of health reported in the 2005
survey and the 2002 CHIP survey, with slightly different wording of questions. In the 2002 rural
CHIP data, about 7 percent of Han and about 8 percent of minority people were reported as
having bad or very bad health. In 2005, about 9 out of 10 individuals from all groups reported
being healthy, and about 2 to 4 percent reported not being able to complete daily tasks or live
alone. In this latter group, no clear pattern emerges: the groups with the highest percentages
falling into this category include the wealthy, urbanized Manchus as well as the impoverished,
rural Miao and the “Other” category. However, self-rated health measures are not very good
proxy measures of health care access, given the potential for those with greater access to health
care to be more aware of their problems.
—Table 23 about here.—
It is well-established that the rural health service infrastructure is less well developed
than that in urban areas. Moreover, within rural villages, the health service infrastructure is less
well developed in minority villages than non-minority villages. Table 24 shows village health
facilities in minority and non-minority villages, from the 2002 rural CHIP village sample. By
official definition, 26 percent of minority villages, but only 7 percent of non-minority villages,
lacked health facilities. Using the 50 percent of households definition, corresponding figures
were 20 percent and 9 percent.
—Table 24 about here.—
- 21 -
Differences in infrastructure, related to the geographic disparities already discussed,
likely contribute to very different health circumstances across ethnic groups. Little recent
national data or research is available on health care access or health problems by ethnic group. A
number of studies of maternal and infant and child health have been completed in Yunnan,
however. Using data from Yunnan’s population censuses and provincial health department, Li et
al. (2008) analyzed infant mortality rates and life expectancies for the national population, the
Yunnan Han population, and the largest minority groups in Yunnan. Results showed that in
2000, the national infant mortality rate was 26.90 per 1,000 live births for China; it was 53.64 for
Han in Yunnan; and it was 77.75 for the 22 largest minority nationalities in Yunnan, despite
improvements in health status indicators since 1990. Disparities in life expectancy at birth
between China as a whole and some minority nationalities also remained striking: national life
expectancy in 2000 was 71.40, compared to 57.18 years for some minorities in Yunnan (it was
64.5 years for the 22 groups studied as a whole). The maternal mortality ratio in Yunnan is
about twice the national average (56.2/100,000 live births), and in remote mountainous regions,
the rate is five times higher (Li et al. 2007). Earlier work in Yunnan conducted by Li et al. (1999)
showed that belonging to the Miao, Yi and Hani ethnic groups, compared with the Han, was
associated with an increased risk for stunting for children.
In addition to the above studies, which speak to a general unmet need for health care
among some ethnic minority groups, recent evidence has indicated that members of some ethnic
minorities in China have been particularly vulnerable to HIV/AIDS (for example, Zhang et al.
2007; Zhang et al. 2008; Choi, Cheung, and Jiang 2007). Overall, more than 30 percent of the
reported HIV/AIDS cases in China are among ethnic minorities—a much higher proportion than
their representation in the general population (Deng et al. 2007). Three of the five highest
prevalence provinces in China are western provinces with large minority populations, namely
Yunnan Province, the Xinjiang Uygur Autonomous Region, and the Guangxi Zhuang
Autonomous Region (Grusky et al. 2002). These findings indicate significant health care needs
and access gaps for some ethnic groups.
Access to Social Services and Programs
— Figure 7 about here.—
Finally, we discuss access to social programs among ethnic minorities. Figure 7 shows
access to social welfare services by ethnic group for the adult population excluding students in
2005. Looking first at unemployment insurance, Figure 7 shows that this benefit is available to
very few members of any ethnic group: just 8 percent of the Han population has access, along
with about 7 percent of the Manchu and about 11 percent of the Hui. Rates are under five
percent for all other groups. Rates of access to pension insurance are a little higher for some
groups, with just under one in five Han people having pension insurance. Once again, the
corresponding figure is just slightly lower for the Manchu, and slightly higher for the Hui. It is
about 8 percent for Zhuang, 7 percent for “Other groups”, 6 percent for Uygurs, and just 4
percent for the Miao. Thus, with the exceptions of the Hui and Manchu, other minority groups
have access to pensions at less than half the rates of the Han. The story for health insurance is a
little different: about half of Uygurs have access to health insurance, as do about one-third of
Han and Hui, about one-fourth of Manchu and “Other”, 19 percent of Zhuang, and 13 percent of
- 22 -
Miao. We were unable to find research to explain the high rate among the Uygurs, though it
likely has to do with policies specific to the Xinjiang Uygur Autonomous Region, as nearly all
Uygurs live there.
—Table 25 about here.—
In general, social welfare services are associated with urban residence (see Table 25).
This pattern is most pronounced for unemployment insurance. Among urban dwellers, rates of
unemployment insurance range from a low of about 10 percent among the Miao, to about 12
percent among members of the “Other” category, to 13 percent among the Zhuang, 15 to 16
percent among the Uygur and Manchu, to 16 percent among the Han, to a high of 18 percent
among the Hui. Among rural dwellers, rates were below 2 percent for all groups. Pension
insurance was available to over one-third of Han, Hui and Manchu urban dwellers, 23 percent of
Zhuang urban dwellers, 22 percent of “Other” urban dwellers, 19 percent of urban Miao, and 18
percent of urban Uygurs. Rates never rise above 4 percent for any rural group.
The story is slightly different for health insurance, in that rural access is higher than for
other social insurance programs. However, the kind of health insurance that exists in rural areas,
the Rural Cooperative Medical Scheme, tends to reimburse costs at a much lower level than
urban health insurance schemes. Among urban dwellers, basic medical insurance rates are
highest among the Han, at 43 percent, and range downward to a low of 29 percent among the
Zhuang and 26 percent among the Miao. Among rural dwellers, the range is from a high of 50
percent among Uygurs to 22 to 26 percent among the Hui, Han, and “Other” categories, to 14 to
17 percent among the Zhuang and Manchu, to below 10 percent for the Miao. Here again, the
Uygur case is unusual in that rural coverage rates are higher than urban rates.
Thus, social services—unemployment, pension, and health insurance—are not the typical
experience for any ethnic group. For unemployment and pensions, the familiar pattern of higher
levels of access for more urbanized Han, Hui and Manchu populations, and lower levels of
access for all other groups, recurs here. In addition, the importance of residence is clear when
urban and rural residents are considered separately: variability is much lower within urban/rural
categories, and levels of access across categories are much different. For health insurance,
Uygurs are added to the groups with high levels of access, and rural access rates are higher than
urban rates. However, this finding is difficult to interpret, as the basic health insurance often
available in rural areas is much more minimal than many urban plans.
Conclusions and Policy Implications
This chapter has investigated social welfare among China’s officially-designated
minority groups. Five main findings emerge. First, poverty rates are dropping among
minorities, but minorities as a group remain disadvantaged in economic terms. Minorities are
more likely to be poor: even restricting the analysis to rural areas, minorities are 1.5 to 2 times
more likely to experience poverty than their Han counterparts. More than one in ten rural
minority children were below the official poverty line, compared to about one in twenty-five
rural Han children, and rural minority children’s household incomes were just under two-thirds
of the figure reported for Han children. In rural areas, minorities have less access to wage
employment than the Han, and make less money when they do engage in wage employment;
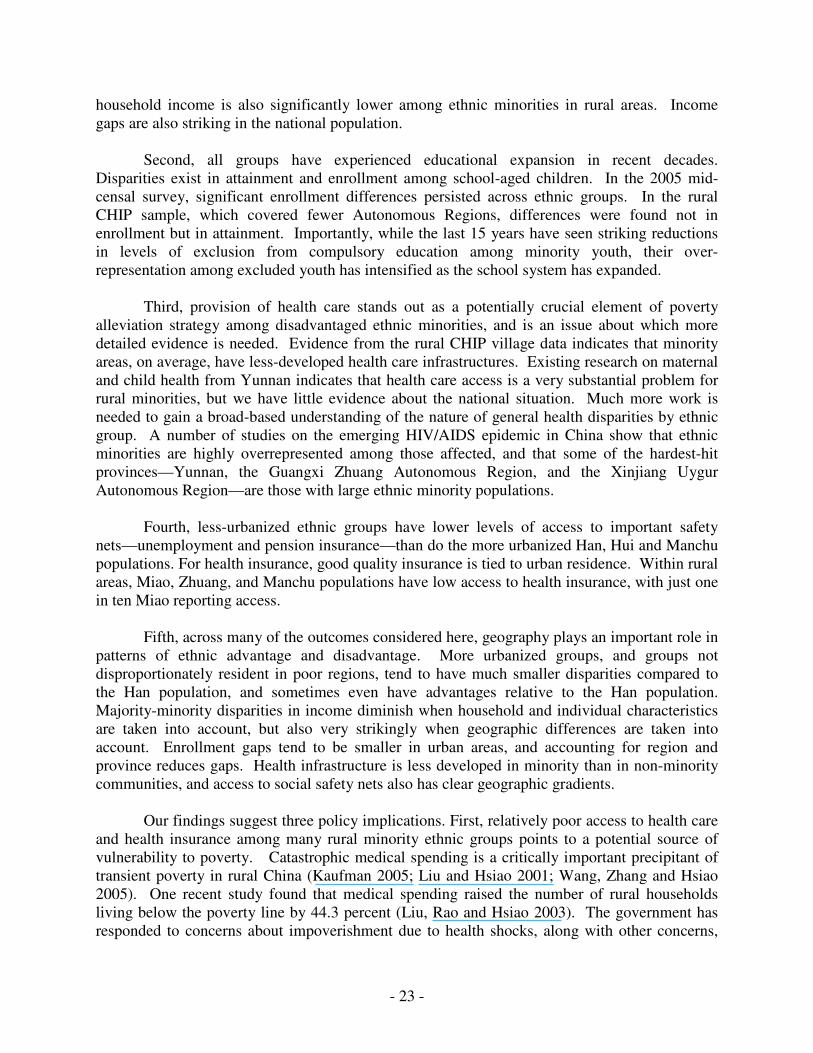
- 23 -
household income is also significantly lower among ethnic minorities in rural areas. Income
gaps are also striking in the national population.
Second, all groups have experienced educational expansion in recent decades.
Disparities exist in attainment and enrollment among school-aged children. In the 2005 mid-
censal survey, significant enrollment differences persisted across ethnic groups. In the rural
CHIP sample, which covered fewer Autonomous Regions, differences were found not in
enrollment but in attainment. Importantly, while the last 15 years have seen striking reductions
in levels of exclusion from compulsory education among minority youth, their over-
representation among excluded youth has intensified as the school system has expanded.
Third, provision of health care stands out as a potentially crucial element of poverty
alleviation strategy among disadvantaged ethnic minorities, and is an issue about which more
detailed evidence is needed. Evidence from the rural CHIP village data indicates that minority
areas, on average, have less-developed health care infrastructures. Existing research on maternal
and child health from Yunnan indicates that health care access is a very substantial problem for
rural minorities, but we have little evidence about the national situation. Much more work is
needed to gain a broad-based understanding of the nature of general health disparities by ethnic
group. A number of studies on the emerging HIV/AIDS epidemic in China show that ethnic
minorities are highly overrepresented among those affected, and that some of the hardest-hit
provinces—Yunnan, the Guangxi Zhuang Autonomous Region, and the Xinjiang Uygur
Autonomous Region—are those with large ethnic minority populations.
Fourth, less-urbanized ethnic groups have lower levels of access to important safety
nets—unemployment and pension insurance—than do the more urbanized Han, Hui and Manchu
populations. For health insurance, good quality insurance is tied to urban residence. Within rural
areas, Miao, Zhuang, and Manchu populations have low access to health insurance, with just one
in ten Miao reporting access.
Fifth, across many of the outcomes considered here, geography plays an important role in
patterns of ethnic advantage and disadvantage. More urbanized groups, and groups not
disproportionately resident in poor regions, tend to have much smaller disparities compared to
the Han population, and sometimes even have advantages relative to the Han population.
Majority-minority disparities in income diminish when household and individual characteristics
are taken into account, but also very strikingly when geographic differences are taken into
account. Enrollment gaps tend to be smaller in urban areas, and accounting for region and
province reduces gaps. Health infrastructure is less developed in minority than in non-minority
communities, and access to social safety nets also has clear geographic gradients.
Our findings suggest three policy implications. First, relatively poor access to health care
and health insurance among many rural minority ethnic groups points to a potential source of
vulnerability to poverty. Catastrophic medical spending is a critically important precipitant of
transient poverty in rural China (Kaufman 2005; Liu and Hsiao 2001; Wang, Zhang and Hsiao
2005). One recent study found that medical spending raised the number of rural households
living below the poverty line by 44.3 percent (Liu, Rao and Hsiao 2003). The government has
responded to concerns about impoverishment due to health shocks, along with other concerns,
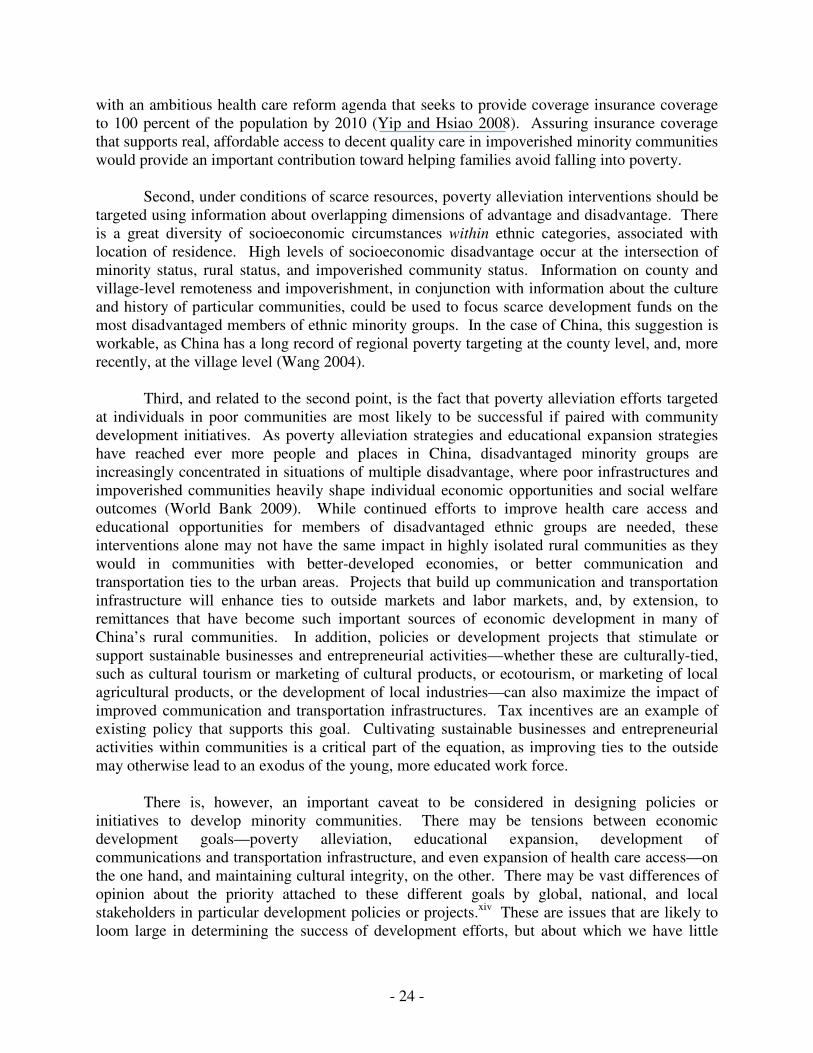
- 24 -
with an ambitious health care reform agenda that seeks to provide coverage insurance coverage
to 100 percent of the population by 2010 (Yip and Hsiao 2008). Assuring insurance coverage
that supports real, affordable access to decent quality care in impoverished minority communities
would provide an important contribution toward helping families avoid falling into poverty.
Second, under conditions of scarce resources, poverty alleviation interventions should be
targeted using information about overlapping dimensions of advantage and disadvantage. There
is a great diversity of socioeconomic circumstances within ethnic categories, associated with
location of residence. High levels of socioeconomic disadvantage occur at the intersection of
minority status, rural status, and impoverished community status. Information on county and
village-level remoteness and impoverishment, in conjunction with information about the culture
and history of particular communities, could be used to focus scarce development funds on the
most disadvantaged members of ethnic minority groups. In the case of China, this suggestion is
workable, as China has a long record of regional poverty targeting at the county level, and, more
recently, at the village level (Wang 2004).
Third, and related to the second point, is the fact that poverty alleviation efforts targeted
at individuals in poor communities are most likely to be successful if paired with community
development initiatives. As poverty alleviation strategies and educational expansion strategies
have reached ever more people and places in China, disadvantaged minority groups are
increasingly concentrated in situations of multiple disadvantage, where poor infrastructures and
impoverished communities heavily shape individual economic opportunities and social welfare
outcomes (World Bank 2009). While continued efforts to improve health care access and
educational opportunities for members of disadvantaged ethnic groups are needed, these
interventions alone may not have the same impact in highly isolated rural communities as they
would in communities with better-developed economies, or better communication and
transportation ties to the urban areas. Projects that build up communication and transportation
infrastructure will enhance ties to outside markets and labor markets, and, by extension, to
remittances that have become such important sources of economic development in many of
China’s rural communities. In addition, policies or development projects that stimulate or
support sustainable businesses and entrepreneurial activities—whether these are culturally-tied,
such as cultural tourism or marketing of cultural products, or ecotourism, or marketing of local
agricultural products, or the development of local industries—can also maximize the impact of
improved communication and transportation infrastructures. Tax incentives are an example of
existing policy that supports this goal. Cultivating sustainable businesses and entrepreneurial
activities within communities is a critical part of the equation, as improving ties to the outside
may otherwise lead to an exodus of the young, more educated work force.
There is, however, an important caveat to be considered in designing policies or
initiatives to develop minority communities. There may be tensions between economic
development goals—poverty alleviation, educational expansion, development of
communications and transportation infrastructure, and even expansion of health care access—on
the one hand, and maintaining cultural integrity, on the other. There may be vast differences of
opinion about the priority attached to these different goals by global, national, and local
stakeholders in particular development policies or projects.xiv
These are issues that are likely to
loom large in determining the success of development efforts, but about which we have little
- 25 -
information at present. They are often highly sensitive, and may be best assessed via field
methods in the context of particular projects.
In addition to policy recommendations, our analysis suggests some directions for data
collection that could support more informative policy research. One issue is that, at present,
limited empirical data precludes many important lines of inquiry on the topic of ethnic
stratification. The available data sources with sufficient sample sizes and suitable geographic
coverage to study majority-minority differences on any indicator are limited, and data sources
that could permit the study of issues of individual ethnic groups, even more so. To obtain a
reasonable portrait of ethnic stratification in China, there is a dire need for better data. The key
issue is sample coverage. This problem could be addressed if regularly-occurring national
surveys were purpose-designed with minority oversamples for selected groups, or by use of
focused surveys that employed sample designs aimed at coverage of minority areas.
Aside from sample coverage, a problem is topical coverage. At present, all large-scale
datasets that might be employed to address questions of ethnic disparities in welfare come from
multi-use household surveys focused on economic and demographic data. Surveys that also
encompassed better measures of health care access and experiences and use of social programs
would be helpful. In addition, much work on other dimensions of social inequality in China, and
work on ethnic disparities in other countries, encompasses attitudes and subjective experiences
of inequality, as well as socioeconomic variables. This sort of data would also help us to better
understand the state of ethnic stratification in China.
Finally, the measurement of ethnicity should be as detailed as possible. Binary concepts
of minority status or indigenous status are useful for developing summary measures, but results
presented here make very clear that these concepts tell only part of the story and will provide
insufficient information for designing and implementing interventions. Of course, more detailed
classification schemes come at a cost in terms of making comparative summary statements, but
are likely to provide a more valid picture of the complicated nature of ethnic disparities and a
more valid indicator of strategies that might ameliorate disadvantages faced by particular groups.
- 26 -
Map 1. Chinese Linguistic Groups, 1990
Source: University of Texas Perry-Castañeda Library Map Collection, 1990. Note: This map
includes languages spoken by the Han majority.
Map 2. Distribution of the Minority Population by County Level Administrative Units,
2000
Source: West 2004, Map 1.
- 27 -
References Cited
Cai, Fang and Meiyan Wang. 2008. "A Counterfactual Analysis on Unlimited Surplus Labor in
Rural China." China & World Economy 16:51-65.
China Data Center. N.D. "2000 Total Han Population (Map C205)." Ann Arbor, Michigan:
University of Michigan, Retrieved March 13, 2009
(http://chinadatacenter.org/chinageography/MapDisplay.asp?FigureNumber=c.205).
China Education and Research Network (CERNET). 2005a. "Bilingual Teaching Promoted in
Ethnic Minority Regions.", Retrieved July 7, 2006
(http://www.edu.cn/20050523/3138247.shtml).
------.2005b. "China Protects Endangered Ethnic Languages.", Retrieved July 7, 2006
(http://www.edu.cn/20050530/3139079.shtml).
Choi, Susanne Y. P., Y. W. Cheung and Z. Q. Jiang. 2007. "Ethnicity and Risk Factors in Needle
Sharing among Intravenous Drug Users in Sichuan Province, China." AIDS Care 19:1-8.
Clothey, Rebecca. 2005. "China's Policies for Minority Nationalities in Higher Education:
Negotiating National Values and Ethnic Identities." Comparative Education Review
49:389-409.
Connelly, Rachel and Zhenzhen Zheng. 2007. "Enrollment and Graduation Patterns as China’s
Reforms Deepen, 1990-2000." Pp. 81-92 in Education and Reform in China, edited by
Emily Hannum and Albert Park. London and New York: Routledge.
Daes, Erica-Irene A. 1996. "On the Concept of "Indigenous People" (Working Paper by the
Chairperson-Rapporteur)." United Nations Economic and Social Council Working Paper
E/CN.4/Sub.2/AC.4/1996/2:1-22.
de Brauw, Alan and Scott Rozelle. 2007. "Returns to Education in Rural China." Pp. 207-23 in
Education and Reform in China, edited by Emily Hannum and Albert Park. London and
New York: Routledge.
de Brauw, Alan, Jikun Huang, Scott Rozelle, Linxiu Zhang and Yigang Zhang. 2002. "The
Evolution of China's Rural Labor Markets during the Reforms." Journal of Comparative
Economics 30:329-53.
Deng, Rui, Jianghong Li, Luechai Sringernyuang and Kaining Zhang. 2007. "Drug Abuse,
HIV/AIDS and Stigmatisation in a Dai Community in Yunnan, China." Social Science &
Medicine, 64:1560-71.
Fei, Xiaotong. 1981. Toward a People's Anthropology. Beijing: New World Press.
- 28 -
Feng, A. 2005. "Bilingualism for the Minor Or the Major? an Evaluative Analysis of Parallel
Conceptions in China." International Journal of Bilingual Education and Bilingualism
8:529-551.
Gladney, D. C. 2004. Dislocating China: Muslims, Minorities, and Other Subaltern Subjects.
Chicago: University of Chicago Press.
Government of China. 1993. "Eight-Seven Poverty Reduction Plan (1994-2000) [国家八七扶贫
攻坚计划(1994-2000年)].".
------.2001. "Poverty Reduction Compendium, 2001-2010 [中国农村扶贫开发纲要(2001-2010
年)].".
Grusky, O., H. Liu and M. Johnston. 2002. "HIV/AIDS in China: 1990–2001." AIDS and
Behavior 6:381-93.
Gu, Baochang, Feng Wang, Zhigang Guo and Erli Zhang. 2007. "China's Local and National
Fertility Policies at the End of the Twentieth Century." Population and Development
Review 33:129-48.
Griffin, Keith and Renwei Zhao. 1988. "Chinese Household Income Project 1988” [Computer
File]. New York, NY: Hunter College. Academic Computing Services [Producer], 1992.
Ann Arbor, MI: Inter-University Consortium for Political and Social Research
[Distributor], 1993. Doi:10.3886/ICPSR09836.
Gustafsson, Bjorn and Sai Ding. 2006. "Villages Where China’s Ethnic Minorities Live."
Institute for the Study of Labor (IZA) Discussion Paper 2418:1-41.
Gustafsson, Bjorn and Sai Ding. 2008. "Temporary and Persistent Poverty among Ethnic
Minorities and the Majority in Rural China." Institute for the Study of Labor (IZA)
Discussion Paper 3791:1-31.
Hoddie, M. 1998. "Ethnic Identity Change in the People's Republic of China: An Explanation
using Data from the 1982 and 1990 Census Enumerations." Nationalism and Ethnic
Politics 4:119-41.
Information Office of the State Council of the People's Republic of China. 2000. "National
Minorities Policy and its Practice in China." Beijing: Information Office of the State
Council of the People’s Republic of China, Retrieved 3/31/2009, 2009
(http://www.china.org.cn/e-white/4/).
Information Office of the State Council of the People's Republic of China. 2001. "The
Development-Oriented Poverty Reduction Program for Rural China." Beijing: State
Council, Retrieved 04/24, 2009 (http://www.china.org.cn/e-white/fp1015/index.htm).
Kaufman, Joan. 2005. "China: The Intersections between Poverty, Health Inequity, Reproductive
Health and HIV/AIDS." Development 48:113.
- 29 -
Khan, Azizur R. 2008. "Growth, Inequality and Poverty: A Comparative Study of China’s
Experience in the Periods before and After the Asian Crisis." Pp. 145-81 in Inequality
and Public Policy in China, edited by B. Gustafsson, S. Li and T. Sicular. Cambridge:
Cambridge University Press.
Li, J., C. Luo, R. Deng, P. Jacoby and N. d. Klerk. 2007. "Maternal Mortality in Yunnan, China:
Recent Trends and Associated Factors." BJOG: An International Journal of Obstetrics &
Gynaecology 114:865-74.
Li, Jianghong, Chun Luo and Nicholas d. Klerk. 2008. "Trends in infant/child Mortality and Life
Expectancy in Indigenous Populations in Yunnan Province, China." Australian and New
Zealand Journal of Public Health 32:216-23.
Li, Yan, Guangping Guo, Anping Shi, Yuping Li, Tokie Anme and Hiroshi Ushijima. 1999.
"Prevalence and Correlates of Malnutrition among Children in Rural Minority Areas of
China." Pediatrics International 41:549-56.
Lin, J. 1997. "Policies and Practices of Bilingual Education for the Minorities in China." Journal
of Multilingual and Multicultural Development 18:193-205.
Lipman, Jonathan N. 1998. Familiar Strangers: A History of Muslims in Northwest China.
Seattle: University of Washington Press.
Liu, Y. and W. C. Hsiao. 2001. "China’s Poor and Poor Policies: The Case of Rural Health
Insurance." Conference on Financial Sector Reform in China, Cambridge, MA., Harvard
School of Public Health.
Liu, Y., K. Rao and W. C. Hsiao. 2003. "Medical Expenditure and Rural Impoverishment in
China." Journal of Health, Population, and Nutrition 21:216-22.
Ma, Rong. 2007. "Bilingual Education for China's Ethnic Minorities." Chinese Education and
Society 40:9-25.
Michaud, Jean. 2009. "Handling Mountain Minorities in China, Vietnam and Laos: From History
to Current Concerns." Asian Ethnicity 10:25.
Ministry of Education. 1986. "People's Republic of China Law on Compulsory Education."
Beijing: Ministry of Education, Retrieved 04/02, 2009
(http://www.edu.cn/20050114/3126820.shtml).
People's Daily. 2007. "China's Rural Poverty Elimination Drive Stalls in Minority Habitats.",
Retrieved 3/2, 2009 (http://english.people.com.cn/90001/90776/90882/6307788.html).
Perry-Castañeda Library Map Collection. 1990. "Chinese Linguistic Groups 1990." Austin,
Texas: University of Texas, Retrieved March 13, 2009
(http://www.lib.utexas.edu/maps/middle_east_and_asia/china_ling_90.jpg).

- 30 -
Poston, Dudley L., Jr. and Jing Shu. 1987. "The Demographic and Socioeconomic Composition
of China's Ethnic Minorities." Population and Development Review 13:703-22.
Ravallion, Martin and Shaohua Chen. 2007. "China's (Uneven) Progress Against Poverty."
Journal of Development Economics 82:1-42.
Ross, Heidi. 2006. "Where and Who are the World’s Illiterates: China." UNESCO: Global
Monitoring Report China Country Study.
Sautman, Barry. 1999. "Ethnic Law and Minority Rights in China: Progress and Constraints."
Law and Policy 21:284-314.
Schein, Louisa. 1997. "Gender and Internal Orientalism in China." Modern China 23:69-98.
Teng, Xing. 2002. "Bilingual Society and Bilingual Education of the Yi Ethnic Minority of the
Liangshan Yi Ethnic Minority Autonomous Prefecture in China Amid Cultural Changes--
History, Present Situation, Problems, and Analysis." Chinese Education and Society
35:65.
United Nations Development Group. 2008. "United Nations Development Group Guidelines on
Indigenous Peoples' Issues." February:1-53.
Wang, Hong, Licheng Zhang and William Hsiao. 2006/10. "Ill Health and its Potential Influence
on Household Consumptions in Rural China." Health Policy 78:167-77.
Wang, Jiayi. 2006a. "农村中小学实施素质教育的几个问题 (Implementing Education for all-
Around Development (Quality Education) in Rural Secondary and Primary Schools:
Several Issues." Lanzhou, China: Northwest Normal University Center for the
Educational Development of Minorities, Ministry of Education Humanities and Social
Sciences Research Base. Consultation Report 2006 (1)., Retrieved June 15, 2006, 2006
(http://www.nwnu.edu.cn/mzjy/jdzxbg/zxbg6.doc).
Wang, Jiayi. 2006b. "素质教育的实施与民族地区教育发展 (Implementation of all-Around
Development Education (Quality Education) and Educational Development in Minority
Areas)." Lanzhou, China: Northwest Normal University Center for the Educational
Development of Minorities, Retrieved June 14, 2006, 2006
(http://www.nwnu.edu.cn/mzjy/chengg/cg9.htm).
Wang, Sangui. 2004. "Poverty Targeting in the People’s Republic of China." Tokyo: Asian
Development Bank Institute Discussion Paper No. 4, Retrieved 4/24, 2009
(http://www.adbi.org/files/2004.01.04.dp004.poverty.china.pdf).
West, Loraine A. 2004. "Demographic and Socioeconomic Status of China's Minority Ethnic
Population: Any Closing of the Gap?" Paper presented at the Annual Meeting of the
Population Association of America, April 1-3, 2004, Boston, Massachusetts. Session 110:
Racial and Ethnic Differences in Schooling: International Contexts:1-30.
- 31 -
Wong, David W. S. 2000. "Ethnic Integration and Spatial Segregation of the Chinese
Population." Asian Ethnicity 1:53-72.
World Bank. 2009. From Poor Areas to Poor People: China's Evolving Poverty Reduction
Agenda. Washington, D.C.: World Bank.
Xiao, Hong. 1998. "Minority Languages in Dehong, China: Policy and Reality." Journal of
Multilingual and Multicultural Development 19:221-235.
Yang, Dennis T. 2005. "Determinants of Schooling Returns during Transition: Evidence from
Chinese Cities." Journal of Comparative Economics 33:244-64.
Yip, Winnie and William C. Hsiao. 2008. "The Chinese Health System at A Crossroads." Health
Affairs 27:460-8.
Zhang, Junsen and Yaohui Zhao. 2007. "Rising Schooling Returns in Urban China." Pp. 248-59
in Education and Reform in China, edited by Emily Hannum and Albert Park. London
and New York: Routledge.
Zhang, Junsen, Yaohui Zhao, Albert Park and Xiaoqing Song. 2005. "Economic Returns to
Schooling in Urban China, 1988 to 2001." Journal of Comparative Economics 33:730-52.
Zhang, Li, Junling Zhu, Baoling Rui, Yuanzhi Zhang, Lijiang Zhang, Lu Yin, Yuhua Ruan, Han-
Zhu Qian and Yiming Shao. 2008. "High HIV Risk among Uigur Minority Ethnic Drug
Users in Northwestern China." Tropical Medicine & International Health 13:814-7.
Zhang, Yuanzhi, Hua Shan, Jennifer Trizzino, Yuhua Ruan, Geetha Beauchamp, Benoît Mâsse,
Jun Ma, Yuan Gu, Yixin He, Baoling Rui, Jun Wang, Katharine Poundstone, Yan Jiang, J.
Brooks Jackson and Yiming Shao. 2007. "Demographic Characteristics and Risk Behaviors
Associated with HIV Positive Injecting Drug Users in Xinjiang, China." Journal of Infection,
54:285-90.
Zhao, W. and X. Zhou. 2007. "Returns to Education in China’s Transitional Economy:
Reassessment and Reconceptualization." Pp. 224-47 in Education and Reform in China,
edited by Emily Hannum and Albert Park. London and New York: Routledge.
Zhao, Yaohui. 1997. "Labor Migration and Returns to Rural Education in China." American
Journal of Agricultural Economics 79:1278.
Zhou, M. 2005. "Legislating Literacy for Linguistic and Ethnic Minorities in Contemporary
China." Current Issues in Language Planning 6:102-121.
Zhou, Wangyun. 1989. "“Tan Sichuan Minzu Diqu De Jiaoyu Tixi Wenti” [A Discussion of
Problems in the Education System in Minority Areas of Sichuan] ." Pp. 18-38 in
Zhongguo Minzu Jiaoyu Luncong (Collected Essays on Ethnic Education), vol. 4, edited
by Hongtao Chen and Zhuqun Meng. N.A.: N.A.
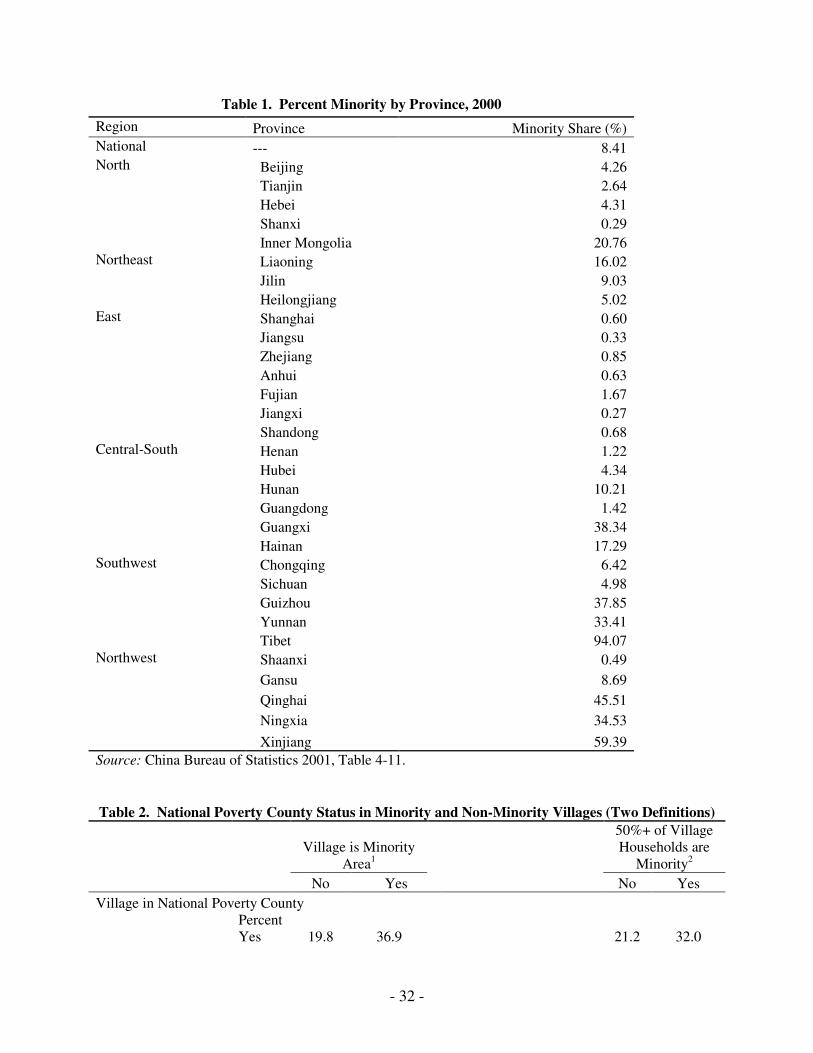
- 32 -
Table 1. Percent Minority by Province, 2000
Region Province Minority Share (%) National --- 8.41 North Beijing 4.26
Tianjin 2.64
Hebei 4.31
Shanxi 0.29
Inner Mongolia 20.76 Northeast Liaoning 16.02
Jilin 9.03
Heilongjiang 5.02 East Shanghai 0.60
Jiangsu 0.33
Zhejiang 0.85
Anhui 0.63
Fujian 1.67
Jiangxi 0.27
Shandong 0.68 Central-South Henan 1.22
Hubei 4.34
Hunan 10.21
Guangdong 1.42
Guangxi 38.34
Hainan 17.29 Southwest Chongqing 6.42
Sichuan 4.98
Guizhou 37.85
Yunnan 33.41
Tibet 94.07 Northwest Shaanxi 0.49
Gansu 8.69
Qinghai 45.51
Ningxia 34.53
Xinjiang 59.39 Source: China Bureau of Statistics 2001, Table 4-11.
Table 2. National Poverty County Status in Minority and Non-Minority Villages (Two Definitions)
Village is Minority
Area1
50%+ of Village
Households are
Minority2
No Yes No Yes
Village in National Poverty County
Percent
Yes 19.8 36.9 21.2 32.0

- 33 -
Source: CHIP 2002 Village Data. 1Pearson: Uncorrected chi2(1) = 21.0908.
2Pearson: Uncorrected
chi2(1) = 7.2336
Table 3. Village Topography in Minority and Non-Minority Villages (Two Definitions)
Village is Minority
Area1
50%+ of Village
Households are
Minority2
No Yes N
o Yes
Flat 49.0 52.3 49.6 46.8
Hilly 33.2 9.4 32.7 9.7
Mountainous 17.8 38.3 17.7 43.5
Total 100 100 100 100 Source: CHIP 2002 Village Data.
1Pearson: Uncorrected chi2(2) = 49.6457.
2Pearson: Uncorrected
chi2(2) = 53.4936.
Table 4. Village Isolation in Minority and Non-Minority Villages (Two Definitions)
Village is Minority
Area*
50%+ of Village Households are
Minority*
No Yes No Yes
Village distance…
From Nearest County Seat (km)* 22.5 33.7 23.0 33.2
From Nearest Township Government (km)* 4.6 6.9 4.7 7.1
From Nearest Transportation Terminal (km)* 5.0 7.6 5.0 7.6
Electricity Available…*
Before 1969 30.3 15.4 30.2 14.4
1970-79 36.1 26.8 36.0 27.2
1980-89 26.0 31.5 25.7 32.8
1990-98 6.7 14.1 6.6 14.4
After 1999 1.0 10.7 1.4 9.6
Not Yet 0.0 1.3 0.0 1.6
Telephone Available…*
Before 1969 19.5 14.1 19.6 12.8
1970-79 11.1 9.4 11.4 7.2
1980-89 12.2 4.0 11.8 4.8
1990-98 34.2 20.1 33.5 24.0
After 1999 19.7 36.2 19.4 38.4
Not Yet 3.3 16.1 4.2 12.8
Source: CHIP 2002 Village Data
*Significantly different at .05 level for both typologies of minority village.
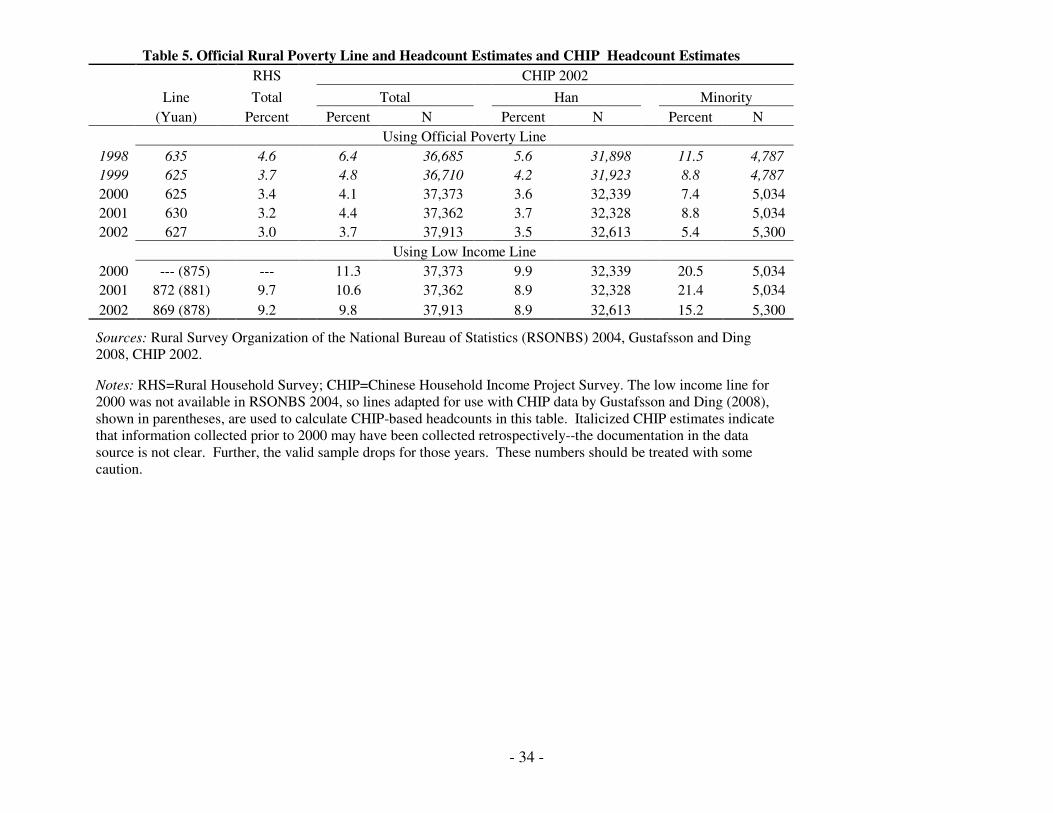
- 34 -
Table 5. Official Rural Poverty Line and Headcount Estimates and CHIP Headcount Estimates
RHS CHIP 2002
Line Total Total Han Minority
(Yuan) Percent Percent N Percent N Percent N
Using Official Poverty Line
1998 635 4.6 6.4 36,685 5.6 31,898 11.5 4,787
1999 625 3.7 4.8 36,710 4.2 31,923 8.8 4,787
2000 625 3.4 4.1 37,373 3.6 32,339 7.4 5,034
2001 630 3.2 4.4 37,362 3.7 32,328 8.8 5,034
2002 627 3.0 3.7 37,913 3.5 32,613 5.4 5,300
Using Low Income Line
2000 --- (875) --- 11.3 37,373 9.9 32,339 20.5 5,034
2001 872 (881) 9.7 10.6 37,362 8.9 32,328 21.4 5,034
2002 869 (878) 9.2 9.8 37,913 8.9 32,613 15.2 5,300
Sources: Rural Survey Organization of the National Bureau of Statistics (RSONBS) 2004, Gustafsson and Ding
2008, CHIP 2002.
Notes: RHS=Rural Household Survey; CHIP=Chinese Household Income Project Survey. The low income line for
2000 was not available in RSONBS 2004, so lines adapted for use with CHIP data by Gustafsson and Ding (2008),
shown in parentheses, are used to calculate CHIP-based headcounts in this table. Italicized CHIP estimates indicate
that information collected prior to 2000 may have been collected retrospectively--the documentation in the data
source is not clear. Further, the valid sample drops for those years. These numbers should be treated with some
caution.
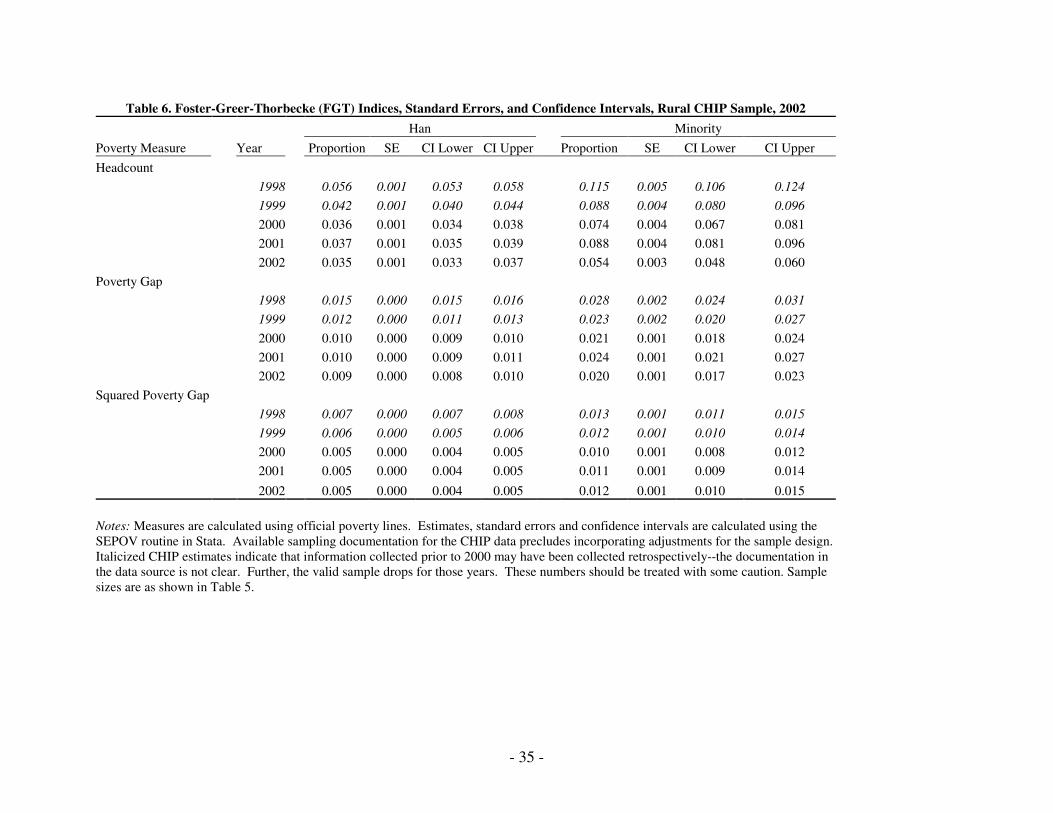
- 35 -
Table 6. Foster-Greer-Thorbecke (FGT) Indices, Standard Errors, and Confidence Intervals, Rural CHIP Sample, 2002
Han Minority
Poverty Measure Year Proportion SE CI Lower CI Upper Proportion SE CI Lower CI Upper
Headcount
1998 0.056 0.001 0.053 0.058 0.115 0.005 0.106 0.124
1999 0.042 0.001 0.040 0.044 0.088 0.004 0.080 0.096
2000 0.036 0.001 0.034 0.038 0.074 0.004 0.067 0.081
2001 0.037 0.001 0.035 0.039 0.088 0.004 0.081 0.096
2002 0.035 0.001 0.033 0.037 0.054 0.003 0.048 0.060
Poverty Gap
1998 0.015 0.000 0.015 0.016 0.028 0.002 0.024 0.031
1999 0.012 0.000 0.011 0.013 0.023 0.002 0.020 0.027
2000 0.010 0.000 0.009 0.010 0.021 0.001 0.018 0.024
2001 0.010 0.000 0.009 0.011 0.024 0.001 0.021 0.027
2002 0.009 0.000 0.008 0.010 0.020 0.001 0.017 0.023
Squared Poverty Gap
1998 0.007 0.000 0.007 0.008 0.013 0.001 0.011 0.015
1999 0.006 0.000 0.005 0.006 0.012 0.001 0.010 0.014
2000 0.005 0.000 0.004 0.005 0.010 0.001 0.008 0.012
2001 0.005 0.000 0.004 0.005 0.011 0.001 0.009 0.014
2002 0.005 0.000 0.004 0.005 0.012 0.001 0.010 0.015
Notes: Measures are calculated using official poverty lines. Estimates, standard errors and confidence intervals are calculated using the
SEPOV routine in Stata. Available sampling documentation for the CHIP data precludes incorporating adjustments for the sample design.
Italicized CHIP estimates indicate that information collected prior to 2000 may have been collected retrospectively--the documentation in
the data source is not clear. Further, the valid sample drops for those years. These numbers should be treated with some caution. Sample
sizes are as shown in Table 5.
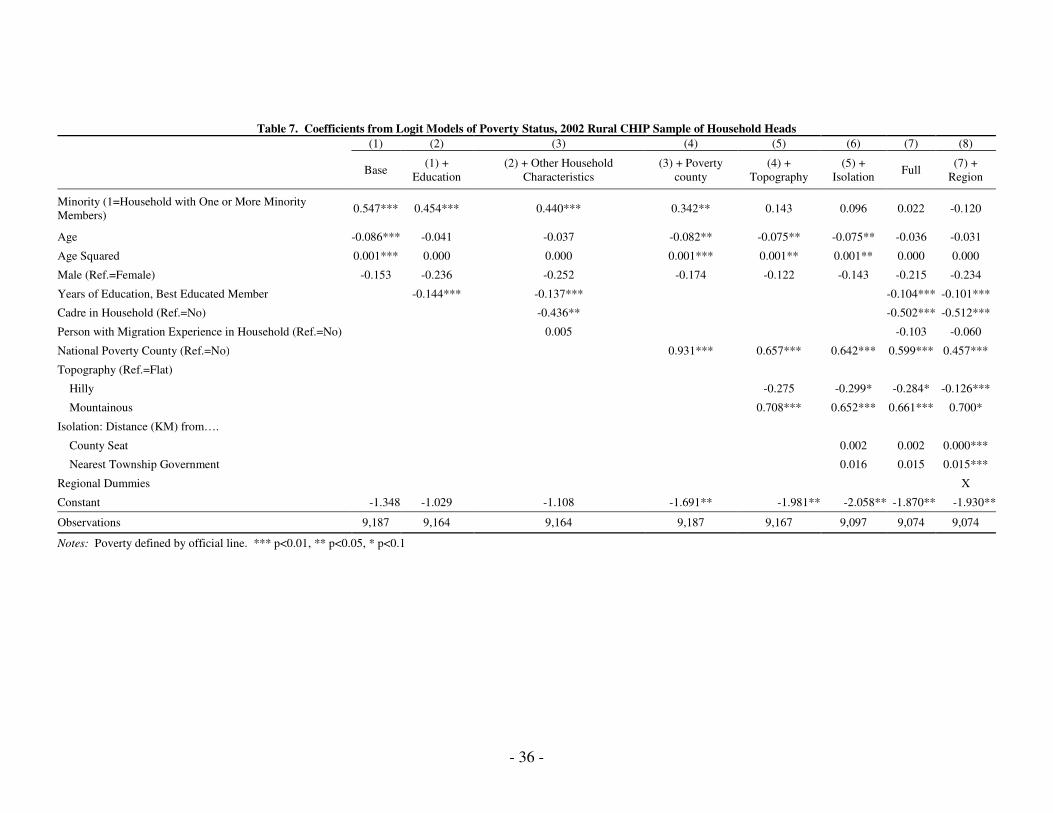
- 36 -
Table 7. Coefficients from Logit Models of Poverty Status, 2002 Rural CHIP Sample of Household Heads
(1) (2) (3) (4) (5) (6) (7) (8)
Base (1) +
Education
(2) + Other Household
Characteristics
(3) + Poverty
county
(4) +
Topography
(5) +
Isolation Full
(7) +
Region
Minority (1=Household with One or More Minority
Members) 0.547*** 0.454*** 0.440*** 0.342** 0.143 0.096 0.022 -0.120
Age -0.086*** -0.041 -0.037 -0.082** -0.075** -0.075** -0.036 -0.031
Age Squared 0.001*** 0.000 0.000 0.001*** 0.001** 0.001** 0.000 0.000
Male (Ref.=Female) -0.153 -0.236 -0.252 -0.174 -0.122 -0.143 -0.215 -0.234
Years of Education, Best Educated Member -0.144*** -0.137*** -0.104*** -0.101***
Cadre in Household (Ref.=No) -0.436** -0.502*** -0.512***
Person with Migration Experience in Household (Ref.=No) 0.005 -0.103 -0.060
National Poverty County (Ref.=No) 0.931*** 0.657*** 0.642*** 0.599*** 0.457***
Topography (Ref.=Flat)
Hilly -0.275 -0.299* -0.284* -0.126***
Mountainous 0.708*** 0.652*** 0.661*** 0.700*
Isolation: Distance (KM) from….
County Seat 0.002 0.002 0.000***
Nearest Township Government 0.016 0.015 0.015***
Regional Dummies X
Constant -1.348 -1.029 -1.108 -1.691** -1.981** -2.058** -1.870** -1.930**
Observations 9,187 9,164 9,164 9,187 9,167 9,097 9,074 9,074
Notes: Poverty defined by official line. *** p<0.01, ** p<0.05, * p<0.1
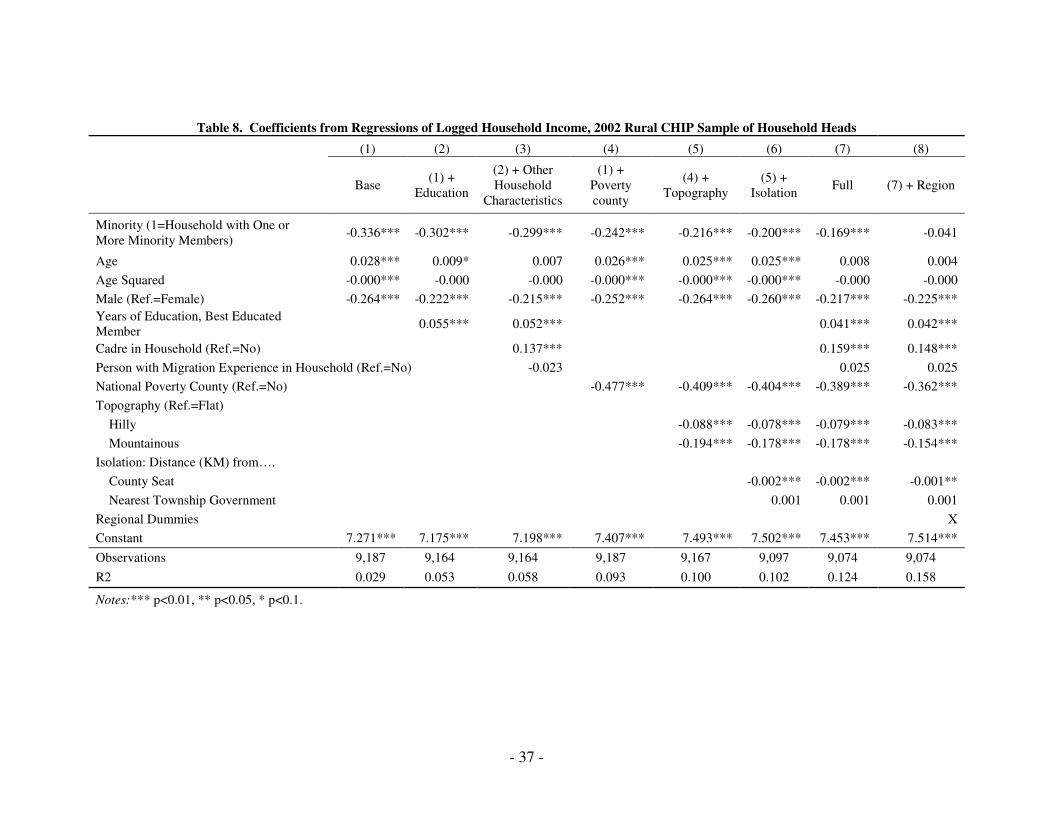
- 37 -
Table 8. Coefficients from Regressions of Logged Household Income, 2002 Rural CHIP Sample of Household Heads
(1) (2) (3) (4) (5) (6) (7) (8)
Base (1) +
Education
(2) + Other
Household
Characteristics
(1) +
Poverty
county
(4) +
Topography
(5) +
Isolation Full (7) + Region
Minority (1=Household with One or
More Minority Members) -0.336*** -0.302*** -0.299*** -0.242*** -0.216*** -0.200*** -0.169*** -0.041
Age 0.028*** 0.009* 0.007 0.026*** 0.025*** 0.025*** 0.008 0.004
Age Squared -0.000*** -0.000 -0.000 -0.000*** -0.000*** -0.000*** -0.000 -0.000
Male (Ref.=Female) -0.264*** -0.222*** -0.215*** -0.252*** -0.264*** -0.260*** -0.217*** -0.225***
Years of Education, Best Educated
Member 0.055*** 0.052*** 0.041*** 0.042***
Cadre in Household (Ref.=No) 0.137*** 0.159*** 0.148***
Person with Migration Experience in Household (Ref.=No) -0.023 0.025 0.025
National Poverty County (Ref.=No) -0.477*** -0.409*** -0.404*** -0.389*** -0.362***
Topography (Ref.=Flat)
Hilly -0.088*** -0.078*** -0.079*** -0.083***
Mountainous -0.194*** -0.178*** -0.178*** -0.154***
Isolation: Distance (KM) from….
County Seat -0.002*** -0.002*** -0.001**
Nearest Township Government 0.001 0.001 0.001
Regional Dummies X
Constant 7.271*** 7.175*** 7.198*** 7.407*** 7.493*** 7.502*** 7.453*** 7.514***
Observations 9,187 9,164 9,164 9,187 9,167 9,097 9,074 9,074
R2 0.029 0.053 0.058 0.093 0.100 0.102 0.124 0.158
Notes:*** p<0.01, ** p<0.05, * p<0.1.
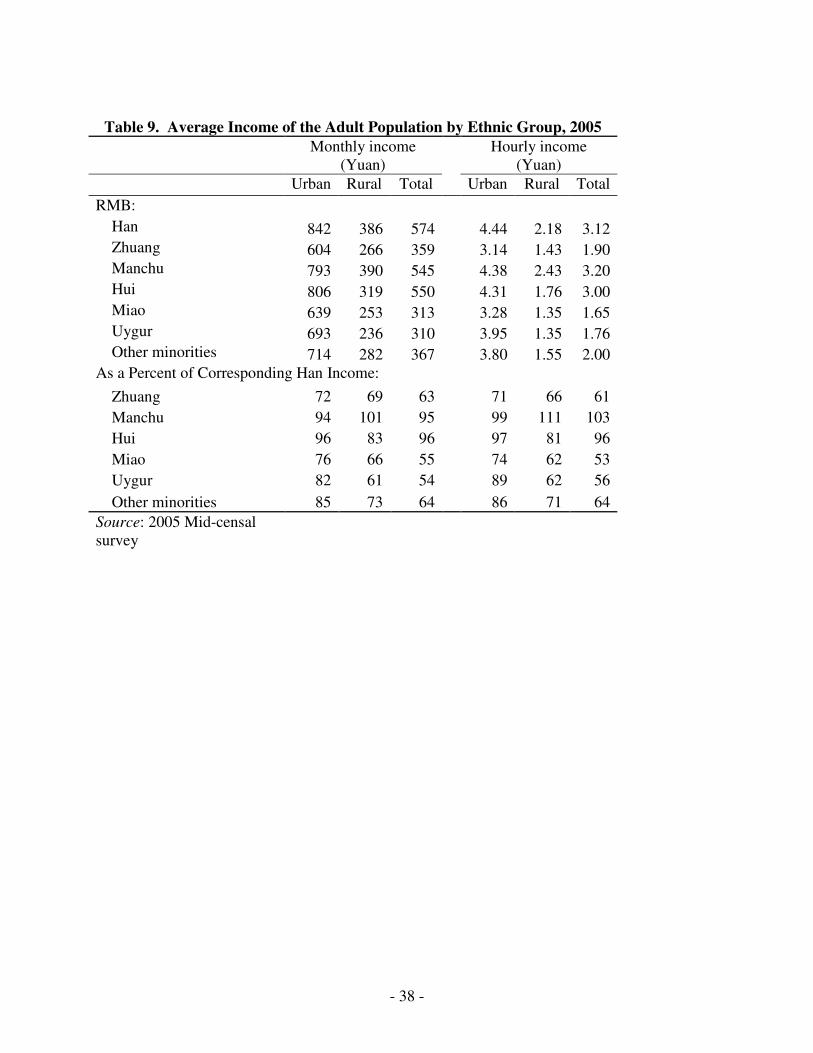
- 38 -
Table 9. Average Income of the Adult Population by Ethnic Group, 2005
Monthly income
(Yuan)
Hourly income
(Yuan)
Urban Rural Total Urban Rural Total
RMB:
Han 842 386 574 4.44 2.18 3.12
Zhuang 604 266 359 3.14 1.43 1.90
Manchu 793 390 545 4.38 2.43 3.20
Hui 806 319 550 4.31 1.76 3.00
Miao 639 253 313 3.28 1.35 1.65
Uygur 693 236 310 3.95 1.35 1.76
Other minorities 714 282 367 3.80 1.55 2.00
As a Percent of Corresponding Han Income:
Zhuang 72 69 63 71 66 61
Manchu 94 101 95 99 111 103
Hui 96 83 96 97 81 96
Miao 76 66 55 74 62 53
Uygur 82 61 54 89 62 56
Other minorities 85 73 64 86 71 64
Source: 2005 Mid-censal
survey
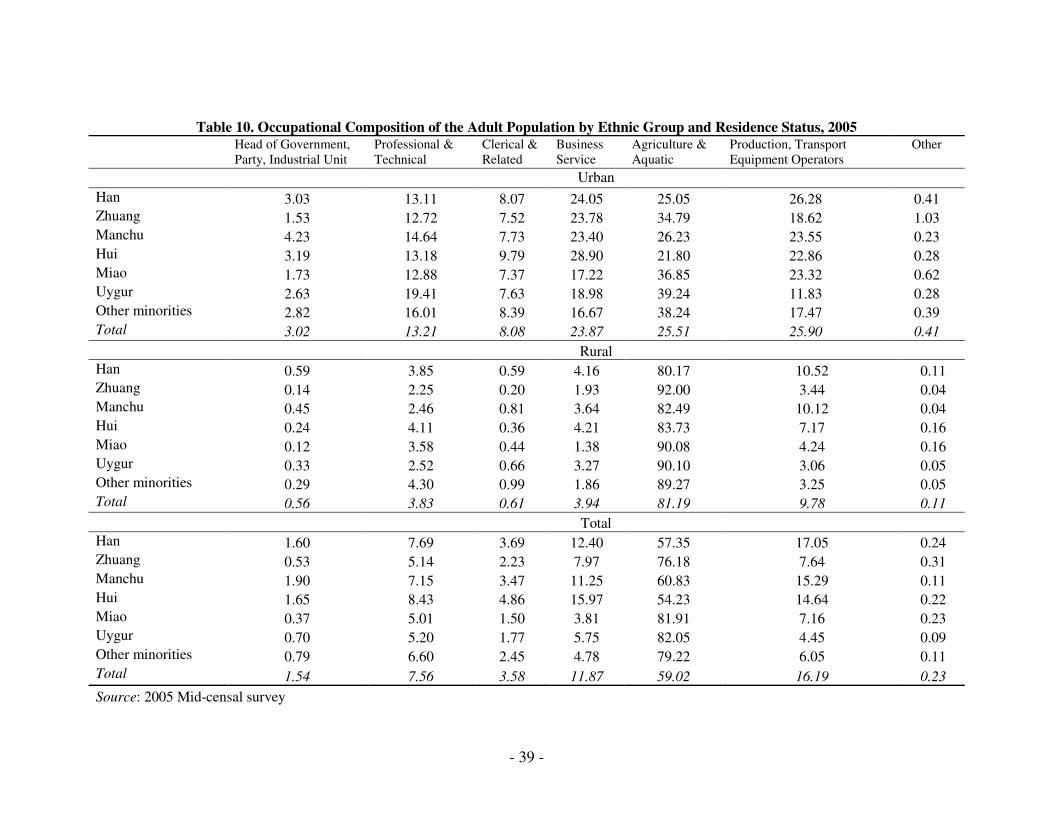
- 39 -
Table 10. Occupational Composition of the Adult Population by Ethnic Group and Residence Status, 2005
Head of Government,
Party, Industrial Unit
Professional &
Technical
Clerical &
Related
Business
Service
Agriculture &
Aquatic
Production, Transport
Equipment Operators
Other
Urban
Han 3.03 13.11 8.07 24.05 25.05 26.28 0.41 Zhuang 1.53 12.72 7.52 23.78 34.79 18.62 1.03 Manchu 4.23 14.64 7.73 23.40 26.23 23.55 0.23 Hui 3.19 13.18 9.79 28.90 21.80 22.86 0.28 Miao 1.73 12.88 7.37 17.22 36.85 23.32 0.62 Uygur 2.63 19.41 7.63 18.98 39.24 11.83 0.28 Other minorities 2.82 16.01 8.39 16.67 38.24 17.47 0.39 Total 3.02 13.21 8.08 23.87 25.51 25.90 0.41 Rural Han 0.59 3.85 0.59 4.16 80.17 10.52 0.11 Zhuang 0.14 2.25 0.20 1.93 92.00 3.44 0.04 Manchu 0.45 2.46 0.81 3.64 82.49 10.12 0.04 Hui 0.24 4.11 0.36 4.21 83.73 7.17 0.16 Miao 0.12 3.58 0.44 1.38 90.08 4.24 0.16 Uygur 0.33 2.52 0.66 3.27 90.10 3.06 0.05 Other minorities 0.29 4.30 0.99 1.86 89.27 3.25 0.05 Total 0.56 3.83 0.61 3.94 81.19 9.78 0.11 Total Han 1.60 7.69 3.69 12.40 57.35 17.05 0.24 Zhuang 0.53 5.14 2.23 7.97 76.18 7.64 0.31 Manchu 1.90 7.15 3.47 11.25 60.83 15.29 0.11 Hui 1.65 8.43 4.86 15.97 54.23 14.64 0.22 Miao 0.37 5.01 1.50 3.81 81.91 7.16 0.23 Uygur 0.70 5.20 1.77 5.75 82.05 4.45 0.09 Other minorities 0.79 6.60 2.45 4.78 79.22 6.05 0.11 Total 1.54 7.56 3.58 11.87 59.02 16.19 0.23
Source: 2005 Mid-censal survey
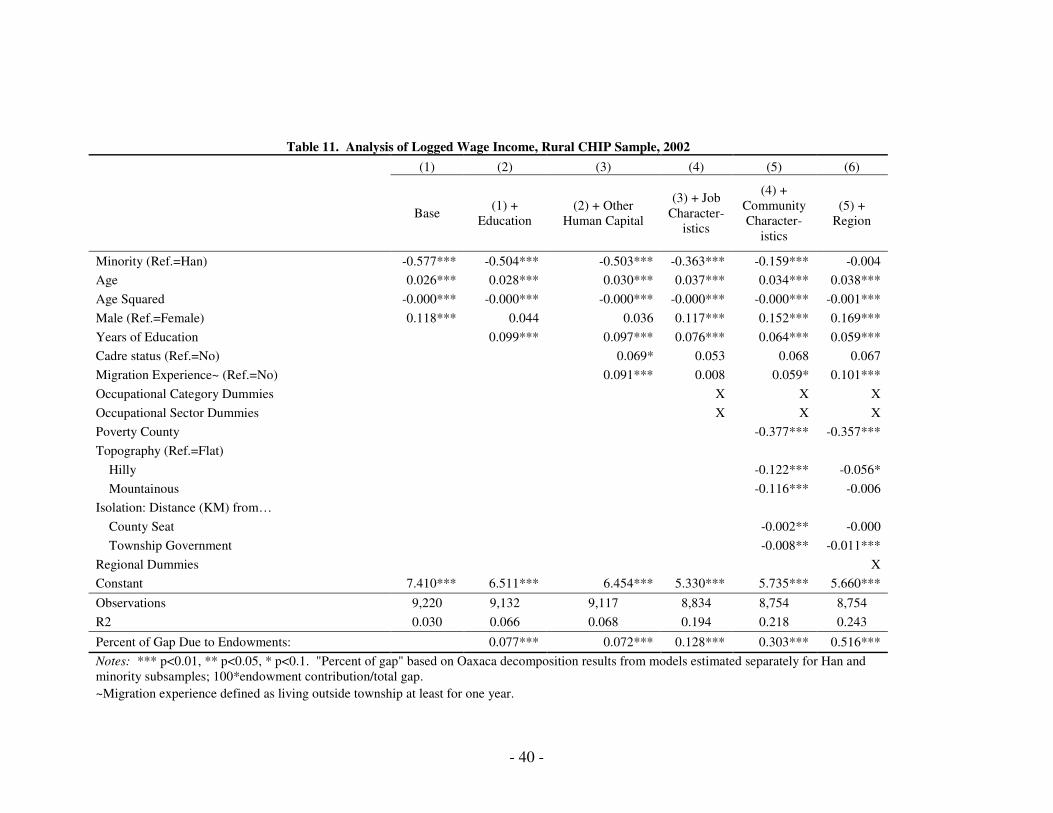
- 40 -
Table 11. Analysis of Logged Wage Income, Rural CHIP Sample, 2002
(1) (2) (3) (4) (5) (6)
Base (1) +
Education
(2) + Other
Human Capital
(3) + Job
Character-
istics
(4) +
Community
Character-
istics
(5) +
Region
Minority (Ref.=Han) -0.577*** -0.504*** -0.503*** -0.363*** -0.159*** -0.004
Age 0.026*** 0.028*** 0.030*** 0.037*** 0.034*** 0.038***
Age Squared -0.000*** -0.000*** -0.000*** -0.000*** -0.000*** -0.001***
Male (Ref.=Female) 0.118*** 0.044 0.036 0.117*** 0.152*** 0.169***
Years of Education 0.099*** 0.097*** 0.076*** 0.064*** 0.059***
Cadre status (Ref.=No) 0.069* 0.053 0.068 0.067
Migration Experience~ (Ref.=No) 0.091*** 0.008 0.059* 0.101***
Occupational Category Dummies X X X
Occupational Sector Dummies X X X
Poverty County -0.377*** -0.357***
Topography (Ref.=Flat)
Hilly -0.122*** -0.056*
Mountainous -0.116*** -0.006
Isolation: Distance (KM) from…
County Seat -0.002** -0.000
Township Government -0.008** -0.011***
Regional Dummies X
Constant 7.410*** 6.511*** 6.454*** 5.330*** 5.735*** 5.660***
Observations 9,220 9,132 9,117 8,834 8,754 8,754
R2 0.030 0.066 0.068 0.194 0.218 0.243
Percent of Gap Due to Endowments: 0.077*** 0.072*** 0.128*** 0.303*** 0.516***
Notes: *** p<0.01, ** p<0.05, * p<0.1. "Percent of gap" based on Oaxaca decomposition results from models estimated separately for Han and
minority subsamples; 100*endowment contribution/total gap.
~Migration experience defined as living outside township at least for one year.
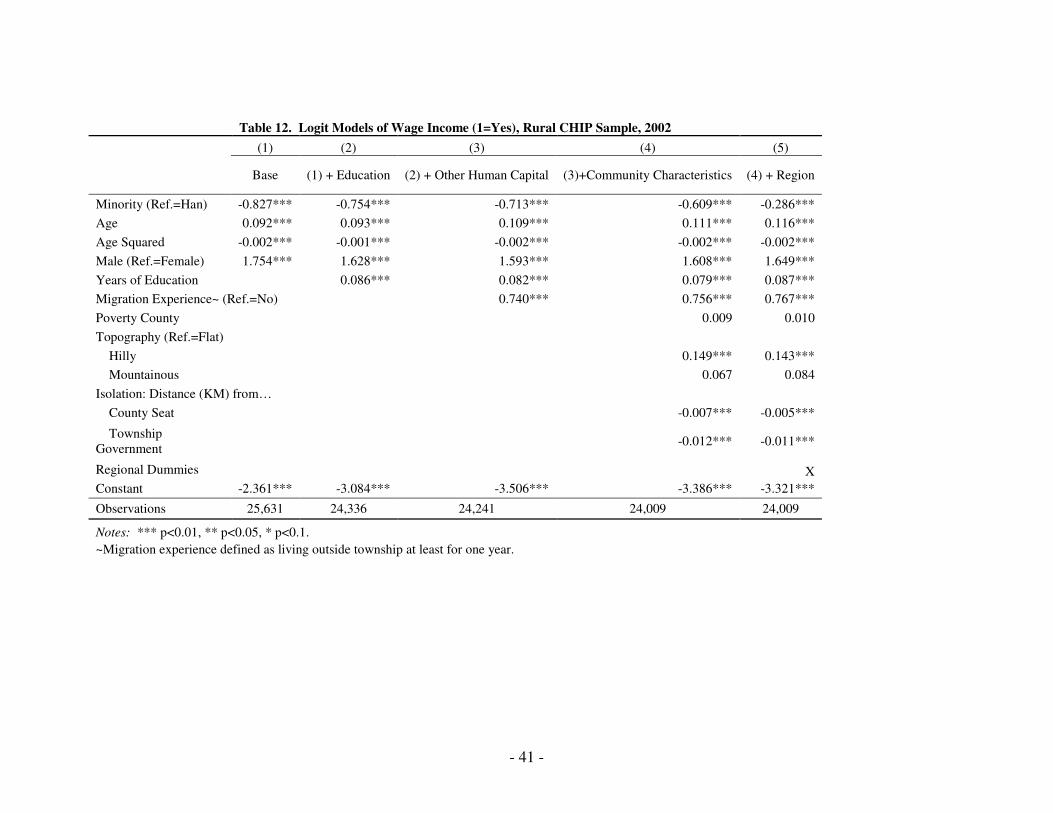
- 41 -
Table 12. Logit Models of Wage Income (1=Yes), Rural CHIP Sample, 2002
(1) (2) (3) (4) (5)
Base (1) + Education (2) + Other Human Capital (3)+Community Characteristics (4) + Region
Minority (Ref.=Han) -0.827*** -0.754*** -0.713*** -0.609*** -0.286***
Age 0.092*** 0.093*** 0.109*** 0.111*** 0.116***
Age Squared -0.002*** -0.001*** -0.002*** -0.002*** -0.002***
Male (Ref.=Female) 1.754*** 1.628*** 1.593*** 1.608*** 1.649***
Years of Education 0.086*** 0.082*** 0.079*** 0.087***
Migration Experience~ (Ref.=No) 0.740*** 0.756*** 0.767***
Poverty County 0.009 0.010
Topography (Ref.=Flat)
Hilly 0.149*** 0.143***
Mountainous 0.067 0.084
Isolation: Distance (KM) from…
County Seat -0.007*** -0.005***
Township
Government -0.012*** -0.011***
Regional Dummies X
Constant -2.361*** -3.084*** -3.506*** -3.386*** -3.321***
Observations 25,631 24,336 24,241 24,009 24,009
Notes: *** p<0.01, ** p<0.05, * p<0.1.
~Migration experience defined as living outside township at least for one year.
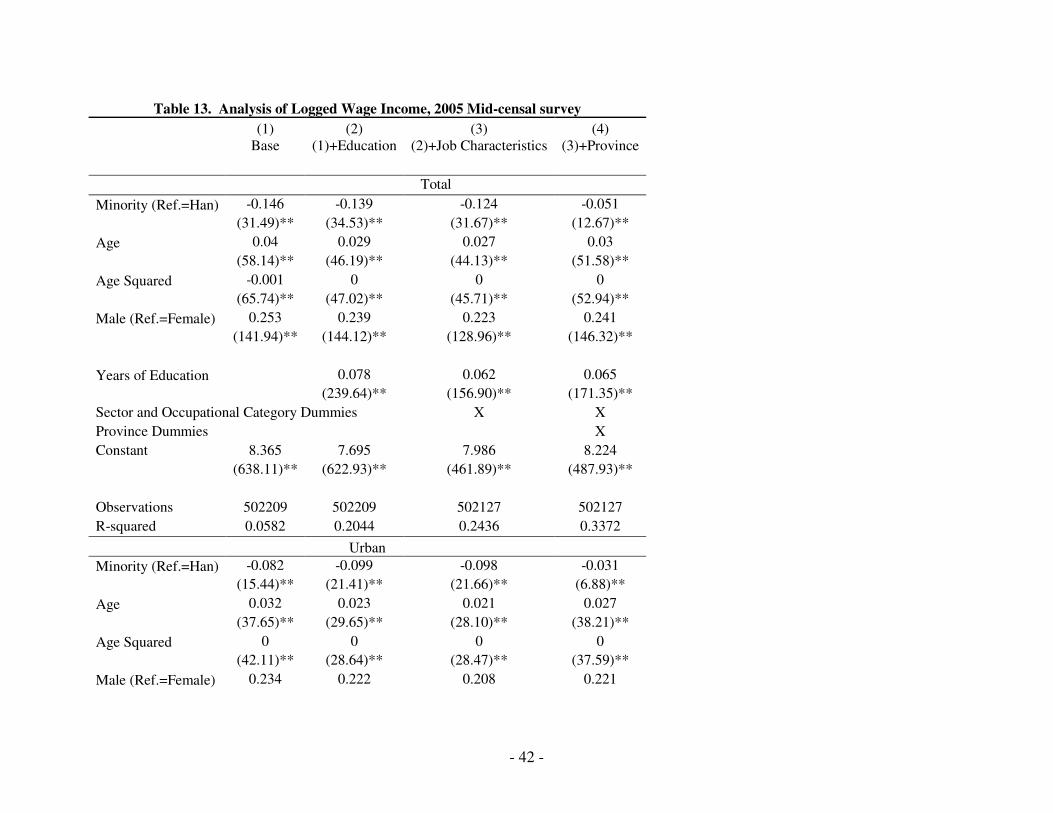
- 42 -
Table 13. Analysis of Logged Wage Income, 2005 Mid-censal survey
(1) (2) (3) (4) Base (1)+Education (2)+Job Characteristics (3)+Province
Total
Minority (Ref.=Han) -0.146 -0.139 -0.124 -0.051
(31.49)** (34.53)** (31.67)** (12.67)**
Age 0.04 0.029 0.027 0.03
(58.14)** (46.19)** (44.13)** (51.58)**
Age Squared -0.001 0 0 0
(65.74)** (47.02)** (45.71)** (52.94)**
Male (Ref.=Female) 0.253 0.239 0.223 0.241
(141.94)** (144.12)** (128.96)** (146.32)**
Years of Education 0.078 0.062 0.065
(239.64)** (156.90)** (171.35)**
Sector and Occupational Category Dummies X X
Province Dummies X
Constant 8.365 7.695 7.986 8.224
(638.11)** (622.93)** (461.89)** (487.93)**
Observations 502209 502209 502127 502127
R-squared 0.0582 0.2044 0.2436 0.3372
Urban
Minority (Ref.=Han) -0.082 -0.099 -0.098 -0.031
(15.44)** (21.41)** (21.66)** (6.88)**
Age 0.032 0.023 0.021 0.027
(37.65)** (29.65)** (28.10)** (38.21)**
Age Squared 0 0 0 0
(42.11)** (28.64)** (28.47)** (37.59)**
Male (Ref.=Female) 0.234 0.222 0.208 0.221
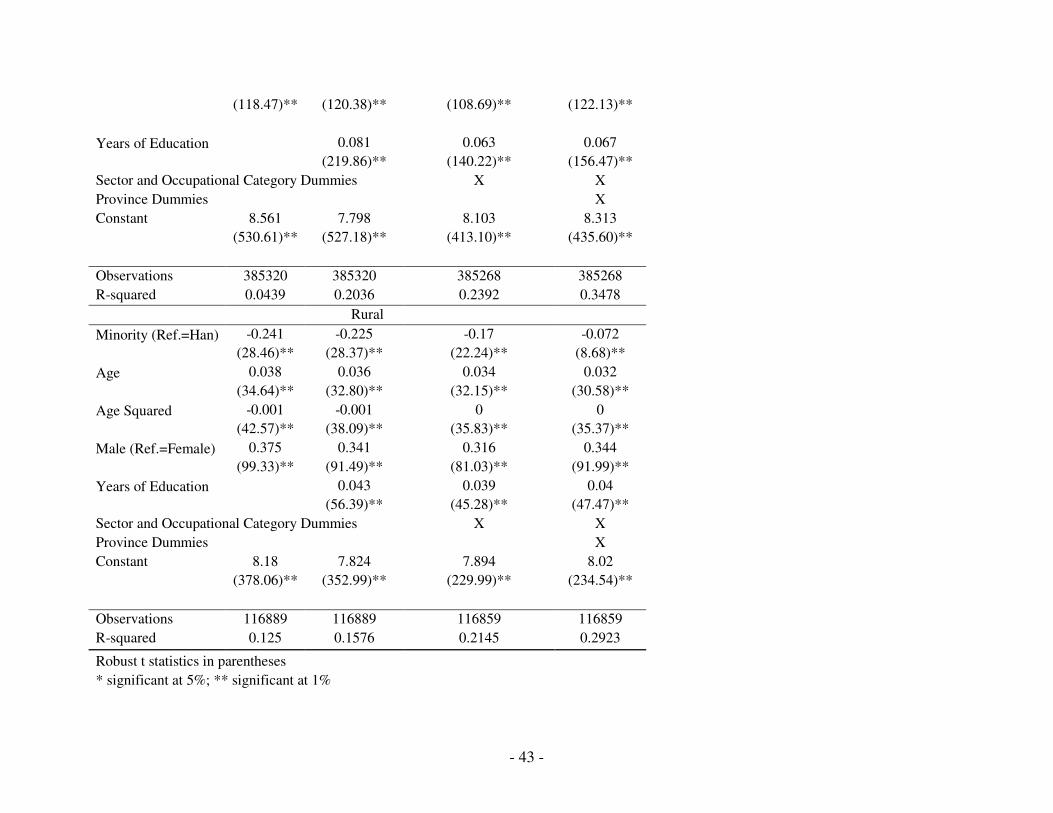
- 43 -
(118.47)** (120.38)** (108.69)** (122.13)**
Years of Education 0.081 0.063 0.067
(219.86)** (140.22)** (156.47)**
Sector and Occupational Category Dummies X X
Province Dummies X
Constant 8.561 7.798 8.103 8.313
(530.61)** (527.18)** (413.10)** (435.60)**
Observations 385320 385320 385268 385268
R-squared 0.0439 0.2036 0.2392 0.3478
Rural
Minority (Ref.=Han) -0.241 -0.225 -0.17 -0.072
(28.46)** (28.37)** (22.24)** (8.68)**
Age 0.038 0.036 0.034 0.032
(34.64)** (32.80)** (32.15)** (30.58)**
Age Squared -0.001 -0.001 0 0
(42.57)** (38.09)** (35.83)** (35.37)**
Male (Ref.=Female) 0.375 0.341 0.316 0.344
(99.33)** (91.49)** (81.03)** (91.99)**
Years of Education 0.043 0.039 0.04
(56.39)** (45.28)** (47.47)**
Sector and Occupational Category Dummies X X
Province Dummies X
Constant 8.18 7.824 7.894 8.02
(378.06)** (352.99)** (229.99)** (234.54)**
Observations 116889 116889 116859 116859
R-squared 0.125 0.1576 0.2145 0.2923
Robust t statistics in parentheses
* significant at 5%; ** significant at 1%
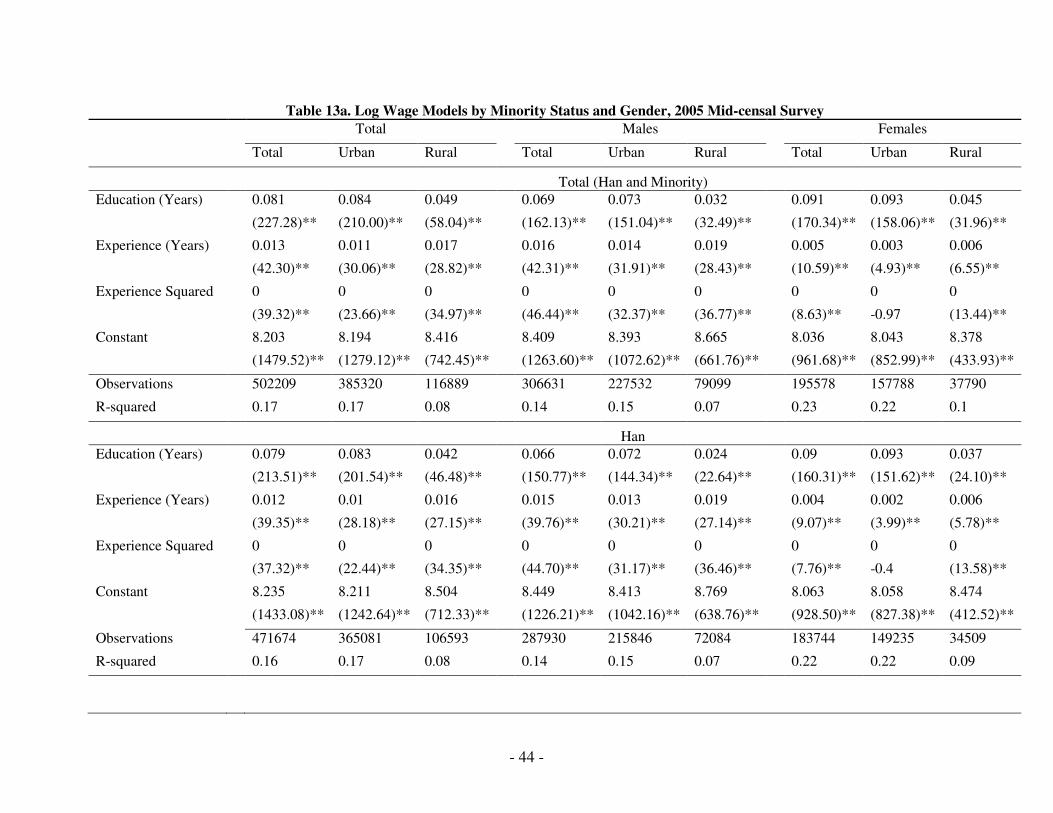
- 44 -
Table 13a. Log Wage Models by Minority Status and Gender, 2005 Mid-censal Survey
Total Males Females
Total Urban Rural Total Urban Rural Total Urban Rural
Total (Han and Minority) Education (Years) 0.081 0.084 0.049 0.069 0.073 0.032 0.091 0.093 0.045
(227.28)** (210.00)** (58.04)** (162.13)** (151.04)** (32.49)** (170.34)** (158.06)** (31.96)**
Experience (Years) 0.013 0.011 0.017 0.016 0.014 0.019 0.005 0.003 0.006
(42.30)** (30.06)** (28.82)** (42.31)** (31.91)** (28.43)** (10.59)** (4.93)** (6.55)**
Experience Squared 0 0 0 0 0 0 0 0 0
(39.32)** (23.66)** (34.97)** (46.44)** (32.37)** (36.77)** (8.63)** -0.97 (13.44)**
Constant 8.203 8.194 8.416 8.409 8.393 8.665 8.036 8.043 8.378
(1479.52)** (1279.12)** (742.45)** (1263.60)** (1072.62)** (661.76)** (961.68)** (852.99)** (433.93)**
Observations 502209 385320 116889 306631 227532 79099 195578 157788 37790
R-squared 0.17 0.17 0.08 0.14 0.15 0.07 0.23 0.22 0.1
Han Education (Years) 0.079 0.083 0.042 0.066 0.072 0.024 0.09 0.093 0.037
(213.51)** (201.54)** (46.48)** (150.77)** (144.34)** (22.64)** (160.31)** (151.62)** (24.10)**
Experience (Years) 0.012 0.01 0.016 0.015 0.013 0.019 0.004 0.002 0.006
(39.35)** (28.18)** (27.15)** (39.76)** (30.21)** (27.14)** (9.07)** (3.99)** (5.78)**
Experience Squared 0 0 0 0 0 0 0 0 0
(37.32)** (22.44)** (34.35)** (44.70)** (31.17)** (36.46)** (7.76)** -0.4 (13.58)**
Constant 8.235 8.211 8.504 8.449 8.413 8.769 8.063 8.058 8.474
(1433.08)** (1242.64)** (712.33)** (1226.21)** (1042.16)** (638.76)** (928.50)** (827.38)** (412.52)**
Observations 471674 365081 106593 287930 215846 72084 183744 149235 34509
R-squared 0.16 0.17 0.08 0.14 0.15 0.07 0.22 0.22 0.09
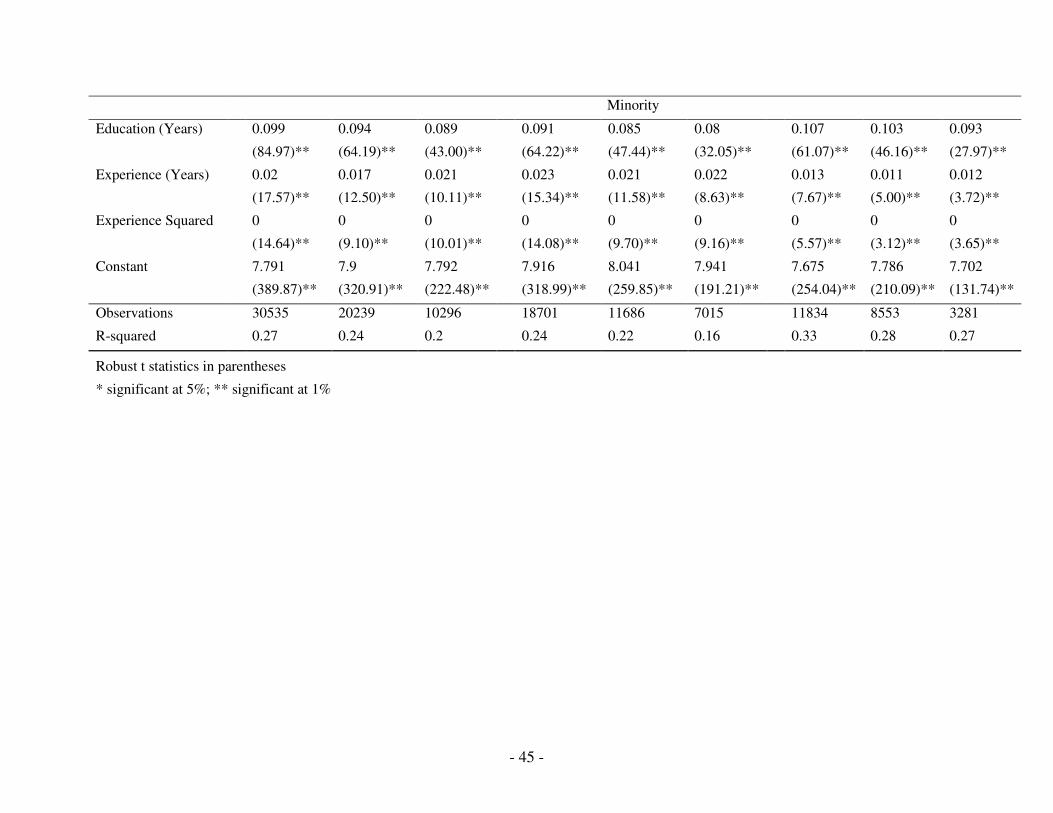
- 45 -
Minority
Education (Years) 0.099 0.094 0.089 0.091 0.085 0.08 0.107 0.103 0.093
(84.97)** (64.19)** (43.00)** (64.22)** (47.44)** (32.05)** (61.07)** (46.16)** (27.97)**
Experience (Years) 0.02 0.017 0.021 0.023 0.021 0.022 0.013 0.011 0.012
(17.57)** (12.50)** (10.11)** (15.34)** (11.58)** (8.63)** (7.67)** (5.00)** (3.72)**
Experience Squared 0 0 0 0 0 0 0 0 0
(14.64)** (9.10)** (10.01)** (14.08)** (9.70)** (9.16)** (5.57)** (3.12)** (3.65)**
Constant 7.791 7.9 7.792 7.916 8.041 7.941 7.675 7.786 7.702
(389.87)** (320.91)** (222.48)** (318.99)** (259.85)** (191.21)** (254.04)** (210.09)** (131.74)**
Observations 30535 20239 10296 18701 11686 7015 11834 8553 3281
R-squared 0.27 0.24 0.2 0.24 0.22 0.16 0.33 0.28 0.27
Robust t statistics in parentheses
* significant at 5%; ** significant at 1%
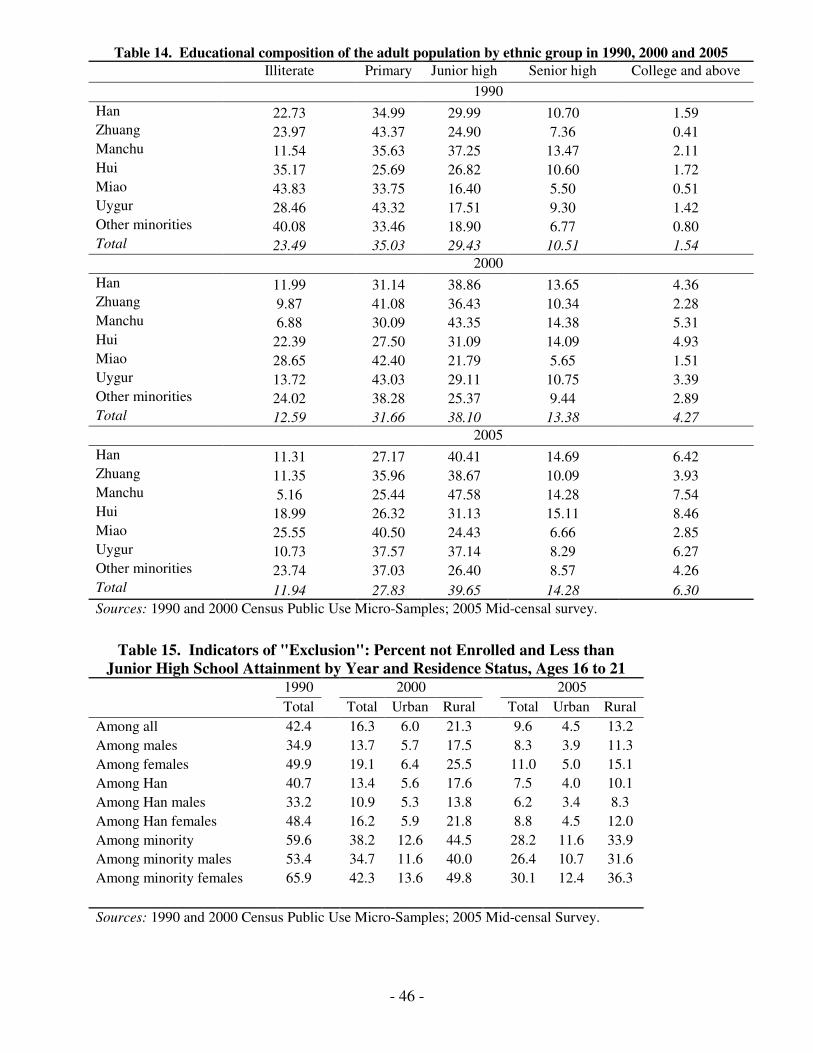
- 46 -
Table 15. Indicators of "Exclusion": Percent not Enrolled and Less than
Junior High School Attainment by Year and Residence Status, Ages 16 to 21
1990 2000 2005
Total Total Urban Rural Total Urban Rural
Among all 42.4 16.3 6.0 21.3 9.6 4.5 13.2
Among males 34.9 13.7 5.7 17.5 8.3 3.9 11.3
Among females 49.9 19.1 6.4 25.5 11.0 5.0 15.1
Among Han 40.7 13.4 5.6 17.6 7.5 4.0 10.1
Among Han males 33.2 10.9 5.3 13.8 6.2 3.4 8.3
Among Han females 48.4 16.2 5.9 21.8 8.8 4.5 12.0
Among minority 59.6 38.2 12.6 44.5 28.2 11.6 33.9
Among minority males 53.4 34.7 11.6 40.0 26.4 10.7 31.6
Among minority females 65.9 42.3 13.6 49.8 30.1 12.4 36.3
Sources: 1990 and 2000 Census Public Use Micro-Samples; 2005 Mid-censal Survey.
Table 14. Educational composition of the adult population by ethnic group in 1990, 2000 and 2005 Illiterate Primary Junior high Senior high College and above
1990
Han 22.73 34.99 29.99 10.70 1.59 Zhuang 23.97 43.37 24.90 7.36 0.41 Manchu 11.54 35.63 37.25 13.47 2.11 Hui 35.17 25.69 26.82 10.60 1.72 Miao 43.83 33.75 16.40 5.50 0.51 Uygur 28.46 43.32 17.51 9.30 1.42 Other minorities 40.08 33.46 18.90 6.77 0.80 Total 23.49 35.03 29.43 10.51 1.54 2000
Han 11.99 31.14 38.86 13.65 4.36 Zhuang 9.87 41.08 36.43 10.34 2.28 Manchu 6.88 30.09 43.35 14.38 5.31 Hui 22.39 27.50 31.09 14.09 4.93 Miao 28.65 42.40 21.79 5.65 1.51 Uygur 13.72 43.03 29.11 10.75 3.39 Other minorities 24.02 38.28 25.37 9.44 2.89 Total 12.59 31.66 38.10 13.38 4.27 2005
Han 11.31 27.17 40.41 14.69 6.42 Zhuang 11.35 35.96 38.67 10.09 3.93 Manchu 5.16 25.44 47.58 14.28 7.54 Hui 18.99 26.32 31.13 15.11 8.46 Miao 25.55 40.50 24.43 6.66 2.85 Uygur 10.73 37.57 37.14 8.29 6.27 Other minorities 23.74 37.03 26.40 8.57 4.26 Total 11.94 27.83 39.65 14.28 6.30
Sources: 1990 and 2000 Census Public Use Micro-Samples; 2005 Mid-censal survey.
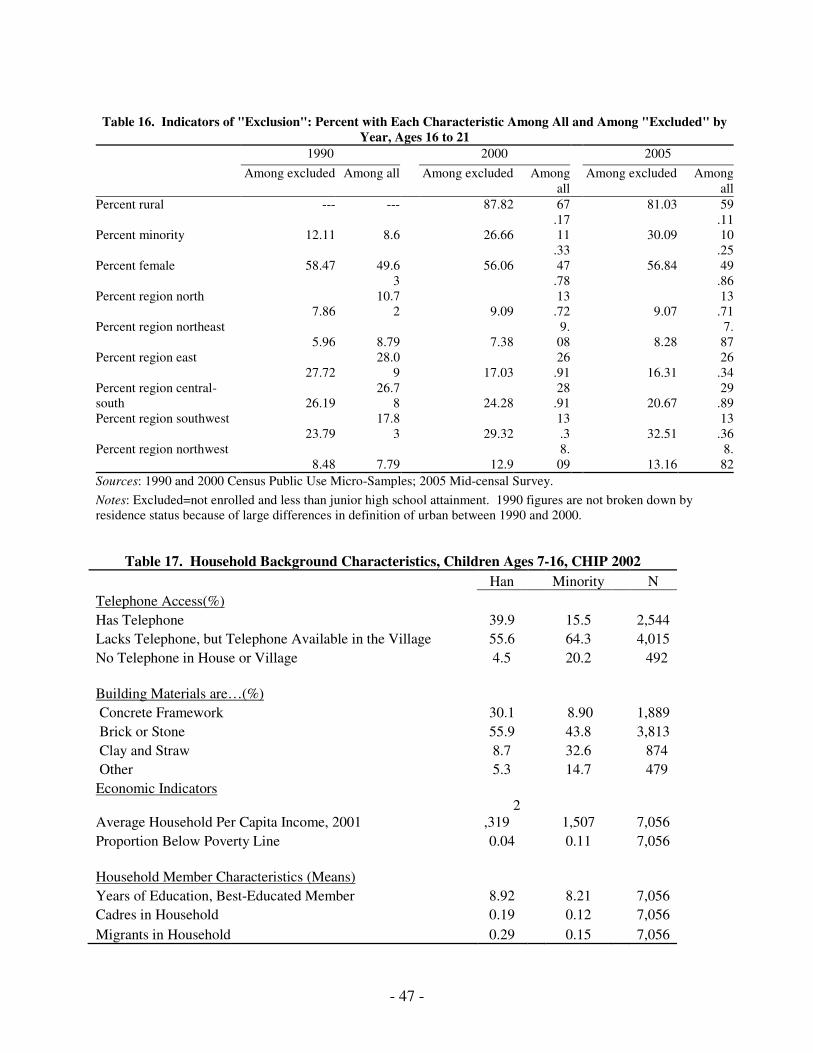
- 47 -
Table 16. Indicators of "Exclusion": Percent with Each Characteristic Among All and Among "Excluded" by
Year, Ages 16 to 21
1990 2000 2005
Among excluded Among all Among excluded Among
all
Among excluded Among
all
Percent rural --- --- 87.82 67
.17
81.03 59
.11
Percent minority 12.11 8.6 26.66 11
.33
30.09 10
.25
Percent female 58.47 49.6
3
56.06 47
.78
56.84 49
.86
Percent region north
7.86
10.7
2 9.09
13
.72 9.07
13
.71
Percent region northeast
5.96 8.79 7.38
9.
08 8.28
7.
87
Percent region east
27.72
28.0
9 17.03
26
.91 16.31
26
.34
Percent region central-
south 26.19
26.7
8 24.28
28
.91 20.67
29
.89
Percent region southwest
23.79
17.8
3 29.32
13
.3 32.51
13
.36
Percent region northwest
8.48 7.79 12.9
8.
09 13.16
8.
82
Sources: 1990 and 2000 Census Public Use Micro-Samples; 2005 Mid-censal Survey.
Notes: Excluded=not enrolled and less than junior high school attainment. 1990 figures are not broken down by
residence status because of large differences in definition of urban between 1990 and 2000.
Table 17. Household Background Characteristics, Children Ages 7-16, CHIP 2002
Han Minority N
Telephone Access(%)
Has Telephone 39.9 15.5 2,544
Lacks Telephone, but Telephone Available in the Village 55.6 64.3 4,015
No Telephone in House or Village 4.5 20.2 492
Building Materials are…(%)
Concrete Framework 30.1 8.90 1,889
Brick or Stone 55.9 43.8 3,813
Clay and Straw 8.7 32.6 874
Other 5.3 14.7 479
Economic Indicators
Average Household Per Capita Income, 2001 2
,319 1,507 7,056
Proportion Below Poverty Line 0.04 0.11 7,056
Household Member Characteristics (Means)
Years of Education, Best-Educated Member 8.92 8.21 7,056
Cadres in Household 0.19 0.12 7,056
Migrants in Household 0.29 0.15 7,056

- 48 -
Source: CHIP 2002
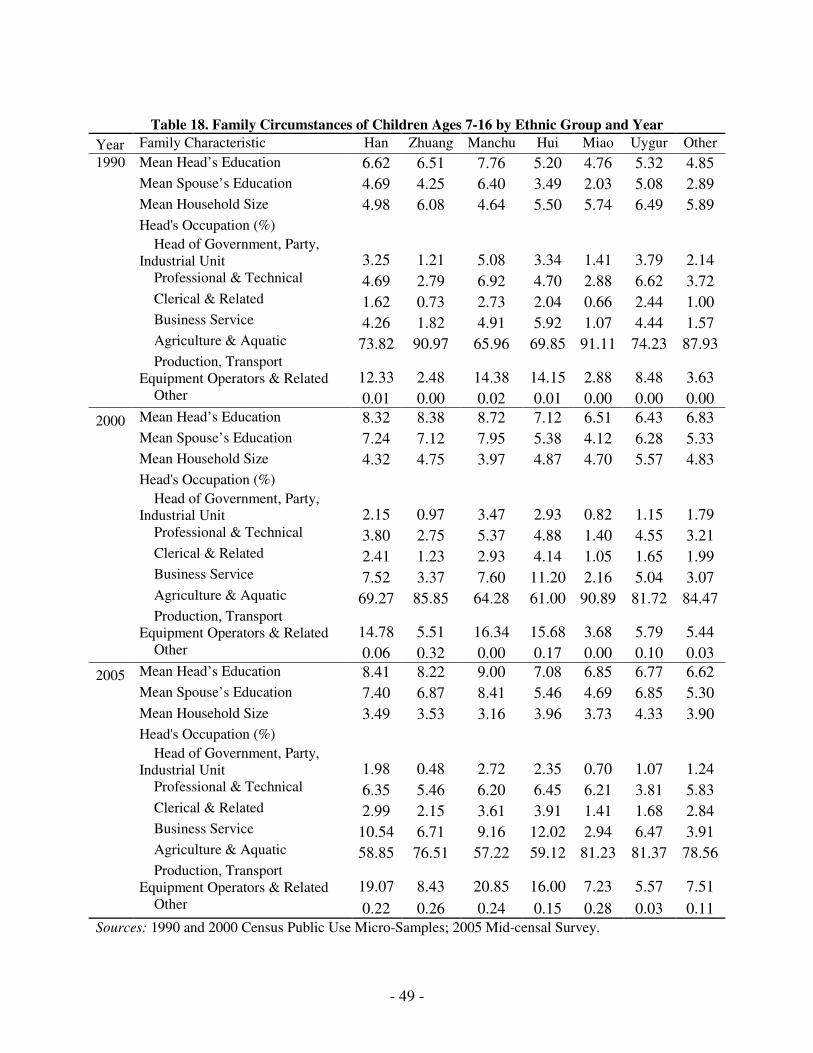
- 49 -
Table 18. Family Circumstances of Children Ages 7-16 by Ethnic Group and Year
Year Family Characteristic Han Zhuang Manchu Hui Miao Uygur Other
1990 Mean Head’s Education 6.62 6.51 7.76 5.20 4.76 5.32 4.85
Mean Spouse’s Education 4.69 4.25 6.40 3.49 2.03 5.08 2.89
Mean Household Size 4.98 6.08 4.64 5.50 5.74 6.49 5.89
Head's Occupation (%)
Head of Government, Party,
Industrial Unit 3.25 1.21 5.08 3.34 1.41 3.79 2.14
Professional & Technical 4.69 2.79 6.92 4.70 2.88 6.62 3.72
Clerical & Related 1.62 0.73 2.73 2.04 0.66 2.44 1.00
Business Service 4.26 1.82 4.91 5.92 1.07 4.44 1.57
Agriculture & Aquatic 73.82 90.97 65.96 69.85 91.11 74.23 87.93
Production, Transport
Equipment Operators & Related 12.33 2.48 14.38 14.15 2.88 8.48 3.63
Other 0.01 0.00 0.02 0.01 0.00 0.00 0.00
2000 Mean Head’s Education 8.32 8.38 8.72 7.12 6.51 6.43 6.83
Mean Spouse’s Education 7.24 7.12 7.95 5.38 4.12 6.28 5.33
Mean Household Size 4.32 4.75 3.97 4.87 4.70 5.57 4.83
Head's Occupation (%)
Head of Government, Party,
Industrial Unit 2.15 0.97 3.47 2.93 0.82 1.15 1.79
Professional & Technical 3.80 2.75 5.37 4.88 1.40 4.55 3.21
Clerical & Related 2.41 1.23 2.93 4.14 1.05 1.65 1.99
Business Service 7.52 3.37 7.60 11.20 2.16 5.04 3.07
Agriculture & Aquatic 69.27 85.85 64.28 61.00 90.89 81.72 84.47
Production, Transport
Equipment Operators & Related 14.78 5.51 16.34 15.68 3.68 5.79 5.44
Other 0.06 0.32 0.00 0.17 0.00 0.10 0.03
2005 Mean Head’s Education 8.41 8.22 9.00 7.08 6.85 6.77 6.62
Mean Spouse’s Education 7.40 6.87 8.41 5.46 4.69 6.85 5.30
Mean Household Size 3.49 3.53 3.16 3.96 3.73 4.33 3.90
Head's Occupation (%)
Head of Government, Party,
Industrial Unit 1.98 0.48 2.72 2.35 0.70 1.07 1.24
Professional & Technical 6.35 5.46 6.20 6.45 6.21 3.81 5.83
Clerical & Related 2.99 2.15 3.61 3.91 1.41 1.68 2.84
Business Service 10.54 6.71 9.16 12.02 2.94 6.47 3.91
Agriculture & Aquatic 58.85 76.51 57.22 59.12 81.23 81.37 78.56
Production, Transport
Equipment Operators & Related 19.07 8.43 20.85 16.00 7.23 5.57 7.51
Other 0.22 0.26 0.24 0.15 0.28 0.03 0.11
Sources: 1990 and 2000 Census Public Use Micro-Samples; 2005 Mid-censal Survey.
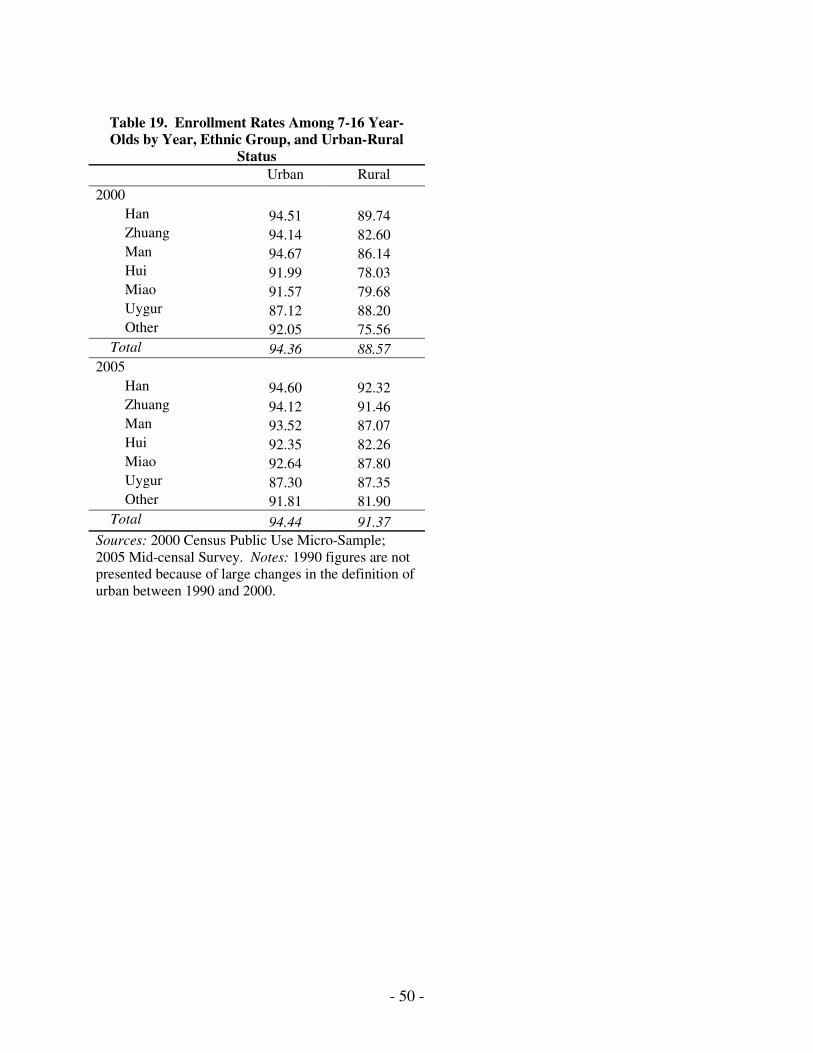
- 50 -
Table 19. Enrollment Rates Among 7-16 Year-
Olds by Year, Ethnic Group, and Urban-Rural
Status
Urban Rural
2000 Han 94.51 89.74 Zhuang 94.14 82.60 Man 94.67 86.14 Hui 91.99 78.03 Miao 91.57 79.68 Uygur 87.12 88.20 Other 92.05 75.56
Total 94.36 88.57 2005
Han 94.60 92.32 Zhuang 94.12 91.46 Man 93.52 87.07 Hui 92.35 82.26 Miao 92.64 87.80 Uygur 87.30 87.35 Other 91.81 81.90
Total 94.44 91.37
Sources: 2000 Census Public Use Micro-Sample;
2005 Mid-censal Survey. Notes: 1990 figures are not
presented because of large changes in the definition of
urban between 1990 and 2000.
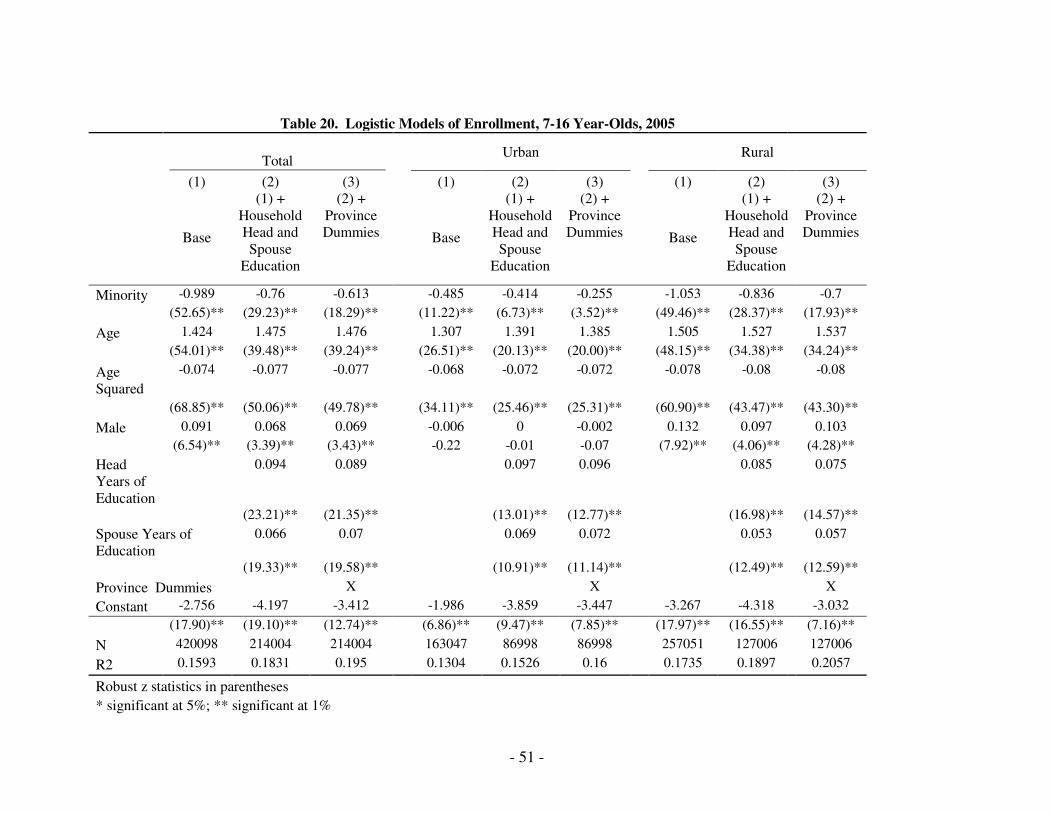
Table 20. Logistic Models of Enrollment, 7
Total
(1) (2) (3)
Base
(1) +
Household
Head and
Spouse
Education
(2) +
Province
Dummies
Minority -0.989 -0.76 -0.613
(52.65)** (29.23)** (18.29)**
Age 1.424 1.475 1.476
(54.01)** (39.48)** (39.24)**
Age
Squared
-0.074 -0.077 -0.077
(68.85)** (50.06)** (49.78)**
Male 0.091 0.068 0.069
(6.54)** (3.39)** (3.43)**
Head
Years of
Education
0.094 0.089
(23.21)** (21.35)**
Spouse Years of
Education 0.066 0.07
(19.33)** (19.58)**
Province Dummies X
Constant -2.756 -4.197 -3.412
(17.90)** (19.10)** (12.74)**
N 420098 214004 214004
R2 0.1593 0.1831 0.195
Robust z statistics in parentheses
* significant at 5%; ** significant at 1%
- 51 -
Table 20. Logistic Models of Enrollment, 7-16 Year-Olds, 2005
Urban Rural
(1) (2) (3) (1) (2)
Base
(1) +
Household
Head and
Spouse
Education
(2) +
Province
Dummies
Base
(1) +
Household
Head and
Spouse
Education
-0.485 -0.414 -0.255 -1.053 -0.836
(11.22)** (6.73)** (3.52)** (49.46)** (28.37)**
1.307 1.391 1.385 1.505 1.527
(26.51)** (20.13)** (20.00)** (48.15)** (34.38)**
-0.068 -0.072 -0.072 -0.078 -0.08
(34.11)** (25.46)** (25.31)** (60.90)** (43.47)**
-0.006 0 -0.002 0.132 0.097
-0.22 -0.01 -0.07 (7.92)** (4.06)**
0.097 0.096 0.085
(13.01)** (12.77)** (16.98)**
0.069 0.072 0.053
(10.91)** (11.14)** (12.49)**
X
-1.986 -3.859 -3.447 -3.267 -4.318
(6.86)** (9.47)** (7.85)** (17.97)** (16.55)**
163047 86998 86998 257051 127006
0.1304 0.1526 0.16 0.1735 0.1897
(3)
Household
Head and
(2) +
Province
Dummies
-0.7
(17.93)**
1.537
(34.24)**
-0.08
(43.30)**
0.103
(4.28)**
0.075
(14.57)**
0.057
(12.59)**
X
-3.032
(7.16)**
127006
0.2057
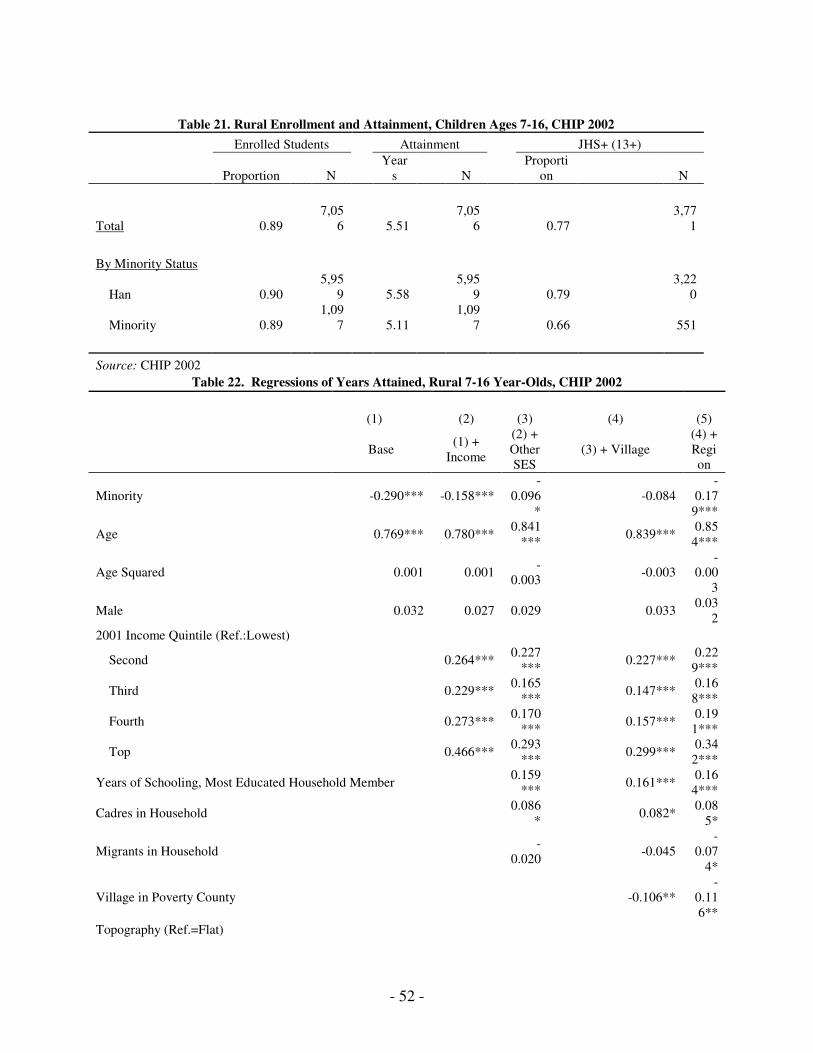
- 52 -
Table 21. Rural Enrollment and Attainment, Children Ages 7-16, CHIP 2002
Enrolled Students Attainment JHS+ (13+)
Proportion N
Year
s N
Proporti
on N
Total 0.89
7,05
6 5.51
7,05
6 0.77
3,77
1
By Minority Status
Han 0.90
5,95
9 5.58
5,95
9 0.79
3,22
0
Minority 0.89
1,09
7 5.11
1,09
7 0.66 551
Source: CHIP 2002
Table 22. Regressions of Years Attained, Rural 7-16 Year-Olds, CHIP 2002
(1)
(2) (3) (4) (5)
Base (1) +
Income
(2) +
Other
SES
(3) + Village
(4) +
Regi
on
Minority -0.290*** -0.158***
-
0.096
*
-0.084
-
0.17
9***
Age 0.769*** 0.780*** 0.841
*** 0.839***
0.85
4***
Age Squared 0.001 0.001 -
0.003 -0.003
-
0.00
3
Male 0.032 0.027 0.029 0.033 0.03
2
2001 Income Quintile (Ref.:Lowest)
Second 0.264*** 0.227
*** 0.227***
0.22
9***
Third 0.229*** 0.165
*** 0.147***
0.16
8***
Fourth 0.273*** 0.170
*** 0.157***
0.19
1***
Top 0.466*** 0.293
*** 0.299***
0.34
2***
Years of Schooling, Most Educated Household Member 0.159
*** 0.161***
0.16
4***
Cadres in Household 0.086
* 0.082*
0.08
5*
Migrants in Household -
0.020 -0.045
-
0.07
4*
Village in Poverty County -0.106**
-
0.11
6**
Topography (Ref.=Flat)
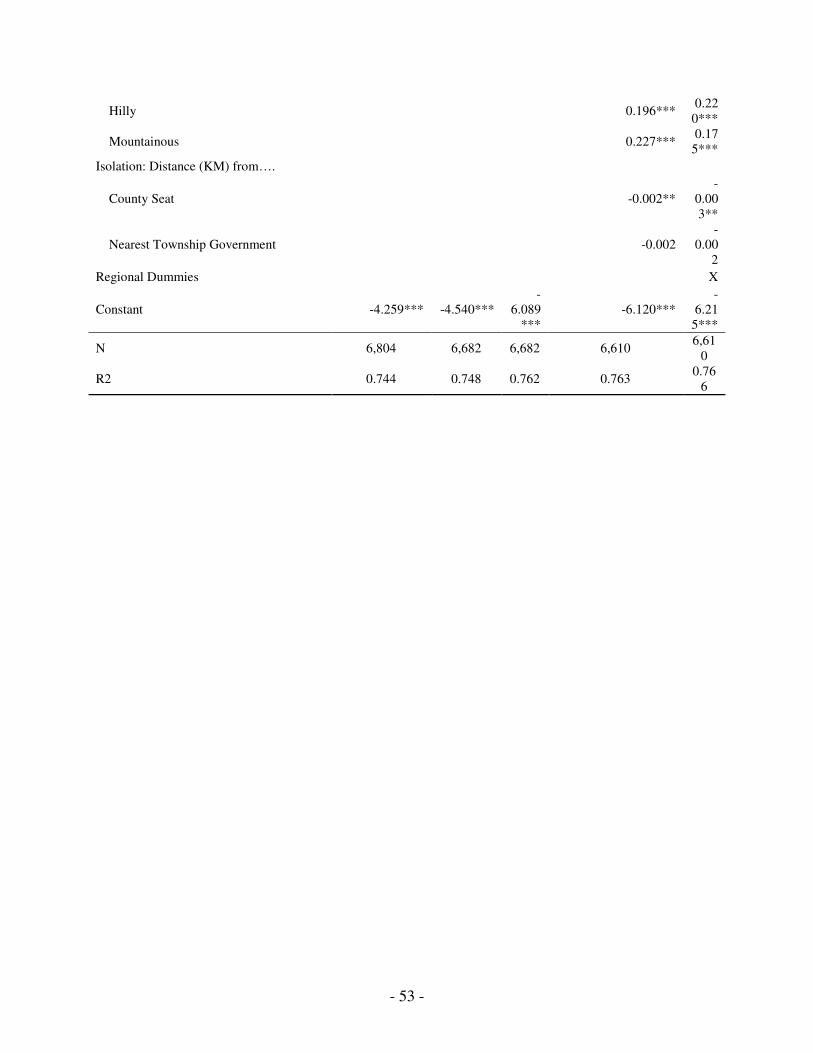
- 53 -
Hilly 0.196*** 0.22
0***
Mountainous 0.227*** 0.17
5***
Isolation: Distance (KM) from….
County Seat -0.002**
-
0.00
3**
Nearest Township Government -0.002
-
0.00
2
Regional Dummies X
Constant -4.259*** -4.540***
-
6.089
***
-6.120***
-
6.21
5***
N 6,804 6,682 6,682 6,610 6,61
0
R2 0.744 0.748 0.762 0.763 0.76
6
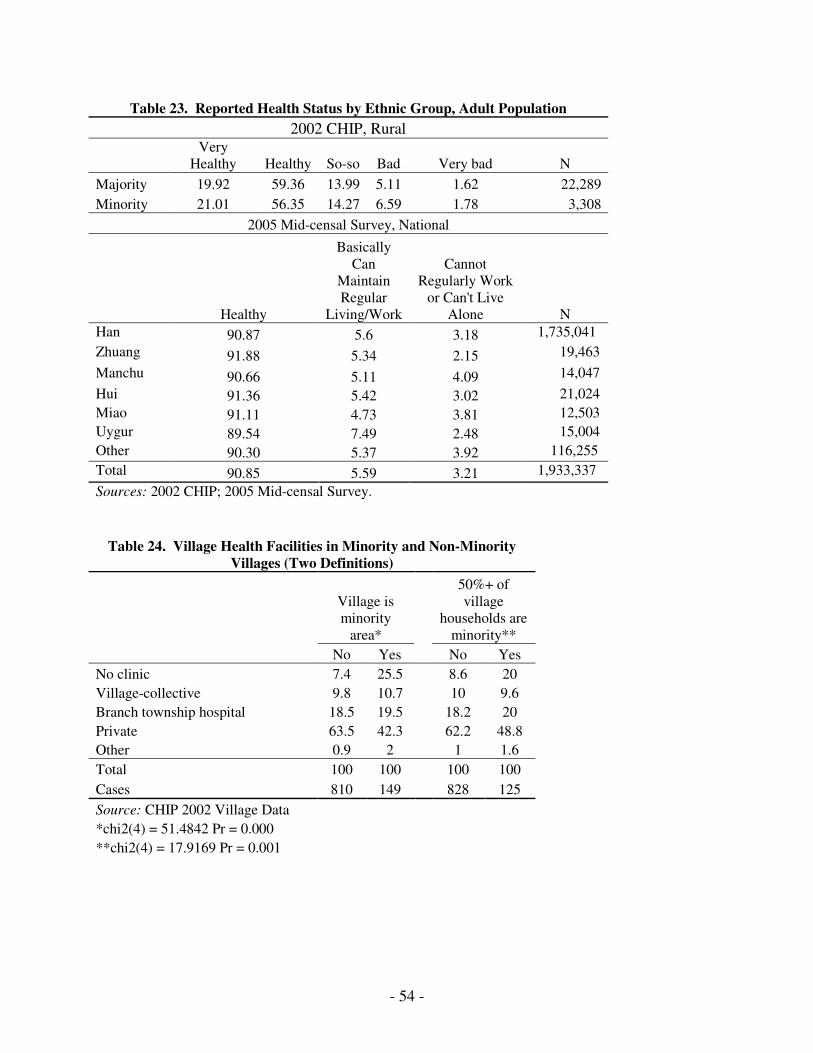
- 54 -
Table 23. Reported Health Status by Ethnic Group, Adult Population
2002 CHIP, Rural
Very
Healthy Healthy So-so Bad Very bad N
Majority 19.92 59.36 13.99 5.11 1.62 22,289
Minority 21.01 56.35 14.27 6.59 1.78 3,308
2005 Mid-censal Survey, National
Healthy
Basically
Can
Maintain
Regular
Living/Work
Cannot
Regularly Work
or Can't Live
Alone N Han 90.87 5.6 3.18 1,735,041
Zhuang 91.88 5.34 2.15 19,463
Manchu 90.66 5.11 4.09 14,047
Hui 91.36 5.42 3.02 21,024
Miao 91.11 4.73 3.81 12,503
Uygur 89.54 7.49 2.48 15,004
Other 90.30 5.37 3.92 116,255
Total 90.85 5.59 3.21 1,933,337
Sources: 2002 CHIP; 2005 Mid-censal Survey.
Table 24. Village Health Facilities in Minority and Non-Minority
Villages (Two Definitions)
Village is
minority
area*
50%+ of
village
households are
minority**
No Yes No Yes
No clinic 7.4 25.5 8.6 20
Village-collective 9.8 10.7 10 9.6
Branch township hospital 18.5 19.5 18.2 20
Private 63.5 42.3 62.2 48.8
Other 0.9 2 1 1.6
Total 100 100 100 100
Cases 810 149 828 125
Source: CHIP 2002 Village Data
*chi2(4) = 51.4842 Pr = 0.000
**chi2(4) = 17.9169 Pr = 0.001
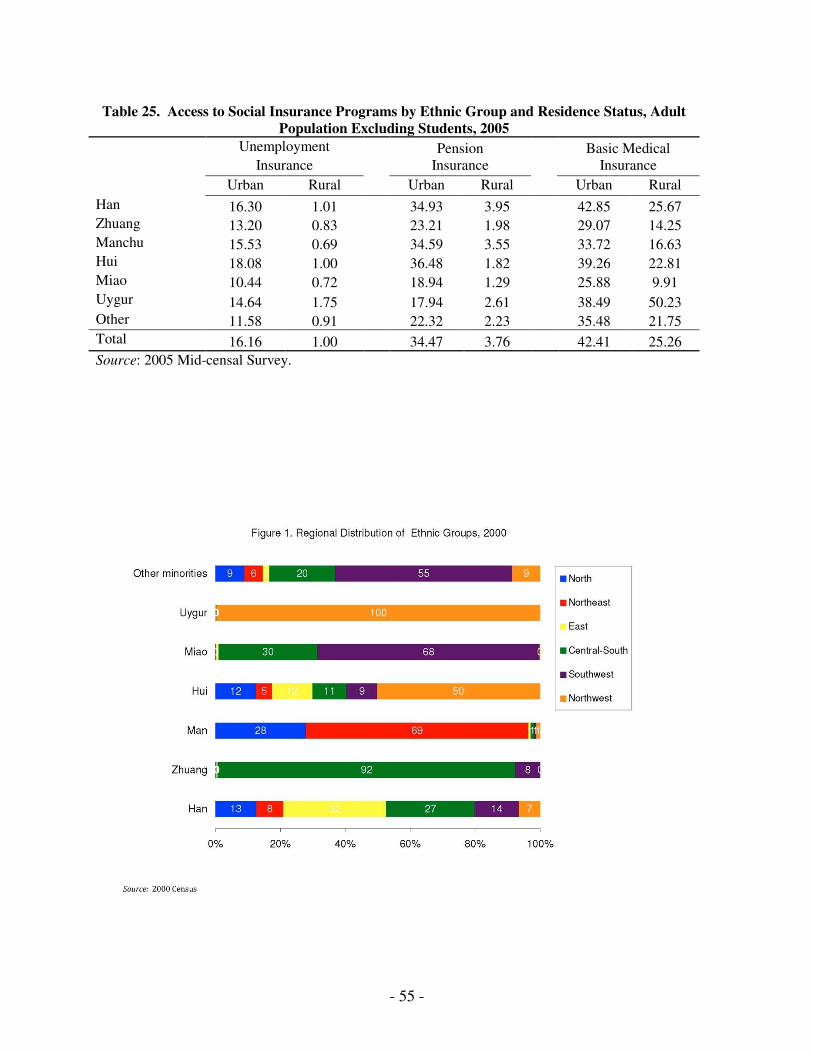
- 55 -
Table 25. Access to Social Insurance Programs by Ethnic Group and Residence Status, Adult
Population Excluding Students, 2005
Unemployment Pension Basic Medical Insurance Insurance Insurance
Urban Rural Urban Rural Urban Rural
Han 16.30 1.01 34.93 3.95 42.85 25.67 Zhuang 13.20 0.83 23.21 1.98 29.07 14.25 Manchu 15.53 0.69 34.59 3.55 33.72 16.63 Hui 18.08 1.00 36.48 1.82 39.26 22.81 Miao 10.44 0.72 18.94 1.29 25.88 9.91 Uygur 14.64 1.75 17.94 2.61 38.49 50.23 Other 11.58 0.91 22.32 2.23 35.48 21.75 Total 16.16 1.00 34.47 3.76 42.41 25.26
Source: 2005 Mid-censal Survey.
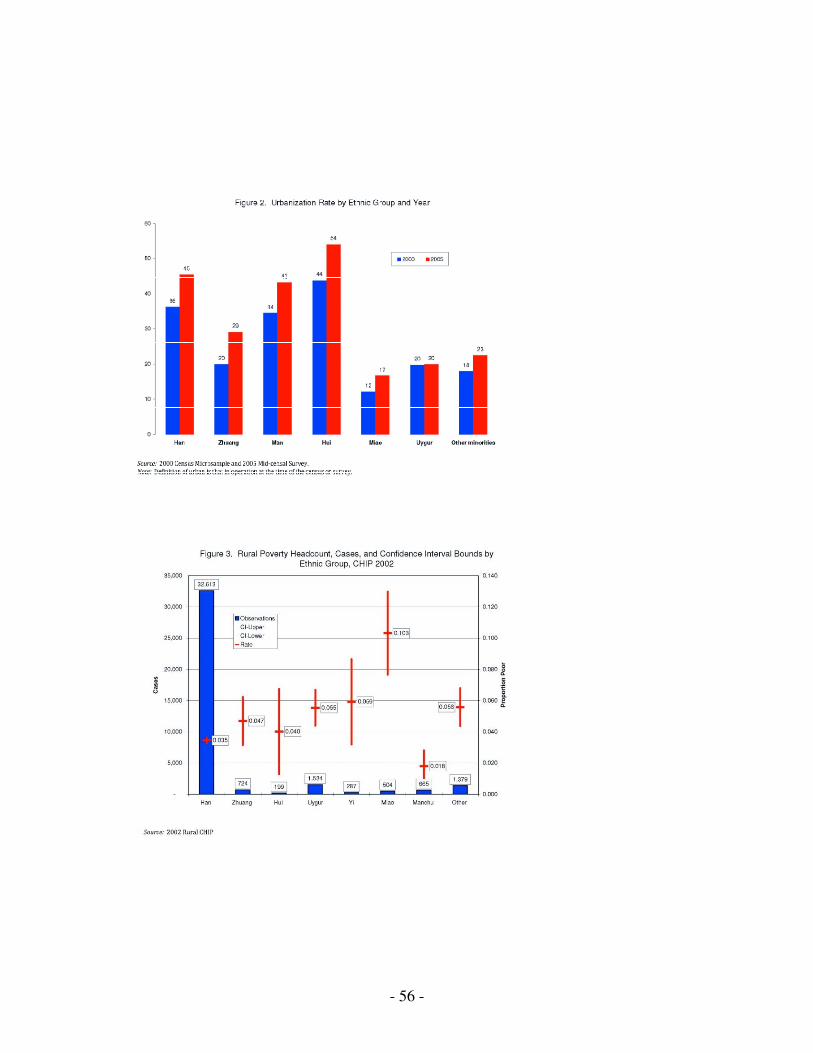
- 56 -

- 57 -
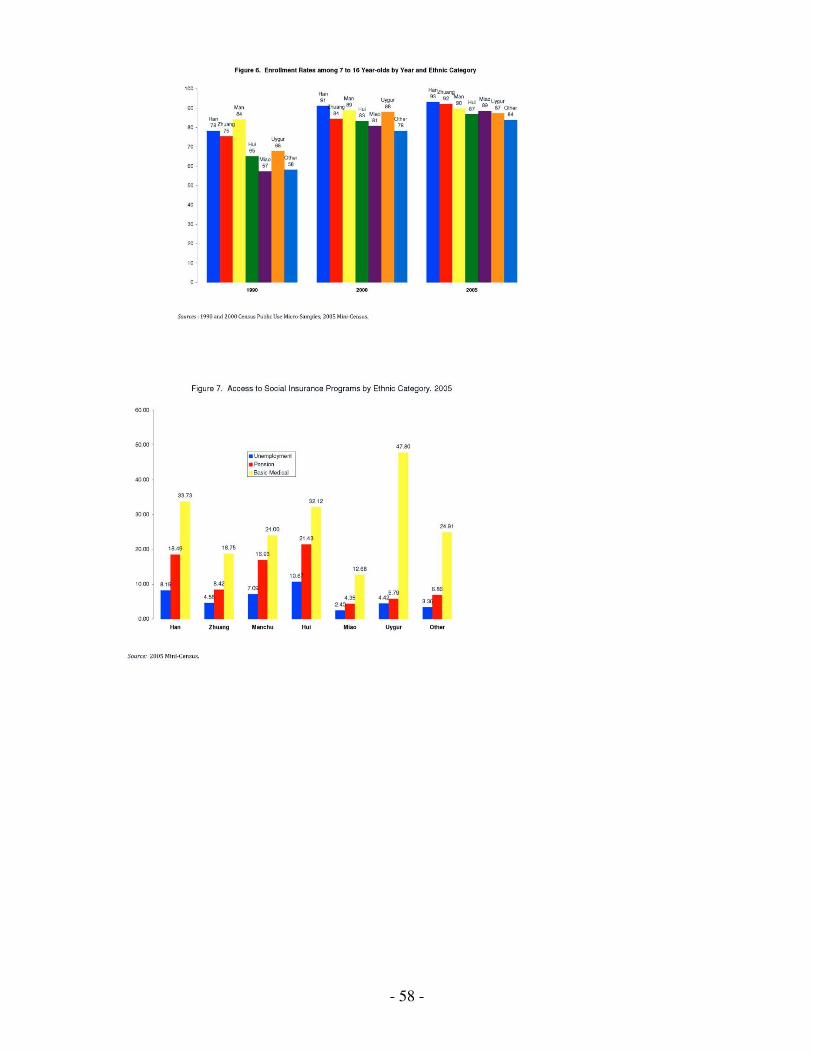
- 58 -
- 59 -
Notes
i The White Paper gives additional details on sources of these rights (Information Office of the State
Council of the People’s Republic of China 2000, section 3):
The Common Program of the CPPCC, adopted at the first CPPCC session on September
29, 1949 and serving as the country's provisional constitution, defined regional
autonomy for ethnic minorities as a basic policy and one of the important political
systems of the state. The Program for the Implementation of Ethnic Regional Autonomy
of the People's Republic of China, issued on August 8, 1952, embodied overall
arrangements for the implementation of regional autonomy for national minorities. The
Constitution of the People's Republic of China adopted in 1954 and later amended and
promulgated defines such autonomy as an important political system of state. The Law of
the People's Republic of China on Ethnic Regional Autonomy, promulgated in 1984,
contains systematic provisions on the political, economic and cultural rights and duties
of ethnic minority autonomous areas. ii The white paper also lays out a series of specific statements about rights (Information Office of the State
Council of the People’s Republic of China 2000, section 3):
“The people's congresses of the autonomous areas have the right to enact regulations on
the exercise of autonomy and separate regulations in light of local political, economic
and cultural characteristics…If resolutions, decisions, orders and instructions from the
higher-level state organs are not suited to the actual conditions of the autonomous areas,
the organs of self-government of these areas may be flexible in carrying them out or may
decide not to carry them out after approval by the higher state organs…Organs of self-
government of autonomous areas may independently arrange and manage local
economic construction within the guidance of state planning, and formulate policies,
principles and plans for their economic construction according to their local
characteristics and requirements. The organs of self-government in the autonomous
areas have trained a large number of minority cadres, technicians, management
personnel and other specialized personnel and skilled workers in line with the needs of
national construction and brought their roles in work into full play…Organs of self-
government of autonomous areas may decide their own local education programs,
including the establishment of schools, the length of study, the forms of school running,
course contents, language of instruction and procedures of enrollment and develop
independently their own type of education based on their ethnic minority characteristics
and within the state education policies and relevant laws.…Organs of self-government of
autonomous areas make their own decisions concerning medical and health work.” iii The publication is “Opinions Concerning Improving the Work of Minority Education” [关于加强民族
教育工作的意见,Guanyu jiaqiang minzu jiaoyu gongzuo de yijian,” cited in Ma 2007, p. 15.
iv There is much contention surrounding what combination of languages of instruction best serves the
needs of minority children (Feng 2005). A debate exists between prioritizing rapid immersion into
Mandarin, as a prerequisite for educational advancement and economic mobility, or first language
maintenance and development, thought to offer carryover effects on literacy in the second language, and
valuable for promoting cultural diversity and cultural survival.
v We thank Professors Wang Jiayi and Xu Jieying at Northwest Normal University for helpful
conversations that pointed out these challenges in curricular content in minority languages.
vi The 1986 and 1995 Laws emphasize popularization of Mandarin, as well as use of minority
languages. . . . . For example, the 1995 law states, “The Chinese language, both oral and written, shall
- 60 -
be the basic oral and written language for education in schools and other educational institutions. Schools
or other educational institutions which mainly consist of students from minority nationalities may use in
education the language of the respective nationality or the native language commonly adopted in that
region.
Schools and other educational institutions shall in their educational activities popularize the
nationally common spoken Chinese and the standard written characters” (Article 12).
vii Gustafsson and Ding (2008, p. 7) provide a useful description of the sample for the rural 2002 CHIP:
“The sample was drawn from the large sample used by [the National Bureau of Statistics] in its annual
household survey covering around 67,000 households. This sample is selected in a multi-stage procedure
to be representative at the province level and each province statistical bureau is responsible for samples at
the village level. At the village level, a probability sample of ten households is selected. The rural
households are asked to keep detailed records of their expenditures as well as provide information on their
income. A large number of assistant enumerators aid the households in keeping good accounts and in
checking the information.”
viii An important caveat is that the CHIP sample is a subsample of a larger Rural Household Survey
sample, and the dataset does not include sufficient documentation to incorporate sample design effects in
these calculations. A second caveat is that the year-to-year observations may not be fully independent.
These caveats suggest that some caution is due in interpreting confidence intervals.
ix These measures are the headcount index, the poverty gap ratio, and the squared poverty gap. They are
calculated as Pα=(1/n)* Σi=1,q [(z-yi)/z]α, where P is the poverty indicator, α=0 for the headcount index, 1
for the poverty gap ratio, and 2 for the squared poverty gap ratio. Z is the poverty line, yi is the income
for person i, and q is the number of people who are poor.
x These percentages are obtained by the formula 100*({exp[b]}-1), where b is the coefficient for years of
education.
xi According to the same source, more than 60 counties had not universalized primary education (Wang
2006b, p. 1).
xii The source uses the term “minority counties” (少数民族县, shaoshu minzu xian), but this does not
appear to mean minority autonomous counties. xiii
Research has indicated that it is primarily in rural contexts where minority educational disadvantage is
concentrated. Connelly and Zheng’s (2007) analysis of 2000 census data showed that that those minority
children who can muster the resources to get through middle school, within urban or rural areas, enjoyed
slightly better chances of going on to high school, compared to their Han counterparts (p. 87).
xiv In thinking about this issue, we benefited from discussions with Professor Wang Jiayi at Northwest
Normal University and participants in the Oxford China Seminar.