socioeconomic variation in absolute cardiovascular disease
TRANSCRIPT
1
Socioeconomic variation in absolute cardiovascular disease risk and
treatment in the Australian population
Ellie Paige1, Jennifer Welsh1, Jason Agostino1, Bianca Calabria1, Emily Banks1,2, Rosemary J.
Korda1
1 National Centre for Epidemiology and Population Health, Research School of Population
Health, Australian National University, Canberra, ACT, Australia
2 Sax Institute, Sydney, NSW, Australia
Correspondence: [email protected]
Abstract
Cardiovascular disease (CVD), preventable through appropriate management of absolute CVD
risk, disproportionately affects socioeconomically disadvantaged individuals. The aim of this
study was to estimate absolute and relative socioeconomic inequalities in absolute CVD risk
and treatment in the Australian population using cross-sectional representative data on 4,751
people aged 45-74 from the 2011-12 Australian Health Survey. Poisson regression was used to
calculate prevalence differences (PD) and ratios (PR) for prior CVD, high 5-year absolute risk of
a primary CVD event and guideline-recommended medication use, in relation to
socioeconomic position (SEP, measured by education). After adjusting for age and sex, the
prevalence of high absolute risk of a primary CVD event among those of low, intermediate and
high SEP was 12.6%, 10.9% and 7.7% (PD, low vs. high=5.0 [95% CI: 2.3, 7.7], PR=1.6 [1.2, 2.2])
and for prior CVD was 10.7%, 9.1% and 6.7% (PD=4.0 [1.4, 6.6], PR=1.6 [1.1, 2.2]). The
proportions using preventive medication use among those with high primary risk were 21.3%,
2
19.5% and 29.4% for low, intermediate and high SEP and for prior CVD, were 37.8%, 35.7% and
17.7% (PD=20.1 [9.7, 30.5], PR=2.1 [1.3, 3.5]). Proportions at high primary risk and not using
medications among those of low, intermediate and high SEP were 10.6%, 8.8% and 4.7% and
with prior CVD not using medications were 8.5%, 6.3% and 4.1%. Findings indicate substantial
potential to prevent CVD and reduce inequalities through appropriate management of high
absolute risk in the population.
Keywords: Cardiovascular disease; absolute risk; socioeconomic position; inequalities.
Introduction
Cardiovascular disease (CVD) is the leading cause of death globally and a leading contributor
to morbidity.1 In Australia, CVD accounts for 12% of the total expenditure on health care, with
estimated costs of $7.7 billion in 2008-09.2 Approximately 80% of CVD events can be prevented
by modifying risk factors to reduce events.3, 4 In high income countries like Australia the
prevalence of modifiable risk factors is known to be disproportionately high in disadvantaged
groups, and individuals of low socioeconomic position are more likely to have a CVD event than
those of high socioeconomic position.5-7 This inverse association is likely the result of a complex
interplay between risk factors, including behavioural and biological factors, across the life-
course,7 and social determinants of health.8
International guidelines (e.g.9, 10) recommend an absolute risk approach for the assessment
and management of primary CVD risk. Absolute risk is quantified using a validated CVD risk
calculator, whereby quantitative data on multiple factors that influence risk, including smoking
3
status, systolic blood pressure, blood lipid levels, and diabetes status, are applied to a person’s
age- and sex-specific background level of absolute risk to predict an individual’s risk of having
a CVD event in a given period of time (typically five or ten years).11 For people who have had a
prior CVD event or who are at high absolute risk of primary CVD event (>15% over 5 years in
Australia) lifestyle modifications and treatment with blood pressure- and lipid-lowering
therapies are generally recommended, unless contraindicated.10
Although the links between socioeconomic position and individual CVD risk factors, morbidity
and mortality have been demonstrated by studies internationally,12-16 there are no studies that
have quantified absolute CVD risk in relation to socioeconomic position. Population-level data
on variations in absolute CVD risk assessment and management are needed to inform
population-level interventions and policies to prevent CVD and address inequalities. This paper
aims to estimate the absolute and relative socioeconomic inequalities in absolute CVD risk and
treatment of risk in Australia.
Methods
Study population
Details on the data sources have been published previously.17 Briefly, we used data from
participants in the 2011-12 Australian Bureau of Statistics Australian Health Survey18 aged 45-
74 years, and who provided data for the National Health Survey and biomedical data for the
National Health Measures Survey, two components of the Australian Health Survey. All those
that completed the National Health Measures Survey also completed the National Health
Survey. The Australian Health Survey is a nationally representative survey of private
4
households in Australia (~97% coverage). Of the 30,329 participants eligible to participate in
the National Health Measures Survey, 11,246 (37%) took part (47% of those aged 45-74 years).
Outcomes: absolute CVD risk assessment and treatment
The outcomes were prior CVD, high absolute risk of a primary CVD event, and use of preventive
medications according to recommendations in national Australian guidelines. Prior CVD was
self-reported as having had one or more of: ischaemic heart disease, angina, heart failure,
oedema, other heart disease (including atrial fibrillation/flutter), cerebrovascular disease,
and diseases of arteries, arterioles and capillaries. People with prior CVD are considered to be
at high risk of secondary CVD events. In participants without prior CVD, absolute risk of a
primary CVD event over the next five years was estimated using the Australian National
Vascular Disease Prevention Alliance risk assessment algorithm.10 Using this algorithm, some
people are considered to be at clinically-determined high risk based on existing risk factors (for
example, people with diabetes who are over 60 years old). For all other people, the
Framingham CVD risk equation10, 11 was applied, with five-year risk categorised as low (<10%),
moderate (10-15%) or high (>15%).10 Recommended treatment (according to Australian
clinical guidelines10) for individuals at high absolute risk of a primary CVD event was defined as
the use of blood pressure- and lipid-lowering medications, as reported in a medications review.
For people with prior CVD, recommended treatment also included antithrombotic medication,
as per Australian clinical guidelines.19-22 Medications were coded using the World Health
Organization Anatomical Therapeutic Chemical (ATC) Classification System23 and included ATC
codes: C02, C03, C07, C08 and C09 for blood pressure-lowering medications, ATC code C10
for lipid-lowering medications, and ATC code B01 for antithrombotic medication.
5
Main exposure: socioeconomic position
Socioeconomic position was based on educational attainment ascertained from self-reported
highest level of qualification and categorised as: high (university degree); intermediate
(certificate, diploma or trade); or low (high school certificate or no qualifications).
Statistical analysis
The proportions with prior CVD and with low, moderate and high primary CVD risk were
calculated, by socioeconomic position. We also summarised the distribution of individual CVD
risk factors in those without a prior CVD event by socioeconomic position. We used Poisson
regression with robust standard errors24, 25 to quantify absolute and relative inequalities in the
prevalence of high absolute risk of primary CVD and of prior CVD, as well as in use of preventive
treatments within each of these high risk groups. In the treatment analysis, we used data from
the full National Health Survey dataset and included an additional 211 participants who
reported having prior CVD and an additional 89 participants who had clinically determined high
risk who were previously excluded due to missing biomedical data. Prevalence ratios (PR) were
obtained directly from the Poisson regression coefficients, and post-estimation marginal
effects were used to estimate the absolute prevalence differences, for each level of
educational attainment in relation to the reference group (university degree). The models were
adjusted sequentially, first for age and sex, and then additionally for region of residence (major
cities, inner regional or other [outer regional and remote/very remote], measured using the
Accessibility/Remoteness Index of Australia) and region of birth (Australia/New Zealand or
other). We applied weights to the prevalence estimates to account for the sampling strategy
and non-response.26 95% confidence intervals (95% CI) were calculated for all estimates.
Analyses were performed using Stata version 13.1.27
6
Sensitivity analyses
We undertook three sensitivity analyses, re-running the main models using alternative
measures of socioeconomic position: (1) educational attainment measured using highest year
of school completed (year 11/12 or equivalent; year 9/10 or equivalent; year 8 or below); (2)
equivalised household income in quartiles; and (3) area-level disadvantage measured using the
Index of Relative Socioeconomic Disadvantage (Socio-Economic Indexes for Areas28) in
population-based quintiles. We also ran a post-hoc analysis to examine whether differences in
medication use according to socioeconomic position varied by type of prior CVD.
Ethics approval for the National Health Measures Survey data collection was provided by the
Australian Government Department of Health Human Research Ethics Committee (ref:
2/2011), with additional approval, for the current study, by the Australian National University
Human Research Ethics Committee (ref: 2014/208).
Results
A total of 4,751 people were included in the main analysis after excluding participants with
missing data on education (n=82, 1.5%) or on any variables needed for assessing absolute CVD
risk (n=520, 9.7%). Forty-nine percent of the participants were male and the median age was
59 years (interquartile range: 52-65 years). Overall, 24% of participants had a high
socioeconomic position, 37% intermediate, and 38% had low socioeconomic position (Table
1). Compared to people with the highest socioeconomic position, those of the lowest
socioeconomic position were more likely to be older, have been born in Australia or New

7
Zealand, or be residing outside major cities (Table 1) and had a greater burden of CVD risk
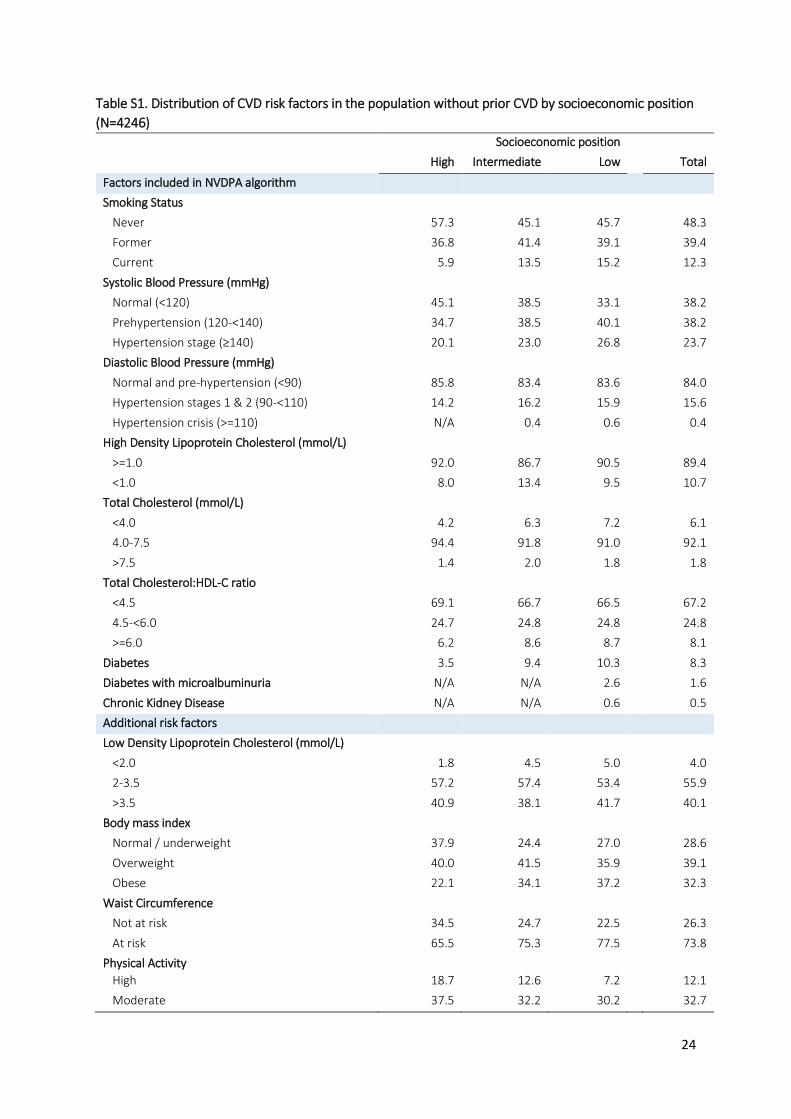
factors (Supplementary Table S1).
8
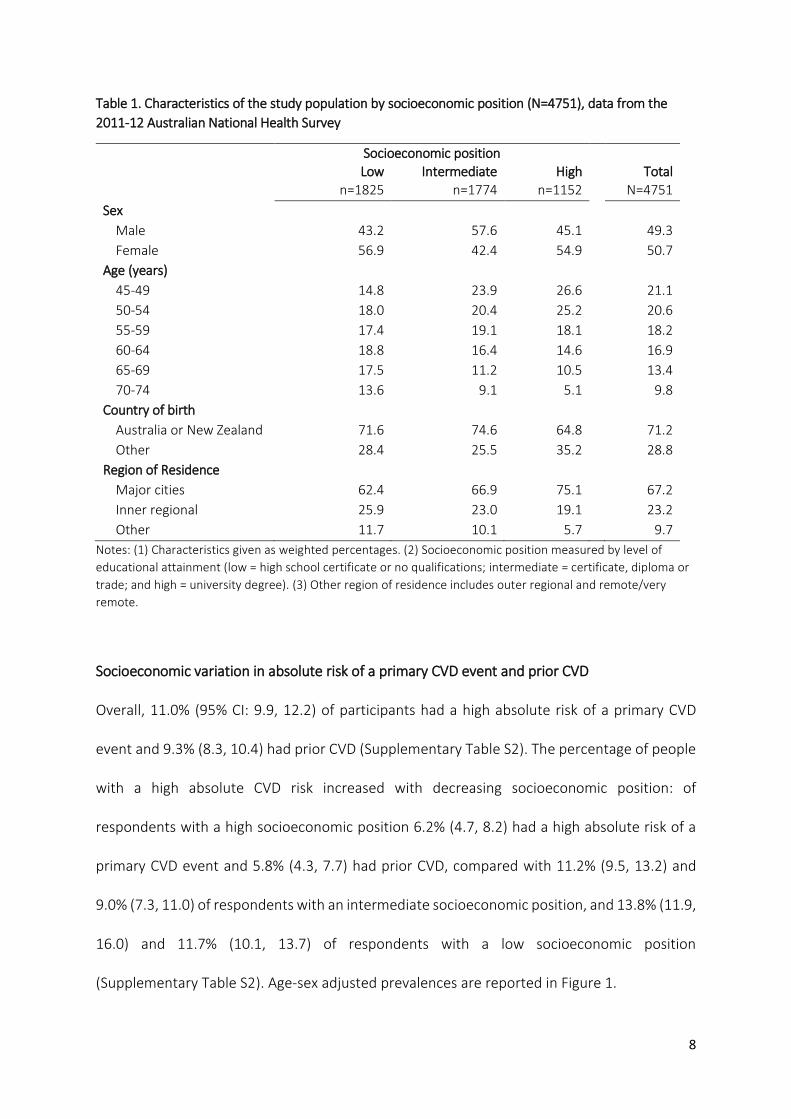
Table 1. Characteristics of the study population by socioeconomic position (N=4751), data from the
2011-12 Australian National Health Survey
Socioeconomic position
Low Intermediate High Total n=1825 n=1774 n=1152 N=4751
Sex
Male 43.2 57.6 45.1 49.3
Female 56.9 42.4 54.9 50.7
Age (years)
45-49 14.8 23.9 26.6 21.1
50-54 18.0 20.4 25.2 20.6
55-59 17.4 19.1 18.1 18.2
60-64 18.8 16.4 14.6 16.9
65-69 17.5 11.2 10.5 13.4
70-74 13.6 9.1 5.1 9.8
Country of birth
Australia or New Zealand 71.6 74.6 64.8 71.2
Other 28.4 25.5 35.2 28.8
Region of Residence
Major cities 62.4 66.9 75.1 67.2
Inner regional 25.9 23.0 19.1 23.2
Other 11.7 10.1 5.7 9.7
Notes: (1) Characteristics given as weighted percentages. (2) Socioeconomic position measured by level of
educational attainment (low = high school certificate or no qualifications; intermediate = certificate, diploma or
trade; and high = university degree). (3) Other region of residence includes outer regional and remote/very
remote.
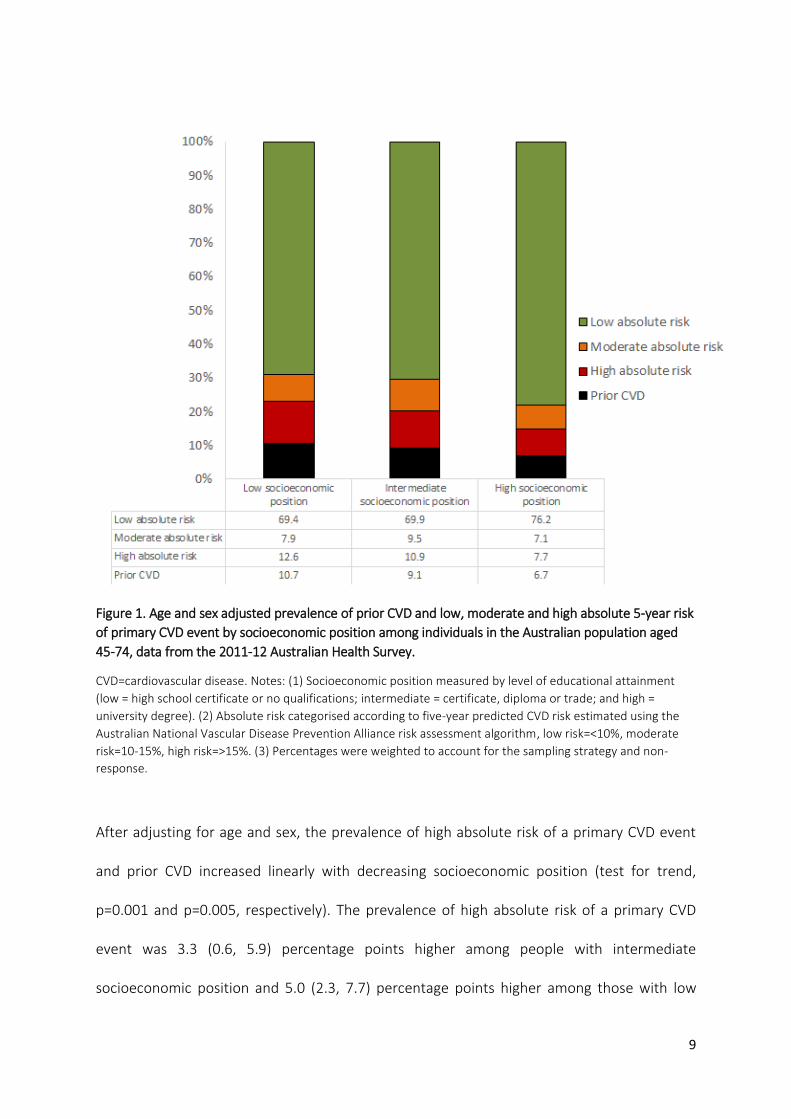
Socioeconomic variation in absolute risk of a primary CVD event and prior CVD
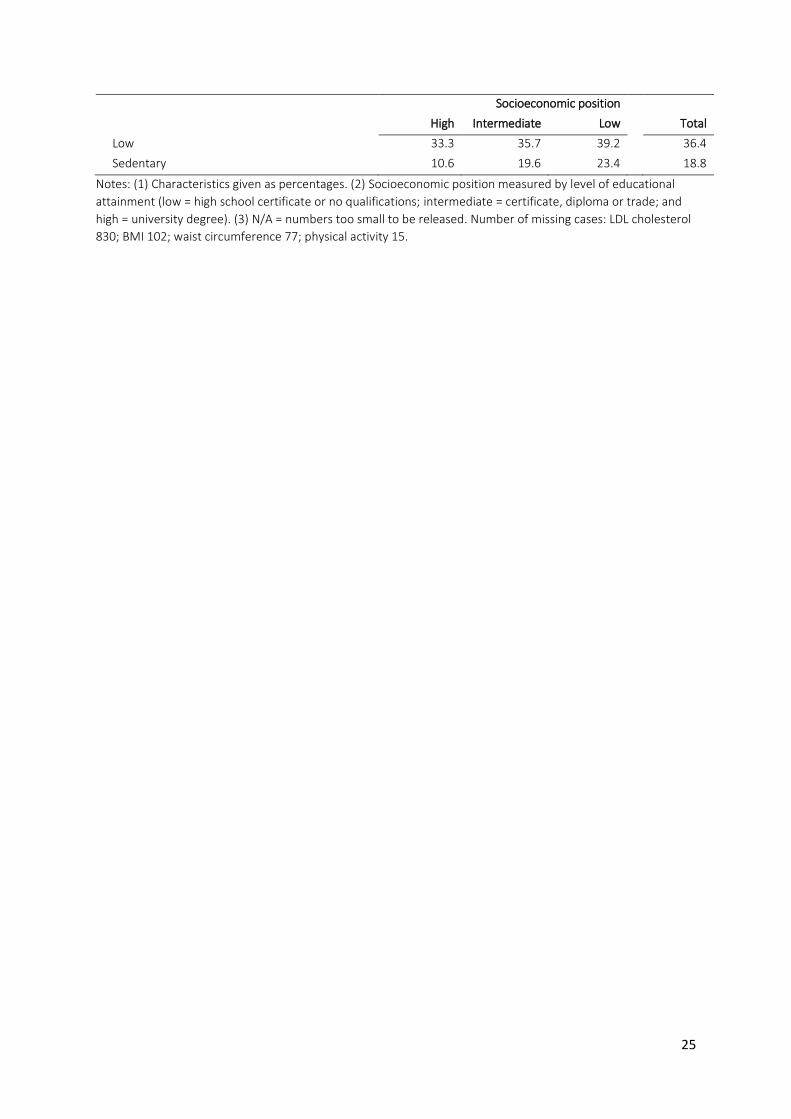
Overall, 11.0% (95% CI: 9.9, 12.2) of participants had a high absolute risk of a primary CVD
event and 9.3% (8.3, 10.4) had prior CVD (Supplementary Table S2). The percentage of people
with a high absolute CVD risk increased with decreasing socioeconomic position: of
respondents with a high socioeconomic position 6.2% (4.7, 8.2) had a high absolute risk of a
primary CVD event and 5.8% (4.3, 7.7) had prior CVD, compared with 11.2% (9.5, 13.2) and
9.0% (7.3, 11.0) of respondents with an intermediate socioeconomic position, and 13.8% (11.9,
16.0) and 11.7% (10.1, 13.7) of respondents with a low socioeconomic position
(Supplementary Table S2). Age-sex adjusted prevalences are reported in Figure 1.
9
Figure 1. Age and sex adjusted prevalence of prior CVD and low, moderate and high absolute 5-year risk
of primary CVD event by socioeconomic position among individuals in the Australian population aged
45-74, data from the 2011-12 Australian Health Survey.
CVD=cardiovascular disease. Notes: (1) Socioeconomic position measured by level of educational attainment
(low = high school certificate or no qualifications; intermediate = certificate, diploma or trade; and high =
university degree). (2) Absolute risk categorised according to five-year predicted CVD risk estimated using the
Australian National Vascular Disease Prevention Alliance risk assessment algorithm, low risk=<10%, moderate
risk=10-15%, high risk=>15%. (3) Percentages were weighted to account for the sampling strategy and non-
response.
After adjusting for age and sex, the prevalence of high absolute risk of a primary CVD event
and prior CVD increased linearly with decreasing socioeconomic position (test for trend,
p=0.001 and p=0.005, respectively). The prevalence of high absolute risk of a primary CVD
event was 3.3 (0.6, 5.9) percentage points higher among people with intermediate
socioeconomic position and 5.0 (2.3, 7.7) percentage points higher among those with low
10
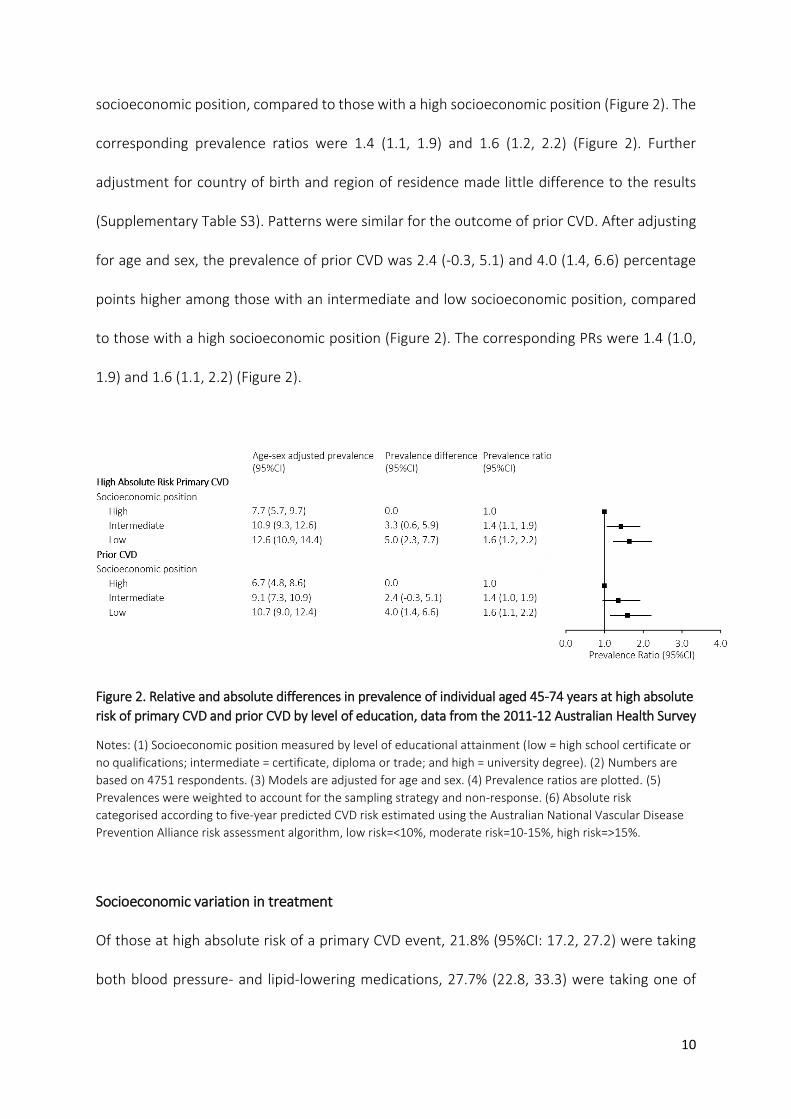
socioeconomic position, compared to those with a high socioeconomic position (Figure 2). The
corresponding prevalence ratios were 1.4 (1.1, 1.9) and 1.6 (1.2, 2.2) (Figure 2). Further
adjustment for country of birth and region of residence made little difference to the results
(Supplementary Table S3). Patterns were similar for the outcome of prior CVD. After adjusting
for age and sex, the prevalence of prior CVD was 2.4 (-0.3, 5.1) and 4.0 (1.4, 6.6) percentage
points higher among those with an intermediate and low socioeconomic position, compared
to those with a high socioeconomic position (Figure 2). The corresponding PRs were 1.4 (1.0,
1.9) and 1.6 (1.1, 2.2) (Figure 2).
Figure 2. Relative and absolute differences in prevalence of individual aged 45-74 years at high absolute
risk of primary CVD and prior CVD by level of education, data from the 2011-12 Australian Health Survey
Notes: (1) Socioeconomic position measured by level of educational attainment (low = high school certificate or
no qualifications; intermediate = certificate, diploma or trade; and high = university degree). (2) Numbers are
based on 4751 respondents. (3) Models are adjusted for age and sex. (4) Prevalence ratios are plotted. (5)
Prevalences were weighted to account for the sampling strategy and non-response. (6) Absolute risk
categorised according to five-year predicted CVD risk estimated using the Australian National Vascular Disease
Prevention Alliance risk assessment algorithm, low risk=<10%, moderate risk=10-15%, high risk=>15%.
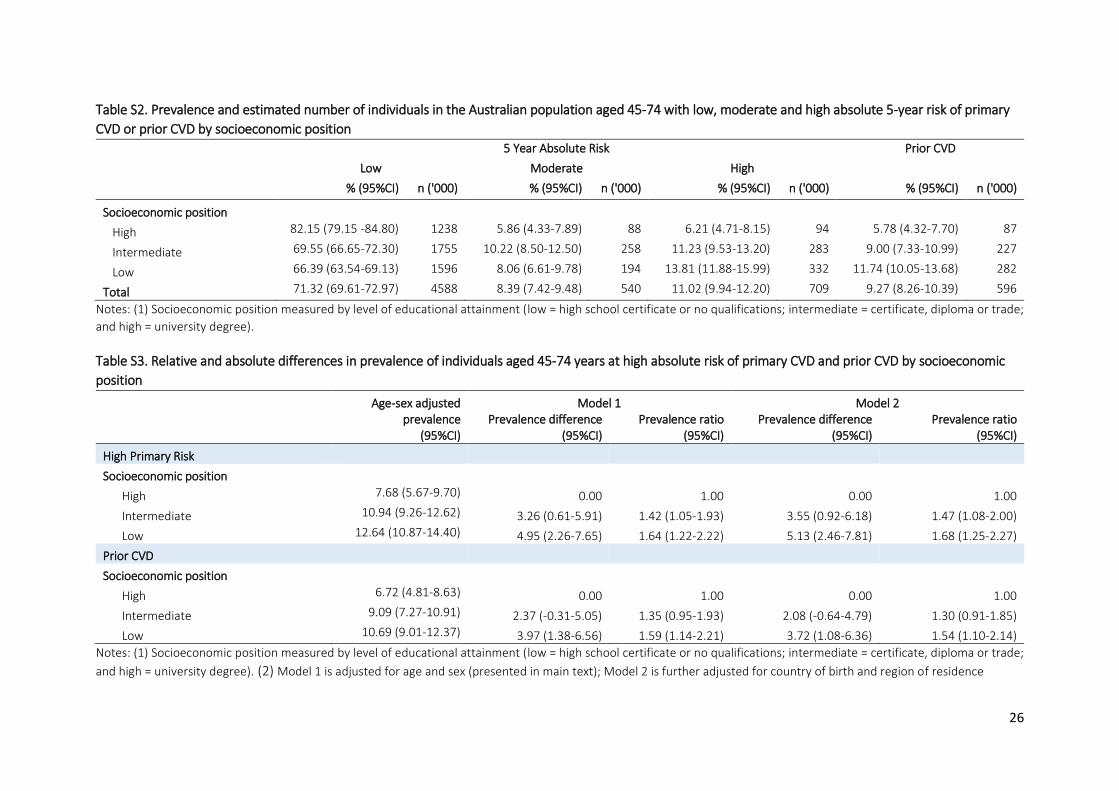
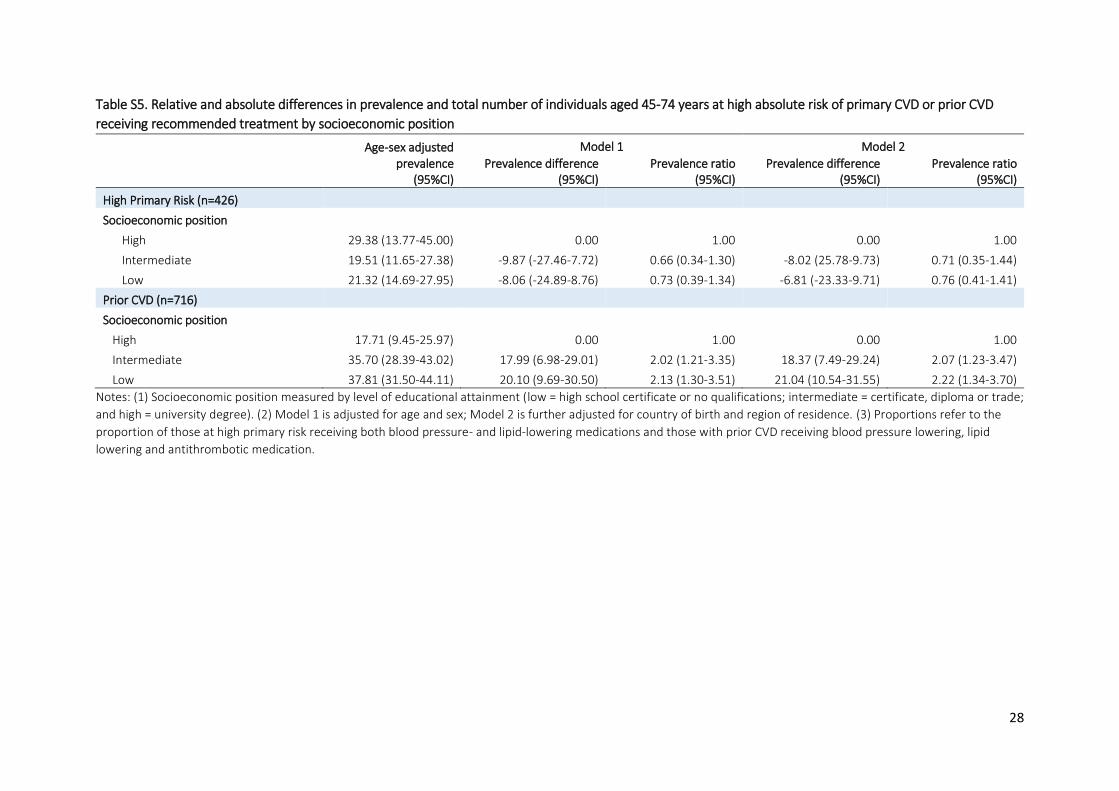
Socioeconomic variation in treatment
Of those at high absolute risk of a primary CVD event, 21.8% (95%CI: 17.2, 27.2) were taking
both blood pressure- and lipid-lowering medications, 27.7% (22.8, 33.3) were taking one of
11
these medications, and half (50.5% [44.4, 56.5]) were taking neither (Supplementary Table S4).
28.5% (15.8, 45.7) of those with a high socioeconomic position, 19.2% (12.5, 28.2) with an
intermediate socioeconomic position and 21.8% (15.6, 29.7) with a low socioeconomic position
were taking both medications (Supplementary Table S4), and after adjusting for age and sex
the differences were not statistically significant (Figure 3). Among those with low, intermediate
and high socioeconomic position respectively, the age-sex adjusted proportions of people at
high primary risk and not using both medications were 10.6% (8.4, 12.8), 8.8% (6.8, 10.9) and
4.7% (2.9, 6.4).
Figure 3. Relative and absolute differences in prevalence and total number of individuals aged 45-74
years at high absolute risk of primary CVD or with prior CVD using recommended medication by level of
education, data from the 2011-12 Australian Health Survey
Notes: (1) Socioeconomic position measured by level of educational attainment (low = high school certificate or
no qualifications; intermediate = certificate, diploma or trade; and high = university degree). (2) Numbers are
based on 426 respondents at high absolute risk of primary CVD and 716 respondents with prior CVD. (3)
Prevalence ratios are plotted. (4) Proportions refer to those at high primary risk using both blood pressure- and
lipid-lowering medications and those using blood pressure- and lipid-lowering, and antithrombotic medications
among those with prior CVD. (5) Models are adjusted for age and sex. (6) Prevalences were weighted to account
for the sampling strategy and non-response. (7) Absolute risk categorised according to five-year predicted CVD
risk estimated using the Australian National Vascular Disease Prevention Alliance risk assessment algorithm, low
risk=<10%, moderate risk=10-15%, high risk=>15%.
12
Among people with prior CVD, 34.3% (95%CI: 30.0-38.9) were taking the recommended
medications, including 37.3% (31.3, 43.8) of those with a low and 36.5% (29.0, 44.7) of those
with an intermediate socioeconomic position compared to 17.6% (10.6, 27.6) of those with a
high socioeconomic position (Supplementary Table S4). After adjusting for age and sex,
prevalence of recommended treatment was 18.0 (95%CI: 7.0, 29.0) and 20.1 (9.7, 30.5)
percentage points higher among those with an intermediate and low socioeconomic position,
compared to those with a high socioeconomic position (Figure 3). The corresponding
prevalence ratios were 2.0 (1.2, 3.4) and 2.1 (1.3, 3.5). Additional adjustment for country of
birth and region of residence made no material difference to the results (Supplementary Table
S5). We observed the same pattern of results when we restricted the analysis to people who
reported having prior CVD and had biomedical data to calculate absolute risk (results not
shown). Among those with low, intermediate and high socioeconomic position respectively,
the age-sex adjusted proportions of people with CVD and not using both medications were
8.5% (6.5, 10.6), 6.3% (4.5, 8.1) and 4.1% (2.3, 5.9).
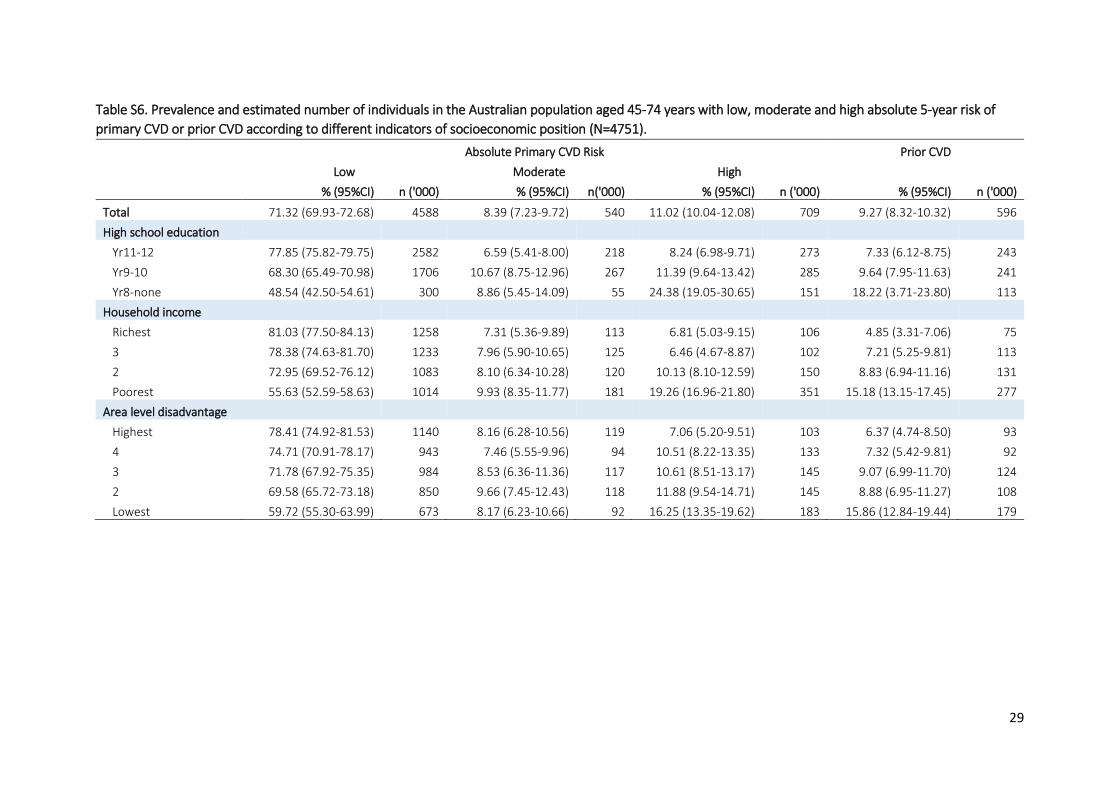
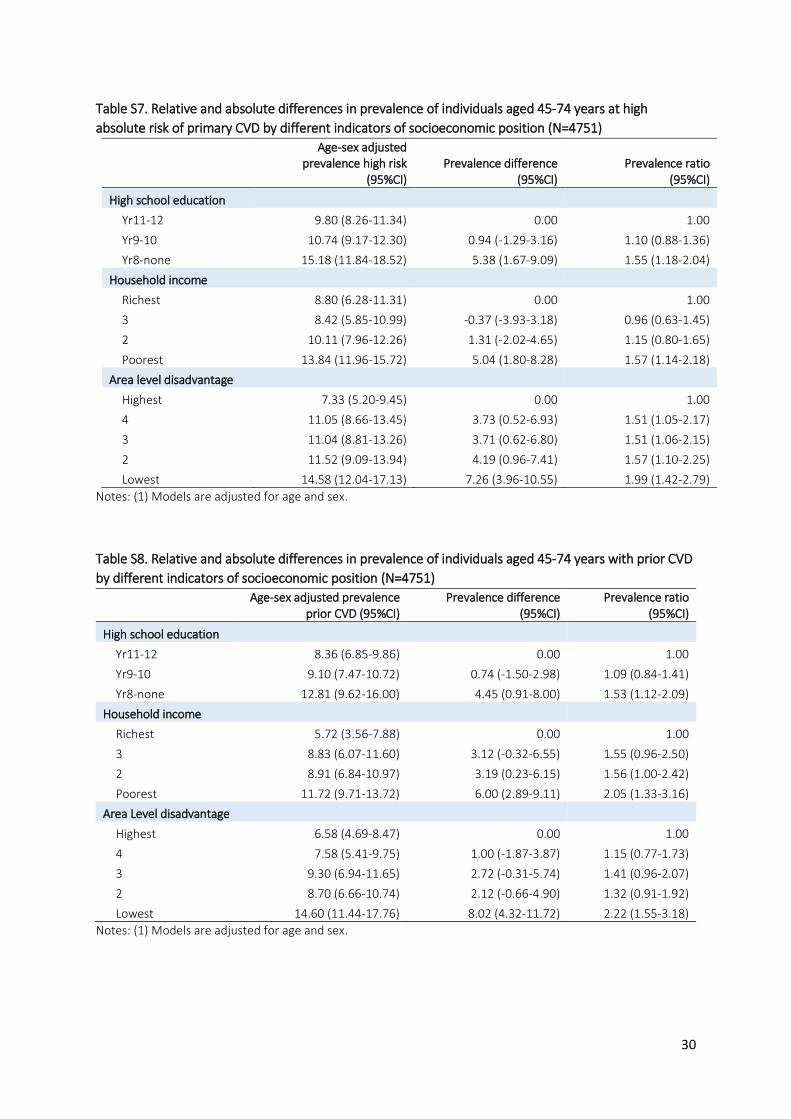
Sensitivity analyses
Results were broadly consistent when alternative measures of socioeconomic position (level
of high school educational attainment, household income, and area level disadvantage) were
used (Supplementary tables S6-S12). Prevalence of high absolute primary CVD risk and prior
CVD increased with lower levels of socioeconomic position (Supplementary Tables S7 and S8).
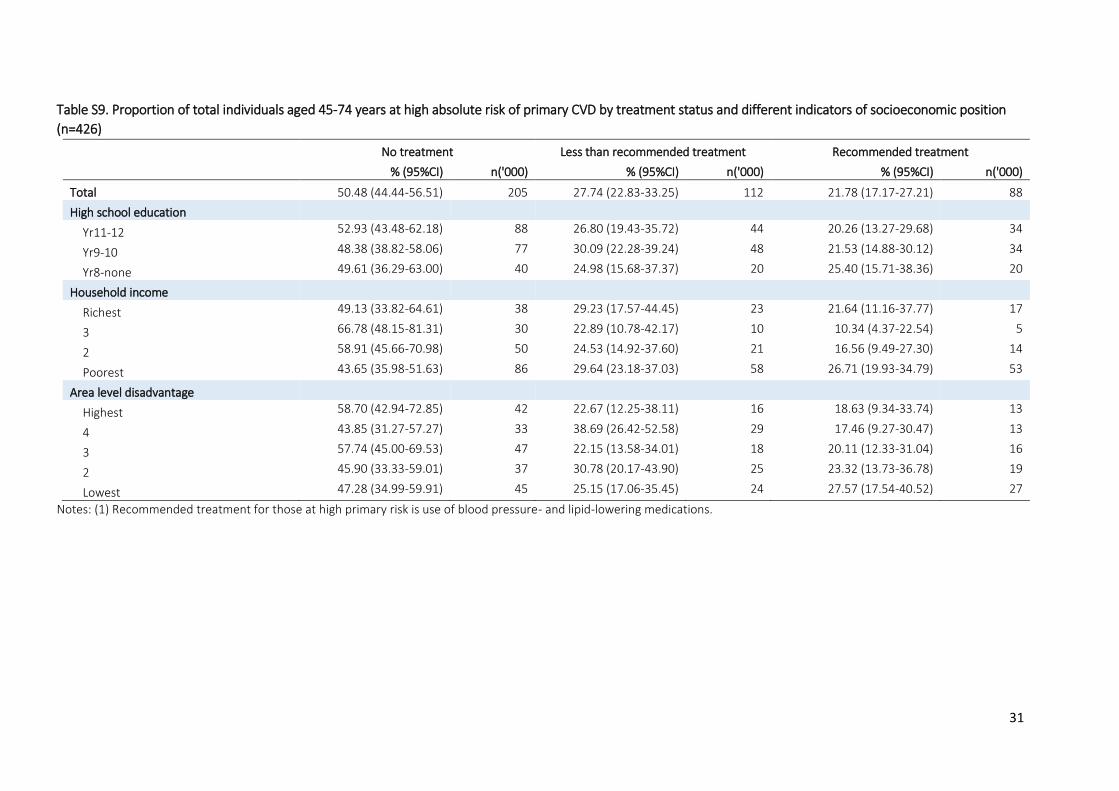
Using the alternative indicators of socioeconomic position, there were no clear patterns
between treatment and socioeconomic position among those at high absolute risk of a primary
CVD event (Supplementary Table S11), while in people with prior CVD, results were in the same
direction as the main analysis but were not statistically significant (Supplementary Table S12).
13
There was little difference in the types of prior CVD reported between those with low,
intermediate and high socioeconomic position (Supplementary Table S13) and prevalence
ratios were slightly attenuated but still in the same direction when type of CVD was adjusted
for in the analysis of treatment in those with prior CVD (Supplementary Table S14).
Discussion
In this nationally representative population-based Australian study, the prevalence of both
high absolute CVD risk and established CVD increased with increasing levels of disadvantage.
In those with no school qualifications versus a university education, the prevalence of
established CVD and of high absolute risk of a primary CVD event were both 1.6 times higher,
and in absolute terms, 4 and 5 percentage points higher, respectively. Treatment levels were
low overall and varied by socioeconomic position. Overall, around one in five people with a
high primary risk and one in three people with established CVD reported using both lipid- and
blood pressure-lowering medications. However, among people with established CVD the use
of recommended preventive medications was twice as high in those with low versus high
socioeconomic position. Despite this, around two times as many people of low compared to
high socioeconomic position were at high absolute risk of a primary CVD event or had existing
CVD and were not using lipid- and blood pressure-lowering medications.
This is the first study, to our knowledge, to investigate how absolute CVD risk and treatment
varies according to socioeconomic position. Our findings are consistent with previous findings
that incidence and prevalence of CVD is higher in people of low compared to high
socioeconomic position.29-32 The observed inverse association between socioeconomic
14
position and treatment in people with prior CVD were contrary to our expectation that,
consistent with findings of inequalities in care33, people with a low socioeconomic position
would be less likely to receive treatment than those with a high socioeconomic position.
However, this finding is not without precedent. Two previous Australian studies found age-
adjusted rates of statin prescribing were highest in the most socioeconomically disadvantaged
people.34, 35
There is limited evidence of socioeconomic variations in preventive treatment use in people
with prior CVD from previous international studies. Findings from an international systematic
review and meta-analysis found socioeconomic-related differences in treatment following
hospitalisation for acute coronary syndrome varied by medication type.36 Overall they found
no inequalities in prescribing of aspirin, a 20% lower prevalence of lipid-lowering prescriptions
and a 16% lower prevalence of beta-blocker prescriptions but a 13% higher prevalence of ACE
inhibitor prescriptions, in the people with the lowest compared to the highest socioeconomic
position.36 Studies of secondary prevention prescribing in people with prior CVD in Denmark,
England and Scotland found no overall evidence of differences in prescribing by socioeconomic
status.37-39 The study in Denmark observed an increased prevalence of statin prescribing in
men (but not women) with higher compared to lower socioeconomic position measured by
occupation in 1995 but this finding was attenuated and no longer statistically significant using
data from 1999.39
It is not clear why there might be an inverse association between socioeconomic position and
use of preventive medications in people with established CVD in Australia, although this does
not appear to be driven by differences in type of CVD. Our findings may reflect, at least in part,
15
differential subsidisation of medications under Australian’s universal healthcare system,
Medicare. Generally, people with a Medicare card (Australian and New Zealand citizens and
permanent residents/visa holders) pay a co-payment for prescription medicines under the
Pharmaceutical Benefits Scheme, but this co-payment is substantially lower for people who
are eligible for a concession, including people with low incomes and pensioners. However, this
does not explain why we did not observe socioeconomic variation in use of preventative
medications for those at high primary risk.
Our study has three crucial strengths compared to previous studies examining CVD treatment.
First, we were able to examine socioeconomic variation in treatment separately for people
with prior CVD and those at high absolute risk of a primary CVD event. Second, we examined
medication use according to recommendations in Australian national guidelines which
recommend the concurrent use of multiple medications to lower risk. Third, we had
information on a range of indicators of socioeconomic position allowing us to test the
robustness of the results to different SEP measures.
Although we observed socioeconomic variation in the prevalence of prior CVD and high
absolute CVD risk, we did not explicitly quantify which CVD risk factors were the main
contributing factors to these inequalities. In our sample, those of the lowest compared with
the highest socioeconomic position had a higher prevalence of many CVD risk factors, including
smoking, diabetes and systolic blood pressure, suggesting these factors are key contributors
to the observed socioeconomic variation. This is consistent with evidence that individual CVD
risk factors are elevated in people with lower socioeconomic position,40, 41 and that most of the
socioeconomic position-CVD relationship is accounted for by traditional CVD risk factors.40, 42
16
This is the first study, to our knowledge, to use nationally representative data from Australia
to estimate socioeconomic inequalities in the prevalence of absolute CVD risk and
recommended treatment use according to national guidelines. This is important as
understanding variations in the prevalence of high absolute CVD risk provides insights about
the potential to target population-based interventions and policies to improve primary
prevention of CVD events. Access to biomedical data allowed for the calculation of absolute
risk according to the National Vascular Disease Prevention Alliance algorithm10 and we tested
the robustness of our findings using a range of individual-level socioeconomic indicators.
In addition to these strengths, our study has some limitations. First, the study is cross-sectional
and since treatment may have lowered absolute risk, the results cannot be used to draw
conclusions of overtreatment in low risk groups. Second, for some analyses, sample sizes were
small resulting in low power to observe statistically significant associations. Third, a small
proportion of individuals may not be prescribed some medications due to contraindications.
However, given we examined broad classes of medications this is likely to only be an issue for
a very small subset of participants and is unlikely to impact interpretation of the results. Finally,
some of the key variables, including socioeconomic position and prior CVD, were self-reported.
This may have resulted in some misclassification, however the direction and extent to which
this would bias the results is unknown.
Our findings of increasing levels of high absolute CVD risk with increasing levels of disadvantage
and low levels of treatment among high risk individuals suggest there is huge potential to
prevent CVD events in the population through appropriate management of absolute risk.

17
Further, given the higher prevalence of untreated individuals at high absolute risk among those
of lower socioeconomic position, treating according to absolute risk should result in reductions
in absolute inequalities in CVD.
18
References
1. Global, regional, and national age-sex specific mortality for 264 causes of death, 1980-2016: a systematic analysis for the Global Burden of Disease Study 2016. Lancet (London, England). 2017 Sep 16;390(10100):1151-210. PubMed PMID: 28919116. Pubmed Central PMCID: Pmc5605883. Epub 2017/09/19. eng. 2. Australian Institute of Health and Welfare. Health-care expenditure on cardiovascular diseases 2008–09. Cat. no. CVD 65. Canberra: AIHW, 2014. 3. Chiuve SE, Fung TT, Rexrode KM, Spiegelman D, Manson JE, Stampfer MJ, et al. Adherence to a low-risk, healthy lifestyle and risk of sudden cardiac death among women. JAMA : the journal of the American Medical Association. 2011;306(1):62-9. PubMed PMID: PMC3210472. 4. Chiuve SE, McCullough ML, Sacks FM, Rimm EB. Healthy lifestyle factors in the primary prevention of coronary heart disease among men: benefits among users and nonusers of lipid-lowering and antihypertensive medications. Circulation. 2006 Jul 11;114(2):160-7. PubMed PMID: 16818808. Epub 2006/07/05. eng. 5. Australian Institute of Health and Welfare. Cardiovascular disease: Australian facts 2011. Cardiovascular disease series. Cat. no. CVD 53. Canberra: AIHW, 2011. 6. Backholer K, Peters SA, Bots SH, Peeters A, Huxley RR, Woodward M. Sex differences in the relationship between socioeconomic status and cardiovascular disease: a systematic review and meta-analysis. Journal of epidemiology and community health. 2016 Dec 14. PubMed PMID: 27974445. Epub 2016/12/16. eng. 7. Clark AM, DesMeules M, Luo W, Duncan AS, Wielgosz A. Socioeconomic status and cardiovascular disease: risks and implications for care. Nature reviews Cardiology. 2009 Nov;6(11):712-22. PubMed PMID: 19770848. Epub 2009/09/23. eng. 8. Chow CK, Lock K, Teo K, Subramanian SV, McKee M, Yusuf S. Environmental and societal influences acting on cardiovascular risk factors and disease at a population level: a review. International journal of epidemiology. 2009 Dec;38(6):1580-94. PubMed PMID: 19261658. Pubmed Central PMCID: Pmc2786248. Epub 2009/03/06. eng. 9. National Institute for Health and Care Excellence. Lipid modification: Cardiovascular risk assessment and the modification of blood lipids for the primary and secondary prevention of cardiovascular disease (clinical guideline CG181). 2014. 10. National Vascular Disease Prevention Alliance. Guidelines for the management of absolute cardiovascular disease risk. 2012. 11. D'Agostino RB, Sr., Vasan RS, Pencina MJ, Wolf PA, Cobain M, Massaro JM, et al. General cardiovascular risk profile for use in primary care: the Framingham Heart Study. Circulation. 2008 Feb 12;117(6):743-53. PubMed PMID: 18212285. Epub 2008/01/24. eng. 12. Bagheri N, Gilmour B, McRae I, Konings P, Dawda P, Del Fante P, et al. Community cardiovascular disease risk from cross-sectional general practice clinical data: A spatial analysis. Preventing Chronic Disease. 2015;12(2). 13. Davis-Lameloise N, Philpot B, Janus ED, Versace VL, Laatikainen T, Vartiainen EA, et al. Occupational differences, cardiovascular risk factors and lifestyle habits in South Eastern rural Australia. BMC Public Health. 2013;13(1):1-7. 14. Ford ES, Giles WH, Mokdad AH. The distribution of 10-Year risk for coronary heart disease among US adults: findings from the National Health and Nutrition Examination Survey III. Journal of the American College of Cardiology. 2004 May 19;43(10):1791-6. PubMed PMID: 15145101. Epub 2004/05/18. eng.
19
15. Ramsay SE, Morris RW, Whincup PH, Papacosta AO, Thomas MC, Wannamethee SG. Prediction of coronary heart disease risk by Framingham and SCORE risk assessments varies by socioeconomic position: results from a study in British men. European journal of cardiovascular prevention and rehabilitation : official journal of the European Society of Cardiology, Working Groups on Epidemiology & Prevention and Cardiac Rehabilitation and Exercise Physiology. 2011 Apr;18(2):186-93. PubMed PMID: 21450664. Epub 2011/04/01. eng. 16. Su TT, Amiri M, Mohd Hairi F, Thangiah N, Bulgiba A, Majid HA. Prediction of cardiovascular disease risk among low-income urban dwellers in metropolitan Kuala Lumpur, Malaysia. BioMed research international. 2015;2015:516984. PubMed PMID: 25821810. Pubmed Central PMCID: PMC4363497. Epub 2015/03/31. eng. 17. Banks E, Crouch SR, Korda RJ, Stavreski B, Page K, Thurber KA, et al. Absolute risk of cardiovascular disease events, and blood pressure- and lipid-lowering therapy in Australia. The Medical journal of Australia. 2016 May 02;204(8):320. PubMed PMID: 27125809. Epub 2016/04/30. eng. 18. Australian Bureau of Statistics. Australian Health Survey, Expanded Confidentialised Unit Record File (CURF), Remote Access Data Laboratory (RADL). Findings based on use of ABS Microdata. 2011-12. 19. Chew DP, Scott IA, Cullen L, French JK, Briffa TG, Tideman PA, et al. National Heart Foundation of Australia & Cardiac Society of Australia and New Zealand: Australian Clinical Guidelines for the Management of Acute Coronary Syndromes 2016. Heart, Lung and Circulation.25(9):895-951. 20. National Heart Foundation of Australia and the Cardiac Society of Australia and New Zealand. Reducing risk in heart disease: an expert guide to clinical practice for secondary prevention of coronary heart disease. Melbourne: National Heart Foundation of Australia, 2012. 21. National Heart Foundation of Australia and the Cardiac Society of Australia and New Zealand (Chronic Heart Failure Guidelines Expert Writing Panel). Guidelines for the prevention, detection and management of chronic heart failure in Australia. 2011. 22. National Stroke Foundation. Clinical Guidelines for Stroke Management. Melboure, Australia: 2010. 23. World Health Organization Collaborating Centre for Drug Statistics Methodology. ATC/DDD Index 2015 2015. Available from: http://www.whocc.no/atc_ddd_index/. 24. Barros AJ, Hirakata VN. Alternatives for logistic regression in cross-sectional studies: an empirical comparison of models that directly estimate the prevalence ratio. BMC medical research methodology. 2003 Oct 20;3:21. PubMed PMID: 14567763. Pubmed Central PMCID: Pmc521200. Epub 2003/10/22. eng. 25. Zou G. A modified poisson regression approach to prospective studies with binary data. American journal of epidemiology. 2004 Apr 01;159(7):702-6. PubMed PMID: 15033648. Epub 2004/03/23. eng. 26. Australian Bureau of Statistics. Weighting, benchmarks and estimation procedures. Australian Health Survey: Users' Guide, 2011-13. Cat. no. 4363.0.55.001. 2013. Available from: http://www.abs.gov.au/ausstats/[email protected]/Lookup/CD71A707B04A8F5BCA257BBB0014CBEC?opendocument 27. StataCorp. Stata Statistical Software: Release 13. College Station, TX: StataCorp LP; 2013.
20
28. Australian Bureau of Statistics. 2033.0.55.001 - Census of Population and Housing: Socio-Economic Indexes for Areas (SEIFA), Australia, 2011 2011 [cited 2017 02/08]. Available from: http://www.abs.gov.au/ausstats/[email protected]/mf/2033.0.55.001. 29. Bagheri N, Gilmour B, McRae I, Konings P, Dawda P, Del Fante P, et al. Community cardiovascular disease risk from cross-sectional general practice clinical data: a spatial analysis. Preventing chronic disease. 2015 Feb 26;12:E26. PubMed PMID: 25719216. Pubmed Central PMCID: Pmc4344355. Epub 2015/02/27. eng. 30. Daviglus ML, Talavera GA, Aviles-Santa ML, Allison M, Cai J, Criqui MH, et al. Prevalence of major cardiovascular risk factors and cardiovascular diseases among Hispanic/Latino individuals of diverse backgrounds in the United States. Jama. 2012 Nov 07;308(17):1775-84. PubMed PMID: 23117778. Pubmed Central PMCID: Pmc3777250. Epub 2012/11/03. eng. 31. Clark RA, Eckert KA, Stewart S, Phillips SM, Yallop JJ, Tonkin AM, et al. Rural and urban differentials in primary care management of chronic heart failure: new data from the CASE study. The Medical journal of Australia. 2007 May 07;186(9):441-5. PubMed PMID: 17484704. Epub 2007/05/09. eng. 32. Woodward M, Peters SAE, Batty GD, Ueshima H, Woo J, Giles GG, et al. Socioeconomic status in relation to cardiovascular disease and cause-specific mortality: a comparison of Asian and Australasian populations in a pooled analysis. BMJ Open. 2015 16 Dec;5(3):e006408. PubMed PMID: PMC4369004. 33. Schroder SL, Richter M, Schroder J, Frantz S, Fink A. Socioeconomic inequalities in access to treatment for coronary heart disease: A systematic review. International journal of cardiology. 2016 Sep 15;219:70-8. PubMed PMID: 27288969. Epub 2016/06/12. eng. 34. Stocks N, Ryan P, Allan J, Williams S, Willson K. Gender, socioeconomic status, need or access? Differences in statin prescribing across urban, rural and remote Australia. The Australian journal of rural health. 2009 Apr;17(2):92-6. PubMed PMID: 19335599. Epub 2009/04/02. eng. 35. Stocks NP, Ryan P, McElroy H, Allan J. Statin prescribing in Australia: socioeconomic and sex differences. A cross-sectional study. The Medical journal of Australia. 2004 Mar 01;180(5):229-31. PubMed PMID: 14984343. Epub 2004/02/27. eng. 36. Hyun KK, Brieger D, Woodward M, Richtering S, Redfern J. The effect of socioeconomic disadvantage on prescription of guideline-recommended medications for patients with acute coronary syndrome: systematic review and meta-analysis. International Journal for Equity in Health. 2017;16:162. PubMed PMID: PMC5579970. 37. Reid FDA, Cook DG, Whincup PH. Use of statins in the secondary prevention of coronary heart disease: is treatment equitable? Heart. 2002 12/05/accepted;88(1):15-9. PubMed PMID: PMC1767198. 38. Simpson CR, Hannaford PC, Williams D. Evidence for inequalities in the management of coronary heart disease in Scotland. Heart. 2005 06/07/accepted;91(5):630-4. PubMed PMID: PMC1768874. 39. Thomsen RW, Johnsen SP, Olesen AV, Mortensen JT, Boggild H, Olsen J, et al. Socioeconomic gradient in use of statins among Danish patients: population-based cross-sectional study. British journal of clinical pharmacology. 2005 Nov;60(5):534-42. PubMed PMID: 16236044. Pubmed Central PMCID: Pmc1884943. Epub 2005/10/21. eng. 40. Albert MA, Glynn RJ, Buring J, Ridker PM. Impact of traditional and novel risk factors on the relationship between socioeconomic status and incident cardiovascular events. Circulation. 2006 Dec 12;114(24):2619-26. PubMed PMID: 17116764. Epub 2006/11/23. eng.

21
41. Winkleby MA, Kraemer HC, Ahn DK, Varady AN. Ethnic and socioeconomic differences in cardiovascular disease risk factors: findings for women from the Third National Health and Nutrition Examination Survey, 1988-1994. Jama. 1998 Jul 22-29;280(4):356-62. PubMed PMID: 9686553. Epub 1998/08/01. eng. 42. Lynch JW, Kaplan GA, Cohen RD, Tuomilehto J, Salonen JT. Do cardiovascular risk factors explain the relation between socioeconomic status, risk of all-cause mortality, cardiovascular mortality, and acute myocardial infarction? American journal of epidemiology. 1996 Nov 15;144(10):934-42. PubMed PMID: 8916504. Epub 1996/11/15. eng.
22
Acknowledgements: The authors thank Deborah Wong for her work on an earlier version of
this analysis.
Contributors: EP drafted the manuscript. JW conducted the analyses. EB and RK conceived the
study. All authors interpreted the data, and critically revised and approved the final
manuscript.
Funding: This work was supported by a National Health and Medical Research Council of
Australia (NHMRC) Partnership Project (reference 1092674) and the NHMRC Centre for
Research Excellence in Medicines and Ageing (reference 1060407). Emily Banks is supported
by the NHMRC (reference 1042717).
Competing interests: None declared.
23
Web material
Contents Table S1. Distribution of CVD risk factors in the population without prior CVD by socioeconomic
position.................................................................................................................................................. 24
Table S2. Prevalence and estimated number of individuals in the Australian population aged 45-74
with low, moderate and high absolute 5-year risk of primary CVD or prior CVD by socioeconomic
position.................................................................................................................................................. 26
Table S3. Relative and absolute differences in prevalence of individuals aged 45-74 years at high
absolute risk of primary CVD and prior CVD by socioeconomic position .............................................. 26
Table S4. Proportion of individuals aged 45-74 years at high absolute risk of primary CVD or with prior
CVD by treatment status and socioeconomic position .......................................................................... 27
Table S5. Relative and absolute differences in prevalence and total number of individuals aged 45-74
years at high absolute risk of primary CVD or prior CVD receiving recommended treatment by
socioeconomic position ......................................................................................................................... 28
Table S6. Prevalence and estimated number of individuals in the Australian population aged 45-74
years with low, moderate and high absolute 5-year risk of primary CVD or prior CVD according to
different indicators of socioeconomic position (N=4751). .................................................................... 29
Table S7. Relative and absolute differences in prevalence of individuals aged 45-74 years at high
absolute risk of primary CVD by different indicators of socioeconomic position (N=4751) .................. 30
Table S8. Relative and absolute differences in prevalence of individuals aged 45-74 years with prior
CVD by different indicators of socioeconomic position (N=4751) ......................................................... 30
Table S9. Proportion of total individuals aged 45-74 years at high absolute risk of primary CVD by
treatment status and different indicators of socioeconomic position (n=426) ..................................... 31
Table S10. Proportion of total individuals aged 45-74 years with prior CVD by treatment status and
different indicators of socioeconomic position (n=716) ........................................................................ 32
Table S11. Relative and absolute differences in prevalence and total number of individuals at high
absolute risk of primary CVD receiving recommended treatment by different indicators of
socioeconomic position (n=426) ........................................................................................................... 33
Table S12. Relative and absolute differences in prevalence and total number of individuals with prior
CVD using recommended treatment by different indicators of socioeconomic position (n=716) ........ 34
Table S13. Age and sex adjusted percentage of respondents with prior CVD reporting each type of
CVD, according to socioeconomic position ........................................................................................... 34
Table S14. Relative and absolute differences in prevalence and total number of individuals aged 45-74
years with prior angina, heart attack or stroke receiving recommended treatment by socioeconomic
position.................................................................................................................................................. 35
24
Table S1. Distribution of CVD risk factors in the population without prior CVD by socioeconomic position
(N=4246)
Socioeconomic position
High Intermediate Low Total
Factors included in NVDPA algorithm
Smoking Status
Never 57.3 45.1 45.7 48.3
Former 36.8 41.4 39.1 39.4
Current 5.9 13.5 15.2 12.3
Systolic Blood Pressure (mmHg)
Normal (<120) 45.1 38.5 33.1 38.2
Prehypertension (120-<140) 34.7 38.5 40.1 38.2
Hypertension stage (≥140) 20.1 23.0 26.8 23.7
Diastolic Blood Pressure (mmHg)
Normal and pre-hypertension (<90) 85.8 83.4 83.6 84.0
Hypertension stages 1 & 2 (90-<110) 14.2 16.2 15.9 15.6
Hypertension crisis (>=110) N/A 0.4 0.6 0.4
High Density Lipoprotein Cholesterol (mmol/L)
>=1.0 92.0 86.7 90.5 89.4
<1.0 8.0 13.4 9.5 10.7
Total Cholesterol (mmol/L)
<4.0 4.2 6.3 7.2 6.1
4.0-7.5 94.4 91.8 91.0 92.1
>7.5 1.4 2.0 1.8 1.8
Total Cholesterol:HDL-C ratio
<4.5 69.1 66.7 66.5 67.2
4.5-<6.0 24.7 24.8 24.8 24.8
>=6.0 6.2 8.6 8.7 8.1
Diabetes 3.5 9.4 10.3 8.3
Diabetes with microalbuminuria N/A N/A 2.6 1.6
Chronic Kidney Disease N/A N/A 0.6 0.5
Additional risk factors
Low Density Lipoprotein Cholesterol (mmol/L)
<2.0 1.8 4.5 5.0 4.0
2-3.5 57.2 57.4 53.4 55.9
>3.5 40.9 38.1 41.7 40.1
Body mass index
Normal / underweight 37.9 24.4 27.0 28.6
Overweight 40.0 41.5 35.9 39.1
Obese 22.1 34.1 37.2 32.3
Waist Circumference
Not at risk 34.5 24.7 22.5 26.3
At risk 65.5 75.3 77.5 73.8
Physical Activity
High 18.7 12.6 7.2 12.1
Moderate 37.5 32.2 30.2 32.7
25
Socioeconomic position
High Intermediate Low Total
Low 33.3 35.7 39.2 36.4
Sedentary 10.6 19.6 23.4 18.8
Notes: (1) Characteristics given as percentages. (2) Socioeconomic position measured by level of educational
attainment (low = high school certificate or no qualifications; intermediate = certificate, diploma or trade; and
high = university degree). (3) N/A = numbers too small to be released. Number of missing cases: LDL cholesterol
830; BMI 102; waist circumference 77; physical activity 15.
26
Table S2. Prevalence and estimated number of individuals in the Australian population aged 45-74 with low, moderate and high absolute 5-year risk of primary
CVD or prior CVD by socioeconomic position
5 Year Absolute Risk Prior CVD
Low Moderate High
% (95%CI) n ('000) % (95%CI) n ('000) % (95%CI) n ('000) % (95%CI) n ('000)
Socioeconomic position
High 82.15 (79.15 -84.80) 1238 5.86 (4.33-7.89) 88 6.21 (4.71-8.15) 94 5.78 (4.32-7.70) 87
Intermediate 69.55 (66.65-72.30) 1755 10.22 (8.50-12.50) 258 11.23 (9.53-13.20) 283 9.00 (7.33-10.99) 227
Low 66.39 (63.54-69.13) 1596 8.06 (6.61-9.78) 194 13.81 (11.88-15.99) 332 11.74 (10.05-13.68) 282
Total 71.32 (69.61-72.97) 4588 8.39 (7.42-9.48) 540 11.02 (9.94-12.20) 709 9.27 (8.26-10.39) 596
Notes: (1) Socioeconomic position measured by level of educational attainment (low = high school certificate or no qualifications; intermediate = certificate, diploma or trade;
and high = university degree).
Table S3. Relative and absolute differences in prevalence of individuals aged 45-74 years at high absolute risk of primary CVD and prior CVD by socioeconomic
position
Age-sex adjusted prevalence
(95%CI)
Model 1 Model 2
Prevalence difference
(95%CI) Prevalence ratio
(95%CI) Prevalence difference
(95%CI) Prevalence ratio
(95%CI)
High Primary Risk Socioeconomic position
High 7.68 (5.67-9.70) 0.00 1.00 0.00 1.00
Intermediate 10.94 (9.26-12.62) 3.26 (0.61-5.91) 1.42 (1.05-1.93) 3.55 (0.92-6.18) 1.47 (1.08-2.00)
Low 12.64 (10.87-14.40) 4.95 (2.26-7.65) 1.64 (1.22-2.22) 5.13 (2.46-7.81) 1.68 (1.25-2.27)
Prior CVD Socioeconomic position
High 6.72 (4.81-8.63) 0.00 1.00 0.00 1.00
Intermediate 9.09 (7.27-10.91) 2.37 (-0.31-5.05) 1.35 (0.95-1.93) 2.08 (-0.64-4.79) 1.30 (0.91-1.85)
Low 10.69 (9.01-12.37) 3.97 (1.38-6.56) 1.59 (1.14-2.21) 3.72 (1.08-6.36) 1.54 (1.10-2.14)
Notes: (1) Socioeconomic position measured by level of educational attainment (low = high school certificate or no qualifications; intermediate = certificate, diploma or trade;
and high = university degree). (2) Model 1 is adjusted for age and sex (presented in main text); Model 2 is further adjusted for country of birth and region of residence
27
Table S4. Proportion of individuals aged 45-74 years at high absolute risk of primary CVD or with prior CVD by treatment status and socioeconomic position
No treatment Less than recommended treatment Recommended treatment
% (95%CI) n('000) % (95%CI) n('000) % (95%CI) n('000)
High Primary Risk (n=426) Socioeconomic position
High 49.14 (32.92-64.52) 29 22.39 (11.85-38.22) 13 28.47 (15.84-45.71) 17
Intermediate 53.94 (44.15-63.43) 82 26.87 (19.51-35.77) 41 19.19 (12.53-28.24) 29
Low 48.17 (39.50-56.95) 94 30.03 (22.83-38.37) 58 21.80 (15.57-29.65) 42
Total 50.48 (44.44-56.51) 205 27.74 (22.83-33.25) 112 21.78 (17.17-27.21) 88
Prior CVD (n=716)
Socioeconomic position
High 26.38 (17.06-38.43) 24 56.06 (43.68-67.74) 52 17.55 (10.61-27.63) 16
Intermediate 12.99 (8.35-19.66) 30 50.50 (42.43-58.55) 117 36.51 (29.00-44.74) 85
Low 12.80 (9.04-17.83) 44 49.87 (43.42-56.32) 173 37.33 (31.27-43.82) 130
Total 14.74 (11.71-18.39) 99 50.94 (46.24-55.62) 342 34.32 (29.98-38.93) 230
Notes: (1) Socioeconomic position measured by level of educational attainment (low = high school certificate or no qualifications; intermediate = certificate, diploma or trade;
and high = university degree). (2) Recommended treatment for those at high primary risk is receiving blood pressure- and lipid-lowering medications. For those with prior
CVD, recommended treatment is receiving blood pressure lowering, lipid lowering and antithrombotic medication.
28
Table S5. Relative and absolute differences in prevalence and total number of individuals aged 45-74 years at high absolute risk of primary CVD or prior CVD
receiving recommended treatment by socioeconomic position
Age-sex adjusted prevalence
(95%CI)
Model 1 Model 2
Prevalence difference (95%CI)
Prevalence ratio (95%CI)
Prevalence difference (95%CI)
Prevalence ratio (95%CI)
High Primary Risk (n=426) Socioeconomic position
High 29.38 (13.77-45.00) 0.00 1.00 0.00 1.00
Intermediate 19.51 (11.65-27.38) -9.87 (-27.46-7.72) 0.66 (0.34-1.30) -8.02 (25.78-9.73) 0.71 (0.35-1.44)
Low 21.32 (14.69-27.95) -8.06 (-24.89-8.76) 0.73 (0.39-1.34) -6.81 (-23.33-9.71) 0.76 (0.41-1.41)
Prior CVD (n=716) Socioeconomic position
High 17.71 (9.45-25.97) 0.00 1.00 0.00 1.00
Intermediate 35.70 (28.39-43.02) 17.99 (6.98-29.01) 2.02 (1.21-3.35) 18.37 (7.49-29.24) 2.07 (1.23-3.47)
Low 37.81 (31.50-44.11) 20.10 (9.69-30.50) 2.13 (1.30-3.51) 21.04 (10.54-31.55) 2.22 (1.34-3.70)
Notes: (1) Socioeconomic position measured by level of educational attainment (low = high school certificate or no qualifications; intermediate = certificate, diploma or trade;
and high = university degree). (2) Model 1 is adjusted for age and sex; Model 2 is further adjusted for country of birth and region of residence. (3) Proportions refer to the
proportion of those at high primary risk receiving both blood pressure- and lipid-lowering medications and those with prior CVD receiving blood pressure lowering, lipid
lowering and antithrombotic medication.
29
Table S6. Prevalence and estimated number of individuals in the Australian population aged 45-74 years with low, moderate and high absolute 5-year risk of
primary CVD or prior CVD according to different indicators of socioeconomic position (N=4751).
Absolute Primary CVD Risk Prior CVD
Low Moderate High % (95%CI) n ('000) % (95%CI) n('000) % (95%CI) n ('000) % (95%CI) n ('000)
Total 71.32 (69.93-72.68) 4588 8.39 (7.23-9.72) 540 11.02 (10.04-12.08) 709 9.27 (8.32-10.32) 596
High school education Yr11-12 77.85 (75.82-79.75) 2582 6.59 (5.41-8.00) 218 8.24 (6.98-9.71) 273 7.33 (6.12-8.75) 243
Yr9-10 68.30 (65.49-70.98) 1706 10.67 (8.75-12.96) 267 11.39 (9.64-13.42) 285 9.64 (7.95-11.63) 241
Yr8-none 48.54 (42.50-54.61) 300 8.86 (5.45-14.09) 55 24.38 (19.05-30.65) 151 18.22 (3.71-23.80) 113
Household income Richest 81.03 (77.50-84.13) 1258 7.31 (5.36-9.89) 113 6.81 (5.03-9.15) 106 4.85 (3.31-7.06) 75
3 78.38 (74.63-81.70) 1233 7.96 (5.90-10.65) 125 6.46 (4.67-8.87) 102 7.21 (5.25-9.81) 113
2 72.95 (69.52-76.12) 1083 8.10 (6.34-10.28) 120 10.13 (8.10-12.59) 150 8.83 (6.94-11.16) 131
Poorest 55.63 (52.59-58.63) 1014 9.93 (8.35-11.77) 181 19.26 (16.96-21.80) 351 15.18 (13.15-17.45) 277
Area level disadvantage Highest 78.41 (74.92-81.53) 1140 8.16 (6.28-10.56) 119 7.06 (5.20-9.51) 103 6.37 (4.74-8.50) 93
4 74.71 (70.91-78.17) 943 7.46 (5.55-9.96) 94 10.51 (8.22-13.35) 133 7.32 (5.42-9.81) 92
3 71.78 (67.92-75.35) 984 8.53 (6.36-11.36) 117 10.61 (8.51-13.17) 145 9.07 (6.99-11.70) 124
2 69.58 (65.72-73.18) 850 9.66 (7.45-12.43) 118 11.88 (9.54-14.71) 145 8.88 (6.95-11.27) 108
Lowest 59.72 (55.30-63.99) 673 8.17 (6.23-10.66) 92 16.25 (13.35-19.62) 183 15.86 (12.84-19.44) 179
30
Table S7. Relative and absolute differences in prevalence of individuals aged 45-74 years at high
absolute risk of primary CVD by different indicators of socioeconomic position (N=4751)
Age-sex adjusted prevalence high risk
(95%CI) Prevalence difference
(95%CI) Prevalence ratio
(95%CI)
High school education Yr11-12 9.80 (8.26-11.34) 0.00 1.00
Yr9-10 10.74 (9.17-12.30) 0.94 (-1.29-3.16) 1.10 (0.88-1.36)
Yr8-none 15.18 (11.84-18.52) 5.38 (1.67-9.09) 1.55 (1.18-2.04)
Household income Richest 8.80 (6.28-11.31) 0.00 1.00
3 8.42 (5.85-10.99) -0.37 (-3.93-3.18) 0.96 (0.63-1.45)
2 10.11 (7.96-12.26) 1.31 (-2.02-4.65) 1.15 (0.80-1.65)
Poorest 13.84 (11.96-15.72) 5.04 (1.80-8.28) 1.57 (1.14-2.18)
Area level disadvantage Highest 7.33 (5.20-9.45) 0.00 1.00
4 11.05 (8.66-13.45) 3.73 (0.52-6.93) 1.51 (1.05-2.17)
3 11.04 (8.81-13.26) 3.71 (0.62-6.80) 1.51 (1.06-2.15)
2 11.52 (9.09-13.94) 4.19 (0.96-7.41) 1.57 (1.10-2.25)
Lowest 14.58 (12.04-17.13) 7.26 (3.96-10.55) 1.99 (1.42-2.79)
Notes: (1) Models are adjusted for age and sex.
Table S8. Relative and absolute differences in prevalence of individuals aged 45-74 years with prior CVD
by different indicators of socioeconomic position (N=4751)
Age-sex adjusted prevalence
prior CVD (95%CI) Prevalence difference
(95%CI) Prevalence ratio
(95%CI)
High school education Yr11-12 8.36 (6.85-9.86) 0.00 1.00
Yr9-10 9.10 (7.47-10.72) 0.74 (-1.50-2.98) 1.09 (0.84-1.41)
Yr8-none 12.81 (9.62-16.00) 4.45 (0.91-8.00) 1.53 (1.12-2.09)
Household income Richest 5.72 (3.56-7.88) 0.00 1.00
3 8.83 (6.07-11.60) 3.12 (-0.32-6.55) 1.55 (0.96-2.50)
2 8.91 (6.84-10.97) 3.19 (0.23-6.15) 1.56 (1.00-2.42)
Poorest 11.72 (9.71-13.72) 6.00 (2.89-9.11) 2.05 (1.33-3.16)
Area Level disadvantage Highest 6.58 (4.69-8.47) 0.00 1.00
4 7.58 (5.41-9.75) 1.00 (-1.87-3.87) 1.15 (0.77-1.73)
3 9.30 (6.94-11.65) 2.72 (-0.31-5.74) 1.41 (0.96-2.07)
2 8.70 (6.66-10.74) 2.12 (-0.66-4.90) 1.32 (0.91-1.92)
Lowest 14.60 (11.44-17.76) 8.02 (4.32-11.72) 2.22 (1.55-3.18)
Notes: (1) Models are adjusted for age and sex.
31
Table S9. Proportion of total individuals aged 45-74 years at high absolute risk of primary CVD by treatment status and different indicators of socioeconomic position
(n=426)
No treatment Less than recommended treatment Recommended treatment
% (95%CI) n('000) % (95%CI) n('000) % (95%CI) n('000)
Total 50.48 (44.44-56.51) 205 27.74 (22.83-33.25) 112 21.78 (17.17-27.21) 88
High school education
Yr11-12 52.93 (43.48-62.18) 88 26.80 (19.43-35.72) 44 20.26 (13.27-29.68) 34
Yr9-10 48.38 (38.82-58.06) 77 30.09 (22.28-39.24) 48 21.53 (14.88-30.12) 34
Yr8-none 49.61 (36.29-63.00) 40 24.98 (15.68-37.37) 20 25.40 (15.71-38.36) 20
Household income
Richest 49.13 (33.82-64.61) 38 29.23 (17.57-44.45) 23 21.64 (11.16-37.77) 17
3 66.78 (48.15-81.31) 30 22.89 (10.78-42.17) 10 10.34 (4.37-22.54) 5
2 58.91 (45.66-70.98) 50 24.53 (14.92-37.60) 21 16.56 (9.49-27.30) 14
Poorest 43.65 (35.98-51.63) 86 29.64 (23.18-37.03) 58 26.71 (19.93-34.79) 53
Area level disadvantage
Highest 58.70 (42.94-72.85) 42 22.67 (12.25-38.11) 16 18.63 (9.34-33.74) 13
4 43.85 (31.27-57.27) 33 38.69 (26.42-52.58) 29 17.46 (9.27-30.47) 13
3 57.74 (45.00-69.53) 47 22.15 (13.58-34.01) 18 20.11 (12.33-31.04) 16
2 45.90 (33.33-59.01) 37 30.78 (20.17-43.90) 25 23.32 (13.73-36.78) 19
Lowest 47.28 (34.99-59.91) 45 25.15 (17.06-35.45) 24 27.57 (17.54-40.52) 27
Notes: (1) Recommended treatment for those at high primary risk is use of blood pressure- and lipid-lowering medications.
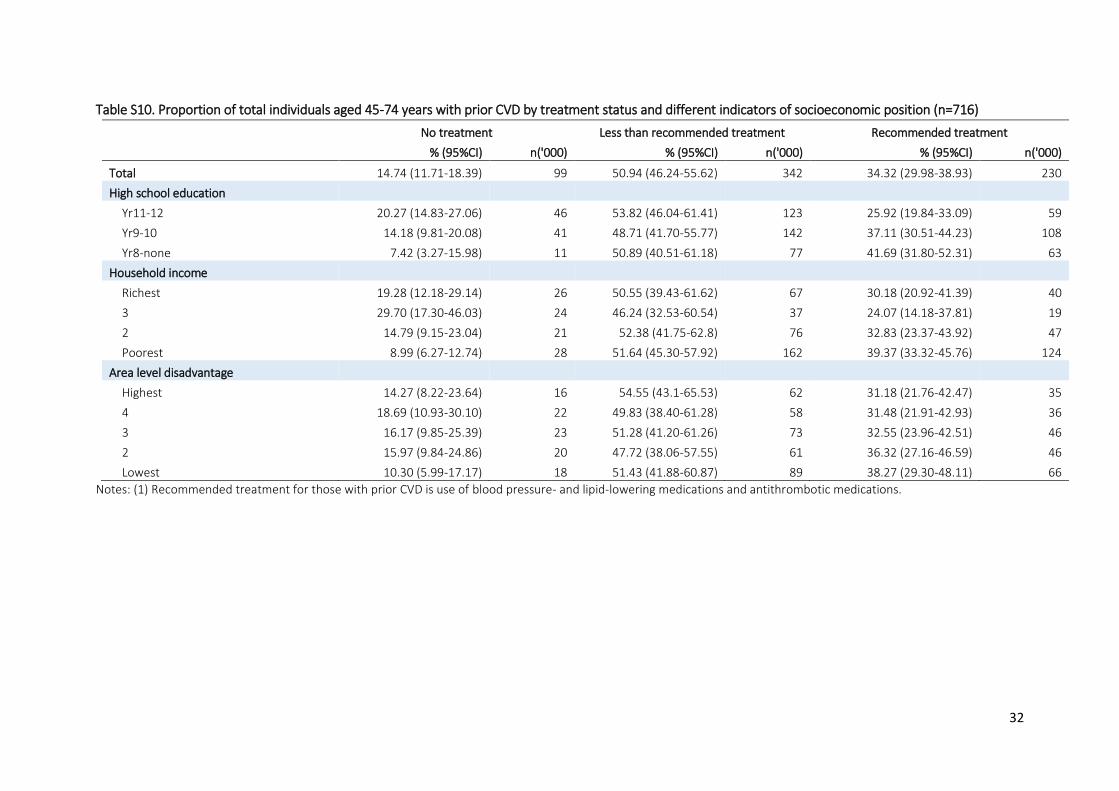
32
Table S10. Proportion of total individuals aged 45-74 years with prior CVD by treatment status and different indicators of socioeconomic position (n=716)
No treatment Less than recommended treatment Recommended treatment
% (95%CI) n('000) % (95%CI) n('000) % (95%CI) n('000)
Total 14.74 (11.71-18.39) 99 50.94 (46.24-55.62) 342 34.32 (29.98-38.93) 230
High school education Yr11-12 20.27 (14.83-27.06) 46 53.82 (46.04-61.41) 123 25.92 (19.84-33.09) 59
Yr9-10 14.18 (9.81-20.08) 41 48.71 (41.70-55.77) 142 37.11 (30.51-44.23) 108
Yr8-none 7.42 (3.27-15.98) 11 50.89 (40.51-61.18) 77 41.69 (31.80-52.31) 63
Household income
Richest 19.28 (12.18-29.14) 26 50.55 (39.43-61.62) 67 30.18 (20.92-41.39) 40
3 29.70 (17.30-46.03) 24 46.24 (32.53-60.54) 37 24.07 (14.18-37.81) 19
2 14.79 (9.15-23.04) 21 52.38 (41.75-62.8) 76 32.83 (23.37-43.92) 47
Poorest 8.99 (6.27-12.74) 28 51.64 (45.30-57.92) 162 39.37 (33.32-45.76) 124
Area level disadvantage
Highest 14.27 (8.22-23.64) 16 54.55 (43.1-65.53) 62 31.18 (21.76-42.47) 35
4 18.69 (10.93-30.10) 22 49.83 (38.40-61.28) 58 31.48 (21.91-42.93) 36
3 16.17 (9.85-25.39) 23 51.28 (41.20-61.26) 73 32.55 (23.96-42.51) 46
2 15.97 (9.84-24.86) 20 47.72 (38.06-57.55) 61 36.32 (27.16-46.59) 46
Lowest 10.30 (5.99-17.17) 18 51.43 (41.88-60.87) 89 38.27 (29.30-48.11) 66
Notes: (1) Recommended treatment for those with prior CVD is use of blood pressure- and lipid-lowering medications and antithrombotic medications.
33
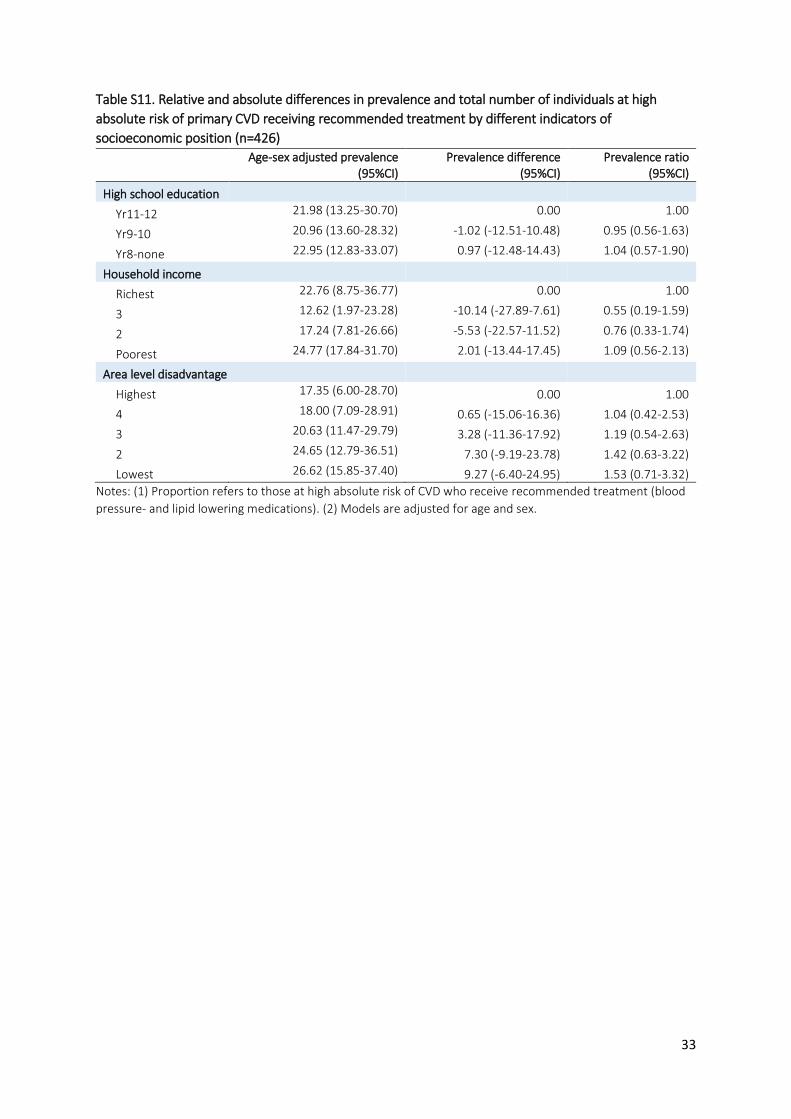
Table S11. Relative and absolute differences in prevalence and total number of individuals at high
absolute risk of primary CVD receiving recommended treatment by different indicators of
socioeconomic position (n=426)
Age-sex adjusted prevalence
(95%CI) Prevalence difference
(95%CI) Prevalence ratio
(95%CI)
High school education
Yr11-12 21.98 (13.25-30.70) 0.00 1.00
Yr9-10 20.96 (13.60-28.32) -1.02 (-12.51-10.48) 0.95 (0.56-1.63)
Yr8-none 22.95 (12.83-33.07) 0.97 (-12.48-14.43) 1.04 (0.57-1.90)
Household income
Richest 22.76 (8.75-36.77) 0.00 1.00
3 12.62 (1.97-23.28) -10.14 (-27.89-7.61) 0.55 (0.19-1.59)
2 17.24 (7.81-26.66) -5.53 (-22.57-11.52) 0.76 (0.33-1.74)
Poorest 24.77 (17.84-31.70) 2.01 (-13.44-17.45) 1.09 (0.56-2.13)
Area level disadvantage
Highest 17.35 (6.00-28.70) 0.00 1.00
4 18.00 (7.09-28.91) 0.65 (-15.06-16.36) 1.04 (0.42-2.53)
3 20.63 (11.47-29.79) 3.28 (-11.36-17.92) 1.19 (0.54-2.63)
2 24.65 (12.79-36.51) 7.30 (-9.19-23.78) 1.42 (0.63-3.22)
Lowest 26.62 (15.85-37.40) 9.27 (-6.40-24.95) 1.53 (0.71-3.32)
Notes: (1) Proportion refers to those at high absolute risk of CVD who receive recommended treatment (blood
pressure- and lipid lowering medications). (2) Models are adjusted for age and sex.
34
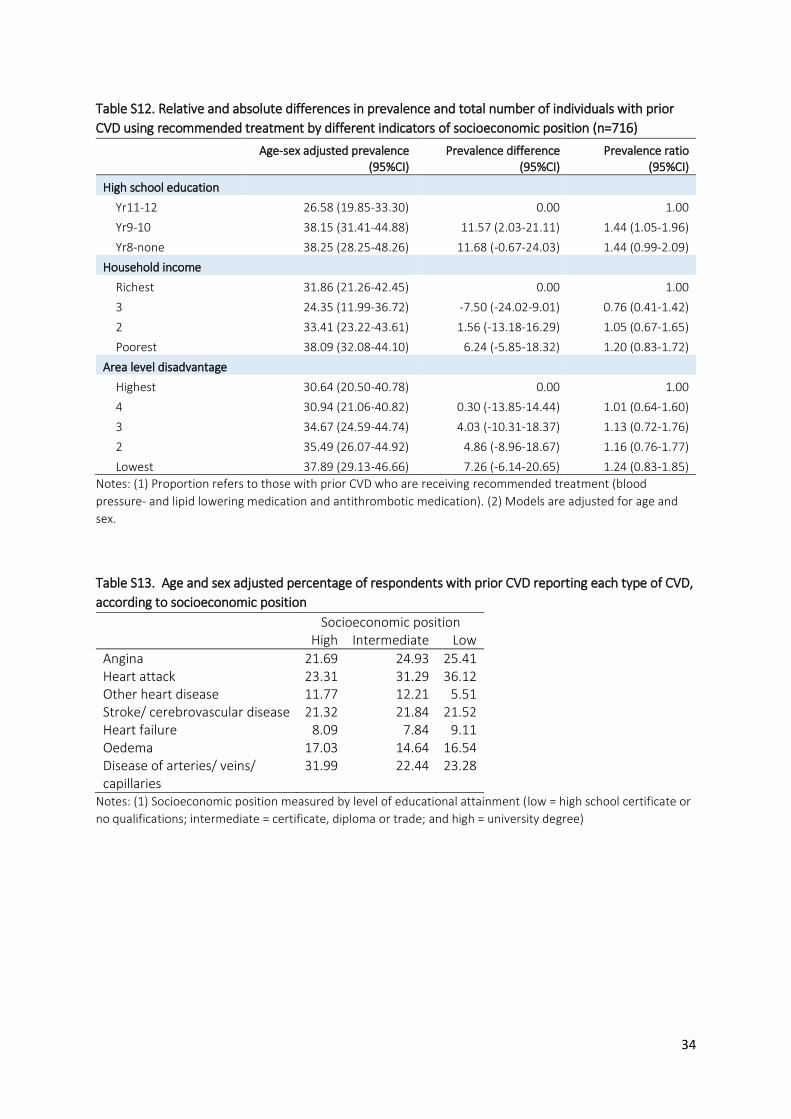
Table S12. Relative and absolute differences in prevalence and total number of individuals with prior
CVD using recommended treatment by different indicators of socioeconomic position (n=716)
Age-sex adjusted prevalence
(95%CI) Prevalence difference
(95%CI) Prevalence ratio
(95%CI)
High school education Yr11-12 26.58 (19.85-33.30) 0.00 1.00
Yr9-10 38.15 (31.41-44.88) 11.57 (2.03-21.11) 1.44 (1.05-1.96)
Yr8-none 38.25 (28.25-48.26) 11.68 (-0.67-24.03) 1.44 (0.99-2.09)
Household income Richest 31.86 (21.26-42.45) 0.00 1.00
3 24.35 (11.99-36.72) -7.50 (-24.02-9.01) 0.76 (0.41-1.42)
2 33.41 (23.22-43.61) 1.56 (-13.18-16.29) 1.05 (0.67-1.65)
Poorest 38.09 (32.08-44.10) 6.24 (-5.85-18.32) 1.20 (0.83-1.72)
Area level disadvantage Highest 30.64 (20.50-40.78) 0.00 1.00
4 30.94 (21.06-40.82) 0.30 (-13.85-14.44) 1.01 (0.64-1.60)
3 34.67 (24.59-44.74) 4.03 (-10.31-18.37) 1.13 (0.72-1.76)
2 35.49 (26.07-44.92) 4.86 (-8.96-18.67) 1.16 (0.76-1.77)
Lowest 37.89 (29.13-46.66) 7.26 (-6.14-20.65) 1.24 (0.83-1.85)
Notes: (1) Proportion refers to those with prior CVD who are receiving recommended treatment (blood
pressure- and lipid lowering medication and antithrombotic medication). (2) Models are adjusted for age and
sex.
Table S13. Age and sex adjusted percentage of respondents with prior CVD reporting each type of CVD,
according to socioeconomic position
Socioeconomic position High Intermediate Low
Angina 21.69 24.93 25.41 Heart attack 23.31 31.29 36.12 Other heart disease 11.77 12.21 5.51 Stroke/ cerebrovascular disease 21.32 21.84 21.52 Heart failure 8.09 7.84 9.11 Oedema 17.03 14.64 16.54 Disease of arteries/ veins/ capillaries
31.99 22.44 23.28
Notes: (1) Socioeconomic position measured by level of educational attainment (low = high school certificate or
no qualifications; intermediate = certificate, diploma or trade; and high = university degree)
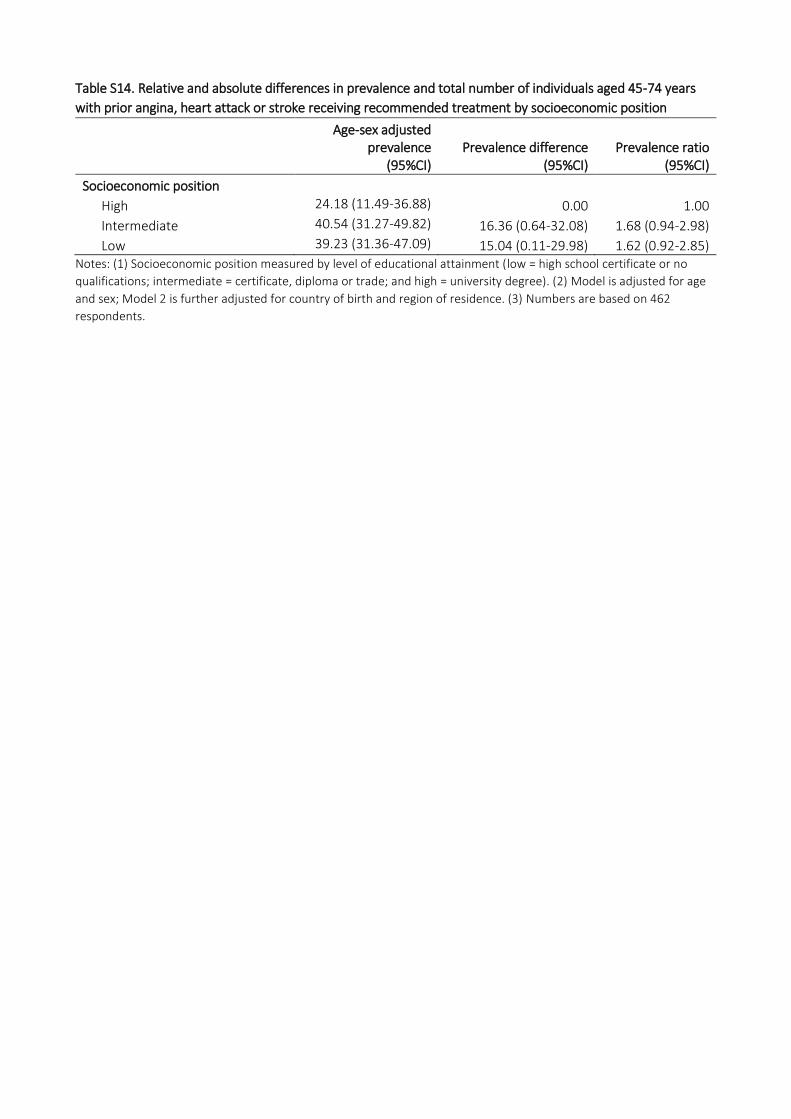
Table S14. Relative and absolute differences in prevalence and total number of individuals aged 45-74 years
with prior angina, heart attack or stroke receiving recommended treatment by socioeconomic position
Age-sex adjusted prevalence
(95%CI)
Prevalence difference
(95%CI) Prevalence ratio
(95%CI)
Socioeconomic position High 24.18 (11.49-36.88) 0.00 1.00
Intermediate 40.54 (31.27-49.82) 16.36 (0.64-32.08) 1.68 (0.94-2.98)
Low 39.23 (31.36-47.09) 15.04 (0.11-29.98) 1.62 (0.92-2.85) Notes: (1) Socioeconomic position measured by level of educational attainment (low = high school certificate or no
qualifications; intermediate = certificate, diploma or trade; and high = university degree). (2) Model is adjusted for age
and sex; Model 2 is further adjusted for country of birth and region of residence. (3) Numbers are based on 462
respondents.