relational pathways between socioeconomic position and cardiovascular risk in a multiethnic urban...
TRANSCRIPT

Relational pathways between socioeconomic position andcardiovascular risk in a multiethnic urban sample: complexitiesand their implications for improving health in economicallydisadvantaged populations
A J Schulz1, J S House2, B A Israel1, G Mentz1, J T Dvonch3, P Y Miranda1, S Kannan3, andM Koch4
1Health Behavior and Health Education, School of Public Health, University of Michigan, Ann Arbor, MI,USA
2Survey Research Center and Department of Sociology, University of Michigan, Ann Arbor, MI, USA
3Nutrition Department, Chenoweth Laboratory, School of Public Health and Health Sciences, University ofMassachusetts, Amherst, MA, USA
4Brightmoor Community Center, Detroit, MI, USA
AbstractBackground—The study was designed to provide evidence of a cascade effect linkingsocioeconomic position to anthropometric indicators of cardiovascular disease (CVD) risk througheffects on psychosocial stress, psychological distress and health-related behaviours, and considerimplications for disease prevention and health promotion.
Methods—A cross-sectional stratified two-stage probability sample of occupied housing units inthree areas of Detroit, Michigan, was used in the study. 919 adults aged ≥25 years completed thesurvey (mean age 46.3; 53% annual household income <$20 000; 57% non-Hispanic black, 22%Latino, 19% non-Hispanic white). Variables included self-report (eg, psychosocial stress, depressivesymptoms, health behaviours) and anthropometric measurements (eg, waist circumference, height,weight). The main outcome variables were depressive symptoms, smoking status, physical activity,body mass index and waist circumference.
Results—Income was inversely associated with depressive symptoms, likelihood of currentsmoking, physical inactivity and waist circumference. These relationships were partly or fullymediated by psychosocial stress. A suppressor effect of current smoking on the relationship betweendepressive symptoms and waist circumference was found. Independent effects of psychosocial stressand psychological distress on current smoking and waist circumference were found, above andbeyond the mediated pathways.
Conclusions—The results suggest that relatively modest improvements in the income ofeconomically disadvantaged people can set in motion a cascade of effects, simultaneously reducingexposure to stressful life conditions, improving mental well-being, increasing health-promoting
Correspondence to: Dr A J Schulz, Department of Health Behavior and Health Education, University of Michigan, School of PublicHealth, 1420 Washington Heights, Ann Arbor, MI 48109-2029, USA; [email protected] interests: None.Additional details for figures 2 and 3 are published online only at http://jech.bmj.com/content/vol62/issue7
NIH Public AccessAuthor ManuscriptJ Epidemiol Community Health. Author manuscript; available in PMC 2009 April 13.
Published in final edited form as:J Epidemiol Community Health. 2008 July ; 62(7): 638–646. doi:10.1136/jech.2007.063222.
NIH
-PA Author Manuscript
NIH
-PA Author Manuscript
NIH
-PA Author Manuscript

behaviours and reducing anthropometric risks associated with CVD. Such interventions offerimportant opportunities to improve population health and reduce health disparities.
Cardiovascular disease (CVD) is the largest contributor to all-cause mortality in the USA.Despite declines over the past 30 years, socioeconomic and racial disparities in CVD haveincreased because of uneven changes across population subgroups.1 2 Persistent relationshipsbetween socioeconomic position (SEP) and health over time have led to the development ofconceptual models that posit that SEP influences health by contributing to unequal exposuresto environments that erode health and unequal access to resources that promote or protecthealth.3-5
Substantial evidence links SEP with patterns of CVD morbidity and mortality.1 5-9Furthermore, research has established associations between SEP and psychosocial stress,10-12 psychological distress,11 13 14 behavioural risks associated with CVD15-17 andanthropometric risk factors for CVD.6 18-20
Evidence from longitudinal studies suggests that psychosocial indicators substantially mediatelong-term effects of SEP on health.5 21 Potential pathways for mediation effects between SEPand CVD include effects of psychosocial stress on depressed mood,11 14 22 23 smoking,24physical inactivity24 and central adiposity.25-27 Depressive symptoms have been associatedwith smoking,15 physical inactivity28 29 and increased risk of cardiovascular mortality.22
Building on this research, we examined evidence for a chain of effects that link SEP to CVDrisk through multiple pathways (fig 1), within a multiethnic urban sample. We first testedassociations between SEP and psychological distress (depressive symptoms), behavioural riskfactors (smoking, physical inactivity) and anthropometric risk factors for CVD (body massindex (BMI), waist circumference) (fig 1, pathways 1a–c). Next, we considered evidence fora cascade of effects, with SEP linked to psychological distress through exposure topsychosocial stress (fig 1, pathway 2a–b); psychosocial distress influencing behavioural riskfactors (pathway 2c); and behavioural risk factors influencing anthropometric risk factors(pathway 2d). Understanding the nature of this presumed causal chain is critical to thedevelopment of effective interventions and policies to reduce socioeconomic disparities incardiovascular risk.
METHODSThe relationships between SEP and CVD in the Detroit metropolitan area are similar to thosedescribed above. Three-year age-adjusted heart disease mortality in Detroit, Michigan (2001–2003), is over two times higher than in neighbouring Oakland County, where householdincomes are double and home values are triple those for Detroit (table 1). In 2000, 83% of thepopulation of Oakland County was white, whereas in Detroit 82% of the population wasAfrican American.35 36 Therefore, African Americans disproportionately bear the increasedrisk of CVD mortality experienced by Detroit residents. CVD mortality rates also vary withinDetroit. The 3-year age-adjusted average CVD mortality rate (2000–2002) in east Detroit was523.9; in northwest Detroit, 395.3; and in southwest Detroit, 426.9.37
SampleData for this study were drawn from the Healthy Environments Partnership (HEP) communitysurvey, one component of a community-based participatory research study involvingacademic, health care and community-based organisations in Detroit, Michigan.38 TheUniversity of Michigan Institutional Review Board for Protection of Human Subjects approvedthe HEP study in January 2001.
Schulz et al. Page 2
J Epidemiol Community Health. Author manuscript; available in PMC 2009 April 13.
NIH
-PA Author Manuscript
NIH
-PA Author Manuscript
NIH
-PA Author Manuscript

The HEP survey is a stratified two-stage probability sample of occupied housing units, designedfor 1000 completed interviews with adults age ≥25 years across three areas of Detroit, allowingfor comparisons of residents of similar demographics across geographic areas of the city. Thefinal sample consisted of 919 face-to-face interviews: interviews were completed with 75% ofhouseholds in which an eligible respondent was identified and 55% of households with a knownor potential respondent.38 Although the proportion of missing data was very low for variablesused in this analysis, given the complex sample design used in the HEP survey data collection,we used multiple imputation procedures derived from Bayesian models to impute missingvalues39 using the %IMPUTE routine (SAS add-in Iveware softwarehttp://www.isr.umich.edu/src/smp/ive/). This imputation enabled us to incorporate design-based features (weight, strata and primary sampling unit) in our analysis, obtaining correctstandard error estimates and producing the correct confidence intervals for our comparison andestimates.40-42
MeasuresDependent variables included psychological distress and behavioural and anthropometricindicators of CVD risk. Psychological distress was assessed using the short form43 of theCenter for Epidemiologic Studies Depressive Symptoms (CES-D) scale44 (Cronbach’s alpha,0.65). Behavioural indicators included smoking (0 = never; 1 = former; 2 = current) and physicalactivity constructed as a composite of minutes of moderate and vigorous physical activity perweek, divided into quintiles (1 = low; 5 = high). Results were similar for models usingcontinuous and categorical scalings of physical activity, so findings are presented using thecontinuous version.
Anthropometric measures were calculated from objective measurements of height, weight andmeasured waist circumference taken at the time of the interview. They included a continuousindicator of BMI calculated as (weight in pounds)/ (height in inches)2 × 703; and waistcircumference in centimetres. We tested categorical versions of waist circumference usinggender-specific cut points (88 cm/36 inches for women; 102 cm/40 inches for men) for highand low risk, and BMI (<25, normal; 25–29, overweight; ≥30, obese). Results were similarand findings for continuous versions are presented.
Other covariates included in the models were: age (years); gender (0 = male; 1 = female);marital status (1 = not married; 0 = currently married); and number of people in the household.Self-reported race and ethnicity were categorised as non-Hispanic black, non-Hispanic whiteand Latino. Indicators of SEP were household income (≤$10K, $10–19.9K, $20–34.9K, ≥$35K) and education (<12 years, 12 years, >12 years).
We included four indicators of chronic psychosocial stress. Everyday unfair treatment45 is themean of five items that assess the frequency of experiences of unfair treatment such as poorerservice than other people in restaurants or stores, or being treated with less courtesy or respectthan other people, in the previous 12 months (Cronbach’s alpha, 0.77). Response categoriesranged from 1 = never to 5 = always.
An index of financial vulnerability was constructed as the mean of two items assessing financialstrain. Responses to “If you lost all your current sources of household income—your wages,public assistance or other sources of income—how long could you continue to live at yourcurrent address and standard of living?” were coded from 1 = >1 year to 5 = <1 month.Responses to the second item, difficulty paying for basics such as food, housing, medical careand heating, were coded from 1 = not difficult at all to 4 = very difficult, and rescaled to a five-point item by multiplying by 5/4. The final mean of both items is a five-point index with 1 =less financial vulnerability to 5 = more financial vulnerability.
Schulz et al. Page 3
J Epidemiol Community Health. Author manuscript; available in PMC 2009 April 13.
NIH
-PA Author Manuscript
NIH
-PA Author Manuscript
NIH
-PA Author Manuscript

We included two indicators of chronic stressful neighbourhood conditions. Neighbourhoodsocial environment is a mean scale of six items assessing the frequency with which respondentsindicated that events such as gang activity, shootings or theft were a problem in theirneighbourhood. Response categories ranged from 1 = never to 5 = always (Cronbach’s alpha,0.83). Neighbourhood physical environment is a mean scale of seven items assessingagreement with statements such as, “houses in my neighbourhood are generally wellmaintained” (reverse coded) and “there is air pollution like diesel from trucks or pollution fromfactories or incinerators in my neighbourhood”. Response categories ranged from 1 = stronglydisagree to 5 = strongly agree (Cronbach’s alpha, 0.69).
Two indicators of acute stressful life events were included. Acute unfair treatment45 is adichotomous variable indicating whether the respondent reported any of seven experienceswith acute unfair treatment (eg, unfair treatment concerning work, treated unfairly by policeor immigration officials) in the past year (0 = none; 1 = one or more). Acute life events is adichotomous variable indicating whether the respondent reported any of nine major life eventsin the past year (0 = none; 1 = one or more). Examples of scale items include death of a lovedone, and family member or close friend with major illness or injury.
ANALYSISWe used multinomial regression models for categorical dependent variables,46 and ordinaryleast squares regression techniques for continuous outcomes. Model 1 tests the hypothesis thatSEP predicts variations in each dependent variable, above and beyond the effects ofdemographic control variables. In addition, in order to explicitly test the hypothesis thatindicators of psychosocial stress mediate relationships between SEP and indicators of CVDrisk, we test relationships between SEP and each indicator of psychosocial stress.47 Model 2tests the contributions of indicators of chronic and acute stress to psychological, behaviouraland anthropometric CVD risk factors. Model 3 tests the contribution of psychological distressto models predicting behavioural and anthropometric indicators of CVD risk. Model 4 teststhe contribution of behavioural risk factors to anthropometric indicators of CVD risk. Allmodels are adjusted for sample weights for unequal probabilities of selection within eachstratum and to match the sample to Census 2000 population distributions for the study areas.
RESULTSDescriptive statistics illustrating study variables adjusted for the sample weights are shown intable 2. Participants’ mean age was 46 years, 52% were women (632 unweighted cases), 26%were currently married and 57% were non-Hispanic black, 22% Latino and 19% non-Hispanicwhite. One-third (33%) reported education beyond high school and 23% reported annualhousehold incomes of >$35K. Thirty-seven per cent reported that they currently smoked, 24%never engaged in physical activity, mean BMI was 31, and mean waist circumference was 98centimetres (about 39 inches). Results from tests for multicollinearity among the independentvariables showed variance inflation factors of 1.3–1.6, well below the cut point of 4.0commonly considered indicative of multicollinearity. Similarly, tolerances ranged from 0.61to 0.76, comfortably above the levels of ≤0.20 considered to be indicative of multicollinearity.
Results presented in table 3 provide partial support for our hypothesis that SEP is associatedwith multiple CVD risk factors. Household income <$10K was positively associated withdepressive symptoms (p<0.001), current smoking (p = 0.05), physical inactivity (p<0.05) andwaist circumference (p<0.05). Income $10–19K was also positively associated with depressivesymptoms (p<0.01). Relationships between income and BMI were in the expected directionbut not statistically significant.
Schulz et al. Page 4
J Epidemiol Community Health. Author manuscript; available in PMC 2009 April 13.
NIH
-PA Author Manuscript
NIH
-PA Author Manuscript
NIH
-PA Author Manuscript

Participants who had completed high school were more likely than those with some college toreport current smoking (p<0.01), and those with less than a high school education were lesslikely to report physical activity (p<0.05). A significant association between <12 years ofeducation and depressive symptoms when income was not included in the model (results notshown) was no longer significant when income was included in model 1. Coefficients forrelationships between education and psychosocial stressors and anthropometric indicators werenot statistically significant.
Results shown in model 2 (table 3) indicate that psychosocial stressors are associated with fourof the five CVD risk factors examined here. Everyday (p<0.001) and acute (p<0.05) unfairtreatment, financial vulnerability (p<0.05), neighbourhood social environment (p<0.001) andacute life events (p<0.001) are each significantly associated with symptoms of depression.Regression coefficients for relationships between income and depressive symptoms werereduced by 32% (income <$10K) and 21% (income $10–19.9K), but remained statisticallysignificant. Model 2 accounted for three times the proportion of variance in depressivesymptoms explained in model 1 (28% versus 9%).
Indicators of financial vulnerability (p<0.05), neighbourhood physical environment (p<0.05),and acute life events (p<0.05) were significantly associated with current smoking. Theinclusion of psychosocial stressors reduced the association between income <$10K and currentsmoking to non-significance, and the amount of variance explained by the model increasedsignificantly (p = 0.01).
Financial vulnerability (p<0.01) and acute unfair treatment (p<0.05) were significantly andnegatively associated with level of physical activity. The inclusion of psychosocial stressorsin model 2 reduced the relationship between income <$10K and physical activity to non-significance, and between education below high school and physical activity by 21% (p<0.05),and increased the amount of variation explained significantly (p<.01). Finally, acute life eventswas significantly associated with waist circumference (p<0.01) and reduced the relationshipbetween income <$10K and waist circumference in model 1 to non-significance.
To test the hypothesis that indicators of psychosocial stress mediate relationships between SEPand symptoms of depression, smoking, physical activity and waist circumference, we examinedrelationships between indicators of psychosocial stress, income and education. Aftercontrolling for other demographic variables, we found no relationship between education andany of the indicators of psychosocial stress considered in these models (results not shown).Household income was significantly associated with financial vulnerability and acute lifeevents (table 4). Combined with results shown in table 3, these findings provide evidence thatis consistent with the hypothesis that relationships between income and symptoms ofdepression, current smoking, physical activity and waist circumference are partially or fullymediated through the effects of income on financial vulnerability and acute life events asindicators of psychosocial stress.
Results from table 3 (model 1) and table 4 are summarised in figure 2. Education, net of income,affects mainly smoking and physical activity, whereas income affects depressive symptomsand waist circumference in addition to smoking and physical activity. Overall, income is amore consequential risk factor for CVD in this population. Results shown in table 3 (model 2)indicate that relationships between income and four of the five indicators of CVD risk are atleast partially mediated through increased levels of financial vulnerability and acute life events.Several additional indicators of psychosocial stress make significant independent contributionsto the dependent variables, but we did not find evidence that they mediate relationships betweenSEP and indicators of CVD risk in this sample.
Schulz et al. Page 5
J Epidemiol Community Health. Author manuscript; available in PMC 2009 April 13.
NIH
-PA Author Manuscript
NIH
-PA Author Manuscript
NIH
-PA Author Manuscript

Symptoms of depression and behavioural and anthropometric risk factorsTable 5 shows results from analyses testing the contributions of depressive symptoms (model3); and behavioural risk factors (model 4).
Results shown for model 3 indicate that depressive symptoms are significantly associated withcurrent smoking (p<0.001) and waist circumference (p<0.05), but not physical activity or BMI,although the latter coefficients are in the expected direction. The inclusion of depressivesymptoms in model 3 significantly improves the fit of the models for both current smoking(p<0.01) and waist circumference (p<0.05), indicating that depressive symptoms contributeindependently to the explanatory value for these dependent variables. For each unit increasein depressive symptoms, there was a 2.97 cm increase in waist circumference.
Results for model 4 indicate significant negative associations between current smoking andboth BMI (p<0.001) and waist circumference (p<0.01). Relationships between physicalactivity and BMI and waist circumference were in the expected direction but were notstatistically significant. The size of the coefficient for depressive symptoms increased from0.51 to 0.96 for BMI (n.s.) and from 2.97 to 3.71 (p<0.05) for waist circumference. Thissuppression effect47 occurred because the direct effects of depressive symptoms on waistcircumference were positive whereas the mediated effects (through probability of currentsmoking) were negative, so the full effects of depressive symptoms on waist circumferencewere not visible until the effect of current smoking was controlled. The addition of behaviouralpredictors in model 4 increased the overall explained variance for BMI from 0.02 to 0.07(p<0.001) and for waist circumference from 0.06 to 0.09 (p<0.01). Findings from table 3 (model2) and table 4 are summarised in figure 3.
DISCUSSIONThe results presented here are generally consistent with our hypothesised pathways linkingSEP to CVD risk. As shown in figure 2, household income is significantly associated with fourof the five CVD risk factors examined, and education is independently associated with two ofthe five. Overall, in this multiethnic, low–moderate income urban sample, income is a moresubstantial risk factor for CVD than education.
The findings presented in tables 3–5 and illustrated in figure 3 are generally consistent withthe cascade of effects hypothesised. Psychosocial stress partially mediates relationshipsbetween income and psychological distress (2a–2b), psychological distress partially mediatesrelationships between psychosocial stress and behavioural risks (2b–2c) and current smokingsuppresses (a form of mediation effect47) relationships between psychological distress andwaist circumference (2c–2d).
We also find evidence of independent effects of psychosocial stress and psychological distresson current smoking and waist circumference, above and beyond the mediation effects describedabove. Specifically, psychosocial stress is associated with current smoking (3a) above andbeyond effects mediated through psychological distress; and psychosocial stress (3b) andpsychological distress (3c) are each associated with waist circumference, beyond effectsmediated through current smoking. Thus, our final model suggests both mediating andcumulative effects of multiple factors.
LimitationsThere are several limitations of the analyses reported here. The data are cross-sectional, andhence we cannot test the causal nature of associations between variables. Our models posit aprimary direction of association, with low SEP associated with higher levels of psychosocialstress and psychological distress, contributing to heightened risk of smoking, physical
Schulz et al. Page 6
J Epidemiol Community Health. Author manuscript; available in PMC 2009 April 13.
NIH
-PA Author Manuscript
NIH
-PA Author Manuscript
NIH
-PA Author Manuscript

inactivity and obesity. The hypothesised direction of effects is supported by a substantialliterature,25-27 48 49 but it is also reasonable to expect some reciprocal effects (eg, depressivesymptoms may predict obesity, but those who are obese may also be at increased risk ofdepressed mood). An important consideration for future analyses will be the availability oflongitudinal data to further disentangle the direction and relative contributions of these effects.
The use of self-reported data for behavioural indicators used in this analysis is also a limitation.The reliability and validity of self-reports of current smoking and levels of physical activitymay be influenced by memory, social acceptability or perceived stigma associated with thesebehaviours. These limitations would tend to bias results in the direction of underestimatingeffects. The measures included in these models are a subset of those that might influence CVDrisk—other measures such as dietary practices should be incorporated in future analyses.
This study draws on data from an urban sample with a circumscribed range of householdincome: 80% of study participants reported annual household incomes <$35 000, with >50%reporting incomes <$20 000. Failure to find a statistically significant relationship betweenincome and BMI, contrary to much of the literature in this area, may reflect the limited rangeof income in our sample, and also the known weaker relationship of income to BMI amongracial/ethnic minority groups. For similar reasons, findings reported here may alsounderestimate relationships between income and our other indicators of cardiovascular risk.
We found modest evidence for independent effects of education, above and beyond the effectsof household income. This finding may reflect the relative lack of variation in levels ofeducation at the upper end of the educational spectrum (just 7% of participants reportedcompletion of ≥4 years of college). It may also reflect the relatively smaller improvements insocial and economic status realised by African Americans, who make up 57% of our sample,compared with whites with similar educational attainments.50-52 To the extent thatrelationships between education and health-related behaviours or anthropometric indicatorsoperate through improved access to resources, residents of communities such as Detroit, withreduced structural access to economic, health and social resources, may realise fewer benefitsfrom education than their counterparts in more affluent neighbourhoods. Future analysesshould attempt to disentangle these individual and neighbourhood-level pathways through, forexample, hierarchical linear modelling techniques.
ImplicationsDespite these limitations, findings presented here are consistent with evidence from cross-sectional and longitudinal studies that suggest that low SEP is associated with increasedexposure to multiple risk factors for CVD. Furthermore, our results are consistent withconceptual models linking household income to cardiovascular risk through exposure tostressful life conditions, with subsequent effects on psychological distress and behavioural andanthropometric indicators.
These findings also highlight the complexity of risk. Several indicators of psychosocial stressincluded in our models were significantly associated with indicators of cardiovascular risk, butwere not significantly associated with SEP in this sample. Everyday and acute unfair treatmenthave been previously demonstrated to be significantly associated with race,53 54 and may beone pathway through which racial disparities in cardiovascular risk occur independently of thewell-established association of race and income in the US.3 55 Furthermore, measures of socialand physical environment stress associated with some indicators of CVD risk were notsignificantly associated with household income in this sample, suggesting the need to betterunderstand predictors of these stressors and their contributions to CVD risk. Such measuresmay be more reflective of neighbourhood-level economic inequalities not captured in thisanalysis, but demonstrated in previous studies to be associated with the unequal distribution
Schulz et al. Page 7
J Epidemiol Community Health. Author manuscript; available in PMC 2009 April 13.
NIH
-PA Author Manuscript
NIH
-PA Author Manuscript
NIH
-PA Author Manuscript

of cardiovascular risk.55 Our results are consistent with models that position smoking as anintermediary within a chain of events linking low SEP to CVD through stressful life conditionsand depressive symptoms. Smoking as a behavioural response to stress associated with lowSEP appears to partially suppress associations between depressive symptoms andanthropometric indicators of risk. Until we account for the negative association betweensmoking and waist circumference, the relationship between depressive symptoms and waistcircumference is partially obscured. These findings suggest the importance of understandingsmoking behaviour as emerging within particular socioeconomic contexts associated withheightened stress and depressive symptoms. Interventions that focus solely on smoking withoutaddressing associated economic and social inequalities address only one aspect of themultifaceted pathways linking unequal social positions to unequal risk of CVD.56 57
These results add weight to arguments regarding the importance of addressing socialinequalities as a means to reduce health disparities.3 4 58 The finding that low income increasesmultiple risk factors in this sample with a relatively circumscribed range of household incomesuggests that even modest improvements in economic circumstances may contribute topopulation-level reductions in CVD risk. Interventions at more fundamental levels can set inmotion a cascade of effects, including reduced exposure to stressful life conditions andimproved mental well-being, with implications for multiple more proximate CVD risk factors.Such interventions offer important opportunities to improve population-level health and qualityof life by reducing and eventually eliminating socioeconomic inequalities in health.
What is already known on this subject
The risk of cardiovascular disease (CVD), the largest contributor to all-cause mortality inthe USA, varies by socioeconomic position (SEP). In addition, SEP is associated withmultiple established risk factors for CVD.
What this study adds
We have drawn on a multiethnic sample from Detroit, Michigan, to test hypotheses linkingSEP to CVD risk through a progression of effects that include exposure to stressful lifeconditions, psychological distress, behavioural risk factors and anthropometric indicatorsof CVD risk. Our results provide support for conceptual models that posit that SEPinfluences CVD risk in part through behavioural and anthropometric responses topsychosocial stress and distress.
Policy implications
These models and results suggest that interventions that improve the socioeconomicposition of economically disadvantaged people can set in motion a cascade of effects,including reductions in exposure to stressful life conditions, improved mental well-being,increased physical activity, reductions in smoking, and reduced anthropometric risksassociated with CVD.
AcknowledgementsThe Healthy Environments Partnership (HEP) (www.hepdetroit.com) is affiliated with the Detroit Community–Academic Urban Research Center (www.sph.umich.edu/urc). We thank the members of HEP (who have includedBoulevard Harambee, Brightmoor Community Center, Detroit Department of Health, Detroit Hispanic DevelopmentCorporation, Friends of Parkside, Henry Ford Health System, Southwest Detroit Environmental Vision, and theUniversity of Michigan Schools of Public Health, Nursing, Social Work and the Survey Research Center) for their
Schulz et al. Page 8
J Epidemiol Community Health. Author manuscript; available in PMC 2009 April 13.
NIH
-PA Author Manuscript
NIH
-PA Author Manuscript
NIH
-PA Author Manuscript

contributions to the work presented here. HEP is funded by the National Institute of Environmental Health Sciences,no. R01 ES10936. Finally, we thank Sue Andersen for her assistance with the preparation of this manuscript.
References1. Cooper R, Cutler JA, Desvigne-Nickens P, et al. Trends and disparities in coronary heart disease, stroke
and other cardiovascular diseases in the United States: findings of the national conference oncardiovascular disease prevention. Circulation 2000;102:3137–47. [PubMed: 11120707]
2. Williams DR. Race, socioeconomic status and health. Ann N Y Acad Sci 1999;896:173–88. [PubMed:10681897]
3. House, JS.; Williams, DR. Understanding and reducing socioeconomic and racial/ ethnic disparitiesin health. In: Smedley, BD.; Syme, SL., editors. Promoting health: intervention strategies from socialand behavioral research. Vol. 81. Washington, DC: National Academy Press; 2000. p. 1-4.
4. Link BG, Phelan J. Social conditions as fundamental causes of disease. J Health Social Behav 1995;36(Special issue):80–94.
5. Marmot MG, Bosma H, Hemingway H, et al. Contribution of job control and other risk factors to socialvariations in coronary heart disease incidence. Lancet 1997;350:235–9. [PubMed: 9242799]
6. Diez-Roux AV, Northridge ME, Morabia A, et al. Prevalence and social correlates of cardiovasculardisease risk factors in Harlem. Am J Public Health 1999;89:302–7. [PubMed: 10076477]
7. Diez-Roux A, Detrano R, Jackson S, et al. Acculturation and socioeconomic position as predictors ofcoronary calcification in a multiethnic sample. Circulation 2005;112:1557–65. [PubMed: 16144996]
8. Rosvall M, Östergren P-O, Hedblad B, et al. Socioeconomic differences in the progression of sub-carotid atherosclerosis in middle-aged men and women with subclinical atherosclerosis in Sweden.Soc Sci Med 2006;62:1785–98. [PubMed: 16181715]
9. Winkleby MA, Kraemer HC, Ahn DK, et al. Ethnic and socioeconomic differences in cardiovasculardisease risk factors. JAMA 1998;280:356–62. [PubMed: 9686553]
10. Heslop P, Smith GD, Carroll D, et al. Perceived stress and coronary heart disease risk factors: thecontribution of socio-economic position. Br J Health Psychol 2001;6:167–78. [PubMed: 14596732]
11. Latkin CA, Curry AD. Stressful neighborhoods and depression: a prospective study of the impact ofneighborhood disorder. J Health Soc Behav 2003;44:34–44. [PubMed: 12751309]
12. Pickering T. Cardiovascular pathways: socioeconomic status and stress effects on hypertension andcardiovascular function. Ann N Y Acad Sci 1999;896:262–77. [PubMed: 10681903]
13. Karlsen S, Nazroo JY. Relation between racial discrimination, social class, and health among ethnicminority groups. Am J Public Health 2002;92:624–31. [PubMed: 11919063]
14. Turner RJ, Lloyd DA. The stress process and the social distribution of depression. J Health Soc Behav1999;40:374–404. [PubMed: 10643162]
15. Ahluwalia IB, Mack KA, Mokdad A. Mental and physical distress and high-risk behaviors amongreproductive-age women. Obstet Gynecol 2004;104:477–83. [PubMed: 15339756]
16. National Center for Health Statistics (NCHS). Health, United States. 2005 [14 July 2006].http://www.cdc.gov/nchs/data/hus/hus05.pdf
17. Schoenborn, CA.; Adams, PF.; Barnes, PM., et al. Vital health statistics, Series 10. Vol. 219.Hyattsville, MD: NCHS; 2004. Health behaviors of adults: United States, 1999–2001; p. 1-79.
18. Everson-Rose SA, Lewis TT. Psychosocial factors and cardiovascular diseases. Annu Rev PublicHealth 2005;26:469–500. [PubMed: 15760298]
19. James SA, Fowler-Brown A, Raghunathan TE, et al. Life-course socioeconomic position and obesityin African American Women: the Pitt County Study. Am J Public Health 2006;96:554–60. [PubMed:16449599]
20. Wilsgaard T, Jacobsen BK, Arnesen E. Determining lifestyle correlates of body mass index usingmultilevel analyses: the Tromso Study, 1979–2001. Am J Epidemiol 2005;162:1179–88. [PubMed:16269586]
21. House JS. Understanding social factors and inequalities in health: 20th century progress and 21stcentury prospects. J Health Social Behav 2002;43:125–42.
Schulz et al. Page 9
J Epidemiol Community Health. Author manuscript; available in PMC 2009 April 13.
NIH
-PA Author Manuscript
NIH
-PA Author Manuscript
NIH
-PA Author Manuscript

22. van Melle JP, de Jonge P, Spijkerman TA, et al. Prognostic association of depression followingmyocardial infarction with mortality and cardiovascular events: a meta-analysis. Psychosom Med2004;66:814–22. [PubMed: 15564344]
23. Williams DR, Neighbors HW, Jackson JS. Racial/ethnic discrimination and health: findings fromcommunity studies. Am J Public Health 2003;93:200–8. [PubMed: 12554570]
24. Ng DM, Jeffery RW. Relationships between perceived stress and health behaviors in a sample ofworking adults. Health Psychol 2003;22:638–42. [PubMed: 14640862]
25. Björntorp P. Heart and soul: stress and the metabolic syndrome. Scand Cardiovasc J 2001;35:172–7. [PubMed: 11515689]
26. McEwen BS. Protective and damaging effects of stress mediators: central role of the brain. Prog BrainRes 2000;122:25–34. [PubMed: 10737048]
27. Vitaliano PP, Scanlan JM, Zhang J, et al. A path model of chronic stress, the metabolic syndrome,and coronary heart disease. Psychosom Med 2002;64:418–35. [PubMed: 12021416]
28. Brown WJ, Ford JH, Burton NW, et al. Prospective study of physical activity and depressivesymptoms in middle-aged women. Am J Prev Med 2005;29:265–72. [PubMed: 16242588]
29. Motl RW, Konopack JF, McAuley E, et al. Depressive symptoms among older adults: long-termreduction after a physical activity intervention. J Behav Med 2005;28:385–94. [PubMed: 16049630]
30. US Census Bureau. State and county quickfacts: Detroit (city), Michigan. 2005 [28 December 2005].last revised December 13, 2005, http://quickfacts.census.gov/qfd/states/26/2622000.html
31. US Census Bureau. State and county quickfacts: Oakland County, Michigan. 2005 [28 December2005]. http://quickfacts.census.gov/qfd/states/26/26125.html
32. Michigan Department of Community Health. Heart disease deaths and death rates, city of DetroitHealth Department district residents, 1989–2005. 2006 [12 January 2007].http://www.mdch.state.mi.us/pha/osr/chi/cri/frame.html
33. Michigan Department of Community Health. Mortality, natality and other vital statistics. 2005 [29September 2006]. http://www.michigan.gov/mdch
34. US Census Bureau. State and county quickfacts: Michigan. 2005 [17 January 2006]. last revised 12January 2006, http://quickfacts.census.gov/qfd/states/26000.html
35. Southeast Michigan Council of Governments. Community profile for Detroit City. 2006 [11September 2006]. http://www.semcog.org/Data/CommunityProfiles/index.htm
36. Southeast Michigan Council of Governments. Community profile for Oakland County. 2006 [11September 2006]. http://www.semcog.org/Data/CommunityProfiles/index.htm
37. Michigan Department of Community Health. Mortality Statistics. 2003 [30 August 2004].http://www.mdch.state.mi.us/pha/osr/chi/Deaths/frame.html
38. Schulz AJ, Kannan S, Dvonch JT, et al. Social and physical environments and disparities in risk forcardiovascular disease: the Healthy Environments Partnership conceptual model. Environ HealthPerspect 2005;113:1817–25. [PubMed: 16330371]
39. Barnard, J.; Schenker, N.; Rubin, DB. Multiple imputation. In: Smelser, NJ.; Baltes, PB., editors.International encyclopedia of the social & behavior sciences. Amsterdam: Elsevier; 2004. p.10204-10.
40. Bryk, AS.; Raudenbush, SW. Hierarchical linear models. Newbury Park, CA: Sage; 1992.41. Rubin DB. Multiple imputation after 18+ years (with discussion). J Am Stat Assoc 1996;91:473–89.42. Schafer, JL. Analysis of incomplete multivariate data. London: Chapman & Hall; 1997.43. Kohout FJ, Berkman LF, Evans DA, et al. Two shorter forms of the CES-D Depression Symptoms
Index. J Aging Health 1993;5:179–93. [PubMed: 10125443]44. Radloff LS. The CES-D: a self-report depression scale for research on the general population. Appl
Psychol Meas 1977;1:385–401.45. Williams DR, Yu Y, Jackson J, et al. Racial differences in physical and mental health: socioeconomic
status, stress and discrimination. J Health Psychol 1997;2:335–51.46. DeMaris A. A tutorial on logistic regression. J Marriage Fam 1995;57:956–68.47. MacKinnon DP, Krull JL, Lockwood CM. Equivalence of the mediation, confounding and
suppression effect. Prev Sci 2000;1:173–81. [PubMed: 11523746]
Schulz et al. Page 10
J Epidemiol Community Health. Author manuscript; available in PMC 2009 April 13.
NIH
-PA Author Manuscript
NIH
-PA Author Manuscript
NIH
-PA Author Manuscript
48. Stansfield SA, Fuhrer R, Shipley MJ, et al. Psychological distress as a risk factor for coronary heartdisease in the Whitehall II study. Int J Epidemiol 2002;31:248–55. [PubMed: 11914328]
49. Steptoe A, Wardle J. Cardiovascular stress responsivity, body mass and abdominal adiposity. Int JObesity 2005;29:1329–37.
50. Conley D. The racial wealth gap: origins and implications for philanthropy in the African Americancommunity. Nonprofit Voluntary Sector Q 2000;29:530–40.
51. Massey, DS.; Denton, NA. American apartheid: segregation and the making of the underclass.Cambridge, MA: Harvard University Press; 1993.
52. Schulz AJ, Israel BA, Williams DR, et al. Social inequalities, stressors and self-reported health statusamong African American and white women in the Detroit metropolitan area. Soc Sci Med2000;51:1639–53. [PubMed: 11072884]
53. Williams DR, Yu Y, Jackson JS, et al. Racial differences in physical and mental health:Socioeconomic status, stress and discrimination. J Health Psychol 1997;2:335–51.
54. Schulz AJ, Williams DR, Israel BA, et al. Unfair treatment, neighborhood effects, and mental healthin the Detroit metropolitan area. J Health Soc Behav 2000;41:314–32. [PubMed: 11011507]
55. Diez-Roux A, Link BG, Northridge ME. A multilevel analysis of income inequality andcardiovascular disease risk factors. Soc Sci Med 2000;50:673–87. [PubMed: 10658848]
56. James SA. Primordial prevention of cardiovascular disease among African Americans: A socialepidemiological perspective. Prev Med 1999;29(6 part 2):S84–9. [PubMed: 10641823]
57. Graham H. Gender and class as dimensions of smoking behaviour in Britain: Insights from a surveyof mothers. Soc Sci Med 1994;38:691–8. [PubMed: 8171347]
58. Marmot M. Inequalities in health. N Engl J Med 2001;345:134–6. [PubMed: 11450663]
Schulz et al. Page 11
J Epidemiol Community Health. Author manuscript; available in PMC 2009 April 13.
NIH
-PA Author Manuscript
NIH
-PA Author Manuscript
NIH
-PA Author Manuscript

Figure 1.Conceptual model of pathways linking socioeconomic position, psychosocial stress,psychological distress and behavioural and anthropometric cardiovascular risk factors. BMI,body mass index; CVD, cardiovascular disease; SEP, socioeconomic position.
Schulz et al. Page 12
J Epidemiol Community Health. Author manuscript; available in PMC 2009 April 13.
NIH
-PA Author Manuscript
NIH
-PA Author Manuscript
NIH
-PA Author Manuscript

Figure 2.Relationships between income and education, and psychosocial stress, psychosocial distress,behavioural and anthropometric risk factors (summary of results shown in table 3, model 1 andtable 4). (Further details available online.)
Schulz et al. Page 13
J Epidemiol Community Health. Author manuscript; available in PMC 2009 April 13.
NIH
-PA Author Manuscript
NIH
-PA Author Manuscript
NIH
-PA Author Manuscript
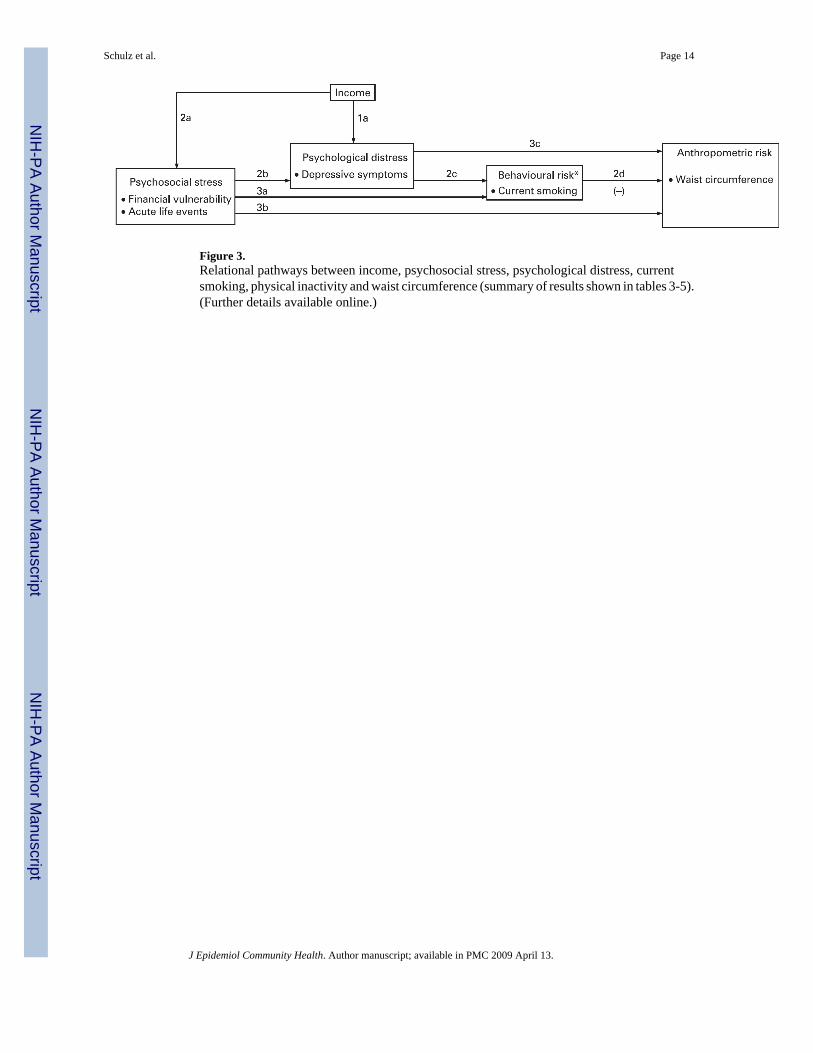
Figure 3.Relational pathways between income, psychosocial stress, psychological distress, currentsmoking, physical inactivity and waist circumference (summary of results shown in tables 3-5).(Further details available online.)
Schulz et al. Page 14
J Epidemiol Community Health. Author manuscript; available in PMC 2009 April 13.
NIH
-PA Author Manuscript
NIH
-PA Author Manuscript
NIH
-PA Author Manuscript

NIH
-PA Author Manuscript
NIH
-PA Author Manuscript
NIH
-PA Author Manuscript
Schulz et al. Page 15
Table 1Median household income, median home value and age-adjusted 3-year average mortality due to heart disease forDetroit City, Oakland County and Michigan
Median householdincome 1999
Median owner-occupiedhome value
3-year age-adjusted mortality dueto heart disease (2001–3)
Detroit City $29 52630 $63 60030 402.132
Oakland County 61 90731 181 20031 240.633
Michigan 44 66734 115 60034 262.833
J Epidemiol Community Health. Author manuscript; available in PMC 2009 April 13.

NIH
-PA Author Manuscript
NIH
-PA Author Manuscript
NIH
-PA Author Manuscript
Schulz et al. Page 16Ta
ble
2D
escr
iptiv
e st
atis
tics f
or st
udy
varia
bles
– fu
ll sa
mpl
e (N
= 9
19)
Unw
eigh
ted
Wei
ghte
d de
scri
ptiv
e st
atis
tics
NPe
r ce
ntM
ean
SDR
ange
Age
919
46.3
0.8
25.0
–96.
0
Fem
ale
632
52.3
Mal
e28
747
.7
Not
mar
ried
689
73.6
Cur
rent
ly m
arrie
d23
026
.4
Num
ber o
f peo
ple
in h
ouse
hold
919
2.8
0.1
1.0–
11.0
Non
-His
pani
c bl
ack
522
56.8
His
pani
c/La
tino
182
22.2
Non
-His
pani
c w
hite
199
18.8
Oth
er16
2.3
Educ
atio
n
<H
igh
scho
ol32
737
.3
H
igh
scho
ol g
radu
ate
259
29.5
>H
igh
scho
ol32
133
.2
Inco
me
<$
10 0
0025
027
.3
$1
0 00
0–$1
9 99
923
826
.0
$2
0 00
0–$3
4 99
923
023
.6
≥$
35 0
0020
123
.0
Ever
yday
unf
air t
reat
men
t91
81.
7<0
.01.
0–5.
0
Acu
te u
nfai
r tre
atm
ent (
any
in la
st 1
2 m
onth
s = 1
)26
329
.0
Fina
ncia
l vul
nera
bilit
y91
93.
10.
11.
1–5.
0
Nei
ghbo
urho
od so
cial
env
ironm
ent
919
2.7
0.1
1.0–
5.0
Nei
ghbo
urho
od p
hysi
cal e
nviro
nmen
t91
92.
90.
11.
0–5.
0
Acu
te li
fe e
vent
s (an
y in
last
12
mon
ths =
1)
655
71.1
Sym
ptom
s of d
epre
ssio
n91
92.
6<0
.01.
4–4.
7
Cur
rent
smok
er34
737
.0
Form
er sm
oker
197
22.6
J Epidemiol Community Health. Author manuscript; available in PMC 2009 April 13.

NIH
-PA Author Manuscript
NIH
-PA Author Manuscript
NIH
-PA Author Manuscript
Schulz et al. Page 17
Unw
eigh
ted
Wei
ghte
d de
scri
ptiv
e st
atis
tics
NPe
r ce
ntM
ean
SDR
ange
Nev
er sm
oker
375
40.4
Phys
ical
act
ivity
leve
l91
91.
90.
10.
0–4.
0
BM
I91
930
.80.
215
.8–6
1.8
Wai
st c
ircum
fere
nce
(cm
)91
998
.00.
634
.0–1
62.0
Dat
a ar
e w
eigh
ted
to a
djus
t for
sam
plin
g de
sign
. BM
I, bo
dy m
ass i
ndex
.
J Epidemiol Community Health. Author manuscript; available in PMC 2009 April 13.

NIH
-PA Author Manuscript
NIH
-PA Author Manuscript
NIH
-PA Author Manuscript
Schulz et al. Page 18Ta
ble
3D
epre
ssiv
e sy
mpt
oms,
smok
ing,
phy
sica
l act
ivity
, BM
I and
wai
st c
ircum
fere
nce
regr
esse
d on
edu
catio
n, in
com
e, e
very
day
unfa
ir tre
atm
ent,
acut
e un
fair
treat
men
t, fin
anci
al v
ulne
rabi
lity,
neig
hbou
rhoo
d so
cial
env
ironm
ent s
tress
, nei
ghbo
urho
od p
hysi
cal e
nviro
nmen
t stre
ss a
nd a
cute
life
eve
nts
(con
trolli
ng fo
r age
, gen
der,
mar
ital s
tatu
s, nu
mbe
r in
hous
ehol
d un
it, ra
ce a
ndet
hnic
ity, n
ot sh
own)
Dep
ress
ive
sym
ptom
sFo
rmer
smok
ing
Cur
rent
smok
ing
Phys
ical
act
ivity
BM
IW
aist
cir
cum
fere
nce
Mod
el 1
Mod
el 2
Mod
el 1
Mod
el 2
Mod
el 1
Mod
el 2
Mod
el 1
Mod
el 2
Mod
el 1
Mod
el 2
Mod
el 1
Mod
el 2
Est
imat
eE
stim
ate
Est
imat
eE
stim
ate
Est
imat
eE
stim
ate
Est
imat
eE
stim
ate
Est
imat
eE
stim
ate
Est
imat
eE
stim
ate
Inte
rcep
t2.
60**
*1.
40**
*−1
.51**
−2.4
7**0.
89−1
.53
3.57
4.02
26.4
7***
24.1
3***
85.7
0***
75.5
5***
Educ
atio
n (>
Hig
h sc
hool
refe
rent
)
<H
igh
scho
ol0.
030.
05−0
.19
−0.1
60.
360.
40−0
.41**
−0.3
2*−0
.42
−0.4
9−2
.34
−2.0
3
H
igh
scho
ol g
radu
ate
−0.0
20.
010.
080.
090.
57**
0.63
**−0
.15
−0.1
6−0
.80
−0.7
6−1
.29
−1.1
2
Inco
me
(≥$3
5 00
0 re
fere
nt)
<$
10 0
000.
28**
*0.
19**
0.11
0.07
0.80
*0.
56−0
.42*
−0.2
80.
880.
394.
24*
3.22
$1
0 00
0–19
999
0.19
**0.
15*
−0.0
6−0
.07
0.50
0.34
−0.1
3−0
.02
0.17
−0.1
90.
11−0
.58
$2
0 00
0–34
999
−0.0
2−0
.03
0.06
0.05
0.20
0.14
−0.0
7−0
.01
0.42
0.26
0.42
0.24
Psyc
hoso
cial
stre
ss m
easu
res
Ev
eryd
ay u
nfai
r tre
atm
ent
0.23
***
0.22
0.13
0.04
0.53
1.97
A
cute
unf
air t
reat
men
t0.
11*
0.04
0.16
0.30
*−0
.54
−0.0
3
Fi
nanc
ial v
ulne
rabi
lity
0.04
*−0
.01
0.20
*−0
.14**
0.27
0.25
N
eigh
bour
hood
soci
al e
nviro
nmen
t0.
09**
*0.
090.
14−0
.06
−0.0
10.
37
N
eigh
bour
hood
phy
sica
l env
ironm
ent
0.02
−0.0
20.
24*
−0.0
60.
010.
29
A
cute
life
eve
nts
0.18
***
0.27
0.59
*0.
031.
034.
13**
Adj
uste
d R2
0.09
0.28
0.08
0.10
0.02
0.02
0.04
0.05
F st
atis
tic/s
igni
fican
ce fo
r cha
nge
39.5
6**3.
89**
1.18
2.97
**
df =
231
.1./−
2log
like
lihoo
d10
.9/1
768.
76.
2/17
360.
410
.9/1
768.
76.
2/17
360.
4
G st
atis
tic/s
igni
fican
ce fo
r cha
nge
32.3
**32
.3**
BM
I, bo
dy m
ass i
ndex
; df,
degr
ees o
f fre
edom
.
* p<0.
05,
**p<
0.01
,
J Epidemiol Community Health. Author manuscript; available in PMC 2009 April 13.

NIH
-PA Author Manuscript
NIH
-PA Author Manuscript
NIH
-PA Author Manuscript
Schulz et al. Page 19**
* p<0.
001.
J Epidemiol Community Health. Author manuscript; available in PMC 2009 April 13.

NIH
-PA Author Manuscript
NIH
-PA Author Manuscript
NIH
-PA Author Manuscript
Schulz et al. Page 20Ta
ble
4Ev
eryd
ay u
nfai
r tre
atm
ent,
acut
e unf
air t
reat
men
t, fin
anci
al v
ulne
rabi
lity,
nei
ghbo
urho
od so
cial
envi
ronm
ent,
neig
hbou
rhoo
d ph
ysic
al en
viro
nmen
t and
acut
e life
even
ts re
gres
sed
on h
ouse
hold
inco
me
(con
trolli
ng fo
r age
, gen
der,
mar
ital s
tatu
s, nu
mbe
r in
hous
ehol
d un
it, ra
ce a
nd e
thni
city
and
edu
catio
n, n
ot sh
own)
Eve
ryda
y un
fair
trea
tmen
tA
cute
unf
air
trea
tmen
tFi
nanc
ial
vuln
erab
ility
Nei
ghbo
urho
odso
cial
env
iron
men
tN
eigh
bour
hood
phys
ical
env
iron
men
tA
cute
life
eve
nts
Inco
me
(≥$3
5 00
0 re
fere
nt)
Est
imat
eO
RE
stim
ate
Est
imat
eE
stim
ate
OR
<$10
000
0.15
1.09
1.09
***
−0.0
10−0
.173
1.90
*
$10
000–
19 9
990.
010.
790.
72**
*−0
.046
−0.0
931.
95*
$20
000–
34 9
99−0
.04
1.02
0.50
***
−0.0
45−0
.157
1.26
* p<0.
05,
*** p<
0.00
1.
J Epidemiol Community Health. Author manuscript; available in PMC 2009 April 13.

NIH
-PA Author Manuscript
NIH
-PA Author Manuscript
NIH
-PA Author Manuscript
Schulz et al. Page 21Ta
ble
5Sm
okin
g, p
hysi
cal
activ
ity, B
MI
and
wai
st c
ircum
fere
nce
regr
esse
d on
edu
catio
n, i
ncom
e, e
very
day
unfa
ir tre
atm
ent,
acut
e un
fair
treat
men
t, fin
anci
al v
ulne
rabi
lity,
nei
ghbo
urho
od so
cial
envi
ronm
ent s
tress
, nei
ghbo
urho
od p
hysi
cal e
nviro
nmen
t stre
ss, a
cute
life
even
tsan
d de
pres
sive
sym
ptom
s (co
ntro
lling
for a
ge, g
ende
r, m
arita
l sta
tus,
num
ber i
n ho
useh
old
unit,
race
and
eth
nici
ty, n
ot sh
own)
Form
er sm
okin
gC
urre
nt sm
okin
gPh
ysic
al a
ctiv
ityB
MI
Wai
st c
ircu
mfe
renc
e
Mod
el 3
Mod
el 3
Mod
el 3
Mod
el 3
Mod
el 4
Mod
el 3
Mod
el 4
Est
imat
eE
stim
ate
Est
imat
eE
stim
ate
Est
imat
eE
stim
ate
Est
imat
e
Inte
rcep
t−1
.93*
−2.4
7**4.
1323
.42**
*23
.92**
*71
.38**
*73
.10**
*
Educ
atio
n (>
Hig
h sc
hool
refe
rent
)
<H
igh
scho
ol−0
.14
0.36
−0.3
1*−0
.52
−0.3
0−2
.18
−1.9
7
H
igh
scho
ol g
radu
ate
0.10
0.64
−0.1
6−0
.77
−0.4
1−1
.16
−0.7
0
Inco
me
(≥$3
5 00
0 =
refe
rent
)
<$
10 0
000.
120.
46−0
.27
0.29
0.50
2.65
2.80
$1
0 00
0–19
999
−0.0
40.
26−0
.01
−0.2
6−0
.10
−1.0
1−0
.77
$2
0 00
0–34
999
0.04
0.18
−0.0
10.
270.
350.
330.
41
Psyc
hoso
cial
stre
ss m
easu
res
Ev
eryd
ay u
nfai
r tre
atm
ent
0.29
−0.0
30.
050.
410.
361.
281.
17
A
cute
unf
air t
reat
men
t0.
060.
090.
31*
−0.6
0−0
.50
−0.3
6−0
.07
Fi
nanc
ial v
ulne
rabi
lity
0.01
0.17
*−0
.14**
0.25
0.34
0.14
0.21
N
eigh
bour
hood
soci
al e
nviro
nmen
t0.
110.
08−0
.05
−0.0
60.
040.
120.
08
N
eigh
bour
hood
phy
sica
l env
ironm
ent
−0.0
20.
23*
−0.0
6−0
.00
0.13
0.22
0.39
A
cute
life
eve
nts
0.31
0.48
*0.
040.
941.
183.
60**
3.92
**
Sym
ptom
s of d
epre
ssio
n−0
.32
0.67
***
−0.0
70.
510.
962.
97*
3.71
*
Cur
rent
smok
er−3
.23**
*−4
.40**
Form
er sm
oker
−0.4
90.
98
Phys
ical
act
ivity
−0.1
0−0
.65
Adj
uste
d R2
0.09
0.02
0.07
0.06
0.09
F st
atis
tic/s
igni
fican
ce fo
r cha
nge
0.51
1.33
7.30
***
5.95
*5.
71*
df =
23.
1./−
2log
like
lihoo
d6.
05/1
709.
3
G st
atis
tic/s
igni
fican
ce fo
r cha
nge
57.4
5**
J Epidemiol Community Health. Author manuscript; available in PMC 2009 April 13.

NIH
-PA Author Manuscript
NIH
-PA Author Manuscript
NIH
-PA Author Manuscript
Schulz et al. Page 22B
MI,
body
mas
s ind
ex; d
f, de
gree
s of f
reed
om.
* p ≤0
.05,
**p≤
0.01
,
*** p≤
0.00
1.
J Epidemiol Community Health. Author manuscript; available in PMC 2009 April 13.