assessing socioeconomic vulnerability to famine
TRANSCRIPT
ASSESSING SOCIOECONOMIC VULNERABILITY TO FAMINE: FRAMEWORKS, CONCEPTS, AND APPLICATIONS
BY
Thomas E. Downing
Final Report to the: U.S. Agency for International Development
Famine Early Warning System Project
/
23 March 1990
ASSESSING SOCIOECONOMIC VULNERABILITY T O FAMINE: FRAMEWORKS, CONCEPTS, AND APPLICATIONS
Thomas E. Downing Research Fellow
Atmospheric Impacts Research Group School of Geography
University of Birmingham Edgbaston
Birmingham B15 2TT, U.K.
and
Visiting Scientist Alan Shawn Feinstein World Hunger Program
Campus Box 1831 Brown University
Providence, RI 029 12
Final Report to the: U.S. Agency for International Development
Famine Early Warning System Project Contract No.: AFR-0466-C-9035-00
FEWS Working Paper 2.1 :.-
/
23 March 1990
TABLE OF CONTENTS
Chapter Page
1 . INTRODUCTION AND OBJECTIVES . . . . . . . . . . . . . . . . . . . . . . . . . . . . . . . . . . . 1 . . . . . . . . . . . . . . . . . . . . . . . . . . . . . . . . . . . . . . . . . . . . . . . . . . 1.1. Objectives 1 1.2. Definition of Famine . . . . . . . . . . . . . . . . . . . . . . . . . . . . . . . . . . . . . . . . . . 2 . . . . . . . . . . . . . . . . . . . . . . . . . . . . . . . . . . . . . . . . . . . . . . . . . . . 1.3. Overview 3
CAUSAL STRUCTURE OF HUNGER . . . . . . . . . . . . . . . . . . . . . . . . . . . . . . . . . . 5 2.1. Causal Structure of Hunger . . . . . . . . . . . . . . . . . . . . . . . . . . . . . . . . . . . . . . 6 2.2. Vulnerability . . . . . . . . . . . . . . . . . . . . . . . . . . . . . . . . . . . . . . . . . . . . . . . . 9
2.2.1. Definition of Vulnerability . . . . . . . . . . . . . . . . . . . . . . . . . . . . . . . . 9 2.2.2. Trends and Triggers . . . . . . . . . . . . . . . . . . . . . . . . . . . . . . . . . . . . . 9 2.2.3. Risk of Exposure, Risk of Consequences . . . . . . . . . . . . . . . . . . . . . 10 2.3.4. Domains. Dimensions. and Indicators . . . . . . . . . . . . . . . . . . . . . . . . 1 1 2.3.5. Analysis of Vulnerability . . . . . . . . . . . . . . . . . . . . . . . . . . . . . . . . . 12
VULNERABILITY IN THE FEWS PROJECT . . . . . . . . . . . . . . . . . . . . . . . . . . . . 15 3.1. Vulnerability: A Unique Approach . . . . . . . . . . . . . . . . . . . . . . . . . . . . . . . 15 3.2. FEWS Vulnerability Assessments in 1989 . . . . . . . . . . . . . . . . . . . . . . . . . . . 17 3.3. Improving Analysis of Vulnerability in FEWS: Overview . . . . . . . . . . . . . . . 18 3.4. Sequence and Degree of Famine Risk . . . . . . . . . . . . . . . . . . . . . . . . . . . . . 18 3.5. Rationale for Focusing on Vulnerable Groups . . . . . . . . . . . . . . . . . . . . . . . 20
4 . IDENTIFICATION AND MONITORING OF VULNERABLE GROUPS . . . . . . . . . 26 4.1. Approaches to Assessing Vulnerability . . . . . . . . . . . . . . . . . . . . . . . . . . . . . 26 4.2. Dimensions of Vulnerability . . . . . . . . . . . . . . . . . . . . . . . . . . . . . . . . . . . . 27 4.3. A Taxonomy of Geheric Vulnerable Groups . . . . . . . . . . . . . . . . . . . . . . . . 29 4.4. Types of Famine . . . . . . . . . . . . . . . . . . . . . . . . . . . . . . . . . . . . . . . . . . . . 32 4.5. Testing Definitions of Vulnerable Groups . . . . . . . . . . . . . . . . . . . . . . . . . . 32
5 . TOWARD REVISED FEWS VULNERABILITY ASSESSMENTS . . . . . . . . . . . . . . . 33 5.1. Baseline Vulnerability of Socioeconomic Groups . . . . . . . . . . . . . . . . . . . . . 33 5.2. Refining the FEWS Vulnerebility Assessments . . . . . . . . . . . . . . . . . . . . . . . 34
5.2.1. Procedures and Frameworks . . . . . . . . . . . . . . . . . . . . . . . . . . . . . . . 34 5.2.2. Vulnerability Assessment Reports . . . . . . . . . . . . . . . . . . . . . . . . . . . 35
6 . MONITORING CURRENT VULNERABILITY AND PREVALENCE OF FAMINE . . . . . . . . . . . . . . . . . . . . . . . . . . . . . . . . . . . . . . . . . . . . . . . . . . . . . . . . 41 6.1. Experience with Monitoring Famine . . . . . . . . . . . . . . . . . . . . . . . . . . . . . . 41
6.1.1. Mali: From Parallel Systems to the Systbme d'Alerte Precoce . . . . . . . 41 6.1.2. Chad: Use of a Nutritional Scoring System . . . . . . . . . . . . . . . . . . . . . 44 6.1.3. Botswana. Timely and Reliable Indicators . . . . . . . . . . . . . . . . . . . . . 45
6.2. Monitoring Famine in the FEWS Project . . . . . . . . . . . . . . . . . . . . . . . . . . . 46 6.2.1. Regional Food Shortage . . . . ; ............................. 47 ' 6.2.2. Household Food Poverty . . . . . . . . . . . . . . . . . . . . . . . . . . . . . . . . . 47 6.2.3. Individual Food Deprivation .............................. 48
7 . SELECTION AND SYNTAESIS OF INDICATORS . . . . . . . . . . . . . . . . . . . . . . . . 53 7.1. Choice of Indicators . . . . . . . . . . . . . . . . . . . . . . . . . . . . . . . . . . . . . . . . . . 53
. . . . . . . . . . . . . . . . 7.2. Composite Indices. Interpretation. and Decision Making 55
iii
RESEARCH TOWARD IMPROVED WARNING OF FAMINE . . . . . . . . . . . . . . . . 57 8.1. Will Improved Information Lead to Improved Responses? . . . . . . . . . . . . . . . 57 8.2. Articulated Scales of Monitoring and Response . . . . . . . . . . . . . . . . . . . . . . 58
. . . . . . . . . . . . . . . . . . . . . . . . . . . . . . . . . . . . . . . . . . . 9 . ACKNOWLEDGEMENTS 61
. . . . . . . . . . . . . . . . . . . . . . . . . . . . . . . . . . 10 . A CONCISE GLOSSARY OF TERMS 65
. . . . . . . . . . . . . . . . . . . . . . . . . . . . 1 1 . VULNERABILITY TO HUNGER IN KENYA 71 . . . . . . . . . . . . . . . . . . . . . . . . . . . . . . 1 1.1. Identification of Vulnerable Groups 71 11.2. Indicators of Vulnerability Using a Geographic Information System . . . . . . . 75
11.2.1. DataandMethods . . . . . . . . . . . . . . . . . . . . . . . . . . . . . . . . . . . . . . 75 ............................... 1 1.2.2. Smallholder Agriculturalists 76 11.2.3. Pastoralists . . . . . . . . . . . . . . . . . . . . . . . . . . . . . . . . . . . . . . . . . . . 77 11.2.4. Results and Discussion . . . . . . . . . . . . . . . . . . . . . . . . . . . . . . . . . . . 77
11.3. Analysis of Food Poverty among Smallholders . . . . . . . . . . . . . . . . . . . . . . . 93 11.4. Scenarios of Vulnerability to Different Famine Mechanisms . . . . . . . . . . . . . 93 11.5. Use of Models to Analyze Household Food Security . . . . . . . . . . . . . . . . . . . 97
. . . . . . . . . . . . . . . . . . . . . . . . . . . . 12 . VULNERABILITY: CONCEPTS AND ISSUES 100 . . . . . . . . . . . . . . . . . . . . . . . . . . . . 12.1. Causal Chains and Sequences cf Events 100 . . . . . . . . . . . . . . . . . . . . . . . . . . . . . . . . . . . . . . . . . . . . . . . . . 12.2. Seasonality 103 . . . . . . . . . . . . . . . . . . . . . . . . . . . . . . . . . . . . . . . . . . . . . . . 12.3. Food Systems 103 . . . . . . . . . . . . . . . . . . . . . . . . . . . . . . . . . . . . . . . . . . . . . . 12.4. Spatial Process 104 . . . . . . . . . . . . . . . . . . . . . . . . . . . . . . . 12.5. Household Processes and Responses 105 12.6. Perception of Famine and Local Monitoring Efforts . . . . . . . . . . . . . . . . . . . 107 12.7. Dynamic Dimensions of Vulnerability . . . . . . . . . . . . . . . . . . . . . . . . . . . . . 108
13 . FRAMEWORKS AND DIMENSIONS OF VULNERABILITY . . . . . . . . . . . . . . . . . 111 13.1. Frameworks of Vulnerability . . . . . . . . . . . . . . . . . . . . . . . . . . . . . . . . . . . . 111
. . . . . . . . . . . . . . . . . . . . . . . . . . . . . . . . . . . . . . . . . 13.1.1. Epidemiology 111 13.1.2. Natural Hazards and Resource Management . . . . . . . . . . . . . . . . . . . 112
13.2. Assessment of Groups Vulnerable to Famine ........................ 116 . . . . . . . . . . . . . . . . . . . . . . . . . . . . . . . . . . 13.2.1. Allocation of Food Aid 116
13.2.2. Impact of Structural Adjustment . . . . . . . . . . . . . . . . . . . . . . . . . . . 119 13.2.3. Vulnerability in Ethiopia . . . . . . . . . . . . . . . . . . . . . . . . . . . . . . . . . 121
13.3. Catalog of Dimensions of Vulnerability ............................ 122 13.3.1. Regional Food Shortage .................................. 122 13.3.2. Household Food Poverty ................................. 124 13.3.3. Individual Food Deprivation .............................. 126
. . . . . . . . . . . . . . . . . . . . . . . . . . . . . . . . . . . . . . . . . 14 . LIST OF ABBREVIATIONS 127
15 . REFERENCES AND BIBLIOGRAPHY .................................. 129
LIST 01; TABLES
Table Pagc
. . . . . . . . . . . . . . . . . . . . . . . . . . . . . . . 1 Domains. Dimensions. and Indicators of Hunger 12 2 . Strategies to Promote Food Security Related to Household Income. Expenditure. and . . . . . . . . . . . . . . . . . . . . . . . . . . . . . . . . . . . . . . . . . . . . . . . . . . Food Entitlement 14 3 . Famine Dimensions and Vulnerable Groups in the 1989 FEWS Vulnerability
. . . . . . . . . . . . . . . . . . . . . . . . . . . . . . . . . . . . . . . . . . . . . . . . . . . . . . Assessments 23 . . . . . . . . . . . . . . . . . . . . . . . . . . . . 4 . Three Levels of a Hierarchy of Vulnerable Groups 31 5 . Domains of Hunger: Overlays in a Vulnerability Assessment . . . . . . . . . . . . . . . . . . . . . 35 6 . Dimensions of Household Food Poverty among Vulnerable Socioeconomic Group6 . . . . . 35 7 . Dimensions and Indicators for Analyzing Vulnerability to Famine . . . . . . . . . . . . . . . . . 39
......................... 8 . Eimensions and Indicators for Monitoring Famine Risk 50 . . . . . . . . . . . . . . . . . . . . . . . . . . . . . . . . 9 . Groups Vulnerable to Food Poverty in Kenya 73 10 . Geographic Distribution of Groups Vulnerable to Food Poverty in 1984 . . . . . . . . . . . . 74 11 . Application of a Geographic Information System to Analysis of Vulnerability to
Hunger in Kenya . . . . . . . . . . . . . . . . . . . . . . . . . . . . . . . . . . . . . . . . . . . . . . . . . . 79 . . . . . . . . . . . . . . . . . . . . . . . . . . . . . . 12 . Classes of Vulnerability for Mapped Indicators 80 13 . Population by Class of Vulnerability for Smallholder Agriculturalists and Pastoralists
inKenya . . . . . . . . . . . . . . . . . . . . . . . . . . . . . . . . . . . . . . . . . . . . . . . . . . . . . . . . 81 . . . . . . . . . . . . . . . . . . . 14 . Factors and Variables Comprising a Social Vulnerability Index 113
. . . . . . . . . . . . . . . . . . . . . . . . . . . . . 15 . Indices Suggested for the A!location of Food Aid 117 . . . . . . . . . . . . . . . . . . . . . . . . . . . . . . . . . . 16 . Vulnerable Groups Identified by UNICEF 119
LIST OF FIGURES
Figure I'agc
. . . . . . . . . . . . . . . . . . . . . . . . . . . . . . . . . . . . . . . . . . . . . . . . 1 . Causal structure of hunger 8 . . . . . . . . . . . . . . . . . . . 2 . Assessment and monitoring of vulnerability in the FEWS project 22 . . . . . . . . . . . . . . . . . . . . . . . . . . . . . . . . . . 3 . Seasonality of nutritional status in Botswana 52 . . . . . . . . . . . . . . . . . . 4 . Temporal and geographic scales of food information and response 60 . . . . . . . . . . . . . . . . . . . . . . 5 . Location of two vulnerable socioeconomic groups in Kenya 82 ................................... 6 . Resource endowment for agricultural areas 83 .................................. 7 . Access to market towns in agricultural areas 84
. . . . . . . . . . . . . . . . . 8 . Balance of maize production and consumption in agricultural areas 85 .............................. 9 . Market exchange entitlement in agricultural areas 86 . . . . . . . . . . . . . . . . . . . . . . . . . . . . . . . . . . . . . . . . . . . . . . 10 . Population density in 1984 87 . . . . . . . . . . . . . . . . . . . . . 11 . Density of population with special nutritional needs in 1984 88 . . . . . . . . . . . . . . . . . . . . . . . . . . 12 . C!omposite index of vulnerability in agricultural areas 89 . . . . . . . . . . . . . . . . . . . . . . . . . . . . . . . . . . . . 13 . Resource endowment for pastoral areas 90 . . . . . . . . . . . . . . . . . . . . . . . . . . . . . . . . . . . . 14 . Access to market towns in pastoral areas 91 . . . . . . . . . . . . . . . . . . . . . . . . . . . . . 15 . Composite index of vulnerability in pastoral areas 92 16 . Vulnerability to chronic and episodic hunger in central and eastern Keny6 . . . . . . . . . . . 96 . . . . . . . . . . . . . . . . . . . . . . . . . . . . 17 . Household food security simulations for 198 1 - 1985 99 . . . . . . . . . . . . . . . . . . . . . . 18 . Causal sequence of smallholder vulnerability to crop failure 101 . . . . . . . . . . . . . . . . . . . . . . . . . . . . . . . . . . 19 . Concatenation of events resulting in famine 102 . . . . . . . . . . . . . . . . . . . . . . . . . . . . . . . 20 . Dimensions of vulnerability to natural hazards 114 . . . . . . . . . . . . . . . . . . . . . . . . . . . . 2 1 . Capability and vulnerability in response to disasters 115 . . . . . . . . . . . . . . . . . . . . . . . . . . . . . . . . . . . . . . . . . . . 22 . Composite food security index 118
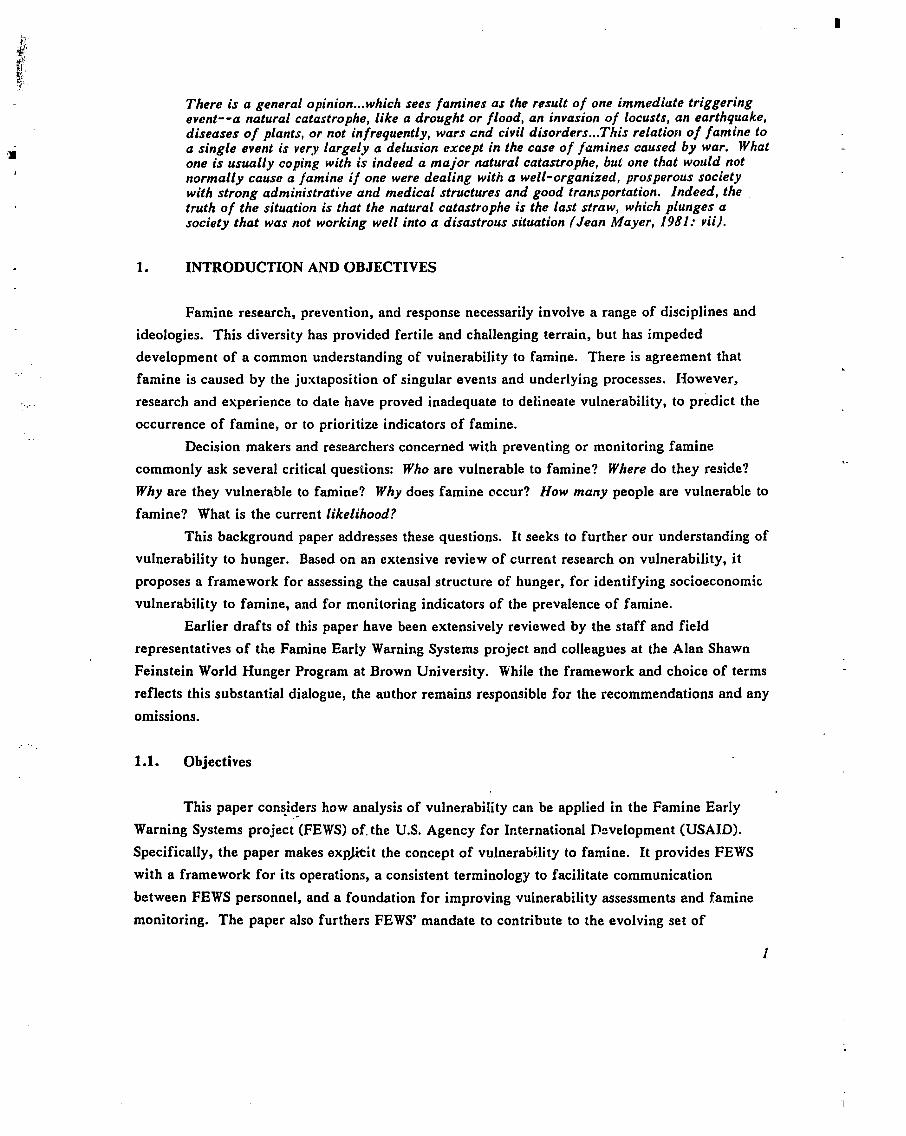
There is a general opinion ... which sees famines as the result of one immediate triggering event--a natural catastrophe, l ike a drought or flood, an invasion of locusts, an earthquake, diseases of plants, or not infrequently, wars cnd civil disorders ... This relatiori of famine to a single event is ver.y largely a delusion except in the case of famines caused by war. What one is usually coping with is indeed a major natural catastrophe, bur one that would not normally cause a famine if one were dealing with a well-organized, prosperous society with strong administrative and medical structures and good transportation. Indeed, the .
truth of the situation is that the natural catastrophe is the last straw, which plunges a society that was not working well into a disastrous situation (Jean Moyer, 1981: v i i ) .
1. INTRODUCTION AND OBJECTIVES
Famine research, prevention, and response necessarily involve a range of disciplines and
ideologies. This diversity has provided fertile and challenging terrain, but has impeded
development of a common understanding of vulnerability to famine. There is agreement that
famine is caused by the juxtaposition of singular events and underlying processes. Ilowever,
research and experience to date have proved inadequate to delineate vulnerability, to predict the
occurrence of famine, or to prioritize indicators of famine.
Decision makers and researchers concerned with preventing or monitoring famine
commonly ask several critical questions: Who are vulnerable to famine? Where do they reside?
Why are they vulnerable to famine? Why does famine occur? How many people are vulnerable to
famine? What is the current likelihood?
This background paper addresses these questions. It seeks to further our understanding of
vulnerability to hunger. Based on an extensive review of current research on vulnerability, it
proposes a framework for assessing the causal structure of hunger, for identifying socioeconomic
vulnerability to famine, and for monitoring indicators of the prevalence of famine.
Earlier drafts of this paper have been extensively reviewed by the staff and field
representatives of the Famine Early Warning Systems project and colleagues at the Alan Shawn
Feinstein World Hunger Program at Brown University. While the framework and choice of terms
reflects this substantial dialogue, the author remains responsible for the recommendations and any
omissions.
1.1. Objectives
This paper con:iders how analysis of vulnerability can be applied in the Famine Early
Warning Systems project (FEWS) of. the U.S. Agency for International D?velopment (USAID).
Specifically, the paper makes expMit the concept of vulnerability to famine. It provides FEWS
with a framework for its operations, a consistent terminology to facilitate communication
between FEWS personnel, and a foundation for improving vulnerability assessments and famine
monitoring. The paper also furthers FEWS' mandate to contribute to the evolving set of

international early warning methodologies.
This review is aimed at distilling our current understanding of vulnerability to famine as
it relates to efforts in monitoring and response. There are already a number of competent
literature reviews on the origins of famine (Devereux and Hay 1986) and the African food crisis
of the 1980s (Borton and Clay 1986, Glantz 1987, Huss-Ashmore and Katz 1989); the range of
potential interventions to reduce chronic and episodic hunger (World Bank 1986); reviews of
specific interventions (Berg 1987, Biswas and Pinstrup-Andersen 1985); famine early warning
systems (D'Souza 1989, Hervio 1987, Walker 1989); case studies of hunger related to specific
political and economic processes, such as structural adjustment (Cornia et al. 1987, 1988); and
prescriptions for what could be done over the course of the next decade, particularly at the
national and international levels (Walker 1989, World Hunger Program 1989). This background
paper is intended specifically to further the application of concepts of vulnerability in famine
early warning systems.
Reviewed below are approaches that could be readily applied in Africa over the course of
the next few years and given the foreseeable resources. To the extent that experience elsewhere
extends the range of alternatives, it contributes to our thinking. In particular, the lessons for
Africa of famine response in India are discussed in Drbze (1986), Field (1989), Herbert (19871,
McAlpin (1 987), Ndegwa (1989), Rangasami (1984), Sen (1987), and Swaminathan (1986).
1.2. Definition of Famine
It is essential to define famine--in light of the contentious debate between those who
view famine as "mass starvation" and those who interpret famine as part of a "community
syndrome" (see Currey 1987, 1984, Devereux and Hay 1986, Field 1989, Rangasami 1985). In the
context of this paper, famine is widespread and substantially increased morbidity, mortality, and
other serious consequences resulting from a sequence of underlying processes, initiating episodes,
and transitional responses that reduce food availability or food entitlements. Following this
definition, famine is distinguished by episodic mass starvation, as opposed to chronic food
deprivation. Famine is:
the state of prolonged food intake deficiency which ultimately leads to excess deaths in a district, region or country as a whole (Alamgir 1980: 7, cited in USAID 1988: 5).
. - The distinction between episodic and chronic hunger is useful. Episodic or transitory
hunger is a temporary decline in Mod consumption or utilization (World Bank 1986: 1). It is a
departure from usual levels of dietary adequacy, often evidenced by wasting and low weight-for-
height. Chronic hunger is a continuously or regularly inadequate diet, the ongoing insufficiency
of food and nutrients to maintain an active, healthy life (World Bank 1986: 1). It is marked by
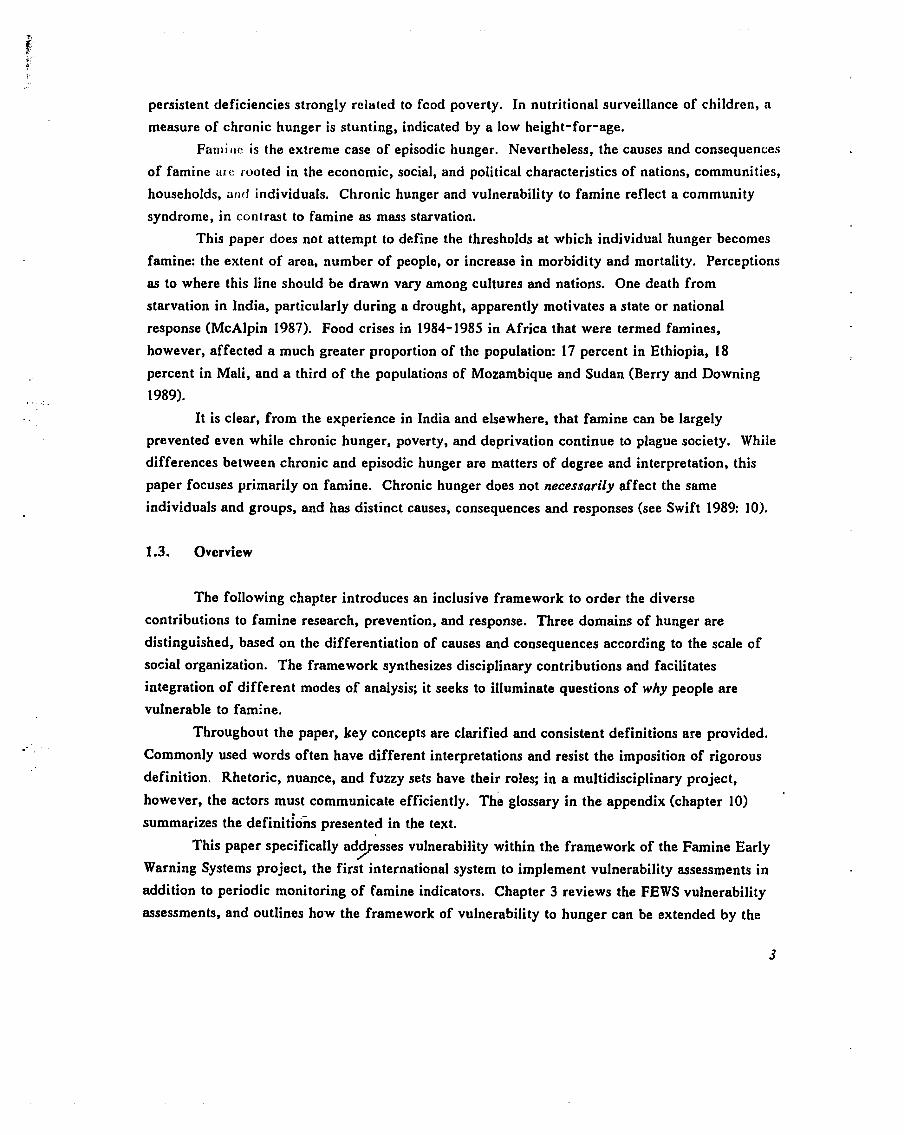
persistent deficiencies strongly rclated to food poverty. In nutritional surveillance of children, a
measure of chronic hunger is stunting, indicated by a low height-for-age.
Farni~~c is the extreme case of episodic hunger. Nevertheless, the causes and consequences
of famine are rooted in the economic, social, and political characteristics of nations, communities,
households, and individuals. Chronic hunger and vulnerability to famine reflect a community
syndrome, in contrast to famine as mass starvation.
This paper does not attempt to define the thresholds at which individual hunger becomes
famine: the extent of area, number of people, or increase in morbidity and mortality. Perceptions
as to where this line should be drawn vary among cultures and nations. One death from
starvation in India, particularly during a drought, apparently motivates a state or national
response (McAlpin 1987). Food crises in 1984-1985 in Africa that were termed famines,
however, affected a much greater proportion of the population: 17 percent in Ethiopia, 18
percent in Mali, and a third of the populations of Mozambique and Sudan (Berry and Downing
1989).
It is clear, from the experience in India and elsewhere, that famine can be largely
prevented even while chronic hunger, poverty, and deprivation continue to plague society. While
differences between chronic and episodic hunger are matters of degree and interpretation, this
paper focuses primarily on famine. Chronic hunger does not necessarily affect the same
individuals and groups, and has distinct causes, consequences and responses (see Swift 1989: 10).
1.3. Overview
The following chapter introduces an inclusive framework to order the diverse
contributions to famine research, prevention, and response. Three domains of hunger are
distinguished, based on the differentiation of causes and consequences according to the scale of
social organization. The framework synthesizes disciplinary contributions and facilitates
integration of different modes of analysis; it seeks to illuminate questions of why people are
vulnerable to famine.
Throughout the paper, key concepts are clarified and consistent definitions are provided.
Commonly used words often have different interpretations and resist the imposition of rigorous
definition. Rhetoric, nuance, and fuzzy sets have their roles; in a multidisciplinary project,
however, the actors must communicate efficiently. he' glossary in the appendix (chapter 10)
summarizes the definitidhs presented in the text.
This paper specifically add esses vulnerability within the framework of the Famine Early /r Warning Systems project, the first international system to implement vulnerability assessments in
addition to periodic monitoring of famine indicators. Chapter 3 reviews the FEWS vulnerability
assessments, and outlines how the framework of vulnerability to hunger can be extended by the
FEWS project. An application of the framework is presented for Kenya, where the author has
personal experience and adequate data, in the appendix (chapter 1 1 ).
The central proposal is that analysis of vulnerability must be accomplished by identifying
socioeconomic groups that are vulnerable to famine in Africa. Chapter 4 reviews the causes of
famine and presents a generic taxonomy of vulnerable groups based on their geographic locations,
institutional infrastructures, household entitlements, and individual characteristics. Additional
literature on the dimensions of vulnerability to hunger is reviewed in chapter 12, while chapter
13 compares different frameworks for assessing vulnerability to hunger, natural hazards, and
disease. These chapters build upon the analysis of the causaI structure of hunger to address the
critical questions of who are vulnerable to famine and where they reside.
Detailed suggestions for improving the FEWS vulnerability assessments are specified in
chapter 5, and chapter 6 proposes improvements in the periodic monitoring of the risk and
prevalence of famine within vulnerable groups. These two chapters establish a framework for
systematic assessments of the likelihood of famine. A key issue is how to compile and interpret
multiple indicators of vulnerability or famine. Chapter 7 summarizes the issues, although theory
provides little guidance and few applied experiences are documented in the literature.
Chapter 8 addresses a research agenda concerning the use of improved information and
the articulation of famine responses at different scales of decision maki.ng. A list of
abbreviations (chapter 14) and a bibliography and references cited (chapter 15) are presented at
the end of the document.
le may be the case that in difficult environments such as semi-arid Karamoja, the indigenous modes of coping with environmental fluctuations have been especially vulnerable to disruptions by colonial intervention and capitalist penetration. But these disruptions cannot be understood without understanding the prevalent ecological relations. 'Nature' and 'political economy' are not alternative but complementary forms of explanation, both necessary..,We need to see...more analyses that clarify the interaction between 'natural' events (which may be responses to earlier human interventions), the local patterns of coping with the natural environment (themselves a product of history) and the process of incorporation into wider systems (imperialism in its manifold forms). Famine is a multi-dimensional phenomenon. T o attempt to locate its roots solely in the process of incorporation into world capitalism without attention to 'nature' or the basic environmental parameters is as simplistic as the attribution of famine solely to environmental causes (Gartrsll 1985: 108- 109).
2. CAUSAL STRUCTURE OF HUNGER
Our conceptual frameworks guide the range of choices we perceive as being viable and
the course of action we,recommend. This section illustrates several efforts to conceptualize
vulnerability to famine and, more broadly, hunger. Drawing upon a diagram of interconnected
boxes, the intention is to establish essential concepts and definitions. Further elaboration and
alternative concepts of vulnerability are discussed in the appendix, chapters 12 and 13.
Models of food systems, hunger, and famine abound. Descriptions of specific groups,
regions, and episodes portray a historical sequence of events, causes, and responses (e.g., Cutler
1985). Such studies can be usefully compared to document variations in famine processes, such
as the roles of landlessness and market integration. A limitation of famine studies, however, is
that they tend to focus only on actual famine and people affected by famine; this presents a
biased picture, since the entire vulnerable population is not sampled. Those who avoided famine
and famines that did not occur do not attract the same degree of research. As a result, there are
few studies of a priori analysis of vulnerability tested against the actual occurrence of famine.
Two types of integrative models attempt to illustrate the entire universe of hunger or
famine at a conceptual level. They either identify flows of food through a system of food
production, trade, and consumption or characterize the risk of experiencing hunger and its
consequences.
Food systems models have been developed in'anthropology, economics, and systems
analysis. They require large amounts of data to estimate food flows and resource allocations
between sectors, regions, and populations. Food balance sheets and food accounting matrices are
examples of food system-approaches that have particular application in scheduling and allocating
imports, exports, and food aid. /
The conceptual model introduced below exemplifies the second approach, drawing upon
the experience of risk assessment in hazards research and epidemiology. The emphasis is on a
typology of causes and consequences that can be used to interpret experience and estimate the
risk of future disruption to food flows. In acknowledging the improbability of constructing an
accurate model of the food system, the key determinants of food security are described in an
attempt to identify risk factors and a causal sequence of famine.
Food systems models and risk assessments both tend to be descriptive: prediction requires
extensive validation that is either lacking or not possible. Most often they can be used to test the
sensitivity of different groups to different causes of hunger. At the very least, they help
organize our thinking.
2.1. Causal Structure of Hunger
Hunger is a product of multiple causes and processes, operating on different scales of
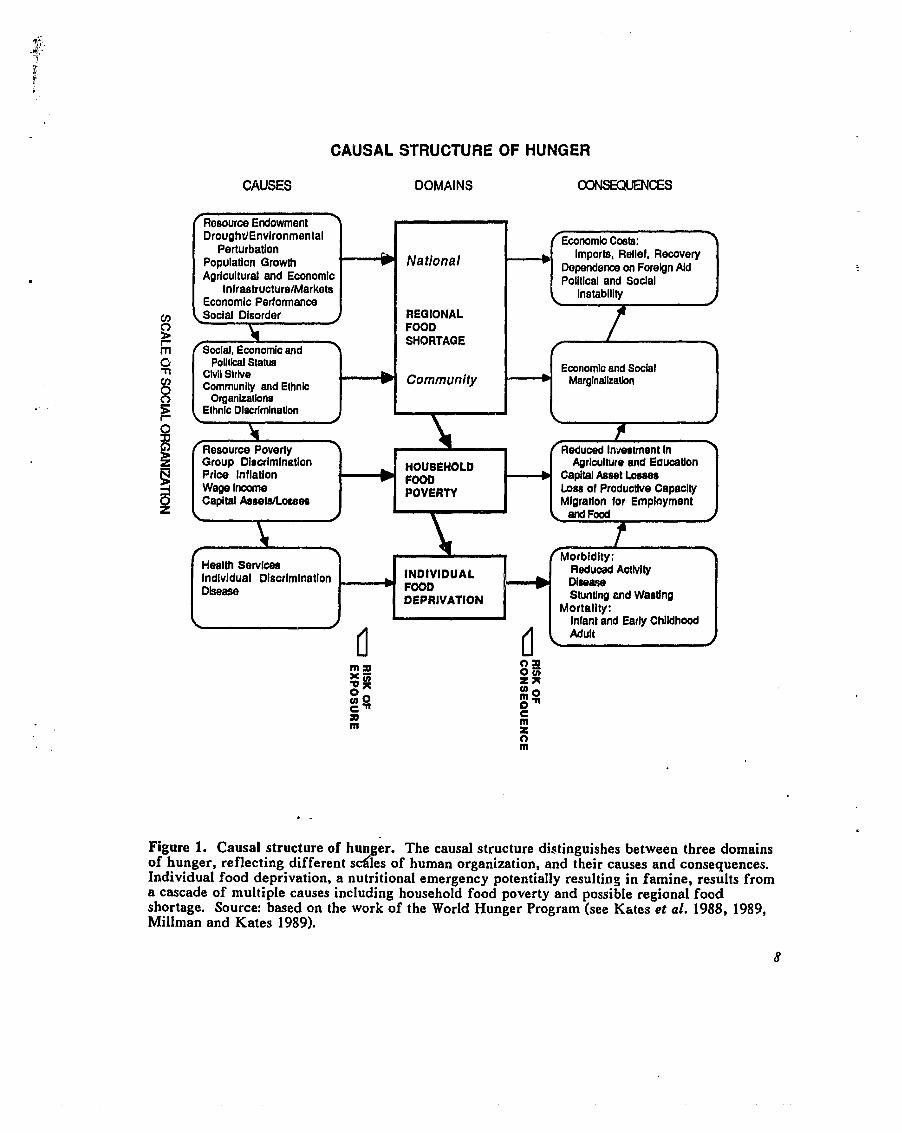
space and time. And hunger entails multiple consequences beyond individual starvation. Figure
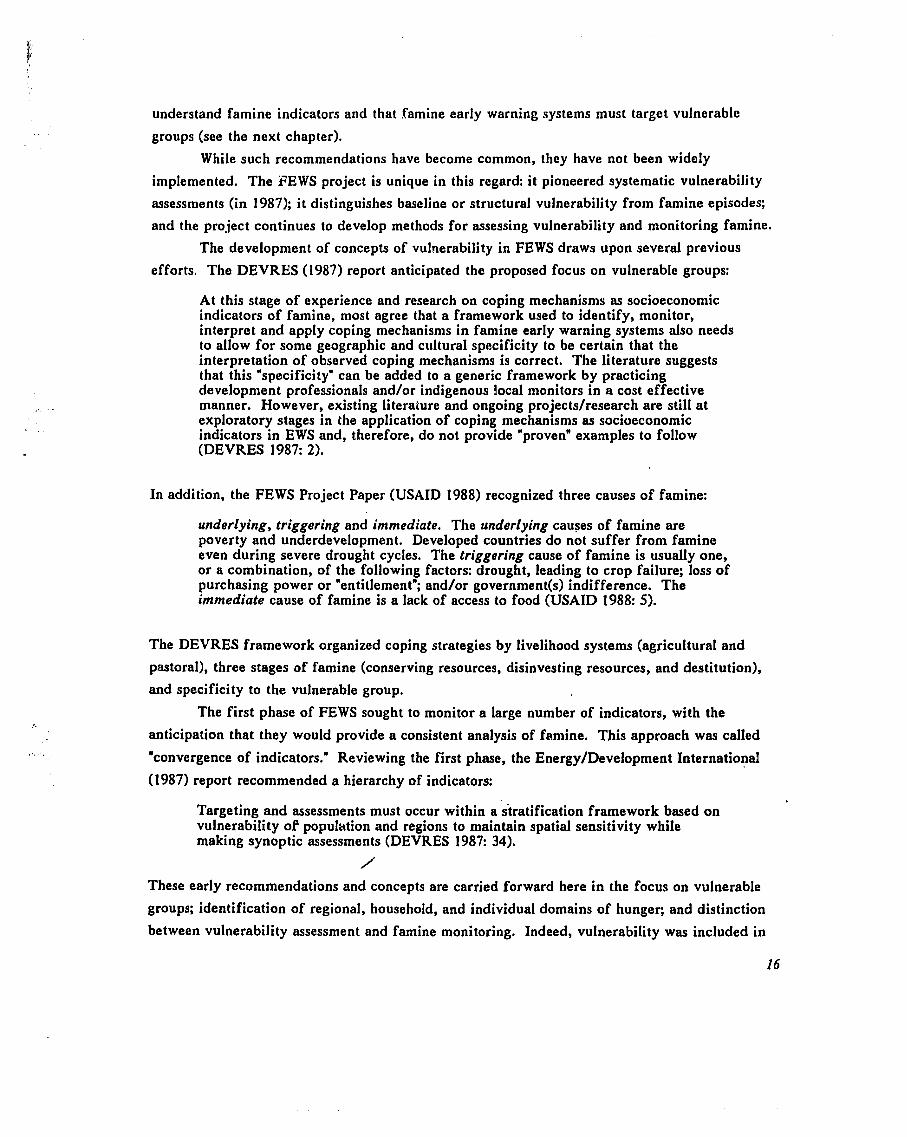
1 organizes the causal structure of hunger in terms of three domains: food shortage, food poverty,
and food deprivation. These domains are distinguished primarily by the level of human
organization, from region to household to individual. As such, the model encompasses tho
disciplinary orientations of the agricultural, household behavioral, and nutritional sciences.
Wherever there is hunger, individuals suffer food deprivation: food consumption and
utilization insufficient to meet nutritional requirements. Indi-~idtial food deprivation may occur
even within households that can affbrd to feed their members adequately, through ignorance,
abuse, neglect, self-denial, or disease that hampers the retention or absorption of nutrients. The
individual consequences are restricted activity, weight loss, impaired development, morbidity,
and mortality. The majority of famine-related deaths, however, occur from infectious disease
rather than starvation per se (de Wad 1988, Drbze 1988). This domain of hunger portrays
process;s within households, but it does not presume that famine monitoring systems must track
actual persons. Micro-level monitoring within the household can only be attempted by local
. institutions.
Often individual food deprivation is caused by household food poverty: the lack of
resources to procure sufficient food for the entire household. Food poverty is demarcated by the
inability to produce food on-farm or on common lands; to purchase food in exchange for cash,
materials, or labor; to procure food through donations; or to retain adequate food supplies. Food
poverty results from a variety of ecological, demographic, and economic causes. These include:
small landholdings, poor soil or rainfall, shortage of labor, lack of employment, ill-health, high '
ratio of dependents, pdof terms of trade for food, low assets, and weak infrastructure. One result
is individual food deprivation, and the sum of its effects on household members. Food poverty /
also has secondary consequences for the household: coping with hunger may reduce future
productive capacity, relocate the household, and change relationships within the household.
Regions experience food shortage: a shortfall in food availability. Food shortage may
precipitate food poverty for households that normally are able to feed their members, but it is
rarely either a necessary or sufficient condition of individual food deprivation or famine. Food
production over the long-term is dependent on natural and human resources, and may be
disrupted by drought, civil strife, or market policies. Stocks and imports are subject to
disruption as well. The aggregate demand for food varies with population growth, incomes, and
dietary preferences. In addition ta pushing households into food poverty and individuals within
those households into food deprivation, food shortage may generate economic and political
disruptions that operate at the aggregate level.
Two levels of food shortage are delineated. First, at the national level the food balance
signals need for imports, exports, and further monitoring of famine conditions. Second,
community food shortage is a broad measure of access to food.
The experience of food shortage and food poverty is not randomly distributed among
households, but often varies according to membership in various groups. Ethnic, religious, or
occupational groups often differ in food entitlement--access to agricultural and economic
resources to produce and procure food. Group membership may also define distinct coping
strategies, capacity for emergency response, and empowerment to draw upon resources of the
larger society in time of need. Oppression and exploitation within societies do much to determine
which households live at or near the margin of subsistence. Group membership may coincide
with location. Often, however, group membership and location will form cross-cutting
dimensions of classification--explicit attention to group membership may be necessary to
understand which households within particular areas are likely to experience food poverty.
Parallel to the causes and domains of hunger, the consequences of famine also vary
according to scale: costs to national budgets, losses of household assets, increases in individual
morbidity and mortality. These consequences in turn may become causes of future famines or
exacerbate the impacts of the current episode. The consequences of famine--individuals
nutritionally at-risk, households with few assets, low national food reserves--are causal factors
increasing vulnerability to a subsequent or prolonged episode.
The definitions of food shortage, food poverty, and food deprivation require specification
of a reference standard of consumption. At the individual level, this encompasses the energy and
micro-nutrients required for a full and healthy life. These requirements vary considerably among
individuals and are the subject of controversy (see Beaton 1989, Messer, 1989, Pelto and Pelto
1989, Scrimshaw, 1989, Seckler 1980, 1982). For one indication of food shortage, the specified
average individual reqcifements are multiplied by population size to estimate the amount of food
needed to meet national needs, and the result is compared to estimates of food actually available. /
Alternatively, the comparison may be between current per capita food availability and the
historical average, whether or not that average is considered adequate.
CAUSALSTRUCTUREOFHUNGER
CAUSES DOMAINS OONSEQUENCES
/ Rosource Endowment 1 -
L I f 3 f~orbld l ty :
Health Servlcee INDIVIDUAL Reduced Aotlvlly
lndlvldual Dlscrlrnlnatlon FOOD D l w w
Disease DEPRIVATION Stunting and Wasting
Mortality: \ Infant and Early Childhood
Adult 1
Droughr/EnvlronmentaI Perturbation
Population Growth Agricultural and Economlc
InfrastructurelMarkets Economlc Performance
Figure 1. Causal structure of hun er. The causal structure distinguishes between three domains of hunger, reflecting different s 2 les of human organization, and their causes and consequences. Individual food deprivation, a nutritional emergency potentially resulting in famine, results from a cascade of multiple causes including household food poverty and possible regional food shortage. Source: based on the work of the World Hunger Program (see Khtes et al. 1988, 1989, Millman and Kates 1989).
b Natlonal
y, ~ S o c l a l Disorder J 0 L ? \ rn f~ocld, Economic and
f~conomlo Coeb: 3 Imports, Relief, Recovery
Dependence on Foreign Ald Polltlcal and Soclal
Instablllly J REGIONAL FOOD SHORTAGE
Comm~nity # 4 a. r
\ 6educed Investment In \
Elhnlc DlscrlmlnaUon J
Political Slatua C*ll Strl, Community and Ethnic
Organizations
f \
b b
Agriculture and Eaucation Capital Asset Loeser, Lose of ProducUve Capacity Mlgrallon for Employment
Group Dlscrlrninatlon Price Inflation Wage l m e Oaplml CnoUYLomm
Economlc and Soclal MarglnaJlzaUon
h / \ \ &Food \ 4
HOUSEHOLD FOOD b POVERTY
J
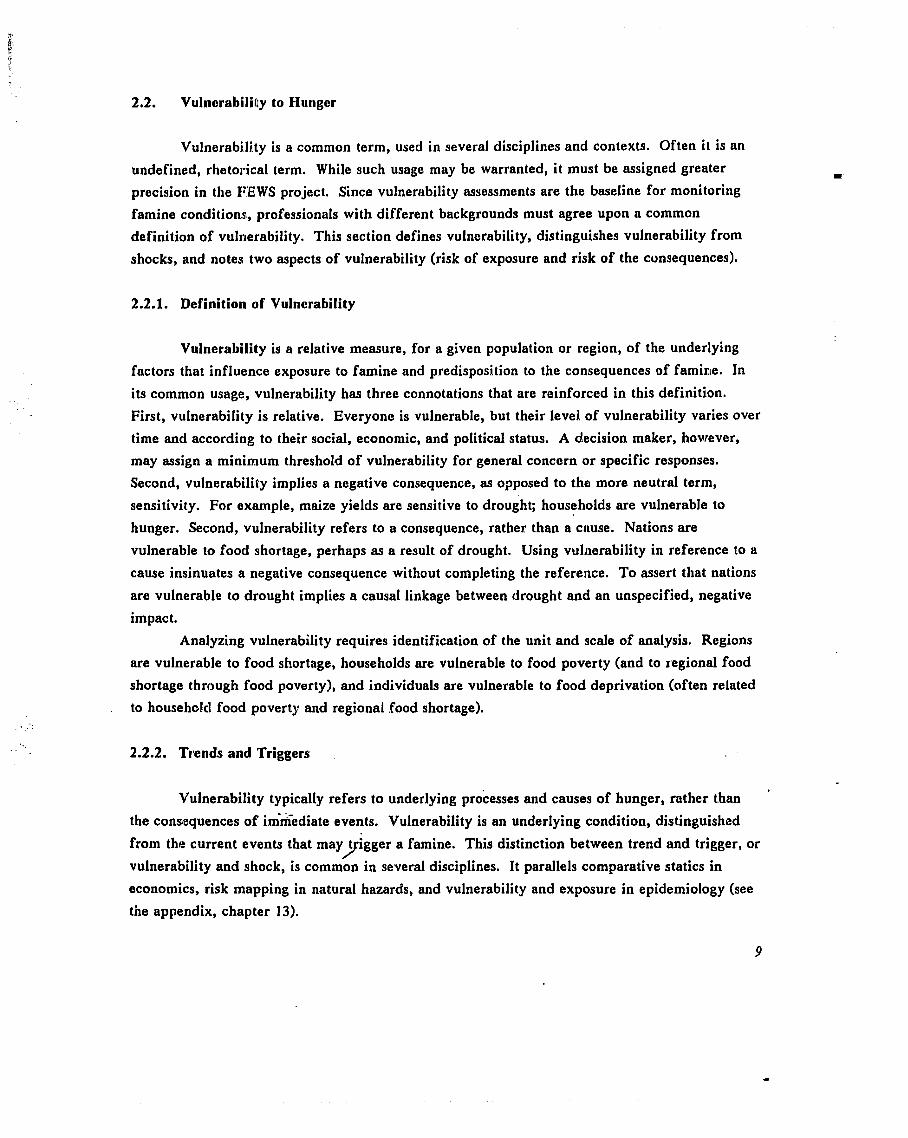
2.2. Vulnerabiilifiy to Hunger
Vulnerability is a common term, used in several disciplines and contexts. Often it is an
undefined, rhetor:ical term. While such usage may be warranted, it must be assigned greater
precision in the FEWS project. Since vulnerability assessments are the baseline for monitoring
famine conditions, professionals with different backgrounds must agree upon a common
definition of vulnerability. This section defines vulnerability, distinguishes vulnerability from
shocks, and notes two aspects of vulnerability (risk of exposure and risk of the consequences).
2.2.1. Definition of Vulnerability
Vulnerability is a relative measure, for a given population or region, of the underlying
factors that influence exposure to famine and predisposition to the consequences of famine. In
its common usage, vulnerability has three connotations that are reinforced in this definiti~on.
First, vulnerability is relative. Everyone is vulnerable, but their level, of vulnerability varies over
time and according to their social, economic, and political status. A decision maker, however,
may assign a minimum threshold of vulnerability for general concern or specific responses.
Second, vulnerability implies a negative consequence, as opposed to tho more neutral term,
sensitivity. For example, maize yields are sensitive to drought; households are vulnerable to
hunger. Second, vulnerability refers to a consequence, rather than a cause. Nations are
vulnerable to food shortage, perhaps as a result of drought. Using vulnerability in reference to a
cause insinuates a negative consequence without completing the reference. To assert that nations
are vulnerable to drought implies a causal linkage between drought and an unspecified, negative
impact.
Analyzing vulnerability requires identification of the unit and scale of analysis. Regions
are vulnerable to food shortage, households are vulnerable to food poverty (and to regional food
shortage through food poverty), and individuals are vulnerable to food deprivation (often related
to household food poverty and regional food shortage).
2.2.2. Trends and Triggers ,
Vulnerability typically refers to underlying processes and causes of hunger, rather than
the consequences of himediate events. Vulnerability is an underlying condition, distinguished
from the current events that may t igger a famine. This distinction between trend and trigger, or 1 vulnerability and shock, is common in several disciplines. It parallels comparative statics in
economics, risk mapping in natural hazards, and vulnerability and exposure in epidemiology (see
the appendix, chapter 13).
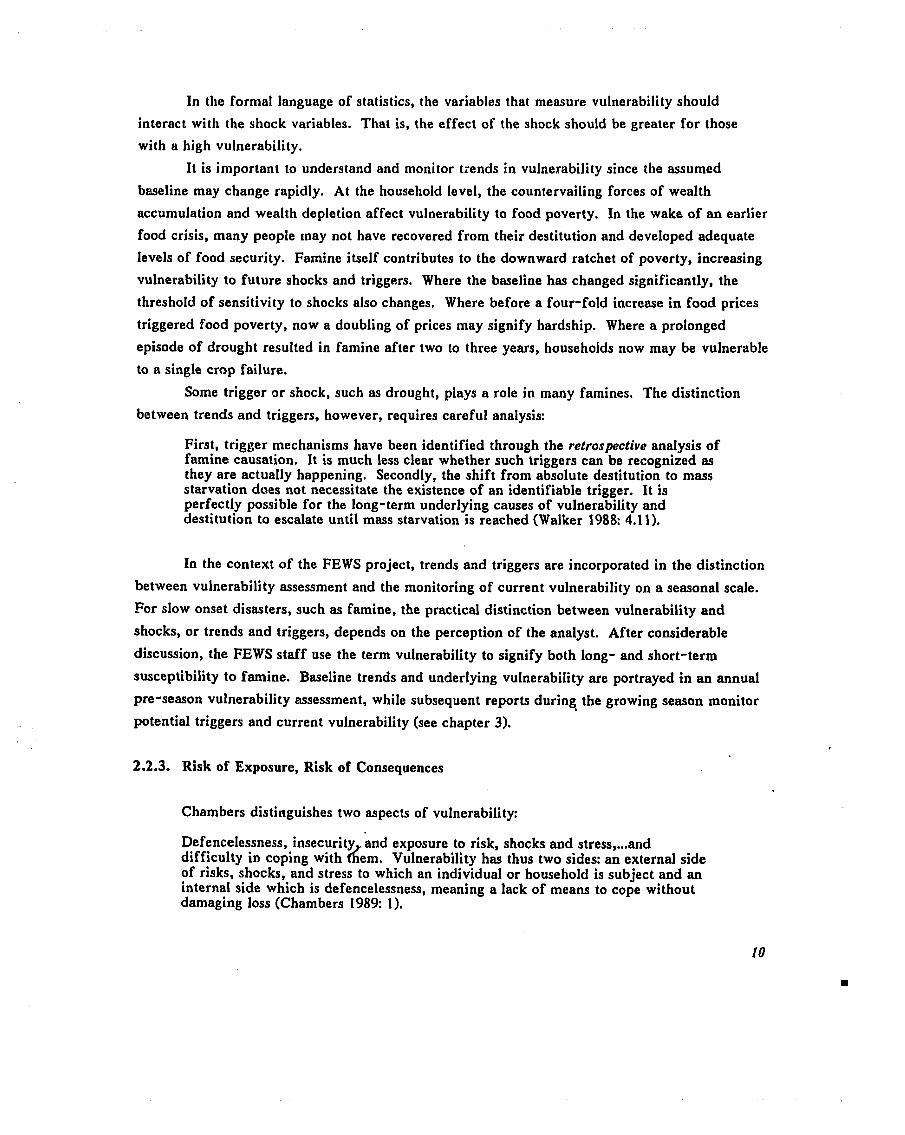
In the formal language of statistics, the variables that measure vulnerability should
interact with the shock variables. That is, the effect of the shock should be greater for those
with a high vulnerability.
It is important to understand and monitor trends in vulnerability since the assumed
baseline may change rapidly. At the household level, the countervailing forces of wealth
accumulation and wealth depletion affect vulnerability to food poverty. In the wake of an earlier
food crisis, many people [nay not have recovered from their destitution and developed adequate
levels of food security. Famine itself contributes to the downward ratchet of poverty, increasing
vulnerability to future shocks and triggers. Where the baseline has changed significantly, the
threshold of sensitivity to shocks also changes. Where before a four-fold increase in food prices
triggered food poverty, now a doubling of prices may signify hardship. Where a prolonged
episode of drought resulted in famine after two to three years, households now may be vulnerable
to a single crop failure.
Some trigger or shock, such as drought, plays a role in many famines. The distinction
between trends and triggers, however, requires careful analysis:
First, trigger mechanisms have been identified through the retrospective analysis of famine causation. It is much less clear whether such triggers can be recognized as they are actually happening. Secondly, the shift from absolute destitution to mass starvation does not necessitate the existence of an identifiable trigger. It is perfectly possible for the long-term underlying causes of vulrierability and destitution to escalate until mass starvation is reached (Walker 1988: 4.1 1).
In the context of the FEWS project, trends and triggers are incorporated in the distinction
between vulnerability assessment and the monitoring of current vulnerability on a seasonal scale.
For slow onset disasters, such as famine, the practical distinction between vulnerability and
shocks, or trends and triggers, depends on the perception of the analyst. After considerable
discussion, the FEWS staff use the term vulnerability to signify both long- and short-term
susceptibility to famine. Baseline trends and underlying vulnerability are portrayed in an annual
pre-season vulnerability assessment, while subsequent reports during the growing season monitor
potential triggers and current vulnerability (see chapter 3).
2.2.3. Risk of Exposure, Risk of Consequences
Chambers distinguishes two aspects of vulnerability:
Defencelessness, insecurity and exposure to risk, shocks and stress, ... and difficulty in coping with d e m . Vulnerability has thus two sides: an external side of risks, shocks, and stress to which an individual or household is subject and an internal side which is defencelessness, meaning a lack of means to cope without damaging loss (Chambers 1989: 1 ).
Vulnerability is the composite of two prospects: risk of exposure and risk (or magnitude) of
consequence. The likelihood of exposure to hunger, of experiencing food shortage, food poverty,
or food deprivation, is distinct from the likelihood of enduring different magnitudes of
consequences of such exposure if it should occur. For example, an individual or group m,ay be
identified as vulnerable on the basis of either a high likelihood of exposure or serious
consequences conditional on exposure, or both. Individuals subject to the same degree of food
deprivation may have strikingly different responses, due. to their previous nutritional status or
special nutritional requirements. Mothers and children are often identified as vulnerable groups:
they may receive less than they need and food deprivation may be more damaging for them than
for others.
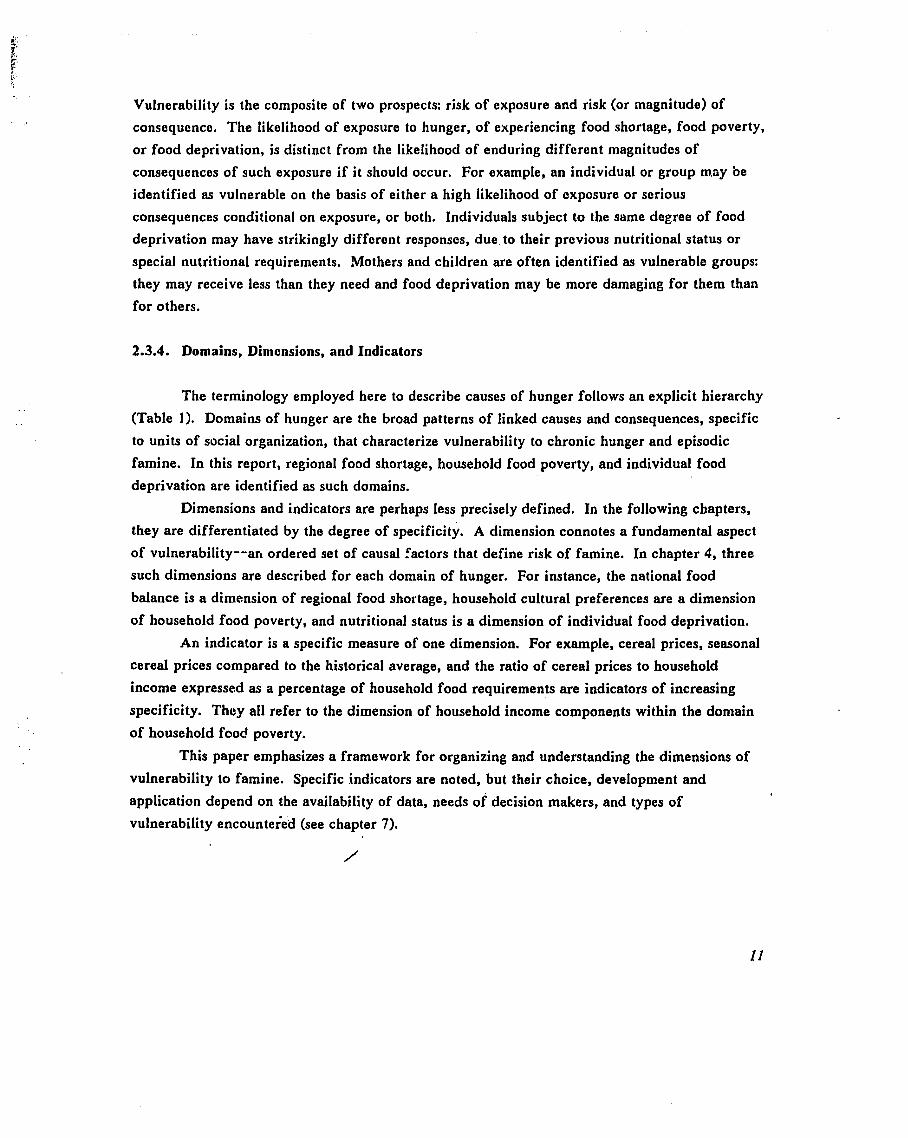
2.3.4. Domains, Dimensions, and Indicators
The terminology employed here to describe causes of hunger follows an explicit hierarchy
(Table 1). Domains of hunger are the broad patterns of linked causes and consequences, specific
to units of social organization, that characterize vulnerability to chronic hunger and episodic
famine. In this report, regional food shortage, household food poverty, and individual food
deprivation are identified as such domains.
Dimensions and indicators are perhaps less precisely defined. In the following chapters,
they are differentiated by the degree of specificity. A dimension connotes a fundamental aspect
of vulnerability--an ordered set of causal factors that define risk of famine. In chapter 4, three
such dimensions are described for each domain of hunger. For instance, the national food
balance is a dimension of regional food shortage, household cultural preferences are a dimension
of household food poverty, and nutritional status is a dimension of individual food deprivation.
An indicator is a specific measure of one dimension. For example, cereal prices, seasonal
cereal prices compared to the historical average, and the ratio of cereal prices to household
income expressed as a percentage of household food requirements are indicators of increasing
specificity. They all refer to the dimension of household income components within the domain
of household food poverty.
This paper emphasizes a framework for organizing and understanding the dimensions of
vulnerability to famine. Specific indicators are noted, but their choice, development and
application depend on the availability of data, needs of decision makers, and types of
vulnerability encounteied (see chapter 7).
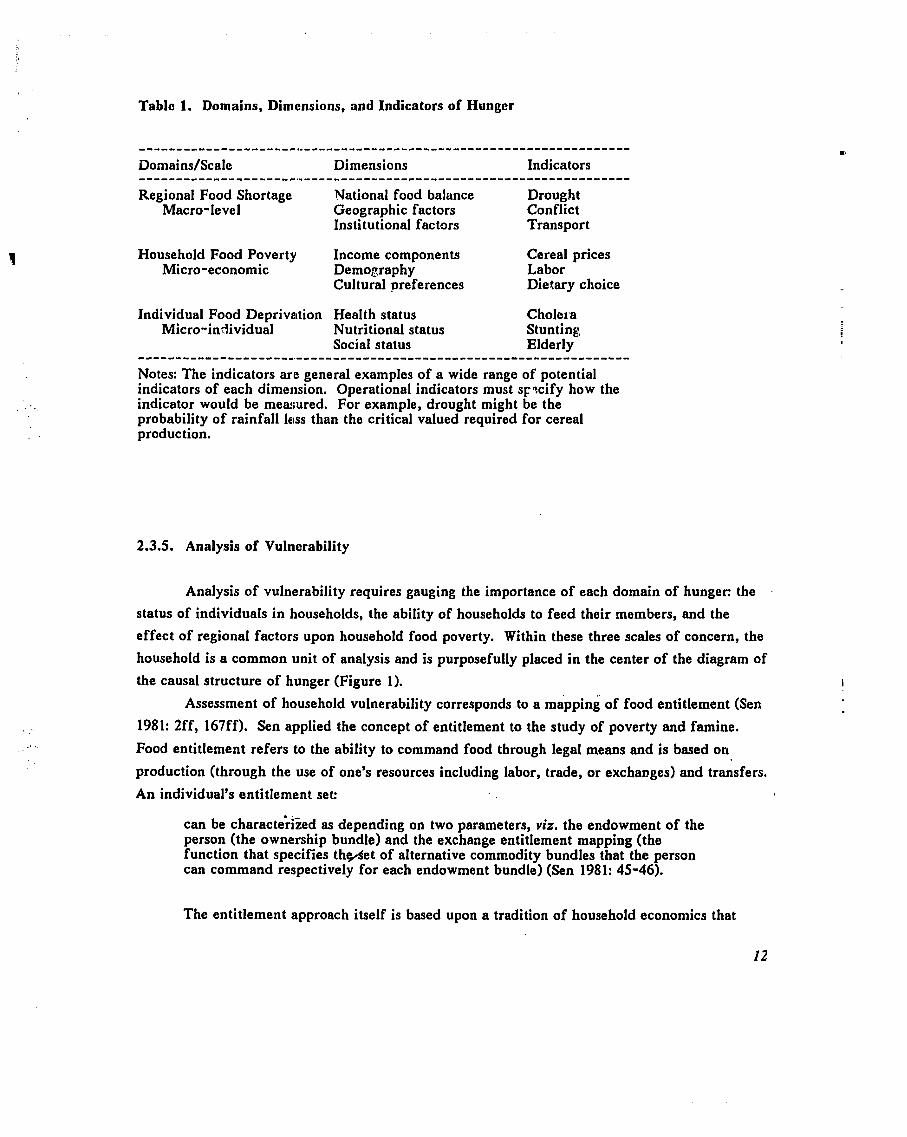
Table 1. Domains, Dimensions, and Indicators of Hunger
Domains/Scale Dimensions Indicators ---------------------,---------------------------------------------
Regional Food Shortage National food balance Drought Macro-level Geographic factors Conflict
Institutional factors Transport
Household Food Poverty Income components Cereal prices Micro-economic Demography Labor
Cultural preferences Dietary choice
Individual Food Depriw~tion Health status Cholera Micro-individual Nutritional status Stunting
Social status Elderly ---------------------.---------------------------------------------
Notes: The indicators are general examples of a wide range of potential indicators of each dimetuion. Operational indicators must sp?cify how the indicator would be meeiured. For example, drought might be the probability of rainfall less than the critical valued required for cereal production.
2.3.5. Analysis of Vulnerability
Analysis of vulnerability requires gauging the importance of each domain of hunger: the
status of individuals in households, the ability of households to feed their members, and the
effect of regional factors upon household food poverty. Within these three scales of concern, the
household is a common unit of analysis and is purposefully placed in the center of the diagram of
the causal structure of hunger (Figure 1).
Assessment of household vulnerability corresponds to a mapping of food entitlement (Sen
1981: 2ff, 167ff). Sen applied the concept of entitlement to the study of poverty and famine.
Food entitlement refers to the ability to command food through legal means and is based on
production (through the use of one's resources including labor, trade, or exchanges) and transfers.
An individual's entitlement set:
can be charact&i%ed as depending on two parameters, viz. the endowment of the person (the ownership bundle) and the exchange entitlement mapping (the function that specifies t h e e t of alternative commodity bundles that the person can command respectively for each endowment bundle) (Sen 1981: 45-46).
The entitlement approach itself is based upon a tradition of household economics that
focuses on a complete specification in income (see, e.g., Becker 1965, Cashdan 1990, Low 1986).
The components of a household budget are the central determinants of household food security
and vulnerabiliiy to famine. Household food security might be gauged as the degree to which
food availability (own production, exchange production, transfers, and stocks) meets consumption
requirements, denominated in staple grain-equivalents, kcal or even a monetary unit. If each
component of household income could be measured on a timely basis and forecast for the current
season, most other famine irldicators would be redundant. Since this is never the case,
monitoring famine requires probabilistic estimates of levels of vulnerability based on a variety of
determinants of household food security.
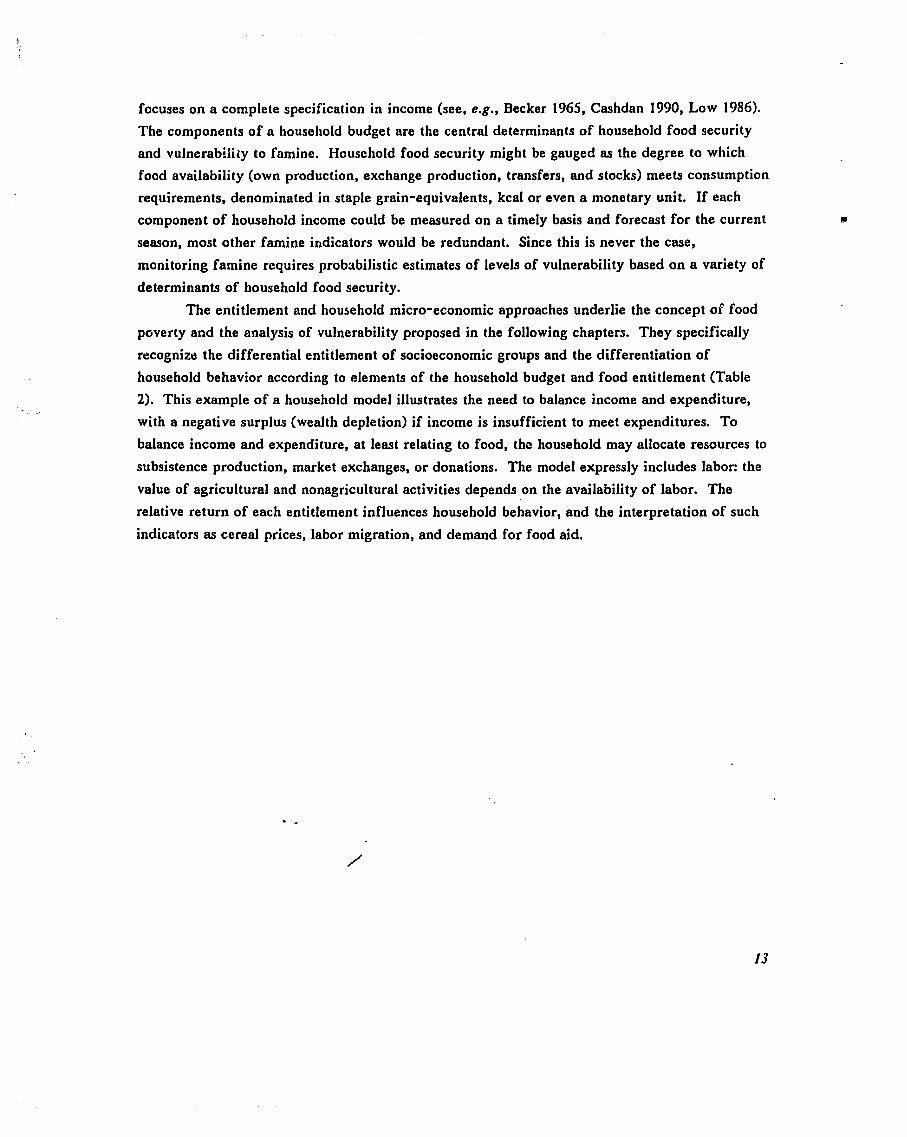
The entitlement and household micro-economic approaches underlie the concept of food
poverty and the analysis of vulnerability proposed in the following chapters. They specifically
recognize the differential entitlement of socioeconomic groups and the differentiation of
household behavior according to elements of the household budget and food entitlement (Table
2). This example of a household model illustrates the need to balance income and expenditure,
with a negative surplus (wealth depletion) if income is insufficient to meet expenditures. To
balance income and expenditure, at least relating to food, the household may allocate resources to
subsistence production, market exchanges, or donations. The model expressly includes labor: the
value of agricultural and nonagricultural activities depends on the availability of labor. The
relative return of each entitlement influences household behavior, and the interpretation of such
indicators as cereal prices, labor migration, and demand for food aid.
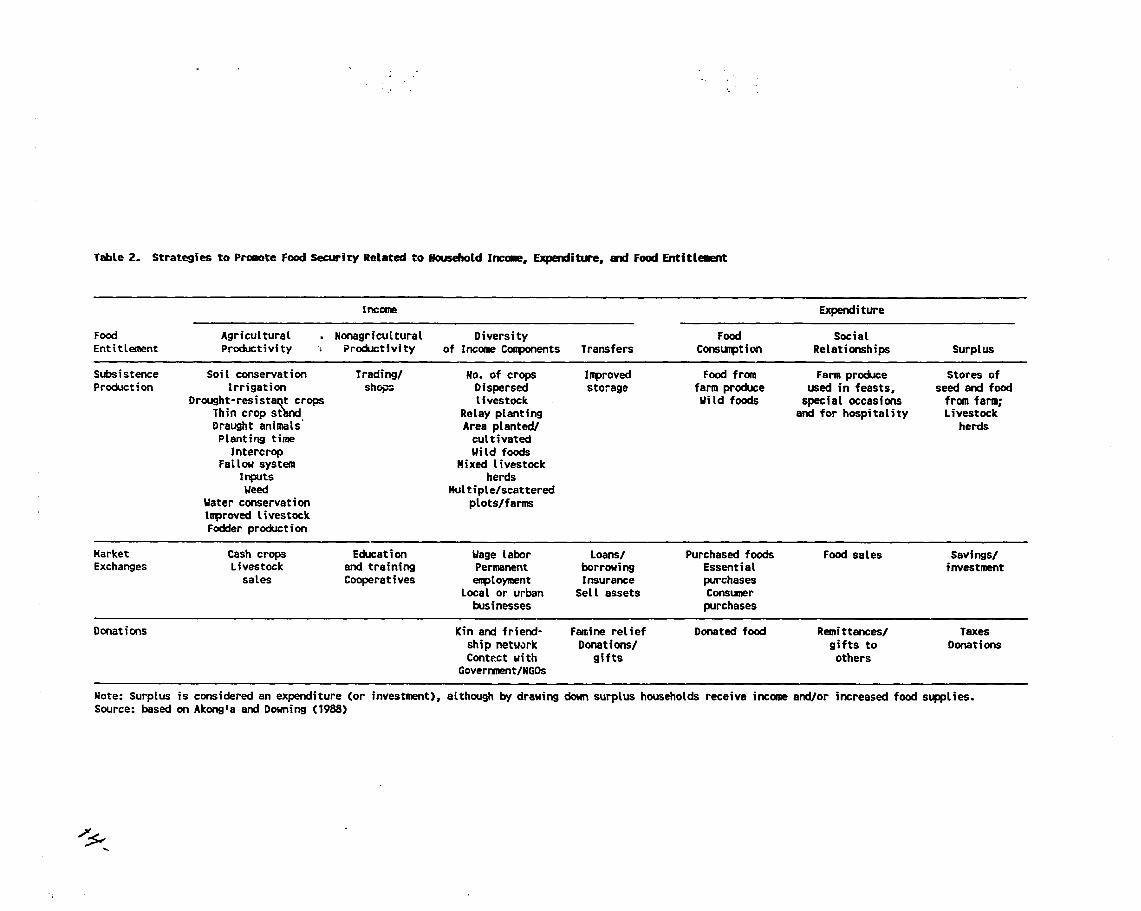
Table 2. Strategies to Proeote Food Seasity Reletal to Harsehold I n r m , w i t w e , end Food Entitlement
Incane Expenditure
Food Agricultural . Nonagricul tural Diversity Food Social Entitlement Productivity 'I Productivity of Income Conponents Transfers C0rts~rpt i on Relationships Surplus
Subsistence Soi 1 conservation Productiw Irrigation
Drought-resista t crops Thin crop st !nd Draught animals' Planting time Intercrop
Fallou system Inputs Weed
Water conservation I~proved livestock Fodder production
Trading/ No. of crops I nproved s h w Dispersed storage
livestock . Relay planting Area planted/ cultivated Vi ld foods
Hixed Livestock herds
Clultiple/scattered plots/f arms
Food from Farm produce Stores of farm produce used in feasts, seed and food Wild foods special occasions from farm;
and for hospitality Livestock herds
Uarket Cash crops Education idage Labor Loans/ Purchased foods Food sales Savings/ Exchznges Livestock and training Pemnent borrouing Essential investment
sales Cooperatives enployment Insurance purchases Local or urban Sell assets Consuner businesses purchases
Donat ions Kin and friend- Fmine relief Donated food Remittances/ Taxes ship network Donat ions/ gifts to Donations Contect with gifts others
Govemnent/NGOs ---- - - --- - - - - - - - - - - - -
Note: Surplus is considered an expenditure (or investment), although by drawing doun surplus households receive income andlor increased food supplies. Source: based on Akongia and Doming (1988)
Detu Adem, a peasant in the Ethiopian rift valley, farms two hectares of land and keeps around 20 head of cattle. In a nortt~al year, he grows just about enough to meet his family's food needs. Income from the sale of cattle pays for sugar, kerosene, and schooling. He saw the crisis of 1985/1986 coming--drought in 1984 reduced his harrest by 75 percent, and he began 1985 weakened and more vulnerable. The family reduced their food consumption and the range of foads they ate. Detu's wife offered to sell her jewelry, but Detu refused. He ploughed early and as tnuch land as he could. But a second year of poor rains made a mockery of his efforts. All Detu's relatives were similarly affected, so he could not borrow food from them. Instead, he sold cattle at low prices to buy grain that sold for twice its normal price. The remaining cattle ate the thatch of f his roof. Later he sold the two oxen he used to plough his land. Detu and his family survived that round of famine. But, by 1988, he had not recovered his former cattle herds and he could no longer af ford to send his children to school (adapted from Walker 1988: 1.1-1.2).
3. VULNERABILITY IN THE FEWS PROJECT
This chapter first notes the background of vulnerability in the FEWS project and then
reviews the 1989 FEWS vulnerability assessments. Section 3.3 provides an overview of
recommendations for improving the FEWS vulnerability assessments (further amplified in
subsequent chapters). The crux of these recommendations is to clarify concepts of vulnerability
and to explicitly identify socioeconomic groups vulnerable to famine. Section 3.4 sets out a
sequence for monitoring vulnera5ility, and the rationale for targeting socioeconomic groups is
presented in section 3.5. Throughout this report, vulnerability assessment refers explicitly to the
FEWS' efforts in June of each year to publish an analysis of current vulnerability to famine.
3.1. Vulnerability: A Unique Approach
Two approaches to famine monitoring have prevailed in the past several decades. One
focuses almost exclusively on food supply--monitoring weather, agricultural production, national
stocks, and expected imports and exports. The Food and Agriculture Organization (FA.0) and
U.S. Department of Agriculture/Economic Research Service (USDACERS) systems exemplify
efforts to calculate national food balances. While aggregated data are critical and early indicators
of some famines, they may not identify specific groups and areas likely to experience famine.
A second approach encompasses food balance calculations, but gauges the severity of a
crisis by the demand for food. For example, in India and Botswana participation rates in public
works projects may trigger increased public assistance. Systems driven by demand are reliable,
but may not provide ea'rry indication of famine conditions.
A substantial literature has ow emerged that recommends ways to increase the specificity /" of famine early warning systems and the lead time between detection and response (de Waal 1988,
D'Souza 1989, Eldridge and Rydjeski 1988, Eldridge, Salter and Rydjeski 1986, Walker 1989).
There appears to be widespread agreement that analysis of vulnerability provides a baseline to
15
understand famine indicators and that famine early warning systems must target vulnerable
groups (see the next chapter).
While such recommendatior~s have become common, they have not been widely
implemented. The FEWS project is unique in this regard: it pioneered systematic vulnerability
assessments (in 1987); it distinguishes baseline or structural vulnerability from famine episodes;
and the proJect continues to develop methods for assessing vulnerability and monitoring famine.
The development of concepts of vulrlerability in FEWS draws upon several previous
efforts, The DEVRES (1987) report anticipated the proposed focus on vulnerable groups:
At this stage of experience and research on coping mechanisms as socioeconomic indicators of famine, most agree that a framework used to identify, monitor, interpret and apply coping mechanisms in famine early warning systems also needs to allow for some geographic and cultural specificity to be certain that the interpretation of observed coping mechanisms is correct. The literature suggests that this "specificity" can be added to a generic framework by practicing development professionals and/or indigenous local monitors in a cost effective manner. However, existing literature and ongoing projects/research are still a t exploratory stages in the application of coping mechanisms as socioeconomic indicators in EWS and, therefore, do not provide "proven" examples to follow (DEVRES 1987: 2).
In addition, the FEWS Project Paper (USAID 1988) recognized three causes of famine:
underlying, triggering and immediate. The underlying causes of famine are poverty and underdevelopment. Developed countries do not suffer from famine even during severe drought cycles. The triggering cause of famine is usually one, or a combination, of the following factors: drought, leading to crop failure; loss of purchasing power or "entitlement"; and/or government(s) indifference. The immediate cause of famine is a lack of access to food (USAID 1988: 5).
The DEVRES framework organized coping strategies by livelihood systems (agricultural and
pastoral), three stages of famine (conserving resources, disinvesting resources, and destitution),
and specificity to the vulnerable group.
The first phase of FEWS sought to monitor a large number of indicators, with the
anticipation that they would provide a consistent analysis of famine. This approach was called
"convergence of indicators." Reviewing the first phase, the Energy/Development International
(1987) report recommended a hierarchy of indicators:
Targeting and assessments must occur within a siratification framework based on vulnerability of population and regions to maintain spatial sensitivity while making synoptic assessments (DEVRES 1987: 34).
/' These early recommendations and concepts are carried forward here in the focus on vulnerable
groups; identification of regional, household, and individual domains of hunger; and distinction
between vulnerability assessment and famine monitoring. Indeed, vulnerability was included in
the first phase of FEWS (Edelman 1986), although the practical focus was the immediate African
food crisis.
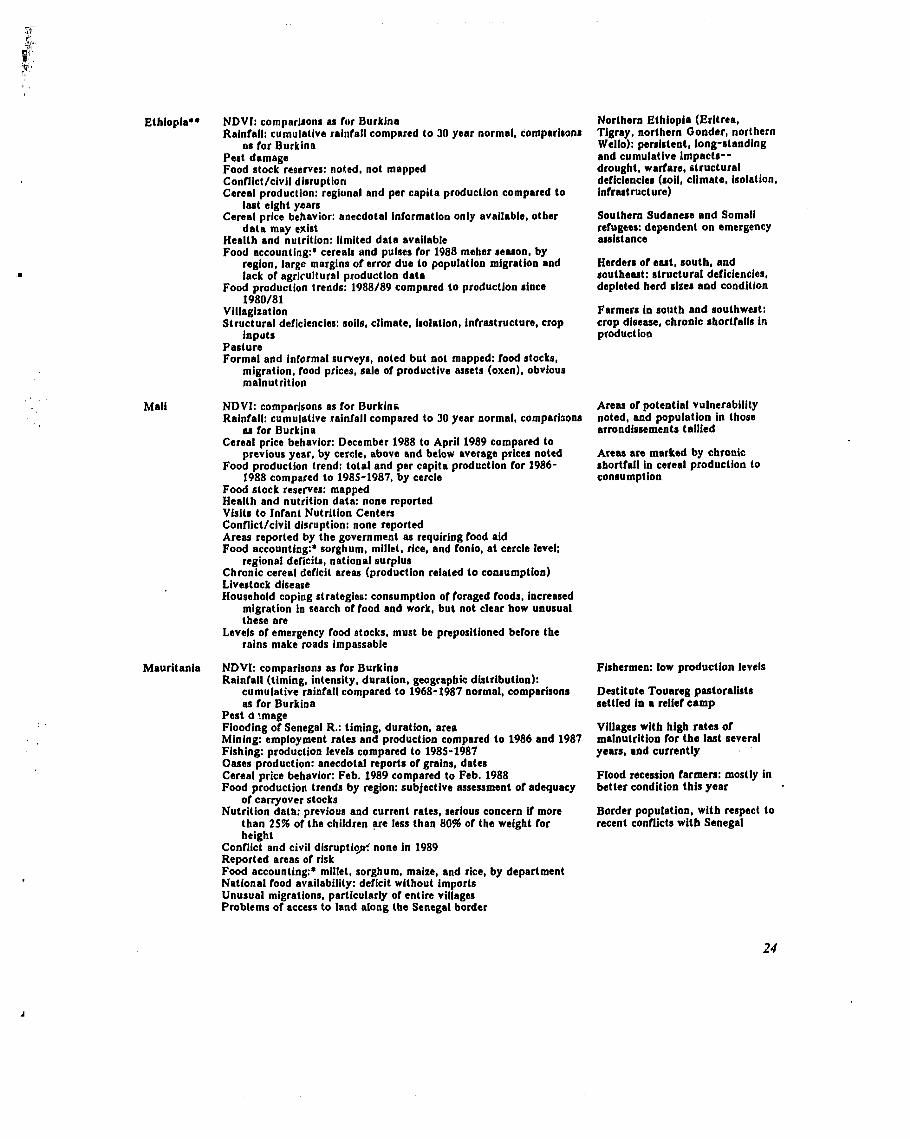
3.2. FEWS Vulnerability Assessmonts in 1989
In June of each year, after the start of the rainy season and before the harvest for most of
the countries covered, the FEWS project compiles and distributes vulnerability assessments.
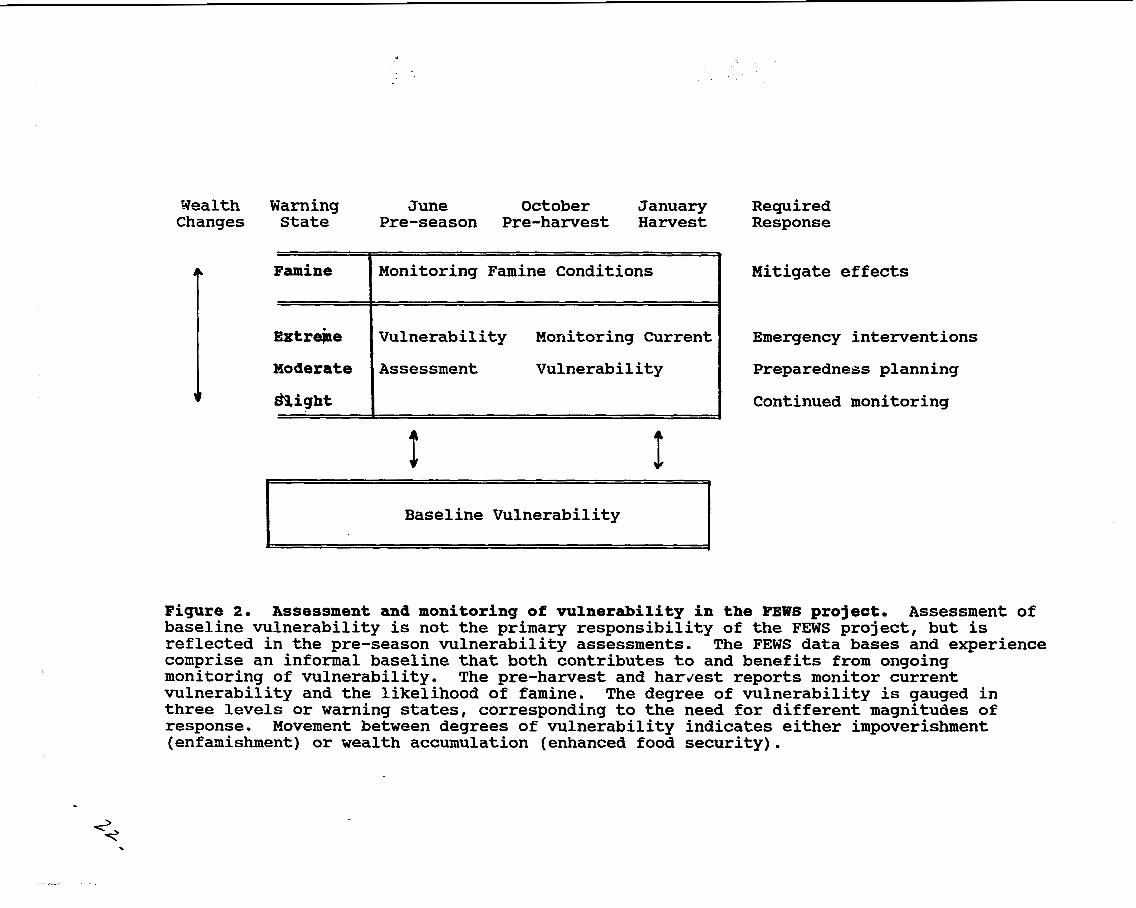
(Table 3 extracts the dimensio~hs and indicators of vulnerability reported for each country, and
any mention of vulnerable groups). The 1989 vulnerability assessments followed a logical
sequence (using the terminology of the FEWS reports):
I. Vulnerable/At-Risk Populations: a sketch of the areas and numbers of people that are vulnerable to famine based on the subsequent analysis of indicators
11. Causes of Reduced/lncrea,red Access to Food: a qualitative assessment of factors that affect access to food (production, exchanges, transfers), compared to previous years
111. Food Accounting: a quantitative assessment of food resources (production and aid) available for consumption until the next harvest
IV. Manifestations of Reduced/lncreased Access to Food: a subjective judgement of the degree of vulnerability based on socioeconomic and nutritional tesponses to food access conditions
Conceptually, the methodology followed a food poverty or entitlement approach. It
sought to portray changes in food access at three levels: (1) significantly decreased food a'ccess;
(2) probably decreased food access; and (3) significantly increased food access. The first level
indicated need for action, the second for additional information and monitoring. There were
references to the range of food sources for different groups, the limited information that can be
extracted from indicators of a gross scale, and qualifications due to missing or poor data. The
assessments included reports from field personnel, development projects, and independent
surveys of vulnerable areas.
The methods employed involve mapping each indicator for the entire country, although at
different scales depending on the original data. The individual maps of indicators (surfaces'of
food access, in the project terminology) were combined using a combination of mathematical ,
weights and subjective.assessments, - although neither of these are specified in the final reports.
Maps are presented for each section: (1) Vulnerable Areas: Composite Overlay of Indicators; (2)
Causes of Food Stress: Consequel)ees of Factors Affecting Food Access; (3) Food Accounting: Per
Capita Access to Food; and (4) Manifestations of Food Stress: Current Food Access Conditions.
Different thresholds and the "convergence of evidence" were used to interpret the meaning of
individual indicators against their background variability.
3.3. Improving Analysis of Vulnerability in FEWS: Overview
Two broad recommendations are proposed in this pager:
1. Clarify concepts of vulnerability assessment and monitoring. Chapter 2 proposes three domains of hunger that correspond to different levels of aggregation and a:rlalysis. Below, a sequence for monitoring vulnerability is suggested.
2. Target early warning systems to vulnerable socioeconomic groups. As elaborated below, the socioeconomic dimensions of vulnerability correspond to the causal structure of famine for specific groups of people.
Adoption of the proposed framework will provide a consistent terminology for the FEWS staff,
facilitate comparison of individual country efforts, improve the analysis of vulnerability in the
FEWS project, and target monitoring toward the populations and areas with the highest risks.
3.4. Sequence and Degree of Famine Risk
The 1989 FEWS vulnerability assessments differentiated between four levels of famine
risk: vulnerable, at-risk, nutritional emergency, and famine (e.g., Price, Williams 1989: 3). This
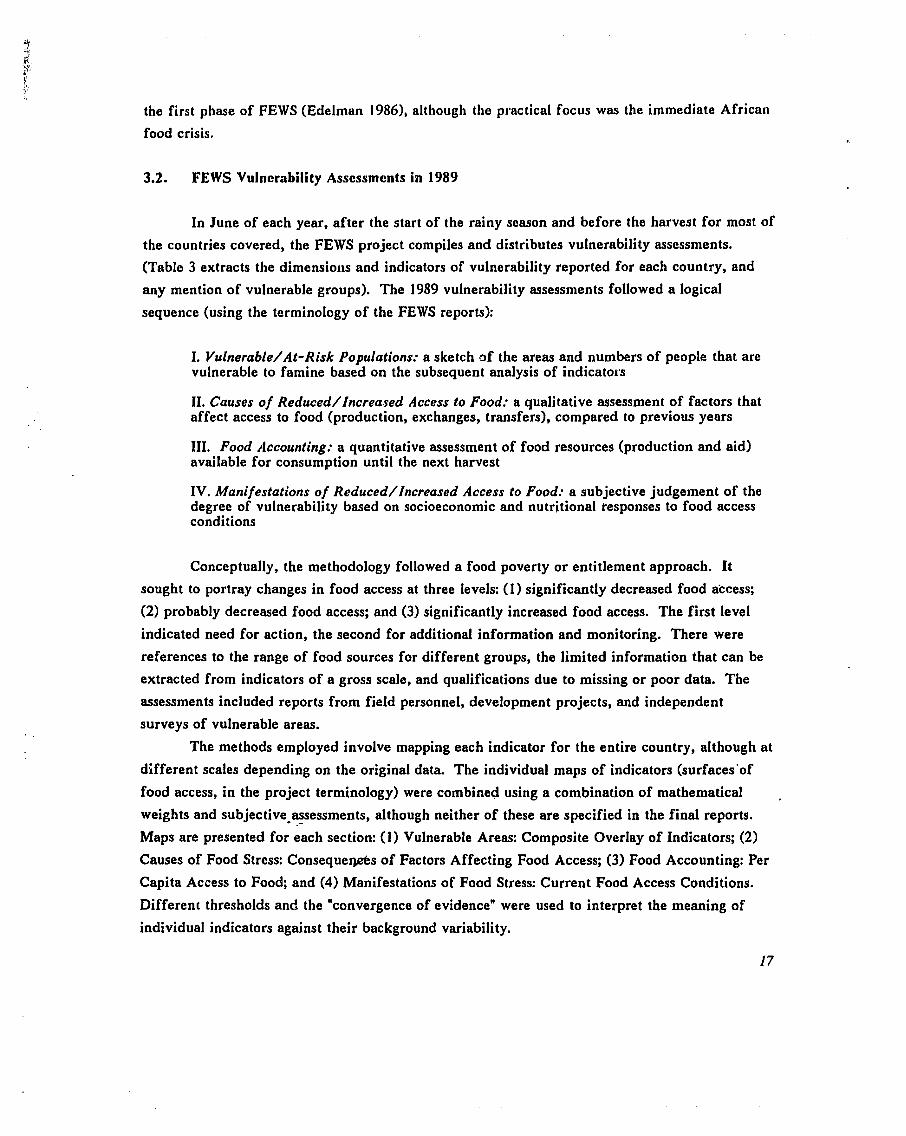
initial construct has been revised in discussion with the FEWS staff. Figure 2 distinguishes
between three types of vulnerability, each of which is gauged by its degree of severity. The
relative degrees of vulnerability are operational warning states corresponding to a set of desirable
responses. The seasonal reporting requirements of FEWS correspond to the kinds of information
available in the Sahel.
The dual processes of impoverishment and accumulation indicate changes between degrees
of vulnerability. Impoverishment may result in famine, or in the other direction, accumulation
signifies recovery and enhanced food security. Recovery refers to the period after the food crisis
when food supplies and consumption begin to return to normal. It signifies the capability of the
vulnerable groups to regain their economic, social, and political status, or their susceptibility to
further impoverishment and destitution. The post-famine period is often critical for future
vulnerability.
Baseline vulnerability is an aggregate measure, for a given population or region, of the ,
underlying factors that influence exposure to famine and predisposition to the consequences of . ._
famine. It refers to the recent history (perhaps the last 3-10 years) of underlying processes and
causes of hunger, rather than imxpediate events (i.e., the previous harvest and current season).
For example, resource-poor smallholders in semi-arid areas are typically vulnerable to famine,
since average production is less than food requirements, off-farm income is unreliable, and the
development infrastructure inadequate.
Baseline vulnerability defines the essential context for interpreting indicators of the
current risk of famine. In the context of USAID, formal baseline vulnerability assessments arc
beyond the FEWS mandate. Rather, they are the responsibility of the Food for Peace office to
allocate long-term food aid, country missions in the development of Country Development
Strategy Statements, and other offices concerned with national, household, and individual food
security and its correlates (e.g., agriculture, health, family planning). The FEWS analysts,
however, draw upon substantial data bases and personal experience that constitute a baseline for
their judgements. In addition, each year of monitoring adds to this baseline. A strong
recommendation of this report is that formal baseline assessments be carried out--to strengthen
both FEWS and development planning (see World Bank 1989a, 1989b).
The June pre-season vulnerability assessments are intended to foreshadow the likelihood
of famine in the coming se:xion. They review elements of baseline vulnerability and the food
situation from the previous season. The data are collected before the growing season has begun
in the Sahel--thus they portray vulnerability to famine rather than the agroclimatic or economic
shocks that might trigger a crisis in the current year. As such, the annual vulnerability
assessments seek to highlight groups and areas that require concerted monitoring and predispose
decision makers to respond through forward planning, such as preliminary allocation of food aid
budgets. The vulnerability assessments establish the context for interpreting subsequent seasonal
reports.
The FEWS project depends on field analysts. Famine has varied causes--no formal
decision making or risk assessment model is likely to capture its many forms (see chapter 7). As
such, the vulnerability assessments are an institutional memory for the skill of the analyst--the
collective human judgement regarding food security in each country.
Subsequent FEWS reports monitor vulnerability to famine as the season progresses. In
October, the pre-i.arvest report relies on indicators of the growing season (e.g., rainfall, state of
vegetation). The harvest report, in January, confirms the harvest results through a variety of
indicators. As in the vulnerability assessments, these seasonal reports continue to monitor
socioeconomic, political, and nutritional indicators as they affect food security.
Throughout the season, three degrees of vulnerability may be distinguished,
corresponding to the need for specific responses. These warning states form a continuum capped
by famine. Vulnerability is seen as a relative condition; everyone is vulnerable, some require
further attention. The three degrees are: . - Slight vulnerability: population continues to be monitored, but famine is not considered likely in the current season* no specific response required. /' Moderate vulnerability: targeted monitoring required; need to earmark resources for continued monitoring (perhaps including special surveys) and potential responses (such as emergency food aid); need to develop contingency plans and ensure government bureaucracies are prepared to respond.
Extreme vulnerability: immediate action required to prevent famine, including nutritional interventions (e.g., food aid) and income support (e.g., food-for-work, commercial food distribution).
Famine: evidenced by widespread and increased morbidity and mortality; immediate interventions required to mitigate the effect of famine or control its spread; in addition to above responses, expanded health services, relief camps, and widespread food distribution may be necessary.
3.5. Rationale for Focusing on Vulnerable Groups
Explicit in the diagram of the causal structure of hunger (Figure 1) is that vulnerability
varies among groups of people. This section sets out the rationale for focusing on vulnerable
groups. Chapter 4 reviews existing vulnerability assessments and methods for identifying
vulnerable groups.
In one sense this paper puts forth an hypothesis: monitoring and responding to famine is
more readily accomplished by addressing the causal structure of famine among specific
socioeconomic groups. This hypothesis will be tested over the next decade as improvements to
famine early warning systems are designed, implemented, and evaluated.
At the outset, there are four reasons to suggest pursuing this strategy.
First, famine varies in its causal structure and incidence according to the entitlements of
specific socioeconomic groups. Typically, it may be the poor who suffer first and those in
marginal areas that suffer the most. The specifics of who is affected in a particular famine,
however, depend on the causes of the famine as they relate to the entitlements of different
groups. A high risk of deterioration in food security need not invariably be associated with
chronic marginality. The other aspect of vulnerability, the seriousness of consequences if
exposure should occur, is more reliably associated with ongoing marginality. For example, those
who are already chronically malnourished will undoubtedly be harder hit by the same
proportionate deterioration in diet than the initially well fed.
Second, correlating famine causes with coherent socioeconomic groups allows the decision
maker to more accurately gauge the effects of food shortage or food poverty through the use: of
sample surveys and limited models. For instance, reports of distress from specific locales, such as
a health center, can be extrapolated to the vulnerable group represented. Similarly, the effect of '
rainfall deficiencies on* self-sufficiency can be more readily calculated for smallholders growing
maize on less than two hectares than for the entire rural population. Secondary benefits from the .
/ focus on socioeconomic groups may include more rapid appraisals and focused monitoring.
Third, individuals participate in social and economic structures that correspond to the
mechanisms of both famine causes and responses. For example, escalation of food prices might
indicate famine among the urban poor, a commonly identified vulnerable group. Market
interventions might then be an appropriate targeted famine response. Similarly, access to health
services may be related to vulnerability to hunger, and also a critical avenue for supporting the
nutritional status of women and children.
Fourth, analysis of vulnerability provides a critical linkage between famine early warning
and development planning (D'Souza 1989). Characterization of vulnerability requires
understanding environmental, demographic, and economic trends. Development planning should
address the impacts on vulnerable groups.
My experience in analyzing vulnerability to hunger in Kenya illustrates the benefits of
focusing on vulnerable groups. Initial efforts in 1988-1989 (Downing 1989) involved a
geographic information system (GIs) and a dozen indicators of vulnerability, all calculated for the
entire population of Kenya. While Kenya has reasonably good data, the effort failed to identify
cohesive regions of vulnerability, showed little difference between vulnerability to chronic and
episodic hunger, and resulted in extremely low estimates of the population at-risk (compared to
other published estimates and methods). In particular, the discrepancy in data and their
interpretation between agricultural and pastoral populations proved insurmountablr:: comparable
indicators for both groups were not available. Possibly, the method could have bvren improved
with better data, more and better indicators, and more elaborate modeling of famine processes.
However, beginning with a causal structure related to distinct socioeconomic groups (as pursued
in the appendix) resulted in a more realistic assessment. Using separate analyses for each group,
a GIs is a valuable tool for constructing composite indices.
There are several limitations to assessing vulnerability and vulnerable groups. Identifying
groups implies a static analysis and insulated processes. In fact, household income is variable and
a household may be poor rural farmers one year and emerging petit bourgeois the next. In
addition, the rural farmer is interdependent with other groups, in a variety of relationships. A
practical question is how specifically the vulnerable group (socioeconomic characteristics and
regional location) must be identified to provide a useful assessment. These are issues that need to
be resolved within the context of specific warning systems. At the scale of the FEWS analyses,
the concern is whether an entire group, on the average, is undergoing impoverishment or
enrichment, not the specific situation of given households. Analysis of the causal structure of
famine should identify critical intergroup linkages that may affect famine impacts and responses.
A hierarchy of groups may be identified, with greater specificity according to available data and . ̂
needs.
Wealth Warning June October January Changes State Pre-season Pre-harvest Harvest
Required Response
Mitigate effects ?
I ,
Famine
~xtrejne
Moderate
sight
Emergency interventions
Monitoring Famine Conditions
Vulnerability Monitoring Current
Assessment Vulnerability Preparedness planning
Continued monitoring
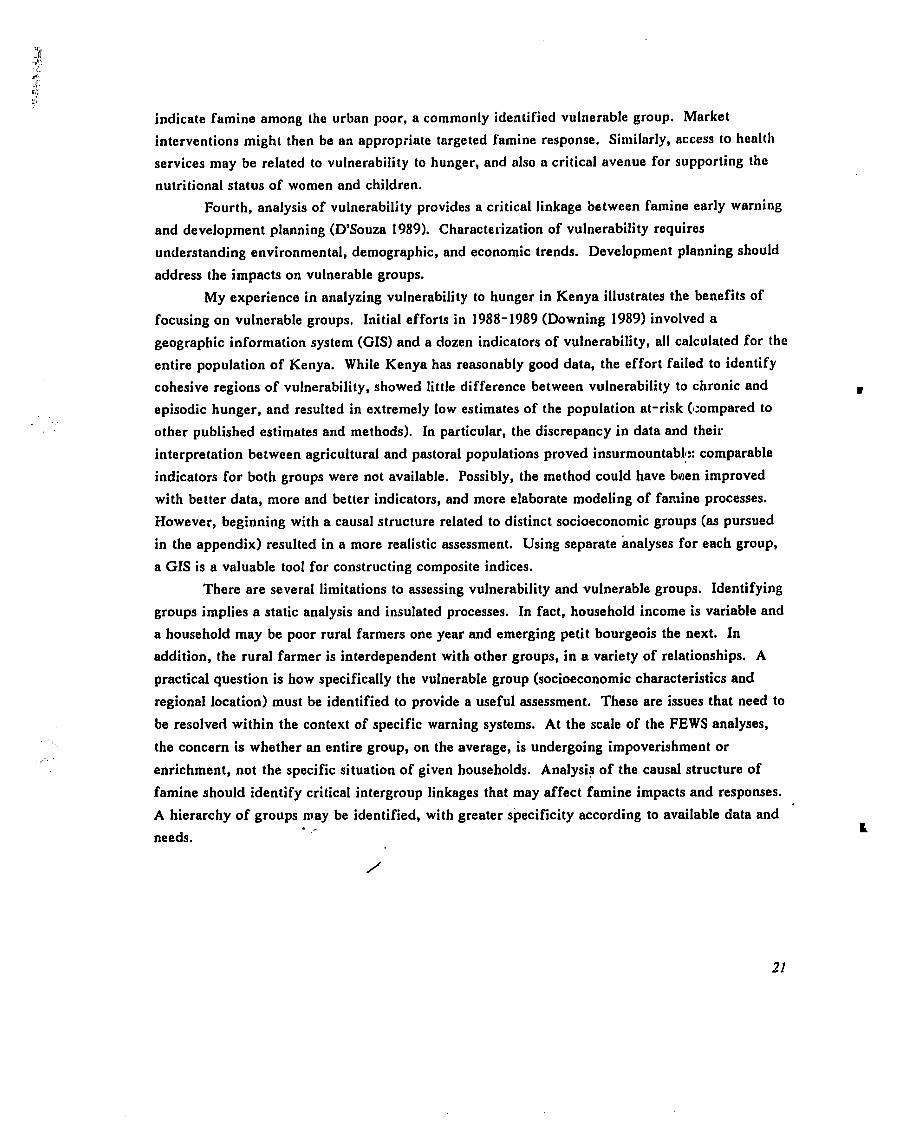
Figure 2. Assessment and monitoring of vulnerability in the FEWS project. Assessment of baseline vulnerability is not the primary responsibility of the FEWS project, but is reflected in the pre-season vulnerability assessments. The FEWS data bases and experience comprise an informal baseline that both contributes to and benefits from ongoing monitoring of vulnerability. The pre-harvest and hardest reports monitor current vulnerability and the likelihood of famine. The degree of vulnerability is gauged in three levels or warning states, corresponding to the need for different magnitudes of response. Movement between degrees of vulnerability indicates either impoverishment (enfazishment) or wealth accumulation (enhanced food security).
I b
Baseline Vulnerability
s
I
Tablo 3. Faminc Dirnonsior~s nnd Vtrlncrablo Groups in tho 1989 FEWS Vulnerability Assossrnon ts
Country Dimensions/lndicatorr ---------------------------.---------------------..--------------------------- Burkina NDV l compared to 1982-1987 normal, departures of 0.05 noted, areas F u o lean than 0.1 NDVl excluded
Rainfall: 1988 cumulative rainfall compared to 30-year normal, departures of 20 percent or more notc:d, arew receiving lerr than 200 mm excluded
Pest damage Flooding Food production trends: total, per capita production, and stocks for
1985-1987 compared to 1986-1987, by province Food stock reserves: noted, not mapped Health and nutrition data: none reported Conflict/civil disruption: none reported Areas reported as vulnerable/requiring food aid: none Food accounting:. sorghum, millet, rice, nnd fonio, at province level Migration: none reported, migration to gold fields often occurs after a
poor harvest
Chad NDVI: as for Burkina Rainfall: as for Burkina Pest damage Flooding Cash crop: cotton compared to 1980-1987, others noted Nonagricultural resources, by canton Off-season harvests: no data Cereal price behavior: Jan. 1989 compared to Jan. 1987, thresholds at
85% below 1987, and 15% and 100% above 1987 levels, by sub- prefecture or town
Food production trend: subjective assessment of adequacy of household carryover stocks; effect of destruction of stores during civil war noted
Assets and weall-h: no data, anecdote of local chief organizing a buying cooperative, slow rebuild in^ of herds and subsequent relien& on-crop production
- Public food stocks: mapped, donor pledges noted National cereal production compared to 1980s harvests Nutrition data: ratos below the threshold for action, 10% of children
measuring less than 80% of the standard weight for height Reported arekc of risk: government and donor assessment teams, no
visible signr of malnutrition Emergency food distribution: improved food security Conflict/civil disruption: no reports, an experiment in food security
under peaceful conditions with harvest comparable to 1984 cereal production
Food accounting:' millet, sorghum, maize, rice, and wheat, at prefecture level
Refugees from Sudan and Central African Repcblic: need to monitor
Vulnerable Groups -------------*----------------
Livestock -depsnden t
Typical household i n Sahelian region: diversified income from livestock, commerce, remittances end croftr, i n addition to crop production; alro traditional systems of reciprocity nod private sector able to cope
Climatic zones (Sahara, Sahel, and Sudan) and regions identified, but specific socioeconomic groups not addressed in section on vulnerable populations.
Mentioned subsequently: herders that have recently become farmers,
refugees from Sudan, pastoralists i n eastern Saharan zone
Ethiopia*. NDVI: comparjsons ar for Burkina Rainfall: cumulative rai~~fall compared to 30 year normal, comparisonr
us for Burkina Pest damage Food stock reserves: noted, not mapped Conflict/civil disruptiorr Cereal production: regional and per capita production compared to
last eight years Cereal price behavior: anecdotal information only available, other
data may exirt Health and nutrition: limited data available Food accounting:' cereals and pulses for 1988 meher serson, by
region, large margins of error due to population migration and lack of agricultural production data
Food production trends: 1988/89 compared to production since 1980/81
Vlllaglzation Structural deficiencies: soils, climate, isolation, infrastructure, crop
inputs Pasture Formal and informal surveys, noted but not mapped: food stocks,
migration, food prices, sale of productive assets (oxen), obvious malnutrition
Mali NDVI: comparisons as for Burkinti Rainfall: cumulative rainfall compared to 30 year normal, comparioons
as for Burkina Cereal price behavior: December 1988 to April 1989 compared to
previous year, by cercle, above and below average prices noted Food production trend: total and per capita productlon for 1986-
1988 compared to 1985-1987, by cercle Food stock reserves: mapped Health and nutrition data: none reported Visits to Infant Nutrition Centers Conflict/clvil disruption: none reported Areas reported by the government as requiring food aid Food accounting:' surghum, millet, rice, and fonio, at cercle level;
regional deficits, national surplus Chronic cereal deficit areas (production related to consumption) Livestock disease Household coping strategies: consumption of foraged foods. increased
migration in search of food and work, but not clear how unusual these are
Levels of emergency food stocks, must be prepositioned before the rains make roads impassable
Mauritania NDVI: comparisons as for Burklna Rainfall (timing, intensity. duration, geographic distribution):
cumulative rainfall compared to 1968-1987 normal, comparisons as for Burkina
Pest d !ma@ Flooding of Senegal R.: timing, duration, area Mining: employment rates and production compared to 1986 and 1987 Fishing: production levels compared to 1985-1987 Oases production: anecdotal reports of grains, dates Cereal price behavior: Feb. 1989 compared to Feb. 1988 Food production trends by region: subjective assessment of adequacy
of carryover stocks Nutrition data: previous and current rates, serious concern if more
than 25% of the children are less than 80% of the weight for - height
Conflict and civil disruptiop! none in 1989
Northern Ethiopia (Erltrea, Tigray, northern Oonder, northern Wello): persistent, long-standlng and cumulative Impacts-- drought, warfare, structural deflciencier (soil, climate, isolation, Infr~tructure)
Southern Sudanese and Somali refugees: dependent on emergency msistance
Herders of emt, south, and southerst: structural deficiencies, depleted herd sizes and condition
Farmers in sorrth and southwest: crop disease, chronic shortfalls in production
Areas of potential vulnerability noted, and population in those arrondissements tallied
Areas are marked by chronic shortfall In cereal production to consumption
Fishermen: low production levels
Destitute Touareg pmtoralists settled in a relief camp
Villages with high rates of malnutrition for the last several years, and currently
Flood recession farmers: mostly in better condition this year
Border population, with respect to recent conflicts with Senegal
Reported areas of risk Food accounting:. millet, sorghum, maize, and rice, by department National food availability: deficit without imports Unusual migrations, particularly of entire villages Problems of access to land along the Senegal border
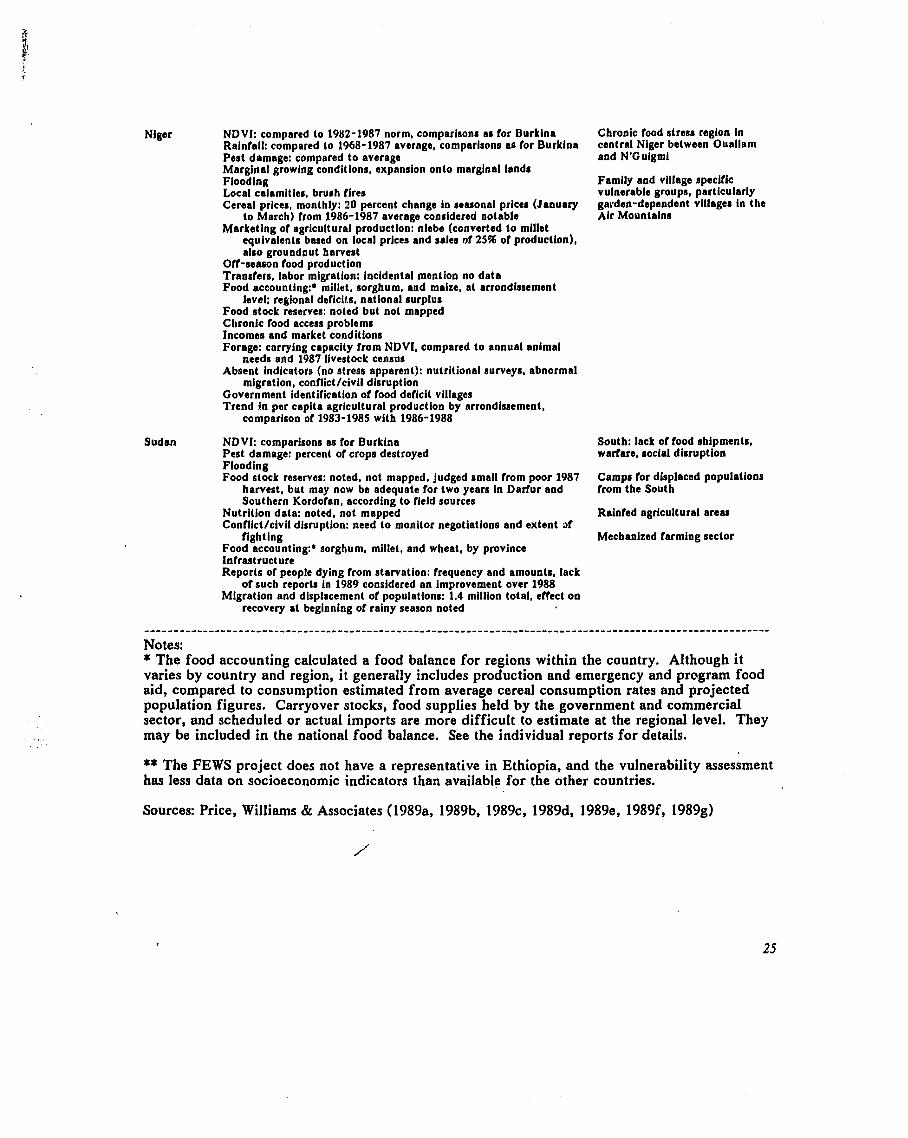
Niger
Sudan
NDVI: compared to 1982-1987 norm, comparisons as for Burkina Chronic food stress region in Rainfall: compared to 1968-1987 average, comparisons M for Burkina central Niger between Ouallam Pest damage: compared to average and N'Guigmi Marginal growing conditions, expansion onto marginal lands Flooding Family and village specific Local calamities, brush fires vulnerable groups, particularly Cereal prices, monthly: 20 percent change in s e ~ o n a l prices (January garden-dependent villages in the
to March) from 1986-1987 average considered notable Air Mountains Marketing of agricultural production: niebe (converted to millet
equivalents based on local prices and sales of 25% of production), also groundnut harvest
Off-seaaon food production Transfers, labor migration: incidental mention no data Food accounting:* millet, sorghum, and maize, at arrondissement
level; regional deficits, national surplus Food stock reserves: noted but not mapped Chronic food access problems Incomes and market conditions Forage: corrying capacity from NDVI, compared to annual animal
needs and 1987 livestock census Absent indicators (no stress apparent): nutritional surveys, abnormal
migration, conflict/civii disruption Government identification of food deficit villages Trend in per capita agricultural production by arrondissement,
comparison of 1983-1985 with 1986-1988
NDVI: comparisons as for Burkina Pest damage: percent of crops destroyed
South: lack of food shipments, warlare, social disruption
Flooding Food stock reserves: noted, not mapped, judged small from poor 1987 Camps for displaced populations
harvest. but mav now be adeauate for two vears in Darlur and from the South southern ~ o r d o i a n , according' to field sourks
Nutrition data: noted, not mapped Rainfed agricultural areas Conflict/civil disruption: need t o monitor negotiations and extent of
fighting Mechanized farming sector Food accounting:' sorghum, millet, and wheat, by province Infrastructure Reports of people dying from starvation: frequency and amounts. lack
of such reports in 1989 considered an improvement over 1988 Migration and displacement of populations: 1.4 million total, effect on
recovery at beginning of rainy season noted
........................................................................................................... Notes: * The food accounting calculated a food balance for regions within the country. Although it varies by country and region, it generally includes production and emergency and program food aid, compared to consumption estimated from average cereal consumption rates and projected population figures. Carryover stocks, food supplies held by the government and commercial sector, and scheduled or actual imports are more difficult to estimate at the regional level. They may be included in the national food balance. See the individual reports for details.
** The PEWS project does not have a representative in Ethiopia, and the vulnerability assessment has less data on socioeconomic indicators than available for the other countries.
Sources: Price, Williams & Associates (1 989a, 1989b, 1989c, 1989d, 1989e, 19891, 1989g)
'Vulnerable' and 'vulnerability' are common terms in the lexicon of development, but their use is often vague. They serve as convenient substitutes for 'poor' and 'poverty', and allow ...p rofessionals to restrain the overuse of those words. Some precision can be found in the use of 'vulnerable groups' where this refers to pregnant and lactating women, to children, or to disadvantaged communities such as Scheduled Castes and Scheduled Tribes in India ... Vulnerability, though, is not the same as poverty. I t means not lack or want, but defencelessness, insecurity, and exposure to risk, shocks and stress (Chambers 1989: 1) .
4. IDENTIFICATION AND MONITORING OF VULNERABLE GROUPS
A variety of socioeconomic groups, such as women and children, the ultra-poor, tenant
farmers, urban squatters, and specialized pastoralists, have been characterized as vulnerable to
famine. This chapter sets out a systematic basis for identifying and monitoring vulnerable
socioeconomic groups. It reviews previous frameworks for assessing vulnerability, expands the
typology of three domains of vulnerability presented in chapter 2, identifies a generic set of
vulnerable groups, and concludes by noting the importance of testing definitions of vulnerable
groups. An extended example from Kenya, in the appendix (chapter 1 l), illustrates aspects of
this approach and some of the practical issues.
4.1. Approaches to Assessing Vulnerability
Concepts of vulnerability have been applied in several disciplines and contexts. While the
applications diverge in methods and interpretation, several aspects are similar: the distinction
between vulnerability and shocks; portrayal of vulnerability by a reduced set of dimensions; and
use of indicators to compile composite indices. These examples, summarized here, are presented
in more detail in the appendix (chapter 13). The examples draw from three traditions:
epidemiology, natural hazards, and food systems.
Epidemiologist have projected the spatial distribution of vulnerability to disease for the
next decade (Dever et al . 1988). A social vulnerability index compiled data on social pathology,
economic well-being, education, health access, and health status. The relative importance of
vulnerability versus stress in describing the actual occurrence and impact of disease is contested
in epidemiology--results depend on the statistical methods chosen (McKee and Vilhjalmsson
1986). An interesting extension of the vulnerability concept is its application to patterns of
recovery from disease. Are there underlying factors that influence recovery; does vulnerability
apply not only to expos'ure and consequences, but to rehabilitation and subsequent exposure?
Within the field of natural azards, vulnerability and disaster have been described for at 2 least several decades (Barton 1969, Burton, Kates and White 1978, Dynes 1970, Quarantelli and
Dynes 1970, 1977). According to Kreps, disasters are: "events ... in which societies or their larger
subunits (e.g. communities, regions) incur physical damages and losses and/or disruption of their
routine functioning. Both the causes and the consequences of these events are related to the
social structures and processes of societies" (Kreps 1984: 312). Rigorous applications, however,
have been limited to single-cause events: e.g., flood hazard mapping and earthquake risk zones.
Several researchers are currently working on composite, all-hazard vulneratllity (see Liverman
1989, Oaks 1989a, 1989b, Riebsame 1988, 1989). In one formal typology, Brittan (1986) proposes
that vulnerability is the sum of physical, cultural, psychosocial, and social influences. A simiJar
matrix of capacities and vulnerabilities (physical/material, social/organizational, and
motivational/attitudinal) is developed in Anderson and Woodrow (1989), drawing upon case
studies of disaster response in developing countries.
The concept of vulnerability is widely used in the literature on food systems, including
contributions from agricultural economics, anthropologists, ecologists, geographers, and systems
analysts. There are fewer attempts, however, to characterize vulnerability a priori as a predictor
of the potential impacts of specific shocks. The most famous example is Currey's (1979) map of
famine risk in Bangladesh. Political units, thanas, were rated on ten factors--flood damage,
drought probability, population pressure, food deficit areas, employment, crop yield,
transportation, river erosion, cyclones, and inputs. The composite index is based on different
weights each factor. A similar exercise was conducted by the Relief and Development Institute
for Zambia (Borton and Shoham 1985). More recently, Manarolla (1989) constructed indices of
food security to guide the allocation of food aid. Data for five variables were compiled to gauge
national self-reliance and household food access (see the appendix, chapter 13, for more detail).
4.2. Dimensions of Vulnerability
The prerequisite for identifying and monitoring vulnerable groups is understanding the
causal structure of famine. This entails three complementary exercises. First, construct a
detailed assessment of the dimensions of vulnerability, as elaborated below. Second, identify
broad socioeconomic (including the political economy) groups of people with similar patterns of
vulnerability to famine, perhaps using a reduced set of dimensions (section 4.3). And third,
identify specific types of famine and famine mechanisms that result in food poverty and food
deprivation for specific vulnerable groups (section 4.4).
It may be important to restate here that if perfect information on individual nutrition and
household food security were available, analysis of vulnerability would be a simple matter of
choosing the best metrf~.-(e.~., grain-equivalent food availability per capita). Since this is beyond
the ability of social science, a structured appraisal must identify domains and dimensions of /
vulnerability that capture the expected variations between vulnerable groups and regions.
A catalog of potential causes (see the appendix, chapter 13) needs to be reduced to a
tractable taxonomy. The choice of dimensions is arbitrary and must be tailored to specific
situations and purposes. The scale of concern of the FEWS project is households or communities
rather than individuals, and famine rather than chronic hunger.
The domains, dimensions, and indicators presented here result from a structured, but
ultimately arbitrary, typology. An equally useful framework might adopt different terms, place
greater emphasis on certain dimensions, or rearrange the indicators into new groups. What
follows is a systematic framework that integrates a span of disciplines and promises to enlighten
our understanding of famine. At the same time, it is accossible to analysts and can be readily
altered to meet specific situations.
The three domains of hunger--regional food shortage, household food poverty, and
individual food deprivation--defined in chapter 2 provide the conceptual framework for
analyzing vulnerability. Each domain is subdivided, resulting in nine dimensions of vulnerability
(Table 1):
Reeional Food Shortape
National Food Balance: A macro-level indication of vulnerability is the ability of national production, storage, and net imports to meet food consumption requirements (measured by either the status quo or nutritional standards). Some regional variations may be revealed in analysis of geographic location, below, but a first signal of impending problems may be revealed in a projected national food balance.
Geographic Location: In many cases, specific regions have been identified as being particularly vulnerable to famine. Often the geographic location implies the coincidence of a number of factors that could be gauged in more specific analyses of institutions, food poverty, or nutrition. For exhmple, food production on-farm compared to household consumption is a measure of food poverty, but a simple index of agroclimatic resources may provide an additional indication of the geographic distribution of vulnerability. In this case, the semi-arid agricultural areas are likely to be more vulnerable than the humid zones. Additional geographic causes are civil strife and population density relative to resources.
Institutional Development: Using the term institutions in a broad sense, this dimension of vulnerability includes the adequacy of infrastructure to support agricultural production, distribute food to markets, provide health services, and participate in famine early warning systems. In addition, it includes the sociopolitical ability to command famine relief when needed. This dimension portrays such circumstances as isolated communities and markets and marginalized ethnic groups. The geographic and institutional dimensions may be termed structural aspects of vulnerability: they tend to portray long-term
'
situations that slowly change.
Household Food Poverty-
Income Components: Characteristics of household livelihood (or food entitlement) from agricultural production o d a r m and from communal lands, market exchanges, barter/labor exchanges, transfers, and assets comprise an essential dimension of famine vulnerability. A complete enumeration of household income would reveal different sources of food, shifts between sources during times of stress, and patterns of vulnerability due to, for example, drought or price inflation.
Cultural Prcfcrcnccs: The choice of crops, agricultural practices, diet, income-generating activities, and the utilization of other resources are influenced by cultural patterns. Although cultures are regional, they affect household income, expenditure, and consumption. For this reason, cultural influences on food security are included as a dimension of household food poverty.
Demography: The composition of the household influences consumption requirements, availability of labor, and the intra-household distribution of food. Some of these factors may be reflected in other dimensions, but the age-sex distribution of the population, household size, lifecycle stage of the household, and number of dependents are basic information for monitoring vulnerability.
Individual Food De~rivatioq
Nutritional Status: Data on malnutrition have two uses. They gauge individual ability to withstand deprivation of food once it occurs, thereby delineating the risk of the consequences of famine. In addition, the distribution of malnourishment is often correlated with the risk qf exposure to famine, which may be related to household food poverty, deficient health !,ervices, or regional environmental or dietary factors.
Health Status: The incidence of disease reflects both the individual ability to withstand further food deprivation and the effects of malnutrition and food stress. For example, the prevalence of cholera, diarrhoea, malaria, and vitamin A deficiency may be correlated with famine risk and impact.
Social Status: Although difficult to gauge, the social status of individuals within households affects who suffers first from food poverty and who experiences the greatest deprivation. For instance, women and the elderly may have a lower status than male laborers and sons. Social status, however, may vary between and within ethnic and socioeconomic groups.
4.3. A Taxonomy of Generic Vulnerable Groups
The domains and dimensions of hunger serve two purposes. First, they help to distinguish
between socioeconomis groups--the first level of a vulnerability assessment. Second, once
targeted groups have been identified, the dimensions form a framework for describing long-
term vulnerability and monitoring current conditions (see chapters 5 and 6). The first analysis
might rely on only a few dimensions, as discussed below.
The identification of vulnerable groups is constrained by the availability of data,
particularly on joint distributions of economic assets and household composition and the
geographic location of vulnerable groups. There is little use in constructing a complex taxonomy
that cannot be put into operation/attempts to interpolate from very sparse data may introduce
unknown errors that reduce the utility of the analysis. For example, it will be difficult to locate
pastoralists with small herds and lack of access to traditional welfare systems. It is desirable and
feasible, however, to formulate a classification system for vulnerable groups that takes advantage
of different levels of information.
For consistent accounting, the vulnerable groups should not overlap and groups not
considered vulnerable to famine should be included. This allows summation to the entire
population and coverage of the entire country. With four dimensions and perhaps four categories
of vulnerability for each dimension, there are theoretically 256 (44) possible vulnerable groups.
There are no fixed rules for extracting either the best dimensions (as by a factor analysis) or
determining a reasonable number of vulnerable groups (a cluster analysis). Given our current
understanding of famine, a hierarchy of vulnerability based on available data and expert opinion
should provide an adequate first approximation.
The resulting taxonomy should order the domains and dimensions of vulnerability. The
first level may be based on characteristics of food poverty, e.g., patterns of livelihood common
among smallholder agriculturalists, pastoralists, or the urban poor. Subsequent levels may
identify household types that are especially vulnerable to famine (e.g., high dependency ratios),
include individuals with special nutritional needs (children urider five, pregnant and lactating
women), or be located in marginal areas where agriculture is sensitive to climatic fluctuations and
infrastructure is lacking. A practical rule is that correspondence of livelihood with other factors,
such as ethnic group, indicates a socioeconomic group with a distinct pattern of vulnerability.
Thus, agro-pastoralists could be split from pastoralists or agriculturalists if they are different
ethnic groups or in reside in separate locations.
A generic set of vulnerable groups is defined in terms of the three domains of hunger
(Table 4). The first order division might capture major livelihoods--the vulnerable
socioeconomic groups distinguished by income sources and patterns of food poverty. Within
these groups, further disaggregation and differentiation of vulnerability may be desirable. For
instance, all groups in a zone of civil warfare may be considered vulnerable to famine.
Food-poor smallholders in semi-arid lands may be chronically subject to famine, whereas only
the most vulnerable individuals in food-poor households in wetter areas should be targeted for
interventions.
General characteristics and famine processes affecting vulnerable groups may be
distinguished (Walker 1988). Groups that are customarily dependent on food markets, such as the
urban poor, landless laborers, and plantation workers are vulnerable to processes that inflate food
prices. Even a modest harvest failure accelerates price' increases and reduces available wage
labor. With less stored'food, famine may develop very quickly among the market-dependent.

Tablo 4. Throo Lovcls of a Hierarchy of Vulncrablo Groups
................................................................................... Household Regional Individual
Food Food Food Poverty Shortage Deprivation ...................................................................................
Urban poor Areas under civil strife Children under five
Food-poor smallholders
Landless rural households, squatters, plantation workers
Arid and semi-arid regions Pregnant and lactating women
High population density relative to resources Elderly
Refugees Pastoralis ts
Not vulnerable: Urban wealthy, Resource-rich smallholders Large farmers Rural wage earners
Poor transportation, communication, health, education or other social services
Isolated agricultural markets
Marginalized ethnic groups
Note: Socioeconomic groups not considered vulnerable to famine are included in this list to present a complete analysis of the population. The dimensions vulnerability are collapsed here into the three domains of hunger.
Subsistence producers are directly affected by poor harvests. Famine escalates as less
grain is available in the market, and demand increases from subsistence producers now dependent
on purchases and richer socioeconomic groups able to pay higher prices. Widespread selling of
assets contributes to deteriorating terms of trade for such commodities as livestock, labor,
jewelry, etc. (see ~ ~ i t z ' l 9 8 1 ) .
For pastoralists, drought re uces the value of their herds, requiring disposal of more P animals in exchange for cereals, which may also be increasing in price. Destitution progresses as
the more productive animals (young males, young females, then reproductive stock) are sold.
4.4. Typos of Famine
Underlying vulnerability is constru~ad according to the anticipated causal structure of
famine. Three types of famine are prominent in recent history (for typologies of famine types,
see Devereux and Hay 1986: 81ff, Sen 1981). The classic famine is associated with food shortage,
initiated by a failure of agriculturnl production and often accompanied by social disruption. An
exchange failure occurs with declining terms of trade: any combination of inflation of food prices
(a boom famine), decline in wage income (a slump famine), and dwindling value of assets (a glut
famine). Famine may also be induced by the failure of institutions to ensure the food security of
vulnerable groups, either deiiberately (as in food terrorism or denial of famine conditions) or
inadvertently (e.g., pursuing competing policies such as structural adjustment). In this case,
famine often illuminates changes in status and loss of a basic human right.
In most cases famines are hybrid types: a modest crop failure and decrease in rangeland
productivity increases demand for purchased food; populations without reliable cash incomes sell
assets at deteriorating prices; food shortage and price inflation in the absence of timely imports
leads to a failure of exchange entitlements; famine ensues unless direct food relief is widespread.
4.5. Testing Definitions of Vulnerable Groups
For the most part, a complete specification of vulnerable groups is deductive: it is an a
priori, logical ordering of the dimensions of vulnerability and a compilation of disparate case
studies and statistical surveys. It is essential to test the resulting specification of vulnerable
groups: does being a member of a particular group increase the probability of suffering from
famine, or the consequences of famine? It may be possible to collect time series of data such as
reported by Mesfin (1984, see chapter 13). Alternatively, the vulnerable groups can be monitored
during a food crisis, as in the Kenya illustration (chapter 11). Additionally, several independent
indicators can be compared to see if they result in a consistent interpretation of vulnerability. At
the least, anecdotal case studies can be collected to document the mechanisms of vulnerability for
particular communities or socioeconomic groups.
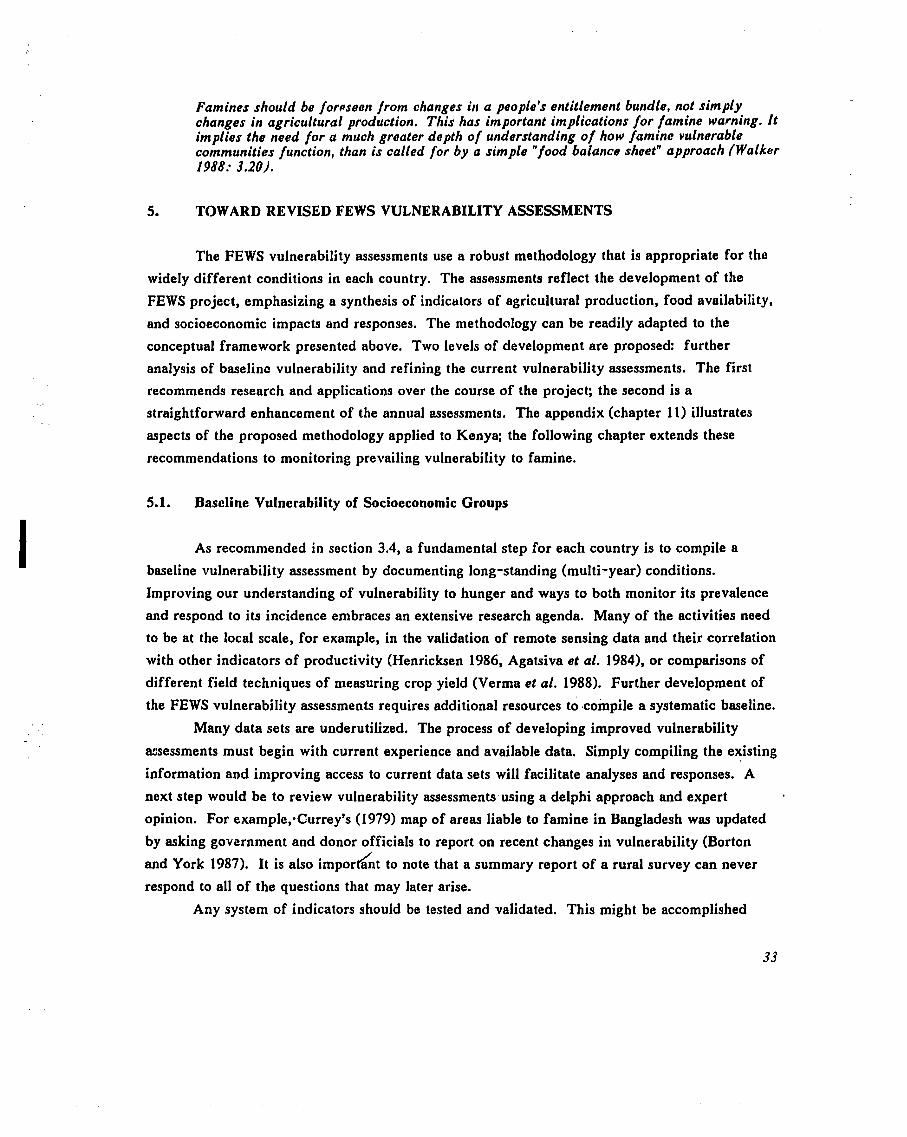
Famines should be for~seen from changes in a people's entitlement bundle, not simply changes in agricultural production. This has important implications for famine warning. I t implies the need for a much greater depth of understanding of how famine vulnerable communities function, than is called for by a simple "food balance sheet" approach (Walker 1988: 3.20).
5. TOWARD REVISED FEWS VULNERABILITY ASSESSMENTS
The FEWS vulnerability assessments use a robust methodology that is appropriate for the
widely different conditions in each country. The assessments reflect the development of the
FEWS project, emphasizing a synthesis of indicators of agricultural production, food availability,
and socioeconomic impacts and responses. The methodology can be readily adapted to the
conceptual framework presented above. Two levels of development are proposed: further
analysis of baseline vulnerability and refining the current vulnerability assessments. The first
recommends research and applications over the course of the project; the second is a
straightforward enhancement of the annual assessments. The appendix (chapter 11) illustrates
aspects of the proposed methodology applied to Kenya; the following chapter extends these
recommendations to monitoring prevailing vulnerability to famine.
5.1. Baseline Vulnerability of Socioeconomic Groups
As recommended in section 3.4, a fundamental step for each country is to compile a
baseline vulnerability assessment by documenting long-standing (multi-year) conditions.
Improving our understanding of vulnerability to hunger and ways to both monitor its prevalence
and respond to its incidence embraces an extensive research agenda. Many of the activities need
to be at the local scale, for example, in the validation of remote sensing data and their correlation
with other indicators of productivity (Henricksen 1986, Agatsiva st al. 1984), or comparisons of
different field techniques of measuring crop yield (Verma et 41. 1988). Further development of
the FEWS vulnerability assessments requires additional resources to compile a systematic baseline.
Many data sets are underutilized. The process of developing improved vulnerability
assessments must begin with current experience and available data. Simply compiling the existing
information and improving access to current data sets will facilitate analyses and responses. A
next step would be to review vulnerability assessments using a delphi approach and expert
opinion. For examp1e;Currey's (1979) map of areas liable to famine in Bangladesh was updated
by asking government and donor officials to report on recent changes in vulnerability (Borton
and York 1987). It is also i m p o r k t to note that a summary report of a rural survey can never
respond to all of the questions that may later arise.
Any system of indicators should be tested and validated. This might be accomplished
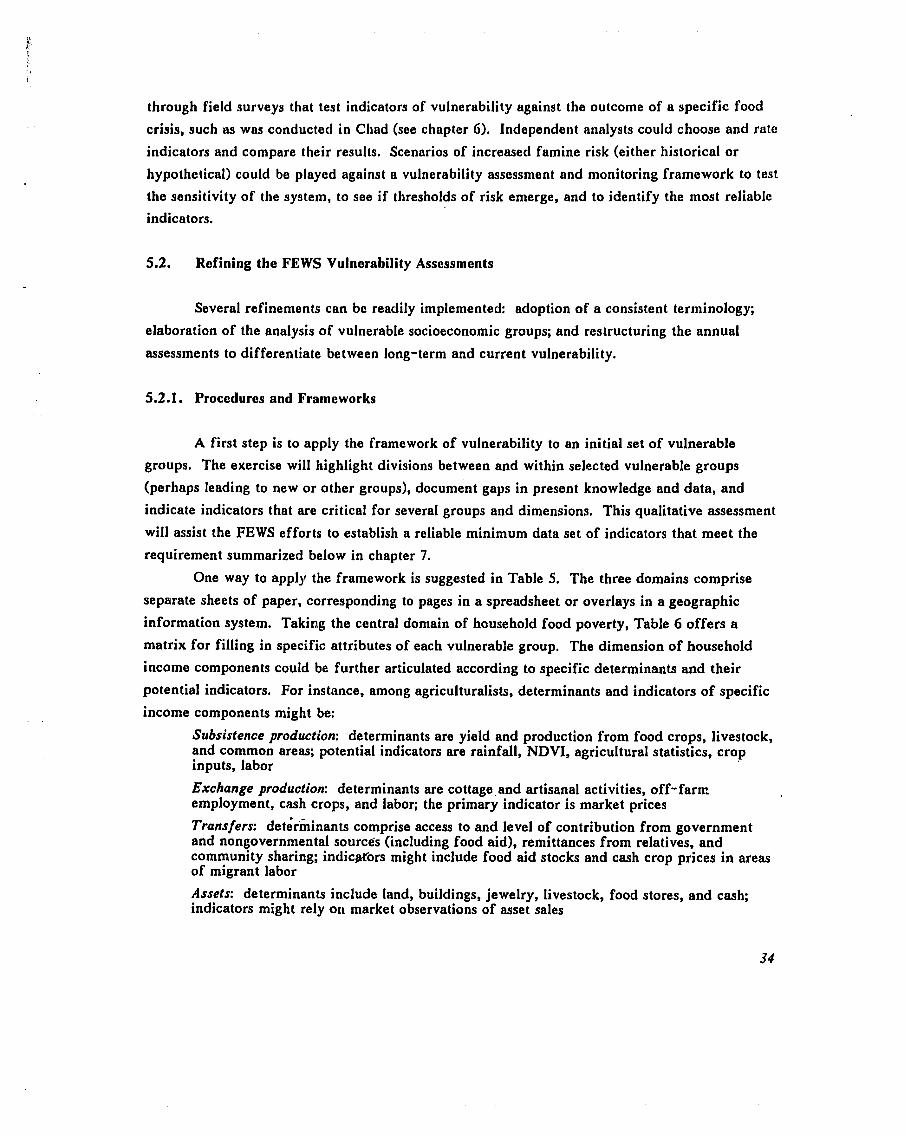
through field surveys that test indicators of vulnerability against the outcome of a specific food
crisis, such as was conducted in Chad (see chapter 6). Independent analysts could choose and rate
indicators and compare their results. Scenarios of increased famine risk (either historical or
hypothetical) could be played against a vulnerability assessment and monitoring framework to test
the sensitivity of the system, to see if thresholds of risk emerge, and to identify the most reliable
indicators.
5.2. Rofining the FEWS Vulnerability Assessments
Several refinements can be readily implemented: adoption of a consistent terminology;
elaboration of the analysis of vulnerable socioeconomic groups; and restructuring the annual
assessments to differentiate between long-term and current vulnerability.
5.2.1. Procedures and Frameworks
A first step is to apply the framework of vulnerability to an initial set of vulnerable
groups. The exercise will highlight divisions between and within selected vulnerable groups
(perhaps leading to new or other groups), document gaps in present knowledge and data, and
indicate indicators that are critical for several groups and dimensions. This qualitative assessment
will assist the FEWS efforts to establish a reliable minimum data set of indicators that meet the
requirement summarized below in chapter 7.
One way to apply the framework is suggested in Table 5. The three domains comprise
separate sheets of paper, corresponding to pages in a spreadsheet or overlays in a geographic
information system. Taking the central domain of household food poverty, Table 6 offers a
matrix for filling in specific attributes of each vulnerable group. The dimension of household
income components could be further articulated according to specific determinants and their
potential indicators. For instance, among agriculturalists, determinants and indicators of specific
income components might be:
Subsistence production: determinants are yield and production from food crops, livestock, and common areas; potential indicators are rainfall, NDVI, agricultural statistics, crop inputs, labor
Exchange production: determinants are cottage.and artisanal activities, off-farm employment, cash crops, and labor; the primary indicator is market prices
Transfers: detdrminants comprise access to and level of contribution from government and nongovernmental sources (including food aid), remittances from relatives, and community sharing; indicNors might include food aid stocks and cash crop prices in areas of migrant labor
Assets: determinants include land, buildings, jewelry, livestock, food stores, and cash; indicators might rely on market observations of asset sales
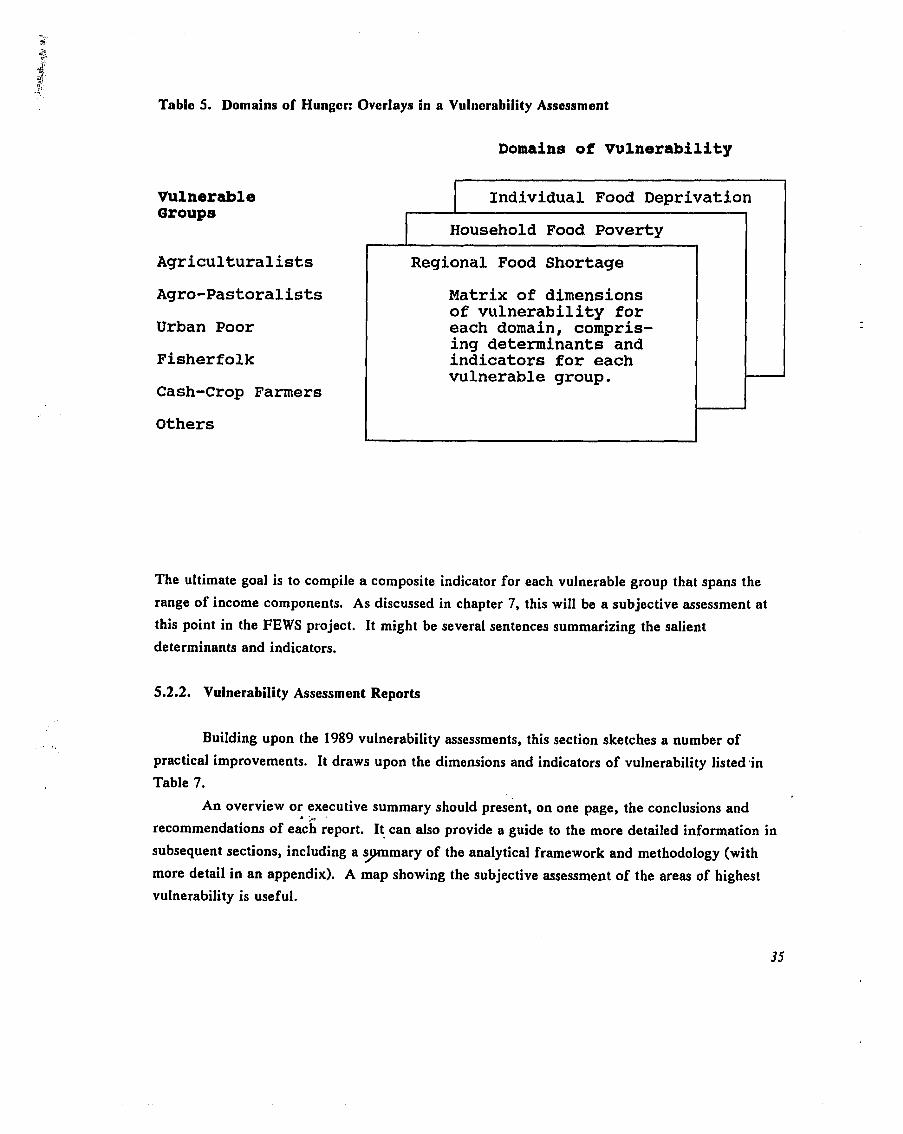
Tabllo 5. Domains of Hungor: Ovorlays In a Vulnerability Assossmont
Vulnerable Groups
Agriculturalists
Agro-Pastoralists
Urban Poor
Fisherfolk
Cash-Crop Farmers
Others
Domains of Vu.lnexability
Individual Food Deprivation
Household Food Poverty
Regional Food Shortage
Matrix of dimensions of vulnerability for each domain, compris- ing determinants and indicators for each vulnerable group.
The ultimate goal is to compile a composite indicator for each vulnerable group that spans the
range of income components. As discussed in chapter 7, this will be a subjective assessment at
this point in the FEWS project. It might be several sentences summarizing the salient
determinants and indicators.
5.2.2. Vulnerability Assessment Reports
Building upon the 1989 vulnerability assessments, this section sketches a number of
practical improvements. It draws upon the dimensions and indicators of vulnerability listed-in
Table 7.
An overview or executive summary should present, on one page, the conclusions and :."
recommendations of each report. It can also provide a guide to the more detailed information in
subsequent sections, including a s y m a r y of the analytical framework and methodology (with
more detail in an appendix). A map showing the subjective assessment of the areas of highest
vulnerability is useful.
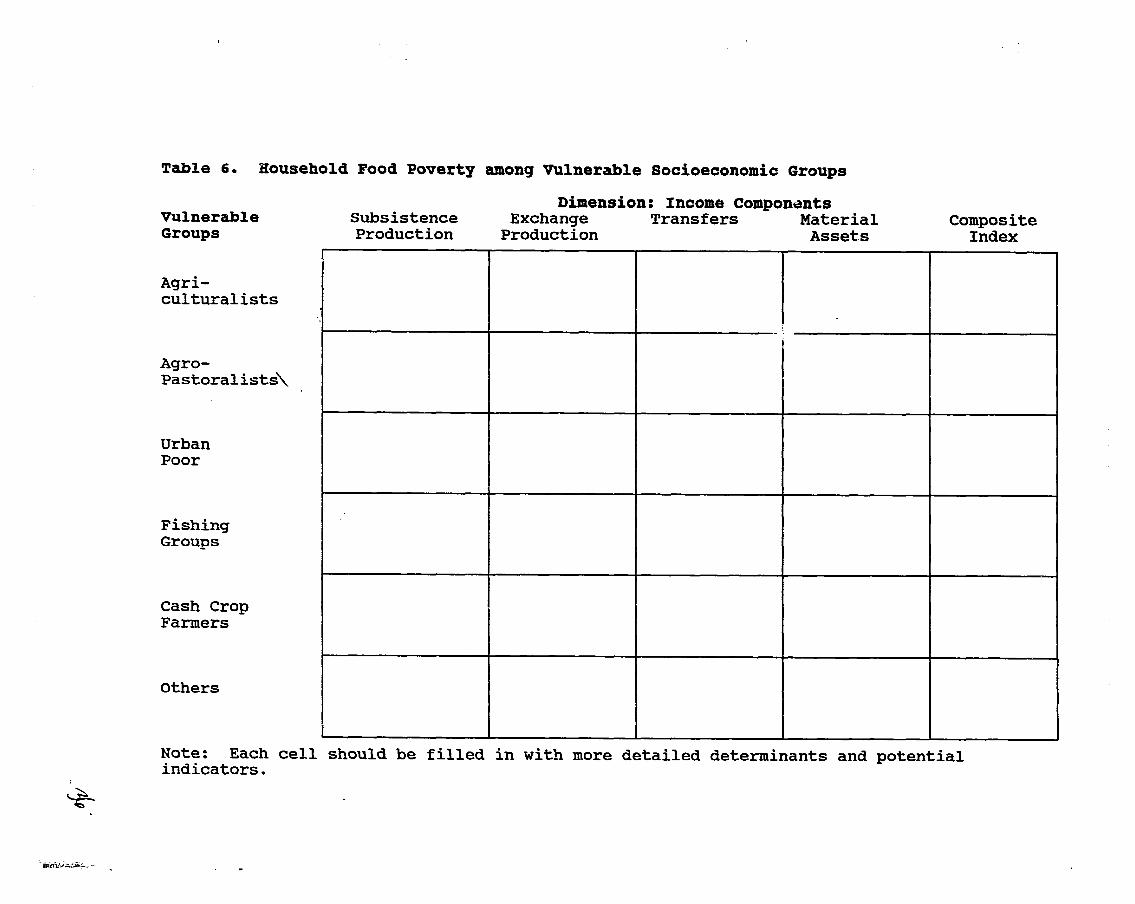
While a more extensive effort wcls proposed above, the annual reports should begin with u first level of analysis that clarifies the distinction between baseline and current vulnerability anti
the prognoses for famine in the current year. This section should identify the vulnerable groups
and describe their vulnerability to famine. The groups should cover the entire country--the
current reports do not specifically identify the urban poor as a vulnerable group. The next
vulnerability assessments might focus on only a few groups, perhaps smallholder agriculturalists,
pastoralists, rural landless, and urban poor.
Most of the FEWS analysis is at the household or community scale. Yet, famine is
inherently a product of national resources and action. An initial section in each report should
focus at this scale to identify national food availability and inst~tutions concerned with famine
monitoring and response. A baseline of food accounting data is important at the national scale to
show the current food balance; the recent history of surplus, shortage and responses; and an
assessment of the sensitivity of the national food balance to climatic and economic factors. If
possible, it is desirable to calculate the food balance for subnational regions (provinces or
districts). The disaggregated data allow finer error checking, and can be used in subsequent
analyses to identify the vulnerable groups and regions. A table of production, trade, stocks, and
consumption could be included, along with a measure of the variability of the final food balance.
The primary geographic factors are the spatial distribution of agricultural resources and
their temporal variability. Three data sets would allow an initial analysis: (1) areas excluded from
agricultural production should be eliminated from further analysis; (2) irrigated areas could be
given separate treatment; and (3) an index of agricultural productivity should include climate,
soils, plant yield, and management. Agricultural indicators might reflect either average
conditions, cverage variability, or the difference between average and drought conditions. In
addition, zones of chronic instability and conflict should be designated if they affect rural
production or access to food markets.
The infrastructure for communication, education, health, and transportation are generally
correlated: a few indicators of this nature probably capture the variations in access to
development services. More directly, distance to the nearest town may be a suitable indicator of
physical access to food markets.
In some cases, food aid is a known, routine entitlement: governments and NGOs have
ongoing projects, administrative procedures target the vulnerable populations, and monitoring of
increased deprivation is routine. Such groups may be vulnerable on most other dimensions, while '
their needs are adequaieljl met through donations and transfers.
The FEWS stafF intend to focus on a complete specification of household income as the /
primary dimension of food poverty. The components of income, as listed in Tables 6 and 7, include: subsistence production, exchange production, transfers, and assets. In the event that
contemporary survey data on actual household income components are not available, two options
are to use older' survey data or to compile several inclicators that approximate different aspects of
food poverty. iFor instance, in the Kenya example, self-sufficiency is gauged by the second1
method using estimates of production and consumption. The indicator of market exchange
entitlement, however, relied on data from thc 1981-1982 Household Budget Survey. The best
indirect measure of self-sufficiency is a carrying capacity indicator, based on area cultivated,
productivity, and household size.
Entitlement to food through market exchanges depends on cash income (either from wage
labor or through sales of livestock, produce, crafts, or assets) and food prices. An index based on
the household budget and market prices is most desirable, but other proxy data may also reveal
variations in economic access to food markets.
An additional aspect of household food poverty, transfers, is included in Table 7. Unless
a rural survey data base is available, inter-household transfers are difficult to gauge. Anecdotal
data, however, may be useful in monitoring current vulnerability. Proxy variables, such as the
price of a cash crop, may be related to transfers from migrant laborers.
Perhaps the most important aspect of cultural preferences is the customary diet. Regional
diets should be specified, along with how they might change during a food crisis.
Demographic data is essential, if only to estimate the number of people in each warning
state. The demographic assessment should include the total population, age-sex distribution, and
rates of fertility, mortality, birth, and overall growth. With such data, the total vulnerable
population and those with special nutritional needs (children under five, and pregnant and
lactating women) can be estimated for each class of vulnerability.
In the vulnerability assessments, indicators of nutritional and health status measure both
individual capacity to withstand further food deprivation and patterns of household food poverty
or process variables (Carlson 1987, 1988). Nutritional and health status (including morbidity and
mortality) are related to access to clean water, child care (e.g., breastfeeding), demography,
education, health services, and sanitation, in addition to nutrition and food consumption. Thus,
vulnerability assessments of the consequences of individual food deprivation must include more
than measures of malnutrition. As with cultural factors, social status may be difficult to measure,
but anecdotal information may help interpret other indicators of vulnerability.
The vulnerability assessment, at the annual to seasonal time scale, lays the foundation for
subsequent monitoring: it distinguishes groups, areas, and indicators that require further analysis.
Thresholds and timing for responses may be identified. For example, it may be possible to assign
a probability to the ouicome of the current agricultural season: "Unless severe drought occurs,
food production will be average or above average for most of the country." Or: "a moderate fall in /
production is expected unless the rest of the season is abnormally good." A more detailed
assessment may be suggested: "If cereal prices remain high in this region through August (the
harvest month), then a survey team should assess the famine risk for cultivators and pastoralists."
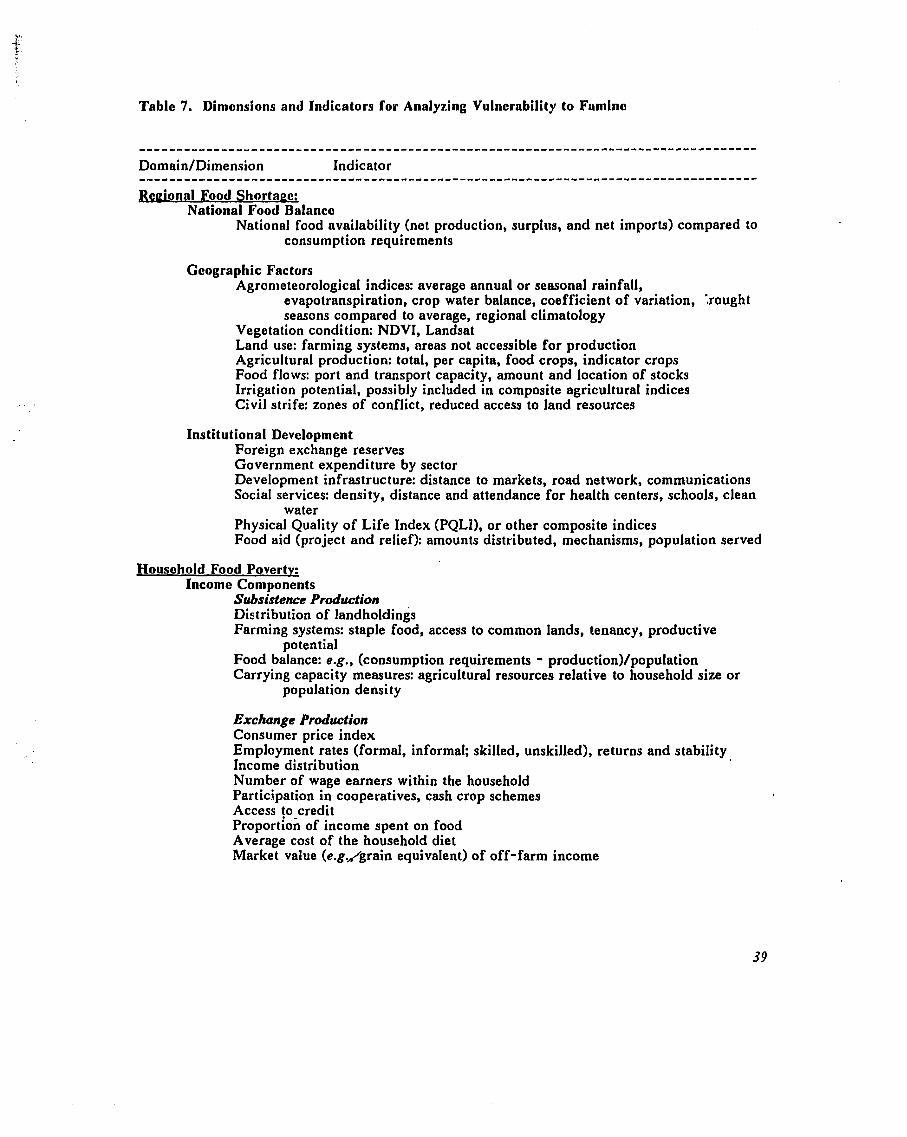
Table 7. Dimensions and Indicators for Analyzing Vulnerability to Fumino
................................................................................... Domain/Dimension Indicator ................................................................................... M o n a 1 Food Shnrtaee:
National Food Balance National food availability (net production, surplus, and net imports) compared to
consumption requirements
Geographic Factors Agrometeorslogical indices: average annual or seasonal rainfall,
evapotranspiration, crop water balance, coefficient of variation, kought seasons compared to average, regional climatology
Vegetation condition: NDVI, Landsat Land use: farming systems, nreas not accessible for production Agricultural production: total, per capita, food crops, indicator crops Food flows: port and transport capacity, amount and location of stocks Irrigation potential, possibly included in composite agricultural indices Civil strife: zones of conflict, reduced access to land resources
Institutional Development Foreign exchange reserves Government expenditure by sector Development infrastructure: distance to markets, road network, communications Social services: density, distance and attendance for health centers, schools, clean
water Physical Quality of Life Index (PQLI), or other composite indices Food aid (project and relief): amounts distributed, mechanisms, population served
Household Food Poverty: Income Components
Subsistence Production Distribution of landholdings Farming systems: staple food, access to common lands, tenancy, productive
potential Food balance: e.g., (consumption requirements - production)/population Carrying capacity measures: agricultural resources relative to household size or
population density
Exchange Production Consumer price index Employment rates (formal, informal; skilled, unskilled), returns and stability Income distribution Number of wage earners within the household Participation in cooperatives, cash crop schemes Access fo credit Proportion of income spent on food Average cost of the household diet Market value (e.g./grain equivalent) of off-farm income
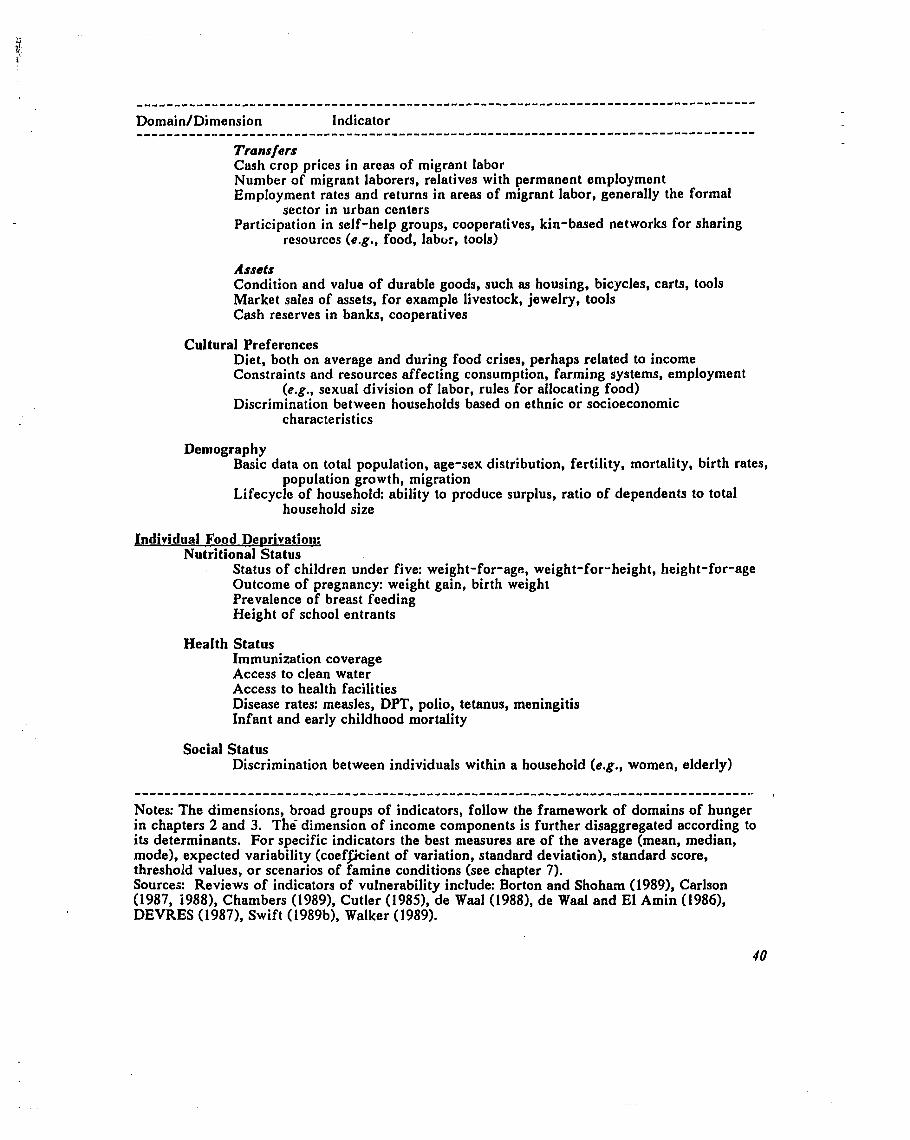
................................................................................... Domain/Dimension Indicator ----------..------------------------------------------------------------------------
Transfers Cush crop prices in areas of migrant labor Number of migrant laborers, relatives with permanent employment Employment rates and returns in areas of migrant labor, generally the formal
sector in urban centers Participation in self-help groups, cooperatives, kin-based networks for sharing
resources (e.g., food, labor, tools)
Assets Condition and value of durable goods, such as housing, bicycles, carts, tools Market sales of assets, for example livestock, jewelry, tools Cash reserves in banks, cooperatives
Cultural Preferonccs Diet, both on average and during food crises, perhaps related to income Constraints and resources affecting consumption, farming systems, employment
(e.g., sexual division of labor, rules for allocating food) Discrimination between households based on ethnic or socioeconomic
characteristics
Demography Basic data on total population, age-sex distribution, fertility, mortality, birth rates,
population growth, migration Lifecycle of household: ability to produce surplus, ratio of dependents to total
household size
Individual Food De~rivation: Nutritional Status
Status of children under five: weight-for-age, weight-for-height, height-for-age Outcome of pregnancy: weight gain, birth weight Prevalence of breast feeding Height of school entrants
Health Status Immunization coverage Access to clean water Access to health facilities Disease rates: measles, DPT, polio, tetanus, meningitis Infant and early childhood mortality
Social Status Discrimination between individuals within a household (e.g., women, elderly)
Notes: The dimensions, broad groups of indicators, follow the framework of domains of hunger in chapters 2 and 3. he dimension of income components is further disaggregated according to its determinants. For specific indicators the best measures are of the average (mean, median, mode), expected variability (coefficient of variation, standard deviation), standard score, threshold values, or scenarios of famine conditions (see chapter 7). Sources: Reviews of indicators of vulnerability include: Borton and Shoharn (1989), Carlson (1987, i988), Chambers (1989), Cutler (1985), de Waal (1988), de Wad and El Amin (1986), DEVRES (1987), Swift (1989b), Walker (1989).
Faced with a major crisis of food and water shortages for a period of four years, rural populations in Western Sudan used numerous strategies to survive. Indigenous institutions and leaders played a crucial role in providing money, support, and food in the early stages of the crisis. However, with depleted resources, local leaders rede f ined their roles from that of provision of financial support to provision of emotional support, and advice to ,
people migrating in search of food .... Further research is needed to assess the extent to which indigenous institutions could overcome the negative impacts of a drought and resume their normal activities (Soheir Sukkary-Stolba 1989: 293).
6. MONITORING CURRENT VULNERABILITY AND PREVALENCE OF FAMINE
Successful experiences in monitoring the prevalence of famine in Africa are relatively
few. This chapter describes current efforts that illustrate the progression from a plethora of
systems to a centralized Systeme d'Alerte Prdcoce (SAP) in Mali, the formal use of weighted
indicators in Chad (also part of the SAP in Mali), and the use of fewer, but timely and reliable
indicators in Botswana.
The second section suggests how FEWS might select indicators for vulnerable groups and
famine types to monitor famine risk based on previous vulnerability assessments. Whereas
underlying socioeconomic processes on the scale of several years to a decade determine
vulnerability to famine, a famine early warning system identifies the population at-risk due to
current events in a seasonal time frame. It is important to repeat here that monitoring famine
requires understanding both the causal mechanisms of vulnerability and the current situation that
might result in famine for the most vulnerable.
Additional reviews of famine monitoring include: Borton and Shoham (1989), D'Souza
(19891, Hervio (1987), Hradsky (1 985), and Walker (1989).
6.1. Experience with Monitoring Famine
The renewed effort to develop reliable famine early warning systems in Africa has
resulted in some successful innovation. The systems in Mali and Chad began as operational
projects to monitor risk, but have developed data bases that begin to.portray long-term
vulnerability. In Botswana, time series of data are now sufficient to allow monitoring based on
analysis of vulnerability and the identification of vulnerable groups.
6.1.1. Mali: From Parallel Systems to the Systhme d'Alerte Prdcoce
In Mali, multiple, paralledystems of monitoring famine conditions emerged in 1984- 1985, during the food crisis, but have been largely consolidated in a centralized administration.
In one of the poorest countries in the world, data on food systems and famine conditions are not
lacking. In the initial period, monitoring efforts involved numerous international orgunizations
(including the World Meteorological Organization [WMO], Comitd Permanent Inter-Etats de Luttc
Contro lo Sdcheresse dens les Pays du Sahel [CILSS], AGRHYMET, Food and Agriculture
Organization [FAO], National Oceanic and Atmospheric Administration [NOAA], U.S.
Department of Agriculture/Economic Research Service [USDA/ERS], and FEWS), and several
efforts within Mali.
The Comite National d'Aide aux Victimes de la Sdcheresse (CNAVS), created in 1973 as
an intermediary between donors and the government, was revived in 1984 to coordinate and
distribute emergency food aid. It published a bulletin on weather, cereal crops, predators, food
deficits, pastoral areas, health, and food aid requests and deliveries (Koenig 1988).
In 1986, the Association Europeenne pour le Developpement et la Sante (AEDES),
Medecins Sans Frontieres-Belgium (MSF), and European Economic Community launched a
famine early warning system in the most vulnerable regions of Mali (Hervio 1987, Walker 1988:
9.9-9.10). At the national level, the Systeme d'A1erte Precoce assessed risk through qualitative
monitoring of weather and crop yields. It was in the same ministry as the CNAVS and published
its own bulletin, covering rainfall, crop growth, market prices, population movements, food
reserves, and health. Information was reported by geographic units (regions and cercles). In high
risk areas, a large set of indicators from existing sources were monitored to identify the onset of
a crisis, using a scoring system similar to the one implemented in Chad. In the advent of an
alarm, local surveys were conducted to gauge the extent of the crisis and necessary assistance.
In the context of parallel systems, the needs of NGOs were coordinated by a government
working group. The Sahel NGO Information Network (funded by Save the Children Fund with
assistance from the London School of Hygiene and Tropical Medicine) gathered information from
NGOs on the qualitative status of agriculture and pasture, principle sources of food for the local
population (stocks, harvest, exchange, markets, food aid, wild foods), prices of cereals and
animals in local markets, labor wage employment rates, and unusual migrations (Borton and York
1987). With the advent of better conditions, the network has broadened its interest to issues of
food security regarding pockets of distress, coping strategies of different economic groups, the
effect of food aid, and trends in purchasing power.
Oxfam developed a famine monitoring response strategy for the cercle, based on four
premises (Borton and York 1987: 15):
1. Famine develops over several years and therefore it should be possible to identify early signs of food crisis at the local level well before emergency aid is needed.
.( 2. Early warning informat~on and response should be integrated so that the agency collecting data is able to act on it.
3. The response should aim to reinforce the population's ability to face a crisis, rather than providing purely emergency aid.
4. Local populations should play a role in the collcction of data.
Koenig (1988) stresses the importance of using and improving existing monitoring
capabilities for multiple purposes. The famine early warning system should be built upon a wider
base of food system information used for development:
To increase the capacity to use one information gathering system for varied goals, special attention should be paid to finding multi-purpose indicators. For example, market prices may serve as an indicator of potential farmer income ... while the famine early warning agency monitors them primarily as an indicator of grain supply (Koenig 1988: 161).
This goal, however, is constrained by the poor :i.~ality of the data. For example, two
agricultural surveys for 1984- 1985 differed by 67 perctilt (Koenig 1988: 162). Local project
offices, the Operations de Developpement Rural (ODRs), cover almost the entire country, but
vary in the level of monitoring. The ability to estiaiatv 1~;>1 i food ,~hortages was severely
constrained:
The data used to make up the food deficit cz! ., .on wLtr,- not accurate. The population figures, for example were extrapoh 1 from the 7'976 census. The production data was from the Ministry of Agricu!:tire a:;d its methodology was seriously questioned. Consumption data was not avzil~b!e, and the levels used, 169 kg/person/yr to 180 kg/person/yr varied. T<i, datp 4,ere a'railable on farmer stocks. There were no field estimates on the amoloni of frea distribution needed (Hoskins 1987: 9, cited in Koenig 1988: 162).
The problems of data collection, the trade-off between comprehensive surveys and
timely, focused analysis, illustrate the utility for assessing vulnerability according to vulnerable
groups and the logic of a hierarchy of information systems keyed to the needs of different
decision-makers (see chapter 8).
In the last several years, the SAP has been expanded and improved (AEDES 1988, Lalau-
Kbraly and Winter 1988). It has become the centralized monitoring system that most of the other
donors and agencies now rely upon. In 1990, the SAP, for the First time, presented the sole
government assessment of food aid needs. The SAP is located in the Ministbre de
1'Administration Territoriale et du Developpement B la Base (MATDB), within the Conlit6 . - National d'Actions d'urgence et de Rehabilitation (CNAUR). It receives funds through a donor
coordinating council, the P r o g r a v e de Restructuration du Marche Cdrealier (PRMC), which
also acts on the SAP findings and organizes the allocation of food aid.
The SAP currently monitors about 167 arrondissements in 6 of the 7 regions of Mali. The
southern cash crop zone and an area of gold mining in the west are not considered vulnerable to m u
famine to the extent that concerted monitoring is required. The information collected is still
mostly qualitative: it parallels but does not supplant formal agricultural statistics. Tlie system
now incorporates market price data from the CILSS project, Systhme d'Information sur le March6
des CBrBalos. The systems takes advantage of a hierarchy of administrative structures, from local
development committees to regional working groups and SAP offices and the national SAP and
interministerial working group. Discrepancies can be verified at each level and further
assessments conducted if required. As sophisticated data base has recently been developed. The
program records information on population, economic activities, adaptation responses to a food
crisis, markets, status and expected yields of the main cultivars, food aid, and food reserves. The
program structures the estimate of vulnerability, using five levels of food stress: no difficulty
expected during the year, a little difficulty during the year, average difficulties, important
difficulties, and missing information/delayed assessment.
6.1.2. Chad: Use of a Nutritional Scoring System
The drought and famir-e in Chad, a country with little basic demographic, economic and
agricultural data, triggered the development of a rapid famine surveillance technique by the
Medecins Sans Frontieres-Belgium (also implemented in Mali) (Autier 1988, Autier et al. 1989).
The Nutritional Scoring System used nine indicators of the population at-risk for famine. The
indicators were given initial scores between 0 and 6; each indicator was then weighted according
do its relative ability to monitor nutritional conditions. The weights were based on each
indicator's ability to detect a nutritional problem, degree of specificity, ease of measurement, and
acceptability to decision makers. The maximum possible score was 100. The indicators and the
maximum transformed score in parentheses were as follows:
Cause of displacement (9 points): whether o r not migration was related to food problems Number of displaced people (9): increased stress on local food situation Type of displaced or threatened people (4): nomads without cattle and cultivators were at
greater risk than urban dwellers or nomads with cattle Mortality (12): for the previous month using various methods of calculation Nutritiorral status of the population (26): clinic evaluation Hmiogeneity of the families (9): labor migration of young males Type of food consumed (16): famine foods ,
Food reserves of the families (15): including ability to buy food in local markets Existence of av'iiaminosis A (14): if suspected, an ophthalmologist was sent to confirm
incidence. This ind'cator was separated from the scoring system due to the J difficulty of conflrrning avitaminosis.
Field teams in each area defined the population groups, estimated the number of people,
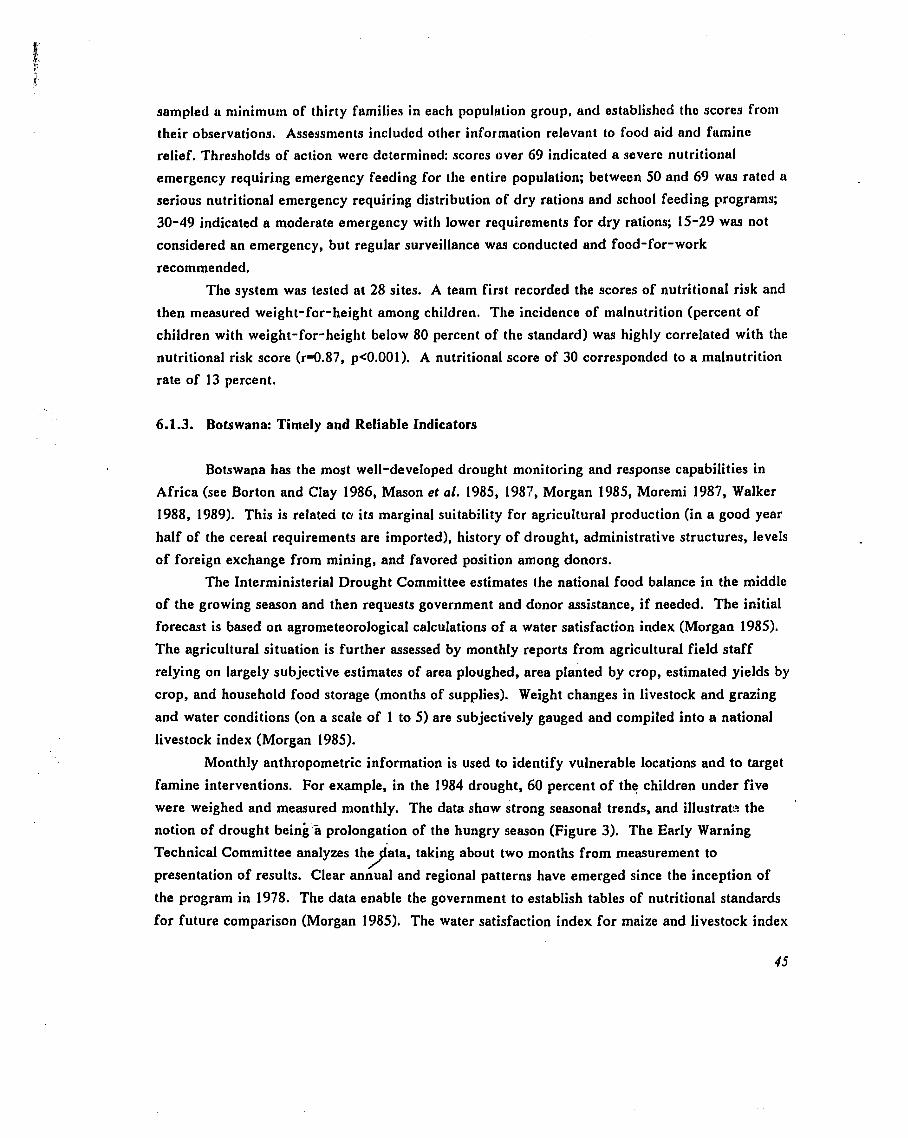
sampled a minimum of thirty families in each populertion group, and established the scores from
their observations. Assessments included other infor'mation relevant to food aid and famine
relief. Thresholds of action were determined: scores over 69 indicated a severe nutritional
emergency requiring emergency feeding for the entire population; between 50 and 69 was rated u
serious nutritional emergency requiring distribution of dry rations and school feeding programs;
30-49 indicated a moderate emergency with lower requirements for dry rations; 15-29 was not
considered an emergency, but regular surveillance was conducted and food-for-work
recommended.
The system was tested at 28 sites. A team first recorded the scores of nutritional risk and
then measured weight-for-height among children. The incidence of malnutrition (percent of
children with weight-for-height below 80 percent of the standard) was highly correlated with the
nutritional risk score (r4.87, p<0.001). A nutritional score of 30 corresponded to a malnutrition
rate of 13 percent.
6.1.3. Botswana: Timely and Reliable Indicators
Botswana has the most well-developed drought monitoring and response capabilities in
Africa (see Borton and Clay 1986, Mason et al. 1985, 198;', Morgan 1985, Moremi 1987, Walker
1988, 1989). This is related to its marginal suitability for agricultural production (in a good year
half of the cereal requirements are imported), history of drought, administrative structures, levels
of foreign exchange from mining, and favored position among donors.
The Interministerial Drought Committee estimates lhe national food balance in the middle
of the growing season and then requests government and donor assistance, if needed. The initial
forecast is based on agrometeorological calculations of a water satisfaction index (Morgan 1985).
The agricultural situation is further assessed by monthly reports from agricultural field staff
relying on largely subjective estimates of area ploughed, area by crop, estimated yields by
crop, and household food storage (months of supplies). Weight changes in livestock and grazing
and water conditions (on a scale of 1 to 5) are subjectively gauged and compiled into a national
livestock index (Morgan 1985).
Monthly anthropometric information is used to identify vulnerable locations and to target
famine interventions. For example, in the 1984 drought, 60 percent of the children under five
were weighed and measured monthly. The data show strong seasonal trends, and illustrat.? the
notion of drought being.a prolongation of the hungry season (Figure 3). The Early Warning
Technical Committee analyzes the ata, taking about two months from measurement to P presentation of results. Clear annual and regional patterns have emerged since the inception of
the program in 1978. The data enable the government to establish tables of nutritional standards
for future comparison (Morgan 1985). The water satisfaction index for maize and livestock index
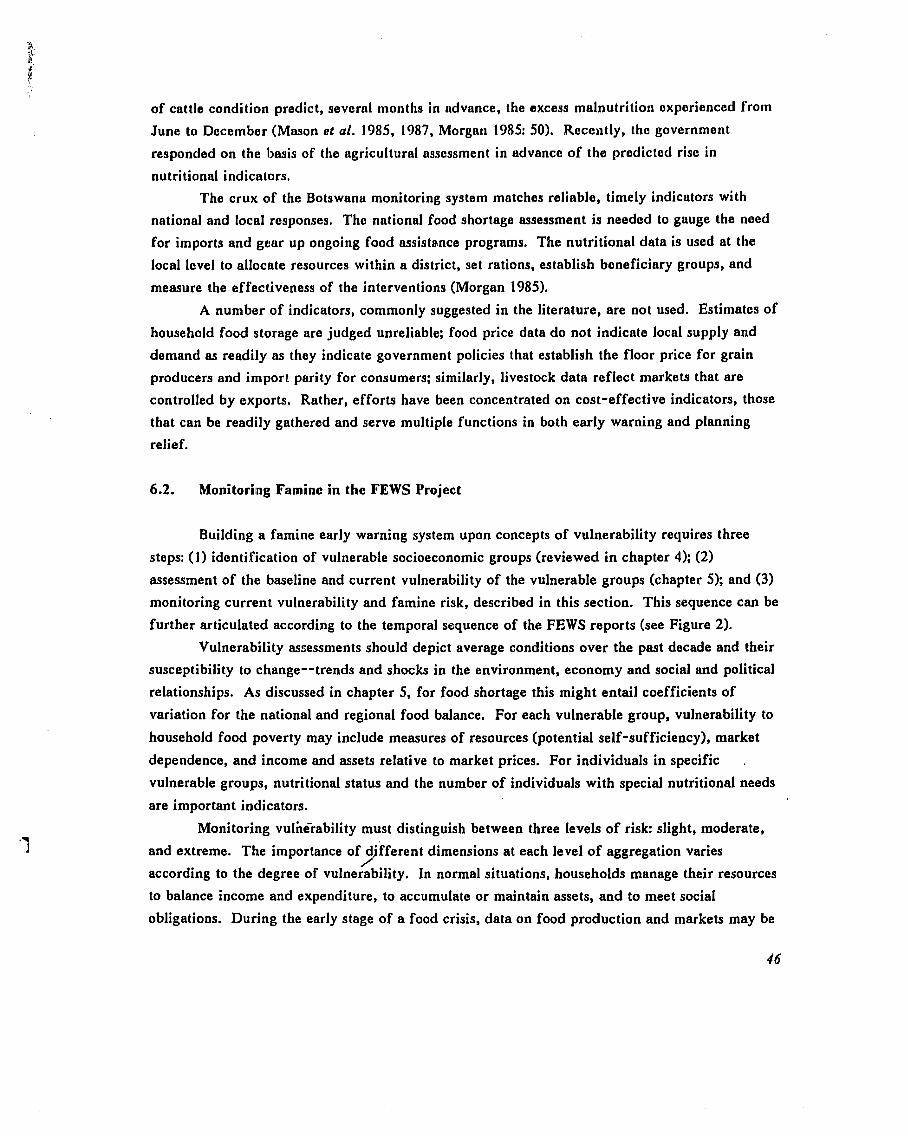
of cattle condition predict, several months in advance, the excess malnutrition experienced from
June to December (Mason et al. 1985, 1987, Morgan 1985: 50). Recently, tho government
responded on the basis of the agricultural assessment in advance of the predicted rise in
nutritional indicatlors.
The crux of the Botswana monitoring system matches reliable, timely indicators with
national and local responses. The national food shortage assessment is needed to gauge the need
for imports and gear up ongoing food assistance programs. The nutritional data is used at the
local level to allocate resources within a district, set rations, establish beneficiary groups, and
measure the effectiveness of the interventions (Morgan 1985).
A number of indicators, commonly suggested in the literature, are not used. Estimates of
household food storage are judged unreliable; food price data do not indicate local supply and
demand as readily as they indicate government policies that establish the floor price for grain
producers and import parity for consumers; similarly, livestock data reflect markets that are
controlled by exports. Rather, efforts have been concentrated on cost-effective indicators, those
that can be readily gathered and serve multiple functions in both early warning and planning
relief.
6.2. Monitoring Famine in the FEWS Project
Building a famine early warning system upon concepts of vulnerability requires three
steps: (1) identification of vulnerable socioeconomic groups (reviewed in chapter 4); (2)
assessment of the baseline and current vulnerability of the vulnerable groups (chapter 5); and (3) monitoring current vulnerability and famine risk, described in this section. This sequence can be
further articulated according to the temporal sequence of the FEWS reports (see Figure 2).
Vulnerability assessments should depict average conditions over the past decade and their
susceptibility to change--trends and shocks in the environment, economy and social and political
relationships. As discussed in chapter 5, for food shortage this might entail coefficients of
variation for the national and regional food balance. For each vulnerable group, vulnerability to
household food poverty may include measures of resources (potential self-sufficiency), market
dependence, and income and assets relative to market prices. For individuals in specific . vulnerable groups, nutritional status and the number of individuals with special nutritional needs
are important indicators.
Monitoring vulh6rability must distinguish between three levels of risk: slight, moderate,
and extreme. The importance of d'fferent dimensions at each level of aggregation varies /' according to the degree of vulnerability. In normal situations, households manage their resources
to balance income and expenditure, to accumulate or maintain assets, and to meet social
obligations. During the early stage of a food crisis, data on food production and markets may be
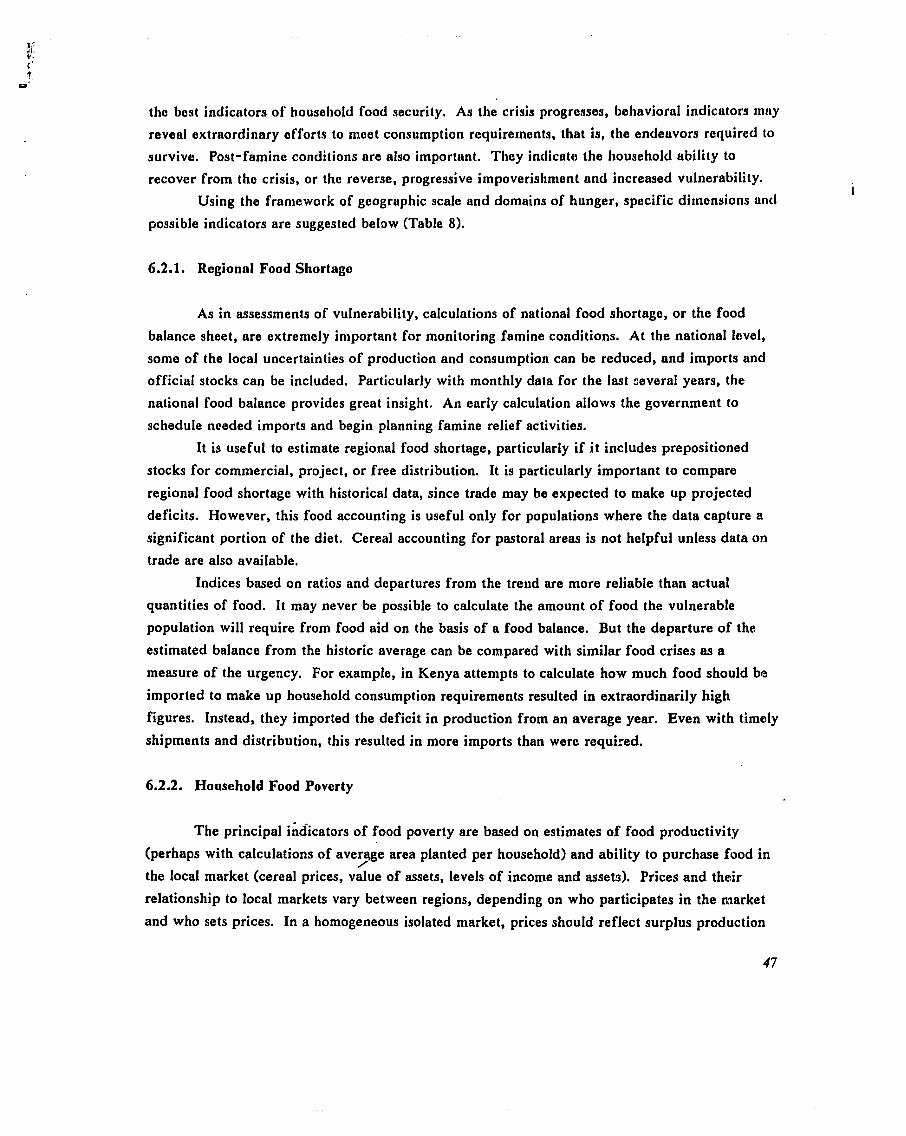
the best indicators of household food security. AY the crisis progresses, behavioral indicators tllliy
reveal extraordinary efforts to meet consumption requirements, that is, the endeavors requirod to
survive. Post-famine conditions are also important. They indicate the household ability to
recover from the crisis, or tho reverse, progressive impoverishment and increased vulnerability. I
Using the framework of geographic scale and domains of hunger, specific dimensions and
possible indicators are suggested below (Table 8).
6.2.1. Ragionrrl Food Shortage
As in assessments of vulnerability, calculations of national food shortage, or the food
balance sheet, are extremely important for monitoring famine conditions. At the national level,
some of the local uncertainties of production and consumption can be reduced, and imports and
official stocks can be included. Particularly with monthly data for the last several years, the
national food balance provides great insight. An early calculation allows the government to
schedule needed imports and begin planning famine relief activities.
It is useful to estimate regional food shortage, particularly if i t includes prepositioned
stocks for commercial, project, or free distribution. It is particularly important to compare
regional food shortage with historical data, since trade may be expected to make up projected
deficits. However, this food accounting is useful only for populations where the data capture a
significant portion of the diet. Cereal accounting for pastoral areas is not helpful unless data on
trade are also available.
Indices based on ratios and departures from the trend are more reliable than actual
quantities of food. It may never be possible to calculate the amount of food the vulnerable
population will require from food aid on the basis of a food balance. But the departure of the:
estimated balance from the historic average can be compared with similar food crises as a
measure of the urgency. For example, in Kenya attempts to calculate how much food should be
imported to make up household consumption requirements resulted in extraordinarily high
figures. Instead, they imported the deficit in production from an average year. Even with timely
shipments and distribution, this resulted in more imports than wero required.
6.2.2. Household Food Poverty
The principal iidicators of food poverty are based on estimates of food productivity
(perhaps with calculations of a v e y e area planted per household) and ability to purchase food in
the local market (cereal prices, value of assets, levels of income and assets). Prices and their
relationship to local markets vary between regions, depending on who participates in the market
and who sets prices. In a homogeneous isolated market, prices should reflect surplus production
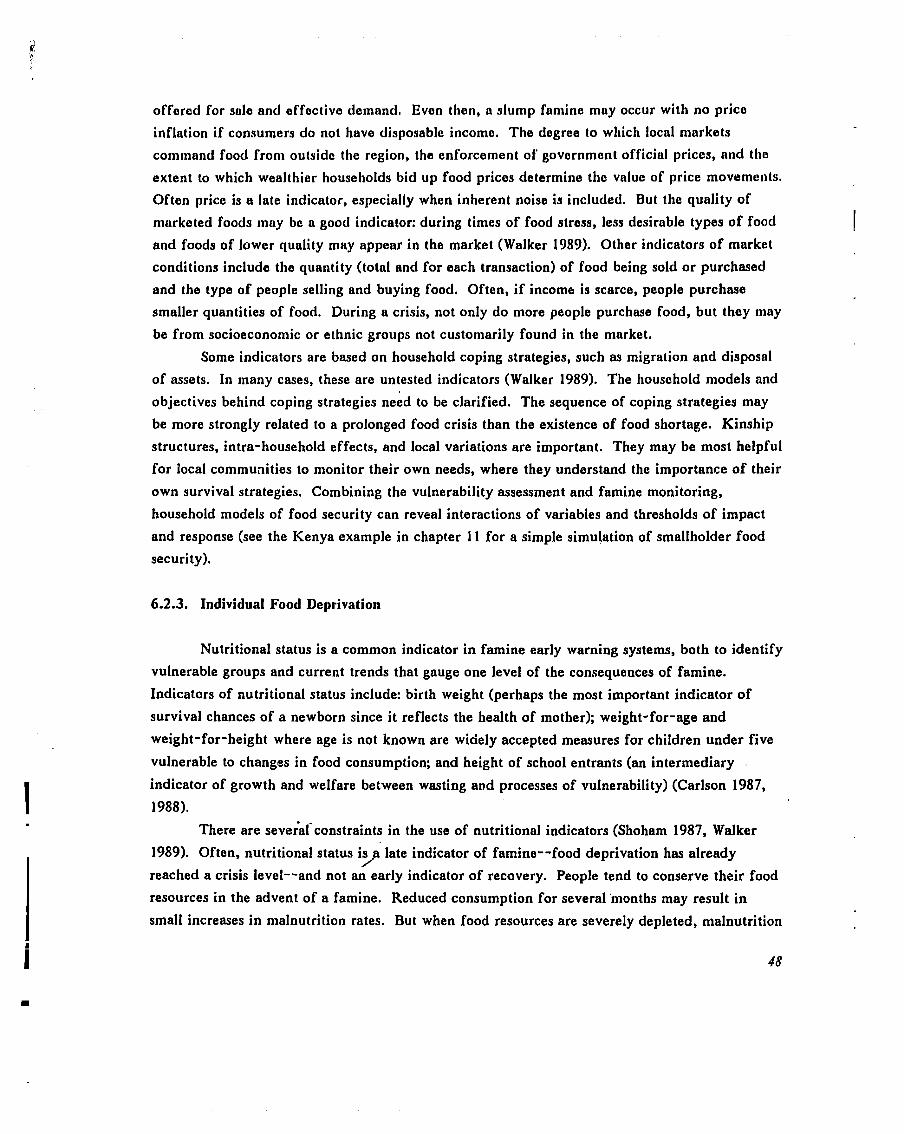
offerod for sale and effective demand, Even then, u slump famine may occur with no price
inflation if consumers do not have disposable income. The degree to which local markets
command food from outside the region, the enforcement of' government official prices, and tho
extent to which wealthier households bid up food prices determine the value of price movemeats.
Often price is a late indicator, especially when inherent noise is included. But the quality of
marketed foods may be a good indicator: during times of food stress, less desirable types of food
and foods of lower quality may appear in the market (Walker 1989). Other indicators of market
conditions include the quantity (total and for each transaction) of food being sold or purchased
and the type of people selling and buying food. Often, if income is scarce, people purchase
smaller quantities of food. During a crisis, not only do more people purchase food, but they may
be from socioeconomic or ethnic groups not customarily found in the market.
Some indicators are based on household coping strategies, such as migration and disposal
of assets. In many cases, these are untested indicators (Walker 1989). The household models and
objectives behind coping strategies need to be clarified. The sequence of coping strategies may
be more strongly related to a prolonged food crisis than the existence of food shortage. Kinship
structures, intra-household effects, and local variations are important. They may be most helpful
for local communities to monitor their own needs, where they understand the importance of their
own survival strategies. Combining the vulnerability assessment and famine monitoring,
household models of food security can reveal interactions of variables and thresholds of impact
and response (see the Kenya example in chapter I1 for a simple simulation of smallholder food
security).
6.2.3. Individual Food Deprivation
Nutritional status is a common indicator in famine early warning systems, both to identify
vulnerable groups and current trends that gauge one level of the consequences of famine.
Indicators of nutritional status include: birth weight (perhaps the most important indicator of
survival chances of a newborn since it reflects the health of mother); weight-for-age and
weight-for-height where age is not known are widely accepted measures for children under five
vulnerable to changes in food consumption; and height of school entrants (an intermediary .
indicator of growth and welfare between wasting and processes of vulnerability) (Carlson 1987,
1988).
There are seveiaf constraints in the use of nutritional indicators (Shoham 1987, Walker
1989). Often, nutritional status i y late indicator of famine--food deprivation has already
reached a crisis level--and not an early indicator of recovery. People tend to conserve their food
resources in the advent of a famine. Reduced consumption for several 'months may result in
small increases in malnutrition rates. But when food resources are severely depleted, malnutrition
rates may increase sharply. Likewise, ufter food becomes more widely available, people may still
ration their consumption in order to preserve their productive assets (perhaps even by selling
some of the food roliof to purchase seeds and tools) or to have a food reserve for the next season.
Regular monitoring of the most vulnerable groups, however, may be an early indicator of a more
widespread crisis.
Nutrition has a complex relationship with food availability. The seasonal trends need to
be isolated. Health, education, literacy, and disease may be more important than food availability
in determining the relationship between malnutrition and mortality o r morbidity.
There are technical problems of sampling. Migration and the death of severe cases may
distort evidence of continuing famine. Attendance at health clinics varies widely, and
malnutrition rates may not be easily extrapolated to the entire population. Monitoring structures
are often lacking.
It appears that for many decision makers and the public, famine is strongly linked to
images of wasting. In this regard, changes in nutritional status may be a stimulus for concerted
responses. In Kenya, the results of the Embu nutritional research project were presented to key
officials after the government had begun planning its response but before food aid had become
widely available. The anecdotal evidence of food deprivation stimulated continued monitoring
and accelerated the responses of the government, donors, and NGOs.
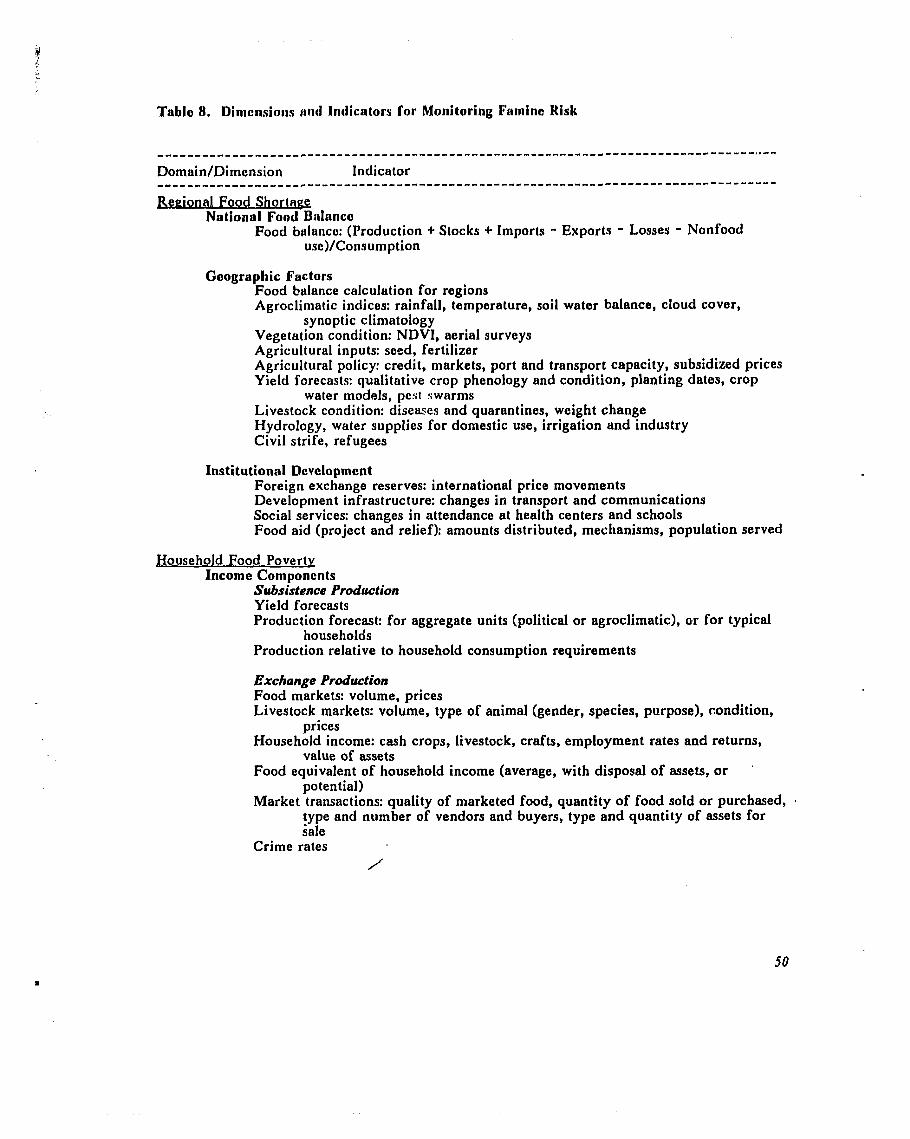
Table 8. Dimensio~~s 11r1d 111dicutors for Monitoring Famine Risk
----------_--------+------------------------------------------------------------,.--
Domain/Dimension Indicator -------------------e------------------------------------------------,---------------
National Food B~~lanco Food bttlancu: (Production + Stocks + Imports - Exports - Losses - Nonfood
use)/Consumption
Geographic Factors Food balance calculation for regions Agroclimatic indices: rainfall, temperature, soil water balance, cloud cover,
synoptic climatology Vegetation condition: NDVI, aerial surveys Agricultural inputs: seed, fertilizer Agricultural policy: credit, markets, port and transport capacity, subsidized prices Yield forecasts: qualitative crop phenology and condition, planting dates, crop
water models, pest swarms Livestock condition: diseases and quarantines, weight change Hydrology, water supplies for domestic use, irrigation and industry Civil strife, refugees
Institutional Development Foreign exchange reserves: international price movements Development infrastructure: changes in transport and communications Social services: changes in attendance at health centers and schools Food aid (project and relief): amounts distributed, mechanisms, population served
Household Food Povertv Income Components
subsistence Production Yield forecasts Production forecast: for aggregate units (political or agroclimatic), or for typical
households Production relative to household consumption requirements
Exchange Production Food markets: volume, prices Livestock markets: volume, type of animal (gender, species, purpose),, condition,
prices Household income: cash crops, livestock, crafts, employment rates and returns,
value of assets Food equivalent of household income (average, with disposal of assets, or '
potential) Market transactions: quality of marketed food, quantity of food sold or purchased,
type and number of vendors and buyers, type and quantity of assets for gale
Crime rates /'
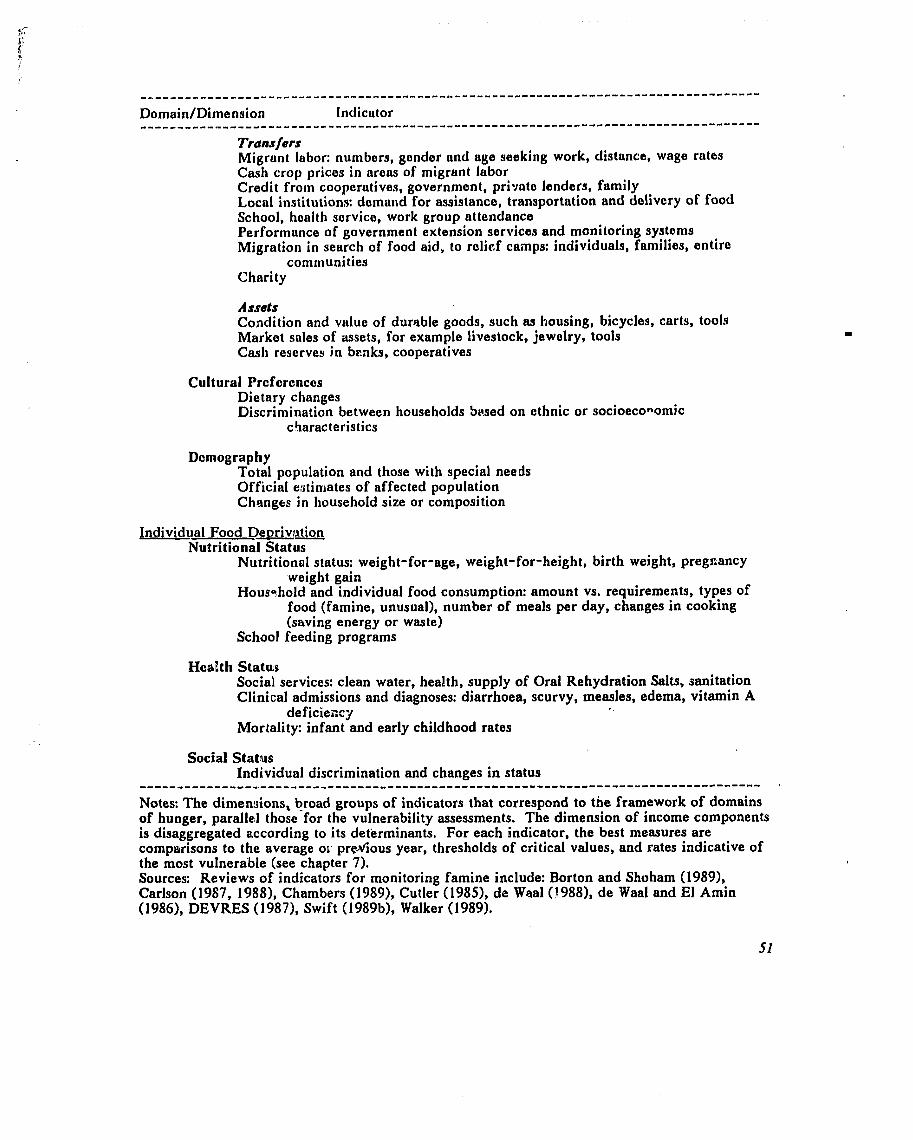
Transfers Migrant labor: numbers, gender and ago seeking work, distance, wage rates Cash crop prices in areas of migrant labor Credit from cooperutives, government, privnto lenders, family Local institutions: domand for assist,ance, transportation and dolivery of food School, health service, work group attendance Performance of government extension services and monitoring systems Migration in search of food aid, to relieif camps: individuals, families, entire
communities Charity
Assets Condition and value of durable goods, such as I.aousing, bicycles, carts, tools Market soles of assets, for example livestock, jewelry, tools Cash reserves in benks, cooperatives
Cultural Proferenccs Dietary changes Discrimination between households based on ethnic or socioeconomic
c.haracteristics
Demography Total population and those with special needs Official e:rtiniates of affected population Changes in household size or composition
Individual Food Devrivtation Nutritional Status
Nutritional status: weight-for-age, weight-for-height, birth weight, pregnancy weight gain
Housshold and individual food consumption: amount vs. requirements, types of food (famine, unusual), number of meals per day, changes in cooking (saving energy or waste)
School feeding programs
Health Status Social services: clean water, health, supply of Oral Rehydration Salts, sanitation Clinical admissions and diagnoses: diarrhoea, scurvy, measles, edema, vitamin A
de ficiezry Mortality: infant and early childhood rates
Social Status Individual discrimination and changes in status
- - - - - - - - - - - - - - - - , - - - - - - - - - - - - - - - - - - - - - - - - - - - - - - 0
Notes: The dimensions, broad groups of indicators that correspond to the framework of domains of hunger, paralle~l those for the vulnerability assessments. The dimension of income components is disaggregated according to its determinants. For each indicator, the best measures are comparisons to the average or predous year, thresholds of critical values, and rates indicative of the most vulnera'ble (see chapter 7). Sources: Reviews of indicators for monitoring famine include: Borton and Shoham (19891, Carlson (1987, 1988), Chambers (1989), Cutler (1985), de Waa1(3988), de Waal and El Amin (1986), DEVRES (1 987), Swift (1 989b), Walker (1 989).
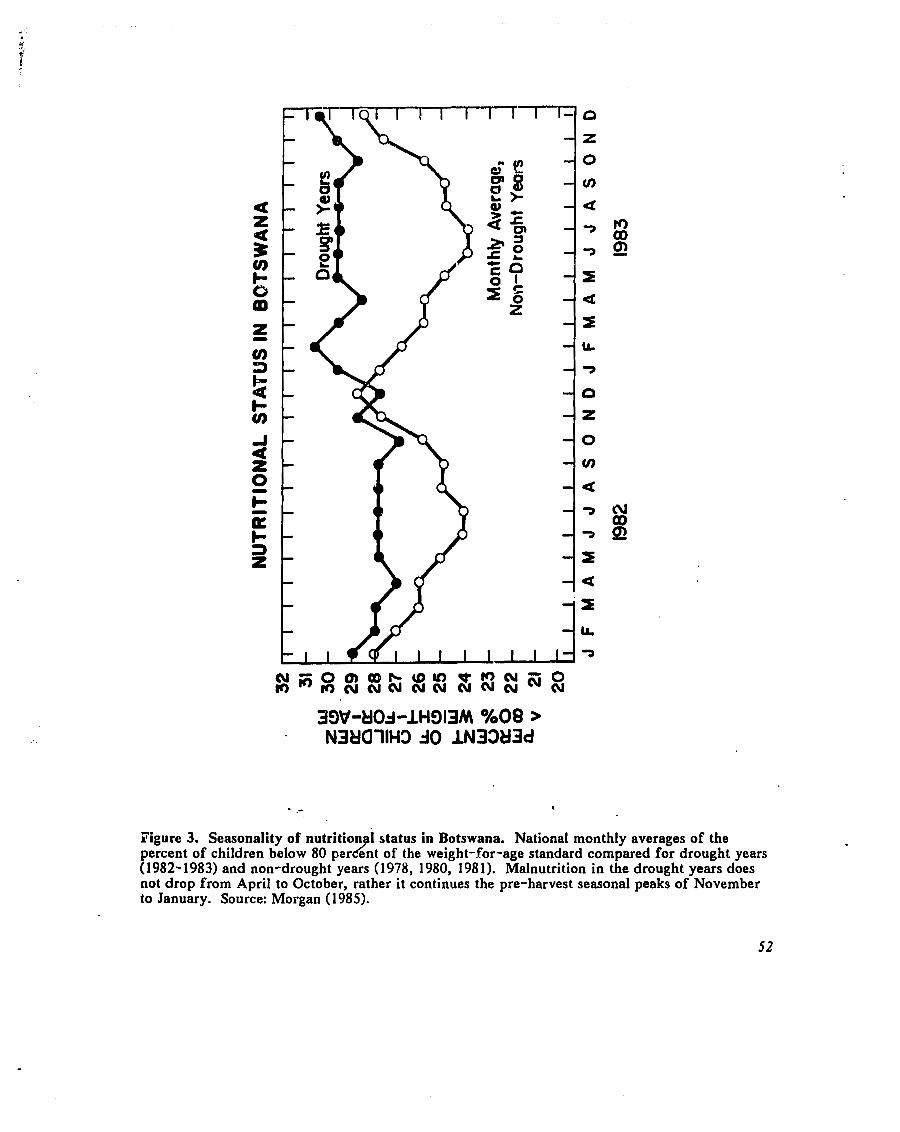
Figure 3. Seasonality of nutrition 1 status in Botswana. National monthly averages of the percent of children below 80 per 2' ent of the weight-for-age standard compared for drought years (1982- 1983) and non-drought years (19713, 1980, 198 1). Malnutrition in the drought years does not drop from April to October, rather it continues the pre-harvest seasonal peaks of November to January. Source: Morgan ( 1985).
First, it is assential to disaggregato by fogion, household wealth, demographic characteristics, and season in order to determine the magnitude, location, artd consoquencos of food insecurity. Average measures can grossly underestimate the sizo of the food problent, depending upon tho underlying distribution of consumption across liouscholds atrd seasons (Ronrdon arid Nation 1989; 134).
7. SELECTION AND SYNTHESIS OF INDICATORS
Beyond adoption of a framework of vulnerability assessment and famine risk monitoring,
issues of the choice of indicators, means to aggregate indicators, and rules for interpretation and
decision making must be clarified. Experimentation and experience are the only means to fully
resolve these issues.
7.1. Choice of Indicators
Drawing upon the dimensions of vulnerability, the analyst must decide which indicators
to use in the vulnerability assessment and to monitor famine risk. Chapters 5 and b organize the
potential indicators, but offer little insight as to the best choices. At this time, there is not
consensus as to the best indicators, or even how many indicators are essential. Filling in the
matrix of vulnerability sketched in chapter 5, however, may reveal critical indicators. The
framework proposed here ensures that the indicators cover a broad spectrum of the potential
causes and consequences of famine.
Criteria for the choice of indicators are readily proposed (see Cutler 1985, DEVRES 1987,
Shoham and Clay 1989, Walker 1989). Indicators should be:
Comprehensive: selected indicators must span the range of vulnerable groups and famine processes--some may be direct (measure specific relationships) while others may reveal food stress through behavieral changes;
Measurable: quantified relationships or discrete qualitative data may establish thresholds for further action; data quality and scale of error must be documented;
Timely: leading indicators must provide time for intervention; Reliable: a suite of indicaiurs must accurately portray a variet.y of famine processes, they
should converge; Redundant: indicators may overlay and be used it interpret each other; Cost effective: simple monitoring systems will be maintained; Consistent: measurements may have to cover long time periods to capture seasonal trends
and departures from a base period; Easy to interpret: speed of analysis is critical; incompatible formats (anecdotal, qualitative,
quantitative) need be merged; the perceptions and information requirements of decision makers 2' ust be considered; the presentation of data is important;
Trigger specific interventions: lead time and type of indicator may assist targeting vulnerable populations; and
Raplicalla in diverse situatintts: sotilo universality, porllups within the salne vulnerable group a ~ i d for similar types of famino, is tlesirablo.
In the forniulation of each intlicator, different statistical properties niay bo appropriate.
Btrselinu vulnerability is rneusured by averages, whilo curront risk of famine is associated with the
degree of departure from tho average.
Tlie median, mean, and ri~ode measure thc zverege conditions af a vnriablc. The average
is a frequently used statistic, but is appropriate only for variables that approximate a normal
distribution and do nat have critical thresholds. In most cases, however, vulnerability to hungor
is associated with marginal conditions: resource scarcity bolow the average.
The expected variability (standard deviation, coefficient of variation) indicates the
potential for deviations from tho average. It provides a first indication of the distribution of the
variable. However, it may be influenced by positive anomalies, e.g., the high variability of
rainfall in deserts is due to occasional haavy rainfalls that distort the statistics.
Specific measures of dispersion indicate the departure from the average. The standard
score (the departure from the average divided by the average) allows comparison between
indicators. The cumulative distribution (e.g., the lower quartile) and rank ordering are similar
measiwes of relative conditions.
For many variables, a threshold or standard can be identified and the departure from the
threshold gauged. For example, if 300 mm of seasonal rainfall is needed to grow maize, an
agroclimatic indicator would be the probability of less than 300 mm. For monitoring nutrition,
the most common standards are food consumption requirements set by the Food and Agricultural
Organization and World Health Organization and rrutritional status in comparison to reference
populations.
Scenarios can be used to assess specific conditions, particularly where data are lacking.
For example, time series of yields may not be adequate to calculate the regional standard
deviation. But it should be possible to estimate production in average and drought conditions
based on experimental data and expert opinion. Indicators of vulnerability might then be the
difference between drought and average production or simply the drought estimate, rather than
assuming that average conditions also reflect vulnerability to famine.
The baseline for each indicator must also be specified. Vulnerability assessments might
rely on three to five years of data, at a minimum. Current monitoring should determine the
departure from the hisforic average and the previous values in order to portray a sense of the
trend. Specific episodes can also be useful standards. Decision makers currently recognize 1983-
1985 as a crisis period; it is a preyailing standard for future comparisons.
7.2. Composite Indices, I~~tcrprotatiot~, and Docision Making
Constructing a conlposite index requires aggregation of individual indicators by explicit,
implicit, or subjective means. The most common approach in spatial statistics is to convert each
indicator into a standard score, add tlie conver~ed indicators and calculate the standard score of
the composite index (Dever et al. 1988). This approach gives equal weight to each indicator and
its measure of dispersion, and is readily compiled and interpreted.
Several variations to this mathematical assessment of vulnerability are possible. Each
transformed indicator could be weighted according to its predictive potential, as in the example
from Chad. Intermediate indices, such as a food poverty index and a self-sufficiency index,
could be calculated before compiling the aggregate index of vulnerability (see the USAID
example in the appendix, chapter 13). The weights might be interdependent, shifting in response
to thresholds in critical indicators.
Famine, however, is more complex than revealed by the addition of indicators. Different
vulnerable groups and types of famine may require different means of compiling and interpreting
indicators and indices. Even the use of weighted indicators implies that the analyst can assign
relative risk levels to such disperse conditions as national food shortage and high food prices.
The research agenda on famine must address the potential for other means of risk
assessment. One alternative is to construct a conditional hierarchy of thresholds for monitoring
and response. In a mathematical formulation, some of the weights might be contingent upon
other variables. As a hypothetical example, if the national food balance is more than 30 percent
below average, famine is imminent for most groups and all other indicators are irrelevant. If the
deficit is less than 30 percent, famine may be pending for some vulnerable groups, and other
indicators (market prices, income, nutritional status) must be utilized. In this strategy, different
types of famine (food shortage, exchange failure, failure of institutions) require alternative
decision rules. The signs of a slump famine might not be revealed by a system designed to
monitor production shortages.
Several judgments emerge from this review that may guide the continued refinement of
the FEWS methods. The project has invested in human capital, albeit aided by sophisticated
software and analytical techniques. Subjective interpretation of indicators can be structured to
take advantage of diverse human experience. The layers of analysis--domains of hunger--
facilitate the interpretation of individual indicators and ensure that "convergence of evidence" is '
systematically organize&- A minimum data set of indicators can only be compiled through such a
structured approach. Theory is to vague and experience is too varied to decide a priori which 9 indicator will fulfill the requirements of decision makers. The FEWS monitoring system will
remain location-specific. Estimates of vulnerability are particular to each region and vulnerable
group, and dependent on the skill and information available to the analyst. It is not currently
possible to construct an aggregate, uni-dimensional index of vulnerability that could discriminutc
between countries or vulnerable groups (see an initial attempt and the discussion in Roardon et al.
1988). Such an effort requires extensive validation; perhaps it could be achieved with a decudc
of documented experience.
In conclusion, operational assessments at present must continue to rely upon subjective
interpre tation of diverse indicators. As the FEWS project paper noted:
No one measure can be independently relied upon for famine early warning. Eventually, with a long enough historical record...and carcful statistical analyses, one indicator may be shown to correlate so closely with the magnitude and location of severe production problems that it could be used as the "leading" indicator. In the meantime, FEWS needs to collect the variety of indicators described above, use them to check one upon the other, and then evaluate'them through field observations and end-of-season analysis of their relationships to at- risk conditions (USAID 1988: 49).
The parade continues of words, pictures, private anger, public anguish, aid programs, citizens' events, academic conferences, political summits and World Bank counsel. Yet people are still starving in Africa fGran 1986: 275).
8. RESEARCH TOWARD IMPROVED WARNING OF FAMINE
The parade of reports--bnckground assessments of vulnerable groups, famine risk
assessments, quarterly bulletins, monthly statistical summaries--provide rich information about
the many dimensions of famine. It does not constitute an effective famine early warning system.
In this section, several issues regarding the use of information in promoting effective famine
response systems are summarized, This is somewhat beyond the fundamental objectives of this
paper. I decm it important, not just because these may be the most critical issues in the design of
famine early warning systems, but because the focus on vulnerable groups may enhance timely
responses. Identification with specific types of people, rather than the population-at-risk, and
anecdotes (case histories and pictures) that represent identified classes of people may be more
convincing than the usual tables, charts, and maps.
8.1. Will Improved Information Lead to Improved Responses?
Organizations that are only occasionally faced with famine conditions maintain a cognitive
dissonance and are inherently conservative. Famine responses require a dramatic change of state,
which requires clear and unambiguous information about the famine and about the organization's
response. In the absence of such evidence, administrators can explain many indicators as part of
normal adjustments or special circumstances that do not entail famine (Walker 1989, Kent 1987).
Few of the current famine early warning systems have systematically assessed what
decision makers require in order to respond in a timely and effective fashion (Borton and York
1987). In fact, I am aware of no formal, published survey of users' perceptions of their
information requirements. Yet, the design of warning systems is replete with guidelines for
information collection, analysis', and dissemination. Criteria include: timeliness, authority,
reliability, mode of presentation, perception of computerized systems, mode of dissemination,
existence of preparedness plans and predetermined responses, confirmation of the message, extent
and utilization of prior knowledge, and experience (see chapter 7 and Walker 1989, Torry 1988). ,
All of these factors suegest ways to ensure that improved information leads to improved - responses.
One goal of a vulnerabilityassessment is to delineate layers of responsibility, from
international donors and central government to community organizations and individuals. A
review of the existitg monitoring and response institutions at the national, district, and local
levels would highlight geographic areas or vulnerable groups that are not well represented in the
current early warning systerns. Households are integrated into national food markets and subject
to responses by international, national, and local institutions. The most important indicator of
vulnerability to famine may well be the capacity of those institutions to monitor and respond to
food shortage, food poverty, or food deprivation.
A logical step would be to ask representative decision makers what information they doen]
most important. This may then set up a framework for developmont of additional data sets,
reporting mechanisms, and thresholds for responses. A number of methods exist to elicit the
value of additional information (see Glantz 1977, Hollinger 1988, Easterling and Mjelde 1987).
The current level of investment (funds, facilities, people) could be summarized and presented
with hypothetical options and contingent marginal costs. Prototype systems could highlight key
characteristics and trade-offs. An historical analysis of the use of information in previous food
crises would provide a check on the responses to hypothetical situations. Scenarios of the
availability of better or different information in historical episodes would document the
opportunities and constraints.
8.2. Articulated Scales of Monitoring and Response
As illustrated in the examples from Botswana and Mali above, food information is
required by different organizations, at different times, and with different degrees of accuracy.
Corresponding to the domains of hunger, three domains of responsibility are distinguished
(Figure 4): (1) Identification of groups vulnerable to seasonal and persistent food shortage and
food poverty should be a collaborative effort of government and private organizations, as part of
drought preparedness and development planning exercises. (2) The primary role of the central
government is to maintain the national food balance, that is, to prevent a national food shortage.
This requires an early response, but not detailed information. (3) Monitoring of individual
entitlement is required by local agencies to target interventions. The three levels interact: an
accurate national food balance requires regional or district estimates; monitoring a sample of
households (food consumption and nutritional indicators) informs central agencies of the progress
and magnitude of the food crisis.
An early, approximate estimate of the national food balance is required to alert the
government of the need for more comprehensive surveys, and to begin the process of ordering
imports (or exports in years of surplus) and appealing to donors for assistance (see, e.g., Hay
1980, F A 0 1984c, cogiliet al. 1989). Timeliness is more important than a comprehensive assess-
ment, provided subsequent decisio s are contingent upon improved data. The government of 2 Kenya, in June 1984, estimated maize import requirements from July 1984 to July 1985 to be 0.9
to 1.1 million mt (Borton 1987, 1989). The estimates were based on preliminary projections of
food production for the long rains of 1984 (before statistical assessments of crop production were
available) and an assumption of below avertrgo 1984 short rains. In August 1984, the FAO, with
preliminary results from agricultural surveys, estimated maize import requiren~ei~ts of 1.2 million
rnt (FA0 1984). The inititrl government estimata was not significantly changed two months later
when additional information was available, thcreby justifyin!; the government's early response in
June to order commercial imports.
In Botswana, action at the national levsl may be trrken before nutritional indicators show
an increase in the consequences of individual food deprivation. The relationships betweon
leading indicators of agricultural production and vulnerable groups have been sufficiently
established to move the system from response to prevention.
Further research on vulnerability to hunger should begin to assess the sensitivity of
entitlement systems to national food shortages. One can easily envision resource, economic, and
political circumstances where even a modest shortfall in national food supplies results in
catastrophe, at least for certain communities or households. One way to formalize such a research
effort is through case scenarios. Based on the 1984- 1985 case history, a variety of scenarios can
be tested to see if they change the outcome of national, agency or household responses to the
food crisis. Such scenarios might include: different patterns of drought magnitude and
persistence; economic scenarios of low foreign exchange reserves (the early 1980s situation
without the fortuitous escalation of coffee and tea prices); long-term decline or sudden shocks; an
intransigent political system; and various levels of food information and famine early warning
systems.
Another approach would be to compare case studies of vulnerability to food crisis among
different socioecononlic groups, in different agroecological environments, or subject to different
political and economic conditions. Citing examples from Kenya, insight may be gleaned from
documenting differences in impacts and coping strategies among different sections of the Maasai
(Grandin et 41. 1989) or Turkana (Ellis et al. 1987), or among smallholders in different
agroclimatic zones (Downing 1988, Akong'a et al. 1988). These efforts could be considerably
expanded. An iterative, delphi process might well collect relevant data and assess the range of
food poverty in different regions and vulnerable groups.
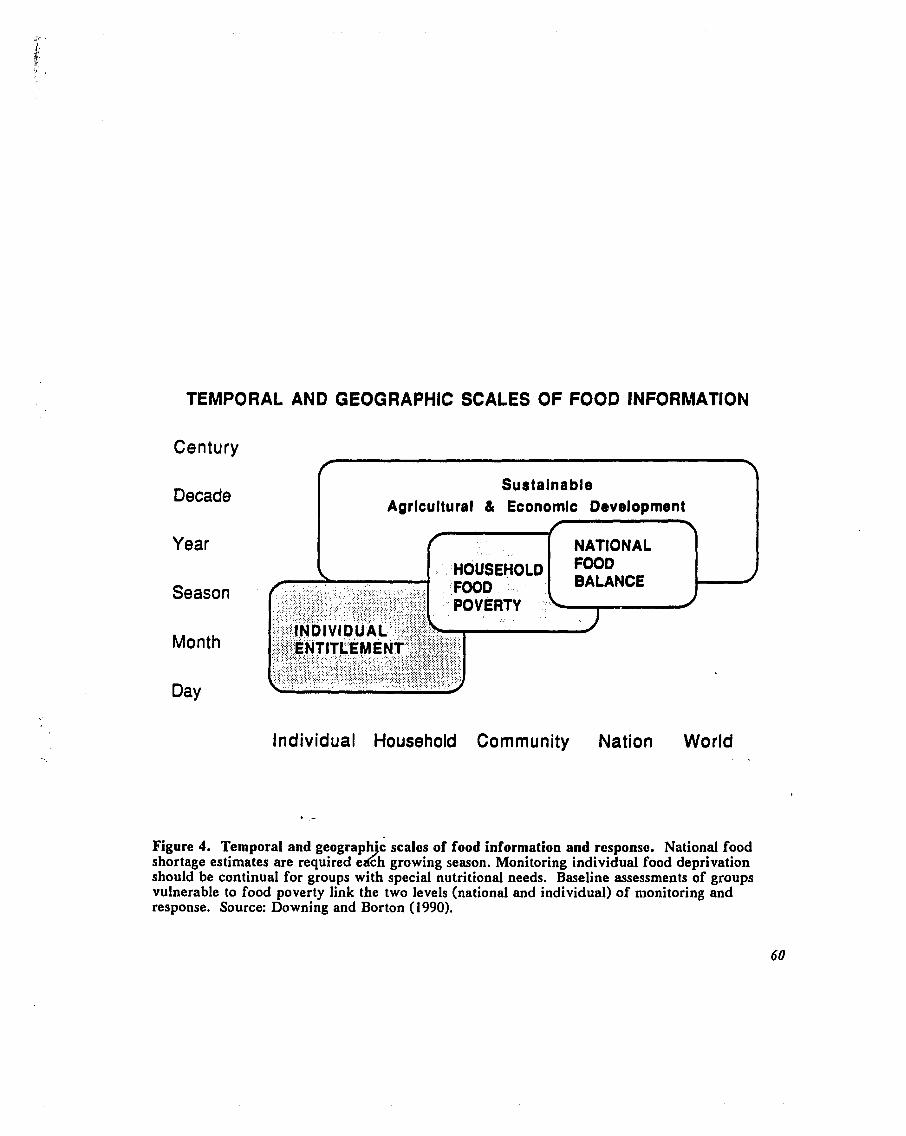
TEMPORAL AND GEOGRAPHIC SCALES OF FOOD INFORMATION
Century
Decade
Year
Season
Month
Day
Individual Household Community Nation World
. :'FOOD , . '
, , POVERTY . : .
Figure 4. Temporal and geograph'd scales of food information and response. National food shortage estimates are required e d ch growing season. Monitoring individual food deprivation should be continual for groups with special nutritional needs. Baseline assessments of groups vulnerable to food poverty link the two levels (national and individual) of monitoring and response. Source: Downing and Borton (1990).
9. ACKNOWLEDGEMENTS
This docurt~er~t roflects tho individuul und collective effort of u nurt~bor of peroplo. Tho
initial concepts of vulnerability to hunger were discuasod and refined by tho stuff of the Alan
Shawn Foinstoin World Hungar Program ut Brown University, as roflocted in Millmun untl Katus
(1989) and Kates st al. (1988, 1989). Draft of this paper were reviewad by the Alan Shawn
Feinstein World Hunger Program, and detailed revisiorns suggeuted by Robert S. Chon, Goran
Hyden, Jeanne X. Kasperson, Robert W. Kates, Ellen .Messer, and Sara Millman. The concepts of
vulnerability were discussed with the staff of the Famine Early Warning Systems project--the
comments and assistance of Gary Eilerts, Graham Farmer, Charles May, and Richard C. Meyer
are particularly appreciated. The draft paper was prese~nted at the FEWS training course in
Tunis, January-February 1990. The comments of the FEWS Field Representatives and U.S.
Geological Survey staff are especially appreciated. Others who contributed in different
discussions include Diana Livermtrn (Pennsylvania State University), Sherry Oaks (U.S. Geological
Survey), Jonathan Olsson (Agency for International Development), and Martin Parry
(Atmospheric Impacts Research Group, University of Birmingham).
While this collective effort is essential to this paper, the author remains solely responsible
for the interpretation of the literature, expression of the concepts, and any errors of commission
or omission. This project began while the author was a Post-Doctoral Research Fellow at the
National Center for Atmospheric Research and completed as a Research Fellow in the
Atmospheric Impacts Research Group, University of Birmingham, U.K. Their support and that
of the U.S. Agency for International Development and World Hunger Program are gratefully
acknowledged. This document does not necessarily reflect the views of the sponsoring agencies.

This page is intentionally blank.
LIST OF AI'I'ENDICES
10. A CONCISE GLOSSARY OF TERMS
11. VULNERABILITY TO HUNGER IN KENYA
12. VULNERABILITY: CONCEI'TS AND ISSUES
13. FRAMEWORKS AND DIMENSIONS OF VULNERABILITY
14. LIST O F ABBREVIATIONS
15. REFERENCES AND BIBLIOGRAPHY

This page is intentionally blank.
10. A CONCISE GLOSSARY OF TERMS
Accoss to food: The ability of individuals, liouseholds, and co~n~~iuni t ies to acquire food: "through production, sxcliungo, or transfer (gifts). Many factors, including rainfall, pests, floods, and warfare, can affect these acquisition mechanisms" (Price, Williams & Associates 1989g: 5). Accoss to food corresponds to tho definition of food poverty, below.
Baseline vulnerability: An aggregate measure, for a given population or region, of the underlying factors that influence exposure to famine and predisposition to the consequences of famine. It refers to the recent liistory of underlyiny processes and causes of hunger, rather than immediate events. It means:
not lack or want, but defencelessness, insecurity, and exposure to risk, shocks and stress ... vulnerability, and its opposite, security, stand out as recurrent concerns of poor people which professional definitions of poverty overlook. Vulnerability here refers to exposure to contingencies and stress, and difficulty in coping with them. Vulnerability has thus two sides: an external side of risks, shocks, and stress to which an individual or liousehold is subject and an interrial side which is defencelessness, meaning a lack of means to cope without damaging loss (Chambers 1989: 1).
Current vulnerability: An aggregate measure tha; extends baseline vulnerability to assess changing vulnerability due to the current prospects of national food shortage, household food poverty, and individual food deprivation. It incorporates recent changes in baseline vulnerability-- national food balance (especially stocks and imports), geographic and institutional factors that affect regional food shortage (including pzoduction and surplus from the previous season), household food poverty (particularly changes in income), and individual food deprivation (especially changes in nutritional and health status).
Chronic and episodic hunger: Chronic hunger is a continuously or regularly inadequate diet, the ongoing insufficiency of food and nutrients to maintain an acti.ve, healthy life (World Bank 1986b: 1). It is marked by persistent deficiencies strongly related to food poverty. In nutritional surveillance of children, a measure of chronic hunger is stunting, indicated by a low height-for-age. Episodic or transitory hunger is a temporary decline in food consumption or utilization (World Bank 1986b: 1). It is a departure from usual levels of dietary adequacy, often evidenced by wasting, lowpeight-for height. Famine is the extreme case of episodic hunger.
Dimension: Conrlotes a fundunlontal uspect of vulnerability--an ordored set of cuusal factors that tlofino risk of famine. In this rcport, thruo tlimonsions ure identifietl for olrch domuin of vulnerability: national food balance, geographic factors, and institutional developrnont are dimensions of the domain of regional food shortage; income components, cultural proferonces, ancl derilogruphy are dimensions of household food poverty; and nutritional, health, and sociai atntrtn are dinlensions of individual food deprivation.
Domain: Broad patterns o f iiriked causes and consequences, specific to units of social organization, that characterize vulfierability to chronic hunger and episodic famine. In this report, regional food shortage, household food poverty, and individual food deprivation are identified as such domains.
Early warning: "Giving notice of populations at-risk (i.e., potential famine victims) in time to prevent fumine through pon-emervencv measures" (USAID 1988: 5).
Entitlement: The ability to command food through legal means, based on production through the use of one's resources including labor, trade, or exchanges, and inheritance and transfers. An individual's set of entitlements "can be characterized as depending on two parameters, viz. the endowment of the person (the ownership bundle) and the exchange entitlement mapping (the function that specifies the set of alternative commodity bundles that the person can conlmand respectively for each endowment bundle)" (Sen 1981: 45-46). The entitlement approach underlies the concept of food poverty. Exchange entitlement refers explicitly to the ability to purchase food, depending on income, assets, and market prices.
Famine: Widespread and substantiall> increased morbidity, mortality, and other serious consequences resulting fron: ;. sequence of underlying processes, initiating ep'scldes and transitional responses that reduce food availability or food entitlement. Following this
h definiticn, famine is distinguished by episodic mass starvation, as opposed to chronic food deprivation. Famine is: "the state of prolonged food intake deficiency which ultimately leads to excess deaths in a district, region or country as a whole" (Alamgir 1980: 7, cited .
n
in USAID 1988; 5).
Food uccoun ling: A quantitative food balancc at tho regionti1 level based on rrvailublo datu:
A q~~rrntitutive account of all ostirnublo food resources (production und aid) uvt~ilublc for consutnption until harvest is culculated using department-level data. Seed, feed, post-harvest losses, oxportu, and consumption-to-date are subtracted from this account. Tho months of food remaining are then caiculated by dividing tho food resources by the consumption rate (population times monthly consumption rate). Inadequate food uccess is assumed if stocks fall short of needs until harvest (Price, Williams & Associaterr 198912: 7).
Food balance sheet: A national food accounting:
a national account of the annual production of food, changes in food stocks, imports and exports, and distribution of food for various uses within the country. It thus provides an indirect estimate of the per capita supplies available for hun; consumption .... The various uses are listed under the fcrlowing headings: animal feed; seed; industrial uses; waste; and the net food availability for hurnan consumptioa at the retail level. Per capita food availability is given for the total populati,sn actually partaking of the food supplies during the reference period .... In some countries, the per capita food availability refers only to the civilian population, the armed forces being excluded. Pur capita food availability is expressed in grams of food and in amounts of energy and of some nutrients (Cameron and van Staveren 1988: 16).
Food consumption: Food and drink ingested, synonymous with food intake and dietary intake. Household food consumption is either the aggregate intake, according to nutritionists, or total food used or purchased, in household budget surveys (Cameron and van Staveren 1988: 13- 14).
Food deprivation: Food consumption and utilization insufficient to meet nutritional requirements. Individual food deprivation may occur evgn within households that can afford to feed their members adequately because of ignorance, abuse, neglect, self-denial, or disease that hampers the retention or absorption of nutrients. The individual consequences are .
restricted activity, weight loss, impaired development, morbidity, and mortality.
Food patterns: . - "repeated arrangements that'can be observed when foods are eaten. This refers particularly to the type and relative proportions, and/or the combinations of foods used in meals by an individual, a given community, or population group .... Synonyms: food consumption patterns; dietary patternsw (Cameron and van Staveren 1988: 15).
Food poverty: The luck of resources to procure,sufficicnt food for tlis entire household. Food poverty is cle~~larcuted by the inc~bility to produce food on-farm or on common lands; to retain adequate food from own production; to purcliase food in exchange for cash, materials, or labor; or to procure food through donations.
Food security: Two definitions are:
access by all people at all times to enough food for an active, healthy life. Its essential elements are the availability of food and the ability to acquire it. Food insecurity, in turn, is the lack of access to enough food (World Bank 1986b: I).
a country and people are food secure when their food system operates in such a way as to remove the fear that there will not be enough to eat. In particular, food security will be achieved when the poor and vulnerable, particularly women, children and those living in marginal areas, have secure access to the food they want. Hood security will be achieved when equitable growth ensures that these groups have sustainable livelihoods; in the meantime and in addition, however, food security requires the efficient and equitable operation of the food system (Maxwell 1988: 10, cited in Maxwell 1989: 4-5).
Food shortage: A shortfall in food availability, measured against either status quo consumption or nutrition-based consumption requirements. Food production is dependent on natural and human resources, and may be disrupted by drought, civil strife, or market policies. Stocks and imports are subject to disruption as well. The aggregate demand for food varies with population growth, incomes, and dietary preferences.
Food supply: Food available for consumption:
Gross food supply is the sum of production and procurement (purchase, barter, receipt, or imports) of foods, minus sales, exports, and decreases in stocks. Net food supply is the gross food supply minus losses in transport and storage and minus non-human uses of food (e.g. feed, seed, manufacture of non-consumable products) (Cameron and van Staveren 1988: 13).
Food stress: A general termbimplying food shortage, food poverty, and food deprivation; the extent to which food consumption fails below nutritional requirements.
/'
Food utilizrrtion: "in terms of physiology ... the process whereby nutrients are absorbed and rnetabolized by the organism. In terms of food economics ... the quantitative breakdown into various cat- egories of use of real or potential food supplyw (Cameron and van Staveren 1988: 14- 15).
Indicator: A specific measure of one dimension of vulnerability or famine risk. Indicators must relate to interrelated phenomena. "The important point is that the criterion for classifying a social statistic as an indicator is its informative value which derives from its empirically verified nexus in a conceptualization of social process" (Sheldon and Parke 1975: 697, cited in Reining 1978: 5).
Information system: "The process of gathering, analyzing and presenting information to facilitate decision making on fariline prevention initiatives" (USAID 1988: 5).
Nutrition-based consumption requirements: Food intake required to meet international or national standards of minimum caloric consumption, often determined by age, sex, weight, and level of activity (USDA/ERS 1988).
Prevalence: The percentage of a vulnerable group that actually experiences hunger or famine.
Recovery: The period after the food crisis, when food supplies and consumption begin to return to normal. It gauges the capability of vulnerable groups to regain their economic, social and political status, or their susceptibility to further impoverishment and destitution. The post-famine period is often critical for future vulnerability.
Sensitivity: The degree of covariance between two variables. Or, the degree to which a shock or pulse variable changes a dependent variable (Downing and Parry 1990).
Status quo consumption: Average level &-food utilization in recent years, often on a per capita basis (USDA/ERS 1988).
/
Vulnerability assessment: The annual report published by FEWS in June that identifics vulnerable socioecor~omic groups and assesses thoir current vulnerability due to the prospects of national food shortage, household food poverty, and individual food deprivation. It is prepared before the growing season and focuses on vulnerability to identify groups and areas that may require further monitoring of famine risk.
Vulnerable group: A socioeconomic group characterized by common patterns of vulnerability to famine. Further definition of a vulnerable group depends on the ordering of importance attached to the dimensions of vulnerability--geographic factors, institutional development, household food poverty, and individual nutritional capacity.
Warning states: Degrees of villnerability corresponding to increasing risk of famine and implying different levels of response: Slight vulnerability: population continues to be monitored, but famine is not considered
likely in the current season; no specific response required. Moderate vulnerability: targeted monitoring required; need to earmark resources for
continued monitoring (perhaps including special surveys) and potential responses (such as emergency food aid); need to develop contingency plans and ensure government bureaucracies are prepared to respond.
Extreme vulnerability: immediate action required to prevent famine, including nutritional intcrventions (e.g., food aid) and income support (c.g., food-for-work, commercial food distribution).
Famine: evidenced by widespread and increased morbidity and mortality; immediate interventions required to mitigate the effect of famine or control its spread; in addition to above responses, expanded health services, relief camps, and widespread food distribution may be necessary.
11. VULNERABILITY T O HUNGER IN KENYA
This appendix reviews vulnerability to hunger in Kenya to iflustrate several applicatio~ls
of the framework proposed ubove. Vulnerable groups were identified in the 1970s by the
government and several researchers. The initial assessments are extended, based upon a variety
of data, to provido a first cut at the national and provincial level of the distribution of
vulnerability (section 11.1). A geographic information system augments this analysis,
demonstrating the use of separate indicators for smallholders and pastoralists (section 11.2).
Smallholders, the bulk of Kenya's population, have received more in-depth analysis. Section 11.3
summarizes a formal economic analysis of food poverty. The use of scenarios (section 11.4) and
models of household food security (section 11.5) further illustrate group-specific methods of
vulnerability assessment.
Identification of socioeconomic groups vulnerable to famine and hunger should be part of
national and local planning efforts. It links national assessments of food shortage and targeted
interventions to prevent food deprivation. This appendix describes vulnerable groups in Kenya,
drawn from Downing and Borton (1990) and Downing (1988, 1989b). As a case study, Kenya
illustrates what can be done with reasonable, but not ideal, data in a country of diverse
environments. Other relevant vulnerability assessments in Kenya include: Kliest (1985) and
Central Bureau of Statistics (CBS) (1982) on seasonality; Hogg (1985, 1986, 1987), Ellis et 41.
(1987), Little (1988), Little, Galvin and Leslie (1988), Little et al. (1988), Little (1985), Grandin
et al. (1989), Robinson (1989), and Swift (1989) on pastoralists; Frohberg and Shah (1980), CBS
(1977b, 1980, 1983c, 1984b), and Alnwick et al. (1988) on nutrition, particularly of woman and
children; Haaga et al. (1986) on household food poverty among smallholders; Porter (19791,
Bernard, Campbell and Thom (1989), Bernard and Thom (1981), and McCarthy and Mwangi
(1982) on agricultural developnlent, and most recently World Bank (1989a) on national policies
regarding hunger, nutrition, and poverty.
11.1. Identification of Vulnerable Groups
Ten socioeconomic groups were identified as being vulnerable to food poverty by Hunt
(1984), and the prevalence of food poverty was estimated for 1974 (Table 9). Data from a variety
of sources were used (see Collier and 1,al 1980, Crawford and Thorbecke 1978, CBS 1977a,
Livingstone 198 1, see ;IS-o, Collier and La1 1984), and the qualifications clearly noted. Over 80
percent of the pastoralists, residiy primarily in Eastern, Rift Valley, and Northeastern Provinces,
were considered vulnerable to food poverty. Pastoralists who also farmed, and migrant farmers
in the pastoral areas had lower rates of food poverty. The landless include two groups: those with
skilled employment were assumed not to be food poor, while half of the unskilled landless were
probably food poor. A~riong those with access to agricultural land, a third or less of tlie
smallholders (less than 20 ha per household) and squatters on large farms (with some access to
land for subsistence production) were estimated to be food poor, partly bused on rural survey
data. Gap farmers (20-50 ha) and large farmers (over 50 ha) were not considered vulnerable to
hunger, but were included for completeness in the population figures. Food poverty rates in the
urban areas were based on estimates of the distribution of income in the formal wage economy.
Hunt's (1984) analysis was extended, using the same vulnerable groups and rates of food
poverty, and updated with 1984 population data (Table 10). This analysis does not include the
special circumstances of food shortages and high prices prevalent during the drought crisis.
Rather, it shows the geographic distribution of the vulnerable groups and estimates of the
number of people in each group vulnerable to chronic food poverty. A total of 5.6 million people
would have been food poor in 1984, based on 1974 prevalence rates and 1984 demographic data.
The largest group of food poor (over half) are smallholders, distributed throughout the country's
agricultural lands. The pastoralists (almost 20 percent of the food poor) and poor landless (over
15 percent) comprise the next large~t groups. Most of the food poor reside in the Rift Valley
Province (1.6 million), followed by Eastern and Nyanza Provinces (under I million each). The
highest percentage of food poor to total population are in Northeastern (69 percent) and Rift
Valley (39 percent) Provinces.
The population at-risk of famine in 1984 can be interpreted from this table by overlaying
the actual famine processes upon the estimates of vulnerability. While most of the country was
affected by the drought, Western, South Nyanza, and Coast Provinces had adequate food supplies
and relatively average prices. Excluding rural smallholders, landless, and urban poor in these
provinces, a total of 3.75 million people (19 percent of the population) were vulnerable to food
poverty in the 1984- I985 food crisis.
This example illustrates what can be done with fairly crude data. It could be the first
step in a series of refinements. In particular, the distribution of rural smallholders and landless
laborers could be drawn from more recent sample surveys. A hierarchy of vulnerable groups
could be incorporated by including the household characteristics of the vulnerable groups. For
instance, the 28.9 percent o l the rural smallholders estimated to be food-poor could be further
identified, perhaps by the size of their holdings, access to off-farm income, dependency ratios,
or agroclimatic zone.
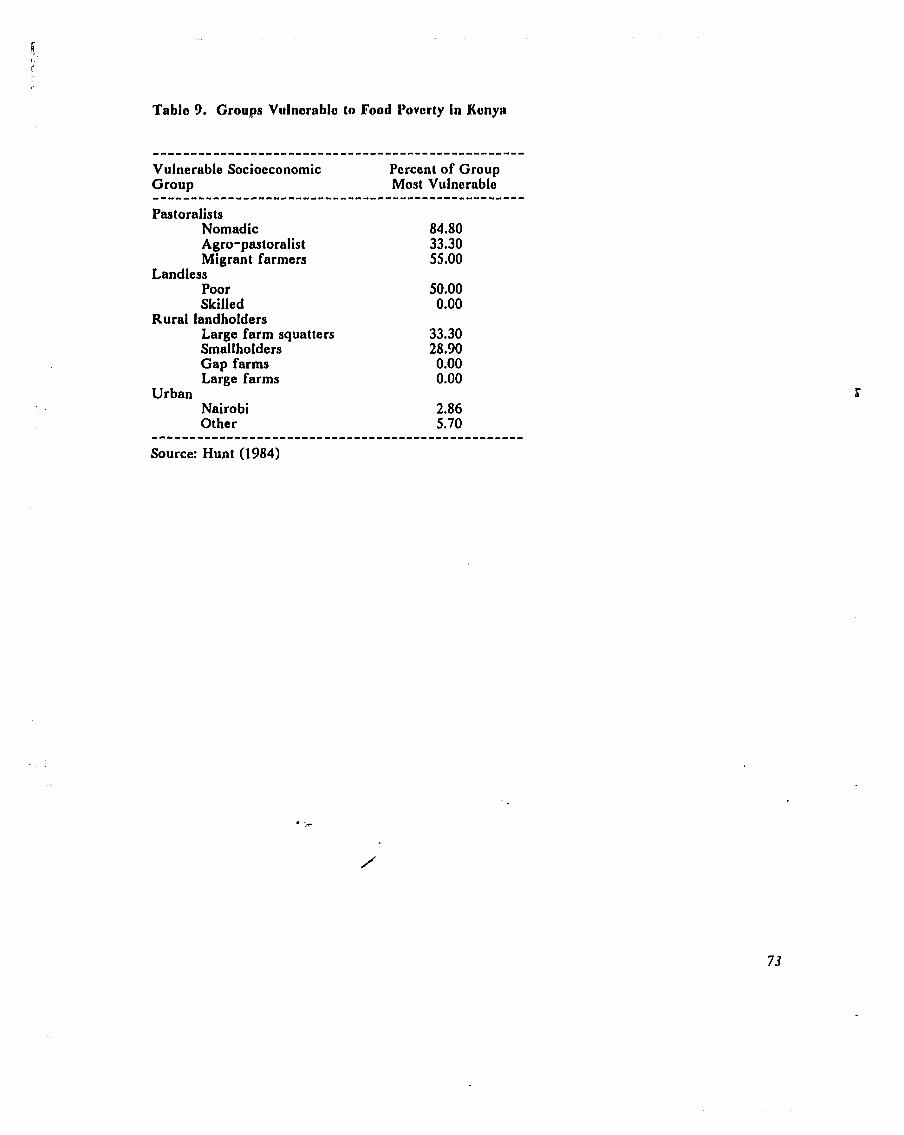
Tablo 9. Groups Vul~~orablo to Food I'ovorty in Konya
.................................................. Vulnerable Socioeconomic Percent of Group Group Most Vulnerable ----------------------------------*---------------
Pastoralists Nomadic 84.80 Agro-pastoralist 33.30 Migrant farmers 55.00
Landless Poor 50.00 Skilled 0.00
Rural landholders Large farm squatters 33.30 Smallholders 28.90 G a p farms 0.00 Large farms 0.00
Urban Nairobi 2.86 Other 5.70 ..................................................
Source: Hunt (1984)
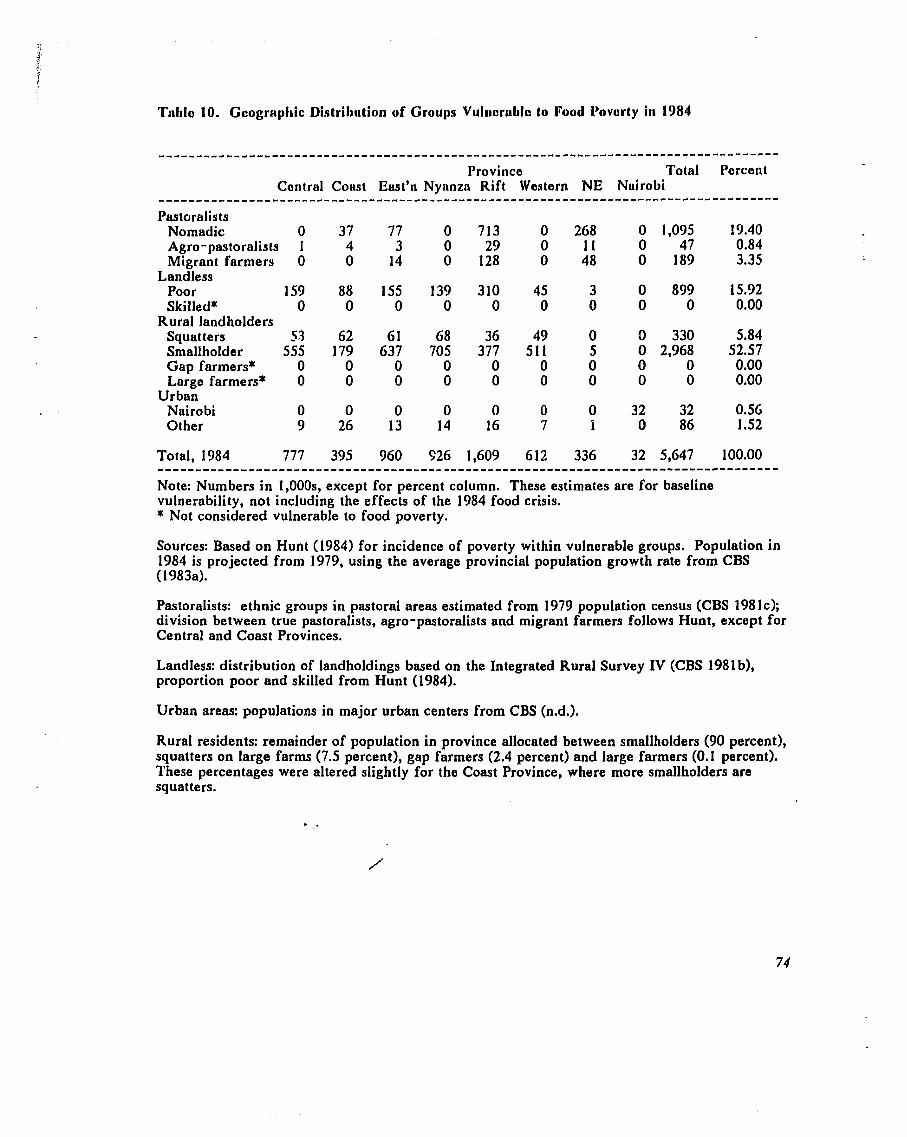
Tablo 10. Guographic Distribution of Groups Vtrl~rorablo to Food I'ovorty i s 1984
................................................................................... Provinco Total Porcont
Contral Coast East'n Nyanzu Rift Wostorn NE Nairobi ................................................................................... Pastoralists
Nomadic 0 37 7 7 0 713 0 268 0 1,095 19.40 Agro-pastoralists I 4 3 0 29 0 11 0 47 0.84 Migrant farmers 0 0 14 0 128 0 48 0 189 3.35
Landless Poor 159 88 155 139 310 45 3 0 899 15.92 Skilled* 0 0 0 0 0 0 0 0 0 0.00
Rural landholders Squatters 53 62 6 1 68 36 49 0 0 330 5.84 Smallholder 555 179 637 705 377 511 5 0 2,968 52.57 Gap farmers* 0 0 0 0 0 0 0 0 0 0.00 Large farmers* 0 0 0 0 0 0 0 0 0 0.00
Urban Nairobi 0 0 0 0 0 0 0 32 32 0.56 Other 9 26 13 14 16 7 1 0 86 1.52
Total, 1984 777 395 960 926 1,609 612 336 32 5,647 100.00 ................................................................................... Note: Numbers in 1,000s, except for percent column. These estimates are for baseline vulnerability, not including the effects of the 1984 food crisis. * Not considered vulnerable to food poverty.
Sources: Based on Hunt (1984) for incidence of poverty within vulnerable groups. Population in 1984 is projected from 1979, using the average provincial population growth rate from CBS (1983a).
Pastoralists: ethnic groups in pastoral areas estimated from 1979 population census (CBS 1981~); division between true pastoralists, agro-pastoralists and migrant farmers follows Hunt, except for Central and Coast Provinces.
Landless: distribution of landholdings based on the Integrated Rural Survey IV (CBS 1981b), proportion poor and skilled from Hunt (1984).
Urban areas: populations in major urban centers from CBS (n.d.).
Rural residents: remainder of population in province allocated between smallholders (90 percent), squatters on large farms (7.5 percent), gap farmers (2.4 percent) and large farmers (0.1 percent). These percentages were altered slightly for the Coast Province, where more smallholders are' squatters.
11.2. lr~clicutors of Vr~leorability Using u Googrupl~ic Irlforn~rrtion Synto~tl
Tha previous section dascribos ton vulno~uble g roup in Kenya trnd intlicates tho
prevulence of food poverty by province. This section prosents a spatial analysis of vulnernbility,
illustrating a mothoclology that could be considerably oxpandad. The analysis utilizes a
geographic information system (CIS) to conlpile several indicrtors of different dinlensions of
vulnerability for two socioeco~lonric groups. Aggregute indicators of vulnerability are also
compiled.
11.2.1. Data and Methods
The Food and Agriculture Organization (FAO) compiled a detailed geographic data base
for Kenya in an extension of the project to map population supporting capacity in developing
countries (Higgins et al. 1982). The data comprise 39,420 pixels (219 rows and 180 columns),
corresponding to a 5-km UTM grid. The availai.>le data are largely undocumented--original
sources and scalcs are not known--but are suitable for this demonstration.
The F A 0 data utilized here include: district boundaries; population density in 1979
census; land class; and location of national parks, forests, and game reserves. Additional data
were digitized (location of secondary towns; agroclimatic zones) or assigned by district
(agricultural management factors; proportion of land cultivated; off-farm income relative to food
prices) and added to the F A 0 data base. The original population data base varied significantly
from the published census figures of district totals. The data were revised and updated to 1984,
using estimates of district growth rates published by the Central Bureau of Statistics (1983a).
A PC-based GIs, Idrisi, was used to compile the indicators. Although Idrisi does not
have a sophisticated user interface, it runs on srnall PCs, includss the necessary GI s functions,
and reads and extracts spreadsheet data.
Each indicator of vulnerability vtas converted to standard scores, and the aggregate
indicators are the standard score of the sum of the individual indicators. Thus, the final data and
the mapped images are in comparable units.
The selection of indicators follows the four dimensions of vulnerability suggested i n .
chapter 4 (Table 11). The highest level in the hierarchy of vulnerability is household livelihood.
The vulnerability of two distinct socioeconomic goups is portrayed: smallholder agriculturalists '
and pastoralists (Figurd 5). Food poverty is gauged by the balance between production and
consumption (an indicator of self- ufficiency) and an indicator of off-farm income relative to 2 food prices. The geographic factors are areas excluded from settlemefit and variations in
agroclimatic resources, factors which can function as surrogates for information cn development
infrastructure. The distance to major market towns is an indicator of access to government and
private und cornrnerciul institutiotia, pirrticultirly footl tnnr4kots t,~ttl footl aitl. 'T'llo pol~ulutiori in
eucli clusa of vt~lrlartrbility intlici~lcn Ilia l~otontial populution al-risk, including thoaa with apoc,iirl
nutritioriul naads.
The trunaformed intli :ittory wero (lividad ir~to ten vulriorability clusses (Tabla 12). The
clnsses urs a continuum, corrovponding to tila potantiel severity of u ftrrrlirie episode, In tlie worst
case the entire populution may be affected; at u minitnurn, perhups classes G through 10 represon1
those populations likely to suffer serious consequences of u moderate cliungo ia food entitlements.
11.2.2. Smallholder Agriculturalists
Smallholder agriculturalists, comprising over half the population of Kenya, reside 5,i the
highlands of westerr., central, and eastern Kenya, and along the coast. These agricultural lands
were mapped based on the suitable agroclimatic zones (I through V, in the Kenya Soil Survey
typology) in districts known to be settled predominately by agricultural groups.
The distribution of food poverty is gauged by two indicators: self-sufficiency and market
exchanges. Self-sufficiency in maize, the major staple grain, is computed as the balance of
production and consumption. Production is based on estimates by agroclimatic zone and district
of average maize productivity an4 area cultivated in maize. The resulting estimate of maize
production, for a year of average Amate, matches recent district and national estimates of maize
production. Household surveys have suggested the average per capita consumption of maize by
district. These estimates were attributed to the population of each pixel according to the
population density in 1984. The pixel-level production and average consumption were compared
and the balance (surplus or deficit) was mapped. This calculation reflects the population/
resource balance in a manner that is directly related to vulnerability to hunger.
Variations in market exchanges are difficult to portray in a ?oatial data base. Surveys
from the early 1980s indicate the average household income from off-farm sources and the
average price of grains for agricultural districts (CBS 1988). The grain equivalent of off-farm
income provides some indication of household ability to purchase food in markets, a t least in
average years, at the district level.
The geographic factors restrict the area occupied by smallholders and portray variations in
resources. National forests, parks, and game reserves were excluded from the analysis. The
Kenya Soil Survey agroclimatic zones (I through V for agriculturalists) indicate the range of
natural resources (climite, soils, water) and the level of development infrastructure
(communication, health facilities, sdhools, transportation). /
Access to institutions (markets, government services, relief and development agencies) is
portrayed as the distance from a major town. This is the planar distance, assuming no natural or
transport barriers. It seeks to identify regions where food aid may simply not be available, due to
gclogrrrpl~ic rrlrrrginulity. In nlc111y rospocts tho tlistril)ution of institutionrll sorvicoa in rrlso cnpt~rrctl
by the egroclimatic i~ltlox.
Pustorulists occupy the retneinder of Konyu not devoted to ugriculturo or major towas.
Vulnerubility assessment in pustoral urerrs is cotr~pourrded by the high degreo of variability in
resources and mobility of pustoral groups, Indicators of variations in the pmtoral economy might
parallol those used for agriculturalists. Howevsr, systematic data on livelihood, self-sufficiency,
and cash incomes are lacking. Some insight might be gained from numerous case studies--at
least, subclistrict differences in food poverty might be gauged. Since mobility is a key factor in
pastoral economies, the minimum geographic unit should be the limits of migration of tribal
units.
The geographic distribution of resources are constrained by national forests, parks, and
game reserves, although they may be available in times of crisis. The agroclimatic index portrays
variations in physical resources at a very general level. An additional constraint, not mapped in
this analysis, is insecurity of border lands.
Access to markets and relief centers is equally as important to pastoralists as to
agriculturalists. The same indicator, distance to market towns, was used, although there are far
fewer major towns in the pastoral areas.
11.2.4. Results and Discussion
The index of aggregate vulnerability to hunger is rhe sum of the individual indicators,
converted to a standard score and grouped into ten classes. The population (total and those with
special nutritional needs) characterized by each class of vulnerability is shown in Table 13.
The areas of highest vulnerability for smallholder agriculturalists are the densely
populated Lake Victoria environs, the semi-arid fringe of the highlands (Kitui and parts of the
Rift Valley), and the dry hinterland of the coastal strip (Figure 12). Assuming class 6 is a
threshold of vulnerability, the population most vulnerable to famine comprises 28 percent of the
smallholder agriculturalists, 59 percent of whom are children and pregnant or lactating women.
The results for pastoralists encourage less confidence since only two indicators were used
and data on the balanck of population and livestock production are not available. Indices such as
the number of livestock units per erson, proportion of nutritional requirements met from P livestock products, or value of livestock holdings in cereal equivalents, would greatly expand the
analysis and could be developed. The composite index shows pockets of high vulnerability
between major towns and in northwestern Kenya (Figure 15). Over a third (37 percent) of the
pastoraliats aro highly vr~ltrorrrblo (cln~sos (i tlrrortglr lo), of' wlriclr JI tl~irtl nlny 110 clriltlrotr atrtl
wortrot1 with spociul t~utritior~erl nootls,
This oxunlplo from Konye illustrrrtos tho c~pplicrrtion of sirtlplo r~~othotls to t l~o aasoasarorrt
of' vrtltrorr~bility to hunger. Perhaps most importtlntly, it highlights litnitations of dutn arrtl
methods. Witlrollt unolyzing ori~irrtrl irortselrold aurvoy dutm, it is itlrpossiblo to ostitnuto the
clistribution of food povarty clntl its spatial correlation with other charactoriatics of vulnerability
to hunger--natural resources, dovelop~nant infrwtructurs, markets, and govornmorrt aervices, It
nray be sufficient, however, to distinguish between smallholder agriculturalists in tlre humid
highlands with good access to markets and those in semi-arid areas, distant from markets. For
the first group. only tho most vulnerable households will need assistance, whoreas the latter group
11ray comprise almost tlls entire population in tinres of severe drought.
The focus on vulnerable groups and dimensions of vulnerability clarifies the use and
interpretation of indicators. Adtlitional improvements may be readily implemented: nrore grains
could be modeled; income-food price indices could be computed for drought years; institutional
coverage could be mapped; and a hierarchy of vulnerable geographic locations could be
established within each vulnerable socioeconomic group.
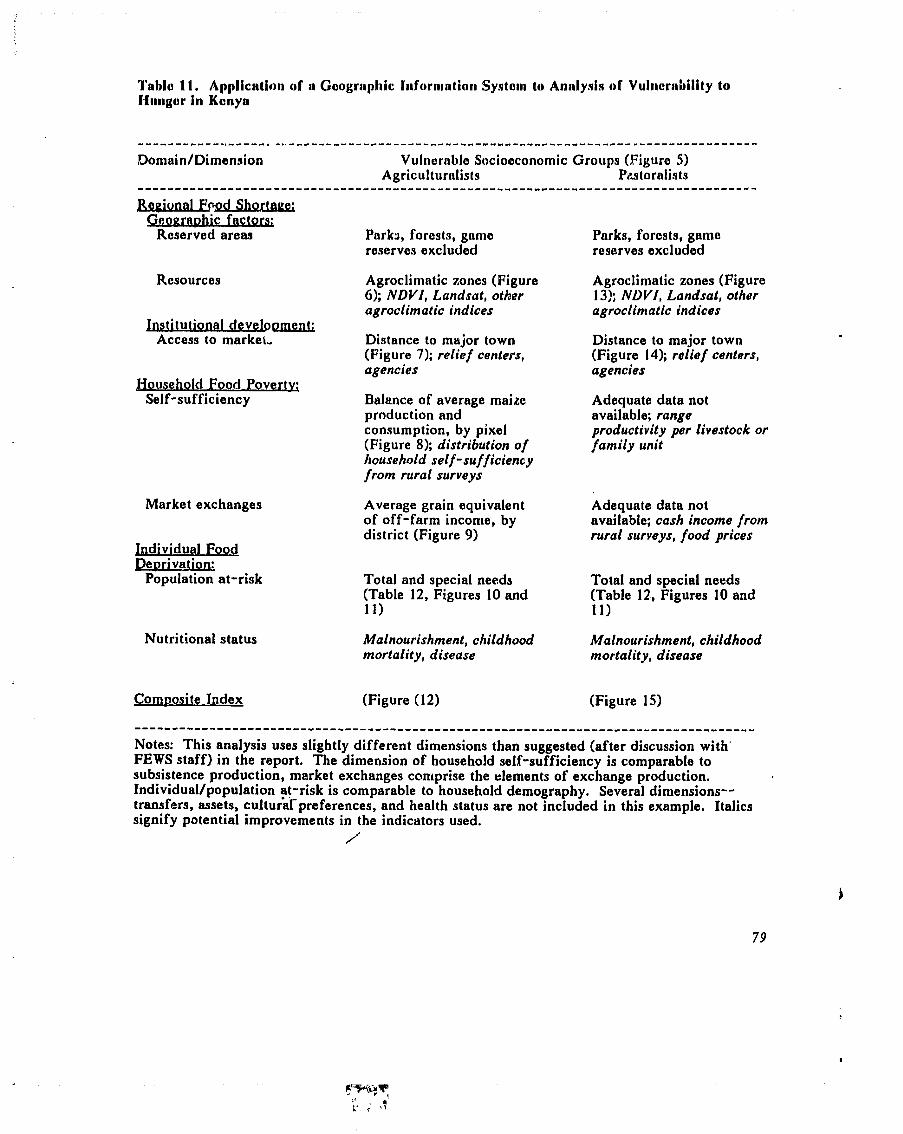
Tablo 11. Applicatlo~~ of a Googrrrphic lriforn~rrtio~l Systoln to Analysis of VultlornI)ility to 1-lungor in Kunya
Vulnorlrblo Socioeconomic Groups (Piguro 5 ) Agriculturalists Pmtoralists
Reserved areas Parks, forests, gotno Parks, forests, game reserves excluded reserves excluded
Resources Agroclimatic zones (Figure 6); N D V I , Lundsat, other
8 .
agroclimatic indices I r \ s t ~ t u t ~ I d e v e b a
Access to markesi, Distance to major town (Figure 7); relief centers, agencies
House hold Food Povertv; Self-sufficiency Balance of average maize
production and consumption, by pixel (Figure 8); distribution of household self-sufficiency from rural surveys
Market exchanges
bdividual Food pe~rivat ion:
Population at-risk
Nutritional status
Agroclimatic zones (Figure 13); N D V I , Landsat, other agroclimatic indices
Distance to major town (Figure 14); relief centers, agencies
Adequate data not available; range productivity per livestock or family unit
Average grain equivalent Adequate data not of off-farm income, by available; cash income from district (Figure 9) rural surveys, food prices
Total and special needs Total and special needs (Table 12, Figures 10 and (Table 12.. Figures 10 and 11) 11)
Malnourishment, childhood Malnourishment, childhood mortality, disease mortality, disease
Com~osi te Index (Figure (1 2) (Figure 15)
................................................................................... Notes: This analysis uses slightly different dimensions than suggested (after discussion with' FEWS staff) in the report. The dimension of household self-sufficiency is comparable to subsistence production, market exchanges coniprise the elements of exchange production. Individual/population $t-risk is comparable to household demography. Several dimensions-- transfers, assets, culturarpreferences, and health status are not included in this example. Italics signify potential improvements in the indicators used.
/
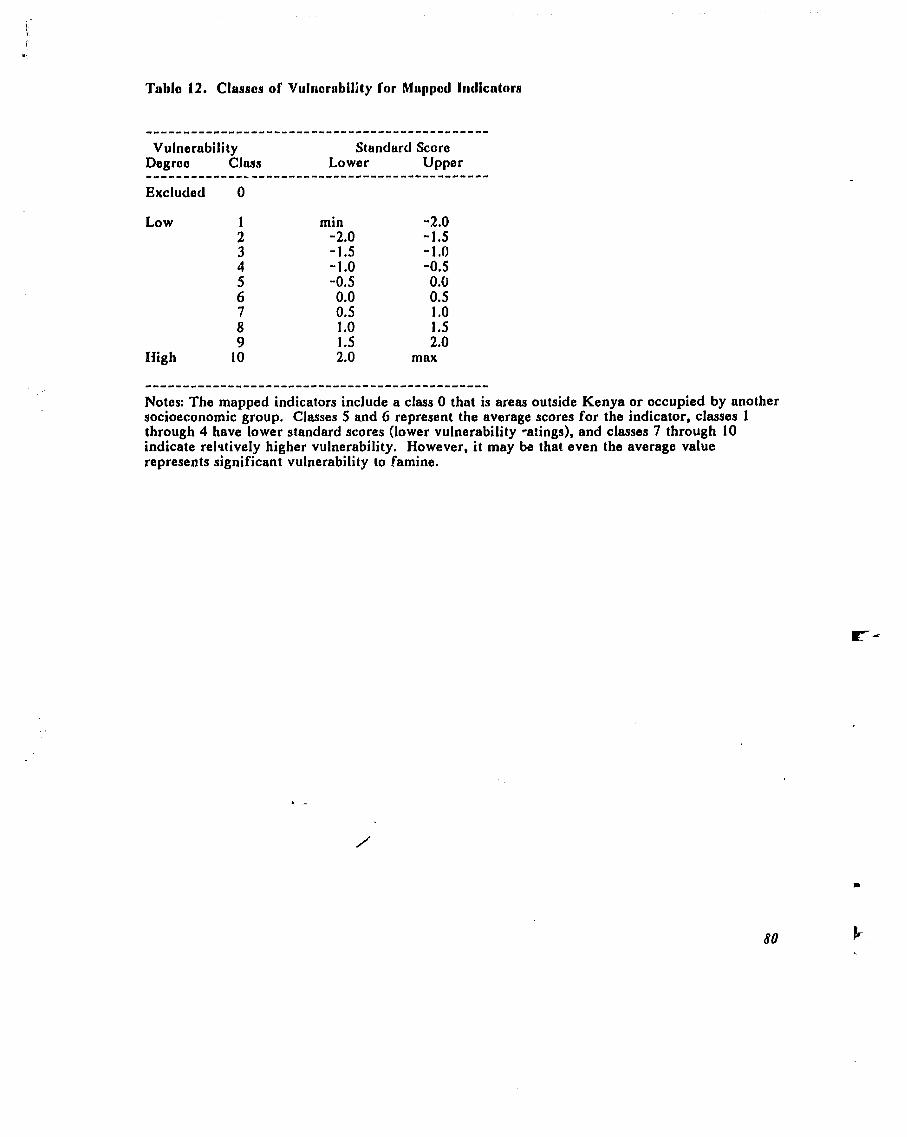
Tablo 12. Clrrssos of Valrrorrrbility for Muppod lr~dlcators
Vulnerability Standard Scoro Degroo Class Lower U P P ~ ~ - - - - - - - - - - - - -& - - - - - - - - - - - - " - - - " - - - - - - - - - " - - - - -
Excluded 0
Low 1 2 3 4 5 6 7 8 9
High 10
min -2.0 - 1.5 -1.0 -0.5 0.0 0.5 1 .o 1.5 2.0
-2.0 -1.5 " 1.0 -0.5 0.0 0.5 1 .o 1.5 2.0
max
.............................................. Notes: The mapped indicators include a class 0 that is areas outside Kenya or occupied by another socioeconomic group. Classes 5 and G represent the average scores for the indicator, classes 1 through 4 have lower standard scores (lower vulnerability casings), and classes 7 through 10 indicate relrtively higher vulnerability. However, it may be that even the average value represents significant vulnerability to famine.
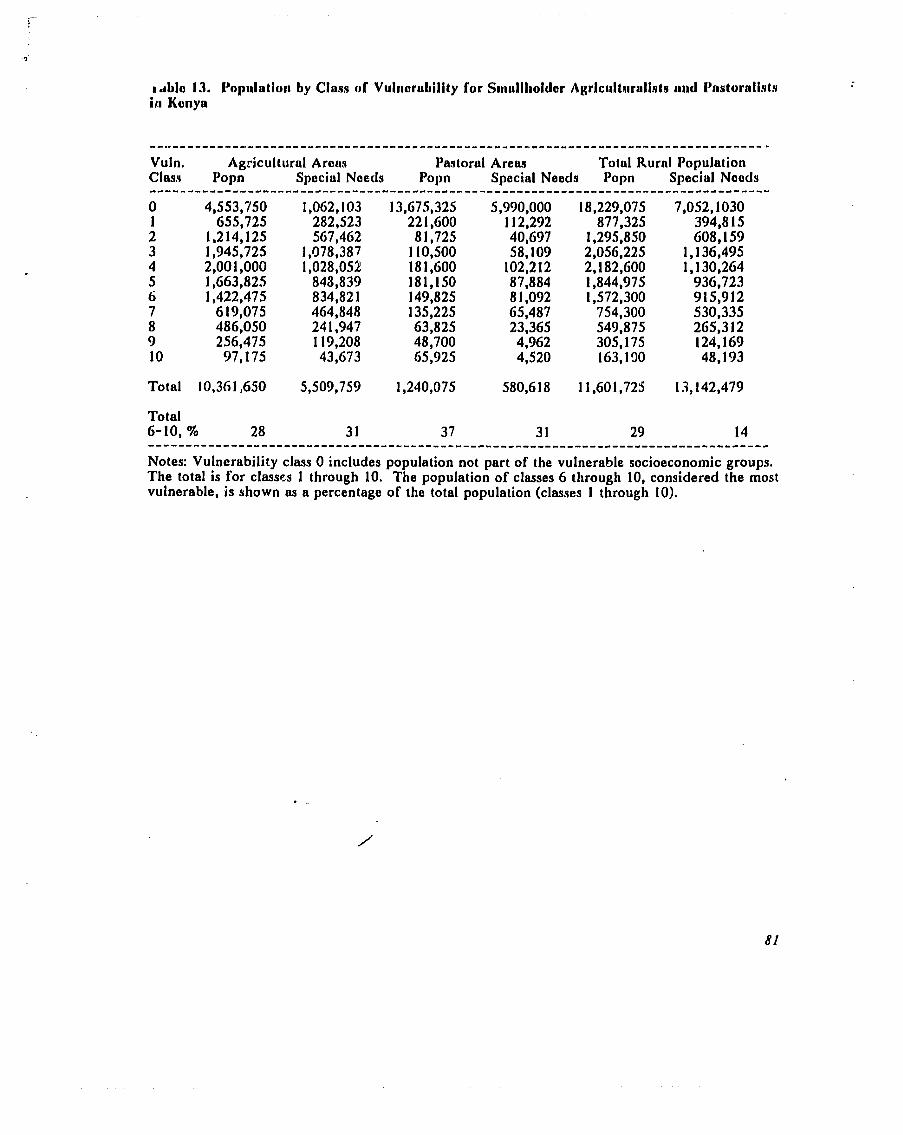
~ d b l o 13. I'apulutio~~ by Clrrns of Vull~orubility for S~~lulll~oldor Agricl~ltn~rulirts alld IDeutorulists i r ~ Konya
--..---------_---------------------------------------------------------------------,.
Vuln. Agricultural Arous Pastoral Areas Total Rurnl Population Class Popn Special Noecls Popn Special Needs Popn Speciul Noeds ................................................................................... 0 4,553,750 1,062,103 13,675,325 5,990,000 18,229,075 7,052,1030 1 655,725 282,523 22 1,600 i 12,292 877,325 394,8 15 2 1,214,125 567,462 8 1,725 40,697 1,295,850 608,159 3 1,945,725 1,078,387 1 10,500 58,109 2,056,225 1,136,495 4 2,OO 1,000 1,028,052! 18 1,600 102,212 2,182,600 1,130,264 5 1,663,825 848,839 181,150 87,884 1,844,975 936,723 6 1,422,475 834,82 1 149,825 8 1,092 1,572,300 915,912 7 6 19,075 464,848 135,225 65,487 754,300 530,335 8 486,050 24 1,947 63,825 23,365 549,875 265,3 12 9 256,475 1 19,208 48,700 4,962 305,175 124,169 10 97,175 43,673 65,925 4,520 163,190 48,193
Total 10,36 1,650 5,509,759 1,240,075 580,6 18 1 1,60 1,729 13,142,479
Total 6-10, % 28 3 1 37 3 1 29 14 ................................................................................... Notes: Vulnerability class 0 includes population not part of the vulnerable socioeconomic groups. The total is for classcs 1 through 10. The population of classes 6 through 10, considered the most vulnerable, is shown as a percentage of the total population (classes 1 through 10).
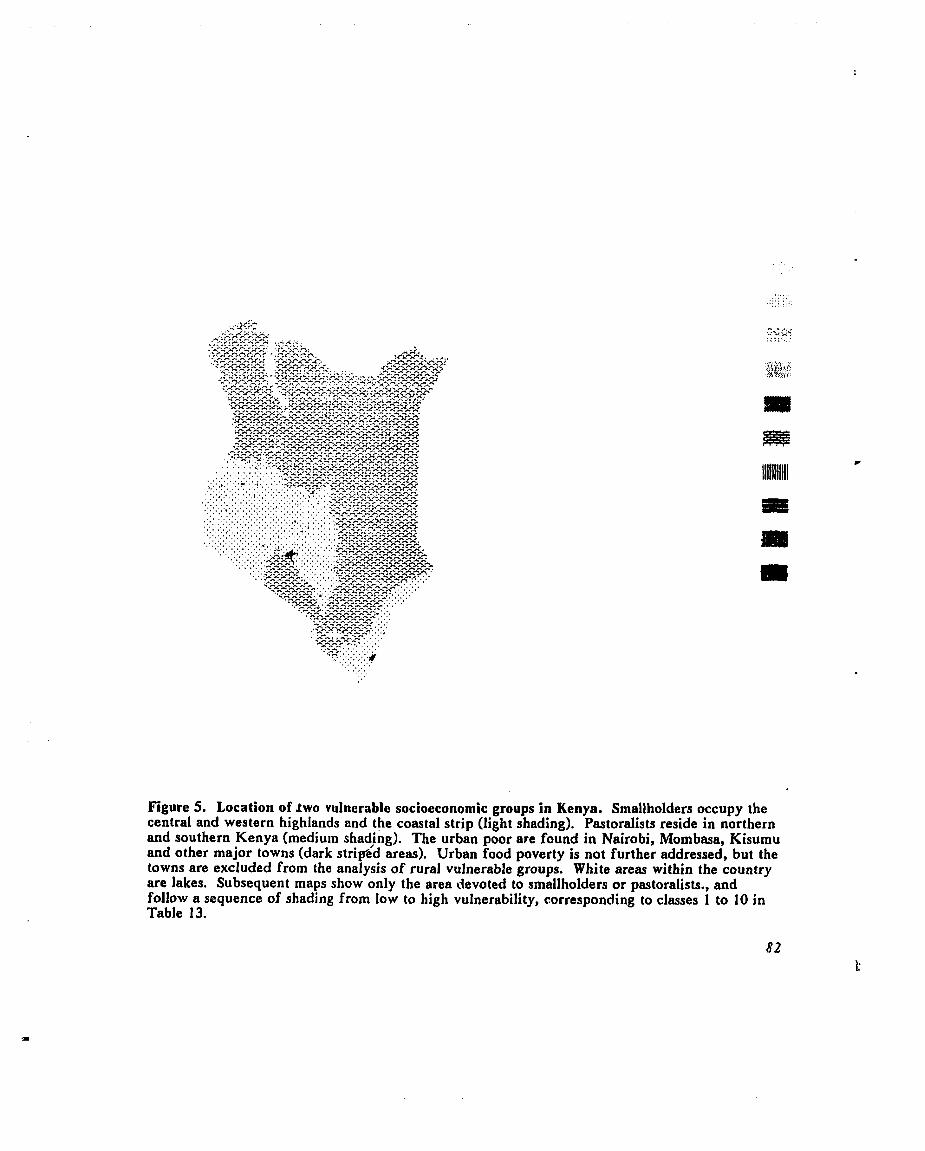
Figure 5. Location of lwo vulnerable socioeconomic groups in Kenya. Smallholders occupy the central and western highlands and the coastal strip (light shading). Pastoralists reside in northern and southern Kenya (medium shadjng). The urban poor are found in Nairobi, Mombasa, Kisuniu and other major towns (dark strifid areas). Urban food poverty is not further addressed, but the towns are excluded from the analysis of rural vulnerable groups. White areas within the country are lakes. Subsequent maps show only the area devoted to smallholders or pastoralists., and follow a sequence of shading from low to high vulnerability, corresponding to classes 1 to 10 in Table 13.
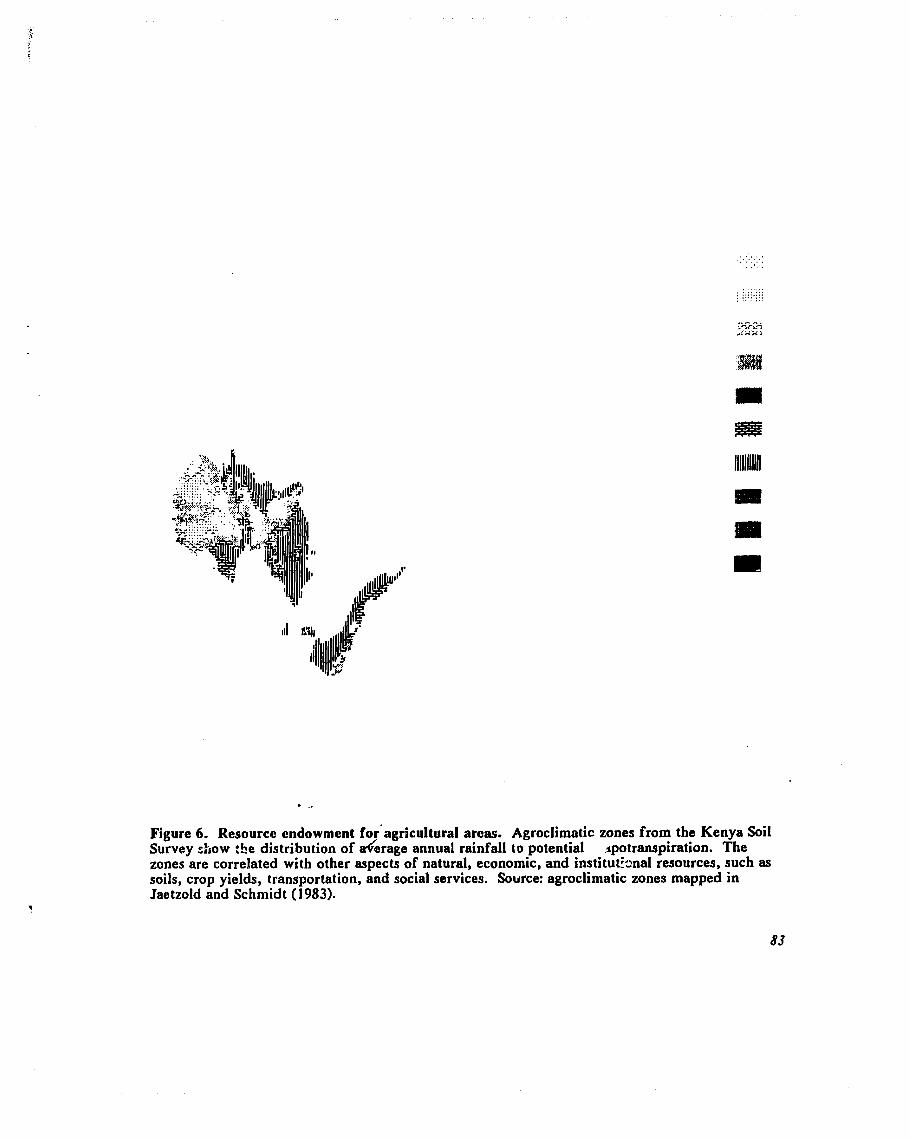
Figure 6. Resource endowment f~r 'a~r icul tura l areas. Agroclim~ic zones from the Kenya Soil Survey show :5e distribution of d6rage annual rainfall to potential ~potranspiration. The zones are correlated with other aspects of natural, economic, and institutknal resources, such as soils, crop yields, transportation, and social services. Source: agroclimatic zones mapped in Jac:tzold and Schmidt (1983).
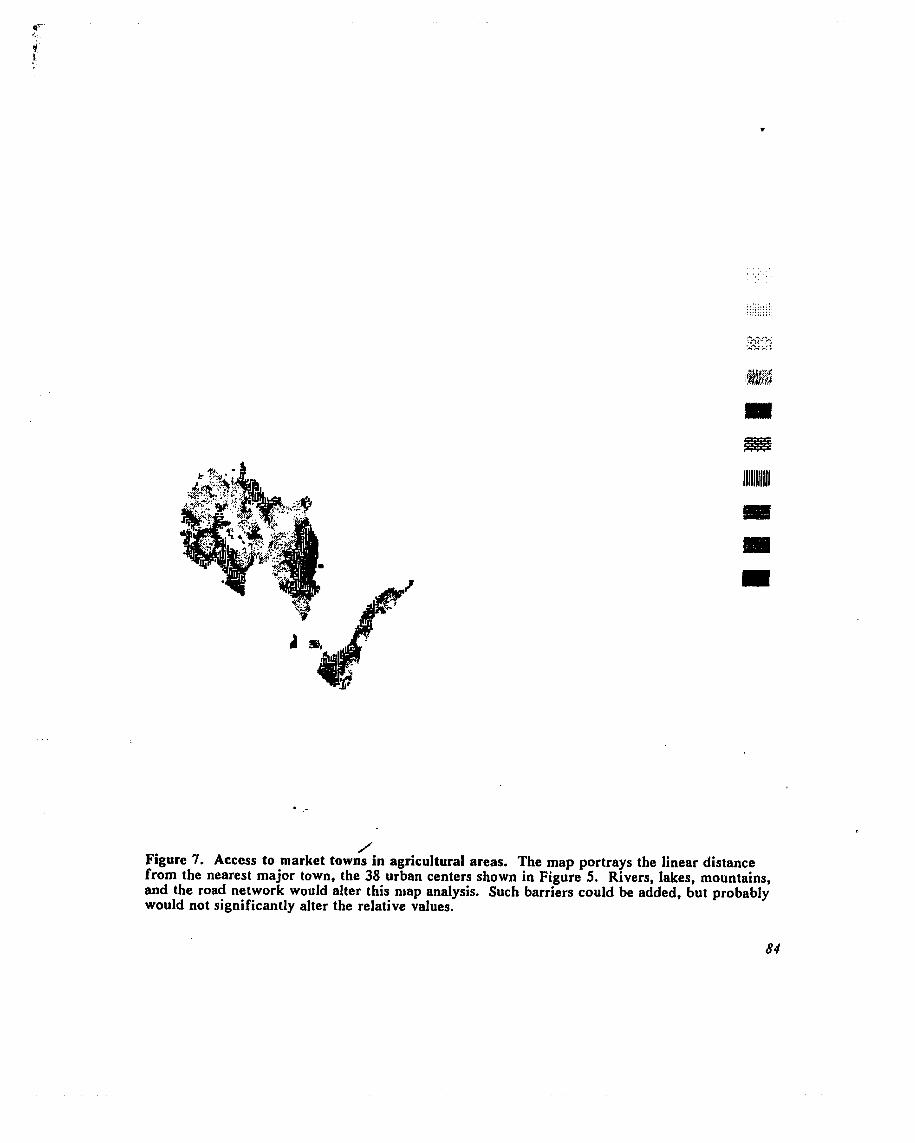
/ Figure 7. Access to market towns in agricultural areas. The map portrays the linear distance from the nearest major town, the 38 urban centers shown in Figure 5. Rivers, lakes, mountains, and the road network would alter this niap analysis. Such barriers could be added, but probably would not significantly alter the relative values.

Figure 8. Balance of maize production and consumption in agricultural areas. Maize production is based on estimates of potential maize yield (by agroclimatic zone), area cultivated (percent of each pixel, varying by .agroclimatic zone), and agricultural management (a fraction to reduce the potential yield, varying by district). The resulting average production levels for each district and the country approxinlate maize production estimates by the CBS. Consumption is based on district estimates of historical, avafage maize consumption per ca?ita. Maize production and consumption balance for the entire country, as is the case in average years. Areas with a maize surplus, shown in the lighter shades, have negative standard scores, as in the western highlands, traditionally a maize-exporting area. Sources: based on data in Jaetzold and Schmidt (1983) and CBS (1982, 1983a, 1984b).
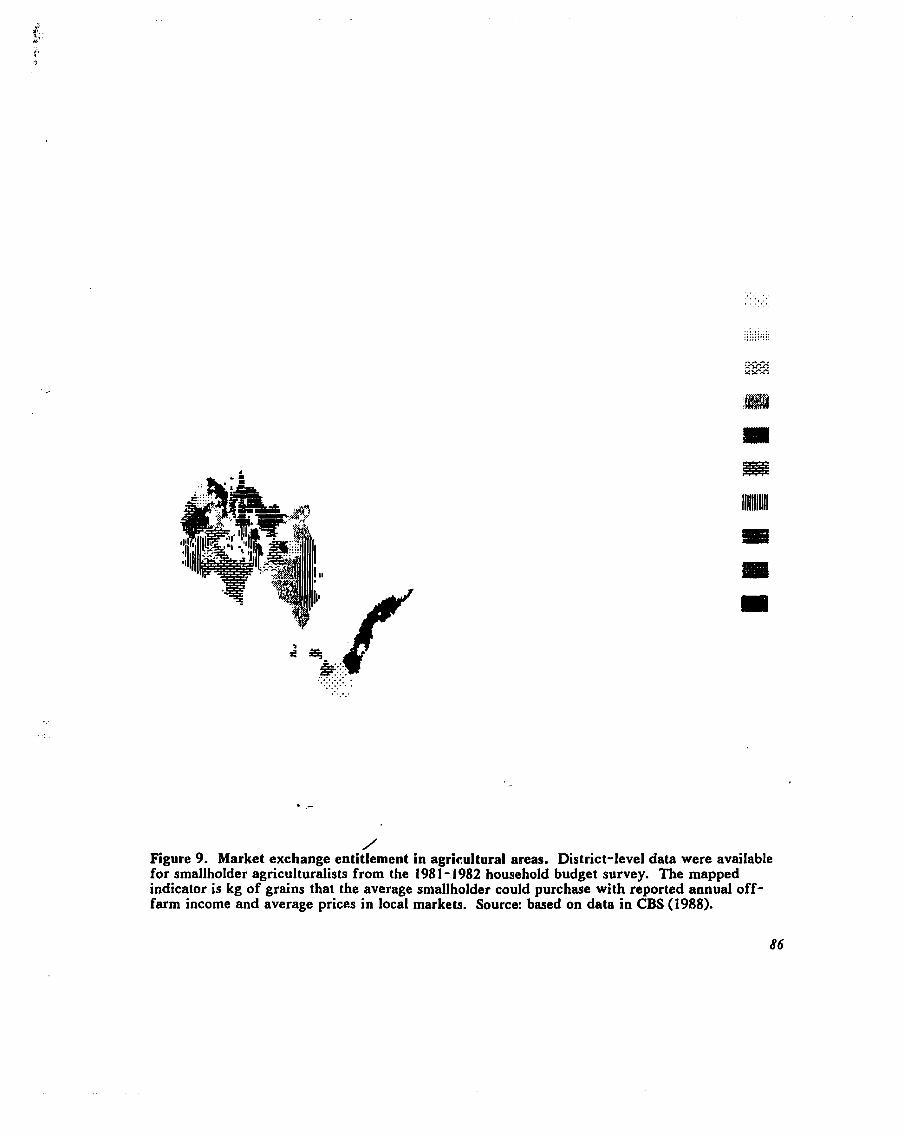
/ Figure 9. Market exchange entitlement in agricultural areas. District-level data were available for smallholder agriculturalists from the 1981-1982 household budget survey. The mapped indicator is kg of grains that the average smallholder could purchase with reported annual off- farm income and average prices in local markets. Source: based on data in CBS (1988).
86
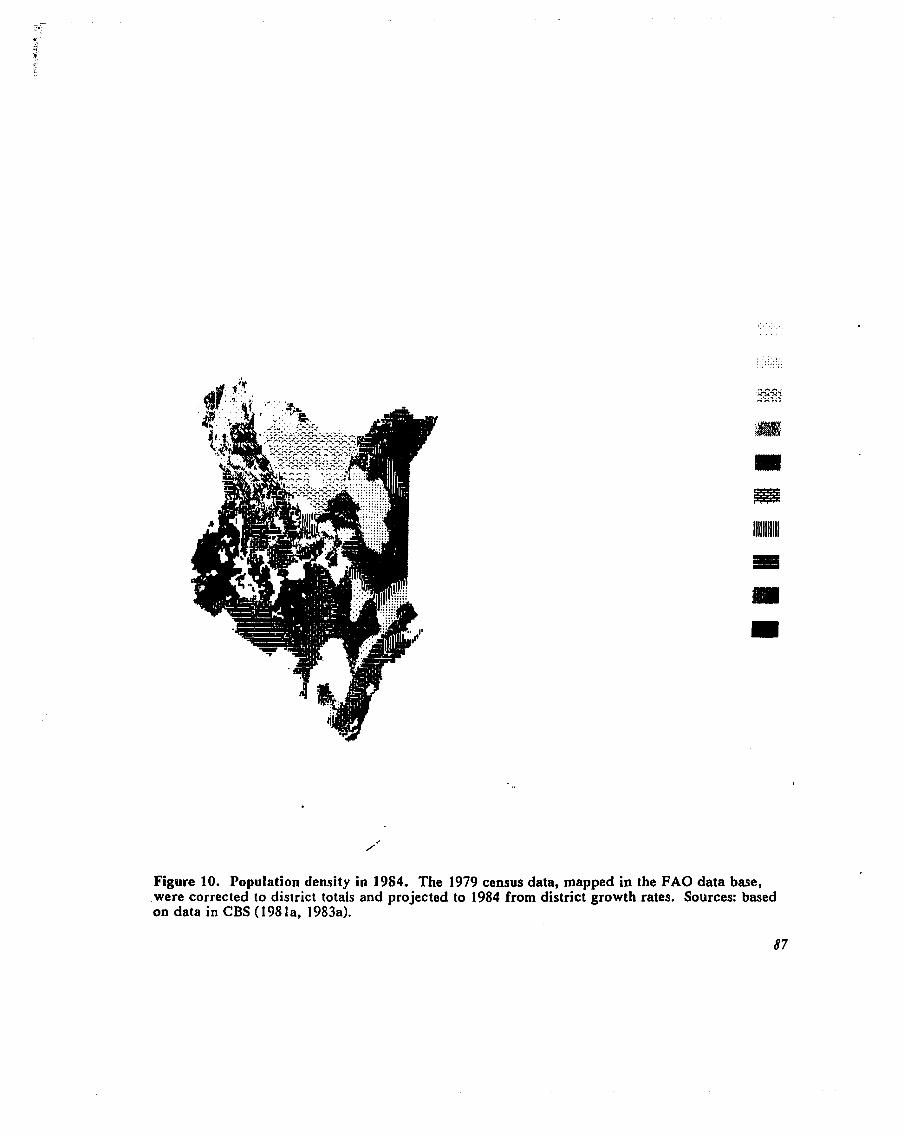
Figure 10. Population density in 1984. The 1979 census data, mapped in the F A 0 data base, .were corrected to district totals and projected to 1984 from district growth rates. Sources: based on data in CBS (1981a, 1983a).
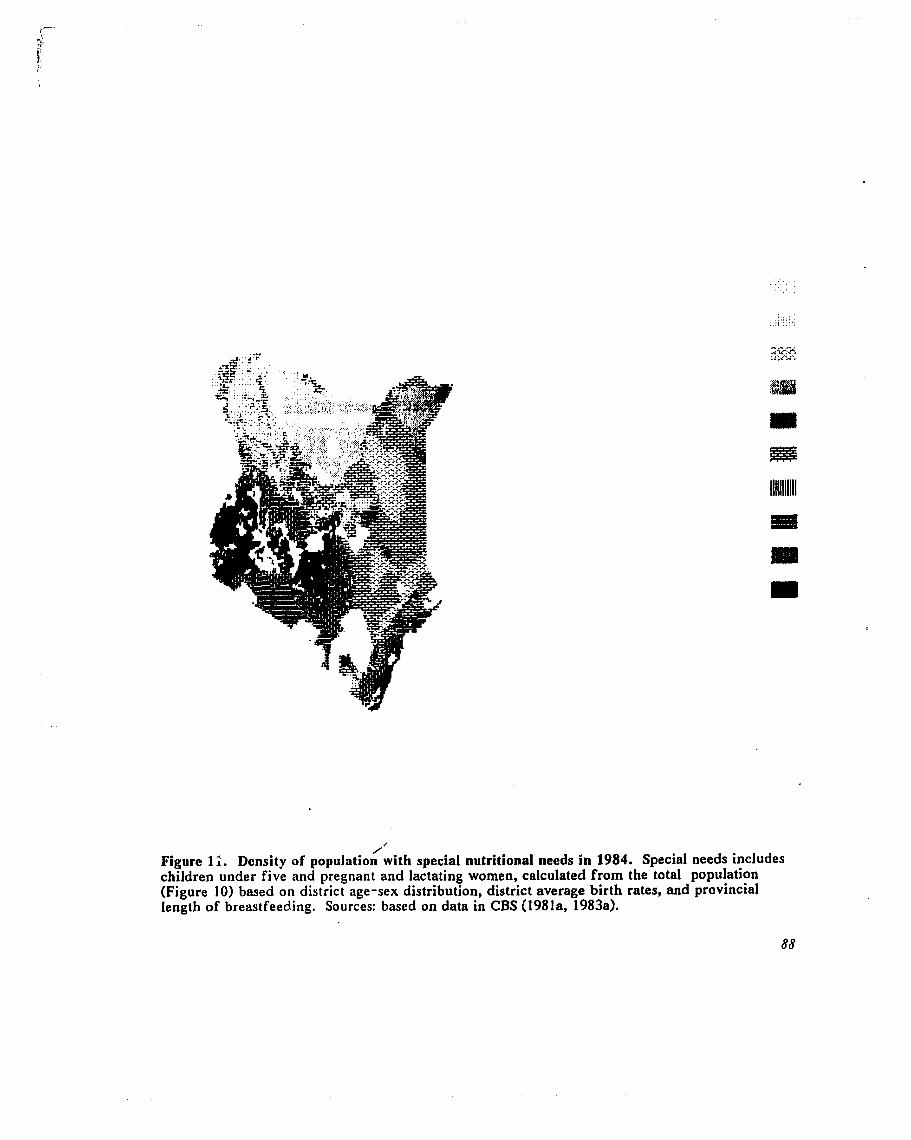
/ /
Figure 11. Density of population with special nutritional needs in 1984. Special needs includes children under five and pregnant and lactating women, calculated from the total population (Figure 10) based on district age-sex distribution, district average birth rates, and provincial length of breastfeeding. Sources: based on data in CBS (1981a, 1983a).
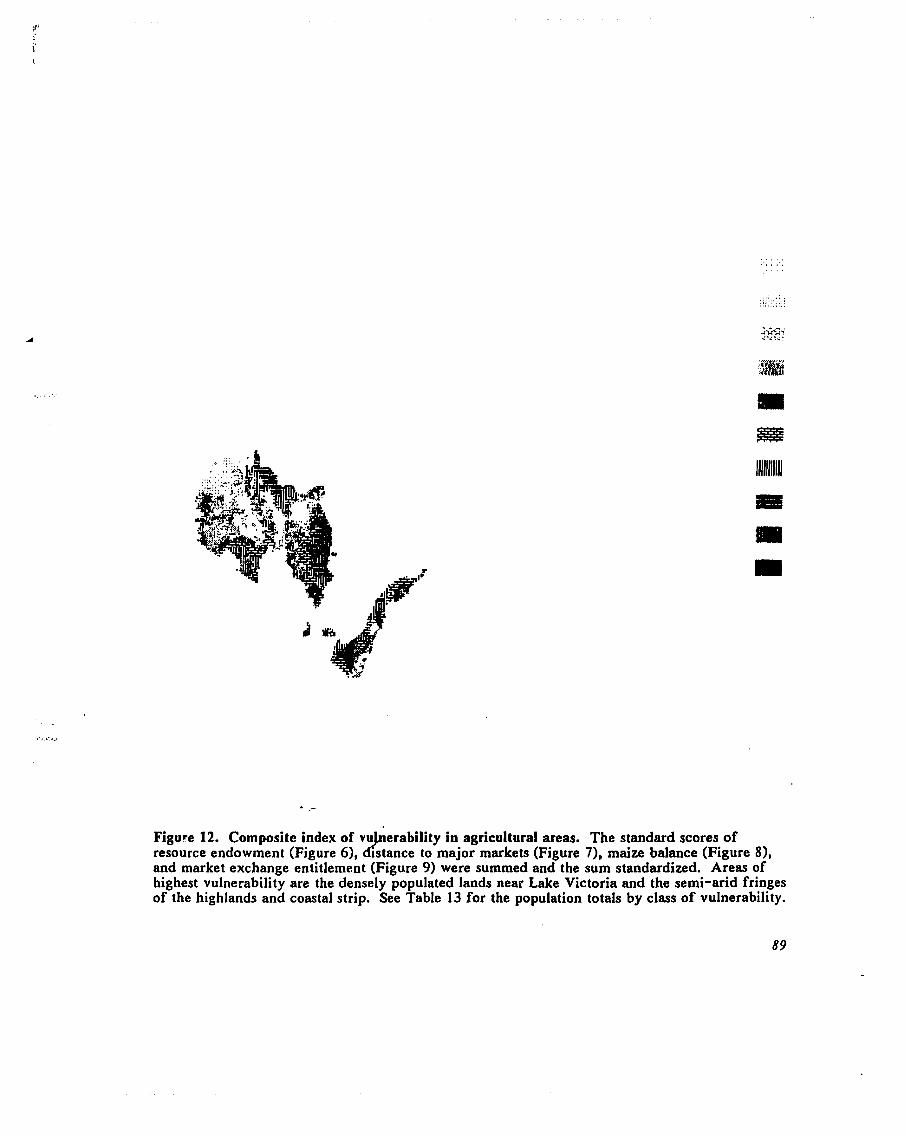
Figure 12. Composite index of vu erability in agricultural areas. The standard scores of d resource endowment (Figure 6), ]stance to major markets (Figure 7), maize balance (Figure 81, and market exchange entitlement (Figure 9) were summed and the sum standardized. Areas of highest vulnerability are the densely populated lands near Lake Victoria and the semi-arid fringes of the highlands and coastal strip. See Table 13 for the population totals by class of vulnerability.
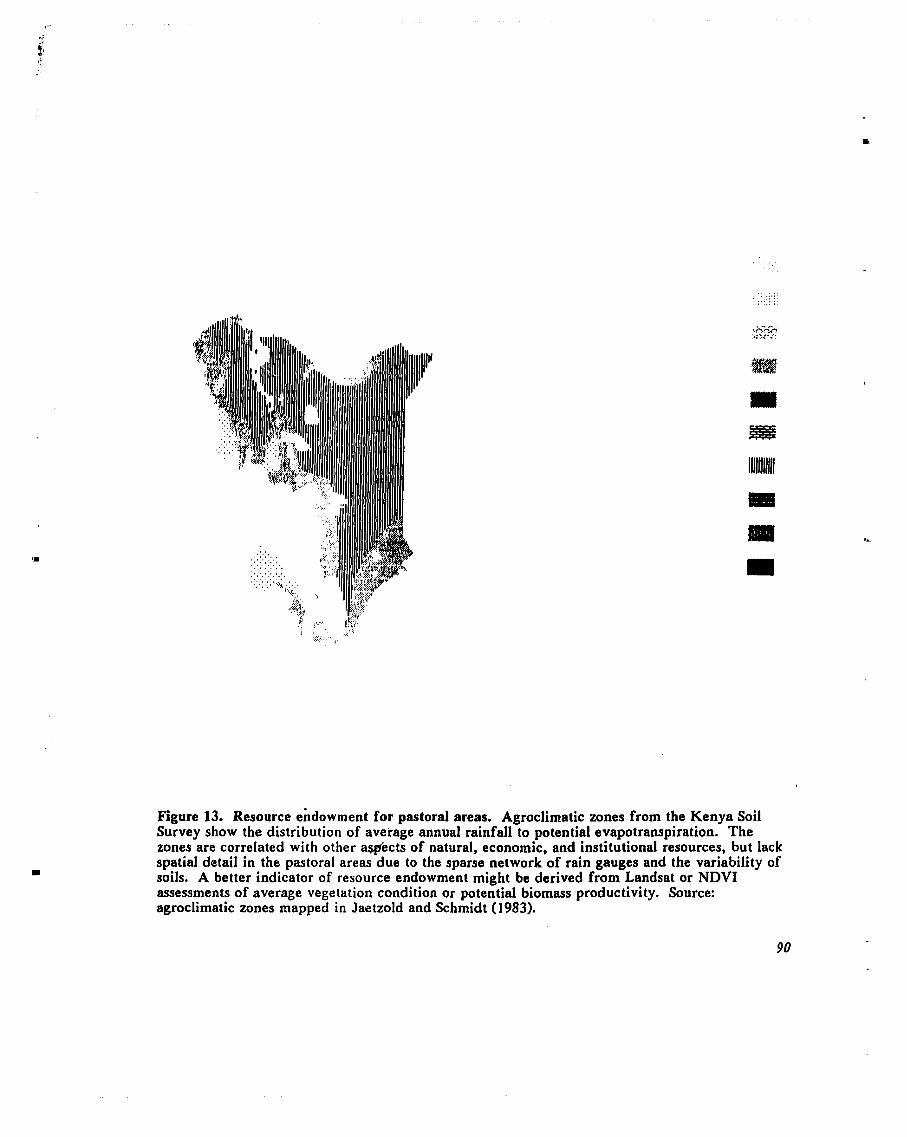
Figure 13. Resource endowment for pastoral areas. Agroclimatic zones from the Kenya Soil Survey show the distribution of average annual rainfall to potential evapotranspiration. The zones are correlated with other w e c t s of natural, economic, and institutional resources, but lack spatial detail in the pastoral areas due to the sparse network of rain gauges and the variability of soils. A better indicator of resource endowment might be derived from Landsat or NDVI assessments of average vegetation condition or potential biomass productivity. Source: agroclimatic zones mapped in Jatetzold and Schmidt (1983).
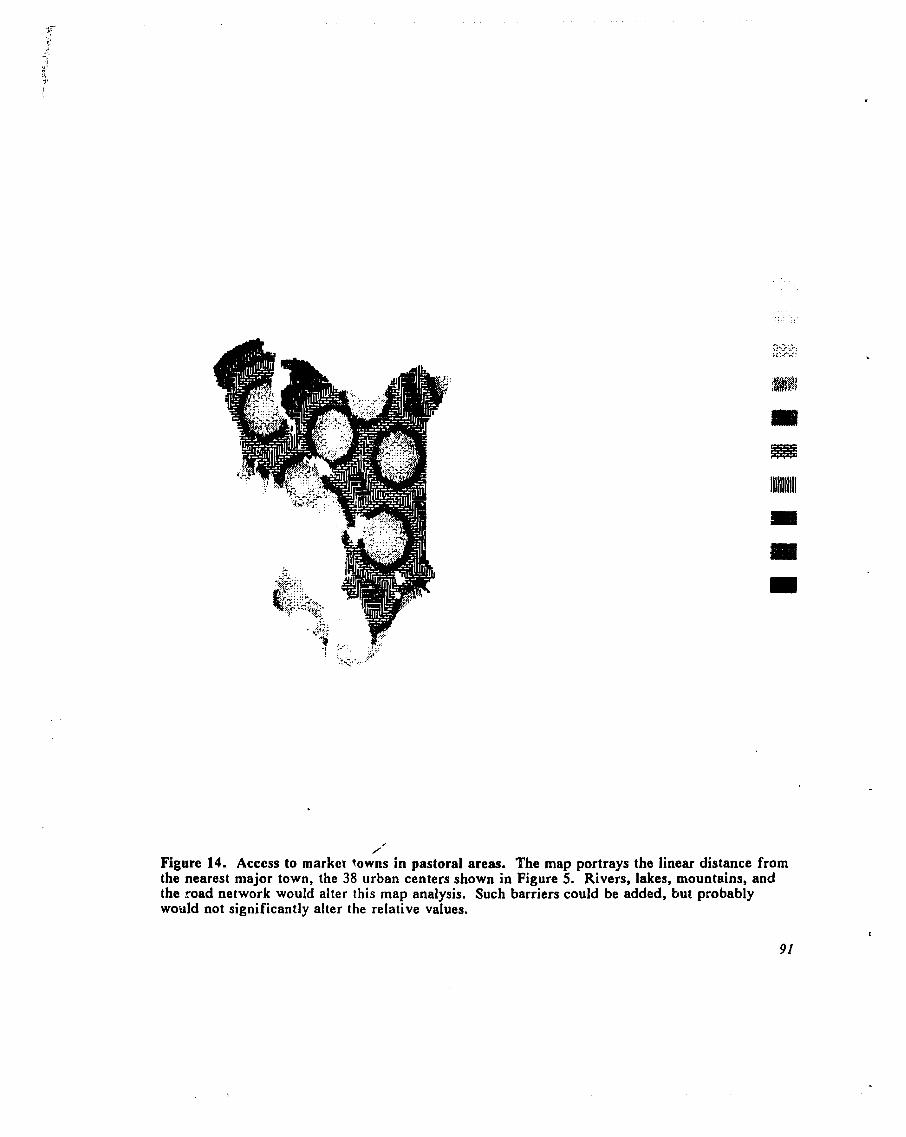
/ ' Figure 14. Access to market towns in pastoral areas. The map portrays the linear distance from the nearest major town, the 38 urban centers shown in Figure 5. Rivers, lakes, mountains, and the road network would alter this map analysis. Such barriers could be added, but probably would not significantly alter the relative values.
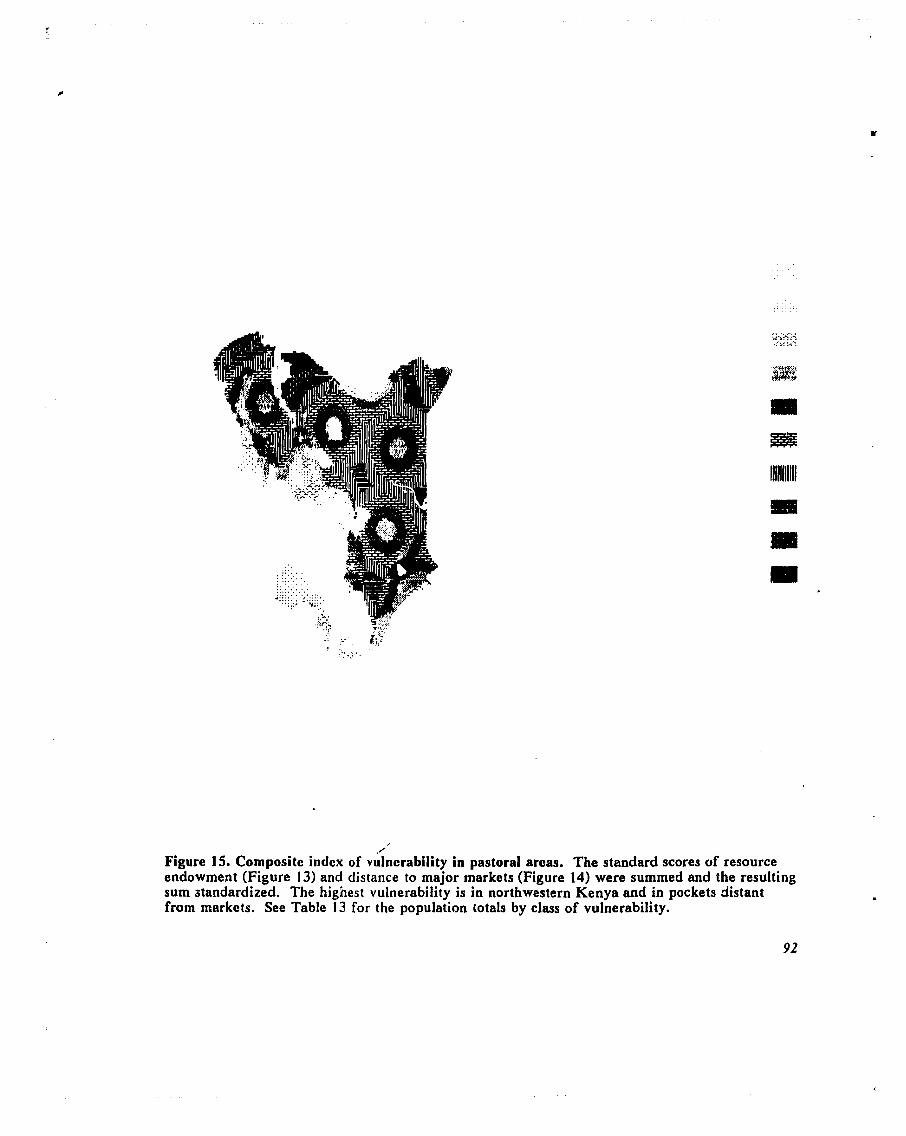
/
Figure 15. Composite index of vulnerability in pastoral areas. The standard scores of resource endowment (Figure 13) and distance to major markets (Figure 14) were summed and the resulting sum standardized. The highest vulnerability is in northwestern Kenya and in pockets distant from markets. See Table 13 for the population totals by class of vulnerability.
11.3. Analysis of Food Poverty among Smallholders
Another calculation of food poverty was based on more recent analysis of household
survey data. The Integrated Rural Survey (IRS) of 1974-1975 collected data for the agricultural
areas on household food production and cotlsumption, income and expenses. Greer and
Thorbecke (1986, 1987) computed poverty lines for each province, based on costs of typical
regional diets and a reference standard of 2,250 kcal/day for adult smallholdars. The percentage
of food-poor households (those with incomes below the poverty level) and a poverty severity
index that measured the degree of poverty (the extent to which household income fell below the
poverty line) were calculated. Over a third (38.6 percent) of the smallholders in the survey were
food poor. The highest percentage were in the Rift Valley (44.7 percent) and Western Provinces
(45.9 percent), although the highest degree of food poverty was in Nyanza Province (poverty
index=3 1.0).
Based on Greer and Thorbecke's analysis of the IRS data, over 7 million people would
have been food poor in 1984, without regarding the additional deprivation caused by the food
crisis. This estimate entails a number of assumptions that could be tested and refined: (1)
food-poor and food-sufficient households are the same size, (2) the prevalence of food poverty
among the surveyed smallholders is the same for the rest of the population (including urban resi-
dents, landless underenumerated in the rural surveys, and pastoralists); and (3) food poverty rates
have not changed between 1974 and 1984. These assumptions are clearly not realistic. For
instance, the skewness of income distribution in Kenya has increased over the last decade
(McCarthy and Mwangi 1982, Hunt 1984, World Bank 1983).
11.4. Scenarios of Vulnerability to Different Famine Mechanisms
Analysis of vulnerability should go beyond the current status quo or historical conditions
to test vulnerability to a range of famine mechanisms. For example, scenarios might assess the
impact of drought on household food security and compare the results across agro-ecological
zones or between households. Even an indication of relative changes in vulnerability wol~ld be
useful. This section reports the differential vulnerability among smallholders of central and.
eastern Kenya for scenarios of average and drought conditions.
The hierarchy of vulnerability in six districts of Central and Eastern Kenya illustrates the
extent of smallholder fb:6d poverty and its variation across agroclimatic zones and between
chronic and episodic conditions (F'gure 16) (Anyango et al. 1989, Downing 1988). The data are / drawn from a survey of 565 households concerning their responses to drought at the height of the
1984-1985 food crisis. The measures of vulnerability are arbitrary, but they correspond to the
domains of hunger (food shortage, food poverty, and food deprivation) described in chapter 1:
food-short households produce less than two-thirds of the household food requirements themselves;
market-sensitive households lack reliable off-farm incomes; and
individuals with special nutritional needs include children under 5 and lactating and pregnant women.
Households vulnerable to food poverty are those that are both food-short and market sensitive.
This definition of food poverty is qualitative, as opposed to the quantitative measures developed
by Greer and Thorbecke (1986)" Since it is based on a recent rural survey, it may be more
representative than Hunt's (1984) approximation.
Food-short households comprise 27 percent of the population in an average year, and 82
percent during a severe drought. Those susceptible to food poverty (residing in households that
are both food-short and market-sensitive) are 10 and 30 percent of the population in average and
drought years, respectively. Finally, individuals most vulnerable to food deprivation, those with
special nutritional needs in the food-poor households, are 2 and 8 percent of the population,
rcspec tively.
Vulnerability to both chronic and episodic hunger varies between agroclimatic zones. In
average years, the livestock-millet zone (V in the Kenya Soil Survey classification) has the lowest
rate of food shortage (6 percent), while the wetter zones are more vu1ner:able (from 24 to 40 L
percent of the population) due to smaller landholdings per capita. In a severe drought, however, L
almost all households in the maize-sunflower-cotton (111), marginal cotton (IV), and livestock-
millet (V) zones are food-short, attributable to the greater variability of food production in these
sub-humid to semi-arid zones. Access to off-farm employment also varies between zones: 20-25
percent of households in the tea and coffee zones (I and 11) compared to 30 to 35 percent in the
lower zones (111 to V).
The rural survey upon which this typology was based also measured the mid-arm
circumference of children under five. Of the 565 households, 279 had young children. These
households were classified according to their vulnerability to food poverty and presence of
marginal or severe malnourishment. The chi-square statistic was significant at the 0.05 level.
Only 8 percent of the households not classified as vulnerable to food poverty had one or more
severely malnourished child, compared to 24 percent of. the food-poor households. Clearly, the a
assignment into vulnerable groups presents a logical typology, illustrates important differences
between environmental resources and infrastructure, and has a basis in reality.
Comparison between dive&e methods of assessing food poverty among vulnerable groups,
however, is not encouraging. The exten :on of Hunt's method (section 11.1) and the GIs
assessment (section 11.2) result in low estimates of national food poverty (29 percent of the
population) compared to the estimate based on the IRS I household expenditure survey (3'q
percent, section 11.3), a difference of almost 2.5 million people. The discrepancy is in tlld
estimates of food poverty among rural smallholdcrs, with highr t rates reported by Greer and
Thorbecke. The estimates for central and eastern Kenya spm the three estiniates for
smallholders, and begins to address the causal structure of vulnerability and its relationship to
climatic episodes. The utility of the analysis of vulnerable groups is its flexibility to draw upon
new data, such as the analysis of the IRS data. The method also allows a regional specification
useful for identifying risk from specific episodes of food shortage or exchange entitlement
failure.
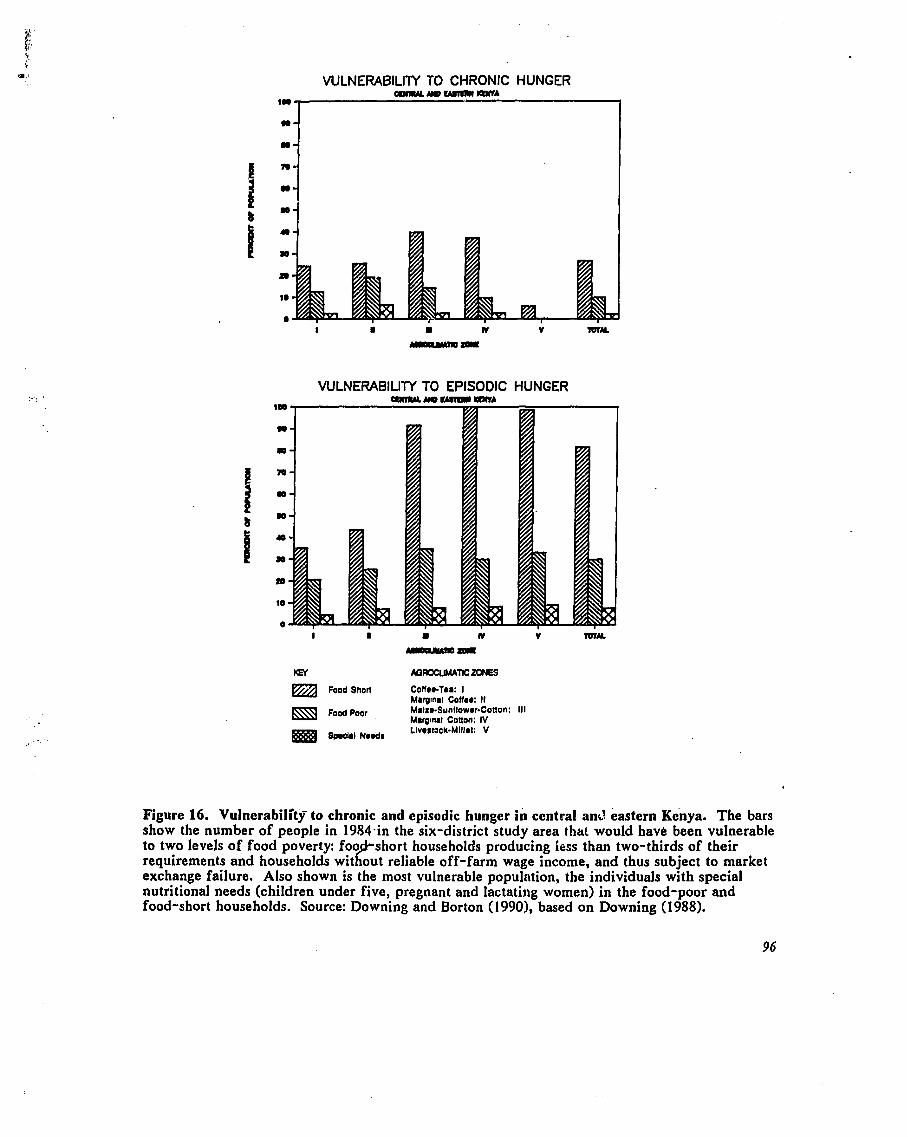
VULNERABILITY TO CHRONIC HUNGER Q D m U L N m - m A
IW I7
WLNERABlUlY TO EPISODIC HUNGER O ( I I U L N m u m r r l w r A
loo
w
a0
'10 n : i :
to
10
0 I D W V
Kfl A G R C C U M A T I C ~ E S
Food Shofl CoUrr-Tea: I Mo~tnal Coffrr: 11
~ o o d Poor Malza-Sunllowrr~Cotton: Ill Morg~nal Conon: IV
emI LIvrst3c~-Millat: V
Figure 16. Vulnerabilit$ to chronic and episodic hunger in central and eastern Kenya. The bars show the number of people in 1984-in the six-district study area that would have been vulnerable to two levels of food poverty: foo short households producing less than two-thirds of their requirements and households wit f? out reliable off-farm wage income, and thus subject to market exchange failure. Also shown is the most vulnerable population, the individuals with special nutritional needs (children under five, pregnant and lactatirig women) in the food-poor and food-short households. Source: Downing and Borton (1990), based on Downing (1988).
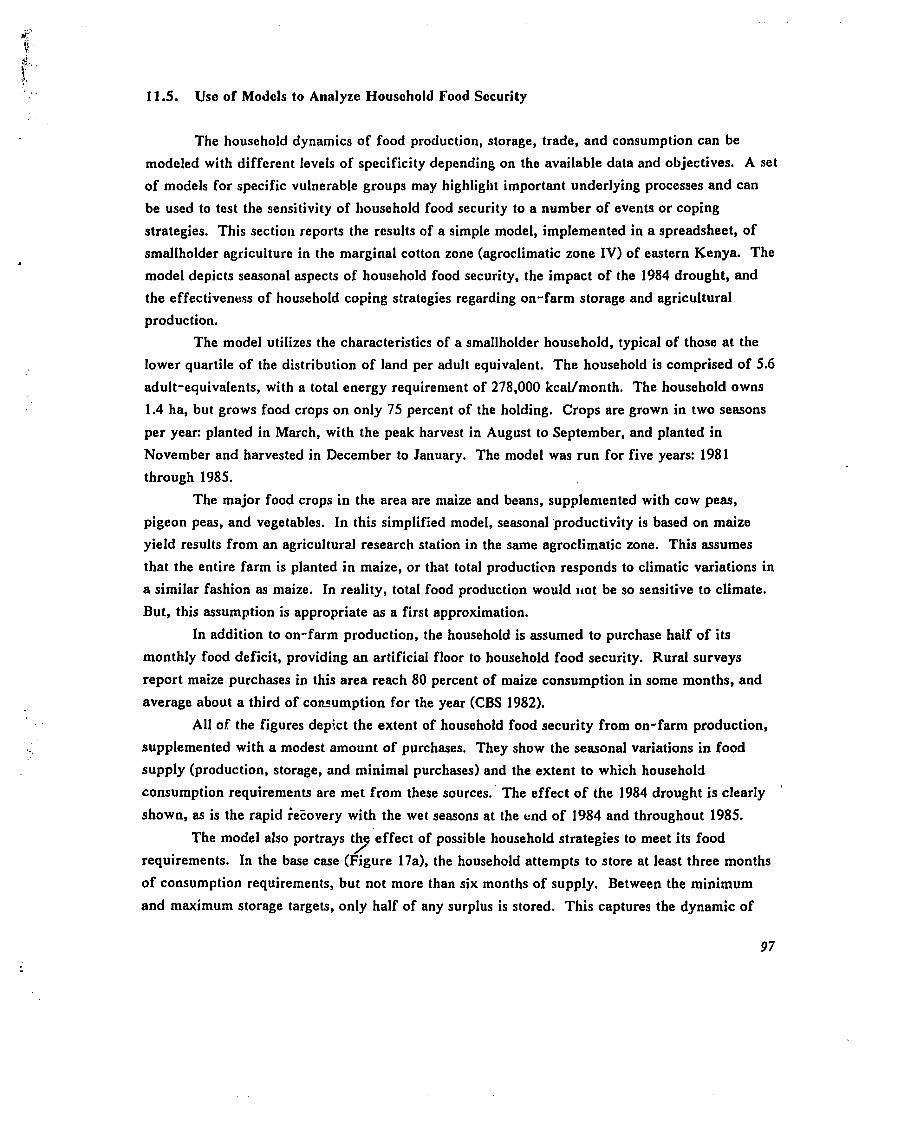
11.5. Uso of Models to Analyze Household Food Security
The household dynamics of food production, storage, trade, and consumption can be
modeled with different levels of specificity depending on the available data and objectives. A set
of models for specific vulnerable groups may highlight important underlying processes and can
be used to test the sensitivity of household food security to a number of events or coping
strategies. This sectioil reports the results of a simple model, implemented in a spreadsheet, of
smallholder agriculture in the marginal cotton zone (agroclimatic zone IV) of eastern Kenya. The
model depicts seasonal aspects of household food security, the impact of the 1984 drought, and
the effectiveness of household coping strategies regarding on-farm storage and agricultural
production.
The model utilizes the characteristics of a smallholder household, typical of those at the
lower quartile of the distribution of land per adult equivalent. The household is comprised of 5.6
adult-equivalents, with a total energy requirement of 278,000 kcal/month. The household owns
1.4 ha, but grows food crops on only 75 percent of the holding. Crops are grown in two seasons
per year: planted in March, with the peak harvest in August to September, and planted in
November and harvested in December to January. The model was run for five years: 1981
through 1985.
The major food crops in the area are maize and beans, supplemented with cow peas,
pigeon peas, and vegetables. In this simplified model, seasonal productivity is based on maize
yield results from an agricultura.1 research station in the same agroclimatic zone. This assumes
that the entire farm is planted in maize, or that total production responds to climatic variations in
a similar fashion as maize. In reality, total food production would not be so sensitive to climate.
But, this assumption is appropriate as a first approximation.
In addition to on-farm production, the household is assumed to purchase half of its
monthly food deficit, providing an artificial floor to household food security. Rural surveys
report maize purchases in this area reach 80 percent of maize consumption in some months, and
average about a third of consumption for the year (CBS 1982).
All of the figures depict the extent of household food security from on-farm production,
supplemented with a modest amount of purchases. They show the seasonal variations in food
supply (production, storage, and minimal purchases) and the extent to which household
consumption requirements are met from these sources. The effect of the 1984 drought is clearly '
shown, as is the rapid ie~overy with the wet seasons at the end of 1984 and throughout 1985.
The model also portrays th effect of possible household strategies to meet its food 9 requirements. In the base case (Figure 17a), the household attempts to store at least three months
of consumption requirements, but not more than six months of supply. Between the minimum
and maximum storage targets, only half of any surplus is stored. This captures the dynamic of
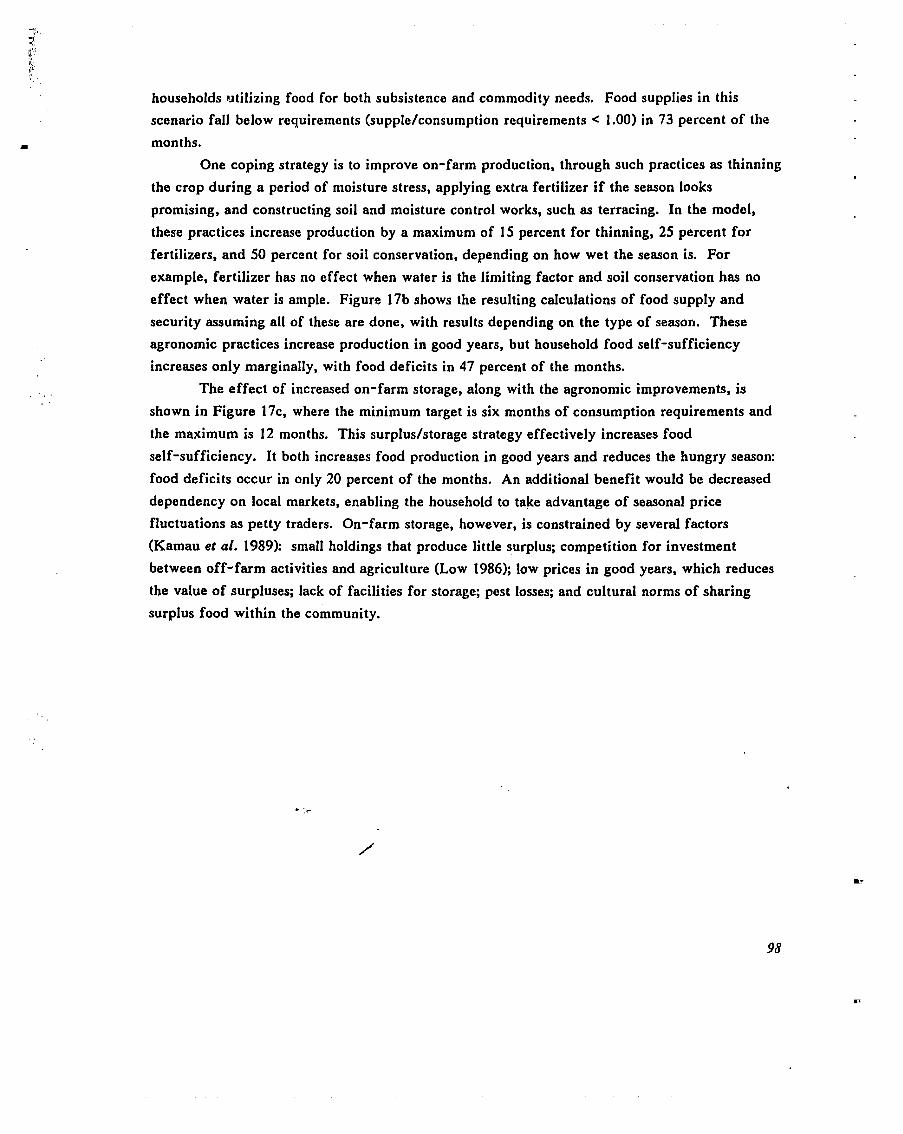
households utilizing food for both subsistence and commodity needs. Food supplies in this
scenario fall below requirements (supple/consumption requirements < 1.00) in 73 percent of the
months.
One coping strategy is to improve on-farm production, through such practices as thinning
the crop during a period of moisture stress, applying extra fertilizer if the season looks
promising, and constructing soil and moisture control works, such as terracing. In the model,
these practices increase production by a maximum of 15 percent for thinning, 25 percent for
fertilizers, and 50 percent for soil conservation, depending on how wet the season is. For
example, fertilizer has no effect when water is the limiting factor and soil conservation has no
effect when water is ample. Figure 17b shows the resulting calculations of food supply and
security assuming all of these are done, with results depending on the type of season. These
agronomic practices increase production in good years, but liousehold food self-sufficiency
increases only marginally, with food deficits in 47 percent of the months.
The effect of increased on-farm storage, along with the agronomic improvements, is
shown in Figure 17c, where the minimum target is six months of consumption requirements and
the maximum is 12 months. This surplus/storage strategy effectively increases food
self-sufficiency. It both increases food production in good years and reduces the hungry season:
food deficits occur in only 20 percent of the months. An additional benefit would be decreased
dependency on local markets, enabling the household to take advantage of seasonal price
fluctuations as petty traders. On-farm storage, however, is constrained by several factors
(Kamau et al. 1989): small holdings that produce little surplus; competition for investment
between off-farm activities and agriculture (Low 1986); low prices in good years, which reduces
the value of surpluses; lack of facilities for storage; pest losses; and cultural norms of sharing
surplus food within the community.
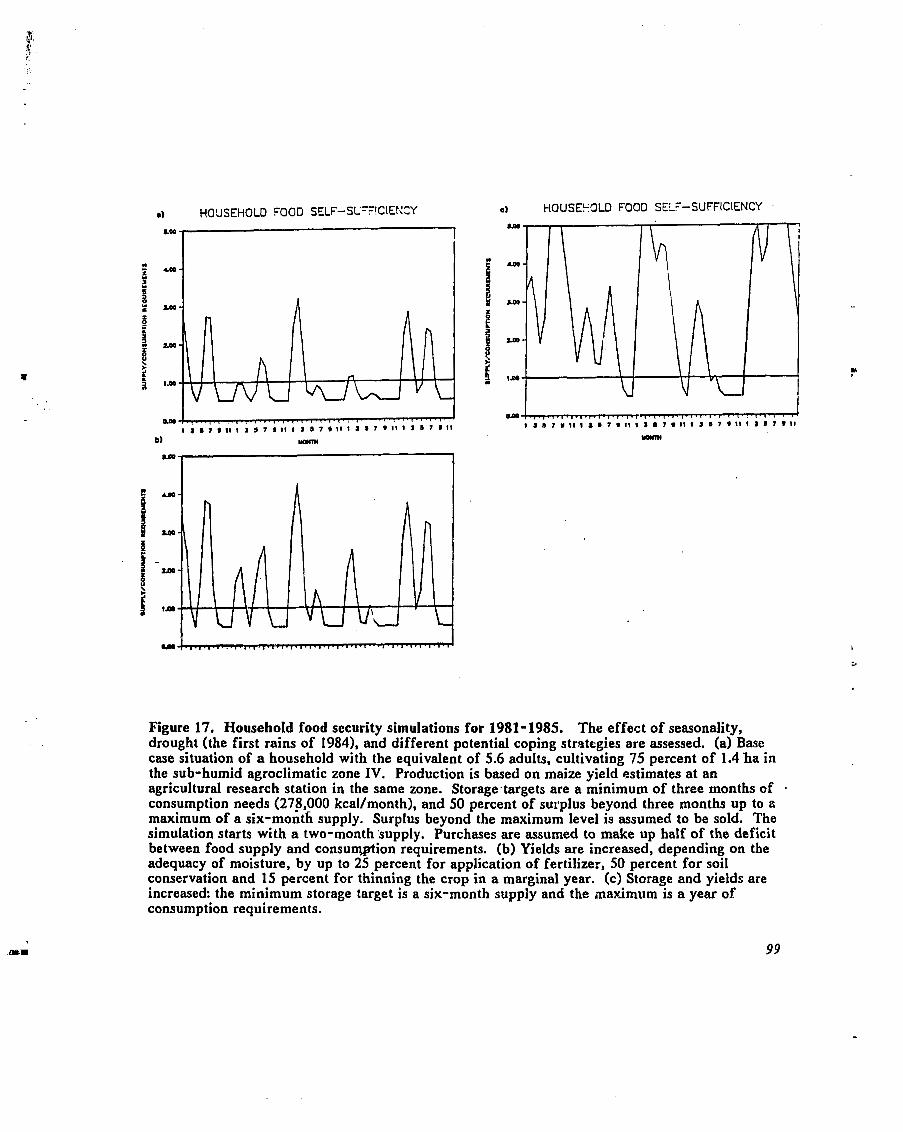
a~ HOUSEHOLD FOOD SELF-SC==!CIEtCCY a) HOUSEC9LD FOOD SELF-SUFFICIENCY
Figure 17. Household food security simulations for 1981-1985. The effect of seasonality, drought (the first rains of 19841, and different potential coping strategies are assessed. (a) Base case situation of a household with the equivalent of 5.6 adults, cultivating 75 percent of 1.4 ha in the sub-humid agroclimatic zone IV. Production is based on maize yield estimates at an agricultural research station in the same zone. Storage.targets are a minimum of three months of consumption needs (27!,000 kcal/month), and 50 percent of sur.plus beyond three months up to a maximum of a six-month supply. Surplus beyond the maximum level is assumed to be sold. The simulation starts with a two-month ~upply. Purchases are assumed to make up half of the deficit between food supply and c o n s u ~ i o n requirements. (b) Yields are increased, depending on the adequacy of moisture, by up to 25 percent for application of fertilizer, 50 percent for soil conservation and 15 percent for thinning the crop in a marginal year. (c) Storage and yields are increased: the minimum storage target is a six-month supply and the maximum is a year of consumption requirements.
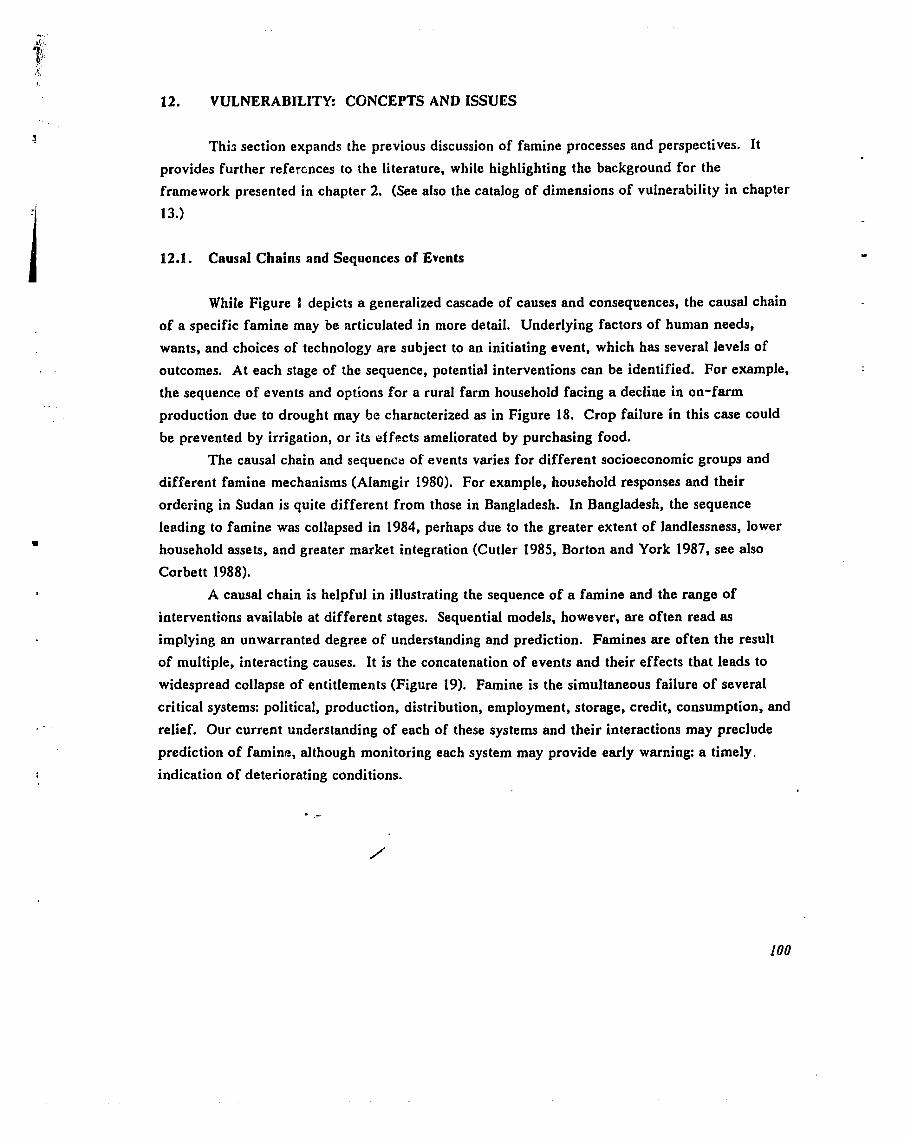
12. VULNERABILITY: CONCEPTS AND ISSUES
This section expands the previous discussion of famine processes and perspectives. It
provides further references to the literature, while highlighting the background for the
framework presented in chapter 2. (See also the catalog of dimensions of vulnerability in chapter
13.)
12.1. Causal Chains and Sequences of Events
While Figure I depicts a generalized cascade of causes and consequences, the causal chain
of a specific famine may be articulated in more detail. Underlying factors of human needs,
wants, and choices of technology are subject to an initiating event, which has several levels of
outcomes. At each stage of the sequence, potential interventions can be identified. For example,
the sequence of events and options for a rural farm household facing a decline in on-farm
production due to drought may bc characterized as in Figure 18. Crop failure in this case could
be prevented by irrigation, or its effects ameliorated by purchasing food.
The causal chein and sequence of events varies for different socioeconomic groups and
different famine mechanisms (Alamgir 1980). For example, household responses and their
ordering in Sudan is quite different from those in Bangladesh. In Bangladesh, the sequence
leading to famine was collapsed in 1984, perhaps due to the greater extent of landlessness, lower
household assets, and greater market integration (Cutler 1985, Borton and York 1987, see also
Corbett 1988).
k causal chain is helpful in illustrating the sequence of a famine and the range of
interventions available at different stages. Sequential models, however, are often read as
implying an unwarranted degree of understanding and prediction. Famines are often the result
of multiple, interacting causes. It is the concatenation of events and their effects that leads to
widespread collapse of entitlements (Figure 19). Famine is the simultaneous failure of several
critical systems: political, production, distribution, employment, storage, credit, consumption, and
relief. Our current understanding of each of these systems and their interactions may preclude
prediction of famine, although monitoring each system may provide early warning: a timely
indication of deteriorating conditions.
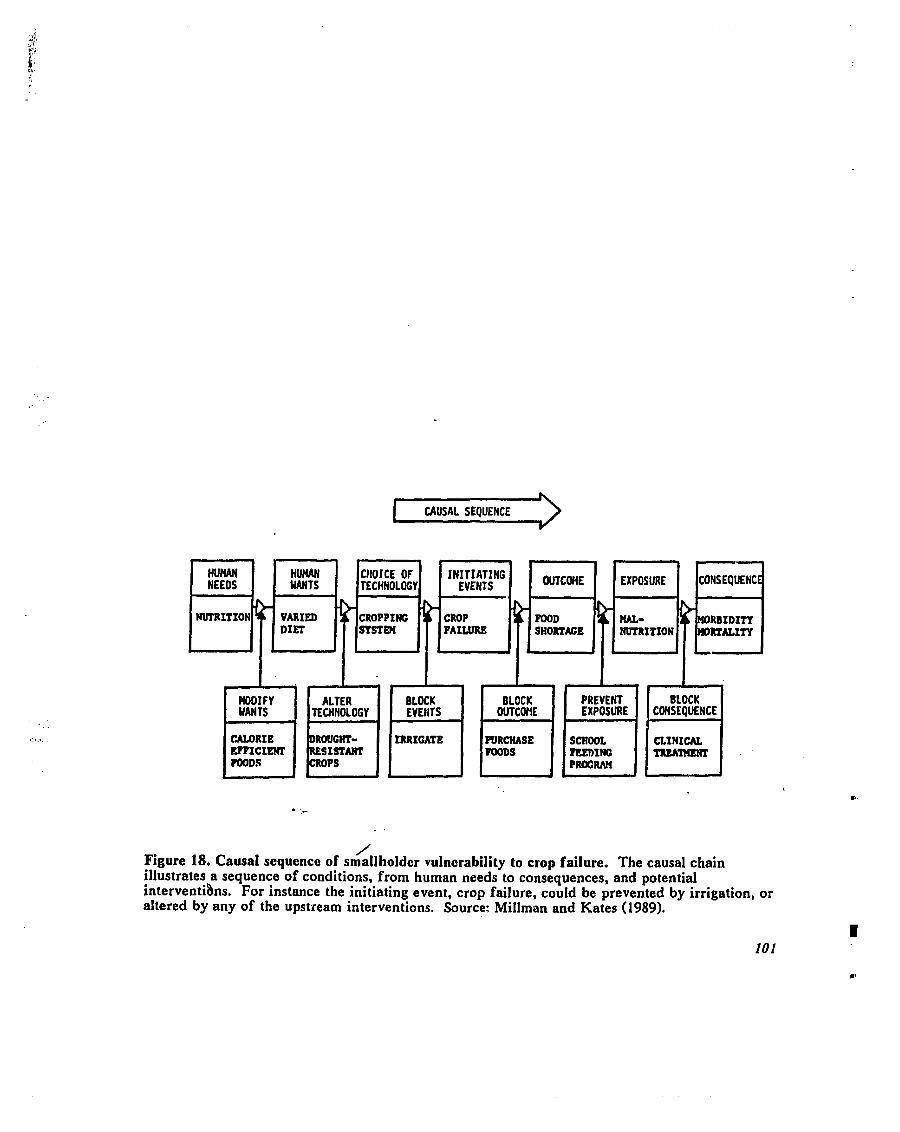
1 CAUSAL SEQUENCE
/ Figure 18. Causal sequence of smallholder vulnerability to crop failure. The causal chain illustrates a sequence of conditions, from human needs to consequences, and potential interventibns. For instance the initiating event, crop failure, could be prevented by irrigation, or altered by any of the upstream interventions. Source: Millman and Kates (1989).
101
VULNERABLE SYSTEMS
P Q ~ ~ C A L P A O W C ~ O U ~ P B U ~ O N fimmw~~ BTORAOF CAEDIT CONBUMP~XWJ RELIEF
KEY: o Potential critical events
Actual critical events . ,-
Figure 19. Concatenation of eve& resul(ing in famine. Each system is vulnerable to a number of critical events. Famine results when a number of these events occur at the same time, or in the same crisis period. Source: based on Currey (1984).
A severe famine may entail widespread disruption of social and economic systems,
marked by migration to feeding camps and urban centers. A moderate food crisis, however, may
be better characterized as an extension of existing seasonal patterns of hunger, rather than a
catastrophe. The hungry season is extended from two months to qix, labor migration is prolonged,
planting occurs several times before an adequate harvest i s o5tair;ed. 'This approach helps
understand the response to drought in Kenya (appendix 11) and Botswana (section 6.1). The
effect of dual cropping seasons is particularly important: hoir;oholds have two opportunities each
year to produce some of their food, and consequently have less need to store food.
12.3. Food Systems
Food is acquired through a variety of mechanisms, that, when taken together, may be
termed a food system. There are numerous attempts to document and model food systems, i.e. to
identify and characterize the key flows of food (production, trade, consumption), the
socioeconomic groups involved (producers, traders, consumers), and the determinants of the flows
of food (environmental resources, population, economic relationships).
Among the numerous approaches to modeling food systems, accounting methods, such as
the Food Needs Assessment framework (Cogill et al. 1989) or the FEWS food accounting, portray
food availability at the national or regional level. The Food Accounting Matrix (Hay 1978, 1980,
1987), on the other hand, attempts to characterize flows between socioeconomic groups, an
important characteristic that enables it to capture relationships that may lead to chronic hunger or
famine. Simulation (Pinckney and Gotsch 1987, Rogers, van der Geest and Greener and 1988)
and econometric studies (Scobie 1989, Bezuneh et al. 1988, Deaton and Bezuneh 1987) may focus
on the impact of food policy decisions.
Social scientists, including anthropologists, geographers, and sociologists, have studied
food systems in the context of the local ecosystem and cultural factors that affect agriculture,
food distribution, and food consumption (see, e.g., Chambers et al. 1981, Colson 1979, Messer
1986, 1989a, 1989b, Moris 1989, Richards 1932, 1939). Common topics include: land use, labor,
seed stock, pests, requisition of crops, social conflict, indigenous and market-oriented coping
mechanisms, seasonality, climatic variations, political power and discrimination, and other
determinants of nutritibiial and health status.
Complete food system asse ments require large amounts of data. Even a national model /$S requires regional data to maintain reality in its structure. These data simply do not exist in
sufficient time series and geographic coverage to instill much confidence in the results of food
systems models. Anthropological assessments require enormous amounts of field work to
document food cons~~mption over several annual cycles. The models, however, have three
fundamental uses.
First, relatively simple calculations provide a historical context within which to evaluate
the current food situation. For example, the national food balance sheets (e.g., the number of
months of consumption provided by current stocks, 3cheduled imports and forecast production)
provide a more accurate gauge of food security than production alone. A time series of the food
balance calculations allows comparison of the current situation with recent food crises, times of
seemingly adequate food availability, and years when surplus could be safely exported. This is
the function of the FEWS indicator of food production trends.
Second, the process of constructing or criticizing a food systems model tests bur
understanding of real world processes by which food reaches nations and communities,
households and individuals. Such models facilitate multidisciplinary efforts that link questions of
production, household dynamics and national economy and policy. Development of co~iceptual
models, even in the absence of data, may guide the design of new household surveys.
Third, a real benefit of food systems research is to identify the sensitivity of food flows
to diffelent conditions. Global models have identified population growth and agricultural
technology as key driving factors (Meadows et al. 1972). national models often focus on price
incentives and import and export policies (Scobie 1989; Rogers et al. 1989), and household models
may identify optimal economic strategies (Bezuneh et al. 1988) and sensitivities to climatic
variations (Akong'a and Downing 1988, Ellis et al. 1987). This application of modeling defines
the realm of probable conditions. For example, the simple household model presented in
appendix 11 tests the potential impact of food production strategies (soil conservation, thinning,
fertilizer), increased food storage, and food prices on household food security. A household
model for each vulnerable group should provide insight into the meaning of key indicators
derived from independent observations.
12.4. Spatial Process
Famine and vulnerability to famine have a spatial dimension. Vulnerable groups are
located in particular places, which may be described in terms of the distribution of natural . resources such as climate and soil, or salient aspects of social and political organization, such as
land-tenure systems. For example, pastoralists often reside in semi-arid areas, and may find
their movements incre&ingly circumscribed by political-economic conditions of war or policies
promoting settled agriculture. T y distribution of natural resources is often correlated with the
distribution of economic infrastructure and services. For example, in central and eastern Kenya,
agroclimatic zones, defined to capture the spatial distribution of climate and soils, also serve as a
surrogate for population density and aspects of infrastructure (roads, water, agricultural
extension, education, health services) that affect vulnerability to hunger (see appendix 11 and
Downing, Lezburg et al. 1989). Interpretation of vulnerability according to the spatial distribution
of natural and manmade resources may provide more insight than characterizations based on
political boundaries (see Mason et al. 1987).
Two other aspects of famine have strong spatial components: (1) the nature of markets
and the spread of market failures; and (2) transportation infrastructure as a constraint to food aid.
Markets in Africa are often characterized as small and fragmented. National markets are
small and volatile: a modest drought may require extraordinary imports and the use of scarce
foreipn exchange. Within a country, food may not move easily from surplus to deficit areas,
constrained by government restrictions, urban dominance, poor roads, minimal transport, and
uncertain information about demand in remote places. For example, traders in Wamba, Kenya, a
not particularly remote market town, refused to bring in yellow maize, complaining that the
government gazetted prices were too low (Sperling 1989).
'The result of spatially fragmented markets may be local food shortages and market
failure, as recognized in the FEWS report on Mauritania for the Air Mountains (Price, Williams
19898). Local shortages may extend outward, in a spatial ripple effect, in response to higher
demand (more food purchases required), movement of food toward the deficit area, and
migration of people from deficit to surplus areas. In addition, an initially patchy drought may
become more coherent and severe, as in the 1983-1984 drought in Kenya (Downing, Gitu and
Kamau 1989). Price rises in Ethiopia, for example, began as local, isolated pockets and spread
throughout the country as demand increased, perhaps accelerated by hoarding (Baulch 1987,
Cutler 1984, Wolde Mariam 1984, Seamon and Holt 1980).
The role of weak transportation infrastructure as a constraint to relief (in addition to
market distribution of food) is widely recognized (Mellor and Gavian 1987). Gould and Rogier
(1984) describe two methods to assess transport costs and delivery times. They also discuss the
effects on remote hinterlands of increased food shortage and decreased funds for transportation
at the international level. The FEWS reports already discuss the prepositioning and location of
emergency food aid as part of the vulnerability assessments.
12.5. Household Processes and Responses
Most of the research on famine adopts, at least in part, a conception of the household and . ._ how it operates to meet 'its consumption requirements. Here we focus on several issues relevant
to food poverty: the notion of enti)lement, household decision making and coping strategies, and
problems with the definition of households and identification of food-poor households.
Swift (1989) emphasizes the role of endowments or assets, including human resources
(labor, education, health), individual productive assets, collective productive assets, stores of
food, capital reserves (e.g., jewelry), and money. Swift includes claims on relatives, community
groups, and the government as (intangible) assets. It seems more appropriate to regard these us
entitlements to transfers rather than assets.
Households may use their nonproductive assets to meet their food requirements, yet
endeavor to maintain their productive assets and prevent impoverishment, even to the point of
food deprivation (see Beck 1989: 26 for an example from Nepal). Thus, an important indicator of
vulnerability and the sequence of household responses is the nature and level of assets.
Household food poverty is strongly affected by regional factors. Even though these
factors are placed at different levels in our causal diagram, they are elements of the household
entitlement set nevertheless. This interconnectedness is recognized in the UNICEF volumes on
the impact of structural adjustment on food poverty, particularly in the report on Ghana
(UNICEF, Accra 1989) which cites entitlements and infrastructure as domains of causali:~. De
Waal (19119a) blames the breakdown of health services during the food crisis in Darfur, Sudan for
the, increase in mortality. It was the lack of health facilities and sanitation infrmtructure to serve
the population displaced by drought and famine that caused death, not a lack of food
consumption.
Appadurai (1984) contrasts entitlement and enfranchisement (or empowerment)--the
degree to which an individual or group legitimately participates in social decisions about
entitlement. Certain groups in India have increased their enfranchisement in social and political
processes since independence. With the decline of patron-client relationships, their access to food
during individual or community crises has declined. They no longer exist in a socioeconomic
structure that provides food security, although the government and NGOs have sought to take
over this role in times of imminent famine. The same process may be occurring in Africa, with
the disintegration of traditional, kin-based control over resources and a lack of effective
government interventions to prevent food poverty.
Households employ a range of strategies to cope with food poverty and prevent food
deprivation of their members (for specific case studies, see Akong'a and Downing 1988,
McCorkle 1987, Rahmato 1988a, 1988b, Zinyama, Campbell and Matiza 1987, Cutler 1984, Cutler
and Stephenson 1984). The prevalence of certain strategies, such as distress sales of jewelry, labor
or household migration, or sales of female livestock, may indicate increased risk of famine.
Corbett (19881, after cornparing several case studies of household coping strategies, characterizes
household decision making as an effort to manage assets or selectively dispose of assets according '
to their potential prod;divity. Akong'a and Downing (1988) and von Braun and Teklu (1989)
characterize coping strategies acco din to the household budget and attempts to balance 2 consumption and expenditures. While these typologies may reflect generic household
mechanisms, they give little insight into the choice of particular strategies. Indicators based on
household strategies need to be interpreted with care, since the sequence and use of different
coping strategies varies in relation to socioeconomic groups, famine condition~s, external
interventions, and community structures. For instance, Cutler (1985) observed dramatic
differences between Ethiopia and Bangladesh, and attributed them to the extent of landlessness
and market infrastructure. Tlie responses observed in central and eastern Kenya in 1984-1985
are directly related to the nature of the drought (a failure of a single season) and the
effectiveness of government intsrventions (see Downing, Gitu and Kamau 1989).
A fundamental issue in the assessment of food poverty is the definition of a household
(Hammel 1984). Definitions may include requirements of kinship, residents, recognized
authority (the head of household), consumption, and production. The household may be an
inappropriate unit of analysis for a variety of reasons. Households may not be stable units, as in
one area of Ethiopia where women may divorce and remarry 3-4 times and men 5-6 times
(McCann 1987: 262). In pastoral areas during times of crisis, households may split up to take
advantage of different opportunities (Dyson-Hudson and McCabe 1984). Significant decision
making and resources outside the household may affect a household, such as when a community
decides to migrate to famine camps (Rahmato 1988) or relatives in urban areas send remittances.
And the characteristics of households are rapidly evolving, requiring a dynamic assessment (see
Taal 1989). For instance, household incomes are not stable. Interannual variations are high: a
food-poor household one year may be relatively wealthy the next (Pryer 1989). Many of these
issues need to be addressed at the local level. A village or community assessment may be a
required complement to understanding household processes.
12.6. Perception of Famine and Local Monitoring Efforts
Indiffsnazls knowledge of the environment is often profound and often not documentsd by
outside luthorities (Brokensha et al. 1980, Barker et al. 1977, Chambers 1983). Studies of
perception of famine may provide insight into indicators of vulnerability and methods for early
warning systems. Throughout Africa, famines are given names that often distinguish subtle
causes. In Darfur, Sudan, two distinct types of famine are: maja'a a1 katala (scarcity that
requires unpleasant coping strategias) and maja'a (famine that kills) (de Waal 1987: 28). In eastern Kenya, the 1984 drought was called IVi kwa ngweta (I could die with cash in my pocket)
indicating the scarcity of food and the high prices even for those with cash incomes.
Famine victims recognize a variety of faminz causes, and are well aware of the
interactions between v;lierability to famine, food markets, and government actions (Rangasami
1985, Walker 1988). In the Red S Hills of Sudan, Beja pastoralists recorded the start of famine Y' in 1979-1980, well before the unusual rise in grain prices in 1984 and fall in animal prices in
1984- 1985 (Cutler 1986, Walker 1988 cited in Walker 1988: 8.18). Omer (1988) documents the
disparity between farmers' resource management and drought perceptions and those of
professional planners and administrators.
Community responses to famine, their abilities to identify populations at-risk and manage
interventions, have not been widely documented. Mutiso (1989) reports on a community in
Machakos, Kenya, that was able to procure food aid from the district administration and
distribute it to needy residents. Food-for-work projects were more effective than is often the
case, since they were undertaken as part of a standing program of community self-help, rather
than an emergency intervention (see Downing, Gitu, and Kamau 1989, for other examples of
community interventions). Grandin (1987) describes a simple method of using local informants to
rank the relative wealth of households in their community. The wealth rankings are typically
used to stratify a sample and correlate with less impressionistic socioeconomic data. In an
application among the Maasai, however, the groups of rankings and field notes reflect local
perceptions of wealth that have implications for vulnerability to famine. Wealth categories were:
(1) rich that have more than enough property and can help others; (2) those with just enough and
cannot help others; (3) poor, but still independent; (4) poor and dependent on other households
for assistance; and (5) have no animals and work elsewhere, subdivided according to number of
animals per household member (Grandin 1987: 22).
Perhaps the most critical lesson from studies of perception and behavior is that the
victims are not passive, they are actors in well-understood processes with significant capabilities.
Walker (1988) records that food aid recipients in Darfur, Sudan, were fatalistic about the
probability of death, but quite active in their efforts to avoid destitution. Anderson and
Woodrow (1989) document case studies of community response to disasters, emphasizing the
active participation of local communities (see chapter 13).
12.7. Dynamic Dimensions of Vulnerability
Temporal and spatial changes in the factors influencing vulnerability are integral to the
processes of population growth, resource management, economic development, and institutional
evolution. These changes suggest the need for understanding dynamic famine processes. DaCorta
(1986: iii, cited in Devereux and Hay 1986: 92) suggests that entitlement theory be extended to
examine the social structure and mobility of individual households and groups by adopting: .
1. A dvnamic a~uroach to place the complete process of entitlement change in a historical perspective and thereby examine the antecedent and sequel processes to the rise and decline of entitlements, as well as changes in the very nature of entitlement systems. /'
2. A vulnertrbilitv analysig to examine how changes in entitlements over time influence the nature and persistence of vulnerability. This involves a separate examination of long- and shoat-term changes in the determinants of:
a. individual vulnerability to starvation (defined as susceptibility to an entitlement decline); and b. aggregate vulnerability to famine.
The dynamic dimensions of vulnerability vary between socioeconomic groups. Nurnerous
processes have been suggested, but they remain hypotheses that are difficult to prove or disprove
due to the lack of adequate time-series data; the singular nature of famine; and the variations
between social, economic, and geographic settings. Several hypotheses are elaborated below.
"Substitution of market and exchange for subsistence economy increases the possibility of
famine" (Alamgir 198 1: 38). Since mixed subsistence/commodity households participate in larger
economic relationships, they are exposed to more causes of famine.
The potential for famine increases with "the emergence of labor-power as a commodity,
wn:l neither the protection of the family system of peasant agriculture, nor the insurance of
unemployment compensation--nor, of course, the guarantee of the right to work at a living wage"
(Sen 1977, cited in Alamgir 1981: 38). Societies in transition between traditionai and modern
welfare systems may be most vulnerable to famine. Data from one rural survey in Kenya,
however, suggested that transitional households had lower rates of food p ~ e r t y (Greer and
Thorbecke 1986). Rural smallholders in central and eastern Kenya, a typical transitional
economy, survived the 1984 drought by purchasing food in local markets: con~rnoditization of
agriculture reduced the effects of the food crisis (Downing 1988).
High rates of population growth and migration accentuate famiue problerns (Alamgir
1981, Akong'a and Downing 1988). New immigrants may not have sufficient knctwledge of the
local ecosystem. Planners may underestimate the number of people affected.
Traditionally nomadic pastoralists become more vulnerable to famine as they sedentarize:
they degrade the local environment, lack mobility to take advantage of distant pastures, and are
subject to local crop failures (Ellis et al. 1987). Conversely, others argue that agro-pastoralists,
with access to a diversity of incomes beyond the livestock economy, are less vulnerable to famine
(Anderson 1988).
A change in the distribution of land from dispersed, fragmented plots to con~olidated
farms increases risk of crop failure: the entire farm may be in an ecological zone wiiki similar ,
climate and soils, whil? a diverse set of micro-environments are less likely to be affected
simultaneously by drought or pests.. Likewise, land subdivision, primarily driven by population
growth, increases famine risk as Egrms become too small to support household subsistence
requirements.
The conversion of land tenure from communal to freehold increases vulnerability, at least
for those who obtain only marginal lands. For instance, the division of communal rangelands to
group ranches, and then to individual titles, constrains traditional coping strategies based on
mobility (Grandin el al. 1989).
13. FRAMEWORKS AND DIMENSIONS OF VULNERABILITY
This report presents an approach to assessing vulnerability, drawing upon a framework of
the causal structure of hunger. Additional concepts of vulnerability, elaborated in chapter 12,
supplement the material presented in chapter 2. It is helpful to review other frameworks of
vulnerability and exercises that identify vulnerable groups. This chapter summarizes frameworks
used in epidemiology and natural hazards, followed by examples of assessments of vulnerability
for the allocation of food aid, the impact of structural adjustment, and in Ethiopia to document
spatial and temporal variations. The final section catalogs dimensions of vulnerability suggested
in the literature.
13.1. Frameworks of Vulnerability
13.1.1. Epidemiology
Perhaps the most rigorous use of the term vulnerability is in epidemiology. The
occurrence and impact of disease have been attributed to vulnerability factors, ongoing
difficulties or long-standing traits of lifestyle, and the circumstances of specific stresses, or
provoking agents (McKee and Vilhjalmsson 1986, citing the work of George Brown and his
colleagues). For depression in women. vulnerability factors include lack of an intimate
relationship, early loss of mother, having three or more young children, and lack of employment
outside the house. McKee and Vilhjalmsson (1986) evaluate the interaction of vulnerability and
stress: the distinction between vulnerability and stress depended on the statistical method chosen.
As an alternative, they propose a cumulative strain model of social epidemiology: ongoing and
episodic stress are additive in determining the probability of disease.
Other applications of the vulnerability model in health sciences note that perception of
vulnerability based on disease prevalence within a community affects health protective behavior
(Ransford 1986) and link poverty and disease in arguing the need for structural change (Zaidi
1988).
At a different scale, Dever et al. (1988) show the spatial patterns of vulnerability i n .
Georgia. The critical resources and socioeconomic characteristics that may affect disease patterns
in the next decade are not evenly distributed. vulnerability in this exercise is developed from a '
social transformation &d;del. The main characteristics of the model are: a service and information
transfer society (e.g., rates of cha e, crowding, stress), demographic trends (baby and senior Y boomers), bionomics of dys-ease (e.g., drug abuse, violence), social pathology (e.g., quality of
life), and lifestyles (values and ethical dilemmas). The composite index is composed of five
factors, each based on two or three variables (Table 14). The values of each variable were
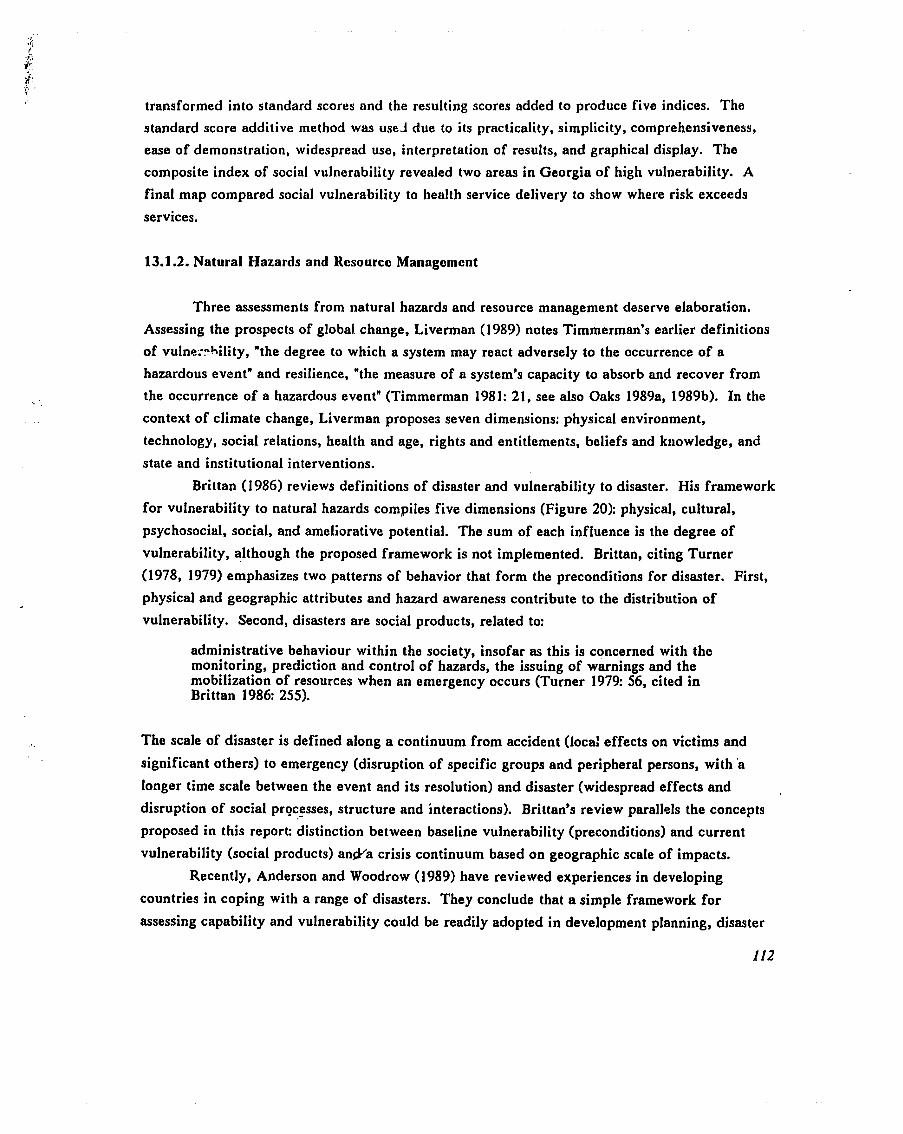
transformed into standard scores and the resulting scores added to produce five indices. The
standard score additive method was useJ due to its practicality, simplicity, comprehensiveness,
ease of demonstration, widespread use, interpretation of results, and graphical display. The
composite index of social vulnerability revealed two areas in Georgia of high vulnerability. A
final map compared social vulnerability to health service delivery to show where risk exceeds
services.
13.1.2. Natural Hazards and Resource Management
Three assessments from natural hazards and resource management deserve elaboration.
Assessing the prospects of global. change, Liverman (1989) notes Timmerman's earlier definitions
of vulnei-zhility, "the degree to which a system may react adversely to the occurrence of a
hazardous event" and resilience, "the measure of a system's capacity to absorb and recover from
the occurrence of a hazardous event" (Timmerman 198 1: 21, see also Oaks 1989a, 1989b). In the
context of climate change, Liverman proposes seven dimensions: physical environment,
technology, social relations, health and age, rights and entitlements, beliefs and knowledge, and
state and institutional interventions.
Brittan (1986) reviews definitions of disaster and vulnerability to disaster. His framework
for vulnerability to natural hazards compiles five dimensions (Figure 20): physical, cultural,
psychosocial, social, and ameliorative potential. The sum of each influence is the degree of
vulnerability, although the proposed framework is not implemented. Brittan, citing Turner
(1978, 1979) emphasizes two patterns of behavior that form the preconditions for disaster. First,
physical and geographic attributes and hazard awareness contribute to the distribution of
vulnerability. Second, disasters are social products, related to:
administrative behaviour within the society, insofar as this is concerned with the monitoring, prediction and control of hazards, the issuing of warnings and the mobilization of resources when an emergency occurs (Turner 1979: 56, cited in Brittan 1986: 255).
The scale of disaster is defined along a continuum from accident (local effects on victims and
significant others) to emergency (disruption of specific groups and peripheral persons, with a
longer time scale between the event and its resolution).and disaster (widespread effects and
disruption of social prgcssses, structure and interactions). Brittan's review parallels the concepts
proposed in this report: distinction between baseline vulnerability (preconditions) and current
vulnerability (social products) a n p a crisis continuum based on geographic scale of impacts.
Recently, Anderson and Woodrow (1989) have reviewed experiences in developing
countries in coping with a range of disasters. They conclude that a simple framework for
assessing capability and vulnerability could be readily adopted in development planning, disaster
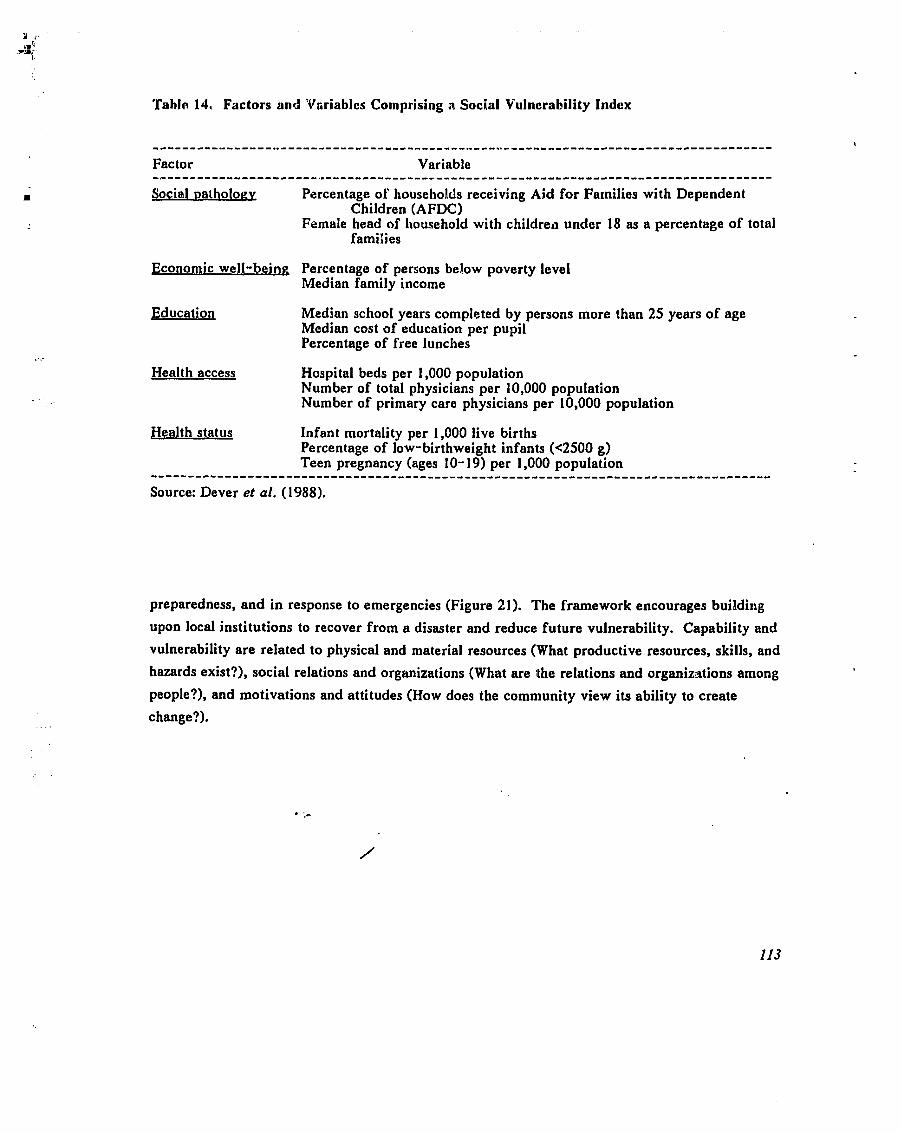
Tahln 14. Factors and 'Voriablcs Comprising a Social Vulnerability Index
------"---------.*------------------------",.---..------------------------------------ Factor Variable
Percentage of households receiving Aid for Farnilies with Dependent Children (AFDC)
Female head of l~ousehold with children under 18 as a percentage of total fami:ies
Economic well-beirg Percentage of persons below poverty level Median family income
Education Median school years completed by persons more than 25 years of age Median cost of education per pupil Percentage of free lunches
Health access Hospital beds per 1,000 population Number of total physicians per 10,000 population Number of primary care physicians per 10,000 population
Health status Infant mortality per 1,000 live births Percentage of low-birthweight infants (<2500 g) Teen pregnancy (ages 10- 19) per 1,000 population ...................................................................................
Source: Dever et al. (1988).
preparedness, and in response to emergencies (Figure 21). The framework encourages building
upon local institutions to recover from a disaster and reduce future vulnerability. Capability and
vulnerability are related to physical and material resources (What productive resources, skills, and
hazards exist?), social relations and organizations (What are the relations and organizations among
people?), and motivations and attitudes (How does the comnlunity view its ability to create
change?).
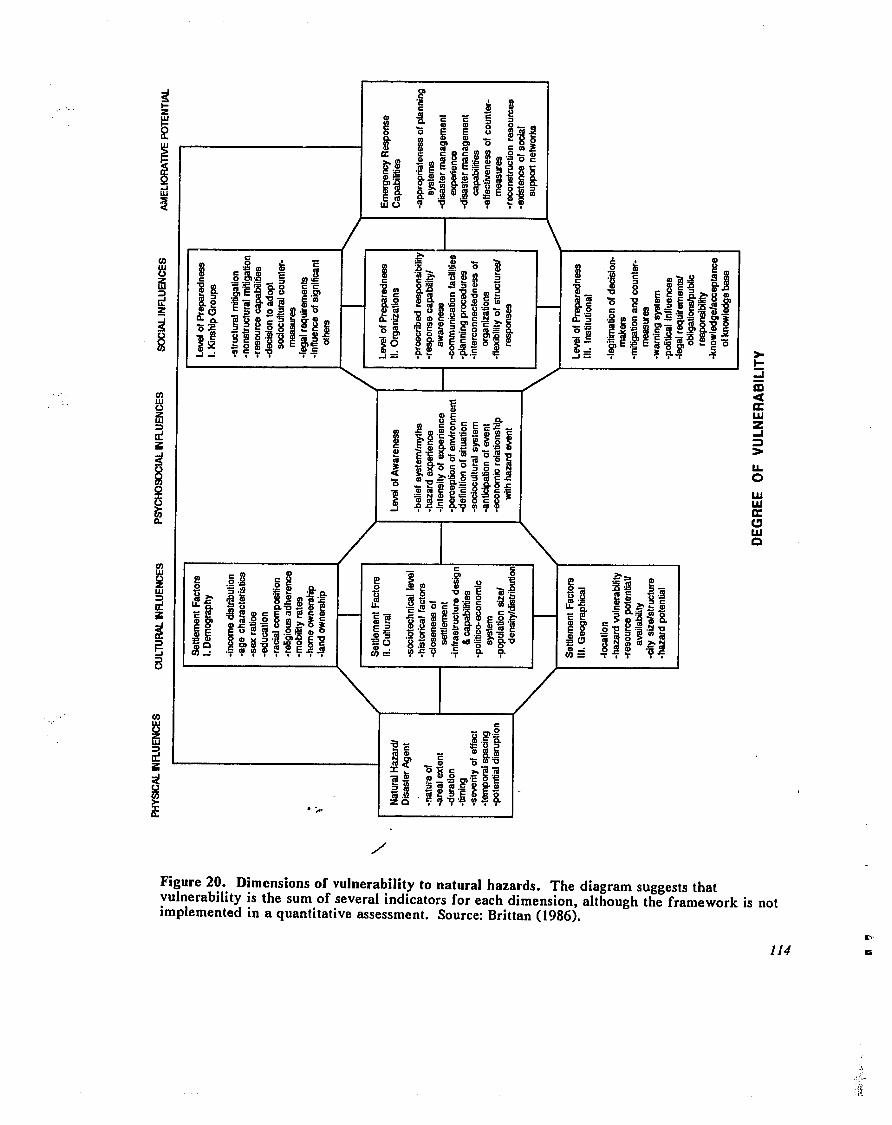
'(9861) UBII!JQ :aalnos .)uaurssasst, a~!pl!]uwnb e u! pa)uauraldur! IOU S! TJoMaweJj aql q%noql1e 'uo!suaur!p qarra JOJ slolampu! le~a~as JO runs aqa s! r(l!l!qelauln~
lsql sisa%%ns we.x%e!p aqL -spr.zeq prnjsu 08 X~!y!qeraup~ jo suo!sualu!a -02 arnl!~
*~o;$.$$5,0Z JIirgEf 8" P~G ags ~5 Sf !$ 3 $6 4.; 8
-e 2
&. .
,*I
ikqg ig ~s~ea, 83 vkDr g 223 s 4;-
c $3 gj; '= p.e -9 "&
.& 7i + hi& =o ~8 a gpogg 8 aq. ba m='Ji qzaS.Q zs ~gasfj 8' n .gji!$ 3%
8tZ2%$f: $1 me B & S 8
/
*&&$I L"
~-j:-[$ S.PEtH.g. ?.a 3.
j$lrn~~i~ -8609% , g3.:;:je, 5 !s3'@.;2g2 - .gag==a w
2 2 a -
-
I,, 80;bf. h~ias gpo P". g ~'~On-:~~m 8 $2 ijS 8;!sgnge $3 jlfgw 3 PS a$ fa s 8 =
& "6 4 - 2 =E 2s- pfi~iig~I ~af~~ Ej is SO lssgf$ 8 3 = s s. 7 8i3s3~~ a si' : fj 8
9 f o
-
'. I &A$* Z[ 9% B/j:ir5 gP
~aalesngg 2s.sz. ,, mi Z~pa. fj 3 sgglg'&, 3% z* )piJ.8 f a 8
-
I \
$*i) 4 =I-
$!s, 3rdl c2 b$
liIiiiiii oeagigg. Bs 5, B1 aspgS Ea
$. gs Z$ 8 E lis T.
"5 -.z g
6.: 6 A om = f( Fmg
w3
z'ipqsag~4 $a li-,. ,,glaal:SI$ --- $4 g-8 111%~$2
2.; H° 8Bg g 1 $ --F D
'i
-
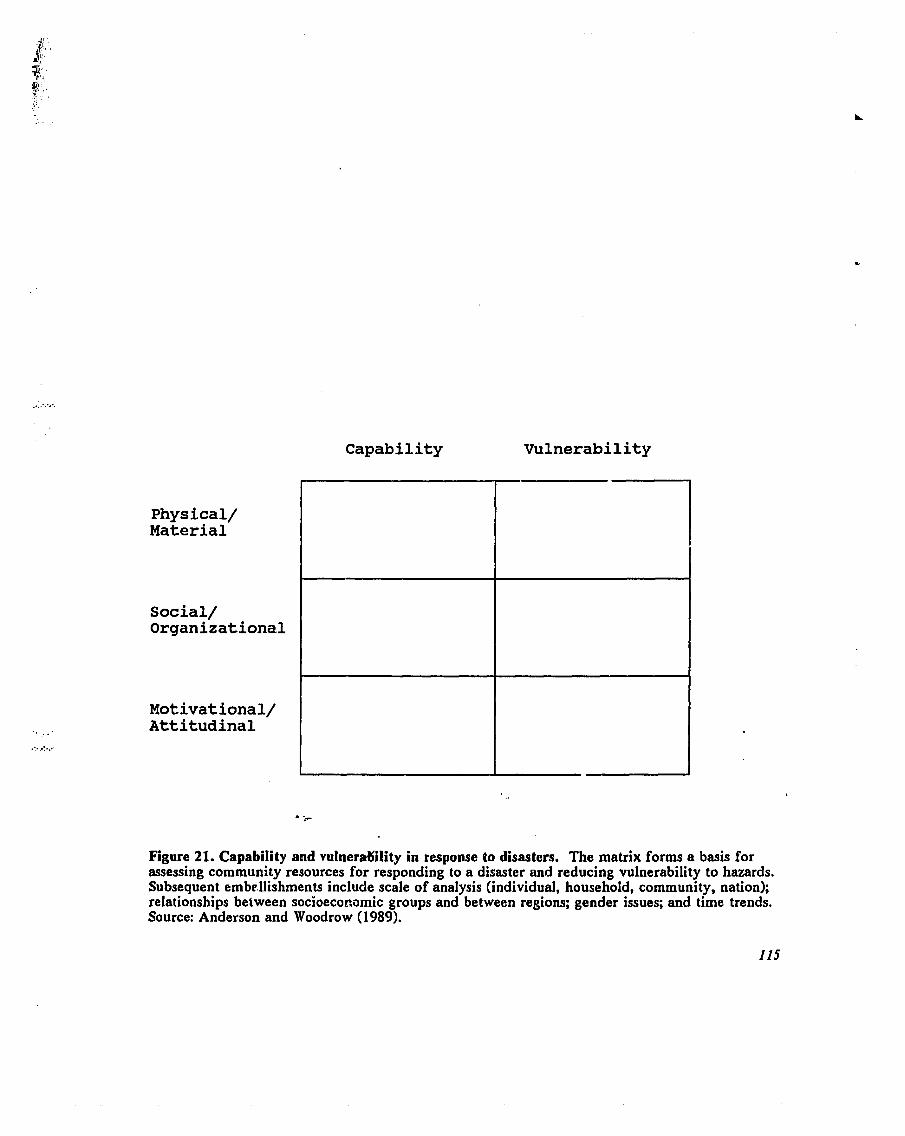
Physical/ Material
Social/ Organizational
Motivational/ Attitudinal
Capability Vulnerability
Figure 21. Capability and vulnera6ility in response to disasters. The matrix forms a basis for assessing community resources for responding to a disaster and reducing vulnerability to hazards. Subsequent embe.llishments include scale of analysis (individual, household, community, nation); relationships between socioeconomic groups and between regions; gender issues; and time trends. Source: Anderson and Woodrow (1989).
13.2. Asscssmont of Groups Vulnerablc to Faminc
13.2.1. Allocation of Food Aid
Manarolla (1989) reviews the rationale for U.S, PL 480 food aid and develops broad
measures of national food security to prioritize countries that should receive assistance.
Historically, support for food aid has been from the American agriculture sector and the needs of
foreign diplomacy. Since the 1980s, the dominant constituency has shifted toward hurnaniiarian
and development groups concerned with food security and hunger. This shift in priorities
warrants a fresh analysis of the allocation of food aid between countries.
The appronch recognizes two aspects of food security (drawing upon Kates et al. 1989):
national self reliance and individual or household economic access to food supplies within the
country. A third dimension relates recent trends to food security. These three dimensions of
food security were used to construct three indices and a composite index of vulnerability to
hunger (Table 15). Each index is calculated on a per capita basis, to enable comparisons between
countries of different sizes. The indices were calculated for 69 developing countries. The
national food self reliance index combines production data with indicators of the ability to import
food. The index of economic access comprises per capita measures of Gross National Product
(GNP), food consumption and childhood mortality. A direct measure of income distribution
would be preferable, but is unavailable for recent years. The performance index measures recent
changes in food prcduction, foreign exchange, and Gross Domestic Production (GDP). Time
series for consumption and mortality will be added to the performance index in the future.
The nominal (absolute) values of each variable were transformed into relative values for
comparison between variables. Two techniques were used. For the first method, countries were
ordered by their rank on each variable, the ranks were summed, and a new rank order established
for the composite index. This is a simple method, easily interpreted: the lowest ranked countries
are the most vulnerable to hunger. The rank ordering, however, masks any thresholds or a sense
of the ordinal distance between countries. The second approach converted each variable to
normalized values (or standard scores):
X (X - mean of X)/standard deviation of X wfike: di = the nominal value of variable X for country i, and
Xni the-normalized value (standard score) of variable X for country i.
The composite index is the sum of the standard scores, with the countries ranked according to the
standard scores. J Composite indices, based on the national and household dimensions, were constructed in
two ways. The double sum technique combines the two component indices (national food self
reliance and household food access). The alternative sums each of the five variables used in the
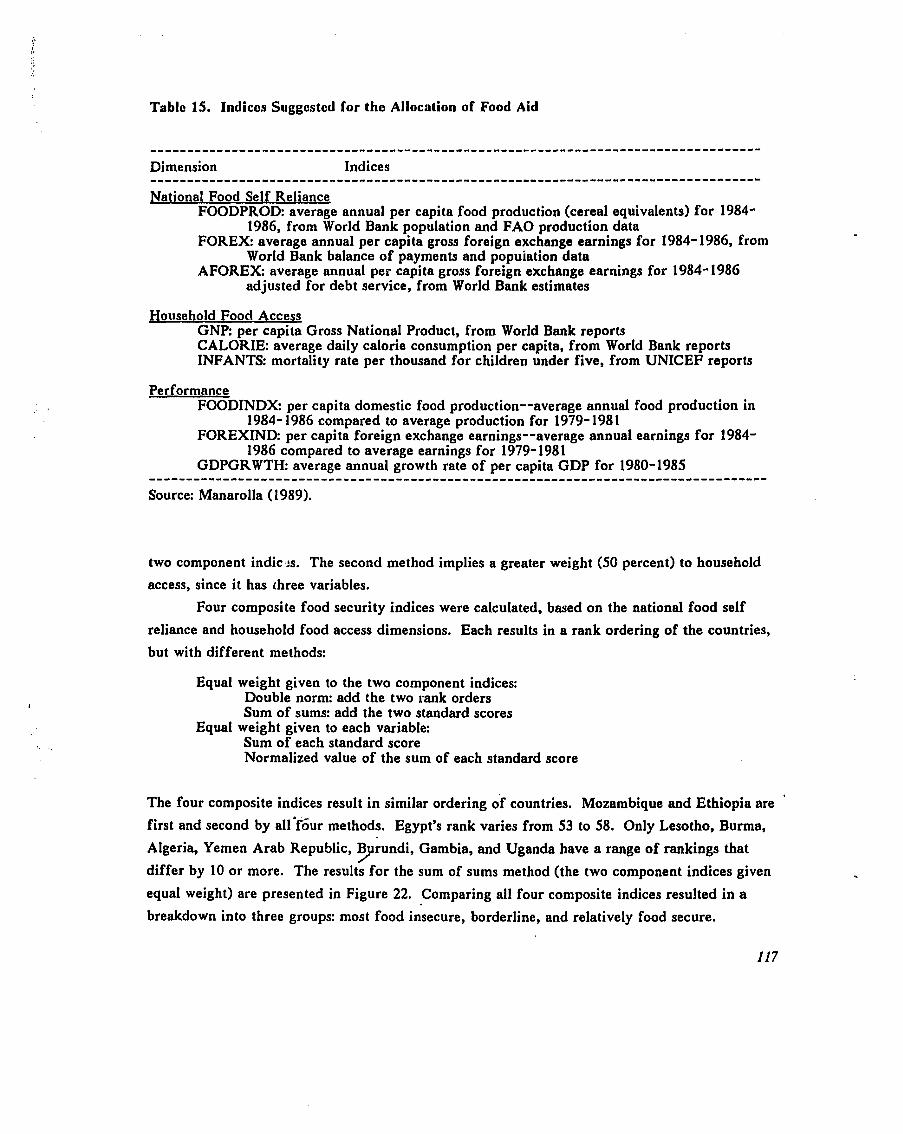
Table 15. Indices Suggcstcd for tho Allocation of Food Aid
.................................................................................. Dimension Indices
National Food Self Reliance FOODPROD: averane annual per capita food production (cereal equivalents) for 1984-
1986, from world ~ a n k popthation and FA0 production data FOREX: average annual per capita gross foreign exchange earnings for 1984-1986, from
World Bank balance of payments and popuiation data AFOREX: average annual pet capita gross foreign exchange earnings for 1984- 1986
adjusted for debt service, from World Bank estimates
Pousehold Food Access GNP: per capita Gross National Product, from World Bank reports CALORIE: iverage daily calorie consumption per capita, from World Bank reports INFANTS: mortality rate per thousand for children under five, from UNICEF reports
Performance FOODINDX: per capita domestic food production--average annual food production in
1984- 1986 compared to average production for 1979- 198 1 FOREXIND: per capita foreign exchange earnings--average annual earnings for 1984-
1986 compared to average earnings for 1979-1981 GDPGRWTH: average annual growth rate of per capita GDP for 1980-1985
Source: Manarolla (1 989).
two component indic%:s. The second method implies a greater weight (50 percent) to household
access, since it has ihree variables.
Four composite food security indices were calculated, based on the national food self
reliance and household food access dimensions. Each results in a rank ordering of the countries,
but with different methods:
Equal weight given to the two component indices: Double norm: add the two rank orders Sum of sums: add the two standard scores
Equal weight given to each variable: Sum of each standard score Normalized value of the sum of each standard score
The four composite indices result in similar ordering of countries. Mozambique and Ethiopia are '
first and second by all'f6ur methods. Egypt's rank varies from 53 to 58. Only Lesotho, Burma,
Algeria, Yemen Arab Republic, B rundi, Gambia, and Uganda have a range of rankings that 2 differ by 10 or more. The results for the sum of sums method (the two component indices given
equal weight) are presented in Figure 22. Comparing all four composite indices resulted in a
breakdown into three groups: most food insecure, borderline, and relatively food secure.
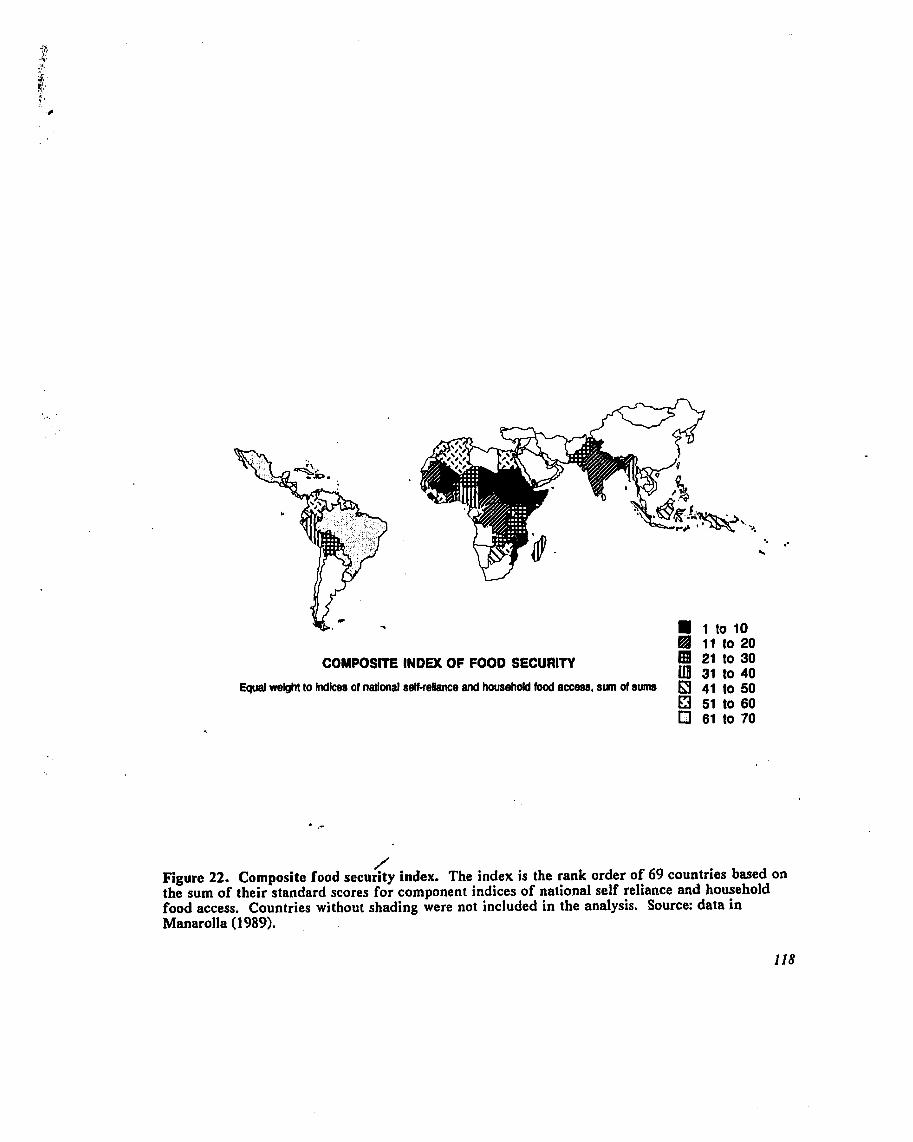
. 1 to10 11 to 20
COMPOSITE INDEX OF FOOD SECURITY 21 to 30 a 31 to 40
Equal welght to lndlces of natlonal self-reliance and household food access, sun of sums 41 to 50 51 to 60 61 to 70
/ Figure 22. Composite food security index. The index is the rank order of 69 countries based on the sum of their standard scores for component indices of national self reliance and household food access. Countries without shading were not included in the analysis. Source: data in Manarolla (1 989).
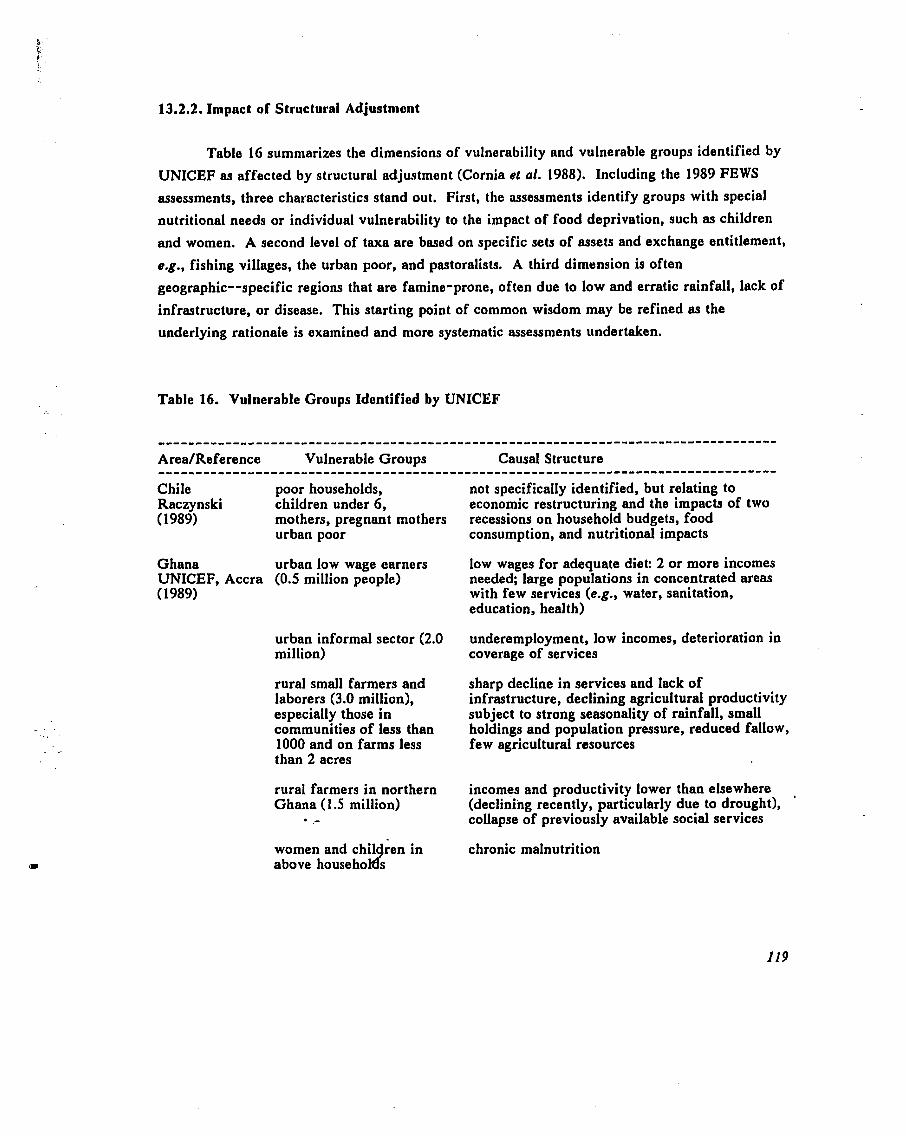
13.2.2. Impact of Structural Adjustment
Table 16 summarizes the dimensions of vulnerability and vulnerable groups identified by
UNICEF as affected by structural adjustment (Cornia et al. 1988). Including the 1989 FEWS
assessments, three characteristics stand out. First, the assessments identify groups with special
nutritional needs or individual vulnerability to the impact of food deprivation, such as children
and women. A second level of taxa are based on specific sets of assets and exchange entitlement,
e.g., fishing villages, the urban poor, and pastoralists. A third dimension is often
geographic--specific regions that are famine-prone, often due to low and erratic rainfall, lack of
infrastructure, or disease. This starting point of common wisdom may be refined as the
underlying rationale is examined and more systematic assessments undertaken.
Table 16. Vulnerable Groups Identified by UNICEF
Area/Reference Vulnerable Groups Causal Structure ................................................................................... Chile poor households, not specifically identified, but relating to Raczynski children under 6, economic restructuring and the impacts of two ( 1989) mothers, pregnant mothers recessions on household budgets, food
urban poor consumption, and nutritional impacts
Ghana urban low wage earners low wages for adequate diet: 2 or more incomes UNICEF, Accra (0.5 million people) needed; large populations in concentrated areas (1 989) with few services (e.g., water, sanitation,
education, health)
urban informal sector (2.0 underemployment, low incomes, deterioration in million) coverage of services
rural small farmers and sharp decline in services and lack of laborers (3.0 million), infrastructure, declining agricultural productivity especially those in subject to strong seasonality of rainfall, small communities of less than holdings and population pressure, reduced fallow, 1000 and on farms less few agricultural resources than 2 acres
rural farmers in northern incomes and productivity lower than elsewhere , Ghana ( 1 .S million) (declining recently, particularly due to drought),
.- collapse of previously available social services
chronic malnutrition
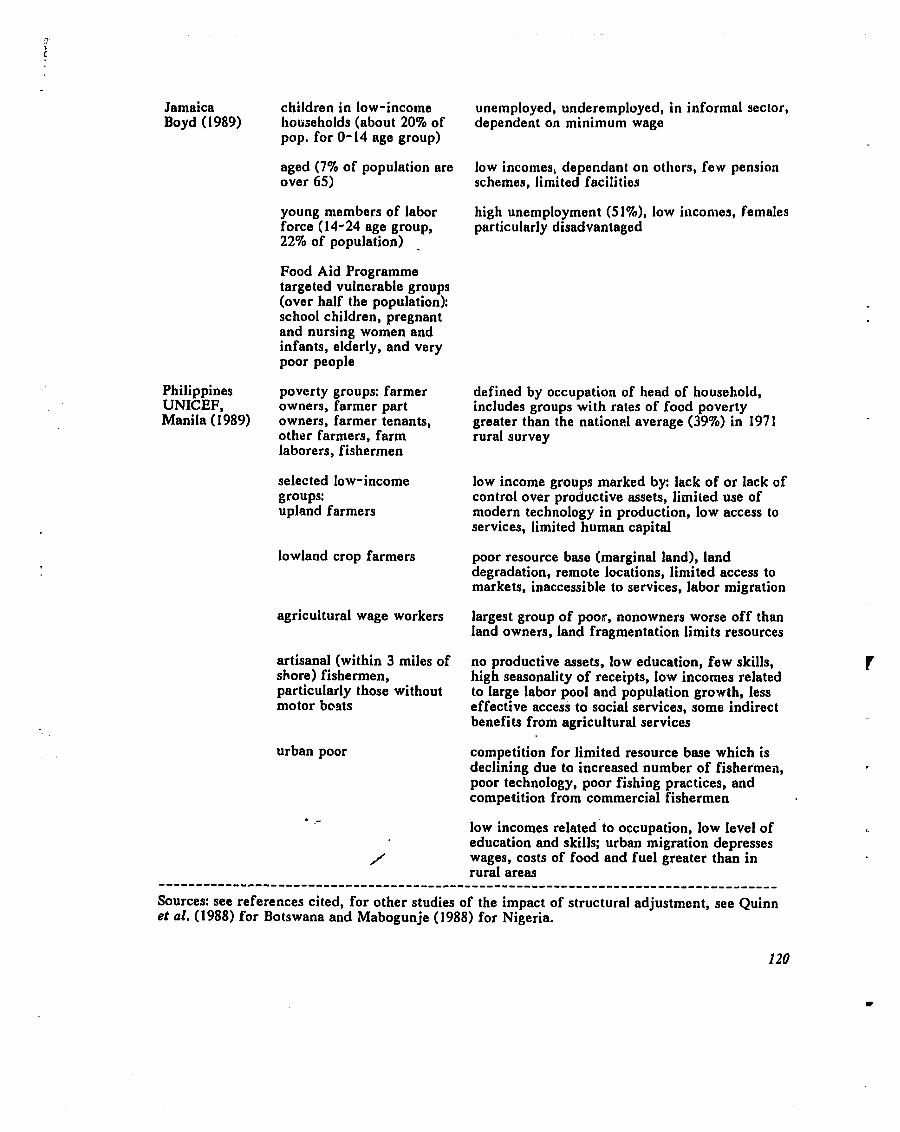
Jamaica children in low-income unemployed, underemployed, in infornlul sector, Boyd (1989) households (about 20% of dependent on minimum wage
pop. for 0-14 age group)
aged (7% of population are low incomes, dependant on others, few pension over 65) schemes, limited facilities
young members of labor high unemployment (51%), low incomes, females force (14-24 age group, particularly disadvantaged 22% of population) -
Food Aid Programme targeted vulnerable groups (over half the population): school children, pregnant and nursing women and infants, elderly, and very poor people
Philippines poverty groups: farmer defined by occupation of head of household, UNICEF, owners, farmer part includes groups with rates of food poverty Manila (1989) owners, farmer tenants, greater than the national average (39%) in 1971
other farmers, farm rural survey laborers, fishermen
selected low-income low income groups marked by: lack of or lack of groups: control over productive assets, limited use of upland farmers modern technology in production, low access to
services, limited human capital
lowland crop farmers poor resource base (marginal land), land degradation, remote locations, limited access to markets, inaccessible to services, labor migration
agricultural wage workers largest group of poor, nonowners worse off than land owners, land fragmentation limits resources
artisanal (within 3 miles of no productive assets, low education, few skills, shore) fishermen, high seasonality of receipts, low incomes related particularly those without to large labor pool and population growth, less motor boats effective access to social services, some indirect
benefits from agricultural services
urban poor competition for limited resource base which is declining due to increased number of fisher'mei~, poor technology, poor fishing practices, and competition from commercial fishermen
. :- low incomes related to occupation, low level of education and skills; urban migration depresses
/ wages, costs of food and fuel greater than in rural areas ...................................................................................
Sources: see references cited, for other studies of the impact of structural adjustment, see Quinn et al. (1988) for Botswana and Mabogunje (1988) for Nigeria.
13.2.3. Vulnorability in Ethiopia
Mesfin Wolde Mariam (1984) presents a thorough analysis of famine in Ethiopia, with
data from 1958-1977. The basic unit of measurement is the annual incidence of famine in an
awraja, or province. There are 102 awrajas in Ethiopia, the avorage awraja possesses an average
area of 12,000 sq km and 250,000 people. "The criterion for determining whothcr or not an
awruja had famine in a given year was that the famine information, in spite of extremely
discouraging bureaucratic red tape, had reached the archives of the Ministry of Interior" (p. 146).
Mesfin begins with analyses of famine incidence over time and space, discovering
increasing frequency of famine, but few new awrajas suffering famine by the end d' the 1560s.
The crux of the analysis is to test explanations of famine, in particular that famine is a product
of a subsistence production system, rather than commercial farming (p. 157, 165). Indices of
famine are compiled, based upon transformations of:
1. temporal intensity: a measure of the duration or persistence of famine;
2. spatial intensity: percent of awrajas experiencing famine;
3. demographic intensity: ratio of the rural population in awra,jas experiencing famine io total rural population; and
4. famine index: a summary index of famine intensity derived from the temporal, spatial and demographic indices.
Indices of explanatory variables are formulated, based on:
5. subsistence level: accounting for crops and livestock, converted to sorghum equivalents based on 1970 prices, weighted by soil quality, and computed on a per capita basis;
6. farm commercialization: based on land under commercial crops, urban population, number of markets, and average farm size;
7. environmental quality: based on mean annual rainfall, mean annual temperature, number of rainy days, coefficient of variation of annual rainfall, soil rating, and proportion of cultivable land; and
8. development: based on the presence of an all-weather road, railroad, airport, telephone, post office, bank, filing station, hospital, electricity, piped water, secondary school, large scale commercial farming and industry.
The results indkite significant associations between famine and subsistence,
commercialization, and environme tal uality (using two-dimensional chi square tests and a
criterion of 0.01). The results: 2
support our hypothesis that a system in which the majority of peasants are totally dependent on the physical environment and on their backward methods of production, and in which the socioeconomic and political forces persist in incapacitating tha productive potential of peasants by incessant oppression and exploitation, is a condition for vulnerability to famine (p. 169).
The indices are aggregated for the twenty-year data set: the hypotheses are tested for the sum of
famine incidence, not the changes over time, nor to identify spatial or temporal dimensions of
famine. The methodology, however, could be extended to such analyses. At the lewt, it
illustrates a rare attempt at systematic analysis of dimensions of vulnerability.
13.3. Catalog of Dimensions of Vulnerability
The existing assessments and thu broader literature on famine suggest numerous causes of
vulnerability among socioeconomic groups. A variety of literature is relevant to assess
vulnerability to famine, including work in farming systems and agroecology (Conway 1983, 1986,
Gilbert 1980); rapid rural appraisals (Ford and Thomas-Slater 1989, McCorkle 1987, Program for
International Development 1988); studies of natural and technological hazards and coping
strategies (Akong'a and Downing 1988, Beck 1989, Campbell 1984, 1987, Corbett 1988, Fleuret
1986, 1989, Jodha 1975, Kates, Hohenemser and Kasperson 1985, Lachenmann 1988, Mortimore
1988, Rahmato 1988a, 1988b, Taal 1989); household budget surveys and economics (Bezuneh et
al. 1988, Greer and Thorbecke 1986, Singh, Squire and Strauss 1986, Singh 1988); farming
systems and community studies (Gilbert et al. 1980, Sands 1986, Shaner, Philipps and Schmehl
1982, Turner and Brush 1987); anthropology (Barlett 1979, Brokensha and Little 1988, Guyer
1981, 1986, Huss-Ashmore and Katz 1989, Messer 1984, Moock 1986, Torry 1979, 1984, 1988);
reviews of hunger and famine (Glantz 1987, Harrison 1988, Johnson and Anderson 1988,
Maxwell 1989, Newman et al. 1989, Robson 1981, Wilhite, Easterling and Wood 1987); and
general theoretical treatments (Alamgir 1980, 1981, Blankson 1987, Devereux and Hay 1986,
Hohenemser, Kasperson and Kates 1985, Millman and Kates 1989, , ~ a n ~ a s a m i 1985, Sen 198 1 ).
Below, factors commonly cited as causes of famine are listed. This is a catalog, in support
of chapters 5 and 6. The relative importance of each item varies according to specific types of
famine and vulnerable groups.
13.3.1. Regional Food Shortage
agricultural infrastructure: proviJ;/on of inputs (seed, fertilizer), extension of credit and services, development and application of research, organization of marketing facilities (Abatena 1988, Bates and Lofchie 1980, Delgado and Mellor 1984, Ghai and Smith 1986, Mellor 1982, 1988, Lofchie 1988, Mellor and Gavian 1987)
cash cropping: competition for land resourcc:s that could be devoted to food (George 1988) climatic factors: the long-term influence of climate on resources (and relatod clevlslopment
potential) and the short-term effects of climatic variations, such as drought (Baier 1982, Bake 1989, Benson and Clay 1986, Blorton and Clay 1986, Carruthers and Kydd 1989, Cossins and Upton 1988, Cox 1981, Degefu 1987, Dennett, Elston and Wadgers 1985, Dent et al. 1987, Gowlett 1988, Farmer and Wigley 1985, Gartrell 1985, Glantz 1977, Henricksen and Durkin 1986, Kates, Ausubel and Berberian 1985, Katz and Glantz 1986, Konare 1989, Leftwich and Harvie 1986, Lockwood 1986, Nicholson 1989, Nieuwolt 1986, Owen and Ward 1989, Porter 1983, Sivakumar 1988, Stewart ard Hash 1981)
environmental degradation: the loss of soil, vegetation, and of water resources due to natural or human-induced processes, such as desertification, conversion of forests to agriculture, salinization, commercial exploitation (Anderson 1984, Berry 1978, Berry, Campbell and Emker 1977, Blaikie and Brookfield 1987, Campbell 1986, Christiansaca 1988, Currey 1984, Ellis and Swift 1988, Hamilton and Maizels 1989, Hurni 1988,Ihn.ahim 1984, 1988, ICIHI 1985, Khogali 1988, Krummel,, O'Neill and Mankin 1986, Left!vicn and Harvie 1986, Sinclair and Fryxell 1985)
import capacity: port and transport capabilities, foreign exchange holdings, aud access to international markets (Berry and Downing 1989)
institutional failure: long-term policies that impoverish and increase vulnerabiiity; short-term failure to respond to famine, either intentionally or through neglect; effective famine monitoring (Alamgir 198 1, Bates 198 1, 1988, Bennet 1987, Brennan 1984, Brennan, Heathcote and Lucas 1984, Cater 1986, Chambers 1983, Clay and Hrlcomb 1988, Cohen and Lewis 1987, Corbett, J. 1987, d'Souza 1988, 1989, Gill 1986, Kclenig 1988, May 1987, McIntire 1987, Opio-Odongo 1988, Pottier 1986, Scott 1987, Sobhart ':'VC), Spitz 1978, Timberlake 1985, Wallerstein 1980)
international food markets: availability and lacation of food for commercial imports, often suggested as a benefit to the 1980s food crises, compared to low international reserves in the early 1970s (Borton and Clay 1986).
low productivity: particularly in areas with a relatively large population and high growth rates (Alamgir 1981, Downing, Lezburg et al. 1989).
macro-economy: factors influencing investment in agriculture, national food security, and household access to wage employment, such as: economic health and growth, distribution of wealth, development philosophy regarding basic needs, urban/rural emphasis, agricultural infrastructure, export vs. import substitution strategies (Lawrence 1986, McIntire 1981, Oyejide 1986, Pinckney 1988, Pinckney and Valdes 1988, Scobie 1989, Smith, Wallerstein and Evers 1984, Timmer 1989, Timmer, Falcon and Pearson 1983)
market failure: a failure of markets to respond with sufficient food to satisfy the effective demand, as distinct from a failure of effective demand due to the lack of cash income, often attributed to: poor transport; small and fragmented markets; competition with larger and safer markets; hoarding and speculation (Clough 1985, Cutler 1985, de Wiide 1984, Devereux and Hay 1986, Dreze 1986, Grould and Rogier 1984, Griffin and Hay 1985, Koester 1987, Ravallion 1985, Seaman and Holt 1980)
natural disasters: such as drought, floods, fires (Berry et al. 1971, Burton, Kates and White 1978, Dahl and Hjort 1976, 1980, Guha-Sapir and Lechat 1986, Hankins 1974, Kates 1987, Kolawole 1987)
pests: such as locusts ad livestock diseases (Ashall 1987, Skaf 1988) population dynamics: population powth (or change) at least affects the demand for food, it may
also affect food productid through either process of land degradation or by expanding labor utilization and food markets (Anker and Knowles 1983, Blaxter 1986, Bongaarts and Cain 1982, Boserup 1981, Dando 1980, Faulingham and Thorbahn 1975, Gleave 1988a, 1988b, Kellman 1987, Lee et al. 1988, Leftwich and Harvie 1986, Lowry 1986)
refugees: increased population requiring food and services; destitution and disruption of social and economic infrastructure underlying refugee movements (Harrell-Bond 1989)
subsistence/commodity food production: during a drought less food may be sold in local markets since the majority of production is utilized for household subsistence, increasing market scarcities (Seaman and Holt 1980, Spitz 1978, 1980, 198 1)
structural adjustment and debt crisis: fewer resources are available for productive investment and services; foreign exchange earnings are given a higher priority than food production (Bigsten and Ndung'u 1988, Cornia et a1. 1987, 1988, George 1988)
war and civil strife: active destruction of crops and displacement of people, prevention of famine relief and agricultural development, and expensive military spending that precludes other investments (Bennet 1987, Borton and Clay 1986, Bush 1985, Copson 1989, Berry and Downing 1989, Lawrence et al. 1985, Leftwich and Harvie 1986, Kates et al . 1988, Shindo 1985, Quan 1987, Wallerstein 1980)
world food policies: production and consumption levels, world reserves, access to international and donor systems, such as the IMF emergency facility for food imports (Alamgir 1981).
13.3.2. Household Food Poverty
access to services: proximity and costs of agricultural, health, and water services (Carlson 1987, 1988)
agribusiness and cash crop schemes: exploitation of peasant households on unfavorable terms with little provision for food security (Bush 1987a, Lapp6 and Collins 1982, Raikes 1989)
assets: the reserves of food, cash, capital, and livestock that people may consume or exchange for food; includes productive assets (seed, oxen for ploughing, labor, tools) which people attempt to preserve to enable a rapid recovery (Gill 1986, Grandin 1987, Hesse 1987, Heyer 1989, Lirenso 1988, cited in Walker 1989, Perevolotsky 1986, Perlov 1981, Swift 1989, Rodgers and Homewood 1986, Shoham and Clay 1989
bargaining power and exploitation: ability of households to command resources, favorable economic relationships, or food aid; vulnerable groups such as sharecroppers, tenants, and wage laborers exploited by landowners and moneylenders (Alamgir 198 1, Appadurai 1984)
capabilities: a range of physical, organizational, and motivational resources (Anderson and Woodrow 1989)
colonialism, imperialism, and the international capitalist economy: the distortion of the indigenous economy and socioeconomic relationships through land use policies, cash cropping, substitution of imports and industrial products for local production (Ambler 1988, Berry, Campbell and Emker 1977, Bryceson 1980, 1981, Buch-Hanson and Kieler 1983, Carney 1988, Franke and Chasin 1980, Lappe and Collins 1982, Moyes n.d., Ndoye and M'Baye 1987, Twose 1984, Watts 1983)
commercialization of agriculture: income, food consumption and nutritional effects of contract farming, cash crop schemes; developing specialization within rural agriculture (Hyden 1986, Kennedy and Cogill 1987, 1988, Little and Horowitz 1987, Nerlove 1988, Niemeijer et al. 1988, Pinstrup-Andersen 1985, Schmied 1989, von Braun 1988, von Braun and Kennedy 1986)
cultivation of marginai&nds: spread of agriculture or economies to less suitable land with higher soil erosion rates, more variable climates, and lower returns to investment (Bennet 1987, Sahli 1981) /
cultural and social processes: extent to which social relationships and cultural practices prevent or mitigate the effects of famine, breakdown of society leading to accelerated effects of famines (Campbell 1986, 1990, de Waal 1989a, Leftwich and Harvie 1986, Riesman 1984, Rutherford and Mahanjane 1985, Turton 1985, 1988).
economic development and marginalization: reduced capacity of rural producers and laborers to compete in the capitalist economy (Field 1987, Wisner 1976)
entitlement: the legal access to food from a variety of sources (production, exchanges, transfers) (Akong'a and Downing 1988, Baulch 1987, Richards 1983, Sen 1977, 1981, 1984, 1986, Swift 1989b)
excessive taxes or rents: exploitation without increased food security (Alamgir 1980) exchange entitlements: the ability of households (or individuals) to exchange (through commercial
markets or barter) their labor or assets for food (Alderman 1986, Cutler 1984, 1985, Desai 1988, Devereux 1987, 1988, Holt 1980, Leftwich and Harvie 1986, Sen 198 1, Ravallion 1985, Richards 1986, Sutter 1982, Turton 1985, 1989)
food aid: prevention of famine through development projects, response to famine to prevent its worst effects (Bezuneh, et 41. 1988, Green 1986, Hay 1986, Reutlinger and Katona-Apte 1987, Singer, Wood and Jennings 1987, Stephens 1986)
food price inflation: price increases in local markets (see exchange entitlement) income: cash income that provides effective demand for food, but is dependent on markets and
terms of trade (Hay 1986, Lipton 1989, Sen 1984) income distribution: an unequal distribution of productive assets increases vulnerability to
external shocks for certain classes that may not be able to attract assistance (Alamgir 1981, Grandin 1988)
indigenous technology: loss of knowledge; lack of participation in development planning (Barker et al. 1977, Bein 1987, Belshaw 1979, Brokensha, Warren and Werner 1980, Moris 1989, Orner 1988, Richards 1985, Sukkary-Stolba 1989, Zinyama 1988, Zinyama, Campbell and Matiza 1987)
irrigation: full-season schemes or supplemental irrigation that can increase the reliability of agricultural production (Adams and Carter 1987, Schliephake 1987)
land tenure: communal, tenancy, squatting, and freehold tenure affect patterns of vulnerability; communal lands may encourage social mechanisms of sharing but are subject to population pressure and degradation; tenants and squatters depend on relationships with landowner; freeholds are fixed assets of variable quality, but improvements may be good investments for owners (Brokensha and Njeru 1977, Haugerud 1984, Victor et al . 1986)
life cycle of household: the demography of the household, particularly its number of laborers and dependents (children and the elderly), but also access to kin networks and extent of debilitating disease (Berry 1985, McCann 1987a, 1987b, Pelto and Pelto 1984, Pryer 1989)
market segmentation: the number of market transactions (and perhaps their geographic distance) required to obtain food or to convert assets into food (Desai 1984, 1986)
market mismanagement: inability of marketing boards to supply and distribute food; price ,
policies that discourage production or enhance inflation; relationships between consumers and merchants (Currey 1978, 1984, Harriss 1979, 1982b, Leftwich and Harvie 1986, Saul 1986)
market speculation: the extent to which traders speculate in grain prices and thus remove food from the market for consumption (Stockton 1987, cited in Walker 1988: 3.19)
material/physical resources: capipl, labor, and other productive assets that enhance capabilities to respond to disaster (Anderson and Woodrow 1989)
motivational/attitudinal resources: individual psychology and community ethics that enhance capabilities to respond to disaster (Anderson and Woodrow 1989, Harrell-Bond 1986, 1989, Twinning 1984)
number of entitlements or wage earners: diversity of entitlements or income reduces vulnerability to famine (Walker 1989)
occupation: type of employment (Curry 1989) soasonality: availability arid rates of wage labor at times that do not compete with production;
grain marketing and prices (Ellsworth and Shapiro 1989, Guyer 1989, Kumar 1988, Sahn 1989b, Messer 1989, Reardon and Matlon 1989, Shuttleworth, Bull and Hodgkinson 1988, Swift 1989, Wandel 1989)
social/organizational resources: community structures that facilitate recovery from disaster (.Anderson and Woodrow 1989)
socioeconomic and political dislocation: changing relationsliips during a crisis (Leftwich and Harvie 1986)
sources of food: quality of entitlement, referring to sensitivity to production or exchange shocks (Akong'a and Downing 1988)
strength of mutual support networks: such as kin-based cultural groups, self-help work groups, cooperatives, religious organizations (Fry 1988, O'Leary 1984)
terms of trade: relative prices of food and items offered for sale, often livestock or jewelry; for example, in one area of Sudan, sorghum prices increased six-fold, while the value of goats declined to one-fourth their prefamine level, generating a 24-fold decrease in the livestock-grain terms of trade (Cutler 1986, Baulch 1987, Sperling 1989, Swift 1989)
transfers, remittances, and donations: often related to relatives with wage income in urban areas type of emplqyment: skilled or unskilled, agricultural or nonagricultural; relationship of
employment type to wage level and security of income
13.3.3. Individual Food Deprivation
age: children under five and the elderly are most vulnerable (Das Gupta 1987) cultural dietary preferences: reluctance to eat some foods (wild, traditional, or imported), effect
of income on diet (Messer 1984) disease: reduced capacity to work, vulnerability to food deprivation (Barnett and Blaikie 1989,
Corbett 1989, Evans 1989) dependent entitlement: intra-household access to food entitlements dependent on other household
members, for example the economic dependence of women upon men in Bangladesh (Bongaarts and Cain 1982)
gender: particularly pregnant and lactating women have special nutritional requirements; intra-household food distribution may be biased against women; differential access to resources (Ahmed 1985, Beaman 1983, Das Gupta 1987, Schroeder 1987)
neglect and abuse: related to other factors or on an individual level (Das Gupta 1987) nutritional status: prior status affects ability to withstand further food deprivation; patterns of
malnutrition are symptomatic of vulnerability (ACC/SCN 1987, 1989, Becker et al. 1986, Biswas and Pinstrup- Andersen 1985, Brabin 1985, Carlson 1987, 1988, Carlson and Wardlaw 1989, Dugdale and Payne 1987, 1988,'Engberg et al . 1987, Galvin 1988, Haaga et ' al. 1986, Martorell 1984, 1989, Mason et al. 1987, Mazur and Sanders 1988, McLean 1987, Norse 1985, Payne 1985, 1989, Rao 1989, Rivers 1988, Shoham 1987)
social status: affects intra-househpld distribution of food, also influences household entitlement (Das Gupta 1987)
voluntary starvation: rationing of food consumption even when food is available, in order to preserve food for the future or to provide other basic needs, such as productive assets needed for recovery from deprivation (Svedberg 1985)
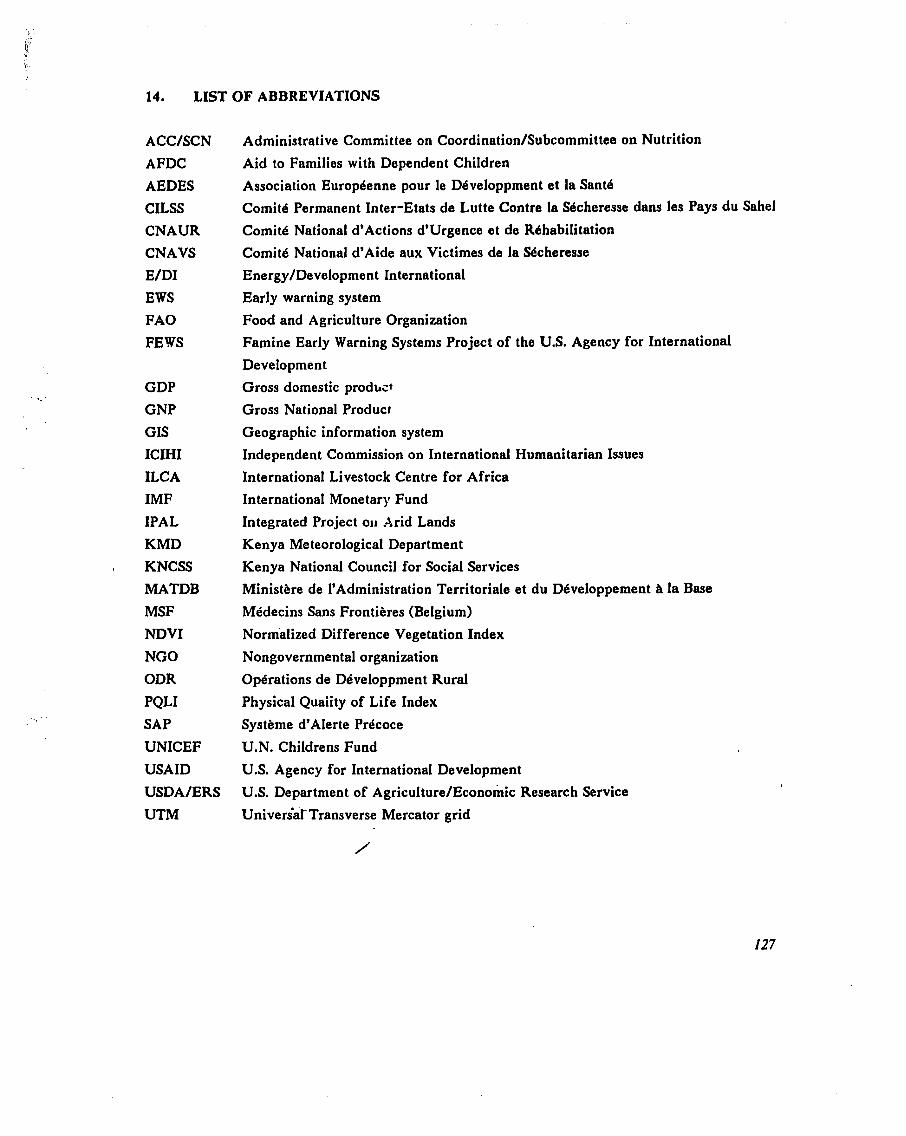
14. LIST OF ABBREVIATIONS
ACC/SCN
AFDC
AEDES
CILSS
CNAUR
CNAVS
E/DI
EWS
FA0
F E I S
GDP
GNP
GIs
ICIHI
ILC A
IMF
IPAL
KMD
KNCSS
MATDB
MSF
NDVI
NO0
ODR
PQLI
SAP
UNICEF
USAID
USDA/ERS
UTM
Administrative Committee on Coordination/Subcommittee on Nutrition
Aid to Families with Dependent Children
Association Europdenne pour le Ddveloppment et la Santd
Comitd Permanent Inter-Etats de Lutte Contre la Sdcheresse dans les Pays du Sahel
Cornit6 National d'Actions d'urgence et de Rdhabilitation
Comitk National d'Aide aux Victimes de la acheresse
Energy/Development International
Early warning system
Food and Agriculture Organization
Famine Early Warning Systems Project of the U.S. Agency for International
Development
Gross domestic prodbct
Gross National Product
Geographic information system
Independent Commission on International Humanitarian Issues
International Livestock Centre for Africa
International Monetary Fund
Integrated Project 0 1 1 Arid Lands
Kenya Meteorological Department
Kenya National Council for Social Services
Ministere de I'Administration Territoriale et du D6veloppement h la Base
A46decins Sans Frontibres (Belgium)
Normalized Difference Vegetation Index
Nongovernmental organization
Operations de Ddveloppment Rural
Physical Quaiity of Life Index
Systbme d'Alerte Prdcoce
U.N. Childrens Fund
U.S. Agency for International Development
U.S. Department of Agriculture/Economic Research Service
Uni~er~aTTransverse Mercator grid
This page is intentionally blank.
Abatena, H. 1988. Structural impediments to agricultural davelopment and the crisis o f food shortage in su b-Saharan Africa, Journal of Rurul Development (Hyderabad) 7(4): 385-409.
Abell, P.I. and Nyamweru, C.K. 1988. Paleoenvironments in the Chalbi Basin of Kenya. Chemical Geology (Isotope Geoscience Sectio~.L 72(4): 283-291.
Aboyade, 0. 1985. Administering Food Producer Prices in Africa: Lessofis from International Experiences. Washington: International Food Policy Research Institute.
ACC/SCN (Administrative Committee on Coordination/Subcommittee on Nutrition). 1987. First Report on the World Nutrition Situation. Rome: ACC/SCN.
ACC/SCN (Administrative Committee on Coordination/Subcommittee on Nutrition). 1989. Update on the Nutrition Situation: Recent Trends in Nutrition in 33 Countries. Rome: ACC/SCN.
Acland, J.D. 197 1. East African Crops. London: Longman.
Adams, l'v1.E. 1986. Merging relief and development: the case of Turkana. Development Policy Review 4(4): 3 14-324.
Adams, W.M. and Carter, R.C. 1987. Small-scale irrigation in Sub-Saharan Africa. Progress in Physical Geography 1 l(1): 1-27.
Agatsiva, J.L. and Mwendwa, H. 1982. Land Use Mapping of Kenya Using Remote Sensing Techniques. Nairobi: Kenya Rangeland Ecological Monitoring Unit.
Agatsiva, J.L., Mwendwa, H., Ottichillo, W.K., Peden, D.G. and Pilloto, J. 1984. Maize llarvest Forecast for 1984 in Bungoma, Kakamega, Nandi, Trans Nzoio and Uasin Gishu Districts. KREMU Technical Report No. 11 1. Nairobi: Kenya Ministry of Finance and Planning.
Agbo, C. and Phillips, R. 1988. Evaluation of alternative grain stabilization programmes for Nigerian food security. Agricultural Administration and Extension 30(1): 65-75.
Agricultural Sub-committee. 1985. Lessons from the Drought. Nairobi: Office of the Delegate of the European Communities. (Manuscript).
Agumba, F.O. 1985. Agroclimatic Assessment of the 1984 Long Rains Season in Kenya. Washington, DC: Assessment and Information Services Center, Climate Impact Assessment Division, National Oceanic and Atmospheric Administration.
Agumba, F.O. 1984. Climatological Fluctuations of Spring Rains in Kenya in Relation to Large-Scale Circulations. M.Sc. Thesis. Columbia: University of Maryland.
I This review has consulted numerous documents on famine, food systems, hunger, monitoring, and vulnerability. T p extensive bibliography includes many sources not explicitly referenced or reviewed in the text. It draws upon published reviews and reference lists (in particular Downing 19891, as well as compilations such as by Parker Shipton (1989). An exchange of references would be helpful. This list is available as a ProCite database and in Wordperfect and ASCII formats.
Agumba, F.O. 1984. Fluctuation of the Long Rains in Kenya in Relation to Large Scale Circulations. Research Report No. 1/85. Nairobi: Institute for Meteorological Training and Research.
Ahmed, I., ed. 1985, Technology and Rural Women: Conceptual and Empirical Issues. London: George Allen and Unwin.
Akong'a, J., Downing, T.E., Konijn, N.T., Mungai, D.N., Muturi, H.R. and Potter, H.L. 1988. The effects of climatic variations on agriculture in central and eastern Kenya. In The Impact of Climatic Variations on Agriculture. Volume 2: Assessments in Semi-Arid Regions, M.L. Parry, T.R. Carter and N.T. Konijn, eds., pp. 121-270. Dordrecht, The Netherlands: Kluwer.
Akong'a, J. and Downing, T.E. 1988. Smallholder vulnerability and response to drought. In The Impact of Climatic Variations on Agriculture. Volume 2: Assessments in Semi- Arid Regions, M.L. Parry, T.R. Carter and N.T. Konijn, eds., pp. 221-248. Dordrecht, The Netherlands: Kluwer.
Alamgir, M. 198 1. An approach towards a theory of famine. In Famine: I ts Causes, Effects and Management, John R.K. Robson, ed. New York: Gordon and Breach.
Alamgir, M. 1980. Famine in South Asia: Political Economy of Mass Starvation. Cambridge: Oelgeschlager, Gunn and Hain.
Alderman, H. 1986. The Effect of Food Price and Income Changes on the Acquisition of Food by Low-Income Households. Washington: International Food Policy Research Institute.
Alnwick, D., Moses, S. and Schmidt, O.G. 1988. Improving Young Child Feeding in Eastern and Southern Africa, Household-Level Food Technology. Ottawa: International Development Research Centre.
Alusa, A.L. 1978. A Note on the Onset of the Rains in East Africa. Research Report 3/78. Nairobi: East African Institute for Meteorological Training and Research.
Ambler, C.H. 1988. Kenya Communities in the Age of Imperialism: The Central Region in the Late Nineteenth Century. New Haven: Yale University Press.
AMREF (African Medical Research and Education Foundation). 1985a. Report on Project No. I D 06 - AMREF Famine Relief Programme. Nairobi: AMREF. (Manuscript).
AMREF (African Medical Research and Education Foundation). 1985b. Turkana 1982 Survey Report on Epidemiology, Nutrition, Health-related Social Anthropology and Radio Communications. Consultancy Report. Nairobi: AMREF.
Anderson, D.M. 1988. Cultivating pastoralists: ecology and economy among the I1 Chamus of Baringo, 1840- 1980. In The Ecology of Survival: Case Studies from Northeast African History, D.H. Johnson and D.M. Anderson, eds., pp. 241-260. Boulder, CO: Westview. _-
Anderson, D.M. 1984. Depression, dast bowl, demography and drought: the colonial state and soil conservation in East A f r i v during the 1930's. African Affairs 83(332): 321-343.
Anderson, D.M. and Johnson, D.H. 1988. Introduction: ecology and society in northeast African history. In The Ecology of Survival: Case Studies from Northeast African History, D.H. Johnson and D.M. Anderson, eds., pp. 1-26. Boulder, CO: Westview.
Anderson, M.B. and Woodrow, P.J. 1989. Rising from the ~shes,; Development Strategies in Times of Disaster. Boulder: Westview Press.
Anker, R. and Knowles, J.C. 1983. Population Growth, Employment and Economic-Demographic Interactions in Kenya: Bachue-Kenya. New York: Gower.
Anthony, C.G. 1988. One, two, how many African famines? The implications for international assistance. Journal of Developing Societies 4(2): 225-237.
Anyamba, E.K. and Ogallo, L.J. 1984. Anomalies in the Wind Field over Africa During the East African Rainy Season 1983/84. Nairobi: Institute for Meteorological Training and Research.
Anyang' N'yong', P. 1981. The development of a middle peasantry in Nyanza. Review of African Political Economy 20: 108- 120.
Anyango, G., Downing, T.E., Getao, C., Gitahi, M., Kabutha, C., Maghanga, S., Kamau, C., Karanja, M., Mbarire, S.K., Munene, S., Mutero, W., Muturi, H.R., Mwangi, B., Wainaina, M. and Were, F. 1989. Drought vulnerability and responses in central and eastern Kenya. In Coping with Drought in Kenya: National and Local Strategies, T.E. Downing, K.W. Gitu and C.M. Kamau, eds., pp. 169-210. Boulder: Lynne Rienner.
Appadurai, A. 1984. How moral is south Asia's economy--a review article. Journal of Asian Studies XLIII(3): 481 -497.
Arnold, D. 1988. Famine: Social Crisis and Historical Changa. Oxford: Basil Blackwell.
Ashall, C. 1987. Needless disaster. Disasters 1 l(1): 1 1 - 17.
Asher, M. 1986. A Desert Dies. New York: St. Martin's Press.
Association Europdenne pur le Developpement et la Sant6 (AEDES). 1988. Detection et Suivi des Zones a Risque. Les Projects Systemes d'Alerte Precoce du Tchad et du Mali mis en Oeuvre par AEDES, Bilan de Deux Ans de Fonctionnement. Bruxelles: AEDES.
Autier, P. 1988. Nutrition assessment through the use of ;a nutritional scoring system. Disasters 12(1): 70-80.
Autier, P., D'Altilia, J.-P., Delamalle, J.-P. and Vercruysse, V. 1989. '~he food and nutrition surveillance systems of Chad and Mali: the "SAP" after two years. Disasters 12(1): 9-32.
Bager, T. 1980. Marketing Cooperatives and Peasants in Kenya. Centre for Development Research 5. Uppsala: Scandinavian Institute of African Studies.
Baier, W. 1982. Agroclimatic modeling: an overview. In Agroclimatic Information for Development: Reviving the Green Revolution, D.B. Cusack, ed., pp. 57-82. Boulder, CO: Westview. . ..-
Bake, G. 1989. Drought and its impiications for water supply in northern Kenya. In Coping with Drought in Kenya: Nation& and Local Strategies, T.E. Downing, K.W. Gitu and C.M. Kamau, eds., pp. 14 1 - 150. Boulder: Lynne Rienner.
Bake, G. 1986. Water Management as a Steering Factor of a Controlled Grazing System in a Nornadic Area: A Plan to Combat Desertification in Northern Kenya. Nairobi: United Nations Educational, Scientific, and Cultural Organization. (Manuscript).
Bake, G. 1984. Water Resources and Water Management in Southwestern Marsabit District. IPAL Technical Report B-4. Nairobi: United Nations Educational, Scientific and Cultural Organization.
Bake, G. 1983. An Analysis of Climatological Data from the Marsabit District of Northern Kenya. IPAL Technical Report No. B-3. Nairobi: United Nations Educational, Scientific and Cultural Organization.
Baker, S.R. 1986. The determinants of famine: the Ethiopia9 example. Einstein Quarterly Journal of Biological Medicine 4: 24-28.
Bakhtri, M.N., Gavotti, S. and Kimeniia, J.K. 1984. On-farm research at Katumani: pre-extension trials experience (with special reference to semi-arid areas of Eastern Province of Kenya). East African Agricultural and Forestry Journal 44: 437-443.
Barker, D., Oguntoyinbo, J. and Richards, P. 1977. The Utility of the Nigerian Peasant Farmer's Knowledge in the Monitoring of Agricultural Resources. London: Monitoring and Assessment Research Centre of the Scientific Committee on Problems of the Environment, International Council of Scientific Unions.
Barlett, P., ed. 1979. Agricultural Decision Making: Anthroplogical Contributions to Rural Development. New York: Academic Press.
Barnes, C. 1983. Differentiation by sex among small-scale farming households in Kenya. Rural Africana 15- 16 (Winter-Spring): 41 -63.
Barnett, T. and Blaikie, P. 1989. AIDS and food-production in East and Central-Africa--a research outline. Food Policy 14(1): 2-6.
Barrett, M. 1985. Women's Economic Initiatives in Kenya: Some Considerations. Paper presented at the Association for Women in Development Conference, April 25-27. Washington, DC: Association for Women in Development.
Barring, L. 1988. Aspects of Daily Rain fa l l Climate Relevant to Soil Erosion in Kenya. Ph.D. Dissertation. Lund: University of Lund, Department of Physical Geography.
Barring, L. 1987. Spatial pattern of daily rainfall in central Kenya. application of principal component analysis, common factor analysis and spatial correlation. Journal of Climatology 7: 267-289.
Barton, AH. 1969. Communities in Disaster: A Sociological Analysis of Collective Stress '
Situations. Garden City, NY: Doubleday.
Bates, R.H. 1988. From drought to famine in Kenya. In Satisfying Africa's Food Needs, Food Production and-Commercialization in African Agriculture, R. Cohen, ed., pp. 103-120. Boulder, CO: Lynne Rienner.
/ Bates, R.H. 198 1. Markets and States in Tropical Africa: The Political Bases of Agricultural
Policeis. Berkeley: University of California Press.
Bates, R.H. and Lofchie, M., eds. 1980. Agricultural Developmentsin Africa. New York: Praeger.
Battisti, F. 1980. Thresholds of security ,in different societies. Disasters 4(1): 101-105.
Baulch, B. 1987. Entitlements and the Wollo famine of 1982- 1985. Disasters 1 1: 195-204.
Beaman, A. 1983. Women's participation in pastoral economy: income maximization among the Rendille. Nomadic Peoples 12: 20-25.
Beaton, G.H. 1989. Small but healthy? Are we asking the right question? Human Organization 48(1): 30-39.
Beck, T. 1989. Survival strategies and power amongst the poorest in a West Bengal village. IDS Bulletin 20(2): 25-34.
Becker, G. S. 1965. A theory of the allocation of time. Economic Journal. (September).
Becker, S., Black, R.E., Brown, K.H. and Nahar, S. 1986. Relations between socio-economic status and morbidity, food intake and growth in young children in two villages in Bangladesh. Ecology of Food and Nutrition 18: 25 1-264.
Bein, F.L. 1987. Human adjustments to the environment in the Sudanese Sahel with respect to the current politics of the Horn of Africa (traditional technology). Bulletin--Association of North Dakota Geographers 36(1): ?-19.
Belshaw, D. 1979. 'Taking indigenous technology seriously: the case of inter-cropping techniques in East Afriica. IDS Bulletin lO(2): 24-27.
Bennet, J. 1987. The Hunger Machine. Oxford: Polity Press.
Benson, C, and Clay, E.J. 1986. Food aid and food crisis in Sub-Saharan Africa: statistical trends and implications. Disasters 1 O(4): 303-3 16.
Berg, A. 1987. Malnritrition: What Can Be Done? Lessons from World Bank Experience. Baltimore: Johns Hopkinis University Press.
Bernard, F.E., Campbell, D.J. and Thom, D.J. 1989. Carrying capacity of the eastern ecological gradient of Kanya. National Geographic Research 5(4): 399-421.
Bernard, F.E. and Thom, D.J. 1981. Population pressure and human carrying capacity in selected locations of Mlachakos and Kitui Districts. The Journal of Developing Areas 15: 381-406.
Berry, E. 1985. The Ajrrican Family-Household: A Behavioral Model. Cooperative Agreement on Settlement and Resource Systems Analysis. Worcester, MA: International Development Program, Clark University.
Berry, L. 1978. Enviro~~rnent: a critical, aspect of development and food production in Bangladesh. Ecology of FooaI and Nutrition 7: 73-86.
Berry, L., Campbell, D':inci Emker, I. 1977. Trends in man-land interaction in the West African Sahel. In Drought in Africa 2, ID. Dalby, R. Church and F. Bezzaz, eds., London: International African I n s t , t e .
Berry, L. and Downing, T.E. 1989. Drought and famine in Africa, 1981-1936: a comparison of impacts and responses in six countries. In The Tragedy of Famine: Recent Experience, Lessons Learned, J.O. Field, ed. Medford: Tufts University. (Forthcoming).
Berry, L., Hankins, T., Kates, R.W., Maki, L. and Porter, P. 1971. Human Adjustment to Agricultural Drought in Tanzania: Pilot Investigations. Working Paper 19. Dar es Salaam: Bureau of Resource Assessment and Land Use Planning.
Berry, L., Hunter, O., Seidman, A., Ford, R., Puffer, F. and Perritt, R. 1980. Eastern Africa Country Profiles: Kenya. Worcester, MA: International Development Program, Clark University.
Berry, S.S. 1984. The food crisis and agrarian change in Africa: a review essay. African Studies Review 27(2): 59- 1 12.
Bertrand, W.E., Mock, N.B., Usdin, L.A. and Trayfors, W.H. 1986. Famine Warning System: Methodological Issues and Field Data. A paper presented at the NCIH 13th Annual International Health Conference, Washington, D.C., June 11. New Orleans: Tuland University School of Public Health and Tropical Medicine.
Bezuneh, M., Deaton, B.J. and Norton, G.W. 1988. Food aid impacts in rural Kenya. American Journal of Agricultural Economics 70(1): 18 1 - 19 1.
Bigsten, A. and Ndung'u, N.S. 1988 (November). The Impact of Structural Adjustment u ; ~ Smallholders and the Rural Poor in Kenya. Report of a project organized by IFAD and FAO. Rome: International Fund for Agricultural Development (IFAD) and Food and Agricultural Organization (FAO).
Bindon, J.R. 1986. Dietary patterns of children in American Samoa: multivariate analysis of food groups and household associations. Ecology of Food and Nutrition 18: 331 -338.
Biswas, M. 1985. Food aid, nutrition, and development. In Nutrition and Development, M. Biswas and P. Pinstrup-Andersen, eds., pp. 97-1 19. Oxford: Oxford University Press.
Biswas, M. and Pinstrup-Andersen, P., eds. 1985. Nutrition and Development. Oxford: Oxford University Press.
Blackie, J.R., Edwards, K.A., Clarke, R.T. and Olembo, T.W., eds. 1979. Hydrological Research in East Africa. Nairobi: Kenya Agricultural Research Institute.
Blaikie, P. and Brookfield, H. 1987. Land Degradation and Society. London: Metheun.
Blankson, C. 1987. The food crisis in West Africa: an examination of theoretical approaches. Rural A fricana 27: 1 - 17.
Blaxter, K. 1986. People, Food and Resources. Cambridge: Cambridge University Press.
Bloemer, H.L., Needham, S.E. and Steyaert, L.T. 1986. Operational .vatellite data assessment for drought/disaster early warning in Africa: comments on GIs iquirements. In Remote Sensing for Resources Development and Environmental Management, Proceedings, 7th a
ISPRS Commisqio_n VII Symposium, Enschede, Vol. 2, M.C. J. Damehi, et al., eds., pp. 561 -568. Rotterdam: Balkema.
Bongaarts, J. and Cain, M. 1982.J3emographic responses to famine. In Famine, K.M. Cahill, ed., pp. 44-59. Maryknoll, NY: Orbis.
Booker Agriculture International and Githongo and Associates. 1983. Grain Marketing Study, Final Report. Nairobi: MinTstry of Finance, Republic of Kenya.

Borton, J. 1989. Overview of the 1984/85 national drought relief program. In Coping with Drought in Kenya: National and Local Strategies, T.E. Downing, K.W. Gitu and C.M. Kamau, eds., pp. 24-64. Boulder: Lynne Rienner.
Borton, J. 1987. The 1984/5 Drought Relief Programme in Kenya: A Provisional Review. Discussion Papor No. 2. London: Relief and Development Institute.
Borton, J. and Clay, E. 1986. The African food crisis of 1982-1986. Disasters lO(4): 258-272.
Borton, J. and Shoham, J. 1989. Experiences of Non-Governmental Organisations in the Targeting of Emergency Food Aid. A report on a "Workshop on Emergency Food Aid Targeting" at the London School of Hygiene and Tropical Medicine, London, 4-6 January 1989. London: Relief and Development Institute.
Borton, J. and Shoham, J. 1985. Risk Mapping and Early Warning Indicators--The Zambia Case Study. A report on a "Workshop on Emergency Food Aid Targeting" at the London School of Hygiene and Tropical Medicine, London, 4-6 January 1989. London: International Disaster Institute.
Borton, J. and Stephenson, R.S. 1984. Disaster Preparedness in Kenya. London: Relief and Development Institute.
Borton, J., Stephenson, R.S. and Morris, C. 1988. ODA Emergency Aid to Africa 1983-86. London: Relief and Development Institute.
Borton, J. and York, S., eds. 1987. Experiences of the Collection and Use of Micro-Level Data in Disaster Preparedness and Managing Emergency Operations. London: Relief and Development Institute.
Boserup, E. 198 1. Populations and Technological Change: A Study of Long-Term Trends. Chicago: University Press of Chicago.
Boyd, D. 1989. Th:! impact of adjustment policies on vulnerable groups: the case of Jamaica, 1973- 1985. In Adjustment with a Human Face, Volume If: Country Case Studies, G.A. Cornia, R. Jolly and F. Stewart, eds., pp. 126-155. Oxford: Clarendon Press.
Brabin, L. 1985. Malnutrition among the Akamba of Kenya--problem or response to a problem. Disasters 9(2): 1 15- 12 1.
Bradley, P.N. 1986. Food production and distribution--and hunger, Africa. In A World in Crisis: Geographical Perspectives, R.J. Johnston and P.J. Taylor, eds., pp. 89-106. New York: Basil Blackwell.
Brainard, J. 1986. Differential mortality in Turkana agriculturalists and pastoralists. British Journal of Nutrition 70(iv): 525-536.
Brammer, H. 1987. Drought in Bangladesh: lessons for planners and administrators. Disasters . - 1 l(1k 21-29. .
Braun, H.M. H. 1977a. The hel iap l i ty of the Rainy Seasons in Machakos and Kitui Districts. Miscellaneous Paper M 12. Nairobi: Kenya Soil Survey.
Braun, H.M. H. 1977b. Seasonal and Monthly Rainfall Probability Tables for the East-Central, North-Western and Coast Region of Kenya. Miscellaneous Paper M13. Nairobi: Kenya Soil Survey.
Brennan, L. 1984. The development of the Indian famine codes: personalities, politics, and policies, In Famine as a Geographical Phenomenon, B. Currey and G. Hugo, eds., pp. 9 1 - 1 1 1. Dordrecht: Reidel.
Brennan, L., Heathcote, R.L. and Lucas, A.E. 1984. The role of the individual administrator in famine rclief: three case studies. Disasters 8(4): 287-296.
Brittan, N.R. 1986. Developing an understanding of disaster. Australian and New Zealand Journal of Sociology 22(2): 254-27 1.
Brokensha, D.W. and Little, P.D., eds. 1988. Anthropology of Development and Change in East Africa. Boulder: Westview.
Brokensha, D.W. and Njeru, E.H. D. 1977. Some Consequences for Land Adjudication in Mbeere Division, Embu. Nairobi: Institute for Development Studies.
Brokensha, D.W., Warren, D.M. and Werner, O., eds. 1980. Indigenous Knowledge Systems and Development. Washington: University Press of America.
Brooke, C. 1967. Types of food shortages in Tanzania. Geographical Review 57(3): 333-357.
Brown, L.H. and Cocheme, J. 1973. A Study of the Agroclimatology of the Highlands of Eastern Africa. Technical Note No. 125. Geneva. World Meteorological Organization.
Bruins, H.J., Evenari, M. and Nessler, U. 1986. Rainwater-harvesting agriculture for food production in arid zones: the challenge of the African famine. Applied Geography 6(1): 13-32.
Bryant, C., ed. 1988. Poverty, Policy and Food Security in Southern Africa. Boulder: Lynne Rienner.
Bryceson, D.F. 198 1. Colonial famine responses: the Bagamoyo District of Tanganyika, 1920-6 1. Food Policy 6(2): 9 1 - 1 04.
Bryceson, D.F. 1980. Changes in peasant food production and food supply in relation to the historical development of commodity production in pre-colonial and colonial Tanganyika. Journal of Peasant Studies 7(3): 28 1-3 1 1.
Buch-Hanson, M. and Kieler, J. 1983. The development of capitalism and the transformation of the peasantry in Kenya. Rural Africana 15-16(8): 13-40.
Buckley, R. 1988. Food targeting in Darfur: Save the Children Fund's programme in 1986. Disasters 12(2): 97- 103.
Bukusi, J.B. M. and MbLire, S.K. 1989. Effect of the 1984 drought on education and responses by the Ministry of Education, Science and Technology. In Coping with Drought in Kenya: National and Local Strategies, T.E. Downing, K.W. Gitu and C.M. Kamau, eds., pp. 299-305. Boulder: Lynne Rienner.
Burki, S.J. 1985. The African Food Crisis: Looking beyond the Emergency. Paper presented at the Conference on South-South Cooperation, November. Harare, Zimbabwe:
Burton, I., Kates, R.W. and White, G.F. 1978. The Environment as Hazard. New York: Oxford University Press.
Bush, R. 1987. Explaining Africa's famine. Social Studies Review 2: 2-8.
Bush, R. 1985. Unnatural disaster--the politics of famine. Marxism Today December.
Buzzard, S. 1982. Women's Status and Wage Labor in Kisumu Kenya. Ph.D. Dissertation. Washington, DC: American University.
Cahill, G.F., Jr. 1981. Physiology of acute starvation in man. In Famine: Its Causes, Effects and Management, J.R. K. Robson, ed., pp. 51-60. New York: Gordon and Breach.
Cahill, K.M., ed. 1982. Famine. Maryknoll, NY: Orbis.
Cameroon, M.E. and van Staveren, W.A. 1988. Manual on Methodology for Food Consumption Studies. Oxford: Oxford University Press.
Campbell, D.J. 1990. Community-based strategies for coping with food scarcity: a role in African famine early-warning systems. GeoJournal20(3): (Forthcoming).
Campbell, D.J. 1987. Strategies for coping with severe food deficits in Northeast Africa. Norhteast African Studies 9(2): 43-54.
Campbell, D.J. 1986a. Coping Strategies as Indicators of Food Shortage in African Villages. East Lansing, MI: Department of Geography, Michigan State University.
Campbell, D.J. 1986b. The prospect for desertification in Kajiado District, Kenya. The Geographical Journal 152(1): 44-55.
Campbell, D.J. 1984. Response to drought among farmers and herders in southern Kajiado District, Kenya. Human Ecology 12(1): 35-64.
Campbell, D.J. 1981. Kajiado District--case study. In The Development of Kenya's Semi-Arid Lands, Occasional Paper 36, D.J. Campbell and S.E. Migot-Adholla, eds., pp. 212-241. Nairobi: Institute for Development Studies, University of Nairobi.
CARE. 1985. The Kenya Drought 1984/5: A Report on the NGO Response and the OFDA Grant ASB-0000-G-SS-4207-00. Nairobi: CARE. (Manuscript).
Carlson, B.A. 1988. Monitoring Human and Social Indicab-rs in the Adjustment Process. New York: UNICEF.
Carlson, B.A. 1987. Core Indicators for the Interagency Food and Nutrition Surveillance Programme 1FNS). New York: UNICEF.
Carlson, B.A. and Wardlaw, T. 1989. Assessing the Nutritional Status of Young Children: A Global Analysis and ~e f iodo log ica l Overview. New York: UNICEF.
Carney, J.A. 1989. Gender and R y a l Transformation in the Gambia. Mexico: CIMMYT Economics Program.
Carney, J.A. 1988. Struggles over crop rights and labour within contract farming households in a Gambian irrigated rice project. Journal of Peasant Studies 15(3): 334-349.
Carruthers, I. and Kydd, J. 1989. Sub-Saharan Africa: putting the meteorology into perspective. Weather 44(2): 43-46.
Cashdan, E., ed. 1990. Risk and Uncertainty in Tribal and Peasant Economies. Boulder: Westview.
Casley, D.J. and Marchant, T.J. 1979. Smallholder Marketing in Kenya. Nairobi: Central Bureau of Statistics and Food and Agriculture Organization.
Cater, N. 1986. Sudan: The Roots of Famine. Oxford: Oxfam.
CBS (Central Bureau of Statistics). 1988. Economic Survey 1988. Nairobi: Government Printer,
CBS (Central Bureau of Statistics). 1986. Economic Survey 1986. Nairobi: Government Printer.
CBS (Central Bureau of Statistics). 1985. Economic Survey 1985. Nairobi: Government Printer.
CBS (Central Bureau of Statistics). 1984a. Economic Survey 1984. Nairobi: Government Printer.
CBS (Central Bureau of Statistics). 1984b (Updated in 1988j. Situation Analysis of Children and Women in Kenya. Nairobi: Central Bureau of Statistics and U.N. Children's Fund (UNICEF).
CBS (Central Bureau of Statistics). 1983a. Population Projections for Kenya, 1980-2000. Nairobi: CBS.
CBS (Central Bureau of Statistics). 1983b. Statistical Abstract. Nairobi: Government Printer.
CBS (Central Bureau of Statistics). 1983c. Third Rural Child Nutrition Survey 1982. Nairobi: Government of Kenya.
CBS (Central Bureau of Statistics). 1982. Seasonal Variations in Food Crops: Evidence from IRS4. Nairobi: Ministry of Economic Planning and Development. (Manuscript).
CBS (Central Bureau of Statistics). 1981a. Compendium to Volume 1, 1979 Population Census. Nairobi: Government Printer.
CBS (Central Bureau of Statistics). 1981b. The Integrated Rural Surveys 1976-79. Nairobi: Ministry of Economic Planning and Development.
CBS (Central Bureau of Statistics). 1981c. Kenya Population Census, 1979. Volume 1. Nairobi: Government Printer.
CBS (Central Bureau of Statistics). 1980. Report of the Child Nutrition Survey 1978/79. Nairobi: UNICEF.
CBS (Central Bureau of Statistics). 1977a. Integrated Rural Survey, 1974-75: Basic Report. Nairobi: CBS.
.-
CBS (Central Bureau of Statistics). 1977b. Nonfarm activities in rural Kenyan households. Social Perspectives 2(2). /'
CBS (Central Bureau of Statistics). 1977c. The rural Kenya nutrition survey. Social Perspectives 2(4): 1-32.
CBS (Central Bureau of Statistics). 1970. Kenya Population Census, 1969. Volume 1. Nairobi: Government Printer.
CBS (Central Bureau of Statistics). n.d, 1979 Population Census. Volume I / : Analytical Report. Nairobi: Central Bureau of Statistics.
Chambers, R. 1989. Editorial introduction: vulnerability, coping and policy. IDS Bulletin 20(2): 1-7.
Chambers, R. 1983. Rural Development: Putting the Last First. London: Longman.
Chambers, R. and Leach, M. 1989. Trees as savings and security for the rural poor. World Development 17(3): 329-342.
Chambers, R., Longhurst, R. and Pacey, A,, eds. 1981. Seasonal Dimensions to Rural Poverty. London: Longman.
Chambers, R. and Morris, J., eds. 1973. Mwea: An irrigated Rice Settlement in Kenya. Munich: Welfrom Verlag.
Chazan, N. and Shaw, T.M., eds. 1988. Coping with Africa's Food Crisis. Boulder, CO: Lynne Rienner.
Chege, F.E. 1978. Socioeconomic Constraints to the Adoption and Diffusion of Chemical Fertilizers among Small-Scale Farmers: A Kenyan Case Study. Working Paper No. 33 1. Nairobi: Institute for Development Studies, University of Nairobi.
Chen, L.C., Chowdhury, A.K., Alauddin, M., and Huffman, S.L. 1979. Seasonal dimensions of energy protein malnutrition in rural Bangladesh: the role of agriculture, dietary practices, and infection. Ecology of Food and Nutrition 8: 175-187.
Chen, R.S. and Fiering, M.B. 1989. Climate Change in the Context of Multiple Environmental Threats. RR-89- 1. Providence, RI: World Hunger Program, Brown University.
Chretien, J.-P. 1987. (Demography and ecology in East Africa at the end of the 19th Century: an exceptional crisis?) [French]. Cahiers dlEtudes A fricaines 105- 106: 43-59.
Christiansson, C. 1988. Degradation and rehabilitation of agropastoral land--perspectives on environmental change in semiarid Tanzania. Ambio 17(2): 144- 152.
. . Clark, M. 1985. Household Economic Strategies and Support Networks of the Poor in Kenya: A
Literature Review. Report No. UDD-69. Washington: World Bank.
Clay, J.W. and Holcomb, B.K. 1988. Politics and the Ethiopian Famine, 1984-1985. London: Transaction Books.
Clough, P. 1985. The social relations of grain marketing in northern Nigeria. Review of African a
Political Economy 34: 16-34. . - Cockcroft, M.J., Wilkinson, M.J. and Tyson, P.D. 1987. The application of a present-day climatic
model to the late Quarterpdry in southern Africa. Climatic Change lO(2): 161- 18 1.
Cogill, B., Marzilli, J. and McNabb, M. 1989. A Manual for Food Needs Assessment: Conceptual Framework and Software Documentation. Washington: Bureau for Food for Peace and Voluntary Assistance, U.S. Agency for International Development.
Cohen, D.W., Atieno-Odhiambo, E.S. 1989. Siaya: The Historical Anthropology of an African Landscape. London: James Currey.
Cohen, J.M. 1984. Participatory planning and Kenya's national food policy paper. Stanford Food Research Institute Studies XIX: 187-2 13.
Cohen, J.M. and Lewis, D.B, 1987. Role of government in combatting food shortages: lessons from Kenya 1984/85. In Drought and Hunger in Africa, M.H. Glantz, eds., pp. 269-296. Cambridge: Cambridge University Press.
Cohen, R., ed. 1988. Satisfying Africa's Food Needs. Boulder, CO: Lynne Rienner.
Collier, P. and Lal, D. 1984. Why poor people get rich: Kenya 1960-79. World Development 12: 1007-1018.
Collier, P. and Lal, D. 1980. Poverty and Growth in Kenya. Washington: World Bank.
Collier, V.C. and Rempel, H. 1973. The divergence of private from social costs in rural-urban migration: a case study. Journal of Development Studies. (199-216).
Colson, E. 1979. In good years and in bad: food strategies of self-reliant societies. Journal of Anthropological Research 35: 18-28.
Commins, S.K., Lofchie, M.F. and Payne, R., eds. 1986. Africa's Agrarian Crisis: The Roots of Famine. Boulder: Lynne Rienner.
Conway, G.R. 1986. Agroecosystem Analysis for Research and Development. Bangkok: Winrock International Institute for Agricultural Development.
Cnnway, G.R. 1983. Agroecosystem Analysis. London: Imperial College for Environmental Technology, University of London.
Coppock, D.L., Ellis, J.E. and Swift, D.M. 1986. Livestock feeding ecology and resource utilization in a nomadic pastoral ecosystem. Journal of Applied Ecology 23(2): 573-584.
Copson, R.W. 1989. Africa: Internal War and Food Insecurity. A discussion paper prepared for "Food Security in Africa", a conference at Swarthmore College on the causes, consequences, and significances of chronic hunger and recurrent famine in Africa, Octover 18-20. Swarthmore: Swarthmore College.
Corbett, J. 1989. Poverty and sickness: the high costs of ill-health. IDS Bulletin 20(2): 58-60.
Corbett, J. 1988. Famine and household coping strategies. World Development 16(9): 1099-1 112.
Corbett, J. 1987. The supply and demand for food statistics in Kenya: creating an effective monitoring system. Eurostat News Special Edition: 12 1 - 127.
Corbe tt, J.D. 1987. ~ o i i 'Moisture/Crop Response in East Africa: An Energy- Water Budget Model. M.A. Thesis. Minneapolis: University of Minnesota. (Manuscript).
/ Cornia, G.A., Jolly, R. and Stewart, F., eds. 1988. Adjustment with a Human Face, Volume 11:
Country Case Studies. Oxford: Clarendon Press.
Cornia, G.A., Jolly, R. and Stewart, F., eds. 1987. Adjustment with a Human Face, Volume I: Protecting the Vulnerable and Promoting Growth. Oxford: Clarendon Press.
Cossins, N.J. and Upton, M. 1988. The impact of climatic variation on the Borana pastoral system. Agricultural Systems 27(2): 1 17- 135.
Coughenour, M.B., Ellis, J.E., Swift, D.M., Coppock, D.L., Galvin, K., McCabe, J.T. and Hart, T.C. 1985. Energy extraction and use in a nomadic ecosystem. Science 230: 619-625.
Cowen, M. 1986. Change in state power, international conditions and peasant producers: the case of Kenya. Journal of Development Studies 22(2): 355-384.
Cox, G.W. 1981. The ecology of famine: an overview. In Famine: I ts Causes, Effects and Management, J.R. K. Robson, ed., pp. 5-18. New York: Gordon and Breach.
Crawford, E. and Thorbecke, E. 1978. Employment, Income Distribution, Poverty Alleviation and Basic Needs in Kenya. Ithaca, NY: Cornell University.
Currey, B. 1984. Coping with complexity in food crisis mari:ciement. In Famine as a Geographical Phenomenon, B. Currey and G. Hugo, eds., pp. 183- 1Y9. Dordrecht: Reidel.
Currey, B. 1979. Mapping Areas Liable to Famine in Bangladesh. Ph.D. Dissertation. Manoa: University of Hawaii.
Currey, B. 1978. The famine syndrome: its definition %r reiiof and rcllabilitation in Bangladesh. Ecology of Food and Nutrition 7: 87-98.
Currey, B. and Hugo, G., eds. 1984. Famine as a Geographi - a ( Phenonlen1;n. Dordrecht: Reidel.
Curry, J.J. 1989. Occupation and drought vulnerability: cast3 stvdiv.4 I'rotn a village in Niger. In African Food Systems in Crisis: Microperspc*ccivc;, R . F.~.~s-P,shri;ore and S.H. Katz, eds., pp. 239-260. New York: Gordon and Breach.
Curtis, D., Hubbard, M. and Shepherd, A. 1988. Pr=rcntZt;g Famirl:,: Policies and Prospects for Africa. London: Routledge.
Cutler, P. 1986. The response to drought of Beja famine r e f l~ge~s in Sudan. Disasters lO(3): 181-188.
Cutler, P. 1985. The Use of Economic and Social Information in Famine Prediction and Aesponse. London: Relief and Development Institute.
Cutler, P. 1984. Famine forecasting: prices and peasant behaviour in northern Ethiopia. Disasters 8: 48-56.
Cutler, P. and Stephenson, R. 1984. The State of Food Emergency Preparedness in Ethiopia. London: International Disasters Institute.
D'Souza, F. 1989. f am in; and the Art of Early warnhg: The African Experience. A report prepared for ODA, Economics and Social Research Division. Oxford: Department of Biological Anthropology, Nniversity of Oxford. (Manuscript).
D'Souza, F. 1988. Famine: social security and an analysis of vulnerability. In Famine, G.A. Harrison, ed., pp. 1-56. Oxford: Oxford University Press.
D'Souza, F. and Shoham, J. 1985. The spread of famine in Africa: avoiding the worst. T l ~ i r d World Quarterly 7(3): 5 15-530.
DaCorta, L. 1986. The Persistence of Famine: A Dynamic Approach Combining Entitlement and . Peasant Mobility Theories in the Analysis of Vulnerability to Famine. Oxford: St. Antony's College, University of Oxford.
Dahl, G. and Hjort, A. 1980. Pastoral Change and the Role of Drought. Report No. 2. Stockholm: SAREC.
Dahl, G. and Hjort, A. 1976. Having Herds: Pastoral Herd Growth and Household Economy. Stockholm: University of Stockholm.
Dalby, D. and Harrison Church, R.J., eds. 1973. Drought in Africa. London: University of London, School of Oriental and African Studies.
Dalby, D., Harrison Church, R.J. and Bezzaz, F., eds. 1977. Drought in Africa 11. African Environment Special Report No. 6. London: International African Institute.
Dando, W.A. 1980. The Geography of Famine. New York: John Wiley.
Das Gupta, M. 1987. Selective discrimination against female children in rural Punjab, India. Population and Development Review 13(1): 77- 100.
Davies, T.D., Vincent, C.E. and Beresford, A.K. C. 1985. July-August rainfall in west-central Kenya. Journal of Climatology 5: 17-23.
Davison, J. 1989. Voices from Mutira: Lives of Rural Gikuyu Women. Boulder: Lynne Rienner.
de Waal, A. 1989a. Famine mortality: a case study of Darfur, Sudan 1984-5. Population Studies 43(1): 5-24.
de Waal, A. 1989b. Is famine relief irrelevant to rural people? IDS Bulletin 20(2): 61-65.
de Waal, A. 1988. Famine early warning systems and the use of socio-economic data. Disasters 12(1> 81-91.
de Waal, A. 1987. The perception of poverty and famines. International Journal of Moral and Social Studies 2(3): 25 1-262.
de Waal, A. and el Amin, M.M. 1986. Survival in Northern Darfur, 1985-1986. London and Nyala: Save the Children Fund.
de Wilde, J.C. 1984. Agriculture, Marketing, and Pricing in Sub-Saharan Africa. Los Angeles: African Studies Center and African Studies Association.
Deaton, B.J. and Bezuneh, M. 1987. Food for work and income distribution in a semiarid region of rural Kenya. an empirical assessment. In Agriculture and Economic Instability, IAAE Occasional Paper-4, M. Bellamy and B. Greenshields, eds., pp. 99-103, discussion pp. 104- 105. Gower, IAAE. '
/ Dejene, A. 1987. Peasants, Agrarian Socialism, and Rural Development in Ethiopia. Boulder, CO:
Westview.
Delgado, C.L. 1988. Setting priorities for promoting African food production. In Satisfying Africa's Food Needs: Food Production and Commercicllization in African Agriculture, R. Cohen, ed., pp, 31-46. Boulder, CO: Lynne Rienner.
Delgado, C.L. and Mellor, J.W. 1984. A structural view of policy issues in African agricultural development. American Journal of Agricultural L?conomics 66: 665-670.
Deloite Haskins & Sells (DH&SMC). 1985. Final Report on the USAID/GOK Food Relief Monitoring and Evaluation. Nairobi: US. Agency for International Development. (Manuscript).
Dennett, M.D., Elston, J. and Rodgers, J.A. 1985. A reappraisal of rainfall trends in the Sahel. Journal of Climatology 5: 353-362.
Dent, M.C., Schulze, R.E., Wills, H.M. M. nnd Lynch, S.D. 1987. Spatial and temporal analysis of the recent drought in the summer rainfall region of southern-Africa. Water SA 13(1): 37-42.
Derrick, J. 1984. West Africa's worst year of famine. African Affairs 83(332): 28 1-299.
Desai, M. 1988. The economics of famine. In Famine, G.A. Harrison, ed., pp. 107-138. Oxford: Oxford University Press.
Desai, M. 1984. A general theory of poverty? Indian Economic Review July-December.
Development Alternatives. 1976. Strategies for Small Farmer Development: An Empirical Study of Rural Development Projects in the Cambia, Ghana, Kenya, Lesotho, Nigeria, Bolivia, Colombia, Mexico, Paraguay and Peru. Washington: Agency for International Development.
Development Planning Division--Ministry of Agriculture and Livestock Development. 1984. The Plan for Agriculture and Livestock Development 1984-1988. Nairobi: Government of Kenya. (Manuscript).
Dever, G.E. Alan, Sciegaj, M., Wade, T.E. and Lofton, T.C. 1988. Creation of a social vulnerability index for justice in health planning. Family and Community Health lO(4): 23-32.
Devereux, S. 1988. Entitlements, availability and famine: a revisionist view of Wollo, 1972-74. Food Policy 13(3): 317-320.
Devereux, S. 1987. FAD Plus Entitlements Equals Famine: Not a Refutation of Professor Sen's Theory. Oxford: Food Studies Group.
Devereux, S. and Hay, R. 1986. Origins of Famine: A Review of the Literature. Oxford: Food Studies Group.
DBVRES, Inc. 1987. The Role of Coping Mechanisms as Socioeconomic Indicators in Famine Early Warning Sistems: A Literature Review and a Framework for Identification, Interpretation and Use. Report submitted to the Agency for International Development. Washington, DC: DEVREX Inc.
Dickinson, N.M., Lepp, N.W. and Surtan, G.T. K. 1987. Lead and potential health risks from subsistence food crops in urban Kenya. Environmental Geochemistry and Health 9(2): 37-42.
Diesfield, H.J. and Hecklau, H.K. 1978. Kenya: A Geomedical Monograph. Berlin: Springer-Verlag.
Dietz, T. 1986. Migration to and from dry areas in Kenya. Tijdschrift voor Economische an Sociale Geogra fie 77(1): 18-26.
Dietz, T. and van Haastrecht, A. 1982a. Market Integration in Elgeyo Marakwet and West Pokot: Comparing Households and Locations. Working Paper 382. Nairobi: Institute for Development Studies.
Dietz, T. and van Haastrecht, A. 1982b. Rapid Rural Appraisal in Kenya's Wild West: Economic Change and Market Integration in Alale Location, West Pokot District. Working Paper 396. Nairobi: Institute for Development Studies.
Dixon, S.D., LeVine, R.A. and Brazelton, T.B. 1982. Malnutrition: a closer look at the problem in an East African village. Develop. Med. Child. Neurol. 24: 670-685.
Dowker, B.D. 1963. Rainfall reliability and yield in Machakos. East Africa Agricultural and Forestry Journal 28: 1 34- 138.
Downing, J., Berry, L., Downing, L., Downing, Thomas E. and Ford, R. 1987. Drought and Famine in Africa, 1981-1986: The U.S. Response. Cooperative Agreement on Settlement and Resource Systems Analysis. Worcester, MA: Clark University.
Downing, T.E. 1989a. A Bibliography on Drought in Kenya. Nairobi: National Environment Secretariat.
Downing, T.E. 1989b. Vulnerability to Hunger in Kenya: A National Estimate for 1984. Boulder, CO: National Center for Atmospheric Research. (Manuscript).
Downing, T.E. 1 988. Climatic Variability, Food Security and Smallholder Agriculturalists in S ix Districts of Central and Eastern Kenya. Ph.D. Dissertation. Worcester, MA: Clark University.
Downing, T.E. 1987. Kenya: the drought and famine, 1984-1985. In Drought and Famine in Africa, 1981-1986: The U.S. Response, J. Downing, L. Berry, L. Downing, T.E. Downing and R. Ford, eds., pp. 243-270. Worcester, MA: SARSA, Clark University.
Downing, T.E. 1982. Eastern Africa Regional Studies: Climate. Worcester, MA: Clark University.
Downing, T.E., Akong'a J., Mungai, D.N., Muturi, H.R. and Potter, H.L. 1988. Introduction to the Kenyan case study. In The Impact of Climatic Variations on Agriculture. Volume 2. Assessments in Semi-Arid Regions, M.L. Parry, T.R. Carter and N.T. Konijn, eds., pp. 129- 148. Dordrecht, The Netherlands: Kluwer.
Downing, T.E. and Borton John. 1990. Monitoring and responding to famine: lessons from the 1984- 1985 food crisis .- in Kenya. Disasters. (Forthcoming).
Downing, T.E., Gitu, K.W. and Kainau, C.M., eds. 1989. Coping with Drought in Kenya: National and Local Strategies. BoulCler: Lynne Rienner.
Downing, T.E., Kamau, C.M., Gitu, K.W. and Borton, J. 1989. Drought in Kenya. In Coping with Drought in Kenya: National and Local Strategies, T.E. Downing, K.W. Gitu and C.M. Kamau, eds., pp. 3-23. Boulder: Lynne Rienner.
Downing, T.E,, Kamau, G., Karaba, M., Lewis, L.A., Ndonye trnd M,, eds. 1985. Monitoring Soil Erosion in Kiambu and Murang'a Districts, Kenya. Progress Report, 1982-1983. Nairobi: National Environmental Secretariat.
Downing, T.E., Lezberg, S., Williams, C. and Berry, L. 1989. Population change and environment in central and eastern Kenya from 1969 to 1979. Environmental Conservation. (Forthcoming).
Downing, T.E., Mungai, D.N. and Muturi, H.R. 1988. Drought climatology of central and eastern Kenya. In The Impact of Climatic Variations on Agriculture. Volume 2. Assessments in Semi-Arid Regions, M.L. Parry, T.R, Carter and N.T. Konijn, eds., pp, 149-174. Dordrecht, The Netherlands: Kluwer.
Downing, T.E. and Parry, M.L. 1989. Potential Effects of Climate Change on Vulnerability to Food Shortage and Food Poverty in Selected Developing Countries. Birmingham: Atmospheric Impacts Research Group, University of Birmingham.
Downing, T.E. and Porter, P.W. 1987. Potential Crop Productivity in Central and Eastern Kenya: Results from a Water Balance Model. In Proceedings of the First Technical Conference on Meteorological Research in Eastern and Southern Africa, 6-9 January 1987, S.B.B. Oteng'i, R.E. Okoola, P.G. Ambenje and S.H. Mwandoto, eds. Nairobi: Institute for Meteorological Training and Research.
Drbze, J. 1988. Famine Prevention in Africa. London: Development Economics Research Programme, London School of Economics.
Drbze, J. 1986. Famine Prevention in India. Paper presented at the WIDER conference, Helsinki. London: Development Economics Research Programme, London School of Economics.
Drbze, J. and Sen, A. 1989. Hunger and Public Action. Oxford: Clarendon Press. (Forthcoming).
Dugdale, A.E. and Payne, P.R.. 1988. Variability in crop yields as a cause of failure among peasant farmers. Ecology of Food and Nutrition 22: 1 17- 123.
Dugdale, A.E. and Payne, P.R. 1987. A model of seasonal changes in energy balance. Ecology of Food and Nutrition 19: 23 1 -245.
Duran, J. 1974. The ecology of ethnic groups from a Kenyan perspective. Ethnicity: 43-64.
Durnin, J. 1984. Measuring impact on physical activity and physical fitness. In Methods for the Evaluation of the Impact of Food and Nutrition Programmes, D.E. Sahn, R. Lockwood and N.S. Scrimshaw, eds., pp. 153-178. Tokyo: United Nations University.
Dynes, R.R. 1970. Organized Behavior in Disaster. Lexington, MA: Lexington Books, D.C. Heath.
Dyson-Hudson, R. 198J. Ecology of nomadic Turkana pastoralists: a discussion. In Arid Lands, Today and Tomo>row, Emily E. Whitehead, Charles F. Hutchinson, Barbara N. Timmermann and Robert G; Varady, eds., pp. 701-704. Boulder: Westview.
/ Dyson-Hudson, R. and McCabe, J.T., eds. 1984. Turkana Nomadism: Coping with an
Unpredictably Varying Environment. New Haven, CT: Human Relations Area Files.
East Africa Meteorological Dopartment (EAMD). 1975. Climatological Statistics for East Africa. Part I : Kenya. Nairqbi: EAMD.
Easterling, W.E. and Mjelde, J.W. 1987. The importance of seasonal climate prediction lead time in ngricultural decision making. Agricultural and Forest Meteorology 40(1): 37-50.
Ebomoyi, E. 1986. -4 comparitive study of the nutritional status of children in urban and rural areas of Kwara State, Nigeria. Ecology of Food and Nutrition 19: 19-30.
Economist Intelligence Unit (EIU). 1986. Country Report: Kenya. London: EIU.
Economist Intelligence Unit (EIU), 1985. Country Report: Kenya. London: EIU.
Economist Intelligence Unit (EIU). 1984. Country Report: Kenya. London: EIU.
Ecosystems Ltd. 1986. Baseline Survey of Machakos District: 1985 and Land Use Changes in Machakos District: 1981 - 1985. Report Number 4 for the Machakos Integrated Development Programme. Nairobi: Ecosystems Ltd.
Edelman, M.L. 1986. FEWS Issues: Briefing Memorandum to the Administrator. Review of the Africa Bureau Famine Early Warning System (FEWS). Washington: U.S. Agency for International Development, AA/AFR.
Edirisinghe, N. 1987. The Food Stamp Scheme in Sri Lanka: Costs, Benefits, and Options for Modification. Research Report No. 58. Washington: International Food Policy Research Institute.
Eele, G. and Funk, P. 1987. An introduction to the food accounting matrix: a statistical framework for food commodity flow data. Eurostat News Special Edition: 225-233.
Eldredge, E.A. 1987. Drought, famine and disease in Nineteenth-Century Lesotho. African Economic History 16: 6 1-93.
Eldredge, E.A. and Rydjeski, D. 1988. Food crises, crisis response and emergency preparedness: the Sudan Case. Disasters 12(1): 1-4.
Eldridge, E.A., Salter, C. and Rydjeski, D. 1986. Towards an early warning system in Sudan. Disasters 1 O(3): 189- 196.
Elkan, W. 1976. Is a proletariat emerging in Nairobi? Economic Development and Cultural Change 24: 695-706.
Ellis, J.E., Galvin, K., McCabe, J.T. and Swift, D.M. 1987. Pastoralism and Drought in Turkana District, Kenya. Bellvue, CO: Development Systems Consultants.
Ellis, J.E. and Swift, D. 1988. Stability of African pastoral ecosystems: alternative paradigms and implications for development. Journal of Range Management 41: 450-459.
Ellsworth, L. and ~haGr6 , K. 1989. Seasonality in Burkina Faso grain marketing: farmer strategies and government policy. In Seasonal Variability in Third World Agriculture: The Consequences for Food Seeftrity, D.E. Sahn, ed., pp. 196-205. Baltimore: Johns Hopkins University Press.
Energy/Development International. 1987. Assessment of the Famine Early Warning System. Washington: Energy/Development International. (Manuscript).
Engberg, L.E., Stlbry, J.Iil. and Beckorson, S.A. 1987. Production activities, food supply, and nutritional status i:n Malawi. Journal of Modem African Studies 25(1): 139- 148.
Ensminger, J.E, 1984. Political Economy among the Pastoral Galole Orma: The Effects of Market Integration. Ph.D. Dissertation. Evanston, IL: Northwestern University.
Ensminger, J.E. 1980. Ho&rsehold Economy among the Orma: Methodological Issues in the Collection of Quantitative Data among Pastoralists. Discussion paper for the Conference on Ecological Stress in Eastern Kenya sponsored by Northwestern University and the National Museums of Kenya, June 15-17. Nairobi: National Museums of Kenya.
Ensminger, J.E. n.d. The E'ffects of Increasing Orma Participation in the Cash Economy. St. Louis, MO: Washington University. (Manuscript).
Epp, H. and Killmayer, A. 1982. Determination of the Cultivation B0undar.y in Kenya. Technical Report No. 90. Nairobi: Kenya Rangeland Ecological Monitoring Unit (KREMU).
Erukudi, C. 1985. Aki~itam~unet (Remembrance). Lodwar, Kenya: Lodwar Diocese. (Manuscript).
Evangelou, P. 1984. Cattle marketing efficiency in Kenya's Maasailand. In Livestock Development in Subsoharan Africa: Constraints, Prospects, Policy, J. Simpson and P. Evangelou, eds., pp. 123-142. Boulder, CO: Westview.
Evans, T. 1989. The impact of permanent disability on rural households: river blindness in Guinea. I D S Bulletin! 20(2): 43-50.
Evers, H.-D., Clauss, W. anal Wong, D. 1984. Subsistence reproduction: a framework for analysis. In Households and the World-Economy, J. Smith, I. Wallerstein and H.-D. Evers, eds., pp. 23-36. Beverly Hills: Sage.
F A 0 (Food and Agriculture Organization). 1985a. The Fifth World Food Survey. Rome: FAO.
F A 0 (Food and Agriculture Organization). 1985b. Report of the F A 0 Workshop on National Preparedness for Acute and Large-Scale Food Shortages in Central and West African Countries. Dakar, Senegal, 28 October- 1 November. Rome: FAO.
F A 0 (Food and Agriculture Clrganization). 1984a. Assessment of the Agriculture, Food Supply and Livestock Situation: Kmya. Rome: FAO/Office for Special Relief Operations.
F A 0 (Food and Agriculture Organization). 1984b. Food ~a1a;;ce Sheets, 1979-81 Average. Rome: FAO.
F A 0 (Food and Agriculture Organization). 1984c. Food Supply in 24 African Countries Affected by Food and Agriculture Emergencies. Special Task Force Report No. 3. Rome: FAO;
F A 0 (Food and Agriculture Organization). 1984d. Production Yearbook 1983. Rome: FAO.
F A 0 (Food and ~ ~ r i c d t i u r e Organization). 1984e. Trade Yearbook 1983. Rome: FAO.
F A 0 (Food and Agriculture Orggdzation). 1969. 1968 Food Composition 'ruble for Use in Africa. Rome: FAO.
Farhar-Pilgrim, B. 1985. Social Analysis. In Climate Impact Assessment, R.W. Kates, J.H. Ausubel and M. Berberian, eds., pp. 323-350. New York: Wiley.
Farmer, G. 1989. Rainfall variability in tropical Africa und Kenya, In Coping with Drought in Kenya: National a?td Local Strategies, T.E. Downing, K.W. Gitu and C.M. Ka~nuu, ads,, pp. 82-93. Roc1:ler: Lynne Rienner.
Farmer. G. 1987a. A Rainfall Database for Eastern Africa with Some Kenyan Examples. Proceedings of the First Technical Conference on Metsorological Research in Eastern rrntl Southern Kenya. Nairobi: Kenya Meteorological Department.
Farmer, G. 1987b. Seasonal forecasting of the Kenya coast short rains 1901-84. Journal of Clitnatology 8(5): 489-497.
Farmer, G. 198 1. Regionalisation ~ n d Study of an Alleged Change in the Rain fa l l Climatology of East Africa. Ph.D. Dissertation. Sheffield: University of Sheffield.
Farmer, G. and Wigley, T.M. L. 1985. Climatic Trends for Tropical Africa. Research Report for the Overseas Development Administration. Norwich: Climatic Research Unit. (Manuscript).
Faruqee, R. 1980. Kenya: Population and Devclopment. Development Economics Department, East Africa Country Programs. Washington, DC: World Bank.
Faught, W.A., Waite, B.H., Manwiller, A., Majisu, B.N. and Ngundo, B.W., eds. 1984. Proceedings of the Symposium on Dryland Farming Research in Kenya. Special Issue of the East African Agricultural and Forestry Journal Vol. 44 (October). Nairobi: Kenya Agricultural Research Institute.
Faulkingham, R.H. and Thorbahn, P.F. 1975. Population dynamics and drought: a village in Niger. Population Studies 29(3): 463-477.
Fedders, A. and Salvadori, C. 1980. Peoples and Cultures of Kenya. Nairobi: Transafrica.
Feldman, R. 1981. Employment Problems of Rural Women in Kenya. Geneva: International Labour Office (JASPA).
Ferraro, G.P. 1973a. Rural and urban ide~tities in East Africa: a false dichotomy. In Social and Cultural Identity: Problems of Persistence and Change, T. Fitzgerald, ed., pp. 92-102. Athens, GA: University of Georgia Press.
Ferraro, G.P. 1973b. Tradition of transition: rural and urban kinsmen in east Africa. Urban Anthropology 2(2): 2 14-23 1.
FEWS Project, Tulane/Pragma Group. 1989. Pre-Harvest Assessment of Cereal Production. Washington: FEWS Project, Tulane/Pragma Group.
Field, C.R., Lamprey, H.F. and Masheti, S.M. 1976. A Preliminary Report of Livestock Numbers and Distribution in Marsabit District. Nairobi: United Nations Educational, Scientific, and Cultural Organization. . ..- (Manuscript).
Field, C.R. and Njiru, G.K. 1985. Conclusions and Urgent Recommendations Concerning Famine Relief Requirements in SiYDistricts of the Arid Zone of Kenya. Marsabit: Integrated Project in Arid Lands. (Manuscript).
Field, J.O. 1989. Beyond Relief: A Developnlental Porspective on Famine. Paper presented at tho 14th Intornational Congross on Nutrition, Seoul, Korea, 20-25 August. Medford, MA: Tufts University.
Field, J.0. 1987. Modernization, marginalization and malnutrition. In The Political Economy o f Nutritional Policies, P. Pinstrup-Andersen, ad. Baltimore: Johns Hopkins University Press.
Field, J.0. 1985. Implementing nutrition programs: lessons from unheeded literature. Annual Review of Nutrition 5: 143- 172.
Fisher, P.M. 1977. Risk Aversion by Small Farmers -- Can It Be Measured? Re~ul t s o f a Survey of 69 Small Farmers, Kabare Location, Kirinyagu District, March 1977. MA Thesis. Nairobi: University of Nairobi.
Fitzpatrick, R.M. 1989. The 1988-1989 Famine in the Southern Sudan. The Causes and the Politics of Relief. MS. Thesis. Medford: MA: Tufts University, Fletcher School of Law and Di ylomacy.
Fleuret, A. 1989. Indigenous Taita responses to drought. Ir. African Food Systems in Crisis: Microperspectives, R. Huss-Ashmore and S.H. Katz, ads., pp. 221-238. New York: Gordon and Breach.
Fleuret, A. 1986. Indigenous responses to droukht in sub-Saharan Africa. Disasters 10(3): 224-229.
Fleuret, P. and Flsuret, A. 1983. Socioeconomic determinants of child nutrition in Taita, Kenya: a call for discussion. Cuit:zre and Agriculture 12.
Fleuret, P. and Greeley, N. 1982. The Kenya Social and Institutional Profile. Nairobi: U.S. Agency for International Development.
Flohn, H. 1987. Rainfall teleconnections in northern and northeastern Africa. Theoretical and Applied Climatology 38(4): 191 - 197.
Folland, C.K., Palmer, T.N. and Parker, D.E. 1986. Sahel rainfall and worldwide sea surface temperatures. Nature 321): 602-607.
Ford, R.W. and Thomas-Slater, B. 1989. Resource Managem~nt in Katheka. Worcester, MA.: Clark University.
Fortman, L. 1981. The plight of the iaiiisible farmer: the effect of national agricultural policies on women in Africa. In Women and Technological Change in Developing Countries, R. Dauber and M. Cain, eds., pp. 205-214. Boulder: Westview Press.
Franke, R.W. and Chasin, B.H. 1980. Seeds of Famine: Ecological Destruction and the Development Dilemma in the Western Sahz!. Totowa, NY: Allanheld and Osmun.
Fraser, C. 1988. t i f e l i i e i for Africa Still in Peril and Distress. London: Huntchinson.
Freeman, D. 1975. Development Hategies in dual economies: a Kenyan example. African Studies Review 18(2): 17-34.
Frere, M. and Popov, G.F. 1979. Agrometeorological Crop monitoring awd Forecasting. Plant Productikm and Protection Paper 17. Rome: Food and Agriculture Organization.
Frohberg, H. and Shah, M.M. 1980. Nutrition Status in Rural and Urban Kenya. WP 80-14. Laxenburg: Intornational Instituto for Applied Systems Analysis,
Fry, P.H. (with assistance from U. Herren). 1988. Evaluation of Oxfam's Four Restocking Projects in Kenya. Nuirobi: Oxfam. (Manuscript).
Fry, P.H. and McCabe, J.T. 1986. A Comparison of Two Survey Methods on Pastoral Turkana Migration Patterns and the Implications for Development Patterns. Pastoral Network Paper 22b. London: Overseas Development Institute.
Fumagalli, C. 1977. A Diachronic Study of Change and Sociocultural Processes Among the Pastoral Nomadic Samburu of Kenya 1900-1975. Ph.D. Dissertation. New York: Buffalo University.
Funnell, D.C. 1988. Crisis in Africa: the agrarian dimension. Geography 73(1): 54-59.
Gaile, G.L. 1979. Distance and development in Kenya. In The Spatial Structure of Development: A Study of Kenya, R.A. Obudho and D.R. F. Taylor, eds., pp. 201-222. Boulder, CO: Westview Press.
Gaile, G.L. 1976. Processes affecting the spatial pattern of rural-urban development in Kenya. African Studies Review 19(3): 1 - 16.
Galaty, J.G., Aronson, D., Salzman, P.C. and Chouinard, A., eds. 1981. The Future of Pastoral Peoples. Proceedings of a conference held in Nairobi, Kenya, 4-8 August 1980. Ottawa: International Development Research Centre.
Galli, R. 1987. The food crisis and the socialist state in Lusophone Africa. African Studies Review 30(1): 19-44.
Galvin, K.A. 1988. Nutritional status as an indicator of impending food stress. Disasters 12(2): 147- 156.
Galvin, K.A. 1985. Food Procurement, Diet, Activities, and Nutrition of Ngisonyoka Turkana Pastoralists in an Ecological and Social Context. Ph.D. Dissertation. Binghamton, NY: State University of New York.
Galvin, K.A. and Waweru, S.K. 1987. Variation in the energy and protein content of milk consumed by nomadic pastoralists of northwest Kenya. In Food and Nutrition in Kenya: A Historical Review, A.A. J. Jansen and H.T. Horelli, eds., Nairobi: UNICEF.
Garcia, R.V. and Escudero, J.C. 1982. Drought and Man, the 1972 Case History. Volume 2: The Constant Catastrophe: Malnutrition, Famines and Drought. Oxford: Pergamon.
Gartrell, B. 1988. Prelude to disaster: the case of Karamoja. In The Ecology of Survival: Case Studies from Northeast African History, D.H. Johnson and D.M. Anderson, eds., pp. 193-218. Boulder CO: Westview. .2
Gartrell, B. 1985. Debates: searching for 'the roots of famine': the case of Karamoja. Review of African Political Economy/ZJ3(A.ugust): 102- 1 10.
Gebriel, Z.W. and Sevenhuysen, G.P. 1988. A comparison of pregnancy outcomes among four population groups in Ethiopia. Ecology of Food and Nutrition 22: 35-42.
Geist, J. 1981. Coastal Agrarian Underdevelopment and Regional Imbalance in Kenya. Ph.D, Dissertation. Berkeley: University of California.
George, S. 1988. A Fate Worse than Debt. London: Penguin.
Gerhart, J.D. 1975. The Diffusion of Hybrid Maize in Western Kenya--Abridged by CIMMYT. Mexico City: Centro Internacional de Mejoramiento de Maiz y Trigo.
Ghai, D. and Smith, L.D. 1986. Agricultural Prices, Policy, and Equity in Sub-Saharan Africa. Boulder, CO: Lynne Rienner.
Ghai, D., Godfrey, M. and Linsk, F. 1979. Planning for Basic Needs in Kenya. Geneva: International Labour Office.
Gibbon, D. 1987. Restoring regenerative systems of production in sub-Saharan Africa: research requirements. Disasters 1 l(1): 53-58.
Giblin, J. 1986. Famine and social change during the transition to colonial rule in northeastern Tanzania, 1880- 1896. African Economic History 15: 85- 105.
Gilbert, E.M., Norman, D.W, and Winch, F.E. 1980. Farming Systems Research: A Critical Appraisal. East Lansing, MI: Department of Agricultural Economics, Michigan State University.
Gill, P. 1986. A Year in the Death of Africa. London: Paladin.
Gittinger, J.P., Leslie, J. and Hoisington, C., eds. 1987. Food Policy: Integrating Supply, Distribution, and Consumption. Baltimore: Johns Hopkins.
Glantz, M.H. 1990. Why are famines difficult to predict? World and I: 409-415.
Glantz, M.H. 1989. Drought, famine, and the seasons in sub-Saharan Africa. In African Food Systems in Crisis: Microperspectives, R. Huss- Ashmore and S.H. Katz, eds., pp. 45-7 1. New York: Gordon and Breach.
Glantz. M.H., ed. 1987. Drought and Hunger in Africa: Denying Famine a Future. Cambridge: Cambridge University Press.
Glantz, M.H. 1977. The value of a long-range weather forecast for the West African Sahel. Bulletin of the American meteorological Society 58(2): 150- 158.
Glantz, M.H. 1976. The Politics of Natural Disaster: The Case of the Sahel Drought. New York: Praeger.
Glazier, J. 1985. Land and the Uses of Tradition Among the Mbeere of Kenya. New York: University Press of America.
Gleave, M.B. 1988a. Boserup and the African Condition. Discussion Papers in Geography, 35. Salford, U.K.: bGpartment of Geography, University of Salford.
Gleave, M.B. 1988b. Population Pyessure in West Africa: Academics' Views and Real World Experience. Discussion Papers in Geography, 34. Salford, U.K.: Department of Geography, University of Salford.
Gomez, M.I. 1982. Sources of vitamin C in the Kenyan diet and their stability to cooking and processing. Ecology of Food and Nutrition 12: 179- 184.
Gommes, R. 1985. The Tanzanian Crop Monitoring and Early Warning Systems Project. Dar es Salaam: Food and Agriculture Organization. (Manuscript).
Gorman, R.F. and Foote, M. 1985. Reducing vulnerability to drought: the case of Seguenega. Disasters Harvard Supplement: 34-35.
Gould, P. and Rogier, A. 1984. Famine as a spatial crisis. In Famine as a Geographical Phettornenon, B. Currey and G. Hugo, eds., pp. 135-154. Dordrecht: Reidel.
Government of Kenya. 1986. Economic Management for Renewed Growth. Sessional Paper No. 1 of 1986. Nairobi: Government of Kenya.
Government of Kenya. 1983. Development Plan 1984-1988. Nairobi: Government of Kenya.
Government of Kenya. 1981. National Food Policy. Sessional Paper No. 4. Nairobi: Government Printer.
Gowlett, J.A. J. 1988. Human adaptation and long-term climatic change in northeast Africa: an archaelogical perspective. In The Ecology of Survival: Case Studies from Northeast African History, D.H. Johnson and D.M. Anderson, eds., pp. 27-46. Boulder, CO: Westview.
Gran, G. 1986. Beyond African famines: whose knowledge matters? Alternatives XI: 275-296.
Grandin, B.E. 1988. Wealth Ranking in Smallholder Communities: A Field Manual. London: Intermediate Technology Publications.
Grandin, B.E. 1986a. Land tenure, sub-division and residential changes on a Maasai group ranch. Development Anthropology Bulletin 4(2): 9- 13.
Grandin, B.E. 1986b. Wealth and Pastoral Dairy Production: A Case Study from Maasailand. Internal Report. Nairobi: International Livestock Centre for Africa. (Manuscript).
Grandin, B.E. 1985. Functions of Sheep and Coats in the Maasai Production System. Paper presented at the SR-CRSP Kenya Workshop, Kakamega. Nairobi: International Livestock Centre for Africa. (Manuscript).
Grandin, B.E. 1984. Livestock Offtake ir hfaasailand. Paper presented at a seminar on Livestock Production Systems: the Masaai, sponsored by ILCA and the Ministry of Agriculture and Livestock Development. Nairobi: International Livestock Centre for Africa. (Manuscript).
Grandin, B.E. and Bekure, S. 1982. Livestock Offtake and Acquisition: A Preliminary Ana ly~ is of Livestock Transactions in Olkarkar and Mbirikani Group Ranches. Internal Report. Nairobi: International Livestock Centre for Africa. (Manuscript).
Grandin, B.E., de Lee<*, P.N. and Lembuya, P. 1989. Drought, resource distribution and mobility in two Maasai group ranche!;, Southeastern Kajiado District. In Coping with Drought in Kenya: Nationgt and Local Strategies, T.E. Downing, K.W. Gitu and C.M. Kamau, eds., pp. 245-263. Boulder: L.:rnne Rienner.
Grandin, B.E. and Lembuya, P. 1987. The 1984 Drought: A Case Study from a Maasai Group Ranch in South-Eastern Kajiado District. Pastoral Network Paper 230. London: Overseas Development Institute.
Graves, T. and Graves, N. 1974. Adaptive strategies in urban migration. Annual Review of Anthropology 3: 1 17- 1 5 1.
Green, R.H. 1986. Hunger, poverty and food aid in Sub-Saharan Africa: retrospect and potential. Disasters 1 O(4): 288-302.
Greer, J. and Thorbecke, E. 1987. Food poverty profile applied to Kenyan smallholders. Economic Development and Cultural Change 35(1): 1 16- 14 1.
Greer, J. and Thorbecke, E. 1986. Food Poverty and Consumption Patterns in Kenya. Geneva. International Labour Office.
Griffin, K. and Hay, R.R. 1985. Problems of agricutlural development in socialist Ethiopia: an overview and a suggested survey. Journal of Peasant Studies 13( 1).
Grigg, D. 1985. The World Food Problem 1950-1980. Oxford: Basil Blackwell.
Grove, A.T. 1986. The state of Africa in the 1980s. Geographical Journal 152(2): 193-203.
Guha-Sapir, D. and Lechat, M.F. 1986a. Information systems and needs assessment in natural disasters: an approach for better disaster relief management. Disasters lO(3): 232-237.
Guha-Sapir, D. and Lechat, M.F. 1986b. Reducing the impact of natural disasters: why aren't we better prepared. Health Policy and Planning l(2): 118-126.
Gulaid, A.A. 1986. Contribution of remote sensing to food security and early warning systems in drought affected countries in Africa. In Remote Sensing for Resources Development and Environmental Management, Proceedings, 7th ISPRS Commission VII Symposium, Enschede, Vol. 1, M.C. J. Damen, et al., eds., p ~ . 457-460. Balkema.
Guyer, J.I. 1989. From seasonal income to daily diet in a partially commercialized rural economy (southern Cameroon). In Seasonal Variability in Third World Agriculture: The Consequences for Food Security, D.E. Sahn, ed., pp. 137- 150. Baltimore: Johns Hopkins University Press.
Guyer, J.I., ed. 1987. Feeding African Cities. Studies in Regional and Social History. Manchester: Manchester University Press for the International African Institute.
Guyer, J.I. 1986. Intra-household processes and farming systems research: perspectives from anthropology. In Understanding Africa's Rural Households and Farming Systems, J.L. Moock, ed., pp. 92-104. Boulder: Westview.
Guyer, J.I. 198 1. Household and community in African studies. African Studies Review 24(2/3): 87- 137.
.*
Haaga, J., Mason, G.J., Omoro, F.Z., Quinn, V., Rafferty, A,, Teft, K. and Wasonga, L. 1986. Child malnutrition in rurgkKenya: a geographic and agricultural classification. Ecology of Food and Nutrition 18: 297-307.
Hamilton, P. and Maizels, J. 1989. Flows to forecast famine. Geographical Magazine: 38-40.
Hammel, E.A. 1984. On the *** of studying household form and function. In Households: Comparative and Historical Studies of the Domestic Group, R.M. Netting, R.R. Wilk and E.J. Arnold, eds. Berkeley: University of California Press.
Hancock, G. 1985, Ethiopia: T/te Challenge of Hunger. London: Victor Gollancz,
Hankins, T.D. 1974. Response, to drought in Sukumaland, Tanzania. In Natural Hazards: Local, National, Global, G.F. White, ed., pp. 98-104. New York: Oxford University Press.
Hansen, A. and McMillan, D.E., eds. 1986. Food in Sub-Saharan Africa. Boulder, CO: Lynne Rienner.
Harrell-Bond, B.E. 1989. Repatriation: under what conditions is it the most desireable solution for refugees? An agenda for research, African Studies Review 32( 1 ): 4 1-70.
Harrell-Bond, B.E. 1986. Imposing Aid. Oxford: Oxford University Press.
Harrison, G.A., ed. 1988. Famine. Oxford: Oxford University Press.
Harriss, B. 1982a. Agricultural Marketing in the Semi- Arid Tropics of West Africa: A Partially Annotated and Indexed Bibliography and List of Common Abbreviations, Addresses and a French-English Technical Glossary. Economics Program Progress Report 30. Patancheru, Andra Pradesh, India: International Crops Research Institute for Semi-Arid Tropics.
Harriss, B. 1982b. The Marketing of Foodgrains in the West African Sudan-Sahelian States: An Interpretive Review af the Literature. Economics Program Progress Report 3 1. Patancheru, Andra Pradesh, India: International Crops Research Institute for Semi-Arid Tropics.
Harriss, B. 1979. Going against the grain. Development and Change lO(3): 363-384.
Harriss, J. 1988. After the green revolution: the Brundtland vision of 'Food 2000'. Land Use Policy 5(3): 266-268.
Hart, K. 1982. The Political Economy of West African Agriculture. Cambridge: Cambridge University Press.
Haugerud, A. 1988. Food surplus production, wealth, and farmers'strategies in Kenya. In Satisfying Africa's Food Needs, Food Production and Commercialization in African Agriculture, R. Cohen, ed., pp. 153-190. Boulder, CO: Lynne Rienner.
Haugerud, A. 1984a. The consequences of land tenure reform among small holders in the Kenya highlands. Rural A fricana 15/16: 65-90.
Haugerud, A. 1984b. Household Dynamics and Rural Political Economy among Embu Farmers in the Kenya Highlands. Ph.D. Dissertation. Evanston, IL: Northwestern University.
Haugerud, A. 1981. Development and Household Economy in Two Eco-Zones of Embu District. Nairobi: Institu!e - for Development Studies.
Hay, R.W. 1988. Famine incomes and employment: has Botswana anything to teach Africa? World Development 16(9): 1 1 12-H25.
Hay, R.W. 1987. Reflections on the food accounting matrix. Eurostat News Special Edition: 234-24 1.
Hay, R.W. 1986. Food aid and relief-development strategies. Disasters lO(4): 273-287.
Hay, R.W. 1980. The food accounting matrix: an analytical device for food planners. Oxford Bulletin of Economics and Statistics 42(2): 97- 124.
Hay, R.W. 1978. The concept of food supply system with special reference to the management of famine. Ecology of Food and Nutrition 7: 65-72.
Hazell, P.B,R., ed. 1986. Summary Proceedings of a Workshop 00 Cereal Yield Variability. Washington: International Food Policy Research Institute.
Hazell, P.B.R. and Roell, A. 1983. Rural Orowth Linkages: Household Expenditure Patterns in Malaysia and Nigeria. Research Report 41. Washington: International Food Policy Research Institute.
Hedfors, L. 198 1. Evaluation and Economic Appraisal of Soil Conservation in a Pilot Area. Nairobi: Soil and Water Conservation Branch, Ministry of Agriculture.
Heller, P.S. and Drake, W.D. 1979. Malnutrition, child morbidity and the family decision process. Journal of Development Economics 6: 203-235.
Henricksen, B.L. 1986a. Determination of agro-ecological zones in Africa: ILCA activities and expectations. ILCA Bulletin 23: 15-22.
Henricksen, B.L. 1986b. Reflections on drought: Ethiopia 1983- 1984. International Journal of Remote Sensing 7(11): 1447- 1452.
Henricksen, B.L. and Durkin, J.W. 1986. Growing period and drought early warning in Africa using satellite data. International Journal of Remote Sensing 7( 1 1): 1583- 1608.
Herbert, J.R. 1987. The social ecology of famine in British India. lessons for Africa in the 1980s? Ecology of Food and Nutrition 20: 97-107.
Herlehy, T.J. 1984. Historical Dimensions of the Food Crisis in Africa: Surviving Famines along the Kenya Coast, 1880-1980. Working Paper No. 87. Boston: Boston University, African Studies Center.
Hertz, B.K. :974. Demographic Pressure and Econc;nic Change: The Case of Kenyan Land Reforms. Ph.D. Dissertation. New Haven, CT: Yale University.
Hervio, G. 1987. Appraisal of the Early Warning Systems in the ahe el. SAHEL D(87)308. Paris: Organisation for Economic Co-operation and Development (OECD) and Permanent Interstate Committee for Drought Control in the Sahel (CILSS).
Hesse, C. 1987. Livestock Market Data as an Early Warning Indicator of Stress in the Pastorizl Economy. Pastoral Development Network Paper 24f. London: Overseas Development Institute.
Hesse, C.R. 1985. An e;;'&luation of the 1984-1985 food situation in Burkina Faso. Disasters 9(1): 3-11.
/ Hesselmark, 0. 1977. The Marketing of Maize and Beans in Kenya: A Proposal for Improved
Effectiveness. Wor-king Paper No. 300. Nairobi: Institute for Development Studies.
Hewitt, K. and Burton, 1. 1971. The Hazardousness of a Place: A Regional Ecology of Damaging Events. Toronto: University of Toronto Press.
Heyer, J. 1989. Landless agricultural labourers' asset strategies. I D S Bulletin 20(2): 35-42.
Heyer, J. 1971. A linear programming analysis of constraints on peasant farms in Konya. Food Research Institute Studies 10( 1 ): 3 1 -55.
Heyer, J., et al., eds. 1976. Agricultural Development in Kenya. Nairobi: Oxford University Press.
Heyer, J., Ireri, D. and Morris, J., eds. 1971. Rural Development in Kenya. Nairobi: East African Publishing House.
Higgins, G.M., Kassam, A.H., Naiken, L., Fischer, 0. and Shah, M.M. 1982. Potential Population Supporting Capacities of Lands in the Developing World. Technical report of Project INT/75/P13 Land Resources for Populations of the Future. Rome: Food and Agriculture Organization.
Hill, P. 1982. Dry Grain Farming Families: Hausaland (Nigeria) and Karnataka ( Ind ia ) Compared. Cambridge: Cambridge University Press.
Hinchley, M.T., ed. 1979. Symposium on Drought in Botswana. Gabarone: Botswana Society and National Museum.
Hitchcock, R.K. 1979. The traditional response to drought in Botswana. In Symposium on Drought in Botswana, M.T. Hinchley, ed., pp. 91-97. Gabarone: Botswana Society and National Museum.
Hitchcock, R.K., Ebert, J.I. and Morgan, R.G. 1989. Drought, drought relief, and dependency among the Basarwa of Botswa~a. In African Food Systems in Crisis: Microperspectives, R. Huss-Ashmore and S.H. Katz, eds., pp. 303-336. New York: Gordon and Breach.
Hitchcock, R.K. and Hussein, H. 1987. Agricultural and nonagricultural settlements for drought-afflicted pastoralists in Somalia. Disasters 1 l(1): 30-39.
Hogg, R. 1987. Development in Kenya: drought, desertification and food scarcity. African Affairs 34(2): 47-58.
Hogg, R. 1986. The new pastoralism: poverty and dependency in northern Kenya. Africa 56(3): 319-333.
Hogg, R. 1985. The politics of the drought: the pauperization of the Isiolo Boran. Disasters 9(1): 39-43.
Hohenemser, C., Kasperson, R.E. and Kates, R.W. 1985. Causal structure. In Perilous Progress: Managing the Hazards of Technology, R.W. Kates, C. Hohenemser and J.X. Kasperson, eds., pp. 25-42. Boulder: Westview.
Holling, C.S. 1986. Th6 Sesilience of terrestrial ecosystems: local surprise and global change. In Sustainable Development of the Biosphere, W.C. Clark and R.E. Munn, eds., pp. 292-317. Cambridge: Cambridge Upiversity Press.
Hollinger, S.E. 1988. Modeling the effects of weather and management practices on maize yield. Agricultural and Forest Meteorology 44: 8 1-97.
Holm, J.D. and Cohen, M.S. 1986. Enhencin& equity in the midst of drought: the Botswana approach. Ceres 19(6): 20-24.
Holmberg, G. 1985, An Economic Evaluation of Soil Conservation in Kalia Sub- Location, Kitui District. Nairobi: Ministry of Agriculluru avd Livestock Development.
Holy, L. 1988. Cultivation as a long-term stratogy of survival: the Berti of Darfur. In The Ecology of Survival: Case Studios from .Nor?heast African [Ilsrory, D.H. Johnson and D.M. Anderson, eds., pp. 135- 154. Bouldui, CO: Westview.
Holy, L. 198'0. Drought and change in a tribal econorny: the Berti of northern Darfur. Disasters 4(1): 65-71.
Homewood, K. end Lewis, J. 1987. Impact of drought on pastoral livestock in Baringo, Kenya 1983-85. Journal of Applied Ecology 24(2): 6 15-63 1.
Hoorweg, J., Kliest, T. and Niemeijer, R. 1988. Seasonality in the Coastal Lowlands of Kenya. Report No. 27. Leiden: Food and Nutrition Studies Programme, African Studies Center.
Hoorweg, J. and Niemeijer, R. 1989. intervention in Child Nutrition: Evaluation Studies in Kenya. London: Kegan Paul International.
Hopcraft, P. 1987. Grain marketing policies and institutions in Africa. Finance and Development 24(1): 37-40.
Hopkins, R.F. 1988. Tlie politics of adjustment: the African case. Food Policy 13(1): 47-55.
Horenstein, N.R. 1989. Women and Food Security in Kenya. World Bank Policy, Planning and Research Working Paper Series, WPS 232. Washington, DC: World Bank.
Horn of Africa Project. 1988. War and Famine: Indigenous Perspectives on Conflict i n the Horn of Africa. Watcrloo: Iiorn of Africa Project, Institute of Peace and Conflict.
Hornetz, B. 1988. Ecophysiological experiments for improving landuse patterns in the drylands of southeast Kenya by means of drought resistant leguminous crops (Tepary beans, Bambarra groundriuts). Tropenlandwirt 89(0ct): 107- 129.
Horowitz, M.M. and Little, P.D. 1987. African pastoralism and poverty: some implications for drought and famine. In Droughe and Hunger in Africa: Denying Famine a Future, M.H. Glantz, ed., pp. 59-82. Cambridge: Cambridge University Press.
Hosior, K. 1985. Energy Use in Rural Kenya: Horrsehold Demand and Rural Transformation. Energy, Environment and Development in Africa 7. Stockholm: The Beijer Institute and The Scandinavian Institute of African Studies.
Hoskins, W.B. 1987. USAID./MaN Involvement in Mal i Droughts: 1984-1987. Bamako: USAID. (Restricted Draft).
Hounan, D.E., Burgos,'J:J., Kalik, M.S., Palmer, W.C. and Rodda, J. 1975. Drought and Agriculture. Technical Note -No. 138. Geneva. World Meteorological Organization.
/' Hradsky, J. 1985. A Special Overview of Early Warning Systems for the Sahel and the African
Continent. Washington: USAID/AFR/PD/SWAP. (Manuscript).
Hunt, D.M. 1984. Thc Impending Crisis in Kenya: The Case for Land Reform. Brookfield, VT: Cower.
Hunt, D.M. 1979. Chayunov's moclol of peasant household resource allocation, Journal of Peasant Studies 6: 247-85.
Hunt, D.M. 1978. Chayanov'~ model of peasant l~ousehold resource allocation and its relevance to Mbeere Division, eastern Kenya. Journal of Development Studies 15: 59-86.
Hunt, D.M. 1976. Chayanov's Model of Peasant Household Resource Allocation and Its Relevance to Mbere Division, Eastern Kenya.. Nairobi: Institute for Development Studies.
Hurni, H. 1988. Ecological Issues in the Creation of Famines in Ethiopia. Berne, Switzerland: Development and Environment Ciroup, Geographical Institute, University of Berne.
Huss- Ashmore, R. and Curry, J.J. 1989. Diet, nutrition, and agricultural development in Swaziland. I . Agricultural ecology and nutritional status. Ecology of Food and Nutrition(Submitted).
Huss-Ashmore, R. and Johnston, F.E. 1985. Bioanthropological research in developing countries. Annual Review of Anthropology 14: 475-528.
Huss-Ashmore, R. and Katz, S.H., eds. 1989. African Food Systems in Crisis; Part One: Microperspectives. Food and Nutrition in History and Anthropology, Volume 7. New York: Gordon and Breach.
Hu tc hinson, C.F. 1987. Early Warning Systems for Determining Drought Conditions in Sub-Saharan Africa. Washington: World Bank.
Hutchinson, P. 1985. Rainfall analysis of the Sahelian drought in the Gambia. Journal of Climatology 5: 665-672.
Cohen, R., ed. 1988. Satisfying Africa's Food Needs: Food Production and Commercialization in African Agriculture. Boulder, CO: Lynne Rienner.
Hyden, C;.. 1986. The invisible economy of smallholder agriculture in Africa. In Understanding Africa's Rural Households and Farming Systems, J.L. Moock, ed., pp. 11-35. Boulder: Westview.
Ibrahim, F.N. 1988. Causes of the famine among the rural population of the Sahelian zone of the Sudan. GeoJournal 17(1): 133- 141.
Ibrahim, F.N. 1984. Ecological Imbalance in the Republic of Sudan, with Reference to Desertification in Darfur. Bayreuth, FRG: Bayreuther Geowissenschaftliche Arbeiten.
ICIHI (Independent Commission on International Humanitarian Issues). 1985. Famine: A Man-Made Disaster. London: Pan Books.
ILCA (International Lhestock Centre for Africa). 1981. Introduction to East African Range Livestock Systems Study/Kenya. Working Document No. 23. Nairobi: ILCA. (Manuscript).
/ ILCA (International Livestock Centre for Africa). 1979. An Illustrated Introduction to the
Rainfall Patterns of Kenya. Working Document No. 12. Nairobi: ILCA. (Manuscript).
Iliffe, J. 1987. The African Poor: A History. Cambridge: Cambridge University P;.ess.
Ingram, J. 1988. Food and disaster relief: issues of management and policy. Disasters 12(1): 12-18.
Inindtl, J.M. 1986. Spatial and Tsmporal Characteristics of Droughts in Eastern and Southern Africa. M.Sc. Thesis, Nairobi: University of Nairobi.
IPAL (Integrated Project in Arid Lands). 1984. Integrated Rasource Assessment and Management Plan for Western Marsabit District, Northern Kenya ( 2 Volumes). Nairobi: United Nations Educational, Scientific, and Cultural Organization. (Manuscript).
Jackson Jr., K.A. 1976. The family entity and famine among the Nineteenth-Century Akamba of Kenya. environmental stress. Journal of Family History l(2): 193-216.
Jackson, T. and Eade, D, 1982. Against the Orain: The Dilsmma of Project Food Aid. Oxford: Oxfam.
Jaetzold, R. and Schmidt, H. 1983. Farm Management Handbook of Kenya: Natural Conditions and Farm Management Information. Nairobi: Ministry of Agriculture.
James, A.W. and Nyambati, G.M. 1987. New food uses for sorghum in Kenya. Appropriate Technology 14(2): 24-26.
Jansen, A.A. J., Horelli, H.T. and Quinn, V.J., eds. 1990. Food and Nutrition in Kenya: A Historical Review. Second Edition. Rome: UNICEF. (In press).
Jansen, A.A. J., Horelli, M.T. and Quinn, V.J., eds. n.d. Food and Nutrition in Kenya: A Historical Review. Nairobi: UNICEF.
Jansson, K., Harris, M. arid Penrose, A. 1987. The Ethiopian Famine. London: Zed Books.
Jodha, N.S. 1975. Famine and famine policies: some empirical evidence. Economic and Political Weekly October 11: 1609-1618.
Johnson, D.H. and Anderson, D.M., eds. 1988. The Ecology of Survival: Case Studies from Northeast African History. Boulder, CO: Westview.
Johnson, D. and Gould, H. 1984. Effects of climate fluctuation on human populations: study of Mesopotamian society. In Climate and Development, A.K. Biswas, ed. Dublin: Tycooly.
Johnson, G.E. and Whitelaw, W.E. 1974. Urban-rural income transfers in Kenya: an estimated remittance function. Economic Development and Cultural Change 22(3): 473-479.
Johnson, K. and O'Keefe, P., eds. 1979. Environment and Development: Community Perspectives. Worcester, MA: Clark University, Center for Technology, Environment and Development.
Jones, W.O. 1987. Food-crop marketing boards in tropical Africa. Journal of Modern African , Studies 25(3): 375-402. . -
Kabuye, C.H.S. 1986. Edible roots Prom wild plants in arid and semi-arid Kenya. Journal of Arid Environments 1 l(1): 65-74/
Kabwegyere, T.B. 1979. Small urban centers and the growth of underdevelopment in rural Kenya. Africa 4'3(3): 308-31 5.
Kalff, J., Downing, J.A. and Smith, T.T. 1983. Rainfall, crops, livestock ancl hurnai~ populstion in the dry regions of Konya. The Kenyan Goographer 5(1 and 2): 92-93.
Kamara, S.1. 1986. The origins and typos of rainfall in Weat Africa. Weather 41(2): 49-56.
Kamau, C.M., Anyango, G.J., Gitahi, M., Wainaina, M. and Downing, T.E. 1989. Case studies of drought impacts and responses. In Coping with Drought in Kenya: National and Local Strategies, T.E. Downing, K.W. Gitu and C.M. Kamau, eds., pp. 21 1-230. Boulder: Lynno Rienner.
Kanatnitsu, N, and Krishnamurti, J.N. 1978. Nortl~ern summer tropical circulations during drought and normal rainfall months. Monthly Wsather Review 106: 331-347.
Kaplan, I., et al. 1976. Area Handbook for Kenya. Washington, DC: U.S. Government Printing Office.
Kashasha, D.A. R. 1989. The Tanzanian crop monitoring and early warning system. In Coping with Drought in Kenya: National and Local Strategies, T.E. Downing, K.W. Gitu and C.M. Kamau, eds., pp. 13 1 - 137. Boulder: Lynne Rienner.
Kashasha, D.A. R. 1982. A Study of Effective Rainfall for Crop Production. M.Sc. Thesis. Nairobi: University of Nairobi.
Kasonga Project Team. 1983. Anthropometric assessment of young children's nutritional status as an indicator of the subsequent risk of dying. Journal of Tropical Paediatrics 29: 69-75.
Kates, R.W. 1987. Hazard assessment and management. In Resources and World Developmerrt, D.J. McLaren and B.J. Skinner, eds., pp. 741-752. New York: John Wiley.
Kates, R.W. 1985a. Hazard assessment: art, science, and ideology. In Perilous Progress: Managing the Hazards of Technology, R.W. Kates, C. Hohenemser and J.X. Kasperson, eds., pp. 25 1-264. Boulder: Westview.
Kates, R.W. 1985b. The interaction of climate and society. In Climate Impact Assessment, R.W. Kates, J.H. Ausubel and M. Berberian, eds., pp. 3-36. New York: Wiley.
Kates, R.W. 1981. Drought in the Sahel: competing views as to what really happened in 1910-14 and 1968-74. Mazingira 5(2): 72-83.
Kates, R.W., Ausubel, J.H. and Berberian, M., eds. 1985. Climate Impact Assessment. New York: Wiley.
Kates, R.W., Chen, R.S., Downing, T.E., Kasperson, J.X., Messer, E. and Millman, S.R. 1988. The Hunger Report: 1988. Providence, RI: World Hunger Program, Brown University.
Kates, R.W., Chen, R.S., Downing, T.E., Kasperson, J.X., Messer, E. and Millman, S.R. 1989. The Hunger Report: Update 1989. Providence, RI: World Hunger Program, Brown University.
.r
Kates, R.W., Hohenemser, C. and Kasperson, J.X., eds. 1985. Perilous Progress: Managing the Hazards of Technology. B ~ l d e r : Westview.
Katz, R.W. and Glantz, M.H. 1986. Anatomy of a rainfall index. Monthly Weather Review 114: 764-77 1.
Kaufman, D, and Lindauor, D. 1980, Basic Needs, Interhousehold Tran,rfers and the Extended Family. Urban and Rural Report No. 80- 15, Urban and Regional Economics Division. Washington, DC: World Bank.
Keating, B.A., Wafula, B.M. and McCown, R.L. 1988. Simulation of Plant Density Effects on Maize Yield as lnfluonced by Water and Nitrogen Limitations. Paper presented at the International Congress of Plant Physiology, February 15-20, New Delhi. Nairobi: ACIAR/CSIRO Dryland Project.
Kebbede, G. 1988. Cycles of famine in a country of plenty: the case of Ethiopia. GeoJournal 17(1): 125-132.
Kellmaa, M. 1987. World Hungor: A Neo-Malthusian Perspective. New York: Fraeger.
Kelly, C. 1987. The situation in Burkina Faso. Disasters 1 l(1): 6-10.
Kennedy, E.T. and Cogill, B. 1988. The commercialization of agriculture and household-level food security: the case of southwestern Kenya. World Development 16(9): 1075- 108 1.
Kennedy, E.T. and Cogill, B. 1987. Income and Nutritional Effects of Commercialization of Agriculture in Southwestern Kenya. Research Report 63. Washington: International Food Policy Research Institute.
Kennedy, E.T. and Knudsen, 0. 1985. A review of supplementary feeding prograrnmes and recommendations on their design. In Nutrition and Development, M. Biswas and P. Pinstrup-Andersen, eds., pp. 77-56. Oxford: Oxford University Press.
Kent, R.C. 1987. Anatomy of Disaster Relief. London: Pinter Press.
Kenya Power and Lighting Co. 1985. Annual Report and Accounts, 1984. Nairobi: Kenya Power and Lighting Co.
Khalifa, A.H. and Simpson, M.C. 1972. P'erverse supply in nomadic societiec. Oxford Agrarian Studies 1: 46-56.
Khogali, M.M. 1988. Socio- Economic Impacts of Deserti fication and Famine on Vulnerable Populations: The Case of Umm Ruwaba District in Kordofan Region, Sudan. Paper presented at the Royal Swedish Academy of Sciences, Stockholm, Conference on Environmental Stress and Political Conflicts, 13- 15 December. Khartoum: University of Khartoum.
Kiangi, R.M. P. 1983. Rainfall patterns and problems. The Kenyan Geographer 5(1 and 2): 33-36.
Kidson, J.W. 1977. African rainfall and its relation to upper air circulation. Quarterly Journal of the Royal Meteorological Society 103: 441 -456.
Kilewe, A.M. and Ulsaker, L.G. 1984. Topographic modification of land to concentrate and redistribute runoff. East African .Agriculture and Forestry Journal 44: 257-265.
.-
Killick, T. 198 1. Papers on the Kenyan Economy: Performance, Problems and Policies. London: Heinemann. /'
Killick, T. 1976. The Economies of East Africa. Boston: Hall.
King, J.M. 1983. Livastock Water Naeds in Pastoral Africa in Relation to Cllvtate and Forage, Roaoarcl~ Report No. 7. Atltlis Absbu: ILCA,
King, P. 1986, An African Winter. Yonguin.
Kinuthia, J .W. , et ul. 1984. Tlrs Failure of the 1984 Long Rains i n Kcnya. Nailobi: lnstituto for Meteorological Training und Kesaarch. (Manuscript),
Kirimi, J,B. 1985. The Role of Price Policy in Promoting Kenya's Agricultural Sect01 . M.Sc. Dissertation. Oxford: Institute of Agricultural Economics, Linacre College, Oxford University.
Kitching, G.N. 1980. Class and Economic Change in Kenya: The Making of an African Petita Bourgeoisie, 1905-1970. New Haven, CT: Yale Unjversity Press.
Kliest, T. 1985. Ragional and Seasonal Food Problems in Kenya. Leidsn: Institute of African Studies.
Kloos, H. 1982. Development, drought, and famine in the Awash Valley of Ethiopia. African Studies Review 25(4): 2 1 -48.
KMD (Kenya Meteorological Department). 1984. Climatological Statistics for Kenya. Nairobi: Kenya Meteorological Department.
KNCSS (Kenya National Council for Social Services). 1984-5. Minutes of the NGO Coordinating Committee. Nairobi: KNCSS. (Manuscript).
Knowles, J.C. and Anker, R. 198 1. An analysis of income transfers in a developing country: the case of Kenya. Journal of Development Economics 8: 205-226.
Koehn, P. 1979. Ethiopia: famine, food production, and changes in the legal order. African Studies Review 22(1): 51 -71.
Koenig, D. 1988. National organizations and famine early warning: the case of Mali. Disasters 12(2): 157-168.
Koester, U. 1987. Market integration in southern Africa: a route to regional food security. Ceres 20(4): 13- 16.
Kolawole, A. 1987. Responses to natural and man-made hazards in Borno, northeast Nigeria. Disasters 1 1 ( 1 ): 59-66.
Kolkena, T.F. M. and Pronk, A. 1975. Report on a Socio-Economic Survey in Two Rural Areas of Machakos District, Kenya, Part I. Utrecht: Utrecht University.
Konare, K. 1989. Applied meteorology in the Sahel: the Malian experience. Weather 44(2): 64-69.
Konijn, N.T. 1988. 'Che effects of climatic variability on maize yields. In The Impact of Climatic Variations on Agriculture. Volume 2. Assessments i n Semi-Arid Regions, M.L. Parry, T.R. Carter and N.T. Konijn, eds., pp. 191-208. Dordrecht, The Netherlands: Kluwer.
/' Kreps, G.A. 1984. Sociological inquiry and disaster research. Annual Review of Sociology 10:
309-330.
Krurnmel, J.R., O'Neill, R,V. and Mankin, J,D. 1986. Regional environmental simulution of African cattle herding societies. Human Ecology 14(1): 1 17- 130.
Kufwafwa, J.W, 1985. Numbers and Distribution of Livestock and Wildlife in Konya: An Overview. Puper presented to tho Livestock/Wildlifr, Interface Conference, Taita Hills Lodse. Nairobi: Kenya Rangeland Monitoring Unit. (Manuscript),
Kumar, S.K. 1988. Effect of seasonal food shortage on agricultursl production in Zambia. World Development 1 G(9): 105 1 - 1063.
Kune, J.b. 1980. Some factors influencing the mortality of under-fives in a rural area of Kenya, a multivariate analysis. Journal of Tropical Paediatrics 26: 1 14- 122.
Kune, J.B., Sloof, R. arid Schulpen, T.W. J. 1979. Machakos project studies XV: The economic setting at the household level. Tropical and Geographical Medicine 31: 441-457.
Lachenmann, G. 1988. Development policy and survival strategies in the zoile lacustre in Mali. Sociologia Ruralis 28(2/3): 182- 198.
Lalau-Keraly, A. and Winter, G. 1988. Ra,pport de Mission d'Evaluation du Project Systdme dDAlert Precoce au Mali. Paris: Office Statistique de Communaut6s Europdennes. (Manuscript).
Lamb, G.B. 1974. Peasant Politics: Conflict and Development in Mtrrang'a. New York: St. Martin's,
Lamb, P.J. 1982. Persistence of subsaharan drought. Nature 299: 46-47.
Lamb, P.J. 1978. Large scale tropical Atlantic circulation patterns associated with Subsahararr weather anomalies. Tellus 30: 240-251.
Lamptey, P. and Sai, F. 1985. Integrated health/nutrition/population programmes. In Nutrition and Development, M. Biswas and P. Pinstrup-Andersen, eds., pp. 120-141. Oxford: Oxford University Press.
Lappe, F.M. and Collins, J. 1982. Food First. London: A b a c ~ ~ s Press. .1
Law, R. and Cooper, P.J. M. 1976. The effect and importance of soil temperature in determining k the early growth rate and final grain yields of maize in western Kenya. East African c Agriculture and Forestry Journal 4 1: 189-200.
Lawrence, P., ed. 1986. World Recession and the Food Crises in Africa. London: James Currey.
Lee, R.D., Arthur, W.B., Kelley, A.C., Rodgers, G. and Srinivasan, T.N., eds. 1988. Population, Food and Rural Development. Oxford: Clarendon.
Lees, S.H. 1980. The "hazardsw approach to development research: reconimendations for Latin - American drylands. Human Organization 39(4): 372-376. . -
Leftwich, A. and Harvie, D. 1986. The Political Economy of Famine: A Preliminary Report on the Literature, Bibliographic &sources, Research Activities and Needs in the UK. York: Institute for Research in the Social Sciences, University of York.
Legesse, A. 1989. Adaptation, drought, and de,,velopment: Boran arrd Gabra pastorarlists of northern Kenya. In African Food Systems in Crisis: Mlcroperspctives, R . Huas- Ashrnorc and S.H. Katz, eds., pp. 261-279. New York: Gordon and Rreach.
Lele, U. and Candler, W. 1981. Food security: some East African considerations, In Food Security for Developing Countries, A. Valdes, ed., pp. 102- 122. Boulder, CO: Westview.
Leslie, P.W., Fry, P.H., Galvin, K. and McCabe, J.T. 1988. Biological, behavioral and ecological influences on fertility in Turkana pastoralis ts. In Arid Lands, Today and Tomorrow, Emily E. Whitehead, Charlns F. Hutchinson, Barbara N. Timmermann and Robert G. Varady, eds., pp. 70.5-7 1 1. Boulder: Westview.
Leys, C. 1975. Underdevelopncst~! ! ; I Kenya. London: Heinemann.
Leys, R. 1986. Drought and drought relief in southern Zimbabwe. In World Recession and the Food Crises in Africa, P. Lawrence, ed., pp. 258-274. London: James Curre;:.
Lindsay, B. 1981. An examination of education, social change and national development policy: the case of Kenyan women. Studies in Third World Societies 16: 29-48.
Lipton, M. 1989. The Poor and the Poorest: Some Interim Findings. Discussion Paper No. 25. Washington, DC: World Bank.
Lipton, M. 1985. The Place of Agricultural Research in the Development of Sub-Saharan Africa. Discussion Paper 202. Sussex: Institute for Development Studies, University of Sussex.
Lirenso, A. 1988. A Baseline Survey of Agricultural Production and Marketing Systems in Dalocha Woreda, Southern Shewa. Addis Ababa: ActionAid-Ethiopia.
Little, M.A. 1988. Introduction to the symposium: "Ecology of Nomadic Turkana Pastoralists". In Arid Lands, Today and Tomorrow, Emily E. Whitehead, Charles F. Hutchinson, Barbara N. Timmermann and Robert G. Varady, eds., pp. 697-700. Boulder: Westview.
Little, M.A. 1984. Weather and climate in south Turkana. In Turkana Nomadism: Coping with an Unpredictably Varying Environment, Appendix 1, R. Dyson-Hudson and J.T. McCabe, eds., New Haven, CT: Humall Relations Area Files.
Little, M.A., Galvin, K.A. and Leslie, P.W. 190Y&. Health and energy requirements of nomadic Turkana pastoralists. In Copizg with Lrticer-bainty in Food Supply, I. de Garine and G.A. Harrison, eds., pp. 290-317. Oxford. Clarendon Press.
Little, M.A., Galvin, K.A. and Mugambi, PA, 1983. Crcss-sectional growth of nomadic Turkrtna pastoralists. Human Biology 55(iv): 81 1-830.
Little, M.A., Galvin, K.A., Shelley, K., Johnson, J.B. R. and Mugambi, M. 1988. Re.$ources, biology and health of pastoralists. In Arid Lands, Today and Tomorrow, Emily E. Whitehead, Charles F. Hutchinson, Barbara N. Timmermann and Robert G. Varady, eds., pp. 7 13-726. Bpulder: - Westview.
Little, P.D. 1985. Absentee herd owners and part-time pastoralists: the political economy of resource use in northern &&nya. human Ecology 13(2): 13 1 - 15 1.
Little, P.D. 1984a. Critical socio-economic variables in African pastoral livestock development: toward a comparative framework. In Livestock Development i n Subsrtharan Africa:
Constraints, Prospects, Policy, J. Simpson and P. Evangelou, eds., pp. 201-214. Boulder, CO: Westview.
Little, P.D. 1984b. Local Resource Management in Kenya: An Issues Paper. Binghamton, NY: Institute for De.tralopment Anthropology.
Little, P.D. and Horowitz, M.M. 1987. Subsistence crops are cash crops: some commants with reference to eastern Africa. Haman Organization 46(2): 254-258.
Liverman, D.M. 1989. Vulnerability to Global Environmental Change. Paper presented at the Workshop on Understanding Global Environmental Change, Clark Univarsity, Worcester, MA, October. Madison: University of Wisconsin. (Manuscript),
Liverman, D.M. 1986. The response of a global food model to possible climate changes; a sensitivity analysis. Journal of Climatology 6: 355-373.
Liverman, D.M. 1983. The Use of a Simulation Model in Assessing the Impacts of Climate on the World Food System. Ph.D. Dissertation. Los Angeles: University of California.
Livingston, I. 1981. Rural Development, Employment and lncomes in Kenya. lteport prepared for the International Labour Organization (ILO) Jobs and Skills Program (JASPA). Addis Ababa: ILO.
Llewelyn-Davies, M. 1979. Two contexts of solidarity among pastoral Maasai women. In Women United, Women Divided: Comparative Studies of Ten Contemporary Cultures, A. Caplan and J. Bujra, eds., pp. 206-237. Bloomington, IN: Indiana University Press.
Lockwood, J.G. 1986. The causes of drought with particular reference to the Sahel. Progress in Physical Geography 10( 1 ): 1 1 1 - 1 19.
Lofchie, M.F. 1988a. China's lessons for African agriculture. In Satisfying Africa's Food Needs: Food Production and Commercialization in African Agriculture, R. Cohen, ed., pp. 79- 102. Boulder, CO: Lynne Rienner.
Lofchie, M.F. 1988b. The Policy Factor: Agricultural Performance in Kenya and Tanzania. Boulder: Lynne Rienner.
Long, F. 1979. Drought and agriculture in Africa: the relevance of technology. Economic Planning 15(2): 3-7.
Lough, J.M. 1981, Atlantic Sea Surface Tamperatures and Weather in Africa. Ph.D. Dissertation. Norwich, UK: University of East Anglia.
Low, A. 1986. Agricultural Development in Southern Africa: Farm Household-Economics and the Food Crisis. Portsmouth, NH: Heinemann.
Lowry, J.H. 1986. World Population and Food Supply. ,Third Edition. Edward Arnold.
Lubeck, P.M., ed. 198j:The African Bourgeoisie: Capitalist Development in Nigeria, Kenya, and the Ivory Coast. Boulder: Lynne Rienner.
/ Lura, R.P. 1982. Demographic Transition in Developing Areas: Population Change in Kericho
District, Kenya, 1905-1969, Ph.D. Dissertation. Syracuse, NY: Syracuse University.
Lusigi, W.J. 1988. Planning range use on arid rangelands occupied by pastoral nomads. In Arid Lands, Today and Tomorrow, Emily E. Whitehead, Charles F. Hutchinson, Barbara N. Timmermann and Robert G. Varady, eds., pp. 1167-1 184. Boulder: Westview.
Mabogunje, A.L. 1988. Coping with structural adjustment: the Nigerian experience. In Satisfying Africa's Food Needs, Food Production and Commercialization in African Agricullure, R. Cohen, ed., pp. 191-208. Boulder, CO: Lynne Rienner.
Mace, R. 1988. A Model of Herd Composition that Maximizes Household Viability and its Potential Application in the Support of Pastoralists under Stress. Pastoral Development Network Paper 26b. London: Overseas Development Institute.
Mackenzie, F. 1986. Local initiatives and national policy: gender and agricultural change in Murang'a District, Kenya. Canadian Journal of African Studies 20(3): 377-401.
hlacodras, M.W., Nthusi, P.N. and Mwikya, J. 1989. Synoptic features associated with the failure of tho 1984 long rains in Kenya. In Coping with Drought in Kenya: National and Local Stralegies, T.E. Downing, K.W. Gitu and C.M. Kamau, eds., pp. 69-81. Raulder: Lynne Rienner.
Maddox, G.H. 1986. Njaa; food shortages and famines in Tanzania between the wars. International Journal of African Historical Studies 19: 17-34.
Magandn, B.F. 1989. Surveys and activities of the Central Bureau of Statistics related to food monitoring. In Coping with Drought in Kenya: National and Local Strategies, T.E. Downing, K.W. Gitu and C.M. Kamau, eds., pp. 106-1 18, Boulder: Lynne Rienner.
Makhoul, N. 1983. Agricultural research and human nutrition: a comparative analysis of Brazil, Cuba, Israel, and the United States. International Journal of Health Services 13(1): 15-3 1.
Manarolla, J.A. 1989. A Methodology for Ranking Countries According to Relative Food Insecurity. Paper presented at the A.I.D. Economists Conference, November 12-17. Washington: Agency for International Development, FVAIPPM.
Manger, L.O. 1988. Traders, farmers, and pastoralists: economic adaptations and environmental problems in the southern Nuba mountains nf the Sudan. In The Ecology of Survival: Case Studies from Northeast African History, D.H. Johnson and D.M. Anderson, eds., pp. 155- 172. Boulder, CO: Westview.
Mann, C.K., Grindle, M. and Shipton, P., eds. 1989. Seeking Solutions: Framework and Cases for Small Enterprise Development Programs. West Hartford, CT: Kumarian.
Markakis, J. 1987. Famine and politics in the Horn of Africa. Capital and Class 31: 16-23.
Martorell, R. 1989. Body size, adaptation and function. Human Organization 48(1): 15-20. '
Martorell, R. 1984. Measureing the impact of nutrition interventions on physical growth. In Methods for the Evaluation of the Impact of Food and Nutrition Programmes, D.E. Sahn, R. Lockwood and N.S. Scrimshaw, eds., pp. 46-64. Tokyo: United Nations University.
Martorell, R. 1982. Nutrition and,Health Status Indicators: Suggestions for Surveys of the Standard of Living in Developing Countries. Washington: World Bank.
Mason, J.B., Haaga, J.G., Maribe, T.O,, Marks, G., Quinn, V.J. and Test, K.E. 1987. Using Agricultural Data for Timely Warning to Prevent the Effects of Drought on Child Nutrition in Botswana. Ecology of Food and Nutrition 19: 169- 184.
Nfason, J.B., Haaga, J.G., Marks, G., Quinn, V., Test, V. and Maribe, T. 1985. Using Agricultural Data for Timely Warning to Prevent the Effects of Drought on Child Nutrition: An Analysis of Historical Data from Botswana. Ithaca, NY: Cornell Nutritional Surveillance Program, Cornell University.
Maxwell, S. 1989. Food Insecurity in North Sudan. Discussion Paper 262. Sussex: Institute of Development Studies.
May, C. 1987. The role of the media in identifying and publicizing drought. In Planning for Drought: Toward a Reduction of Societal Vulnerability, D.A. WiPhite, W.E. Easterling and D.A. Wood, eds., pp. 5 15-5 18. Boulder: Westview Press.
May, J.M. and McLellan, D.L. 1970. The Ecology of Malnutrition in Eastern Africa and Four Countries of West Africa. New York: Hafner Publishing Co.
Mayer, J. 1981. Preface. In Famine: I ts Causes, Effects and Management, J.R. K. Robson, ed., pp. vii-x. New York: Gordon and Breach.
Mazur, R. and Sanders, D. 1988. Socioeconomic factors associated with child health and nutrition in peri-urban Zimbabwe. Ecology of Food and Nutrition 22: 19-34.
Mbithi, P.M. 1974. Rural Sociology and Rural Development: I ts Application in Kenya. Nairobi: East African Literature Bureau.
Mbithi, P.M. and Barnes, C. 1975. Spontaneous Settlement Problems in Kenya. Nairobi: East African Literature Bureau.
Mbithi, P.M. and Wisner, B.G. 1972. Drought and Famine in Kenya: Magnitude and Attempted Solutions. Nairobi: Institute for Development Studies.
Mbugua, M.G. 1989. Drought relief activities of the Kenya Freedom From Hunger Council. In Coping with Drought in Kenya: National and Local Strategies, T.E. Downing, K.W. Gitu and C.M. Kamau, eds., pp. 337-343. Boulder: Lyn~ne Rienner.
Mbugua, S.W. 1986. Monitoring Livestock and Wildlife in Kenya. Nairobi: Kenya Rangeland Ecological Monitoring Unit (KREMU). (Manuscript).
McAlpin, M.B. 1987. Famine relief policy in India. six lessons for Africa. In Drought and Hunger in Africa, M.H. Glantz, ed., pp. 393-414. Cambridge: Cambridge University ]Press.
McCabe, J.T. 1990. Success and failure: the breakdown of traditional drought coping institutions among the pastoral Turkana of Kenya. Journal of Asian and African Studies (Forthcoming).
McCabe, J.T. 1987a. ~ k c i u ~ h t and recovery: livestock dynamics among the Ngisonyoka Turkana of Kenya. Human Ecology tS(4): 371-389.
/ McCabe, J.T. 1987b. Inter-household variation in Ngisonyoka Turkana livestock production.
Research in Economic Anthropology 8: 277- 293.
McCabe, J.T. 1985. Livestock Management among the Turkana: A Social and Ecological Analysis of Herding in an East Ajrican Pastoral Population. Ph.D. Dissertation. Binghamton, NY: State University of New York.
McCabe, J.T. 1983. Land use among the pastoral Turkana. Rural A fricana 15- 16: 109- 121.
McCabe, J.T., Dyson-Hudson, R., Leslie, P.W., Fry, P.H. and Wienpahl, J. 1988. Movement and migration as pastoral responses to limited and unpredictable resources. In Arid Lands, Today und Tomorrow, Emily E. Whitehead, Charles F. Hutchinson, Barbara N. Timmermann and Robert G. Varady, eds., pp. 727-734. Boulder: Westview.
McCabe, J.T. and Ellis, J.E. 1987. Beating the odds in arid Africa. Natural History 96(1): 32-41.
McCann, J. 1988. History, drought and reproduction: dynamics of society and ecology in northeast Ethiopia. In The Ecology of Survival: Case Studies from Northeast African History, D.H. Johnson and D.M. Anderson, eds., pp. 283-304. Boulder, CO: Westview.
McCann, J. 1987a. From Poverty to Famine in Northeast Ethiopia: A Rural History, 1900.-35. Philadelphia, PA: University of Pennsylvania Press.
McCann, J. 1987b. The social impact of drought in Ethiopia. oxen, households, and some implications for rehabilitation. In Drought and Hunger in Africa: Denying Famine a Future, M.H. Glantz, ed., pp. 245-268. Cambridge: Cambridge University Press.
McCarthy, F.D. and Mwangi, W.M. 1982. Kenyan Agriculture: Toward 2000. Laxenburg, Austria: International Institute for Applied Systems Analysis.
McCorkle, C.M. 1987. Foodgrain disposals as early warning famine signals: o case from Burkina Faso. Disasters 1 l(4): 273-28 1.
McCracken, J.A., Pretty, J.N. and Conway, G.R. 1988. An Introduction to Rapid Rural Appraisal for Agricultural Development. London: International Institute for Environment and Development, Sustainable Agriculture Programme.
McGuire, J. and Popkin, B.M. 1988. Increasing Women's Resources for Nutrition in Developing Countries. Presentation for the U.N. Coordinaf.ing Committee's Subcommittee on Nutrition "Symposium on Women and Nutrition", New York, February 27-March 1. Washington: World Bank, Population, Health and Nutrition Division.
McIntire, J. 1987. Would better information from an early warning system improve African food security. In Planning for Drought: Toward a Reduction of Societal Vulnerability, D.A. Wilhite, W.E. Easterling and D.A. Wood, eds., pp. 283-293. Boulder: Westview Press.
McIntire, J. 1981. Food Security in the Sahel: Variable Import Levy, Grain Reserves, and Foreign Exchange Assistance. Research Report 26. Washington: Internatio.~ai Food Policy Research Institute.
McKee, D. and Vilhja!msson, R. 1986. Life stress, vulnerability, and depression: a methodological critique of Brown et al. Sociology 20(4): 589-599.
McLean, W.P. 1987. Nutritional &fk: concepts and imp1icat;ons. In Food Policy: Integrating Supply, Distribution, and Consumption, J.P. Gittinger, J. Leslie and C. Hoisington, eds., pp. 393-401. Baltimore: Johns Hopkins.
McNeill, G., Rayne, P.R., Rivers, J.P. W., Enos, A.M. T., do Britto, J,J, and Mukurji, D.S. 1988. Socio-economic and seusonal patterns of adult energy nutrition in a south Indiun villuge. Ecology of Food and Nutrition 22: 85-95.
Meadows, D.H., Meadows, D.L., Ranclers, J. and Behrens, W.W. I. 1972. The Limits to Growth. New York: Universe Books.
Meillassoux, C. 1974. Development or exploitation: is the Sahel famine good business? Review of African Political Economy 1: 27-33.
Meir, A. 1987, Comparative vital statistics along the pastoral nomadism-sedentarism continuum. Human Ecology 15(1): 91 - 107.
Mellor, J.W. 1988. The intertwining of environmental problems and poverty. Environment 30(9): 8-30.
Mellor, J.W. 1982. Third world development: food, employment, and growth interactions. American Journal of Agricultural Economics May.
Mellor, J.W. and Gavian, S. 1987. Famine: causes, prevention, and relief. Science 235: 539-545.
Mengisteab, K. 1988. Africa's food crisis: a challenge to existing development theories. Journal of Developing Societies 4(2): 166- 179.
Merryman, J.L. 1984. Ecological Stress and Adaptive Response: The Kenya Somali in the Twentieth Century. Ph.D. Dissertation. Evanston, IL: Northwestern University.
Merry man, N.H. 1 984. Economy and Ecological Stress: Household Strategies of Transitional Somali Pastoralists in Northern Kenya. Ph.D. Dissertation. Evanston, IL: Northwestern University.
Messer, E. 1989a. Ecology and politics of food availability. In African Food Systems in Crisis: Microperspectives, R. Huss-Ashmore and S.H. Katz, eds., pp. 189-202. New York: Gordon and Breach.
Messer, E. 1989b. Seasonality in food systems: an anthropological perspective on household food secu~ iry. In Seasonal Variability in Third World Agriculture: The Consequences for Food Security, D.E. Sahn, ed., pp. 15 1 - 175. Baltimore: Johns Hopkins University Press.
Messer, E. 1969~. Small but hadthy? Some cultural considerations. Human Organization 48(1): 39-52. \
Messer, E. 1986. The "small but healthy" hypothesis: historical, political, and ecological influences on nutritional standards. Human Ecology 14: 57-75.
Messer, E. 1984. Anthropological perspectives on diet. Annual Review of Anthropology 13: 205-249.
Migot-Adholla, S.E., eh.-1985. Significance and Prospects of Camel Pastoralism in Kenya. IDS Occasional Paper No. 45. Nairobi: Institute for Development Studies.
/ Migot-Adholla, S.E. and Little, P.D. 1981. Evolution of policy toward the development of
pastoral areas in Kenya. In The Future of Pastoral Peoples, Proceedings of a conference held in Nairobi, Kenya, 4-8 August 1980, J.G. Galaty, D. Aronson, P.C. Salzman and A. Chouinard, eds., pp. 144- 155. Ottawa: International Development Research Centre.
Milford, J.R. 1989. Satellite monitoring of the Sahol. Weat.11er 44(2): 77-8 1.
Millas, L.S. 1983. The years of drought. Deserti f ication Control Bulletin 9,
Miller, J.C. 1982. The significance of drought, disease and famine in the agriculturally marginal zones of Wsst-Central Africa. Journal of African History (23): 17-61.
Miller, N.N. 1984. Kenya: The Quest for Prosperity. Boulder: Westview.
Millman, S. and Kcttes, R.W. 1989. Toward understanding hunger. In Hunger in History: Food Shortage, Poverty, and Deprivation, L.F. Newman, W. Crossgrove, R.W. Kates, R. Matthews and S. Millman, eds. New York: Basil Blackwell. (Forthcoming).
Ministry of Livestock Planning Development. 1980. National Livestock Development Policy. Nairobi: Government of Kenya. (Manuscript).
Ministry of Planning and National Development. 1988. A Second-Generation Strategy and Policy for Reclamation and Development in the Arid and Semi-Arid Lands, Kenya, 1989-1993. Nairobi: Ministry of Planning and National Development. (Manuscript).
Mitchell, J.M. J., Dzerdzeevskii, B., Flodn, H., Hofmeyer, W.L., Lamb, H.H., Rao, K.N. and Wallen, C.C. 1966. Climatic Change. WMO Technical Note 79. Geneva: World Meteorological Organization.
Mokobi, K. and Asefa, S. 1987. The Role of the Government of Botswana in Increasing h r a i and Urban Access to Food. Paper presented at the Third Annual Conference on Food Security Research in Southern Africa, University of Zimbabwe, November 1-5. Gabarone: Department of Food Resources, Ministry of Local Government and Lands.
Monsted, M. and Walji, P. 1978. A Demographic Analysis of East Africa: A Sociological Interpretation. Uppsala: Scandinavian Institute for African Studies.
Moock, J.L., ed. 1986. Understanding Africa's Rural Houseltolds and Farming Systems. Boulder: Westview.
Moock, J.L. 1978. The content and maintenance of social tics between urban migrants and their home-based support groups: the Maragoli Case. African Urban Studies 3: 15-31.
Msock, P.R. 1976. The efficiency of women as farm managers: Kenya. American Journal of Agricultural Economics 58(5): 83 1 -835.
Moore, H. and Vaughan, M. 1987. Cutting down trees: women, nutrition and agricultural change in the Northern Province of Zambia, 1920-1986. African Affairs 86(345): 323-340.
Moremi, T.C. 1987. Drought planning and response: Botswana experience. In Planning for Drought: Toward a Reduction of Societal Vulnerability, D.A. Wilhite, W.E. Easterling and D.A. Wood, ed$.,-pp. 425-444. Boulder: Westview Press.
Morgan, R. 1985. The development'and application of a drought early warning system in Botswana. Disasters 9: 44+0.
Moris, J.R. 1989. Indigenous versus introduced solutions to food stress in Africa. In Seasonal Variability in Thi rd World Agriculture: The Consequences for Food Security, D.E. Sahn, ed., pp. 209-234. Baltimore: Johns Hopkins University Press.
Moris, J.R. 1988a. Failing to cope with drought: the plight of Africa's ex-pastorulists. Developmrnt Policy Review G: 269-294.
Moriu, J.R. 1988b. Oxfam's Kenya Restocking Projects. Pastoral Development Network Paper 2Gc,
Morth, H.T. 1973. A Study of the Areal and Temporal Distributions of Rainfall Anomalies in East Africa. Technical Memorandum No. 19. Nairobi: East African Meteorological Department.
Mortimore, M. 1988. Adapting to Drought: Farmers, Famine and Desertification in West Africa. Cambridge: Cambridge University Press.
Moseley, P. 1986. The politics of economic liberalization: USAID and the World Bank in Kenya, 1980-84. African Affairs 85(338): 107- 1 19.
Mosley, W.H. and Chen, L.C. 1984. Child survival: strategies for research. Population and Development Review f Supplement) 10.
Moyes, A. n.d. How Farming in Europe Affects the Thi rd World Poor. Oxford: Oxfam.
Muchena, F.N. and Gachena, C.K. K. 1988. Soils of the highland and mountainous areas of Kenya with special emphasis on agricultural soils. Mountain Research and Development 8(2-3): 183- 191.
Muhammed, L., Scott, F.H. C. and Steeghs, M.H. C.G. 1985. Seed Availability, Distribution and Use in Machakos District, Short Rains 1983 - Short Rains 1984. Machakos: Ministry of Agriculture and Livestock Development.
Mukhebi, A.W., et al. 1985. Impact of the 1983/84 Drought on Cattle, Sheep and Goats in Kenya. Technical Report No. 3. Kiboko, Kenya: Kiboko National Range Research Station, Ministry of Agriculture and Livestock Development.
Mukui, J.T., ed. 1979. Price and Marketing Controls in Kenya. Occasional Paper No. 32. Nairobi: Institute for Development Studies.
Muller, A.S., Ouma, J.K., Mburu, F.M., Blok, P.G. and Kleevens, J.W. L. 1977. Machakos project studies--I. Introduction: study design and methodology. Tropical and Geographical Medicine 29: 291 -302.
Mungai, D.N. 1984. Analysis of Some Seasonal Rain fa l l Characteristics in the Lake Victoria Region of Kenya. M.A. Thesis. Nairobi: University of Nairobi.
Mungai, D.N. and Muturi, H.R. 1988. Agroclimatic zones and agricultural production in central and eastern Kenya, In The Impact of Climatic Variations on Agriculture. Volume 2. Assessments in Semi-Arid Regions, M.L. Parry, T.R. Carter and N.T. Konijn, eds., pp. 175- 190. Dordrecht, The Netherlands: Kluwer.
Murage, F.G. 1989. Aericultural yields, production and monitoring methods of the National Cereals and Produce Board. In Coping with Drought in Kenya: National and Local Strategies, T.E. Downing, K.W. Gitu and C.M. Kamau, eds., pp. 122-130. Boulder: Lynne Rienner. J
Murage, F.G. 1985. NCPB Maize Yield Survey, A Forecasting Tool in the Context of Food Policy. Oxford: Oxford University, Food Studies Group. (Manuscript).
Murton, B. 1984. Spatinl uncl tetnporul patterns of farnine in southern India befora the famine codas. In Famine as a Geographical Phenommon, B. Currey and G, Hugo, eds,, pp. 71-90. Dordrecht: Reidel.
Muson~bi, D.K. 1984, Identification of Crop-Crowing Seasons of Semi-Arid Kenya by Analysis of the Soil Moisture Patterns. M.Sc. Thesis. College Station: Texas A&M University.
Mutiso, Go-C. M. 1989. Media and Money are not for Orassroots: The Utooni Experience. Paper presented at the Second Annual Hunger Research Briefing and Exchange. Providenca, RI: World Hunger Program, Brown University.
Mutulu, P.M., Okoola, K.E. and Cheres, K.A. 1988. Further Evidence of Periodic Fluctuations in Kenyan Rainfall Records. Nairobi: Kenya Meteorological Department. (Manuscript).
Muzaale, P.J. 1981. Famine and hunger in East Africa: conceptualisation of the problem of nutritional depr;i.~!lon and implications for policy design. Eastern Africa Journal of Rural Development 14(1 and 2): 1-46.
Muzaale, P.J. 1980. Famine and Hunger in Rural East A ftica: Analysis and Intervention. D.S.W. Dissertation. Berkeley: University of California.
Mwangi, W.M. 1987. Forces facing the future of Kenyan agriculture. In Agriculture and Economic Instability, IAAE Occasional Paper 4, M. Bellamy end B. Graenshields, lads., pp. 32-35, discussion pp. 44-46. Gower, IAAE.
Mwangi, W.M. and Mwabu, G.M. 1986. Economics of health and nutrition in Kenya. Social Science and Medicine 22(7): 775-780.
Mwaniki, H.S. K. 1975. The Living History of Embu and Mbeere. Nairobi: East African Literature Bureau.
Mwaniki, N. 1982. Social and Economic Impacts of Land Reform in Mbere. Nairobi: Institute for Development Studies.
Mwanjila, D.N. 1989. Food crop monitoring and reporting by the Ministry of Agriculture. In Coping with Drought in Kenya: National and Local Strategies, T.E. Downing, K.W. Gitu and C.M. Kamau, eds., pp. 1 19- 121. Boulder: Lynne Rienner.
Mwendwa, H. 1989. Agricultural and livestock monitoring using aerial photography. In Coping with Drought in Kenya: National and Local Strategies, T.E. Downing, K.W. Gitu and C.M. Kamau, eds., pp. 94-105. Boulder: Lynne Rienner.
Myers, L.R. 1982. ~oc ioecono~ ic Determinants of Credit Adoption in a Semi-arid District of Kenya. Ph.D. Dissertation. Ithaca, NY: Cornell University.
Nadar, H.M. and Faught, W.A. 1984. Maize yield response to different levels of nitrogen and phosphorus fertilizer application. East African iigricultural and Forestry Journal 44: 147- 156.
.-
Ndegwa, P. 1989. Drought and food policy ip ihe African context. In Coping with Drought in Kenya: National and LocqPStrategies, T.E. Downing, K.W. Gitu and C.M. Kamau, eds., pp. 369-378. Boulder: Lynne Rienner.
Ndegwa, P. 1986. The African Challenge. Nairobi: Heinemann.
Ndolo, I.J. Water Bnlancs and Rice Yields in a Tropical Environment: A Case Study o/' Mtctoa Irrigation Settlement, Kenya. M.Sc. Thosis. Nairobi: University of Nairobi.
Ndoye, T, and M'Baya, M, 1987, A grain revolution: the imp~ct of imported rice on millet-husocl African civilizations (Sahel). World Farmors' 7'imes 2(10): 22-23.
Needharn, R. 1989. Dro~~ght ussistnnco to NGOs provided by CARE-Kenya. In Coping with Drought in Kenya: National and Local Strategies, T.E. Downing, K. W. Gitu and C.M. Kamau, eds., pp. 329-336. Boulder: Lynne Riennar.
Nerlove, M. 1988. Modernizing Traditional Agriculture. Occasional Papers No. 16. San Francisco: International Center for Economic Growth.
Nestel, P. 1985. Nutrition of Maasai Women and Children in Relation to Subsistence Food Production. P1i.D. Dissertation. London: University of London.
A'estel, P. and Geissler, C. 1986. Potential deficiencies of a pastoral diet: a case study of the Maasai. Ecology of Food and Nutrition 19: 1 - 10.
Neumann, C.G., Bwibo, N.O., Carter, E., Weinberg, S., Jansen, A.A., Cattle, D., Ngare, D., Baksh, M., Paolisso, M., Coulson, A.H. and Trostle, M. 1989. Impact of the 1984 drought on food intake, nutritional status and household response in Embu District, Kenya. In Coping with Drought in Kenya: National Local Strategies, T.E. Downing, K.W. CStu and C.M. Kamau, eds., pp. 231 -244. Boulder: Lynne Rienner. .
Neunhauser, P., Bayreuther, H., Engel, A., Friesenegger, M., Magelassa, A., Neves, A.M., Renneke, V. and Salzer, W. 1983. Appropriate Land Use Systems for Smallholder Farms: A Survey of Ecological and Socio-Economic Conditions in Machakos District (Kenya). Berlin: Centre for Advrtnced Training in Agricultural Development, Institute of Socio-Economics of Agricultural Development, Technical University of Berlin.
Newell, R.E. and Kidson, J.W. 1984. African mean wind changes between Sahelian wet and dry periods. Journal of Climatology 4: 27-33.
Newitt, M.D. D. 1988. Drought in Mozambique 1823- 183 1. Journal of Southern African Studies 15(1): 15-35.
Newman, L.F., Crossgrove, W., Kates, R.W., Matthews, R. and M~llman, S., eds. 1989. Hunger in History: Food Shortage, Poverty, and Deprivation. New York: Basil Blackwell. (Forthcoming). "
L Ng'ethe, N. and Chege, F. 1982. Arid and Semi Arid Lands Pre-Investment Study: Kitui, Embu
and Meru. IDS Consultancy Report No. 8. Nairobi: Institute for Development Studies.
Ngunjiri, E. 1989. Relief and recovery for pastoralists: Oxfam's experience. In Coping with . Drought in Kenya: National and Local Strategies, T.E. Downing, K.W. Gitu and C.M. Kamau, eds., pp. 344-351. Boulder: Lynne Rienner.
Ngunjiri, E. 1987. A Case Study on Food for Livestock Exchange fDe-Stocking) in Samburu District. Nairobi: Oxfam. (Manuscript).
/' Ngutter, L.G. K. 1979. Government Policy in Semi-Arid Lands: I ts Evolution.. Paper presented at the Workshop on Semi-Arid Areas in Kenya, 23-27 July 1979. Nairobi: Institute for Dltvelopment Studies.
Nicholson, S,E. 1989. Long-tor111 chntlges in African ruiafall. Wuathur 44(2): 46-56.
Nicholson, S.E. I9H5, African rainfall I'luctuutions IS50 to preaent: spatial coherence, periodic behavior and long tertll trends. American Msteorological Society Bxtrnded Abstracts: 62-63,
Nicholson, S.E. 1981a. Tlre historical clit:~r~tology of Africa. In Climatr and History, T.M.L. Wigley, M.J, 1ngr.ao1 crnd 0. Farnror, eda., pp. 249-270. Cambridge: Carnbridgo University Press.
Nicholson, S.E. 1981 b. Rainfall and atmospheric circulation during drought periorls and wetter years in west Africa. Monthly Weather Review 109: 2191-2208.
Nicholson, S.E. and Entokhabi, D. 1986. The quasi-periodic behavior of rainfall v~riability in Africa and its relationship to the Southern Oscillation. Archiv fur Motrorologie, Gsonhysik urtd Bioclimatologie 34: 3 1 1 -348.
Niemeijer, R., Geuns, M., Kliest, T., Ogon, V, and Hoorweg, J. 1988. Nutrition in agricultu,ral development: the case of irrigated rice cultivation in West Kenya. Ecology of Food and Nutrition 22: 65-8 1.
Nieuwolt, S. 1986. Agricultural droughts in the tropics. Theoretical and Applied Climatology 37( 1-2): 29-38.
Njeru, E.H. 1984. The Farming Herders: Irrigation, Reciprocity and Marriage among the Turkancf Pastoralists of North Western Kenya. Ph.D. Dissertation. Santa Barbara: University of' California.
Njeru, N. 1984. Some physiologi,al properties of different maize varieties at NARS Kitale. In More Food from Better Technology, J.C. Mohucs and W.H. Tahir, eds., Rome: Food and Agriculture Organization.
Njihia, J.K. 1979. The Relationship Between Plant Density, Global Radiation and Yield of Maize Crop. Research Report 7/79. Nairobi: East African Institute for Meteorological Training and Research.
Njoka, T.J. 1979. Ecological and Socio-cultural Trends of Kaputiei Group Ranches in Kenya. Ph.D. Dissertation. Berkeley: University of California.
Njoku, J.E. Eberegbulam. 1986. Malthusianism: An African Dilemma; Hunger, Drought and Starvation in Africa. Metuchen, NJ: The Scarecrow Press.
Nkamany, K., Glass, R., Schamper, J., Nwanze, K., Veiasco, J.R., Franklin, R.R., Dikassa, L., Beda, M.m. Mavambu ye, Duckett, Eileen M. and Carlisle, J. 1980. The consequences of drought in Bas- Zaire, 1978. Disasters 4(1): 55-64.
Nkanata, J. 1985. Workshop on Provision of Livestock Production Research Information for Use by Extension Workers in the Training and Visit Programme. Muguga, Kenya: Kenya Agricultural Risgarch Institute.
Norcliffe, G.B., Freeman, D.G. apd Miles, N.J. 0. 1981. Non-farm activities in market centers of Central Province, Kenya. Canadian Journal of African Studies 14( 14).
Norgaard, 0. 198 1. Kenya and the Social Sciences: A Survey of Bibliographies and Bibliographic Work. Nairobi: Kenya Literature Bureau.
Norse, D. 1985. Nutritionul it~rplicutinns of roaource policiea ~c t l t l teclrtlologictrl chatlge. 111 Nutrition and Development, M, Uizlwns nnd P. Pirrnfrup-Antlerson, ads., pp. 20-42, Oxfortl: Oxford University Press.
Norton-Griffitha, M. 1978. Counting Animals. Flantlbook 1. N~irobi: Africutl Wilrllife Loudershil) Foundation.
O'Keefo, P. and Westgate, K. 1977. Proventive planning for disasters. Long Range Planning 10: 26-29.
O'Leary, M. 1984. The Kitui Akamba. Nairobi: Hoinettlann.
O'L.eary, M. 1980. Rosponses to drought in Kitui District, Kenya. Disasters 4(3): 315-327.
Oaks, S.D. 1989a. Hazards and sustainable development: multiple considerations of environrnental and societal factors. In Tal ler Internacionul de Ecoturismo. Yucatan, Mexico: Pronatura.
Oaks, S.D, 1989b. An Interactive Envrionmental/Societal Process Model for the Assessment of Vulnerability to Earthquakes and Related Hazards. National Earthquake Hazard Reduction Program Summaries of Technical Reports, Volumes XXVIII and XXIX. Department of Interior, U.S. Geological Survey: Washington.
Oba, G. and Lusigi, W. 1987. An overview of drought strategies and land use in African pastoral systems. Pastoral Network Paper 23a. London: Overseas Development Institute.
Oboler, R.S. 1982. Women, Men, Property and Change in Nandi District, Kenya. Ph.D, Dissertation. Temple University.
Oboler, R.S. 1985. Women, Power, and Economic Change: The ~Vandi of Kenya. Stanford: Stanford University Press.
Odegi-Awuondo, C. 1983. Drought rrnd famine in Turkana. The Kenyan Geographer 5(1 and 2): 175- 183.
Odingo, R..S. 1986. A Study of the Causes, Consequences and Policy Recommendations on Drought in Kenya. Background paper for Drought and Man: The 1972 Case Study (R. Garcia and J. Escudero, eds. New York: Pergamon). Nairobi: Department of Geography, University of Nairobi.
Odingo, R.S. 1985. A Review of Drought Research in Eastern Africa (Ethiopia, Kenya, Somalia and Uganda). Nairobi: International Development Research Cchtrs. (Manuscript).
Office of the President. 1984. Guidelines on Food Supply and Distribution. Circular sent to District Officials, 21st August. Nairobi: Office of the President. (Manuscript).
Office of the President. n.d. Wind Up 0)' the Food Distribution Exercise. Notes for the Meeting of the National Fqod Steering Committee. Nairobi: Office of the President. (Manuscript).
Ogallo, L.J. 1989. Drought and Destirtification. Report of the CC1 Rapporteur on Drought and Desertification in Warm axnates to the tenth session of the Commission for Climatology, Lisbon, April 1989, WCAP-7, WMO/TD-No. 286. Geneva: World Meteorological Organization.
Ogallo, l . , J . 1983. T l ~ e apt~tial r~ncl teti~porlrl potterns of the Enat African souso11o1 rnins tlariverl from principal cornponetit nnalysis, lniernational Journal of Climatology 8: 145- 167,
Ognllo, L.J. 1987. Kalationship botwoar) seasonal rainfall i n East Africu und tha Southern Oscillation. Journal of Climatology 8: 3 1 -43,
O~allo, L.J. 198 1. Rain fa l l C/raracteri.rtics in tka Arid and Sami-arid Regions of Kenya. Pupor preronterl nt the lnternetiotlul Workshop for Developing Rerources for the Arid and Semi-arid Arens of Konyu. Nliirobi: University of Nairobi. (Manuscript).
Ogallo, L.J. 1980. Time Ssries Analysis of Rainfall in East Africa. P1l.D. Dissertation. Nairobi: University of Nairobi.
Oppllo, L.J. 1979, Rainfall Variability in Africa. Monthly Weather Review 107: 1133-1 139.
Ogoilo, L.J. 1978. Rainfall i;t Africa. Research Report No. 5/78. Nairobi: East African Institute for Meteorological Trnining and Research.
Ogallo, L.J. afid Anyamha, E.K. 1385. Drought of Tropical Central and Eastern Africa, July-November, Northern Springs of 1983-1984. Nairobi: Kenya Meteorological Department. (Manuscript).
Ogallo, L.J., Janowiak, J.E. and Halpert, M.S. 1988. Teleconnection between seasonal rainfall over East Africa and global sea surface temperature anomalies. Journal of the Meteorologicul Society of ,lapan 66(6).
Ogallo, L.J. and Nossib, I.R. 1984. Drought patterns in East Africa during 1922-1983. In Extended Abstracts of Papers presented at the Second WMO Symposium on Meteorological Aspects of Tropical Droughts, Fortaleza, Brazil, 24-29 September. Geneva: World Meteorological Organization.
Ogallo, L.J. and Okoola, R.E. 1985. Response of Seasonal Rainfall in East Africa to the Weather Changes Over Some Regions of the Indian Ocean. Nairobi: Kenya Meteorological Department. (Manuscript).
Ojany, F. and Ogendo, R. 1973. Kenya: A Study in Physical and Human Geography. Nairobi: Longman.
Ojo, 0. 1987. Hydroclimatic consequences of climatic events in West Africa the lessons of the 1469-1984 Sahelian droughts. In Water for the Future, P~oceedings, Rome Symposium; IAHS Publication 164, J.C. Rodda and N.C. Matalas, eds., IAHS.
Okeyo, A.P. 1980. Daughters of the lakes and rivers: colonization and the land tights of Luo women. In Women and Colonization: Anthropological Perspectives, M. Etienne and E. Leacock, eds., pp. 186-213. New York: Praeger.
Okeyo, A.P. 1978. Women's Access to land and their Role in Agriculture and Decision-making on - the Farm: Expfriences of the Joluo cf Kenya. Discussion Paper No. 263. Nairobi: Institute of Development Studies.
Okoofa, R.E. 1986. The Role of Wteorology in the National Food System--A Management Perspective. Technical Note No. 2. Nairobi: Kenya Meteorological Department.
Okoth, M.A. and Wumbani, V,S, 1989. Nutrition and health activities of the Ministry of I-lealth. In Coping with Drought in Kenya: National and Local Strategies, T.E. Downing, K.W. Oitu and C.M. Kurnau, ads., pp. 289-298. Boulder: Lynne Rienner.
Omer, M.M. el-Jaili. 1988. i nvironmental Management: Traditional Versus Modern (Case Study: Um-Ruaba District, Sudan). Worcester, MA: Clark Universtiy.
Onchere, S. 198 1. The Pattern of Food Production, Availability and Intakes of People of Eastern Kenya: The Casu of North-Western Machakos. M.Phi1. Thesis. Reading: University of Reading.
Oomen, H.A. P.C., Jansen, A.A. J. and 'T. Mannetje, W. 1979. Machakos project studies XIV: Growth pattern of rural Akamba pre-school children. Tropical and Geographical Medicine 3 1: 42 1-439.
Opio-Odongo, J.M. A. 1988. Governance, morality and food security in sub-Saharan Africa. Agricultural Administration and Extension 28(4): 245-264.
Oshaug, A. and Wandel, M. 1989. Food indices in Sri Lanka, adapted to local situations. Ecology of Food and Nutrition 22: 267-275.
Osunade, M.A. A. 1987. A viable method of land capability classification for small farmers. Journal of Environmental Management 25(1): 8 1-94.
Otengi, S.B. 1979. Analysis of Pentad Rainfall for Agricultural Purposes in Kenya. M.Sc. Thesis. Nairobi: University of Nairobi.
Ott, R.B. 1979. Decisions and Development: The Lowlanc* Tugen of Baringo District, Kenya. Ph.D. Dissertation. Stonybrook, N X State University of New York.
Ottichilo, W.K. 1987. The causes of the recent heavy elephant mortality in the Tsavo ecosystem, Kenya, 1975-80. Biological Conservatiotj 4 l(4): 279-289.
Oudraogo, I. 1983. A Socioecono.;rric Analysis of Farmers' Food Grain -44arketing Linkages and Behavior in Eastern Upjet Volta. Ph.D. Dissertation. East Lansing, MI: Michigan State University.
Owen, J.A. and Ward, M.N. 1989. Forecasting Sahel rainfall. Weather 44(2): 57-63.
Owen, R.B. and Renaut, R.W. 1986. Sedimentology, stratigraphy and palaeoenvironments of the Holocene Galana Boi Formation, NE Lake Turkana, Kenya. In Sedimentation in the African Rifts, Geological Society Special Publication 25, R.B. Owen and R.W. Renaut, eds., pp. 31 1-322. Blackwell Scientific.
Oye jide, T.A. 1986. The Effects of Trade and Exchange Rate Policies on Agriculture in Nigeria. Research Report 55. Washington: International Food Policy Research Institute.
Pagezy, H. 1982. Seasonal hunger as experienced by the Oto and the Twa of a Ntomba village in the eqcatorial forest (Lake Tumba, Zaire). Ecology of Food and Nutrition 12: 139- 153.
PslutikoF, J.P. 1985. Drought str&gies in East Africa: the climatologist's role. Climatic Change 9: 67-78.
Palutikof, J.P., Farmer, G. and Wigley, T.M. L. 1982. Strategies for the Amelioration of Agricultdral Drought in Africa. In Procec;cJitt!gs of the Technical Conferexce on
Climate--A frica, Worltl Meteorniog~cul Orgsnization, ad., pp. 222-248. Genova: World Meteorological Organization.
Pankhurst, R. 1972. The history of fnn.ine und pelrtiltrnce in Ethiopia prior to the founding of tllu Gondar. Journal of Jthiopian Studios 1 O(2): 37-64.
Pankhurst, R. and Johnszg, D.H. 1988. Ths gre0.t drougl~t and famine ot' 1898-92 in northeast Africa. In The Ecology of Survival: Caso Studia,~ from Northeast African History, D.H. Johnson ~ n d D.M. Al~derson, eds., pp. 47-72. U~ulder, CO: Westview.
Park, P. and Jackson, T. 1985. Lands of Plenty, Lands of Scarcity. Agricultural Po1ic.v and Peasant Farmers in Zimbabwe and Tanzania. Oxtbrd: Oxfam.
Parrac .W. 1978. Famine symposium--ecosystems and famine. Ecology of Food and Nutrition 7: 17-21.
Parry, M.L., Carter, T.R. and Konijn, N.T., eds. 1988. The Impact of Climatic Variations on Agriculture. ,'olume 2: Assrssments in Semi-arid Regions. Dordrecht, The Netherlands: Kluwer.
Paul, A.A. and Southgate, D.A. 1'. 1978. McCance and Widdowsm's Tho Composition of Food. 4th Revised and Extended Edition of MRC Special Report No. 297. Now York: ELev' .,r/North-Ii~lland Biomedical Press.
Payne, P.K. 1989. Public health and functional consequences of seasonal hunger and malnutrition. In Seasonal Variability in Third World Agricultrrre: The Consequences for1 Food Security, D.B. Sahn, ed., pp. 19-46. Bzltimore: Johns Hopkins University Press.
Payne, P.R. 1985. The nature of malnutrition. In Nutrition and Development, M. Biswas and P. Pinstrup-Andersen, eds., pp. 1-19. Oxford: Oxford Univer.sity Press.
Peacock, C.P. 1984. The Prcductivity of Smallstock in Three Grortp Ranches in Kajiado District, Kenya. Rh.D. Dissertation. Reading: University of Reading.
Peacock, C.P., de Leeuw, P.N. and King, J.M. 1982. Herd Movement in the Mbirikani Area. Internal Report. Nairobi: International Livestock Centre for Africa. (hqanuscript).
Peden, D.G. and Mwendwa, H. 1984. Estimating Maize Yield Using Airborne Digital Photometers. KREMU Technical Report No. 110. Nairobi: Kenya Ministry of Finance and Planning.
Pe-den, D.G., Mwendwa, H., Agatsiva, J.L. and Ottichillo, W.K, 1985. Experiments in estimating maize yield in Kenya using airborne digital photometers. ITC Journal 1: 9-13.
Pelto, G.H. and Pelto, P.J. 1989. Small but healthy? An anthropological perspective. Human Organization 48(1): 1 1 - 15.
Pelto, G.Y. and Pelto, P.J. 1984. Anthropological metb.gdologies for assessing household organization an$ structure. In Methods for the Evaluation of the Impact of Food and Nutrition Programmes, D.E. Sahn, K. Lockwood and N.S. Scrimshh~w, eds., pp. 204-225. Tokyo: United Nations Univenity.
/ Perevolotsky, A. 1986. To sell or not to sell--a pastoralisr's dilemmr~: lessons from the
slaughterhouse. Human Ecology 14(3): 287-3 10.
Perlov, b. 1981. Livestock Marketing in Samburu Land, Kenya: An Invustigation of tho Sociocultural Contuxt of Marksting Behaviour, Working Paper 414. Nairobi: Institute for Development Stuclies.
Peters, P.E. 1986. Houseliold mariegement in Botswana: cattle, crops, and wage labor. In Understanding Africa's Rural Households and Farming Systems, J.L. Moock, ed., pp. 133- 154. Boulder: Westview.
Peters, P.E. 1983. Gender, developmental cycles and historical process: a critique of recent research on women in Botswana. Journal of Southern A frlcan Studies 10( 1 ): 100- 122.
Peters, P.E. and Herrera, G. 1989. Cash Cropping, Food Security and Nutrition: The Effects of Agricultural Commercialization among Smallholders in Malawi. A Report to U.S.A.I.D. Zomba: U.S. Agency for International Development. (Manuscript).
Peterson, S. 1986. Neglecting the poor: state policy toward the smallholder in Kenya. In Africa's Agrarian Crisis: The Roots of Famine, S.K. Commins, M.P. Lofchie and R. Payne, eds. Boulder: Lynne Rienner.
Pinckney, T.C. 1988. Storage, Trade, and Price Policy under Production Instability: Maize in Kenya. Rosearch Report 71. Washington, DC: International Food Policy Research Institute.
Pinckney, T.C. and Gotsch, C.H. 1897. Simulation and optimization of price stabilization policies: maize in Kenya. Food Research Institute Studies 20(3): 265-98.
Pinckney, T.C. and Valdes, A. 1988. Short-run supply management and food security: results from Pakistan arad Kenya. World Development 16(9): 1025- 1034.
Pinstrup-Andersen, P. 1985. The impact of export crop production on human nutrition. In Nutrition and Development, M. Biswas and P. Pinstrup-Andersen, eds., pp. 43-59. Oxford: Oxford University Press.
Platt, B.S. 1462. Tables of Represen~ative Values of Foods Commonly Used in Tropical Countries. Special Report Series 302 (Revised Edition of SRS 253). London: Medical Research Council.
Porter, P.W. 1983. Probiems of agrometeorological modeling in Kenya. In Agrocli.mate Information for Development: Reviving the Green Revolution, D.F. Cusack, ed., pp. 276-290. Boulder: Westview Press.
Porter, P.W. 1979. Food and Development in the Semi-Arid Zone of East Africa. Syracuse: Maxwell School of Citizenship and Public Affairs.
Porter, P.W. 1976. Climate and agriculture in East Africa. In Contemporary Africa, Geography and Change, C.G. Knight and J.L. Newman, eds., pp. 112-139. Englewood Cliffs:
'
Prentice-Hall.
Potter, H.L. 1988. The-effects of climatic variability on livestock production. In The Impact of Climatic Variations on Agyiculture. Volume 2. Assessments in Semi-Arid Regions, M.L. Parry, T.R. Carter and pmN.T. Konijn, eds., pp. 209-220. Dordrecht, The Netherlands: Kluwer. /. 1
Pottier, J.P. 1986. The politics of famine prevention: ecology, regional production and food complementarity in western Rwanda. African Affajrs 85: 207-239.
Prico, M.F, 1990, The Human Aspects of Olobal Change. Douldor, CO: Nationtrl Centor for Atmospheric Research,
Price, Williams & Associates. 1989a. Burkina Vulnerability Assessment. Washington: Office of Technical Rosources, U.S. Agency for lntornational Development.
Price, Williams & Associates. 1989b. Chad Vulnerability Assessment. Washington: Offico of Technical Resources, U.S. Agency for International Development.
Price, Williams & Associates. 1989c. Ethiopia Vulnerability Assessment. Washington: Office of Technical Resources, U.S. Agency for International Dovelopmont.
Price, Willic.rns & Associates. 1989d. Mal i Vulnerability Assessment. Washington: Offico of Technical Resources, U,S. Agency for International Development.
Price, Williams & Associates. 1989e. Mauritania Vulnerability Assessment. Washington: Office of Technical Resources, U.S. Agency for International Development.
Price, Williams & Associates. 1989f. Niger Vulnerability Assessment. Washington: Office of Technical Resources, U.S. Agency for International Development.
Price, Williams & Associates. 1989g. Sudan Vulnerability Assessment. Washington: Office of Technical Resources, U.S. Agency for International Development.
Price, Williams & Associates. 1988. Sudan Vulnerability Assessment. Washingf~n: Office of Technical Resources, U.S. Agency for International Development.
Program for International Development, Clark University and Nat.iona1 Environment Secretariat. 1988. Resources Management, Population, and Local Institutiorts in Katheka: A Case Study of Effective Natural Resources Management in Machakos, Kenya. Worcester, MA: Clark University.
Pryer, J. 1989. When breadwinners fall ill: prelimiilary findings from a casc study in Bangladesh. I D S Bulletin 20(2): 5 1-57.
Quan, J. 1987. Mozambique; A Cry for Peace. Oxford: Oxfam.
Quarantelli, E.L. and Dynes, R.R. 1977. Response to social crisis and disaster. Annual Review of Sociology 3: 23-49.
Quarantelli, E.L. lrud Dynes, R.R. 1970. 'Editors' introduction. kmerican Behavioral Scientist 13: 325-330.
Quinn, V., Cohen, M., Mason, J. and Kgosidintsi, B.N. 1988. Crisis-proofing the economy: th. response of Botswana to economic recession and drought. In Adjustment with a Humah Face; Volume 11: Country Case Studies, G.A. Cornia, R. Jolly and F. Stewart, eds., pp. 3-27. Oxford: Clarsndon.
Raczynski, D. 1989. ~o'cfal policy, poverty, and vulnerable groups: children in Chile. In Adjustment with a Human Face, Volume 11; Country Case Studies, G.A. Cornia, R. Jolly and F. Stewart, eds., pp. 9 -92 . Oxford: Clarendon Press.
Radley, D.E., Brown, C.G. O., Burridge, M.J., Cunningham, M.P., Kirimi, I.M., Purnell, R.E. and Young, A.S. 1975. East coast fever: chemoprophylacric immunization of cattle against Theileria Parva (Muguga) and five Theilerial strains. Veterinary Parasitology 1: 35-41.
Rahtnuto, D. 19888. Famine and Survlval Stratogles: A Case Study from Northdust Ethiopia. Addis Ababa: Institute of Developtnont Roseurch, University of Addis Ababa. (Manuscript).
Rahmato, D, 1988b. Peasant survival strategies in Ethiopia. Discrsters 12(4): 326-344.
Raikes, P. 1989. Modernizing Hurrger: Famine, Food Surplus and Farm Policy. London: James Cur~ey for the Catholic Institute for International Relations.
Rangasumi, A. 1985. 'Failir re of exchange anti tlements* theory of famine: a response. Economic and Political Weekly 4 l(1747- 1801).
Rangasami, A. 1984. The McAlpin capers. Economic and Political Weekly September 1: 1524- 1528.
Ransford, H.E. 1986. Race, heart disease worry and health protective behavior. Social Science and Medicine 22( 12): 1355- 1362.
Rao, N.P. 1989. Diet and nutrition during drought--an Indian experience. Disasters 13(1): 61 -72.
Ravellion, M. 1985. The performance of rice markets in Bangladesh during the 1974 famine. The Economic Journal 95(March): 15-29.
Ray, R.T. 1984. Drought Assessment: Kenya. Nairobi: USAID/Kenya.
Reardon, T. and Matlon, P. 1989. Seasonal 1'.!..~;! insecurity and vulnerability in drought-affected regions of Burkina Faso. In .Ceasonal Vizriability in Third World Agriculture: Tho Consequences for Food Security, D.E. Sahn, ed., pp. 118- 136. Baltimore: Johns Hopkins University Press.
Reardon, T. and Matlon, P. 1988. Coping with household-level food insecurity in drought-affected areas of Burkina Faso. World Development 16(9): 1065- 1074.
Reed, J.D. 1987. Improving livestock productivity by strengthening crop/livestock interactions in smallholder farming systems in Africa. In The Exploitation of Animals in Africa, Colloquium Proceedings, J.C. Stone, ed., pp. 71 -84. Aberdeen: Aberdeen Univsrsity African Studies Group.
Reining, P. 1978. Handbook on Desertification Indicators. Washington: American Association for the Advancement of Science..
Rempel, H. 198 1. Rural-Urban Labor Migration and Urban Unemployment in Kanya. RR-81-24. Laxenburg: International Institute for Applied Systems Analysis.
Rempel, H. and Lobdell, R.A. 1985. A Model of Labour Allocation Decirion-Making in Peasant-Typo Households. Nairobi: Institute for Development Studies, University of Nairobi. . _
Reutlinger, S. 1987. Urban Malnutrition and Food Interventions. Washington: World Bank. /'
Reutlinger, S. and Katona-Apte, J. 1987. The nutritional impact of food aid: criteria for the selection of cost-effective foods. In Food Policy: Integrating Supply, Distribution, and Consumption, J.P. Gittinger, J. Leslie and C. Hoisington, eds., pp. 234-245. Baltimore: Johns Hopkins.
Reynolds, D.R. 1982. The Household Divided: Cornpotition for Cash Between Husbands and Wives in West Pokot, Kenya. Pupor presented ut tho Amorican An~thropological Association 8lst Annual Mooting, Decernbor 3-7. Washington, DC: Americcmn Anthropological Association.
Richards, A. 1939. Land, Labour and Diet in Northern Rhodesia. 1,ondon: Oxford University Press.
Richards, A. 1932. Hunger and Work in a Savage Tr,ibe. London: Routledge.
Richards, P. 1986. Coping with Hunger: Hazard and Experiment i n an African Rice-Farming System. Boston: Allen & Unwin.
Richards, P. 1987. The politics of famine: some recent literature. African Affairs 86(342-345): 111-116.
Richards, P. 1985. Indigenous Agricultural Revolution: Ecology and Food Production in West Africa. Boulder, CO: Westview.
Richards, P. 1983. Ecological change and the politics of African land use. African Studies Review 26(2).
Riebsame, W.E. 1989. Complex River Basin Managem:ent in a Changing Glolal Climate: A Sensitivity Analysis of Selected Rivers. Boulder: Natural Hazards Research and Applications Information Center, University of Colorado.
Riebsame, W.E. 1988. Assessing the Social Implications of Climate Flcrctuations. Nairobi: U.N. Environment Programme.
Riesman, P. 1984. The Fulani in a development context: the relevance of cultural traditions for coping with change and crisis. In Life Before the Drought, Scott, ed., pp. 171-191. Boston: Allen and Unwin.
Rivers, J.P. W. 1988. The nutritional biology of famine. In Famine, G.A. Harrison, ed., pp. 57- 106. Oxford: Oxford University Press.
Robertson, A.F. 1987. The Dynamics of Productive Relationships: African Share Contracts in Comparative Perspective. Cambridge: Cambridge University Press.
Robertson, A.F. 1984. People and the State: An Anthropology of Planned Development. Cambridge: Cambridge University Press.
Robinson, P.W. 1989. Reconstructing Gabbra history and chronology: time reckoning, tF- Gabbra calendar, and the cyclical view of life. In Coping with Drought in Kdnya: Natic;.. and Local St.rategies, T.E. Downing, K.W. Gitu and C.M. Kamau, eds., pp. 151- 168. bueider: Lynne Rienner.
Robinson, P.W. 1985. Gabbra Nomadic Pastoraiistfi in Nineteenth and Twentieth Century Northern Kenya: Strategiei for Survival in a Marginal Environment. Ph.D. Dissertation. Evanston, IL: Northwestern University.
/' Robson, J.R. K., ed. 1981. Famine: I ts Causes, Effects and Management. New York: Gordon and
Breach.
Rodgors, W.A. and Homewood, K.M. 1986. Cattle dynatnics in a paatorolist community in Ngorongoro, Tanzrrnia, during the 1982-3 drouglrt. Agricultural Systems 22( 1): 33-5 1.
Rodlie, H. and Virji, H. 1976. Trends and periodicities of East African rainfall data. Monthly Weather Review 104: 307-3 15.
Rogers, J.B., van der Geest, W. and Greener, R. 1788. The ODNRI/FSU Ceroal Market Model: A Diagrammatic Presentation. RBI 5. Oxford: Food Studies Group. (Manuscript).
Rohrbach, D.D. 1987. The Growth of Smallholder Maize Production Jn Zimbabwe, 1979- 1985: Implications for Food Security. Paper presented at the University of Zimbabwe's Third Annual Conference on Food Security in Sautliern Africa, 1-5 November 1987. Harare: University of Zimbabwe.
Ropelewski, C.F. and Ha!pert, M.S. 1986. Global and regional-scale precipitation patterns associated with the El Nino/Southern Oscillation (ENSO). Monthly Weather Review 114: 2352-2362.
Rukandema, M., Mavua, J.K. and Audi, P.O. 1981. .?#port on Survey Results from Mwala Location (Machukos). Katumani, Kenya: National Dryland Farming Research Station,
Rukandema, M., Muhammed, L. and Jeza, A. 1983. The Farming Systems of Semi-Arid Lower Embu, Eastern Kenya. Dryland Farming and Development Project. Katumani, Kenya: National Dryland Farming Research Station.
Rukuni, M. and Eicher, C.K. 1987. The Food Security Equation in Southern Africa. Reprint No. 5. East Lansing, MI: Department of Agricultural Economics, Michigan State University.
Rundquist, F.M. 1984. Hybrid Maize D',ffusion in Kenya: Policies, Diffusion Patterns, and Consequences; Case Studies from Central and Scuth Nyanza Provinces. Lund: Nedderanden fran Lunds Universitets Geografiska.
Rupesinghe, K. 1987. The quest for a disaster early warning system: giving a voice to the vulnerable. Bulletin of Peace Proposals 18(2): 2 17-227.
Rutherford, G.W. and Mahanjane, A.E. 1985. Morbidity and mortality in the Mozambican famine of 1983: prevalence of malnutrition and causes and rates of death and illness among dislocated persons in Gaza and Inhambane Provinces. Journal of Tropical Pediatrics 31: 143-149.
Ruttan, V.W. 1984. Induced innovations and agricultural development. In Agricultural Sustainability in a Changing World Order, G.K. Douglas, ed. Boulder, CO: Westview.
Rwegasira, D.G. 1987. Balance-of-pay men!^ adjustment in low-income developing countries: the experiences of Kenya and Tanzania in the 1970s. World Development 15(10-11): ,
1321-1335.
Sahli, Z. 198 1. The phenomenon of marginalisation in underdeveloped rural communities. Third World Quarterlj .3(3): 489-498.
Sahn, D.E. 1989a. Reconsidering #e Links Between Food Security an J Macroeconomic Adjustment in Africa. Paper prepared for the conference on "Food Insesuiity in Africaw, Swarthmore College, October 18-20. Swarthmore: Swarthmore College.
Sahn, D.E., ed. 1989b. Seasonal Variability in Third World Agriculture: The Consequences for Food Security. Baltimore: Johns Hopkins University Press.
Sahn, D.E., Lockwood, R. and Scrimshaw, N.S., ads. 1984. Methods f i r the Evaluation of tho Impact of Food and Nutrition Programmes. Tokyo: United Nations University.
Saiko, T.A. 1986. Drought in the Sudano-Sahelian zone [Russian]. Problemy Osvoeniya Pustyn' - - Akademiya Nauk Turkmenskoi SSR 1: 26-35.
Sandford, S. 1979. Towards a definition of drought. In Symposium on Drought in Botswana, M.T. Hinchey, ed., pp. 33-40. Gabarone: Botswana Society.
Sands, D.M. 1986. Farming systems research: clarification of terms and concepts. Explanation in Agriculture 22: 87- 104.
Sarma, J.S. 1983. Contingency Planning for Famines and Other Acute Food Shortages: A Brief Review. Washington: International Food Policy Research Institutie.
Saul, M. 1987. The organization of a West African grain Market. American Anthropologist 89: 74-95.
Saul, M. 1986. Development of the grain market and merchants in Burkina Faso. Journal of Modern African Studies 24(1): 127- 153.
Savane, M.A. 1986. The effects of social and economic changes on the role and status of women in sub-Saharan Africa. In Understanding Africa's Rural Households and Farming Systems, J.L. Moock, ed., pp. 124- 132. Boulder: Westview.
Scandizzo, P.L. and Tsakok, I. 1985. Food price policies and nutrition in developing countries. In Nutrition and Development, M. Biswas and P. Pinstrup-Andersen, eds., pp. 60-76. Oxford: Oxford University Press.
Schliephake, K. 1987. Irrigation and food production: experience from North Africa and application to East Africa. Applied Geography and Development 30: 30-45.
Schmidt, G. 1979a. Effectiveness of maize marketing controls in Kenya. In Price and Marketing in Kenya, Occasional Publication No. 32, J.T. Mukui, ed., pp. 158-180. Nairobi: Institute of Development Studies, University of Nairobi.
Schmidt, G. 1979b. Maize and Beans in Kenya: The Interaction and Effectiveness of the l n formal and Formal Marketing S y s t ~ * s. Occasional Paper No. 31. Nairobi: Institute for Development Studies.
Schmied, D. 1989. Subsistence Cultivation, Market Production and Agricultural Development in Ruvuma Region, Southern Tanzania. Bayreuth African Studies. Bayreuth: Bayreuth
'
University.
Schoepf, B.G. and Schgepf, C. 1987. Food crisis and agrarian change in the eastern highlands of Zaire. Urban Anthropology 16(1): 5-37.
School of Public Health, UniversH of California and College of Health Sciences, University of Nairobi. 1987. The Collaborative Research Support Program on Food Intake and Human Function Kenya Project, Final Report. Los Angeles, CA: School of Public Health, University of California.
Schroeder, R.A. 1987. Oender Vulnerability to Drought: A Gas. Study of the Hausa Social Environment. Natural Hazard R~search Working Paper No, 58. Boulder: Institue of Behavioral Scionce, University of Colorado.
Scobie. 1989. Macro-economic Adjustment and the Poor: Toward a Research Strategy. FNPP Monograph 89- 1. Washington: Cornell Nutritional Surveillance Program.
Scott, E.P., ed. 1984. Life Before the Drought. Boston: Allen and Unwin.
Scott, M.F. 1987. The role on non-governmental organizations in famine relief and prevention. In Drought and Hunger in Africa: Denying Famine a Future, M.H. Glantz, ed., pp. 349-366. Cambridge: Cambridge University Press.
Scrimshaw, N.S. and Young, V.R. 1989. Adaptation to low protein and energ,y it~takes. Human Organization 48(1): 20-30.
Scrimshaw, S.C.M. and Hurtado, E. 1 987. Rapid Assessment Procedures for Nutrition and Primary Health Care: Anthropological Approaches to Improving Programme Effectiveness. Tokyo: U.N. University, UNICEF, and UCLA Latin American Center.
Seaman, J. and Holt, J. 1980. Markets and famines in the third world. Disasters 4(3): 283-297.
Seavoy, R.E. 1989. Famine in East Africa: Food Production and Food Policies. Westford: Greenwood Press.
Seckler, D. 1982. Small but heallthy? Some basic problems in the concept of malnutrition. In Newer Concepts in Nutrition and Their Implications Jor Policy, P.V. Sukhatme, ed., pp. 139- 148. Pune, India: Maharashtra Association for the Cultivation of Science.
Seckler, D. 1980. Malnutrition: an intellectual odyssey, Western Journal of Agricultural Economics 5: 219-227.
Seeley, J.A. 1986. Famine in Sub-Sahai an Africa: A Select Bibliography (Excluding the Sahsl) from 1978. Cambridge African Occasional Paper 3. Cambridge: African Studies Centre, University of Cambridge.
Seifert, W.W. and Kamrany, N.M. 1974. A Framework for Evaluating Long-Term Strategies for the Development of the Sahel-Sudan Region: Volume I, Summary Report: Project Objectives, Methodologies, and Major Findings. Cambridge, MA: MIT Center for Policy Alternatives.
Sen, A. 1987. Africa and India: What Do We Have to Learn from Each Other?. Working Paper 19. Helsinki: World Institute for Development Economics.
Sen, A. 1986. The causes of famine: a reply. Food Policy. (May): 125- 132.
Sen, A. 1984. Resources, Values and Development. Oxford: Basil Blackwell.
Sen, A. 1981. Poverty i n d Famine: An Essay on Entitlement and Deprivation. Oxford: Oxford University Press.
/ Sen, A. 1977. Starvation and exchange entitlements: a general approach and its application to the
great Bengal famine. Canabridge Journal of Economics 1.
Shah, M.M. und Fischer, G. 198 1. Assessmrnt of Food Productlon Potential: Resources, Technology and Environment--A Case Study of Kenya. Laxenburg, Austria: Internatior~ul Institute for Appliacl Systoms Analysis.
Shah, M.M., Higgins, G.M., Kassam, A.H. ancl Fischer, 0. 1985. Land Resources and Productivity Potentio! - Agro-ecological Mothodology for Agricultural Development Planning. Laxenburg, Austria: International Institute for Applied Systems Analysis.
Shaner, W.W., Philipps, P.F. and Schmehl, W.R. 1982. Farming Systems Research and Development: A Guidefino for Developing Countries. Boulder, CO: Westviow.
Sheldon, E.B. and Parka, R. 1975. Social indicator. Science 188: 693-699.
Shelley, K. 1985. Medicines for Misfortune: Diagnosis and Health Care Among Southern Turkana Pastoralists of Kenya. Ph.D. Dissertation. Chapel Hill, NC: University of North Carolina.
Sherman, J. 1984. Brain Markets and the Marketing Behavior of Farmers: A Case Study of Manga, Upper Volta. Ph.D. Dissertation. Ann Arbor: University of Michigan.
Shindo, E. 1985. Hunger and weapons: the entropy of militarisation. Review of African Political Economy 33: 6-23.
Shipton, P.M. 1989a. African Famines and Food Security: Anthropological Perspectives. Draft Bibliography. Cambridge, MA: Harvard Institute for International Development and Department of Anthropology.
Sliipton, P.M. 1989b. ','he Rope and the Box: Gambian Saving Strategies and What They Imply for International Aid in the Sahel. Discussion Paper. Washington: Agricultural and Rural Development Department, World Bank.
Shoham, J. 1987. Does nutritional surveillance have a role to play in early warning of food crisis and in the management of relief operations? Disasters 1 l(4): 282-285.
Shoham, J. and Clay, E. 1989. The role of socio-economic data in food needs assessment and monitoring. Disasters 13(1): 44-60.
Shuttleworth, G., Bull, R. and Hodgkinson, P. 1988. Food security through seasonal stabilization: the case of Madagascar. Food Policy 13(2): 140-153.
Siegel, S., Gutman, H., Romashko, T. and Connick, L. 1986. An ,Analysis of the U.S. Response to the African Famine in r984-1986: Recommendations for the Future. Washington: Development Associates, Inc.
Silverfein, M. 1989. Rural Change in Machakos, Kenya: A Historical Geography Perspective. Lanham: Freedom House.
Silverman, A. 1985. Kenya Emergency Programme 1984/5: Reflections. Nairobi: UNICEF. (Manuscript).
.-
Sinclair, A.R. E. and Fryxell, J.M. 1985. The Sahel of Africa. ecology of a disaster. Canadian Journal of Zoology 63: 987994.
Sindiga, I. 1987. Fertility control and population growth among the Maasai (Kenya). Human Ecology 1 S(1): 53-66.
Singer, 1.1.. Wood, J, and Jenningr, T. 1987. Food Aid: Tho Challmge and the Opportunity. Oxford: Clarendon Prear,
Singh, a. 1988, History of aridland vegetation and climate: a global petspectiva. Uiological Revlows--Cambridge Philosophical Society 63(2): 159- 195.
Singh, I., Squiro, L. and Strnusa, J., eds. 1986. Agricultural Household Models: Extensions, Applications and Policy. Bal timore: Johns Hopkins.
Singh, R.D. 1988. Economics of the Family and Farming Systems in Sub-Saharan Africa: Development Perspectives. Boulder: Westview.
Sivakumar, M.V. K. 1988. Predicting rainy season potential from the onset of rains in southern Sahelian and Sudaniatl climatic zones of West Africa. Agricultural and Forest Meteorology 42(4): 295-305.
Skaf, R. 1988. A story of a disaster: why locust plagues are still possible. Disasters 12(2): 122-127.
Sloof, PA. and Schulpen, T.W. J. 1978. Machakos project sutdies VI: The social and hygienic environment. Tropical and Geographical Medicine 30: 257-274.
Slovic, P., Fischhoff, B. and Lichtenstein, S. 1985. Characterizing perceived risk. In Perilous Progress: Managing the Hazards of Technology, R.W. Kates, C. Hohenemser and J.X. Kasperson, eds., pp. 91-125. Boulder: Westview.
Smith, J., Wallerstein, I. and Evers, H.-D., eds. 1984. Households and the World-Economy. Beverly Hills: Sage.
Sobhan, R. 1579. Politics of food and famine in Bangladesh. Economic and Political Weekly(December 1st).
Soja, E.W. 1968. The Geography of Modernization in Kenya: A Spatial Analysis of Social, Political and Economic Change. Syracuse, NY: Syracuse University Press.
Sombroek, W.G., Braun, H.M. H. and van der Bauw, B.J. A. 1982. Exploratory Soil Map and Agroclimatic Zone Map of Kenya. Nairobi: Kenya Soil Survey.
Sonka, S.T. 1987. Adaptation and adjustments in drought-prone areas: research directions. In Planning for Drought: Toward a Reduction of Societal Vulnerability, D.A. Wilhite, W.E. Easterling and D.A. Wood, eds., pp. 351-368. Boulder: Westview Press.
Sperling, L. 1989. Food acquisition by the Samburu during the drought of 1983-1984. In Coping with Drought in Kenya: National and Local Strategies, T.E. Downing, K.W. Gitu and C.M. Kamau, eds., pp. 264-279. Boulder: Lynne Rienner Publishers.
Sperling, L. 1987a. The adoptiot~ of camels by Samburu cattle herders. Nomadic Peoples 22.
Sperling, L. 1987b. Thf Labor Organization of Samburu Pastoralism. Ph.D. Dissertation. Montreal: McGilf University.
Sperling, L. 1987c. Wage employplent among Samburu pastoralists of northcentral Kenya. Research in Economic Antliropology 9.
Spitz, P. 1981. Economic Consequences of Food/Climate Variability. Geneva: UNRISD.
Spi tz, P, 1980. Drought and Self- Provisioning, Geneva: UNRISD.
Spita, P. 1978. Silent violsrrcu: fntnine and itrecluality. International Social Scienoes Journal XXX(4).
Splettstoesser, D. 1987. Model of a Computer-Based Food Monitoring and Control System for Developing Countries. Development Discussion Paper, 246. tiarvard: Hurvard Institute for lnternationul Developriiant, Harvurd University,
Sprigg, W.A., ed. 1985. African Drought: Monitoring and Prrdiction. A Report of a Workshop. Boulder: University Corporation for Atmospheric Research.
Staudt, K. 1985. Agricultural Policy /mp/emenhtion: A Case Study from Western Kenya. The Bopulatiol~ Council Series on Women's Roles and Gender Differences in Development. West Hartford, CT: Kumeriarl Press.
Stelfox, J.G., Kufwafwa, J.W. and Ottichillo, W.K. 1981. Distribution and Population Trends of Elephants and Rhinoceros in Kenya, 1977-1980. Report No. 43. Nairobi: Kenya Rangeland Ecology Monitoring Unit.
Stelfox, J.G. and Ngatia, M. 1979. Grevy's Zebra Survey in Northern Central Kenya. Report No. 13. Nairobi: Kenya Rangeland Ecology monitoring Unit.
Stephenson, L.S., Latham, M.C. and Jansen, A. 1983. A Comparison of Growth Standards: Similarities between NCHS, Harvard, Denver and Privileged African Children and Differences with Kenyan Rural Childfen. Cornell International Nutrition Monograph Series No. 12. Ithaca, NY: Cornell University.
Stephens, T.W. 1986. Af!er the famine: food aid policy and management issues in sub-Saharan Africa. Food Policy 1 l(3): 193- 196.
Stewart, J.I. and Faught, W.A. 1984. Responsc farming of maize and beans at Katumani. East African Agriculture1 and Forestry Journal 44: 29-5 1.
Stewart, J.I. and Hash, T.C. 1982. Impact of weather analysis on agricultural production and planning decisions for semi-arid areas of Kenya. Journal of Applied Meteorology 27: 447-494.
Stewart, J.I. and Hash, T.C. 198 1. Impact of Weather Analysis on Agricultural Production and Planning Decisions for the Semiarid Areas of Kenya. Nairobi: Kenya Agriculturd Research Institute.
Stewart, P.J. 1988. The ecology of famine. In Famine, G.A. Harrison, ed., pp. 139-162. Oxford: Oxford University Press.
Stiles, D.N. 1983. Camel pastoralism and desertification in northern Kenya. Desertification Control 8: 2-8.
Sukkary-Stolba, S. 1989.-~ndi~enous institutions and adaptation to famine: the case of the western Sudan. In African Food Systems in Crisis: Microperspectives, R. Huss-Ashmore and S.H. Katz, eds., pp. 281 -293. ww York: Gordon and Breach.
Survey of Kenya. 1970. National Atlas of Kenya. Nairobi: Survey of Kenya.
Sutter, I. W. 1982. Colt~ti~ercit~l strategicla, <lrought, arid rnonetary pressure: Wa'tlau'be tlornads of 'ranout Arrondis~e~nent , Niger, Nomadic Peoples 1 1: 26-60,
Suzuki, Y , and Dornard, A, 19H7. Ef fects of Panterritorial Pricing Policy for Maizl it1 Tanzania. Wnshington: lnterriatiori~l Food Policy Kesoarcli Institute.
Svedbarg, P. 1985. The Economics of Food jnsocurity in Developing Countries, Stockholrl~: Inrtitute for lr~ternatiotial Econoniic Studies, University of Stockholm.
Swamay, A.V. and Shears, P. 1987. Agricultural rehabilitation during and after drougl~t it) Orisau, emtern Inclia, 1974- 1980. Disastrrs 1 l(1): 49-52.
Swaminathan, MS. 198G, Sustainable Nutrition Security for Africa: Lessons from India. The Hunger Project Papers, Nuniber 5. Srrn Francisco: The Hunger Project.
Swift, J. 1989a. Planning against drought and famine in Turkana: a district contingency plan. In Coping with Drought in Kenya: National and L c m l Strategies, T,E. Downing, K.W. Gitu and C.M. Kamau, eds., pp. 306-328. Boulder: Lynne Rienner.
Swift, .I. 1989b. Why are rural people vulnerable to famind? IDS Bulletin 20(2): 8-15.
Swift, J. 1985. Planning against Drought and Famine in Turkana, Northern Kenya. Sussex: Institute for Development Studies. (Manuscript).
Taal, H. 1989. How farmers cope with risk and stress in rural Gambia. IDS Bulletin 20(2): 16-24.
Talbot, L.M. 1986. Demographic factors in resource depletion and environmental degradation in East Afr-ican rangelands. Populaiion and Development Review 12(3): 44 1-45 1.
Tanaka, M. 1988. Recent climatic change and increased aridity in the tropical regions. Geographical Review of Japan, Series A 6 l(2): 104- 1 12.
Tanner, C. 1987. Malnutrition and the development of rural households in the Agreste of Paraiba State, North-east Brazil. Journal of Development Studies 23(2): 242-264.
Taylor, A.E. 1947. Famine. Stanford: Stanford University Food Research Institute. (Manuscript).
Thomas, B. 198 1. Local Organization, Politics and Participation in Rur-a1 Development: A Study of Harambee Self-help in Kenya. Ph.D. Dissertation. Brandeis University.
Thomas-Slayter, B. and Ford, R.A. '989. Resources management, food production, and local institutions in rural Kenya: a ~ o c u s on village-based development. In The Tragedy of Famine: Recent Experience, Lessons Learned, J.O. Field, ed. Medford: Tufts University. (Forthcoming).
Tiercelin, J.-J., et a1. 1987. (The Baringo-Bogoria half-graben, Gregory Rift, Kenya. 30 000 years of hydrological and sedimentary history) [French]. Bulletin--Centres de Recherche Exploration-Pr?duc:i'on Elf -Aquitaine 1 l(2): 249-540.
.-
Timberlake, L. 1985. Africa in Crisis: The Causes, the Cures o f Environmental Bankruptcy. Washington: Internationa1,histitute for Environment and Dcvelopment.
Timmer, C.P. 1989. Food price policy--the rationale for government intervention. Food Policy 14(1): 17-27.
Titnrner, C Y . , Pnlccln, W.P. naltl Penrson, S,R, 1983, Food Policy Analysir, Daltitnore: Jollns llopkiae.
Tirtltrrertr an, P. 198 1 . Vulnerability, Nerilience and the Collapse of Society, tlnvironnrental rAonogrlaph Na, I . Toronto: Institute for Et~virontnentcll Stc~dies, University of Toronto.
'I'oberr, N. 1985. The effect of clrougllt nrrrotlg (lie Z~ghawa in northern Darfur. Disasters 9(3): 2 13-223.
T ~ r r ; ~ , W.I. 1989. Famitre Monitoring and Response; The Sudan Red Crescent Society's Program it1 Darfur. Medford, MA: Tufta University.
Tarry, W,I. 1988. Famine aarly warning systems: the need for an anthropological dimension. Human Organization 47(3): 273-28 1.
Torry, W.I. 1987. Evolution of food rationing systenls with reference to African group farms in tha context of drought. In Drought and Hunger in Africa: Denying Famine a Future, M.H. Glantz, ed., pp. 323-348. Cambridge: Cambridge University Press.
Torry, W.I. 1984. Social science research on famine: a critical evaluation. Human Ecology 12(3): 227-252.
Tarry, W.I. 1979. Anthropological studies in hazardous environments: past trends and new horizons. Current Anthropology 20(3): 51 7-538.
Tshibaka, T.B. 1986. The Eff8cts of Trade and Exchange Rate Policies on Agric.ulture i n Zaire. Research Report 56. Washington: International Food Policy Research Institute.
Tuinenburg, K. 1987. Experience with foot! strategies in four African countries. In Food Policy: Integrating Supply, Distributiorr, and Consumption, J.P. Gittinger, J. Leslie and C. Hoisington, eds., pp. 497-508. Baltimore: Johns Hopkins.
Turner, B.A. 1979. The social aetiology of disasters. Disasters 3(1): 54-59.
Turner, B.A. 1978. Man- Made Disasters. London: Wykeham.
Turner 11, B.L. and Brush, S.B., eds. 1987. Compara#ve Farming Systems. New Ycirk: Guilford.
Tuttan, D. 1988. Looking for a cool place: the Mursi, 1890s to 1980s. In The Ecology of Survival: Case Studies from Northeast African History, D.H. Johnson and D.M. Anderson, eds., pp. 26 1-282. Boulder, CO: Westview.
Turton, D. 1985. Mursi response to drought: some lessons for reliof and rehabilitation. African Affairs: 331 -346.
Twinni~~g, K. 1984. Food for the Future (Soil Conservation in Tigray). 0-ford: Oxfam.
Twose, N. 1984. Behind the Weather: Why the Poor Suffer Most, Drought and the Sahel. Oxford: Oxfam.
U.S. Agency for International Dey6lopment. 1988. Famine Early Warning System (FEWS) Project Paper. Washington: USAID.
U.S. Agency for International Development. 1987. Situation and Outlook Report for Maize and Wheat as of January 20, 1987. Nairobi: USAID/Kenya. (Manuscript).
U.S. Agency for International Development. 1985. Situation and Outlook Report for Maize and Wheat as of September 20, 1985. Nairobi: USAID/l<enya/Agricultural Economics. (Manuscript).
U.S. Agency for International Development. 1982. Agrometeorology: USAID/KARI Dryland Cropping Systems Research Project. Record of Research - 1982. Nairobi: USAID.
U.S. Agency for International Development. 1980. Foreign Disaster Assistance, Kenya Famine May, 1980. OFDA Disaster Case Reports. Washington, DC: USAID/Office of Foreign Disaster Assistance.
U.S. Department of Agriculture (USDA). 1981. Food Problems and Prospects in Sub-Saharan Africa: The Decade of the 1980s. Washington: USDlA.
U.S. Department of Agriculture/Economic Research Service (USDA/ERS). 1988. World Food Needs and Availabilities, 1968. Washington: USDAi'ERS.
UNICEF, Accra. 1989. Adjustment policies and programmes to protect children and other vulnerable groups in Ghana. In Adjustment with a ,Human Face, Volume II: Country Case Studies, G.A. Cornia, R. Jolly and F. Stewart, eds., pp. 93-125. Oxford: Clarendon Press.
UNICEF, Manila. 1989. Redirecting adjustment programmes towards growth and the protection of the poor: the Philippine case. In Adjustment witt~ u Human Face, Volume II: Country Case Studies, G.A. Cornia, R.. Jolly and F. Stewart, eds., pp. 184-217. Oxford: Clarendon Press.
United Nations Disaster Relief Co-ordinator. 1986. Disaster Prevention and Mitigation: A Compendium of Current Knowledge. Volume 12: Social and Sociological Aspects. Geneva: United Nations Disaster Releif Office (UNDRO) and United Nations Environment Programme (UNEP).
United Nations. '1986. How to Weigh and Measure Children: Assessi.:g Nutritional Status of Young Children in Household Surveys. New York: U.N. Department of Technical Co-operation for Development and Statistical Office.
Valdes, A,, ed. 1981. Food Security for Developing Countrien. Boulder, CO: Westview.
van Apeldoorn, G.J. 1981. Perspectives on Drought and Famine in Nigeria. London: George Allen and Unwin.
van den Boogaard, R. 1986. Arutritional Status of under Five Children in Turkana District. Report of a survey for the Turkana Rehabilitation Project/?'urkana Development Support Unit. Nairobi: Ministry of Energy and Regional Development.
Van Ginneken, J.K. 1980. Machakos project studies XVIII: Fertility, mortality and migration in 1975- 1978. Tropical and Geographical Medicine. 32: 174- 188.
Van Steenbergen, W.M.,'Xusin, J.A. and Onchere, S.R. 1978. Machakos project studies VIII: Food resources and eating habits of the Akamba household. Tropical and Geographical Medicine 30: 393-41 3. /
Van Zinderen Bakker, E.M. and Mercer, J.H. 1986. Major late Cainozoic climatic events and palaeoenvironmental changes in Africa viewed in a world wide context. Palaeogeography, Palaeoclimatofogy, Palaeoecology 56(3-4): 2 17-235.
Vandermoortele, J. 1983. The Public Sector and the Basic Needs Strategy in Kenya: The Experience of the '70s. World Employment Program Research. Geneva: International Labour Office.
Vaughan, M. 1987. The Story of an African Famine. Cambridge: Cambridge University Press.
Vaughan, M. 1985. Famine analysis and family relations: 1949 in Nyasaland. Past and Present 108: 177-205.
Vaughan, M. 1983. Food production and income generation in a matrilineal society: rural women in Zomba, Malawi. Journal of Southern African Studies lO(1): 86-99.
Verma, V., Marchant, T. and Scott, C. 1988. Evaluation of Crop Cut Methods and Farmer Reports for Estimating Crop Production: Results of a Methodological Study in Five African Countries. London: Longacre Agricultural Development Centre, Ltd. (Manuscript).
Vermeer, D.E. 1981. Collision of climate, cattle and culture in Mauritania during the 1970s. Geographical Review 7 l(3): 28 1-297.
Victora, C.G., Vaughan, J.P., Kirkwood, B., Martines, J.C. and Barcelos, L.B. 1986. Child malnutrition and land ownership in southern Brazil. Ecology of Food and Nutrition 18: 265-275.
Vierich, H. 1986. Agricultural production, social status, and intra-compound relationships. In Understanding Africcr's Rural Households and Farming Systems, J.L. Moock, ed., pp. 155- 165. Boulder: Westview.
Viuncens, A., Casanova, J. and Tiercelin, J.J. 1986. Palaeolimnology of Lake Bogoria (Kenya) during the 4500 BP high lacustrine phase. ;in Sedimentation in the African Rifts, Geological Society Special Publication 25? L.E. Frostick, et al., eds., pp. 323-330. New York: Blackwell Scientific.
von Braun, J. 1988. Effects of technological change in agriculture on food consumption and nutrition: rice in a West African setting. World Development 16(9): 1083- 1098.
von Braun, J. and Kennedy, E. 1986. Commercialization of Subsistence Agriculture: Income and Nutritional Effects in Developing Countries. Working Papers on Commercialization of Agriculture and Nutrition, Number I . Washington: International Food Policy Research Institute.
von Braun, J. and Teklu, T. 1989. Households' Responses to Severe Food Shortages--Expriences from Rwanda, The Gambia and Western Sudan. Paper presented at the workshop on Famine and Famine Policy, Tufts University, September 7-10. Washington: International
' Food Policy Research Institute.
Wafula, B.M. and Keating, B.A. 1988. Evaluation of the CERES-Maize Simulation Model for a Short-Season Maize Cultivar in Semi-Arid Eastern Kenya. For submission to Field Crops Research. Nairhbi: ACIAR/CSIRO Dryland Project. (Manuscript).
Wafula, B.M. and Keating, B.A. L986. Use of Crop Growth Models to Analyse and Better Manage the Climatic Risks of Maize Production in Semi-Arid Kenya. Katumani, Kenya: ACIAR. 3SIRO Dryland Project, Katumani National Dryland Farming Research Station. (Manuscript).
Waghela, S., Ndarathi, C.M., Okello, O.J. A,, Semenye, P.P. and Rugema, E. 1983. Animal Health Component Report on Phase I--Extensive Studies. Nairobi: Veterinary Research J,aboratory and International Livestock Centre for Africa. (Manuscript).
Walker, B.H., Emslie, R.H., Owen-Smith, R.N. and Scholes, R.J. 1987. To cull or not to cull: lessons from a southern African drought. Journal of Applied Ecology 24(2): 381-401.
Walker, P.J.C. 1989. Famine Early Warning Systems: Victims and Destitution. London: Earthscan.
Walker, P.J.C. 1988. Famine and Rapid Onset Disaster Warning Systems. A Report by the International Institute for Environment and Development (IIED) for the Red Cross. Addis Ababa and London: IIED.
Waller, R.D. 1985. Ecology, migration and expansion in East Africa. African Affairs 84: 347-370.
Wallerstein, M. 1980. Food for War, Food for Peace. Cambridge, MA: Massachusetts Institute of Technology.
Wallis, M. and Van Waning, E.E. 1976. Report on a Socio-Economic Survey in Two Rural Areas of Machakos District, Kenya, Part 11. Utrecht: Utrecht University.
Wandel, M. 1989. Household food consumption and seasonal variations in food availability in Sri Lanka. Ecology of Food and Nutrition 22: 169- 182.
Wasonga, L.M. 1985. Kenya Nutrition and Economic Development--Policies and Strategies. Paper presented in the Seminar on Nutrition in Agriculture and Rural Development. Nairobi: Kenya Food and Nutrition Planning Unit. (Manuscript).
Watt, B.K. and Merrill, A.L. 1975. Composition of Foods. Handbook No. 8. Washington, DC: U.S. Department of Agriculture.
Watts, M.J. 1987. Drought, environment and food security: food and famine in a Sudano-Sahelian region in historical perspective. In Drought and Hunger in Africa: Denying Famine a Future, M.H. Glantz, ed., pp. 171 -212. Cambridge: Cambridge University Press.
Watts, M.J. 1983a. The political economy of climatic hazards: a village perspective on drought and peasant economy in a semi-arid region of West Africa. Cahiers dlEtudes Africaines 89-9O(XXIII/l-2): 37-72.
Watts, M.J. 1983b. Silent Violence: Food, Famine and Peasantry in Northern Nigeria. Berkeley: University of California Press.
Webb, P. and von Braun, J. 1989. Drought, Food Shortages, and Famine in Ethiopia: A Preliminary Review of Effects and Policy Interventions. Washington: International Food Policy Research Institute.
Weber, M.T., Staatz, J.M., Holtzman, J.S., Crawford, E.W. and Bernsten, R.H. 1988. Informing food security decisions in Africa--empirical analysis and policy dialog. American Journal of Agricultural 'Kconomics 70(5): 1044- 1052.
Werner, L.H. 1986. Growth Monitpring Programme: Final Report. Nairobi: United Nations International Children's Emergency Fund (UNICEF). (Manuscript).
Western, D. and Finch, V. 1986. Cattle and pastoralism: survival and production in arid land. Human Ecology 14(1): 77-94.
White, C. 1984. Herd Reconstitution: The Role of Credit among Wodaabe Herders in Central Ilrizer. Putoral Development Network Paper 18d. London: Overseas Deve.bpmen0 Instirute.
White, C.C., Houston, J.F. T. and Barker, R.D.]. 1988. The Victoria Province Drought Relief Project. I. Geophysical siting of boraholc?s (Zimbabwe). Ground Water 26(3): 309-316.
Wienpahl, J. 1985. Turkana herds under environmental stress. Nomadic 2eoples 27: 59-87.
Wienpahl, J. 1984. Livestock Production attd Social Organization aiiiong the Turkana. Ph. D. Dissertation. Phoenix: University of Arizona.
Wienpahl, J. 1984. Women's roles in livestock production among the Turkana of Kenya. Research in Economic Anthropology 6: 193-2 15.
White, D.A. 1989. Planning for Drought: A Process for State Government in the United States. A discussion paper prepared for the Drought Preparedness Training Seminar, Gabarone, Botswana, 25-29 September. Lincoln, NE: International Drought Information Center, Department of Agricultural Meteorology, University of Nebraska.
Wilhite, D.A., Easterling, W.E. and Wood, D.A., eds. 1987. Planning for Drought: Toward a Reduction of Societal Vulnerability. Boulder: Westview Press.
Wilhite, U.A. and Glantz, M.H. 1985. Understanding the drought phenomenon: the role of definitions. Water International 10: 1 1 1 - 120.
Williams, K. 1987. A framework for timely warning systems in endemic drought and famine situations. Eurostat News Special Edition: 196- 198.
Wilson, F. and Ramphele, M. 1989. Uprooting Poverty: The South African Challenge. New York: W.W. Norton.
Winer, N. 1989. Agriculture and food security in Ethiopia. Disasters 13(1): 1-8.
Wisner, B.G. 1980. Nutritional consequences of the articulation of capitalist and non-capitalist modes of production in Eastern Kenya. Rural A fricana 8-9: 99- 132.
Wisner, B.G. 1977. The Human Ecology of Drought in Eastern Kenya. Ph.D. Dissertation. Worcester, MA: Clark University.
Wisner, B.G. and Mbithi, P.M. 1974. Drought in eastern Kenya: nutritional status and farmer activity. In Natural Hazards: Local, National, Global, G.F. White, ed., pp. 87-94. New York: Oxford University Press.
Wolde Mariam, M. 1984. Rural Vulnerability to Famine in Ethiopia: 1958-1977. New Dehli: Vikas Publishing House.
Wong, D. 1984. The limi'ls of using the household as a unit of analysis. In Households and the World-Economy, J . Smith, I.' Wallerstein and H.-D. Evers, eds. B~verly Hills: Sage.
/ Woodhouse, P. 1989. From green-revolution to food security in sub-Saharan Africa--issues in
1,esearch and technology development. Food Policy 14(1): 7-12.
World Bank. 1989a. Kenya Food and Nutrition Policy. A World Bank Sector Report. Washington, DC: World Bank. (Confidential).
World Bank. 1989b. Mozanrbique Food Security Study. Report No. 7963-MOZ. Washington, DC: World,Bank, Agriculture Division.
World Bank. 1988. The Challenge of Hhmgc;. in Africa: A Call to Action. Washington, DC: World Bank.
World Bank. 1987. Kenya Industrial Sector Survey. Washington, DC: World Bank.
World Bank. 1986r1. Kenya: Policies c,rd Prospects for Restoring Sustained Growtmi of Per Capita Income. Wuhington, DC; World Bank.
Wor!d Bank. 1986b. Poverty and Hunger: Issues and Options for Food Security in Developing Countries. Washington, DC: World Bank.
World Bank. 1983. Kenya: Greowth and Structural Change. Washington, DC: World Bank.
World Foor! Progrernme. 1986a. Evaluation of WFP Emergency Response to the African Food Crisis, 1983-1984, Country Report: Ethiopia. Rome: World Food Programme.
World Food Frogramme. 1986b. Evaluation of WFP Emergency Respnse in West Africa, 1983-1984, Country Report: Niger. Rome: World Food Programme.
World Food Programme. 1986c. Evaluation of WFP Emergency Response to the African Food Crisis, 1983- 1984, Country Report: Mozambique. Rome: World Food Programme.
World Food Programme. 1986d. Evaluation of WFP Emergency Response to the African'Food Crisis, 1983-1984, Country Report: Sudan. Rome: World Food Programme.
World Food Programme. 1986e. Evaluation of WFP Emergency Response to the African Food Crisis, 1983-1984, Country Report: Uganda. Rome: World Food Programme.
World Food Programme. 1986f. Evaluation of WFP Emergency Response in West Africa, 1983-1985, Country Report: Burkina Faso. Romc: World Food Programme.
World Food Programme. 1986g. Evaluation of WFP Emergency Response in West Africa, 1983-1985, Country Report: Mali. Rome: World Food Programme.
World Food Programme. 1986h. Evaluation of Emergency Operations: Lessons from the African Food Crisis. WFP/CFA: 22/7. Rome: World Food Programme.
World Food Programme. 19863. Summury Report on the Bvaluation of WFP Emergency Operations in West Africcl., 1983-el985 (Burkina Faso - Mali - Niger - Chad). WFP/CFA: 22/7. Rome: World Food Programme.
World Food Programme. 1989. World Food Programme emergency food aid for drought victims in Kenya. In coping with Drougnt in Kenya: National and Local Strategies, T.E. Downing, K.W. Gitu and C.M. Kamau; eds., pp. 283-287. Boulder: Lynne Rienner.
/ . World Hunger Program. 1989. The Bellagio Declaration: Overcoming Hunger in the 19901,s.
Providence, RI: World Hunger Program, Brown University.
World Health Organization. 1983. Measuring Change in Nutritional Status: Guidelines for Assessing the Nutritional Impact of Supplementary Feeding Programmes for Vulnerable Croups. Geneva: World Health Organization.
Wyckoff, J.B. 1989. Drought and food policy in Kenya. In Coping with Drought in Kenya: National and Local Strategies, T.E. Downing, K.W. Gitu and C.M. Kamau, ads., pp. 355-368. Boulder: Lynne Rienner.
Wyckoff, J.B. and Ngutter, L.G. K. 1985. Livestock Policy Identification and Formulation: The Kenyan Experience. Development Planning Division, Ministry of Agriculture and Livestock Development Working Paper No. 18. Nairobi: Government of Kenya.
Wylie, D. 1989. The changing face of hunger in southern African history. Past and Present 122: 159- 199.
York, S. 1985. Report on a pilot project to set-up a drought information network in conjunction with the Red Crescent Society in Darfur. Disasters 3(3): 173- 178.
Yousef, N. and Hetler, C. 1983. Establishing the economic condition of woman-headed households in the Third World: a new approach. In Women and Poverty in the Third World, M. Buvinic, M . Lycette and W. McGreevey, eds., pp. 216-243. Baltimore: Johns Hopkins University Press.
Zaidi, S.A. 1988. Poverty and disease: need for structural change. Social Science Medicine 27(2): 119-127.
Zinyama, L.M. 1988. Farmers perceptions of the constraints against increased crop production in the subsistence communal farming sector of Zimbabwe. Agricultural Administration and Extension 29(2): 97- 109.
Zinyama, L.M., Campbell, D. and Matiza, T. 1987. Traditional Household Strategies to Cope with Food Insecurity in the SADCC Region. Harare, Zimbabwe: Department of Geography, University of Harare.