estimating surface soil moisture from terrasar-x data over two small catchments in the sahelian part...
TRANSCRIPT
Remote Sens. 2011, 3, 1266-1283; doi:10.3390/rs3061266
Remote Sensing ISSN 2072-4292
www.mdpi.com/journal/remotesensing
Article
Estimating Surface Soil Moisture from TerraSAR-X Data over
Two Small Catchments in the Sahelian Part of Western Niger
Nicolas Baghdadi 1,
*, Pauline Camus 1, Nicolas Beaugendre
2, Oumarou Malam Issa
3,4,
Mehrez Zribi 5, Jean François Desprats
6, Jean Louis Rajot
4, Chadi Abdallah
7 and
Christophe Sannier 2
1 CEMAGREF, UMR TETIS, 500 rue François Breton, 34093 Montpellier Cedex 5, France;
E-Mail: [email protected] 2 SIRS, 59650 Villeneuve d’Ascq, France; E-Mails: [email protected] (N.B.);
[email protected] (C.S.) 3 Université de Reims Champagne Ardenne, GEGENA EA 3795, 51687 Reims, France;
E-Mail: [email protected] 4 IRD, BIOEMCO, Niamey, Niger; E-Mail: [email protected]
5 CESBIO, 31401 Toulouse, France; E-Mail: [email protected]
6 BRGM, RNSC, 34000 Montpellier, France; E-Mail: [email protected]
7 Remote Sensing Centre, Lebanese National Council for Scientific Research, Beirut, Lebanon;
E-Mail: [email protected]
* Author to whom correspondence should be addressed; E-Mail: [email protected];
Tel.: +33-4-6754-8724; Fax: +33-4-6754-8700.
Received: 22 April 2011; in revised form: 15 June 2011 / Accepted: 15 June 2011 /
Published: 23 June 2011
Abstract: The objective of this study is to validate an approach based on the change
detection in multitemporal TerraSAR images (X-band) for mapping soil moisture in the
Sahelian area. In situ measurements were carried out simultaneously with TerraSAR-X
acquisitions on two study sites in Niger. The results show the need for comparing the
difference between the rainy season image and a reference image acquired in the dry
season. The use of two images enables a reduction of the roughness effects. The soils of
plateaus covered with erosion crusts are dry throughout the year while the fallows show
more significant moisture during the rainy season. The accuracy on the estimate of soil
moisture is about 2.3% (RMSE) in comparison with in situ moisture contents.
OPEN ACCESS
Remote Sens. 2011, 3
1267
Keywords: soil moisture estimation; Sahel; TerraSAR-X; biological crust
1. Introduction
Biological soil crusts are organo-mineral complexes resulting from the colonisation of the soil
surface by communities of micro-organisms, i.e., cyanobacteria, bacteria, algae, lichens and mosses.
They are widespread in arid and semi-arid environments where they perform a number of important
functions [1-6]. The ability of these organisms to colonize bare substrates is due to their ability to
withstand high temperatures, radiation, low water potential, and their capability to move up and down
the soil surface as a response to changes in soil moisture availability [7]. They also have the ability to
remain dormant in a dry state for long periods of time.
Biological soil crusts (BSC) that occur within the Sahelian zone are associated with various types of
physical soil crusts in sandy soils that have been left fallow and in soils of a “tiger bush ecosystem”
(landscape with a typical pattern consisting of alternating densely vegetated bands, comprising small
trees and shrubs, and bare soil bands) [5,8,9]. Their appearance at the soil surface was interpreted as
the first sign of soil degradation [10,11]. Their beneficial impact on ecological processes has been
observed on degraded soil in Sahel in Western Niger [5,9,12,13]. Undisturbed BSCs enhance the
quality of degraded soil by providing a more stable structure and water retaining substratum [5,9,12]
and increasing fertility by N and C fixations [13].
Monitoring the location, extension and/or degradation of BSC is worth studying in order to evaluate
ecological functions of such crusts at regional scale. This study is a part of the BioCrust project
(Biological soil crusts’ vulnerability and soil surface disturbance in Sahelian zone), a project on
microbiotic crust vulnerability and soil degradation in Sahelian zone. The purpose of BioCrust is to
improve the understanding of the temporal and spatial dynamics of BSCs in Sahelian ecosystems and
to provide tools for management in assessing soil degradation due to future changes in land uses
and climate.
The direct mapping of biological soil crusts from satellite imagery is not possible in Sahelian areas.
Mapping by optical imagery should determine the areas of potential presence and development of
biological crusts, based on favourable criteria to their development (in particular on the land
occupation such as fallow and plateaus). Moreover, as the presence and the development of biological
crusts is supposededly dependent on soil moisture content, a relationship between radar signal and
crusts presence could be possible. Indeed, the radar signal is strongly dependent on the soil moisture
and it seems that the biological crusts need a certain moisture level for their development. With the
radar imagery, the soil moisture maps could be used to add supplementary information in the research
of areas favorable to crusts development.
Radar sensors allow mapping irrespective of meteorological conditions (clouds, fog, etc.), both day
and night. This is not the case with optical sensors, which are not possible if there is cloud cover, a
frequent situation in rainy season. The Soil Surface Characteristics can be estimated from microwave
remote sensing sensors due to the sensitivity of the radar signal to soil characteristics such as the soil’s
roughness and dielectric constant [14-16]. In addition, the radar signal depends on various radar
Remote Sens. 2011, 3
1268
parameters such as polarization, incidence angle and frequency. The penetration depth of a radar wave
in vegetation cover is more important at a high than a low radar wavelength (L-band rather than
X-band) [16]. Baghdadi et al. [17] used TerraSAR-X data to show that, after strong rains, the soil
contribution to the backscattering of sugarcane fields can be important for canes with heights of less
than 30 cm. Thus, only bare soils or soils covered by a thin herbaceous layer could be used for
estimating soil moisture content.
The study concerns two study sites in Niger where Synthetic Aperture Radar (SAR) images of
TerraSAR-X sensor were acquired simultaneously to ground measurements. These results will
contribute to the implementation of a soil degradation and biocrust vulnerability monitoring tool. The
possibility of retrieving these soil parameters was widely investigated from C-band Synthetic Aperture
Radar [18-22]. A radar configuration that minimizes the effects of surface roughness is recommended
for a better estimate of soil moisture when using only one incidence angle. The optimal radar
incidences in C-band for the retrieval of soil moisture are weaker than 35° [21]. However, the use of
only one image is limited only to study areas with homogeneous values of surface roughness. The use
of two images acquired at two different incidence angles (low and high) allows the precision on the
estimated moisture to be markedly improved because both surface roughness and soil moisture can be
estimated [18,19,21]. This configuration is not possible with current SAR sensors. Indeed, the time
separating two SAR images acquired at two different incidences is several days, which limits the use of
this inversion procedure. Another solution involves the use of two SAR images, one in dry season and
one in rainy season. This method is easily applicable in Sahelian region where the soil roughness
remains unchanged except for in cultivated areas. Moreover, the soil moisture in dry season could be
supposed to be equal to zero [22]. Many studies showed that, with SAR imagery, it is possible to
estimate the soil moisture with an accuracy of 2 to 6% (RMSE) [19,21,22].
The objective of this study is to examine the potential of TerraSAR-X data for retrieving volumetric
soil moisture over Sahelian areas. This work evaluates whether the use of two SAR images at X-band
(one reference image “dry season” and one image of interest “rainy season”) improves the accuracy of
the estimate of surface soil moisture in comparison to only one image (without reference image). In
Section 2, the study sites, the database including satellite images and experimental measurements are
described. Section 3 presents the proposed methodology for the retrieval of soil moisture. Finally,
conclusions and perspectives are presented in Section 4.
2. Study Sites and Database
2.1. Study Sites Description
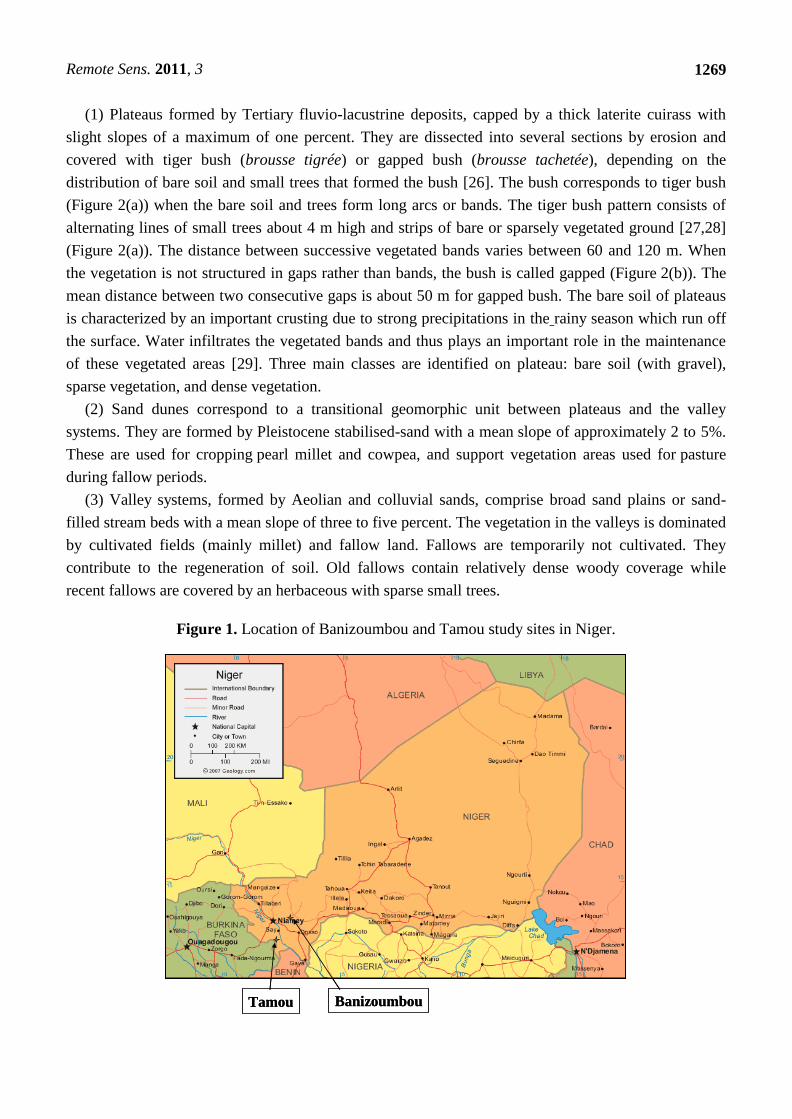
Two study sites were chosen in the south-west part of Niger: Banizoumbou (13,53°N ; 2,67°E) and
Tamou (12.80°N; 2.14°E) (Figure 1). The climate is semi arid with a rainy season between June and
October and an annual rainfall ranges from 140 mm in the North to 720 mm in the South with a
pluviometric gradient of 1 mm/km for the whole of western Niger. Average rainfalls of 500 mm and
650 mm are observed for Banizoumbou and Tamou, respectively [23]. The landscape is composed of
two major geomorphic units [24,25]:
Remote Sens. 2011, 3
1269
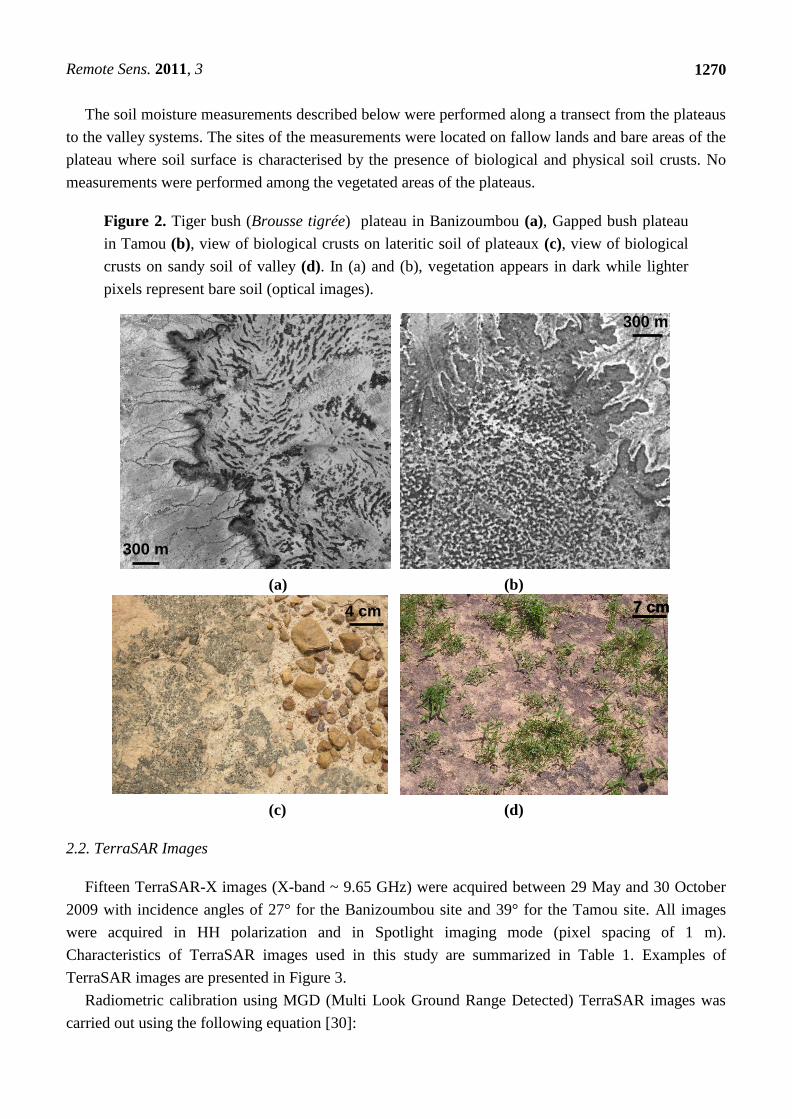
(1) Plateaus formed by Tertiary fluvio-lacustrine deposits, capped by a thick laterite cuirass with
slight slopes of a maximum of one percent. They are dissected into several sections by erosion and
covered with tiger bush (brousse tigrée) or gapped bush (brousse tachetée), depending on the
distribution of bare soil and small trees that formed the bush [26]. The bush corresponds to tiger bush
(Figure 2(a)) when the bare soil and trees form long arcs or bands. The tiger bush pattern consists of
alternating lines of small trees about 4 m high and strips of bare or sparsely vegetated ground [27,28]
(Figure 2(a)). The distance between successive vegetated bands varies between 60 and 120 m. When
the vegetation is not structured in gaps rather than bands, the bush is called gapped (Figure 2(b)). The
mean distance between two consecutive gaps is about 50 m for gapped bush. The bare soil of plateaus
is characterized by an important crusting due to strong precipitations in the rainy season which run off
the surface. Water infiltrates the vegetated bands and thus plays an important role in the maintenance
of these vegetated areas [29]. Three main classes are identified on plateau: bare soil (with gravel),
sparse vegetation, and dense vegetation.
(2) Sand dunes correspond to a transitional geomorphic unit between plateaus and the valley
systems. They are formed by Pleistocene stabilised-sand with a mean slope of approximately 2 to 5%.
These are used for cropping pearl millet and cowpea, and support vegetation areas used for pasture
during fallow periods.
(3) Valley systems, formed by Aeolian and colluvial sands, comprise broad sand plains or sand-
filled stream beds with a mean slope of three to five percent. The vegetation in the valleys is dominated
by cultivated fields (mainly millet) and fallow land. Fallows are temporarily not cultivated. They
contribute to the regeneration of soil. Old fallows contain relatively dense woody coverage while
recent fallows are covered by an herbaceous with sparse small trees.
Figure 1. Location of Banizoumbou and Tamou study sites in Niger.
Tamou BanizoumbouTamou Banizoumbou
Remote Sens. 2011, 3
1270
The soil moisture measurements described below were performed along a transect from the plateaus
to the valley systems. The sites of the measurements were located on fallow lands and bare areas of the
plateau where soil surface is characterised by the presence of biological and physical soil crusts. No
measurements were performed among the vegetated areas of the plateaus.
Figure 2. Tiger bush (Brousse tigrée) plateau in Banizoumbou (a), Gapped bush plateau
in Tamou (b), view of biological crusts on lateritic soil of plateaux (c), view of biological
crusts on sandy soil of valley (d). In (a) and (b), vegetation appears in dark while lighter
pixels represent bare soil (optical images).
300 m300 m
300 m300 m
(a) (b)
4 cm4 cm
(c) (d)
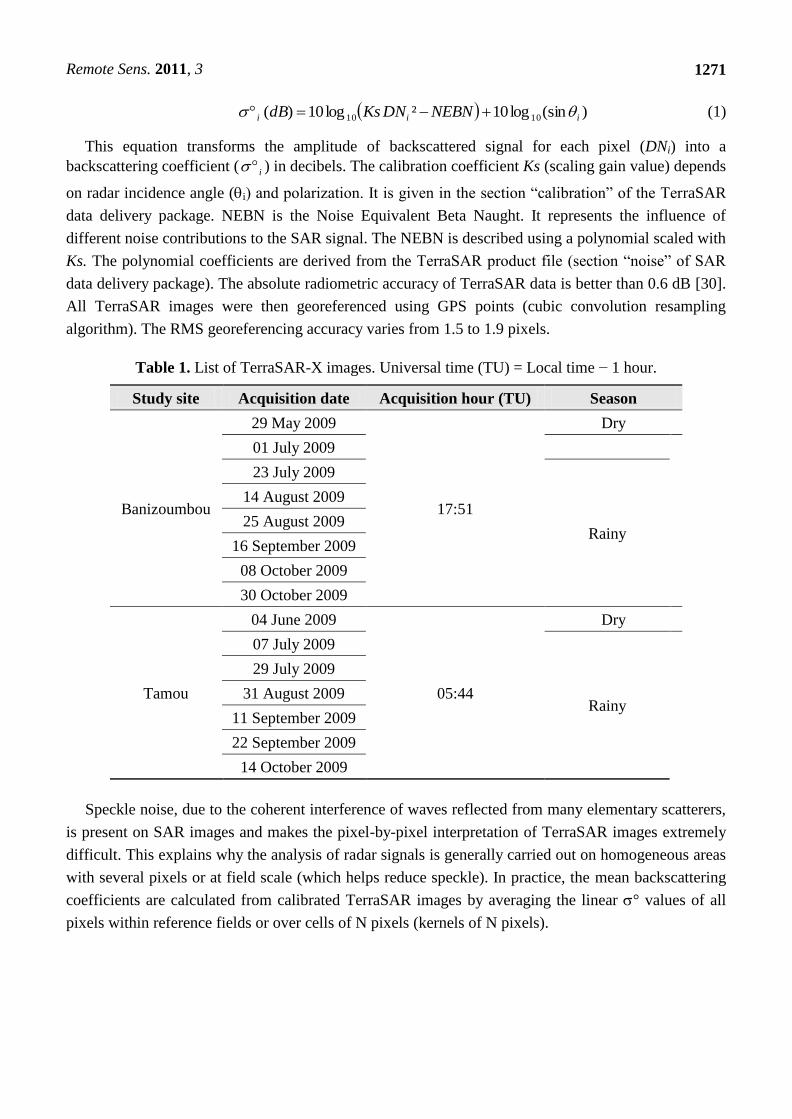
2.2. TerraSAR Images
Fifteen TerraSAR-X images (X-band ~ 9.65 GHz) were acquired between 29 May and 30 October
2009 with incidence angles of 27° for the Banizoumbou site and 39° for the Tamou site. All images
were acquired in HH polarization and in Spotlight imaging mode (pixel spacing of 1 m).
Characteristics of TerraSAR images used in this study are summarized in Table 1. Examples of
TerraSAR images are presented in Figure 3.
Radiometric calibration using MGD (Multi Look Ground Range Detected) TerraSAR images was
carried out using the following equation [30]:
7 cm 7 cm
Remote Sens. 2011, 3
1271
)(sinlog10²log10)( 1010 iii NEBNDNKsdB (1)
This equation transforms the amplitude of backscattered signal for each pixel (DNi) into a
backscattering coefficient ( i ) in decibels. The calibration coefficient Ks (scaling gain value) depends
on radar incidence angle (i) and polarization. It is given in the section “calibration” of the TerraSAR
data delivery package. NEBN is the Noise Equivalent Beta Naught. It represents the influence of
different noise contributions to the SAR signal. The NEBN is described using a polynomial scaled with
Ks. The polynomial coefficients are derived from the TerraSAR product file (section “noise” of SAR
data delivery package). The absolute radiometric accuracy of TerraSAR data is better than 0.6 dB [30].
All TerraSAR images were then georeferenced using GPS points (cubic convolution resampling
algorithm). The RMS georeferencing accuracy varies from 1.5 to 1.9 pixels.
Table 1. List of TerraSAR-X images. Universal time (TU) = Local time − 1 hour.
Study site Acquisition date Acquisition hour (TU) Season
Banizoumbou
29 May 2009
17:51
Dry
01 July 2009
23 July 2009
Rainy
14 August 2009
25 August 2009
16 September 2009
08 October 2009
30 October 2009
Tamou
04 June 2009
05:44
Dry
07 July 2009
Rainy
29 July 2009
31 August 2009
11 September 2009
22 September 2009
14 October 2009
Speckle noise, due to the coherent interference of waves reflected from many elementary scatterers,
is present on SAR images and makes the pixel-by-pixel interpretation of TerraSAR images extremely
difficult. This explains why the analysis of radar signals is generally carried out on homogeneous areas
with several pixels or at field scale (which helps reduce speckle). In practice, the mean backscattering
coefficients are calculated from calibrated TerraSAR images by averaging the linear ° values of all
pixels within reference fields or over cells of N pixels (kernels of N pixels).
Remote Sens. 2011, 3
1272
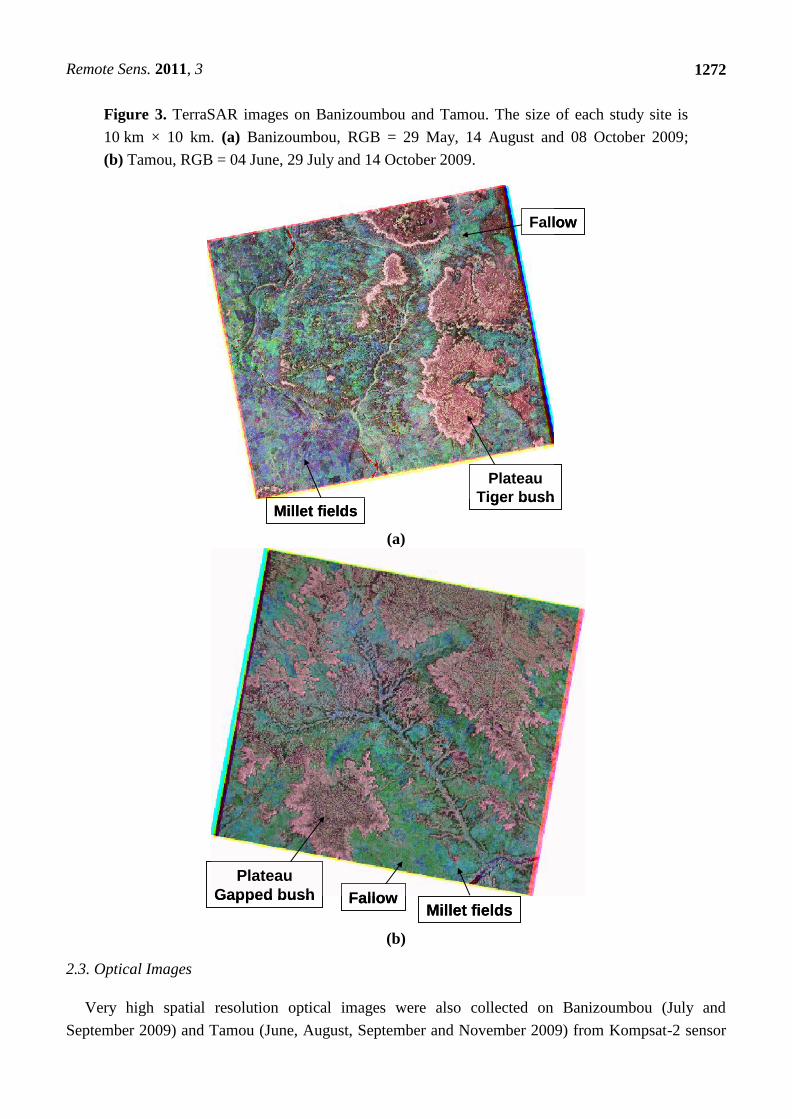
Figure 3. TerraSAR images on Banizoumbou and Tamou. The size of each study site is
10 km × 10 km. (a) Banizoumbou, RGB = 29 May, 14 August and 08 October 2009;
(b) Tamou, RGB = 04 June, 29 July and 14 October 2009.
Millet fields
Plateau
Tiger bush
Fallow
Millet fields
Plateau
Tiger bush
Fallow
(a)
Millet fields
Plateau
Gapped bush FallowMillet fields
Plateau
Gapped bush Fallow
(b)
2.3. Optical Images
Very high spatial resolution optical images were also collected on Banizoumbou (July and
September 2009) and Tamou (June, August, September and November 2009) from Kompsat-2 sensor
Remote Sens. 2011, 3
1273
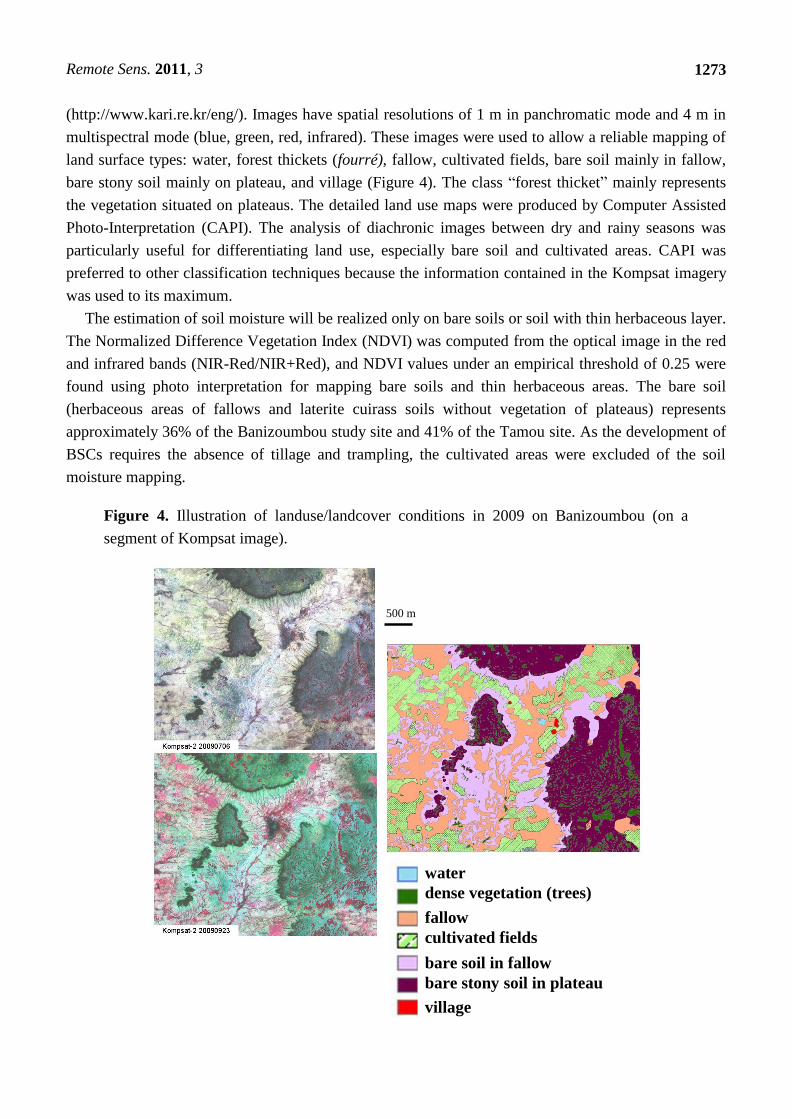
(http://www.kari.re.kr/eng/). Images have spatial resolutions of 1 m in panchromatic mode and 4 m in
multispectral mode (blue, green, red, infrared). These images were used to allow a reliable mapping of
land surface types: water, forest thickets (fourré), fallow, cultivated fields, bare soil mainly in fallow,
bare stony soil mainly on plateau, and village (Figure 4). The class “forest thicket” mainly represents
the vegetation situated on plateaus. The detailed land use maps were produced by Computer Assisted
Photo-Interpretation (CAPI). The analysis of diachronic images between dry and rainy seasons was
particularly useful for differentiating land use, especially bare soil and cultivated areas. CAPI was
preferred to other classification techniques because the information contained in the Kompsat imagery
was used to its maximum.
The estimation of soil moisture will be realized only on bare soils or soil with thin herbaceous layer.
The Normalized Difference Vegetation Index (NDVI) was computed from the optical image in the red
and infrared bands (NIR-Red/NIR+Red), and NDVI values under an empirical threshold of 0.25 were
found using photo interpretation for mapping bare soils and thin herbaceous areas. The bare soil
(herbaceous areas of fallows and laterite cuirass soils without vegetation of plateaus) represents
approximately 36% of the Banizoumbou study site and 41% of the Tamou site. As the development of
BSCs requires the absence of tillage and trampling, the cultivated areas were excluded of the soil
moisture mapping.
Figure 4. Illustration of landuse/landcover conditions in 2009 on Banizoumbou (on a
segment of Kompsat image).
water
dense vegetation (trees)
fallow
cultivated fields
bare soil in fallow
bare stony soil in plateau
village
500 m
water
dense vegetation (trees)
fallow
cultivated fields
bare soil in fallow
bare stony soil in plateau
village
500 m
Remote Sens. 2011, 3
1274
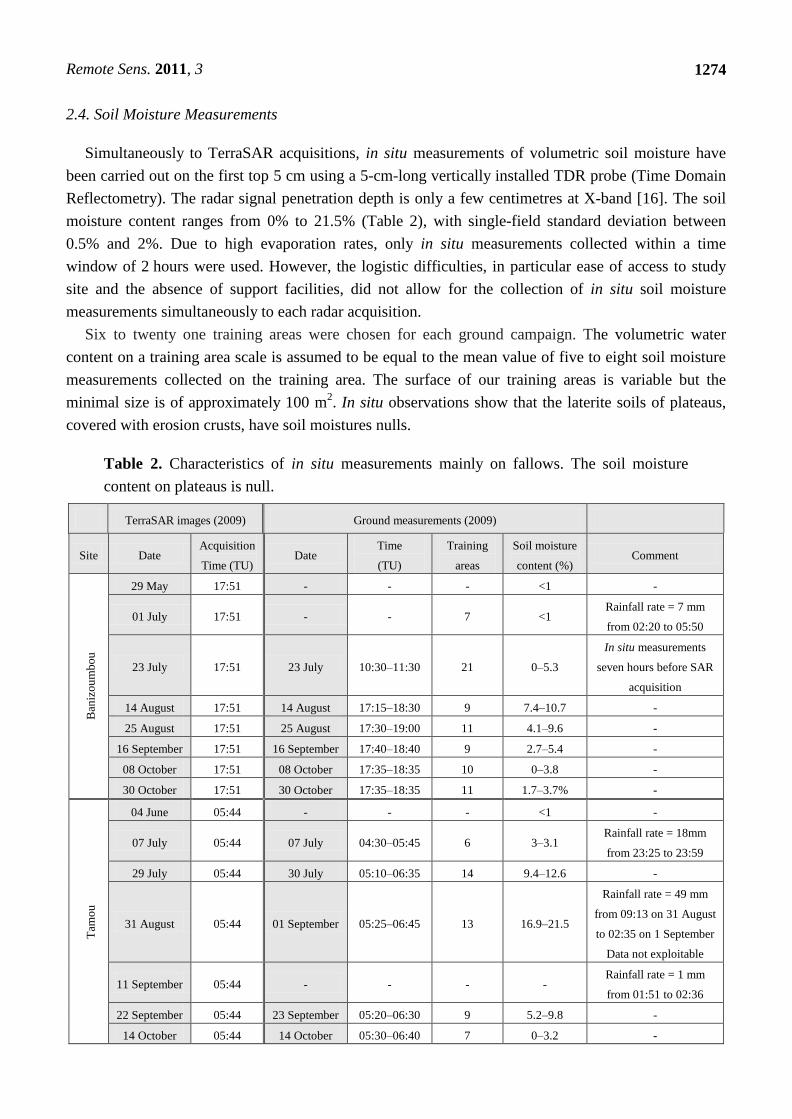
2.4. Soil Moisture Measurements
Simultaneously to TerraSAR acquisitions, in situ measurements of volumetric soil moisture have
been carried out on the first top 5 cm using a 5-cm-long vertically installed TDR probe (Time Domain
Reflectometry). The radar signal penetration depth is only a few centimetres at X-band [16]. The soil
moisture content ranges from 0% to 21.5% (Table 2), with single-field standard deviation between
0.5% and 2%. Due to high evaporation rates, only in situ measurements collected within a time
window of 2 hours were used. However, the logistic difficulties, in particular ease of access to study
site and the absence of support facilities, did not allow for the collection of in situ soil moisture
measurements simultaneously to each radar acquisition.
Six to twenty one training areas were chosen for each ground campaign. The volumetric water
content on a training area scale is assumed to be equal to the mean value of five to eight soil moisture
measurements collected on the training area. The surface of our training areas is variable but the
minimal size is of approximately 100 m2. In situ observations show that the laterite soils of plateaus,
covered with erosion crusts, have soil moistures nulls.
Table 2. Characteristics of in situ measurements mainly on fallows. The soil moisture
content on plateaus is null.
TerraSAR images (2009) Ground measurements (2009)
Site Date Acquisition
Time (TU) Date
Time
(TU)
Training
areas
Soil moisture
content (%) Comment
Ban
izo
um
bo
u
29 May 17:51 - - - <1 -
01 July 17:51 - - 7 <1 Rainfall rate = 7 mm
from 02:20 to 05:50
23 July 17:51 23 July 10:30–11:30 21 0–5.3
In situ measurements
seven hours before SAR
acquisition
14 August 17:51 14 August 17:15–18:30 9 7.4–10.7 -
25 August 17:51 25 August 17:30–19:00 11 4.1–9.6 -
16 September 17:51 16 September 17:40–18:40 9 2.7–5.4 -
08 October 17:51 08 October 17:35–18:35 10 0–3.8 -
30 October 17:51 30 October 17:35–18:35 11 1.7–3.7% -
Tam
ou
04 June 05:44 - - - <1 -
07 July 05:44 07 July 04:30–05:45 6 3–3.1 Rainfall rate = 18mm
from 23:25 to 23:59
29 July 05:44 30 July 05:10–06:35 14 9.4–12.6 -
31 August 05:44 01 September 05:25–06:45 13 16.9–21.5
Rainfall rate = 49 mm
from 09:13 on 31 August
to 02:35 on 1 September
Data not exploitable
11 September 05:44 - - - - Rainfall rate = 1 mm
from 01:51 to 02:36
22 September 05:44 23 September 05:20–06:30 9 5.2–9.8 -
14 October 05:44 14 October 05:30–06:40 7 0–3.2 -
Remote Sens. 2011, 3
1275
The soil moisture content measurements on Banizoumbou were carried out within less than one
hour of TerraSAR acquisitions, except for the image acquired on 23 July where seven hours separate
in situ measurements from SAR acquisition (Table 2) (measurements not used). On the Tamou site,
some ground campaigns were carried out after one day of TerraSAR acquisitions. Thus, only data
acquired simultaneously to SAR acquisitions (2 hours) would be used in the definition of a
relationship between the backscattering coefficient and soil moisture.
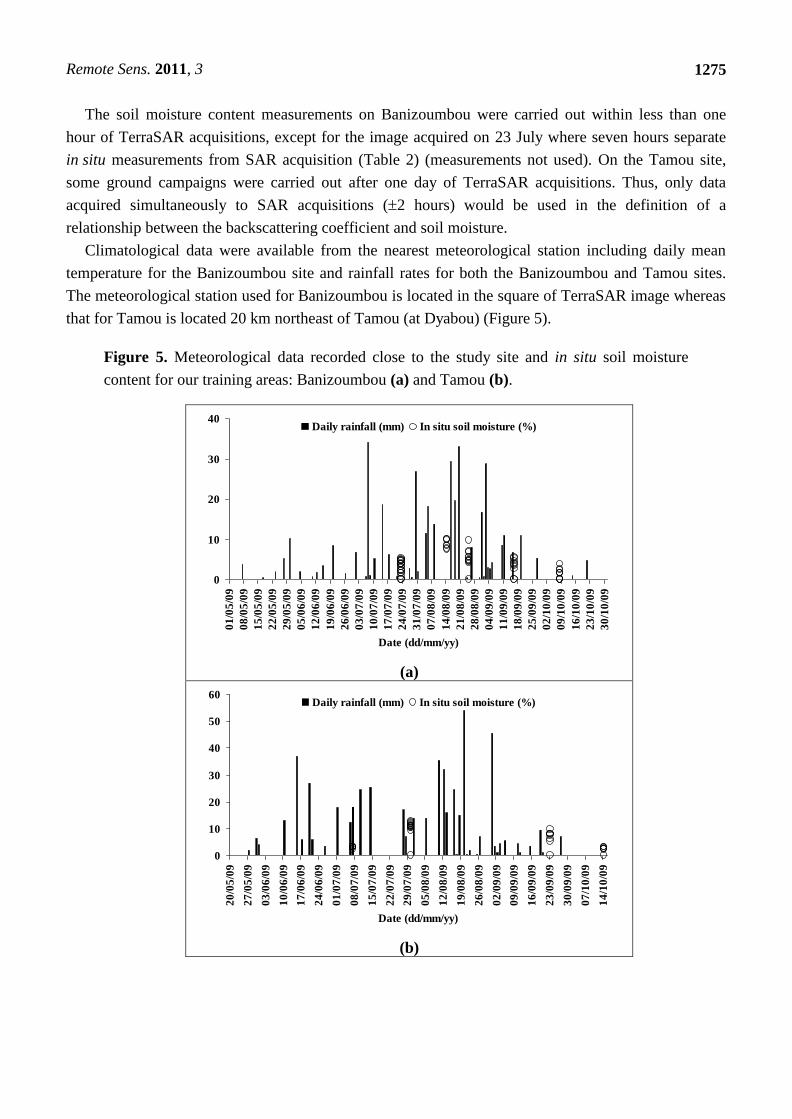
Climatological data were available from the nearest meteorological station including daily mean
temperature for the Banizoumbou site and rainfall rates for both the Banizoumbou and Tamou sites.
The meteorological station used for Banizoumbou is located in the square of TerraSAR image whereas
that for Tamou is located 20 km northeast of Tamou (at Dyabou) (Figure 5).
Figure 5. Meteorological data recorded close to the study site and in situ soil moisture
content for our training areas: Banizoumbou (a) and Tamou (b).
0
10
20
30
40
01
/05
/09
08
/05
/09
15
/05
/09
22
/05
/09
29
/05
/09
05
/06
/09
12
/06
/09
19
/06
/09
26
/06
/09
03
/07
/09
10
/07
/09
17
/07
/09
24
/07
/09
31
/07
/09
07
/08
/09
14
/08
/09
21
/08
/09
28
/08
/09
04
/09
/09
11
/09
/09
18
/09
/09
25
/09
/09
02
/10
/09
09
/10
/09
16
/10
/09
23
/10
/09
30
/10
/09
Date (dd/mm/yy)
Daily rainfall (mm) In situ soil moisture (%)
(a)
0
10
20
30
40
50
60
20
/05
/09
27
/05
/09
03
/06
/09
10
/06
/09
17
/06
/09
24
/06
/09
01
/07
/09
08
/07
/09
15
/07
/09
22
/07
/09
29
/07
/09
05
/08
/09
12
/08
/09
19
/08
/09
26
/08
/09
02
/09
/09
09
/09
/09
16
/09
/09
23
/09
/09
30
/09
/09
07
/10
/09
14
/10
/09
Date (dd/mm/yy)
Daily rainfall (mm) In situ soil moisture (%)
(b)
Remote Sens. 2011, 3
1276
3. Soil Moisture Mapping
3.1. Relationship between Radar Signal and Soil Moisture
For bare soils, the radar backscattering coefficient in decibels can be written as the sum of two
functions, a linear function to describe the dependence of radar signal on volumetric surface soil
moisture (for values between 5% and 35%), and an exponential function to illustrate the dependence of
° on surface roughness [16,18,21,31]:
cebma krms
vdB 0 (2)
where k is the wave number (2 cm−1
for X-band), and rms is the root mean square surface height
(surface roughness). For a given radar wavelength, the coefficients a, b, and c are observed to be
dependent on both radar incidence angle and polarization [19,21,31]. To retrieve soil moisture (mv)
from a single radar configuration, it is necessary to establish a relationship between the radar
backscattering coefficient (°) and mv alone, without having any knowledge of the rms surface height.
As a first approximation, the radar backscattering coefficient (in dB) may be expressed as
follows [16,21]:
dma vdB 0 (3)
This simplified relationship ignores the surface roughness. The coefficient a is dependent on both
incidence angle and polarization. The coefficient d is primarily controlled by incidence angle,
polarization and surface roughness (for a given radar wavelength).
To eliminate the soil roughness effects, a reference image acquired in dry season could be used. The
difference between one image acquired during the rainy season (soil moisture = mv) and the reference
image (Δσ°) can be expressed as [22]:
vdB ma' (4)
This approach assumes that the soil roughness is unchanged between the two SAR acquisition dates.
This condition is valuable for bare soils, except for cultivated fields. Moreover, the assumption that the
soil moisture in dry season is null is verified by ground measurements.
The development of biological crusts requires wet soil and little anthropic disturbance. Moreover,
their presence is limited mainly to fallows and plateaus. Thus, the approaches for mapping soil
moisture as defined in Equations (3) and (4) will be applied using TerraSAR imagery to bare soils and
areas with a short herbaceous layer. Firstly, the relationship defined in Equation (3) between the radar
backscattering coefficient and the in situ soil moisture content was established for one part of the
database (25% of 91 points ° and mv). A mean backscattering coefficient was calculated for each soil
moisture measurement using pixels around the location of moisture content measurements (on
homogeneous areas around GPS location).
However, TerraSAR images acquired on 29 July, 31 August and 22 September had not been used in
the calibration phase of relationships between σ° and mv (Equations (3) and (4)) because the associated
ground measurements of moisture content were carried out one day after acquisitions (Table 2).
Moreover, strong rains were recorded on the night of 31 August, making it impossible to use the data
from 31 August and 1 September. Finally, the SAR image on 11 September cannot be exploited for
lack of ground measurements.
Remote Sens. 2011, 3
1277
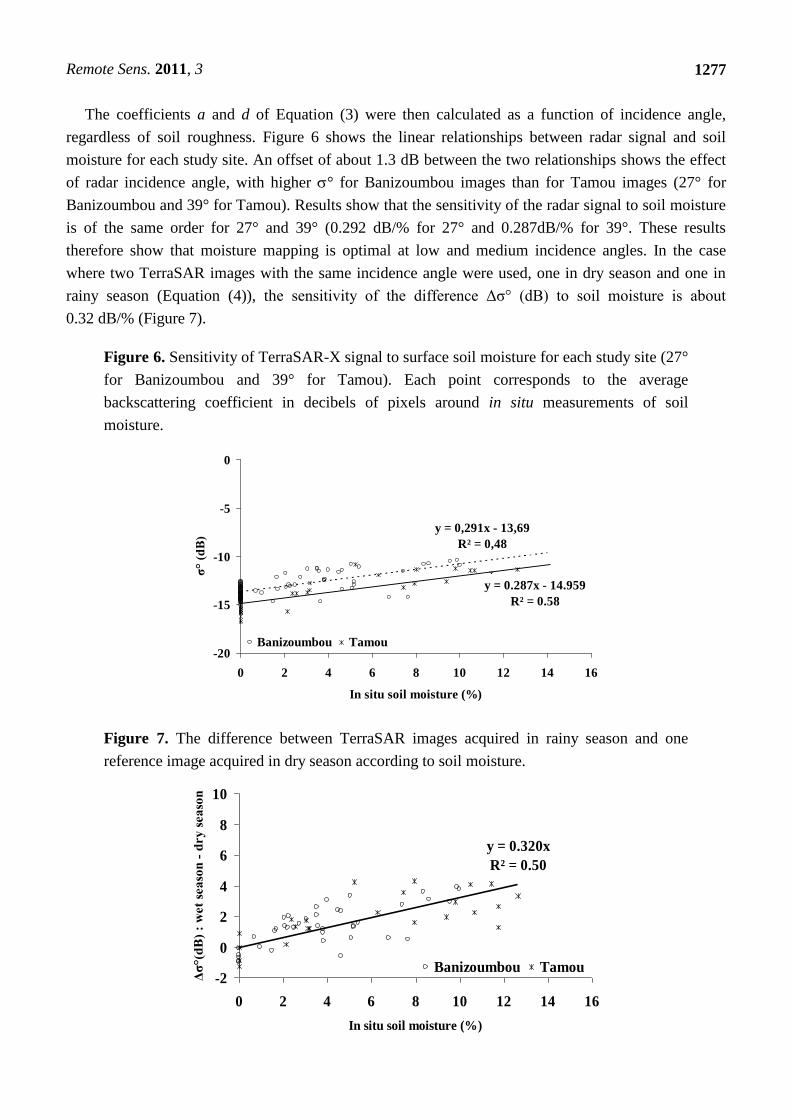
The coefficients a and d of Equation (3) were then calculated as a function of incidence angle,
regardless of soil roughness. Figure 6 shows the linear relationships between radar signal and soil
moisture for each study site. An offset of about 1.3 dB between the two relationships shows the effect
of radar incidence angle, with higher ° for Banizoumbou images than for Tamou images (27° for
Banizoumbou and 39° for Tamou). Results show that the sensitivity of the radar signal to soil moisture
is of the same order for 27° and 39° (0.292 dB/% for 27° and 0.287dB/% for 39°. These results
therefore show that moisture mapping is optimal at low and medium incidence angles. In the case
where two TerraSAR images with the same incidence angle were used, one in dry season and one in
rainy season (Equation (4)), the sensitivity of the difference Δσ° (dB) to soil moisture is about
0.32 dB/% (Figure 7).
Figure 6. Sensitivity of TerraSAR-X signal to surface soil moisture for each study site (27°
for Banizoumbou and 39° for Tamou). Each point corresponds to the average
backscattering coefficient in decibels of pixels around in situ measurements of soil
moisture.
y = 0,291x - 13,69
R² = 0,48
y = 0.287x - 14.959
R² = 0.58
-20
-15
-10
-5
0
0 2 4 6 8 10 12 14 16
In situ soil moisture (%)
σ°
(dB
)
Banizoumbou Tamou
Figure 7. The difference between TerraSAR images acquired in rainy season and one
reference image acquired in dry season according to soil moisture.
y = 0.320x
R² = 0.50
-2
0
2
4
6
8
10
0 2 4 6 8 10 12 14 16
In situ soil moisture (%)
Δσ
°(d
B)
: w
et
seaso
n -
dry s
easo
n
Banizoumbou Tamou
Remote Sens. 2011, 3
1278
3.2. Soil Moisture Mapping
Soil moisture estimates are obtained by inverting the relationships between radar signal and the soil
moisture (Equations (3) and (4)). The two simple procedures defined above were applied for mapping
the surface soil moisture. Only bare soils or soil with a thin herbaceous layer (NDVI < 0.25) were used
for soil moisture mapping. The study sites were divided into contiguous cells/areas of 500 m × 500 m
before calculating the mean backscattering coefficient on every bare soil pixel belonging to each class
in each cell and for each land surface class. So, in each cell, we will have as many values of mean ° as
of classes present in the cell. This approach for soil moisture mapping in each cell and for each class is
justified by the difference in the soil type of each class (different soil moisture levels).
The soil moisture retrieval approach using radar images with a georeferencing accuracy of about
2 m (1.5 to 1.9 pixels) is compatible with optical images having a pixel spacing of 4 m (used to extract
the bare soils). Indeed, the georeferencing accuracy of radar images is smaller than the pixel spacing of
optical images. Moreover, the soil moisture mapping will be made in cells gathering several pixels.
The in situ soil moisture in each cell and for each land surface class is assumed to be equal to the
mean value of all moisture measurements present in each cell. Validation of the soil moisture retrieval
algorithm was carried out in comparing in situ data and estimations derived from TerraSAR-X using
the inversion model (Equations (3) and (4)). The use of a single TerraSAR image (method 1)
overestimates the moisture content on plateaus of about 6.3% (with RMSE = 6.6%). This
overestimation of soil moisture on plateaus is due to a stronger soil roughness (cuirass) whereas the
soil of fallows is relatively smoother (sandy). Moreover, the limit between low lands and plateaus also
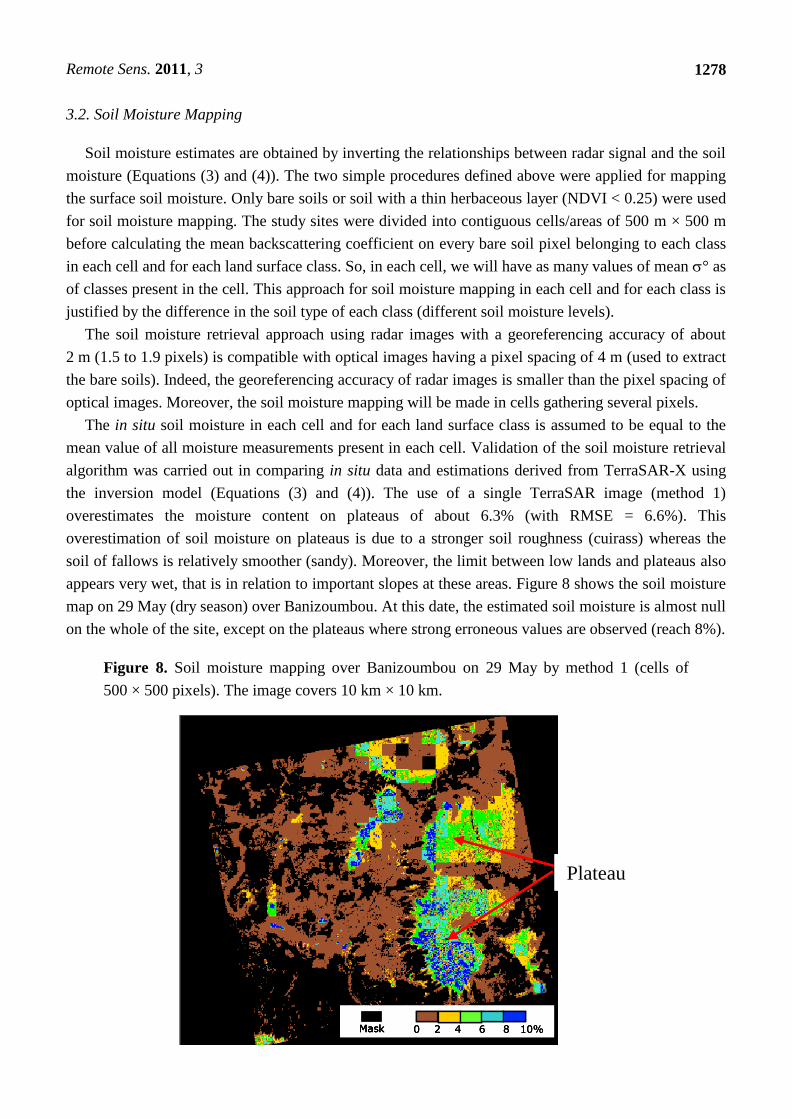
appears very wet, that is in relation to important slopes at these areas. Figure 8 shows the soil moisture
map on 29 May (dry season) over Banizoumbou. At this date, the estimated soil moisture is almost null
on the whole of the site, except on the plateaus where strong erroneous values are observed (reach 8%).
Figure 8. Soil moisture mapping over Banizoumbou on 29 May by method 1 (cells of
500 × 500 pixels). The image covers 10 km × 10 km.
0 2 4 6 8 10%Mask
Plateau
0 2 4 6 8 10%Mask 0 2 4 6 8 10%Mask 0 2 4 6 8 10%0 2 4 6 8 10%MaskMaskMask
PlateauPlateau
Remote Sens. 2011, 3
1279
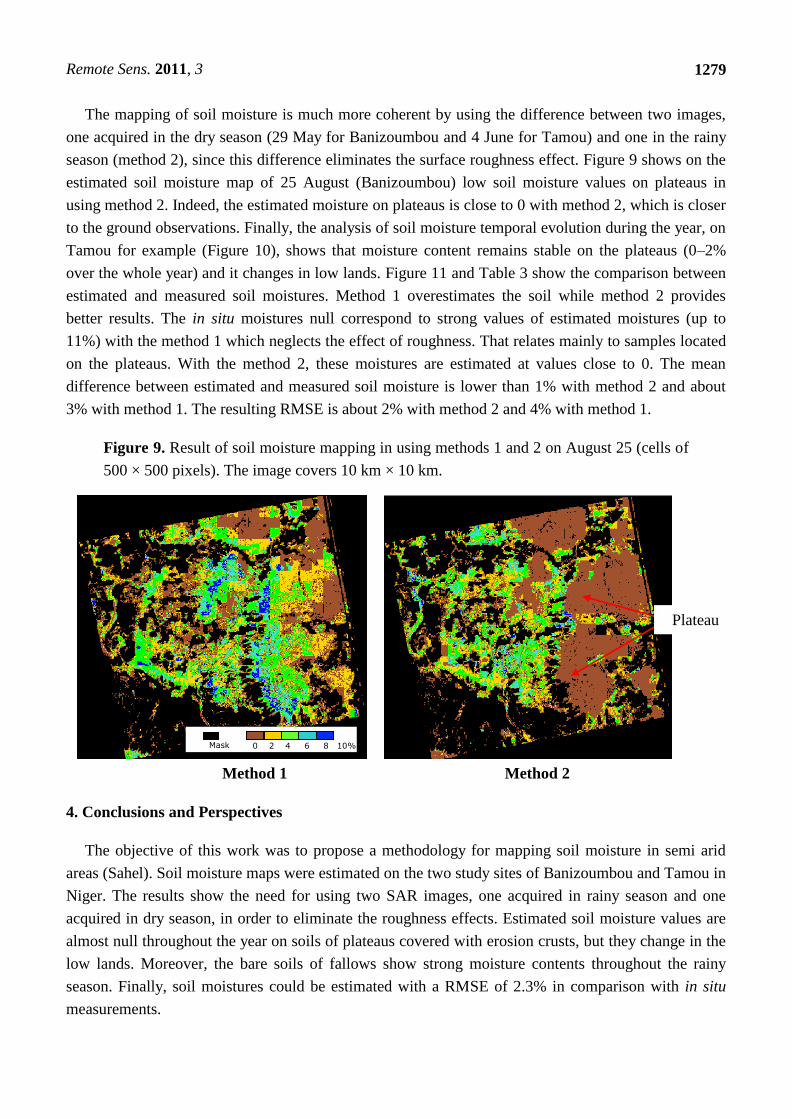
The mapping of soil moisture is much more coherent by using the difference between two images,
one acquired in the dry season (29 May for Banizoumbou and 4 June for Tamou) and one in the rainy
season (method 2), since this difference eliminates the surface roughness effect. Figure 9 shows on the
estimated soil moisture map of 25 August (Banizoumbou) low soil moisture values on plateaus in
using method 2. Indeed, the estimated moisture on plateaus is close to 0 with method 2, which is closer
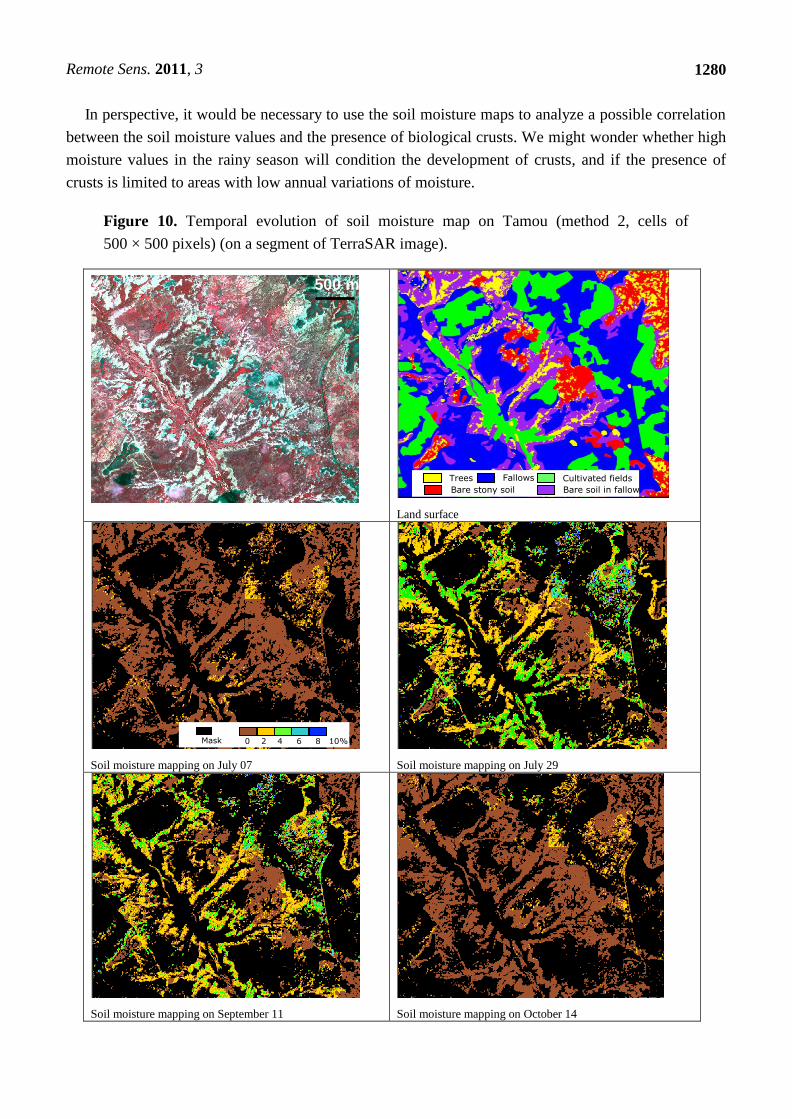
to the ground observations. Finally, the analysis of soil moisture temporal evolution during the year, on
Tamou for example (Figure 10), shows that moisture content remains stable on the plateaus (0–2%
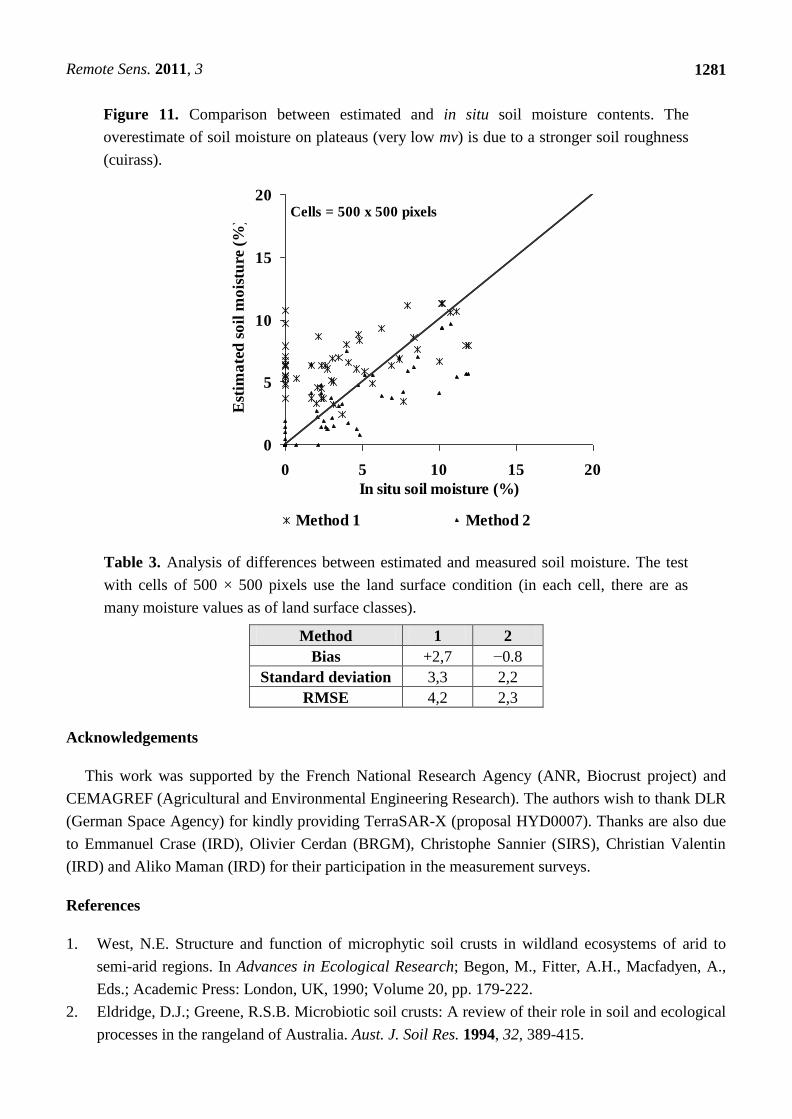
over the whole year) and it changes in low lands. Figure 11 and Table 3 show the comparison between
estimated and measured soil moistures. Method 1 overestimates the soil while method 2 provides
better results. The in situ moistures null correspond to strong values of estimated moistures (up to
11%) with the method 1 which neglects the effect of roughness. That relates mainly to samples located
on the plateaus. With the method 2, these moistures are estimated at values close to 0. The mean
difference between estimated and measured soil moisture is lower than 1% with method 2 and about
3% with method 1. The resulting RMSE is about 2% with method 2 and 4% with method 1.
Figure 9. Result of soil moisture mapping in using methods 1 and 2 on August 25 (cells of
500 × 500 pixels). The image covers 10 km × 10 km.
0 2 4 6 8 10% Mask
Plateau
Method 1 Method 2
4. Conclusions and Perspectives
The objective of this work was to propose a methodology for mapping soil moisture in semi arid
areas (Sahel). Soil moisture maps were estimated on the two study sites of Banizoumbou and Tamou in
Niger. The results show the need for using two SAR images, one acquired in rainy season and one
acquired in dry season, in order to eliminate the roughness effects. Estimated soil moisture values are
almost null throughout the year on soils of plateaus covered with erosion crusts, but they change in the
low lands. Moreover, the bare soils of fallows show strong moisture contents throughout the rainy
season. Finally, soil moistures could be estimated with a RMSE of 2.3% in comparison with in situ
measurements.
Remote Sens. 2011, 3
1280
In perspective, it would be necessary to use the soil moisture maps to analyze a possible correlation
between the soil moisture values and the presence of biological crusts. We might wonder whether high
moisture values in the rainy season will condition the development of crusts, and if the presence of
crusts is limited to areas with low annual variations of moisture.
Figure 10. Temporal evolution of soil moisture map on Tamou (method 2, cells of
500 × 500 pixels) (on a segment of TerraSAR image).
Optical image over Tamou on September 26, 2009
Land surface
Soil moisture mapping on July 07
Soil moisture mapping on July 29
Soil moisture mapping on September 11
Soil moisture mapping on October 14
0 2 4 6 8 10% Mask
Cultivated fields
Trees
Bare soil in fallow
Fallows
Bare stony soil
soilsoilsoiouteux
500 m500 m
Remote Sens. 2011, 3
1281
Figure 11. Comparison between estimated and in situ soil moisture contents. The
overestimate of soil moisture on plateaus (very low mv) is due to a stronger soil roughness
(cuirass).
Cells = 500 x 500 pixels
0
5
10
15
20
0 5 10 15 20
In situ soil moisture (%)
Est
ima
ted
so
il m
ois
ture
(%
)
Method 1 Method 2
Table 3. Analysis of differences between estimated and measured soil moisture. The test
with cells of 500 × 500 pixels use the land surface condition (in each cell, there are as
many moisture values as of land surface classes).
Method 1 2
Bias +2,7 −0.8
Standard deviation 3,3 2,2
RMSE 4,2 2,3
Acknowledgements
This work was supported by the French National Research Agency (ANR, Biocrust project) and
CEMAGREF (Agricultural and Environmental Engineering Research). The authors wish to thank DLR
(German Space Agency) for kindly providing TerraSAR-X (proposal HYD0007). Thanks are also due
to Emmanuel Crase (IRD), Olivier Cerdan (BRGM), Christophe Sannier (SIRS), Christian Valentin
(IRD) and Aliko Maman (IRD) for their participation in the measurement surveys.
References
1. West, N.E. Structure and function of microphytic soil crusts in wildland ecosystems of arid to
semi-arid regions. In Advances in Ecological Research; Begon, M., Fitter, A.H., Macfadyen, A.,
Eds.; Academic Press: London, UK, 1990; Volume 20, pp. 179-222.
2. Eldridge, D.J.; Greene, R.S.B. Microbiotic soil crusts: A review of their role in soil and ecological
processes in the rangeland of Australia. Aust. J. Soil Res. 1994, 32, 389-415.
Remote Sens. 2011, 3
1282
3. Verrecchia, E.; Yair, A.; Kidron, G.J.; Verrecchia, K. Physical properties of the psammophile
cryptogamic crust and their consequences to the water regime of sandy soils, north-western Negev
Desert, Israël. J. Arid Environ. 1995, 29, 427-437.
4. Pérez, F.L. Microbiotic crusts in the high equatorial Andes, and their influence on 502 paramo
soils. Catena 1997, 31, 173-198.
5. Malam Issa, O.; Tichet, J.; Défarge, C.; Couté, A.; Valentin, C. Morphology and microstructure of
microbiotic soil crusts on a tiger bush sequence (Niger, Sahel). Catena 1999, 37, 175-196.
6. Belnap, J. The potential roles of biological soil crusts in dryland hydrologic cycles. Hydrol.
Process. 2006, 20, 3159-3178.
7. Garcia-Pichel, F.; Pringault, O. Cyanobacteria track water in desert soils. Nature 2001, 413,
380-381.
8. D’Herbes, J.M.; Valentin, C. Land surface conditions of the Niamey region, ecological and
hydrological implications. J. Hydrol. 1997, 188-189, 18-42.
9. Malam Issa, O.; Le Bissonnais, Y.; Défarge, C.; Tichet, J. Role of a cyanobacterial cover on
structural stability of sandy soils in Sahelian part of western Niger. Geoderma 2001a, 101, 15-31.
10. Dulieu, D.; Gaston, A.; Darley, J. La dégradation des pâturages de la région de N’Djamena
(République du Tchad) en relation avec la présence des cyanophycées psammophiles. Etude
préliminaire. Revue D’élevage et de Medicine Vétérinaire des Pays Tropicaux 1977, 30, 181-190.
11. Hahn, A.; Kusserow, H. Spatial and temporal distribution of algae in soil crusts in the Sahel of W
Africa: Preliminary results. Willdenowia 1988, 28, 227-238.
12. Défarge, C.; Malam Issa, O.; Trichet, J. Apports du Cryo-microscope électronique à balayage à
émission de champ à l'étude des matières organiques et des relations organo-minérales naturelles.
II. Application aux croûtes microbiotiques des sols. Comptes Rendus Académie des Sciences
1999, 328, 591-597.
13. Malam Issa, O.; Stal, L.J.; Défarge, C.; Trichet, J.; and Couté, A. Nitrogen fixation by microbial
crusts from desiccated Sahelian soils (Niger). Soil Biol. Biochem. 2001b, 33, 1425-1428.
14. Dobson, M.C.; Ulaby, F.T. Active microwave soil moisture research. IEEE Trans. Geosci. Remote
Sens. 1986, 24, 23-36.
15. Fung, A.K. Microwave Scattering and Emission Models and Their Applications; Artech House,
Inc.: Norwood, MA, USA, 1994.
16. Ulaby, F.T.; Moore, R.K.; Fung, A.K. Microwave Remote Sensing, Active and Passive, From
Theory to Applications; Artech House, Inc.: Norwood, MA, USA, 1986; Volume 3.
17. Baghdadi, N.; Cresson, R.; Todoroff, P.; Soizic, M. Multitemporal observations of sugarcane by
TerraSAR-X images. Sensors 2010, 10, 8899-8919; doi:10.3390/s101008899.
18. Zribi, M.; Dechambre, M. A new empirical model to retrieve soil moisture and roughness from
C-band radar data. Remote Sens. Environ. 2002, 84, 42-52.
19. Srivastava, H.S.; Patel, P.; Manchanda, M.L.; Adiga, S. Use of multi-incidence angle
RADARSAT-1 SAR data to incorporate the effect of surface roughness in soil moisture
estimation. IEEE Trans. Geosci. Remote Sens. 2003, 41, 1638-1640.
20. Oh, Y. Quantitative retrieval of soil moisture content and surface roughness from multipolarized
radar observations of bare soil surfaces. IEEE Trans. Geosci. Remote Sens. 2004, 42, 596-601.
Remote Sens. 2011, 3
1283
21. Baghdadi, N.; Holah, N; Zribi, M. Soil moisture estimation using multi-incidence and
multi-polarization ASAR data. Int. J. Remote Sens. 2006, 27, 1907-1920.
22. Zribi, M.; Saux-Picart, S.; André, C.; Descroix, L.; Ottlé, C.; Kallel, A. Soil moisture mapping
based on ASAR/ENVISAT radar data over a Sahelian region. Int. J. Remote Sens. 2007, 28,
3547-3565.
23. Le Barbé, L.; Lebel, T. Rainfall climatology of the HAPEX-Sahel region during the years
1950–1990. J. Hydrol. 1997, 188-189, 43-73.
24. Valentin, C. Effects of grazing and trampling on soil deterioration around recently drilled
water-holes in the Sahelian zone. In Soil Erosion and Conservation; El Swaïfy, S.A.,
Moldenhauer, WL., Lo, A., Eds. ; Soil Conservation Society of America: Ankeny, IA, USA, 1985;
pp. 51-65.
25. Courault, D.; D’Herbes, J.M; Valentin, C. Le Bassin versant de Sama Dey: Premières
Observations Pédologiques et Phyto-Écologiques; ORSTOM: Paris, France, 1990.
26. Ambouta, J.M.K. Définition et caractérisation des structures de végétation contractée au Sahel:
cas de la brousse tigrée nigérien; d’Herbès, J.M., Ambouta, J.M.K., Peltier, R., Eds.; John Libbey
Eurotext: Paris, France, 1997; pp. 41-57.
27. White, L.P. Brousse Tigree patterns in Southern Niger. J. Ecol. 1970, 58, 549-553.
28. Seghieri, J.; Galle, S.; Rajot, J.L.; Ehrmann, M. Relationships between the soil moisture regime
and the growth of the herbaceous plants in a natural vegetation mosaic in Niger. J. Arid Environ.
1997, 36, 87-102.
29. Galle, S.; Seghieri, J.; Mounkaila, H. Fonctionnement hydrologique et biologique à l’échelle
locale. Cas de la brousse tigrée au Niger. Chapitre 9; Fonctionnement et Gestion des Écosystèmes
Forestiers Contractés Sahéliens; John Libbey Eurotext: Paris, France, 1997; pp. 105-118.
30. Eineder, M.; Fritz, T. TerraSAR-X Ground Segment Basic Product Specification Document; Doc.:
TX-GS-DD-3302; DLR: Wessling, Germany, 18 March 2009; Issue 1.6, p. 108. Available online:
https://tandemx-science.dlr.de/pdfs/TX-GS-DD-3302_Basic-Products-Specification-Document_V1.6.pdf
(accessed on 22 April 2011).
31. Holah, H.; Baghdadi, N.; Zribi, M.; Bruand, A.; King, C. Potential of ASAR/ENVISAT for the
characterisation of soil surface parameters over bare agricultural fields. Remote Sens. Environ.
2005, 96, 78-86.
© 2011 by the authors; licensee MDPI, Basel, Switzerland. This article is an open access article
distributed under the terms and conditions of the Creative Commons Attribution license
(http://creativecommons.org/licenses/by/3.0/).