unit hydrographs for catchments of different sizes and dissimilar regions
TRANSCRIPT

Journal of Hydrology, 22 (1974) 143--153 © North-Holland Publishing Company, Amsterdam -- Printed in The Netherlands
U N I T H Y D R O G R A P H S F O R C A T C H M E N T S O F D I F F E R E N T S I Z E S A N D
D I S S I M I L A R R E G I O N S
RICHARD G. HEERDEGEN and BRIAN M. REICH
Department of Geography, Massey University, Palmerston Nortb (New Zealand) Department of Civil Engineering, Pennsylvania State University, University Park, Pa. (U.S.A.)
(Accepted for publication November 5, 1973)
ABSTRACT
Heerdegen, R.G. and Reich, B.M., 1974. Unit hydrographs for catchments of different sizes and dissimilar regions. J. Hydrol., 22: 143--153.
A study was made of 96 flood events, larger than the mean annual flood, from 17 catchments situated in different regions of the Commonwealth of Pennsylvania, an area of widely differing geology, physiography and climate. The mean annual precipitation ranges from 90 to 125 cm, mean monthly temperatures vary from a minimum of -3°C in January to 24°C in July, and mean elevation differences within a catchment range from 220 to 875 m; catchment sizes are 10 to 450 km 2 . Unit hydrographs, derived by the least-squares method on a digital computer, show some consistency of shape for one catchment but very considerable variations among catchments. Storm parameters seem to have small effects on the unit hydrographs but physiographic parameters cause the major inter-catchment variations in the shapes of the unit hydrographs. The baselength of the unit hydrograph is found to be closely related to the physiographic region while the time- to-peak and the peak discharge seem to be dependent on area and other associated physiographic parameters. It is possible within the ranges of catchment size and physio- graphic regions studied to develop unit hydrographs for ungaged watersheds, from which flood hydrographs and characteristic discharges may be derived.
INTRODUCTION
In an e f f o r t to d e t e r m i n e the e f fec t s o f c l i m a t e a n d p h y s i o g r a p h i c or c a t c h m e n t p a r a m e t e r s on the u n i t h y d r o g r a p h , 17 c a t c h m e n t s rang ing in size f r o m 10 t o 450 k m 2 r e p r e s e n t i n g a wide range of geograph ic l o c a t i o n s in the C o m m o n w e a l t h o f Pennsy lvan i a were chosen . F l o o d h y d r o g r a p h s were se lec ted t h a t were f ree o f s n o w effects , h a d p e a k d ischarge ra tes e x c e e d i n g t h a t o f a 2 .33 -yea r r e t u r n pe r i od , h a d a p l u v i o g r a p h in r ea sonab le p r o x i m i t y , and h a d a c c e p t a b l y u n i f o r m areal d i s t r i b u t i o n o f s t o r m ra infa l l . The classical e q u a t i o n s o b t a i n e d f r o m c o n v o l u t i n g the un i t h y d r o g r a p h t h r o u g h o u t t he sequence o f ra infa l l excesses were app l i ed t o o b t a i n a o n e - h o u r un i t h y d r o - graph fo r each s t o rm . The m o d i f i e d N e w t o n a n d V i n y a r d (1967) c o m p u t e r p r o g r a m gave an i t e ra t ive s o l u t i o n t o w a r d s an o p t i m u m c o m b i n a t i o n o f Unit
144
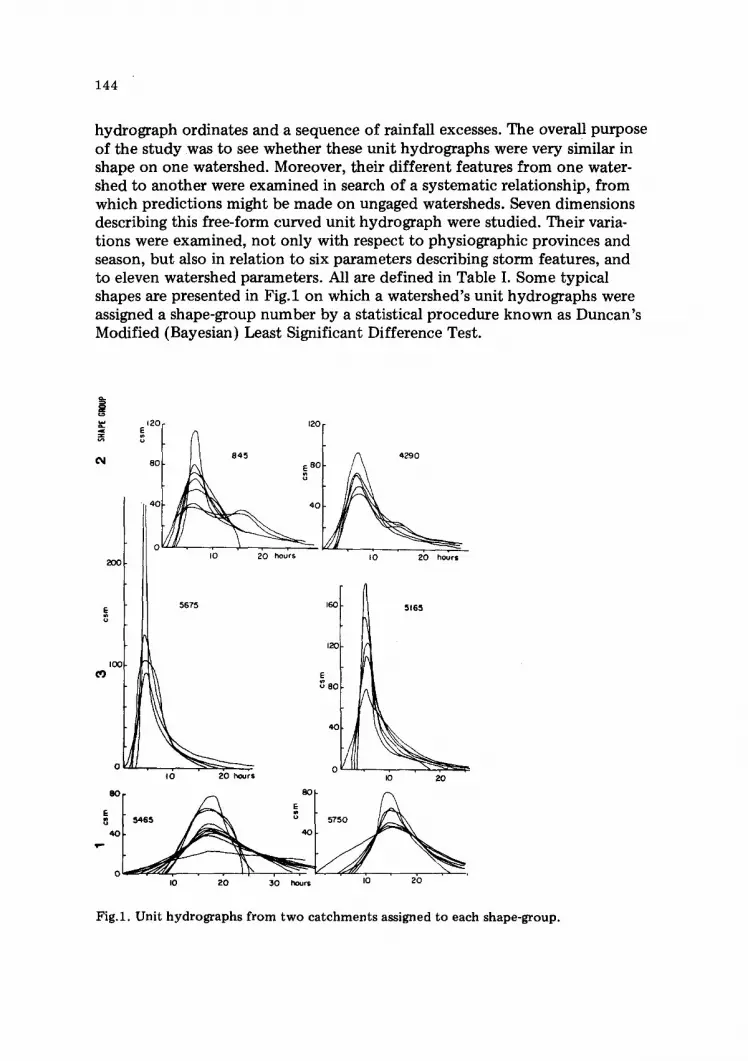
hydrograph ordinates and a sequence of rainfall excesses. The overall purpose of the study was to see whether these unit hydrographs were very similar in shape on one watershed. Moreover, their different features from one water- shed to another were examined in search of a systematic relationship, from which predictions might be made on ungaged watersheds. Seven dimensions describing this free-form curved unit hydrograph were studied. Their varia- tions were examined, not only with respect to physiographic provinces and season, but also in relation to six parameters describing storm features, and to eleven watershed parameters. All are defined in Table I. Some typical shapes are presented in Fig.1 on which a watershed's unit hydrographs were assigned a shape-group number by a statistical procedure known as Duncan's Modified (Bayesian) Least Significant Difference Test.
2OO
I00 CO
80
iO
0
120
845
I0 20 hours I 0 20 hours
5675
I 0 20 hours
I , 516S
~Z,O I
E
IO 20
.4o !
O . . . . . . . . . . . . . . I0 20 30 hours I0 20
Fig.1. Unit hydrographs from two catchments assigned to each shape-group.

145
TABLE I
Definition of acronyms
Unit hydrograph variables QPHUH peak discharge, in csm (cub. ft. sec -1 sq. mile -~ ) for an individual
QPHUH TPEAK TBASE TRECESS WIDTH75 WIDTH50 TPEAK TBASE
event average QPHUH for each watershed time to peak or rise time (in hours) total baselength (in hours) length of recession limb (in hours) width at 75% of the QPHUH (in hours) width at 50% of the QPHUH (in hours)
ratio of TPEAK to TBASE
Storm variables PEDUR
PETOT = QTOT,
PE2 PTOT PIATOT
PFATOT
duration of precipitation excess (PETOT), as used in the compilation of the unit hydrograph (in hours)
the volume of quickflow measured from the flood hydrograph above a "baseflow" separation line (Chiang, 1971) sloping according to:
~QPEAK~ °'s8 S b = 4.14 AREA °'8~ \ ~ ] cub. ft. sec -I day -~
where AREA = area of catchment (in sq. miles); QPEAK = overall flood peak observed (or designed); and Q2.33 = peak with a 2.33 year return period;
most intense two-hour period of precipitation excess (in inches) rainfall in concentrated storm (in inches) initially abstracted storm precipitation, or that part of PTOT prior to
the start of hydrograph rise (in inches) total inches falling after start of flood hydrograph.
Catchment parameters AREA catchment area (in sq. miles) TRAVTIME length of main channel (in miles)
(geometric mean slope of main channel) 0.s where geometric mean slope is defined as the slope of a line drawn
from the outlet on the profile of the main channel having the same area beneath it as the area beneath the actual channel profile.
SINU channel sinuosity, defined as: channel length of longest collector (in miles)
- - 1 valley length of longest collector (in 1-mile chords)
SCG slope of the main channel or geometric mean slope (in ft . /100 ft.) PWAM percentage wooded area of watershed, from U.S.G.S. topographical
maps. SCS-II U.S. Soil Conservation Service potential maximum retention of soil
water plus initial abstraction for condition II (average) moisture (in inches)
Q70 low-flow discharge, equaUed or exceeded 70% of time (csm)
SHAPE catchment shape = (length of longest valley measured in 1-mile chords) 2 catchment area (in sq. miles)
total lengths of all streams (in miles) DDB drainage density = catchment area (in sq. miles) MAP mean annual precipitation (in inches) YMD maximum annual 24-h rain with return period of 2.33 years (in inches)

146
THE PHYSICAL LANDSCAPE
Pennsylvania has a very diverse physical landscape ranging from the dis- sected plateau country in the west and north, through the steeply folded Appalachian Mountains in the center to the undulating Piedmont area of the southeast. The northern and northeastern parts underwent extensive glacia- tion during the Pleistocene era. The northwest is composed of flat-lying sed- imentary rocks little disturbed by tectonic movement while the Valley- and Ridge area of the Appalachians consists of similar sedimentary rocks highly deformed by earth movement. In constrast the southeast is an area of general- ly much older rocks, many of which have undergone metamorphism in a com- plicated geologic history. The sandstones, which constitute a part of most watersheds in the central, western and northern parts of the Commonwealth have much greater water storage properties than do the indurated and little fractured rocks of the southeast. The range of elevation reaches over 1,500 ft. in the north, varies from 600 to 1,200 ft. in the Valley- and Ridge and is less than 600 ft. in the southeast. The relief intensity (ridge-top to valley-bottom) often exceeds 1,000 ft. in the center and north of the Commonwealth. In the Valley-and-Ridge, the valley sides are steep, but the bottoms are much broader, and the divides more sharply crested than in the northwestern plateau country. The Piedmont's rolling topography suggests valleys which are not incised into the landscape except where they cut through ridges of harder rock, or pass over the "Fall Line" onto the Coastal Plain.
The Commonwealth of Pennsylvania had been divided into three flood zones with respect to mean annual flood peaks (White, 1969). These sugges- tions were adopted as a preliminary stratification in an analysis (Heerdegen, 1973) of sources of variation in unit hydrograph shapes. These zones are shown in Fig.2 to contain like numbers of gaged catchments. The differences found in this study between hydrographs from different flood zones that White had based largely upon physiographic provinces (Fenneman, 1928) support the division for curvilinear unit hydrograph synthesis. For conve-
N 5165Q qZgO. ~. l
APPALACHIAN 5495'~:> 5 ~ J ) v ~',~
0 I00 200 kilometers
Fig.2. Pennsylvania with flood zones and 17 study catchments, identified by U.S.G.S. numbers.

147
nience these will be abbreviated as: AP. = Appalachian Plateau; V+R = Valley and Ridge; Pd. = Piedmont.
The 17 watersheds whose 96 hydrographs were studied have been located on Fig.2.
STORM PARAMETERS
Individual storm features may be divided into two groups: precipitation, and precipitation excess. The former is what designers on ungaged streams usually start with from some regional studies (Reich et al., 1970) giving prob- able maximum precipitation or amounts and durations for shorter return periods. Precipitation features studied here include: PTOT, PIATOT and PFATOT as defined in Table I. Precipitation excess is more commonly deter- mined in research involving runoff and flood modeling. For the designer its parameters are far more elusive. Precipitation excess parameters used were: PETOT, PEDUR and PE2.
There is a high degree of interdependence among the storm parameters ex- cept PIATOT. So that research workers should usually only use one storm parameter in seeking regression equations. From the practicing engineer's viewpoint this means that only one of the above storm parameters forms his starting point for design.
It should be noted that the parameters PE2 and PTOT could have been used interchangeably by the researcher. The same was the case for PTOT and PFATOT. PIATOT is independent of all other storm parameters except PTOT. This initial abstraction is a designer's dilemma to which little at tent ion has been given (Hamon, 1964; Cordery, 1970).
SEASONAL AND GEOGRAPHIC CHANGES
An analysis of variance was conducted on each of the storm parameters to find if any significant differences existed across flood zones or between grow- ing and dormant seasons. The growing season, or that period between the average dates of the last 0 ° C minimum temperature and the first 0 ° C mini- mum is longer in the south and southeast of Pennsylvania by two months compared with the elevated regions in the north. The length of the growing season ranges, then, from 120 days to 180 days. Furthermore, that part of the Commonwealth lying north of Pittsburgh and the Valley-and-Ridge area has has a dormant season which is longer than the growing season.
Both PFATOT and PTOT show marked differences by season but little difference by physiographic province. There is also a considerable decrease within each physiographic province by season from a higher total in the growing season to a lower total in the dormant season, a fact which is con- firmed by the meteorological records. The first of these parameters generally is about half an inch less than PTOT. The average PTOT was 3.56 and 2.60

1 4 8
for 31 growing and 65 dormant season floods. It will of course be determined at each location from maps (Kerr et al., 1970).
The differences exhibited by duration of precipitation excess, PEDUR, were significant at the 0.10 and 0.01 levels for season and physiographic province, respectively. For the interaction of these two categories, PEDUR increased substantially from growing to dormant season both in the AP. (9.2--13.1 h) and V + R (4.6--7.8). They remained the same in the Piedmont. This means that the storms which produced our floods were substantially longer during dormant season than growing season throughout AP. and V+R.
For the volume of precipitation excess (PETOT), significant differences exist between physiographic provinces. These averaged 1.23, 0.83, and 0.92 inches of runoff for AP., V+R, and Pd. Also, somewhat lower but significant differences in PETOT were detected between seasons. However, all provinces show an increase in PETOT from growing to dormant season, probably as a result of £he latter's higher antecedent soil moisture status. The highest PETOT aCerag e was f rom 24 dormant season events in AP. of 1.29 inches. The low- est was 0.72 from averaging 9 growing season events in the warmer Pd.
Very real differences exist for PIATOT by season and also by season with- in physiographic province. By season, PIATOT drops from a mean of 0.69 inches in the growing season to 0.37 in the dormant season, and in the Pied- mpn.t, v~here seasonality is most marked, it falls from 0.85 to 0.42 inches from growing to dormant season. This substantiates the proposal that ante- ced~n-tmoisture conditions are much higher in the dormant season and therefore less precipitation is required before effective direct runoff becomes evident.
U N I T H Y D R O G R A P H F E A T U R E S
Peak discharge
It has long been recognized that area is proportional to the peak of the unit hydrograph. Recent studies (Alexander, 1972) indicate that the unit hydrograph peak is theoretically related to area raised to the power of: +0.7 if the peak is expressed in cfs*; and - 0.35 if the peak is expressed in csm*. An exponent o f - 0.329 was obtained by a least-squares log-log fit to the 17 average unit hydrograph peaks for these Pennsylvania catchments, and changed to - 0.374 with the deletion Of four maverick watersheds (see Fig.3).
Further regressions were run, progressively including more watershed and storm parameters, in an a t tempt to obtain a better relationship. One of the resultirlg equations signified by the first line in Table II accounts for 78% of the variance in the unit hydrograph peaks, QPHUH. The latter is a function of the two physiographic parameters AREA and PWAM, and the storm vari-
* A b b r e v a t i o n s : c f s = c u b i c f e e t p e r s e c o n d = 0 . 0 2 8 3 m ~ s e c -~ ;
~" c s m = c f s p e r s q u a r e m i l e = 0 . 0 1 1 m 3 s e c -~ k m -2 .

149
2 0 0
15@
I 0 0
4C
840~ Eqn. Fitted to 13 Catchments with Numbers not underlined
5, 5 x
.... ~o~ 4 7 7 0 _,806.8 _ _ 4 8 0 ~ . ~ r
- 0 0 0 0 X 5495
LEGEND 5575~1~¢)~4290 '-4%5~_ X Appalachian Plateau 4695~ ~465~ 5750
Valley and Ridge
-- Piedmont
Limestone (V. and R.) .450_ 0 X
1'o ~o ~*o Zo ' ~o ' ,~ 200 AREA (square miles)
Fig.3. Average un i t h y d r o g r a p h peak, QPHUH, for each c a t c h m e n t vs. A R E A .
T A B L E II
Regress ion coef f ic ien t s and u n c o r r e c t e d coef f ic ien ts for 7 un i t h y d r o g r a p h pa rame te r s , Y, f rom a l t e rna te p red ic to r s B, C or D in: log Y = a + b (log B) + c (log C) + d (log D) f rom means for each of 17 c a t c h m e n t s wi th 96 f loods
D e p e n d e n t I n t e r c e p t variables Y a
Regression coef f ic ien t s b, c and d for p red ic to r s r 2
P E D U R P E T O T A R E A PWAM MAP
S.E.E.
Q P H U H 2 .8383 0 .4930 - 0 . 4 1 2 4 - 0 . 4 7 7 1 .78 T P E A K 0 .8635 - 0 . 5 4 2 9 0 .2661 .64 T B A S E 0 . 6 0 4 9 0 .1998 0 .3664 .78 T R E C E S S 0 .3603 0 .1891 0 .4701 .72 WIDTH75 0 .0236 - 0 . 3 1 4 9 0 .3215 .54 W I D T H 5 0 0 .2787 0 .3511 .51 T P E A K
- 2 . 1 5 1 6 - 0 . 4 3 3 6 - 0 . 3 3 8 5 1 .1912 .71 T B A S E
.1119
.1016
.0686
.0879
.1684
.1708
.0976
able PEDUR. Area is an effect which cannot be dismissed from any hydro- graph equation because of its influence on the hydrological response of the watershed. PWAM although defined as percentage wooded area is a very good parameter for estimating the water retention qualities of the soil, in Penn- sylvania, because of its association with areas of steep, stony, rocky and agri- culturally unsuitable land. However, in non-forested areas other similar parameters such as the U.S. Soil Conservation Service's S for condition II soil moisture may be tried.

150
Duration of rainfall excess appears to be one of the few storm variables which influence the unit hydrograph to any large extent. There was a signifi- cant difference of QPHUH at the 5% level in an analysis of variance, between storms of less than and greater than 5 h of precipitation excess. By season, unit hydrographs show some difference in QPHUH, the growing season having a mean value of 99.3 csm while the dormant season is considerably less at 77.5 csm. This seasonal variability was noted elsewhere {Reich, 1969) and can be accepted rationally. Variation in response to duration of precipi- tation excess, PEDUR, is a contradiction of unit hydrograph theory. What is important to practitioners, however, is that PEDUR can be entered into the predictive equation at different values to see its effect on the predicted unit hydrograph.
Fig.4 is a plot of QPHUH versus AREA for the whole sample of 96 events. The mean values, QPHUH, of these 1-h unit hydrographs for the 17 catch- ments are freed of the individual variation of QPHUH from each catchment on different floods, in Fig.3. These figures are included to remind the person concerned with estimation of QPHUH that variation within a watershed exists for a large number of reasons. It is felt by Lee (in preparation) that much of this variation can be explained by variation in antecedent moisture and storm conditions.
+ '~ ~oo ,~1,o o]~
X CATCHMENT NUMBERS
Underlined Catchments were Considered Unrepresentative
x x
x
+ x
i o o f...
9 0 +-
8 0 , k o °
6O
50
40
30
LEGEND
X A p p a l a c h i a n P l a t e a u
"J" V a l l e y and Ridge
-- P iedmont
L i m e s t o n e (V. and R.)
÷ + -
+
=
+
x x :
- -'X + X - _
I- + × X $ = × $ X $ -
X +it_ x - + ~ _
t+ x j_ X ÷
+ } + ×
2 0 = , , , , , , , , , , , , +, , X
4 5 6 7 8 I0 20 50 4 0 5 0 6 0 80 I00 A R E A ( S Q U A R E M I L E S )
Fig.4. Indiv idual Q P H U H f r o m each o f 96 f loods observed on 17 c a t c h m e n t s .

151
It should be noted that watersheds which are characterized by detent ion qualities such as extreme stoniness, lakes, reservoirs, or cavernous limestone geology viz. 0000, 4500, 4695, and 5465 in that order, will produce lower peak discharges than catchments with limited storage. The low positions of their QPHUH in Fig.3 confirms this correlation with field conditions. By rights new regression equations should be obtained for the remaining 13 catchments as has been done (Reich and Wolf, 1973) for synthetic triangular hydrographs. For these reasons, prediction equations in Table II were not presented in their usable form after correction so that the mean of their pre- diction equals the mean of the observed data.
Baselength
The regression equation for baselength in Table II has an r 2 of 0.78 which is significant at the 0.01 level, merely by using two parameters, AREA and PWAM. Since PWAM varies considerably between physiographic provinces in Pennsylvania averaging 24% in the Piedmont, 50% in the Appalachian Plateau and 60% in the Valley-and-Ridge it is a very good regional parameter. The analysis of variance showed that significant differences were apparent in the TBASE of the unit hydrograph by physiographic province, especially be- tween the Piedmont and the rest of the Commonwealth. Also, when TBASE was grouped by PWAM the mean TBASE for PWAM of greater than 40% was 41 h while for those catchments with a wooded area of less than 40% it was 28 h.
When TBASE is plot ted against the low-flow parameter Q70 in Fig.5 very little relationship is at first apparent. However, the plot can be subdivided
6O oxx\~ ~ ~. /
.og: ?/4
2O
O. 2 0.3 0.4 0.6 0.8 Q?O (csm)
Fig.5. Relationships for TBASE from low-flow parameter Q70.

152
into several groups: (1) unglaciated and glaciated Appalachian Plateau; (2) upland and lowland Piedmont; and (3) Valley-and-Ridge.
The catchments lying on the glaciated parts of the Appalachian Plateau have considerably higher low-flow than those on the unglaciated section be- cause of the great thickness of ou/~wash gravels lying beneath them. The Valley-and-Ridge catchments also lie close to the glaciated Plateau catch- ments on the plot because of additional storage in the sandstone divide ridges. In contrast, the TBASE of the Piedmont watersheds are little affected by Q70 variations. The three catchments which lie on the upper part of the Piedmont show almost no change in baselength with changes in Q70 while the two catchments which lie abreast the "Fall Line" have much shorter and similar length TBASE. However, there are very wide differences in their respective Q70, which is an unusual occurrence for two catchments lying side by side.
Width of the unit hydrograph
Table II indicates that the variation in WIDTH50 and WIDTH75 is con- siderably higher than in other unit hydrograph variables. These dimensions are influenced by many interacting factors such as rainfall duration, initial discharge at the time of rise, antecedent moisture conditions, volume of runoff at the QPHUH. It is significant that the equation for WIDTH75 con- tains a storm parameter, because unit hydrograph theory classically dis- counted the influence of storm parameters upon the model.
CONCLUSIONS"
This paper has not proposed specific formulae for prediction of floods from unit hydrographs. It has shown that the prediction process may be refined by the judicious use of regression equations, graphical inspection of data, combined with field knowledge of the catchments.
The s tudy shows that variations in runoff are generally dependent on a few catchment parameters, especially area and percent wooded area, while storm variables do account for a little of the variation within a catchment. However, no satisfactory method has yet been found to predict the magni- tude of the rarely occurring event, and in this study, there was no apparent relationship between such events and all the available variables. Cognizance of variation above an "average" hydrograph will always have to be taken by devices like a safety factor.

153
REFERENCES
Alexander, G.N., 1972. Effect of catchment area on flood magnitude. J. Hydrol. , 16: 225--240
Chiang, S.L., 1971. Calibration of Watershed Wetness and Prediction of F lood Volume from Small Watersheds in Humid Regions. Ph.D. Thesis, Dept. of Civil Eng., The Penn- sylvania State University, University Park, Pa., 164 pp.
Cordery, I., 1970. Initial loss for f lood estimation and forecasting. Proc. ASCE, 97, HY12: 2447--2466
Fenneman, N.M., 1928. Physiographic divisions of the United States. Ann. Assoc. Am. Geograph., 18 :261- -353
Hamon, W.R., 1964. Computat ion of direct runoff amounts from storm rainfall. Int. Assoc. Sci. Hydrol. , Publ., 6 3 : 5 2 - - 6 2
Heerdegen, R.G., 1973. The Effects of Physiography and Climate on Unit Hydrographs. M.S. Thesis, Dept. of Civil Eng., The Pennsylvania State University, University Park, Pa., 104 pp.
Kerr, R.L., McGinnis, D.F., Reich, B.M. and Rachford, T.M., 1971. Analysis of Rainfall-- Durat ion--Frequency for Pennsylvania. Institute for Research on Land and Water Resources, Penn. State Univ., Publ. 70, 152 pp.
Lee, B.H., in preparation. A Method of Incremental Runoff Prediction. Ph.D. Thesis, Department of Civil Eng., The Pennsylvania State University
Newton, D.W. and Vinyard, J.W., 1967. Computer-determined unit hydrograph from floods. Proc. ASCE, 93, HY5:219- -235
Reich, B.M., 1969. Discussion on "Design Hydrographs for Pennsylvania Watersheds," by J.E. McSparran. Proc. ASCE, 95, HY3:1065- -1068
Reich, B.M. and Wolf, D.A., 1973. The Triangle as a Tentative Unit Hydrograph. Paper to 1st World Congr. Int. Water Resour. Assoc., Chicago, 20 pp.
Reich, B.M., McGinnis, D.F. and Kerr, R.L., 1970. Design Procedures for Rainfall--Dura- t i o n - F r e q u e n c y in Pennsylvania. Insti tute for Research on Land and Water Resources, University Park, Pa., Publ. 65, 60 pp.
White, E.L., 1969. Regional Trends in Flood Parameters for Small Watersheds in Penn- sylvania. M.S. Thesis, Dept. of Civil Eng., The Pennsylvania State University, University Park, Pa., 117 pp.