epr and optical absorption spectral studies on voglite mineral
TRANSCRIPT
This is the author version published as: This is the accepted version of this article. To be published as : This is the author version published as: Catalogue from Homo Faber 2007
QUT Digital Repository: http://eprints.qut.edu.au/
Frost, Ray L. and Reddy, S. Lakshmi and Maheswaramma, K. Sesha and Reddy, G. Siva and Reddy, B. Jagannadha and Endo, Tamio (2010) EPR and optical absorption spectral studies on voglite mineral. Spectrochimica Acta Part A : Molecular and Biomolecular Spectroscopy, 77(1). pp. 11-15.
Copyright 2010 Elsevier
EPR AND OPTICAL ABSORPTION SPECTRAL STUDIES ON VOGLITE MINERAL
S. Lakshmi Reddy1, K.Sesha Maheswaramma2, G.Siva Reddy3, B.J. Reddy4,
Ray L Frost4* and Tamio Endo5
1. Dept. of Physics, S.V.D. College, Kadapa 516 003, India. 2. Dept. of Chemistry, JNTUCollege of Engineering, Pulivendala, Kadapa, India. 3. Dept. of Chemistry, S.V.University, Tirupati 517 502, India. 4. Inorganic Materials Research Program, Queensland University of Technology 2 George Street, Brisbane, GPO Box 2434, Queensland 4001, Australia.
5. Faculty of Engineering, Mie University, TSU, Mie 514 8507, Japan *Corresponding author email: [email protected] Key words: EPR, optical absorption, copper, manganese, iron, voglite. Abstract
A voglite mineral sample of Volrite Canyon #1 mine, Frey Point, White Canyon Mine District, San Juan County, Utah, USA is used in the present study. An EPR study on powdered sample confirms the presence of Mn(II) and Cu(II). Optical absorption spectral results are due to Cu(II) which is in distorted octahedron. NIR results are indicating the presence of water fundamentals. 1.1 Introduction
A significant number of compounds contain the uranyl ion.[1-4]. The study of the
uranyl carbonates was undertaken since a long time due to its wide distribution [5,6].
Uranyl carbonates may be classified into tri-carbonates and a mono/single-carbonates. Uranyl carbonate mineral voglite is a rare mineral resulting from the oxidation of uraninite with a formula of some uncertainty is given as Ca2Cu2[(UO2)(CO3)3](CO3)6H2O[3,7-11]. The mineral is monoclinic, with cell dimensions a = 25.97, b = 24.5, c = 10.7 Å and with probable space group P21 or P21/m.The mineral is composed of tubular to scalar crystals in parallel stacked aggregates. Voglite is radioactive (>70 Bq/gm) as defined in 49 CFR 173.403. Green granular voglite mineral from Volrite Canyon #1 mine, Frey Point, White Canyon Mine District, San Juan County, Utah, USA is used in the present work. Its chemical analysis is reported and is also compared with other origins [8]. The analysis is presented in Table 1.
Table 1 Chemical analysis of Voglite mineral from different origins
Element Utah, USA Czech Republic Wt% Wt%
CaO 14.72 14.09
UO2 35.44 37.0
UO3 ---- 37.54
CuO 10.44 8.40
H2O 14.19 13.9
CO2 23.11 26.41
Total oxide 97.90 99.8 But from the Table-1 it is clear the chemical analysis varies from place to place. Also CuO and CO2 have major changes composition.
Spectroscopic techniques like electron paramagnetic resonance (EPR) spectroscopy, optical absorption spectroscopy, infrared and Raman spectroscopies are widely employed for the study and analysis of uranyl containing minerals. Geochemically, Cu(II), Mn(II) and Fe(III) occur not only in many mineral groups but also in other natural environments like herbs, trees and fossils. These ions though present at low concentrations, affect the characteristics of compounds and thus their use in industry, medicine, etc.[12] Electron paramagnetic resonance (EPR) technique is quite useful to assess these impurities when present in lower concentrations. Electron paramagnetic resonance occurs between spin sub levels emerging in the external magnetic field following the splitting of the ground orbital state of the atom. In optical absorption spectroscopy, transitions proceed between orbital levels. Thus EPR spectroscopy is a natural sequel to optical spectroscopy. Thus optical absorption not only supplements but also complements the EPR results [13]. These techniques serve to find information about the molecular structure of minerals that is not obtained through X-ray diffraction (XRD) techniques using single crystal or powder. Further, no information on the orientation of hydroxyl groups will be obtained by XRD. No attempt, so far, has been made with respect to optical absorption and electron paramagnetic resonance (EPR) studies on voglite mineral. Therefore in this work the authors report the EPR, optical absorption, NIR spectral studies of voglite mineral at room temperature [12]. 1.2 Experimental
The EPR spectrum of the powdered voglite mineral is recorded at room temperature (RT) on JEOL JES-TE100 ESR spectrometer operating at X-band frequencies ( = 9.38253 GHz, modulation 0.2 mT with 1mW power and amplitude 10),
having a 100 KHz field modulation to obtain a first derivative EPR spectrum. DPPH with a g value of 2.0036 is used for g factor calculations. Optical absorption spectrum of the compound is recorded at RT on Carey 5E UV Vis-NIR spectrophotometer in mull form in the range 200-1500 nm.
Band component analysis was undertaken 96 using the Jandel “PEAKFIT”
software package which enabled the type of fitting function to be selected and specific parameters to be fixed or varied accordingly. Band fitting was carried out using a Lorentz–Gauss cross product function with a mini100mum number of component bands used for the fitting process. The Lorentz–Gauss ratio was maintained at values greater than 0.7 and fitting was undertaken until reproducible results were obtained with squared correlations of r2 greater than 0.997 1.3 Theory
Several EPR parameters such as g, A, D and E are employed while interpreting EPR spectrum. The g parameter is a measure of the coupling between the unpaired electron's spin angular momentum (S) with its orbital angular momentum (L) [14]. The unpaired electron interacts (couples) with the nuclear spin (I) to form a (2I + 1) line hyperfine structure centered on g and spaced with the distance quantified by the hyperfine coupling parameter A. The coupling between the nuclear and electron spins becomes stronger as the A parameter becomes larger. The combination of g and A parameters can be utilized to differentiate between electron environments of Fe3+ and Mn2+ ions. The EPR zero field splitting (ZFS) parameters, D and E, measure the deviation of the ion crystal field from ideal tetrahedral or octahedral symmetries and they apply to ions with more than one unpaired electron, e.g., low field Fe3+ and Mn2+. However, the broad nature of EPR spectra of Fe3+ makes the determination of D and E difficult [15]. Mn(II), being a d5 ion, has total spin S = 5/2. This state splits into three Kramers’ doublets, ±5/2>, ±3/2>and ±1/2> separated by 4D and 2D respectively where D is the zero-field splitting parameter. The deviation from axial symmetry leads to a term known as E in the spin Hamiltonian. The value of E can be easily calculated from single crystal measurements. A non-zero value of E results in making the spectrum unsymmetrical about the central sextet.
Cu(II) has an electronic configuration [Ar] 3d9. In an octahedral crystal field, the corresponding ground state electronic configuration is t2g
6eg3 which yields 2Eg term. The
excited electronic configuration, t2g5eg
4 , corresponds to 2T2g term. Hence single electron transition 2Eg
2T2g is expected in an octahedral crystal field. Normally, the ground 2Eg state splits due to Jahn-Teller effect and hence lowering of symmetry is expected for Cu(II) ion. This state splits into 2B1g(dx
2-y2) and 2A1g(dz
2) states in tetragonal symmetry and the excited term 2T2g also splits into 2B2g(dxy) and 2Eg(dxz,dyz) levels. In rhombic field, 2Eg ground state splits into 2A1g(dx
2-y2) and 2A2g(dz
2) whereas 2T2g splits into 2B1g(dxy),
2B2g(dxz) and 2B3g(dyz) states. Thus, three bands are expected for tetragonal (C4v) symmetry and four bands are expected for rhombic (D2h) symmetry. The wave numbers of the three transitions in the tetragonal field are given by the following equations [16] 2B1g 2A1g : 4Ds + 5Dt
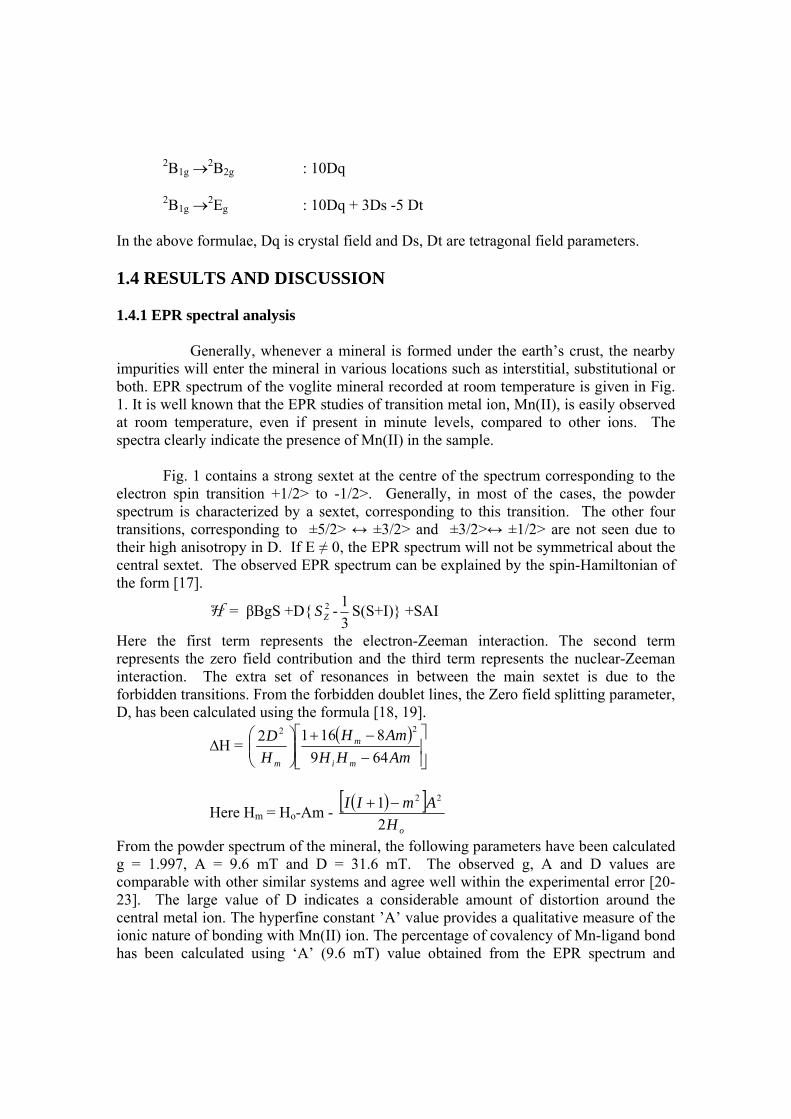
2B1g 2B2g : 10Dq 2B1g 2Eg : 10Dq + 3Ds -5 Dt In the above formulae, Dq is crystal field and Ds, Dt are tetragonal field parameters. 1.4 RESULTS AND DISCUSSION 1.4.1 EPR spectral analysis Generally, whenever a mineral is formed under the earth’s crust, the nearby impurities will enter the mineral in various locations such as interstitial, substitutional or both. EPR spectrum of the voglite mineral recorded at room temperature is given in Fig. 1. It is well known that the EPR studies of transition metal ion, Mn(II), is easily observed at room temperature, even if present in minute levels, compared to other ions. The spectra clearly indicate the presence of Mn(II) in the sample. Fig. 1 contains a strong sextet at the centre of the spectrum corresponding to the electron spin transition +1/2> to -1/2>. Generally, in most of the cases, the powder spectrum is characterized by a sextet, corresponding to this transition. The other four transitions, corresponding to ±5/2> ↔ ±3/2> and ±3/2>↔ ±1/2> are not seen due to their high anisotropy in D. If E ≠ 0, the EPR spectrum will not be symmetrical about the central sextet. The observed EPR spectrum can be explained by the spin-Hamiltonian of the form [17].
H = βBgS +D{ 2ZS -
3
1S(S+I)} +SAI
Here the first term represents the electron-Zeeman interaction. The second term represents the zero field contribution and the third term represents the nuclear-Zeeman interaction. The extra set of resonances in between the main sextet is due to the forbidden transitions. From the forbidden doublet lines, the Zero field splitting parameter, D, has been calculated using the formula [18, 19].
∆H =
AmHH
AmH
H
D
mi
m
m 649
8161222
Here Hm = Ho-Am -
oH
AmII
2
1 22
From the powder spectrum of the mineral, the following parameters have been calculated g = 1.997, A = 9.6 mT and D = 31.6 mT. The observed g, A and D values are comparable with other similar systems and agree well within the experimental error [20-23]. The large value of D indicates a considerable amount of distortion around the central metal ion. The hyperfine constant ’A’ value provides a qualitative measure of the ionic nature of bonding with Mn(II) ion. The percentage of covalency of Mn-ligand bond has been calculated using ‘A’ (9.6 mT) value obtained from the EPR spectrum and
Matumura’s plot [24]. It corresponds to an ionicity of 96%. Also the approximate value of hyperfine constant (A) is calculated by using covalency (C) equations [25,26]
Aiso = (2.04C – 104.5) 10-4 cm-1. The value obtained is 91x 10-4 cm-1. This calculated value agrees well with the
observed hyperfine constant for the sample indicating ionic character for Mn-O bond in the mineral under study. The number of ligands around Mn(II) ion is estimated using the covalency [27] equation for C
2035.016.011
qpqp XXXXn
C
Here XP and Xq represent electronagativities of metal and ligand. Assuming Xp = XMn = 1.4 and Xq = XO = 3.5, the number of ligands (n) obtained are 30. This suggests that Mn(II) may be surrounded by six 2
3CO . Further the g value for the hyperfine splitting is
indicative of the nature of bonding. If the g value shows negative shift with respect to free electron g value of 2.0023, the bonding is ionic and conversely, if the shift is positive, the bonding is more covalent in nature [28]. In the present work, from the observed negative value of 5.3x10⁻³, it is apparent that the Mn(II) is in an ionic environment. Depending on the charge considerations, the impurity might have entered the lattice in place of Ca(II).
EPR spectrum of mineral reveals that in between third and fourth manganese hyperfine resonance lines a very sharp peak at (33.5 mT) having a g value 2.001 and a peak at (32.6 mT) having a g value 2.063, are observed. These can be ascribed to a radical such as 2
3CO , because the mineral contains CO3 as a constituent. The absence of
any super hyperfine structure in the radical suggests that the radical may be 23CO [29].
To know the ions which are responsible for low field resonances in the spectrum, amplitude is changed from 10 to 100 without change in magnetic field scale and the same is recorded as above (Fig.1) on left side. The overall spectrum is normally symmetric with two components of g. From the EPR spectrum on low magnetic field side the g values obtained are g11 = 2.27 and g = 2.19. As the mineral contains a very high percentage of copper the hyperfine lines due to Cu(II) could not be resolved. Even though the g values are in agreement with previously reported data. [30,\31]. When the sample cooled to 77 K, an EPR spectrum similar to RT has been obtained with a slight reduction in line width. If g11 > g , the ground state is 2B1g, where as if g >g11 or if g11 = 2.00, the ground state is2A1g. Further tetragonal cupric complexes with D4h generally have g11 (corresponding to the magnetic field along the Z axis of the complexes) > g >2.04 have the ground state 22 yx
d
[32-34]. In the present case g11 > g >2.00
(2.27>2.19>2.00) and hence the ground state is 2B1g ( 22 yxd
).
The EPR spectrum of the mineral exhibits a weak resonance centered at g = 2.39.
It is attributed to the presence of isolated Fe(III) ion incorporated as an impurity in the mineral [35]. P..S. Rao, Spectrochim. Acta A 52 (1996) 1127–1134.
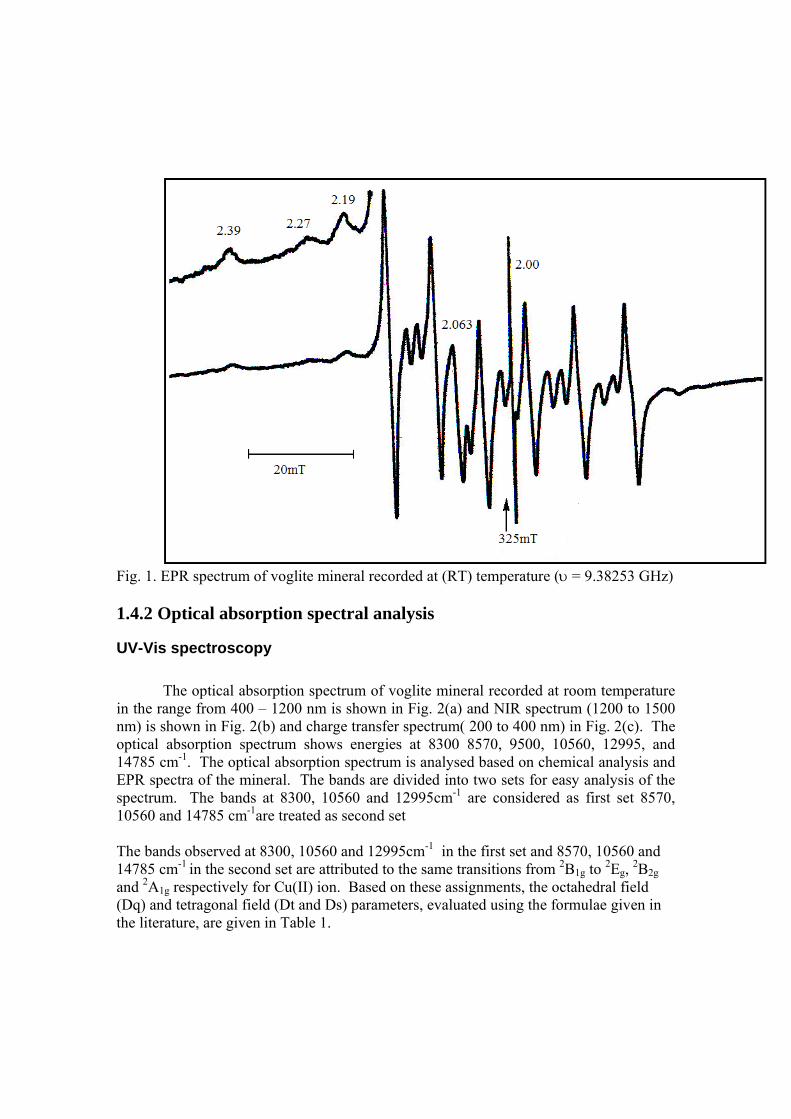
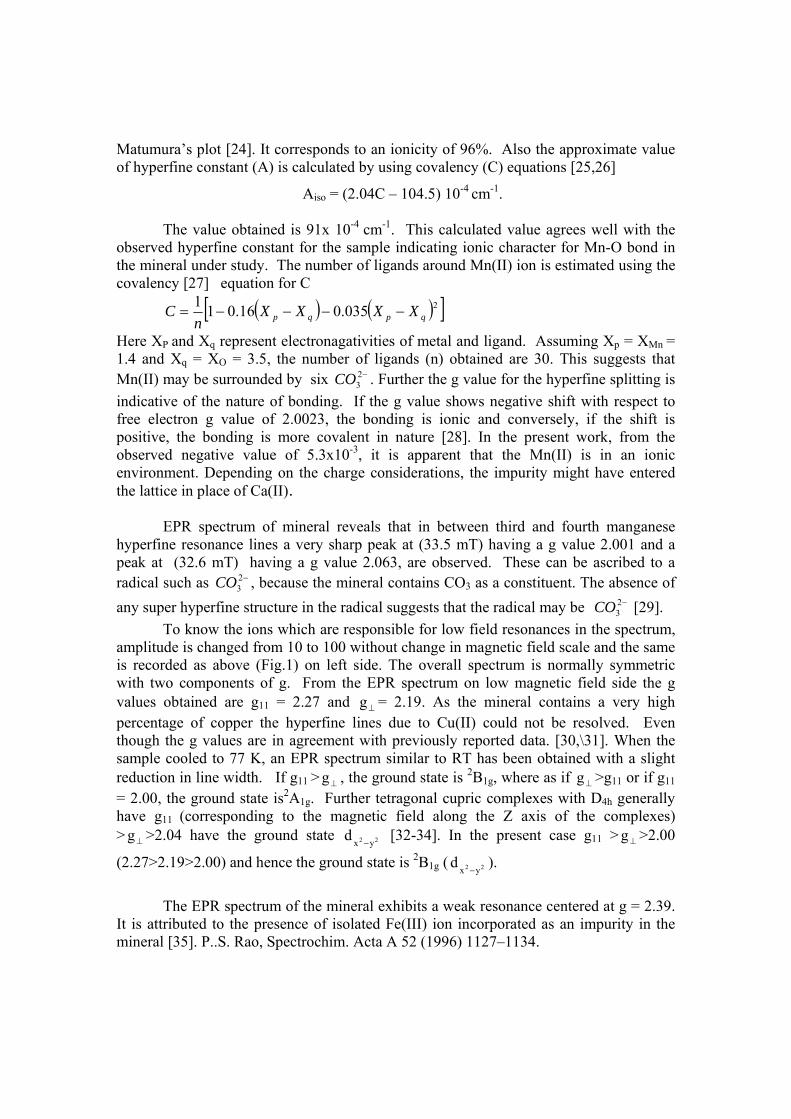
Fig. 1. EPR spectrum of voglite mineral recorded at (RT) temperature ( = 9.38253 GHz) 1.4.2 Optical absorption spectral analysis
UV-Vis spectroscopy
The optical absorption spectrum of voglite mineral recorded at room temperature
in the range from 400 – 1200 nm is shown in Fig. 2(a) and NIR spectrum (1200 to 1500 nm) is shown in Fig. 2(b) and charge transfer spectrum( 200 to 400 nm) in Fig. 2(c). The optical absorption spectrum shows energies at 8300 8570, 9500, 10560, 12995, and 14785 cm-1. The optical absorption spectrum is analysed based on chemical analysis and EPR spectra of the mineral. The bands are divided into two sets for easy analysis of the spectrum. The bands at 8300, 10560 and 12995cm-1 are considered as first set 8570, 10560 and 14785 cm-1are treated as second set
The bands observed at 8300, 10560 and 12995cm-1 in the first set and 8570, 10560 and 14785 cm-1 in the second set are attributed to the same transitions from 2B1g to 2Eg,
2B2g and 2A1g respectively for Cu(II) ion. Based on these assignments, the octahedral field (Dq) and tetragonal field (Dt and Ds) parameters, evaluated using the formulae given in the literature, are given in Table 1.
Table 1
Observed and calculated energies of the bands with their assignments in voglite
For Cu(II): Site I Ds = 1534, Dt = 433 and Dq = 1056 cm-1 Site II Ds = 1828, Dt = 252 and Dq = 1056 cm-1
Site I Site II Transitionfrom 2B1g
Wave length
(nm)
Wave number (cm-1) Wave length
(nm)
Wave number (cm-1)
Observed Calculated Observed Calculated
1204
946.7
769.4
8300
10560
12995
8301
10560
12997
1167
946.7
676.3
8570
10560
14785
8572
10560
14784
2A1g
2B2g
2Eg
The same sign obtained for Dq and Dt indicates an axial elongation in the tetragonal field and also confirms the ground state [36,37]. Since, two copper ions are present, one will form one set and the other form another set. This may be the reason for obtaining two types of copper(II) ions in the optical spectrum.
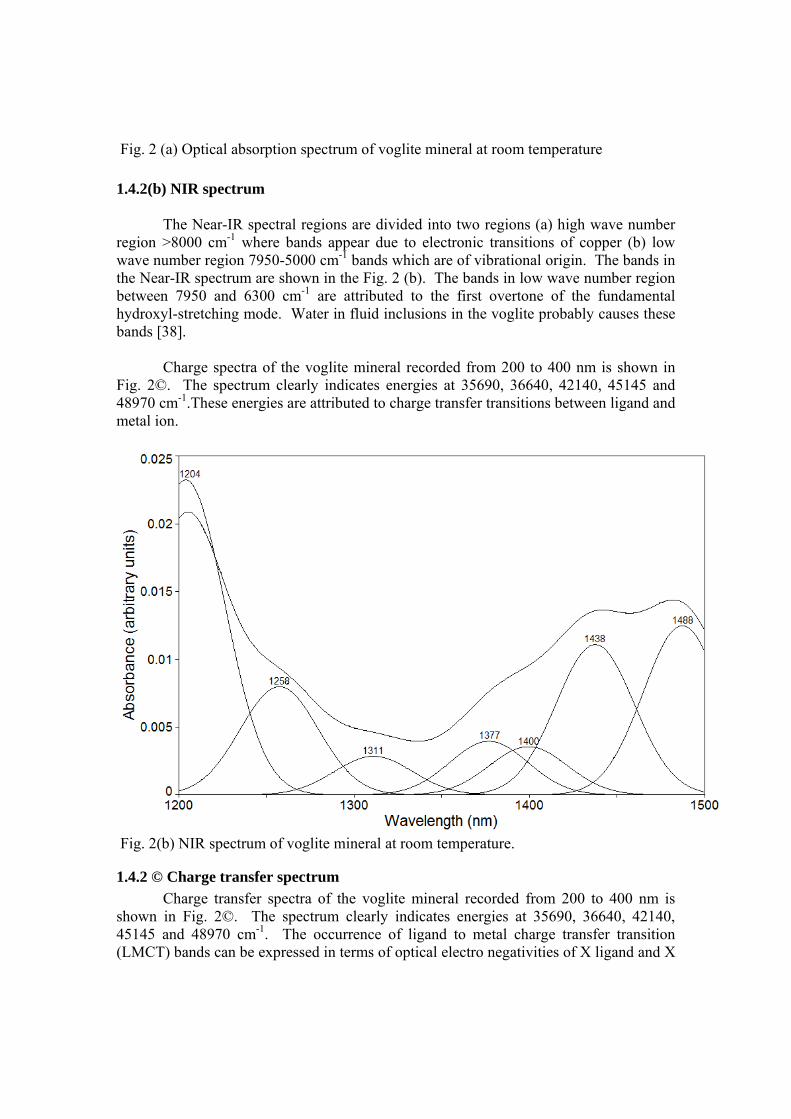
Fig. 2 (a) Optical absorption spectrum of voglite mineral at room temperature
1.4.2(b) NIR spectrum
The Near-IR spectral regions are divided into two regions (a) high wave number
region >8000 cm-1 where bands appear due to electronic transitions of copper (b) low wave number region 7950-5000 cm-1 bands which are of vibrational origin. The bands in the Near-IR spectrum are shown in the Fig. 2 (b). The bands in low wave number region between 7950 and 6300 cm-1 are attributed to the first overtone of the fundamental hydroxyl-stretching mode. Water in fluid inclusions in the voglite probably causes these bands [38].
Charge spectra of the voglite mineral recorded from 200 to 400 nm is shown in Fig. 2©. The spectrum clearly indicates energies at 35690, 36640, 42140, 45145 and 48970 cm-1.These energies are attributed to charge transfer transitions between ligand and metal ion.
Fig. 2(b) NIR spectrum of voglite mineral at room temperature.
1.4.2 © Charge transfer spectrum
Charge transfer spectra of the voglite mineral recorded from 200 to 400 nm is shown in Fig. 2©. The spectrum clearly indicates energies at 35690, 36640, 42140, 45145 and 48970 cm-1. The occurrence of ligand to metal charge transfer transition (LMCT) bands can be expressed in terms of optical electro negativities of X ligand and X
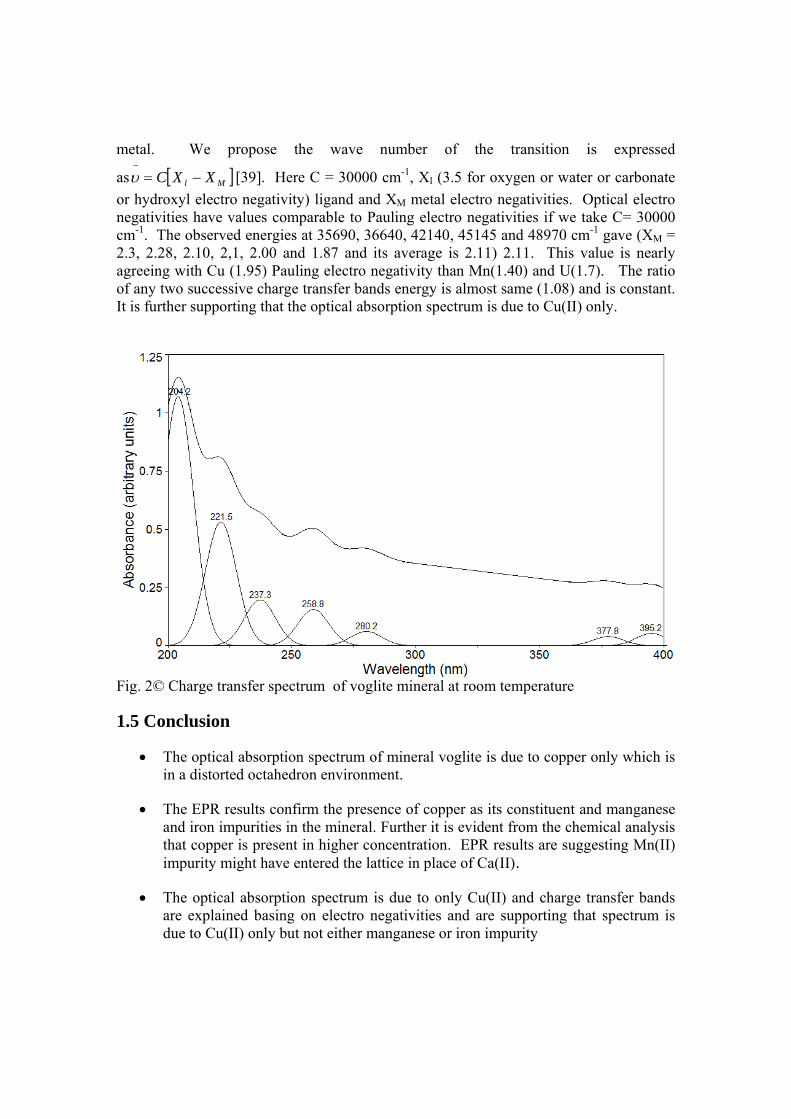
metal. We propose the wave number of the transition is expressed
as Ml XXC
[39]. Here C = 30000 cm-1, Xl (3.5 for oxygen or water or carbonate
or hydroxyl electro negativity) ligand and XM metal electro negativities. Optical electro negativities have values comparable to Pauling electro negativities if we take C= 30000 cm-1. The observed energies at 35690, 36640, 42140, 45145 and 48970 cm-1 gave (XM = 2.3, 2.28, 2.10, 2,1, 2.00 and 1.87 and its average is 2.11) 2.11. This value is nearly agreeing with Cu (1.95) Pauling electro negativity than Mn(1.40) and U(1.7). The ratio of any two successive charge transfer bands energy is almost same (1.08) and is constant. It is further supporting that the optical absorption spectrum is due to Cu(II) only.
Fig. 2© Charge transfer spectrum of voglite mineral at room temperature
1.5 Conclusion
The optical absorption spectrum of mineral voglite is due to copper only which is in a distorted octahedron environment.
The EPR results confirm the presence of copper as its constituent and manganese and iron impurities in the mineral. Further it is evident from the chemical analysis that copper is present in higher concentration. EPR results are suggesting Mn(II) impurity might have entered the lattice in place of Ca(II).
The optical absorption spectrum is due to only Cu(II) and charge transfer bands are explained basing on electro negativities and are supporting that spectrum is due to Cu(II) only but not either manganese or iron impurity
NIR results confirm the presence of water fundamentals, which also supports the formula of the mineral.
1.6 References 1. Whittle AWG. J. Geol. Soc. Aust.,2 (1955) 21. 2. Urbanec Z, Cejka J. Collect. Czech. Chem. Commun. 1974; 39: 2891. 3 . Urbanec Z, Cejka J. Collect. Czech. Chem. Commun. 1979; 44: 10. 4. Urbanec Z, Cejka J. Collect. Czech. Chem. Commun. 1979; 44: 1. 5. Neumann H, Bryn KO. Avhandl. Norske Videnskaps-Akad. Oslo.,I., Mat.-Naturv. Kl., 1958. 6 Huang CK, Kerr PF. Am. Mineral. 45 (1960)311. 7. Piret P (1979) New crystal data for Ca, Cu, UO2 hydrated carbonat: voglite, Journal of Applied Crystallography, 12, 616. 8. Anthony JW, Bideaux RA, Bladh KW, Nichols MC. Handbook of Mineralogy Vol.V. Borates, Carbonates, Sulfates. Mineral Data Publishing: Tucson, Arizona, 2003.18. 9. Ondrus P, Veselovsky F, Hlousek J, Skala R, Vavrin I, Fryda J, Cejka J, Gabasova A. J. Czech. Geol. Soc. 42 (1997) 3. 10. Axelrod JM, Grimaldi FS, Milton C, Murata KJ. Am. Mineral. 36 (1951) 1. 20. 11. Antipoff JA. Verh. Kais. Russ. Min. Ges. 1900; 38: 38.
12. R. L. Frost, J.C. ejka,G. A. Ayoko and M. J. Dickfos, J. Raman Spectrosc. 39 (2008) 374–379 13. . A.S. Marfunin, Physics of Minerals and Inorganic Materials, Springer-Verlag, Moscow, 1979. 14. M. Symons, “Chemical & Biological Aspects of Electron Spin Resonance Spectroscopy”, John Wiley & Sons, New York (1978.). 15. De Vos, D.E., B.M. Weckhuysen, and T. Bein., J. Am. Chem. Soc. 118 (1996) 9615 16. M.A.Hitachmann and T.D.Waite, Inorg.Chem.,15, (1976) 2150 17. A. .Abragam, B.Bleancy, “Electron Paramagnetic Resonance of Transtion Ions”, Oxford University Press, (1970) p187 18. B. Bleancy, R.S.Rubins, Proc. Phys. Soc. 77 (1961) 103 19. J.M. Nedelec, M.Bouazaoui, S. Turrell, Phys.Chem. Glasses, 40 (1999) 264 20. S. Lakshmi Reddy, N.C. Gangi Reddy, G. Siva Reddy,B. Jagannatha Reddy, Ray L. Frost, Spec.Chim Acta 65 (2006) 684 . 21 S.Lakshmi Reddy, K.N.M.Reddy, G.Siva Reddy, B.J.Reddy, R.L.Frost and Tamio Endo, Spec.Chim Acta 69(2008) 503. 22 C.P.Lakshmi Prasuna, K.V.Narasimhulu, N.O.Gopal, J.Lakshmana Rao, T.V.R.K.Rao, Spec. Chim. Acta 60 (2004) 2305. 23. P.Schindler, Am. Miner. 55,1889 (1970). 24. O. .Matumura, J.Phys.Soc.Japan, 14 (1959) 108. 25. E. Simanck, K.A. Muller, J. Phys. Chem. Solids 31 (1970) 1027. 26. A.M.F. Benial, V.Ramakrishnan, R.Murugesan, Spec. Chim Acta A 55 (1999) 2573. 27. E. Simanck, K.A. Muller, J. Phys. Chem. Solids 31 (1970) 1027 28. V. Wieringen, Discuss. Faraday Soc. 19 (1955) 118.
29. R.W.A. Franco, F.Pelegrini and A.M. Rossi, Phys.Chem. Minerals, 30 (2003) 39. 30. S.N. Rao, Y.P. Reddy, P.S. Rao, Solid State Commun. 78 (1991)1025. 31. B.J. Reddy, P. Sreeramulu, K. Ramesh and Y.P. Reddy, An. Asoc. Qumic. Argentina, 26 (1988) 297. 32. E.L. Solomon, D.L. Michael, The proceedings of the first International Conference on The chemistry of the Copper and Zinc Triads, Uni. of Edinburgh, U.K. (1992) 12. 33. A.A. Gewirth, S.L. Colien, H.J. Schugar, E.I. Solomon, Inorg. Chem. 26 (1987) 1133. 34. D. Attanasio, I. Collamati, C. Ercolani, J. Chem. Soc. Dalton Trans. (1974) 35. P.S. Rao, Spectrochim. Acta A 52 (1996) 1127–1134. 36. J. Fergusen, J.E. Wood, H.J. Guggenhein, Inorg. Chem. 14 (1975)177 37. B.J. Hathaway, D.E. Billing, Coord. Chem. Rev. 5 (1970) 134. 38. G.R. Hunt, J.W. Salisbury, C.J. Lenhoff, Mod. Geol. 3 (1971) 1.
39. K.Naga Krishna Vani, “A Text Book of Coordination Chemistry”, ‘Kalyani Publishers’, Hyderabad, India pp 149 (2002).