environmental and social impact assessment - bp
TRANSCRIPT
République Islamique de
MauritanieHonneur-Fraternité-Justice
Ministère de l’Environnement et duDéveloppement Durable
Direction du ContrôleEnvironnemental
République du
SénégalUn peuple-Un but-Une foi
Ministère de l’Environnement et duDéveloppement Durable
Direction de l’Environnement et desÉtablissements Classés
Greater Tortue / Ahmeyim Phase 1 Gas Production Project
Environmental and Social Impact AssessmentConsolidated Final Report Including Regulatory Reviews from Mauritania and Senegal
In partnership with
ESIA report produced by
Volume 5 of 7June 2019
ESIA FOR THE GREATER TORTUE/AHMEYIM PHASE 1 GAS PRODUCTION PROJECT
Ref. No. : 1653939
The report on the environmental and social impact assessment for the Greater Tortue/Ahmeyim Phase 1 Gas Production Project is divided into 7 volumes as follows:
Volume 1: The Non-Technical Summary, the list of Main Contributors to the ESIA, the Table of Contents, the list of Abbreviations and Acronyms, as well as Chapters 1 to 6
Volume 2: Chapter 7
Volume 3: Chapters 8 to 11 as well as the Bibliography and References
Volume 4: Appendices A to J
Volume 5:
Volume 6:
Volume 7:
Appendices K to O
Appendices P to R
Appendices S to Y
The present document is Volume 5 which contains:
Appendix K - Water Discharges Calculations and Produced Water Modeling Report
Appendix L - Muds and Cuttings Dispersion Modeling Report
Appendix M - Plankton Entrainment Modeling Report
Appendix N - Accidental Event Scenarios Modeling Reports
Appendix O - Risk Study Support Material
ESIA FOR THE GREATER TORTUE/AHMEYIM PHASE 1 GAS PRODUCTION PROJECT
Ref. No.: 1653939
APPENDIX K : WATER DISCHARGES CALCULATIONS AND PRODUCED WATER MODELING REPORT

ESIA FOR THE GREATER TORTUE/AHMEYIM PHASE 1 GAS PRODUCTION PROJECT
Ref. No.: 1653939
Appendix K Water Discharges Calculations and Produced Water Modeling Report
APPENDIX CONTENTS
K-1 Water Discharges Calculations
K-2 Produced Water Modeling Report
ESIA FOR THE GREATER TORTUE/AHMEYIM PHASE 1 GAS PRODUCTION PROJECT
Ref. No.: 1653939
APPENDIX K-1 : WATER DISCHARGES CALCULATIONS
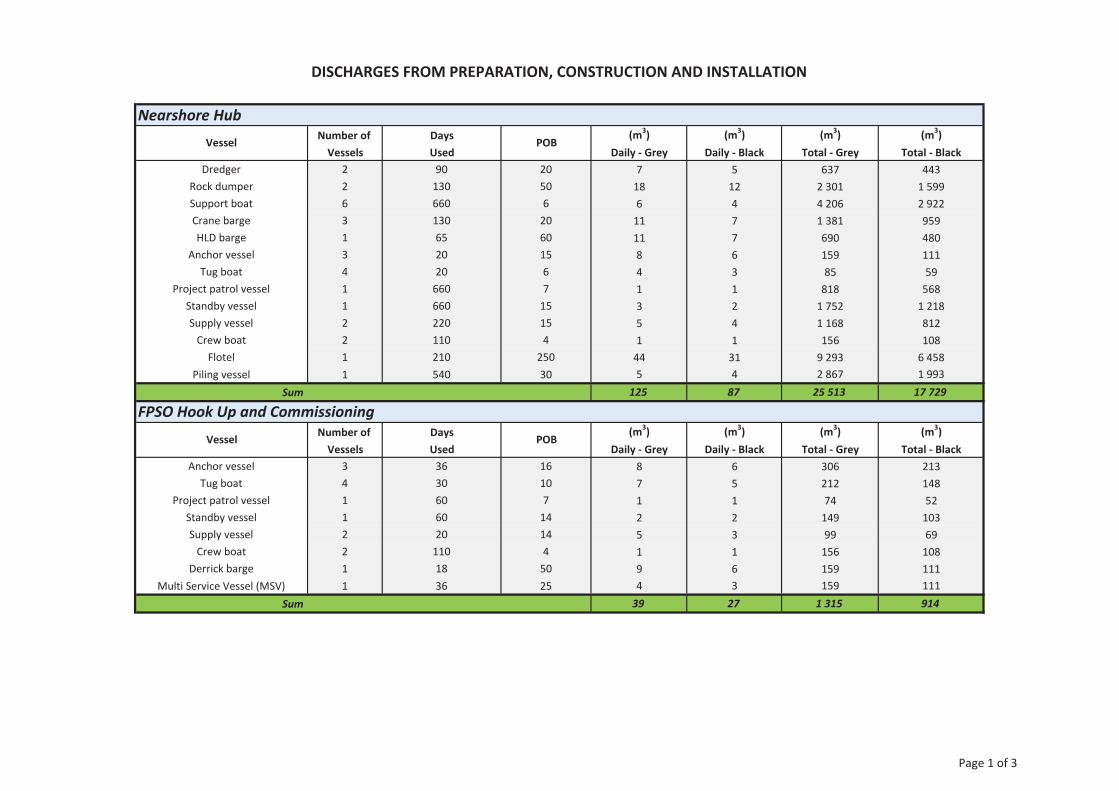
Nearshore HubNumber of Days (m3) (m3) (m3) (m3)
Vessels Used Daily Grey Daily Black Total Grey Total BlackDredger 2 90 20 7 5 637 443
Rock dumper 2 130 50 18 12 2 301 1 599Support boat 6 660 6 6 4 4 206 2 922Crane barge 3 130 20 11 7 1 381 959HLD barge 1 65 60 11 7 690 480
Anchor vessel 3 20 15 8 6 159 111Tug boat 4 20 6 4 3 85 59
Project patrol vessel 1 660 7 1 1 818 568Standby vessel 1 660 15 3 2 1 752 1 218Supply vessel 2 220 15 5 4 1 168 812
Crew boat 2 110 4 1 1 156 108Flotel 1 210 250 44 31 9 293 6 458
Piling vessel 1 540 30 5 4 2 867 1 993Sum 125 87 25 513 17 729
Number of Days (m3) (m3) (m3) (m3)Vessels Used Daily Grey Daily Black Total Grey Total Black
Anchor vessel 3 36 16 8 6 306 213Tug boat 4 30 10 7 5 212 148
Project patrol vessel 1 60 7 1 1 74 52Standby vessel 1 60 14 2 2 149 103Supply vessel 2 20 14 5 3 99 69
Crew boat 2 110 4 1 1 156 108Derrick barge 1 18 50 9 6 159 111
Multi Service Vessel (MSV) 1 36 25 4 3 159 111Sum 39 27 1 315 914
DISCHARGES FROM PREPARATION, CONSTRUCTION AND INSTALLATION
Vessel
Vessel
POB
POB
FPSO Hook Up and Commissioning
Page 1 of 3
DISCHARGES FROM PREPARATION, CONSTRUCTION AND INSTALLATION
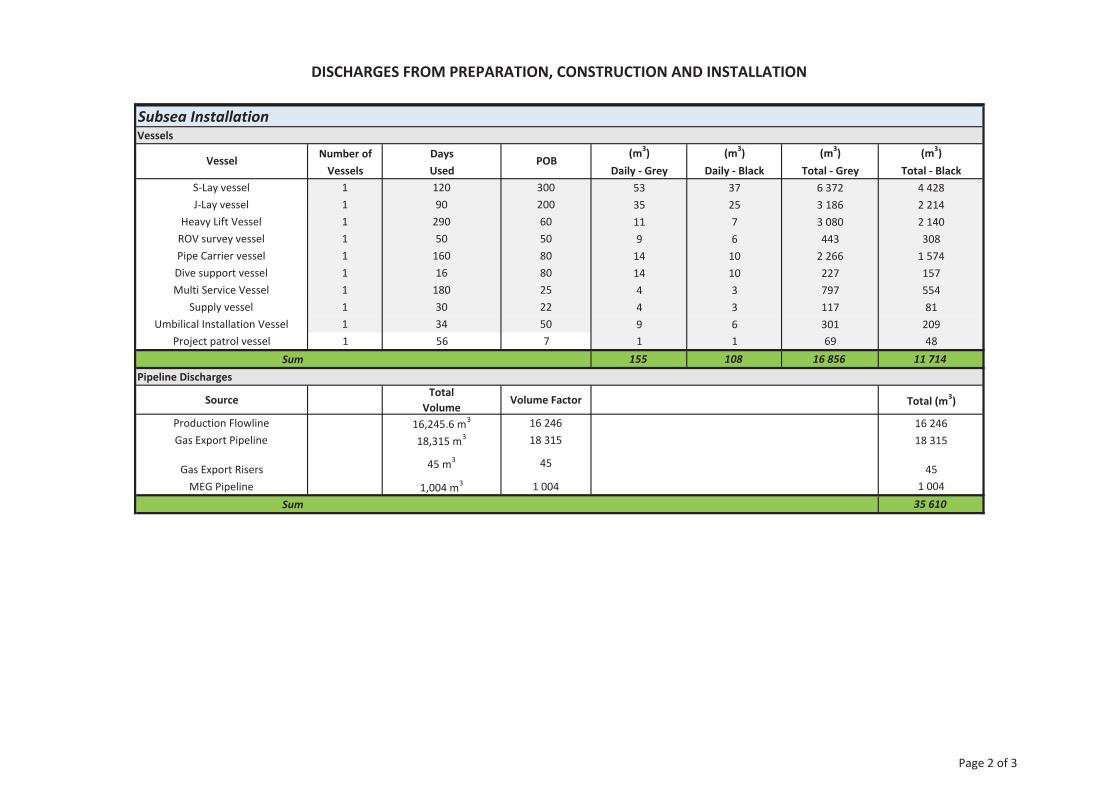
Subsea InstallationVessels
Number of Days (m3) (m3) (m3) (m3)Vessels Used Daily Grey Daily Black Total Grey Total Black
S Lay vessel 1 120 300 53 37 6 372 4 428J Lay vessel 1 90 200 35 25 3 186 2 214
Heavy Lift Vessel 1 290 60 11 7 3 080 2 140ROV survey vessel 1 50 50 9 6 443 308Pipe Carrier vessel 1 160 80 14 10 2 266 1 574Dive support vessel 1 16 80 14 10 227 157Multi Service Vessel 1 180 25 4 3 797 554
Supply vessel 1 30 22 4 3 117 81Umbilical Installation Vessel 1 34 50 9 6 301 209
Project patrol vessel 1 56 7 1 1 69 48Sum 155 108 16 856 11 714
Pipeline Discharges
SourceTotal
VolumeVolume Factor Total (m3)
Production Flowline 16,245.6 m3 16 246 16 246Gas Export Pipeline 18,315 m3 18 315 18 315
Gas Export Risers 45 m3 45 45MEG Pipeline 1,004 m3 1 004 1 004
Sum 35 610
POBVessel
Page 2 of 3
DISCHARGES FROM PREPARATION, CONSTRUCTION AND INSTALLATION
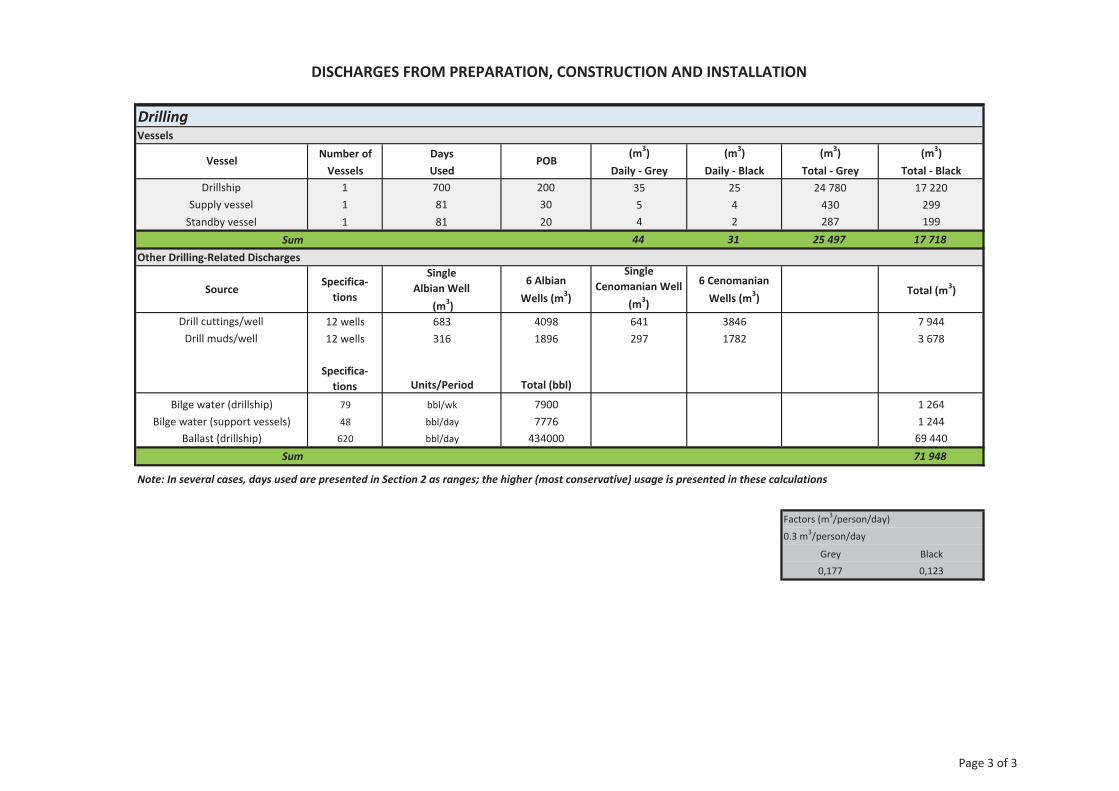
DrillingVessels
Number of Days (m3) (m3) (m3) (m3)Vessels Used Daily Grey Daily Black Total Grey Total Black
Drillship 1 700 200 35 25 24 780 17 220Supply vessel 1 81 30 5 4 430 299
Standby vessel 1 81 20 4 2 287 199Sum 44 31 25 497 17 718
Other Drilling Related Discharges
SourceSpecifica
tions
SingleAlbian Well
(m3)
6 AlbianWells (m3)
SingleCenomanian Well
(m3)
6 CenomanianWells (m3)
Total (m3)
Drill cuttings/well 12 wells 683 4098 641 3846 7 944Drill muds/well 12 wells 316 1896 297 1782 3 678
Specifications Units/Period Total (bbl)
Bilge water (drillship) 79 bbl/wk 7900 1 264Bilge water (support vessels) 48 bbl/day 7776 1 244
Ballast (drillship) 620 bbl/day 434000 69 440Sum 71 948
Note: In several cases, days used are presented in Section 2 as ranges; the higher (most conservative) usage is presented in these calculations
Factors (m3/person/day)
0.3 m3/person/day
Grey Black0,177 0,123
Vessel POB
Page 3 of 3
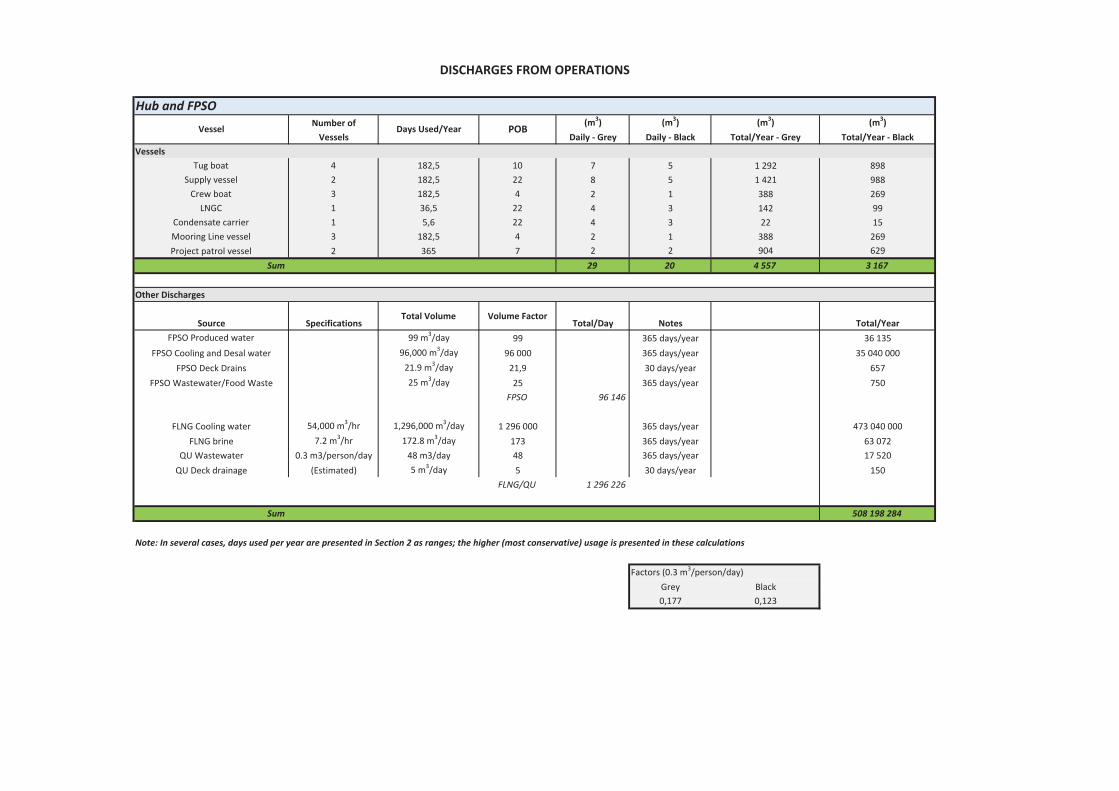
Number of (m3) (m3) (m3) (m3)Vessels Daily Grey Daily Black Total/Year Grey Total/Year Black
VesselsTug boat 4 182,5 10 7 5 1 292 898
Supply vessel 2 182,5 22 8 5 1 421 988Crew boat 3 182,5 4 2 1 388 269
LNGC 1 36,5 22 4 3 142 99Condensate carrier 1 5,6 22 4 3 22 15Mooring Line vessel 3 182,5 4 2 1 388 269Project patrol vessel 2 365 7 2 2 904 629
Sum 29 20 4 557 3 167
Other Discharges
Source SpecificationsTotal Volume Volume Factor
Total/Day Notes Total/YearFPSO Produced water 99 m3/day 99 365 days/year 36 135
FPSO Cooling and Desal water 96,000 m3/day 96 000 365 days/year 35 040 000FPSO Deck Drains 21.9 m3/day 21,9 30 days/year 657
FPSO Wastewater/Food Waste 25 m3/day 25 365 days/year 750FPSO 96 146
FLNG Cooling water 54,000 m3/hr 1,296,000 m3/day 1 296 000 365 days/year 473 040 000FLNG brine 7.2 m3/hr 172.8 m3/day 173 365 days/year 63 072
QU Wastewater 0.3 m3/person/day 48 m3/day 48 365 days/year 17 520QU Deck drainage (Estimated) 5 m3/day 5 30 days/year 150
FLNG/QU 1 296 226
Sum 508 198 284
Note: In several cases, days used per year are presented in Section 2 as ranges; the higher (most conservative) usage is presented in these calculations
Factors (0.3 m3/person/day)Grey Black0,177 0,123
Vessel Days Used/Year POB
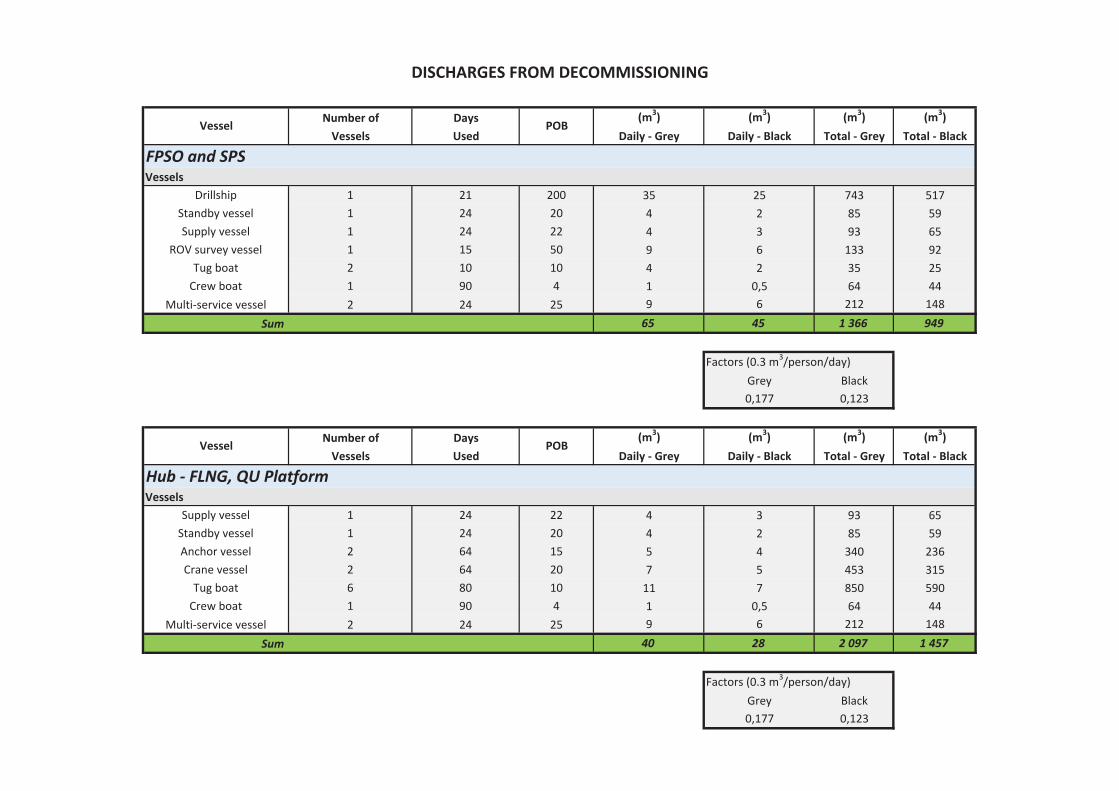
DISCHARGES FROM OPERATIONS
Hub and FPSO
Number of Days (m3) (m3) (m3) (m3)Vessels Used Daily Grey Daily Black Total Grey Total Black
FPSO and SPSVessels
Drillship 1 21 200 35 25 743 517Standby vessel 1 24 20 4 2 85 59Supply vessel 1 24 22 4 3 93 65
ROV survey vessel 1 15 50 9 6 133 92Tug boat 2 10 10 4 2 35 25
Crew boat 1 90 4 1 0,5 64 44Multi service vessel 2 24 25 9 6 212 148
Sum 65 45 1 366 949
Factors (0.3 m3/person/day)Grey Black0,177 0,123
Number of Days (m3) (m3) (m3) (m3)Vessels Used Daily Grey Daily Black Total Grey Total Black
Hub FLNG, QU PlatformVessels
Supply vessel 1 24 22 4 3 93 65Standby vessel 1 24 20 4 2 85 59Anchor vessel 2 64 15 5 4 340 236Crane vessel 2 64 20 7 5 453 315
Tug boat 6 80 10 11 7 850 590Crew boat 1 90 4 1 0,5 64 44
Multi service vessel 2 24 25 9 6 212 148Sum 40 28 2 097 1 457
Factors (0.3 m3/person/day)Grey Black0,177 0,123
Vessel POB
POBVessel
DISCHARGES FROM DECOMMISSIONING

Phase Grey Water Black Water TotalDecommissioning Hub 0,177 0,123 0,3Decommissioning FPSO, SPS 0,177 0,123 0,3Installation & Operation 0,177 0,123 0,3
Notes:BP cites wastewater generation at 0.3 m3/person/day, maximum
USEPA (1993) cites 185 liters/person/day 110 liters (grey water)/person/day and 75 liters (black water)/person/day
0.3 m3/person/day used for installation, operations, and decommissioning at FPSO and SPS, consistent with BP documentation0.3 m3/person/day used for decommissioning at the Hub, correcting BP documentation
Division of grey water and black water (per USEPA, 1993 proportions):Grey water: 110/185 = 0.59Black water: 75/185 = 0.41
For 0.3 m3:grey water: 0.177 m3/person/day (0.3 x 0.59)black water: 0.123 m3/person/day (0.3 x 0.41)
WASTEWATER FACTORS (m3/person/day)
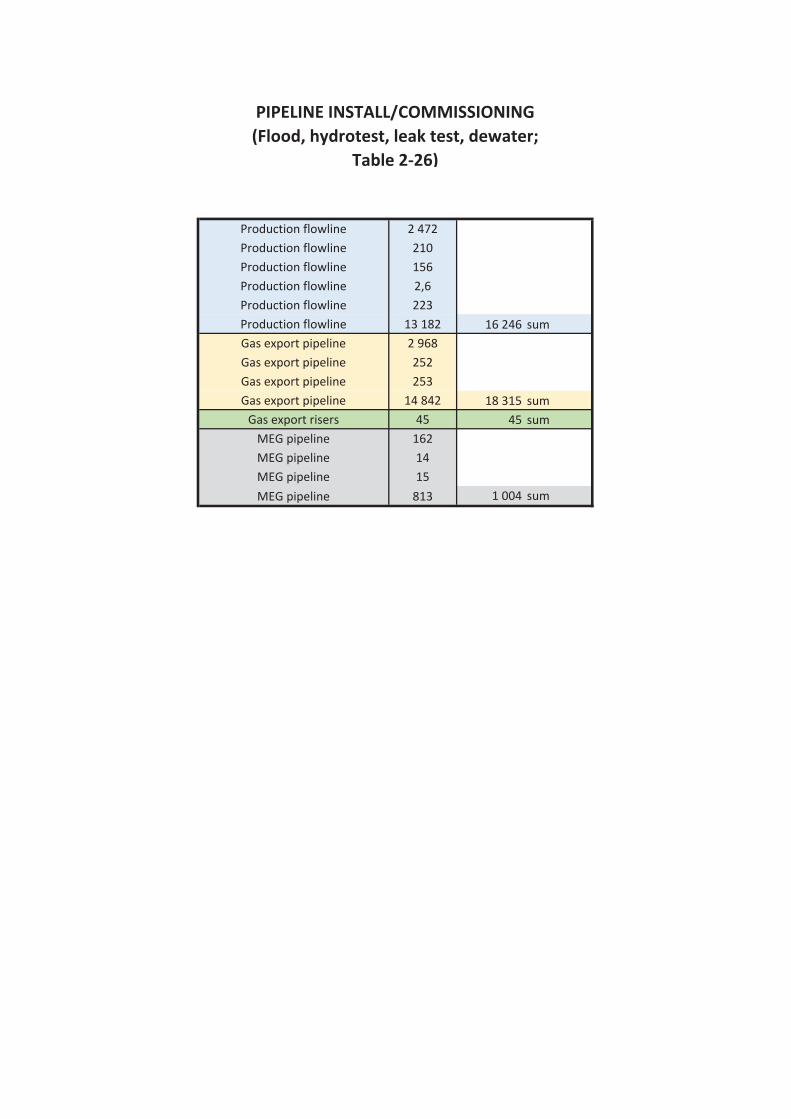
Production flowline 2 472Production flowline 210Production flowline 156Production flowline 2,6Production flowline 223Production flowline 13 182 16 246 sumGas export pipeline 2 968Gas export pipeline 252Gas export pipeline 253Gas export pipeline 14 842 18 315 sum
Gas export risers 45 45 sumMEG pipeline 162MEG pipeline 14MEG pipeline 15MEG pipeline 813 1 004 sum
PIPELINE INSTALL/COMMISSIONING(Flood, hydrotest, leak test, dewater;
Table 2 26)
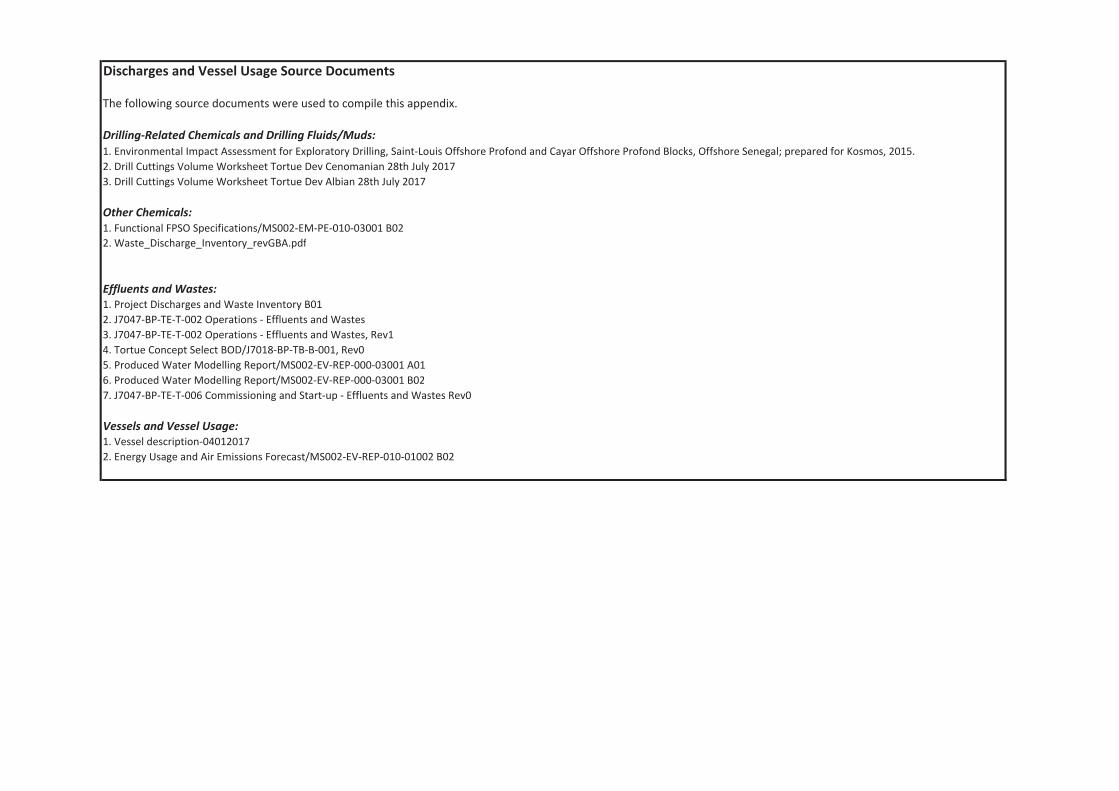
Discharges and Vessel Usage Source Documents
The following source documents were used to compile this appendix.
Drilling Related Chemicals and Drilling Fluids/Muds:1. Environmental Impact Assessment for Exploratory Drilling, Saint Louis Offshore Profond and Cayar Offshore Profond Blocks, Offshore Senegal; prepared for Kosmos, 2015.2. Drill Cuttings Volume Worksheet Tortue Dev Cenomanian 28th July 20173. Drill Cuttings Volume Worksheet Tortue Dev Albian 28th July 2017
Other Chemicals:1. Functional FPSO Specifications/MS002 EM PE 010 03001 B022. Waste_Discharge_Inventory_revGBA.pdf
Effluents and Wastes:1. Project Discharges and Waste Inventory B012. J7047 BP TE T 002 Operations Effluents and Wastes3. J7047 BP TE T 002 Operations Effluents and Wastes, Rev14. Tortue Concept Select BOD/J7018 BP TB B 001, Rev05. Produced Water Modelling Report/MS002 EV REP 000 03001 A016. Produced Water Modelling Report/MS002 EV REP 000 03001 B027. J7047 BP TE T 006 Commissioning and Start up Effluents and Wastes Rev0
Vessels and Vessel Usage:1. Vessel description 040120172. Energy Usage and Air Emissions Forecast/MS002 EV REP 010 01002 B02
ESIA FOR THE GREATER TORTUE/AHMEYIM PHASE 1 GAS PRODUCTION PROJECT
Ref. No.: 1653939
APPENDIX K-2 : PRODUCED WATER MODELING REPORT
Security Classification: General
by Mauritania Senegal Region
Tortue Phase
&
1 KBR
TORTUE DEVELOPMENT PROJECT
Produced Water Modelling Report
B02 Issued for Use 28/03/2018 Paul Page a'ic and /Steve Cousins
o Cousins David Cowie KBR DMG
A01 Issued for Review 17/01/2018 Paul Page Richard Pawson /Steve Cousins
David Cowie KBR DMG
Rev. Reason for Issue Date Author Checker Approver DMG QA
Refresh Cycle Code (Years): Not Applicable
Unique Identifier: Not Applicable
MS002-EV-REP-010-03001 Rev.
RD Type: Not Applicable B02
Uncontrolled when printed or stored locally
Tortue Development Project: Produced Water Discharge Modelling Introduction
MS002-EV-REP-000-03001 Page 2 of 71 Rev: B02 © BP p.l.c. BP Internal
Uncontrolled when printed or stored locally
Use and Interpretation of this Document
This document is classified BP Internal. Distribution is intended for BP authorized recipients only. The content of this document is proprietary information, protection of which is required by BP’s Code of Conduct. Its distribution and use by any person outside BP are subject to the terms and conditions of any applicable agreement or contract, as the case may be, under which it was supplied or received.
The content of this document may differ from or go beyond what is legally required. This document does not affect the obligation to comply with applicable legal and regulatory requirements. BP Requirements, BP Recommendations and BP Permissive Statements apply only if they do not conflict with applicable legal and regulatory requirements. If any apparent conflict with applicable legal and regulatory requirements is identified, a reader should seek advice from BP Legal.
The authoritative set of BP Requirements, BP Recommendations, and BP Permissive Statements is held electronically on https://intranet.bp.com/en_gb/group/bp-requirements.html. Readers are reminded to check that any paper or other version of this document is current.
BP Recommendations are made available to help readers within BP to choose between potential options that may be available to them, for example to convey a desirable (but not mandatory) higher standard going beyond a BP Requirement. An alternative approach may be necessary or appropriate.
This document does not seek to describe or establish an industry standard or practice, and its content may differ from or go beyond what a reader might consider to be good or best practice. The content of this document has been approved for BP’s purposes only. No person outside BP is entitled to rely on its content, and BP accepts no liability or responsibility for any such reliance.
The English language version of this document is the original and has primacy over any translation into another language in the event of any conflict or inconsistency.
Copyright © 2013. BP p.l.c. All rights reserved.
Tortue Development Project: Produced Water Discharge Modelling Introduction
MS002-EV-REP-000-03001 Page 3 of 71 Rev: B02 © BP p.l.c. BP Internal
Uncontrolled when printed or stored locally
Revision History*
Revision Date Revision Number Approver Revision
21st Dec 2017 A01 Paul Page 1st Draft Issued for checking and review
05th Jan 2018 B01 Paul Sutherland
Steve Cousins
Issued for Use
20th March 2018 B01-01 Paul Page Issued for review - Report updated to include mercury contaminants in the PW discharges
26th March 2018 B02 Paul Sutherland
Steve Cousins
Issued for Use - Report updated to include mercury contaminants in the PW discharges
* history prior to front page.
Operating Management System (OMS)
OMS Sub-
element
OMS Sub-element Title Relevant Section(s) of this Document
3.6 Environment
7.1 Regulatory Compliance
Hold References
Hold Reference Description / Reason for Hold Relevant Section(s) of this Document
<HOLD01>
<HOLD02>
This is an optional table and can be removed if it is not required. It is intended to list all items in the document that are held, and the reason for the hold. A single ‘hold’ may apply to more than one section of the document. When holds are released, the relevant entry in the table should be deleted as well as being removed from the body of the text.
Tortue Development Project: Produced Water Discharge Modelling Introduction
MS002-EV-REP-000-03001 Page 4 of 71 Rev: B02 © BP p.l.c. BP Internal
Uncontrolled when printed or stored locally
Reviewers
Name Role Type of Review Date Reviewed
Steve Cousins Environmental Advisor - Mauritania and Senegal, GPO - Tortue
Related Documents
GPO Document
Number / Identifier
RD Identifier
(If Applicable)
Document Name Location
Unless stated otherwise in the content of this document, reference to the documents above is for information. Specific sections of the referenced documents will be given in the content of this document if conformance is required.
Tortue Development Project: Produced Water Discharge Modelling Introduction
MS002-EV-REP-000-03001 Page 5 of 71 Rev: B02 © BP p.l.c. BP Internal
Uncontrolled when printed or stored locally
Contents
Page
1 Executive summary ..................................................................................................................... 7
2 Introduction .............................................................................................................................. 10
2.1 Background .................................................................................................................... 10
3 Risk assessment methodology ................................................................................................. 12
3.1 Data Collection .............................................................................................................. 12
3.2 Hazard assessment ........................................................................................................ 13
3.2.1 PNEC calculation and use of Assessment (Safety) Factors ................................................ 13
3.3 Exposure Assessment .................................................................................................... 14
3.4 Risk Characterisation ..................................................................................................... 14
3.4.1 DREAM/EIF modelling approach ....................................................................................... 14
3.4.2 Advantages and limitations of the risk based approaches ................................................ 18
4 Produced Water Discharge Scenarios ...................................................................................... 20
5 Risk assessment input data ...................................................................................................... 21
5.1 Outfall Parameters ........................................................................................................ 21
5.2 Ambient conditions ....................................................................................................... 21
5.2.1 Bathymetry ........................................................................................................................ 21
5.2.2 Hydrodynamic and wind data ............................................................................................ 21
5.3 Produced water properties – Contaminants of Potential Concern (COPCs) ................ 25
5.3.1 Naturally occurring compounds ........................................................................................ 26
5.3.2 Production chemicals ........................................................................................................ 26
5.3.3 Model settings and assumptions ....................................................................................... 27
6 Risk Assessment Results ........................................................................................................... 28
6.1 Assessment of naturally occurring substances only ..................................................... 28
6.2 Assessment of naturally occurring substances and added Chemicals .......................... 33
7 Discussion ................................................................................................................................. 40
8 References ................................................................................................................................ 41
Annex A PNEC Calculation and Assessment (Safety) Factors ............................................................ 43
Annex B PNECs for Naturally Occurring Components of PW ............................................................. 45
Annex C Environmental exposure risk modelling results for each release scenario ......................... 48
C.1 Scenario 1 ...................................................................................................................... 48
C.2 Scenario 2 ...................................................................................................................... 51
C.3 Scenario 3 ...................................................................................................................... 54
C.4 Scenario 4 ...................................................................................................................... 57

Tortue Development Project: Produced Water Discharge Modelling Introduction
MS002-EV-REP-000-03001 Page 6 of 71 Rev: B02 © BP p.l.c. BP Internal
Uncontrolled when printed or stored locally
C.5 Scenario 5 ...................................................................................................................... 60
C.6 Scenario 6 ...................................................................................................................... 63
C.7 Scenario 7 ...................................................................................................................... 66
C.8 Scenario 8 ...................................................................................................................... 69
Tortue Development Project: Produced Water Discharge Modelling Introduction
MS002-EV-REP-000-03001 Page 7 of 71 Rev: B02 © BP p.l.c. BP Internal
Uncontrolled when printed or stored locally
1 Executive summary
This report describes the findings of a modelling study conducted to assess the potential ecological exposure risks associated with various offshore produced water (PW) discharge scenarios from the Tortue Development Floating Production Storage and Offloading (FPSO) vessel. In accordance with the Basis of Design, it has been assumed that free oil separation has been performed using hydro cyclones /induced gas flotation. The study has been carried out to support the Environmental and Social Impact Assessment (ESIA) for Tortue Phase 1A.
The purpose of the modelling was to:
• Simulate anticipated continuous discharge flow rates and effluent compositions over a 45day period;
• Provide a quantitative assessment of the environmental risk to the marine environmentassociated with various discharge scenarios.
• Establish the relative contribution of key contaminants to the environmental exposure risk
• Understand the sensitivity of the risk to changes in hydrocarbon component concentrationsand production chemicals in the PW discharge as well as ambient conditions (backgroundcurrent speed etc.).
The methodology used in this study is aligned with OSPAR Recommendation 2012/5 for a Risk Based Approach (RBA) to the Management of Produced Water Discharges from Offshore Installations (1) and the OSPAR Guidelines in support of Recommendation 2012/5 (2).
The OSPAR RBA was developed specifically for the offshore environment and follows the internationally recognised principles of ERA already in place in Europe (ECHA – Technical Guidance documents (3, 4)) and is currently being implemented in the North East Atlantic region.
The OSPAR risk assessment process follows the standard data collection, hazard assessment, exposure assessment and risk characterization steps, which are described in more detail below. The risk characterization step is based on the same widely accepted principle of comparing a Predicted Environmental Concentration (PEC) for each chemical compound discharged into the receiving environment to a Predicted No Effect Concentration (PNEC). When PEC is larger than the threshold PNEC, there may be a risk for damage. When the PEC is lower than the PNEC threshold, the risk for damage is considered to be “acceptable”.
A Substance Based Approach (SBA) was used to estimate the PW effluent toxicity associated with each discharge scenario. The approach involves estimating the concentration of each Naturally Occurring Substance (NOS) and production chemical additive in the PW discharge and gathering eco toxicological information and physical-chemical properties data for each contaminant present. The eco toxicological information is used to estimate PNEC values for each substance.
The Dose-related Risk and Effect Assessments Model (DREAM) was then used to calculate the dispersion of PW discharges and to calculate the Environmental Impact Factor (EIF). The EIF represents the aggregation of PEC/PNEC ratios for all contaminants in the discharge into a single integrated risk value, which is related to the probability of damage. One EIF unit represents a volume of water (defined as 105 m3) which has the potential to harm ≥ 5% of the marine species in the receiving environment, if they become exposed to harmful substances arising from the discharge.
Tortue Development Project: Produced Water Discharge Modelling Introduction
MS002-EV-REP-000-03001 Page 8 of 71 Rev: B02 © BP p.l.c. BP Internal
Uncontrolled when printed or stored locally
The EIF approach has the advantage that it provides a quantitative measure of the environmental risks involved when produced water discharges are released into the sea. In addition, when the risk characterisation follows a SBA, the EIF method is able to quantify the EIF contribution from each contaminant in the discharge and is thus able to provide a basis for reduction of exposure risk in a systematic and a quantitative manner.
Eight PW discharge scenarios were modelled to investigate the sensitivity of ecological risk to Benzene, Toluene Ethyl-benzene and Xylene (BTEX) concentrations in the effluent (Base Case and “High” BTEX case), both with and without production chemical additives in the PW discharge. The purpose of this approach was to identify the change in the total risk following inclusion of the added chemicals; as the management options for NOS and added chemicals will normally be very different.
DREAM modelling was carried out under a range of ambient current conditions (lowest and highest current velocities) selected from a 3-year hindcast 3D hydrodynamic dataset (2009 – 2011) to assess the sensitivity of exposure risk to the prevailing metocean conditions in the vicinity of the release location. The discharge rate of produced water used in the modelling was 625 bpd.
Substance level modelling of both naturally occurring substances and added chemicals in the Tortue FPSO PW discharge showed that ≥ 90% of the environmental exposure risk is attributable to the presence of corrosion inhibitor in the discharge, with minor contributions from Benzene (3%-6%), and the chemical flocculent (2%-3%)
The highest maximum and mean EIF values obtained when modelling PW profiles that only contained substance level data for NOSs were 2.12 and 1.03 respectively, indicating that contribution of NOSs to the PW toxicity is negligible. The highest time-averaged maximum exposure risk and mean EIF values of 64% and 1.03 respectively were associated with the High BTEX concentration case / lowest ambient current velocity scenario. A mean EIF of 1.03 is equivalent to a maximum volume of water which experiences an exposure risk ≥ 5% of 1.03 x 10⁻⁴ km3
For the NOS only base case, the maximum distance from the release location where the exposure risk was ≥ 5% for all time steps ranged from 1.93 km to 3.20 km for the low and high ambient current cases respectively.
The High BTEX case scenarios gave maximum and mean EIFs ranging from 51% - 66% greater than those for the corresponding BTEX Base case scenarios.
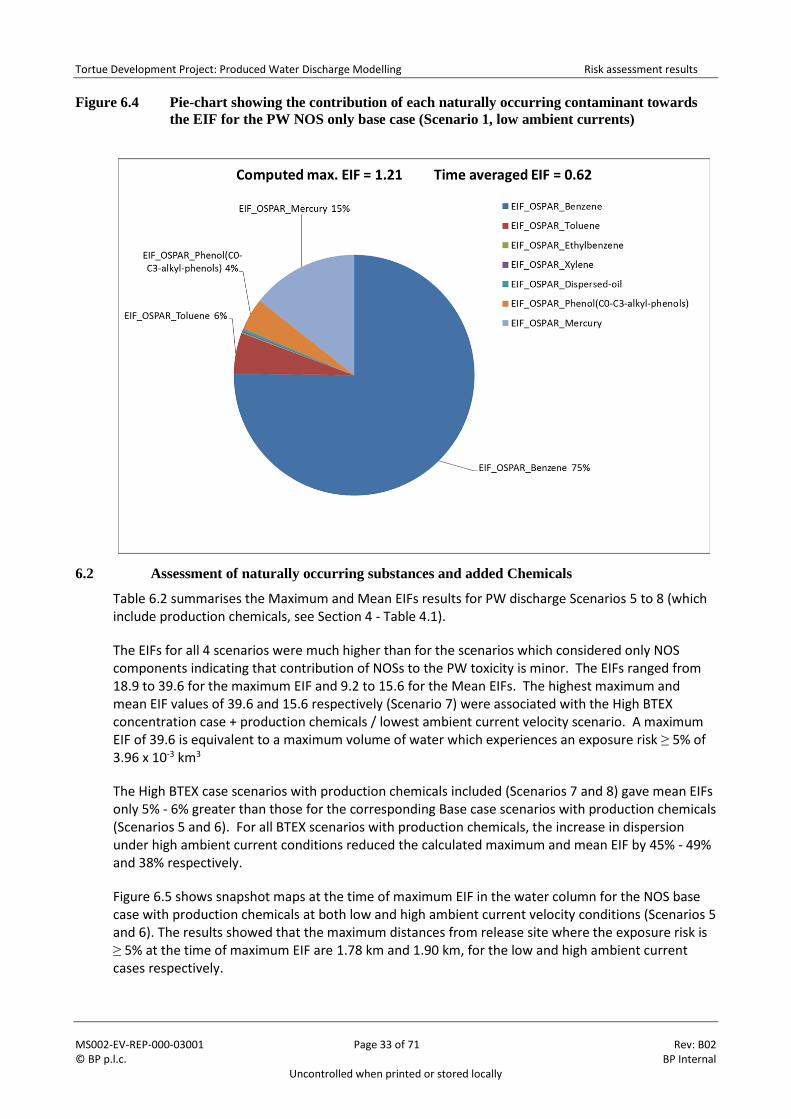
The predicted EIFs were higher when production chemicals were included in the PW profile. The highest maximum and mean EIF values of 39.6 and 15.6 were associated with the High BTEX concentration case + production chemicals / lowest ambient current velocity scenario. A maximum EIF of 39.6 is equivalent to a maximum volume of water which experiences an exposure risk ≥ 5% of 3.96 x 10⁻³ km3. The modelling results for the High BTEX case scenarios with production chemicals included gave mean EIFs only 5% - 6% greater than those for the corresponding NOS Base case scenarios with production chemicals, indicating once again that the contribution of NOSs to the PW toxicity is minor.
For all BTEX scenarios with production chemicals, the increase in dispersion under high ambient current conditions reduced the calculated maximum and mean EIF by 45% - 49% and 38% respectively.
For the NOS base case with production chemicals, the maximum distance from the release location where the exposure risk was ≥ 5% for all time steps ranged from 5.31 km to 8.47 km for the low and high ambient current cases respectively.
Tortue Development Project: Produced Water Discharge Modelling Introduction
MS002-EV-REP-000-03001 Page 9 of 71 Rev: B02 © BP p.l.c. BP Internal
Uncontrolled when printed or stored locally
Although the results suggest that added chemicals are the main contributor to environmental exposure risk, it must be stressed that this is in part due to the assessment (safety) factor (AF) approach included in the EIF methodology. The variability in quality and quantity of toxicity data for the different substance groups causes a large range in applied AFs that account for extrapolation uncertainty. For example the PNEC values for Ethylbenzene and Benzene were derived using AFs of 10 and 100 respectively, because comprehensive chronic toxicity data is available (7). In contrast, AFs of 1,000 were applied to production chemicals as there is limited acute toxicity data available for 3 species at 3 different trophic levels (algae, zooplankton, and fish) (3). It is important that the extrapolation uncertainty “hidden” in AFs is taken into account when defining risk reduction measures; otherwise it could result in the wrong prioritization of mitigation options.
Thus in the case of PW discharges from the Tortue FPSO, the first priority before considering any other risk mitigation options, should be establish whether acquiring chronic toxicity test data for the corrosion inhibitor will allow a less conservative AF of 100, or 50 to be used in EIF calculations thereby reducing the overall EIF and contribution from the CI chemical.
Although it is not advisable to compare EIFs from different installations because of differences in the nature and scale of discharges and different environmental conditions, the highest maximum and mean EIF values of 39.6 and 15.6 predicted for the Tortue FPSO PW discharge are small when compared to the limited published PW EIF data for North Sea installations. In 2002 Statoil published EIF data for the discharge of PW from 25 fields in the North Sea. The values ranged from 0 (zero) to 15,000, with an EIF of 100 or less for seven fields, and EIF of approximately 1,000 for the majority of the fields and an EIF of >5,000 for three fields.
Tortue Development Project: Produced Water Discharge Modelling Introduction
MS002-EV-REP-000-03001 Page 10 of 71 Rev: B02 © BP p.l.c. BP Internal
Uncontrolled when printed or stored locally
2 Introduction
This report describes the findings of a modelling study conducted to assess the potential ecological exposure risks associated with various offshore produced water (PW) discharge scenarios from the Tortue Development Floating Production Storage and Offloading (FPSO) vessel. In accordance with the Basis of Design, it has been assumed that free oil separation has been performed using hydrocyclones /induced gas flotation. It has also been assumed that there will be no comingling of thermal effluents in the PW discharge stream and so is not included in the scope of this study.
The study has been carried out to support the Environmental and Social Impact Assessment (ESIA) for Tortue Phase 1A.
2.1 Background
Development of the Tortue field is expected to be performed in two phases. Phase 1A targets first gas production during 2021 from 4 wells across a number of drill centres, and will be incrementally developed with additional wells and drill centres. Phase 1A will provide ~480 MMscfd of sales gas production, generate ~2.5 MTPA of LNG and deliver a domestic supply of 35 MMscfd each to Mauritania and Senegal.
The Phase 1A FPSO, which is located in 100-130 m of water, will process up to 505 MMscfd of inlet gas from the subsea wells by separating condensate from the gas stream and exporting conditioned gas to a hub, where LNG processing and export will occur. The Hub, which is located in shallow water (30-33 m water depth) on the Mauritania and Senegal maritime border, comprises a breakwater to protect marine operations, including LNG processing and carrier loading. A single Floating LNG (FLNG) vessel will condition the gas for LNG export. Domestic gas pipeline connections will be available on the trestle riser platform.
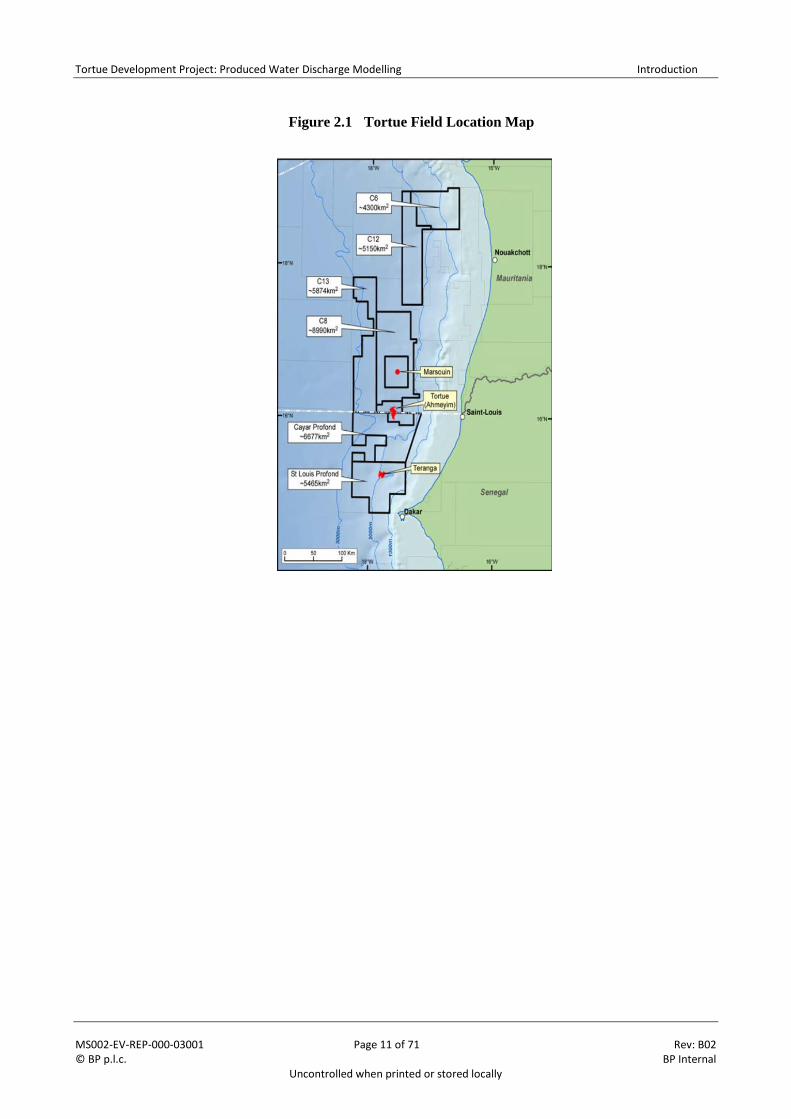
A map showing the field location is provided in Figure 2.1
The modelling of PW discharges has been completed using the Dose-related Risk and Effect Assessments Model (DREAM) developed by the Foundation for Scientific and Industrial Research (SINTEF). DREAM forms part of SINTEF’s Marine Environmental Modelling Workbench (MEMW) v8.0 software package and is a tool used to predict the trajectory, fate and environmental consequences of regular, planned releases to the marine environment.
The purpose of the modelling was to:
• Simulate anticipated continuous discharge flow rates and effluent compositions over a 45day period;
• Provide a quantitative assessment of the environmental risk to the marine environmentassociated with various discharge scenarios.
• Establish the relative contribution of key contaminants to the environmental exposure risk
• Understand the sensitivity of the risk to changes in hydrocarbon component concentrationsand production chemicals in the PW discharge as well as ambient conditions (backgroundcurrent speed etc.).
Tortue Development Project: Produced Water Discharge Modelling Introduction
MS002-EV-REP-000-03001 Page 11 of 71 Rev: B02 © BP p.l.c. BP Internal
Uncontrolled when printed or stored locally
Figure 2.1 Tortue Field Location Map
Tortue Development Project: Produced Water Discharge Modelling Risk assessment methodology
MS002-EV-REP-000-03001 Page 12 of 71 Rev: B02 © BP p.l.c. BP Internal
Uncontrolled when printed or stored locally
3 Risk assessment methodology
The methodology used in this study is aligned with OSPAR Recommendation 2012/5 for a Risk Based Approach (RBA) to the Management of Produced Water Discharges from Offshore Installations (1) and the OSPAR Guidelines in support of Recommendation 2012/5 (2).
The OSPAR RBA was developed specifically for the offshore environment and follows the internationally recognised principles of ERA already in place in Europe (ECHA – Technical Guidance documents (3, 4)) and is currently being implemented in the North East Atlantic region.
The OSPAR risk assessment process follows the standard data collection, hazard assessment, exposure assessment and risk characterization steps, which are described in more detail below. The risk characterization step is based on the same widely accepted principle of comparing a Predicted Environmental Concentration (PEC) for each chemical compound discharged into the receiving environment to a Predicted No Effect Concentration (PNEC). When PEC is larger than the threshold PNEC, there may be a risk for damage. When the PEC is lower than the PNEC threshold, the risk for damage is considered to be “acceptable
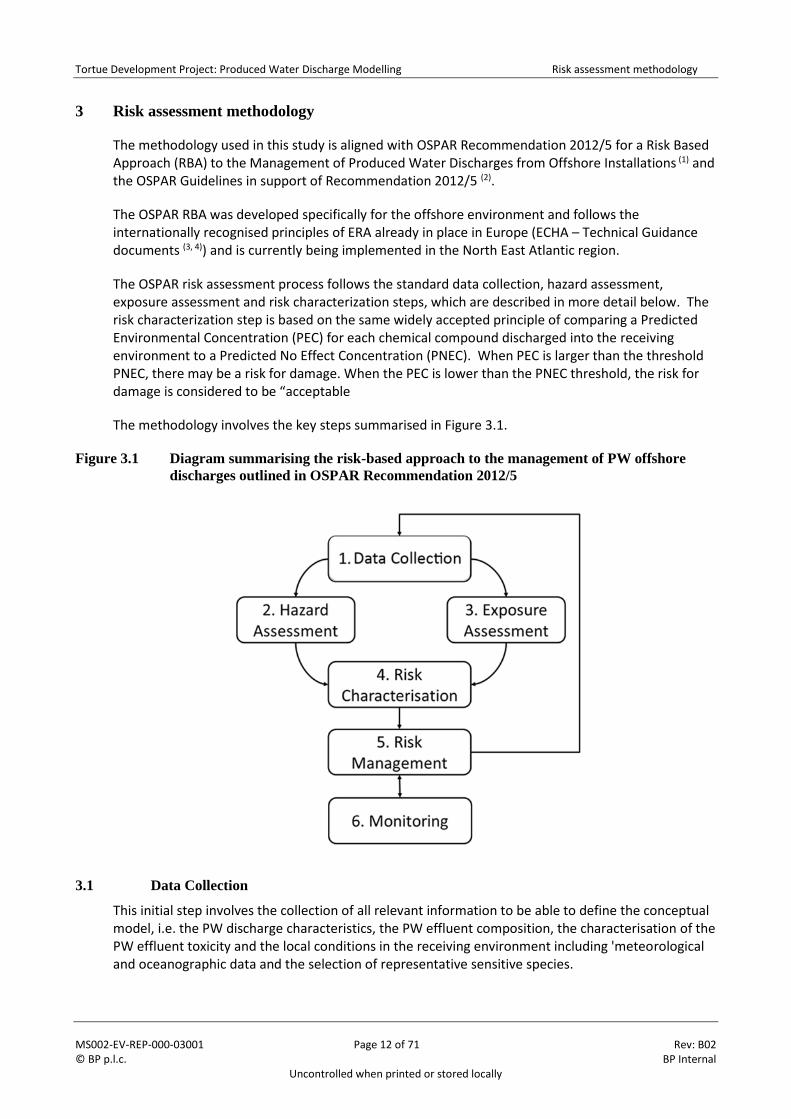
The methodology involves the key steps summarised in Figure 3.1.
Figure 3.1 Diagram summarising the risk-based approach to the management of PW offshore
discharges outlined in OSPAR Recommendation 2012/5
3.1 Data Collection
This initial step involves the collection of all relevant information to be able to define the conceptual model, i.e. the PW discharge characteristics, the PW effluent composition, the characterisation of the PW effluent toxicity and the local conditions in the receiving environment including 'meteorological and oceanographic data and the selection of representative sensitive species.
Tortue Development Project: Produced Water Discharge Modelling Risk assessment methodology
MS002-EV-REP-000-03001 Page 13 of 71 Rev: B02 © BP p.l.c. BP Internal
Uncontrolled when printed or stored locally
A Substance Based Approach (SBA) was used to estimate the PW effluent toxicity associated with each discharge scenario. The approach involves estimating the concentration of each Naturally Occurring Substance (NOS) and production chemical additive in the PW discharge and gathering eco toxicological information and physical-chemical properties data for each contaminant present. The eco toxicological information is used to estimate PNEC values for each substance as described in the “Hazard assessment” step (see Section 3.2).
The minimum eco toxicological information that should be collected includes short-term (acute) toxicity data for three trophic levels; invertebrates (e.g. crustacean, molluscs, echinoderms), algae (growth inhibition) and fish. If data on the individual substances are not available, the worst case toxicity values for the product are used.
The physical-chemical properties data required includes for each substance, includes, molecular weight, density, solubility, vapour pressure octanol/water partition coefficients (log Pow) and degradation rates.
3.2 Hazard assessment
In this step the reference no-effect concentrations, i.e. the PNECs are derived from laboratory toxicity tests results (i.e. EC50, LC50 or NOEC) using appropriate Assessment Factors (AFs) to take into account inherent uncertainties. The application of AFs is based on the `precautionary principle' which is expected to extrapolate to a conservative estimate of the PNEC.
PNECs are developed to protect the marine ecosystem using surrogates of known sensitive species based on the principle that:
• Ecosystem sensitivity depends on the most sensitive species
• Protecting the ecosystem structure protects the community function
3.2.1 PNEC calculation and use of Assessment (Safety) Factors
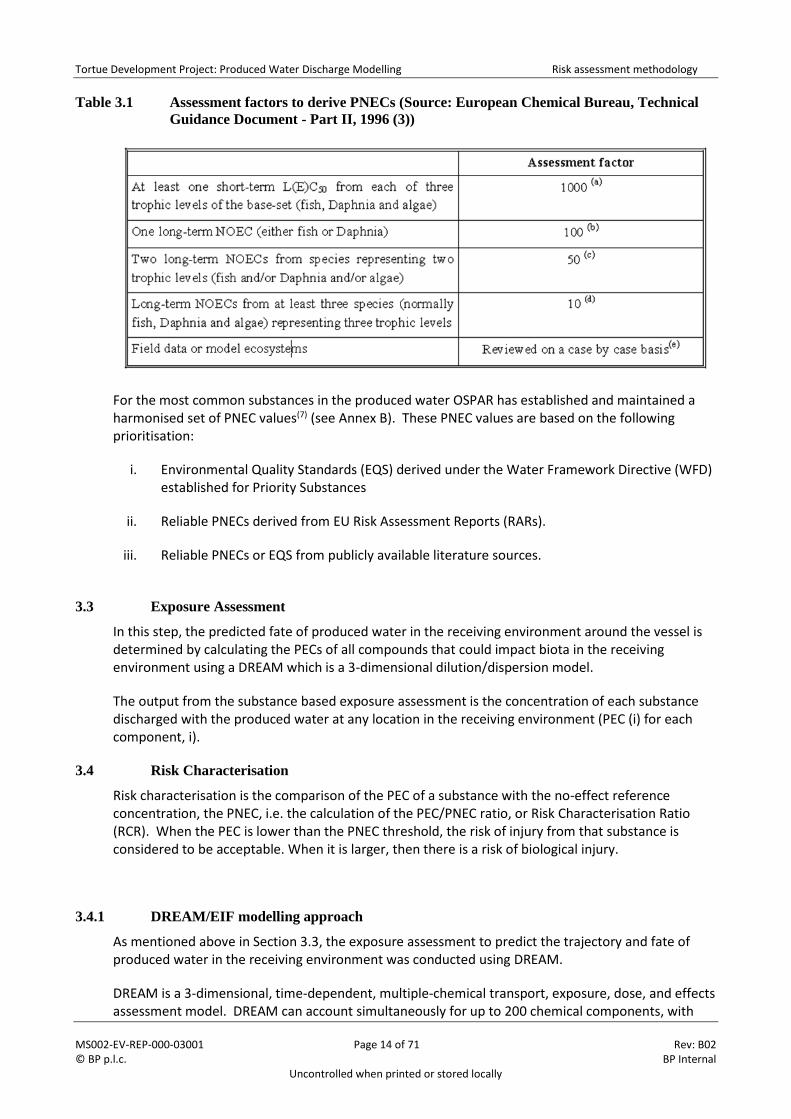
The OSPAR Guidelines in support of Recommendation 2012/5 for a Risk-based Approach to the Management of Produced Water recommend the continued use of the assessment factors set out in the 1996 ECB EC Technical Guidance Document on Environmental Risk Assessment (3) (see Table 3.1 and Annex A). These assessment factors have been used control chemical discharges from offshore installations for a number of years, and monitoring studies have indicated that they provide an appropriate level of protection to the ecosystem function.
The OSPAR Guidelines noted the fact that the assessment factors set out more recently in the updated ECB EC 2003 Technical Guidance (TGD) (4) and subsequent ECHA Guidance (2008) for Chemical Safety Assessment (5) are overly conservative and have the potential to overestimate the contribution to produced water toxicity from added production chemicals and thereby mask the contribution from natural components. This is a consequence of the introduction of an additional factor of 10 to the assessment factors derived for the marine environment. In a review of the science behind the additional factor, the Scientific Committee on Health and Environmental Risks (SCHER (6)) commented that they did not accept the additional safety factor of 10 as a default for marine ecosystems as being generally justified. In the opinion of SCHER, the use of different approaches for both freshwater and marine ecosystems should be scientifically justified on a case-by-case basis. Therefore to align with OSPAR guidance, a maximum assessment factor of 1,000 has been used in this study, as the ECHA guidance was developed for near-coastal waters and a factor of 10,000 is considered too conservative for offshore waters.
Tortue Development Project: Produced Water Discharge Modelling Risk assessment methodology
MS002-EV-REP-000-03001 Page 14 of 71 Rev: B02 © BP p.l.c. BP Internal
Uncontrolled when printed or stored locally
Table 3.1 Assessment factors to derive PNECs (Source: European Chemical Bureau, Technical
Guidance Document - Part II, 1996 (3))
For the most common substances in the produced water OSPAR has established and maintained a harmonised set of PNEC values(7) (see Annex B). These PNEC values are based on the following prioritisation:
i. Environmental Quality Standards (EQS) derived under the Water Framework Directive (WFD)established for Priority Substances
ii. Reliable PNECs derived from EU Risk Assessment Reports (RARs).
iii. Reliable PNECs or EQS from publicly available literature sources.
3.3 Exposure Assessment
In this step, the predicted fate of produced water in the receiving environment around the vessel is determined by calculating the PECs of all compounds that could impact biota in the receiving environment using a DREAM which is a 3-dimensional dilution/dispersion model.
The output from the substance based exposure assessment is the concentration of each substance discharged with the produced water at any location in the receiving environment (PEC (i) for each component, i).
3.4 Risk Characterisation
Risk characterisation is the comparison of the PEC of a substance with the no-effect reference concentration, the PNEC, i.e. the calculation of the PEC/PNEC ratio, or Risk Characterisation Ratio (RCR). When the PEC is lower than the PNEC threshold, the risk of injury from that substance is considered to be acceptable. When it is larger, then there is a risk of biological injury.
3.4.1 DREAM/EIF modelling approach
As mentioned above in Section 3.3, the exposure assessment to predict the trajectory and fate of produced water in the receiving environment was conducted using DREAM.
DREAM is a 3-dimensional, time-dependent, multiple-chemical transport, exposure, dose, and effects assessment model. DREAM can account simultaneously for up to 200 chemical components, with
Tortue Development Project: Produced Water Discharge Modelling Risk assessment methodology
MS002-EV-REP-000-03001 Page 15 of 71 Rev: B02 © BP p.l.c. BP Internal
Uncontrolled when printed or stored locally
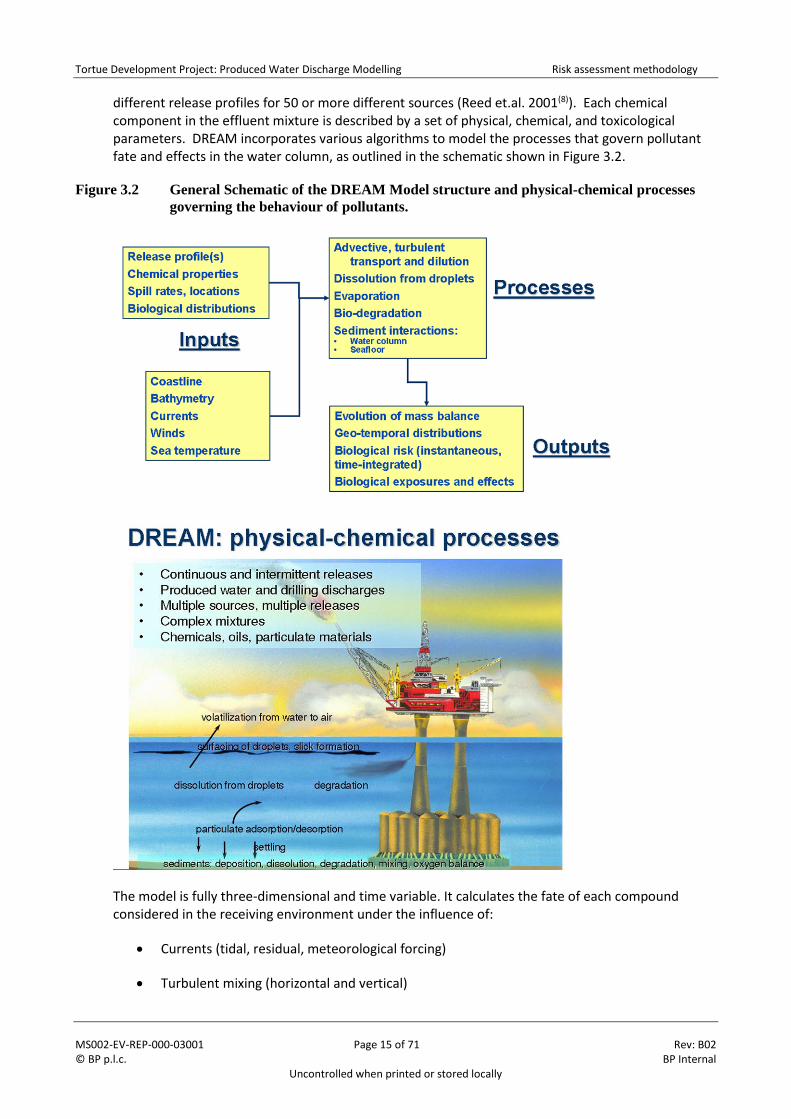
different release profiles for 50 or more different sources (Reed et.al. 2001(8)). Each chemical component in the effluent mixture is described by a set of physical, chemical, and toxicological parameters. DREAM incorporates various algorithms to model the processes that govern pollutant fate and effects in the water column, as outlined in the schematic shown in Figure 3.2.
Figure 3.2 General Schematic of the DREAM Model structure and physical-chemical processes
governing the behaviour of pollutants.
The model is fully three-dimensional and time variable. It calculates the fate of each compound considered in the receiving environment under the influence of:
• Currents (tidal, residual, meteorological forcing)
• Turbulent mixing (horizontal and vertical)
Tortue Development Project: Produced Water Discharge Modelling Risk assessment methodology
MS002-EV-REP-000-03001 Page 16 of 71 Rev: B02 © BP p.l.c. BP Internal
Uncontrolled when printed or stored locally
• Evaporation at the sea surface
• Reduction of concentration due to biodegradation
The algorithms used in the computations, and verification tests of the resulting code, are presented in Reed et al, 2002(9). The model has also been verified against field measurements (Neff et al, 2006(10); Durrell et al, 2006(11)).
The ocean current field used in DREAM modelling was based on the global current model (HYCOM) with hourly tidal currents superimposed and is described in more detail in Section 5.2.2. This hindcast current dataset was considered of sufficient quality for use in the initial PW discharge modelling undertaken to inform the ESIA.
a. Environmental exposure risk and the EIF
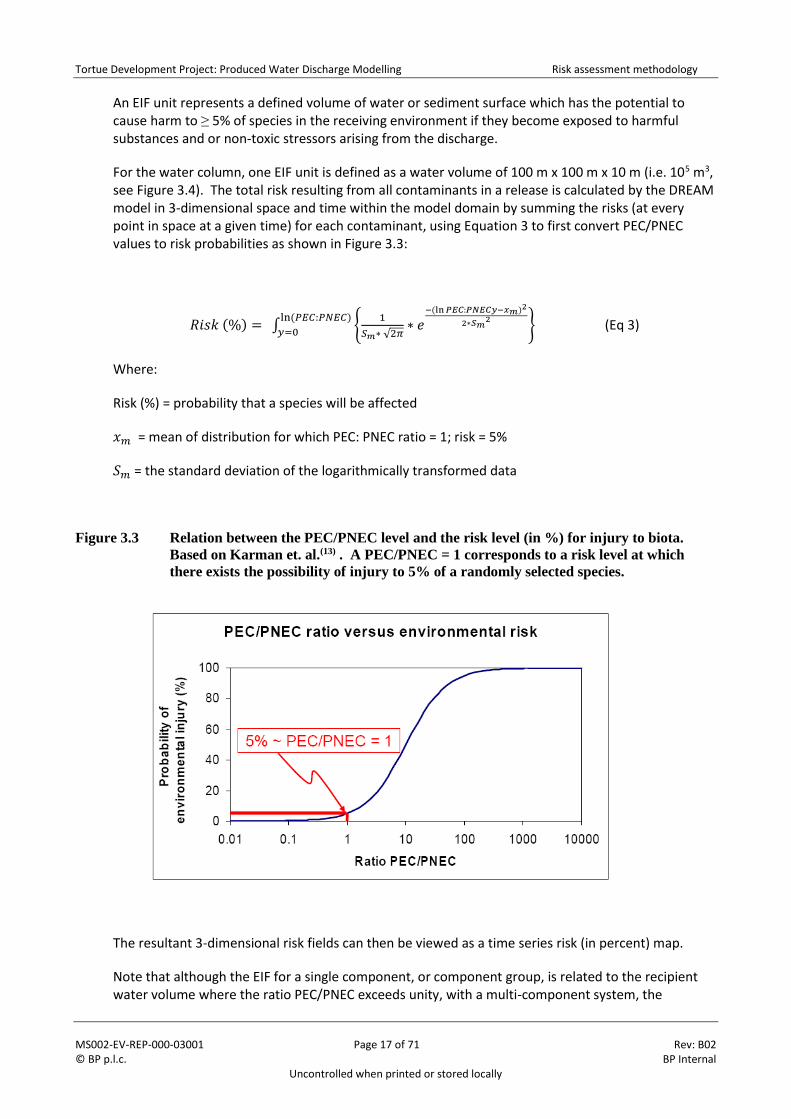
The DREAM model incorporates a risk assessment methodology, the Environmental Impact Factor (EIF) method (Johnsen et. al., 2000(12)). Development of the EIF method is based on a PEC/PNEC approach gives an indication of the likelihood of adverse effects occurring as a result of the anticipated exposure level to a toxic substance. The ratio PEC/PNEC is related to the probability of biological injury according to a method developed by Karman et. al (13), (and also published in Karman and Reerink, 1997 (14)). When the PEC/PNEC ratio = 1, there is a probability of potentially damaging 5% of the marine species in the receiving environment. Figure 3.3 shows the relation between the PEC/PNEC ratio and the probability of injury.
The methodology has been guided by the principle that areas of uncertainty should be resolved in favour of protecting the environment (i.e. conservative environmental assumptions are invoked). The methodology is therefore conservative, in the sense of over-protecting rather than under-protecting the environment.
The EIF method has the advantage over other risk assessment methods in that it can calculate risk contributions from exposure to multiple chemicals and/or natural compounds in the recipient environment. For the total risk associated with multiple chemicals and non-toxic stressors arising from the produced water discharge, the total risk is calculated from the sum of independent probabilities. For two stressors A and B, the total risk is calculated assuming independent action using the equation:
P(A+B) = P(A) + P(B) - P(A) * P(B) (Eq. 1)
Where P(A) and P(B) are the risk probabilities for each stressor at a particular time and spatial location. For small risks (i.e., P(A) and P(B) are both small), or risks from chemicals which are toxicologically similar in their activity, the risks can be considered to be linearly additive, approximately. The method does not account for interactions among chemicals.
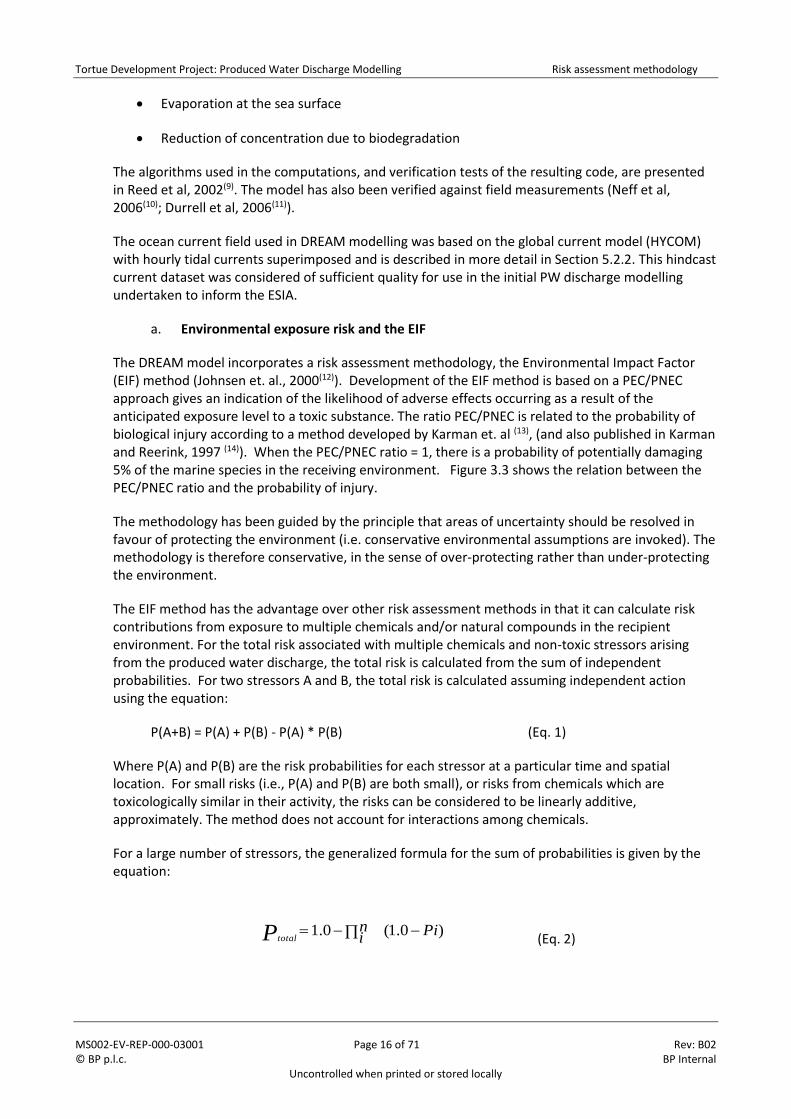
For a large number of stressors, the generalized formula for the sum of probabilities is given by the equation:
(Eq. 2) )0.1(0.1 Pin
iPtotal
Tortue Development Project: Produced Water Discharge Modelling Risk assessment methodology
MS002-EV-REP-000-03001 Page 17 of 71 Rev: B02 © BP p.l.c. BP Internal
Uncontrolled when printed or stored locally
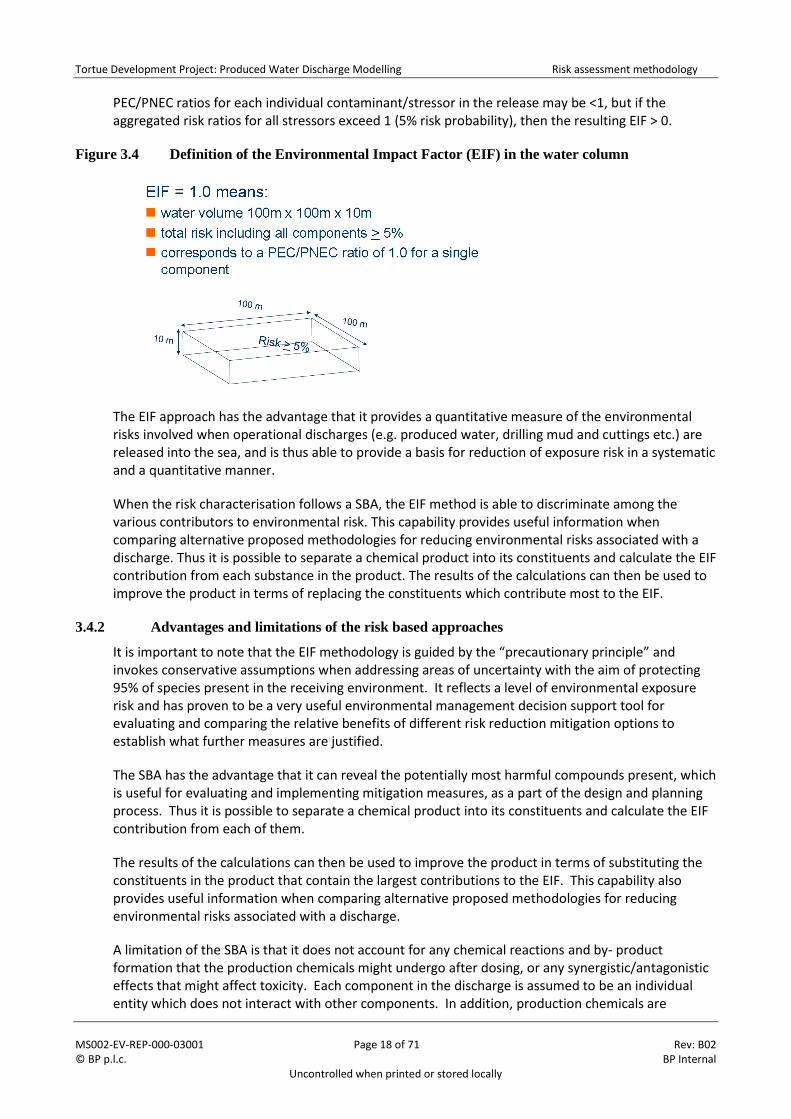
An EIF unit represents a defined volume of water or sediment surface which has the potential to cause harm to ≥ 5% of species in the receiving environment if they become exposed to harmful substances and or non-toxic stressors arising from the discharge.
For the water column, one EIF unit is defined as a water volume of 100 m x 100 m x 10 m (i.e. 105 m3, see Figure 3.4). The total risk resulting from all contaminants in a release is calculated by the DREAM model in 3-dimensional space and time within the model domain by summing the risks (at every point in space at a given time) for each contaminant, using Equation 3 to first convert PEC/PNEC values to risk probabilities as shown in Figure 3.3:
𝑅𝑖𝑠𝑘 (%) = ∫ {1
𝑆𝑚∗ √2𝜋∗ 𝑒
−(ln𝑃𝐸𝐶:𝑃𝑁𝐸𝐶𝑦−𝑥𝑚)2
2∗𝑆𝑚2
}ln(𝑃𝐸𝐶:𝑃𝑁𝐸𝐶)
𝑦=0 (Eq 3)
Where:
Risk (%) = probability that a species will be affected
𝑥𝑚 = mean of distribution for which PEC: PNEC ratio = 1; risk = 5%
𝑆𝑚 = the standard deviation of the logarithmically transformed data
Figure 3.3 Relation between the PEC/PNEC level and the risk level (in %) for injury to biota.
Based on Karman et. al.(13) . A PEC/PNEC = 1 corresponds to a risk level at which
there exists the possibility of injury to 5% of a randomly selected species.
The resultant 3-dimensional risk fields can then be viewed as a time series risk (in percent) map.
Note that although the EIF for a single component, or component group, is related to the recipient water volume where the ratio PEC/PNEC exceeds unity, with a multi-component system, the
Tortue Development Project: Produced Water Discharge Modelling Risk assessment methodology
MS002-EV-REP-000-03001 Page 18 of 71 Rev: B02 © BP p.l.c. BP Internal
Uncontrolled when printed or stored locally
PEC/PNEC ratios for each individual contaminant/stressor in the release may be <1, but if the aggregated risk ratios for all stressors exceed 1 (5% risk probability), then the resulting EIF > 0.
Figure 3.4 Definition of the Environmental Impact Factor (EIF) in the water column
The EIF approach has the advantage that it provides a quantitative measure of the environmental risks involved when operational discharges (e.g. produced water, drilling mud and cuttings etc.) are released into the sea, and is thus able to provide a basis for reduction of exposure risk in a systematic and a quantitative manner.
When the risk characterisation follows a SBA, the EIF method is able to discriminate among the various contributors to environmental risk. This capability provides useful information when comparing alternative proposed methodologies for reducing environmental risks associated with a discharge. Thus it is possible to separate a chemical product into its constituents and calculate the EIF contribution from each substance in the product. The results of the calculations can then be used to improve the product in terms of replacing the constituents which contribute most to the EIF.
3.4.2 Advantages and limitations of the risk based approaches
It is important to note that the EIF methodology is guided by the “precautionary principle” and invokes conservative assumptions when addressing areas of uncertainty with the aim of protecting 95% of species present in the receiving environment. It reflects a level of environmental exposure risk and has proven to be a very useful environmental management decision support tool for evaluating and comparing the relative benefits of different risk reduction mitigation options to establish what further measures are justified.
The SBA has the advantage that it can reveal the potentially most harmful compounds present, which is useful for evaluating and implementing mitigation measures, as a part of the design and planning process. Thus it is possible to separate a chemical product into its constituents and calculate the EIF contribution from each of them.
The results of the calculations can then be used to improve the product in terms of substituting the constituents in the product that contain the largest contributions to the EIF. This capability also provides useful information when comparing alternative proposed methodologies for reducing environmental risks associated with a discharge.
A limitation of the SBA is that it does not account for any chemical reactions and by- product formation that the production chemicals might undergo after dosing, or any synergistic/antagonistic effects that might affect toxicity. Each component in the discharge is assumed to be an individual entity which does not interact with other components. In addition, production chemicals are

Tortue Development Project: Produced Water Discharge Modelling Risk assessment methodology
MS002-EV-REP-000-03001 Page 19 of 71 Rev: B02 © BP p.l.c. BP Internal
Uncontrolled when printed or stored locally
complex mixtures and certain components of the chemical product may have different solubility in oil and water, so that large portions of the modelled chemical may not enter the produced water (PW) stream. This in turn may lead to an overestimation of the concentration and risk associated with these components.
The metocean data used in the modelling was chosen to include conditions giving rise to the minimum dispersion of substances in the discharges, and as such is conservative and not representative of most of the year when dispersion and mixing conditions are enhanced.
Tortue Development Project: Produced Water Discharge Modelling Produced water discharge scenarios
MS002-EV-REP-000-03001 Page 20 of 71 Rev: B02 © BP p.l.c. BP Internal
Uncontrolled when printed or stored locally
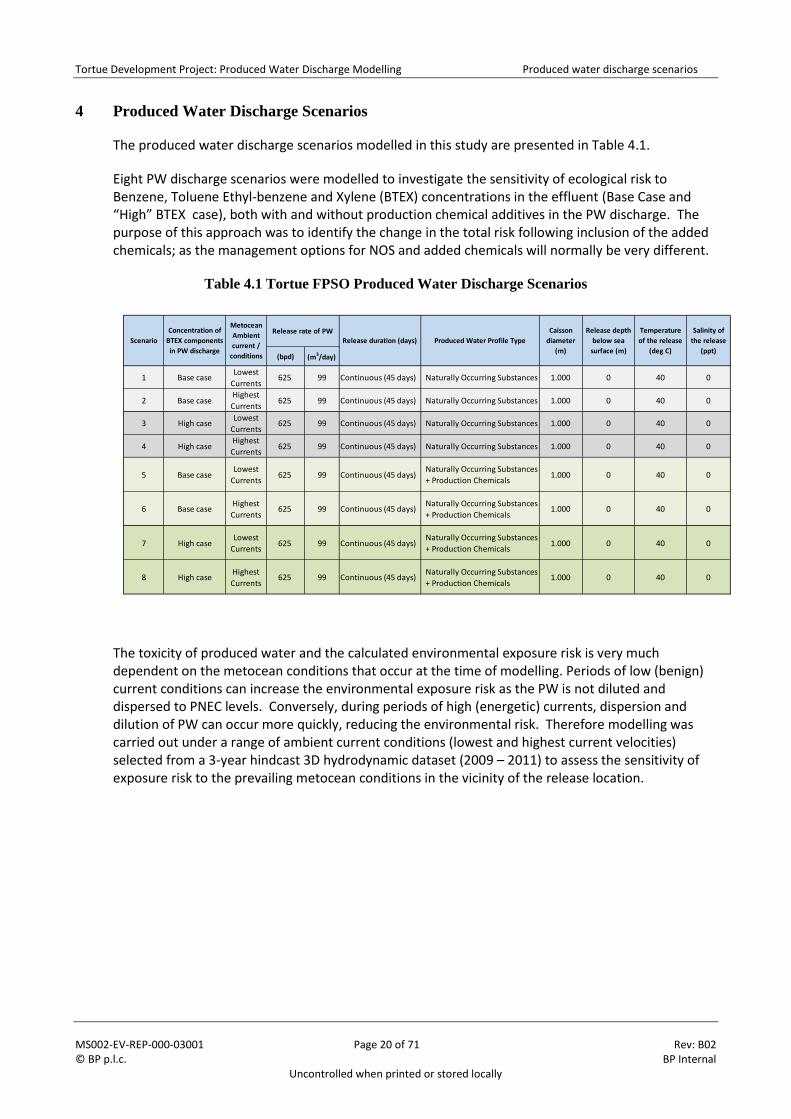
4 Produced Water Discharge Scenarios
The produced water discharge scenarios modelled in this study are presented in Table 4.1.
Eight PW discharge scenarios were modelled to investigate the sensitivity of ecological risk to Benzene, Toluene Ethyl-benzene and Xylene (BTEX) concentrations in the effluent (Base Case and “High” BTEX case), both with and without production chemical additives in the PW discharge. The purpose of this approach was to identify the change in the total risk following inclusion of the added chemicals; as the management options for NOS and added chemicals will normally be very different.
Table 4.1 Tortue FPSO Produced Water Discharge Scenarios
The toxicity of produced water and the calculated environmental exposure risk is very much dependent on the metocean conditions that occur at the time of modelling. Periods of low (benign) current conditions can increase the environmental exposure risk as the PW is not diluted and dispersed to PNEC levels. Conversely, during periods of high (energetic) currents, dispersion and dilution of PW can occur more quickly, reducing the environmental risk. Therefore modelling was carried out under a range of ambient current conditions (lowest and highest current velocities) selected from a 3-year hindcast 3D hydrodynamic dataset (2009 – 2011) to assess the sensitivity of exposure risk to the prevailing metocean conditions in the vicinity of the release location.
(bpd) (m3/day)
1 Base caseLowest
Currents625 99 Continuous (45 days) Naturally Occurring Substances 1.000 0 40 0
2 Base caseHighest
Currents625 99 Continuous (45 days) Naturally Occurring Substances 1.000 0 40 0
3 High caseLowest
Currents625 99 Continuous (45 days) Naturally Occurring Substances 1.000 0 40 0
4 High caseHighest
Currents625 99 Continuous (45 days) Naturally Occurring Substances 1.000 0 40 0
5 Base caseLowest
Currents625 99 Continuous (45 days)
Naturally Occurring Substances
+ Production Chemicals1.000 0 40 0
6 Base caseHighest
Currents625 99 Continuous (45 days)
Naturally Occurring Substances
+ Production Chemicals1.000 0 40 0
7 High caseLowest
Currents625 99 Continuous (45 days)
Naturally Occurring Substances
+ Production Chemicals1.000 0 40 0
8 High caseHighest
Currents625 99 Continuous (45 days)
Naturally Occurring Substances
+ Production Chemicals1.000 0 40 0
Scenario
Concentration of
BTEX components
in PW discharge
Metocean
Ambient
current /
conditions
Release rate of PWRelease duration (days) Produced Water Profile Type
Caisson
diameter
(m)
Release depth
below sea
surface (m)
Temperature
of the release
(deg C)
Salinity of
the release
(ppt)
Tortue Development Project: Produced Water Discharge Modelling Risk assessment input data
MS002-EV-REP-000-03001 Page 21 of 71 Rev: B02 © BP p.l.c. BP Internal
Uncontrolled when printed or stored locally
5 Risk assessment input data
This section outlines the model input data used to characterize the produced water discharge scenarios.
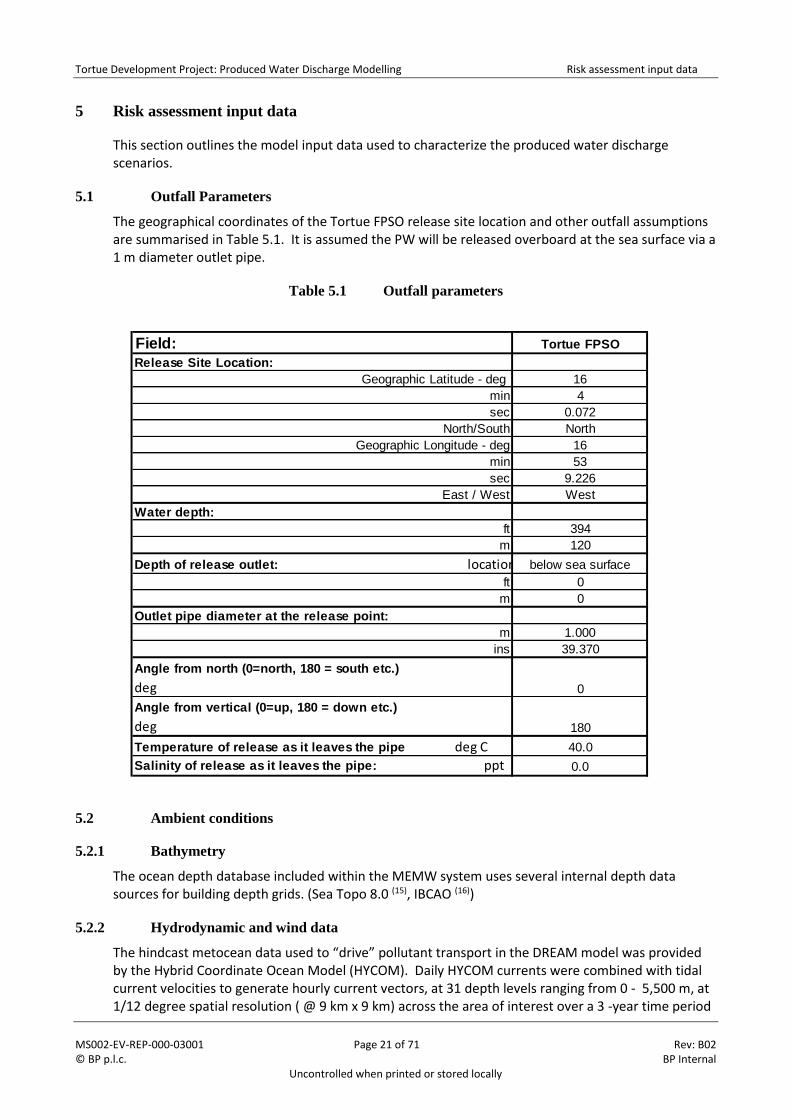
5.1 Outfall Parameters
The geographical coordinates of the Tortue FPSO release site location and other outfall assumptions are summarised in Table 5.1. It is assumed the PW will be released overboard at the sea surface via a 1 m diameter outlet pipe.
Table 5.1 Outfall parameters
5.2 Ambient conditions
5.2.1 Bathymetry
The ocean depth database included within the MEMW system uses several internal depth data sources for building depth grids. (Sea Topo 8.0 (15), IBCAO (16))
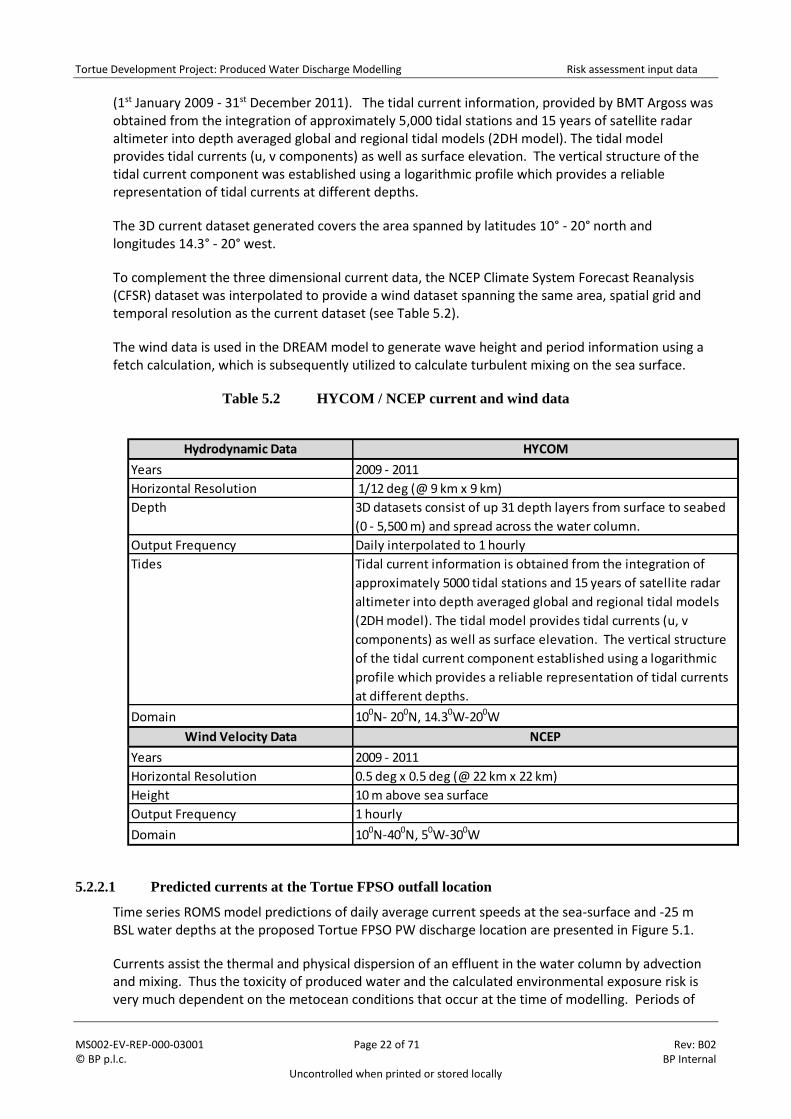
5.2.2 Hydrodynamic and wind data
The hindcast metocean data used to “drive” pollutant transport in the DREAM model was provided by the Hybrid Coordinate Ocean Model (HYCOM). Daily HYCOM currents were combined with tidal current velocities to generate hourly current vectors, at 31 depth levels ranging from 0 - 5,500 m, at 1/12 degree spatial resolution ( @ 9 km x 9 km) across the area of interest over a 3 -year time period
Field: Tortue FPSORelease Site Location:
Geographic Latitude - deg 16min 4sec 0.072
North/South NorthGeographic Longitude - deg 16
min 53sec 9.226
East / West WestWater depth:
ft 394m 120
Depth of release outlet: location below sea surfaceft 0
m 0Outlet pipe diameter at the release point:
m 1.000ins 39.370
Angle from north (0=north, 180 = south etc.) deg 0Angle from vertical (0=up, 180 = down etc.) deg 180Temperature of release as it leaves the pipe deg C 40.0Salinity of release as it leaves the pipe: ppt 0.0
Tortue Development Project: Produced Water Discharge Modelling Risk assessment input data
MS002-EV-REP-000-03001 Page 22 of 71 Rev: B02 © BP p.l.c. BP Internal
Uncontrolled when printed or stored locally
(1st January 2009 - 31st December 2011). The tidal current information, provided by BMT Argoss was obtained from the integration of approximately 5,000 tidal stations and 15 years of satellite radar altimeter into depth averaged global and regional tidal models (2DH model). The tidal model provides tidal currents (u, v components) as well as surface elevation. The vertical structure of the tidal current component was established using a logarithmic profile which provides a reliable representation of tidal currents at different depths.
The 3D current dataset generated covers the area spanned by latitudes 10° - 20° north and longitudes 14.3° - 20° west.
To complement the three dimensional current data, the NCEP Climate System Forecast Reanalysis (CFSR) dataset was interpolated to provide a wind dataset spanning the same area, spatial grid and temporal resolution as the current dataset (see Table 5.2).
The wind data is used in the DREAM model to generate wave height and period information using a fetch calculation, which is subsequently utilized to calculate turbulent mixing on the sea surface.
Table 5.2 HYCOM / NCEP current and wind data
5.2.2.1 Predicted currents at the Tortue FPSO outfall location
Time series ROMS model predictions of daily average current speeds at the sea-surface and -25 m BSL water depths at the proposed Tortue FPSO PW discharge location are presented in Figure 5.1.
Currents assist the thermal and physical dispersion of an effluent in the water column by advection and mixing. Thus the toxicity of produced water and the calculated environmental exposure risk is very much dependent on the metocean conditions that occur at the time of modelling. Periods of
Hydrodynamic Data HYCOM
Years 2009 - 2011
Horizontal Resolution 1/12 deg (@ 9 km x 9 km)
Depth 3D datasets consist of up 31 depth layers from surface to seabed
(0 - 5,500 m) and spread across the water column.
Output Frequency Daily interpolated to 1 hourly
Tides Tidal current information is obtained from the integration of
approximately 5000 tidal stations and 15 years of satellite radar
altimeter into depth averaged global and regional tidal models
(2DH model). The tidal model provides tidal currents (u, v
components) as well as surface elevation. The vertical structure
of the tidal current component established using a logarithmic
profile which provides a reliable representation of tidal currents
at different depths.
Domain 100N- 200N, 14.30W-200W
Wind Velocity Data NCEP
Years 2009 - 2011
Horizontal Resolution 0.5 deg x 0.5 deg (@ 22 km x 22 km)
Height 10 m above sea surface
Output Frequency 1 hourly
Domain 100N-400N, 50W-300W
Tortue Development Project: Produced Water Discharge Modelling Risk assessment input data
MS002-EV-REP-000-03001 Page 23 of 71 Rev: B02 © BP p.l.c. BP Internal
Uncontrolled when printed or stored locally
low (benign) current conditions can increase the environmental exposure risk as the PW is not diluted and dispersed to contaminant concentrations below the PNECs whereas during periods of high (energetic) currents, dispersion and dilution of PW to concentrations below PNECs can occur more quickly, reducing the environmental risk.
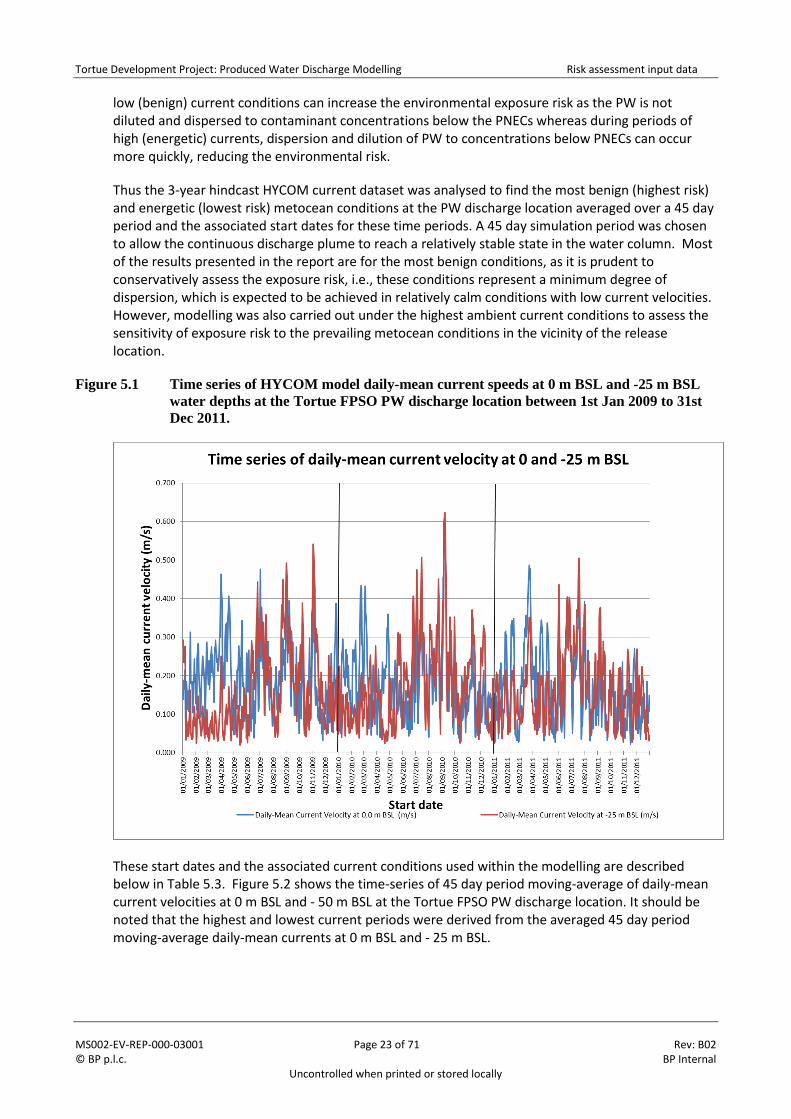
Thus the 3-year hindcast HYCOM current dataset was analysed to find the most benign (highest risk) and energetic (lowest risk) metocean conditions at the PW discharge location averaged over a 45 day period and the associated start dates for these time periods. A 45 day simulation period was chosen to allow the continuous discharge plume to reach a relatively stable state in the water column. Most of the results presented in the report are for the most benign conditions, as it is prudent to conservatively assess the exposure risk, i.e., these conditions represent a minimum degree of dispersion, which is expected to be achieved in relatively calm conditions with low current velocities. However, modelling was also carried out under the highest ambient current conditions to assess the sensitivity of exposure risk to the prevailing metocean conditions in the vicinity of the release location.
Figure 5.1 Time series of HYCOM model daily-mean current speeds at 0 m BSL and -25 m BSL
water depths at the Tortue FPSO PW discharge location between 1st Jan 2009 to 31st
Dec 2011.
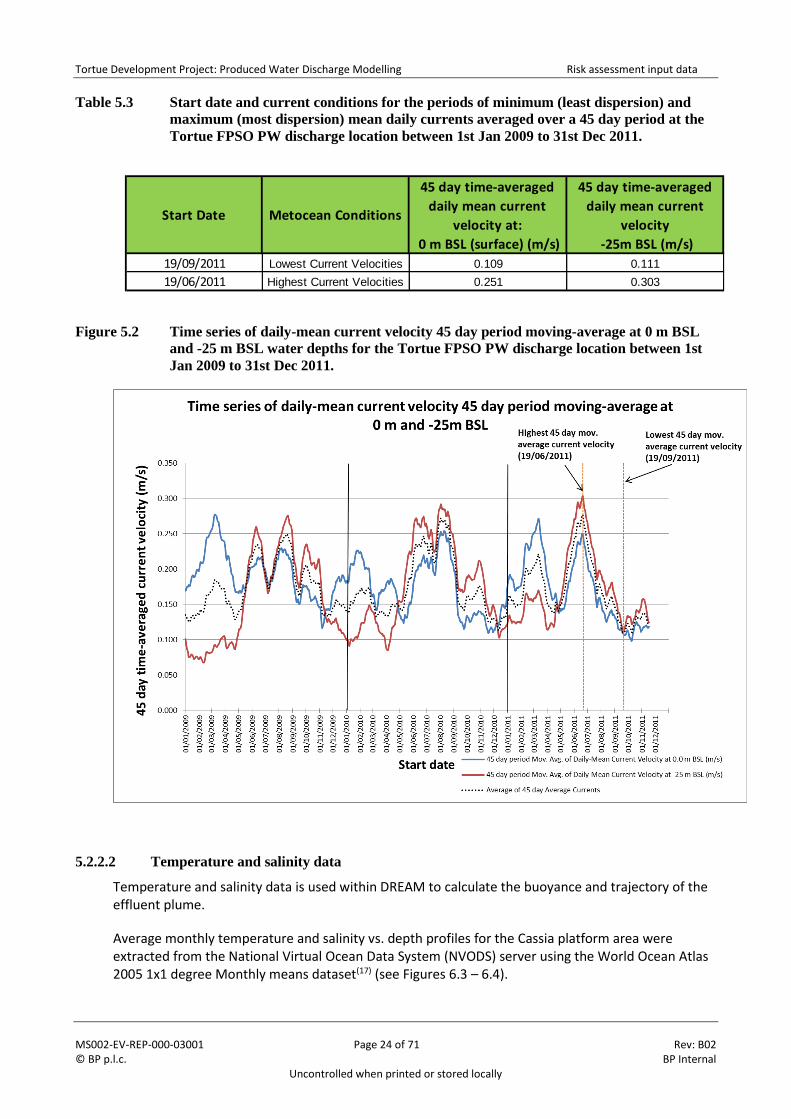
These start dates and the associated current conditions used within the modelling are described below in Table 5.3. Figure 5.2 shows the time-series of 45 day period moving-average of daily-mean current velocities at 0 m BSL and - 50 m BSL at the Tortue FPSO PW discharge location. It should be noted that the highest and lowest current periods were derived from the averaged 45 day period moving-average daily-mean currents at 0 m BSL and - 25 m BSL.
Tortue Development Project: Produced Water Discharge Modelling Risk assessment input data
MS002-EV-REP-000-03001 Page 24 of 71 Rev: B02 © BP p.l.c. BP Internal
Uncontrolled when printed or stored locally
Table 5.3 Start date and current conditions for the periods of minimum (least dispersion) and
maximum (most dispersion) mean daily currents averaged over a 45 day period at the
Tortue FPSO PW discharge location between 1st Jan 2009 to 31st Dec 2011.
Figure 5.2 Time series of daily-mean current velocity 45 day period moving-average at 0 m BSL
and -25 m BSL water depths for the Tortue FPSO PW discharge location between 1st
Jan 2009 to 31st Dec 2011.
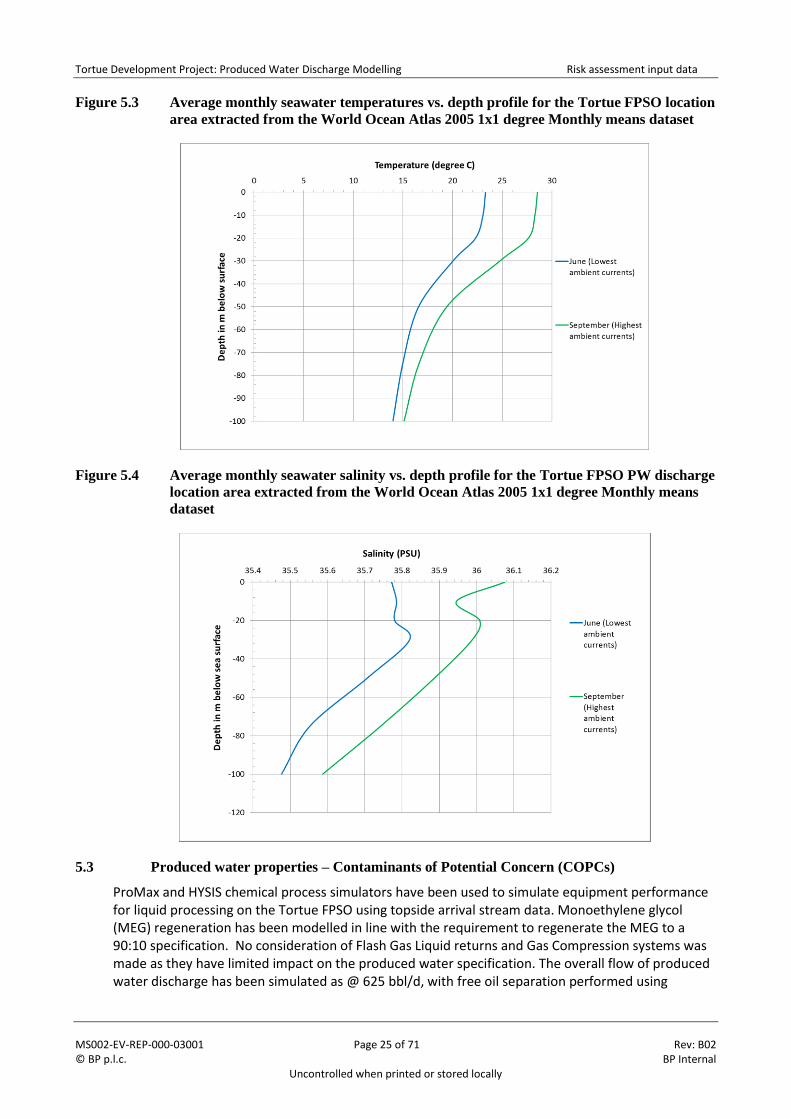
5.2.2.2 Temperature and salinity data
Temperature and salinity data is used within DREAM to calculate the buoyance and trajectory of the effluent plume.
Average monthly temperature and salinity vs. depth profiles for the Cassia platform area were extracted from the National Virtual Ocean Data System (NVODS) server using the World Ocean Atlas 2005 1x1 degree Monthly means dataset(17) (see Figures 6.3 – 6.4).
45 day time-averaged
daily mean current
velocity at:
45 day time-averaged
daily mean current
velocity
0 m BSL (surface) (m/s) -25m BSL (m/s)
19/09/2011 Lowest Current Velocities 0.109 0.11119/06/2011 Highest Current Velocities 0.251 0.303
Start Date Metocean Conditions
Tortue Development Project: Produced Water Discharge Modelling Risk assessment input data
MS002-EV-REP-000-03001 Page 25 of 71 Rev: B02 © BP p.l.c. BP Internal
Uncontrolled when printed or stored locally
Figure 5.3 Average monthly seawater temperatures vs. depth profile for the Tortue FPSO location
area extracted from the World Ocean Atlas 2005 1x1 degree Monthly means dataset
Figure 5.4 Average monthly seawater salinity vs. depth profile for the Tortue FPSO PW discharge
location area extracted from the World Ocean Atlas 2005 1x1 degree Monthly means
dataset
5.3 Produced water properties – Contaminants of Potential Concern (COPCs)
ProMax and HYSIS chemical process simulators have been used to simulate equipment performance for liquid processing on the Tortue FPSO using topside arrival stream data. Monoethylene glycol (MEG) regeneration has been modelled in line with the requirement to regenerate the MEG to a 90:10 specification. No consideration of Flash Gas Liquid returns and Gas Compression systems was made as they have limited impact on the produced water specification. The overall flow of produced water discharge has been simulated as @ 625 bbl/d, with free oil separation performed using
Tortue Development Project: Produced Water Discharge Modelling Risk assessment input data
MS002-EV-REP-000-03001 Page 26 of 71 Rev: B02 © BP p.l.c. BP Internal
Uncontrolled when printed or stored locally
hydrocyclone/induced gas flotation units with no additional tertiary treatment to reduce dissolved oil components.
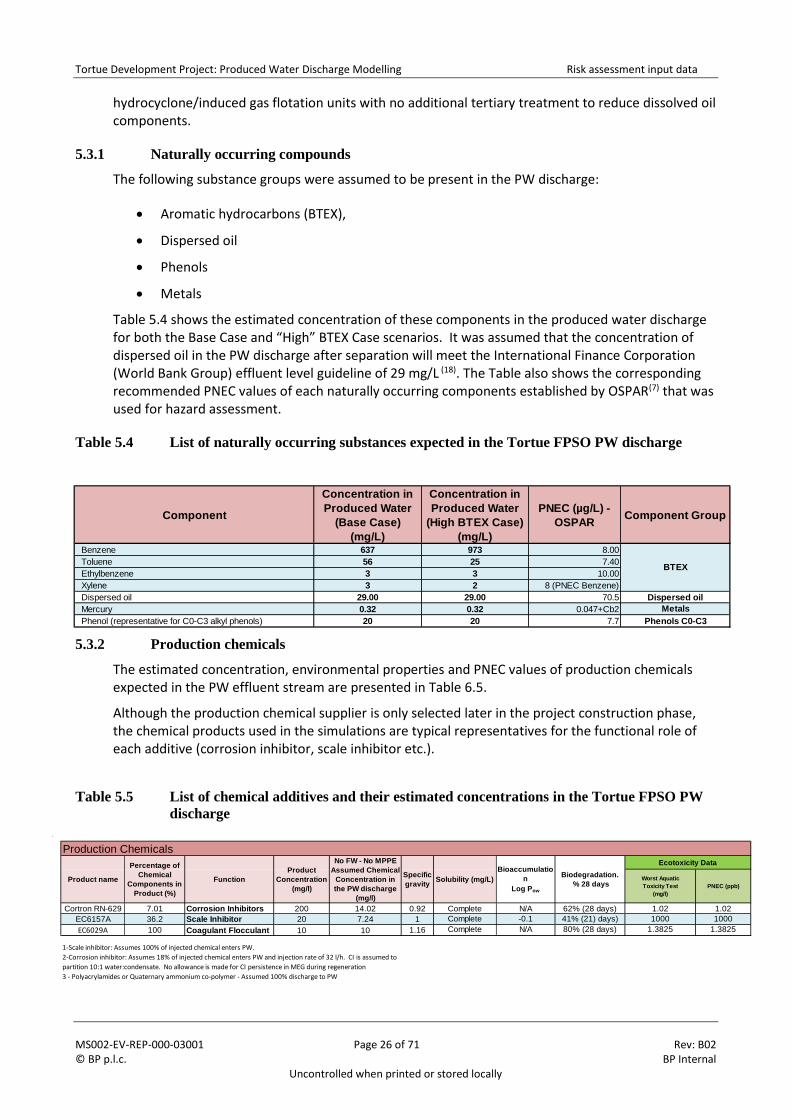
5.3.1 Naturally occurring compounds
The following substance groups were assumed to be present in the PW discharge:
• Aromatic hydrocarbons (BTEX),
• Dispersed oil
• Phenols
• Metals
Table 5.4 shows the estimated concentration of these components in the produced water discharge for both the Base Case and “High” BTEX Case scenarios. It was assumed that the concentration of dispersed oil in the PW discharge after separation will meet the International Finance Corporation (World Bank Group) effluent level guideline of 29 mg/L (18). The Table also shows the corresponding recommended PNEC values of each naturally occurring components established by OSPAR(7) that was used for hazard assessment.
Table 5.4 List of naturally occurring substances expected in the Tortue FPSO PW discharge
5.3.2 Production chemicals
The estimated concentration, environmental properties and PNEC values of production chemicals expected in the PW effluent stream are presented in Table 6.5.
Although the production chemical supplier is only selected later in the project construction phase, the chemical products used in the simulations are typical representatives for the functional role of each additive (corrosion inhibitor, scale inhibitor etc.).
Table 5.5 List of chemical additives and their estimated concentrations in the Tortue FPSO PW
discharge
`
Worst Aquatic Toxicity Test
(mg/l)PNEC (ppb)
Cortron RN-629 7.01 Corrosion Inhibitors 200 14.02 0.92 Complete N/A 62% (28 days) 1.02 1.02EC6157A 36.2 Scale Inhibitor 20 7.24 1 Complete -0.1 41% (21) days) 1000 1000EC6029A 100 Coagulant Flocculant 10 10 1.16 Complete N/A 80% (28 days) 1.3825 1.3825
Ecotoxicity Data
1-Scale inhibitor: Assumes 100% of injected chemical enters PW.
2-Corrosion inhibitor: Assumes 18% of injected chemical enters PW and injection rate of 32 l/h. CI is assumed to
partition 10:1 water:condensate. No allowance is made for CI persistence in MEG during regeneration
3 - Polyacrylamides or Quaternary ammonium co-polymer - Assumed 100% discharge to PW
Production Chemicals
Product name
Percentage of Chemical
Components in Product (%)
FunctionProduct
Concentration(mg/l)
No FW - No MPPE Assumed Chemical
Concentration in the PW discharge
(mg/l)
Specific gravity Solubility (mg/L)
Bioaccumulation
Log Pow
Biodegradation. % 28 days
Component
Concentration in Produced Water
(Base Case)(mg/L)
Concentration in Produced Water
(High BTEX Case)(mg/L)
PNEC (µg/L) - OSPAR Component Group
Benzene 637 973 8.00Toluene 56 25 7.40Ethylbenzene 3 3 10.00Xylene 3 2 8 (PNEC Benzene)Dispersed oil 29.00 29.00 70.5 Dispersed oilMercury 0.32 0.32 0.047+Cb2Phenol (representative for C0-C3 alkyl phenols) 20 20 7.7 Phenols C0-C3
BTEX
Metals
Tortue Development Project: Produced Water Discharge Modelling Risk assessment input data
MS002-EV-REP-000-03001 Page 27 of 71 Rev: B02 © BP p.l.c. BP Internal
Uncontrolled when printed or stored locally
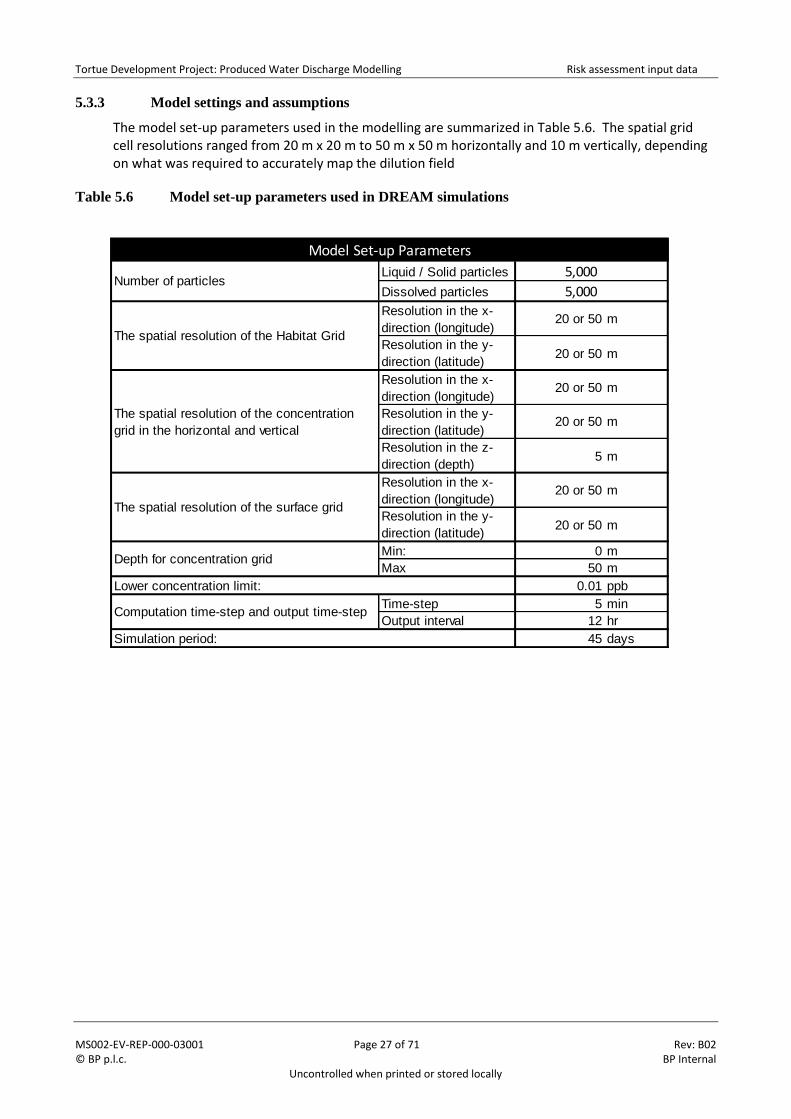
5.3.3 Model settings and assumptions
The model set-up parameters used in the modelling are summarized in Table 5.6. The spatial grid cell resolutions ranged from 20 m x 20 m to 50 m x 50 m horizontally and 10 m vertically, depending on what was required to accurately map the dilution field
Table 5.6 Model set-up parameters used in DREAM simulations
Liquid / Solid particles 5,000
Dissolved particles 5,000
Resolution in the x-direction (longitude)
20 or 50 m
Resolution in the y-direction (latitude) 20 or 50 m
Resolution in the x-direction (longitude)
20 or 50 m
Resolution in the y-direction (latitude)
20 or 50 m
Resolution in the z-direction (depth) 5 m
Resolution in the x-direction (longitude)
20 or 50 m
Resolution in the y-direction (latitude) 20 or 50 m
Min: 0 mMax 50 m
Lower concentration limit: 0.01 ppbTime-step 5 minOutput interval 12 hr
45 days
Computation time-step and output time-step
Simulation period:
Model Set-up Parameters
Number of particles
The spatial resolution of the Habitat Grid
The spatial resolution of the concentrationgrid in the horizontal and vertical
The spatial resolution of the surface grid
Depth for concentration grid
Tortue Development Project: Produced Water Discharge Modelling Risk assessment results
MS002-EV-REP-000-03001 Page 28 of 71 Rev: B02 © BP p.l.c. BP Internal
Uncontrolled when printed or stored locally
6 Risk Assessment Results
This section summarises the key findings from the exposure assessment and risk characterisation stages of the RBA carried out using DREAM. The complete sets of modelling results are presented in Annex C.
6.1 Assessment of naturally occurring substances only
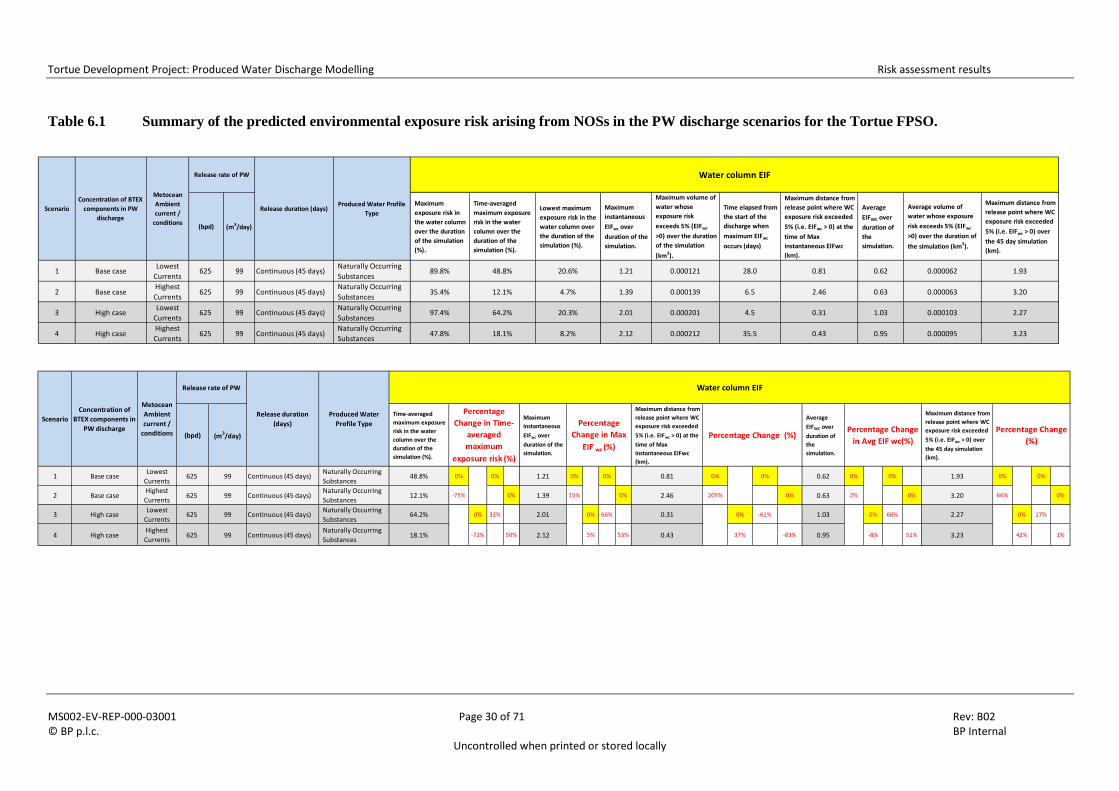
Table 6.1 summarises the Maximum and Mean EIFs results for PW discharge Scenarios 1 to 4 (which exclude production chemicals, see Section 4 - Table 4.1). The EIF results therefore give an indication of the contribution of NOSs to the overall toxicity and ecological risk associated with potential PW overboard discharges at the Tortue FPSO.
The EIFs for all 4 scenarios were very small ranging from 1.21 to 2.12 for the maximum EIF and 0.62 to 1.03 for the Mean EIFs, indicating that contribution of NOSs to the PW toxicity is negligible. The highest time-averaged maximum exposure risk and mean EIF values of 64% and 1.03 respectively (Scenario 3) were associated with the High BTEX concentration case / lowest ambient current velocity scenario. A mean EIF of 1.03 is equivalent to a maximum volume of water which experiences an exposure risk ≥ 5% of 1.03 x 10⁻⁴ km3
The High BTEX case scenarios (Scenarios 3 and 4) gave maximum and mean EIFs ranging from 51% - 66% greater than those for the corresponding BTEX Base case scenarios (Scenarios 1 and 2).
Under high ambient current conditions (Scenarios 2 and 4), the PW plume was transported further away from the discharge point before the risk was reduced to <5% resulting in an increase in the maximum spatial extent of the exposure risk footprint over the 45 day simulation. This represents a 66 % (Scenario 2) and 42% (Scenario 4) increase in distance compared to the respective low ambient scenarios (Scenarios 1 and 3).
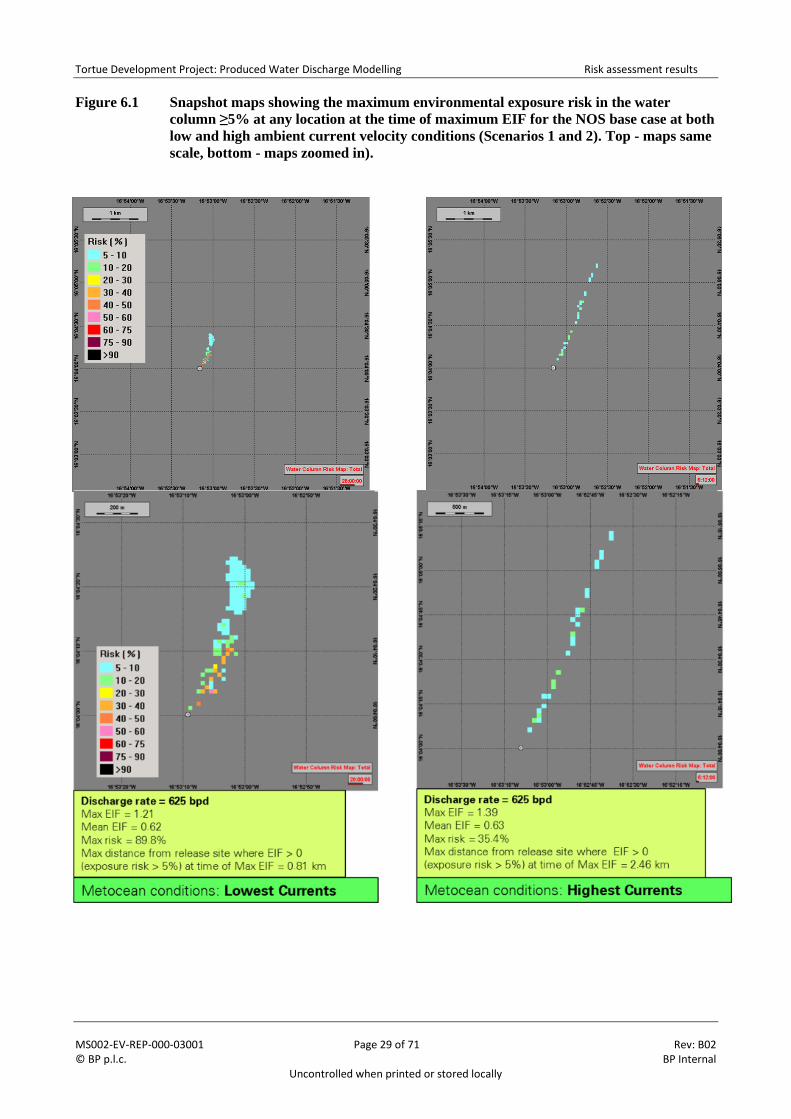
Figure 6.1 shows snapshot maps of the maximum environmental exposure risk ≥ 5% in the water at any location at the time of maximum EIF for the NOS base case at both low and high ambient current velocity conditions (Scenarios 1 and 2). The results showed that the maximum distances from release site where the exposure risk is ≥ 5% at the time of maximum EIF are 0.81 km and 2.46 km, for the low and high ambient current cases respectively.
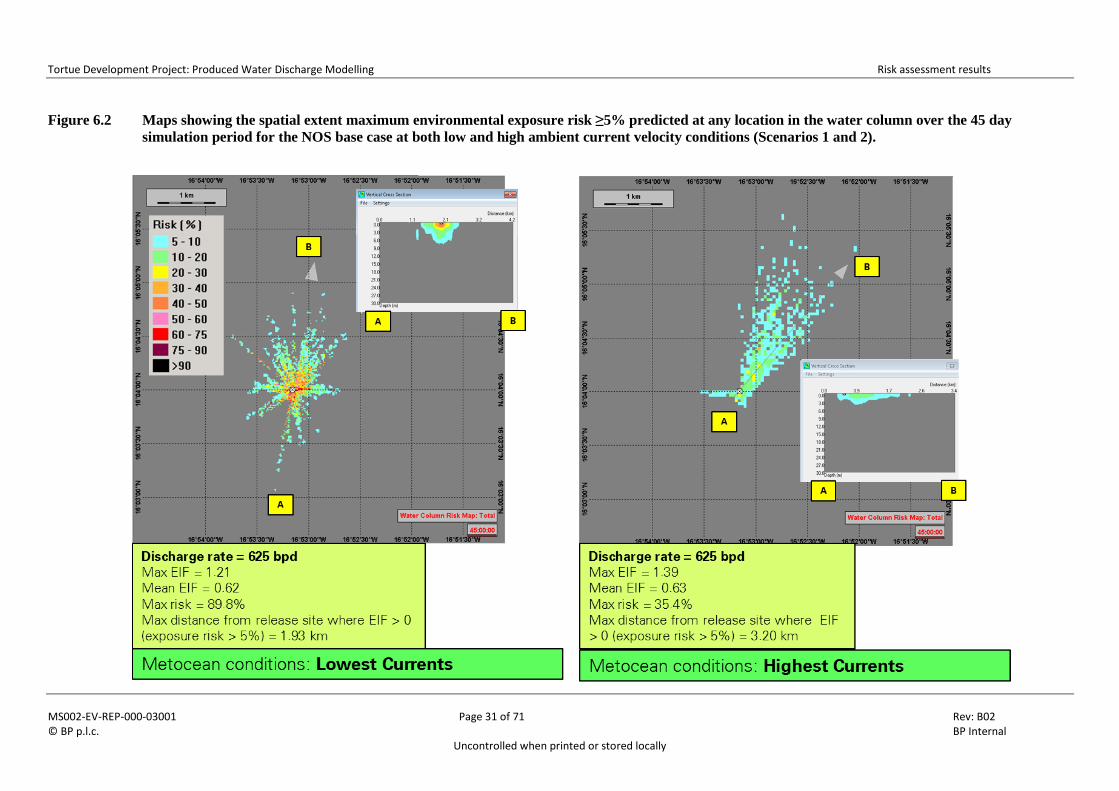
If all time steps are considered, then Figure 6.2 shows the maximum environmental exposure risk predicted at any location in the water column over the 45 day simulation period for Scenarios 1 and 2. The maximum distances from release site where the maximum exposure risk is ≥ 5% are 1.93 kmand 3.20 km, for the low and high ambient current cases respectively. These maps also show avertical cross section of risk in the water column along the vector A-B.
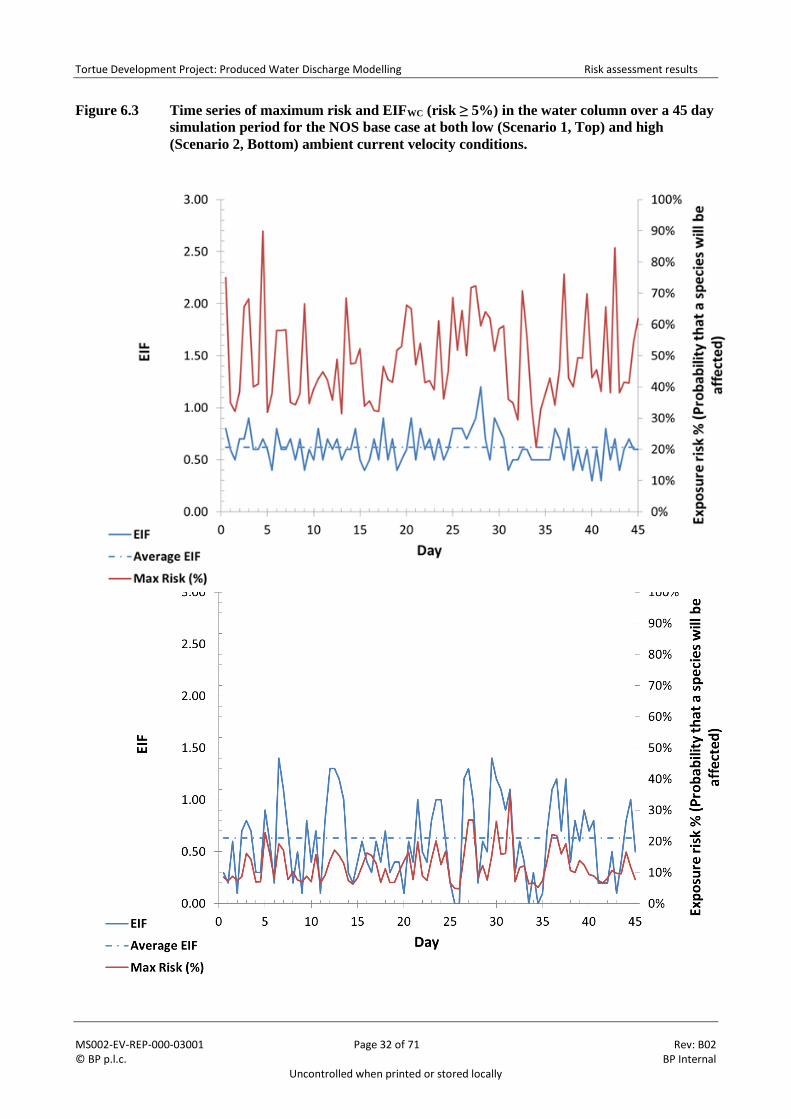
The variation in EIF and maximum risk in the water column over the simulation period for the PW NOS base case is shown in Figure 6.3. The increase in dispersion under high ambient current conditions reduced the predicted time-averaged maximum exposure risk by 75% compared to the low ambient current scenario,
Figure 6.4 shows the contribution of each NOS contaminant in the PW water to the EIF for Scenario 1 (NOS base case, low ambient currents). The pie-chart reveals that 96% of the EIF risk in the water column is attributable to Benzene (75%), Mercury (15%) and Toluene (6%). Similar results were obtained under high ambient current conditions (Scenario 2). However, for the “High” BTEX case scenarios (Scenario 3 and 4) the relative contribution of Benzene increased to @ 85% whilst the Mercury and Toluene contributions reduced to @ 10% and 2% respectively.
Tortue Development Project: Produced Water Discharge Modelling Risk assessment results
MS002-EV-REP-000-03001 Page 29 of 71 Rev: B02 © BP p.l.c. BP Internal
Uncontrolled when printed or stored locally
Figure 6.1 Snapshot maps showing the maximum environmental exposure risk in the water
column ≥5% at any location at the time of maximum EIF for the NOS base case at both
low and high ambient current velocity conditions (Scenarios 1 and 2). Top - maps same
scale, bottom - maps zoomed in).
Tortue Development Project: Produced Water Discharge Modelling Risk assessment results
MS002-EV-REP-000-03001 Page 30 of 71 Rev: B02 © BP p.l.c. BP Internal
Uncontrolled when printed or stored locally
Table 6.1 Summary of the predicted environmental exposure risk arising from NOSs in the PW discharge scenarios for the Tortue FPSO.
(bpd) (m3/day)
Maximum
exposure risk in
the water column
over the duration
of the simulation
(%).
Time-averaged
maximum exposure
risk in the water
column over the
duration of the
simulation (%).
Lowest maximum
exposure risk in the
water column over
the duration of the
simulation (%).
Maximum
instantaneous
EIFwc over
duration of the
simulation.
Maximum volume of
water whose
exposure risk
exceeds 5% (EIFwc
>0) over the duration
of the simulation
(km3).
Time elapsed from
the start of the
discharge when
maximum EIFwc
occurs (days)
Maximum distance from
release point where WC
exposure risk exceeded
5% (i.e. EIFwc > 0) at the
time of Max
instantaneous EIFwc
(km).
Average
EIFWC over
duration of
the
simulation.
Average volume of
water whose exposure
risk exceeds 5% (EIFwc
>0) over the duration of
the simulation (km3).
Maximum distance from
release point where WC
exposure risk exceeded
5% (i.e. EIFwc > 0) over
the 45 day simulation
(km).
1 Base caseLowest
Currents625 99 Continuous (45 days)
Naturally Occurring
Substances89.8% 48.8% 20.6% 1.21 0.000121 28.0 0.81 0.62 0.000062 1.93
2 Base caseHighest
Currents625 99 Continuous (45 days)
Naturally Occurring
Substances35.4% 12.1% 4.7% 1.39 0.000139 6.5 2.46 0.63 0.000063 3.20
3 High caseLowest
Currents625 99 Continuous (45 days)
Naturally Occurring
Substances97.4% 64.2% 20.3% 2.01 0.000201 4.5 0.31 1.03 0.000103 2.27
4 High caseHighest
Currents625 99 Continuous (45 days)
Naturally Occurring
Substances47.8% 18.1% 8.2% 2.12 0.000212 35.5 0.43 0.95 0.000095 3.23
Produced Water Profile
TypeScenario
Concentration of BTEX
components in PW
discharge
Metocean
Ambient
current /
conditions
Release rate of PW
Release duration (days)
Water column EIF
(bpd) (m3/day)
Time-averaged
maximum exposure
risk in the water
column over the
duration of the
simulation (%).
Maximum
instantaneous
EIFwc over
duration of the
simulation.
Maximum distance from
release point where WC
exposure risk exceeded
5% (i.e. EIFwc > 0) at the
time of Max
instantaneous EIFwc
(km).
Average
EIFWC over
duration of
the
simulation.
Maximum distance from
release point where WC
exposure risk exceeded
5% (i.e. EIFwc > 0) over
the 45 day simulation
(km).
1 Base caseLowest
Currents625 99 Continuous (45 days)
Naturally Occurring
Substances48.8% 0% 0% 1.21 0% 0% 0.81 0% 0% 0.62 0% 0% 1.93 0% 0%
2 Base caseHighest
Currents625 99 Continuous (45 days)
Naturally Occurring
Substances12.1% -75% 0% 1.39 15% 0% 2.46 205% 0% 0.63 2% 0% 3.20 66% 0%
3 High caseLowest
Currents625 99 Continuous (45 days)
Naturally Occurring
Substances64.2% 0% 32% 2.01 0% 66% 0.31 0% -61% 1.03 0% 66% 2.27 0% 17%
4 High caseHighest
Currents625 99 Continuous (45 days)
Naturally Occurring
Substances18.1% -72% 50% 2.12 5% 53% 0.43 37% -83% 0.95 -8% 51% 3.23 42% 1%
Produced Water
Profile TypeScenario
Concentration of
BTEX components in
PW discharge
Metocean
Ambient
current /
conditions
Release rate of PW
Release duration
(days)
Water column EIF
Percentage
Change in Max
EIF wc (%)
Percentage Change (%)Percentage Change
in Avg EIF wc(%)
Percentage Change
(%)
Percentage
Change in Time-
averaged
maximum
exposure risk (%)
Tortue Development Project: Produced Water Discharge Modelling Risk assessment results
MS002-EV-REP-000-03001 Page 31 of 71 Rev: B02 © BP p.l.c. BP Internal
Uncontrolled when printed or stored locally
Figure 6.2 Maps showing the spatial extent maximum environmental exposure risk ≥5% predicted at any location in the water column over the 45 day
simulation period for the NOS base case at both low and high ambient current velocity conditions (Scenarios 1 and 2).
Tortue Development Project: Produced Water Discharge Modelling Risk assessment results
MS002-EV-REP-000-03001 Page 32 of 71 Rev: B02 © BP p.l.c. BP Internal BP Internal
Uncontrolled when printed or stored locally
Figure 6.3 Time series of maximum risk and EIFWC (risk ≥ 5%) in the water column over a 45 day
simulation period for the NOS base case at both low (Scenario 1, Top) and high
(Scenario 2, Bottom) ambient current velocity conditions.
Tortue Development Project: Produced Water Discharge Modelling Risk assessment results
MS002-EV-REP-000-03001 Page 33 of 71 Rev: B02 © BP p.l.c. BP Internal BP Internal
Uncontrolled when printed or stored locally
Figure 6.4 Pie-chart showing the contribution of each naturally occurring contaminant towards
the EIF for the PW NOS only base case (Scenario 1, low ambient currents)
6.2 Assessment of naturally occurring substances and added Chemicals
Table 6.2 summarises the Maximum and Mean EIFs results for PW discharge Scenarios 5 to 8 (which include production chemicals, see Section 4 - Table 4.1).
The EIFs for all 4 scenarios were much higher than for the scenarios which considered only NOS components indicating that contribution of NOSs to the PW toxicity is minor. The EIFs ranged from 18.9 to 39.6 for the maximum EIF and 9.2 to 15.6 for the Mean EIFs. The highest maximum and mean EIF values of 39.6 and 15.6 respectively (Scenario 7) were associated with the High BTEX concentration case + production chemicals / lowest ambient current velocity scenario. A maximum EIF of 39.6 is equivalent to a maximum volume of water which experiences an exposure risk ≥ 5% of 3.96 x 10⁻³ km3
The High BTEX case scenarios with production chemicals included (Scenarios 7 and 8) gave mean EIFs only 5% - 6% greater than those for the corresponding Base case scenarios with production chemicals (Scenarios 5 and 6). For all BTEX scenarios with production chemicals, the increase in dispersion under high ambient current conditions reduced the calculated maximum and mean EIF by 45% - 49% and 38% respectively.
Figure 6.5 shows snapshot maps at the time of maximum EIF in the water column for the NOS base case with production chemicals at both low and high ambient current velocity conditions (Scenarios 5 and 6). The results showed that the maximum distances from release site where the exposure risk is ≥ 5% at the time of maximum EIF are 1.78 km and 1.90 km, for the low and high ambient current cases respectively.
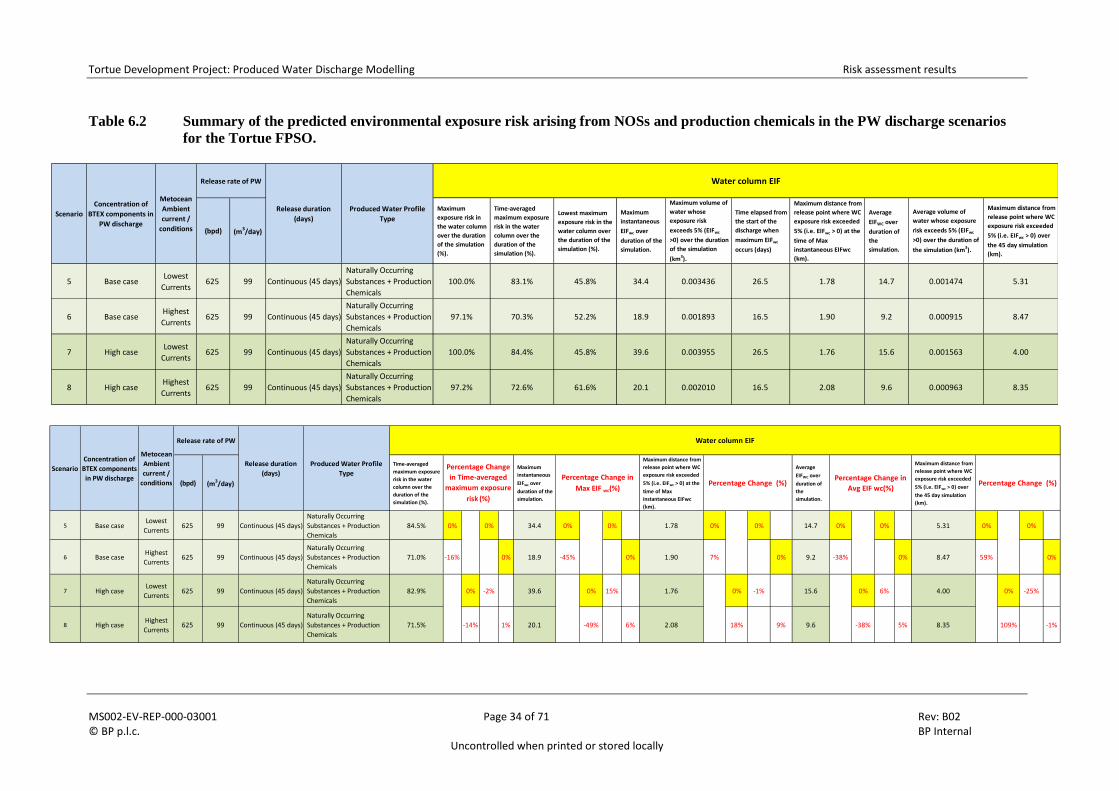
Tortue Development Project: Produced Water Discharge Modelling Risk assessment results
MS002-EV-REP-000-03001 Page 34 of 71 Rev: B02 © BP p.l.c. BP Internal
Uncontrolled when printed or stored locally
Table 6.2 Summary of the predicted environmental exposure risk arising from NOSs and production chemicals in the PW discharge scenarios
for the Tortue FPSO.
(bpd) (m3/day)
Maximum
exposure risk in
the water column
over the duration
of the simulation
(%).
Time-averaged
maximum exposure
risk in the water
column over the
duration of the
simulation (%).
Lowest maximum
exposure risk in the
water column over
the duration of the
simulation (%).
Maximum
instantaneous
EIFwc over
duration of the
simulation.
Maximum volume of
water whose
exposure risk
exceeds 5% (EIFwc
>0) over the duration
of the simulation
(km3).
Time elapsed from
the start of the
discharge when
maximum EIFwc
occurs (days)
Maximum distance from
release point where WC
exposure risk exceeded
5% (i.e. EIFwc > 0) at the
time of Max
instantaneous EIFwc
(km).
Average
EIFWC over
duration of
the
simulation.
Average volume of
water whose exposure
risk exceeds 5% (EIFwc
>0) over the duration of
the simulation (km3).
Maximum distance from
release point where WC
exposure risk exceeded
5% (i.e. EIFwc > 0) over
the 45 day simulation
(km).
5 Base caseLowest
Currents625 99 Continuous (45 days)
Naturally Occurring
Substances + Production
Chemicals
100.0% 83.1% 45.8% 34.4 0.003436 26.5 1.78 14.7 0.001474 5.31
6 Base caseHighest
Currents625 99 Continuous (45 days)
Naturally Occurring
Substances + Production
Chemicals
97.1% 70.3% 52.2% 18.9 0.001893 16.5 1.90 9.2 0.000915 8.47
7 High caseLowest
Currents625 99 Continuous (45 days)
Naturally Occurring
Substances + Production
Chemicals
100.0% 84.4% 45.8% 39.6 0.003955 26.5 1.76 15.6 0.001563 4.00
8 High caseHighest
Currents625 99 Continuous (45 days)
Naturally Occurring
Substances + Production
Chemicals
97.2% 72.6% 61.6% 20.1 0.002010 16.5 2.08 9.6 0.000963 8.35
Produced Water Profile
TypeScenario
Concentration of
BTEX components in
PW discharge
Metocean
Ambient
current /
conditions
Release rate of PW
Release duration
(days)
Water column EIF
(bpd) (m3/day)
Time-averaged
maximum exposure
risk in the water
column over the
duration of the
simulation (%).
Maximum
instantaneous
EIFwc over
duration of the
simulation.
Maximum distance from
release point where WC
exposure risk exceeded
5% (i.e. EIFwc > 0) at the
time of Max
instantaneous EIFwc
(km).
Average
EIFWC over
duration of
the
simulation.
Maximum distance from
release point where WC
exposure risk exceeded
5% (i.e. EIFwc > 0) over
the 45 day simulation
(km).
5 Base caseLowest
Currents625 99 Continuous (45 days)
Naturally Occurring
Substances + Production
Chemicals
84.5% 0% 0% 34.4 0% 0% 1.78 0% 0% 14.7 0% 0% 5.31 0% 0%
6 Base caseHighest
Currents625 99 Continuous (45 days)
Naturally Occurring
Substances + Production
Chemicals
71.0% -16% 0% 18.9 -45% 0% 1.90 7% 0% 9.2 -38% 0% 8.47 59% 0%
7 High caseLowest
Currents625 99 Continuous (45 days)
Naturally Occurring
Substances + Production
Chemicals
82.9% 0% -2% 39.6 0% 15% 1.76 0% -1% 15.6 0% 6% 4.00 0% -25%
8 High caseHighest
Currents625 99 Continuous (45 days)
Naturally Occurring
Substances + Production
Chemicals
71.5% -14% 1% 20.1 -49% 6% 2.08 18% 9% 9.6 -38% 5% 8.35 109% -1%
Produced Water Profile
TypeScenario
Concentration of
BTEX components
in PW discharge
Metocean
Ambient
current /
conditions
Release rate of PW
Release duration
(days)Percentage Change in
Avg EIF wc(%)
Percentage Change in
Max EIF wc(%)Percentage Change (%)
Water column EIF
Percentage Change (%)
Percentage Change
in Time-averaged
maximum exposure
risk (%)
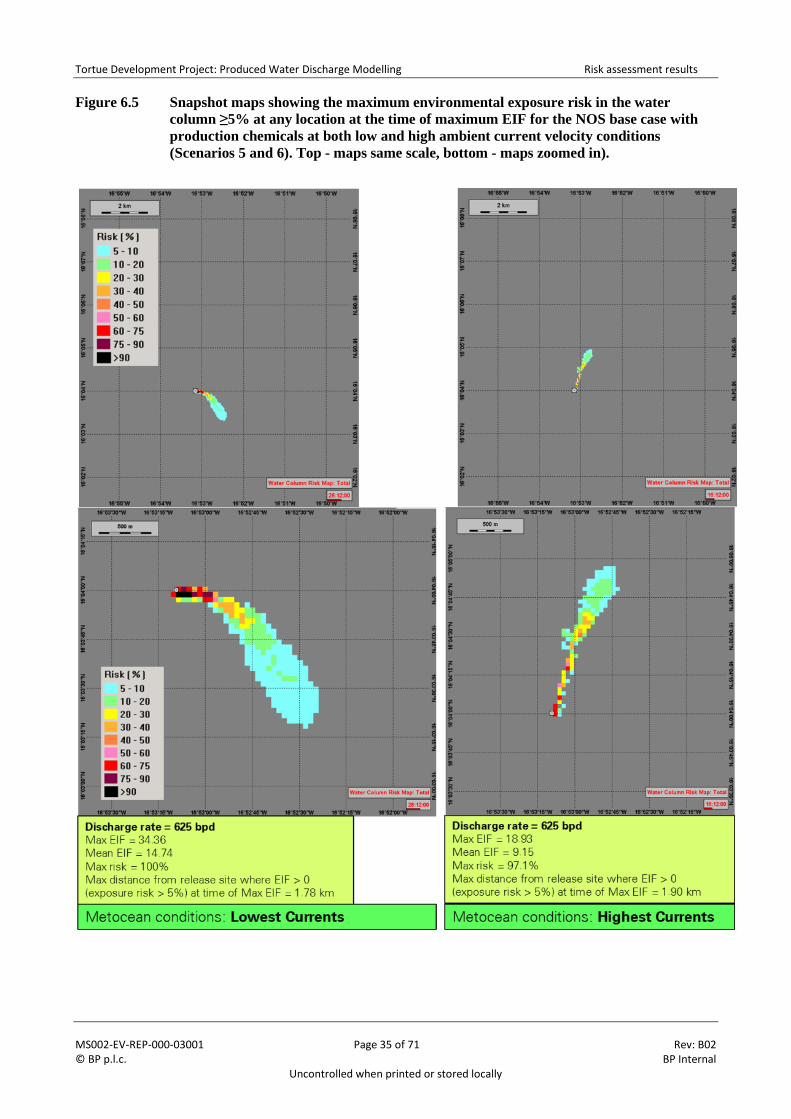
Tortue Development Project: Produced Water Discharge Modelling Risk assessment results
MS002-EV-REP-000-03001 Page 35 of 71 Rev: B02 © BP p.l.c. BP Internal BP Internal
Uncontrolled when printed or stored locally
Figure 6.5 Snapshot maps showing the maximum environmental exposure risk in the water
column ≥5% at any location at the time of maximum EIF for the NOS base case with
production chemicals at both low and high ambient current velocity conditions
(Scenarios 5 and 6). Top - maps same scale, bottom - maps zoomed in).
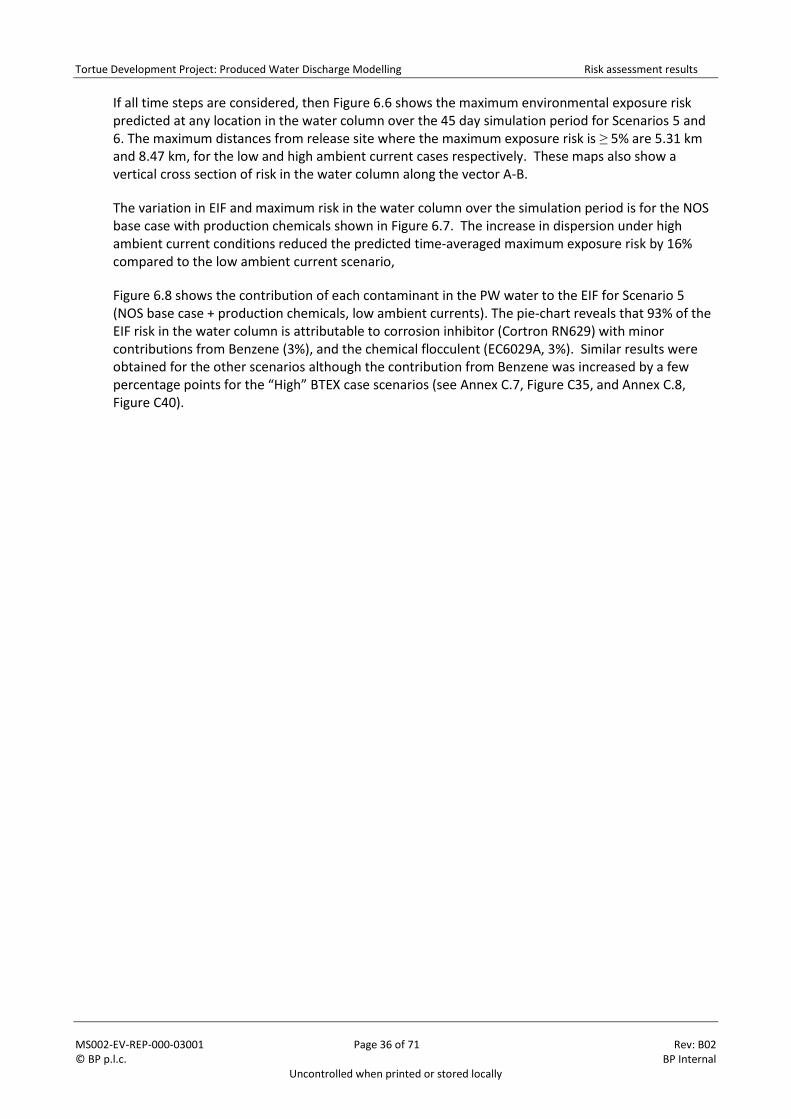
Tortue Development Project: Produced Water Discharge Modelling Risk assessment results
MS002-EV-REP-000-03001 Page 36 of 71 Rev: B02 © BP p.l.c. BP Internal BP Internal
Uncontrolled when printed or stored locally
If all time steps are considered, then Figure 6.6 shows the maximum environmental exposure risk predicted at any location in the water column over the 45 day simulation period for Scenarios 5 and 6. The maximum distances from release site where the maximum exposure risk is ≥ 5% are 5.31 kmand 8.47 km, for the low and high ambient current cases respectively. These maps also show avertical cross section of risk in the water column along the vector A-B.
The variation in EIF and maximum risk in the water column over the simulation period is for the NOS base case with production chemicals shown in Figure 6.7. The increase in dispersion under high ambient current conditions reduced the predicted time-averaged maximum exposure risk by 16% compared to the low ambient current scenario,
Figure 6.8 shows the contribution of each contaminant in the PW water to the EIF for Scenario 5 (NOS base case + production chemicals, low ambient currents). The pie-chart reveals that 93% of the EIF risk in the water column is attributable to corrosion inhibitor (Cortron RN629) with minor contributions from Benzene (3%), and the chemical flocculent (EC6029A, 3%). Similar results were obtained for the other scenarios although the contribution from Benzene was increased by a few percentage points for the “High” BTEX case scenarios (see Annex C.7, Figure C35, and Annex C.8, Figure C40).
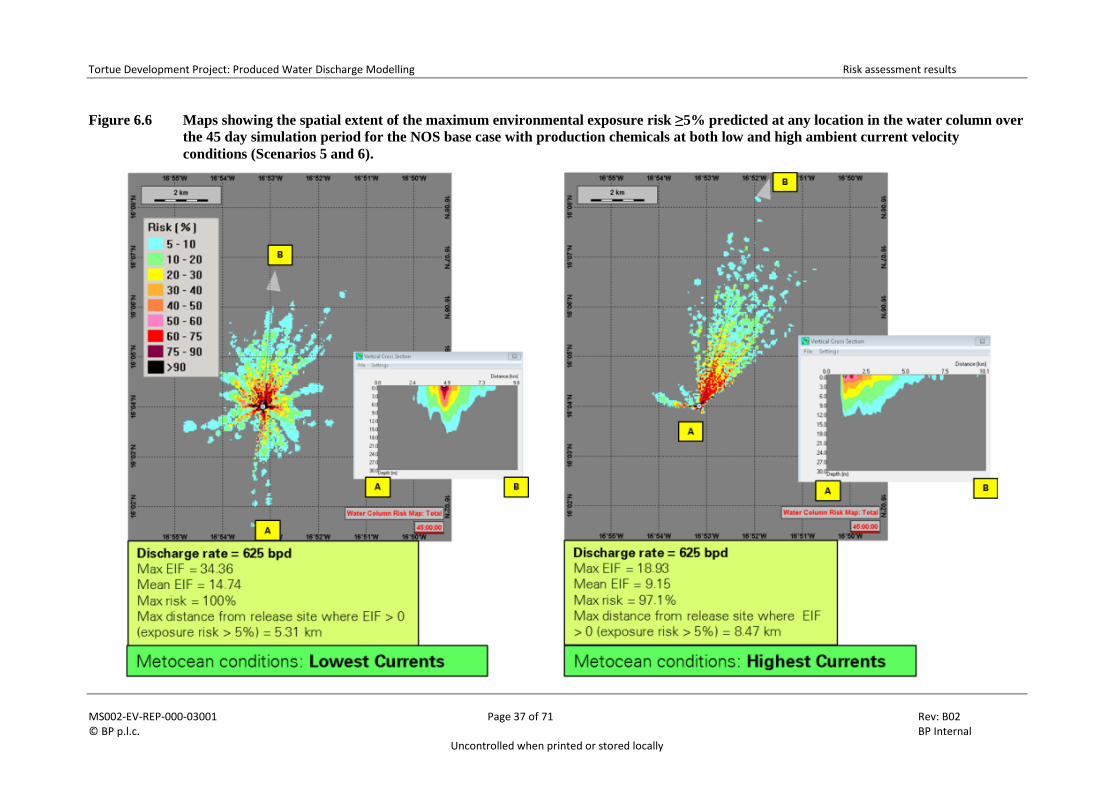
Tortue Development Project: Produced Water Discharge Modelling Risk assessment results
MS002-EV-REP-000-03001 Page 37 of 71 Rev: B02 © BP p.l.c. BP Internal
Uncontrolled when printed or stored locally
Figure 6.6 Maps showing the spatial extent of the maximum environmental exposure risk ≥5% predicted at any location in the water column over
the 45 day simulation period for the NOS base case with production chemicals at both low and high ambient current velocity
conditions (Scenarios 5 and 6).
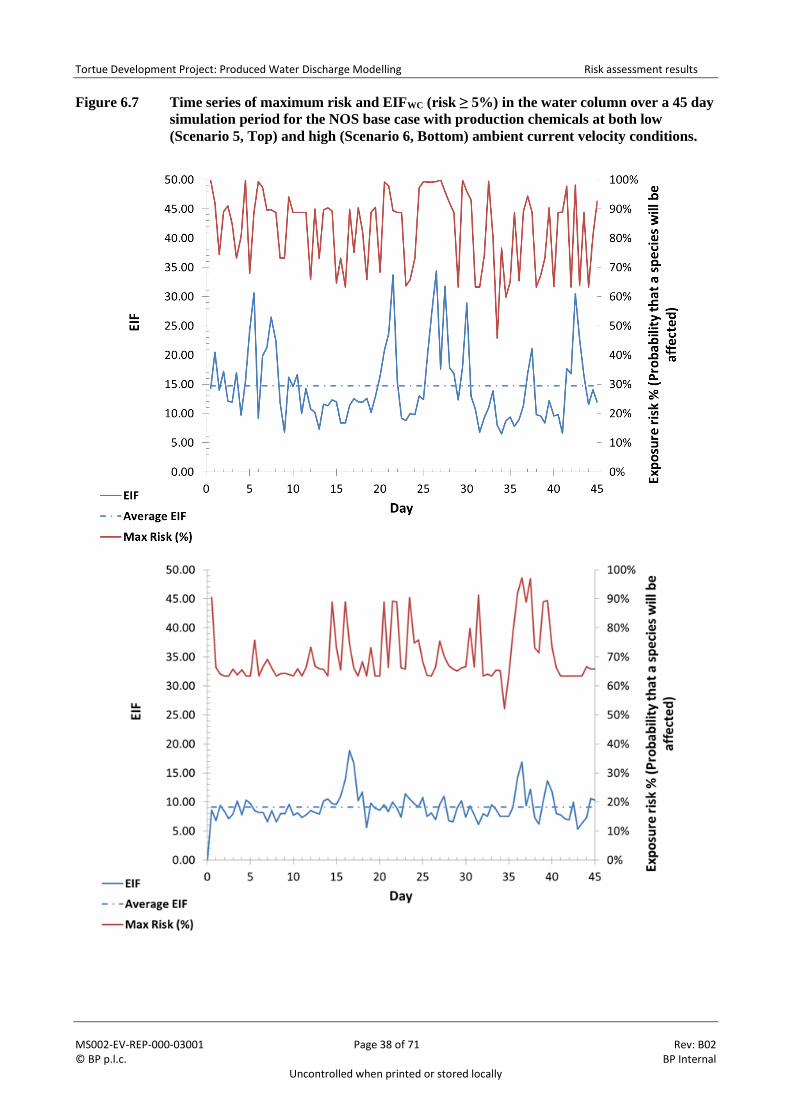
Tortue Development Project: Produced Water Discharge Modelling Risk assessment results
MS002-EV-REP-000-03001 Page 38 of 71 Rev: B02 © BP p.l.c. BP Internal
Uncontrolled when printed or stored locally
Figure 6.7 Time series of maximum risk and EIFWC (risk ≥ 5%) in the water column over a 45 day
simulation period for the NOS base case with production chemicals at both low
(Scenario 5, Top) and high (Scenario 6, Bottom) ambient current velocity conditions.
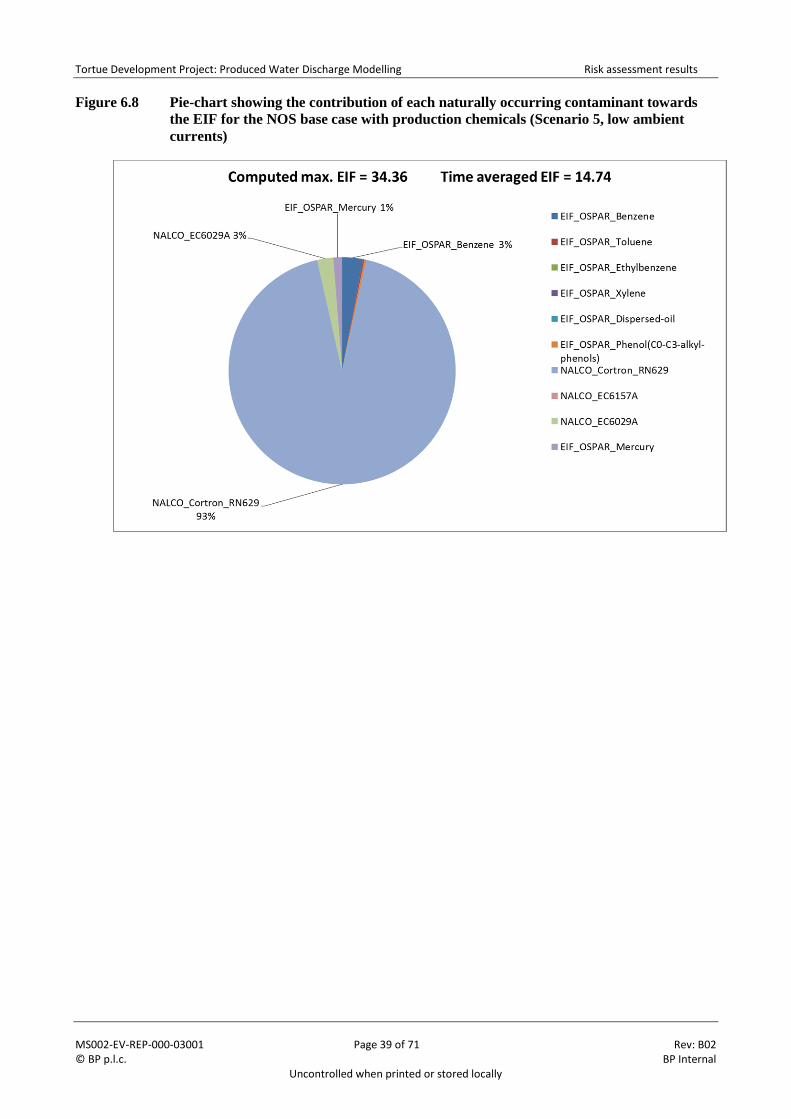
Tortue Development Project: Produced Water Discharge Modelling Risk assessment results
MS002-EV-REP-000-03001 Page 39 of 71 Rev: B02 © BP p.l.c. BP Internal
Uncontrolled when printed or stored locally
Figure 6.8 Pie-chart showing the contribution of each naturally occurring contaminant towards
the EIF for the NOS base case with production chemicals (Scenario 5, low ambient
currents)
Tortue Development Project: Produced Water Discharge Modelling Discussion
MS002-EV-REP-000-03001 Page 40 of 71 Rev: B02 © BP p.l.c. BP Internal
Uncontrolled when printed or stored locally
7 Discussion
Overall, the results show significant variability in the calculated EIFs, which depends on the ambient metocean conditions, the concentration of BTEX components in the PW and whether the PW discharge profiles contain chemical additives.
Although the predicted EIFs were higher when production chemicals were included in the PW profile, which suggests that added chemicals are the main contributor to environmental exposure risk, it must be stressed that this is in part due to the assessment (safety) factor (AF) approach included in the EIF methodology. The variability in quality and quantity of toxicity data for the different substance groups causes a large range in applied AFs that account for extrapolation uncertainty. For example the PNEC values for Ethylbenzene and Benzene were derived using AFs of 10 and 100 respectively, because comprehensive chronic toxicity data is available (7). In contrast, AFs of 1,000 were applied to production chemicals as there is limited acute toxicity data available for 3 species at 3 different trophic levels (algae, zooplankton, and fish) (3). It is important that the extrapolation uncertainty “hidden” in AFs is taken into account when defining risk reduction measures; otherwise it could result in the wrong prioritisation of mitigation options.
Thus in the case of PW discharges from the Tortue FPSO, the first priority before considering any other risk mitigation options, should be establish whether acquiring chronic toxicity test data for the corrosion inhibitor will allow a less conservative AF of 100, or 50 to be used in EIF calculations thereby reducing the overall EIF and contribution from the CI chemical.
Although it is not advisable to compare EIFs from different installations because of differences in the nature and scale of discharges and different environmental conditions, the highest maximum and mean EIF values of 39.6 and 15.6 predicted for the Tortue FPSO PW discharge are small when compared to the limited published PW EIF data for North Sea installations. In 2002 Statoil published EIF data for the discharge of PW from 25 fields in the North Sea. The values ranged from 0 (zero) to 15,000, with an EIF of 100 or less for seven fields, and EIF of approximately 1,000 for the majority of the fields and an EIF of >5,000 for three fields(12).
Tortue Development Project: Produced Water Discharge Modelling References
MS002-EV-REP-000-03001 Page 41 of 71 Rev: B02 © BP p.l.c. BP Internal
Uncontrolled when printed or stored locally
8 References
[1] OSPAR Recommendation 2012/5 for a risk-based approach to the management of produced waterdischarges from offshore installations.
[2] OSPAR 12/22/1 Annex 19 of OSPAR Agreement 2012/7, OSPAR Guidelines in support ofRecommendation 2012/5 for a Risk-based Approach to the Management of Produced WaterDischarges from Offshore Installations.
[3] EC(1996). Technical Guidance Document in support of the Commission Directive 93/67/EEC on RiskAssessment for New Notified Substances and Commission Regulation (EC) No 1488/94 on RiskAssessment for Existing Substances. Part II – Environmental Risk Assessment. Office for OfficialPublications of the EC, Luxembourg.
[4] EC (2003): Technical Guidance Document on risk assessment in support of Commission Directive93/67/EEC on risk assessment for new notified substances and Commission Regulation (EC) No1488/94 on risk assessment for existing substances and Directive 98/8/EC of the Europeanparliament and of the council concerning the placing of biocidal products on the market. Part II –Environmental Risk Assessment.
[5] [10] ECHA Guidance on information requirements and chemical safety assessment. Chapter R.10:Characterisation of dose [concentration]-response for environment, May 2008.http://echa.europa.eu/web/guest/guidance-documents/guidance-on-information-requirements-and-chemical-safety-assessment.
[6] SCHER (Scientific Committee on Health and Environmental Risks), Opinion on the Chemicals and theWater Framework Directive: Technical Guidance for Deriving Environmental Quality Standards,October 2010.
[7] OSPAR Agreement 2014/5, Establishment of a list of Predicted No Effect Concentrations (PNECs) fornaturally occurring substances in produced water.
[8] Reed, M. et. al., 2001: “DREAM: a Dose-Related Exposure Assessment Model. Technical Descriptionof Physical-Chemical Fates Components. Proceedings 5th Int. Marine Environmental ModellingSeminar, New Orleans, USA, Oct. 9-11 2001.
[9] Reed, M., B. Hetland, 2002. DREAM: a Dose-Related Exposure Assessment Model TechnicalDescription of Physical-Chemical Fates Components. SPE 73856.
[10] Neff, J., S. Johnsen, T. K. Frost, T. I. R. U., G. S. Durell, 2006. Oil well produced water discharges tothe North Sea. Part II: Comparison of deployed mussels (Mytilus edulis) and the DREAM model topredict ecological risk. Marine Environmental Research 62 (2006) 224–246.
[11] Durell, G., T. R. Utvik , S. Johnsen, T. Frost, J. Neff., 2006. Oil well produced water discharges to theNorth Sea. Part I: Comparison of deployed mussels (Mytilus edulis), semi-permeable membranedevices, and the DREAM model predictions to estimate the dispersion of polycyclic aromatichydrocarbons. Marine Environmental Research 62 (2006) 194–223.
[12] Johnsen, S., T.K. Frost, M. Hjelsvold and T.R. Utvik, 2000: “The Environmental Impact Factor – aproposed tool for produced water impact reduction, management and regulation”. SPE paper61178 presented at the SPE International Conference on Health, Safety and Environment in Oil andGas Exploration and Production held in Stavanger, Norway, 26 – 28 June 2000.
Tortue Development Project: Produced Water Discharge Modelling References
MS002-EV-REP-000-03001 Page 42 of 71 Rev: B02 © BP p.l.c. BP Internal
Uncontrolled when printed or stored locally
[13] Karman, C., 1994: “Eco toxicological Risk of Produced Water from Oil Production Platforms in theStatfjord and Gullfax Fields”. TNO Environmental Sciences. Laboratory for Applied Marine Research,den Helder, The Netherlands. Report TNO-ES, February 1994.
[14] Karman, C. and Reerink, H.G., 1997: ”Dynamic Assessment of the Ecological Risk of the Discharge ofproduced Water from Oil and Gas producing Platforms”. Paper presented at the SPE conference in1997, Dallas, USA. SPE paper No. SPE 37905.
[15] Smith, W.H.F, Sandwell, D.T., Global Seafloor Topography from Satellite Altimetry, NOAAGeosciences Laboratory and Scripps Institution of Oceanography, University of California, SanDiego.https://www.ngdc.noaa.gov/mgg/announcements/announce_predict.html,http://topex.ucsd.edu/WWW_html/mar_topo.html
[16] International Bathymetric Chart of the Arctic Ocean,https://www.ngdc.noaa.gov/mgg/bathymetry/arctic/arctic.html
[17] National Virtual Ocean Data System (NVODS) server - World Ocean Atlas 2005 1x1 degree Monthlymeans dataset (http://ferret.pmel.noaa.gov/nvods/las/)
[18] International Finance Corporation of the World Bank Group. Environmental, Health, and SafetyGuidelines for Offshore Oil and Gas Development, June 2015.
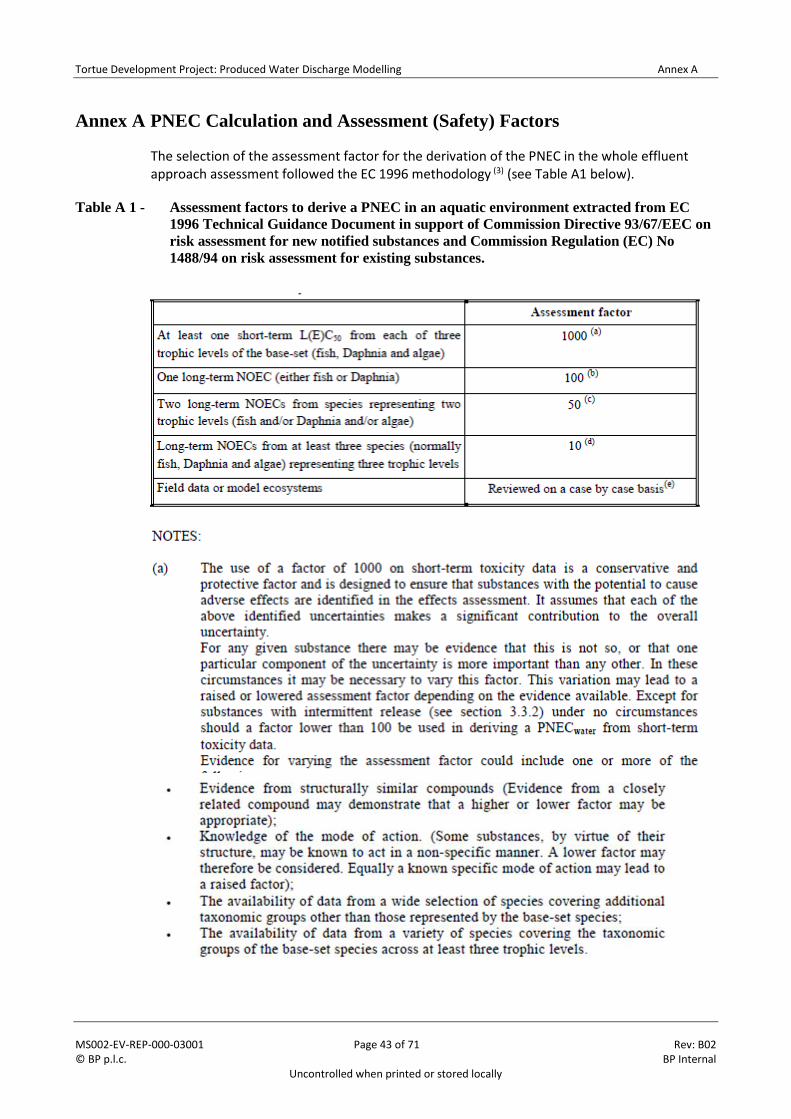
Tortue Development Project: Produced Water Discharge Modelling Annex A
MS002-EV-REP-000-03001 Page 43 of 71 Rev: B02 © BP p.l.c. BP Internal
Uncontrolled when printed or stored locally
Annex A PNEC Calculation and Assessment (Safety) Factors
The selection of the assessment factor for the derivation of the PNEC in the whole effluent approach assessment followed the EC 1996 methodology (3) (see Table A1 below).
Table A 1 - Assessment factors to derive a PNEC in an aquatic environment extracted from EC
1996 Technical Guidance Document in support of Commission Directive 93/67/EEC on
risk assessment for new notified substances and Commission Regulation (EC) No
1488/94 on risk assessment for existing substances.
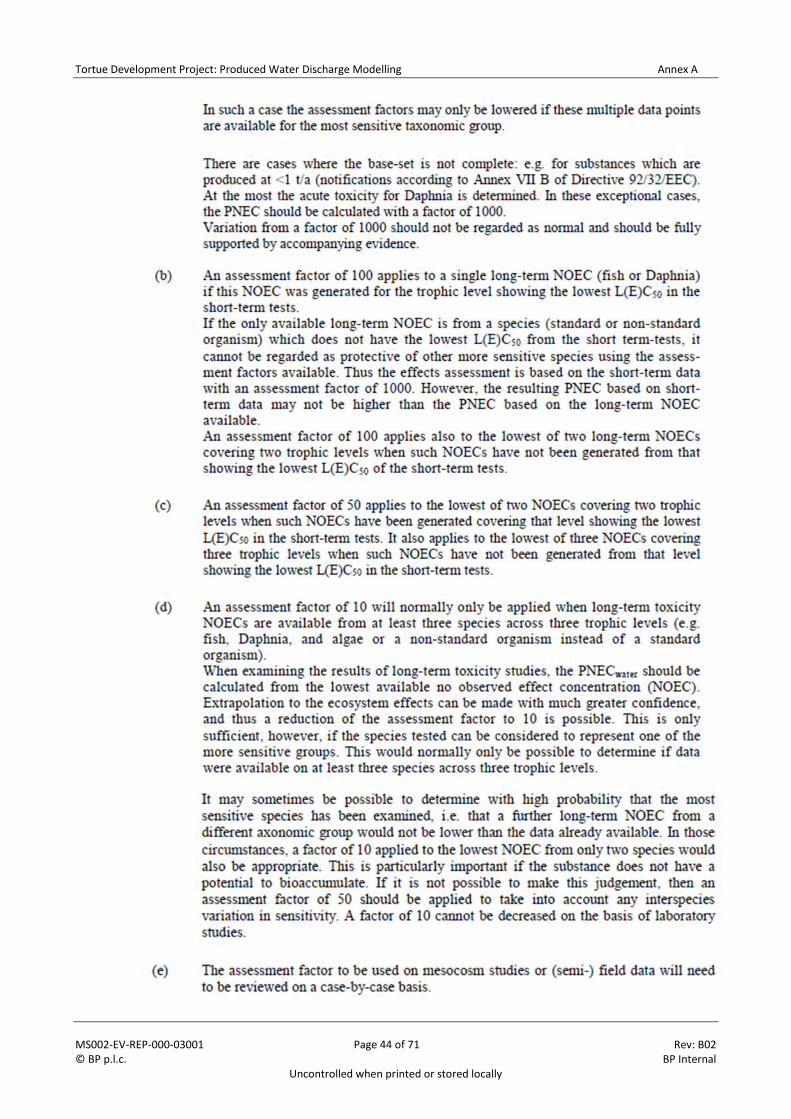
Tortue Development Project: Produced Water Discharge Modelling Annex A
MS002-EV-REP-000-03001 Page 44 of 71 Rev: B02 © BP p.l.c. BP Internal
Uncontrolled when printed or stored locally
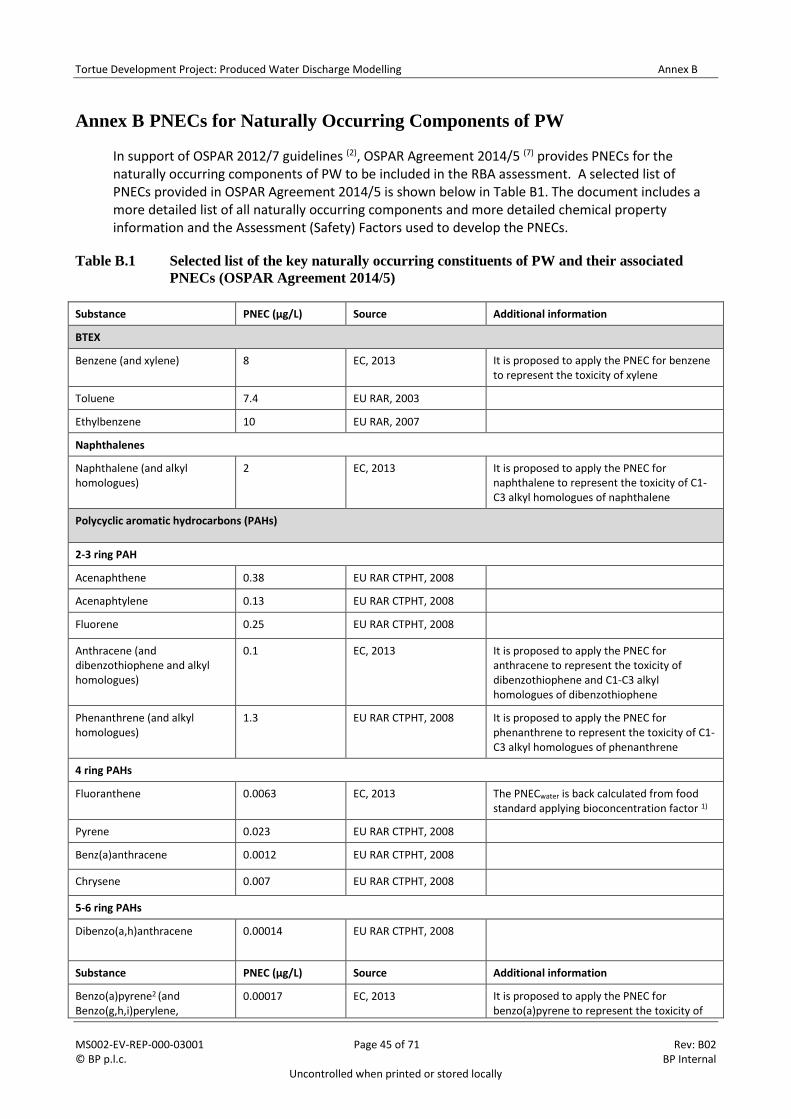
Tortue Development Project: Produced Water Discharge Modelling Annex B
MS002-EV-REP-000-03001 Page 45 of 71 Rev: B02 © BP p.l.c. BP Internal
Uncontrolled when printed or stored locally
Annex B PNECs for Naturally Occurring Components of PW
In support of OSPAR 2012/7 guidelines (2), OSPAR Agreement 2014/5 (7) provides PNECs for the naturally occurring components of PW to be included in the RBA assessment. A selected list of PNECs provided in OSPAR Agreement 2014/5 is shown below in Table B1. The document includes a more detailed list of all naturally occurring components and more detailed chemical property information and the Assessment (Safety) Factors used to develop the PNECs.
Table B.1 Selected list of the key naturally occurring constituents of PW and their associated
PNECs (OSPAR Agreement 2014/5)
Substance PNEC (µg/L) Source Additional information
BTEX
Benzene (and xylene) 8 EC, 2013 It is proposed to apply the PNEC for benzene to represent the toxicity of xylene
Toluene 7.4 EU RAR, 2003
Ethylbenzene 10 EU RAR, 2007
Naphthalenes
Naphthalene (and alkyl homologues)
2 EC, 2013 It is proposed to apply the PNEC for naphthalene to represent the toxicity of C1-C3 alkyl homologues of naphthalene
Polycyclic aromatic hydrocarbons (PAHs)
2-3 ring PAH
Acenaphthene 0.38 EU RAR CTPHT, 2008
Acenaphtylene 0.13 EU RAR CTPHT, 2008
Fluorene 0.25 EU RAR CTPHT, 2008
Anthracene (and dibenzothiophene and alkyl homologues)
0.1 EC, 2013 It is proposed to apply the PNEC for anthracene to represent the toxicity of dibenzothiophene and C1-C3 alkyl homologues of dibenzothiophene
Phenanthrene (and alkyl homologues)
1.3 EU RAR CTPHT, 2008 It is proposed to apply the PNEC for phenanthrene to represent the toxicity of C1-C3 alkyl homologues of phenanthrene
4 ring PAHs
Fluoranthene 0.0063 EC, 2013 The PNECwater is back calculated from food standard applying bioconcentration factor 1)
Pyrene 0.023 EU RAR CTPHT, 2008
Benz(a)anthracene 0.0012 EU RAR CTPHT, 2008
Chrysene 0.007 EU RAR CTPHT, 2008
5-6 ring PAHs
Dibenzo(a,h)anthracene 0.00014 EU RAR CTPHT, 2008
Substance PNEC (µg/L) Source Additional information
Benzo(a)pyrene2 (and Benzo(g,h,i)perylene,
0.00017 EC, 2013 It is proposed to apply the PNEC for benzo(a)pyrene to represent the toxicity of
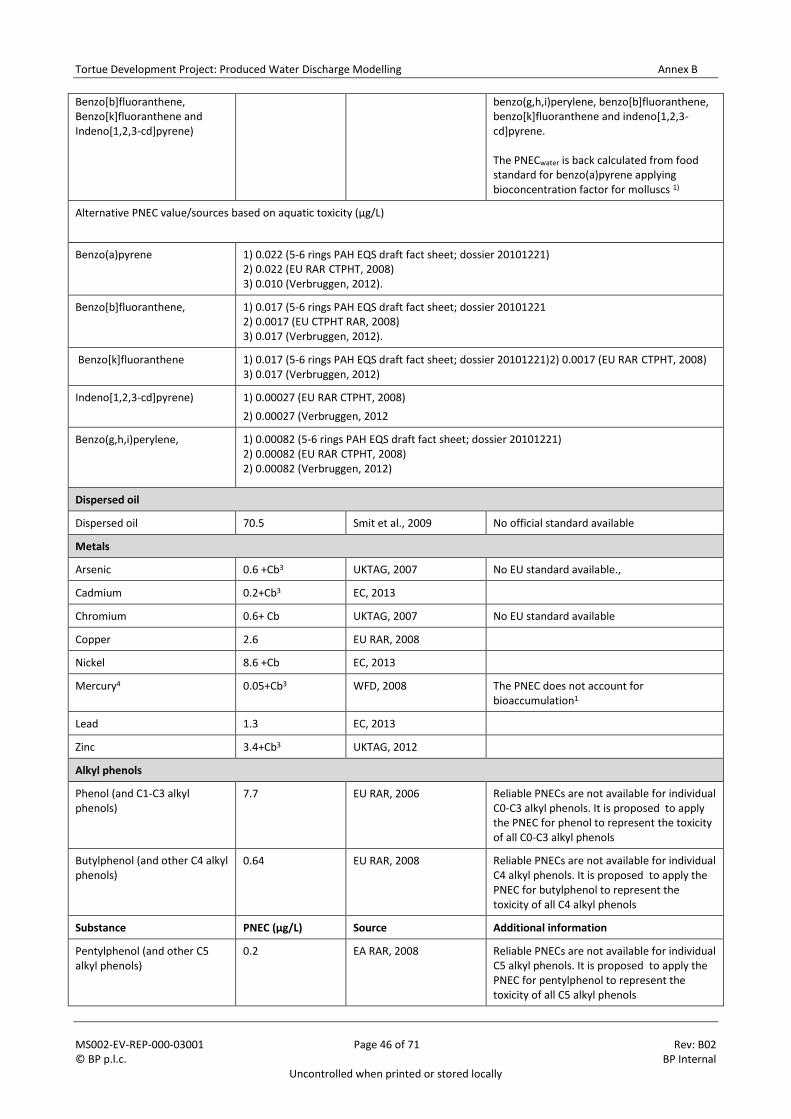
Tortue Development Project: Produced Water Discharge Modelling Annex B
MS002-EV-REP-000-03001 Page 46 of 71 Rev: B02 © BP p.l.c. BP Internal
Uncontrolled when printed or stored locally
Benzo[b]fluoranthene, Benzo[k]fluoranthene and Indeno[1,2,3-cd]pyrene)
benzo(g,h,i)perylene, benzo[b]fluoranthene, benzo[k]fluoranthene and indeno[1,2,3-cd]pyrene.
The PNECwater is back calculated from food standard for benzo(a)pyrene applying bioconcentration factor for molluscs 1)
Alternative PNEC value/sources based on aquatic toxicity (µg/L)
Benzo(a)pyrene 1) 0.022 (5-6 rings PAH EQS draft fact sheet; dossier 20101221)2) 0.022 (EU RAR CTPHT, 2008) 3) 0.010 (Verbruggen, 2012).
Benzo[b]fluoranthene, 1) 0.017 (5-6 rings PAH EQS draft fact sheet; dossier 201012212) 0.0017 (EU CTPHT RAR, 2008) 3) 0.017 (Verbruggen, 2012).
Benzo[k]fluoranthene 1) 0.017 (5-6 rings PAH EQS draft fact sheet; dossier 20101221)2) 0.0017 (EU RAR CTPHT, 2008) 3) 0.017 (Verbruggen, 2012)
Indeno[1,2,3-cd]pyrene) 1) 0.00027 (EU RAR CTPHT, 2008)
2) 0.00027 (Verbruggen, 2012
Benzo(g,h,i)perylene, 1) 0.00082 (5-6 rings PAH EQS draft fact sheet; dossier 20101221)2) 0.00082 (EU RAR CTPHT, 2008) 2) 0.00082 (Verbruggen, 2012)
Dispersed oil
Dispersed oil 70.5 Smit et al., 2009 No official standard available
Metals
Arsenic 0.6 +Cb3 UKTAG, 2007 No EU standard available.,
Cadmium 0.2+Cb3 EC, 2013
Chromium 0.6+ Cb UKTAG, 2007 No EU standard available
Copper 2.6 EU RAR, 2008
Nickel 8.6 +Cb EC, 2013
Mercury4 0.05+Cb3 WFD, 2008 The PNEC does not account for bioaccumulation1
Lead 1.3 EC, 2013
Zinc 3.4+Cb3 UKTAG, 2012
Alkyl phenols
Phenol (and C1-C3 alkyl phenols)
7.7 EU RAR, 2006 Reliable PNECs are not available for individual C0-C3 alkyl phenols. It is proposed to apply the PNEC for phenol to represent the toxicity of all C0-C3 alkyl phenols
Butylphenol (and other C4 alkyl phenols)
0.64 EU RAR, 2008 Reliable PNECs are not available for individual C4 alkyl phenols. It is proposed to apply the PNEC for butylphenol to represent the toxicity of all C4 alkyl phenols
Substance PNEC (µg/L) Source Additional information
Pentylphenol (and other C5 alkyl phenols)
0.2 EA RAR, 2008 Reliable PNECs are not available for individual C5 alkyl phenols. It is proposed to apply the PNEC for pentylphenol to represent the toxicity of all C5 alkyl phenols
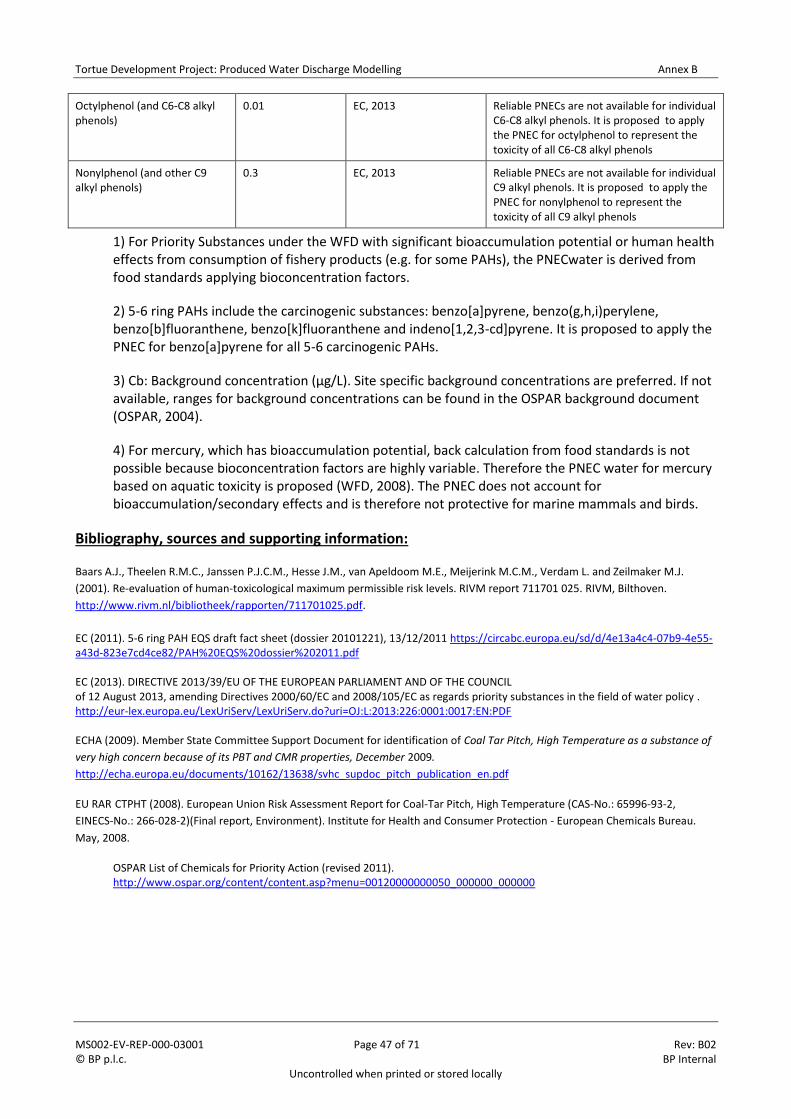
Tortue Development Project: Produced Water Discharge Modelling Annex B
MS002-EV-REP-000-03001 Page 47 of 71 Rev: B02 © BP p.l.c. BP Internal
Uncontrolled when printed or stored locally
Octylphenol (and C6-C8 alkyl phenols)
0.01 EC, 2013 Reliable PNECs are not available for individual C6-C8 alkyl phenols. It is proposed to apply the PNEC for octylphenol to represent the toxicity of all C6-C8 alkyl phenols
Nonylphenol (and other C9 alkyl phenols)
0.3 EC, 2013 Reliable PNECs are not available for individual C9 alkyl phenols. It is proposed to apply the PNEC for nonylphenol to represent the toxicity of all C9 alkyl phenols
1) For Priority Substances under the WFD with significant bioaccumulation potential or human healtheffects from consumption of fishery products (e.g. for some PAHs), the PNECwater is derived fromfood standards applying bioconcentration factors.
2) 5-6 ring PAHs include the carcinogenic substances: benzo[a]pyrene, benzo(g,h,i)perylene,benzo[b]fluoranthene, benzo[k]fluoranthene and indeno[1,2,3-cd]pyrene. It is proposed to apply thePNEC for benzo[a]pyrene for all 5-6 carcinogenic PAHs.
3) Cb: Background concentration (µg/L). Site specific background concentrations are preferred. If notavailable, ranges for background concentrations can be found in the OSPAR background document(OSPAR, 2004).
4) For mercury, which has bioaccumulation potential, back calculation from food standards is notpossible because bioconcentration factors are highly variable. Therefore the PNEC water for mercurybased on aquatic toxicity is proposed (WFD, 2008). The PNEC does not account forbioaccumulation/secondary effects and is therefore not protective for marine mammals and birds.
Bibliography, sources and supporting information:
Baars A.J., Theelen R.M.C., Janssen P.J.C.M., Hesse J.M., van Apeldoom M.E., Meijerink M.C.M., Verdam L. and Zeilmaker M.J.
(2001). Re-evaluation of human-toxicological maximum permissible risk levels. RIVM report 711701 025. RIVM, Bilthoven.
http://www.rivm.nl/bibliotheek/rapporten/711701025.pdf.
EC (2011). 5-6 ring PAH EQS draft fact sheet (dossier 20101221), 13/12/2011 https://circabc.europa.eu/sd/d/4e13a4c4-07b9-4e55-a43d-823e7cd4ce82/PAH%20EQS%20dossier%202011.pdf
EC (2013). DIRECTIVE 2013/39/EU OF THE EUROPEAN PARLIAMENT AND OF THE COUNCIL of 12 August 2013, amending Directives 2000/60/EC and 2008/105/EC as regards priority substances in the field of water policy . http://eur-lex.europa.eu/LexUriServ/LexUriServ.do?uri=OJ:L:2013:226:0001:0017:EN:PDF
ECHA (2009). Member State Committee Support Document for identification of Coal Tar Pitch, High Temperature as a substance of
very high concern because of its PBT and CMR properties, December 2009.
http://echa.europa.eu/documents/10162/13638/svhc_supdoc_pitch_publication_en.pdf
EU RAR CTPHT (2008). European Union Risk Assessment Report for Coal-Tar Pitch, High Temperature (CAS-No.: 65996-93-2,
EINECS-No.: 266-028-2)(Final report, Environment). Institute for Health and Consumer Protection - European Chemicals Bureau.
May, 2008.
OSPAR List of Chemicals for Priority Action (revised 2011). http://www.ospar.org/content/content.asp?menu=00120000000050_000000_000000
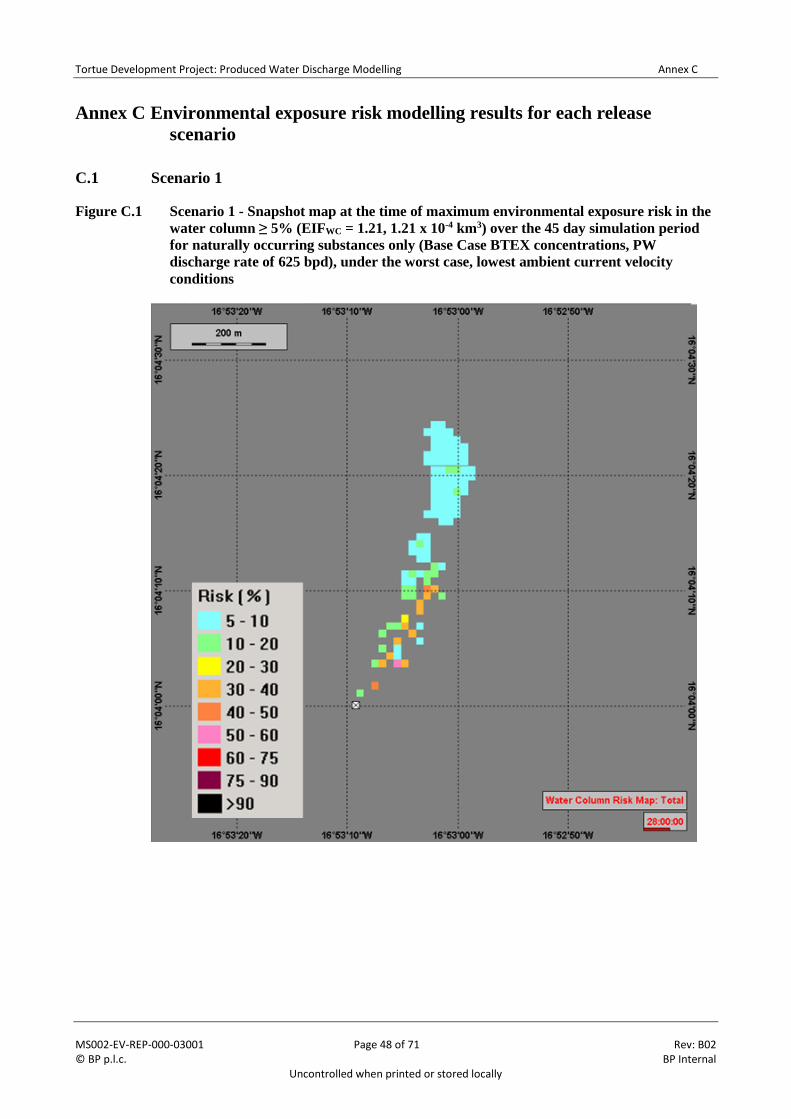
Tortue Development Project: Produced Water Discharge Modelling Annex C
MS002-EV-REP-000-03001 Page 48 of 71 Rev: B02 © BP p.l.c. BP Internal
Uncontrolled when printed or stored locally
Annex C Environmental exposure risk modelling results for each release
scenario
C.1 Scenario 1
Figure C.1 Scenario 1 - Snapshot map at the time of maximum environmental exposure risk in the
water column ≥ 5% (EIFWC = 1.21, 1.21 x 10⁻⁴ km3) over the 45 day simulation period
for naturally occurring substances only (Base Case BTEX concentrations, PW
discharge rate of 625 bpd), under the worst case, lowest ambient current velocity
conditions
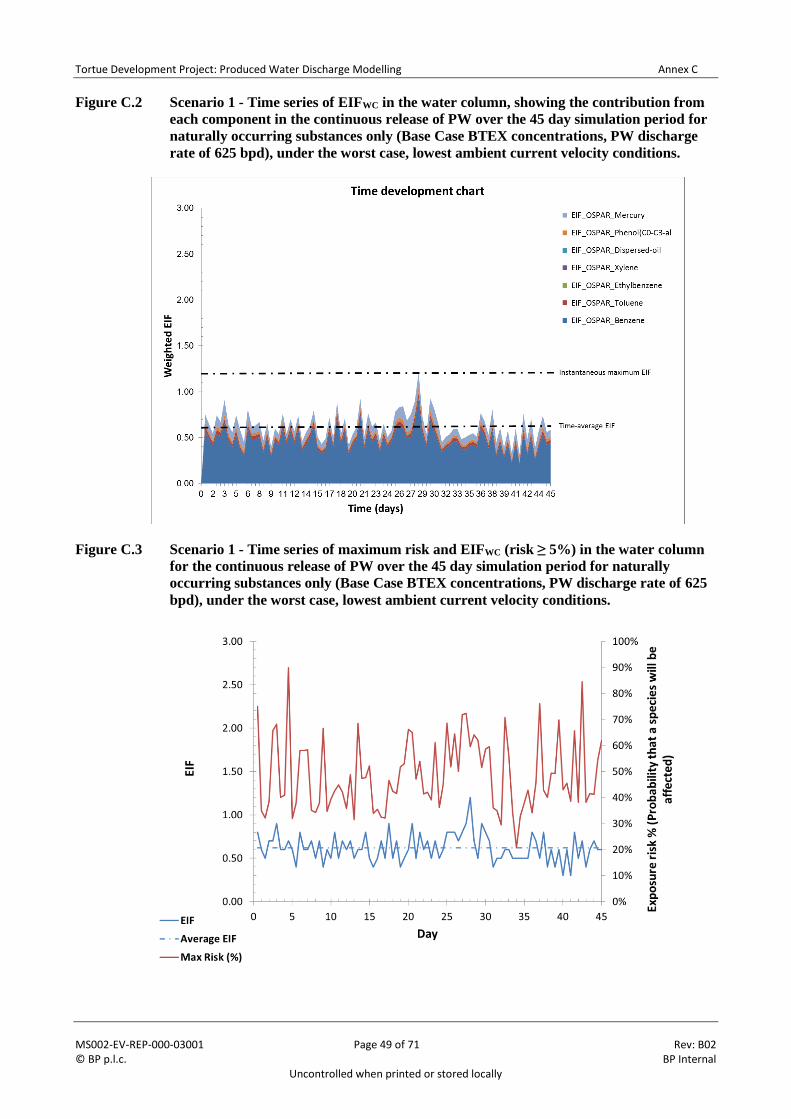
Tortue Development Project: Produced Water Discharge Modelling Annex C
MS002-EV-REP-000-03001 Page 49 of 71 Rev: B02 © BP p.l.c. BP Internal
Uncontrolled when printed or stored locally
Figure C.2 Scenario 1 - Time series of EIFWC in the water column, showing the contribution from
each component in the continuous release of PW over the 45 day simulation period for
naturally occurring substances only (Base Case BTEX concentrations, PW discharge
rate of 625 bpd), under the worst case, lowest ambient current velocity conditions.
Figure C.3 Scenario 1 - Time series of maximum risk and EIFWC (risk ≥ 5%) in the water column
for the continuous release of PW over the 45 day simulation period for naturally
occurring substances only (Base Case BTEX concentrations, PW discharge rate of 625
bpd), under the worst case, lowest ambient current velocity conditions.
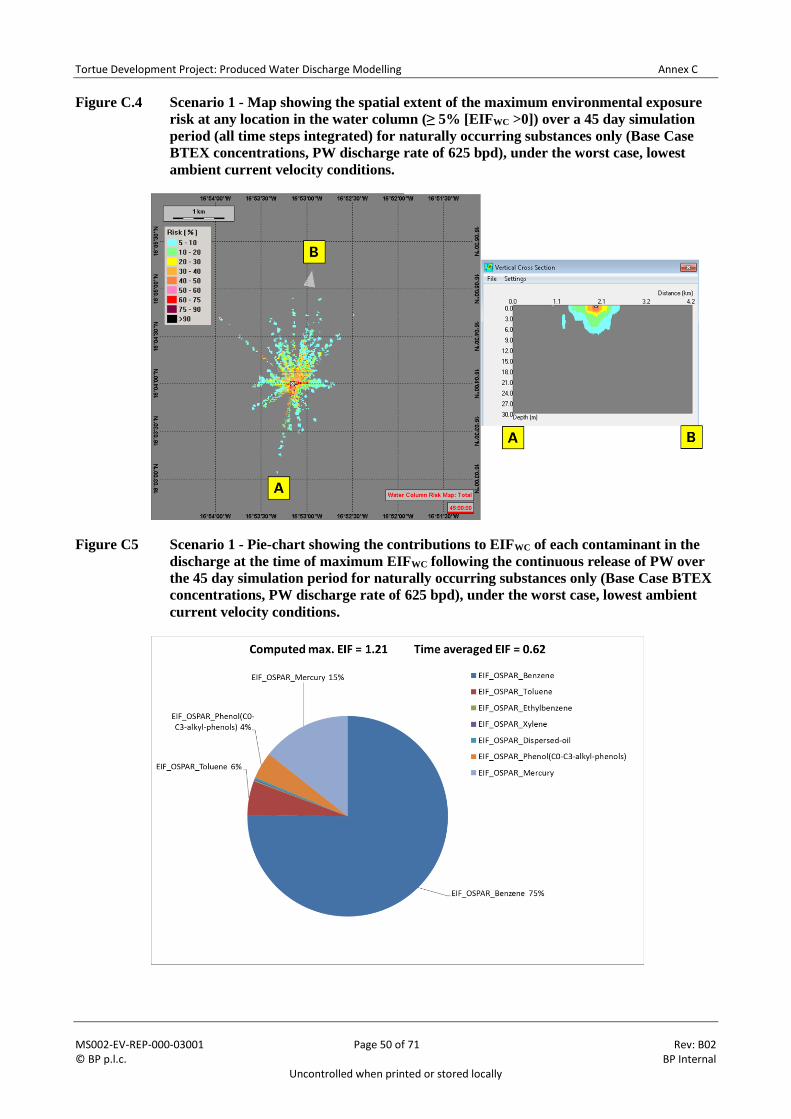
Tortue Development Project: Produced Water Discharge Modelling Annex C
MS002-EV-REP-000-03001 Page 50 of 71 Rev: B02 © BP p.l.c. BP Internal
Uncontrolled when printed or stored locally
Figure C.4 Scenario 1 - Map showing the spatial extent of the maximum environmental exposure
risk at any location in the water column (≥ 5% [EIFWC >0]) over a 45 day simulation
period (all time steps integrated) for naturally occurring substances only (Base Case
BTEX concentrations, PW discharge rate of 625 bpd), under the worst case, lowest
ambient current velocity conditions.
Figure C5 Scenario 1 - Pie-chart showing the contributions to EIFWC of each contaminant in the
discharge at the time of maximum EIFWC following the continuous release of PW over
the 45 day simulation period for naturally occurring substances only (Base Case BTEX
concentrations, PW discharge rate of 625 bpd), under the worst case, lowest ambient
current velocity conditions.
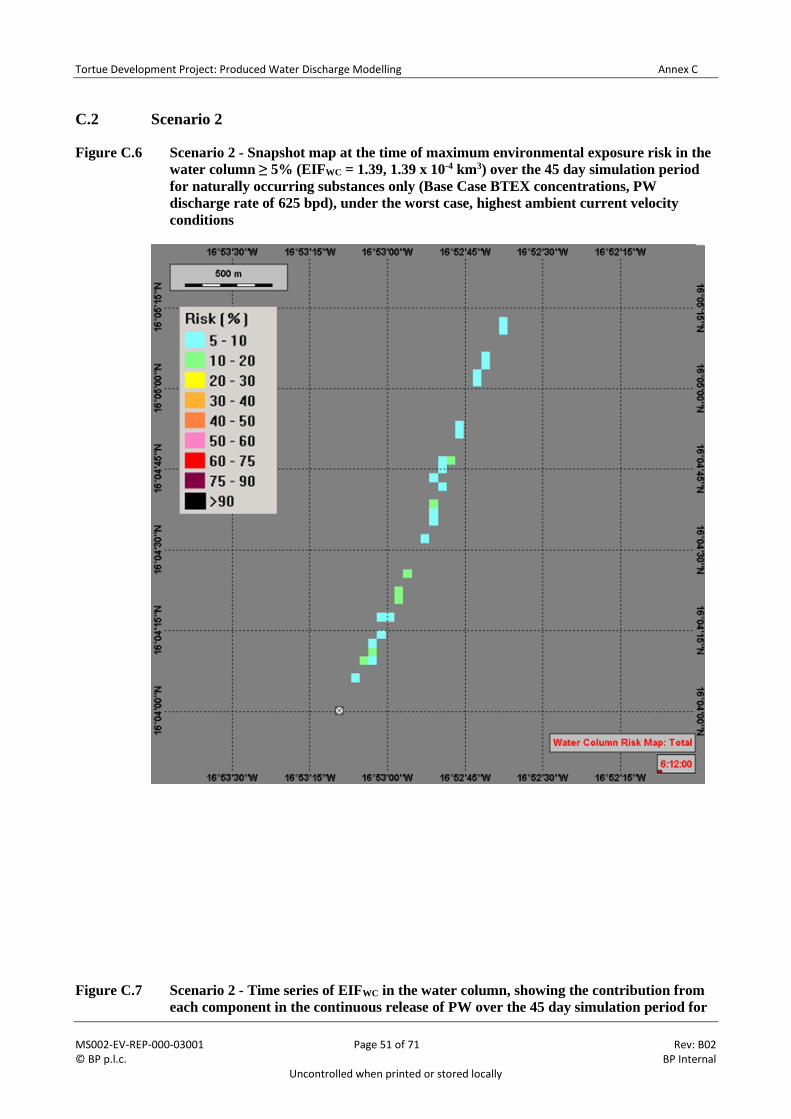
Tortue Development Project: Produced Water Discharge Modelling Annex C
MS002-EV-REP-000-03001 Page 51 of 71 Rev: B02 © BP p.l.c. BP Internal
Uncontrolled when printed or stored locally
C.2 Scenario 2
Figure C.6 Scenario 2 - Snapshot map at the time of maximum environmental exposure risk in the
water column ≥ 5% (EIFWC = 1.39, 1.39 x 10⁻⁴ km3) over the 45 day simulation period
for naturally occurring substances only (Base Case BTEX concentrations, PW
discharge rate of 625 bpd), under the worst case, highest ambient current velocity
conditions
Figure C.7 Scenario 2 - Time series of EIFWC in the water column, showing the contribution from
each component in the continuous release of PW over the 45 day simulation period for
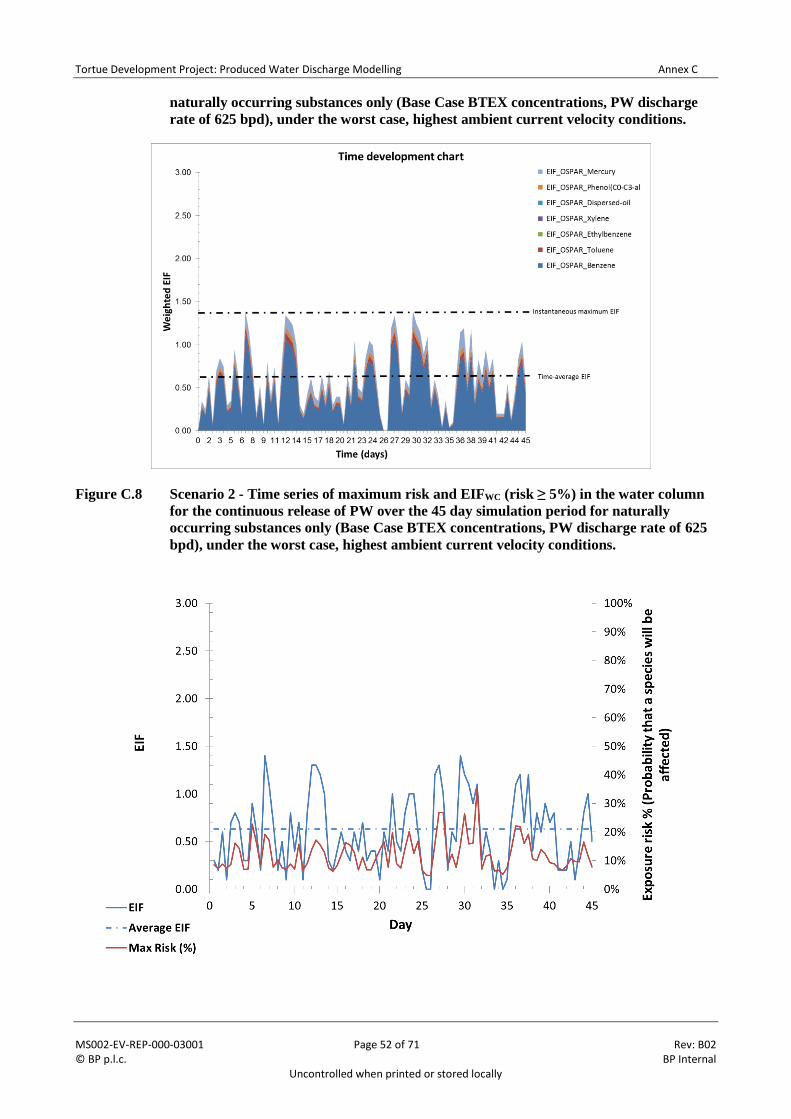
Tortue Development Project: Produced Water Discharge Modelling Annex C
MS002-EV-REP-000-03001 Page 52 of 71 Rev: B02 © BP p.l.c. BP Internal
Uncontrolled when printed or stored locally
naturally occurring substances only (Base Case BTEX concentrations, PW discharge
rate of 625 bpd), under the worst case, highest ambient current velocity conditions.
Figure C.8 Scenario 2 - Time series of maximum risk and EIFWC (risk ≥ 5%) in the water column
for the continuous release of PW over the 45 day simulation period for naturally
occurring substances only (Base Case BTEX concentrations, PW discharge rate of 625
bpd), under the worst case, highest ambient current velocity conditions.
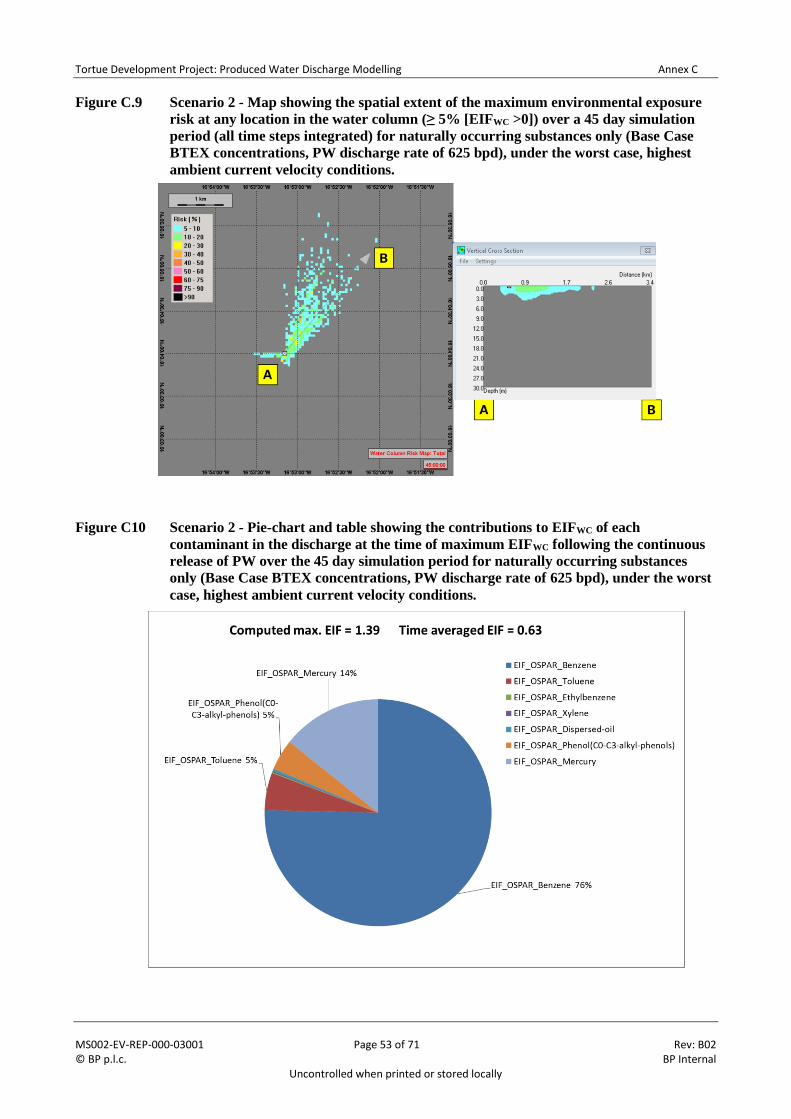
Tortue Development Project: Produced Water Discharge Modelling Annex C
MS002-EV-REP-000-03001 Page 53 of 71 Rev: B02 © BP p.l.c. BP Internal
Uncontrolled when printed or stored locally
Figure C.9 Scenario 2 - Map showing the spatial extent of the maximum environmental exposure
risk at any location in the water column (≥ 5% [EIFWC >0]) over a 45 day simulation
period (all time steps integrated) for naturally occurring substances only (Base Case
BTEX concentrations, PW discharge rate of 625 bpd), under the worst case, highest
ambient current velocity conditions.
Figure C10 Scenario 2 - Pie-chart and table showing the contributions to EIFWC of each
contaminant in the discharge at the time of maximum EIFWC following the continuous
release of PW over the 45 day simulation period for naturally occurring substances
only (Base Case BTEX concentrations, PW discharge rate of 625 bpd), under the worst
case, highest ambient current velocity conditions.
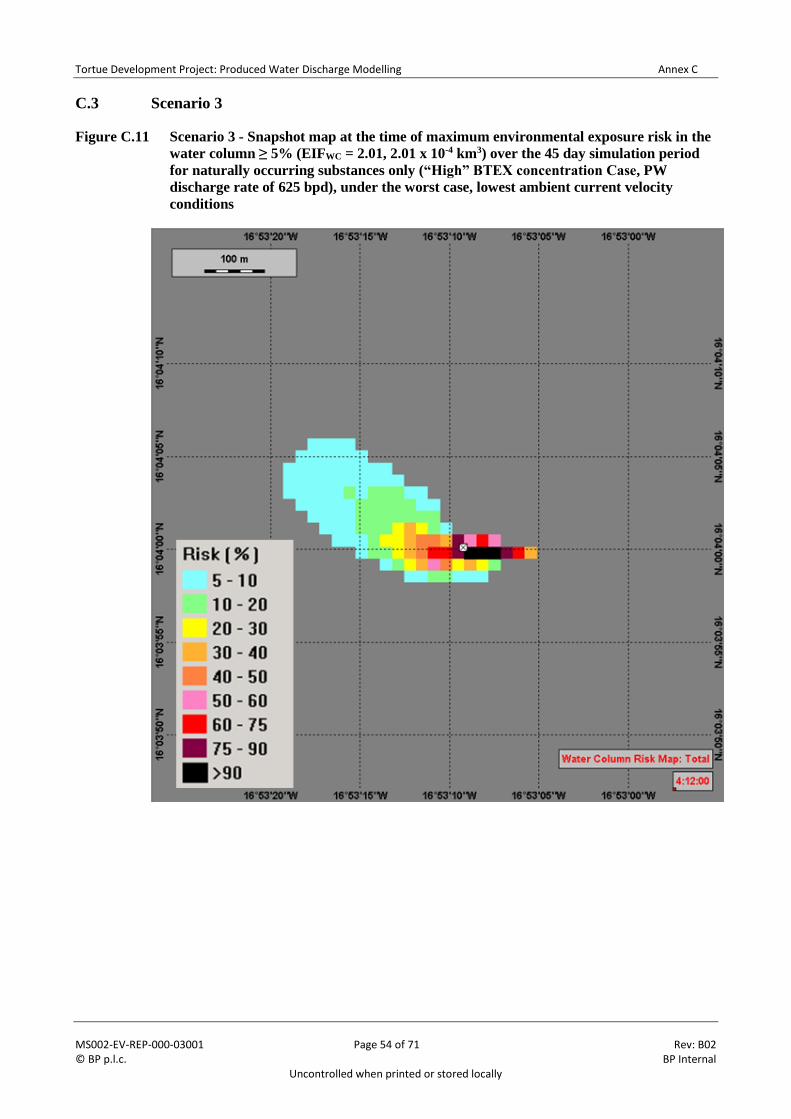
Tortue Development Project: Produced Water Discharge Modelling Annex C
MS002-EV-REP-000-03001 Page 54 of 71 Rev: B02 © BP p.l.c. BP Internal
Uncontrolled when printed or stored locally
C.3 Scenario 3
Figure C.11 Scenario 3 - Snapshot map at the time of maximum environmental exposure risk in the
water column ≥ 5% (EIFWC = 2.01, 2.01 x 10⁻⁴ km3) over the 45 day simulation period
for naturally occurring substances only (“High” BTEX concentration Case, PW
discharge rate of 625 bpd), under the worst case, lowest ambient current velocity
conditions
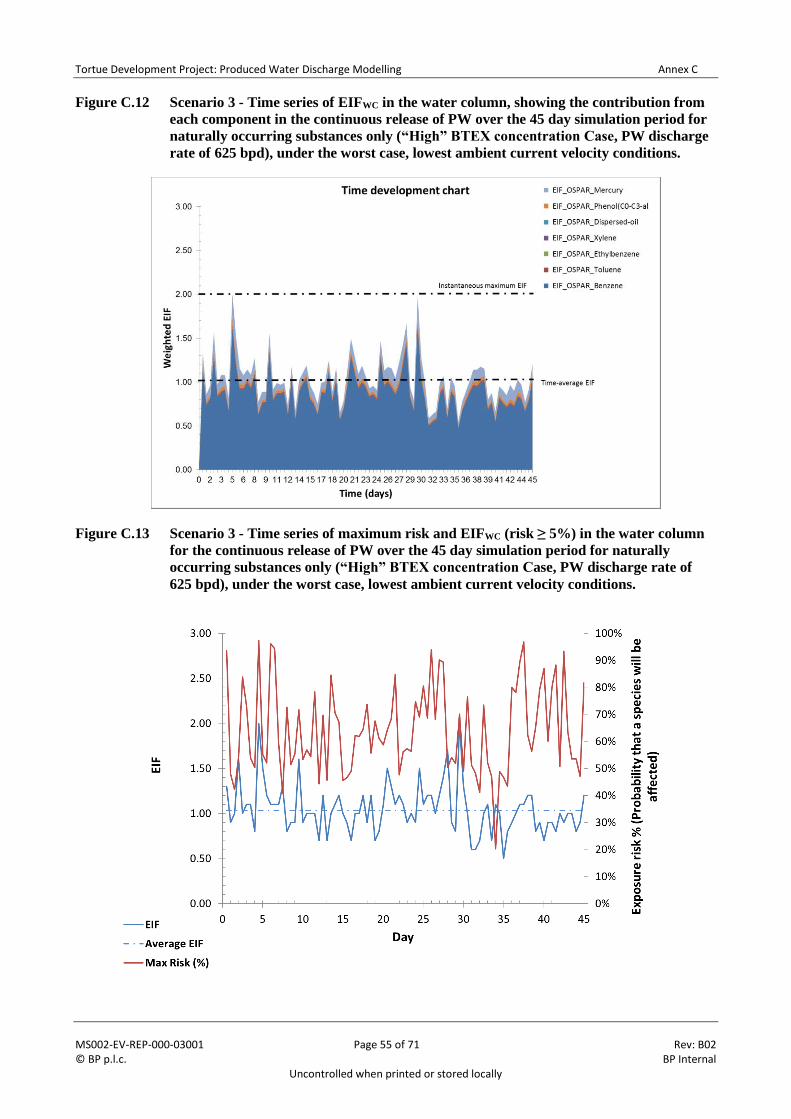
Tortue Development Project: Produced Water Discharge Modelling Annex C
MS002-EV-REP-000-03001 Page 55 of 71 Rev: B02 © BP p.l.c. BP Internal
Uncontrolled when printed or stored locally
Figure C.12 Scenario 3 - Time series of EIFWC in the water column, showing the contribution from
each component in the continuous release of PW over the 45 day simulation period for
naturally occurring substances only (“High” BTEX concentration Case, PW discharge
rate of 625 bpd), under the worst case, lowest ambient current velocity conditions.
Figure C.13 Scenario 3 - Time series of maximum risk and EIFWC (risk ≥ 5%) in the water column
for the continuous release of PW over the 45 day simulation period for naturally
occurring substances only (“High” BTEX concentration Case, PW discharge rate of
625 bpd), under the worst case, lowest ambient current velocity conditions.
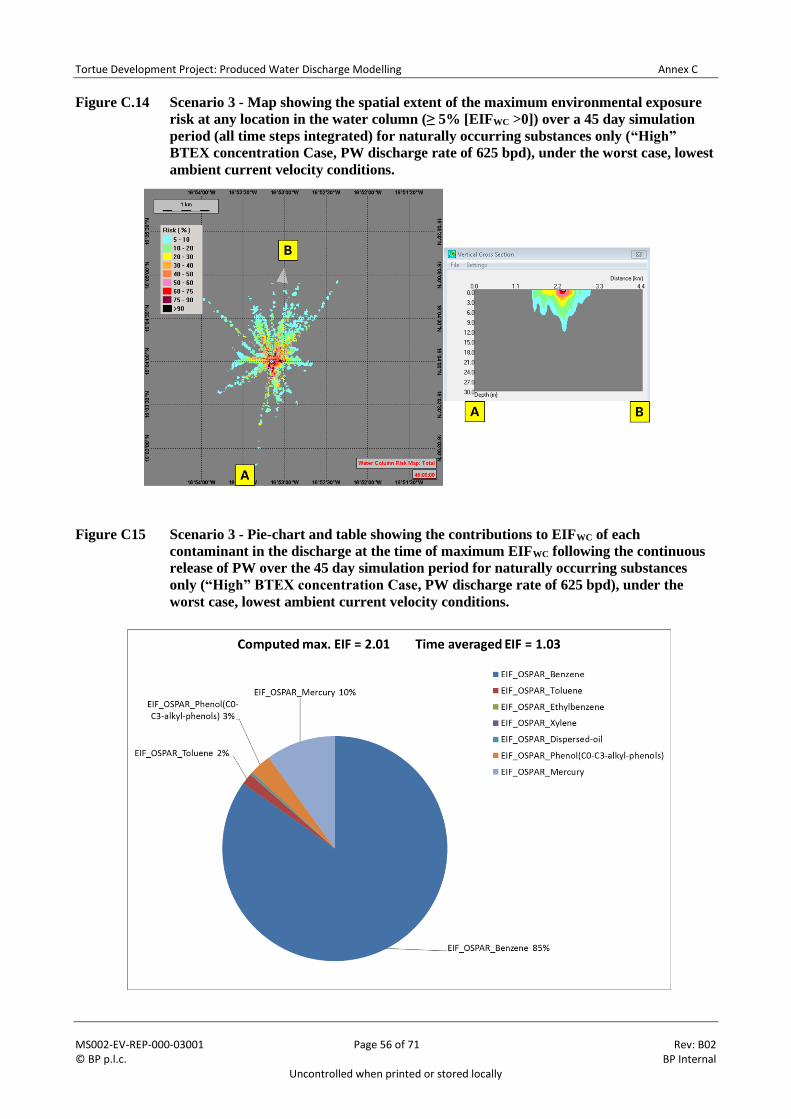
Tortue Development Project: Produced Water Discharge Modelling Annex C
MS002-EV-REP-000-03001 Page 56 of 71 Rev: B02 © BP p.l.c. BP Internal
Uncontrolled when printed or stored locally
Figure C.14 Scenario 3 - Map showing the spatial extent of the maximum environmental exposure
risk at any location in the water column (≥ 5% [EIFWC >0]) over a 45 day simulation
period (all time steps integrated) for naturally occurring substances only (“High”
BTEX concentration Case, PW discharge rate of 625 bpd), under the worst case, lowest
ambient current velocity conditions.
Figure C15 Scenario 3 - Pie-chart and table showing the contributions to EIFWC of each
contaminant in the discharge at the time of maximum EIFWC following the continuous
release of PW over the 45 day simulation period for naturally occurring substances
only (“High” BTEX concentration Case, PW discharge rate of 625 bpd), under the
worst case, lowest ambient current velocity conditions.
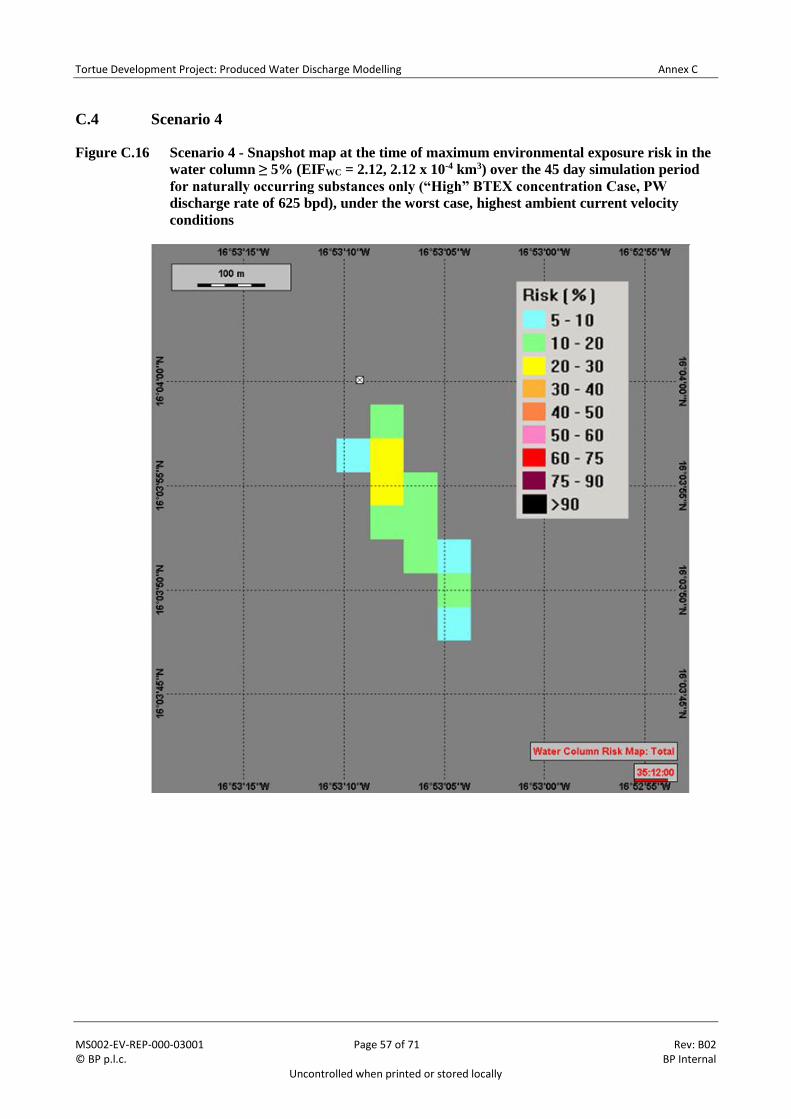
Tortue Development Project: Produced Water Discharge Modelling Annex C
MS002-EV-REP-000-03001 Page 57 of 71 Rev: B02 © BP p.l.c. BP Internal
Uncontrolled when printed or stored locally
C.4 Scenario 4
Figure C.16 Scenario 4 - Snapshot map at the time of maximum environmental exposure risk in the
water column ≥ 5% (EIFWC = 2.12, 2.12 x 10⁻⁴ km3) over the 45 day simulation period
for naturally occurring substances only (“High” BTEX concentration Case, PW
discharge rate of 625 bpd), under the worst case, highest ambient current velocity
conditions
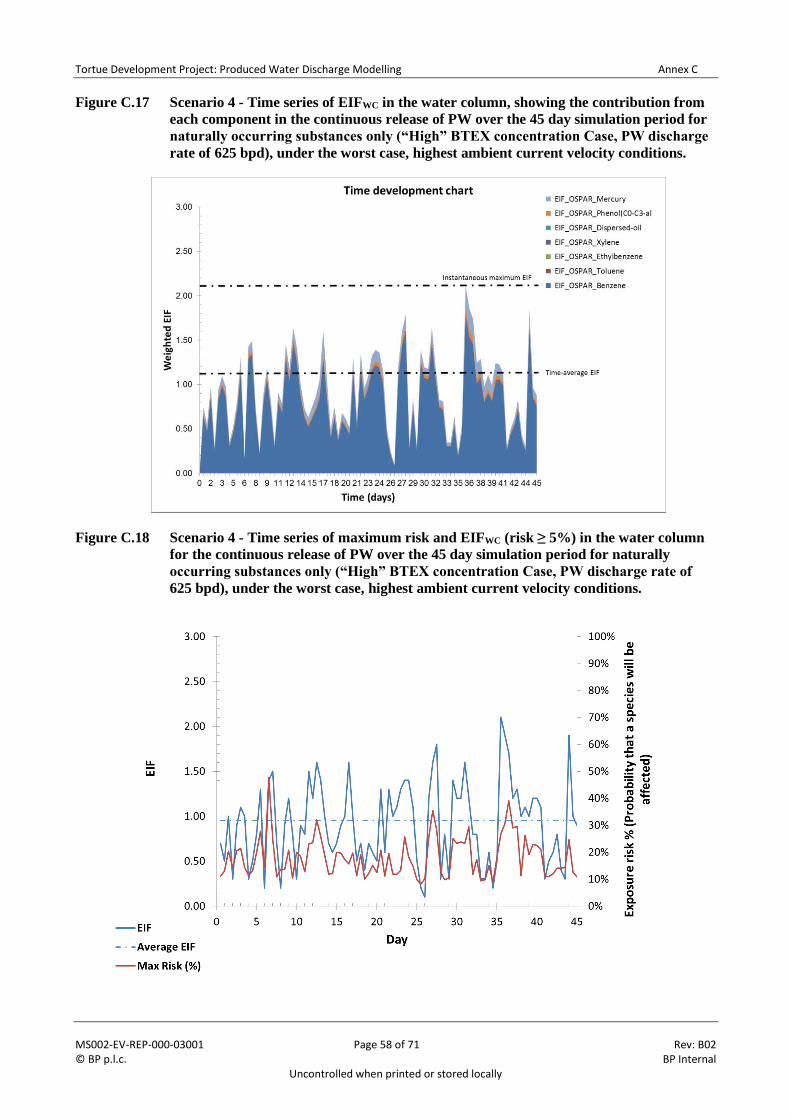
Tortue Development Project: Produced Water Discharge Modelling Annex C
MS002-EV-REP-000-03001 Page 58 of 71 Rev: B02 © BP p.l.c. BP Internal
Uncontrolled when printed or stored locally
Figure C.17 Scenario 4 - Time series of EIFWC in the water column, showing the contribution from
each component in the continuous release of PW over the 45 day simulation period for
naturally occurring substances only (“High” BTEX concentration Case, PW discharge
rate of 625 bpd), under the worst case, highest ambient current velocity conditions.
Figure C.18 Scenario 4 - Time series of maximum risk and EIFWC (risk ≥ 5%) in the water column
for the continuous release of PW over the 45 day simulation period for naturally
occurring substances only (“High” BTEX concentration Case, PW discharge rate of
625 bpd), under the worst case, highest ambient current velocity conditions.
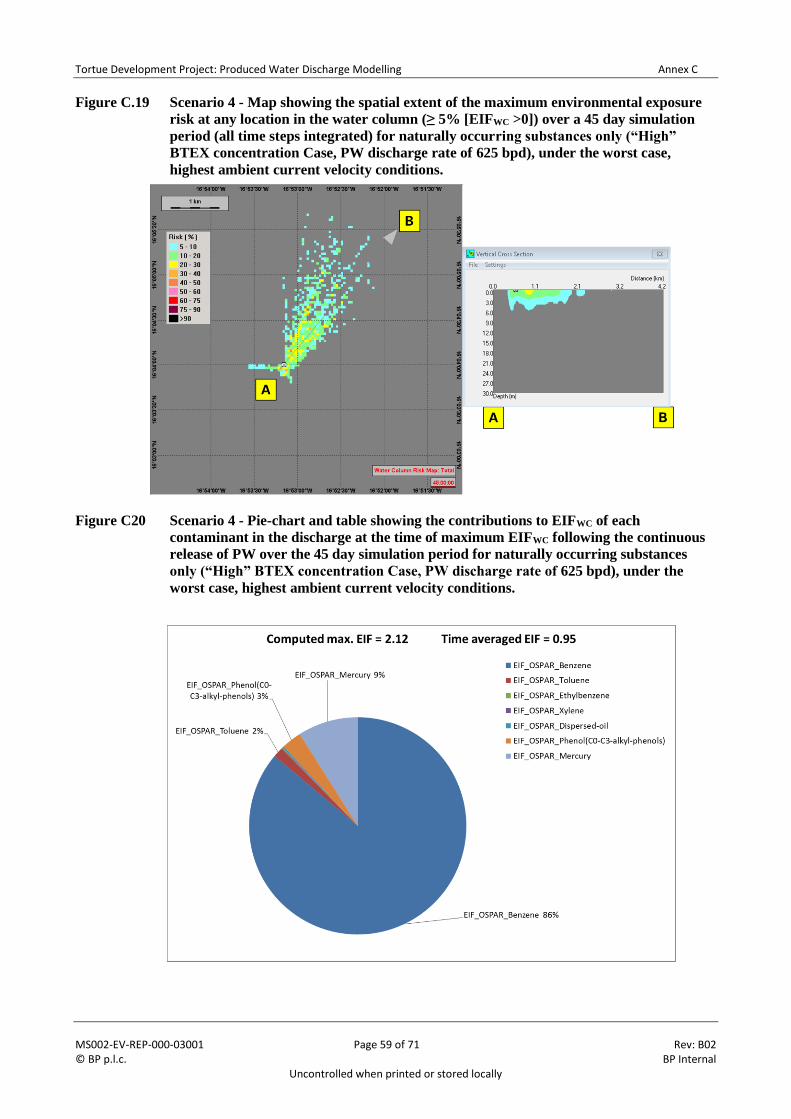
Tortue Development Project: Produced Water Discharge Modelling Annex C
MS002-EV-REP-000-03001 Page 59 of 71 Rev: B02 © BP p.l.c. BP Internal
Uncontrolled when printed or stored locally
Figure C.19 Scenario 4 - Map showing the spatial extent of the maximum environmental exposure
risk at any location in the water column (≥ 5% [EIFWC >0]) over a 45 day simulation
period (all time steps integrated) for naturally occurring substances only (“High”
BTEX concentration Case, PW discharge rate of 625 bpd), under the worst case,
highest ambient current velocity conditions.
Figure C20 Scenario 4 - Pie-chart and table showing the contributions to EIFWC of each
contaminant in the discharge at the time of maximum EIFWC following the continuous
release of PW over the 45 day simulation period for naturally occurring substances
only (“High” BTEX concentration Case, PW discharge rate of 625 bpd), under the
worst case, highest ambient current velocity conditions.
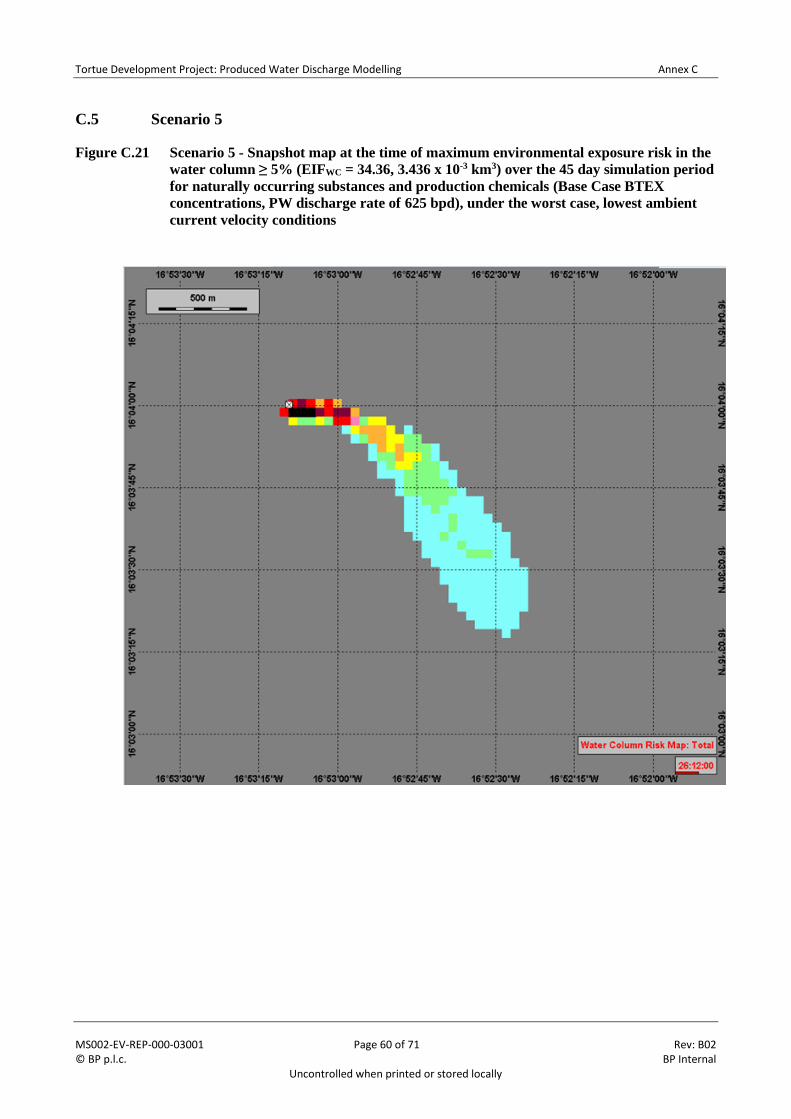
Tortue Development Project: Produced Water Discharge Modelling Annex C
MS002-EV-REP-000-03001 Page 60 of 71 Rev: B02 © BP p.l.c. BP Internal
Uncontrolled when printed or stored locally
C.5 Scenario 5
Figure C.21 Scenario 5 - Snapshot map at the time of maximum environmental exposure risk in the
water column ≥ 5% (EIFWC = 34.36, 3.436 x 10⁻³ km3) over the 45 day simulation period
for naturally occurring substances and production chemicals (Base Case BTEX
concentrations, PW discharge rate of 625 bpd), under the worst case, lowest ambient
current velocity conditions
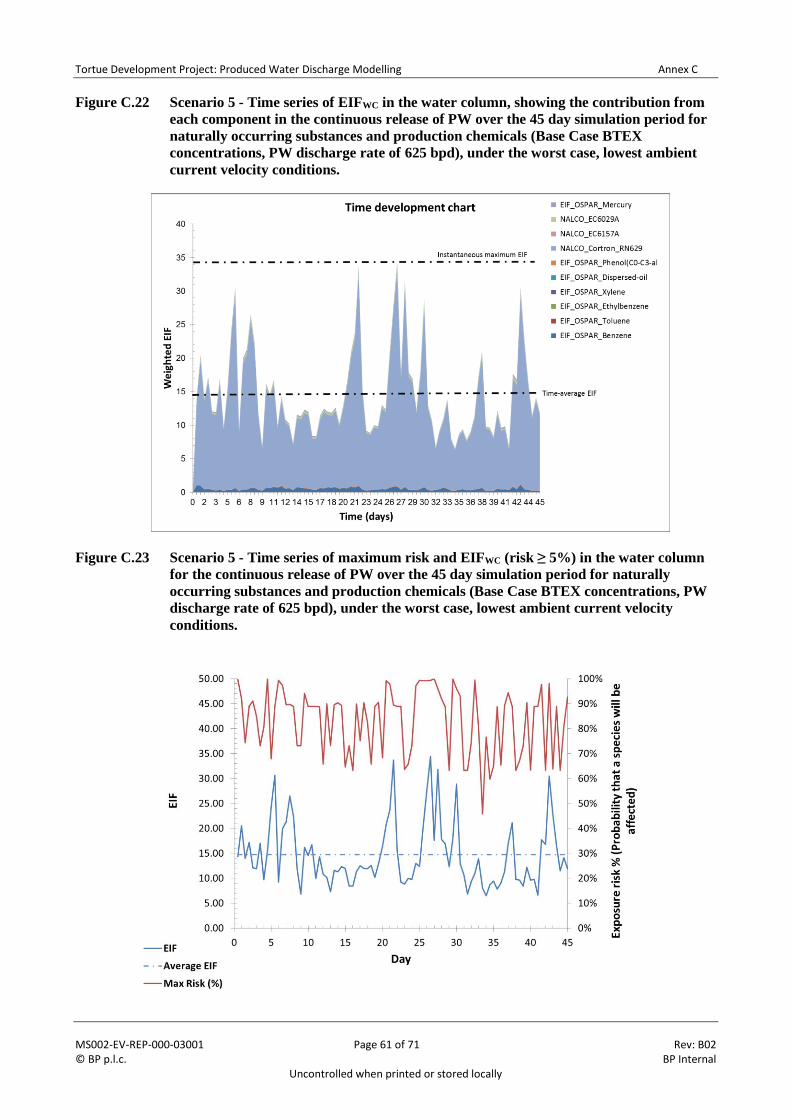
Tortue Development Project: Produced Water Discharge Modelling Annex C
MS002-EV-REP-000-03001 Page 61 of 71 Rev: B02 © BP p.l.c. BP Internal
Uncontrolled when printed or stored locally
Figure C.22 Scenario 5 - Time series of EIFWC in the water column, showing the contribution from
each component in the continuous release of PW over the 45 day simulation period for
naturally occurring substances and production chemicals (Base Case BTEX
concentrations, PW discharge rate of 625 bpd), under the worst case, lowest ambient
current velocity conditions.
Figure C.23 Scenario 5 - Time series of maximum risk and EIFWC (risk ≥ 5%) in the water column
for the continuous release of PW over the 45 day simulation period for naturally
occurring substances and production chemicals (Base Case BTEX concentrations, PW
discharge rate of 625 bpd), under the worst case, lowest ambient current velocity
conditions.
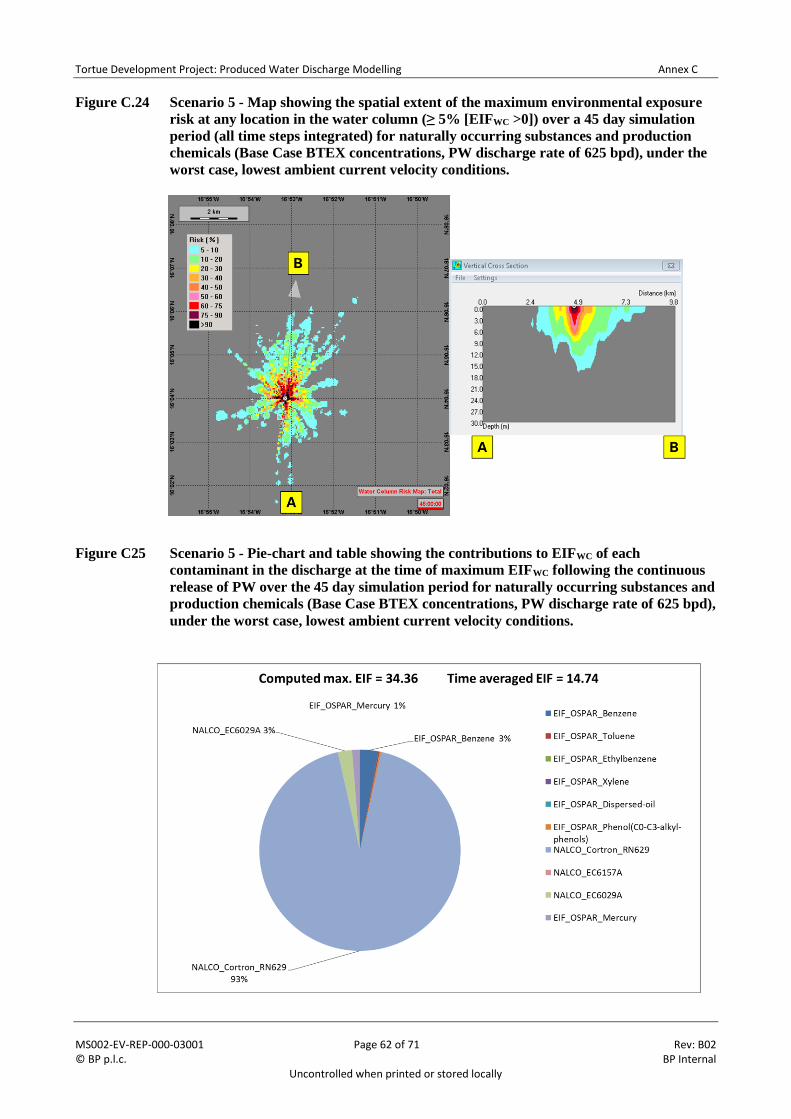
Tortue Development Project: Produced Water Discharge Modelling Annex C
MS002-EV-REP-000-03001 Page 62 of 71 Rev: B02 © BP p.l.c. BP Internal
Uncontrolled when printed or stored locally
Figure C.24 Scenario 5 - Map showing the spatial extent of the maximum environmental exposure
risk at any location in the water column (≥ 5% [EIFWC >0]) over a 45 day simulation
period (all time steps integrated) for naturally occurring substances and production
chemicals (Base Case BTEX concentrations, PW discharge rate of 625 bpd), under the
worst case, lowest ambient current velocity conditions.
Figure C25 Scenario 5 - Pie-chart and table showing the contributions to EIFWC of each
contaminant in the discharge at the time of maximum EIFWC following the continuous
release of PW over the 45 day simulation period for naturally occurring substances and
production chemicals (Base Case BTEX concentrations, PW discharge rate of 625 bpd),
under the worst case, lowest ambient current velocity conditions.
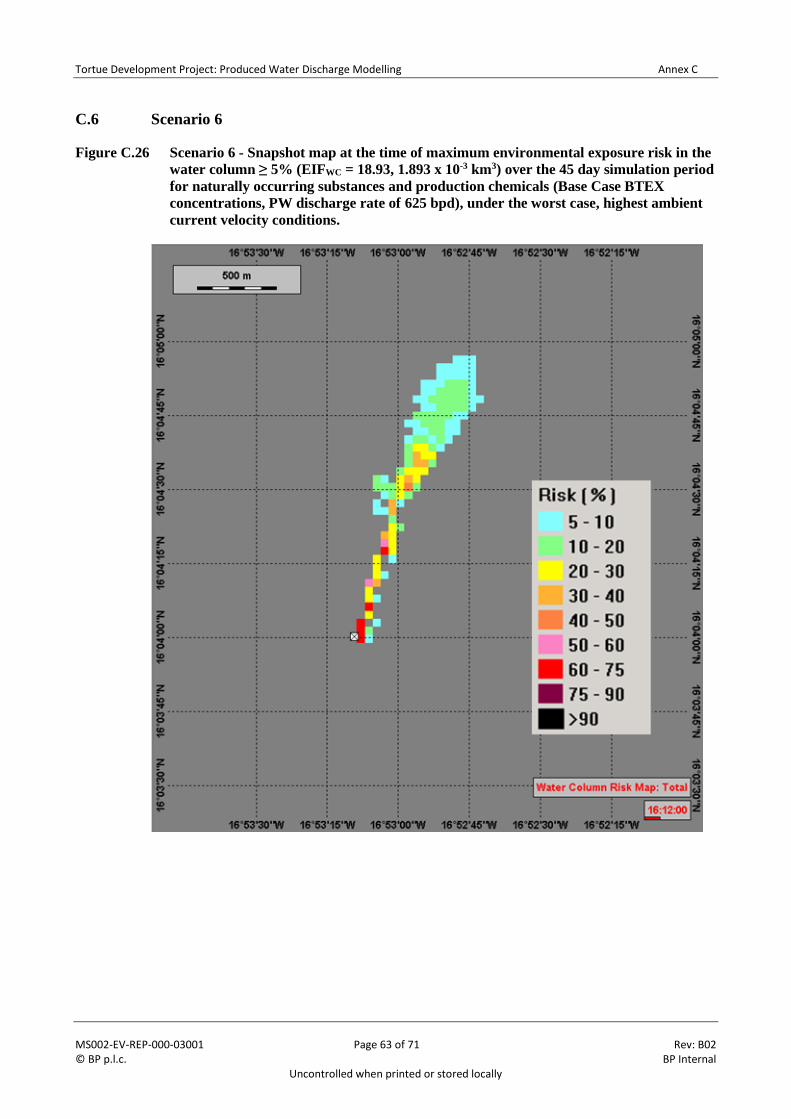
Tortue Development Project: Produced Water Discharge Modelling Annex C
MS002-EV-REP-000-03001 Page 63 of 71 Rev: B02 © BP p.l.c. BP Internal
Uncontrolled when printed or stored locally
C.6 Scenario 6
Figure C.26 Scenario 6 - Snapshot map at the time of maximum environmental exposure risk in the
water column ≥ 5% (EIFWC = 18.93, 1.893 x 10⁻³ km3) over the 45 day simulation period
for naturally occurring substances and production chemicals (Base Case BTEX
concentrations, PW discharge rate of 625 bpd), under the worst case, highest ambient
current velocity conditions.
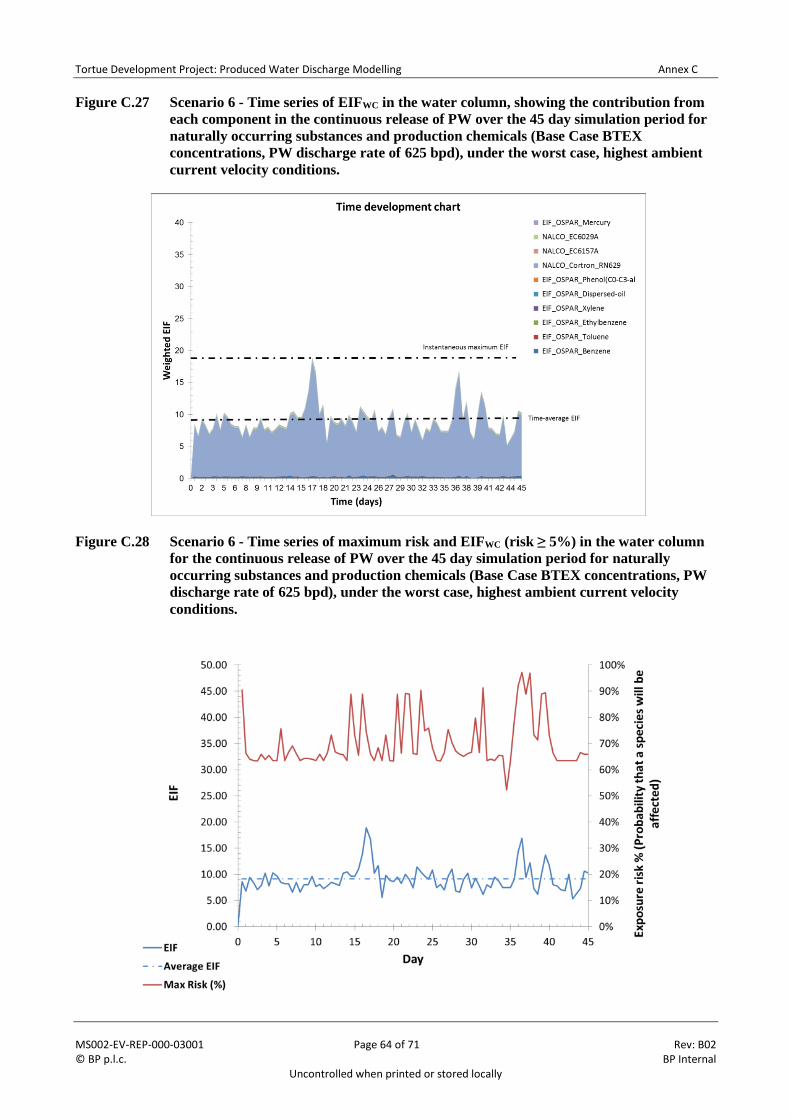
Tortue Development Project: Produced Water Discharge Modelling Annex C
MS002-EV-REP-000-03001 Page 64 of 71 Rev: B02 © BP p.l.c. BP Internal
Uncontrolled when printed or stored locally
Figure C.27 Scenario 6 - Time series of EIFWC in the water column, showing the contribution from
each component in the continuous release of PW over the 45 day simulation period for
naturally occurring substances and production chemicals (Base Case BTEX
concentrations, PW discharge rate of 625 bpd), under the worst case, highest ambient
current velocity conditions.
Figure C.28 Scenario 6 - Time series of maximum risk and EIFWC (risk ≥ 5%) in the water column
for the continuous release of PW over the 45 day simulation period for naturally
occurring substances and production chemicals (Base Case BTEX concentrations, PW
discharge rate of 625 bpd), under the worst case, highest ambient current velocity
conditions.
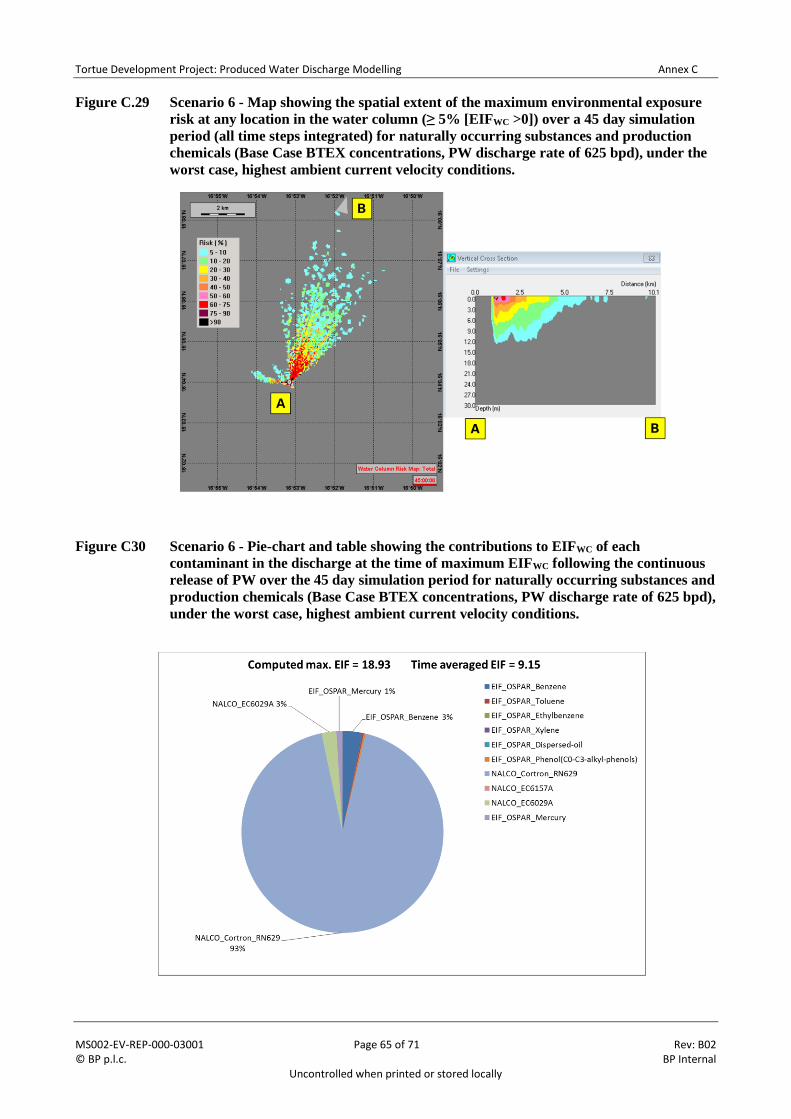
Tortue Development Project: Produced Water Discharge Modelling Annex C
MS002-EV-REP-000-03001 Page 65 of 71 Rev: B02 © BP p.l.c. BP Internal
Uncontrolled when printed or stored locally
Figure C.29 Scenario 6 - Map showing the spatial extent of the maximum environmental exposure
risk at any location in the water column (≥ 5% [EIFWC >0]) over a 45 day simulation
period (all time steps integrated) for naturally occurring substances and production
chemicals (Base Case BTEX concentrations, PW discharge rate of 625 bpd), under the
worst case, highest ambient current velocity conditions.
Figure C30 Scenario 6 - Pie-chart and table showing the contributions to EIFWC of each
contaminant in the discharge at the time of maximum EIFWC following the continuous
release of PW over the 45 day simulation period for naturally occurring substances and
production chemicals (Base Case BTEX concentrations, PW discharge rate of 625 bpd),
under the worst case, highest ambient current velocity conditions.
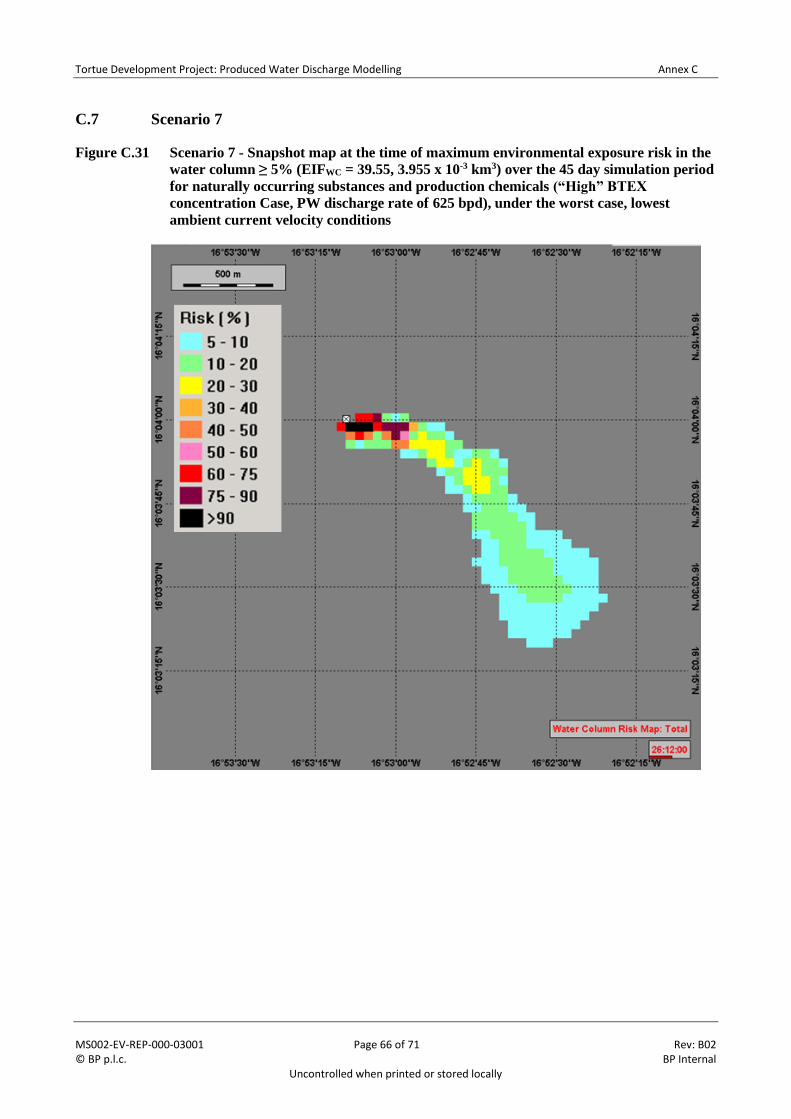
Tortue Development Project: Produced Water Discharge Modelling Annex C
MS002-EV-REP-000-03001 Page 66 of 71 Rev: B02 © BP p.l.c. BP Internal
Uncontrolled when printed or stored locally
C.7 Scenario 7
Figure C.31 Scenario 7 - Snapshot map at the time of maximum environmental exposure risk in the
water column ≥ 5% (EIFWC = 39.55, 3.955 x 10⁻³ km3) over the 45 day simulation period
for naturally occurring substances and production chemicals (“High” BTEX
concentration Case, PW discharge rate of 625 bpd), under the worst case, lowest
ambient current velocity conditions
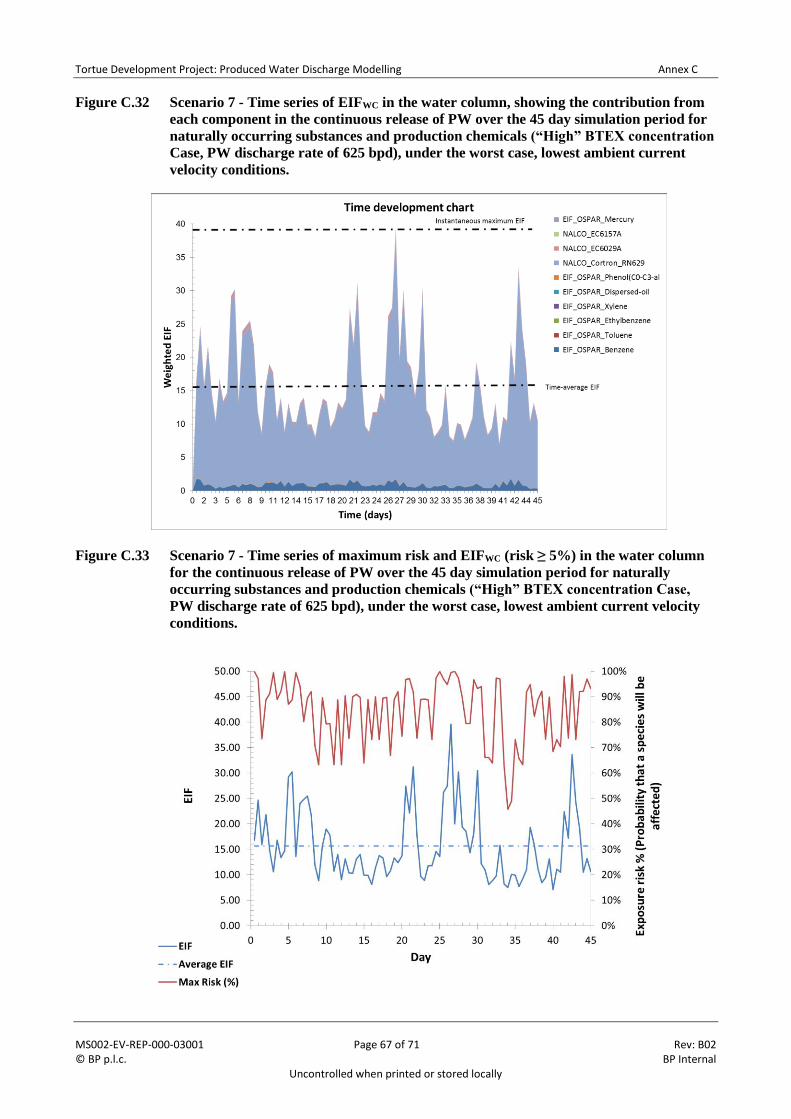
Tortue Development Project: Produced Water Discharge Modelling Annex C
MS002-EV-REP-000-03001 Page 67 of 71 Rev: B02 © BP p.l.c. BP Internal
Uncontrolled when printed or stored locally
Figure C.32 Scenario 7 - Time series of EIFWC in the water column, showing the contribution from
each component in the continuous release of PW over the 45 day simulation period for
naturally occurring substances and production chemicals (“High” BTEX concentration
Case, PW discharge rate of 625 bpd), under the worst case, lowest ambient current
velocity conditions.
Figure C.33 Scenario 7 - Time series of maximum risk and EIFWC (risk ≥ 5%) in the water column
for the continuous release of PW over the 45 day simulation period for naturally
occurring substances and production chemicals (“High” BTEX concentration Case,
PW discharge rate of 625 bpd), under the worst case, lowest ambient current velocity
conditions.
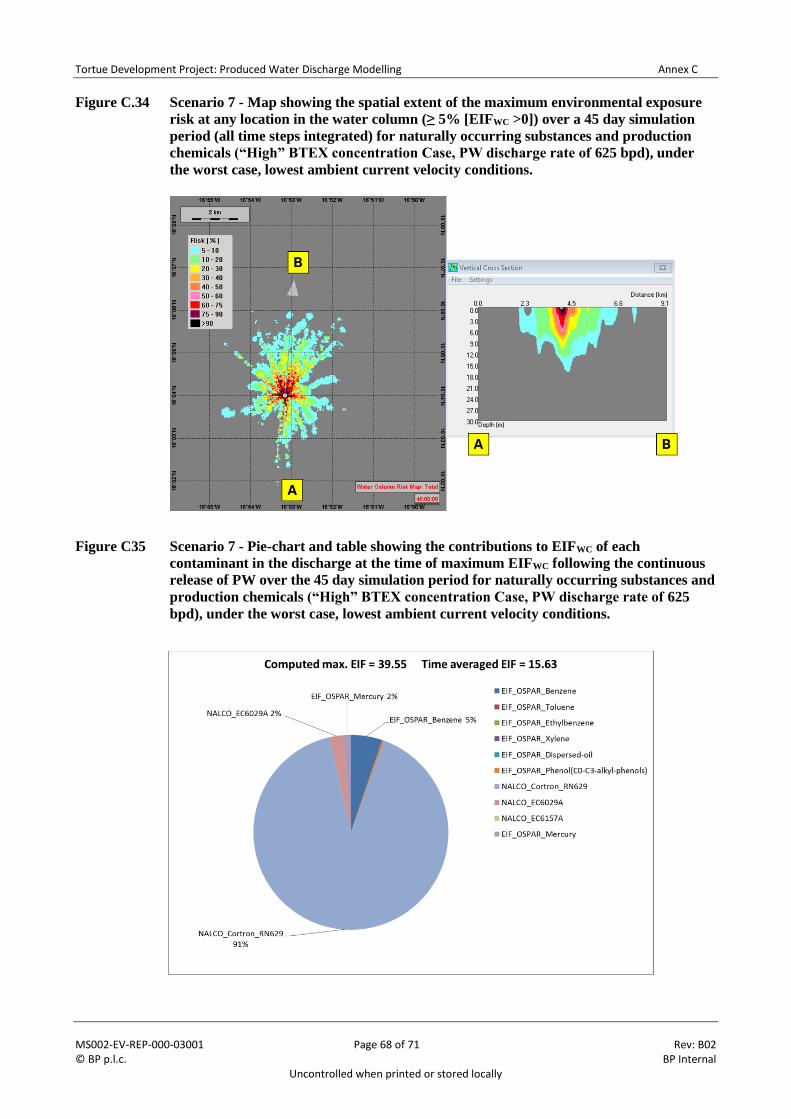
Tortue Development Project: Produced Water Discharge Modelling Annex C
MS002-EV-REP-000-03001 Page 68 of 71 Rev: B02 © BP p.l.c. BP Internal
Uncontrolled when printed or stored locally
Figure C.34 Scenario 7 - Map showing the spatial extent of the maximum environmental exposure
risk at any location in the water column (≥ 5% [EIFWC >0]) over a 45 day simulation
period (all time steps integrated) for naturally occurring substances and production
chemicals (“High” BTEX concentration Case, PW discharge rate of 625 bpd), under
the worst case, lowest ambient current velocity conditions.
Figure C35 Scenario 7 - Pie-chart and table showing the contributions to EIFWC of each
contaminant in the discharge at the time of maximum EIFWC following the continuous
release of PW over the 45 day simulation period for naturally occurring substances and
production chemicals (“High” BTEX concentration Case, PW discharge rate of 625
bpd), under the worst case, lowest ambient current velocity conditions.
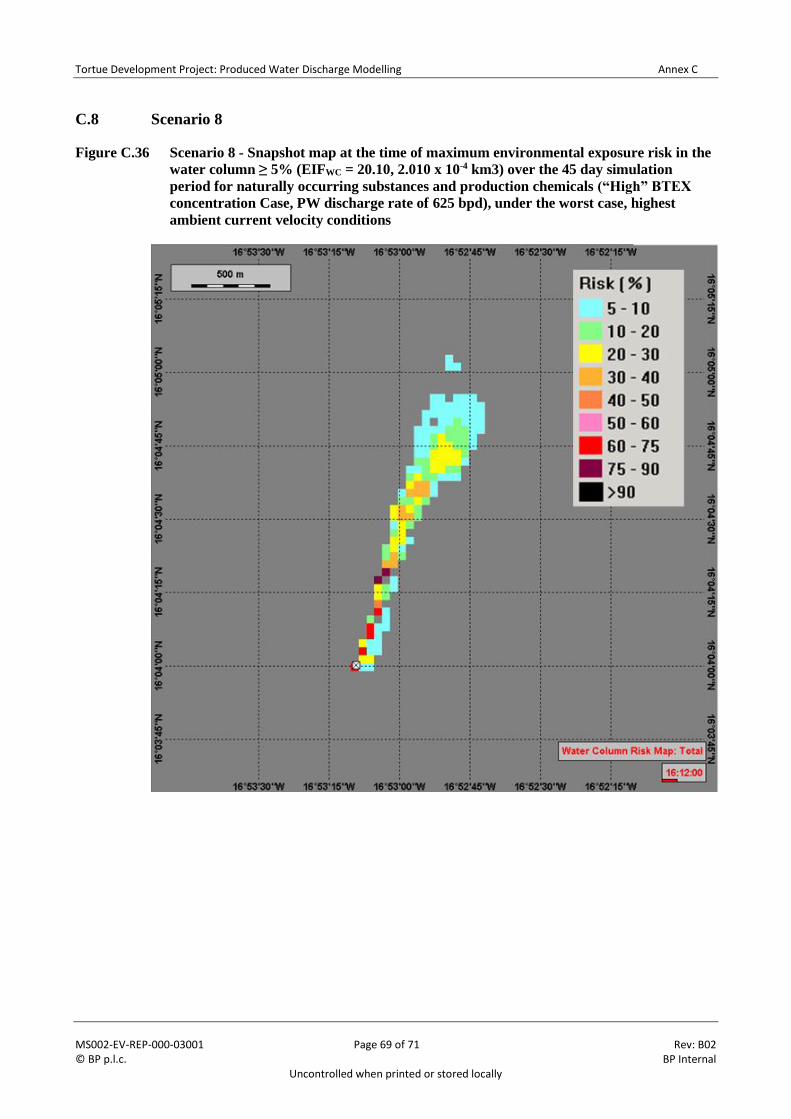
Tortue Development Project: Produced Water Discharge Modelling Annex C
MS002-EV-REP-000-03001 Page 69 of 71 Rev: B02 © BP p.l.c. BP Internal
Uncontrolled when printed or stored locally
C.8 Scenario 8
Figure C.36 Scenario 8 - Snapshot map at the time of maximum environmental exposure risk in the
water column ≥ 5% (EIFWC = 20.10, 2.010 x 10⁻⁴ km3) over the 45 day simulation
period for naturally occurring substances and production chemicals (“High” BTEX
concentration Case, PW discharge rate of 625 bpd), under the worst case, highest
ambient current velocity conditions
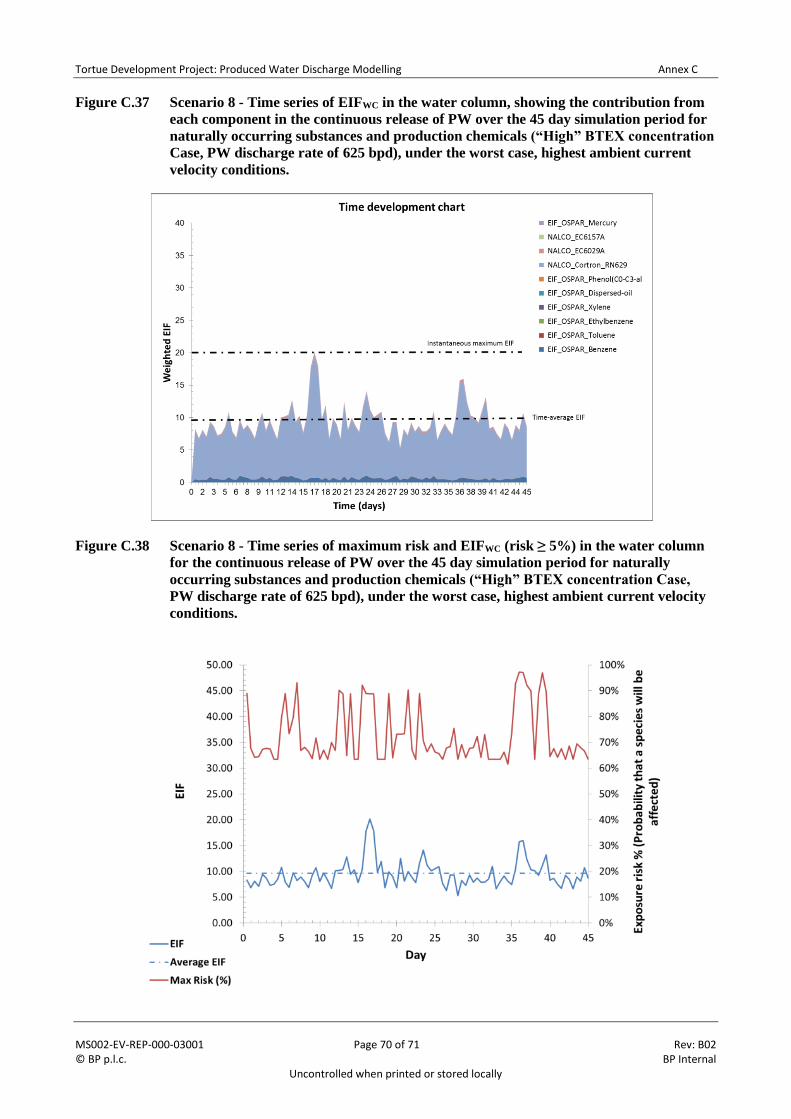
Tortue Development Project: Produced Water Discharge Modelling Annex C
MS002-EV-REP-000-03001 Page 70 of 71 Rev: B02 © BP p.l.c. BP Internal
Uncontrolled when printed or stored locally
Figure C.37 Scenario 8 - Time series of EIFWC in the water column, showing the contribution from
each component in the continuous release of PW over the 45 day simulation period for
naturally occurring substances and production chemicals (“High” BTEX concentration
Case, PW discharge rate of 625 bpd), under the worst case, highest ambient current
velocity conditions.
Figure C.38 Scenario 8 - Time series of maximum risk and EIFWC (risk ≥ 5%) in the water column
for the continuous release of PW over the 45 day simulation period for naturally
occurring substances and production chemicals (“High” BTEX concentration Case,
PW discharge rate of 625 bpd), under the worst case, highest ambient current velocity
conditions.
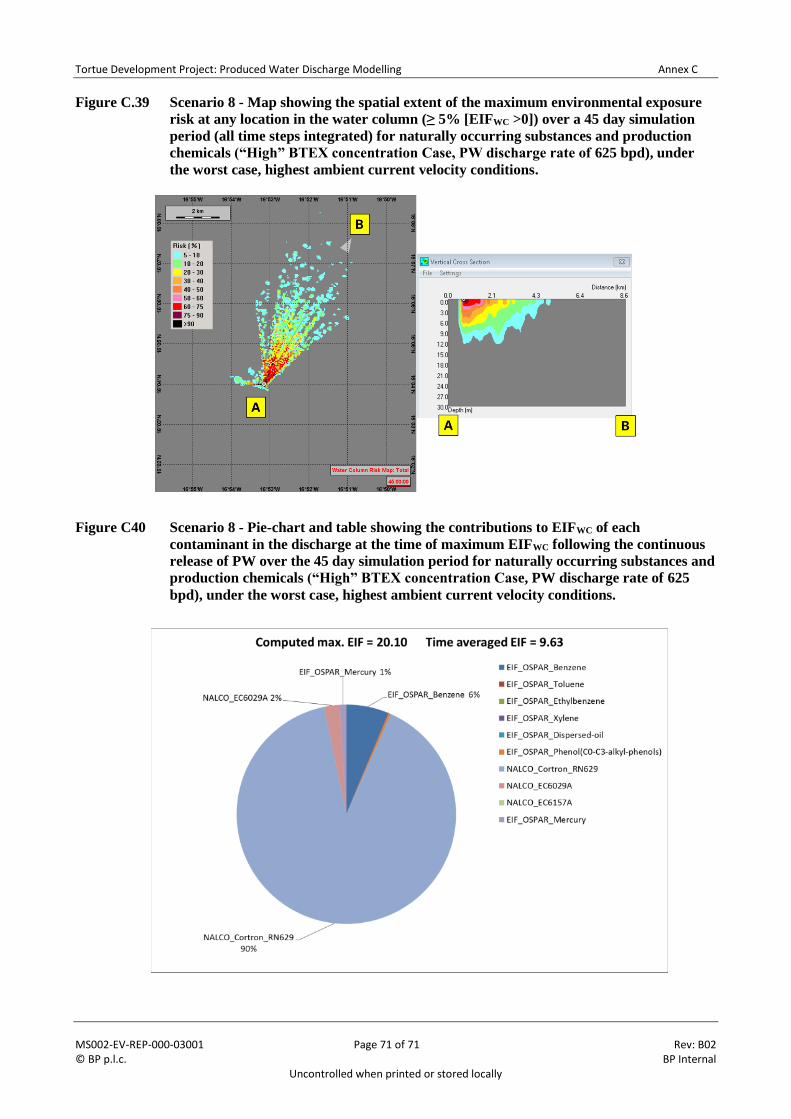
Tortue Development Project: Produced Water Discharge Modelling Annex C
MS002-EV-REP-000-03001 Page 71 of 71 Rev: B02 © BP p.l.c. BP Internal
Uncontrolled when printed or stored locally
Figure C.39 Scenario 8 - Map showing the spatial extent of the maximum environmental exposure
risk at any location in the water column (≥ 5% [EIFWC >0]) over a 45 day simulation
period (all time steps integrated) for naturally occurring substances and production
chemicals (“High” BTEX concentration Case, PW discharge rate of 625 bpd), under
the worst case, highest ambient current velocity conditions.
Figure C40 Scenario 8 - Pie-chart and table showing the contributions to EIFWC of each
contaminant in the discharge at the time of maximum EIFWC following the continuous
release of PW over the 45 day simulation period for naturally occurring substances and
production chemicals (“High” BTEX concentration Case, PW discharge rate of 625
bpd), under the worst case, highest ambient current velocity conditions.
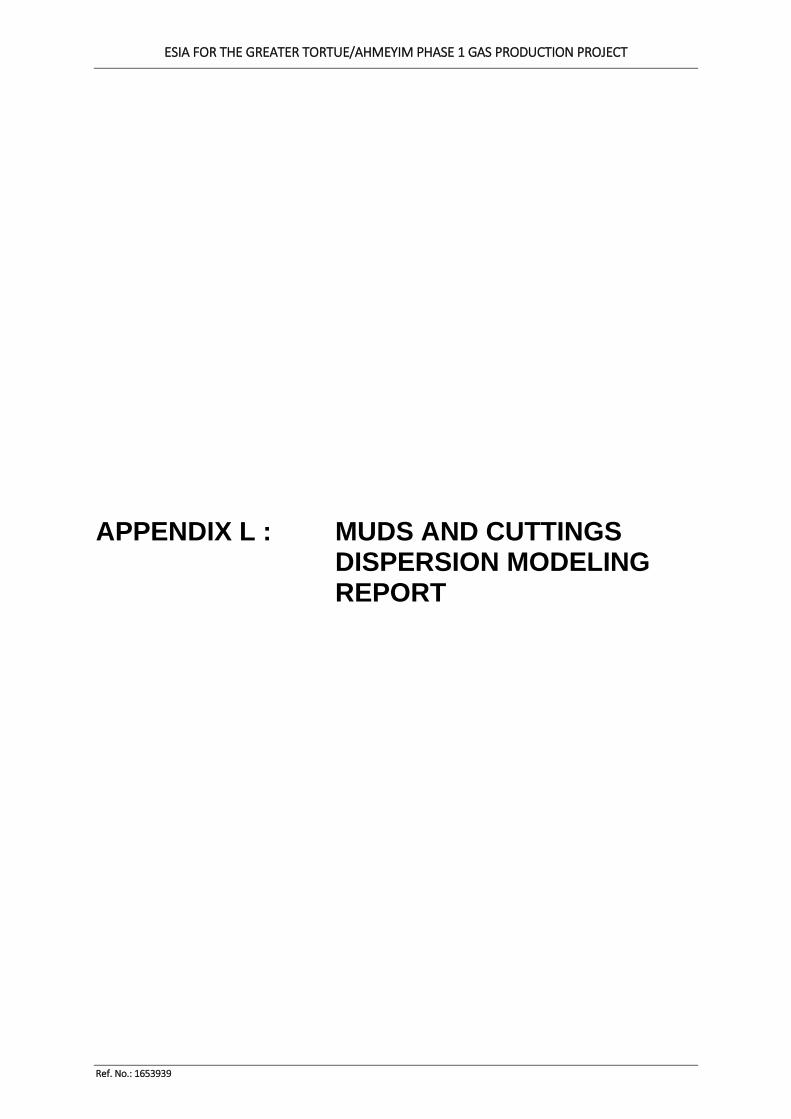
ESIA FOR THE GREATER TORTUE/AHMEYIM PHASE 1 GAS PRODUCTION PROJECT
Ref. No.: 1653939
APPENDIX L : MUDS AND CUTTINGS DISPERSION MODELING REPORT
Applied Science Associates A member of the RPS Group plc 55 Village Square Drive South Kingstown, RI 02879 USA Tel: +1 (401) 789-6224 Fax: +1 (401) 789-1932 www: www.rpsgroup.com www: www.asascience.com
Draft Report
Dispersion Modeling of Drilling Discharges: A/G Field, Offshore
Mauritania/Senegal
AUTHOR(S): Dan Torre, Nathan Vinhateiro, Alicia Morandi, Stephanie Berkman, Sitara Baboolal, Tayebeh Bakhsh, Eric Comerma
Project Manager: Nathan Vinhateiro
PROJECT NUMBER:
17-000701 VERSION: V3
DATE: 18 Dec 2017
CLIENT:
Brian Balcom CSA Ocean Sciences Inc., Salinas, CA
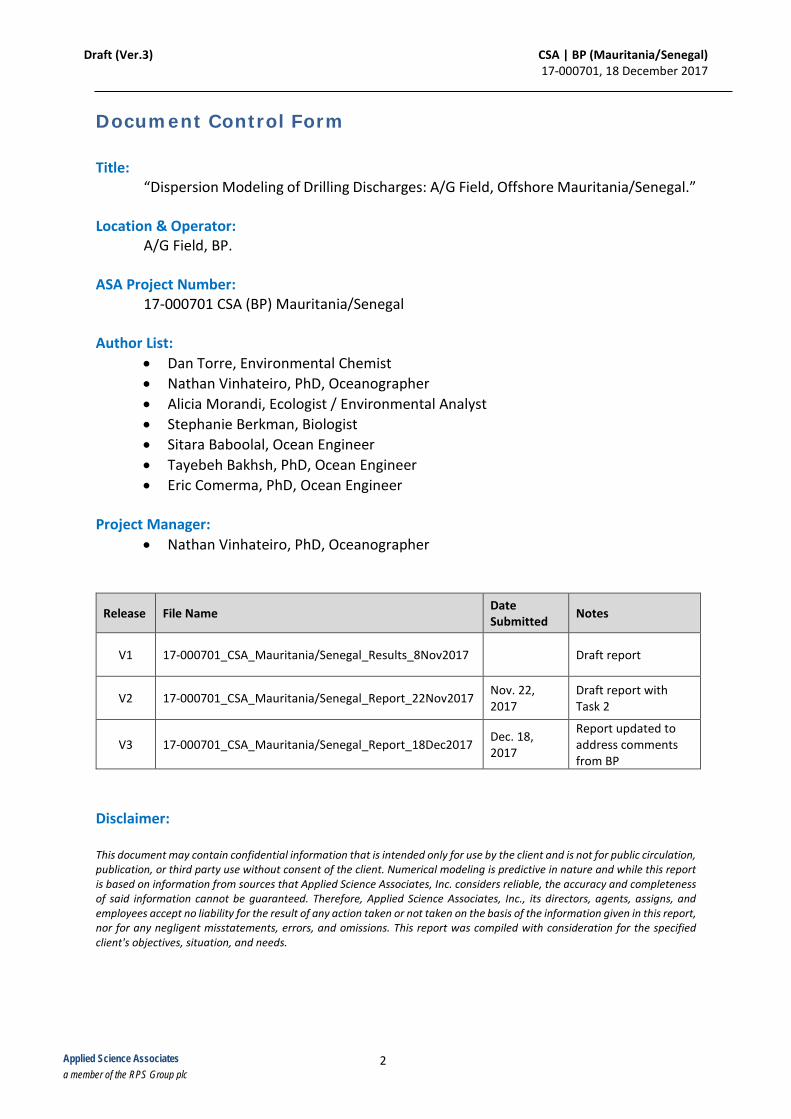
Draft (Ver.3) CSA | BP (Mauritania/Senegal) 17-000701, 18 December 2017
2 Applied Science Associates a member of the RPS Group plc
Document Control Form Title:
“Dispersion Modeling of Drilling Discharges: A/G Field, Offshore Mauritania/Senegal.” Location & Operator:
A/G Field, BP. ASA Project Number:
17-000701 CSA (BP) Mauritania/Senegal Author List:
• Dan Torre, Environmental Chemist • Nathan Vinhateiro, PhD, Oceanographer • Alicia Morandi, Ecologist / Environmental Analyst • Stephanie Berkman, Biologist • Sitara Baboolal, Ocean Engineer • Tayebeh Bakhsh, PhD, Ocean Engineer • Eric Comerma, PhD, Ocean Engineer
Project Manager:
• Nathan Vinhateiro, PhD, Oceanographer
Release File Name Date Submitted Notes
V1 17-000701_CSA_Mauritania/Senegal_Results_8Nov2017 Draft report
V2 17-000701_CSA_Mauritania/Senegal_Report_22Nov2017 Nov. 22, 2017
Draft report with Task 2
V3 17-000701_CSA_Mauritania/Senegal_Report_18Dec2017 Dec. 18, 2017
Report updated to address comments from BP
Disclaimer: This document may contain confidential information that is intended only for use by the client and is not for public circulation, publication, or third party use without consent of the client. Numerical modeling is predictive in nature and while this report is based on information from sources that Applied Science Associates, Inc. considers reliable, the accuracy and completeness of said information cannot be guaranteed. Therefore, Applied Science Associates, Inc., its directors, agents, assigns, and employees accept no liability for the result of any action taken or not taken on the basis of the information given in this report, nor for any negligent misstatements, errors, and omissions. This report was compiled with consideration for the specified client's objectives, situation, and needs.
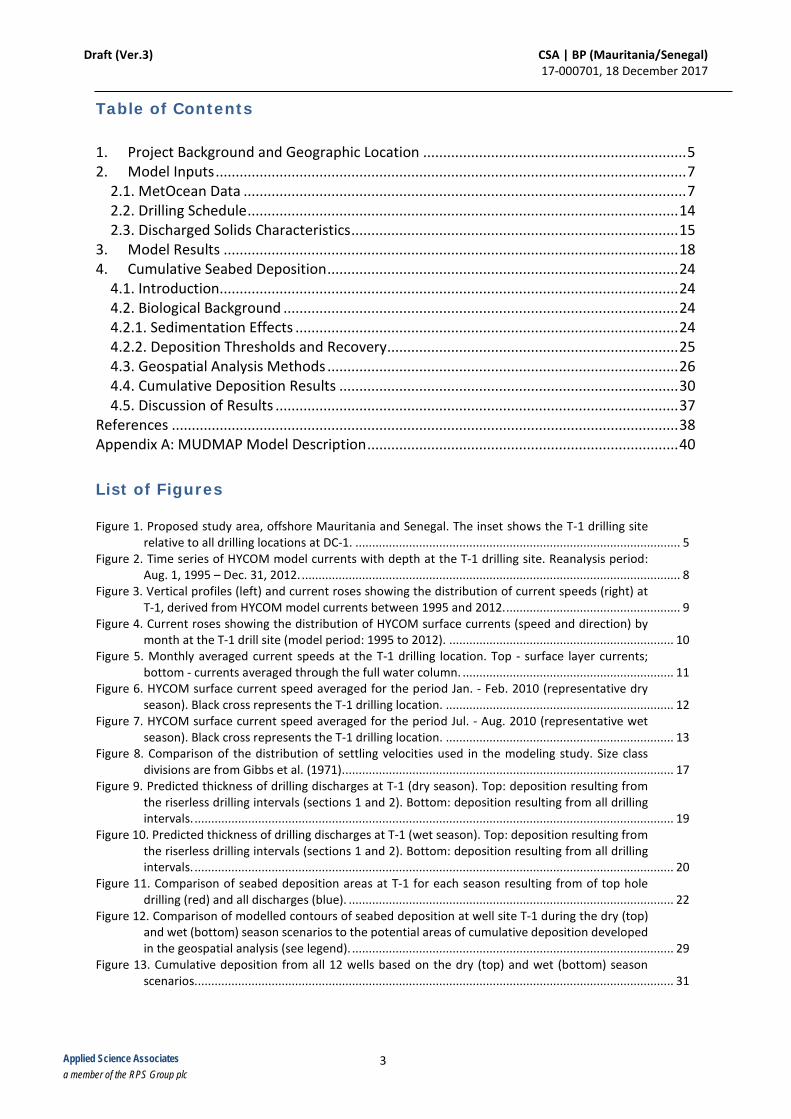
Draft (Ver.3) CSA | BP (Mauritania/Senegal) 17-000701, 18 December 2017
3 Applied Science Associates a member of the RPS Group plc
Table of Contents
1. Project Background and Geographic Location .................................................................. 5 2. Model Inputs ...................................................................................................................... 7
2.1. MetOcean Data ............................................................................................................... 7 2.2. Drilling Schedule ............................................................................................................ 14 2.3. Discharged Solids Characteristics .................................................................................. 15
3. Model Results .................................................................................................................. 18 4. Cumulative Seabed Deposition ........................................................................................ 24
4.1. Introduction ................................................................................................................... 24 4.2. Biological Background ................................................................................................... 24 4.2.1. Sedimentation Effects ................................................................................................ 24 4.2.2. Deposition Thresholds and Recovery ......................................................................... 25 4.3. Geospatial Analysis Methods ........................................................................................ 26 4.4. Cumulative Deposition Results ..................................................................................... 30 4.5. Discussion of Results ..................................................................................................... 37
References ............................................................................................................................... 38 Appendix A: MUDMAP Model Description .............................................................................. 40
List of Figures Figure 1. Proposed study area, offshore Mauritania and Senegal. The inset shows the T-1 drilling site
relative to all drilling locations at DC-1. ................................................................................................. 5 Figure 2. Time series of HYCOM model currents with depth at the T-1 drilling site. Reanalysis period:
Aug. 1, 1995 – Dec. 31, 2012. ................................................................................................................. 8 Figure 3. Vertical profiles (left) and current roses showing the distribution of current speeds (right) at
T-1, derived from HYCOM model currents between 1995 and 2012. .................................................... 9 Figure 4. Current roses showing the distribution of HYCOM surface currents (speed and direction) by
month at the T-1 drill site (model period: 1995 to 2012). ................................................................... 10 Figure 5. Monthly averaged current speeds at the T-1 drilling location. Top - surface layer currents;
bottom - currents averaged through the full water column. ............................................................... 11 Figure 6. HYCOM surface current speed averaged for the period Jan. - Feb. 2010 (representative dry
season). Black cross represents the T-1 drilling location. .................................................................... 12 Figure 7. HYCOM surface current speed averaged for the period Jul. - Aug. 2010 (representative wet
season). Black cross represents the T-1 drilling location. .................................................................... 13 Figure 8. Comparison of the distribution of settling velocities used in the modeling study. Size class
divisions are from Gibbs et al. (1971)................................................................................................... 17 Figure 9. Predicted thickness of drilling discharges at T-1 (dry season). Top: deposition resulting from
the riserless drilling intervals (sections 1 and 2). Bottom: deposition resulting from all drilling intervals. ............................................................................................................................................... 19
Figure 10. Predicted thickness of drilling discharges at T-1 (wet season). Top: deposition resulting from the riserless drilling intervals (sections 1 and 2). Bottom: deposition resulting from all drilling intervals. ............................................................................................................................................... 20
Figure 11. Comparison of seabed deposition areas at T-1 for each season resulting from of top hole drilling (red) and all discharges (blue). ................................................................................................. 22
Figure 12. Comparison of modelled contours of seabed deposition at well site T-1 during the dry (top) and wet (bottom) season scenarios to the potential areas of cumulative deposition developed in the geospatial analysis (see legend). ................................................................................................ 29
Figure 13. Cumulative deposition from all 12 wells based on the dry (top) and wet (bottom) season scenarios............................................................................................................................................... 31
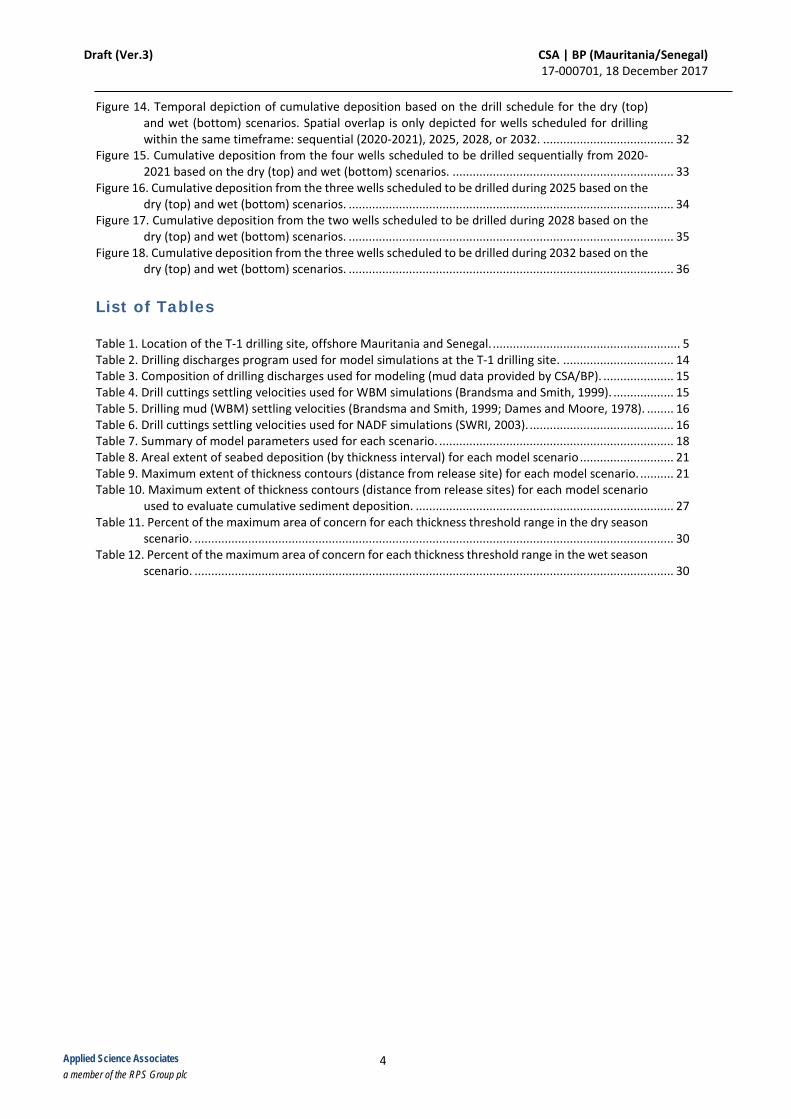
Draft (Ver.3) CSA | BP (Mauritania/Senegal) 17-000701, 18 December 2017
4 Applied Science Associates a member of the RPS Group plc
Figure 14. Temporal depiction of cumulative deposition based on the drill schedule for the dry (top) and wet (bottom) scenarios. Spatial overlap is only depicted for wells scheduled for drilling within the same timeframe: sequential (2020-2021), 2025, 2028, or 2032. ....................................... 32
Figure 15. Cumulative deposition from the four wells scheduled to be drilled sequentially from 2020-2021 based on the dry (top) and wet (bottom) scenarios. .................................................................. 33
Figure 16. Cumulative deposition from the three wells scheduled to be drilled during 2025 based on the dry (top) and wet (bottom) scenarios. ................................................................................................. 34
Figure 17. Cumulative deposition from the two wells scheduled to be drilled during 2028 based on the dry (top) and wet (bottom) scenarios. ................................................................................................. 35
Figure 18. Cumulative deposition from the three wells scheduled to be drilled during 2032 based on the dry (top) and wet (bottom) scenarios. ................................................................................................. 36
List of Tables Table 1. Location of the T-1 drilling site, offshore Mauritania and Senegal. ........................................................ 5 Table 2. Drilling discharges program used for model simulations at the T-1 drilling site. ................................. 14 Table 3. Composition of drilling discharges used for modeling (mud data provided by CSA/BP). ..................... 15 Table 4. Drill cuttings settling velocities used for WBM simulations (Brandsma and Smith, 1999). .................. 15 Table 5. Drilling mud (WBM) settling velocities (Brandsma and Smith, 1999; Dames and Moore, 1978). ........ 16 Table 6. Drill cuttings settling velocities used for NADF simulations (SWRI, 2003). ........................................... 16 Table 7. Summary of model parameters used for each scenario. ...................................................................... 18 Table 8. Areal extent of seabed deposition (by thickness interval) for each model scenario ............................ 21 Table 9. Maximum extent of thickness contours (distance from release site) for each model scenario. .......... 21 Table 10. Maximum extent of thickness contours (distance from release sites) for each model scenario
used to evaluate cumulative sediment deposition. ............................................................................. 27 Table 11. Percent of the maximum area of concern for each thickness threshold range in the dry season
scenario. ............................................................................................................................................... 30 Table 12. Percent of the maximum area of concern for each thickness threshold range in the wet season
scenario. ............................................................................................................................................... 30
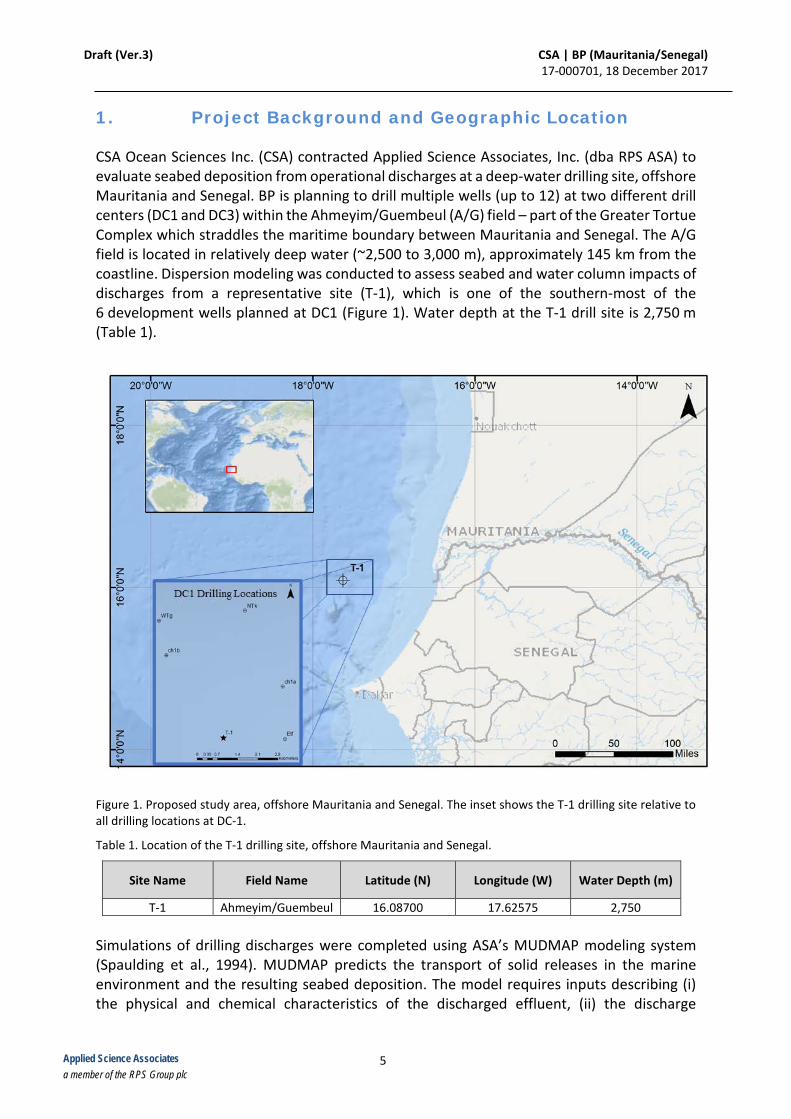
Draft (Ver.3) CSA | BP (Mauritania/Senegal) 17-000701, 18 December 2017
5 Applied Science Associates a member of the RPS Group plc
1. Project Background and Geographic Location CSA Ocean Sciences Inc. (CSA) contracted Applied Science Associates, Inc. (dba RPS ASA) to evaluate seabed deposition from operational discharges at a deep-water drilling site, offshore Mauritania and Senegal. BP is planning to drill multiple wells (up to 12) at two different drill centers (DC1 and DC3) within the Ahmeyim/Guembeul (A/G) field – part of the Greater Tortue Complex which straddles the maritime boundary between Mauritania and Senegal. The A/G field is located in relatively deep water (~2,500 to 3,000 m), approximately 145 km from the coastline. Dispersion modeling was conducted to assess seabed and water column impacts of discharges from a representative site (T-1), which is one of the southern-most of the 6 development wells planned at DC1 (Figure 1). Water depth at the T-1 drill site is 2,750 m (Table 1).
Figure 1. Proposed study area, offshore Mauritania and Senegal. The inset shows the T-1 drilling site relative to all drilling locations at DC-1.
Table 1. Location of the T-1 drilling site, offshore Mauritania and Senegal.
Site Name Field Name Latitude (N) Longitude (W) Water Depth (m)
T-1 Ahmeyim/Guembeul 16.08700 17.62575 2,750 Simulations of drilling discharges were completed using ASA’s MUDMAP modeling system (Spaulding et al., 1994). MUDMAP predicts the transport of solid releases in the marine environment and the resulting seabed deposition. The model requires inputs describing (i) the physical and chemical characteristics of the discharged effluent, (ii) the discharge
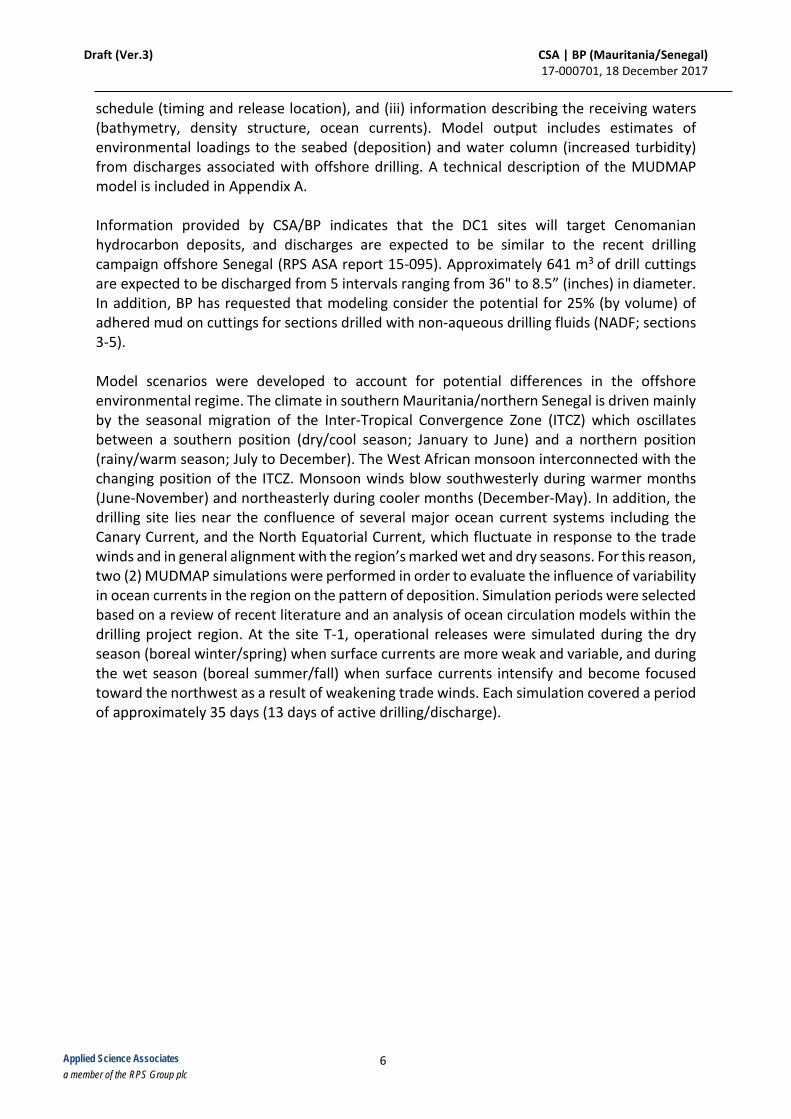
Draft (Ver.3) CSA | BP (Mauritania/Senegal) 17-000701, 18 December 2017
6 Applied Science Associates a member of the RPS Group plc
schedule (timing and release location), and (iii) information describing the receiving waters (bathymetry, density structure, ocean currents). Model output includes estimates of environmental loadings to the seabed (deposition) and water column (increased turbidity) from discharges associated with offshore drilling. A technical description of the MUDMAP model is included in Appendix A. Information provided by CSA/BP indicates that the DC1 sites will target Cenomanian hydrocarbon deposits, and discharges are expected to be similar to the recent drilling campaign offshore Senegal (RPS ASA report 15-095). Approximately 641 m3 of drill cuttings are expected to be discharged from 5 intervals ranging from 36" to 8.5” (inches) in diameter. In addition, BP has requested that modeling consider the potential for 25% (by volume) of adhered mud on cuttings for sections drilled with non-aqueous drilling fluids (NADF; sections 3-5). Model scenarios were developed to account for potential differences in the offshore environmental regime. The climate in southern Mauritania/northern Senegal is driven mainly by the seasonal migration of the Inter-Tropical Convergence Zone (ITCZ) which oscillates between a southern position (dry/cool season; January to June) and a northern position (rainy/warm season; July to December). The West African monsoon interconnected with the changing position of the ITCZ. Monsoon winds blow southwesterly during warmer months (June-November) and northeasterly during cooler months (December-May). In addition, the drilling site lies near the confluence of several major ocean current systems including the Canary Current, and the North Equatorial Current, which fluctuate in response to the trade winds and in general alignment with the region’s marked wet and dry seasons. For this reason, two (2) MUDMAP simulations were performed in order to evaluate the influence of variability in ocean currents in the region on the pattern of deposition. Simulation periods were selected based on a review of recent literature and an analysis of ocean circulation models within the drilling project region. At the site T-1, operational releases were simulated during the dry season (boreal winter/spring) when surface currents are more weak and variable, and during the wet season (boreal summer/fall) when surface currents intensify and become focused toward the northwest as a result of weakening trade winds. Each simulation covered a period of approximately 35 days (13 days of active drilling/discharge).
Draft (Ver.3) CSA | BP (Mauritania/Senegal) 17-000701, 18 December 2017
7 Applied Science Associates a member of the RPS Group plc
2. Model Inputs 2.1. MetOcean Data Hydrodynamic data from the HYCOM (HYbrid Coordinate Ocean Model) was used as the primary forcing for the cuttings dispersion simulations. The specific version of the model used was the HYCOM + NCODA (Navy Coupled Ocean Data Assimilation) Global 1/12° Reanalysis, which includes native hycom .[ab] data converted to NetCDF on native Mercator-curvilinear HYCOM horizontal grid. Details of the data assimilation procedure are described in Cummings and Smedstad (2013) and Cummings (2005). Fox et al. (2002) describe the technique for projecting surface information (collected for assimilation) downward. The horizontal dimensions of the global grid are 4500 x 3298 grid points resulting in ~7 km spacing on average. The HYCOM system is run daily at the US Navy DoD Supercomputing Resource Center to provide a 5-day operational forecast (+ 5 day of hindcast as best estimate) composed of 3-D daily mean temperature, salinity, sea surface height, zonal velocity and meridional velocity fields. Ocean dynamics including geostrophic and wind driven currents are reproduced by the model. Data are provided as daily snapshots at 00Z. The most recent reanalysis experiment (GLBa0.08/expt_19.1) includes data between August 1, 1995 and December 31, 2012. RPS ASA utilizes a series of processing steps to prepare HYCOM output for ingestion by the MUDMAP cuttings dispersion model. The current field at the location of each well is developed using a distance weighted interpolation routine from the nearest 4 (surrounding) HYCOM nodes. At the model cell closest to the T-1 site the water column is represented in 37 vertical layers to a depth of 2,500 m. As shown in the figures below, the HYCOM model reproduces fluctuations in surface flows that are coincident with observations of seasonal variations offshore Mauritania and Senegal (i.e., the intensification and northward focusing of surface currents along the continental slope during the rainy season months). Vertically and time varied currents for a representative period (yr. 2010) were subset from the dataset to use as forcing for the MUDMAP model. The following figures are presented to summarize the hydrodynamic dataset:
• Stick plot showing HYCOM current speeds and directions with depth. • Vertical current profiles (by month) and current roses comparing the distribution of
flow at various depths from the HYCOM cell closest to the drilling site. • Current roses illustrating differences in the distribution of speed and direction of
HYCOM currents by month (season). • Monthly current speeds derived from the HYCOM model at the sea surface and
averaged throughout the full water column. • Surface current patterns for the offshore region for two modelled release periods.
All figures display current data in the oceanographic convention (stick vectors/roses indicate the direction toward which currents are flowing)
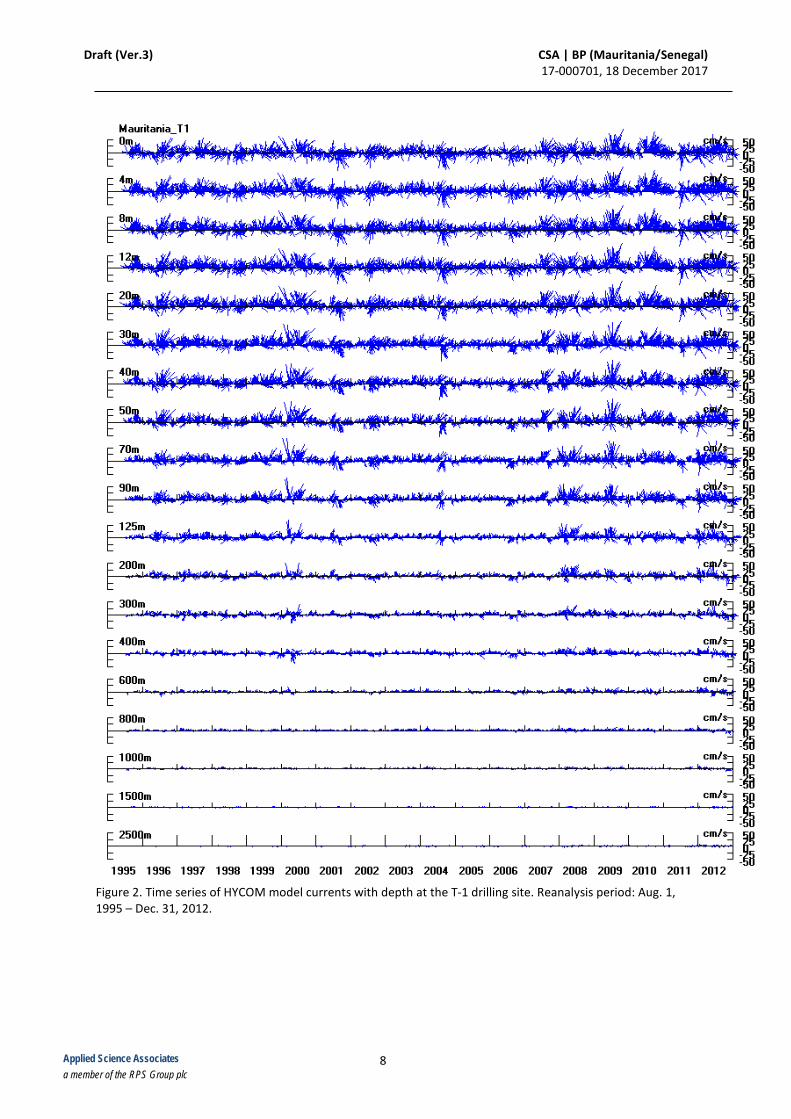
Draft (Ver.3) CSA | BP (Mauritania/Senegal) 17-000701, 18 December 2017
8 Applied Science Associates a member of the RPS Group plc
Figure 2. Time series of HYCOM model currents with depth at the T-1 drilling site. Reanalysis period: Aug. 1, 1995 – Dec. 31, 2012.
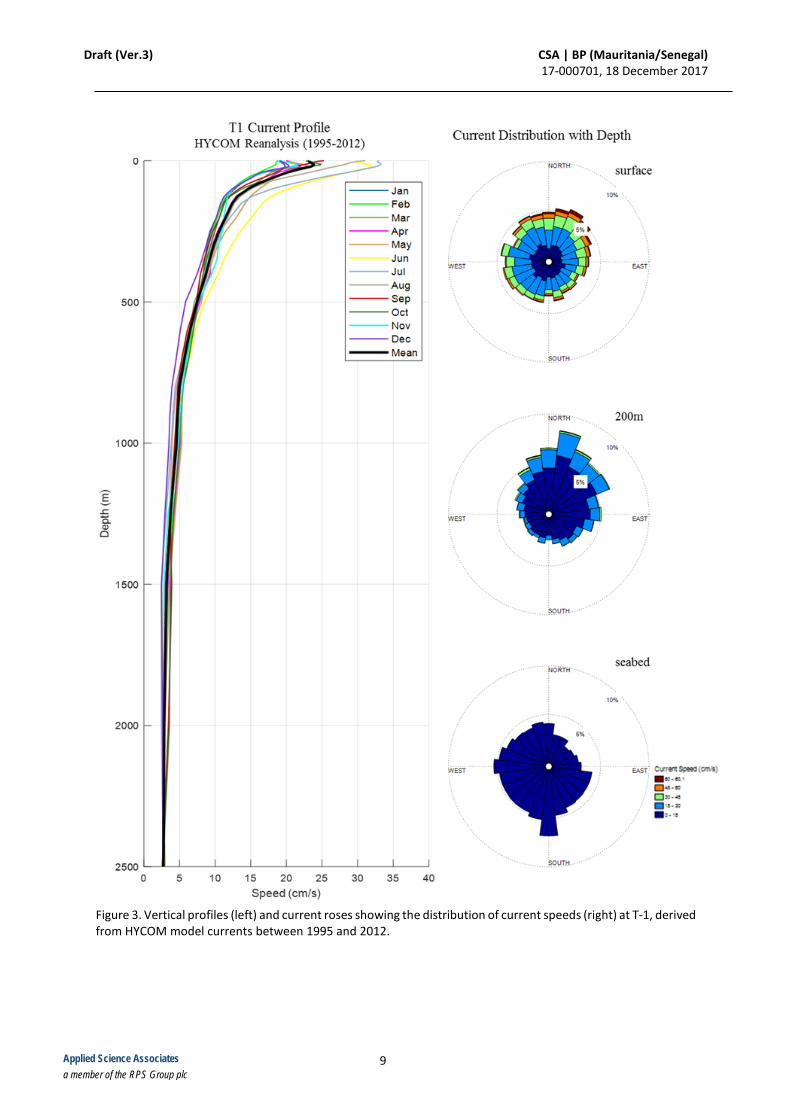
Draft (Ver.3) CSA | BP (Mauritania/Senegal) 17-000701, 18 December 2017
9 Applied Science Associates a member of the RPS Group plc
Figure 3. Vertical profiles (left) and current roses showing the distribution of current speeds (right) at T-1, derived from HYCOM model currents between 1995 and 2012.
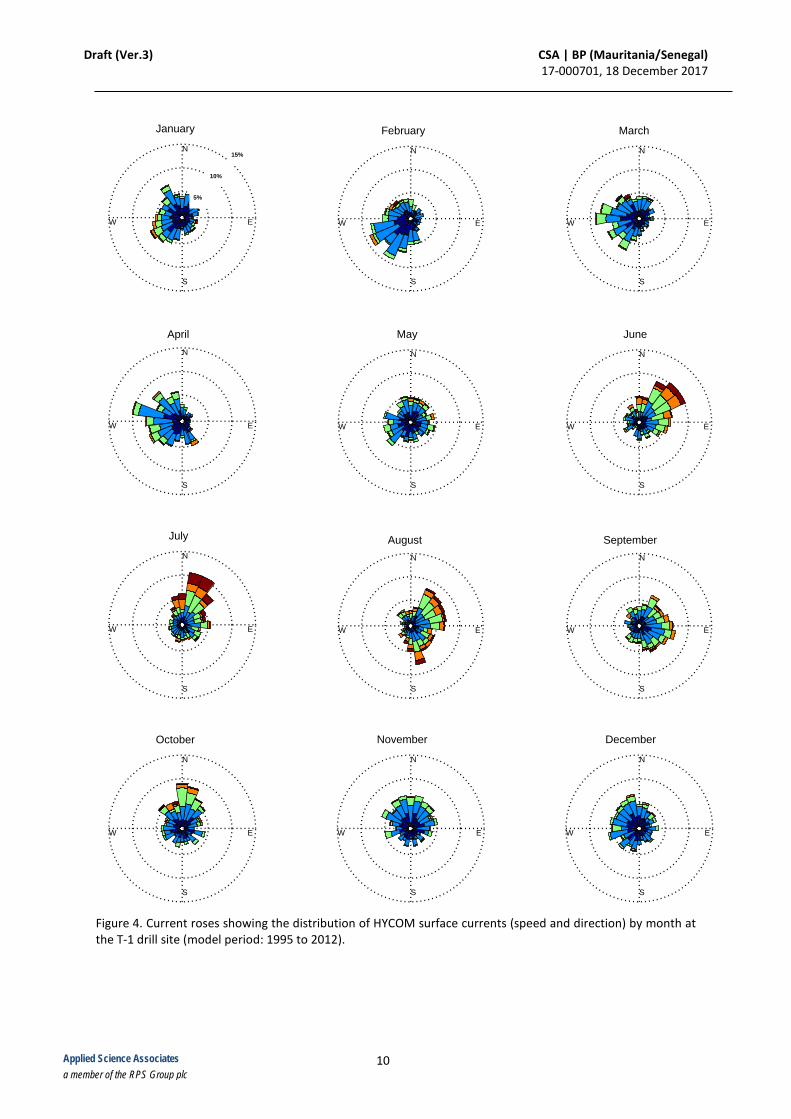
Draft (Ver.3) CSA | BP (Mauritania/Senegal) 17-000701, 18 December 2017
10 Applied Science Associates a member of the RPS Group plc
Figure 4. Current roses showing the distribution of HYCOM surface currents (speed and direction) by month at the T-1 drill site (model period: 1995 to 2012).
January
5%
10%
15%
W E
S
N
February
W E
S
N
March
W E
S
N
April
W E
S
N
May
W E
S
N
June
W E
S
N
July
W E
S
N
August
W E
S
N
September
W E
S
N
October
W E
S
N
November
W E
S
N
December
W E
S
N
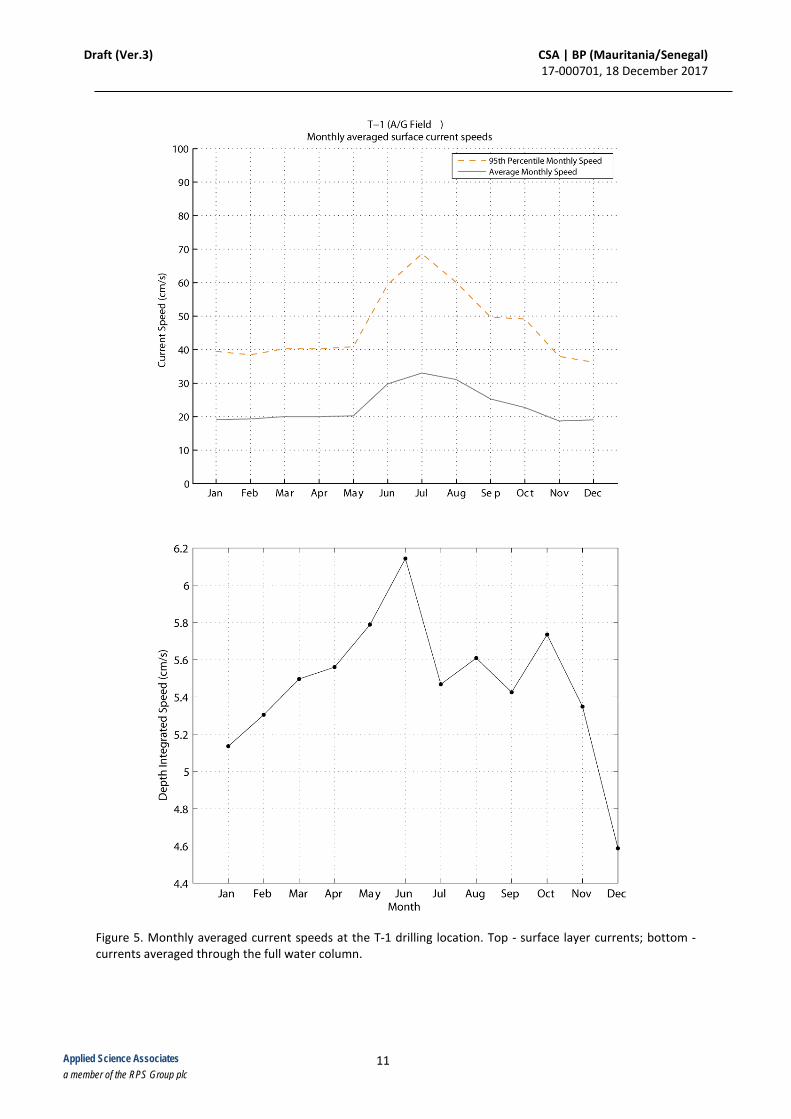
Draft (Ver.3) CSA | BP (Mauritania/Senegal) 17-000701, 18 December 2017
11 Applied Science Associates a member of the RPS Group plc
Figure 5. Monthly averaged current speeds at the T-1 drilling location. Top - surface layer currents; bottom - currents averaged through the full water column.
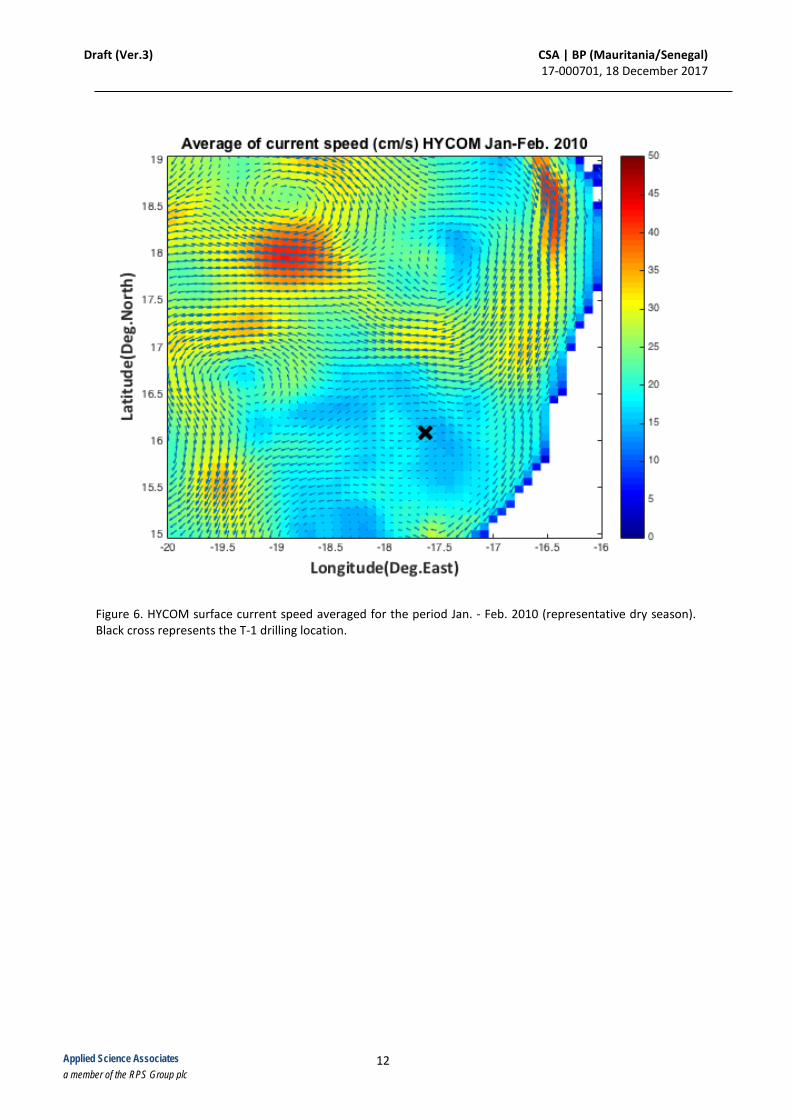
Draft (Ver.3) CSA | BP (Mauritania/Senegal) 17-000701, 18 December 2017
12 Applied Science Associates a member of the RPS Group plc
Figure 6. HYCOM surface current speed averaged for the period Jan. - Feb. 2010 (representative dry season). Black cross represents the T-1 drilling location.
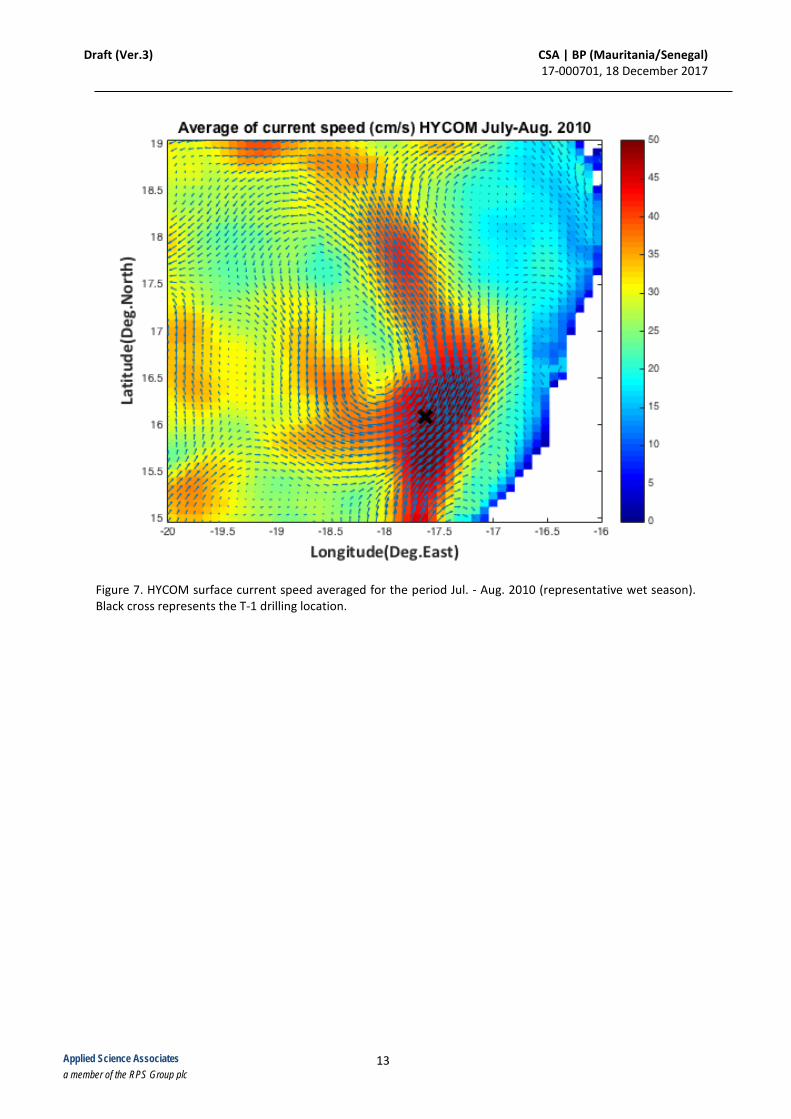
Draft (Ver.3) CSA | BP (Mauritania/Senegal) 17-000701, 18 December 2017
13 Applied Science Associates a member of the RPS Group plc
Figure 7. HYCOM surface current speed averaged for the period Jul. - Aug. 2010 (representative wet season). Black cross represents the T-1 drilling location.
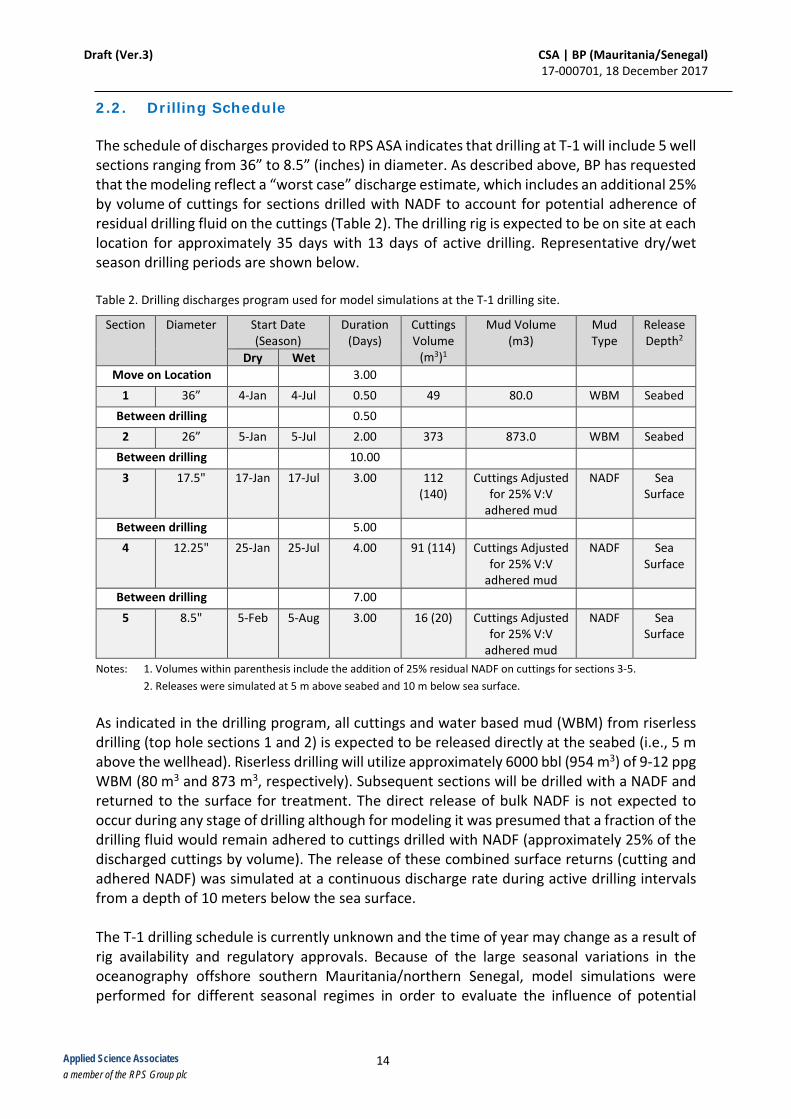
Draft (Ver.3) CSA | BP (Mauritania/Senegal) 17-000701, 18 December 2017
14 Applied Science Associates a member of the RPS Group plc
2.2. Drilling Schedule The schedule of discharges provided to RPS ASA indicates that drilling at T-1 will include 5 well sections ranging from 36” to 8.5” (inches) in diameter. As described above, BP has requested that the modeling reflect a “worst case” discharge estimate, which includes an additional 25% by volume of cuttings for sections drilled with NADF to account for potential adherence of residual drilling fluid on the cuttings (Table 2). The drilling rig is expected to be on site at each location for approximately 35 days with 13 days of active drilling. Representative dry/wet season drilling periods are shown below. Table 2. Drilling discharges program used for model simulations at the T-1 drilling site.
Section Diameter Start Date (Season)
Duration (Days)
Cuttings Volume
(m3)1
Mud Volume (m3)
Mud Type
Release Depth2
Dry Wet Move on Location
3.00
1 36” 4-Jan 4-Jul 0.50 49 80.0 WBM Seabed Between drilling
0.50
2 26” 5-Jan 5-Jul 2.00 373 873.0 WBM Seabed Between drilling
10.00
3 17.5" 17-Jan 17-Jul 3.00 112 (140)
Cuttings Adjusted for 25% V:V
adhered mud
NADF
Sea Surface
Between drilling
5.00
4 12.25" 25-Jan 25-Jul 4.00 91 (114) Cuttings Adjusted for 25% V:V
adhered mud
NADF
Sea Surface
Between drilling
7.00
5 8.5" 5-Feb 5-Aug 3.00 16 (20) Cuttings Adjusted for 25% V:V
adhered mud
NADF Sea Surface
Notes: 1. Volumes within parenthesis include the addition of 25% residual NADF on cuttings for sections 3-5. 2. Releases were simulated at 5 m above seabed and 10 m below sea surface. As indicated in the drilling program, all cuttings and water based mud (WBM) from riserless drilling (top hole sections 1 and 2) is expected to be released directly at the seabed (i.e., 5 m above the wellhead). Riserless drilling will utilize approximately 6000 bbl (954 m3) of 9-12 ppg WBM (80 m3 and 873 m3, respectively). Subsequent sections will be drilled with a NADF and returned to the surface for treatment. The direct release of bulk NADF is not expected to occur during any stage of drilling although for modeling it was presumed that a fraction of the drilling fluid would remain adhered to cuttings drilled with NADF (approximately 25% of the discharged cuttings by volume). The release of these combined surface returns (cutting and adhered NADF) was simulated at a continuous discharge rate during active drilling intervals from a depth of 10 meters below the sea surface. The T-1 drilling schedule is currently unknown and the time of year may change as a result of rig availability and regulatory approvals. Because of the large seasonal variations in the oceanography offshore southern Mauritania/northern Senegal, model simulations were performed for different seasonal regimes in order to evaluate the influence of potential
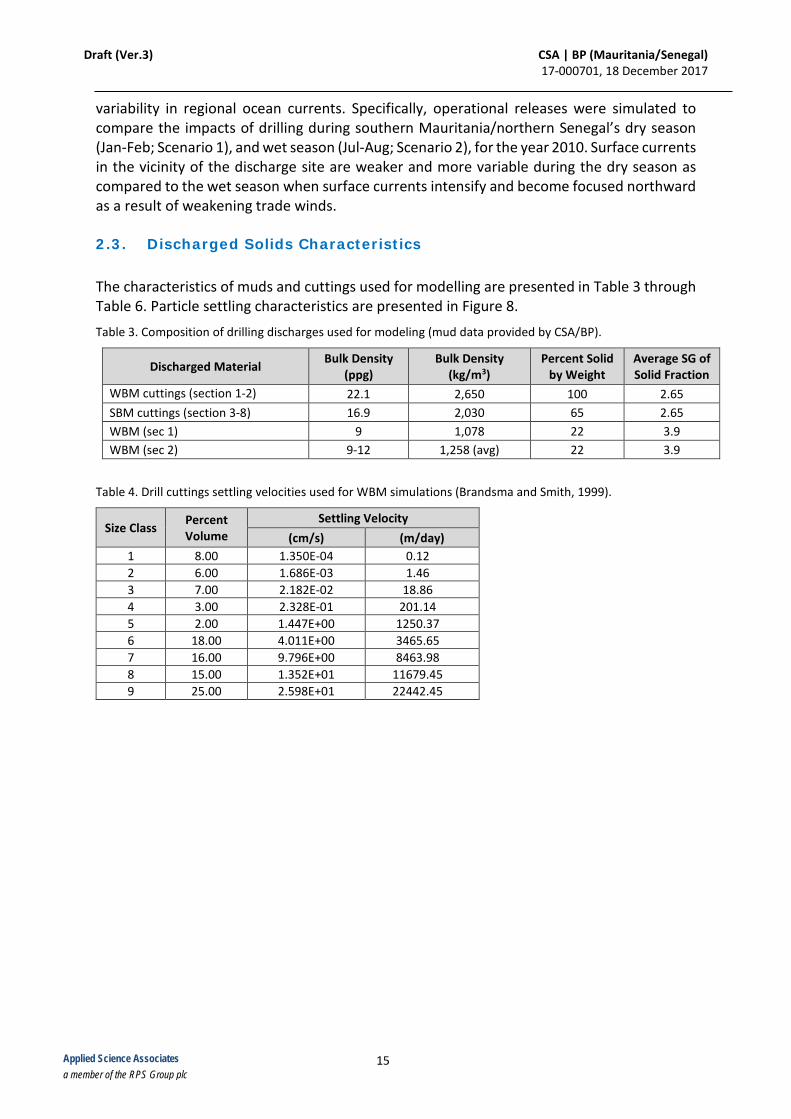
Draft (Ver.3) CSA | BP (Mauritania/Senegal) 17-000701, 18 December 2017
15 Applied Science Associates a member of the RPS Group plc
variability in regional ocean currents. Specifically, operational releases were simulated to compare the impacts of drilling during southern Mauritania/northern Senegal’s dry season (Jan-Feb; Scenario 1), and wet season (Jul-Aug; Scenario 2), for the year 2010. Surface currents in the vicinity of the discharge site are weaker and more variable during the dry season as compared to the wet season when surface currents intensify and become focused northward as a result of weakening trade winds. 2.3. Discharged Solids Characteristics
The characteristics of muds and cuttings used for modelling are presented in Table 3 through Table 6. Particle settling characteristics are presented in Figure 8. Table 3. Composition of drilling discharges used for modeling (mud data provided by CSA/BP).
Discharged Material Bulk Density (ppg)
Bulk Density (kg/m3)
Percent Solid by Weight
Average SG of Solid Fraction
WBM cuttings (section 1-2) 22.1 2,650 100 2.65 SBM cuttings (section 3-8) 16.9 2,030 65 2.65 WBM (sec 1) 9 1,078 22 3.9 WBM (sec 2) 9-12 1,258 (avg) 22 3.9
Table 4. Drill cuttings settling velocities used for WBM simulations (Brandsma and Smith, 1999).
Size Class Percent Volume
Settling Velocity (cm/s) (m/day)
1 8.00 1.350E-04 0.12 2 6.00 1.686E-03 1.46 3 7.00 2.182E-02 18.86 4 3.00 2.328E-01 201.14 5 2.00 1.447E+00 1250.37 6 18.00 4.011E+00 3465.65 7 16.00 9.796E+00 8463.98 8 15.00 1.352E+01 11679.45 9 25.00 2.598E+01 22442.45
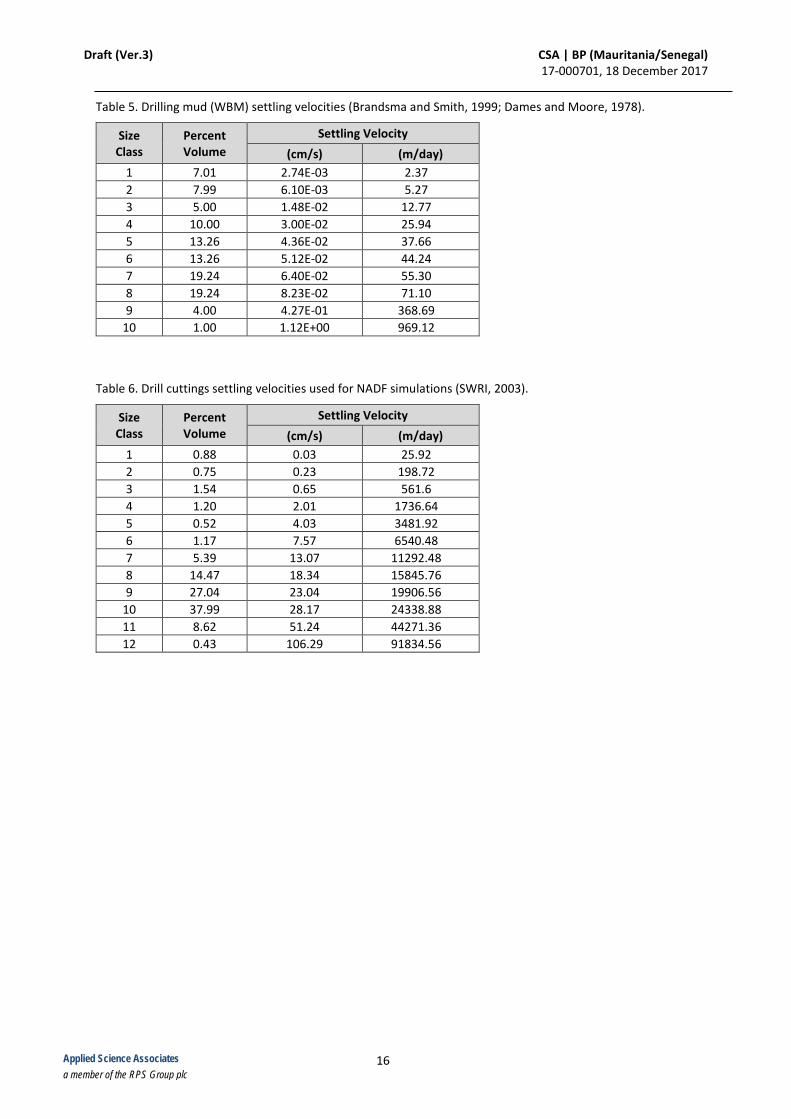
Draft (Ver.3) CSA | BP (Mauritania/Senegal) 17-000701, 18 December 2017
16 Applied Science Associates a member of the RPS Group plc
Table 5. Drilling mud (WBM) settling velocities (Brandsma and Smith, 1999; Dames and Moore, 1978).
Size Class
Percent Volume
Settling Velocity (cm/s) (m/day)
1 7.01 2.74E-03 2.37 2 7.99 6.10E-03 5.27 3 5.00 1.48E-02 12.77 4 10.00 3.00E-02 25.94 5 13.26 4.36E-02 37.66 6 13.26 5.12E-02 44.24 7 19.24 6.40E-02 55.30 8 19.24 8.23E-02 71.10 9 4.00 4.27E-01 368.69
10 1.00 1.12E+00 969.12
Table 6. Drill cuttings settling velocities used for NADF simulations (SWRI, 2003).
Size Class
Percent Volume
Settling Velocity (cm/s) (m/day)
1 0.88 0.03 25.92 2 0.75 0.23 198.72 3 1.54 0.65 561.6 4 1.20 2.01 1736.64 5 0.52 4.03 3481.92 6 1.17 7.57 6540.48 7 5.39 13.07 11292.48 8 14.47 18.34 15845.76 9 27.04 23.04 19906.56
10 37.99 28.17 24338.88 11 8.62 51.24 44271.36 12 0.43 106.29 91834.56
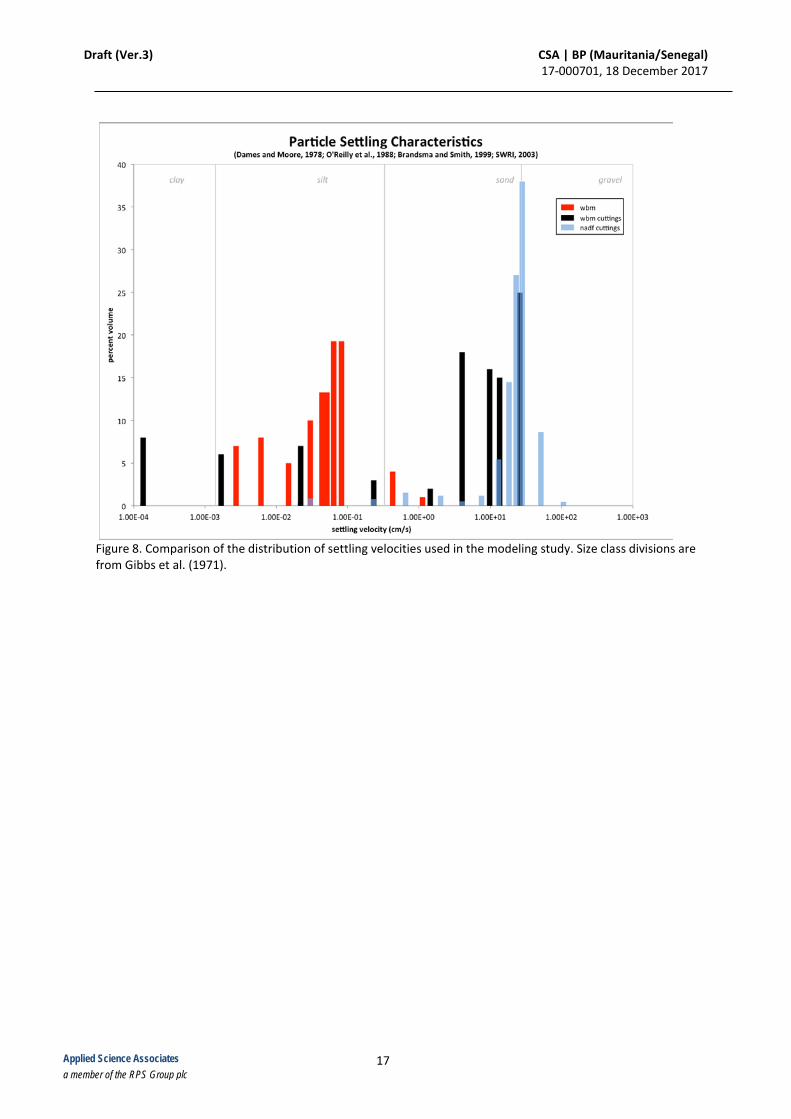
Draft (Ver.3) CSA | BP (Mauritania/Senegal) 17-000701, 18 December 2017
17 Applied Science Associates a member of the RPS Group plc
Figure 8. Comparison of the distribution of settling velocities used in the modeling study. Size class divisions are from Gibbs et al. (1971).
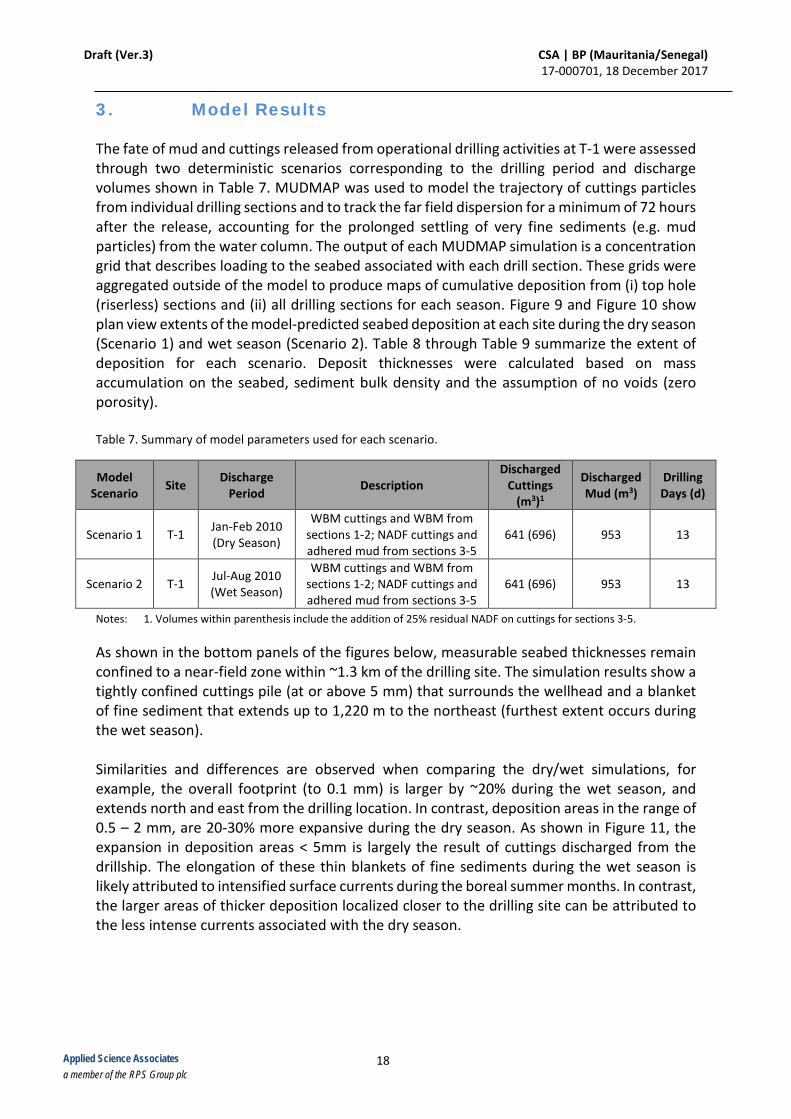
Draft (Ver.3) CSA | BP (Mauritania/Senegal) 17-000701, 18 December 2017
18 Applied Science Associates a member of the RPS Group plc
3. Model Results The fate of mud and cuttings released from operational drilling activities at T-1 were assessed through two deterministic scenarios corresponding to the drilling period and discharge volumes shown in Table 7. MUDMAP was used to model the trajectory of cuttings particles from individual drilling sections and to track the far field dispersion for a minimum of 72 hours after the release, accounting for the prolonged settling of very fine sediments (e.g. mud particles) from the water column. The output of each MUDMAP simulation is a concentration grid that describes loading to the seabed associated with each drill section. These grids were aggregated outside of the model to produce maps of cumulative deposition from (i) top hole (riserless) sections and (ii) all drilling sections for each season. Figure 9 and Figure 10 show plan view extents of the model-predicted seabed deposition at each site during the dry season (Scenario 1) and wet season (Scenario 2). Table 8 through Table 9 summarize the extent of deposition for each scenario. Deposit thicknesses were calculated based on mass accumulation on the seabed, sediment bulk density and the assumption of no voids (zero porosity). Table 7. Summary of model parameters used for each scenario.
Notes: 1. Volumes within parenthesis include the addition of 25% residual NADF on cuttings for sections 3-5. As shown in the bottom panels of the figures below, measurable seabed thicknesses remain confined to a near-field zone within ~1.3 km of the drilling site. The simulation results show a tightly confined cuttings pile (at or above 5 mm) that surrounds the wellhead and a blanket of fine sediment that extends up to 1,220 m to the northeast (furthest extent occurs during the wet season). Similarities and differences are observed when comparing the dry/wet simulations, for example, the overall footprint (to 0.1 mm) is larger by ~20% during the wet season, and extends north and east from the drilling location. In contrast, deposition areas in the range of 0.5 – 2 mm, are 20-30% more expansive during the dry season. As shown in Figure 11, the expansion in deposition areas < 5mm is largely the result of cuttings discharged from the drillship. The elongation of these thin blankets of fine sediments during the wet season is likely attributed to intensified surface currents during the boreal summer months. In contrast, the larger areas of thicker deposition localized closer to the drilling site can be attributed to the less intense currents associated with the dry season.
Model Scenario Site Discharge
Period Description Discharged
Cuttings (m3)1
Discharged Mud (m3)
Drilling Days (d)
Scenario 1 T-1 Jan-Feb 2010 (Dry Season)
WBM cuttings and WBM from sections 1-2; NADF cuttings and adhered mud from sections 3-5
641 (696) 953 13
Scenario 2 T-1 Jul-Aug 2010 (Wet Season)
WBM cuttings and WBM from sections 1-2; NADF cuttings and adhered mud from sections 3-5
641 (696) 953 13
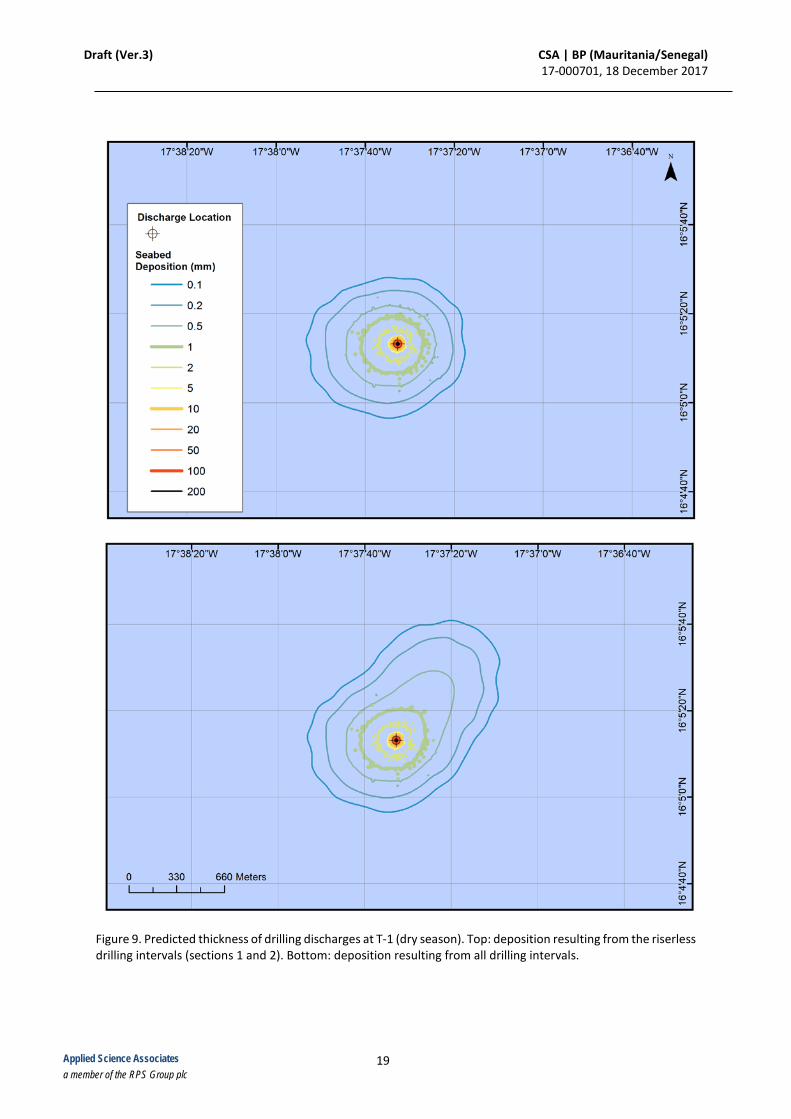
Draft (Ver.3) CSA | BP (Mauritania/Senegal) 17-000701, 18 December 2017
19 Applied Science Associates a member of the RPS Group plc
Figure 9. Predicted thickness of drilling discharges at T-1 (dry season). Top: deposition resulting from the riserless drilling intervals (sections 1 and 2). Bottom: deposition resulting from all drilling intervals.
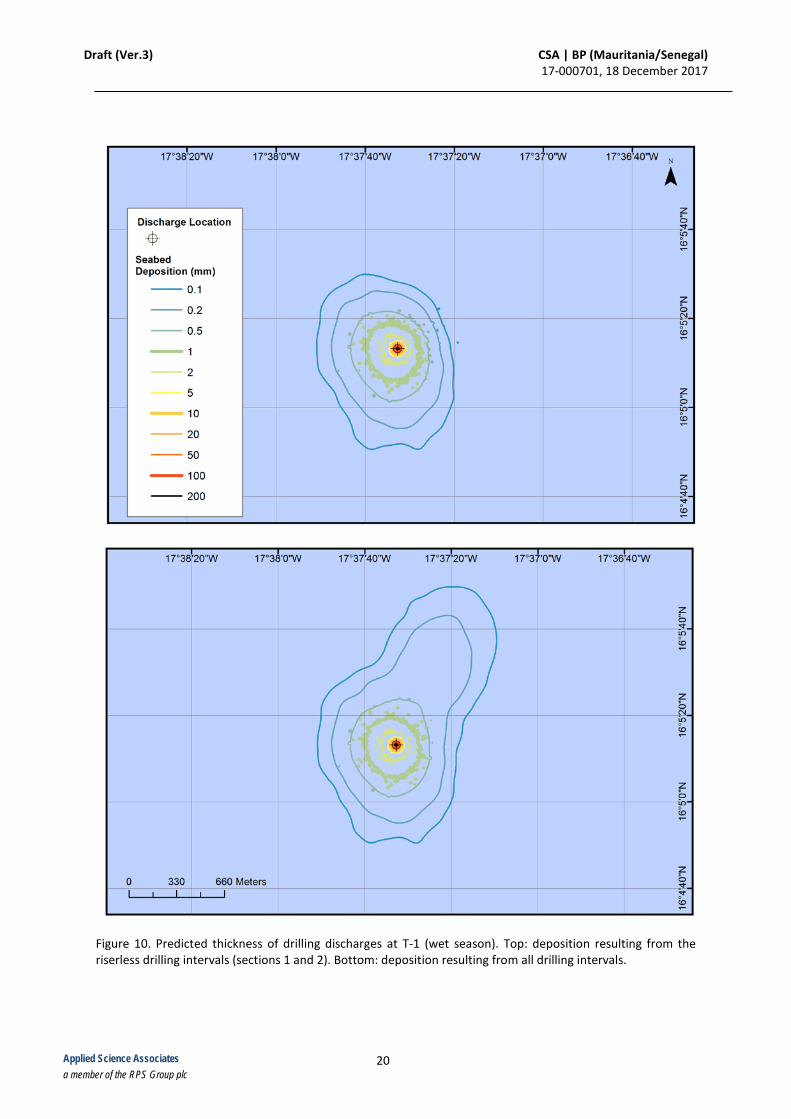
Draft (Ver.3) CSA | BP (Mauritania/Senegal) 17-000701, 18 December 2017
20 Applied Science Associates a member of the RPS Group plc
Figure 10. Predicted thickness of drilling discharges at T-1 (wet season). Top: deposition resulting from the riserless drilling intervals (sections 1 and 2). Bottom: deposition resulting from all drilling intervals.
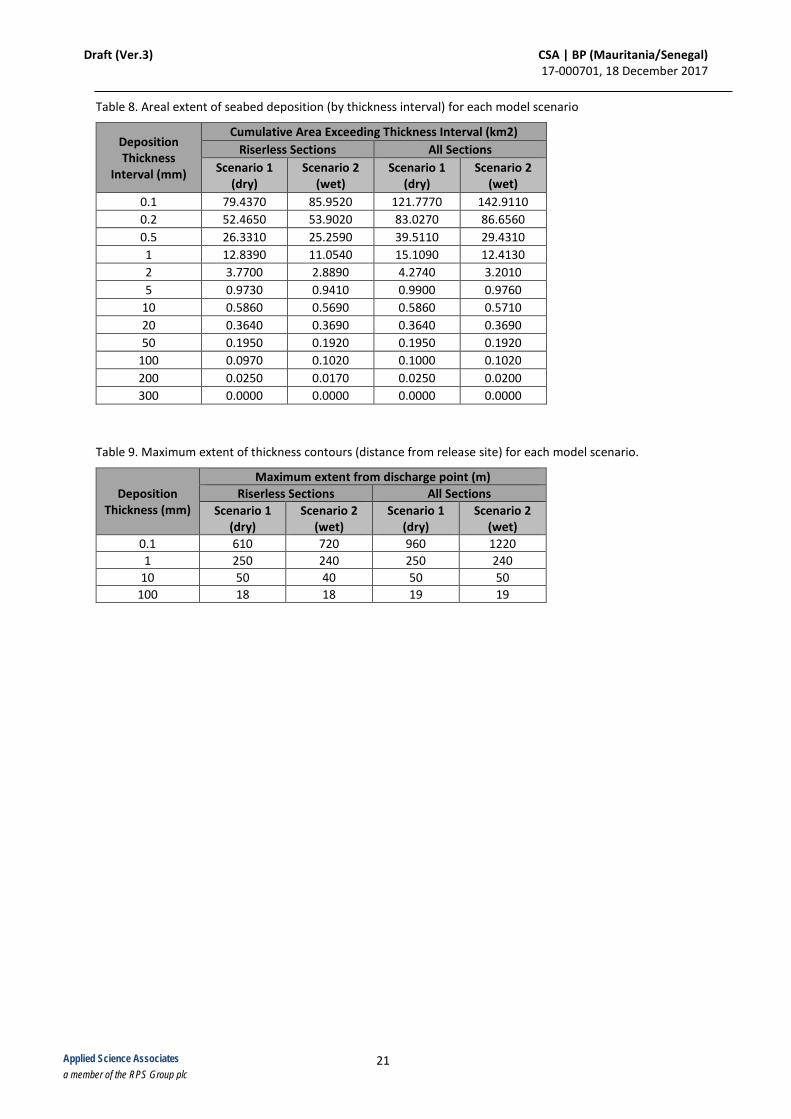
Draft (Ver.3) CSA | BP (Mauritania/Senegal) 17-000701, 18 December 2017
21 Applied Science Associates a member of the RPS Group plc
Table 8. Areal extent of seabed deposition (by thickness interval) for each model scenario
Deposition Thickness
Interval (mm)
Cumulative Area Exceeding Thickness Interval (km2) Riserless Sections All Sections
Scenario 1 (dry)
Scenario 2 (wet)
Scenario 1 (dry)
Scenario 2 (wet)
0.1 79.4370 85.9520 121.7770 142.9110 0.2 52.4650 53.9020 83.0270 86.6560 0.5 26.3310 25.2590 39.5110 29.4310 1 12.8390 11.0540 15.1090 12.4130 2 3.7700 2.8890 4.2740 3.2010 5 0.9730 0.9410 0.9900 0.9760
10 0.5860 0.5690 0.5860 0.5710 20 0.3640 0.3690 0.3640 0.3690 50 0.1950 0.1920 0.1950 0.1920
100 0.0970 0.1020 0.1000 0.1020 200 0.0250 0.0170 0.0250 0.0200 300 0.0000 0.0000 0.0000 0.0000
Table 9. Maximum extent of thickness contours (distance from release site) for each model scenario.
Deposition Thickness (mm)
Maximum extent from discharge point (m) Riserless Sections All Sections
Scenario 1 (dry)
Scenario 2 (wet)
Scenario 1 (dry)
Scenario 2 (wet)
0.1 610 720 960 1220 1 250 240 250 240
10 50 40 50 50 100 18 18 19 19
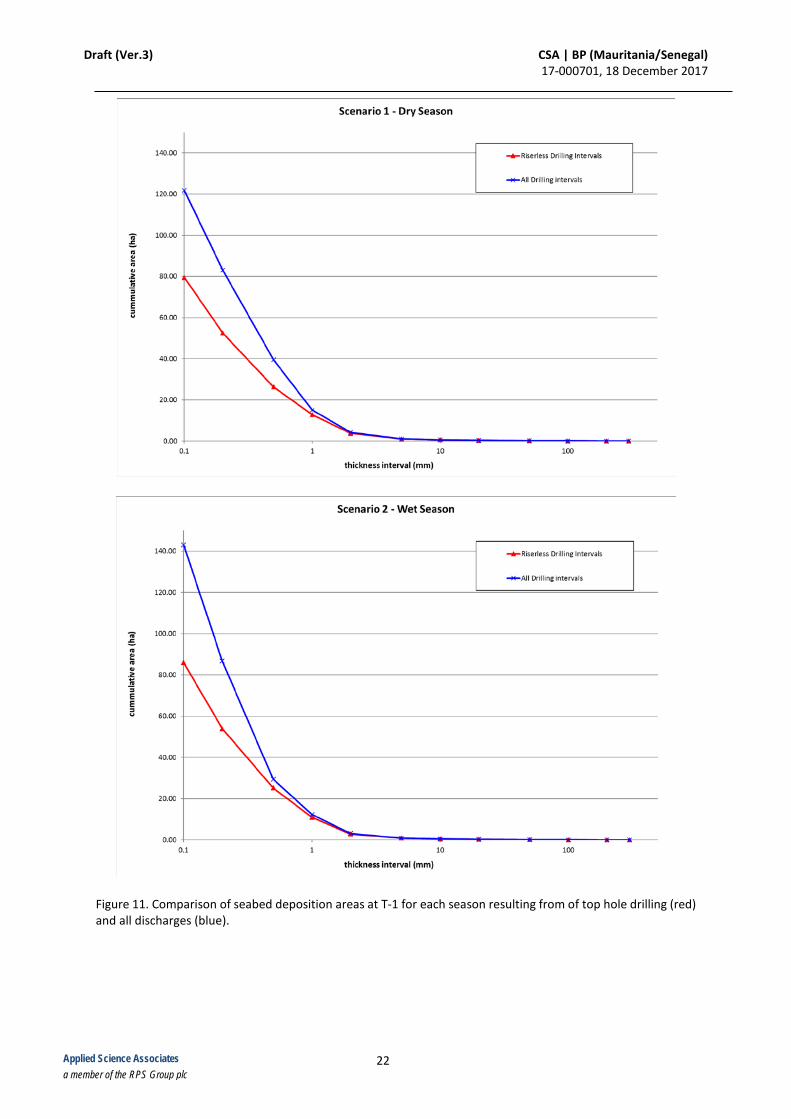
Draft (Ver.3) CSA | BP (Mauritania/Senegal) 17-000701, 18 December 2017
22 Applied Science Associates a member of the RPS Group plc
Figure 11. Comparison of seabed deposition areas at T-1 for each season resulting from of top hole drilling (red) and all discharges (blue).
Draft (Ver.3) CSA | BP (Mauritania/Senegal) 17-000701, 18 December 2017
23 Applied Science Associates a member of the RPS Group plc
For the top-hole drilling (sections 1-2), there is little noticeable difference in the footprint shape and extent following the discharge. These sediments deposit rapidly during the first few days of operations and surround the drill site forming the more substantial cuttings pile. Table 8 and Figure 11, which compare the extent of deposition between riserless sections and all sections, indicate that deposition at or above 5 mm is almost exclusively the result of top hole drilling. Because currents near the seabed are relatively weak (< 5 cm/s) there is limited opportunity for sediment transport during the top hole phase. Both scenarios result in a fairly concentric depositional footprint that remains close to the well head, which indicates that dispersion processes are nearly as influential as advection from currents due to the settling characteristics of material being released and the release depths. For Scenario 1 (dry season), the maximum predicted cumulative deposition is 260 mm in the area immediately adjacent to the wellhead. Deposition of 100 mm extends up to 18 m from the well and covers a maximum aerial extent of 0.100 ha; deposition at 10 mm extends to 50 m and covers a maximum area of 0.586 ha; and deposition at a thickness of 1 mm extends a maximum of 240 m and covers 15.109 ha of the seabed. For Scenario 2 (wet season), the maximum predicted cumulative deposition is 240 mm. Deposition of 100 mm extends up to 27 m from the well and covers a maximum aerial extent of 0.102 ha; deposition at 10 mm extends to 40 m and covers a maximum area of 0.5710 ha; and deposition at a thickness of 1 mm extends a maximum of 250 m and covers 12.4130 ha of the seabed.
Draft (Ver.3) CSA | BP (Mauritania/Senegal) 17-000701, 18 December 2017
24 Applied Science Associates a member of the RPS Group plc
4. Cumulative Seabed Deposition 4.1. Introduction Studies describing the biological effects of sedimentation were reviewed and thresholds for deposition were compiled for benthic taxa where available in the literature (Section 4.2). The potential cumulative seabed deposition from the proposed drilling program was evaluated in a geospatial analysis using ArcGIS tools (Section 4.3). Results of the geospatial analysis are presented as maps depicting overlap between areas of potential deposition around the twelve well sites and as areas above deposition thresholds (Section 4.4). Potential impacts are discussed relating the possible cumulative deposition calculated and the biological effects thresholds reviewed (Section 4.5). 4.2. Biological Background 4.2.1. Sedimentation Effects Although sediment deposition is a natural process, rate of sedimentation varies based on oceanographic characteristics of the area. Deep sea habitats, like those in the current study, are generally characterized by low-energy currents and slow sediment accumulation rates of 1 – 100 mm per thousand years (Gage and Tyler, 1991; Glover and Smith, 2003). Benthic organisms associated with these environments are generally adapted to tolerate a range of conditions and sedimentation rates. Rapid increases in sedimentation associated with mud and cuttings discharges can have direct and indirect effects on benthic infauna communities in deep sea habitats. Direct effects can include smothering, toxicity exposure, and physical abrasion; indirect effects include habitat alterations and changes to community assemblages (DOER, 2005). The severity of sedimentation effects on organisms depends on factors including burial depth, burial rate, burial time, species-specific tolerances, the grain size of the deposited sediments, and seasonal timing (Kjeilen-Eilertsen et al., 2004). For example, higher mortality can occur in the summer than in the winter (Smit et al., 2008). Higher mortality has been shown to occur at higher temperatures in mesocosm and lab studies of mussel and gastropod burial, possibly due to greater oxygen demand at higher temperatures (Chandrasekara and Frid, 1998; Hutchison et al., 2016). Taxonomic groups react differently and have varying levels of tolerance for sedimentation, with sessile and attached organisms having the lowest tolerance and highest mortality rate during sedimentation events (DOER, 2005; Gates and Jones, 2012). Benthic suspension feeders are also particularly sensitive to mud and cuttings discharges because suspended particles, such as those that compose silt and clay substrates, can remain suspended in the water column for weeks to months and interfere with feeding and growth (DOER, 2005; Smit et al., 2008). For example, crustaceans in the project region (Leptognathiella, Pseudotanais, and Paratanaoidae) will likely be the most sensitive to burial, as these taxa are filter feeders with extremely limited motility (CSA, 2017; Jumars et al., 2014). Meanwhile, polychaetes and mollusk species that burrow or feed in subsurface sediments will likely be less sensitive to burial. Grab samples collected by CSA during the Environmental Baseline Survey (EBS) indicated that sediment at the five offshore project sites (>2,500 m deep) consisted primarily of silt or silt/clay. Therefore, fine particles discharged from drilling are not expected to cause drastic changes in the median sediment grain size or habitat type present in the project region. If the range in grain size of the discharged particles were to differ greatly from the current
Draft (Ver.3) CSA | BP (Mauritania/Senegal) 17-000701, 18 December 2017
25 Applied Science Associates a member of the RPS Group plc
conditions, it could cause changes in benthic diversity as the new minimum or maximum grain sizes could support preferences of different species even if the median grain size was the same (Smit et al., 2008). Areas with the thickest deposition will incur the most severe impacts and lead to highest mortality rates. Benthic grab samples indicated that within the project region, species diversity was high, abundance of each species was low, and there was a relatively equal distribution of individuals among taxa (CSA, 2017). Polychaetes, malacostracans, and bivalves represented the highest percent abundance in the offshore samples. Previous research conducted on sedimentation and recovery of benthic infauna in Newfoundland, Canada, observed increased abundance and biomass in some polychaete species and declines in others in the area around the drill site. Reduced abundance in those species negatively affected (e.g., Paraonidae, a taxon also present in the project region) extended approximately 1 - 2 km from the drill site (Paine et al., 2014). This aligns with findings from an extensive literature review that documented biological effects (such as changes in benthic community structure) at distances of 200 – 2,000 m from platforms using water-based drilling fluids (Ellis et al., 2012). The range of effects from synthetic-based drilling fluids was found to be somewhat smaller, detecting biological effects from 50 – 1,000 m from the drill site (Ellis et al., 2012). Ellis et al. (2012) stated that there were virtually always changes to community structure observed within 300 m of a drill site using water-based fluids, which included a reduction in species diversity, increases in opportunistic species abundance, loss of suspension-feeding species, and increase in deposit-feeding species. However, biological effects would generally be stronger for seagrass and hard-bottom epibenthic communities than for the types of soft-sediment communities that dominate the project region. 4.2.2. Deposition Thresholds and Recovery Specific sedimentation thresholds tested and reported by Smit et al. (2008) indicate that epibenthic, sessile, filter-feeding species cannot survive sediment burial depths over 10 mm. Meanwhile, infauna taxa that are adapted to habitat covered in sediment may escape from burial under 100 mm of sediment or more (Kjeilen-Eilertsen et al., 2004). In a mesocosm and field study, Trannum et al. (2011) observed that 24 mm of water-based drill cuttings lowered oxygen availability and reduced abundance for macrofauna in the sediment. Overall, Smit et al. (2008) estimated that mortality of 5% of benthic organisms (including mollusks, polychaetes, and crustaceans) would occur at burial depths of 6.3 mm (3.1 – 10.6 mm) and mortality of 50% would occur at burial depths of 54 mm (37 – 79 mm). Studies on the recovery of benthic infaunal communities post-sedimentation present varying results. The ability of a benthic community to recover after sediment deposition depends on larval settlement, the rate of bioturbation, and sediment mixing by currents (Smit et al. 2008; Trannum et al., 2011). Because many benthic species have drifting pelagic larvae, resettlement can occur within months post-disturbance. Trannum et al. (2011) observed reestablishment of species-rich communities within 6 months of sedimentation and noted that the most successful colonizers were species in the Spionidae family of polychaete worms, which are present in the project region. In studies from the North Sea, recolonization of cuttings piles from the edges of the pile occurs in 1 – 5 years (Kjeilen-Eilertsen et al., 2004). There is little information available on recovery timescales for benthic habitats after drilling multiple wells in a region (Ellis et al., 2012). Areas with the thickest deposition will likely rely
Draft (Ver.3) CSA | BP (Mauritania/Senegal) 17-000701, 18 December 2017
26 Applied Science Associates a member of the RPS Group plc
on larval transport and resettlement for recolonization, as survival of buried organisms is unlikely. In areas with lower levels of deposition, reestablishment by surviving organisms that burrow or sift through sediment to feed is possible, as they mix mud and cuttings with native sediments and slowly return habitats to pre-drilling conditions (Smit et al., 2008; Gates and Jones, 2012). In the project region, 6 of the 10 most abundant infaunal species were either tube-building or burrowing and may aide in the redistribution of sediment and recovery of benthic habitat in the project region (CSA, 2017). Time is an important factor in determining the impact of drilling discharges on the benthic environment; unfortunately, it is also the factor that is least understood. Developing thresholds of deposition rate may be the best method for determining levels of effect on benthic organisms, but the data to support such thresholds are rare in the literature and difficult to discern (Kjeilen-Eilertsen et al., 2004). For instance, a particular high deposition rate might be tolerated if there is no further deposition for a few months following burial, or a lower rate of continuous deposition might be better tolerated. At present, reliable thresholds regarding the timing of deposition or chronic and sublethal impacts of long-term deposition on the ecosystem have not yet been developed (Ellis et al. 2012). Additionally, many studies of biological effects of drilling discharge were conducted on the continental shelf, and information on impacts in the deep-sea environment is limited. Another data gap is the cumulative impact of multiple wells in a region. One study (Hernández Arana et al., 2005) assessed the impact of 200 wells in shallow shelf waters of the Gulf of Mexico and found that stations located in areas of high platform densities had lower abundance and biomass and different assemblages than sample stations with fewer drill sites nearby. Research into cumulative effects is limited and needs to account for recovery times at regional scales (Ellis et al., 2012). 4.3. Geospatial Analysis Methods The UTM coordinates of 12 well sites from DC1 and DC3 were plotted and buffered to the maximum extent of each of 7 deposition thickness thresholds. The maximum distances from the well site were derived from the modeling output for the dry and wet scenarios (Table 10).
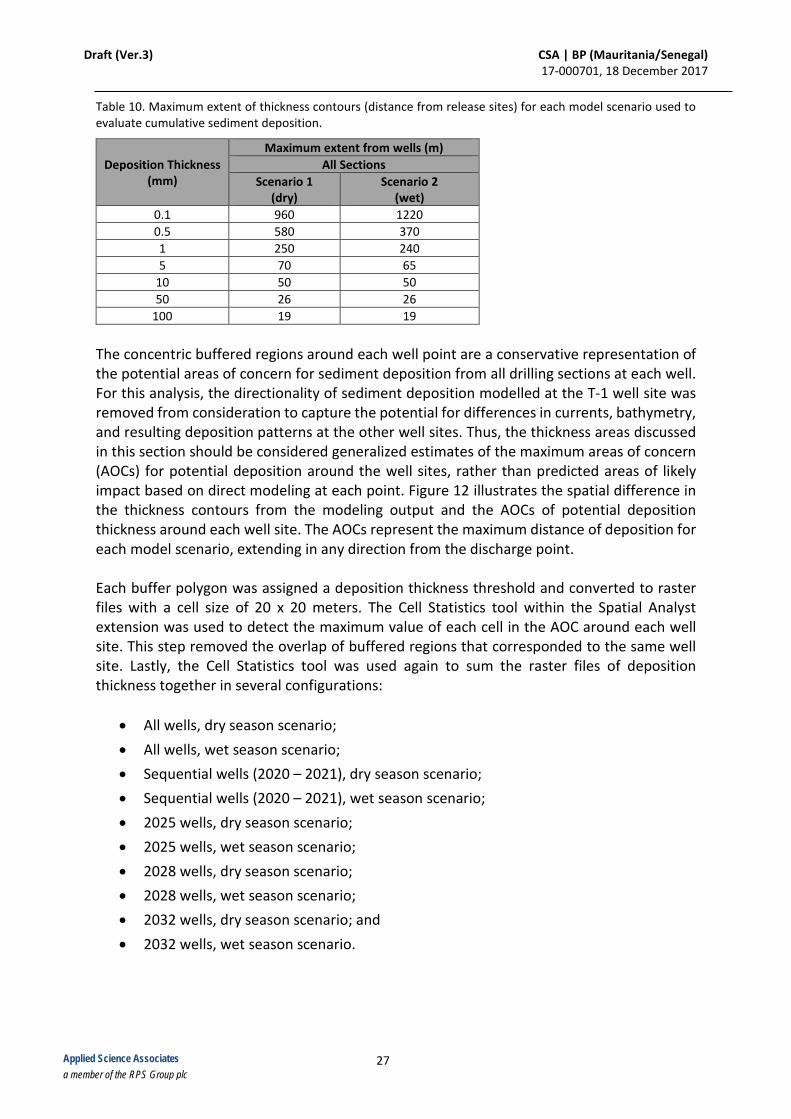
Draft (Ver.3) CSA | BP (Mauritania/Senegal) 17-000701, 18 December 2017
27 Applied Science Associates a member of the RPS Group plc
Table 10. Maximum extent of thickness contours (distance from release sites) for each model scenario used to evaluate cumulative sediment deposition.
Deposition Thickness (mm)
Maximum extent from wells (m) All Sections
Scenario 1 (dry)
Scenario 2 (wet)
0.1 960 1220 0.5 580 370 1 250 240 5 70 65
10 50 50 50 26 26
100 19 19 The concentric buffered regions around each well point are a conservative representation of the potential areas of concern for sediment deposition from all drilling sections at each well. For this analysis, the directionality of sediment deposition modelled at the T-1 well site was removed from consideration to capture the potential for differences in currents, bathymetry, and resulting deposition patterns at the other well sites. Thus, the thickness areas discussed in this section should be considered generalized estimates of the maximum areas of concern (AOCs) for potential deposition around the well sites, rather than predicted areas of likely impact based on direct modeling at each point. Figure 12 illustrates the spatial difference in the thickness contours from the modeling output and the AOCs of potential deposition thickness around each well site. The AOCs represent the maximum distance of deposition for each model scenario, extending in any direction from the discharge point. Each buffer polygon was assigned a deposition thickness threshold and converted to raster files with a cell size of 20 x 20 meters. The Cell Statistics tool within the Spatial Analyst extension was used to detect the maximum value of each cell in the AOC around each well site. This step removed the overlap of buffered regions that corresponded to the same well site. Lastly, the Cell Statistics tool was used again to sum the raster files of deposition thickness together in several configurations:
• All wells, dry season scenario; • All wells, wet season scenario; • Sequential wells (2020 – 2021), dry season scenario; • Sequential wells (2020 – 2021), wet season scenario; • 2025 wells, dry season scenario; • 2025 wells, wet season scenario; • 2028 wells, dry season scenario; • 2028 wells, wet season scenario; • 2032 wells, dry season scenario; and • 2032 wells, wet season scenario.

Draft (Ver.3) CSA | BP (Mauritania/Senegal) 17-000701, 18 December 2017
28 Applied Science Associates a member of the RPS Group plc
Finally, the number of cells of each summed raster file that fell within specific thickness ranges were recorded to calculate the area above thickness thresholds and evaluate the percent of deposition AOC overlap between wells in each configuration.
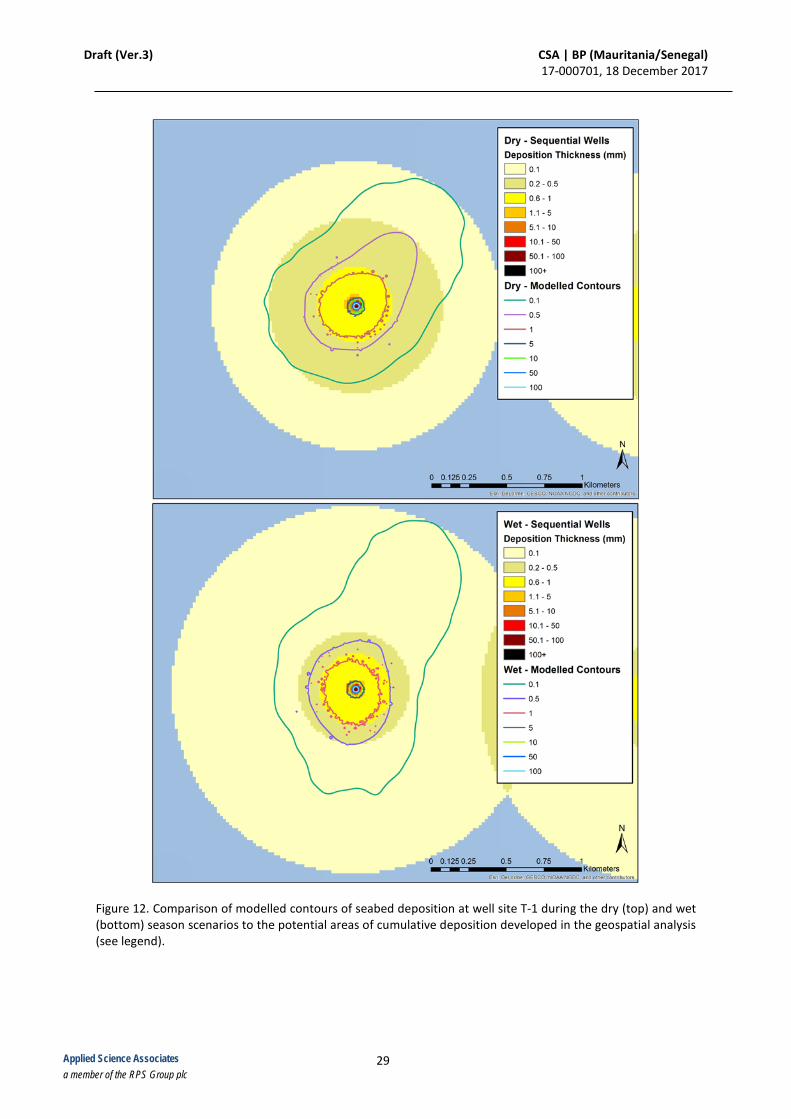
Draft (Ver.3) CSA | BP (Mauritania/Senegal) 17-000701, 18 December 2017
29 Applied Science Associates a member of the RPS Group plc
Figure 12. Comparison of modelled contours of seabed deposition at well site T-1 during the dry (top) and wet (bottom) season scenarios to the potential areas of cumulative deposition developed in the geospatial analysis (see legend).
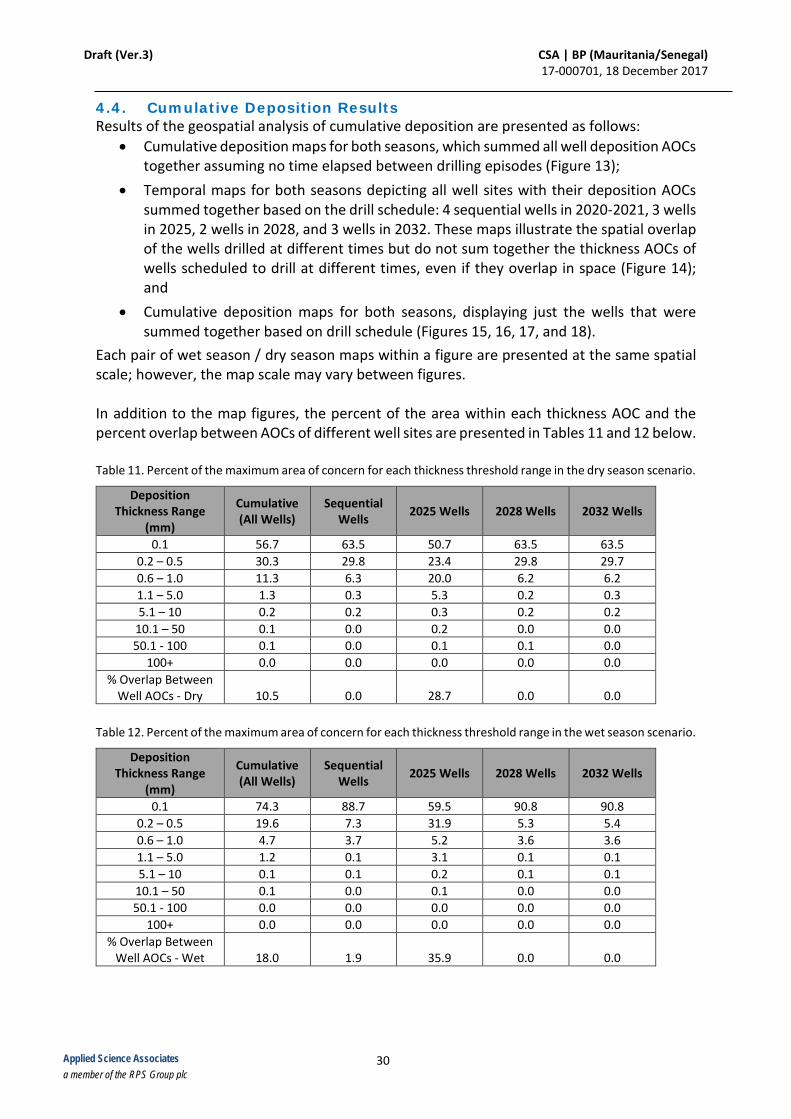
Draft (Ver.3) CSA | BP (Mauritania/Senegal) 17-000701, 18 December 2017
30 Applied Science Associates a member of the RPS Group plc
4.4. Cumulative Deposition Results Results of the geospatial analysis of cumulative deposition are presented as follows:
• Cumulative deposition maps for both seasons, which summed all well deposition AOCs together assuming no time elapsed between drilling episodes (Figure 13);
• Temporal maps for both seasons depicting all well sites with their deposition AOCs summed together based on the drill schedule: 4 sequential wells in 2020-2021, 3 wells in 2025, 2 wells in 2028, and 3 wells in 2032. These maps illustrate the spatial overlap of the wells drilled at different times but do not sum together the thickness AOCs of wells scheduled to drill at different times, even if they overlap in space (Figure 14); and
• Cumulative deposition maps for both seasons, displaying just the wells that were summed together based on drill schedule (Figures 15, 16, 17, and 18).
Each pair of wet season / dry season maps within a figure are presented at the same spatial scale; however, the map scale may vary between figures. In addition to the map figures, the percent of the area within each thickness AOC and the percent overlap between AOCs of different well sites are presented in Tables 11 and 12 below. Table 11. Percent of the maximum area of concern for each thickness threshold range in the dry season scenario.
Deposition Thickness Range
(mm)
Cumulative (All Wells)
Sequential Wells 2025 Wells 2028 Wells 2032 Wells
0.1 56.7 63.5 50.7 63.5 63.5 0.2 – 0.5 30.3 29.8 23.4 29.8 29.7 0.6 – 1.0 11.3 6.3 20.0 6.2 6.2 1.1 – 5.0 1.3 0.3 5.3 0.2 0.3 5.1 – 10 0.2 0.2 0.3 0.2 0.2
10.1 – 50 0.1 0.0 0.2 0.0 0.0 50.1 - 100 0.1 0.0 0.1 0.1 0.0
100+ 0.0 0.0 0.0 0.0 0.0 % Overlap Between
Well AOCs - Dry 10.5 0.0 28.7 0.0 0.0 Table 12. Percent of the maximum area of concern for each thickness threshold range in the wet season scenario.
Deposition Thickness Range
(mm)
Cumulative (All Wells)
Sequential Wells 2025 Wells 2028 Wells 2032 Wells
0.1 74.3 88.7 59.5 90.8 90.8 0.2 – 0.5 19.6 7.3 31.9 5.3 5.4 0.6 – 1.0 4.7 3.7 5.2 3.6 3.6 1.1 – 5.0 1.2 0.1 3.1 0.1 0.1 5.1 – 10 0.1 0.1 0.2 0.1 0.1
10.1 – 50 0.1 0.0 0.1 0.0 0.0 50.1 - 100 0.0 0.0 0.0 0.0 0.0
100+ 0.0 0.0 0.0 0.0 0.0 % Overlap Between
Well AOCs - Wet 18.0 1.9 35.9 0.0 0.0
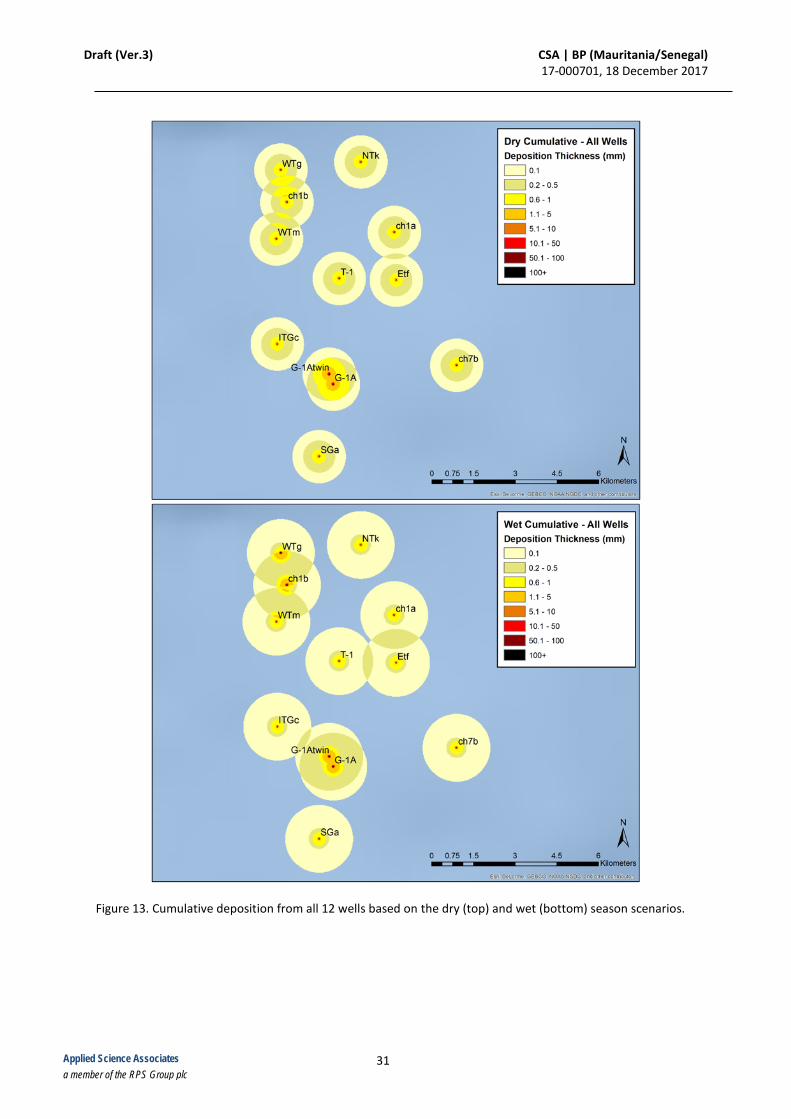
Draft (Ver.3) CSA | BP (Mauritania/Senegal) 17-000701, 18 December 2017
31 Applied Science Associates a member of the RPS Group plc
Figure 13. Cumulative deposition from all 12 wells based on the dry (top) and wet (bottom) season scenarios.
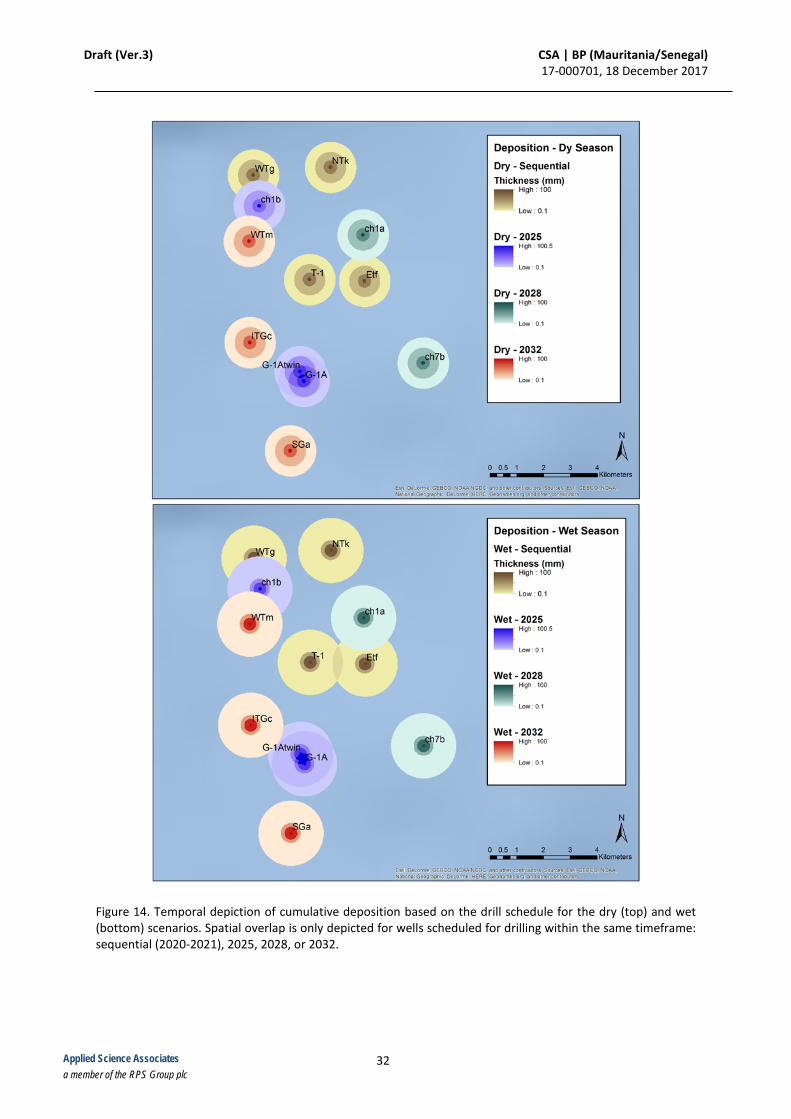
Draft (Ver.3) CSA | BP (Mauritania/Senegal) 17-000701, 18 December 2017
32 Applied Science Associates a member of the RPS Group plc
Figure 14. Temporal depiction of cumulative deposition based on the drill schedule for the dry (top) and wet (bottom) scenarios. Spatial overlap is only depicted for wells scheduled for drilling within the same timeframe: sequential (2020-2021), 2025, 2028, or 2032.
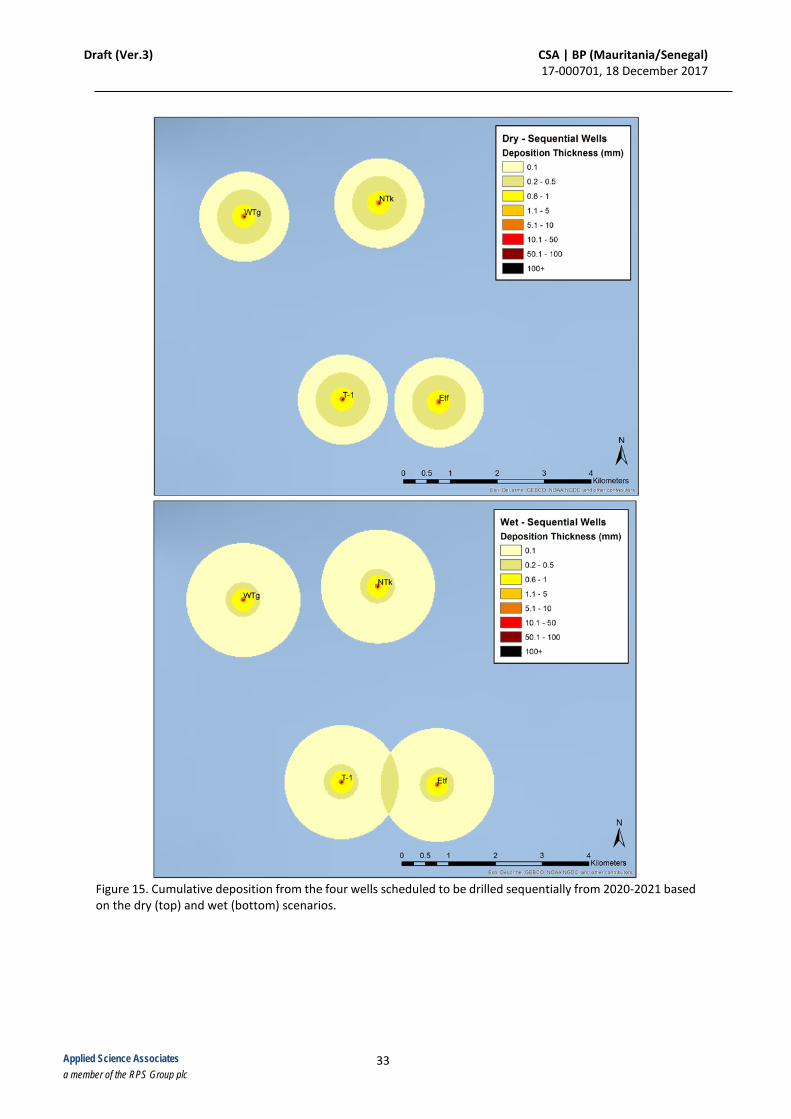
Draft (Ver.3) CSA | BP (Mauritania/Senegal) 17-000701, 18 December 2017
33 Applied Science Associates a member of the RPS Group plc
Figure 15. Cumulative deposition from the four wells scheduled to be drilled sequentially from 2020-2021 based on the dry (top) and wet (bottom) scenarios.
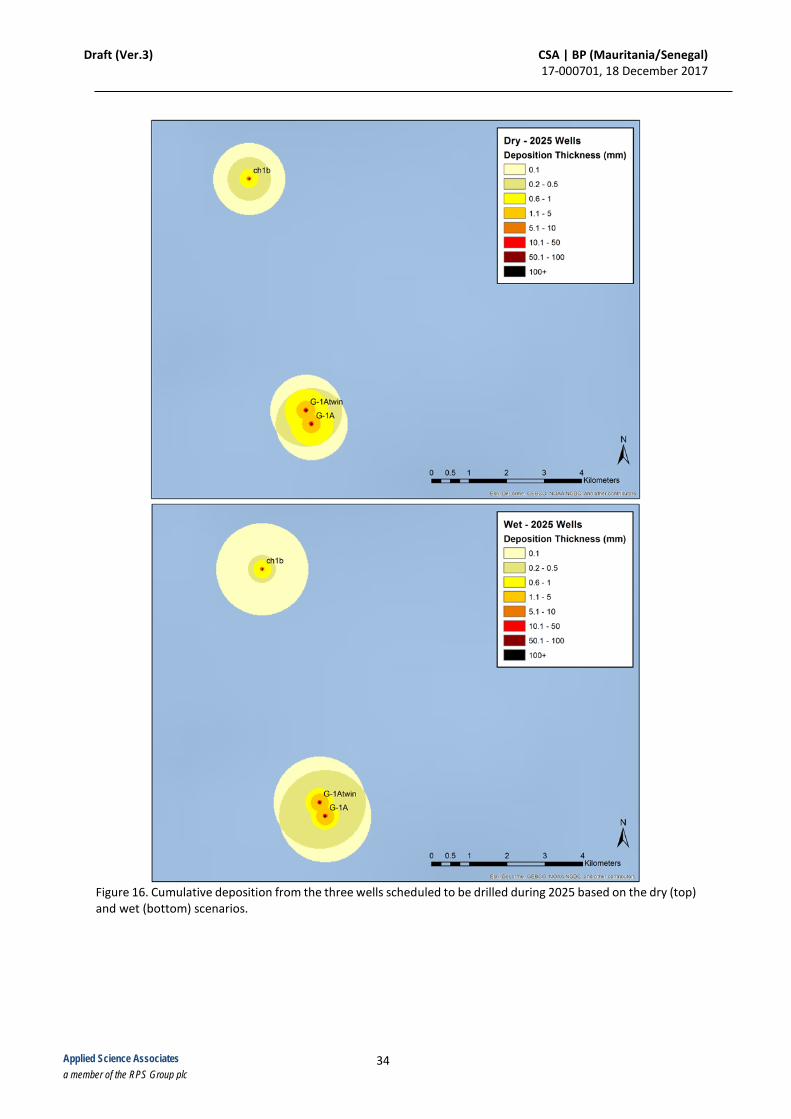
Draft (Ver.3) CSA | BP (Mauritania/Senegal) 17-000701, 18 December 2017
34 Applied Science Associates a member of the RPS Group plc
Figure 16. Cumulative deposition from the three wells scheduled to be drilled during 2025 based on the dry (top) and wet (bottom) scenarios.
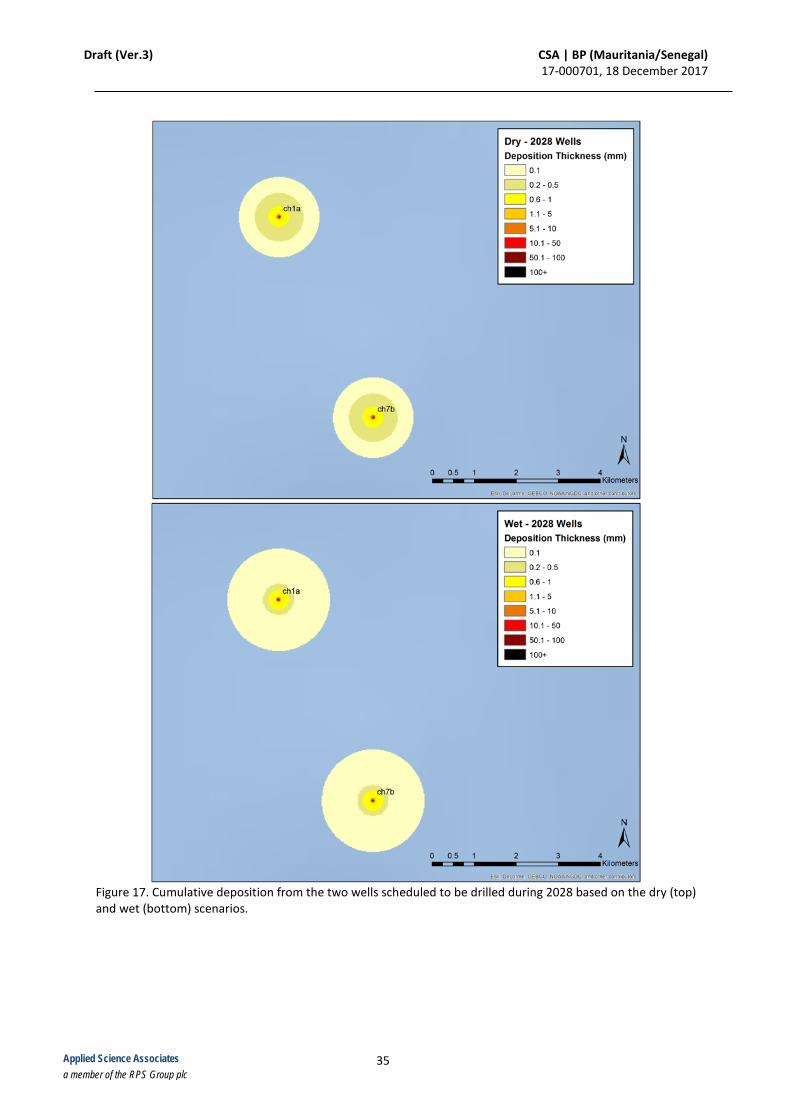
Draft (Ver.3) CSA | BP (Mauritania/Senegal) 17-000701, 18 December 2017
35 Applied Science Associates a member of the RPS Group plc
Figure 17. Cumulative deposition from the two wells scheduled to be drilled during 2028 based on the dry (top) and wet (bottom) scenarios.
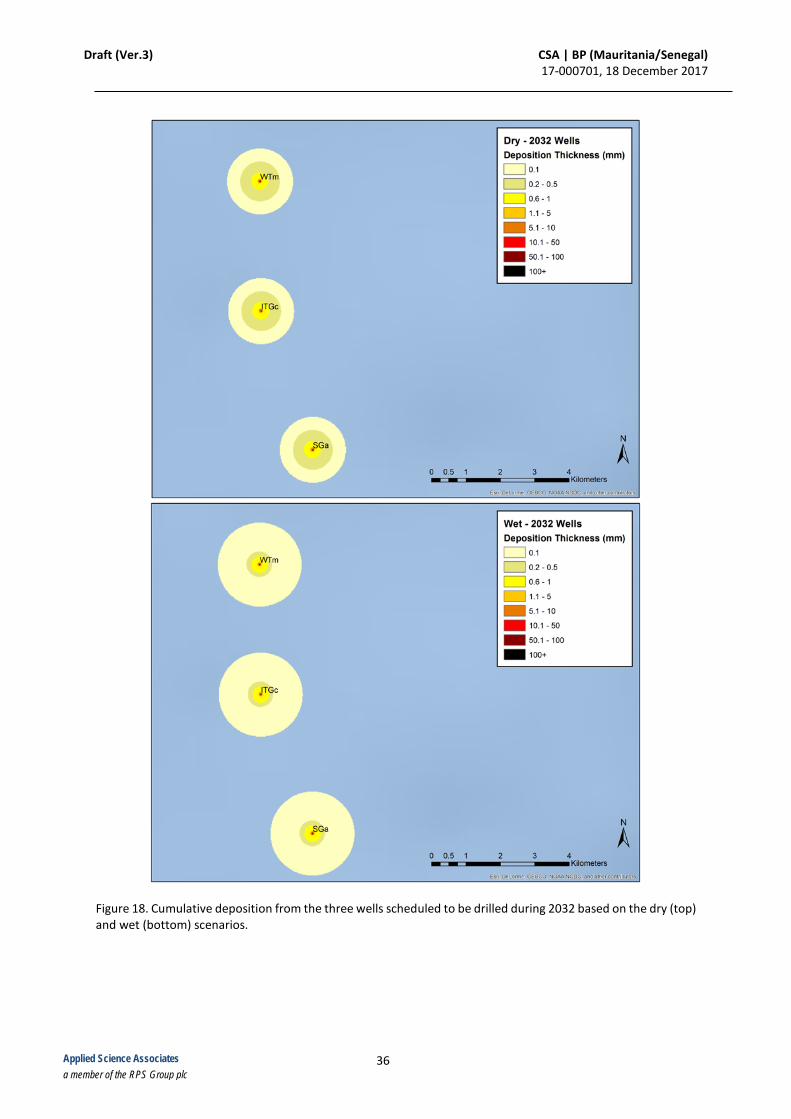
Draft (Ver.3) CSA | BP (Mauritania/Senegal) 17-000701, 18 December 2017
36 Applied Science Associates a member of the RPS Group plc
Figure 18. Cumulative deposition from the three wells scheduled to be drilled during 2032 based on the dry (top) and wet (bottom) scenarios.
Draft (Ver.3) CSA | BP (Mauritania/Senegal) 17-000701, 18 December 2017
37 Applied Science Associates a member of the RPS Group plc
4.5. Discussion of Results As can be seen from the figures in Section 4.4, the AOCs of maximum potential deposition varied somewhat between the dry and wet season scenarios. In the dry season, the maximum extent of the 0.1 mm deposition thickness threshold was smaller than during the wet season, suggesting a reduction in current transport of suspended sediment during the dry season. Thus, the maximum extent for all other thickness thresholds were larger during the dry season than during the wet season since the drilling discharges didn’t spread out as far. The maximum extent for the largest thickness thresholds (10 mm, 50 mm, and 100 mm) were identical for both dry and wet season scenarios (Table 10). In the cumulative maps depicting the spatiotemporal overlap of AOCs from all wells at once for each season (Figure 13), there is potential overlap between AOCs of 7 wells in the dry scenario and 9 wells in the wet scenario (Figure 13). This overlap between AOCs of different wells represents approximately 10% of the total AOC area in the dry scenario and 18% in the wet scenario. The vast majority of the AOC area is for deposition thicknesses < 1.0 mm in both seasonal scenarios (98.3% dry, 98.5% wet; Tables 11 and 12). Deposition thicknesses that may cause 5% mortality to benthic organisms (> 6.4 mm, or 5.1 – 50 mm in this analysis) comprised 0.3% of the cumulative AOC area for the dry scenario and 0.2% of the cumulative AOC area for the wet scenario, or approximately 0.09 km2 for both. Deposition thicknesses that may cause 50% mortality to benthic organisms (> 54 mm, or 50.1 – 100+ mm in this analysis) comprised < 0.01% of the cumulative AOC area or approximately 0.02 km2 for both season scenarios. In the temporal maps depicting different well configurations based on the drilling schedule, there is the potential for less accumulation in the overlapped AOCs assuming that the benthic communities can recover between drilling sessions (Figure 14). Note that this is a large assumption, considering that the drilling sessions are scheduled approximately 3-5 years apart and recovery times in the deep sea can potentially take many years. Of the four scheduled drilling sessions (sequential 2020-2021, 2025, 2028, and 2032), there is no spatiotemporal overlap between the AOCs of the wells scheduled to be drilled in 2028 (Figure 17) or in 2032 (Figure 18) for either seasonal scenario. For the sequential wells (Figure 15), there is 1.9% overlap in AOC area for the wet season only. The largest amount of spatiotemporal overlap occurred for the 2025 wells, with 28.7% overlap in AOC area during the dry season and 35.9% overlap during the wet season. This overlap lead to deposition thicknesses that may cause 5% mortality in 0.5% of the 2025 AOC for the dry scenario and 0.3% for the wet, or approximately 0.03 km2. Deposition thicknesses that may cause 50% mortality comprised 0.10% of the 2025 AOC for the dry scenario and 0.07% for the wet, or approximately 0.01 km2
Draft (Ver.3) CSA | BP (Mauritania/Senegal) 17-000701, 18 December 2017
38 Applied Science Associates a member of the RPS Group plc
References Brandsma, M.G., and Smith, J.P. (1999). Offshore Operators Committee mud and produced
water discharge model – report and user guide. Exxon Production Research Company, December 1999.
Chandrasekara, W.U., and C.L.J. Frid. (1998). A laboratory assessment of the survival and vertical movement of two epibenthic gastropod species, Hydrobia ulvae and Littorina littorea, after burial in sediment. Journal of Experimental Marine Biology and Ecology 221(2): 191-207.
CSA Ocean Sciences Inc. (CSA). (2017). Ahmeyim/Guembeul LNG Development, Environmental Baseline Survey Report. Report prepared for Kosmos Energy LLC, November 2017. 64 pp. + apps.
Cummings, J.A. and O. M. Smedstad. (2013). Variational Data Assimilation for the Global Ocean. Data Assimilation for Atmospheric, Oceanic and Hydrologic Applications vol II, chapter 13, 303-343.
Cummings, J.A. 2005. Operational multivariate ocean data assimilation. Quart. J. Royal Met. Soc., Part C, 131(613), 3583-3604.
Dames and Moore. (1978). Drilling fluid dispersion and biological effects study for the lower Cook inlet C.O.S.T. well." Report submitted to Atlantic Richfield Co. by Dames and Moore, Anchorage, AK. April 1978.
Ellis, J.I., G. Fraser, and J. Russell. (2012). Discharged drilling waste from oil and gas platforms and its effects on benthic communities. Marine Ecology Progress Series. Vol. 456: 285-302.
Fox, D.N., W.J. Teague, C.N. Barron, M.R. Carnes, and C.M. Lee. (2002). The Modular Ocean Data Assimilation System (MODAS). J. Atmos. Ocean. Technol., 19, 240-252.
Gates A.R., and D.O.B. Jones. (2012). Recovery of benthic megafauna from anthropogenic disturbance at a hydrocarbon drilling well (380 m depth in the Norwegian Sea). PLoS ONE, 7, e44114.
Gibbs, R.J., M.D. Matthews, and D.A. Link. (1971). The relationship between sphere size and settling velocity. Journal of Sedimentary Research, v. 41, 7-18.
Glover, A.G., and C.R. Smith. (2003). The deep-sea floor ecosystem: current status and prospects of anthropogenic change by the year 2025. Environmental Conservation 30, 219-241.
Hernández Arana, H.A., R.M. Warwick, M.J. Attrill, A.A. Rowden, and G. Gold-Bouchot. (2005).
Draft (Ver.3) CSA | BP (Mauritania/Senegal) 17-000701, 18 December 2017
39 Applied Science Associates a member of the RPS Group plc
Assessing the impact of oil-related activities on benthic macroinfauna assemblages of the Campeche shelf, southern Gulf of Mexico. Marine Ecology Progress Series. Vol. 289:89-107.
Hutchison, Z.L., V.J. Hendrick, M.T. Burrows, B. Wilson, and K.S. Last. (2016). Buried alive: the behavioural response of the mussels, Modiolus modiolus and Mytilus edulis to sudden burial by sediment. PLoS ONE 11(3): e0151471. doi: 10.1371/journal.pone.0151471.
Jimenez, M.P., R. Sanchez-Leal, C. Gonzalez, E. Garcia-Isarch, and A. Garcia. (2014).
Oceanographic scenario and fish larval distribution off Guinea-Bissau (north-west Africa). Journal of the Marine Biological Association of the United Kingdom, 1-18.
Kjeilen-Eilertsen, G., H. Trannum, R. Jak, M. Smit, J. Neff, and G. Durell. (2004). Literature report on burial: derivation of PNEC as component in the MEMW model tool. ERMS Report no. 9B. Report AM 2004/024. 25 pp.
Paine, M. D., E. M. DeBlois, B. M. Kilgour, E. Tracy, P. Pocklington, R. D. Crowley, U. P. Williams, G.G. Janes. (2014). Effects of the Terra Nova offshore oil development on benthic macro-invertebrates over 10 years of development drilling on the Grand Banks of Newfoundland, Canada. Deep Sea Res. II 110, 38–64.
Smit, M.G., K. I. Holthaus, H. C. Trannum, J. M. Neff, G. Kjeilen-Eilertsen, R. G. Jak, I. Singsaas, M.A. Huijbregts, and A.J. Hendriks. (2008). Species sensitivity distributions for suspended clays, sediment burial, and grain size change in the marine environment. Environmental Toxicology and Chemistry. 27(4):1006-12.
Southwest Research Institute. (2003). Drill cuttings fall velocity tests. Final Report submitted to the American Petroleum Institute. San Antonio, Texas. SwRI Project 18.06134.
Spaulding, M. L., T. Isaji, and E. Howlett. (1994). MUDMAP: A model to predict the transport and dispersion of drill muds and production water, Applied Science Associates, Inc, Narragansett, RI.
Trannum, H. C., A. Setvik, K. Norling, H. C. Nilsson. (2011). Rapid macrofaunal colonization of water- based drill cuttings on different sediments. Marine Pollution Bulletin 62, 2145-2156.
Wilber, D. H., W. Brostoff, D. G. Clarke, G. L. Ray. (2005). Sedimentation: potential biological effects of dredging operations in estuarine and marine environments. US Army Engineer Research and Development Center DOER-E. 15 pp.
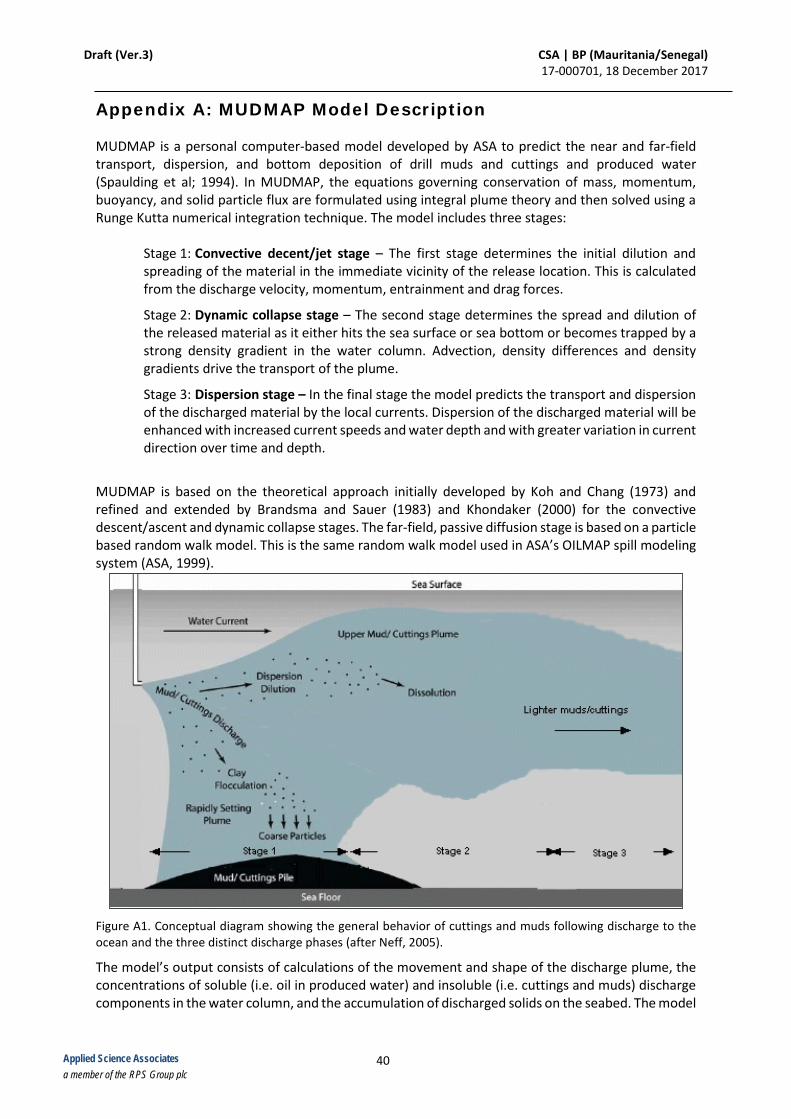
Draft (Ver.3) CSA | BP (Mauritania/Senegal) 17-000701, 18 December 2017
40 Applied Science Associates a member of the RPS Group plc
Appendix A: MUDMAP Model Description MUDMAP is a personal computer-based model developed by ASA to predict the near and far-field transport, dispersion, and bottom deposition of drill muds and cuttings and produced water (Spaulding et al; 1994). In MUDMAP, the equations governing conservation of mass, momentum, buoyancy, and solid particle flux are formulated using integral plume theory and then solved using a Runge Kutta numerical integration technique. The model includes three stages:
Stage 1: Convective decent/jet stage – The first stage determines the initial dilution and spreading of the material in the immediate vicinity of the release location. This is calculated from the discharge velocity, momentum, entrainment and drag forces.
Stage 2: Dynamic collapse stage – The second stage determines the spread and dilution of the released material as it either hits the sea surface or sea bottom or becomes trapped by a strong density gradient in the water column. Advection, density differences and density gradients drive the transport of the plume.
Stage 3: Dispersion stage – In the final stage the model predicts the transport and dispersion of the discharged material by the local currents. Dispersion of the discharged material will be enhanced with increased current speeds and water depth and with greater variation in current direction over time and depth.
MUDMAP is based on the theoretical approach initially developed by Koh and Chang (1973) and refined and extended by Brandsma and Sauer (1983) and Khondaker (2000) for the convective descent/ascent and dynamic collapse stages. The far-field, passive diffusion stage is based on a particle based random walk model. This is the same random walk model used in ASA’s OILMAP spill modeling system (ASA, 1999).
Figure A1. Conceptual diagram showing the general behavior of cuttings and muds following discharge to the ocean and the three distinct discharge phases (after Neff, 2005).
The model’s output consists of calculations of the movement and shape of the discharge plume, the concentrations of soluble (i.e. oil in produced water) and insoluble (i.e. cuttings and muds) discharge components in the water column, and the accumulation of discharged solids on the seabed. The model
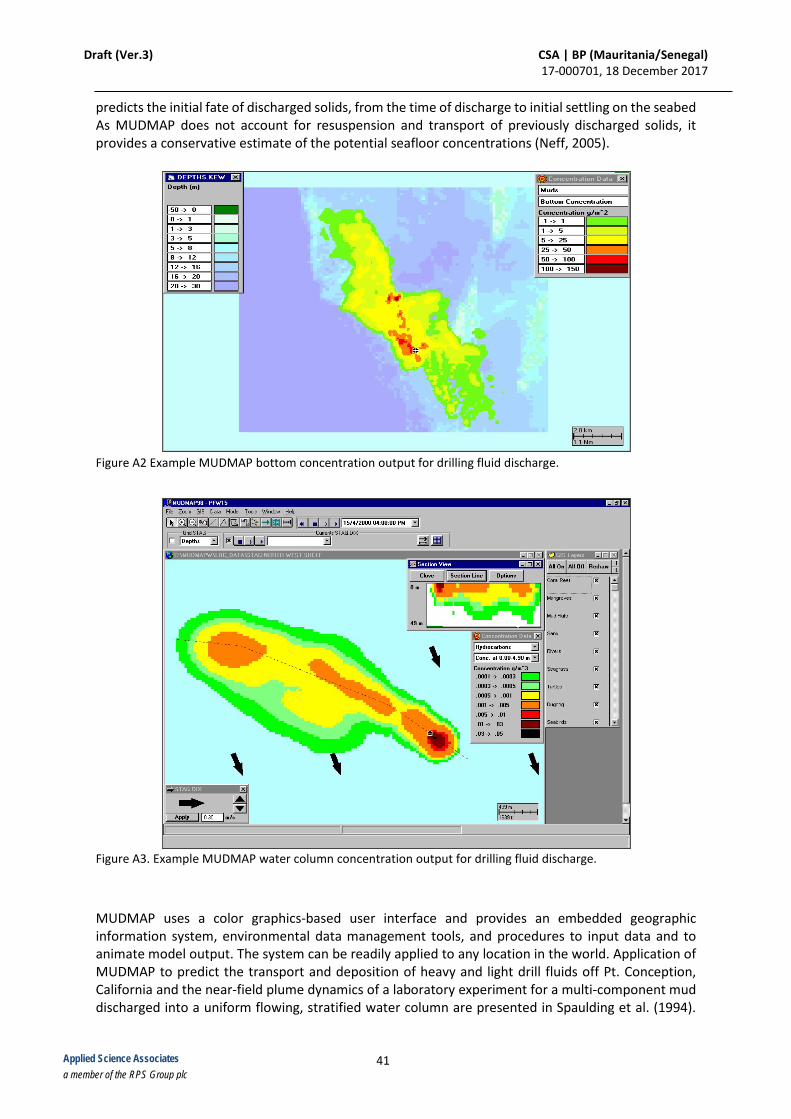
Draft (Ver.3) CSA | BP (Mauritania/Senegal) 17-000701, 18 December 2017
41 Applied Science Associates a member of the RPS Group plc
predicts the initial fate of discharged solids, from the time of discharge to initial settling on the seabed As MUDMAP does not account for resuspension and transport of previously discharged solids, it provides a conservative estimate of the potential seafloor concentrations (Neff, 2005).
Figure A2 Example MUDMAP bottom concentration output for drilling fluid discharge.
Figure A3. Example MUDMAP water column concentration output for drilling fluid discharge.
MUDMAP uses a color graphics-based user interface and provides an embedded geographic information system, environmental data management tools, and procedures to input data and to animate model output. The system can be readily applied to any location in the world. Application of MUDMAP to predict the transport and deposition of heavy and light drill fluids off Pt. Conception, California and the near-field plume dynamics of a laboratory experiment for a multi-component mud discharged into a uniform flowing, stratified water column are presented in Spaulding et al. (1994).

Draft (Ver.3) CSA | BP (Mauritania/Senegal) 17-000701, 18 December 2017
42 Applied Science Associates a member of the RPS Group plc
King and McAllister (1997, 1998) present the application and extensive verification of the model for a produced water discharge on Australia’s northwest shelf. GEMS (1998) applied the model to assess the dispersion and deposition of drilling cuttings released off the northwest coast of Australia.
Draft (Ver.3) CSA | BP (Mauritania/Senegal) 17-000701, 18 December 2017
43 Applied Science Associates a member of the RPS Group plc
MUDMAP References Applied Science Associates, Inc. (ASA). 1999. OILMAP technical and user’s manual, Applied
Science Associates, Inc., Narragansett, RI.
Brandsma, M.G., and T.C. Sauer, Jr. 1983. The OOC model: prediction of short term fate of drilling mud in the ocean, Part I model description and Part II model results. Proceedings of Workshop on an Evaluation of Effluent Dispersion and Fate Models for OCS Platforms, Santa Barbara, California.
GEMS - Global Environmental Modeling Services. 1998. Quantitative assessment of the dispersion and seabed depositions of drill cutting discharges from Lameroo-1 AC/P16, prepared for Woodside Offshore Petroleum. Prepared by Global Environmental Modeling Services, Australia, June 16, 1998.
King, B., and F.A. McAllister. 1997. Modeling the dispersion of produced water discharge in Australia, Volume I and II. Australian Institute of Marine Science report to the APPEA and ERDC.
King, B., and F.A. McAllister. 1998. Modeling the dispersion of produced water discharges. APPEA Journal 1998, pp. 681-691.
Koh, R.C.Y., and Y.C. Chang. 1973. Mathematical model for barged ocean disposal of waste. Environmental Protection Technology Series EPA 660/2-73-029, U.S. Army Engineer Waterways Experiment Station, Vicksburg, Mississippi.
Khondaker, A.N. 2000. Modeling the fate of drilling waste in marine environment – an overview. Journal of Computers and Geosciences Vol. 26, pp. 531-540.
Neff, J. 2005. Composition, environment fates, and biological effect of water based drilling muds and cuttings discharged to the marine environment: A synthesis and annotated bibliography. Report prepared for Petroleum Environment Research Forum and American Petroleum Institute.
Spaulding, M.L., T. Isaji, and E. Howlett. 1994. MUDMAP: A model to predict the transport and dispersion of drill muds and production water, Applied Science Associates, Inc, Narragansett, RI.
ESIA FOR THE GREATER TORTUE/AHMEYIM PHASE 1 GAS PRODUCTION PROJECT
Ref. No.: 1653939
APPENDIX M : PLANKTON ENTRAINMENT MODELING REPORT
Plankton Entrainment Modeling Report
DOCUMENT NO. CSA-GOLDER-KOSMOS-FL-18-80098-3086-01-REP-03
VERSION DATE DESCRIPTION PREPARED BY: REVIEWED BY: APPROVED BY:
03 02/06/18 Revised D. Snyder
B. Balcom B. Balcom
04 03/28/18 Revised D. Snyder B. Douglas
B. Balcom B. Balcom
05 05/18/18 Revised D. Snyder B. Balcom D. Snyder B. Balcom
The electronic PDF version of this document is the Controlled Master Copy at all times. A printed copy is considered to be uncontrolled and it is the holder’s responsibility to ensure that they have the current revision. Controlled copies are available on the Management System network site or on request from the Document Production team.
Plankton Entrainment Modeling Report iii
Table of Contents
Page
1.0 Introduction .................................................................................................................................. 1 2.0 Objectives .................................................................................................................................... 1 3.0 Methods ....................................................................................................................................... 2
3.1 Task 1 – Source Water Calculations ....................................................................................... 2 3.2 Task 2 – Plankton Sampling ................................................................................................... 5 3.3 Task 3 – Estimate Species-Specific Proportional Entrainment and Proportional Mortality .... 6
4.0 Results ........................................................................................................................................ 7 4.1 Ichthyoplankton Composition and Densities ........................................................................... 7 4.2 Zooplankton Composition and Densities .............................................................................. 13 4.3 Entrainment Rates ................................................................................................................ 15
4.3.1 Ichthyoplankton ............................................................................................................. 15 4.4 Proportional Mortality ............................................................................................................ 17
5.0 Discussion ................................................................................................................................. 18 6.0 Summary ................................................................................................................................... 19 7.0 Literature Cited .......................................................................................................................... 21
Plankton Entrainment Modeling Report iv
List of Tables
Table Page
Table 1. Phylogenetic listing of fish larvae collected in plankton samples during Winter 2016 (n=12) and Summer 2017 (n=10) at the Nearshore Hub/Terminal Area. ..................... 8
Table 2. Means and standard deviations (SD) for total fish larvae and egg densities (n 100 m-3) collected at the Nearshore Hub/Terminal Area during Winter 2016 and Summer 2017 surveys. Samples (n=3) were collected in each combination of day/night and upper and lower strata in the water column. ............................................................... 11
Table 3. Results of two-way analysis of variance for the effects of time (day/night) and depth (water column strata) on density of fish larvae and eggs collected at the Nearshore Hub/Terminal Area in Winter (2016) and Summer (2017). Df=degrees of freedom, MS=Mean Square, F=Fisher’s ratio (MS/Residual). Significant results (p<0.05) are in bold. ............................................................................................................................ 11
Table 4. Mean densities (individuals m-3) of major zooplankton groups in samples collected at the Nearshore Hub/Terminal during Winter 2016 and Summer 2017 surveys, listed in alphabetical order........................................................................................................ 14
Table 5. Means and standard deviations (SD) for total zooplankton densities (individuals m-3) collected at the Nearshore Hub/Terminal, Mid-Depth, and Offshore Areas during Winter 2016 and Summer 2017 surveys..................................................................... 15
Table 6. Results of two-way analysis of variance for density of zooplankton (individuals m-3) collected at the Nearshore Hub/Terminal during the Summer 2017 survey. Df=Degrees of Freedom, MS=Mean Square, F=F (Fisher’s) ratio (MS/Residual). Significant results are in bold. ..................................................................................... 15
Table 7. Estimated ichthyoplankton entrainment for the 10 most abundant taxa collected in the upper 0 to 10 m of the water column from the Nearshore Hub/Terminal Area during Winter 2016 and Summer 2017 surveys. R=Rank order of abundance. .................... 16
Table 8. Estimated ichthyoplankton entrainment for the 10 most abundant taxa collected in the lower 10 to 20 m of the water column from the Nearshore Hub/Terminal Area during Winter 2016 and Summer 2017 surveys. R=Rank order of abundance. .................... 17
Table 9. Proportional mortality (PM) estimates for larvae of selected fish taxa. ....................... 18
Plankton Entrainment Modeling Report v
List of Figures
Figure Page
Figure 1. Canary Current regional surface current velocities estimated from the Global Drifter Program. The project area is located offshore along 16° N Latitude, denoted by a red oval. Upper panel = winter; lower panel = summer. ..................................................... 3
Figure 2. Source water area identified for the proposed nearshore LNG facility. ........................ 5 Figure 3. Total length measurements for fish larvae (exclusive of eels) collected from the
Nearshore Area during Winter 2016, by depth stratum. ............................................. 12 Figure 4. Total length measurements for fish larvae collected from the Nearshore Area during
Summer 2017, by depth stratum. ................................................................................ 13
Plankton Entrainment Modeling Report 1
1.0 Introduction
The proposed Ahmeyim/Guembeul (A/G) LNG project, as detailed in ESIA Section 2, seeks to transport natural gas extracted from wells located approximately 125 km offshore via pipeline to a floating, production, storage and offloading (FPSO) vessel for processing. Processed gas will be transported by pipeline to a Nearshore Hub/Terminal facility located offshore along the Mauritania-Senegal maritime border. At the Nearshore Hub/Terminal, the natural gas will be liquefied by a specialized liquefied natural gas processing vessel (FLNG) for storage and periodic transfer to LNG carriers destined for transport to foreign markets. The liquefaction of gas will require a considerable volume of seawater to be withdrawn from the area surrounding the Nearshore Hub/Terminal facility. This report provides a preliminary assessment of the potential environmental impact of seawater extraction on planktonic organisms contained within that volume of water that are unable to escape or avoid being entrained.
The proposed project is expected to liquefy about 16,000 m3 of gas per day (Golar LNG, 2017). The overall process will require up to 54,000 m3 of seawater per hour including 38,000 m3 for liquefaction; 12,500 m3 to cool condensers; and about 3,000 m3 to cool engine rooms. Thus, the total daily volume of seawater intake is 1.296 million m3. This water will be drawn in through sea chests (large tanks) within the hull of the FLNG.
Such large volumes of water will contain an abundance of plankton that may be entrained (drawn into) the system with the water. Assuming that all of the entrained planktonic organisms die, there is concern regarding the long-term, population level effects of removing large numbers of plankton (including egg and larval stages of fishes and invertebrates) from multiple fish and invertebrate species residing in local waters.
Zooplankton may be broadly divided into holoplankters and meroplankters. Holoplankters are organisms that spend their entire lives in the pelagic realm, whereas meroplankters are the early life stages of invertebrates that only spend a short portion of their lives in the plankton. Impact analyses of water intakes generally focus on fish eggs and larvae (ichthyoplankton) but also consider effects on larvae of invertebrates such as crabs, shrimps, and mollusks. Several of these taxa are economically important to artisanal or industrial fisheries.
2.0 Objectives
A common approach used to assess impacts of entrainment is to estimate densities of planktonic organisms (fish eggs and larvae) from samples collected near or within the intake stream to ascertain entrainment losses. These site-specific entrainment values are compared with overall and species-specific abundance estimated for a larger parcel of water potentially subject to entrainment. This parcel is known as the source water. From the ratio of entrainment losses to source, population impacts can be translated into a proportional mortality (or survival) of the local populations. This approach, generally referred to as the empirical transport model (ETM), was originally developed to assess impacts of water intakes by riverine power plants on early life stages of fishes (Boreman et al., 1978, 1981). This original formulation requires extensive data on life history and size classes of focal species not usually available for coastal marine assemblages.
Recognizing this, MacCall et al. (1983) developed a simplified version of the ETM that has been used extensively (e.g., off California) to assess entrainment impacts on larval fishes and invertebrates by coastal power plants and desalination operations (e.g., Raimondi, 2016; Steinbeck et al., 2007). However, even the simplified approach involves sampling water intakes in existing facilities. The ETM has also been used by applicants and approved by regulators to evaluate proposed facilities such as LNG operations that require large volumes of seawater (e.g., Entrix, Inc., 2007). For the A/G LNG project, proposed facility location and intake volume estimates have been developed, and plankton samples have been collected in the project area.
The tasks (objectives) of this exercise are as follows:
Task 1: Identify the source water body and calculate its total volume;
Task 2: Gather data on species-specific densities of fish larvae and total densities of fish eggs and major zooplanktonic groups from the project area; and
Plankton Entrainment Modeling Report 2
Task 3: Use data as input into the model to estimate species-specific proportional entrainment and proportional mortalities.
3.0 Methods
3.1 Task 1 – Source Water Calculations
The source water body was calculated as a cylinder of water centered at the proposed intake (i.e., FLNG berthed at the Nearshore Hub/Terminal). The radius of the cylinder was provided by ambient current flow that could transport a parcel of water from the outer edge of the cylinder to the intake in 1 day (24 h). The volume of this cylinder was defined as all the water on the shelf within the cylinder from surface to seafloor. As there was no direct, site-specific measurement of currents for the proposed project area at the time of the study, the available scientific literature was searched to obtain an estimate of current velocity for the region.
The project area is embedded within the Canary Current Upwelling system (Auger et al., 2016; Menna et al., 2016) which extends from Cape Blanc, Mauritania to Cape Vert, Senegal. Oceanographers have partitioned the region into discrete north-south sub-units when describing circulation, sea surface temperature, and upwelling during a typical year (e.g., Auger et al., 2016; Arkhipov, 2009; John and Zelck, 1997; Hamann et al., 1981). The sub-unit encompassing the project area is bounded on the north and south by 18 N° Latitude and 15 N° Latitude, respectively. The western boundary is located, approximately, along the 2,000 m isobath; the eastern boundary is the southern Mauritania and northern Senegal shoreline. This sub-unit has been called the Mauritanian Bight or Senegalo-Mauritania section (Auger et al., 2016).
Circulation patterns within the Senegalo-Mauritania area vary between winter (December to May) and summer (June to October); circulation is largely wind driven and not directly influenced by upwelling that occurs offshore and to the north (Menna et al., 2016). In winter, water temperatures drop below 24°̊C, with predominant current flows to the south or southwest (but see below). In summer, water temperatures increase to >24°C, and currents tend to flow northward along the coast. The current speeds are not well known but have been estimated to range from 10 to 40 cm sec-1 based on a prediction of average surface currents for the region available from the Global Drifter Program (GDP; University of Miami, 2017).
Methods used for the extrapolation of drifter data to larger regions is described in detail by Lumpkin and Johnson (2013) and Laurindo et al. (2017). For the periods coinciding with the plankton sampling periods (Winter 2016 and Summer 2017), the GDP showed that currents in the project area were northerly during both Winter and Summer at about 20 cm sec-1 (Figure 1).

Plankton Entrainment Modeling Report 3
(Source: University of Miami, 2017)
Figure 1. Canary Current regional surface current velocities estimated from the Global Drifter Program. The project area is located offshore along 16° N Latitude, denoted by a red oval. Upper panel = winter; lower panel = summer.

Plankton Entrainment Modeling Report 4
Assuming the current could vary its direction, a passively transported plankter (i.e., an individual plankton specimen) could come from as far as away as 17.3 km south, west, or north of the intake on any given day. To the east, the distance from the proposed intake would be interrupted by the shoreline.
The source water parcel was delineated with those dimensions and the shoreline (Figure 2). The area was rasterized in ArcGiS as a layer representing the sea surface. Next, bathymetry data were input from the Marine Geoscience Data System (Marine Geoscience Data System, 2017; Ryan et al., 2009) and a second raster layer under the polygon was formed, representing the seabed. Volume was derived by comparing the two raster surfaces and calculating the volume between them. The calculated volume of this semi-circular area depicted in Figure 2 was 33.632 × 10⁹ m3.
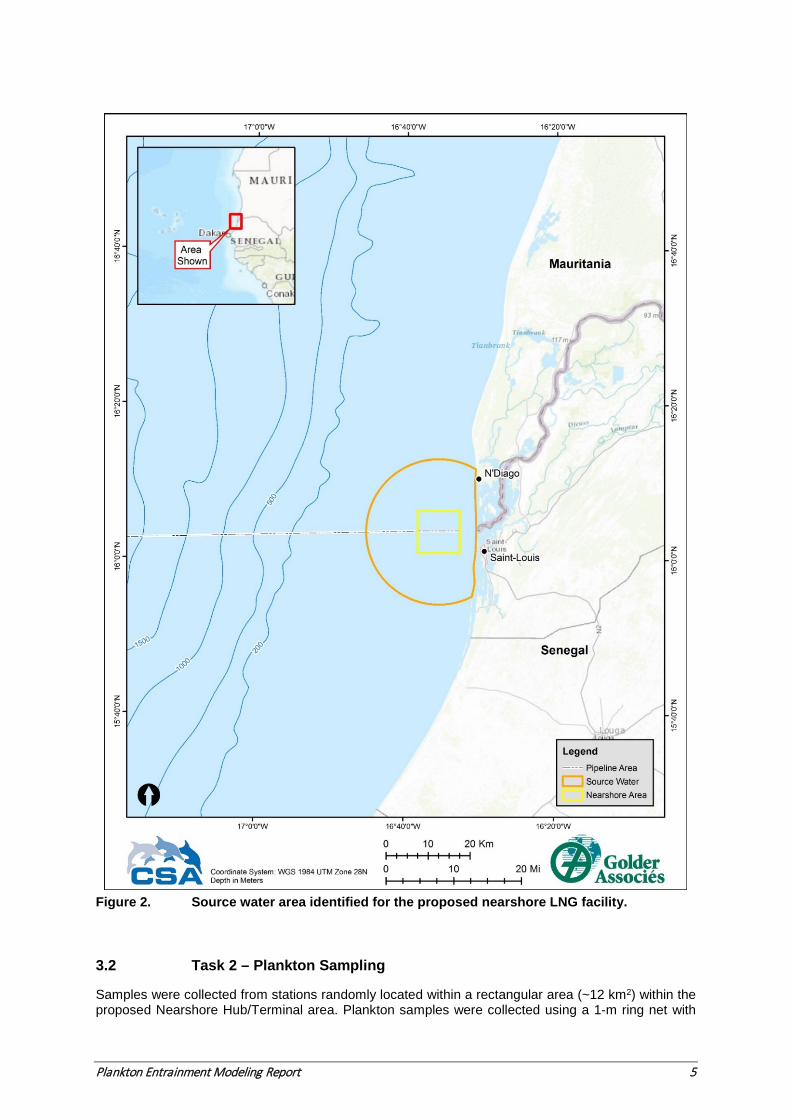
Plankton Entrainment Modeling Report 5
Figure 2. Source water area identified for the proposed nearshore LNG facility.
3.2 Task 2 – Plankton Sampling
Samples were collected from stations randomly located within a rectangular area (~12 km2) within the proposed Nearshore Hub/Terminal area. Plankton samples were collected using a 1-m ring net with
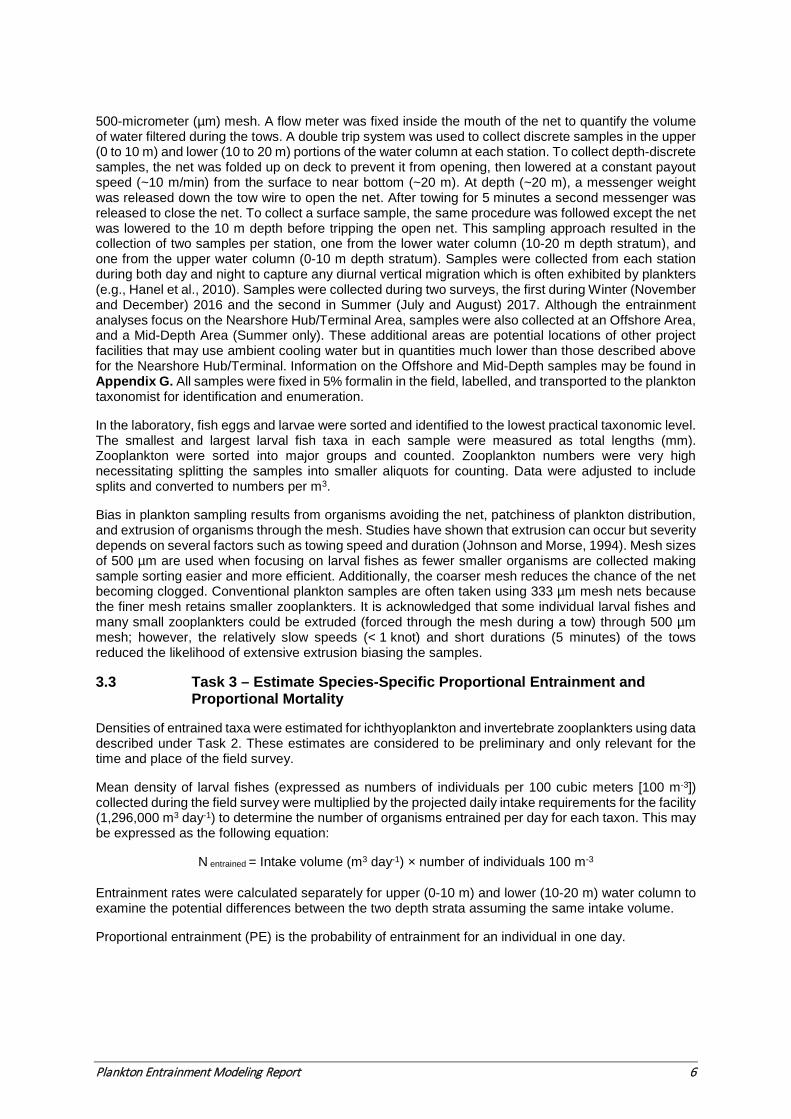
Plankton Entrainment Modeling Report 6
500-micrometer (µm) mesh. A flow meter was fixed inside the mouth of the net to quantify the volume of water filtered during the tows. A double trip system was used to collect discrete samples in the upper (0 to 10 m) and lower (10 to 20 m) portions of the water column at each station. To collect depth-discrete samples, the net was folded up on deck to prevent it from opening, then lowered at a constant payout speed (~10 m/min) from the surface to near bottom (~20 m). At depth (~20 m), a messenger weight was released down the tow wire to open the net. After towing for 5 minutes a second messenger was released to close the net. To collect a surface sample, the same procedure was followed except the net was lowered to the 10 m depth before tripping the open net. This sampling approach resulted in the collection of two samples per station, one from the lower water column (10-20 m depth stratum), and one from the upper water column (0-10 m depth stratum). Samples were collected from each station during both day and night to capture any diurnal vertical migration which is often exhibited by plankters (e.g., Hanel et al., 2010). Samples were collected during two surveys, the first during Winter (November and December) 2016 and the second in Summer (July and August) 2017. Although the entrainment analyses focus on the Nearshore Hub/Terminal Area, samples were also collected at an Offshore Area, and a Mid-Depth Area (Summer only). These additional areas are potential locations of other project facilities that may use ambient cooling water but in quantities much lower than those described above for the Nearshore Hub/Terminal. Information on the Offshore and Mid-Depth samples may be found in Appendix G. All samples were fixed in 5% formalin in the field, labelled, and transported to the plankton taxonomist for identification and enumeration.
In the laboratory, fish eggs and larvae were sorted and identified to the lowest practical taxonomic level. The smallest and largest larval fish taxa in each sample were measured as total lengths (mm). Zooplankton were sorted into major groups and counted. Zooplankton numbers were very high necessitating splitting the samples into smaller aliquots for counting. Data were adjusted to include splits and converted to numbers per m3.
Bias in plankton sampling results from organisms avoiding the net, patchiness of plankton distribution, and extrusion of organisms through the mesh. Studies have shown that extrusion can occur but severity depends on several factors such as towing speed and duration (Johnson and Morse, 1994). Mesh sizes of 500 µm are used when focusing on larval fishes as fewer smaller organisms are collected making sample sorting easier and more efficient. Additionally, the coarser mesh reduces the chance of the net becoming clogged. Conventional plankton samples are often taken using 333 µm mesh nets because the finer mesh retains smaller zooplankters. It is acknowledged that some individual larval fishes and many small zooplankters could be extruded (forced through the mesh during a tow) through 500 µm mesh; however, the relatively slow speeds (< 1 knot) and short durations (5 minutes) of the tows reduced the likelihood of extensive extrusion biasing the samples.
3.3 Task 3 – Estimate Species-Specific Proportional Entrainment and Proportional Mortality
Densities of entrained taxa were estimated for ichthyoplankton and invertebrate zooplankters using data described under Task 2. These estimates are considered to be preliminary and only relevant for the time and place of the field survey.
Mean density of larval fishes (expressed as numbers of individuals per 100 cubic meters [100 m-3]) collected during the field survey were multiplied by the projected daily intake requirements for the facility (1,296,000 m3 day-1) to determine the number of organisms entrained per day for each taxon. This may be expressed as the following equation:
N entrained = Intake volume (m3 day-1) × number of individuals 100 m-3
Entrainment rates were calculated separately for upper (0-10 m) and lower (10-20 m) water column to examine the potential differences between the two depth strata assuming the same intake volume.
Proportional entrainment (PE) is the probability of entrainment for an individual in one day.
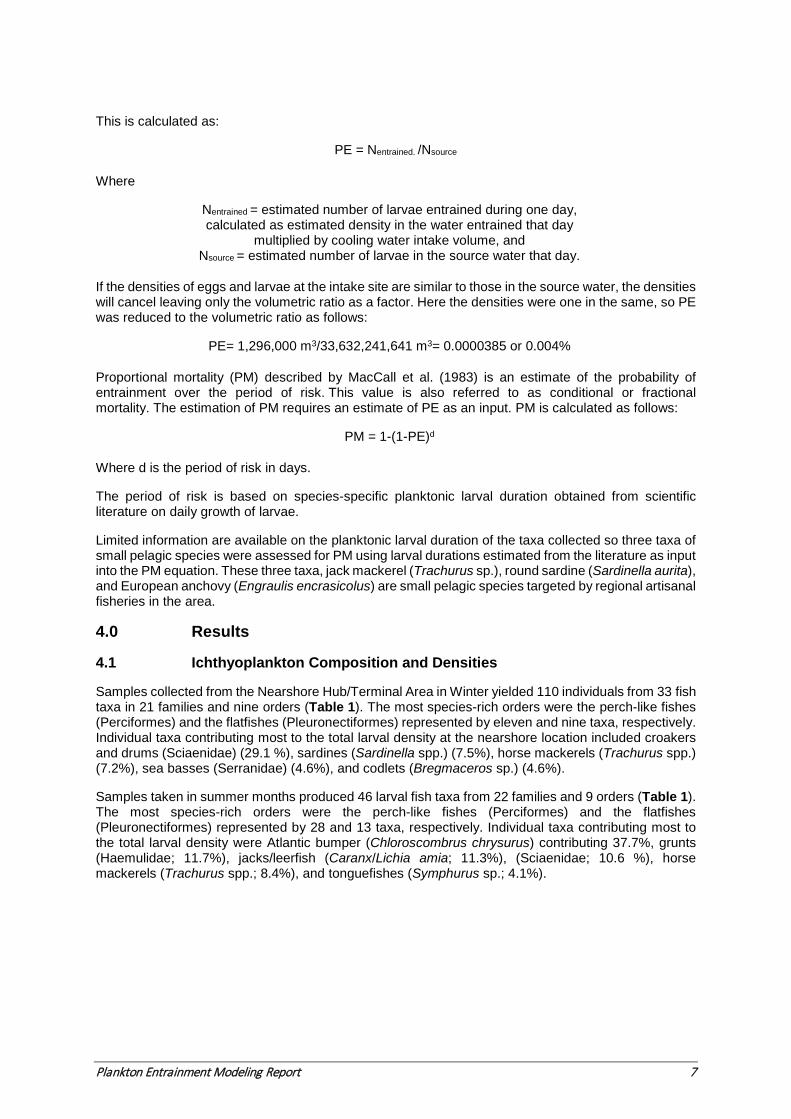
Plankton Entrainment Modeling Report 7
This is calculated as:
PE = Nentrained. /Nsource
Where
Nentrained = estimated number of larvae entrained during one day, calculated as estimated density in the water entrained that day
multiplied by cooling water intake volume, and Nsource = estimated number of larvae in the source water that day.
If the densities of eggs and larvae at the intake site are similar to those in the source water, the densities will cancel leaving only the volumetric ratio as a factor. Here the densities were one in the same, so PE was reduced to the volumetric ratio as follows:
PE= 1,296,000 m3/33,632,241,641 m3= 0.0000385 or 0.004%
Proportional mortality (PM) described by MacCall et al. (1983) is an estimate of the probability of entrainment over the period of risk. This value is also referred to as conditional or fractional mortality. The estimation of PM requires an estimate of PE as an input. PM is calculated as follows:
PM = 1-(1-PE)d
Where d is the period of risk in days.
The period of risk is based on species-specific planktonic larval duration obtained from scientific literature on daily growth of larvae.
Limited information are available on the planktonic larval duration of the taxa collected so three taxa of small pelagic species were assessed for PM using larval durations estimated from the literature as input into the PM equation. These three taxa, jack mackerel (Trachurus sp.), round sardine (Sardinella aurita), and European anchovy (Engraulis encrasicolus) are small pelagic species targeted by regional artisanal fisheries in the area.
4.0 Results
4.1 Ichthyoplankton Composition and Densities
Samples collected from the Nearshore Hub/Terminal Area in Winter yielded 110 individuals from 33 fish taxa in 21 families and nine orders (Table 1). The most species-rich orders were the perch-like fishes (Perciformes) and the flatfishes (Pleuronectiformes) represented by eleven and nine taxa, respectively. Individual taxa contributing most to the total larval density at the nearshore location included croakers and drums (Sciaenidae) (29.1 %), sardines (Sardinella spp.) (7.5%), horse mackerels (Trachurus spp.) (7.2%), sea basses (Serranidae) (4.6%), and codlets (Bregmaceros sp.) (4.6%).
Samples taken in summer months produced 46 larval fish taxa from 22 families and 9 orders (Table 1). The most species-rich orders were the perch-like fishes (Perciformes) and the flatfishes (Pleuronectiformes) represented by 28 and 13 taxa, respectively. Individual taxa contributing most to the total larval density were Atlantic bumper (Chloroscombrus chrysurus) contributing 37.7%, grunts (Haemulidae; 11.7%), jacks/leerfish (Caranx/Lichia amia; 11.3%), (Sciaenidae; 10.6 %), horse mackerels (Trachurus spp.; 8.4%), and tonguefishes (Symphurus sp.; 4.1%).
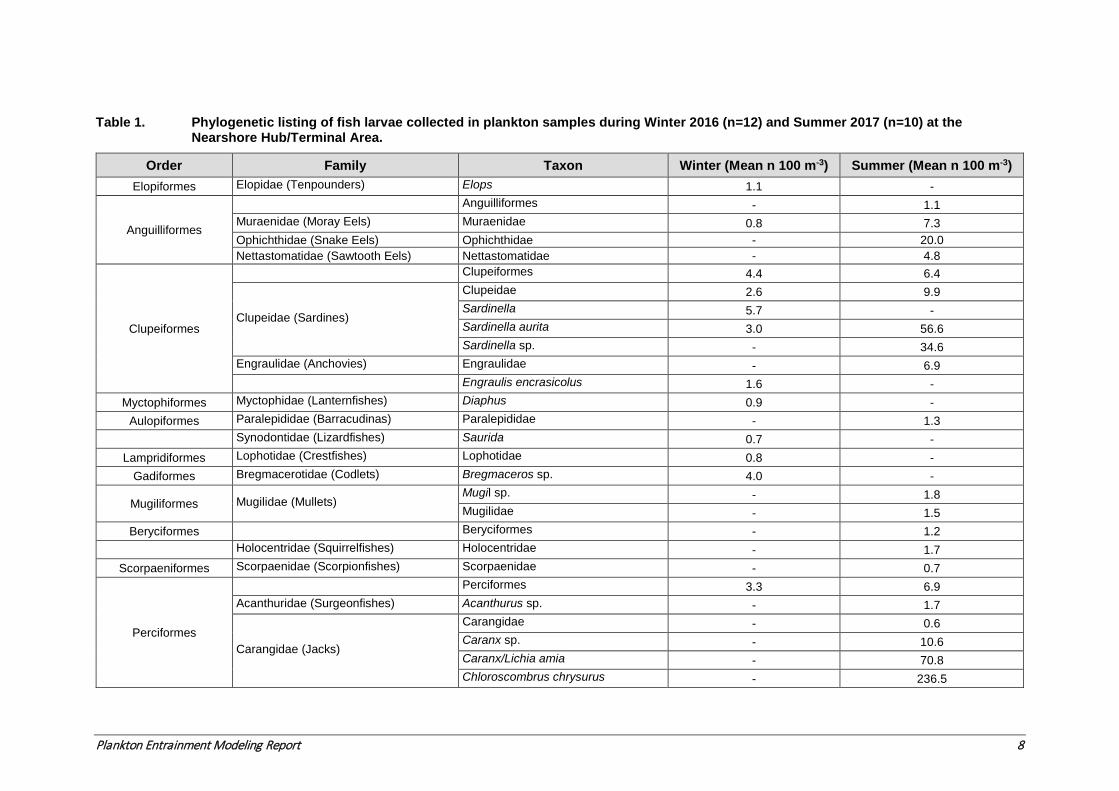
Plankton Entrainment Modeling Report 8
Table 1. Phylogenetic listing of fish larvae collected in plankton samples during Winter 2016 (n=12) and Summer 2017 (n=10) at the Nearshore Hub/Terminal Area.
Order Family Taxon Winter (Mean n 100 m-3) Summer (Mean n 100 m-3) Elopiformes Elopidae (Tenpounders) Elops 1.1 -
Anguilliformes
Anguilliformes - 1.1 Muraenidae (Moray Eels) Muraenidae 0.8 7.3 Ophichthidae (Snake Eels) Ophichthidae - 20.0 Nettastomatidae (Sawtooth Eels) Nettastomatidae - 4.8
Clupeiformes
Clupeiformes 4.4 6.4
Clupeidae (Sardines)
Clupeidae 2.6 9.9 Sardinella 5.7 - Sardinella aurita 3.0 56.6 Sardinella sp. - 34.6
Engraulidae (Anchovies) Engraulidae - 6.9 Engraulis encrasicolus 1.6 -
Myctophiformes Myctophidae (Lanternfishes) Diaphus 0.9 - Aulopiformes Paralepididae (Barracudinas) Paralepididae - 1.3
Synodontidae (Lizardfishes) Saurida 0.7 - Lampridiformes Lophotidae (Crestfishes) Lophotidae 0.8 -
Gadiformes Bregmacerotidae (Codlets) Bregmaceros sp. 4.0 -
Mugiliformes Mugilidae (Mullets) Mugil sp. - 1.8 Mugilidae - 1.5
Beryciformes Beryciformes - 1.2 Holocentridae (Squirrelfishes) Holocentridae - 1.7
Scorpaeniformes Scorpaenidae (Scorpionfishes) Scorpaenidae - 0.7
Perciformes
Perciformes 3.3 6.9 Acanthuridae (Surgeonfishes) Acanthurus sp. - 1.7
Carangidae (Jacks)
Carangidae - 0.6 Caranx sp. - 10.6 Caranx/Lichia amia - 70.8 Chloroscombrus chrysurus - 236.5
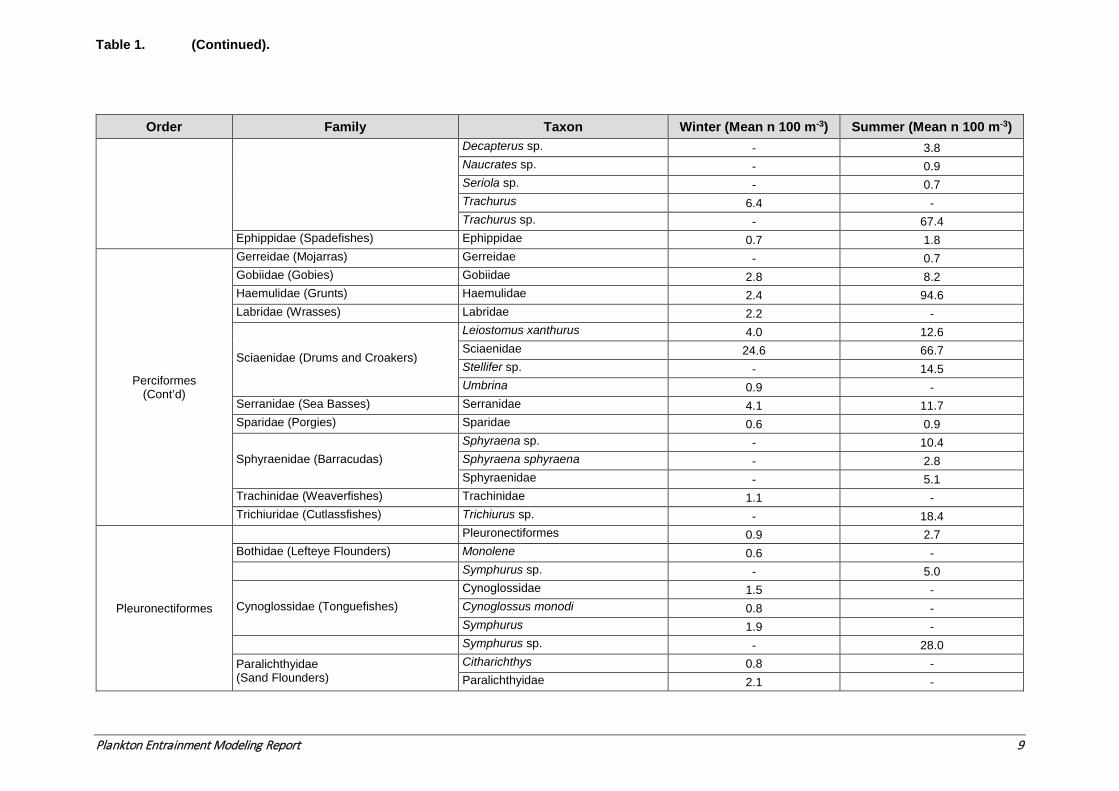
Table 1. (Continued).
Plankton Entrainment Modeling Report 9
Order Family Taxon Winter (Mean n 100 m-3) Summer (Mean n 100 m-3) Decapterus sp. - 3.8 Naucrates sp. - 0.9 Seriola sp. - 0.7 Trachurus 6.4 - Trachurus sp. - 67.4
Ephippidae (Spadefishes) Ephippidae 0.7 1.8
Perciformes (Cont’d)
Gerreidae (Mojarras) Gerreidae - 0.7 Gobiidae (Gobies) Gobiidae 2.8 8.2 Haemulidae (Grunts) Haemulidae 2.4 94.6 Labridae (Wrasses) Labridae 2.2 -
Sciaenidae (Drums and Croakers)
Leiostomus xanthurus 4.0 12.6 Sciaenidae 24.6 66.7 Stellifer sp. - 14.5 Umbrina 0.9 -
Serranidae (Sea Basses) Serranidae 4.1 11.7 Sparidae (Porgies) Sparidae 0.6 0.9
Sphyraenidae (Barracudas) Sphyraena sp. - 10.4 Sphyraena sphyraena - 2.8 Sphyraenidae - 5.1
Trachinidae (Weaverfishes) Trachinidae 1.1 - Trichiuridae (Cutlassfishes) Trichiurus sp. - 18.4
Pleuronectiformes
Pleuronectiformes 0.9 2.7 Bothidae (Lefteye Flounders) Monolene 0.6 - Symphurus sp. - 5.0
Cynoglossidae (Tonguefishes) Cynoglossidae 1.5 - Cynoglossus monodi 0.8 - Symphurus 1.9 -
Symphurus sp. - 28.0 Paralichthyidae (Sand Flounders)
Citharichthys 0.8 - Paralichthyidae 2.1 -
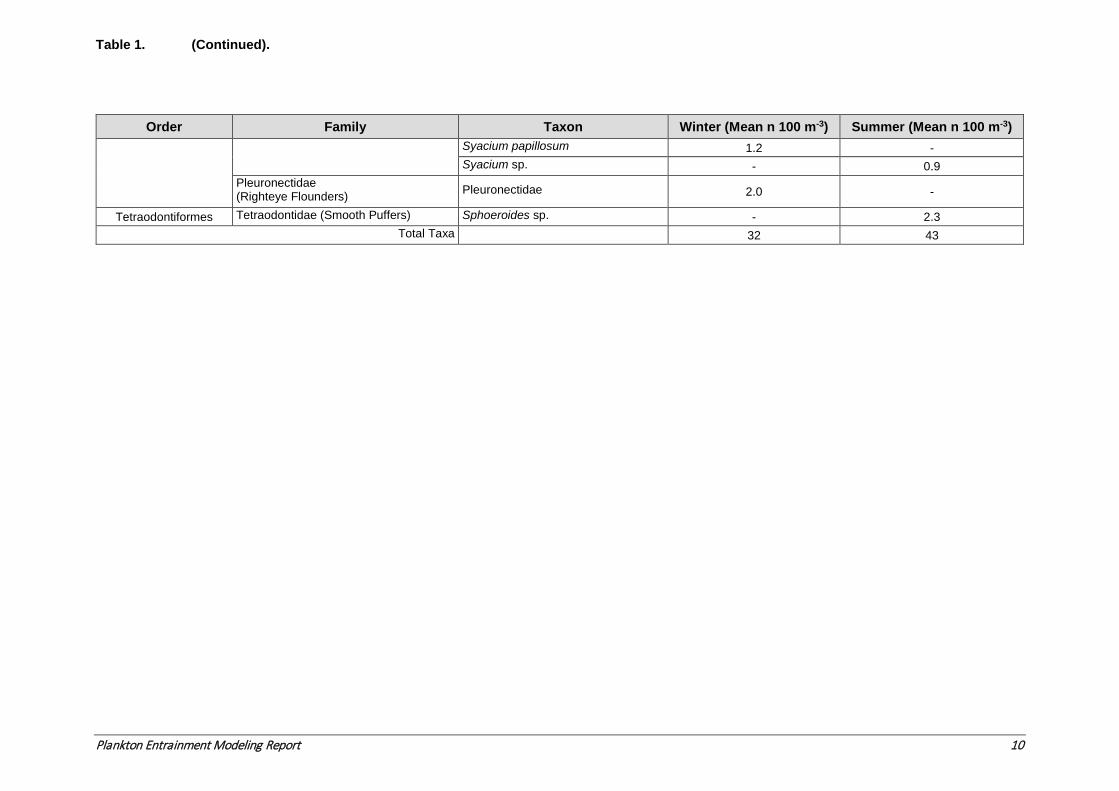
Table 1. (Continued).
Plankton Entrainment Modeling Report 10
Order Family Taxon Winter (Mean n 100 m-3) Summer (Mean n 100 m-3) Syacium papillosum 1.2 - Syacium sp. - 0.9
Pleuronectidae (Righteye Flounders) Pleuronectidae 2.0 -
Tetraodontiformes Tetraodontidae (Smooth Puffers) Sphoeroides sp. - 2.3 Total Taxa 32 43
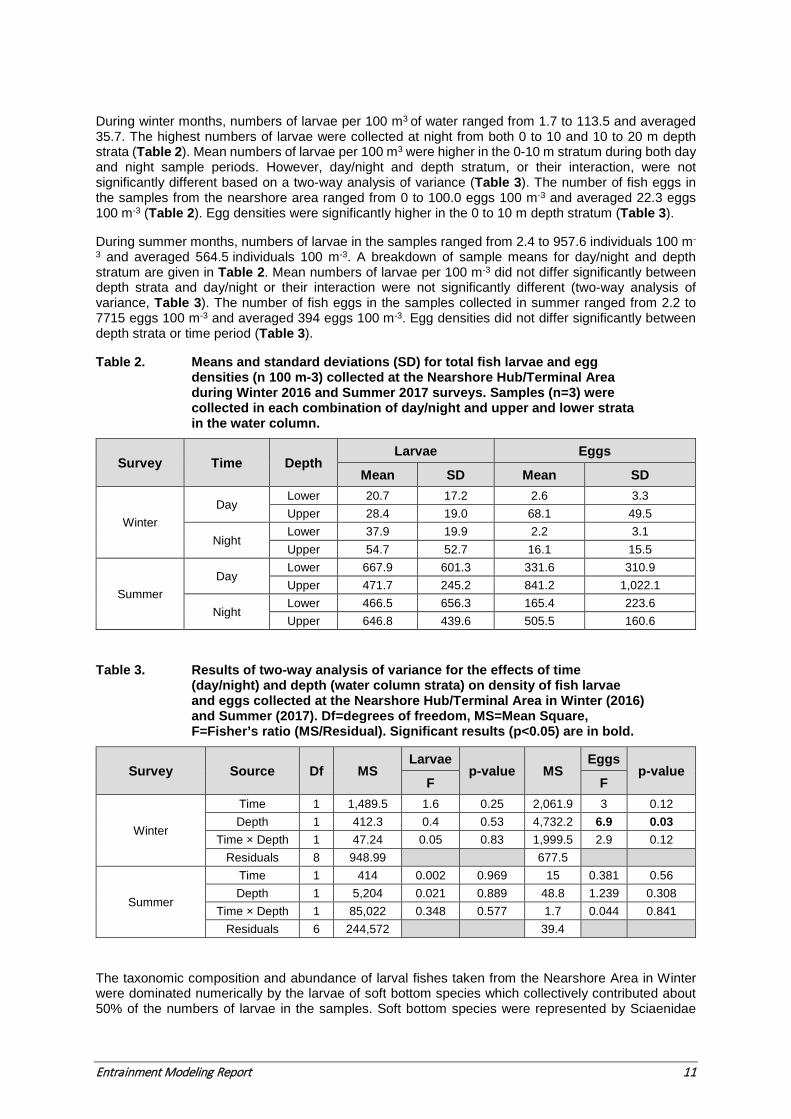
Entrainment Modeling Report 11
During winter months, numbers of larvae per 100 m3 of water ranged from 1.7 to 113.5 and averaged 35.7. The highest numbers of larvae were collected at night from both 0 to 10 and 10 to 20 m depth strata (Table 2). Mean numbers of larvae per 100 m3 were higher in the 0-10 m stratum during both day and night sample periods. However, day/night and depth stratum, or their interaction, were not significantly different based on a two-way analysis of variance (Table 3). The number of fish eggs in the samples from the nearshore area ranged from 0 to 100.0 eggs 100 m-3 and averaged 22.3 eggs 100 m-3 (Table 2). Egg densities were significantly higher in the 0 to 10 m depth stratum (Table 3).
During summer months, numbers of larvae in the samples ranged from 2.4 to 957.6 individuals 100 m-
3 and averaged 564.5 individuals 100 m-3. A breakdown of sample means for day/night and depth stratum are given in Table 2. Mean numbers of larvae per 100 m-3 did not differ significantly between depth strata and day/night or their interaction were not significantly different (two-way analysis of variance, Table 3). The number of fish eggs in the samples collected in summer ranged from 2.2 to 7715 eggs 100 m-3 and averaged 394 eggs 100 m-3. Egg densities did not differ significantly between depth strata or time period (Table 3).
Table 2. Means and standard deviations (SD) for total fish larvae and egg densities (n 100 m-3) collected at the Nearshore Hub/Terminal Area during Winter 2016 and Summer 2017 surveys. Samples (n=3) were collected in each combination of day/night and upper and lower strata in the water column.
Survey Time Depth Larvae Eggs
Mean SD Mean SD
Winter Day
Lower 20.7 17.2 2.6 3.3 Upper 28.4 19.0 68.1 49.5
Night Lower 37.9 19.9 2.2 3.1 Upper 54.7 52.7 16.1 15.5
Summer Day
Lower 667.9 601.3 331.6 310.9 Upper 471.7 245.2 841.2 1,022.1
Night Lower 466.5 656.3 165.4 223.6 Upper 646.8 439.6 505.5 160.6
Table 3. Results of two-way analysis of variance for the effects of time (day/night) and depth (water column strata) on density of fish larvae and eggs collected at the Nearshore Hub/Terminal Area in Winter (2016) and Summer (2017). Df=degrees of freedom, MS=Mean Square, F=Fisher’s ratio (MS/Residual). Significant results (p<0.05) are in bold.
Survey Source Df MS Larvae
p-value MS Eggs
p-value F F
Winter
Time 1 1,489.5 1.6 0.25 2,061.9 3 0.12 Depth 1 412.3 0.4 0.53 4,732.2 6.9 0.03
Time × Depth 1 47.24 0.05 0.83 1,999.5 2.9 0.12 Residuals 8 948.99 677.5
Summer
Time 1 414 0.002 0.969 15 0.381 0.56 Depth 1 5,204 0.021 0.889 48.8 1.239 0.308
Time × Depth 1 85,022 0.348 0.577 1.7 0.044 0.841 Residuals 6 244,572 39.4
The taxonomic composition and abundance of larval fishes taken from the Nearshore Area in Winter were dominated numerically by the larvae of soft bottom species which collectively contributed about 50% of the numbers of larvae in the samples. Soft bottom species were represented by Sciaenidae
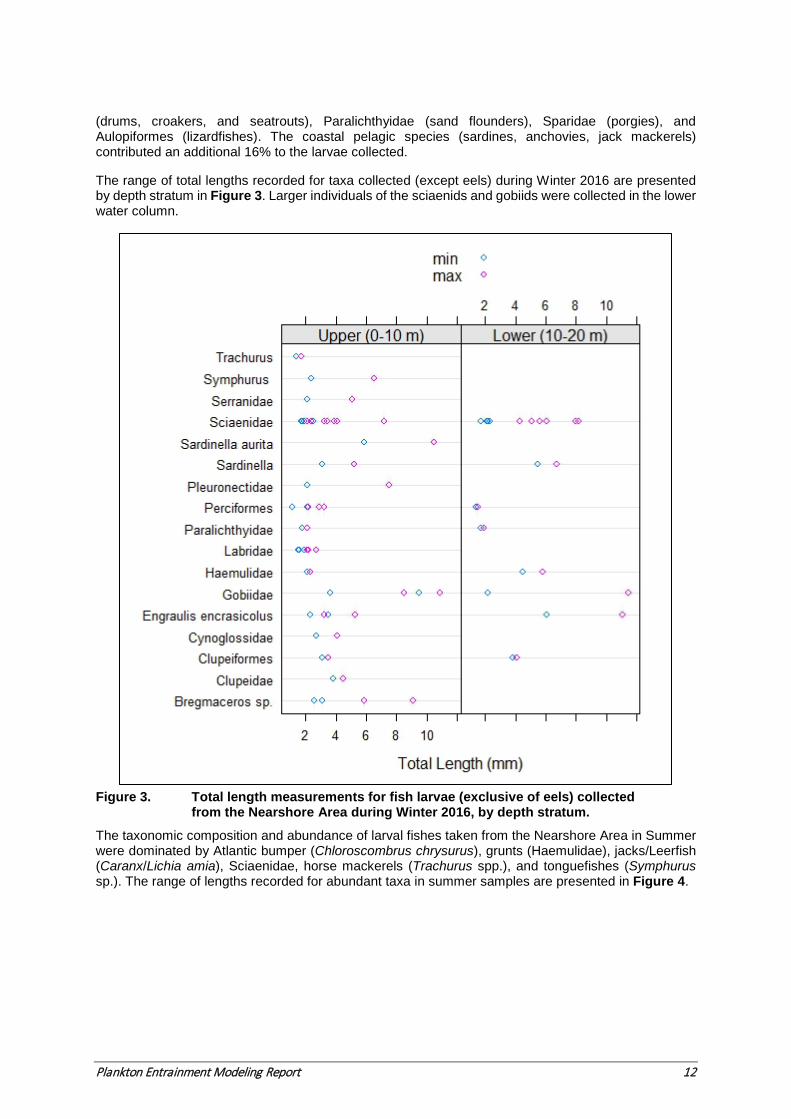
Plankton Entrainment Modeling Report 12
(drums, croakers, and seatrouts), Paralichthyidae (sand flounders), Sparidae (porgies), and Aulopiformes (lizardfishes). The coastal pelagic species (sardines, anchovies, jack mackerels) contributed an additional 16% to the larvae collected.
The range of total lengths recorded for taxa collected (except eels) during Winter 2016 are presented by depth stratum in Figure 3. Larger individuals of the sciaenids and gobiids were collected in the lower water column.
Figure 3. Total length measurements for fish larvae (exclusive of eels) collected
from the Nearshore Area during Winter 2016, by depth stratum. The taxonomic composition and abundance of larval fishes taken from the Nearshore Area in Summer were dominated by Atlantic bumper (Chloroscombrus chrysurus), grunts (Haemulidae), jacks/Leerfish (Caranx/Lichia amia), Sciaenidae, horse mackerels (Trachurus spp.), and tonguefishes (Symphurus sp.). The range of lengths recorded for abundant taxa in summer samples are presented in Figure 4.
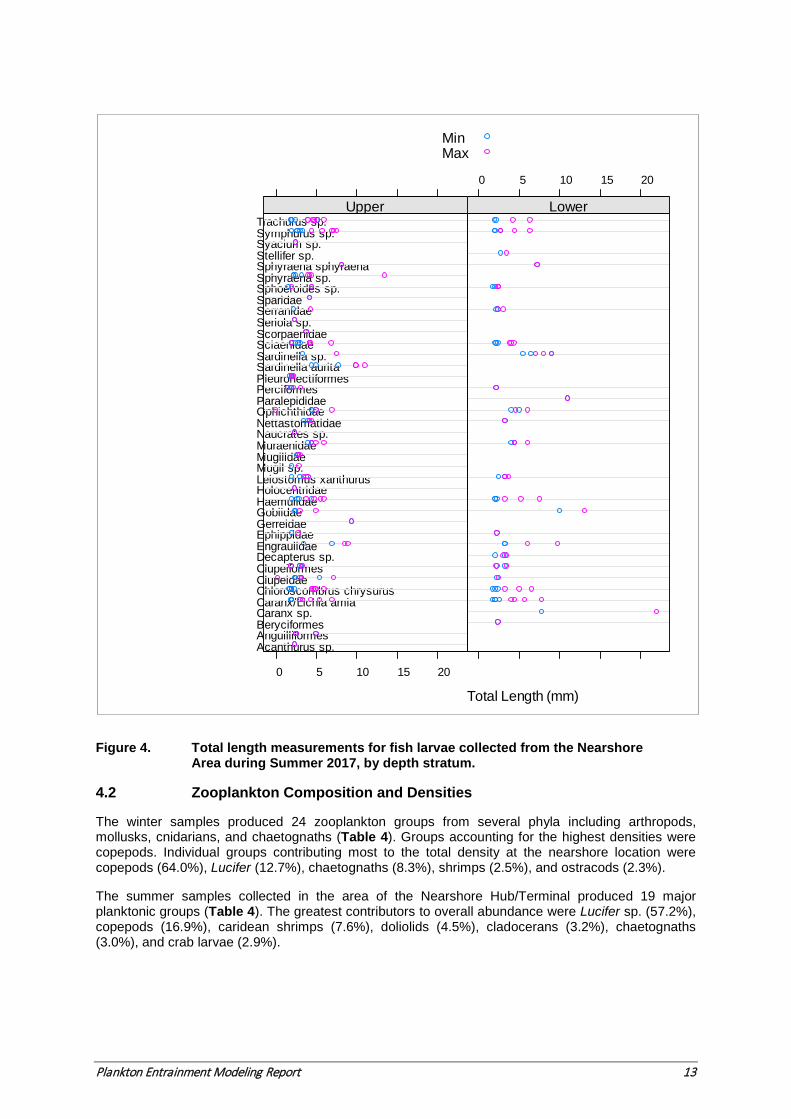
Plankton Entrainment Modeling Report 13
Figure 4. Total length measurements for fish larvae collected from the Nearshore Area during Summer 2017, by depth stratum.
4.2 Zooplankton Composition and Densities
The winter samples produced 24 zooplankton groups from several phyla including arthropods, mollusks, cnidarians, and chaetognaths (Table 4). Groups accounting for the highest densities were copepods. Individual groups contributing most to the total density at the nearshore location were copepods (64.0%), Lucifer (12.7%), chaetognaths (8.3%), shrimps (2.5%), and ostracods (2.3%).
The summer samples collected in the area of the Nearshore Hub/Terminal produced 19 major planktonic groups (Table 4). The greatest contributors to overall abundance were Lucifer sp. (57.2%), copepods (16.9%), caridean shrimps (7.6%), doliolids (4.5%), cladocerans (3.2%), chaetognaths (3.0%), and crab larvae (2.9%).
Total Length (mm)
Acanthurus sp.AnguilliformesBeryciformesCaranx sp.Caranx/Lichia amiaChloroscombrus chrysurusClupeidaeClupeiformesDecapterus sp.EngraulidaeEphippidaeGerreidaeGobiidaeHaemulidaeHolocentridaeLeiostomus xanthurusMugil sp.MugilidaeMuraenidaeNaucrates sp.NettastomatidaeOphichthidaeParalepididaePerciformesPleuronectiformesSardinella auritaSardinella sp.SciaenidaeScorpaenidaeSeriola sp.SerranidaeSparidaeSphoeroides sp.Sphyraena sp.Sphyraena sphyraenaStellifer sp.Syacium sp.Symphurus sp.Trachurus sp.
0 5 10 15 20
Upper
0 5 10 15 20
Lower
MinMax
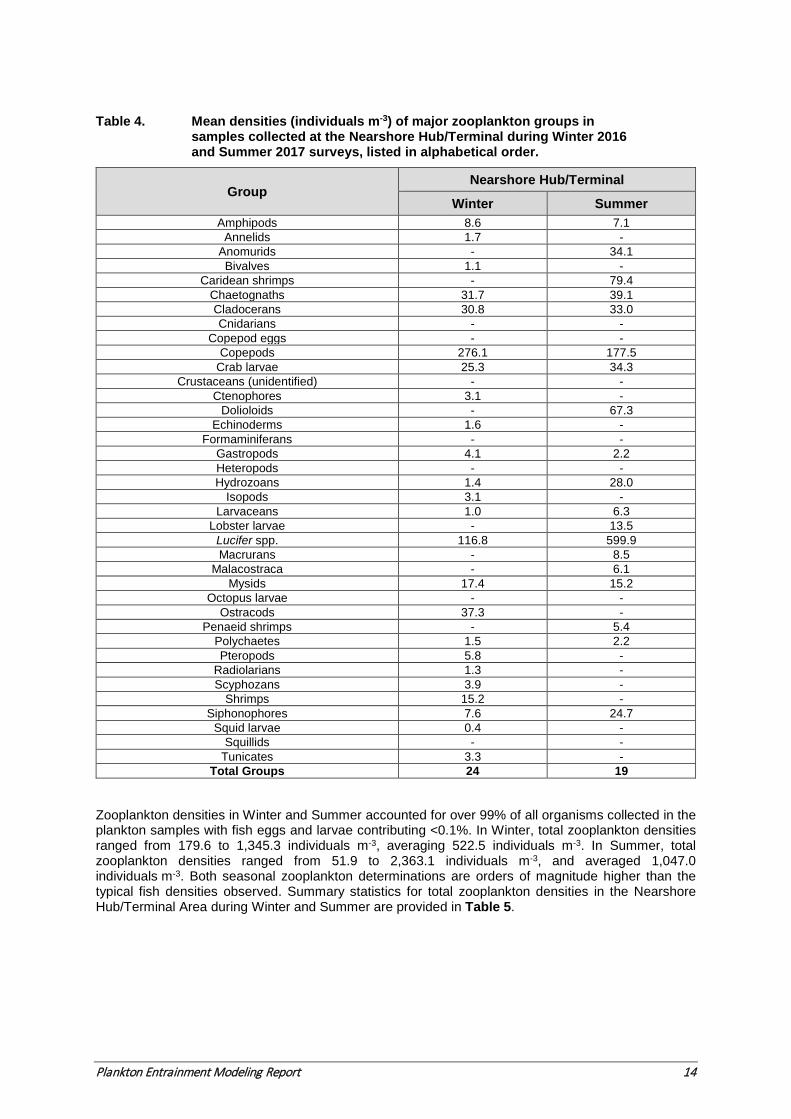
Plankton Entrainment Modeling Report 14
Table 4. Mean densities (individuals m-3) of major zooplankton groups in samples collected at the Nearshore Hub/Terminal during Winter 2016 and Summer 2017 surveys, listed in alphabetical order.
Group Nearshore Hub/Terminal
Winter Summer Amphipods 8.6 7.1
Annelids 1.7 - Anomurids - 34.1 Bivalves 1.1 -
Caridean shrimps - 79.4 Chaetognaths 31.7 39.1 Cladocerans 30.8 33.0 Cnidarians - -
Copepod eggs - - Copepods 276.1 177.5
Crab larvae 25.3 34.3 Crustaceans (unidentified) - -
Ctenophores 3.1 - Dolioloids - 67.3
Echinoderms 1.6 - Formaminiferans - -
Gastropods 4.1 2.2 Heteropods - - Hydrozoans 1.4 28.0
Isopods 3.1 - Larvaceans 1.0 6.3
Lobster larvae - 13.5 Lucifer spp. 116.8 599.9 Macrurans - 8.5
Malacostraca - 6.1 Mysids 17.4 15.2
Octopus larvae - - Ostracods 37.3 -
Penaeid shrimps - 5.4 Polychaetes 1.5 2.2 Pteropods 5.8 -
Radiolarians 1.3 - Scyphozans 3.9 -
Shrimps 15.2 - Siphonophores 7.6 24.7
Squid larvae 0.4 - Squillids - -
Tunicates 3.3 - Total Groups 24 19
Zooplankton densities in Winter and Summer accounted for over 99% of all organisms collected in the plankton samples with fish eggs and larvae contributing <0.1%. In Winter, total zooplankton densities
ranged from 179.6 to 1,345.3 individuals m-3, averaging 522.5 individuals m-3. In Summer, total zooplankton densities ranged from 51.9 to 2,363.1 individuals m-3, and averaged 1,047.0 individuals m-3. Both seasonal zooplankton determinations are orders of magnitude higher than the typical fish densities observed. Summary statistics for total zooplankton densities in the Nearshore Hub/Terminal Area during Winter and Summer are provided in Table 5.
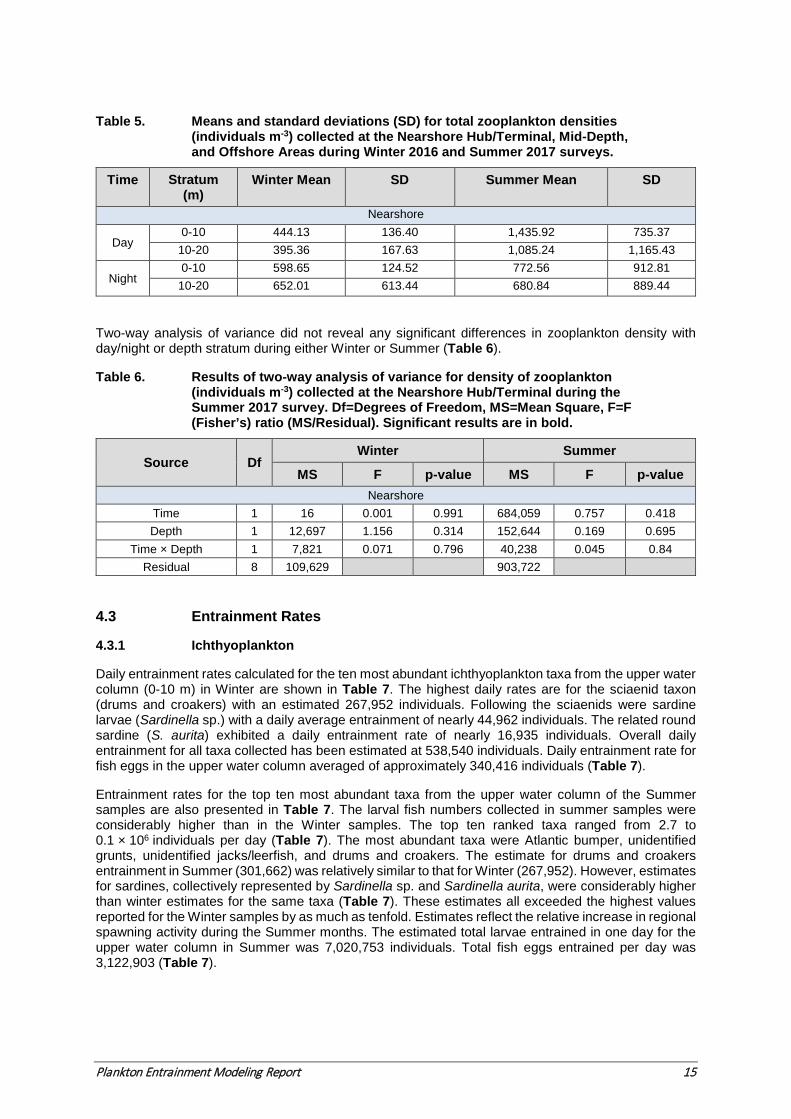
Plankton Entrainment Modeling Report 15
Table 5. Means and standard deviations (SD) for total zooplankton densities (individuals m-3) collected at the Nearshore Hub/Terminal, Mid-Depth, and Offshore Areas during Winter 2016 and Summer 2017 surveys.
Time Stratum (m)
Winter Mean SD Summer Mean SD
Nearshore
Day 0-10 444.13 136.40 1,435.92 735.37
10-20 395.36 167.63 1,085.24 1,165.43
Night 0-10 598.65 124.52 772.56 912.81
10-20 652.01 613.44 680.84 889.44
Two-way analysis of variance did not reveal any significant differences in zooplankton density with day/night or depth stratum during either Winter or Summer (Table 6).
Table 6. Results of two-way analysis of variance for density of zooplankton (individuals m-3) collected at the Nearshore Hub/Terminal during the Summer 2017 survey. Df=Degrees of Freedom, MS=Mean Square, F=F (Fisher’s) ratio (MS/Residual). Significant results are in bold.
Source Df Winter Summer
MS F p-value MS F p-value Nearshore
Time 1 16 0.001 0.991 684,059 0.757 0.418 Depth 1 12,697 1.156 0.314 152,644 0.169 0.695
Time × Depth 1 7,821 0.071 0.796 40,238 0.045 0.84 Residual 8 109,629 903,722
4.3 Entrainment Rates
4.3.1 Ichthyoplankton
Daily entrainment rates calculated for the ten most abundant ichthyoplankton taxa from the upper water column (0-10 m) in Winter are shown in Table 7. The highest daily rates are for the sciaenid taxon (drums and croakers) with an estimated 267,952 individuals. Following the sciaenids were sardine larvae (Sardinella sp.) with a daily average entrainment of nearly 44,962 individuals. The related round sardine (S. aurita) exhibited a daily entrainment rate of nearly 16,935 individuals. Overall daily entrainment for all taxa collected has been estimated at 538,540 individuals. Daily entrainment rate for fish eggs in the upper water column averaged of approximately 340,416 individuals (Table 7).
Entrainment rates for the top ten most abundant taxa from the upper water column of the Summer samples are also presented in Table 7. The larval fish numbers collected in summer samples were considerably higher than in the Winter samples. The top ten ranked taxa ranged from 2.7 to 0.1 × 10⁶ individuals per day (Table 7). The most abundant taxa were Atlantic bumper, unidentified grunts, unidentified jacks/leerfish, and drums and croakers. The estimate for drums and croakers entrainment in Summer (301,662) was relatively similar to that for Winter (267,952). However, estimates for sardines, collectively represented by Sardinella sp. and Sardinella aurita, were considerably higher than winter estimates for the same taxa (Table 7). These estimates all exceeded the highest values reported for the Winter samples by as much as tenfold. Estimates reflect the relative increase in regional spawning activity during the Summer months. The estimated total larvae entrained in one day for the upper water column in Summer was 7,020,753 individuals. Total fish eggs entrained per day was 3,122,903 (Table 7).
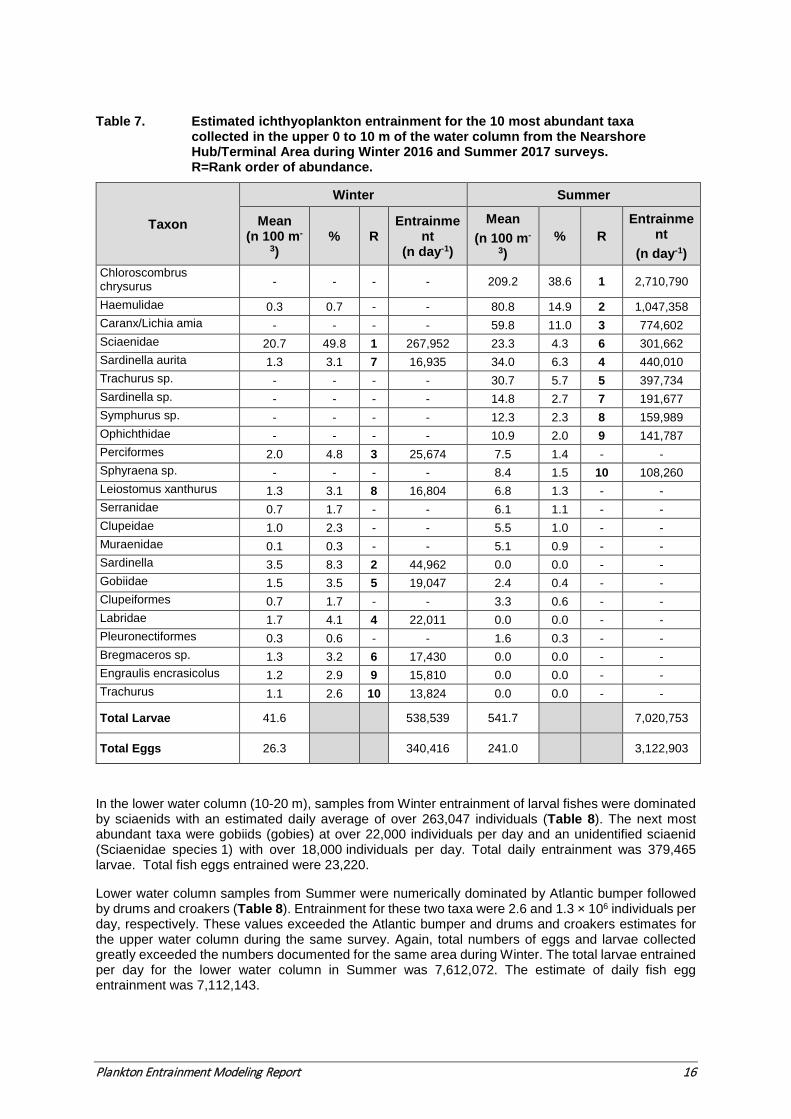
Plankton Entrainment Modeling Report 16
Table 7. Estimated ichthyoplankton entrainment for the 10 most abundant taxa collected in the upper 0 to 10 m of the water column from the Nearshore Hub/Terminal Area during Winter 2016 and Summer 2017 surveys. R=Rank order of abundance.
Taxon
Winter Summer
Mean (n 100 m-
3) % R
Entrainment
(n day-1)
Mean (n 100 m-
3) % R
Entrainment
(n day-1) Chloroscombrus chrysurus - - - - 209.2 38.6 1 2,710,790
Haemulidae 0.3 0.7 - - 80.8 14.9 2 1,047,358 Caranx/Lichia amia - - - - 59.8 11.0 3 774,602 Sciaenidae 20.7 49.8 1 267,952 23.3 4.3 6 301,662 Sardinella aurita 1.3 3.1 7 16,935 34.0 6.3 4 440,010 Trachurus sp. - - - - 30.7 5.7 5 397,734 Sardinella sp. - - - - 14.8 2.7 7 191,677 Symphurus sp. - - - - 12.3 2.3 8 159,989 Ophichthidae - - - - 10.9 2.0 9 141,787 Perciformes 2.0 4.8 3 25,674 7.5 1.4 - - Sphyraena sp. - - - - 8.4 1.5 10 108,260 Leiostomus xanthurus 1.3 3.1 8 16,804 6.8 1.3 - - Serranidae 0.7 1.7 - - 6.1 1.1 - - Clupeidae 1.0 2.3 - - 5.5 1.0 - - Muraenidae 0.1 0.3 - - 5.1 0.9 - - Sardinella 3.5 8.3 2 44,962 0.0 0.0 - - Gobiidae 1.5 3.5 5 19,047 2.4 0.4 - - Clupeiformes 0.7 1.7 - - 3.3 0.6 - - Labridae 1.7 4.1 4 22,011 0.0 0.0 - - Pleuronectiformes 0.3 0.6 - - 1.6 0.3 - - Bregmaceros sp. 1.3 3.2 6 17,430 0.0 0.0 - - Engraulis encrasicolus 1.2 2.9 9 15,810 0.0 0.0 - - Trachurus 1.1 2.6 10 13,824 0.0 0.0 - -
Total Larvae 41.6 538,539 541.7 7,020,753
Total Eggs 26.3 340,416 241.0 3,122,903
In the lower water column (10-20 m), samples from Winter entrainment of larval fishes were dominated by sciaenids with an estimated daily average of over 263,047 individuals (Table 8). The next most abundant taxa were gobiids (gobies) at over 22,000 individuals per day and an unidentified sciaenid (Sciaenidae species 1) with over 18,000 individuals per day. Total daily entrainment was 379,465 larvae. Total fish eggs entrained were 23,220.
Lower water column samples from Summer were numerically dominated by Atlantic bumper followed by drums and croakers (Table 8). Entrainment for these two taxa were 2.6 and 1.3 × 10⁶ individuals per day, respectively. These values exceeded the Atlantic bumper and drums and croakers estimates for the upper water column during the same survey. Again, total numbers of eggs and larvae collected greatly exceeded the numbers documented for the same area during Winter. The total larvae entrained per day for the lower water column in Summer was 7,612,072. The estimate of daily fish egg entrainment was 7,112,143.
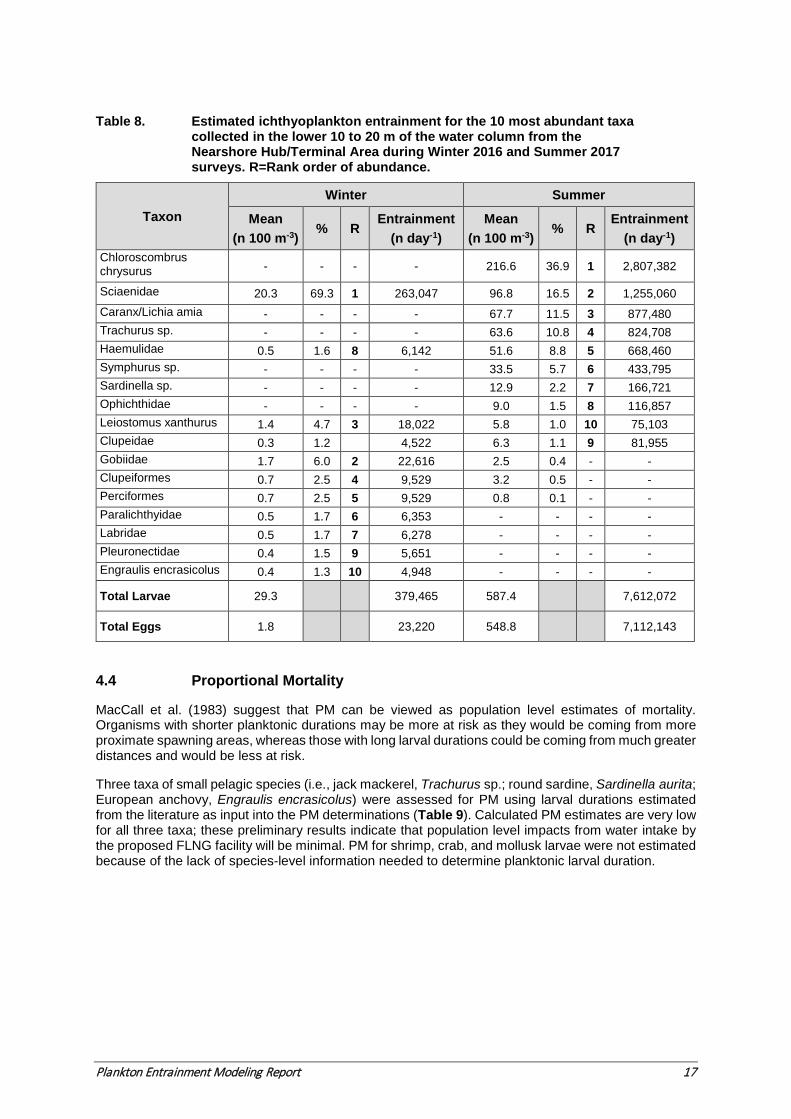
Plankton Entrainment Modeling Report 17
Table 8. Estimated ichthyoplankton entrainment for the 10 most abundant taxa collected in the lower 10 to 20 m of the water column from the Nearshore Hub/Terminal Area during Winter 2016 and Summer 2017 surveys. R=Rank order of abundance.
Taxon Winter Summer
Mean (n 100 m-3)
% R Entrainment
(n day-1) Mean
(n 100 m-3) % R
Entrainment (n day-1)
Chloroscombrus chrysurus - - - - 216.6 36.9 1 2,807,382
Sciaenidae 20.3 69.3 1 263,047 96.8 16.5 2 1,255,060 Caranx/Lichia amia - - - - 67.7 11.5 3 877,480 Trachurus sp. - - - - 63.6 10.8 4 824,708 Haemulidae 0.5 1.6 8 6,142 51.6 8.8 5 668,460 Symphurus sp. - - - - 33.5 5.7 6 433,795 Sardinella sp. - - - - 12.9 2.2 7 166,721 Ophichthidae - - - - 9.0 1.5 8 116,857 Leiostomus xanthurus 1.4 4.7 3 18,022 5.8 1.0 10 75,103 Clupeidae 0.3 1.2 4,522 6.3 1.1 9 81,955 Gobiidae 1.7 6.0 2 22,616 2.5 0.4 - - Clupeiformes 0.7 2.5 4 9,529 3.2 0.5 - - Perciformes 0.7 2.5 5 9,529 0.8 0.1 - - Paralichthyidae 0.5 1.7 6 6,353 - - - - Labridae 0.5 1.7 7 6,278 - - - - Pleuronectidae 0.4 1.5 9 5,651 - - - - Engraulis encrasicolus 0.4 1.3 10 4,948 - - - -
Total Larvae 29.3 379,465 587.4 7,612,072
Total Eggs 1.8 23,220 548.8 7,112,143
4.4 Proportional Mortality
MacCall et al. (1983) suggest that PM can be viewed as population level estimates of mortality. Organisms with shorter planktonic durations may be more at risk as they would be coming from more proximate spawning areas, whereas those with long larval durations could be coming from much greater distances and would be less at risk.
Three taxa of small pelagic species (i.e., jack mackerel, Trachurus sp.; round sardine, Sardinella aurita; European anchovy, Engraulis encrasicolus) were assessed for PM using larval durations estimated from the literature as input into the PM determinations (Table 9). Calculated PM estimates are very low for all three taxa; these preliminary results indicate that population level impacts from water intake by the proposed FLNG facility will be minimal. PM for shrimp, crab, and mollusk larvae were not estimated because of the lack of species-level information needed to determine planktonic larval duration.
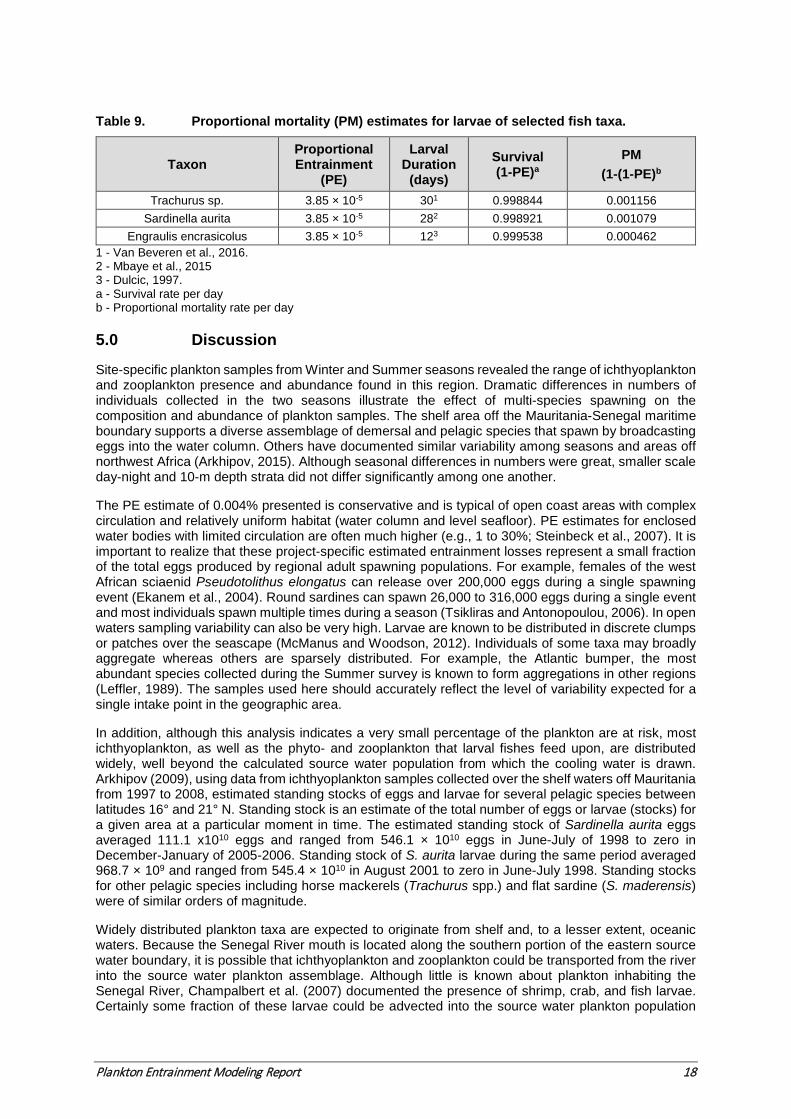
Plankton Entrainment Modeling Report 18
Table 9. Proportional mortality (PM) estimates for larvae of selected fish taxa.
Taxon Proportional Entrainment
(PE)
Larval Duration
(days) Survival (1-PE)a
PM (1-(1-PE)b
Trachurus sp. 3.85 × 10⁻⁵ 301 0.998844 0.001156 Sardinella aurita 3.85 × 10⁻⁵ 282 0.998921 0.001079
Engraulis encrasicolus 3.85 × 10⁻⁵ 123 0.999538 0.000462 1 - Van Beveren et al., 2016. 2 - Mbaye et al., 2015 3 - Dulcic, 1997. a - Survival rate per day b - Proportional mortality rate per day
5.0 Discussion
Site-specific plankton samples from Winter and Summer seasons revealed the range of ichthyoplankton and zooplankton presence and abundance found in this region. Dramatic differences in numbers of individuals collected in the two seasons illustrate the effect of multi-species spawning on the composition and abundance of plankton samples. The shelf area off the Mauritania-Senegal maritime boundary supports a diverse assemblage of demersal and pelagic species that spawn by broadcasting eggs into the water column. Others have documented similar variability among seasons and areas off northwest Africa (Arkhipov, 2015). Although seasonal differences in numbers were great, smaller scale day-night and 10-m depth strata did not differ significantly among one another.
The PE estimate of 0.004% presented is conservative and is typical of open coast areas with complex circulation and relatively uniform habitat (water column and level seafloor). PE estimates for enclosed water bodies with limited circulation are often much higher (e.g., 1 to 30%; Steinbeck et al., 2007). It is important to realize that these project-specific estimated entrainment losses represent a small fraction of the total eggs produced by regional adult spawning populations. For example, females of the west African sciaenid Pseudotolithus elongatus can release over 200,000 eggs during a single spawning event (Ekanem et al., 2004). Round sardines can spawn 26,000 to 316,000 eggs during a single event and most individuals spawn multiple times during a season (Tsikliras and Antonopoulou, 2006). In open waters sampling variability can also be very high. Larvae are known to be distributed in discrete clumps or patches over the seascape (McManus and Woodson, 2012). Individuals of some taxa may broadly aggregate whereas others are sparsely distributed. For example, the Atlantic bumper, the most abundant species collected during the Summer survey is known to form aggregations in other regions (Leffler, 1989). The samples used here should accurately reflect the level of variability expected for a single intake point in the geographic area.
In addition, although this analysis indicates a very small percentage of the plankton are at risk, most ichthyoplankton, as well as the phyto- and zooplankton that larval fishes feed upon, are distributed widely, well beyond the calculated source water population from which the cooling water is drawn. Arkhipov (2009), using data from ichthyoplankton samples collected over the shelf waters off Mauritania from 1997 to 2008, estimated standing stocks of eggs and larvae for several pelagic species between latitudes 16° and 21° N. Standing stock is an estimate of the total number of eggs or larvae (stocks) for a given area at a particular moment in time. The estimated standing stock of Sardinella aurita eggs averaged 111.1 x10¹⁰ eggs and ranged from 546.1 × 10¹⁰ eggs in June-July of 1998 to zero in December-January of 2005-2006. Standing stock of S. aurita larvae during the same period averaged 968.7 × 10⁹ and ranged from 545.4 × 10¹⁰ in August 2001 to zero in June-July 1998. Standing stocks for other pelagic species including horse mackerels (Trachurus spp.) and flat sardine (S. maderensis) were of similar orders of magnitude.
Widely distributed plankton taxa are expected to originate from shelf and, to a lesser extent, oceanic waters. Because the Senegal River mouth is located along the southern portion of the eastern source water boundary, it is possible that ichthyoplankton and zooplankton could be transported from the river into the source water plankton assemblage. Although little is known about plankton inhabiting the Senegal River, Champalbert et al. (2007) documented the presence of shrimp, crab, and fish larvae. Certainly some fraction of these larvae could be advected into the source water plankton population
Plankton Entrainment Modeling Report 19
depending on the season and current patterns, but the composition of the samples collected at the Nearshore Hub/Terminal Area do not indicate many taxa of estuarine origin.
Although invertebrate plankton (particularly shrimp, crab and mollusk larvae) would be similarly affected by the cooling water intake, these groups were not evaluated because individuals were not identified to a taxonomic level that would allow a meaningful assessment. Despite their high abundance, holoplanktonic groups such as copepods, chaetognaths, siphonophores, amphipods, and mysids are rarely assessed due to wide geographic distribution and high population turnover rates (Steinbeck et al., 2007). Estimates presented in the current analysis are considered representative of the time period when samples were collected. The numbers and kinds of larvae present will differ for different times of the year as spawning patterns and currents will seasonally change. Samples from a different time period will likely exhibit different taxonomic composition, densities, and mean current speeds, one or more of which would potentially change entrainment estimates and the PE ratio.
It is inherently difficult to reliably extrapolate the effects of entrainment losses to the population level because of numerous confounding factors including water temperature, salinity, and nutrient concentrations (Berraho et al., 2015; Hinde et al., 2017; Arkhipov, 2009); circulation patterns and upwelling (Auger et al., 2016; Olivar et al., 2016); prey availability (Hinde et al., 2017); and variability of adult spawning times and locations (Arkhipov, 2009).
6.0 Summary
Plankton samples were collected at two different depth strata during both day and night during Winter 2016 and Summer 2017. Based on the collection of plankton samples from three randomly selected stations located in the Nearshore Hub/Terminal Area, eggs and larvae densities were higher in the 0 to 10 m depth stratum, with higher values evident at night. Zooplankton densities accounted for over 99% of all organisms collected in the plankton samples with fish eggs and larvae contributing <0.1%. The range of taxa collected represents the assemblage expected for the water depth and latitude. Most taxa collected were coastal or shelf forms such as carangids (jacks, leerfishes, and jack mackerels), gobiids (gobies), sciaenids (drums and croakers), cynoglossids (tonguefishes), paralichthids (sand flounders), and bothids (lefteye flounders) that reside along the soft bottom environment of the inner shelf (water depths <60 m). Based on sizes of larvae collected, many could have been spawned within the source water (i.e., within a 17.3 km radius of the proposed FLNG site). A few oceanic taxa such as lanternfishes (Diaphus sp.) were also collected, indicating shoreward movement of some larvae spawned in deeper waters (>300 m) as has been documented for this region (Olivar et al., 2016; John and Zelck, 1997).
Daily entrainment rates calculated for ichthyoplankton taxa from the upper water column in Winter were highest for the sciaenid taxon (drums and croakers), contributing nearly 46% to total entrainment losses. Other ichthyoplankton taxa entrainment losses (e.g., Sardinella sp.) were 9% or less. In the lower water column, entrainment of larval fishes was also dominated by sciaenids.
In Summer, the dramatic increase in ichthyoplankton density resulted in entrainment rates that greatly exceed the Winter estimates. Atlantic bumper, a number of jack taxa, grunts, and sardines accounted for most individuals. In spite of these seasonal differences, losses from entrainment represent an extremely minor fraction of the standing stock.
The ratio of entrainment densities to source water densities is 0.004%. This ratio is constant for all taxa evaluated, as identical entrainment densities and source water densities were employed in the calculations. Density differences between the depth strata are not obvious for specific taxa; statistical treatment beyond the summary data is problematic, given the sparse nature of the data.
The PE estimate of 0.004% presented is conservative and is typical of open coast areas with complex circulation and relatively uniform habitat (water column and level seafloor). In addition, although this analysis indicates a very small percentage of the plankton are at risk, most ichthyoplankton, as well as the phyto- and zooplankton that larval fishes feed upon, are distributed widely, well beyond the calculated source water population from which the cooling water is drawn.
Widely distributed plankton taxa are expected to originate from shelf and, to a lesser extent, oceanic waters. Because the Senegal River mouth is located along the southern portion of the eastern source water boundary, it is possible that ichthyoplankton and zooplankton could be transported from the river
Plankton Entrainment Modeling Report 20
into the source water plankton assemblage. While little is known about plankton inhabiting the Senegal River, it is possible that some fraction of shrimp, crab, and fish larvae from the Senegal River could be advected into the source water plankton population depending on the season and current patterns.
Invertebrate plankton (e.g., shrimp, crab and mollusk larvae) would be similarly affected by the cooling water intake, although these groups were not evaluated in this analysis. Despite their high abundance, holoplanktonic groups such as copepods, chaetognaths, siphonophores, amphipods, and mysids are rarely assessed due to wide geographic distribution and high population turnover rates. Estimates presented in the current analysis are considered representative of both sampling periods – Winter and Summer – when samples were collected. The numbers and kinds of larvae present will differ for different times of the year as spawning patterns and currents will seasonally change. This was demonstrated by the differences in fish larval composition and abundance collected between Winter and Summer sampling periods.
Finally, it is inherently difficult to reliably extrapolate the effects of entrainment losses to the population level because of numerous confounding factors including water temperature, salinity, and nutrient concentrations (Berraho et al., 2015; Hinde et al., 2017; Arkhipov, 2009); circulation patterns and upwelling (Auger et al., 2016; Olivar et al., 2017); prey availability; and variability of adult spawning times (Arkhipov, 2009). The level of variability was highlighted by the differences in ichthyoplankton densities found between the Winter and Summer samples from the nearshore and offshore areas.
Plankton Entrainment Modeling Report 21
7.0 Literature Cited
Arkhipov, A.G. 2009. Seasonal and inter-annual variation of ichthyoplankton off Mauritania. Journal of Ichthyology 49(6):460-468.
Arkhipov, A.G. 2015. Dynamics of abundance of eggs and larvae of common fish species in the central part of the Eastern Central Atlantic. Journal of Ichthyology 55 (2): 217-223.
Auger, P., T. Gorgues, E. Machu, O. Aumont, and P. Brehmer. 2016. What drives the spatial variability of primary productivity in the north-west African upwelling system? A modeling approach. Biogeosciences 13:6419-6440.
Berraho, A., L. Somoue, S. Hernández‐León and L. Valdés. 2015. Zooplankton In The Canary Current Large Marine Ecosystem, pp. 183-196. In: Valdes, L. and I. Déniz‐González (eds.). Oceanographic and Biological Features in the Canary Current Large Marine Ecosystem. Governmental Oceanographic Commission Technical Series 115.
Boreman, J., C.P. Goodyear, and S.W. Christensen. 1978. An empirical transport model for evaluating entrainment of aquatic organism by power plants. FWS/OBS-78/90. U.S. Fish and Wildlife Service, Ann Arbor, MI.
Boreman, J., C.P. Goodyear, and S.W. Christensen. 1981. An empirical methodology for estimating entrainment losses at power plants sited on estuaries. Transactions of the American Fishery Society 110:253-260.
Champalbert, G., M. Pagano, P. Sene, and D. Corbin. 2007. Relationships between meso- and macro-zooplankton communities in the Senegal River estuary. Estuarine and Coastal Shelf Science 74:381-394.
Dulcic, J., 1997. Growth of anchovy, Engraulis encrasicolus (L.), larvae in the Northern Adriatic Sea. Fisheries Research 31:189-195.
Ekanem, S.B., M. Achima, and M. M. Ekere. 2004. Studies on some reproductive aspects of Pseudotolithus elongatus in the Cross River estuary, Nigeria. Scientia Marina 68(2):265-271.
Entrix, Inc. 2007. Draft Environmental Impact Statement for Calypso LNG Deepwater Port License Application. DOT docket number USCG-2006-26009. Prepared for USCG Deepwater Ports Standards Division (CG03PSO-5), Washington, D.C.
Golar LNG. 2017. Summary of indicative emissions and discharges of Mkl FLNG. Report to Kosmos, 8 pp.
Hamann, I., H.-Ch. John, and E. Mittlestaedt. 1981. Hydrography and its effect on fish larvae in the Mauritanian upwelling area. Deep-Sea Research 28:561-575.
Hanel, R., H. John, O. Meyer-Klaeden, U. Piatkowski. 2010. Larval fish abundance, composition, and distribution at Senghor Seamount (Cape Verde Islands). Journal of Plankton Research 23(11): 1541-1556.
Hinde, A., B. Amina, B. Tarik, A. Aziz, M. Ahmed, and E. Ahmed. 2017. Autumn larval fish assemblages in the northwest African Atlantic coastal zone. Chinese Journal of Oceanology and Limnology 35(3):515-527.
John, H.-Ch. and C. Zelck. 1997. Features, boundaries, and connecting mechanisms of the Mauritanian Province exemplified by oceanic fish larvae. Helgolander Meersunters 51:213-240.
Johnson, D. L., and W.W. Morse. 1994. Net extrusion of larval fish: correction factors for 0.333 mm versus 0.505 mm mesh bongo nets. NAFO Science Council Studies 20:85-92.
Plankton Entrainment Modeling Report 22
Laurindo, L.C., A.J. Mariano, and R. Lumpkin. 2017. An improved surface climatology for the global ocean from drifter observations. Deep Sea Research Part I: Oceanographic Research Papers 1124:75-92.
Leffler, D. L. 1989. Composition, abundance, and small-scale distribution of ichthyoplankton off the Louisiana-Mississippi Barrier Islands, with special emphasis on the age, growth, and mortality of Chloroscombrus chrysurus. M.S. Thesis, Louisiana State Univ. Agricultural and Mechanical College, Louisiana. 150 p.
Lumpkin, R., and D.L. Johnson. 2013. Global ocean surface velocities from drifters: Mean, variance, El Niño–Southern Oscillation response, and seasonal cycle. J. Geophys. Res. Oceans 118:2992-3006.
MacCall, A.D., K.R. Parker, R. Leithiser, and B. Jessee. 1983. Power plant impact assessment: A simple fishery production model approach. Fishery Bulletin 81(3):613-619.
Marine Geoscience Data System. 2017. Interdisciplinary Earth Data Alliance (IEDA) Data Browser. Accessed at: www.marine-geo.org. Accessed: August 2017.
Mbaye, B.C., T. Brochier, V. Echevin, A. Lazar, M. Lévy, E. Mason, A.T. Gaye, and E. Machu. 2015. Do Sardinella aurita spawning seasons match local retention patterns in the Senegalese-Mauritanian upwelling region? Fisheries Oceanography 24(1):69-89.
McManus, M.A. and C.B. Woodson. 2012. Plankton distribution and ocean dispersal. Journal of Experimental Biology 215:1008-1016.
Menna, M., S. Faye, P.-M. Poulain, L. Centurioni, A. Lazar, A. Gaye, B. Sow, and D. Dagorne. 2016. Upwelling features off the coast of north-western Africa in 2009-2013. Bolletino di Geofisica Teorica ed Applicata 57(1):71-86.
Olivar, M.P., A. Sabates, M.V. Pastor, and J.L. Pelegri. 2016. Water masses and mesoscale control on latitudinal and cross-shelf variations in larval fish assemblages of NW Africa. Deep-Sea Research I: Oceanographic Research Papers 117:120-137.
Raimondi, P. 2016. Overview of impacts of ocean intakes on the marine environment, mitigation strategies, and implications of the new California policy regarding ocean intakes. Accessed at: http://waterinthewest.stanford.edu/sites/default/files/related_documents/Pete%20Raimondi.pdf. Accessed: 17 May 2016.
Ryan, W.B.F., S.M. Carbotte, J.O. Coplan, S. O'Hara, A. Melkonian, R. Arko, R.A. Weissel, V. Ferrini, A. Goodwillie, F. Nitsche, J. Bonczkowski, and R. Zemsky. 2009. Global Multi-Resolution Topography synthesis. Geochem. Geophys. Geosyst. 10, Q03014. doi: 10.1029/2008GC002332.
Steinbeck, J.R., J. Hedgepeth, P. Raimondi, G. Cailliet, and D.L. Mayer. 2007. Assessing Power Plant Cooling Water Intake System Entrainment Impacts. Report to California Energy Commission. CEC-700-2007-010. 105 pp. Appendix E - Guidance Documents for Assessing Entrainment Including Additional Information on the Following Loss Rate Models: Fecundity Hindcasting (FH), Adult Equivalent Loss (AEL) and Area Production Forgone using an Empirical Transport Model (ETM/APF).
Tsikliras, A.C. and E. Antonopoulou. 2006. Reproductive biology of round sardinella (Sardinella aurita) in the north-eastern Mediterranean. Scientia Marina 70(2):281-290.
University of Miami. 2017. Surface Currents in the Atlantic Ocean. Global Ocean Surface Velocities from Drifters. Accessed at: http://oceancurrents.rsmas.miami.edu/atlantic/img_gosv_seasonal.php. Accessed: August 2017.

Plankton Entrainment Modeling Report 23
Van Beveren, E., M. Klein, E.A. Serrão, E.J. Goncalves, and R. Borges. 2016. Early life history of larvae and early juvenile Atlantic horse mackerel Trachurus trachurus off the Portuguese west coast. Fisheries Research 183:111-118.

ESIA FOR THE GREATER TORTUE/AHMEYIM PHASE 1 GAS PRODUCTION PROJECT
Ref. No.: 1653939
APPENDIX N : ACCIDENTAL EVENT SCENARIOS MODELING REPORTS
ESIA FOR THE GREATER TORTUE/AHMEYIM PHASE 1 GAS PRODUCTION PROJECT
Ref. No.: 1653939
APPENDIX N Accidental Event Scenarios Modeling Reports
APPENDIX CONTENTS
N-1 Oil Spill Modeling Reports
N-1a Oil Spill Modeling Report – Well Head Failure
N-1b Oil Spill Modeling Report – FPSO Failure due to a Vessel Collision
N-1c Oil Spill Modeling Report – Pipelaying Vessel Collision
N-1d Oil Spill Modeling Report – Senegal River Study
N-2 Risk Study Consequence Modeling Report

ESIA FOR THE GREATER TORTUE/AHMEYIM PHASE 1 GAS PRODUCTION PROJECT
Ref. No.: 1653939
APPENDIX N-1 : OIL SPILL MODELING REPORTS
ESIA FOR THE GREATER TORTUE/AHMEYIM PHASE 1 GAS PRODUCTION PROJECT
Ref. No.: 1653939
APPENDIX N-1a : OIL SPILL MODELING REPORT – WELL HEAD FAILURE

Oil Spill Modelling Report – Well Head Failure Tortue Phase 1a
BP p.l.c. Document Number: GEOM0132a R03 Issued: 19 January 2018
Oil Spill Response Limited
Lower William Street Southampton
SO14 5QE United Kingdom
Tel: +44 (0)23 8033 1551 Fax: +44 (0)23 8022 1972
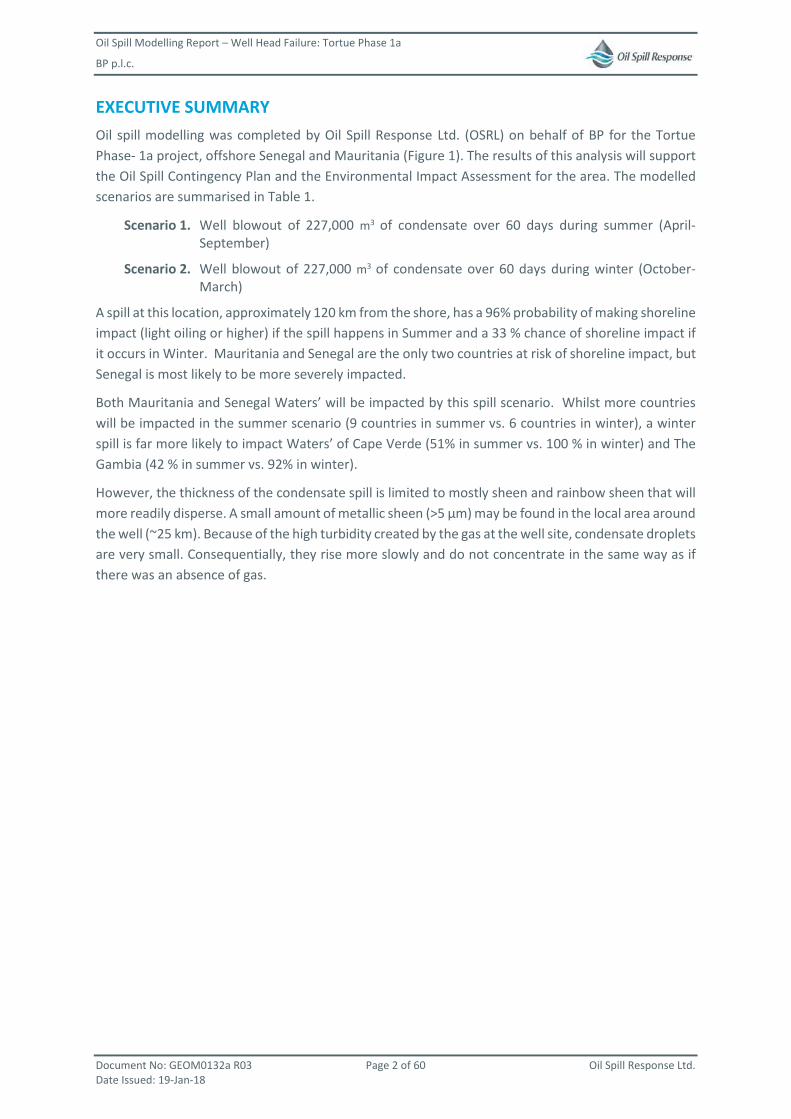
Oil Spill Modelling Report – Well Head Failure: Tortue Phase 1a
BP p.l.c.
Document No: GEOM0132a R03 Page 2 of 60 Oil Spill Response Ltd. Date Issued: 19-Jan-18
EXECUTIVE SUMMARY Oil spill modelling was completed by Oil Spill Response Ltd. (OSRL) on behalf of BP for the Tortue Phase- 1a project, offshore Senegal and Mauritania (Figure 1). The results of this analysis will support the Oil Spill Contingency Plan and the Environmental Impact Assessment for the area. The modelled scenarios are summarised in Table 1.
Scenario 1. Well blowout of 227,000 m3 of condensate over 60 days during summer (April-September)
Scenario 2. Well blowout of 227,000 m3 of condensate over 60 days during winter (October-March)
A spill at this location, approximately 120 km from the shore, has a 96% probability of making shoreline impact (light oiling or higher) if the spill happens in Summer and a 33 % chance of shoreline impact if it occurs in Winter. Mauritania and Senegal are the only two countries at risk of shoreline impact, but Senegal is most likely to be more severely impacted.
Both Mauritania and Senegal Waters’ will be impacted by this spill scenario. Whilst more countries will be impacted in the summer scenario (9 countries in summer vs. 6 countries in winter), a winter spill is far more likely to impact Waters’ of Cape Verde (51% in summer vs. 100 % in winter) and The Gambia (42 % in summer vs. 92% in winter).
However, the thickness of the condensate spill is limited to mostly sheen and rainbow sheen that will more readily disperse. A small amount of metallic sheen (>5 μm) may be found in the local area around the well (~25 km). Because of the high turbidity created by the gas at the well site, condensate droplets are very small. Consequentially, they rise more slowly and do not concentrate in the same way as if there was an absence of gas.
Oil Spill Modelling Report – Well Head Failure: Tortue Phase 1a
BP p.l.c.
Document No: GEOM0132a R03 Page 3 of 60 Oil Spill Response Ltd. Date Issued: 19-Jan-18
DOCUMENT HISTORY
Document Number Revision Document
Type Author Technical Review
Format Review
Date of Issue
GEOM0132a R01 Draft Modelling Report JKM LHM SJB 24-Nov-2017
GEOM0132 R02 Client Comments Addressed JKM LHM SJB 12-Jan-2018
GEOM0132 R03 Client Comments Addressed LHM N/A N/A 19-Jan-2018
JKM – Jenny Kirsty Mitchell LHM – Liam Harrington-Missin SJB – Simon Blaen
DISCLAIMERS
Modelling results are to be used for guidance purposes only and response strategies should not be based on these results alone. The resolution / quality of wind and current data vary between regions and models. As with any model, the quality and reliability of the results are dependent on the quality of the input data.
Considering the above, all advice, modelling, and other information provided is generic and illustrative only and not intended to be relied upon in any specific instance. The recipient of any advice, modelling or other information from, or on behalf of, OSRL acknowledges and agrees that any number of variables may impact on an oil spill and, as such, should be addressed on an individual basis. OSRL has no liability in relation to such advice, modelling or other information and the recipient of such information hereby fully indemnifies and holds harmless OSRL its officers, employees, shareholders, agents, contractors and sub-contractors against any costs, losses, claims or liabilities arising about such advice, modelling, training or other information.
Oil Spill Modelling Report – Well Head Failure: Tortue Phase 1a
BP p.l.c.
Document No: GEOM0132a R03 Page 4 of 60 Oil Spill Response Ltd. Date Issued: 19-Jan-18
TABLE OF CONTENTS
1 INTRODUCTION ............................................................................................................... 5 1.1 BACKGROUND ........................................................................................................................ 5 1.2 AIMS .................................................................................................................................... 5 1.3 MODELLING SETUP ................................................................................................................. 7 1.4 THRESHOLDS.......................................................................................................................... 8
2 RESULTS ........................................................................................................................ 10 2.1 STOCHASTIC RESULTS ............................................................................................................ 10
2.1.1 Surface Impact .................................................................................................... 12 2.1.2 Shoreline Impact.................................................................................................. 18 2.1.3 Dissolved Water Column Impact ......................................................................... 25 2.1.4 Total Water Column Impact ................................................................................ 30
2.2 COMPARISON BETWEEN WINTER AND SUMMER ........................................................................ 35 2.3 WORST-CASE OIL SPILL SCENARIO........................................................................................... 37
3 CONCLUSION ................................................................................................................. 44
APPENDIX A. MODEL SETUP ........................................................................................... 46 APPENDIX B. METOCEAN DATA ...................................................................................... 47 APPENDIX C. JUSTIFY RELEASE DURATION ...................................................................... 49 APPENDIX D. HABITAT GRID ........................................................................................... 53 APPENDIX E. OIL CHARACTERISTICS AND BEHAVIOUR ..................................................... 54 APPENDIX F. OIL SPILL MODELLING SOFTWARE and methodology ................................... 57 APPENDIX G. GLOSSARY OF TERMS, ACRONYMS AND ABBREVIATIONS ........................... 58 APPENDIX H. REFERENCES .............................................................................................. 60
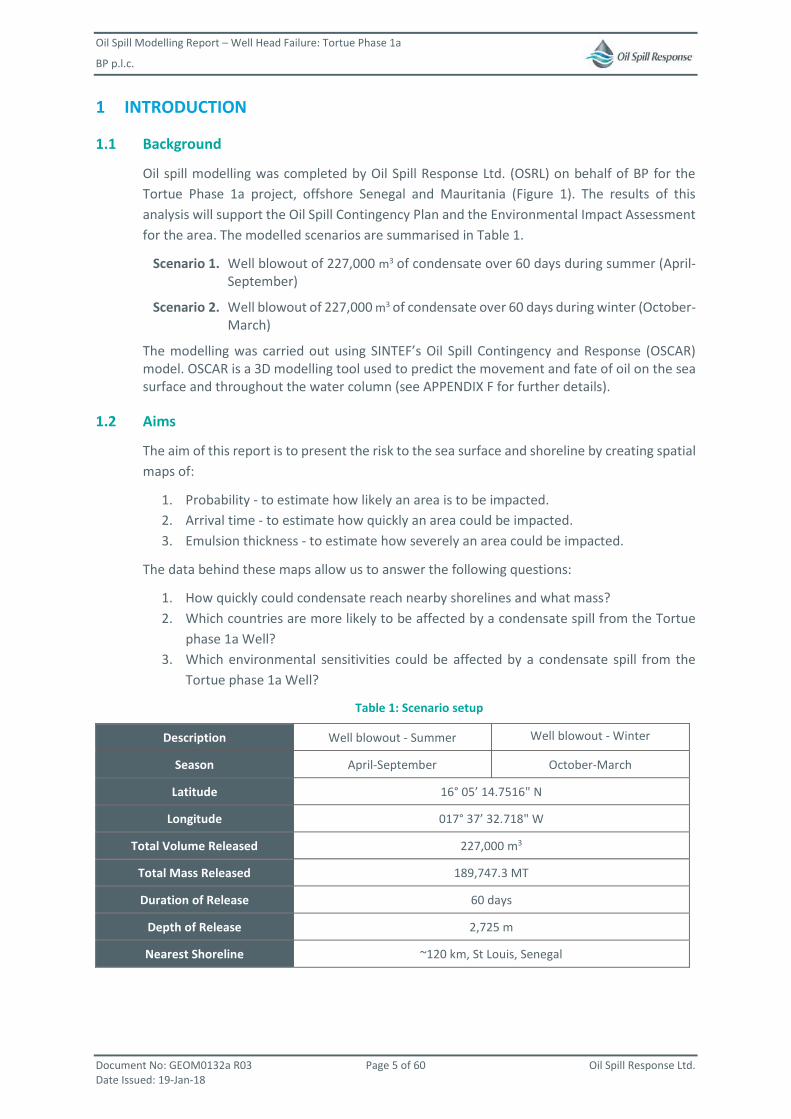
Oil Spill Modelling Report – Well Head Failure: Tortue Phase 1a
BP p.l.c.
Document No: GEOM0132a R03 Page 5 of 60 Oil Spill Response Ltd. Date Issued: 19-Jan-18
1 INTRODUCTION
1.1 Background
Oil spill modelling was completed by Oil Spill Response Ltd. (OSRL) on behalf of BP for the Tortue Phase 1a project, offshore Senegal and Mauritania (Figure 1). The results of this analysis will support the Oil Spill Contingency Plan and the Environmental Impact Assessment for the area. The modelled scenarios are summarised in Table 1.
Scenario 1. Well blowout of 227,000 m3 of condensate over 60 days during summer (April-September)
Scenario 2. Well blowout of 227,000 m3 of condensate over 60 days during winter (October-March)
The modelling was carried out using SINTEF’s Oil Spill Contingency and Response (OSCAR) model. OSCAR is a 3D modelling tool used to predict the movement and fate of oil on the sea surface and throughout the water column (see APPENDIX F for further details).
1.2 Aims
The aim of this report is to present the risk to the sea surface and shoreline by creating spatial maps of:
1. Probability - to estimate how likely an area is to be impacted. 2. Arrival time - to estimate how quickly an area could be impacted. 3. Emulsion thickness - to estimate how severely an area could be impacted.
The data behind these maps allow us to answer the following questions:
1. How quickly could condensate reach nearby shorelines and what mass? 2. Which countries are more likely to be affected by a condensate spill from the Tortue
phase 1a Well? 3. Which environmental sensitivities could be affected by a condensate spill from the
Tortue phase 1a Well?
Table 1: Scenario setup
Description Well blowout - Summer Well blowout - Winter
Season April-September October-March
Latitude 16° 05’ 14.7516" N
Longitude 017° 37’ 32.718" W
Total Volume Released 227,000 m3
Total Mass Released 189,747.3 MT
Duration of Release 60 days
Depth of Release 2,725 m
Nearest Shoreline ~120 km, St Louis, Senegal
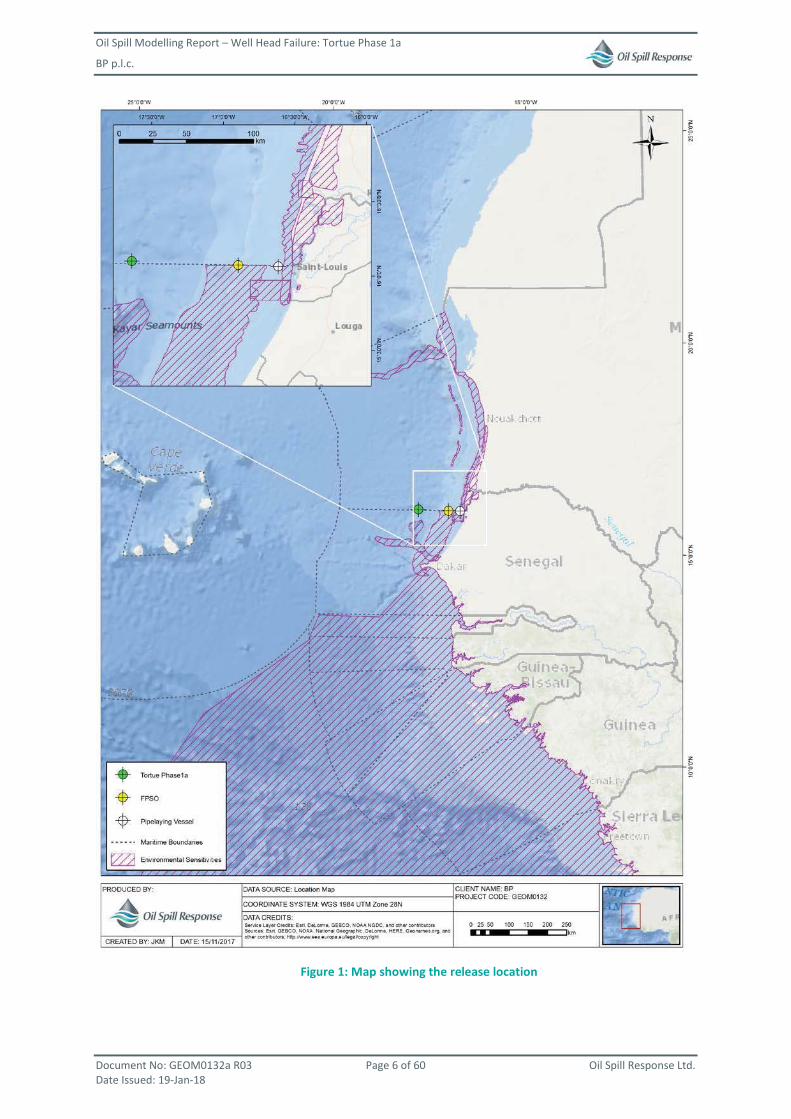
Oil Spill Modelling Report – Well Head Failure: Tortue Phase 1a
BP p.l.c.
Document No: GEOM0132a R03 Page 6 of 60 Oil Spill Response Ltd. Date Issued: 19-Jan-18
Figure 1: Map showing the release location

Oil Spill Modelling Report – Well Head Failure: Tortue Phase 1a
BP p.l.c.
Document No: GEOM0132a R03 Page 7 of 60 Oil Spill Response Ltd. Date Issued: 19-Jan-18
1.3 Modelling Setup
Two worst case stochastic simulations were run for the Tortue phase 1a project (Table 2), with a total of 308 individual trajectories post-processed for the scenario to create the stochastic results. Each trajectory began on a different start date, so that each spill was simulated using a range of wind and current conditions.
Three years of hydrodynamic data (sourced from Copernicus and NOAA) were used as model inputs. See APPENDIX A to APPENDIX E for more information on the model setup.
Table 2: Summary of stochastic setup for spill scenarios
Description Well Blowout in Summer Well Blowout in Winter
Location 16° 05’ 14.7516" N 017° 37’ 32.718" W
Time of Year April-September October-March
Release Period 60 days
Release Rate 3,783.3 m3/day
Total Release (Volume) 227,000 m3
Total Run Duration 95 days
Total Number of Trajectories 154 154
Time Between Trajectories 4 days, 14 hours 3 days, 3 hours
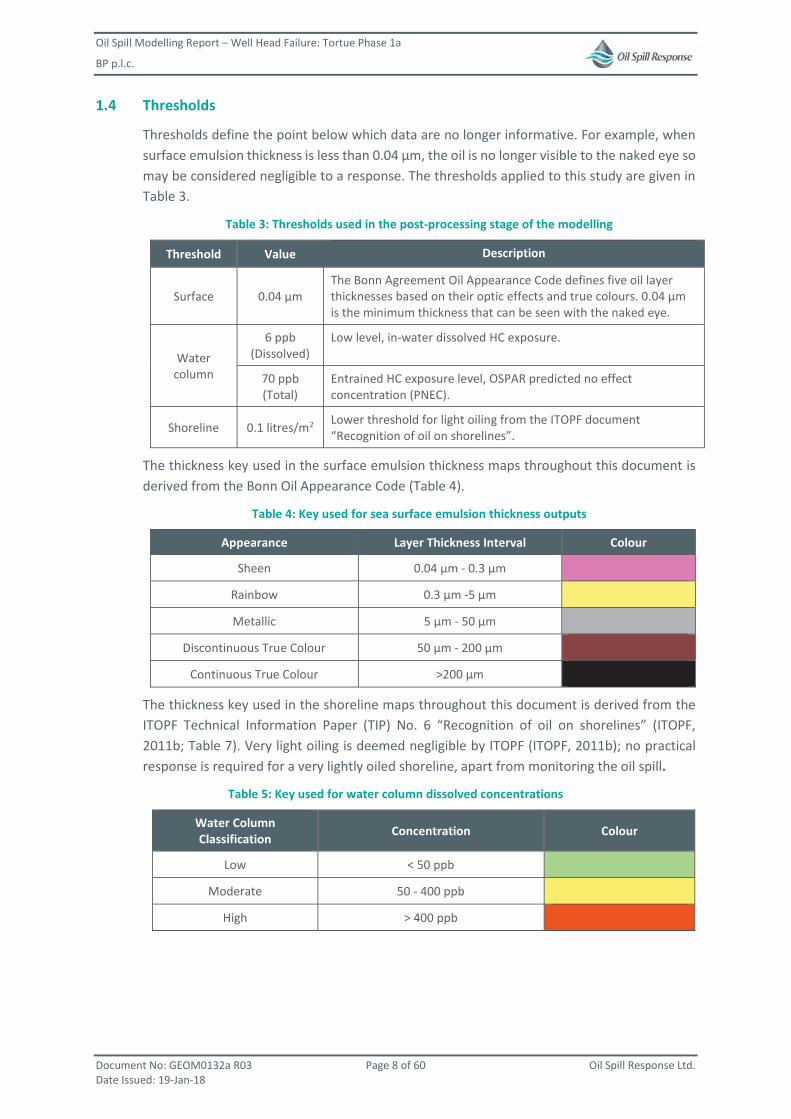
Oil Spill Modelling Report – Well Head Failure: Tortue Phase 1a
BP p.l.c.
Document No: GEOM0132a R03 Page 8 of 60 Oil Spill Response Ltd. Date Issued: 19-Jan-18
1.4 Thresholds
Thresholds define the point below which data are no longer informative. For example, when surface emulsion thickness is less than 0.04 μm, the oil is no longer visible to the naked eye so may be considered negligible to a response. The thresholds applied to this study are given in Table 3.
Table 3: Thresholds used in the post-processing stage of the modelling
Threshold Value Description
Surface 0.04 μm The Bonn Agreement Oil Appearance Code defines five oil layer thicknesses based on their optic effects and true colours. 0.04 μm is the minimum thickness that can be seen with the naked eye.
Water column
6 ppb (Dissolved)
Low level, in-water dissolved HC exposure.
70 ppb (Total)
Entrained HC exposure level, OSPAR predicted no effect concentration (PNEC).
Shoreline 0.1 litres/m2 Lower threshold for light oiling from the ITOPF document “Recognition of oil on shorelines”.
The thickness key used in the surface emulsion thickness maps throughout this document is derived from the Bonn Oil Appearance Code (Table 4).
Table 4: Key used for sea surface emulsion thickness outputs
Appearance Layer Thickness Interval Colour
Sheen 0.04 μm - 0.3 μm
Rainbow 0.3 μm -5 μm
Metallic 5 μm - 50 μm
Discontinuous True Colour 50 μm - 200 μm
Continuous True Colour >200 μm
The thickness key used in the shoreline maps throughout this document is derived from the ITOPF Technical Information Paper (TIP) No. 6 “Recognition of oil on shorelines” (ITOPF, 2011b; Table 7). Very light oiling is deemed negligible by ITOPF (ITOPF, 2011b); no practical response is required for a very lightly oiled shoreline, apart from monitoring the oil spill.
Table 5: Key used for water column dissolved concentrations
Water Column Classification Concentration Colour
Low < 50 ppb
Moderate 50 - 400 ppb
High > 400 ppb

Oil Spill Modelling Report – Well Head Failure: Tortue Phase 1a
BP p.l.c.
Document No: GEOM0132a R03 Page 9 of 60 Oil Spill Response Ltd. Date Issued: 19-Jan-18
Table 6: Key used for water column total concentrations
Concentration Colour
< 150 ppb
150 – 500 ppb
500 – 750 ppb
750 - 1000 ppb
> 1000 ppb
Table 7: Key used for shoreline emulsion thickness outputs
Shoreline Oiling Classification Concentration Thickness Colour
Light Oiling 0.1 – 1 litres/m2 0.1 mm – 1.0 mm
Moderate Oiling 1 – 10 litres/m2 1 mm – 10 mm
Heavy Oiling > 10 litres/m2 > 10 mm
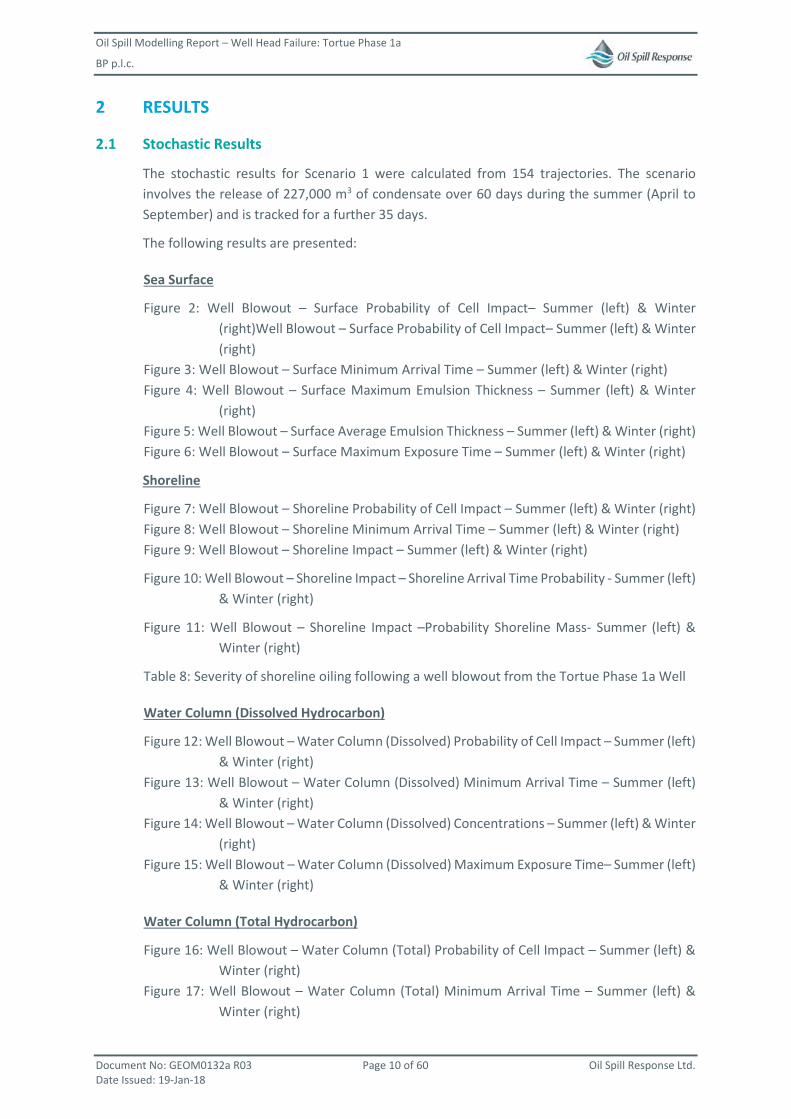
Oil Spill Modelling Report – Well Head Failure: Tortue Phase 1a
BP p.l.c.
Document No: GEOM0132a R03 Page 10 of 60 Oil Spill Response Ltd. Date Issued: 19-Jan-18
2 RESULTS
2.1 Stochastic Results
The stochastic results for Scenario 1 were calculated from 154 trajectories. The scenario involves the release of 227,000 m3 of condensate over 60 days during the summer (April to September) and is tracked for a further 35 days.
The following results are presented:
Sea Surface
Figure 2: Well Blowout – Surface Probability of Cell Impact– Summer (left) & Winter (right)Well Blowout – Surface Probability of Cell Impact– Summer (left) & Winter (right)
Figure 3: Well Blowout – Surface Minimum Arrival Time – Summer (left) & Winter (right) Figure 4: Well Blowout – Surface Maximum Emulsion Thickness – Summer (left) & Winter
(right) Figure 5: Well Blowout – Surface Average Emulsion Thickness – Summer (left) & Winter (right) Figure 6: Well Blowout – Surface Maximum Exposure Time – Summer (left) & Winter (right)
Shoreline
Figure 7: Well Blowout – Shoreline Probability of Cell Impact – Summer (left) & Winter (right) Figure 8: Well Blowout – Shoreline Minimum Arrival Time – Summer (left) & Winter (right) Figure 9: Well Blowout – Shoreline Impact – Summer (left) & Winter (right)
Figure 10: Well Blowout – Shoreline Impact – Shoreline Arrival Time Probability - Summer (left) & Winter (right)
Figure 11: Well Blowout – Shoreline Impact –Probability Shoreline Mass- Summer (left) & Winter (right)
Table 8: Severity of shoreline oiling following a well blowout from the Tortue Phase 1a Well
Water Column (Dissolved Hydrocarbon)
Figure 12: Well Blowout – Water Column (Dissolved) Probability of Cell Impact – Summer (left) & Winter (right)
Figure 13: Well Blowout – Water Column (Dissolved) Minimum Arrival Time – Summer (left) & Winter (right)
Figure 14: Well Blowout – Water Column (Dissolved) Concentrations – Summer (left) & Winter (right)
Figure 15: Well Blowout – Water Column (Dissolved) Maximum Exposure Time– Summer (left) & Winter (right)
Water Column (Total Hydrocarbon)
Figure 16: Well Blowout – Water Column (Total) Probability of Cell Impact – Summer (left) & Winter (right)
Figure 17: Well Blowout – Water Column (Total) Minimum Arrival Time – Summer (left) & Winter (right)

Oil Spill Modelling Report – Well Head Failure: Tortue Phase 1a
BP p.l.c.
Document No: GEOM0132a R03 Page 11 of 60 Oil Spill Response Ltd. Date Issued: 19-Jan-18
Figure 18: Well Blowout – Water Column (Total) Concentrations – Summer (left) & Winter (right)
Figure 19: Well Blowout – Water Column (Total) Maximum Exposure Time – Summer (left) & Winter (right)

Oil Spill Modelling Report – Well Head Failure: Tortue Phase 1a
BP p.l.c.
Document No: GEOM0132a R03 Page 12 of 60 Oil Spill Response Ltd. Date Issued: 19-Jan-18
2.1.1 Surface Impact
Well Blowout Surface
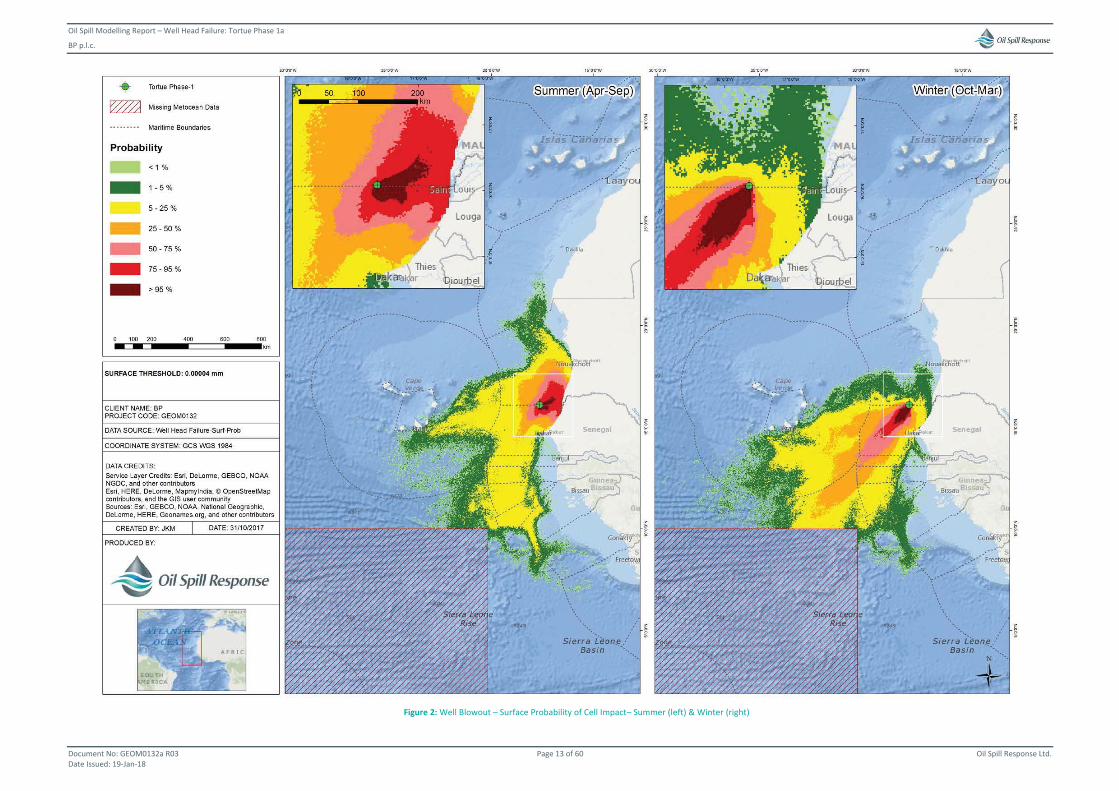
Oil Spill Modelling Report – Well Head Failure: Tortue Phase 1a
BP p.l.c.
Document No: GEOM0132a R03 Page 13 of 60 Oil Spill Response Ltd. Date Issued: 19-Jan-18
Figure 2: Well Blowout – Surface Probability of Cell Impact– Summer (left) & Winter (right)
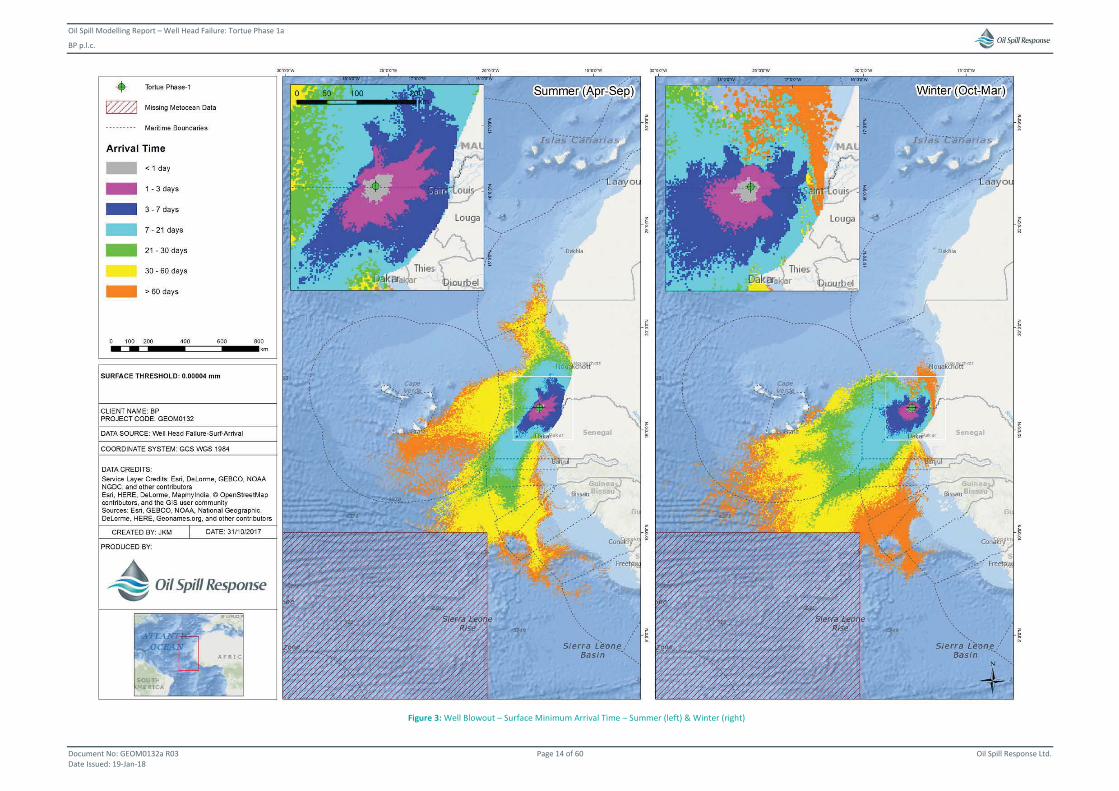
Oil Spill Modelling Report – Well Head Failure: Tortue Phase 1a
BP p.l.c.
Document No: GEOM0132a R03 Page 14 of 60 Oil Spill Response Ltd. Date Issued: 19-Jan-18
Figure 3: Well Blowout – Surface Minimum Arrival Time – Summer (left) & Winter (right)
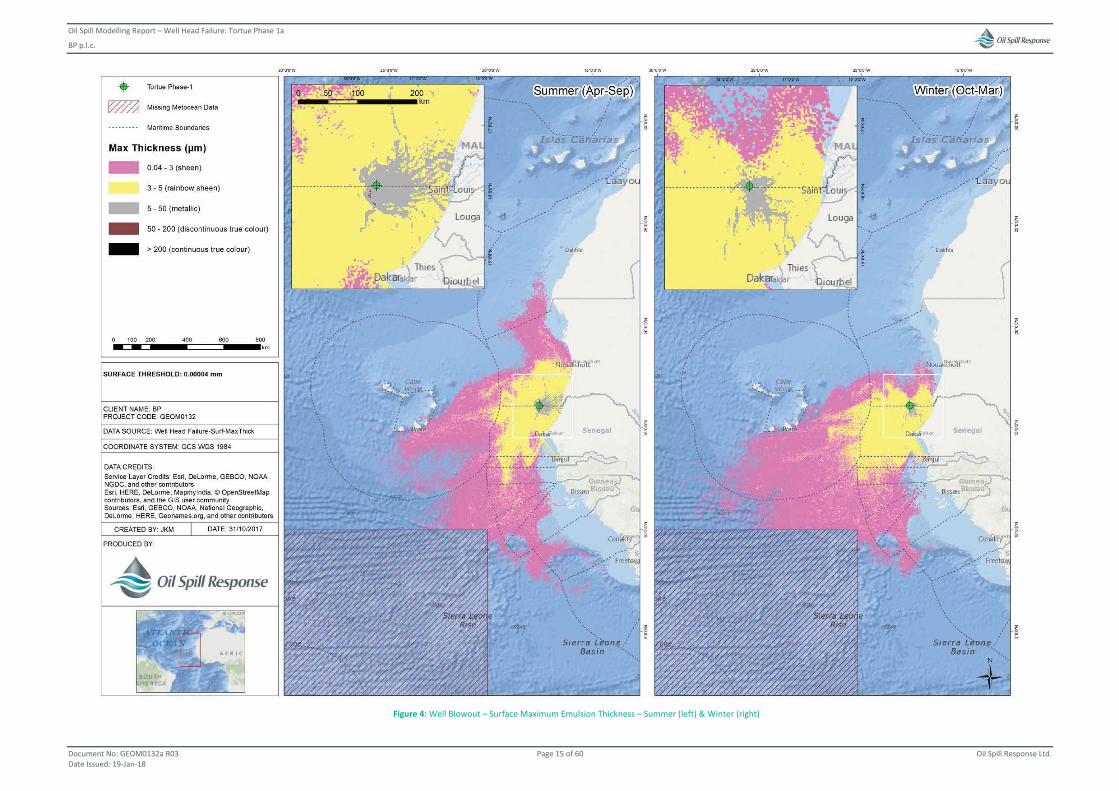
Oil Spill Modelling Report – Well Head Failure: Tortue Phase 1a
BP p.l.c.
Document No: GEOM0132a R03 Page 15 of 60 Oil Spill Response Ltd. Date Issued: 19-Jan-18
Figure 4: Well Blowout – Surface Maximum Emulsion Thickness – Summer (left) & Winter (right)
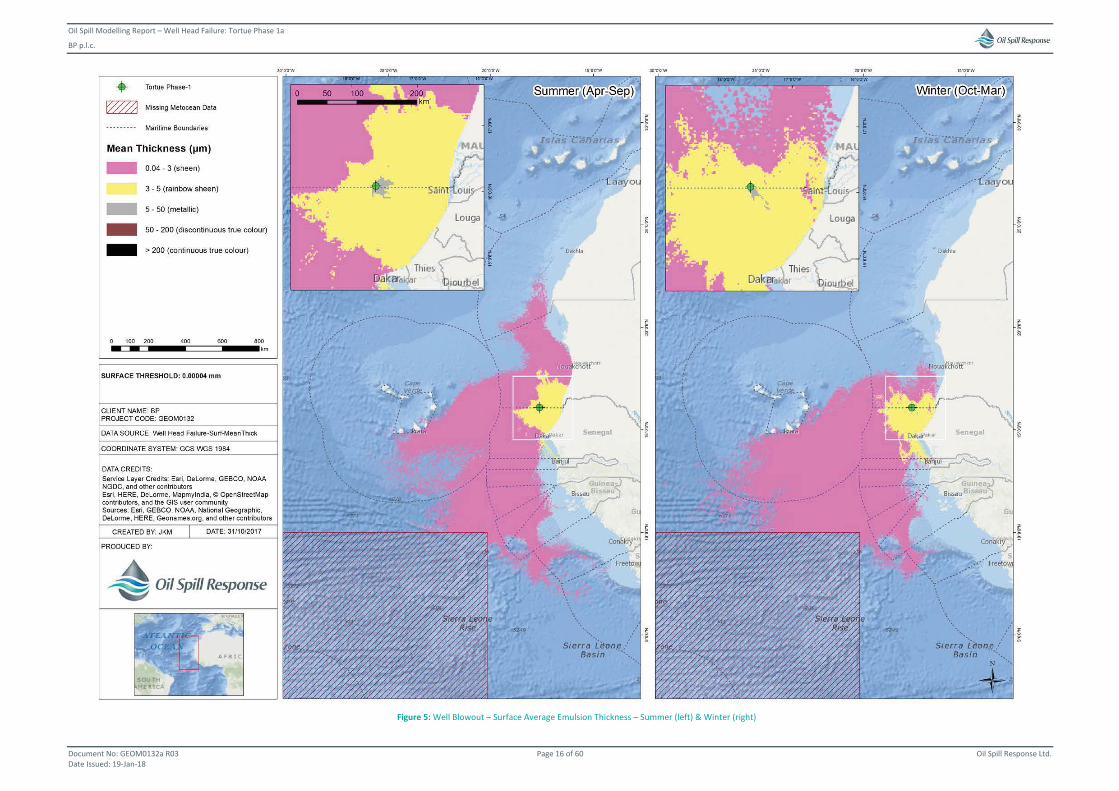
Oil Spill Modelling Report – Well Head Failure: Tortue Phase 1a
BP p.l.c.
Document No: GEOM0132a R03 Page 16 of 60 Oil Spill Response Ltd. Date Issued: 19-Jan-18
Figure 5: Well Blowout – Surface Average Emulsion Thickness – Summer (left) & Winter (right)
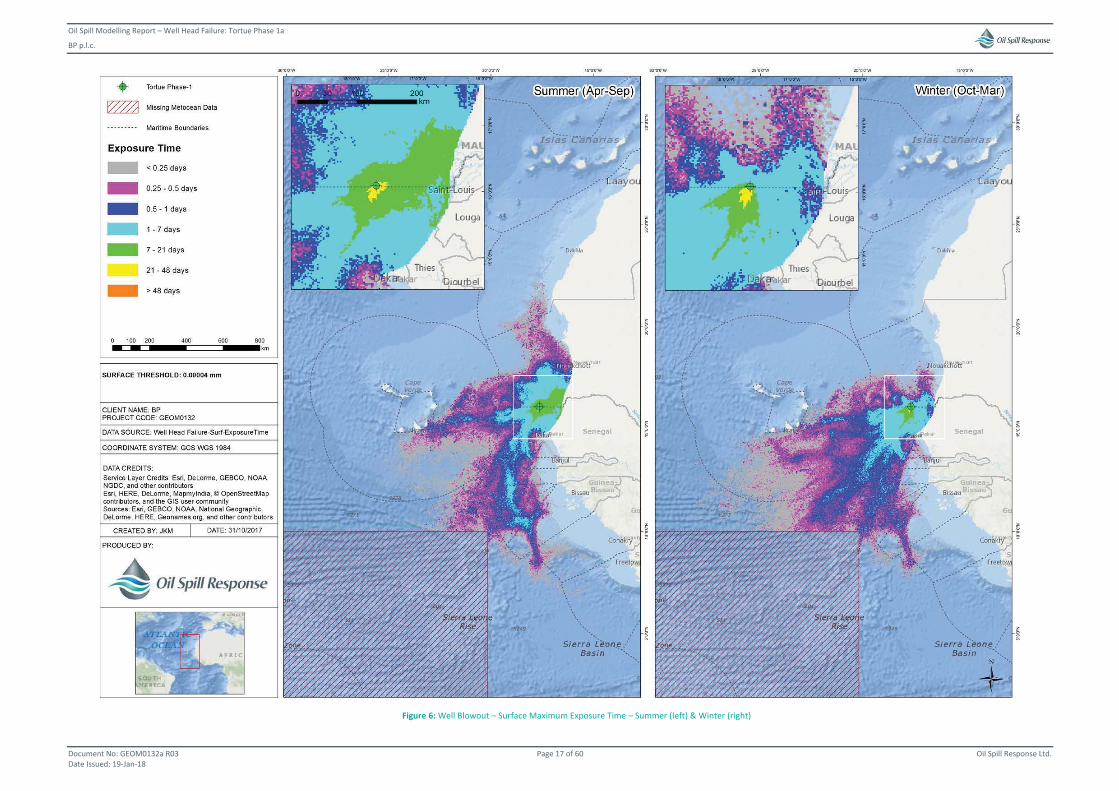
Oil Spill Modelling Report – Well Head Failure: Tortue Phase 1a
BP p.l.c.
Document No: GEOM0132a R03 Page 17 of 60 Oil Spill Response Ltd. Date Issued: 19-Jan-18
Figure 6: Well Blowout – Surface Maximum Exposure Time – Summer (left) & Winter (right)

Oil Spill Modelling Report – Well Head Failure: Tortue Phase 1a
BP p.l.c.
Document No: GEOM0132a R03 Page 18 of 60 Oil Spill Response Ltd. Date Issued: 19-Jan-18
2.1.2 Shoreline Impact
Well Blowout Shoreline

Oil Spill Modelling Report – Well Head Failure: Tortue Phase 1a
BP p.l.c.
Document No: GEOM0132a R03 Page 19 of 60 Oil Spill Response Ltd. Date Issued: 19-Jan-18
Figure 7: Well Blowout – Shoreline Probability of Cell Impact – Summer (left) & Winter (right)
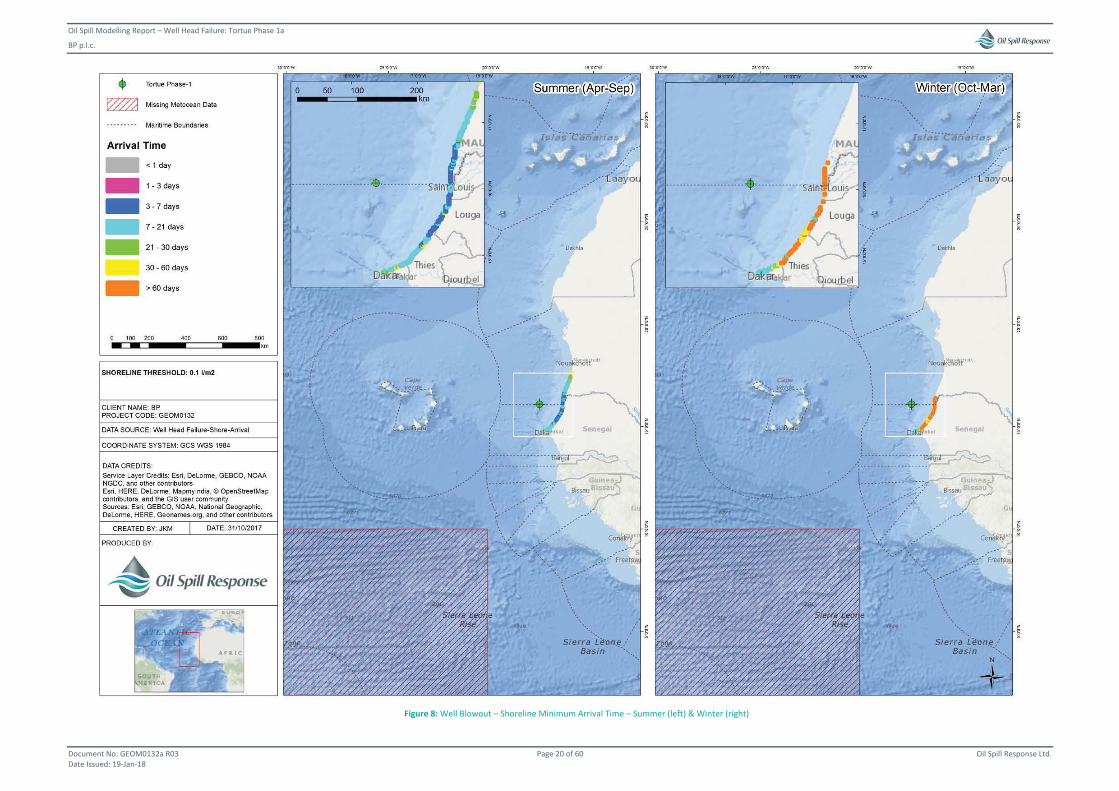
Oil Spill Modelling Report – Well Head Failure: Tortue Phase 1a
BP p.l.c.
Document No: GEOM0132a R03 Page 20 of 60 Oil Spill Response Ltd. Date Issued: 19-Jan-18
Figure 8: Well Blowout – Shoreline Minimum Arrival Time – Summer (left) & Winter (right)
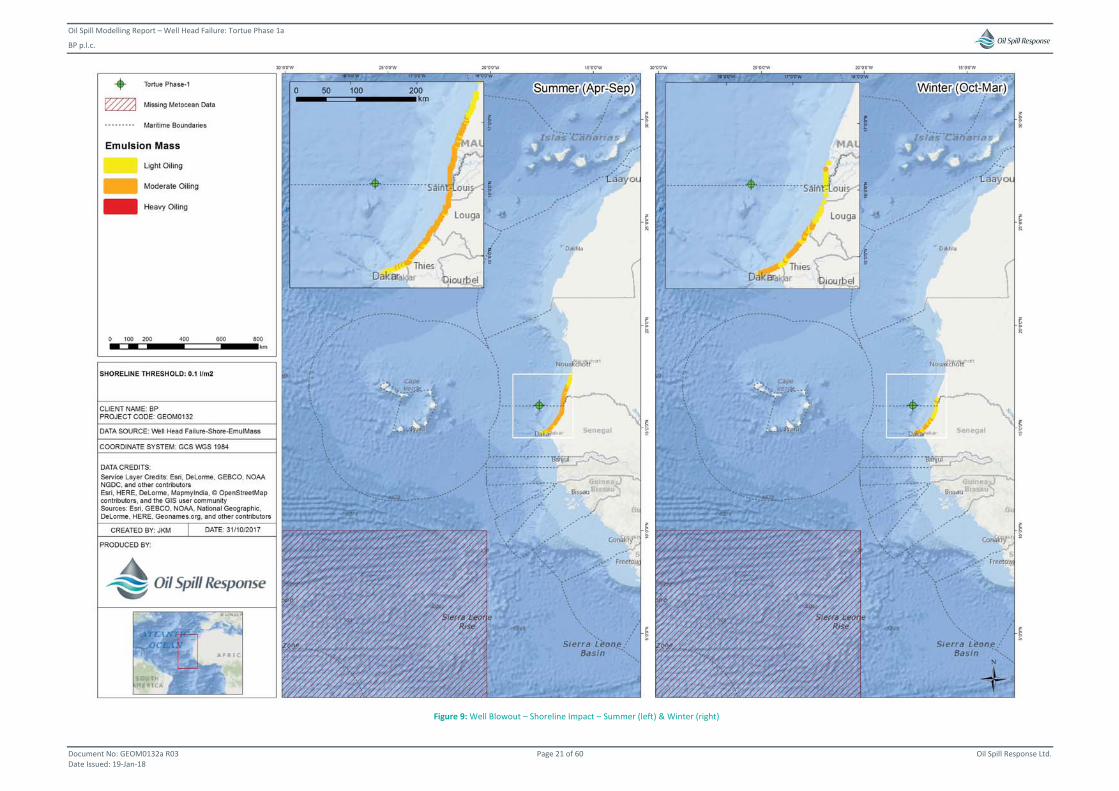
Oil Spill Modelling Report – Well Head Failure: Tortue Phase 1a
BP p.l.c.
Document No: GEOM0132a R03 Page 21 of 60 Oil Spill Response Ltd. Date Issued: 19-Jan-18
Figure 9: Well Blowout – Shoreline Impact – Summer (left) & Winter (right)
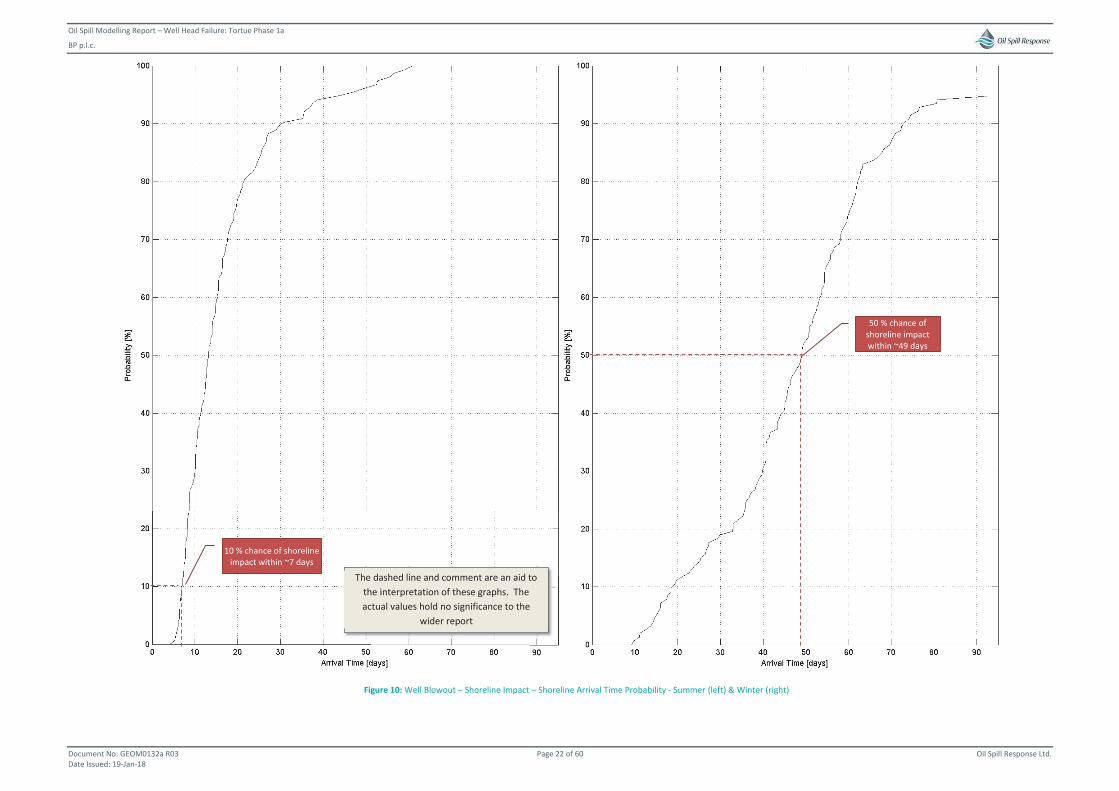
Oil Spill Modelling Report – Well Head Failure: Tortue Phase 1a
BP p.l.c.
Document No: GEOM0132a R03 Page 22 of 60 Oil Spill Response Ltd. Date Issued: 19-Jan-18
Figure 10: Well Blowout – Shoreline Impact – Shoreline Arrival Time Probability - Summer (left) & Winter (right)
10 % chance of shoreline impact within ~7 days
50 % chance of shoreline impact within ~49 days
The dashed line and comment are an aid to the interpretation of these graphs. The actual values hold no significance to the
wider report
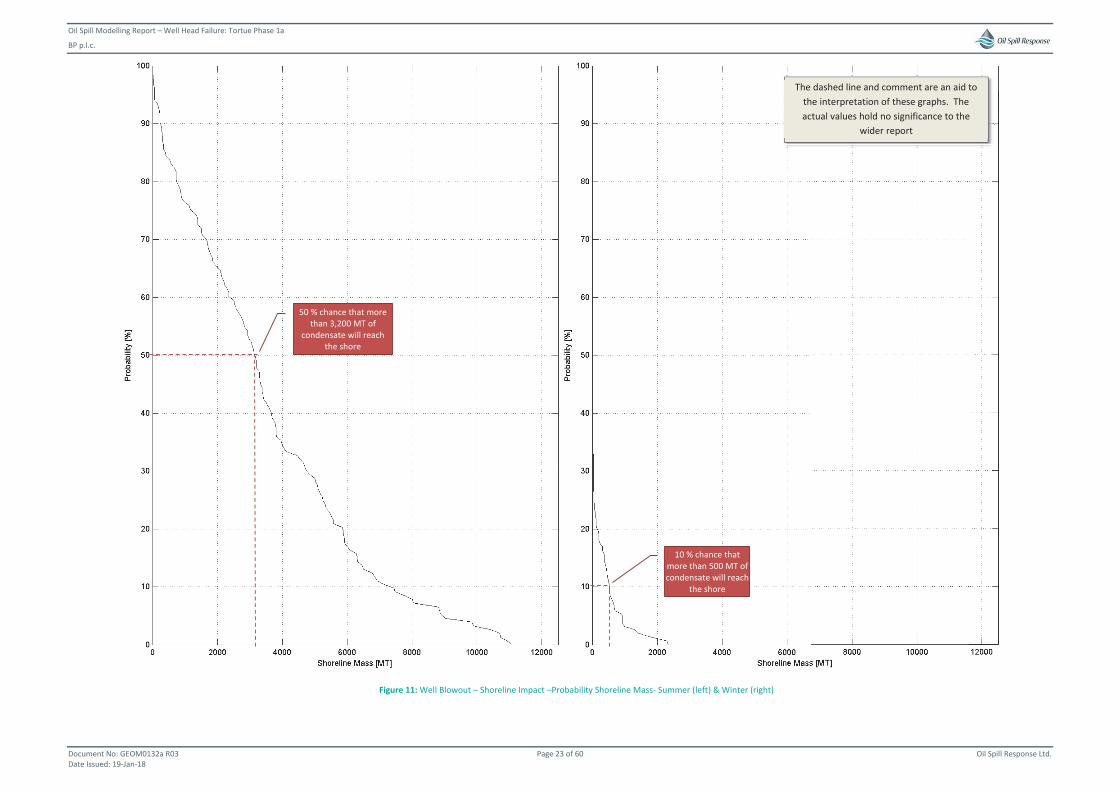
Oil Spill Modelling Report – Well Head Failure: Tortue Phase 1a
BP p.l.c.
Document No: GEOM0132a R03 Page 23 of 60 Oil Spill Response Ltd. Date Issued: 19-Jan-18
Figure 11: Well Blowout – Shoreline Impact –Probability Shoreline Mass- Summer (left) & Winter (right)
50 % chance that more than 3,200 MT of
condensate will reach the shore
10 % chance that more than 500 MT of condensate will reach
the shore
The dashed line and comment are an aid to the interpretation of these graphs. The actual values hold no significance to the
wider report
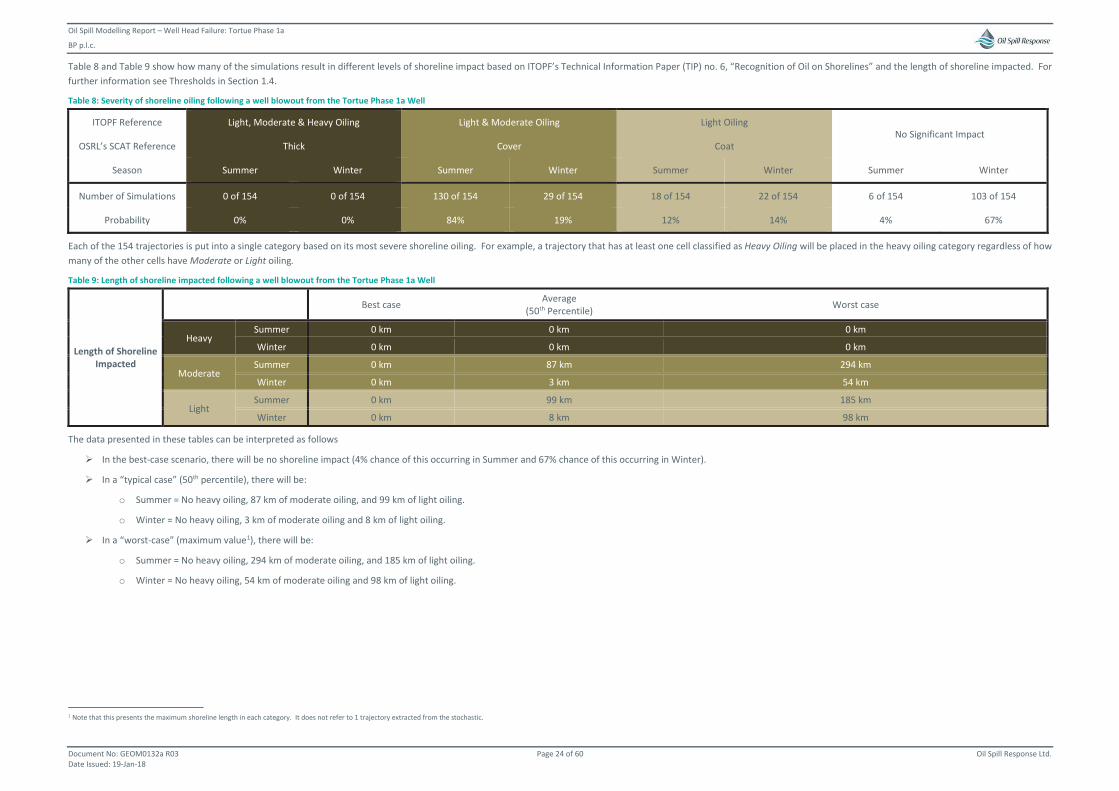
Oil Spill Modelling Report – Well Head Failure: Tortue Phase 1a
BP p.l.c.
Document No: GEOM0132a R03 Page 24 of 60 Oil Spill Response Ltd. Date Issued: 19-Jan-18
Table 8 and Table 9 show how many of the simulations result in different levels of shoreline impact based on ITOPF’s Technical Information Paper (TIP) no. 6, “Recognition of Oil on Shorelines” and the length of shoreline impacted. For further information see Thresholds in Section 1.4.
Table 8: Severity of shoreline oiling following a well blowout from the Tortue Phase 1a Well
ITOPF Reference Light, Moderate & Heavy Oiling Light & Moderate Oiling Light Oiling No Significant Impact
OSRL’s SCAT Reference Thick Cover Coat
Season Summer Winter Summer Winter Summer Winter Summer Winter
Number of Simulations 0 of 154 0 of 154 130 of 154 29 of 154 18 of 154 22 of 154 6 of 154 103 of 154
Probability 0% 0% 84% 19% 12% 14% 4% 67%
Each of the 154 trajectories is put into a single category based on its most severe shoreline oiling. For example, a trajectory that has at least one cell classified as Heavy Oiling will be placed in the heavy oiling category regardless of how many of the other cells have Moderate or Light oiling.
Table 9: Length of shoreline impacted following a well blowout from the Tortue Phase 1a Well
Length of Shoreline Impacted
Best case Average (50th Percentile) Worst case
Heavy Summer 0 km 0 km 0 km
Winter 0 km 0 km 0 km
Moderate Summer 0 km 87 km 294 km
Winter 0 km 3 km 54 km
Light Summer 0 km 99 km 185 km
Winter 0 km 8 km 98 km
The data presented in these tables can be interpreted as follows
In the best-case scenario, there will be no shoreline impact (4% chance of this occurring in Summer and 67% chance of this occurring in Winter).
In a “typical case” (50th percentile), there will be:
o Summer = No heavy oiling, 87 km of moderate oiling, and 99 km of light oiling.
o Winter = No heavy oiling, 3 km of moderate oiling and 8 km of light oiling.
In a “worst-case” (maximum value1), there will be:
o Summer = No heavy oiling, 294 km of moderate oiling, and 185 km of light oiling.
o Winter = No heavy oiling, 54 km of moderate oiling and 98 km of light oiling.
1 Note that this presents the maximum shoreline length in each category. It does not refer to 1 trajectory extracted from the stochastic.

Oil Spill Modelling Report – Well Head Failure: Tortue Phase 1a
BP p.l.c.
Document No: GEOM0132a R03 Page 25 of 60 Oil Spill Response Ltd. Date Issued: 19-Jan-18
2.1.3 Dissolved Water Column Impact
Well Blowout Water Column Maps p
Dissolved Concentrations
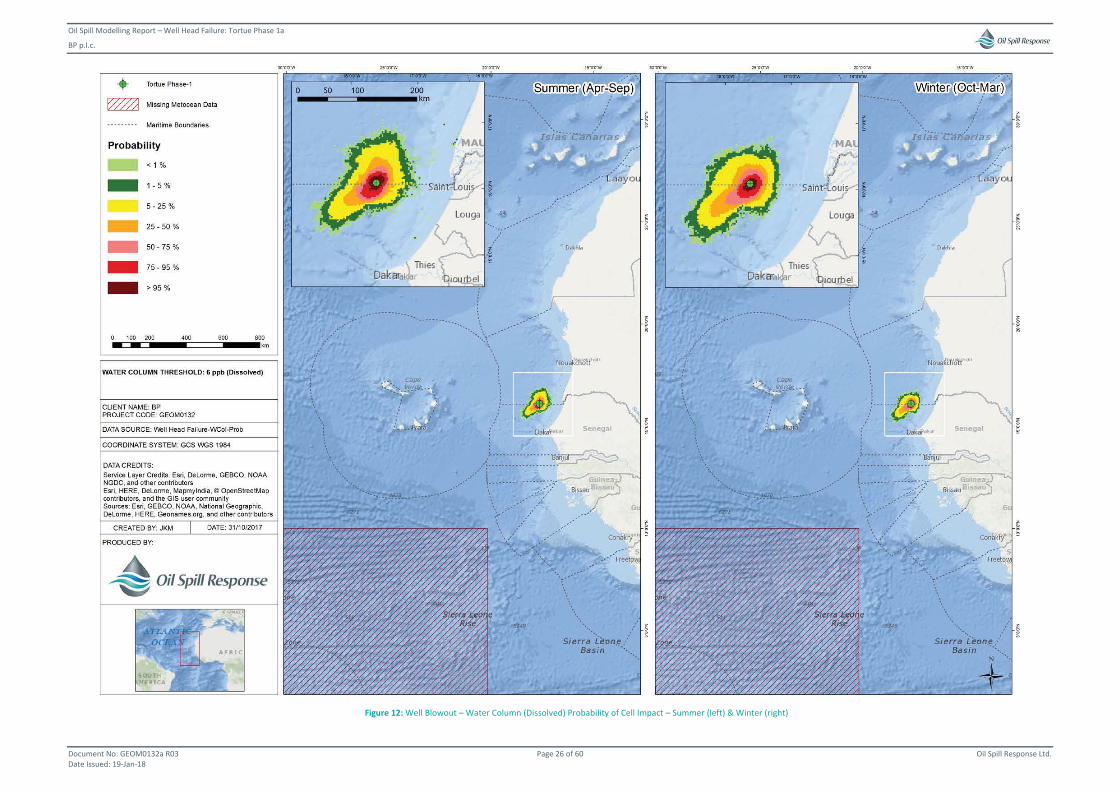
Oil Spill Modelling Report – Well Head Failure: Tortue Phase 1a
BP p.l.c.
Document No: GEOM0132a R03 Page 26 of 60 Oil Spill Response Ltd. Date Issued: 19-Jan-18
Figure 12: Well Blowout – Water Column (Dissolved) Probability of Cell Impact – Summer (left) & Winter (right)
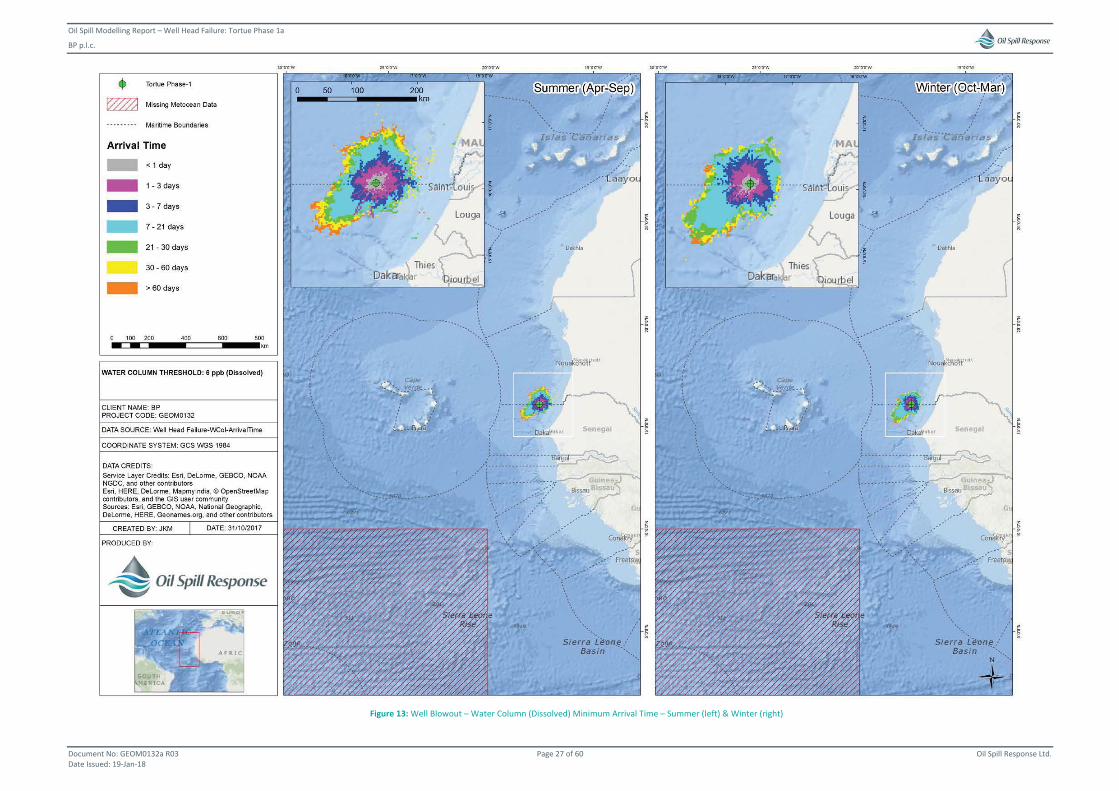
Oil Spill Modelling Report – Well Head Failure: Tortue Phase 1a
BP p.l.c.
Document No: GEOM0132a R03 Page 27 of 60 Oil Spill Response Ltd. Date Issued: 19-Jan-18
Figure 13: Well Blowout – Water Column (Dissolved) Minimum Arrival Time – Summer (left) & Winter (right)
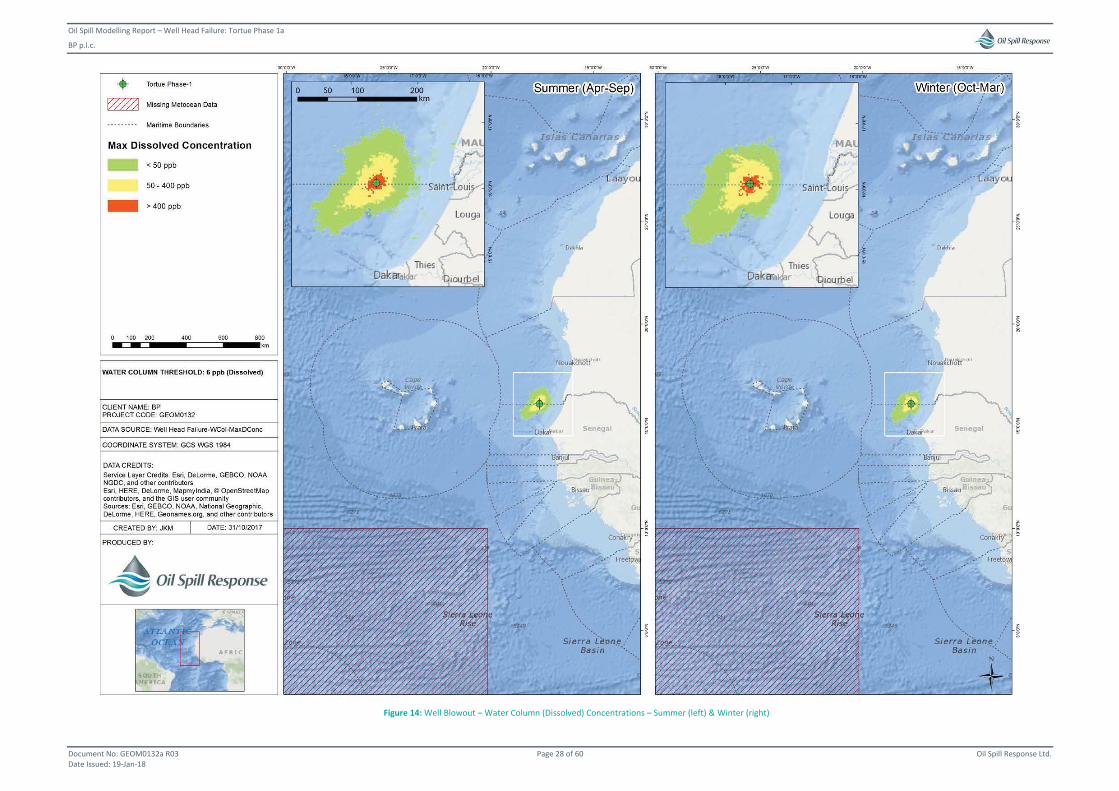
Oil Spill Modelling Report – Well Head Failure: Tortue Phase 1a
BP p.l.c.
Document No: GEOM0132a R03 Page 28 of 60 Oil Spill Response Ltd. Date Issued: 19-Jan-18
Figure 14: Well Blowout – Water Column (Dissolved) Concentrations – Summer (left) & Winter (right)
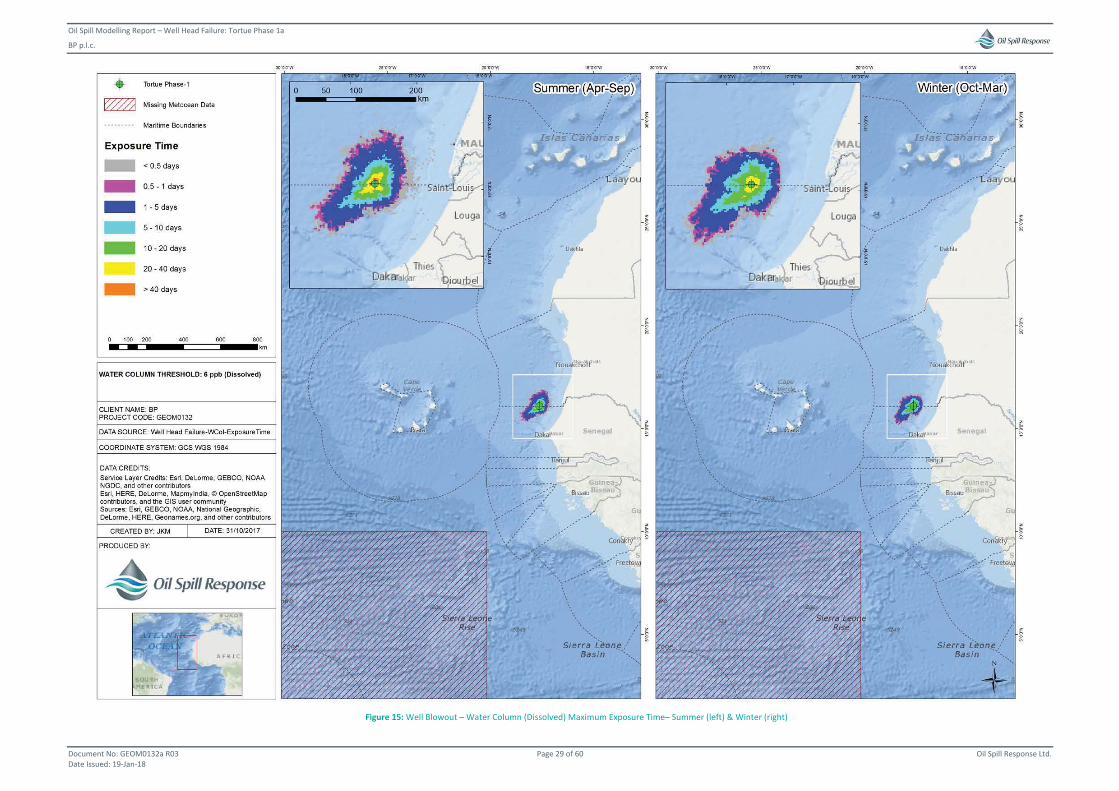
Oil Spill Modelling Report – Well Head Failure: Tortue Phase 1a
BP p.l.c.
Document No: GEOM0132a R03 Page 29 of 60 Oil Spill Response Ltd. Date Issued: 19-Jan-18
Figure 15: Well Blowout – Water Column (Dissolved) Maximum Exposure Time– Summer (left) & Winter (right)

Oil Spill Modelling Report – Well Head Failure: Tortue Phase 1a
BP p.l.c.
Document No: GEOM0132a R03 Page 30 of 60 Oil Spill Response Ltd. Date Issued: 19-Jan-18
2.1.4 Total Water Column Impact
Well Blowout Water Column Maps p
Total Concentrations
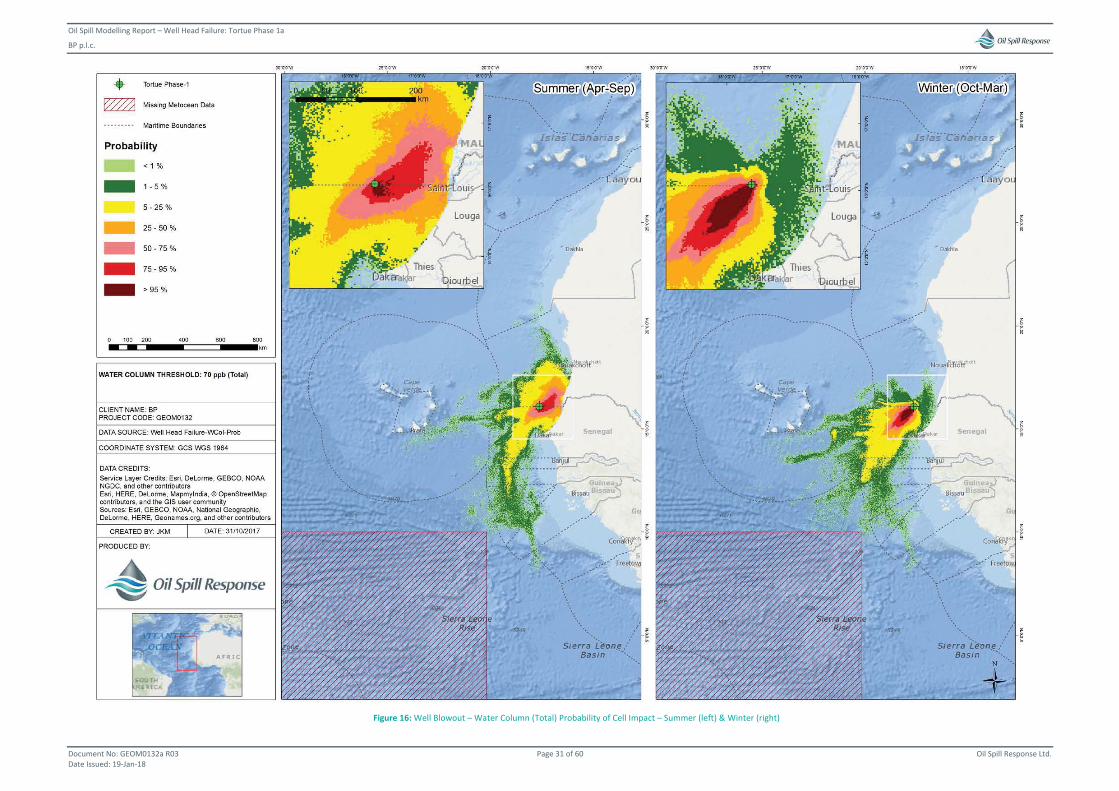
Oil Spill Modelling Report – Well Head Failure: Tortue Phase 1a
BP p.l.c.
Document No: GEOM0132a R03 Page 31 of 60 Oil Spill Response Ltd. Date Issued: 19-Jan-18
Figure 16: Well Blowout – Water Column (Total) Probability of Cell Impact – Summer (left) & Winter (right)
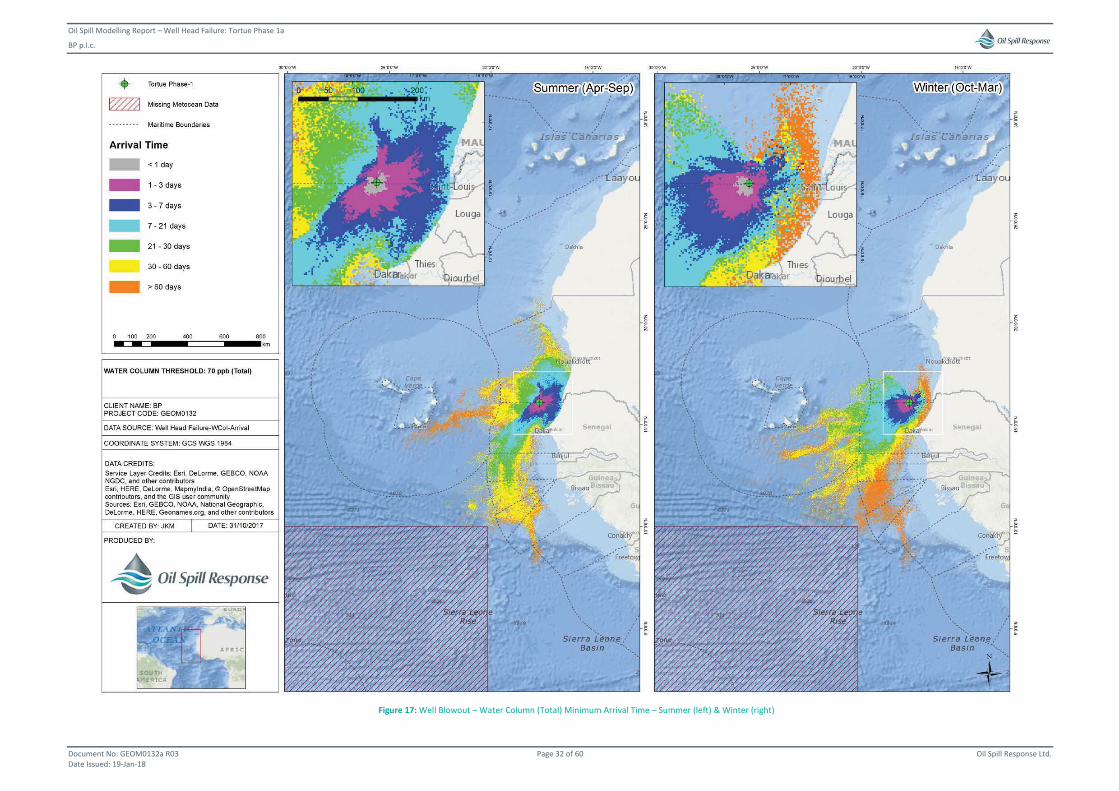
Oil Spill Modelling Report – Well Head Failure: Tortue Phase 1a
BP p.l.c.
Document No: GEOM0132a R03 Page 32 of 60 Oil Spill Response Ltd. Date Issued: 19-Jan-18
Figure 17: Well Blowout – Water Column (Total) Minimum Arrival Time – Summer (left) & Winter (right)
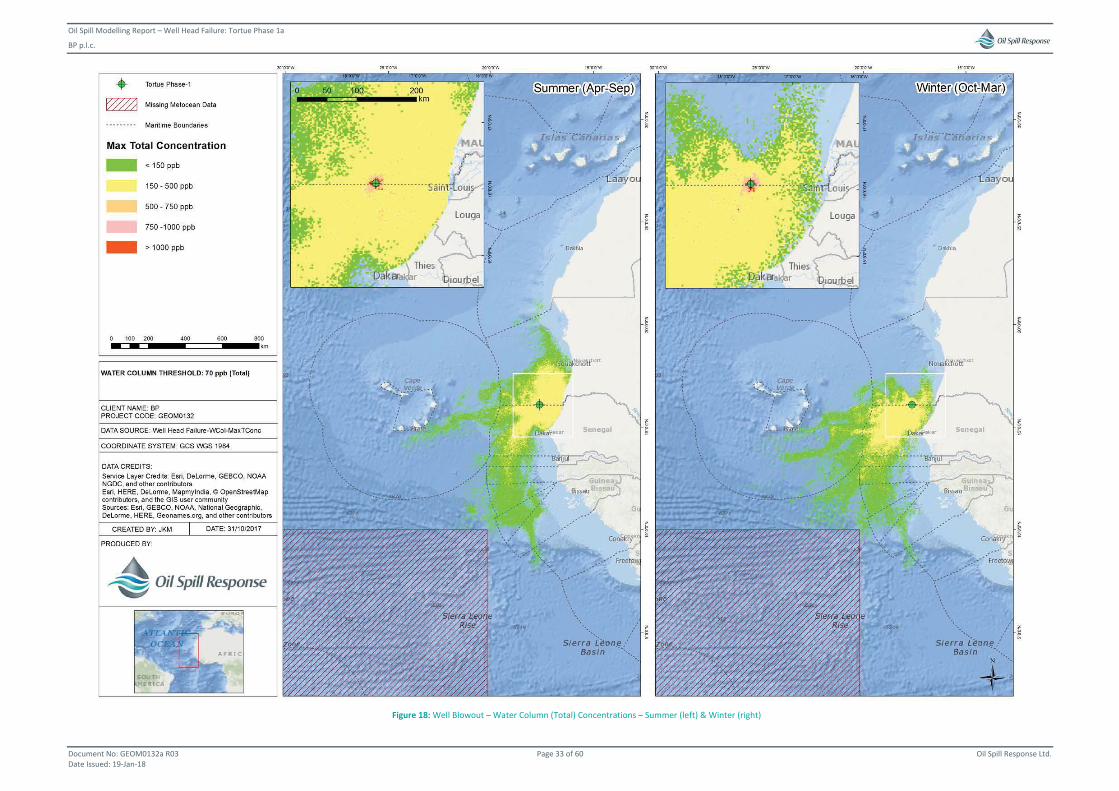
Oil Spill Modelling Report – Well Head Failure: Tortue Phase 1a
BP p.l.c.
Document No: GEOM0132a R03 Page 33 of 60 Oil Spill Response Ltd. Date Issued: 19-Jan-18
Figure 18: Well Blowout – Water Column (Total) Concentrations – Summer (left) & Winter (right)
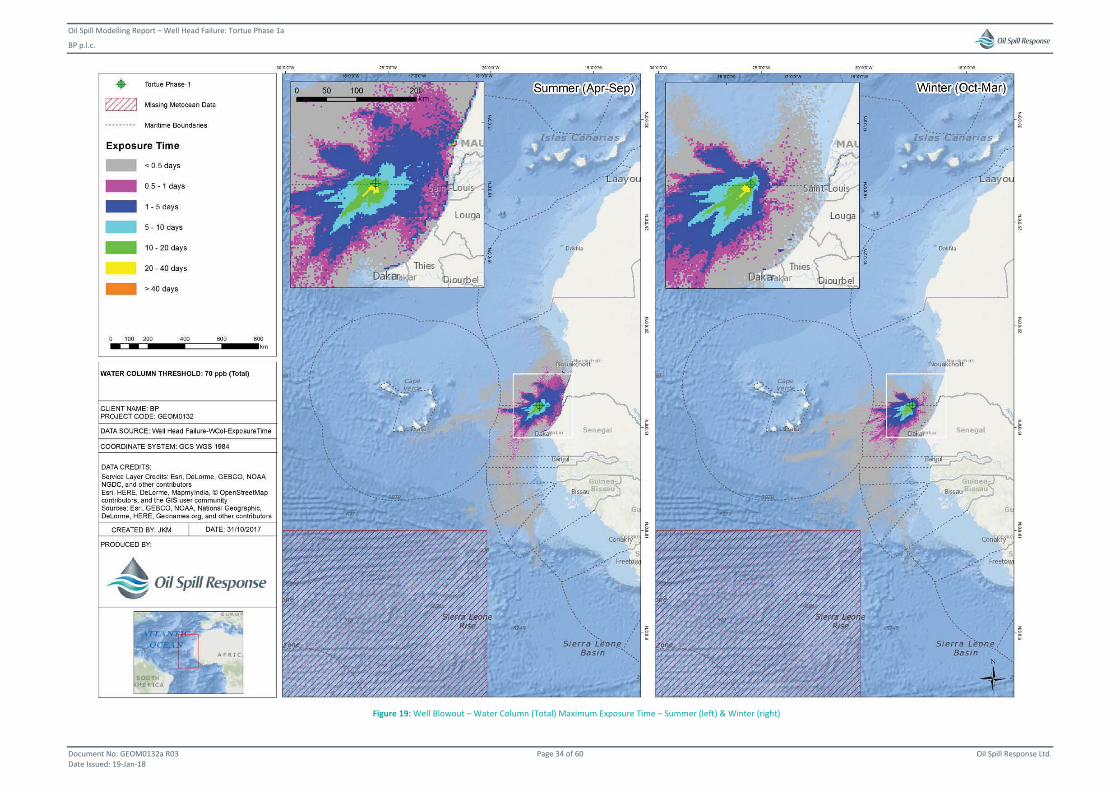
Oil Spill Modelling Report – Well Head Failure: Tortue Phase 1a
BP p.l.c.
Document No: GEOM0132a R03 Page 34 of 60 Oil Spill Response Ltd. Date Issued: 19-Jan-18
Figure 19: Well Blowout – Water Column (Total) Maximum Exposure Time – Summer (left) & Winter (right)
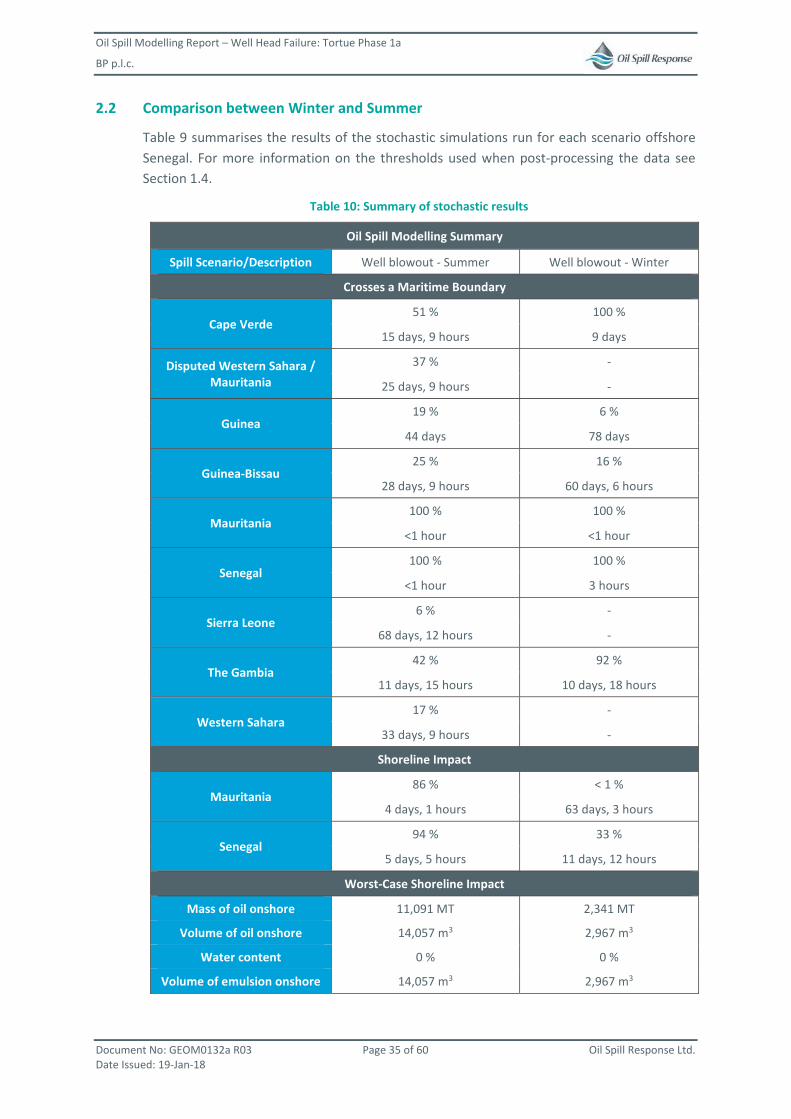
Oil Spill Modelling Report – Well Head Failure: Tortue Phase 1a
BP p.l.c.
Document No: GEOM0132a R03 Page 35 of 60 Oil Spill Response Ltd. Date Issued: 19-Jan-18
2.2 Comparison between Winter and Summer
Table 9 summarises the results of the stochastic simulations run for each scenario offshore Senegal. For more information on the thresholds used when post-processing the data see Section 1.4.
Table 10: Summary of stochastic results
Oil Spill Modelling Summary
Spill Scenario/Description Well blowout - Summer Well blowout - Winter
Crosses a Maritime Boundary
Cape Verde 51 % 100 %
15 days, 9 hours 9 days
Disputed Western Sahara / Mauritania
37 % -
25 days, 9 hours -
Guinea 19 % 6 %
44 days 78 days
Guinea-Bissau 25 % 16 %
28 days, 9 hours 60 days, 6 hours
Mauritania 100 % 100 %
<1 hour <1 hour
Senegal 100 % 100 %
<1 hour 3 hours
Sierra Leone 6 % -
68 days, 12 hours -
The Gambia 42 % 92 %
11 days, 15 hours 10 days, 18 hours
Western Sahara 17 % -
33 days, 9 hours -
Shoreline Impact
Mauritania86 % < 1 %
4 days, 1 hours 63 days, 3 hours
Senegal 94 % 33 %
5 days, 5 hours 11 days, 12 hours
Worst-Case Shoreline Impact
Mass of oil onshore 11,091 MT 2,341 MT
Volume of oil onshore 14,057 m3 2,967 m3
Water content 0 % 0 %
Volume of emulsion onshore 14,057 m3 2,967 m3
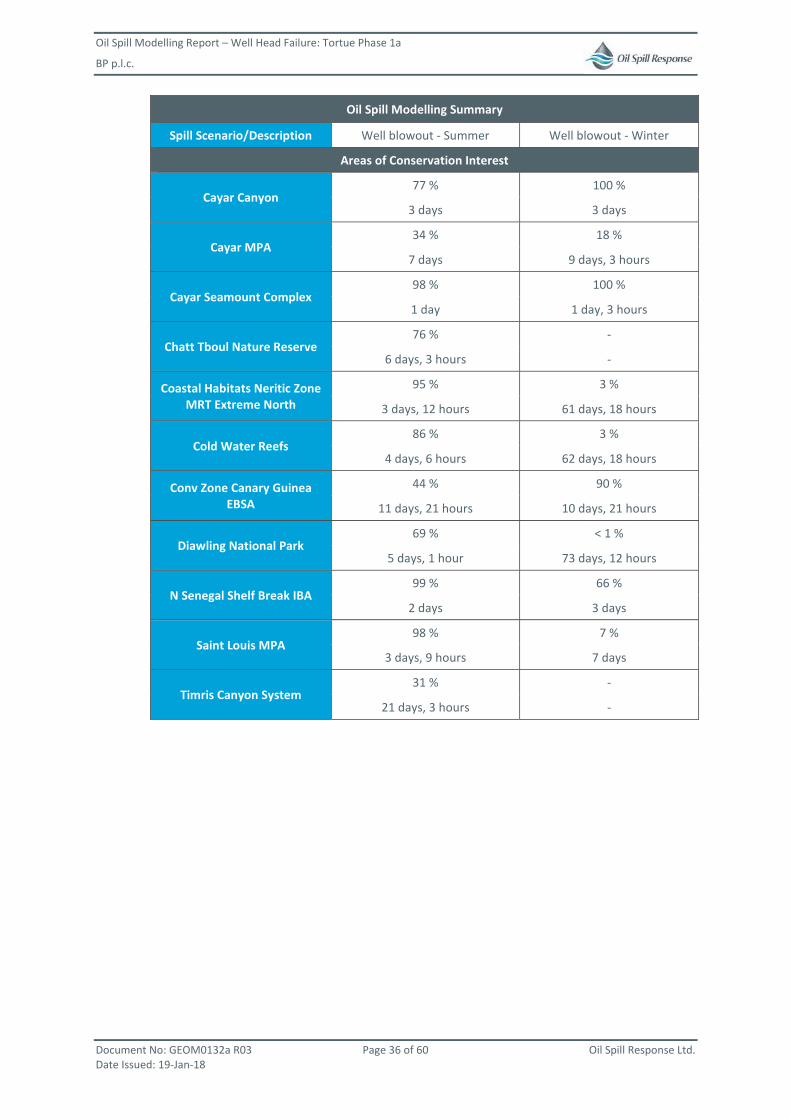
Oil Spill Modelling Report – Well Head Failure: Tortue Phase 1a
BP p.l.c.
Document No: GEOM0132a R03 Page 36 of 60 Oil Spill Response Ltd. Date Issued: 19-Jan-18
Oil Spill Modelling Summary
Spill Scenario/Description Well blowout - Summer Well blowout - Winter
Areas of Conservation Interest
Cayar Canyon 77 % 100 %
3 days 3 days
Cayar MPA 34 % 18 %
7 days 9 days, 3 hours
Cayar Seamount Complex 98 % 100 %
1 day 1 day, 3 hours
Chatt Tboul Nature Reserve 76 % -
6 days, 3 hours -
Coastal Habitats Neritic Zone MRT Extreme North
95 % 3 %
3 days, 12 hours 61 days, 18 hours
Cold Water Reefs 86 % 3 %
4 days, 6 hours 62 days, 18 hours
Conv Zone Canary Guinea EBSA
44 % 90 %
11 days, 21 hours 10 days, 21 hours
Diawling National Park 69 % < 1 %
5 days, 1 hour 73 days, 12 hours
N Senegal Shelf Break IBA 99 % 66 %
2 days 3 days
Saint Louis MPA 98 % 7 %
3 days, 9 hours 7 days
Timris Canyon System 31 % -
21 days, 3 hours -
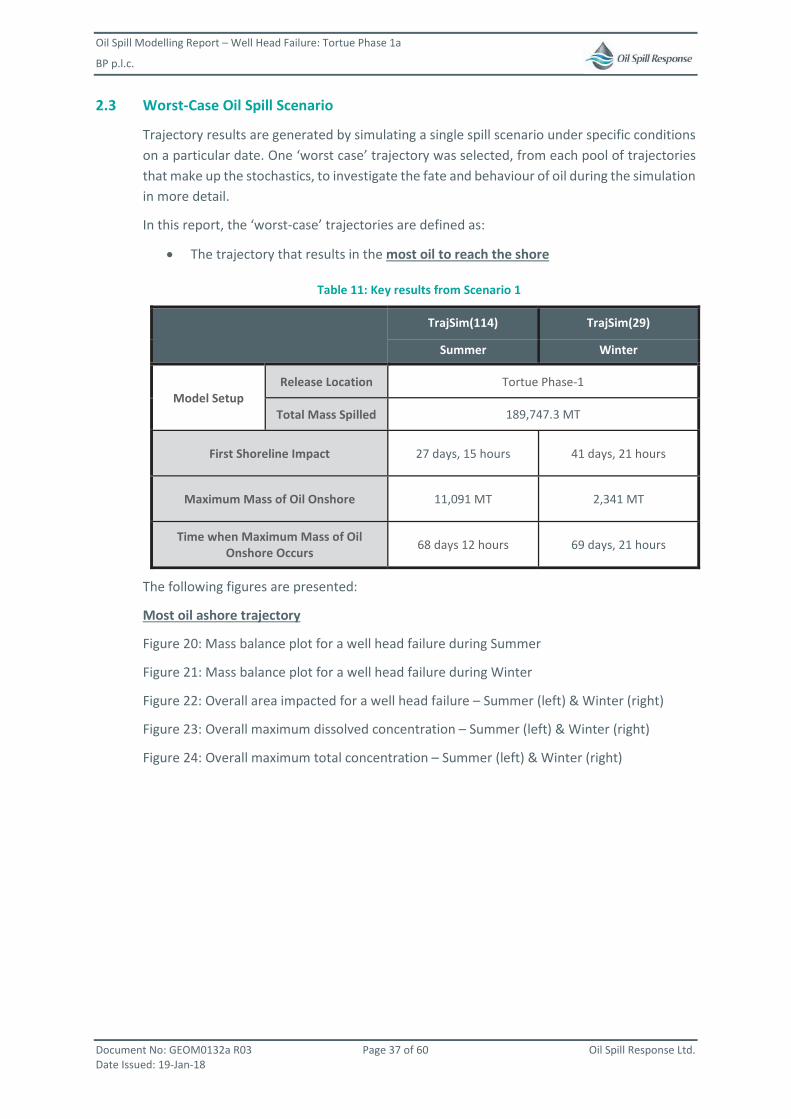
Oil Spill Modelling Report – Well Head Failure: Tortue Phase 1a
BP p.l.c.
Document No: GEOM0132a R03 Page 37 of 60 Oil Spill Response Ltd. Date Issued: 19-Jan-18
2.3 Worst-Case Oil Spill Scenario
Trajectory results are generated by simulating a single spill scenario under specific conditions on a particular date. One ‘worst case’ trajectory was selected, from each pool of trajectories that make up the stochastics, to investigate the fate and behaviour of oil during the simulation in more detail.
In this report, the ‘worst-case’ trajectories are defined as:
The trajectory that results in the most oil to reach the shore
Table 11: Key results from Scenario 1
TrajSim(114) TrajSim(29)
Summer Winter
Model Setup Release Location Tortue Phase-1
Total Mass Spilled 189,747.3 MT
First Shoreline Impact 27 days, 15 hours 41 days, 21 hours
Maximum Mass of Oil Onshore 11,091 MT 2,341 MT
Time when Maximum Mass of Oil Onshore Occurs 68 days 12 hours 69 days, 21 hours
The following figures are presented:
Most oil ashore trajectory
Figure 20: Mass balance plot for a well head failure during Summer
Figure 21: Mass balance plot for a well head failure during Winter
Figure 22: Overall area impacted for a well head failure – Summer (left) & Winter (right)
Figure 23: Overall maximum dissolved concentration – Summer (left) & Winter (right)
Figure 24: Overall maximum total concentration – Summer (left) & Winter (right)
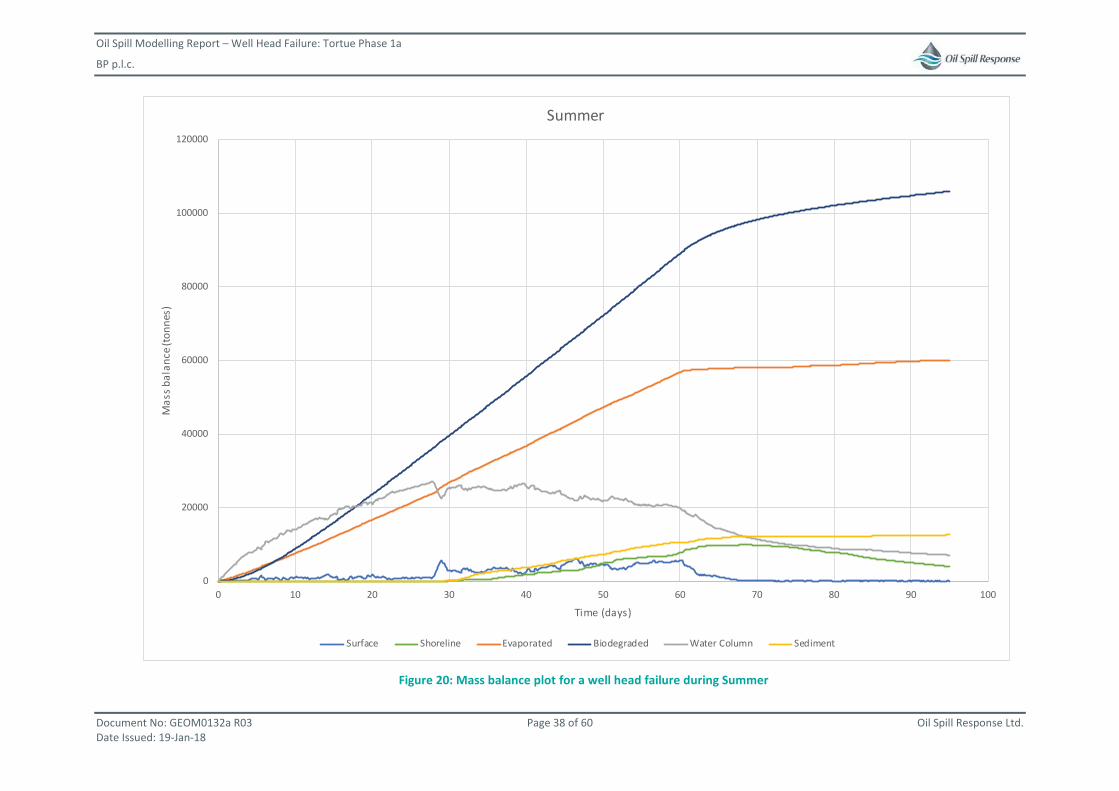
Oil Spill Modelling Report – Well Head Failure: Tortue Phase 1a
BP p.l.c.
Document No: GEOM0132a R03 Page 38 of 60 Oil Spill Response Ltd. Date Issued: 19-Jan-18
Figure 20: Mass balance plot for a well head failure during Summer
0
20000
40000
60000
80000
100000
120000
0 10 20 30 40 50 60 70 80 90 100
Mas
s bal
ance
(ton
nes)
Time (days)
Summer
Surface Shoreline Evaporated Biodegraded Water Column Sediment
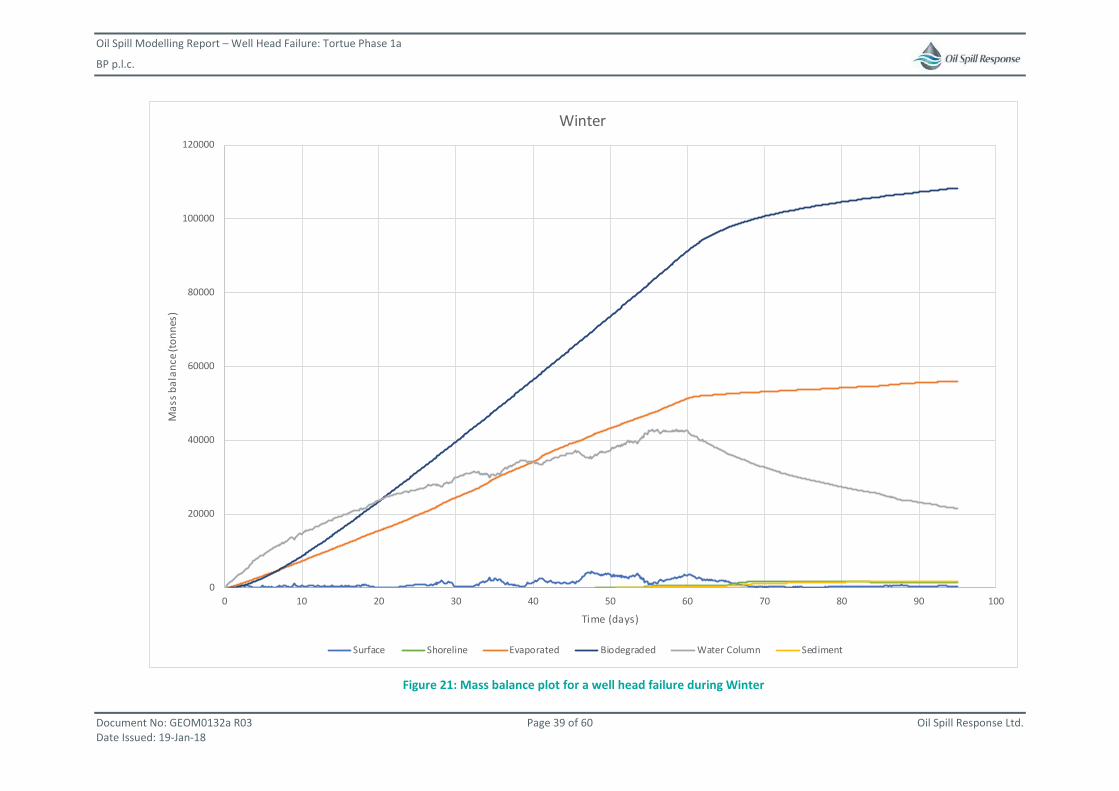
Oil Spill Modelling Report – Well Head Failure: Tortue Phase 1a
BP p.l.c.
Document No: GEOM0132a R03 Page 39 of 60 Oil Spill Response Ltd. Date Issued: 19-Jan-18
Figure 21: Mass balance plot for a well head failure during Winter
0
20000
40000
60000
80000
100000
120000
0 10 20 30 40 50 60 70 80 90 100
Mas
s bal
ance
(ton
nes)
Time (days)
Winter
Surface Shoreline Evaporated Biodegraded Water Column Sediment
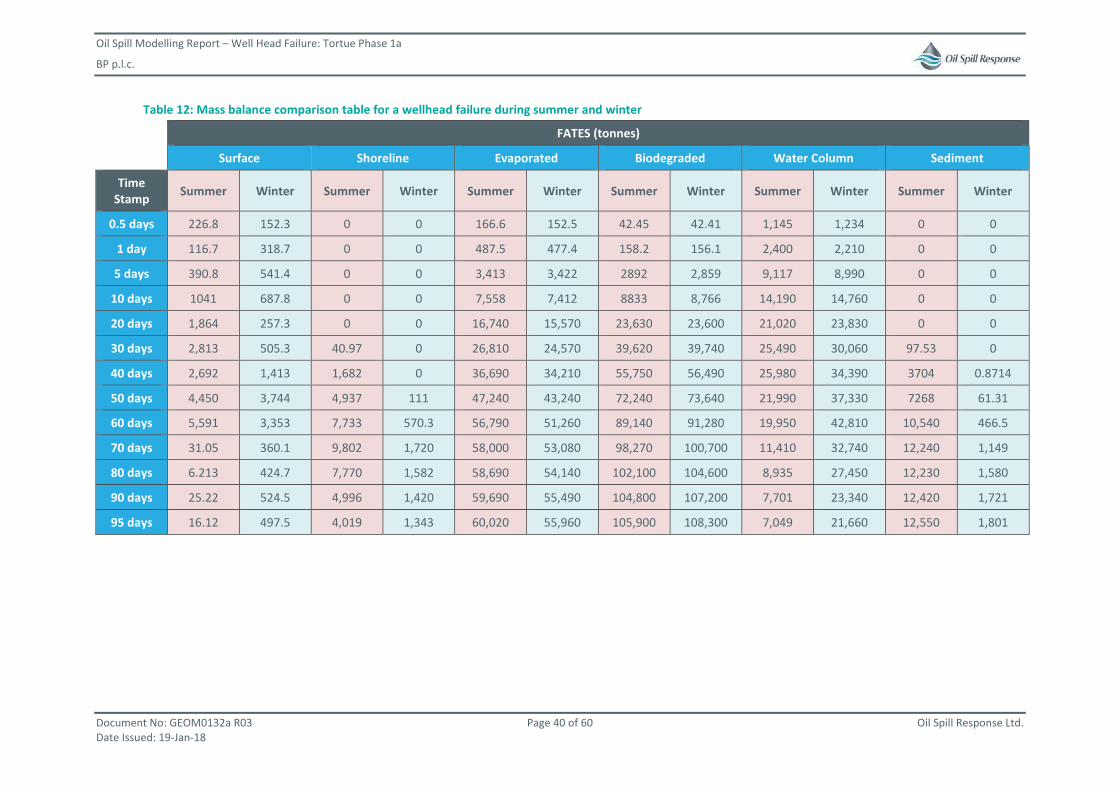
Oil Spill Modelling Report – Well Head Failure: Tortue Phase 1a
BP p.l.c.
Document No: GEOM0132a R03 Page 40 of 60 Oil Spill Response Ltd. Date Issued: 19-Jan-18
Table 12: Mass balance comparison table for a wellhead failure during summer and winter
FATES (tonnes)
Surface Shoreline Evaporated Biodegraded Water Column Sediment
Time Stamp Summer Winter Summer Winter Summer Winter Summer Winter Summer Winter Summer Winter
0.5 days 226.8 152.3 0 0 166.6 152.5 42.45 42.41 1,145 1,234 0 0
1 day 116.7 318.7 0 0 487.5 477.4 158.2 156.1 2,400 2,210 0 0
5 days 390.8 541.4 0 0 3,413 3,422 2892 2,859 9,117 8,990 0 0
10 days 1041 687.8 0 0 7,558 7,412 8833 8,766 14,190 14,760 0 0
20 days 1,864 257.3 0 0 16,740 15,570 23,630 23,600 21,020 23,830 0 0
30 days 2,813 505.3 40.97 0 26,810 24,570 39,620 39,740 25,490 30,060 97.53 0
40 days 2,692 1,413 1,682 0 36,690 34,210 55,750 56,490 25,980 34,390 3704 0.8714
50 days 4,450 3,744 4,937 111 47,240 43,240 72,240 73,640 21,990 37,330 7268 61.31
60 days 5,591 3,353 7,733 570.3 56,790 51,260 89,140 91,280 19,950 42,810 10,540 466.5
70 days 31.05 360.1 9,802 1,720 58,000 53,080 98,270 100,700 11,410 32,740 12,240 1,149
80 days 6.213 424.7 7,770 1,582 58,690 54,140 102,100 104,600 8,935 27,450 12,230 1,580
90 days 25.22 524.5 4,996 1,420 59,690 55,490 104,800 107,200 7,701 23,340 12,420 1,721
95 days 16.12 497.5 4,019 1,343 60,020 55,960 105,900 108,300 7,049 21,660 12,550 1,801
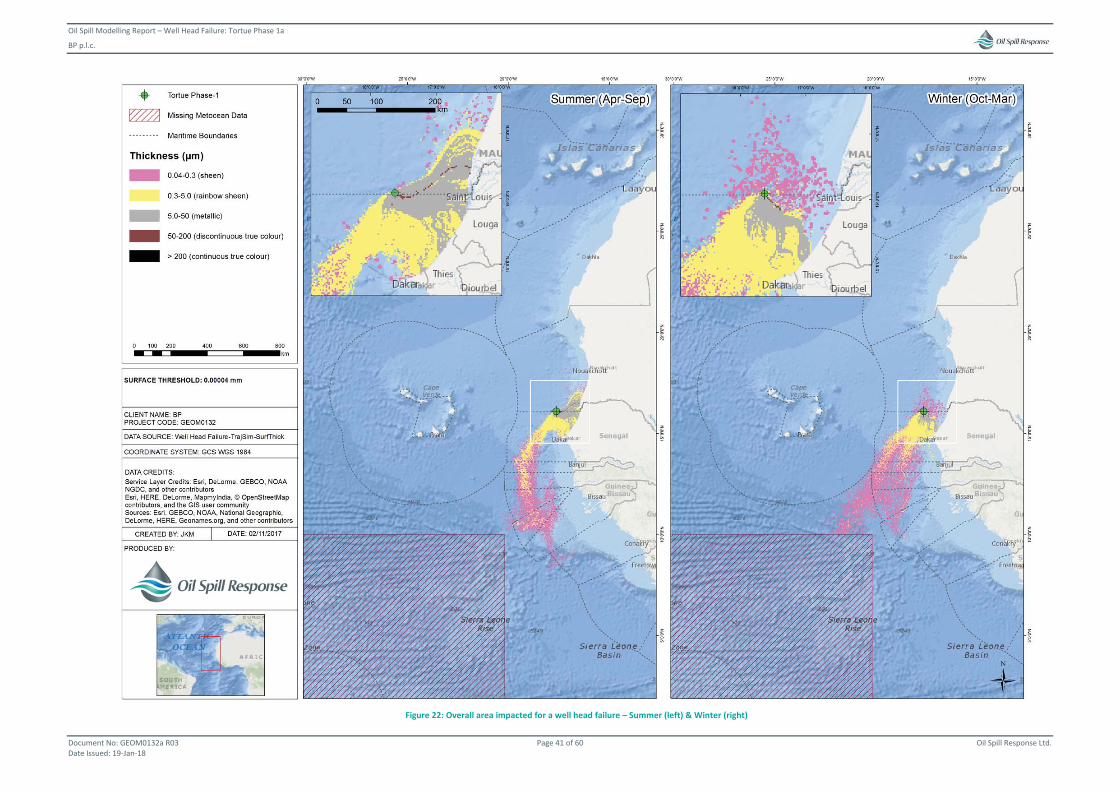
Oil Spill Modelling Report – Well Head Failure: Tortue Phase 1a
BP p.l.c.
Document No: GEOM0132a R03 Page 41 of 60 Oil Spill Response Ltd. Date Issued: 19-Jan-18
Figure 22: Overall area impacted for a well head failure – Summer (left) & Winter (right)
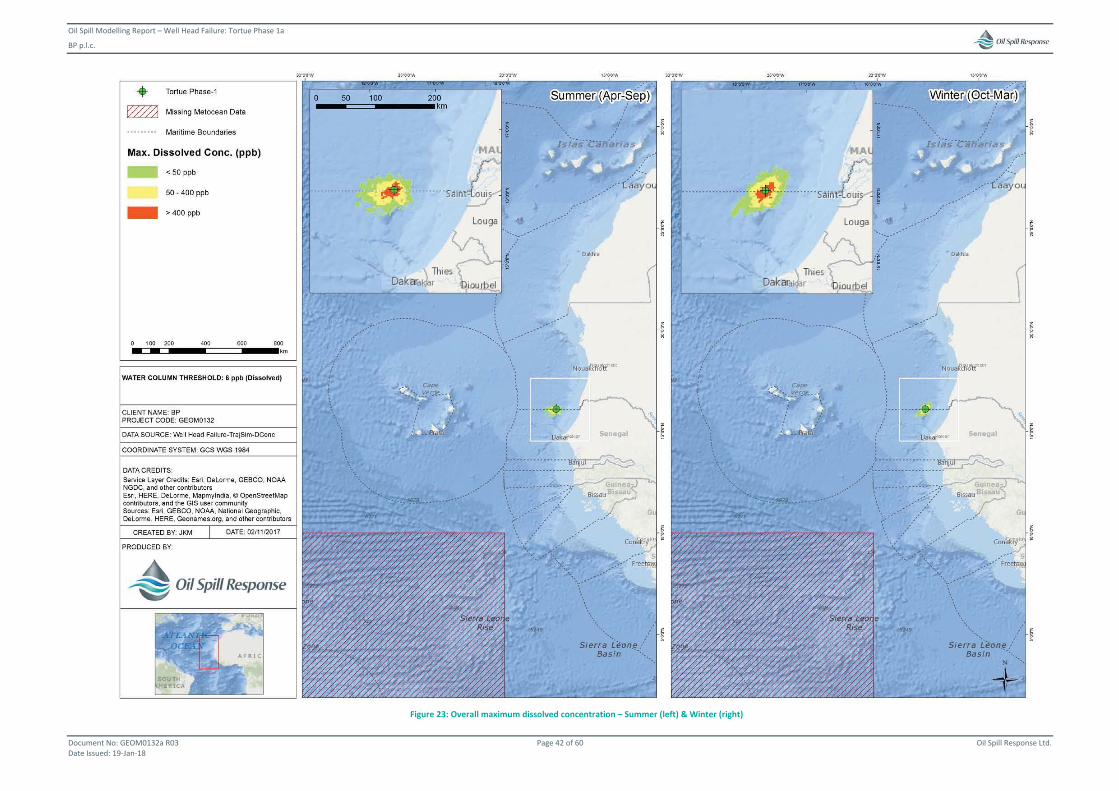
Oil Spill Modelling Report – Well Head Failure: Tortue Phase 1a
BP p.l.c.
Document No: GEOM0132a R03 Page 42 of 60 Oil Spill Response Ltd. Date Issued: 19-Jan-18
Figure 23: Overall maximum dissolved concentration – Summer (left) & Winter (right)
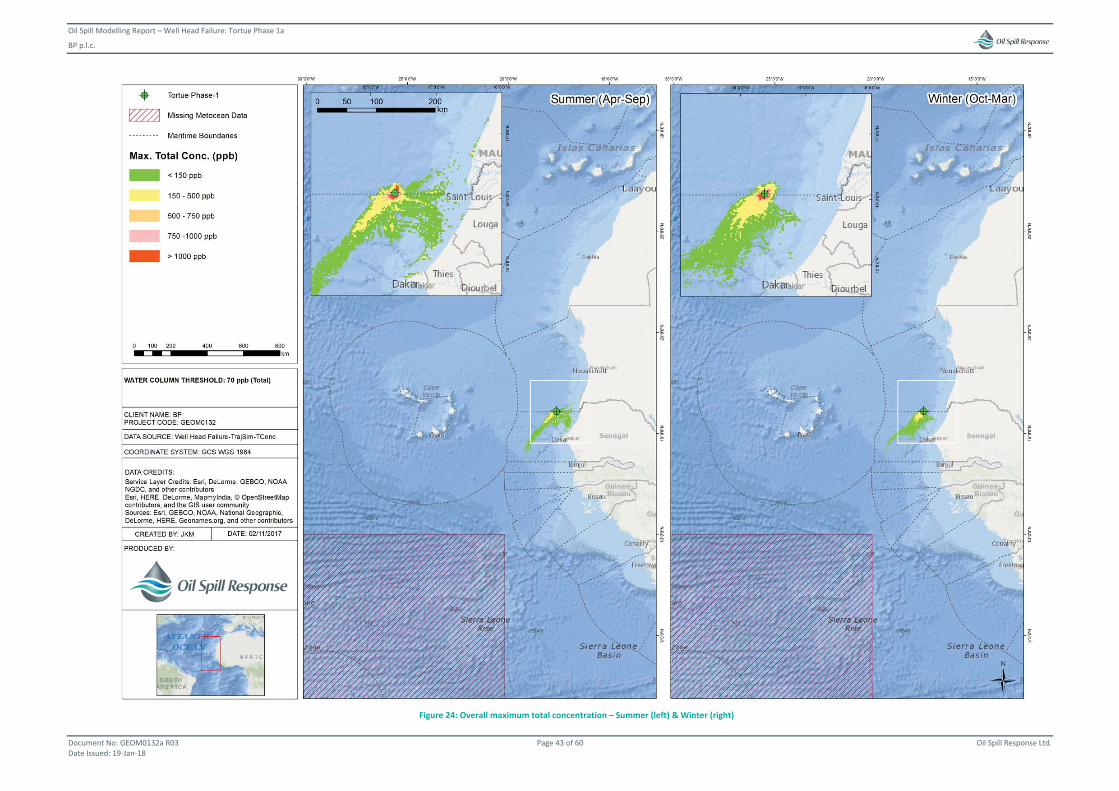
Oil Spill Modelling Report – Well Head Failure: Tortue Phase 1a
BP p.l.c.
Document No: GEOM0132a R03 Page 43 of 60 Oil Spill Response Ltd. Date Issued: 19-Jan-18
Figure 24: Overall maximum total concentration – Summer (left) & Winter (right)
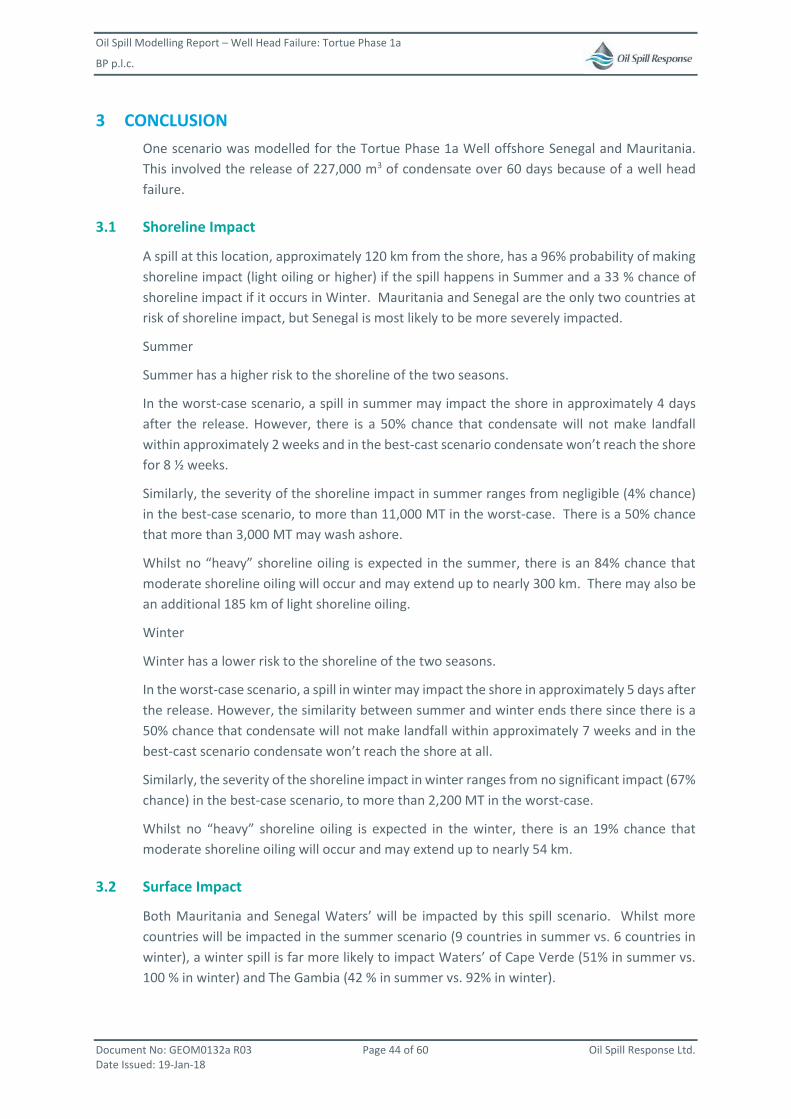
Oil Spill Modelling Report – Well Head Failure: Tortue Phase 1a
BP p.l.c.
Document No: GEOM0132a R03 Page 44 of 60 Oil Spill Response Ltd. Date Issued: 19-Jan-18
3 CONCLUSION One scenario was modelled for the Tortue Phase 1a Well offshore Senegal and Mauritania. This involved the release of 227,000 m3 of condensate over 60 days because of a well head failure.
3.1 Shoreline Impact
A spill at this location, approximately 120 km from the shore, has a 96% probability of making shoreline impact (light oiling or higher) if the spill happens in Summer and a 33 % chance of shoreline impact if it occurs in Winter. Mauritania and Senegal are the only two countries at risk of shoreline impact, but Senegal is most likely to be more severely impacted.
Summer
Summer has a higher risk to the shoreline of the two seasons.
In the worst-case scenario, a spill in summer may impact the shore in approximately 4 days after the release. However, there is a 50% chance that condensate will not make landfall within approximately 2 weeks and in the best-cast scenario condensate won’t reach the shore for 8 ½ weeks.
Similarly, the severity of the shoreline impact in summer ranges from negligible (4% chance) in the best-case scenario, to more than 11,000 MT in the worst-case. There is a 50% chance that more than 3,000 MT may wash ashore.
Whilst no “heavy” shoreline oiling is expected in the summer, there is an 84% chance that moderate shoreline oiling will occur and may extend up to nearly 300 km. There may also be an additional 185 km of light shoreline oiling.
Winter
Winter has a lower risk to the shoreline of the two seasons.
In the worst-case scenario, a spill in winter may impact the shore in approximately 5 days after the release. However, the similarity between summer and winter ends there since there is a 50% chance that condensate will not make landfall within approximately 7 weeks and in the best-cast scenario condensate won’t reach the shore at all.
Similarly, the severity of the shoreline impact in winter ranges from no significant impact (67% chance) in the best-case scenario, to more than 2,200 MT in the worst-case.
Whilst no “heavy” shoreline oiling is expected in the winter, there is an 19% chance that moderate shoreline oiling will occur and may extend up to nearly 54 km.
3.2 Surface Impact
Both Mauritania and Senegal Waters’ will be impacted by this spill scenario. Whilst more countries will be impacted in the summer scenario (9 countries in summer vs. 6 countries in winter), a winter spill is far more likely to impact Waters’ of Cape Verde (51% in summer vs. 100 % in winter) and The Gambia (42 % in summer vs. 92% in winter).
Oil Spill Modelling Report – Well Head Failure: Tortue Phase 1a
BP p.l.c.
Document No: GEOM0132a R03 Page 45 of 60 Oil Spill Response Ltd. Date Issued: 19-Jan-18
However, the thickness of the condensate spill is limited to mostly sheen and rainbow sheen that will more readily disperse. A small amount of metallic sheen (>5 μm) may be found in the local area around the well (~25 km). Because of the high turbidity created by the gas at the well site, condensate droplets are very small. Consequentially, they rise more slowly and do not concentrate in the same way as if there was an absence of gas.
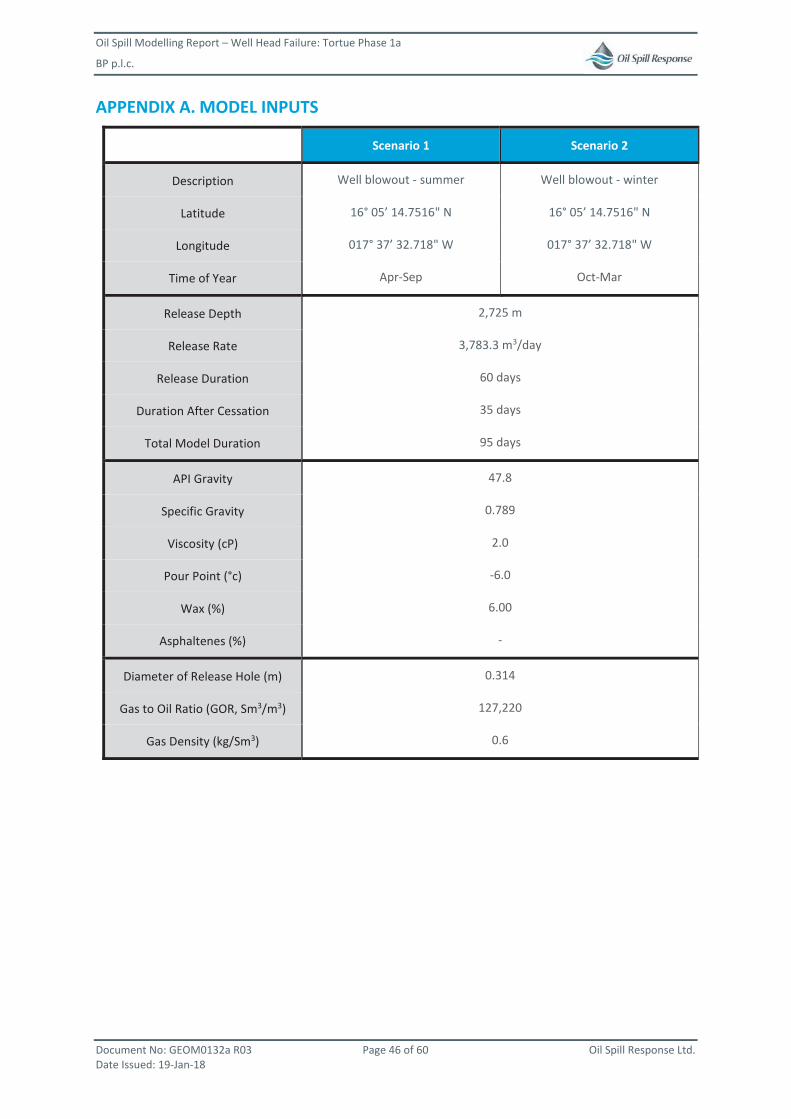
Oil Spill Modelling Report – Well Head Failure: Tortue Phase 1a
BP p.l.c.
Document No: GEOM0132a R03 Page 46 of 60 Oil Spill Response Ltd. Date Issued: 19-Jan-18
APPENDIX A. MODEL INPUTS
Scenario 1 Scenario 2
Description Well blowout - summer Well blowout - winter
Latitude 16° 05’ 14.7516" N 16° 05’ 14.7516" N
Longitude 017° 37’ 32.718" W 017° 37’ 32.718" W
Time of Year Apr-Sep Oct-Mar
Release Depth 2,725 m
Release Rate 3,783.3 m3/day
Release Duration 60 days
Duration After Cessation 35 days
Total Model Duration 95 days
API Gravity 47.8
Specific Gravity 0.789
Viscosity (cP) 2.0
Pour Point (°c) -6.0
Wax (%) 6.00
Asphaltenes (%) -
Diameter of Release Hole (m) 0.314
Gas to Oil Ratio (GOR, Sm3/m3) 127,220
Gas Density (kg/Sm3) 0.6
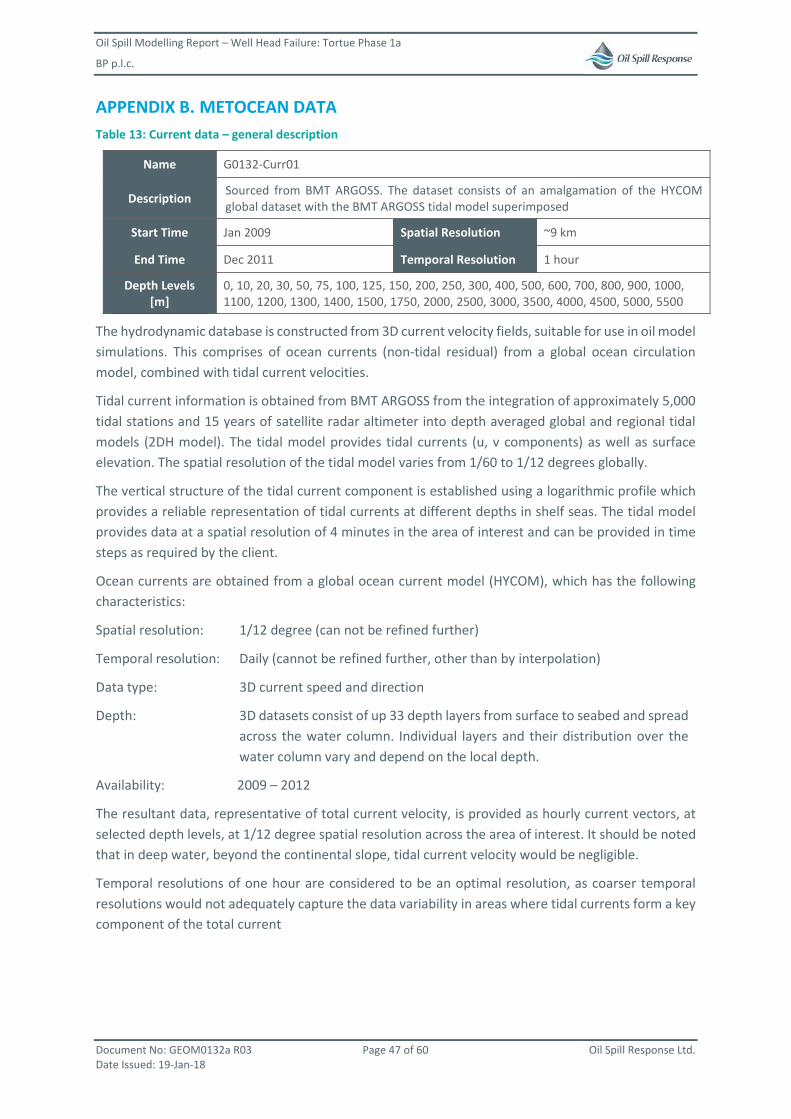
Oil Spill Modelling Report – Well Head Failure: Tortue Phase 1a
BP p.l.c.
Document No: GEOM0132a R03 Page 47 of 60 Oil Spill Response Ltd. Date Issued: 19-Jan-18
APPENDIX B. METOCEAN DATA Table 13: Current data – general description
Name G0132-Curr01
Description Sourced from BMT ARGOSS. The dataset consists of an amalgamation of the HYCOM global dataset with the BMT ARGOSS tidal model superimposed
Start Time Jan 2009 Spatial Resolution ~9 km
End Time Dec 2011 Temporal Resolution 1 hour
Depth Levels [m]
0, 10, 20, 30, 50, 75, 100, 125, 150, 200, 250, 300, 400, 500, 600, 700, 800, 900, 1000, 1100, 1200, 1300, 1400, 1500, 1750, 2000, 2500, 3000, 3500, 4000, 4500, 5000, 5500
The hydrodynamic database is constructed from 3D current velocity fields, suitable for use in oil model simulations. This comprises of ocean currents (non-tidal residual) from a global ocean circulation model, combined with tidal current velocities.
Tidal current information is obtained from BMT ARGOSS from the integration of approximately 5,000 tidal stations and 15 years of satellite radar altimeter into depth averaged global and regional tidal models (2DH model). The tidal model provides tidal currents (u, v components) as well as surface elevation. The spatial resolution of the tidal model varies from 1/60 to 1/12 degrees globally.
The vertical structure of the tidal current component is established using a logarithmic profile which provides a reliable representation of tidal currents at different depths in shelf seas. The tidal model provides data at a spatial resolution of 4 minutes in the area of interest and can be provided in time steps as required by the client.
Ocean currents are obtained from a global ocean current model (HYCOM), which has the following characteristics:
Spatial resolution: 1/12 degree (can not be refined further)
Temporal resolution: Daily (cannot be refined further, other than by interpolation)
Data type: 3D current speed and direction
Depth: 3D datasets consist of up 33 depth layers from surface to seabed and spread across the water column. Individual layers and their distribution over the water column vary and depend on the local depth.
Availability: 2009 – 2012
The resultant data, representative of total current velocity, is provided as hourly current vectors, at selected depth levels, at 1/12 degree spatial resolution across the area of interest. It should be noted that in deep water, beyond the continental slope, tidal current velocity would be negligible.
Temporal resolutions of one hour are considered to be an optimal resolution, as coarser temporal resolutions would not adequately capture the data variability in areas where tidal currents form a key component of the total current
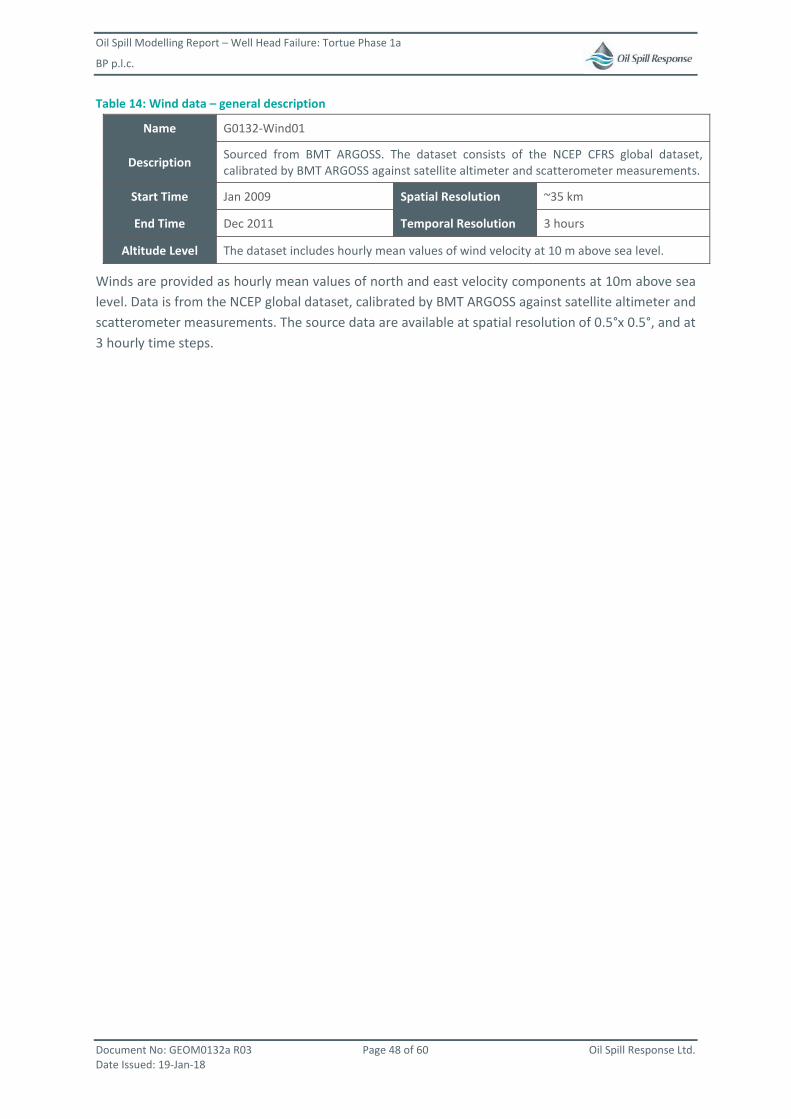
Oil Spill Modelling Report – Well Head Failure: Tortue Phase 1a
BP p.l.c.
Document No: GEOM0132a R03 Page 48 of 60 Oil Spill Response Ltd. Date Issued: 19-Jan-18
Table 14: Wind data – general description
Name G0132-Wind01
Description Sourced from BMT ARGOSS. The dataset consists of the NCEP CFRS global dataset, calibrated by BMT ARGOSS against satellite altimeter and scatterometer measurements.
Start Time Jan 2009 Spatial Resolution ~35 km
End Time Dec 2011 Temporal Resolution 3 hours
Altitude Level The dataset includes hourly mean values of wind velocity at 10 m above sea level.
Winds are provided as hourly mean values of north and east velocity components at 10m above sea level. Data is from the NCEP global dataset, calibrated by BMT ARGOSS against satellite altimeter and scatterometer measurements. The source data are available at spatial resolution of 0.5°x 0.5°, and at 3 hourly time steps.
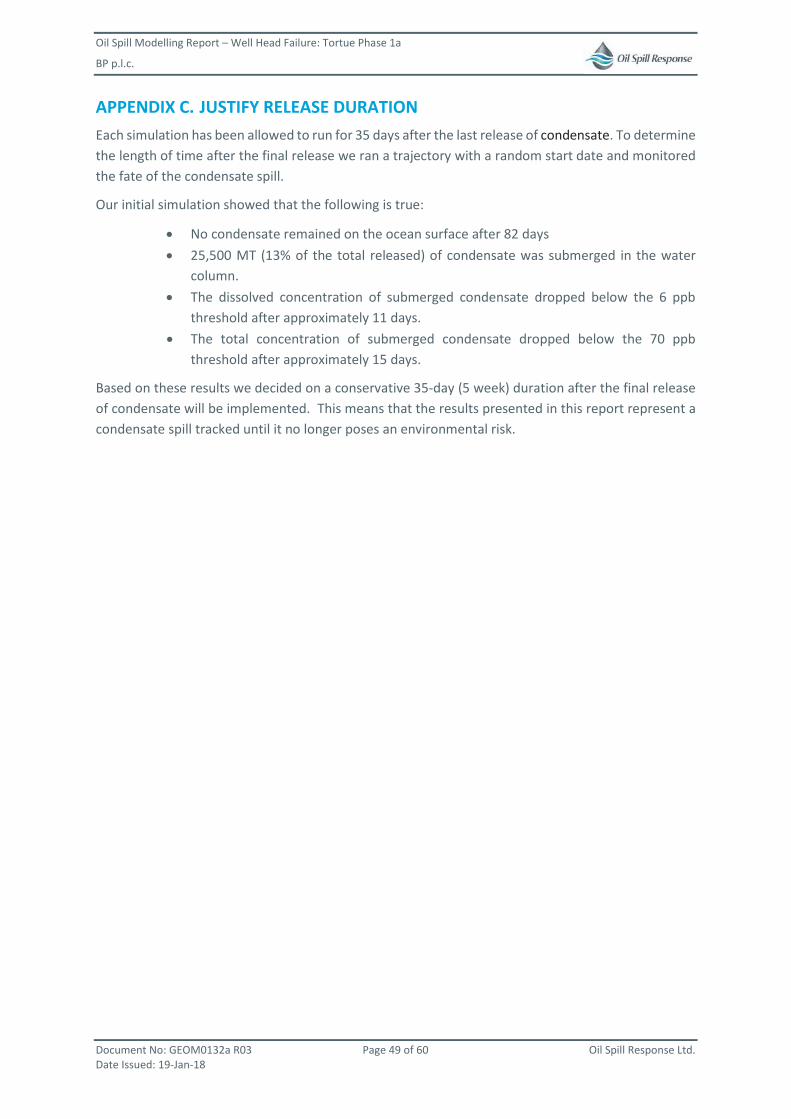
Oil Spill Modelling Report – Well Head Failure: Tortue Phase 1a
BP p.l.c.
Document No: GEOM0132a R03 Page 49 of 60 Oil Spill Response Ltd. Date Issued: 19-Jan-18
APPENDIX C. JUSTIFY RELEASE DURATION Each simulation has been allowed to run for 35 days after the last release of condensate. To determine the length of time after the final release we ran a trajectory with a random start date and monitored the fate of the condensate spill.
Our initial simulation showed that the following is true:
No condensate remained on the ocean surface after 82 days 25,500 MT (13% of the total released) of condensate was submerged in the water column. The dissolved concentration of submerged condensate dropped below the 6 ppb threshold after approximately 11 days. The total concentration of submerged condensate dropped below the 70 ppb threshold after approximately 15 days.
Based on these results we decided on a conservative 35-day (5 week) duration after the final release of condensate will be implemented. This means that the results presented in this report represent a condensate spill tracked until it no longer poses an environmental risk.
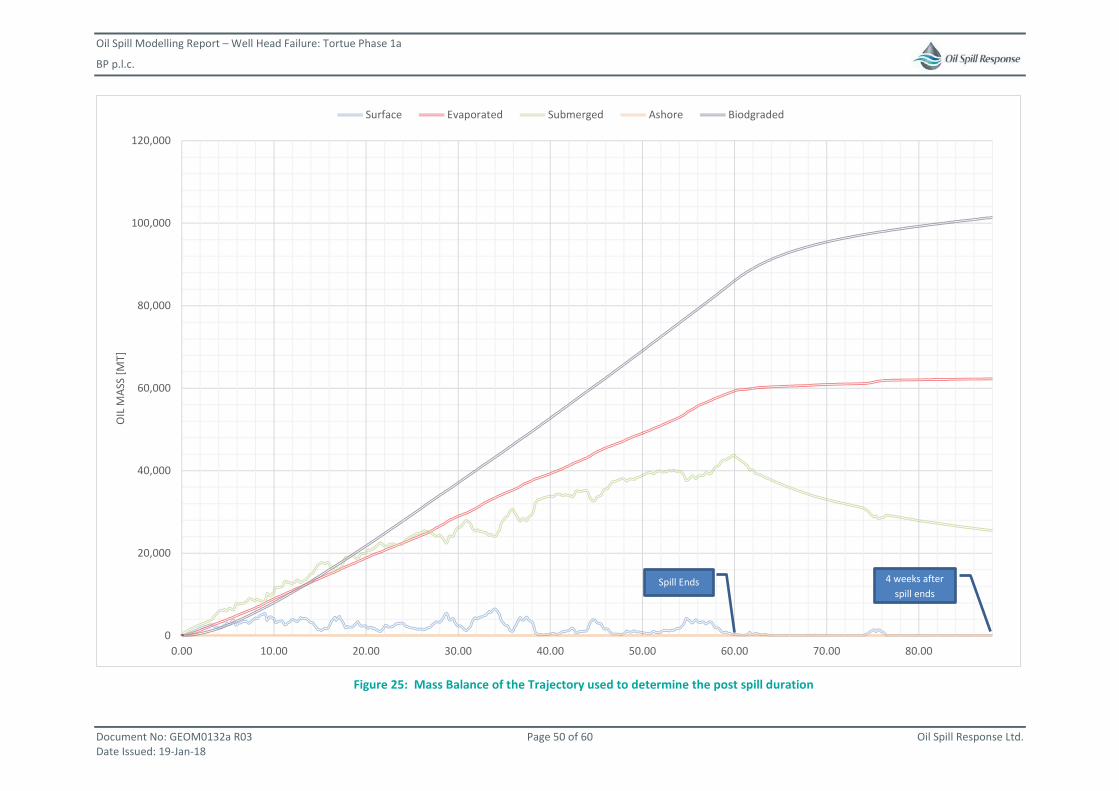
Oil Spill Modelling Report – Well Head Failure: Tortue Phase 1a
BP p.l.c.
Document No: GEOM0132a R03 Page 50 of 60 Oil Spill Response Ltd. Date Issued: 19-Jan-18
Figure 25: Mass Balance of the Trajectory used to determine the post spill duration
0
20,000
40,000
60,000
80,000
100,000
120,000
0.00 10.00 20.00 30.00 40.00 50.00 60.00 70.00 80.00
OIL
MAS
S [M
T]Surface Evaporated Submerged Ashore Biodgraded
4 weeks after spill ends
Spill Ends
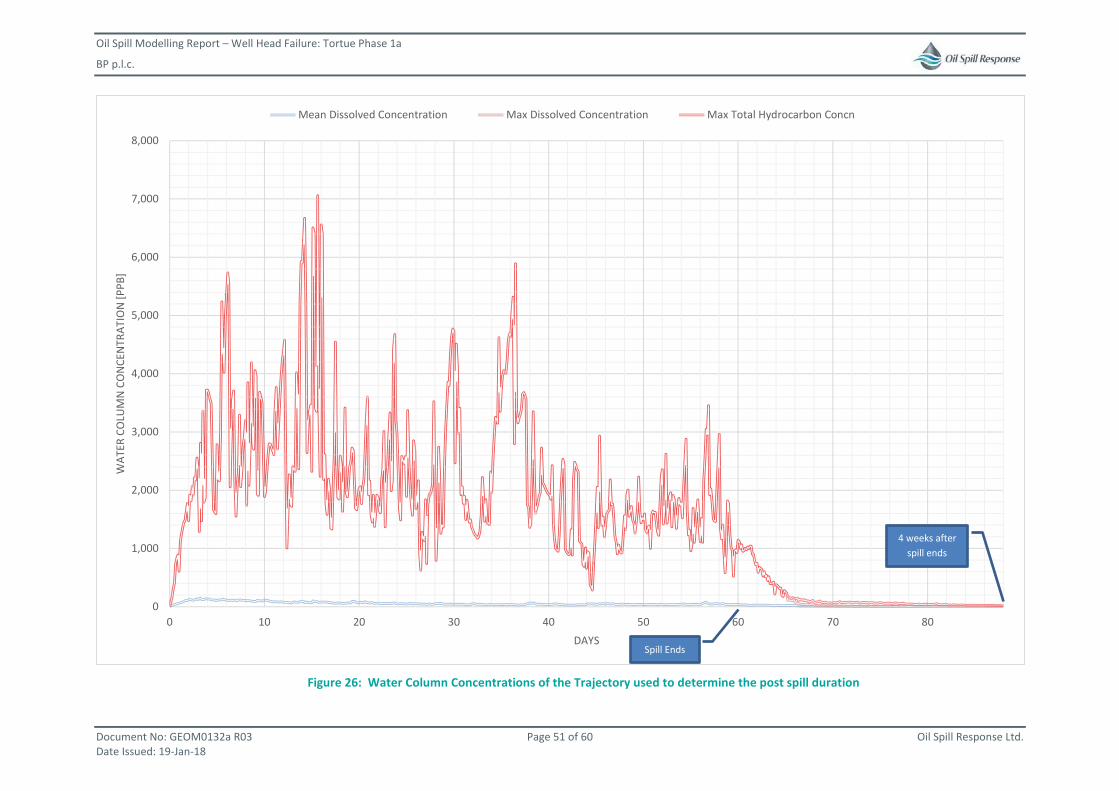
Oil Spill Modelling Report – Well Head Failure: Tortue Phase 1a
BP p.l.c.
Document No: GEOM0132a R03 Page 51 of 60 Oil Spill Response Ltd. Date Issued: 19-Jan-18
Figure 26: Water Column Concentrations of the Trajectory used to determine the post spill duration
0
1,000
2,000
3,000
4,000
5,000
6,000
7,000
8,000
0 10 20 30 40 50 60 70 80
WAT
ER C
OLU
MN
CO
NCE
NTR
ATIO
N [P
PB]
DAYS
Mean Dissolved Concentration Max Dissolved Concentration Max Total Hydrocarbon Concn
Spill Ends
4 weeks after spill ends
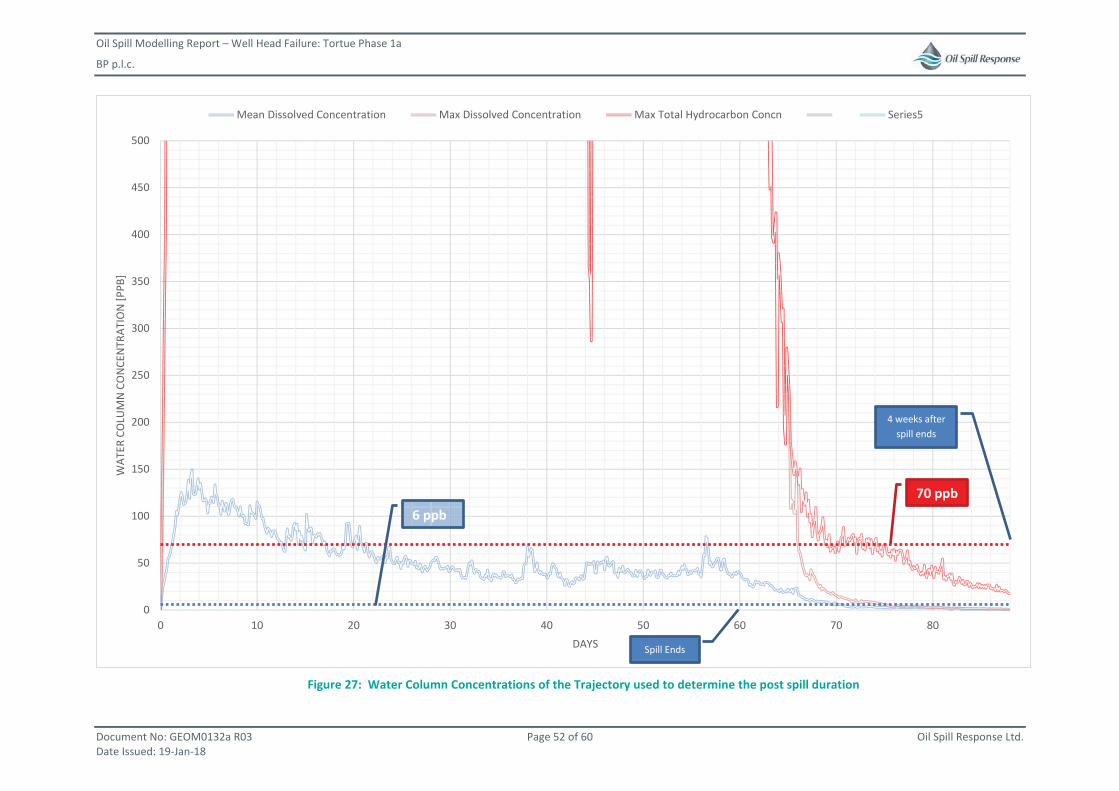
Oil Spill Modelling Report – Well Head Failure: Tortue Phase 1a
BP p.l.c.
Document No: GEOM0132a R03 Page 52 of 60 Oil Spill Response Ltd. Date Issued: 19-Jan-18
Figure 27: Water Column Concentrations of the Trajectory used to determine the post spill duration
0
50
100
150
200
250
300
350
400
450
500
0 10 20 30 40 50 60 70 80
WAT
ER C
OLU
MN
CO
NCE
NTR
ATIO
N [P
PB]
DAYS
Mean Dissolved Concentration Max Dissolved Concentration Max Total Hydrocarbon Concn Series5
70 ppb6 ppb
Spill Ends
4 weeks after spill ends

Oil Spill Modelling Report – Well Head Failure: Tortue Phase 1a
BP p.l.c.
Document No: GEOM0132a R03 Page 53 of 60 Oil Spill Response Ltd. Date Issued: 19-Jan-18
APPENDIX D. HABITAT GRID Table 15: Habitat domain details
Name Domain Extent
G0132-Hab02
Bottom Top Left Right
05° 00' 00’’ N 25° 00' 00’’ N 030° 00' 00’’ W 010° 00' 00’’ W
Number of Cells Cell Resolution
East to West North to South East to West North to South
858 888 2,500 km 2,500 km
Domain Size
East to West North to South
2,145 km 2,220 km
Figure 28:Extent of habitat grid used in this study
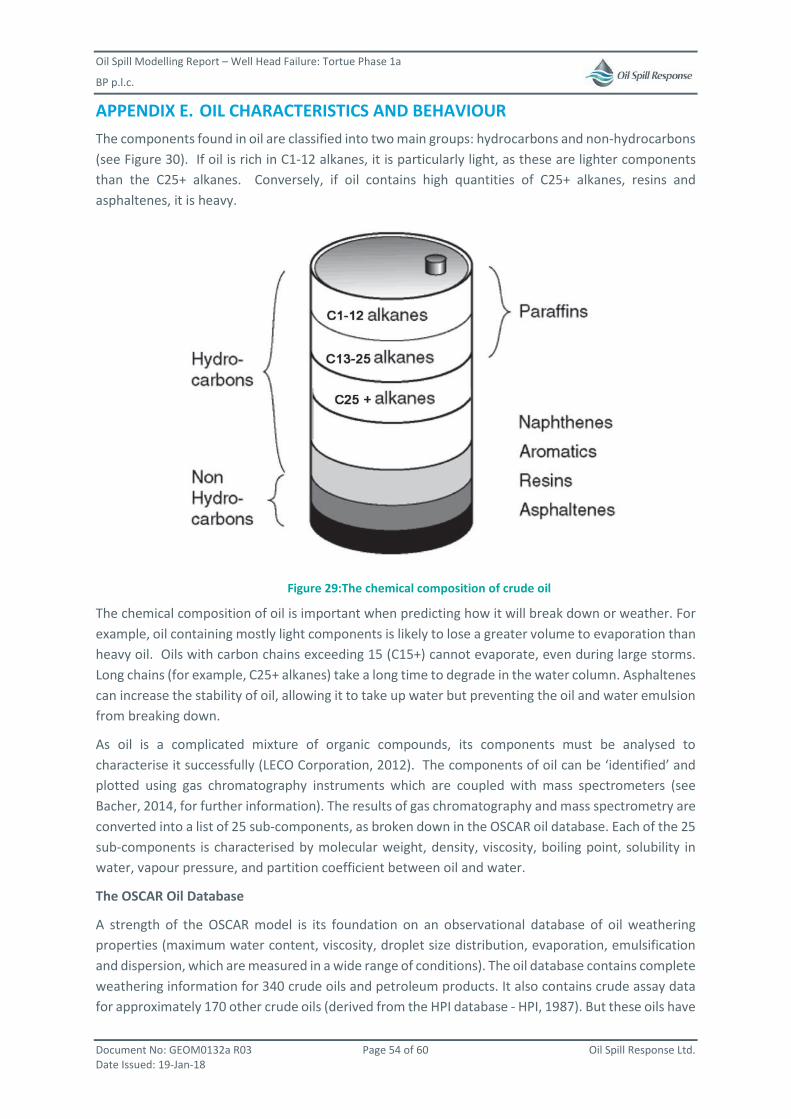
Oil Spill Modelling Report – Well Head Failure: Tortue Phase 1a
BP p.l.c.
Document No: GEOM0132a R03 Page 54 of 60 Oil Spill Response Ltd. Date Issued: 19-Jan-18
APPENDIX E. OIL CHARACTERISTICS AND BEHAVIOUR The components found in oil are classified into two main groups: hydrocarbons and non-hydrocarbons (see Figure 30). If oil is rich in C1-12 alkanes, it is particularly light, as these are lighter components than the C25+ alkanes. Conversely, if oil contains high quantities of C25+ alkanes, resins and asphaltenes, it is heavy.
Figure 29:The chemical composition of crude oil
The chemical composition of oil is important when predicting how it will break down or weather. For example, oil containing mostly light components is likely to lose a greater volume to evaporation than heavy oil. Oils with carbon chains exceeding 15 (C15+) cannot evaporate, even during large storms. Long chains (for example, C25+ alkanes) take a long time to degrade in the water column. Asphaltenes can increase the stability of oil, allowing it to take up water but preventing the oil and water emulsion from breaking down.
As oil is a complicated mixture of organic compounds, its components must be analysed to characterise it successfully (LECO Corporation, 2012). The components of oil can be ‘identified’ and plotted using gas chromatography instruments which are coupled with mass spectrometers (see Bacher, 2014, for further information). The results of gas chromatography and mass spectrometry are converted into a list of 25 sub-components, as broken down in the OSCAR oil database. Each of the 25 sub-components is characterised by molecular weight, density, viscosity, boiling point, solubility in water, vapour pressure, and partition coefficient between oil and water.
The OSCAR Oil Database
A strength of the OSCAR model is its foundation on an observational database of oil weathering properties (maximum water content, viscosity, droplet size distribution, evaporation, emulsification and dispersion, which are measured in a wide range of conditions). The oil database contains complete weathering information for 340 crude oils and petroleum products. It also contains crude assay data for approximately 170 other crude oils (derived from the HPI database - HPI, 1987). But these oils have
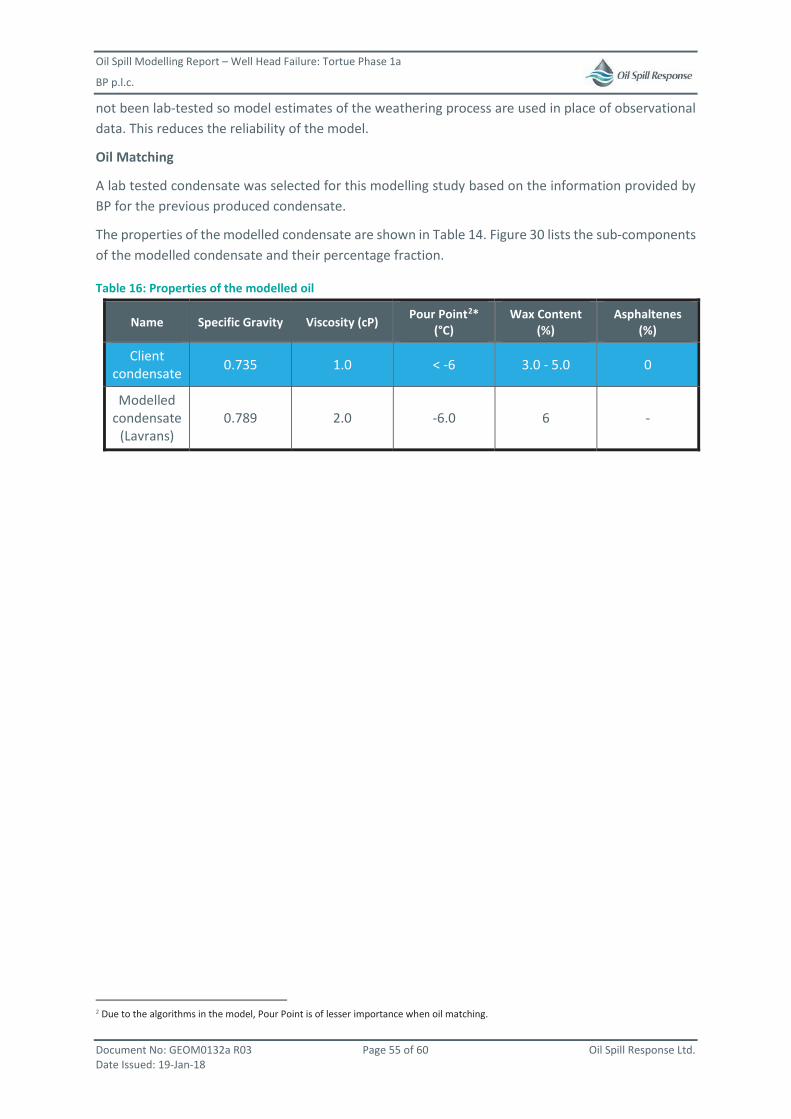
Oil Spill Modelling Report – Well Head Failure: Tortue Phase 1a
BP p.l.c.
Document No: GEOM0132a R03 Page 55 of 60 Oil Spill Response Ltd. Date Issued: 19-Jan-18
not been lab-tested so model estimates of the weathering process are used in place of observational data. This reduces the reliability of the model.
Oil Matching
A lab tested condensate was selected for this modelling study based on the information provided by BP for the previous produced condensate.
The properties of the modelled condensate are shown in Table 14. Figure 30 lists the sub-components of the modelled condensate and their percentage fraction.
Table 16: Properties of the modelled oil
Name Specific Gravity Viscosity (cP) Pour Point2* (°C)
Wax Content (%)
Asphaltenes (%)
Client condensate 0.735 1.0 < -6 3.0 - 5.0 0
Modelled condensate
(Lavrans) 0.789 2.0 -6.0 6 -
2 Due to the algorithms in the model, Pour Point is of lesser importance when oil matching.
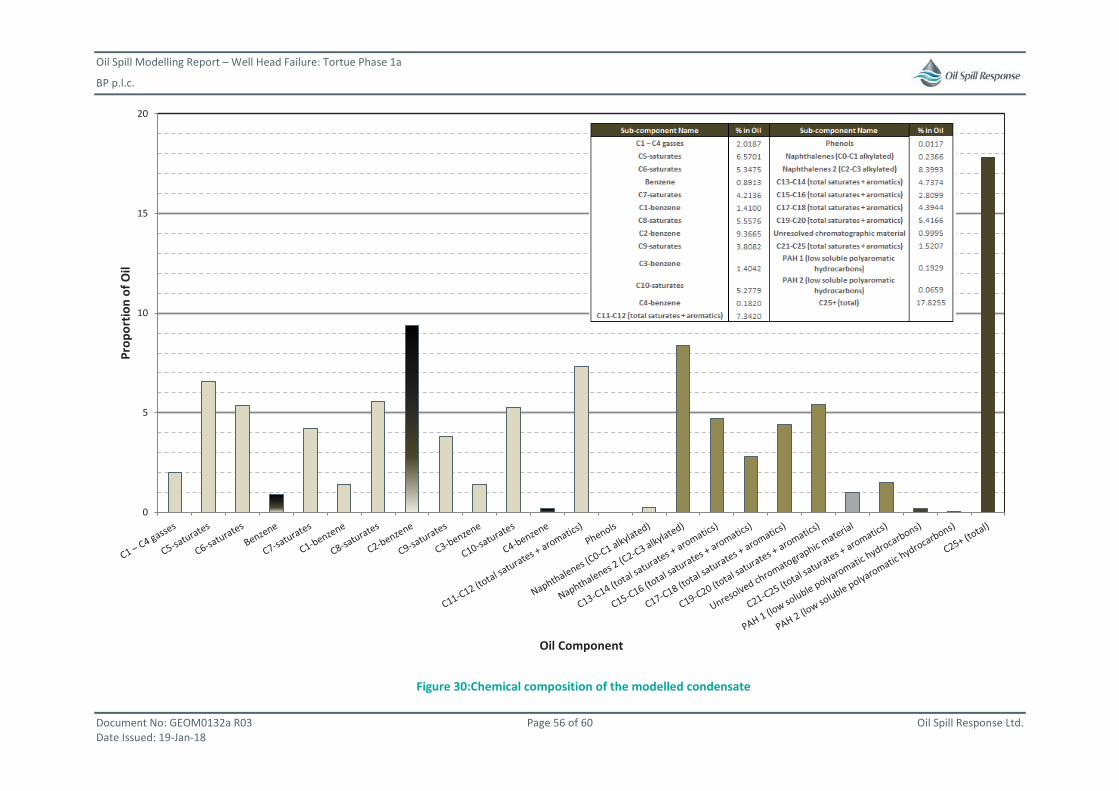
Oil Spill Modelling Report – Well Head Failure: Tortue Phase 1a
BP p.l.c.
Document No: GEOM0132a R03 Page 56 of 60 Oil Spill Response Ltd. Date Issued: 19-Jan-18
Figure 30:Chemical composition of the modelled condensate
0
5
10
15
20Pr
opor
tion
of O
il
Oil Component

Oil Spill Modelling Report – Well Head Failure: Tortue Phase 1a
BP p.l.c.
Document No: GEOM0132a R03 Page 57 of 60 Oil Spill Response Ltd. Date Issued: 19-Jan-18
APPENDIX F. OIL SPILL MODELLING SOFTWARE AND METHODOLOGY This project was completed using the version of OSCAR contained within the Marine Environmental Modelling Workbench (MEMW) 8.0, a model that has been fully validated and calibrated using various field observations from several experimental oil spills (Reed et al., 1995, 1996).
OSCAR predicts the movement of oil at the water’s surface and throughout the water column. OSCAR consists of several interlocking modules that are activated as required. The following infographic illustrates the OSCAR modelling process.
Oil Spill Modelling Report – Well Head Failure: Tortue Phase 1a
BP p.l.c.
Document No: GEOM0132a R03 Page 58 of 60 Oil Spill Response Ltd. Date Issued: 19-Jan-18
APPENDIX G. GLOSSARY OF TERMS, ACRONYMS AND ABBREVIATIONS
°C Degrees Celsius (1.0°C = 33.8° Fahrenheit)
-6 m)
API American Petroleum Institute
API Gravity
API Gravity, like specific gravity, is a ratio between the densities of oil and water. Unlike specific gravity, API gravity is only used to describe oil, which it characterises as:
Light - API > 31.1
Medium - API between 22.3 and 31.1 Heavy - API < 22.3 Extra Heavy - API < 10.0
API Gravity is converted to Specific Gravity using the following formula: API gravity = (141.5/Specific Gravity) – 131.5
An API of 10 is equivalent to water, so oils with an API above 10 will float on water while oils with an API below 10 will sink. See also: Specific Gravity, API
ArcGIS A geographic Information System (GIS) used to present OSCAR outputs on maps.
Asphaltene Content
The asphaltenes present the crude oil components that are (1) insoluble in n-heptane at a dilution ratio of 40 parts alkane to 1 part crude oil and (2) re-dissolves in toluene. The asphaltenes include the crude oil material highest in molecular weight, polarity and aromaticity.
bbls
Barrels of oil (a unit of volume). (1.0 bbls = 0.15899 m³ and 1.0 m³ = 6.2898 bbls) The conversion between mass and volume requires knowledge of the oil density. See also: MT, API Gravity, Specific Gravity
bbls/day Barrels of oil per day (rate).
BONN Agreement
The BONN Agreement is an international standard and agreement on how to characterise and respond to pollution. Although aimed at pollution in the North Sea (Europe) many of the characterisation standards are internationally recognised.
FPSO Floating Production Storage and Offloading - a floating vessel used for producing, processing and storing oil.
GOR
Gas to Oil Ratio - the ratio of volumetric flow of produced gas to the volumetric flow of oil. Although GOR is a ratio, the volume units must be known since gas and oil volumes are measured differently. GOR changes with temperature and pressure so the condition under which GOR is measured must be known.
ITOPF The International Tanker Owners Pollution Federation Limited
km Kilometres (1.0 km = 1,000 m) See also: m
m Metres (1.0 km = 1,000 m) See also: , km
MATLAB Matrix Laboratory - a multi-paradigm numerical computing environment and programming language used in this study for the manipulation of data outputs from OSCAR.
Oil Spill Modelling Report – Well Head Failure: Tortue Phase 1a
BP p.l.c.
Document No: GEOM0132a R03 Page 59 of 60 Oil Spill Response Ltd. Date Issued: 19-Jan-18
MEMW
Marine Environmental Modelling Workbench - the modelling software package developed by SINTEF. The MEMW consists of three models:
DREAM (Dose, Risk and Effects Assessment Model) OSCAR (Oil Spill Contingency and Response Model) ParTrack Model
When combined, these three models quantify the environmental effect of most chemical pollution activities. See also: OSCAR, SINTEF
MT
Metric Tonnes - this is a unit of oil mass. (1.0 MT = 1,000 kg) The conversion between mass and volume requires knowledge of the oil’s API or Specific Gravity as follows:
Barrels per metric ton = 1/[(141.5/(API + 131.5) x 0.159] See also: bbls, API Gravity, Specific Gravity
NOAA National Oceanic and Atmospheric Administration – an American scientific agency focussed on metocean conditions
OSCAR
Oil Spill Contingency And Response A state of the art 3D oil spill model and simulation tool for predicting the fates and effects of oil released into the marine environment. Developed by SINTEF, it sits within the larger MEMW application. See also: SINTEF, MEMW
OSRL Oil Spill Response Limited
Pour Point The pour point of a liquid is the lowest temperature at which it shows flow characteristics. If ambient temperature is less than the liquid’s pour point it will begin to solidify.
SCAT Shoreline Cleanup Assessment Technique
SINTEF SINTEF is an independent research organisation in Norway which develops the OSCAR model used in this study.
Specific Gravity
Specific gravity is a ratio of the density of one substance to the density of a reference substance, usually water. Specific gravity of oil is a ratio of the density of oil to the density of water. See also: API Gravity, bbls, MT
Stochastic
Stochastic (or probabilistic) results show the probability or likelihood of an event occurring. They provide statistical data that can be used to assess risk and identify worst-case scenarios. Stochastic results are achieved by combining many different trajectory simulations. See also: Trajectory
Trajectory Trajectory or deterministic results show the impact of a single spill event over time. Can be used to assess different response options such as booms, skimmers and dispersant. See also: Stochastic
UTC Coordinated Universal Time
Wax Content Represents the crude oil components that are soluble in higher molecular weight normal alkanes (n-heptane) but are insoluble in lower molecular weight alkanes (n-pentane).

Oil Spill Modelling Report – Well Head Failure: Tortue Phase 1a
BP p.l.c.
Document No: GEOM0132a R03 Page 60 of 60 Oil Spill Response Ltd. Date Issued: 19-Jan-18
APPENDIX H. REFERENCES Bacher, A.D. (2014) ‘Gas Chromatography Theory’, accessible online via:
http://www.chem.ucla.edu/~bacher/General/30BL/gc/theory.html, last accessed 31st October 2017.
HPI Consultants Inc. (1987) HPI Crude Oil Assay Handbook, First Edition, California: USA.
The International Tanker Owners Pollution Federation Limited (ITOPF) (n.d.) ‘Technical Information Paper 02: Fate of marine oil spills’, accessible online via: http://www.itopf.com/knowledge-resources/documents-guides/document/tip-2-fate-of-marine-oil-spills/, last accessed 31st October 2017.
The International Tanker Owners Pollution Federation Limited (ITOPF) (n.d.) ‘Technical Information Paper 06: Recognition of oil on shorelines’, accessible online via: http://www.itopf.com/knowledge-resources/documents-guides/document/tip-6-recognition-of-oil-on-shorelines/, last accessed 31st October 2017.
LECO Corporation (2012) ‘Analysis of Light Crude Oil Using Gas Chromatography – High Resolution Time-of-Flight Mass Spectrometry’, Form No. 203-821-410 Rev0, accessible online via: http://www.leco.com/index.php/component/edocman/?task=document.download&id=404&Itemid=404, last accessed 31st October 2017.
National Oceanic and Atmospheric Administration (NOAA, 2014) National Oceanographic Data Center (NODC), World Ocean Atlas Select (WOAselect), accessible via: http://www.nodc.noaa.gov/OC5/SELECT/woaselect/woaselect.html, last accessed 31st October 2017.
Oil Spill Response Ltd. (OSRL) ‘Shoreline Cleanup and Assessment Technique (SCAT) Field Guide’ accessible online via: http://www.oilspillresponse.com/technical-development/technical-field-guides, last accessed 31st October 2017.
Reed, M., French, D., Rines, G. and Rye, H. (1995) ‘A three-dimensional oil and chemical spill model for environmental impact assessment’, paper presented at 1995 International Oil Spill Conference, pp.61-66.
Reed, M., Aamo, O.M. and Downing, K. (1996) ‘Calibration and Testing of IKU’s Oil Spill Contingency and Response (OSCAR) Model System’, paper presented at 1996 AMOP Oil Spill Conference.
Saha, S., S. Moorthi, H. Pan, X. Wu, J. Wang, and Co-authors, 2010: The NCEP Climate Forecast System Reanalysis. Bulletin of the American Meteorological Society, 91, 1015–1057.
Saha, S., S. Moorthi, X. Wu, J. Wang, and Co-authors, 2014: The NCEP Climate Forecast System Version 2. Journal of Climate, 27, 2185–2208.
SINTEF (2014) ‘OSCAR – Oil Spill Contingency and Response’, accessible online via: https://www.sintef.no/en/software/oscar/, last accessed 31st October 2017.
ESIA FOR THE GREATER TORTUE/AHMEYIM PHASE 1 GAS PRODUCTION PROJECT
Ref. No.: 1653939
APPENDIX N-1b : OIL SPILL MODELING REPORT – FPSO FAILURE DUE TO A VESSEL COLLISION
Oil Spill Modelling Report – FPSO Storage Tank & Diesel Tank Failure Tortue Phase 1a
BP p.l.c. Document Number: GEOM0132g R03 Issued: 19 January 2018
Oil Spill Response Limited
Lower William Street Southampton
SO14 5QE United Kingdom
Tel: +44 (0)23 8033 1551 Fax: +44 (0)23 8022 1972
Oil Spill Modelling Report – FPSO Storage Tank & Diesel Tank Failure: Tortue Phase 1a
BP p.l.c.
Document No: GEOM0132g R03 Page 2 of 56 Oil Spill Response Ltd. Date Issued: 19-Jan-18
EXECUTIVE SUMMARY Oil spill modelling was completed by Oil Spill Response Ltd. (OSRL) on behalf of BP for the Tortue Phase 1a project, offshore Senegal and Mauritania (Figure 1). The results of this analysis will support the Oil Spill Contingency Plan and the Environmental Impact Assessment for the area. The modelled scenarios are summarised in Table 1.
Scenario 1. FPSO storage tank and diesel tank failure resulting in release of 163,200 m3 over 160 hours during summer (Apr-Sep)
Scenario 2. FPSO storage tank and diesel tank failure resulting in release of 163,200 m3 over 160 hours during winter (Oct-Mar)
The coastlines of Senegal and Mauritania are at risk due to a FPSO storage tank and diesel tank failure. Summer is worse than winter with condensate and diesel almost certainly reaching the shore within 8 days and in the worst-case in less than 2 days. Summer also has a greater chance of a more considerable impact with a 50% chance that the amount of condensate and diesel reaching the shore will exceed 9,500 MT. Winter has only a 13% chance that the same amount of condensate and diesel will reach the shore.
Senegal is expected to see more oiling than Mauritania. A summer spill may also result in ‘heavy’ shoreline oiling (using ITOPF’s recognition of shoreline oiling (See Thresholds)). However, the length of shoreline that could be impacted by heavy oiling is restricted to less than 7 km.
The trajectories undertaken shows that evaporation of the condensate and diesel is considerable within the first 7 days. Shoreline oiling, sedimentation and biodegradation then become the dominant processes.
In the worst-case winter scenario, the amount of condensate and diesel on the shore peaks at 21,536 MT (27,295 m3) after 28 days.
The waters of Senegal and Mauritania could experience a spill with a surface thickness more than 5 μm making them candidates for containment and recovery techniques.
Oil Spill Modelling Report – FPSO Storage Tank & Diesel Tank Failure: Tortue Phase 1a
BP p.l.c.
Document No: GEOM0132g R03 Page 3 of 56 Oil Spill Response Ltd. Date Issued: 19-Jan-18
DOCUMENT HISTORY
Document Number Revision Document
Type Author Technical Review
Format Review
Date of Issue
GEOM0132g R01 Draft Modelling Report JKM LHM SJB 08-Dec-17
GEOM0132g R02 Response to Comments JKM LHM SJB 12-Jan-18
GEOM0132g R03 Response to Comments LHM N/A N/A 19-Jan-18 JKM – Jenny Kirsty Mitchell LHM – Liam Harrington-Missin SJB – Simon Blaen
DISCLAIMERS
Modelling results are to be used for guidance purposes only and response strategies should not be based on these results alone. The resolution / quality of wind and current data vary between regions and models. As with any model, the quality and reliability of the results are dependent on the quality of the input data.
Considering the above, all advice, modelling, and other information provided is generic and illustrative only and not intended to be relied upon in any specific instance. The recipient of any advice, modelling or other information from, or on behalf of, OSRL acknowledges and agrees that any number of variables may impact on an oil spill and, as such, should be addressed on an individual basis. OSRL has no liability in relation to such advice, modelling or other information and the recipient of such information hereby fully indemnifies and holds harmless OSRL its officers, employees, shareholders, agents, contractors and sub-contractors against any costs, losses, claims or liabilities arising about such advice, modelling, training or other information.
Oil Spill Modelling Report – FPSO Storage Tank & Diesel Tank Failure: Tortue Phase 1a
BP p.l.c.
Document No: GEOM0132g R03 Page 4 of 56 Oil Spill Response Ltd. Date Issued: 19-Jan-18
TABLE OF CONTENTS
1 INTRODUCTION ............................................................................................................... 5 1.1 BACKGROUND ........................................................................................................................ 5 1.2 AIMS .................................................................................................................................... 5 1.3 MODELLING SETUP ................................................................................................................. 7 1.4 THRESHOLDS.......................................................................................................................... 8
2 RESULTS ........................................................................................................................ 10 2.1 STOCHASTIC RESULTS ............................................................................................................ 10
2.1.1 Surface Impact .................................................................................................... 12 2.1.2 Shoreline Impact.................................................................................................. 18 2.1.3 Dissolved Water Column Impact ......................................................................... 25 2.1.4 Total Water Column Impact ................................................................................ 30
2.2 COMPARISON BETWEEN WINTER AND SUMMER ........................................................................ 35 2.3 WORST-CASE OIL SPILL SCENARIO........................................................................................... 37
3 CONCLUSION ................................................................................................................. 43 3.1 SHORELINE IMPACT ............................................................................................................... 43 3.2 SURFACE IMPACT .................................................................................................................. 43
APPENDIX A. MODEL SETUP ........................................................................................... 45 APPENDIX B. METOCEAN DATA ...................................................................................... 46 APPENDIX C. JUSTIFY RELEASE DURATION Error! Bookmark not defined. APPENDIX D. HABITAT GRID ........................................................................................... 48 APPENDIX E. OIL CHARACTERISTICS AND BEHAVIOUR ..................................................... 49 APPENDIX F. OIL SPILL MODELLING SOFTWARE and methodology ................................... 53 APPENDIX G. GLOSSARY OF TERMS, ACRONYMS AND ABBREVIATIONS ........................... 54 APPENDIX H. REFERENCES .............................................................................................. 56
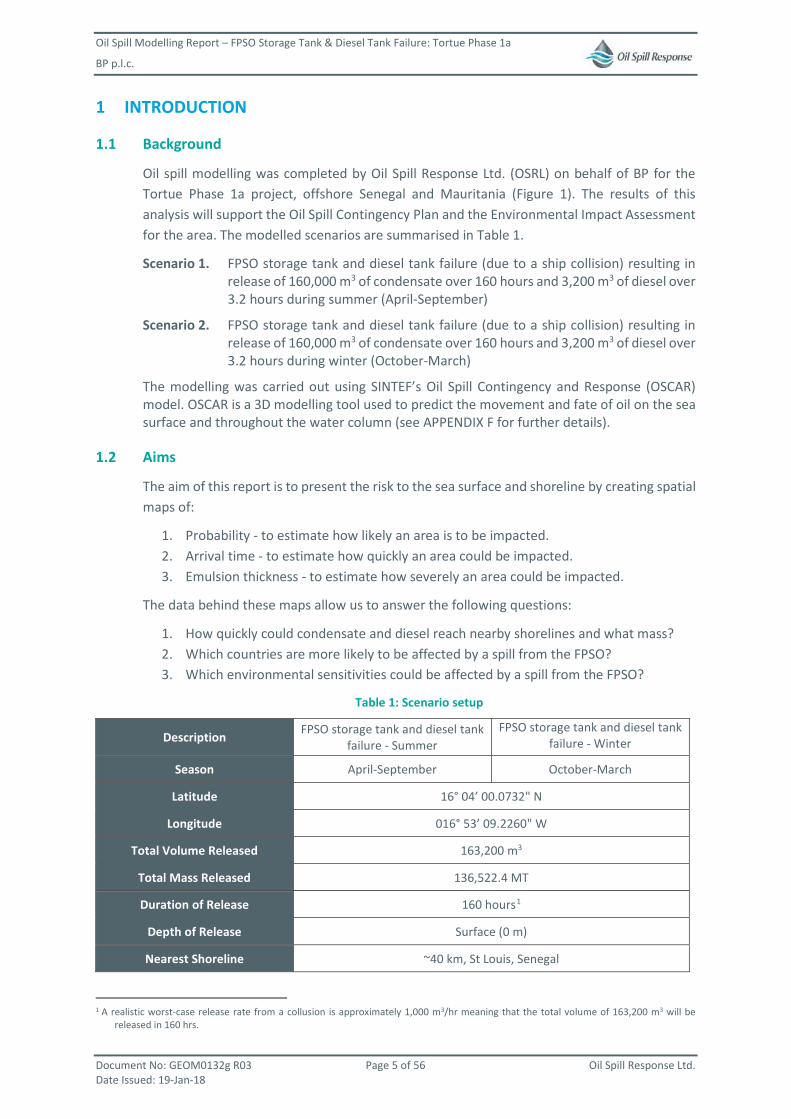
Oil Spill Modelling Report – FPSO Storage Tank & Diesel Tank Failure: Tortue Phase 1a
BP p.l.c.
Document No: GEOM0132g R03 Page 5 of 56 Oil Spill Response Ltd. Date Issued: 19-Jan-18
1 INTRODUCTION
1.1 Background
Oil spill modelling was completed by Oil Spill Response Ltd. (OSRL) on behalf of BP for the Tortue Phase 1a project, offshore Senegal and Mauritania (Figure 1). The results of this analysis will support the Oil Spill Contingency Plan and the Environmental Impact Assessment for the area. The modelled scenarios are summarised in Table 1.
Scenario 1. FPSO storage tank and diesel tank failure (due to a ship collision) resulting in release of 160,000 m3 of condensate over 160 hours and 3,200 m3 of diesel over 3.2 hours during summer (April-September)
Scenario 2. FPSO storage tank and diesel tank failure (due to a ship collision) resulting in release of 160,000 m3 of condensate over 160 hours and 3,200 m3 of diesel over 3.2 hours during winter (October-March)
The modelling was carried out using SINTEF’s Oil Spill Contingency and Response (OSCAR) model. OSCAR is a 3D modelling tool used to predict the movement and fate of oil on the sea surface and throughout the water column (see APPENDIX F for further details).
1.2 Aims
The aim of this report is to present the risk to the sea surface and shoreline by creating spatial maps of:
1. Probability - to estimate how likely an area is to be impacted. 2. Arrival time - to estimate how quickly an area could be impacted. 3. Emulsion thickness - to estimate how severely an area could be impacted.
The data behind these maps allow us to answer the following questions:
1. How quickly could condensate and diesel reach nearby shorelines and what mass? 2. Which countries are more likely to be affected by a spill from the FPSO? 3. Which environmental sensitivities could be affected by a spill from the FPSO?
Table 1: Scenario setup
Description FPSO storage tank and diesel tank failure - Summer
FPSO storage tank and diesel tank failure - Winter
Season April-September October-March
Latitude 16° 04’ 00.0732" N
Longitude 016° 53’ 09.2260" W
Total Volume Released 163,200 m3
Total Mass Released 136,522.4 MT
Duration of Release 160 hours1
Depth of Release Surface (0 m)
Nearest Shoreline ~40 km, St Louis, Senegal
1 A realistic worst-case release rate from a collusion is approximately 1,000 m3/hr meaning that the total volume of 163,200 m3 will be
released in 160 hrs.
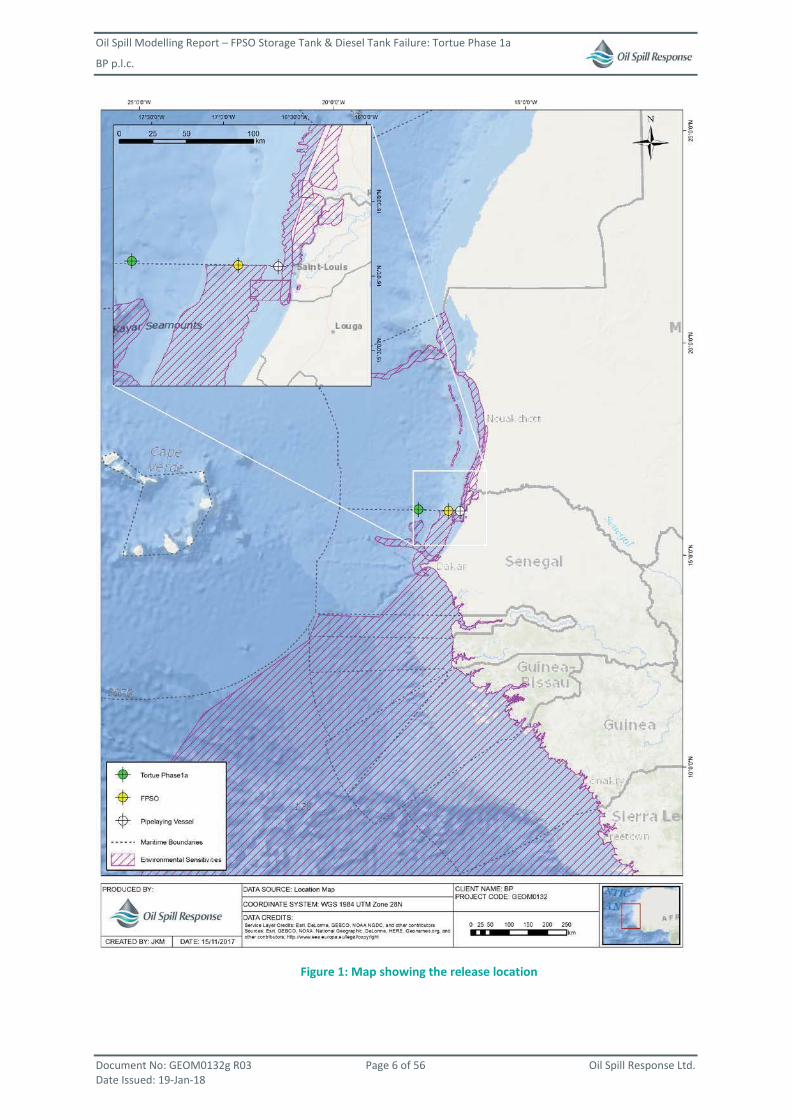
Oil Spill Modelling Report – FPSO Storage Tank & Diesel Tank Failure: Tortue Phase 1a
BP p.l.c.
Document No: GEOM0132g R03 Page 6 of 56 Oil Spill Response Ltd. Date Issued: 19-Jan-18
Figure 1: Map showing the release location
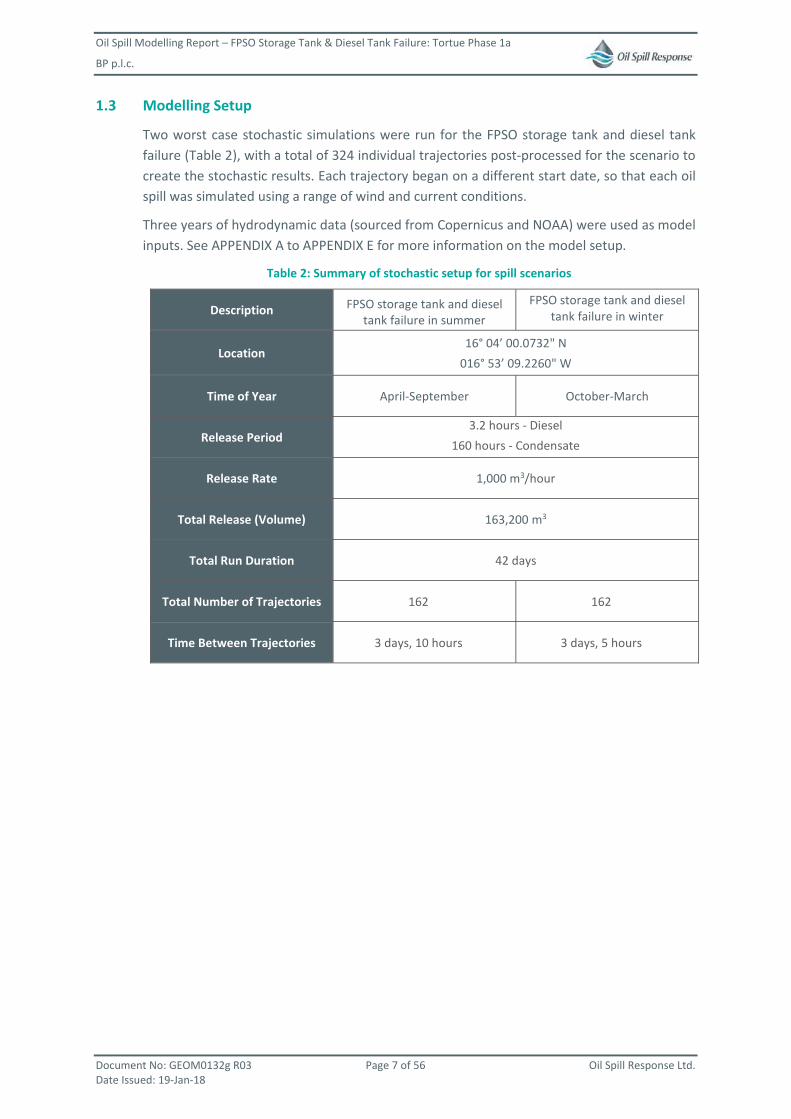
Oil Spill Modelling Report – FPSO Storage Tank & Diesel Tank Failure: Tortue Phase 1a
BP p.l.c.
Document No: GEOM0132g R03 Page 7 of 56 Oil Spill Response Ltd. Date Issued: 19-Jan-18
1.3 Modelling Setup
Two worst case stochastic simulations were run for the FPSO storage tank and diesel tank failure (Table 2), with a total of 324 individual trajectories post-processed for the scenario to create the stochastic results. Each trajectory began on a different start date, so that each oil spill was simulated using a range of wind and current conditions.
Three years of hydrodynamic data (sourced from Copernicus and NOAA) were used as model inputs. See APPENDIX A to APPENDIX E for more information on the model setup.
Table 2: Summary of stochastic setup for spill scenarios
Description FPSO storage tank and diesel tank failure in summer
FPSO storage tank and diesel tank failure in winter
Location 16° 04’ 00.0732" N
016° 53’ 09.2260" W
Time of Year April-September October-March
Release Period 3.2 hours - Diesel
160 hours - Condensate
Release Rate 1,000 m3/hour
Total Release (Volume) 163,200 m3
Total Run Duration 42 days
Total Number of Trajectories 162 162
Time Between Trajectories 3 days, 10 hours 3 days, 5 hours
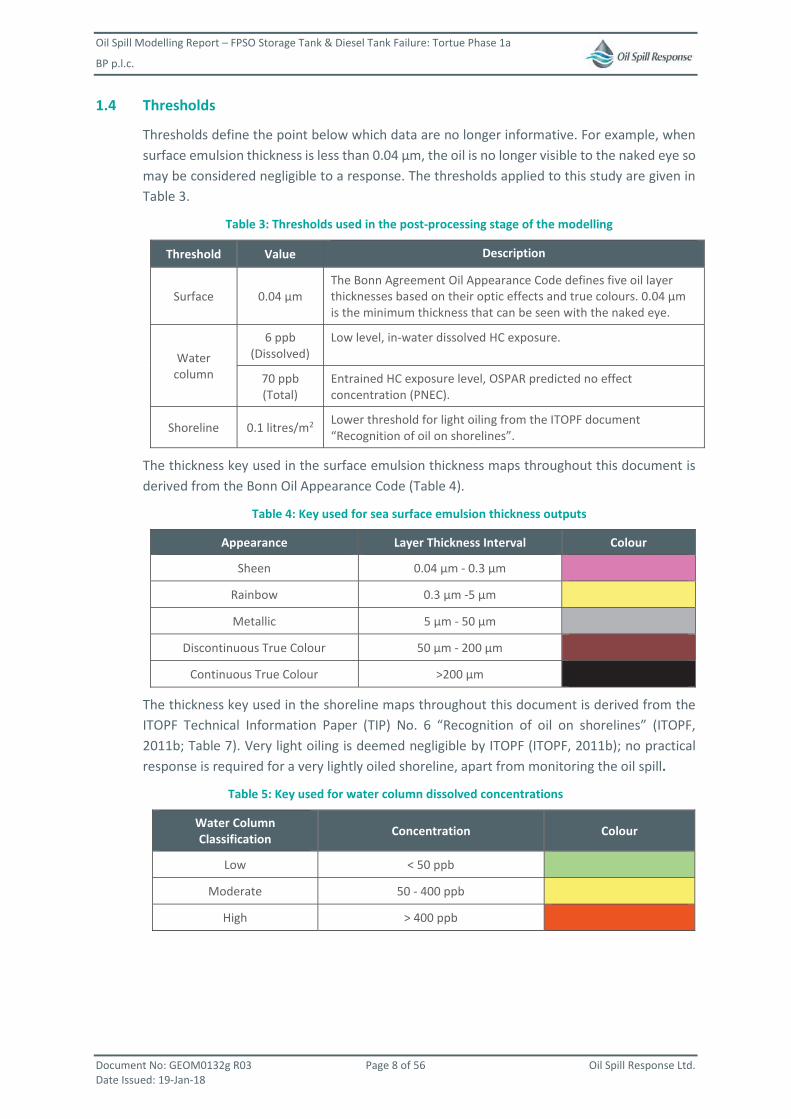
Oil Spill Modelling Report – FPSO Storage Tank & Diesel Tank Failure: Tortue Phase 1a
BP p.l.c.
Document No: GEOM0132g R03 Page 8 of 56 Oil Spill Response Ltd. Date Issued: 19-Jan-18
1.4 Thresholds
Thresholds define the point below which data are no longer informative. For example, when surface emulsion thickness is less than 0.04 μm, the oil is no longer visible to the naked eye so may be considered negligible to a response. The thresholds applied to this study are given in Table 3.
Table 3: Thresholds used in the post-processing stage of the modelling
Threshold Value Description
Surface 0.04 μm The Bonn Agreement Oil Appearance Code defines five oil layer thicknesses based on their optic effects and true colours. 0.04 μm is the minimum thickness that can be seen with the naked eye.
Water column
6 ppb (Dissolved)
Low level, in-water dissolved HC exposure.
70 ppb (Total)
Entrained HC exposure level, OSPAR predicted no effect concentration (PNEC).
Shoreline 0.1 litres/m2 Lower threshold for light oiling from the ITOPF document “Recognition of oil on shorelines”.
The thickness key used in the surface emulsion thickness maps throughout this document is derived from the Bonn Oil Appearance Code (Table 4).
Table 4: Key used for sea surface emulsion thickness outputs
Appearance Layer Thickness Interval Colour
Sheen 0.04 μm - 0.3 μm
Rainbow 0.3 μm -5 μm
Metallic 5 μm - 50 μm
Discontinuous True Colour 50 μm - 200 μm
Continuous True Colour >200 μm
The thickness key used in the shoreline maps throughout this document is derived from the ITOPF Technical Information Paper (TIP) No. 6 “Recognition of oil on shorelines” (ITOPF, 2011b; Table 7). Very light oiling is deemed negligible by ITOPF (ITOPF, 2011b); no practical response is required for a very lightly oiled shoreline, apart from monitoring the oil spill.
Table 5: Key used for water column dissolved concentrations
Water Column Classification Concentration Colour
Low < 50 ppb
Moderate 50 - 400 ppb
High > 400 ppb
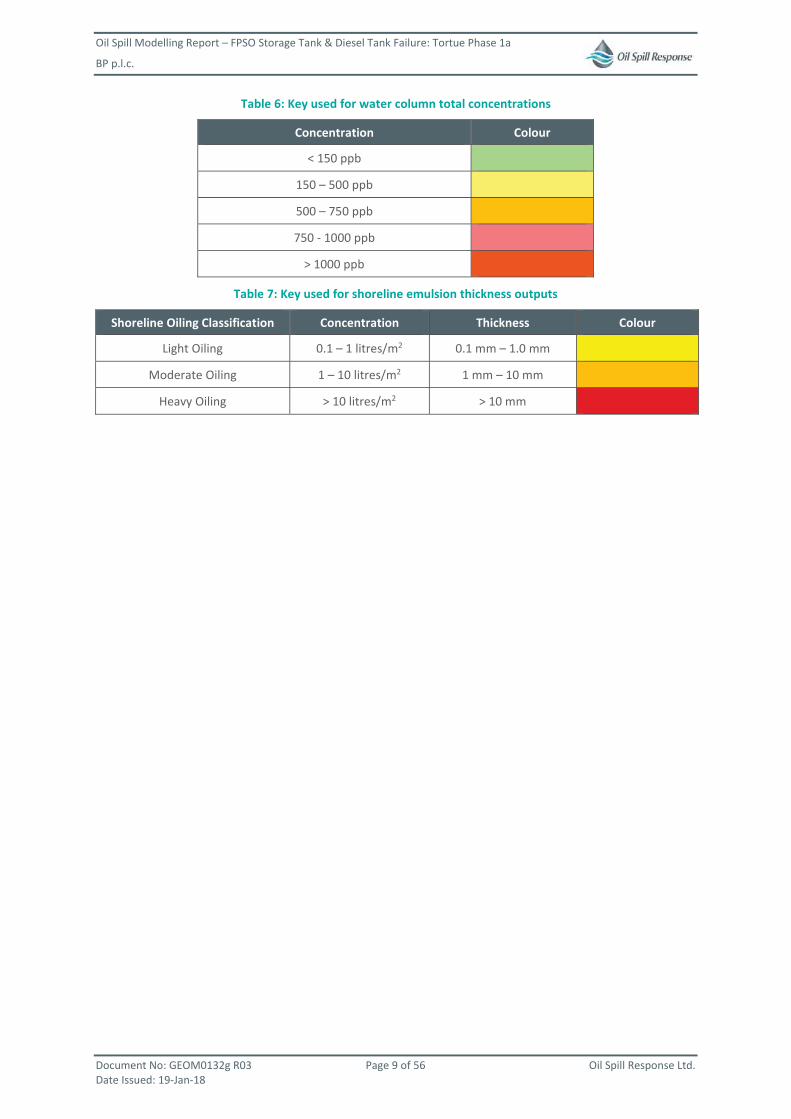
Oil Spill Modelling Report – FPSO Storage Tank & Diesel Tank Failure: Tortue Phase 1a
BP p.l.c.
Document No: GEOM0132g R03 Page 9 of 56 Oil Spill Response Ltd. Date Issued: 19-Jan-18
Table 6: Key used for water column total concentrations
Concentration Colour
< 150 ppb
150 – 500 ppb
500 – 750 ppb
750 - 1000 ppb
> 1000 ppb
Table 7: Key used for shoreline emulsion thickness outputs
Shoreline Oiling Classification Concentration Thickness Colour
Light Oiling 0.1 – 1 litres/m2 0.1 mm – 1.0 mm
Moderate Oiling 1 – 10 litres/m2 1 mm – 10 mm
Heavy Oiling > 10 litres/m2 > 10 mm
Oil Spill Modelling Report – FPSO Storage Tank & Diesel Tank Failure: Tortue Phase 1a
BP p.l.c.
Document No: GEOM0132g R03 Page 10 of 56 Oil Spill Response Ltd. Date Issued: 19-Jan-18
2 RESULTS
2.1 Stochastic Results
The stochastic results for Scenario 1 were calculated from 324 trajectories. The scenario involves the release of 160,000 m3 of condensate over 160 hours and 3,200 m3 of diesel over 3.2 hours during the summer (April to September) and during winter (Oct to March). The release is tracked for a total of 42 days.
The following results are presented:
Sea Surface
Figure 2: FPSO storage tank and diesel tank failure – Surface Probability of Cell Impact– Summer (left) & Winter (right)FPSO storage tank and diesel tank failure – Surface Probability of Cell Impact– Summer (left) & Winter (right)
Figure 3: FPSO storage tank and diesel tank failure – Surface Minimum Arrival Time – Summer (left) & Winter (right)
Figure 4: FPSO storage tank and diesel tank failure – Surface Maximum Emulsion Thickness – Summer (left) & Winter (right)
Figure 5: FPSO storage tank and diesel tank failure – Surface Average Emulsion Thickness – Summer (left) & Winter (right)
Figure 6: FPSO storage tank and diesel tank failure – Surface Maximum Exposure Time – Summer (left) & Winter (right)
Shoreline
Figure 7: FPSO storage tank and diesel tank failure – Shoreline Probability of Cell Impact – Summer (left) & Winter (right)
Figure 8: FPSO storage tank and diesel tank failure – Shoreline Minimum Arrival Time – Summer (left) & Winter (right)
Figure 9: FPSO storage tank and diesel tank failure – Shoreline Impact – Summer (left) & Winter (right)
Figure 10: FPSO storage tank and diesel tank failure – Shoreline Impact – Shoreline Arrival Time Probability - Summer (left) & Winter (right)
Figure 11: FPSO storage tank and diesel tank failure – Shoreline Impact – Shoreline Arrival Time Probability - Summer (left) & Winter (right)
Water Column (Dissolved Hydrocarbon)
Figure 12: FPSO storage tank and diesel tank failure – Water Column (Dissolved) Probability of Cell Impact – Summer (left) & Winter (right)
Figure 13: FPSO storage tank and diesel tank failure – Water Column (Dissolved) Minimum Arrival Time – Summer (left) & Winter (right)
Figure 14: FPSO storage tank and diesel tank failure – Water Column (Dissolved) Concentrations – Summer (left) & Winter (right)
Oil Spill Modelling Report – FPSO Storage Tank & Diesel Tank Failure: Tortue Phase 1a
BP p.l.c.
Document No: GEOM0132g R03 Page 11 of 56 Oil Spill Response Ltd. Date Issued: 19-Jan-18
Figure 15: FPSO storage tank and diesel tank failure – Water Column (Dissolved) Maximum Exposure Time– Summer (left) & Winter (right)
Water Column (Total Hydrocarbon)
Figure 16: FPSO storage tank and diesel tank failure – Water Column (Total) Probability of Cell Impact – Summer (left) & Winter (right)
Figure 17: FPSO storage tank and diesel tank failure – Water Column (Total) Minimum Arrival Time – Summer (left) & Winter (right)
Figure 18: FPSO storage tank and diesel tank failure – Water Column (Total) Concentrations – Summer (left) & Winter (right)
Figure 19: FPSO storage tank and diesel tank failure – Water Column (Total) Maximum Exposure Time – Summer (left) & Winter (right)
Oil Spill Modelling Report – FPSO Storage Tank & Diesel Tank Failure: Tortue Phase 1a
BP p.l.c.
Document No: GEOM0132g R03 Page 12 of 56 Oil Spill Response Ltd. Date Issued: 19-Jan-18
2.1.1 Surface Impact
FPSO storage tank and gdiesel tank failure
Surface
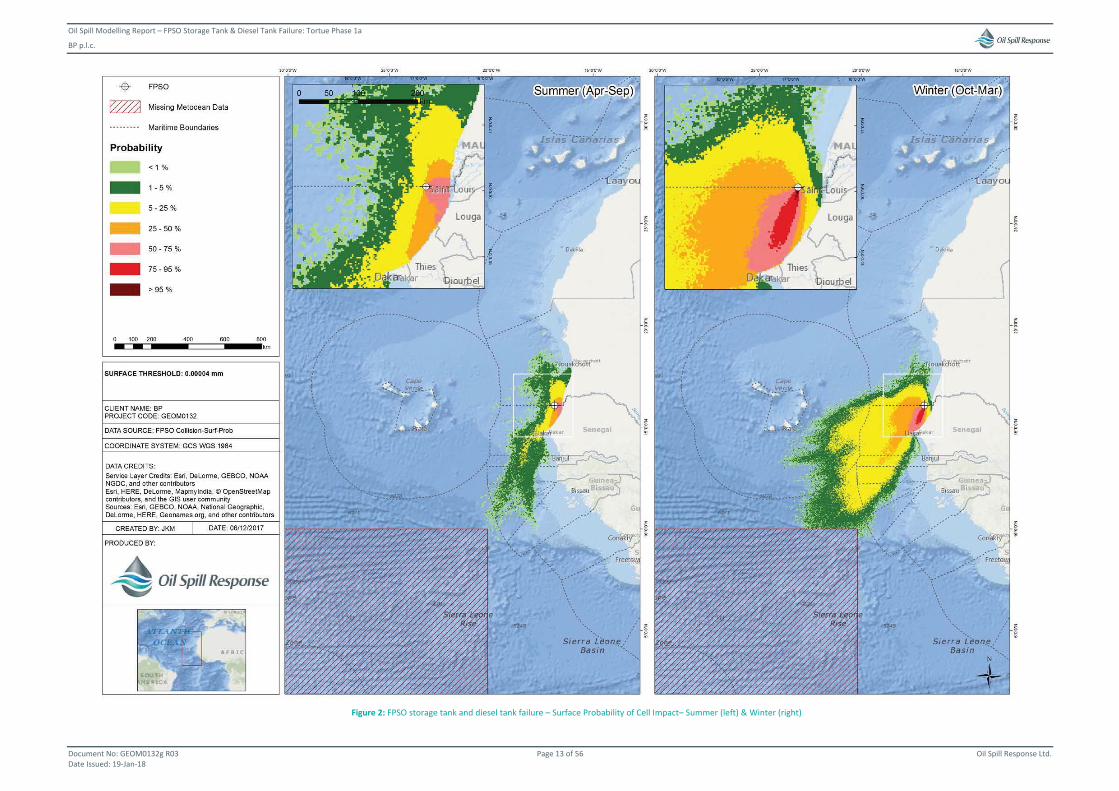
Oil Spill Modelling Report – FPSO Storage Tank & Diesel Tank Failure: Tortue Phase 1a
BP p.l.c.
Document No: GEOM0132g R03 Page 13 of 56 Oil Spill Response Ltd. Date Issued: 19-Jan-18
Figure 2: FPSO storage tank and diesel tank failure – Surface Probability of Cell Impact– Summer (left) & Winter (right)
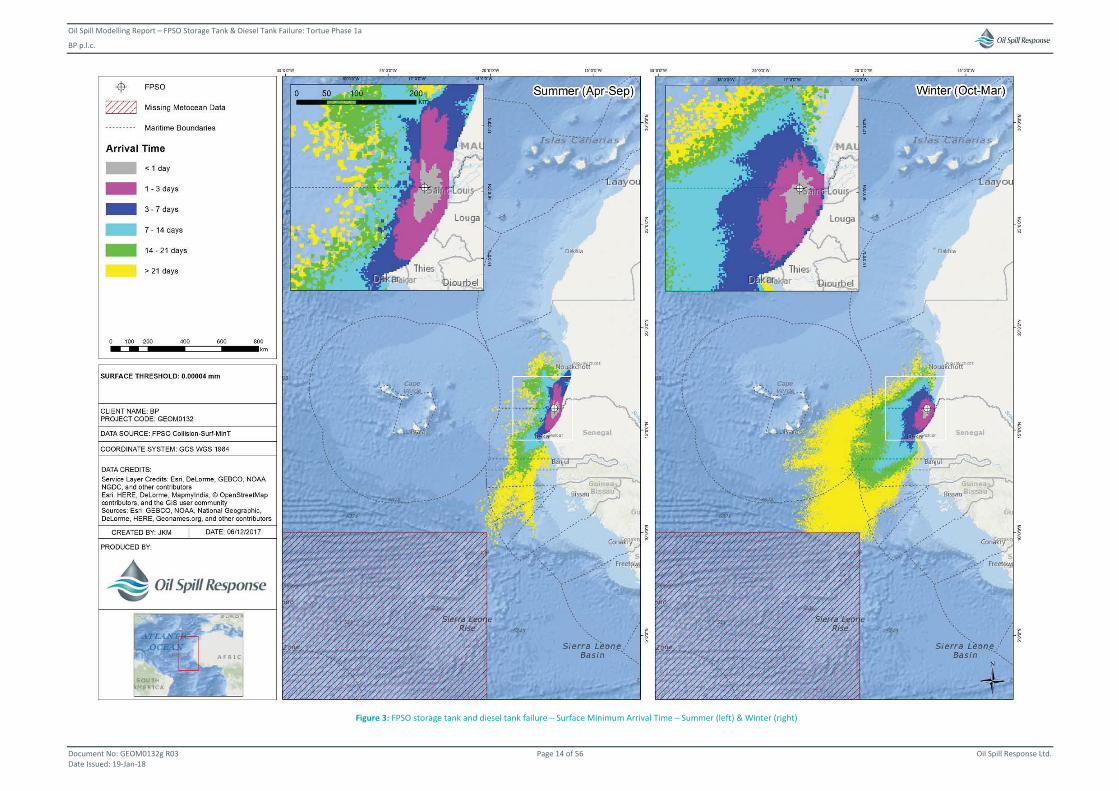
Oil Spill Modelling Report – FPSO Storage Tank & Diesel Tank Failure: Tortue Phase 1a
BP p.l.c.
Document No: GEOM0132g R03 Page 14 of 56 Oil Spill Response Ltd. Date Issued: 19-Jan-18
Figure 3: FPSO storage tank and diesel tank failure – Surface Minimum Arrival Time – Summer (left) & Winter (right)
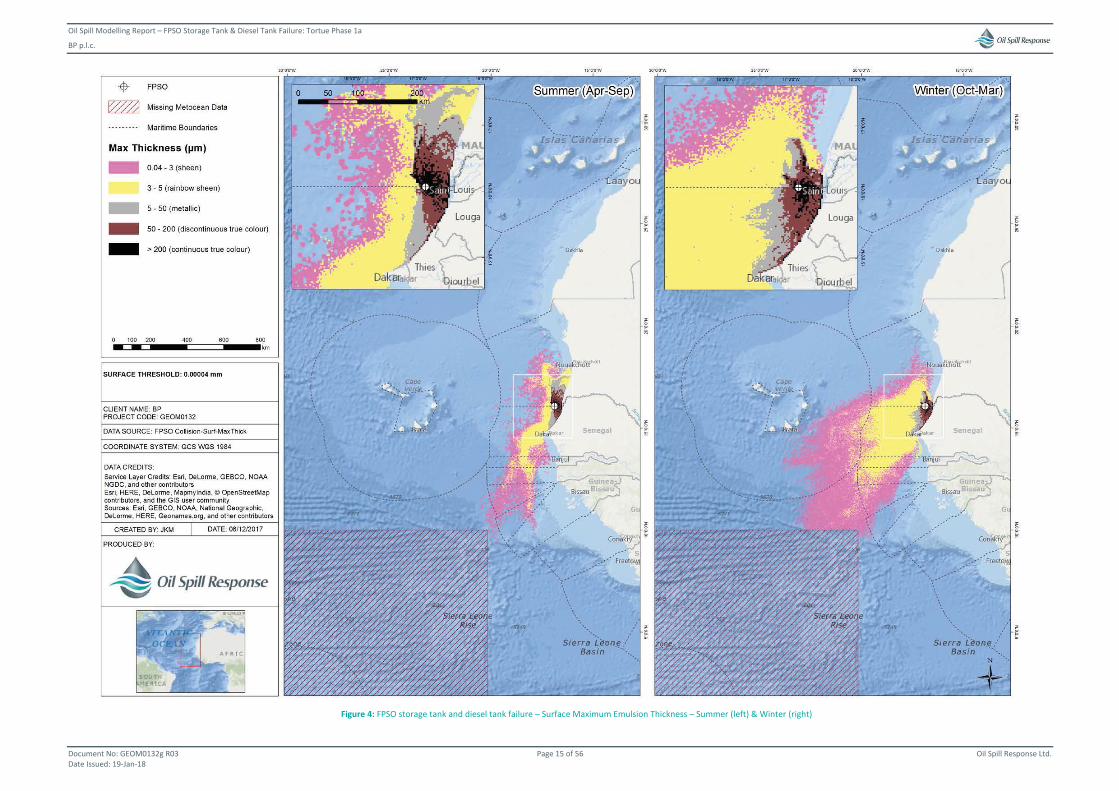
Oil Spill Modelling Report – FPSO Storage Tank & Diesel Tank Failure: Tortue Phase 1a
BP p.l.c.
Document No: GEOM0132g R03 Page 15 of 56 Oil Spill Response Ltd. Date Issued: 19-Jan-18
Figure 4: FPSO storage tank and diesel tank failure – Surface Maximum Emulsion Thickness – Summer (left) & Winter (right)
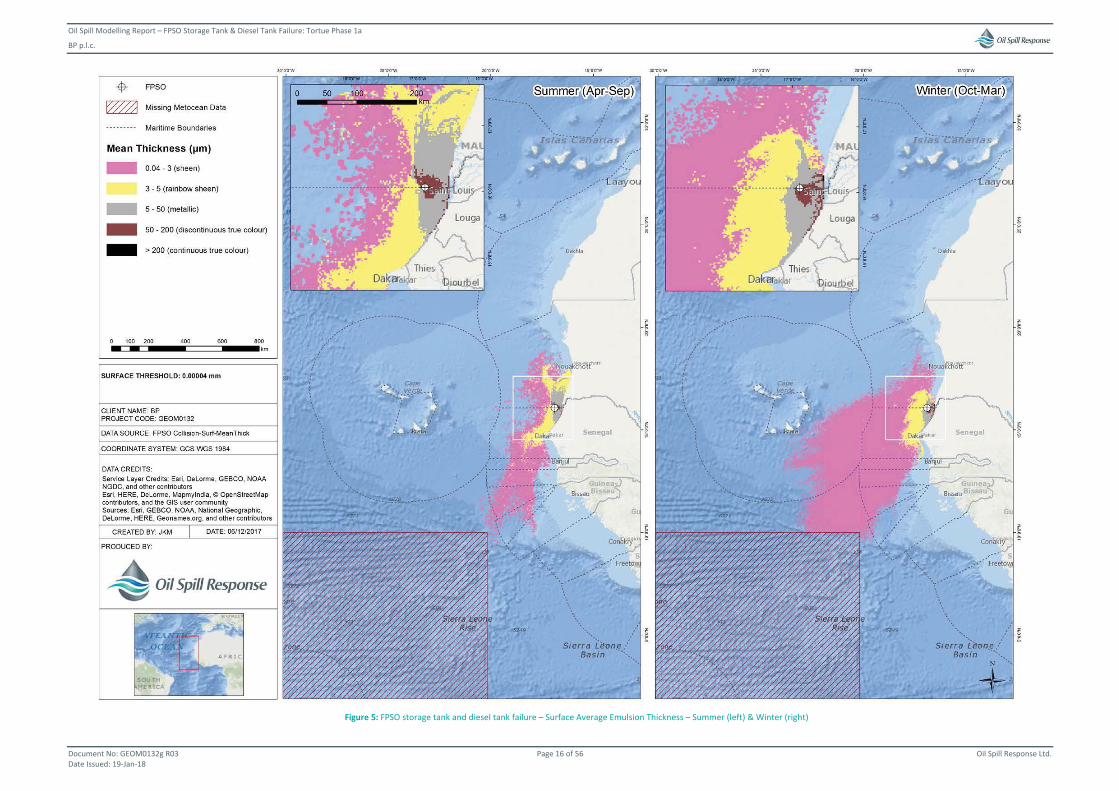
Oil Spill Modelling Report – FPSO Storage Tank & Diesel Tank Failure: Tortue Phase 1a
BP p.l.c.
Document No: GEOM0132g R03 Page 16 of 56 Oil Spill Response Ltd. Date Issued: 19-Jan-18
Figure 5: FPSO storage tank and diesel tank failure – Surface Average Emulsion Thickness – Summer (left) & Winter (right)
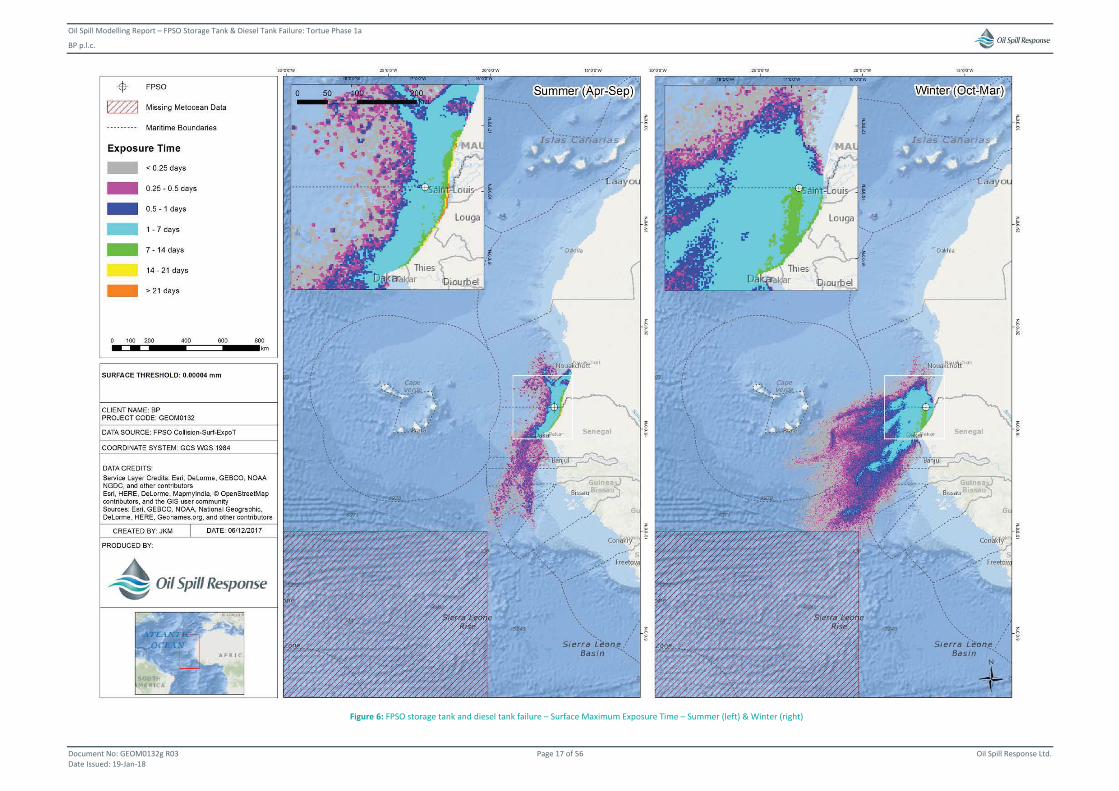
Oil Spill Modelling Report – FPSO Storage Tank & Diesel Tank Failure: Tortue Phase 1a
BP p.l.c.
Document No: GEOM0132g R03 Page 17 of 56 Oil Spill Response Ltd. Date Issued: 19-Jan-18
Figure 6: FPSO storage tank and diesel tank failure – Surface Maximum Exposure Time – Summer (left) & Winter (right)

Oil Spill Modelling Report – FPSO Storage Tank & Diesel Tank Failure: Tortue Phase 1a
BP p.l.c.
Document No: GEOM0132g R03 Page 18 of 56 Oil Spill Response Ltd. Date Issued: 19-Jan-18
2.1.2 Shoreline Impact
FPSO storage tank and gdiesel tank failure
Shoreline
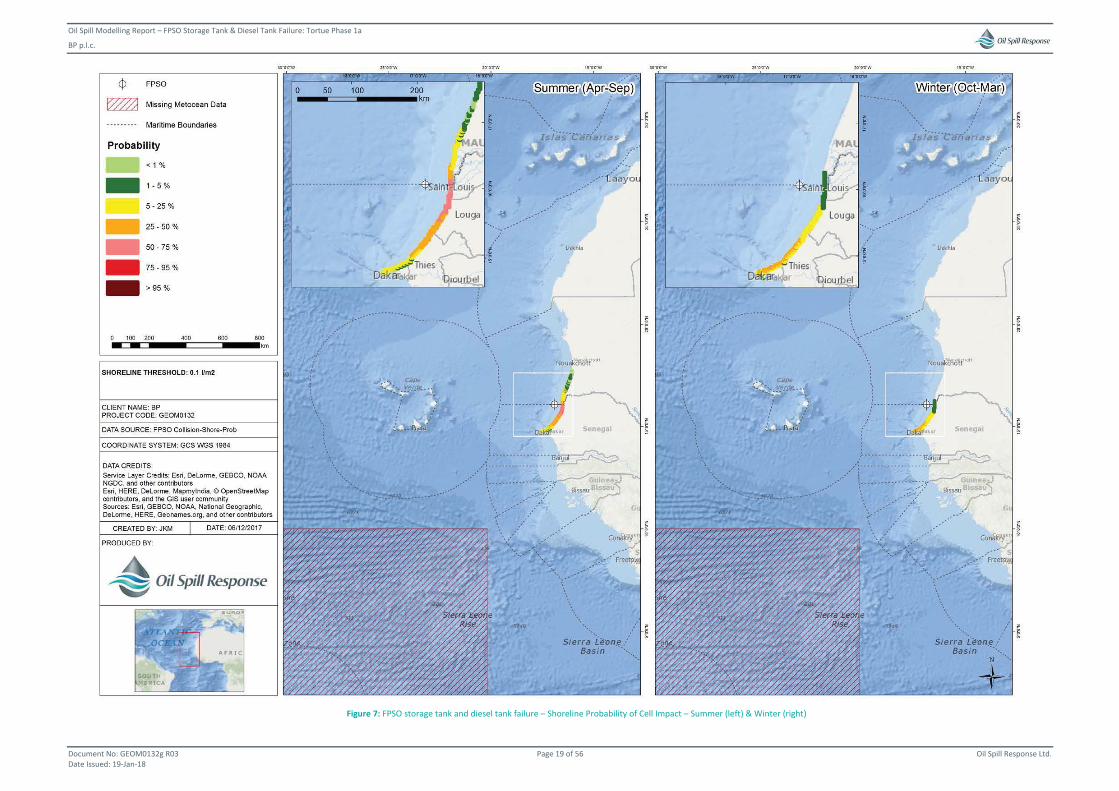
Oil Spill Modelling Report – FPSO Storage Tank & Diesel Tank Failure: Tortue Phase 1a
BP p.l.c.
Document No: GEOM0132g R03 Page 19 of 56 Oil Spill Response Ltd. Date Issued: 19-Jan-18
Figure 7: FPSO storage tank and diesel tank failure – Shoreline Probability of Cell Impact – Summer (left) & Winter (right)

Oil Spill Modelling Report – FPSO Storage Tank & Diesel Tank Failure: Tortue Phase 1a
BP p.l.c.
Document No: GEOM0132g R03 Page 20 of 56 Oil Spill Response Ltd. Date Issued: 19-Jan-18
Figure 8: FPSO storage tank and diesel tank failure – Shoreline Minimum Arrival Time – Summer (left) & Winter (right)
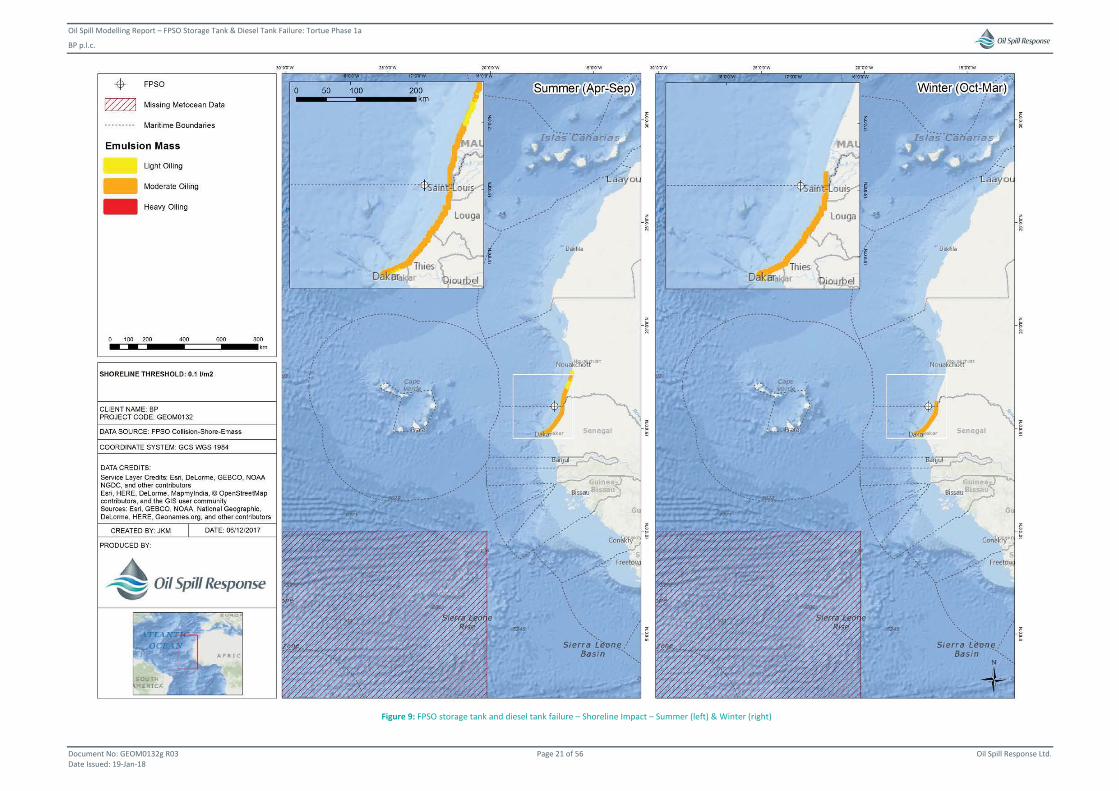
Oil Spill Modelling Report – FPSO Storage Tank & Diesel Tank Failure: Tortue Phase 1a
BP p.l.c.
Document No: GEOM0132g R03 Page 21 of 56 Oil Spill Response Ltd. Date Issued: 19-Jan-18
Figure 9: FPSO storage tank and diesel tank failure – Shoreline Impact – Summer (left) & Winter (right)
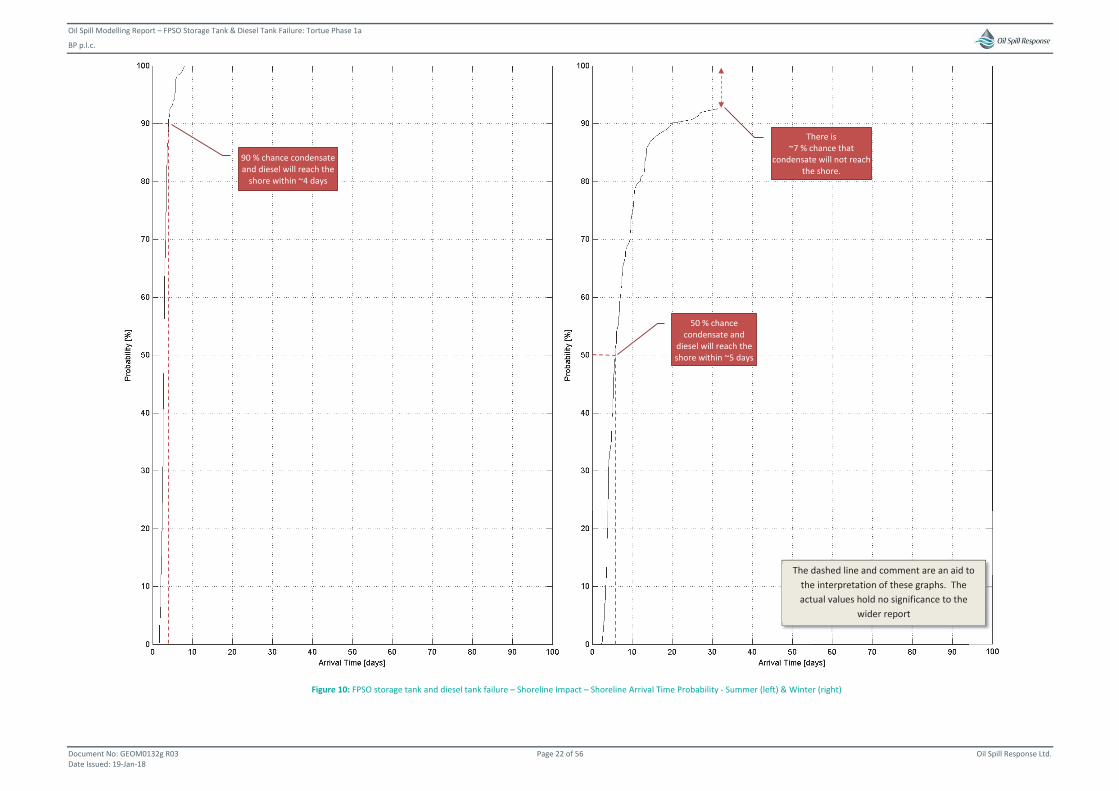
Oil Spill Modelling Report – FPSO Storage Tank & Diesel Tank Failure: Tortue Phase 1a
BP p.l.c.
Document No: GEOM0132g R03 Page 22 of 56 Oil Spill Response Ltd. Date Issued: 19-Jan-18
Figure 10: FPSO storage tank and diesel tank failure – Shoreline Impact – Shoreline Arrival Time Probability - Summer (left) & Winter (right)
90 % chance condensate and diesel will reach the
shore within ~4 days
50 % chance condensate and
diesel will reach the shore within ~5 days
There is ~7 % chance that
condensate will not reach the shore.
The dashed line and comment are an aid to the interpretation of these graphs. The actual values hold no significance to the
wider report
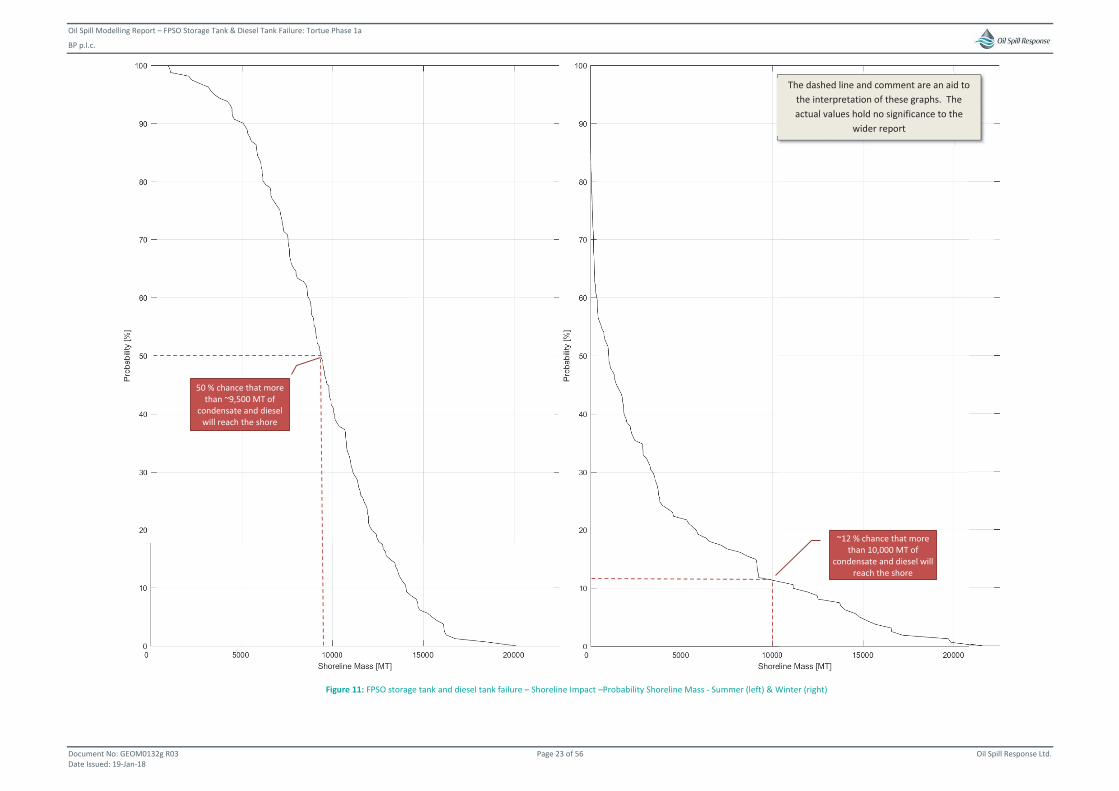
Oil Spill Modelling Report – FPSO Storage Tank & Diesel Tank Failure: Tortue Phase 1a
BP p.l.c.
Document No: GEOM0132g R03 Page 23 of 56 Oil Spill Response Ltd. Date Issued: 19-Jan-18
Figure 11: FPSO storage tank and diesel tank failure – Shoreline Impact –Probability Shoreline Mass - Summer (left) & Winter (right)
50 % chance that more than ~9,500 MT of
condensate and diesel will reach the shore
~12 % chance that more than 10,000 MT of
condensate and diesel will reach the shore
The dashed line and comment are an aid to the interpretation of these graphs. The actual values hold no significance to the
wider report
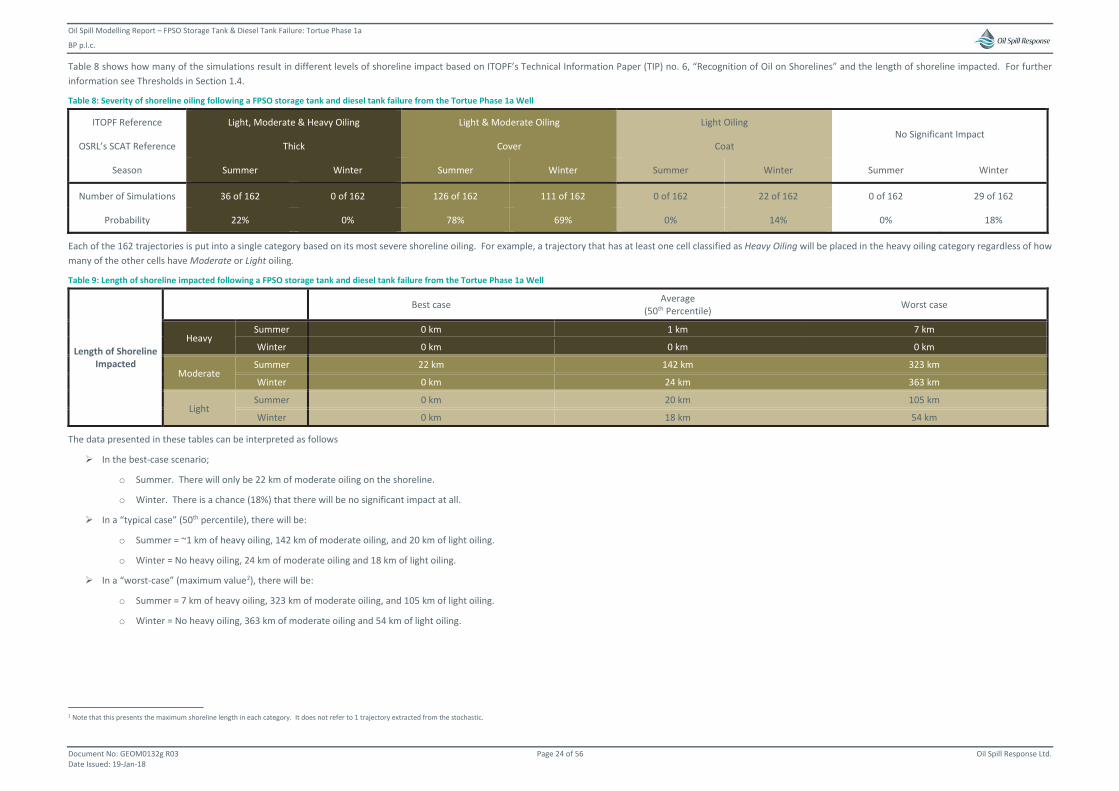
Oil Spill Modelling Report – FPSO Storage Tank & Diesel Tank Failure: Tortue Phase 1a
BP p.l.c.
Document No: GEOM0132g R03 Page 24 of 56 Oil Spill Response Ltd. Date Issued: 19-Jan-18
Table 8 shows how many of the simulations result in different levels of shoreline impact based on ITOPF’s Technical Information Paper (TIP) no. 6, “Recognition of Oil on Shorelines” and the length of shoreline impacted. For further information see Thresholds in Section 1.4.
Table 8: Severity of shoreline oiling following a FPSO storage tank and diesel tank failure from the Tortue Phase 1a Well
ITOPF Reference Light, Moderate & Heavy Oiling Light & Moderate Oiling Light Oiling No Significant Impact
OSRL’s SCAT Reference Thick Cover Coat
Season Summer Winter Summer Winter Summer Winter Summer Winter
Number of Simulations 36 of 162 0 of 162 126 of 162 111 of 162 0 of 162 22 of 162 0 of 162 29 of 162
Probability 22% 0% 78% 69% 0% 14% 0% 18%
Each of the 162 trajectories is put into a single category based on its most severe shoreline oiling. For example, a trajectory that has at least one cell classified as Heavy Oiling will be placed in the heavy oiling category regardless of how many of the other cells have Moderate or Light oiling.
Table 9: Length of shoreline impacted following a FPSO storage tank and diesel tank failure from the Tortue Phase 1a Well
Length of Shoreline Impacted
Best case Average (50th Percentile) Worst case
Heavy Summer 0 km 1 km 7 km
Winter 0 km 0 km 0 km
Moderate Summer 22 km 142 km 323 km
Winter 0 km 24 km 363 km
Light Summer 0 km 20 km 105 km
Winter 0 km 18 km 54 km
The data presented in these tables can be interpreted as follows
In the best-case scenario;
o Summer. There will only be 22 km of moderate oiling on the shoreline.
o Winter. There is a chance (18%) that there will be no significant impact at all.
In a “typical case” (50th percentile), there will be:
o Summer = ~1 km of heavy oiling, 142 km of moderate oiling, and 20 km of light oiling.
o Winter = No heavy oiling, 24 km of moderate oiling and 18 km of light oiling.
In a “worst-case” (maximum value2), there will be:
o Summer = 7 km of heavy oiling, 323 km of moderate oiling, and 105 km of light oiling.
o Winter = No heavy oiling, 363 km of moderate oiling and 54 km of light oiling.
2 Note that this presents the maximum shoreline length in each category. It does not refer to 1 trajectory extracted from the stochastic.

Oil Spill Modelling Report – FPSO Storage Tank & Diesel Tank Failure: Tortue Phase 1a
BP p.l.c.
Document No: GEOM0132g R03 Page 25 of 56 Oil Spill Response Ltd. Date Issued: 19-Jan-18
2.1.3 Dissolved Water Column Impact
FPSO storage tank and gdiesel tank failure
Water Column Maps pDissolved Concentrations
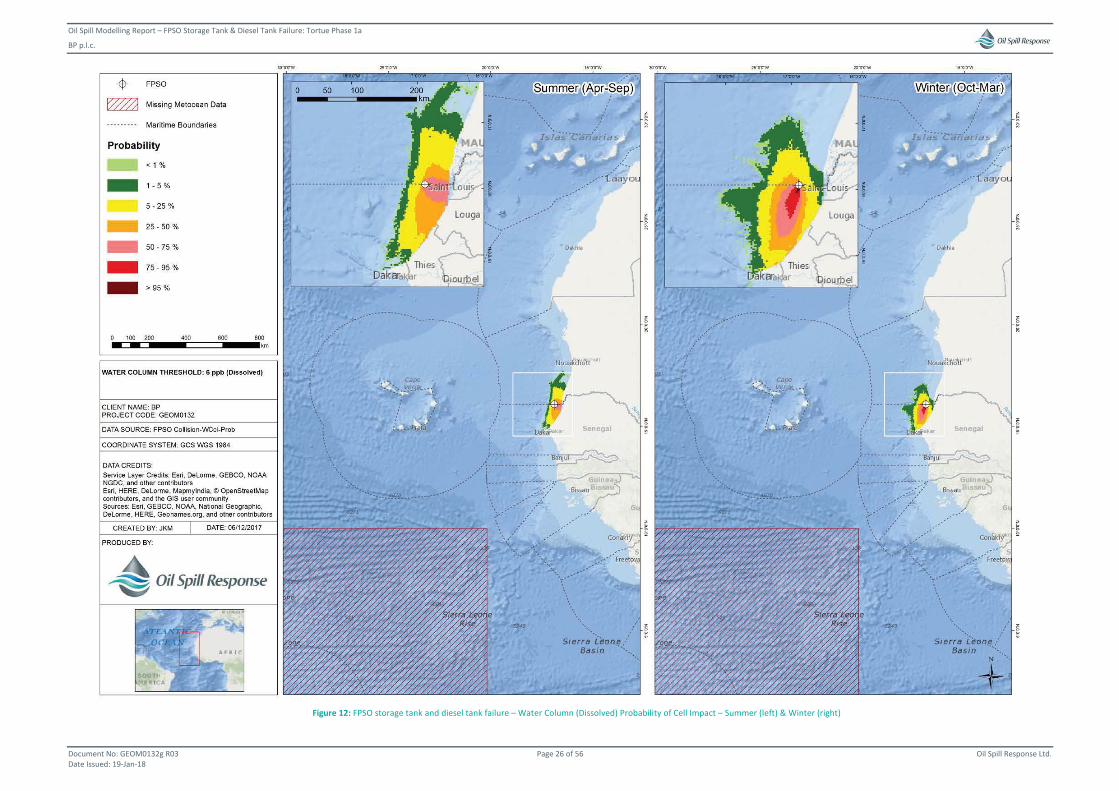
Oil Spill Modelling Report – FPSO Storage Tank & Diesel Tank Failure: Tortue Phase 1a
BP p.l.c.
Document No: GEOM0132g R03 Page 26 of 56 Oil Spill Response Ltd. Date Issued: 19-Jan-18
Figure 12: FPSO storage tank and diesel tank failure – Water Column (Dissolved) Probability of Cell Impact – Summer (left) & Winter (right)
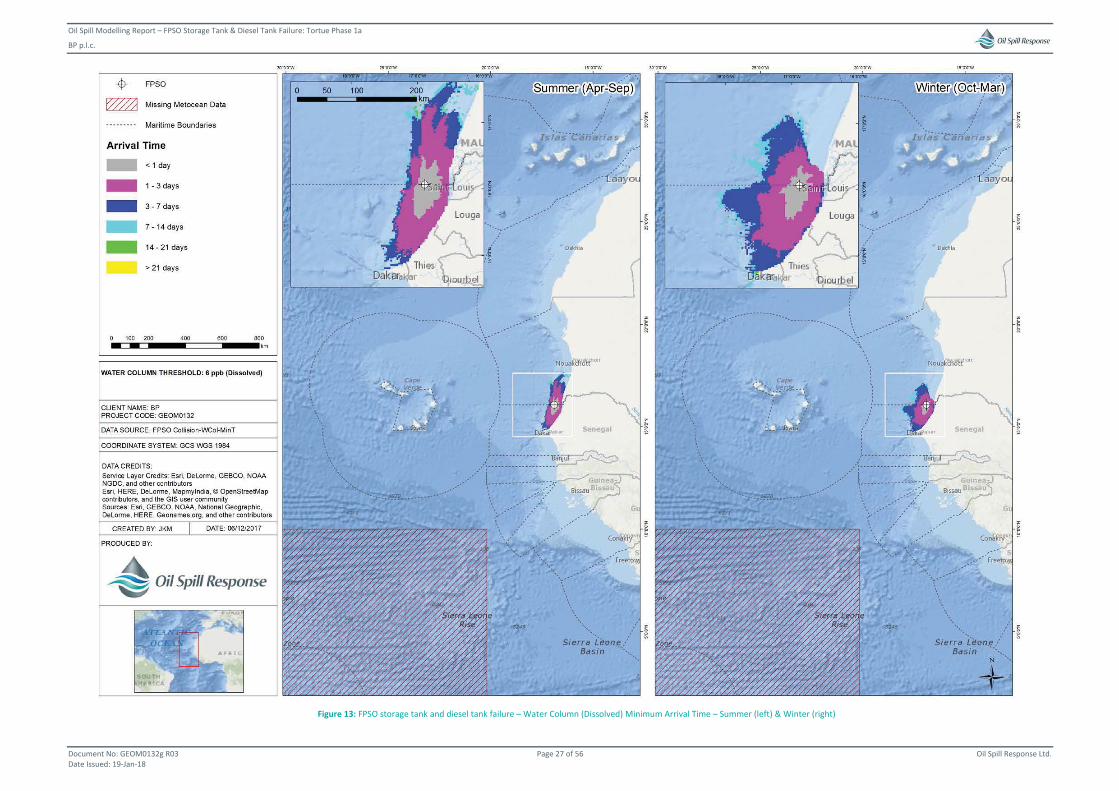
Oil Spill Modelling Report – FPSO Storage Tank & Diesel Tank Failure: Tortue Phase 1a
BP p.l.c.
Document No: GEOM0132g R03 Page 27 of 56 Oil Spill Response Ltd. Date Issued: 19-Jan-18
Figure 13: FPSO storage tank and diesel tank failure – Water Column (Dissolved) Minimum Arrival Time – Summer (left) & Winter (right)
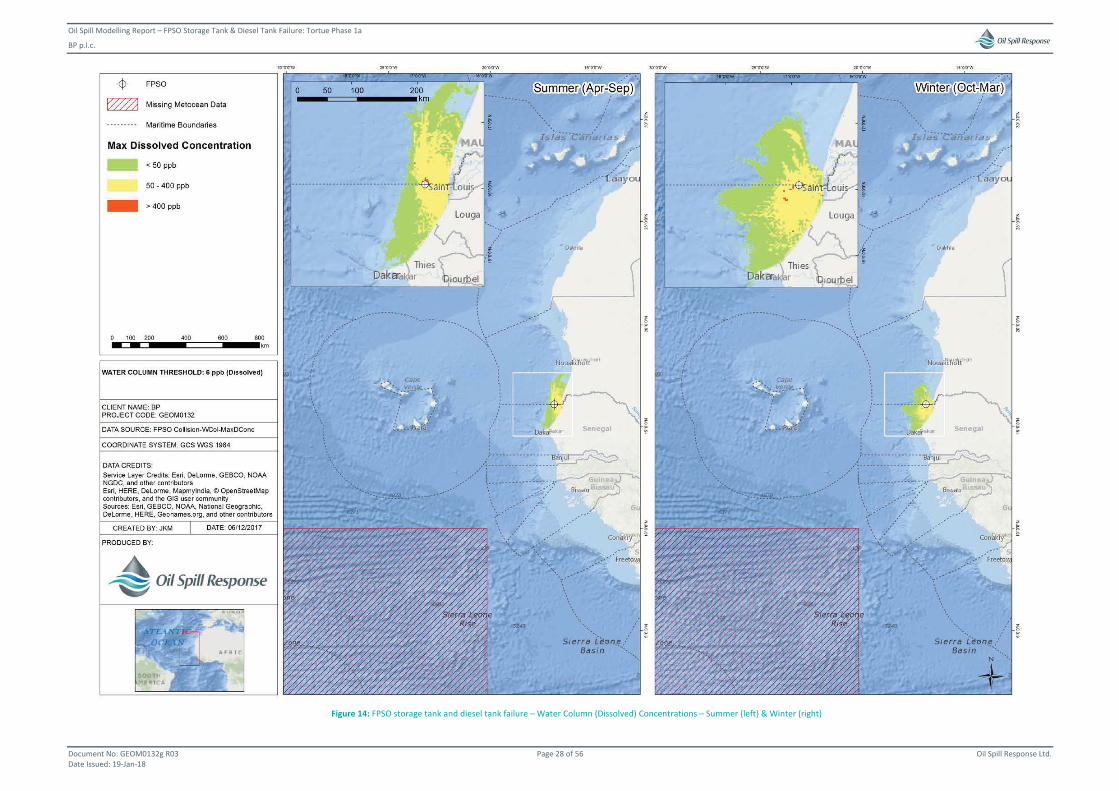
Oil Spill Modelling Report – FPSO Storage Tank & Diesel Tank Failure: Tortue Phase 1a
BP p.l.c.
Document No: GEOM0132g R03 Page 28 of 56 Oil Spill Response Ltd. Date Issued: 19-Jan-18
Figure 14: FPSO storage tank and diesel tank failure – Water Column (Dissolved) Concentrations – Summer (left) & Winter (right)
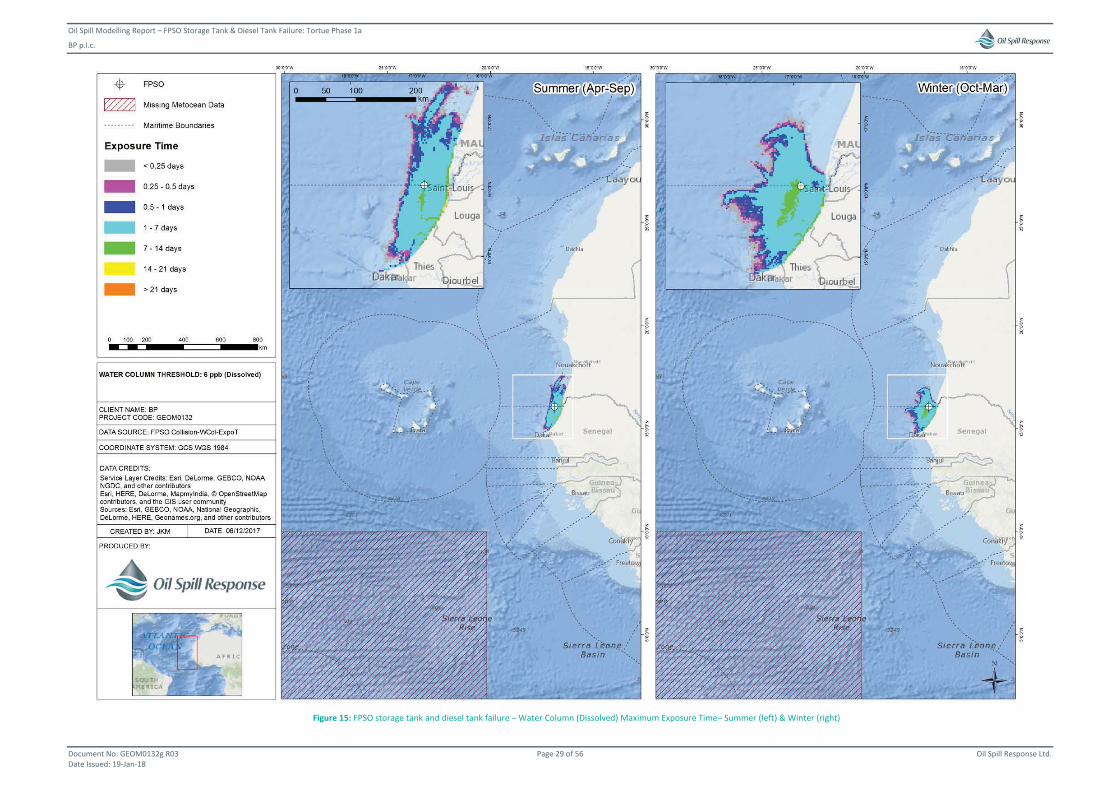
Oil Spill Modelling Report – FPSO Storage Tank & Diesel Tank Failure: Tortue Phase 1a
BP p.l.c.
Document No: GEOM0132g R03 Page 29 of 56 Oil Spill Response Ltd. Date Issued: 19-Jan-18
Figure 15: FPSO storage tank and diesel tank failure – Water Column (Dissolved) Maximum Exposure Time– Summer (left) & Winter (right)

Oil Spill Modelling Report – FPSO Storage Tank & Diesel Tank Failure: Tortue Phase 1a
BP p.l.c.
Document No: GEOM0132g R03 Page 30 of 56 Oil Spill Response Ltd. Date Issued: 19-Jan-18
2.1.4 Total Water Column Impact
FPSO storage tank and gdiesel tank failure
Water Column Maps pTotal Concentrations
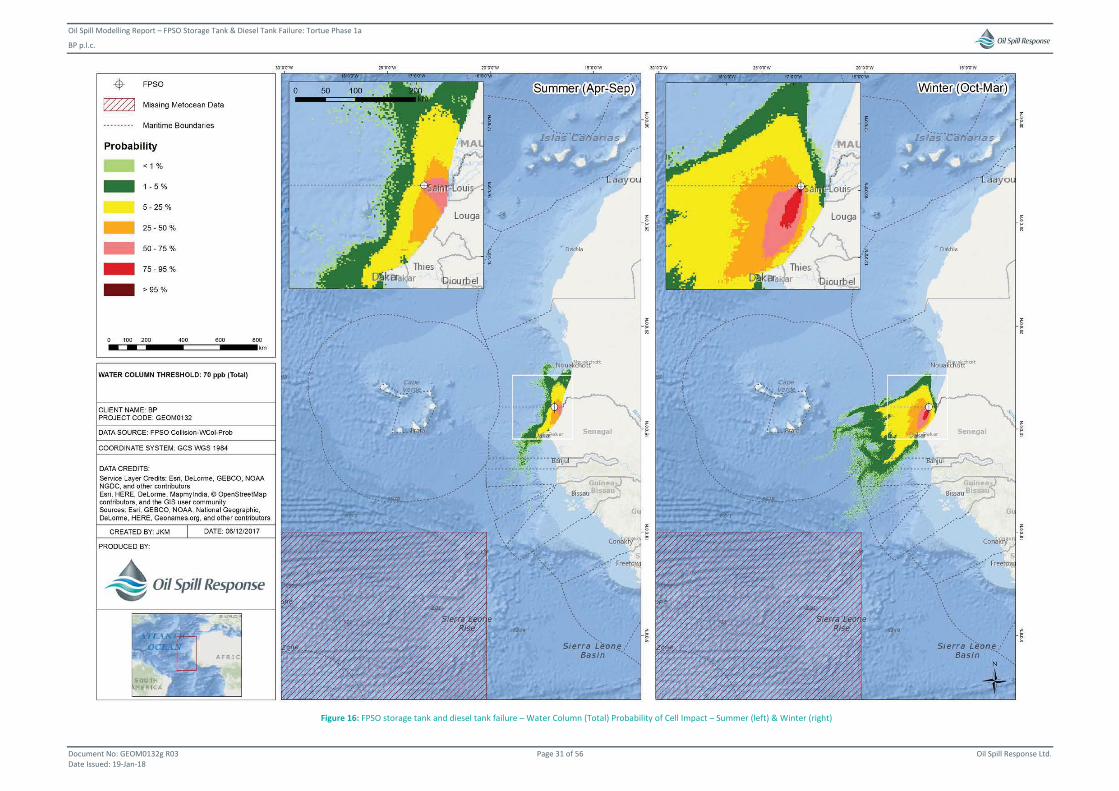
Oil Spill Modelling Report – FPSO Storage Tank & Diesel Tank Failure: Tortue Phase 1a
BP p.l.c.
Document No: GEOM0132g R03 Page 31 of 56 Oil Spill Response Ltd. Date Issued: 19-Jan-18
Figure 16: FPSO storage tank and diesel tank failure – Water Column (Total) Probability of Cell Impact – Summer (left) & Winter (right)
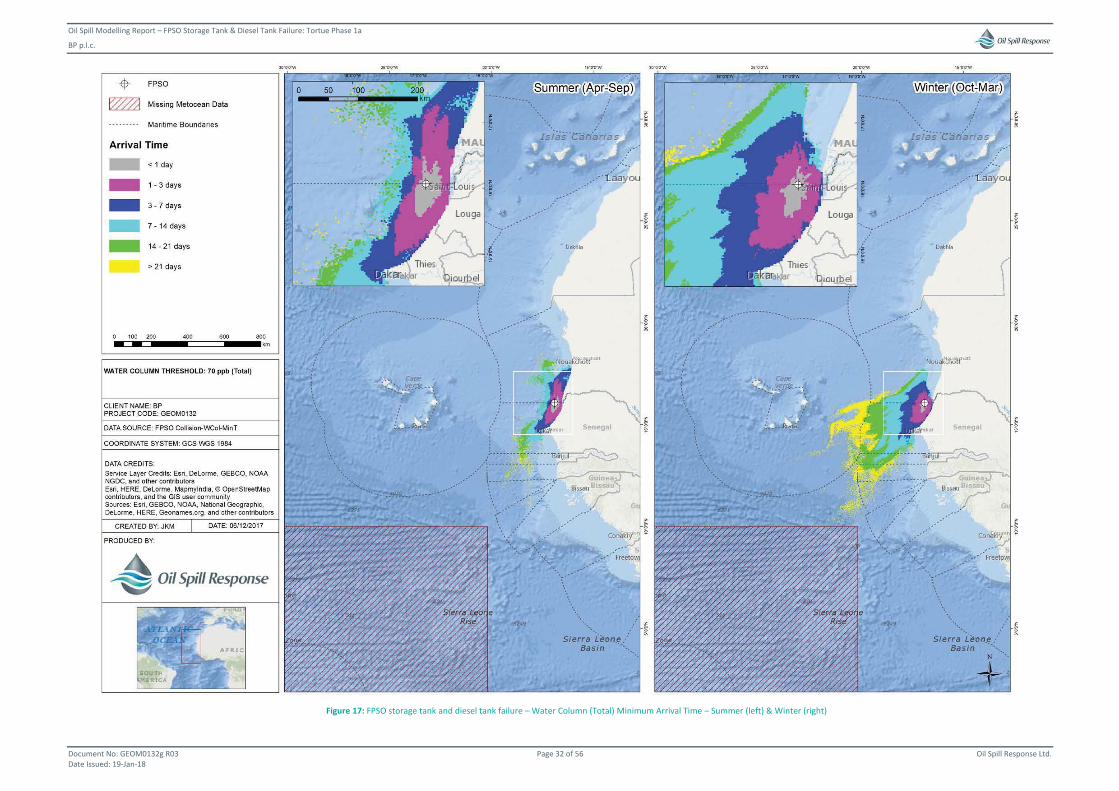
Oil Spill Modelling Report – FPSO Storage Tank & Diesel Tank Failure: Tortue Phase 1a
BP p.l.c.
Document No: GEOM0132g R03 Page 32 of 56 Oil Spill Response Ltd. Date Issued: 19-Jan-18
Figure 17: FPSO storage tank and diesel tank failure – Water Column (Total) Minimum Arrival Time – Summer (left) & Winter (right)
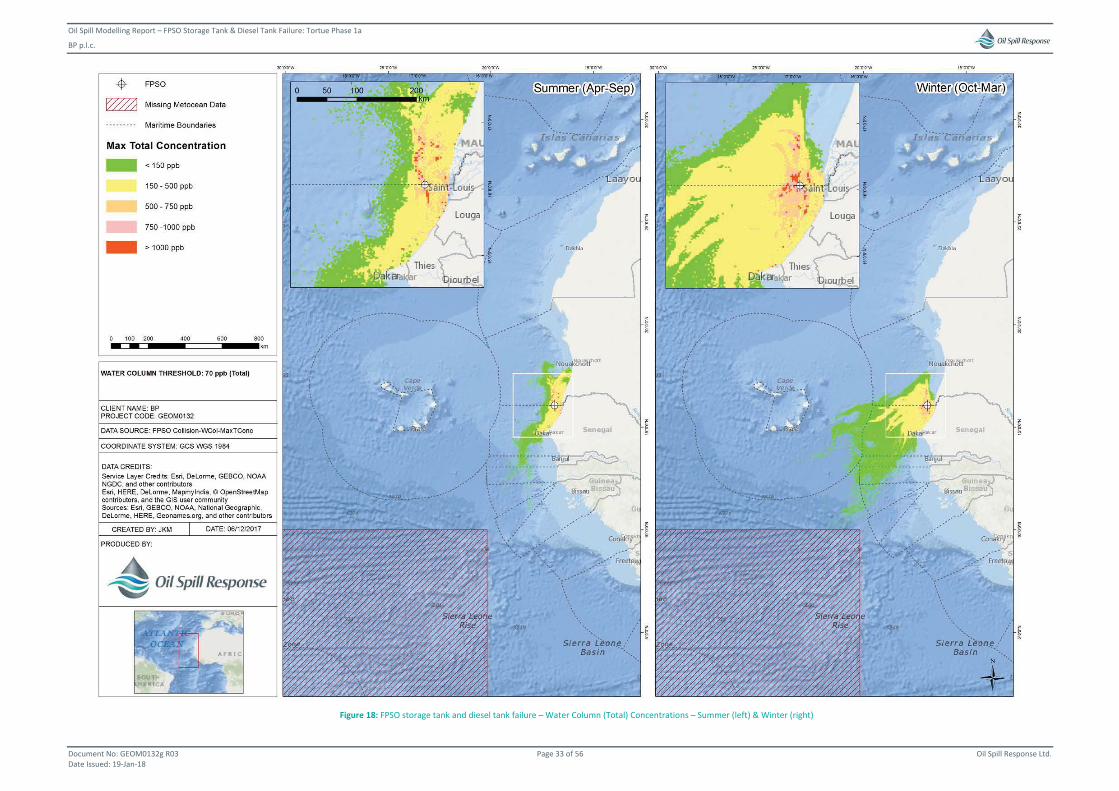
Oil Spill Modelling Report – FPSO Storage Tank & Diesel Tank Failure: Tortue Phase 1a
BP p.l.c.
Document No: GEOM0132g R03 Page 33 of 56 Oil Spill Response Ltd. Date Issued: 19-Jan-18
Figure 18: FPSO storage tank and diesel tank failure – Water Column (Total) Concentrations – Summer (left) & Winter (right)
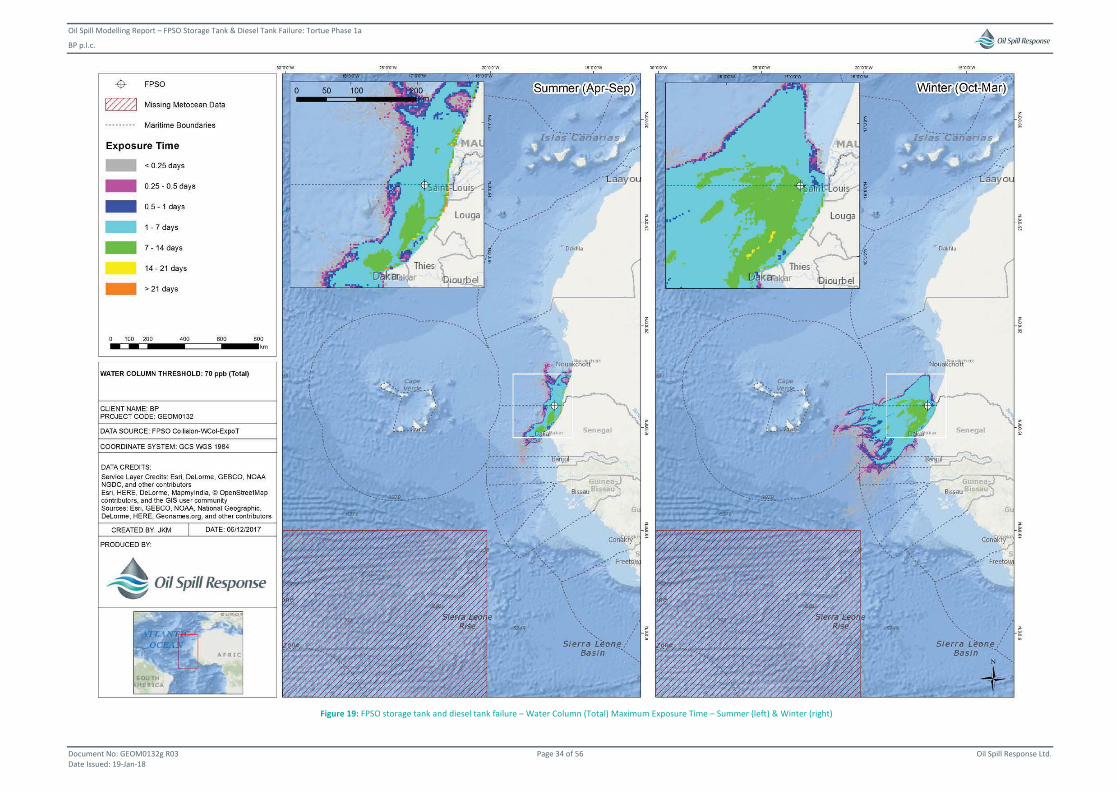
Oil Spill Modelling Report – FPSO Storage Tank & Diesel Tank Failure: Tortue Phase 1a
BP p.l.c.
Document No: GEOM0132g R03 Page 34 of 56 Oil Spill Response Ltd. Date Issued: 19-Jan-18
Figure 19: FPSO storage tank and diesel tank failure – Water Column (Total) Maximum Exposure Time – Summer (left) & Winter (right)
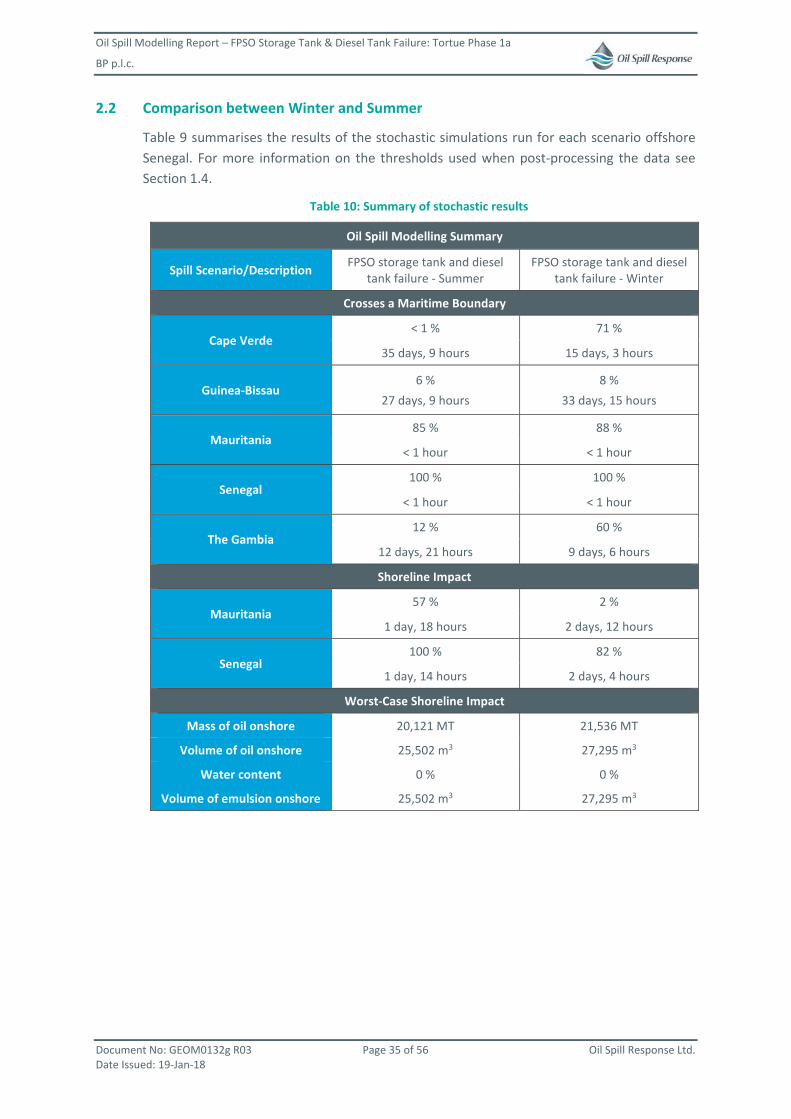
Oil Spill Modelling Report – FPSO Storage Tank & Diesel Tank Failure: Tortue Phase 1a
BP p.l.c.
Document No: GEOM0132g R03 Page 35 of 56 Oil Spill Response Ltd. Date Issued: 19-Jan-18
2.2 Comparison between Winter and Summer
Table 9 summarises the results of the stochastic simulations run for each scenario offshore Senegal. For more information on the thresholds used when post-processing the data see Section 1.4.
Table 10: Summary of stochastic results
Oil Spill Modelling Summary
Spill Scenario/Description FPSO storage tank and diesel tank failure - Summer
FPSO storage tank and diesel tank failure - Winter
Crosses a Maritime Boundary
Cape Verde < 1 % 71 %
35 days, 9 hours 15 days, 3 hours
Guinea-Bissau 6 %
27 days, 9 hours 8 %
33 days, 15 hours
Mauritania 85 % 88 %
< 1 hour < 1 hour
Senegal 100 % 100 %
< 1 hour < 1 hour
The Gambia 12 % 60 %
12 days, 21 hours 9 days, 6 hours
Shoreline Impact
Mauritania 57 % 2 %
1 day, 18 hours 2 days, 12 hours
Senegal 100 % 82 %
1 day, 14 hours 2 days, 4 hours
Worst-Case Shoreline Impact
Mass of oil onshore 20,121 MT 21,536 MT
Volume of oil onshore 25,502 m3 27,295 m3
Water content 0 % 0 %
Volume of emulsion onshore 25,502 m3 27,295 m3
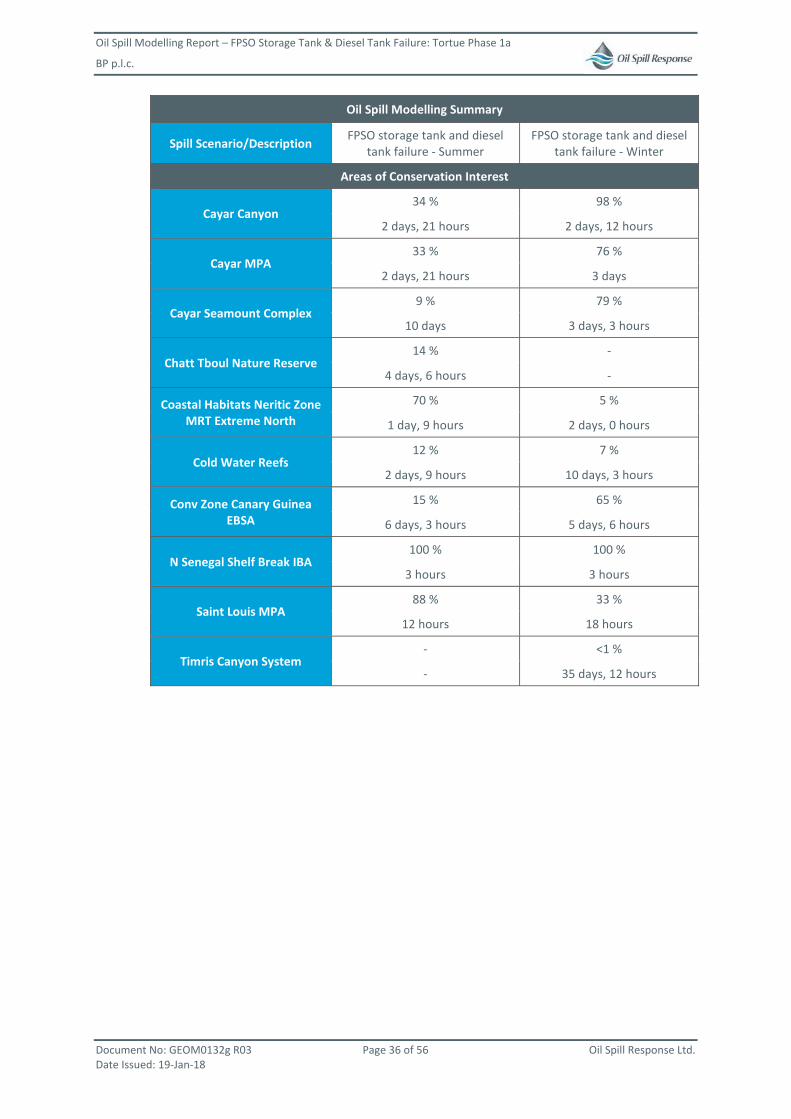
Oil Spill Modelling Report – FPSO Storage Tank & Diesel Tank Failure: Tortue Phase 1a
BP p.l.c.
Document No: GEOM0132g R03 Page 36 of 56 Oil Spill Response Ltd. Date Issued: 19-Jan-18
Oil Spill Modelling Summary
Spill Scenario/Description FPSO storage tank and diesel tank failure - Summer
FPSO storage tank and diesel tank failure - Winter
Areas of Conservation Interest
Cayar Canyon 34 % 98 %
2 days, 21 hours 2 days, 12 hours
Cayar MPA 33 % 76 %
2 days, 21 hours 3 days
Cayar Seamount Complex 9 % 79 %
10 days 3 days, 3 hours
Chatt Tboul Nature Reserve 14 % -
4 days, 6 hours -
Coastal Habitats Neritic Zone MRT Extreme North
70 % 5 %
1 day, 9 hours 2 days, 0 hours
Cold Water Reefs 12 % 7 %
2 days, 9 hours 10 days, 3 hours
Conv Zone Canary Guinea EBSA
15 % 65 %
6 days, 3 hours 5 days, 6 hours
N Senegal Shelf Break IBA 100 % 100 %
3 hours 3 hours
Saint Louis MPA 88 % 33 %
12 hours 18 hours
Timris Canyon System - <1 %
- 35 days, 12 hours
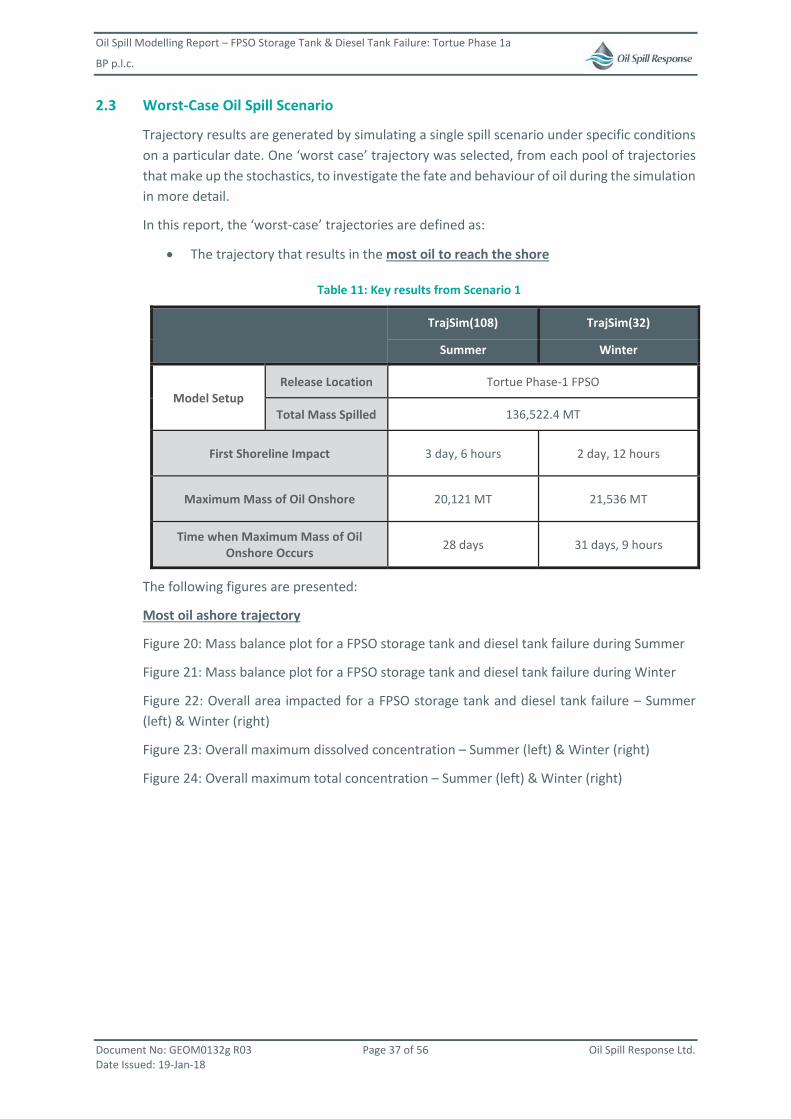
Oil Spill Modelling Report – FPSO Storage Tank & Diesel Tank Failure: Tortue Phase 1a
BP p.l.c.
Document No: GEOM0132g R03 Page 37 of 56 Oil Spill Response Ltd. Date Issued: 19-Jan-18
2.3 Worst-Case Oil Spill Scenario
Trajectory results are generated by simulating a single spill scenario under specific conditions on a particular date. One ‘worst case’ trajectory was selected, from each pool of trajectories that make up the stochastics, to investigate the fate and behaviour of oil during the simulation in more detail.
In this report, the ‘worst-case’ trajectories are defined as:
The trajectory that results in the most oil to reach the shore
Table 11: Key results from Scenario 1
TrajSim(108) TrajSim(32)
Summer Winter
Model Setup Release Location Tortue Phase-1 FPSO
Total Mass Spilled 136,522.4 MT
First Shoreline Impact 3 day, 6 hours 2 day, 12 hours
Maximum Mass of Oil Onshore 20,121 MT 21,536 MT
Time when Maximum Mass of Oil Onshore Occurs 28 days 31 days, 9 hours
The following figures are presented:
Most oil ashore trajectory
Figure 20: Mass balance plot for a FPSO storage tank and diesel tank failure during Summer
Figure 21: Mass balance plot for a FPSO storage tank and diesel tank failure during Winter
Figure 22: Overall area impacted for a FPSO storage tank and diesel tank failure – Summer (left) & Winter (right)
Figure 23: Overall maximum dissolved concentration – Summer (left) & Winter (right)
Figure 24: Overall maximum total concentration – Summer (left) & Winter (right)
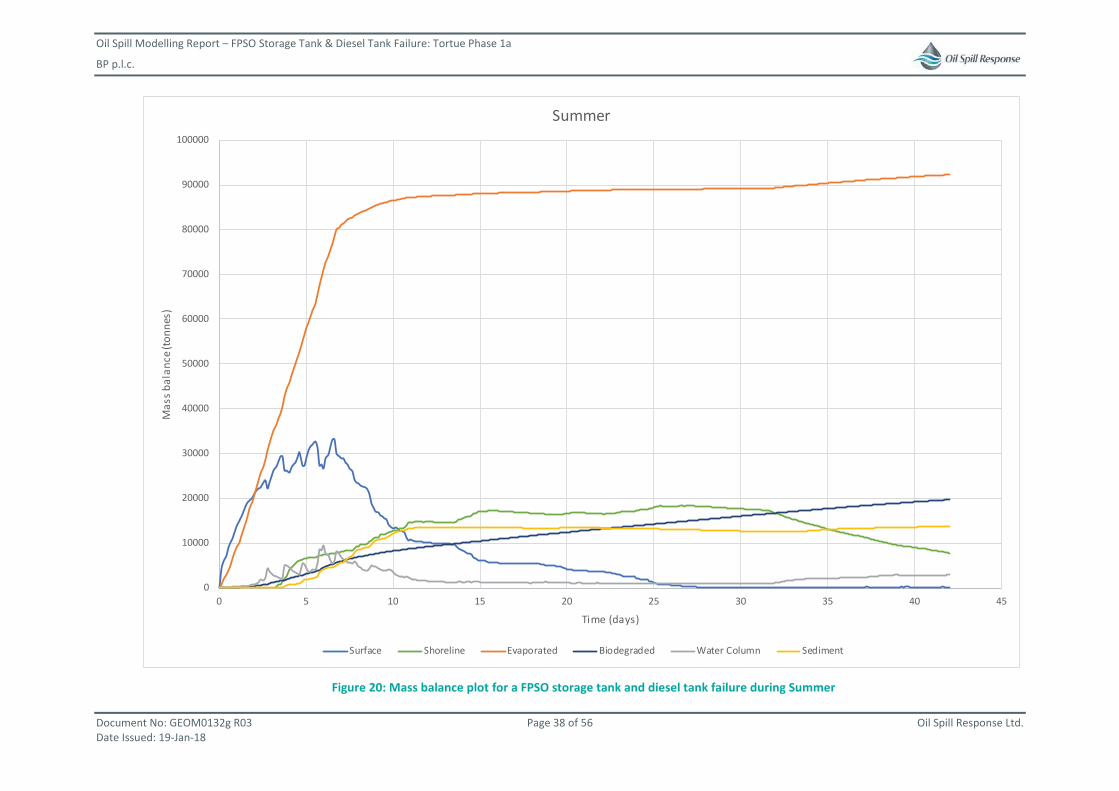
Oil Spill Modelling Report – FPSO Storage Tank & Diesel Tank Failure: Tortue Phase 1a
BP p.l.c.
Document No: GEOM0132g R03 Page 38 of 56 Oil Spill Response Ltd. Date Issued: 19-Jan-18
Figure 20: Mass balance plot for a FPSO storage tank and diesel tank failure during Summer
0
10000
20000
30000
40000
50000
60000
70000
80000
90000
100000
0 5 10 15 20 25 30 35 40 45
Mas
s bal
ance
(ton
nes)
Time (days)
Summer
Surface Shoreline Evaporated Biodegraded Water Column Sediment
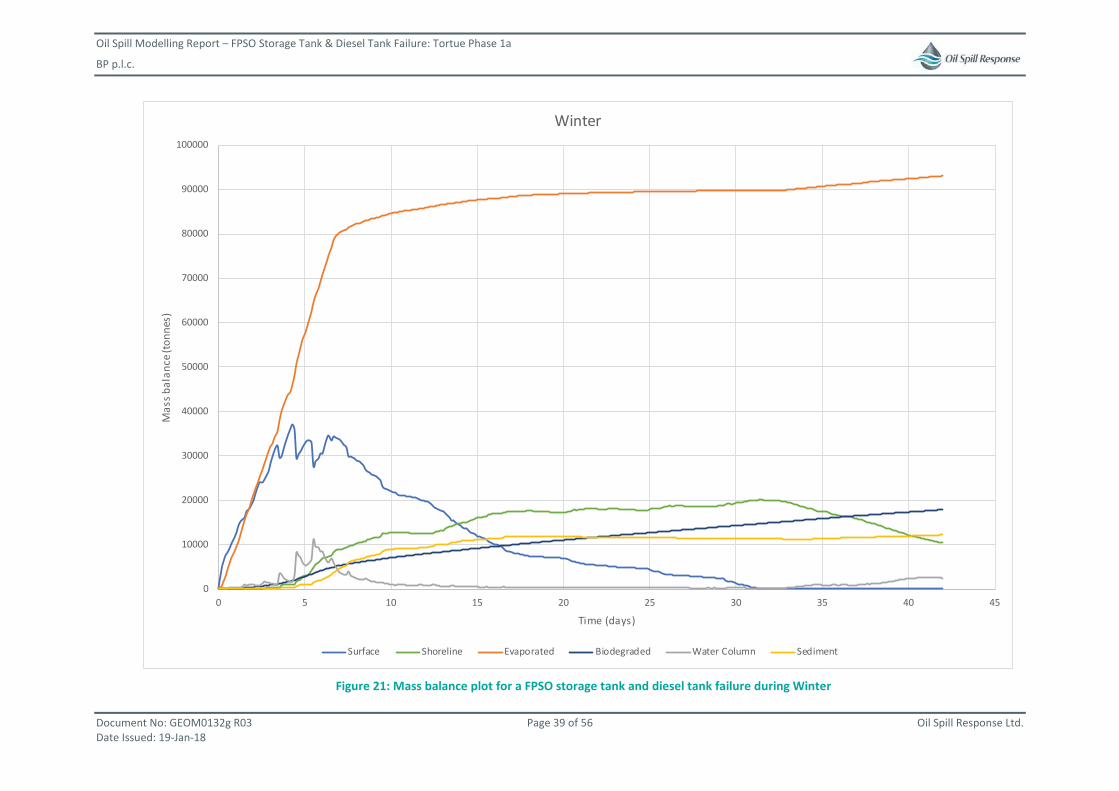
Oil Spill Modelling Report – FPSO Storage Tank & Diesel Tank Failure: Tortue Phase 1a
BP p.l.c.
Document No: GEOM0132g R03 Page 39 of 56 Oil Spill Response Ltd. Date Issued: 19-Jan-18
Figure 21: Mass balance plot for a FPSO storage tank and diesel tank failure during Winter
0
10000
20000
30000
40000
50000
60000
70000
80000
90000
100000
0 5 10 15 20 25 30 35 40 45
Mas
s bal
ance
(ton
nes)
Time (days)
Winter
Surface Shoreline Evaporated Biodegraded Water Column Sediment
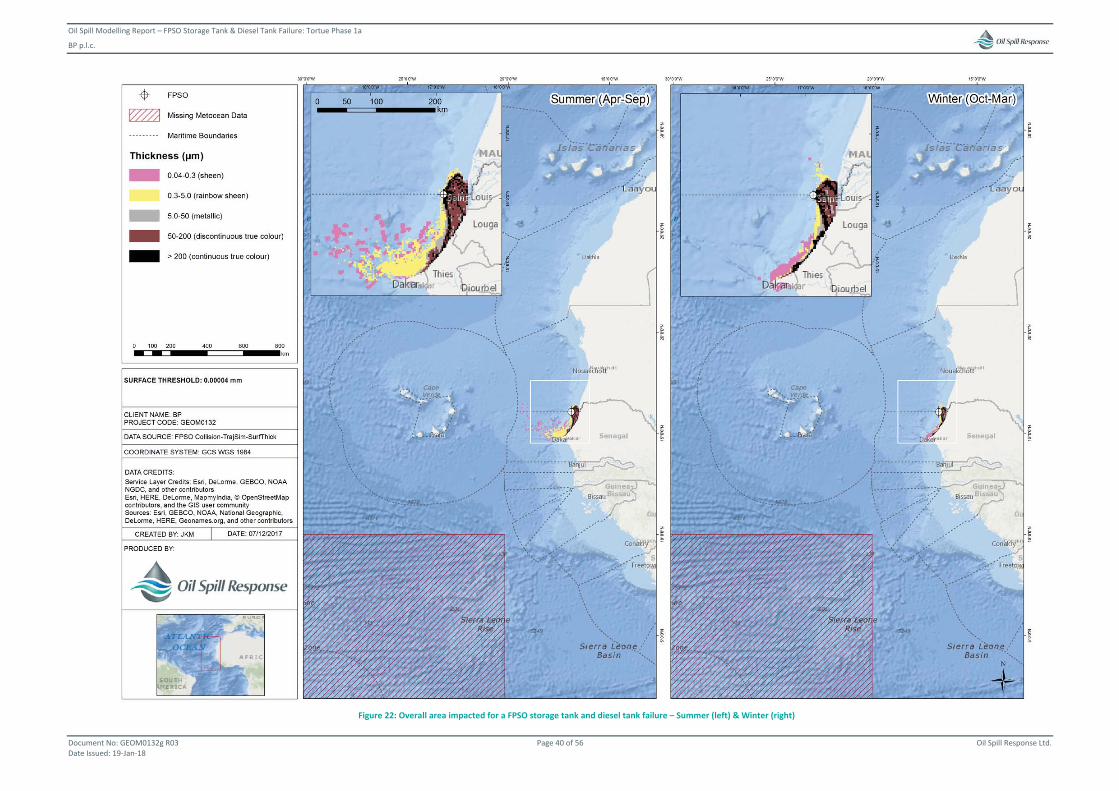
Oil Spill Modelling Report – FPSO Storage Tank & Diesel Tank Failure: Tortue Phase 1a
BP p.l.c.
Document No: GEOM0132g R03 Page 40 of 56 Oil Spill Response Ltd. Date Issued: 19-Jan-18
Figure 22: Overall area impacted for a FPSO storage tank and diesel tank failure – Summer (left) & Winter (right)
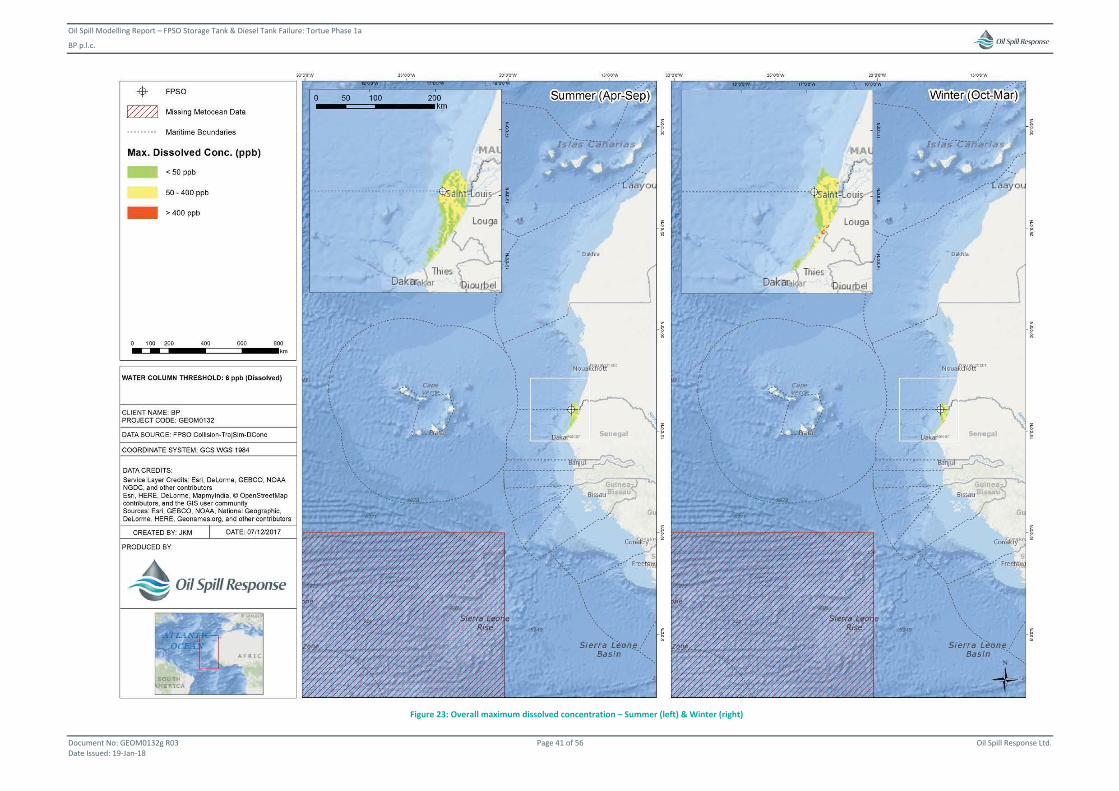
Oil Spill Modelling Report – FPSO Storage Tank & Diesel Tank Failure: Tortue Phase 1a
BP p.l.c.
Document No: GEOM0132g R03 Page 41 of 56 Oil Spill Response Ltd. Date Issued: 19-Jan-18
Figure 23: Overall maximum dissolved concentration – Summer (left) & Winter (right)
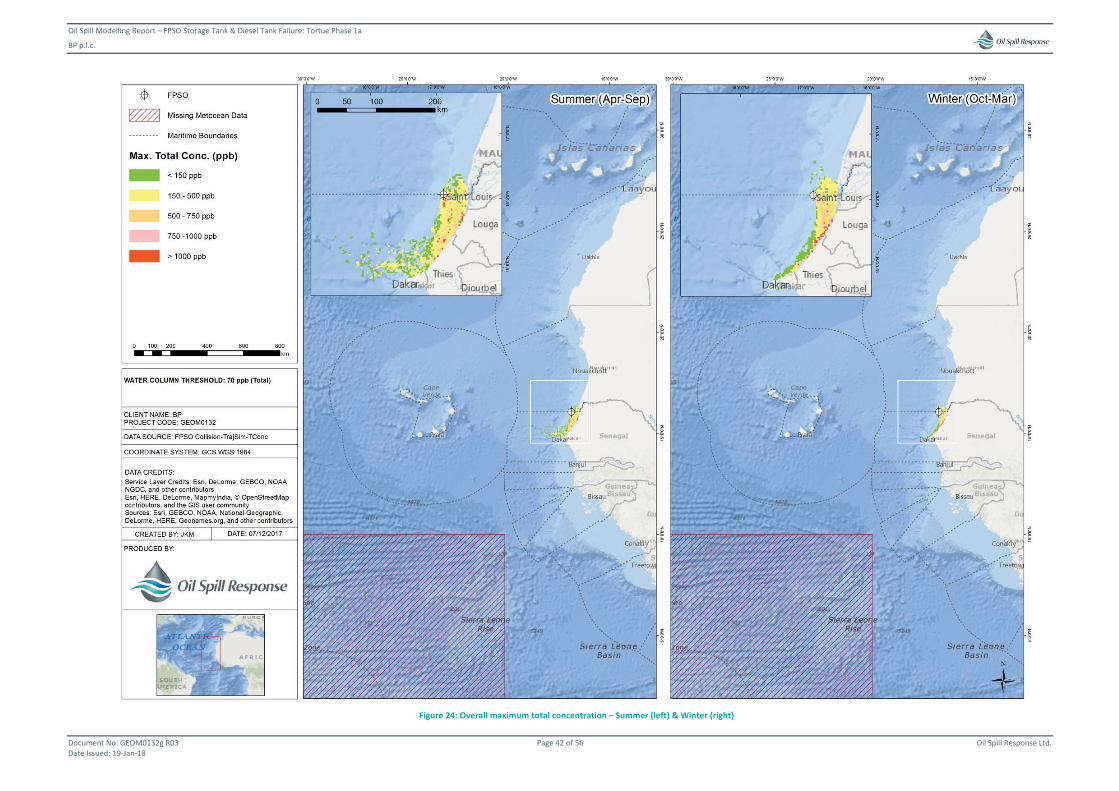
Oil Spill Modelling Report – FPSO Storage Tank & Diesel Tank Failure: Tortue Phase 1a
BP p.l.c.
Document No: GEOM0132g R03 Page 42 of 56 Oil Spill Response Ltd. Date Issued: 19-Jan-18
Figure 24: Overall maximum total concentration – Summer (left) & Winter (right)
Oil Spill Modelling Report – FPSO Storage Tank & Diesel Tank Failure: Tortue Phase 1a
BP p.l.c.
Document No: GEOM0132g R03 Page 43 of 56 Oil Spill Response Ltd. Date Issued: 19-Jan-18
3 Conclusion One scenario was modelled for the Tortue Phase 1a Well offshore Senegal and Mauritania. This involved the release of 160,000 m3 of condensate over 160 hours and 3,200 m3 of diesel over 3.2 hours, due to an FPSO storage tank and diesel tank failure, resulting from a ship collision.
3.1 Shoreline Impact
A spill at this location, approximately 40 km from the shore, has a 100% chance of making a considerable shoreline impact (light oiling or higher) if the spill happens in Summer and an 82% chance of shoreline impact if it occurs in Winter. Mauritania and Senegal are the only two countries at risk of shoreline impact, but Senegal is most likely to be more severely impacted.
Summer
Summer has a higher risk to the shoreline of the two seasons.
In the worst-case scenario, a spill in summer may impact the shore 1 day, 14 hours after the release. However, there is a 10% chance that condensate and diesel will not make landfall within 4 days and in the best-cast scenario will not reach the shore for 8 days.
Similarly, the severity of the shoreline impact in summer ranges from around 1,000 MT in the best-case scenario, to more than 20,000 MT in the worst-case. There is a 50% chance that more than 9,500 MT may wash ashore.
A shoreline impact in the summer months is expected to have at least moderate shoreline oil. Further, these is a 22% chance of “heavy” shoreline oiling. Spatially, only a few km is expected to have heavy shoreline oiling but up to 323 km could be impacted by moderate oiling.
Winter
Winter has a lower risk to the shoreline of the two seasons.
In the worst-case scenario, a spill in winter may impact the shore in a little more than 2 days after the release. However, the similarity between summer and winter ends there since there is a 50% chance that condensate and diesel will not make landfall within approximately 5 days and in the best-cast scenario will not reach the shore at all.
Similarly, the severity of the shoreline impact in winter ranges from negligible (18% chance) in the best-case scenario, to more than 21,000 MT in the worst-case.
There is a 69% chance of moderate shoreline oiling and 14 % chance of light oiling, no heavy shoreline oiling is expected. Spatially, around 25 km is expected to have moderate shoreline oiling but up to 363 km could be impacted by moderate oiling in the worst-case.
3.2 Surface Impact
Senegal Waters’ are more than likely to be impacted by this spill scenario but Mauritania may not due to a southerly flowing current occurring in some scenarios. The waters of Cape Verde, Guinea-Bissau and The Gambia are also at risk in both summer and winter scenarios.

Oil Spill Modelling Report – FPSO Storage Tank & Diesel Tank Failure: Tortue Phase 1a
BP p.l.c.
Document No: GEOM0132g R03 Page 44 of 56 Oil Spill Response Ltd. Date Issued: 19-Jan-18
The waters of Senegal and Mauritania could experience a spill with a surface thickness more than 5 μm making them candidates for containment and recovery techniques. The waters of other neighbouring countries may experience oil sheen on the surface waters but not at a thickness that is likely to be effective for containment and recovery.
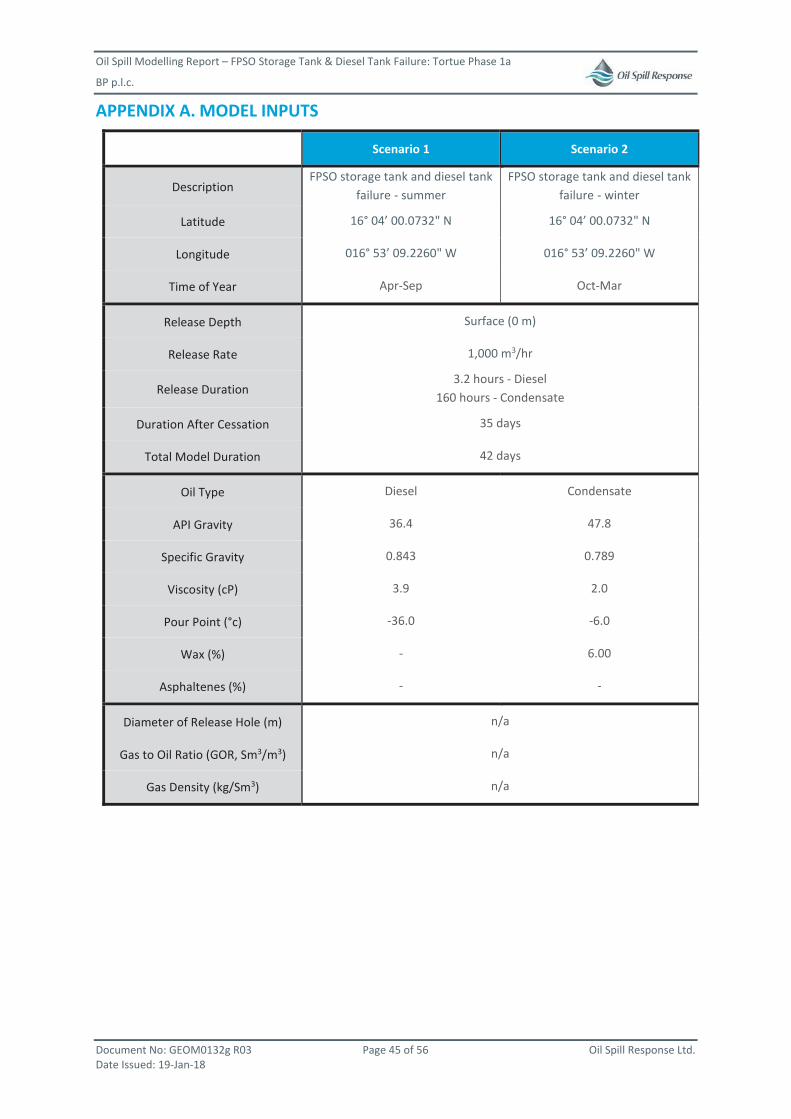
Oil Spill Modelling Report – FPSO Storage Tank & Diesel Tank Failure: Tortue Phase 1a
BP p.l.c.
Document No: GEOM0132g R03 Page 45 of 56 Oil Spill Response Ltd. Date Issued: 19-Jan-18
APPENDIX A. MODEL INPUTS
Scenario 1 Scenario 2
Description FPSO storage tank and diesel tank
failure - summer FPSO storage tank and diesel tank
failure - winter
Latitude 16° 04’ 00.0732" N 16° 04’ 00.0732" N
Longitude 016° 53’ 09.2260" W 016° 53’ 09.2260" W
Time of Year Apr-Sep Oct-Mar
Release Depth Surface (0 m)
Release Rate 1,000 m3/hr
Release Duration 3.2 hours - Diesel
160 hours - Condensate
Duration After Cessation 35 days
Total Model Duration 42 days
Oil Type Diesel Condensate
API Gravity 36.4 47.8
Specific Gravity 0.843 0.789
Viscosity (cP) 3.9 2.0
Pour Point (°c) -36.0 -6.0
Wax (%) - 6.00
Asphaltenes (%) - -
Diameter of Release Hole (m) n/a
Gas to Oil Ratio (GOR, Sm3/m3) n/a
Gas Density (kg/Sm3) n/a

Oil Spill Modelling Report – FPSO Storage Tank & Diesel Tank Failure: Tortue Phase 1a
BP p.l.c.
Document No: GEOM0132g R03 Page 46 of 56 Oil Spill Response Ltd. Date Issued: 19-Jan-18
APPENDIX B. METOCEAN DATA Table 12: Current data – general description
Name G0132-Curr01
Description Sourced from BMT ARGOSS. The dataset consists of an amalgamation of the HYCOM global dataset with the BMT ARGOSS tidal model superimposed
Start Time Jan 2009 Spatial Resolution ~9 km
End Time Dec 2011 Temporal Resolution 1 hour
Depth Levels [m]
0, 10, 20, 30, 50, 75, 100, 125, 150, 200, 250, 300, 400, 500, 600, 700, 800, 900, 1000, 1100, 1200, 1300, 1400, 1500, 1750, 2000, 2500, 3000, 3500, 4000, 4500, 5000, 5500
The hydrodynamic database is constructed from 3D current velocity fields, suitable for use in oil model simulations. This comprises of ocean currents (non-tidal residual) from a global ocean circulation model, combined with tidal current velocities.
Tidal current information is obtained from BMT ARGOSS from the integration of approximately 5,000 tidal stations and 15 years of satellite radar altimeter into depth averaged global and regional tidal models (2DH model). The tidal model provides tidal currents (u, v components) as well as surface elevation. The spatial resolution of the tidal model varies from 1/60 to 1/12 degrees globally.
The vertical structure of the tidal current component is established using a logarithmic profile which provides a reliable representation of tidal currents at different depths in shelf seas. The tidal model provides data at a spatial resolution of 4 minutes in the area of interest and can be provided in time steps as required by the client.
Ocean currents are obtained from a global ocean current model (HYCOM), which has the following characteristics:
Spatial resolution: 1/12 degree (can not be refined further)
Temporal resolution: Daily (cannot be refined further, other than by interpolation)
Data type: 3D current speed and direction
Depth: 3D datasets consist of up 33 depth layers from surface to seabed and spread across the water column. Individual layers and their distribution over the water column vary and depend on the local depth.
Availability: 2009 – 2012
The resultant data, representative of total current velocity, is provided as hourly current vectors, at selected depth levels, at 1/12 degree spatial resolution across the area of interest. It should be noted that in deep water, beyond the continental slope, tidal current velocity would be negligible.
Temporal resolutions of one hour are considered to be an optimal resolution, as coarser temporal resolutions would not adequately capture the data variability in areas where tidal currents form a key component of the total current

Oil Spill Modelling Report – FPSO Storage Tank & Diesel Tank Failure: Tortue Phase 1a
BP p.l.c.
Document No: GEOM0132g R03 Page 47 of 56 Oil Spill Response Ltd. Date Issued: 19-Jan-18
Table 13: Wind data – general description
Name G0132-Wind01
Description Sourced from BMT ARGOSS. The dataset consists of the NCEP CFRS global dataset, calibrated by BMT ARGOSS against satellite altimeter and scatterometer measurements.
Start Time Jan 2009 Spatial Resolution ~35 km
End Time Dec 2011 Temporal Resolution 3 hours
Altitude Level The dataset includes hourly mean values of wind velocity at 10 m above sea level.
Winds are provided as hourly mean values of north and east velocity components at 10m above sea level. Data is from the NCEP global dataset, calibrated by BMT ARGOSS against satellite altimeter and scatterometer measurements. The source data are available at spatial resolution of 0.5°x 0.5°, and at 3 hourly time steps.
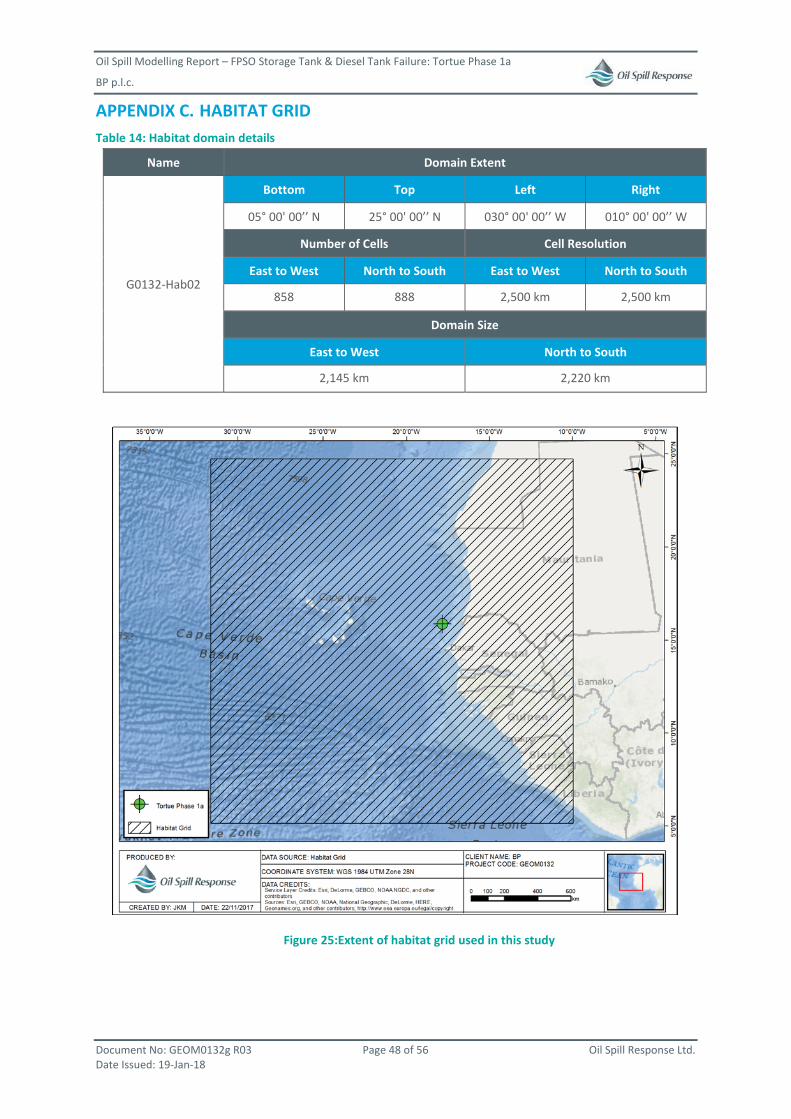
Oil Spill Modelling Report – FPSO Storage Tank & Diesel Tank Failure: Tortue Phase 1a
BP p.l.c.
Document No: GEOM0132g R03 Page 48 of 56 Oil Spill Response Ltd. Date Issued: 19-Jan-18
APPENDIX C. HABITAT GRID Table 14: Habitat domain details
Name Domain Extent
G0132-Hab02
Bottom Top Left Right
05° 00' 00’’ N 25° 00' 00’’ N 030° 00' 00’’ W 010° 00' 00’’ W
Number of Cells Cell Resolution
East to West North to South East to West North to South
858 888 2,500 km 2,500 km
Domain Size
East to West North to South
2,145 km 2,220 km
Figure 25:Extent of habitat grid used in this study
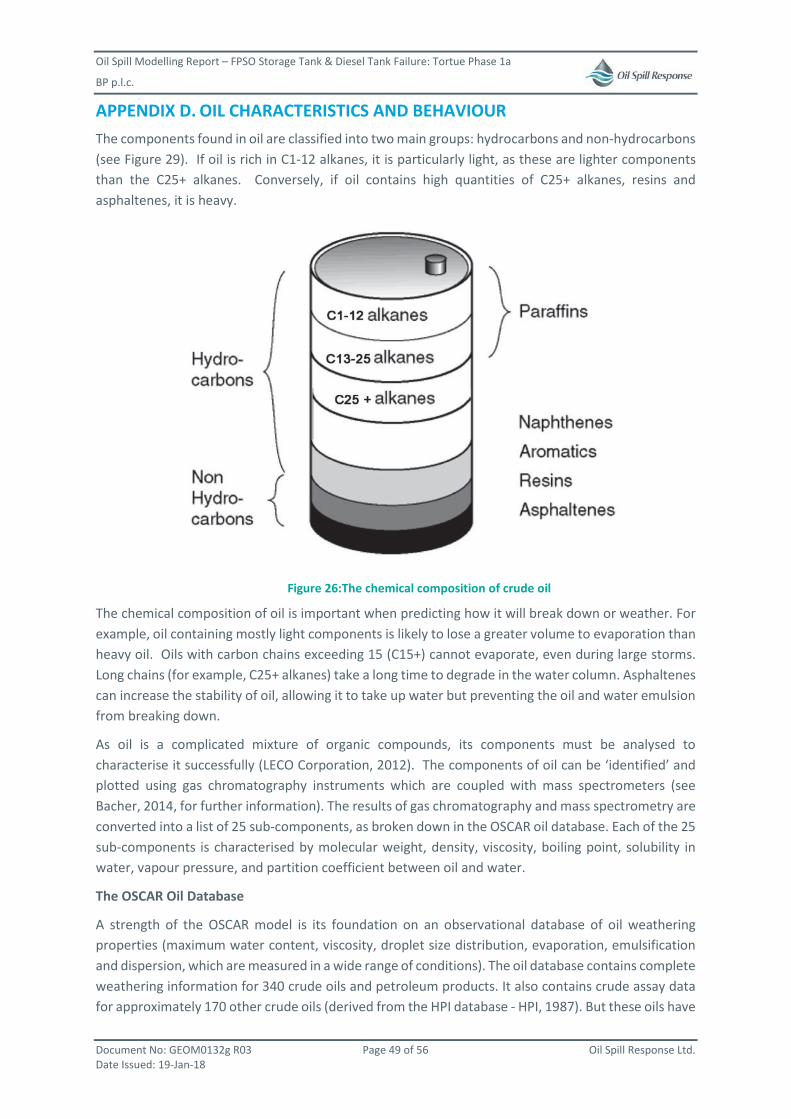
Oil Spill Modelling Report – FPSO Storage Tank & Diesel Tank Failure: Tortue Phase 1a
BP p.l.c.
Document No: GEOM0132g R03 Page 49 of 56 Oil Spill Response Ltd. Date Issued: 19-Jan-18
APPENDIX D. OIL CHARACTERISTICS AND BEHAVIOUR The components found in oil are classified into two main groups: hydrocarbons and non-hydrocarbons (see Figure 29). If oil is rich in C1-12 alkanes, it is particularly light, as these are lighter components than the C25+ alkanes. Conversely, if oil contains high quantities of C25+ alkanes, resins and asphaltenes, it is heavy.
Figure 26:The chemical composition of crude oil
The chemical composition of oil is important when predicting how it will break down or weather. For example, oil containing mostly light components is likely to lose a greater volume to evaporation than heavy oil. Oils with carbon chains exceeding 15 (C15+) cannot evaporate, even during large storms. Long chains (for example, C25+ alkanes) take a long time to degrade in the water column. Asphaltenes can increase the stability of oil, allowing it to take up water but preventing the oil and water emulsion from breaking down.
As oil is a complicated mixture of organic compounds, its components must be analysed to characterise it successfully (LECO Corporation, 2012). The components of oil can be ‘identified’ and plotted using gas chromatography instruments which are coupled with mass spectrometers (see Bacher, 2014, for further information). The results of gas chromatography and mass spectrometry are converted into a list of 25 sub-components, as broken down in the OSCAR oil database. Each of the 25 sub-components is characterised by molecular weight, density, viscosity, boiling point, solubility in water, vapour pressure, and partition coefficient between oil and water.
The OSCAR Oil Database
A strength of the OSCAR model is its foundation on an observational database of oil weathering properties (maximum water content, viscosity, droplet size distribution, evaporation, emulsification and dispersion, which are measured in a wide range of conditions). The oil database contains complete weathering information for 340 crude oils and petroleum products. It also contains crude assay data for approximately 170 other crude oils (derived from the HPI database - HPI, 1987). But these oils have
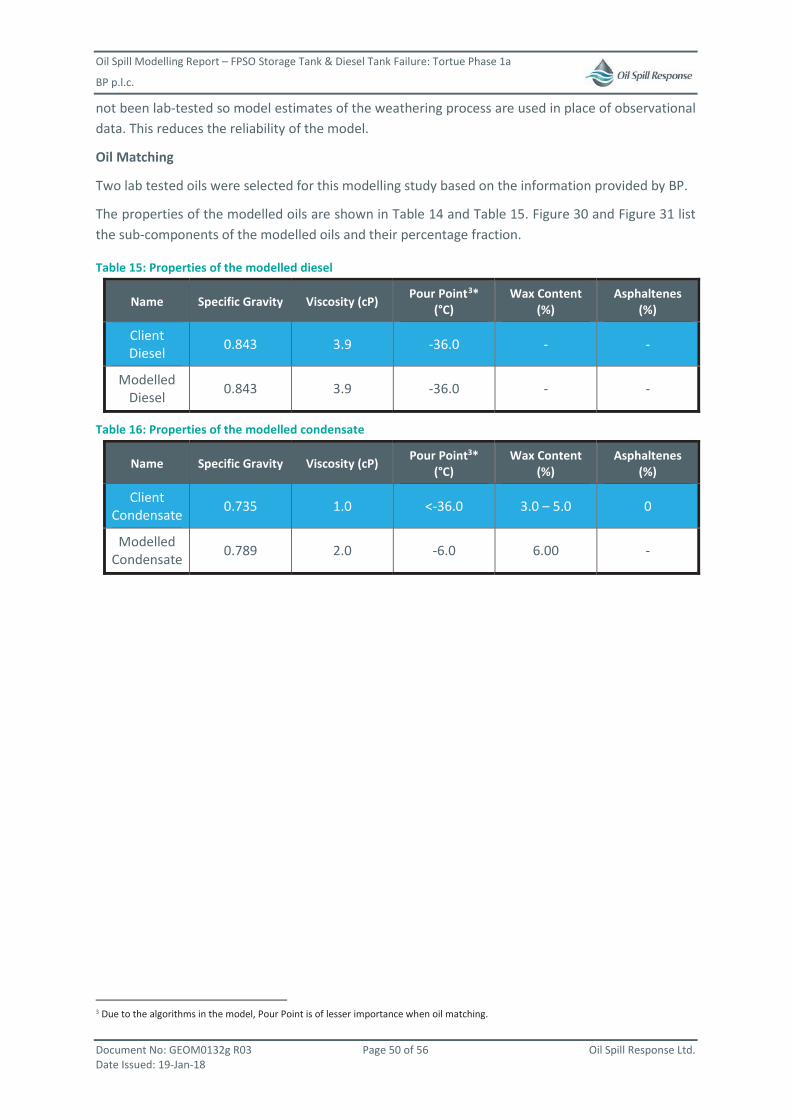
Oil Spill Modelling Report – FPSO Storage Tank & Diesel Tank Failure: Tortue Phase 1a
BP p.l.c.
Document No: GEOM0132g R03 Page 50 of 56 Oil Spill Response Ltd. Date Issued: 19-Jan-18
not been lab-tested so model estimates of the weathering process are used in place of observational data. This reduces the reliability of the model.
Oil Matching
Two lab tested oils were selected for this modelling study based on the information provided by BP.
The properties of the modelled oils are shown in Table 14 and Table 15. Figure 30 and Figure 31 list the sub-components of the modelled oils and their percentage fraction.
Table 15: Properties of the modelled diesel
Name Specific Gravity Viscosity (cP) Pour Point3* (°C)
Wax Content (%)
Asphaltenes (%)
Client Diesel 0.843 3.9 -36.0 - -
Modelled Diesel 0.843 3.9 -36.0 - -
Table 16: Properties of the modelled condensate
Name Specific Gravity Viscosity (cP) Pour Point3* (°C)
Wax Content (%)
Asphaltenes (%)
Client Condensate 0.735 1.0 <-36.0 3.0 – 5.0 0
Modelled Condensate 0.789 2.0 -6.0 6.00 -
3 Due to the algorithms in the model, Pour Point is of lesser importance when oil matching.
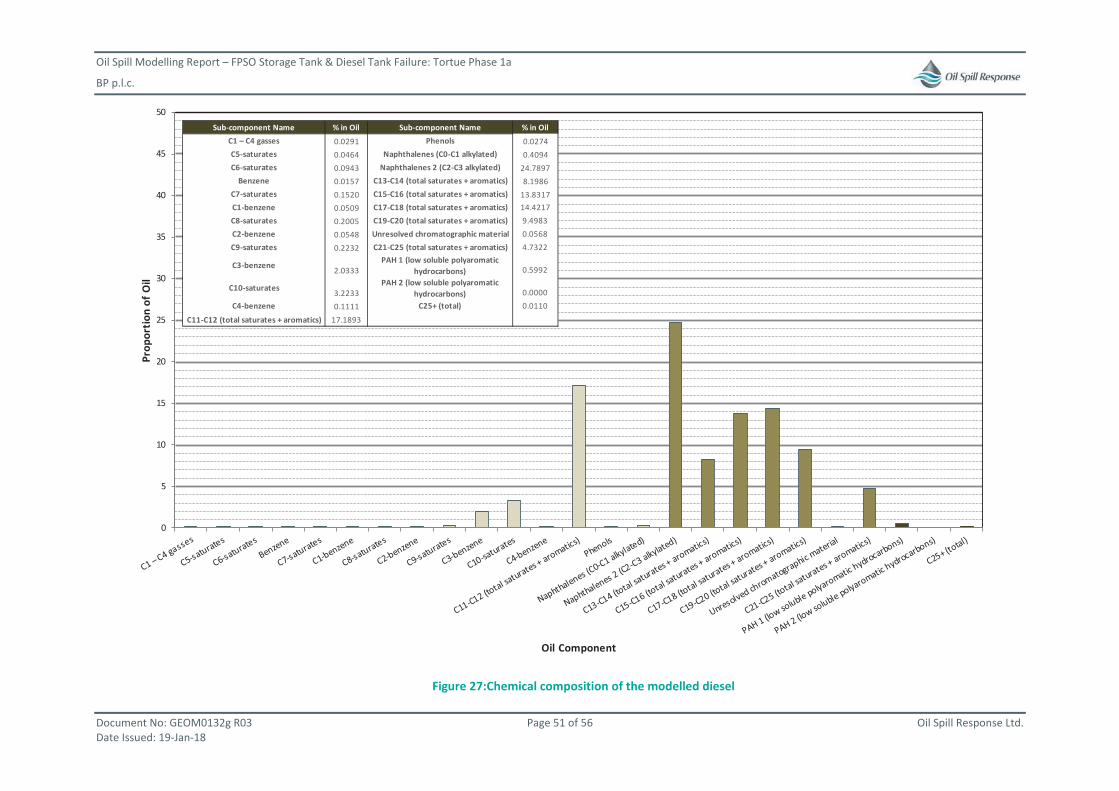
Oil Spill Modelling Report – FPSO Storage Tank & Diesel Tank Failure: Tortue Phase 1a
BP p.l.c.
Document No: GEOM0132g R03 Page 51 of 56 Oil Spill Response Ltd. Date Issued: 19-Jan-18
Figure 27:Chemical composition of the modelled diesel
0
5
10
15
20
25
30
35
40
45
50
Prop
ortio
n of
Oil
Oil Component
Sub-component Name % in Oil Sub-component Name % in OilC1 – C4 gasses 0.0291 Phenols 0.0274C5-saturates 0.0464 Naphthalenes (C0-C1 alkylated) 0.4094C6-saturates 0.0943 Naphthalenes 2 (C2-C3 alkylated) 24.7897
Benzene 0.0157 C13-C14 (total saturates + aromatics) 8.1986C7-saturates 0.1520 C15-C16 (total saturates + aromatics) 13.8317C1-benzene 0.0509 C17-C18 (total saturates + aromatics) 14.4217C8-saturates 0.2005 C19-C20 (total saturates + aromatics) 9.4983C2-benzene 0.0548 Unresolved chromatographic material 0.0568C9-saturates 0.2232 C21-C25 (total saturates + aromatics) 4.7322
C3-benzene 2.0333PAH 1 (low soluble polyaromatic
hydrocarbons) 0.5992
C10-saturates 3.2233PAH 2 (low soluble polyaromatic
hydrocarbons) 0.0000C4-benzene 0.1111 C25+ (total) 0.0110
C11-C12 (total saturates + aromatics) 17.1893
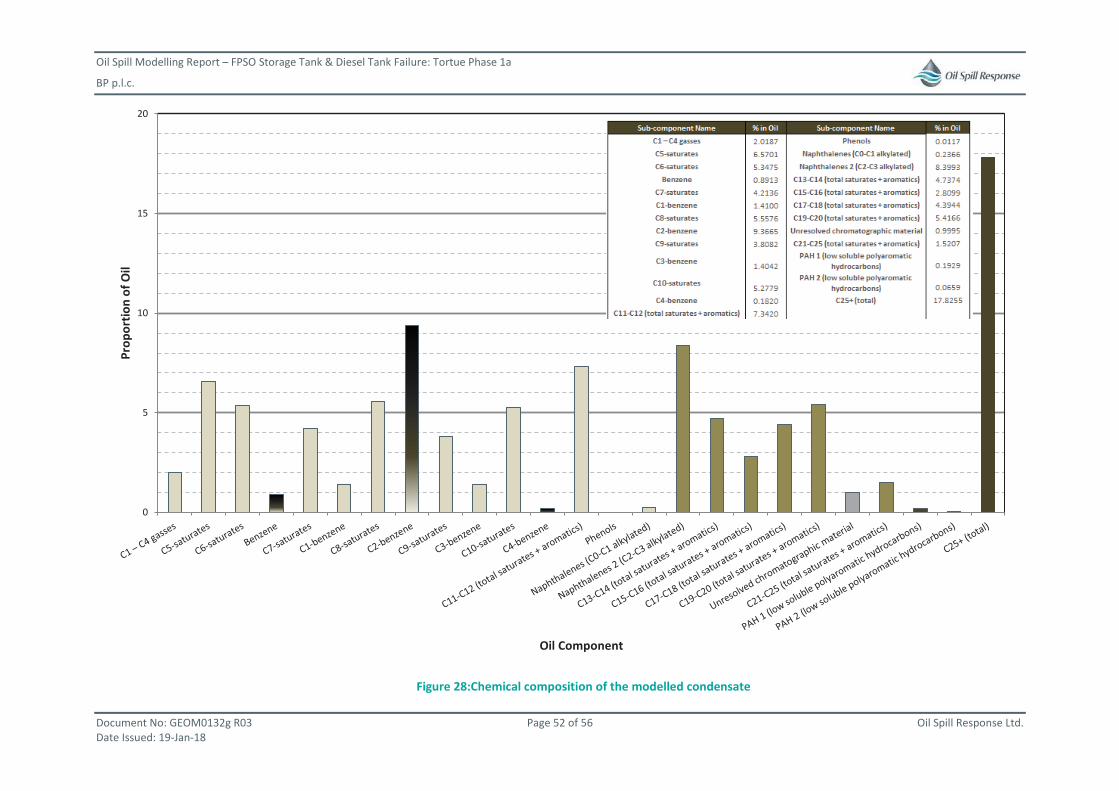
Oil Spill Modelling Report – FPSO Storage Tank & Diesel Tank Failure: Tortue Phase 1a
BP p.l.c.
Document No: GEOM0132g R03 Page 52 of 56 Oil Spill Response Ltd. Date Issued: 19-Jan-18
Figure 28:Chemical composition of the modelled condensate
0
5
10
15
20Pr
opor
tion
of O
il
Oil Component
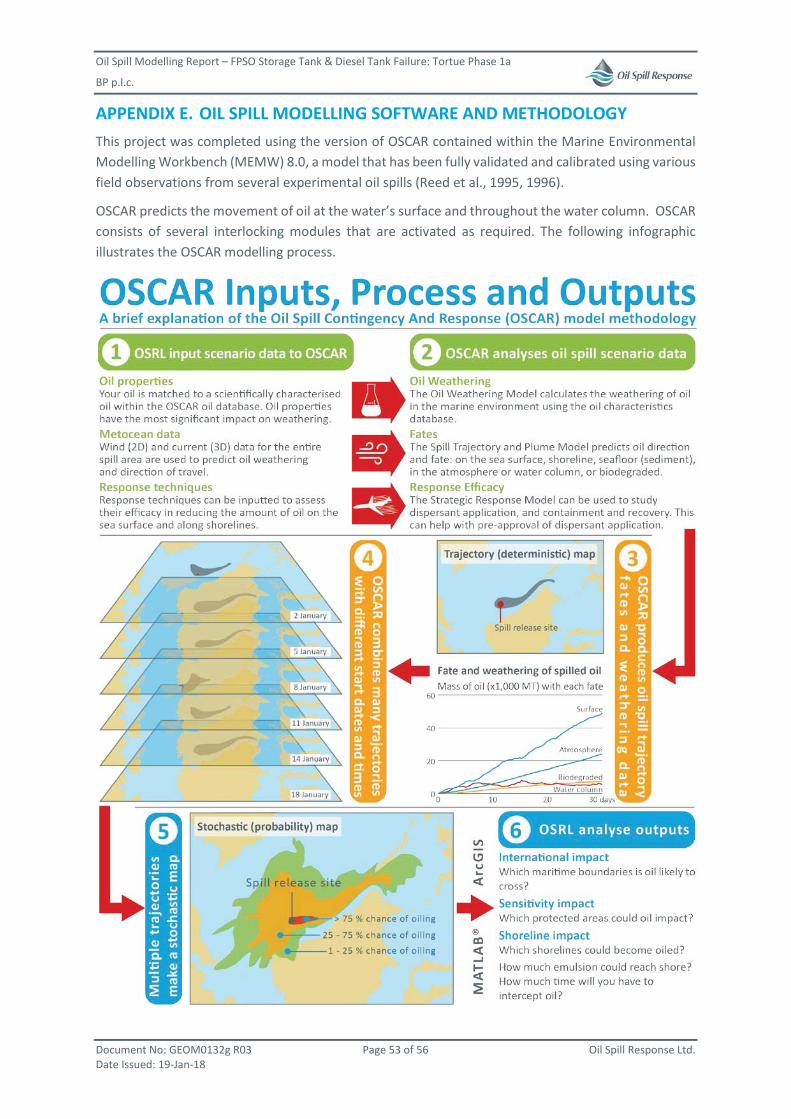
Oil Spill Modelling Report – FPSO Storage Tank & Diesel Tank Failure: Tortue Phase 1a
BP p.l.c.
Document No: GEOM0132g R03 Page 53 of 56 Oil Spill Response Ltd. Date Issued: 19-Jan-18
APPENDIX E. OIL SPILL MODELLING SOFTWARE AND METHODOLOGY This project was completed using the version of OSCAR contained within the Marine Environmental Modelling Workbench (MEMW) 8.0, a model that has been fully validated and calibrated using various field observations from several experimental oil spills (Reed et al., 1995, 1996).
OSCAR predicts the movement of oil at the water’s surface and throughout the water column. OSCAR consists of several interlocking modules that are activated as required. The following infographic illustrates the OSCAR modelling process.
Oil Spill Modelling Report – FPSO Storage Tank & Diesel Tank Failure: Tortue Phase 1a
BP p.l.c.
Document No: GEOM0132g R03 Page 54 of 56 Oil Spill Response Ltd. Date Issued: 19-Jan-18
APPENDIX F. GLOSSARY OF TERMS, ACRONYMS AND ABBREVIATIONS
°C Degrees Celsius (1.0°C = 33.8° Fahrenheit)
-6 m)
API American Petroleum Institute
API Gravity
API Gravity, like specific gravity, is a ratio between the densities of oil and water. Unlike specific gravity, API gravity is only used to describe oil, which it characterises as:
Light - API > 31.1
Medium - API between 22.3 and 31.1 Heavy - API < 22.3 Extra Heavy - API < 10.0
API Gravity is converted to Specific Gravity using the following formula: API gravity = (141.5/Specific Gravity) – 131.5
An API of 10 is equivalent to water, so oils with an API above 10 will float on water while oils with an API below 10 will sink. See also: Specific Gravity, API
ArcGIS A geographic Information System (GIS) used to present OSCAR outputs on maps.
Asphaltene Content
The asphaltenes present the crude oil components that are (1) insoluble in n-heptane at a dilution ratio of 40 parts alkane to 1 part crude oil and (2) re-dissolves in toluene. The asphaltenes include the crude oil material highest in molecular weight, polarity and aromaticity.
bbls
Barrels of oil (a unit of volume). (1.0 bbls = 0.15899 m³ and 1.0 m³ = 6.2898 bbls) The conversion between mass and volume requires knowledge of the oil density. See also: MT, API Gravity, Specific Gravity
bbls/day Barrels of oil per day (rate).
BONN Agreement
The BONN Agreement is an international standard and agreement on how to characterise and respond to pollution. Although aimed at pollution in the North Sea (Europe) many of the characterisation standards are internationally recognised.
FPSO Floating Production Diesel and Offloading - a floating vessel used for producing, processing and storing oil.
GOR
Gas to Oil Ratio - the ratio of volumetric flow of produced gas to the volumetric flow of oil. Although GOR is a ratio, the volume units must be known since gas and oil volumes are measured differently. GOR changes with temperature and pressure so the condition under which GOR is measured must be known.
ITOPF The International Tanker Owners Pollution Federation Limited
km Kilometres (1.0 km = 1,000 m) See also: m
m Metres (1.0 km = 1,000 m) See also: , km
MATLAB Matrix Laboratory - a multi-paradigm numerical computing environment and programming language used in this study for the manipulation of data outputs from OSCAR.
Oil Spill Modelling Report – FPSO Storage Tank & Diesel Tank Failure: Tortue Phase 1a
BP p.l.c.
Document No: GEOM0132g R03 Page 55 of 56 Oil Spill Response Ltd. Date Issued: 19-Jan-18
MEMW
Marine Environmental Modelling Workbench - the modelling software package developed by SINTEF. The MEMW consists of three models:
DREAM (Dose, Risk and Effects Assessment Model) OSCAR (Oil Spill Contingency and Response Model) ParTrack Model
When combined, these three models quantify the environmental effect of most chemical pollution activities. See also: OSCAR, SINTEF
MT
Metric Tonnes - this is a unit of oil mass. (1.0 MT = 1,000 kg) The conversion between mass and volume requires knowledge of the oil’s API or Specific Gravity as follows:
Barrels per metric ton = 1/[(141.5/(API + 131.5) x 0.159] See also: bbls, API Gravity, Specific Gravity
NOAA National Oceanic and Atmospheric Administration – an American scientific agency focussed on metocean conditions
OSCAR
Oil Spill Contingency And Response A state of the art 3D oil spill model and simulation tool for predicting the fates and effects of oil released into the marine environment. Developed by SINTEF, it sits within the larger MEMW application. See also: SINTEF, MEMW
OSRL Oil Spill Response Limited
Pour Point The pour point of a liquid is the lowest temperature at which it shows flow characteristics. If ambient temperature is less than the liquid’s pour point it will begin to solidify.
SCAT Shoreline Cleanup Assessment Technique
SINTEF SINTEF is an independent research organisation in Norway which develops the OSCAR model used in this study.
Specific Gravity
Specific gravity is a ratio of the density of one substance to the density of a reference substance, usually water. Specific gravity of oil is a ratio of the density of oil to the density of water. See also: API Gravity, bbls, MT
Stochastic
Stochastic (or probabilistic) results show the probability or likelihood of an event occurring. They provide statistical data that can be used to assess risk and identify worst-case scenarios. Stochastic results are achieved by combining many different trajectory simulations. See also: Trajectory
Trajectory Trajectory or deterministic results show the impact of a single spill event over time. Can be used to assess different response options such as booms, skimmers and dispersant. See also: Stochastic
UTC Coordinated Universal Time
Wax Content Represents the crude oil components that are soluble in higher molecular weight normal alkanes (n-heptane) but are insoluble in lower molecular weight alkanes (n-pentane).
Oil Spill Modelling Report – FPSO Storage Tank & Diesel Tank Failure: Tortue Phase 1a
BP p.l.c.
Document No: GEOM0132g R03 Page 56 of 56 Oil Spill Response Ltd. Date Issued: 19-Jan-18
APPENDIX G. REFERENCES Bacher, A.D. (2014) ‘Gas Chromatography Theory’, accessible online via:
http://www.chem.ucla.edu/~bacher/General/30BL/gc/theory.html, last accessed 31st October 2017.
HPI Consultants Inc. (1987) HPI Crude Oil Assay Handbook, First Edition, California: USA.
The International Tanker Owners Pollution Federation Limited (ITOPF) (n.d.) ‘Technical Information Paper 02: Fate of marine oil spills’, accessible online via: http://www.itopf.com/knowledge-resources/documents-guides/document/tip-2-fate-of-marine-oil-spills/, last accessed 31st October 2017.
The International Tanker Owners Pollution Federation Limited (ITOPF) (n.d.) ‘Technical Information Paper 06: Recognition of oil on shorelines’, accessible online via: http://www.itopf.com/knowledge-resources/documents-guides/document/tip-6-recognition-of-oil-on-shorelines/, last accessed 31st October 2017.
LECO Corporation (2012) ‘Analysis of Light Crude Oil Using Gas Chromatography – High Resolution Time-of-Flight Mass Spectrometry’, Form No. 203-821-410 Rev0, accessible online via: http://www.leco.com/index.php/component/edocman/?task=document.download&id=404&Itemid=404, last accessed 31st October 2017.
National Oceanic and Atmospheric Administration (NOAA, 2014) National Oceanographic Data Center (NODC), World Ocean Atlas Select (WOAselect), accessible via: http://www.nodc.noaa.gov/OC5/SELECT/woaselect/woaselect.html, last accessed 31st October 2017.
Oil Spill Response Ltd. (OSRL) ‘Shoreline Cleanup and Assessment Technique (SCAT) Field Guide’ accessible online via: http://www.oilspillresponse.com/technical-development/technical-field-guides, last accessed 31st October 2017.
Reed, M., French, D., Rines, G. and Rye, H. (1995) ‘A three-dimensional oil and chemical spill model for environmental impact assessment’, paper presented at 1995 International Oil Spill Conference, pp.61-66.
Reed, M., Aamo, O.M. and Downing, K. (1996) ‘Calibration and Testing of IKU’s Oil Spill Contingency and Response (OSCAR) Model System’, paper presented at 1996 AMOP Oil Spill Conference.
Saha, S., S. Moorthi, H. Pan, X. Wu, J. Wang, and Co-authors, 2010: The NCEP Climate Forecast System Reanalysis. Bulletin of the American Meteorological Society, 91, 1015–1057.
Saha, S., S. Moorthi, X. Wu, J. Wang, and Co-authors, 2014: The NCEP Climate Forecast System Version 2. Journal of Climate, 27, 2185–2208.
SINTEF (2014) ‘OSCAR – Oil Spill Contingency and Response’, accessible online via: https://www.sintef.no/en/software/oscar/, last accessed 31st October 2017.
ESIA FOR THE GREATER TORTUE/AHMEYIM PHASE 1 GAS PRODUCTION PROJECT
Ref. No.: 1653939
APPENDIX N-1c : OIL SPILL MODELING REPORT – PIPELAYING VESSEL COLLISION

Oil Spill Modelling Report – Pipelaying Vessel Collision Tortue Phase 1a
BP p.l.c. Document Number: GEOM0132h R04 Issued: 21 May 2018
Oil Spill Response Limited
Lower William Street Southampton
SO14 5QE United Kingdom
Tel: +44 (0)23 8033 1551 Fax: +44 (0)23 8022 1972
Oil Spill Modelling Report – Pipelaying Vessel Collision: Tortue Phase 1a
BP p.l.c.
Document No: GEOM0132h R04 Page 2 of 58 Oil Spill Response Ltd. Date Issued: 21-May-18
EXECUTIVE SUMMARY Oil spill modelling was completed by Oil Spill Response Ltd. (OSRL) on behalf of BP for the Tortue Phase 1a project, offshore Senegal and Mauritania (Figure 1). The results of this analysis will support the Oil Spill Contingency Plan and the Environmental Impact Assessment for the area. The modelled scenarios are summarised in Table 1.
Scenario 1. Pipelaying vessel collision resulting in the release of 2,980 m3 of diesel over 3 hours, 3,370 m3 of heavy fuel oil over 3.4 hours; and 92 m3 of lubricating oil over 1 hour during summer (April-September)
Scenario 2. Pipelaying vessel collision resulting in the release of 2,980 m3 of diesel over 3 hours, 3,370 m3 of heavy fuel oil over 3.4 hours; and 92 m3 of lubricating oil over 1 hour during winter (October-March)
The coastlines of Senegal and Mauritania are at risk due to a Pipelaying vessel collision. Summer is worse than winter with shoreline impact almost certainly occurring within 4.5 days and in the worst-case in less than 1 day. Whilst the worst-case shoreline impact for Summer and Winter is approximately the same at a little over 4,500 MT, Summer is the higher risk season. Summer has a 50% chance of 3,400 MT reaching the shore whereas Winter has only 2,900 MT for the same probability. Further, first shoreline impact in Summer ranges from less than a day to approximately 4.5 days in the best case. The Winter scenario has a much larger range, from less than a day to more than 50 days in the best case.
Senegal is expected to see more oiling than Mauritania. A Summer spill may also result in more “heavy” shoreline oiling (using ITOPF’s recognition of shoreline oiling (See Thresholds)) than winter. However, the length of shoreline that could be impacted by heavy oiling is restricted to less than 4 km.
The trajectories undertaken shows that, whilst shoreline oiling may initially be considerable, the oil properties mean that it evaporates and biodegrades quickly.
The waters of Senegal and Mauritania could experience a spill with a surface thickness more than 5 μm making them candidates for containment and recovery techniques. The waters of other neighbouring countries are not expected to be impacted during summer, but are impacted by oil up to 3 μm during winter.
Oil Spill Modelling Report – Pipelaying Vessel Collision: Tortue Phase 1a
BP p.l.c.
Document No: GEOM0132h R04 Page 3 of 58 Oil Spill Response Ltd. Date Issued: 21-May-18
DOCUMENT HISTORY
Document Number Revision Document
Type Author Technical Review
Format Review
Date of Issue
GEOM0132h R01 Draft Modelling Report JKM LHM SJB 08-Dec-17
GEOM0132h R02 In response to comments JKM LHM SJB 12-Jan-17
GEOM0132h R03 In response to comments LHM LHM LHM 19-Jan-17
GEOM0132h R04 In response to comments LHM LHM LHM 21-May-17
JKM – Jenny Kirsty Mitchell LHM – Liam Harrington-Missin SJB – Simon Blaen
DISCLAIMERS
Modelling results are to be used for guidance purposes only and response strategies should not be based on these results alone. The resolution / quality of wind and current data vary between regions and models. As with any model, the quality and reliability of the results are dependent on the quality of the input data.
Considering the above, all advice, modelling, and other information provided is generic and illustrative only and not intended to be relied upon in any specific instance. The recipient of any advice, modelling or other information from, or on behalf of, OSRL acknowledges and agrees that any number of variables may impact on an oil spill and, as such, should be addressed on an individual basis. OSRL has no liability in relation to such advice, modelling or other information and the recipient of such information hereby fully indemnifies and holds harmless OSRL its officers, employees, shareholders, agents, contractors and sub-contractors against any costs, losses, claims or liabilities arising about such advice, modelling, training or other information.
Oil Spill Modelling Report – Pipelaying Vessel Collision: Tortue Phase 1a
BP p.l.c.
Document No: GEOM0132h R04 Page 4 of 58 Oil Spill Response Ltd. Date Issued: 21-May-18
TABLE OF CONTENTS
1 INTRODUCTION ............................................................................................................... 5 1.1 BACKGROUND ........................................................................................................................ 5 1.2 AIMS .................................................................................................................................... 5 1.3 MODELLING SETUP ................................................................................................................. 7 1.4 THRESHOLDS.......................................................................................................................... 8
2 RESULTS ........................................................................................................................ 10 2.1 STOCHASTIC RESULTS ............................................................................................................ 10
2.1.1 Surface Impact .................................................................................................... 12 2.1.2 Shoreline Impact.................................................................................................. 18 2.1.3 Dissolved Water Column Impact ......................................................................... 25 2.1.4 Total Water Column Impact ................................................................................ 30
2.2 COMPARISON BETWEEN WINTER AND SUMMER ........................................................................ 35 2.3 WORST-CASE OIL SPILL SCENARIO........................................................................................... 37
3 CONCLUSION ................................................................................................................. 44 3.1 SHORELINE IMPACT ............................................................................................................... 44 3.2 SURFACE IMPACT .................................................................................................................. 44
APPENDIX A. MODEL INPUTS .......................................................................................... 46 APPENDIX B. METOCEAN DATA ...................................................................................... 47 APPENDIX C. HABITAT GRID ........................................................................................... 49 APPENDIX D. OIL CHARACTERISTICS AND BEHAVIOUR ..................................................... 50 APPENDIX E. OIL SPILL MODELLING SOFTWARE and methodology ................................... 55 APPENDIX F. GLOSSARY OF TERMS, ACRONYMS AND ABBREVIATIONS ............................ 56 APPENDIX G. REFERENCES .............................................................................................. 58
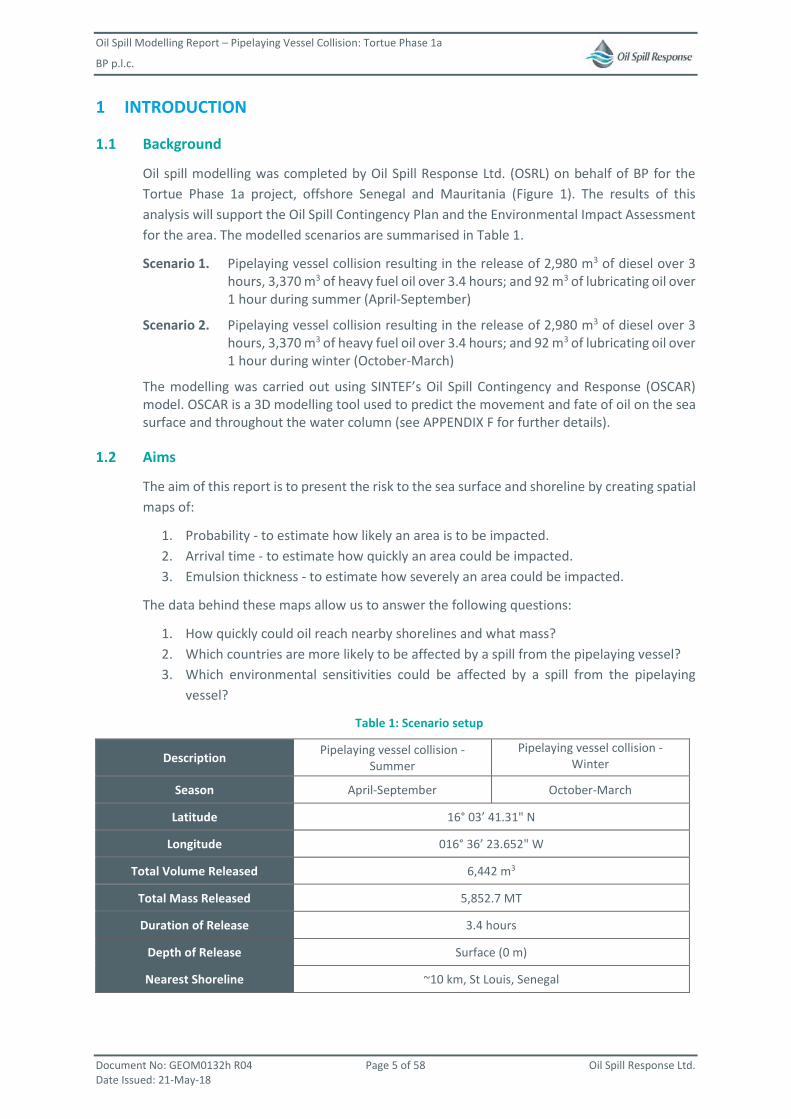
Oil Spill Modelling Report – Pipelaying Vessel Collision: Tortue Phase 1a
BP p.l.c.
Document No: GEOM0132h R04 Page 5 of 58 Oil Spill Response Ltd. Date Issued: 21-May-18
1 INTRODUCTION
1.1 Background
Oil spill modelling was completed by Oil Spill Response Ltd. (OSRL) on behalf of BP for the Tortue Phase 1a project, offshore Senegal and Mauritania (Figure 1). The results of this analysis will support the Oil Spill Contingency Plan and the Environmental Impact Assessment for the area. The modelled scenarios are summarised in Table 1.
Scenario 1. Pipelaying vessel collision resulting in the release of 2,980 m3 of diesel over 3 hours, 3,370 m3 of heavy fuel oil over 3.4 hours; and 92 m3 of lubricating oil over 1 hour during summer (April-September)
Scenario 2. Pipelaying vessel collision resulting in the release of 2,980 m3 of diesel over 3 hours, 3,370 m3 of heavy fuel oil over 3.4 hours; and 92 m3 of lubricating oil over 1 hour during winter (October-March)
The modelling was carried out using SINTEF’s Oil Spill Contingency and Response (OSCAR) model. OSCAR is a 3D modelling tool used to predict the movement and fate of oil on the sea surface and throughout the water column (see APPENDIX F for further details).
1.2 Aims
The aim of this report is to present the risk to the sea surface and shoreline by creating spatial maps of:
1. Probability - to estimate how likely an area is to be impacted. 2. Arrival time - to estimate how quickly an area could be impacted. 3. Emulsion thickness - to estimate how severely an area could be impacted.
The data behind these maps allow us to answer the following questions:
1. How quickly could oil reach nearby shorelines and what mass? 2. Which countries are more likely to be affected by a spill from the pipelaying vessel? 3. Which environmental sensitivities could be affected by a spill from the pipelaying
vessel?
Table 1: Scenario setup
Description Pipelaying vessel collision - Summer
Pipelaying vessel collision - Winter
Season April-September October-March
Latitude 16° 03’ 41.31" N
Longitude 016° 36’ 23.652" W
Total Volume Released 6,442 m3
Total Mass Released 5,852.7 MT
Duration of Release 3.4 hours
Depth of Release Surface (0 m)
Nearest Shoreline ~10 km, St Louis, Senegal

Oil Spill Modelling Report – Pipelaying Vessel Collision: Tortue Phase 1a
BP p.l.c.
Document No: GEOM0132h R04 Page 6 of 58 Oil Spill Response Ltd. Date Issued: 21-May-18
Figure 1: Map showing the release location
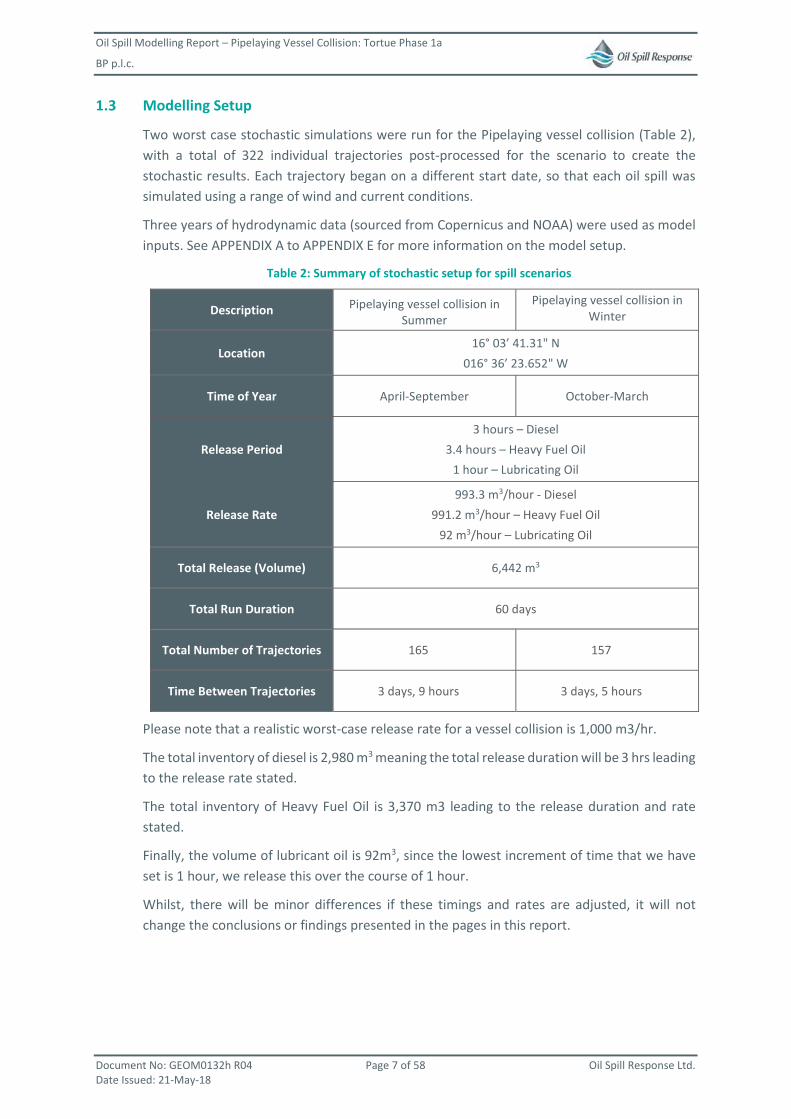
Oil Spill Modelling Report – Pipelaying Vessel Collision: Tortue Phase 1a
BP p.l.c.
Document No: GEOM0132h R04 Page 7 of 58 Oil Spill Response Ltd. Date Issued: 21-May-18
1.3 Modelling Setup
Two worst case stochastic simulations were run for the Pipelaying vessel collision (Table 2), with a total of 322 individual trajectories post-processed for the scenario to create the stochastic results. Each trajectory began on a different start date, so that each oil spill was simulated using a range of wind and current conditions.
Three years of hydrodynamic data (sourced from Copernicus and NOAA) were used as model inputs. See APPENDIX A to APPENDIX E for more information on the model setup.
Table 2: Summary of stochastic setup for spill scenarios
Description Pipelaying vessel collision in Summer
Pipelaying vessel collision in Winter
Location 16° 03’ 41.31" N
016° 36’ 23.652" W
Time of Year April-September October-March
Release Period 3 hours – Diesel
3.4 hours – Heavy Fuel Oil 1 hour – Lubricating Oil
Release Rate 993.3 m3/hour - Diesel
991.2 m3/hour – Heavy Fuel Oil 92 m3/hour – Lubricating Oil
Total Release (Volume) 6,442 m3
Total Run Duration 60 days
Total Number of Trajectories 165 157
Time Between Trajectories 3 days, 9 hours 3 days, 5 hours
Please note that a realistic worst-case release rate for a vessel collision is 1,000 m3/hr.
The total inventory of diesel is 2,980 m3 meaning the total release duration will be 3 hrs leading to the release rate stated.
The total inventory of Heavy Fuel Oil is 3,370 m3 leading to the release duration and rate stated.
Finally, the volume of lubricant oil is 92m3, since the lowest increment of time that we have set is 1 hour, we release this over the course of 1 hour.
Whilst, there will be minor differences if these timings and rates are adjusted, it will not change the conclusions or findings presented in the pages in this report.

Oil Spill Modelling Report – Pipelaying Vessel Collision: Tortue Phase 1a
BP p.l.c.
Document No: GEOM0132h R04 Page 8 of 58 Oil Spill Response Ltd. Date Issued: 21-May-18
1.4 Thresholds
Thresholds define the point below which data are no longer informative. For example, when surface emulsion thickness is less than 0.04 μm, the oil is no longer visible to the naked eye so may be considered negligible to a response. The thresholds applied to this study are given in Table 3.
Table 3: Thresholds used in the post-processing stage of the modelling
Threshold Value Description
Surface 0.04 μm The Bonn Agreement Oil Appearance Code defines five oil layer thicknesses based on their optic effects and true colours. 0.04 μm is the minimum thickness that can be seen with the naked eye.
Water column
6 ppb (Dissolved)
Low level, in-water dissolved HC exposure.
70 ppb (Total)
Entrained HC exposure level, OSPAR predicted no effect concentration (PNEC).
Shoreline 0.1 litres/m2 Lower threshold for light oiling from the ITOPF document “Recognition of oil on shorelines”.
The thickness key used in the surface emulsion thickness maps throughout this document is derived from the Bonn Oil Appearance Code (Table 4).
Table 4: Key used for sea surface emulsion thickness outputs
Appearance Layer Thickness Interval Colour
Sheen 0.04 μm - 0.3 μm
Rainbow 0.3 μm -5 μm
Metallic 5 μm - 50 μm
Discontinuous True Colour 50 μm - 200 μm
Continuous True Colour >200 μm
The thickness key used in the shoreline maps throughout this document is derived from the ITOPF Technical Information Paper (TIP) No. 6 “Recognition of oil on shorelines” (ITOPF, 2011b; Table 7). Very light oiling is deemed negligible by ITOPF (ITOPF, 2011b); no practical response is required for a very lightly oiled shoreline, apart from monitoring the oil spill.
Table 5: Key used for water column dissolved concentrations
Water Column Classification Concentration Colour
Low < 50 ppb
Moderate 50 - 400 ppb
High > 400 ppb

Oil Spill Modelling Report – Pipelaying Vessel Collision: Tortue Phase 1a
BP p.l.c.
Document No: GEOM0132h R04 Page 9 of 58 Oil Spill Response Ltd. Date Issued: 21-May-18
Table 6: Key used for water column total concentrations
Concentration Colour
< 150 ppb
150 – 500 ppb
500 – 750 ppb
750 - 1000 ppb
> 1000 ppb
Table 7: Key used for shoreline emulsion thickness outputs
Shoreline Oiling Classification Concentration Thickness Colour
Light Oiling 0.1 – 1 litres/m2 0.1 mm – 1.0 mm
Moderate Oiling 1 – 10 litres/m2 1 mm – 10 mm
Heavy Oiling > 10 litres/m2 > 10 mm
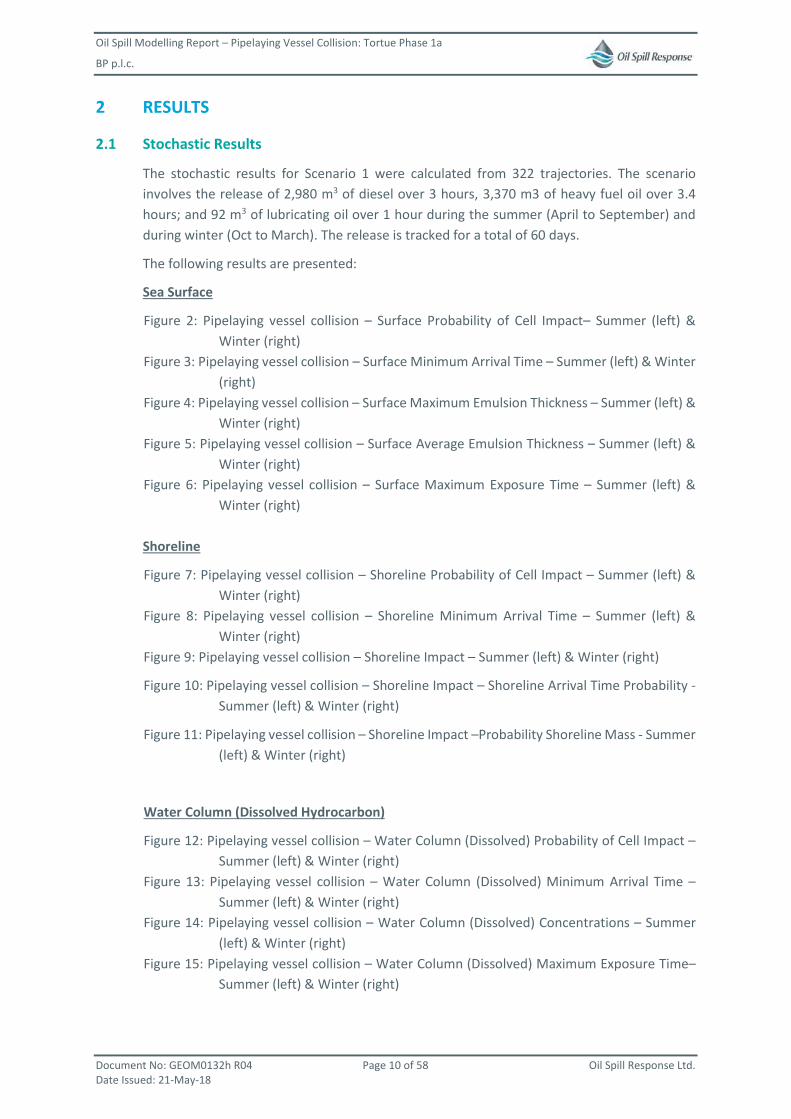
Oil Spill Modelling Report – Pipelaying Vessel Collision: Tortue Phase 1a
BP p.l.c.
Document No: GEOM0132h R04 Page 10 of 58 Oil Spill Response Ltd. Date Issued: 21-May-18
2 RESULTS
2.1 Stochastic Results
The stochastic results for Scenario 1 were calculated from 322 trajectories. The scenario involves the release of 2,980 m3 of diesel over 3 hours, 3,370 m3 of heavy fuel oil over 3.4 hours; and 92 m3 of lubricating oil over 1 hour during the summer (April to September) and during winter (Oct to March). The release is tracked for a total of 60 days.
The following results are presented:
Sea Surface
Figure 2: Pipelaying vessel collision – Surface Probability of Cell Impact– Summer (left) & Winter (right)
Figure 3: Pipelaying vessel collision – Surface Minimum Arrival Time – Summer (left) & Winter (right)
Figure 4: Pipelaying vessel collision – Surface Maximum Emulsion Thickness – Summer (left) & Winter (right)
Figure 5: Pipelaying vessel collision – Surface Average Emulsion Thickness – Summer (left) & Winter (right)
Figure 6: Pipelaying vessel collision – Surface Maximum Exposure Time – Summer (left) & Winter (right)
Shoreline
Figure 7: Pipelaying vessel collision – Shoreline Probability of Cell Impact – Summer (left) & Winter (right)
Figure 8: Pipelaying vessel collision – Shoreline Minimum Arrival Time – Summer (left) & Winter (right)
Figure 9: Pipelaying vessel collision – Shoreline Impact – Summer (left) & Winter (right)
Figure 10: Pipelaying vessel collision – Shoreline Impact – Shoreline Arrival Time Probability - Summer (left) & Winter (right)
Figure 11: Pipelaying vessel collision – Shoreline Impact –Probability Shoreline Mass - Summer (left) & Winter (right)
Water Column (Dissolved Hydrocarbon)
Figure 12: Pipelaying vessel collision – Water Column (Dissolved) Probability of Cell Impact – Summer (left) & Winter (right)
Figure 13: Pipelaying vessel collision – Water Column (Dissolved) Minimum Arrival Time – Summer (left) & Winter (right)
Figure 14: Pipelaying vessel collision – Water Column (Dissolved) Concentrations – Summer (left) & Winter (right)
Figure 15: Pipelaying vessel collision – Water Column (Dissolved) Maximum Exposure Time– Summer (left) & Winter (right)

Oil Spill Modelling Report – Pipelaying Vessel Collision: Tortue Phase 1a
BP p.l.c.
Document No: GEOM0132h R04 Page 11 of 58 Oil Spill Response Ltd. Date Issued: 21-May-18
Water Column (Total Hydrocarbon)
Figure 16: Pipelaying vessel collision – Water Column (Total) Probability of Cell Impact – Summer (left) & Winter (right)
Figure 17: Pipelaying vessel collision – Water Column (Total) Minimum Arrival Time – Summer (left) & Winter (right)
Figure 18: Pipelaying vessel collision – Water Column (Total) Concentrations – Summer (left) & Winter (right)
Figure 19: Pipelaying vessel collision – Water Column (Total) Maximum Exposure Time – Summer (left) & Winter (right)
Oil Spill Modelling Report – Pipelaying Vessel Collision: Tortue Phase 1a
BP p.l.c.
Document No: GEOM0132h R04 Page 12 of 58 Oil Spill Response Ltd. Date Issued: 21-May-18
2.1.1 Surface Impact
Pipelaying vessel p y gcollision Surface
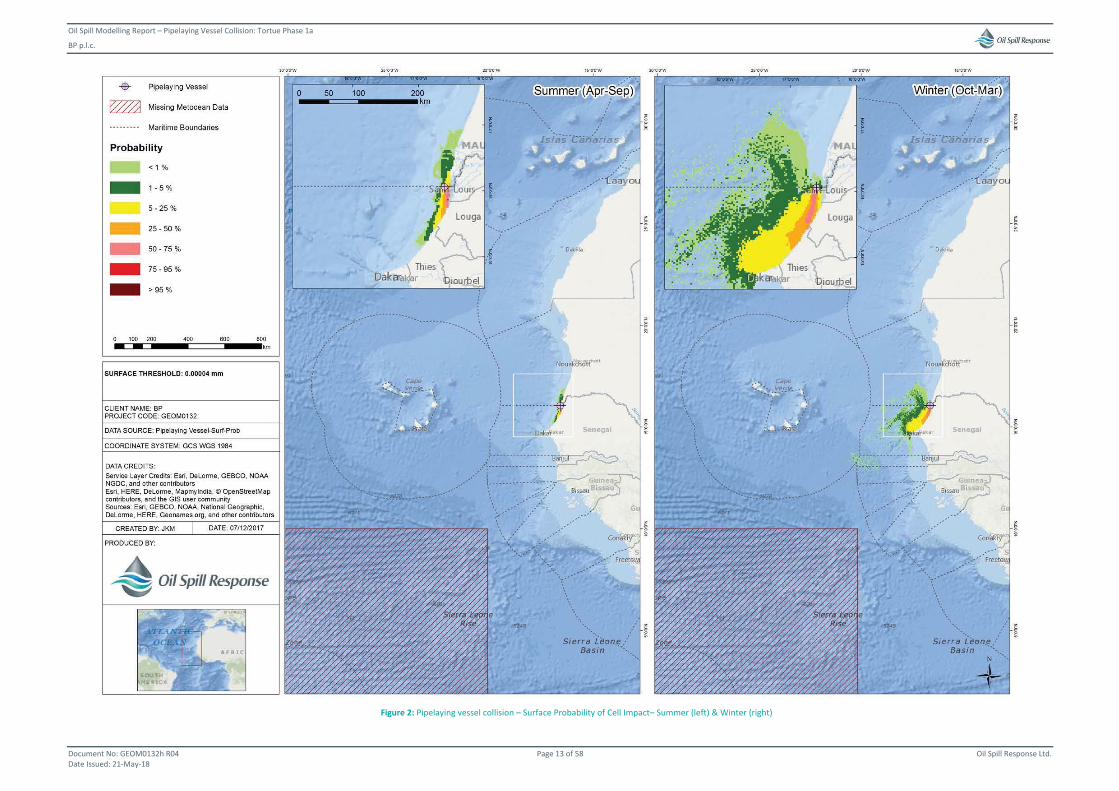
Oil Spill Modelling Report – Pipelaying Vessel Collision: Tortue Phase 1a
BP p.l.c.
Document No: GEOM0132h R04 Page 13 of 58 Oil Spill Response Ltd. Date Issued: 21-May-18
Figure 2: Pipelaying vessel collision – Surface Probability of Cell Impact– Summer (left) & Winter (right)
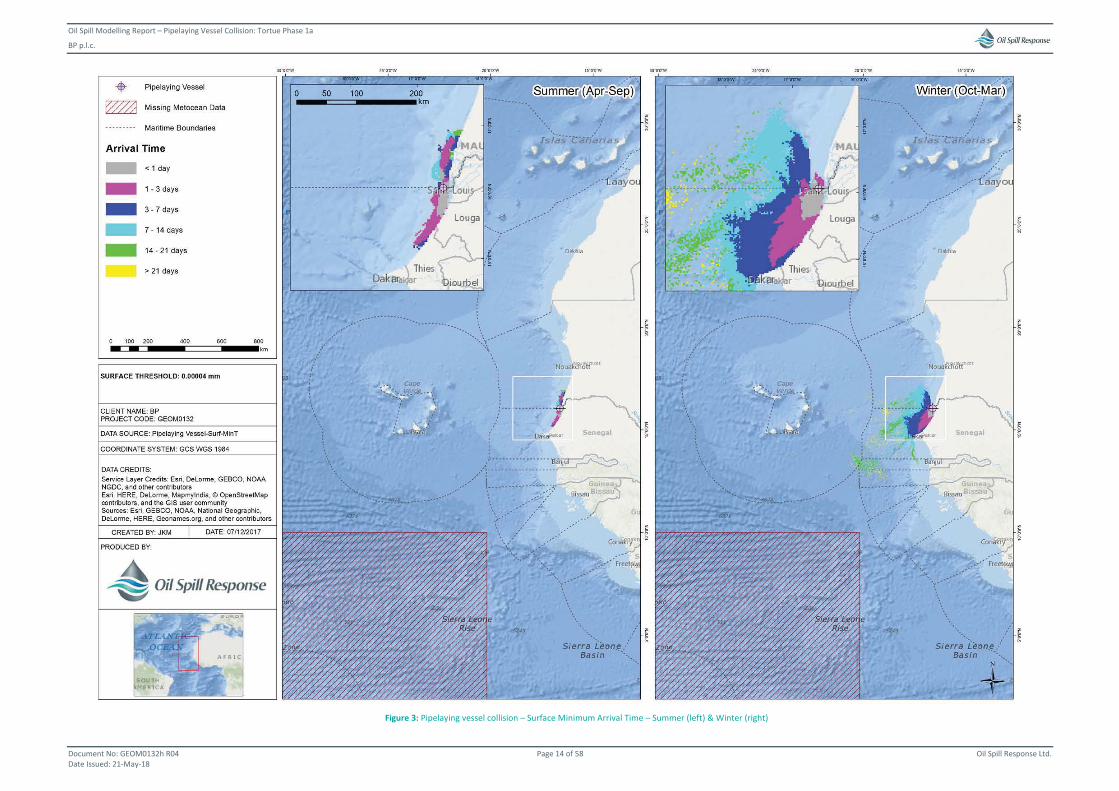
Oil Spill Modelling Report – Pipelaying Vessel Collision: Tortue Phase 1a
BP p.l.c.
Document No: GEOM0132h R04 Page 14 of 58 Oil Spill Response Ltd. Date Issued: 21-May-18
Figure 3: Pipelaying vessel collision – Surface Minimum Arrival Time – Summer (left) & Winter (right)
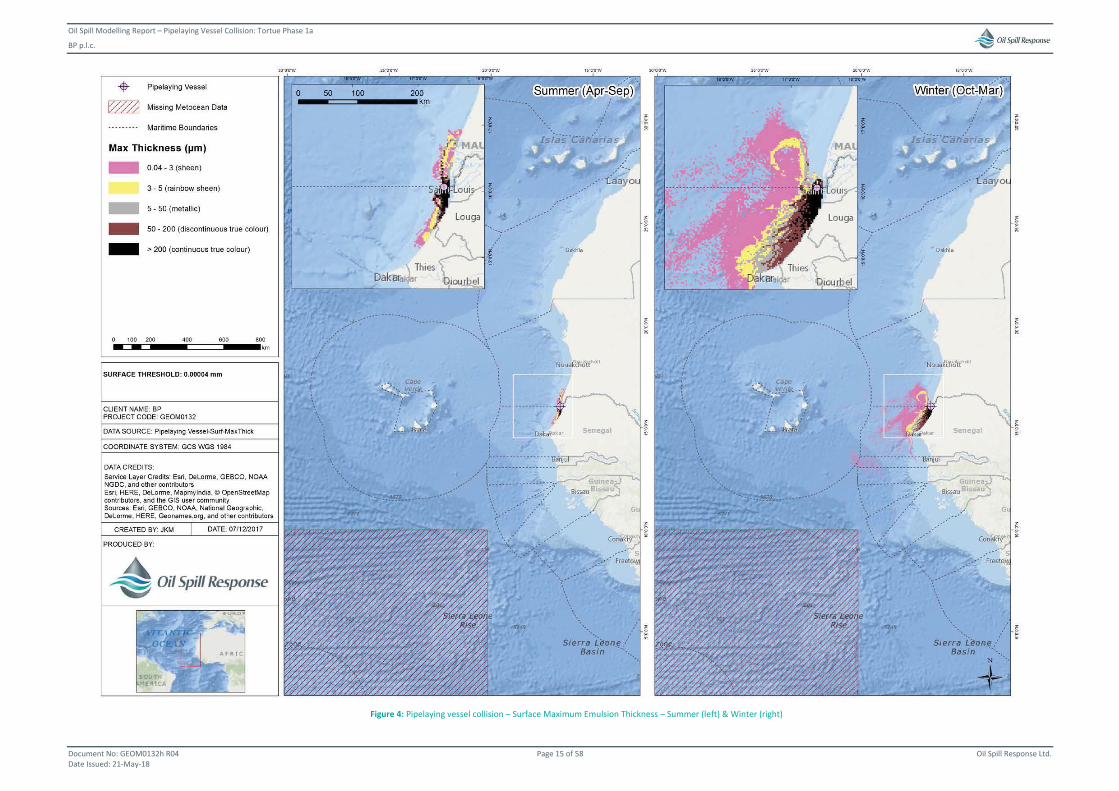
Oil Spill Modelling Report – Pipelaying Vessel Collision: Tortue Phase 1a
BP p.l.c.
Document No: GEOM0132h R04 Page 15 of 58 Oil Spill Response Ltd. Date Issued: 21-May-18
Figure 4: Pipelaying vessel collision – Surface Maximum Emulsion Thickness – Summer (left) & Winter (right)
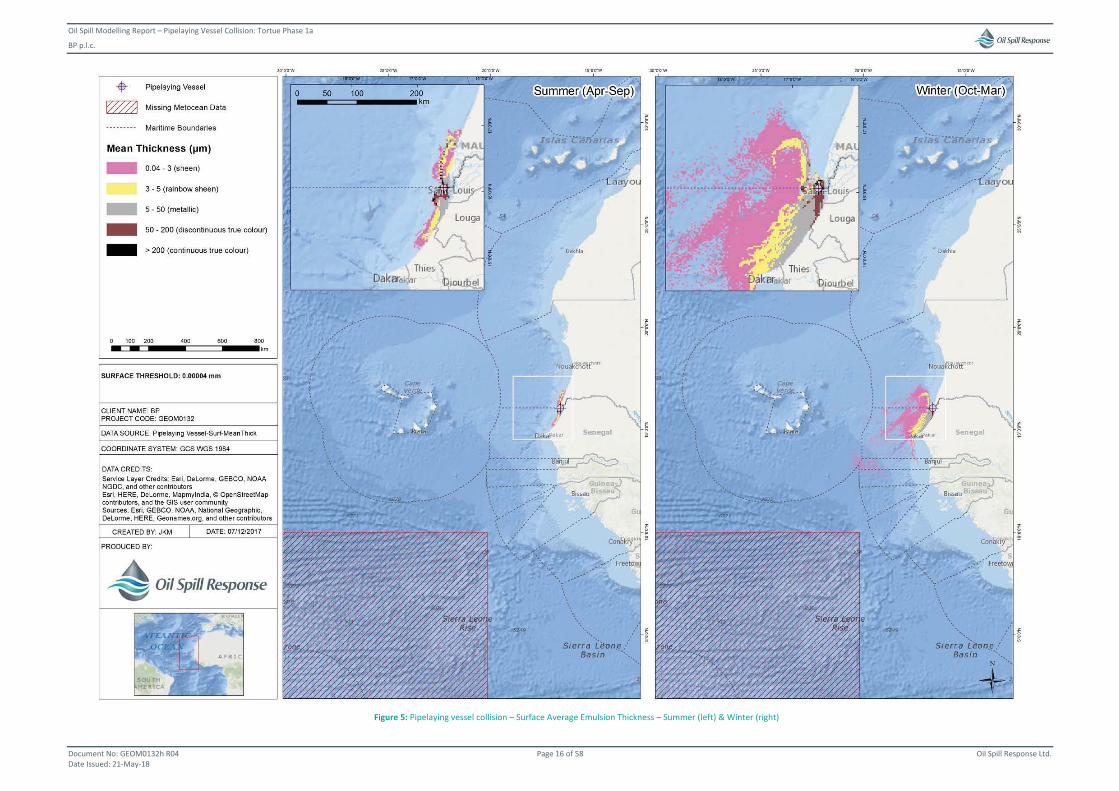
Oil Spill Modelling Report – Pipelaying Vessel Collision: Tortue Phase 1a
BP p.l.c.
Document No: GEOM0132h R04 Page 16 of 58 Oil Spill Response Ltd. Date Issued: 21-May-18
Figure 5: Pipelaying vessel collision – Surface Average Emulsion Thickness – Summer (left) & Winter (right)
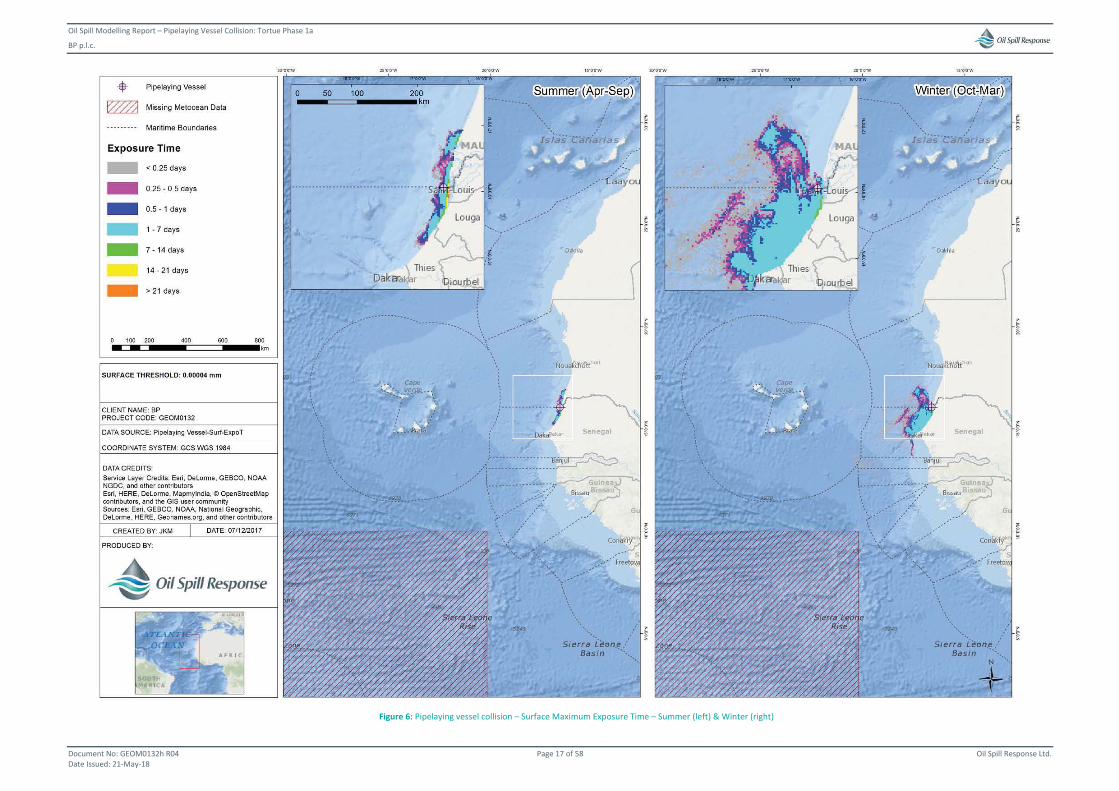
Oil Spill Modelling Report – Pipelaying Vessel Collision: Tortue Phase 1a
BP p.l.c.
Document No: GEOM0132h R04 Page 17 of 58 Oil Spill Response Ltd. Date Issued: 21-May-18
Figure 6: Pipelaying vessel collision – Surface Maximum Exposure Time – Summer (left) & Winter (right)
Oil Spill Modelling Report – Pipelaying Vessel Collision: Tortue Phase 1a
BP p.l.c.
Document No: GEOM0132h R04 Page 18 of 58 Oil Spill Response Ltd. Date Issued: 21-May-18
2.1.2 Shoreline Impact
Pipelaying vessel p y gcollision
Shoreline
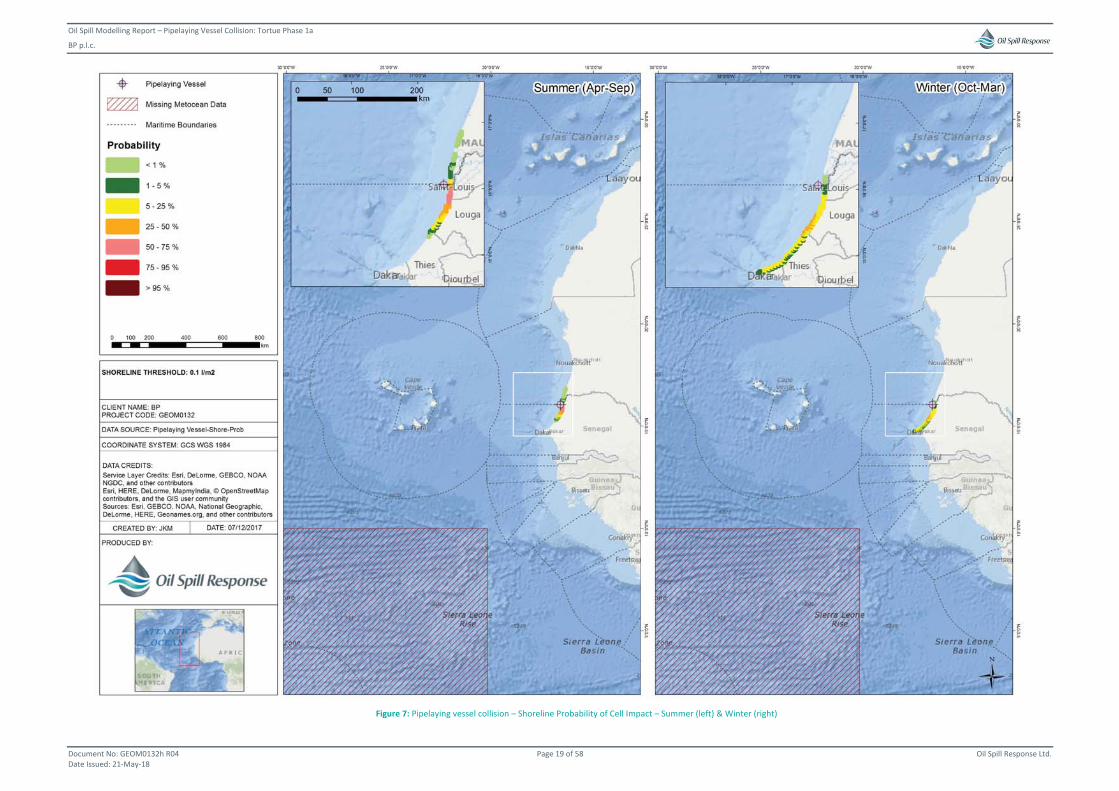
Oil Spill Modelling Report – Pipelaying Vessel Collision: Tortue Phase 1a
BP p.l.c.
Document No: GEOM0132h R04 Page 19 of 58 Oil Spill Response Ltd. Date Issued: 21-May-18
Figure 7: Pipelaying vessel collision – Shoreline Probability of Cell Impact – Summer (left) & Winter (right)
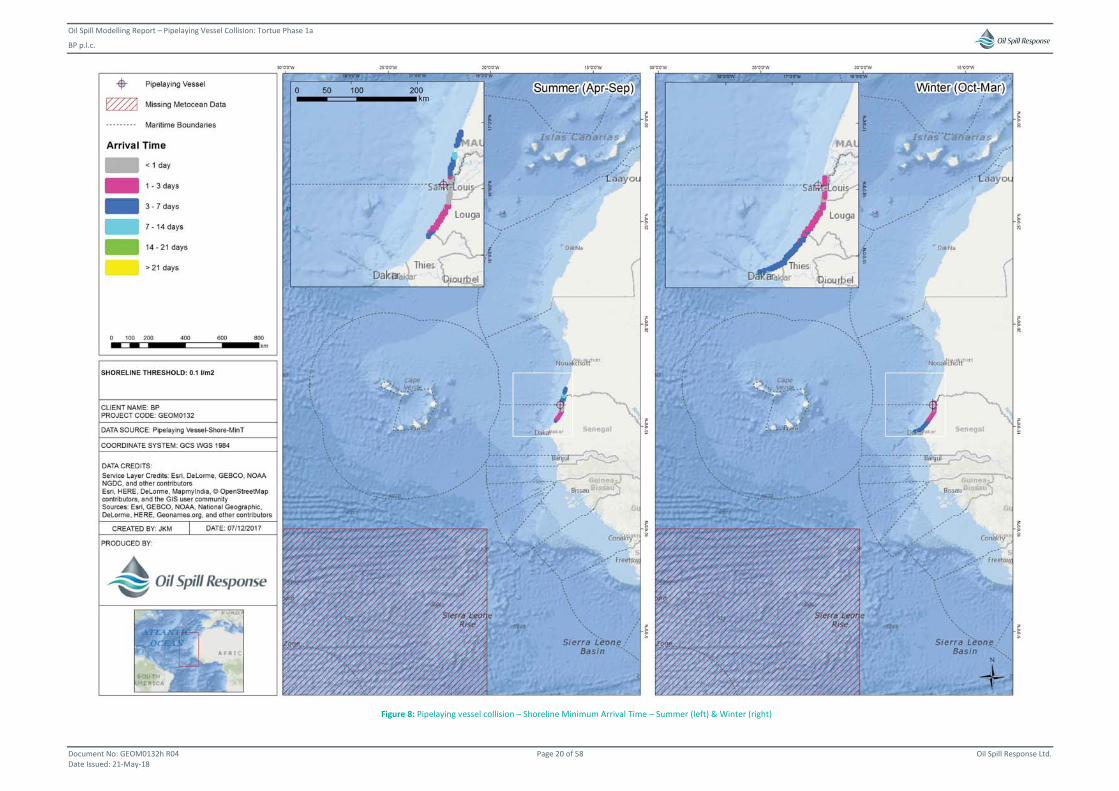
Oil Spill Modelling Report – Pipelaying Vessel Collision: Tortue Phase 1a
BP p.l.c.
Document No: GEOM0132h R04 Page 20 of 58 Oil Spill Response Ltd. Date Issued: 21-May-18
Figure 8: Pipelaying vessel collision – Shoreline Minimum Arrival Time – Summer (left) & Winter (right)
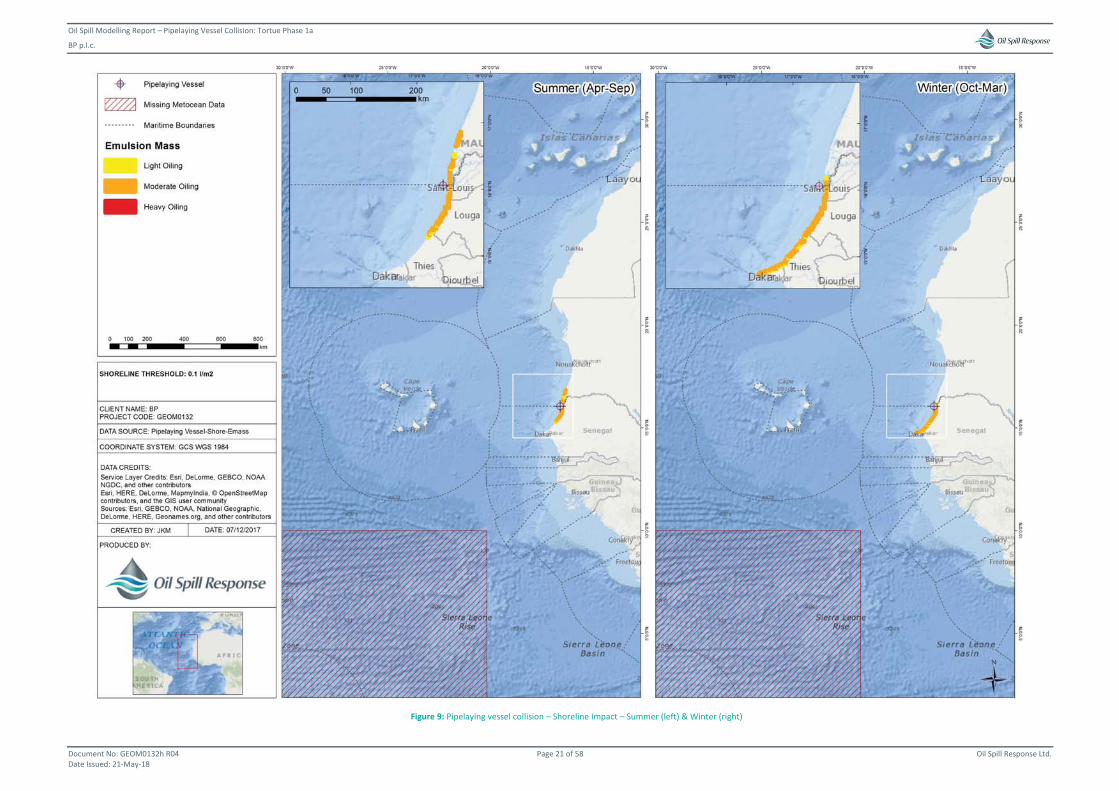
Oil Spill Modelling Report – Pipelaying Vessel Collision: Tortue Phase 1a
BP p.l.c.
Document No: GEOM0132h R04 Page 21 of 58 Oil Spill Response Ltd. Date Issued: 21-May-18
Figure 9: Pipelaying vessel collision – Shoreline Impact – Summer (left) & Winter (right)
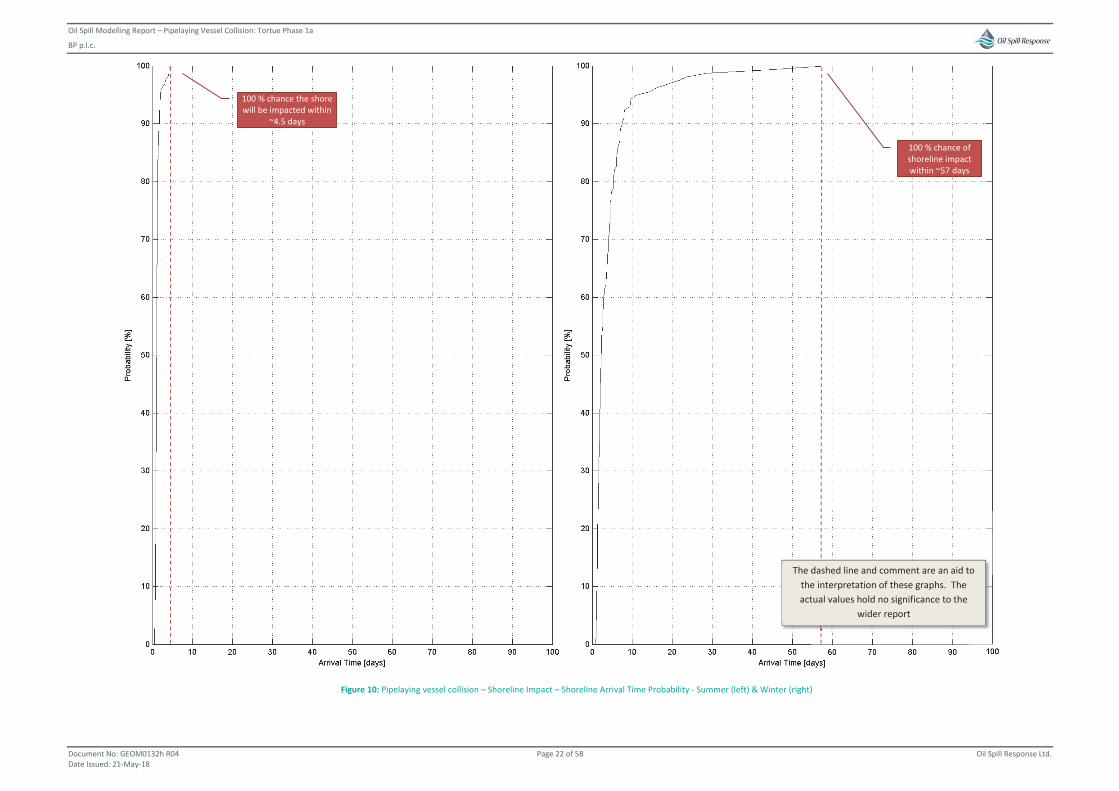
Oil Spill Modelling Report – Pipelaying Vessel Collision: Tortue Phase 1a
BP p.l.c.
Document No: GEOM0132h R04 Page 22 of 58 Oil Spill Response Ltd. Date Issued: 21-May-18
Figure 10: Pipelaying vessel collision – Shoreline Impact – Shoreline Arrival Time Probability - Summer (left) & Winter (right)
100 % chance the shore will be impacted within
~4.5 days
100 % chance of shoreline impact within ~57 days
The dashed line and comment are an aid to the interpretation of these graphs. The actual values hold no significance to the
wider report
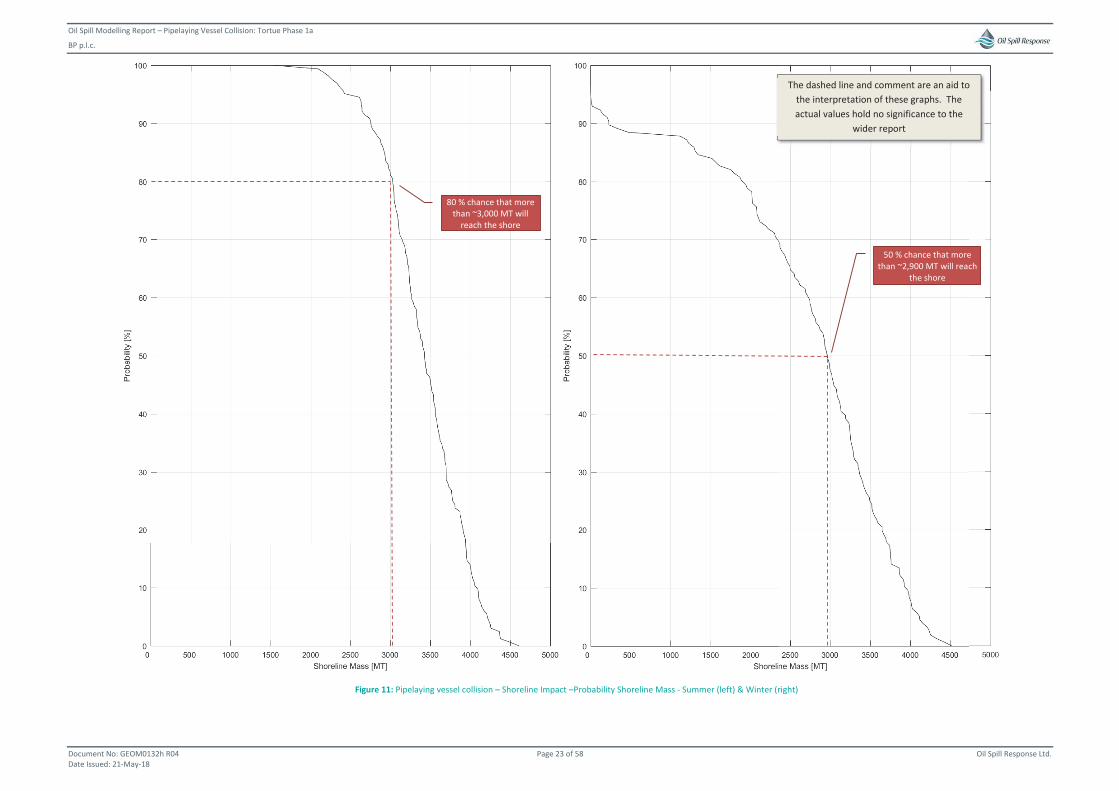
Oil Spill Modelling Report – Pipelaying Vessel Collision: Tortue Phase 1a
BP p.l.c.
Document No: GEOM0132h R04 Page 23 of 58 Oil Spill Response Ltd. Date Issued: 21-May-18
Figure 11: Pipelaying vessel collision – Shoreline Impact –Probability Shoreline Mass - Summer (left) & Winter (right)
80 % chance that more than ~3,000 MT will
reach the shore
50 % chance that more than ~2,900 MT will reach
the shore
The dashed line and comment are an aid to the interpretation of these graphs. The actual values hold no significance to the
wider report
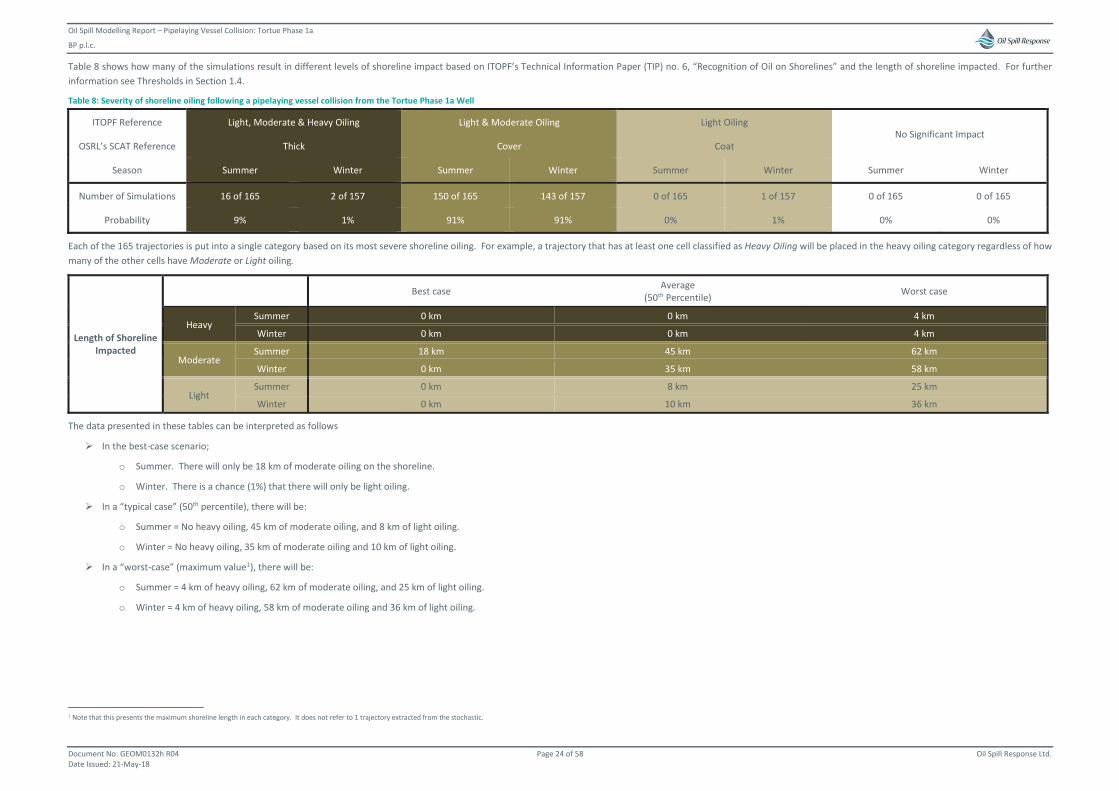
Oil Spill Modelling Report – Pipelaying Vessel Collision: Tortue Phase 1a
BP p.l.c.
Document No: GEOM0132h R04 Page 24 of 58 Oil Spill Response Ltd. Date Issued: 21-May-18
Table 8 shows how many of the simulations result in different levels of shoreline impact based on ITOPF’s Technical Information Paper (TIP) no. 6, “Recognition of Oil on Shorelines” and the length of shoreline impacted. For further information see Thresholds in Section 1.4.
Table 8: Severity of shoreline oiling following a pipelaying vessel collision from the Tortue Phase 1a Well
ITOPF Reference Light, Moderate & Heavy Oiling Light & Moderate Oiling Light Oiling No Significant Impact
OSRL’s SCAT Reference Thick Cover Coat
Season Summer Winter Summer Winter Summer Winter Summer Winter
Number of Simulations 16 of 165 2 of 157 150 of 165 143 of 157 0 of 165 1 of 157 0 of 165 0 of 165
Probability 9% 1% 91% 91% 0% 1% 0% 0%
Each of the 165 trajectories is put into a single category based on its most severe shoreline oiling. For example, a trajectory that has at least one cell classified as Heavy Oiling will be placed in the heavy oiling category regardless of how many of the other cells have Moderate or Light oiling.
Length of Shoreline Impacted
Best case Average (50th Percentile) Worst case
Heavy Summer 0 km 0 km 4 km
Winter 0 km 0 km 4 km
Moderate Summer 18 km 45 km 62 km
Winter 0 km 35 km 58 km
Light Summer 0 km 8 km 25 km
Winter 0 km 10 km 36 km
The data presented in these tables can be interpreted as follows
In the best-case scenario;
o Summer. There will only be 18 km of moderate oiling on the shoreline.
o Winter. There is a chance (1%) that there will only be light oiling.
In a “typical case” (50th percentile), there will be:
o Summer = No heavy oiling, 45 km of moderate oiling, and 8 km of light oiling.
o Winter = No heavy oiling, 35 km of moderate oiling and 10 km of light oiling.
In a “worst-case” (maximum value1), there will be:
o Summer = 4 km of heavy oiling, 62 km of moderate oiling, and 25 km of light oiling.
o Winter = 4 km of heavy oiling, 58 km of moderate oiling and 36 km of light oiling.
1 Note that this presents the maximum shoreline length in each category. It does not refer to 1 trajectory extracted from the stochastic.
Oil Spill Modelling Report – Pipelaying Vessel Collision: Tortue Phase 1a
BP p.l.c.
Document No: GEOM0132h R04 Page 25 of 58 Oil Spill Response Ltd. Date Issued: 21-May-18
2.1.3 Dissolved Water Column Impact
Pipelaying vessel p y gcollision
Water Column Maps pDissolved Concentrations
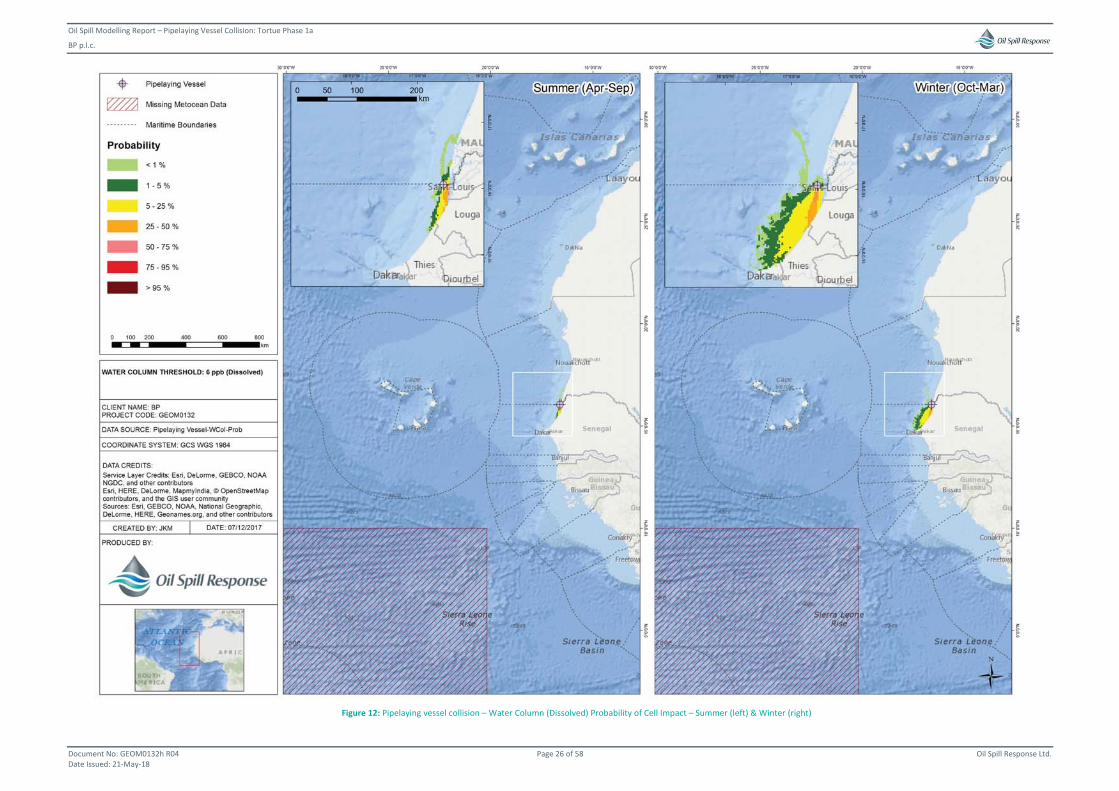
Oil Spill Modelling Report – Pipelaying Vessel Collision: Tortue Phase 1a
BP p.l.c.
Document No: GEOM0132h R04 Page 26 of 58 Oil Spill Response Ltd. Date Issued: 21-May-18
Figure 12: Pipelaying vessel collision – Water Column (Dissolved) Probability of Cell Impact – Summer (left) & Winter (right)
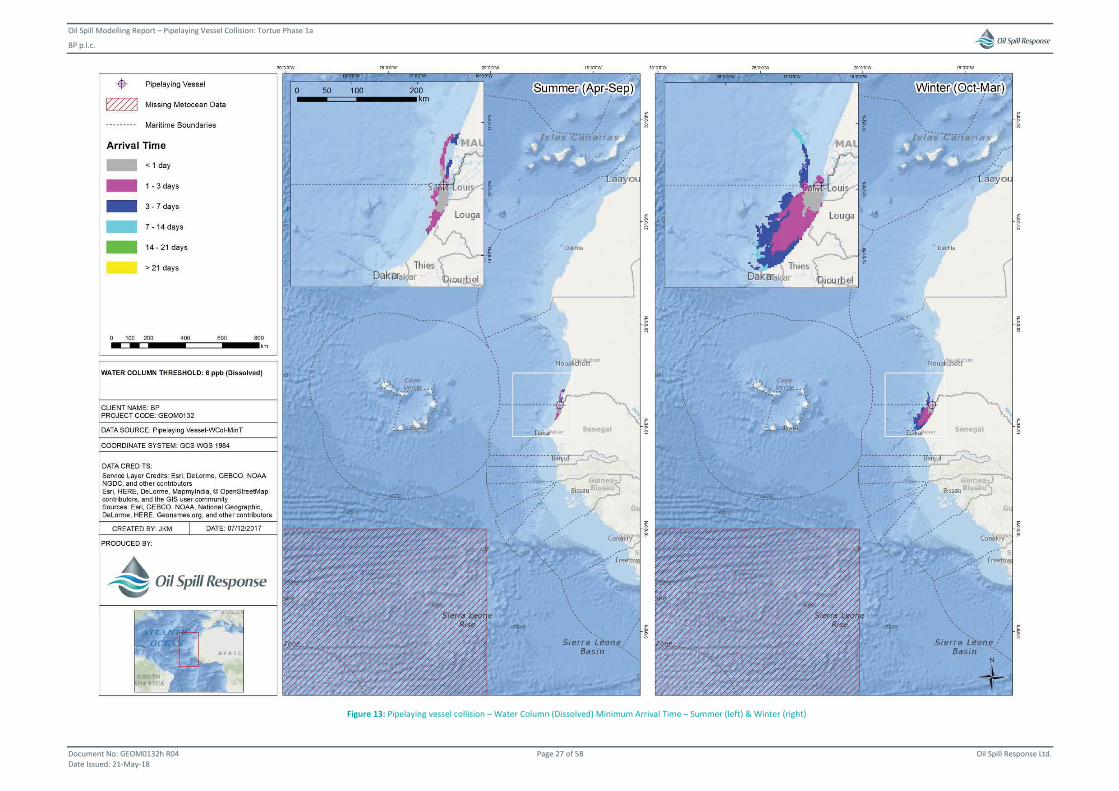
Oil Spill Modelling Report – Pipelaying Vessel Collision: Tortue Phase 1a
BP p.l.c.
Document No: GEOM0132h R04 Page 27 of 58 Oil Spill Response Ltd. Date Issued: 21-May-18
Figure 13: Pipelaying vessel collision – Water Column (Dissolved) Minimum Arrival Time – Summer (left) & Winter (right)
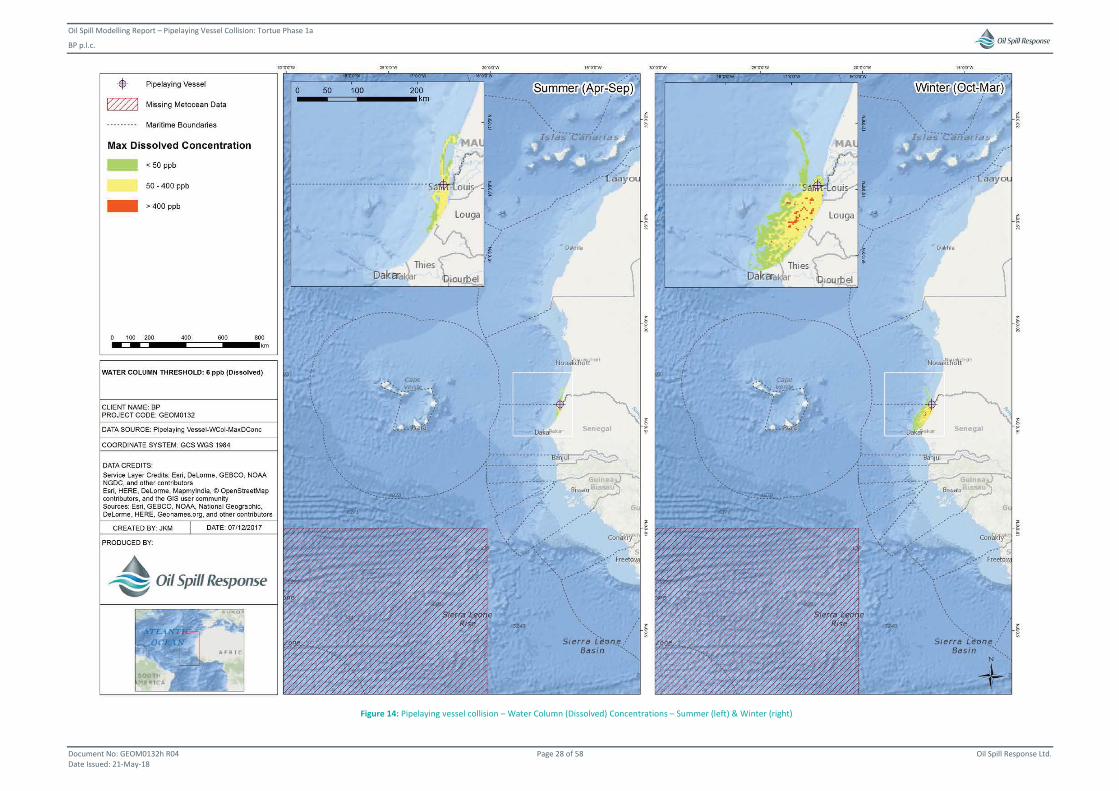
Oil Spill Modelling Report – Pipelaying Vessel Collision: Tortue Phase 1a
BP p.l.c.
Document No: GEOM0132h R04 Page 28 of 58 Oil Spill Response Ltd. Date Issued: 21-May-18
Figure 14: Pipelaying vessel collision – Water Column (Dissolved) Concentrations – Summer (left) & Winter (right)
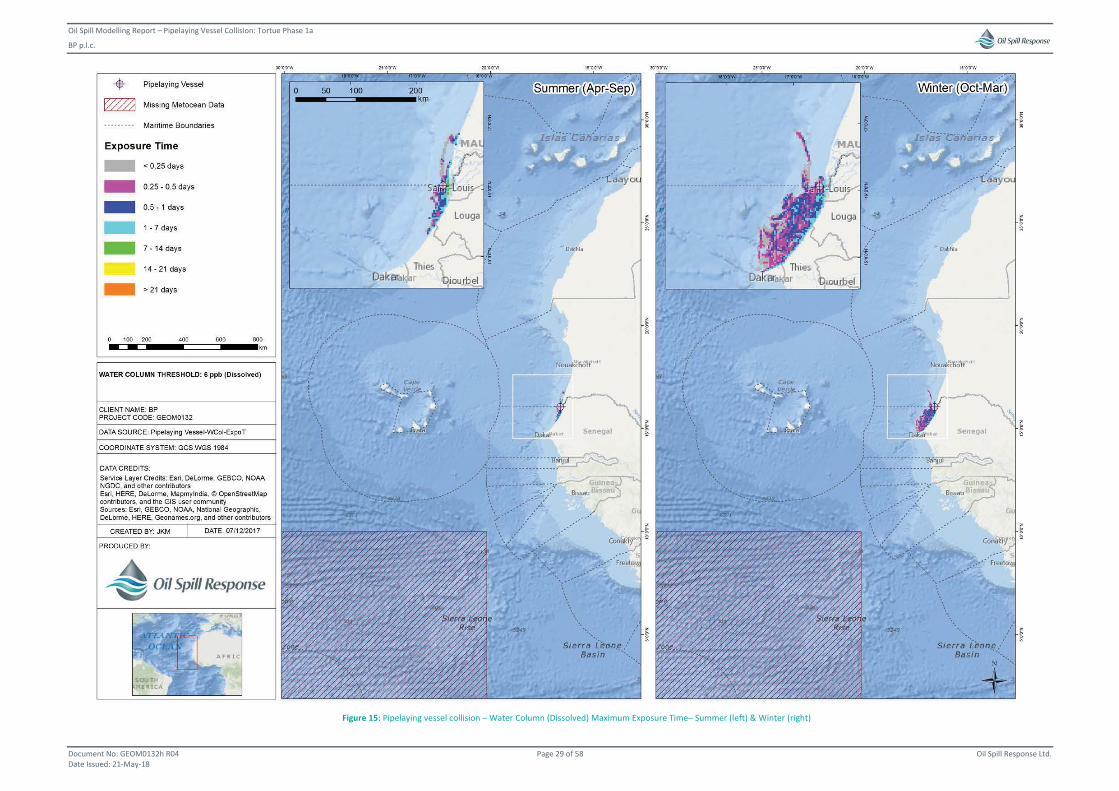
Oil Spill Modelling Report – Pipelaying Vessel Collision: Tortue Phase 1a
BP p.l.c.
Document No: GEOM0132h R04 Page 29 of 58 Oil Spill Response Ltd. Date Issued: 21-May-18
Figure 15: Pipelaying vessel collision – Water Column (Dissolved) Maximum Exposure Time– Summer (left) & Winter (right)
Oil Spill Modelling Report – Pipelaying Vessel Collision: Tortue Phase 1a
BP p.l.c.
Document No: GEOM0132h R04 Page 30 of 58 Oil Spill Response Ltd. Date Issued: 21-May-18
2.1.4 Total Water Column Impact
Pipelaying vessel p y gcollision
Water Column Maps pTotal Concentrations
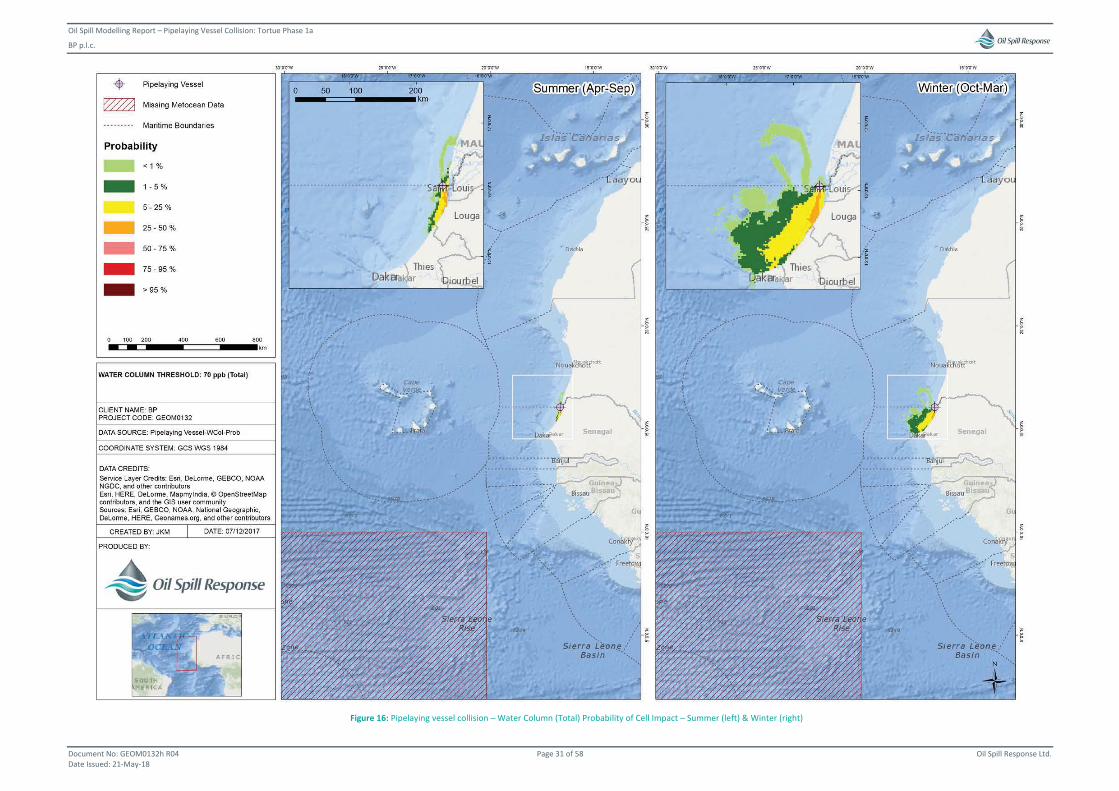
Oil Spill Modelling Report – Pipelaying Vessel Collision: Tortue Phase 1a
BP p.l.c.
Document No: GEOM0132h R04 Page 31 of 58 Oil Spill Response Ltd. Date Issued: 21-May-18
Figure 16: Pipelaying vessel collision – Water Column (Total) Probability of Cell Impact – Summer (left) & Winter (right)
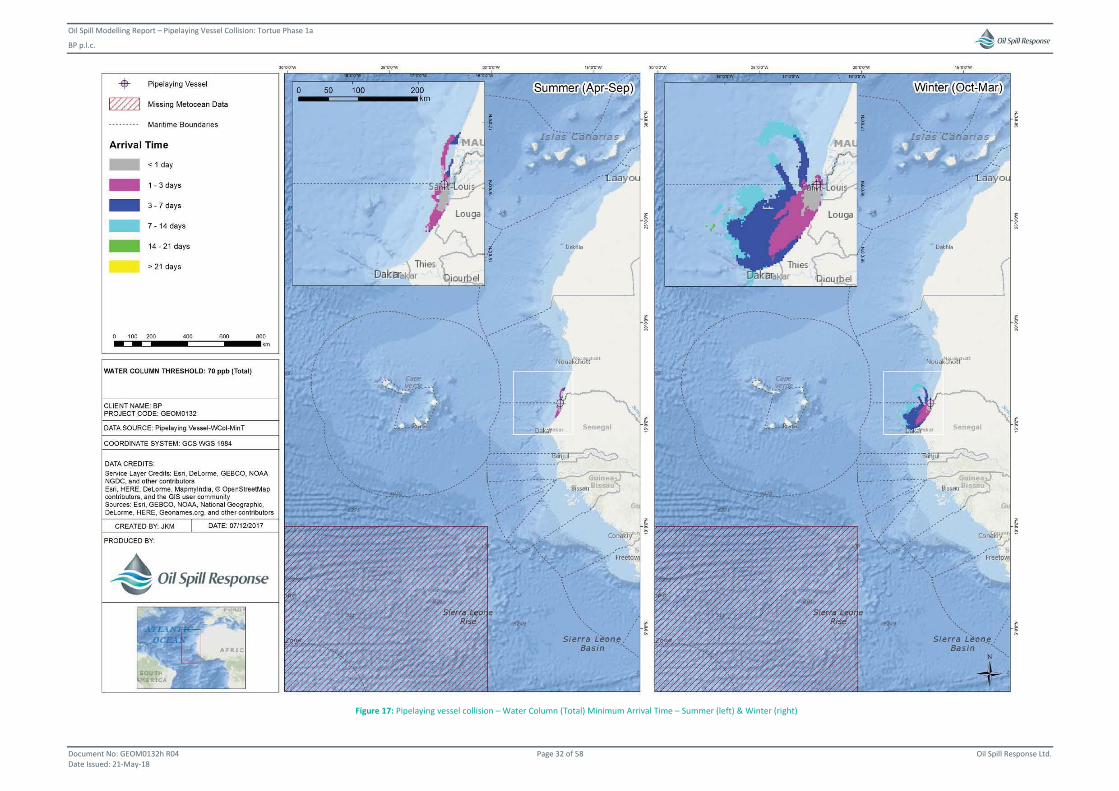
Oil Spill Modelling Report – Pipelaying Vessel Collision: Tortue Phase 1a
BP p.l.c.
Document No: GEOM0132h R04 Page 32 of 58 Oil Spill Response Ltd. Date Issued: 21-May-18
Figure 17: Pipelaying vessel collision – Water Column (Total) Minimum Arrival Time – Summer (left) & Winter (right)
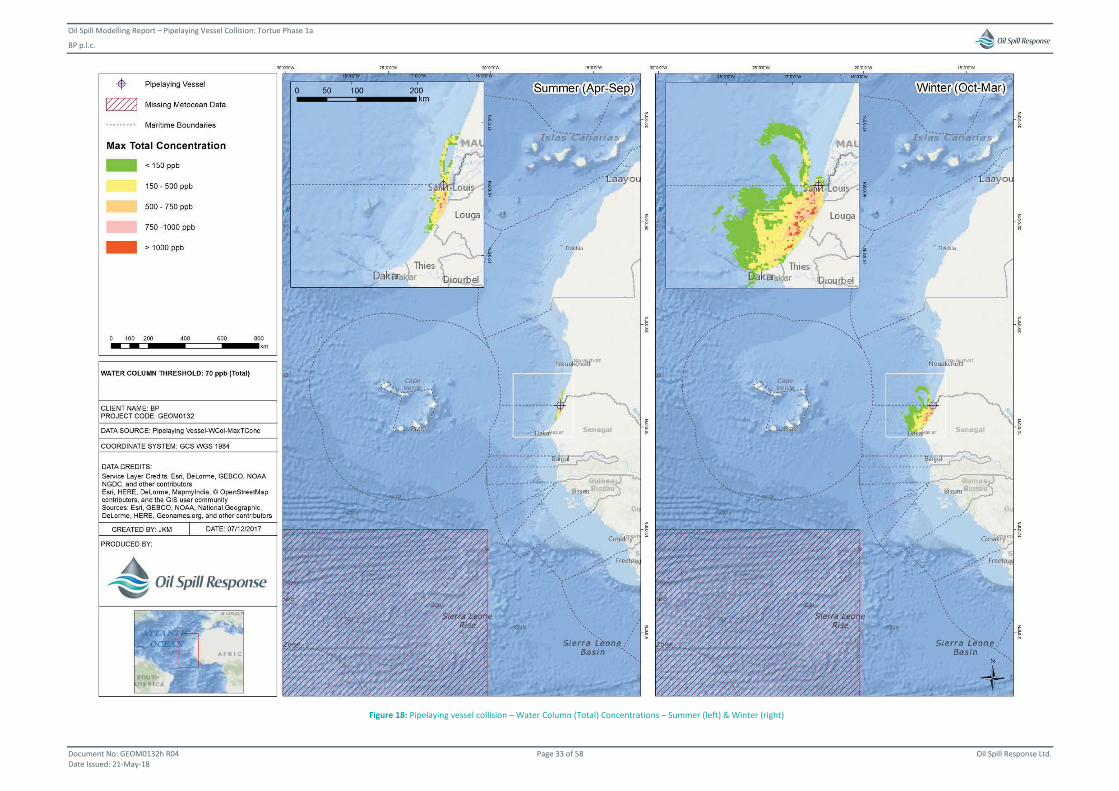
Oil Spill Modelling Report – Pipelaying Vessel Collision: Tortue Phase 1a
BP p.l.c.
Document No: GEOM0132h R04 Page 33 of 58 Oil Spill Response Ltd. Date Issued: 21-May-18
Figure 18: Pipelaying vessel collision – Water Column (Total) Concentrations – Summer (left) & Winter (right)
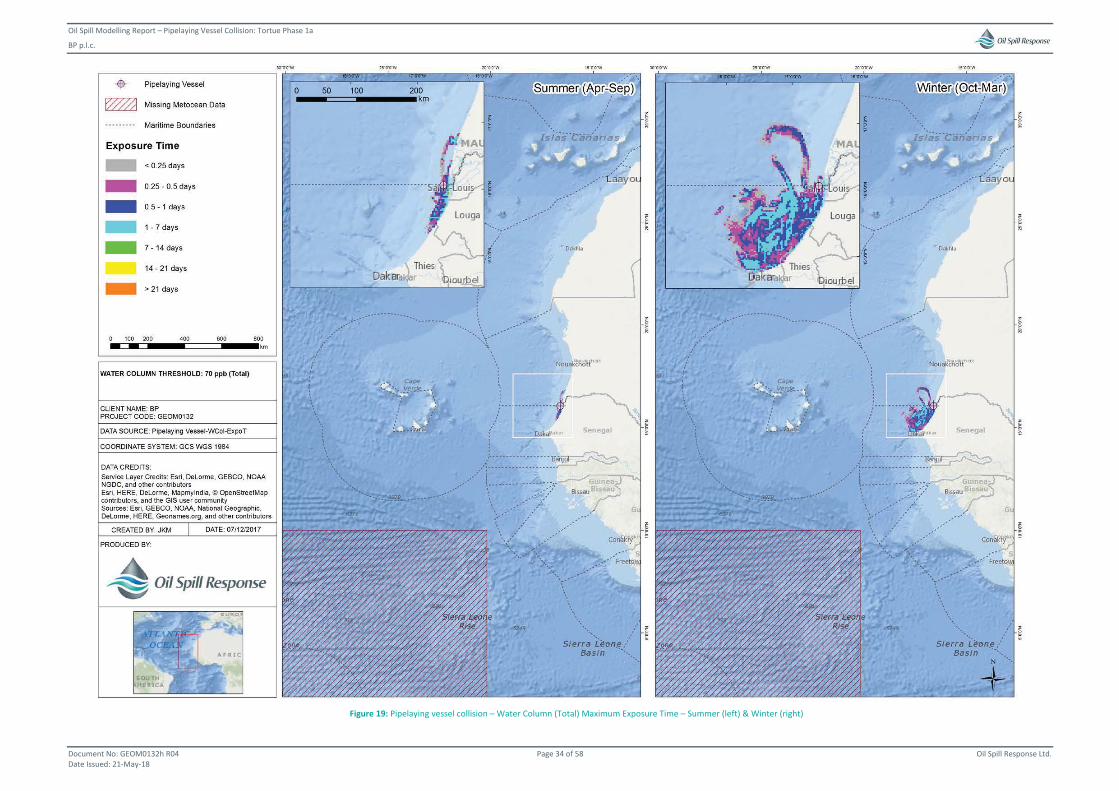
Oil Spill Modelling Report – Pipelaying Vessel Collision: Tortue Phase 1a
BP p.l.c.
Document No: GEOM0132h R04 Page 34 of 58 Oil Spill Response Ltd. Date Issued: 21-May-18
Figure 19: Pipelaying vessel collision – Water Column (Total) Maximum Exposure Time – Summer (left) & Winter (right)
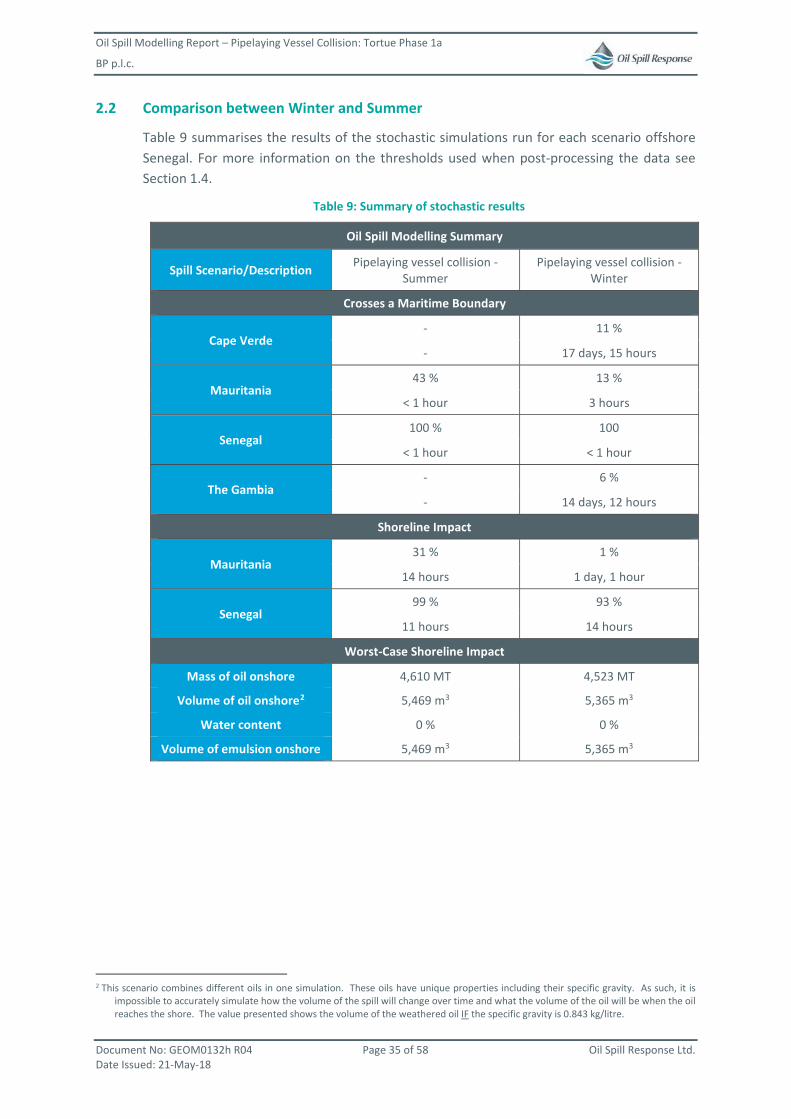
Oil Spill Modelling Report – Pipelaying Vessel Collision: Tortue Phase 1a
BP p.l.c.
Document No: GEOM0132h R04 Page 35 of 58 Oil Spill Response Ltd. Date Issued: 21-May-18
2.2 Comparison between Winter and Summer
Table 9 summarises the results of the stochastic simulations run for each scenario offshore Senegal. For more information on the thresholds used when post-processing the data see Section 1.4.
Table 9: Summary of stochastic results
Oil Spill Modelling Summary
Spill Scenario/Description Pipelaying vessel collision - Summer
Pipelaying vessel collision - Winter
Crosses a Maritime Boundary
Cape Verde - 11 %
- 17 days, 15 hours
Mauritania 43 % 13 %
< 1 hour 3 hours
Senegal 100 % 100
< 1 hour < 1 hour
The Gambia - 6 %
- 14 days, 12 hours
Shoreline Impact
Mauritania 31 % 1 %
14 hours 1 day, 1 hour
Senegal 99 % 93 %
11 hours 14 hours
Worst-Case Shoreline Impact
Mass of oil onshore 4,610 MT 4,523 MT
Volume of oil onshore2 5,469 m3 5,365 m3
Water content 0 % 0 %
Volume of emulsion onshore 5,469 m3 5,365 m3
2 This scenario combines different oils in one simulation. These oils have unique properties including their specific gravity. As such, it is
impossible to accurately simulate how the volume of the spill will change over time and what the volume of the oil will be when the oil reaches the shore. The value presented shows the volume of the weathered oil IF the specific gravity is 0.843 kg/litre.
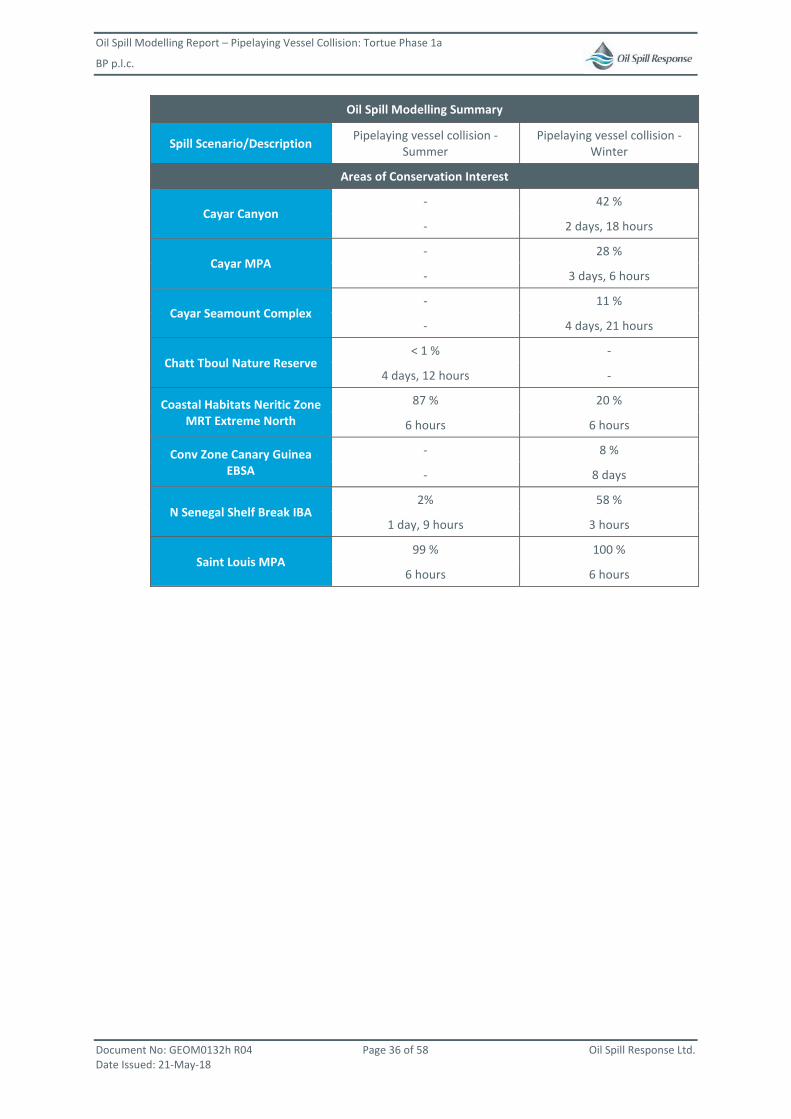
Oil Spill Modelling Report – Pipelaying Vessel Collision: Tortue Phase 1a
BP p.l.c.
Document No: GEOM0132h R04 Page 36 of 58 Oil Spill Response Ltd. Date Issued: 21-May-18
Oil Spill Modelling Summary
Spill Scenario/Description Pipelaying vessel collision - Summer
Pipelaying vessel collision - Winter
Areas of Conservation Interest
Cayar Canyon - 42 %
- 2 days, 18 hours
Cayar MPA - 28 %
- 3 days, 6 hours
Cayar Seamount Complex - 11 %
- 4 days, 21 hours
Chatt Tboul Nature Reserve < 1 % -
4 days, 12 hours -
Coastal Habitats Neritic Zone MRT Extreme North
87 % 20 %
6 hours 6 hours
Conv Zone Canary Guinea EBSA
- 8 %
- 8 days
N Senegal Shelf Break IBA 2% 58 %
1 day, 9 hours 3 hours
Saint Louis MPA 99 % 100 %
6 hours 6 hours
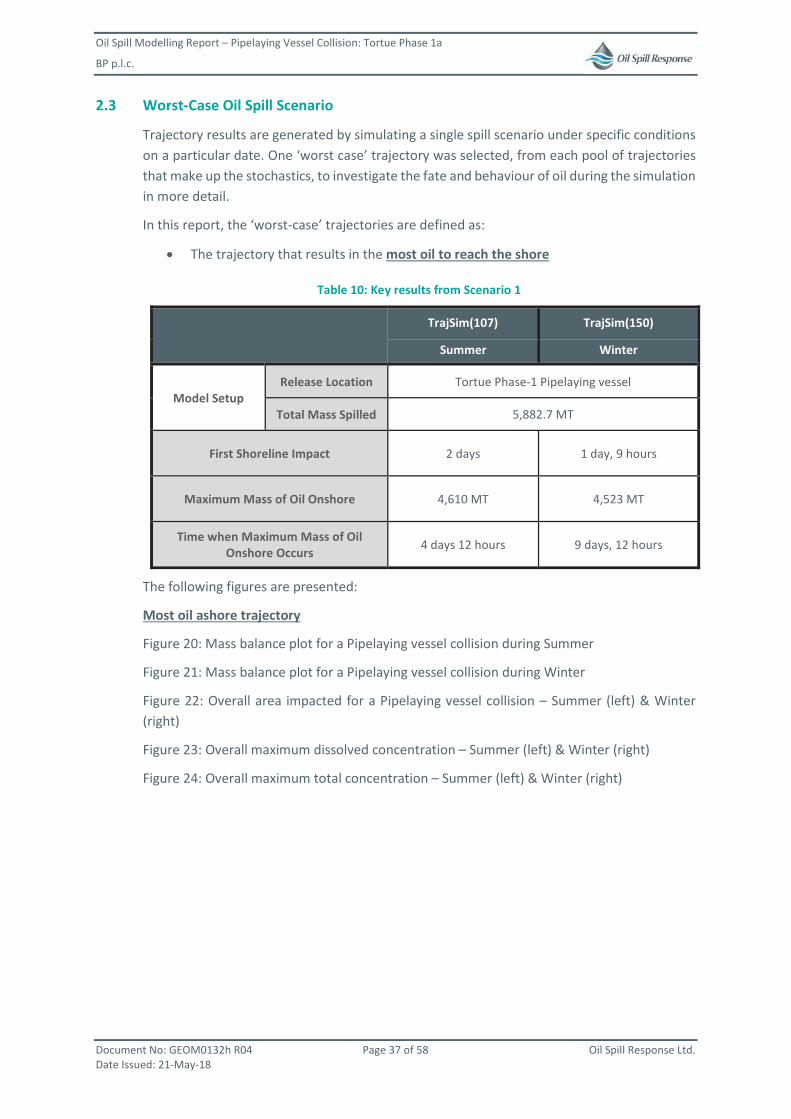
Oil Spill Modelling Report – Pipelaying Vessel Collision: Tortue Phase 1a
BP p.l.c.
Document No: GEOM0132h R04 Page 37 of 58 Oil Spill Response Ltd. Date Issued: 21-May-18
2.3 Worst-Case Oil Spill Scenario
Trajectory results are generated by simulating a single spill scenario under specific conditions on a particular date. One ‘worst case’ trajectory was selected, from each pool of trajectories that make up the stochastics, to investigate the fate and behaviour of oil during the simulation in more detail.
In this report, the ‘worst-case’ trajectories are defined as:
The trajectory that results in the most oil to reach the shore
Table 10: Key results from Scenario 1
TrajSim(107) TrajSim(150)
Summer Winter
Model Setup Release Location Tortue Phase-1 Pipelaying vessel
Total Mass Spilled 5,882.7 MT
First Shoreline Impact 2 days 1 day, 9 hours
Maximum Mass of Oil Onshore 4,610 MT 4,523 MT
Time when Maximum Mass of Oil Onshore Occurs 4 days 12 hours 9 days, 12 hours
The following figures are presented:
Most oil ashore trajectory
Figure 20: Mass balance plot for a Pipelaying vessel collision during Summer
Figure 21: Mass balance plot for a Pipelaying vessel collision during Winter
Figure 22: Overall area impacted for a Pipelaying vessel collision – Summer (left) & Winter (right)
Figure 23: Overall maximum dissolved concentration – Summer (left) & Winter (right)
Figure 24: Overall maximum total concentration – Summer (left) & Winter (right)
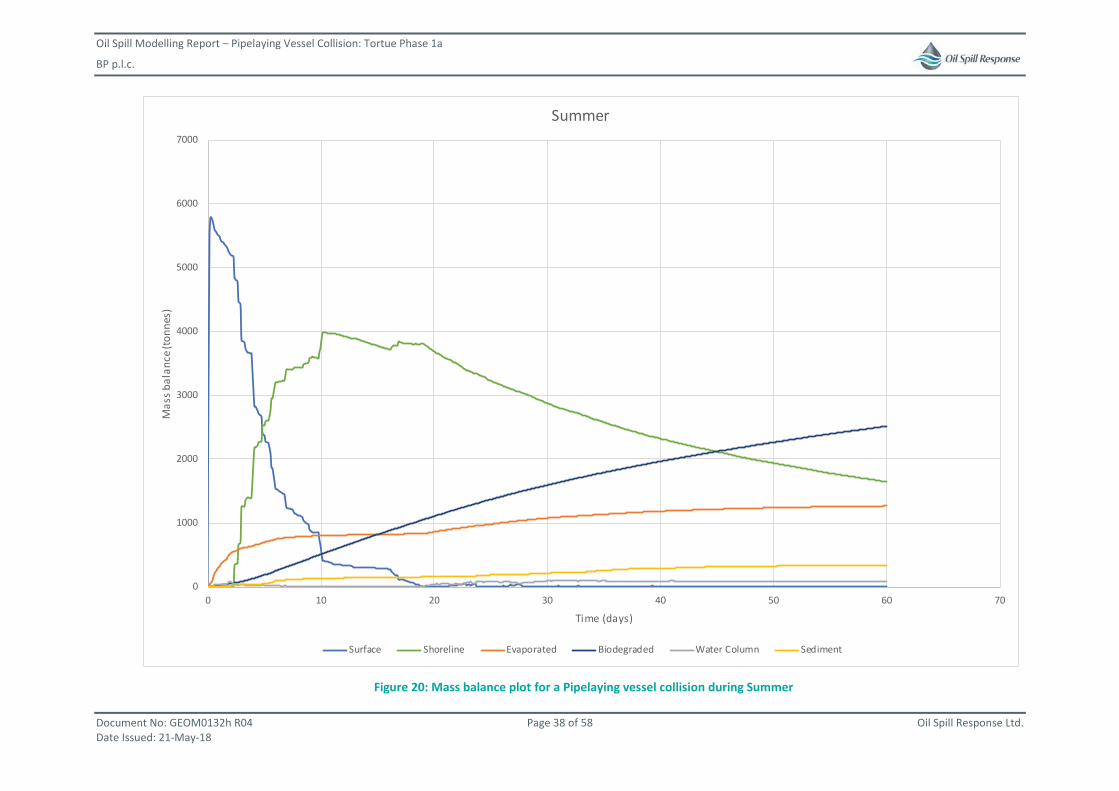
Oil Spill Modelling Report – Pipelaying Vessel Collision: Tortue Phase 1a
BP p.l.c.
Document No: GEOM0132h R04 Page 38 of 58 Oil Spill Response Ltd. Date Issued: 21-May-18
Figure 20: Mass balance plot for a Pipelaying vessel collision during Summer
0
1000
2000
3000
4000
5000
6000
7000
0 10 20 30 40 50 60 70
Mas
s bal
ance
(ton
nes)
Time (days)
Summer
Surface Shoreline Evaporated Biodegraded Water Column Sediment
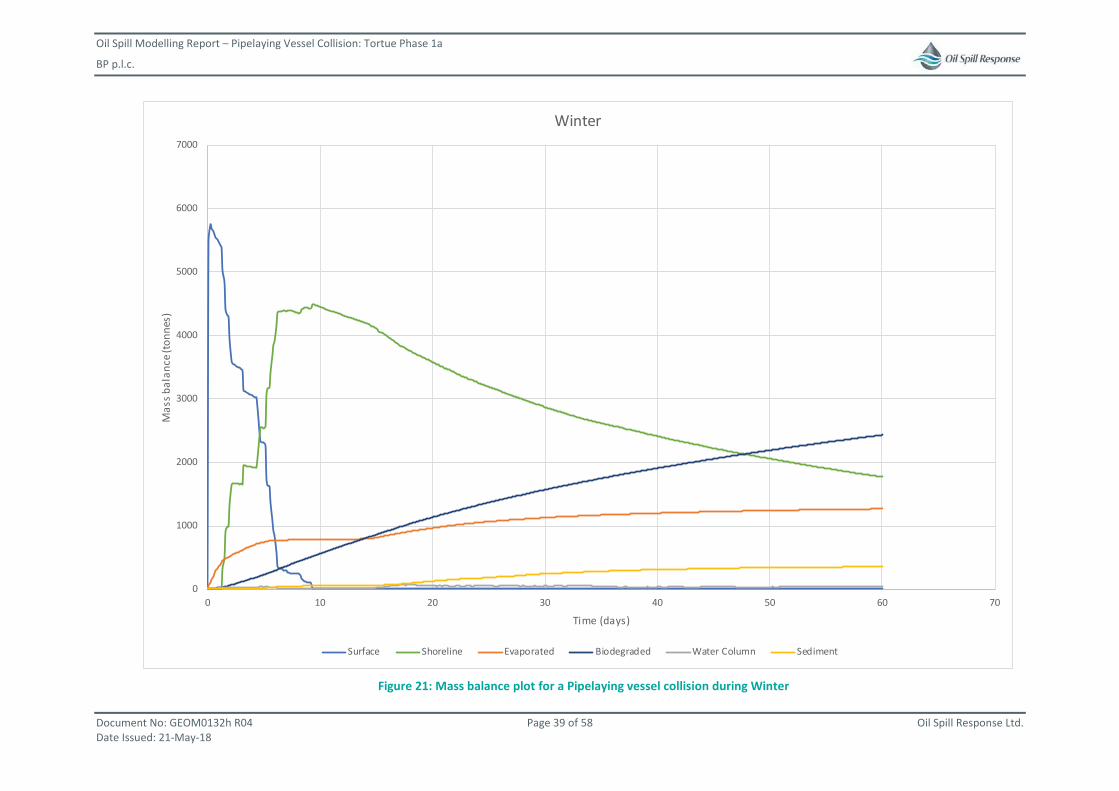
Oil Spill Modelling Report – Pipelaying Vessel Collision: Tortue Phase 1a
BP p.l.c.
Document No: GEOM0132h R04 Page 39 of 58 Oil Spill Response Ltd. Date Issued: 21-May-18
Figure 21: Mass balance plot for a Pipelaying vessel collision during Winter
0
1000
2000
3000
4000
5000
6000
7000
0 10 20 30 40 50 60 70
Mas
s bal
ance
(ton
nes)
Time (days)
Winter
Surface Shoreline Evaporated Biodegraded Water Column Sediment
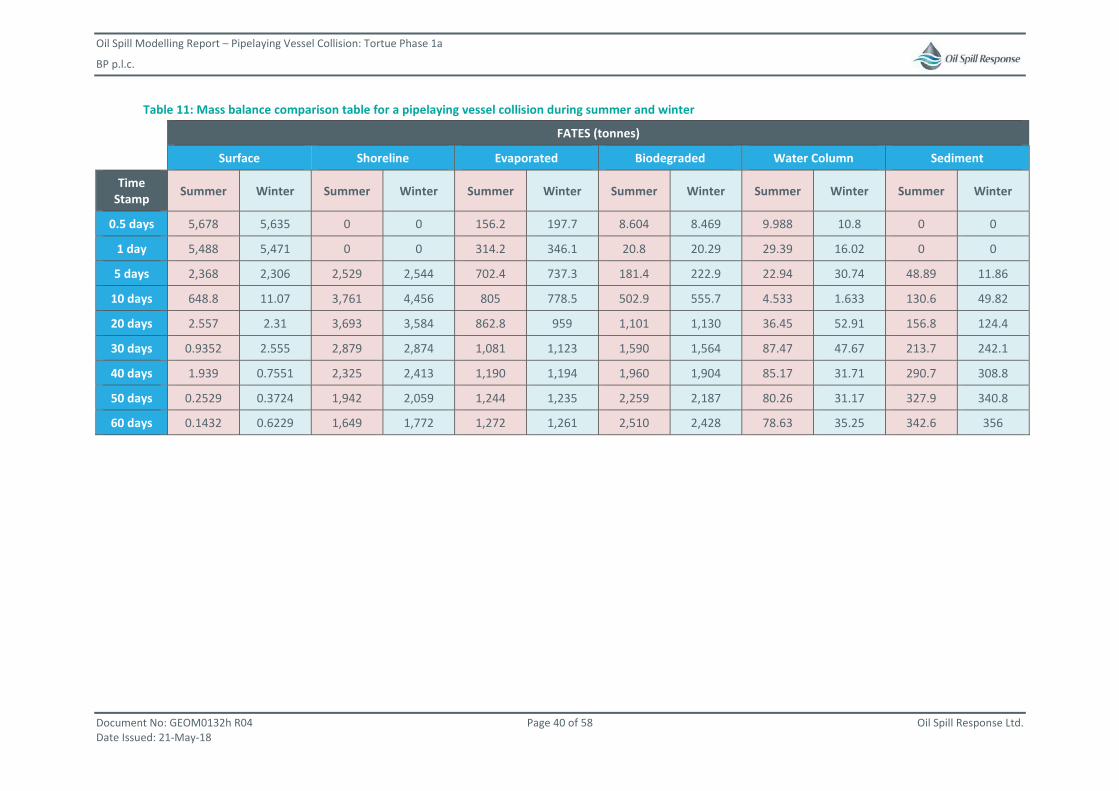
Oil Spill Modelling Report – Pipelaying Vessel Collision: Tortue Phase 1a
BP p.l.c.
Document No: GEOM0132h R04 Page 40 of 58 Oil Spill Response Ltd. Date Issued: 21-May-18
Table 11: Mass balance comparison table for a pipelaying vessel collision during summer and winter
FATES (tonnes)
Surface Shoreline Evaporated Biodegraded Water Column Sediment
Time Stamp Summer Winter Summer Winter Summer Winter Summer Winter Summer Winter Summer Winter
0.5 days 5,678 5,635 0 0 156.2 197.7 8.604 8.469 9.988 10.8 0 0
1 day 5,488 5,471 0 0 314.2 346.1 20.8 20.29 29.39 16.02 0 0
5 days 2,368 2,306 2,529 2,544 702.4 737.3 181.4 222.9 22.94 30.74 48.89 11.86
10 days 648.8 11.07 3,761 4,456 805 778.5 502.9 555.7 4.533 1.633 130.6 49.82
20 days 2.557 2.31 3,693 3,584 862.8 959 1,101 1,130 36.45 52.91 156.8 124.4
30 days 0.9352 2.555 2,879 2,874 1,081 1,123 1,590 1,564 87.47 47.67 213.7 242.1
40 days 1.939 0.7551 2,325 2,413 1,190 1,194 1,960 1,904 85.17 31.71 290.7 308.8
50 days 0.2529 0.3724 1,942 2,059 1,244 1,235 2,259 2,187 80.26 31.17 327.9 340.8
60 days 0.1432 0.6229 1,649 1,772 1,272 1,261 2,510 2,428 78.63 35.25 342.6 356

Oil Spill Modelling Report – Pipelaying Vessel Collision: Tortue Phase 1a
BP p.l.c.
Document No: GEOM0132h R04 Page 41 of 58 Oil Spill Response Ltd. Date Issued: 21-May-18
Figure 22: Overall area impacted for a Pipelaying vessel collision – Summer (left) & Winter (right)
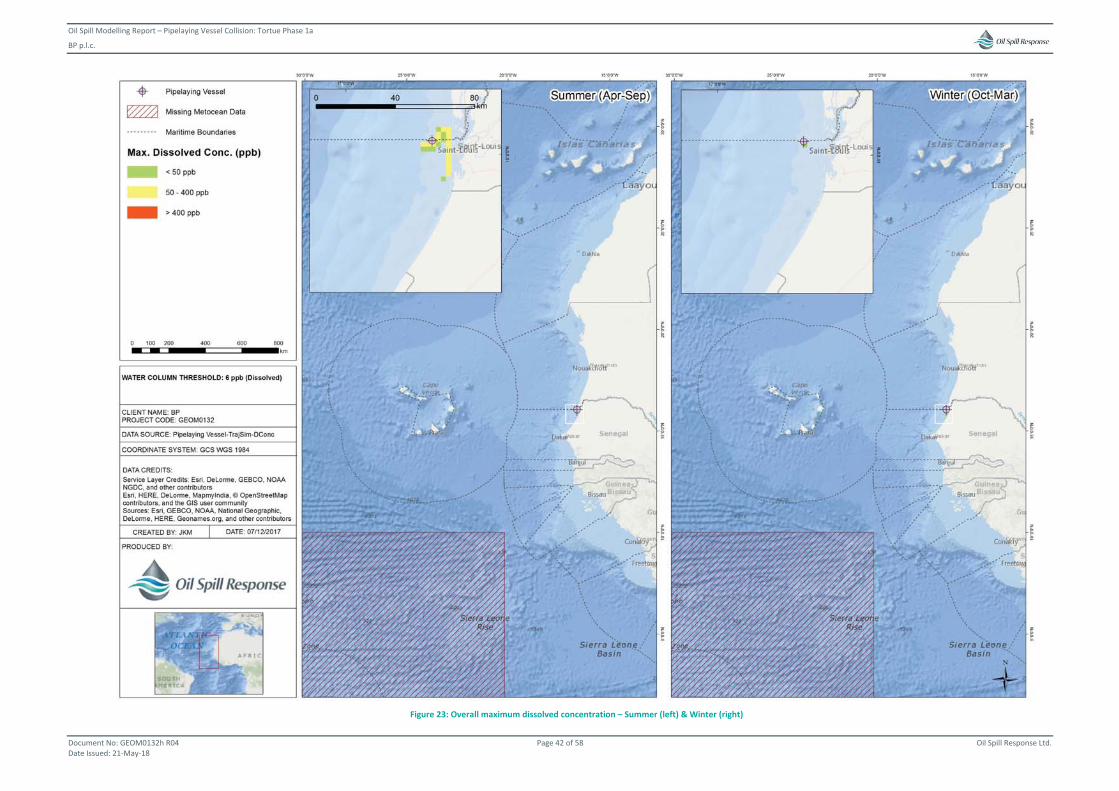
Oil Spill Modelling Report – Pipelaying Vessel Collision: Tortue Phase 1a
BP p.l.c.
Document No: GEOM0132h R04 Page 42 of 58 Oil Spill Response Ltd. Date Issued: 21-May-18
Figure 23: Overall maximum dissolved concentration – Summer (left) & Winter (right)
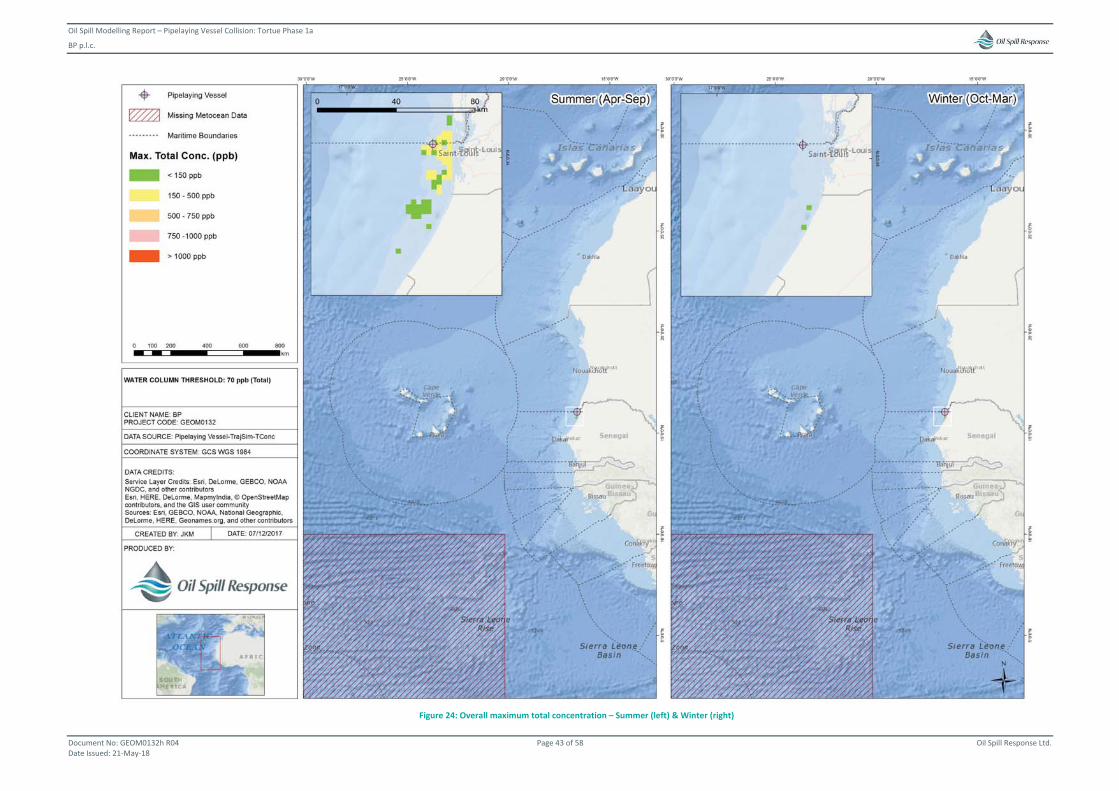
Oil Spill Modelling Report – Pipelaying Vessel Collision: Tortue Phase 1a
BP p.l.c.
Document No: GEOM0132h R04 Page 43 of 58 Oil Spill Response Ltd. Date Issued: 21-May-18
Figure 24: Overall maximum total concentration – Summer (left) & Winter (right)
Oil Spill Modelling Report – Pipelaying Vessel Collision: Tortue Phase 1a
BP p.l.c.
Document No: GEOM0132h R04 Page 44 of 58 Oil Spill Response Ltd. Date Issued: 21-May-18
3 CONCLUSION One scenario was modelled for the Tortue Phase 1a Well offshore Senegal and Mauritania. This involved the release of 2,980 m3 of diesel over 3 hours, 3,370 m3 of heavy fuel oil over 3.4 hours; and 92 m3 of lubricating oil over 1 hour, due to a pipelaying vessel collision.
3.1 Shoreline Impact
A spill at this location, approximately 10 km from the shore, has a 100 % chance of making a considerable shoreline impact (light oiling or higher) whether the spill happens in Summer or Winter. Mauritania and Senegal are the only two countries at risk of shoreline impact, but Senegal is most likely to be more severely impacted.
Summer
Summer has a higher risk to the shoreline of the two seasons.
In the worst-case arrival time scenario, a spill in summer may impact the shore 2 days after the initial release.
The severity of the shoreline impact in summer ranges from 1,500 MT in the best-case scenario, to more than 4,500 MT in the worst-case. There is a 50% chance that more than 3400 MT of oil could impact the shore3.
A shoreline impact in the summer months is expected to have at least moderate shoreline oiling. Further, there is a 9% chance of “heavy” shoreline oiling and an 91% chance of moderate shoreline oiling. Spatially, only a few km is expected to have heavy shoreline oiling but up to 62 km could be impacted by moderate oiling.
Winter
Winter has a lower risk to the shoreline of the two seasons.
In the worst-case scenario, a spill in winter may impact the shore in a little more than 1 day after the release.
Similarly, the severity of the shoreline impact in winter ranges from a few metric tonnes in the best-case scenario, to more than 4,500 MT in the worst-case. There is a 50% chance that more than 2,900 MT may wash ashore3. This is 500 MT less than the Summer scenario.
There is a 1% chance of “heavy” shoreline oiling, a 91% chance of moderate shoreline oiling and 1% chance of “light” shoreline oiling. Spatially, only a few km is expected to have heavy shoreline oiling but up to 58 km could be impacted by moderate oiling.
3.2 Surface Impact
Senegal Waters’ are more than likely to be impacted by this spill scenario, no matter what the season, but Mauritania may not due to a southerly flowing current occurring in some scenarios. Only two countries are at risk in the summer, however, four countries could be
3 Calculated from Figure 11

Oil Spill Modelling Report – Pipelaying Vessel Collision: Tortue Phase 1a
BP p.l.c.
Document No: GEOM0132h R04 Page 45 of 58 Oil Spill Response Ltd. Date Issued: 21-May-18
impacted in the winter scenario although both Cape Verde and The Gambia have only an 11% and 6% chance of impact respectively.
The waters of Senegal and Mauritania could experience a spill with a surface thickness more than 5 μm making them candidates for containment and recovery techniques. The waters of other neighbouring countries may experience oil sheen on the surface waters during winter, but not during summer. During winter, the oil sheen on the surface waters are not at a thickness that is likely to be effective for containment and recovery.
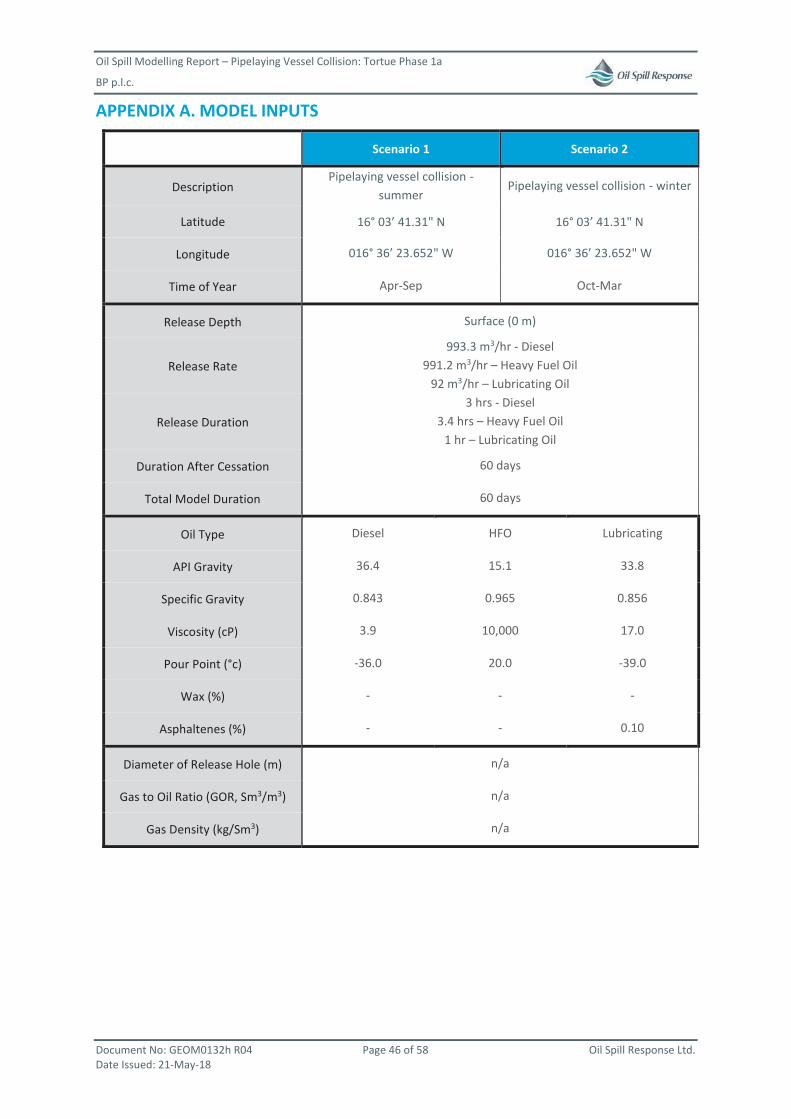
Oil Spill Modelling Report – Pipelaying Vessel Collision: Tortue Phase 1a
BP p.l.c.
Document No: GEOM0132h R04 Page 46 of 58 Oil Spill Response Ltd. Date Issued: 21-May-18
APPENDIX A. MODEL INPUTS
Scenario 1 Scenario 2
Description Pipelaying vessel collision -
summer Pipelaying vessel collision - winter
Latitude 16° 03’ 41.31" N 16° 03’ 41.31" N
Longitude 016° 36’ 23.652" W 016° 36’ 23.652" W
Time of Year Apr-Sep Oct-Mar
Release Depth Surface (0 m)
Release Rate 993.3 m3/hr - Diesel
991.2 m3/hr – Heavy Fuel Oil 92 m3/hr – Lubricating Oil
Release Duration 3 hrs - Diesel
3.4 hrs – Heavy Fuel Oil 1 hr – Lubricating Oil
Duration After Cessation 60 days
Total Model Duration 60 days
Oil Type Diesel HFO Lubricating
API Gravity 36.4 15.1 33.8
Specific Gravity 0.843 0.965 0.856
Viscosity (cP) 3.9 10,000 17.0
Pour Point (°c) -36.0 20.0 -39.0
Wax (%) - - -
Asphaltenes (%) - - 0.10
Diameter of Release Hole (m) n/a
Gas to Oil Ratio (GOR, Sm3/m3) n/a
Gas Density (kg/Sm3) n/a

Oil Spill Modelling Report – Pipelaying Vessel Collision: Tortue Phase 1a
BP p.l.c.
Document No: GEOM0132h R04 Page 47 of 58 Oil Spill Response Ltd. Date Issued: 21-May-18
APPENDIX B. METOCEAN DATA Table 12: Current data – general description
Name G0132-Curr01
Description Sourced from BMT ARGOSS. The dataset consists of an amalgamation of the HYCOM global dataset with the BMT ARGOSS tidal model superimposed
Start Time Jan 2009 Spatial Resolution ~9 km
End Time Dec 2011 Temporal Resolution 1 hour
Depth Levels [m]
0, 10, 20, 30, 50, 75, 100, 125, 150, 200, 250, 300, 400, 500, 600, 700, 800, 900, 1000, 1100, 1200, 1300, 1400, 1500, 1750, 2000, 2500, 3000, 3500, 4000, 4500, 5000, 5500
The hydrodynamic database is constructed from 3D current velocity fields, suitable for use in oil model simulations. This comprises of ocean currents (non-tidal residual) from a global ocean circulation model, combined with tidal current velocities.
Tidal current information is obtained from BMT ARGOSS from the integration of approximately 5,000 tidal stations and 15 years of satellite radar altimeter into depth averaged global and regional tidal models (2DH model). The tidal model provides tidal currents (u, v components) as well as surface elevation. The spatial resolution of the tidal model varies from 1/60 to 1/12 degrees globally.
The vertical structure of the tidal current component is established using a logarithmic profile which provides a reliable representation of tidal currents at different depths in shelf seas. The tidal model provides data at a spatial resolution of 4 minutes in the area of interest and can be provided in time steps as required by the client.
Ocean currents are obtained from a global ocean current model (HYCOM), which has the following characteristics:
Spatial resolution: 1/12 degree (can not be refined further)
Temporal resolution: Daily (cannot be refined further, other than by interpolation)
Data type: 3D current speed and direction
Depth: 3D datasets consist of up to 33 depth layers from surface to seabed and spread across the water column. Individual layers and their distribution over the water column vary and depend on the local depth.
Availability: 2009 – 2012
The resultant data, representative of total current velocity, is provided as hourly current vectors, at selected depth levels, at 1/12 degree spatial resolution across the area of interest. It should be noted that in deep water, beyond the continental slope, tidal current velocity would be negligible.
Temporal resolutions of one hour are considered to be an optimal resolution, as coarser temporal resolutions would not adequately capture the data variability in areas where tidal currents form a key component of the total current

Oil Spill Modelling Report – Pipelaying Vessel Collision: Tortue Phase 1a
BP p.l.c.
Document No: GEOM0132h R04 Page 48 of 58 Oil Spill Response Ltd. Date Issued: 21-May-18
Table 13: Wind data – general description
Name G0132-Wind01
Description Sourced from BMT ARGOSS. The dataset consists of the NCEP CFRS global dataset, calibrated by BMT ARGOSS against satellite altimeter and scatterometer measurements.
Start Time Jan 2009 Spatial Resolution ~35 km
End Time Dec 2011 Temporal Resolution 3 hours
Altitude Level The dataset includes hourly mean values of wind velocity at 10 m above sea level.
Winds are provided as hourly mean values of north and east velocity components at 10m above sea level. Data is from the NCEP global dataset, calibrated by BMT ARGOSS against satellite altimeter and scatterometer measurements. The source data are available at spatial resolution of 0.5°x 0.5°, and at 3 hourly time steps.

Oil Spill Modelling Report – Pipelaying Vessel Collision: Tortue Phase 1a
BP p.l.c.
Document No: GEOM0132h R04 Page 49 of 58 Oil Spill Response Ltd. Date Issued: 21-May-18
APPENDIX C. HABITAT GRID Table 14: Habitat domain details
Name Domain Extent
G0132-Hab02
Bottom Top Left Right
05° 00' 00’’ N 25° 00' 00’’ N 030° 00' 00’’ W 010° 00' 00’’ W
Number of Cells Cell Resolution
East to West North to South East to West North to South
858 888 2,500 km 2,500 km
Domain Size
East to West North to South
2,145 km 2,220 km
Figure 25:Extent of habitat grid used in this study

Oil Spill Modelling Report – Pipelaying Vessel Collision: Tortue Phase 1a
BP p.l.c.
Document No: GEOM0132h R04 Page 50 of 58 Oil Spill Response Ltd. Date Issued: 21-May-18
APPENDIX D. OIL CHARACTERISTICS AND BEHAVIOUR The components found in oil are classified into two main groups: hydrocarbons and non-hydrocarbons (see Figure 29). If oil is rich in C1-12 alkanes, it is particularly light, as these are lighter components than the C25+ alkanes. Conversely, if oil contains high quantities of C25+ alkanes, resins and asphaltenes, it is heavy.
Figure 26:The chemical composition of crude oil
The chemical composition of oil is important when predicting how it will break down or weather. For example, oil containing mostly light components is likely to lose a greater volume to evaporation than heavy oil. Oils with carbon chains exceeding 15 (C15+) cannot evaporate, even during large storms. Long chains (for example, C25+ alkanes) take a long time to degrade in the water column. Asphaltenes can increase the stability of oil, allowing it to take up water but preventing the oil and water emulsion from breaking down.
As oil is a complicated mixture of organic compounds, its components must be analysed to characterise it successfully (LECO Corporation, 2012). The components of oil can be ‘identified’ and plotted using gas chromatography instruments which are coupled with mass spectrometers (see Bacher, 2014, for further information). The results of gas chromatography and mass spectrometry are converted into a list of 25 sub-components, as broken down in the OSCAR oil database. Each of the 25 sub-components is characterised by molecular weight, density, viscosity, boiling point, solubility in water, vapour pressure, and partition coefficient between oil and water.
The OSCAR Oil Database
A strength of the OSCAR model is its foundation on an observational database of oil weathering properties (maximum water content, viscosity, droplet size distribution, evaporation, emulsification and dispersion, which are measured in a wide range of conditions). The oil database contains complete weathering information for 340 crude oils and petroleum products. It also contains crude assay data for approximately 170 other crude oils (derived from the HPI database - HPI, 1987). But these oils have
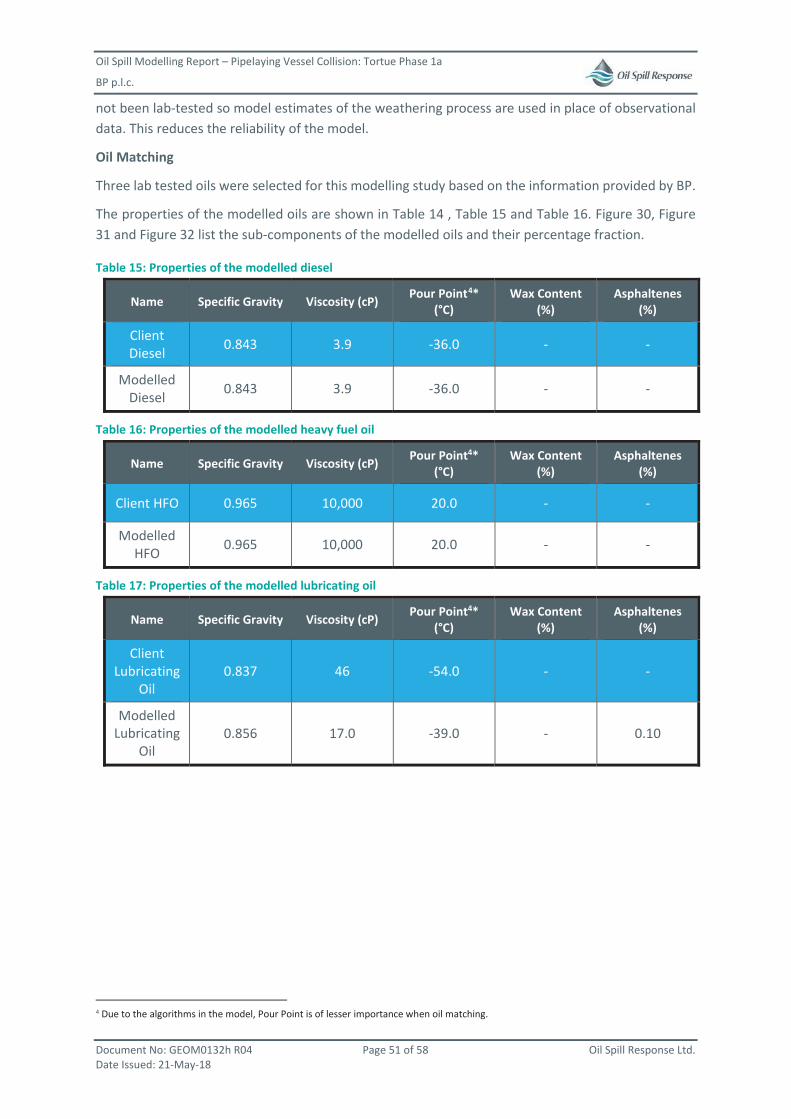
Oil Spill Modelling Report – Pipelaying Vessel Collision: Tortue Phase 1a
BP p.l.c.
Document No: GEOM0132h R04 Page 51 of 58 Oil Spill Response Ltd. Date Issued: 21-May-18
not been lab-tested so model estimates of the weathering process are used in place of observational data. This reduces the reliability of the model.
Oil Matching
Three lab tested oils were selected for this modelling study based on the information provided by BP.
The properties of the modelled oils are shown in Table 14 , Table 15 and Table 16. Figure 30, Figure 31 and Figure 32 list the sub-components of the modelled oils and their percentage fraction.
Table 15: Properties of the modelled diesel
Name Specific Gravity Viscosity (cP) Pour Point4* (°C)
Wax Content (%)
Asphaltenes (%)
Client Diesel 0.843 3.9 -36.0 - -
Modelled Diesel 0.843 3.9 -36.0 - -
Table 16: Properties of the modelled heavy fuel oil
Name Specific Gravity Viscosity (cP) Pour Point4* (°C)
Wax Content (%)
Asphaltenes (%)
Client HFO 0.965 10,000 20.0 - -
Modelled HFO 0.965 10,000 20.0 - -
Table 17: Properties of the modelled lubricating oil
Name Specific Gravity Viscosity (cP) Pour Point4* (°C)
Wax Content (%)
Asphaltenes (%)
Client Lubricating
Oil 0.837 46 -54.0 - -
Modelled Lubricating
Oil 0.856 17.0 -39.0 - 0.10
4 Due to the algorithms in the model, Pour Point is of lesser importance when oil matching.

Oil Spill Modelling Report – Pipelaying Vessel Collision: Tortue Phase 1a
BP p.l.c.
Document No: GEOM0132h R04 Page 52 of 58 Oil Spill Response Ltd. Date Issued: 21-May-18
Figure 27:Chemical composition of the modelled diesel
0
5
10
15
20
25
30
35
40
45
50
Prop
ortio
n of
Oil
Oil Component
Sub-component Name % in Oil Sub-component Name % in OilC1 – C4 gasses 0.0291 Phenols 0.0274C5-saturates 0.0464 Naphthalenes (C0-C1 alkylated) 0.4094C6-saturates 0.0943 Naphthalenes 2 (C2-C3 alkylated) 24.7897
Benzene 0.0157 C13-C14 (total saturates + aromatics) 8.1986C7-saturates 0.1520 C15-C16 (total saturates + aromatics) 13.8317C1-benzene 0.0509 C17-C18 (total saturates + aromatics) 14.4217C8-saturates 0.2005 C19-C20 (total saturates + aromatics) 9.4983C2-benzene 0.0548 Unresolved chromatographic material 0.0568C9-saturates 0.2232 C21-C25 (total saturates + aromatics) 4.7322
C3-benzene 2.0333PAH 1 (low soluble polyaromatic
hydrocarbons) 0.5992
C10-saturates 3.2233PAH 2 (low soluble polyaromatic
hydrocarbons) 0.0000C4-benzene 0.1111 C25+ (total) 0.0110
C11-C12 (total saturates + aromatics) 17.1893
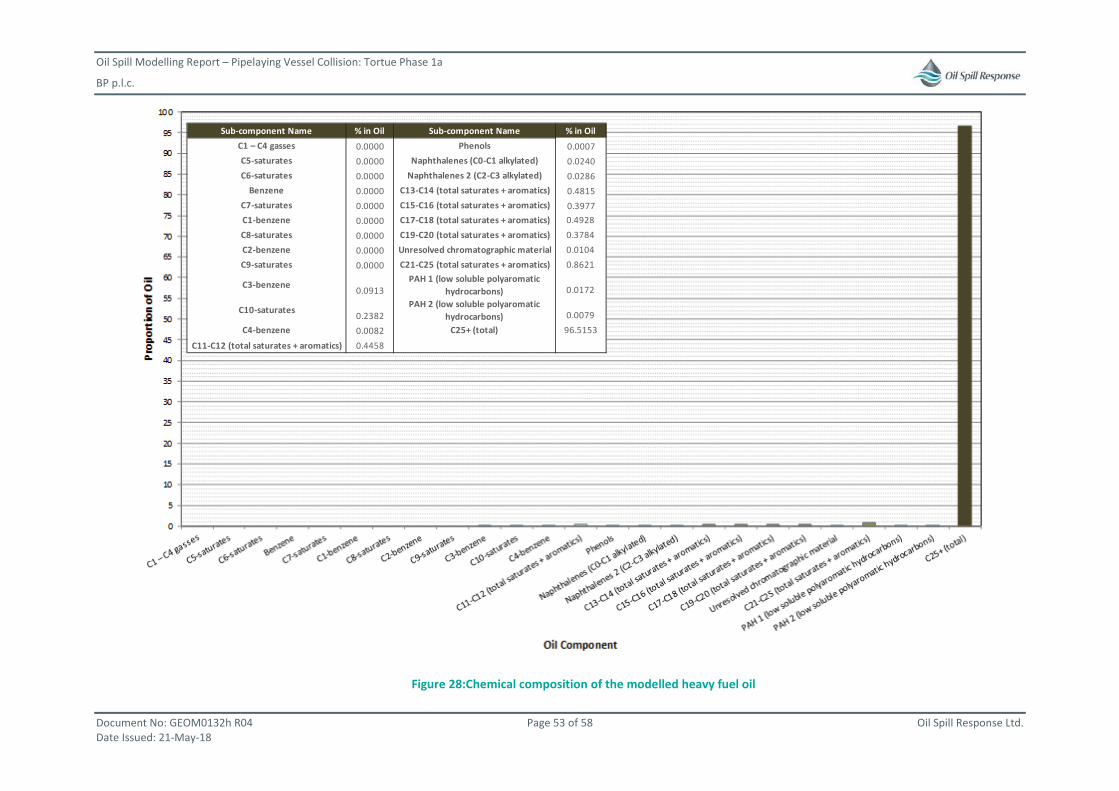
Oil Spill Modelling Report – Pipelaying Vessel Collision: Tortue Phase 1a
BP p.l.c.
Document No: GEOM0132h R04 Page 53 of 58 Oil Spill Response Ltd. Date Issued: 21-May-18
Figure 28:Chemical composition of the modelled heavy fuel oil
Sub-component Name % in Oil Sub-component Name % in OilC1 – C4 gasses 0.0000 Phenols 0.0007C5-saturates 0.0000 Naphthalenes (C0-C1 alkylated) 0.0240C6-saturates 0.0000 Naphthalenes 2 (C2-C3 alkylated) 0.0286
Benzene 0.0000 C13-C14 (total saturates + aromatics) 0.4815C7-saturates 0.0000 C15-C16 (total saturates + aromatics) 0.3977C1-benzene 0.0000 C17-C18 (total saturates + aromatics) 0.4928C8-saturates 0.0000 C19-C20 (total saturates + aromatics) 0.3784C2-benzene 0.0000 Unresolved chromatographic material 0.0104C9-saturates 0.0000 C21-C25 (total saturates + aromatics) 0.8621
C3-benzene 0.0913PAH 1 (low soluble polyaromatic
hydrocarbons) 0.0172
C10-saturates 0.2382PAH 2 (low soluble polyaromatic
hydrocarbons) 0.0079C4-benzene 0.0082 C25+ (total) 96.5153
C11-C12 (total saturates + aromatics) 0.4458
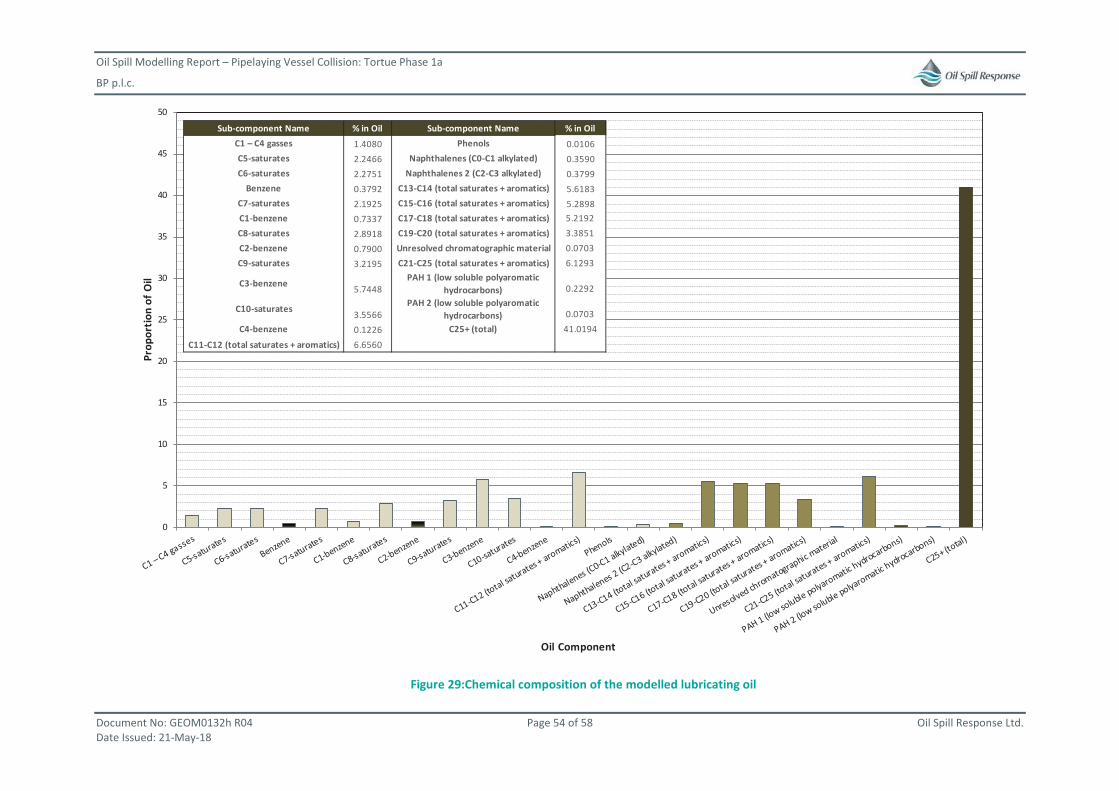
Oil Spill Modelling Report – Pipelaying Vessel Collision: Tortue Phase 1a
BP p.l.c.
Document No: GEOM0132h R04 Page 54 of 58 Oil Spill Response Ltd. Date Issued: 21-May-18
Figure 29:Chemical composition of the modelled lubricating oil
0
5
10
15
20
25
30
35
40
45
50
Prop
ortio
n of
Oil
Oil Component
Sub-component Name % in Oil Sub-component Name % in OilC1 – C4 gasses 1.4080 Phenols 0.0106C5-saturates 2.2466 Naphthalenes (C0-C1 alkylated) 0.3590C6-saturates 2.2751 Naphthalenes 2 (C2-C3 alkylated) 0.3799
Benzene 0.3792 C13-C14 (total saturates + aromatics) 5.6183C7-saturates 2.1925 C15-C16 (total saturates + aromatics) 5.2898C1-benzene 0.7337 C17-C18 (total saturates + aromatics) 5.2192C8-saturates 2.8918 C19-C20 (total saturates + aromatics) 3.3851C2-benzene 0.7900 Unresolved chromatographic material 0.0703C9-saturates 3.2195 C21-C25 (total saturates + aromatics) 6.1293
C3-benzene 5.7448PAH 1 (low soluble polyaromatic
hydrocarbons) 0.2292
C10-saturates 3.5566PAH 2 (low soluble polyaromatic
hydrocarbons) 0.0703C4-benzene 0.1226 C25+ (total) 41.0194
C11-C12 (total saturates + aromatics) 6.6560
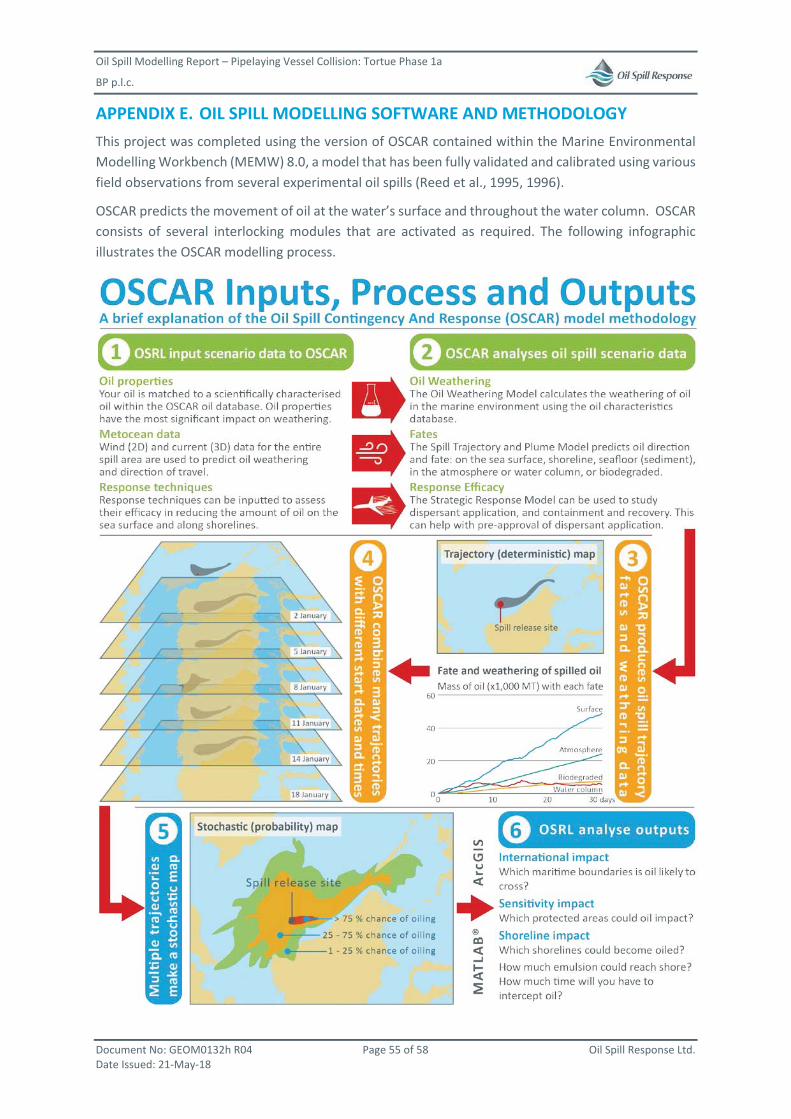
Oil Spill Modelling Report – Pipelaying Vessel Collision: Tortue Phase 1a
BP p.l.c.
Document No: GEOM0132h R04 Page 55 of 58 Oil Spill Response Ltd. Date Issued: 21-May-18
APPENDIX E. OIL SPILL MODELLING SOFTWARE AND METHODOLOGY This project was completed using the version of OSCAR contained within the Marine Environmental Modelling Workbench (MEMW) 8.0, a model that has been fully validated and calibrated using various field observations from several experimental oil spills (Reed et al., 1995, 1996).
OSCAR predicts the movement of oil at the water’s surface and throughout the water column. OSCAR consists of several interlocking modules that are activated as required. The following infographic illustrates the OSCAR modelling process.
Oil Spill Modelling Report – Pipelaying Vessel Collision: Tortue Phase 1a
BP p.l.c.
Document No: GEOM0132h R04 Page 56 of 58 Oil Spill Response Ltd. Date Issued: 21-May-18
APPENDIX F. GLOSSARY OF TERMS, ACRONYMS AND ABBREVIATIONS
°C Degrees Celsius (1.0°C = 33.8° Fahrenheit)
-6 m)
API American Petroleum Institute
API Gravity
API Gravity, like specific gravity, is a ratio between the densities of oil and water. Unlike specific gravity, API gravity is only used to describe oil, which it characterises as:
Light - API > 31.1
Medium - API between 22.3 and 31.1 Heavy - API < 22.3 Extra Heavy - API < 10.0
API Gravity is converted to Specific Gravity using the following formula: API gravity = (141.5/Specific Gravity) – 131.5
An API of 10 is equivalent to water, so oils with an API above 10 will float on water while oils with an API below 10 will sink. See also: Specific Gravity, API
ArcGIS A geographic Information System (GIS) used to present OSCAR outputs on maps.
Asphaltene Content
The asphaltenes present the crude oil components that are (1) insoluble in n-heptane at a dilution ratio of 40 parts alkane to 1 part crude oil and (2) re-dissolves in toluene. The asphaltenes include the crude oil material highest in molecular weight, polarity and aromaticity.
bbls
Barrels of oil (a unit of volume). (1.0 bbls = 0.15899 m³ and 1.0 m³ = 6.2898 bbls) The conversion between mass and volume requires knowledge of the oil density. See also: MT, API Gravity, Specific Gravity
bbls/day Barrels of oil per day (rate).
BONN Agreement
The BONN Agreement is an international standard and agreement on how to characterise and respond to pollution. Although aimed at pollution in the North Sea (Europe) many of the characterisation standards are internationally recognised.
FPSO Floating Production Diesel and Offloading - a floating vessel used for producing, processing and storing oil.
GOR
Gas to Oil Ratio - the ratio of volumetric flow of produced gas to the volumetric flow of oil. Although GOR is a ratio, the volume units must be known since gas and oil volumes are measured differently. GOR changes with temperature and pressure so the condition under which GOR is measured must be known.
ITOPF The International Tanker Owners Pollution Federation Limited
km Kilometres (1.0 km = 1,000 m) See also: m
m Metres (1.0 km = 1,000 m) See also: , km
MATLAB Matrix Laboratory - a multi-paradigm numerical computing environment and programming language used in this study for the manipulation of data outputs from OSCAR.
Oil Spill Modelling Report – Pipelaying Vessel Collision: Tortue Phase 1a
BP p.l.c.
Document No: GEOM0132h R04 Page 57 of 58 Oil Spill Response Ltd. Date Issued: 21-May-18
MEMW
Marine Environmental Modelling Workbench - the modelling software package developed by SINTEF. The MEMW consists of three models:
DREAM (Dose, Risk and Effects Assessment Model) OSCAR (Oil Spill Contingency and Response Model) ParTrack Model
When combined, these three models quantify the environmental effect of most chemical pollution activities. See also: OSCAR, SINTEF
MT
Metric Tonnes - this is a unit of oil mass. (1.0 MT = 1,000 kg) The conversion between mass and volume requires knowledge of the oil’s API or Specific Gravity as follows:
Barrels per metric ton = 1/[(141.5/(API + 131.5) x 0.159] See also: bbls, API Gravity, Specific Gravity
NOAA National Oceanic and Atmospheric Administration – an American scientific agency focussed on metocean conditions
OSCAR
Oil Spill Contingency And Response A state of the art 3D oil spill model and simulation tool for predicting the fates and effects of oil released into the marine environment. Developed by SINTEF, it sits within the larger MEMW application. See also: SINTEF, MEMW
OSRL Oil Spill Response Limited
Pour Point The pour point of a liquid is the lowest temperature at which it shows flow characteristics. If ambient temperature is less than the liquid’s pour point it will begin to solidify.
SCAT Shoreline Cleanup Assessment Technique
SINTEF SINTEF is an independent research organisation in Norway which develops the OSCAR model used in this study.
Specific Gravity
Specific gravity is a ratio of the density of one substance to the density of a reference substance, usually water. Specific gravity of oil is a ratio of the density of oil to the density of water. See also: API Gravity, bbls, MT
Stochastic
Stochastic (or probabilistic) results show the probability or likelihood of an event occurring. They provide statistical data that can be used to assess risk and identify worst-case scenarios. Stochastic results are achieved by combining many different trajectory simulations. See also: Trajectory
Trajectory Trajectory or deterministic results show the impact of a single spill event over time. Can be used to assess different response options such as booms, skimmers and dispersant. See also: Stochastic
UTC Coordinated Universal Time
Wax Content Represents the crude oil components that are soluble in higher molecular weight normal alkanes (n-heptane) but are insoluble in lower molecular weight alkanes (n-pentane).
Oil Spill Modelling Report – Pipelaying Vessel Collision: Tortue Phase 1a
BP p.l.c.
Document No: GEOM0132h R04 Page 58 of 58 Oil Spill Response Ltd. Date Issued: 21-May-18
APPENDIX G. REFERENCES Bacher, A.D. (2014) ‘Gas Chromatography Theory’, accessible online via:
http://www.chem.ucla.edu/~bacher/General/30BL/gc/theory.html, last accessed 31st October 2017.
HPI Consultants Inc. (1987) HPI Crude Oil Assay Handbook, First Edition, California: USA.
The International Tanker Owners Pollution Federation Limited (ITOPF) (n.d.) ‘Technical Information Paper 02: Fate of marine oil spills’, accessible online via: http://www.itopf.com/knowledge-resources/documents-guides/document/tip-2-fate-of-marine-oil-spills/, last accessed 31st October 2017.
The International Tanker Owners Pollution Federation Limited (ITOPF) (n.d.) ‘Technical Information Paper 06: Recognition of oil on shorelines’, accessible online via: http://www.itopf.com/knowledge-resources/documents-guides/document/tip-6-recognition-of-oil-on-shorelines/, last accessed 31st October 2017.
LECO Corporation (2012) ‘Analysis of Light Crude Oil Using Gas Chromatography – High Resolution Time-of-Flight Mass Spectrometry’, Form No. 203-821-410 Rev0, accessible online via: http://www.leco.com/index.php/component/edocman/?task=document.download&id=404&Itemid=404, last accessed 31st October 2017.
National Oceanic and Atmospheric Administration (NOAA, 2014) National Oceanographic Data Center (NODC), World Ocean Atlas Select (WOAselect), accessible via: http://www.nodc.noaa.gov/OC5/SELECT/woaselect/woaselect.html, last accessed 31st October 2017.
Oil Spill Response Ltd. (OSRL) ‘Shoreline Cleanup and Assessment Technique (SCAT) Field Guide’ accessible online via: http://www.oilspillresponse.com/technical-development/technical-field-guides, last accessed 31st October 2017.
Reed, M., French, D., Rines, G. and Rye, H. (1995) ‘A three-dimensional oil and chemical spill model for environmental impact assessment’, paper presented at 1995 International Oil Spill Conference, pp.61-66.
Reed, M., Aamo, O.M. and Downing, K. (1996) ‘Calibration and Testing of IKU’s Oil Spill Contingency and Response (OSCAR) Model System’, paper presented at 1996 AMOP Oil Spill Conference.
Saha, S., S. Moorthi, H. Pan, X. Wu, J. Wang, and Co-authors, 2010: The NCEP Climate Forecast System Reanalysis. Bulletin of the American Meteorological Society, 91, 1015–1057.
Saha, S., S. Moorthi, X. Wu, J. Wang, and Co-authors, 2014: The NCEP Climate Forecast System Version 2. Journal of Climate, 27, 2185–2208.
SINTEF (2014) ‘OSCAR – Oil Spill Contingency and Response’, accessible online via: https://www.sintef.no/en/software/oscar/, last accessed 31st October 2017.
ESIA FOR THE GREATER TORTUE/AHMEYIM PHASE 1 GAS PRODUCTION PROJECT
Ref. No.: 1653939
APPENDIX N-1d : OIL SPILL MODELING REPORT – SENEGAL RIVER STUDY
Oil Spill Modelling Report – Senegal River Study Tortue Phase 1a
BP p.l.c. Document Number: GEOM0132i R01 Issued: 05 February 2018
Oil Spill Response Limited
Lower William Street Southampton
SO14 5QE United Kingdom
Tel: +44 (0)23 8033 1551 Fax: +44 (0)23 8022 1972
Oil Spill Modelling Report – Senegal River Study: Tortue Phase 1a
BP p.l.c.
Document No: GEOM0132i R01 Page 2 of 14 Oil Spill Response Ltd. Date Issued: 5-Feb-18
DOCUMENT HISTORY
Document Number Revision Document
Type Author Technical Review
Format Review
Date of Issue
GEOM0132i R01 Draft Modelling Report LHM 31-Jan-18
GEOM0132i R02 Final Report LHM 05-Feb-18 LHM – Liam Harrington-Missin
DISCLAIMERS Modelling results are to be used for guidance purposes only and response strategies should not be based on these
results alone. The resolution / quality of wind and current data vary between regions and models. As with any model, the quality
and reliability of the results are dependent on the quality of the input data.
Considering the above, all advice, modelling, and other information provided is generic and illustrative only and not intended to be relied upon in any specific instance. The recipient of any advice, modelling or other information from, or on behalf of, OSRL acknowledges and agrees that any number of variables may impact on an oil spill and, as such, should be addressed on an individual basis. OSRL has no liability in relation to such advice, modelling or other information and the recipient of such information hereby fully indemnifies and holds harmless OSRL its officers, employees, shareholders, agents, contractors and sub-contractors against any costs, losses, claims or liabilities arising about such advice, modelling, training or other information.
Oil Spill Modelling Report – Senegal River Study: Tortue Phase 1a
BP p.l.c.
Document No: GEOM0132i R01 Page 3 of 14 Oil Spill Response Ltd. Date Issued: 5-Feb-18
TABLE OF CONTENTS
1 INTRODUCTION ............................................................................................................... 4
2 RESULTS .......................................................................................................................... 4
3 METHODOLOGY ............................................................................................................ 11 3.1 RIVER MOUTH BOUNDARY CONDITIONS ................................................................................... 11 3.2 CONCENTRATIONS OF DISSOLVED AND TOTAL OIL UP THE SENEGAL RIVER ..................................... 11
4 ASSUMPTIONS AND LIMITATIONS .................................................................................. 12 4.1 THE OIL SPILL RELEASE SCENARIO ........................................................................................... 12 4.2 TRANSPORT TO THE RIVER MOUTH .......................................................................................... 12 4.3 THE SENEGAL RIVER .............................................................................................................. 12
APPENDIX A. ..................................................................................................................... 14
Oil Spill Modelling Report – Senegal River Study: Tortue Phase 1a
BP p.l.c.
Document No: GEOM0132i R01 Page 4 of 14 Oil Spill Response Ltd. Date Issued: 5-Feb-18
1 Introduction The oil spill modelling undertaken to investigate the impact of various worst-case oil spill scenarios showed a risk to the Senegal River. Given its potential sensitivity to an oil spill, this study further investigates the risk specific to the Senegal River.
Oil spill risk statistics for the mouth of the Senegal River are extracted from the existing modelling data. Following that, the model outputs are scaled using salinity as a proxy for how the oil will dilute as it travels upstream and interacts with the fresh water from the river.
Assumptions must be made in undertaking this kind of study and more detail can be found in Section 4.
2 Results The following figures and tables provide insight into how the Senegal River could be impacted in the worst-case scenario. The worst-case oil spill scenario for the Senegal River would be a significant spill from the FPSO due to a collision (or other cause) in the Summer months (April to September).
The impact of the other scenarios on the Senegal River can be seen in APPENDIX A for comparison.
The following tables and figures are presented:
• Table 1: Worst-case Oil Spill Risk Statistics at the mouth of the Senegal River (Boundary Conditions) – Sea Surface
• Table 2: Worst-case Oil Spill Risk Statistics at the mouth of the Senegal River (Boundary Conditions) – Water Column and Shoreline
• Table 3: Maximum Dissolved and Total Concentrations (ppb) at various locations on the Senegal River
• Figure 1: Senegal River Mouth Probability of Exceedance Graphs for; Maximum Dissolved Concentration (top left), Maximum Total Concentration (top right), Water column Minimum Arrival Time (bottom left) and Water Column Maximum Exposure Time (bottom right)
• Figure 2: Senegal River Mouth Probability of Exceedance Graphs for; Maximum Shoreline Emulsion Mass (top left), Maximum Shoreline Thickness (top right) and Shoreline Minimum Arrival Time (bottom left)
• Figure 3: Senegal River Mouth Probability of Exceedance Graphs for; Maximum Surface Oil Mass (top left), Maximum Surface Emulsion Mass (top right), Surface Minimum Arrival Time (bottom left) and Surface Maximum Exposure Time (bottom right)
• Figure 4: Senegal River Mouth Probability of Exceedance Graphs for; Maximum Surface Thickness (top left), Maximum Surface Viscosity (top right) and Maximum Surface Water Content (bottom left)
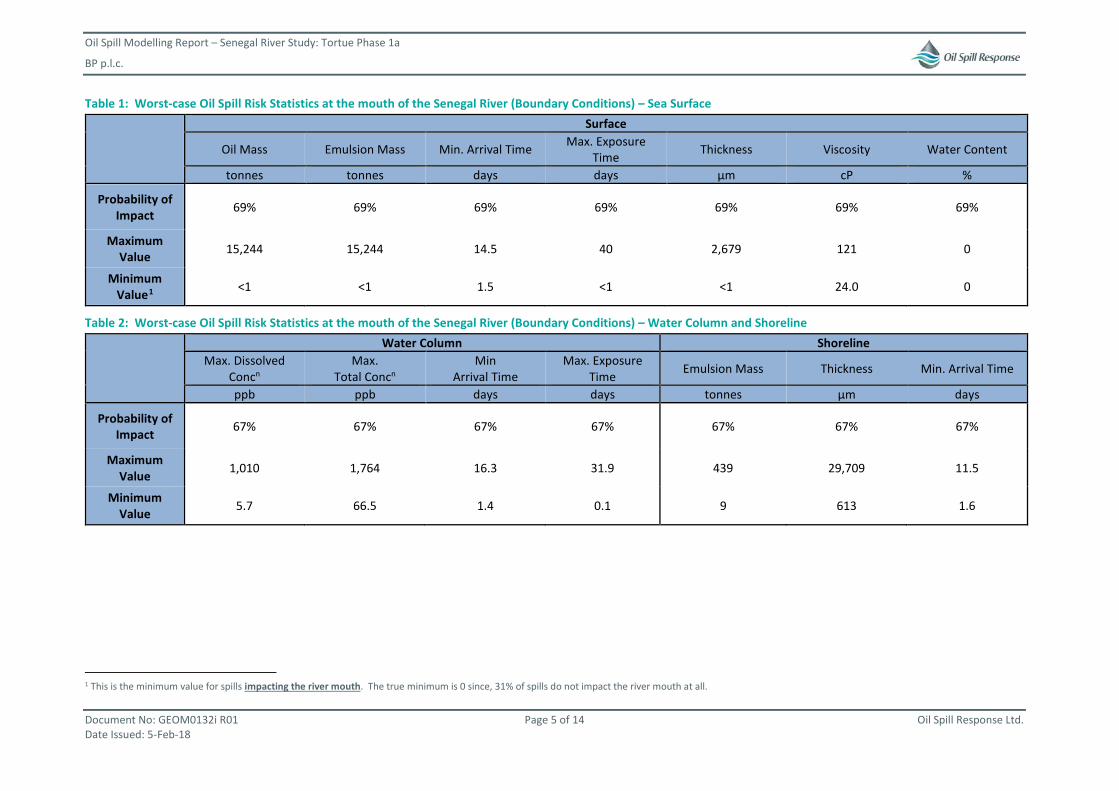
Oil Spill Modelling Report – Senegal River Study: Tortue Phase 1a
BP p.l.c.
Document No: GEOM0132i R01 Page 5 of 14 Oil Spill Response Ltd. Date Issued: 5-Feb-18
Table 1: Worst-case Oil Spill Risk Statistics at the mouth of the Senegal River (Boundary Conditions) – Sea Surface
Surface
Oil Mass Emulsion Mass Min. Arrival Time Max. Exposure Time Thickness Viscosity Water Content
tonnes tonnes days days µm cP %
Probability of Impact 69% 69% 69% 69% 69% 69% 69%
Maximum Value 15,244 15,244 14.5 40 2,679 121 0
Minimum Value1 <1 <1 1.5 <1 <1 24.0 0
Table 2: Worst-case Oil Spill Risk Statistics at the mouth of the Senegal River (Boundary Conditions) – Water Column and Shoreline
Water Column Shoreline Max. Dissolved
Concn Max.
Total Concn Min
Arrival Time Max. Exposure
Time Emulsion Mass Thickness Min. Arrival Time
ppb ppb days days tonnes µm days
Probability of Impact 67% 67% 67% 67% 67% 67% 67%
Maximum Value 1,010 1,764 16.3 31.9 439 29,709 11.5
Minimum Value 5.7 66.5 1.4 0.1 9 613 1.6
1 This is the minimum value for spills impacting the river mouth. The true minimum is 0 since, 31% of spills do not impact the river mouth at all.
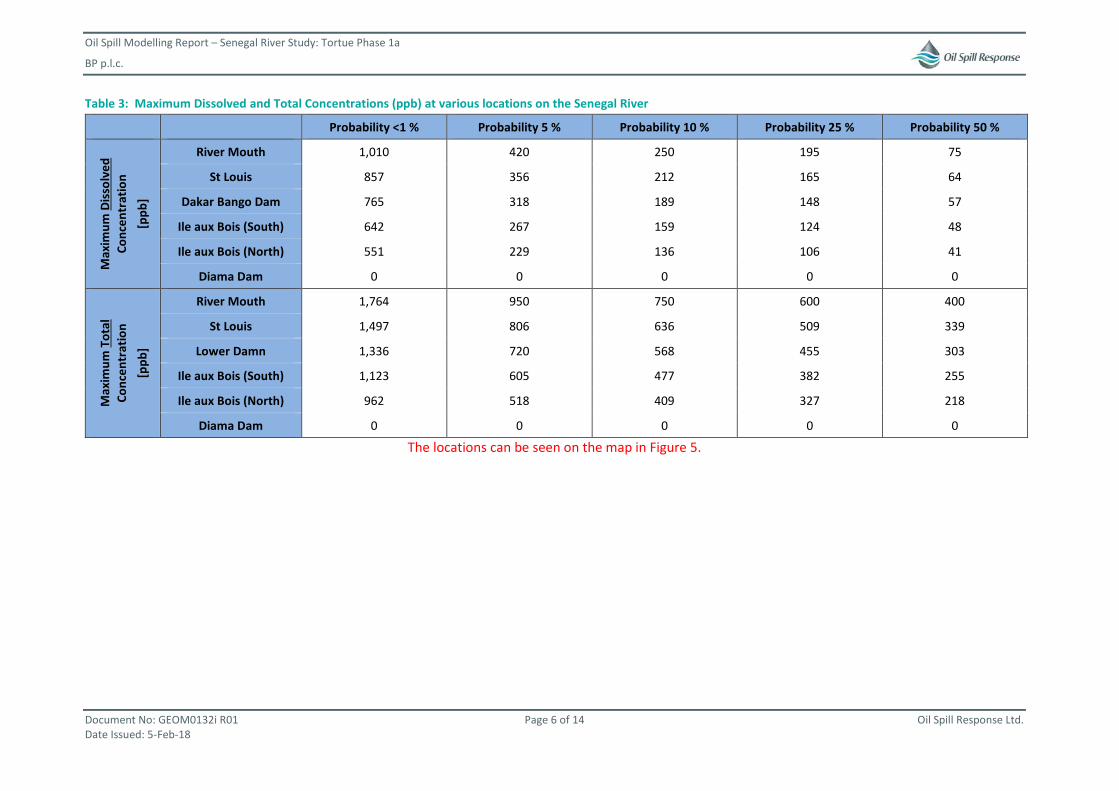
Oil Spill Modelling Report – Senegal River Study: Tortue Phase 1a
BP p.l.c.
Document No: GEOM0132i R01 Page 6 of 14 Oil Spill Response Ltd. Date Issued: 5-Feb-18
Table 3: Maximum Dissolved and Total Concentrations (ppb) at various locations on the Senegal River
Probability <1 % Probability 5 % Probability 10 % Probability 25 % Probability 50 %
Max
imum
Dis
solv
ed
Conc
entr
atio
n [p
pb]
River Mouth 1,010 420 250 195 75
St Louis 857 356 212 165 64
Dakar Bango Dam 765 318 189 148 57
Ile aux Bois (South) 642 267 159 124 48
Ile aux Bois (North) 551 229 136 106 41
Diama Dam 0 0 0 0 0
Max
imum
Tot
al
Conc
entr
atio
n [p
pb]
River Mouth 1,764 950 750 600 400
St Louis 1,497 806 636 509 339
Lower Damn 1,336 720 568 455 303
Ile aux Bois (South) 1,123 605 477 382 255
Ile aux Bois (North) 962 518 409 327 218
Diama Dam 0 0 0 0 0
The locations can be seen on the map in Figure 5.
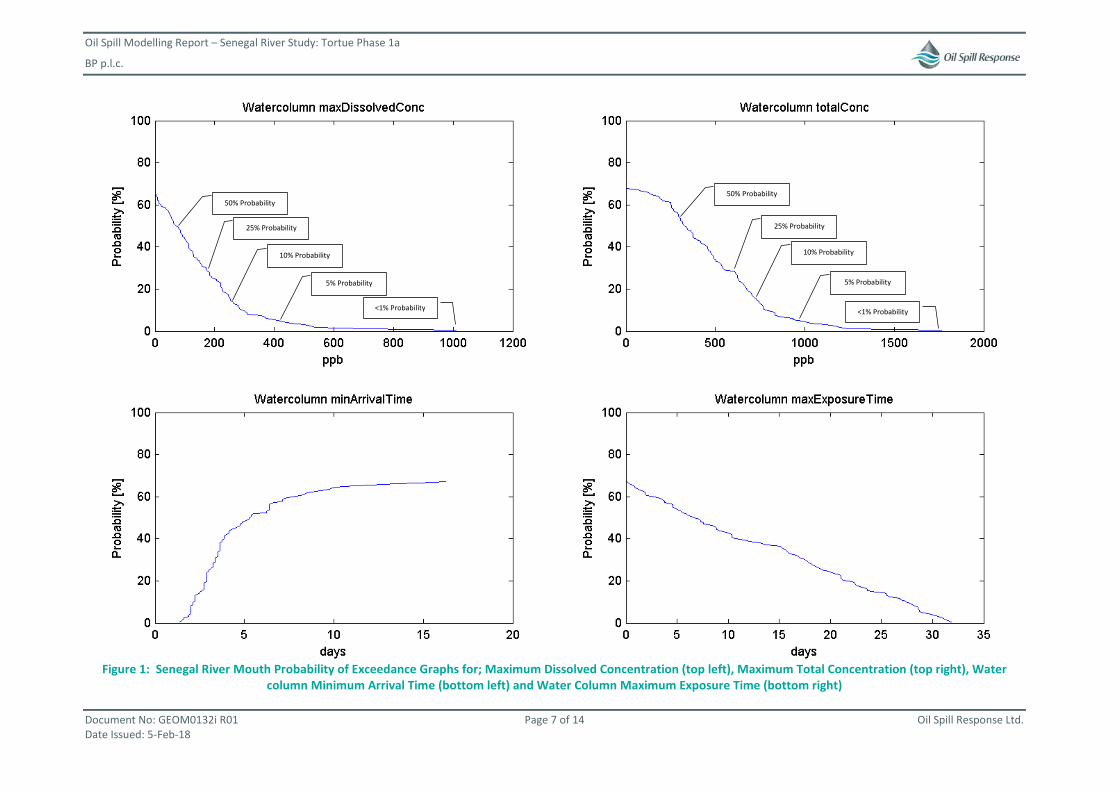
Oil Spill Modelling Report – Senegal River Study: Tortue Phase 1a
BP p.l.c.
Document No: GEOM0132i R01 Page 7 of 14 Oil Spill Response Ltd. Date Issued: 5-Feb-18
Figure 1: Senegal River Mouth Probability of Exceedance Graphs for; Maximum Dissolved Concentration (top left), Maximum Total Concentration (top right), Water
column Minimum Arrival Time (bottom left) and Water Column Maximum Exposure Time (bottom right)
<1% Probability
5% Probability
10% Probability
25% Probability
50% Probability
<1% Probability
5% Probability
10% Probability
25% Probability
50% Probability
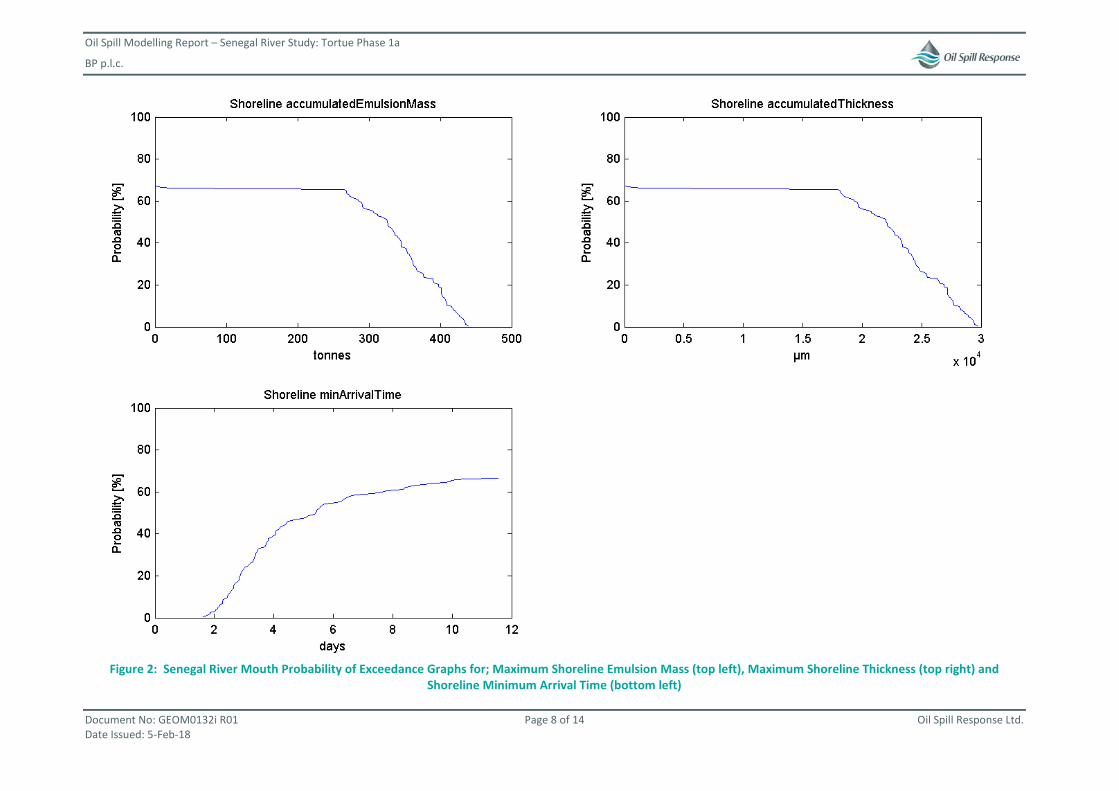
Oil Spill Modelling Report – Senegal River Study: Tortue Phase 1a
BP p.l.c.
Document No: GEOM0132i R01 Page 8 of 14 Oil Spill Response Ltd. Date Issued: 5-Feb-18
Figure 2: Senegal River Mouth Probability of Exceedance Graphs for; Maximum Shoreline Emulsion Mass (top left), Maximum Shoreline Thickness (top right) and
Shoreline Minimum Arrival Time (bottom left)
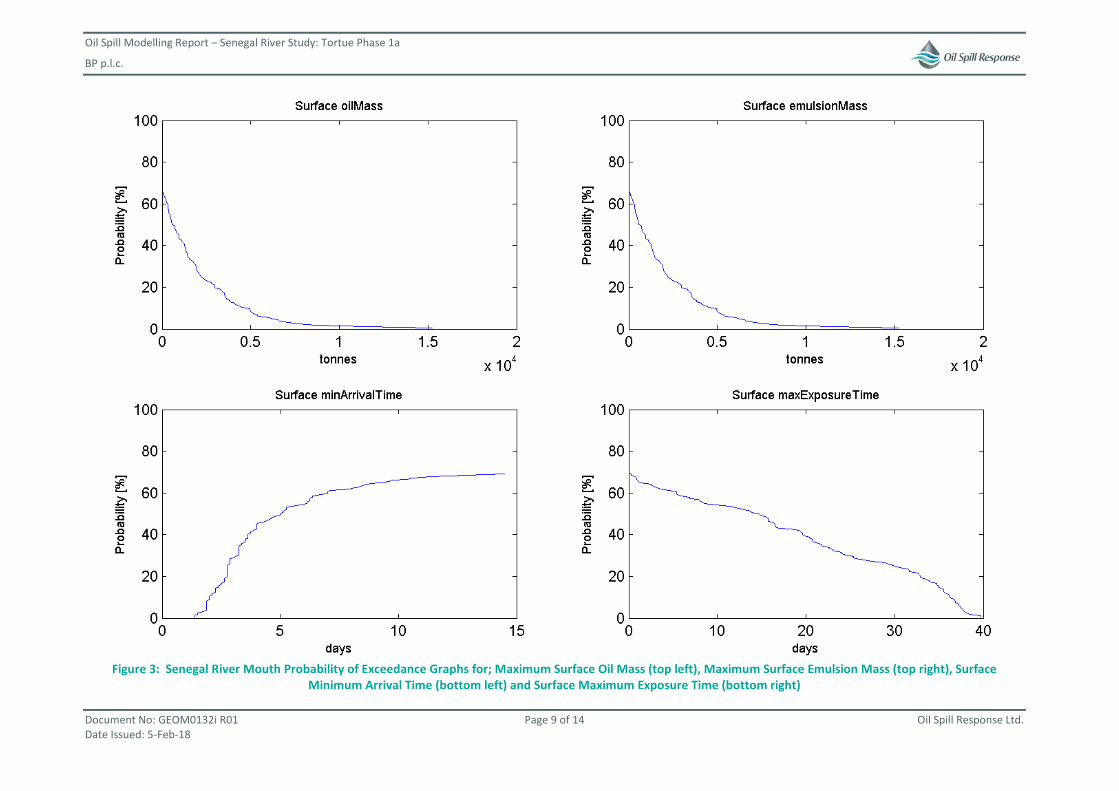
Oil Spill Modelling Report – Senegal River Study: Tortue Phase 1a
BP p.l.c.
Document No: GEOM0132i R01 Page 9 of 14 Oil Spill Response Ltd. Date Issued: 5-Feb-18
Figure 3: Senegal River Mouth Probability of Exceedance Graphs for; Maximum Surface Oil Mass (top left), Maximum Surface Emulsion Mass (top right), Surface
Minimum Arrival Time (bottom left) and Surface Maximum Exposure Time (bottom right)
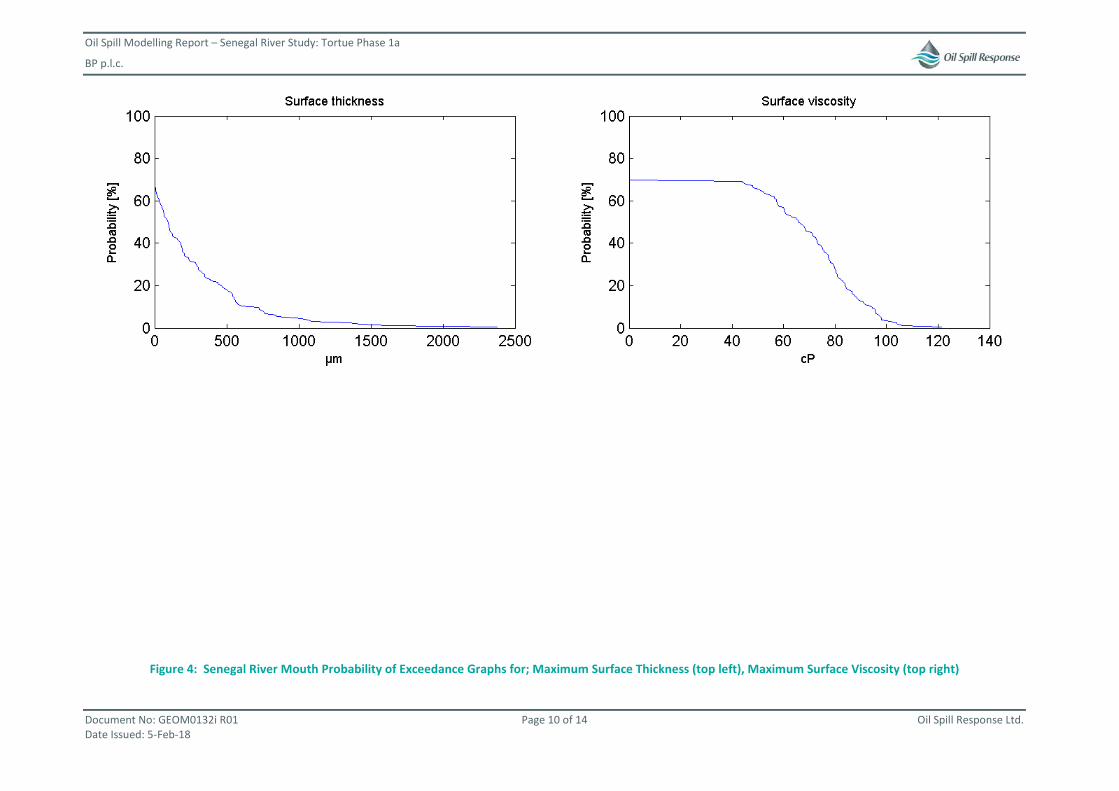
Oil Spill Modelling Report – Senegal River Study: Tortue Phase 1a
BP p.l.c.
Document No: GEOM0132i R01 Page 10 of 14 Oil Spill Response Ltd. Date Issued: 5-Feb-18
Figure 4: Senegal River Mouth Probability of Exceedance Graphs for; Maximum Surface Thickness (top left), Maximum Surface Viscosity (top right)
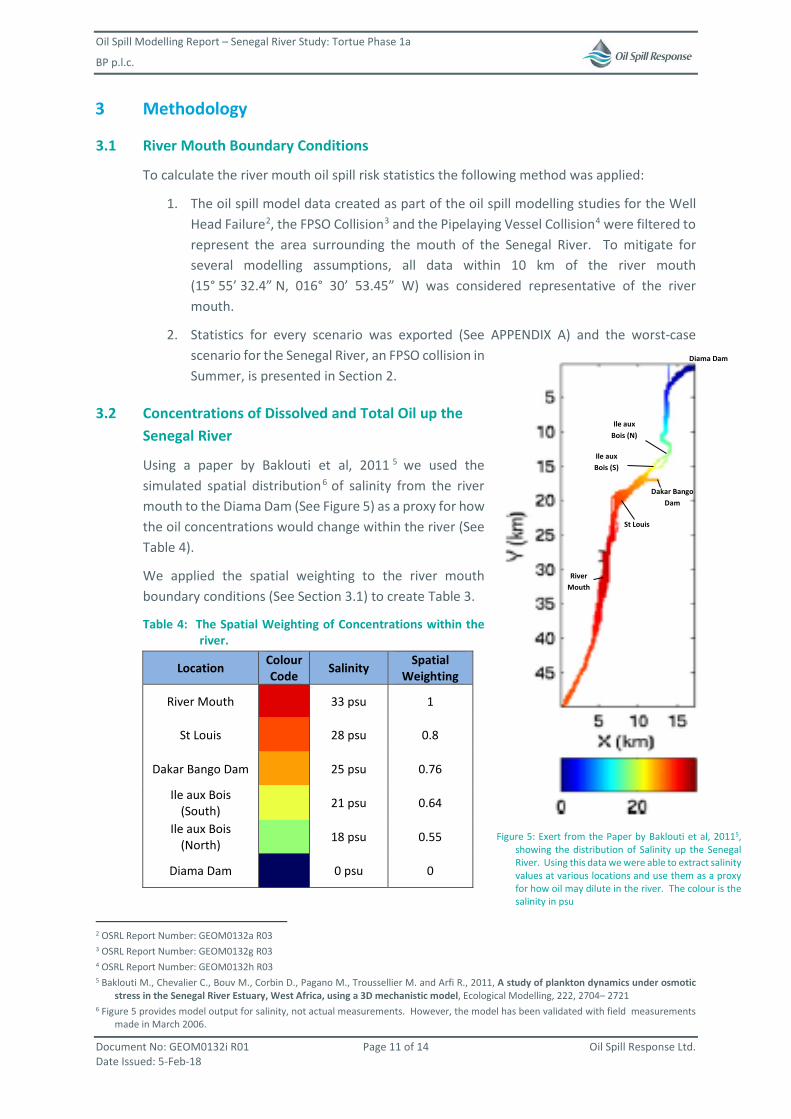
Oil Spill Modelling Report – Senegal River Study: Tortue Phase 1a
BP p.l.c.
Document No: GEOM0132i R01 Page 11 of 14 Oil Spill Response Ltd. Date Issued: 5-Feb-18
3 Methodology
3.1 River Mouth Boundary Conditions
To calculate the river mouth oil spill risk statistics the following method was applied:
1. The oil spill model data created as part of the oil spill modelling studies for the Well Head Failure2, the FPSO Collision3 and the Pipelaying Vessel Collision4 were filtered to represent the area surrounding the mouth of the Senegal River. To mitigate for several modelling assumptions, all data within 10 km of the river mouth (15° 55’ 32.4” N, 016° 30’ 53.45” W) was considered representative of the river mouth.
2. Statistics for every scenario was exported (See APPENDIX A) and the worst-case scenario for the Senegal River, an FPSO collision in Summer, is presented in Section 2.
3.2 Concentrations of Dissolved and Total Oil up the Senegal River
Using a paper by Baklouti et al, 2011 5 we used the simulated spatial distribution6 of salinity from the river mouth to the Diama Dam (See Figure 5) as a proxy for how the oil concentrations would change within the river (See Table 4).
We applied the spatial weighting to the river mouth boundary conditions (See Section 3.1) to create Table 3.
Table 4: The Spatial Weighting of Concentrations within the river.
Location Colour Code Salinity Spatial
Weighting
River Mouth 33 psu 1
St Louis 28 psu 0.8
Dakar Bango Dam 25 psu 0.76
Ile aux Bois (South)
21 psu 0.64
Ile aux Bois (North)
18 psu 0.55
Diama Dam 0 psu 0
2 OSRL Report Number: GEOM0132a R03 3 OSRL Report Number: GEOM0132g R03 4 OSRL Report Number: GEOM0132h R03 5 Baklouti M., Chevalier C., Bouv M., Corbin D., Pagano M., Troussellier M. and Arfi R., 2011, A study of plankton dynamics under osmotic
stress in the Senegal River Estuary, West Africa, using a 3D mechanistic model, Ecological Modelling, 222, 2704– 2721 6 Figure 5 provides model output for salinity, not actual measurements. However, the model has been validated with field measurements
made in March 2006.
Figure 5: Exert from the Paper by Baklouti et al, 20115, showing the distribution of Salinity up the Senegal River. Using this data we were able to extract salinity values at various locations and use them as a proxy for how oil may dilute in the river. The colour is the salinity in psu
St Louis
River Mouth
Diama Dam
Dakar Bango Dam
Ile aux Bois (N)
Ile aux Bois (S)
Oil Spill Modelling Report – Senegal River Study: Tortue Phase 1a
BP p.l.c.
Document No: GEOM0132i R01 Page 12 of 14 Oil Spill Response Ltd. Date Issued: 5-Feb-18
4 Assumptions and Limitations
4.1 The Oil Spill Release Scenario
The FPSO collision in Summer that shows the worst-case impact (in terms of oiling at surface and in water column) to the Senegal River, is a highly improbably worst-case event. Using this scenario, ensures that oil spill contingency planning and environmental impact assessments are comprehensive and consider even the very unlikely scenarios.
In this instance, the scenario is that a collision with the FPSO causes the entire contents of both diesel and product to be released at a continuous release rate of 1,000 m3 per hour. This results in over 163,000 m3 of products to be released in to the environment over a period of approximately 1 week. Mitigation measures on the FPSO will almost certainly result in a far smaller release if a vessel collision were to occur.
4.2 Transport to the River Mouth
Oil spill modelling relies on metocean data (mainly wind and currents) to predict both the transport and weathering of oil in the marine environment. Offshore, the spatial and temporal variability is typically orders of magnitude larger and slower than that of the near shore environment (e.g. coastal). This (typically) makes stochastic modelling of winds and currents in the offshore environment more reliable and easier than near shore environments. Consequentially, our confidence in the model’s prediction of movement and behaviour of oil as it gets close to the coast is less than offshore.
In this work, we have compensated for this by assuming oil impact within 10 km of the river mouth is representative of the river mouth. However, this method does not account for inherent inaccuracies in the underlying metocean data.
4.3 The Senegal River
Accurately representing an oil spill entering the Senegal river and travelling “upstream” is beyond the capabilities of current oil spill models. To be of use in the context of this study, the model would have to consider the following in addition to all the offshore variables:
• Local current patterns, e.g. tidal flow and river flow interactions, complicated island flows, river run off, operational management of dams etc.
• Local wind patterns, e.g. wind swirling around headlands and small islands and the sea breeze phenomena.
• Different fresh water flows due to seasonal to hourly changes.
• Drying out of land due to tidal changes or weather conditions.
This considerable number of additional variables that change rapidly in time and space, makes modelling the movement of oil in the river an unrealistic exercise.
To provide a semi-quantitative assessment of how oil in the water column may travel upstream we have made some large assumptions around the salinity of the Senegal River Basin. All our assumptions are based on worst-case, for example we assume that all the salt
Oil Spill Modelling Report – Senegal River Study: Tortue Phase 1a
BP p.l.c.
Document No: GEOM0132i R01 Page 13 of 14 Oil Spill Response Ltd. Date Issued: 5-Feb-18
in the river originated from the river mouth. Salt may have leached into the river from the local environment making our spatial weighting conservative.
Whilst we could have applied the same spatial weighting to surface oiling, we chose not to as there are additional variables that play a more important part to the movement of surface oil. Specifically, the currents and winds in the area will drive the oil onto the shore.
Whilst we cannot quantitively support the following statement, the narrow entrance to the river and the narrow and complex lower reaches of the river, along with the expected weather conditions should keep a majority of the surface oil in the lower reaches, south of Saint Louis. River vessels may be the primary mode of transfer for surface oil from the lower reaches, upstream.
It should also be highlighted that all these results assume no human intervention or oil spill response whatsoever.
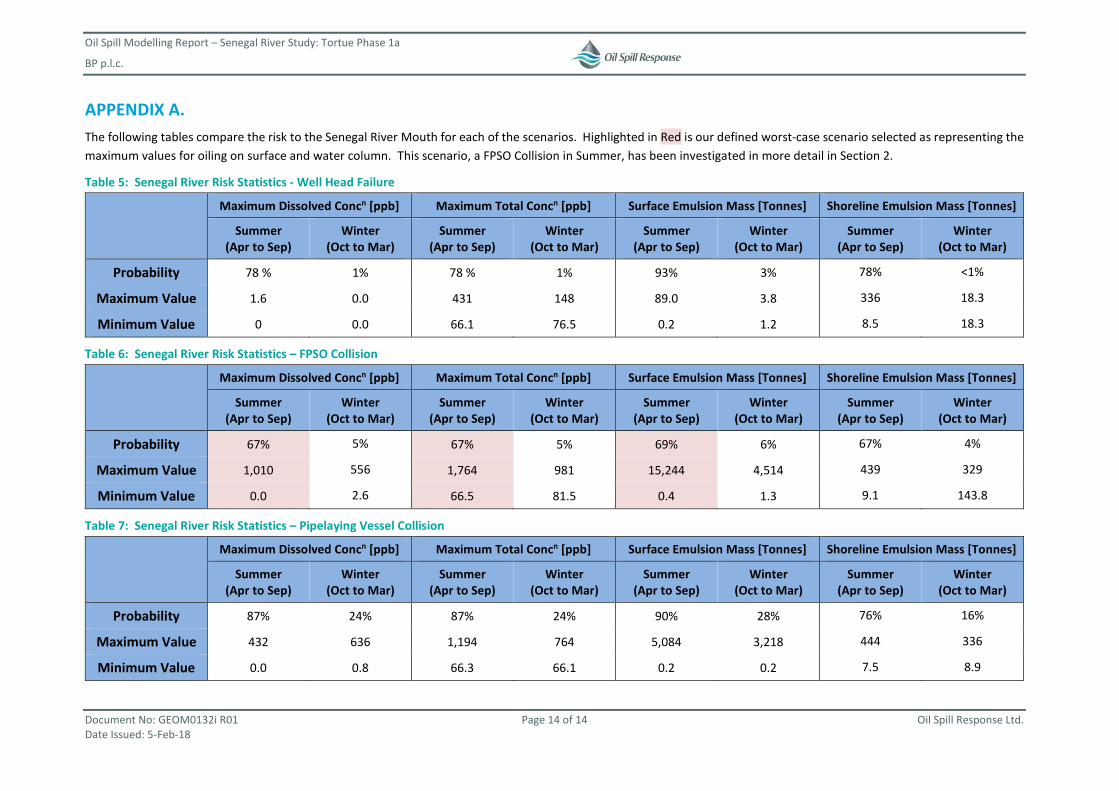
Oil Spill Modelling Report – Senegal River Study: Tortue Phase 1a
BP p.l.c.
Document No: GEOM0132i R01 Page 14 of 14 Oil Spill Response Ltd. Date Issued: 5-Feb-18
APPENDIX A. The following tables compare the risk to the Senegal River Mouth for each of the scenarios. Highlighted in Red is our defined worst-case scenario selected as representing the maximum values for oiling on surface and water column. This scenario, a FPSO Collision in Summer, has been investigated in more detail in Section 2.
Table 5: Senegal River Risk Statistics - Well Head Failure
Maximum Dissolved Concn [ppb] Maximum Total Concn [ppb] Surface Emulsion Mass [Tonnes] Shoreline Emulsion Mass [Tonnes]
Summer (Apr to Sep)
Winter (Oct to Mar)
Summer (Apr to Sep)
Winter (Oct to Mar)
Summer (Apr to Sep)
Winter (Oct to Mar)
Summer (Apr to Sep)
Winter (Oct to Mar)
Probability 78 % 1% 78 % 1% 93% 3% 78% <1%
Maximum Value 1.6 0.0 431 148 89.0 3.8 336 18.3
Minimum Value 0 0.0 66.1 76.5 0.2 1.2 8.5 18.3
Table 6: Senegal River Risk Statistics – FPSO Collision
Maximum Dissolved Concn [ppb] Maximum Total Concn [ppb] Surface Emulsion Mass [Tonnes] Shoreline Emulsion Mass [Tonnes]
Summer (Apr to Sep)
Winter (Oct to Mar)
Summer (Apr to Sep)
Winter (Oct to Mar)
Summer (Apr to Sep)
Winter (Oct to Mar)
Summer (Apr to Sep)
Winter (Oct to Mar)
Probability 67% 5% 67% 5% 69% 6% 67% 4%
Maximum Value 1,010 556 1,764 981 15,244 4,514 439 329
Minimum Value 0.0 2.6 66.5 81.5 0.4 1.3 9.1 143.8
Table 7: Senegal River Risk Statistics – Pipelaying Vessel Collision
Maximum Dissolved Concn [ppb] Maximum Total Concn [ppb] Surface Emulsion Mass [Tonnes] Shoreline Emulsion Mass [Tonnes]
Summer (Apr to Sep)
Winter (Oct to Mar)
Summer (Apr to Sep)
Winter (Oct to Mar)
Summer (Apr to Sep)
Winter (Oct to Mar)
Summer (Apr to Sep)
Winter (Oct to Mar)
Probability 87% 24% 87% 24% 90% 28% 76% 16%
Maximum Value 432 636 1,194 764 5,084 3,218 444 336
Minimum Value 0.0 0.8 66.3 66.1 0.2 0.2 7.5 8.9
ESIA FOR THE GREATER TORTUE/AHMEYIM PHASE 1 GAS PRODUCTION PROJECT
Ref. No.: 1653939
APPENDIX N-2 : RISK STUDY CONSEQUENCE MODELING REPORT

Ahmeyim/Guembeul Project Consequence Modelling BP
January 2018
Contains private information
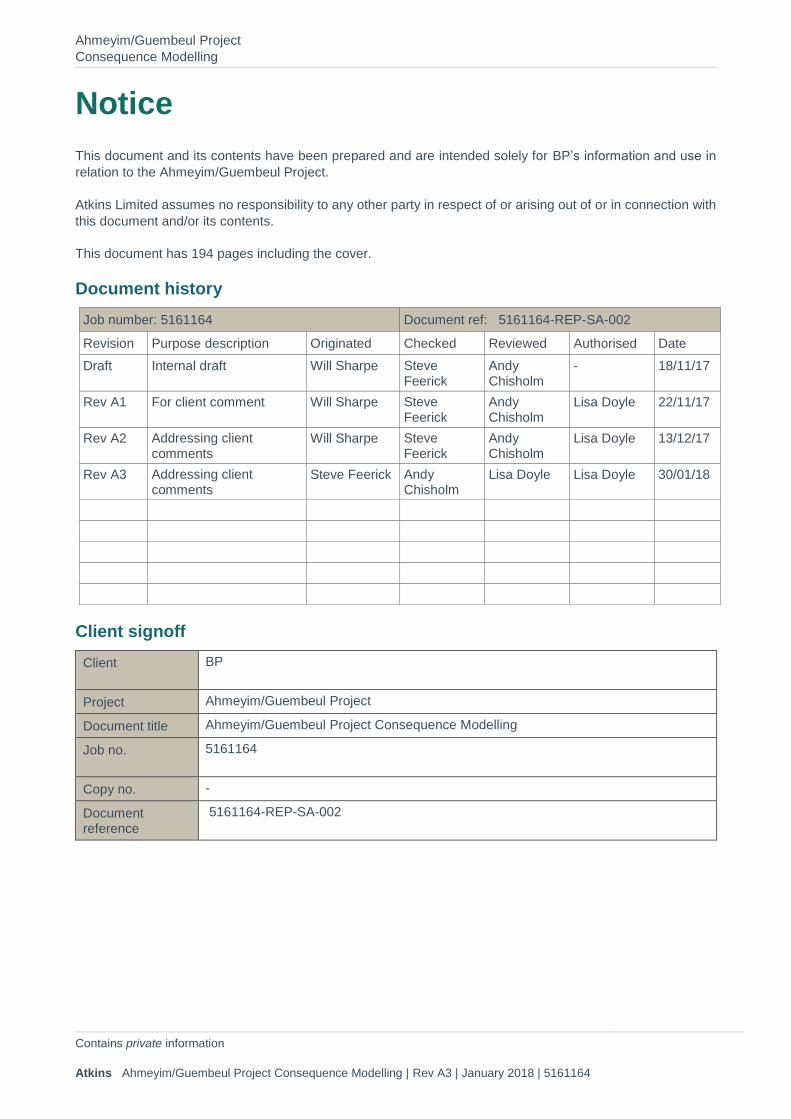
Ahmeyim/Guembeul Project Consequence Modelling
Contains private information Atkins Ahmeyim/Guembeul Project Consequence Modelling | Rev A3 | January 2018 | 5161164
Notice This document and its contents have been prepared and are intended solely for BP’s information and use in
relation to the Ahmeyim/Guembeul Project.
Atkins Limited assumes no responsibility to any other party in respect of or arising out of or in connection with this document and/or its contents.
This document has 194 pages including the cover.
Document history Job number: 5161164 Document ref: 5161164-REP-SA-002 Revision Purpose description Originated Checked Reviewed Authorised Date Draft Internal draft Will Sharpe Steve
Feerick Andy Chisholm
- 18/11/17
Rev A1 For client comment Will Sharpe Steve Feerick
Andy Chisholm
Lisa Doyle 22/11/17
Rev A2 Addressing client comments
Will Sharpe Steve Feerick
Andy Chisholm
Lisa Doyle 13/12/17
Rev A3 Addressing client comments
Steve Feerick Andy Chisholm
Lisa Doyle Lisa Doyle 30/01/18
Client signoff Client BP
Project Ahmeyim/Guembeul Project
Document title Ahmeyim/Guembeul Project Consequence Modelling
Job no. 5161164
Copy no. -
Document reference
5161164-REP-SA-002
Ahmeyim/Guembeul Project Consequence Modelling
Contains private information Atkins Ahmeyim/Guembeul Project Consequence Modelling | Rev A3 | January 2018 | 5161164
Table of Contents Chapter Pages Executive Summary 5
1. Introduction 7 1.1. Ahmeyim/Guembeul Project Background 7
1.2. Purpose 9
1.3. Scope 9
2. Failure Scenarios 10
3. Modelling Basis 12 3.1. Inventory Size and Operating Conditions 12
3.2. Failure Sizes 12
3.3. Meteorological Conditions 13
3.4. Fires 14
3.5. Flammable Gas Dispersion 15
3.6. Explosions 15
3.7. Cryogenic Spills 18
4. FPSO and Subsea Failure Scenarios 19 4.1. MAE F-01: Hydrocarbon Release from Production Riser 19
4.2. MAE F-02: Gas Release from Export Gas Risers 21
4.3. MAE F-03: Gas Release from Reception Facilities (Slug Catchers) 24
4.4. MAE F-04: Liquid Release from Reception Facilities (Slug Catchers) 28
4.5. MAE F-05: Gas Release from Gas Processing 34
4.6. MAE F-06: Liquid Release from Gas Processing 39
4.7. MAE F-07: Liquid Release from MP Separator 43
4.8. MAE F-08: Liquid Release from LP Separator 48
4.9. MAE F-09: Liquid Release from LLP Separator 53
4.10. MAE F-10: Gas Release from Flash Gas Compression 56
4.11. MAE F-11: Gas Release from Fuel Gas System\ 60
4.12. MAE F-12: Injection Chemical Release Topsides 64
4.13. MAE F-14: Condensate Storage Tank Fire 65
4.14. FPSO and Subsea Failure Scenario Summary Tables 67
5. Near Shore Hub Failure Scenarios 72 5.1. MAE N-01: Gas Release from Import Gas Riser 72
5.2. MAE N-02: Gas Release from Trestle Feed Gas Flowline / Hose to FLNG 75
5.3. MAE N-03: Gas Release from Trestle Fuel Gas Flowline to QU Platform 78
5.4. MAE N-04: Gas Release from FLNG Inlet Metering and Amine Treatment 82
5.5. MAE N-05: Gas Release from FLNG Dehydration and Regeneration 87
5.6. MAE N-06: Gas Release from FLNG Boil Off Gas / Flash Gas Compression 92
5.7. MAE N-07: Fuel Gas Release from FLNG HP Fuel Gas System 97
5.8. MAE N-08: Gas Release from FLNG Fractionation 101
5.9. MAE N-09: Light Hydrocarbon Liquid Releases from FLNG Fractionation 105
5.10. MAE N-10: LNG Release from FLNG Liquefaction Process 112
5.11. MAE N-11: LNG Release from FLNG Flash Gas Drum 119
5.12. MAE N-12: BLEVE of Vessel on FLNG Containing Refrigerant 128
Ahmeyim/Guembeul Project Consequence Modelling
Contains private information Atkins Ahmeyim/Guembeul Project Consequence Modelling | Rev A3 | January 2018 | 5161164
5.13. MAE N-13: Gas Release from FLNG SMR Refrigerant Closed Loop 131
5.14. MAE N-14: Liquid / Two Phase Release from FLNG SMR Refrigerant Closed Loop 135
5.15. MAE N-15: Refrigerant Release from FLNG Refrigerant Storage 142
5.16. MAE N-16: Gas Release (Fuel Gas) in QU Platform Utility Space / Area 151
5.17. MAE N-17: LNG Release from FLNG / LNGC Storage Tanks 156
5.18. MAE N-18: LNG Release during LNGC Loading 159
5.19. Near Shore Hub Failure Scenario Summary Tables 168
6. Conclusions 175 6.1. Summary of Worst Case Impact 175
6.2. Recommendations for Further Analysis 184
7. References 185
Appendices 187
Appendix A. Process Flow Diagrams 188 A.1. FPSO 188
A.2. FLNG 189
A.3. FLNG – Liquefaction/Fractionation 190
Appendix B. Ahmeyim/Guembeul Project MAE Listing & Inventories 191
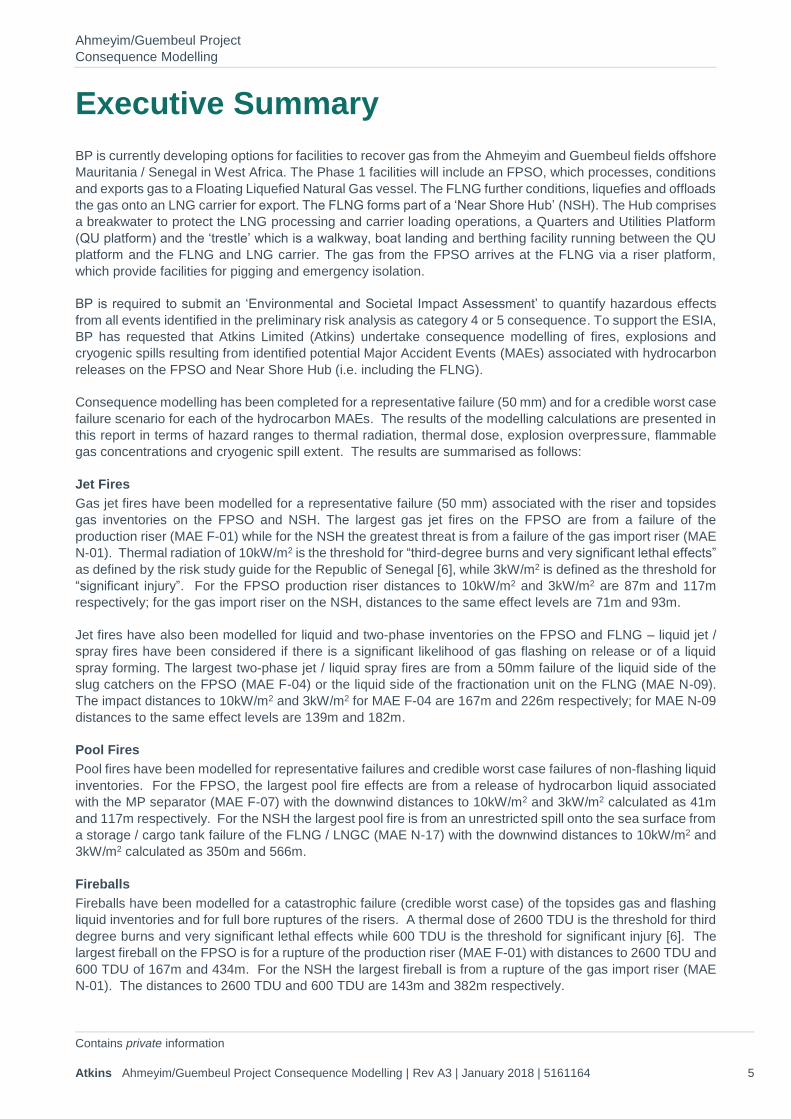
Ahmeyim/Guembeul Project Consequence Modelling
Contains private information Atkins Ahmeyim/Guembeul Project Consequence Modelling | Rev A3 | January 2018 | 5161164 5
Executive Summary BP is currently developing options for facilities to recover gas from the Ahmeyim and Guembeul fields offshore Mauritania / Senegal in West Africa. The Phase 1 facilities will include an FPSO, which processes, conditions and exports gas to a Floating Liquefied Natural Gas vessel. The FLNG further conditions, liquefies and offloads the gas onto an LNG carrier for export. The FLNG forms part of a ‘Near Shore Hub’ (NSH). The Hub comprises a breakwater to protect the LNG processing and carrier loading operations, a Quarters and Utilities Platform (QU platform) and the ‘trestle’ which is a walkway, boat landing and berthing facility running between the QU platform and the FLNG and LNG carrier. The gas from the FPSO arrives at the FLNG via a riser platform, which provide facilities for pigging and emergency isolation.
BP is required to submit an ‘Environmental and Societal Impact Assessment’ to quantify hazardous effects from all events identified in the preliminary risk analysis as category 4 or 5 consequence. To support the ESIA, BP has requested that Atkins Limited (Atkins) undertake consequence modelling of fires, explosions and cryogenic spills resulting from identified potential Major Accident Events (MAEs) associated with hydrocarbon releases on the FPSO and Near Shore Hub (i.e. including the FLNG).
Consequence modelling has been completed for a representative failure (50 mm) and for a credible worst case failure scenario for each of the hydrocarbon MAEs. The results of the modelling calculations are presented in this report in terms of hazard ranges to thermal radiation, thermal dose, explosion overpressure, flammable gas concentrations and cryogenic spill extent. The results are summarised as follows:
Jet Fires Gas jet fires have been modelled for a representative failure (50 mm) associated with the riser and topsides gas inventories on the FPSO and NSH. The largest gas jet fires on the FPSO are from a failure of the production riser (MAE F-01) while for the NSH the greatest threat is from a failure of the gas import riser (MAE N-01). Thermal radiation of 10kW/m2 is the threshold for “third-degree burns and very significant lethal effects” as defined by the risk study guide for the Republic of Senegal [6], while 3kW/m2 is defined as the threshold for “significant injury”. For the FPSO production riser distances to 10kW/m2 and 3kW/m2 are 87m and 117m respectively; for the gas import riser on the NSH, distances to the same effect levels are 71m and 93m.
Jet fires have also been modelled for liquid and two-phase inventories on the FPSO and FLNG – liquid jet / spray fires have been considered if there is a significant likelihood of gas flashing on release or of a liquid spray forming. The largest two-phase jet / liquid spray fires are from a 50mm failure of the liquid side of the slug catchers on the FPSO (MAE F-04) or the liquid side of the fractionation unit on the FLNG (MAE N-09). The impact distances to 10kW/m2 and 3kW/m2 for MAE F-04 are 167m and 226m respectively; for MAE N-09 distances to the same effect levels are 139m and 182m.
Pool Fires Pool fires have been modelled for representative failures and credible worst case failures of non-flashing liquid inventories. For the FPSO, the largest pool fire effects are from a release of hydrocarbon liquid associated with the MP separator (MAE F-07) with the downwind distances to 10kW/m2 and 3kW/m2 calculated as 41m and 117m respectively. For the NSH the largest pool fire is from an unrestricted spill onto the sea surface from a storage / cargo tank failure of the FLNG / LNGC (MAE N-17) with the downwind distances to 10kW/m2 and 3kW/m2 calculated as 350m and 566m.
Fireballs Fireballs have been modelled for a catastrophic failure (credible worst case) of the topsides gas and flashing liquid inventories and for full bore ruptures of the risers. A thermal dose of 2600 TDU is the threshold for third degree burns and very significant lethal effects while 600 TDU is the threshold for significant injury [6]. The largest fireball on the FPSO is for a rupture of the production riser (MAE F-01) with distances to 2600 TDU and 600 TDU of 167m and 434m. For the NSH the largest fireball is from a rupture of the gas import riser (MAE N-01). The distances to 2600 TDU and 600 TDU are 143m and 382m respectively.
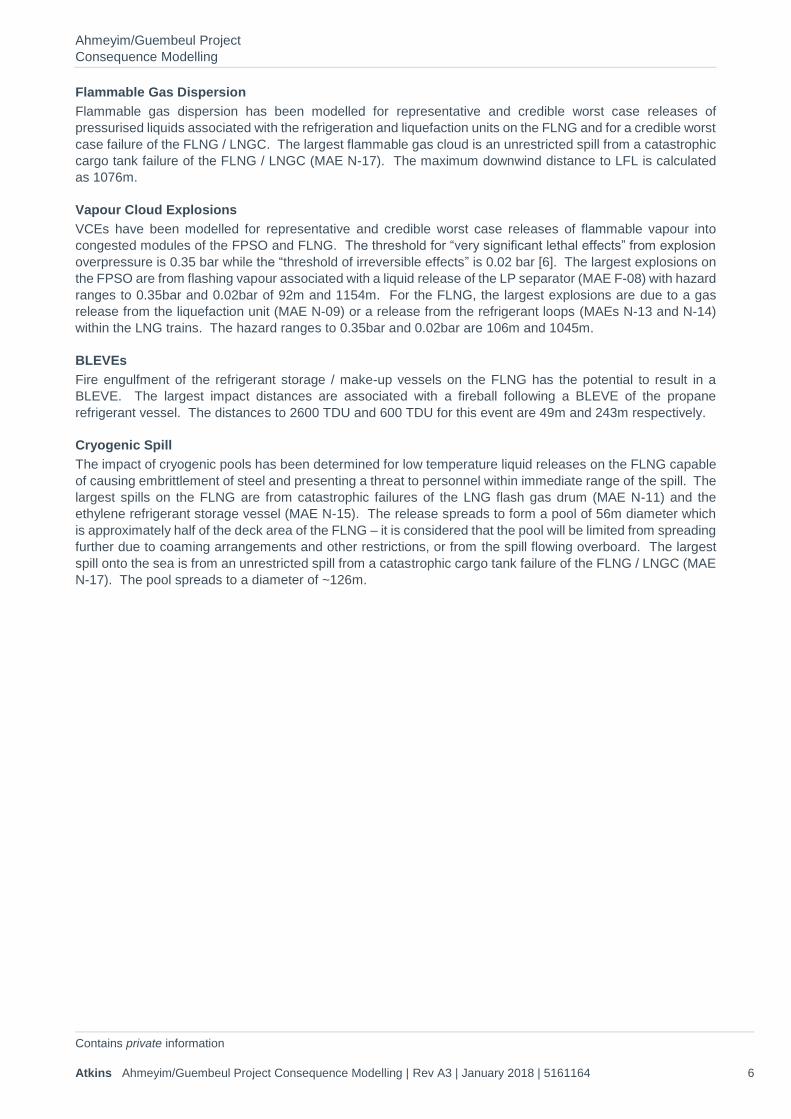
Ahmeyim/Guembeul Project Consequence Modelling
Contains private information Atkins Ahmeyim/Guembeul Project Consequence Modelling | Rev A3 | January 2018 | 5161164 6
Flammable Gas Dispersion Flammable gas dispersion has been modelled for representative and credible worst case releases of pressurised liquids associated with the refrigeration and liquefaction units on the FLNG and for a credible worst case failure of the FLNG / LNGC. The largest flammable gas cloud is an unrestricted spill from a catastrophic cargo tank failure of the FLNG / LNGC (MAE N-17). The maximum downwind distance to LFL is calculated as 1076m.
Vapour Cloud Explosions VCEs have been modelled for representative and credible worst case releases of flammable vapour into congested modules of the FPSO and FLNG. The threshold for “very significant lethal effects” from explosion
overpressure is 0.35 bar while the “threshold of irreversible effects” is 0.02 bar [6]. The largest explosions on the FPSO are from flashing vapour associated with a liquid release of the LP separator (MAE F-08) with hazard ranges to 0.35bar and 0.02bar of 92m and 1154m. For the FLNG, the largest explosions are due to a gas release from the liquefaction unit (MAE N-09) or a release from the refrigerant loops (MAEs N-13 and N-14) within the LNG trains. The hazard ranges to 0.35bar and 0.02bar are 106m and 1045m.
BLEVEs Fire engulfment of the refrigerant storage / make-up vessels on the FLNG has the potential to result in a BLEVE. The largest impact distances are associated with a fireball following a BLEVE of the propane refrigerant vessel. The distances to 2600 TDU and 600 TDU for this event are 49m and 243m respectively.
Cryogenic Spill The impact of cryogenic pools has been determined for low temperature liquid releases on the FLNG capable of causing embrittlement of steel and presenting a threat to personnel within immediate range of the spill. The largest spills on the FLNG are from catastrophic failures of the LNG flash gas drum (MAE N-11) and the ethylene refrigerant storage vessel (MAE N-15). The release spreads to form a pool of 56m diameter which is approximately half of the deck area of the FLNG – it is considered that the pool will be limited from spreading further due to coaming arrangements and other restrictions, or from the spill flowing overboard. The largest spill onto the sea is from an unrestricted spill from a catastrophic cargo tank failure of the FLNG / LNGC (MAE N-17). The pool spreads to a diameter of ~126m.
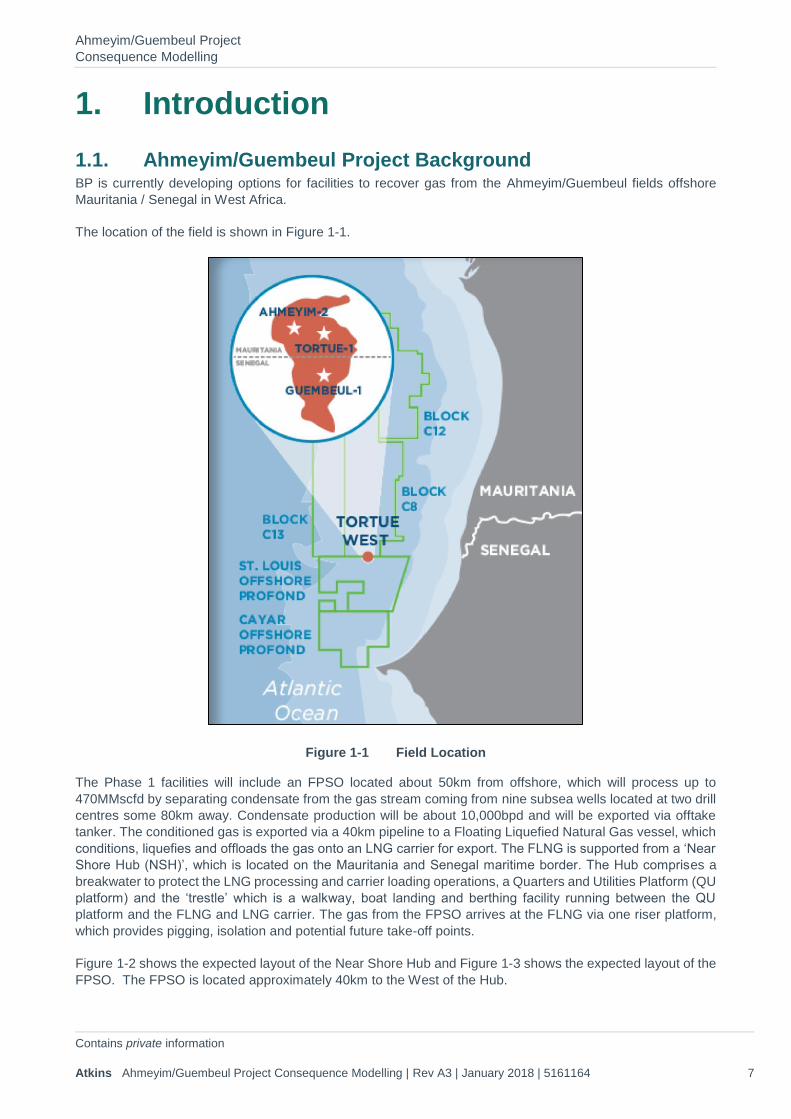
Ahmeyim/Guembeul Project Consequence Modelling
Contains private information Atkins Ahmeyim/Guembeul Project Consequence Modelling | Rev A3 | January 2018 | 5161164 7
1. Introduction 1.1. Ahmeyim/Guembeul Project Background BP is currently developing options for facilities to recover gas from the Ahmeyim/Guembeul fields offshore Mauritania / Senegal in West Africa.
The location of the field is shown in Figure 1-1.
Figure 1-1 Field Location
The Phase 1 facilities will include an FPSO located about 50km from offshore, which will process up to 470MMscfd by separating condensate from the gas stream coming from nine subsea wells located at two drill centres some 80km away. Condensate production will be about 10,000bpd and will be exported via offtake tanker. The conditioned gas is exported via a 40km pipeline to a Floating Liquefied Natural Gas vessel, which conditions, liquefies and offloads the gas onto an LNG carrier for export. The FLNG is supported from a ‘Near
Shore Hub (NSH)’, which is located on the Mauritania and Senegal maritime border. The Hub comprises a breakwater to protect the LNG processing and carrier loading operations, a Quarters and Utilities Platform (QU platform) and the ‘trestle’ which is a walkway, boat landing and berthing facility running between the QU
platform and the FLNG and LNG carrier. The gas from the FPSO arrives at the FLNG via one riser platform, which provides pigging, isolation and potential future take-off points.
Figure 1-2 shows the expected layout of the Near Shore Hub and Figure 1-3 shows the expected layout of the FPSO. The FPSO is located approximately 40km to the West of the Hub.
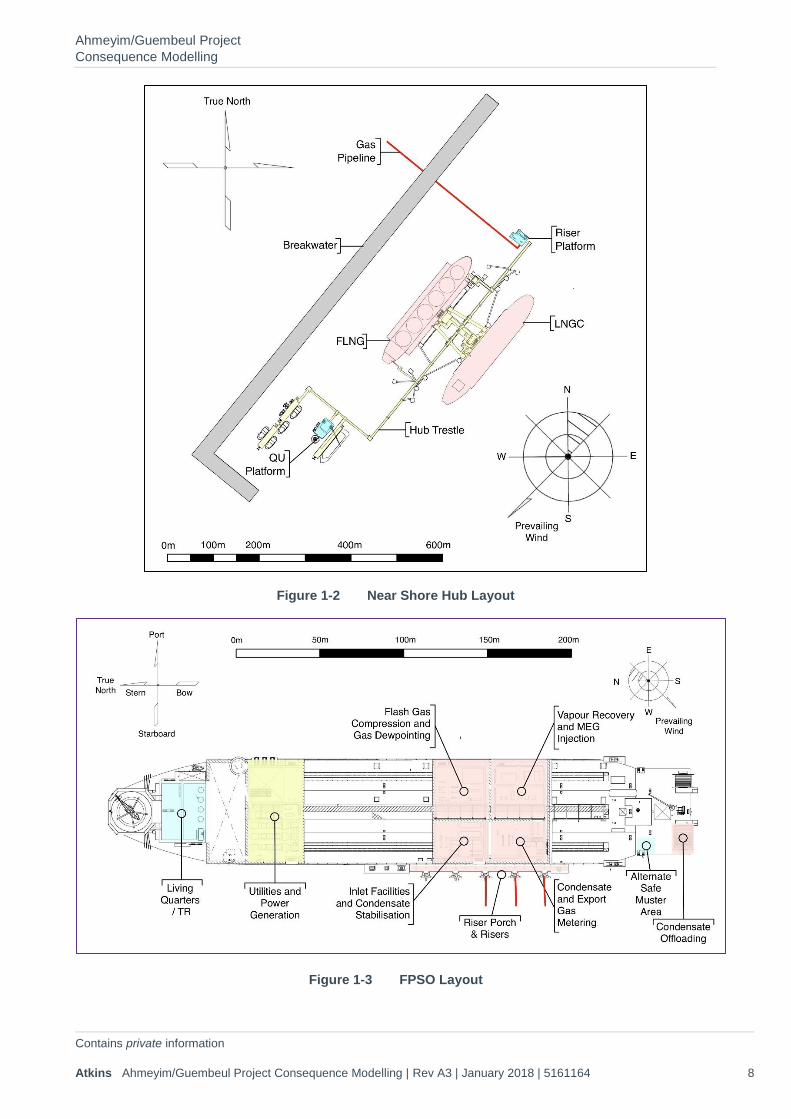
Ahmeyim/Guembeul Project Consequence Modelling
Contains private information Atkins Ahmeyim/Guembeul Project Consequence Modelling | Rev A3 | January 2018 | 5161164 8
Figure 1-2 Near Shore Hub Layout
Figure 1-3 FPSO Layout
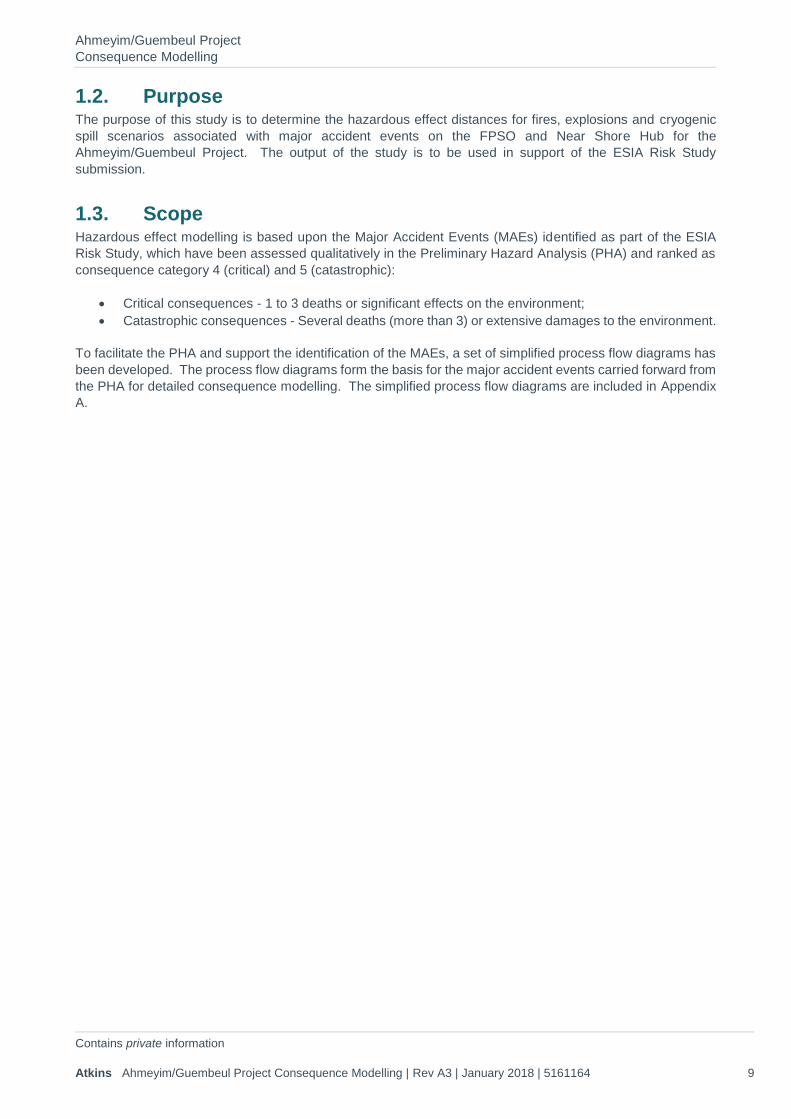
Ahmeyim/Guembeul Project Consequence Modelling
Contains private information Atkins Ahmeyim/Guembeul Project Consequence Modelling | Rev A3 | January 2018 | 5161164 9
1.2. Purpose The purpose of this study is to determine the hazardous effect distances for fires, explosions and cryogenic spill scenarios associated with major accident events on the FPSO and Near Shore Hub for the Ahmeyim/Guembeul Project. The output of the study is to be used in support of the ESIA Risk Study submission.
1.3. Scope Hazardous effect modelling is based upon the Major Accident Events (MAEs) identified as part of the ESIA Risk Study, which have been assessed qualitatively in the Preliminary Hazard Analysis (PHA) and ranked as consequence category 4 (critical) and 5 (catastrophic):
• Critical consequences - 1 to 3 deaths or significant effects on the environment; • Catastrophic consequences - Several deaths (more than 3) or extensive damages to the environment.
To facilitate the PHA and support the identification of the MAEs, a set of simplified process flow diagrams has been developed. The process flow diagrams form the basis for the major accident events carried forward from the PHA for detailed consequence modelling. The simplified process flow diagrams are included in Appendix A.
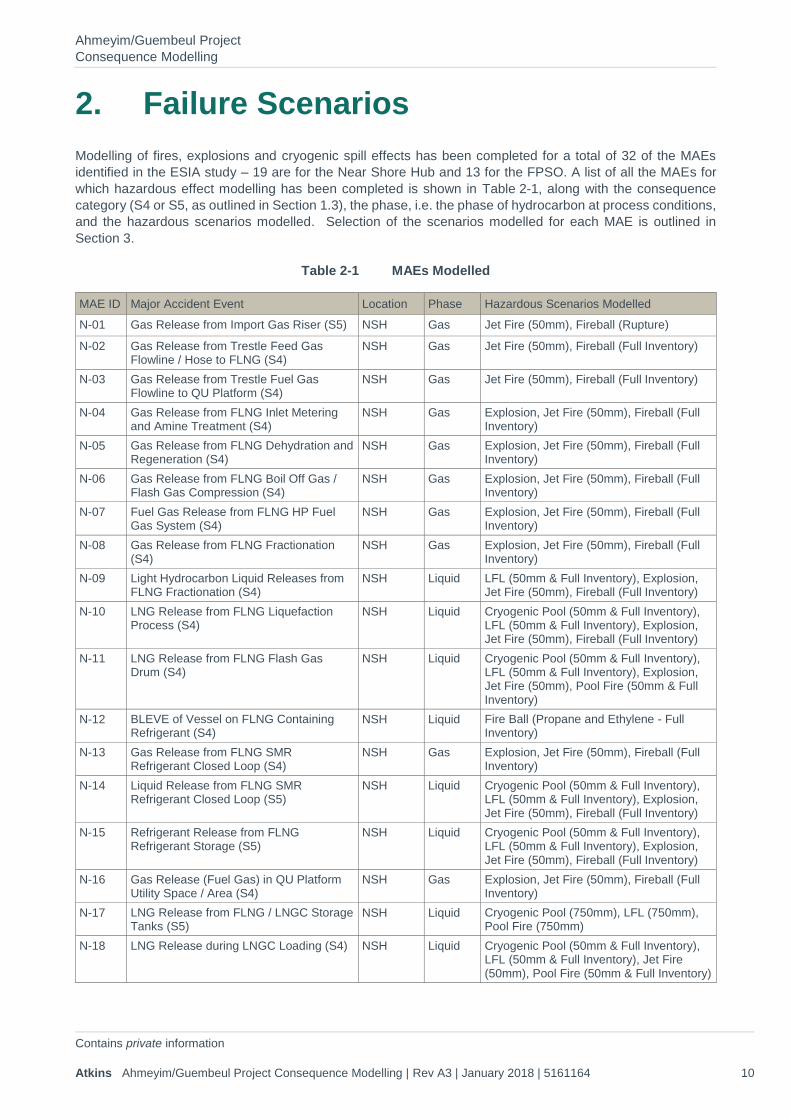
Ahmeyim/Guembeul Project Consequence Modelling
Contains private information Atkins Ahmeyim/Guembeul Project Consequence Modelling | Rev A3 | January 2018 | 5161164 10
2. Failure Scenarios Modelling of fires, explosions and cryogenic spill effects has been completed for a total of 32 of the MAEs identified in the ESIA study – 19 are for the Near Shore Hub and 13 for the FPSO. A list of all the MAEs for which hazardous effect modelling has been completed is shown in Table 2-1, along with the consequence category (S4 or S5, as outlined in Section 1.3), the phase, i.e. the phase of hydrocarbon at process conditions, and the hazardous scenarios modelled. Selection of the scenarios modelled for each MAE is outlined in Section 3.
Table 2-1 MAEs Modelled
MAE ID Major Accident Event Location Phase Hazardous Scenarios Modelled
N-01 Gas Release from Import Gas Riser (S5) NSH Gas Jet Fire (50mm), Fireball (Rupture)
N-02 Gas Release from Trestle Feed Gas Flowline / Hose to FLNG (S4)
NSH Gas Jet Fire (50mm), Fireball (Full Inventory)
N-03 Gas Release from Trestle Fuel Gas Flowline to QU Platform (S4)
NSH Gas Jet Fire (50mm), Fireball (Full Inventory)
N-04 Gas Release from FLNG Inlet Metering and Amine Treatment (S4)
NSH Gas Explosion, Jet Fire (50mm), Fireball (Full Inventory)
N-05 Gas Release from FLNG Dehydration and Regeneration (S4)
NSH Gas Explosion, Jet Fire (50mm), Fireball (Full Inventory)
N-06 Gas Release from FLNG Boil Off Gas / Flash Gas Compression (S4)
NSH Gas Explosion, Jet Fire (50mm), Fireball (Full Inventory)
N-07 Fuel Gas Release from FLNG HP Fuel Gas System (S4)
NSH Gas Explosion, Jet Fire (50mm), Fireball (Full Inventory)
N-08 Gas Release from FLNG Fractionation (S4)
NSH Gas Explosion, Jet Fire (50mm), Fireball (Full Inventory)
N-09 Light Hydrocarbon Liquid Releases from FLNG Fractionation (S4)
NSH Liquid LFL (50mm & Full Inventory), Explosion, Jet Fire (50mm), Fireball (Full Inventory)
N-10 LNG Release from FLNG Liquefaction Process (S4)
NSH Liquid Cryogenic Pool (50mm & Full Inventory), LFL (50mm & Full Inventory), Explosion, Jet Fire (50mm), Fireball (Full Inventory)
N-11 LNG Release from FLNG Flash Gas Drum (S4)
NSH Liquid Cryogenic Pool (50mm & Full Inventory), LFL (50mm & Full Inventory), Explosion, Jet Fire (50mm), Pool Fire (50mm & Full Inventory)
N-12 BLEVE of Vessel on FLNG Containing Refrigerant (S4)
NSH Liquid Fire Ball (Propane and Ethylene - Full Inventory)
N-13 Gas Release from FLNG SMR Refrigerant Closed Loop (S4)
NSH Gas Explosion, Jet Fire (50mm), Fireball (Full Inventory)
N-14 Liquid Release from FLNG SMR Refrigerant Closed Loop (S5)
NSH Liquid Cryogenic Pool (50mm & Full Inventory), LFL (50mm & Full Inventory), Explosion, Jet Fire (50mm), Fireball (Full Inventory)
N-15 Refrigerant Release from FLNG Refrigerant Storage (S5)
NSH Liquid Cryogenic Pool (50mm & Full Inventory), LFL (50mm & Full Inventory), Explosion, Jet Fire (50mm), Fireball (Full Inventory)
N-16 Gas Release (Fuel Gas) in QU Platform Utility Space / Area (S4)
NSH Gas Explosion, Jet Fire (50mm), Fireball (Full Inventory)
N-17 LNG Release from FLNG / LNGC Storage Tanks (S5)
NSH Liquid Cryogenic Pool (750mm), LFL (750mm), Pool Fire (750mm)
N-18 LNG Release during LNGC Loading (S4) NSH Liquid Cryogenic Pool (50mm & Full Inventory), LFL (50mm & Full Inventory), Jet Fire (50mm), Pool Fire (50mm & Full Inventory)
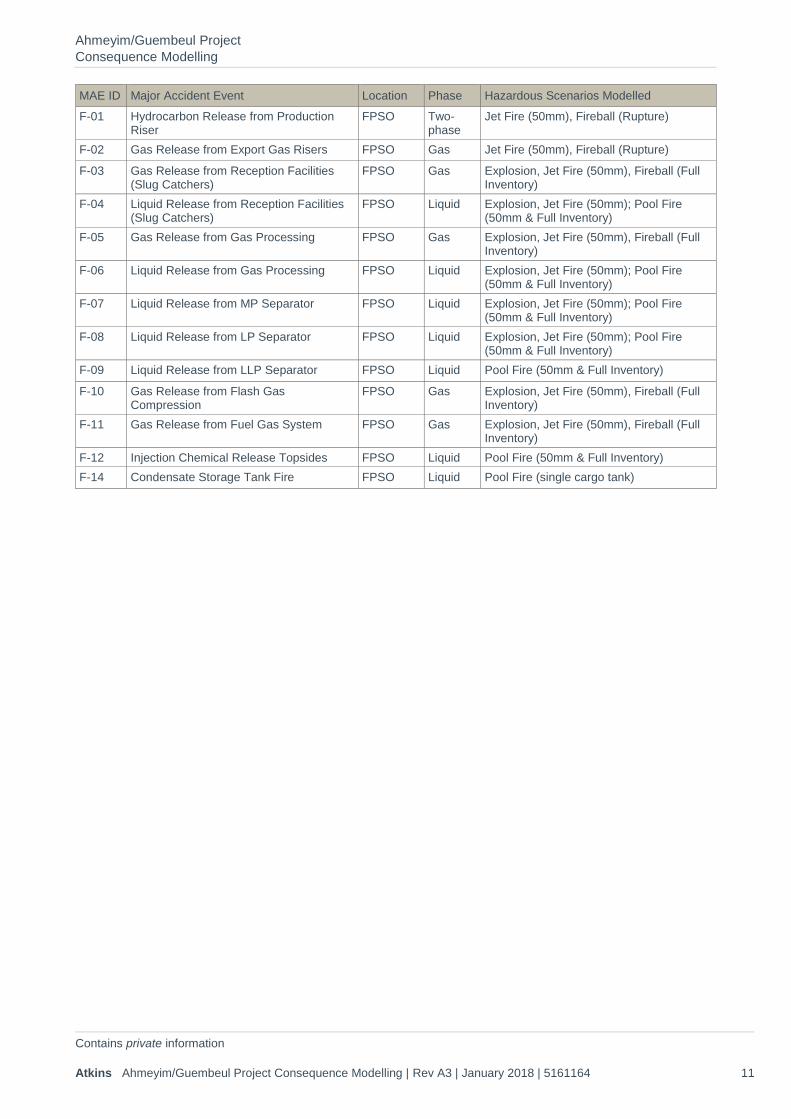
Ahmeyim/Guembeul Project Consequence Modelling
Contains private information Atkins Ahmeyim/Guembeul Project Consequence Modelling | Rev A3 | January 2018 | 5161164 11
MAE ID Major Accident Event Location Phase Hazardous Scenarios Modelled
F-01 Hydrocarbon Release from Production Riser
FPSO Two-phase
Jet Fire (50mm), Fireball (Rupture)
F-02 Gas Release from Export Gas Risers FPSO Gas Jet Fire (50mm), Fireball (Rupture)
F-03 Gas Release from Reception Facilities (Slug Catchers)
FPSO Gas Explosion, Jet Fire (50mm), Fireball (Full Inventory)
F-04 Liquid Release from Reception Facilities (Slug Catchers)
FPSO Liquid Explosion, Jet Fire (50mm); Pool Fire (50mm & Full Inventory)
F-05 Gas Release from Gas Processing FPSO Gas Explosion, Jet Fire (50mm), Fireball (Full Inventory)
F-06 Liquid Release from Gas Processing FPSO Liquid Explosion, Jet Fire (50mm); Pool Fire (50mm & Full Inventory)
F-07 Liquid Release from MP Separator FPSO Liquid Explosion, Jet Fire (50mm); Pool Fire (50mm & Full Inventory)
F-08 Liquid Release from LP Separator FPSO Liquid Explosion, Jet Fire (50mm); Pool Fire (50mm & Full Inventory)
F-09 Liquid Release from LLP Separator FPSO Liquid Pool Fire (50mm & Full Inventory)
F-10 Gas Release from Flash Gas Compression
FPSO Gas Explosion, Jet Fire (50mm), Fireball (Full Inventory)
F-11 Gas Release from Fuel Gas System FPSO Gas Explosion, Jet Fire (50mm), Fireball (Full Inventory)
F-12 Injection Chemical Release Topsides FPSO Liquid Pool Fire (50mm & Full Inventory) F-14 Condensate Storage Tank Fire FPSO Liquid Pool Fire (single cargo tank)
Ahmeyim/Guembeul Project Consequence Modelling
Contains private information Atkins Ahmeyim/Guembeul Project Consequence Modelling | Rev A3 | January 2018 | 5161164 12
3. Modelling Basis Modelling of hazardous effects from fires and explosions associated with the MAEs identified in Section 2 has been completed using the PHAST software package from DNV. Apart from where noted in the assumptions below, PHAST modelling is aligned with BP’s agreed approach or using default PHAST parameters.
3.1. Inventory Size and Operating Conditions Fire, gas dispersion and explosion modelling is completed for each of the MAEs using input data for system pressure, temperature, composition etc. and an estimate of the mass that could be released or involved in a fire or explosion. The mass involved for each of the topsides and the cargo tank MAEs has been approximated by using the isolated mass within each MAE section while for the pipeline and loading arm MAEs the mass released prior to isolation is also considered.
For MAEs on the Near Shore Hub the isolated section mass, plus the operating conditions (pressure, temperature, composition etc.), are mostly taken from BP Major Accident Risk (MAR) study with the following exceptions (for these cases inventory data is not available in MAR study and hence the inputs are based on Atkins previous project experience).
• Volume and operating conditions for fractionator and associated reflux conditioner, reflux drum and fractionation reboiler (MAE N-08 and N-09)
• Volume and operating conditions for LNG stream in main cryogenic heat exchanger (MAE N-10) • Volume and operating conditions for gas side of Single Mixed Refrigerant (SMR) refrigerant loop (MAE
N-13) • Volume and operating conditions for LNG offloading (MAE N-18)
For MAEs on the FPSO the isolated section mass is calculated by considering volumes contained in major vessels plus supporting pipework. Vessel dimensions taken from the Major Equipment List (MEL). The operating pressure, temperature and composition for MAEs on the FPSO are taken from the ‘Heat and Material
Balance Phase 1A’ [Ref 1] with the most representative stream selected for consequence modelling calculations.
3.2. Failure Sizes Two release sizes are modelled – a representative breach of 50mm and a credible worst case failure. The failures have been modelled as follows:
Gas and Two-Phase Process Inventories Gas and two-phase process inventories are modelled as a 50mm release and an instantaneous failure with release of the full MAE inventory.
Liquid and Sub-Cooled Liquid Process Inventories Liquid and sub-cooled liquid process inventories are modelled as a 50mm breach and a release of the largest liquid vessel inventory over a 60 second period – modelled in PHAST as a spill.
Pipelines and Risers Pipeline and risers are modelled as a 50mm failure and a full-bore rupture based on the internal diameter of the line.
Cargo Storage Tanks The following approaches for failure of a cargo storage tank are considered:
• ACDS 1991 [Ref 2]: For gas carriers, one whole tank released in 300 seconds.
Ahmeyim/Guembeul Project Consequence Modelling
Contains private information Atkins Ahmeyim/Guembeul Project Consequence Modelling | Rev A3 | January 2018 | 5161164 13
• Pitblado et al 2004 [Ref 3]: 750mm hole (maximum credible hole from accidental operational events), release of one cargo tank. Note: a maximum hole size of 1500mm is quoted but this is for intentional impacts, e.g. terrorist activity, and is not considered relevant for this study.
• SANDIA 2004 4: 0.5 to 1m2 effective breach size, release of one cargo tank. This references the Pitblado et al paper [Ref 3]: as the source for the breach area.
• TNO: Release of 180m3 over 1800 seconds (see Table 3.20 in [Ref. 5]).
The Pitblado paper [Ref 3]: is considered most appropriate for this study based on the type of impacts that are possible and so cargo storage tank failures are modelled as a breach of 750 mm with the entire contents of one tank released.
Loading Arms Loading arms are modelled as a 50mm failure and a rupture of a single loading arm with one minute of outflow.
3.3. Meteorological Conditions Wind Speed and Stability Class Modelling of fires and gas dispersion is completed for two representative wind speeds – an average wind speed and a low wind speed.
Atmospheric stability is influenced by temperature differences between the ground or sea and the air; when the ground heats up by the sun during the day, this leads to unstable conditions (Pasquill classes A, B, C). Conversely, during still nights with clear skies, the ground can cool sufficiently (due to radiation back into space), to create stable conditions (Pasquill stability class F). When the ground and the air are at the same temperature, conditions are neutral. Also, when the wind is more than 2m/s, this introduces added turbulence which means that even F conditions can be assumed neutral. Sea surface temperatures do not change in the same way as the ground, and therefore conditions over the sea can be assumed as neutral always. On this basis, Pasquill stability class D (neutral) is typically assumed in all cases during day time or night time, regardless of wind speed.
The two representative conditions are therefore as follows:
• D2; this category is chosen to represent low wind speed conditions: wind speed taken as 2 m/s with neutral stability class
• D5; this category is chosen to represent the average conditions: mean wind speed approximated as 5 m/s with neutral stability class
Sea Temperature The average temperatures for deeper water are considered most appropriate – these range from 15.9ºC in February to 25.3ºC in September. A sea temperature of 17ºC is chosen as representative for the PHAST modelling.
Air Temperature The average minimum is 16.4ºC in December and the average maximum is 33.7ºC in October. An air temperature of 20ºC is used as representative.
Ahmeyim/Guembeul Project Consequence Modelling
Contains private information Atkins Ahmeyim/Guembeul Project Consequence Modelling | Rev A3 | January 2018 | 5161164 14
3.4. Fires
3.4.1. Jet Fires Jet fires are modelled for gas, flashing liquid and liquid spray releases associated with a 50mm breach with potential for liquid releases to flash or form a spray based on the following rule-set:
• Condensate and other lighter components are assumed to flash on release or generate a spray at pressures above 4 barg.
Jet fires are orientated horizontally to give the worst extent hazard range (note: this differs from typical BP approach which is to model these at 45 degrees to the horizontal).
Impact from jet fires due to thermal radiation is based on the hazard levels defined in the Senegal Risk Study Guide [Ref 6]. These are shown in Table 3-1 below.
Table 3-1 Thermal Radiation Hazard Levels
Criteria Impact 3 kW/m2 Threshold of significant injury (blisters in 30s for unprotected persons)
5 kW/m2 Threshold of first lethal effects, threshold of destruction of windows by thermal effect
10 kW/m2 Threshold of very significant lethal effects, third-degree burns, domino effect, risk of fire for combustible material
20 kW/m2 Destruction or breaking of structural elements, concrete holds for some hours
3.4.2. Pool Fires Pool fires are modelled for all non-flashing liquid scenarios and for liquid releases which have potential to form a spray – these are also considered since a pool may be formed if the spray is directed vertically downwards.
For continuous releases (50mm and full-bore ruptures) the ‘early’ pool fire model within PHAST is used – i.e. the extent of the pool is determined by the equilibrium of the spill rate into the pool and the burn rate of the fire.
For releases on the FPSO or FLNG the maximum extent of a pool is initially limited to an area of 50m x 50m – this is considered representative of coaming arrangements restricting extensive spreading of a release on the topsides. However, coaming will not fully contain hydrocarbon liquids from catastrophic failures or full bore ruptures associated with the largest inventories. For releases spreading beyond a pool size of 50m x 50m, it is expected that hydrocarbon will spill overboard. The primary concern for these releases is from topsides pool fires and so impact from the overboard spill is not included in the analysis. For releases onto the sea (loading arm failures, risers etc.) no cap is included – pools are considered to spread to a maximum extent without restriction.
Impact from pool fires due to thermal radiation is based on the hazard levels defined in the Senegal Risk Study Guide. These are shown in Table 3-1 above.
3.4.3. Fireballs Fireballs are modelled for all credible worst case failures associated with a gas inventories and for liquid process inventories where most of the material will flash in the event of a catastrophic rupture. For pipeline and riser releases, the flammable mass involved in the fireball is approximated as the released mass in the first 45 seconds following a full-bore rupture.
Impact from fireballs due to thermal dose is based on the hazard levels defined in the Senegal Risk Study Guide and shown in Table 3-2 below, with thermal dose taken at an elevation of 0m.
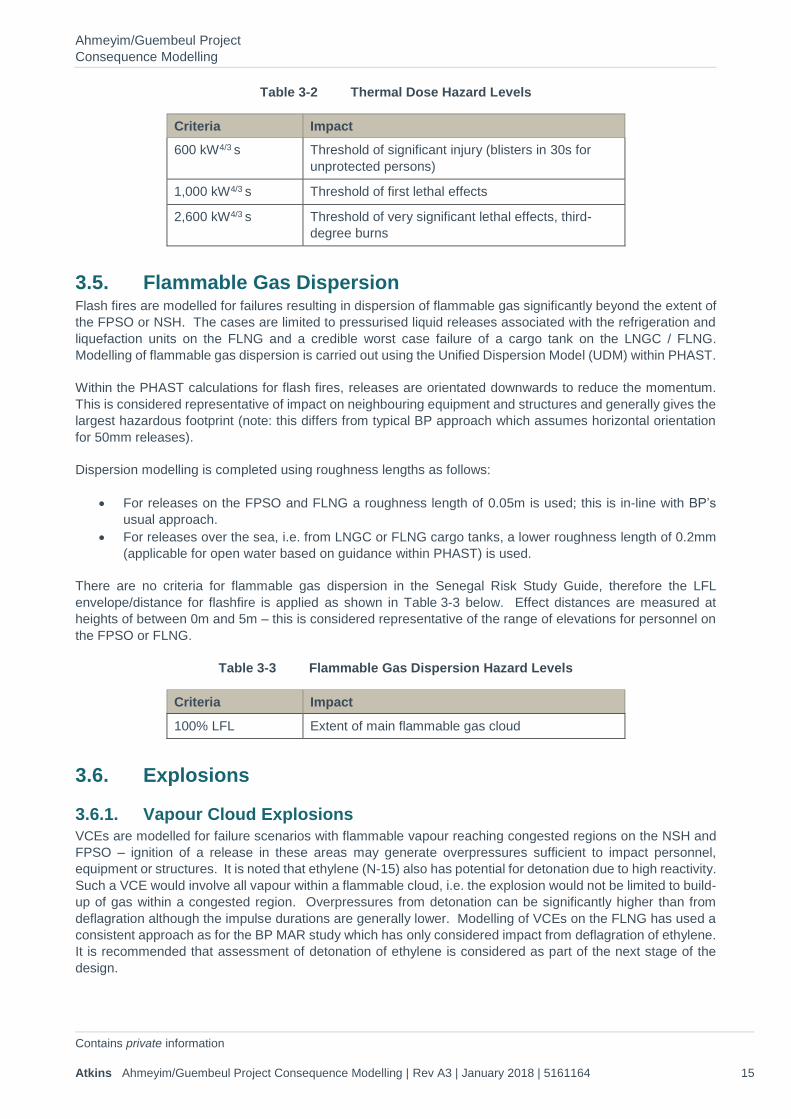
Ahmeyim/Guembeul Project Consequence Modelling
Contains private information Atkins Ahmeyim/Guembeul Project Consequence Modelling | Rev A3 | January 2018 | 5161164 15
Table 3-2 Thermal Dose Hazard Levels
Criteria Impact 600 kW4/3 s Threshold of significant injury (blisters in 30s for
unprotected persons)
1,000 kW4/3 s Threshold of first lethal effects
2,600 kW4/3 s Threshold of very significant lethal effects, third-degree burns
3.5. Flammable Gas Dispersion Flash fires are modelled for failures resulting in dispersion of flammable gas significantly beyond the extent of the FPSO or NSH. The cases are limited to pressurised liquid releases associated with the refrigeration and liquefaction units on the FLNG and a credible worst case failure of a cargo tank on the LNGC / FLNG. Modelling of flammable gas dispersion is carried out using the Unified Dispersion Model (UDM) within PHAST.
Within the PHAST calculations for flash fires, releases are orientated downwards to reduce the momentum. This is considered representative of impact on neighbouring equipment and structures and generally gives the largest hazardous footprint (note: this differs from typical BP approach which assumes horizontal orientation for 50mm releases).
Dispersion modelling is completed using roughness lengths as follows:
• For releases on the FPSO and FLNG a roughness length of 0.05m is used; this is in-line with BP’s
usual approach. • For releases over the sea, i.e. from LNGC or FLNG cargo tanks, a lower roughness length of 0.2mm
(applicable for open water based on guidance within PHAST) is used.
There are no criteria for flammable gas dispersion in the Senegal Risk Study Guide, therefore the LFL envelope/distance for flashfire is applied as shown in Table 3-3 below. Effect distances are measured at heights of between 0m and 5m – this is considered representative of the range of elevations for personnel on the FPSO or FLNG.
Table 3-3 Flammable Gas Dispersion Hazard Levels
Criteria Impact
100% LFL Extent of main flammable gas cloud
3.6. Explosions
3.6.1. Vapour Cloud Explosions VCEs are modelled for failure scenarios with flammable vapour reaching congested regions on the NSH and FPSO – ignition of a release in these areas may generate overpressures sufficient to impact personnel, equipment or structures. It is noted that ethylene (N-15) also has potential for detonation due to high reactivity. Such a VCE would involve all vapour within a flammable cloud, i.e. the explosion would not be limited to build-up of gas within a congested region. Overpressures from detonation can be significantly higher than from deflagration although the impulse durations are generally lower. Modelling of VCEs on the FLNG has used a consistent approach as for the BP MAR study which has only considered impact from deflagration of ethylene. It is recommended that assessment of detonation of ethylene is considered as part of the next stage of the design.
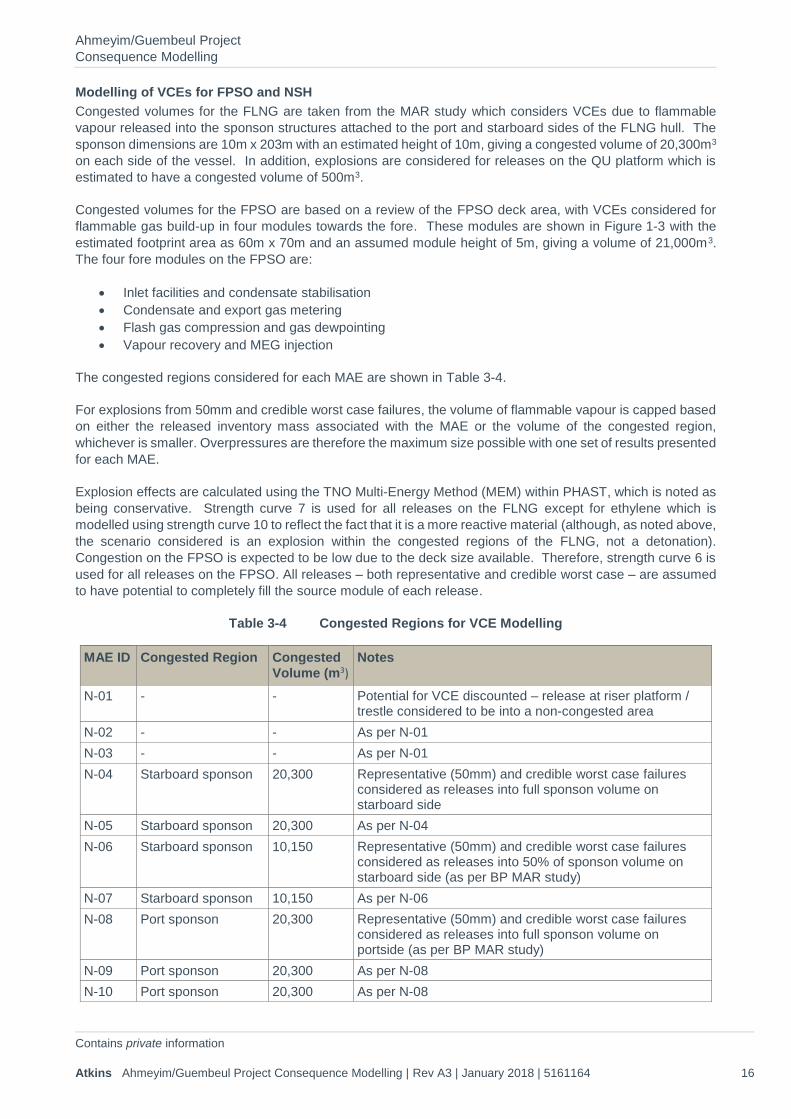
Ahmeyim/Guembeul Project Consequence Modelling
Contains private information Atkins Ahmeyim/Guembeul Project Consequence Modelling | Rev A3 | January 2018 | 5161164 16
Modelling of VCEs for FPSO and NSH Congested volumes for the FLNG are taken from the MAR study which considers VCEs due to flammable vapour released into the sponson structures attached to the port and starboard sides of the FLNG hull. The sponson dimensions are 10m x 203m with an estimated height of 10m, giving a congested volume of 20,300m3 on each side of the vessel. In addition, explosions are considered for releases on the QU platform which is estimated to have a congested volume of 500m3.
Congested volumes for the FPSO are based on a review of the FPSO deck area, with VCEs considered for flammable gas build-up in four modules towards the fore. These modules are shown in Figure 1-3 with the estimated footprint area as 60m x 70m and an assumed module height of 5m, giving a volume of 21,000m3. The four fore modules on the FPSO are:
• Inlet facilities and condensate stabilisation • Condensate and export gas metering • Flash gas compression and gas dewpointing • Vapour recovery and MEG injection
The congested regions considered for each MAE are shown in Table 3-4.
For explosions from 50mm and credible worst case failures, the volume of flammable vapour is capped based on either the released inventory mass associated with the MAE or the volume of the congested region, whichever is smaller. Overpressures are therefore the maximum size possible with one set of results presented for each MAE.
Explosion effects are calculated using the TNO Multi-Energy Method (MEM) within PHAST, which is noted as being conservative. Strength curve 7 is used for all releases on the FLNG except for ethylene which is modelled using strength curve 10 to reflect the fact that it is a more reactive material (although, as noted above, the scenario considered is an explosion within the congested regions of the FLNG, not a detonation). Congestion on the FPSO is expected to be low due to the deck size available. Therefore, strength curve 6 is used for all releases on the FPSO. All releases – both representative and credible worst case – are assumed to have potential to completely fill the source module of each release.
Table 3-4 Congested Regions for VCE Modelling
MAE ID Congested Region Congested Volume (m3)
Notes
N-01 - - Potential for VCE discounted – release at riser platform / trestle considered to be into a non-congested area
N-02 - - As per N-01 N-03 - - As per N-01 N-04 Starboard sponson 20,300 Representative (50mm) and credible worst case failures
considered as releases into full sponson volume on starboard side
N-05 Starboard sponson 20,300 As per N-04 N-06 Starboard sponson 10,150 Representative (50mm) and credible worst case failures
considered as releases into 50% of sponson volume on starboard side (as per BP MAR study)
N-07 Starboard sponson 10,150 As per N-06 N-08 Port sponson 20,300 Representative (50mm) and credible worst case failures
considered as releases into full sponson volume on portside (as per BP MAR study)
N-09 Port sponson 20,300 As per N-08 N-10 Port sponson 20,300 As per N-08
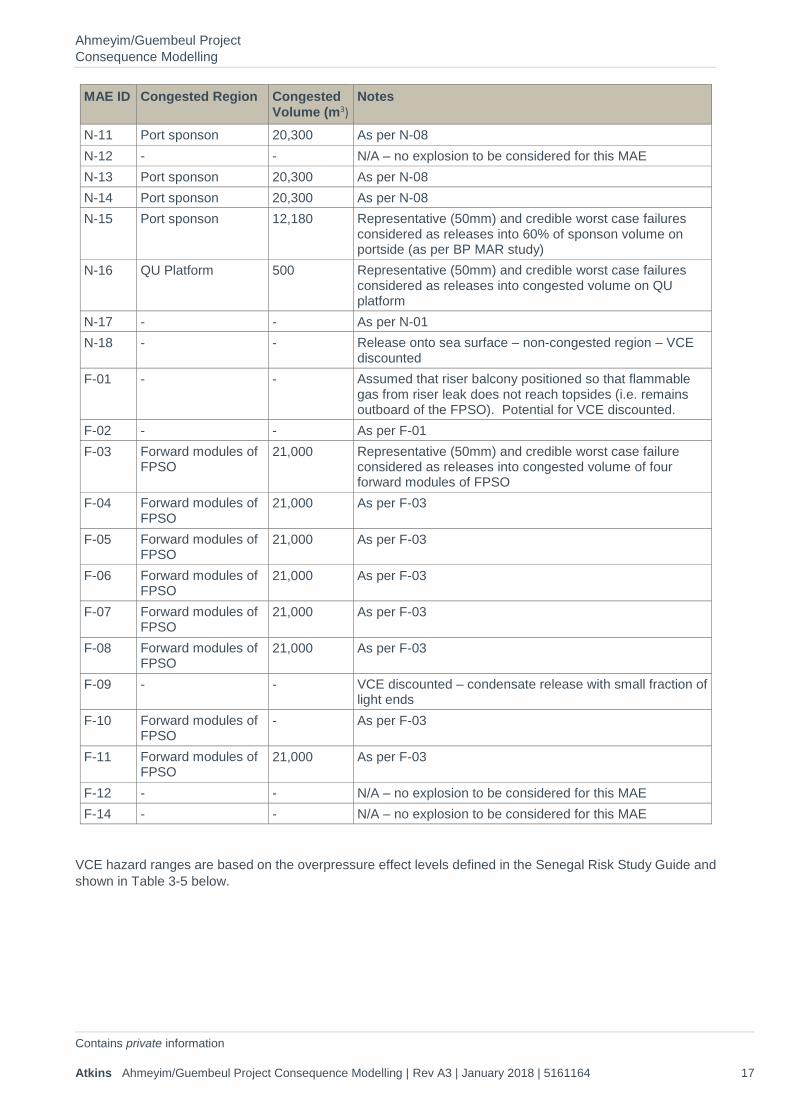
Ahmeyim/Guembeul Project Consequence Modelling
Contains private information Atkins Ahmeyim/Guembeul Project Consequence Modelling | Rev A3 | January 2018 | 5161164 17
MAE ID Congested Region Congested Volume (m3)
Notes
N-11 Port sponson 20,300 As per N-08 N-12 - - N/A – no explosion to be considered for this MAE N-13 Port sponson 20,300 As per N-08 N-14 Port sponson 20,300 As per N-08 N-15 Port sponson 12,180 Representative (50mm) and credible worst case failures
considered as releases into 60% of sponson volume on portside (as per BP MAR study)
N-16 QU Platform 500 Representative (50mm) and credible worst case failures considered as releases into congested volume on QU platform
N-17 - - As per N-01 N-18 - - Release onto sea surface – non-congested region – VCE
discounted F-01 - - Assumed that riser balcony positioned so that flammable
gas from riser leak does not reach topsides (i.e. remains outboard of the FPSO). Potential for VCE discounted.
F-02 - - As per F-01 F-03 Forward modules of
FPSO 21,000 Representative (50mm) and credible worst case failure
considered as releases into congested volume of four forward modules of FPSO
F-04 Forward modules of FPSO
21,000 As per F-03
F-05 Forward modules of FPSO
21,000 As per F-03
F-06 Forward modules of FPSO
21,000 As per F-03
F-07 Forward modules of FPSO
21,000 As per F-03
F-08 Forward modules of FPSO
21,000 As per F-03
F-09 - - VCE discounted – condensate release with small fraction of light ends
F-10 Forward modules of FPSO
- As per F-03
F-11 Forward modules of FPSO
21,000 As per F-03
F-12 - - N/A – no explosion to be considered for this MAE F-14 - - N/A – no explosion to be considered for this MAE
VCE hazard ranges are based on the overpressure effect levels defined in the Senegal Risk Study Guide and shown in Table 3-5 below.
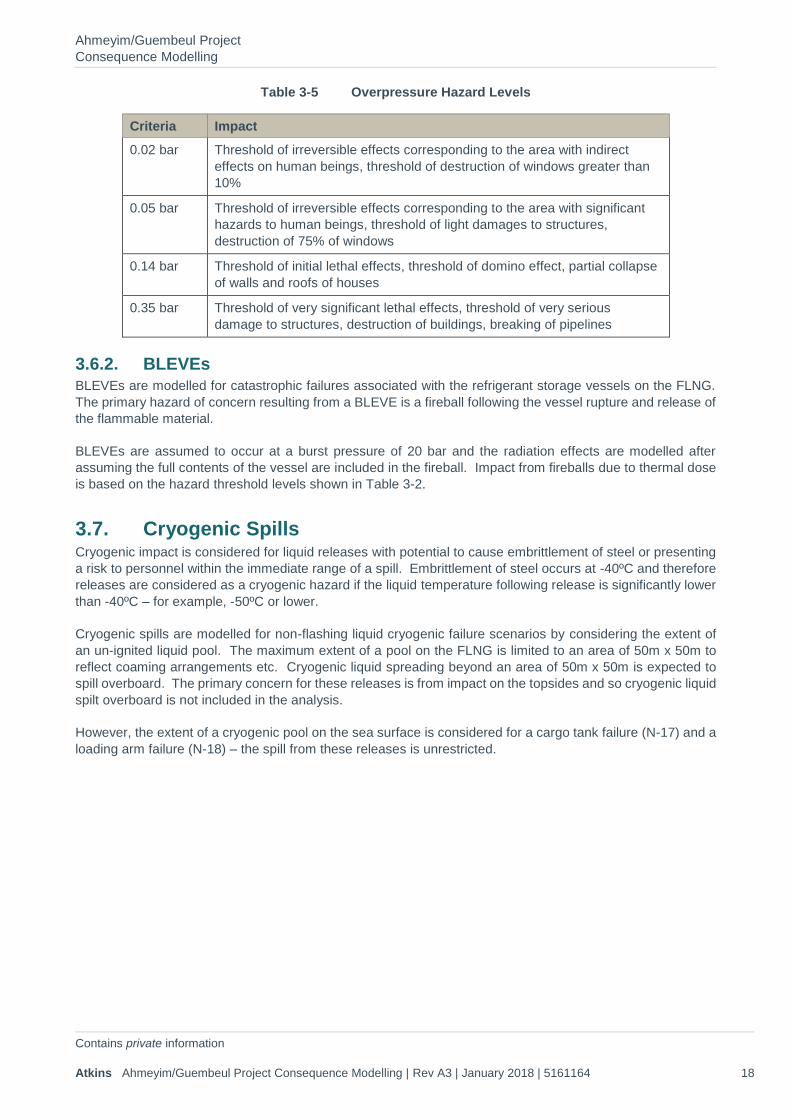
Ahmeyim/Guembeul Project Consequence Modelling
Contains private information Atkins Ahmeyim/Guembeul Project Consequence Modelling | Rev A3 | January 2018 | 5161164 18
Table 3-5 Overpressure Hazard Levels
Criteria Impact 0.02 bar Threshold of irreversible effects corresponding to the area with indirect
effects on human beings, threshold of destruction of windows greater than 10%
0.05 bar Threshold of irreversible effects corresponding to the area with significant hazards to human beings, threshold of light damages to structures, destruction of 75% of windows
0.14 bar Threshold of initial lethal effects, threshold of domino effect, partial collapse of walls and roofs of houses
0.35 bar Threshold of very significant lethal effects, threshold of very serious damage to structures, destruction of buildings, breaking of pipelines
3.6.2. BLEVEs BLEVEs are modelled for catastrophic failures associated with the refrigerant storage vessels on the FLNG. The primary hazard of concern resulting from a BLEVE is a fireball following the vessel rupture and release of the flammable material.
BLEVEs are assumed to occur at a burst pressure of 20 bar and the radiation effects are modelled after assuming the full contents of the vessel are included in the fireball. Impact from fireballs due to thermal dose is based on the hazard threshold levels shown in Table 3-2.
3.7. Cryogenic Spills Cryogenic impact is considered for liquid releases with potential to cause embrittlement of steel or presenting a risk to personnel within the immediate range of a spill. Embrittlement of steel occurs at -40ºC and therefore releases are considered as a cryogenic hazard if the liquid temperature following release is significantly lower than -40ºC – for example, -50ºC or lower.
Cryogenic spills are modelled for non-flashing liquid cryogenic failure scenarios by considering the extent of an un-ignited liquid pool. The maximum extent of a pool on the FLNG is limited to an area of 50m x 50m to reflect coaming arrangements etc. Cryogenic liquid spreading beyond an area of 50m x 50m is expected to spill overboard. The primary concern for these releases is from impact on the topsides and so cryogenic liquid spilt overboard is not included in the analysis.
However, the extent of a cryogenic pool on the sea surface is considered for a cargo tank failure (N-17) and a loading arm failure (N-18) – the spill from these releases is unrestricted.
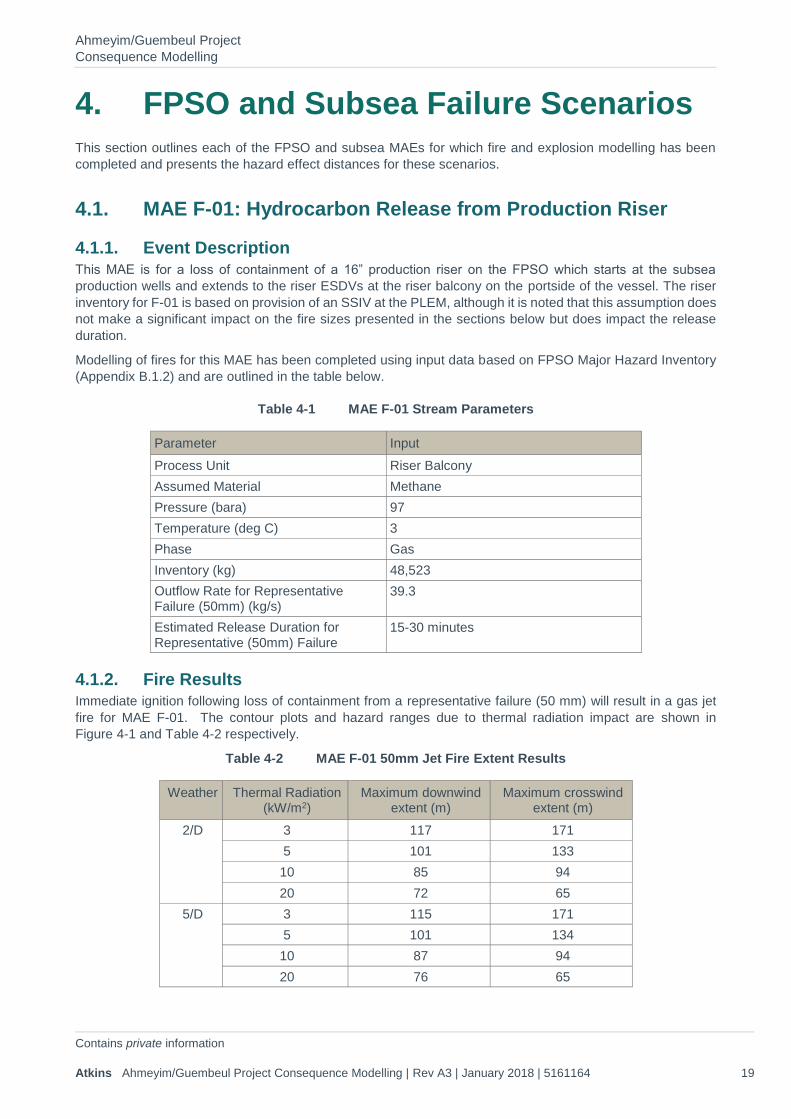
Ahmeyim/Guembeul Project Consequence Modelling
Contains private information Atkins Ahmeyim/Guembeul Project Consequence Modelling | Rev A3 | January 2018 | 5161164 19
4. FPSO and Subsea Failure Scenarios This section outlines each of the FPSO and subsea MAEs for which fire and explosion modelling has been completed and presents the hazard effect distances for these scenarios.
4.1. MAE F-01: Hydrocarbon Release from Production Riser
4.1.1. Event Description This MAE is for a loss of containment of a 16” production riser on the FPSO which starts at the subsea
production wells and extends to the riser ESDVs at the riser balcony on the portside of the vessel. The riser inventory for F-01 is based on provision of an SSIV at the PLEM, although it is noted that this assumption does not make a significant impact on the fire sizes presented in the sections below but does impact the release duration.
Modelling of fires for this MAE has been completed using input data based on FPSO Major Hazard Inventory (Appendix B.1.2) and are outlined in the table below.
Table 4-1 MAE F-01 Stream Parameters
Parameter Input Process Unit Riser Balcony Assumed Material Methane Pressure (bara) 97 Temperature (deg C) 3 Phase Gas Inventory (kg) 48,523 Outflow Rate for Representative Failure (50mm) (kg/s)
39.3
Estimated Release Duration for Representative (50mm) Failure
15-30 minutes
4.1.2. Fire Results Immediate ignition following loss of containment from a representative failure (50 mm) will result in a gas jet fire for MAE F-01. The contour plots and hazard ranges due to thermal radiation impact are shown in Figure 4-1 and Table 4-2 respectively.
Table 4-2 MAE F-01 50mm Jet Fire Extent Results
Weather Thermal Radiation (kW/m2)
Maximum downwind extent (m)
Maximum crosswind extent (m)
2/D 3 117 171 5 101 133 10 85 94 20 72 65
5/D 3 115 171 5 101 134 10 87 94 20 76 65
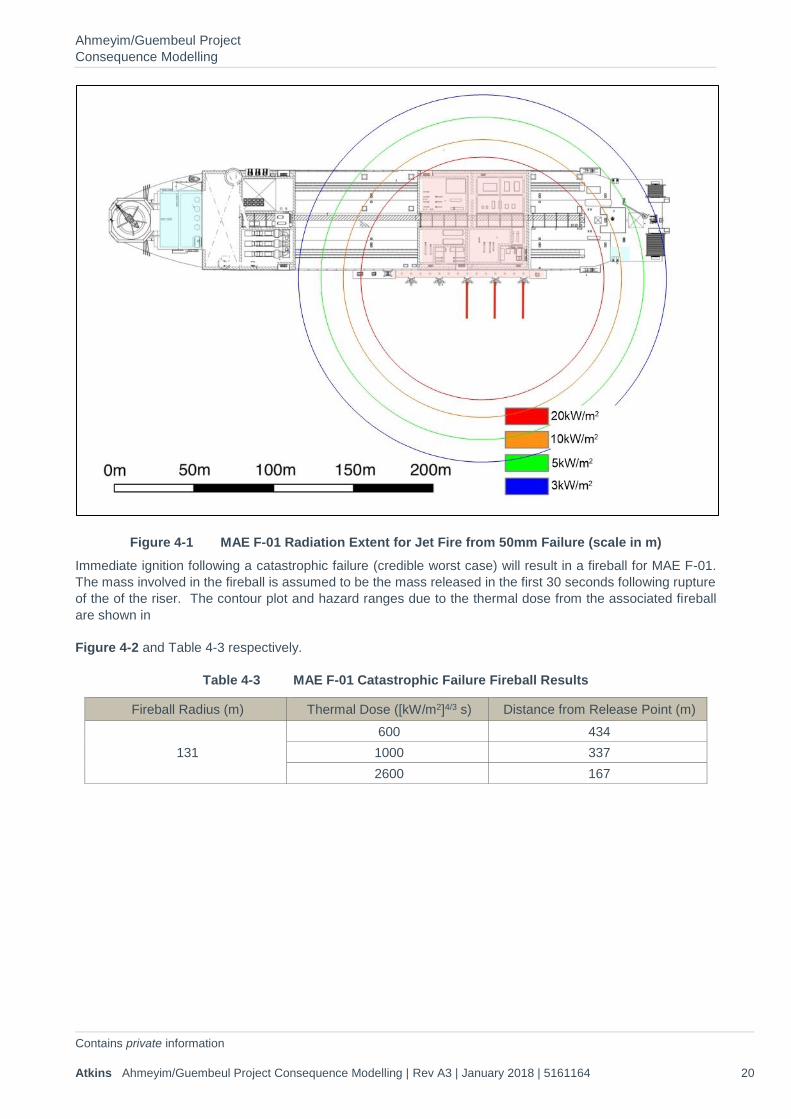
Ahmeyim/Guembeul Project Consequence Modelling
Contains private information Atkins Ahmeyim/Guembeul Project Consequence Modelling | Rev A3 | January 2018 | 5161164 20
Figure 4-1 MAE F-01 Radiation Extent for Jet Fire from 50mm Failure (scale in m) Immediate ignition following a catastrophic failure (credible worst case) will result in a fireball for MAE F-01. The mass involved in the fireball is assumed to be the mass released in the first 30 seconds following rupture of the of the riser. The contour plot and hazard ranges due to the thermal dose from the associated fireball are shown in
Figure 4-2 and Table 4-3 respectively.
Table 4-3 MAE F-01 Catastrophic Failure Fireball Results
Fireball Radius (m) Thermal Dose ([kW/m2]4/3 s) Distance from Release Point (m)
131 600 434 1000 337 2600 167
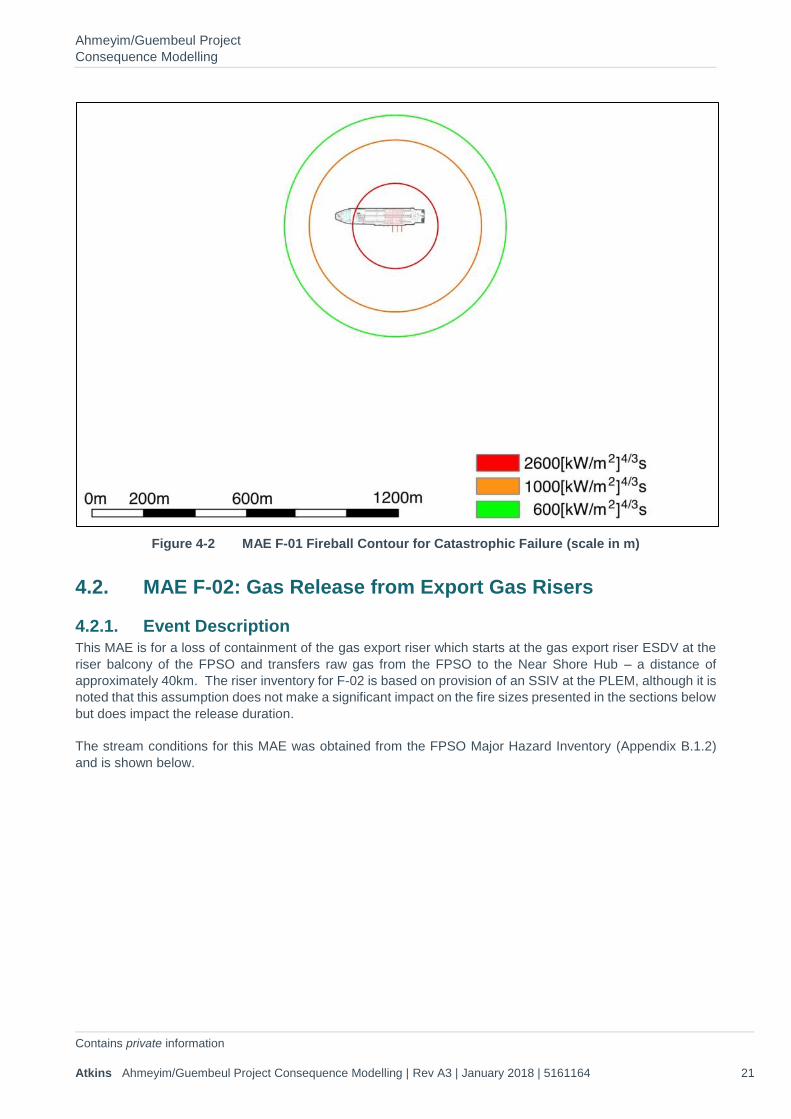
Ahmeyim/Guembeul Project Consequence Modelling
Contains private information Atkins Ahmeyim/Guembeul Project Consequence Modelling | Rev A3 | January 2018 | 5161164 21
Figure 4-2 MAE F-01 Fireball Contour for Catastrophic Failure (scale in m)
4.2. MAE F-02: Gas Release from Export Gas Risers
4.2.1. Event Description This MAE is for a loss of containment of the gas export riser which starts at the gas export riser ESDV at the riser balcony of the FPSO and transfers raw gas from the FPSO to the Near Shore Hub – a distance of approximately 40km. The riser inventory for F-02 is based on provision of an SSIV at the PLEM, although it is noted that this assumption does not make a significant impact on the fire sizes presented in the sections below but does impact the release duration.
The stream conditions for this MAE was obtained from the FPSO Major Hazard Inventory (Appendix B.1.2) and is shown below.
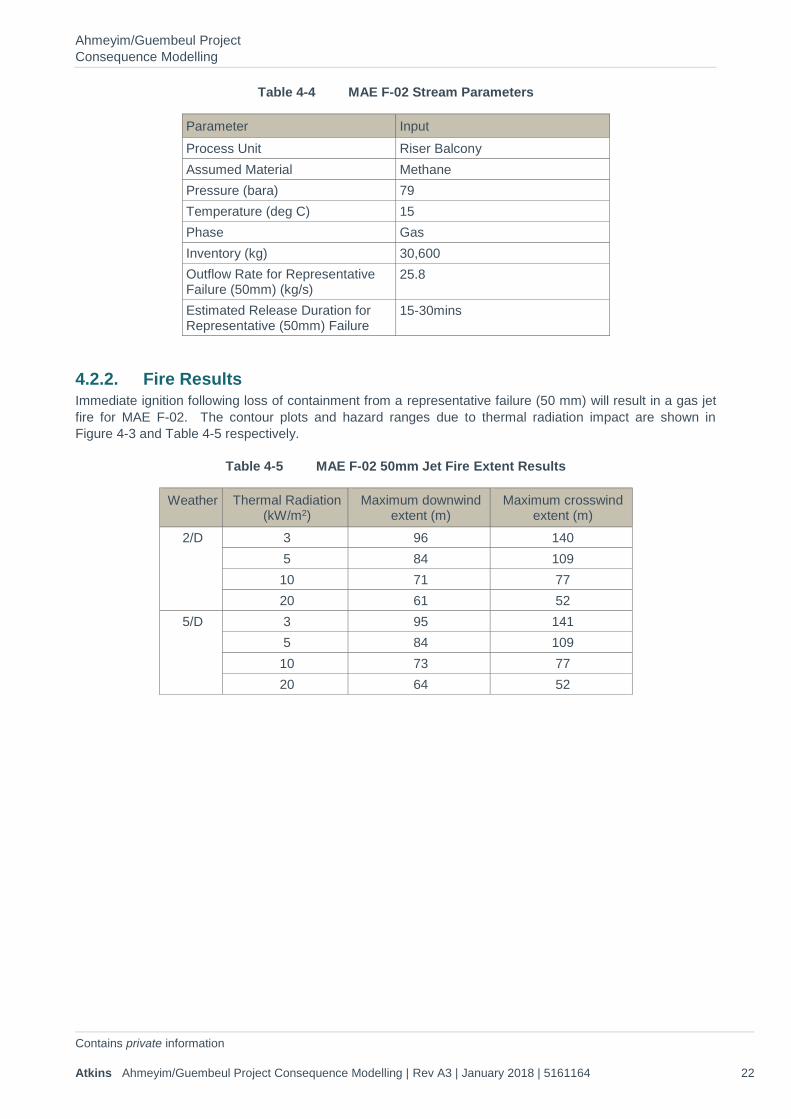
Ahmeyim/Guembeul Project Consequence Modelling
Contains private information Atkins Ahmeyim/Guembeul Project Consequence Modelling | Rev A3 | January 2018 | 5161164 22
Table 4-4 MAE F-02 Stream Parameters
Parameter Input Process Unit Riser Balcony Assumed Material Methane Pressure (bara) 79 Temperature (deg C) 15 Phase Gas Inventory (kg) 30,600 Outflow Rate for Representative Failure (50mm) (kg/s)
25.8
Estimated Release Duration for Representative (50mm) Failure
15-30mins
4.2.2. Fire Results Immediate ignition following loss of containment from a representative failure (50 mm) will result in a gas jet fire for MAE F-02. The contour plots and hazard ranges due to thermal radiation impact are shown in Figure 4-3 and Table 4-5 respectively.
Table 4-5 MAE F-02 50mm Jet Fire Extent Results
Weather Thermal Radiation (kW/m2)
Maximum downwind extent (m)
Maximum crosswind extent (m)
2/D 3 96 140 5 84 109 10 71 77 20 61 52
5/D 3 95 141 5 84 109 10 73 77 20 64 52
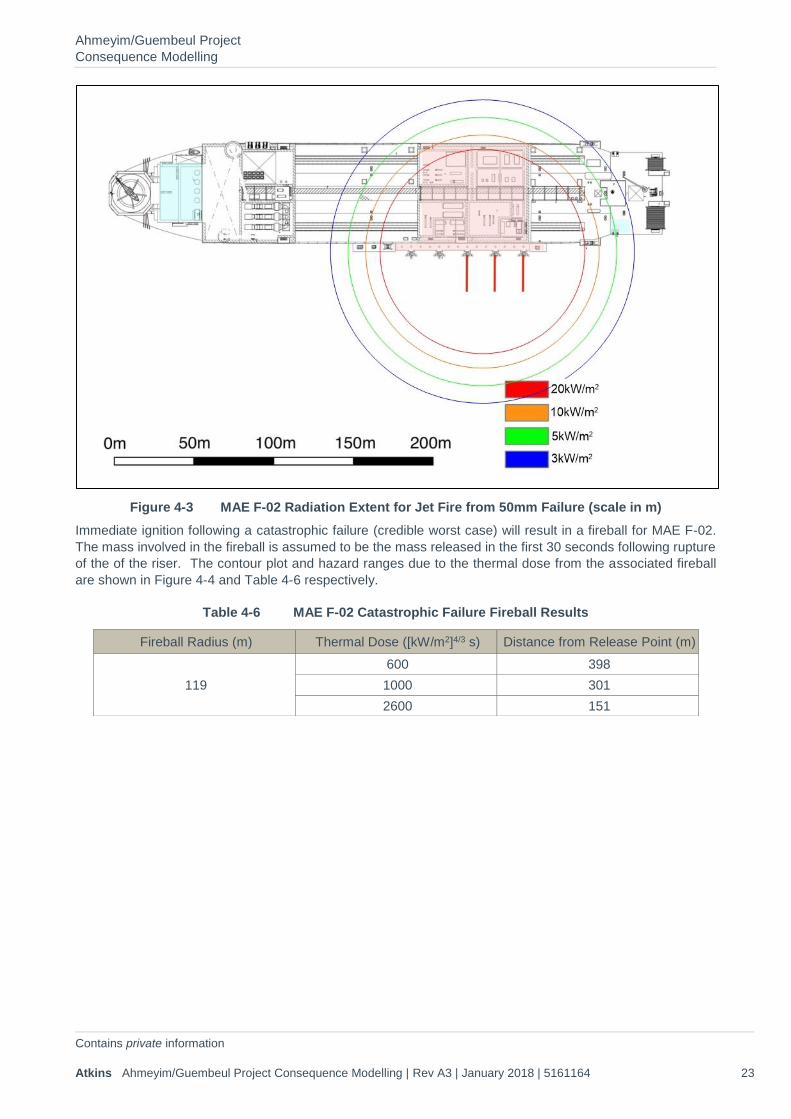
Ahmeyim/Guembeul Project Consequence Modelling
Contains private information Atkins Ahmeyim/Guembeul Project Consequence Modelling | Rev A3 | January 2018 | 5161164 23
Figure 4-3 MAE F-02 Radiation Extent for Jet Fire from 50mm Failure (scale in m)
Immediate ignition following a catastrophic failure (credible worst case) will result in a fireball for MAE F-02. The mass involved in the fireball is assumed to be the mass released in the first 30 seconds following rupture of the of the riser. The contour plot and hazard ranges due to the thermal dose from the associated fireball are shown in Figure 4-4 and Table 4-6 respectively.
Table 4-6 MAE F-02 Catastrophic Failure Fireball Results
Fireball Radius (m) Thermal Dose ([kW/m2]4/3 s) Distance from Release Point (m)
119 600 398 1000 301 2600 151
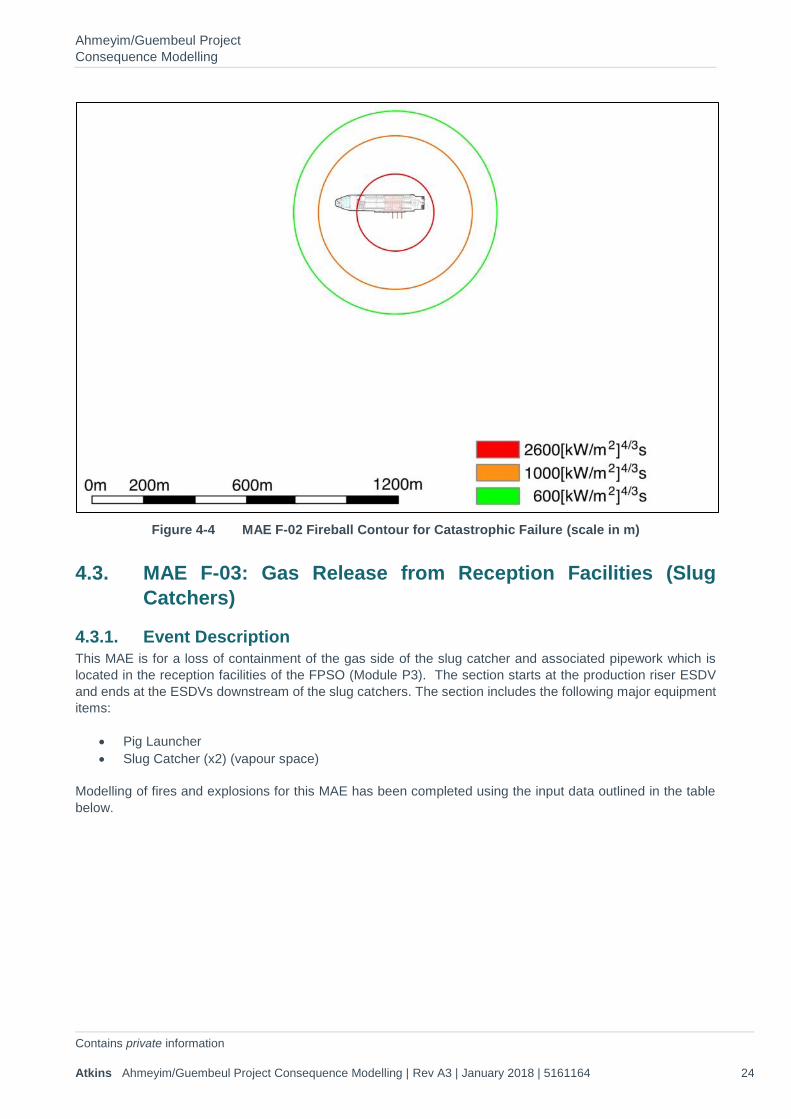
Ahmeyim/Guembeul Project Consequence Modelling
Contains private information Atkins Ahmeyim/Guembeul Project Consequence Modelling | Rev A3 | January 2018 | 5161164 24
Figure 4-4 MAE F-02 Fireball Contour for Catastrophic Failure (scale in m)
4.3. MAE F-03: Gas Release from Reception Facilities (Slug Catchers)
4.3.1. Event Description This MAE is for a loss of containment of the gas side of the slug catcher and associated pipework which is located in the reception facilities of the FPSO (Module P3). The section starts at the production riser ESDV and ends at the ESDVs downstream of the slug catchers. The section includes the following major equipment items:
• Pig Launcher • Slug Catcher (x2) (vapour space)
Modelling of fires and explosions for this MAE has been completed using the input data outlined in the table below.
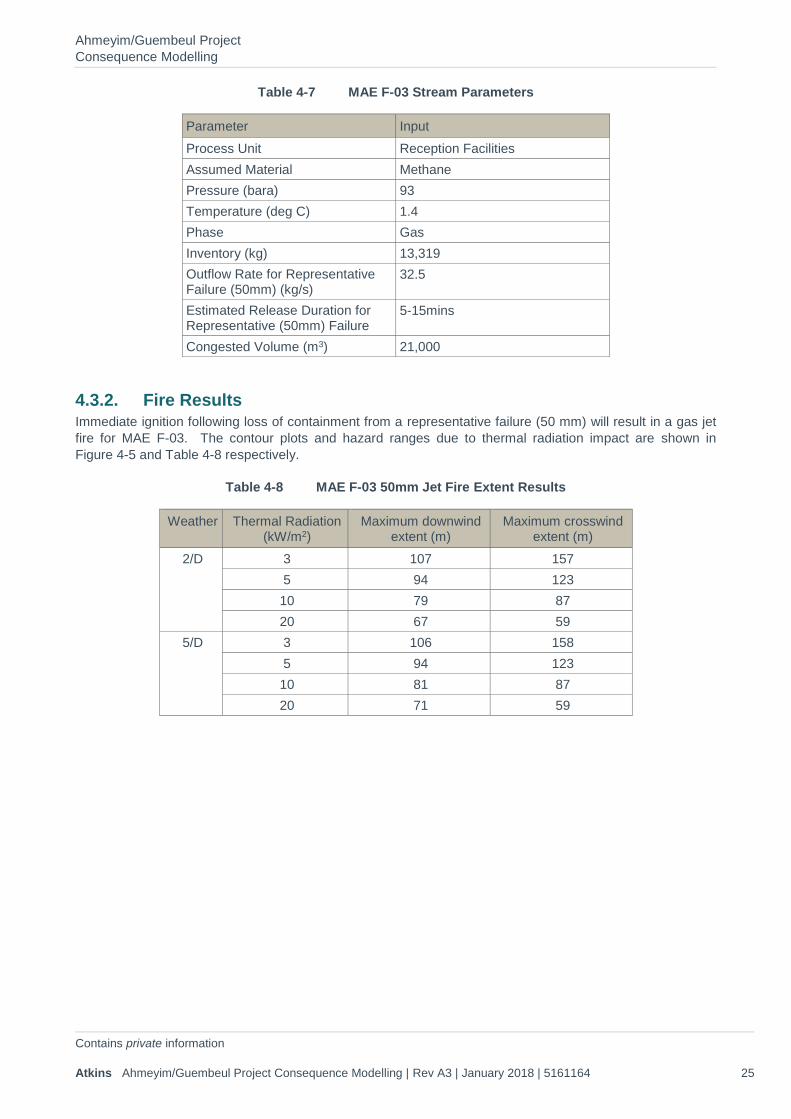
Ahmeyim/Guembeul Project Consequence Modelling
Contains private information Atkins Ahmeyim/Guembeul Project Consequence Modelling | Rev A3 | January 2018 | 5161164 25
Table 4-7 MAE F-03 Stream Parameters
Parameter Input Process Unit Reception Facilities Assumed Material Methane Pressure (bara) 93 Temperature (deg C) 1.4 Phase Gas Inventory (kg) 13,319 Outflow Rate for Representative Failure (50mm) (kg/s)
32.5
Estimated Release Duration for Representative (50mm) Failure
5-15mins
Congested Volume (m3) 21,000
4.3.2. Fire Results Immediate ignition following loss of containment from a representative failure (50 mm) will result in a gas jet fire for MAE F-03. The contour plots and hazard ranges due to thermal radiation impact are shown in Figure 4-5 and Table 4-8 respectively.
Table 4-8 MAE F-03 50mm Jet Fire Extent Results
Weather Thermal Radiation (kW/m2)
Maximum downwind extent (m)
Maximum crosswind extent (m)
2/D 3 107 157 5 94 123 10 79 87 20 67 59
5/D 3 106 158 5 94 123 10 81 87 20 71 59
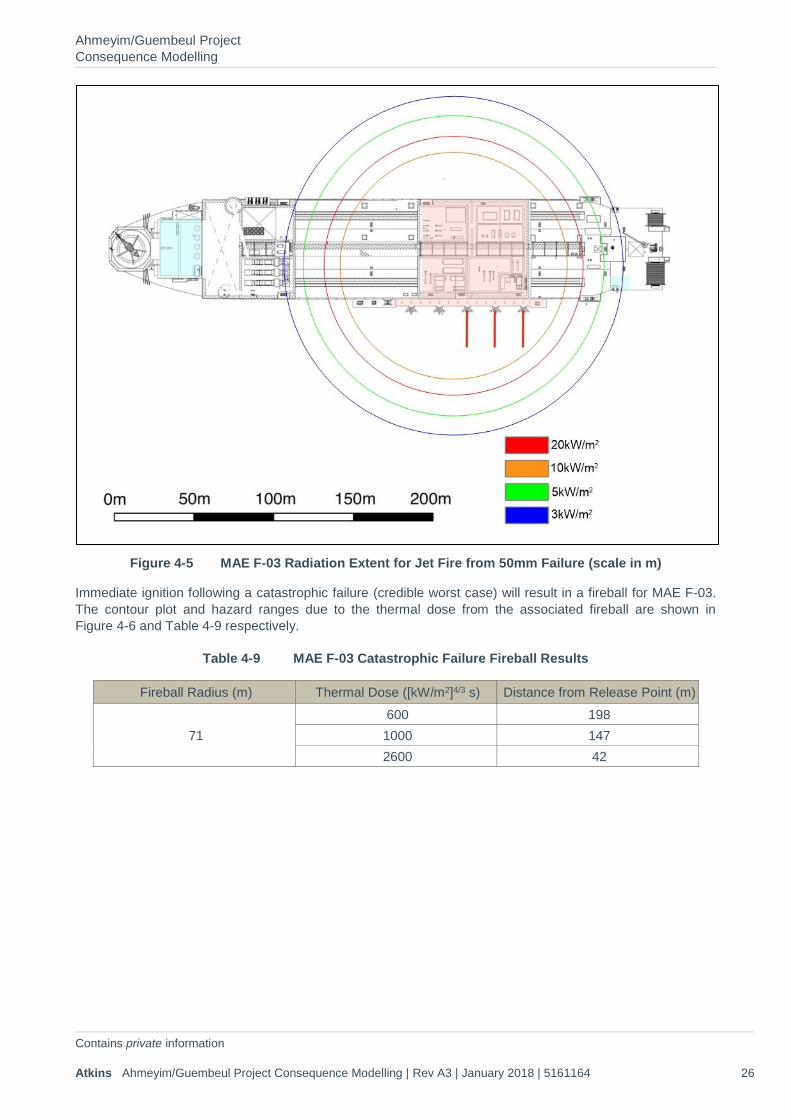
Ahmeyim/Guembeul Project Consequence Modelling
Contains private information Atkins Ahmeyim/Guembeul Project Consequence Modelling | Rev A3 | January 2018 | 5161164 26
Figure 4-5 MAE F-03 Radiation Extent for Jet Fire from 50mm Failure (scale in m)
Immediate ignition following a catastrophic failure (credible worst case) will result in a fireball for MAE F-03. The contour plot and hazard ranges due to the thermal dose from the associated fireball are shown in Figure 4-6 and Table 4-9 respectively.
Table 4-9 MAE F-03 Catastrophic Failure Fireball Results
Fireball Radius (m) Thermal Dose ([kW/m2]4/3 s) Distance from Release Point (m)
71 600 198 1000 147 2600 42
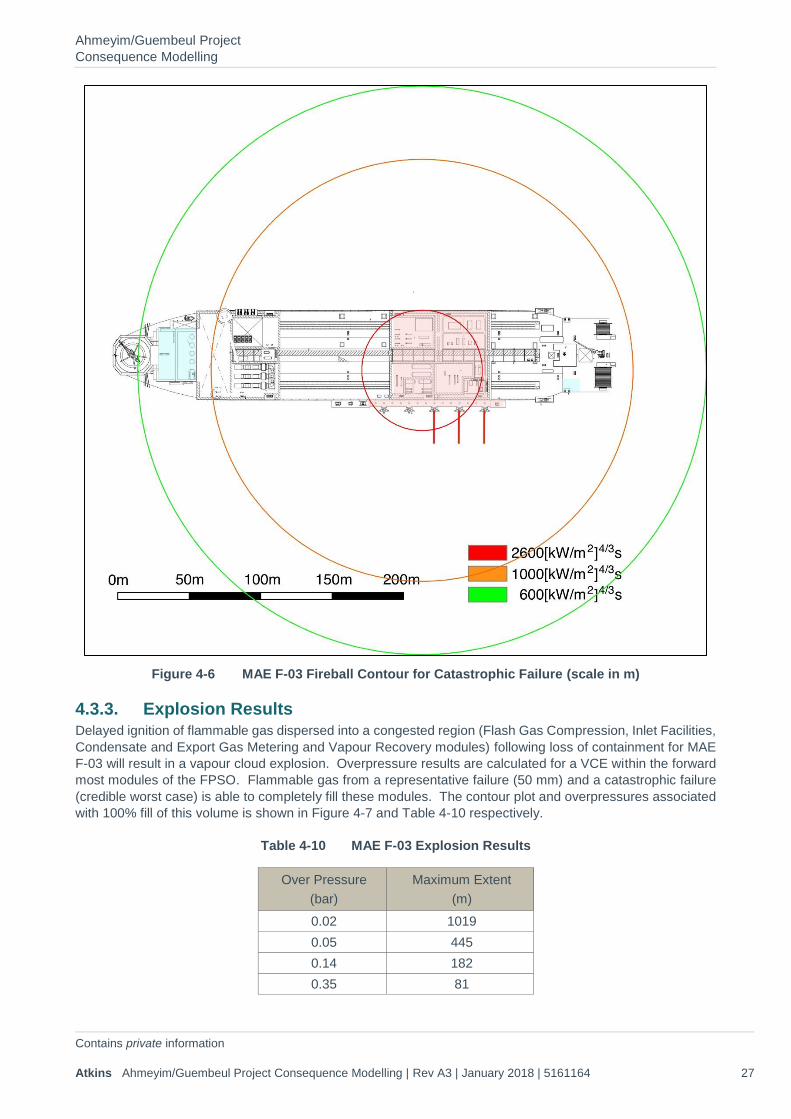
Ahmeyim/Guembeul Project Consequence Modelling
Contains private information Atkins Ahmeyim/Guembeul Project Consequence Modelling | Rev A3 | January 2018 | 5161164 27
Figure 4-6 MAE F-03 Fireball Contour for Catastrophic Failure (scale in m)
4.3.3. Explosion Results Delayed ignition of flammable gas dispersed into a congested region (Flash Gas Compression, Inlet Facilities, Condensate and Export Gas Metering and Vapour Recovery modules) following loss of containment for MAE F-03 will result in a vapour cloud explosion. Overpressure results are calculated for a VCE within the forward most modules of the FPSO. Flammable gas from a representative failure (50 mm) and a catastrophic failure (credible worst case) is able to completely fill these modules. The contour plot and overpressures associated with 100% fill of this volume is shown in Figure 4-7 and Table 4-10 respectively.
Table 4-10 MAE F-03 Explosion Results
Over Pressure (bar)
Maximum Extent (m)
0.02 1019 0.05 445 0.14 182 0.35 81
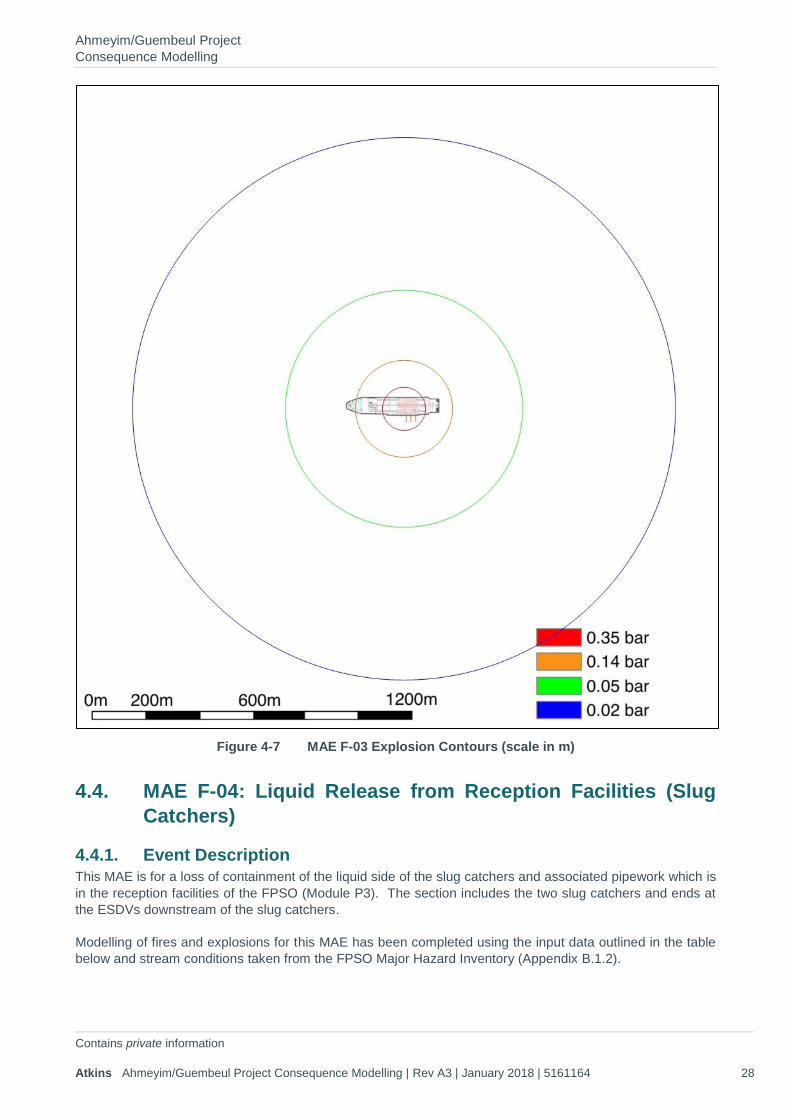
Ahmeyim/Guembeul Project Consequence Modelling
Contains private information Atkins Ahmeyim/Guembeul Project Consequence Modelling | Rev A3 | January 2018 | 5161164 28
Figure 4-7 MAE F-03 Explosion Contours (scale in m)
4.4. MAE F-04: Liquid Release from Reception Facilities (Slug Catchers)
4.4.1. Event Description This MAE is for a loss of containment of the liquid side of the slug catchers and associated pipework which is in the reception facilities of the FPSO (Module P3). The section includes the two slug catchers and ends at the ESDVs downstream of the slug catchers.
Modelling of fires and explosions for this MAE has been completed using the input data outlined in the table below and stream conditions taken from the FPSO Major Hazard Inventory (Appendix B.1.2).
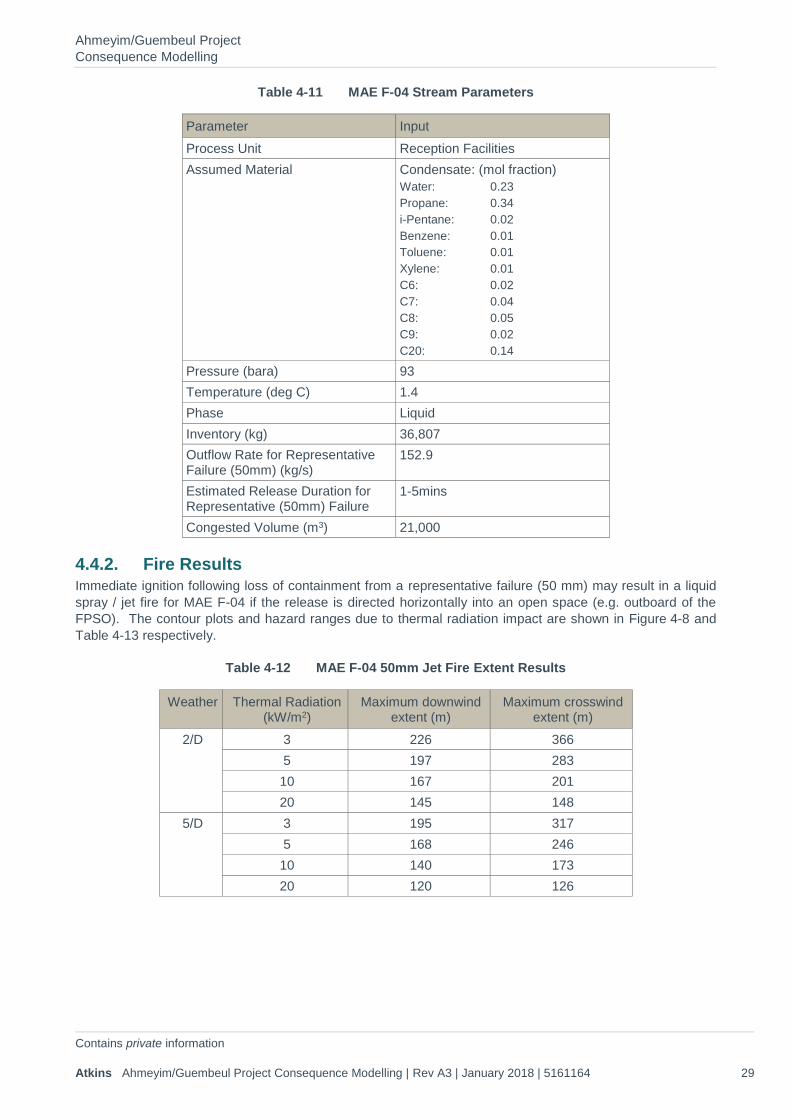
Ahmeyim/Guembeul Project Consequence Modelling
Contains private information Atkins Ahmeyim/Guembeul Project Consequence Modelling | Rev A3 | January 2018 | 5161164 29
Table 4-11 MAE F-04 Stream Parameters
Parameter Input Process Unit Reception Facilities Assumed Material Condensate: (mol fraction)
Water: 0.23 Propane: 0.34 i-Pentane: 0.02 Benzene: 0.01 Toluene: 0.01 Xylene: 0.01 C6: 0.02 C7: 0.04 C8: 0.05 C9: 0.02 C20: 0.14
Pressure (bara) 93 Temperature (deg C) 1.4 Phase Liquid Inventory (kg) 36,807 Outflow Rate for Representative Failure (50mm) (kg/s)
152.9
Estimated Release Duration for Representative (50mm) Failure
1-5mins
Congested Volume (m3) 21,000
4.4.2. Fire Results Immediate ignition following loss of containment from a representative failure (50 mm) may result in a liquid spray / jet fire for MAE F-04 if the release is directed horizontally into an open space (e.g. outboard of the FPSO). The contour plots and hazard ranges due to thermal radiation impact are shown in Figure 4-8 and Table 4-13 respectively.
Table 4-12 MAE F-04 50mm Jet Fire Extent Results
Weather Thermal Radiation (kW/m2)
Maximum downwind extent (m)
Maximum crosswind extent (m)
2/D 3 226 366 5 197 283 10 167 201 20 145 148
5/D 3 195 317 5 168 246 10 140 173 20 120 126
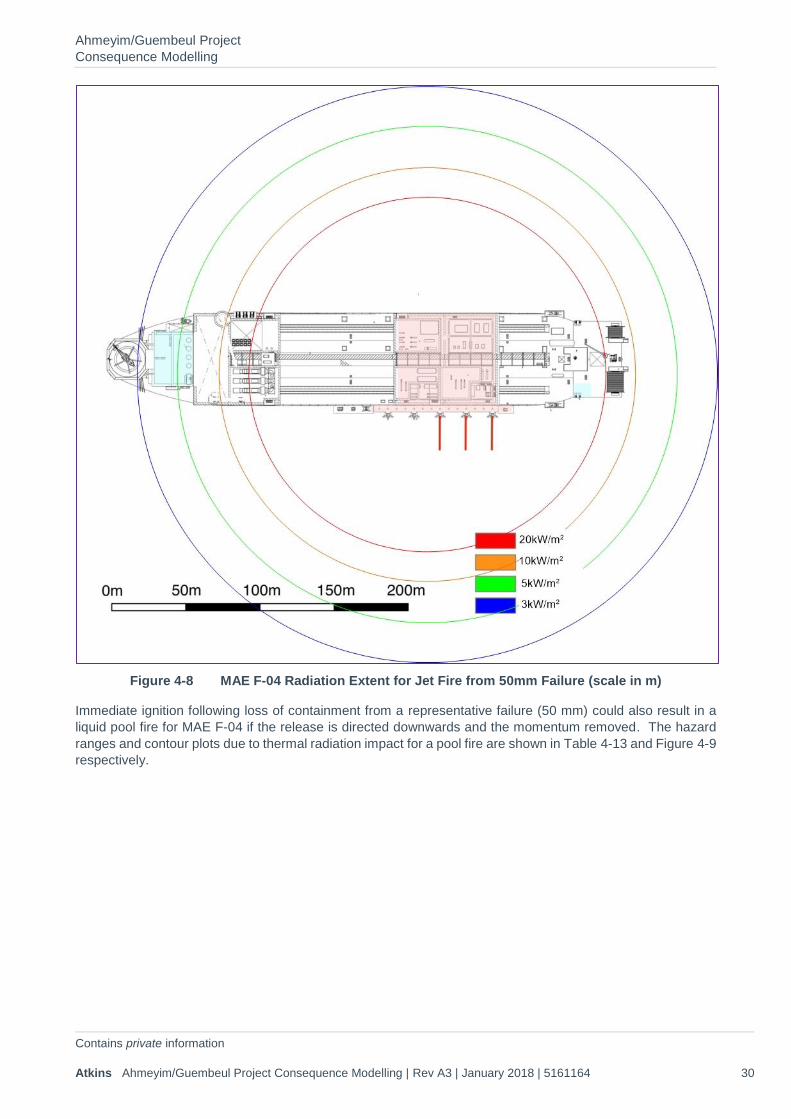
Ahmeyim/Guembeul Project Consequence Modelling
Contains private information Atkins Ahmeyim/Guembeul Project Consequence Modelling | Rev A3 | January 2018 | 5161164 30
Figure 4-8 MAE F-04 Radiation Extent for Jet Fire from 50mm Failure (scale in m)
Immediate ignition following loss of containment from a representative failure (50 mm) could also result in a liquid pool fire for MAE F-04 if the release is directed downwards and the momentum removed. The hazard ranges and contour plots due to thermal radiation impact for a pool fire are shown in Table 4-13 and Figure 4-9 respectively.
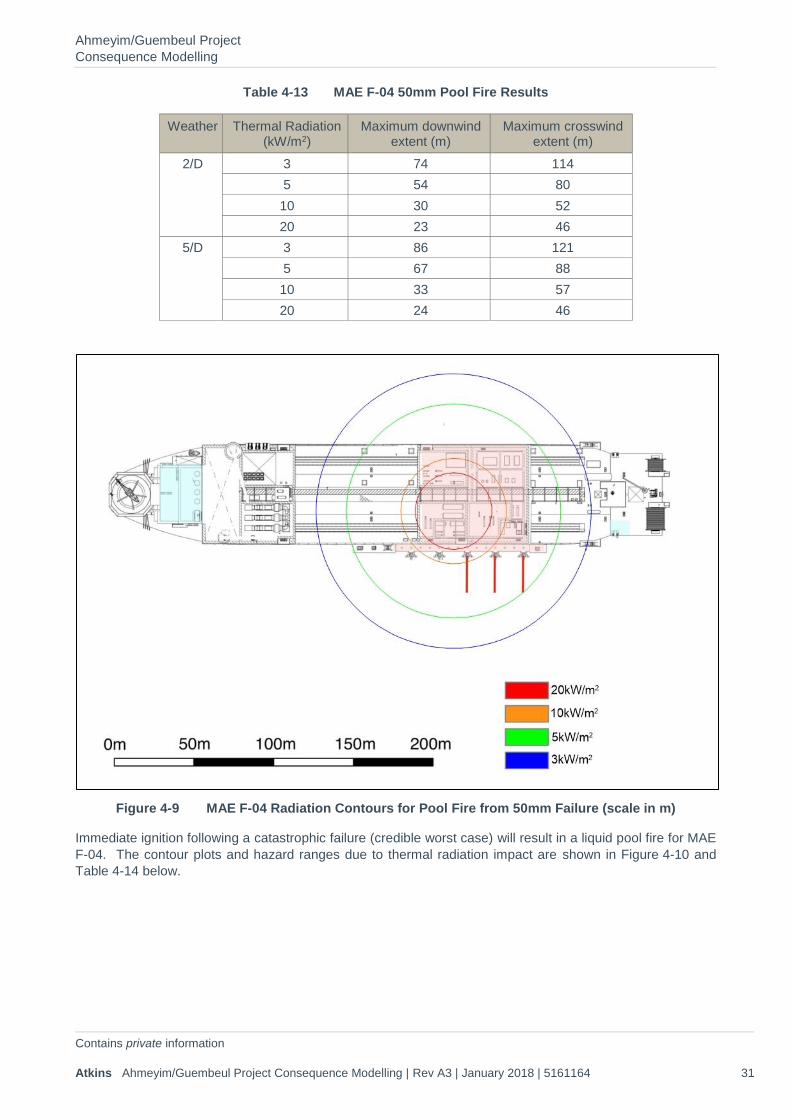
Ahmeyim/Guembeul Project Consequence Modelling
Contains private information Atkins Ahmeyim/Guembeul Project Consequence Modelling | Rev A3 | January 2018 | 5161164 31
Table 4-13 MAE F-04 50mm Pool Fire Results
Weather Thermal Radiation (kW/m2)
Maximum downwind extent (m)
Maximum crosswind extent (m)
2/D 3 74 114 5 54 80 10 30 52 20 23 46
5/D 3 86 121 5 67 88 10 33 57 20 24 46
Figure 4-9 MAE F-04 Radiation Contours for Pool Fire from 50mm Failure (scale in m)
Immediate ignition following a catastrophic failure (credible worst case) will result in a liquid pool fire for MAE F-04. The contour plots and hazard ranges due to thermal radiation impact are shown in Figure 4-10 and Table 4-14 below.
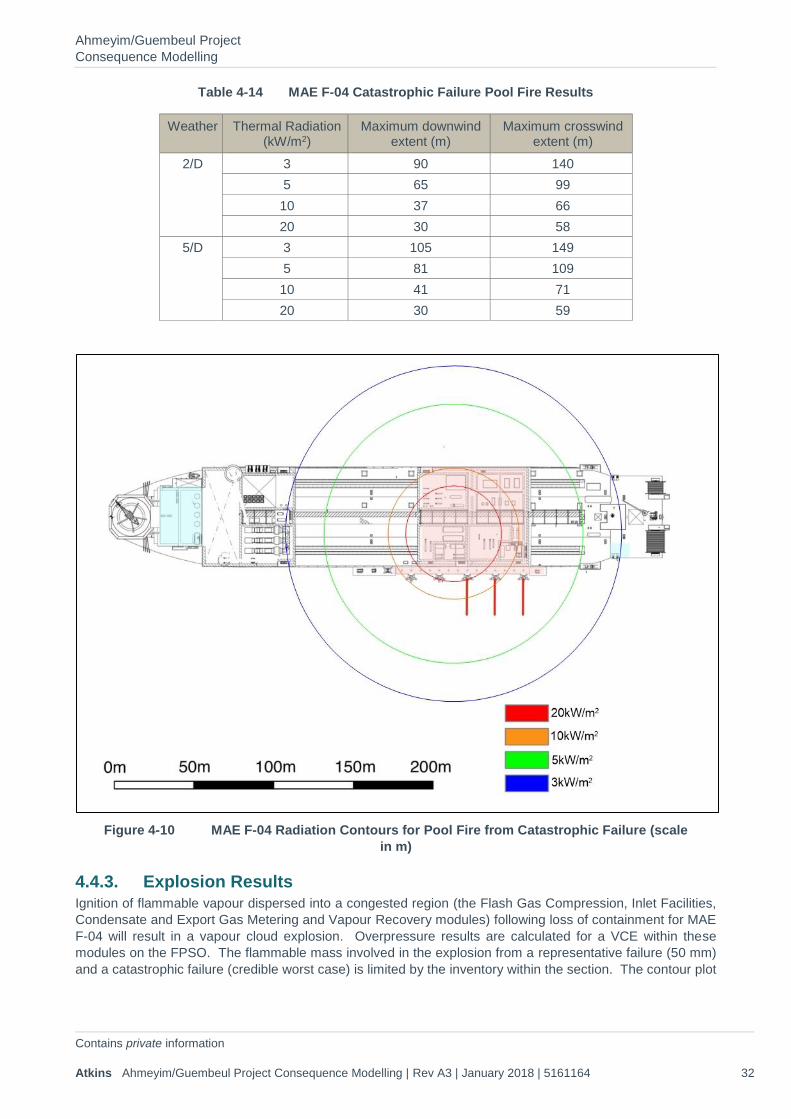
Ahmeyim/Guembeul Project Consequence Modelling
Contains private information Atkins Ahmeyim/Guembeul Project Consequence Modelling | Rev A3 | January 2018 | 5161164 32
Table 4-14 MAE F-04 Catastrophic Failure Pool Fire Results
Weather Thermal Radiation (kW/m2)
Maximum downwind extent (m)
Maximum crosswind extent (m)
2/D 3 90 140 5 65 99 10 37 66 20 30 58
5/D 3 105 149 5 81 109 10 41 71 20 30 59
Figure 4-10 MAE F-04 Radiation Contours for Pool Fire from Catastrophic Failure (scale
in m)
4.4.3. Explosion Results Ignition of flammable vapour dispersed into a congested region (the Flash Gas Compression, Inlet Facilities, Condensate and Export Gas Metering and Vapour Recovery modules) following loss of containment for MAE F-04 will result in a vapour cloud explosion. Overpressure results are calculated for a VCE within these modules on the FPSO. The flammable mass involved in the explosion from a representative failure (50 mm) and a catastrophic failure (credible worst case) is limited by the inventory within the section. The contour plot

Ahmeyim/Guembeul Project Consequence Modelling
Contains private information Atkins Ahmeyim/Guembeul Project Consequence Modelling | Rev A3 | January 2018 | 5161164 33
and overpressures associated with an explosion due to vapour released into these modules are shown in Figure 4-11 and Table 4-15 respectively.
Table 4-15 MAE F-04 Explosion Results
Over Pressure (bar)
Maximum Extent (m)
0.02 1078 0.05 471 0.14 192 0.35 86
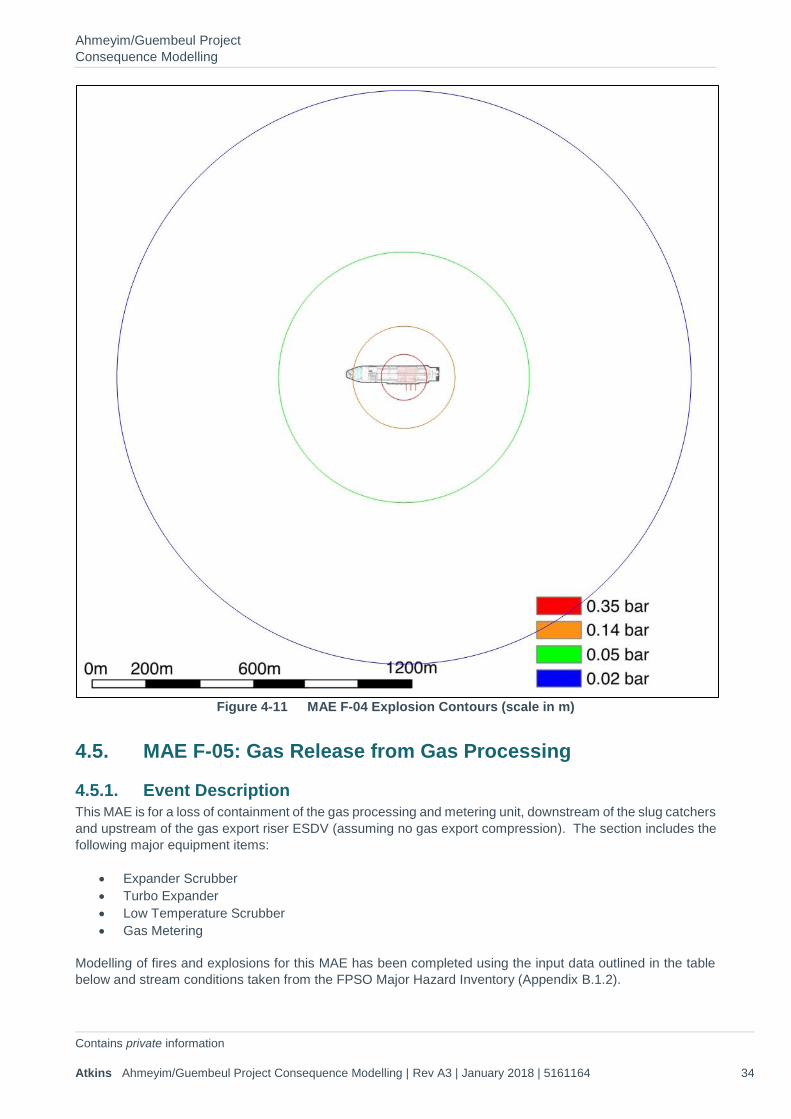
Ahmeyim/Guembeul Project Consequence Modelling
Contains private information Atkins Ahmeyim/Guembeul Project Consequence Modelling | Rev A3 | January 2018 | 5161164 34
Figure 4-11 MAE F-04 Explosion Contours (scale in m)
4.5. MAE F-05: Gas Release from Gas Processing
4.5.1. Event Description This MAE is for a loss of containment of the gas processing and metering unit, downstream of the slug catchers and upstream of the gas export riser ESDV (assuming no gas export compression). The section includes the following major equipment items:
• Expander Scrubber • Turbo Expander • Low Temperature Scrubber • Gas Metering
Modelling of fires and explosions for this MAE has been completed using the input data outlined in the table below and stream conditions taken from the FPSO Major Hazard Inventory (Appendix B.1.2).
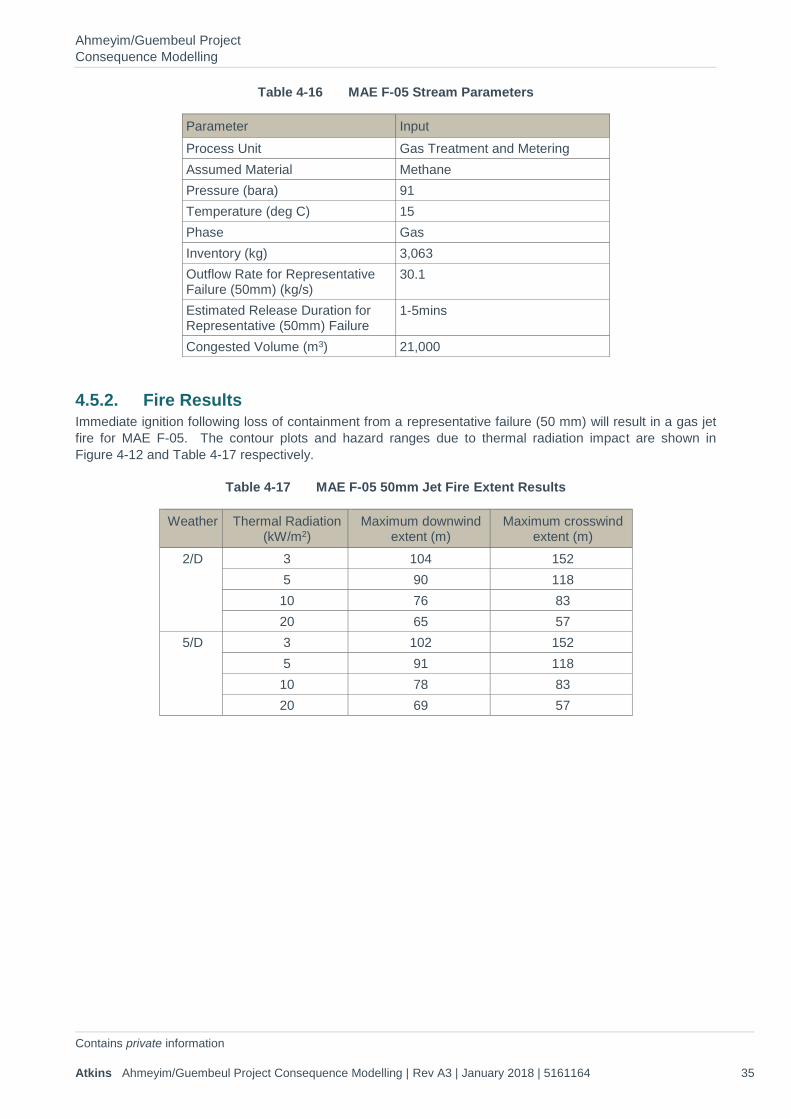
Ahmeyim/Guembeul Project Consequence Modelling
Contains private information Atkins Ahmeyim/Guembeul Project Consequence Modelling | Rev A3 | January 2018 | 5161164 35
Table 4-16 MAE F-05 Stream Parameters
Parameter Input Process Unit Gas Treatment and Metering Assumed Material Methane Pressure (bara) 91 Temperature (deg C) 15 Phase Gas Inventory (kg) 3,063 Outflow Rate for Representative Failure (50mm) (kg/s)
30.1
Estimated Release Duration for Representative (50mm) Failure
1-5mins
Congested Volume (m3) 21,000
4.5.2. Fire Results Immediate ignition following loss of containment from a representative failure (50 mm) will result in a gas jet fire for MAE F-05. The contour plots and hazard ranges due to thermal radiation impact are shown in Figure 4-12 and Table 4-17 respectively.
Table 4-17 MAE F-05 50mm Jet Fire Extent Results
Weather Thermal Radiation (kW/m2)
Maximum downwind extent (m)
Maximum crosswind extent (m)
2/D 3 104 152 5 90 118 10 76 83 20 65 57
5/D 3 102 152 5 91 118 10 78 83 20 69 57
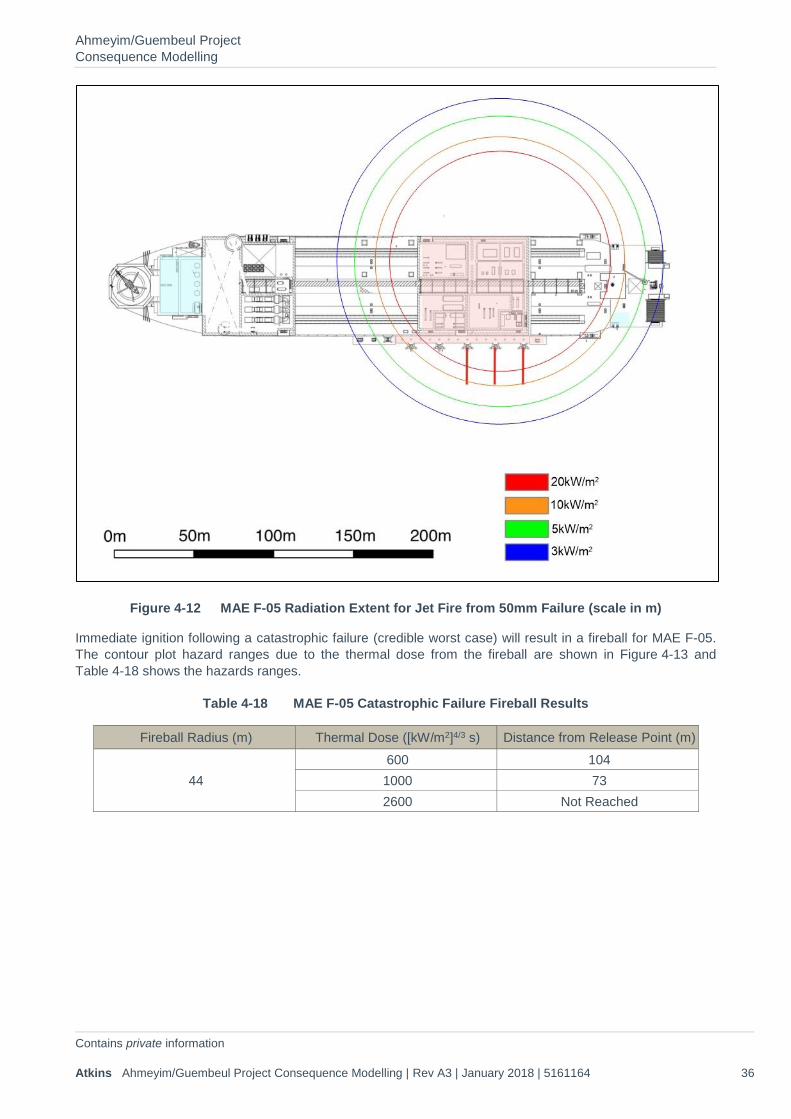
Ahmeyim/Guembeul Project Consequence Modelling
Contains private information Atkins Ahmeyim/Guembeul Project Consequence Modelling | Rev A3 | January 2018 | 5161164 36
Figure 4-12 MAE F-05 Radiation Extent for Jet Fire from 50mm Failure (scale in m)
Immediate ignition following a catastrophic failure (credible worst case) will result in a fireball for MAE F-05. The contour plot hazard ranges due to the thermal dose from the fireball are shown in Figure 4-13 and Table 4-18 shows the hazards ranges.
Table 4-18 MAE F-05 Catastrophic Failure Fireball Results
Fireball Radius (m) Thermal Dose ([kW/m2]4/3 s) Distance from Release Point (m)
44 600 104 1000 73 2600 Not Reached
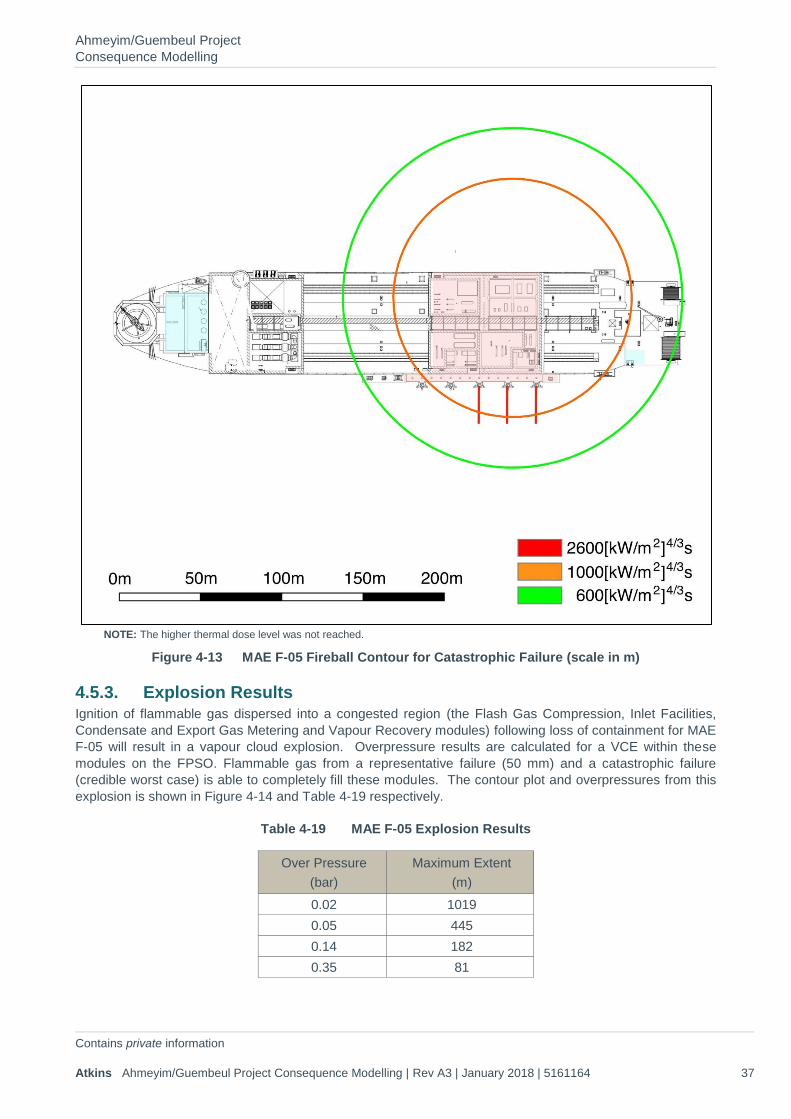
Ahmeyim/Guembeul Project Consequence Modelling
Contains private information Atkins Ahmeyim/Guembeul Project Consequence Modelling | Rev A3 | January 2018 | 5161164 37
NOTE: The higher thermal dose level was not reached.
Figure 4-13 MAE F-05 Fireball Contour for Catastrophic Failure (scale in m)
4.5.3. Explosion Results Ignition of flammable gas dispersed into a congested region (the Flash Gas Compression, Inlet Facilities, Condensate and Export Gas Metering and Vapour Recovery modules) following loss of containment for MAE F-05 will result in a vapour cloud explosion. Overpressure results are calculated for a VCE within these modules on the FPSO. Flammable gas from a representative failure (50 mm) and a catastrophic failure (credible worst case) is able to completely fill these modules. The contour plot and overpressures from this explosion is shown in Figure 4-14 and Table 4-19 respectively.
Table 4-19 MAE F-05 Explosion Results
Over Pressure (bar)
Maximum Extent (m)
0.02 1019 0.05 445 0.14 182 0.35 81
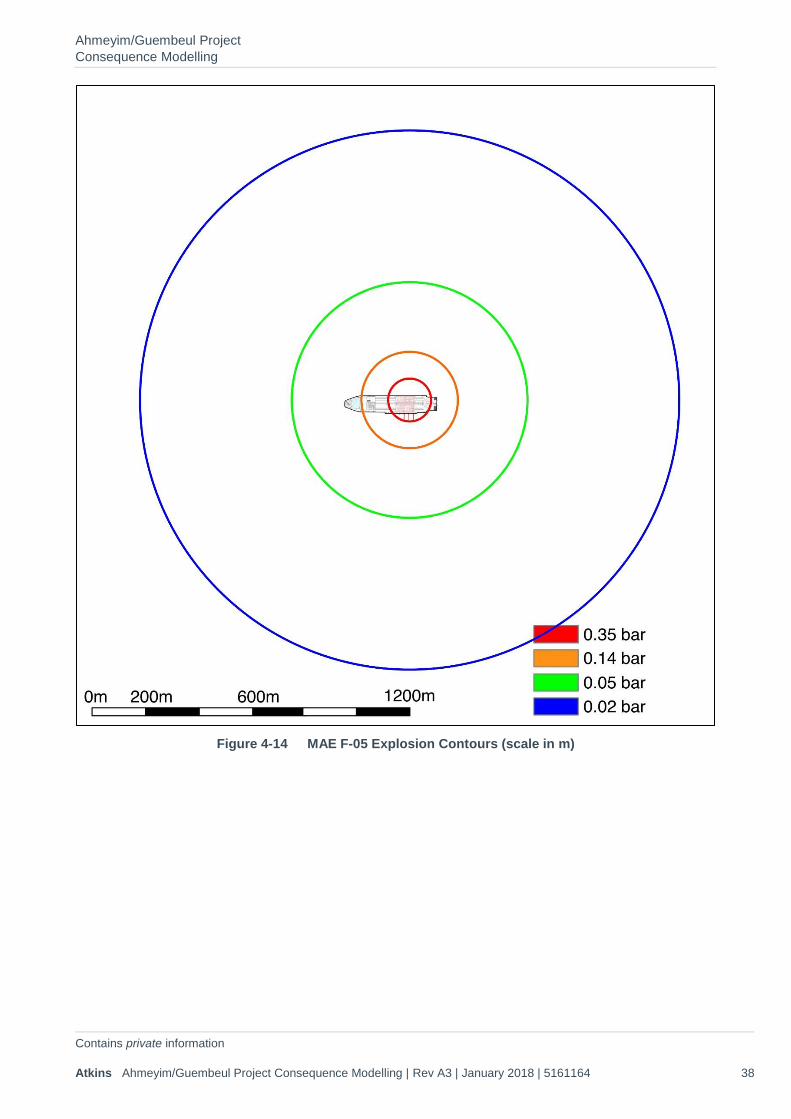
Ahmeyim/Guembeul Project Consequence Modelling
Contains private information Atkins Ahmeyim/Guembeul Project Consequence Modelling | Rev A3 | January 2018 | 5161164 38
Figure 4-14 MAE F-05 Explosion Contours (scale in m)
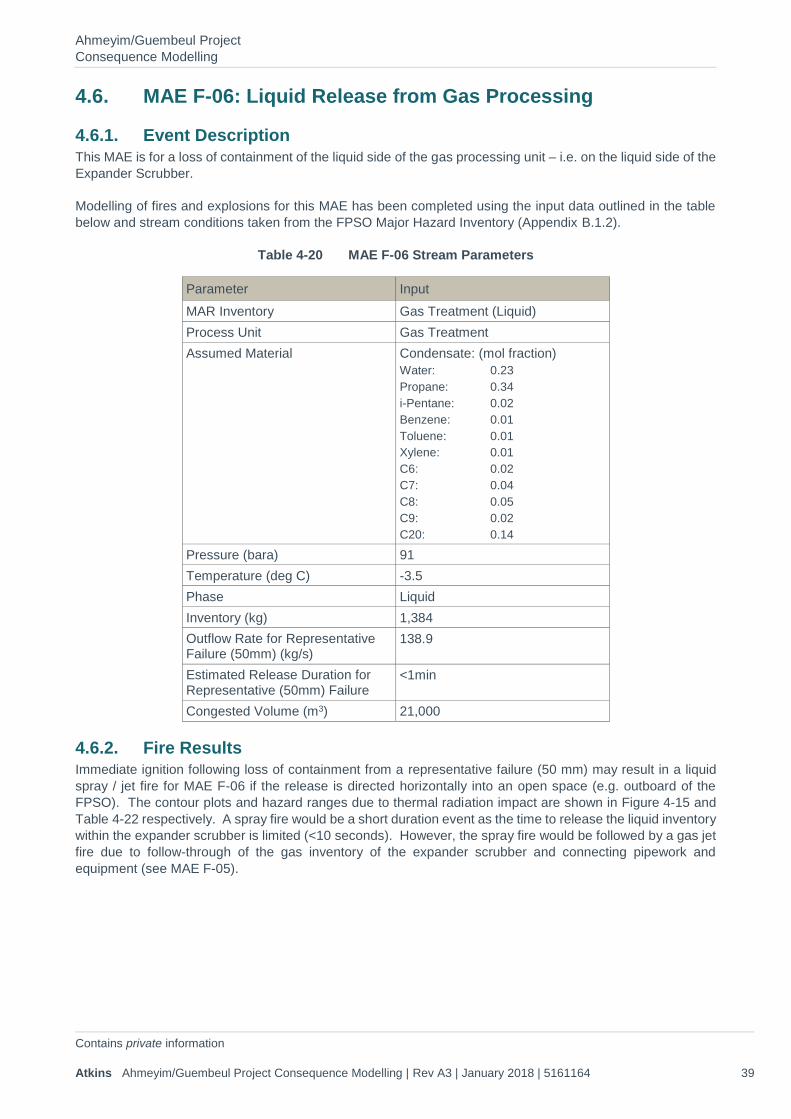
Ahmeyim/Guembeul Project Consequence Modelling
Contains private information Atkins Ahmeyim/Guembeul Project Consequence Modelling | Rev A3 | January 2018 | 5161164 39
4.6. MAE F-06: Liquid Release from Gas Processing
4.6.1. Event Description This MAE is for a loss of containment of the liquid side of the gas processing unit – i.e. on the liquid side of the Expander Scrubber.
Modelling of fires and explosions for this MAE has been completed using the input data outlined in the table below and stream conditions taken from the FPSO Major Hazard Inventory (Appendix B.1.2).
Table 4-20 MAE F-06 Stream Parameters
Parameter Input MAR Inventory Gas Treatment (Liquid) Process Unit Gas Treatment Assumed Material Condensate: (mol fraction)
Water: 0.23 Propane: 0.34 i-Pentane: 0.02 Benzene: 0.01 Toluene: 0.01 Xylene: 0.01 C6: 0.02 C7: 0.04 C8: 0.05 C9: 0.02 C20: 0.14
Pressure (bara) 91 Temperature (deg C) -3.5 Phase Liquid Inventory (kg) 1,384 Outflow Rate for Representative Failure (50mm) (kg/s)
138.9
Estimated Release Duration for Representative (50mm) Failure
<1min
Congested Volume (m3) 21,000
4.6.2. Fire Results Immediate ignition following loss of containment from a representative failure (50 mm) may result in a liquid spray / jet fire for MAE F-06 if the release is directed horizontally into an open space (e.g. outboard of the FPSO). The contour plots and hazard ranges due to thermal radiation impact are shown in Figure 4-15 and Table 4-22 respectively. A spray fire would be a short duration event as the time to release the liquid inventory within the expander scrubber is limited (<10 seconds). However, the spray fire would be followed by a gas jet fire due to follow-through of the gas inventory of the expander scrubber and connecting pipework and equipment (see MAE F-05).
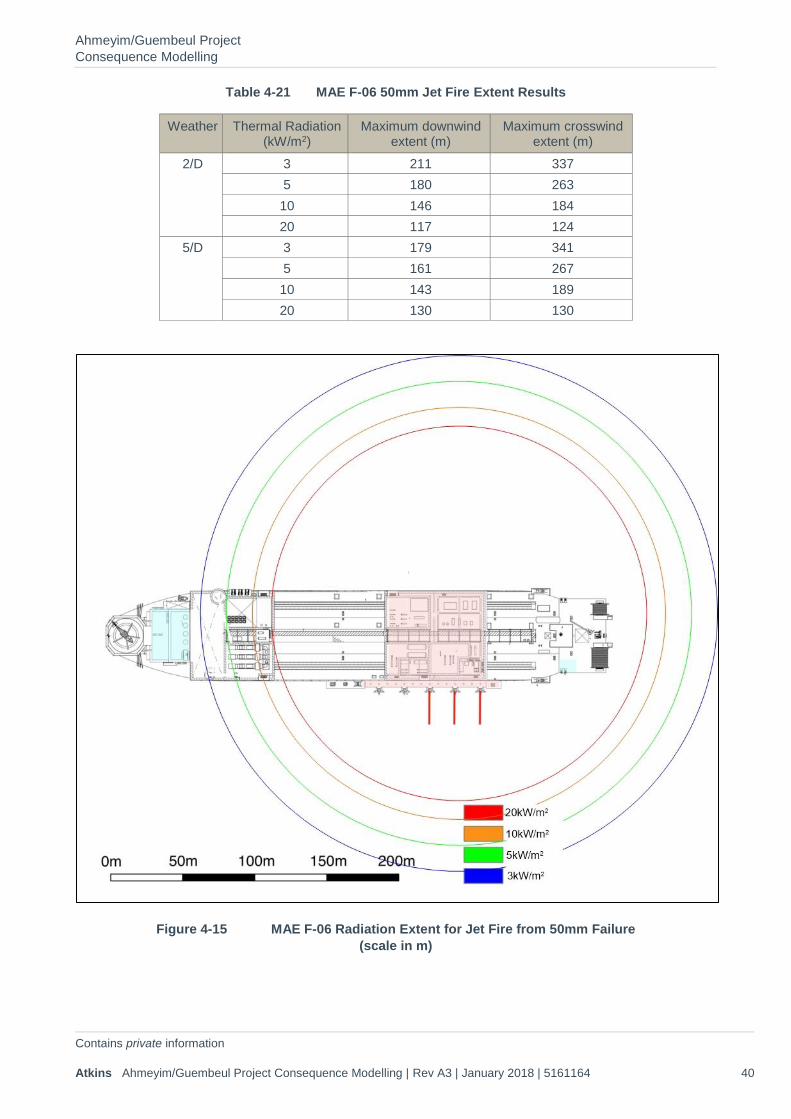
Ahmeyim/Guembeul Project Consequence Modelling
Contains private information Atkins Ahmeyim/Guembeul Project Consequence Modelling | Rev A3 | January 2018 | 5161164 40
Table 4-21 MAE F-06 50mm Jet Fire Extent Results
Weather Thermal Radiation (kW/m2)
Maximum downwind extent (m)
Maximum crosswind extent (m)
2/D 3 211 337 5 180 263 10 146 184 20 117 124
5/D 3 179 341 5 161 267 10 143 189 20 130 130
Figure 4-15 MAE F-06 Radiation Extent for Jet Fire from 50mm Failure (scale in m)
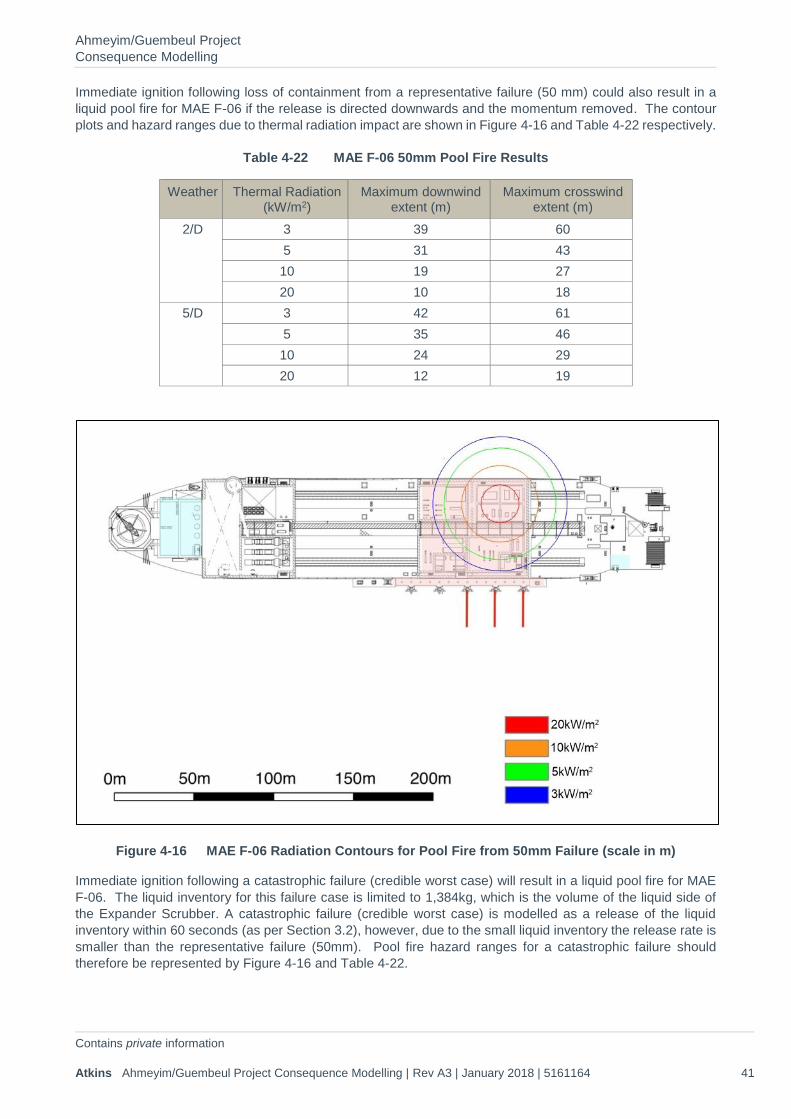
Ahmeyim/Guembeul Project Consequence Modelling
Contains private information Atkins Ahmeyim/Guembeul Project Consequence Modelling | Rev A3 | January 2018 | 5161164 41
Immediate ignition following loss of containment from a representative failure (50 mm) could also result in a liquid pool fire for MAE F-06 if the release is directed downwards and the momentum removed. The contour plots and hazard ranges due to thermal radiation impact are shown in Figure 4-16 and Table 4-22 respectively.
Table 4-22 MAE F-06 50mm Pool Fire Results
Weather Thermal Radiation (kW/m2)
Maximum downwind extent (m)
Maximum crosswind extent (m)
2/D 3 39 60 5 31 43 10 19 27 20 10 18
5/D 3 42 61 5 35 46 10 24 29 20 12 19
Figure 4-16 MAE F-06 Radiation Contours for Pool Fire from 50mm Failure (scale in m)
Immediate ignition following a catastrophic failure (credible worst case) will result in a liquid pool fire for MAE F-06. The liquid inventory for this failure case is limited to 1,384kg, which is the volume of the liquid side of the Expander Scrubber. A catastrophic failure (credible worst case) is modelled as a release of the liquid inventory within 60 seconds (as per Section 3.2), however, due to the small liquid inventory the release rate is smaller than the representative failure (50mm). Pool fire hazard ranges for a catastrophic failure should therefore be represented by Figure 4-16 and Table 4-22.
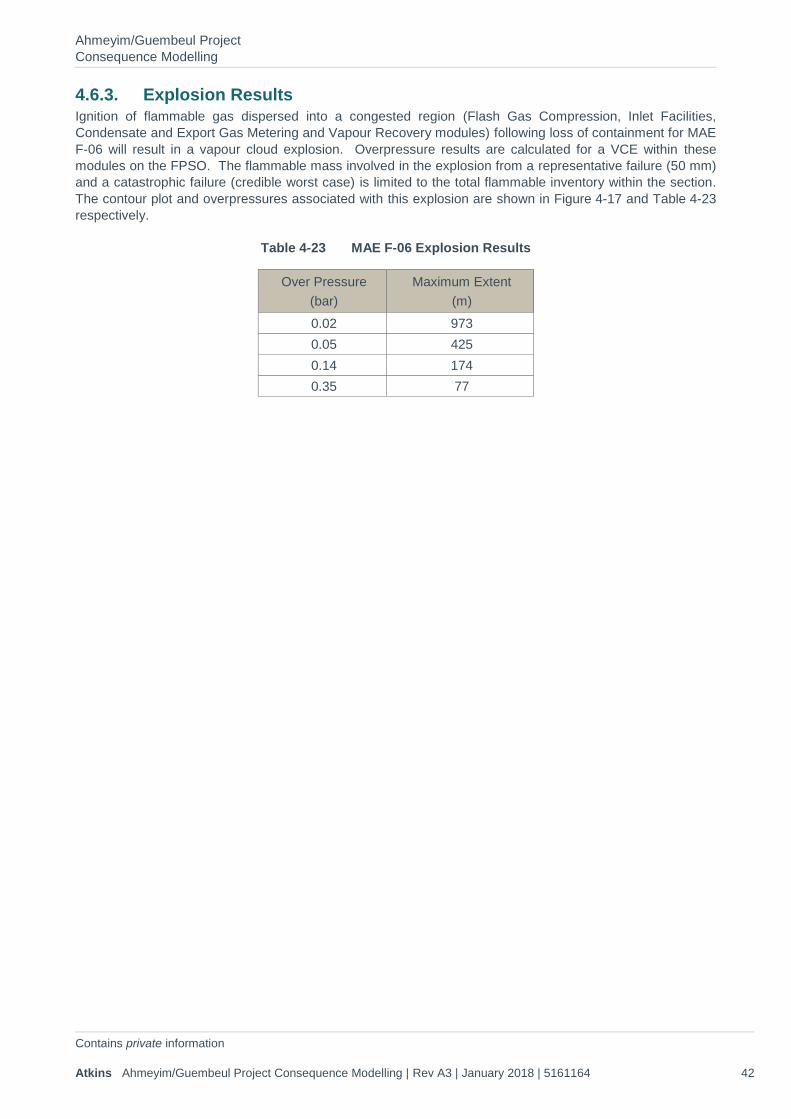
Ahmeyim/Guembeul Project Consequence Modelling
Contains private information Atkins Ahmeyim/Guembeul Project Consequence Modelling | Rev A3 | January 2018 | 5161164 42
4.6.3. Explosion Results Ignition of flammable gas dispersed into a congested region (Flash Gas Compression, Inlet Facilities, Condensate and Export Gas Metering and Vapour Recovery modules) following loss of containment for MAE F-06 will result in a vapour cloud explosion. Overpressure results are calculated for a VCE within these modules on the FPSO. The flammable mass involved in the explosion from a representative failure (50 mm) and a catastrophic failure (credible worst case) is limited to the total flammable inventory within the section. The contour plot and overpressures associated with this explosion are shown in Figure 4-17 and Table 4-23 respectively.
Table 4-23 MAE F-06 Explosion Results
Over Pressure (bar)
Maximum Extent (m)
0.02 973 0.05 425 0.14 174 0.35 77
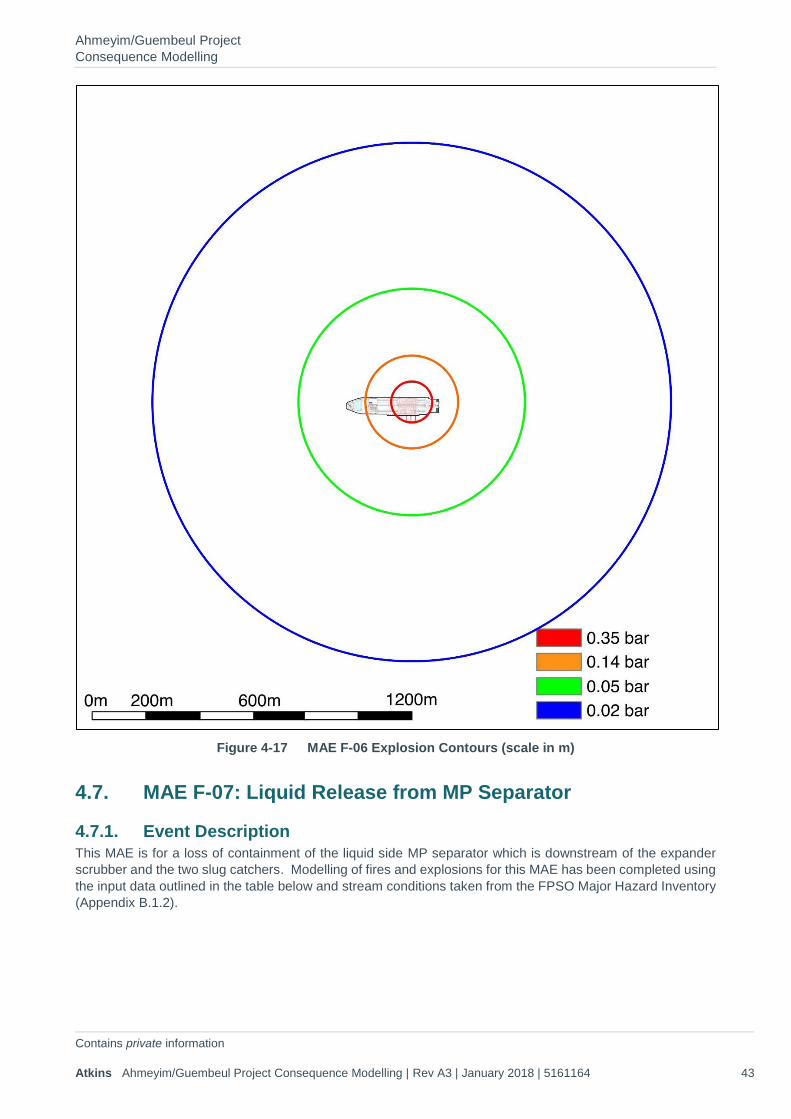
Ahmeyim/Guembeul Project Consequence Modelling
Contains private information Atkins Ahmeyim/Guembeul Project Consequence Modelling | Rev A3 | January 2018 | 5161164 43
Figure 4-17 MAE F-06 Explosion Contours (scale in m)
4.7. MAE F-07: Liquid Release from MP Separator
4.7.1. Event Description This MAE is for a loss of containment of the liquid side MP separator which is downstream of the expander scrubber and the two slug catchers. Modelling of fires and explosions for this MAE has been completed using the input data outlined in the table below and stream conditions taken from the FPSO Major Hazard Inventory (Appendix B.1.2).
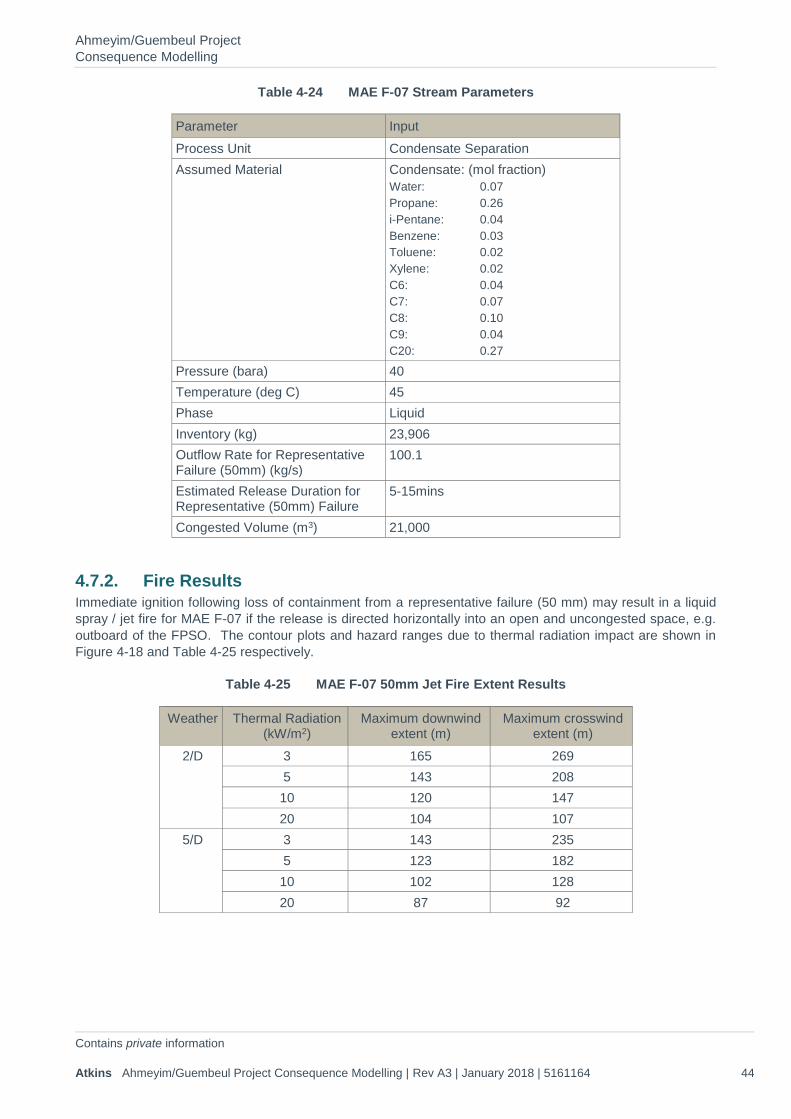
Ahmeyim/Guembeul Project Consequence Modelling
Contains private information Atkins Ahmeyim/Guembeul Project Consequence Modelling | Rev A3 | January 2018 | 5161164 44
Table 4-24 MAE F-07 Stream Parameters
Parameter Input Process Unit Condensate Separation Assumed Material Condensate: (mol fraction)
Water: 0.07 Propane: 0.26 i-Pentane: 0.04 Benzene: 0.03 Toluene: 0.02 Xylene: 0.02 C6: 0.04 C7: 0.07 C8: 0.10 C9: 0.04 C20: 0.27
Pressure (bara) 40 Temperature (deg C) 45 Phase Liquid Inventory (kg) 23,906 Outflow Rate for Representative Failure (50mm) (kg/s)
100.1
Estimated Release Duration for Representative (50mm) Failure
5-15mins
Congested Volume (m3) 21,000
4.7.2. Fire Results Immediate ignition following loss of containment from a representative failure (50 mm) may result in a liquid spray / jet fire for MAE F-07 if the release is directed horizontally into an open and uncongested space, e.g. outboard of the FPSO. The contour plots and hazard ranges due to thermal radiation impact are shown in Figure 4-18 and Table 4-25 respectively.
Table 4-25 MAE F-07 50mm Jet Fire Extent Results
Weather Thermal Radiation (kW/m2)
Maximum downwind extent (m)
Maximum crosswind extent (m)
2/D 3 165 269 5 143 208 10 120 147 20 104 107
5/D 3 143 235 5 123 182 10 102 128 20 87 92
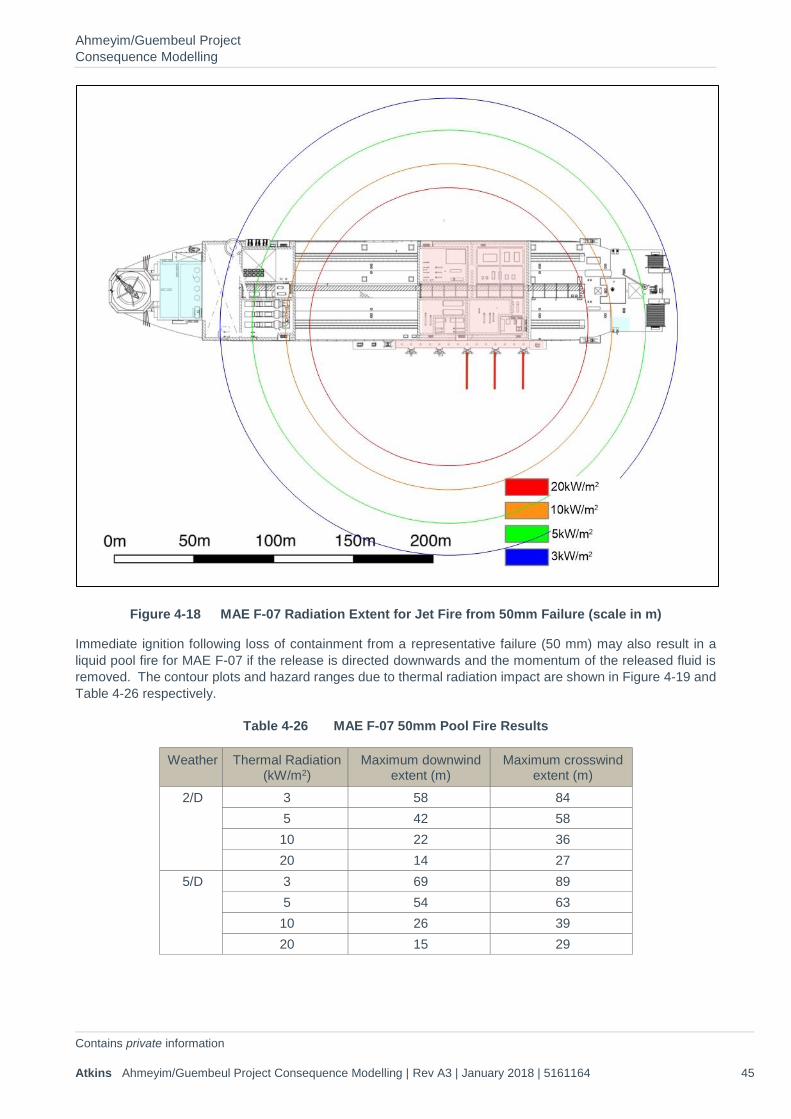
Ahmeyim/Guembeul Project Consequence Modelling
Contains private information Atkins Ahmeyim/Guembeul Project Consequence Modelling | Rev A3 | January 2018 | 5161164 45
Figure 4-18 MAE F-07 Radiation Extent for Jet Fire from 50mm Failure (scale in m)
Immediate ignition following loss of containment from a representative failure (50 mm) may also result in a liquid pool fire for MAE F-07 if the release is directed downwards and the momentum of the released fluid is removed. The contour plots and hazard ranges due to thermal radiation impact are shown in Figure 4-19 and Table 4-26 respectively.
Table 4-26 MAE F-07 50mm Pool Fire Results
Weather Thermal Radiation (kW/m2)
Maximum downwind extent (m)
Maximum crosswind extent (m)
2/D 3 58 84 5 42 58 10 22 36 20 14 27
5/D 3 69 89 5 54 63 10 26 39 20 15 29
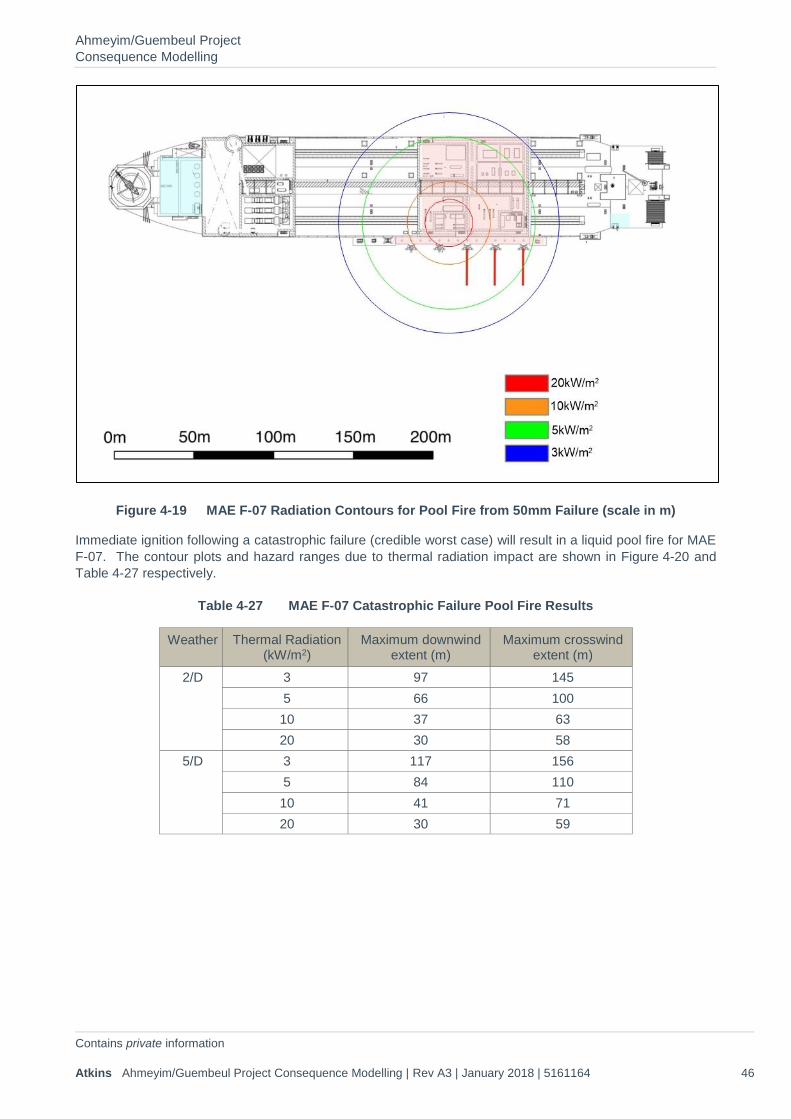
Ahmeyim/Guembeul Project Consequence Modelling
Contains private information Atkins Ahmeyim/Guembeul Project Consequence Modelling | Rev A3 | January 2018 | 5161164 46
Figure 4-19 MAE F-07 Radiation Contours for Pool Fire from 50mm Failure (scale in m)
Immediate ignition following a catastrophic failure (credible worst case) will result in a liquid pool fire for MAE F-07. The contour plots and hazard ranges due to thermal radiation impact are shown in Figure 4-20 and Table 4-27 respectively.
Table 4-27 MAE F-07 Catastrophic Failure Pool Fire Results
Weather Thermal Radiation (kW/m2)
Maximum downwind extent (m)
Maximum crosswind extent (m)
2/D 3 97 145 5 66 100 10 37 63 20 30 58
5/D 3 117 156 5 84 110 10 41 71 20 30 59
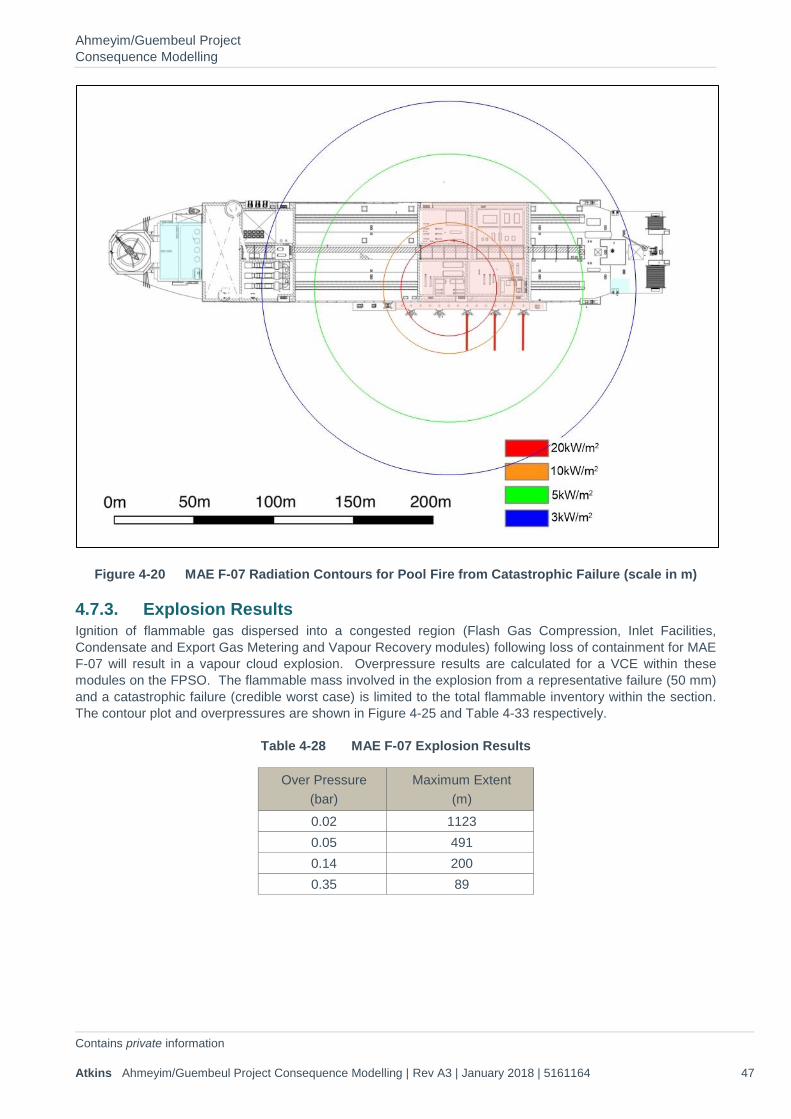
Ahmeyim/Guembeul Project Consequence Modelling
Contains private information Atkins Ahmeyim/Guembeul Project Consequence Modelling | Rev A3 | January 2018 | 5161164 47
Figure 4-20 MAE F-07 Radiation Contours for Pool Fire from Catastrophic Failure (scale in m)
4.7.3. Explosion Results Ignition of flammable gas dispersed into a congested region (Flash Gas Compression, Inlet Facilities, Condensate and Export Gas Metering and Vapour Recovery modules) following loss of containment for MAE F-07 will result in a vapour cloud explosion. Overpressure results are calculated for a VCE within these modules on the FPSO. The flammable mass involved in the explosion from a representative failure (50 mm) and a catastrophic failure (credible worst case) is limited to the total flammable inventory within the section. The contour plot and overpressures are shown in Figure 4-25 and Table 4-33 respectively.
Table 4-28 MAE F-07 Explosion Results
Over Pressure (bar)
Maximum Extent (m)
0.02 1123 0.05 491 0.14 200 0.35 89
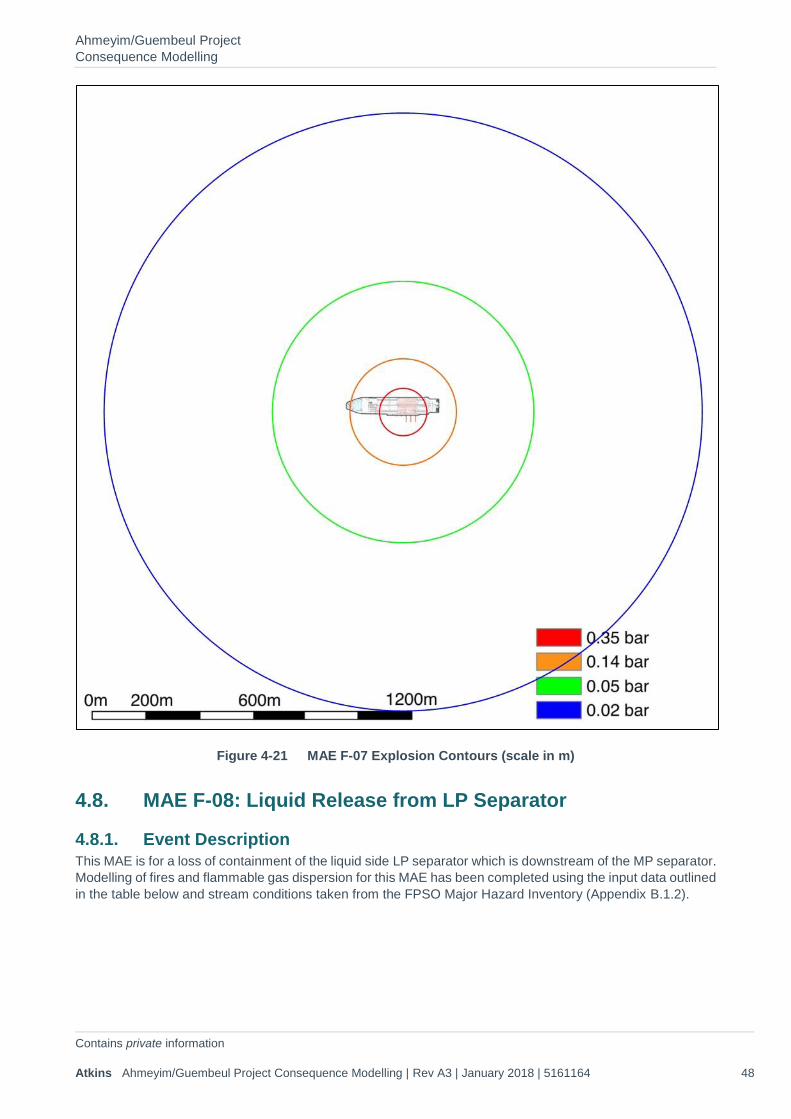
Ahmeyim/Guembeul Project Consequence Modelling
Contains private information Atkins Ahmeyim/Guembeul Project Consequence Modelling | Rev A3 | January 2018 | 5161164 48
Figure 4-21 MAE F-07 Explosion Contours (scale in m)
4.8. MAE F-08: Liquid Release from LP Separator
4.8.1. Event Description This MAE is for a loss of containment of the liquid side LP separator which is downstream of the MP separator. Modelling of fires and flammable gas dispersion for this MAE has been completed using the input data outlined in the table below and stream conditions taken from the FPSO Major Hazard Inventory (Appendix B.1.2).
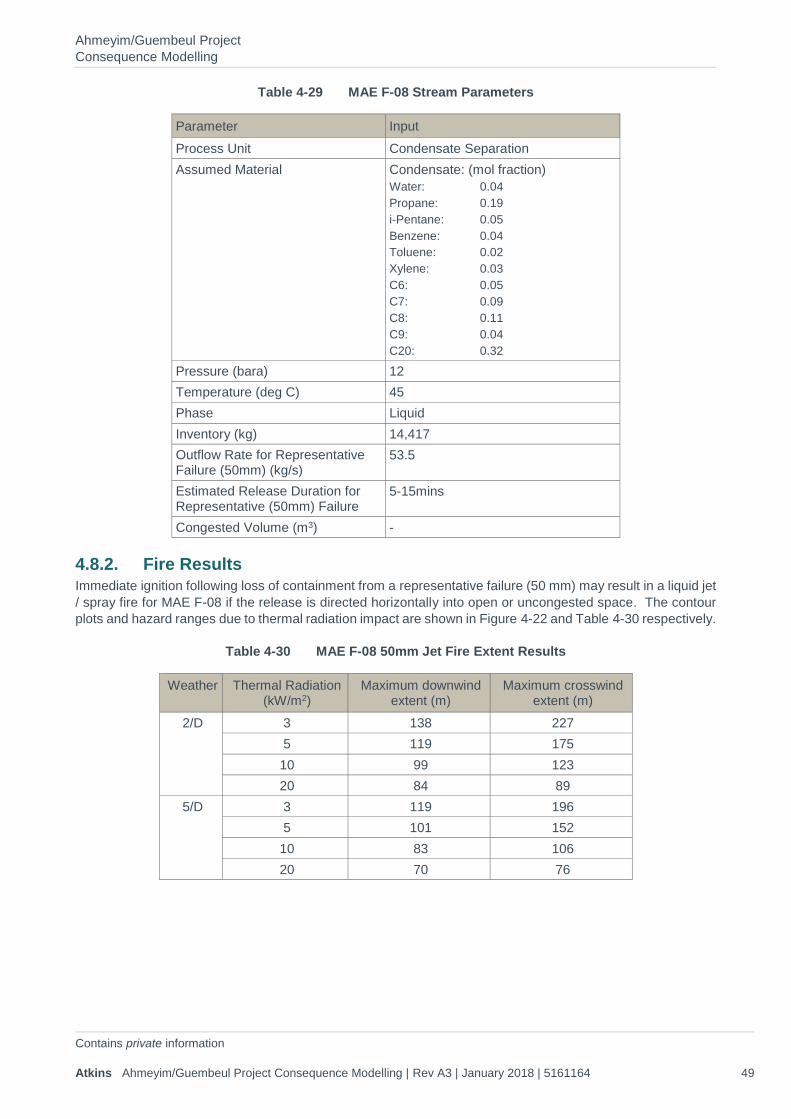
Ahmeyim/Guembeul Project Consequence Modelling
Contains private information Atkins Ahmeyim/Guembeul Project Consequence Modelling | Rev A3 | January 2018 | 5161164 49
Table 4-29 MAE F-08 Stream Parameters
Parameter Input Process Unit Condensate Separation Assumed Material Condensate: (mol fraction)
Water: 0.04 Propane: 0.19 i-Pentane: 0.05 Benzene: 0.04 Toluene: 0.02 Xylene: 0.03 C6: 0.05 C7: 0.09 C8: 0.11 C9: 0.04 C20: 0.32
Pressure (bara) 12 Temperature (deg C) 45 Phase Liquid Inventory (kg) 14,417 Outflow Rate for Representative Failure (50mm) (kg/s)
53.5
Estimated Release Duration for Representative (50mm) Failure
5-15mins
Congested Volume (m3) -
4.8.2. Fire Results Immediate ignition following loss of containment from a representative failure (50 mm) may result in a liquid jet / spray fire for MAE F-08 if the release is directed horizontally into open or uncongested space. The contour plots and hazard ranges due to thermal radiation impact are shown in Figure 4-22 and Table 4-30 respectively.
Table 4-30 MAE F-08 50mm Jet Fire Extent Results
Weather Thermal Radiation (kW/m2)
Maximum downwind extent (m)
Maximum crosswind extent (m)
2/D 3 138 227 5 119 175 10 99 123 20 84 89
5/D 3 119 196 5 101 152 10 83 106 20 70 76
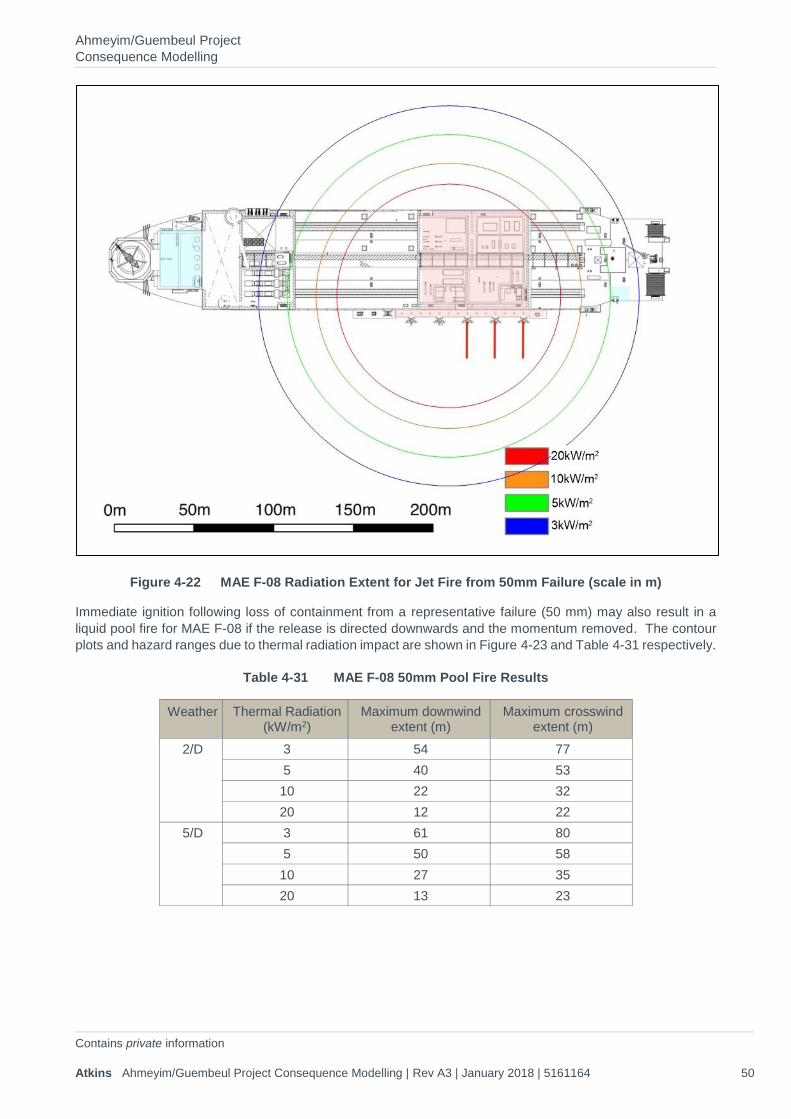
Ahmeyim/Guembeul Project Consequence Modelling
Contains private information Atkins Ahmeyim/Guembeul Project Consequence Modelling | Rev A3 | January 2018 | 5161164 50
Figure 4-22 MAE F-08 Radiation Extent for Jet Fire from 50mm Failure (scale in m)
Immediate ignition following loss of containment from a representative failure (50 mm) may also result in a liquid pool fire for MAE F-08 if the release is directed downwards and the momentum removed. The contour plots and hazard ranges due to thermal radiation impact are shown in Figure 4-23 and Table 4-31 respectively.
Table 4-31 MAE F-08 50mm Pool Fire Results
Weather Thermal Radiation (kW/m2)
Maximum downwind extent (m)
Maximum crosswind extent (m)
2/D 3 54 77 5 40 53 10 22 32 20 12 22
5/D 3 61 80 5 50 58 10 27 35 20 13 23
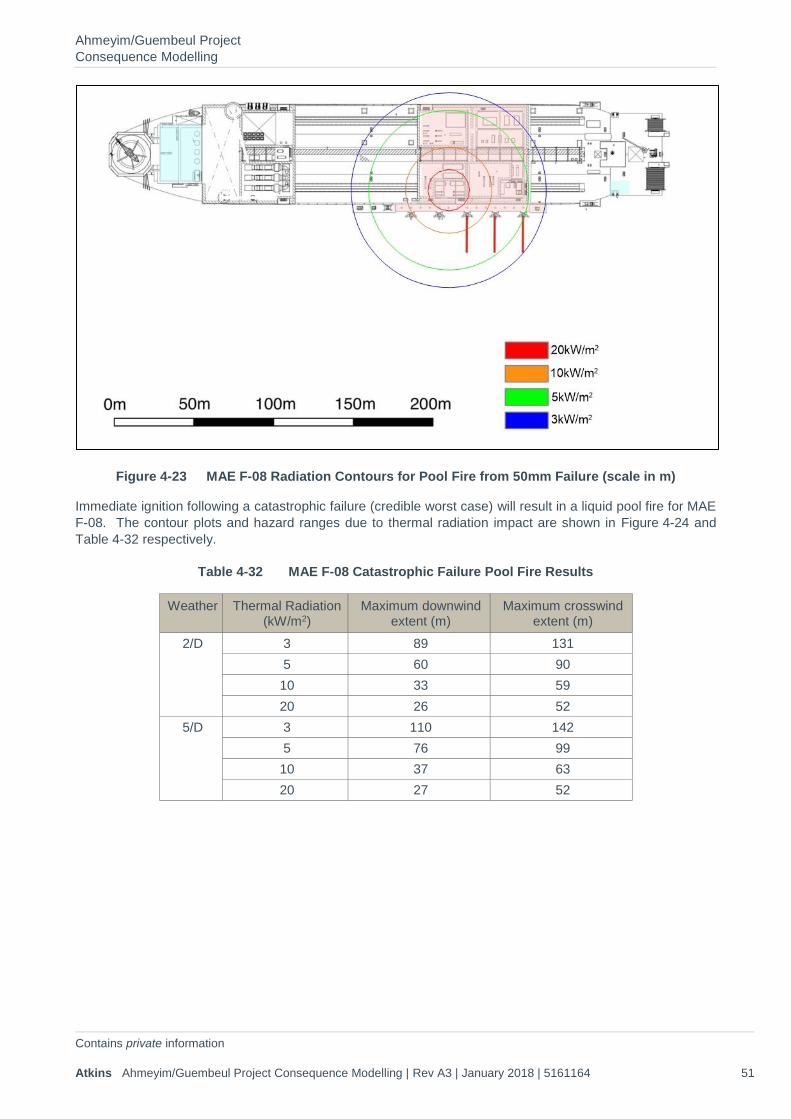
Ahmeyim/Guembeul Project Consequence Modelling
Contains private information Atkins Ahmeyim/Guembeul Project Consequence Modelling | Rev A3 | January 2018 | 5161164 51
Figure 4-23 MAE F-08 Radiation Contours for Pool Fire from 50mm Failure (scale in m)
Immediate ignition following a catastrophic failure (credible worst case) will result in a liquid pool fire for MAE F-08. The contour plots and hazard ranges due to thermal radiation impact are shown in Figure 4-24 and Table 4-32 respectively.
Table 4-32 MAE F-08 Catastrophic Failure Pool Fire Results
Weather Thermal Radiation (kW/m2)
Maximum downwind extent (m)
Maximum crosswind extent (m)
2/D 3 89 131 5 60 90 10 33 59 20 26 52
5/D 3 110 142 5 76 99 10 37 63 20 27 52
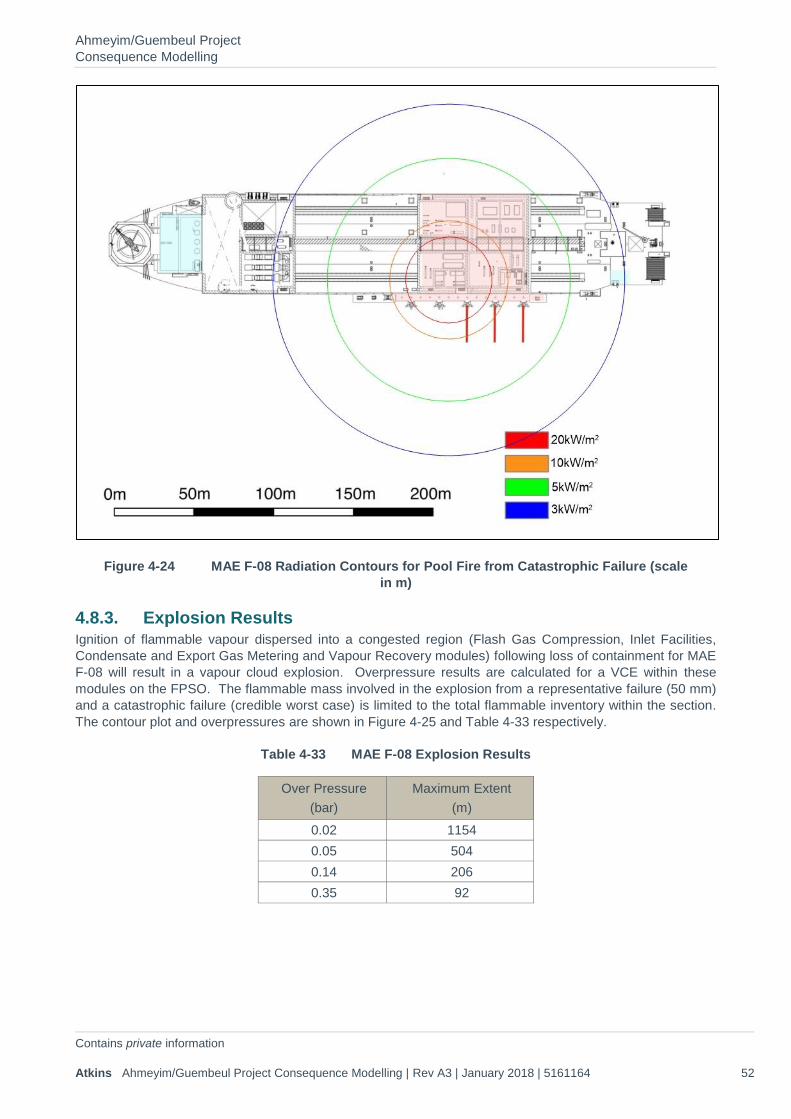
Ahmeyim/Guembeul Project Consequence Modelling
Contains private information Atkins Ahmeyim/Guembeul Project Consequence Modelling | Rev A3 | January 2018 | 5161164 52
Figure 4-24 MAE F-08 Radiation Contours for Pool Fire from Catastrophic Failure (scale in m)
4.8.3. Explosion Results Ignition of flammable vapour dispersed into a congested region (Flash Gas Compression, Inlet Facilities, Condensate and Export Gas Metering and Vapour Recovery modules) following loss of containment for MAE F-08 will result in a vapour cloud explosion. Overpressure results are calculated for a VCE within these modules on the FPSO. The flammable mass involved in the explosion from a representative failure (50 mm) and a catastrophic failure (credible worst case) is limited to the total flammable inventory within the section. The contour plot and overpressures are shown in Figure 4-25 and Table 4-33 respectively.
Table 4-33 MAE F-08 Explosion Results
Over Pressure (bar)
Maximum Extent (m)
0.02 1154 0.05 504 0.14 206 0.35 92
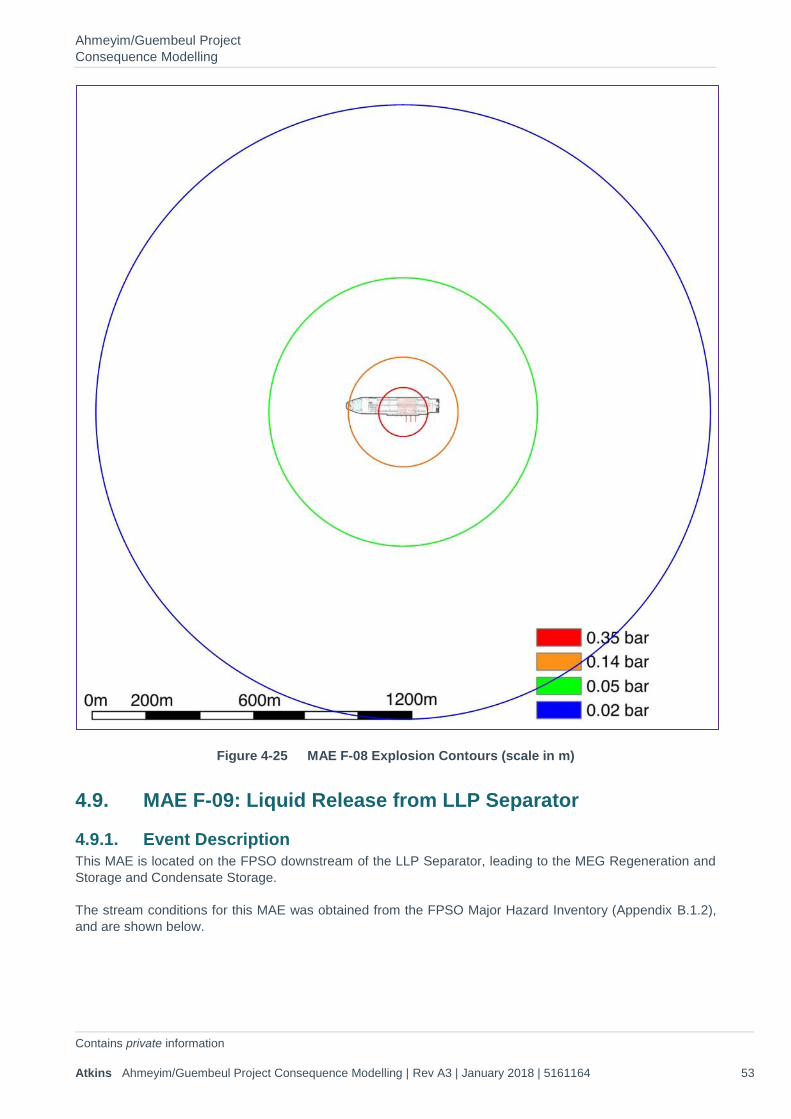
Ahmeyim/Guembeul Project Consequence Modelling
Contains private information Atkins Ahmeyim/Guembeul Project Consequence Modelling | Rev A3 | January 2018 | 5161164 53
Figure 4-25 MAE F-08 Explosion Contours (scale in m)
4.9. MAE F-09: Liquid Release from LLP Separator
4.9.1. Event Description This MAE is located on the FPSO downstream of the LLP Separator, leading to the MEG Regeneration and Storage and Condensate Storage.
The stream conditions for this MAE was obtained from the FPSO Major Hazard Inventory (Appendix B.1.2), and are shown below.
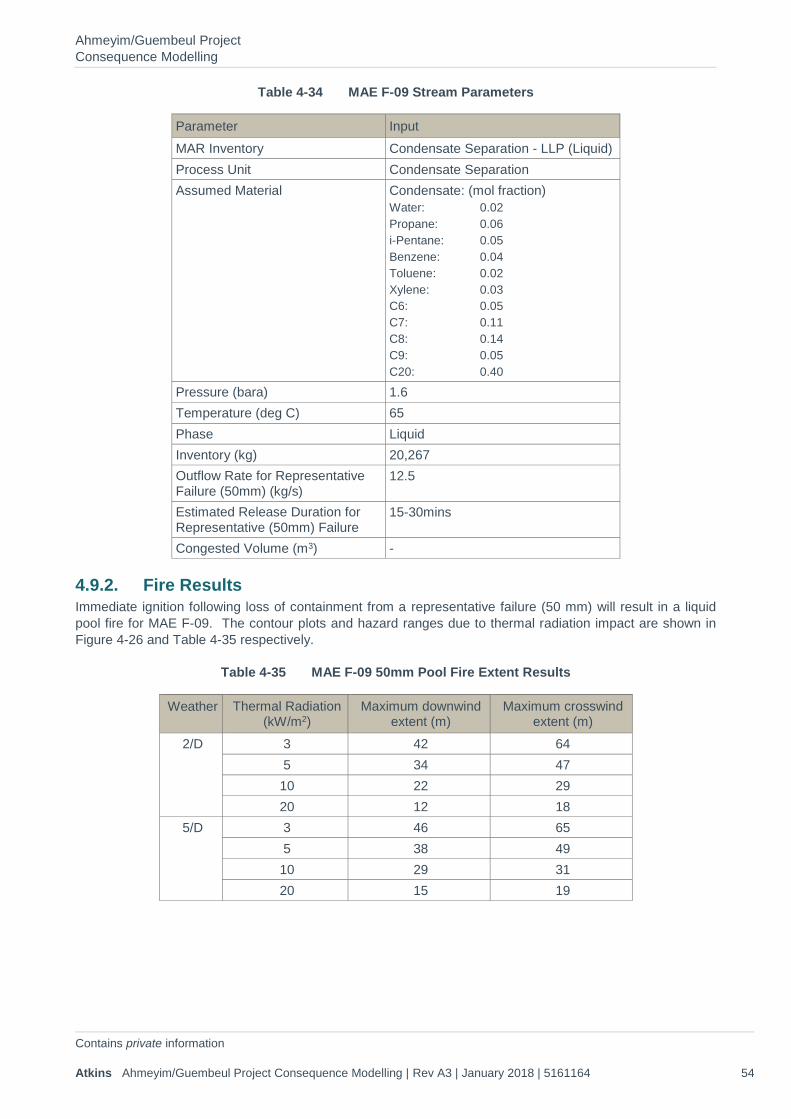
Ahmeyim/Guembeul Project Consequence Modelling
Contains private information Atkins Ahmeyim/Guembeul Project Consequence Modelling | Rev A3 | January 2018 | 5161164 54
Table 4-34 MAE F-09 Stream Parameters
Parameter Input MAR Inventory Condensate Separation - LLP (Liquid) Process Unit Condensate Separation Assumed Material Condensate: (mol fraction)
Water: 0.02 Propane: 0.06 i-Pentane: 0.05 Benzene: 0.04 Toluene: 0.02 Xylene: 0.03 C6: 0.05 C7: 0.11 C8: 0.14 C9: 0.05 C20: 0.40
Pressure (bara) 1.6 Temperature (deg C) 65 Phase Liquid Inventory (kg) 20,267 Outflow Rate for Representative Failure (50mm) (kg/s)
12.5
Estimated Release Duration for Representative (50mm) Failure
15-30mins
Congested Volume (m3) -
4.9.2. Fire Results Immediate ignition following loss of containment from a representative failure (50 mm) will result in a liquid pool fire for MAE F-09. The contour plots and hazard ranges due to thermal radiation impact are shown in Figure 4-26 and Table 4-35 respectively.
Table 4-35 MAE F-09 50mm Pool Fire Extent Results
Weather Thermal Radiation (kW/m2)
Maximum downwind extent (m)
Maximum crosswind extent (m)
2/D 3 42 64 5 34 47 10 22 29 20 12 18
5/D 3 46 65 5 38 49 10 29 31 20 15 19
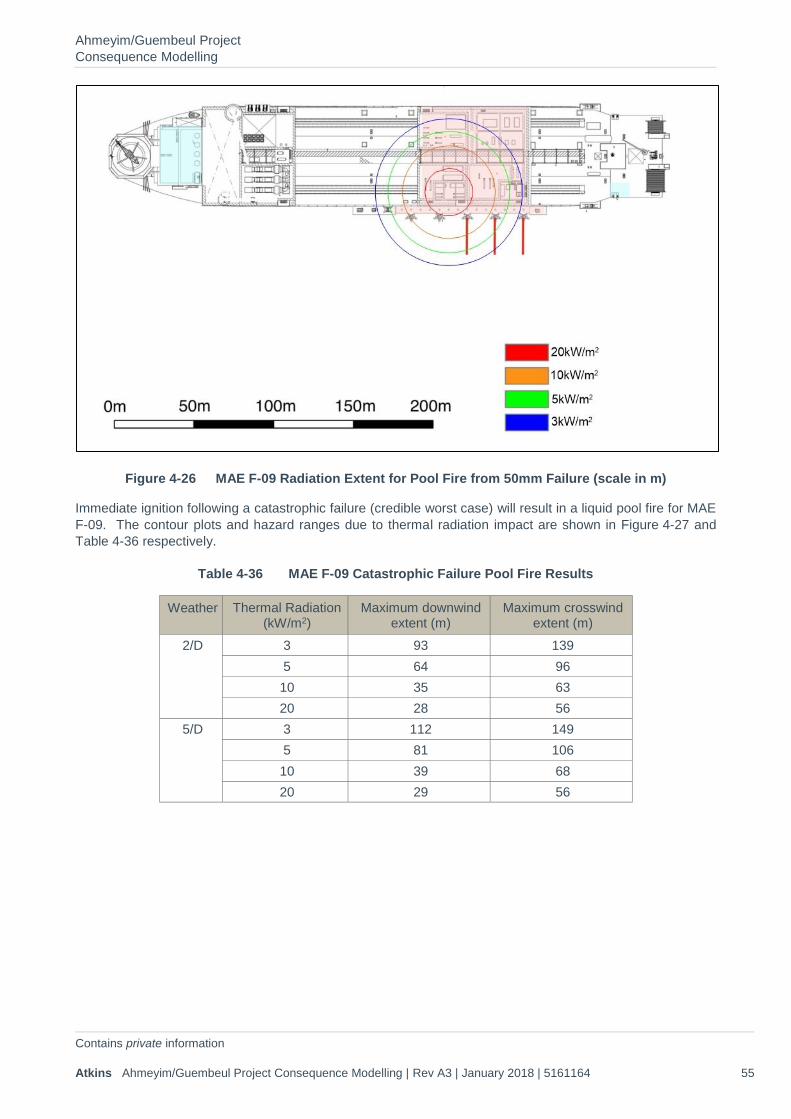
Ahmeyim/Guembeul Project Consequence Modelling
Contains private information Atkins Ahmeyim/Guembeul Project Consequence Modelling | Rev A3 | January 2018 | 5161164 55
Figure 4-26 MAE F-09 Radiation Extent for Pool Fire from 50mm Failure (scale in m)
Immediate ignition following a catastrophic failure (credible worst case) will result in a liquid pool fire for MAE F-09. The contour plots and hazard ranges due to thermal radiation impact are shown in Figure 4-27 and Table 4-36 respectively.
Table 4-36 MAE F-09 Catastrophic Failure Pool Fire Results
Weather Thermal Radiation (kW/m2)
Maximum downwind extent (m)
Maximum crosswind extent (m)
2/D 3 93 139 5 64 96 10 35 63 20 28 56
5/D 3 112 149 5 81 106 10 39 68 20 29 56
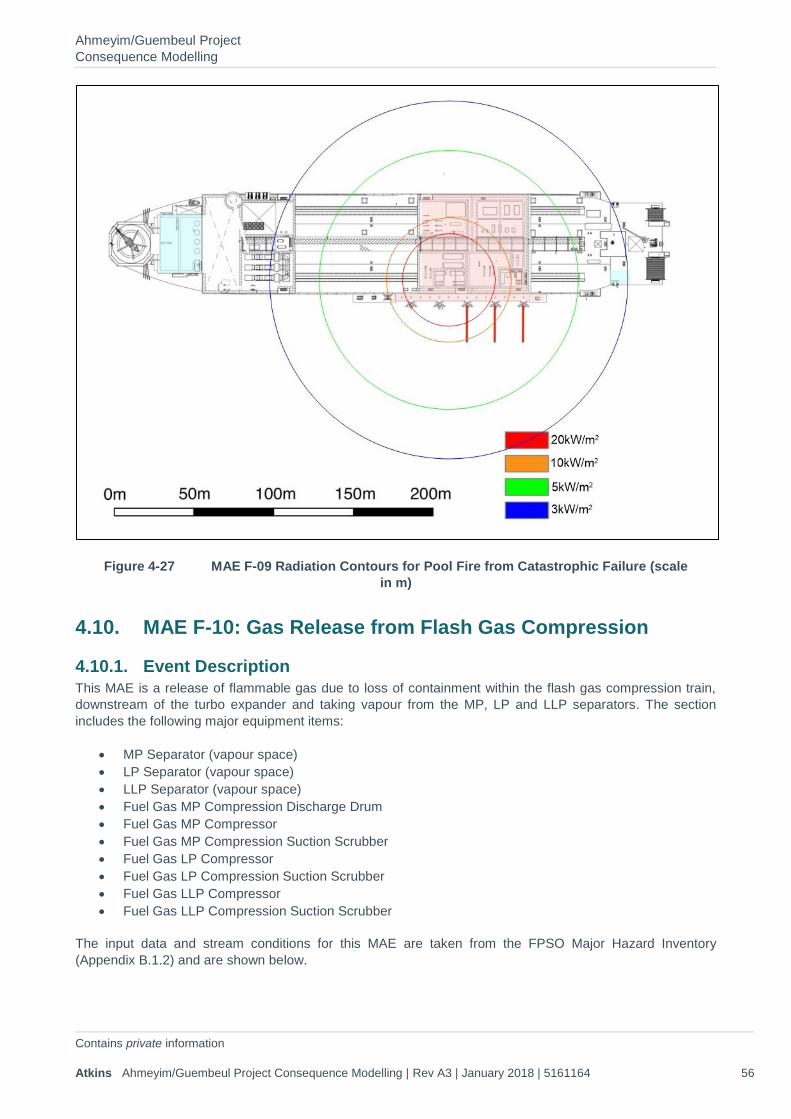
Ahmeyim/Guembeul Project Consequence Modelling
Contains private information Atkins Ahmeyim/Guembeul Project Consequence Modelling | Rev A3 | January 2018 | 5161164 56
Figure 4-27 MAE F-09 Radiation Contours for Pool Fire from Catastrophic Failure (scale in m)
4.10. MAE F-10: Gas Release from Flash Gas Compression
4.10.1. Event Description This MAE is a release of flammable gas due to loss of containment within the flash gas compression train, downstream of the turbo expander and taking vapour from the MP, LP and LLP separators. The section includes the following major equipment items:
• MP Separator (vapour space) • LP Separator (vapour space) • LLP Separator (vapour space) • Fuel Gas MP Compression Discharge Drum • Fuel Gas MP Compressor • Fuel Gas MP Compression Suction Scrubber • Fuel Gas LP Compressor • Fuel Gas LP Compression Suction Scrubber • Fuel Gas LLP Compressor • Fuel Gas LLP Compression Suction Scrubber
The input data and stream conditions for this MAE are taken from the FPSO Major Hazard Inventory (Appendix B.1.2) and are shown below.
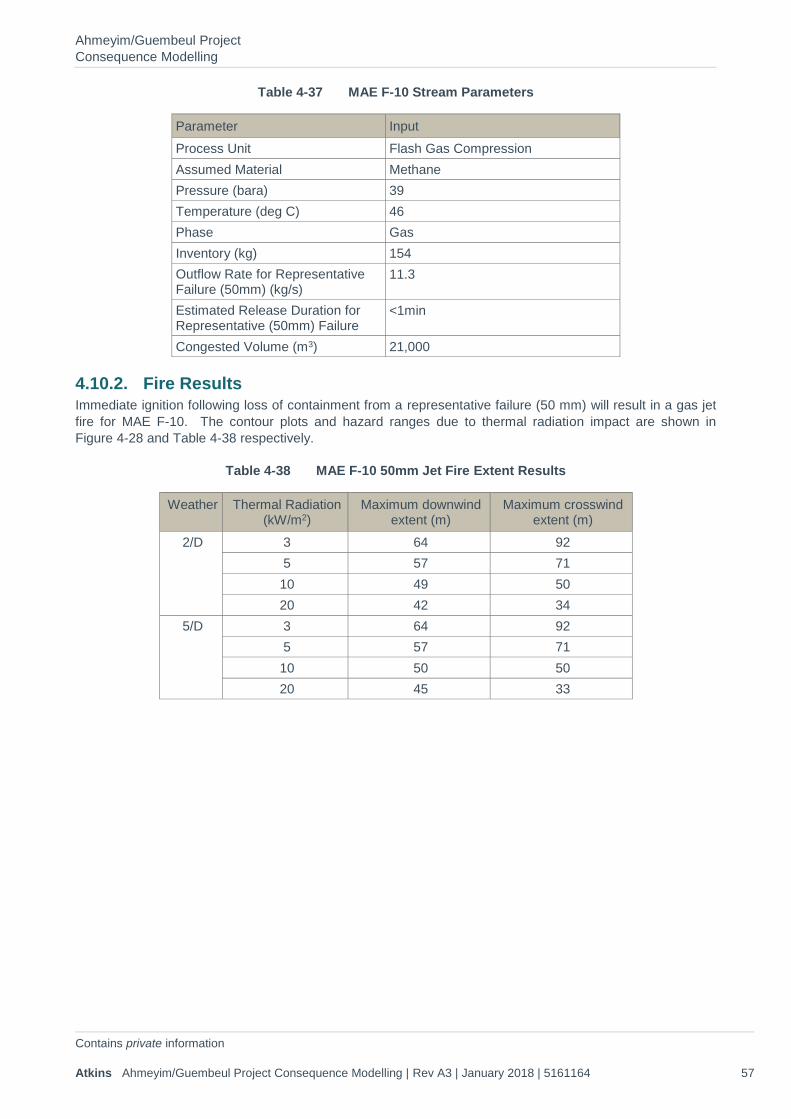
Ahmeyim/Guembeul Project Consequence Modelling
Contains private information Atkins Ahmeyim/Guembeul Project Consequence Modelling | Rev A3 | January 2018 | 5161164 57
Table 4-37 MAE F-10 Stream Parameters
Parameter Input Process Unit Flash Gas Compression Assumed Material Methane Pressure (bara) 39 Temperature (deg C) 46 Phase Gas Inventory (kg) 154 Outflow Rate for Representative Failure (50mm) (kg/s)
11.3
Estimated Release Duration for Representative (50mm) Failure
<1min
Congested Volume (m3) 21,000
4.10.2. Fire Results Immediate ignition following loss of containment from a representative failure (50 mm) will result in a gas jet fire for MAE F-10. The contour plots and hazard ranges due to thermal radiation impact are shown in Figure 4-28 and Table 4-38 respectively.
Table 4-38 MAE F-10 50mm Jet Fire Extent Results
Weather Thermal Radiation (kW/m2)
Maximum downwind extent (m)
Maximum crosswind extent (m)
2/D 3 64 92 5 57 71 10 49 50 20 42 34
5/D 3 64 92 5 57 71 10 50 50 20 45 33
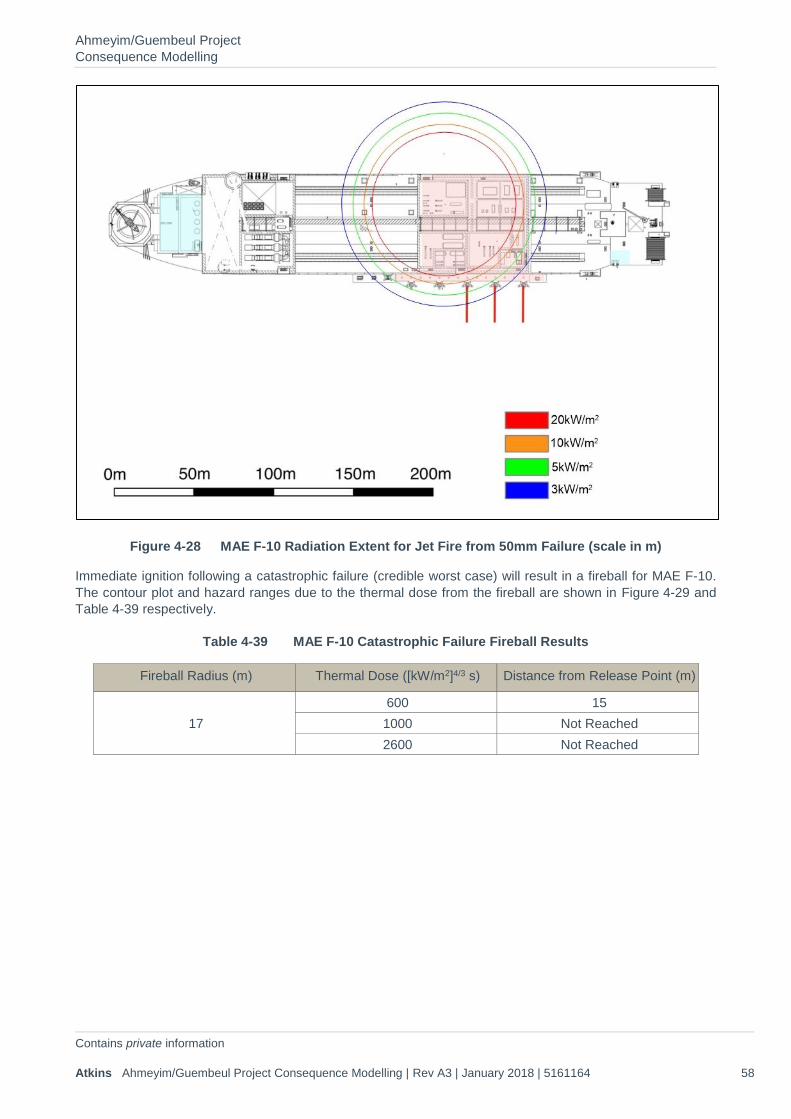
Ahmeyim/Guembeul Project Consequence Modelling
Contains private information Atkins Ahmeyim/Guembeul Project Consequence Modelling | Rev A3 | January 2018 | 5161164 58
Figure 4-28 MAE F-10 Radiation Extent for Jet Fire from 50mm Failure (scale in m)
Immediate ignition following a catastrophic failure (credible worst case) will result in a fireball for MAE F-10. The contour plot and hazard ranges due to the thermal dose from the fireball are shown in Figure 4-29 and Table 4-39 respectively.
Table 4-39 MAE F-10 Catastrophic Failure Fireball Results
Fireball Radius (m) Thermal Dose ([kW/m2]4/3 s) Distance from Release Point (m)
17 600 15 1000 Not Reached 2600 Not Reached
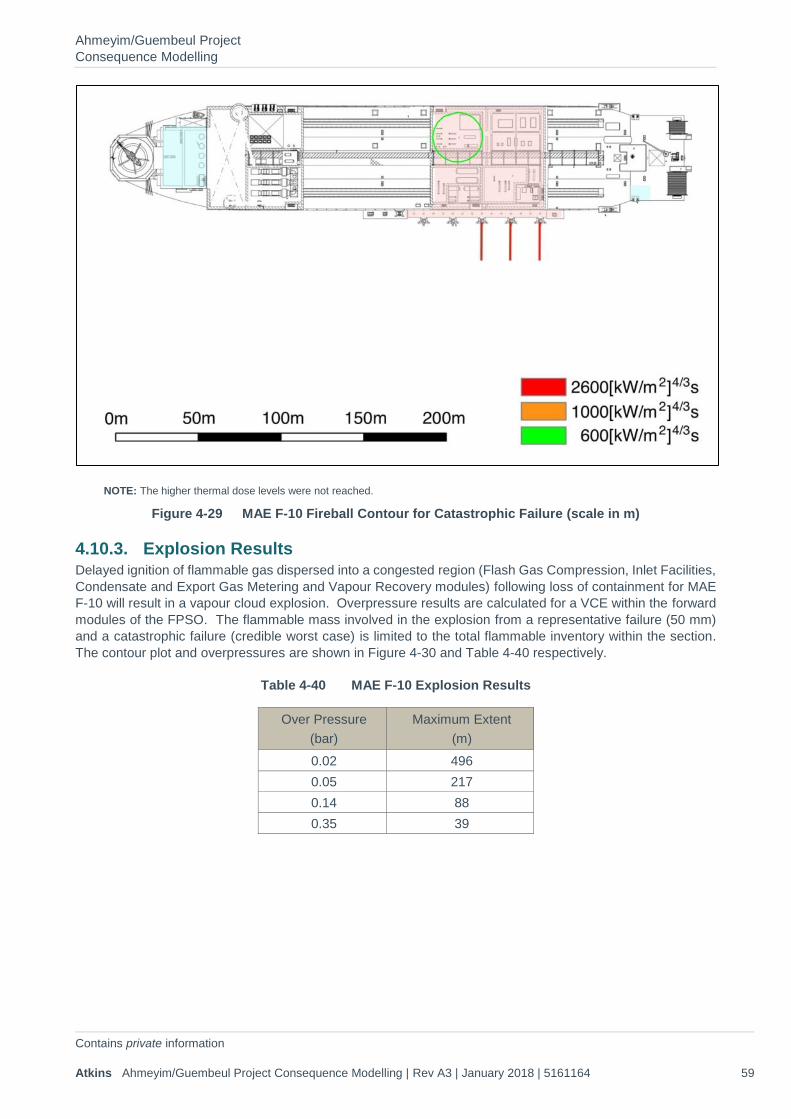
Ahmeyim/Guembeul Project Consequence Modelling
Contains private information Atkins Ahmeyim/Guembeul Project Consequence Modelling | Rev A3 | January 2018 | 5161164 59
NOTE: The higher thermal dose levels were not reached.
Figure 4-29 MAE F-10 Fireball Contour for Catastrophic Failure (scale in m)
4.10.3. Explosion Results Delayed ignition of flammable gas dispersed into a congested region (Flash Gas Compression, Inlet Facilities, Condensate and Export Gas Metering and Vapour Recovery modules) following loss of containment for MAE F-10 will result in a vapour cloud explosion. Overpressure results are calculated for a VCE within the forward modules of the FPSO. The flammable mass involved in the explosion from a representative failure (50 mm) and a catastrophic failure (credible worst case) is limited to the total flammable inventory within the section. The contour plot and overpressures are shown in Figure 4-30 and Table 4-40 respectively.
Table 4-40 MAE F-10 Explosion Results
Over Pressure (bar)
Maximum Extent (m)
0.02 496 0.05 217 0.14 88 0.35 39
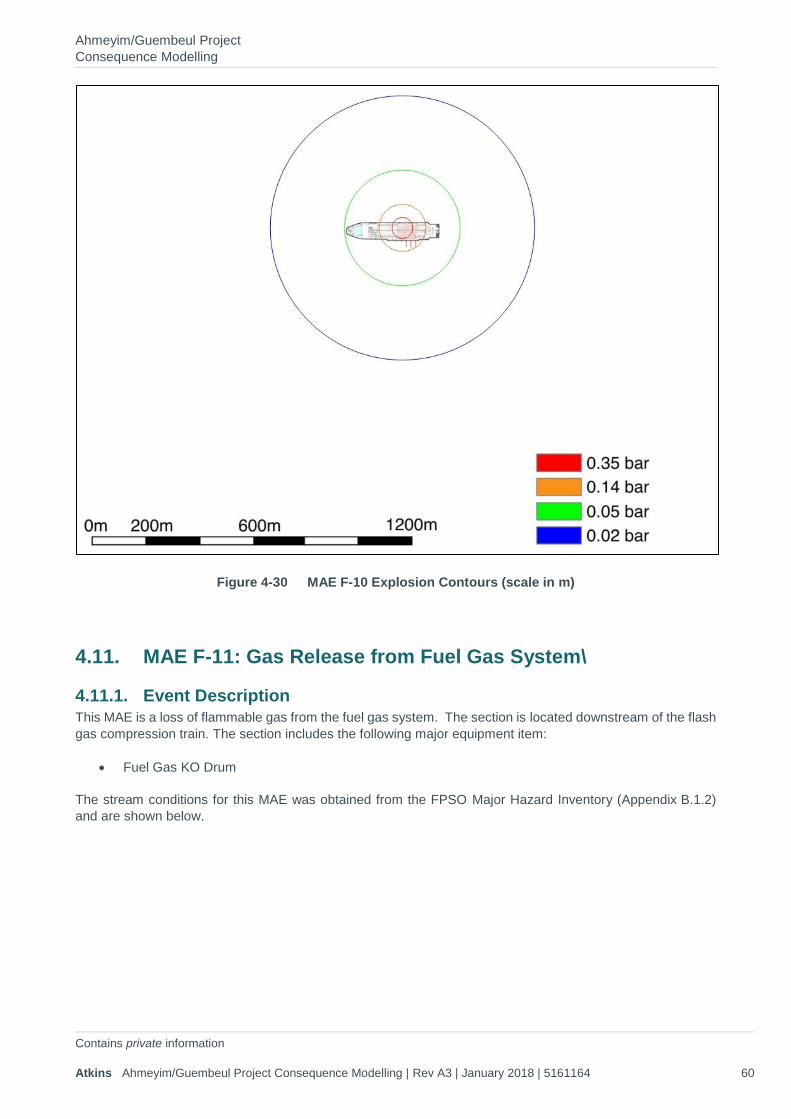
Ahmeyim/Guembeul Project Consequence Modelling
Contains private information Atkins Ahmeyim/Guembeul Project Consequence Modelling | Rev A3 | January 2018 | 5161164 60
Figure 4-30 MAE F-10 Explosion Contours (scale in m)
4.11. MAE F-11: Gas Release from Fuel Gas System\
4.11.1. Event Description This MAE is a loss of flammable gas from the fuel gas system. The section is located downstream of the flash gas compression train. The section includes the following major equipment item:
• Fuel Gas KO Drum
The stream conditions for this MAE was obtained from the FPSO Major Hazard Inventory (Appendix B.1.2) and are shown below.
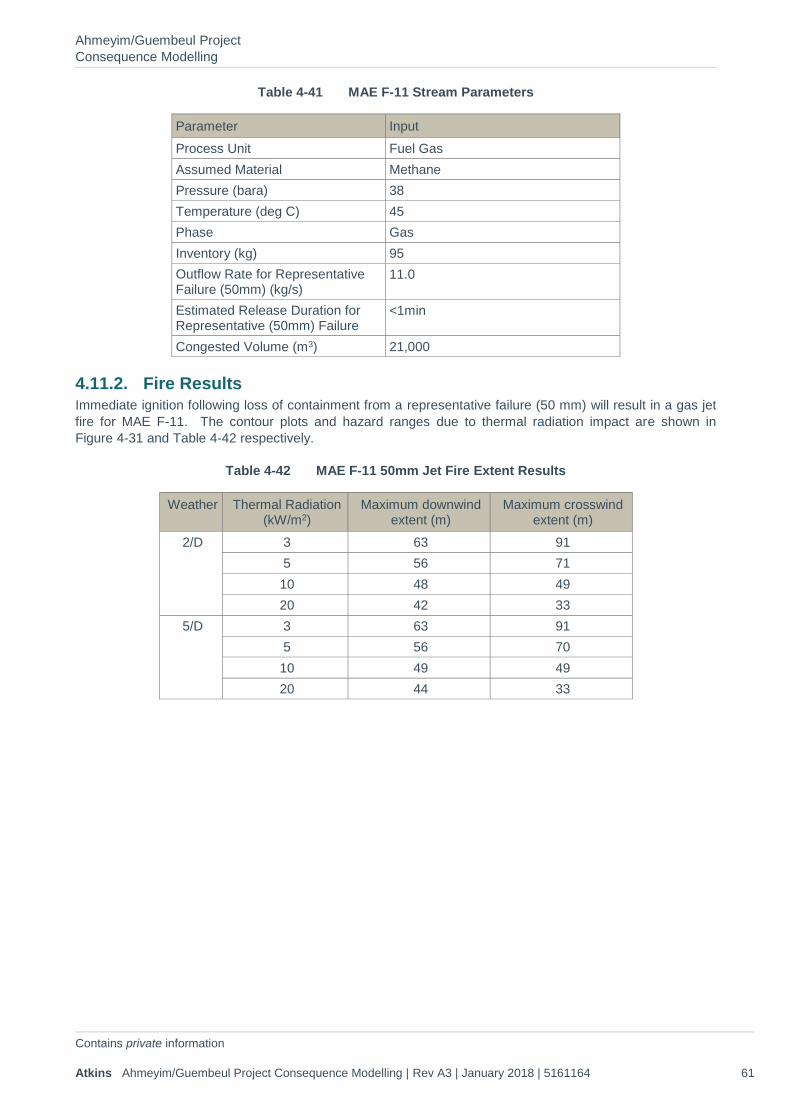
Ahmeyim/Guembeul Project Consequence Modelling
Contains private information Atkins Ahmeyim/Guembeul Project Consequence Modelling | Rev A3 | January 2018 | 5161164 61
Table 4-41 MAE F-11 Stream Parameters
Parameter Input Process Unit Fuel Gas Assumed Material Methane Pressure (bara) 38 Temperature (deg C) 45 Phase Gas Inventory (kg) 95 Outflow Rate for Representative Failure (50mm) (kg/s)
11.0
Estimated Release Duration for Representative (50mm) Failure
<1min
Congested Volume (m3) 21,000
4.11.2. Fire Results Immediate ignition following loss of containment from a representative failure (50 mm) will result in a gas jet fire for MAE F-11. The contour plots and hazard ranges due to thermal radiation impact are shown in Figure 4-31 and Table 4-42 respectively.
Table 4-42 MAE F-11 50mm Jet Fire Extent Results
Weather Thermal Radiation (kW/m2)
Maximum downwind extent (m)
Maximum crosswind extent (m)
2/D 3 63 91 5 56 71 10 48 49 20 42 33
5/D 3 63 91 5 56 70 10 49 49 20 44 33
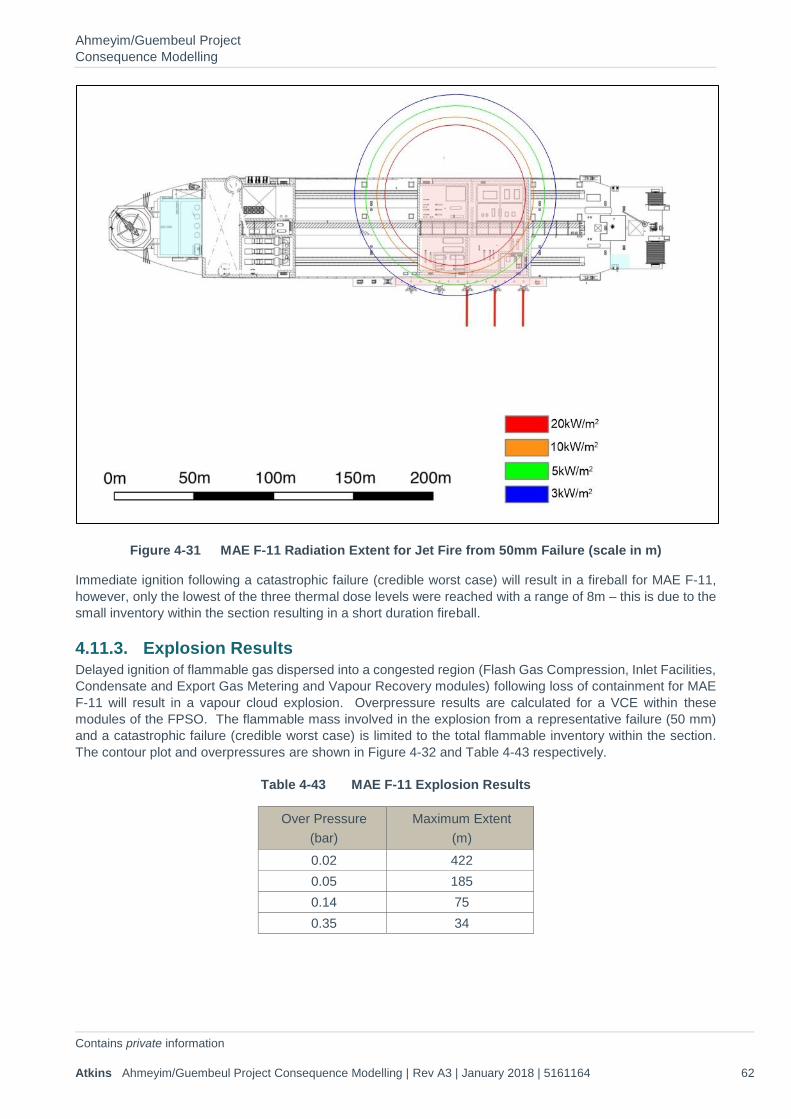
Ahmeyim/Guembeul Project Consequence Modelling
Contains private information Atkins Ahmeyim/Guembeul Project Consequence Modelling | Rev A3 | January 2018 | 5161164 62
Figure 4-31 MAE F-11 Radiation Extent for Jet Fire from 50mm Failure (scale in m)
Immediate ignition following a catastrophic failure (credible worst case) will result in a fireball for MAE F-11, however, only the lowest of the three thermal dose levels were reached with a range of 8m – this is due to the small inventory within the section resulting in a short duration fireball.
4.11.3. Explosion Results Delayed ignition of flammable gas dispersed into a congested region (Flash Gas Compression, Inlet Facilities, Condensate and Export Gas Metering and Vapour Recovery modules) following loss of containment for MAE F-11 will result in a vapour cloud explosion. Overpressure results are calculated for a VCE within these modules of the FPSO. The flammable mass involved in the explosion from a representative failure (50 mm) and a catastrophic failure (credible worst case) is limited to the total flammable inventory within the section. The contour plot and overpressures are shown in Figure 4-32 and Table 4-43 respectively.
Table 4-43 MAE F-11 Explosion Results
Over Pressure (bar)
Maximum Extent (m)
0.02 422 0.05 185 0.14 75 0.35 34
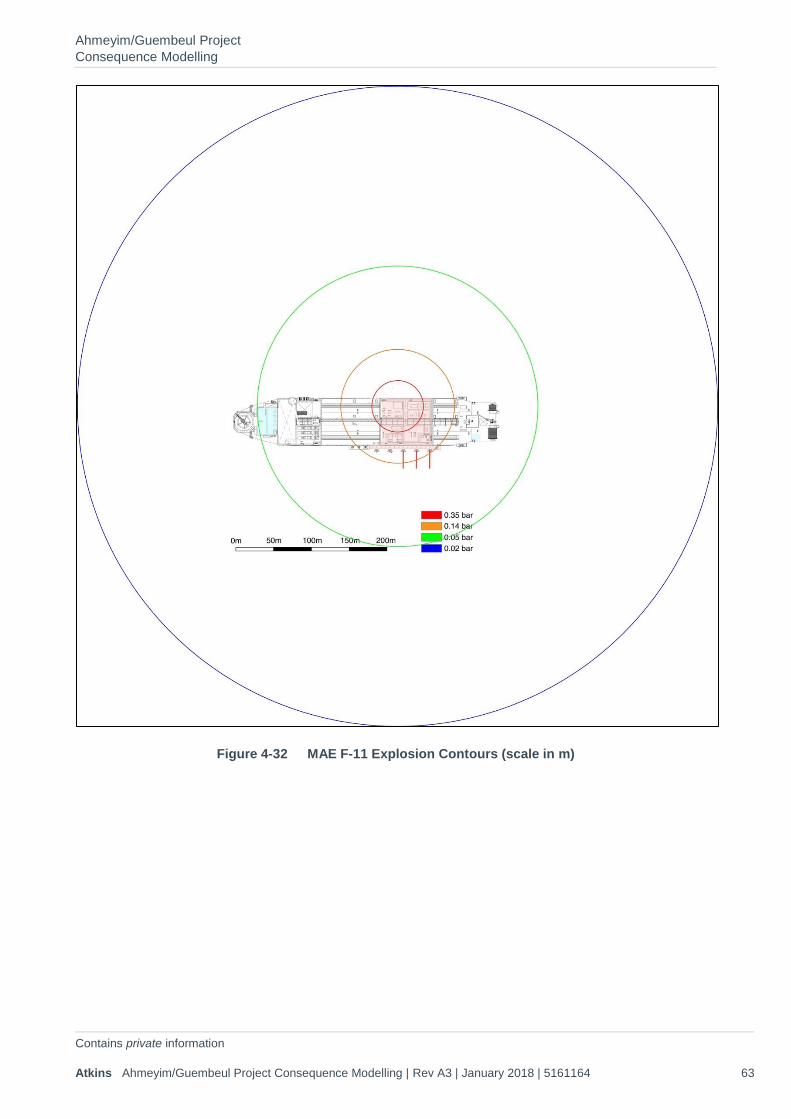
Ahmeyim/Guembeul Project Consequence Modelling
Contains private information Atkins Ahmeyim/Guembeul Project Consequence Modelling | Rev A3 | January 2018 | 5161164 63
Figure 4-32 MAE F-11 Explosion Contours (scale in m)
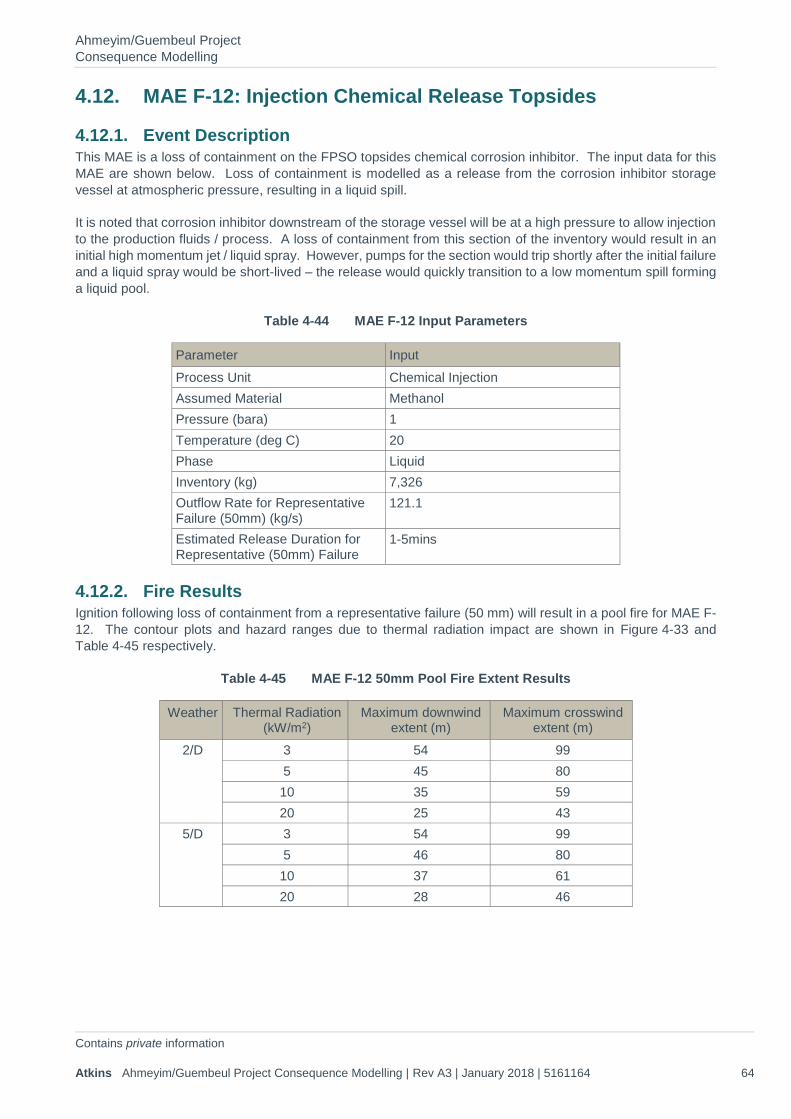
Ahmeyim/Guembeul Project Consequence Modelling
Contains private information Atkins Ahmeyim/Guembeul Project Consequence Modelling | Rev A3 | January 2018 | 5161164 64
4.12. MAE F-12: Injection Chemical Release Topsides
4.12.1. Event Description This MAE is a loss of containment on the FPSO topsides chemical corrosion inhibitor. The input data for this MAE are shown below. Loss of containment is modelled as a release from the corrosion inhibitor storage vessel at atmospheric pressure, resulting in a liquid spill.
It is noted that corrosion inhibitor downstream of the storage vessel will be at a high pressure to allow injection to the production fluids / process. A loss of containment from this section of the inventory would result in an initial high momentum jet / liquid spray. However, pumps for the section would trip shortly after the initial failure and a liquid spray would be short-lived – the release would quickly transition to a low momentum spill forming a liquid pool.
Table 4-44 MAE F-12 Input Parameters
Parameter Input Process Unit Chemical Injection Assumed Material Methanol Pressure (bara) 1 Temperature (deg C) 20 Phase Liquid Inventory (kg) 7,326 Outflow Rate for Representative Failure (50mm) (kg/s)
121.1
Estimated Release Duration for Representative (50mm) Failure
1-5mins
4.12.2. Fire Results Ignition following loss of containment from a representative failure (50 mm) will result in a pool fire for MAE F-12. The contour plots and hazard ranges due to thermal radiation impact are shown in Figure 4-33 and Table 4-45 respectively.
Table 4-45 MAE F-12 50mm Pool Fire Extent Results
Weather Thermal Radiation (kW/m2)
Maximum downwind extent (m)
Maximum crosswind extent (m)
2/D 3 54 99 5 45 80 10 35 59 20 25 43
5/D 3 54 99 5 46 80 10 37 61 20 28 46
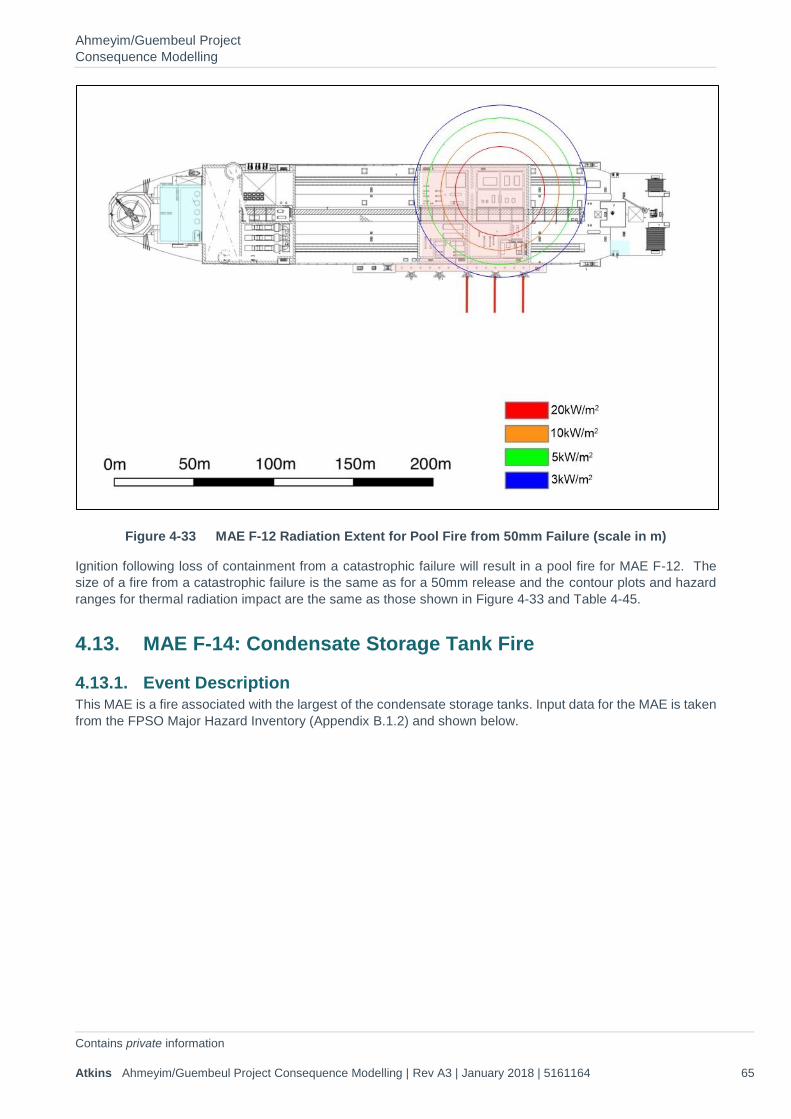
Ahmeyim/Guembeul Project Consequence Modelling
Contains private information Atkins Ahmeyim/Guembeul Project Consequence Modelling | Rev A3 | January 2018 | 5161164 65
Figure 4-33 MAE F-12 Radiation Extent for Pool Fire from 50mm Failure (scale in m)
Ignition following loss of containment from a catastrophic failure will result in a pool fire for MAE F-12. The size of a fire from a catastrophic failure is the same as for a 50mm release and the contour plots and hazard ranges for thermal radiation impact are the same as those shown in Figure 4-33 and Table 4-45.
4.13. MAE F-14: Condensate Storage Tank Fire
4.13.1. Event Description This MAE is a fire associated with the largest of the condensate storage tanks. Input data for the MAE is taken from the FPSO Major Hazard Inventory (Appendix B.1.2) and shown below.
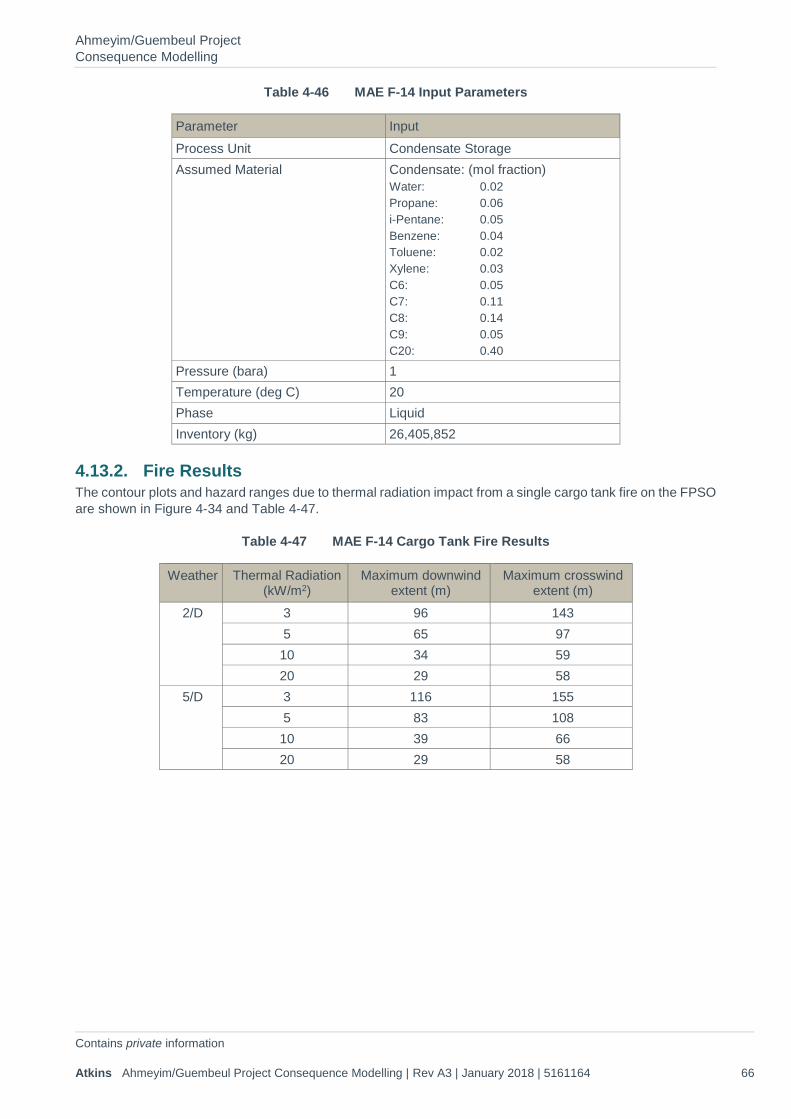
Ahmeyim/Guembeul Project Consequence Modelling
Contains private information Atkins Ahmeyim/Guembeul Project Consequence Modelling | Rev A3 | January 2018 | 5161164 66
Table 4-46 MAE F-14 Input Parameters
Parameter Input Process Unit Condensate Storage Assumed Material Condensate: (mol fraction)
Water: 0.02 Propane: 0.06 i-Pentane: 0.05 Benzene: 0.04 Toluene: 0.02 Xylene: 0.03 C6: 0.05 C7: 0.11 C8: 0.14 C9: 0.05 C20: 0.40
Pressure (bara) 1 Temperature (deg C) 20 Phase Liquid Inventory (kg) 26,405,852
4.13.2. Fire Results The contour plots and hazard ranges due to thermal radiation impact from a single cargo tank fire on the FPSO are shown in Figure 4-34 and Table 4-47.
Table 4-47 MAE F-14 Cargo Tank Fire Results
Weather Thermal Radiation (kW/m2)
Maximum downwind extent (m)
Maximum crosswind extent (m)
2/D 3 96 143 5 65 97 10 34 59 20 29 58
5/D 3 116 155 5 83 108 10 39 66 20 29 58
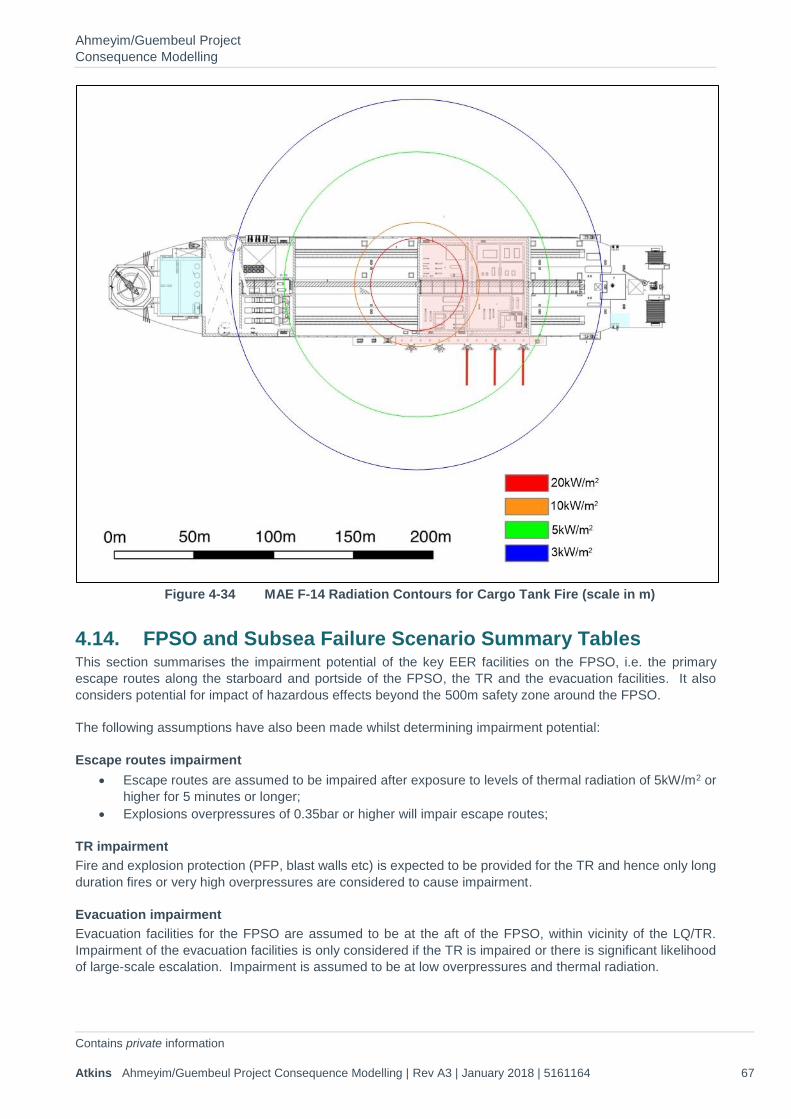
Ahmeyim/Guembeul Project Consequence Modelling
Contains private information Atkins Ahmeyim/Guembeul Project Consequence Modelling | Rev A3 | January 2018 | 5161164 67
Figure 4-34 MAE F-14 Radiation Contours for Cargo Tank Fire (scale in m)
4.14. FPSO and Subsea Failure Scenario Summary Tables This section summarises the impairment potential of the key EER facilities on the FPSO, i.e. the primary escape routes along the starboard and portside of the FPSO, the TR and the evacuation facilities. It also considers potential for impact of hazardous effects beyond the 500m safety zone around the FPSO.
The following assumptions have also been made whilst determining impairment potential:
Escape routes impairment • Escape routes are assumed to be impaired after exposure to levels of thermal radiation of 5kW/m2 or
higher for 5 minutes or longer; • Explosions overpressures of 0.35bar or higher will impair escape routes;
TR impairment Fire and explosion protection (PFP, blast walls etc) is expected to be provided for the TR and hence only long duration fires or very high overpressures are considered to cause impairment.
Evacuation impairment Evacuation facilities for the FPSO are assumed to be at the aft of the FPSO, within vicinity of the LQ/TR. Impairment of the evacuation facilities is only considered if the TR is impaired or there is significant likelihood of large-scale escalation. Impairment is assumed to be at low overpressures and thermal radiation.
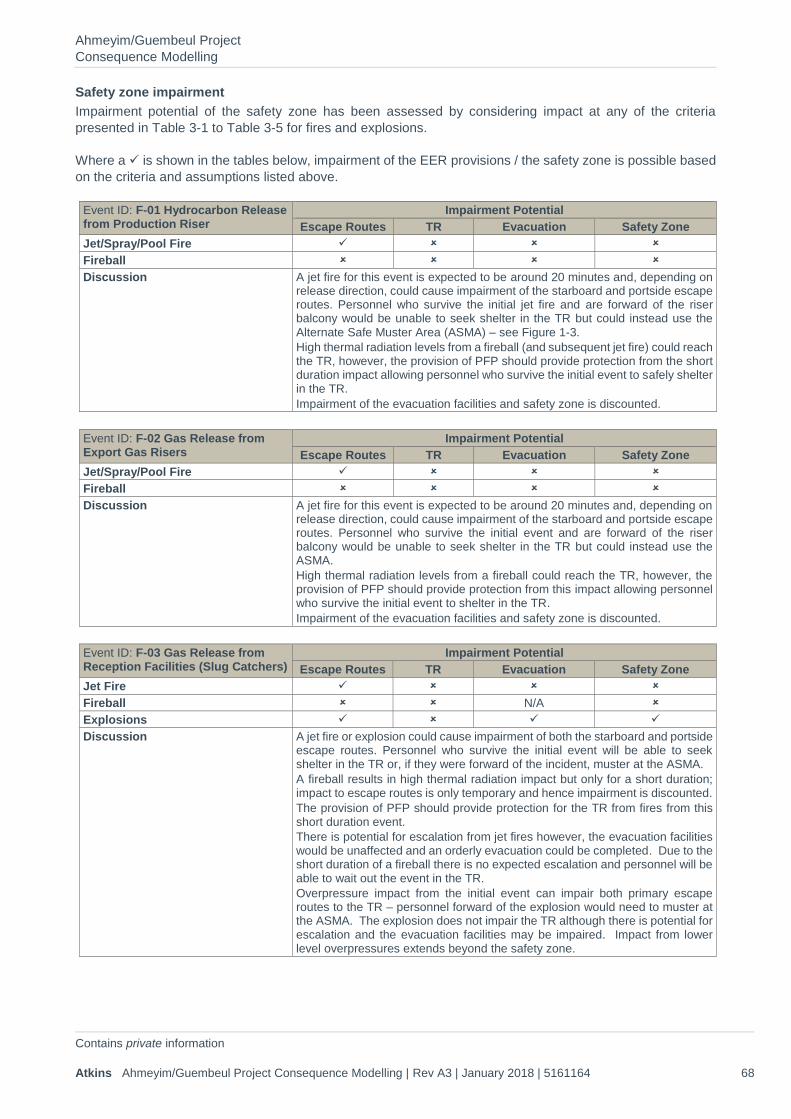
Ahmeyim/Guembeul Project Consequence Modelling
Contains private information Atkins Ahmeyim/Guembeul Project Consequence Modelling | Rev A3 | January 2018 | 5161164 68
Safety zone impairment Impairment potential of the safety zone has been assessed by considering impact at any of the criteria presented in Table 3-1 to Table 3-5 for fires and explosions.
Where a ✓ is shown in the tables below, impairment of the EER provisions / the safety zone is possible based on the criteria and assumptions listed above.
Event ID: F-01 Hydrocarbon Release from Production Riser
Impairment Potential Escape Routes TR Evacuation Safety Zone
Jet/Spray/Pool Fire ✓ Fireball Discussion A jet fire for this event is expected to be around 20 minutes and, depending on
release direction, could cause impairment of the starboard and portside escape routes. Personnel who survive the initial jet fire and are forward of the riser balcony would be unable to seek shelter in the TR but could instead use the Alternate Safe Muster Area (ASMA) – see Figure 1-3. High thermal radiation levels from a fireball (and subsequent jet fire) could reach the TR, however, the provision of PFP should provide protection from the short duration impact allowing personnel who survive the initial event to safely shelter in the TR. Impairment of the evacuation facilities and safety zone is discounted.
Event ID: F-02 Gas Release from Export Gas Risers
Impairment Potential Escape Routes TR Evacuation Safety Zone
Jet/Spray/Pool Fire ✓ Fireball Discussion A jet fire for this event is expected to be around 20 minutes and, depending on
release direction, could cause impairment of the starboard and portside escape routes. Personnel who survive the initial event and are forward of the riser balcony would be unable to seek shelter in the TR but could instead use the ASMA. High thermal radiation levels from a fireball could reach the TR, however, the provision of PFP should provide protection from this impact allowing personnel who survive the initial event to shelter in the TR. Impairment of the evacuation facilities and safety zone is discounted.
Event ID: F-03 Gas Release from Reception Facilities (Slug Catchers)
Impairment Potential Escape Routes TR Evacuation Safety Zone
Jet Fire ✓ Fireball N/A Explosions ✓ ✓ ✓ Discussion A jet fire or explosion could cause impairment of both the starboard and portside
escape routes. Personnel who survive the initial event will be able to seek shelter in the TR or, if they were forward of the incident, muster at the ASMA. A fireball results in high thermal radiation impact but only for a short duration; impact to escape routes is only temporary and hence impairment is discounted. The provision of PFP should provide protection for the TR from fires from this short duration event. There is potential for escalation from jet fires however, the evacuation facilities would be unaffected and an orderly evacuation could be completed. Due to the short duration of a fireball there is no expected escalation and personnel will be able to wait out the event in the TR. Overpressure impact from the initial event can impair both primary escape routes to the TR – personnel forward of the explosion would need to muster at the ASMA. The explosion does not impair the TR although there is potential for escalation and the evacuation facilities may be impaired. Impact from lower level overpressures extends beyond the safety zone.
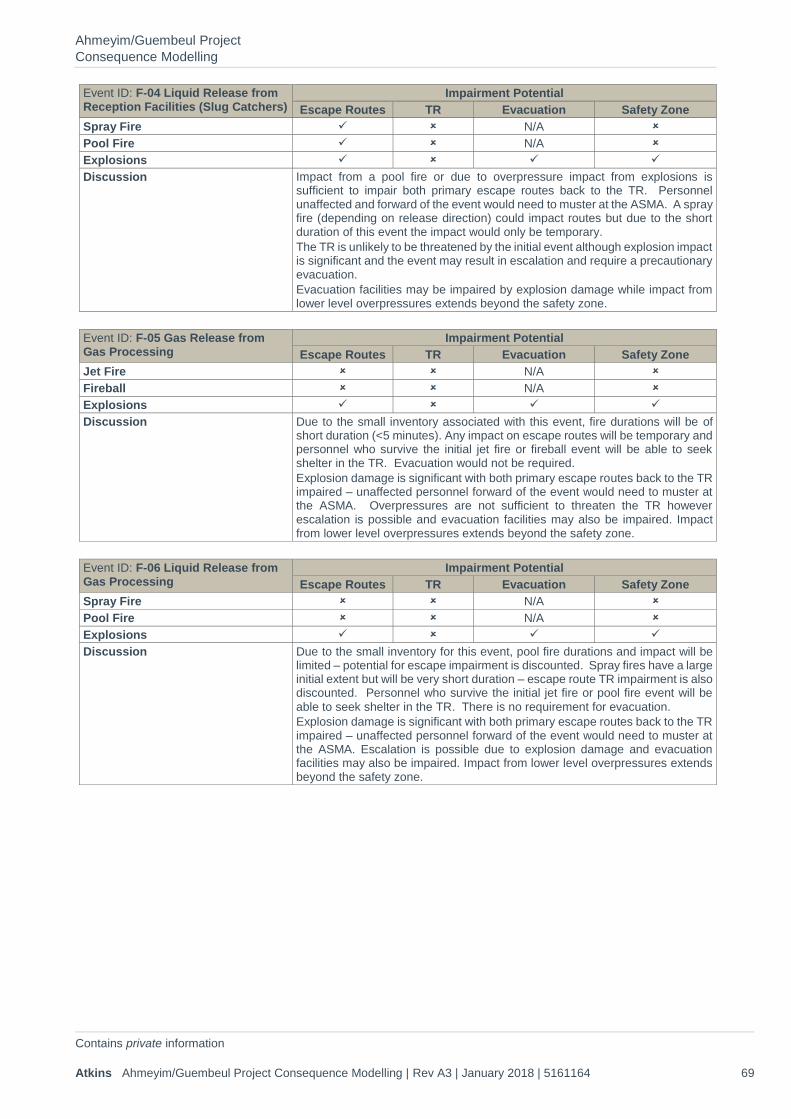
Ahmeyim/Guembeul Project Consequence Modelling
Contains private information Atkins Ahmeyim/Guembeul Project Consequence Modelling | Rev A3 | January 2018 | 5161164 69
Event ID: F-04 Liquid Release from Reception Facilities (Slug Catchers)
Impairment Potential Escape Routes TR Evacuation Safety Zone
Spray Fire ✓ N/A Pool Fire ✓ N/A Explosions ✓ ✓ ✓ Discussion Impact from a pool fire or due to overpressure impact from explosions is
sufficient to impair both primary escape routes back to the TR. Personnel unaffected and forward of the event would need to muster at the ASMA. A spray fire (depending on release direction) could impact routes but due to the short duration of this event the impact would only be temporary. The TR is unlikely to be threatened by the initial event although explosion impact is significant and the event may result in escalation and require a precautionary evacuation. Evacuation facilities may be impaired by explosion damage while impact from lower level overpressures extends beyond the safety zone.
Event ID: F-05 Gas Release from Gas Processing
Impairment Potential Escape Routes TR Evacuation Safety Zone
Jet Fire N/A Fireball N/A Explosions ✓ ✓ ✓ Discussion Due to the small inventory associated with this event, fire durations will be of
short duration (<5 minutes). Any impact on escape routes will be temporary and personnel who survive the initial jet fire or fireball event will be able to seek shelter in the TR. Evacuation would not be required. Explosion damage is significant with both primary escape routes back to the TR impaired – unaffected personnel forward of the event would need to muster at the ASMA. Overpressures are not sufficient to threaten the TR however escalation is possible and evacuation facilities may also be impaired. Impact from lower level overpressures extends beyond the safety zone.
Event ID: F-06 Liquid Release from Gas Processing
Impairment Potential Escape Routes TR Evacuation Safety Zone
Spray Fire N/A Pool Fire N/A Explosions ✓ ✓ ✓ Discussion Due to the small inventory for this event, pool fire durations and impact will be
limited – potential for escape impairment is discounted. Spray fires have a large initial extent but will be very short duration – escape route TR impairment is also discounted. Personnel who survive the initial jet fire or pool fire event will be able to seek shelter in the TR. There is no requirement for evacuation. Explosion damage is significant with both primary escape routes back to the TR impaired – unaffected personnel forward of the event would need to muster at the ASMA. Escalation is possible due to explosion damage and evacuation facilities may also be impaired. Impact from lower level overpressures extends beyond the safety zone.
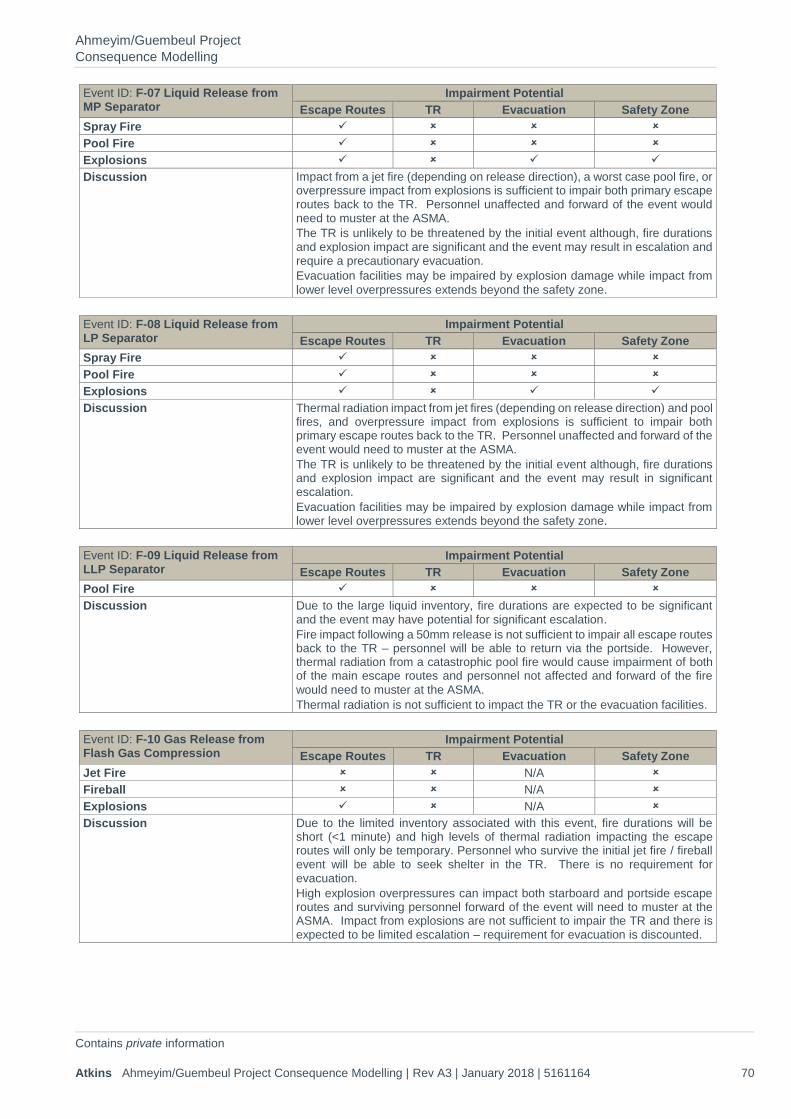
Ahmeyim/Guembeul Project Consequence Modelling
Contains private information Atkins Ahmeyim/Guembeul Project Consequence Modelling | Rev A3 | January 2018 | 5161164 70
Event ID: F-07 Liquid Release from MP Separator
Impairment Potential Escape Routes TR Evacuation Safety Zone
Spray Fire ✓ Pool Fire ✓ Explosions ✓ ✓ ✓ Discussion Impact from a jet fire (depending on release direction), a worst case pool fire, or
overpressure impact from explosions is sufficient to impair both primary escape routes back to the TR. Personnel unaffected and forward of the event would need to muster at the ASMA. The TR is unlikely to be threatened by the initial event although, fire durations and explosion impact are significant and the event may result in escalation and require a precautionary evacuation. Evacuation facilities may be impaired by explosion damage while impact from lower level overpressures extends beyond the safety zone.
Event ID: F-08 Liquid Release from LP Separator
Impairment Potential Escape Routes TR Evacuation Safety Zone
Spray Fire ✓ Pool Fire ✓ Explosions ✓ ✓ ✓ Discussion Thermal radiation impact from jet fires (depending on release direction) and pool
fires, and overpressure impact from explosions is sufficient to impair both primary escape routes back to the TR. Personnel unaffected and forward of the event would need to muster at the ASMA. The TR is unlikely to be threatened by the initial event although, fire durations and explosion impact are significant and the event may result in significant escalation. Evacuation facilities may be impaired by explosion damage while impact from lower level overpressures extends beyond the safety zone.
Event ID: F-09 Liquid Release from LLP Separator
Impairment Potential Escape Routes TR Evacuation Safety Zone
Pool Fire ✓ Discussion Due to the large liquid inventory, fire durations are expected to be significant
and the event may have potential for significant escalation. Fire impact following a 50mm release is not sufficient to impair all escape routes back to the TR – personnel will be able to return via the portside. However, thermal radiation from a catastrophic pool fire would cause impairment of both of the main escape routes and personnel not affected and forward of the fire would need to muster at the ASMA. Thermal radiation is not sufficient to impact the TR or the evacuation facilities.
Event ID: F-10 Gas Release from Flash Gas Compression
Impairment Potential Escape Routes TR Evacuation Safety Zone
Jet Fire N/A Fireball N/A Explosions ✓ N/A Discussion Due to the limited inventory associated with this event, fire durations will be
short (<1 minute) and high levels of thermal radiation impacting the escape routes will only be temporary. Personnel who survive the initial jet fire / fireball event will be able to seek shelter in the TR. There is no requirement for evacuation. High explosion overpressures can impact both starboard and portside escape routes and surviving personnel forward of the event will need to muster at the ASMA. Impact from explosions are not sufficient to impair the TR and there is expected to be limited escalation – requirement for evacuation is discounted.
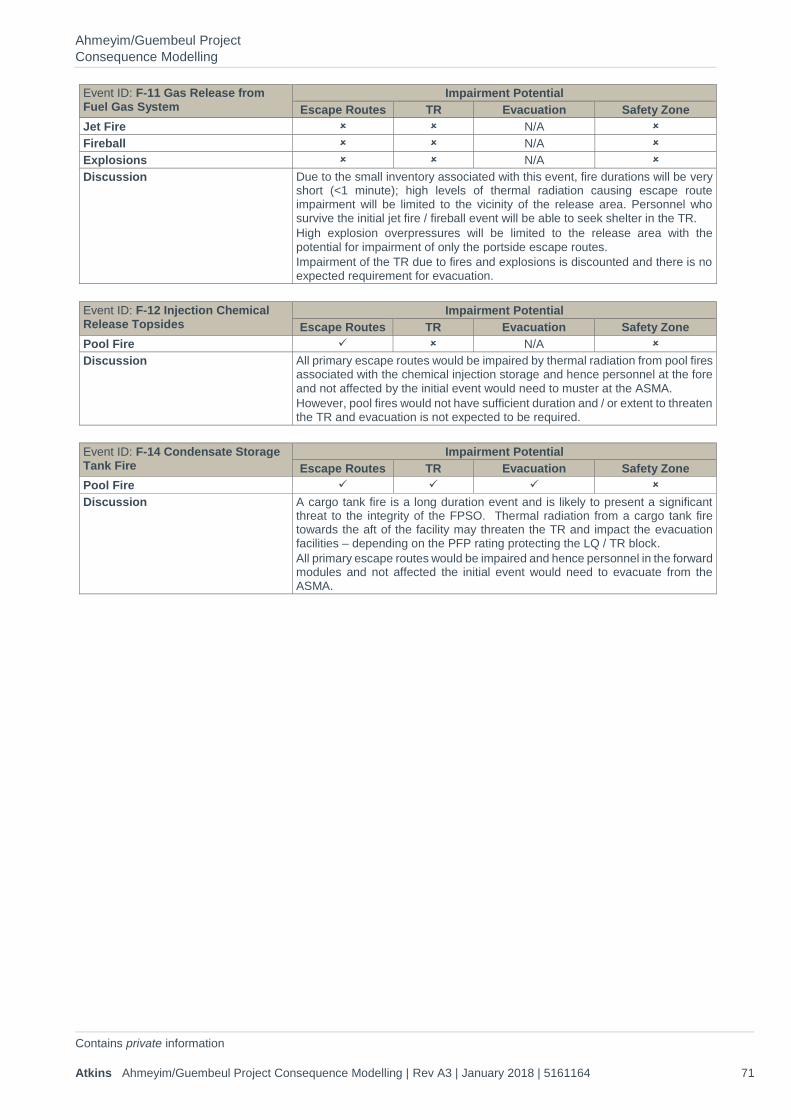
Ahmeyim/Guembeul Project Consequence Modelling
Contains private information Atkins Ahmeyim/Guembeul Project Consequence Modelling | Rev A3 | January 2018 | 5161164 71
Event ID: F-11 Gas Release from Fuel Gas System
Impairment Potential Escape Routes TR Evacuation Safety Zone
Jet Fire N/A Fireball N/A Explosions N/A Discussion Due to the small inventory associated with this event, fire durations will be very
short (<1 minute); high levels of thermal radiation causing escape route impairment will be limited to the vicinity of the release area. Personnel who survive the initial jet fire / fireball event will be able to seek shelter in the TR. High explosion overpressures will be limited to the release area with the potential for impairment of only the portside escape routes. Impairment of the TR due to fires and explosions is discounted and there is no expected requirement for evacuation.
Event ID: F-12 Injection Chemical Release Topsides
Impairment Potential Escape Routes TR Evacuation Safety Zone
Pool Fire ✓ N/A Discussion All primary escape routes would be impaired by thermal radiation from pool fires
associated with the chemical injection storage and hence personnel at the fore and not affected by the initial event would need to muster at the ASMA. However, pool fires would not have sufficient duration and / or extent to threaten the TR and evacuation is not expected to be required.
Event ID: F-14 Condensate Storage Tank Fire
Impairment Potential Escape Routes TR Evacuation Safety Zone
Pool Fire ✓ ✓ ✓ Discussion A cargo tank fire is a long duration event and is likely to present a significant
threat to the integrity of the FPSO. Thermal radiation from a cargo tank fire towards the aft of the facility may threaten the TR and impact the evacuation facilities – depending on the PFP rating protecting the LQ / TR block. All primary escape routes would be impaired and hence personnel in the forward modules and not affected the initial event would need to evacuate from the ASMA.
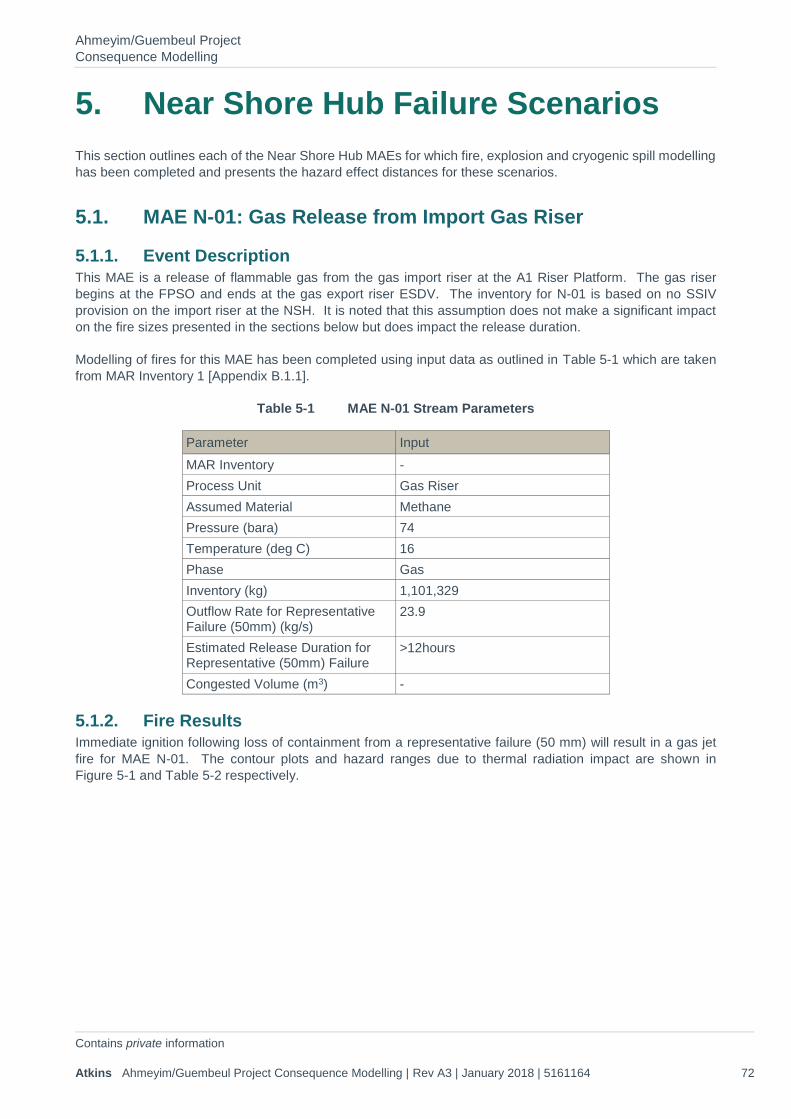
Ahmeyim/Guembeul Project Consequence Modelling
Contains private information Atkins Ahmeyim/Guembeul Project Consequence Modelling | Rev A3 | January 2018 | 5161164 72
5. Near Shore Hub Failure Scenarios This section outlines each of the Near Shore Hub MAEs for which fire, explosion and cryogenic spill modelling has been completed and presents the hazard effect distances for these scenarios.
5.1. MAE N-01: Gas Release from Import Gas Riser
5.1.1. Event Description This MAE is a release of flammable gas from the gas import riser at the A1 Riser Platform. The gas riser begins at the FPSO and ends at the gas export riser ESDV. The inventory for N-01 is based on no SSIV provision on the import riser at the NSH. It is noted that this assumption does not make a significant impact on the fire sizes presented in the sections below but does impact the release duration.
Modelling of fires for this MAE has been completed using input data as outlined in Table 5-1 which are taken from MAR Inventory 1 [Appendix B.1.1].
Table 5-1 MAE N-01 Stream Parameters
Parameter Input MAR Inventory - Process Unit Gas Riser Assumed Material Methane Pressure (bara) 74 Temperature (deg C) 16 Phase Gas Inventory (kg) 1,101,329 Outflow Rate for Representative Failure (50mm) (kg/s)
23.9
Estimated Release Duration for Representative (50mm) Failure
>12hours
Congested Volume (m3) -
5.1.2. Fire Results Immediate ignition following loss of containment from a representative failure (50 mm) will result in a gas jet fire for MAE N-01. The contour plots and hazard ranges due to thermal radiation impact are shown in Figure 5-1 and Table 5-2 respectively.

Ahmeyim/Guembeul Project Consequence Modelling
Contains private information Atkins Ahmeyim/Guembeul Project Consequence Modelling | Rev A3 | January 2018 | 5161164 73
Table 5-2 MAE N-01 50mm Jet Fire Extent Results
Weather Thermal Radiation (kW/m2)
Maximum downwind extent (m)
Maximum crosswind extent (m)
2/D 3 93 135 5 81 105 10 69 74 20 59 51
5/D 3 92 135 5 81 105 10 71 74 20 62 50
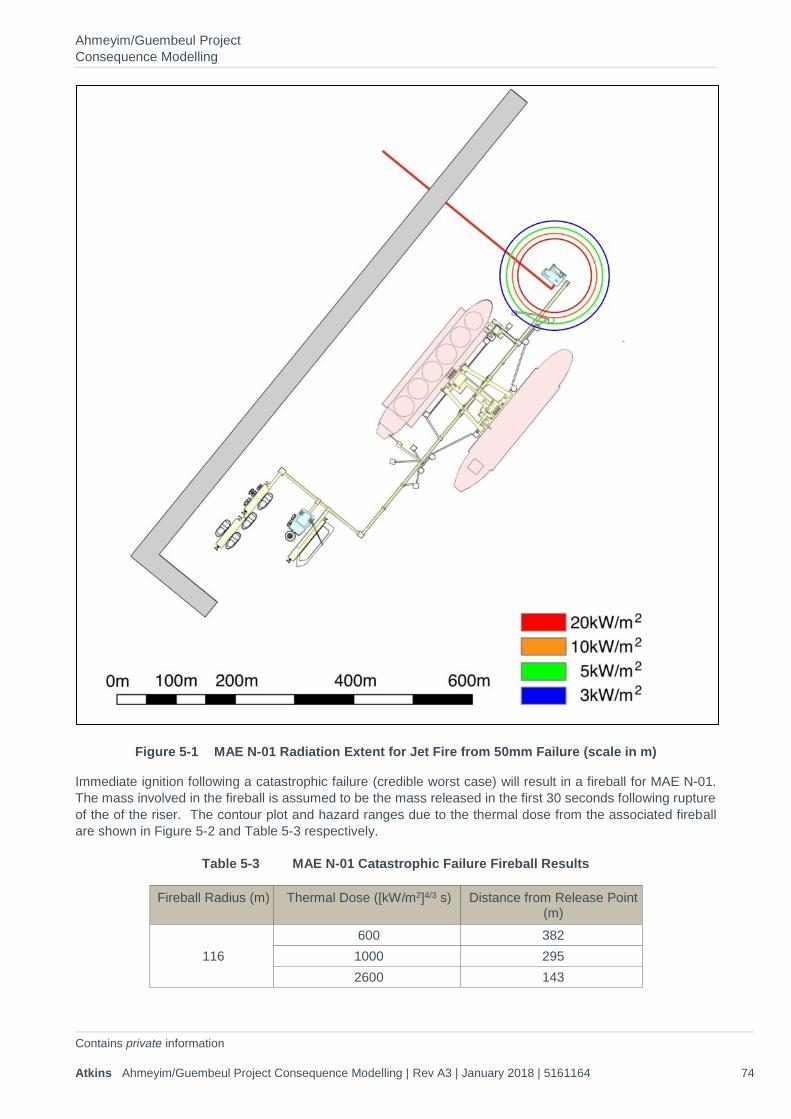
Ahmeyim/Guembeul Project Consequence Modelling
Contains private information Atkins Ahmeyim/Guembeul Project Consequence Modelling | Rev A3 | January 2018 | 5161164 74
Figure 5-1 MAE N-01 Radiation Extent for Jet Fire from 50mm Failure (scale in m)
Immediate ignition following a catastrophic failure (credible worst case) will result in a fireball for MAE N-01. The mass involved in the fireball is assumed to be the mass released in the first 30 seconds following rupture of the of the riser. The contour plot and hazard ranges due to the thermal dose from the associated fireball are shown in Figure 5-2 and Table 5-3 respectively.
Table 5-3 MAE N-01 Catastrophic Failure Fireball Results
Fireball Radius (m) Thermal Dose ([kW/m2]4/3 s) Distance from Release Point (m)
116 600 382 1000 295 2600 143
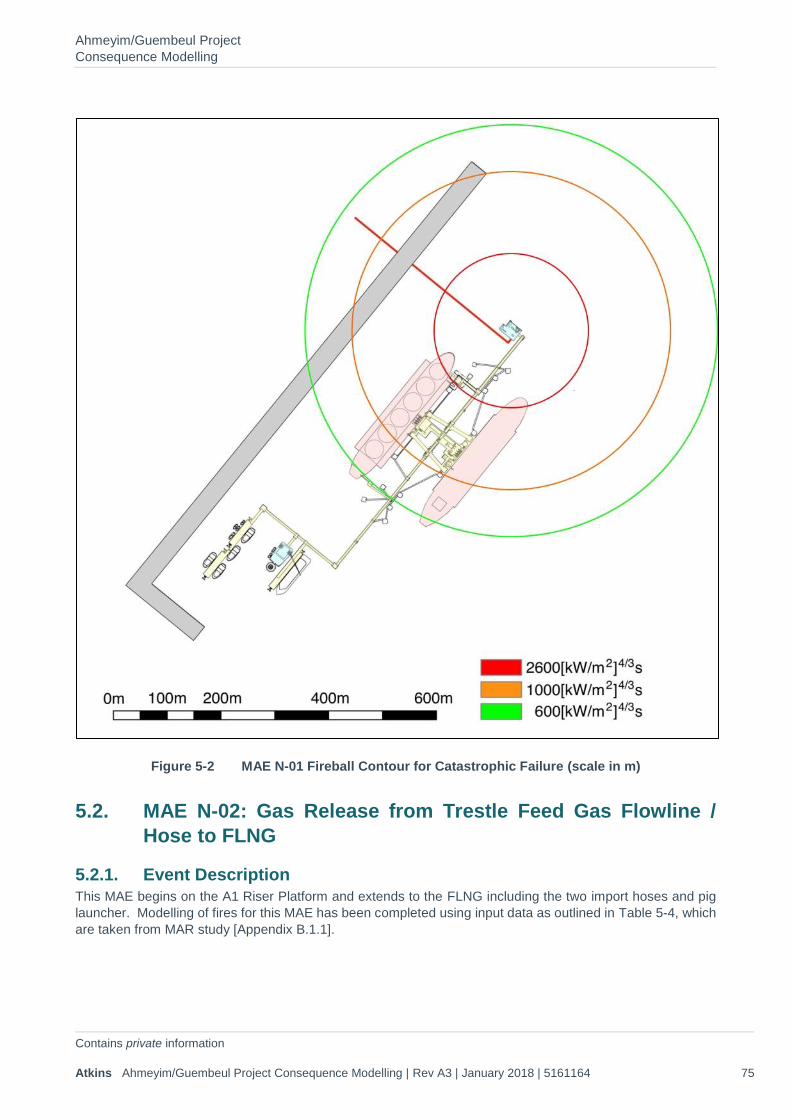
Ahmeyim/Guembeul Project Consequence Modelling
Contains private information Atkins Ahmeyim/Guembeul Project Consequence Modelling | Rev A3 | January 2018 | 5161164 75
Figure 5-2 MAE N-01 Fireball Contour for Catastrophic Failure (scale in m)
5.2. MAE N-02: Gas Release from Trestle Feed Gas Flowline / Hose to FLNG
5.2.1. Event Description This MAE begins on the A1 Riser Platform and extends to the FLNG including the two import hoses and pig launcher. Modelling of fires for this MAE has been completed using input data as outlined in Table 5-4, which are taken from MAR study [Appendix B.1.1].
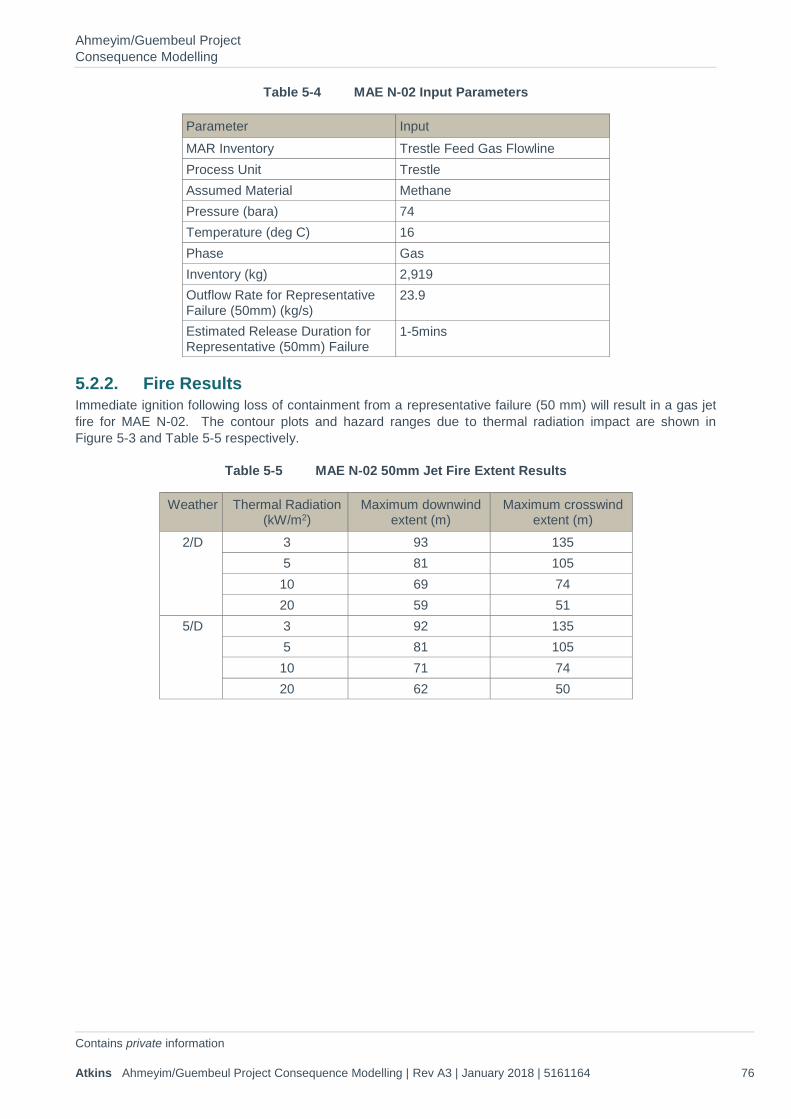
Ahmeyim/Guembeul Project Consequence Modelling
Contains private information Atkins Ahmeyim/Guembeul Project Consequence Modelling | Rev A3 | January 2018 | 5161164 76
Table 5-4 MAE N-02 Input Parameters
Parameter Input MAR Inventory Trestle Feed Gas Flowline Process Unit Trestle Assumed Material Methane Pressure (bara) 74 Temperature (deg C) 16 Phase Gas Inventory (kg) 2,919 Outflow Rate for Representative Failure (50mm) (kg/s)
23.9
Estimated Release Duration for Representative (50mm) Failure
1-5mins
5.2.2. Fire Results Immediate ignition following loss of containment from a representative failure (50 mm) will result in a gas jet fire for MAE N-02. The contour plots and hazard ranges due to thermal radiation impact are shown in Figure 5-3 and Table 5-5 respectively.
Table 5-5 MAE N-02 50mm Jet Fire Extent Results
Weather Thermal Radiation (kW/m2)
Maximum downwind extent (m)
Maximum crosswind extent (m)
2/D 3 93 135 5 81 105 10 69 74 20 59 51
5/D 3 92 135 5 81 105 10 71 74 20 62 50
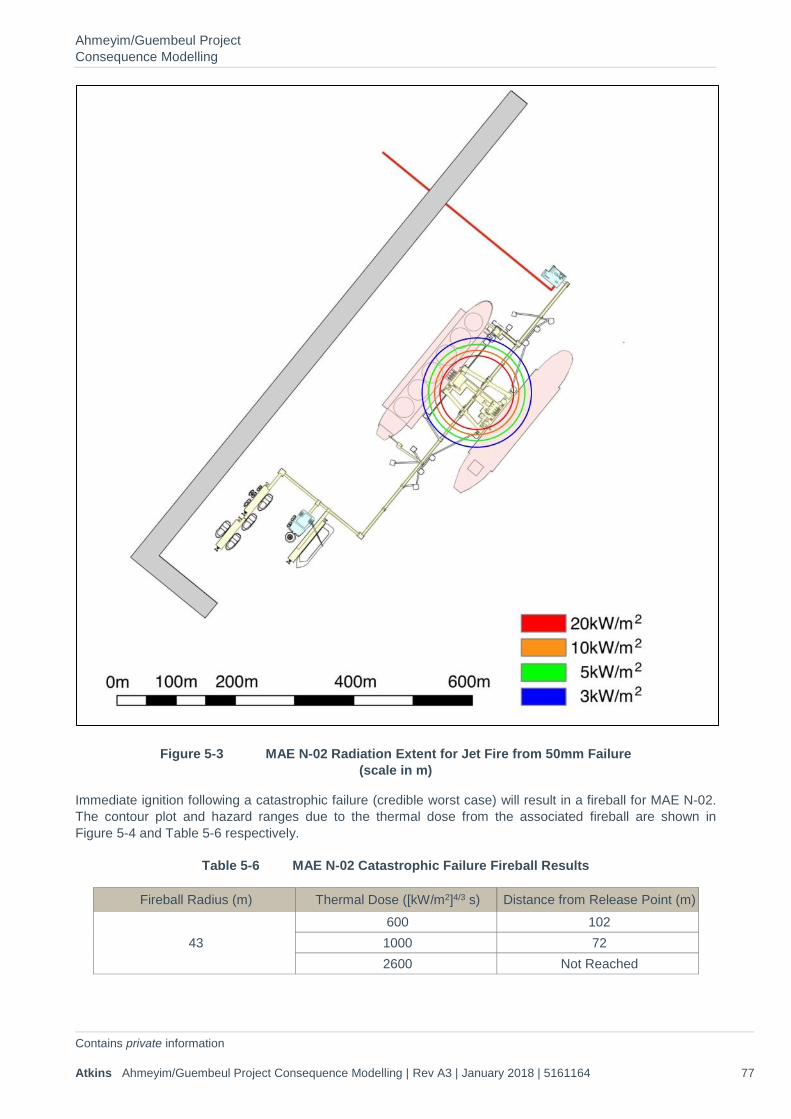
Ahmeyim/Guembeul Project Consequence Modelling
Contains private information Atkins Ahmeyim/Guembeul Project Consequence Modelling | Rev A3 | January 2018 | 5161164 77
Figure 5-3 MAE N-02 Radiation Extent for Jet Fire from 50mm Failure (scale in m)
Immediate ignition following a catastrophic failure (credible worst case) will result in a fireball for MAE N-02. The contour plot and hazard ranges due to the thermal dose from the associated fireball are shown in Figure 5-4 and Table 5-6 respectively.
Table 5-6 MAE N-02 Catastrophic Failure Fireball Results
Fireball Radius (m) Thermal Dose ([kW/m2]4/3 s) Distance from Release Point (m)
43 600 102 1000 72 2600 Not Reached
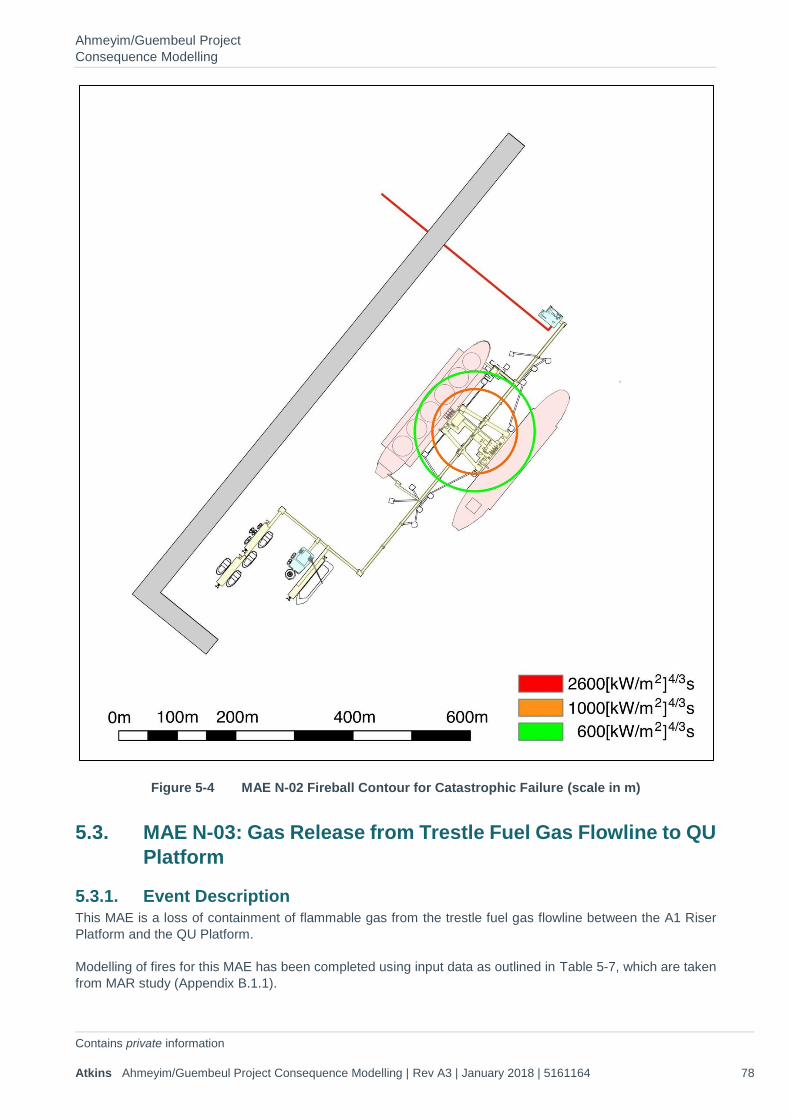
Ahmeyim/Guembeul Project Consequence Modelling
Contains private information Atkins Ahmeyim/Guembeul Project Consequence Modelling | Rev A3 | January 2018 | 5161164 78
Figure 5-4 MAE N-02 Fireball Contour for Catastrophic Failure (scale in m)
5.3. MAE N-03: Gas Release from Trestle Fuel Gas Flowline to QU Platform
5.3.1. Event Description This MAE is a loss of containment of flammable gas from the trestle fuel gas flowline between the A1 Riser Platform and the QU Platform.
Modelling of fires for this MAE has been completed using input data as outlined in Table 5-7, which are taken from MAR study (Appendix B.1.1).
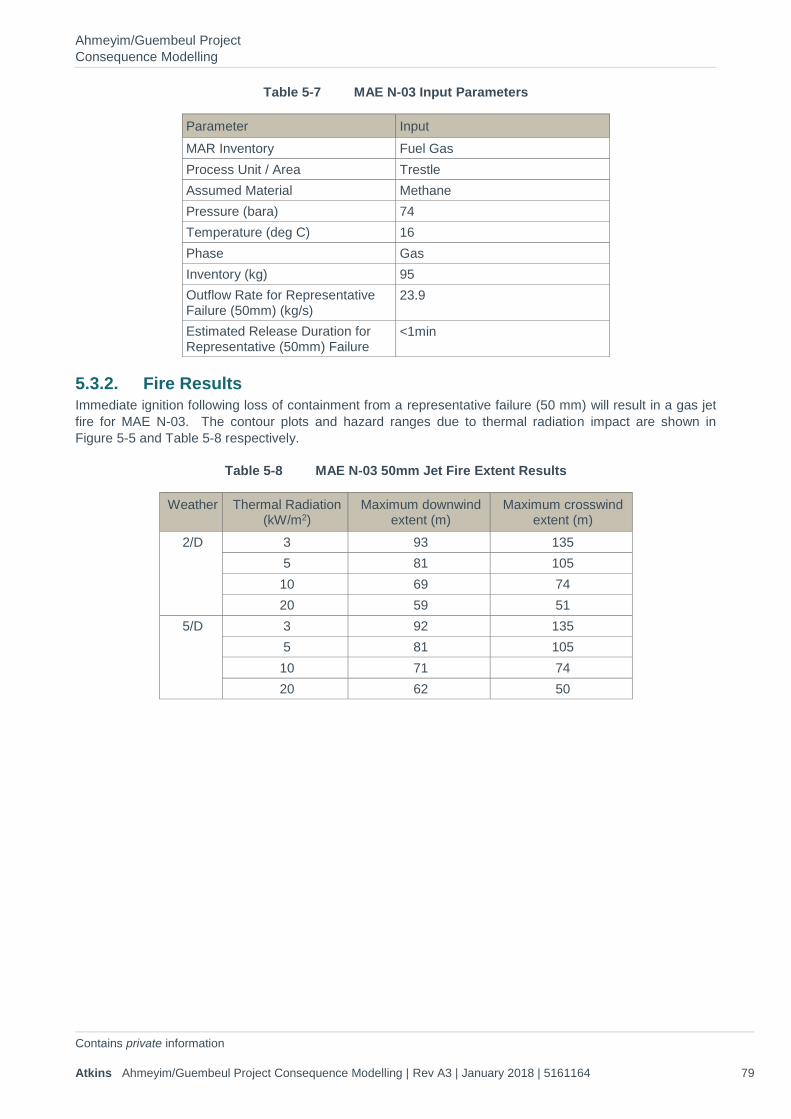
Ahmeyim/Guembeul Project Consequence Modelling
Contains private information Atkins Ahmeyim/Guembeul Project Consequence Modelling | Rev A3 | January 2018 | 5161164 79
Table 5-7 MAE N-03 Input Parameters
Parameter Input MAR Inventory Fuel Gas Process Unit / Area Trestle Assumed Material Methane Pressure (bara) 74 Temperature (deg C) 16 Phase Gas Inventory (kg) 95 Outflow Rate for Representative Failure (50mm) (kg/s)
23.9
Estimated Release Duration for Representative (50mm) Failure
<1min
5.3.2. Fire Results Immediate ignition following loss of containment from a representative failure (50 mm) will result in a gas jet fire for MAE N-03. The contour plots and hazard ranges due to thermal radiation impact are shown in Figure 5-5 and Table 5-8 respectively.
Table 5-8 MAE N-03 50mm Jet Fire Extent Results
Weather Thermal Radiation (kW/m2)
Maximum downwind extent (m)
Maximum crosswind extent (m)
2/D 3 93 135 5 81 105 10 69 74 20 59 51
5/D 3 92 135 5 81 105 10 71 74 20 62 50
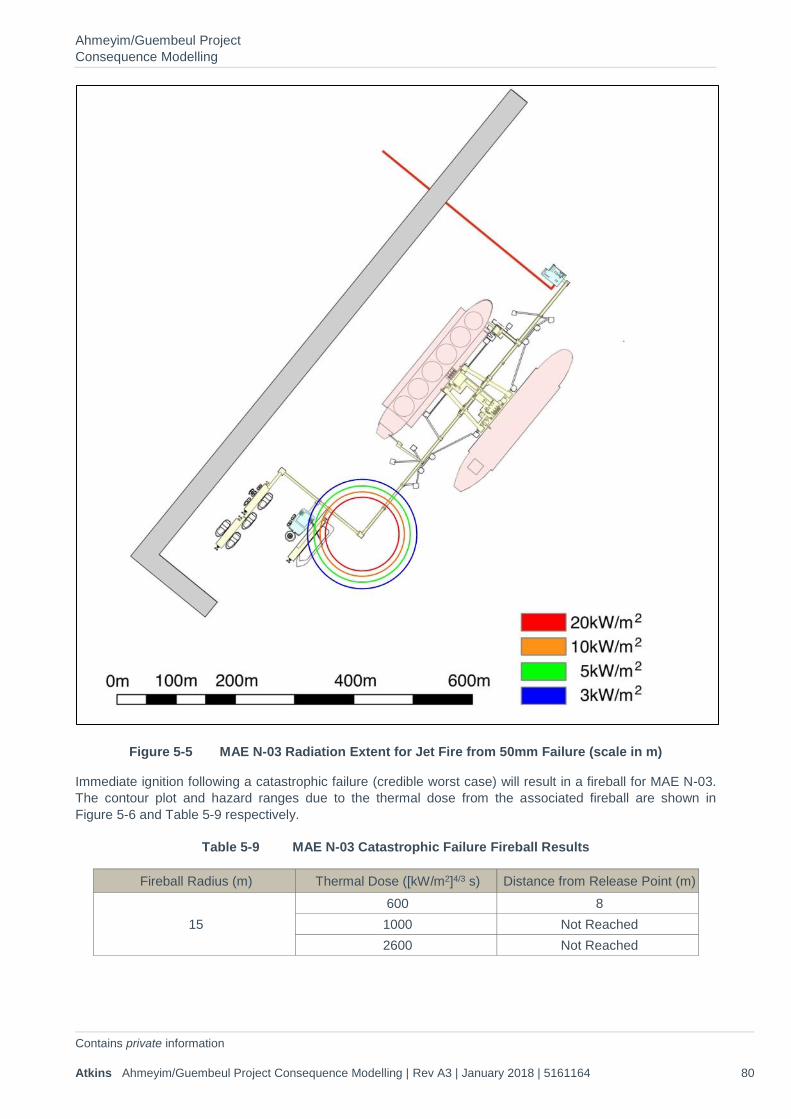
Ahmeyim/Guembeul Project Consequence Modelling
Contains private information Atkins Ahmeyim/Guembeul Project Consequence Modelling | Rev A3 | January 2018 | 5161164 80
Figure 5-5 MAE N-03 Radiation Extent for Jet Fire from 50mm Failure (scale in m)
Immediate ignition following a catastrophic failure (credible worst case) will result in a fireball for MAE N-03. The contour plot and hazard ranges due to the thermal dose from the associated fireball are shown in Figure 5-6 and Table 5-9 respectively.
Table 5-9 MAE N-03 Catastrophic Failure Fireball Results
Fireball Radius (m) Thermal Dose ([kW/m2]4/3 s) Distance from Release Point (m)
15 600 8 1000 Not Reached 2600 Not Reached
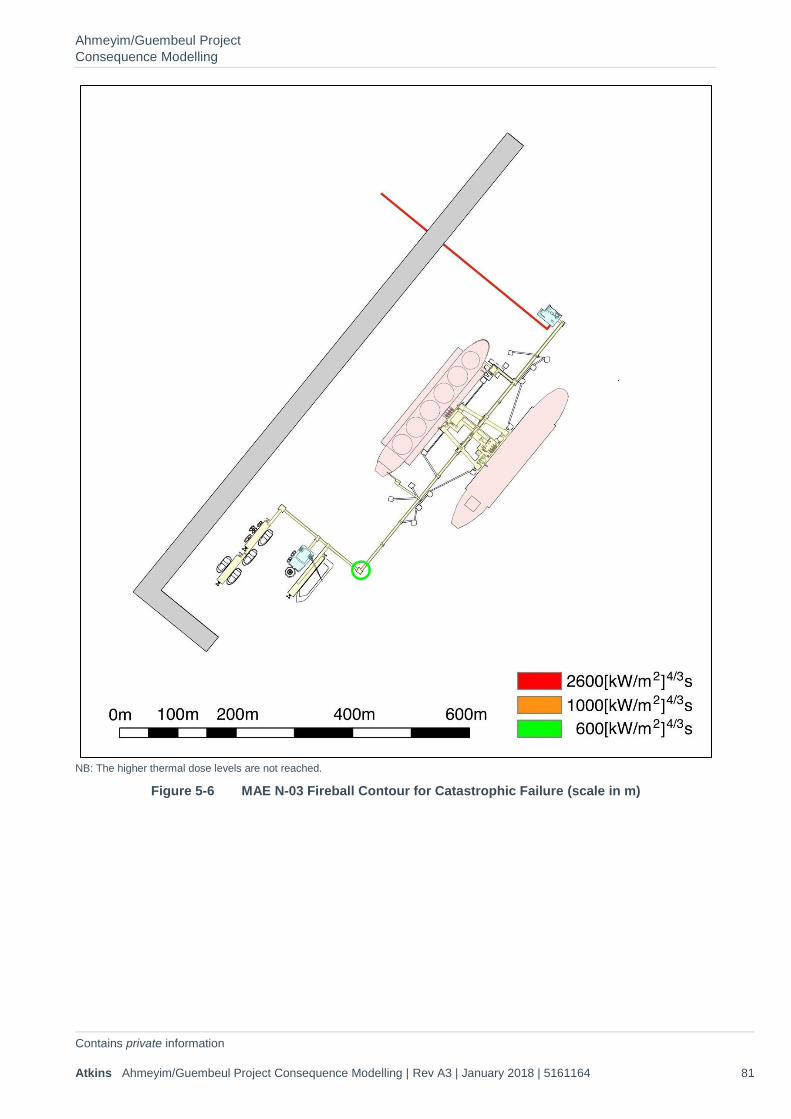
Ahmeyim/Guembeul Project Consequence Modelling
Contains private information Atkins Ahmeyim/Guembeul Project Consequence Modelling | Rev A3 | January 2018 | 5161164 81
NB: The higher thermal dose levels are not reached.
Figure 5-6 MAE N-03 Fireball Contour for Catastrophic Failure (scale in m)
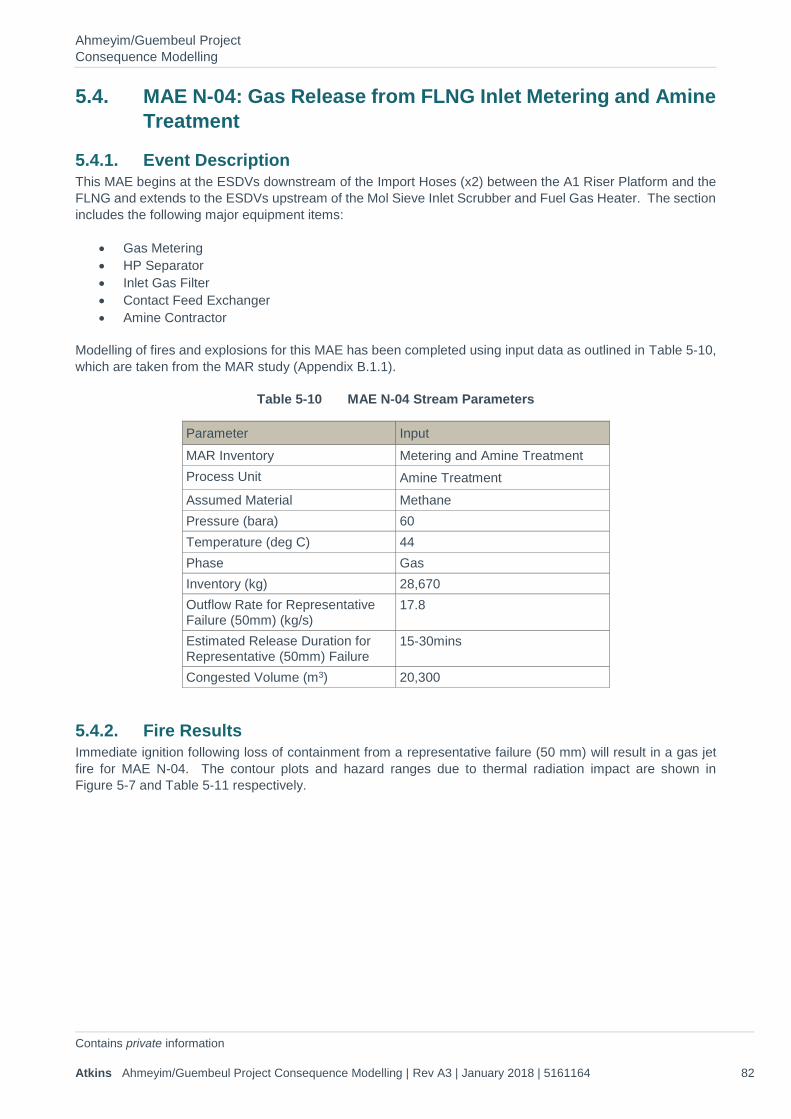
Ahmeyim/Guembeul Project Consequence Modelling
Contains private information Atkins Ahmeyim/Guembeul Project Consequence Modelling | Rev A3 | January 2018 | 5161164 82
5.4. MAE N-04: Gas Release from FLNG Inlet Metering and Amine Treatment
5.4.1. Event Description This MAE begins at the ESDVs downstream of the Import Hoses (x2) between the A1 Riser Platform and the FLNG and extends to the ESDVs upstream of the Mol Sieve Inlet Scrubber and Fuel Gas Heater. The section includes the following major equipment items:
• Gas Metering • HP Separator • Inlet Gas Filter • Contact Feed Exchanger • Amine Contractor
Modelling of fires and explosions for this MAE has been completed using input data as outlined in Table 5-10, which are taken from the MAR study (Appendix B.1.1).
Table 5-10 MAE N-04 Stream Parameters
Parameter Input MAR Inventory Metering and Amine Treatment Process Unit Amine Treatment Assumed Material Methane Pressure (bara) 60 Temperature (deg C) 44 Phase Gas Inventory (kg) 28,670 Outflow Rate for Representative Failure (50mm) (kg/s)
17.8
Estimated Release Duration for Representative (50mm) Failure
15-30mins
Congested Volume (m3) 20,300
5.4.2. Fire Results Immediate ignition following loss of containment from a representative failure (50 mm) will result in a gas jet fire for MAE N-04. The contour plots and hazard ranges due to thermal radiation impact are shown in Figure 5-7 and Table 5-11 respectively.

Ahmeyim/Guembeul Project Consequence Modelling
Contains private information Atkins Ahmeyim/Guembeul Project Consequence Modelling | Rev A3 | January 2018 | 5161164 83
Table 5-11 MAE N-04 50mm Jet Fire Extent Results
Weather Thermal Radiation (kW/m2)
Maximum downwind extent (m)
Maximum crosswind extent (m)
2/D 3 80 117 5 71 91 10 60 64 20 52 43
5/D 3 80 117 5 71 91 10 62 64 20 55 43
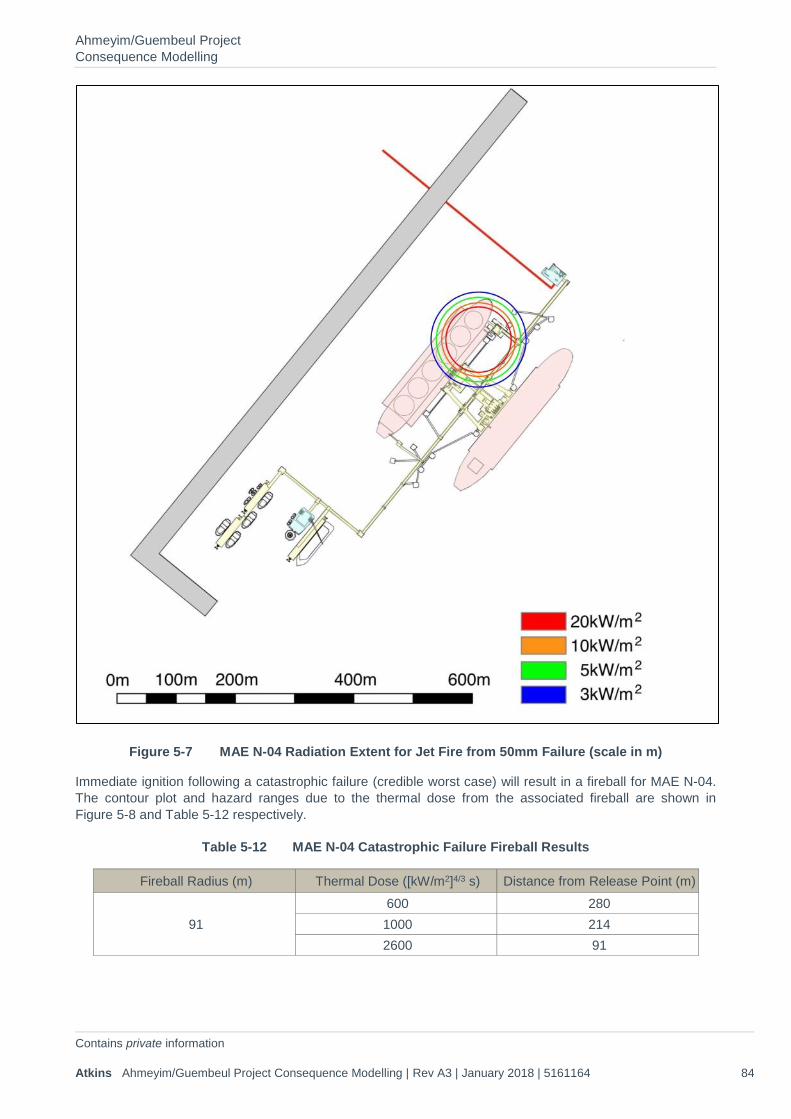
Ahmeyim/Guembeul Project Consequence Modelling
Contains private information Atkins Ahmeyim/Guembeul Project Consequence Modelling | Rev A3 | January 2018 | 5161164 84
Figure 5-7 MAE N-04 Radiation Extent for Jet Fire from 50mm Failure (scale in m)
Immediate ignition following a catastrophic failure (credible worst case) will result in a fireball for MAE N-04. The contour plot and hazard ranges due to the thermal dose from the associated fireball are shown in Figure 5-8 and Table 5-12 respectively.
Table 5-12 MAE N-04 Catastrophic Failure Fireball Results
Fireball Radius (m) Thermal Dose ([kW/m2]4/3 s) Distance from Release Point (m)
91 600 280 1000 214 2600 91
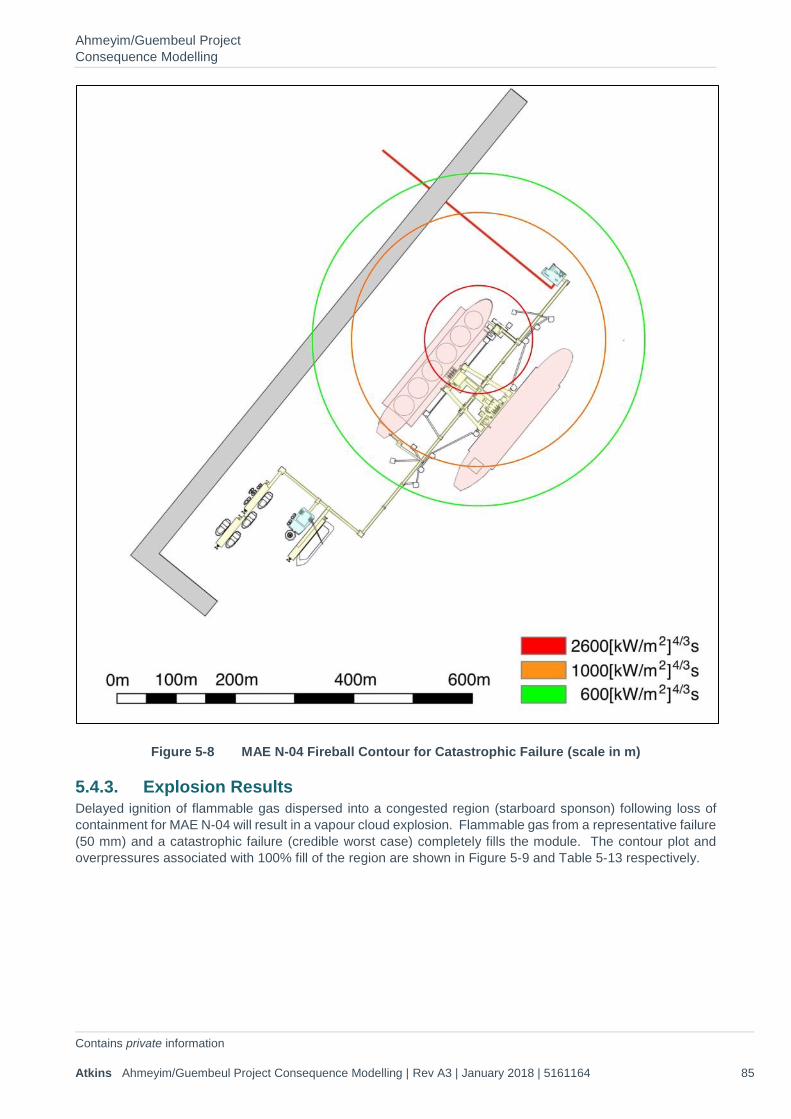
Ahmeyim/Guembeul Project Consequence Modelling
Contains private information Atkins Ahmeyim/Guembeul Project Consequence Modelling | Rev A3 | January 2018 | 5161164 85
Figure 5-8 MAE N-04 Fireball Contour for Catastrophic Failure (scale in m)
5.4.3. Explosion Results Delayed ignition of flammable gas dispersed into a congested region (starboard sponson) following loss of containment for MAE N-04 will result in a vapour cloud explosion. Flammable gas from a representative failure (50 mm) and a catastrophic failure (credible worst case) completely fills the module. The contour plot and overpressures associated with 100% fill of the region are shown in Figure 5-9 and Table 5-13 respectively.
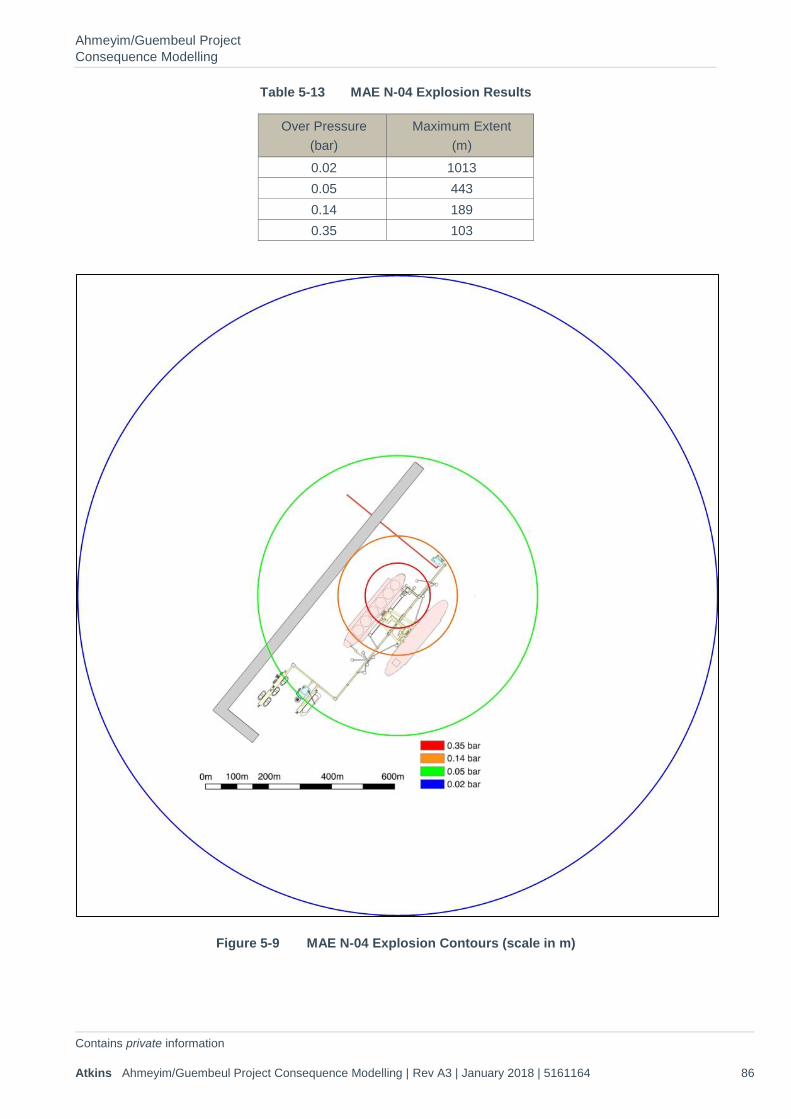
Ahmeyim/Guembeul Project Consequence Modelling
Contains private information Atkins Ahmeyim/Guembeul Project Consequence Modelling | Rev A3 | January 2018 | 5161164 86
Table 5-13 MAE N-04 Explosion Results
Over Pressure (bar)
Maximum Extent (m)
0.02 1013 0.05 443 0.14 189 0.35 103
Figure 5-9 MAE N-04 Explosion Contours (scale in m)
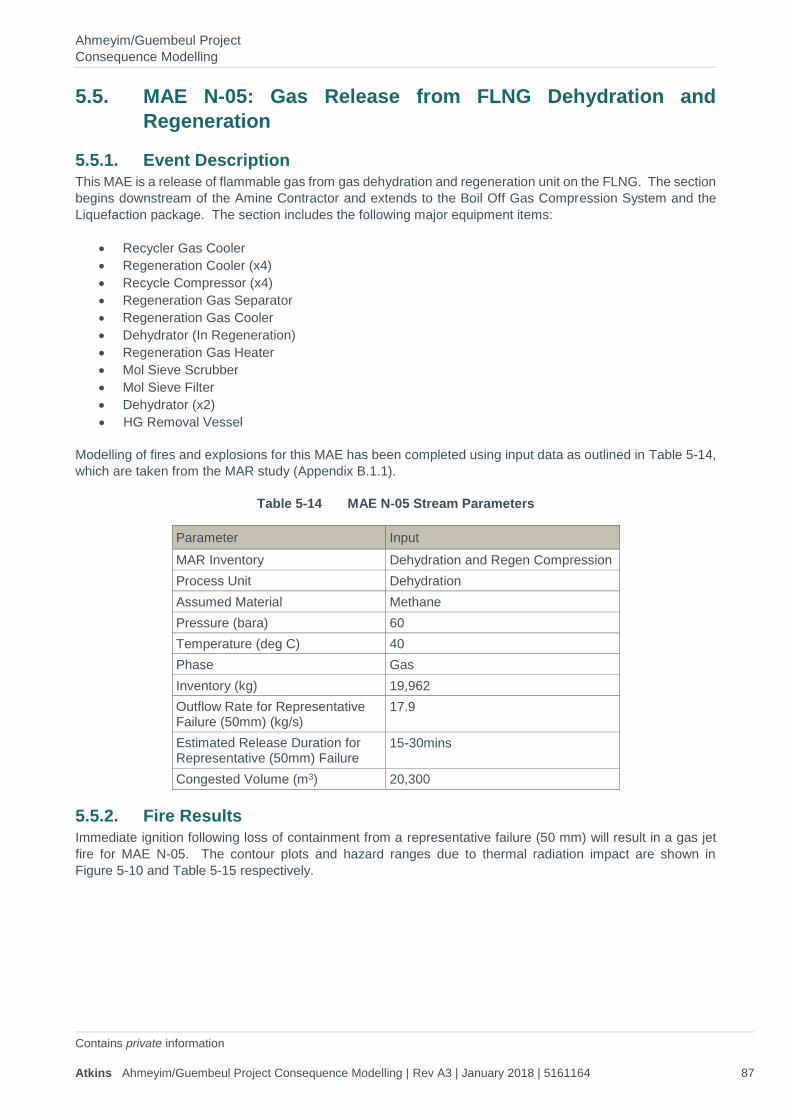
Ahmeyim/Guembeul Project Consequence Modelling
Contains private information Atkins Ahmeyim/Guembeul Project Consequence Modelling | Rev A3 | January 2018 | 5161164 87
5.5. MAE N-05: Gas Release from FLNG Dehydration and Regeneration
5.5.1. Event Description This MAE is a release of flammable gas from gas dehydration and regeneration unit on the FLNG. The section begins downstream of the Amine Contractor and extends to the Boil Off Gas Compression System and the Liquefaction package. The section includes the following major equipment items:
• Recycler Gas Cooler • Regeneration Cooler (x4) • Recycle Compressor (x4) • Regeneration Gas Separator • Regeneration Gas Cooler • Dehydrator (In Regeneration) • Regeneration Gas Heater • Mol Sieve Scrubber • Mol Sieve Filter • Dehydrator (x2) • HG Removal Vessel
Modelling of fires and explosions for this MAE has been completed using input data as outlined in Table 5-14, which are taken from the MAR study (Appendix B.1.1).
Table 5-14 MAE N-05 Stream Parameters
Parameter Input MAR Inventory Dehydration and Regen Compression Process Unit Dehydration Assumed Material Methane Pressure (bara) 60 Temperature (deg C) 40 Phase Gas Inventory (kg) 19,962 Outflow Rate for Representative Failure (50mm) (kg/s)
17.9
Estimated Release Duration for Representative (50mm) Failure
15-30mins
Congested Volume (m3) 20,300
5.5.2. Fire Results Immediate ignition following loss of containment from a representative failure (50 mm) will result in a gas jet fire for MAE N-05. The contour plots and hazard ranges due to thermal radiation impact are shown in Figure 5-10 and Table 5-15 respectively.

Ahmeyim/Guembeul Project Consequence Modelling
Contains private information Atkins Ahmeyim/Guembeul Project Consequence Modelling | Rev A3 | January 2018 | 5161164 88
Table 5-15 MAE N-05 50mm Jet Fire Extent Results
Weather Thermal Radiation (kW/m2)
Maximum downwind extent (m)
Maximum crosswind extent (m)
2/D 3 81 117 5 71 91 10 60 64 20 52 43
5/D 3 80 117 5 71 91 10 62 64 20 55 43
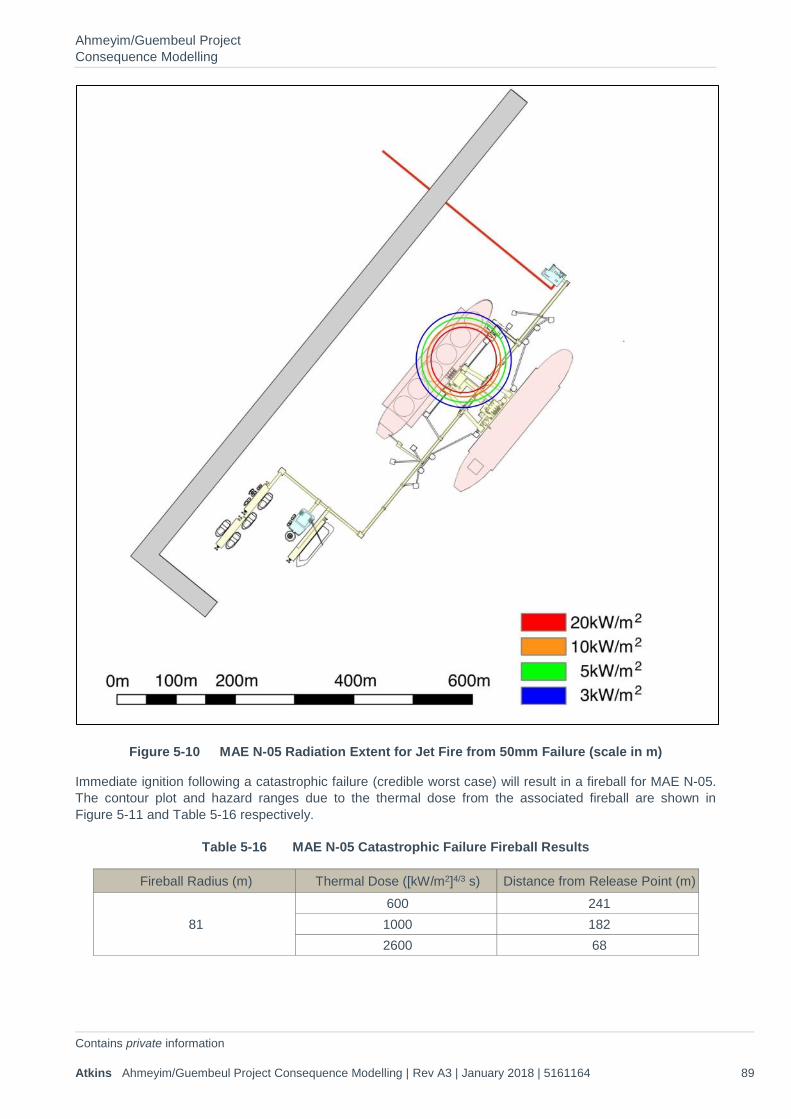
Ahmeyim/Guembeul Project Consequence Modelling
Contains private information Atkins Ahmeyim/Guembeul Project Consequence Modelling | Rev A3 | January 2018 | 5161164 89
Figure 5-10 MAE N-05 Radiation Extent for Jet Fire from 50mm Failure (scale in m)
Immediate ignition following a catastrophic failure (credible worst case) will result in a fireball for MAE N-05. The contour plot and hazard ranges due to the thermal dose from the associated fireball are shown in Figure 5-11 and Table 5-16 respectively.
Table 5-16 MAE N-05 Catastrophic Failure Fireball Results
Fireball Radius (m) Thermal Dose ([kW/m2]4/3 s) Distance from Release Point (m)
81 600 241 1000 182 2600 68
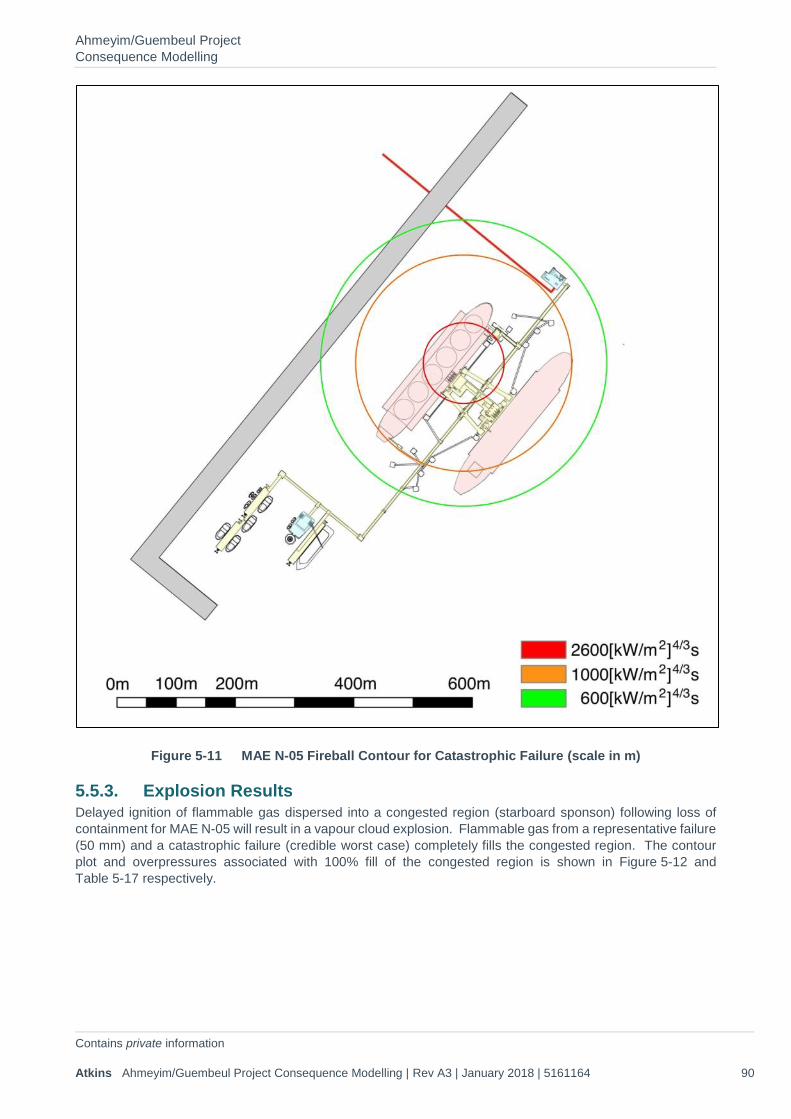
Ahmeyim/Guembeul Project Consequence Modelling
Contains private information Atkins Ahmeyim/Guembeul Project Consequence Modelling | Rev A3 | January 2018 | 5161164 90
Figure 5-11 MAE N-05 Fireball Contour for Catastrophic Failure (scale in m)
5.5.3. Explosion Results Delayed ignition of flammable gas dispersed into a congested region (starboard sponson) following loss of containment for MAE N-05 will result in a vapour cloud explosion. Flammable gas from a representative failure (50 mm) and a catastrophic failure (credible worst case) completely fills the congested region. The contour plot and overpressures associated with 100% fill of the congested region is shown in Figure 5-12 and Table 5-17 respectively.
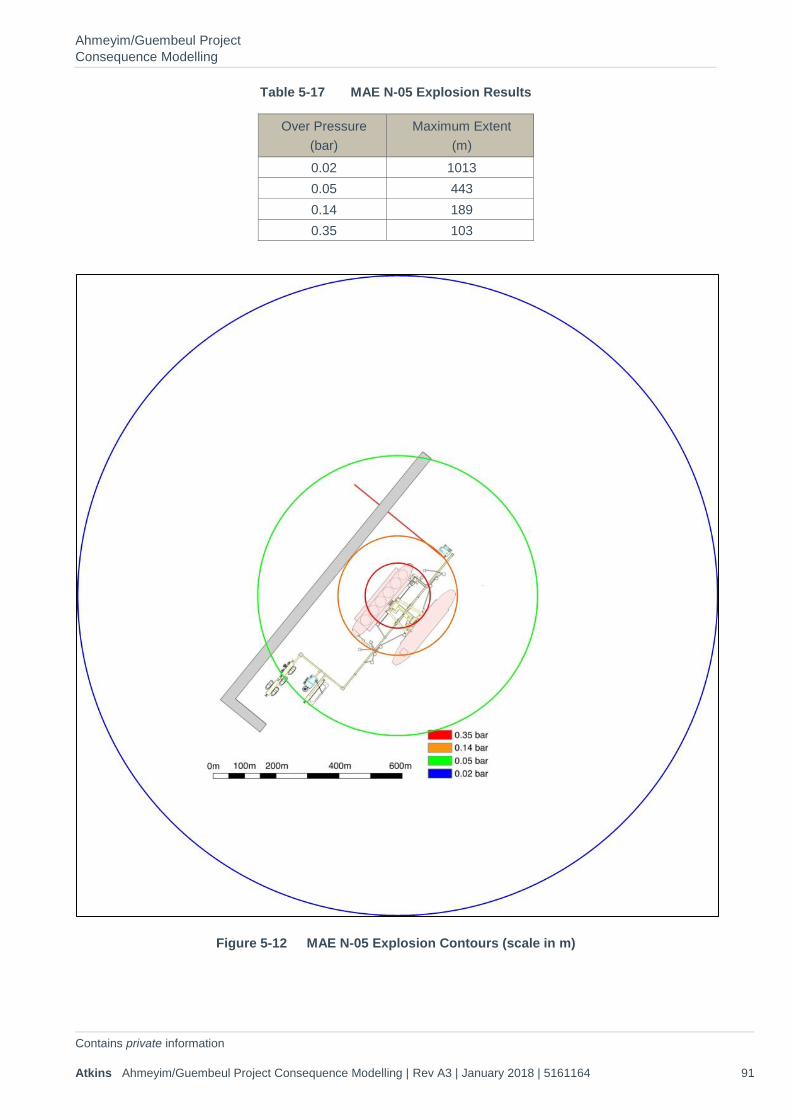
Ahmeyim/Guembeul Project Consequence Modelling
Contains private information Atkins Ahmeyim/Guembeul Project Consequence Modelling | Rev A3 | January 2018 | 5161164 91
Table 5-17 MAE N-05 Explosion Results
Over Pressure (bar)
Maximum Extent (m)
0.02 1013 0.05 443 0.14 189 0.35 103
Figure 5-12 MAE N-05 Explosion Contours (scale in m)
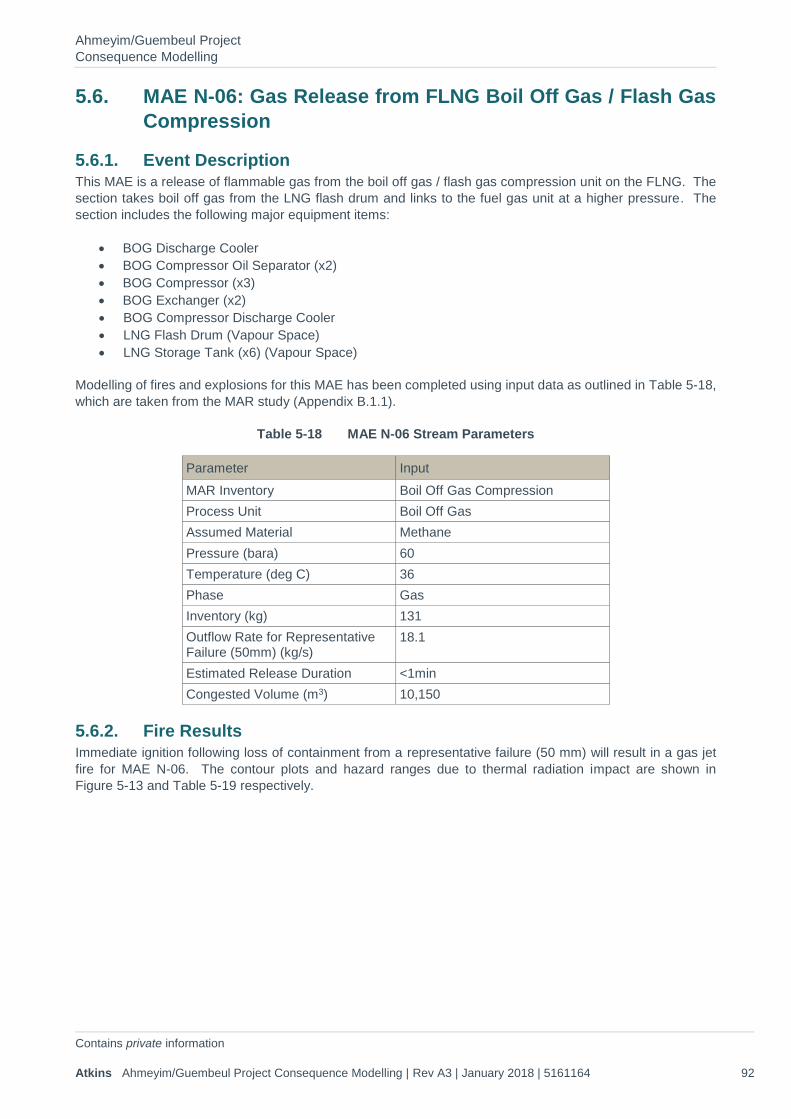
Ahmeyim/Guembeul Project Consequence Modelling
Contains private information Atkins Ahmeyim/Guembeul Project Consequence Modelling | Rev A3 | January 2018 | 5161164 92
5.6. MAE N-06: Gas Release from FLNG Boil Off Gas / Flash Gas Compression
5.6.1. Event Description This MAE is a release of flammable gas from the boil off gas / flash gas compression unit on the FLNG. The section takes boil off gas from the LNG flash drum and links to the fuel gas unit at a higher pressure. The section includes the following major equipment items:
• BOG Discharge Cooler • BOG Compressor Oil Separator (x2) • BOG Compressor (x3) • BOG Exchanger (x2) • BOG Compressor Discharge Cooler • LNG Flash Drum (Vapour Space) • LNG Storage Tank (x6) (Vapour Space)
Modelling of fires and explosions for this MAE has been completed using input data as outlined in Table 5-18, which are taken from the MAR study (Appendix B.1.1).
Table 5-18 MAE N-06 Stream Parameters
Parameter Input MAR Inventory Boil Off Gas Compression Process Unit Boil Off Gas Assumed Material Methane Pressure (bara) 60 Temperature (deg C) 36 Phase Gas Inventory (kg) 131 Outflow Rate for Representative Failure (50mm) (kg/s)
18.1
Estimated Release Duration <1min Congested Volume (m3) 10,150
5.6.2. Fire Results Immediate ignition following loss of containment from a representative failure (50 mm) will result in a gas jet fire for MAE N-06. The contour plots and hazard ranges due to thermal radiation impact are shown in Figure 5-13 and Table 5-19 respectively.

Ahmeyim/Guembeul Project Consequence Modelling
Contains private information Atkins Ahmeyim/Guembeul Project Consequence Modelling | Rev A3 | January 2018 | 5161164 93
Table 5-19 MAE N-06 50mm Jet Fire Extent Results
Weather Thermal Radiation (kW/m2)
Maximum downwind extent (m)
Maximum crosswind extent (m)
2/D 3 81 118 5 71 92 10 61 64 20 52 44
5/D 3 80 118 5 72 91 10 62 64 20 55 43

Ahmeyim/Guembeul Project Consequence Modelling
Contains private information Atkins Ahmeyim/Guembeul Project Consequence Modelling | Rev A3 | January 2018 | 5161164 94
Figure 5-13 MAE N-06 Radiation Extent for Jet Fire from 50mm Failure (scale in m)
Immediate ignition following a catastrophic failure (credible worst case) will result in a fireball for MAE N-06. The contour plot and hazard ranges due to the thermal dose from the associated fireball are shown in Figure 5-14 and Table 5-20 respectively.
Table 5-20 MAE N-06 Catastrophic Failure Fireball Results
Fireball Radius (m) Thermal Dose ([kW/m2]4/3 s) Distance from Release Point (m)
16 600 18 1000 Not Reached 2600 Not Reached

Ahmeyim/Guembeul Project Consequence Modelling
Contains private information Atkins Ahmeyim/Guembeul Project Consequence Modelling | Rev A3 | January 2018 | 5161164 95
NOTE: The higher thermal dose levels were not reached.
Figure 5-14 MAE N-06 Fireball Contour for Catastrophic Failure (scale in m)
5.6.3. Explosion Results Ignition of flammable gas dispersed into a congested region (starboard sponson) following loss of containment for MAE N-06 will result in a vapour cloud explosion. Flammable gas from a representative failure (50 mm) and a catastrophic failure (credible worst case) is limited to the total flammable inventory within the section. The contour plot and overpressures associated with an explosion in this region are shown in Figure 5-15 and Table 5-21 respectively.
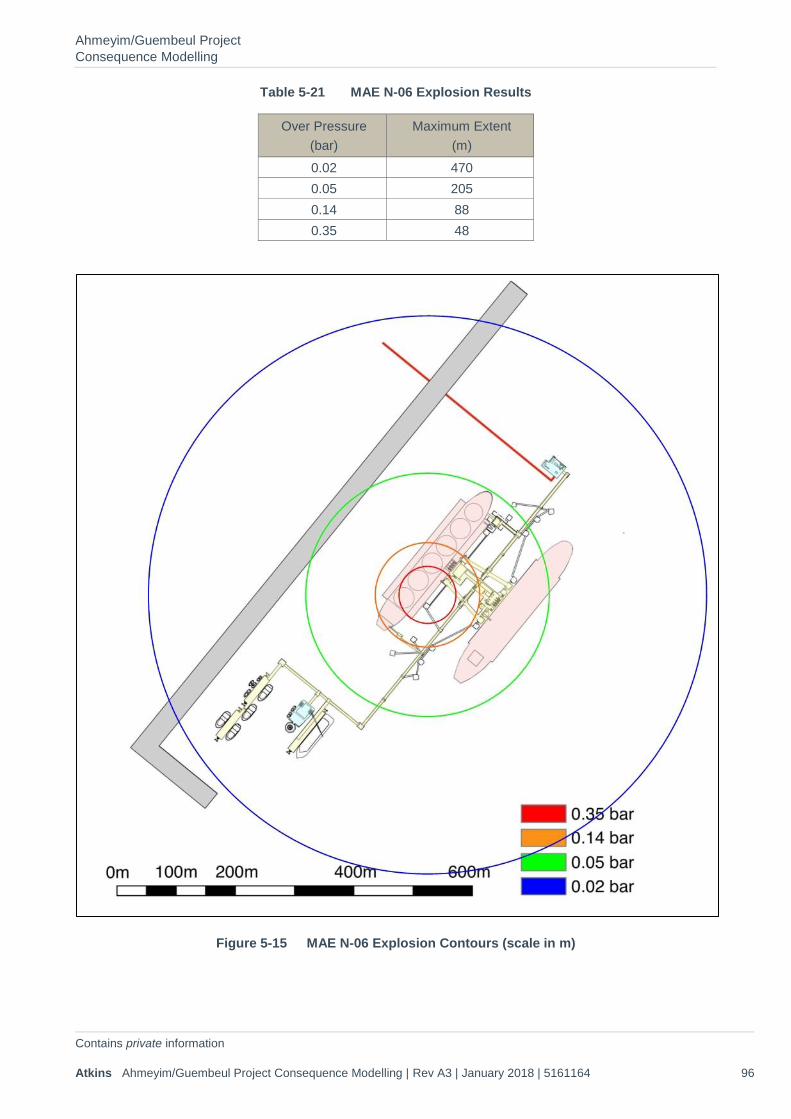
Ahmeyim/Guembeul Project Consequence Modelling
Contains private information Atkins Ahmeyim/Guembeul Project Consequence Modelling | Rev A3 | January 2018 | 5161164 96
Table 5-21 MAE N-06 Explosion Results
Over Pressure (bar)
Maximum Extent (m)
0.02 470 0.05 205 0.14 88 0.35 48
Figure 5-15 MAE N-06 Explosion Contours (scale in m)
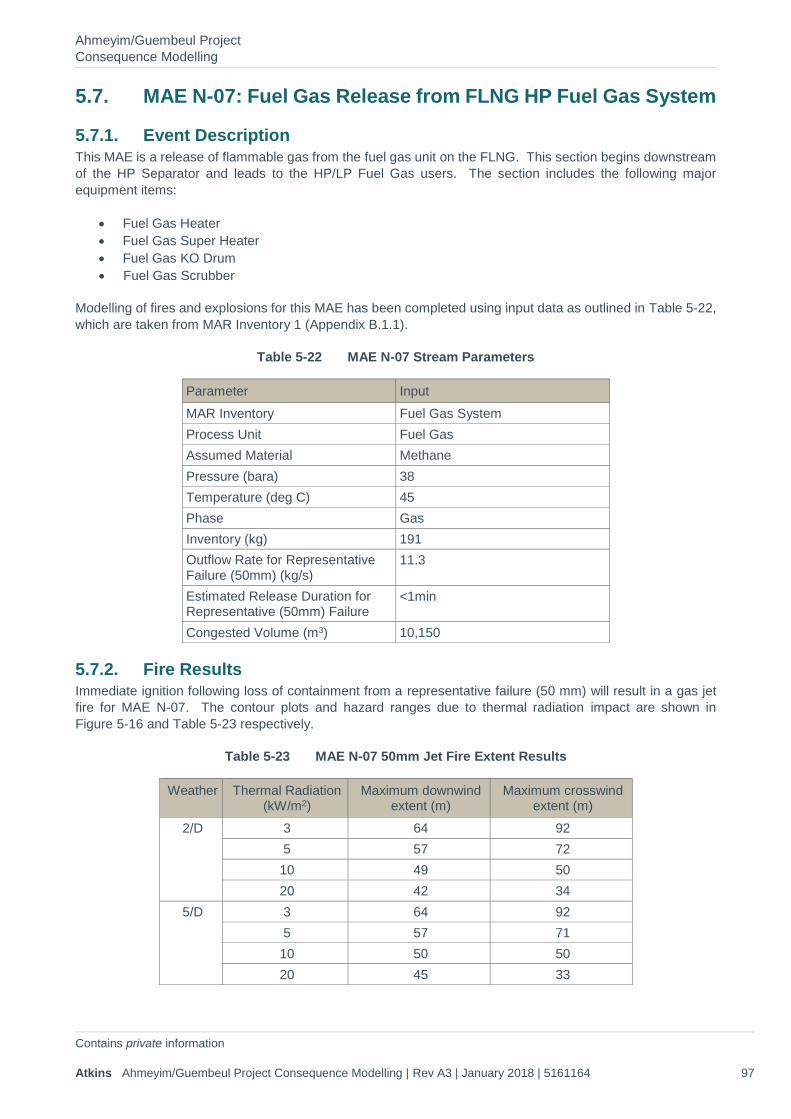
Ahmeyim/Guembeul Project Consequence Modelling
Contains private information Atkins Ahmeyim/Guembeul Project Consequence Modelling | Rev A3 | January 2018 | 5161164 97
5.7. MAE N-07: Fuel Gas Release from FLNG HP Fuel Gas System
5.7.1. Event Description This MAE is a release of flammable gas from the fuel gas unit on the FLNG. This section begins downstream of the HP Separator and leads to the HP/LP Fuel Gas users. The section includes the following major equipment items:
• Fuel Gas Heater • Fuel Gas Super Heater • Fuel Gas KO Drum • Fuel Gas Scrubber
Modelling of fires and explosions for this MAE has been completed using input data as outlined in Table 5-22, which are taken from MAR Inventory 1 (Appendix B.1.1).
Table 5-22 MAE N-07 Stream Parameters
Parameter Input MAR Inventory Fuel Gas System Process Unit Fuel Gas Assumed Material Methane Pressure (bara) 38 Temperature (deg C) 45 Phase Gas Inventory (kg) 191 Outflow Rate for Representative Failure (50mm) (kg/s)
11.3
Estimated Release Duration for Representative (50mm) Failure
<1min
Congested Volume (m3) 10,150
5.7.2. Fire Results Immediate ignition following loss of containment from a representative failure (50 mm) will result in a gas jet fire for MAE N-07. The contour plots and hazard ranges due to thermal radiation impact are shown in Figure 5-16 and Table 5-23 respectively.
Table 5-23 MAE N-07 50mm Jet Fire Extent Results
Weather Thermal Radiation (kW/m2)
Maximum downwind extent (m)
Maximum crosswind extent (m)
2/D 3 64 92 5 57 72 10 49 50 20 42 34
5/D 3 64 92 5 57 71 10 50 50 20 45 33
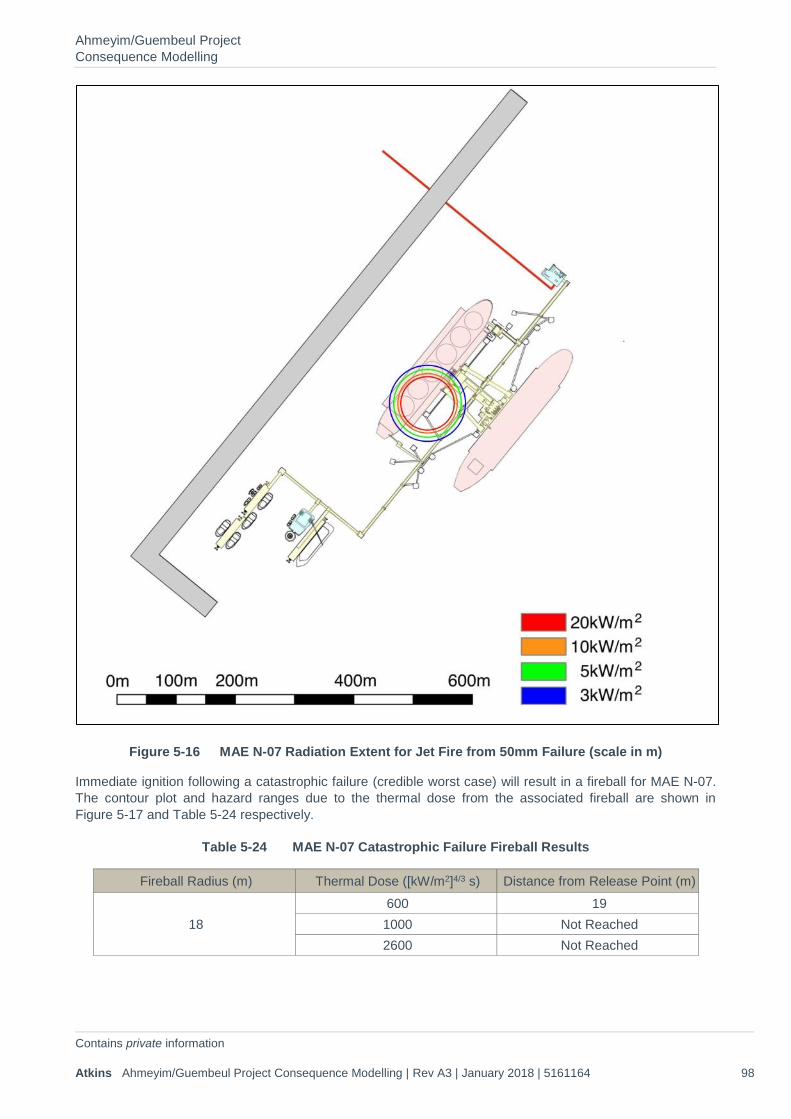
Ahmeyim/Guembeul Project Consequence Modelling
Contains private information Atkins Ahmeyim/Guembeul Project Consequence Modelling | Rev A3 | January 2018 | 5161164 98
Figure 5-16 MAE N-07 Radiation Extent for Jet Fire from 50mm Failure (scale in m)
Immediate ignition following a catastrophic failure (credible worst case) will result in a fireball for MAE N-07. The contour plot and hazard ranges due to the thermal dose from the associated fireball are shown in Figure 5-17 and Table 5-24 respectively.
Table 5-24 MAE N-07 Catastrophic Failure Fireball Results
Fireball Radius (m) Thermal Dose ([kW/m2]4/3 s) Distance from Release Point (m)
18 600 19 1000 Not Reached 2600 Not Reached

Ahmeyim/Guembeul Project Consequence Modelling
Contains private information Atkins Ahmeyim/Guembeul Project Consequence Modelling | Rev A3 | January 2018 | 5161164 99
NOTE: The higher thermal dose levels were not reached.
Figure 5-17 MAE N-07 Fireball Contour for Catastrophic Failure (scale in m)
5.7.3. Explosion Results Delayed ignition of flammable gas dispersed into a congested region (starboard sponson) following loss of containment for MAE N-07 will result in a vapour cloud explosion. Flammable gas from a representative failure (50 mm) and a catastrophic failure (credible worst case) is capped by the total mass in the section. The contour plot and overpressures associated with an explosion in this region is shown in Figure 5-18 and Table 5-25 respectively.
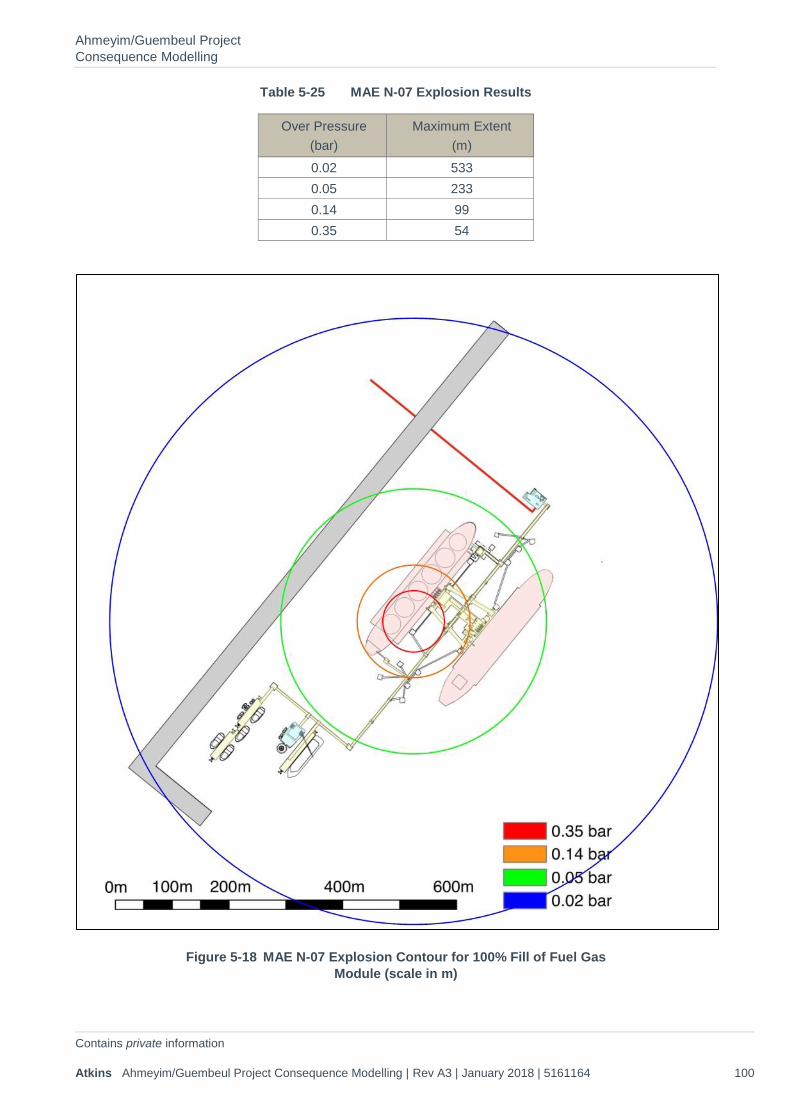
Ahmeyim/Guembeul Project Consequence Modelling
Contains private information Atkins Ahmeyim/Guembeul Project Consequence Modelling | Rev A3 | January 2018 | 5161164 100
Table 5-25 MAE N-07 Explosion Results
Over Pressure (bar)
Maximum Extent (m)
0.02 533 0.05 233 0.14 99 0.35 54
Figure 5-18 MAE N-07 Explosion Contour for 100% Fill of Fuel Gas Module (scale in m)
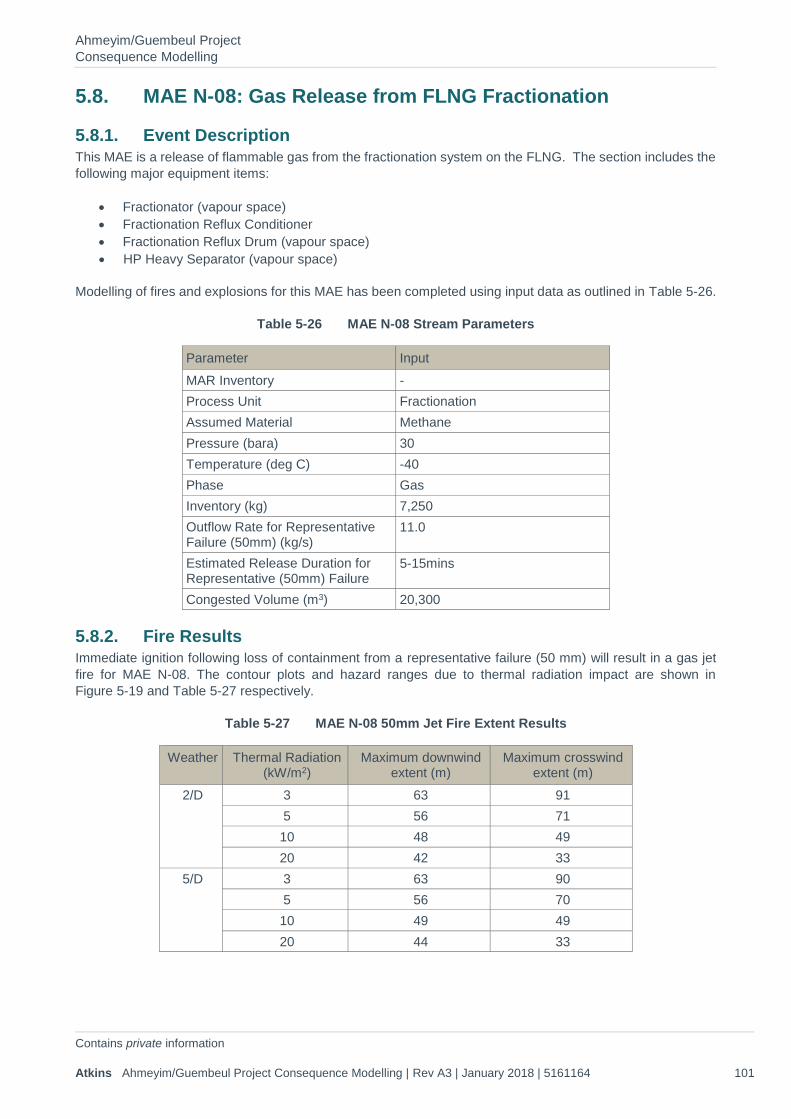
Ahmeyim/Guembeul Project Consequence Modelling
Contains private information Atkins Ahmeyim/Guembeul Project Consequence Modelling | Rev A3 | January 2018 | 5161164 101
5.8. MAE N-08: Gas Release from FLNG Fractionation
5.8.1. Event Description This MAE is a release of flammable gas from the fractionation system on the FLNG. The section includes the following major equipment items:
• Fractionator (vapour space) • Fractionation Reflux Conditioner • Fractionation Reflux Drum (vapour space) • HP Heavy Separator (vapour space)
Modelling of fires and explosions for this MAE has been completed using input data as outlined in Table 5-26.
Table 5-26 MAE N-08 Stream Parameters
Parameter Input MAR Inventory - Process Unit Fractionation Assumed Material Methane Pressure (bara) 30 Temperature (deg C) -40 Phase Gas Inventory (kg) 7,250 Outflow Rate for Representative Failure (50mm) (kg/s)
11.0
Estimated Release Duration for Representative (50mm) Failure
5-15mins
Congested Volume (m3) 20,300
5.8.2. Fire Results Immediate ignition following loss of containment from a representative failure (50 mm) will result in a gas jet fire for MAE N-08. The contour plots and hazard ranges due to thermal radiation impact are shown in Figure 5-19 and Table 5-27 respectively.
Table 5-27 MAE N-08 50mm Jet Fire Extent Results
Weather Thermal Radiation (kW/m2)
Maximum downwind extent (m)
Maximum crosswind extent (m)
2/D 3 63 91 5 56 71 10 48 49 20 42 33
5/D 3 63 90 5 56 70 10 49 49 20 44 33
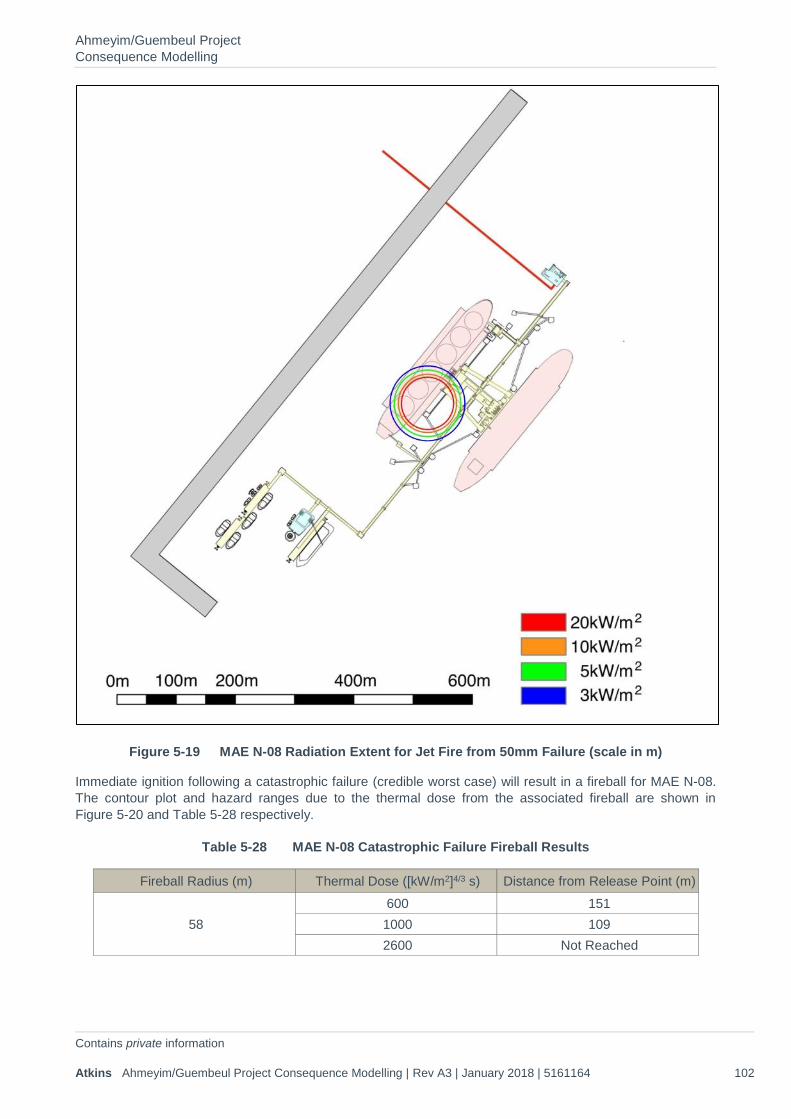
Ahmeyim/Guembeul Project Consequence Modelling
Contains private information Atkins Ahmeyim/Guembeul Project Consequence Modelling | Rev A3 | January 2018 | 5161164 102
Figure 5-19 MAE N-08 Radiation Extent for Jet Fire from 50mm Failure (scale in m)
Immediate ignition following a catastrophic failure (credible worst case) will result in a fireball for MAE N-08. The contour plot and hazard ranges due to the thermal dose from the associated fireball are shown in Figure 5-20 and Table 5-28 respectively.
Table 5-28 MAE N-08 Catastrophic Failure Fireball Results
Fireball Radius (m) Thermal Dose ([kW/m2]4/3 s) Distance from Release Point (m)
58 600 151 1000 109 2600 Not Reached
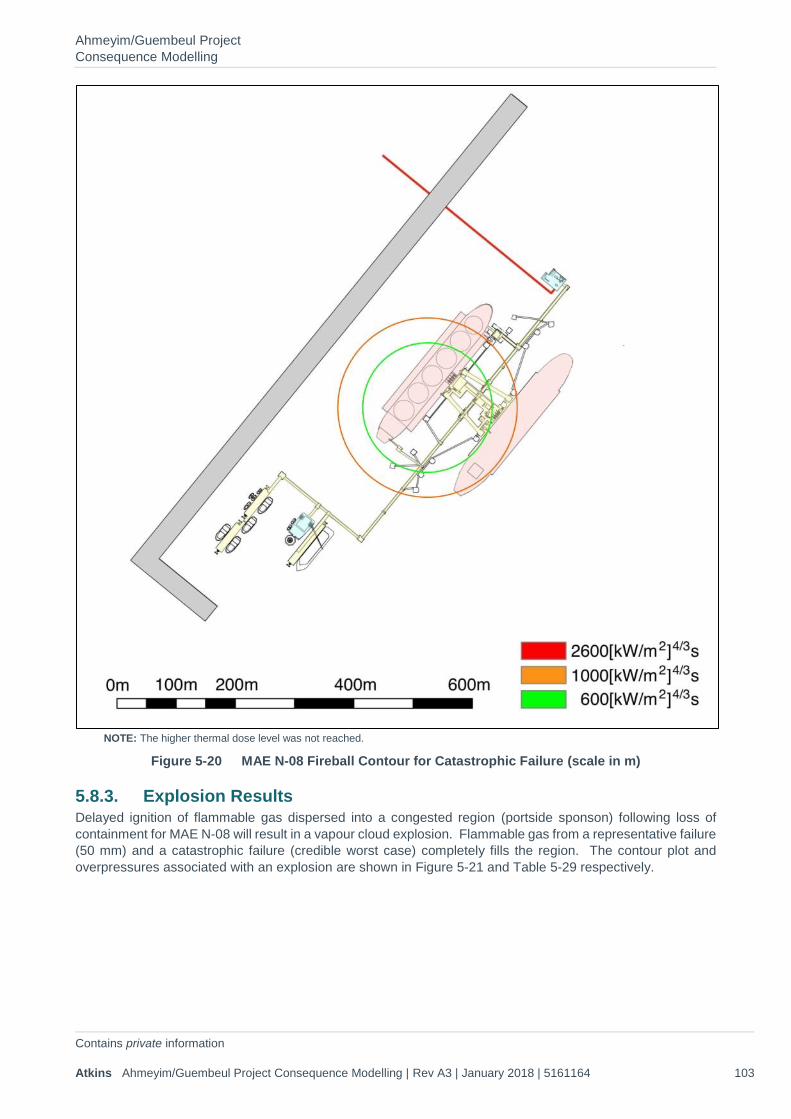
Ahmeyim/Guembeul Project Consequence Modelling
Contains private information Atkins Ahmeyim/Guembeul Project Consequence Modelling | Rev A3 | January 2018 | 5161164 103
NOTE: The higher thermal dose level was not reached.
Figure 5-20 MAE N-08 Fireball Contour for Catastrophic Failure (scale in m)
5.8.3. Explosion Results Delayed ignition of flammable gas dispersed into a congested region (portside sponson) following loss of containment for MAE N-08 will result in a vapour cloud explosion. Flammable gas from a representative failure (50 mm) and a catastrophic failure (credible worst case) completely fills the region. The contour plot and overpressures associated with an explosion are shown in Figure 5-21 and Table 5-29 respectively.
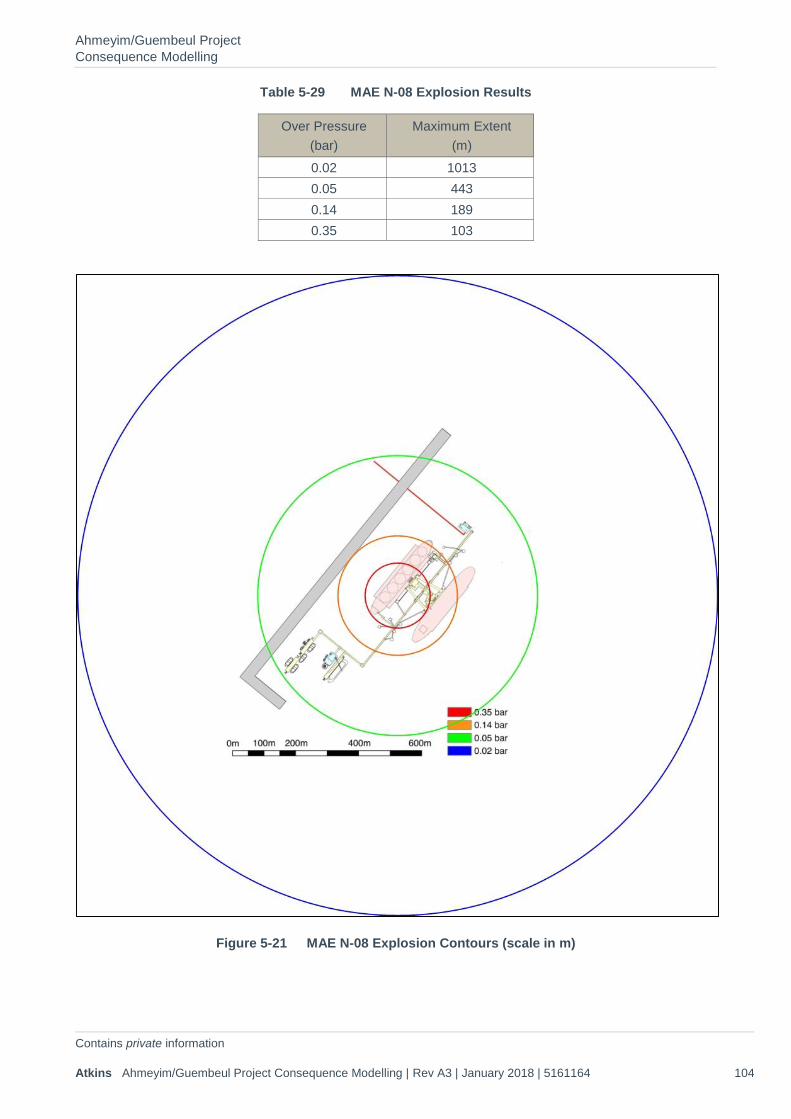
Ahmeyim/Guembeul Project Consequence Modelling
Contains private information Atkins Ahmeyim/Guembeul Project Consequence Modelling | Rev A3 | January 2018 | 5161164 104
Table 5-29 MAE N-08 Explosion Results
Over Pressure (bar)
Maximum Extent (m)
0.02 1013 0.05 443 0.14 189 0.35 103
Figure 5-21 MAE N-08 Explosion Contours (scale in m)
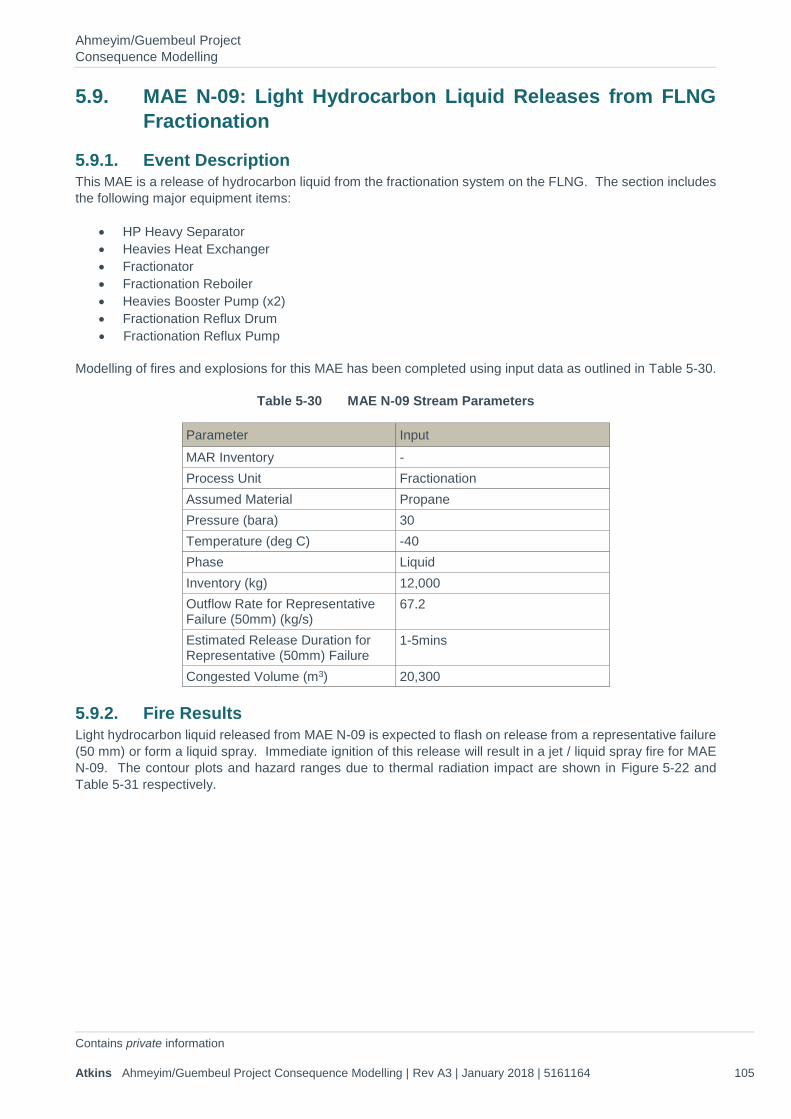
Ahmeyim/Guembeul Project Consequence Modelling
Contains private information Atkins Ahmeyim/Guembeul Project Consequence Modelling | Rev A3 | January 2018 | 5161164 105
5.9. MAE N-09: Light Hydrocarbon Liquid Releases from FLNG Fractionation
5.9.1. Event Description This MAE is a release of hydrocarbon liquid from the fractionation system on the FLNG. The section includes the following major equipment items:
• HP Heavy Separator • Heavies Heat Exchanger • Fractionator • Fractionation Reboiler • Heavies Booster Pump (x2) • Fractionation Reflux Drum • Fractionation Reflux Pump
Modelling of fires and explosions for this MAE has been completed using input data as outlined in Table 5-30.
Table 5-30 MAE N-09 Stream Parameters
Parameter Input MAR Inventory - Process Unit Fractionation Assumed Material Propane Pressure (bara) 30 Temperature (deg C) -40 Phase Liquid Inventory (kg) 12,000 Outflow Rate for Representative Failure (50mm) (kg/s)
67.2
Estimated Release Duration for Representative (50mm) Failure
1-5mins
Congested Volume (m3) 20,300
5.9.2. Fire Results Light hydrocarbon liquid released from MAE N-09 is expected to flash on release from a representative failure (50 mm) or form a liquid spray. Immediate ignition of this release will result in a jet / liquid spray fire for MAE N-09. The contour plots and hazard ranges due to thermal radiation impact are shown in Figure 5-22 and Table 5-31 respectively.

Ahmeyim/Guembeul Project Consequence Modelling
Contains private information Atkins Ahmeyim/Guembeul Project Consequence Modelling | Rev A3 | January 2018 | 5161164 106
Table 5-31 MAE N-09 50mm Jet Fire Extent Results
Weather Thermal Radiation (kW/m2)
Maximum downwind extent (m)
Maximum crosswind extent (m)
2/D 3 182 263 5 160 203 10 139 148 20 122 107
5/D 3 168 265 5 146 204 10 123 144 20 106 106
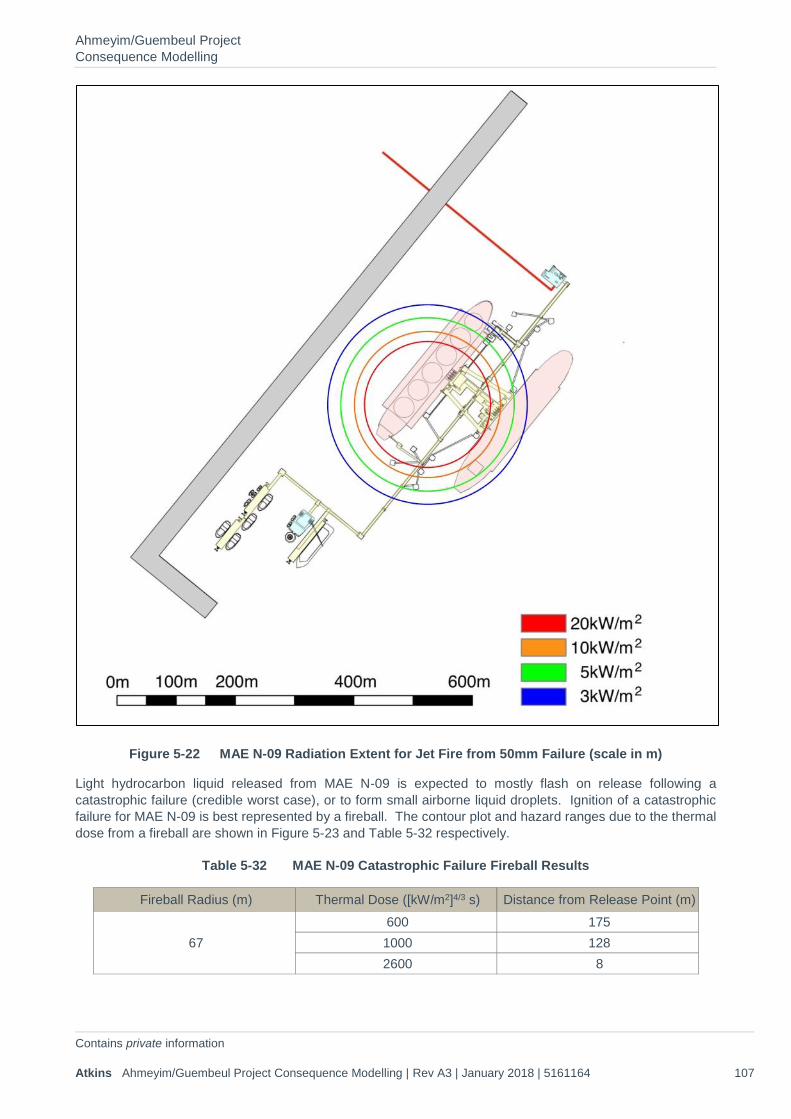
Ahmeyim/Guembeul Project Consequence Modelling
Contains private information Atkins Ahmeyim/Guembeul Project Consequence Modelling | Rev A3 | January 2018 | 5161164 107
Figure 5-22 MAE N-09 Radiation Extent for Jet Fire from 50mm Failure (scale in m)
Light hydrocarbon liquid released from MAE N-09 is expected to mostly flash on release following a catastrophic failure (credible worst case), or to form small airborne liquid droplets. Ignition of a catastrophic failure for MAE N-09 is best represented by a fireball. The contour plot and hazard ranges due to the thermal dose from a fireball are shown in Figure 5-23 and Table 5-32 respectively.
Table 5-32 MAE N-09 Catastrophic Failure Fireball Results
Fireball Radius (m) Thermal Dose ([kW/m2]4/3 s) Distance from Release Point (m)
67 600 175 1000 128 2600 8
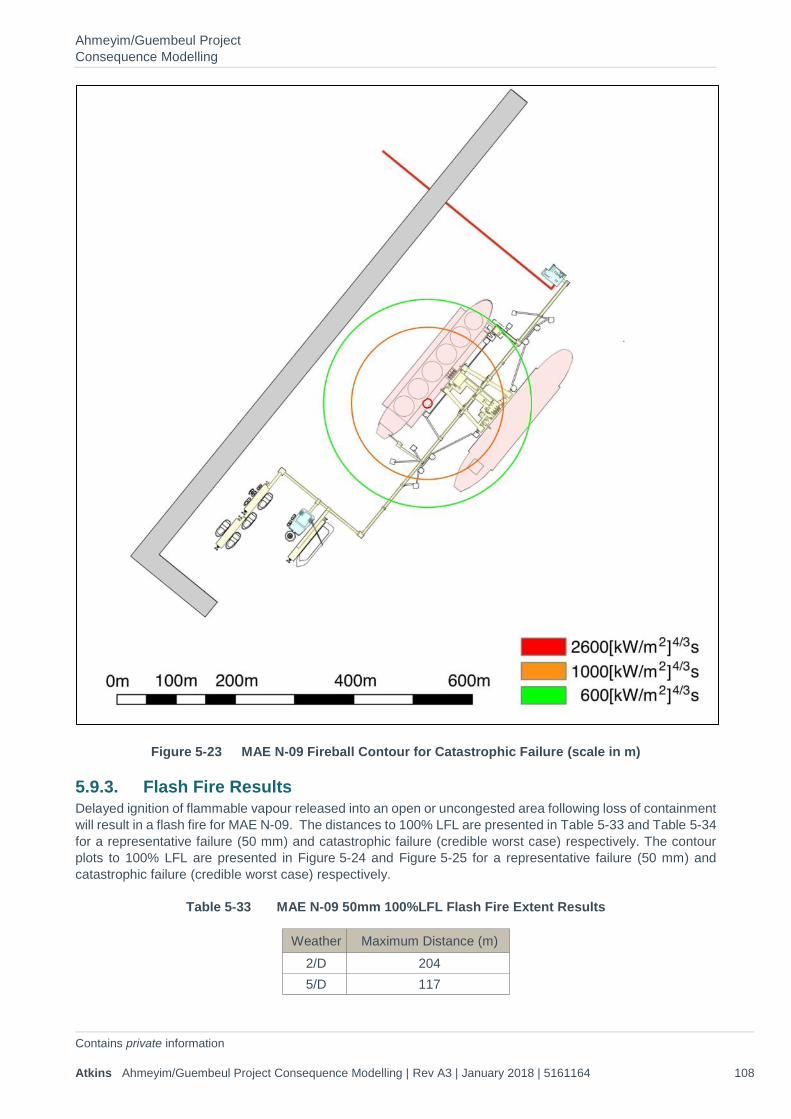
Ahmeyim/Guembeul Project Consequence Modelling
Contains private information Atkins Ahmeyim/Guembeul Project Consequence Modelling | Rev A3 | January 2018 | 5161164 108
Figure 5-23 MAE N-09 Fireball Contour for Catastrophic Failure (scale in m)
5.9.3. Flash Fire Results Delayed ignition of flammable vapour released into an open or uncongested area following loss of containment will result in a flash fire for MAE N-09. The distances to 100% LFL are presented in Table 5-33 and Table 5-34 for a representative failure (50 mm) and catastrophic failure (credible worst case) respectively. The contour plots to 100% LFL are presented in Figure 5-24 and Figure 5-25 for a representative failure (50 mm) and catastrophic failure (credible worst case) respectively.
Table 5-33 MAE N-09 50mm 100%LFL Flash Fire Extent Results
Weather Maximum Distance (m) 2/D 204 5/D 117
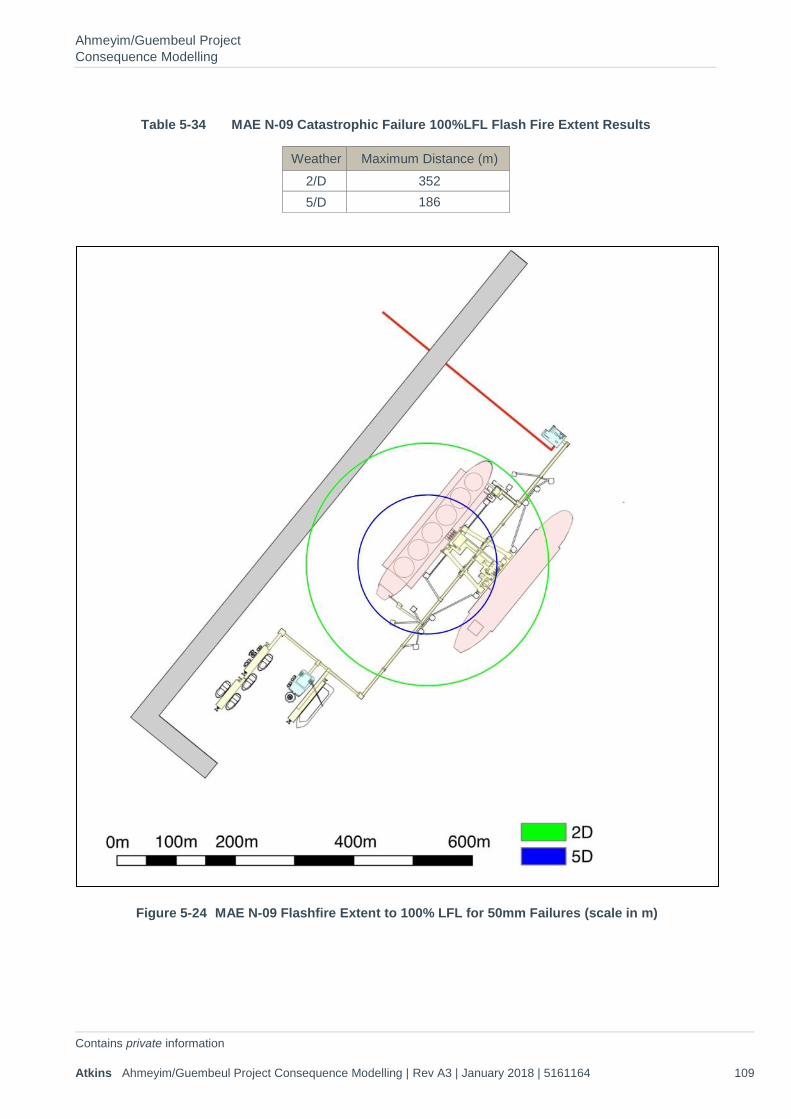
Ahmeyim/Guembeul Project Consequence Modelling
Contains private information Atkins Ahmeyim/Guembeul Project Consequence Modelling | Rev A3 | January 2018 | 5161164 109
Table 5-34 MAE N-09 Catastrophic Failure 100%LFL Flash Fire Extent Results
Weather Maximum Distance (m) 2/D 352 5/D 186
Figure 5-24 MAE N-09 Flashfire Extent to 100% LFL for 50mm Failures (scale in m)
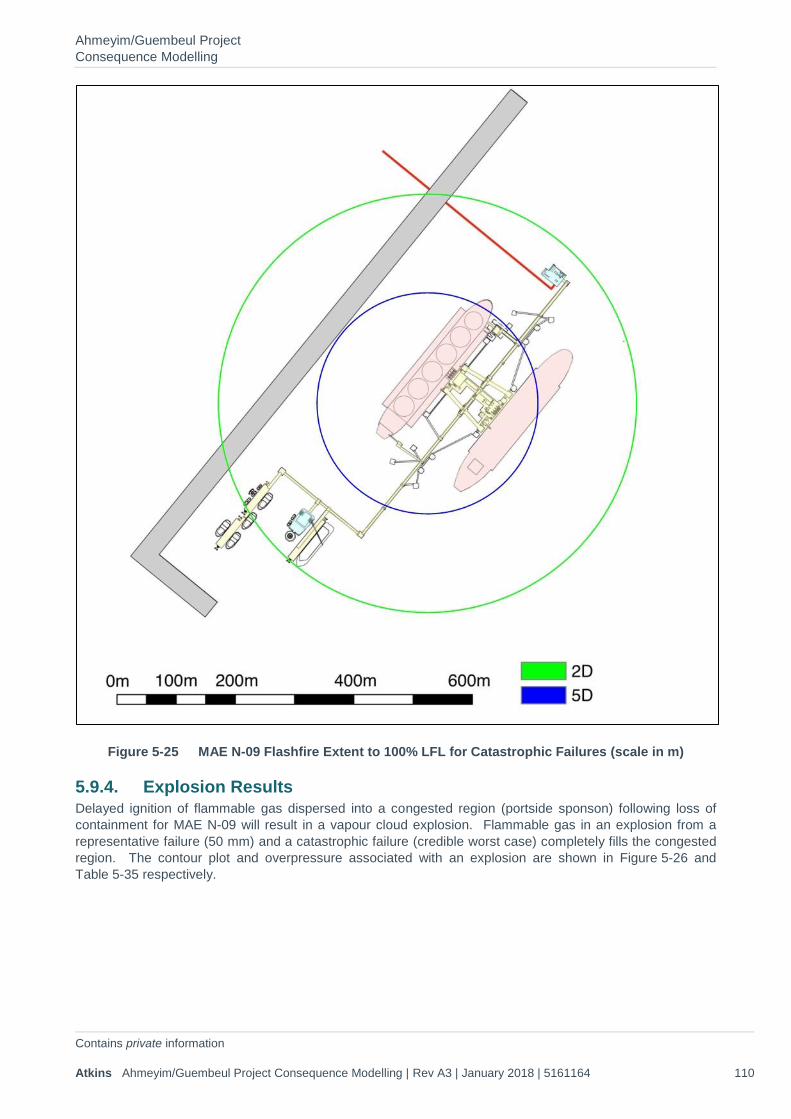
Ahmeyim/Guembeul Project Consequence Modelling
Contains private information Atkins Ahmeyim/Guembeul Project Consequence Modelling | Rev A3 | January 2018 | 5161164 110
Figure 5-25 MAE N-09 Flashfire Extent to 100% LFL for Catastrophic Failures (scale in m)
5.9.4. Explosion Results Delayed ignition of flammable gas dispersed into a congested region (portside sponson) following loss of containment for MAE N-09 will result in a vapour cloud explosion. Flammable gas in an explosion from a representative failure (50 mm) and a catastrophic failure (credible worst case) completely fills the congested region. The contour plot and overpressure associated with an explosion are shown in Figure 5-26 and Table 5-35 respectively.
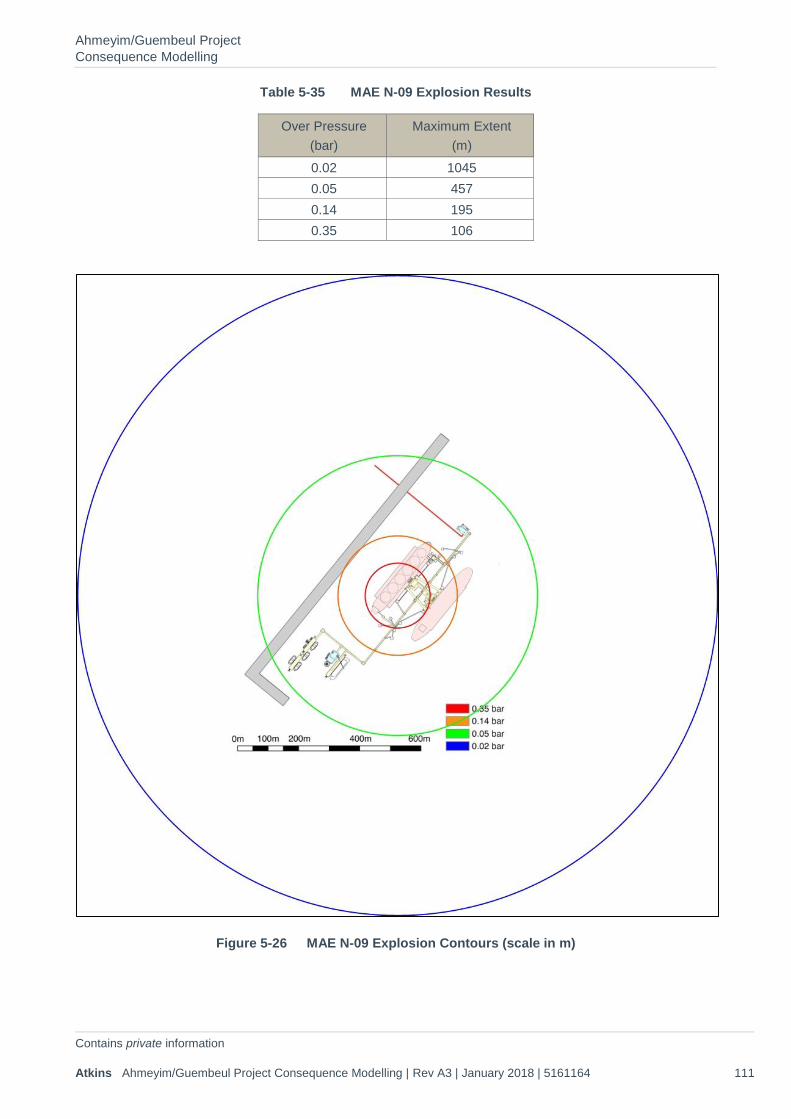
Ahmeyim/Guembeul Project Consequence Modelling
Contains private information Atkins Ahmeyim/Guembeul Project Consequence Modelling | Rev A3 | January 2018 | 5161164 111
Table 5-35 MAE N-09 Explosion Results
Over Pressure (bar)
Maximum Extent (m)
0.02 1045 0.05 457 0.14 195 0.35 106
Figure 5-26 MAE N-09 Explosion Contours (scale in m)
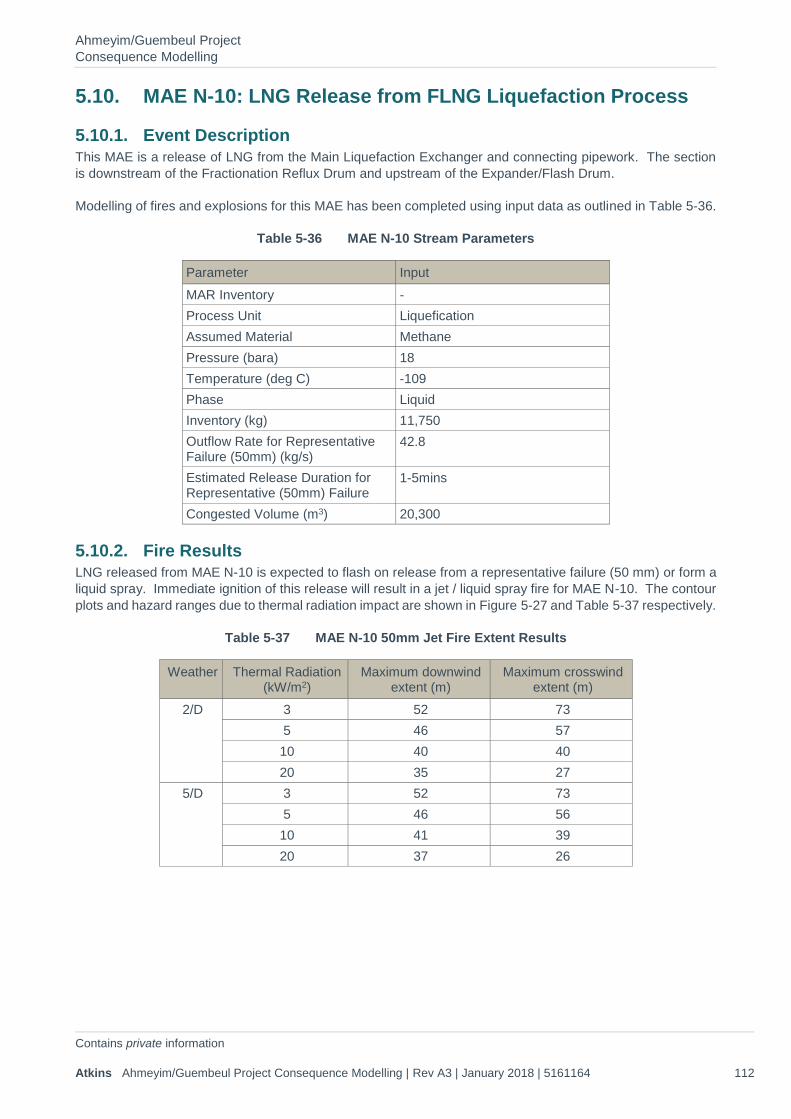
Ahmeyim/Guembeul Project Consequence Modelling
Contains private information Atkins Ahmeyim/Guembeul Project Consequence Modelling | Rev A3 | January 2018 | 5161164 112
5.10. MAE N-10: LNG Release from FLNG Liquefaction Process
5.10.1. Event Description This MAE is a release of LNG from the Main Liquefaction Exchanger and connecting pipework. The section is downstream of the Fractionation Reflux Drum and upstream of the Expander/Flash Drum.
Modelling of fires and explosions for this MAE has been completed using input data as outlined in Table 5-36.
Table 5-36 MAE N-10 Stream Parameters
Parameter Input MAR Inventory - Process Unit Liquefication Assumed Material Methane Pressure (bara) 18 Temperature (deg C) -109 Phase Liquid Inventory (kg) 11,750 Outflow Rate for Representative Failure (50mm) (kg/s)
42.8
Estimated Release Duration for Representative (50mm) Failure
1-5mins
Congested Volume (m3) 20,300
5.10.2. Fire Results LNG released from MAE N-10 is expected to flash on release from a representative failure (50 mm) or form a liquid spray. Immediate ignition of this release will result in a jet / liquid spray fire for MAE N-10. The contour plots and hazard ranges due to thermal radiation impact are shown in Figure 5-27 and Table 5-37 respectively.
Table 5-37 MAE N-10 50mm Jet Fire Extent Results
Weather Thermal Radiation (kW/m2)
Maximum downwind extent (m)
Maximum crosswind extent (m)
2/D 3 52 73 5 46 57 10 40 40 20 35 27
5/D 3 52 73 5 46 56 10 41 39 20 37 26
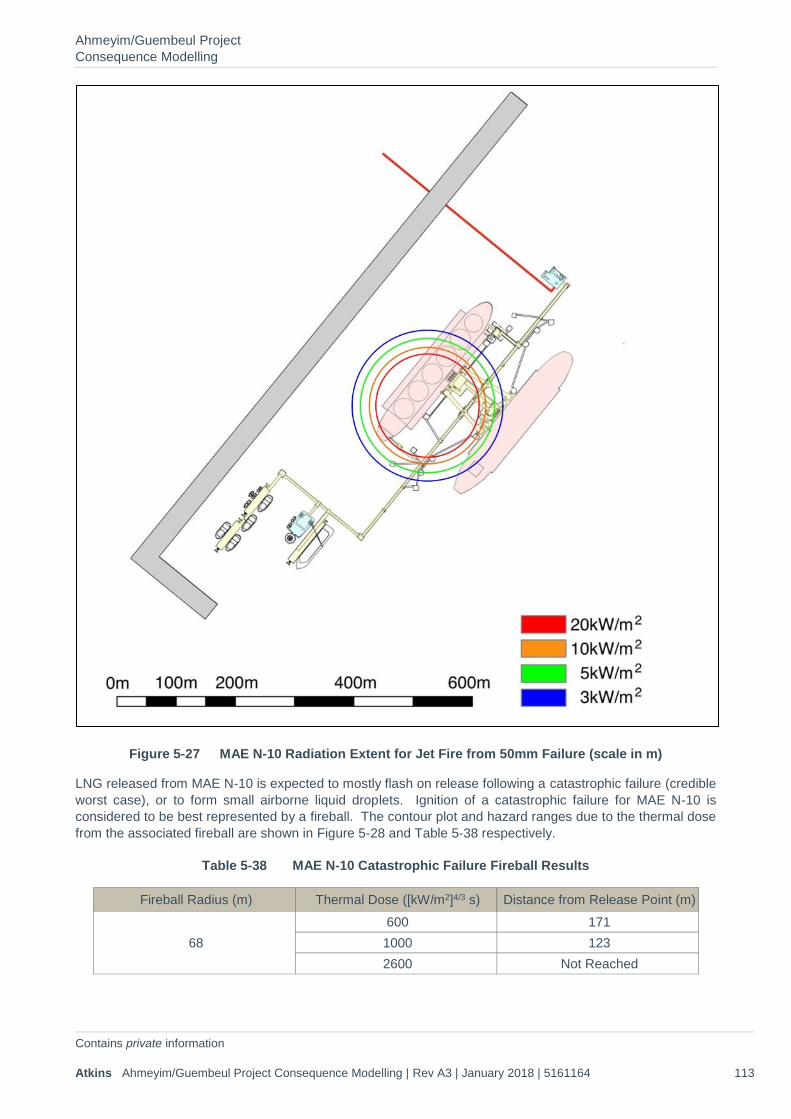
Ahmeyim/Guembeul Project Consequence Modelling
Contains private information Atkins Ahmeyim/Guembeul Project Consequence Modelling | Rev A3 | January 2018 | 5161164 113
Figure 5-27 MAE N-10 Radiation Extent for Jet Fire from 50mm Failure (scale in m)
LNG released from MAE N-10 is expected to mostly flash on release following a catastrophic failure (credible worst case), or to form small airborne liquid droplets. Ignition of a catastrophic failure for MAE N-10 is considered to be best represented by a fireball. The contour plot and hazard ranges due to the thermal dose from the associated fireball are shown in Figure 5-28 and Table 5-38 respectively.
Table 5-38 MAE N-10 Catastrophic Failure Fireball Results
Fireball Radius (m) Thermal Dose ([kW/m2]4/3 s) Distance from Release Point (m)
68 600 171 1000 123 2600 Not Reached
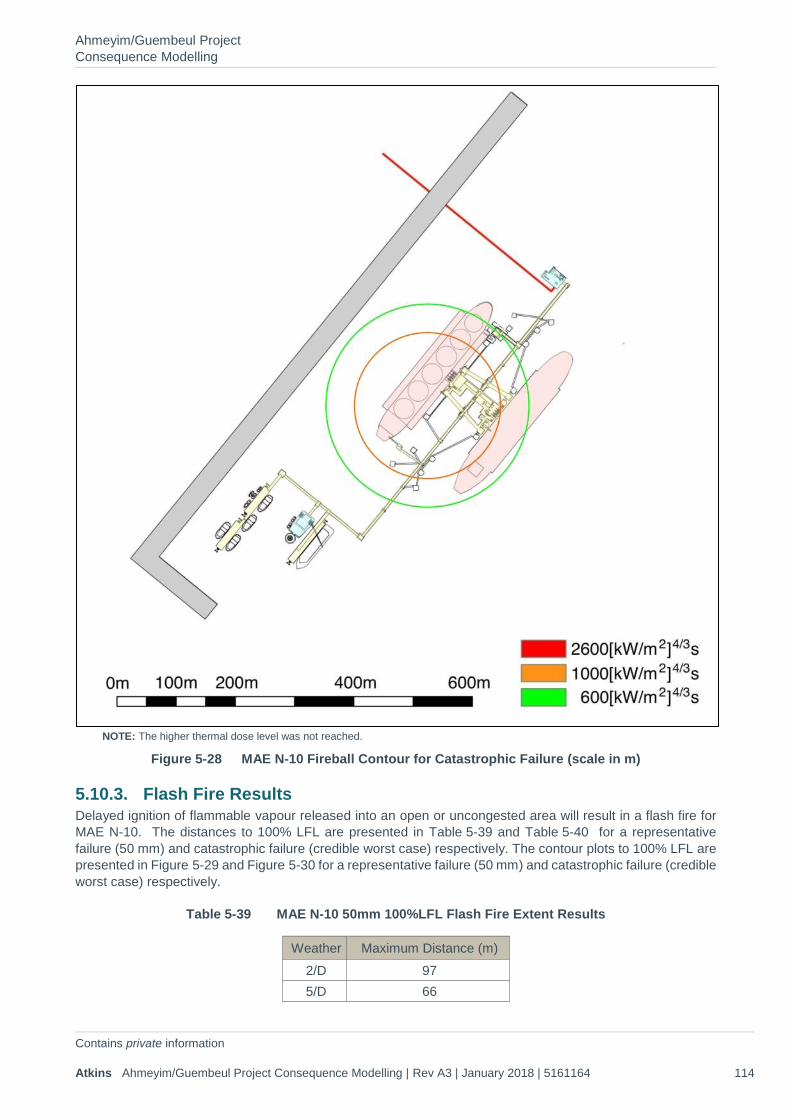
Ahmeyim/Guembeul Project Consequence Modelling
Contains private information Atkins Ahmeyim/Guembeul Project Consequence Modelling | Rev A3 | January 2018 | 5161164 114
NOTE: The higher thermal dose level was not reached.
Figure 5-28 MAE N-10 Fireball Contour for Catastrophic Failure (scale in m)
5.10.3. Flash Fire Results Delayed ignition of flammable vapour released into an open or uncongested area will result in a flash fire for MAE N-10. The distances to 100% LFL are presented in Table 5-39 and Table 5-40 for a representative failure (50 mm) and catastrophic failure (credible worst case) respectively. The contour plots to 100% LFL are presented in Figure 5-29 and Figure 5-30 for a representative failure (50 mm) and catastrophic failure (credible worst case) respectively.
Table 5-39 MAE N-10 50mm 100%LFL Flash Fire Extent Results
Weather Maximum Distance (m) 2/D 97 5/D 66
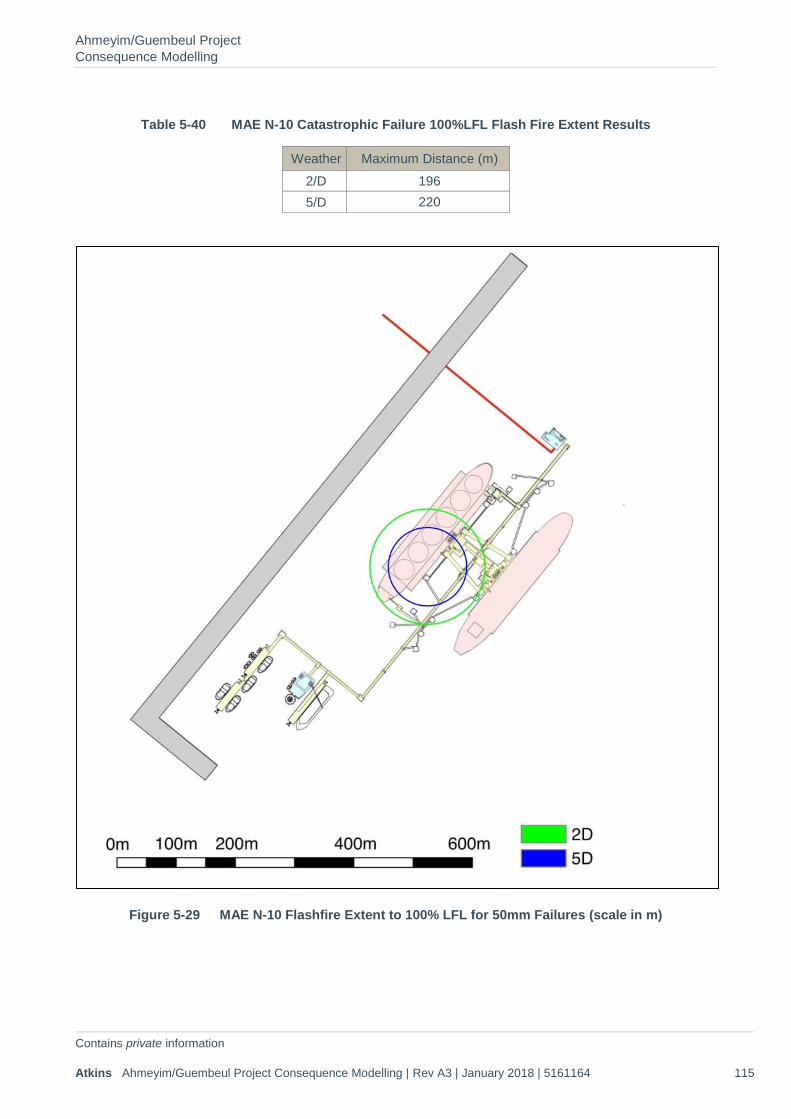
Ahmeyim/Guembeul Project Consequence Modelling
Contains private information Atkins Ahmeyim/Guembeul Project Consequence Modelling | Rev A3 | January 2018 | 5161164 115
Table 5-40 MAE N-10 Catastrophic Failure 100%LFL Flash Fire Extent Results
Weather Maximum Distance (m) 2/D 196 5/D 220
Figure 5-29 MAE N-10 Flashfire Extent to 100% LFL for 50mm Failures (scale in m)
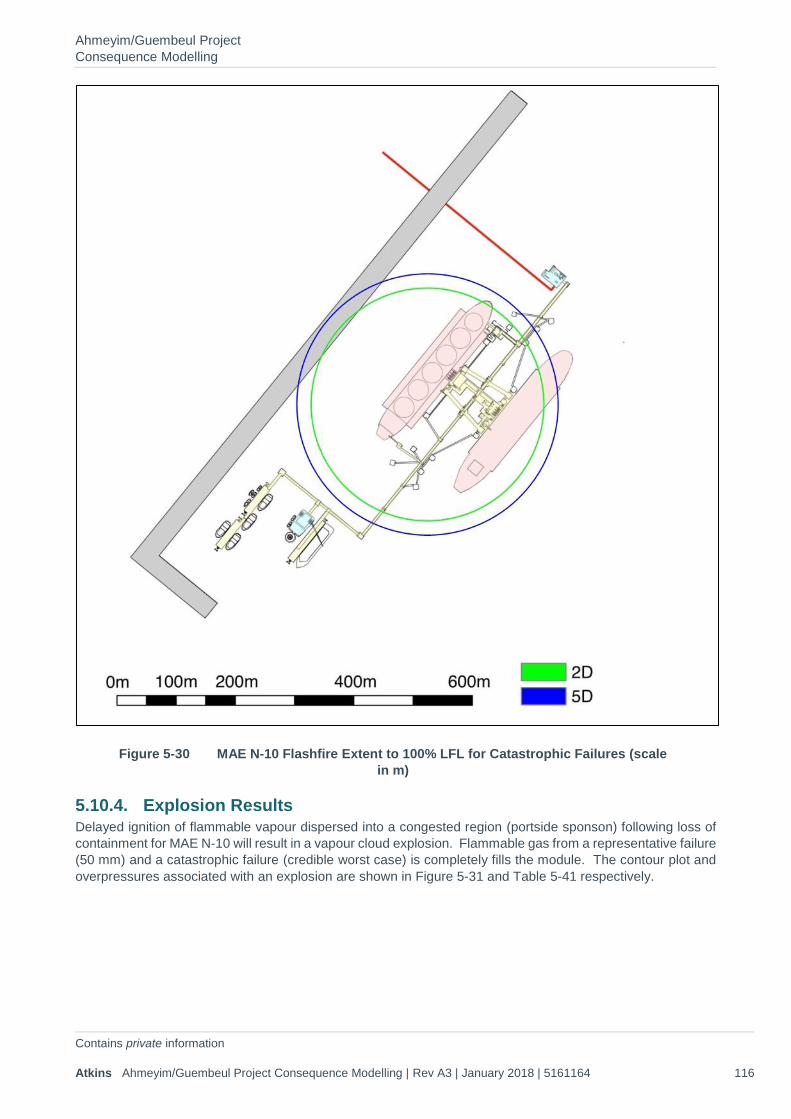
Ahmeyim/Guembeul Project Consequence Modelling
Contains private information Atkins Ahmeyim/Guembeul Project Consequence Modelling | Rev A3 | January 2018 | 5161164 116
Figure 5-30 MAE N-10 Flashfire Extent to 100% LFL for Catastrophic Failures (scale in m)
5.10.4. Explosion Results Delayed ignition of flammable vapour dispersed into a congested region (portside sponson) following loss of containment for MAE N-10 will result in a vapour cloud explosion. Flammable gas from a representative failure (50 mm) and a catastrophic failure (credible worst case) is completely fills the module. The contour plot and overpressures associated with an explosion are shown in Figure 5-31 and Table 5-41 respectively.
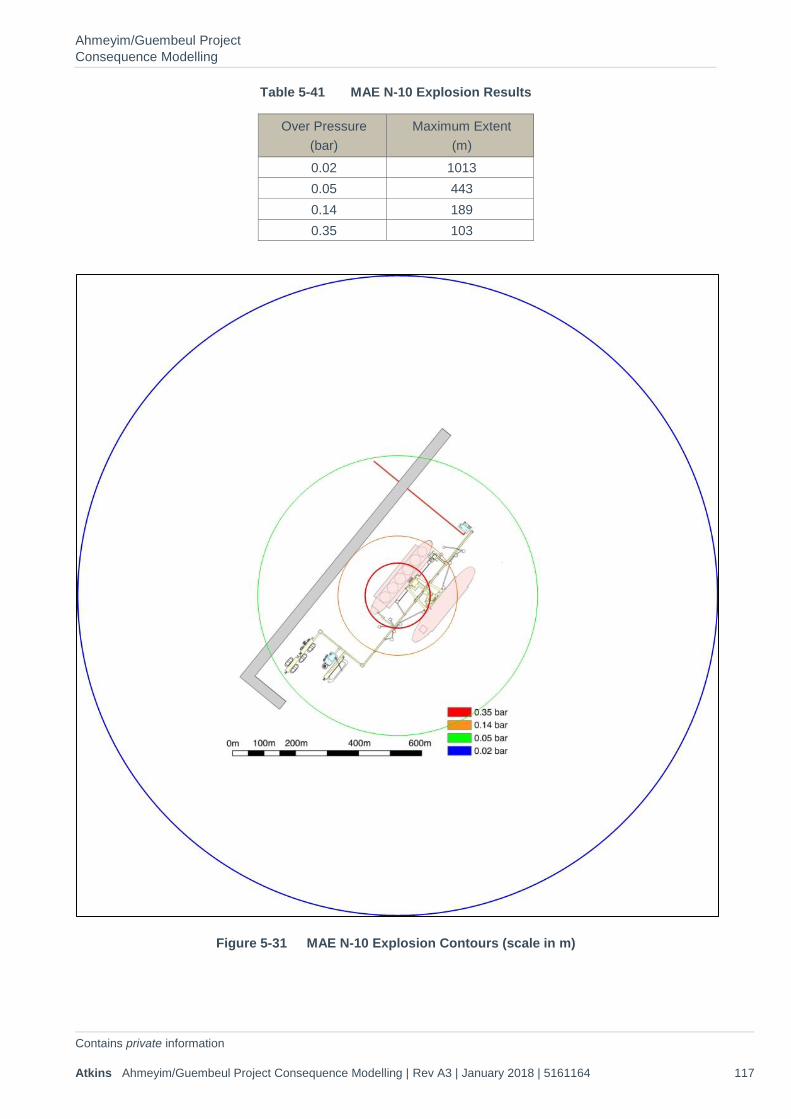
Ahmeyim/Guembeul Project Consequence Modelling
Contains private information Atkins Ahmeyim/Guembeul Project Consequence Modelling | Rev A3 | January 2018 | 5161164 117
Table 5-41 MAE N-10 Explosion Results
Over Pressure (bar)
Maximum Extent (m)
0.02 1013 0.05 443 0.14 189 0.35 103
Figure 5-31 MAE N-10 Explosion Contours (scale in m)

Ahmeyim/Guembeul Project Consequence Modelling
Contains private information Atkins Ahmeyim/Guembeul Project Consequence Modelling | Rev A3 | January 2018 | 5161164 118
5.10.5. Cryogenic Spill Results The extent of a cryogenic pool has been determined for a representative and credible worst case release associated with MAE N-10. For a representative failure (50 mm) the pool spreads to a radius of 15m while for a catastrophic vessel failure the pool extends to 22m.
Table 5-42 MAE N-10 Cryogenic Spill Results
Release Scenario Pool Radius
(m) Representative failure (50 mm) 15 Catastrophic failure (credible worst case) 21
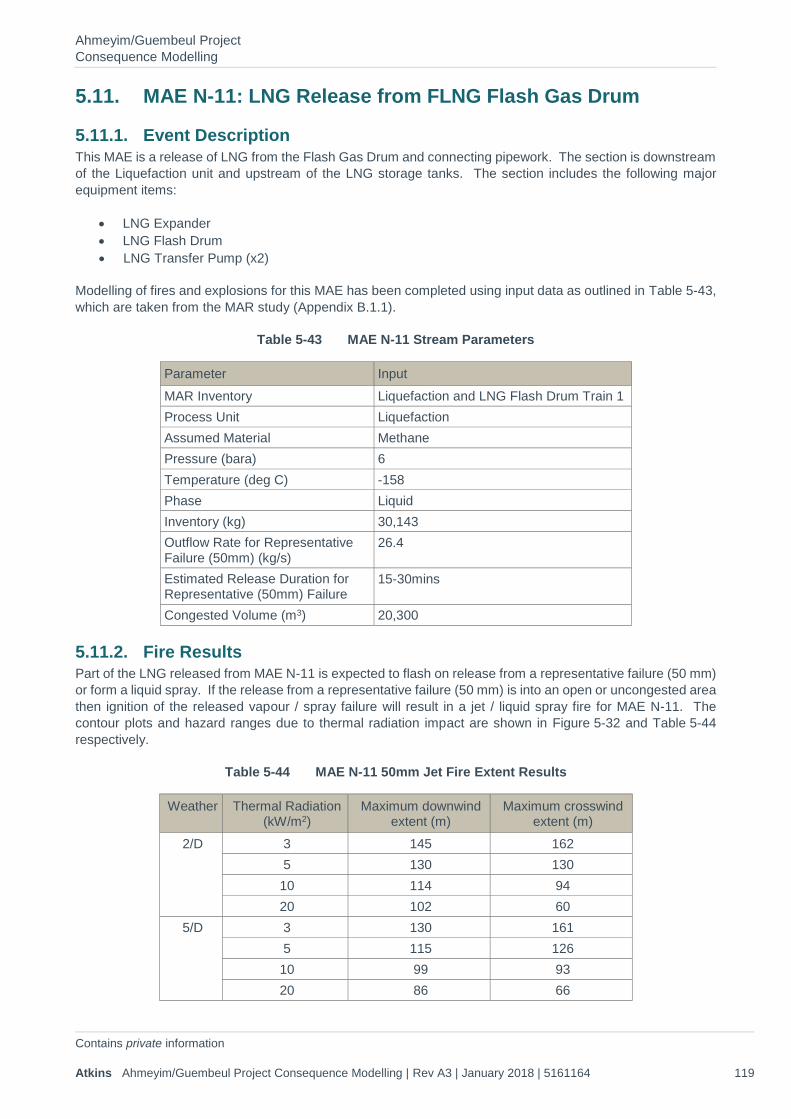
Ahmeyim/Guembeul Project Consequence Modelling
Contains private information Atkins Ahmeyim/Guembeul Project Consequence Modelling | Rev A3 | January 2018 | 5161164 119
5.11. MAE N-11: LNG Release from FLNG Flash Gas Drum
5.11.1. Event Description This MAE is a release of LNG from the Flash Gas Drum and connecting pipework. The section is downstream of the Liquefaction unit and upstream of the LNG storage tanks. The section includes the following major equipment items:
• LNG Expander • LNG Flash Drum • LNG Transfer Pump (x2)
Modelling of fires and explosions for this MAE has been completed using input data as outlined in Table 5-43, which are taken from the MAR study (Appendix B.1.1).
Table 5-43 MAE N-11 Stream Parameters
Parameter Input MAR Inventory Liquefaction and LNG Flash Drum Train 1 Process Unit Liquefaction Assumed Material Methane Pressure (bara) 6 Temperature (deg C) -158 Phase Liquid Inventory (kg) 30,143 Outflow Rate for Representative Failure (50mm) (kg/s)
26.4
Estimated Release Duration for Representative (50mm) Failure
15-30mins
Congested Volume (m3) 20,300
5.11.2. Fire Results Part of the LNG released from MAE N-11 is expected to flash on release from a representative failure (50 mm) or form a liquid spray. If the release from a representative failure (50 mm) is into an open or uncongested area then ignition of the released vapour / spray failure will result in a jet / liquid spray fire for MAE N-11. The contour plots and hazard ranges due to thermal radiation impact are shown in Figure 5-32 and Table 5-44 respectively.
Table 5-44 MAE N-11 50mm Jet Fire Extent Results
Weather Thermal Radiation (kW/m2)
Maximum downwind extent (m)
Maximum crosswind extent (m)
2/D 3 145 162 5 130 130 10 114 94 20 102 60
5/D 3 130 161 5 115 126 10 99 93 20 86 66

Ahmeyim/Guembeul Project Consequence Modelling
Contains private information Atkins Ahmeyim/Guembeul Project Consequence Modelling | Rev A3 | January 2018 | 5161164 120
Figure 5-32 MAE N-11 Radiation Extent for Jet Fire from 50mm Failure (scale in m)
Immediate ignition following loss of containment from a representative failure (50 mm) may more likely result in a liquid pool fire for MAE N-11 – in particular, if the release is directed vertically downwards and the momentum is removed. The size of a pool on the deck of the FLNG is limited to a pool or 50m by 50m. The contour plots and hazard ranges due to thermal radiation impact are shown in Figure 5-33 and Table 5-45 respectively.

Ahmeyim/Guembeul Project Consequence Modelling
Contains private information Atkins Ahmeyim/Guembeul Project Consequence Modelling | Rev A3 | January 2018 | 5161164 121
Table 5-45 MAE N-11 50mm Pool Fire Results
Weather Thermal Radiation (kW/m2)
Maximum downwind extent (m)
Maximum crosswind extent (m)
2/D 3 97 172 5 78 134 10 43 61 20 31 41
5/D 3 98 169 5 81 132 10 48 64 20 39 45
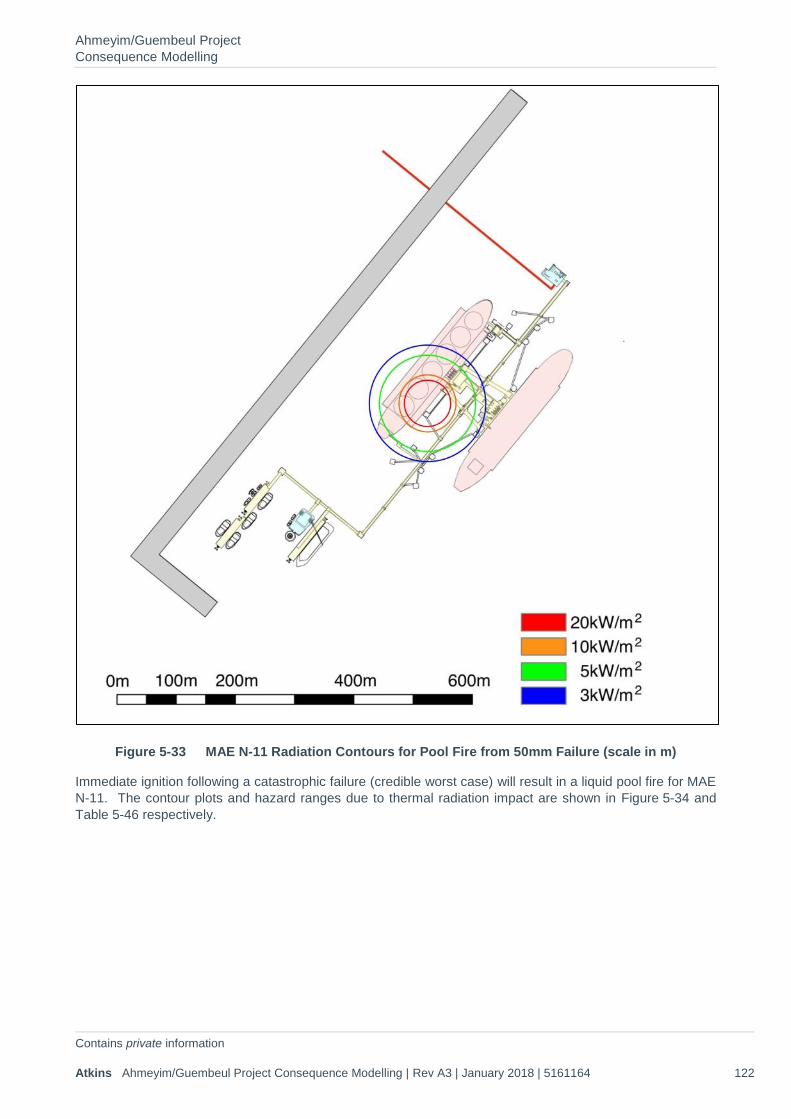
Ahmeyim/Guembeul Project Consequence Modelling
Contains private information Atkins Ahmeyim/Guembeul Project Consequence Modelling | Rev A3 | January 2018 | 5161164 122
Figure 5-33 MAE N-11 Radiation Contours for Pool Fire from 50mm Failure (scale in m)
Immediate ignition following a catastrophic failure (credible worst case) will result in a liquid pool fire for MAE N-11. The contour plots and hazard ranges due to thermal radiation impact are shown in Figure 5-34 and Table 5-46 respectively.

Ahmeyim/Guembeul Project Consequence Modelling
Contains private information Atkins Ahmeyim/Guembeul Project Consequence Modelling | Rev A3 | January 2018 | 5161164 123
Table 5-46 MAE N-11 Catastrophic Pool Fire Results
Weather Thermal Radiation (kW/m2)
Maximum downwind extent (m)
Maximum crosswind extent (m)
2/D 3 294 544 5 237 425 10 176 299 20 127 201
5/D 3 300 536 5 245 422 10 187 302 20 143 209
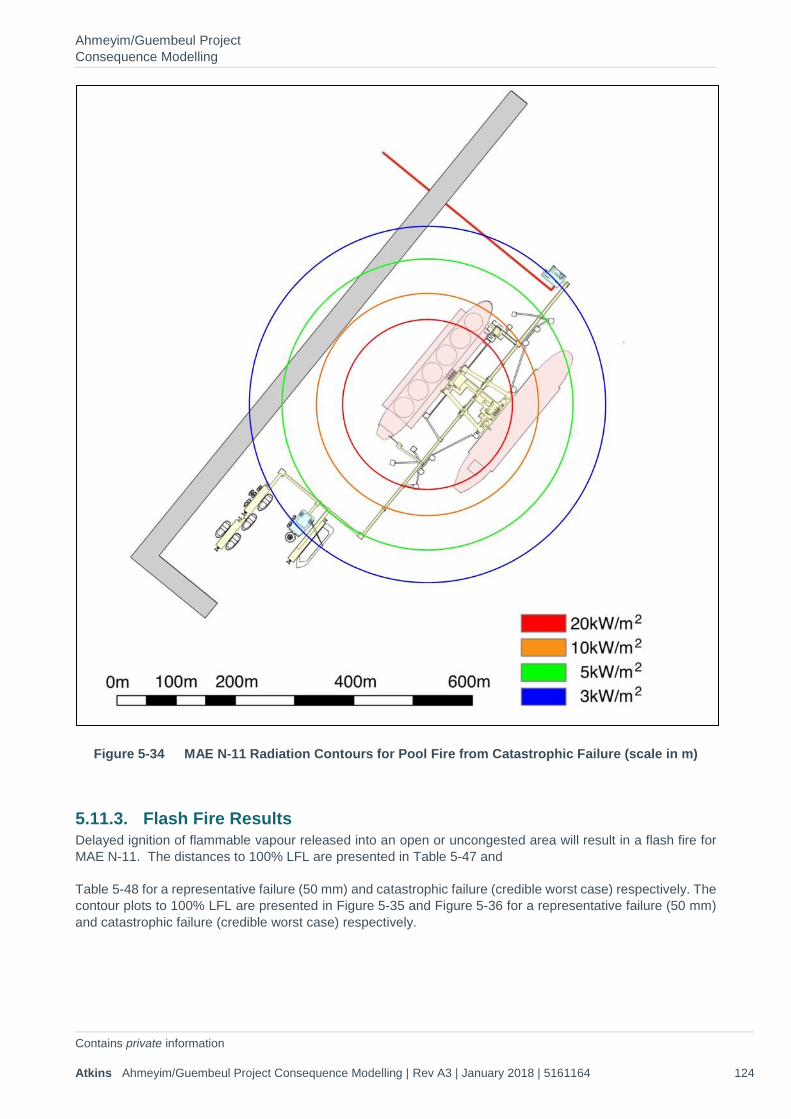
Ahmeyim/Guembeul Project Consequence Modelling
Contains private information Atkins Ahmeyim/Guembeul Project Consequence Modelling | Rev A3 | January 2018 | 5161164 124
Figure 5-34 MAE N-11 Radiation Contours for Pool Fire from Catastrophic Failure (scale in m)
5.11.3. Flash Fire Results Delayed ignition of flammable vapour released into an open or uncongested area will result in a flash fire for MAE N-11. The distances to 100% LFL are presented in Table 5-47 and
Table 5-48 for a representative failure (50 mm) and catastrophic failure (credible worst case) respectively. The contour plots to 100% LFL are presented in Figure 5-35 and Figure 5-36 for a representative failure (50 mm) and catastrophic failure (credible worst case) respectively.
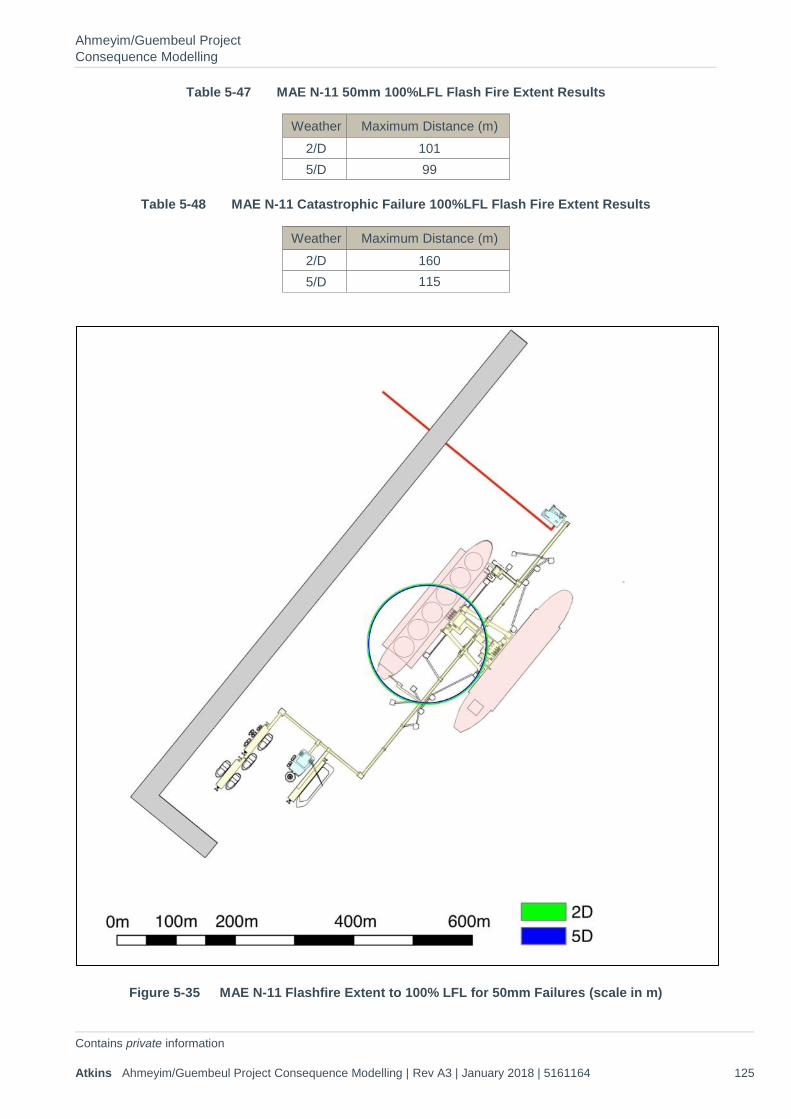
Ahmeyim/Guembeul Project Consequence Modelling
Contains private information Atkins Ahmeyim/Guembeul Project Consequence Modelling | Rev A3 | January 2018 | 5161164 125
Table 5-47 MAE N-11 50mm 100%LFL Flash Fire Extent Results
Weather Maximum Distance (m) 2/D 101 5/D 99
Table 5-48 MAE N-11 Catastrophic Failure 100%LFL Flash Fire Extent Results
Weather Maximum Distance (m) 2/D 160 5/D 115
Figure 5-35 MAE N-11 Flashfire Extent to 100% LFL for 50mm Failures (scale in m)
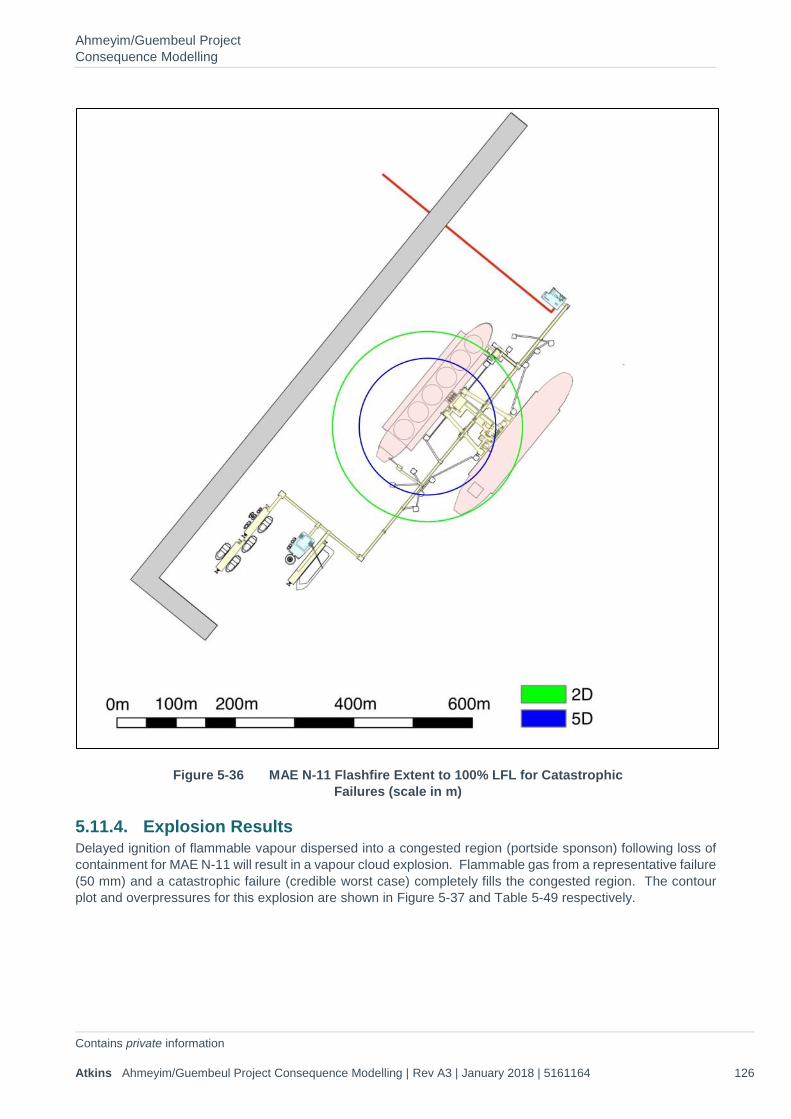
Ahmeyim/Guembeul Project Consequence Modelling
Contains private information Atkins Ahmeyim/Guembeul Project Consequence Modelling | Rev A3 | January 2018 | 5161164 126
Figure 5-36 MAE N-11 Flashfire Extent to 100% LFL for Catastrophic Failures (scale in m)
5.11.4. Explosion Results Delayed ignition of flammable vapour dispersed into a congested region (portside sponson) following loss of containment for MAE N-11 will result in a vapour cloud explosion. Flammable gas from a representative failure (50 mm) and a catastrophic failure (credible worst case) completely fills the congested region. The contour plot and overpressures for this explosion are shown in Figure 5-37 and Table 5-49 respectively.
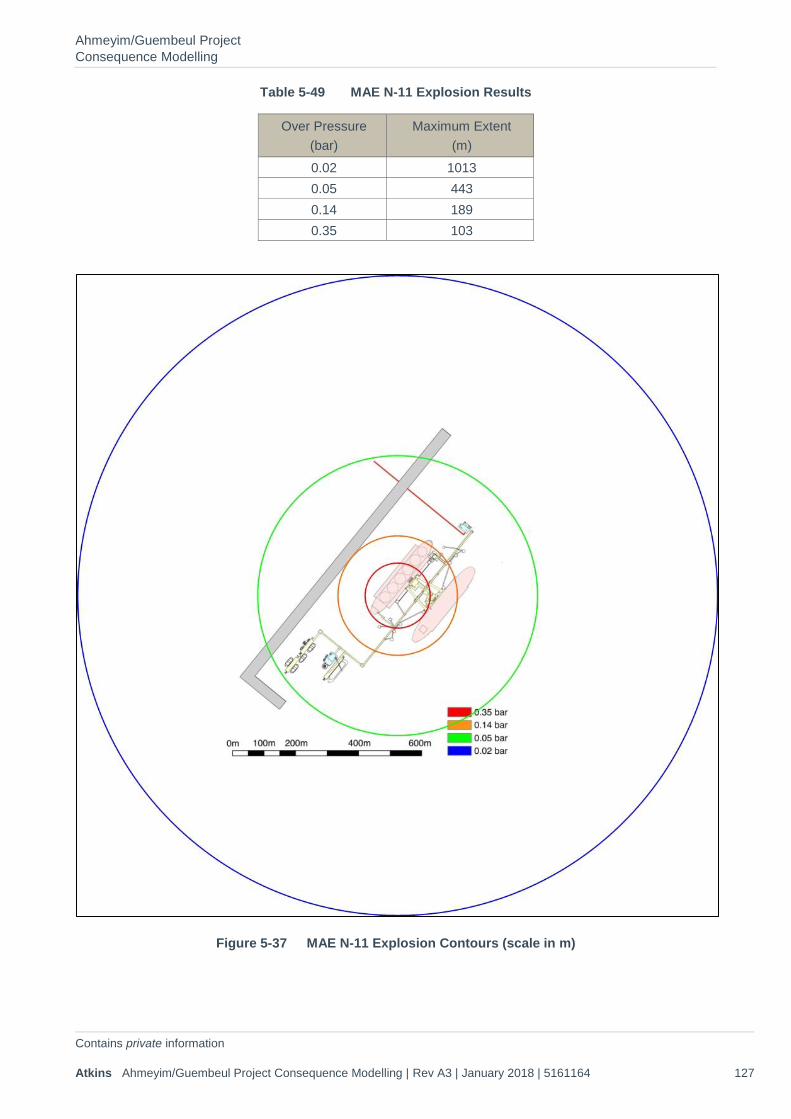
Ahmeyim/Guembeul Project Consequence Modelling
Contains private information Atkins Ahmeyim/Guembeul Project Consequence Modelling | Rev A3 | January 2018 | 5161164 127
Table 5-49 MAE N-11 Explosion Results
Over Pressure (bar)
Maximum Extent (m)
0.02 1013 0.05 443 0.14 189 0.35 103
Figure 5-37 MAE N-11 Explosion Contours (scale in m)
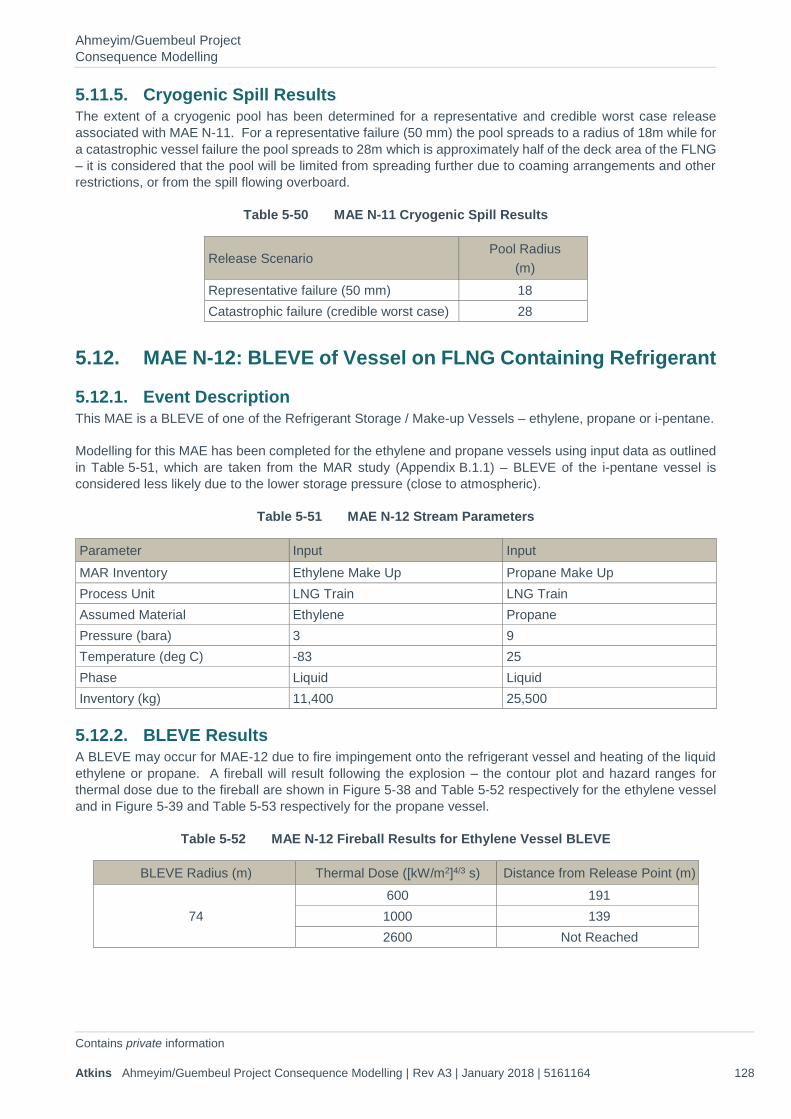
Ahmeyim/Guembeul Project Consequence Modelling
Contains private information Atkins Ahmeyim/Guembeul Project Consequence Modelling | Rev A3 | January 2018 | 5161164 128
5.11.5. Cryogenic Spill Results The extent of a cryogenic pool has been determined for a representative and credible worst case release associated with MAE N-11. For a representative failure (50 mm) the pool spreads to a radius of 18m while for a catastrophic vessel failure the pool spreads to 28m which is approximately half of the deck area of the FLNG – it is considered that the pool will be limited from spreading further due to coaming arrangements and other restrictions, or from the spill flowing overboard.
Table 5-50 MAE N-11 Cryogenic Spill Results
Release Scenario Pool Radius
(m) Representative failure (50 mm) 18 Catastrophic failure (credible worst case) 28
5.12. MAE N-12: BLEVE of Vessel on FLNG Containing Refrigerant
5.12.1. Event Description This MAE is a BLEVE of one of the Refrigerant Storage / Make-up Vessels – ethylene, propane or i-pentane.
Modelling for this MAE has been completed for the ethylene and propane vessels using input data as outlined in Table 5-51, which are taken from the MAR study (Appendix B.1.1) – BLEVE of the i-pentane vessel is considered less likely due to the lower storage pressure (close to atmospheric).
Table 5-51 MAE N-12 Stream Parameters
Parameter Input Input MAR Inventory Ethylene Make Up Propane Make Up Process Unit LNG Train LNG Train Assumed Material Ethylene Propane Pressure (bara) 3 9 Temperature (deg C) -83 25 Phase Liquid Liquid Inventory (kg) 11,400 25,500
5.12.2. BLEVE Results A BLEVE may occur for MAE-12 due to fire impingement onto the refrigerant vessel and heating of the liquid ethylene or propane. A fireball will result following the explosion – the contour plot and hazard ranges for thermal dose due to the fireball are shown in Figure 5-38 and Table 5-52 respectively for the ethylene vessel and in Figure 5-39 and Table 5-53 respectively for the propane vessel.
Table 5-52 MAE N-12 Fireball Results for Ethylene Vessel BLEVE
BLEVE Radius (m) Thermal Dose ([kW/m2]4/3 s) Distance from Release Point (m)
74 600 191 1000 139 2600 Not Reached
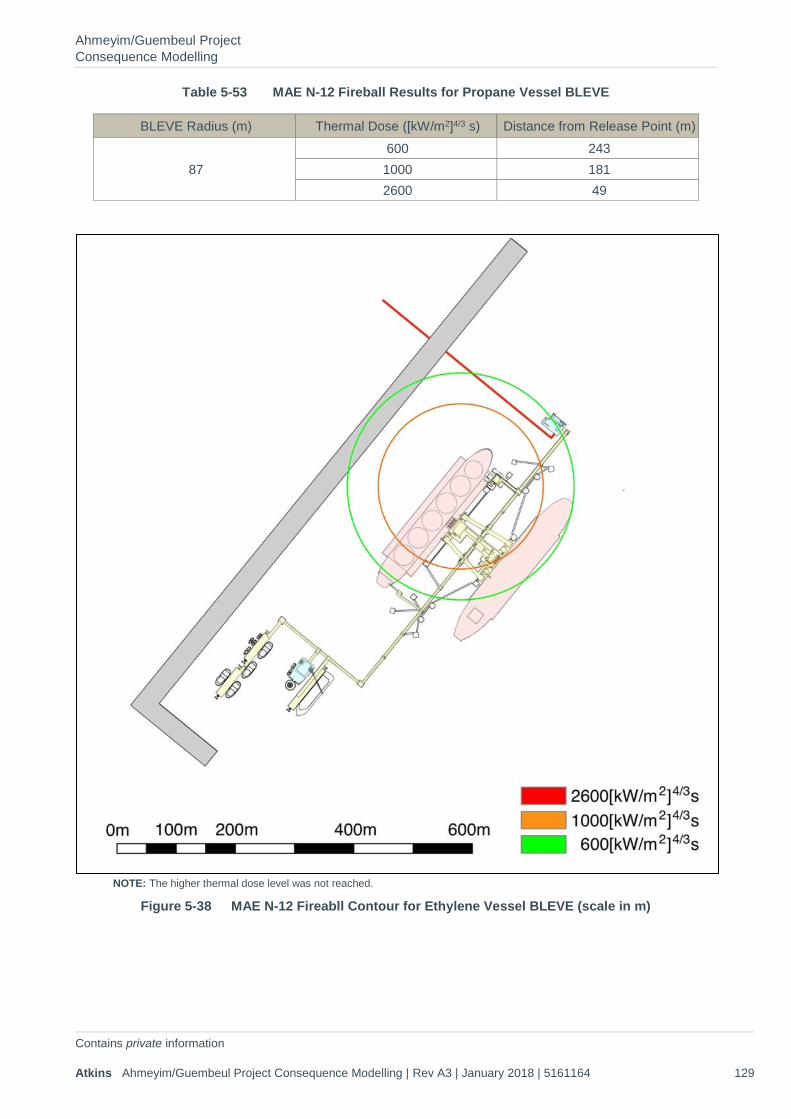
Ahmeyim/Guembeul Project Consequence Modelling
Contains private information Atkins Ahmeyim/Guembeul Project Consequence Modelling | Rev A3 | January 2018 | 5161164 129
Table 5-53 MAE N-12 Fireball Results for Propane Vessel BLEVE
BLEVE Radius (m) Thermal Dose ([kW/m2]4/3 s) Distance from Release Point (m)
87 600 243 1000 181 2600 49
NOTE: The higher thermal dose level was not reached.
Figure 5-38 MAE N-12 Fireabll Contour for Ethylene Vessel BLEVE (scale in m)
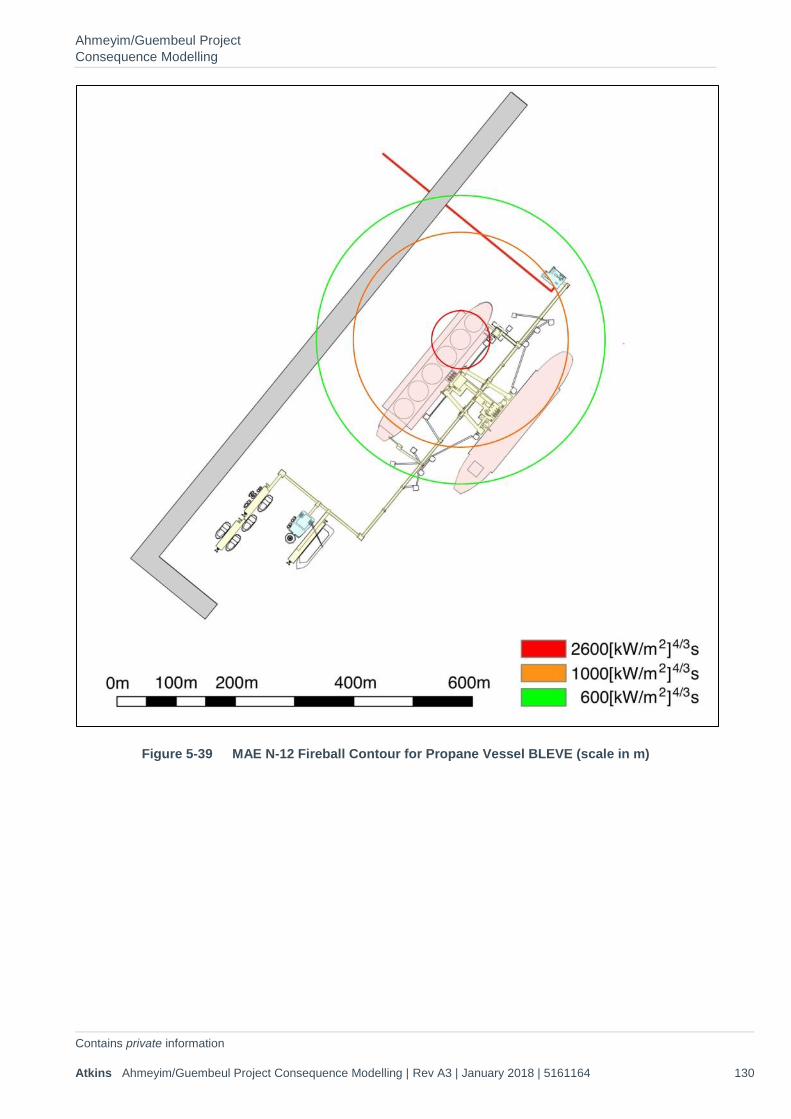
Ahmeyim/Guembeul Project Consequence Modelling
Contains private information Atkins Ahmeyim/Guembeul Project Consequence Modelling | Rev A3 | January 2018 | 5161164 130
Figure 5-39 MAE N-12 Fireball Contour for Propane Vessel BLEVE (scale in m)
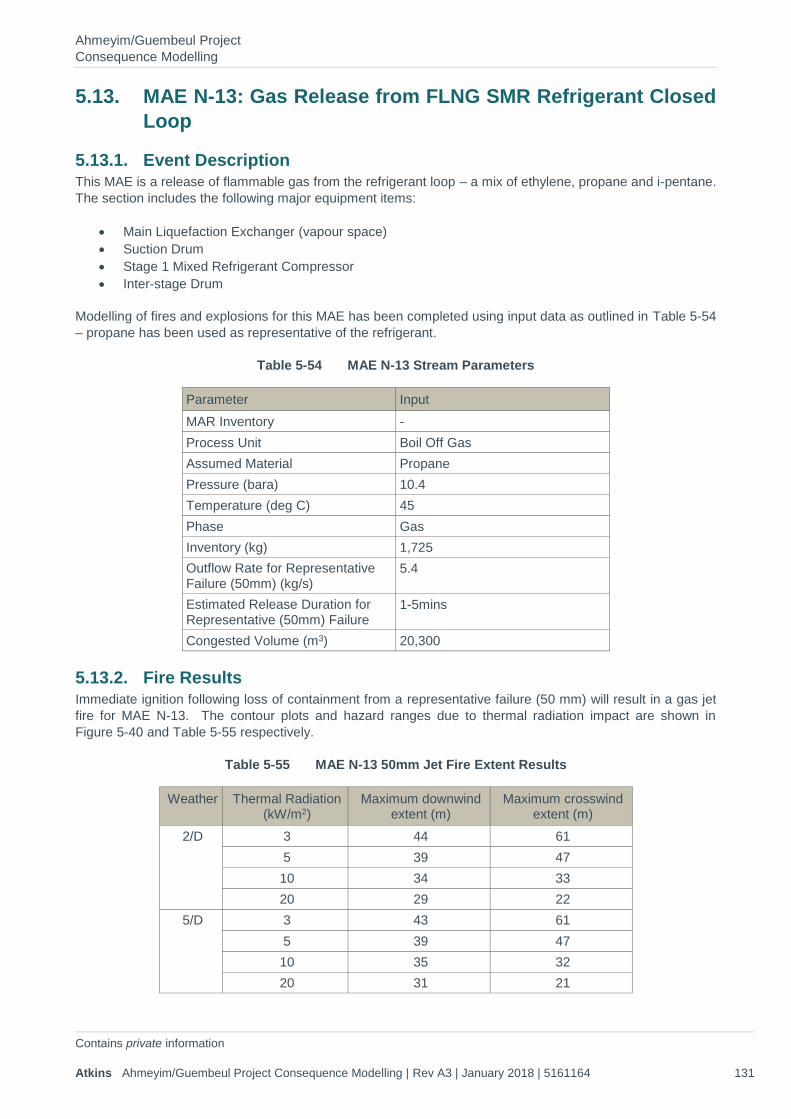
Ahmeyim/Guembeul Project Consequence Modelling
Contains private information Atkins Ahmeyim/Guembeul Project Consequence Modelling | Rev A3 | January 2018 | 5161164 131
5.13. MAE N-13: Gas Release from FLNG SMR Refrigerant Closed Loop
5.13.1. Event Description This MAE is a release of flammable gas from the refrigerant loop – a mix of ethylene, propane and i-pentane. The section includes the following major equipment items:
• Main Liquefaction Exchanger (vapour space) • Suction Drum • Stage 1 Mixed Refrigerant Compressor • Inter-stage Drum
Modelling of fires and explosions for this MAE has been completed using input data as outlined in Table 5-54 – propane has been used as representative of the refrigerant.
Table 5-54 MAE N-13 Stream Parameters
Parameter Input MAR Inventory - Process Unit Boil Off Gas Assumed Material Propane Pressure (bara) 10.4 Temperature (deg C) 45 Phase Gas Inventory (kg) 1,725 Outflow Rate for Representative Failure (50mm) (kg/s)
5.4
Estimated Release Duration for Representative (50mm) Failure
1-5mins
Congested Volume (m3) 20,300
5.13.2. Fire Results Immediate ignition following loss of containment from a representative failure (50 mm) will result in a gas jet fire for MAE N-13. The contour plots and hazard ranges due to thermal radiation impact are shown in Figure 5-40 and Table 5-55 respectively.
Table 5-55 MAE N-13 50mm Jet Fire Extent Results
Weather Thermal Radiation (kW/m2)
Maximum downwind extent (m)
Maximum crosswind extent (m)
2/D 3 44 61 5 39 47 10 34 33 20 29 22
5/D 3 43 61 5 39 47 10 35 32 20 31 21
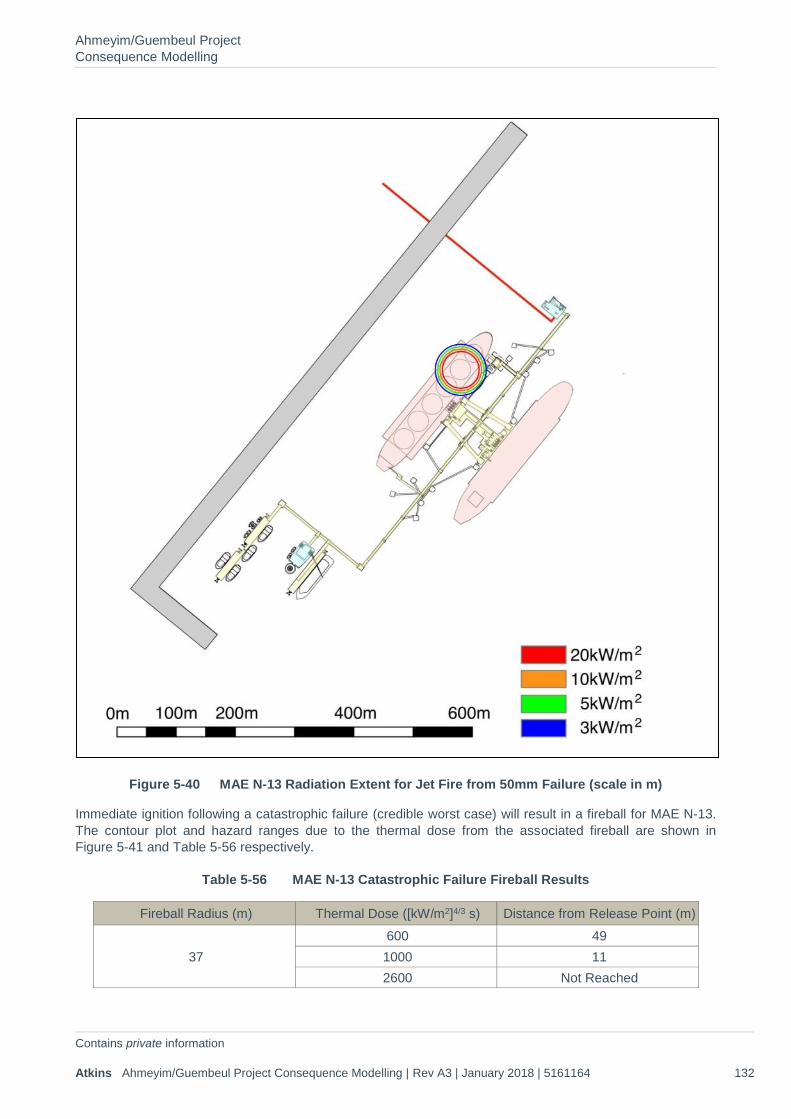
Ahmeyim/Guembeul Project Consequence Modelling
Contains private information Atkins Ahmeyim/Guembeul Project Consequence Modelling | Rev A3 | January 2018 | 5161164 132
Figure 5-40 MAE N-13 Radiation Extent for Jet Fire from 50mm Failure (scale in m)
Immediate ignition following a catastrophic failure (credible worst case) will result in a fireball for MAE N-13. The contour plot and hazard ranges due to the thermal dose from the associated fireball are shown in Figure 5-41 and Table 5-56 respectively.
Table 5-56 MAE N-13 Catastrophic Failure Fireball Results
Fireball Radius (m) Thermal Dose ([kW/m2]4/3 s) Distance from Release Point (m)
37 600 49 1000 11 2600 Not Reached
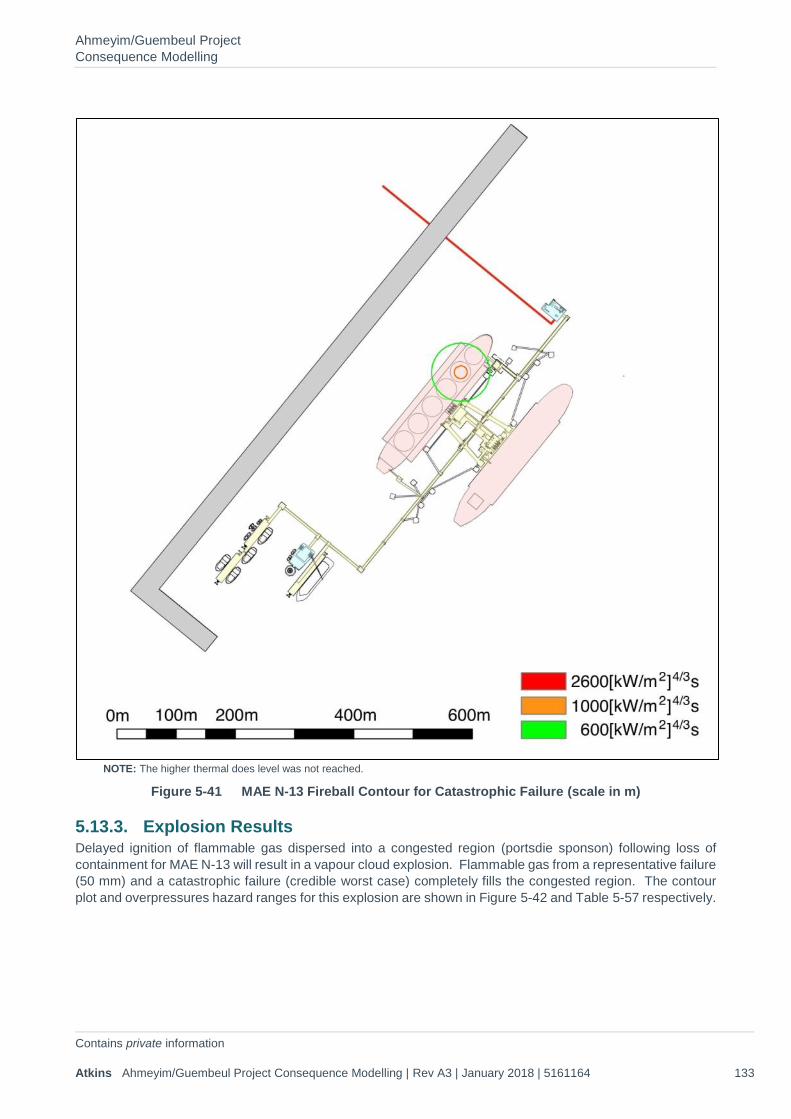
Ahmeyim/Guembeul Project Consequence Modelling
Contains private information Atkins Ahmeyim/Guembeul Project Consequence Modelling | Rev A3 | January 2018 | 5161164 133
NOTE: The higher thermal does level was not reached.
Figure 5-41 MAE N-13 Fireball Contour for Catastrophic Failure (scale in m)
5.13.3. Explosion Results Delayed ignition of flammable gas dispersed into a congested region (portsdie sponson) following loss of containment for MAE N-13 will result in a vapour cloud explosion. Flammable gas from a representative failure (50 mm) and a catastrophic failure (credible worst case) completely fills the congested region. The contour plot and overpressures hazard ranges for this explosion are shown in Figure 5-42 and Table 5-57 respectively.
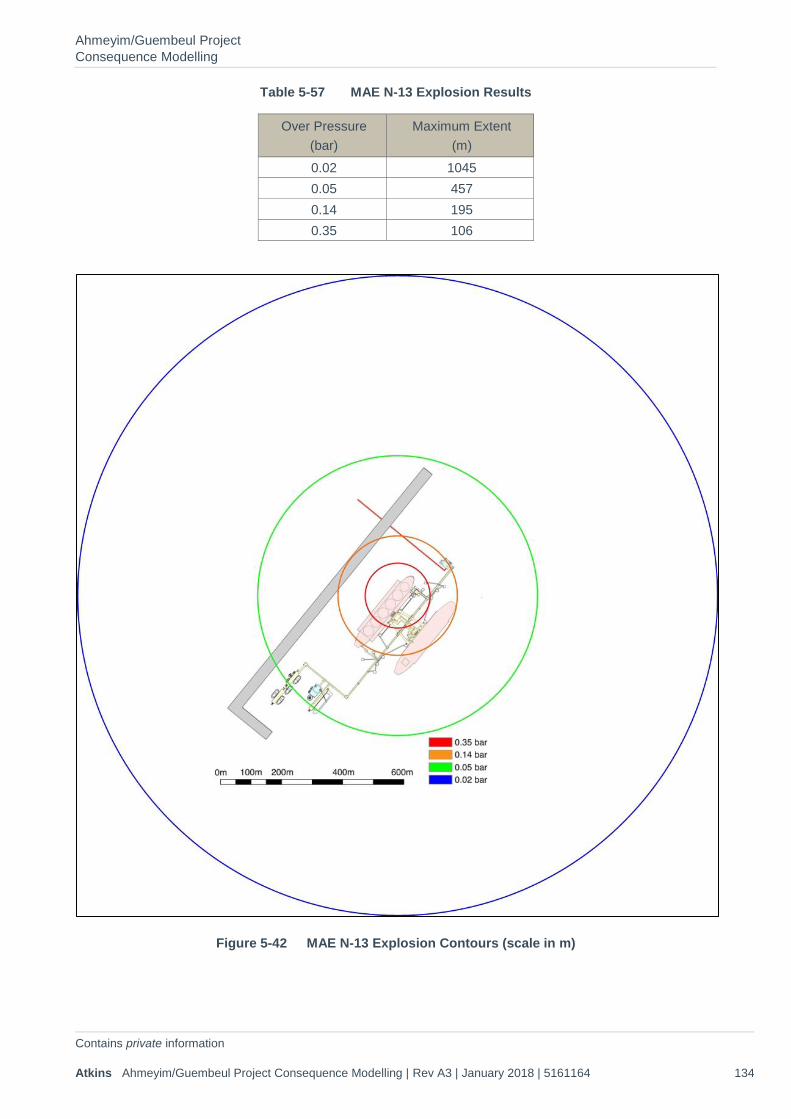
Ahmeyim/Guembeul Project Consequence Modelling
Contains private information Atkins Ahmeyim/Guembeul Project Consequence Modelling | Rev A3 | January 2018 | 5161164 134
Table 5-57 MAE N-13 Explosion Results
Over Pressure (bar)
Maximum Extent (m)
0.02 1045 0.05 457 0.14 195 0.35 106
Figure 5-42 MAE N-13 Explosion Contours (scale in m)
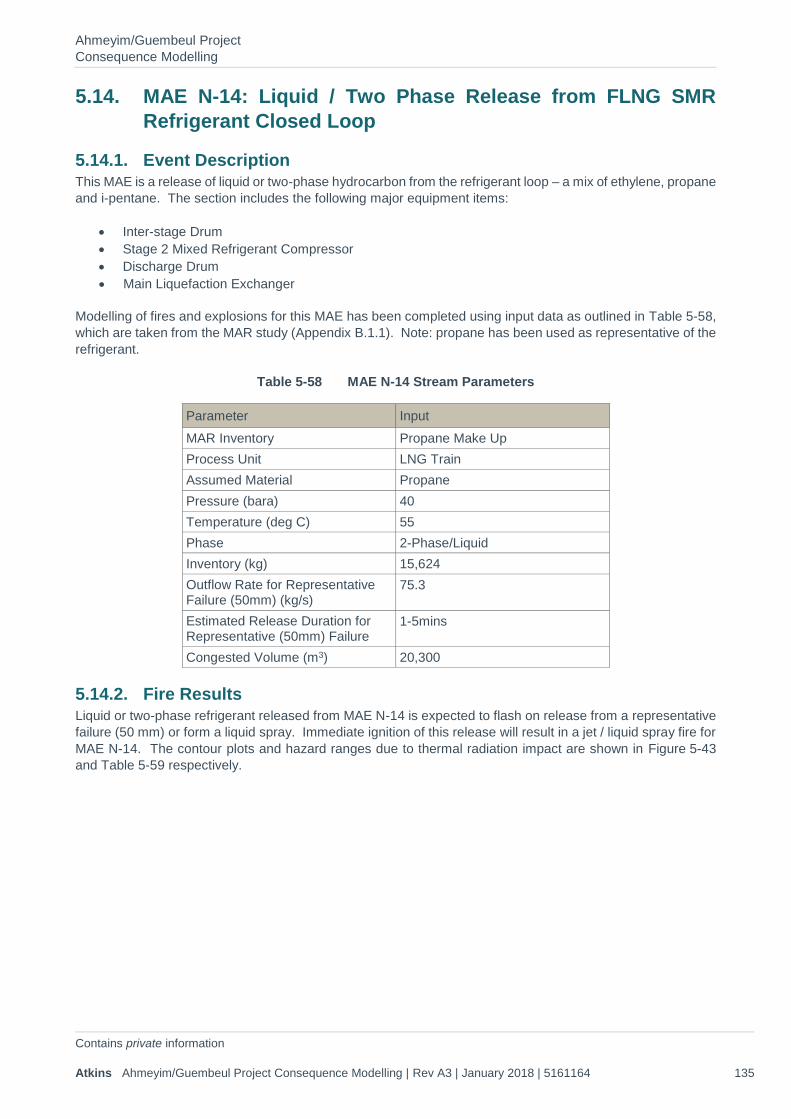
Ahmeyim/Guembeul Project Consequence Modelling
Contains private information Atkins Ahmeyim/Guembeul Project Consequence Modelling | Rev A3 | January 2018 | 5161164 135
5.14. MAE N-14: Liquid / Two Phase Release from FLNG SMR Refrigerant Closed Loop
5.14.1. Event Description This MAE is a release of liquid or two-phase hydrocarbon from the refrigerant loop – a mix of ethylene, propane and i-pentane. The section includes the following major equipment items:
• Inter-stage Drum • Stage 2 Mixed Refrigerant Compressor • Discharge Drum • Main Liquefaction Exchanger
Modelling of fires and explosions for this MAE has been completed using input data as outlined in Table 5-58, which are taken from the MAR study (Appendix B.1.1). Note: propane has been used as representative of the refrigerant.
Table 5-58 MAE N-14 Stream Parameters
Parameter Input MAR Inventory Propane Make Up Process Unit LNG Train Assumed Material Propane Pressure (bara) 40 Temperature (deg C) 55 Phase 2-Phase/Liquid Inventory (kg) 15,624 Outflow Rate for Representative Failure (50mm) (kg/s)
75.3
Estimated Release Duration for Representative (50mm) Failure
1-5mins
Congested Volume (m3) 20,300
5.14.2. Fire Results Liquid or two-phase refrigerant released from MAE N-14 is expected to flash on release from a representative failure (50 mm) or form a liquid spray. Immediate ignition of this release will result in a jet / liquid spray fire for MAE N-14. The contour plots and hazard ranges due to thermal radiation impact are shown in Figure 5-43 and Table 5-59 respectively.

Ahmeyim/Guembeul Project Consequence Modelling
Contains private information Atkins Ahmeyim/Guembeul Project Consequence Modelling | Rev A3 | January 2018 | 5161164 136
Table 5-59 MAE N-14 50mm Jet Fire Extent Results
Weather Thermal Radiation (kW/m2)
Maximum downwind extent (m)
Maximum crosswind extent (m)
2/D 3 177 259 5 157 201 10 136 146 20 120 105
5/D 3 163 261 5 142 202 10 120 143 20 104 105

Ahmeyim/Guembeul Project Consequence Modelling
Contains private information Atkins Ahmeyim/Guembeul Project Consequence Modelling | Rev A3 | January 2018 | 5161164 137
Figure 5-43 MAE N-14 Radiation Extent for Jet Fire from 50mm Failure (scale in m)
Mixed refrigerant released from MAE N-14 is expected to mostly flash on release following a catastrophic failure (credible worst case), or to form small airborne liquid droplets. Ignition of a catastrophic failure for MAE N-14 is considered to be best represented by a fireball. The contour plot and hazard ranges due to the thermal dose from the associated fireball are shown in Figure 5-44 and Table 5-60 respectively.
Table 5-60 MAE N-14 Catastrophic Failure Fireball Results
Fireball Radius (m) Thermal Dose ([kW/m2]4/3 s) Distance from Release Point (m)
75 600 217 1000 163 2600 56

Ahmeyim/Guembeul Project Consequence Modelling
Contains private information Atkins Ahmeyim/Guembeul Project Consequence Modelling | Rev A3 | January 2018 | 5161164 138
Figure 5-44 MAE N-14 Fireball Contour for Catastrophic Failure (scale in m)
5.14.3. Flash Fire Results Delayed ignition of flammable vapour dispersed into non-congested regions will result in flash fires for MAE N-14. The distances to 100% LFL are presented in Table 5-61 and Table 5-62 for a representative failure (50 mm) and catastrophic failure (credible worst case) respectively. The contour plots to 100% LFL are presented in Figure 5-45 and Figure 5-46 for a representative failure (50 mm) and catastrophic failure (credible worst case) respectively.
Table 5-61 MAE N-14 50mm 100%LFL Flash Fire Extent Results
Weather Maximum Distance (m) 2/D 282 5/D 158
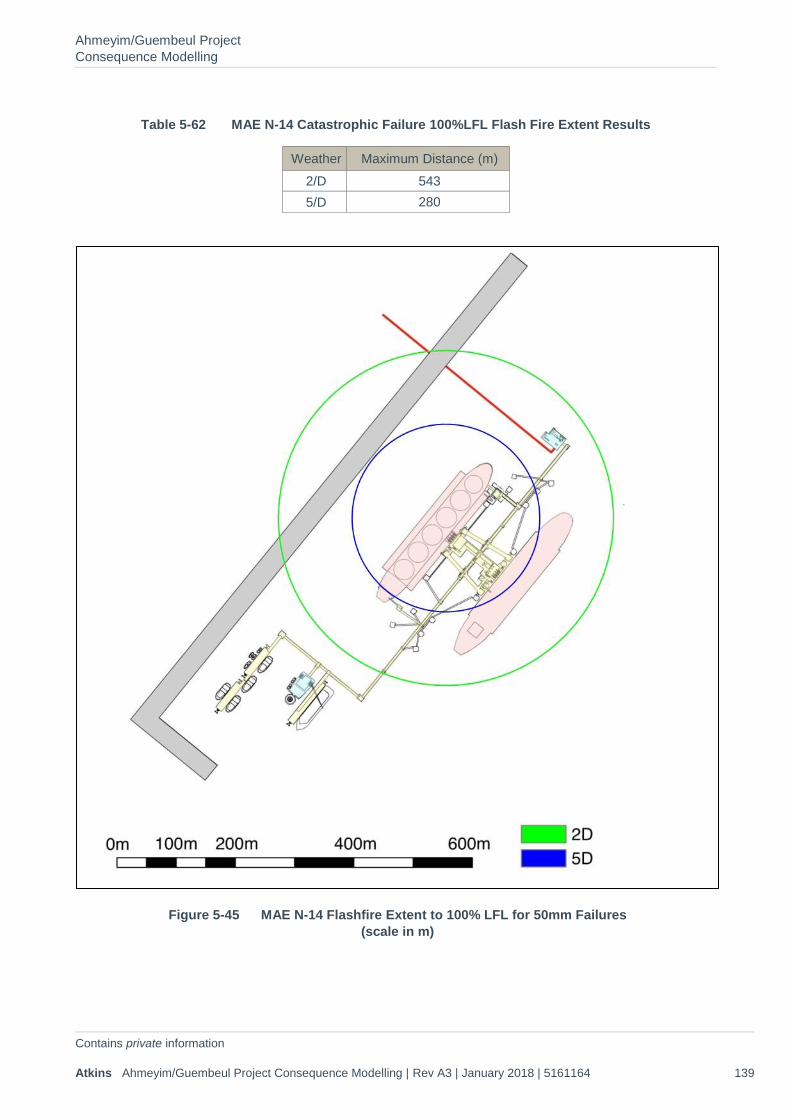
Ahmeyim/Guembeul Project Consequence Modelling
Contains private information Atkins Ahmeyim/Guembeul Project Consequence Modelling | Rev A3 | January 2018 | 5161164 139
Table 5-62 MAE N-14 Catastrophic Failure 100%LFL Flash Fire Extent Results
Weather Maximum Distance (m) 2/D 543 5/D 280
Figure 5-45 MAE N-14 Flashfire Extent to 100% LFL for 50mm Failures (scale in m)
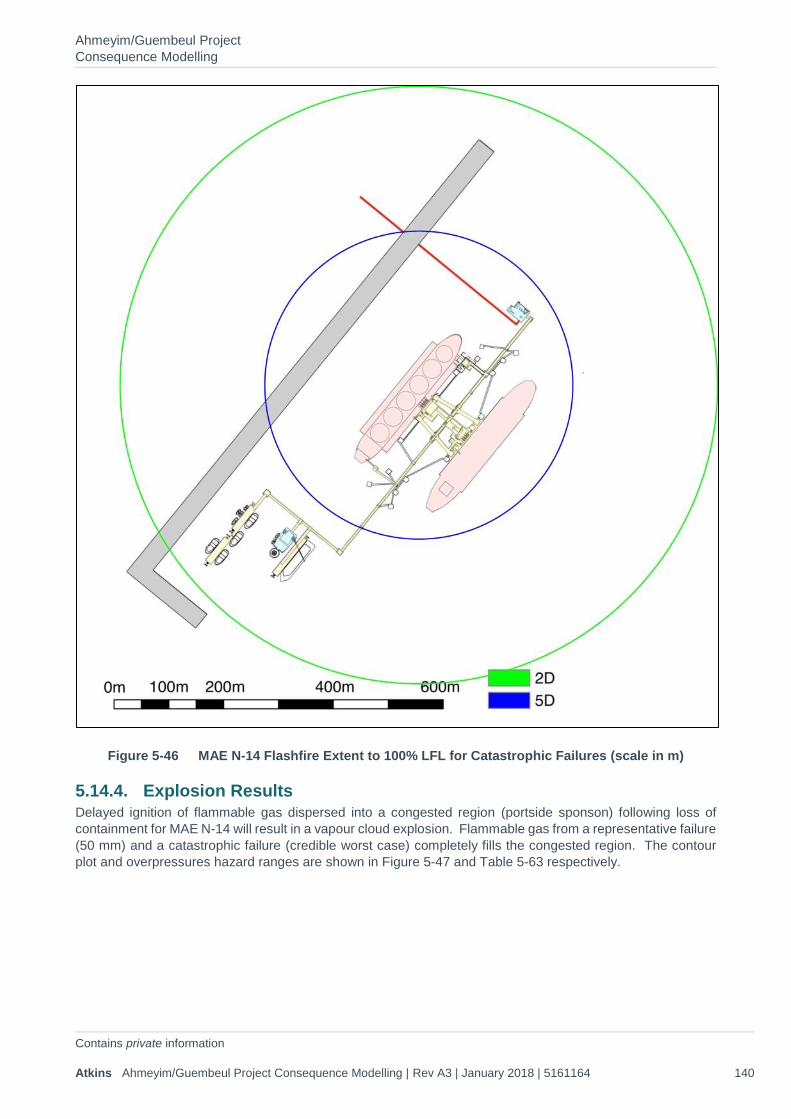
Ahmeyim/Guembeul Project Consequence Modelling
Contains private information Atkins Ahmeyim/Guembeul Project Consequence Modelling | Rev A3 | January 2018 | 5161164 140
Figure 5-46 MAE N-14 Flashfire Extent to 100% LFL for Catastrophic Failures (scale in m)
5.14.4. Explosion Results Delayed ignition of flammable gas dispersed into a congested region (portside sponson) following loss of containment for MAE N-14 will result in a vapour cloud explosion. Flammable gas from a representative failure (50 mm) and a catastrophic failure (credible worst case) completely fills the congested region. The contour plot and overpressures hazard ranges are shown in Figure 5-47 and Table 5-63 respectively.
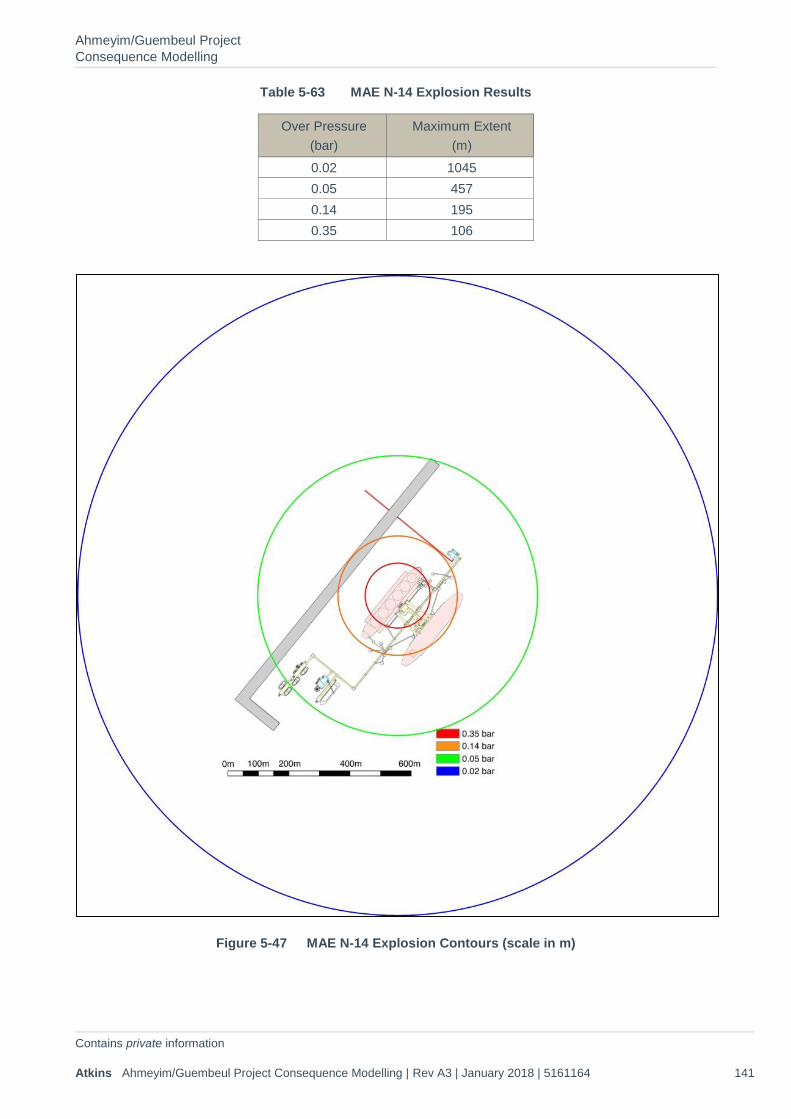
Ahmeyim/Guembeul Project Consequence Modelling
Contains private information Atkins Ahmeyim/Guembeul Project Consequence Modelling | Rev A3 | January 2018 | 5161164 141
Table 5-63 MAE N-14 Explosion Results
Over Pressure (bar)
Maximum Extent (m)
0.02 1045 0.05 457 0.14 195 0.35 106
Figure 5-47 MAE N-14 Explosion Contours (scale in m)
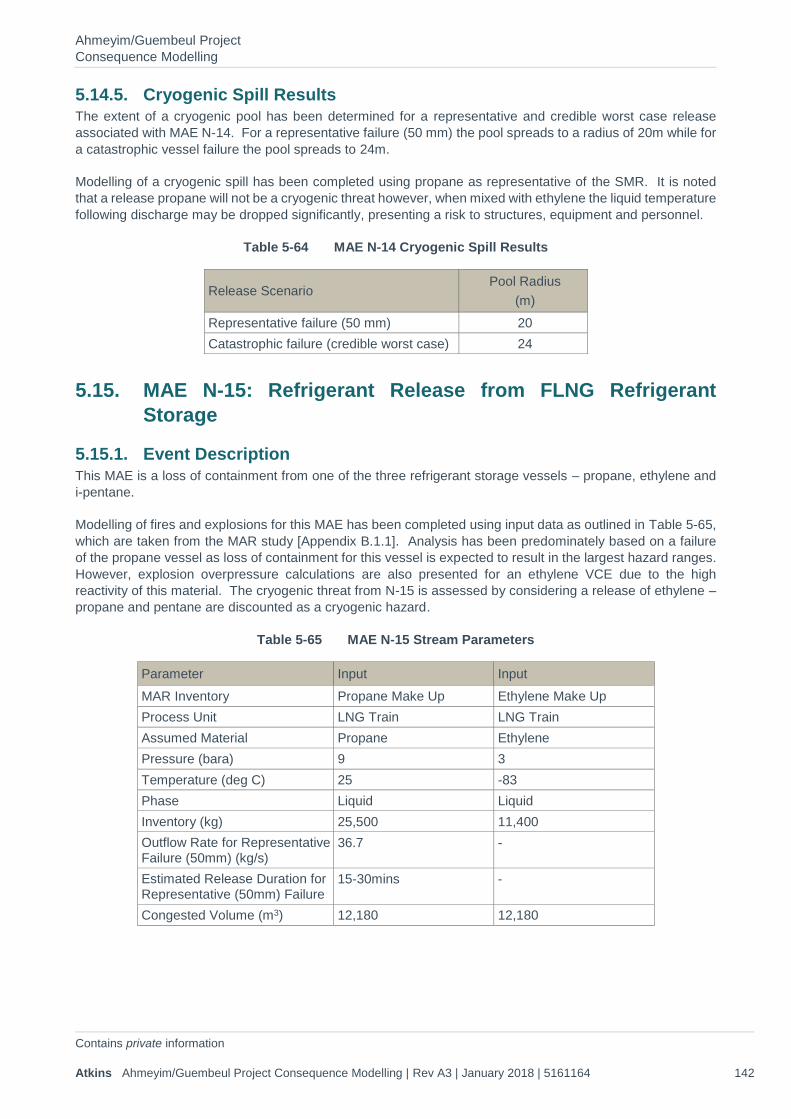
Ahmeyim/Guembeul Project Consequence Modelling
Contains private information Atkins Ahmeyim/Guembeul Project Consequence Modelling | Rev A3 | January 2018 | 5161164 142
5.14.5. Cryogenic Spill Results The extent of a cryogenic pool has been determined for a representative and credible worst case release associated with MAE N-14. For a representative failure (50 mm) the pool spreads to a radius of 20m while for a catastrophic vessel failure the pool spreads to 24m.
Modelling of a cryogenic spill has been completed using propane as representative of the SMR. It is noted that a release propane will not be a cryogenic threat however, when mixed with ethylene the liquid temperature following discharge may be dropped significantly, presenting a risk to structures, equipment and personnel.
Table 5-64 MAE N-14 Cryogenic Spill Results
Release Scenario Pool Radius
(m) Representative failure (50 mm) 20 Catastrophic failure (credible worst case) 24
5.15. MAE N-15: Refrigerant Release from FLNG Refrigerant Storage
5.15.1. Event Description This MAE is a loss of containment from one of the three refrigerant storage vessels – propane, ethylene and i-pentane.
Modelling of fires and explosions for this MAE has been completed using input data as outlined in Table 5-65, which are taken from the MAR study [Appendix B.1.1]. Analysis has been predominately based on a failure of the propane vessel as loss of containment for this vessel is expected to result in the largest hazard ranges. However, explosion overpressure calculations are also presented for an ethylene VCE due to the high reactivity of this material. The cryogenic threat from N-15 is assessed by considering a release of ethylene – propane and pentane are discounted as a cryogenic hazard.
Table 5-65 MAE N-15 Stream Parameters
Parameter Input Input MAR Inventory Propane Make Up Ethylene Make Up Process Unit LNG Train LNG Train Assumed Material Propane Ethylene Pressure (bara) 9 3 Temperature (deg C) 25 -83 Phase Liquid Liquid Inventory (kg) 25,500 11,400 Outflow Rate for Representative Failure (50mm) (kg/s)
36.7 -
Estimated Release Duration for Representative (50mm) Failure
15-30mins -
Congested Volume (m3) 12,180 12,180
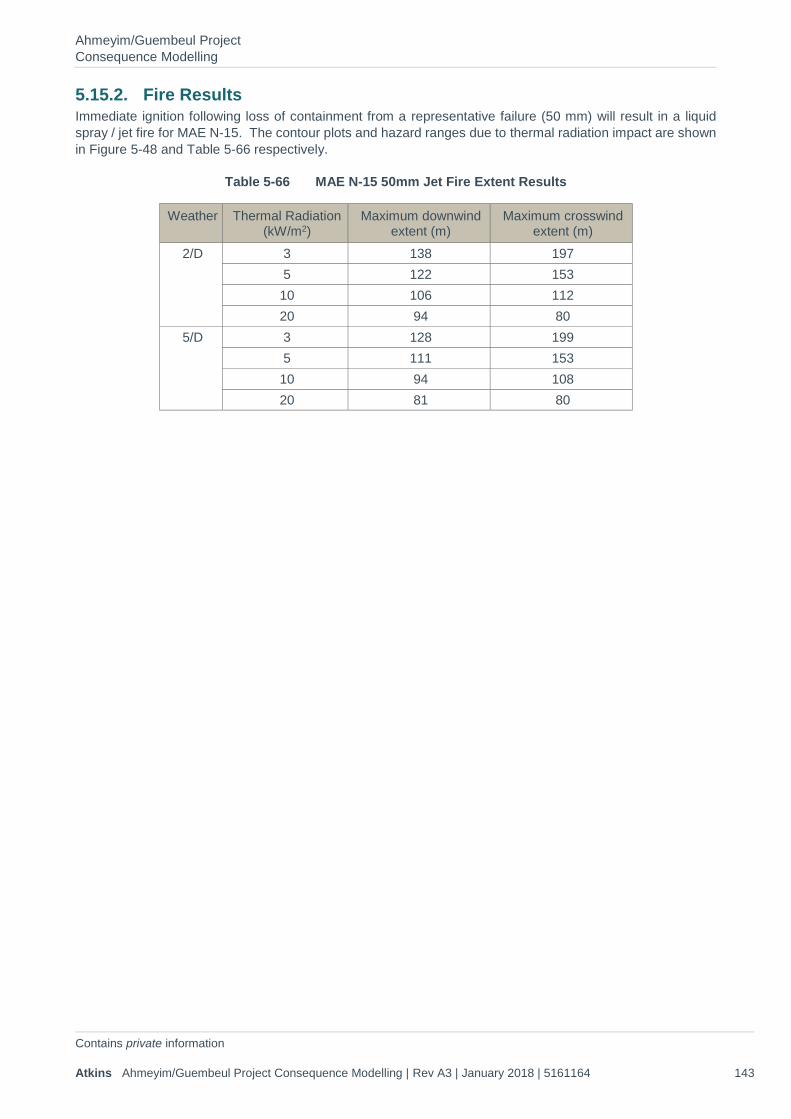
Ahmeyim/Guembeul Project Consequence Modelling
Contains private information Atkins Ahmeyim/Guembeul Project Consequence Modelling | Rev A3 | January 2018 | 5161164 143
5.15.2. Fire Results Immediate ignition following loss of containment from a representative failure (50 mm) will result in a liquid spray / jet fire for MAE N-15. The contour plots and hazard ranges due to thermal radiation impact are shown in Figure 5-48 and Table 5-66 respectively.
Table 5-66 MAE N-15 50mm Jet Fire Extent Results
Weather Thermal Radiation (kW/m2)
Maximum downwind extent (m)
Maximum crosswind extent (m)
2/D 3 138 197 5 122 153 10 106 112 20 94 80
5/D 3 128 199 5 111 153 10 94 108 20 81 80
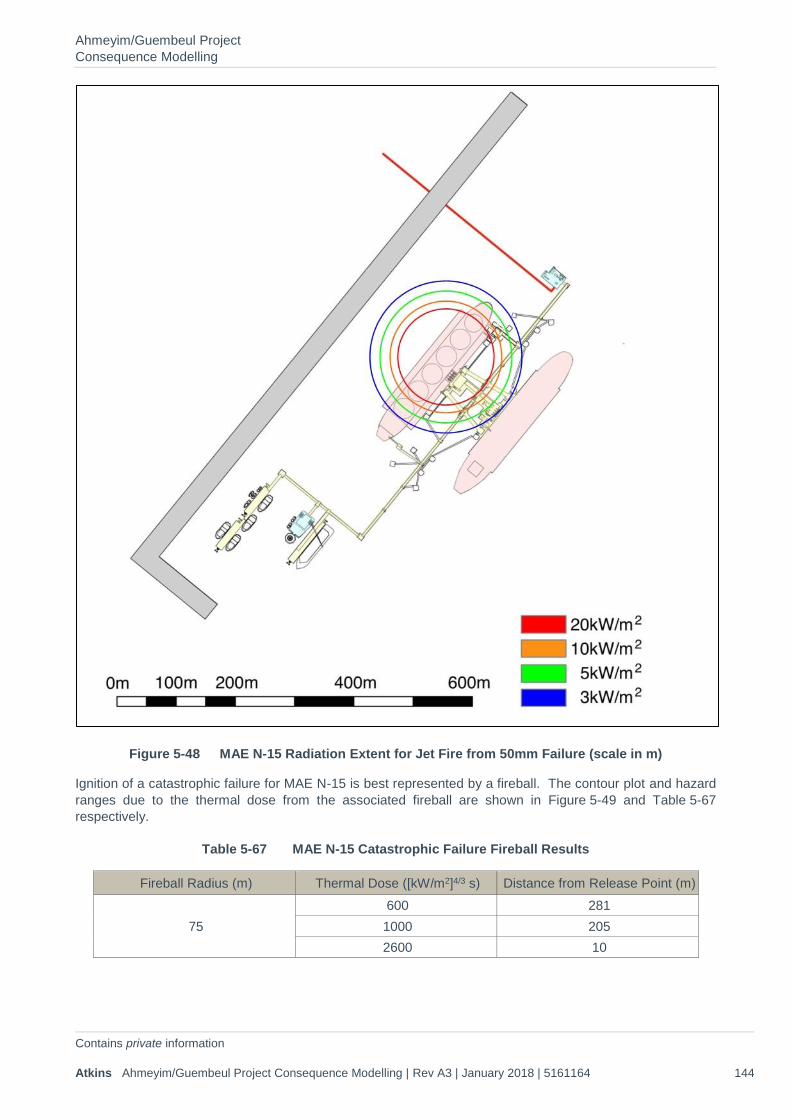
Ahmeyim/Guembeul Project Consequence Modelling
Contains private information Atkins Ahmeyim/Guembeul Project Consequence Modelling | Rev A3 | January 2018 | 5161164 144
Figure 5-48 MAE N-15 Radiation Extent for Jet Fire from 50mm Failure (scale in m)
Ignition of a catastrophic failure for MAE N-15 is best represented by a fireball. The contour plot and hazard ranges due to the thermal dose from the associated fireball are shown in Figure 5-49 and Table 5-67 respectively.
Table 5-67 MAE N-15 Catastrophic Failure Fireball Results
Fireball Radius (m) Thermal Dose ([kW/m2]4/3 s) Distance from Release Point (m)
75 600 281 1000 205 2600 10

Ahmeyim/Guembeul Project Consequence Modelling
Contains private information Atkins Ahmeyim/Guembeul Project Consequence Modelling | Rev A3 | January 2018 | 5161164 145
Figure 5-49 MAE N-15 Fireball Contour for Catastrophic Failure (scale in m)
5.15.3. Flash Fire Results Delayed ignition of flammable gas dispersed into non-congested regions following loss of containment will result in flash fires for MAE N-15. The distances to 100% LFL are presented in Table 5-68 and Table 5-69 for a representative failure (50 mm) and catastrophic failure (credible worst case) respectively. The contour plots to 100% LFL are presented in Figure 5-50 for a representative failure (50 mm) and Figure 5-51 for a catastrophic failure (credible worst case).
Table 5-68 MAE N-15 50mm 100%LFL Flash Fire Extent Results (Propane)
Weather Maximum Distance (m) 2/D 176 5/D 101
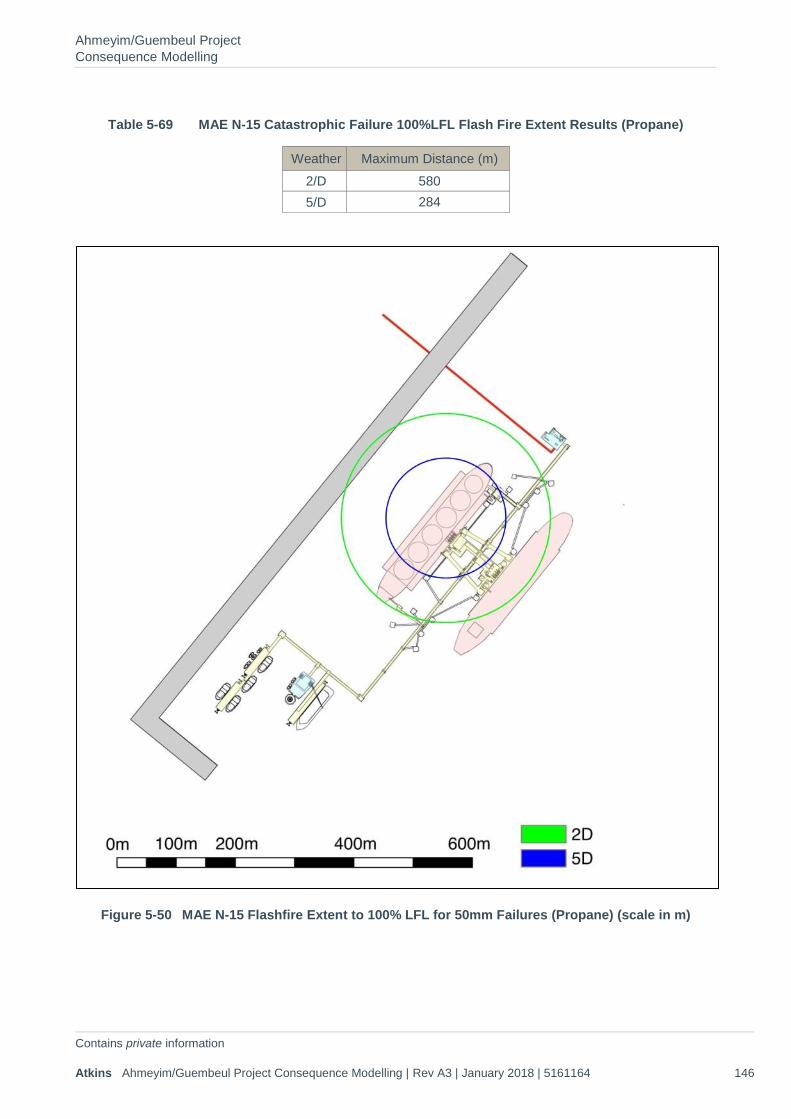
Ahmeyim/Guembeul Project Consequence Modelling
Contains private information Atkins Ahmeyim/Guembeul Project Consequence Modelling | Rev A3 | January 2018 | 5161164 146
Table 5-69 MAE N-15 Catastrophic Failure 100%LFL Flash Fire Extent Results (Propane)
Weather Maximum Distance (m) 2/D 580 5/D 284
Figure 5-50 MAE N-15 Flashfire Extent to 100% LFL for 50mm Failures (Propane) (scale in m)
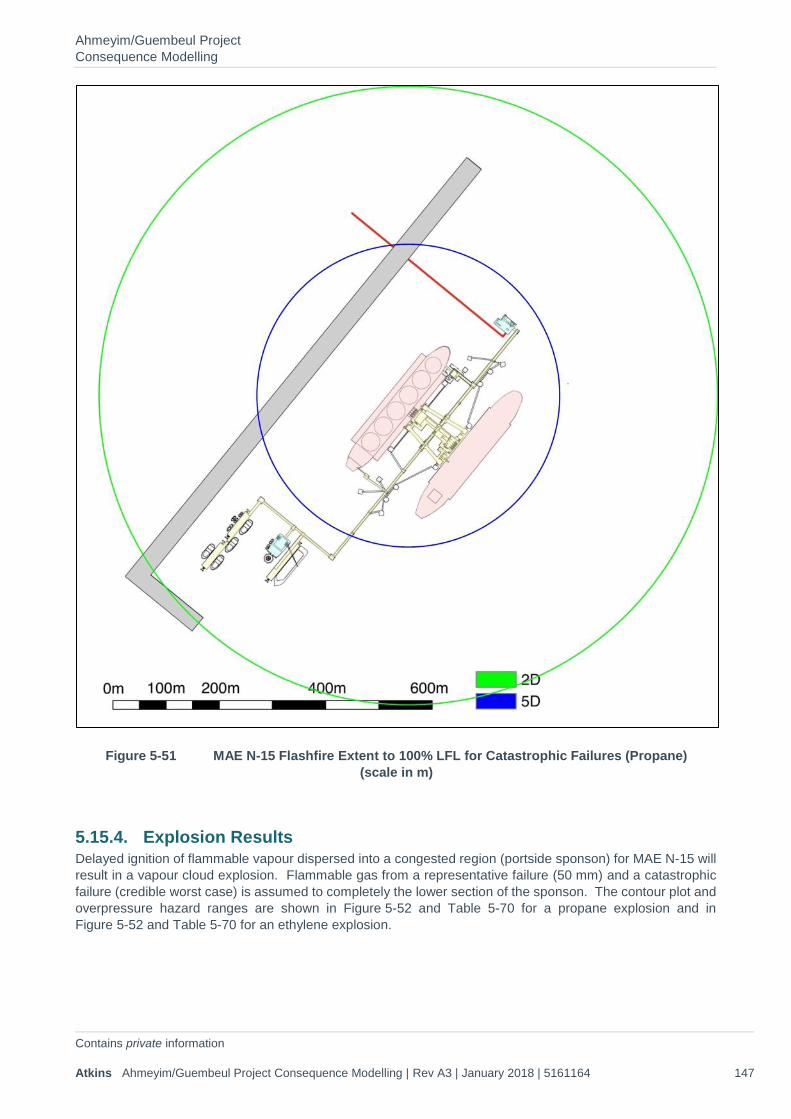
Ahmeyim/Guembeul Project Consequence Modelling
Contains private information Atkins Ahmeyim/Guembeul Project Consequence Modelling | Rev A3 | January 2018 | 5161164 147
Figure 5-51 MAE N-15 Flashfire Extent to 100% LFL for Catastrophic Failures (Propane) (scale in m)
5.15.4. Explosion Results Delayed ignition of flammable vapour dispersed into a congested region (portside sponson) for MAE N-15 will result in a vapour cloud explosion. Flammable gas from a representative failure (50 mm) and a catastrophic failure (credible worst case) is assumed to completely the lower section of the sponson. The contour plot and overpressure hazard ranges are shown in Figure 5-52 and Table 5-70 for a propane explosion and in Figure 5-52 and Table 5-70 for an ethylene explosion.
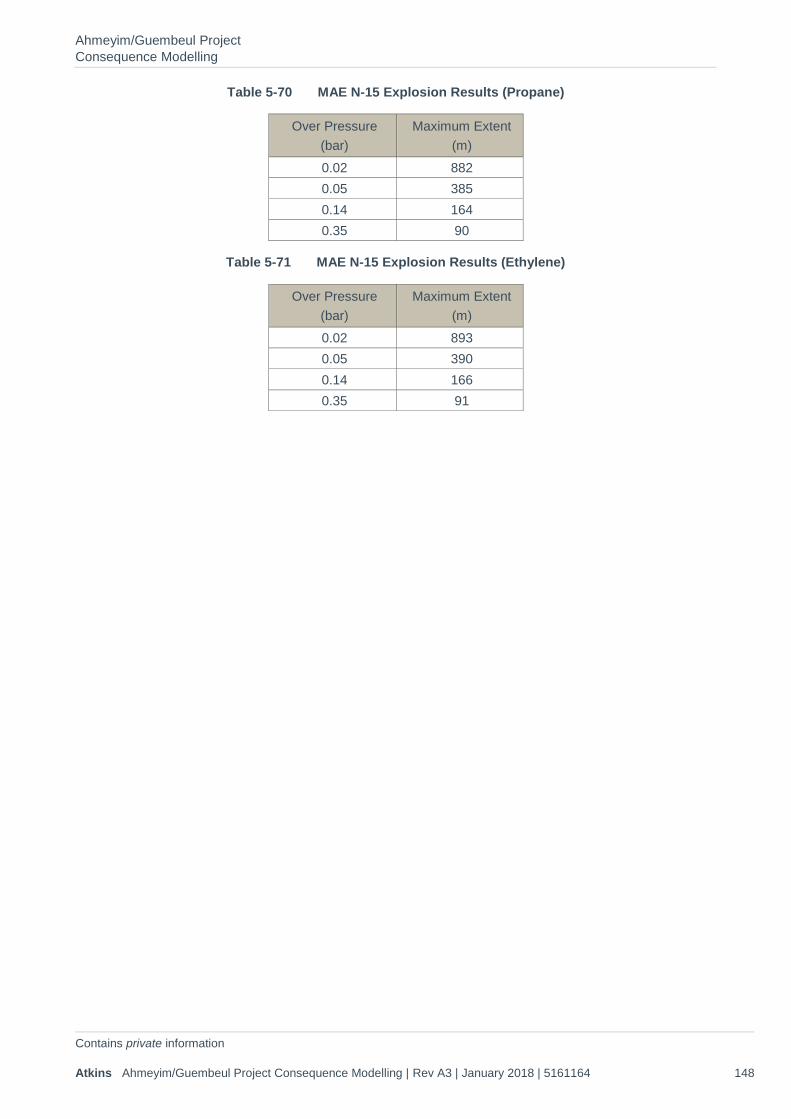
Ahmeyim/Guembeul Project Consequence Modelling
Contains private information Atkins Ahmeyim/Guembeul Project Consequence Modelling | Rev A3 | January 2018 | 5161164 148
Table 5-70 MAE N-15 Explosion Results (Propane)
Over Pressure (bar)
Maximum Extent (m)
0.02 882 0.05 385 0.14 164 0.35 90
Table 5-71 MAE N-15 Explosion Results (Ethylene)
Over Pressure (bar)
Maximum Extent (m)
0.02 893 0.05 390 0.14 166 0.35 91
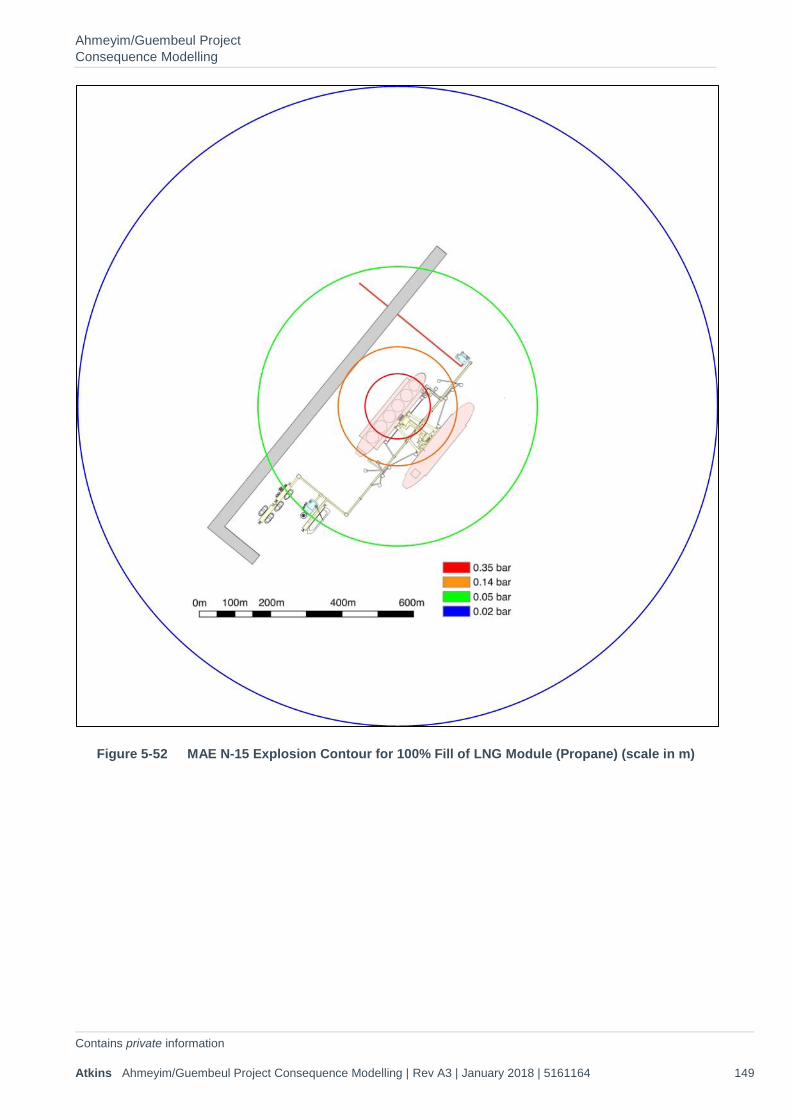
Ahmeyim/Guembeul Project Consequence Modelling
Contains private information Atkins Ahmeyim/Guembeul Project Consequence Modelling | Rev A3 | January 2018 | 5161164 149
Figure 5-52 MAE N-15 Explosion Contour for 100% Fill of LNG Module (Propane) (scale in m)
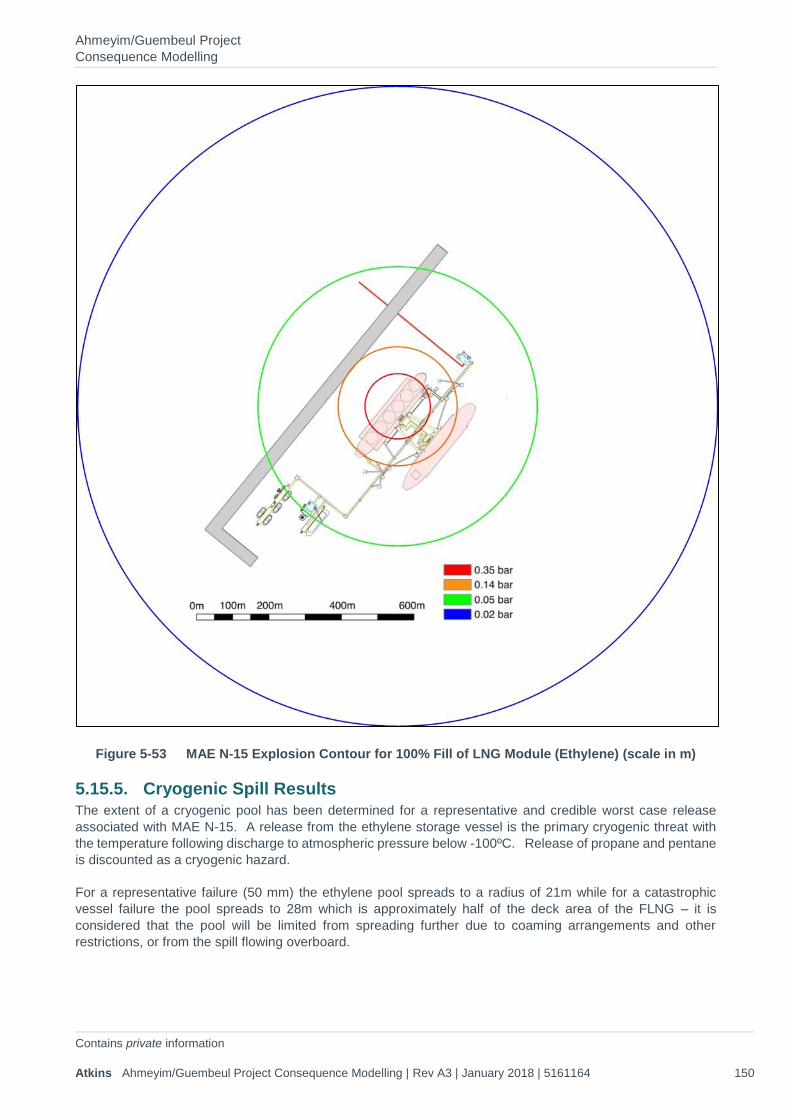
Ahmeyim/Guembeul Project Consequence Modelling
Contains private information Atkins Ahmeyim/Guembeul Project Consequence Modelling | Rev A3 | January 2018 | 5161164 150
Figure 5-53 MAE N-15 Explosion Contour for 100% Fill of LNG Module (Ethylene) (scale in m)
5.15.5. Cryogenic Spill Results The extent of a cryogenic pool has been determined for a representative and credible worst case release associated with MAE N-15. A release from the ethylene storage vessel is the primary cryogenic threat with the temperature following discharge to atmospheric pressure below -100ºC. Release of propane and pentane is discounted as a cryogenic hazard.
For a representative failure (50 mm) the ethylene pool spreads to a radius of 21m while for a catastrophic vessel failure the pool spreads to 28m which is approximately half of the deck area of the FLNG – it is considered that the pool will be limited from spreading further due to coaming arrangements and other restrictions, or from the spill flowing overboard.
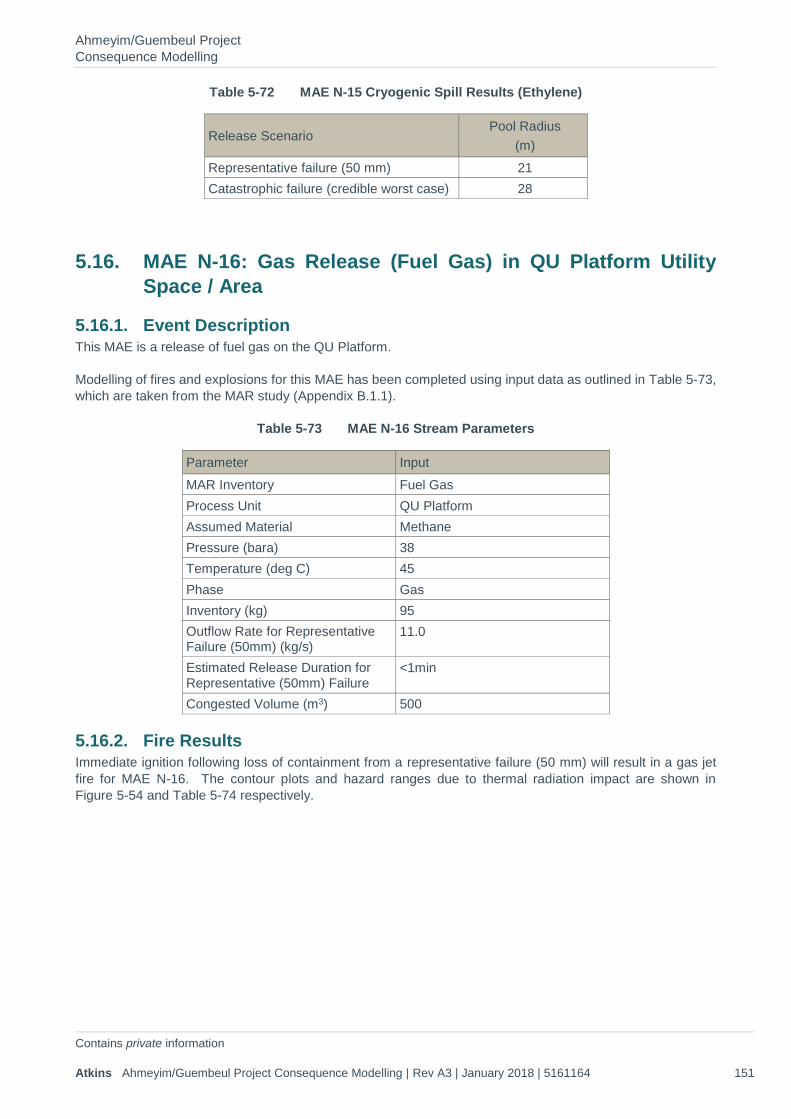
Ahmeyim/Guembeul Project Consequence Modelling
Contains private information Atkins Ahmeyim/Guembeul Project Consequence Modelling | Rev A3 | January 2018 | 5161164 151
Table 5-72 MAE N-15 Cryogenic Spill Results (Ethylene)
Release Scenario Pool Radius
(m) Representative failure (50 mm) 21 Catastrophic failure (credible worst case) 28
5.16. MAE N-16: Gas Release (Fuel Gas) in QU Platform Utility Space / Area
5.16.1. Event Description This MAE is a release of fuel gas on the QU Platform.
Modelling of fires and explosions for this MAE has been completed using input data as outlined in Table 5-73, which are taken from the MAR study (Appendix B.1.1).
Table 5-73 MAE N-16 Stream Parameters
Parameter Input MAR Inventory Fuel Gas Process Unit QU Platform Assumed Material Methane Pressure (bara) 38 Temperature (deg C) 45 Phase Gas Inventory (kg) 95 Outflow Rate for Representative Failure (50mm) (kg/s)
11.0
Estimated Release Duration for Representative (50mm) Failure
<1min
Congested Volume (m3) 500
5.16.2. Fire Results Immediate ignition following loss of containment from a representative failure (50 mm) will result in a gas jet fire for MAE N-16. The contour plots and hazard ranges due to thermal radiation impact are shown in Figure 5-54 and Table 5-74 respectively.

Ahmeyim/Guembeul Project Consequence Modelling
Contains private information Atkins Ahmeyim/Guembeul Project Consequence Modelling | Rev A3 | January 2018 | 5161164 152
Table 5-74 MAE N-16 50mm Jet Fire Extent Results
Weather Thermal Radiation (kW/m2)
Maximum downwind extent (m)
Maximum crosswind extent (m)
2/D 3 63 91 5 56 71 10 48 49 20 42 33
5/D 3 63 91 5 56 70 10 49 49 20 44 33
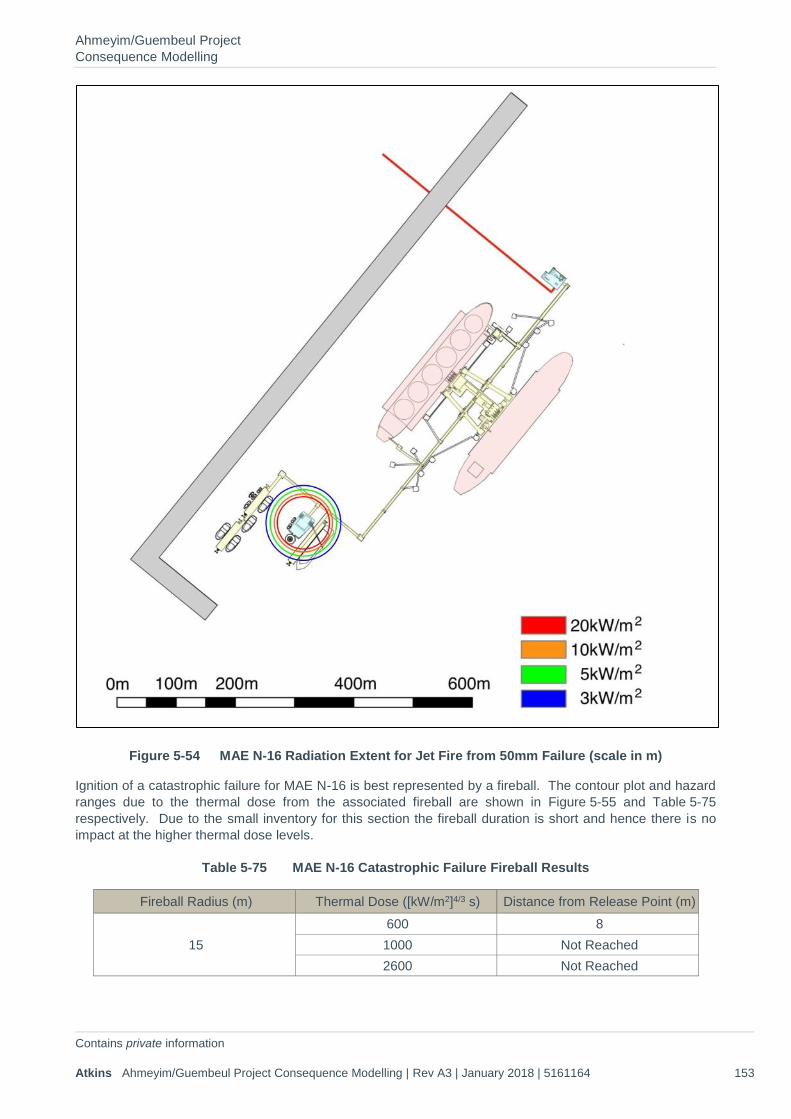
Ahmeyim/Guembeul Project Consequence Modelling
Contains private information Atkins Ahmeyim/Guembeul Project Consequence Modelling | Rev A3 | January 2018 | 5161164 153
Figure 5-54 MAE N-16 Radiation Extent for Jet Fire from 50mm Failure (scale in m)
Ignition of a catastrophic failure for MAE N-16 is best represented by a fireball. The contour plot and hazard ranges due to the thermal dose from the associated fireball are shown in Figure 5-55 and Table 5-75 respectively. Due to the small inventory for this section the fireball duration is short and hence there is no impact at the higher thermal dose levels.
Table 5-75 MAE N-16 Catastrophic Failure Fireball Results
Fireball Radius (m) Thermal Dose ([kW/m2]4/3 s) Distance from Release Point (m)
15 600 8 1000 Not Reached 2600 Not Reached
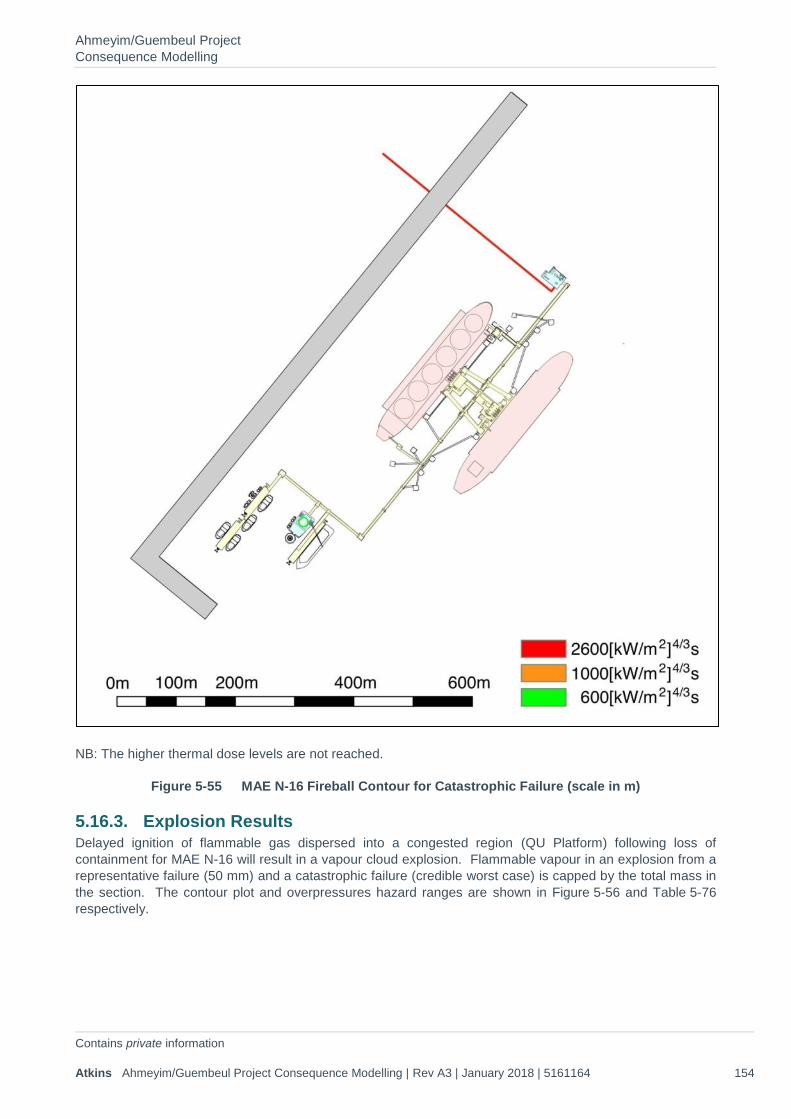
Ahmeyim/Guembeul Project Consequence Modelling
Contains private information Atkins Ahmeyim/Guembeul Project Consequence Modelling | Rev A3 | January 2018 | 5161164 154
NB: The higher thermal dose levels are not reached.
Figure 5-55 MAE N-16 Fireball Contour for Catastrophic Failure (scale in m)
5.16.3. Explosion Results Delayed ignition of flammable gas dispersed into a congested region (QU Platform) following loss of containment for MAE N-16 will result in a vapour cloud explosion. Flammable vapour in an explosion from a representative failure (50 mm) and a catastrophic failure (credible worst case) is capped by the total mass in the section. The contour plot and overpressures hazard ranges are shown in Figure 5-56 and Table 5-76 respectively.
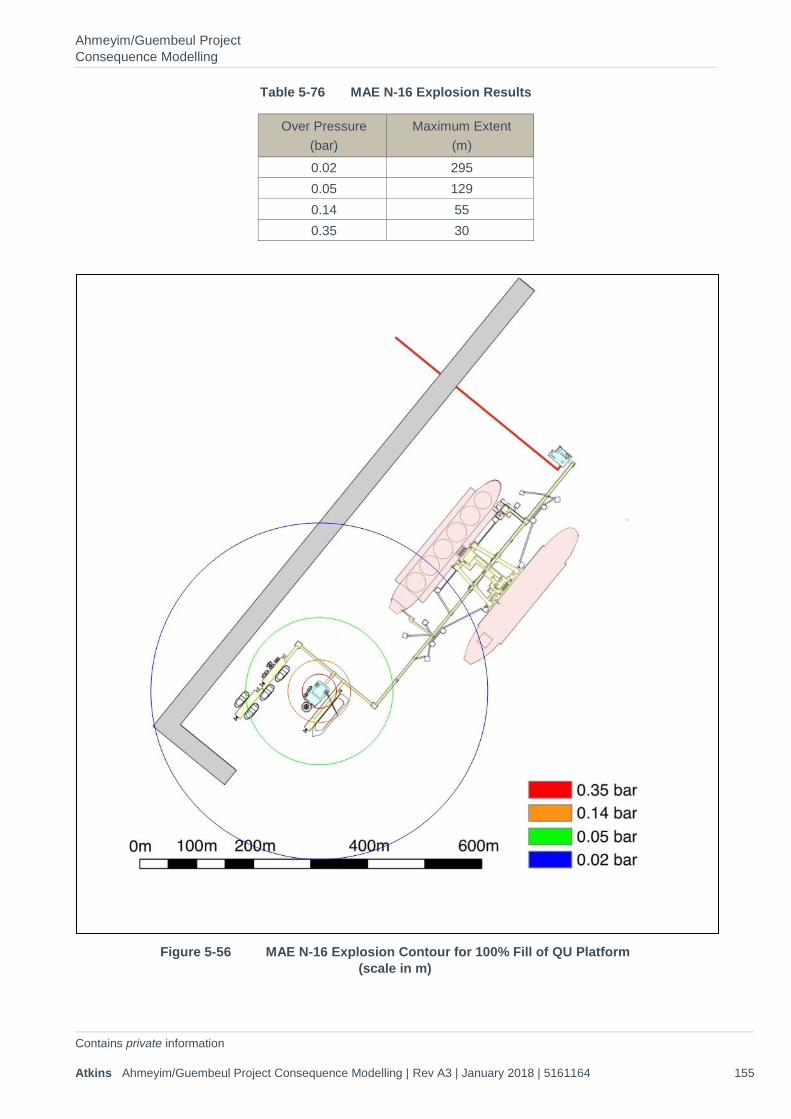
Ahmeyim/Guembeul Project Consequence Modelling
Contains private information Atkins Ahmeyim/Guembeul Project Consequence Modelling | Rev A3 | January 2018 | 5161164 155
Table 5-76 MAE N-16 Explosion Results
Over Pressure (bar)
Maximum Extent (m)
0.02 295 0.05 129 0.14 55 0.35 30
Figure 5-56 MAE N-16 Explosion Contour for 100% Fill of QU Platform
(scale in m)
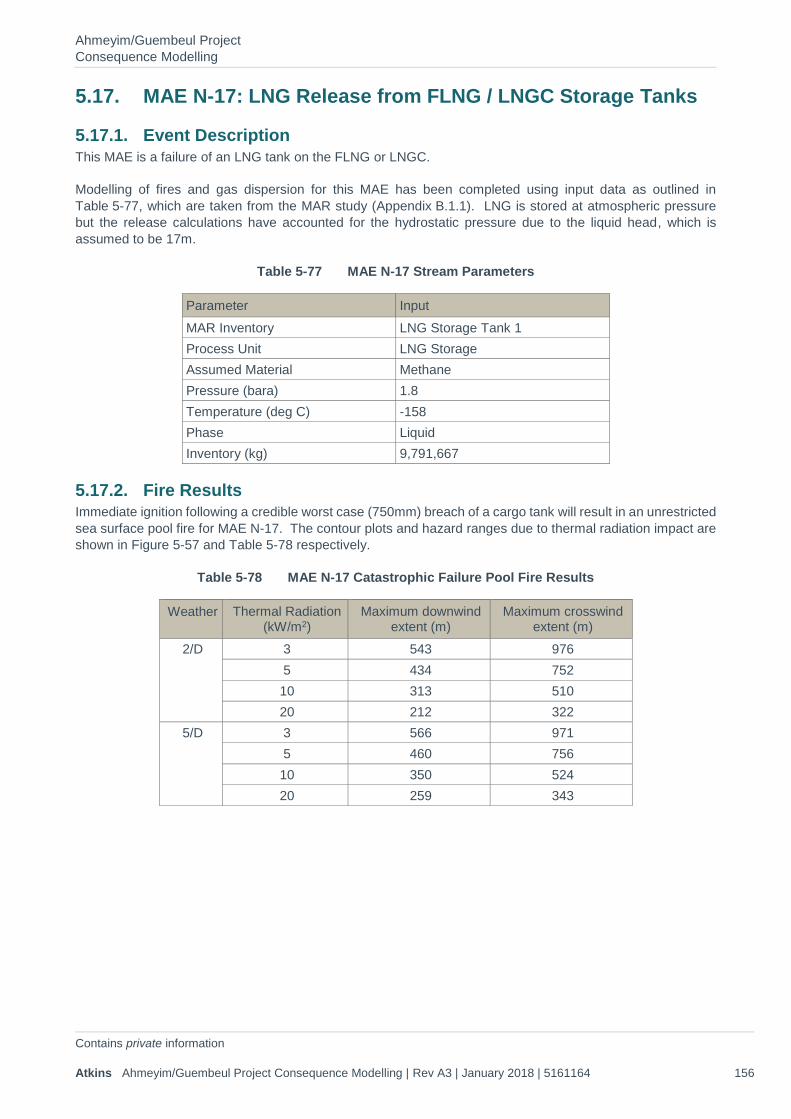
Ahmeyim/Guembeul Project Consequence Modelling
Contains private information Atkins Ahmeyim/Guembeul Project Consequence Modelling | Rev A3 | January 2018 | 5161164 156
5.17. MAE N-17: LNG Release from FLNG / LNGC Storage Tanks
5.17.1. Event Description This MAE is a failure of an LNG tank on the FLNG or LNGC.
Modelling of fires and gas dispersion for this MAE has been completed using input data as outlined in Table 5-77, which are taken from the MAR study (Appendix B.1.1). LNG is stored at atmospheric pressure but the release calculations have accounted for the hydrostatic pressure due to the liquid head, which is assumed to be 17m.
Table 5-77 MAE N-17 Stream Parameters
Parameter Input MAR Inventory LNG Storage Tank 1 Process Unit LNG Storage Assumed Material Methane Pressure (bara) 1.8 Temperature (deg C) -158 Phase Liquid Inventory (kg) 9,791,667
5.17.2. Fire Results Immediate ignition following a credible worst case (750mm) breach of a cargo tank will result in an unrestricted sea surface pool fire for MAE N-17. The contour plots and hazard ranges due to thermal radiation impact are shown in Figure 5-57 and Table 5-78 respectively.
Table 5-78 MAE N-17 Catastrophic Failure Pool Fire Results
Weather Thermal Radiation (kW/m2)
Maximum downwind extent (m)
Maximum crosswind extent (m)
2/D 3 543 976 5 434 752 10 313 510 20 212 322
5/D 3 566 971 5 460 756 10 350 524 20 259 343
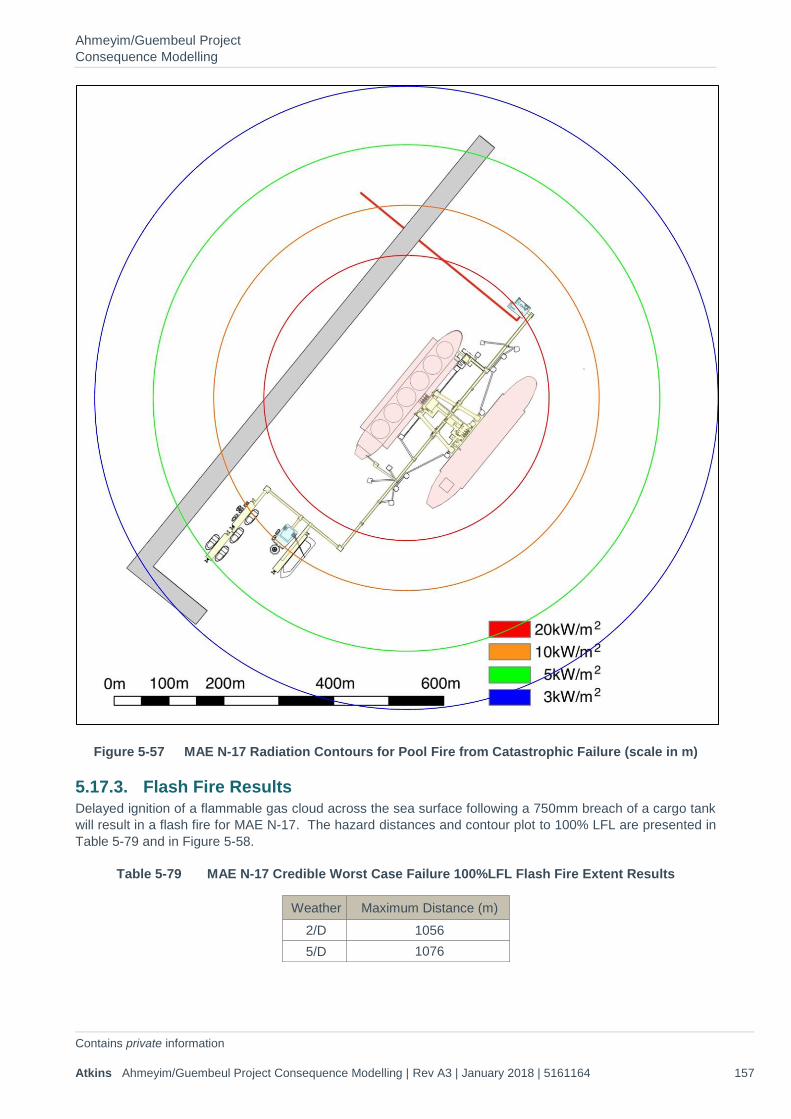
Ahmeyim/Guembeul Project Consequence Modelling
Contains private information Atkins Ahmeyim/Guembeul Project Consequence Modelling | Rev A3 | January 2018 | 5161164 157
Figure 5-57 MAE N-17 Radiation Contours for Pool Fire from Catastrophic Failure (scale in m)
5.17.3. Flash Fire Results Delayed ignition of a flammable gas cloud across the sea surface following a 750mm breach of a cargo tank will result in a flash fire for MAE N-17. The hazard distances and contour plot to 100% LFL are presented in Table 5-79 and in Figure 5-58.
Table 5-79 MAE N-17 Credible Worst Case Failure 100%LFL Flash Fire Extent Results
Weather Maximum Distance (m) 2/D 1056 5/D 1076
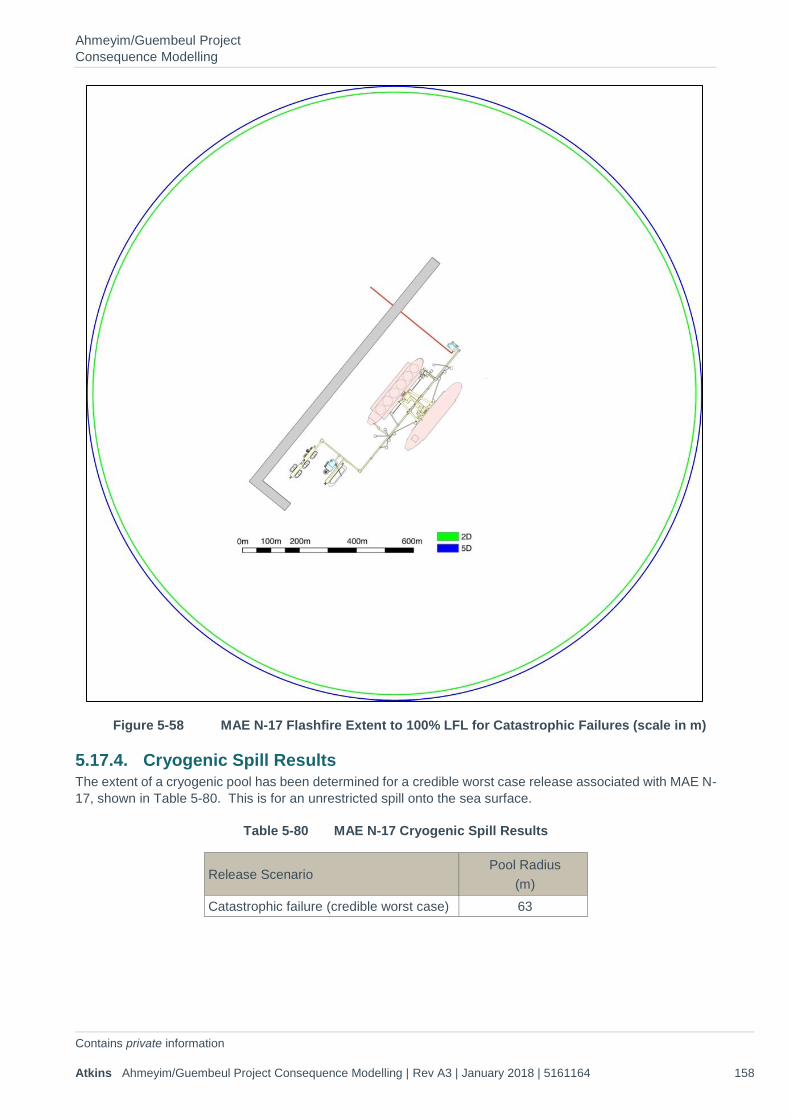
Ahmeyim/Guembeul Project Consequence Modelling
Contains private information Atkins Ahmeyim/Guembeul Project Consequence Modelling | Rev A3 | January 2018 | 5161164 158
Figure 5-58 MAE N-17 Flashfire Extent to 100% LFL for Catastrophic Failures (scale in m)
5.17.4. Cryogenic Spill Results The extent of a cryogenic pool has been determined for a credible worst case release associated with MAE N-17, shown in Table 5-80. This is for an unrestricted spill onto the sea surface.
Table 5-80 MAE N-17 Cryogenic Spill Results
Release Scenario Pool Radius
(m) Catastrophic failure (credible worst case) 63
Ahmeyim/Guembeul Project Consequence Modelling
Contains private information Atkins Ahmeyim/Guembeul Project Consequence Modelling | Rev A3 | January 2018 | 5161164 159
5.18. MAE N-18: LNG Release during LNGC Loading
5.18.1. Event Description This MAE is a failure of the loading arms during transfer from the FLNG to the LNGC.
Modelling of fires and flammable for this MAE has been completed using input data as outlined in Table 5-81, which are taken from MAR Inventory 1 (Appendix B.1.1).
Table 5-81 MAE N-18 Stream Parameters
Parameter Input MAR Inventory LNG Export Process Unit LNGC Loading Assumed Material Methane Pressure (bara) 7 Temperature (deg C) -158 Phase Liquid Inventory (kg) 18,800 Outflow Rate for Representative Failure (50mm) (kg/s)
28.5
Estimated Release Duration for Representative (50mm) Failure
15-30mins
Loading Rate (m3/hr) 5,000 (Single Loading Arm) Congested Volume (m3) -
5.18.2. Fire Results Immediate ignition following loss of containment from a representative failure (50 mm) may result in a liquid spray / jet fire for MAE N-18 if the release is directed horizontally into an open space (e.g. outboard of the FPSO). The contour plots and hazard ranges due to thermal radiation impact are shown in Figure 5-59 and Table 5-82 respectively.
Table 5-82 MAE N-18 50mm Jet Fire Extent Results
Weather Thermal Radiation (kW/m2)
Maximum downwind extent (m)
Maximum crosswind extent (m)
2/D 3 149 168 5 133 134 10 117 97 20 105 63
5/D 3 134 167 5 118 130 10 101 96 20 89 68
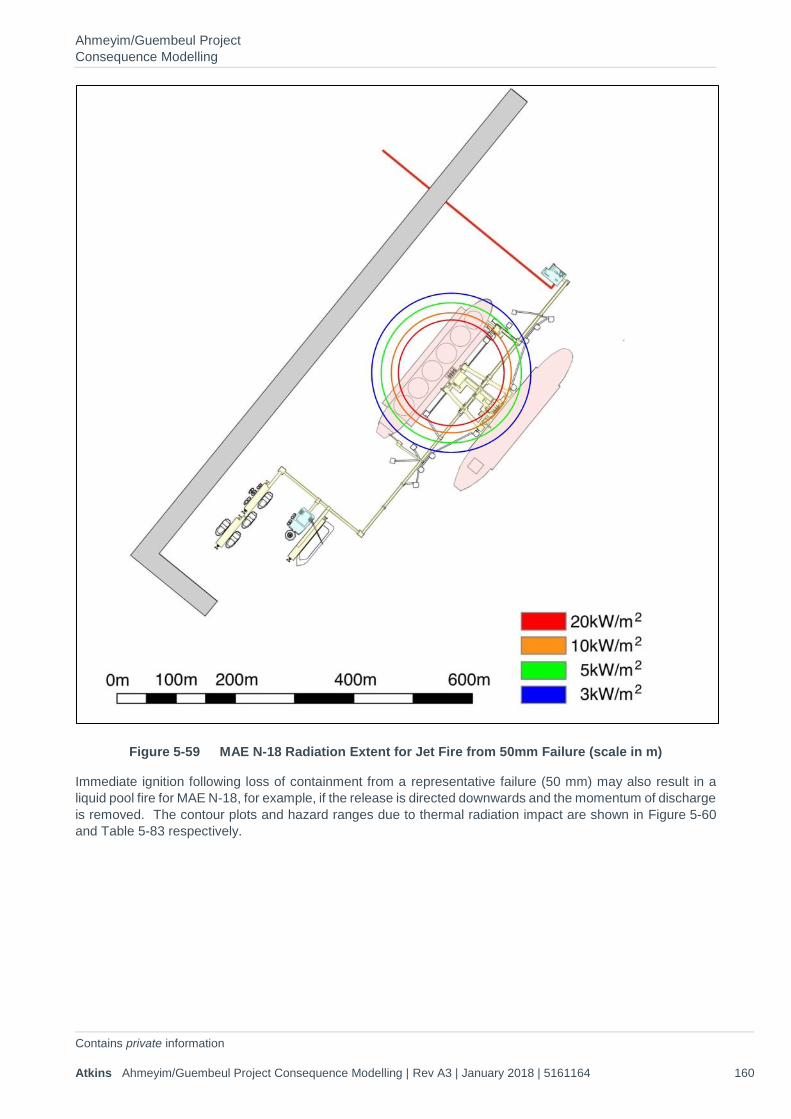
Ahmeyim/Guembeul Project Consequence Modelling
Contains private information Atkins Ahmeyim/Guembeul Project Consequence Modelling | Rev A3 | January 2018 | 5161164 160
Figure 5-59 MAE N-18 Radiation Extent for Jet Fire from 50mm Failure (scale in m)
Immediate ignition following loss of containment from a representative failure (50 mm) may also result in a liquid pool fire for MAE N-18, for example, if the release is directed downwards and the momentum of discharge is removed. The contour plots and hazard ranges due to thermal radiation impact are shown in Figure 5-60 and Table 5-83 respectively.
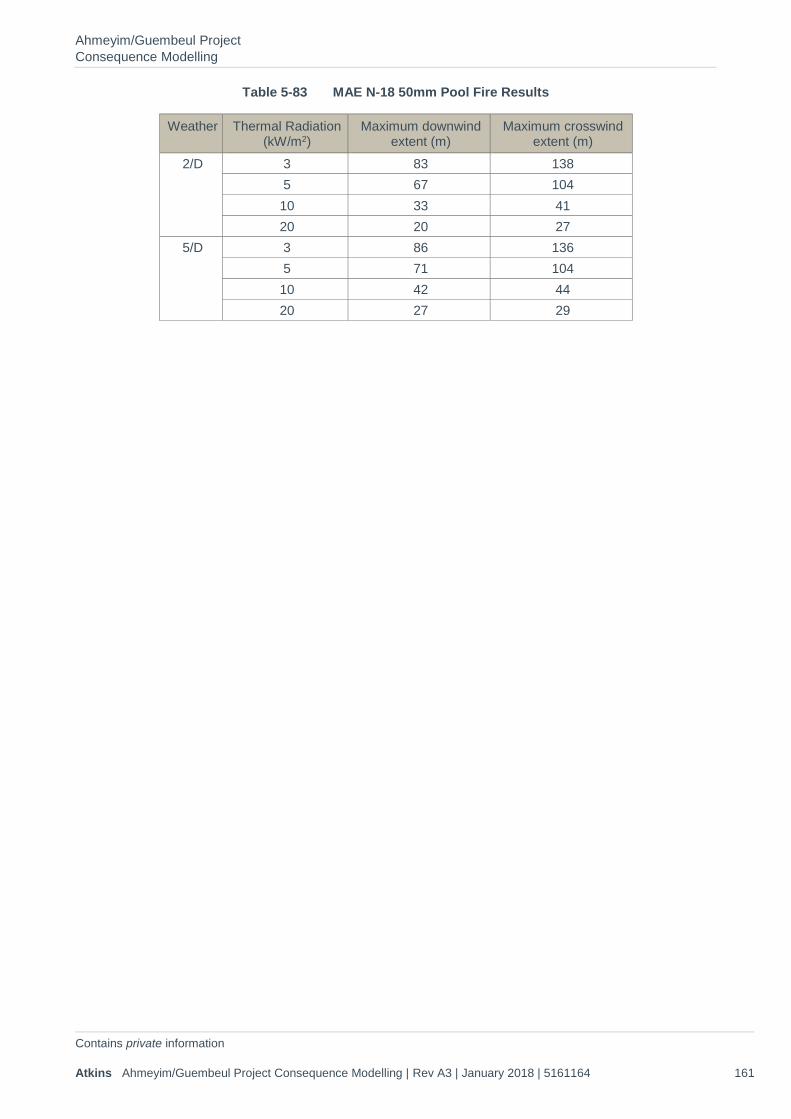
Ahmeyim/Guembeul Project Consequence Modelling
Contains private information Atkins Ahmeyim/Guembeul Project Consequence Modelling | Rev A3 | January 2018 | 5161164 161
Table 5-83 MAE N-18 50mm Pool Fire Results
Weather Thermal Radiation (kW/m2)
Maximum downwind extent (m)
Maximum crosswind extent (m)
2/D 3 83 138 5 67 104 10 33 41 20 20 27
5/D 3 86 136 5 71 104 10 42 44 20 27 29
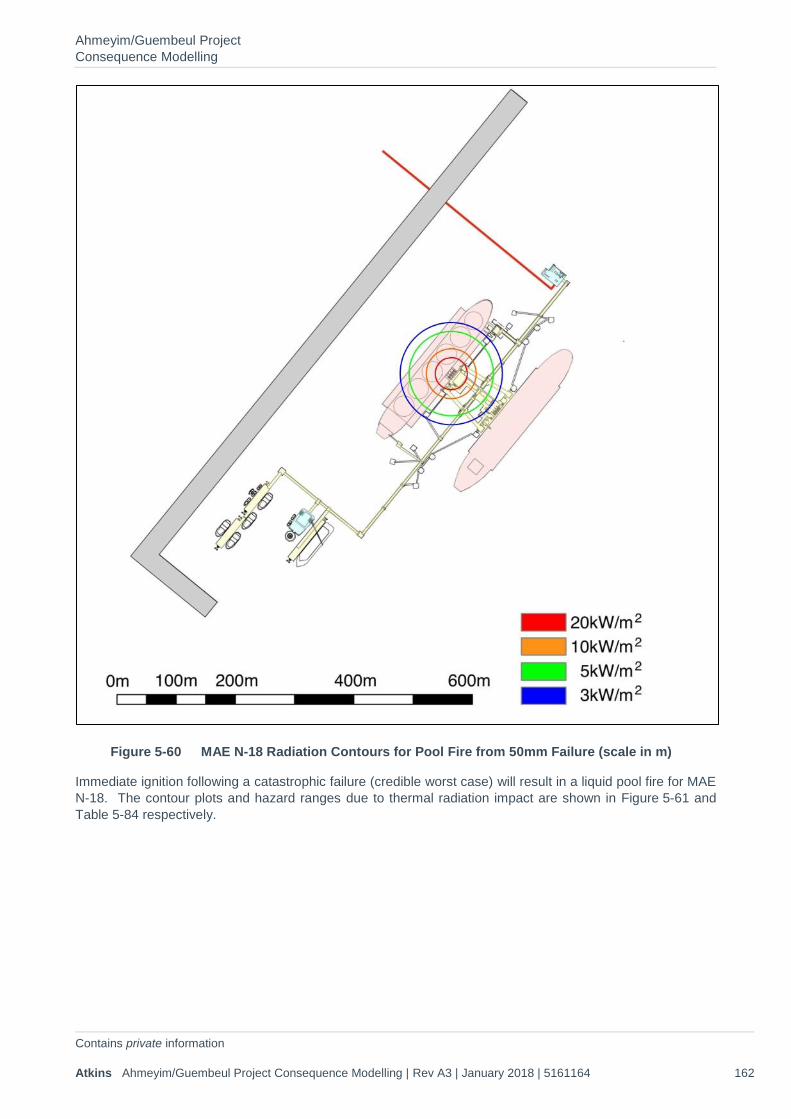
Ahmeyim/Guembeul Project Consequence Modelling
Contains private information Atkins Ahmeyim/Guembeul Project Consequence Modelling | Rev A3 | January 2018 | 5161164 162
Figure 5-60 MAE N-18 Radiation Contours for Pool Fire from 50mm Failure (scale in m)
Immediate ignition following a catastrophic failure (credible worst case) will result in a liquid pool fire for MAE N-18. The contour plots and hazard ranges due to thermal radiation impact are shown in Figure 5-61 and Table 5-84 respectively.
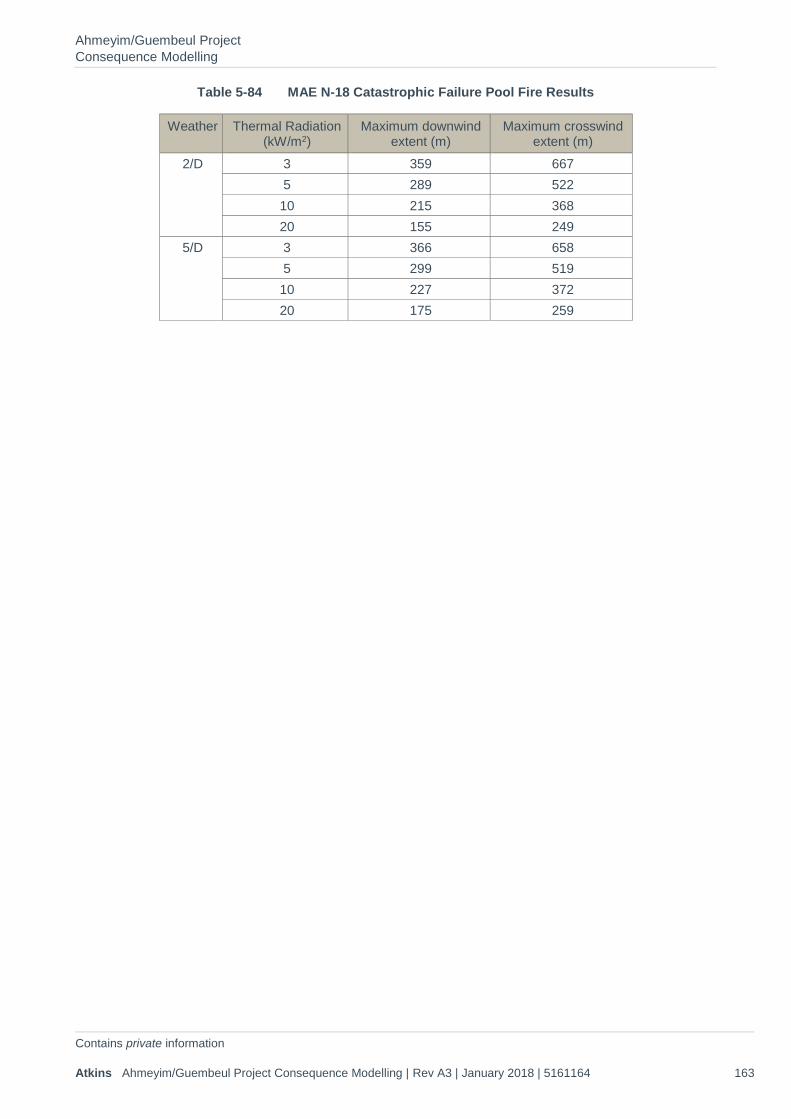
Ahmeyim/Guembeul Project Consequence Modelling
Contains private information Atkins Ahmeyim/Guembeul Project Consequence Modelling | Rev A3 | January 2018 | 5161164 163
Table 5-84 MAE N-18 Catastrophic Failure Pool Fire Results
Weather Thermal Radiation (kW/m2)
Maximum downwind extent (m)
Maximum crosswind extent (m)
2/D 3 359 667 5 289 522 10 215 368 20 155 249
5/D 3 366 658 5 299 519 10 227 372 20 175 259
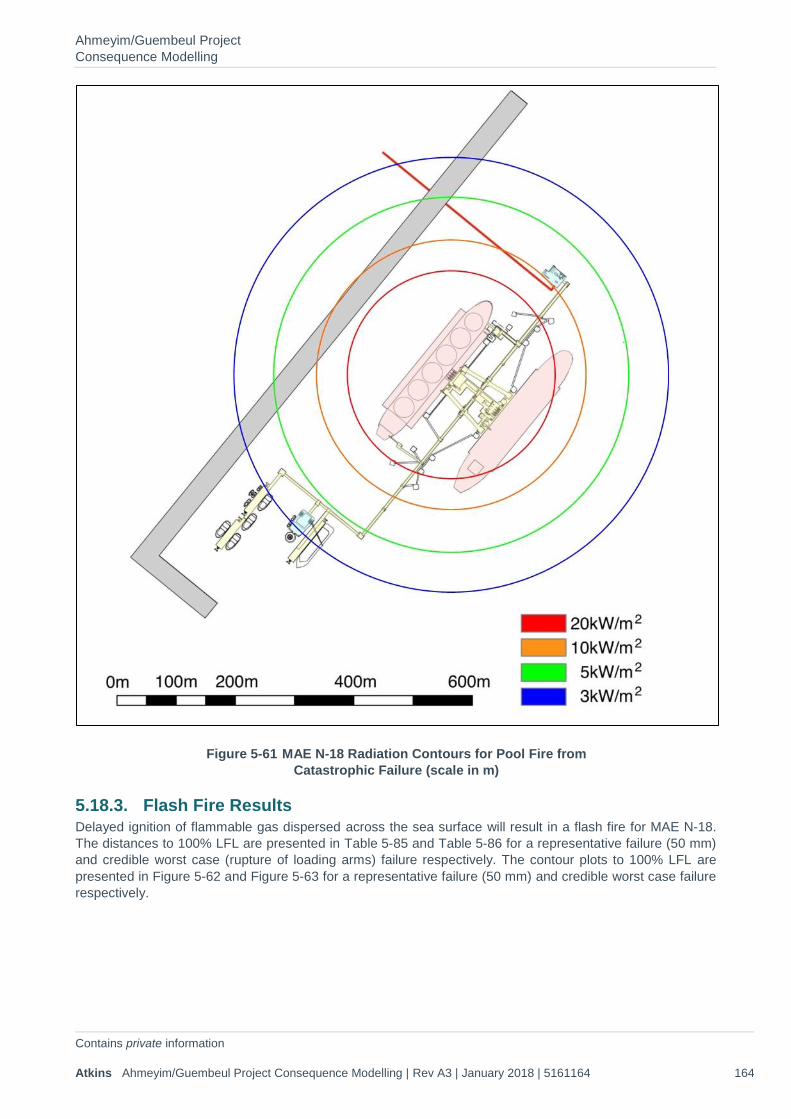
Ahmeyim/Guembeul Project Consequence Modelling
Contains private information Atkins Ahmeyim/Guembeul Project Consequence Modelling | Rev A3 | January 2018 | 5161164 164
Figure 5-61 MAE N-18 Radiation Contours for Pool Fire from Catastrophic Failure (scale in m)
5.18.3. Flash Fire Results Delayed ignition of flammable gas dispersed across the sea surface will result in a flash fire for MAE N-18. The distances to 100% LFL are presented in Table 5-85 and Table 5-86 for a representative failure (50 mm) and credible worst case (rupture of loading arms) failure respectively. The contour plots to 100% LFL are presented in Figure 5-62 and Figure 5-63 for a representative failure (50 mm) and credible worst case failure respectively.

Ahmeyim/Guembeul Project Consequence Modelling
Contains private information Atkins Ahmeyim/Guembeul Project Consequence Modelling | Rev A3 | January 2018 | 5161164 165
Table 5-85 MAE N-18 50mm 100%LFL Flash Fire Extent Results
Weather Maximum Distance (m) 2/D 117 5/D 76
Table 5-86 MAE N-18 FBR 100%LFL Flash Fire Extent Results
Weather Maximum Distance (m) 2/D 223 5/D 159
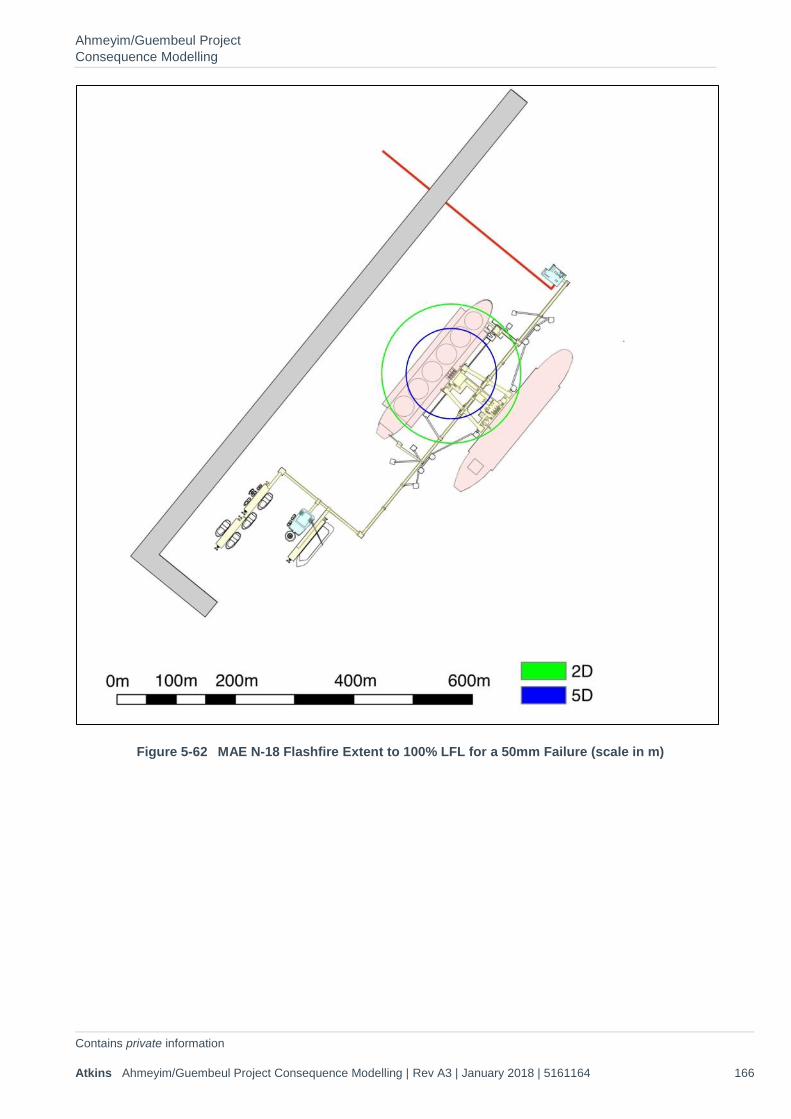
Ahmeyim/Guembeul Project Consequence Modelling
Contains private information Atkins Ahmeyim/Guembeul Project Consequence Modelling | Rev A3 | January 2018 | 5161164 166
Figure 5-62 MAE N-18 Flashfire Extent to 100% LFL for a 50mm Failure (scale in m)
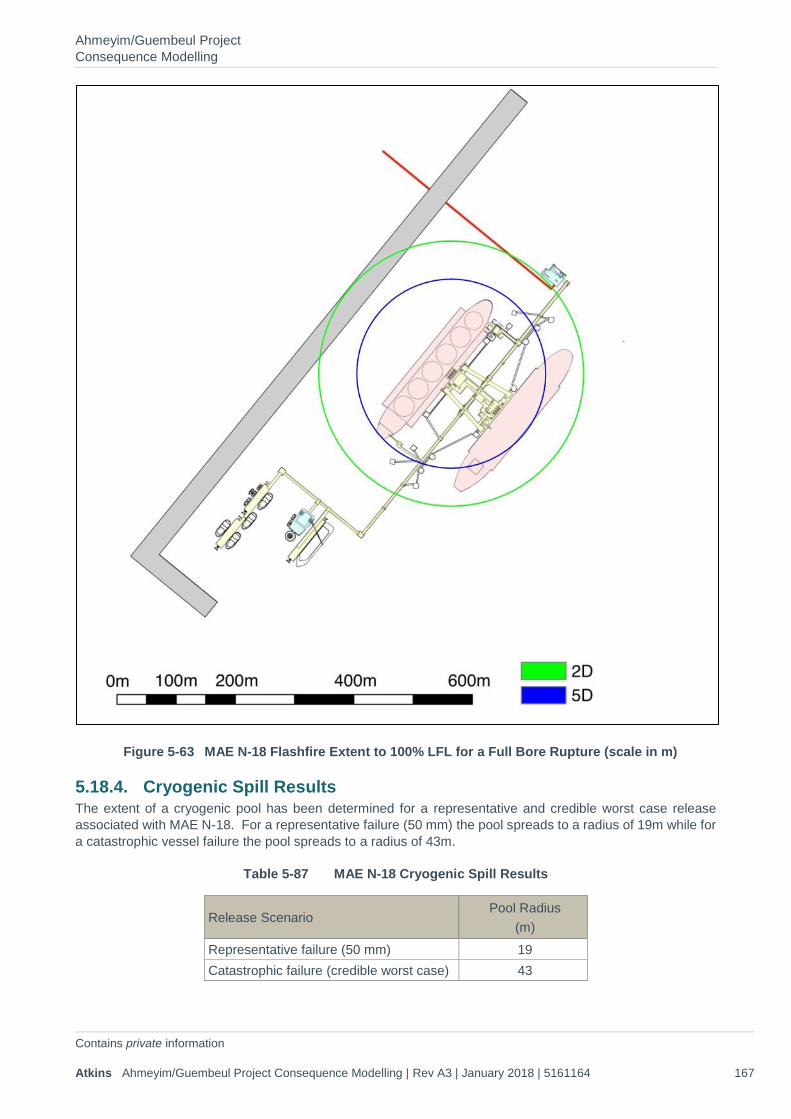
Ahmeyim/Guembeul Project Consequence Modelling
Contains private information Atkins Ahmeyim/Guembeul Project Consequence Modelling | Rev A3 | January 2018 | 5161164 167
Figure 5-63 MAE N-18 Flashfire Extent to 100% LFL for a Full Bore Rupture (scale in m)
5.18.4. Cryogenic Spill Results The extent of a cryogenic pool has been determined for a representative and credible worst case release associated with MAE N-18. For a representative failure (50 mm) the pool spreads to a radius of 19m while for a catastrophic vessel failure the pool spreads to a radius of 43m.
Table 5-87 MAE N-18 Cryogenic Spill Results
Release Scenario Pool Radius
(m) Representative failure (50 mm) 19 Catastrophic failure (credible worst case) 43
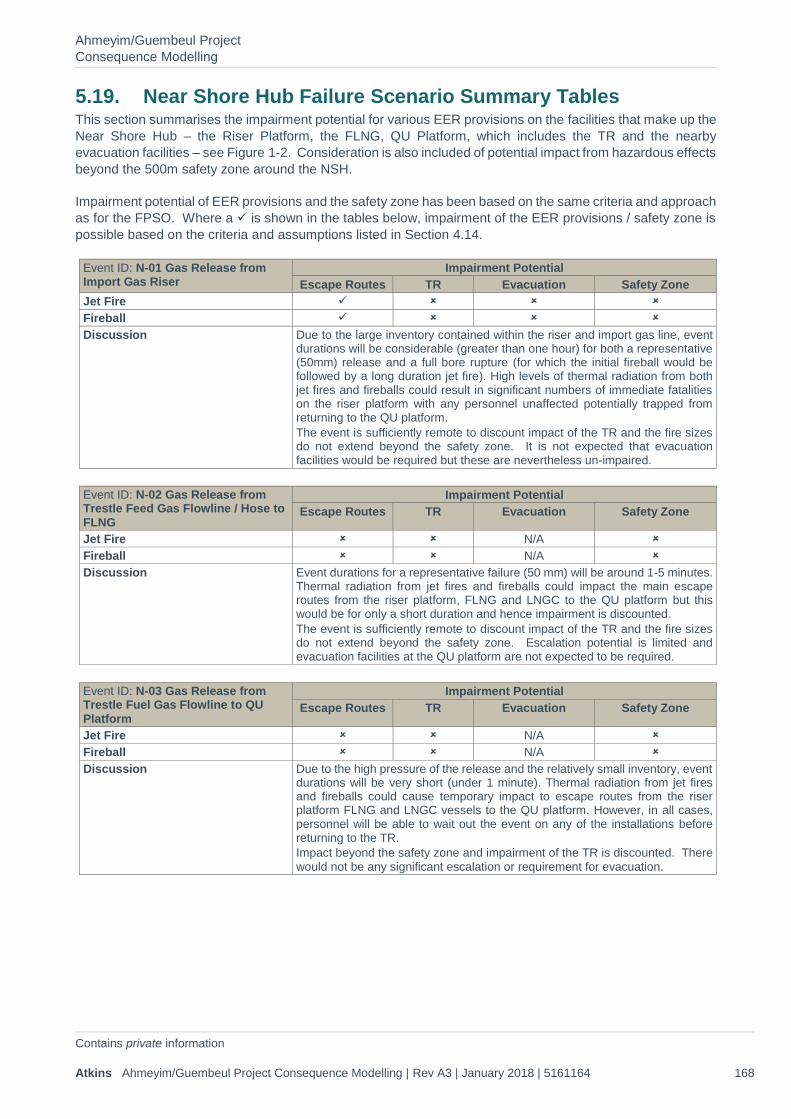
Ahmeyim/Guembeul Project Consequence Modelling
Contains private information Atkins Ahmeyim/Guembeul Project Consequence Modelling | Rev A3 | January 2018 | 5161164 168
5.19. Near Shore Hub Failure Scenario Summary Tables This section summarises the impairment potential for various EER provisions on the facilities that make up the Near Shore Hub – the Riser Platform, the FLNG, QU Platform, which includes the TR and the nearby evacuation facilities – see Figure 1-2. Consideration is also included of potential impact from hazardous effects beyond the 500m safety zone around the NSH.
Impairment potential of EER provisions and the safety zone has been based on the same criteria and approach as for the FPSO. Where a ✓ is shown in the tables below, impairment of the EER provisions / safety zone is possible based on the criteria and assumptions listed in Section 4.14.
Event ID: N-01 Gas Release from Import Gas Riser
Impairment Potential Escape Routes TR Evacuation Safety Zone
Jet Fire ✓ Fireball ✓ Discussion Due to the large inventory contained within the riser and import gas line, event
durations will be considerable (greater than one hour) for both a representative (50mm) release and a full bore rupture (for which the initial fireball would be followed by a long duration jet fire). High levels of thermal radiation from both jet fires and fireballs could result in significant numbers of immediate fatalities on the riser platform with any personnel unaffected potentially trapped from returning to the QU platform. The event is sufficiently remote to discount impact of the TR and the fire sizes do not extend beyond the safety zone. It is not expected that evacuation facilities would be required but these are nevertheless un-impaired.
Event ID: N-02 Gas Release from Trestle Feed Gas Flowline / Hose to FLNG
Impairment Potential Escape Routes TR Evacuation Safety Zone
Jet Fire N/A Fireball N/A Discussion Event durations for a representative failure (50 mm) will be around 1-5 minutes.
Thermal radiation from jet fires and fireballs could impact the main escape routes from the riser platform, FLNG and LNGC to the QU platform but this would be for only a short duration and hence impairment is discounted. The event is sufficiently remote to discount impact of the TR and the fire sizes do not extend beyond the safety zone. Escalation potential is limited and evacuation facilities at the QU platform are not expected to be required.
Event ID: N-03 Gas Release from Trestle Fuel Gas Flowline to QU Platform
Impairment Potential Escape Routes TR Evacuation Safety Zone
Jet Fire N/A Fireball N/A Discussion Due to the high pressure of the release and the relatively small inventory, event
durations will be very short (under 1 minute). Thermal radiation from jet fires and fireballs could cause temporary impact to escape routes from the riser platform FLNG and LNGC vessels to the QU platform. However, in all cases, personnel will be able to wait out the event on any of the installations before returning to the TR. Impact beyond the safety zone and impairment of the TR is discounted. There would not be any significant escalation or requirement for evacuation.
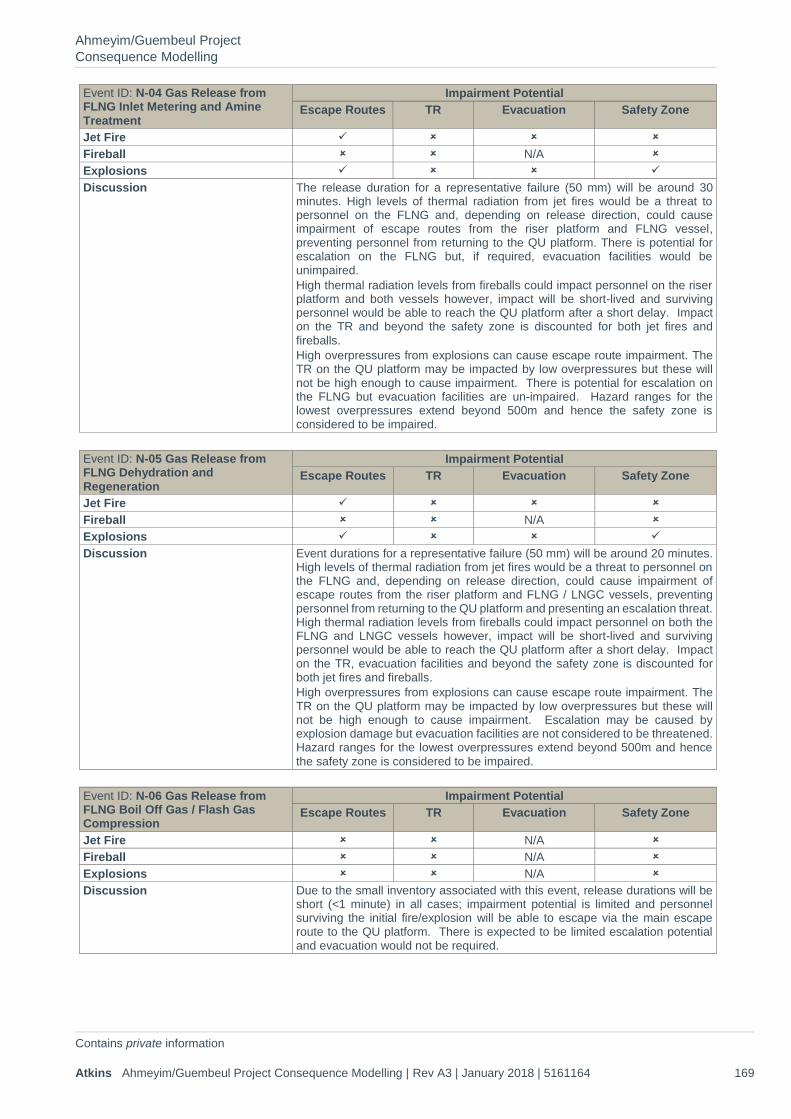
Ahmeyim/Guembeul Project Consequence Modelling
Contains private information Atkins Ahmeyim/Guembeul Project Consequence Modelling | Rev A3 | January 2018 | 5161164 169
Event ID: N-04 Gas Release from FLNG Inlet Metering and Amine Treatment
Impairment Potential Escape Routes TR Evacuation Safety Zone
Jet Fire ✓ Fireball N/A Explosions ✓ ✓ Discussion The release duration for a representative failure (50 mm) will be around 30
minutes. High levels of thermal radiation from jet fires would be a threat to personnel on the FLNG and, depending on release direction, could cause impairment of escape routes from the riser platform and FLNG vessel, preventing personnel from returning to the QU platform. There is potential for escalation on the FLNG but, if required, evacuation facilities would be unimpaired. High thermal radiation levels from fireballs could impact personnel on the riser platform and both vessels however, impact will be short-lived and surviving personnel would be able to reach the QU platform after a short delay. Impact on the TR and beyond the safety zone is discounted for both jet fires and fireballs. High overpressures from explosions can cause escape route impairment. The TR on the QU platform may be impacted by low overpressures but these will not be high enough to cause impairment. There is potential for escalation on the FLNG but evacuation facilities are un-impaired. Hazard ranges for the lowest overpressures extend beyond 500m and hence the safety zone is considered to be impaired.
Event ID: N-05 Gas Release from FLNG Dehydration and Regeneration
Impairment Potential Escape Routes TR Evacuation Safety Zone
Jet Fire ✓ Fireball N/A Explosions ✓ ✓ Discussion Event durations for a representative failure (50 mm) will be around 20 minutes.
High levels of thermal radiation from jet fires would be a threat to personnel on the FLNG and, depending on release direction, could cause impairment of escape routes from the riser platform and FLNG / LNGC vessels, preventing personnel from returning to the QU platform and presenting an escalation threat. High thermal radiation levels from fireballs could impact personnel on both the FLNG and LNGC vessels however, impact will be short-lived and surviving personnel would be able to reach the QU platform after a short delay. Impact on the TR, evacuation facilities and beyond the safety zone is discounted for both jet fires and fireballs. High overpressures from explosions can cause escape route impairment. The TR on the QU platform may be impacted by low overpressures but these will not be high enough to cause impairment. Escalation may be caused by explosion damage but evacuation facilities are not considered to be threatened. Hazard ranges for the lowest overpressures extend beyond 500m and hence the safety zone is considered to be impaired.
Event ID: N-06 Gas Release from FLNG Boil Off Gas / Flash Gas Compression
Impairment Potential Escape Routes TR Evacuation Safety Zone
Jet Fire N/A Fireball N/A Explosions N/A Discussion Due to the small inventory associated with this event, release durations will be
short (<1 minute) in all cases; impairment potential is limited and personnel surviving the initial fire/explosion will be able to escape via the main escape route to the QU platform. There is expected to be limited escalation potential and evacuation would not be required.
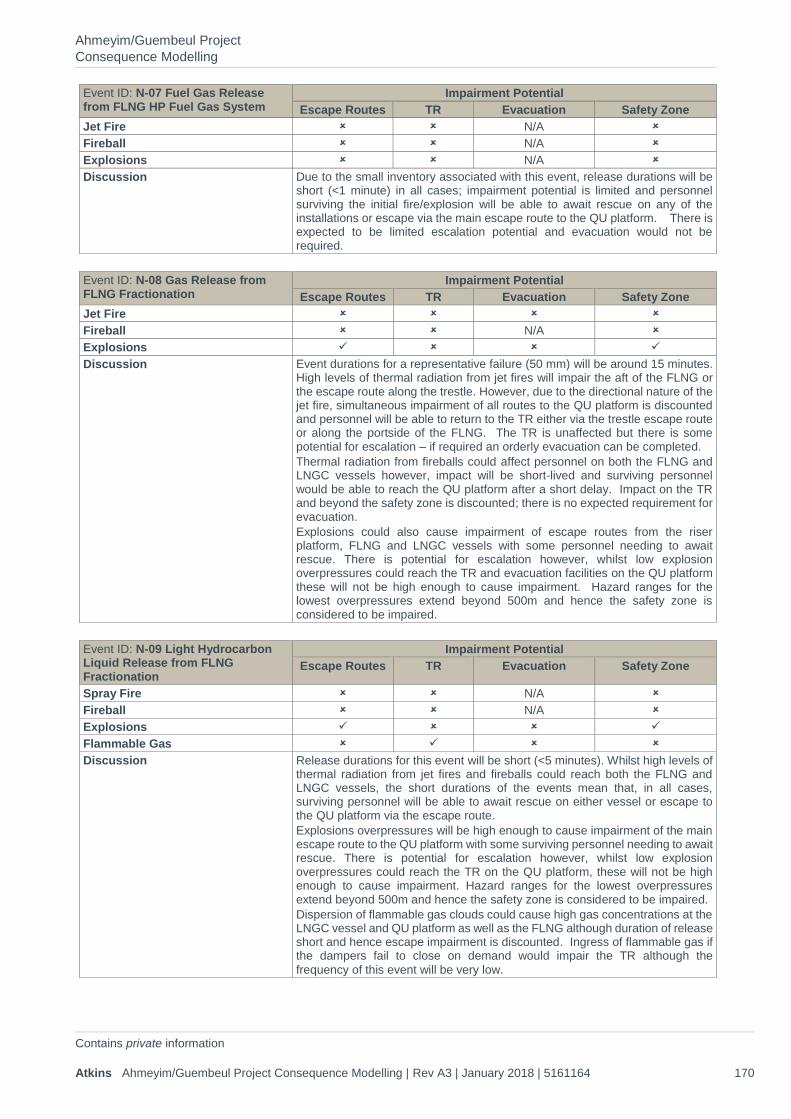
Ahmeyim/Guembeul Project Consequence Modelling
Contains private information Atkins Ahmeyim/Guembeul Project Consequence Modelling | Rev A3 | January 2018 | 5161164 170
Event ID: N-07 Fuel Gas Release from FLNG HP Fuel Gas System
Impairment Potential Escape Routes TR Evacuation Safety Zone
Jet Fire N/A Fireball N/A Explosions N/A Discussion Due to the small inventory associated with this event, release durations will be
short (<1 minute) in all cases; impairment potential is limited and personnel surviving the initial fire/explosion will be able to await rescue on any of the installations or escape via the main escape route to the QU platform. There is expected to be limited escalation potential and evacuation would not be required.
Event ID: N-08 Gas Release from FLNG Fractionation
Impairment Potential Escape Routes TR Evacuation Safety Zone
Jet Fire Fireball N/A Explosions ✓ ✓ Discussion Event durations for a representative failure (50 mm) will be around 15 minutes.
High levels of thermal radiation from jet fires will impair the aft of the FLNG or the escape route along the trestle. However, due to the directional nature of the jet fire, simultaneous impairment of all routes to the QU platform is discounted and personnel will be able to return to the TR either via the trestle escape route or along the portside of the FLNG. The TR is unaffected but there is some potential for escalation – if required an orderly evacuation can be completed. Thermal radiation from fireballs could affect personnel on both the FLNG and LNGC vessels however, impact will be short-lived and surviving personnel would be able to reach the QU platform after a short delay. Impact on the TR and beyond the safety zone is discounted; there is no expected requirement for evacuation. Explosions could also cause impairment of escape routes from the riser platform, FLNG and LNGC vessels with some personnel needing to await rescue. There is potential for escalation however, whilst low explosion overpressures could reach the TR and evacuation facilities on the QU platform these will not be high enough to cause impairment. Hazard ranges for the lowest overpressures extend beyond 500m and hence the safety zone is considered to be impaired.
Event ID: N-09 Light Hydrocarbon Liquid Release from FLNG Fractionation
Impairment Potential Escape Routes TR Evacuation Safety Zone
Spray Fire N/A Fireball N/A Explosions ✓ ✓ Flammable Gas ✓ Discussion Release durations for this event will be short (<5 minutes). Whilst high levels of
thermal radiation from jet fires and fireballs could reach both the FLNG and LNGC vessels, the short durations of the events mean that, in all cases, surviving personnel will be able to await rescue on either vessel or escape to the QU platform via the escape route. Explosions overpressures will be high enough to cause impairment of the main escape route to the QU platform with some surviving personnel needing to await rescue. There is potential for escalation however, whilst low explosion overpressures could reach the TR on the QU platform, these will not be high enough to cause impairment. Hazard ranges for the lowest overpressures extend beyond 500m and hence the safety zone is considered to be impaired. Dispersion of flammable gas clouds could cause high gas concentrations at the LNGC vessel and QU platform as well as the FLNG although duration of release short and hence escape impairment is discounted. Ingress of flammable gas if the dampers fail to close on demand would impair the TR although the frequency of this event will be very low.
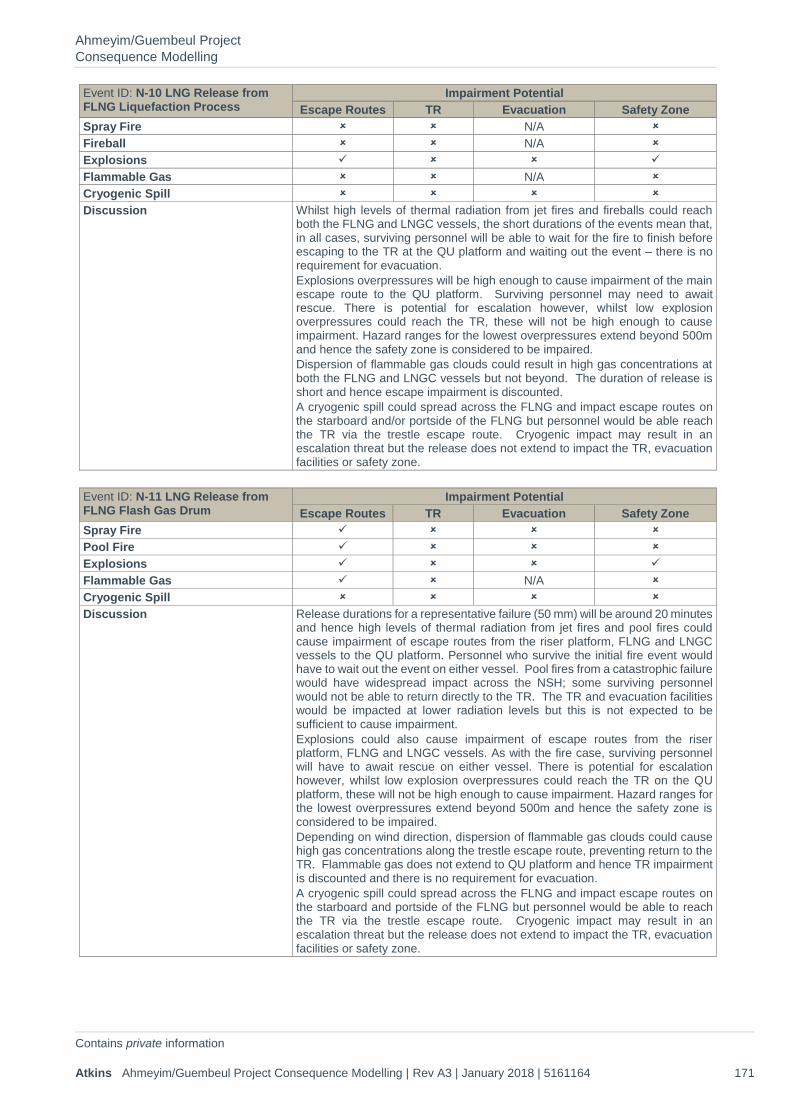
Ahmeyim/Guembeul Project Consequence Modelling
Contains private information Atkins Ahmeyim/Guembeul Project Consequence Modelling | Rev A3 | January 2018 | 5161164 171
Event ID: N-10 LNG Release from FLNG Liquefaction Process
Impairment Potential Escape Routes TR Evacuation Safety Zone
Spray Fire N/A Fireball N/A Explosions ✓ ✓ Flammable Gas N/A Cryogenic Spill Discussion Whilst high levels of thermal radiation from jet fires and fireballs could reach
both the FLNG and LNGC vessels, the short durations of the events mean that, in all cases, surviving personnel will be able to wait for the fire to finish before escaping to the TR at the QU platform and waiting out the event – there is no requirement for evacuation. Explosions overpressures will be high enough to cause impairment of the main escape route to the QU platform. Surviving personnel may need to await rescue. There is potential for escalation however, whilst low explosion overpressures could reach the TR, these will not be high enough to cause impairment. Hazard ranges for the lowest overpressures extend beyond 500m and hence the safety zone is considered to be impaired. Dispersion of flammable gas clouds could result in high gas concentrations at both the FLNG and LNGC vessels but not beyond. The duration of release is short and hence escape impairment is discounted. A cryogenic spill could spread across the FLNG and impact escape routes on the starboard and/or portside of the FLNG but personnel would be able reach the TR via the trestle escape route. Cryogenic impact may result in an escalation threat but the release does not extend to impact the TR, evacuation facilities or safety zone.
Event ID: N-11 LNG Release from FLNG Flash Gas Drum
Impairment Potential Escape Routes TR Evacuation Safety Zone
Spray Fire ✓ Pool Fire ✓ Explosions ✓ ✓ Flammable Gas ✓ N/A Cryogenic Spill Discussion Release durations for a representative failure (50 mm) will be around 20 minutes
and hence high levels of thermal radiation from jet fires and pool fires could cause impairment of escape routes from the riser platform, FLNG and LNGC vessels to the QU platform. Personnel who survive the initial fire event would have to wait out the event on either vessel. Pool fires from a catastrophic failure would have widespread impact across the NSH; some surviving personnel would not be able to return directly to the TR. The TR and evacuation facilities would be impacted at lower radiation levels but this is not expected to be sufficient to cause impairment. Explosions could also cause impairment of escape routes from the riser platform, FLNG and LNGC vessels. As with the fire case, surviving personnel will have to await rescue on either vessel. There is potential for escalation however, whilst low explosion overpressures could reach the TR on the QU platform, these will not be high enough to cause impairment. Hazard ranges for the lowest overpressures extend beyond 500m and hence the safety zone is considered to be impaired. Depending on wind direction, dispersion of flammable gas clouds could cause high gas concentrations along the trestle escape route, preventing return to the TR. Flammable gas does not extend to QU platform and hence TR impairment is discounted and there is no requirement for evacuation. A cryogenic spill could spread across the FLNG and impact escape routes on the starboard and portside of the FLNG but personnel would be able to reach the TR via the trestle escape route. Cryogenic impact may result in an escalation threat but the release does not extend to impact the TR, evacuation facilities or safety zone.
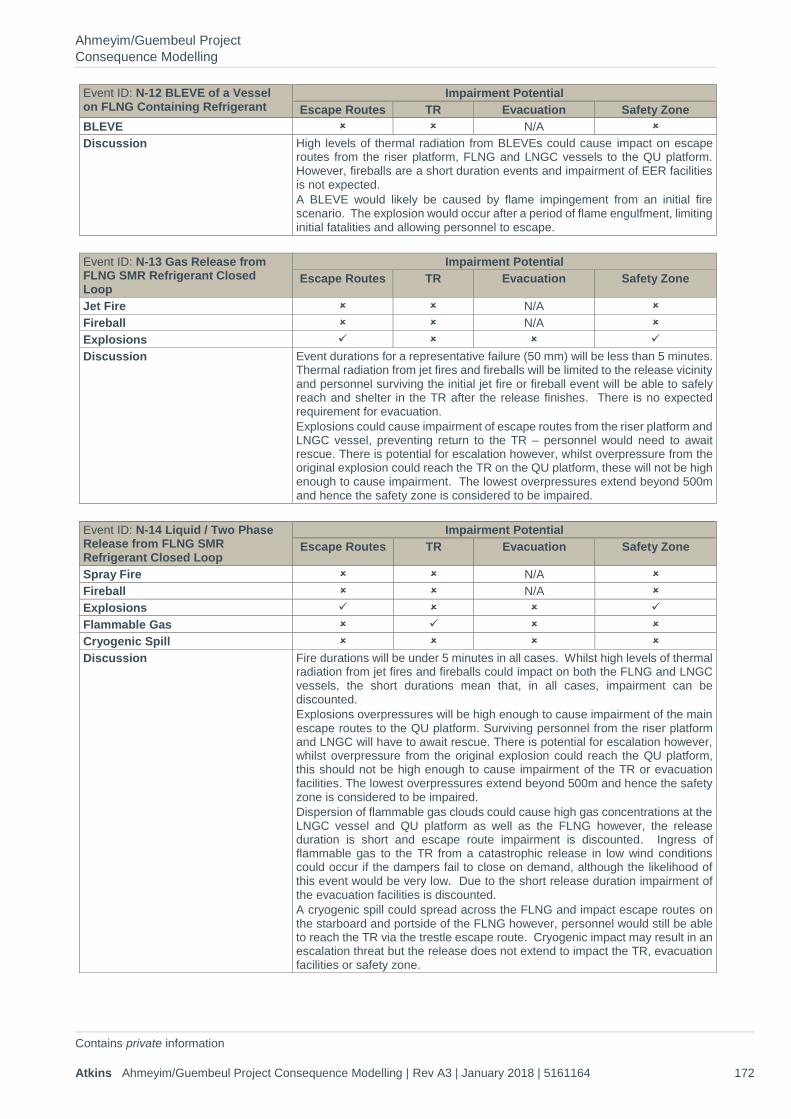
Ahmeyim/Guembeul Project Consequence Modelling
Contains private information Atkins Ahmeyim/Guembeul Project Consequence Modelling | Rev A3 | January 2018 | 5161164 172
Event ID: N-12 BLEVE of a Vessel on FLNG Containing Refrigerant
Impairment Potential Escape Routes TR Evacuation Safety Zone
BLEVE N/A Discussion High levels of thermal radiation from BLEVEs could cause impact on escape
routes from the riser platform, FLNG and LNGC vessels to the QU platform. However, fireballs are a short duration events and impairment of EER facilities is not expected. A BLEVE would likely be caused by flame impingement from an initial fire scenario. The explosion would occur after a period of flame engulfment, limiting initial fatalities and allowing personnel to escape.
Event ID: N-13 Gas Release from FLNG SMR Refrigerant Closed Loop
Impairment Potential Escape Routes TR Evacuation Safety Zone
Jet Fire N/A Fireball N/A Explosions ✓ ✓ Discussion Event durations for a representative failure (50 mm) will be less than 5 minutes.
Thermal radiation from jet fires and fireballs will be limited to the release vicinity and personnel surviving the initial jet fire or fireball event will be able to safely reach and shelter in the TR after the release finishes. There is no expected requirement for evacuation. Explosions could cause impairment of escape routes from the riser platform and LNGC vessel, preventing return to the TR – personnel would need to await rescue. There is potential for escalation however, whilst overpressure from the original explosion could reach the TR on the QU platform, these will not be high enough to cause impairment. The lowest overpressures extend beyond 500m and hence the safety zone is considered to be impaired.
Event ID: N-14 Liquid / Two Phase Release from FLNG SMR Refrigerant Closed Loop
Impairment Potential Escape Routes TR Evacuation Safety Zone
Spray Fire N/A Fireball N/A Explosions ✓ ✓ Flammable Gas ✓ Cryogenic Spill Discussion Fire durations will be under 5 minutes in all cases. Whilst high levels of thermal
radiation from jet fires and fireballs could impact on both the FLNG and LNGC vessels, the short durations mean that, in all cases, impairment can be discounted. Explosions overpressures will be high enough to cause impairment of the main escape routes to the QU platform. Surviving personnel from the riser platform and LNGC will have to await rescue. There is potential for escalation however, whilst overpressure from the original explosion could reach the QU platform, this should not be high enough to cause impairment of the TR or evacuation facilities. The lowest overpressures extend beyond 500m and hence the safety zone is considered to be impaired. Dispersion of flammable gas clouds could cause high gas concentrations at the LNGC vessel and QU platform as well as the FLNG however, the release duration is short and escape route impairment is discounted. Ingress of flammable gas to the TR from a catastrophic release in low wind conditions could occur if the dampers fail to close on demand, although the likelihood of this event would be very low. Due to the short release duration impairment of the evacuation facilities is discounted. A cryogenic spill could spread across the FLNG and impact escape routes on the starboard and portside of the FLNG however, personnel would still be able to reach the TR via the trestle escape route. Cryogenic impact may result in an escalation threat but the release does not extend to impact the TR, evacuation facilities or safety zone.
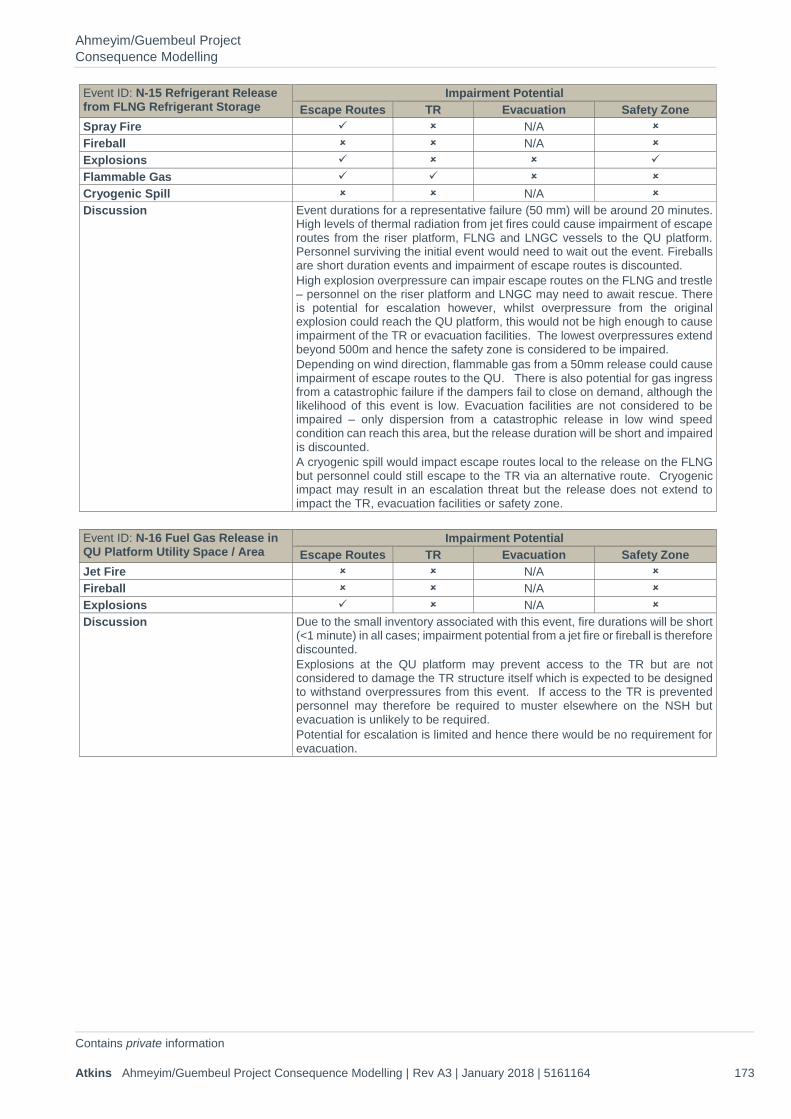
Ahmeyim/Guembeul Project Consequence Modelling
Contains private information Atkins Ahmeyim/Guembeul Project Consequence Modelling | Rev A3 | January 2018 | 5161164 173
Event ID: N-15 Refrigerant Release from FLNG Refrigerant Storage
Impairment Potential Escape Routes TR Evacuation Safety Zone
Spray Fire ✓ N/A Fireball N/A Explosions ✓ ✓ Flammable Gas ✓ ✓ Cryogenic Spill N/A Discussion Event durations for a representative failure (50 mm) will be around 20 minutes.
High levels of thermal radiation from jet fires could cause impairment of escape routes from the riser platform, FLNG and LNGC vessels to the QU platform. Personnel surviving the initial event would need to wait out the event. Fireballs are short duration events and impairment of escape routes is discounted. High explosion overpressure can impair escape routes on the FLNG and trestle – personnel on the riser platform and LNGC may need to await rescue. There is potential for escalation however, whilst overpressure from the original explosion could reach the QU platform, this would not be high enough to cause impairment of the TR or evacuation facilities. The lowest overpressures extend beyond 500m and hence the safety zone is considered to be impaired. Depending on wind direction, flammable gas from a 50mm release could cause impairment of escape routes to the QU. There is also potential for gas ingress from a catastrophic failure if the dampers fail to close on demand, although the likelihood of this event is low. Evacuation facilities are not considered to be impaired – only dispersion from a catastrophic release in low wind speed condition can reach this area, but the release duration will be short and impaired is discounted. A cryogenic spill would impact escape routes local to the release on the FLNG but personnel could still escape to the TR via an alternative route. Cryogenic impact may result in an escalation threat but the release does not extend to impact the TR, evacuation facilities or safety zone.
Event ID: N-16 Fuel Gas Release in QU Platform Utility Space / Area
Impairment Potential Escape Routes TR Evacuation Safety Zone
Jet Fire N/A Fireball N/A Explosions ✓ N/A Discussion Due to the small inventory associated with this event, fire durations will be short
(<1 minute) in all cases; impairment potential from a jet fire or fireball is therefore discounted. Explosions at the QU platform may prevent access to the TR but are not considered to damage the TR structure itself which is expected to be designed to withstand overpressures from this event. If access to the TR is prevented personnel may therefore be required to muster elsewhere on the NSH but evacuation is unlikely to be required. Potential for escalation is limited and hence there would be no requirement for evacuation.
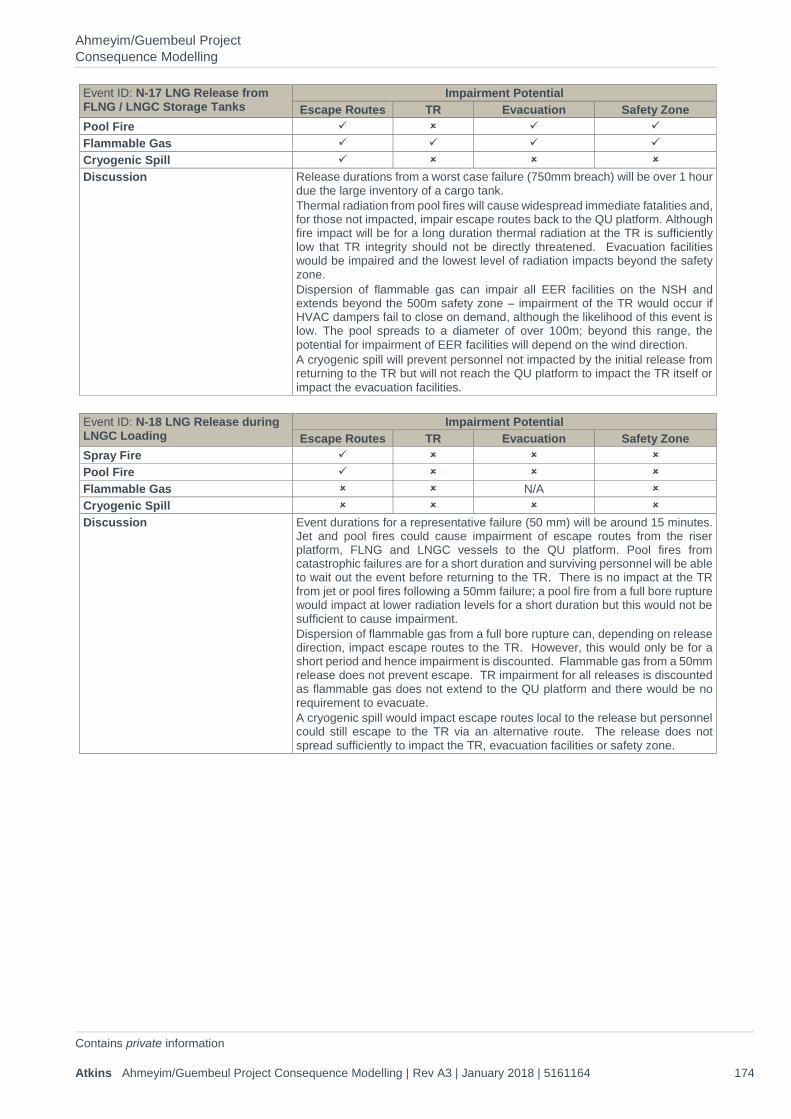
Ahmeyim/Guembeul Project Consequence Modelling
Contains private information Atkins Ahmeyim/Guembeul Project Consequence Modelling | Rev A3 | January 2018 | 5161164 174
Event ID: N-17 LNG Release from FLNG / LNGC Storage Tanks
Impairment Potential Escape Routes TR Evacuation Safety Zone
Pool Fire ✓ ✓ ✓ Flammable Gas ✓ ✓ ✓ ✓ Cryogenic Spill ✓ Discussion Release durations from a worst case failure (750mm breach) will be over 1 hour
due the large inventory of a cargo tank. Thermal radiation from pool fires will cause widespread immediate fatalities and, for those not impacted, impair escape routes back to the QU platform. Although fire impact will be for a long duration thermal radiation at the TR is sufficiently low that TR integrity should not be directly threatened. Evacuation facilities would be impaired and the lowest level of radiation impacts beyond the safety zone. Dispersion of flammable gas can impair all EER facilities on the NSH and extends beyond the 500m safety zone – impairment of the TR would occur if HVAC dampers fail to close on demand, although the likelihood of this event is low. The pool spreads to a diameter of over 100m; beyond this range, the potential for impairment of EER facilities will depend on the wind direction. A cryogenic spill will prevent personnel not impacted by the initial release from returning to the TR but will not reach the QU platform to impact the TR itself or impact the evacuation facilities.
Event ID: N-18 LNG Release during LNGC Loading
Impairment Potential Escape Routes TR Evacuation Safety Zone
Spray Fire ✓ Pool Fire ✓ Flammable Gas N/A Cryogenic Spill Discussion Event durations for a representative failure (50 mm) will be around 15 minutes.
Jet and pool fires could cause impairment of escape routes from the riser platform, FLNG and LNGC vessels to the QU platform. Pool fires from catastrophic failures are for a short duration and surviving personnel will be able to wait out the event before returning to the TR. There is no impact at the TR from jet or pool fires following a 50mm failure; a pool fire from a full bore rupture would impact at lower radiation levels for a short duration but this would not be sufficient to cause impairment. Dispersion of flammable gas from a full bore rupture can, depending on release direction, impact escape routes to the TR. However, this would only be for a short period and hence impairment is discounted. Flammable gas from a 50mm release does not prevent escape. TR impairment for all releases is discounted as flammable gas does not extend to the QU platform and there would be no requirement to evacuate. A cryogenic spill would impact escape routes local to the release but personnel could still escape to the TR via an alternative route. The release does not spread sufficiently to impact the TR, evacuation facilities or safety zone.
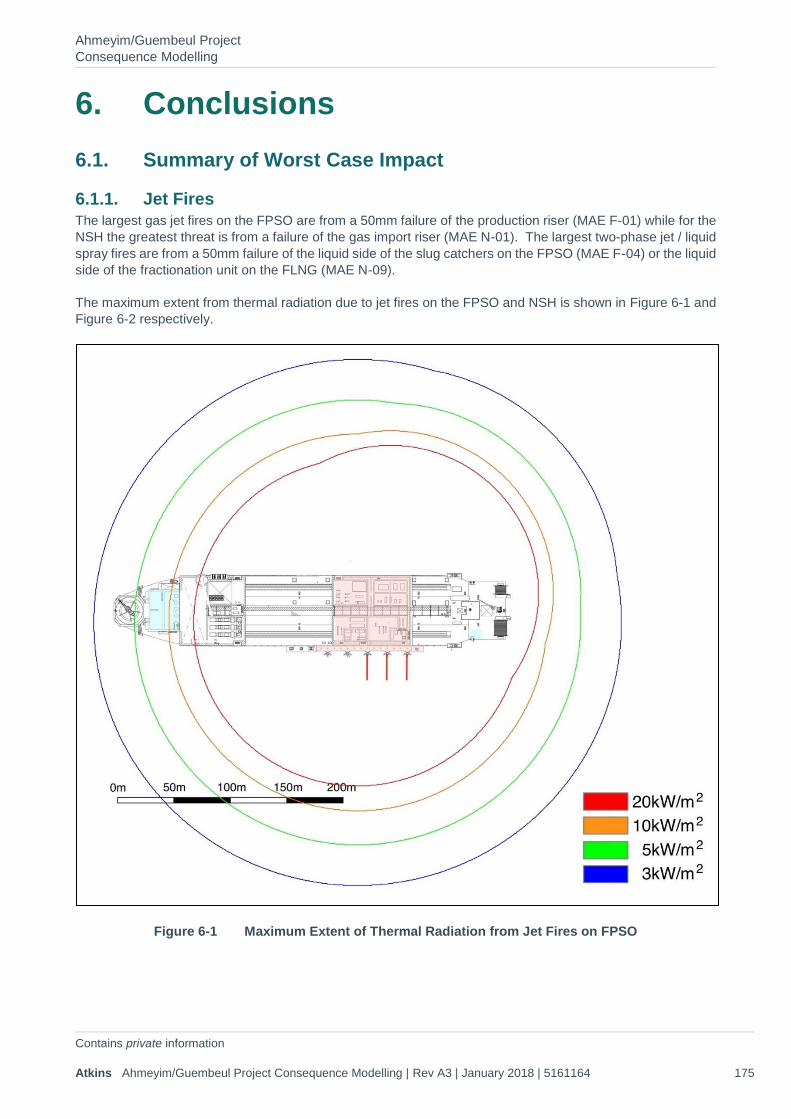
Ahmeyim/Guembeul Project Consequence Modelling
Contains private information Atkins Ahmeyim/Guembeul Project Consequence Modelling | Rev A3 | January 2018 | 5161164 175
6. Conclusions 6.1. Summary of Worst Case Impact
6.1.1. Jet Fires The largest gas jet fires on the FPSO are from a 50mm failure of the production riser (MAE F-01) while for the NSH the greatest threat is from a failure of the gas import riser (MAE N-01). The largest two-phase jet / liquid spray fires are from a 50mm failure of the liquid side of the slug catchers on the FPSO (MAE F-04) or the liquid side of the fractionation unit on the FLNG (MAE N-09).
The maximum extent from thermal radiation due to jet fires on the FPSO and NSH is shown in Figure 6-1 and Figure 6-2 respectively.
Figure 6-1 Maximum Extent of Thermal Radiation from Jet Fires on FPSO
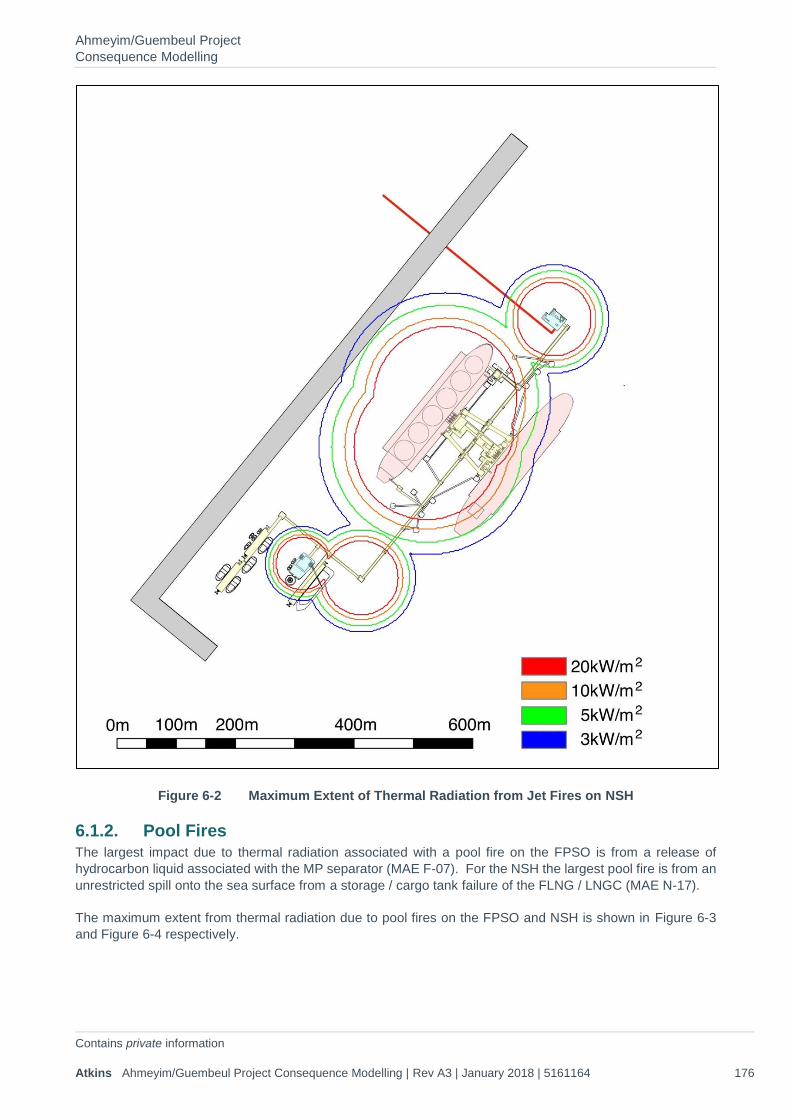
Ahmeyim/Guembeul Project Consequence Modelling
Contains private information Atkins Ahmeyim/Guembeul Project Consequence Modelling | Rev A3 | January 2018 | 5161164 176
Figure 6-2 Maximum Extent of Thermal Radiation from Jet Fires on NSH
6.1.2. Pool Fires The largest impact due to thermal radiation associated with a pool fire on the FPSO is from a release of hydrocarbon liquid associated with the MP separator (MAE F-07). For the NSH the largest pool fire is from an unrestricted spill onto the sea surface from a storage / cargo tank failure of the FLNG / LNGC (MAE N-17).
The maximum extent from thermal radiation due to pool fires on the FPSO and NSH is shown in Figure 6-3 and Figure 6-4 respectively.

Ahmeyim/Guembeul Project Consequence Modelling
Contains private information Atkins Ahmeyim/Guembeul Project Consequence Modelling | Rev A3 | January 2018 | 5161164 177
Figure 6-3 Maximum Extent of Thermal Radiation from Pool Fires on FPSO
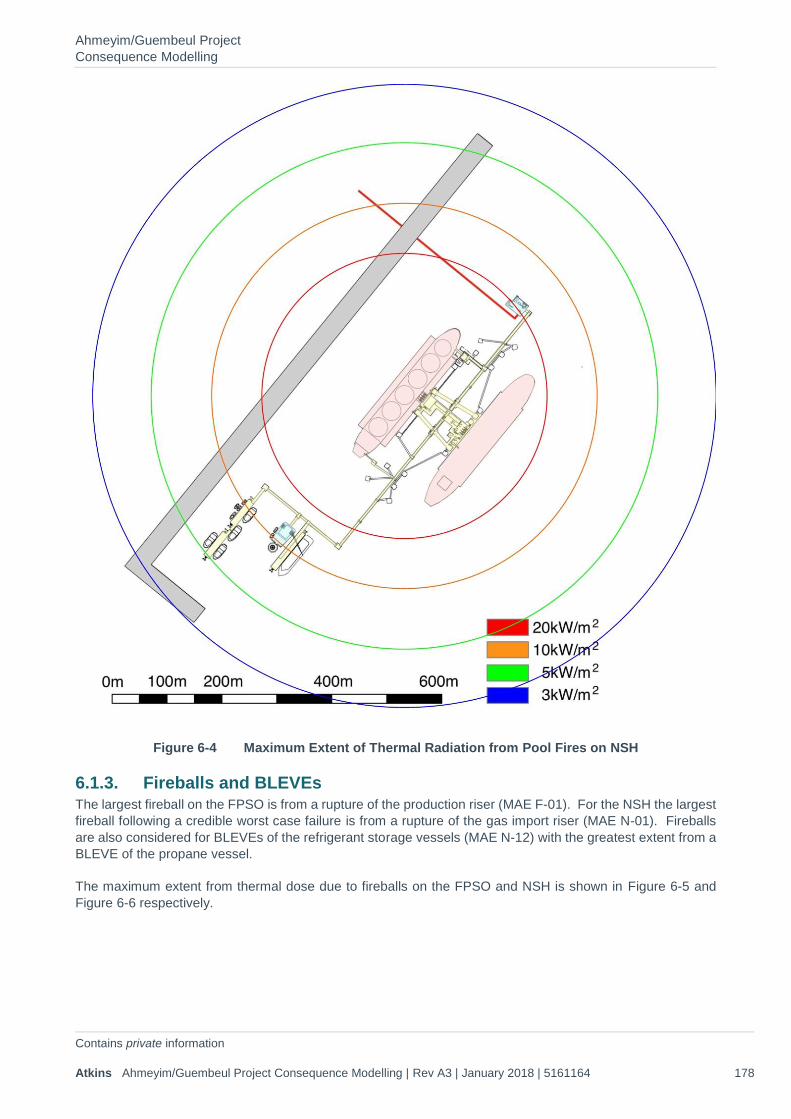
Ahmeyim/Guembeul Project Consequence Modelling
Contains private information Atkins Ahmeyim/Guembeul Project Consequence Modelling | Rev A3 | January 2018 | 5161164 178
Figure 6-4 Maximum Extent of Thermal Radiation from Pool Fires on NSH
6.1.3. Fireballs and BLEVEs The largest fireball on the FPSO is from a rupture of the production riser (MAE F-01). For the NSH the largest fireball following a credible worst case failure is from a rupture of the gas import riser (MAE N-01). Fireballs are also considered for BLEVEs of the refrigerant storage vessels (MAE N-12) with the greatest extent from a BLEVE of the propane vessel.
The maximum extent from thermal dose due to fireballs on the FPSO and NSH is shown in Figure 6-5 and Figure 6-6 respectively.
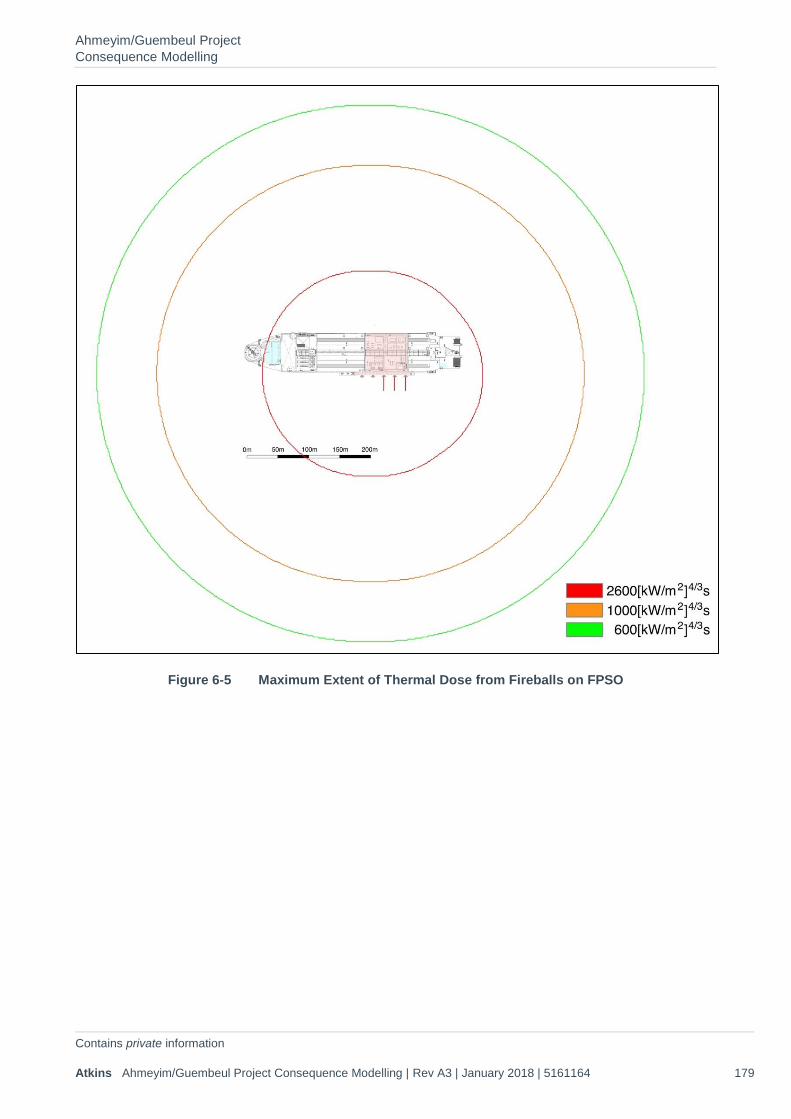
Ahmeyim/Guembeul Project Consequence Modelling
Contains private information Atkins Ahmeyim/Guembeul Project Consequence Modelling | Rev A3 | January 2018 | 5161164 179
Figure 6-5 Maximum Extent of Thermal Dose from Fireballs on FPSO
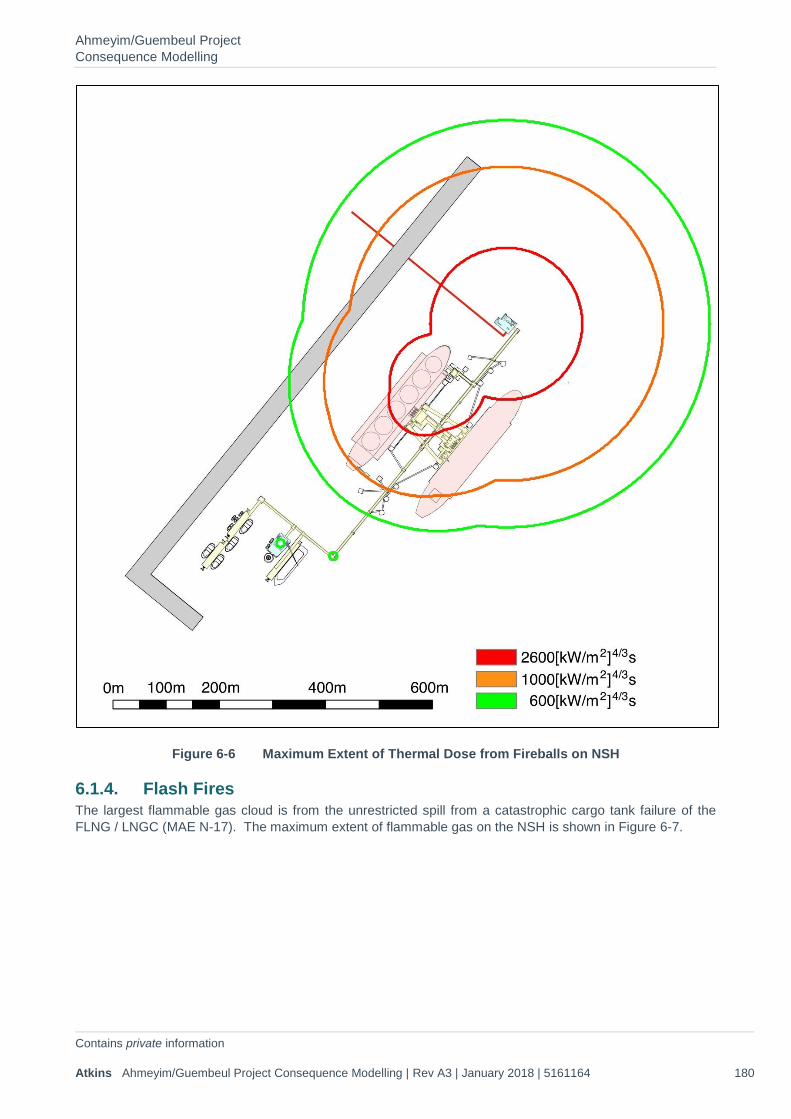
Ahmeyim/Guembeul Project Consequence Modelling
Contains private information Atkins Ahmeyim/Guembeul Project Consequence Modelling | Rev A3 | January 2018 | 5161164 180
Figure 6-6 Maximum Extent of Thermal Dose from Fireballs on NSH
6.1.4. Flash Fires The largest flammable gas cloud is from the unrestricted spill from a catastrophic cargo tank failure of the FLNG / LNGC (MAE N-17). The maximum extent of flammable gas on the NSH is shown in Figure 6-7.
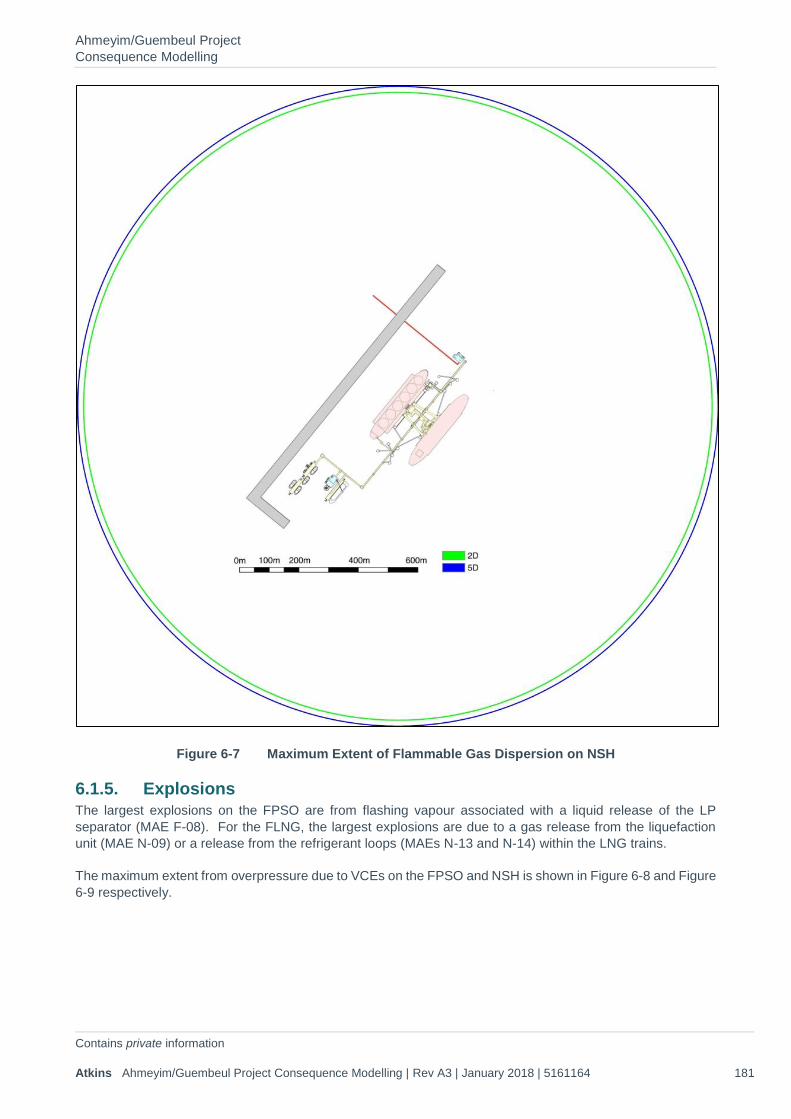
Ahmeyim/Guembeul Project Consequence Modelling
Contains private information Atkins Ahmeyim/Guembeul Project Consequence Modelling | Rev A3 | January 2018 | 5161164 181
Figure 6-7 Maximum Extent of Flammable Gas Dispersion on NSH
6.1.5. Explosions The largest explosions on the FPSO are from flashing vapour associated with a liquid release of the LP separator (MAE F-08). For the FLNG, the largest explosions are due to a gas release from the liquefaction unit (MAE N-09) or a release from the refrigerant loops (MAEs N-13 and N-14) within the LNG trains.
The maximum extent from overpressure due to VCEs on the FPSO and NSH is shown in Figure 6-8 and Figure 6-9 respectively.
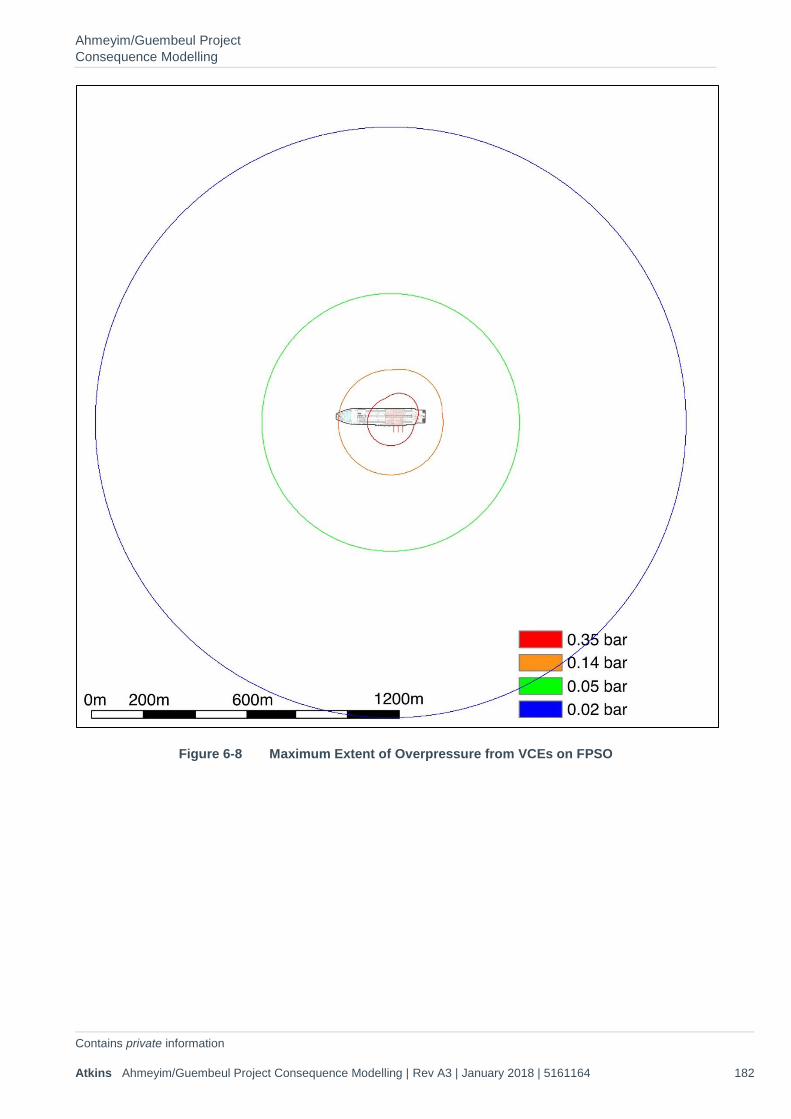
Ahmeyim/Guembeul Project Consequence Modelling
Contains private information Atkins Ahmeyim/Guembeul Project Consequence Modelling | Rev A3 | January 2018 | 5161164 182
Figure 6-8 Maximum Extent of Overpressure from VCEs on FPSO
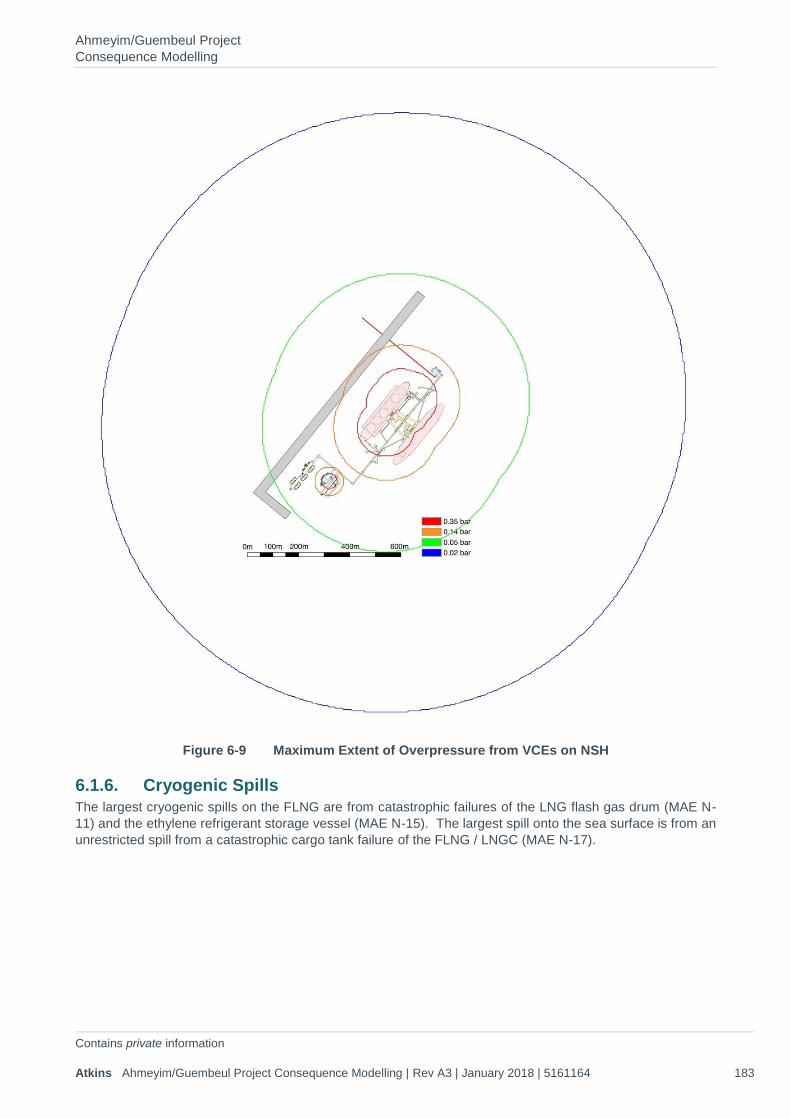
Ahmeyim/Guembeul Project Consequence Modelling
Contains private information Atkins Ahmeyim/Guembeul Project Consequence Modelling | Rev A3 | January 2018 | 5161164 183
Figure 6-9 Maximum Extent of Overpressure from VCEs on NSH
6.1.6. Cryogenic Spills The largest cryogenic spills on the FLNG are from catastrophic failures of the LNG flash gas drum (MAE N-11) and the ethylene refrigerant storage vessel (MAE N-15). The largest spill onto the sea surface is from an unrestricted spill from a catastrophic cargo tank failure of the FLNG / LNGC (MAE N-17).
Ahmeyim/Guembeul Project Consequence Modelling
Contains private information Atkins Ahmeyim/Guembeul Project Consequence Modelling | Rev A3 | January 2018 | 5161164 184
6.2. Recommendations for Further Analysis It is recommended that further assessment of hazardous effects from hydrocarbon MAEs is completed during the FEED stage of the of Ahmeyim/Guembeul Project. Based on the analysis in this study the following areas are identified for consideration:
• Vapour cloud explosion modelling: Modelling of VCEs has been limited to deflagration however, ethylene has potential for detonation which can result in significantly higher overpressures, although impulse durations are generally lower. It is recommended that assessment of detonation of ethylene is considered as part of the next stage of the design.
• Assessment of cryogenic sprays: modelling of cryogenic releases has been considered the extent of cryogenic pools on the process / hull deck of the FLNG however, high pressure releases in the liquefaction and refrigeration units are likely to result in sprays which may also threaten structures and personnel within the process modules. Assessment of this hazard should be completed in the next design stage.
• Assessment of escalation impact: A detailed analysis of escalation potential should be completed to determine the likelihood for impairment of equipment and structures leading to significant escalation of an initial event – e.g. a cargo tank fire or rupture of a riser. Such scenarios may threaten the integrity of the TR or the FPSO / FLNG and require an evacuation. Escalation may be caused by overpressure impact, fire engulfment for a sustained period or embrittlement of structures due to cryogenic impact. Escalation analysis can also be used to determine the benefit of fire, explosion and cryogenic spill protection for key structures.
• Position of refrigerant storage vessels: Sustained engulfment by fire of the refrigerant vessels will result in a BLEVE – generating significant overpressure and a large fireball (as shown in MAE N12). It is recommended that consideration is given to the position of the refrigerant storage vessels so that potential for escalation impact is minimised.
• Inclusion of SSIVs: modelling of riser failures on the FPSO have been completed assuming provision of SSIVs on the production and gas export riser. While modelling for the import gas riser at the NSH modelling is completed assuming no SSIV. It is recommended that assessment of the benefit of SSIV on the gas import riser at the NSH is completed – this would act to limit the release duration and hence lower the impact of escalation.
Ahmeyim/Guembeul Project Consequence Modelling
Contains private information Atkins Ahmeyim/Guembeul Project Consequence Modelling | Rev A3 | January 2018 | 5161164 185
7. References 1. Heat and Material Balance Phase 1A, BP Project Internal, MS002-PR-LST-010-03004 (Rev. A01), October
2017. 2. ACDS (1991), Major Hazard Aspects of the Transport of Dangerous Substances: Report and Appendices,
Advisory Committee on Dangerous Substances, H.M Stationery Office, HSE Books, 1991. 3. Pitblado, CCPS Paper Consequence of LNG Marine Incidents, Jun 18 2004. 4. SANDIA, Guidance on Risk Analysis and Safety Implications of a Large Liquefied Natural Gas (LNG) Spill
Over Water 2004. 5. CPR 18E - Guidelines for Quantitative Risk Assessment (‘Purple Book’), Publication Series on Dangerous
Substances (PGS 3), VROM, December 2005 6. Risk Study Guide, Ministry of the Environment and of Protection of Nature Department of Environment and
Classified Establishments, Republic of Senegal, October 2005

Contains private information

Ahmeyim/Guembeul Project Consequence Modelling
Contains private information Atkins Ahmeyim/Guembeul Project Consequence Modelling | Rev A3 | January 2018 | 5161164 187
Appendices
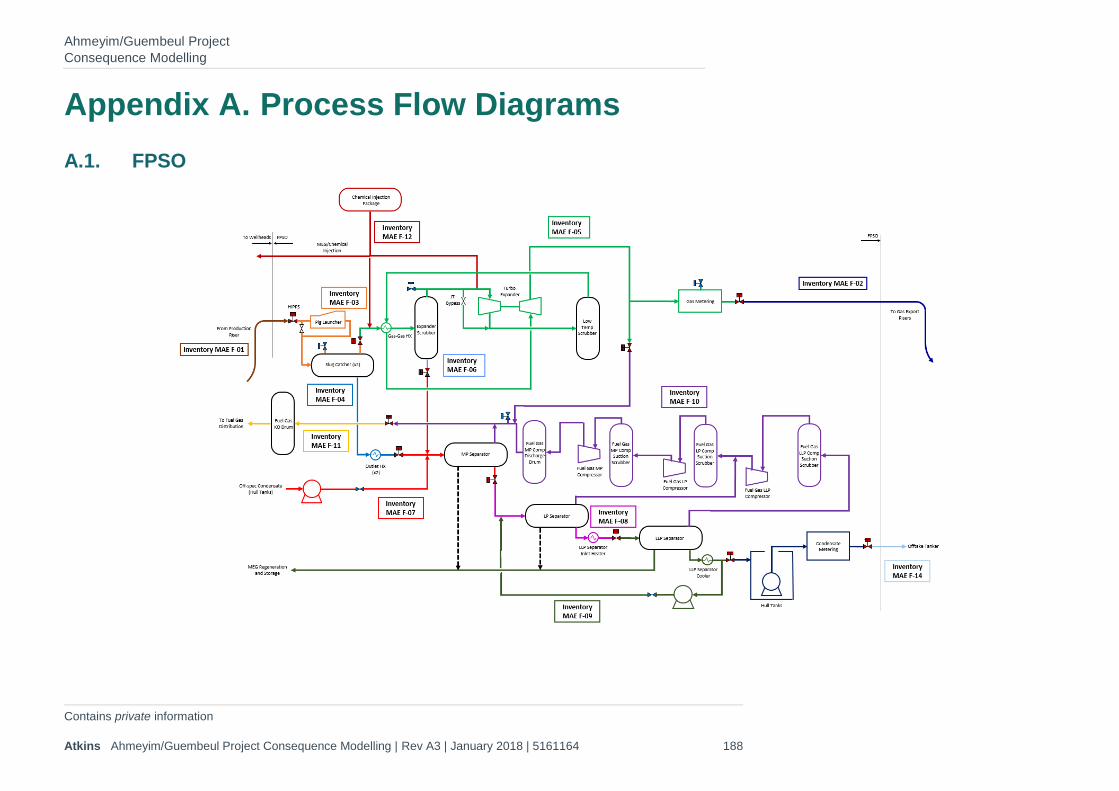
Ahmeyim/Guembeul Project Consequence Modelling
Contains private information Atkins Ahmeyim/Guembeul Project Consequence Modelling | Rev A3 | January 2018 | 5161164 188
Appendix A. Process Flow Diagrams A.1. FPSO
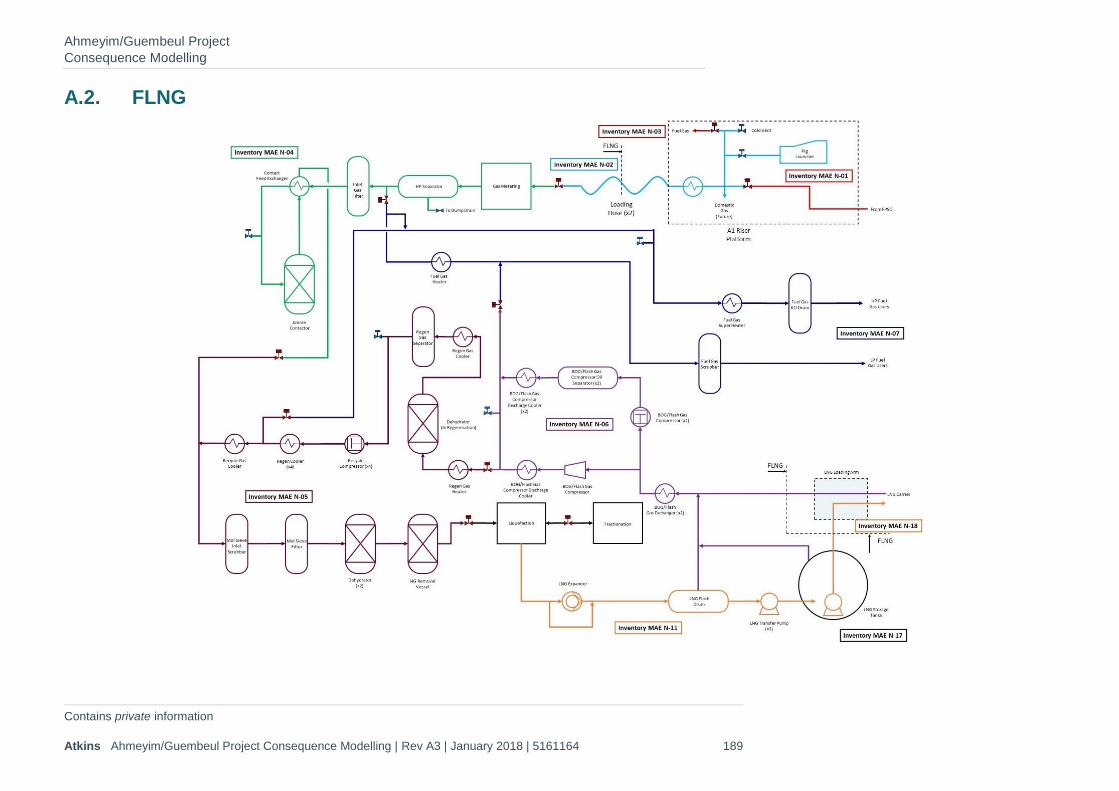
Ahmeyim/Guembeul Project Consequence Modelling
Contains private information Atkins Ahmeyim/Guembeul Project Consequence Modelling | Rev A3 | January 2018 | 5161164 189
A.2. FLNG
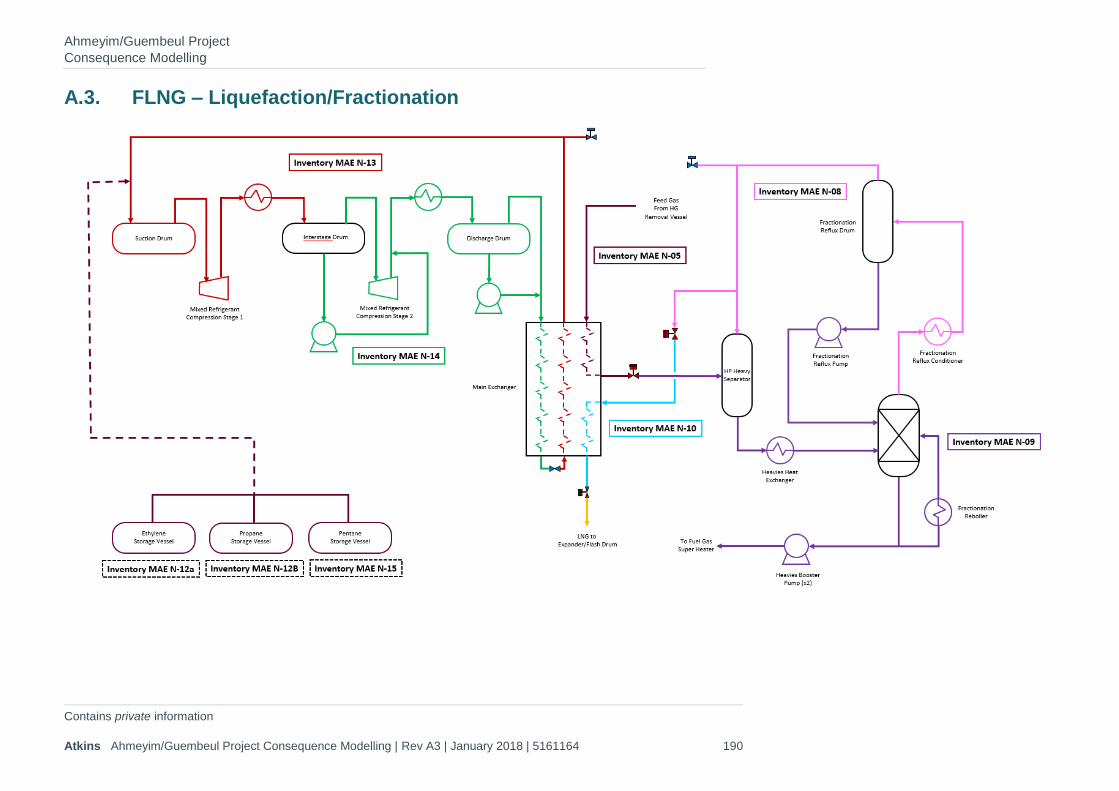
Ahmeyim/Guembeul Project Consequence Modelling
Contains private information Atkins Ahmeyim/Guembeul Project Consequence Modelling | Rev A3 | January 2018 | 5161164 190
A.3. FLNG – Liquefaction/Fractionation
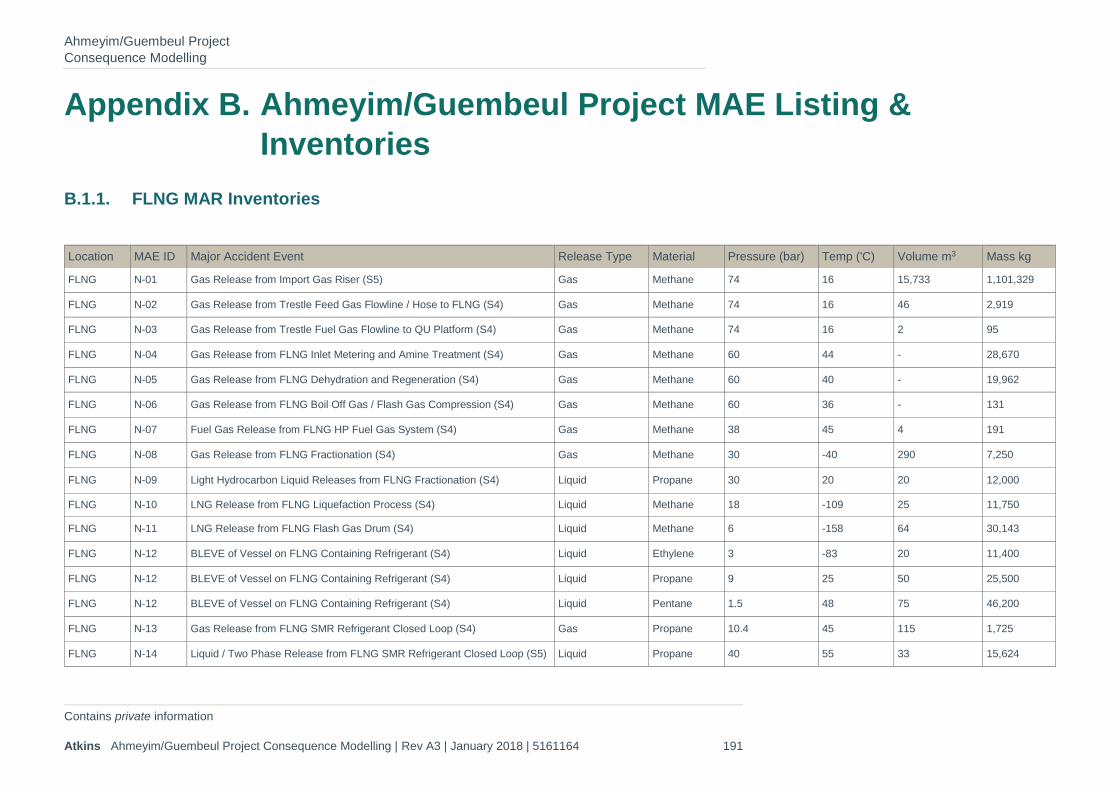
Ahmeyim/Guembeul Project Consequence Modelling
Contains private information Atkins Ahmeyim/Guembeul Project Consequence Modelling | Rev A3 | January 2018 | 5161164 191
Appendix B. Ahmeyim/Guembeul Project MAE Listing & Inventories
B.1.1. FLNG MAR Inventories
Location MAE ID Major Accident Event Release Type Material Pressure (bar) Temp ('C) Volume m3 Mass kg
FLNG N-01 Gas Release from Import Gas Riser (S5) Gas Methane 74 16 15,733 1,101,329
FLNG N-02 Gas Release from Trestle Feed Gas Flowline / Hose to FLNG (S4) Gas Methane 74 16 46 2,919
FLNG N-03 Gas Release from Trestle Fuel Gas Flowline to QU Platform (S4) Gas Methane 74 16 2 95
FLNG N-04 Gas Release from FLNG Inlet Metering and Amine Treatment (S4) Gas Methane 60 44 - 28,670
FLNG N-05 Gas Release from FLNG Dehydration and Regeneration (S4) Gas Methane 60 40 - 19,962
FLNG N-06 Gas Release from FLNG Boil Off Gas / Flash Gas Compression (S4) Gas Methane 60 36 - 131
FLNG N-07 Fuel Gas Release from FLNG HP Fuel Gas System (S4) Gas Methane 38 45 4 191
FLNG N-08 Gas Release from FLNG Fractionation (S4) Gas Methane 30 -40 290 7,250
FLNG N-09 Light Hydrocarbon Liquid Releases from FLNG Fractionation (S4) Liquid Propane 30 20 20 12,000
FLNG N-10 LNG Release from FLNG Liquefaction Process (S4) Liquid Methane 18 -109 25 11,750
FLNG N-11 LNG Release from FLNG Flash Gas Drum (S4) Liquid Methane 6 -158 64 30,143
FLNG N-12 BLEVE of Vessel on FLNG Containing Refrigerant (S4) Liquid Ethylene 3 -83 20 11,400
FLNG N-12 BLEVE of Vessel on FLNG Containing Refrigerant (S4) Liquid Propane 9 25 50 25,500
FLNG N-12 BLEVE of Vessel on FLNG Containing Refrigerant (S4) Liquid Pentane 1.5 48 75 46,200
FLNG N-13 Gas Release from FLNG SMR Refrigerant Closed Loop (S4) Gas Propane 10.4 45 115 1,725
FLNG N-14 Liquid / Two Phase Release from FLNG SMR Refrigerant Closed Loop (S5) Liquid Propane 40 55 33 15,624
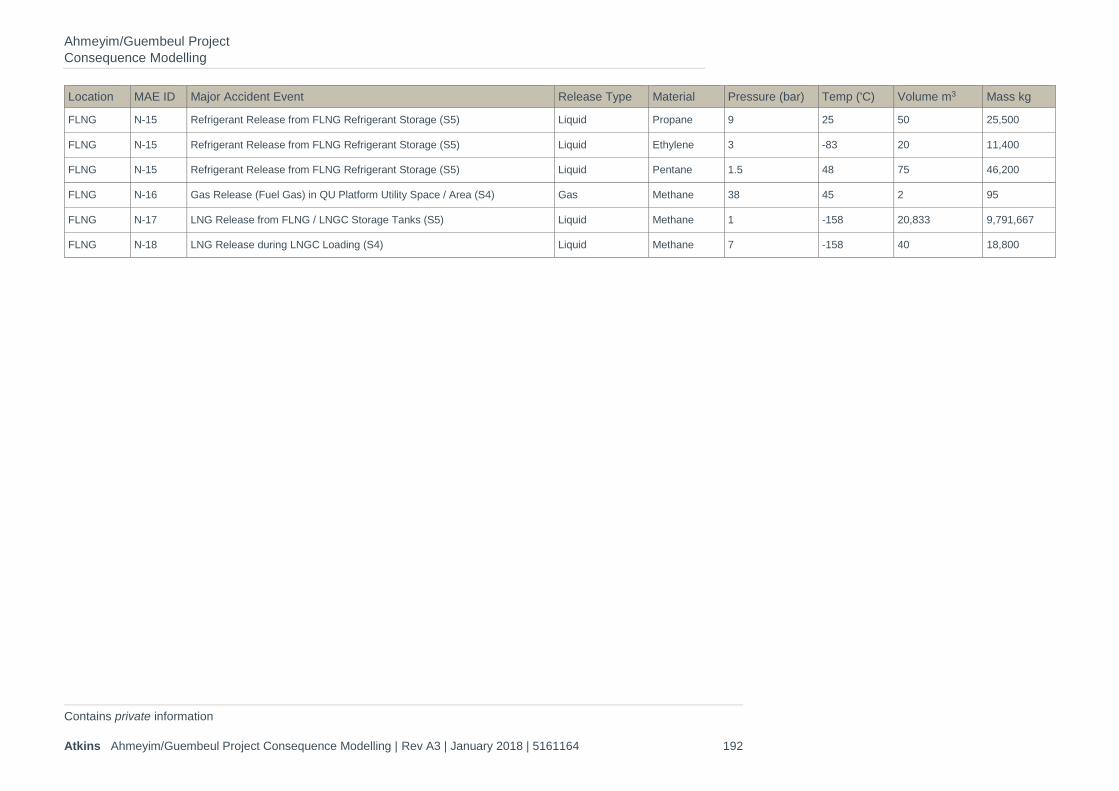
Ahmeyim/Guembeul Project Consequence Modelling
Contains private information Atkins Ahmeyim/Guembeul Project Consequence Modelling | Rev A3 | January 2018 | 5161164 192
Location MAE ID Major Accident Event Release Type Material Pressure (bar) Temp ('C) Volume m3 Mass kg
FLNG N-15 Refrigerant Release from FLNG Refrigerant Storage (S5) Liquid Propane 9 25 50 25,500
FLNG N-15 Refrigerant Release from FLNG Refrigerant Storage (S5) Liquid Ethylene 3 -83 20 11,400
FLNG N-15 Refrigerant Release from FLNG Refrigerant Storage (S5) Liquid Pentane 1.5 48 75 46,200
FLNG N-16 Gas Release (Fuel Gas) in QU Platform Utility Space / Area (S4) Gas Methane 38 45 2 95
FLNG N-17 LNG Release from FLNG / LNGC Storage Tanks (S5) Liquid Methane 1 -158 20,833 9,791,667
FLNG N-18 LNG Release during LNGC Loading (S4) Liquid Methane 7 -158 40 18,800
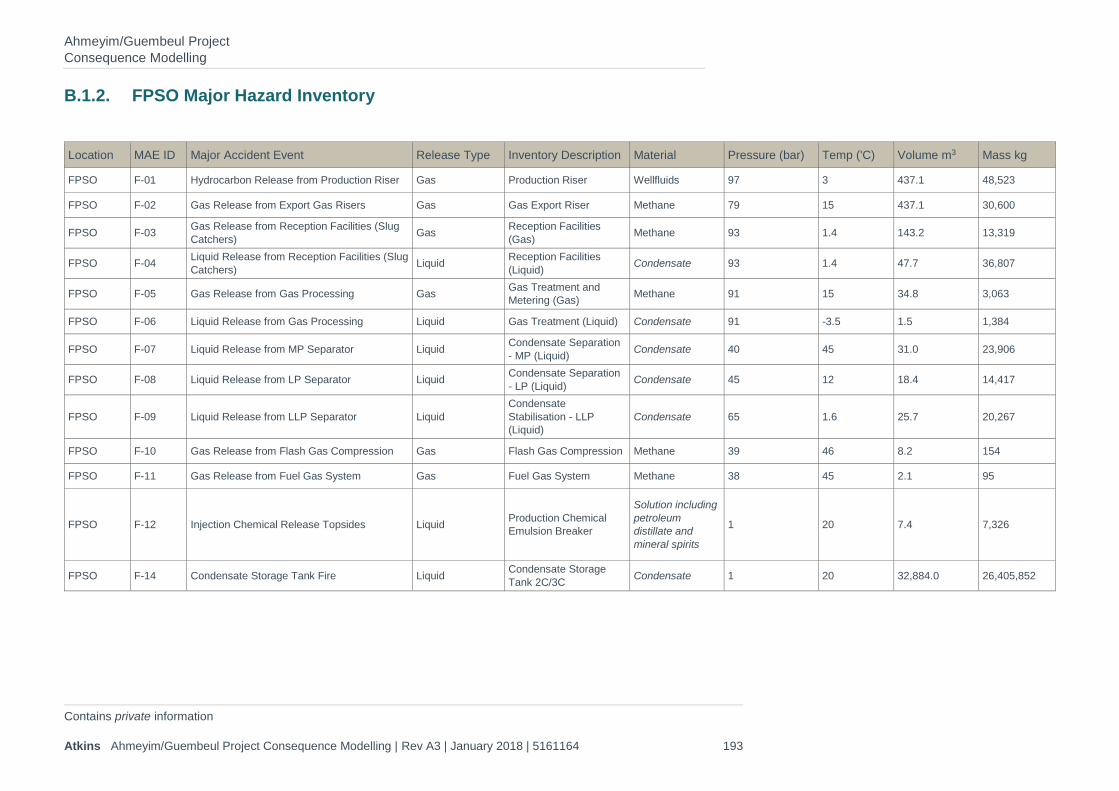
Ahmeyim/Guembeul Project Consequence Modelling
Contains private information Atkins Ahmeyim/Guembeul Project Consequence Modelling | Rev A3 | January 2018 | 5161164 193
B.1.2. FPSO Major Hazard Inventory
Location MAE ID Major Accident Event Release Type Inventory Description Material Pressure (bar) Temp ('C) Volume m3 Mass kg
FPSO F-01 Hydrocarbon Release from Production Riser Gas Production Riser Wellfluids 97 3 437.1 48,523
FPSO F-02 Gas Release from Export Gas Risers Gas Gas Export Riser Methane 79 15 437.1 30,600
FPSO F-03 Gas Release from Reception Facilities (Slug Catchers) Gas Reception Facilities
(Gas) Methane 93 1.4 143.2 13,319
FPSO F-04 Liquid Release from Reception Facilities (Slug Catchers) Liquid Reception Facilities
(Liquid) Condensate 93 1.4 47.7 36,807
FPSO F-05 Gas Release from Gas Processing Gas Gas Treatment and Metering (Gas) Methane 91 15 34.8 3,063
FPSO F-06 Liquid Release from Gas Processing Liquid Gas Treatment (Liquid) Condensate 91 -3.5 1.5 1,384
FPSO F-07 Liquid Release from MP Separator Liquid Condensate Separation - MP (Liquid) Condensate 40 45 31.0 23,906
FPSO F-08 Liquid Release from LP Separator Liquid Condensate Separation - LP (Liquid) Condensate 45 12 18.4 14,417
FPSO F-09 Liquid Release from LLP Separator Liquid Condensate Stabilisation - LLP (Liquid)
Condensate 65 1.6 25.7 20,267
FPSO F-10 Gas Release from Flash Gas Compression Gas Flash Gas Compression Methane 39 46 8.2 154
FPSO F-11 Gas Release from Fuel Gas System Gas Fuel Gas System Methane 38 45 2.1 95
FPSO F-12 Injection Chemical Release Topsides Liquid Production Chemical Emulsion Breaker
Solution including
petroleum
distillate and
mineral spirits
1 20 7.4 7,326
FPSO F-14 Condensate Storage Tank Fire Liquid Condensate Storage Tank 2C/3C Condensate 1 20 32,884.0 26,405,852

© Atkins Ltd except where stated otherwise. The Atkins logo, ‘Carbon Critical Design’ and the strapline ‘Plan Design Enable’ are trademarks of Atkins Ltd.
ESIA FOR THE GREATER TORTUE/AHMEYIM PHASE 1 GAS PRODUCTION PROJECT
Ref. No.: 1653939
APPENDIX O RISK STUDY SUPPORT MATERIAL
ESIA FOR THE GREATER TORTUE/AHMEYIM PHASE 1 GAS PRODUCTION PROJECT
Ref. No.: 1653939
Appendix O Risk Study Support Material
APPENDIX CONTENTS
O-1 Provisional Listing of Hazardous Substances and Materials
O-2 Preliminary Risk Analysis Worksheets
O-3 Bowtie Diagrams (Severity Ranking 4)
O-4 Occupational Risk Analysis Worksheets
O-5 Fault/Event Tree Bowtie Approach Example (D-01 Blowout or Well Release)
ESIA FOR THE GREATER TORTUE/AHMEYIM PHASE 1 GAS PRODUCTION PROJECT
Ref. No.: 1653939
APPENDIX O-1 : PROVISIONAL LISTING OF HAZARDOUS SUBSTANCES AND MATERIALS
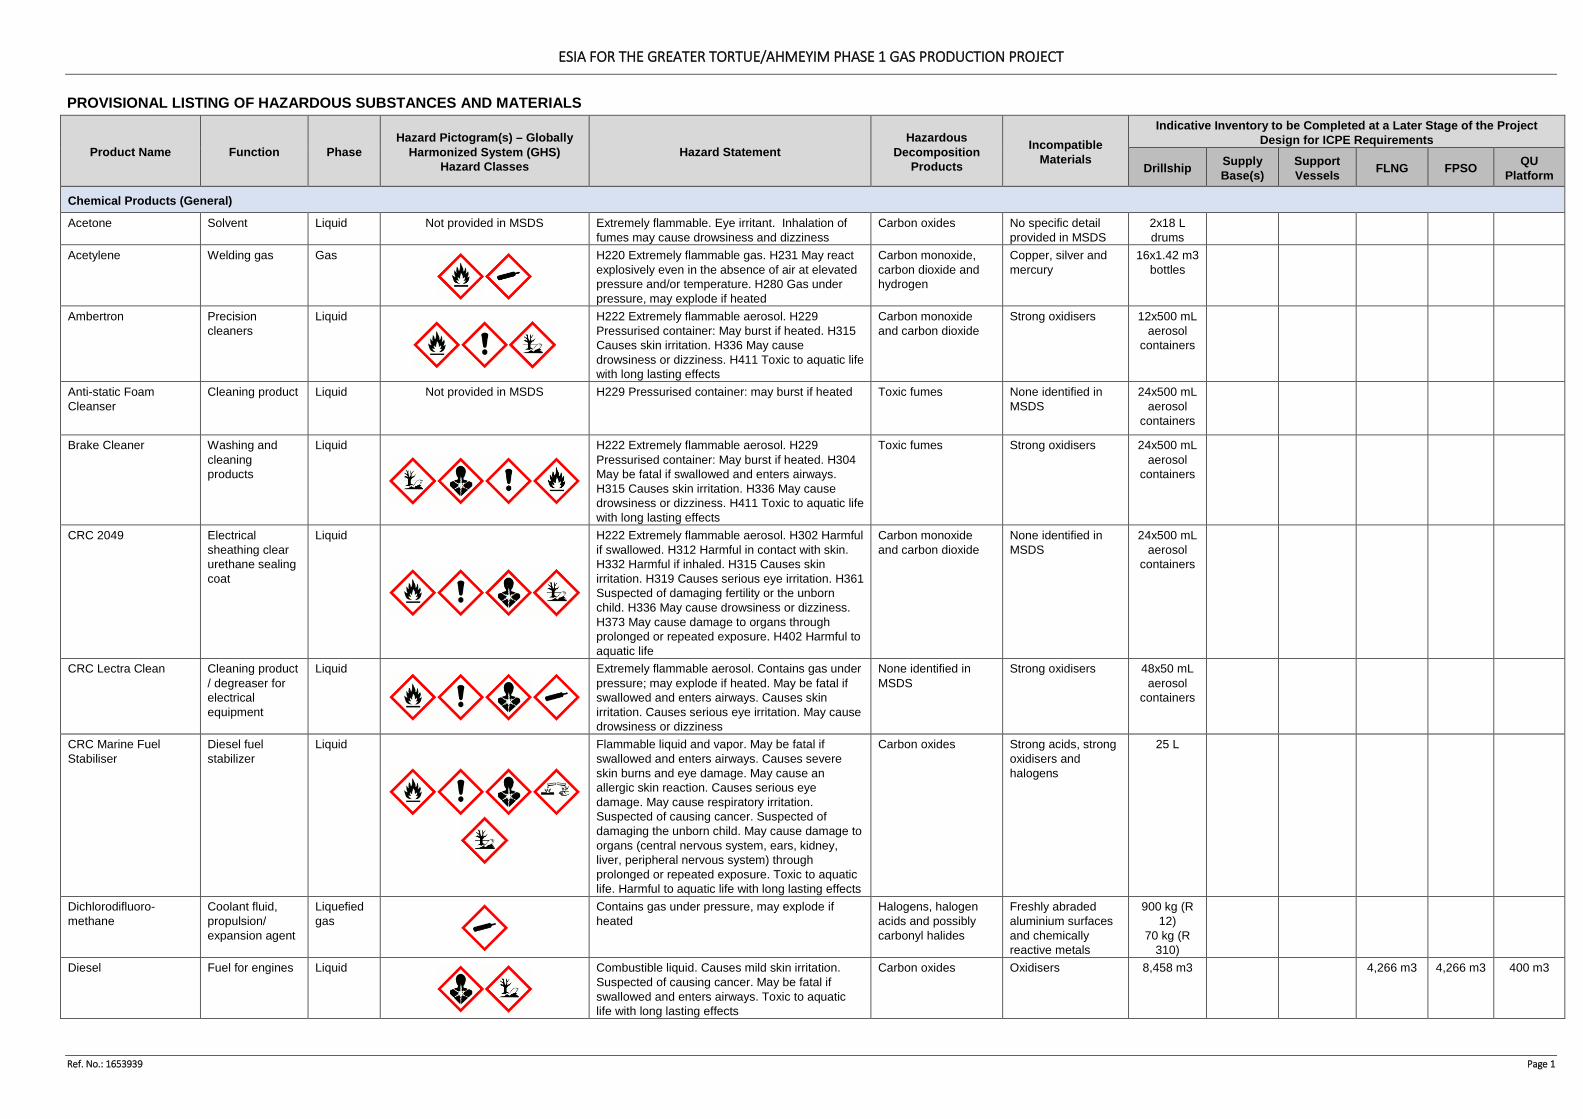
ESIA FOR THE GREATER TORTUE/AHMEYIM PHASE 1 GAS PRODUCTION PROJECT
Ref. No.: 1653939 Page 1
PROVISIONAL LISTING OF HAZARDOUS SUBSTANCES AND MATERIALS
Product Name Function Phase Hazard Pictogram(s) – Globally
Harmonized System (GHS) Hazard Classes
Hazard Statement Hazardous
Decomposition Products
Incompatible Materials
Indicative Inventory to be Completed at a Later Stage of the Project Design for ICPE Requirements
Drillship Supply Base(s)
Support Vessels FLNG FPSO QU
Platform
Chemical Products (General)
Acetone Solvent Liquid Not provided in MSDS Extremely flammable. Eye irritant. Inhalation of fumes may cause drowsiness and dizziness
Carbon oxides No specific detail provided in MSDS
2x18 L drums
Acetylene Welding gas Gas
H220 Extremely flammable gas. H231 May react explosively even in the absence of air at elevated pressure and/or temperature. H280 Gas under pressure, may explode if heated
Carbon monoxide, carbon dioxide and hydrogen
Copper, silver and mercury
16x1.42 m3 bottles
Ambertron Precision cleaners
Liquid
H222 Extremely flammable aerosol. H229 Pressurised container: May burst if heated. H315 Causes skin irritation. H336 May cause drowsiness or dizziness. H411 Toxic to aquatic life with long lasting effects
Carbon monoxide and carbon dioxide
Strong oxidisers 12x500 mL aerosol
containers
Anti-static Foam Cleanser
Cleaning product Liquid Not provided in MSDS H229 Pressurised container: may burst if heated Toxic fumes None identified in MSDS
24x500 mL aerosol
containers
Brake Cleaner Washing and cleaning products
Liquid
H222 Extremely flammable aerosol. H229 Pressurised container: May burst if heated. H304 May be fatal if swallowed and enters airways. H315 Causes skin irritation. H336 May cause drowsiness or dizziness. H411 Toxic to aquatic life with long lasting effects
Toxic fumes Strong oxidisers 24x500 mL aerosol
containers
CRC 2049 Electrical sheathing clear urethane sealing coat
Liquid
H222 Extremely flammable aerosol. H302 Harmful if swallowed. H312 Harmful in contact with skin. H332 Harmful if inhaled. H315 Causes skin irritation. H319 Causes serious eye irritation. H361 Suspected of damaging fertility or the unborn child. H336 May cause drowsiness or dizziness. H373 May cause damage to organs through prolonged or repeated exposure. H402 Harmful to aquatic life
Carbon monoxide and carbon dioxide
None identified in MSDS
24x500 mL aerosol
containers
CRC Lectra Clean Cleaning product / degreaser for electrical equipment
Liquid
Extremely flammable aerosol. Contains gas under pressure; may explode if heated. May be fatal if swallowed and enters airways. Causes skin irritation. Causes serious eye irritation. May cause drowsiness or dizziness
None identified in MSDS
Strong oxidisers 48x50 mL aerosol
containers
CRC Marine Fuel Stabiliser
Diesel fuel stabilizer
Liquid
Flammable liquid and vapor. May be fatal if swallowed and enters airways. Causes severe skin burns and eye damage. May cause an allergic skin reaction. Causes serious eye damage. May cause respiratory irritation. Suspected of causing cancer. Suspected of damaging the unborn child. May cause damage to organs (central nervous system, ears, kidney, liver, peripheral nervous system) through prolonged or repeated exposure. Toxic to aquatic life. Harmful to aquatic life with long lasting effects
Carbon oxides Strong acids, strong oxidisers and halogens
25 L
Dichlorodifluoro-methane
Coolant fluid, propulsion/ expansion agent
Liquefied gas
Contains gas under pressure, may explode if heated
Halogens, halogen acids and possibly carbonyl halides
Freshly abraded aluminium surfaces and chemically reactive metals
900 kg (R 12)
70 kg (R 310)
Diesel Fuel for engines Liquid
Combustible liquid. Causes mild skin irritation. Suspected of causing cancer. May be fatal if swallowed and enters airways. Toxic to aquatic life with long lasting effects
Carbon oxides Oxidisers
8,458 m3 4,266 m3 4,266 m3 400 m3
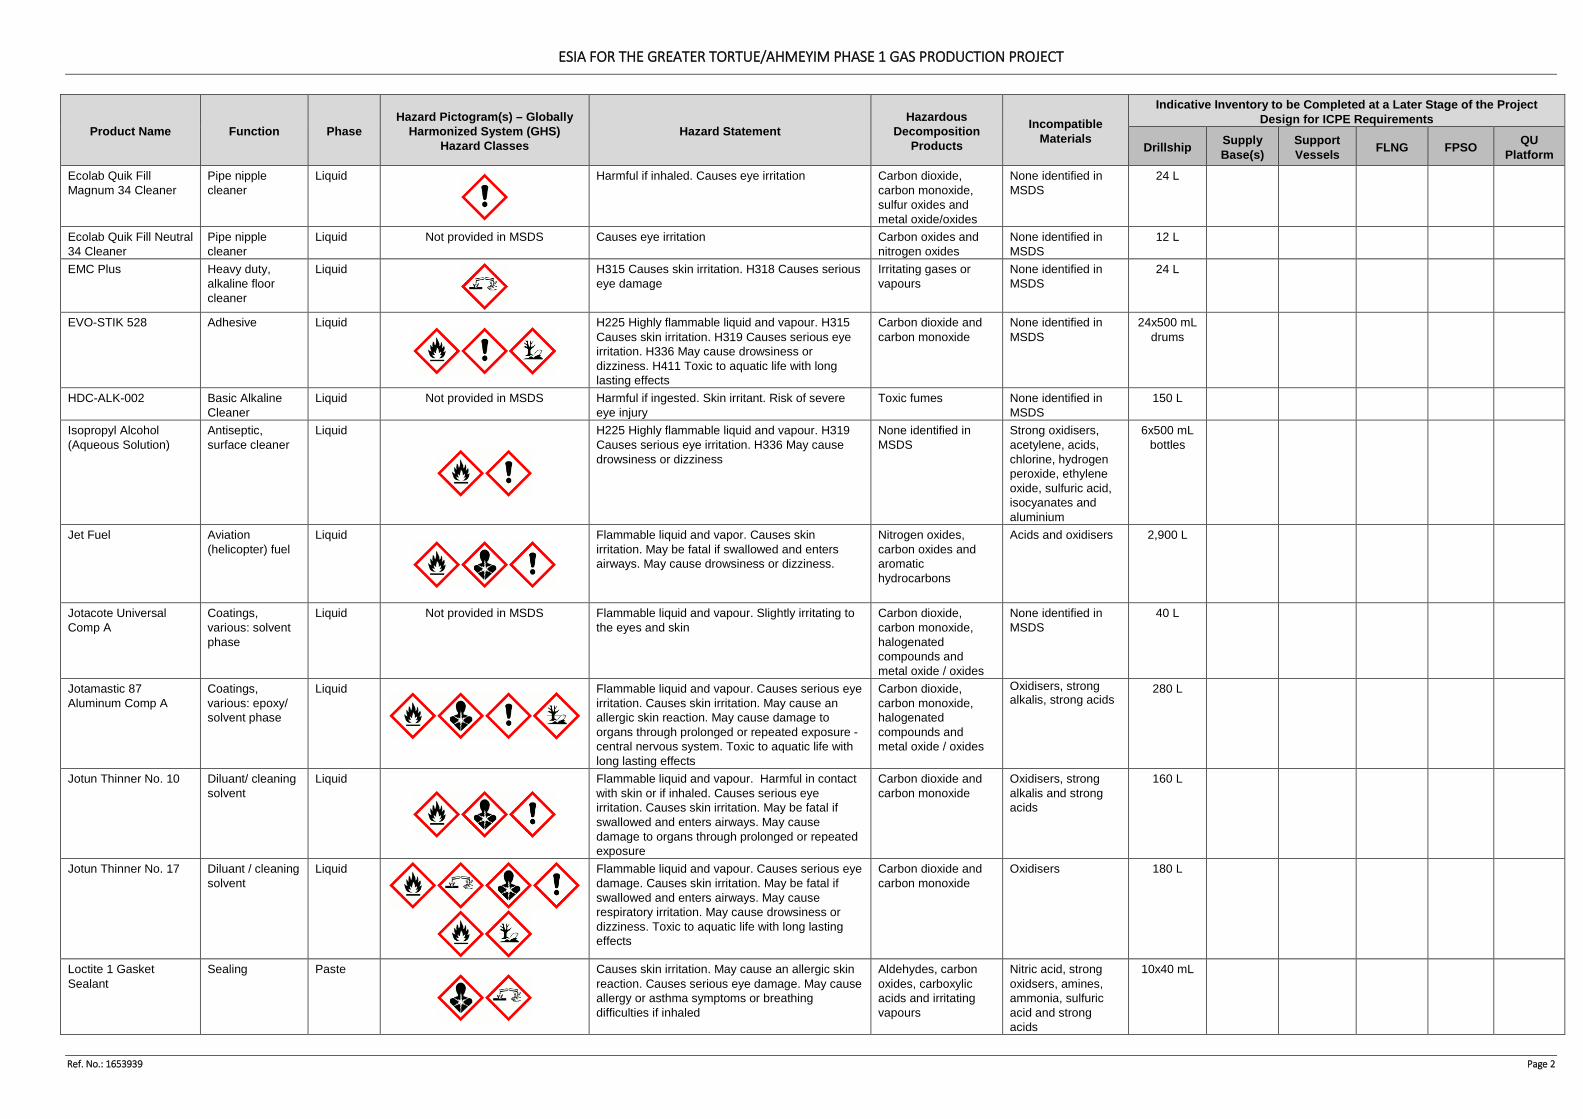
ESIA FOR THE GREATER TORTUE/AHMEYIM PHASE 1 GAS PRODUCTION PROJECT
Ref. No.: 1653939 Page 2
Product Name Function Phase Hazard Pictogram(s) – Globally
Harmonized System (GHS) Hazard Classes
Hazard Statement Hazardous
Decomposition Products
Incompatible Materials
Indicative Inventory to be Completed at a Later Stage of the Project Design for ICPE Requirements
Drillship Supply Base(s)
Support Vessels FLNG FPSO QU
Platform Ecolab Quik Fill Magnum 34 Cleaner
Pipe nipple cleaner
Liquid
Harmful if inhaled. Causes eye irritation Carbon dioxide, carbon monoxide, sulfur oxides and metal oxide/oxides
None identified in MSDS
24 L
Ecolab Quik Fill Neutral 34 Cleaner
Pipe nipple cleaner
Liquid Not provided in MSDS Causes eye irritation Carbon oxides and nitrogen oxides
None identified in MSDS
12 L
EMC Plus Heavy duty, alkaline floor cleaner
Liquid
H315 Causes skin irritation. H318 Causes serious eye damage
Irritating gases or vapours
None identified in MSDS
24 L
EVO-STIK 528 Adhesive Liquid
H225 Highly flammable liquid and vapour. H315 Causes skin irritation. H319 Causes serious eye irritation. H336 May cause drowsiness or dizziness. H411 Toxic to aquatic life with long lasting effects
Carbon dioxide and carbon monoxide
None identified in MSDS
24x500 mL drums
HDC-ALK-002 Basic Alkaline Cleaner
Liquid Not provided in MSDS Harmful if ingested. Skin irritant. Risk of severe eye injury
Toxic fumes None identified in MSDS
150 L
Isopropyl Alcohol (Aqueous Solution)
Antiseptic, surface cleaner
Liquid
H225 Highly flammable liquid and vapour. H319 Causes serious eye irritation. H336 May cause drowsiness or dizziness
None identified in MSDS
Strong oxidisers, acetylene, acids, chlorine, hydrogen peroxide, ethylene oxide, sulfuric acid, isocyanates and aluminium
6x500 mL bottles
Jet Fuel Aviation (helicopter) fuel
Liquid
Flammable liquid and vapor. Causes skin irritation. May be fatal if swallowed and enters airways. May cause drowsiness or dizziness.
Nitrogen oxides, carbon oxides and aromatic hydrocarbons
Acids and oxidisers
2,900 L
Jotacote Universal Comp A
Coatings, various: solvent phase
Liquid Not provided in MSDS Flammable liquid and vapour. Slightly irritating to the eyes and skin
Carbon dioxide, carbon monoxide, halogenated compounds and metal oxide / oxides
None identified in MSDS
40 L
Jotamastic 87 Aluminum Comp A
Coatings, various: epoxy/ solvent phase
Liquid
Flammable liquid and vapour. Causes serious eye irritation. Causes skin irritation. May cause an allergic skin reaction. May cause damage to organs through prolonged or repeated exposure - central nervous system. Toxic to aquatic life with long lasting effects
Carbon dioxide, carbon monoxide, halogenated compounds and metal oxide / oxides
Oxidisers, strong alkalis, strong acids
280 L
Jotun Thinner No. 10
Diluant/ cleaning solvent
Liquid
Flammable liquid and vapour. Harmful in contact with skin or if inhaled. Causes serious eye irritation. Causes skin irritation. May be fatal if swallowed and enters airways. May cause damage to organs through prolonged or repeated exposure
Carbon dioxide and carbon monoxide
Oxidisers, strong alkalis and strong acids
160 L
Jotun Thinner No. 17 Diluant / cleaning solvent
Liquid
Flammable liquid and vapour. Causes serious eye damage. Causes skin irritation. May be fatal if swallowed and enters airways. May cause respiratory irritation. May cause drowsiness or dizziness. Toxic to aquatic life with long lasting effects
Carbon dioxide and carbon monoxide
Oxidisers 180 L
Loctite 1 Gasket Sealant
Sealing Paste
Causes skin irritation. May cause an allergic skin reaction. Causes serious eye damage. May cause allergy or asthma symptoms or breathing difficulties if inhaled
Aldehydes, carbon oxides, carboxylic acids and irritating vapours
Nitric acid, strong oxidsers, amines, ammonia, sulfuric acid and strong acids
10x40 mL
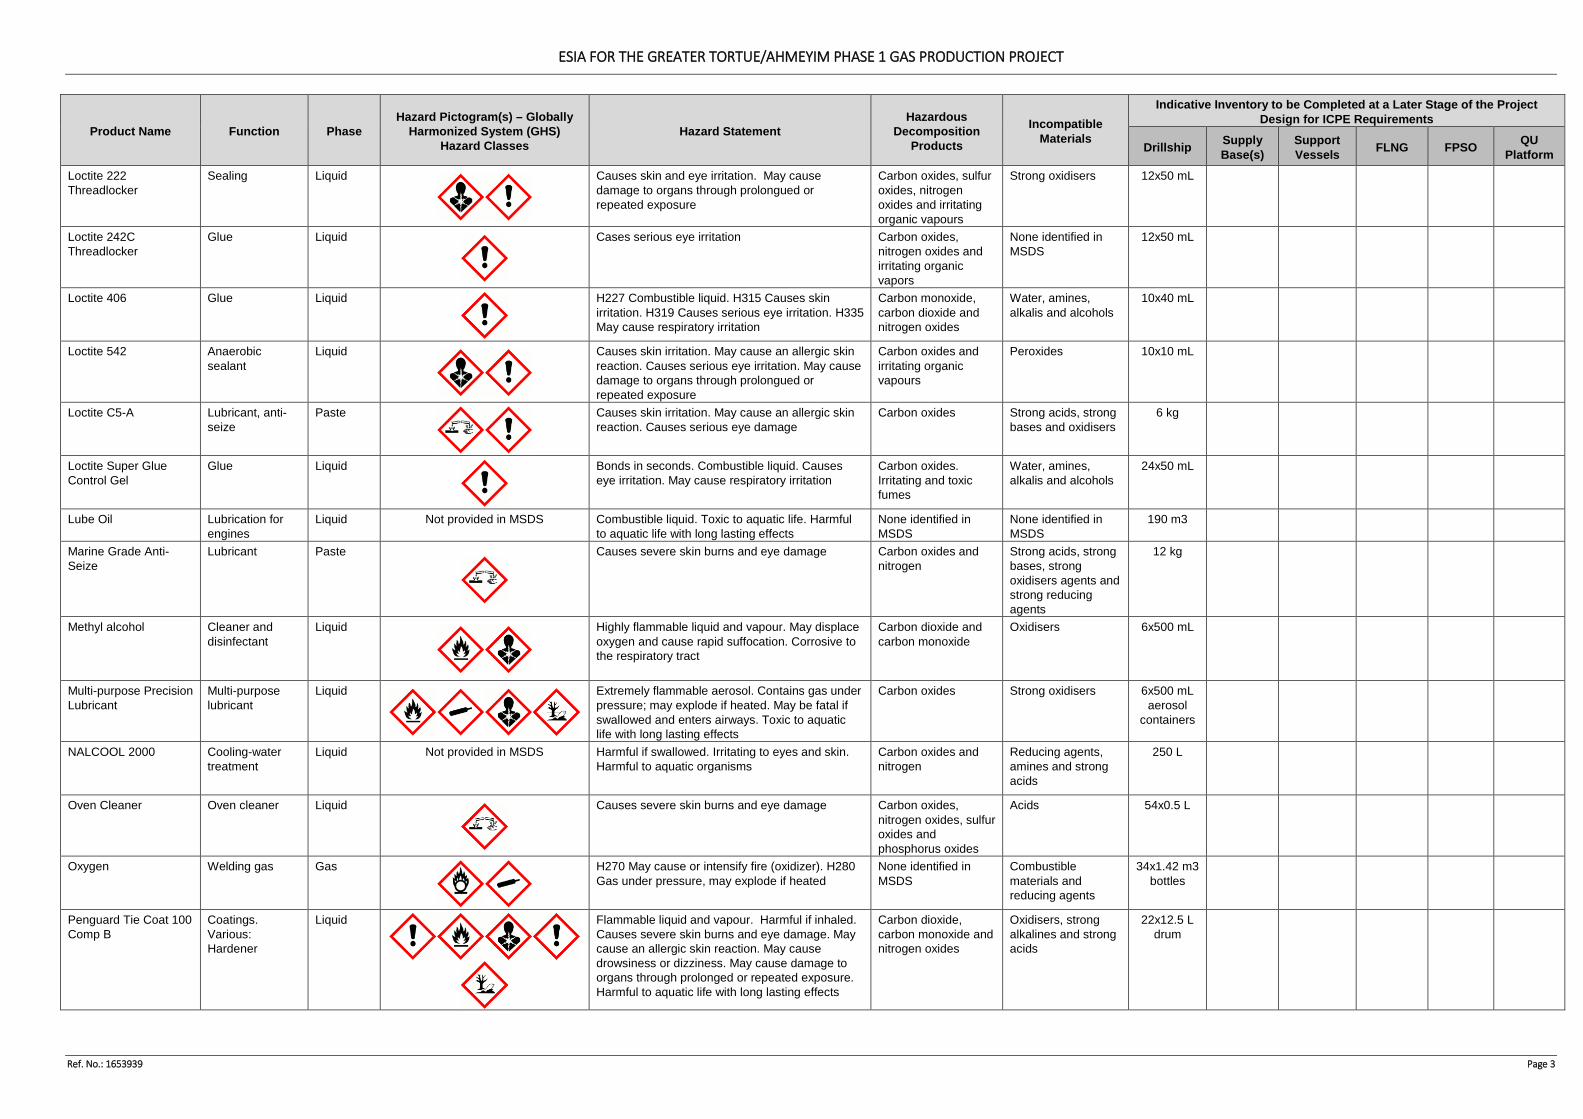
ESIA FOR THE GREATER TORTUE/AHMEYIM PHASE 1 GAS PRODUCTION PROJECT
Ref. No.: 1653939 Page 3
Product Name Function Phase Hazard Pictogram(s) – Globally
Harmonized System (GHS) Hazard Classes
Hazard Statement Hazardous
Decomposition Products
Incompatible Materials
Indicative Inventory to be Completed at a Later Stage of the Project Design for ICPE Requirements
Drillship Supply Base(s)
Support Vessels FLNG FPSO QU
Platform Loctite 222 Threadlocker
Sealing Liquid
Causes skin and eye irritation. May cause damage to organs through prolongued or repeated exposure
Carbon oxides, sulfur oxides, nitrogen oxides and irritating organic vapours
Strong oxidisers 12x50 mL
Loctite 242C Threadlocker
Glue Liquid
Cases serious eye irritation
Carbon oxides, nitrogen oxides and irritating organic vapors
None identified in MSDS
12x50 mL
Loctite 406 Glue Liquid
H227 Combustible liquid. H315 Causes skin irritation. H319 Causes serious eye irritation. H335 May cause respiratory irritation
Carbon monoxide, carbon dioxide and nitrogen oxides
Water, amines, alkalis and alcohols
10x40 mL
Loctite 542 Anaerobic sealant
Liquid
Causes skin irritation. May cause an allergic skin reaction. Causes serious eye irritation. May cause damage to organs through prolongued or repeated exposure
Carbon oxides and irritating organic vapours
Peroxides 10x10 mL
Loctite C5-A Lubricant, anti-seize
Paste
Causes skin irritation. May cause an allergic skin reaction. Causes serious eye damage
Carbon oxides Strong acids, strong bases and oxidisers
6 kg
Loctite Super Glue Control Gel
Glue Liquid
Bonds in seconds. Combustible liquid. Causes eye irritation. May cause respiratory irritation
Carbon oxides. Irritating and toxic fumes
Water, amines, alkalis and alcohols
24x50 mL
Lube Oil Lubrication for engines
Liquid Not provided in MSDS Combustible liquid. Toxic to aquatic life. Harmful to aquatic life with long lasting effects
None identified in MSDS
None identified in MSDS
190 m3
Marine Grade Anti-Seize
Lubricant Paste
Causes severe skin burns and eye damage Carbon oxides and nitrogen
Strong acids, strong bases, strong oxidisers agents and strong reducing agents
12 kg
Methyl alcohol Cleaner and disinfectant
Liquid
Highly flammable liquid and vapour. May displace oxygen and cause rapid suffocation. Corrosive to the respiratory tract
Carbon dioxide and carbon monoxide
Oxidisers 6x500 mL
Multi-purpose Precision Lubricant
Multi-purpose lubricant
Liquid
Extremely flammable aerosol. Contains gas under pressure; may explode if heated. May be fatal if swallowed and enters airways. Toxic to aquatic life with long lasting effects
Carbon oxides Strong oxidisers 6x500 mL aerosol
containers
NALCOOL 2000 Cooling-water treatment
Liquid Not provided in MSDS Harmful if swallowed. Irritating to eyes and skin. Harmful to aquatic organisms
Carbon oxides and nitrogen
Reducing agents, amines and strong acids
250 L
Oven Cleaner Oven cleaner Liquid
Causes severe skin burns and eye damage Carbon oxides, nitrogen oxides, sulfur oxides and phosphorus oxides
Acids 54x0.5 L
Oxygen Welding gas Gas
H270 May cause or intensify fire (oxidizer). H280 Gas under pressure, may explode if heated
None identified in MSDS
Combustible materials and reducing agents
34x1.42 m3 bottles
Penguard Tie Coat 100 Comp B
Coatings. Various: Hardener
Liquid
Flammable liquid and vapour. Harmful if inhaled. Causes severe skin burns and eye damage. May cause an allergic skin reaction. May cause drowsiness or dizziness. May cause damage to organs through prolonged or repeated exposure. Harmful to aquatic life with long lasting effects
Carbon dioxide, carbon monoxide and nitrogen oxides
Oxidisers, strong alkalines and strong acids
22x12.5 L drum
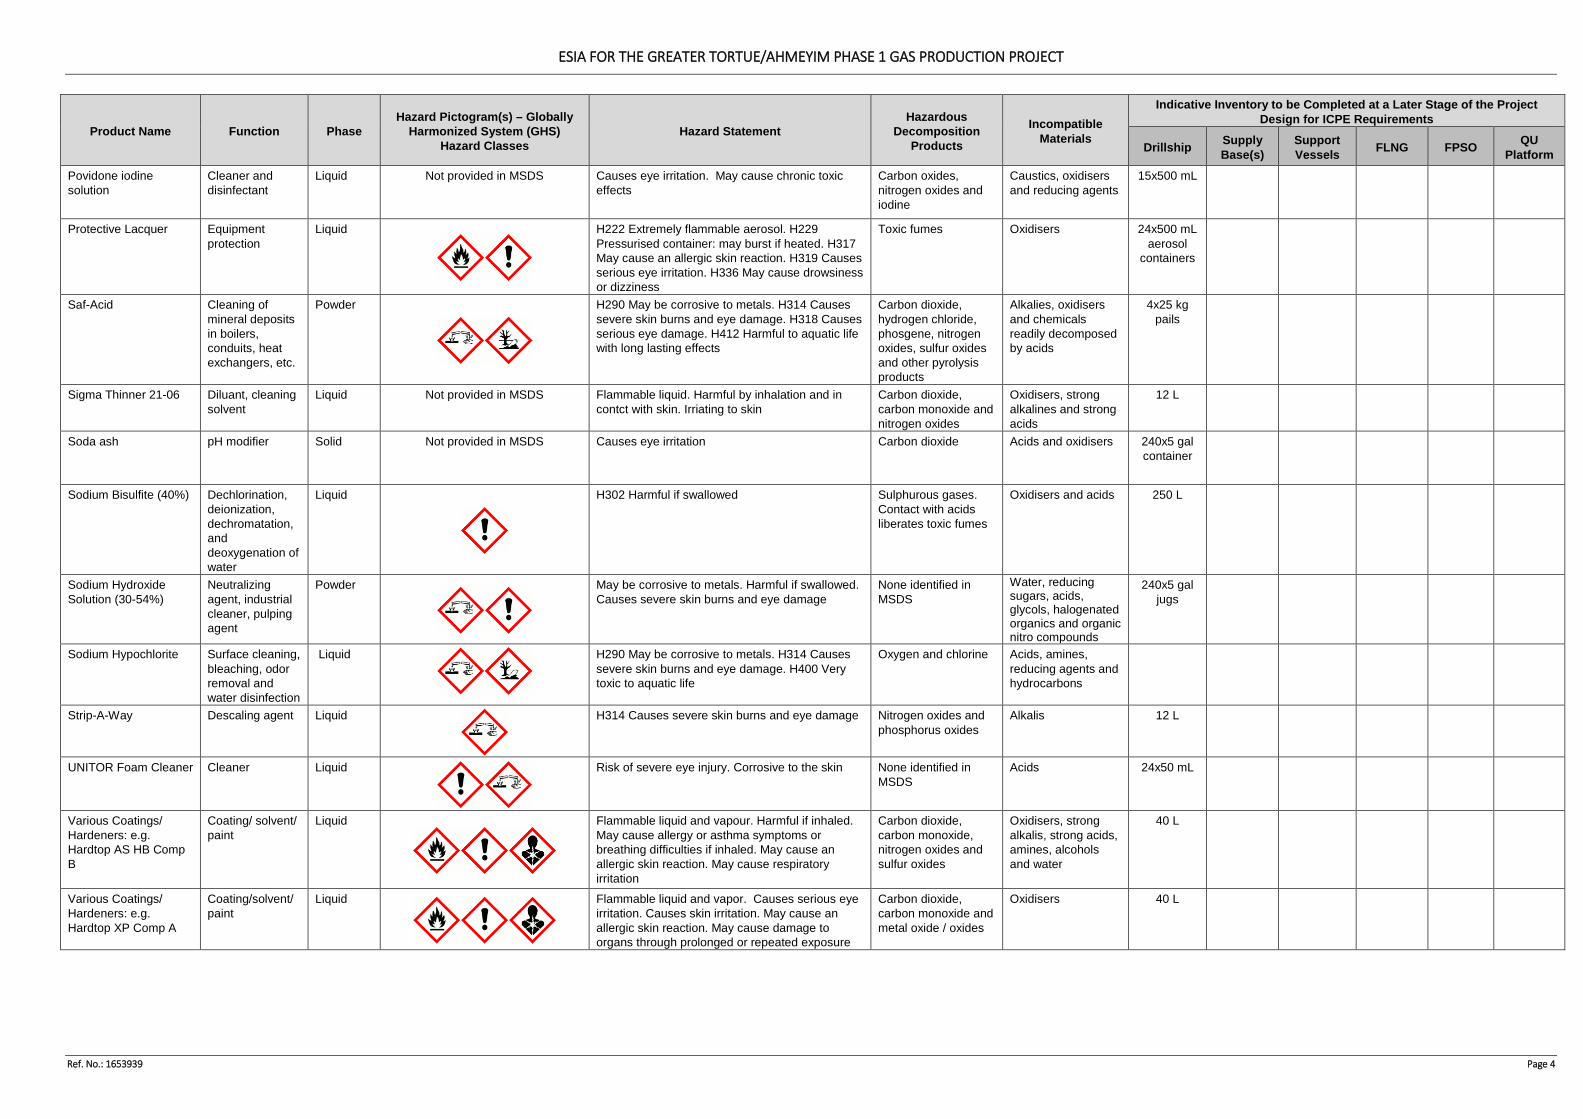
ESIA FOR THE GREATER TORTUE/AHMEYIM PHASE 1 GAS PRODUCTION PROJECT
Ref. No.: 1653939 Page 4
Product Name Function Phase Hazard Pictogram(s) – Globally
Harmonized System (GHS) Hazard Classes
Hazard Statement Hazardous
Decomposition Products
Incompatible Materials
Indicative Inventory to be Completed at a Later Stage of the Project Design for ICPE Requirements
Drillship Supply Base(s)
Support Vessels FLNG FPSO QU
Platform Povidone iodine solution
Cleaner and disinfectant
Liquid Not provided in MSDS Causes eye irritation. May cause chronic toxic effects
Carbon oxides, nitrogen oxides and iodine
Caustics, oxidisers and reducing agents
15x500 mL
Protective Lacquer Equipment protection
Liquid
H222 Extremely flammable aerosol. H229 Pressurised container: may burst if heated. H317 May cause an allergic skin reaction. H319 Causes serious eye irritation. H336 May cause drowsiness or dizziness
Toxic fumes Oxidisers 24x500 mL aerosol
containers
Saf-Acid Cleaning of mineral deposits in boilers, conduits, heat exchangers, etc.
Powder
H290 May be corrosive to metals. H314 Causes severe skin burns and eye damage. H318 Causes serious eye damage. H412 Harmful to aquatic life with long lasting effects
Carbon dioxide, hydrogen chloride, phosgene, nitrogen oxides, sulfur oxides and other pyrolysis products
Alkalies, oxidisers and chemicals readily decomposed by acids
4x25 kg pails
Sigma Thinner 21-06 Diluant, cleaning solvent
Liquid Not provided in MSDS Flammable liquid. Harmful by inhalation and in contct with skin. Irriating to skin
Carbon dioxide, carbon monoxide and nitrogen oxides
Oxidisers, strong alkalines and strong acids
12 L
Soda ash pH modifier Solid Not provided in MSDS Causes eye irritation Carbon dioxide Acids and oxidisers 240x5 gal container
Sodium Bisulfite (40%) Dechlorination, deionization, dechromatation, and deoxygenation of water
Liquid
H302 Harmful if swallowed Sulphurous gases. Contact with acids liberates toxic fumes
Oxidisers and acids 250 L
Sodium Hydroxide Solution (30-54%)
Neutralizing agent, industrial cleaner, pulping agent
Powder
May be corrosive to metals. Harmful if swallowed. Causes severe skin burns and eye damage
None identified in MSDS
Water, reducing sugars, acids, glycols, halogenated organics and organic nitro compounds
240x5 gal jugs
Sodium Hypochlorite Surface cleaning, bleaching, odor removal and water disinfection
Liquid
H290 May be corrosive to metals. H314 Causes severe skin burns and eye damage. H400 Very toxic to aquatic life
Oxygen and chlorine Acids, amines, reducing agents and hydrocarbons
Strip-A-Way Descaling agent Liquid
H314 Causes severe skin burns and eye damage Nitrogen oxides and phosphorus oxides
Alkalis 12 L
UNITOR Foam Cleaner Cleaner Liquid
Risk of severe eye injury. Corrosive to the skin None identified in MSDS
Acids 24x50 mL
Various Coatings/ Hardeners: e.g. Hardtop AS HB Comp B
Coating/ solvent/ paint
Liquid
Flammable liquid and vapour. Harmful if inhaled. May cause allergy or asthma symptoms or breathing difficulties if inhaled. May cause an allergic skin reaction. May cause respiratory irritation
Carbon dioxide, carbon monoxide, nitrogen oxides and sulfur oxides
Oxidisers, strong alkalis, strong acids, amines, alcohols and water
40 L
Various Coatings/ Hardeners: e.g. Hardtop XP Comp A
Coating/solvent/ paint
Liquid
Flammable liquid and vapor. Causes serious eye irritation. Causes skin irritation. May cause an allergic skin reaction. May cause damage to organs through prolonged or repeated exposure
Carbon dioxide, carbon monoxide and metal oxide / oxides
Oxidisers 40 L
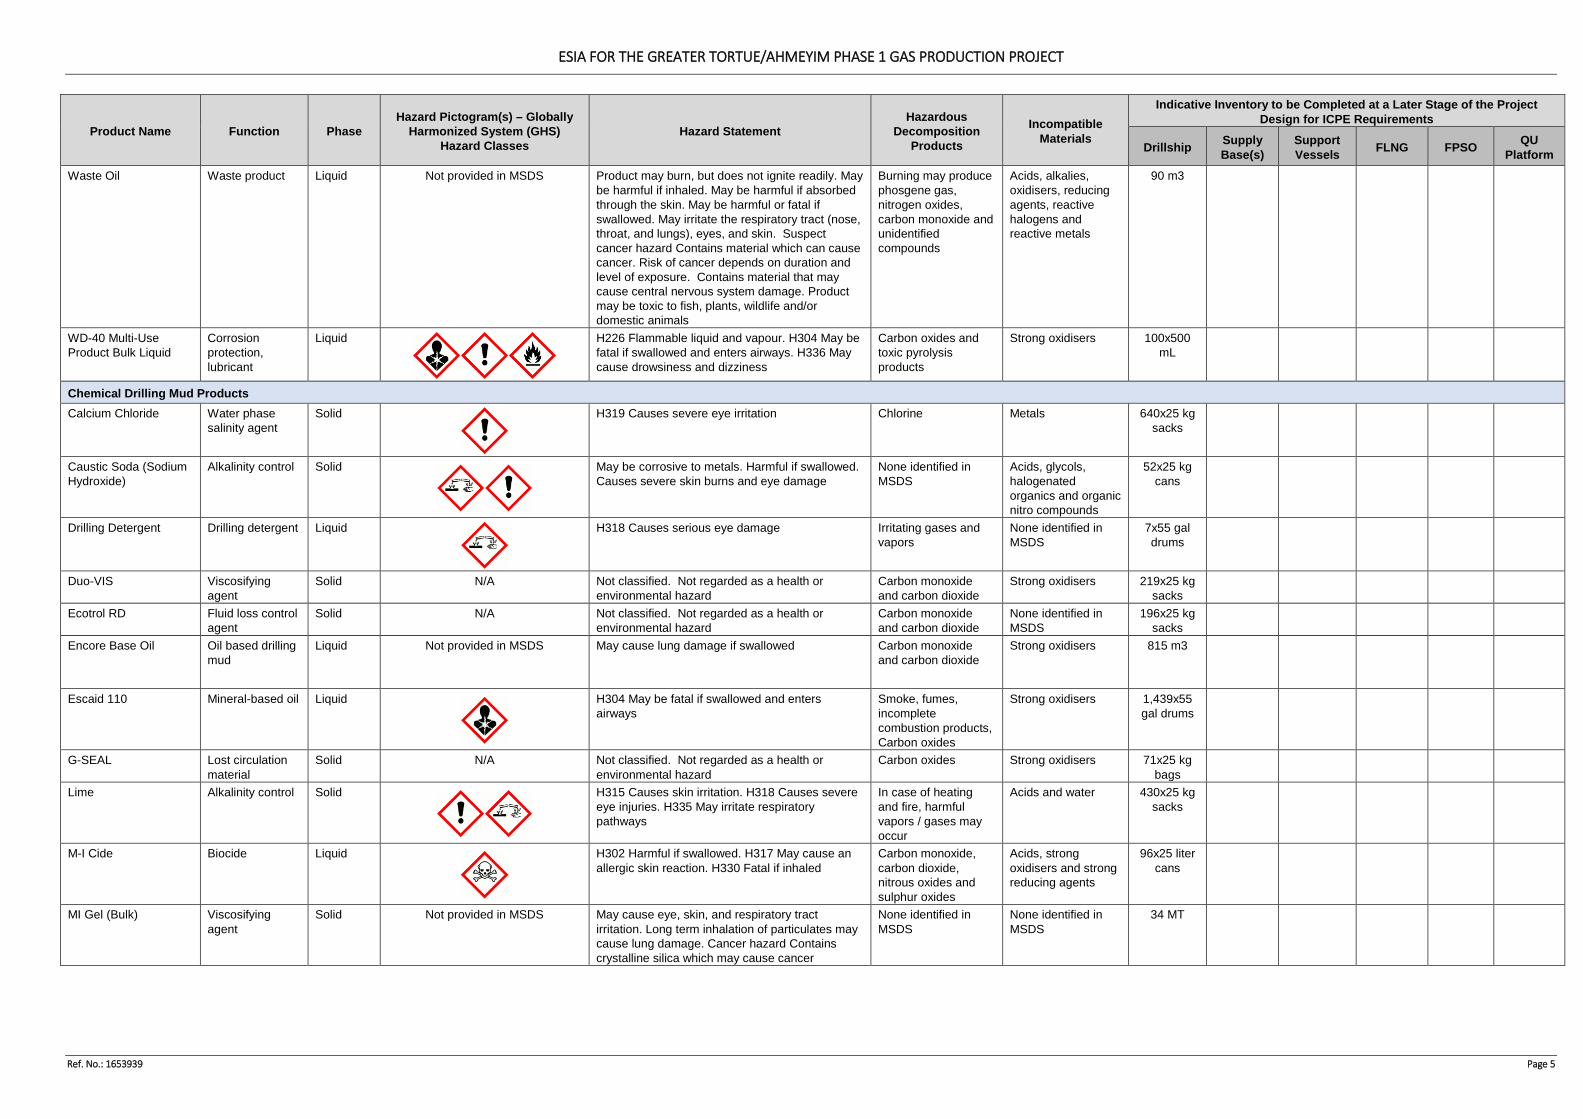
ESIA FOR THE GREATER TORTUE/AHMEYIM PHASE 1 GAS PRODUCTION PROJECT
Ref. No.: 1653939 Page 5
Product Name Function Phase Hazard Pictogram(s) – Globally
Harmonized System (GHS) Hazard Classes
Hazard Statement Hazardous
Decomposition Products
Incompatible Materials
Indicative Inventory to be Completed at a Later Stage of the Project Design for ICPE Requirements
Drillship Supply Base(s)
Support Vessels FLNG FPSO QU
Platform Waste Oil Waste product Liquid Not provided in MSDS Product may burn, but does not ignite readily. May
be harmful if inhaled. May be harmful if absorbed through the skin. May be harmful or fatal if swallowed. May irritate the respiratory tract (nose, throat, and lungs), eyes, and skin. Suspect cancer hazard Contains material which can cause cancer. Risk of cancer depends on duration and level of exposure. Contains material that may cause central nervous system damage. Product may be toxic to fish, plants, wildlife and/or domestic animals
Burning may produce phosgene gas, nitrogen oxides, carbon monoxide and unidentified compounds
Acids, alkalies, oxidisers, reducing agents, reactive halogens and reactive metals
90 m3
WD-40 Multi-Use Product Bulk Liquid
Corrosion protection, lubricant
Liquid
H226 Flammable liquid and vapour. H304 May be fatal if swallowed and enters airways. H336 May cause drowsiness and dizziness
Carbon oxides and toxic pyrolysis products
Strong oxidisers 100x500 mL
Chemical Drilling Mud Products Calcium Chloride Water phase
salinity agent Solid
H319 Causes severe eye irritation Chlorine Metals 640x25 kg sacks
Caustic Soda (Sodium Hydroxide)
Alkalinity control Solid
May be corrosive to metals. Harmful if swallowed. Causes severe skin burns and eye damage
None identified in MSDS
Acids, glycols, halogenated organics and organic nitro compounds
52x25 kg cans
Drilling Detergent Drilling detergent Liquid
H318 Causes serious eye damage Irritating gases and vapors
None identified in MSDS
7x55 gal drums
Duo-VIS Viscosifying agent
Solid N/A Not classified. Not regarded as a health or environmental hazard
Carbon monoxide and carbon dioxide
Strong oxidisers 219x25 kg sacks
Ecotrol RD Fluid loss control agent
Solid N/A Not classified. Not regarded as a health or environmental hazard
Carbon monoxide and carbon dioxide
None identified in MSDS
196x25 kg sacks
Encore Base Oil Oil based drilling mud
Liquid Not provided in MSDS May cause lung damage if swallowed Carbon monoxide and carbon dioxide
Strong oxidisers
815 m3
Escaid 110 Mineral-based oil Liquid
H304 May be fatal if swallowed and enters airways
Smoke, fumes, incomplete combustion products, Carbon oxides
Strong oxidisers 1,439x55 gal drums
G-SEAL Lost circulation material
Solid N/A Not classified. Not regarded as a health or environmental hazard
Carbon oxides Strong oxidisers 71x25 kg bags
Lime Alkalinity control Solid
H315 Causes skin irritation. H318 Causes severe eye injuries. H335 May irritate respiratory pathways
In case of heating and fire, harmful vapors / gases may occur
Acids and water 430x25 kg sacks
M-I Cide Biocide Liquid
H302 Harmful if swallowed. H317 May cause an allergic skin reaction. H330 Fatal if inhaled
Carbon monoxide, carbon dioxide, nitrous oxides and sulphur oxides
Acids, strong oxidisers and strong reducing agents
96x25 liter cans
MI Gel (Bulk) Viscosifying agent
Solid Not provided in MSDS May cause eye, skin, and respiratory tract irritation. Long term inhalation of particulates may cause lung damage. Cancer hazard Contains crystalline silica which may cause cancer
None identified in MSDS
None identified in MSDS
34 MT
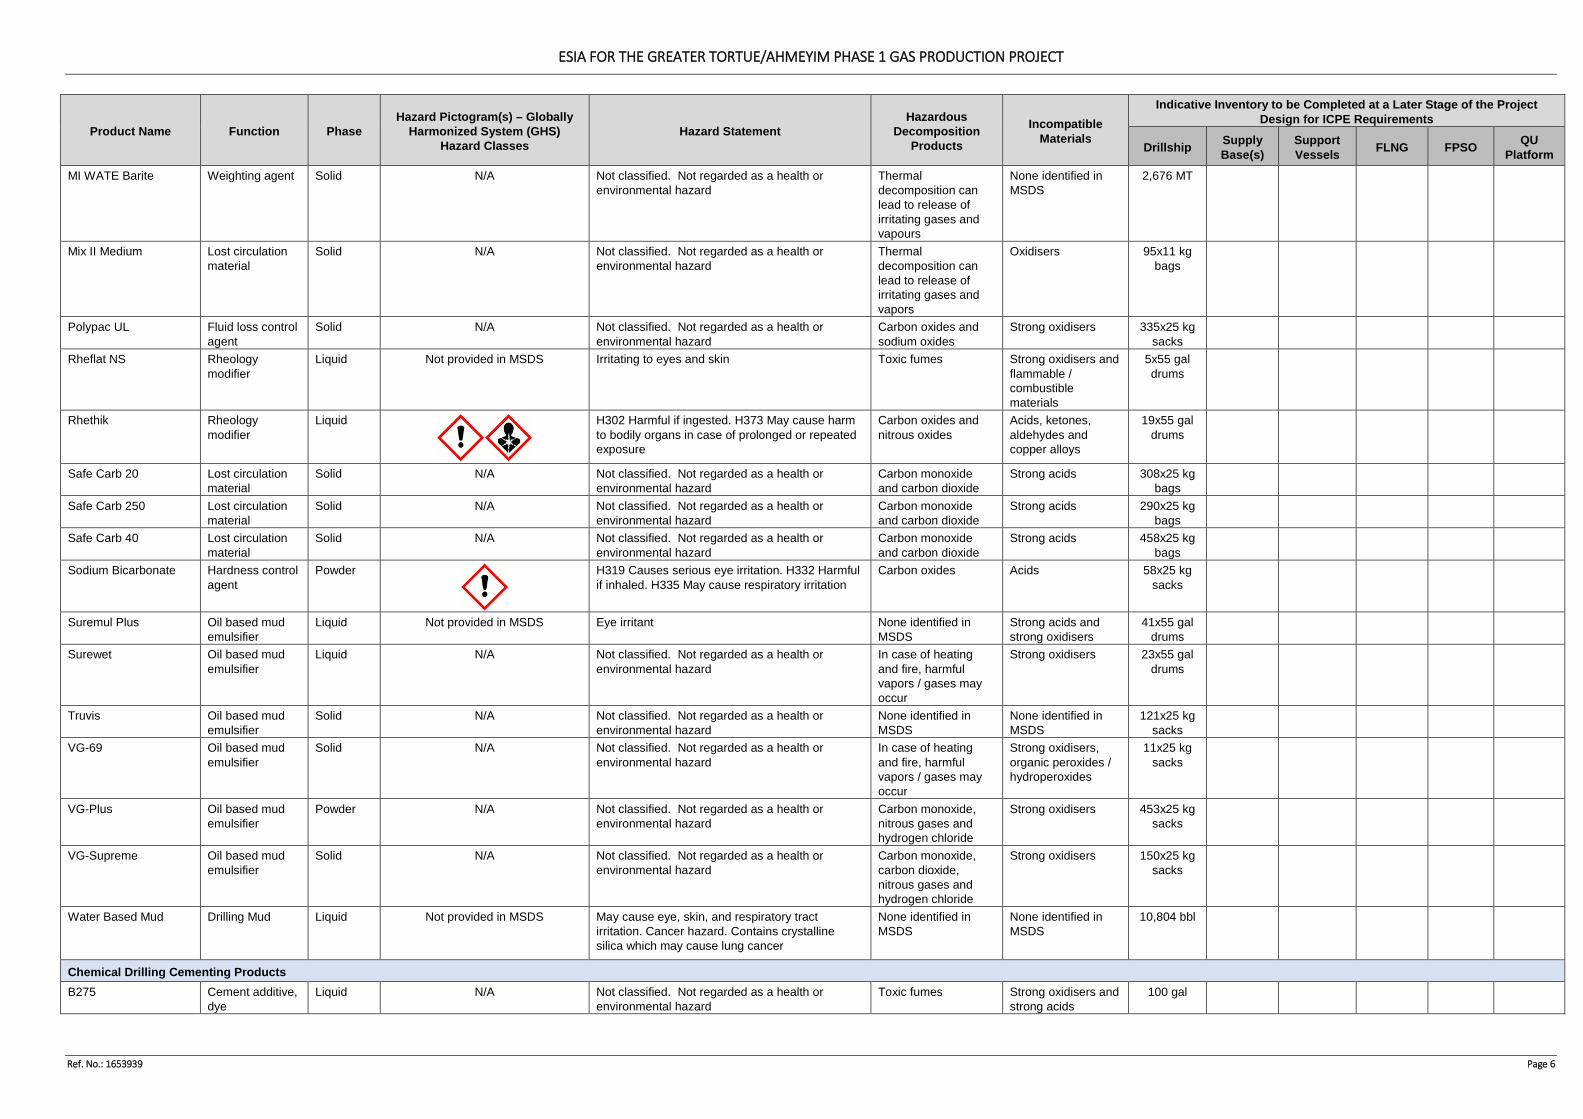
ESIA FOR THE GREATER TORTUE/AHMEYIM PHASE 1 GAS PRODUCTION PROJECT
Ref. No.: 1653939 Page 6
Product Name Function Phase Hazard Pictogram(s) – Globally
Harmonized System (GHS) Hazard Classes
Hazard Statement Hazardous
Decomposition Products
Incompatible Materials
Indicative Inventory to be Completed at a Later Stage of the Project Design for ICPE Requirements
Drillship Supply Base(s)
Support Vessels FLNG FPSO QU
Platform MI WATE Barite Weighting agent Solid N/A Not classified. Not regarded as a health or
environmental hazard Thermal decomposition can lead to release of irritating gases and vapours
None identified in MSDS
2,676 MT
Mix II Medium Lost circulation material
Solid N/A Not classified. Not regarded as a health or environmental hazard
Thermal decomposition can lead to release of irritating gases and vapors
Oxidisers 95x11 kg bags
Polypac UL Fluid loss control agent
Solid N/A Not classified. Not regarded as a health or environmental hazard
Carbon oxides and sodium oxides
Strong oxidisers 335x25 kg sacks
Rheflat NS Rheology modifier
Liquid Not provided in MSDS Irritating to eyes and skin Toxic fumes Strong oxidisers and flammable / combustible materials
5x55 gal drums
Rhethik Rheology modifier
Liquid
H302 Harmful if ingested. H373 May cause harm to bodily organs in case of prolonged or repeated exposure
Carbon oxides and nitrous oxides
Acids, ketones, aldehydes and copper alloys
19x55 gal drums
Safe Carb 20 Lost circulation material
Solid N/A Not classified. Not regarded as a health or environmental hazard
Carbon monoxide and carbon dioxide
Strong acids 308x25 kg bags
Safe Carb 250 Lost circulation material
Solid N/A Not classified. Not regarded as a health or environmental hazard
Carbon monoxide and carbon dioxide
Strong acids 290x25 kg bags
Safe Carb 40 Lost circulation material
Solid N/A Not classified. Not regarded as a health or environmental hazard
Carbon monoxide and carbon dioxide
Strong acids 458x25 kg bags
Sodium Bicarbonate Hardness control agent
Powder
H319 Causes serious eye irritation. H332 Harmful if inhaled. H335 May cause respiratory irritation
Carbon oxides Acids 58x25 kg sacks
Suremul Plus Oil based mud emulsifier
Liquid Not provided in MSDS Eye irritant None identified in MSDS
Strong acids and strong oxidisers
41x55 gal drums
Surewet Oil based mud emulsifier
Liquid N/A Not classified. Not regarded as a health or environmental hazard
In case of heating and fire, harmful vapors / gases may occur
Strong oxidisers 23x55 gal drums
Truvis Oil based mud emulsifier
Solid N/A Not classified. Not regarded as a health or environmental hazard
None identified in MSDS
None identified in MSDS
121x25 kg sacks
VG-69 Oil based mud emulsifier
Solid N/A Not classified. Not regarded as a health or environmental hazard
In case of heating and fire, harmful vapors / gases may occur
Strong oxidisers, organic peroxides / hydroperoxides
11x25 kg sacks
VG-Plus Oil based mud emulsifier
Powder N/A Not classified. Not regarded as a health or environmental hazard
Carbon monoxide, nitrous gases and hydrogen chloride
Strong oxidisers 453x25 kg sacks
VG-Supreme Oil based mud emulsifier
Solid N/A Not classified. Not regarded as a health or environmental hazard
Carbon monoxide, carbon dioxide, nitrous gases and hydrogen chloride
Strong oxidisers 150x25 kg sacks
Water Based Mud Drilling Mud Liquid Not provided in MSDS May cause eye, skin, and respiratory tract irritation. Cancer hazard. Contains crystalline silica which may cause lung cancer
None identified in MSDS
None identified in MSDS
10,804 bbl
Chemical Drilling Cementing Products B275 Cement additive,
dye Liquid N/A Not classified. Not regarded as a health or
environmental hazard Toxic fumes Strong oxidisers and
strong acids 100 gal
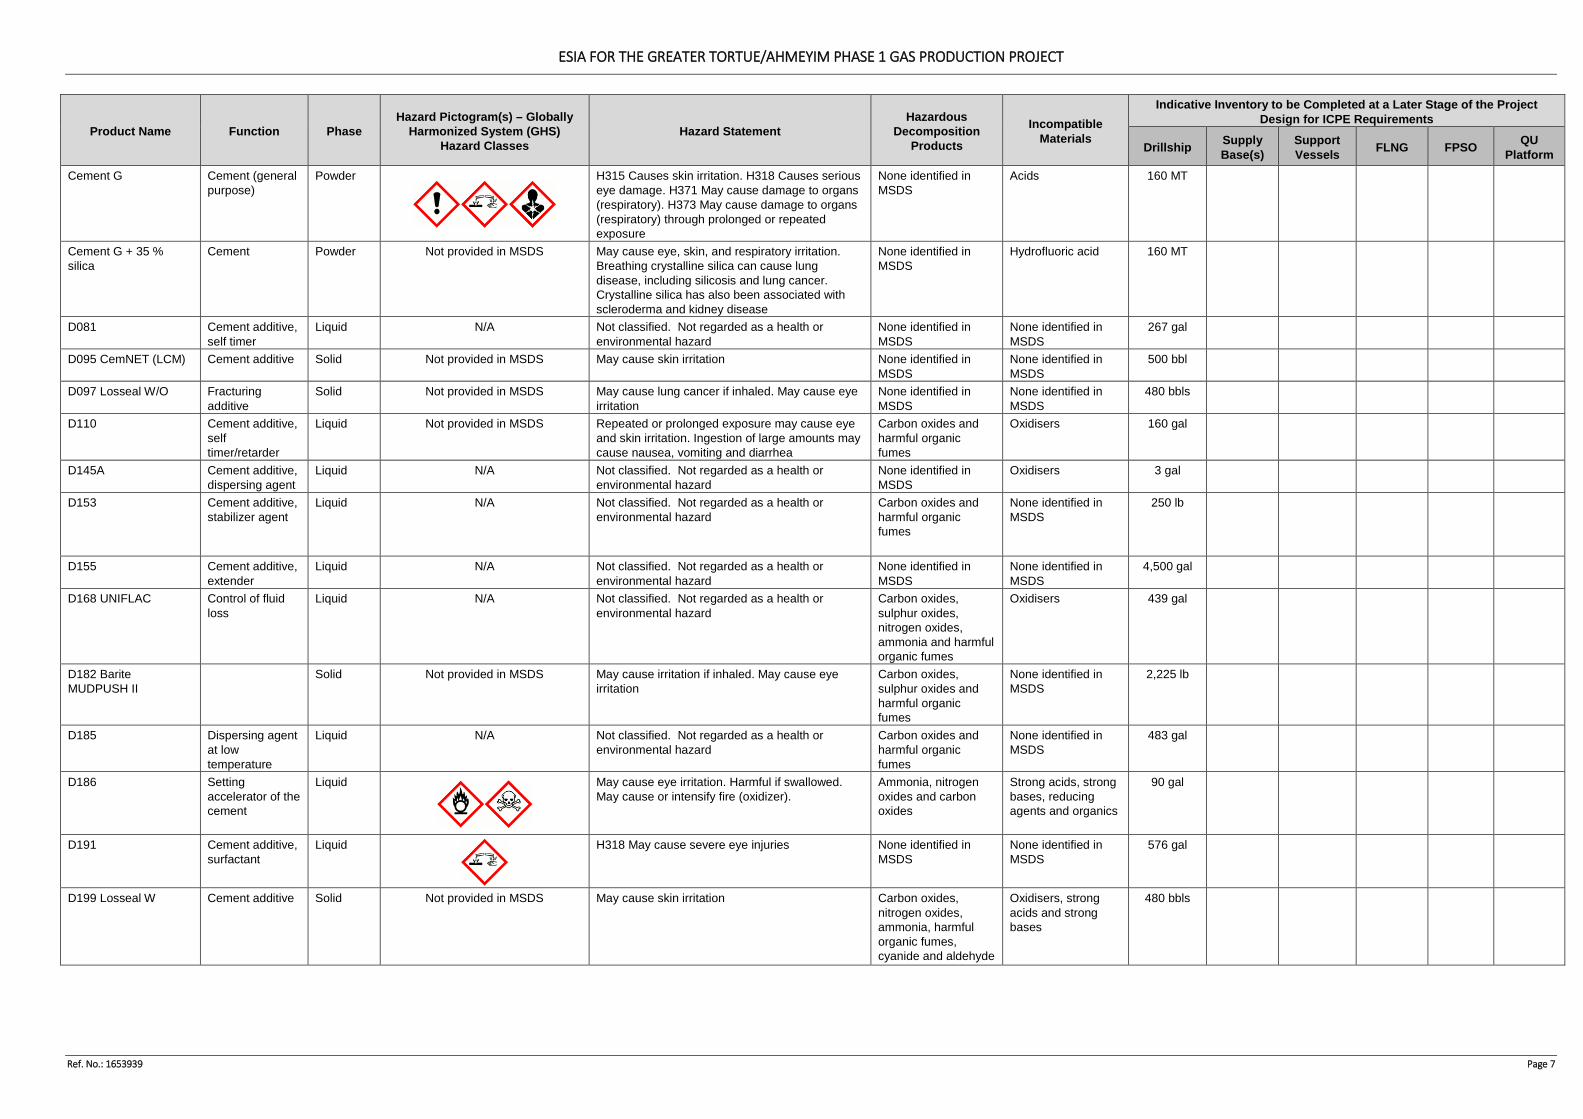
ESIA FOR THE GREATER TORTUE/AHMEYIM PHASE 1 GAS PRODUCTION PROJECT
Ref. No.: 1653939 Page 7
Product Name Function Phase Hazard Pictogram(s) – Globally
Harmonized System (GHS) Hazard Classes
Hazard Statement Hazardous
Decomposition Products
Incompatible Materials
Indicative Inventory to be Completed at a Later Stage of the Project Design for ICPE Requirements
Drillship Supply Base(s)
Support Vessels FLNG FPSO QU
Platform Cement G Cement (general
purpose) Powder
H315 Causes skin irritation. H318 Causes serious eye damage. H371 May cause damage to organs (respiratory). H373 May cause damage to organs (respiratory) through prolonged or repeated exposure
None identified in MSDS
Acids 160 MT
Cement G + 35 % silica
Cement Powder Not provided in MSDS May cause eye, skin, and respiratory irritation. Breathing crystalline silica can cause lung disease, including silicosis and lung cancer. Crystalline silica has also been associated with scleroderma and kidney disease
None identified in MSDS
Hydrofluoric acid 160 MT
D081 Cement additive, self timer
Liquid N/A Not classified. Not regarded as a health or environmental hazard
None identified in MSDS
None identified in MSDS
267 gal
D095 CemNET (LCM) Cement additive Solid Not provided in MSDS May cause skin irritation None identified in MSDS
None identified in MSDS
500 bbl
D097 Losseal W/O Fracturing additive
Solid Not provided in MSDS May cause lung cancer if inhaled. May cause eye irritation
None identified in MSDS
None identified in MSDS
480 bbls
D110 Cement additive, self timer/retarder
Liquid Not provided in MSDS Repeated or prolonged exposure may cause eye and skin irritation. Ingestion of large amounts may cause nausea, vomiting and diarrhea
Carbon oxides and harmful organic fumes
Oxidisers 160 gal
D145A Cement additive, dispersing agent
Liquid N/A Not classified. Not regarded as a health or environmental hazard
None identified in MSDS
Oxidisers 3 gal
D153 Cement additive, stabilizer agent
Liquid N/A Not classified. Not regarded as a health or environmental hazard
Carbon oxides and harmful organic fumes
None identified in MSDS
250 lb
D155 Cement additive, extender
Liquid N/A Not classified. Not regarded as a health or environmental hazard
None identified in MSDS
None identified in MSDS
4,500 gal
D168 UNIFLAC Control of fluid loss
Liquid N/A Not classified. Not regarded as a health or environmental hazard
Carbon oxides, sulphur oxides, nitrogen oxides, ammonia and harmful organic fumes
Oxidisers 439 gal
D182 Barite MUDPUSH II
Solid Not provided in MSDS May cause irritation if inhaled. May cause eye irritation
Carbon oxides, sulphur oxides and harmful organic fumes
None identified in MSDS
2,225 lb
D185 Dispersing agent at low temperature
Liquid N/A Not classified. Not regarded as a health or environmental hazard
Carbon oxides and harmful organic fumes
None identified in MSDS
483 gal
D186 Setting accelerator of the cement
Liquid
May cause eye irritation. Harmful if swallowed. May cause or intensify fire (oxidizer).
Ammonia, nitrogen oxides and carbon oxides
Strong acids, strong bases, reducing agents and organics
90 gal
D191 Cement additive, surfactant
Liquid
H318 May cause severe eye injuries None identified in MSDS
None identified in MSDS
576 gal
D199 Losseal W Cement additive Solid Not provided in MSDS May cause skin irritation Carbon oxides, nitrogen oxides, ammonia, harmful organic fumes, cyanide and aldehyde
Oxidisers, strong acids and strong bases
480 bbls
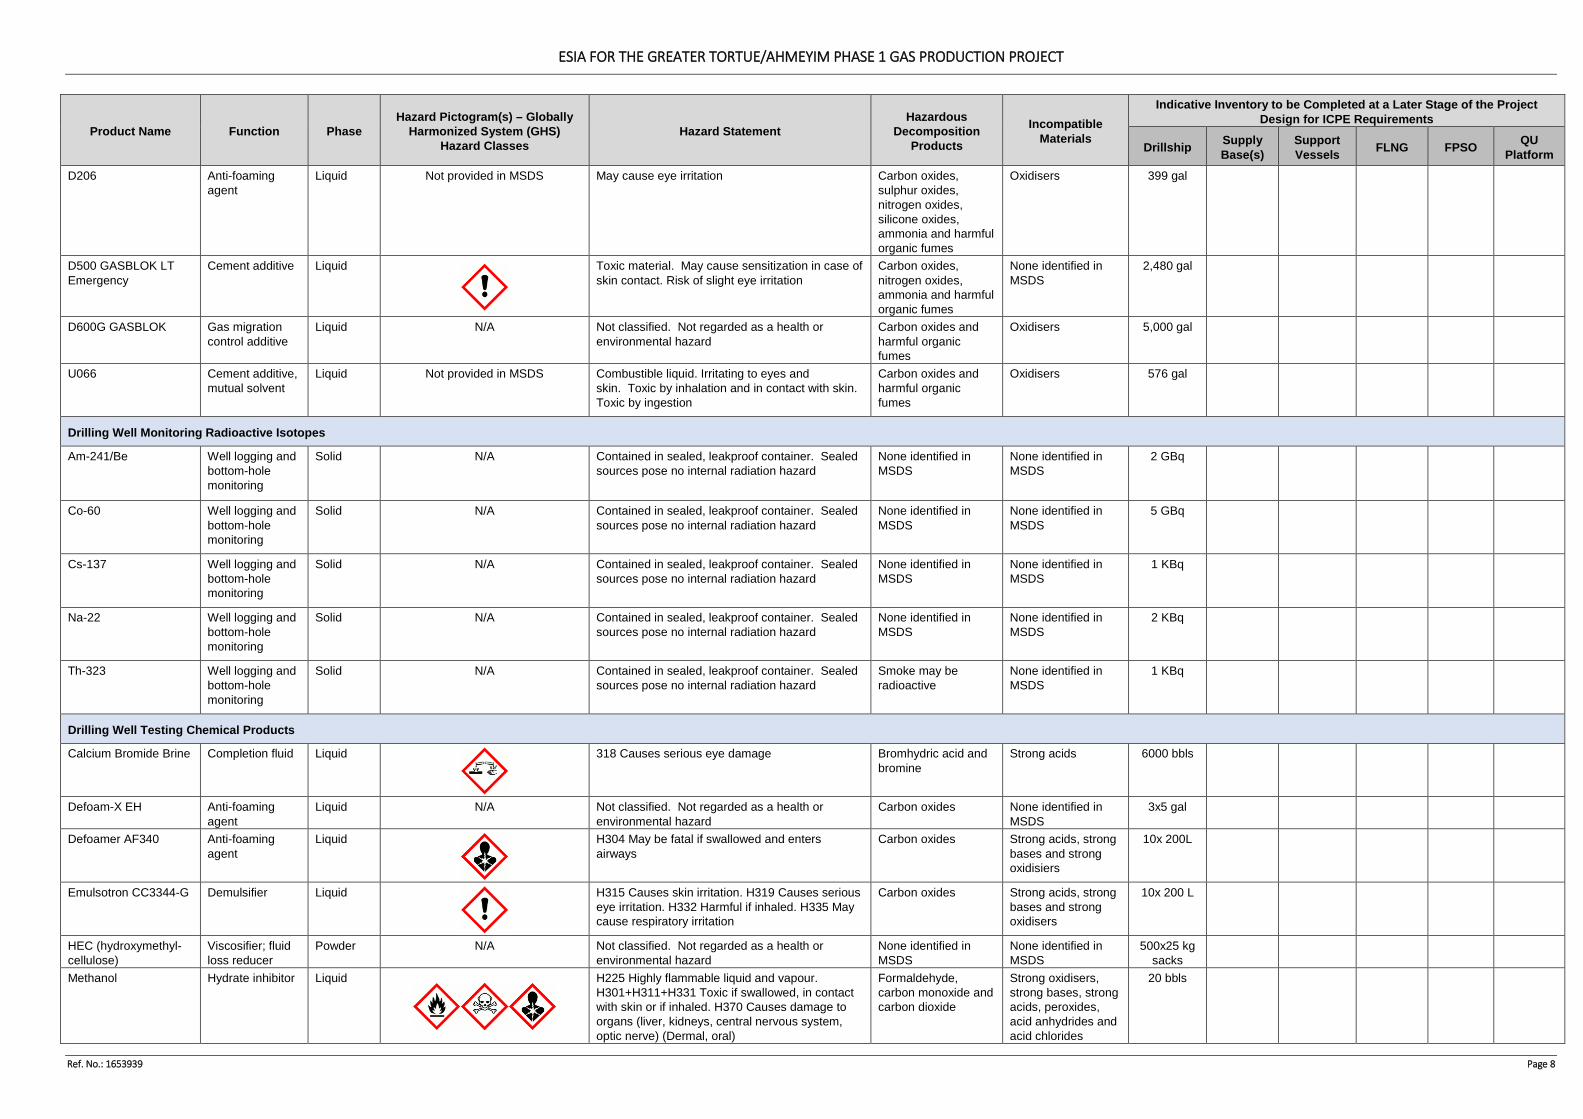
ESIA FOR THE GREATER TORTUE/AHMEYIM PHASE 1 GAS PRODUCTION PROJECT
Ref. No.: 1653939 Page 8
Product Name Function Phase Hazard Pictogram(s) – Globally
Harmonized System (GHS) Hazard Classes
Hazard Statement Hazardous
Decomposition Products
Incompatible Materials
Indicative Inventory to be Completed at a Later Stage of the Project Design for ICPE Requirements
Drillship Supply Base(s)
Support Vessels FLNG FPSO QU
Platform D206 Anti-foaming
agent Liquid Not provided in MSDS May cause eye irritation Carbon oxides,
sulphur oxides, nitrogen oxides, silicone oxides, ammonia and harmful organic fumes
Oxidisers 399 gal
D500 GASBLOK LT Emergency
Cement additive Liquid
Toxic material. May cause sensitization in case of skin contact. Risk of slight eye irritation
Carbon oxides, nitrogen oxides, ammonia and harmful organic fumes
None identified in MSDS
2,480 gal
D600G GASBLOK Gas migration control additive
Liquid N/A Not classified. Not regarded as a health or environmental hazard
Carbon oxides and harmful organic fumes
Oxidisers 5,000 gal
U066 Cement additive, mutual solvent
Liquid Not provided in MSDS Combustible liquid. Irritating to eyes and skin. Toxic by inhalation and in contact with skin. Toxic by ingestion
Carbon oxides and harmful organic fumes
Oxidisers 576 gal
Drilling Well Monitoring Radioactive Isotopes
Am-241/Be Well logging and bottom-hole monitoring
Solid N/A Contained in sealed, leakproof container. Sealed sources pose no internal radiation hazard
None identified in MSDS
None identified in MSDS
2 GBq
Co-60 Well logging and bottom-hole monitoring
Solid N/A Contained in sealed, leakproof container. Sealed sources pose no internal radiation hazard
None identified in MSDS
None identified in MSDS
5 GBq
Cs-137 Well logging and bottom-hole monitoring
Solid N/A Contained in sealed, leakproof container. Sealed sources pose no internal radiation hazard
None identified in MSDS
None identified in MSDS
1 KBq
Na-22 Well logging and bottom-hole monitoring
Solid N/A Contained in sealed, leakproof container. Sealed sources pose no internal radiation hazard
None identified in MSDS
None identified in MSDS
2 KBq
Th-323 Well logging and bottom-hole monitoring
Solid N/A Contained in sealed, leakproof container. Sealed sources pose no internal radiation hazard
Smoke may be radioactive
None identified in MSDS
1 KBq
Drilling Well Testing Chemical Products
Calcium Bromide Brine Completion fluid Liquid
318 Causes serious eye damage Bromhydric acid and bromine
Strong acids 6000 bbls
Defoam-X EH Anti-foaming agent
Liquid N/A Not classified. Not regarded as a health or environmental hazard
Carbon oxides None identified in MSDS
3x5 gal
Defoamer AF340 Anti-foaming agent
Liquid
H304 May be fatal if swallowed and enters airways
Carbon oxides Strong acids, strong bases and strong oxidisiers
10x 200L
Emulsotron CC3344-G Demulsifier Liquid
H315 Causes skin irritation. H319 Causes serious eye irritation. H332 Harmful if inhaled. H335 May cause respiratory irritation
Carbon oxides Strong acids, strong bases and strong oxidisers
10x 200 L
HEC (hydroxymethyl-cellulose)
Viscosifier; fluid loss reducer
Powder N/A Not classified. Not regarded as a health or environmental hazard
None identified in MSDS
None identified in MSDS
500x25 kg sacks
Methanol Hydrate inhibitor Liquid
H225 Highly flammable liquid and vapour. H301+H311+H331 Toxic if swallowed, in contact with skin or if inhaled. H370 Causes damage to organs (liver, kidneys, central nervous system, optic nerve) (Dermal, oral)
Formaldehyde, carbon monoxide and carbon dioxide
Strong oxidisers, strong bases, strong acids, peroxides, acid anhydrides and acid chlorides
20 bbls
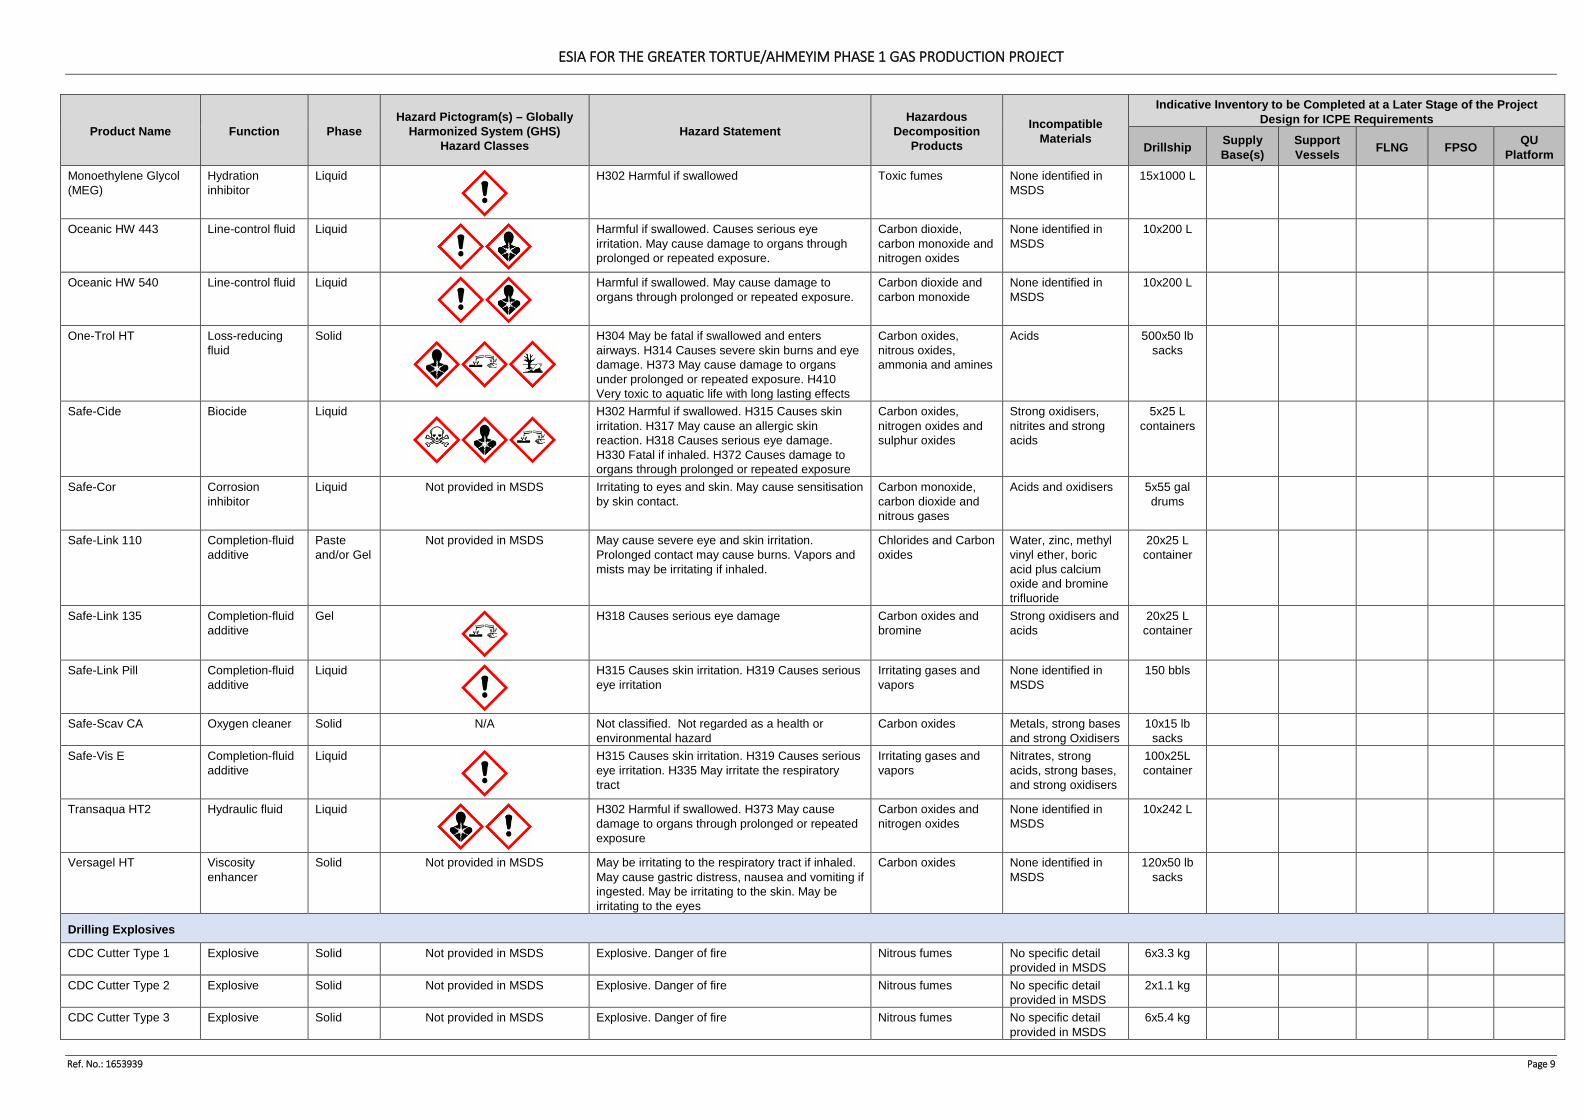
ESIA FOR THE GREATER TORTUE/AHMEYIM PHASE 1 GAS PRODUCTION PROJECT
Ref. No.: 1653939 Page 9
Product Name Function Phase Hazard Pictogram(s) – Globally
Harmonized System (GHS) Hazard Classes
Hazard Statement Hazardous
Decomposition Products
Incompatible Materials
Indicative Inventory to be Completed at a Later Stage of the Project Design for ICPE Requirements
Drillship Supply Base(s)
Support Vessels FLNG FPSO QU
Platform Monoethylene Glycol (MEG)
Hydration inhibitor
Liquid
H302 Harmful if swallowed Toxic fumes None identified in MSDS
15x1000 L
Oceanic HW 443 Line-control fluid Liquid
Harmful if swallowed. Causes serious eye irritation. May cause damage to organs through prolonged or repeated exposure.
Carbon dioxide, carbon monoxide and nitrogen oxides
None identified in MSDS
10x200 L
Oceanic HW 540 Line-control fluid Liquid
Harmful if swallowed. May cause damage to organs through prolonged or repeated exposure.
Carbon dioxide and carbon monoxide
None identified in MSDS
10x200 L
One-Trol HT Loss-reducing fluid
Solid
H304 May be fatal if swallowed and enters airways. H314 Causes severe skin burns and eye damage. H373 May cause damage to organs under prolonged or repeated exposure. H410 Very toxic to aquatic life with long lasting effects
Carbon oxides, nitrous oxides, ammonia and amines
Acids 500x50 lb sacks
Safe-Cide Biocide Liquid
H302 Harmful if swallowed. H315 Causes skin irritation. H317 May cause an allergic skin reaction. H318 Causes serious eye damage. H330 Fatal if inhaled. H372 Causes damage to organs through prolonged or repeated exposure
Carbon oxides, nitrogen oxides and sulphur oxides
Strong oxidisers, nitrites and strong acids
5x25 L containers
Safe-Cor Corrosion inhibitor
Liquid Not provided in MSDS Irritating to eyes and skin. May cause sensitisation by skin contact.
Carbon monoxide, carbon dioxide and nitrous gases
Acids and oxidisers 5x55 gal drums
Safe-Link 110 Completion-fluid additive
Paste and/or Gel
Not provided in MSDS May cause severe eye and skin irritation. Prolonged contact may cause burns. Vapors and mists may be irritating if inhaled.
Chlorides and Carbon oxides
Water, zinc, methyl vinyl ether, boric acid plus calcium oxide and bromine trifluoride
20x25 L container
Safe-Link 135 Completion-fluid additive
Gel
H318 Causes serious eye damage Carbon oxides and bromine
Strong oxidisers and acids
20x25 L container
Safe-Link Pill Completion-fluid additive
Liquid
H315 Causes skin irritation. H319 Causes serious eye irritation
Irritating gases and vapors
None identified in MSDS
150 bbls
Safe-Scav CA Oxygen cleaner Solid N/A Not classified. Not regarded as a health or environmental hazard
Carbon oxides Metals, strong bases and strong Oxidisers
10x15 lb sacks
Safe-Vis E Completion-fluid additive
Liquid
H315 Causes skin irritation. H319 Causes serious eye irritation. H335 May irritate the respiratory tract
Irritating gases and vapors
Nitrates, strong acids, strong bases, and strong oxidisers
100x25L container
Transaqua HT2 Hydraulic fluid Liquid
H302 Harmful if swallowed. H373 May cause damage to organs through prolonged or repeated exposure
Carbon oxides and nitrogen oxides
None identified in MSDS
10x242 L
Versagel HT Viscosity enhancer
Solid Not provided in MSDS May be irritating to the respiratory tract if inhaled. May cause gastric distress, nausea and vomiting if ingested. May be irritating to the skin. May be irritating to the eyes
Carbon oxides None identified in MSDS
120x50 lb sacks
Drilling Explosives
CDC Cutter Type 1 Explosive Solid Not provided in MSDS Explosive. Danger of fire Nitrous fumes No specific detail provided in MSDS
6x3.3 kg
CDC Cutter Type 2 Explosive Solid Not provided in MSDS Explosive. Danger of fire Nitrous fumes No specific detail provided in MSDS
2x1.1 kg
CDC Cutter Type 3 Explosive Solid Not provided in MSDS Explosive. Danger of fire Nitrous fumes No specific detail provided in MSDS
6x5.4 kg
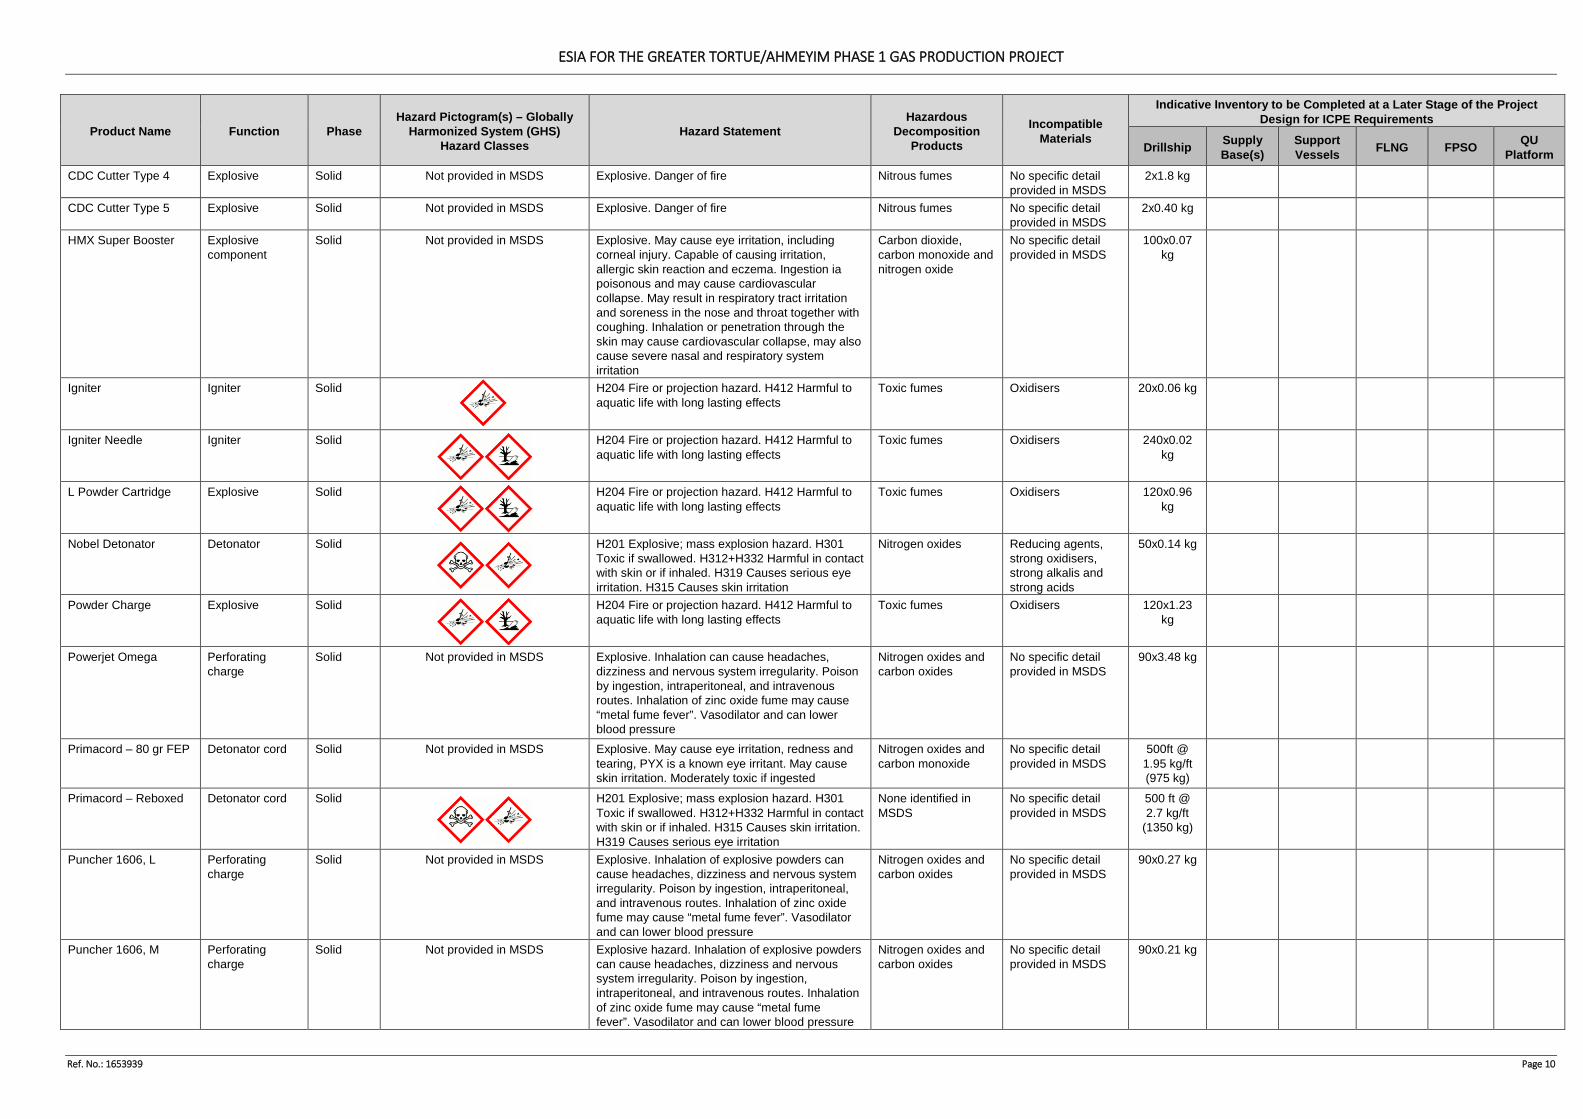
ESIA FOR THE GREATER TORTUE/AHMEYIM PHASE 1 GAS PRODUCTION PROJECT
Ref. No.: 1653939 Page 10
Product Name Function Phase Hazard Pictogram(s) – Globally
Harmonized System (GHS) Hazard Classes
Hazard Statement Hazardous
Decomposition Products
Incompatible Materials
Indicative Inventory to be Completed at a Later Stage of the Project Design for ICPE Requirements
Drillship Supply Base(s)
Support Vessels FLNG FPSO QU
Platform CDC Cutter Type 4 Explosive Solid Not provided in MSDS Explosive. Danger of fire Nitrous fumes No specific detail
provided in MSDS 2x1.8 kg
CDC Cutter Type 5 Explosive Solid Not provided in MSDS Explosive. Danger of fire Nitrous fumes No specific detail provided in MSDS
2x0.40 kg
HMX Super Booster Explosive component
Solid Not provided in MSDS Explosive. May cause eye irritation, including corneal injury. Capable of causing irritation, allergic skin reaction and eczema. Ingestion ia poisonous and may cause cardiovascular collapse. May result in respiratory tract irritation and soreness in the nose and throat together with coughing. Inhalation or penetration through the skin may cause cardiovascular collapse, may also cause severe nasal and respiratory system irritation
Carbon dioxide, carbon monoxide and nitrogen oxide
No specific detail provided in MSDS
100x0.07 kg
Igniter Igniter Solid
H204 Fire or projection hazard. H412 Harmful to aquatic life with long lasting effects
Toxic fumes Oxidisers 20x0.06 kg
Igniter Needle Igniter Solid
H204 Fire or projection hazard. H412 Harmful to aquatic life with long lasting effects
Toxic fumes Oxidisers 240x0.02 kg
L Powder Cartridge Explosive Solid
H204 Fire or projection hazard. H412 Harmful to aquatic life with long lasting effects
Toxic fumes Oxidisers 120x0.96 kg
Nobel Detonator Detonator Solid
H201 Explosive; mass explosion hazard. H301 Toxic if swallowed. H312+H332 Harmful in contact with skin or if inhaled. H319 Causes serious eye irritation. H315 Causes skin irritation
Nitrogen oxides Reducing agents, strong oxidisers, strong alkalis and strong acids
50x0.14 kg
Powder Charge Explosive Solid
H204 Fire or projection hazard. H412 Harmful to aquatic life with long lasting effects
Toxic fumes Oxidisers 120x1.23 kg
Powerjet Omega Perforating charge
Solid Not provided in MSDS Explosive. Inhalation can cause headaches, dizziness and nervous system irregularity. Poison by ingestion, intraperitoneal, and intravenous routes. Inhalation of zinc oxide fume may cause “metal fume fever”. Vasodilator and can lower blood pressure
Nitrogen oxides and carbon oxides
No specific detail provided in MSDS
90x3.48 kg
Primacord – 80 gr FEP Detonator cord Solid Not provided in MSDS Explosive. May cause eye irritation, redness and tearing, PYX is a known eye irritant. May cause skin irritation. Moderately toxic if ingested
Nitrogen oxides and carbon monoxide
No specific detail provided in MSDS
500ft @ 1.95 kg/ft (975 kg)
Primacord – Reboxed Detonator cord Solid
H201 Explosive; mass explosion hazard. H301 Toxic if swallowed. H312+H332 Harmful in contact with skin or if inhaled. H315 Causes skin irritation. H319 Causes serious eye irritation
None identified in MSDS
No specific detail provided in MSDS
500 ft @ 2.7 kg/ft
(1350 kg)
Puncher 1606, L Perforating charge
Solid Not provided in MSDS Explosive. Inhalation of explosive powders can cause headaches, dizziness and nervous system irregularity. Poison by ingestion, intraperitoneal, and intravenous routes. Inhalation of zinc oxide fume may cause “metal fume fever”. Vasodilator and can lower blood pressure
Nitrogen oxides and carbon oxides
No specific detail provided in MSDS
90x0.27 kg
Puncher 1606, M Perforating charge
Solid Not provided in MSDS Explosive hazard. Inhalation of explosive powders can cause headaches, dizziness and nervous system irregularity. Poison by ingestion, intraperitoneal, and intravenous routes. Inhalation of zinc oxide fume may cause “metal fume fever”. Vasodilator and can lower blood pressure
Nitrogen oxides and carbon oxides
No specific detail provided in MSDS
90x0.21 kg
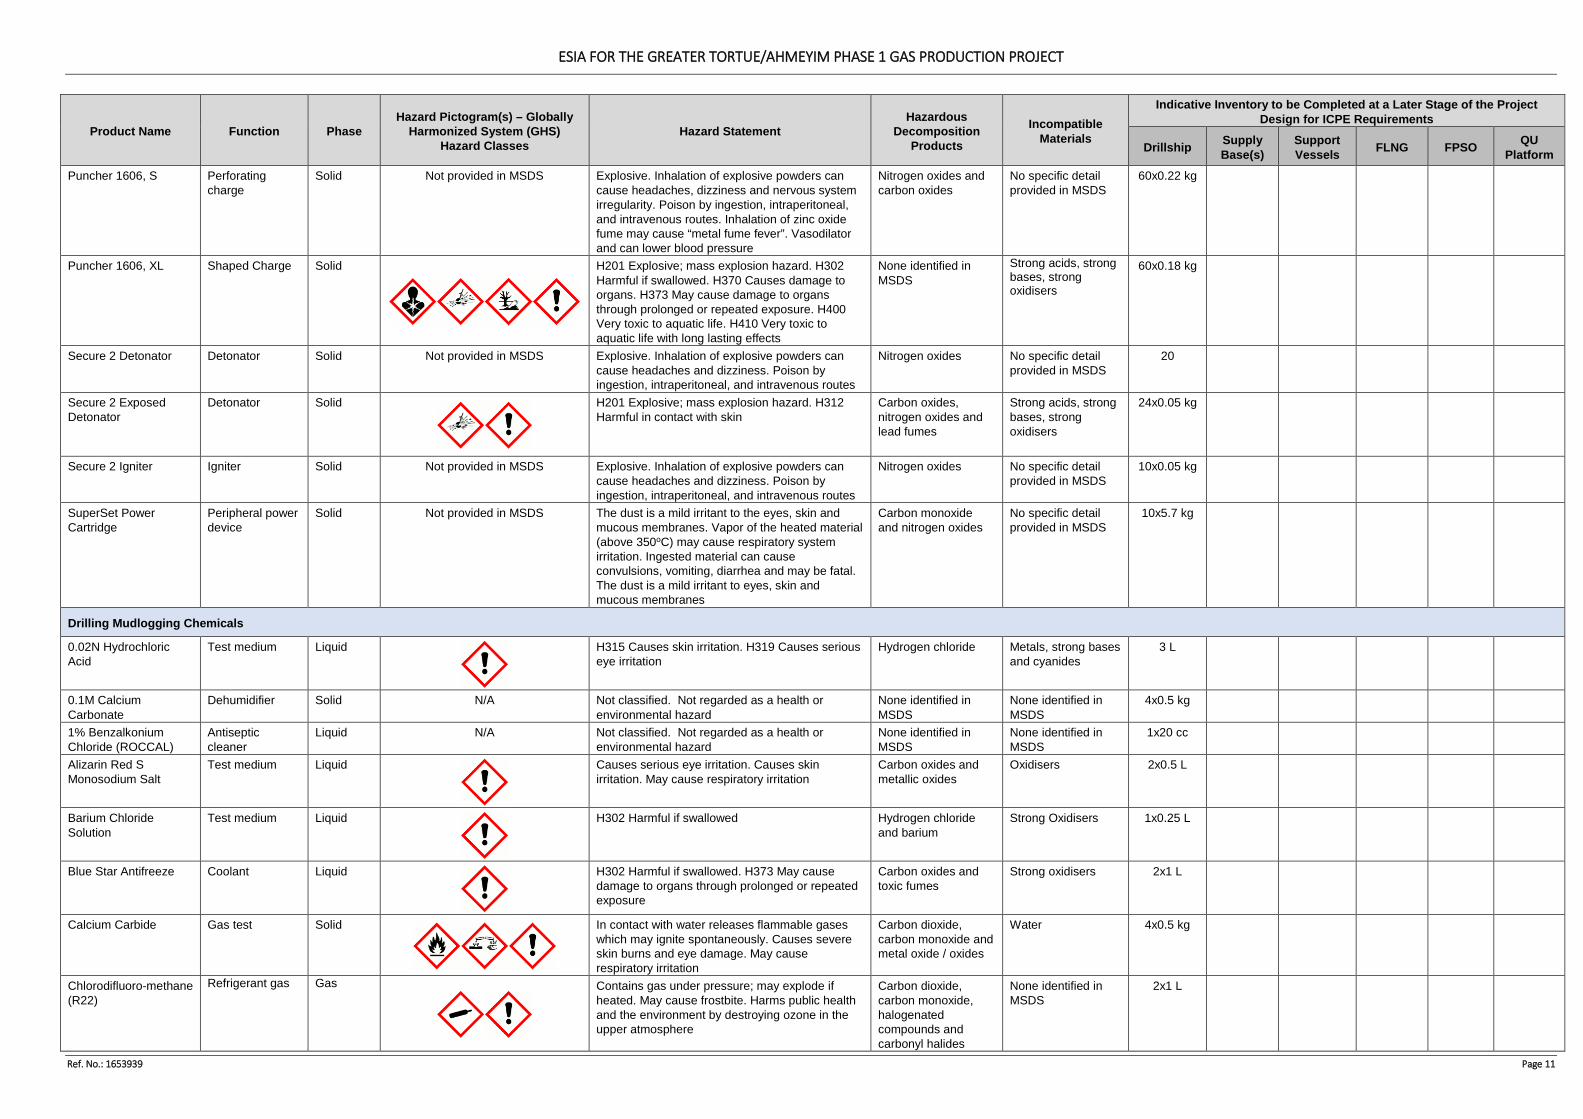
ESIA FOR THE GREATER TORTUE/AHMEYIM PHASE 1 GAS PRODUCTION PROJECT
Ref. No.: 1653939 Page 11
Product Name Function Phase Hazard Pictogram(s) – Globally
Harmonized System (GHS) Hazard Classes
Hazard Statement Hazardous
Decomposition Products
Incompatible Materials
Indicative Inventory to be Completed at a Later Stage of the Project Design for ICPE Requirements
Drillship Supply Base(s)
Support Vessels FLNG FPSO QU
Platform Puncher 1606, S Perforating
charge Solid Not provided in MSDS Explosive. Inhalation of explosive powders can
cause headaches, dizziness and nervous system irregularity. Poison by ingestion, intraperitoneal, and intravenous routes. Inhalation of zinc oxide fume may cause “metal fume fever”. Vasodilator and can lower blood pressure
Nitrogen oxides and carbon oxides
No specific detail provided in MSDS
60x0.22 kg
Puncher 1606, XL Shaped Charge Solid
H201 Explosive; mass explosion hazard. H302 Harmful if swallowed. H370 Causes damage to organs. H373 May cause damage to organs through prolonged or repeated exposure. H400 Very toxic to aquatic life. H410 Very toxic to aquatic life with long lasting effects
None identified in MSDS
Strong acids, strong bases, strong oxidisers
60x0.18 kg
Secure 2 Detonator Detonator Solid Not provided in MSDS Explosive. Inhalation of explosive powders can cause headaches and dizziness. Poison by ingestion, intraperitoneal, and intravenous routes
Nitrogen oxides No specific detail provided in MSDS
20
Secure 2 Exposed Detonator
Detonator Solid
H201 Explosive; mass explosion hazard. H312 Harmful in contact with skin
Carbon oxides, nitrogen oxides and lead fumes
Strong acids, strong bases, strong oxidisers
24x0.05 kg
Secure 2 Igniter Igniter Solid Not provided in MSDS Explosive. Inhalation of explosive powders can cause headaches and dizziness. Poison by ingestion, intraperitoneal, and intravenous routes
Nitrogen oxides No specific detail provided in MSDS
10x0.05 kg
SuperSet Power Cartridge
Peripheral power device
Solid Not provided in MSDS The dust is a mild irritant to the eyes, skin and mucous membranes. Vapor of the heated material (above 350oC) may cause respiratory system irritation. Ingested material can cause convulsions, vomiting, diarrhea and may be fatal. The dust is a mild irritant to eyes, skin and mucous membranes
Carbon monoxide and nitrogen oxides
No specific detail provided in MSDS
10x5.7 kg
Drilling Mudlogging Chemicals
0.02N Hydrochloric Acid
Test medium Liquid
H315 Causes skin irritation. H319 Causes serious eye irritation
Hydrogen chloride Metals, strong bases and cyanides
3 L
0.1M Calcium Carbonate
Dehumidifier Solid N/A Not classified. Not regarded as a health or environmental hazard
None identified in MSDS
None identified in MSDS
4x0.5 kg
1% Benzalkonium Chloride (ROCCAL)
Antiseptic cleaner
Liquid N/A Not classified. Not regarded as a health or environmental hazard
None identified in MSDS
None identified in MSDS
1x20 cc
Alizarin Red S Monosodium Salt
Test medium Liquid
Causes serious eye irritation. Causes skin irritation. May cause respiratory irritation
Carbon oxides and metallic oxides
Oxidisers 2x0.5 L
Barium Chloride Solution
Test medium Liquid
H302 Harmful if swallowed
Hydrogen chloride and barium
Strong Oxidisers 1x0.25 L
Blue Star Antifreeze
Coolant Liquid
H302 Harmful if swallowed. H373 May cause damage to organs through prolonged or repeated exposure
Carbon oxides and toxic fumes
Strong oxidisers 2x1 L
Calcium Carbide Gas test Solid
In contact with water releases flammable gases which may ignite spontaneously. Causes severe skin burns and eye damage. May cause respiratory irritation
Carbon dioxide, carbon monoxide and metal oxide / oxides
Water 4x0.5 kg
Chlorodifluoro-methane (R22)
Refrigerant gas Gas
Contains gas under pressure; may explode if heated. May cause frostbite. Harms public health and the environment by destroying ozone in the upper atmosphere
Carbon dioxide, carbon monoxide, halogenated compounds and carbonyl halides
None identified in MSDS
2x1 L
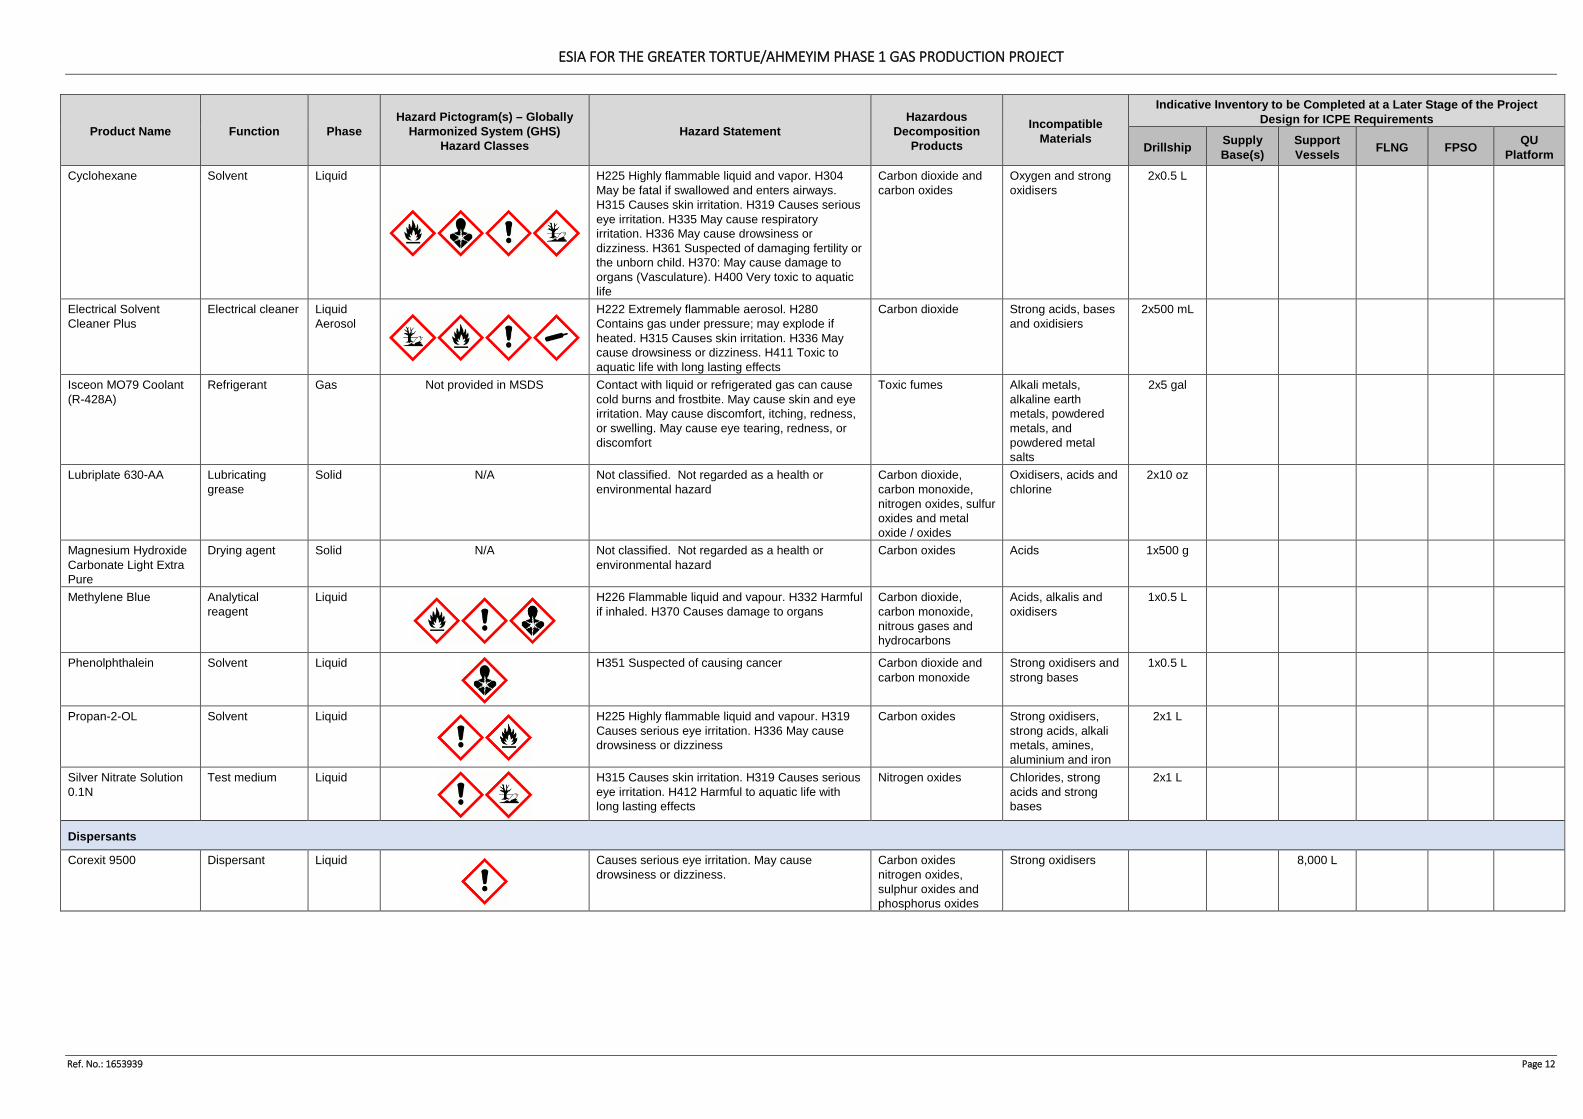
ESIA FOR THE GREATER TORTUE/AHMEYIM PHASE 1 GAS PRODUCTION PROJECT
Ref. No.: 1653939 Page 12
Product Name Function Phase Hazard Pictogram(s) – Globally
Harmonized System (GHS) Hazard Classes
Hazard Statement Hazardous
Decomposition Products
Incompatible Materials
Indicative Inventory to be Completed at a Later Stage of the Project Design for ICPE Requirements
Drillship Supply Base(s)
Support Vessels FLNG FPSO QU
Platform Cyclohexane Solvent Liquid
H225 Highly flammable liquid and vapor. H304 May be fatal if swallowed and enters airways. H315 Causes skin irritation. H319 Causes serious eye irritation. H335 May cause respiratory irritation. H336 May cause drowsiness or dizziness. H361 Suspected of damaging fertility or the unborn child. H370: May cause damage to organs (Vasculature). H400 Very toxic to aquatic life
Carbon dioxide and carbon oxides
Oxygen and strong oxidisers
2x0.5 L
Electrical Solvent Cleaner Plus
Electrical cleaner Liquid Aerosol
H222 Extremely flammable aerosol. H280 Contains gas under pressure; may explode if heated. H315 Causes skin irritation. H336 May cause drowsiness or dizziness. H411 Toxic to aquatic life with long lasting effects
Carbon dioxide Strong acids, bases and oxidisiers
2x500 mL
Isceon MO79 Coolant (R-428A)
Refrigerant Gas Not provided in MSDS Contact with liquid or refrigerated gas can cause cold burns and frostbite. May cause skin and eye irritation. May cause discomfort, itching, redness, or swelling. May cause eye tearing, redness, or discomfort
Toxic fumes Alkali metals, alkaline earth metals, powdered metals, and powdered metal salts
2x5 gal
Lubriplate 630-AA Lubricating grease
Solid N/A Not classified. Not regarded as a health or environmental hazard
Carbon dioxide, carbon monoxide, nitrogen oxides, sulfur oxides and metal oxide / oxides
Oxidisers, acids and chlorine
2x10 oz
Magnesium Hydroxide Carbonate Light Extra Pure
Drying agent Solid N/A Not classified. Not regarded as a health or environmental hazard
Carbon oxides Acids 1x500 g
Methylene Blue Analytical reagent
Liquid
H226 Flammable liquid and vapour. H332 Harmful if inhaled. H370 Causes damage to organs
Carbon dioxide, carbon monoxide, nitrous gases and hydrocarbons
Acids, alkalis and oxidisers
1x0.5 L
Phenolphthalein Solvent Liquid
H351 Suspected of causing cancer Carbon dioxide and carbon monoxide
Strong oxidisers and strong bases
1x0.5 L
Propan-2-OL Solvent Liquid
H225 Highly flammable liquid and vapour. H319 Causes serious eye irritation. H336 May cause drowsiness or dizziness
Carbon oxides Strong oxidisers, strong acids, alkali metals, amines, aluminium and iron
2x1 L
Silver Nitrate Solution 0.1N
Test medium Liquid
H315 Causes skin irritation. H319 Causes serious eye irritation. H412 Harmful to aquatic life with long lasting effects
Nitrogen oxides Chlorides, strong acids and strong bases
2x1 L
Dispersants
Corexit 9500 Dispersant Liquid
Causes serious eye irritation. May cause drowsiness or dizziness.
Carbon oxides nitrogen oxides, sulphur oxides and phosphorus oxides
Strong oxidisers 8,000 L
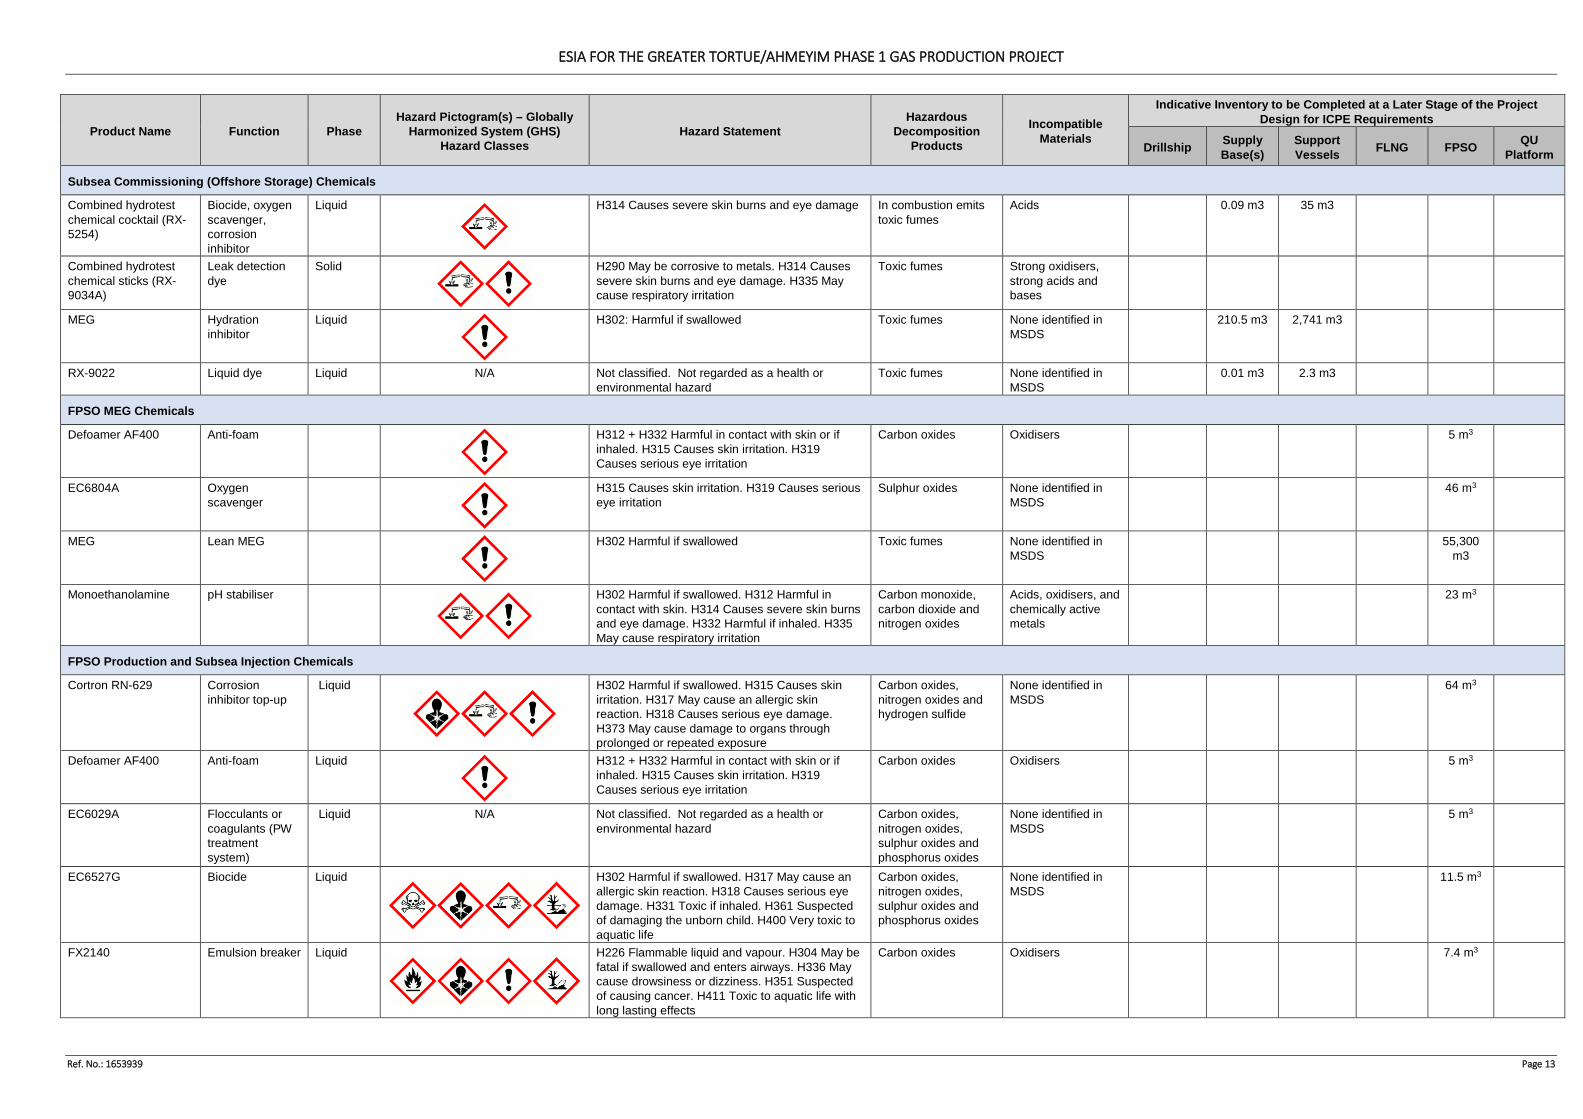
ESIA FOR THE GREATER TORTUE/AHMEYIM PHASE 1 GAS PRODUCTION PROJECT
Ref. No.: 1653939 Page 13
Product Name Function Phase Hazard Pictogram(s) – Globally
Harmonized System (GHS) Hazard Classes
Hazard Statement Hazardous
Decomposition Products
Incompatible Materials
Indicative Inventory to be Completed at a Later Stage of the Project Design for ICPE Requirements
Drillship Supply Base(s)
Support Vessels FLNG FPSO QU
Platform
Subsea Commissioning (Offshore Storage) Chemicals
Combined hydrotest chemical cocktail (RX-5254)
Biocide, oxygen scavenger, corrosion inhibitor
Liquid
H314 Causes severe skin burns and eye damage In combustion emits toxic fumes
Acids 0.09 m3 35 m3
Combined hydrotest chemical sticks (RX-9034A)
Leak detection dye
Solid
H290 May be corrosive to metals. H314 Causes severe skin burns and eye damage. H335 May cause respiratory irritation
Toxic fumes Strong oxidisers, strong acids and bases
MEG Hydration inhibitor
Liquid
H302: Harmful if swallowed Toxic fumes None identified in MSDS
210.5 m3 2,741 m3
RX-9022 Liquid dye Liquid N/A Not classified. Not regarded as a health or environmental hazard
Toxic fumes None identified in MSDS
0.01 m3 2.3 m3
FPSO MEG Chemicals
Defoamer AF400 Anti-foam
H312 + H332 Harmful in contact with skin or if inhaled. H315 Causes skin irritation. H319 Causes serious eye irritation
Carbon oxides Oxidisers 5 m3
EC6804A Oxygen scavenger
H315 Causes skin irritation. H319 Causes serious eye irritation
Sulphur oxides None identified in MSDS
46 m3
MEG Lean MEG
H302 Harmful if swallowed Toxic fumes None identified in MSDS
55,300 m3
Monoethanolamine pH stabiliser
H302 Harmful if swallowed. H312 Harmful in contact with skin. H314 Causes severe skin burns and eye damage. H332 Harmful if inhaled. H335 May cause respiratory irritation
Carbon monoxide, carbon dioxide and nitrogen oxides
Acids, oxidisers, and chemically active metals
23 m3
FPSO Production and Subsea Injection Chemicals
Cortron RN-629 Corrosion inhibitor top-up
Liquid
H302 Harmful if swallowed. H315 Causes skin irritation. H317 May cause an allergic skin reaction. H318 Causes serious eye damage. H373 May cause damage to organs through prolonged or repeated exposure
Carbon oxides, nitrogen oxides and hydrogen sulfide
None identified in MSDS
64 m3
Defoamer AF400 Anti-foam Liquid
H312 + H332 Harmful in contact with skin or if inhaled. H315 Causes skin irritation. H319 Causes serious eye irritation
Carbon oxides Oxidisers 5 m3
EC6029A Flocculants or coagulants (PW treatment system)
Liquid N/A Not classified. Not regarded as a health or environmental hazard
Carbon oxides, nitrogen oxides, sulphur oxides and phosphorus oxides
None identified in MSDS
5 m3
EC6527G Biocide Liquid
H302 Harmful if swallowed. H317 May cause an allergic skin reaction. H318 Causes serious eye damage. H331 Toxic if inhaled. H361 Suspected of damaging the unborn child. H400 Very toxic to aquatic life
Carbon oxides, nitrogen oxides, sulphur oxides and phosphorus oxides
None identified in MSDS
11.5 m3
FX2140 Emulsion breaker Liquid
H226 Flammable liquid and vapour. H304 May be fatal if swallowed and enters airways. H336 May cause drowsiness or dizziness. H351 Suspected of causing cancer. H411 Toxic to aquatic life with long lasting effects
Carbon oxides Oxidisers 7.4 m3
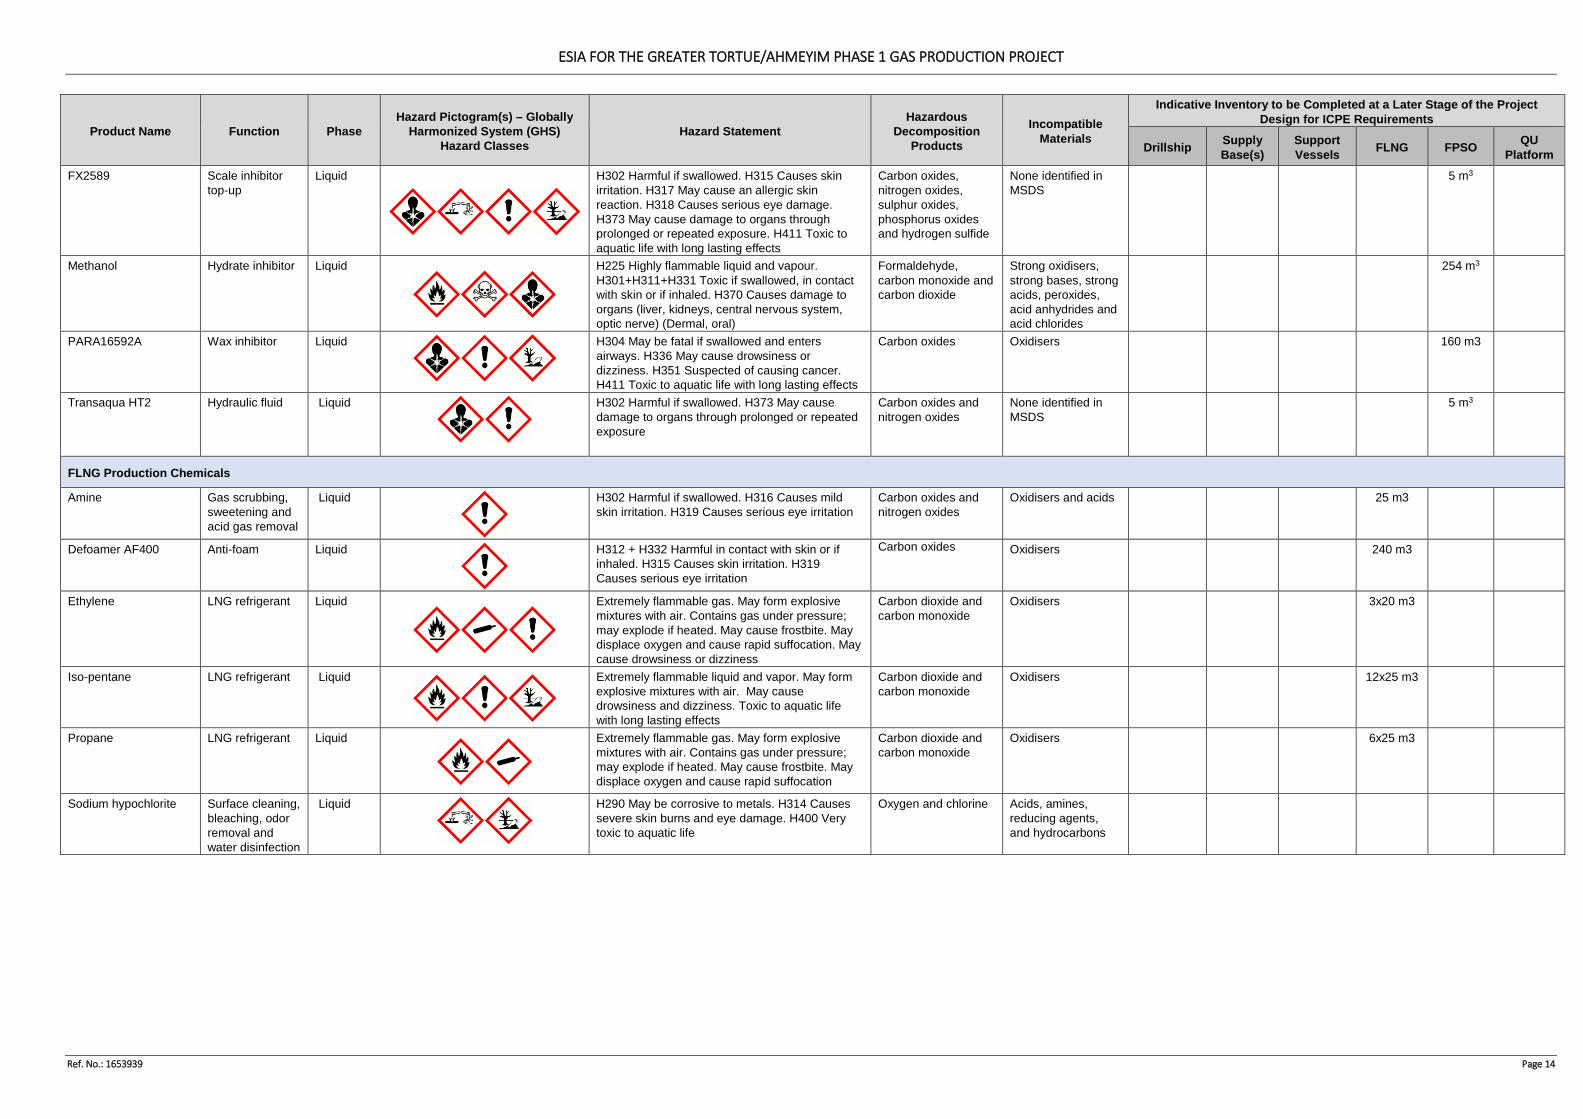
ESIA FOR THE GREATER TORTUE/AHMEYIM PHASE 1 GAS PRODUCTION PROJECT
Ref. No.: 1653939 Page 14
Product Name Function Phase Hazard Pictogram(s) – Globally
Harmonized System (GHS) Hazard Classes
Hazard Statement Hazardous
Decomposition Products
Incompatible Materials
Indicative Inventory to be Completed at a Later Stage of the Project Design for ICPE Requirements
Drillship Supply Base(s)
Support Vessels FLNG FPSO QU
Platform FX2589 Scale inhibitor
top-up Liquid
H302 Harmful if swallowed. H315 Causes skin irritation. H317 May cause an allergic skin reaction. H318 Causes serious eye damage. H373 May cause damage to organs through prolonged or repeated exposure. H411 Toxic to aquatic life with long lasting effects
Carbon oxides, nitrogen oxides, sulphur oxides, phosphorus oxides and hydrogen sulfide
None identified in MSDS
5 m3
Methanol Hydrate inhibitor Liquid
H225 Highly flammable liquid and vapour. H301+H311+H331 Toxic if swallowed, in contact with skin or if inhaled. H370 Causes damage to organs (liver, kidneys, central nervous system, optic nerve) (Dermal, oral)
Formaldehyde, carbon monoxide and carbon dioxide
Strong oxidisers, strong bases, strong acids, peroxides, acid anhydrides and acid chlorides
254 m3
PARA16592A Wax inhibitor Liquid
H304 May be fatal if swallowed and enters airways. H336 May cause drowsiness or dizziness. H351 Suspected of causing cancer. H411 Toxic to aquatic life with long lasting effects
Carbon oxides Oxidisers 160 m3
Transaqua HT2 Hydraulic fluid Liquid
H302 Harmful if swallowed. H373 May cause damage to organs through prolonged or repeated exposure
Carbon oxides and nitrogen oxides
None identified in MSDS
5 m3
FLNG Production Chemicals
Amine Gas scrubbing, sweetening and acid gas removal
Liquid
H302 Harmful if swallowed. H316 Causes mild skin irritation. H319 Causes serious eye irritation
Carbon oxides and nitrogen oxides
Oxidisers and acids 25 m3
Defoamer AF400 Anti-foam Liquid
H312 + H332 Harmful in contact with skin or if inhaled. H315 Causes skin irritation. H319 Causes serious eye irritation
Carbon oxides Oxidisers 240 m3
Ethylene LNG refrigerant Liquid
Extremely flammable gas. May form explosive mixtures with air. Contains gas under pressure; may explode if heated. May cause frostbite. May displace oxygen and cause rapid suffocation. May cause drowsiness or dizziness
Carbon dioxide and carbon monoxide
Oxidisers 3x20 m3
Iso-pentane LNG refrigerant Liquid
Extremely flammable liquid and vapor. May form explosive mixtures with air. May cause drowsiness and dizziness. Toxic to aquatic life with long lasting effects
Carbon dioxide and carbon monoxide
Oxidisers 12x25 m3
Propane LNG refrigerant Liquid
Extremely flammable gas. May form explosive mixtures with air. Contains gas under pressure; may explode if heated. May cause frostbite. May displace oxygen and cause rapid suffocation
Carbon dioxide and carbon monoxide
Oxidisers 6x25 m3
Sodium hypochlorite Surface cleaning, bleaching, odor removal and water disinfection
Liquid
H290 May be corrosive to metals. H314 Causes severe skin burns and eye damage. H400 Very toxic to aquatic life
Oxygen and chlorine Acids, amines, reducing agents, and hydrocarbons
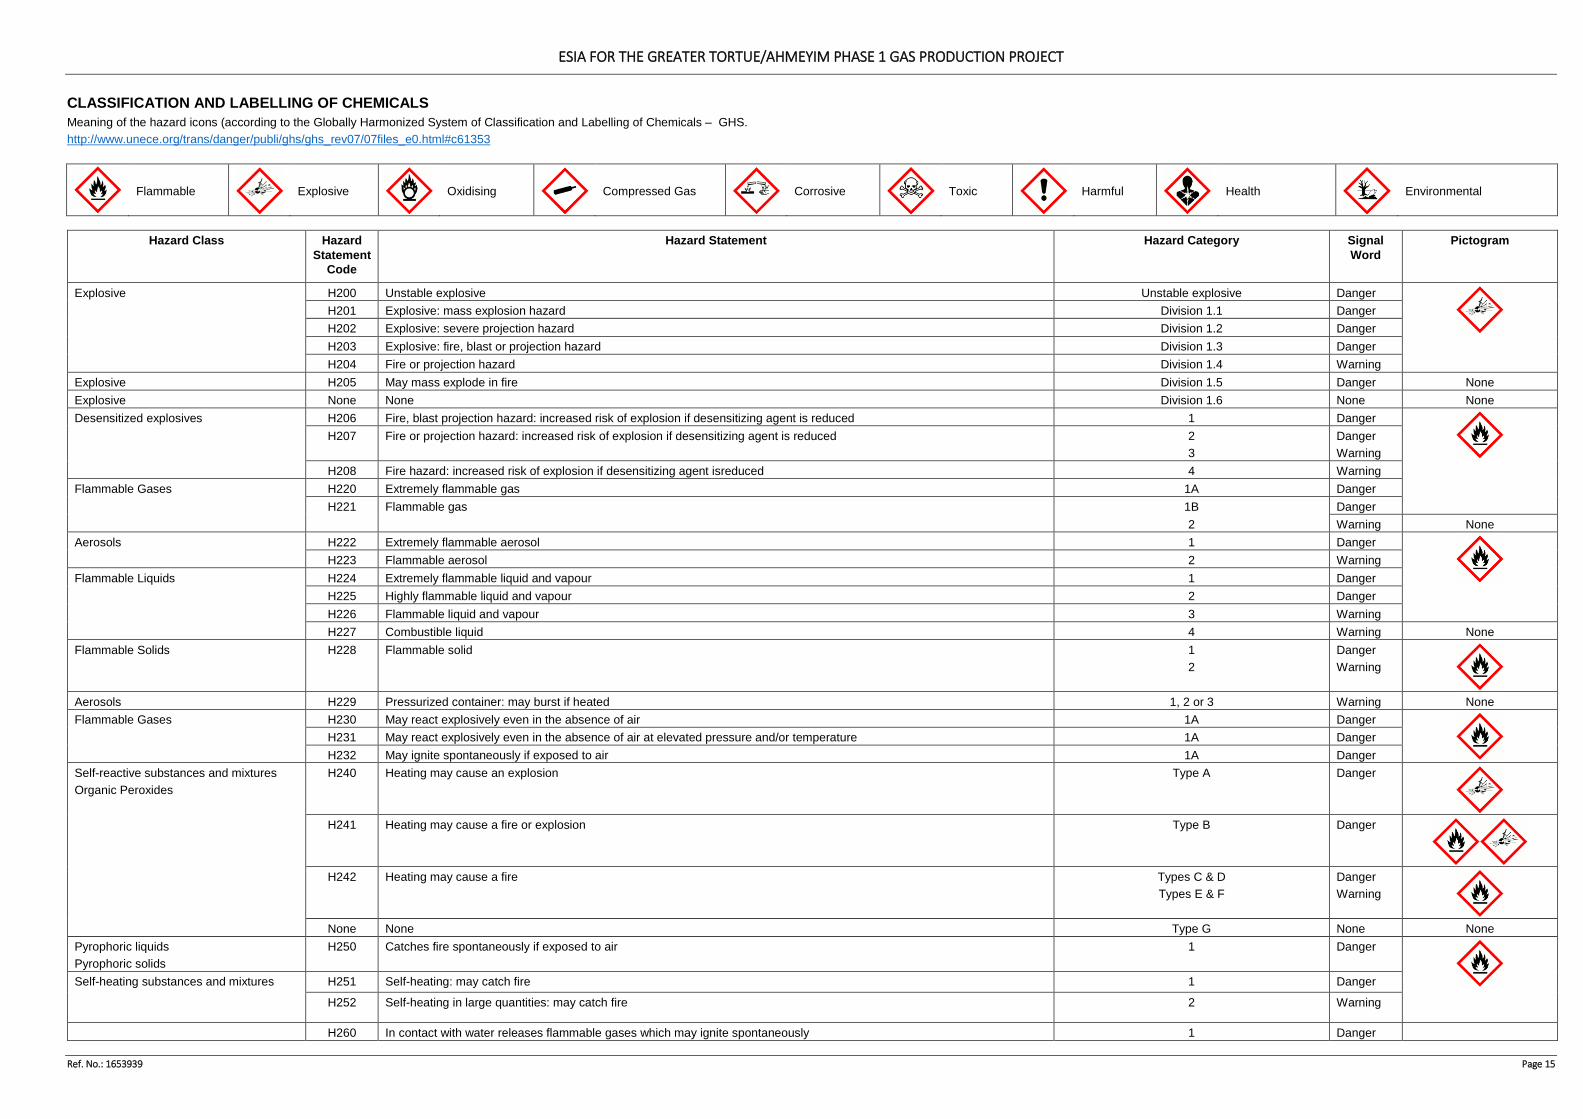
ESIA FOR THE GREATER TORTUE/AHMEYIM PHASE 1 GAS PRODUCTION PROJECT
Ref. No.: 1653939 Page 15
CLASSIFICATION AND LABELLING OF CHEMICALS Meaning of the hazard icons (according to the Globally Harmonized System of Classification and Labelling of Chemicals – GHS. http://www.unece.org/trans/danger/publi/ghs/ghs_rev07/07files_e0.html#c61353
Flammable
Explosive
Oxidising
Compressed Gas
Corrosive
Toxic
Harmful
Health
Environmental
Hazard Class Hazard
Statement Code
Hazard Statement Hazard Category Signal Word
Pictogram
Explosive H200 Unstable explosive Unstable explosive Danger
H201 Explosive: mass explosion hazard Division 1.1 Danger H202 Explosive: severe projection hazard Division 1.2 Danger H203 Explosive: fire, blast or projection hazard Division 1.3 Danger H204 Fire or projection hazard Division 1.4 Warning
Explosive H205 May mass explode in fire Division 1.5 Danger None Explosive None None Division 1.6 None None Desensitized explosives
H206 Fire, blast projection hazard: increased risk of explosion if desensitizing agent is reduced 1 Danger
H207 Fire or projection hazard: increased risk of explosion if desensitizing agent is reduced 2
3 Danger Warning
H208 Fire hazard: increased risk of explosion if desensitizing agent isreduced 4 Warning Flammable Gases H220 Extremely flammable gas 1A Danger
H221 Flammable gas 1B Danger 2 Warning None Aerosols H222 Extremely flammable aerosol 1 Danger
H223 Flammable aerosol 2 Warning
Flammable Liquids H224 Extremely flammable liquid and vapour 1 Danger H225 Highly flammable liquid and vapour 2 Danger H226 Flammable liquid and vapour 3 Warning H227 Combustible liquid 4 Warning None
Flammable Solids H228 Flammable solid 1 2
Danger Warning
Aerosols H229 Pressurized container: may burst if heated 1, 2 or 3 Warning None Flammable Gases H230 May react explosively even in the absence of air 1A Danger
H231 May react explosively even in the absence of air at elevated pressure and/or temperature 1A Danger H232 May ignite spontaneously if exposed to air 1A Danger
Self-reactive substances and mixtures Organic Peroxides
H240 Heating may cause an explosion
Type A Danger
H241 Heating may cause a fire or explosion Type B Danger
H242 Heating may cause a fire
Types C & D Types E & F
Danger Warning
None None Type G None None
Pyrophoric liquids Pyrophoric solids
H250 Catches fire spontaneously if exposed to air 1 Danger
Self-heating substances and mixtures H251 Self-heating: may catch fire 1 Danger
H252 Self-heating in large quantities: may catch fire 2 Warning
H260 In contact with water releases flammable gases which may ignite spontaneously 1 Danger
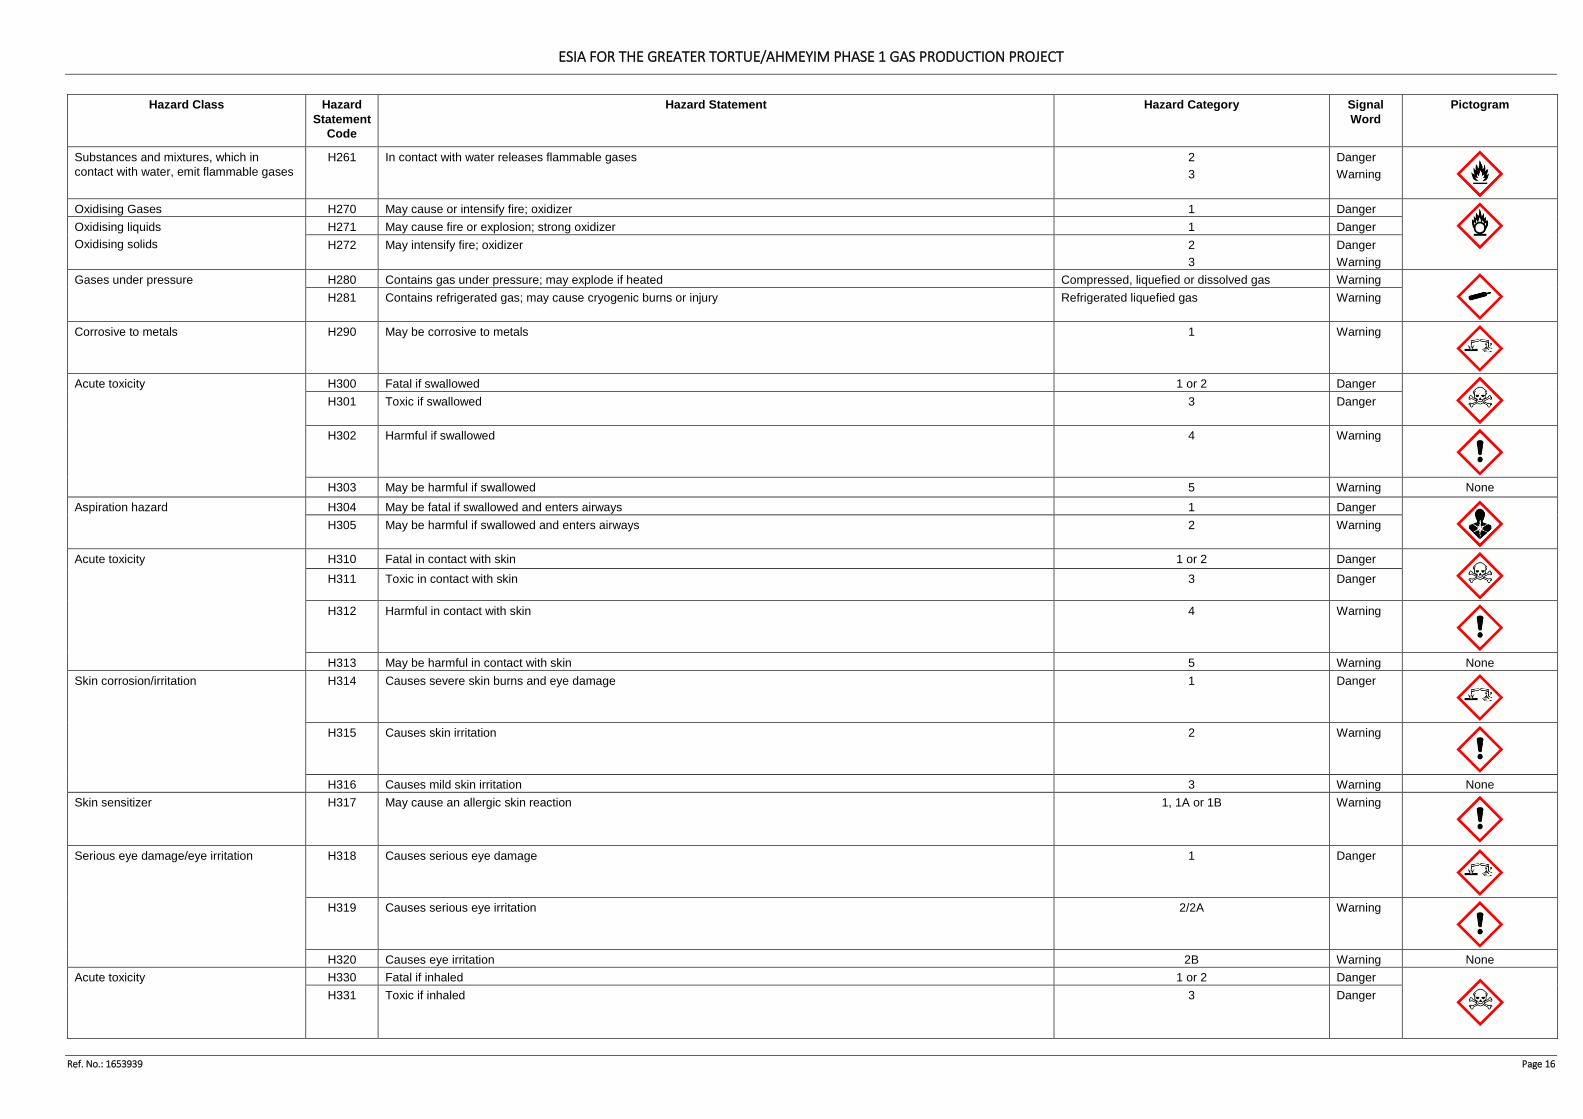
ESIA FOR THE GREATER TORTUE/AHMEYIM PHASE 1 GAS PRODUCTION PROJECT
Ref. No.: 1653939 Page 16
Hazard Class Hazard Statement
Code
Hazard Statement Hazard Category Signal Word
Pictogram
Substances and mixtures, which in contact with water, emit flammable gases
H261 In contact with water releases flammable gases
2 3
Danger Warning
Oxidising Gases H270 May cause or intensify fire; oxidizer 1 Danger
Oxidising liquids Oxidising solids
H271 May cause fire or explosion; strong oxidizer 1 Danger H272 May intensify fire; oxidizer
2 3
Danger Warning
Gases under pressure H280 Contains gas under pressure; may explode if heated Compressed, liquefied or dissolved gas Warning
H281 Contains refrigerated gas; may cause cryogenic burns or injury Refrigerated liquefied gas Warning
Corrosive to metals H290 May be corrosive to metals 1 Warning
Acute toxicity H300 Fatal if swallowed 1 or 2 Danger
H301 Toxic if swallowed 3 Danger
H302 Harmful if swallowed 4 Warning
H303 May be harmful if swallowed 5 Warning None
Aspiration hazard
H304 May be fatal if swallowed and enters airways 1 Danger
H305 May be harmful if swallowed and enters airways 2 Warning
Acute toxicity H310 Fatal in contact with skin 1 or 2 Danger
H311 Toxic in contact with skin 3 Danger
H312 Harmful in contact with skin 4 Warning
H313 May be harmful in contact with skin 5 Warning None
Skin corrosion/irritation H314 Causes severe skin burns and eye damage 1 Danger
H315 Causes skin irritation 2 Warning
H316 Causes mild skin irritation 3 Warning None
Skin sensitizer H317 May cause an allergic skin reaction 1, 1A or 1B Warning
Serious eye damage/eye irritation
H318 Causes serious eye damage 1 Danger
H319 Causes serious eye irritation 2/2A Warning
H320 Causes eye irritation 2B Warning None
Acute toxicity H330 Fatal if inhaled 1 or 2 Danger H331 Toxic if inhaled 3 Danger
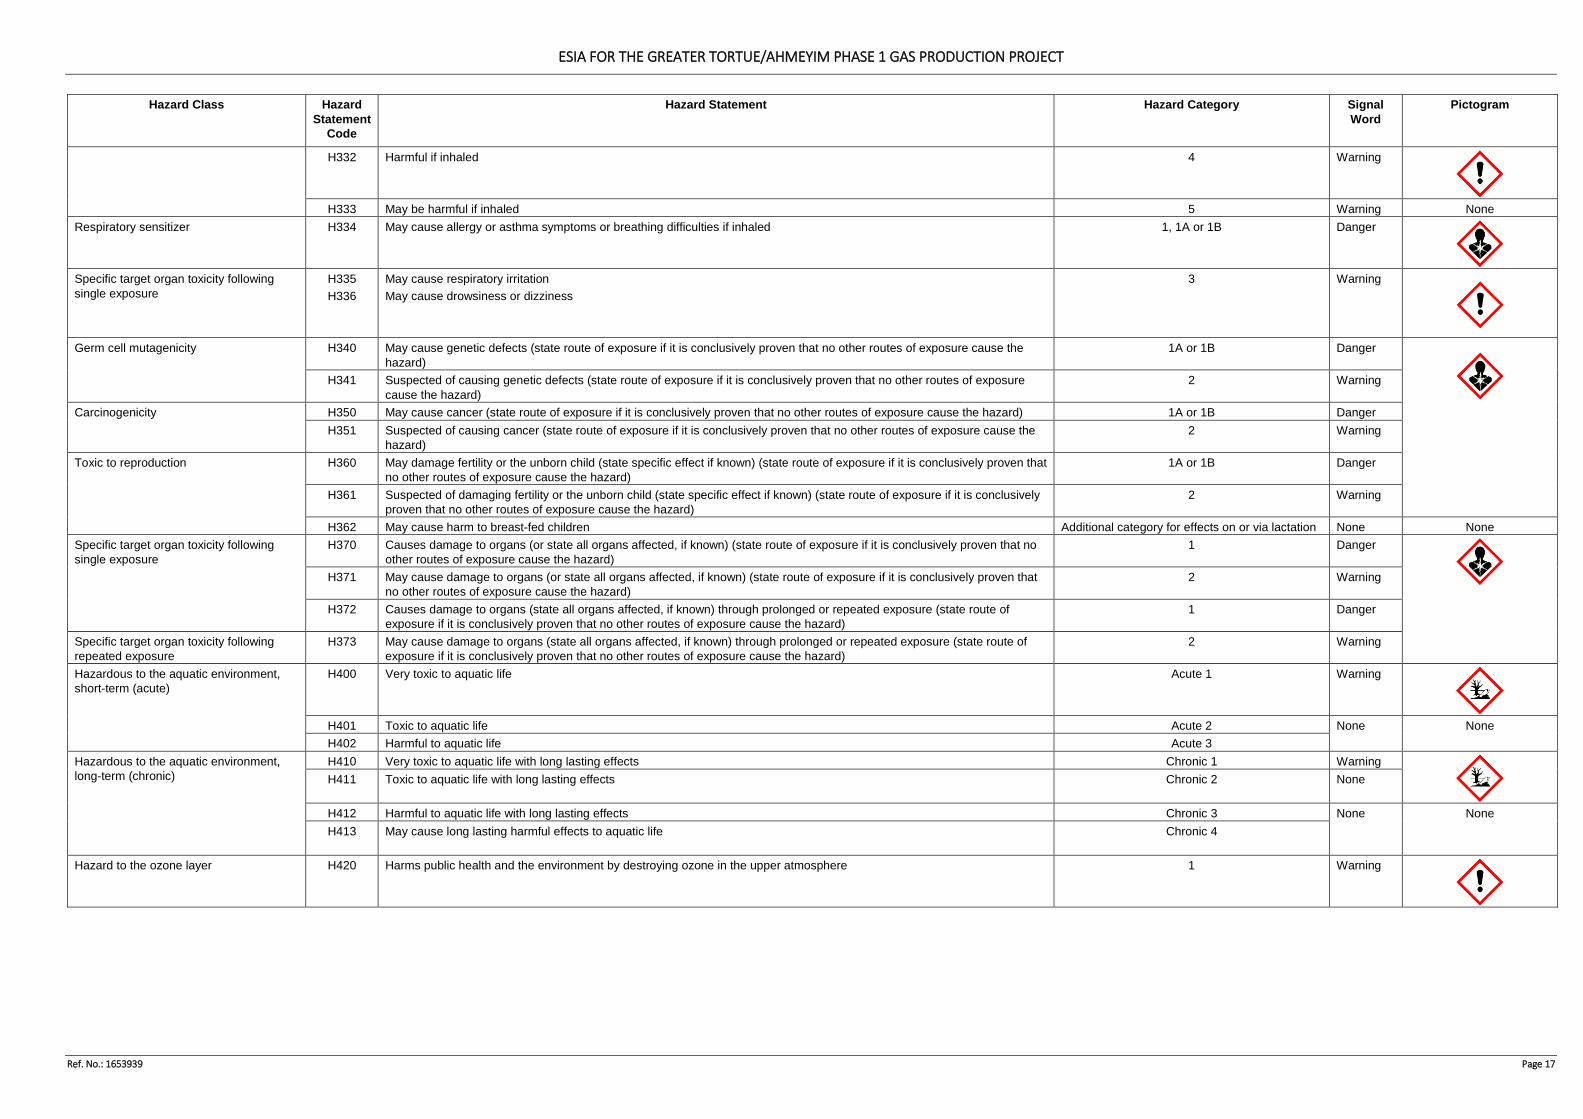
ESIA FOR THE GREATER TORTUE/AHMEYIM PHASE 1 GAS PRODUCTION PROJECT
Ref. No.: 1653939 Page 17
Hazard Class Hazard Statement
Code
Hazard Statement Hazard Category Signal Word
Pictogram
H332 Harmful if inhaled 4 Warning
H333 May be harmful if inhaled 5 Warning None
Respiratory sensitizer H334 May cause allergy or asthma symptoms or breathing difficulties if inhaled 1, 1A or 1B Danger
Specific target organ toxicity following single exposure
H335 H336
May cause respiratory irritation May cause drowsiness or dizziness
3 Warning
Germ cell mutagenicity H340 May cause genetic defects (state route of exposure if it is conclusively proven that no other routes of exposure cause the hazard)
1A or 1B Danger
H341 Suspected of causing genetic defects (state route of exposure if it is conclusively proven that no other routes of exposure cause the hazard)
2 Warning
Carcinogenicity H350 May cause cancer (state route of exposure if it is conclusively proven that no other routes of exposure cause the hazard) 1A or 1B Danger H351 Suspected of causing cancer (state route of exposure if it is conclusively proven that no other routes of exposure cause the
hazard) 2 Warning
Toxic to reproduction H360 May damage fertility or the unborn child (state specific effect if known) (state route of exposure if it is conclusively proven that no other routes of exposure cause the hazard)
1A or 1B Danger
H361 Suspected of damaging fertility or the unborn child (state specific effect if known) (state route of exposure if it is conclusively proven that no other routes of exposure cause the hazard)
2 Warning
H362 May cause harm to breast-fed children Additional category for effects on or via lactation None None Specific target organ toxicity following single exposure
H370 Causes damage to organs (or state all organs affected, if known) (state route of exposure if it is conclusively proven that no other routes of exposure cause the hazard)
1 Danger
H371 May cause damage to organs (or state all organs affected, if known) (state route of exposure if it is conclusively proven that no other routes of exposure cause the hazard)
2 Warning
H372 Causes damage to organs (state all organs affected, if known) through prolonged or repeated exposure (state route of exposure if it is conclusively proven that no other routes of exposure cause the hazard)
1 Danger
Specific target organ toxicity following repeated exposure
H373 May cause damage to organs (state all organs affected, if known) through prolonged or repeated exposure (state route of exposure if it is conclusively proven that no other routes of exposure cause the hazard)
2 Warning
Hazardous to the aquatic environment, short-term (acute)
H400 Very toxic to aquatic life
Acute 1 Warning
H401 Toxic to aquatic life Acute 2 None None H402 Harmful to aquatic life Acute 3
Hazardous to the aquatic environment, long-term (chronic)
H410 Very toxic to aquatic life with long lasting effects Chronic 1 Warning
H411 Toxic to aquatic life with long lasting effects Chronic 2 None
H412 Harmful to aquatic life with long lasting effects Chronic 3 None None H413 May cause long lasting harmful effects to aquatic life Chronic 4
Hazard to the ozone layer H420 Harms public health and the environment by destroying ozone in the upper atmosphere 1 Warning
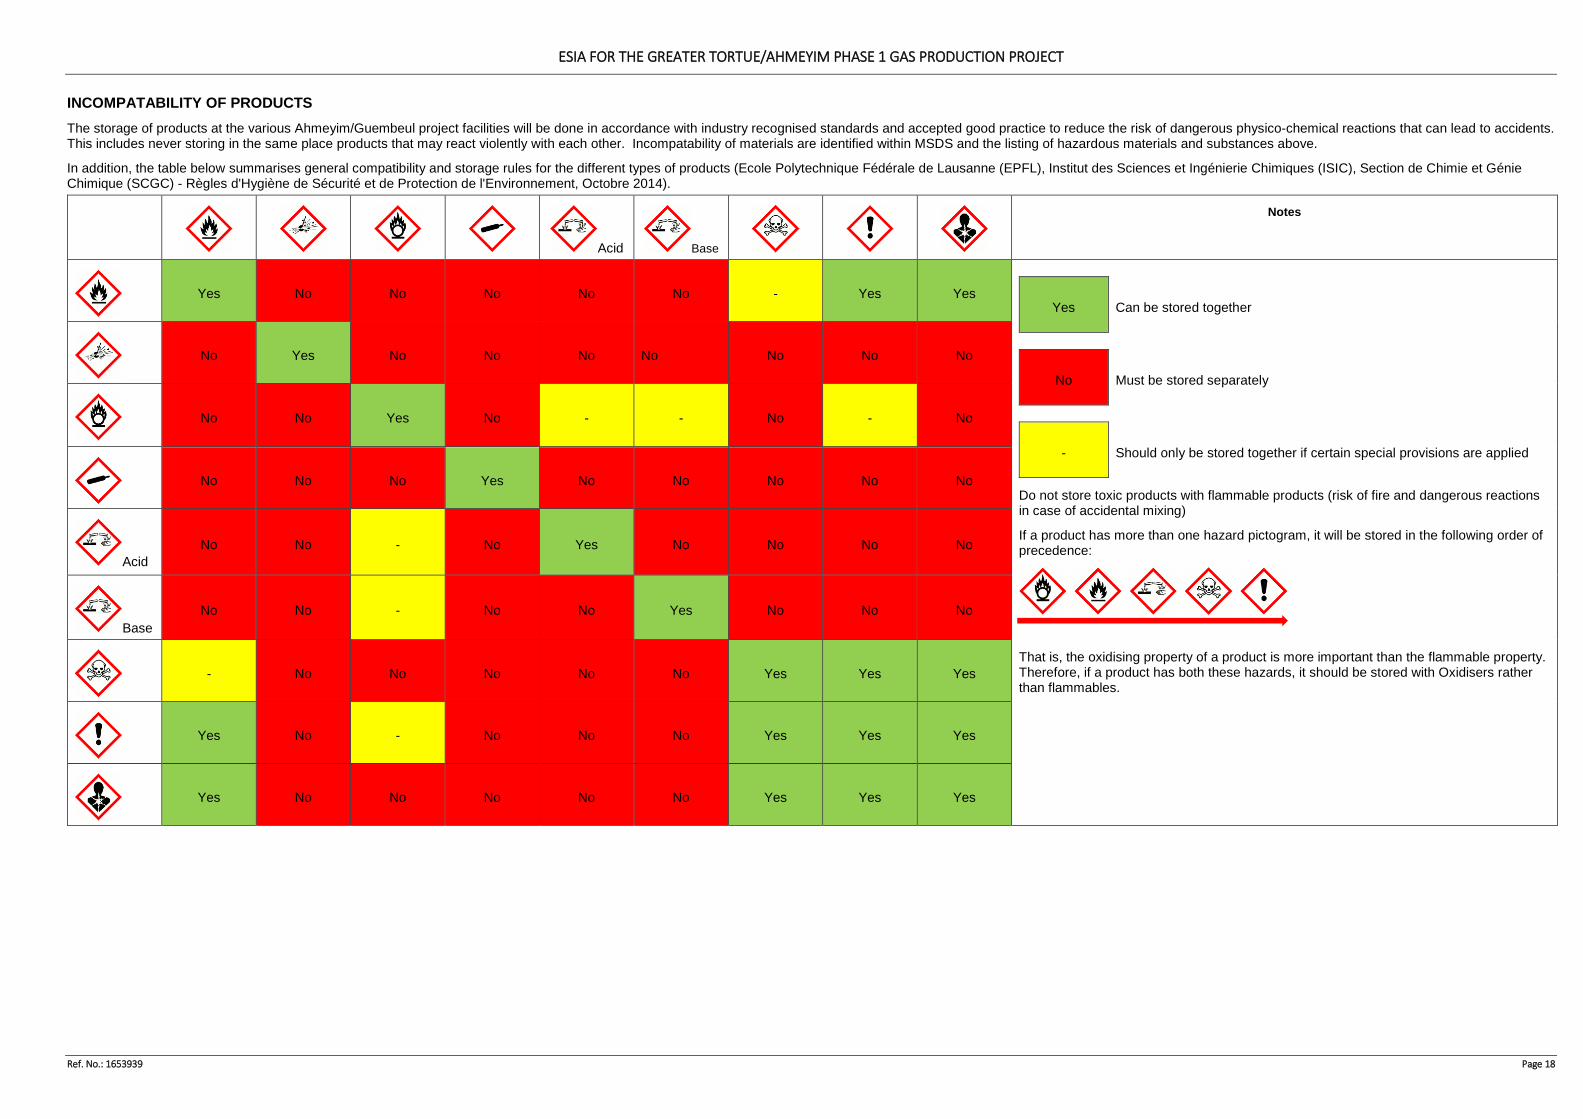
ESIA FOR THE GREATER TORTUE/AHMEYIM PHASE 1 GAS PRODUCTION PROJECT
Ref. No.: 1653939 Page 18
INCOMPATABILITY OF PRODUCTS The storage of products at the various Ahmeyim/Guembeul project facilities will be done in accordance with industry recognised standards and accepted good practice to reduce the risk of dangerous physico-chemical reactions that can lead to accidents. This includes never storing in the same place products that may react violently with each other. Incompatability of materials are identified within MSDS and the listing of hazardous materials and substances above.
In addition, the table below summarises general compatibility and storage rules for the different types of products (Ecole Polytechnique Fédérale de Lausanne (EPFL), Institut des Sciences et Ingénierie Chimiques (ISIC), Section de Chimie et Génie Chimique (SCGC) - Règles d'Hygiène de Sécurité et de Protection de l'Environnement, Octobre 2014).
Acid Base
Notes
Yes No No No No No - Yes Yes
Yes Can be stored together
No Must be stored separately
- Should only be stored together if certain special provisions are applied
Do not store toxic products with flammable products (risk of fire and dangerous reactions in case of accidental mixing)
If a product has more than one hazard pictogram, it will be stored in the following order of precedence:
That is, the oxidising property of a product is more important than the flammable property. Therefore, if a product has both these hazards, it should be stored with Oxidisers rather than flammables.
No Yes No No No No No No No
No No Yes No - - No - No
No No No Yes No No No No No
Acid No No - No Yes No No No No
Base No No - No No Yes No No No
- No No No No No Yes Yes Yes
Yes No - No No No Yes Yes Yes
Yes No No No No No Yes Yes Yes
ESIA FOR THE GREATER TORTUE/AHMEYIM PHASE 1 GAS PRODUCTION PROJECT
Ref. No.: 1653939
APPENDIX O-2 : PRELIMINARY RISK ANALYSIS WORKSHEETS
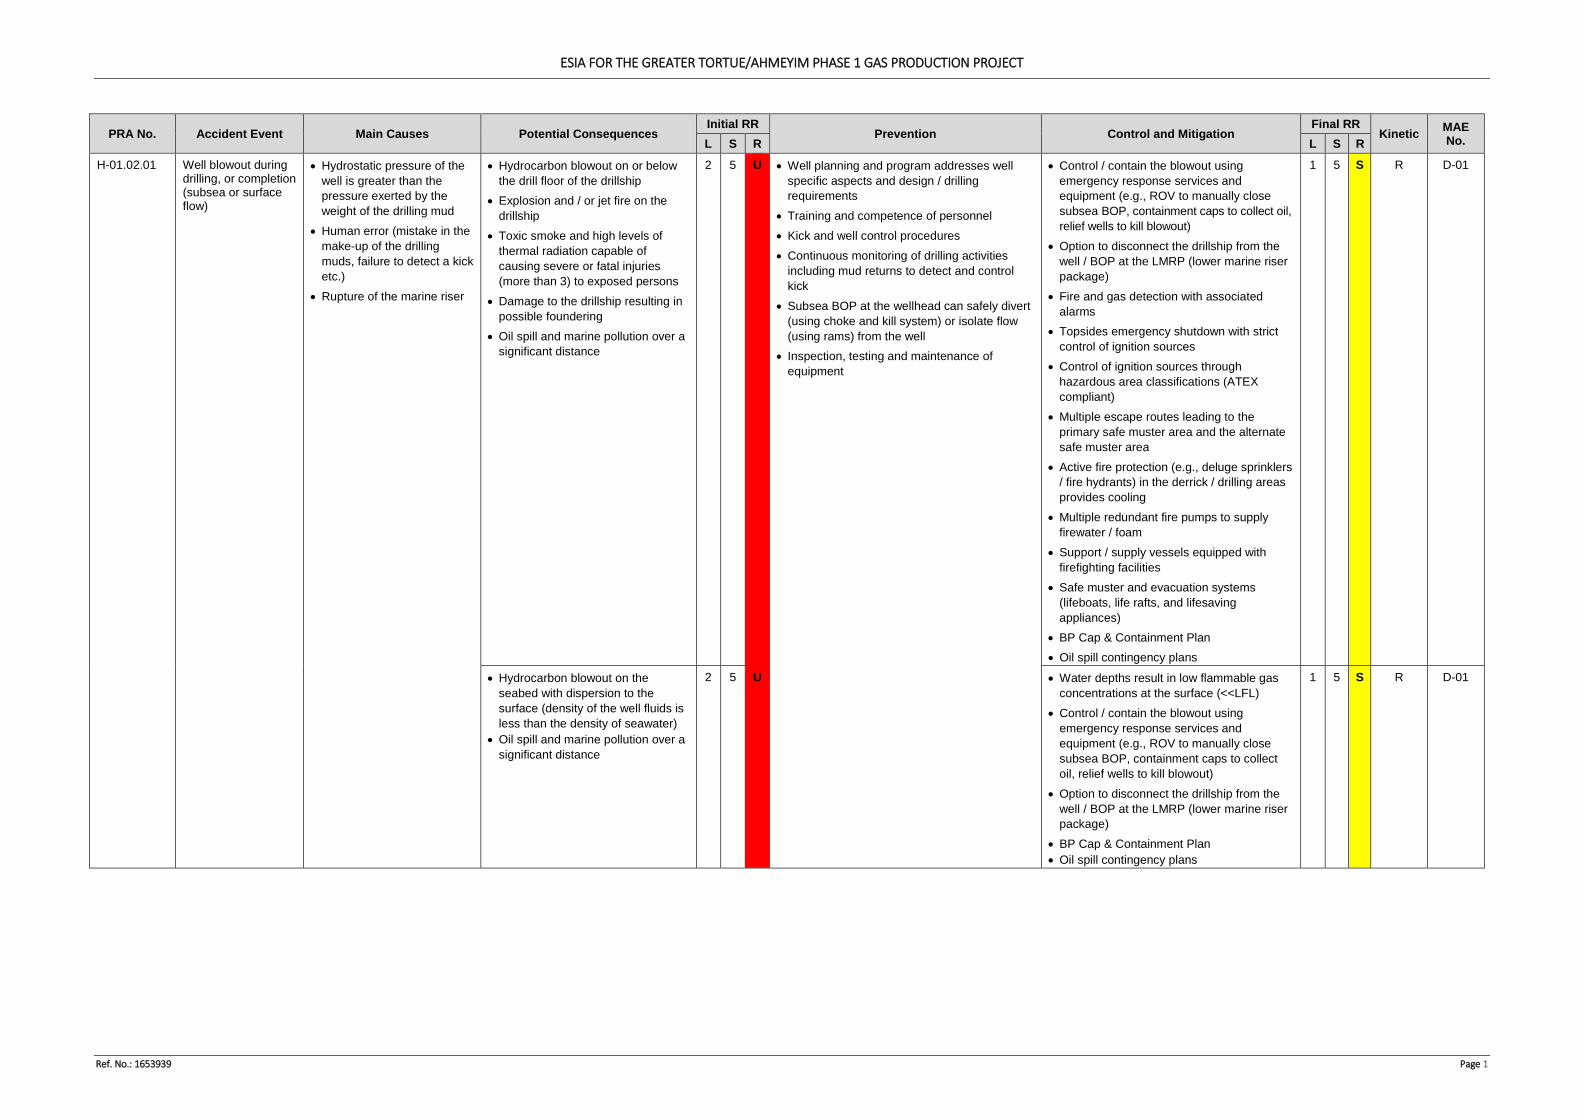
ESIA FOR THE GREATER TORTUE/AHMEYIM PHASE 1 GAS PRODUCTION PROJECT
Ref. No.: 1653939 Page 1
PRA No. Accident Event Main Causes Potential Consequences Initial RR
Prevention Control and Mitigation Final RR
Kinetic MAE No. L S R L S R
H-01.02.01 Well blowout during drilling, or completion (subsea or surface flow)
• Hydrostatic pressure of the well is greater than the pressure exerted by the weight of the drilling mud
• Human error (mistake in the make-up of the drilling muds, failure to detect a kick etc.)
• Rupture of the marine riser
• Hydrocarbon blowout on or below the drill floor of the drillship
• Explosion and / or jet fire on the drillship
• Toxic smoke and high levels of thermal radiation capable of causing severe or fatal injuries (more than 3) to exposed persons
• Damage to the drillship resulting in possible foundering
• Oil spill and marine pollution over a significant distance
2 5 U • Well planning and program addresses well specific aspects and design / drilling requirements
• Training and competence of personnel • Kick and well control procedures • Continuous monitoring of drilling activities
including mud returns to detect and control kick
• Subsea BOP at the wellhead can safely divert (using choke and kill system) or isolate flow (using rams) from the well
• Inspection, testing and maintenance of equipment
• Control / contain the blowout using emergency response services and equipment (e.g., ROV to manually close subsea BOP, containment caps to collect oil, relief wells to kill blowout)
• Option to disconnect the drillship from the well / BOP at the LMRP (lower marine riser package)
• Fire and gas detection with associated alarms
• Topsides emergency shutdown with strict control of ignition sources
• Control of ignition sources through hazardous area classifications (ATEX compliant)
• Multiple escape routes leading to the primary safe muster area and the alternate safe muster area
• Active fire protection (e.g., deluge sprinklers / fire hydrants) in the derrick / drilling areas provides cooling
• Multiple redundant fire pumps to supply firewater / foam
• Support / supply vessels equipped with firefighting facilities
• Safe muster and evacuation systems (lifeboats, life rafts, and lifesaving appliances)
• BP Cap & Containment Plan • Oil spill contingency plans
1 5 S R D-01
• Hydrocarbon blowout on the seabed with dispersion to the surface (density of the well fluids is less than the density of seawater)
• Oil spill and marine pollution over a significant distance
2 5 U • Water depths result in low flammable gas concentrations at the surface (<<LFL)
• Control / contain the blowout using emergency response services and equipment (e.g., ROV to manually close subsea BOP, containment caps to collect oil, relief wells to kill blowout)
• Option to disconnect the drillship from the well / BOP at the LMRP (lower marine riser package)
• BP Cap & Containment Plan • Oil spill contingency plans
1 5 S R D-01
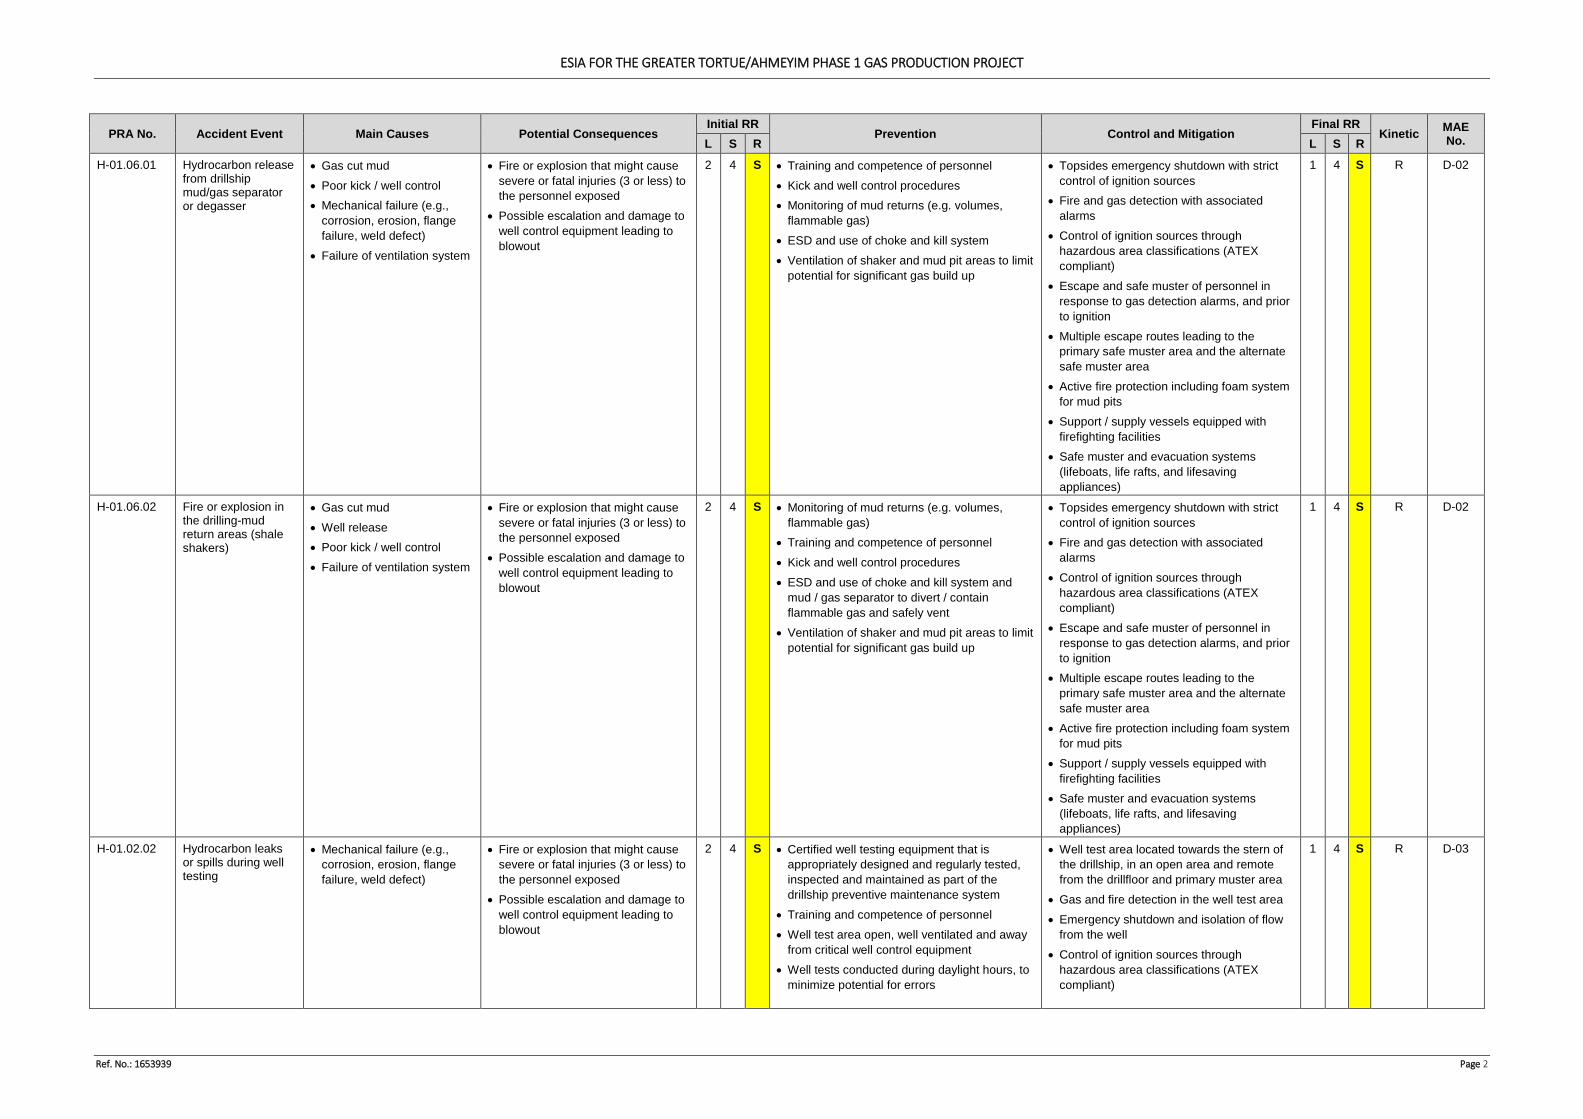
ESIA FOR THE GREATER TORTUE/AHMEYIM PHASE 1 GAS PRODUCTION PROJECT
Ref. No.: 1653939 Page 2
PRA No. Accident Event Main Causes Potential Consequences Initial RR
Prevention Control and Mitigation Final RR
Kinetic MAE No. L S R L S R
H-01.06.01 Hydrocarbon release from drillship mud/gas separator or degasser
• Gas cut mud • Poor kick / well control • Mechanical failure (e.g.,
corrosion, erosion, flange failure, weld defect)
• Failure of ventilation system
• Fire or explosion that might cause severe or fatal injuries (3 or less) to the personnel exposed
• Possible escalation and damage to well control equipment leading to blowout
2 4 S • Training and competence of personnel • Kick and well control procedures • Monitoring of mud returns (e.g. volumes,
flammable gas) • ESD and use of choke and kill system • Ventilation of shaker and mud pit areas to limit
potential for significant gas build up
• Topsides emergency shutdown with strict control of ignition sources
• Fire and gas detection with associated alarms
• Control of ignition sources through hazardous area classifications (ATEX compliant)
• Escape and safe muster of personnel in response to gas detection alarms, and prior to ignition
• Multiple escape routes leading to the primary safe muster area and the alternate safe muster area
• Active fire protection including foam system for mud pits
• Support / supply vessels equipped with firefighting facilities
• Safe muster and evacuation systems (lifeboats, life rafts, and lifesaving appliances)
1 4 S R D-02
H-01.06.02 Fire or explosion in the drilling-mud return areas (shale shakers)
• Gas cut mud • Well release • Poor kick / well control • Failure of ventilation system
• Fire or explosion that might cause severe or fatal injuries (3 or less) to the personnel exposed
• Possible escalation and damage to well control equipment leading to blowout
2 4 S • Monitoring of mud returns (e.g. volumes, flammable gas)
• Training and competence of personnel • Kick and well control procedures • ESD and use of choke and kill system and
mud / gas separator to divert / contain flammable gas and safely vent
• Ventilation of shaker and mud pit areas to limit potential for significant gas build up
• Topsides emergency shutdown with strict control of ignition sources
• Fire and gas detection with associated alarms
• Control of ignition sources through hazardous area classifications (ATEX compliant)
• Escape and safe muster of personnel in response to gas detection alarms, and prior to ignition
• Multiple escape routes leading to the primary safe muster area and the alternate safe muster area
• Active fire protection including foam system for mud pits
• Support / supply vessels equipped with firefighting facilities
• Safe muster and evacuation systems (lifeboats, life rafts, and lifesaving appliances)
1 4 S R D-02
H-01.02.02 Hydrocarbon leaks or spills during well testing
• Mechanical failure (e.g., corrosion, erosion, flange failure, weld defect)
• Fire or explosion that might cause severe or fatal injuries (3 or less) to the personnel exposed
• Possible escalation and damage to well control equipment leading to blowout
2 4 S • Certified well testing equipment that is appropriately designed and regularly tested, inspected and maintained as part of the drillship preventive maintenance system
• Training and competence of personnel • Well test area open, well ventilated and away
from critical well control equipment • Well tests conducted during daylight hours, to
minimize potential for errors
• Well test area located towards the stern of the drillship, in an open area and remote from the drillfloor and primary muster area
• Gas and fire detection in the well test area • Emergency shutdown and isolation of flow
from the well • Control of ignition sources through
hazardous area classifications (ATEX compliant)
1 4 S R D-03
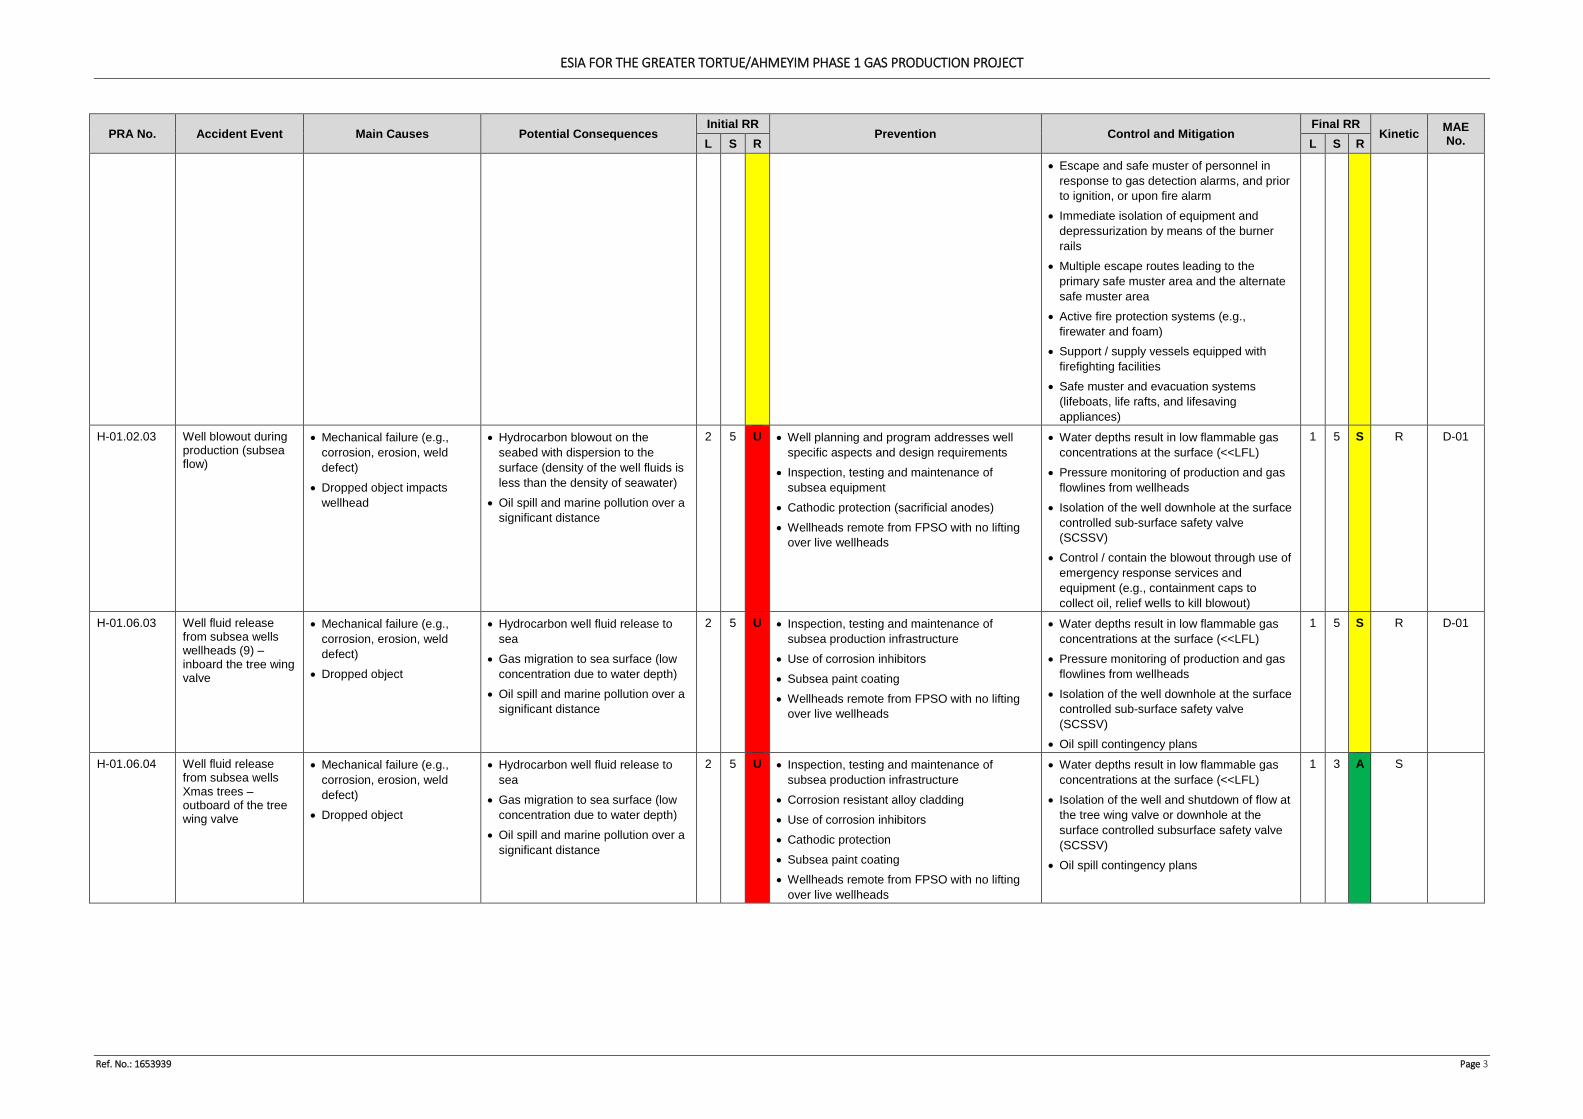
ESIA FOR THE GREATER TORTUE/AHMEYIM PHASE 1 GAS PRODUCTION PROJECT
Ref. No.: 1653939 Page 3
PRA No. Accident Event Main Causes Potential Consequences Initial RR
Prevention Control and Mitigation Final RR
Kinetic MAE No. L S R L S R
• Escape and safe muster of personnel in response to gas detection alarms, and prior to ignition, or upon fire alarm
• Immediate isolation of equipment and depressurization by means of the burner rails
• Multiple escape routes leading to the primary safe muster area and the alternate safe muster area
• Active fire protection systems (e.g., firewater and foam)
• Support / supply vessels equipped with firefighting facilities
• Safe muster and evacuation systems (lifeboats, life rafts, and lifesaving appliances)
H-01.02.03 Well blowout during production (subsea flow)
• Mechanical failure (e.g., corrosion, erosion, weld defect)
• Dropped object impacts wellhead
• Hydrocarbon blowout on the seabed with dispersion to the surface (density of the well fluids is less than the density of seawater)
• Oil spill and marine pollution over a significant distance
2 5 U • Well planning and program addresses well specific aspects and design requirements
• Inspection, testing and maintenance of subsea equipment
• Cathodic protection (sacrificial anodes) • Wellheads remote from FPSO with no lifting
over live wellheads
• Water depths result in low flammable gas concentrations at the surface (<<LFL)
• Pressure monitoring of production and gas flowlines from wellheads
• Isolation of the well downhole at the surface controlled sub-surface safety valve (SCSSV)
• Control / contain the blowout through use of emergency response services and equipment (e.g., containment caps to collect oil, relief wells to kill blowout)
1 5 S R D-01
H-01.06.03 Well fluid release from subsea wells wellheads (9) – inboard the tree wing valve
• Mechanical failure (e.g., corrosion, erosion, weld defect)
• Dropped object
• Hydrocarbon well fluid release to sea
• Gas migration to sea surface (low concentration due to water depth)
• Oil spill and marine pollution over a significant distance
2 5 U • Inspection, testing and maintenance of subsea production infrastructure
• Use of corrosion inhibitors • Subsea paint coating • Wellheads remote from FPSO with no lifting
over live wellheads
• Water depths result in low flammable gas concentrations at the surface (<<LFL)
• Pressure monitoring of production and gas flowlines from wellheads
• Isolation of the well downhole at the surface controlled sub-surface safety valve (SCSSV)
• Oil spill contingency plans
1 5 S R D-01
H-01.06.04 Well fluid release from subsea wells Xmas trees – outboard of the tree wing valve
• Mechanical failure (e.g., corrosion, erosion, weld defect)
• Dropped object
• Hydrocarbon well fluid release to sea
• Gas migration to sea surface (low concentration due to water depth)
• Oil spill and marine pollution over a significant distance
2 5 U • Inspection, testing and maintenance of subsea production infrastructure
• Corrosion resistant alloy cladding • Use of corrosion inhibitors • Cathodic protection • Subsea paint coating • Wellheads remote from FPSO with no lifting
over live wellheads
• Water depths result in low flammable gas concentrations at the surface (<<LFL)
• Isolation of the well and shutdown of flow at the tree wing valve or downhole at the surface controlled subsurface safety valve (SCSSV)
• Oil spill contingency plans
1 3 A S
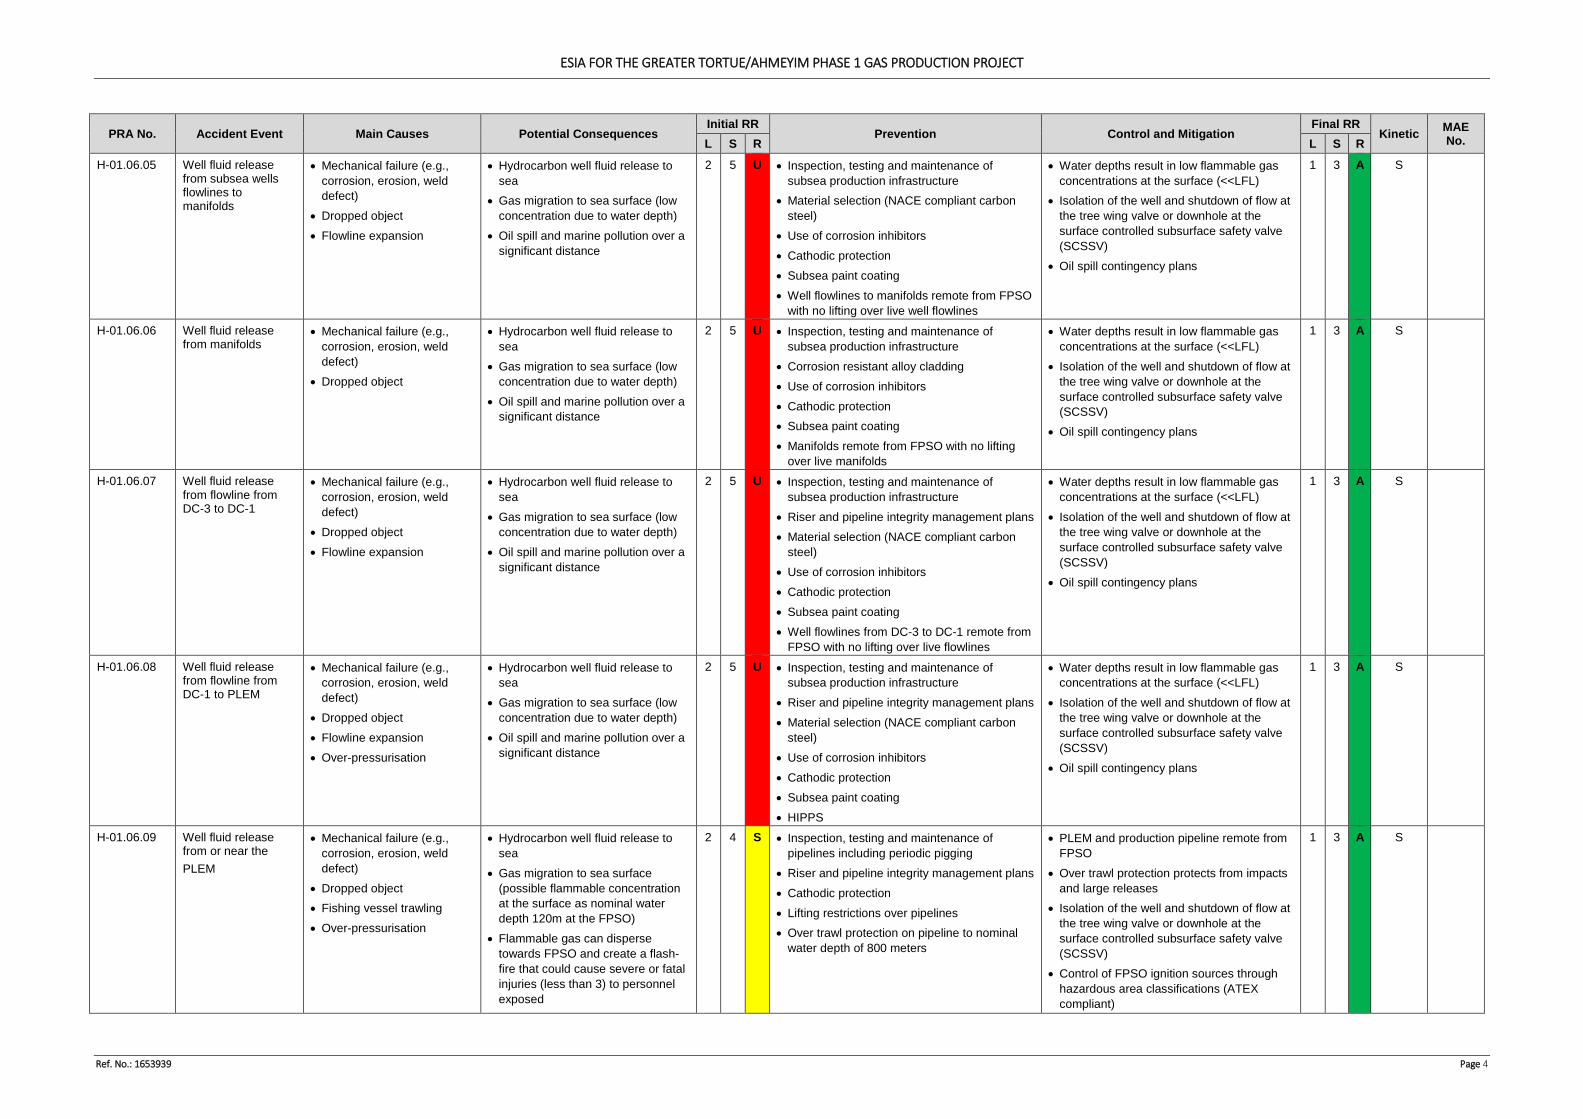
ESIA FOR THE GREATER TORTUE/AHMEYIM PHASE 1 GAS PRODUCTION PROJECT
Ref. No.: 1653939 Page 4
PRA No. Accident Event Main Causes Potential Consequences Initial RR
Prevention Control and Mitigation Final RR
Kinetic MAE No. L S R L S R
H-01.06.05 Well fluid release from subsea wells flowlines to manifolds
• Mechanical failure (e.g., corrosion, erosion, weld defect)
• Dropped object • Flowline expansion
• Hydrocarbon well fluid release to sea
• Gas migration to sea surface (low concentration due to water depth)
• Oil spill and marine pollution over a significant distance
2 5 U • Inspection, testing and maintenance of subsea production infrastructure
• Material selection (NACE compliant carbon steel)
• Use of corrosion inhibitors • Cathodic protection • Subsea paint coating • Well flowlines to manifolds remote from FPSO
with no lifting over live well flowlines
• Water depths result in low flammable gas concentrations at the surface (<<LFL)
• Isolation of the well and shutdown of flow at the tree wing valve or downhole at the surface controlled subsurface safety valve (SCSSV)
• Oil spill contingency plans
1 3 A S
H-01.06.06 Well fluid release from manifolds
• Mechanical failure (e.g., corrosion, erosion, weld defect)
• Dropped object
• Hydrocarbon well fluid release to sea
• Gas migration to sea surface (low concentration due to water depth)
• Oil spill and marine pollution over a significant distance
2 5 U • Inspection, testing and maintenance of subsea production infrastructure
• Corrosion resistant alloy cladding • Use of corrosion inhibitors • Cathodic protection • Subsea paint coating • Manifolds remote from FPSO with no lifting
over live manifolds
• Water depths result in low flammable gas concentrations at the surface (<<LFL)
• Isolation of the well and shutdown of flow at the tree wing valve or downhole at the surface controlled subsurface safety valve (SCSSV)
• Oil spill contingency plans
1 3 A S
H-01.06.07 Well fluid release from flowline from DC-3 to DC-1
• Mechanical failure (e.g., corrosion, erosion, weld defect)
• Dropped object • Flowline expansion
• Hydrocarbon well fluid release to sea
• Gas migration to sea surface (low concentration due to water depth)
• Oil spill and marine pollution over a significant distance
2 5 U • Inspection, testing and maintenance of subsea production infrastructure
• Riser and pipeline integrity management plans • Material selection (NACE compliant carbon
steel) • Use of corrosion inhibitors • Cathodic protection • Subsea paint coating • Well flowlines from DC-3 to DC-1 remote from
FPSO with no lifting over live flowlines
• Water depths result in low flammable gas concentrations at the surface (<<LFL)
• Isolation of the well and shutdown of flow at the tree wing valve or downhole at the surface controlled subsurface safety valve (SCSSV)
• Oil spill contingency plans
1 3 A S
H-01.06.08 Well fluid release from flowline from DC-1 to PLEM
• Mechanical failure (e.g., corrosion, erosion, weld defect)
• Dropped object • Flowline expansion • Over-pressurisation
• Hydrocarbon well fluid release to sea
• Gas migration to sea surface (low concentration due to water depth)
• Oil spill and marine pollution over a significant distance
2 5 U • Inspection, testing and maintenance of subsea production infrastructure
• Riser and pipeline integrity management plans • Material selection (NACE compliant carbon
steel) • Use of corrosion inhibitors • Cathodic protection • Subsea paint coating • HIPPS
• Water depths result in low flammable gas concentrations at the surface (<<LFL)
• Isolation of the well and shutdown of flow at the tree wing valve or downhole at the surface controlled subsurface safety valve (SCSSV)
• Oil spill contingency plans
1 3 A S
H-01.06.09
Well fluid release from or near the PLEM
• Mechanical failure (e.g., corrosion, erosion, weld defect)
• Dropped object • Fishing vessel trawling • Over-pressurisation
• Hydrocarbon well fluid release to sea
• Gas migration to sea surface (possible flammable concentration at the surface as nominal water depth 120m at the FPSO)
• Flammable gas can disperse towards FPSO and create a flash-fire that could cause severe or fatal injuries (less than 3) to personnel exposed
2 4 S • Inspection, testing and maintenance of pipelines including periodic pigging
• Riser and pipeline integrity management plans • Cathodic protection • Lifting restrictions over pipelines • Over trawl protection on pipeline to nominal
water depth of 800 meters
• PLEM and production pipeline remote from FPSO
• Over trawl protection protects from impacts and large releases
• Isolation of the well and shutdown of flow at the tree wing valve or downhole at the surface controlled subsurface safety valve (SCSSV)
• Control of FPSO ignition sources through hazardous area classifications (ATEX compliant)
1 3 A S
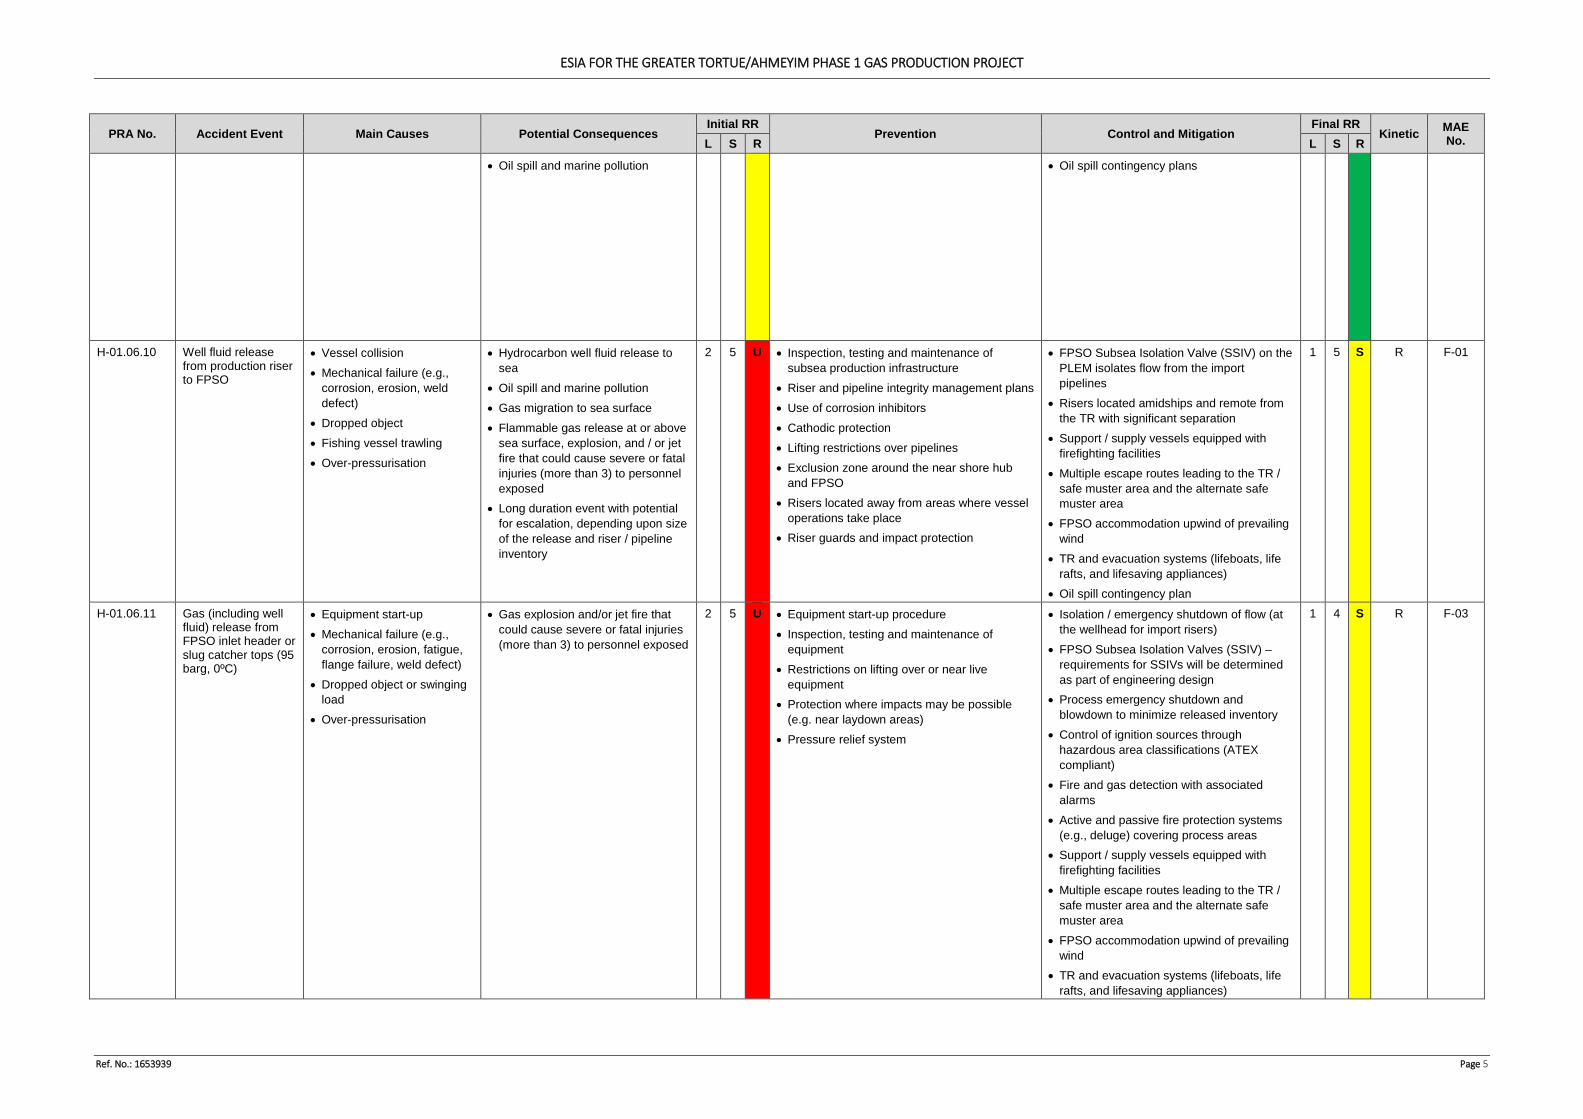
ESIA FOR THE GREATER TORTUE/AHMEYIM PHASE 1 GAS PRODUCTION PROJECT
Ref. No.: 1653939 Page 5
PRA No. Accident Event Main Causes Potential Consequences Initial RR
Prevention Control and Mitigation Final RR
Kinetic MAE No. L S R L S R
• Oil spill and marine pollution • Oil spill contingency plans
H-01.06.10 Well fluid release from production riser to FPSO
• Vessel collision • Mechanical failure (e.g.,
corrosion, erosion, weld defect)
• Dropped object • Fishing vessel trawling • Over-pressurisation
• Hydrocarbon well fluid release to sea
• Oil spill and marine pollution • Gas migration to sea surface • Flammable gas release at or above
sea surface, explosion, and / or jet fire that could cause severe or fatal injuries (more than 3) to personnel exposed
• Long duration event with potential for escalation, depending upon size of the release and riser / pipeline inventory
2 5 U • Inspection, testing and maintenance of subsea production infrastructure
• Riser and pipeline integrity management plans • Use of corrosion inhibitors • Cathodic protection • Lifting restrictions over pipelines • Exclusion zone around the near shore hub
and FPSO • Risers located away from areas where vessel
operations take place • Riser guards and impact protection
• FPSO Subsea Isolation Valve (SSIV) on the PLEM isolates flow from the import pipelines
• Risers located amidships and remote from the TR with significant separation
• Support / supply vessels equipped with firefighting facilities
• Multiple escape routes leading to the TR / safe muster area and the alternate safe muster area
• FPSO accommodation upwind of prevailing wind
• TR and evacuation systems (lifeboats, life rafts, and lifesaving appliances)
• Oil spill contingency plan
1 5 S R F-01
H-01.06.11 Gas (including well fluid) release from FPSO inlet header or slug catcher tops (95 barg, 0ºC)
• Equipment start-up • Mechanical failure (e.g.,
corrosion, erosion, fatigue, flange failure, weld defect)
• Dropped object or swinging load
• Over-pressurisation
• Gas explosion and/or jet fire that could cause severe or fatal injuries (more than 3) to personnel exposed
2 5 U • Equipment start-up procedure • Inspection, testing and maintenance of
equipment • Restrictions on lifting over or near live
equipment • Protection where impacts may be possible
(e.g. near laydown areas) • Pressure relief system
• Isolation / emergency shutdown of flow (at the wellhead for import risers)
• FPSO Subsea Isolation Valves (SSIV) – requirements for SSIVs will be determined as part of engineering design
• Process emergency shutdown and blowdown to minimize released inventory
• Control of ignition sources through hazardous area classifications (ATEX compliant)
• Fire and gas detection with associated alarms
• Active and passive fire protection systems (e.g., deluge) covering process areas
• Support / supply vessels equipped with firefighting facilities
• Multiple escape routes leading to the TR / safe muster area and the alternate safe muster area
• FPSO accommodation upwind of prevailing wind
• TR and evacuation systems (lifeboats, life rafts, and lifesaving appliances)
1 4 S R F-03
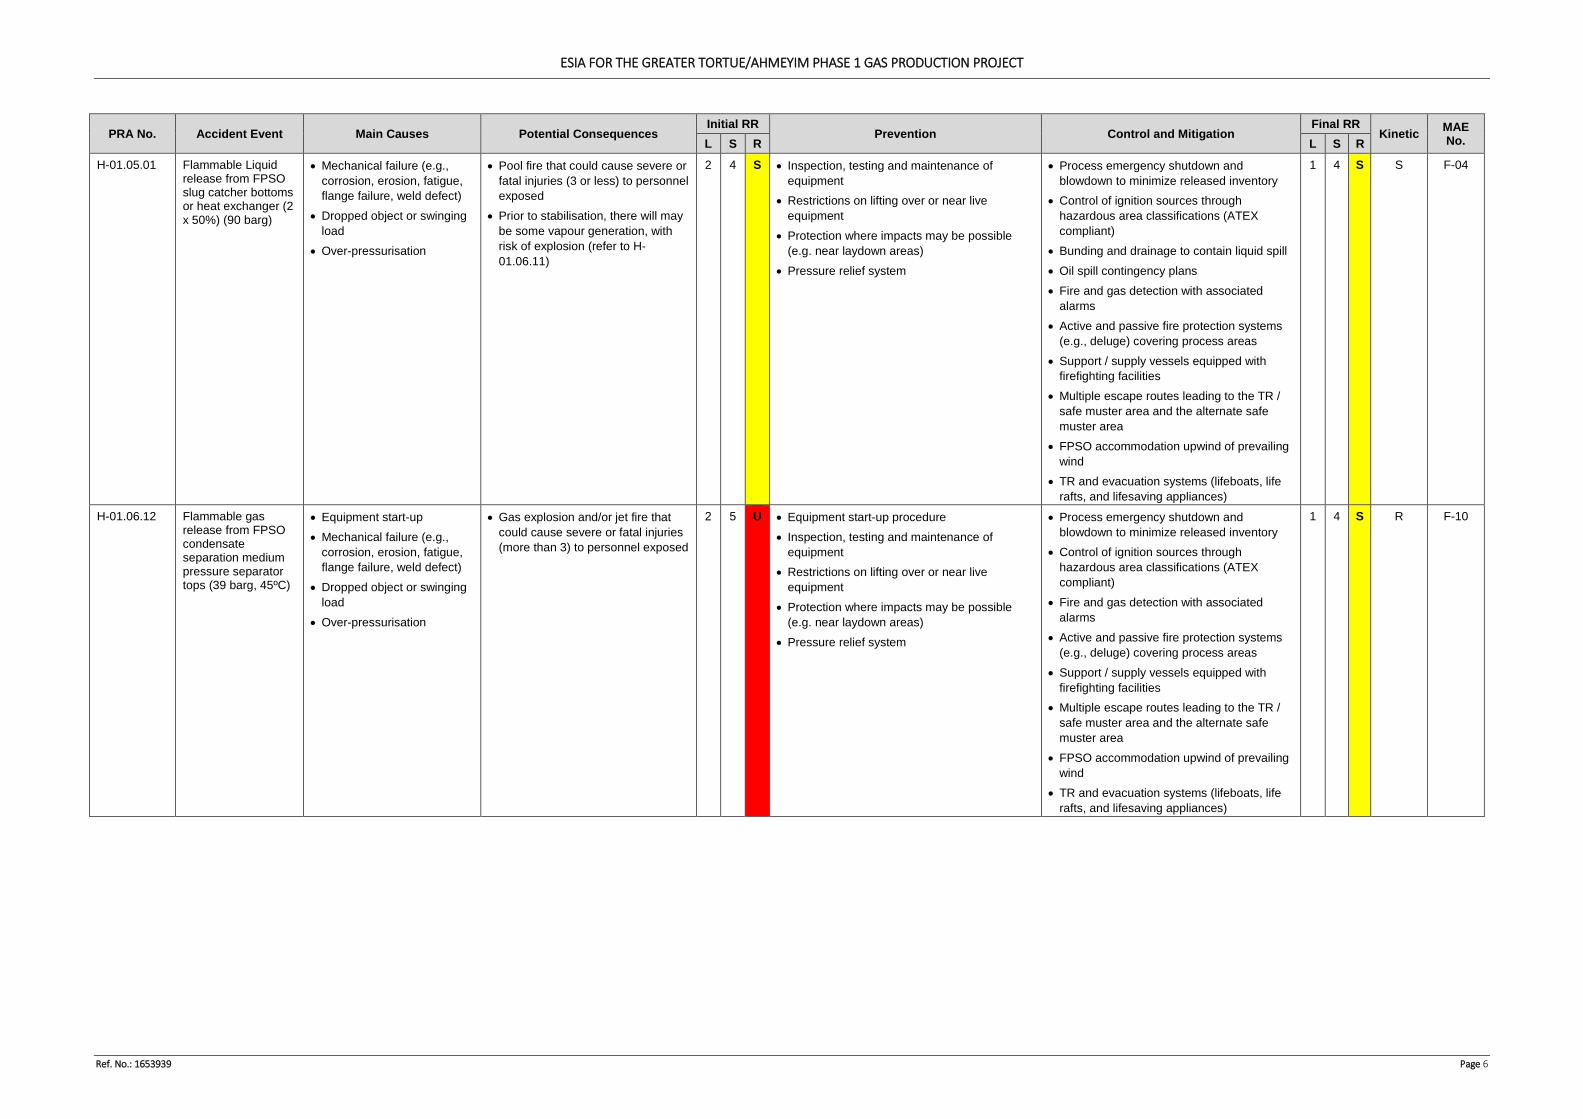
ESIA FOR THE GREATER TORTUE/AHMEYIM PHASE 1 GAS PRODUCTION PROJECT
Ref. No.: 1653939 Page 6
PRA No. Accident Event Main Causes Potential Consequences Initial RR
Prevention Control and Mitigation Final RR
Kinetic MAE No. L S R L S R
H-01.05.01 Flammable Liquid release from FPSO slug catcher bottoms or heat exchanger (2 x 50%) (90 barg)
• Mechanical failure (e.g., corrosion, erosion, fatigue, flange failure, weld defect)
• Dropped object or swinging load
• Over-pressurisation
• Pool fire that could cause severe or fatal injuries (3 or less) to personnel exposed
• Prior to stabilisation, there will may be some vapour generation, with risk of explosion (refer to H-01.06.11)
2 4 S • Inspection, testing and maintenance of equipment
• Restrictions on lifting over or near live equipment
• Protection where impacts may be possible (e.g. near laydown areas)
• Pressure relief system
• Process emergency shutdown and blowdown to minimize released inventory
• Control of ignition sources through hazardous area classifications (ATEX compliant)
• Bunding and drainage to contain liquid spill • Oil spill contingency plans • Fire and gas detection with associated
alarms • Active and passive fire protection systems
(e.g., deluge) covering process areas • Support / supply vessels equipped with
firefighting facilities • Multiple escape routes leading to the TR /
safe muster area and the alternate safe muster area
• FPSO accommodation upwind of prevailing wind
• TR and evacuation systems (lifeboats, life rafts, and lifesaving appliances)
1 4 S S F-04
H-01.06.12 Flammable gas release from FPSO condensate separation medium pressure separator tops (39 barg, 45ºC)
• Equipment start-up • Mechanical failure (e.g.,
corrosion, erosion, fatigue, flange failure, weld defect)
• Dropped object or swinging load
• Over-pressurisation
• Gas explosion and/or jet fire that could cause severe or fatal injuries (more than 3) to personnel exposed
2 5 U • Equipment start-up procedure • Inspection, testing and maintenance of
equipment • Restrictions on lifting over or near live
equipment • Protection where impacts may be possible
(e.g. near laydown areas) • Pressure relief system
• Process emergency shutdown and blowdown to minimize released inventory
• Control of ignition sources through hazardous area classifications (ATEX compliant)
• Fire and gas detection with associated alarms
• Active and passive fire protection systems (e.g., deluge) covering process areas
• Support / supply vessels equipped with firefighting facilities
• Multiple escape routes leading to the TR / safe muster area and the alternate safe muster area
• FPSO accommodation upwind of prevailing wind
• TR and evacuation systems (lifeboats, life rafts, and lifesaving appliances)
1 4 S R F-10
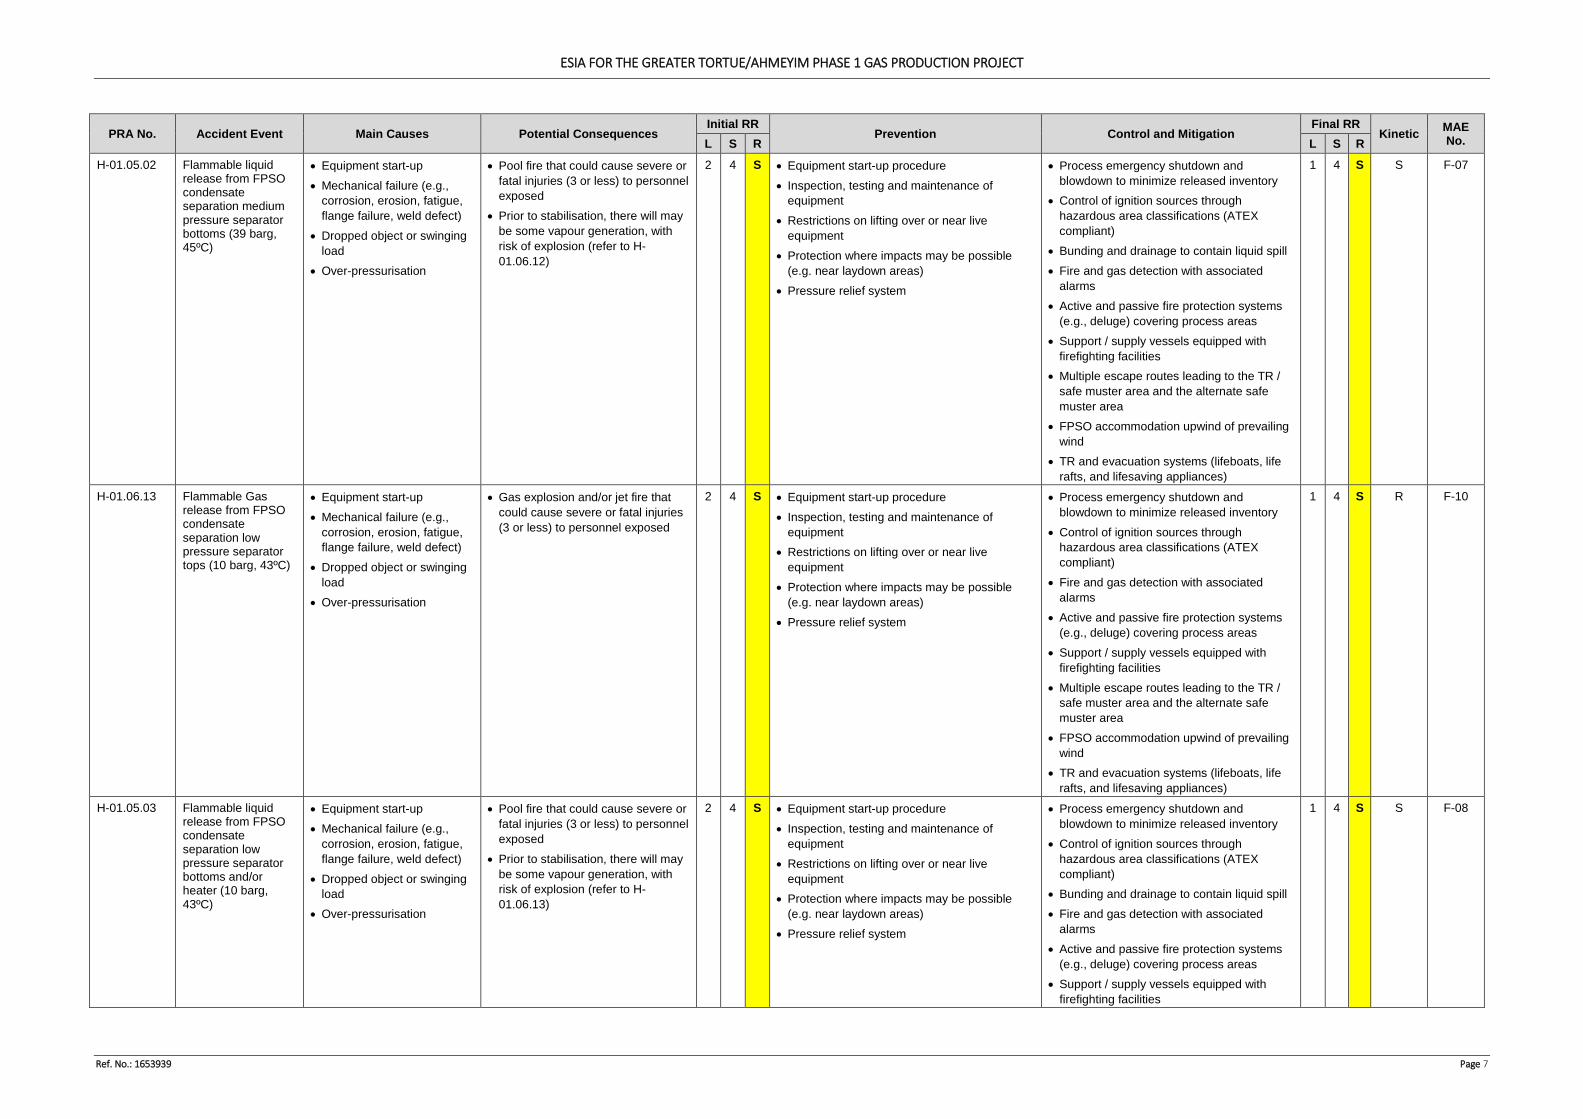
ESIA FOR THE GREATER TORTUE/AHMEYIM PHASE 1 GAS PRODUCTION PROJECT
Ref. No.: 1653939 Page 7
PRA No. Accident Event Main Causes Potential Consequences Initial RR
Prevention Control and Mitigation Final RR
Kinetic MAE No. L S R L S R
H-01.05.02 Flammable liquid release from FPSO condensate separation medium pressure separator bottoms (39 barg, 45ºC)
• Equipment start-up • Mechanical failure (e.g.,
corrosion, erosion, fatigue, flange failure, weld defect)
• Dropped object or swinging load
• Over-pressurisation
• Pool fire that could cause severe or fatal injuries (3 or less) to personnel exposed
• Prior to stabilisation, there will may be some vapour generation, with risk of explosion (refer to H-01.06.12)
2 4 S • Equipment start-up procedure • Inspection, testing and maintenance of
equipment • Restrictions on lifting over or near live
equipment • Protection where impacts may be possible
(e.g. near laydown areas) • Pressure relief system
• Process emergency shutdown and blowdown to minimize released inventory
• Control of ignition sources through hazardous area classifications (ATEX compliant)
• Bunding and drainage to contain liquid spill • Fire and gas detection with associated
alarms • Active and passive fire protection systems
(e.g., deluge) covering process areas • Support / supply vessels equipped with
firefighting facilities • Multiple escape routes leading to the TR /
safe muster area and the alternate safe muster area
• FPSO accommodation upwind of prevailing wind
• TR and evacuation systems (lifeboats, life rafts, and lifesaving appliances)
1 4 S S F-07
H-01.06.13 Flammable Gas release from FPSO condensate separation low pressure separator tops (10 barg, 43ºC)
• Equipment start-up • Mechanical failure (e.g.,
corrosion, erosion, fatigue, flange failure, weld defect)
• Dropped object or swinging load
• Over-pressurisation
• Gas explosion and/or jet fire that could cause severe or fatal injuries (3 or less) to personnel exposed
2 4 S • Equipment start-up procedure • Inspection, testing and maintenance of
equipment • Restrictions on lifting over or near live
equipment • Protection where impacts may be possible
(e.g. near laydown areas) • Pressure relief system
• Process emergency shutdown and blowdown to minimize released inventory
• Control of ignition sources through hazardous area classifications (ATEX compliant)
• Fire and gas detection with associated alarms
• Active and passive fire protection systems (e.g., deluge) covering process areas
• Support / supply vessels equipped with firefighting facilities
• Multiple escape routes leading to the TR / safe muster area and the alternate safe muster area
• FPSO accommodation upwind of prevailing wind
• TR and evacuation systems (lifeboats, life rafts, and lifesaving appliances)
1 4 S R F-10
H-01.05.03 Flammable liquid release from FPSO condensate separation low pressure separator bottoms and/or heater (10 barg, 43ºC)
• Equipment start-up • Mechanical failure (e.g.,
corrosion, erosion, fatigue, flange failure, weld defect)
• Dropped object or swinging load
• Over-pressurisation
• Pool fire that could cause severe or fatal injuries (3 or less) to personnel exposed
• Prior to stabilisation, there will may be some vapour generation, with risk of explosion (refer to H-01.06.13)
2 4 S • Equipment start-up procedure • Inspection, testing and maintenance of
equipment • Restrictions on lifting over or near live
equipment • Protection where impacts may be possible
(e.g. near laydown areas) • Pressure relief system
• Process emergency shutdown and blowdown to minimize released inventory
• Control of ignition sources through hazardous area classifications (ATEX compliant)
• Bunding and drainage to contain liquid spill • Fire and gas detection with associated
alarms • Active and passive fire protection systems
(e.g., deluge) covering process areas • Support / supply vessels equipped with
firefighting facilities
1 4 S S F-08
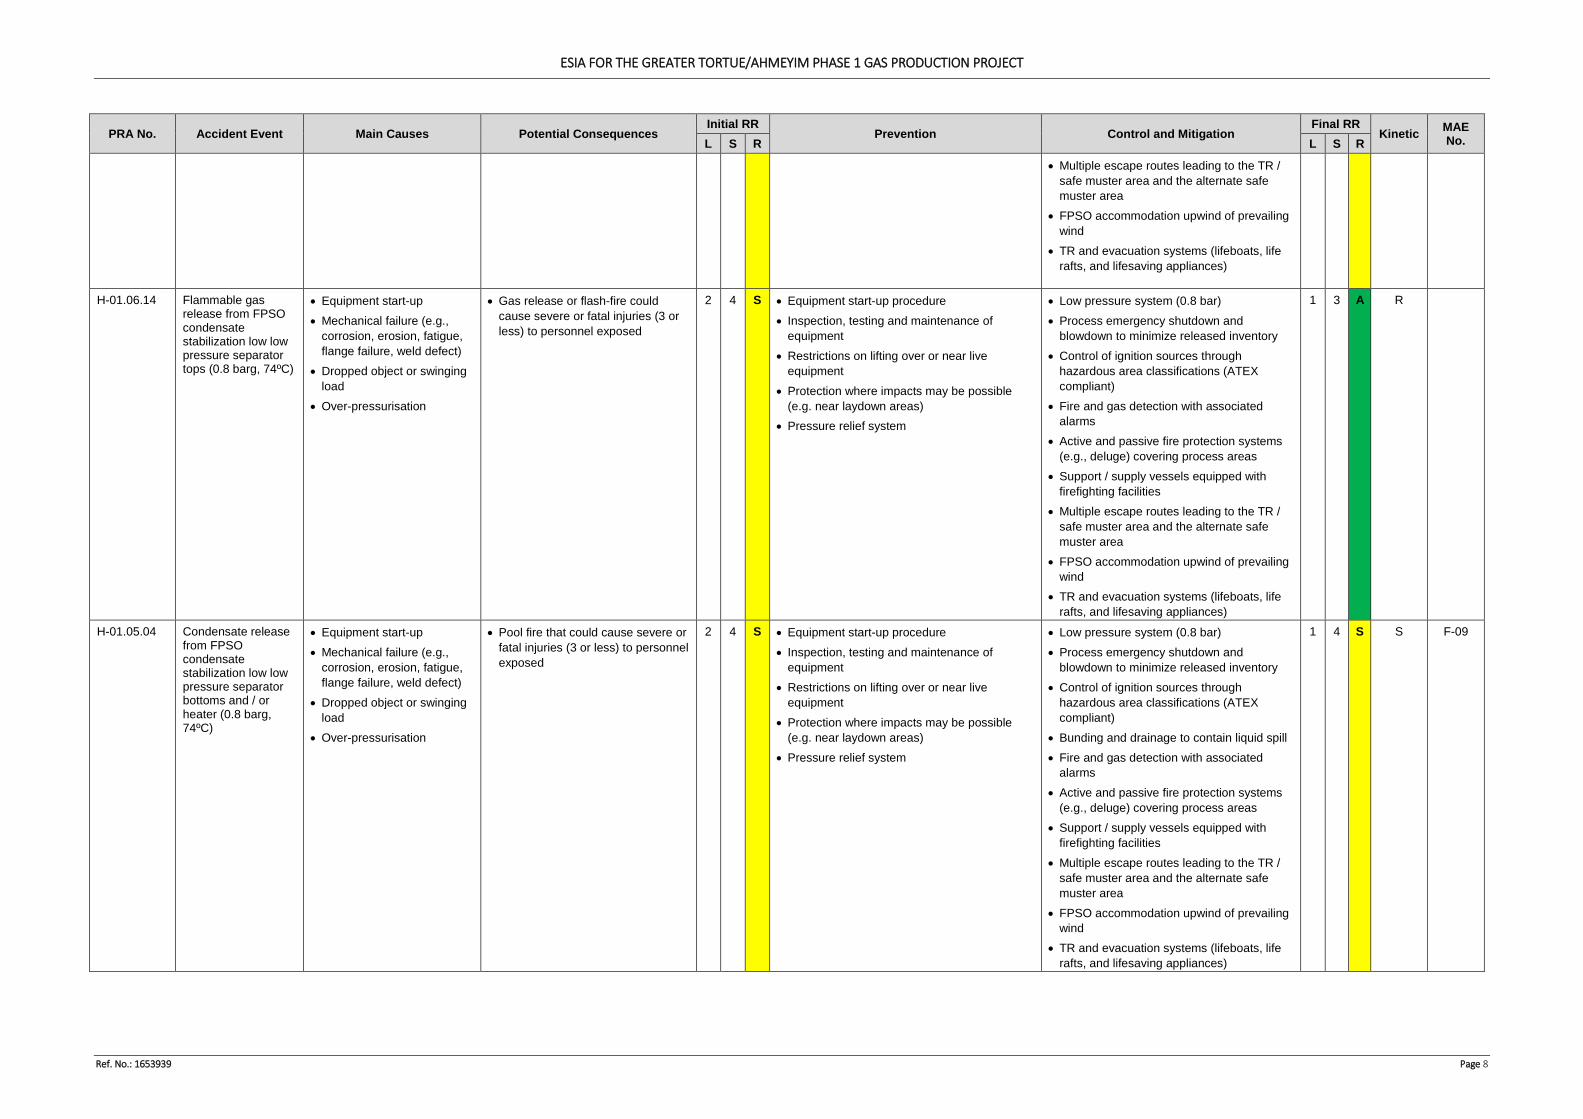
ESIA FOR THE GREATER TORTUE/AHMEYIM PHASE 1 GAS PRODUCTION PROJECT
Ref. No.: 1653939 Page 8
PRA No. Accident Event Main Causes Potential Consequences Initial RR
Prevention Control and Mitigation Final RR
Kinetic MAE No. L S R L S R
• Multiple escape routes leading to the TR / safe muster area and the alternate safe muster area
• FPSO accommodation upwind of prevailing wind
• TR and evacuation systems (lifeboats, life rafts, and lifesaving appliances)
H-01.06.14 Flammable gas release from FPSO condensate stabilization low low pressure separator tops (0.8 barg, 74ºC)
• Equipment start-up • Mechanical failure (e.g.,
corrosion, erosion, fatigue, flange failure, weld defect)
• Dropped object or swinging load
• Over-pressurisation
• Gas release or flash-fire could cause severe or fatal injuries (3 or less) to personnel exposed
2 4 S • Equipment start-up procedure • Inspection, testing and maintenance of
equipment • Restrictions on lifting over or near live
equipment • Protection where impacts may be possible
(e.g. near laydown areas) • Pressure relief system
• Low pressure system (0.8 bar) • Process emergency shutdown and
blowdown to minimize released inventory • Control of ignition sources through
hazardous area classifications (ATEX compliant)
• Fire and gas detection with associated alarms
• Active and passive fire protection systems (e.g., deluge) covering process areas
• Support / supply vessels equipped with firefighting facilities
• Multiple escape routes leading to the TR / safe muster area and the alternate safe muster area
• FPSO accommodation upwind of prevailing wind
• TR and evacuation systems (lifeboats, life rafts, and lifesaving appliances)
1 3 A R
H-01.05.04 Condensate release from FPSO condensate stabilization low low pressure separator bottoms and / or heater (0.8 barg, 74ºC)
• Equipment start-up • Mechanical failure (e.g.,
corrosion, erosion, fatigue, flange failure, weld defect)
• Dropped object or swinging load
• Over-pressurisation
• Pool fire that could cause severe or fatal injuries (3 or less) to personnel exposed
2 4 S • Equipment start-up procedure • Inspection, testing and maintenance of
equipment • Restrictions on lifting over or near live
equipment • Protection where impacts may be possible
(e.g. near laydown areas) • Pressure relief system
• Low pressure system (0.8 bar) • Process emergency shutdown and
blowdown to minimize released inventory • Control of ignition sources through
hazardous area classifications (ATEX compliant)
• Bunding and drainage to contain liquid spill • Fire and gas detection with associated
alarms • Active and passive fire protection systems
(e.g., deluge) covering process areas • Support / supply vessels equipped with
firefighting facilities • Multiple escape routes leading to the TR /
safe muster area and the alternate safe muster area
• FPSO accommodation upwind of prevailing wind
• TR and evacuation systems (lifeboats, life rafts, and lifesaving appliances)
1 4 S S F-09
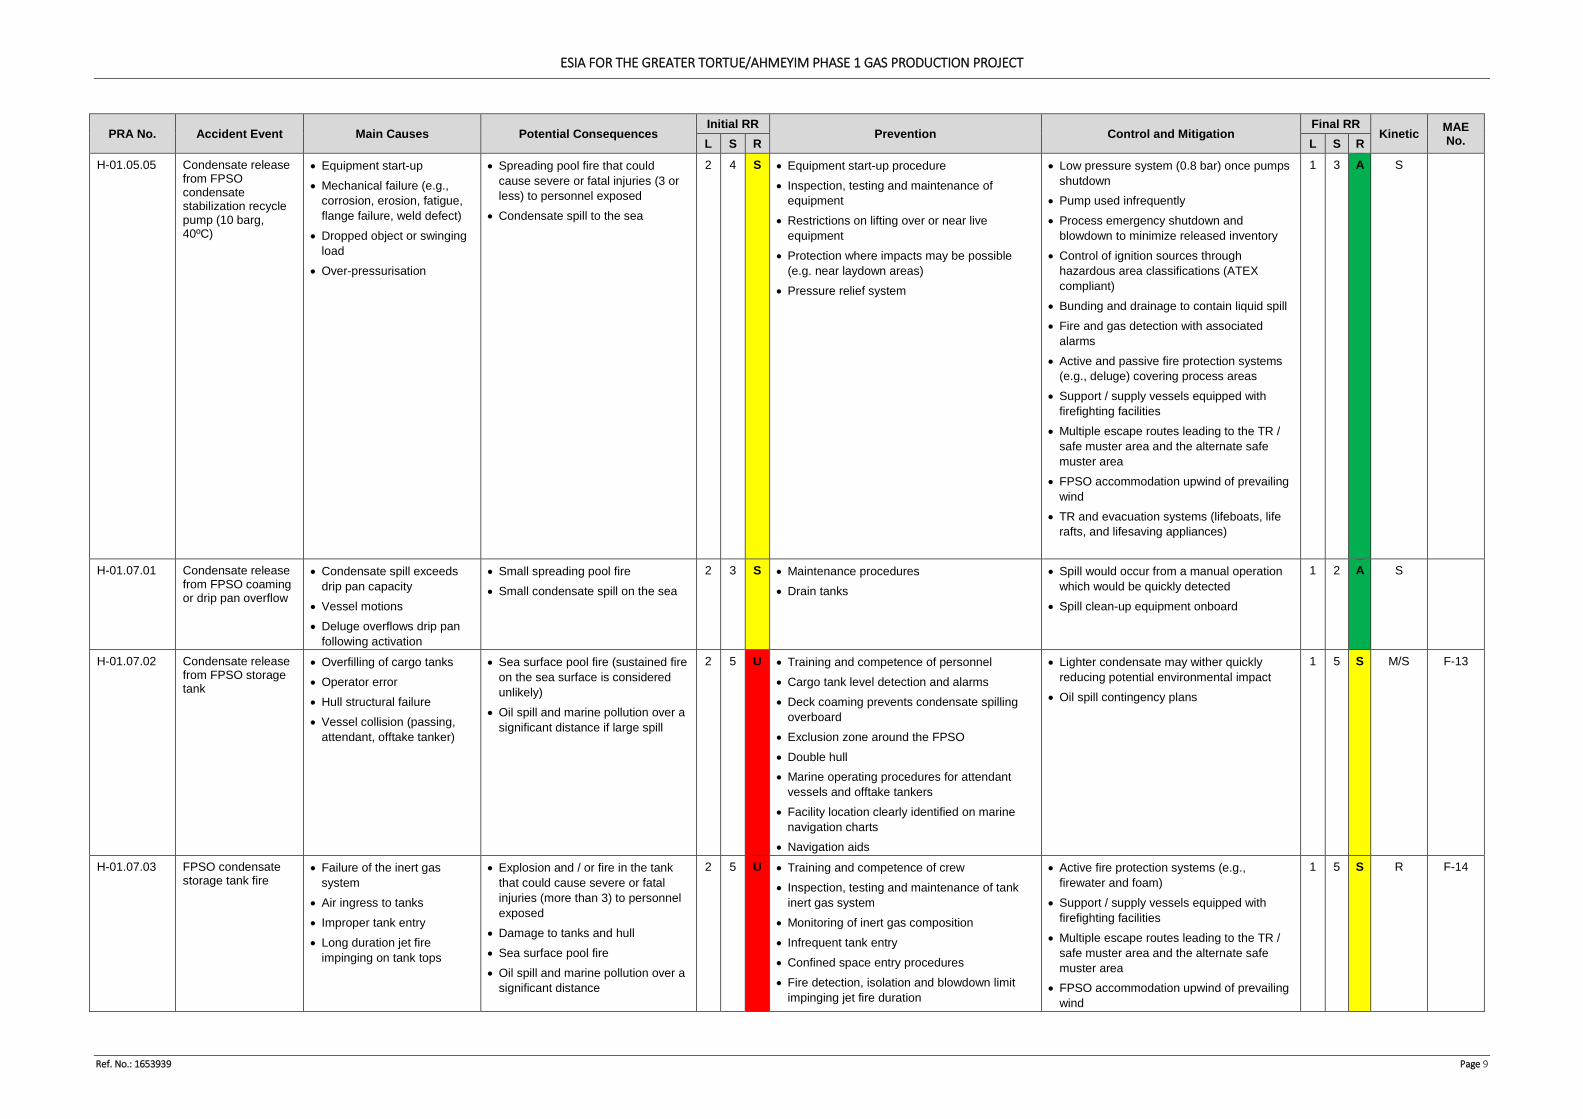
ESIA FOR THE GREATER TORTUE/AHMEYIM PHASE 1 GAS PRODUCTION PROJECT
Ref. No.: 1653939 Page 9
PRA No. Accident Event Main Causes Potential Consequences Initial RR
Prevention Control and Mitigation Final RR
Kinetic MAE No. L S R L S R
H-01.05.05 Condensate release from FPSO condensate stabilization recycle pump (10 barg, 40ºC)
• Equipment start-up • Mechanical failure (e.g.,
corrosion, erosion, fatigue, flange failure, weld defect)
• Dropped object or swinging load
• Over-pressurisation
• Spreading pool fire that could cause severe or fatal injuries (3 or less) to personnel exposed
• Condensate spill to the sea
2 4 S • Equipment start-up procedure • Inspection, testing and maintenance of
equipment • Restrictions on lifting over or near live
equipment • Protection where impacts may be possible
(e.g. near laydown areas) • Pressure relief system
• Low pressure system (0.8 bar) once pumps shutdown
• Pump used infrequently • Process emergency shutdown and
blowdown to minimize released inventory • Control of ignition sources through
hazardous area classifications (ATEX compliant)
• Bunding and drainage to contain liquid spill • Fire and gas detection with associated
alarms • Active and passive fire protection systems
(e.g., deluge) covering process areas • Support / supply vessels equipped with
firefighting facilities • Multiple escape routes leading to the TR /
safe muster area and the alternate safe muster area
• FPSO accommodation upwind of prevailing wind
• TR and evacuation systems (lifeboats, life rafts, and lifesaving appliances)
1 3 A S
H-01.07.01 Condensate release from FPSO coaming or drip pan overflow
• Condensate spill exceeds drip pan capacity
• Vessel motions • Deluge overflows drip pan
following activation
• Small spreading pool fire • Small condensate spill on the sea
2 3 S • Maintenance procedures • Drain tanks
• Spill would occur from a manual operation which would be quickly detected
• Spill clean-up equipment onboard
1 2 A S
H-01.07.02 Condensate release from FPSO storage tank
• Overfilling of cargo tanks • Operator error • Hull structural failure • Vessel collision (passing,
attendant, offtake tanker)
• Sea surface pool fire (sustained fire on the sea surface is considered unlikely)
• Oil spill and marine pollution over a significant distance if large spill
2 5 U • Training and competence of personnel • Cargo tank level detection and alarms • Deck coaming prevents condensate spilling
overboard • Exclusion zone around the FPSO • Double hull • Marine operating procedures for attendant
vessels and offtake tankers • Facility location clearly identified on marine
navigation charts • Navigation aids
• Lighter condensate may wither quickly reducing potential environmental impact
• Oil spill contingency plans
1 5 S M/S F-13
H-01.07.03 FPSO condensate storage tank fire
• Failure of the inert gas system
• Air ingress to tanks • Improper tank entry • Long duration jet fire
impinging on tank tops
• Explosion and / or fire in the tank that could cause severe or fatal injuries (more than 3) to personnel exposed
• Damage to tanks and hull • Sea surface pool fire • Oil spill and marine pollution over a
significant distance
2 5 U • Training and competence of crew • Inspection, testing and maintenance of tank
inert gas system • Monitoring of inert gas composition • Infrequent tank entry • Confined space entry procedures • Fire detection, isolation and blowdown limit
impinging jet fire duration
• Active fire protection systems (e.g., firewater and foam)
• Support / supply vessels equipped with firefighting facilities
• Multiple escape routes leading to the TR / safe muster area and the alternate safe muster area
• FPSO accommodation upwind of prevailing wind
1 5 S R F-14
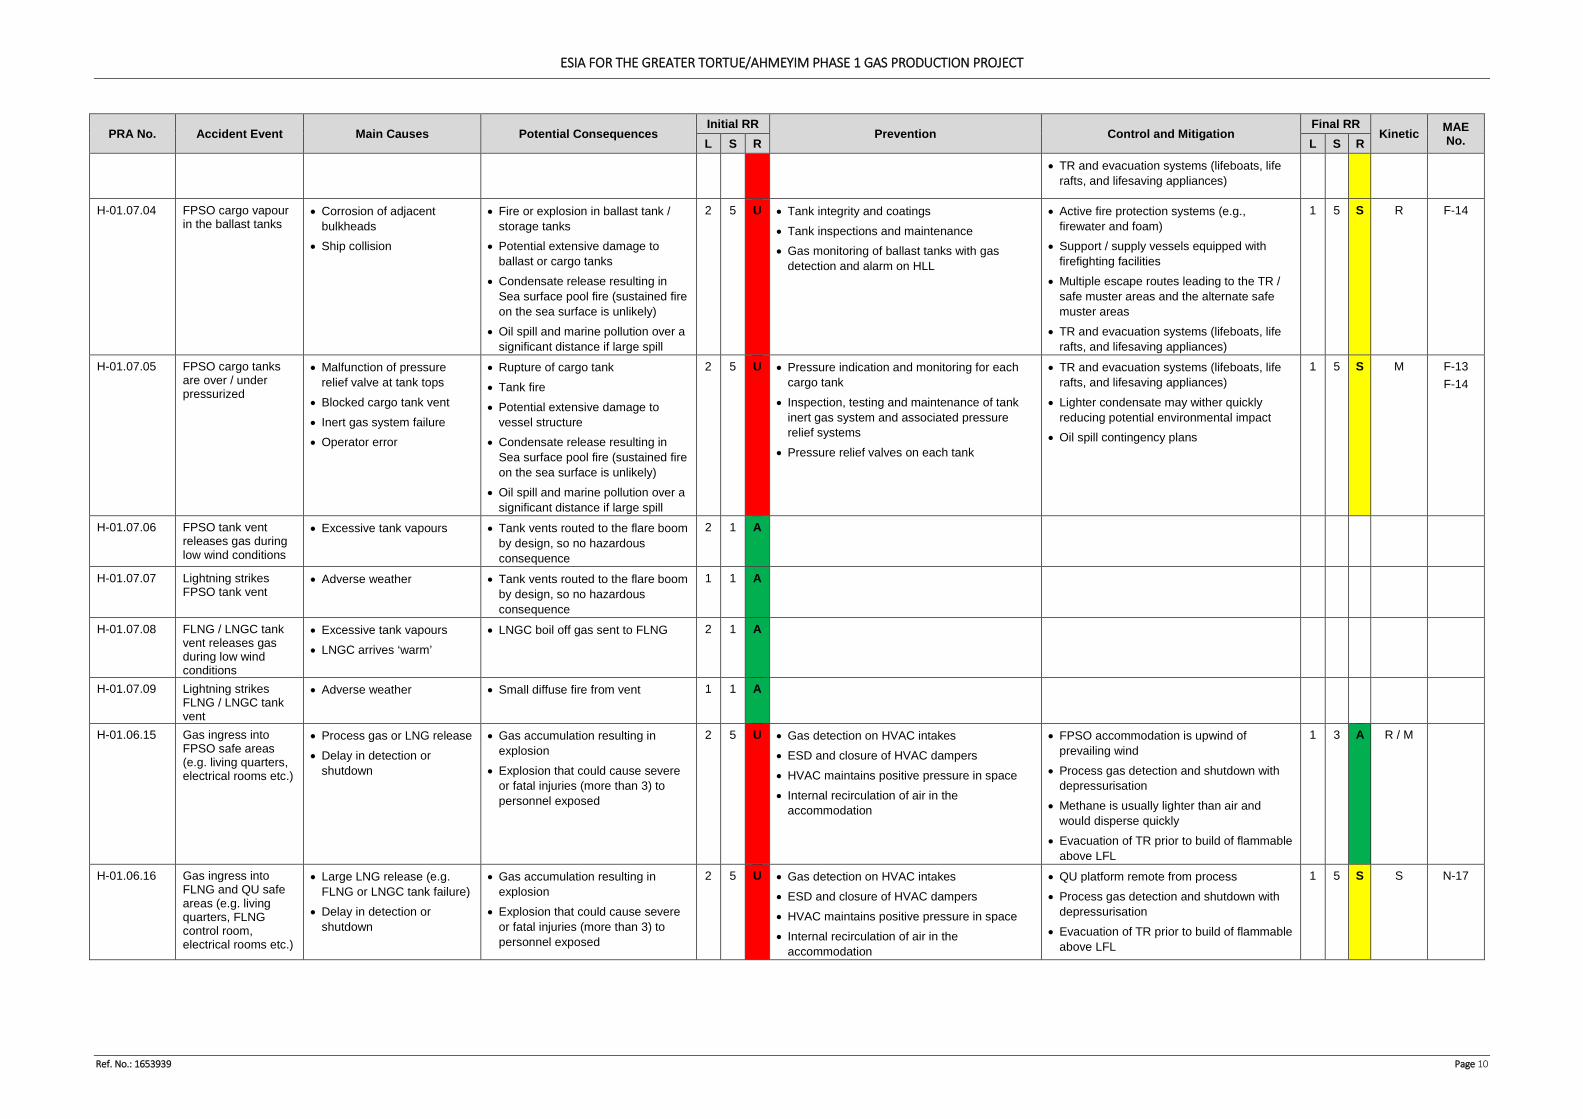
ESIA FOR THE GREATER TORTUE/AHMEYIM PHASE 1 GAS PRODUCTION PROJECT
Ref. No.: 1653939 Page 10
PRA No. Accident Event Main Causes Potential Consequences Initial RR
Prevention Control and Mitigation Final RR
Kinetic MAE No. L S R L S R
• TR and evacuation systems (lifeboats, life rafts, and lifesaving appliances)
H-01.07.04 FPSO cargo vapour in the ballast tanks
• Corrosion of adjacent bulkheads
• Ship collision
• Fire or explosion in ballast tank / storage tanks
• Potential extensive damage to ballast or cargo tanks
• Condensate release resulting in Sea surface pool fire (sustained fire on the sea surface is unlikely)
• Oil spill and marine pollution over a significant distance if large spill
2 5 U • Tank integrity and coatings • Tank inspections and maintenance • Gas monitoring of ballast tanks with gas
detection and alarm on HLL
• Active fire protection systems (e.g., firewater and foam)
• Support / supply vessels equipped with firefighting facilities
• Multiple escape routes leading to the TR / safe muster areas and the alternate safe muster areas
• TR and evacuation systems (lifeboats, life rafts, and lifesaving appliances)
1 5 S R F-14
H-01.07.05 FPSO cargo tanks are over / under pressurized
• Malfunction of pressure relief valve at tank tops
• Blocked cargo tank vent • Inert gas system failure • Operator error
• Rupture of cargo tank • Tank fire • Potential extensive damage to
vessel structure • Condensate release resulting in
Sea surface pool fire (sustained fire on the sea surface is unlikely)
• Oil spill and marine pollution over a significant distance if large spill
2 5 U • Pressure indication and monitoring for each cargo tank
• Inspection, testing and maintenance of tank inert gas system and associated pressure relief systems
• Pressure relief valves on each tank
• TR and evacuation systems (lifeboats, life rafts, and lifesaving appliances)
• Lighter condensate may wither quickly reducing potential environmental impact
• Oil spill contingency plans
1 5 S M F-13 F-14
H-01.07.06 FPSO tank vent releases gas during low wind conditions
• Excessive tank vapours • Tank vents routed to the flare boom by design, so no hazardous consequence
2 1 A
H-01.07.07 Lightning strikes FPSO tank vent
• Adverse weather • Tank vents routed to the flare boom by design, so no hazardous consequence
1 1 A
H-01.07.08 FLNG / LNGC tank vent releases gas during low wind conditions
• Excessive tank vapours • LNGC arrives ‘warm’
• LNGC boil off gas sent to FLNG 2 1 A
H-01.07.09 Lightning strikes FLNG / LNGC tank vent
• Adverse weather • Small diffuse fire from vent 1 1 A
H-01.06.15 Gas ingress into FPSO safe areas (e.g. living quarters, electrical rooms etc.)
• Process gas or LNG release • Delay in detection or
shutdown
• Gas accumulation resulting in explosion
• Explosion that could cause severe or fatal injuries (more than 3) to personnel exposed
2 5 U • Gas detection on HVAC intakes • ESD and closure of HVAC dampers • HVAC maintains positive pressure in space • Internal recirculation of air in the
accommodation
• FPSO accommodation is upwind of prevailing wind
• Process gas detection and shutdown with depressurisation
• Methane is usually lighter than air and would disperse quickly
• Evacuation of TR prior to build of flammable above LFL
1 3 A R / M
H-01.06.16 Gas ingress into FLNG and QU safe areas (e.g. living quarters, FLNG control room, electrical rooms etc.)
• Large LNG release (e.g. FLNG or LNGC tank failure)
• Delay in detection or shutdown
• Gas accumulation resulting in explosion
• Explosion that could cause severe or fatal injuries (more than 3) to personnel exposed
2 5 U • Gas detection on HVAC intakes • ESD and closure of HVAC dampers • HVAC maintains positive pressure in space • Internal recirculation of air in the
accommodation
• QU platform remote from process • Process gas detection and shutdown with
depressurisation • Evacuation of TR prior to build of flammable
above LFL
1 5 S S N-17
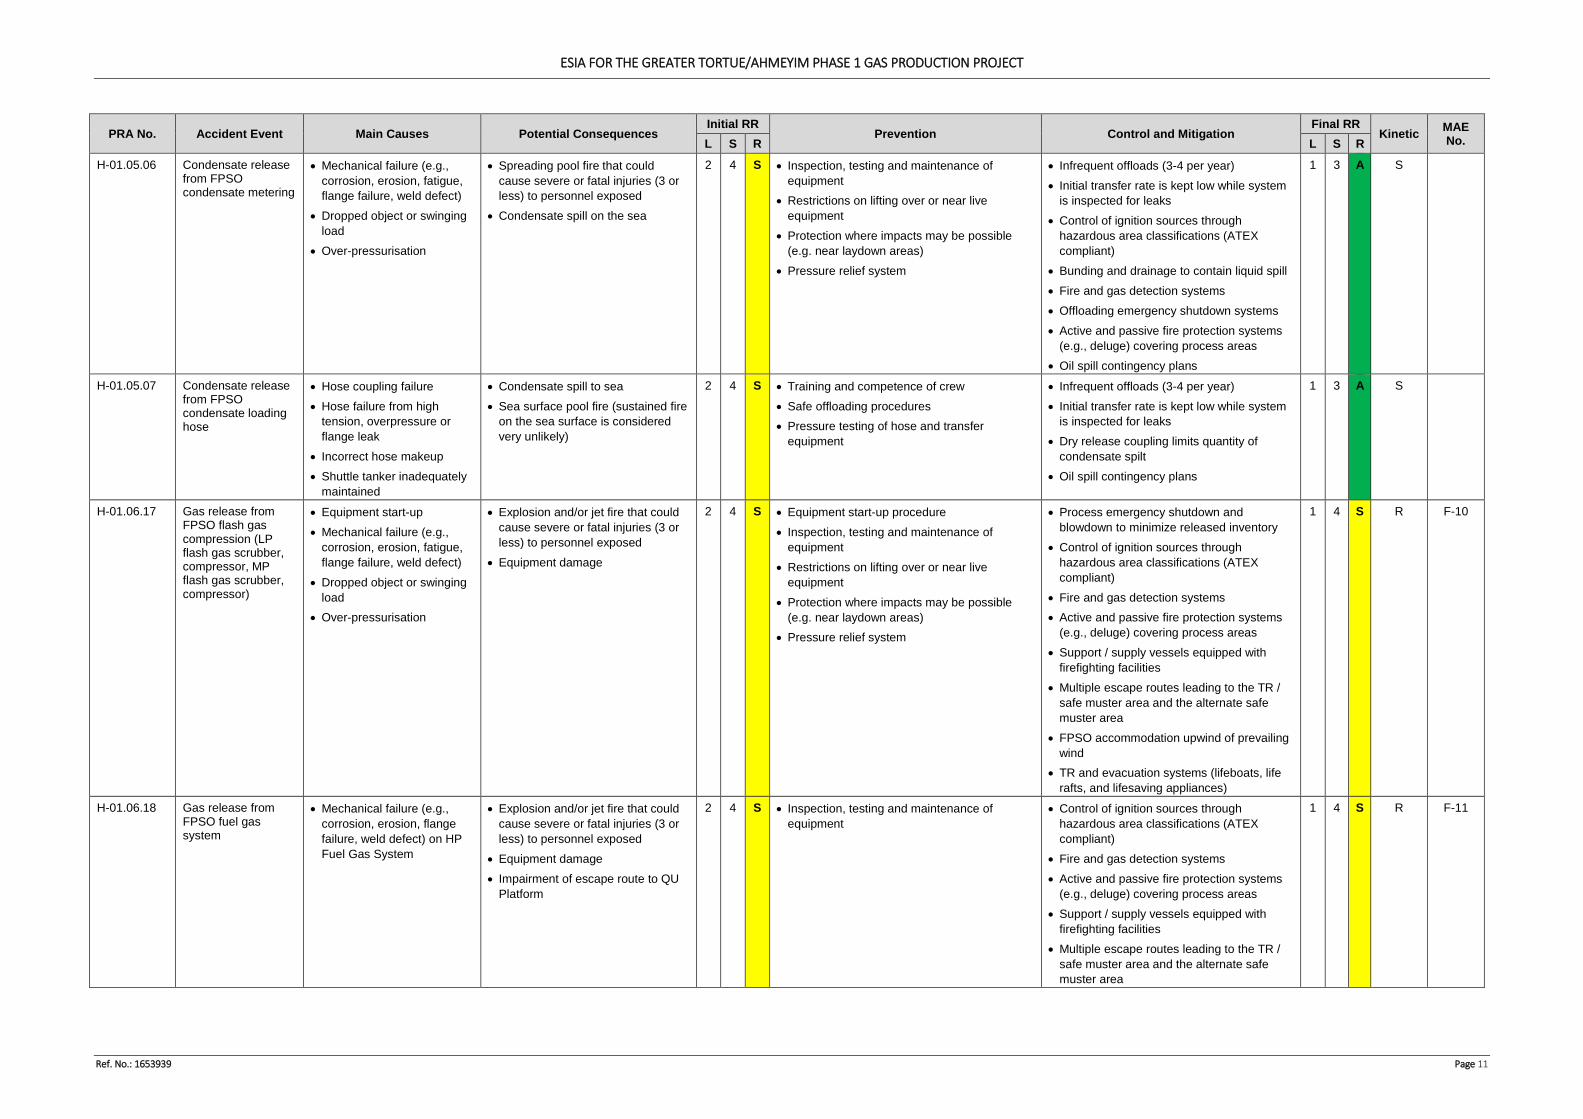
ESIA FOR THE GREATER TORTUE/AHMEYIM PHASE 1 GAS PRODUCTION PROJECT
Ref. No.: 1653939 Page 11
PRA No. Accident Event Main Causes Potential Consequences Initial RR
Prevention Control and Mitigation Final RR
Kinetic MAE No. L S R L S R
H-01.05.06 Condensate release from FPSO condensate metering
• Mechanical failure (e.g., corrosion, erosion, fatigue, flange failure, weld defect)
• Dropped object or swinging load
• Over-pressurisation
• Spreading pool fire that could cause severe or fatal injuries (3 or less) to personnel exposed
• Condensate spill on the sea
2 4 S • Inspection, testing and maintenance of equipment
• Restrictions on lifting over or near live equipment
• Protection where impacts may be possible (e.g. near laydown areas)
• Pressure relief system
• Infrequent offloads (3-4 per year) • Initial transfer rate is kept low while system
is inspected for leaks • Control of ignition sources through
hazardous area classifications (ATEX compliant)
• Bunding and drainage to contain liquid spill • Fire and gas detection systems • Offloading emergency shutdown systems • Active and passive fire protection systems
(e.g., deluge) covering process areas • Oil spill contingency plans
1 3 A S
H-01.05.07 Condensate release from FPSO condensate loading hose
• Hose coupling failure • Hose failure from high
tension, overpressure or flange leak
• Incorrect hose makeup • Shuttle tanker inadequately
maintained
• Condensate spill to sea • Sea surface pool fire (sustained fire
on the sea surface is considered very unlikely)
2 4 S • Training and competence of crew • Safe offloading procedures • Pressure testing of hose and transfer
equipment
• Infrequent offloads (3-4 per year) • Initial transfer rate is kept low while system
is inspected for leaks • Dry release coupling limits quantity of
condensate spilt • Oil spill contingency plans
1 3 A S
H-01.06.17 Gas release from FPSO flash gas compression (LP flash gas scrubber, compressor, MP flash gas scrubber, compressor)
• Equipment start-up • Mechanical failure (e.g.,
corrosion, erosion, fatigue, flange failure, weld defect)
• Dropped object or swinging load
• Over-pressurisation
• Explosion and/or jet fire that could cause severe or fatal injuries (3 or less) to personnel exposed
• Equipment damage
2 4 S • Equipment start-up procedure • Inspection, testing and maintenance of
equipment • Restrictions on lifting over or near live
equipment • Protection where impacts may be possible
(e.g. near laydown areas) • Pressure relief system
• Process emergency shutdown and blowdown to minimize released inventory
• Control of ignition sources through hazardous area classifications (ATEX compliant)
• Fire and gas detection systems • Active and passive fire protection systems
(e.g., deluge) covering process areas • Support / supply vessels equipped with
firefighting facilities • Multiple escape routes leading to the TR /
safe muster area and the alternate safe muster area
• FPSO accommodation upwind of prevailing wind
• TR and evacuation systems (lifeboats, life rafts, and lifesaving appliances)
1 4 S R F-10
H-01.06.18 Gas release from FPSO fuel gas system
• Mechanical failure (e.g., corrosion, erosion, flange failure, weld defect) on HP Fuel Gas System
• Explosion and/or jet fire that could cause severe or fatal injuries (3 or less) to personnel exposed
• Equipment damage • Impairment of escape route to QU
Platform
2 4 S • Inspection, testing and maintenance of equipment
• Control of ignition sources through hazardous area classifications (ATEX compliant)
• Fire and gas detection systems • Active and passive fire protection systems
(e.g., deluge) covering process areas • Support / supply vessels equipped with
firefighting facilities • Multiple escape routes leading to the TR /
safe muster area and the alternate safe muster area
1 4 S R F-11
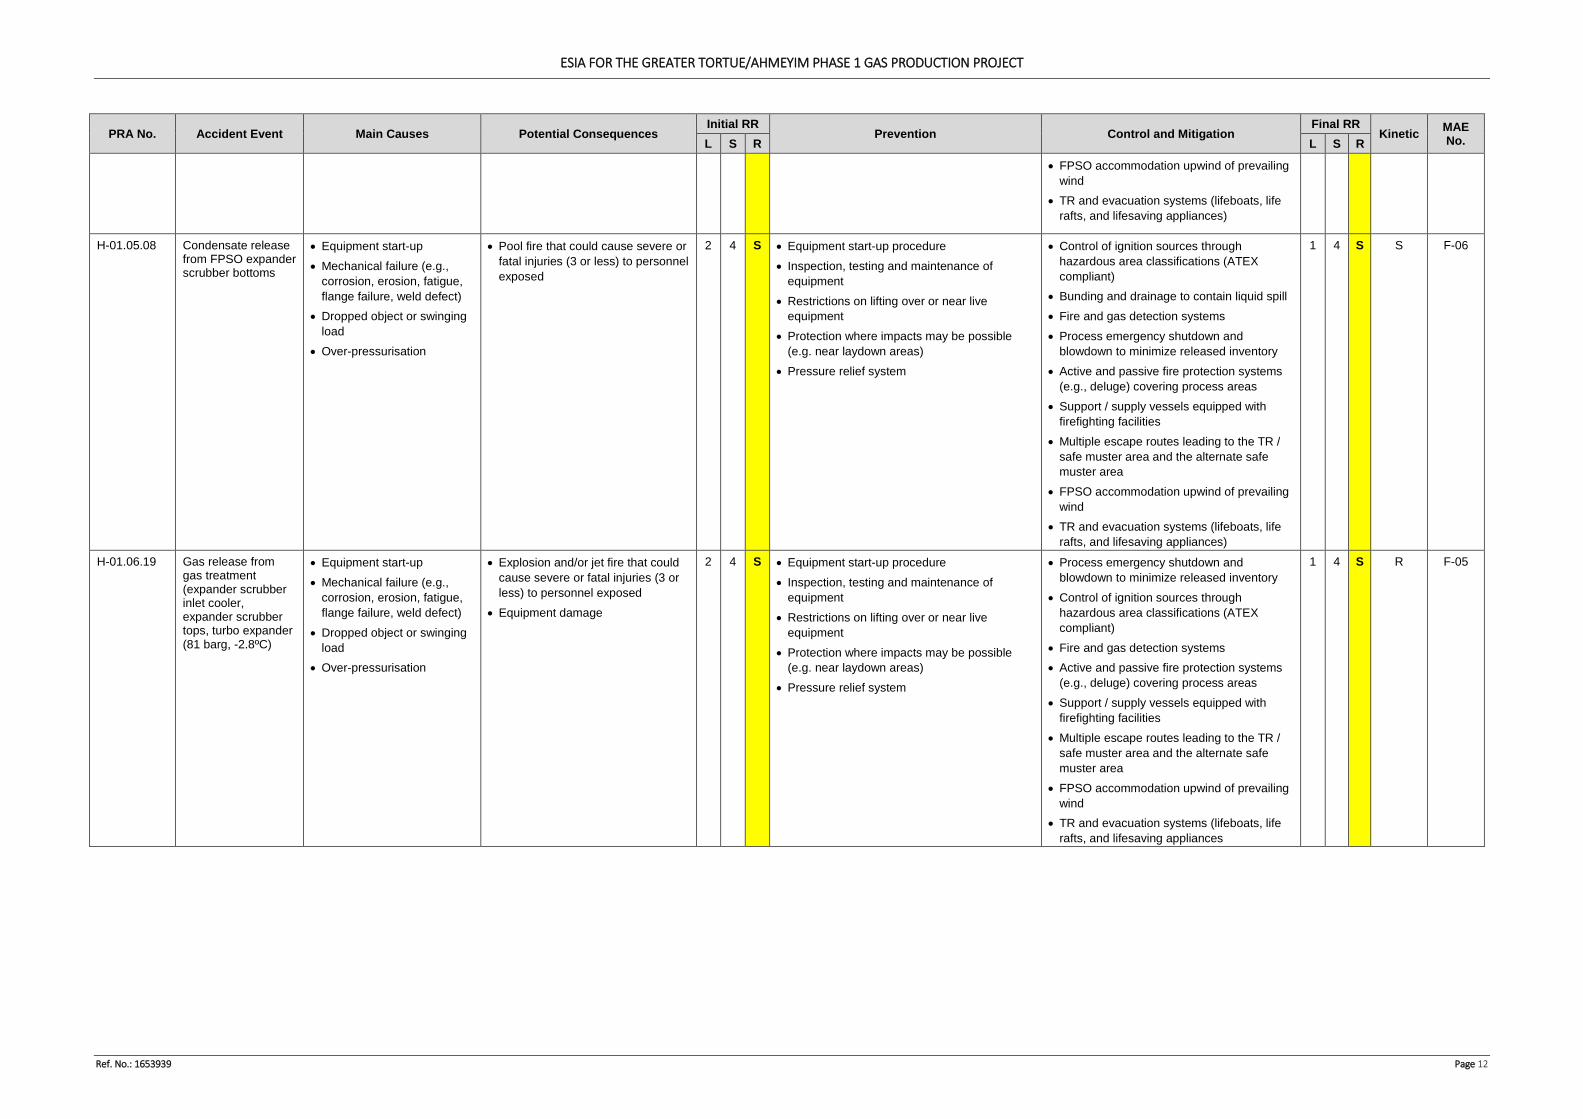
ESIA FOR THE GREATER TORTUE/AHMEYIM PHASE 1 GAS PRODUCTION PROJECT
Ref. No.: 1653939 Page 12
PRA No. Accident Event Main Causes Potential Consequences Initial RR
Prevention Control and Mitigation Final RR
Kinetic MAE No. L S R L S R
• FPSO accommodation upwind of prevailing wind
• TR and evacuation systems (lifeboats, life rafts, and lifesaving appliances)
H-01.05.08 Condensate release from FPSO expander scrubber bottoms
• Equipment start-up • Mechanical failure (e.g.,
corrosion, erosion, fatigue, flange failure, weld defect)
• Dropped object or swinging load
• Over-pressurisation
• Pool fire that could cause severe or fatal injuries (3 or less) to personnel exposed
2 4 S • Equipment start-up procedure • Inspection, testing and maintenance of
equipment • Restrictions on lifting over or near live
equipment • Protection where impacts may be possible
(e.g. near laydown areas) • Pressure relief system
• Control of ignition sources through hazardous area classifications (ATEX compliant)
• Bunding and drainage to contain liquid spill • Fire and gas detection systems • Process emergency shutdown and
blowdown to minimize released inventory • Active and passive fire protection systems
(e.g., deluge) covering process areas • Support / supply vessels equipped with
firefighting facilities • Multiple escape routes leading to the TR /
safe muster area and the alternate safe muster area
• FPSO accommodation upwind of prevailing wind
• TR and evacuation systems (lifeboats, life rafts, and lifesaving appliances)
1 4 S S F-06
H-01.06.19 Gas release from gas treatment (expander scrubber inlet cooler, expander scrubber tops, turbo expander (81 barg, -2.8ºC)
• Equipment start-up • Mechanical failure (e.g.,
corrosion, erosion, fatigue, flange failure, weld defect)
• Dropped object or swinging load
• Over-pressurisation
• Explosion and/or jet fire that could cause severe or fatal injuries (3 or less) to personnel exposed
• Equipment damage
2 4 S • Equipment start-up procedure • Inspection, testing and maintenance of
equipment • Restrictions on lifting over or near live
equipment • Protection where impacts may be possible
(e.g. near laydown areas) • Pressure relief system
• Process emergency shutdown and blowdown to minimize released inventory
• Control of ignition sources through hazardous area classifications (ATEX compliant)
• Fire and gas detection systems • Active and passive fire protection systems
(e.g., deluge) covering process areas • Support / supply vessels equipped with
firefighting facilities • Multiple escape routes leading to the TR /
safe muster area and the alternate safe muster area
• FPSO accommodation upwind of prevailing wind
• TR and evacuation systems (lifeboats, life rafts, and lifesaving appliances
1 4 S R F-05
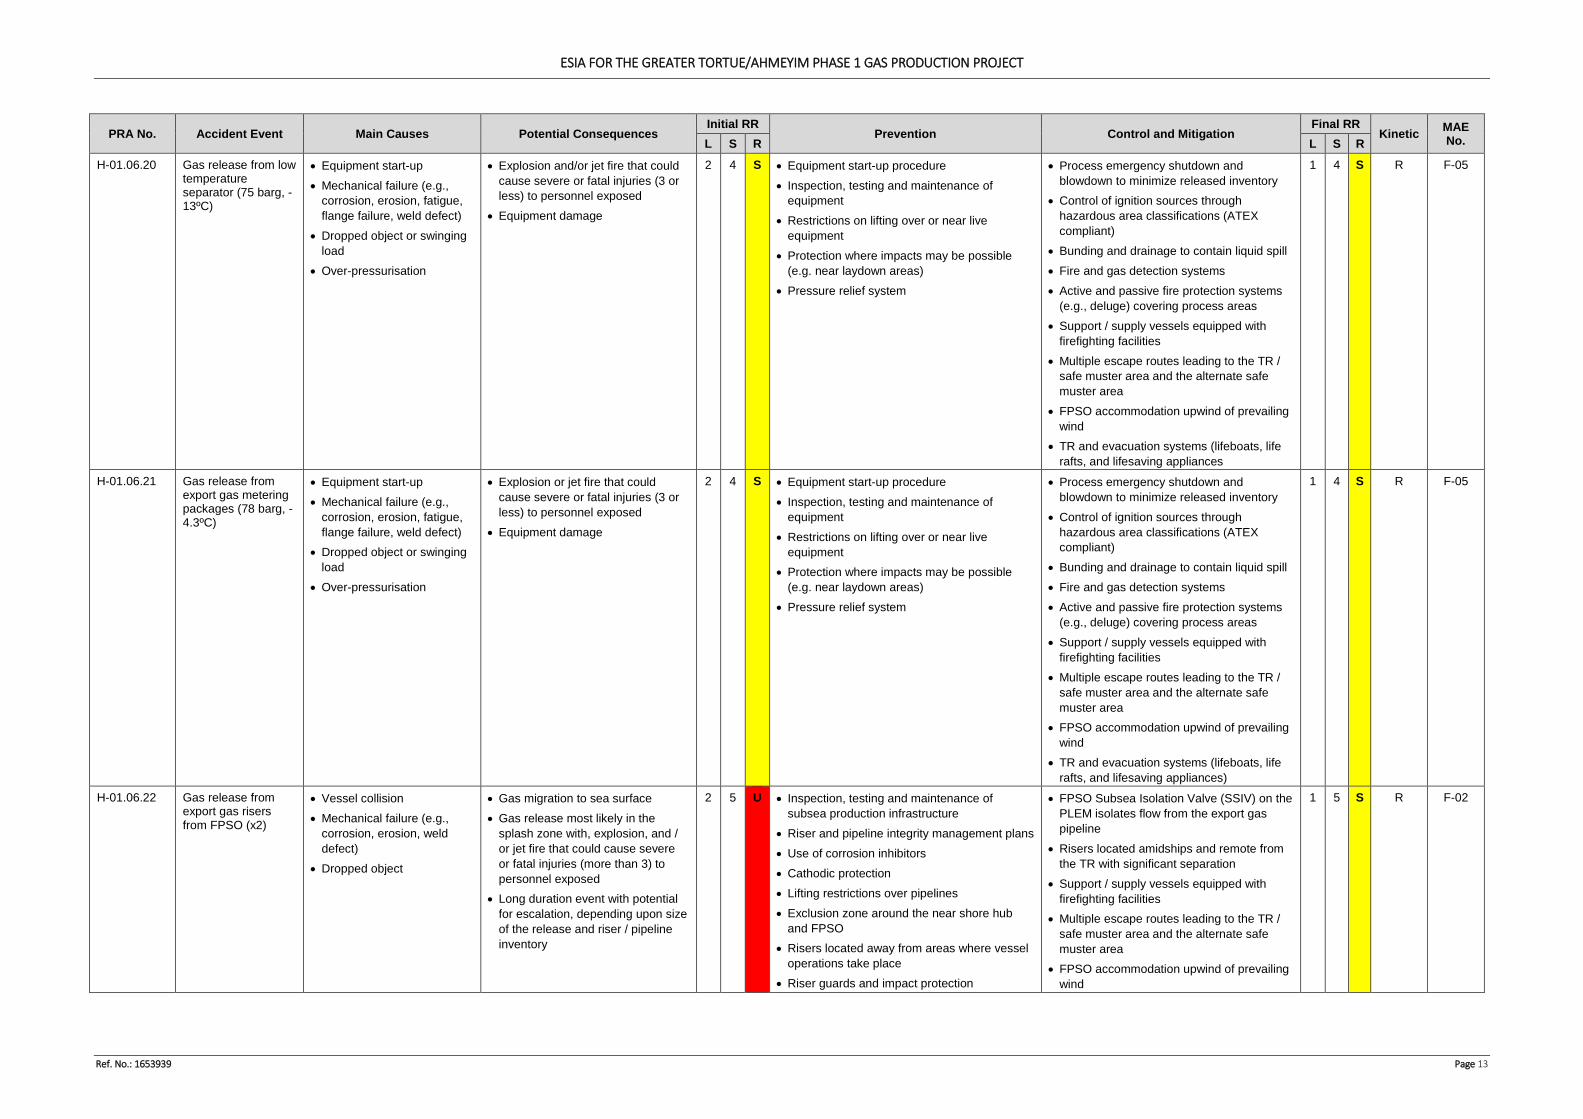
ESIA FOR THE GREATER TORTUE/AHMEYIM PHASE 1 GAS PRODUCTION PROJECT
Ref. No.: 1653939 Page 13
PRA No. Accident Event Main Causes Potential Consequences Initial RR
Prevention Control and Mitigation Final RR
Kinetic MAE No. L S R L S R
H-01.06.20 Gas release from low temperature separator (75 barg, -13ºC)
• Equipment start-up • Mechanical failure (e.g.,
corrosion, erosion, fatigue, flange failure, weld defect)
• Dropped object or swinging load
• Over-pressurisation
• Explosion and/or jet fire that could cause severe or fatal injuries (3 or less) to personnel exposed
• Equipment damage
2 4 S • Equipment start-up procedure • Inspection, testing and maintenance of
equipment • Restrictions on lifting over or near live
equipment • Protection where impacts may be possible
(e.g. near laydown areas) • Pressure relief system
• Process emergency shutdown and blowdown to minimize released inventory
• Control of ignition sources through hazardous area classifications (ATEX compliant)
• Bunding and drainage to contain liquid spill • Fire and gas detection systems • Active and passive fire protection systems
(e.g., deluge) covering process areas • Support / supply vessels equipped with
firefighting facilities • Multiple escape routes leading to the TR /
safe muster area and the alternate safe muster area
• FPSO accommodation upwind of prevailing wind
• TR and evacuation systems (lifeboats, life rafts, and lifesaving appliances
1 4 S R F-05
H-01.06.21 Gas release from export gas metering packages (78 barg, -4.3ºC)
• Equipment start-up • Mechanical failure (e.g.,
corrosion, erosion, fatigue, flange failure, weld defect)
• Dropped object or swinging load
• Over-pressurisation
• Explosion or jet fire that could cause severe or fatal injuries (3 or less) to personnel exposed
• Equipment damage
2 4 S • Equipment start-up procedure • Inspection, testing and maintenance of
equipment • Restrictions on lifting over or near live
equipment • Protection where impacts may be possible
(e.g. near laydown areas) • Pressure relief system
• Process emergency shutdown and blowdown to minimize released inventory
• Control of ignition sources through hazardous area classifications (ATEX compliant)
• Bunding and drainage to contain liquid spill • Fire and gas detection systems • Active and passive fire protection systems
(e.g., deluge) covering process areas • Support / supply vessels equipped with
firefighting facilities • Multiple escape routes leading to the TR /
safe muster area and the alternate safe muster area
• FPSO accommodation upwind of prevailing wind
• TR and evacuation systems (lifeboats, life rafts, and lifesaving appliances)
1 4 S R F-05
H-01.06.22 Gas release from export gas risers from FPSO (x2)
• Vessel collision • Mechanical failure (e.g.,
corrosion, erosion, weld defect)
• Dropped object
• Gas migration to sea surface • Gas release most likely in the
splash zone with, explosion, and / or jet fire that could cause severe or fatal injuries (more than 3) to personnel exposed
• Long duration event with potential for escalation, depending upon size of the release and riser / pipeline inventory
2 5 U • Inspection, testing and maintenance of subsea production infrastructure
• Riser and pipeline integrity management plans • Use of corrosion inhibitors • Cathodic protection • Lifting restrictions over pipelines • Exclusion zone around the near shore hub
and FPSO • Risers located away from areas where vessel
operations take place • Riser guards and impact protection
• FPSO Subsea Isolation Valve (SSIV) on the PLEM isolates flow from the export gas pipeline
• Risers located amidships and remote from the TR with significant separation
• Support / supply vessels equipped with firefighting facilities
• Multiple escape routes leading to the TR / safe muster area and the alternate safe muster area
• FPSO accommodation upwind of prevailing wind
1 5 S R F-02
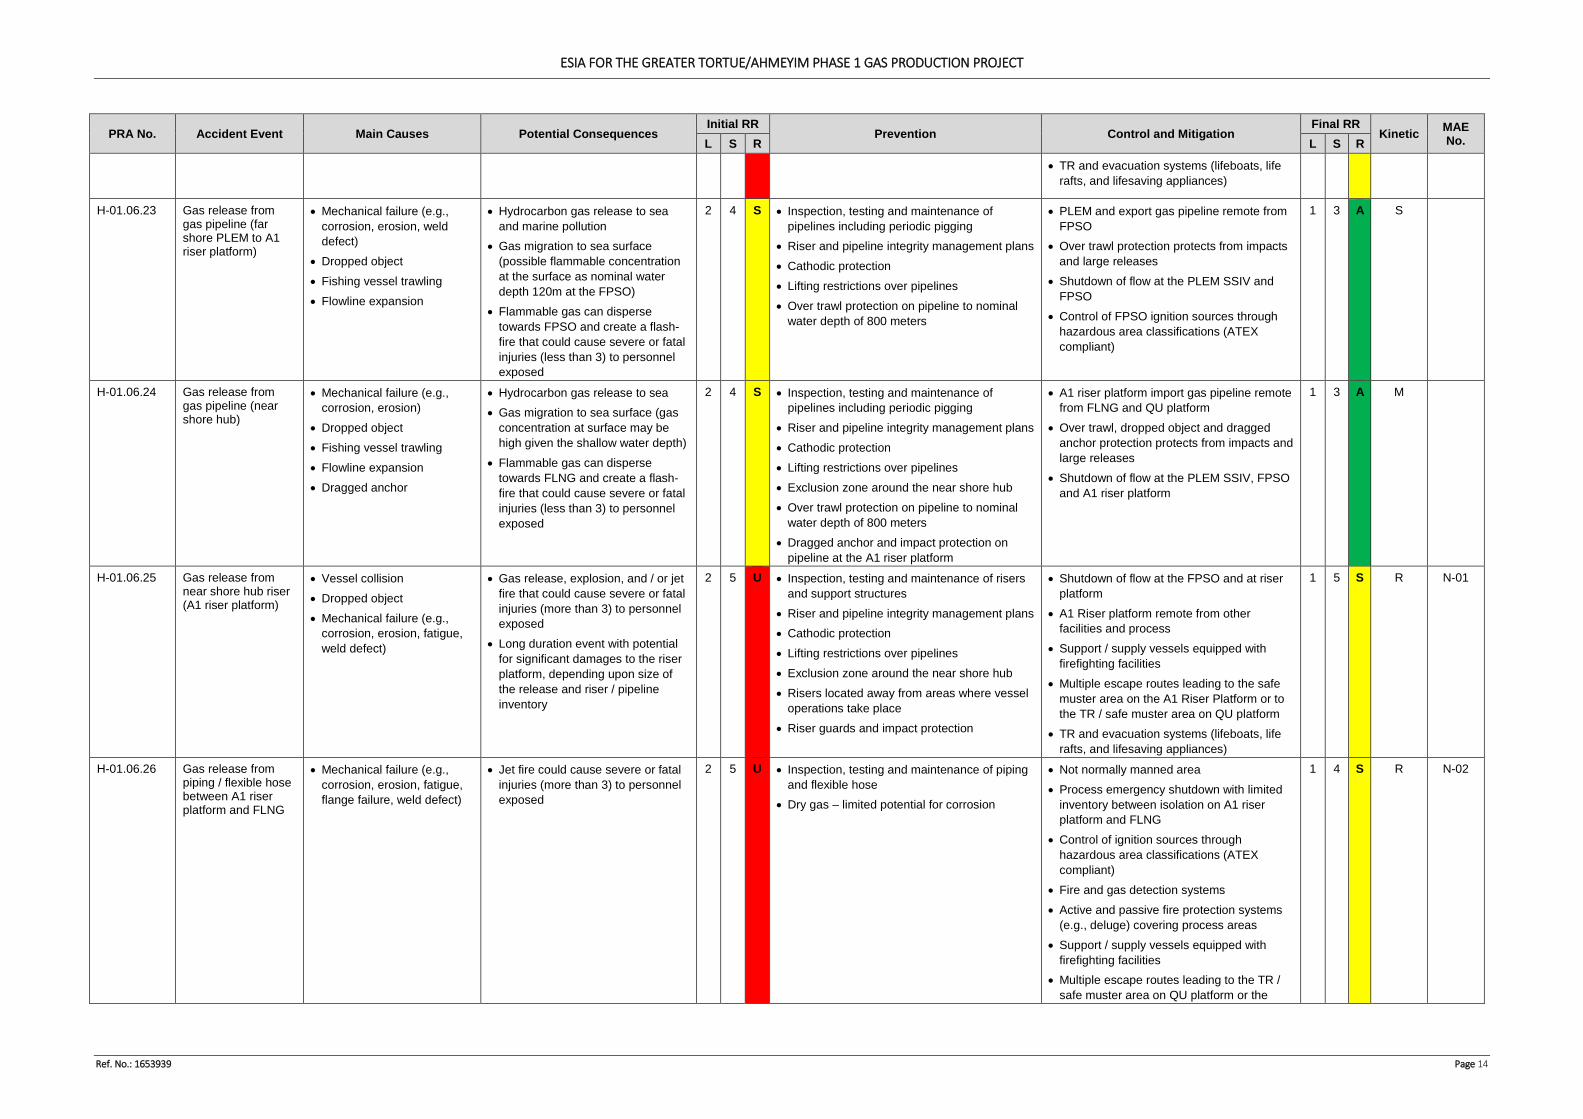
ESIA FOR THE GREATER TORTUE/AHMEYIM PHASE 1 GAS PRODUCTION PROJECT
Ref. No.: 1653939 Page 14
PRA No. Accident Event Main Causes Potential Consequences Initial RR
Prevention Control and Mitigation Final RR
Kinetic MAE No. L S R L S R
• TR and evacuation systems (lifeboats, life rafts, and lifesaving appliances)
H-01.06.23 Gas release from gas pipeline (far shore PLEM to A1 riser platform)
• Mechanical failure (e.g., corrosion, erosion, weld defect)
• Dropped object • Fishing vessel trawling • Flowline expansion
• Hydrocarbon gas release to sea and marine pollution
• Gas migration to sea surface (possible flammable concentration at the surface as nominal water depth 120m at the FPSO)
• Flammable gas can disperse towards FPSO and create a flash-fire that could cause severe or fatal injuries (less than 3) to personnel exposed
2 4 S • Inspection, testing and maintenance of pipelines including periodic pigging
• Riser and pipeline integrity management plans • Cathodic protection • Lifting restrictions over pipelines • Over trawl protection on pipeline to nominal
water depth of 800 meters
• PLEM and export gas pipeline remote from FPSO
• Over trawl protection protects from impacts and large releases
• Shutdown of flow at the PLEM SSIV and FPSO
• Control of FPSO ignition sources through hazardous area classifications (ATEX compliant)
1 3 A S
H-01.06.24 Gas release from gas pipeline (near shore hub)
• Mechanical failure (e.g., corrosion, erosion)
• Dropped object • Fishing vessel trawling • Flowline expansion • Dragged anchor
• Hydrocarbon gas release to sea • Gas migration to sea surface (gas
concentration at surface may be high given the shallow water depth)
• Flammable gas can disperse towards FLNG and create a flash-fire that could cause severe or fatal injuries (less than 3) to personnel exposed
2 4 S • Inspection, testing and maintenance of pipelines including periodic pigging
• Riser and pipeline integrity management plans • Cathodic protection • Lifting restrictions over pipelines • Exclusion zone around the near shore hub • Over trawl protection on pipeline to nominal
water depth of 800 meters • Dragged anchor and impact protection on
pipeline at the A1 riser platform
• A1 riser platform import gas pipeline remote from FLNG and QU platform
• Over trawl, dropped object and dragged anchor protection protects from impacts and large releases
• Shutdown of flow at the PLEM SSIV, FPSO and A1 riser platform
1 3 A M
H-01.06.25 Gas release from near shore hub riser (A1 riser platform)
• Vessel collision • Dropped object • Mechanical failure (e.g.,
corrosion, erosion, fatigue, weld defect)
• Gas release, explosion, and / or jet fire that could cause severe or fatal injuries (more than 3) to personnel exposed
• Long duration event with potential for significant damages to the riser platform, depending upon size of the release and riser / pipeline inventory
2 5 U • Inspection, testing and maintenance of risers and support structures
• Riser and pipeline integrity management plans • Cathodic protection • Lifting restrictions over pipelines • Exclusion zone around the near shore hub • Risers located away from areas where vessel
operations take place • Riser guards and impact protection
• Shutdown of flow at the FPSO and at riser platform
• A1 Riser platform remote from other facilities and process
• Support / supply vessels equipped with firefighting facilities
• Multiple escape routes leading to the safe muster area on the A1 Riser Platform or to the TR / safe muster area on QU platform
• TR and evacuation systems (lifeboats, life rafts, and lifesaving appliances)
1 5 S R N-01
H-01.06.26 Gas release from piping / flexible hose between A1 riser platform and FLNG
• Mechanical failure (e.g., corrosion, erosion, fatigue, flange failure, weld defect)
• Jet fire could cause severe or fatal injuries (more than 3) to personnel exposed
2 5 U • Inspection, testing and maintenance of piping and flexible hose
• Dry gas – limited potential for corrosion
• Not normally manned area • Process emergency shutdown with limited
inventory between isolation on A1 riser platform and FLNG
• Control of ignition sources through hazardous area classifications (ATEX compliant)
• Fire and gas detection systems • Active and passive fire protection systems
(e.g., deluge) covering process areas • Support / supply vessels equipped with
firefighting facilities • Multiple escape routes leading to the TR /
safe muster area on QU platform or the
1 4 S R N-02
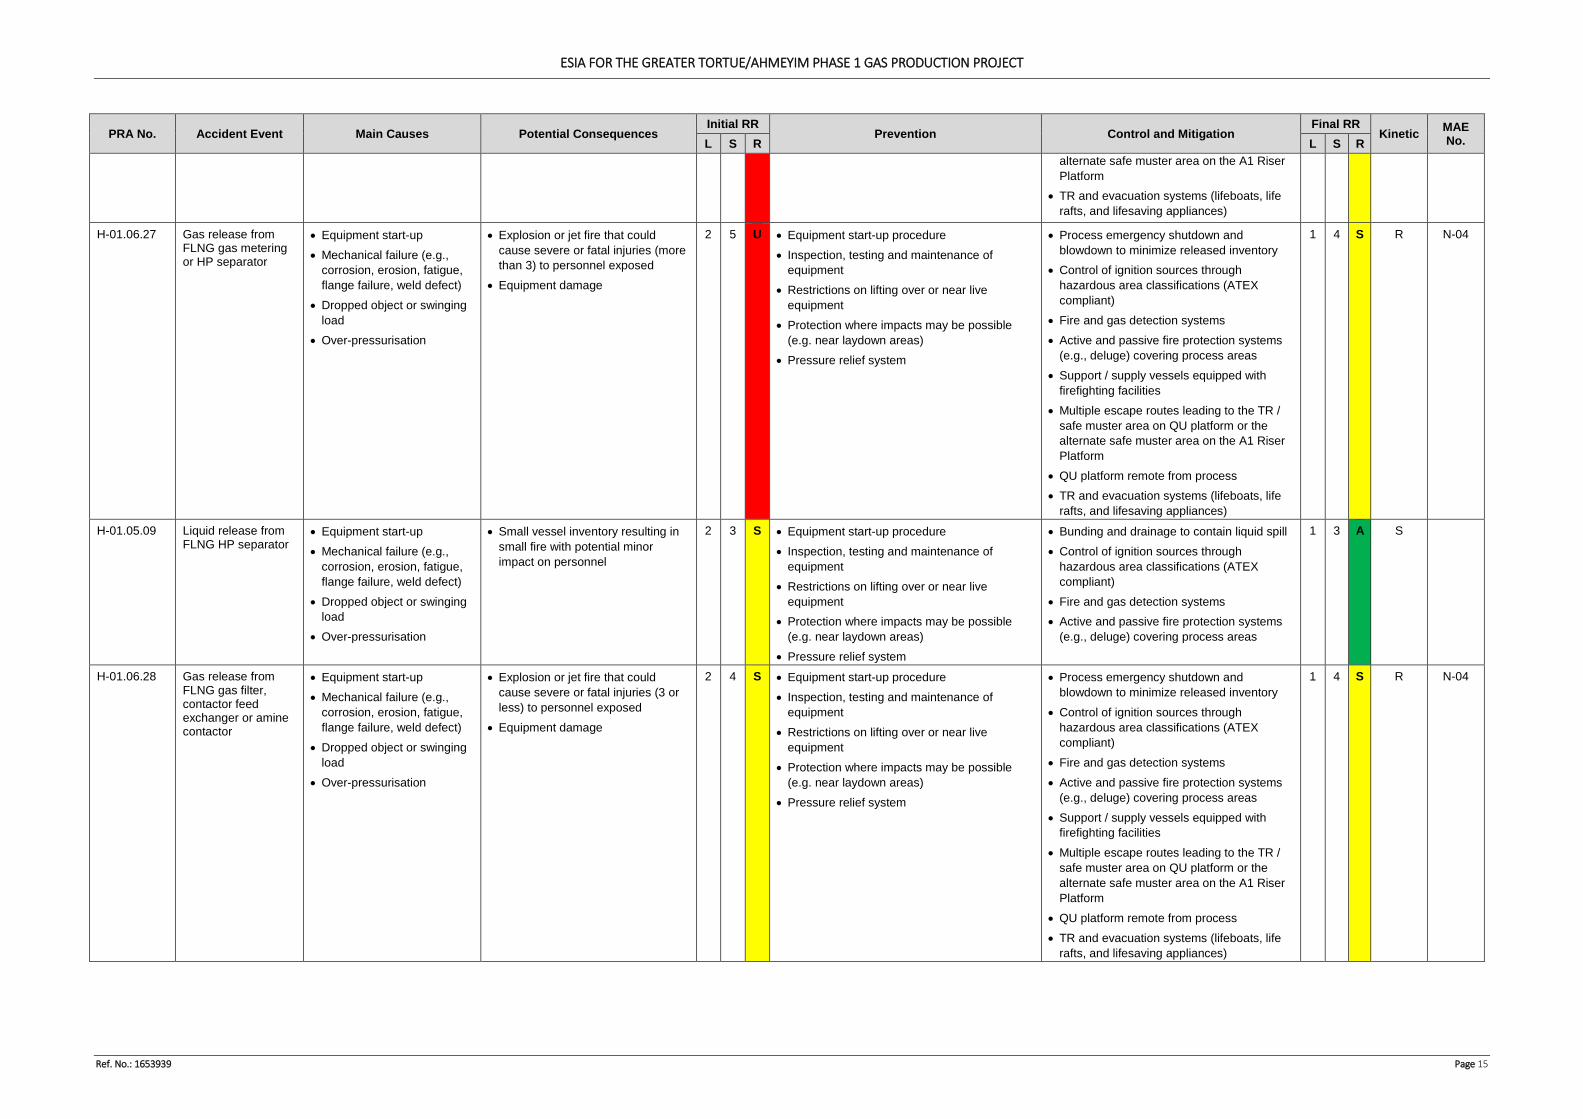
ESIA FOR THE GREATER TORTUE/AHMEYIM PHASE 1 GAS PRODUCTION PROJECT
Ref. No.: 1653939 Page 15
PRA No. Accident Event Main Causes Potential Consequences Initial RR
Prevention Control and Mitigation Final RR
Kinetic MAE No. L S R L S R
alternate safe muster area on the A1 Riser Platform
• TR and evacuation systems (lifeboats, life rafts, and lifesaving appliances)
H-01.06.27 Gas release from FLNG gas metering or HP separator
• Equipment start-up • Mechanical failure (e.g.,
corrosion, erosion, fatigue, flange failure, weld defect)
• Dropped object or swinging load
• Over-pressurisation
• Explosion or jet fire that could cause severe or fatal injuries (more than 3) to personnel exposed
• Equipment damage
2 5 U • Equipment start-up procedure • Inspection, testing and maintenance of
equipment • Restrictions on lifting over or near live
equipment • Protection where impacts may be possible
(e.g. near laydown areas) • Pressure relief system
• Process emergency shutdown and blowdown to minimize released inventory
• Control of ignition sources through hazardous area classifications (ATEX compliant)
• Fire and gas detection systems • Active and passive fire protection systems
(e.g., deluge) covering process areas • Support / supply vessels equipped with
firefighting facilities • Multiple escape routes leading to the TR /
safe muster area on QU platform or the alternate safe muster area on the A1 Riser Platform
• QU platform remote from process • TR and evacuation systems (lifeboats, life
rafts, and lifesaving appliances)
1 4 S R N-04
H-01.05.09 Liquid release from FLNG HP separator
• Equipment start-up • Mechanical failure (e.g.,
corrosion, erosion, fatigue, flange failure, weld defect)
• Dropped object or swinging load
• Over-pressurisation
• Small vessel inventory resulting in small fire with potential minor impact on personnel
2 3 S • Equipment start-up procedure • Inspection, testing and maintenance of
equipment • Restrictions on lifting over or near live
equipment • Protection where impacts may be possible
(e.g. near laydown areas) • Pressure relief system
• Bunding and drainage to contain liquid spill • Control of ignition sources through
hazardous area classifications (ATEX compliant)
• Fire and gas detection systems • Active and passive fire protection systems
(e.g., deluge) covering process areas
1 3 A S
H-01.06.28 Gas release from FLNG gas filter, contactor feed exchanger or amine contactor
• Equipment start-up • Mechanical failure (e.g.,
corrosion, erosion, fatigue, flange failure, weld defect)
• Dropped object or swinging load
• Over-pressurisation
• Explosion or jet fire that could cause severe or fatal injuries (3 or less) to personnel exposed
• Equipment damage
2 4 S • Equipment start-up procedure • Inspection, testing and maintenance of
equipment • Restrictions on lifting over or near live
equipment • Protection where impacts may be possible
(e.g. near laydown areas) • Pressure relief system
• Process emergency shutdown and blowdown to minimize released inventory
• Control of ignition sources through hazardous area classifications (ATEX compliant)
• Fire and gas detection systems • Active and passive fire protection systems
(e.g., deluge) covering process areas • Support / supply vessels equipped with
firefighting facilities • Multiple escape routes leading to the TR /
safe muster area on QU platform or the alternate safe muster area on the A1 Riser Platform
• QU platform remote from process • TR and evacuation systems (lifeboats, life
rafts, and lifesaving appliances)
1 4 S R N-04
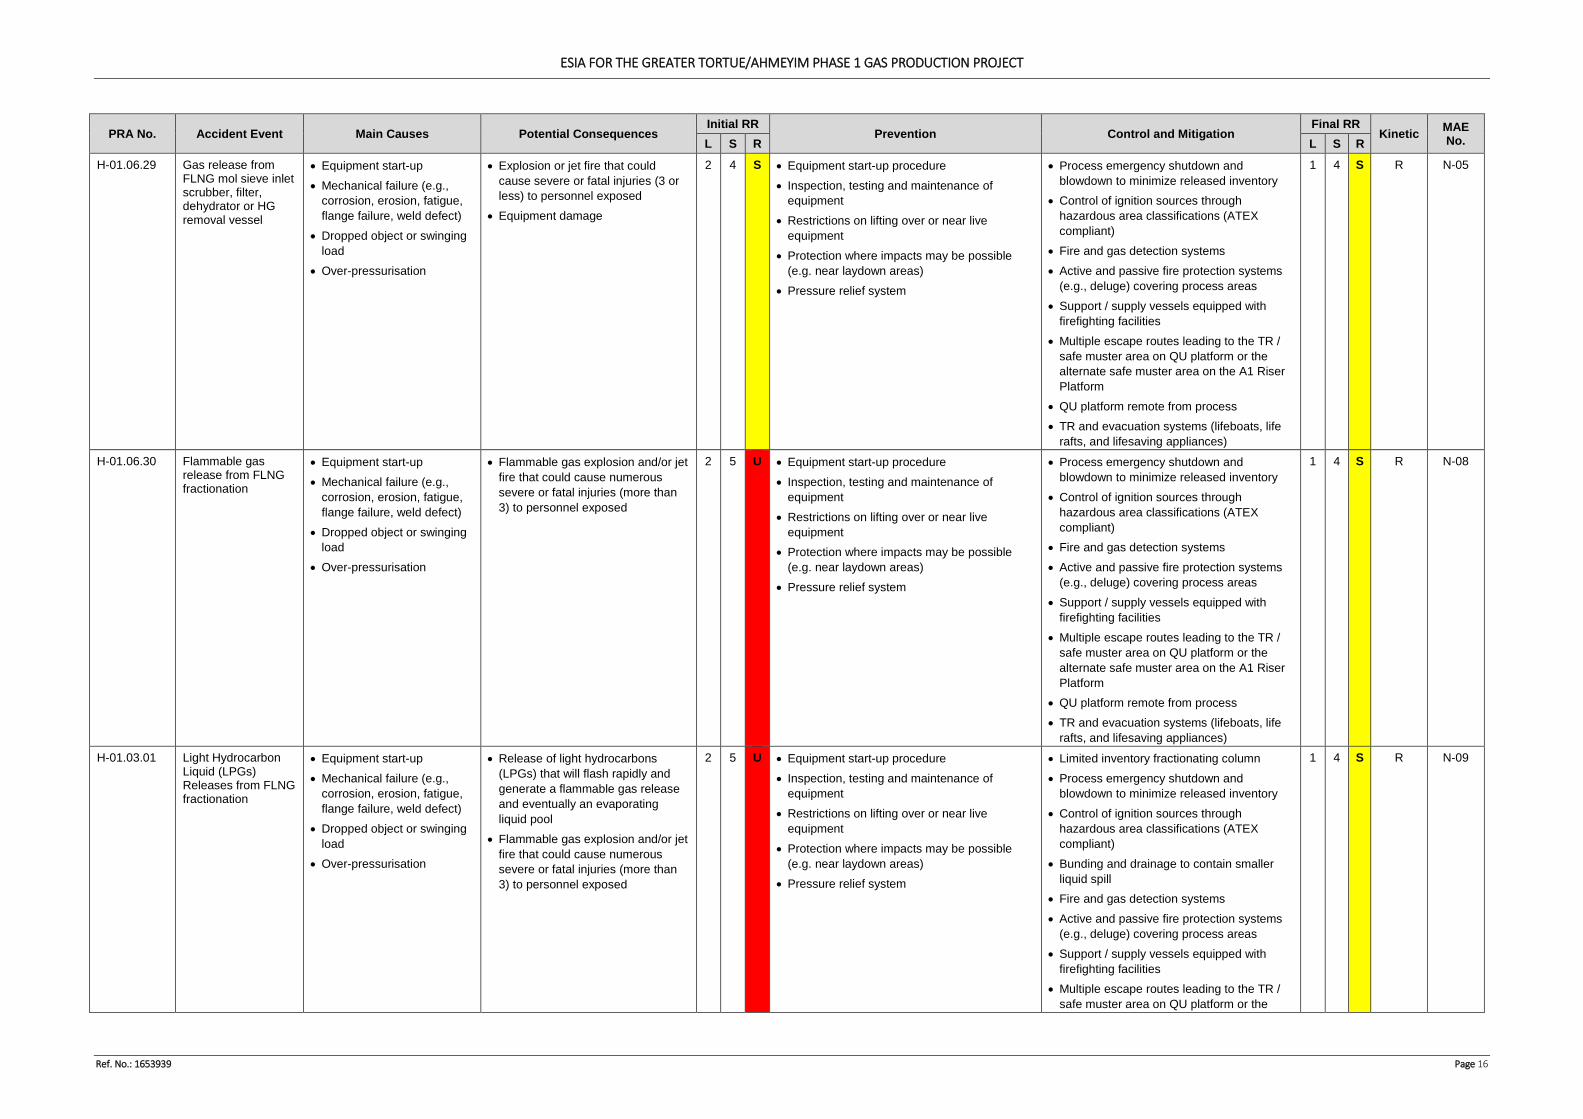
ESIA FOR THE GREATER TORTUE/AHMEYIM PHASE 1 GAS PRODUCTION PROJECT
Ref. No.: 1653939 Page 16
PRA No. Accident Event Main Causes Potential Consequences Initial RR
Prevention Control and Mitigation Final RR
Kinetic MAE No. L S R L S R
H-01.06.29 Gas release from FLNG mol sieve inlet scrubber, filter, dehydrator or HG removal vessel
• Equipment start-up • Mechanical failure (e.g.,
corrosion, erosion, fatigue, flange failure, weld defect)
• Dropped object or swinging load
• Over-pressurisation
• Explosion or jet fire that could cause severe or fatal injuries (3 or less) to personnel exposed
• Equipment damage
2 4 S • Equipment start-up procedure • Inspection, testing and maintenance of
equipment • Restrictions on lifting over or near live
equipment • Protection where impacts may be possible
(e.g. near laydown areas) • Pressure relief system
• Process emergency shutdown and blowdown to minimize released inventory
• Control of ignition sources through hazardous area classifications (ATEX compliant)
• Fire and gas detection systems • Active and passive fire protection systems
(e.g., deluge) covering process areas • Support / supply vessels equipped with
firefighting facilities • Multiple escape routes leading to the TR /
safe muster area on QU platform or the alternate safe muster area on the A1 Riser Platform
• QU platform remote from process • TR and evacuation systems (lifeboats, life
rafts, and lifesaving appliances)
1 4 S R N-05
H-01.06.30 Flammable gas release from FLNG fractionation
• Equipment start-up • Mechanical failure (e.g.,
corrosion, erosion, fatigue, flange failure, weld defect)
• Dropped object or swinging load
• Over-pressurisation
• Flammable gas explosion and/or jet fire that could cause numerous severe or fatal injuries (more than 3) to personnel exposed
2 5 U • Equipment start-up procedure • Inspection, testing and maintenance of
equipment • Restrictions on lifting over or near live
equipment • Protection where impacts may be possible
(e.g. near laydown areas) • Pressure relief system
• Process emergency shutdown and blowdown to minimize released inventory
• Control of ignition sources through hazardous area classifications (ATEX compliant)
• Fire and gas detection systems • Active and passive fire protection systems
(e.g., deluge) covering process areas • Support / supply vessels equipped with
firefighting facilities • Multiple escape routes leading to the TR /
safe muster area on QU platform or the alternate safe muster area on the A1 Riser Platform
• QU platform remote from process • TR and evacuation systems (lifeboats, life
rafts, and lifesaving appliances)
1 4 S R N-08
H-01.03.01 Light Hydrocarbon Liquid (LPGs) Releases from FLNG fractionation
• Equipment start-up • Mechanical failure (e.g.,
corrosion, erosion, fatigue, flange failure, weld defect)
• Dropped object or swinging load
• Over-pressurisation
• Release of light hydrocarbons (LPGs) that will flash rapidly and generate a flammable gas release and eventually an evaporating liquid pool
• Flammable gas explosion and/or jet fire that could cause numerous severe or fatal injuries (more than 3) to personnel exposed
2 5 U • Equipment start-up procedure • Inspection, testing and maintenance of
equipment • Restrictions on lifting over or near live
equipment • Protection where impacts may be possible
(e.g. near laydown areas) • Pressure relief system
• Limited inventory fractionating column • Process emergency shutdown and
blowdown to minimize released inventory • Control of ignition sources through
hazardous area classifications (ATEX compliant)
• Bunding and drainage to contain smaller liquid spill
• Fire and gas detection systems • Active and passive fire protection systems
(e.g., deluge) covering process areas • Support / supply vessels equipped with
firefighting facilities • Multiple escape routes leading to the TR /
safe muster area on QU platform or the
1 4 S R N-09
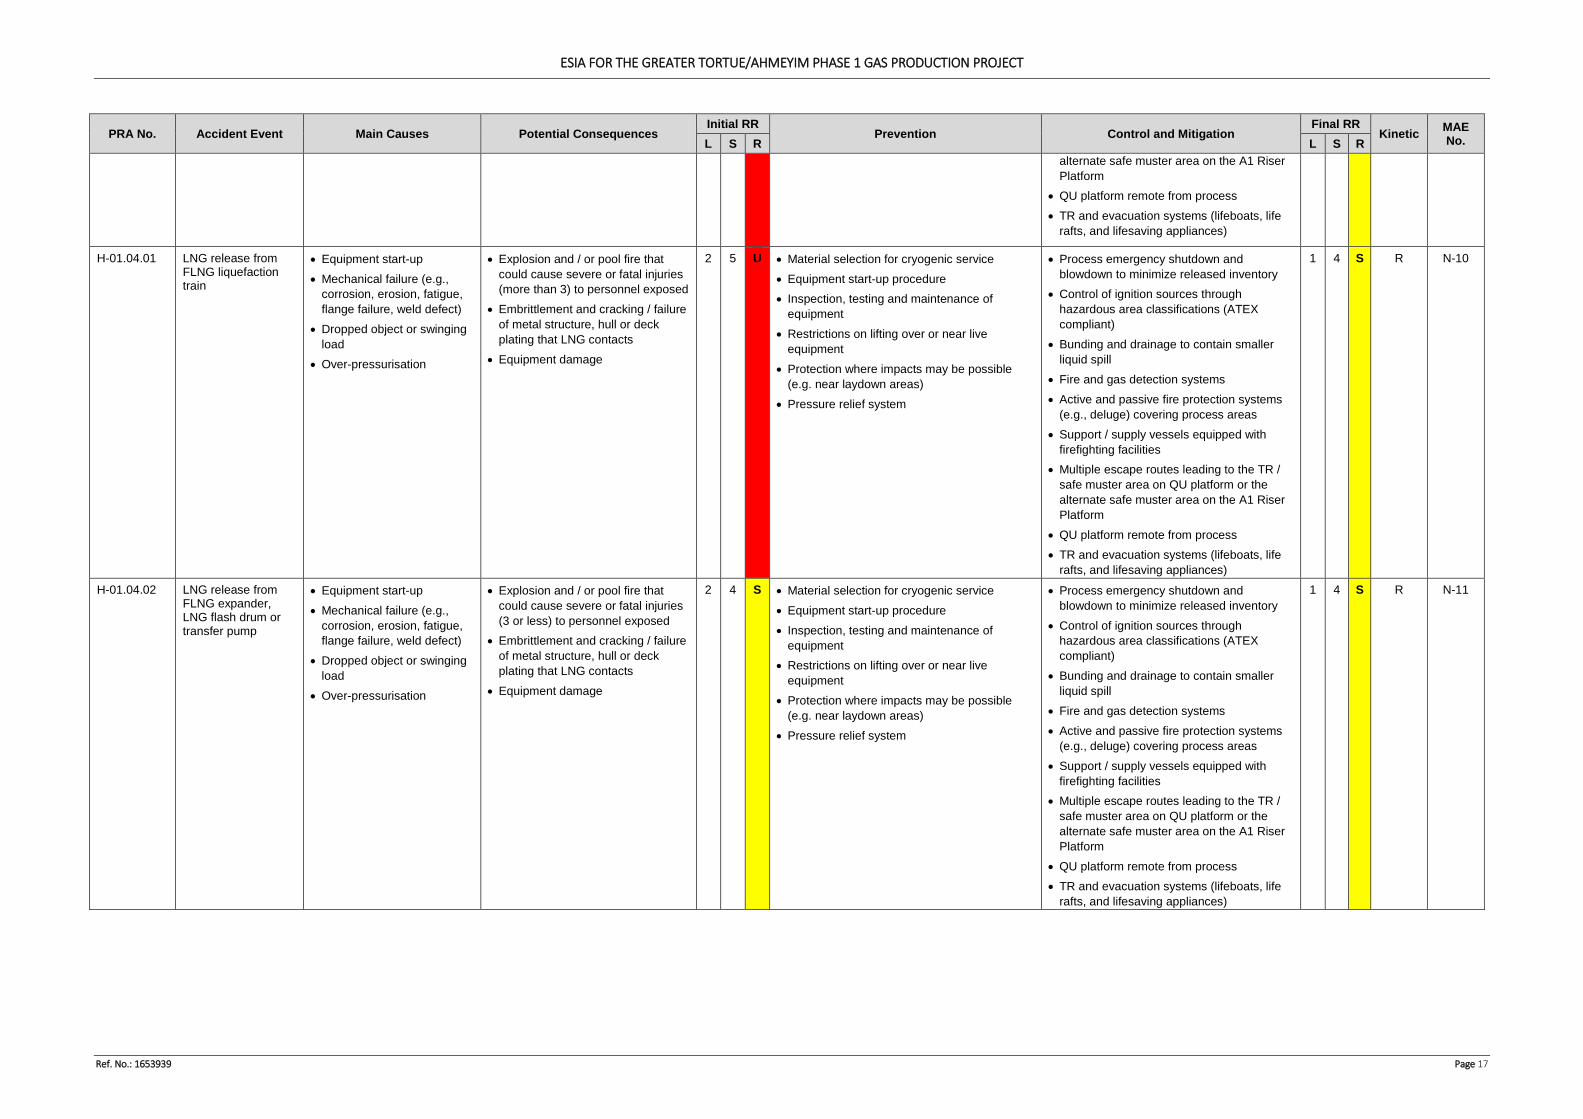
ESIA FOR THE GREATER TORTUE/AHMEYIM PHASE 1 GAS PRODUCTION PROJECT
Ref. No.: 1653939 Page 17
PRA No. Accident Event Main Causes Potential Consequences Initial RR
Prevention Control and Mitigation Final RR
Kinetic MAE No. L S R L S R
alternate safe muster area on the A1 Riser Platform
• QU platform remote from process • TR and evacuation systems (lifeboats, life
rafts, and lifesaving appliances)
H-01.04.01 LNG release from FLNG liquefaction train
• Equipment start-up • Mechanical failure (e.g.,
corrosion, erosion, fatigue, flange failure, weld defect)
• Dropped object or swinging load
• Over-pressurisation
• Explosion and / or pool fire that could cause severe or fatal injuries (more than 3) to personnel exposed
• Embrittlement and cracking / failure of metal structure, hull or deck plating that LNG contacts
• Equipment damage
2 5 U • Material selection for cryogenic service • Equipment start-up procedure • Inspection, testing and maintenance of
equipment • Restrictions on lifting over or near live
equipment • Protection where impacts may be possible
(e.g. near laydown areas) • Pressure relief system
• Process emergency shutdown and blowdown to minimize released inventory
• Control of ignition sources through hazardous area classifications (ATEX compliant)
• Bunding and drainage to contain smaller liquid spill
• Fire and gas detection systems • Active and passive fire protection systems
(e.g., deluge) covering process areas • Support / supply vessels equipped with
firefighting facilities • Multiple escape routes leading to the TR /
safe muster area on QU platform or the alternate safe muster area on the A1 Riser Platform
• QU platform remote from process • TR and evacuation systems (lifeboats, life
rafts, and lifesaving appliances)
1 4 S R N-10
H-01.04.02 LNG release from FLNG expander, LNG flash drum or transfer pump
• Equipment start-up • Mechanical failure (e.g.,
corrosion, erosion, fatigue, flange failure, weld defect)
• Dropped object or swinging load
• Over-pressurisation
• Explosion and / or pool fire that could cause severe or fatal injuries (3 or less) to personnel exposed
• Embrittlement and cracking / failure of metal structure, hull or deck plating that LNG contacts
• Equipment damage
2 4 S • Material selection for cryogenic service • Equipment start-up procedure • Inspection, testing and maintenance of
equipment • Restrictions on lifting over or near live
equipment • Protection where impacts may be possible
(e.g. near laydown areas) • Pressure relief system
• Process emergency shutdown and blowdown to minimize released inventory
• Control of ignition sources through hazardous area classifications (ATEX compliant)
• Bunding and drainage to contain smaller liquid spill
• Fire and gas detection systems • Active and passive fire protection systems
(e.g., deluge) covering process areas • Support / supply vessels equipped with
firefighting facilities • Multiple escape routes leading to the TR /
safe muster area on QU platform or the alternate safe muster area on the A1 Riser Platform
• QU platform remote from process • TR and evacuation systems (lifeboats, life
rafts, and lifesaving appliances)
1 4 S R N-11
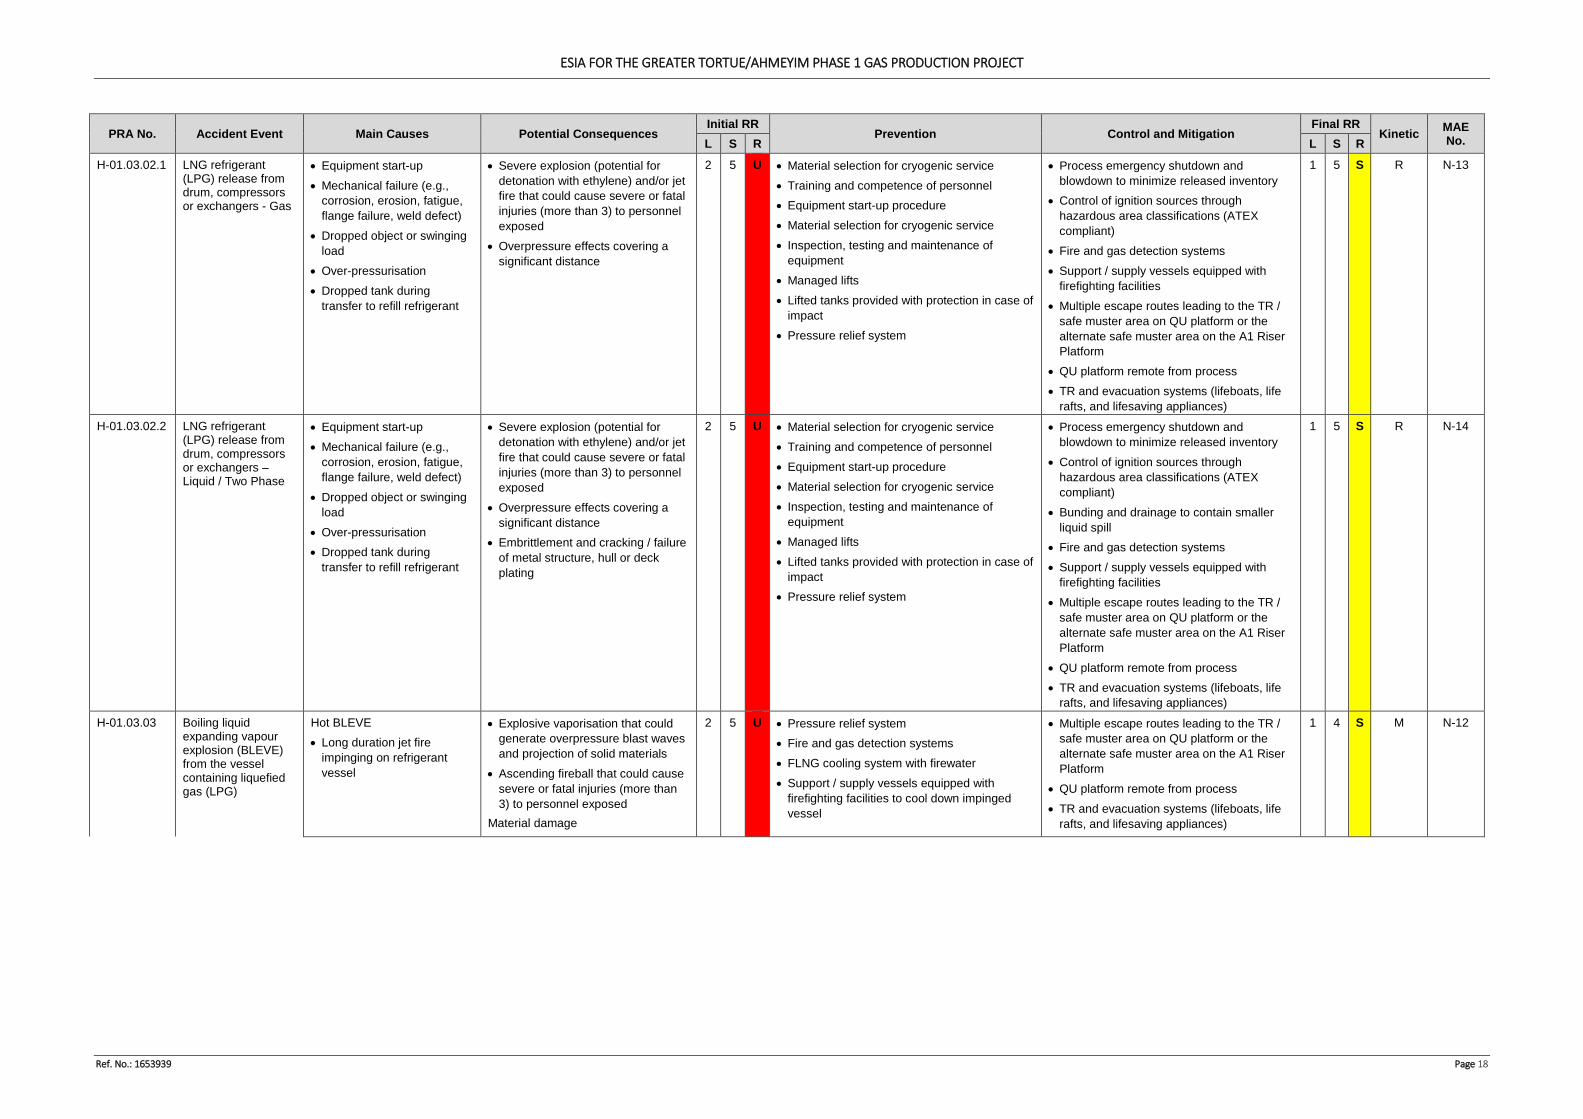
ESIA FOR THE GREATER TORTUE/AHMEYIM PHASE 1 GAS PRODUCTION PROJECT
Ref. No.: 1653939 Page 18
PRA No. Accident Event Main Causes Potential Consequences Initial RR
Prevention Control and Mitigation Final RR
Kinetic MAE No. L S R L S R
H-01.03.02.1 LNG refrigerant (LPG) release from drum, compressors or exchangers - Gas
• Equipment start-up • Mechanical failure (e.g.,
corrosion, erosion, fatigue, flange failure, weld defect)
• Dropped object or swinging load
• Over-pressurisation • Dropped tank during
transfer to refill refrigerant
• Severe explosion (potential for detonation with ethylene) and/or jet fire that could cause severe or fatal injuries (more than 3) to personnel exposed
• Overpressure effects covering a significant distance
2 5 U • Material selection for cryogenic service • Training and competence of personnel • Equipment start-up procedure • Material selection for cryogenic service • Inspection, testing and maintenance of
equipment • Managed lifts • Lifted tanks provided with protection in case of
impact • Pressure relief system
• Process emergency shutdown and blowdown to minimize released inventory
• Control of ignition sources through hazardous area classifications (ATEX compliant)
• Fire and gas detection systems • Support / supply vessels equipped with
firefighting facilities • Multiple escape routes leading to the TR /
safe muster area on QU platform or the alternate safe muster area on the A1 Riser Platform
• QU platform remote from process • TR and evacuation systems (lifeboats, life
rafts, and lifesaving appliances)
1 5 S R N-13
H-01.03.02.2 LNG refrigerant (LPG) release from drum, compressors or exchangers – Liquid / Two Phase
• Equipment start-up • Mechanical failure (e.g.,
corrosion, erosion, fatigue, flange failure, weld defect)
• Dropped object or swinging load
• Over-pressurisation • Dropped tank during
transfer to refill refrigerant
• Severe explosion (potential for detonation with ethylene) and/or jet fire that could cause severe or fatal injuries (more than 3) to personnel exposed
• Overpressure effects covering a significant distance
• Embrittlement and cracking / failure of metal structure, hull or deck plating
2 5 U • Material selection for cryogenic service • Training and competence of personnel • Equipment start-up procedure • Material selection for cryogenic service • Inspection, testing and maintenance of
equipment • Managed lifts • Lifted tanks provided with protection in case of
impact • Pressure relief system
• Process emergency shutdown and blowdown to minimize released inventory
• Control of ignition sources through hazardous area classifications (ATEX compliant)
• Bunding and drainage to contain smaller liquid spill
• Fire and gas detection systems • Support / supply vessels equipped with
firefighting facilities • Multiple escape routes leading to the TR /
safe muster area on QU platform or the alternate safe muster area on the A1 Riser Platform
• QU platform remote from process • TR and evacuation systems (lifeboats, life
rafts, and lifesaving appliances)
1 5 S R N-14
H-01.03.03 Boiling liquid expanding vapour explosion (BLEVE) from the vessel containing liquefied gas (LPG)
Hot BLEVE • Long duration jet fire
impinging on refrigerant vessel
• Explosive vaporisation that could generate overpressure blast waves and projection of solid materials
• Ascending fireball that could cause severe or fatal injuries (more than 3) to personnel exposed
Material damage
2 5 U • Pressure relief system • Fire and gas detection systems • FLNG cooling system with firewater • Support / supply vessels equipped with
firefighting facilities to cool down impinged vessel
• Multiple escape routes leading to the TR / safe muster area on QU platform or the alternate safe muster area on the A1 Riser Platform
• QU platform remote from process • TR and evacuation systems (lifeboats, life
rafts, and lifesaving appliances)
1 4 S M N-12
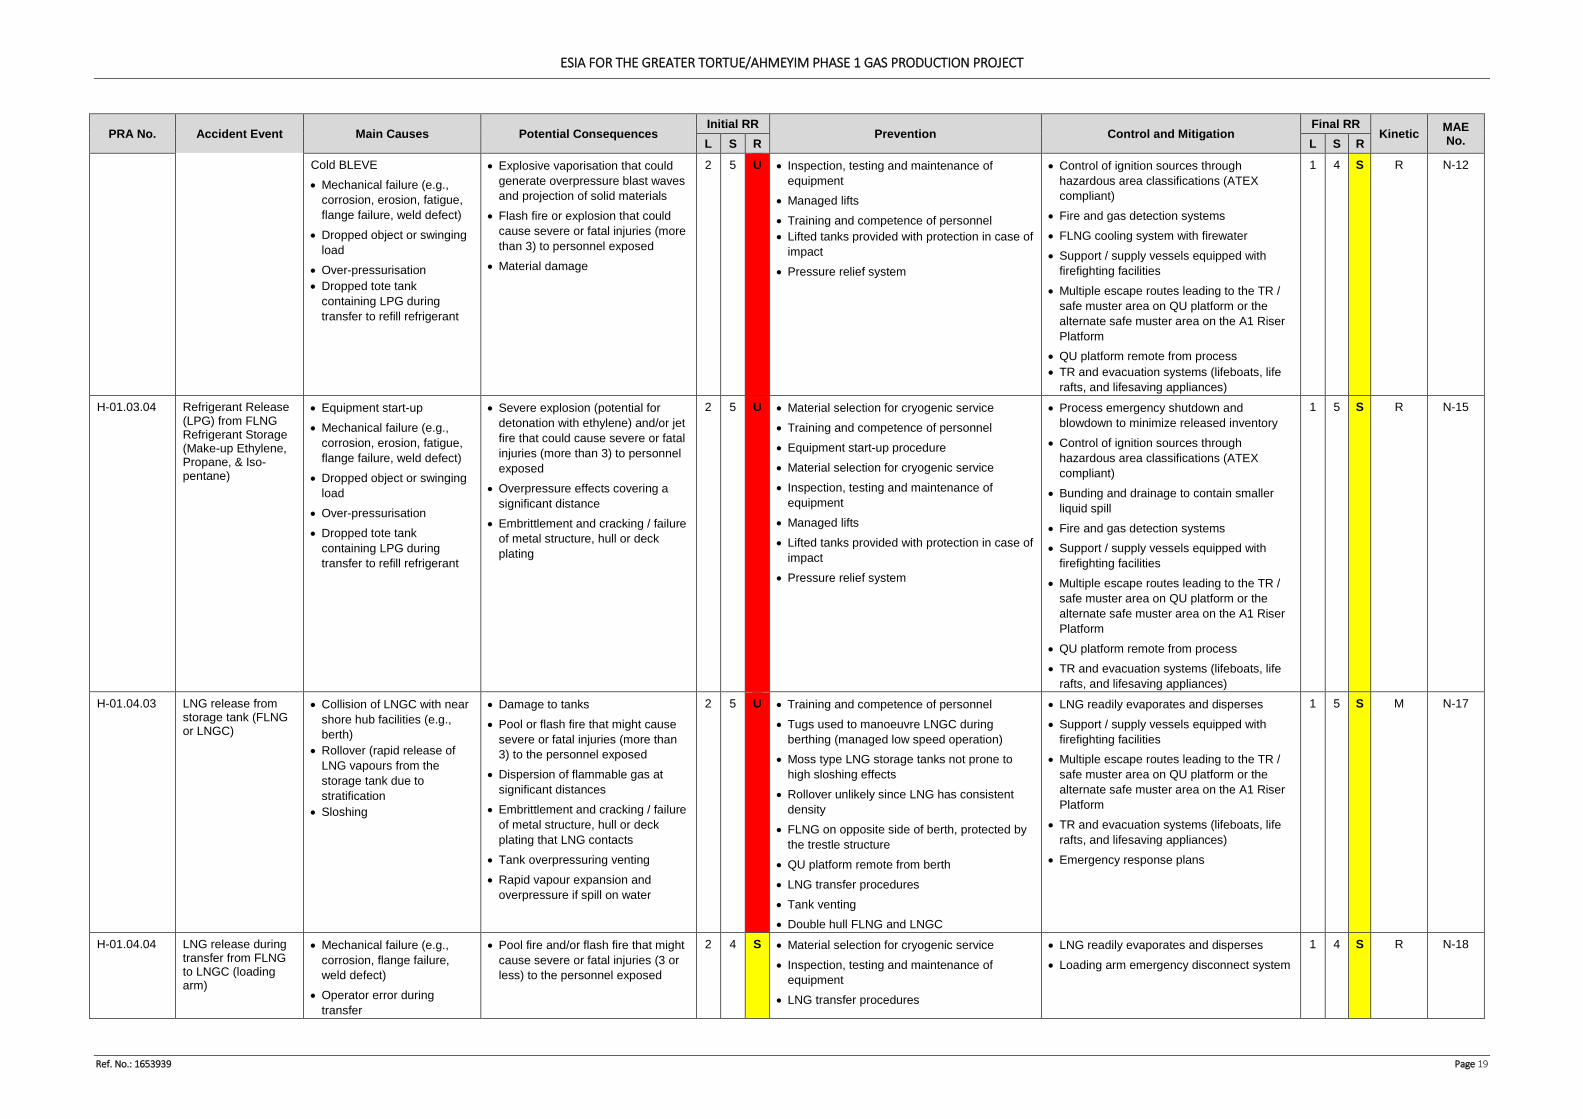
ESIA FOR THE GREATER TORTUE/AHMEYIM PHASE 1 GAS PRODUCTION PROJECT
Ref. No.: 1653939 Page 19
PRA No. Accident Event Main Causes Potential Consequences Initial RR
Prevention Control and Mitigation Final RR
Kinetic MAE No. L S R L S R
Cold BLEVE • Mechanical failure (e.g.,
corrosion, erosion, fatigue, flange failure, weld defect)
• Dropped object or swinging load
• Over-pressurisation • Dropped tote tank
containing LPG during transfer to refill refrigerant
• Explosive vaporisation that could generate overpressure blast waves and projection of solid materials
• Flash fire or explosion that could cause severe or fatal injuries (more than 3) to personnel exposed
• Material damage
2 5 U • Inspection, testing and maintenance of equipment
• Managed lifts • Training and competence of personnel • Lifted tanks provided with protection in case of
impact • Pressure relief system
• Control of ignition sources through hazardous area classifications (ATEX compliant)
• Fire and gas detection systems • FLNG cooling system with firewater • Support / supply vessels equipped with
firefighting facilities • Multiple escape routes leading to the TR /
safe muster area on QU platform or the alternate safe muster area on the A1 Riser Platform
• QU platform remote from process • TR and evacuation systems (lifeboats, life
rafts, and lifesaving appliances)
1 4 S R N-12
H-01.03.04 Refrigerant Release (LPG) from FLNG Refrigerant Storage (Make-up Ethylene, Propane, & Iso-pentane)
• Equipment start-up • Mechanical failure (e.g.,
corrosion, erosion, fatigue, flange failure, weld defect)
• Dropped object or swinging load
• Over-pressurisation • Dropped tote tank
containing LPG during transfer to refill refrigerant
• Severe explosion (potential for detonation with ethylene) and/or jet fire that could cause severe or fatal injuries (more than 3) to personnel exposed
• Overpressure effects covering a significant distance
• Embrittlement and cracking / failure of metal structure, hull or deck plating
2 5 U • Material selection for cryogenic service • Training and competence of personnel • Equipment start-up procedure • Material selection for cryogenic service • Inspection, testing and maintenance of
equipment • Managed lifts • Lifted tanks provided with protection in case of
impact • Pressure relief system
• Process emergency shutdown and blowdown to minimize released inventory
• Control of ignition sources through hazardous area classifications (ATEX compliant)
• Bunding and drainage to contain smaller liquid spill
• Fire and gas detection systems • Support / supply vessels equipped with
firefighting facilities • Multiple escape routes leading to the TR /
safe muster area on QU platform or the alternate safe muster area on the A1 Riser Platform
• QU platform remote from process • TR and evacuation systems (lifeboats, life
rafts, and lifesaving appliances)
1 5 S R N-15
H-01.04.03 LNG release from storage tank (FLNG or LNGC)
• Collision of LNGC with near shore hub facilities (e.g., berth)
• Rollover (rapid release of LNG vapours from the storage tank due to stratification
• Sloshing
• Damage to tanks • Pool or flash fire that might cause
severe or fatal injuries (more than 3) to the personnel exposed
• Dispersion of flammable gas at significant distances
• Embrittlement and cracking / failure of metal structure, hull or deck plating that LNG contacts
• Tank overpressuring venting • Rapid vapour expansion and
overpressure if spill on water
2 5 U • Training and competence of personnel • Tugs used to manoeuvre LNGC during
berthing (managed low speed operation) • Moss type LNG storage tanks not prone to
high sloshing effects • Rollover unlikely since LNG has consistent
density • FLNG on opposite side of berth, protected by
the trestle structure • QU platform remote from berth • LNG transfer procedures • Tank venting • Double hull FLNG and LNGC
• LNG readily evaporates and disperses • Support / supply vessels equipped with
firefighting facilities • Multiple escape routes leading to the TR /
safe muster area on QU platform or the alternate safe muster area on the A1 Riser Platform
• TR and evacuation systems (lifeboats, life rafts, and lifesaving appliances)
• Emergency response plans
1 5 S M N-17
H-01.04.04 LNG release during transfer from FLNG to LNGC (loading arm)
• Mechanical failure (e.g., corrosion, flange failure, weld defect)
• Operator error during transfer
• Pool fire and/or flash fire that might cause severe or fatal injuries (3 or less) to the personnel exposed
2 4 S • Material selection for cryogenic service • Inspection, testing and maintenance of
equipment • LNG transfer procedures
• LNG readily evaporates and disperses • Loading arm emergency disconnect system
1 4 S R N-18
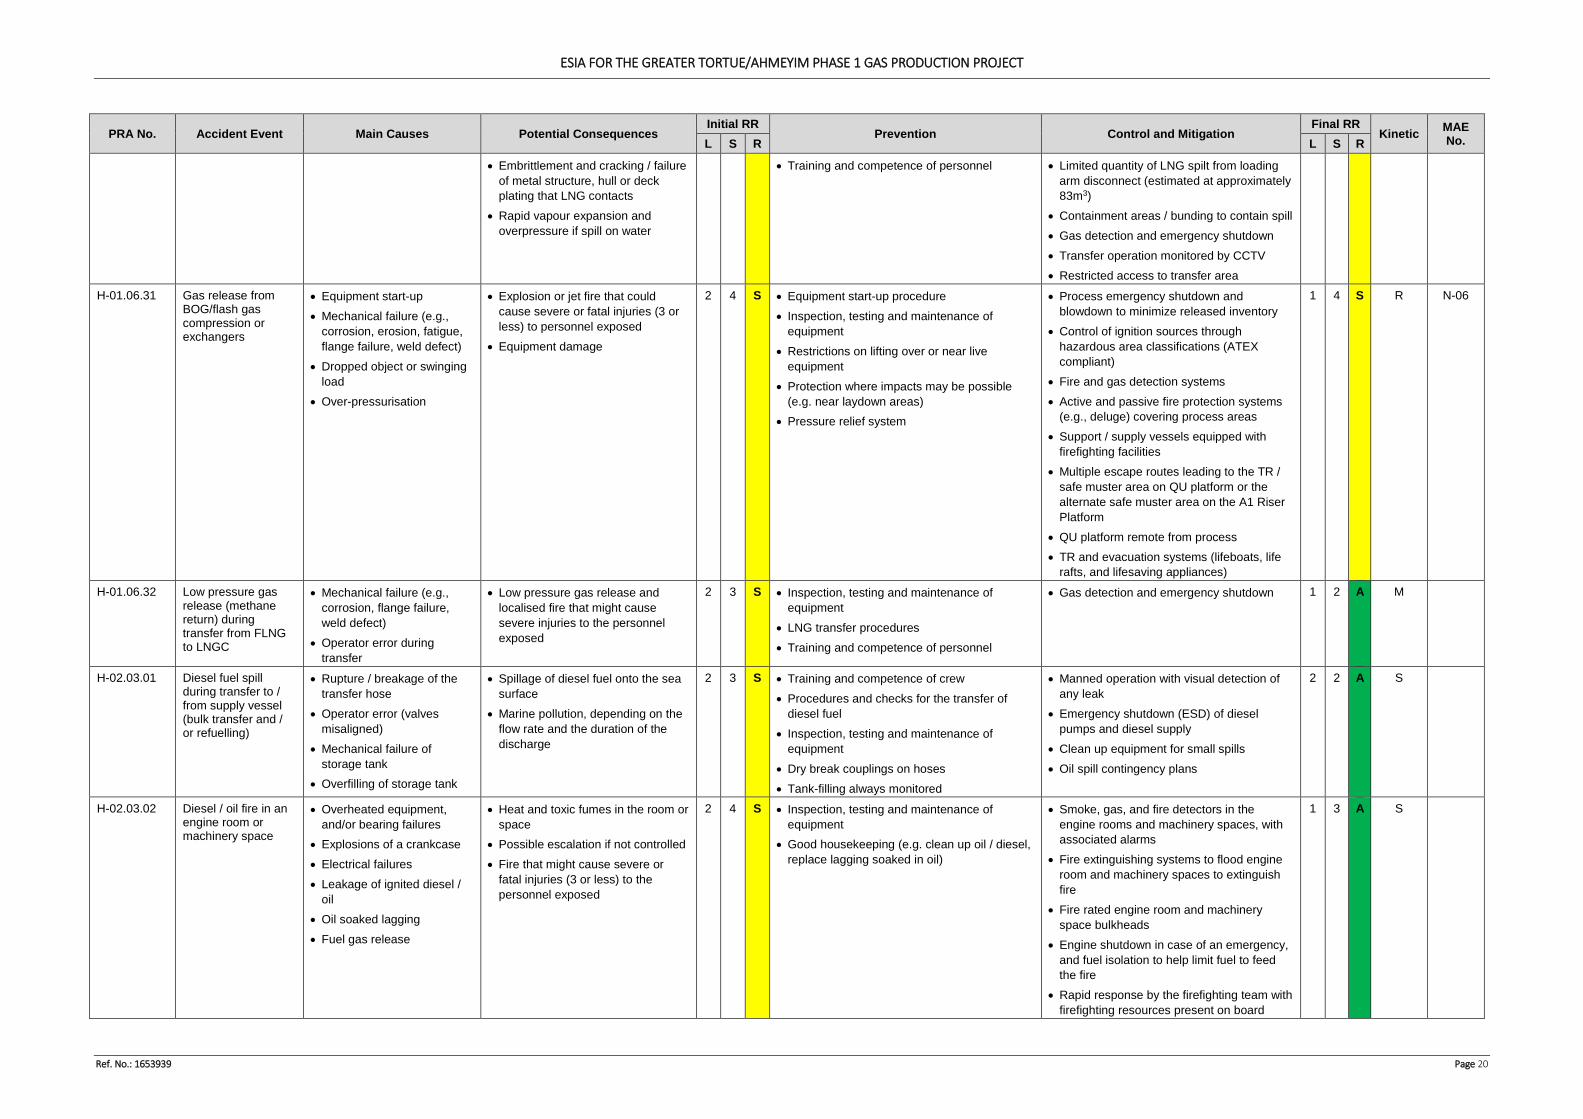
ESIA FOR THE GREATER TORTUE/AHMEYIM PHASE 1 GAS PRODUCTION PROJECT
Ref. No.: 1653939 Page 20
PRA No. Accident Event Main Causes Potential Consequences Initial RR
Prevention Control and Mitigation Final RR
Kinetic MAE No. L S R L S R
• Embrittlement and cracking / failure of metal structure, hull or deck plating that LNG contacts
• Rapid vapour expansion and overpressure if spill on water
• Training and competence of personnel • Limited quantity of LNG spilt from loading arm disconnect (estimated at approximately 83m3)
• Containment areas / bunding to contain spill • Gas detection and emergency shutdown • Transfer operation monitored by CCTV • Restricted access to transfer area
H-01.06.31 Gas release from BOG/flash gas compression or exchangers
• Equipment start-up • Mechanical failure (e.g.,
corrosion, erosion, fatigue, flange failure, weld defect)
• Dropped object or swinging load
• Over-pressurisation
• Explosion or jet fire that could cause severe or fatal injuries (3 or less) to personnel exposed
• Equipment damage
2 4 S • Equipment start-up procedure • Inspection, testing and maintenance of
equipment • Restrictions on lifting over or near live
equipment • Protection where impacts may be possible
(e.g. near laydown areas) • Pressure relief system
• Process emergency shutdown and blowdown to minimize released inventory
• Control of ignition sources through hazardous area classifications (ATEX compliant)
• Fire and gas detection systems • Active and passive fire protection systems
(e.g., deluge) covering process areas • Support / supply vessels equipped with
firefighting facilities • Multiple escape routes leading to the TR /
safe muster area on QU platform or the alternate safe muster area on the A1 Riser Platform
• QU platform remote from process • TR and evacuation systems (lifeboats, life
rafts, and lifesaving appliances)
1 4 S R N-06
H-01.06.32 Low pressure gas release (methane return) during transfer from FLNG to LNGC
• Mechanical failure (e.g., corrosion, flange failure, weld defect)
• Operator error during transfer
• Low pressure gas release and localised fire that might cause severe injuries to the personnel exposed
2 3 S • Inspection, testing and maintenance of equipment
• LNG transfer procedures • Training and competence of personnel
• Gas detection and emergency shutdown 1 2 A M
H-02.03.01 Diesel fuel spill during transfer to / from supply vessel (bulk transfer and / or refuelling)
• Rupture / breakage of the transfer hose
• Operator error (valves misaligned)
• Mechanical failure of storage tank
• Overfilling of storage tank
• Spillage of diesel fuel onto the sea surface
• Marine pollution, depending on the flow rate and the duration of the discharge
2 3 S • Training and competence of crew • Procedures and checks for the transfer of
diesel fuel • Inspection, testing and maintenance of
equipment • Dry break couplings on hoses • Tank-filling always monitored
• Manned operation with visual detection of any leak
• Emergency shutdown (ESD) of diesel pumps and diesel supply
• Clean up equipment for small spills • Oil spill contingency plans
2 2 A S
H-02.03.02 Diesel / oil fire in an engine room or machinery space
• Overheated equipment, and/or bearing failures
• Explosions of a crankcase • Electrical failures • Leakage of ignited diesel /
oil • Oil soaked lagging • Fuel gas release
• Heat and toxic fumes in the room or space
• Possible escalation if not controlled • Fire that might cause severe or
fatal injuries (3 or less) to the personnel exposed
2 4 S • Inspection, testing and maintenance of equipment
• Good housekeeping (e.g. clean up oil / diesel, replace lagging soaked in oil)
• Smoke, gas, and fire detectors in the engine rooms and machinery spaces, with associated alarms
• Fire extinguishing systems to flood engine room and machinery spaces to extinguish fire
• Fire rated engine room and machinery space bulkheads
• Engine shutdown in case of an emergency, and fuel isolation to help limit fuel to feed the fire
• Rapid response by the firefighting team with firefighting resources present on board
1 3 A S
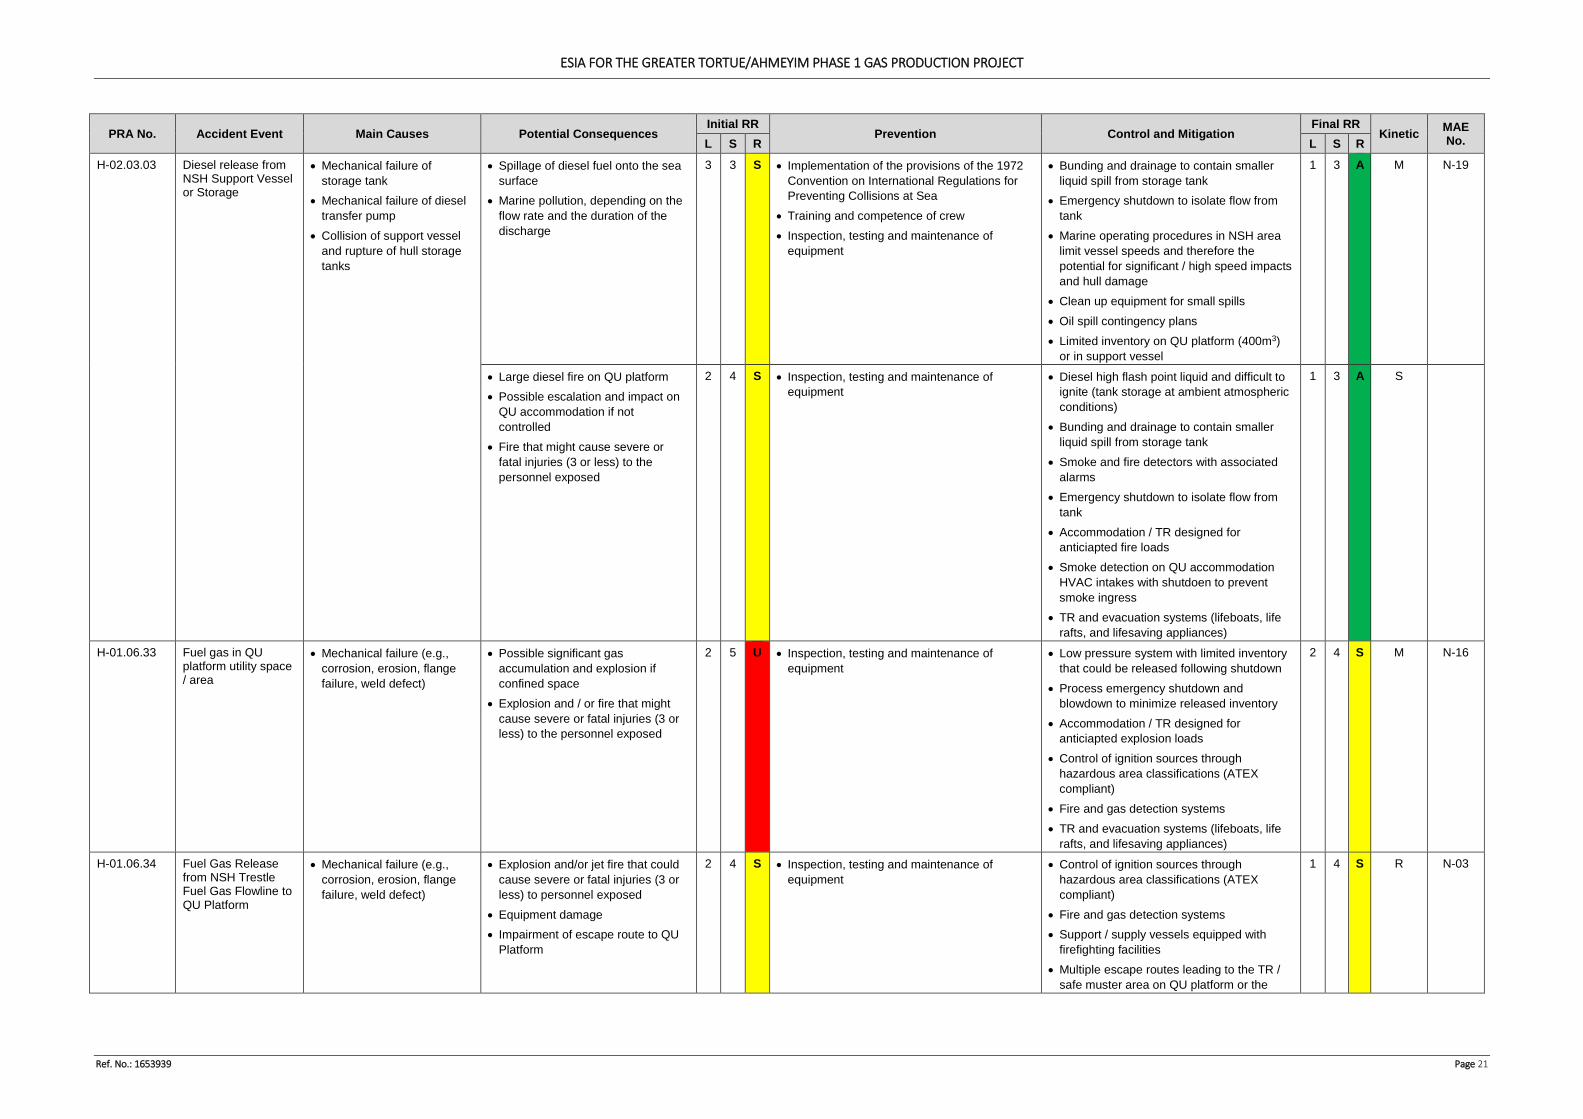
ESIA FOR THE GREATER TORTUE/AHMEYIM PHASE 1 GAS PRODUCTION PROJECT
Ref. No.: 1653939 Page 21
PRA No. Accident Event Main Causes Potential Consequences Initial RR
Prevention Control and Mitigation Final RR
Kinetic MAE No. L S R L S R
H-02.03.03 Diesel release from NSH Support Vessel or Storage
• Mechanical failure of storage tank
• Mechanical failure of diesel transfer pump
• Collision of support vessel and rupture of hull storage tanks
• Spillage of diesel fuel onto the sea surface
• Marine pollution, depending on the flow rate and the duration of the discharge
3 3 S • Implementation of the provisions of the 1972 Convention on International Regulations for Preventing Collisions at Sea
• Training and competence of crew • Inspection, testing and maintenance of
equipment
• Bunding and drainage to contain smaller liquid spill from storage tank
• Emergency shutdown to isolate flow from tank
• Marine operating procedures in NSH area limit vessel speeds and therefore the potential for significant / high speed impacts and hull damage
• Clean up equipment for small spills • Oil spill contingency plans • Limited inventory on QU platform (400m3)
or in support vessel
1 3 A M N-19
• Large diesel fire on QU platform • Possible escalation and impact on
QU accommodation if not controlled
• Fire that might cause severe or fatal injuries (3 or less) to the personnel exposed
2 4 S • Inspection, testing and maintenance of equipment
• Diesel high flash point liquid and difficult to ignite (tank storage at ambient atmospheric conditions)
• Bunding and drainage to contain smaller liquid spill from storage tank
• Smoke and fire detectors with associated alarms
• Emergency shutdown to isolate flow from tank
• Accommodation / TR designed for anticiapted fire loads
• Smoke detection on QU accommodation HVAC intakes with shutdoen to prevent smoke ingress
• TR and evacuation systems (lifeboats, life rafts, and lifesaving appliances)
1 3 A S
H-01.06.33 Fuel gas in QU platform utility space / area
• Mechanical failure (e.g., corrosion, erosion, flange failure, weld defect)
• Possible significant gas accumulation and explosion if confined space
• Explosion and / or fire that might cause severe or fatal injuries (3 or less) to the personnel exposed
2 5 U • Inspection, testing and maintenance of equipment
• Low pressure system with limited inventory that could be released following shutdown
• Process emergency shutdown and blowdown to minimize released inventory
• Accommodation / TR designed for anticiapted explosion loads
• Control of ignition sources through hazardous area classifications (ATEX compliant)
• Fire and gas detection systems • TR and evacuation systems (lifeboats, life
rafts, and lifesaving appliances)
2 4 S M N-16
H-01.06.34 Fuel Gas Release from NSH Trestle Fuel Gas Flowline to QU Platform
• Mechanical failure (e.g., corrosion, erosion, flange failure, weld defect)
• Explosion and/or jet fire that could cause severe or fatal injuries (3 or less) to personnel exposed
• Equipment damage • Impairment of escape route to QU
Platform
2 4 S • Inspection, testing and maintenance of equipment
• Control of ignition sources through hazardous area classifications (ATEX compliant)
• Fire and gas detection systems • Support / supply vessels equipped with
firefighting facilities • Multiple escape routes leading to the TR /
safe muster area on QU platform or the
1 4 S R N-03
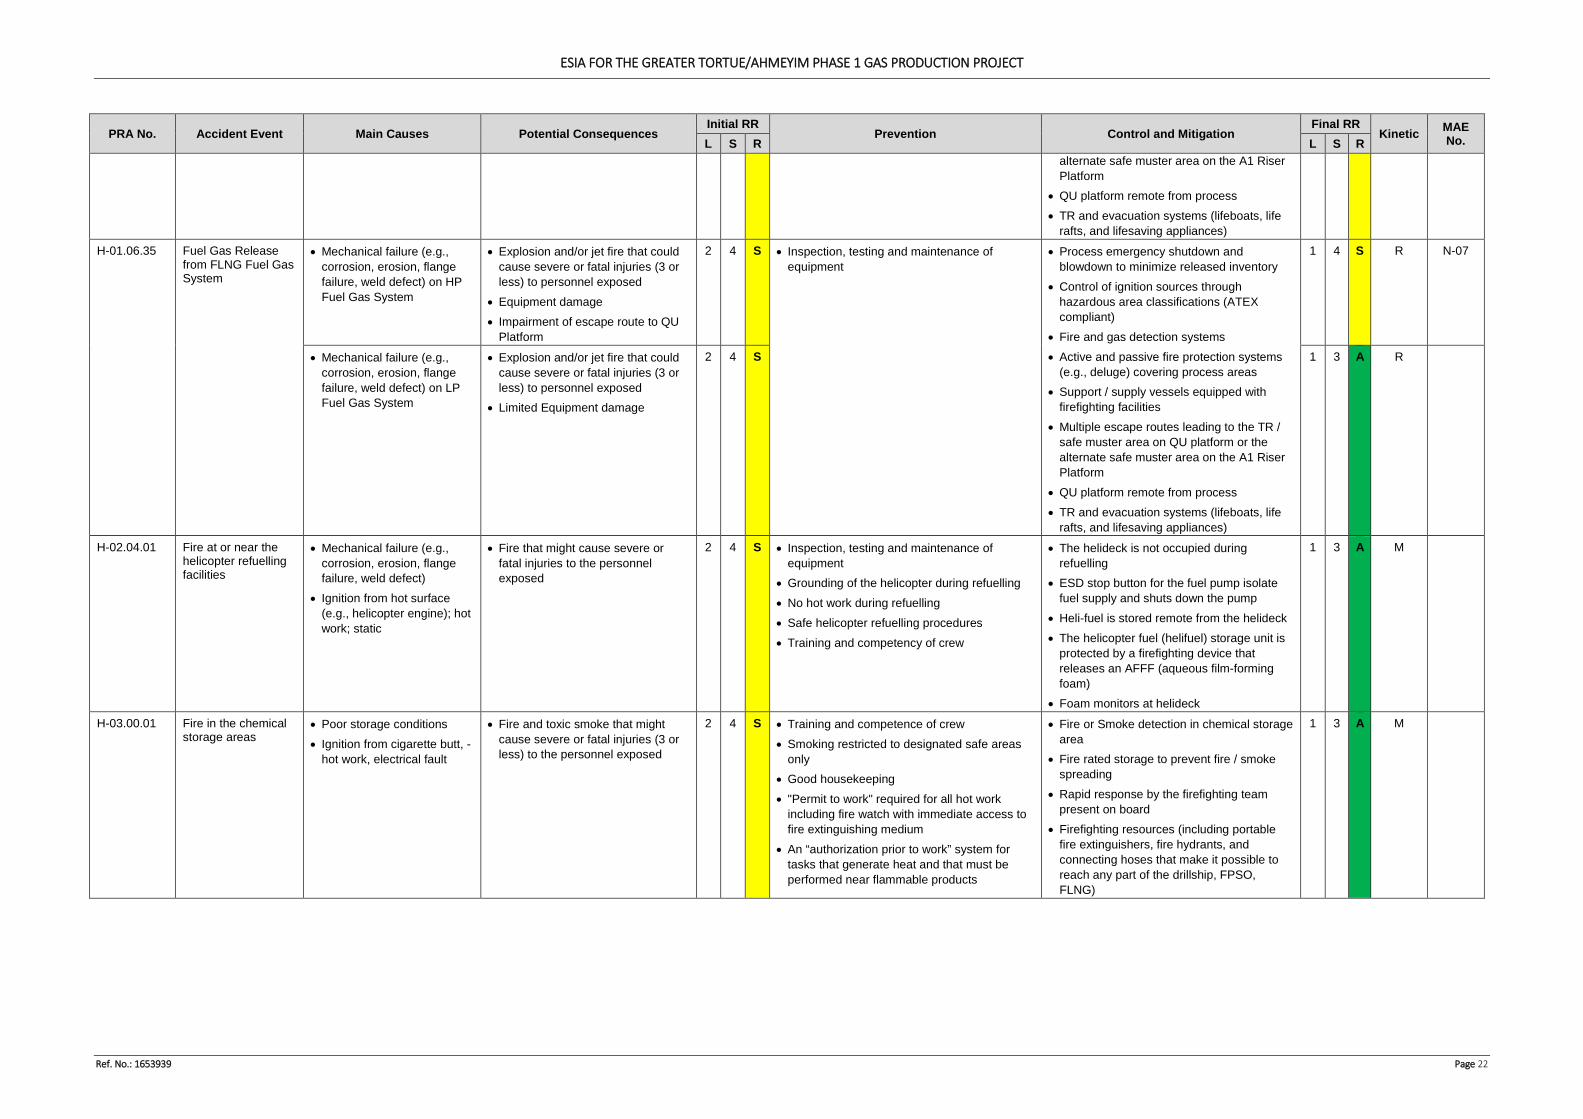
ESIA FOR THE GREATER TORTUE/AHMEYIM PHASE 1 GAS PRODUCTION PROJECT
Ref. No.: 1653939 Page 22
PRA No. Accident Event Main Causes Potential Consequences Initial RR
Prevention Control and Mitigation Final RR
Kinetic MAE No. L S R L S R
alternate safe muster area on the A1 Riser Platform
• QU platform remote from process • TR and evacuation systems (lifeboats, life
rafts, and lifesaving appliances) H-01.06.35 Fuel Gas Release
from FLNG Fuel Gas System
• Mechanical failure (e.g., corrosion, erosion, flange failure, weld defect) on HP Fuel Gas System
• Explosion and/or jet fire that could cause severe or fatal injuries (3 or less) to personnel exposed
• Equipment damage • Impairment of escape route to QU
Platform
2 4 S • Inspection, testing and maintenance of equipment
• Process emergency shutdown and blowdown to minimize released inventory
• Control of ignition sources through hazardous area classifications (ATEX compliant)
• Fire and gas detection systems • Active and passive fire protection systems
(e.g., deluge) covering process areas • Support / supply vessels equipped with
firefighting facilities • Multiple escape routes leading to the TR /
safe muster area on QU platform or the alternate safe muster area on the A1 Riser Platform
• QU platform remote from process • TR and evacuation systems (lifeboats, life
rafts, and lifesaving appliances)
1 4 S R N-07
• Mechanical failure (e.g., corrosion, erosion, flange failure, weld defect) on LP Fuel Gas System
• Explosion and/or jet fire that could cause severe or fatal injuries (3 or less) to personnel exposed
• Limited Equipment damage
2 4 S 1 3 A R
H-02.04.01 Fire at or near the helicopter refuelling facilities
• Mechanical failure (e.g., corrosion, erosion, flange failure, weld defect)
• Ignition from hot surface (e.g., helicopter engine); hot work; static
• Fire that might cause severe or fatal injuries to the personnel exposed
2 4 S • Inspection, testing and maintenance of equipment
• Grounding of the helicopter during refuelling • No hot work during refuelling • Safe helicopter refuelling procedures • Training and competency of crew
• The helideck is not occupied during refuelling
• ESD stop button for the fuel pump isolate fuel supply and shuts down the pump
• Heli-fuel is stored remote from the helideck • The helicopter fuel (helifuel) storage unit is
protected by a firefighting device that releases an AFFF (aqueous film-forming foam)
• Foam monitors at helideck
1 3 A M
H-03.00.01 Fire in the chemical storage areas
• Poor storage conditions • Ignition from cigarette butt, -
hot work, electrical fault
• Fire and toxic smoke that might cause severe or fatal injuries (3 or less) to the personnel exposed
2 4 S • Training and competence of crew • Smoking restricted to designated safe areas
only • Good housekeeping • "Permit to work" required for all hot work
including fire watch with immediate access to fire extinguishing medium
• An “authorization prior to work” system for tasks that generate heat and that must be performed near flammable products
• Fire or Smoke detection in chemical storage area
• Fire rated storage to prevent fire / smoke spreading
• Rapid response by the firefighting team present on board
• Firefighting resources (including portable fire extinguishers, fire hydrants, and connecting hoses that make it possible to reach any part of the drillship, FPSO, FLNG)
1 3 A M
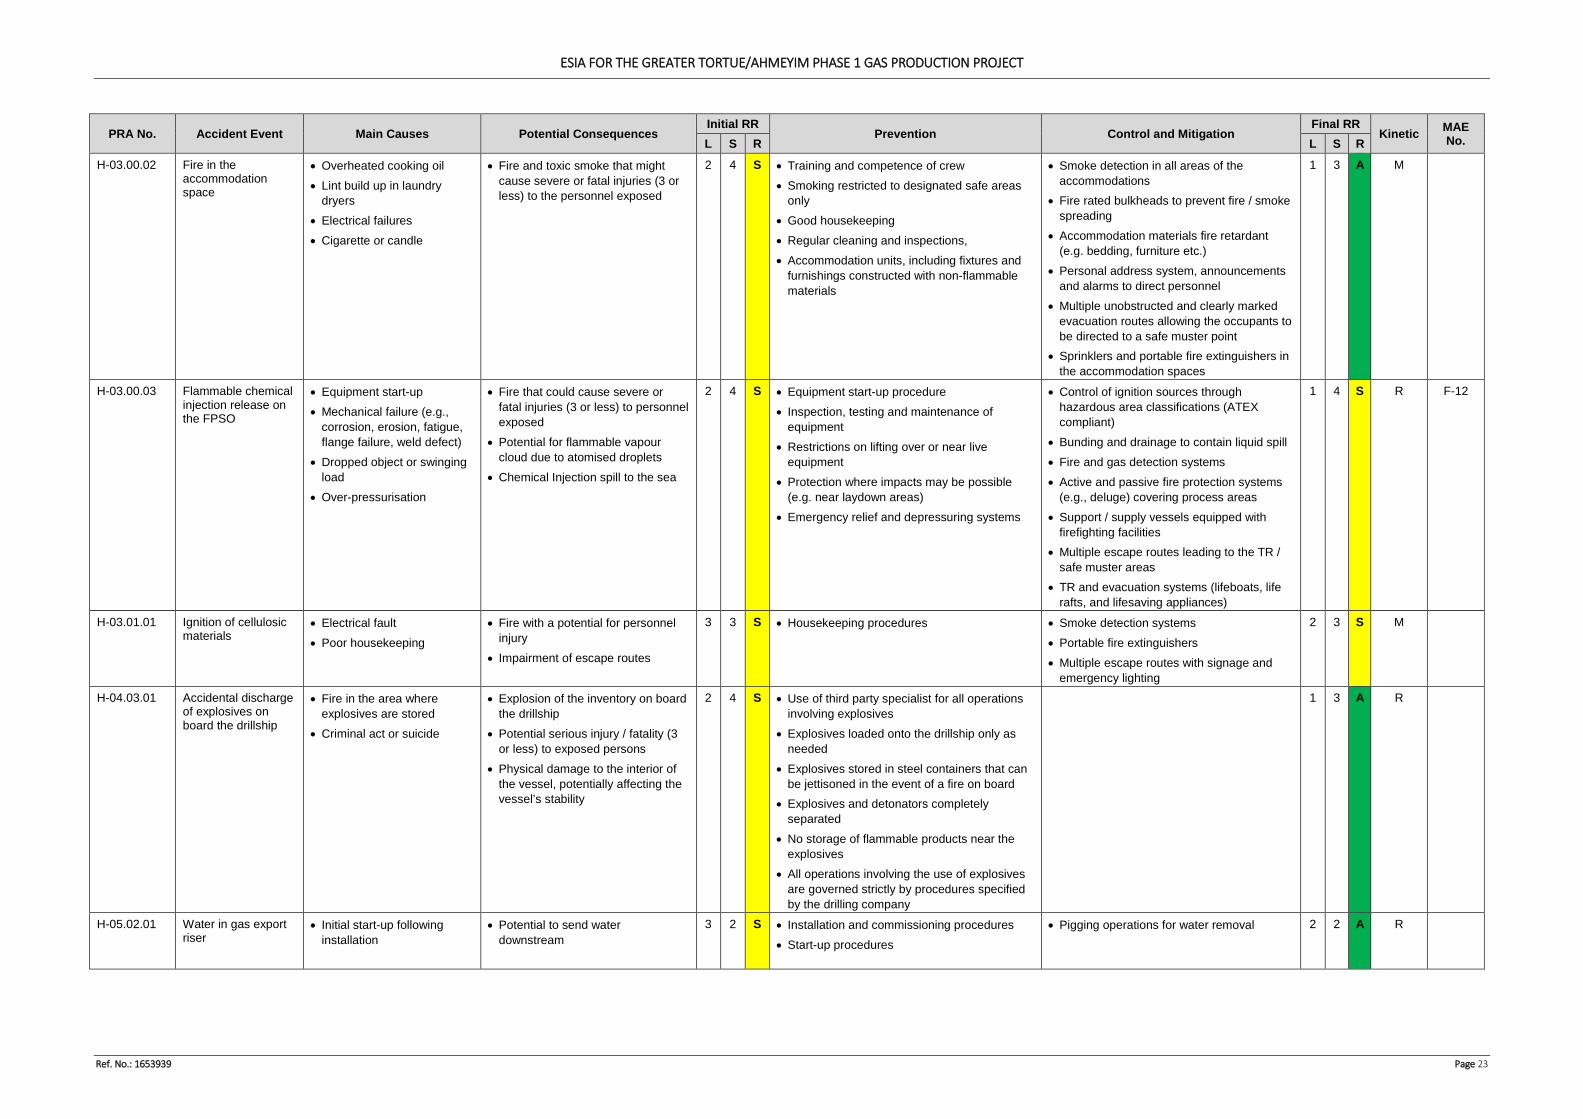
ESIA FOR THE GREATER TORTUE/AHMEYIM PHASE 1 GAS PRODUCTION PROJECT
Ref. No.: 1653939 Page 23
PRA No. Accident Event Main Causes Potential Consequences Initial RR
Prevention Control and Mitigation Final RR
Kinetic MAE No. L S R L S R
H-03.00.02 Fire in the accommodation space
• Overheated cooking oil • Lint build up in laundry
dryers • Electrical failures • Cigarette or candle
• Fire and toxic smoke that might cause severe or fatal injuries (3 or less) to the personnel exposed
2 4 S • Training and competence of crew • Smoking restricted to designated safe areas
only • Good housekeeping • Regular cleaning and inspections, • Accommodation units, including fixtures and
furnishings constructed with non-flammable materials
• Smoke detection in all areas of the accommodations
• Fire rated bulkheads to prevent fire / smoke spreading
• Accommodation materials fire retardant (e.g. bedding, furniture etc.)
• Personal address system, announcements and alarms to direct personnel
• Multiple unobstructed and clearly marked evacuation routes allowing the occupants to be directed to a safe muster point
• Sprinklers and portable fire extinguishers in the accommodation spaces
1 3 A M
H-03.00.03 Flammable chemical injection release on the FPSO
• Equipment start-up • Mechanical failure (e.g.,
corrosion, erosion, fatigue, flange failure, weld defect)
• Dropped object or swinging load
• Over-pressurisation
• Fire that could cause severe or fatal injuries (3 or less) to personnel exposed
• Potential for flammable vapour cloud due to atomised droplets
• Chemical Injection spill to the sea
2 4 S • Equipment start-up procedure • Inspection, testing and maintenance of
equipment • Restrictions on lifting over or near live
equipment • Protection where impacts may be possible
(e.g. near laydown areas) • Emergency relief and depressuring systems
• Control of ignition sources through hazardous area classifications (ATEX compliant)
• Bunding and drainage to contain liquid spill • Fire and gas detection systems • Active and passive fire protection systems
(e.g., deluge) covering process areas • Support / supply vessels equipped with
firefighting facilities • Multiple escape routes leading to the TR /
safe muster areas • TR and evacuation systems (lifeboats, life
rafts, and lifesaving appliances)
1 4 S R F-12
H-03.01.01 Ignition of cellulosic materials
• Electrical fault • Poor housekeeping
• Fire with a potential for personnel injury
• Impairment of escape routes
3 3 S • Housekeeping procedures • Smoke detection systems • Portable fire extinguishers • Multiple escape routes with signage and
emergency lighting
2 3 S M
H-04.03.01 Accidental discharge of explosives on board the drillship
• Fire in the area where explosives are stored
• Criminal act or suicide
• Explosion of the inventory on board the drillship
• Potential serious injury / fatality (3 or less) to exposed persons
• Physical damage to the interior of the vessel, potentially affecting the vessel’s stability
2 4 S • Use of third party specialist for all operations involving explosives
• Explosives loaded onto the drillship only as needed
• Explosives stored in steel containers that can be jettisoned in the event of a fire on board
• Explosives and detonators completely separated
• No storage of flammable products near the explosives
• All operations involving the use of explosives are governed strictly by procedures specified by the drilling company
1 3 A R
H-05.02.01 Water in gas export riser
• Initial start-up following installation
• Potential to send water downstream
3 2 S • Installation and commissioning procedures • Start-up procedures
• Pigging operations for water removal 2 2 A R
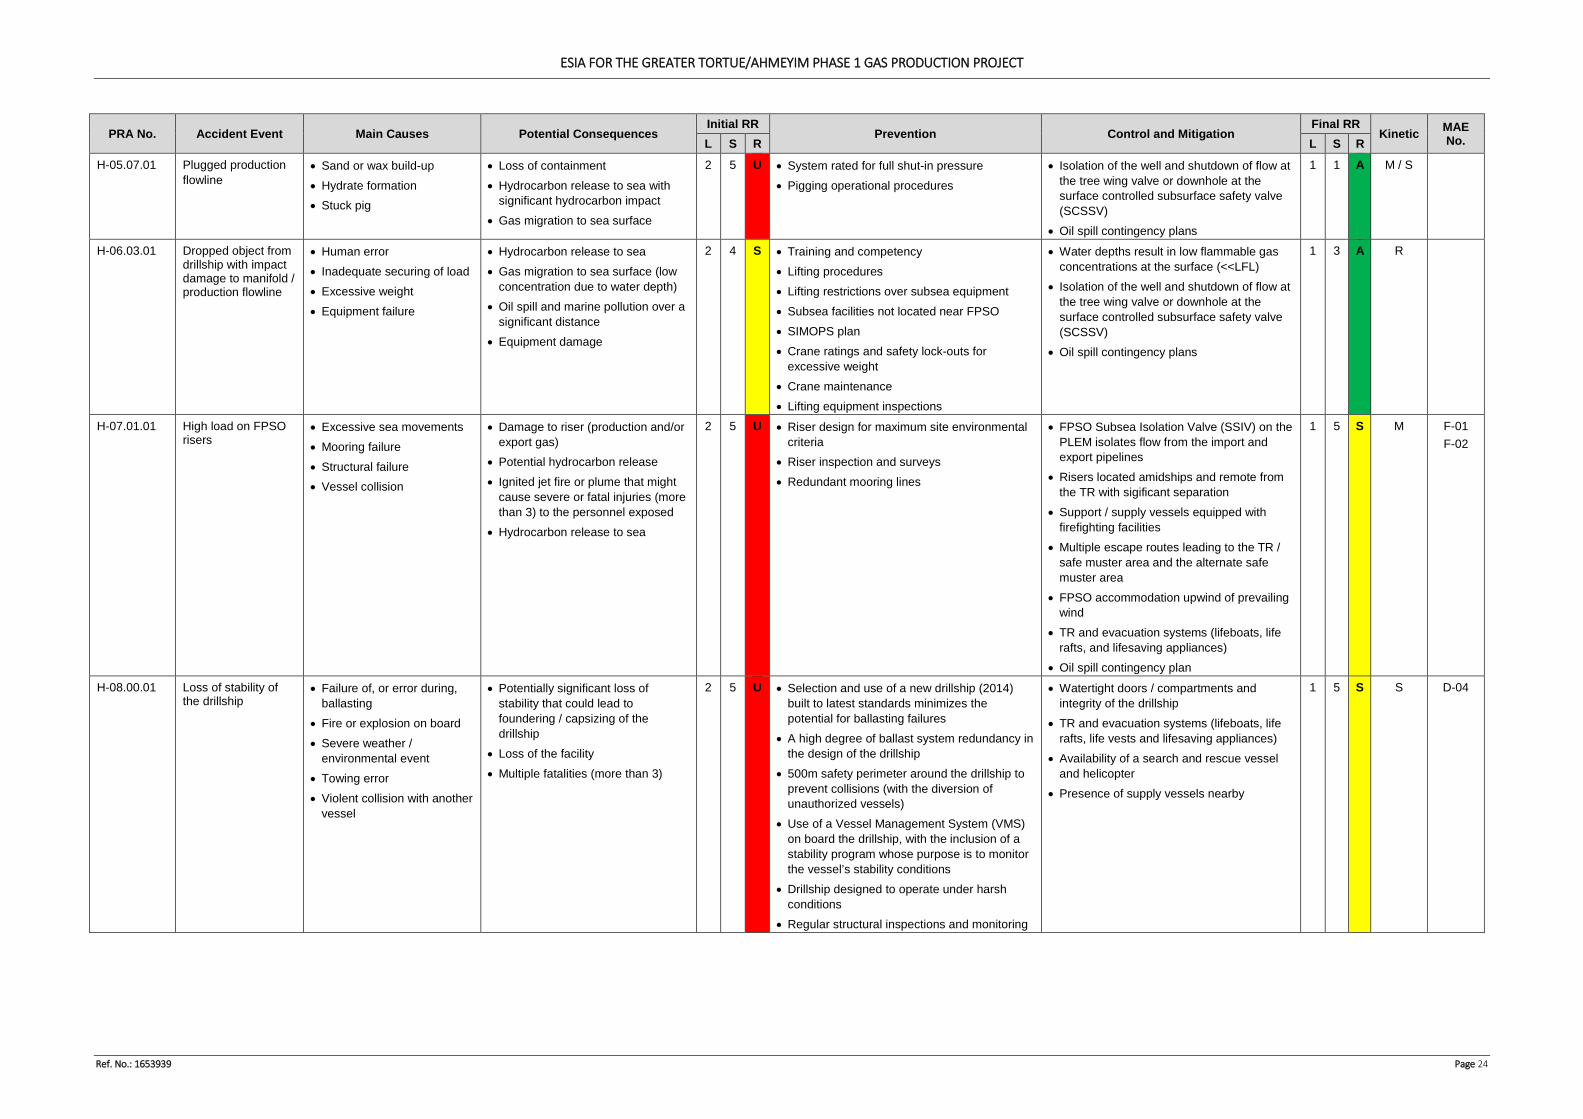
ESIA FOR THE GREATER TORTUE/AHMEYIM PHASE 1 GAS PRODUCTION PROJECT
Ref. No.: 1653939 Page 24
PRA No. Accident Event Main Causes Potential Consequences Initial RR
Prevention Control and Mitigation Final RR
Kinetic MAE No. L S R L S R
H-05.07.01
Plugged production flowline
• Sand or wax build-up • Hydrate formation • Stuck pig
• Loss of containment • Hydrocarbon release to sea with
significant hydrocarbon impact • Gas migration to sea surface
2 5 U • System rated for full shut-in pressure • Pigging operational procedures
• Isolation of the well and shutdown of flow at the tree wing valve or downhole at the surface controlled subsurface safety valve (SCSSV)
• Oil spill contingency plans
1 1 A M / S
H-06.03.01
Dropped object from drillship with impact damage to manifold / production flowline
• Human error • Inadequate securing of load • Excessive weight • Equipment failure
• Hydrocarbon release to sea • Gas migration to sea surface (low
concentration due to water depth) • Oil spill and marine pollution over a
significant distance • Equipment damage
2 4 S • Training and competency
• Lifting procedures
• Lifting restrictions over subsea equipment • Subsea facilities not located near FPSO • SIMOPS plan • Crane ratings and safety lock-outs for
excessive weight • Crane maintenance
• Lifting equipment inspections
• Water depths result in low flammable gas concentrations at the surface (<<LFL)
• Isolation of the well and shutdown of flow at the tree wing valve or downhole at the surface controlled subsurface safety valve (SCSSV)
• Oil spill contingency plans
1 3 A R
H-07.01.01 High load on FPSO risers
• Excessive sea movements • Mooring failure • Structural failure • Vessel collision
• Damage to riser (production and/or export gas)
• Potential hydrocarbon release • Ignited jet fire or plume that might
cause severe or fatal injuries (more than 3) to the personnel exposed
• Hydrocarbon release to sea
2 5 U • Riser design for maximum site environmental criteria
• Riser inspection and surveys • Redundant mooring lines
• FPSO Subsea Isolation Valve (SSIV) on the PLEM isolates flow from the import and export pipelines
• Risers located amidships and remote from the TR with sigificant separation
• Support / supply vessels equipped with firefighting facilities
• Multiple escape routes leading to the TR / safe muster area and the alternate safe muster area
• FPSO accommodation upwind of prevailing wind
• TR and evacuation systems (lifeboats, life rafts, and lifesaving appliances)
• Oil spill contingency plan
1 5 S M F-01 F-02
H-08.00.01 Loss of stability of the drillship
• Failure of, or error during, ballasting
• Fire or explosion on board • Severe weather /
environmental event • Towing error • Violent collision with another
vessel
• Potentially significant loss of stability that could lead to foundering / capsizing of the drillship
• Loss of the facility • Multiple fatalities (more than 3)
2 5 U • Selection and use of a new drillship (2014) built to latest standards minimizes the potential for ballasting failures
• A high degree of ballast system redundancy in the design of the drillship
• 500m safety perimeter around the drillship to prevent collisions (with the diversion of unauthorized vessels)
• Use of a Vessel Management System (VMS) on board the drillship, with the inclusion of a stability program whose purpose is to monitor the vessel’s stability conditions
• Drillship designed to operate under harsh conditions
• Regular structural inspections and monitoring
• Watertight doors / compartments and integrity of the drillship
• TR and evacuation systems (lifeboats, life rafts, life vests and lifesaving appliances)
• Availability of a search and rescue vessel and helicopter
• Presence of supply vessels nearby
1 5 S S D-04
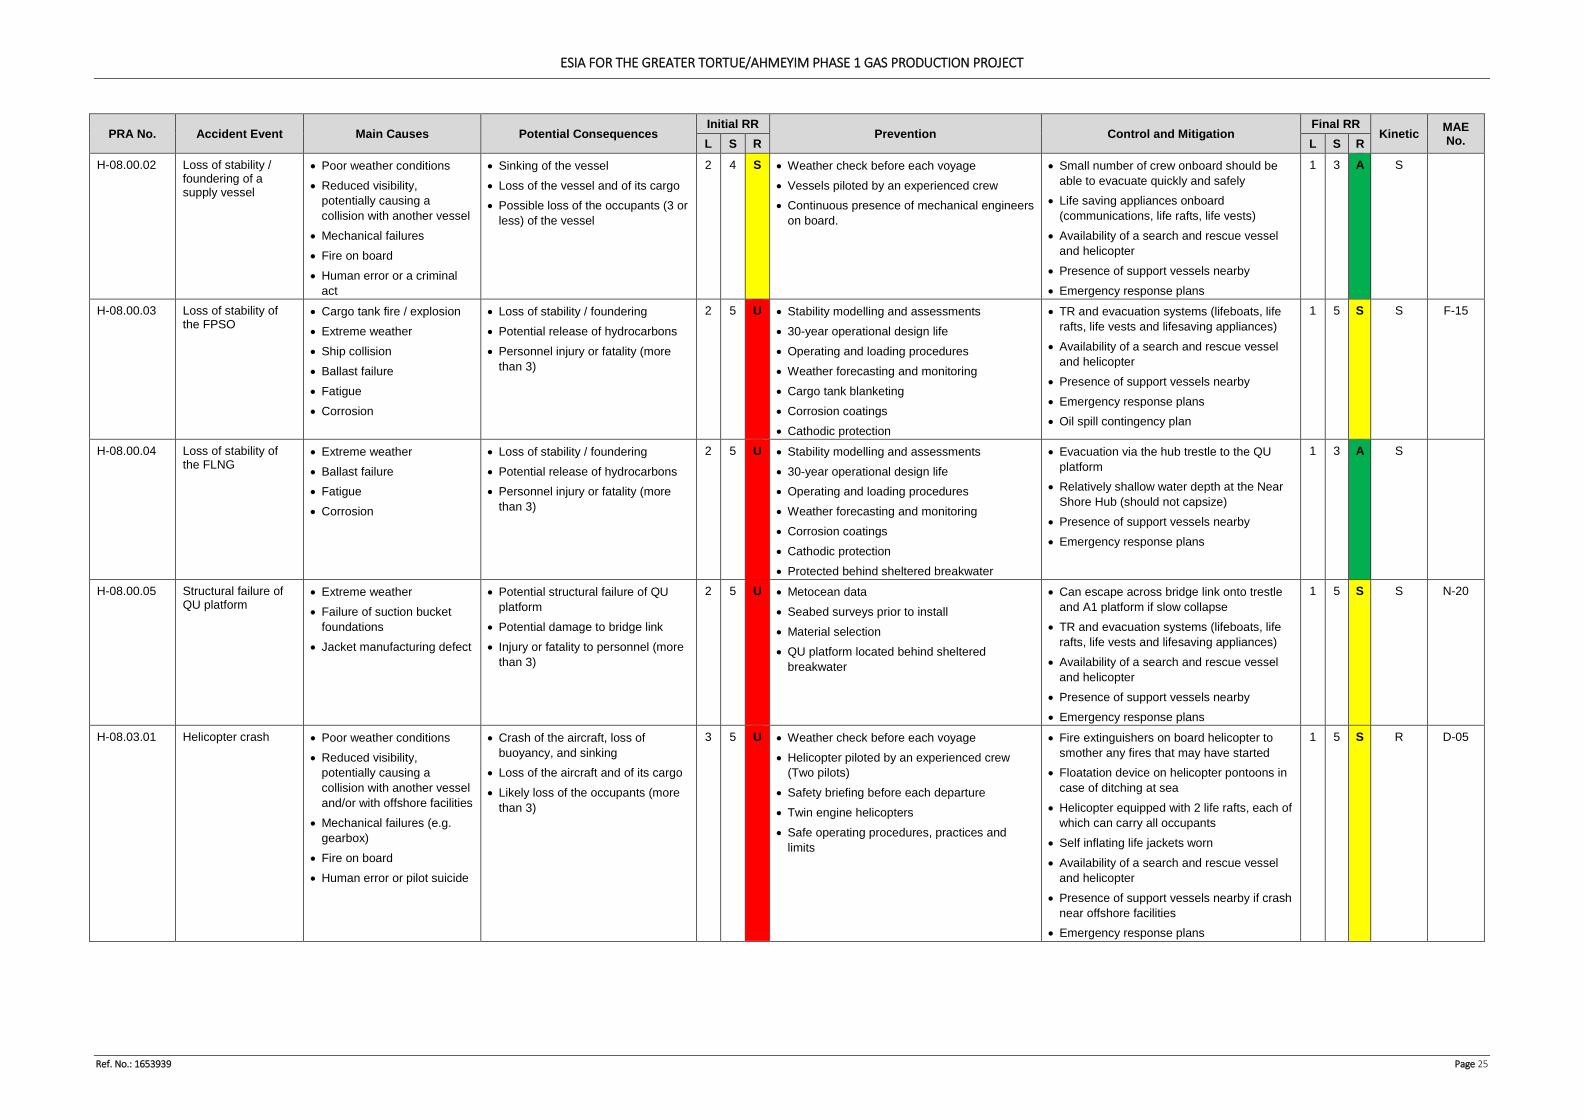
ESIA FOR THE GREATER TORTUE/AHMEYIM PHASE 1 GAS PRODUCTION PROJECT
Ref. No.: 1653939 Page 25
PRA No. Accident Event Main Causes Potential Consequences Initial RR
Prevention Control and Mitigation Final RR
Kinetic MAE No. L S R L S R
H-08.00.02 Loss of stability / foundering of a supply vessel
• Poor weather conditions • Reduced visibility,
potentially causing a collision with another vessel
• Mechanical failures • Fire on board • Human error or a criminal
act
• Sinking of the vessel • Loss of the vessel and of its cargo • Possible loss of the occupants (3 or
less) of the vessel
2 4 S • Weather check before each voyage • Vessels piloted by an experienced crew • Continuous presence of mechanical engineers
on board.
• Small number of crew onboard should be able to evacuate quickly and safely
• Life saving appliances onboard (communications, life rafts, life vests)
• Availability of a search and rescue vessel and helicopter
• Presence of support vessels nearby • Emergency response plans
1 3 A S
H-08.00.03 Loss of stability of the FPSO
• Cargo tank fire / explosion • Extreme weather • Ship collision • Ballast failure • Fatigue • Corrosion
• Loss of stability / foundering • Potential release of hydrocarbons • Personnel injury or fatality (more
than 3)
2 5 U • Stability modelling and assessments • 30-year operational design life • Operating and loading procedures • Weather forecasting and monitoring • Cargo tank blanketing • Corrosion coatings • Cathodic protection
• TR and evacuation systems (lifeboats, life rafts, life vests and lifesaving appliances)
• Availability of a search and rescue vessel and helicopter
• Presence of support vessels nearby • Emergency response plans • Oil spill contingency plan
1 5 S S F-15
H-08.00.04 Loss of stability of the FLNG
• Extreme weather • Ballast failure • Fatigue • Corrosion
• Loss of stability / foundering • Potential release of hydrocarbons • Personnel injury or fatality (more
than 3)
2 5 U • Stability modelling and assessments • 30-year operational design life • Operating and loading procedures • Weather forecasting and monitoring • Corrosion coatings • Cathodic protection • Protected behind sheltered breakwater
• Evacuation via the hub trestle to the QU platform
• Relatively shallow water depth at the Near Shore Hub (should not capsize)
• Presence of support vessels nearby • Emergency response plans
1 3 A S
H-08.00.05 Structural failure of QU platform
• Extreme weather • Failure of suction bucket
foundations • Jacket manufacturing defect
• Potential structural failure of QU platform
• Potential damage to bridge link • Injury or fatality to personnel (more
than 3)
2 5 U • Metocean data • Seabed surveys prior to install • Material selection • QU platform located behind sheltered
breakwater
• Can escape across bridge link onto trestle and A1 platform if slow collapse
• TR and evacuation systems (lifeboats, life rafts, life vests and lifesaving appliances)
• Availability of a search and rescue vessel and helicopter
• Presence of support vessels nearby • Emergency response plans
1 5 S S N-20
H-08.03.01 Helicopter crash • Poor weather conditions • Reduced visibility,
potentially causing a collision with another vessel and/or with offshore facilities
• Mechanical failures (e.g. gearbox)
• Fire on board • Human error or pilot suicide
• Crash of the aircraft, loss of buoyancy, and sinking
• Loss of the aircraft and of its cargo • Likely loss of the occupants (more
than 3)
3 5 U • Weather check before each voyage • Helicopter piloted by an experienced crew
(Two pilots) • Safety briefing before each departure • Twin engine helicopters • Safe operating procedures, practices and
limits
• Fire extinguishers on board helicopter to smother any fires that may have started
• Floatation device on helicopter pontoons in case of ditching at sea
• Helicopter equipped with 2 life rafts, each of which can carry all occupants
• Self inflating life jackets worn • Availability of a search and rescue vessel
and helicopter • Presence of support vessels nearby if crash
near offshore facilities • Emergency response plans
1 5 S R D-05
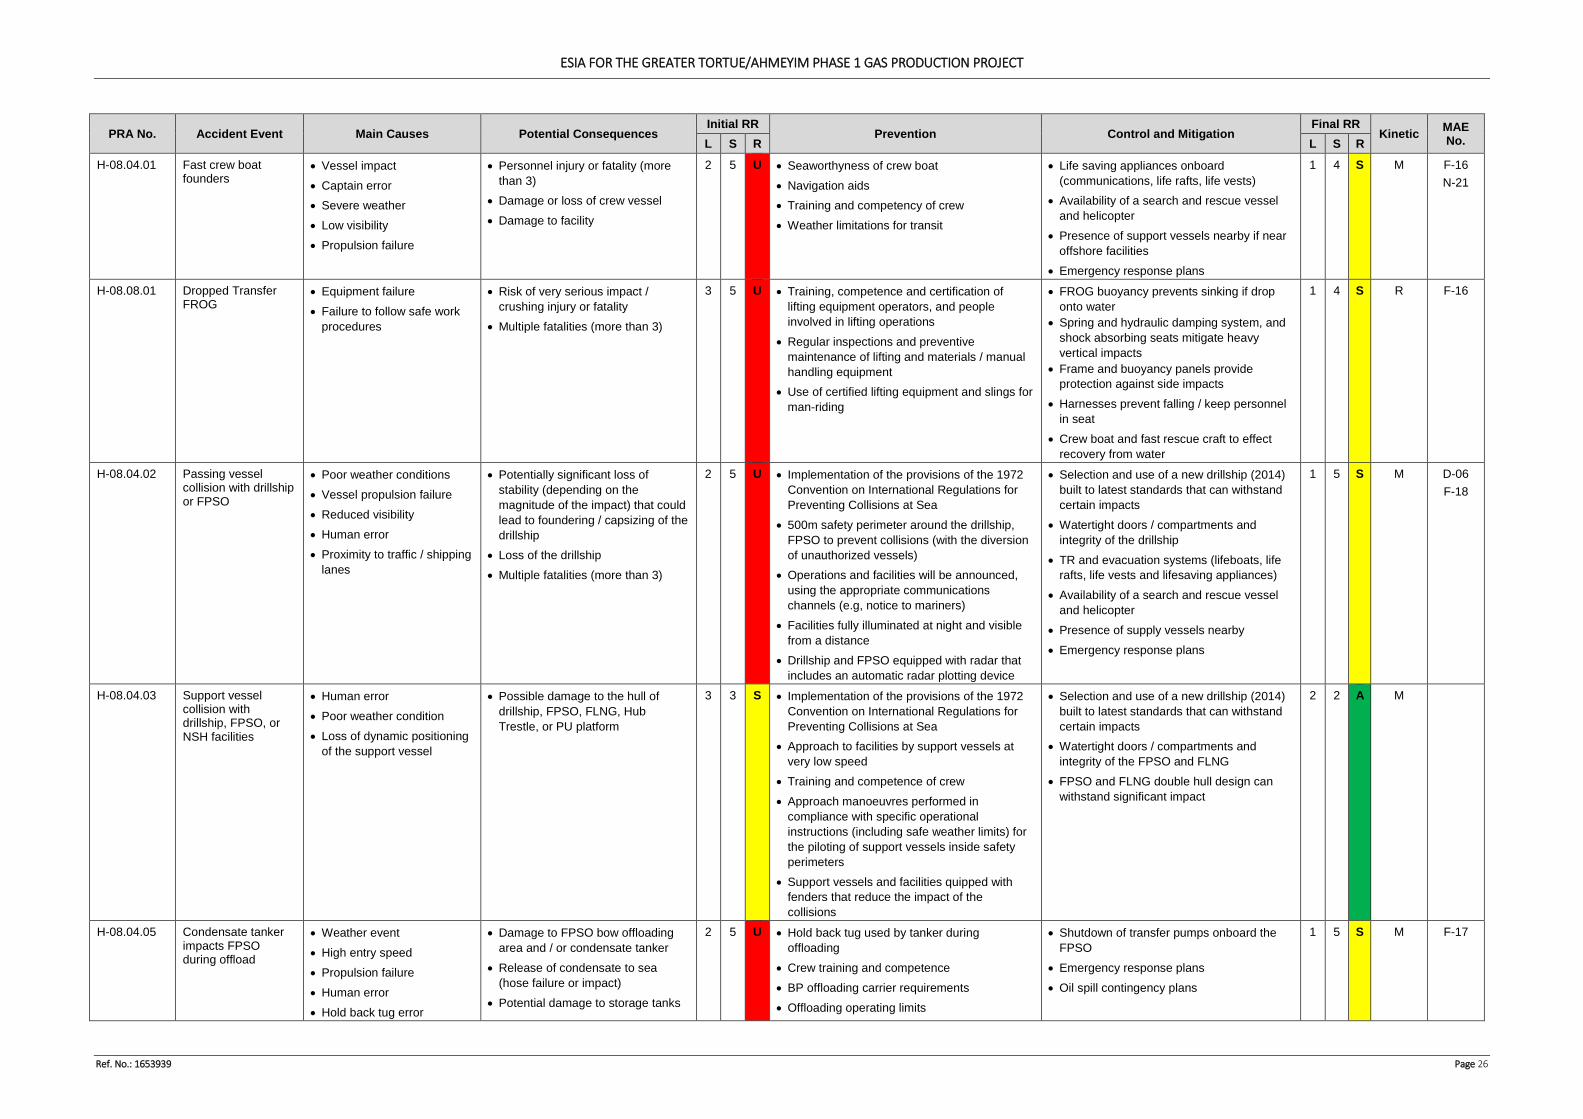
ESIA FOR THE GREATER TORTUE/AHMEYIM PHASE 1 GAS PRODUCTION PROJECT
Ref. No.: 1653939 Page 26
PRA No. Accident Event Main Causes Potential Consequences Initial RR
Prevention Control and Mitigation Final RR
Kinetic MAE No. L S R L S R
H-08.04.01 Fast crew boat founders
• Vessel impact • Captain error • Severe weather • Low visibility • Propulsion failure
• Personnel injury or fatality (more than 3)
• Damage or loss of crew vessel • Damage to facility
2 5 U • Seaworthyness of crew boat • Navigation aids • Training and competency of crew • Weather limitations for transit
• Life saving appliances onboard (communications, life rafts, life vests)
• Availability of a search and rescue vessel and helicopter
• Presence of support vessels nearby if near offshore facilities
• Emergency response plans
1 4 S M F-16 N-21
H-08.08.01 Dropped Transfer FROG
• Equipment failure • Failure to follow safe work
procedures
• Risk of very serious impact / crushing injury or fatality
• Multiple fatalities (more than 3)
3 5 U • Training, competence and certification of lifting equipment operators, and people involved in lifting operations
• Regular inspections and preventive maintenance of lifting and materials / manual handling equipment
• Use of certified lifting equipment and slings for man-riding
• FROG buoyancy prevents sinking if drop onto water
• Spring and hydraulic damping system, and shock absorbing seats mitigate heavy vertical impacts
• Frame and buoyancy panels provide protection against side impacts
• Harnesses prevent falling / keep personnel in seat
• Crew boat and fast rescue craft to effect recovery from water
1 4 S R F-16
H-08.04.02 Passing vessel collision with drillship or FPSO
• Poor weather conditions • Vessel propulsion failure • Reduced visibility • Human error • Proximity to traffic / shipping
lanes
• Potentially significant loss of stability (depending on the magnitude of the impact) that could lead to foundering / capsizing of the drillship
• Loss of the drillship • Multiple fatalities (more than 3)
2 5 U • Implementation of the provisions of the 1972 Convention on International Regulations for Preventing Collisions at Sea
• 500m safety perimeter around the drillship, FPSO to prevent collisions (with the diversion of unauthorized vessels)
• Operations and facilities will be announced, using the appropriate communications channels (e.g, notice to mariners)
• Facilities fully illuminated at night and visible from a distance
• Drillship and FPSO equipped with radar that includes an automatic radar plotting device
• Selection and use of a new drillship (2014) built to latest standards that can withstand certain impacts
• Watertight doors / compartments and integrity of the drillship
• TR and evacuation systems (lifeboats, life rafts, life vests and lifesaving appliances)
• Availability of a search and rescue vessel and helicopter
• Presence of supply vessels nearby • Emergency response plans
1 5 S M D-06 F-18
H-08.04.03 Support vessel collision with drillship, FPSO, or NSH facilities
• Human error • Poor weather condition • Loss of dynamic positioning
of the support vessel
• Possible damage to the hull of drillship, FPSO, FLNG, Hub Trestle, or PU platform
3 3 S • Implementation of the provisions of the 1972 Convention on International Regulations for Preventing Collisions at Sea
• Approach to facilities by support vessels at very low speed
• Training and competence of crew • Approach manoeuvres performed in
compliance with specific operational instructions (including safe weather limits) for the piloting of support vessels inside safety perimeters
• Support vessels and facilities quipped with fenders that reduce the impact of the collisions
• Selection and use of a new drillship (2014) built to latest standards that can withstand certain impacts
• Watertight doors / compartments and integrity of the FPSO and FLNG
• FPSO and FLNG double hull design can withstand significant impact
2 2 A M
H-08.04.05 Condensate tanker impacts FPSO during offload
• Weather event • High entry speed • Propulsion failure • Human error • Hold back tug error
• Damage to FPSO bow offloading area and / or condensate tanker
• Release of condensate to sea (hose failure or impact)
• Potential damage to storage tanks
2 5 U • Hold back tug used by tanker during offloading
• Crew training and competence • BP offloading carrier requirements • Offloading operating limits
• Shutdown of transfer pumps onboard the FPSO
• Emergency response plans • Oil spill contingency plans
1 5 S M F-17
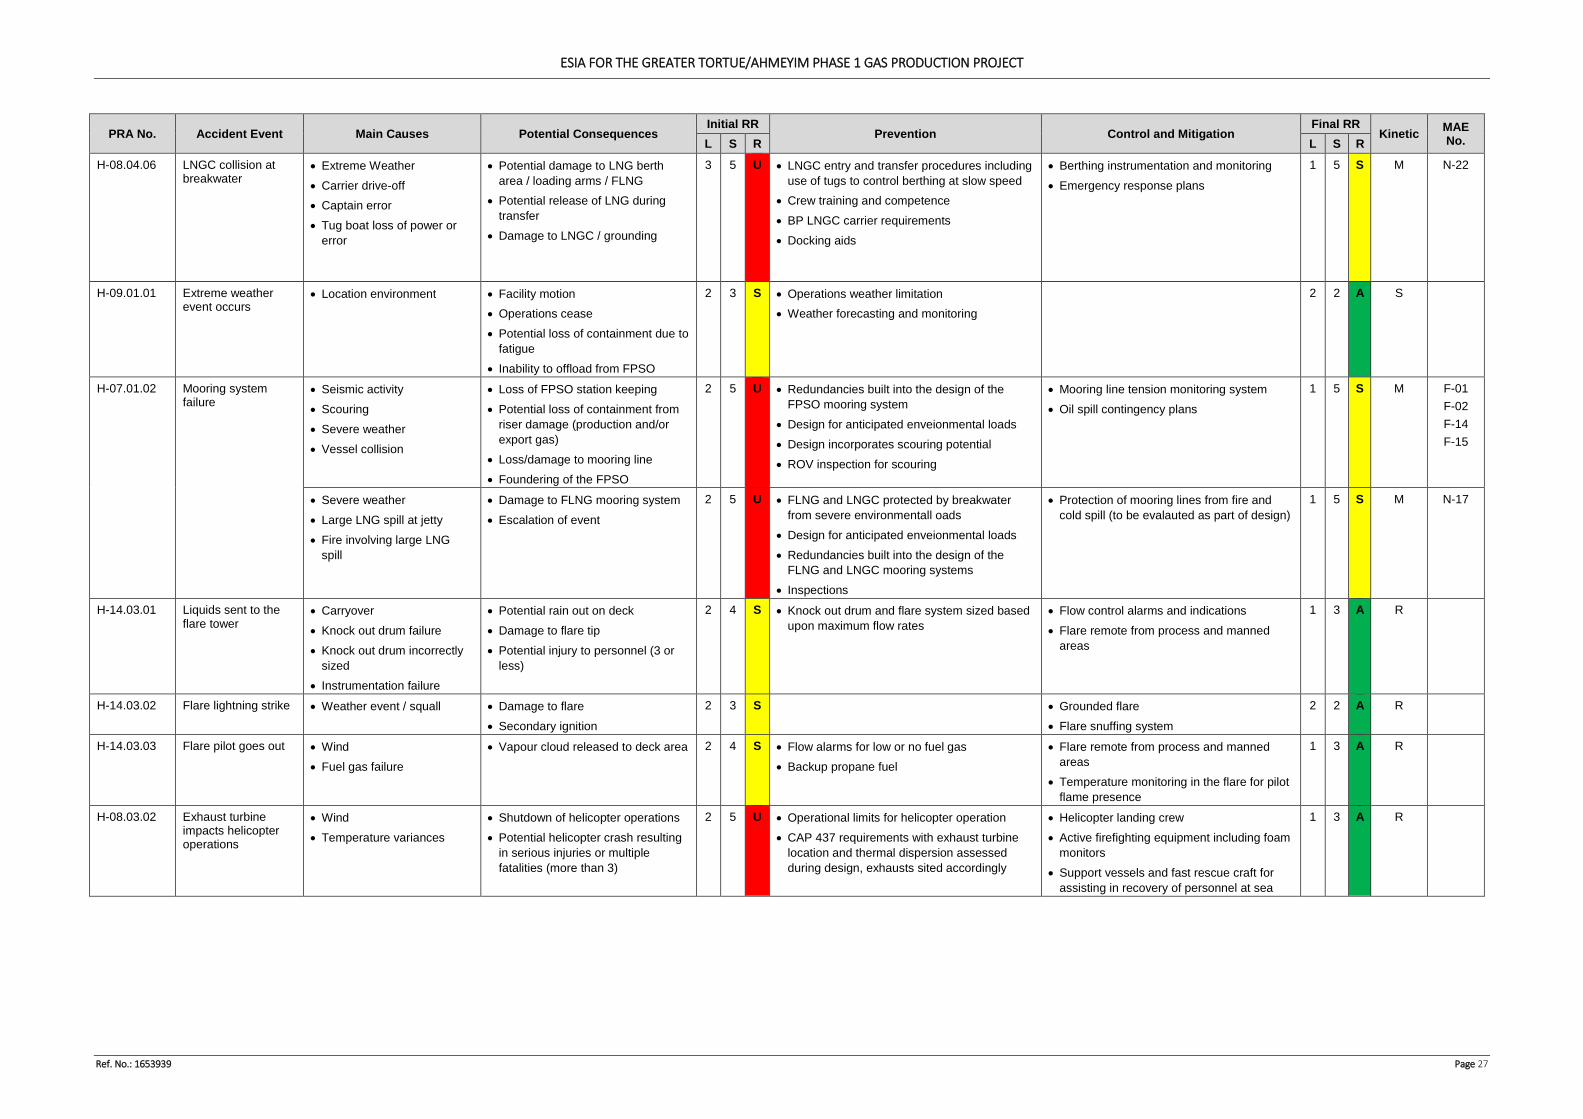
ESIA FOR THE GREATER TORTUE/AHMEYIM PHASE 1 GAS PRODUCTION PROJECT
Ref. No.: 1653939 Page 27
PRA No. Accident Event Main Causes Potential Consequences Initial RR
Prevention Control and Mitigation Final RR
Kinetic MAE No. L S R L S R
H-08.04.06 LNGC collision at breakwater
• Extreme Weather • Carrier drive-off • Captain error • Tug boat loss of power or
error
• Potential damage to LNG berth area / loading arms / FLNG
• Potential release of LNG during transfer
• Damage to LNGC / grounding
3 5 U • LNGC entry and transfer procedures including use of tugs to control berthing at slow speed
• Crew training and competence • BP LNGC carrier requirements • Docking aids
• Berthing instrumentation and monitoring • Emergency response plans
1 5 S M N-22
H-09.01.01 Extreme weather event occurs
• Location environment • Facility motion • Operations cease • Potential loss of containment due to
fatigue • Inability to offload from FPSO
2 3 S • Operations weather limitation • Weather forecasting and monitoring
2 2 A S
H-07.01.02 Mooring system failure
• Seismic activity • Scouring • Severe weather • Vessel collision
• Loss of FPSO station keeping • Potential loss of containment from
riser damage (production and/or export gas)
• Loss/damage to mooring line • Foundering of the FPSO
2 5 U • Redundancies built into the design of the FPSO mooring system
• Design for anticipated enveionmental loads • Design incorporates scouring potential • ROV inspection for scouring
• Mooring line tension monitoring system • Oil spill contingency plans
1 5 S M F-01 F-02 F-14 F-15
• Severe weather • Large LNG spill at jetty • Fire involving large LNG
spill
• Damage to FLNG mooring system • Escalation of event
2 5 U • FLNG and LNGC protected by breakwater from severe environmentall oads
• Design for anticipated enveionmental loads • Redundancies built into the design of the
FLNG and LNGC mooring systems • Inspections
• Protection of mooring lines from fire and cold spill (to be evalauted as part of design)
1 5 S M N-17
H-14.03.01 Liquids sent to the flare tower
• Carryover • Knock out drum failure • Knock out drum incorrectly
sized • Instrumentation failure
• Potential rain out on deck • Damage to flare tip • Potential injury to personnel (3 or
less)
2 4 S • Knock out drum and flare system sized based upon maximum flow rates
• Flow control alarms and indications • Flare remote from process and manned
areas
1 3 A R
H-14.03.02 Flare lightning strike • Weather event / squall • Damage to flare • Secondary ignition
2 3 S
• Grounded flare • Flare snuffing system
2 2 A R
H-14.03.03 Flare pilot goes out • Wind • Fuel gas failure
• Vapour cloud released to deck area 2 4 S • Flow alarms for low or no fuel gas • Backup propane fuel
• Flare remote from process and manned areas
• Temperature monitoring in the flare for pilot flame presence
1 3 A R
H-08.03.02 Exhaust turbine impacts helicopter operations
• Wind • Temperature variances
• Shutdown of helicopter operations • Potential helicopter crash resulting
in serious injuries or multiple fatalities (more than 3)
2 5 U • Operational limits for helicopter operation • CAP 437 requirements with exhaust turbine
location and thermal dispersion assessed during design, exhausts sited accordingly
• Helicopter landing crew • Active firefighting equipment including foam
monitors • Support vessels and fast rescue craft for
assisting in recovery of personnel at sea
1 3 A R
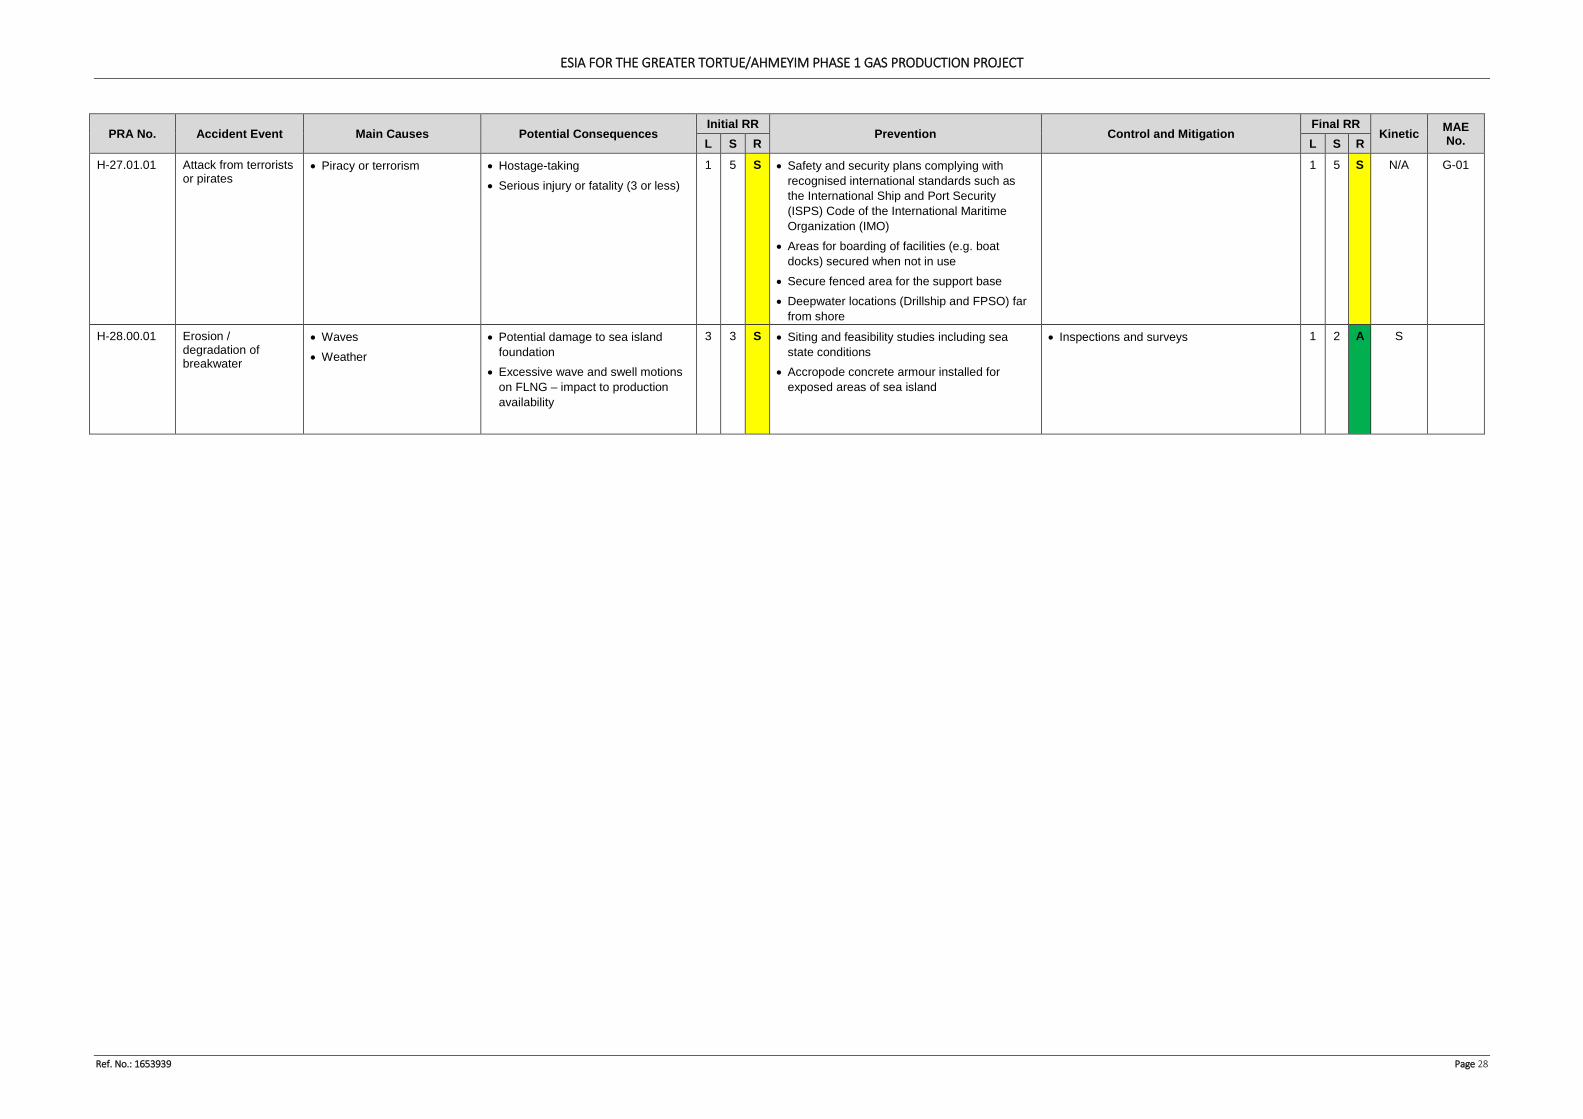
ESIA FOR THE GREATER TORTUE/AHMEYIM PHASE 1 GAS PRODUCTION PROJECT
Ref. No.: 1653939 Page 28
PRA No. Accident Event Main Causes Potential Consequences Initial RR
Prevention Control and Mitigation Final RR
Kinetic MAE No. L S R L S R
H-27.01.01 Attack from terrorists or pirates
• Piracy or terrorism • Hostage-taking • Serious injury or fatality (3 or less)
1 5 S • Safety and security plans complying with recognised international standards such as the International Ship and Port Security (ISPS) Code of the International Maritime Organization (IMO)
• Areas for boarding of facilities (e.g. boat docks) secured when not in use
• Secure fenced area for the support base • Deepwater locations (Drillship and FPSO) far
from shore
1 5 S N/A G-01
H-28.00.01 Erosion / degradation of breakwater
• Waves • Weather
• Potential damage to sea island foundation
• Excessive wave and swell motions on FLNG – impact to production availability
3 3 S • Siting and feasibility studies including sea state conditions
• Accropode concrete armour installed for exposed areas of sea island
• Inspections and surveys 1 2 A S

ESIA FOR THE GREATER TORTUE/AHMEYIM PHASE 1 GAS PRODUCTION PROJECT
Ref. No.: 1653939
APPENDIX O-3 : BOWTIE DIAGRAMS (SEVERITY RANKING 4)
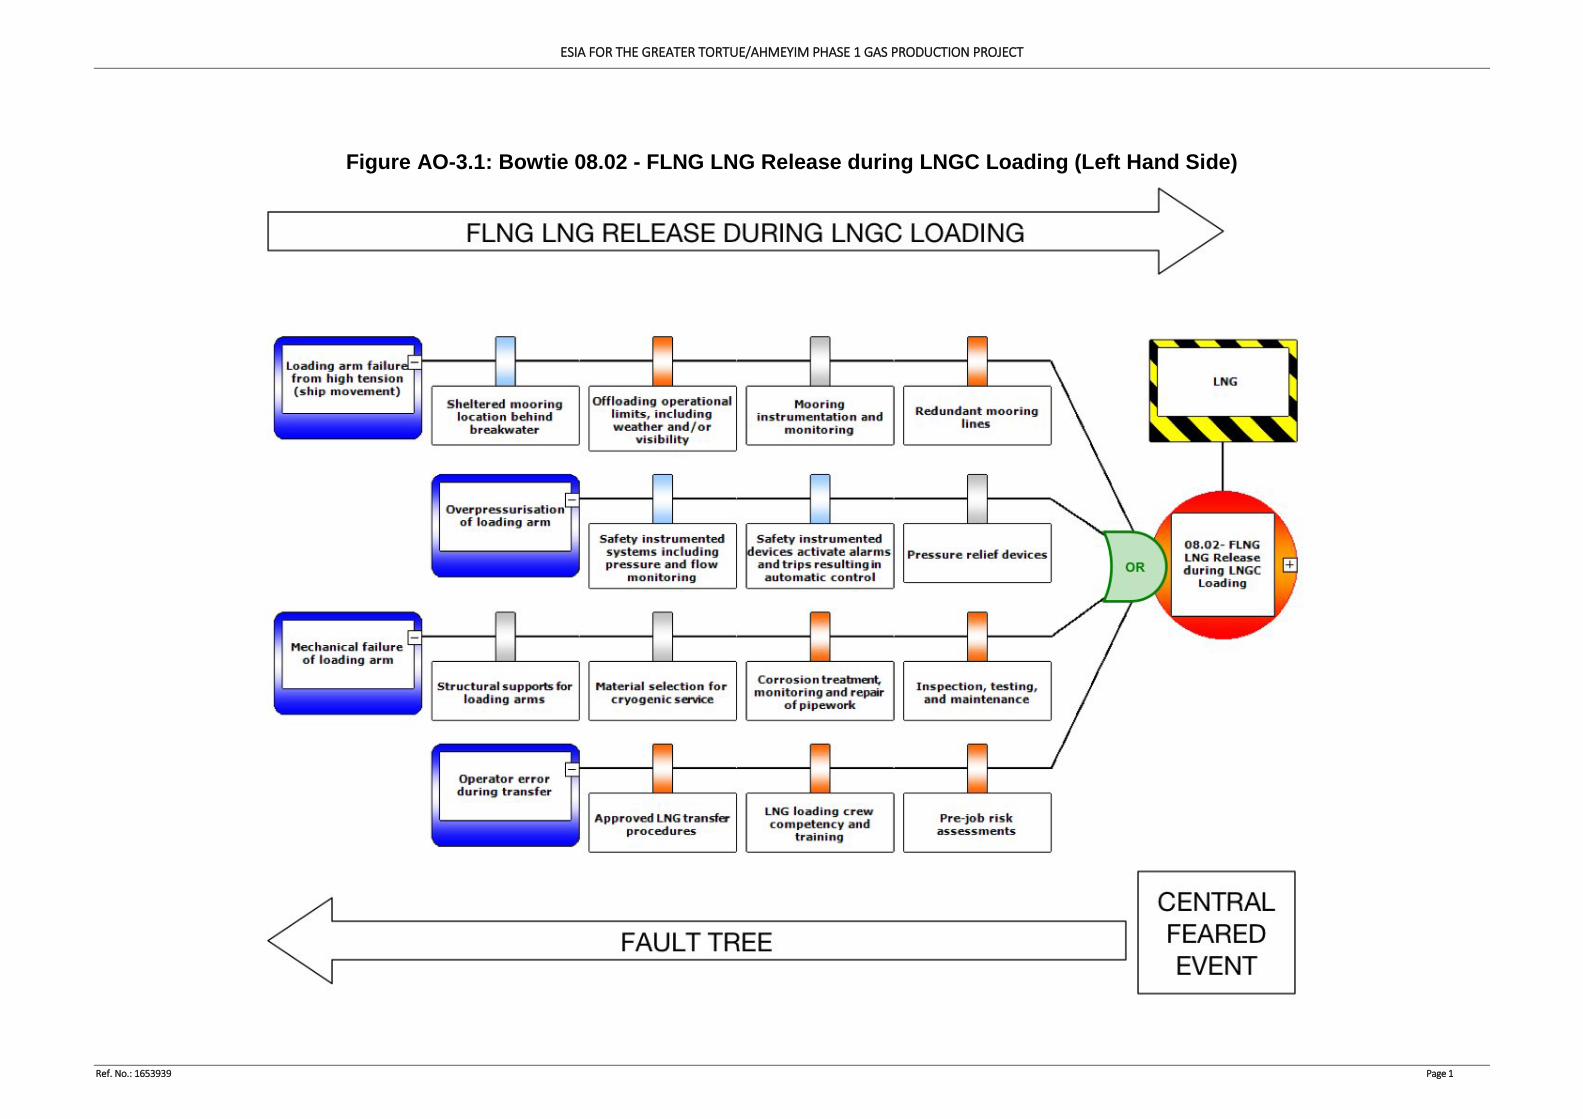
ESIA FOR THE GREATER TORTUE/AHMEYIM PHASE 1 GAS PRODUCTION PROJECT
Ref. No.: 1653939 Page 1
Figure AO-3.1: Bowtie 08.02 - FLNG LNG Release during LNGC Loading (Left Hand Side)
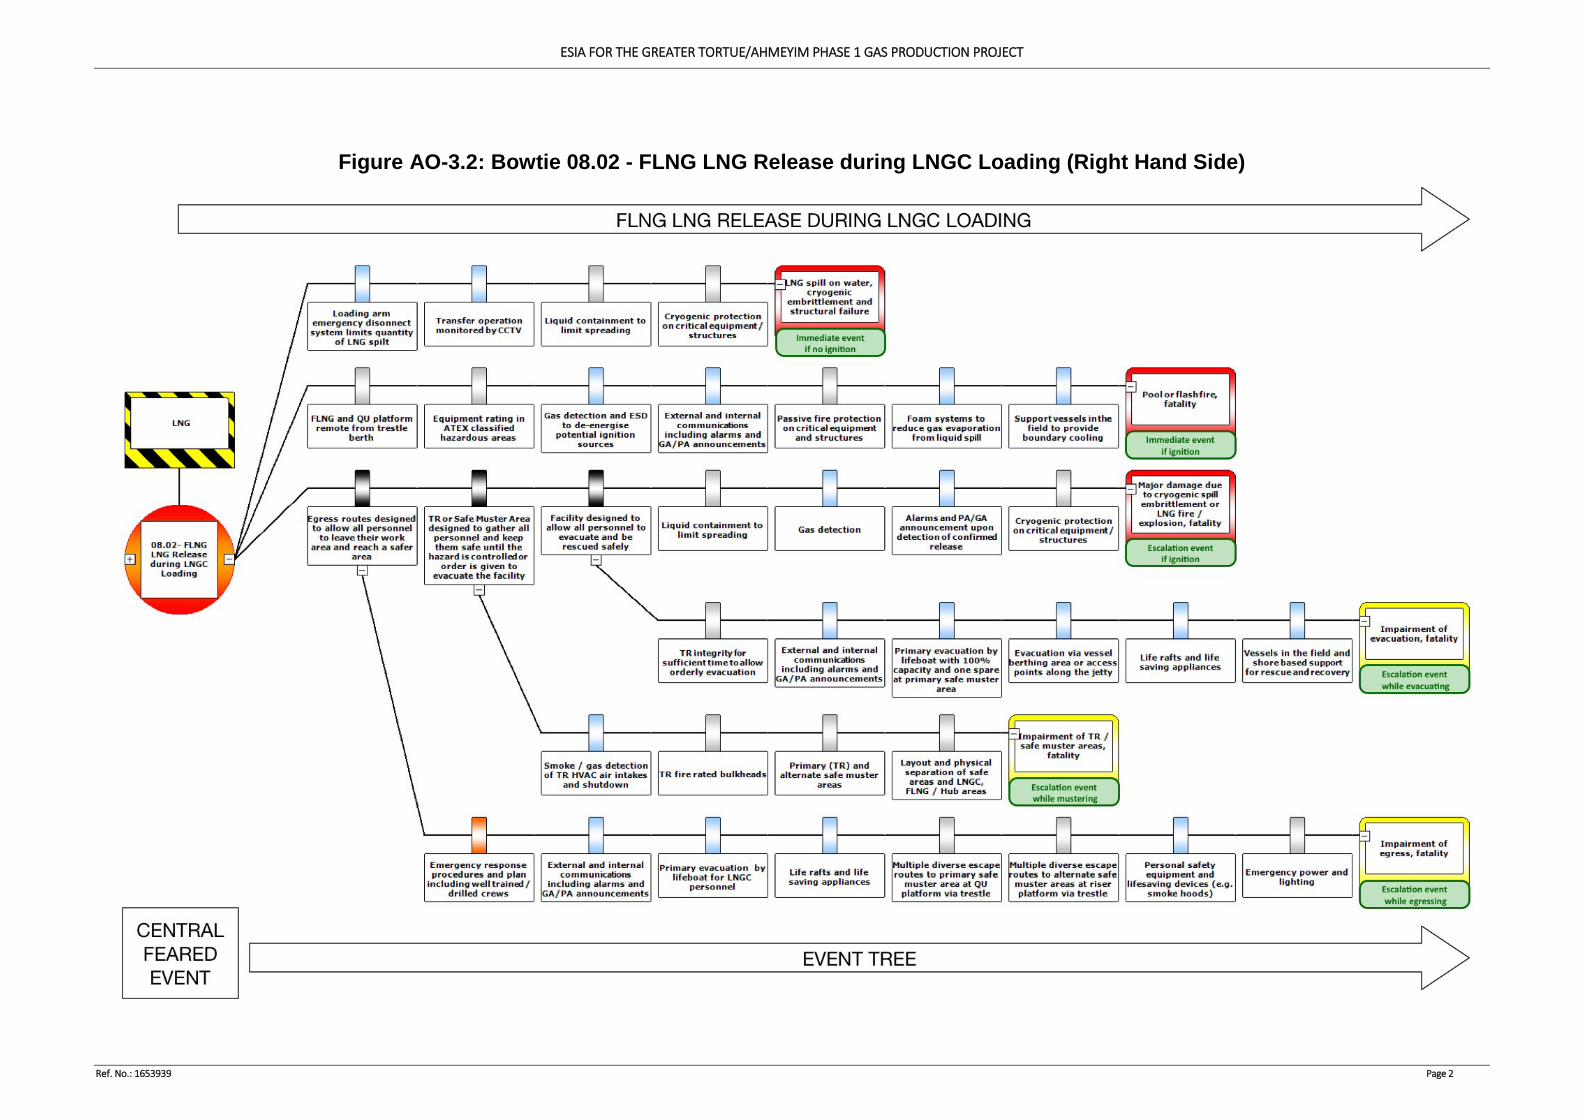
ESIA FOR THE GREATER TORTUE/AHMEYIM PHASE 1 GAS PRODUCTION PROJECT
Ref. No.: 1653939 Page 2
Figure AO-3.2: Bowtie 08.02 - FLNG LNG Release during LNGC Loading (Right Hand Side)
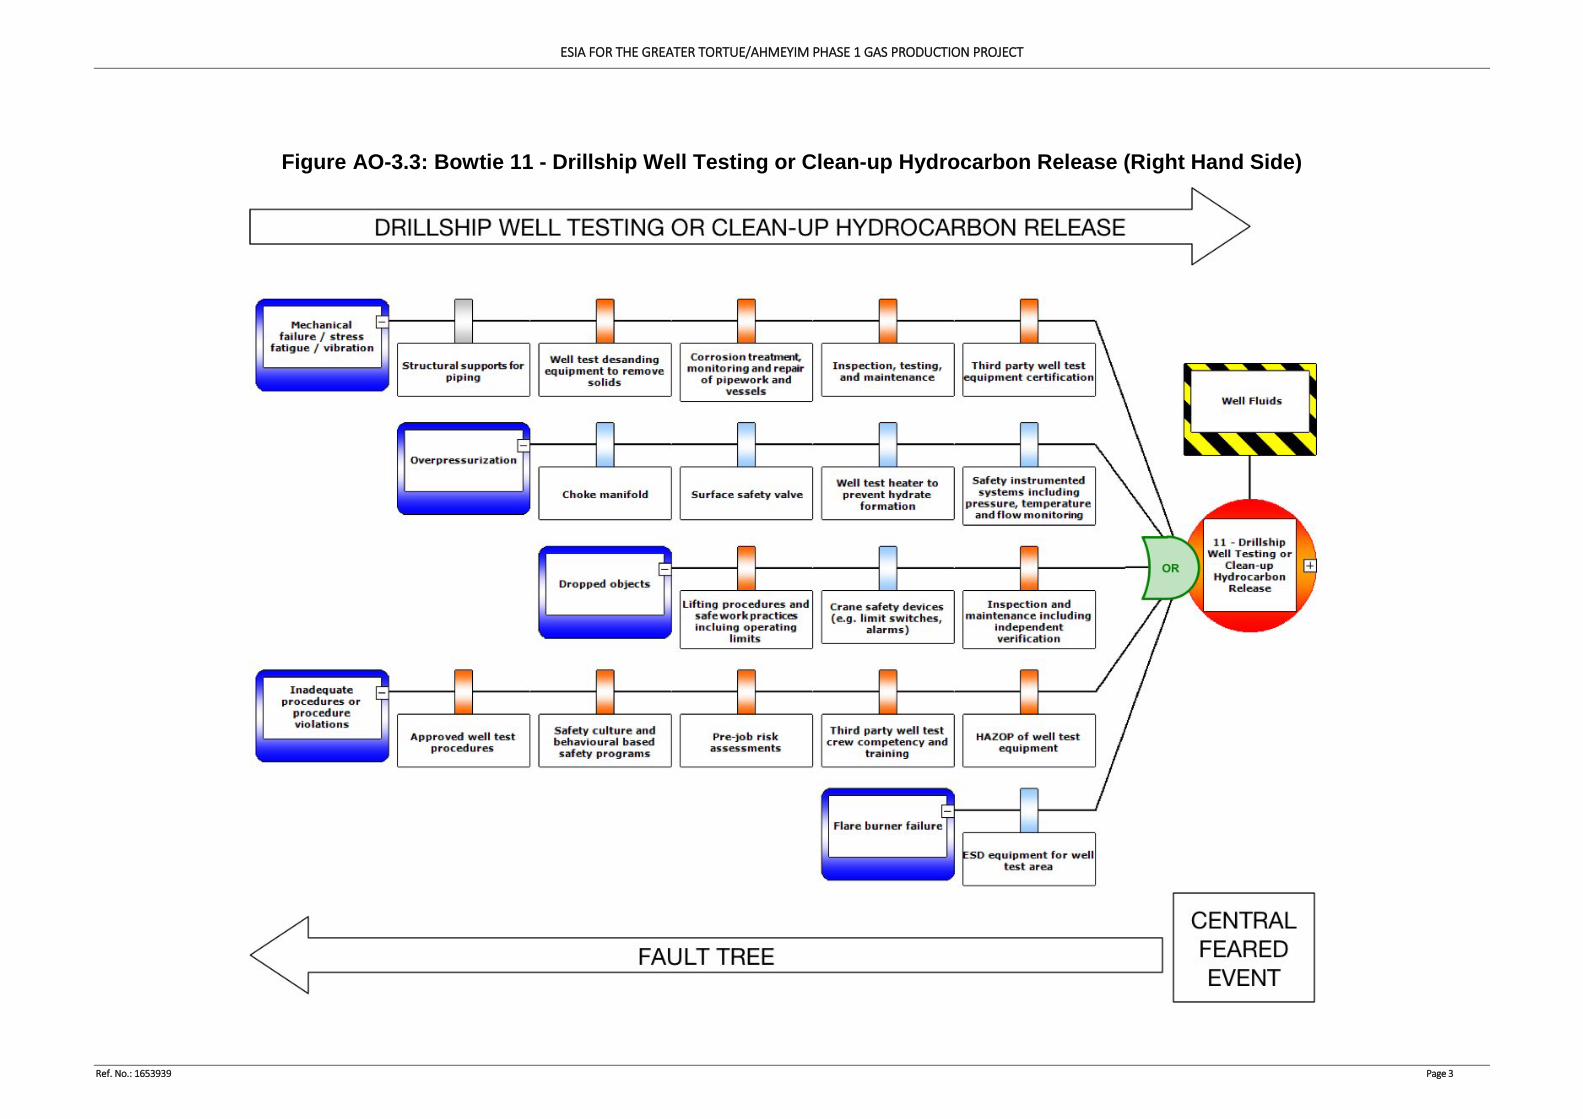
ESIA FOR THE GREATER TORTUE/AHMEYIM PHASE 1 GAS PRODUCTION PROJECT
Ref. No.: 1653939 Page 3
Figure AO-3.3: Bowtie 11 - Drillship Well Testing or Clean-up Hydrocarbon Release (Right Hand Side)
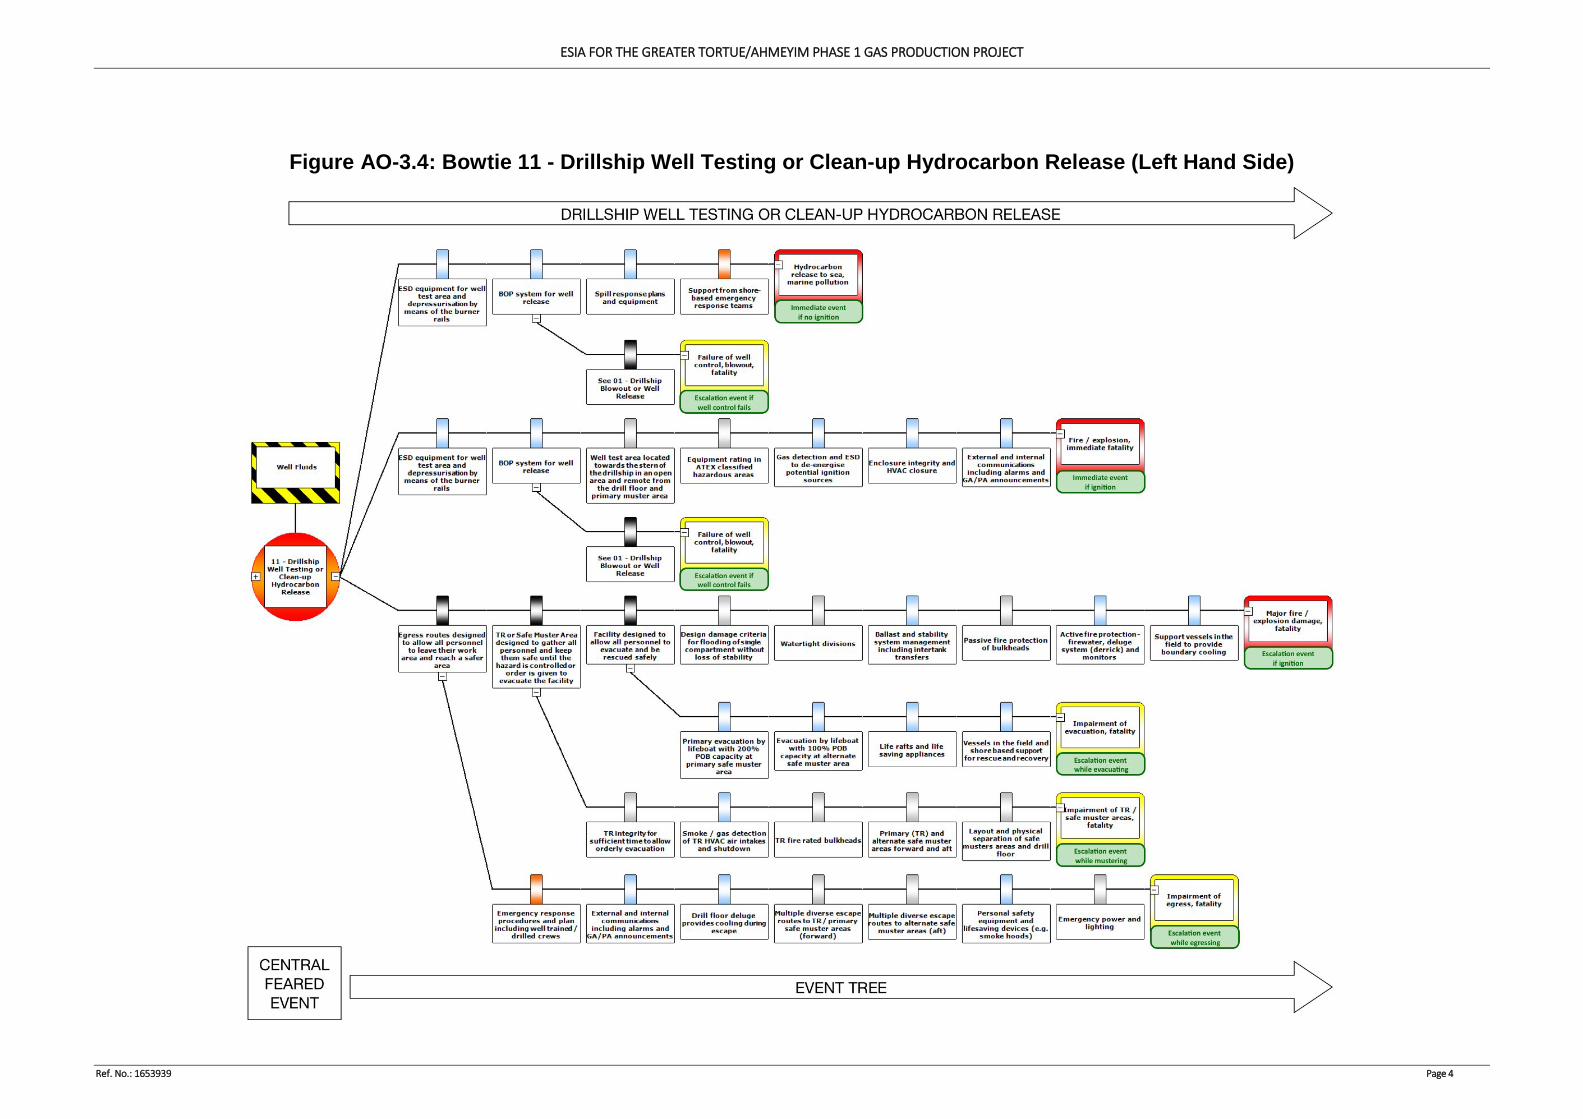
ESIA FOR THE GREATER TORTUE/AHMEYIM PHASE 1 GAS PRODUCTION PROJECT
Ref. No.: 1653939 Page 4
Figure AO-3.4: Bowtie 11 - Drillship Well Testing or Clean-up Hydrocarbon Release (Left Hand Side)
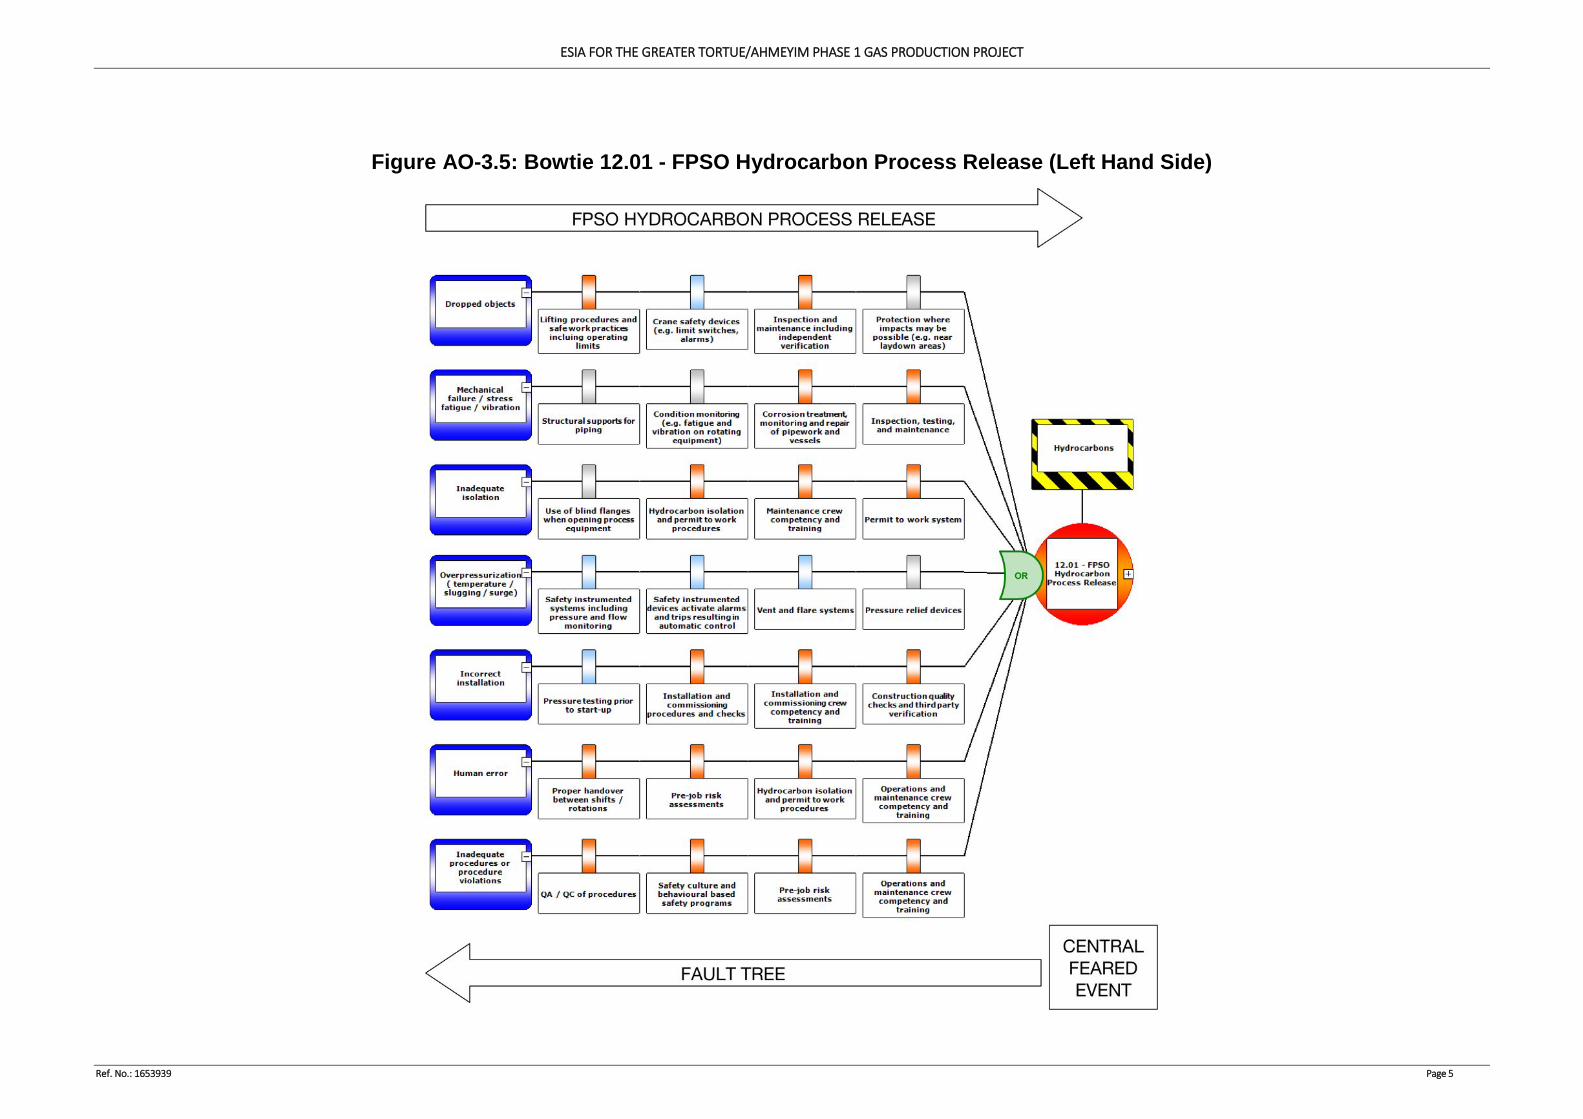
ESIA FOR THE GREATER TORTUE/AHMEYIM PHASE 1 GAS PRODUCTION PROJECT
Ref. No.: 1653939 Page 5
Figure AO-3.5: Bowtie 12.01 - FPSO Hydrocarbon Process Release (Left Hand Side)
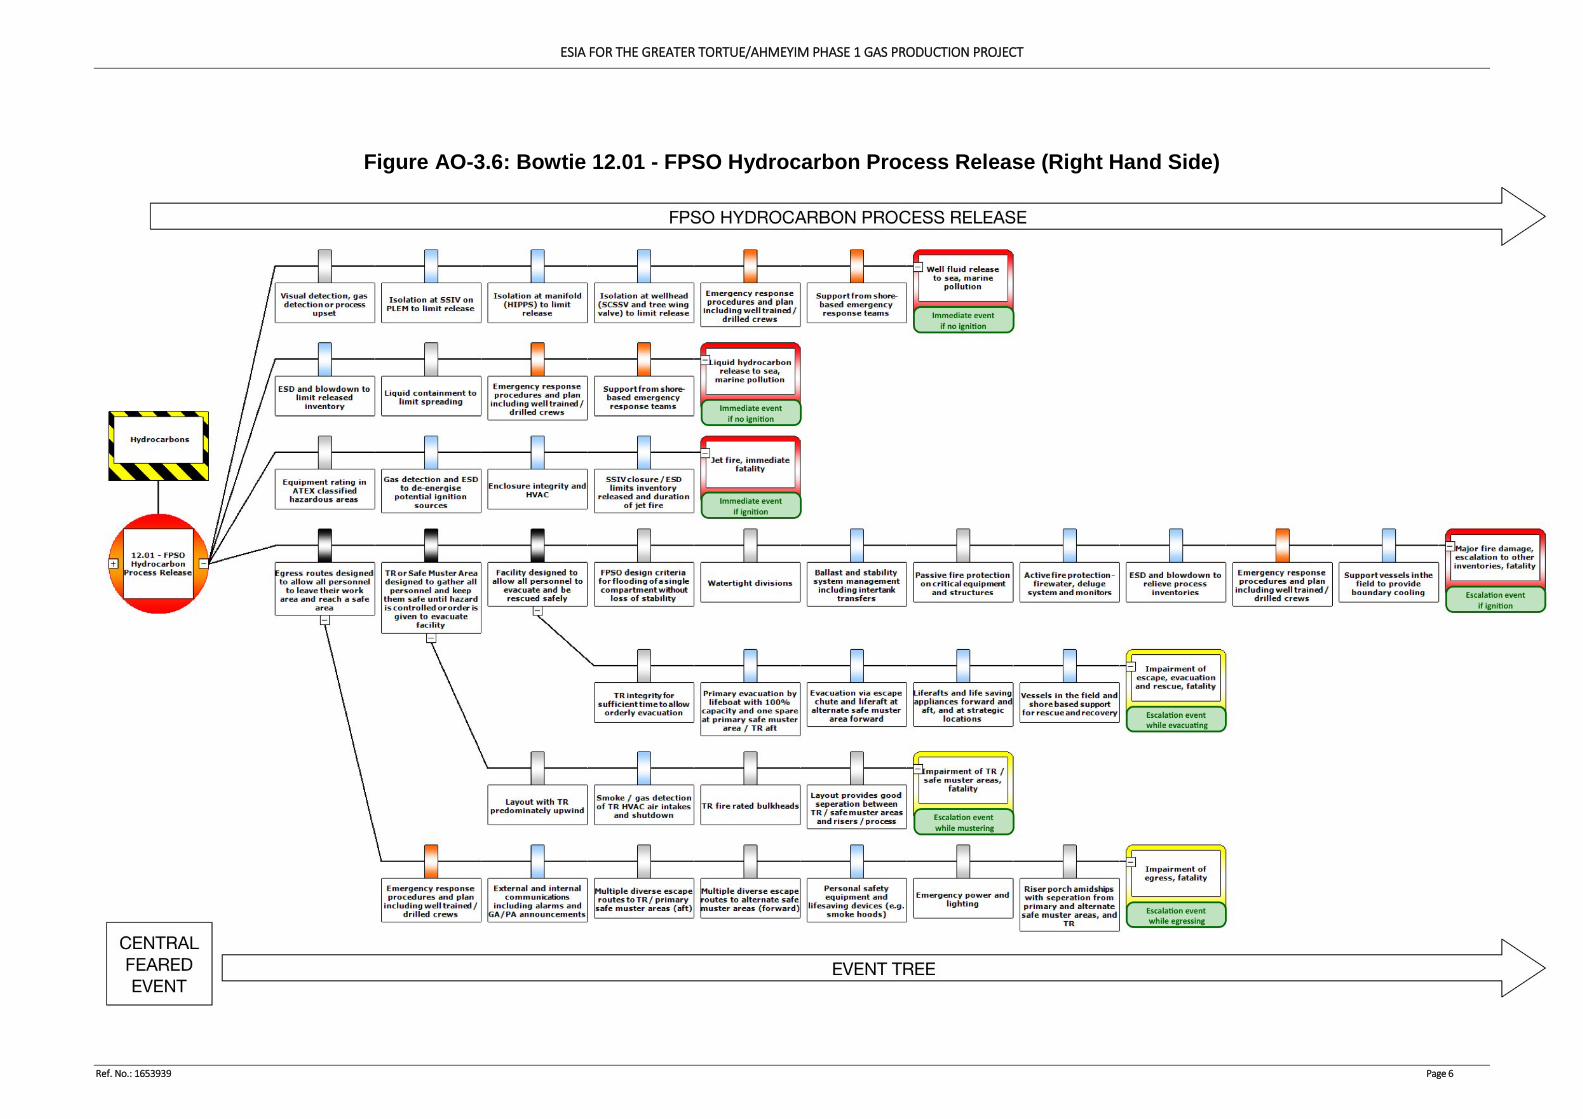
ESIA FOR THE GREATER TORTUE/AHMEYIM PHASE 1 GAS PRODUCTION PROJECT
Ref. No.: 1653939 Page 6
Figure AO-3.6: Bowtie 12.01 - FPSO Hydrocarbon Process Release (Right Hand Side)
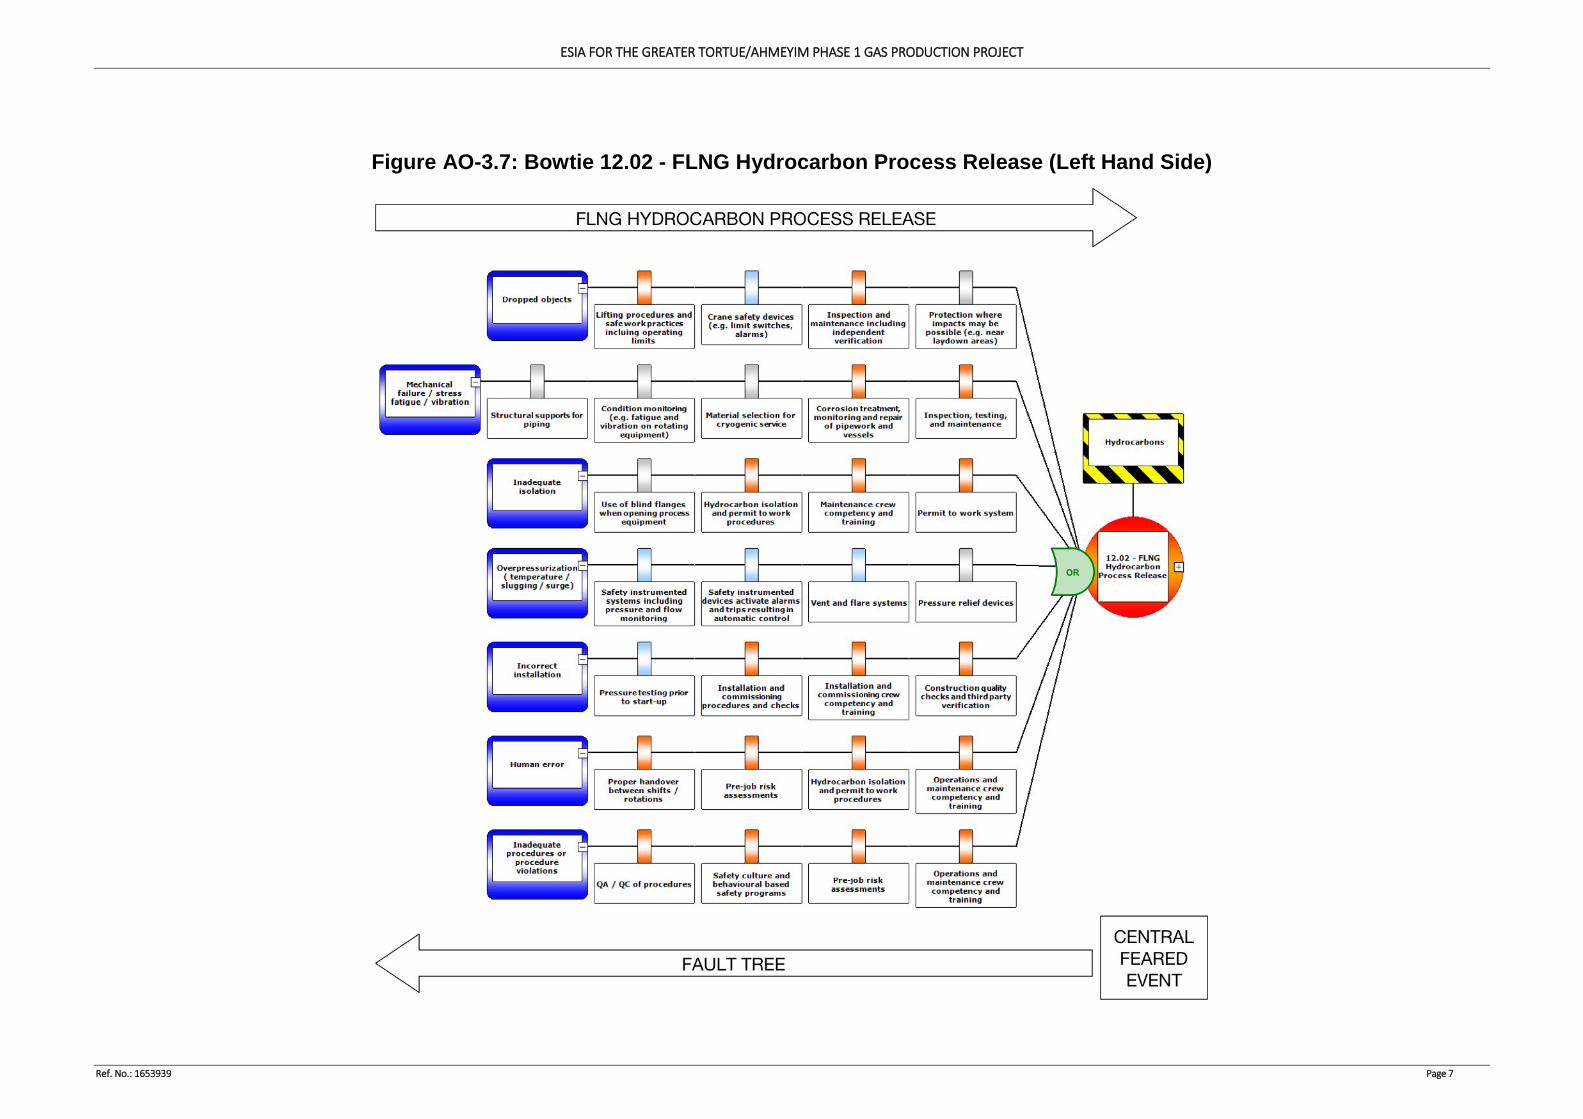
ESIA FOR THE GREATER TORTUE/AHMEYIM PHASE 1 GAS PRODUCTION PROJECT
Ref. No.: 1653939 Page 7
Figure AO-3.7: Bowtie 12.02 - FLNG Hydrocarbon Process Release (Left Hand Side)
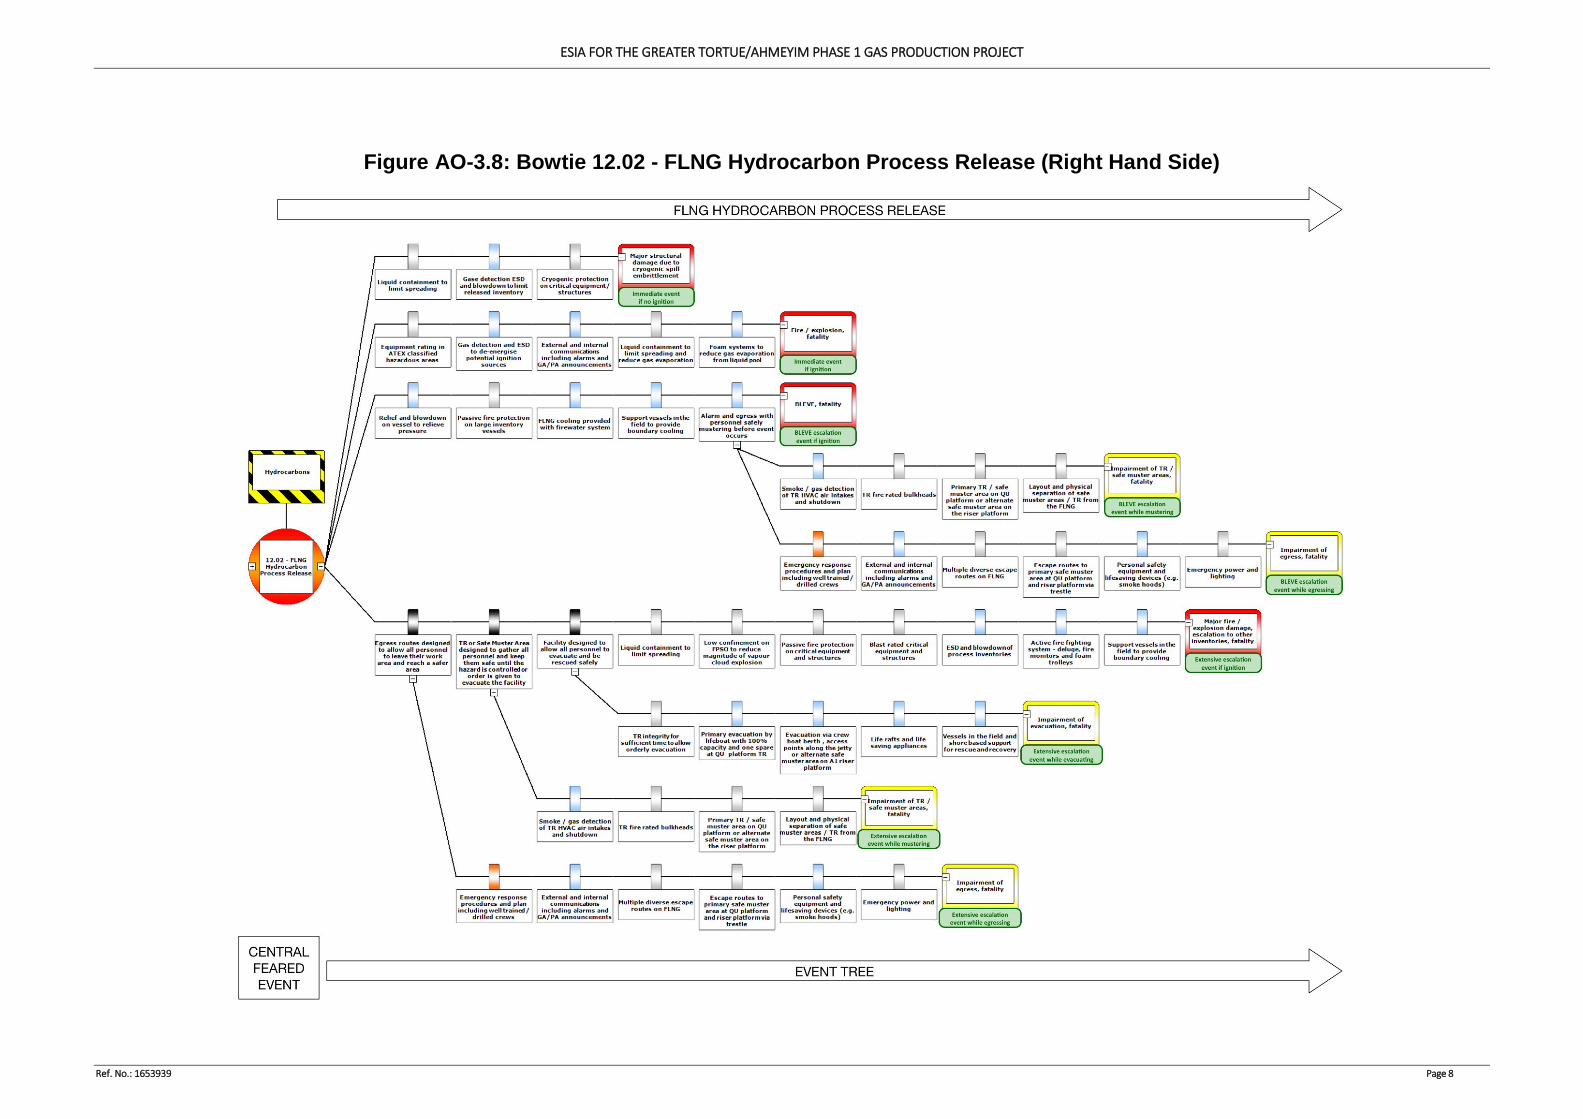
ESIA FOR THE GREATER TORTUE/AHMEYIM PHASE 1 GAS PRODUCTION PROJECT
Ref. No.: 1653939 Page 8
Figure AO-3.8: Bowtie 12.02 - FLNG Hydrocarbon Process Release (Right Hand Side)
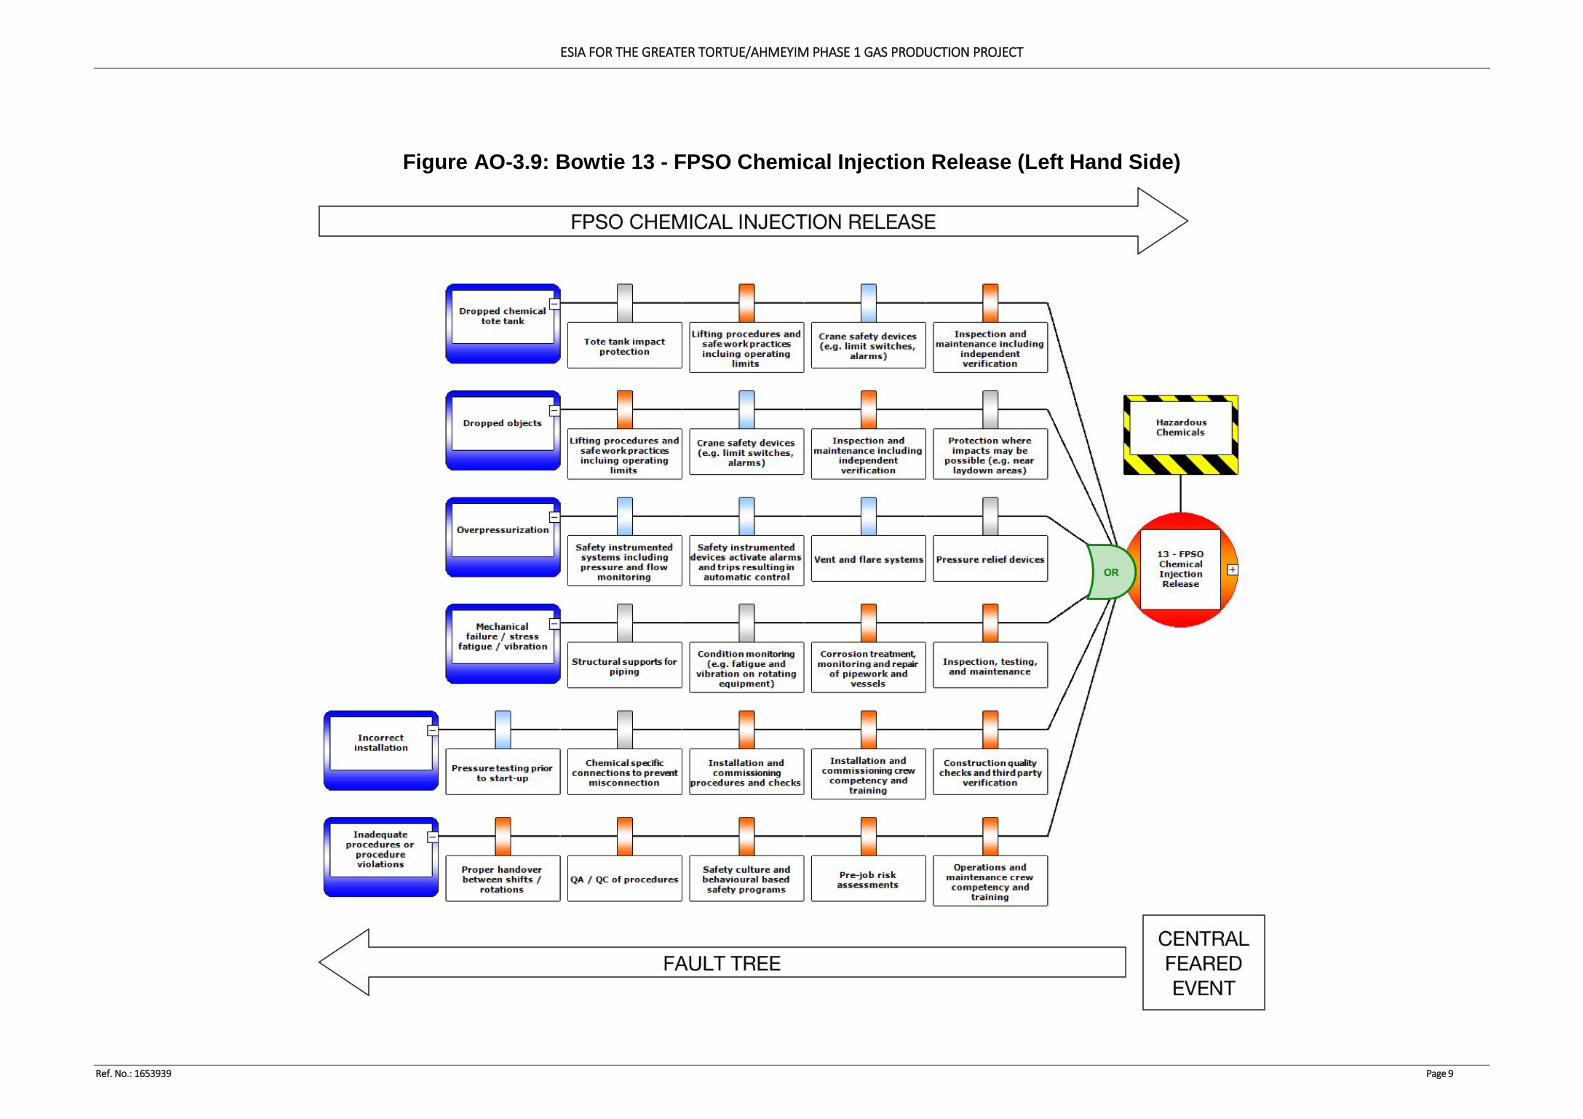
ESIA FOR THE GREATER TORTUE/AHMEYIM PHASE 1 GAS PRODUCTION PROJECT
Ref. No.: 1653939 Page 9
Figure AO-3.9: Bowtie 13 - FPSO Chemical Injection Release (Left Hand Side)
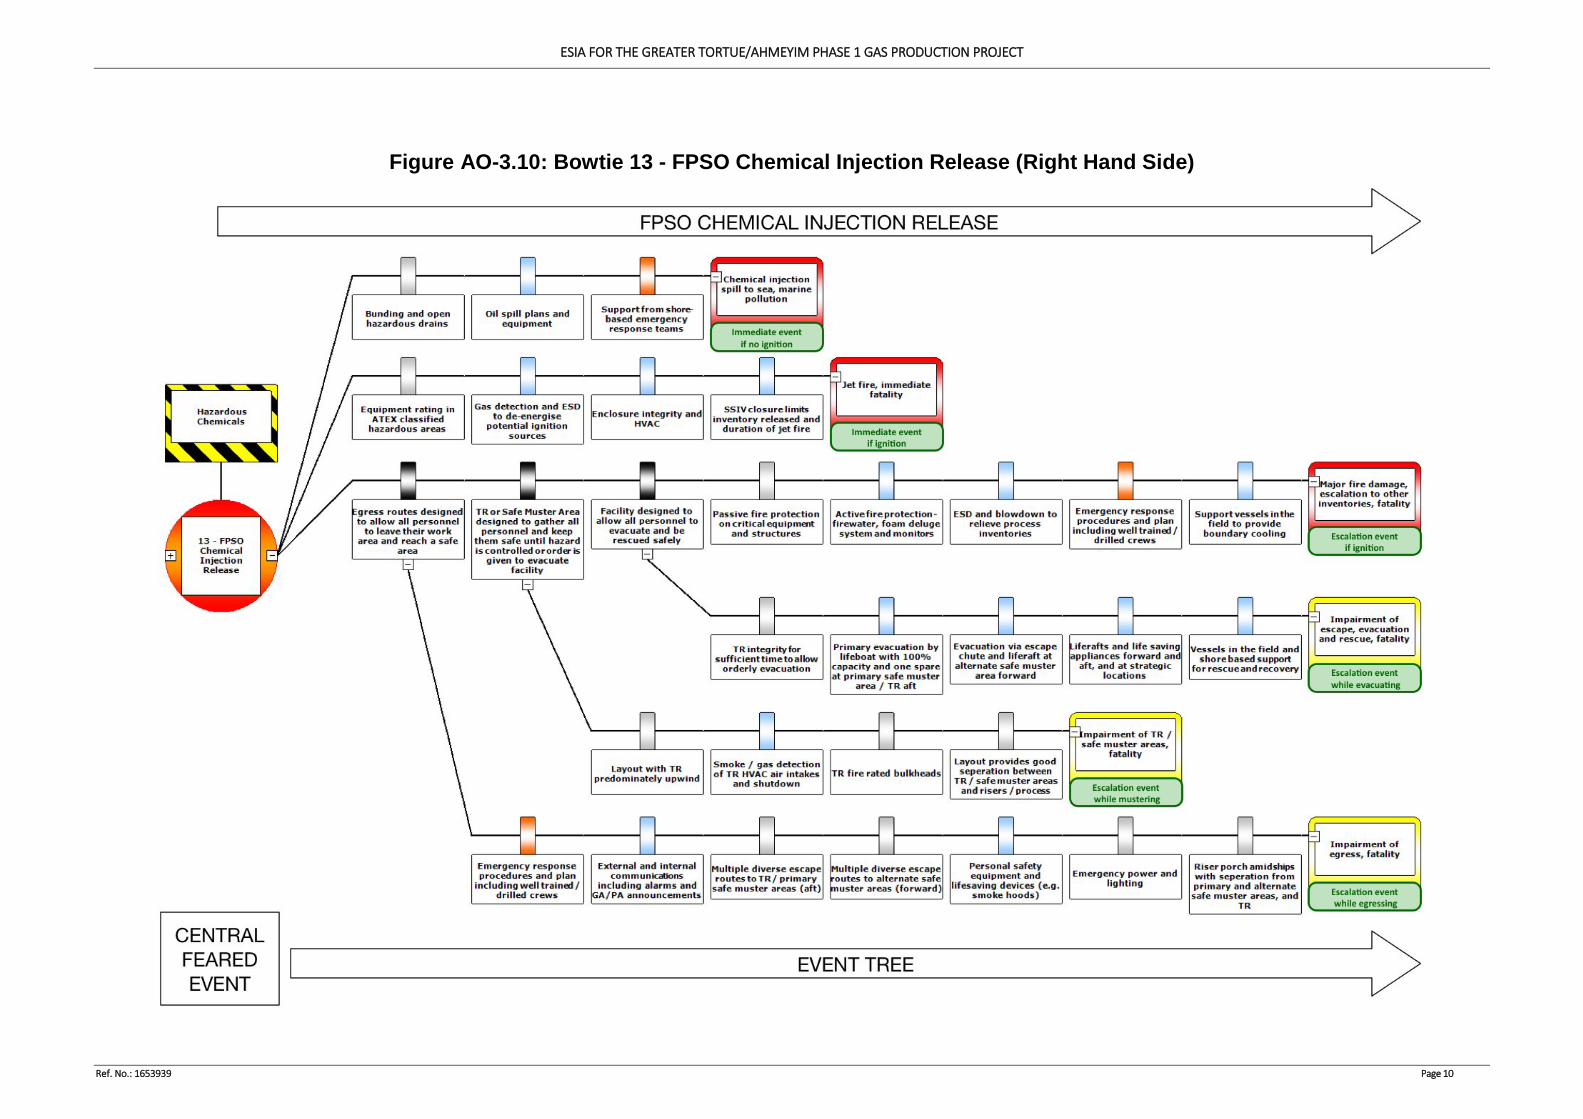
ESIA FOR THE GREATER TORTUE/AHMEYIM PHASE 1 GAS PRODUCTION PROJECT
Ref. No.: 1653939 Page 10
Figure AO-3.10: Bowtie 13 - FPSO Chemical Injection Release (Right Hand Side)
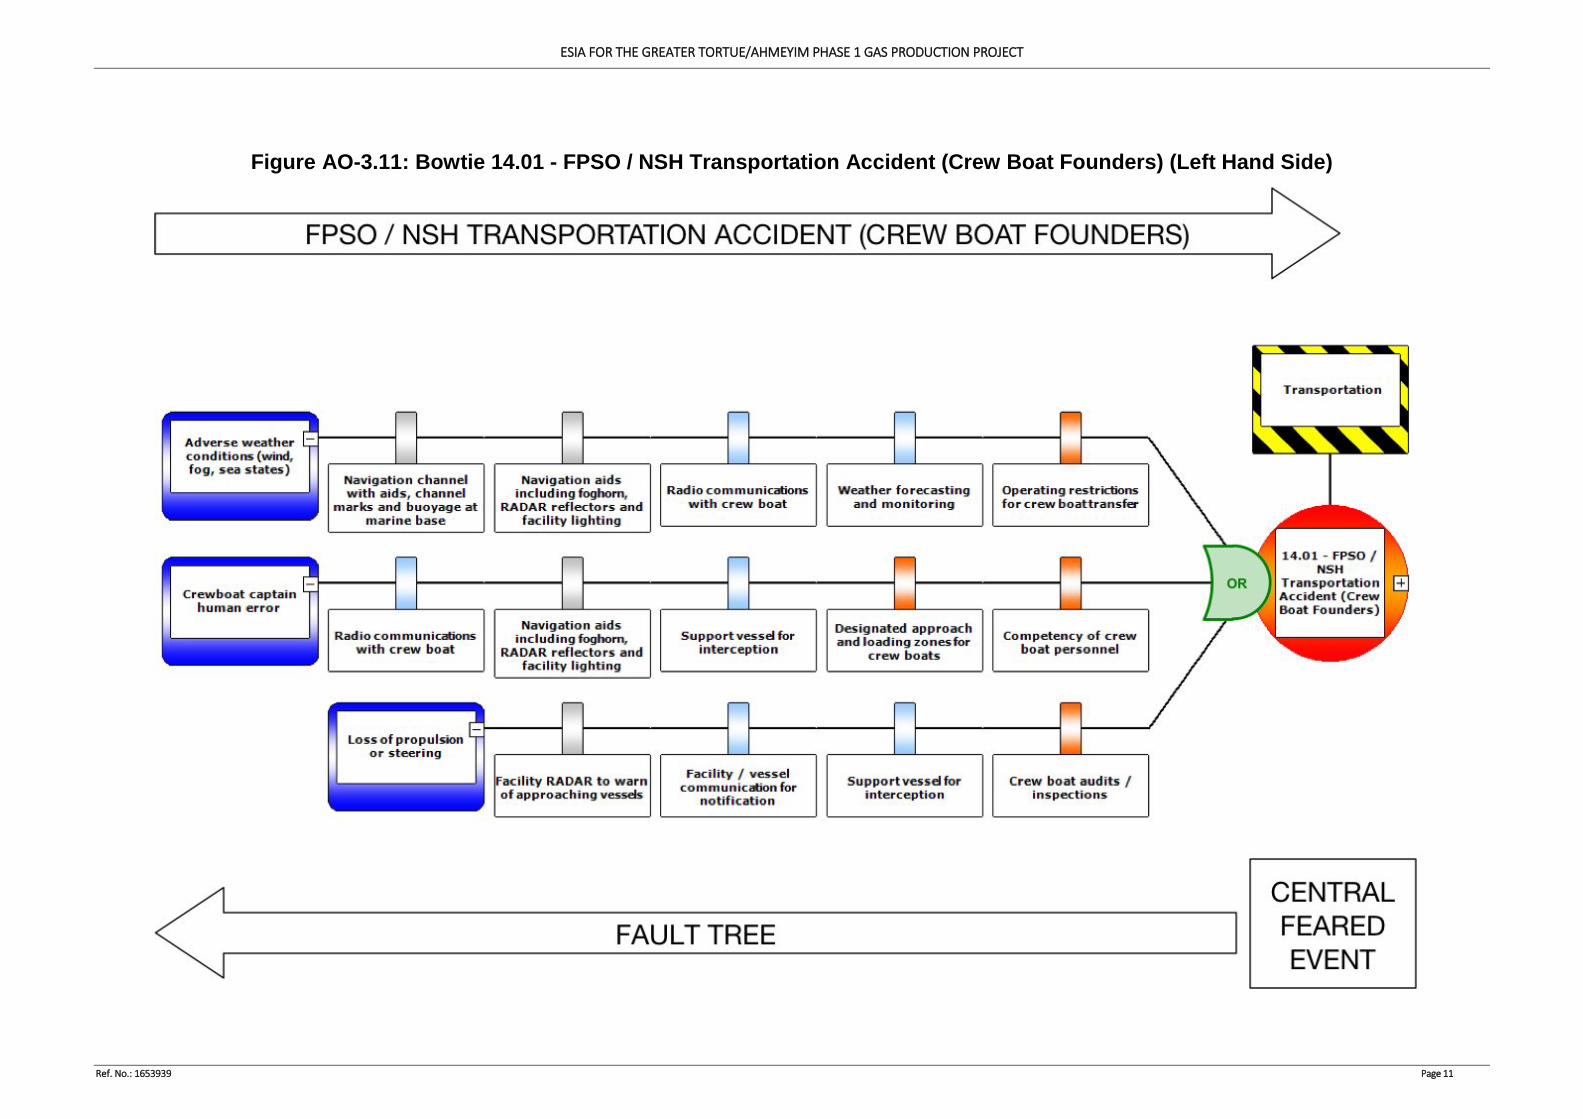
ESIA FOR THE GREATER TORTUE/AHMEYIM PHASE 1 GAS PRODUCTION PROJECT
Ref. No.: 1653939 Page 11
Figure AO-3.11: Bowtie 14.01 - FPSO / NSH Transportation Accident (Crew Boat Founders) (Left Hand Side)
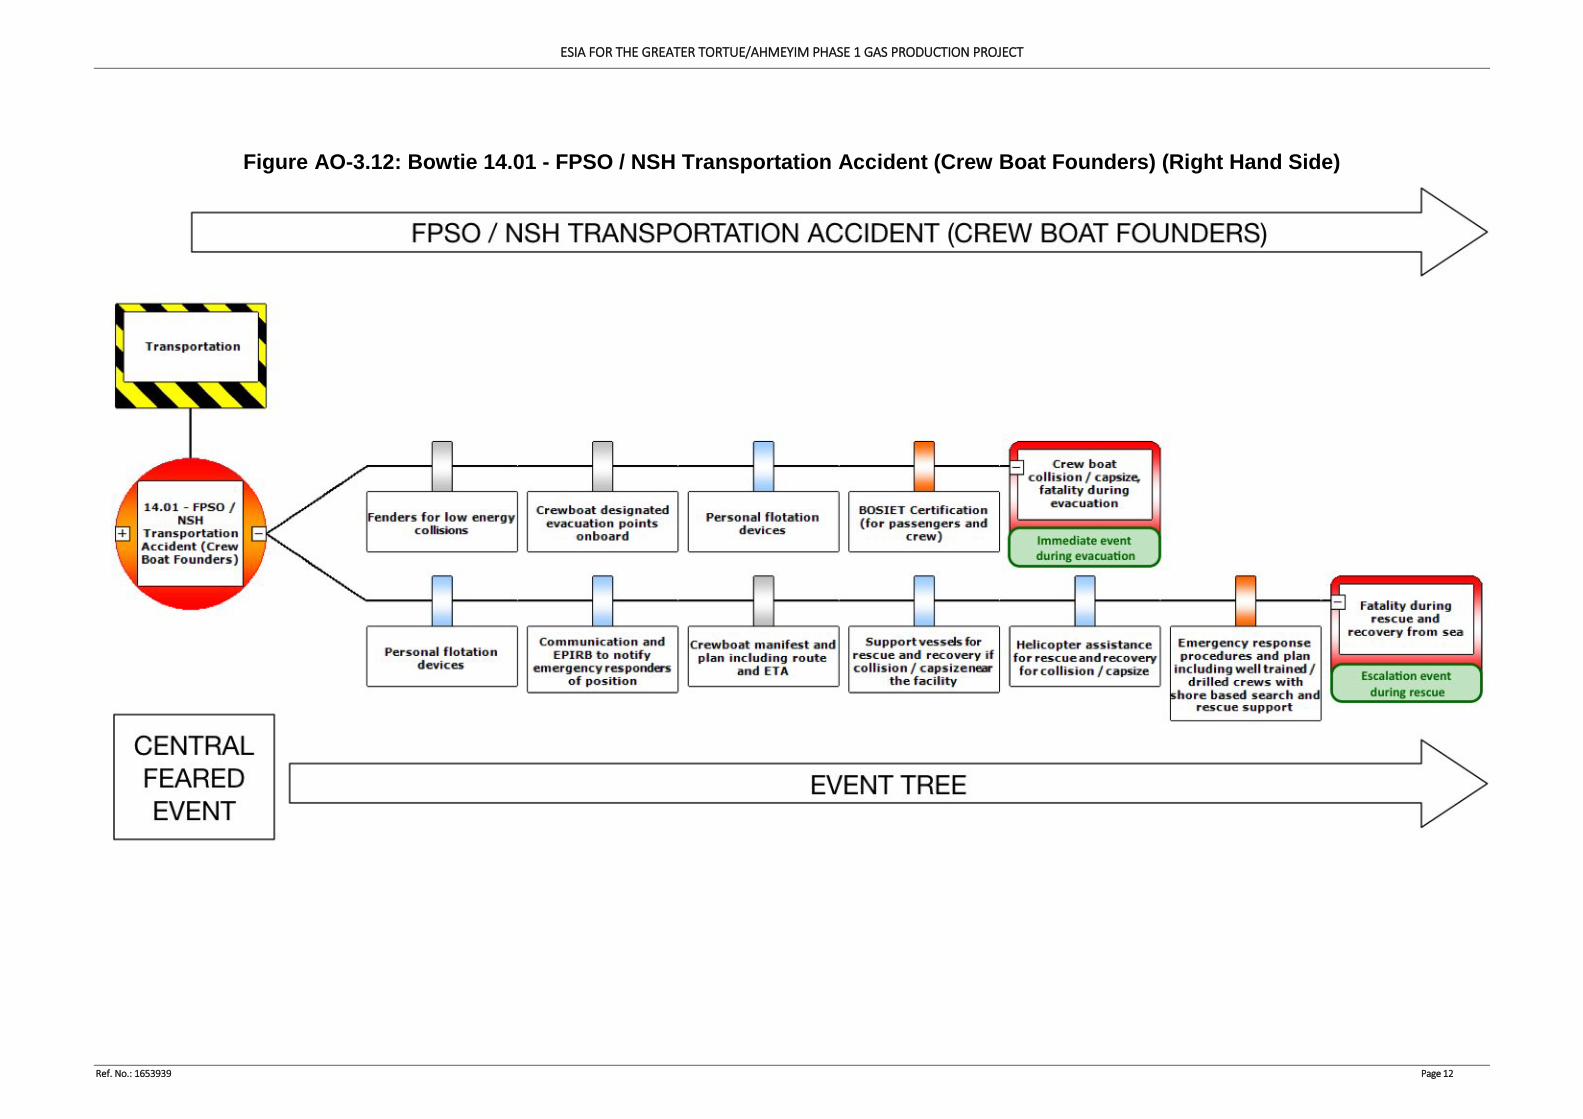
ESIA FOR THE GREATER TORTUE/AHMEYIM PHASE 1 GAS PRODUCTION PROJECT
Ref. No.: 1653939 Page 12
Figure AO-3.12: Bowtie 14.01 - FPSO / NSH Transportation Accident (Crew Boat Founders) (Right Hand Side)
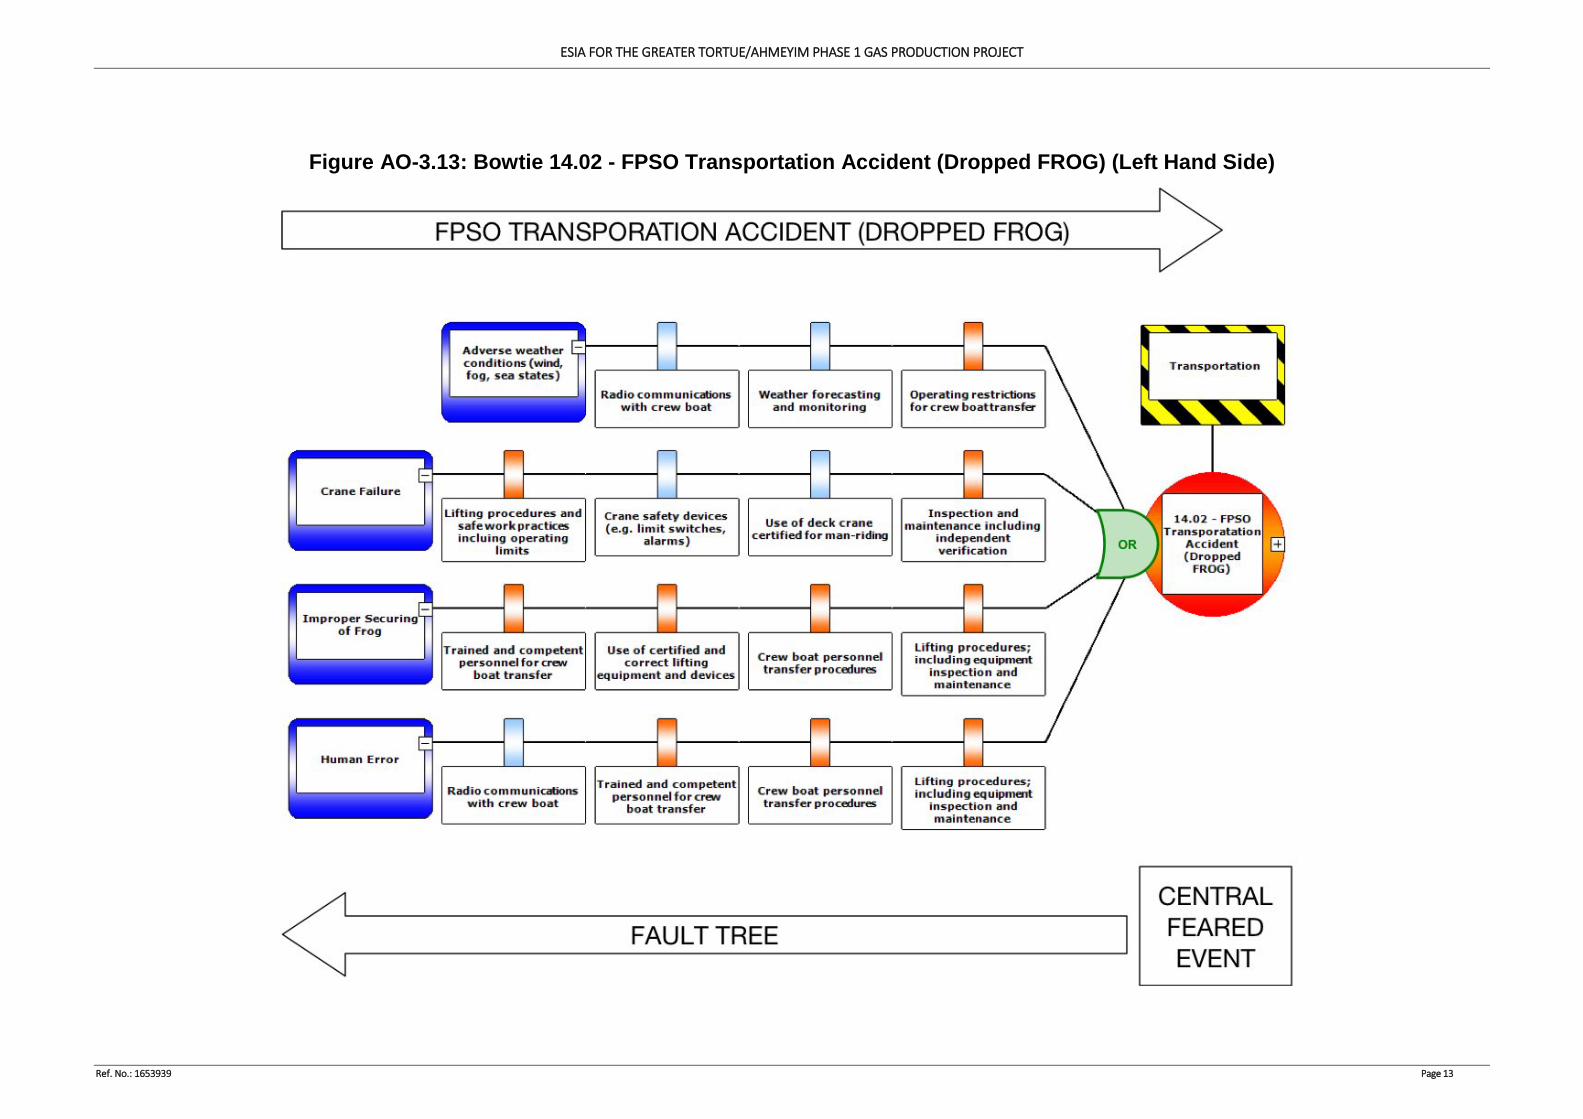
ESIA FOR THE GREATER TORTUE/AHMEYIM PHASE 1 GAS PRODUCTION PROJECT
Ref. No.: 1653939 Page 13
Figure AO-3.13: Bowtie 14.02 - FPSO Transportation Accident (Dropped FROG) (Left Hand Side)
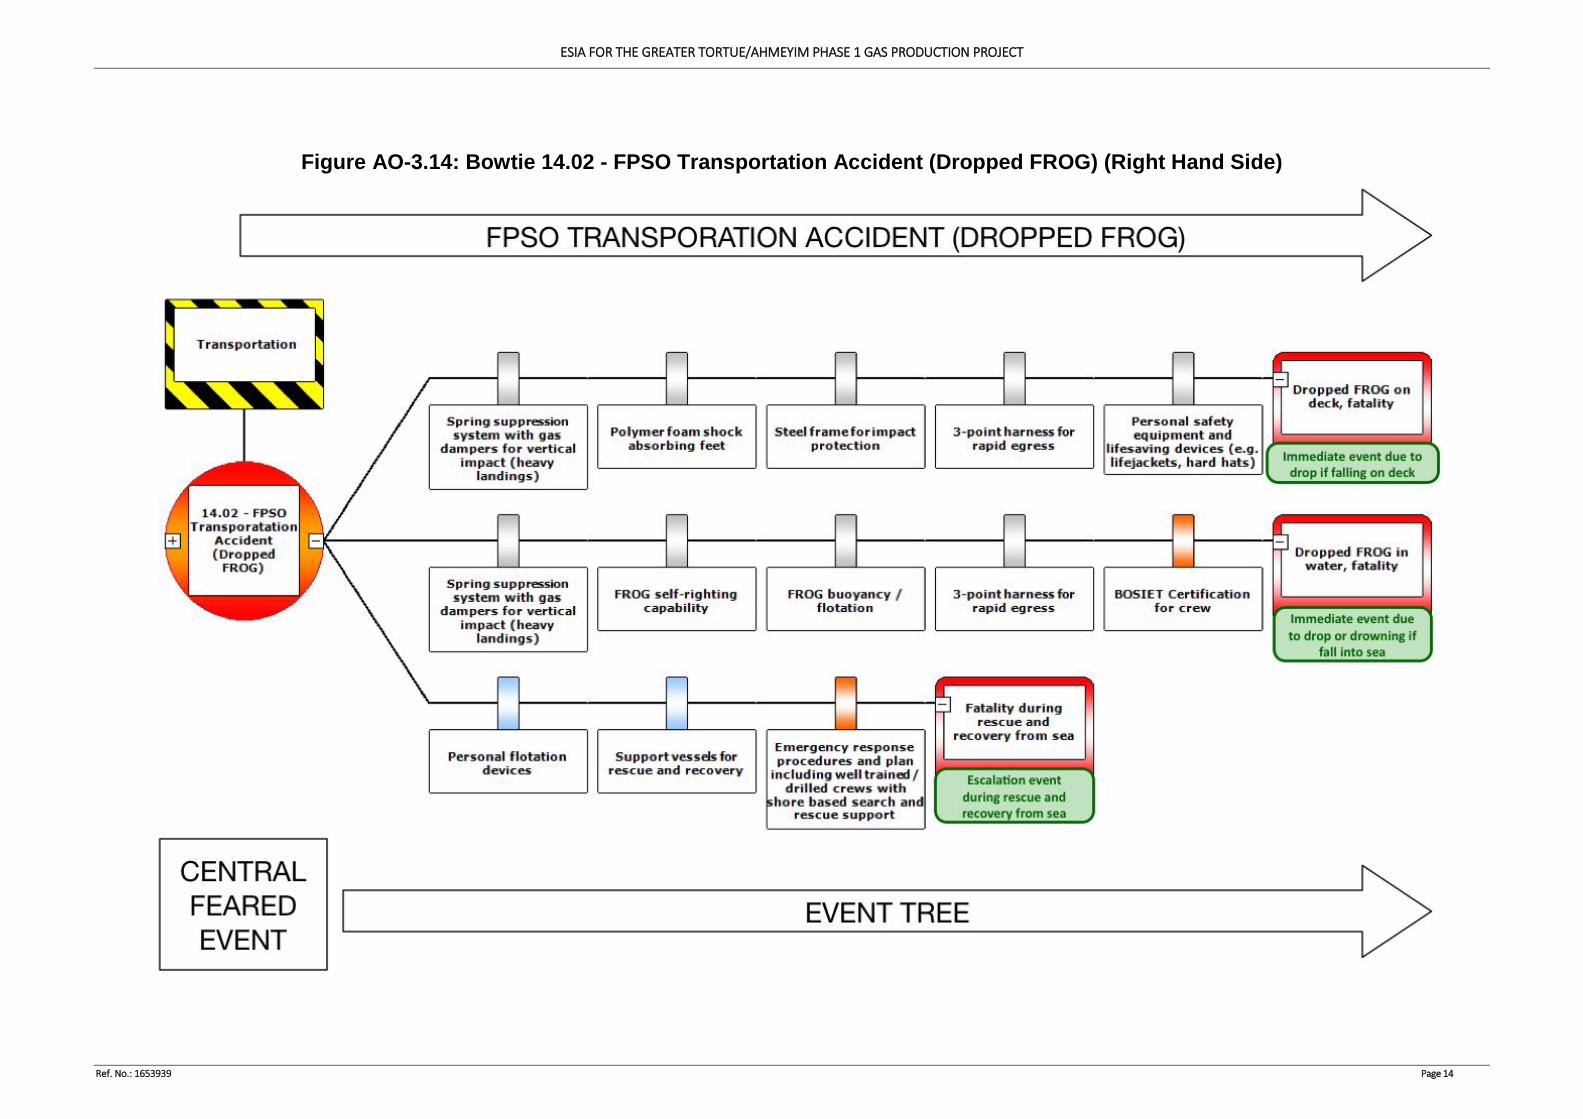
ESIA FOR THE GREATER TORTUE/AHMEYIM PHASE 1 GAS PRODUCTION PROJECT
Ref. No.: 1653939 Page 14
Figure AO-3.14: Bowtie 14.02 - FPSO Transportation Accident (Dropped FROG) (Right Hand Side)
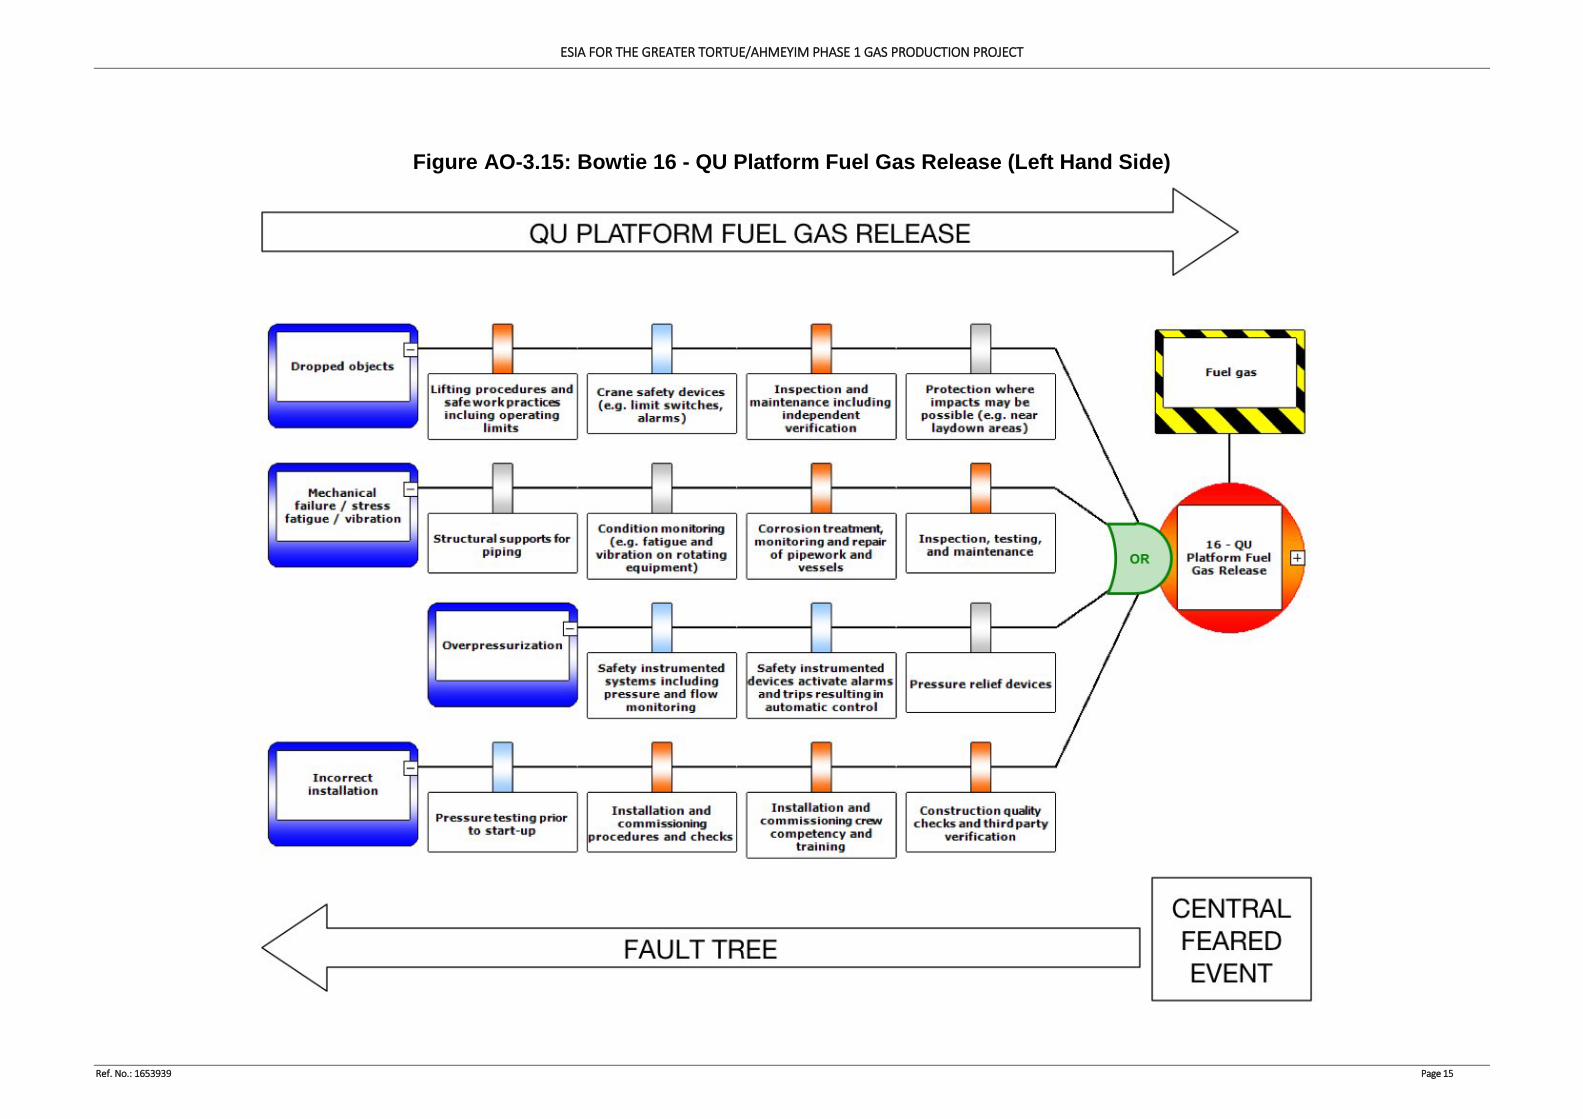
ESIA FOR THE GREATER TORTUE/AHMEYIM PHASE 1 GAS PRODUCTION PROJECT
Ref. No.: 1653939 Page 15
Figure AO-3.15: Bowtie 16 - QU Platform Fuel Gas Release (Left Hand Side)
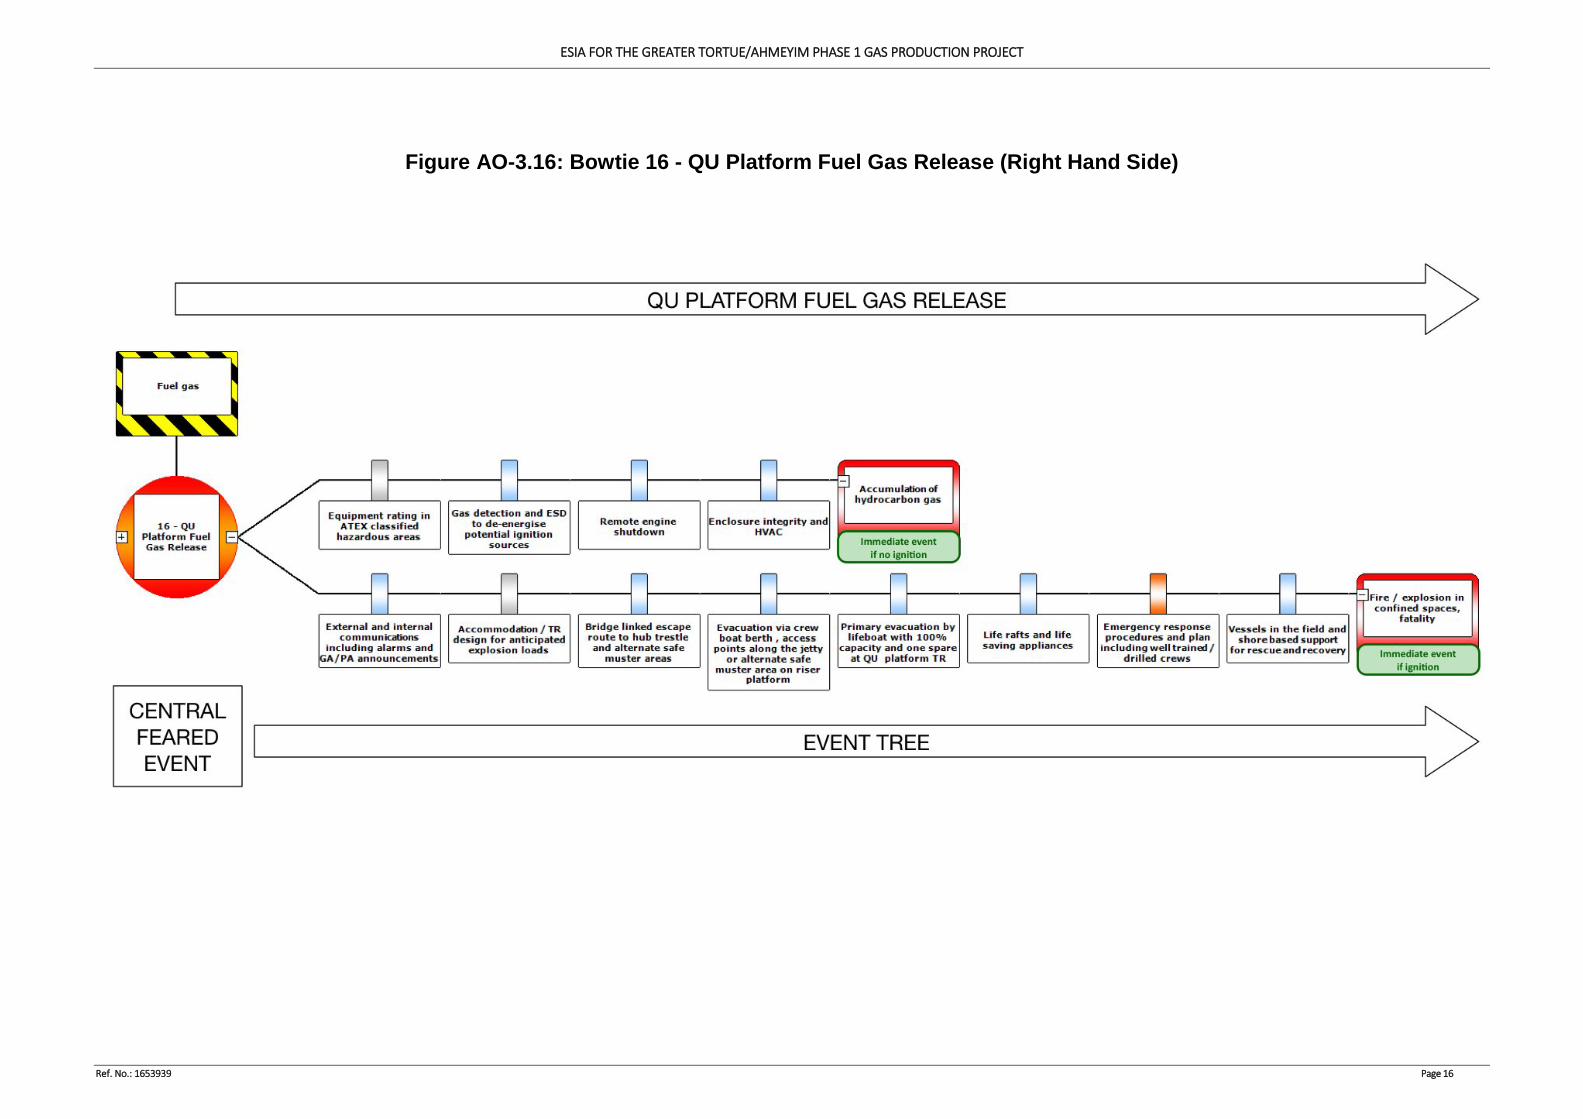
ESIA FOR THE GREATER TORTUE/AHMEYIM PHASE 1 GAS PRODUCTION PROJECT
Ref. No.: 1653939 Page 16
Figure AO-3.16: Bowtie 16 - QU Platform Fuel Gas Release (Right Hand Side)
ESIA FOR THE GREATER TORTUE/AHMEYIM PHASE 1 GAS PRODUCTION PROJECT
Ref. No.: 1653939
APPENDIX O-4 : OCCUPATIONAL RISK ANALYSIS WORKSHEETS
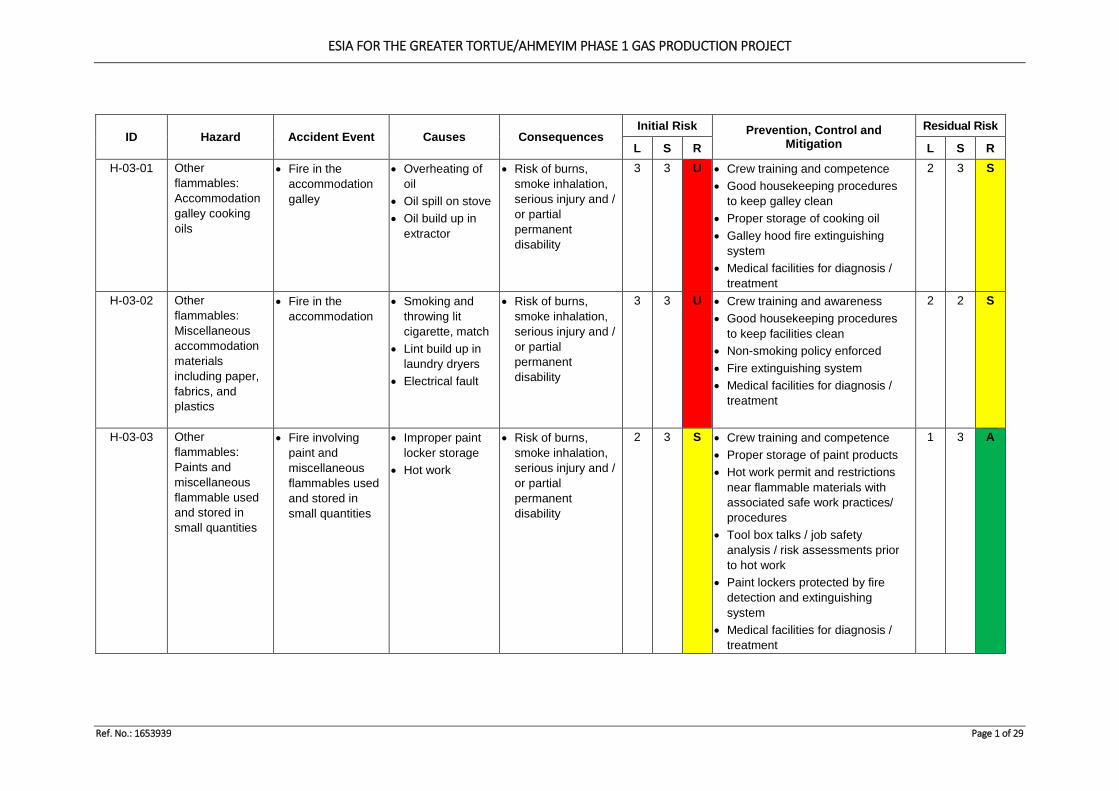
ESIA FOR THE GREATER TORTUE/AHMEYIM PHASE 1 GAS PRODUCTION PROJECT
Ref. No.: 1653939 Page 1 of 29
ID Hazard Accident Event Causes Consequences Initial Risk Prevention, Control and
Mitigation Residual Risk
L S R L S R H-03-01 Other
flammables: Accommodation galley cooking oils
• Fire in theaccommodationgalley
• Overheating ofoil
• Oil spill on stove• Oil build up in
extractor
• Risk of burns,smoke inhalation,serious injury and /or partialpermanentdisability
3 3 U • Crew training and competence• Good housekeeping procedures
to keep galley clean• Proper storage of cooking oil• Galley hood fire extinguishing
system• Medical facilities for diagnosis /
treatment
2 3 S
H-03-02 Other flammables: Miscellaneous accommodation materials including paper, fabrics, and plastics
• Fire in theaccommodation
• Smoking andthrowing litcigarette, match
• Lint build up inlaundry dryers
• Electrical fault
• Risk of burns,smoke inhalation,serious injury and /or partialpermanentdisability
3 3 U • Crew training and awareness• Good housekeeping procedures
to keep facilities clean• Non-smoking policy enforced• Fire extinguishing system• Medical facilities for diagnosis /
treatment
2 2 S
H-03-03 Other flammables: Paints and miscellaneous flammable used and stored in small quantities
• Fire involvingpaint andmiscellaneousflammables usedand stored insmall quantities
• Improper paintlocker storage
• Hot work
• Risk of burns,smoke inhalation,serious injury and /or partialpermanentdisability
2 3 S • Crew training and competence• Proper storage of paint products• Hot work permit and restrictions
near flammable materials withassociated safe work practices/procedures
• Tool box talks / job safetyanalysis / risk assessments priorto hot work
• Paint lockers protected by firedetection and extinguishingsystem
• Medical facilities for diagnosis /treatment
1 3 A
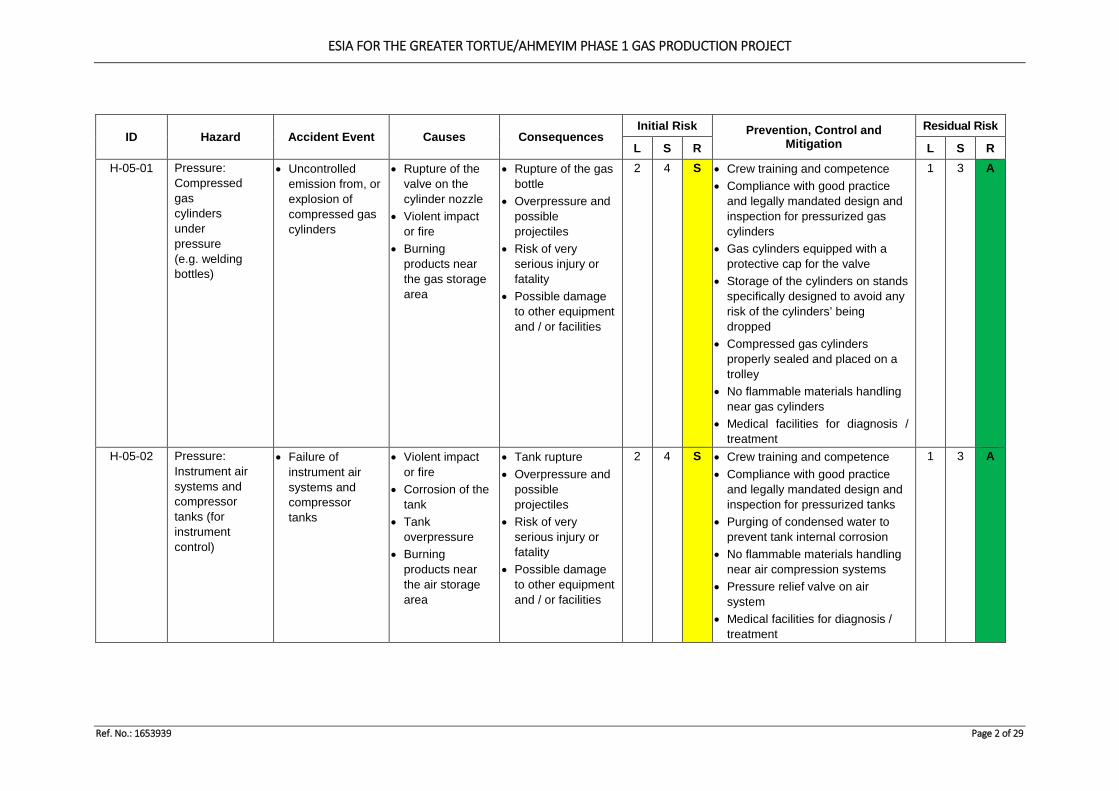
ESIA FOR THE GREATER TORTUE/AHMEYIM PHASE 1 GAS PRODUCTION PROJECT
Ref. No.: 1653939 Page 2 of 29
ID Hazard Accident Event Causes Consequences Initial Risk Prevention, Control and
Mitigation Residual Risk
L S R L S R H-05-01 Pressure:
Compressed gas cylinders under pressure (e.g. welding bottles)
• Uncontrolled emission from, or explosion of compressed gas cylinders
• Rupture of the valve on the cylinder nozzle
• Violent impact or fire
• Burning products near the gas storage area
• Rupture of the gas bottle
• Overpressure and possible projectiles
• Risk of very serious injury or fatality
• Possible damage to other equipment and / or facilities
2 4 S • Crew training and competence • Compliance with good practice
and legally mandated design and inspection for pressurized gas cylinders
• Gas cylinders equipped with a protective cap for the valve
• Storage of the cylinders on stands specifically designed to avoid any risk of the cylinders’ being dropped
• Compressed gas cylinders properly sealed and placed on a trolley
• No flammable materials handling near gas cylinders
• Medical facilities for diagnosis / treatment
1 3 A
H-05-02 Pressure: Instrument air systems and compressor tanks (for instrument control)
• Failure of instrument air systems and compressor tanks
• Violent impact or fire
• Corrosion of the tank
• Tank overpressure
• Burning products near the air storage area
• Tank rupture • Overpressure and
possible projectiles
• Risk of very serious injury or fatality
• Possible damage to other equipment and / or facilities
2 4 S • Crew training and competence • Compliance with good practice
and legally mandated design and inspection for pressurized tanks
• Purging of condensed water to prevent tank internal corrosion
• No flammable materials handling near air compression systems
• Pressure relief valve on air system
• Medical facilities for diagnosis / treatment
1 3 A
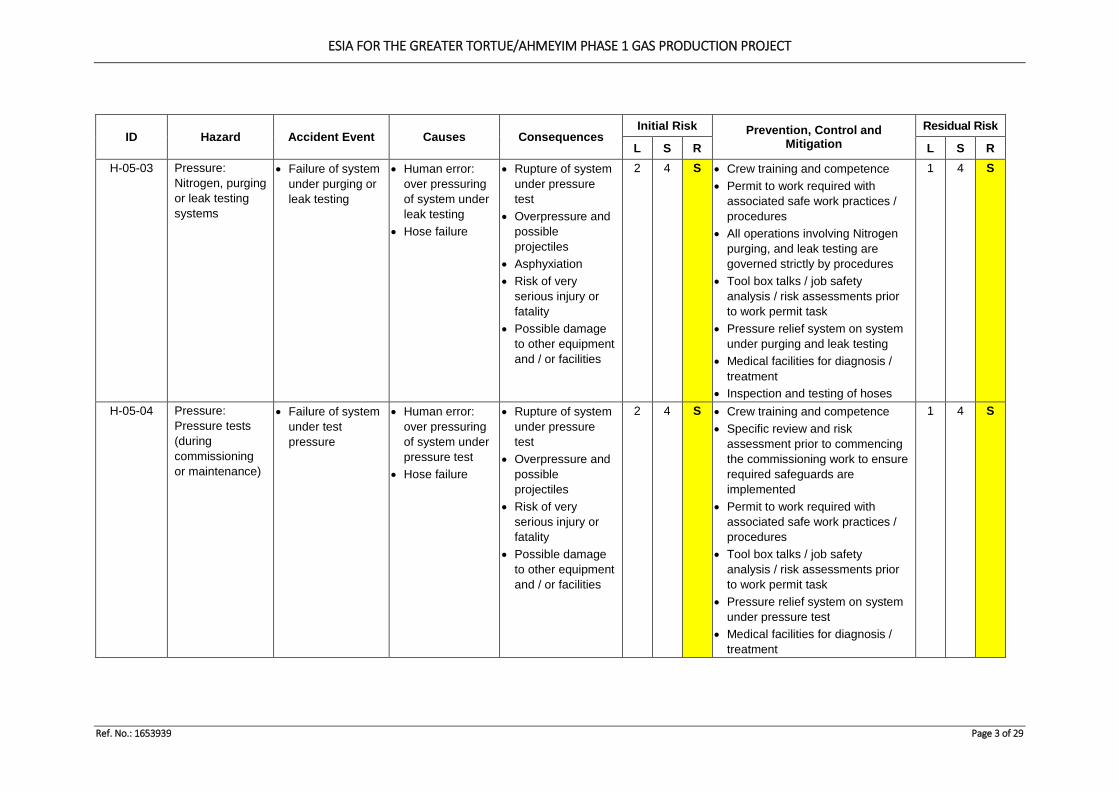
ESIA FOR THE GREATER TORTUE/AHMEYIM PHASE 1 GAS PRODUCTION PROJECT
Ref. No.: 1653939 Page 3 of 29
ID Hazard Accident Event Causes Consequences Initial Risk Prevention, Control and
Mitigation Residual Risk
L S R L S R H-05-03 Pressure:
Nitrogen, purging or leak testing systems
• Failure of system under purging or leak testing
• Human error: over pressuring of system under leak testing
• Hose failure
• Rupture of system under pressure test
• Overpressure and possible projectiles
• Asphyxiation • Risk of very
serious injury or fatality
• Possible damage to other equipment and / or facilities
2 4 S • Crew training and competence • Permit to work required with
associated safe work practices / procedures
• All operations involving Nitrogen purging, and leak testing are governed strictly by procedures
• Tool box talks / job safety analysis / risk assessments prior to work permit task
• Pressure relief system on system under purging and leak testing
• Medical facilities for diagnosis / treatment
• Inspection and testing of hoses
1 4 S
H-05-04 Pressure: Pressure tests (during commissioning or maintenance)
• Failure of system under test pressure
• Human error: over pressuring of system under pressure test
• Hose failure
• Rupture of system under pressure test
• Overpressure and possible projectiles
• Risk of very serious injury or fatality
• Possible damage to other equipment and / or facilities
2 4 S • Crew training and competence • Specific review and risk
assessment prior to commencing the commissioning work to ensure required safeguards are implemented
• Permit to work required with associated safe work practices / procedures
• Tool box talks / job safety analysis / risk assessments prior to work permit task
• Pressure relief system on system under pressure test
• Medical facilities for diagnosis / treatment
1 4 S
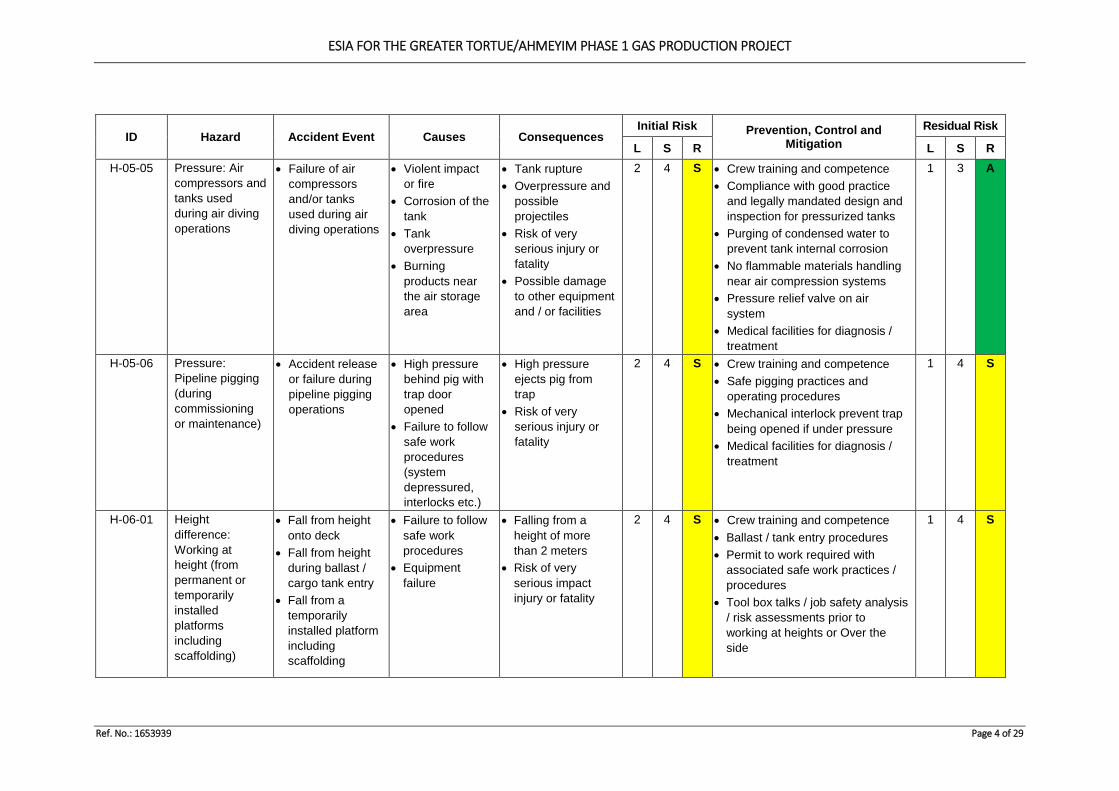
ESIA FOR THE GREATER TORTUE/AHMEYIM PHASE 1 GAS PRODUCTION PROJECT
Ref. No.: 1653939 Page 4 of 29
ID Hazard Accident Event Causes Consequences Initial Risk Prevention, Control and
Mitigation Residual Risk
L S R L S R H-05-05 Pressure: Air
compressors and tanks used during air diving operations
• Failure of air compressors and/or tanks used during air diving operations
• Violent impact or fire
• Corrosion of the tank
• Tank overpressure
• Burning products near the air storage area
• Tank rupture • Overpressure and
possible projectiles
• Risk of very serious injury or fatality
• Possible damage to other equipment and / or facilities
2 4 S • Crew training and competence • Compliance with good practice
and legally mandated design and inspection for pressurized tanks
• Purging of condensed water to prevent tank internal corrosion
• No flammable materials handling near air compression systems
• Pressure relief valve on air system
• Medical facilities for diagnosis / treatment
1 3 A
H-05-06 Pressure: Pipeline pigging (during commissioning or maintenance)
• Accident release or failure during pipeline pigging operations
• High pressure behind pig with trap door opened
• Failure to follow safe work procedures (system depressured, interlocks etc.)
• High pressure ejects pig from trap
• Risk of very serious injury or fatality
2 4 S • Crew training and competence • Safe pigging practices and
operating procedures • Mechanical interlock prevent trap
being opened if under pressure • Medical facilities for diagnosis /
treatment
1 4 S
H-06-01 Height difference: Working at height (from permanent or temporarily installed platforms including scaffolding)
• Fall from height onto deck
• Fall from height during ballast / cargo tank entry
• Fall from a temporarily installed platform including scaffolding
• Failure to follow safe work procedures
• Equipment failure
• Falling from a height of more than 2 meters
• Risk of very serious impact injury or fatality
2 4 S • Crew training and competence • Ballast / tank entry procedures • Permit to work required with
associated safe work practices / procedures
• Tool box talks / job safety analysis / risk assessments prior to working at heights or Over the side
1 4 S
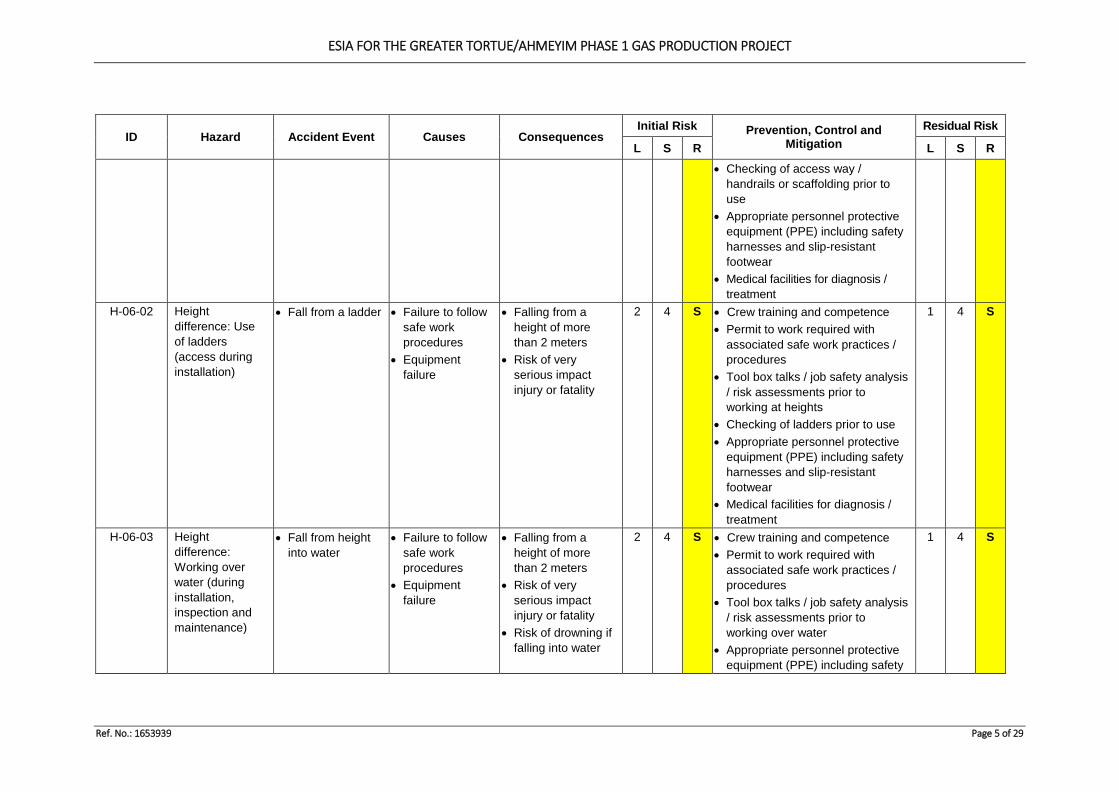
ESIA FOR THE GREATER TORTUE/AHMEYIM PHASE 1 GAS PRODUCTION PROJECT
Ref. No.: 1653939 Page 5 of 29
ID Hazard Accident Event Causes Consequences Initial Risk Prevention, Control and
Mitigation Residual Risk
L S R L S R • Checking of access way /
handrails or scaffolding prior to use
• Appropriate personnel protective equipment (PPE) including safety harnesses and slip-resistant footwear
• Medical facilities for diagnosis / treatment
H-06-02 Height difference: Use of ladders (access during installation)
• Fall from a ladder • Failure to follow safe work procedures
• Equipment failure
• Falling from a height of more than 2 meters
• Risk of very serious impact injury or fatality
2 4 S • Crew training and competence • Permit to work required with
associated safe work practices / procedures
• Tool box talks / job safety analysis / risk assessments prior to working at heights
• Checking of ladders prior to use • Appropriate personnel protective
equipment (PPE) including safety harnesses and slip-resistant footwear
• Medical facilities for diagnosis / treatment
1 4 S
H-06-03 Height difference: Working over water (during installation, inspection and maintenance)
• Fall from height into water
• Failure to follow safe work procedures
• Equipment failure
• Falling from a height of more than 2 meters
• Risk of very serious impact injury or fatality
• Risk of drowning if falling into water
2 4 S • Crew training and competence • Permit to work required with
associated safe work practices / procedures
• Tool box talks / job safety analysis / risk assessments prior to working over water
• Appropriate personnel protective equipment (PPE) including safety
1 4 S
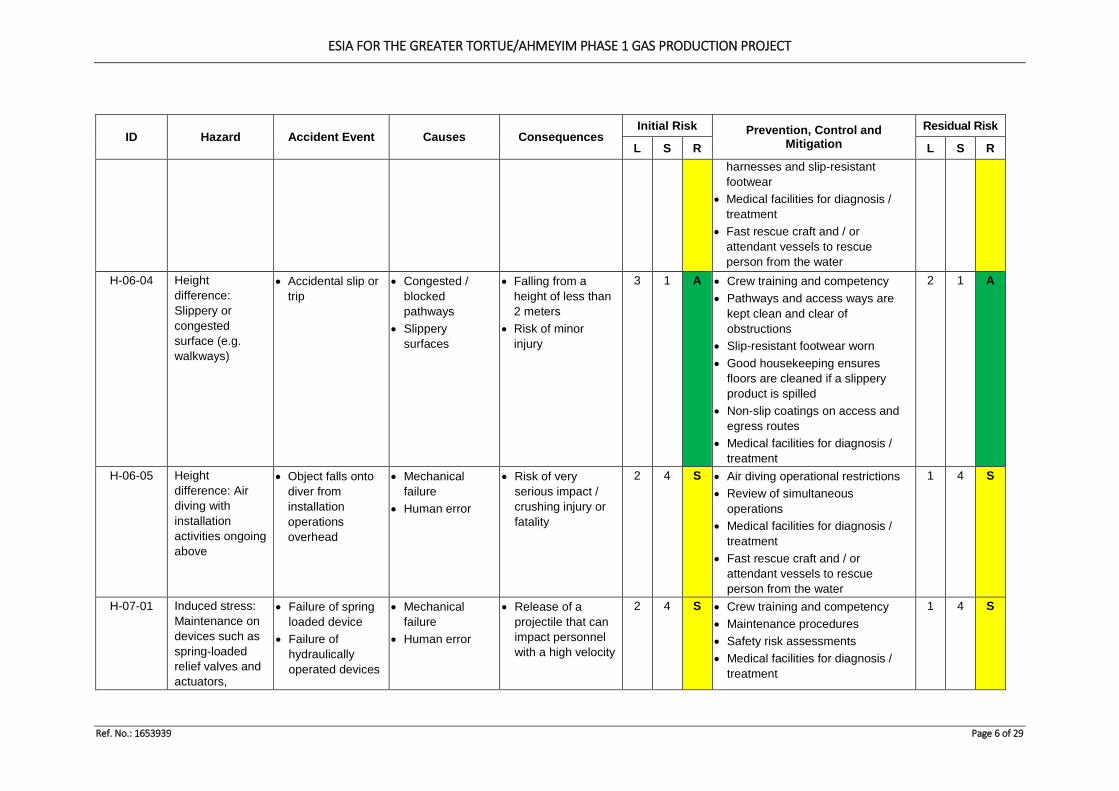
ESIA FOR THE GREATER TORTUE/AHMEYIM PHASE 1 GAS PRODUCTION PROJECT
Ref. No.: 1653939 Page 6 of 29
ID Hazard Accident Event Causes Consequences Initial Risk Prevention, Control and
Mitigation Residual Risk
L S R L S R harnesses and slip-resistant footwear
• Medical facilities for diagnosis / treatment
• Fast rescue craft and / or attendant vessels to rescue person from the water
H-06-04 Height difference: Slippery or congested surface (e.g. walkways)
• Accidental slip or trip
• Congested / blocked pathways
• Slippery surfaces
• Falling from a height of less than 2 meters
• Risk of minor injury
3 1 A • Crew training and competency • Pathways and access ways are
kept clean and clear of obstructions
• Slip-resistant footwear worn • Good housekeeping ensures
floors are cleaned if a slippery product is spilled
• Non-slip coatings on access and egress routes
• Medical facilities for diagnosis / treatment
2 1 A
H-06-05 Height difference: Air diving with installation activities ongoing above
• Object falls onto diver from installation operations overhead
• Mechanical failure
• Human error
• Risk of very serious impact / crushing injury or fatality
2 4 S • Air diving operational restrictions • Review of simultaneous
operations • Medical facilities for diagnosis /
treatment • Fast rescue craft and / or
attendant vessels to rescue person from the water
1 4 S
H-07-01 Induced stress: Maintenance on devices such as spring-loaded relief valves and actuators,
• Failure of spring loaded device
• Failure of hydraulically operated devices
• Mechanical failure
• Human error
• Release of a projectile that can impact personnel with a high velocity
2 4 S • Crew training and competency • Maintenance procedures • Safety risk assessments • Medical facilities for diagnosis /
treatment
1 4 S
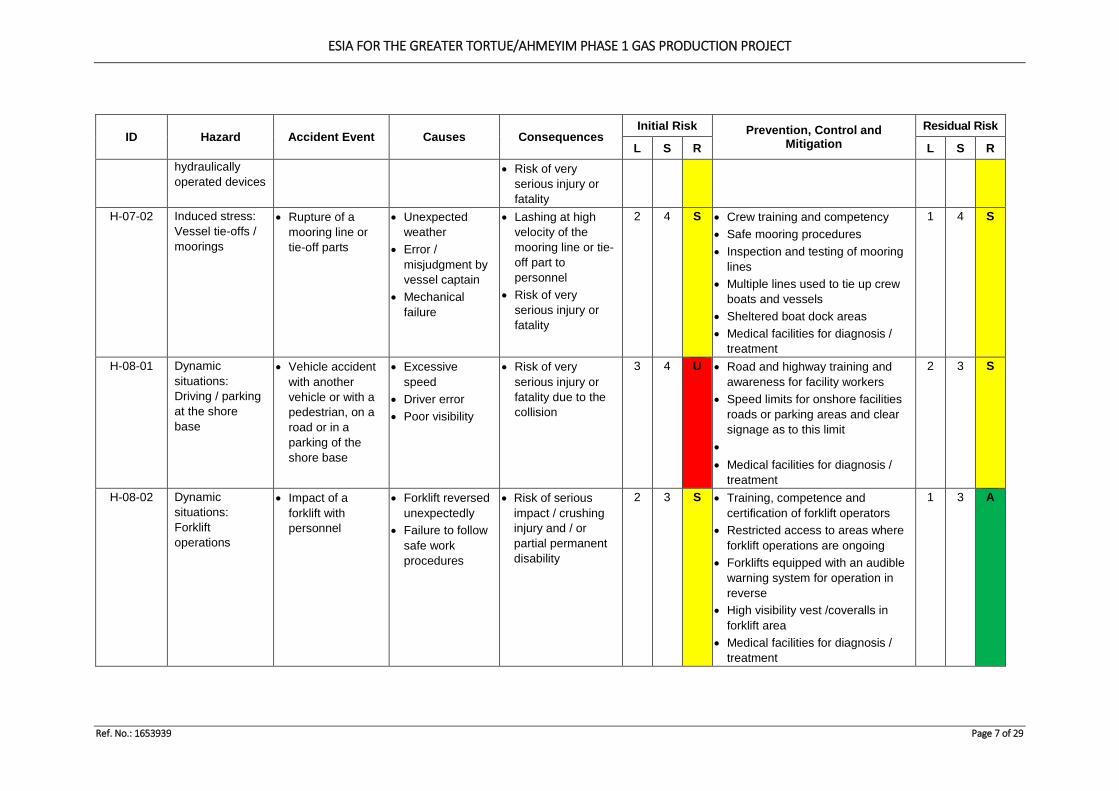
ESIA FOR THE GREATER TORTUE/AHMEYIM PHASE 1 GAS PRODUCTION PROJECT
Ref. No.: 1653939 Page 7 of 29
ID Hazard Accident Event Causes Consequences Initial Risk Prevention, Control and
Mitigation Residual Risk
L S R L S R hydraulically operated devices
• Risk of very serious injury or fatality
H-07-02 Induced stress: Vessel tie-offs / moorings
• Rupture of a mooring line or tie-off parts
• Unexpected weather
• Error / misjudgment by vessel captain
• Mechanical failure
• Lashing at high velocity of the mooring line or tie-off part to personnel
• Risk of very serious injury or fatality
2 4 S • Crew training and competency • Safe mooring procedures • Inspection and testing of mooring
lines • Multiple lines used to tie up crew
boats and vessels • Sheltered boat dock areas • Medical facilities for diagnosis /
treatment
1 4 S
H-08-01 Dynamic situations: Driving / parking at the shore base
• Vehicle accident with another vehicle or with a pedestrian, on a road or in a parking of the shore base
• Excessive speed
• Driver error • Poor visibility
• Risk of very serious injury or fatality due to the collision
3 4 U • Road and highway training and awareness for facility workers
• Speed limits for onshore facilities roads or parking areas and clear signage as to this limit
• • Medical facilities for diagnosis /
treatment
2 3 S
H-08-02 Dynamic situations: Forklift operations
• Impact of a forklift with personnel
• Forklift reversed unexpectedly
• Failure to follow safe work procedures
• Risk of serious impact / crushing injury and / or partial permanent disability
2 3 S • Training, competence and certification of forklift operators
• Restricted access to areas where forklift operations are ongoing
• Forklifts equipped with an audible warning system for operation in reverse
• High visibility vest /coveralls in forklift area
• Medical facilities for diagnosis / treatment
1 3 A
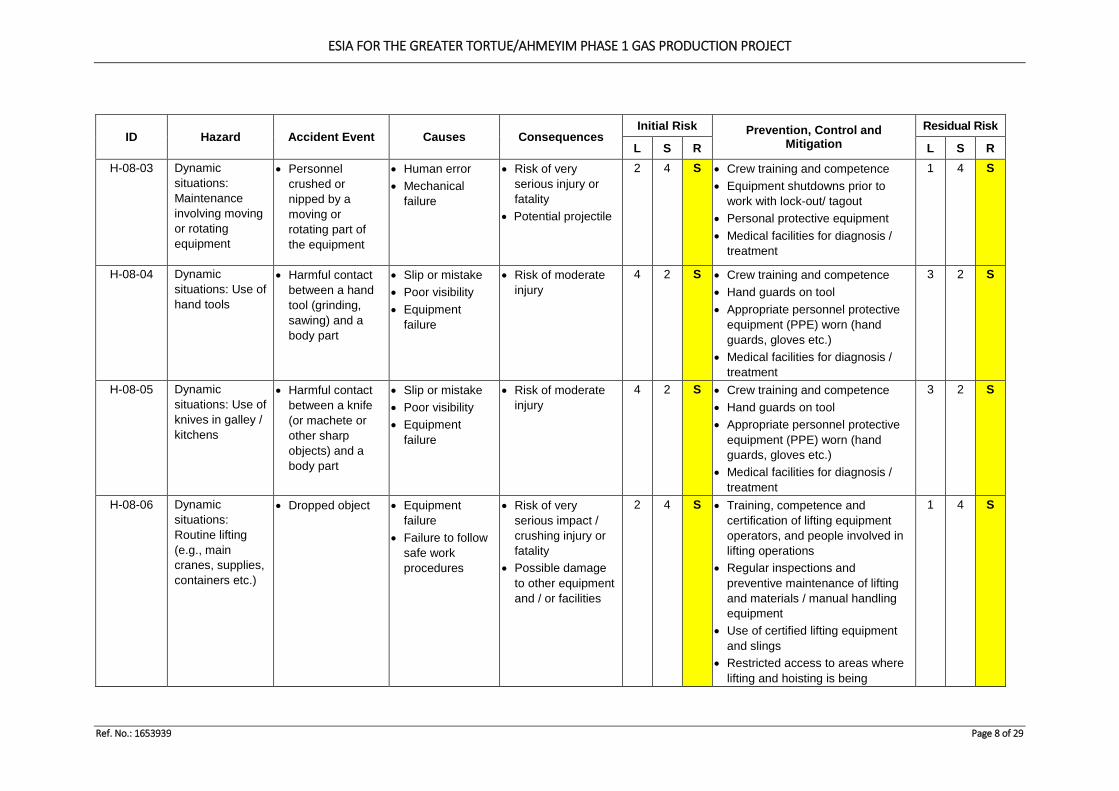
ESIA FOR THE GREATER TORTUE/AHMEYIM PHASE 1 GAS PRODUCTION PROJECT
Ref. No.: 1653939 Page 8 of 29
ID Hazard Accident Event Causes Consequences Initial Risk Prevention, Control and
Mitigation Residual Risk
L S R L S R H-08-03 Dynamic
situations: Maintenance involving moving or rotating equipment
• Personnel crushed or nipped by a moving or rotating part of the equipment
• Human error • Mechanical
failure
• Risk of very serious injury or fatality
• Potential projectile
2 4 S • Crew training and competence • Equipment shutdowns prior to
work with lock-out/ tagout • Personal protective equipment • Medical facilities for diagnosis /
treatment
1 4 S
H-08-04 Dynamic situations: Use of hand tools
• Harmful contact between a hand tool (grinding, sawing) and a body part
• Slip or mistake • Poor visibility • Equipment
failure
• Risk of moderate injury
4 2 S • Crew training and competence • Hand guards on tool • Appropriate personnel protective
equipment (PPE) worn (hand guards, gloves etc.)
• Medical facilities for diagnosis / treatment
3 2 S
H-08-05 Dynamic situations: Use of knives in galley / kitchens
• Harmful contact between a knife (or machete or other sharp objects) and a body part
• Slip or mistake • Poor visibility • Equipment
failure
• Risk of moderate injury
4 2 S • Crew training and competence • Hand guards on tool • Appropriate personnel protective
equipment (PPE) worn (hand guards, gloves etc.)
• Medical facilities for diagnosis / treatment
3 2 S
H-08-06 Dynamic situations: Routine lifting (e.g., main cranes, supplies, containers etc.)
• Dropped object • Equipment failure
• Failure to follow safe work procedures
• Risk of very serious impact / crushing injury or fatality
• Possible damage to other equipment and / or facilities
2 4 S • Training, competence and certification of lifting equipment operators, and people involved in lifting operations
• Regular inspections and preventive maintenance of lifting and materials / manual handling equipment
• Use of certified lifting equipment and slings
• Restricted access to areas where lifting and hoisting is being
1 4 S
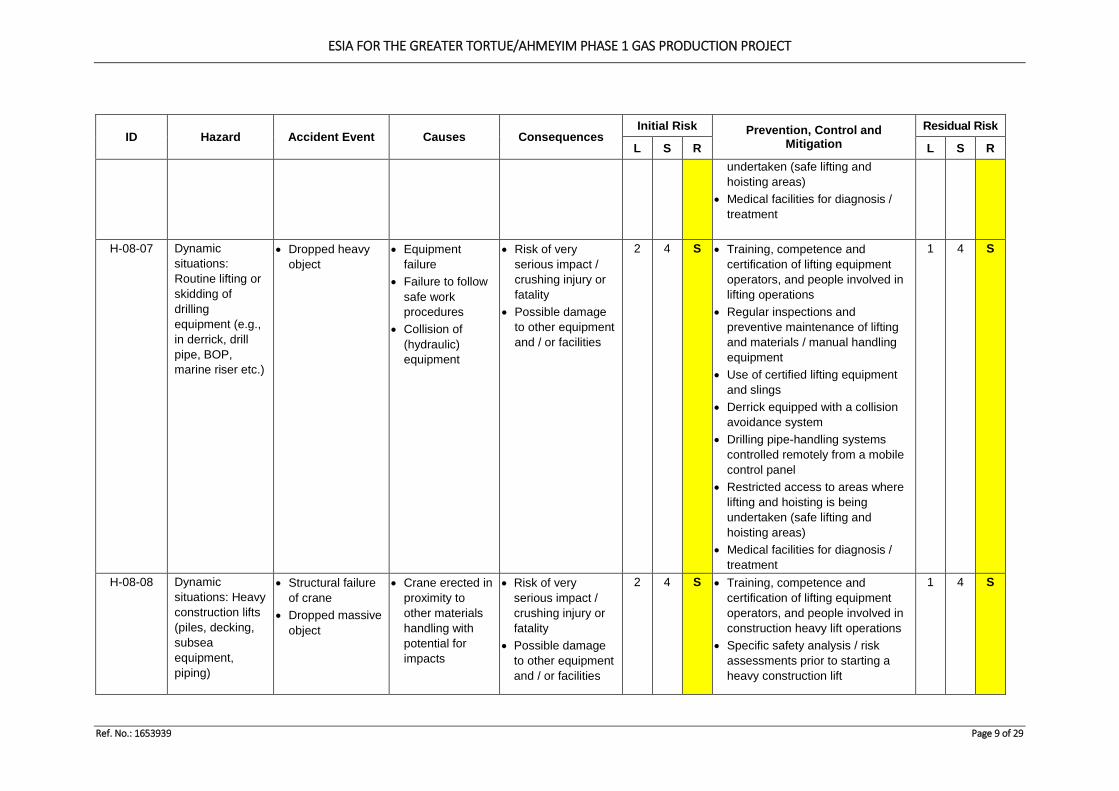
ESIA FOR THE GREATER TORTUE/AHMEYIM PHASE 1 GAS PRODUCTION PROJECT
Ref. No.: 1653939 Page 9 of 29
ID Hazard Accident Event Causes Consequences Initial Risk Prevention, Control and
Mitigation Residual Risk
L S R L S R undertaken (safe lifting and hoisting areas)
• Medical facilities for diagnosis / treatment
H-08-07 Dynamic situations: Routine lifting or skidding of drilling equipment (e.g., in derrick, drill pipe, BOP, marine riser etc.)
• Dropped heavy object
• Equipment failure
• Failure to follow safe work procedures
• Collision of (hydraulic) equipment
• Risk of very serious impact / crushing injury or fatality
• Possible damage to other equipment and / or facilities
2 4 S • Training, competence and certification of lifting equipment operators, and people involved in lifting operations
• Regular inspections and preventive maintenance of lifting and materials / manual handling equipment
• Use of certified lifting equipment and slings
• Derrick equipped with a collision avoidance system
• Drilling pipe-handling systems controlled remotely from a mobile control panel
• Restricted access to areas where lifting and hoisting is being undertaken (safe lifting and hoisting areas)
• Medical facilities for diagnosis / treatment
1 4 S
H-08-08 Dynamic situations: Heavy construction lifts (piles, decking, subsea equipment, piping)
• Structural failure of crane
• Dropped massive object
• Crane erected in proximity to other materials handling with potential for impacts
• Risk of very serious impact / crushing injury or fatality
• Possible damage to other equipment and / or facilities
2 4 S • Training, competence and certification of lifting equipment operators, and people involved in construction heavy lift operations
• Specific safety analysis / risk assessments prior to starting a heavy construction lift
1 4 S
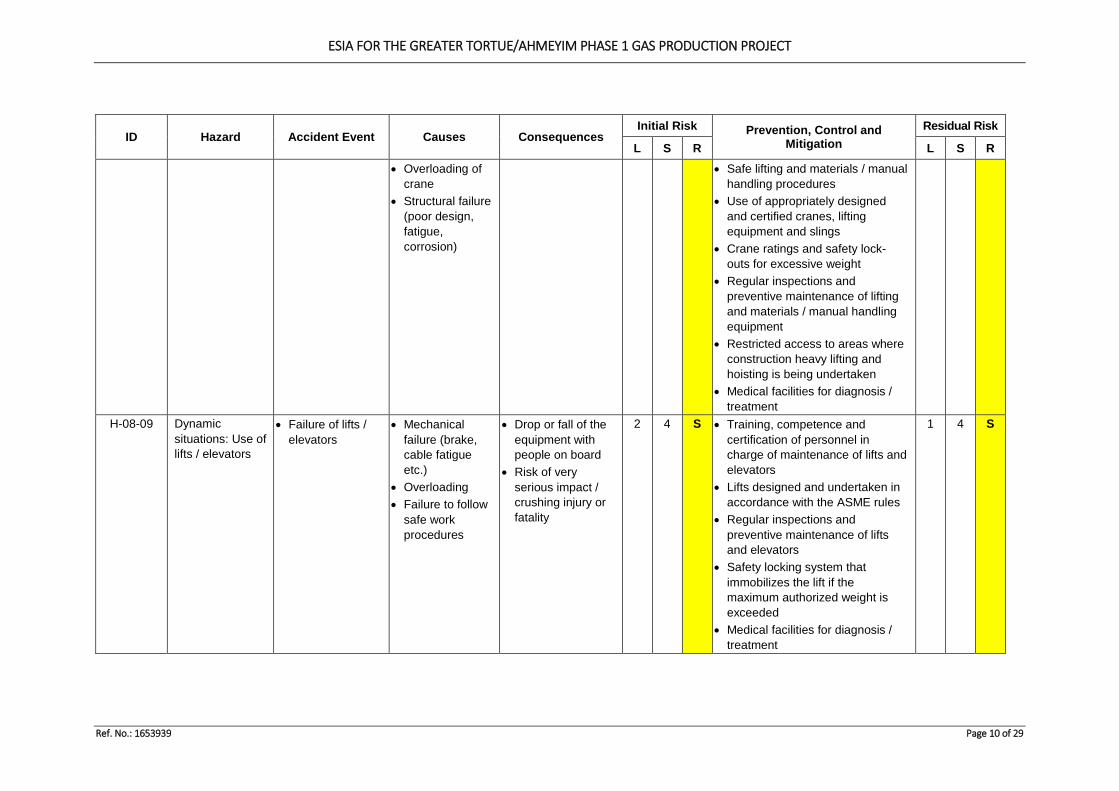
ESIA FOR THE GREATER TORTUE/AHMEYIM PHASE 1 GAS PRODUCTION PROJECT
Ref. No.: 1653939 Page 10 of 29
ID Hazard Accident Event Causes Consequences Initial Risk Prevention, Control and
Mitigation Residual Risk
L S R L S R • Overloading of
crane • Structural failure
(poor design, fatigue, corrosion)
• Safe lifting and materials / manual handling procedures
• Use of appropriately designed and certified cranes, lifting equipment and slings
• Crane ratings and safety lock-outs for excessive weight
• Regular inspections and preventive maintenance of lifting and materials / manual handling equipment
• Restricted access to areas where construction heavy lifting and hoisting is being undertaken
• Medical facilities for diagnosis / treatment
H-08-09 Dynamic situations: Use of lifts / elevators
• Failure of lifts / elevators
• Mechanical failure (brake, cable fatigue etc.)
• Overloading • Failure to follow
safe work procedures
• Drop or fall of the equipment with people on board
• Risk of very serious impact / crushing injury or fatality
2 4 S • Training, competence and certification of personnel in charge of maintenance of lifts and elevators
• Lifts designed and undertaken in accordance with the ASME rules
• Regular inspections and preventive maintenance of lifts and elevators
• Safety locking system that immobilizes the lift if the maximum authorized weight is exceeded
• Medical facilities for diagnosis / treatment
1 4 S
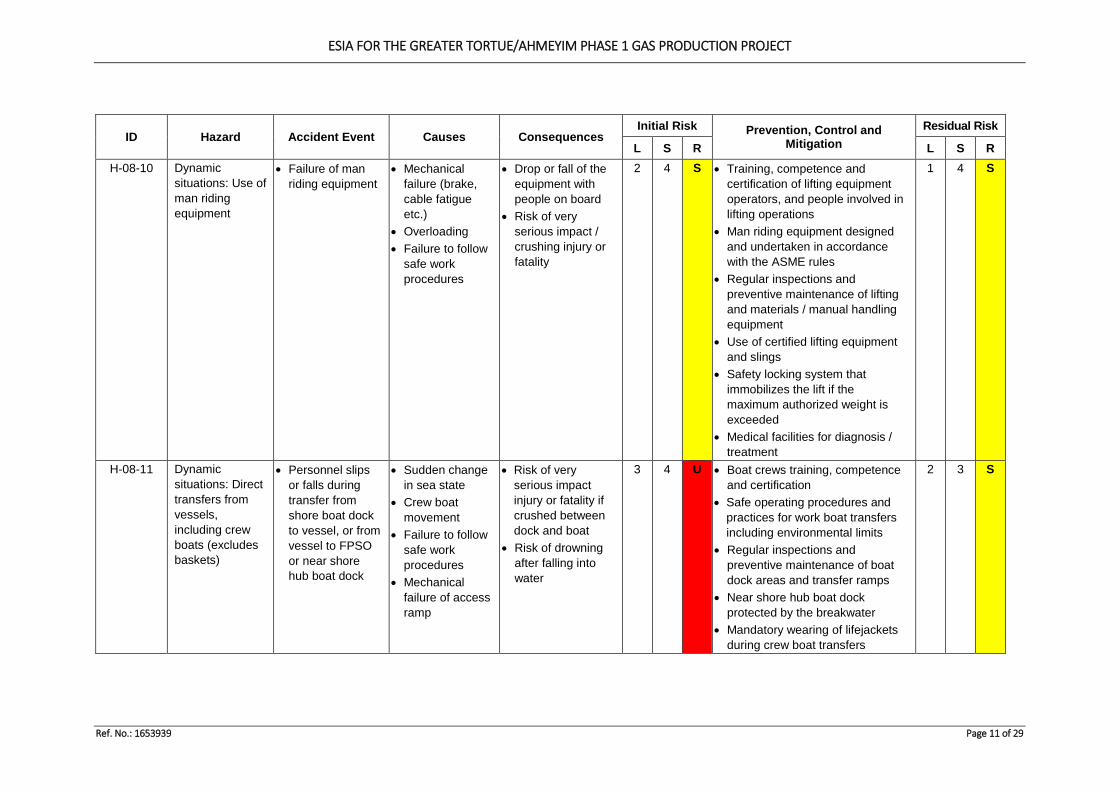
ESIA FOR THE GREATER TORTUE/AHMEYIM PHASE 1 GAS PRODUCTION PROJECT
Ref. No.: 1653939 Page 11 of 29
ID Hazard Accident Event Causes Consequences Initial Risk Prevention, Control and
Mitigation Residual Risk
L S R L S R H-08-10 Dynamic
situations: Use of man riding equipment
• Failure of man riding equipment
• Mechanical failure (brake, cable fatigue etc.)
• Overloading • Failure to follow
safe work procedures
• Drop or fall of the equipment with people on board
• Risk of very serious impact / crushing injury or fatality
2 4 S • Training, competence and certification of lifting equipment operators, and people involved in lifting operations
• Man riding equipment designed and undertaken in accordance with the ASME rules
• Regular inspections and preventive maintenance of lifting and materials / manual handling equipment
• Use of certified lifting equipment and slings
• Safety locking system that immobilizes the lift if the maximum authorized weight is exceeded
• Medical facilities for diagnosis / treatment
1 4 S
H-08-11 Dynamic situations: Direct transfers from vessels, including crew boats (excludes baskets)
• Personnel slips or falls during transfer from shore boat dock to vessel, or from vessel to FPSO or near shore hub boat dock
• Sudden change in sea state
• Crew boat movement
• Failure to follow safe work procedures
• Mechanical failure of access ramp
• Risk of very serious impact injury or fatality if crushed between dock and boat
• Risk of drowning after falling into water
3 4 U • Boat crews training, competence and certification
• Safe operating procedures and practices for work boat transfers including environmental limits
• Regular inspections and preventive maintenance of boat dock areas and transfer ramps
• Near shore hub boat dock protected by the breakwater
• Mandatory wearing of lifejackets during crew boat transfers
2 3 S
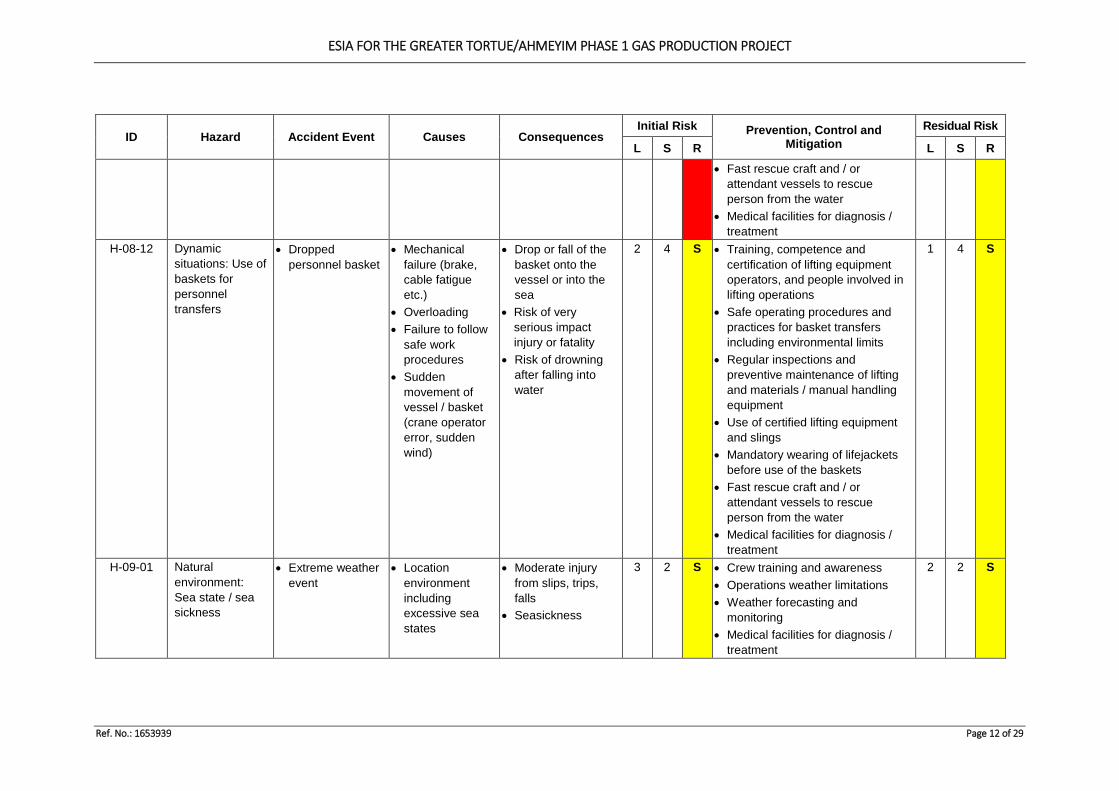
ESIA FOR THE GREATER TORTUE/AHMEYIM PHASE 1 GAS PRODUCTION PROJECT
Ref. No.: 1653939 Page 12 of 29
ID Hazard Accident Event Causes Consequences Initial Risk Prevention, Control and
Mitigation Residual Risk
L S R L S R • Fast rescue craft and / or
attendant vessels to rescue person from the water
• Medical facilities for diagnosis / treatment
H-08-12 Dynamic situations: Use of baskets for personnel transfers
• Dropped personnel basket
• Mechanical failure (brake, cable fatigue etc.)
• Overloading • Failure to follow
safe work procedures
• Sudden movement of vessel / basket (crane operator error, sudden wind)
• Drop or fall of the basket onto the vessel or into the sea
• Risk of very serious impact injury or fatality
• Risk of drowning after falling into water
2 4 S • Training, competence and certification of lifting equipment operators, and people involved in lifting operations
• Safe operating procedures and practices for basket transfers including environmental limits
• Regular inspections and preventive maintenance of lifting and materials / manual handling equipment
• Use of certified lifting equipment and slings
• Mandatory wearing of lifejackets before use of the baskets
• Fast rescue craft and / or attendant vessels to rescue person from the water
• Medical facilities for diagnosis / treatment
1 4 S
H-09-01 Natural environment: Sea state / sea sickness
• Extreme weather event
• Location environment including excessive sea states
• Moderate injury from slips, trips, falls
• Seasickness
3 2 S • Crew training and awareness • Operations weather limitations • Weather forecasting and
monitoring • Medical facilities for diagnosis /
treatment
2 2 S
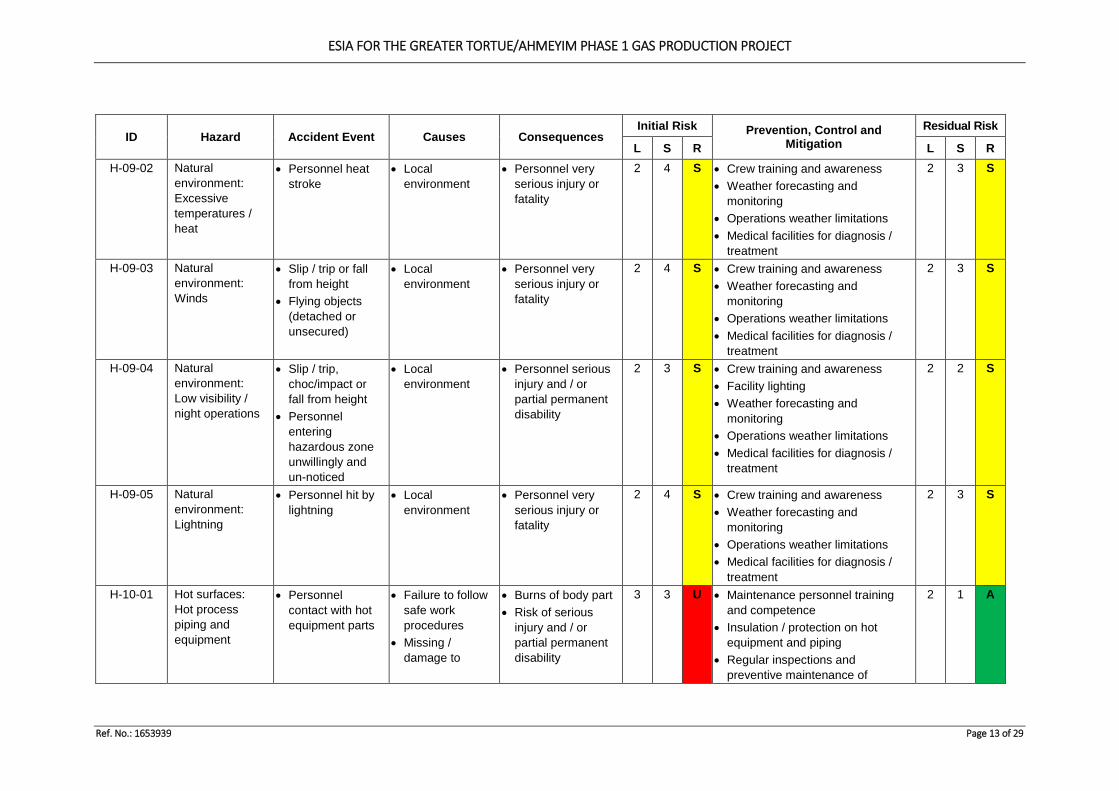
ESIA FOR THE GREATER TORTUE/AHMEYIM PHASE 1 GAS PRODUCTION PROJECT
Ref. No.: 1653939 Page 13 of 29
ID Hazard Accident Event Causes Consequences Initial Risk Prevention, Control and
Mitigation Residual Risk
L S R L S R H-09-02 Natural
environment: Excessive temperatures / heat
• Personnel heat stroke
• Local environment
• Personnel very serious injury or fatality
2 4 S • Crew training and awareness • Weather forecasting and
monitoring • Operations weather limitations • Medical facilities for diagnosis /
treatment
2 3 S
H-09-03 Natural environment: Winds
• Slip / trip or fall from height
• Flying objects (detached or unsecured)
• Local environment
• Personnel very serious injury or fatality
2 4 S • Crew training and awareness • Weather forecasting and
monitoring • Operations weather limitations • Medical facilities for diagnosis /
treatment
2 3 S
H-09-04 Natural environment: Low visibility / night operations
• Slip / trip, choc/impact or fall from height
• Personnel entering hazardous zone unwillingly and un-noticed
• Local environment
• Personnel serious injury and / or partial permanent disability
2 3 S • Crew training and awareness • Facility lighting • Weather forecasting and
monitoring • Operations weather limitations • Medical facilities for diagnosis /
treatment
2 2 S
H-09-05 Natural environment: Lightning
• Personnel hit by lightning
• Local environment
• Personnel very serious injury or fatality
2 4 S • Crew training and awareness • Weather forecasting and
monitoring • Operations weather limitations • Medical facilities for diagnosis /
treatment
2 3 S
H-10-01 Hot surfaces: Hot process piping and equipment
• Personnel contact with hot equipment parts
• Failure to follow safe work procedures
• Missing / damage to
• Burns of body part • Risk of serious
injury and / or partial permanent disability
3 3 U • Maintenance personnel training and competence
• Insulation / protection on hot equipment and piping
• Regular inspections and preventive maintenance of
2 1 A
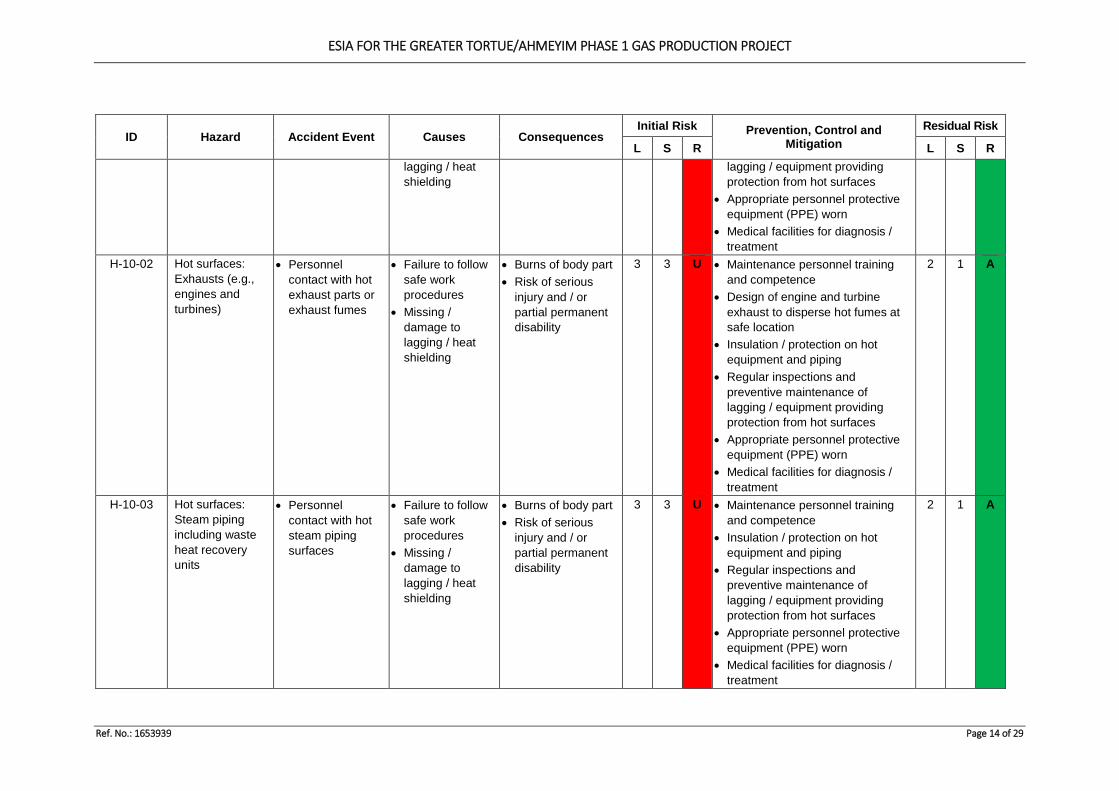
ESIA FOR THE GREATER TORTUE/AHMEYIM PHASE 1 GAS PRODUCTION PROJECT
Ref. No.: 1653939 Page 14 of 29
ID Hazard Accident Event Causes Consequences Initial Risk Prevention, Control and
Mitigation Residual Risk
L S R L S R lagging / heat shielding
lagging / equipment providing protection from hot surfaces
• Appropriate personnel protective equipment (PPE) worn
• Medical facilities for diagnosis / treatment
H-10-02 Hot surfaces: Exhausts (e.g., engines and turbines)
• Personnel contact with hot exhaust parts or exhaust fumes
• Failure to follow safe work procedures
• Missing / damage to lagging / heat shielding
• Burns of body part • Risk of serious
injury and / or partial permanent disability
3 3 U • Maintenance personnel training and competence
• Design of engine and turbine exhaust to disperse hot fumes at safe location
• Insulation / protection on hot equipment and piping
• Regular inspections and preventive maintenance of lagging / equipment providing protection from hot surfaces
• Appropriate personnel protective equipment (PPE) worn
• Medical facilities for diagnosis / treatment
2 1 A
H-10-03 Hot surfaces: Steam piping including waste heat recovery units
• Personnel contact with hot steam piping surfaces
• Failure to follow safe work procedures
• Missing / damage to lagging / heat shielding
• Burns of body part • Risk of serious
injury and / or partial permanent disability
3 3 U • Maintenance personnel training and competence
• Insulation / protection on hot equipment and piping
• Regular inspections and preventive maintenance of lagging / equipment providing protection from hot surfaces
• Appropriate personnel protective equipment (PPE) worn
• Medical facilities for diagnosis / treatment
2 1 A
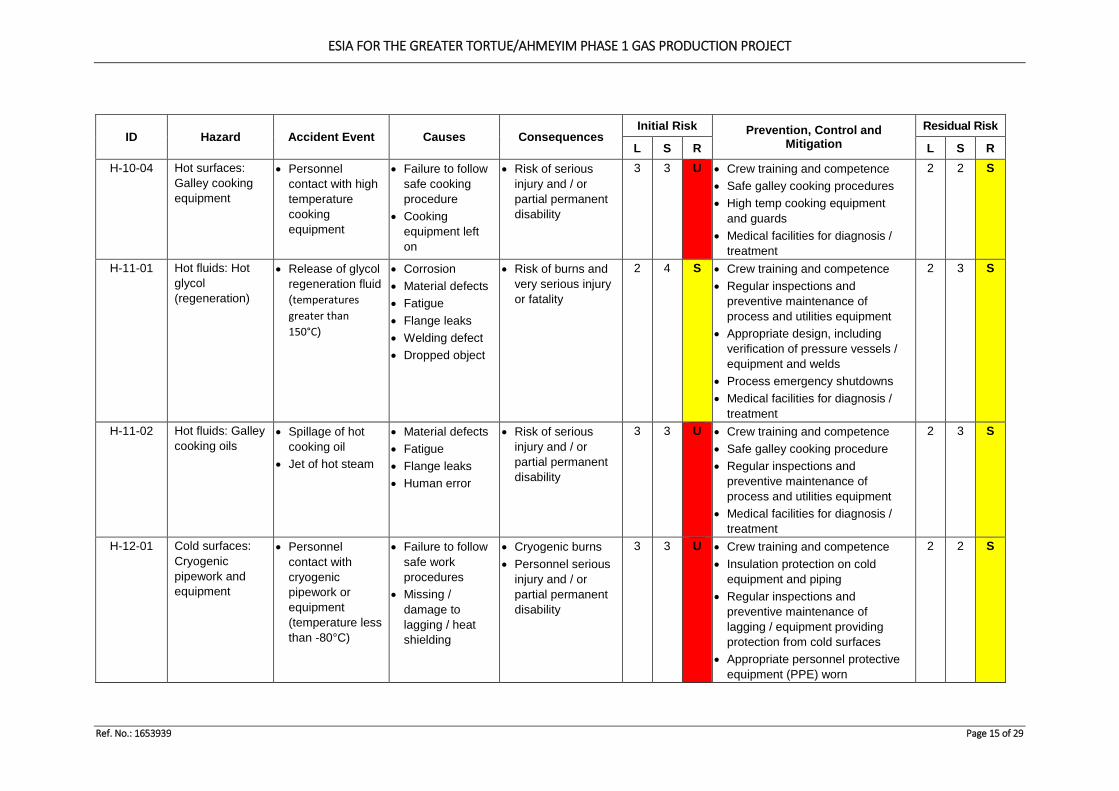
ESIA FOR THE GREATER TORTUE/AHMEYIM PHASE 1 GAS PRODUCTION PROJECT
Ref. No.: 1653939 Page 15 of 29
ID Hazard Accident Event Causes Consequences Initial Risk Prevention, Control and
Mitigation Residual Risk
L S R L S R H-10-04 Hot surfaces:
Galley cooking equipment
• Personnel contact with high temperature cooking equipment
• Failure to follow safe cooking procedure
• Cooking equipment left on
• Risk of serious injury and / or partial permanent disability
3 3 U • Crew training and competence • Safe galley cooking procedures • High temp cooking equipment
and guards • Medical facilities for diagnosis /
treatment
2 2 S
H-11-01 Hot fluids: Hot glycol (regeneration)
• Release of glycol regeneration fluid (temperatures greater than 150°C)
• Corrosion • Material defects • Fatigue • Flange leaks • Welding defect • Dropped object
• Risk of burns and very serious injury or fatality
2 4 S • Crew training and competence • Regular inspections and
preventive maintenance of process and utilities equipment
• Appropriate design, including verification of pressure vessels / equipment and welds
• Process emergency shutdowns • Medical facilities for diagnosis /
treatment
2 3 S
H-11-02 Hot fluids: Galley cooking oils
• Spillage of hot cooking oil
• Jet of hot steam
• Material defects • Fatigue • Flange leaks • Human error
• Risk of serious injury and / or partial permanent disability
3 3 U • Crew training and competence • Safe galley cooking procedure • Regular inspections and
preventive maintenance of process and utilities equipment
• Medical facilities for diagnosis / treatment
2 3 S
H-12-01 Cold surfaces: Cryogenic pipework and equipment
• Personnel contact with cryogenic pipework or equipment (temperature less than -80°C)
• Failure to follow safe work procedures
• Missing / damage to lagging / heat shielding
• Cryogenic burns • Personnel serious
injury and / or partial permanent disability
3 3 U • Crew training and competence • Insulation protection on cold
equipment and piping • Regular inspections and
preventive maintenance of lagging / equipment providing protection from cold surfaces
• Appropriate personnel protective equipment (PPE) worn
2 2 S
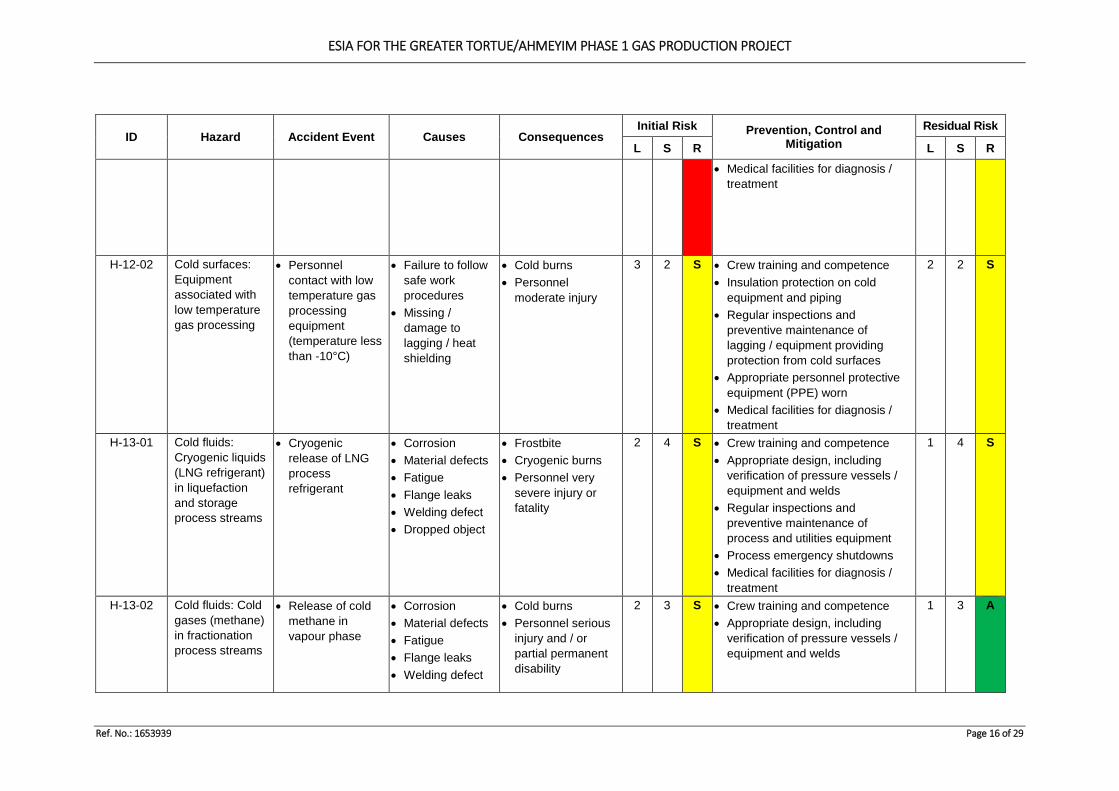
ESIA FOR THE GREATER TORTUE/AHMEYIM PHASE 1 GAS PRODUCTION PROJECT
Ref. No.: 1653939 Page 16 of 29
ID Hazard Accident Event Causes Consequences Initial Risk Prevention, Control and
Mitigation Residual Risk
L S R L S R • Medical facilities for diagnosis /
treatment
H-12-02 Cold surfaces: Equipment associated with low temperature gas processing
• Personnel contact with low temperature gas processing equipment (temperature less than -10°C)
• Failure to follow safe work procedures
• Missing / damage to lagging / heat shielding
• Cold burns • Personnel
moderate injury
3 2 S • Crew training and competence • Insulation protection on cold
equipment and piping • Regular inspections and
preventive maintenance of lagging / equipment providing protection from cold surfaces
• Appropriate personnel protective equipment (PPE) worn
• Medical facilities for diagnosis / treatment
2 2 S
H-13-01 Cold fluids: Cryogenic liquids (LNG refrigerant) in liquefaction and storage process streams
• Cryogenic release of LNG process refrigerant
• Corrosion • Material defects • Fatigue • Flange leaks • Welding defect • Dropped object
• Frostbite • Cryogenic burns • Personnel very
severe injury or fatality
2 4 S • Crew training and competence • Appropriate design, including
verification of pressure vessels / equipment and welds
• Regular inspections and preventive maintenance of process and utilities equipment
• Process emergency shutdowns • Medical facilities for diagnosis /
treatment
1 4 S
H-13-02 Cold fluids: Cold gases (methane) in fractionation process streams
• Release of cold methane in vapour phase
• Corrosion • Material defects • Fatigue • Flange leaks • Welding defect
• Cold burns • Personnel serious
injury and / or partial permanent disability
2 3 S • Crew training and competence • Appropriate design, including
verification of pressure vessels / equipment and welds
1 3 A
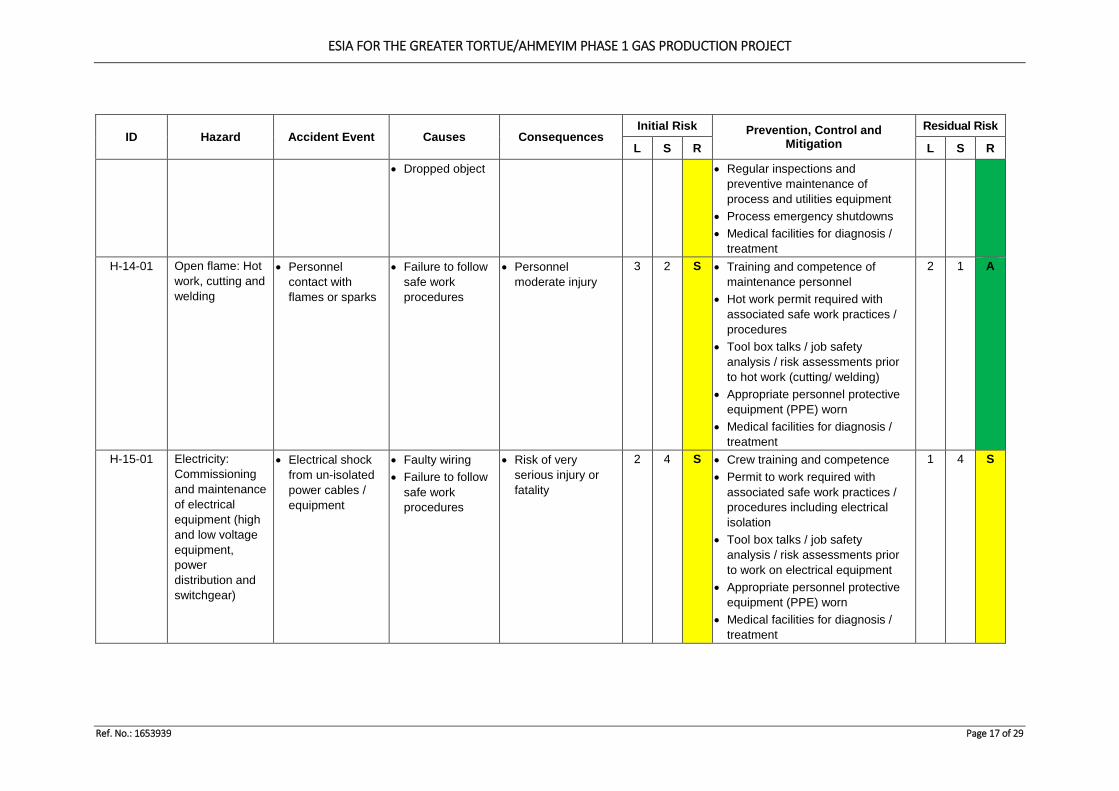
ESIA FOR THE GREATER TORTUE/AHMEYIM PHASE 1 GAS PRODUCTION PROJECT
Ref. No.: 1653939 Page 17 of 29
ID Hazard Accident Event Causes Consequences Initial Risk Prevention, Control and
Mitigation Residual Risk
L S R L S R • Dropped object • Regular inspections and
preventive maintenance of process and utilities equipment
• Process emergency shutdowns • Medical facilities for diagnosis /
treatment H-14-01 Open flame: Hot
work, cutting and welding
• Personnel contact with flames or sparks
• Failure to follow safe work procedures
• Personnel moderate injury
3 2 S • Training and competence of maintenance personnel
• Hot work permit required with associated safe work practices / procedures
• Tool box talks / job safety analysis / risk assessments prior to hot work (cutting/ welding)
• Appropriate personnel protective equipment (PPE) worn
• Medical facilities for diagnosis / treatment
2 1 A
H-15-01 Electricity: Commissioning and maintenance of electrical equipment (high and low voltage equipment, power distribution and switchgear)
• Electrical shock from un-isolated power cables / equipment
• Faulty wiring • Failure to follow
safe work procedures
• Risk of very serious injury or fatality
2 4 S • Crew training and competence • Permit to work required with
associated safe work practices / procedures including electrical isolation
• Tool box talks / job safety analysis / risk assessments prior to work on electrical equipment
• Appropriate personnel protective equipment (PPE) worn
• Medical facilities for diagnosis / treatment
1 4 S
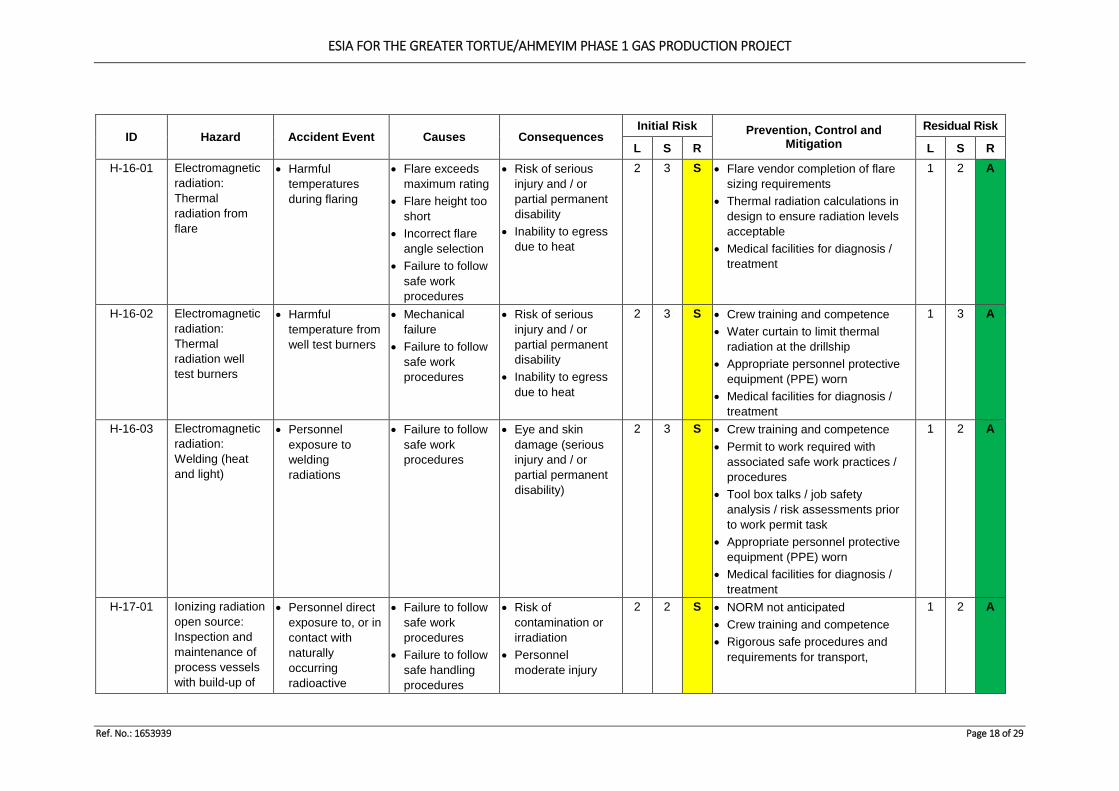
ESIA FOR THE GREATER TORTUE/AHMEYIM PHASE 1 GAS PRODUCTION PROJECT
Ref. No.: 1653939 Page 18 of 29
ID Hazard Accident Event Causes Consequences Initial Risk Prevention, Control and
Mitigation Residual Risk
L S R L S R H-16-01 Electromagnetic
radiation: Thermal radiation from flare
• Harmful temperatures during flaring
• Flare exceeds maximum rating
• Flare height too short
• Incorrect flare angle selection
• Failure to follow safe work procedures
• Risk of serious injury and / or partial permanent disability
• Inability to egress due to heat
2 3 S • Flare vendor completion of flare sizing requirements
• Thermal radiation calculations in design to ensure radiation levels acceptable
• Medical facilities for diagnosis / treatment
1 2 A
H-16-02 Electromagnetic radiation: Thermal radiation well test burners
• Harmful temperature from well test burners
• Mechanical failure
• Failure to follow safe work procedures
• Risk of serious injury and / or partial permanent disability
• Inability to egress due to heat
2 3 S • Crew training and competence • Water curtain to limit thermal
radiation at the drillship • Appropriate personnel protective
equipment (PPE) worn • Medical facilities for diagnosis /
treatment
1 3 A
H-16-03 Electromagnetic radiation: Welding (heat and light)
• Personnel exposure to welding radiations
• Failure to follow safe work procedures
• Eye and skin damage (serious injury and / or partial permanent disability)
2 3 S • Crew training and competence • Permit to work required with
associated safe work practices / procedures
• Tool box talks / job safety analysis / risk assessments prior to work permit task
• Appropriate personnel protective equipment (PPE) worn
• Medical facilities for diagnosis / treatment
1 2 A
H-17-01 Ionizing radiation open source: Inspection and maintenance of process vessels with build-up of
• Personnel direct exposure to, or in contact with naturally occurring radioactive
• Failure to follow safe work procedures
• Failure to follow safe handling procedures
• Risk of contamination or irradiation
• Personnel moderate injury
2 2 S • NORM not anticipated • Crew training and competence • Rigorous safe procedures and
requirements for transport,
1 2 A
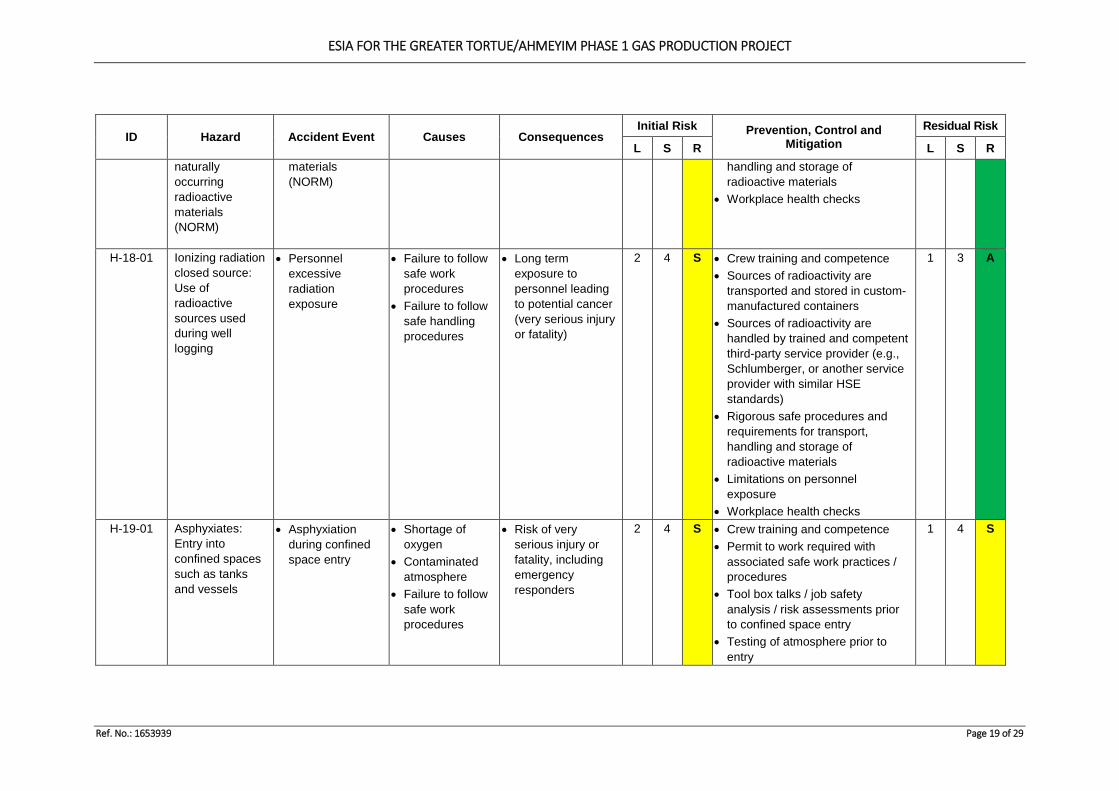
ESIA FOR THE GREATER TORTUE/AHMEYIM PHASE 1 GAS PRODUCTION PROJECT
Ref. No.: 1653939 Page 19 of 29
ID Hazard Accident Event Causes Consequences Initial Risk Prevention, Control and
Mitigation Residual Risk
L S R L S R naturally occurring radioactive materials (NORM)
materials (NORM)
handling and storage of radioactive materials
• Workplace health checks
H-18-01 Ionizing radiation closed source: Use of radioactive sources used during well logging
• Personnel excessive radiation exposure
• Failure to follow safe work procedures
• Failure to follow safe handling procedures
• Long term exposure to personnel leading to potential cancer (very serious injury or fatality)
2 4 S • Crew training and competence • Sources of radioactivity are
transported and stored in custom-manufactured containers
• Sources of radioactivity are handled by trained and competent third-party service provider (e.g., Schlumberger, or another service provider with similar HSE standards)
• Rigorous safe procedures and requirements for transport, handling and storage of radioactive materials
• Limitations on personnel exposure
• Workplace health checks
1 3 A
H-19-01 Asphyxiates: Entry into confined spaces such as tanks and vessels
• Asphyxiation during confined space entry
• Shortage of oxygen
• Contaminated atmosphere
• Failure to follow safe work procedures
• Risk of very serious injury or fatality, including emergency responders
2 4 S • Crew training and competence • Permit to work required with
associated safe work practices / procedures
• Tool box talks / job safety analysis / risk assessments prior to confined space entry
• Testing of atmosphere prior to entry
1 4 S
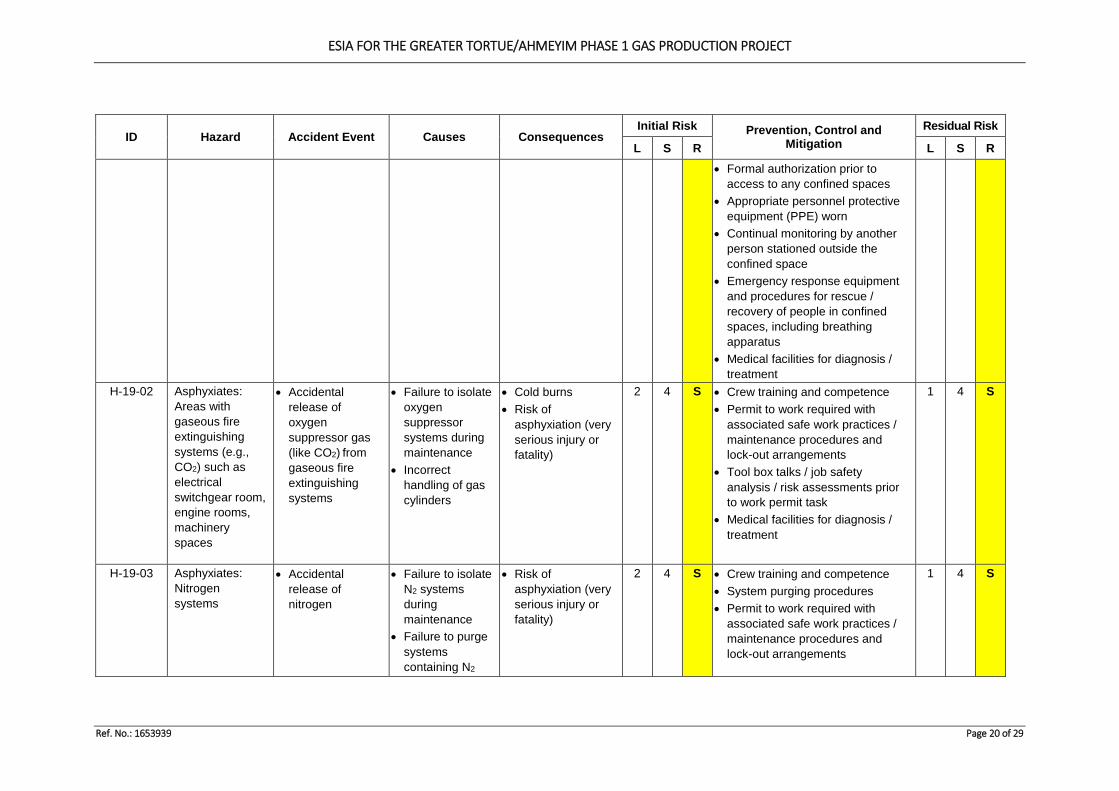
ESIA FOR THE GREATER TORTUE/AHMEYIM PHASE 1 GAS PRODUCTION PROJECT
Ref. No.: 1653939 Page 20 of 29
ID Hazard Accident Event Causes Consequences Initial Risk Prevention, Control and
Mitigation Residual Risk
L S R L S R • Formal authorization prior to
access to any confined spaces • Appropriate personnel protective
equipment (PPE) worn • Continual monitoring by another
person stationed outside the confined space
• Emergency response equipment and procedures for rescue / recovery of people in confined spaces, including breathing apparatus
• Medical facilities for diagnosis / treatment
H-19-02 Asphyxiates: Areas with gaseous fire extinguishing systems (e.g., CO2) such as electrical switchgear room, engine rooms, machinery spaces
• Accidental release of oxygen suppressor gas (like CO2) from gaseous fire extinguishing systems
• Failure to isolate oxygen suppressor systems during maintenance
• Incorrect handling of gas cylinders
• Cold burns • Risk of
asphyxiation (very serious injury or fatality)
2 4 S • Crew training and competence • Permit to work required with
associated safe work practices / maintenance procedures and lock-out arrangements
• Tool box talks / job safety analysis / risk assessments prior to work permit task
• Medical facilities for diagnosis / treatment
1 4 S
H-19-03 Asphyxiates: Nitrogen systems
• Accidental release of nitrogen
• Failure to isolate N2 systems during maintenance
• Failure to purge systems containing N2
• Risk of asphyxiation (very serious injury or fatality)
2 4 S • Crew training and competence • System purging procedures • Permit to work required with
associated safe work practices / maintenance procedures and lock-out arrangements
1 4 S
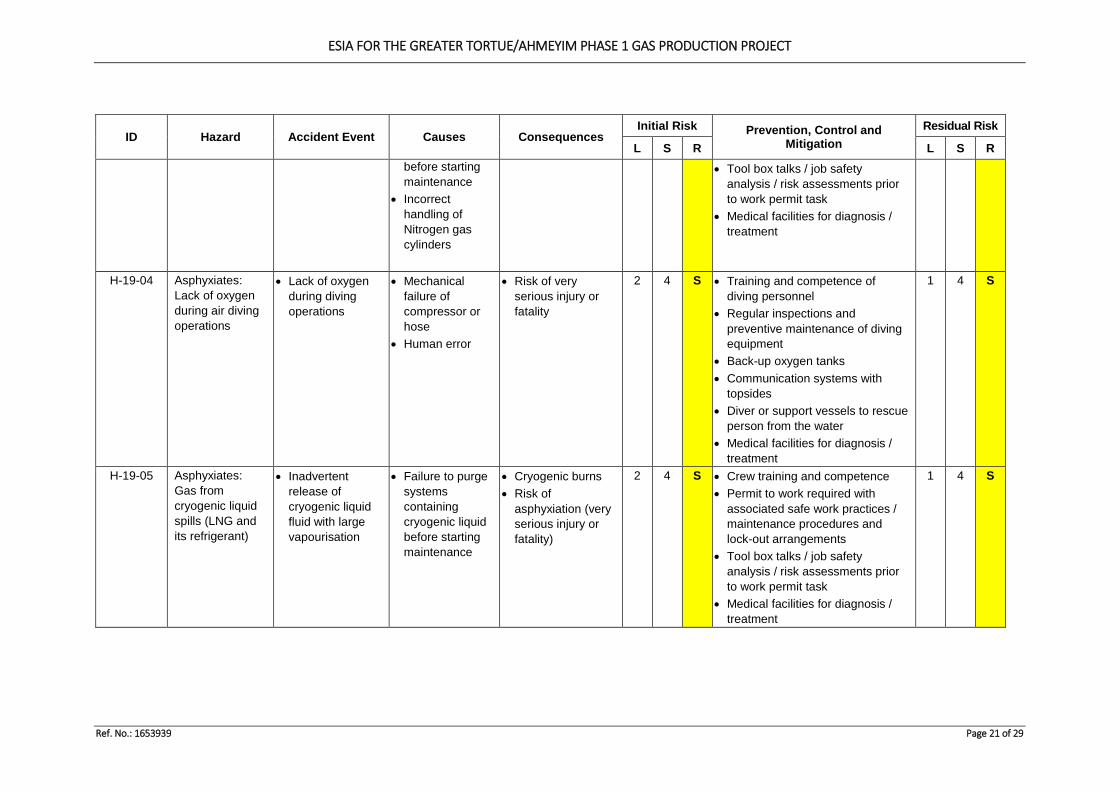
ESIA FOR THE GREATER TORTUE/AHMEYIM PHASE 1 GAS PRODUCTION PROJECT
Ref. No.: 1653939 Page 21 of 29
ID Hazard Accident Event Causes Consequences Initial Risk Prevention, Control and
Mitigation Residual Risk
L S R L S R before starting maintenance
• Incorrect handling of Nitrogen gas cylinders
• Tool box talks / job safety analysis / risk assessments prior to work permit task
• Medical facilities for diagnosis / treatment
H-19-04 Asphyxiates: Lack of oxygen during air diving operations
• Lack of oxygen during diving operations
• Mechanical failure of compressor or hose
• Human error
• Risk of very serious injury or fatality
2 4 S • Training and competence of diving personnel
• Regular inspections and preventive maintenance of diving equipment
• Back-up oxygen tanks • Communication systems with
topsides • Diver or support vessels to rescue
person from the water • Medical facilities for diagnosis /
treatment
1 4 S
H-19-05 Asphyxiates: Gas from cryogenic liquid spills (LNG and its refrigerant)
• Inadvertent release of cryogenic liquid fluid with large vapourisation
• Failure to purge systems containing cryogenic liquid before starting maintenance
• Cryogenic burns • Risk of
asphyxiation (very serious injury or fatality)
2 4 S • Crew training and competence • Permit to work required with
associated safe work practices / maintenance procedures and lock-out arrangements
• Tool box talks / job safety analysis / risk assessments prior to work permit task
• Medical facilities for diagnosis / treatment
1 4 S
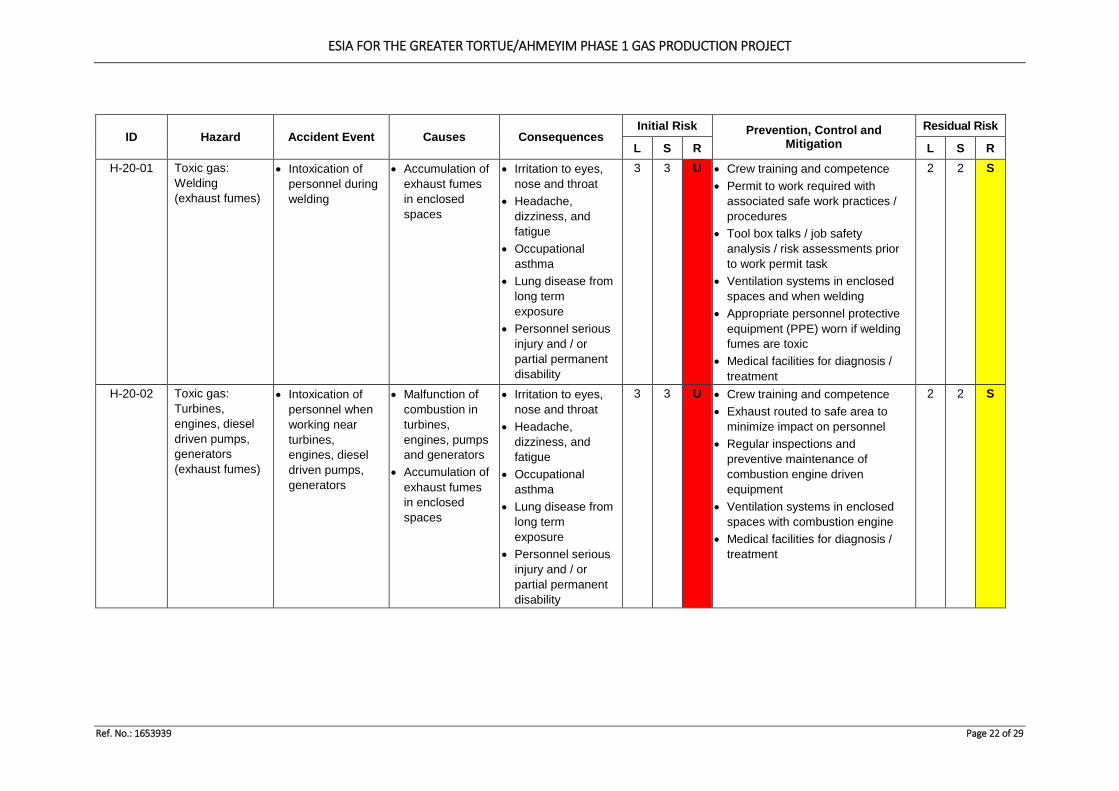
ESIA FOR THE GREATER TORTUE/AHMEYIM PHASE 1 GAS PRODUCTION PROJECT
Ref. No.: 1653939 Page 22 of 29
ID Hazard Accident Event Causes Consequences Initial Risk Prevention, Control and
Mitigation Residual Risk
L S R L S R H-20-01 Toxic gas:
Welding (exhaust fumes)
• Intoxication of personnel during welding
• Accumulation of exhaust fumes in enclosed spaces
• Irritation to eyes, nose and throat
• Headache, dizziness, and fatigue
• Occupational asthma
• Lung disease from long term exposure
• Personnel serious injury and / or partial permanent disability
3 3 U • Crew training and competence • Permit to work required with
associated safe work practices / procedures
• Tool box talks / job safety analysis / risk assessments prior to work permit task
• Ventilation systems in enclosed spaces and when welding
• Appropriate personnel protective equipment (PPE) worn if welding fumes are toxic
• Medical facilities for diagnosis / treatment
2 2 S
H-20-02 Toxic gas: Turbines, engines, diesel driven pumps, generators (exhaust fumes)
• Intoxication of personnel when working near turbines, engines, diesel driven pumps, generators
• Malfunction of combustion in turbines, engines, pumps and generators
• Accumulation of exhaust fumes in enclosed spaces
• Irritation to eyes, nose and throat
• Headache, dizziness, and fatigue
• Occupational asthma
• Lung disease from long term exposure
• Personnel serious injury and / or partial permanent disability
3 3 U • Crew training and competence • Exhaust routed to safe area to
minimize impact on personnel • Regular inspections and
preventive maintenance of combustion engine driven equipment
• Ventilation systems in enclosed spaces with combustion engine
• Medical facilities for diagnosis / treatment
2 2 S
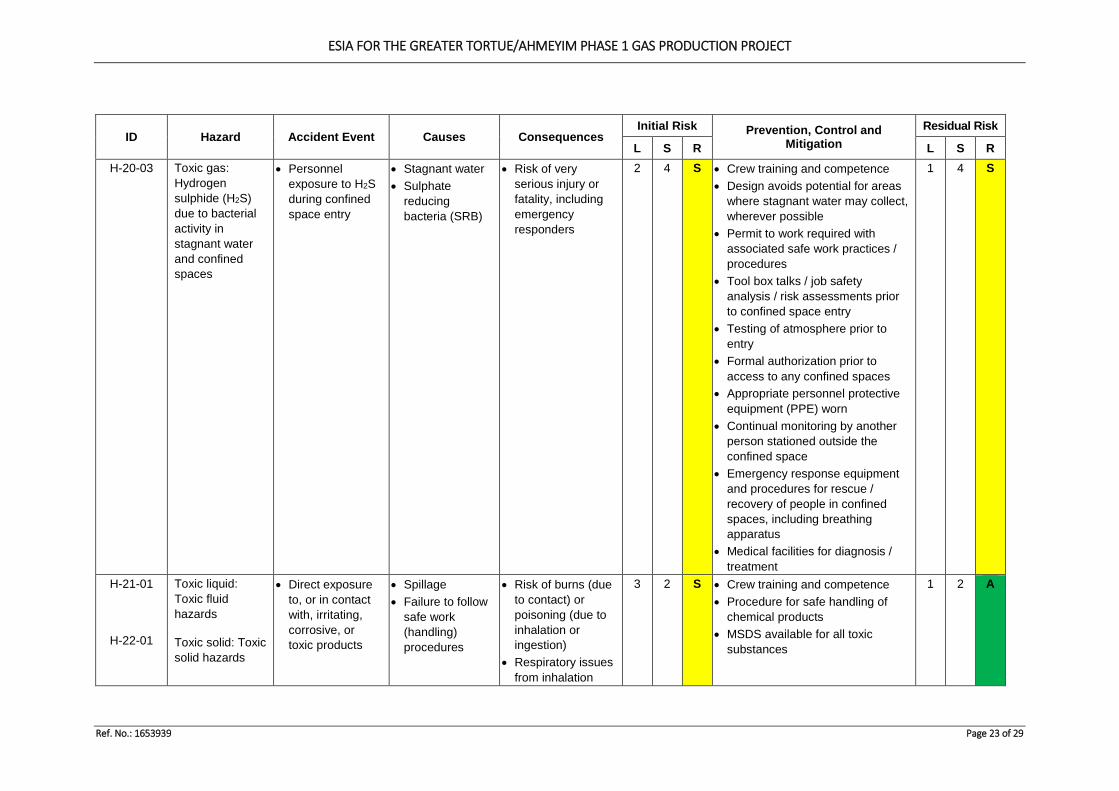
ESIA FOR THE GREATER TORTUE/AHMEYIM PHASE 1 GAS PRODUCTION PROJECT
Ref. No.: 1653939 Page 23 of 29
ID Hazard Accident Event Causes Consequences Initial Risk Prevention, Control and
Mitigation Residual Risk
L S R L S R H-20-03 Toxic gas:
Hydrogen sulphide (H2S) due to bacterial activity in stagnant water and confined spaces
• Personnel exposure to H2S during confined space entry
• Stagnant water • Sulphate
reducing bacteria (SRB)
• Risk of very serious injury or fatality, including emergency responders
2 4 S • Crew training and competence • Design avoids potential for areas
where stagnant water may collect, wherever possible
• Permit to work required with associated safe work practices / procedures
• Tool box talks / job safety analysis / risk assessments prior to confined space entry
• Testing of atmosphere prior to entry
• Formal authorization prior to access to any confined spaces
• Appropriate personnel protective equipment (PPE) worn
• Continual monitoring by another person stationed outside the confined space
• Emergency response equipment and procedures for rescue / recovery of people in confined spaces, including breathing apparatus
• Medical facilities for diagnosis / treatment
1 4 S
H-21-01
H-22-01
Toxic liquid: Toxic fluid hazards
Toxic solid: Toxic solid hazards
• Direct exposure to, or in contact with, irritating, corrosive, or toxic products
• Spillage • Failure to follow
safe work (handling) procedures
• Risk of burns (due to contact) or poisoning (due to inhalation or ingestion)
• Respiratory issues from inhalation
3 2 S • Crew training and competence • Procedure for safe handling of
chemical products • MSDS available for all toxic
substances
1 2 A
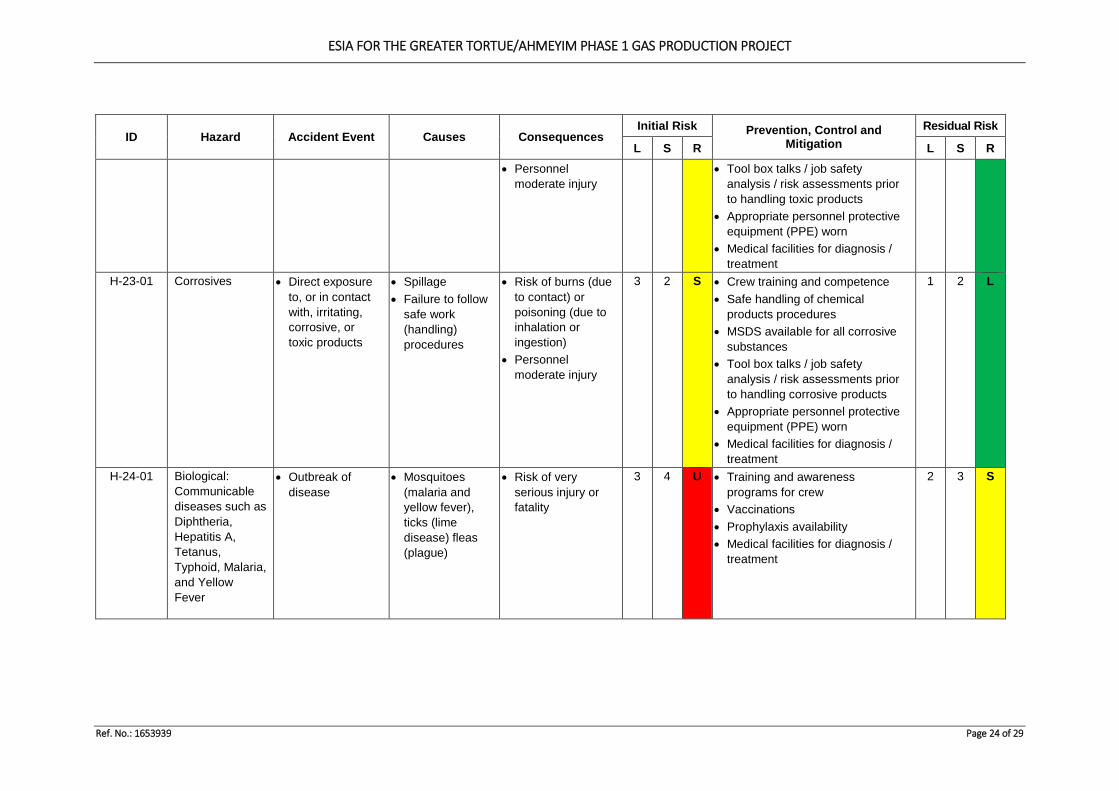
ESIA FOR THE GREATER TORTUE/AHMEYIM PHASE 1 GAS PRODUCTION PROJECT
Ref. No.: 1653939 Page 24 of 29
ID Hazard Accident Event Causes Consequences Initial Risk Prevention, Control and
Mitigation Residual Risk
L S R L S R • Personnel
moderate injury • Tool box talks / job safety
analysis / risk assessments prior to handling toxic products
• Appropriate personnel protective equipment (PPE) worn
• Medical facilities for diagnosis / treatment
H-23-01 Corrosives • Direct exposure to, or in contact with, irritating, corrosive, or toxic products
• Spillage • Failure to follow
safe work (handling) procedures
• Risk of burns (due to contact) or poisoning (due to inhalation or ingestion)
• Personnel moderate injury
3 2 S • Crew training and competence • Safe handling of chemical
products procedures • MSDS available for all corrosive
substances • Tool box talks / job safety
analysis / risk assessments prior to handling corrosive products
• Appropriate personnel protective equipment (PPE) worn
• Medical facilities for diagnosis / treatment
1 2 L
H-24-01 Biological: Communicable diseases such as Diphtheria, Hepatitis A, Tetanus, Typhoid, Malaria, and Yellow Fever
• Outbreak of disease
• Mosquitoes (malaria and yellow fever), ticks (lime disease) fleas (plague)
• Risk of very serious injury or fatality
3 4 U • Training and awareness programs for crew
• Vaccinations • Prophylaxis availability • Medical facilities for diagnosis /
treatment
2 3 S
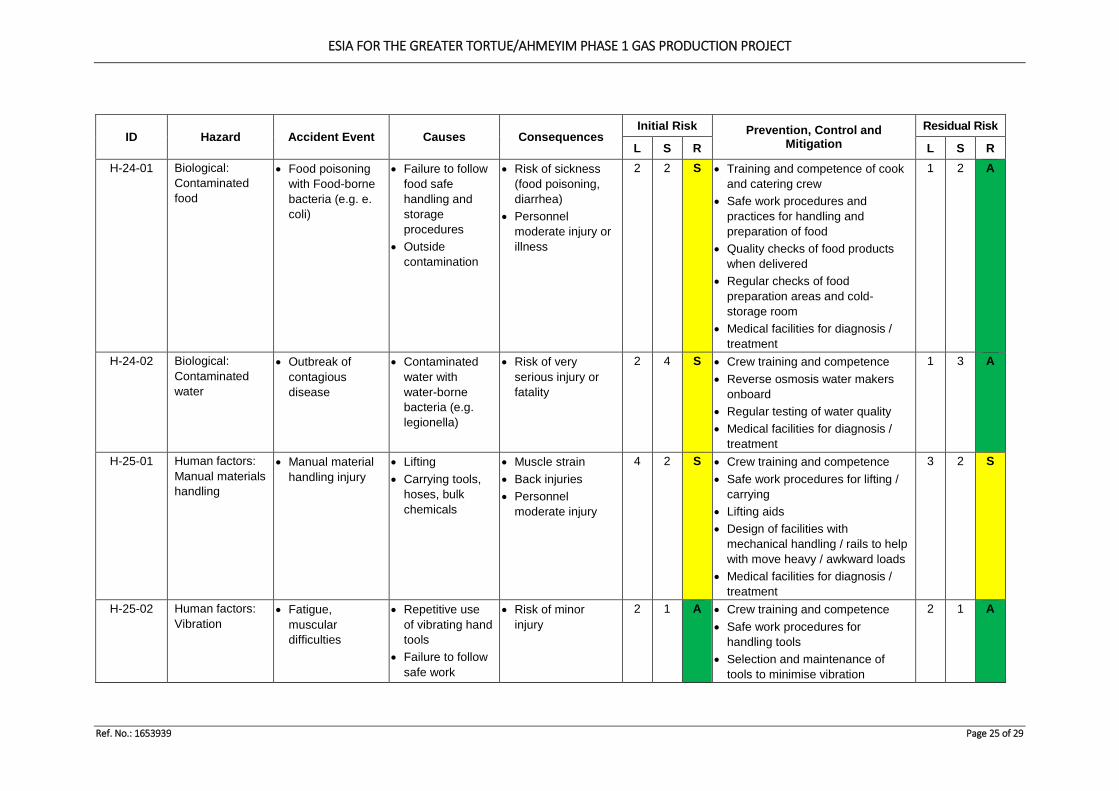
ESIA FOR THE GREATER TORTUE/AHMEYIM PHASE 1 GAS PRODUCTION PROJECT
Ref. No.: 1653939 Page 25 of 29
ID Hazard Accident Event Causes Consequences Initial Risk Prevention, Control and
Mitigation Residual Risk
L S R L S R H-24-01 Biological:
Contaminated food
• Food poisoning with Food-borne bacteria (e.g. e. coli)
• Failure to follow food safe handling and storage procedures
• Outside contamination
• Risk of sickness (food poisoning, diarrhea)
• Personnel moderate injury or illness
2 2 S • Training and competence of cook and catering crew
• Safe work procedures and practices for handling and preparation of food
• Quality checks of food products when delivered
• Regular checks of food preparation areas and cold-storage room
• Medical facilities for diagnosis / treatment
1 2 A
H-24-02 Biological: Contaminated water
• Outbreak of contagious disease
• Contaminated water with water-borne bacteria (e.g. legionella)
• Risk of very serious injury or fatality
2 4 S • Crew training and competence • Reverse osmosis water makers
onboard • Regular testing of water quality • Medical facilities for diagnosis /
treatment
1 3 A
H-25-01 Human factors: Manual materials handling
• Manual material handling injury
• Lifting • Carrying tools,
hoses, bulk chemicals
• Muscle strain • Back injuries • Personnel
moderate injury
4 2 S • Crew training and competence • Safe work procedures for lifting /
carrying • Lifting aids • Design of facilities with
mechanical handling / rails to help with move heavy / awkward loads
• Medical facilities for diagnosis / treatment
3 2 S
H-25-02 Human factors: Vibration
• Fatigue, muscular difficulties
• Repetitive use of vibrating hand tools
• Failure to follow safe work
• Risk of minor injury
2 1 A • Crew training and competence • Safe work procedures for
handling tools • Selection and maintenance of
tools to minimise vibration
2 1 A
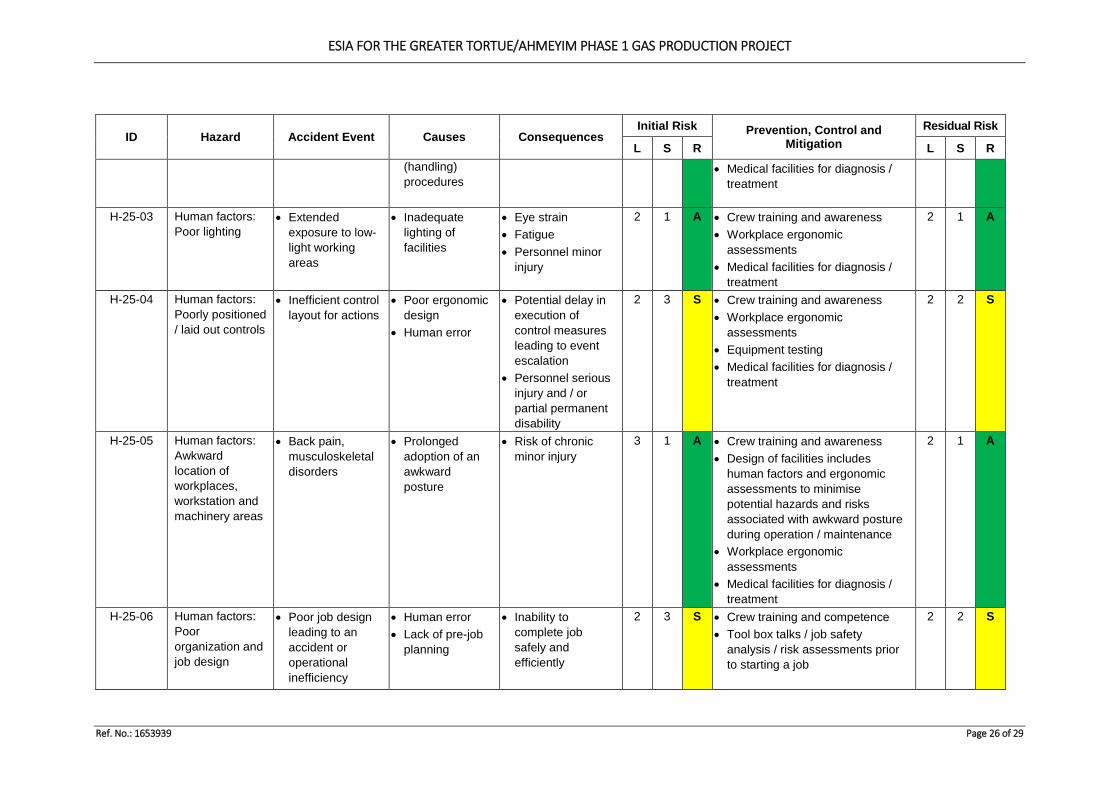
ESIA FOR THE GREATER TORTUE/AHMEYIM PHASE 1 GAS PRODUCTION PROJECT
Ref. No.: 1653939 Page 26 of 29
ID Hazard Accident Event Causes Consequences Initial Risk Prevention, Control and
Mitigation Residual Risk
L S R L S R (handling) procedures
• Medical facilities for diagnosis / treatment
H-25-03 Human factors: Poor lighting
• Extended exposure to low-light working areas
• Inadequate lighting of facilities
• Eye strain • Fatigue • Personnel minor
injury
2 1 A • Crew training and awareness • Workplace ergonomic
assessments • Medical facilities for diagnosis /
treatment
2 1 A
H-25-04 Human factors: Poorly positioned / laid out controls
• Inefficient control layout for actions
• Poor ergonomic design
• Human error
• Potential delay in execution of control measures leading to event escalation
• Personnel serious injury and / or partial permanent disability
2 3 S • Crew training and awareness • Workplace ergonomic
assessments • Equipment testing • Medical facilities for diagnosis /
treatment
2 2 S
H-25-05 Human factors: Awkward location of workplaces, workstation and machinery areas
• Back pain, musculoskeletal disorders
• Prolonged adoption of an awkward posture
• Risk of chronic minor injury
3 1 A • Crew training and awareness • Design of facilities includes
human factors and ergonomic assessments to minimise potential hazards and risks associated with awkward posture during operation / maintenance
• Workplace ergonomic assessments
• Medical facilities for diagnosis / treatment
2 1 A
H-25-06 Human factors: Poor organization and job design
• Poor job design leading to an accident or operational inefficiency
• Human error • Lack of pre-job
planning
• Inability to complete job safely and efficiently
2 3 S • Crew training and competence • Tool box talks / job safety
analysis / risk assessments prior to starting a job
2 2 S
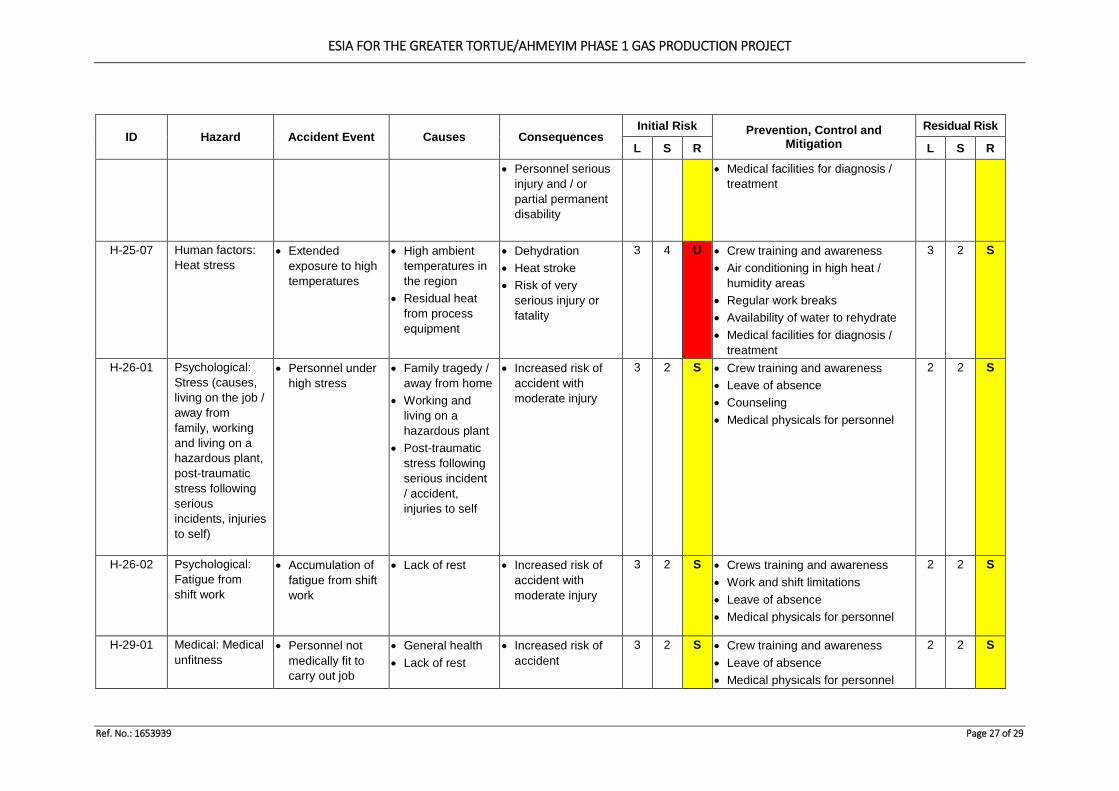
ESIA FOR THE GREATER TORTUE/AHMEYIM PHASE 1 GAS PRODUCTION PROJECT
Ref. No.: 1653939 Page 27 of 29
ID Hazard Accident Event Causes Consequences Initial Risk Prevention, Control and
Mitigation Residual Risk
L S R L S R • Personnel serious
injury and / or partial permanent disability
• Medical facilities for diagnosis / treatment
H-25-07 Human factors: Heat stress
• Extended exposure to high temperatures
• High ambient temperatures in the region
• Residual heat from process equipment
• Dehydration • Heat stroke • Risk of very
serious injury or fatality
3 4 U • Crew training and awareness • Air conditioning in high heat /
humidity areas • Regular work breaks • Availability of water to rehydrate • Medical facilities for diagnosis /
treatment
3 2 S
H-26-01 Psychological: Stress (causes, living on the job / away from family, working and living on a hazardous plant, post-traumatic stress following serious incidents, injuries to self)
• Personnel under high stress
• Family tragedy / away from home
• Working and living on a hazardous plant
• Post-traumatic stress following serious incident / accident, injuries to self
• Increased risk of accident with moderate injury
3 2 S • Crew training and awareness • Leave of absence • Counseling • Medical physicals for personnel
2 2 S
H-26-02 Psychological: Fatigue from shift work
• Accumulation of fatigue from shift work
• Lack of rest • Increased risk of accident with moderate injury
3 2 S • Crews training and awareness • Work and shift limitations • Leave of absence • Medical physicals for personnel
2 2 S
H-29-01 Medical: Medical unfitness
• Personnel not medically fit to carry out job
• General health • Lack of rest
• Increased risk of accident
3 2 S • Crew training and awareness • Leave of absence • Medical physicals for personnel
2 2 S
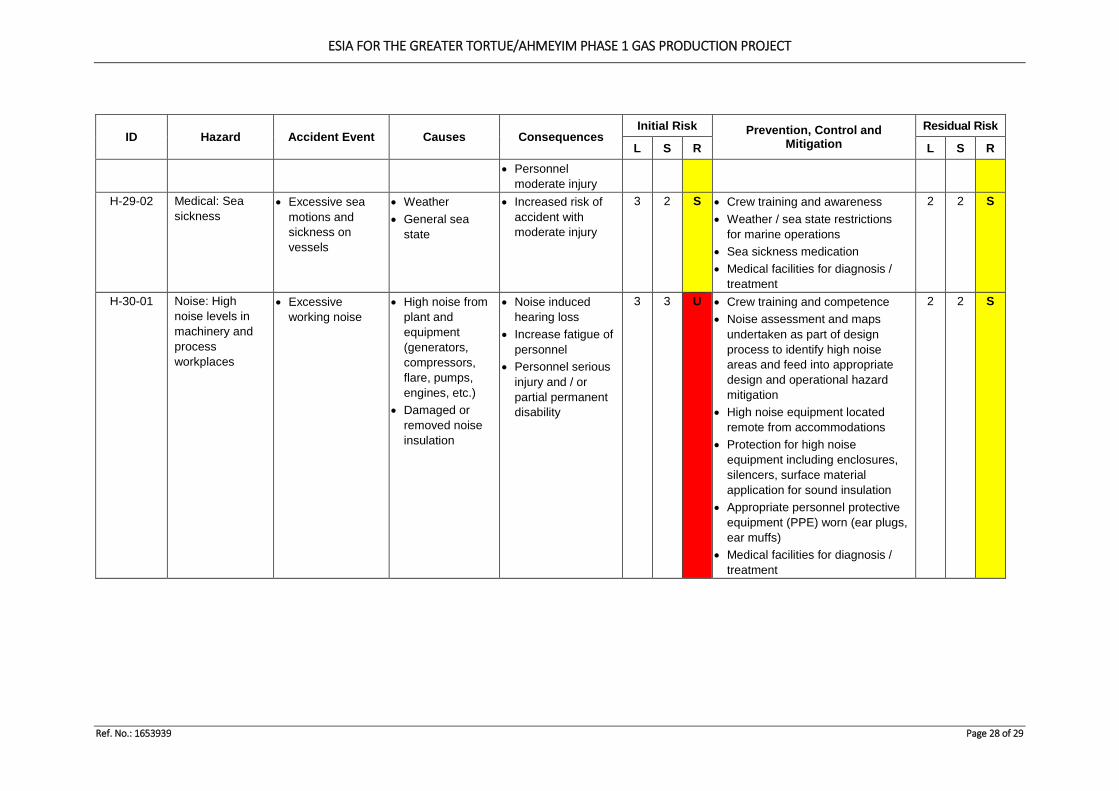
ESIA FOR THE GREATER TORTUE/AHMEYIM PHASE 1 GAS PRODUCTION PROJECT
Ref. No.: 1653939 Page 28 of 29
ID Hazard Accident Event Causes Consequences Initial Risk Prevention, Control and
Mitigation Residual Risk
L S R L S R • Personnel
moderate injury H-29-02 Medical: Sea
sickness • Excessive sea
motions and sickness on vessels
• Weather • General sea
state
• Increased risk of accident with moderate injury
3 2 S • Crew training and awareness • Weather / sea state restrictions
for marine operations • Sea sickness medication • Medical facilities for diagnosis /
treatment
2 2 S
H-30-01 Noise: High noise levels in machinery and process workplaces
• Excessive working noise
• High noise from plant and equipment (generators, compressors, flare, pumps, engines, etc.)
• Damaged or removed noise insulation
• Noise induced hearing loss
• Increase fatigue of personnel
• Personnel serious injury and / or partial permanent disability
3 3 U • Crew training and competence • Noise assessment and maps
undertaken as part of design process to identify high noise areas and feed into appropriate design and operational hazard mitigation
• High noise equipment located remote from accommodations
• Protection for high noise equipment including enclosures, silencers, surface material application for sound insulation
• Appropriate personnel protective equipment (PPE) worn (ear plugs, ear muffs)
• Medical facilities for diagnosis / treatment
2 2 S
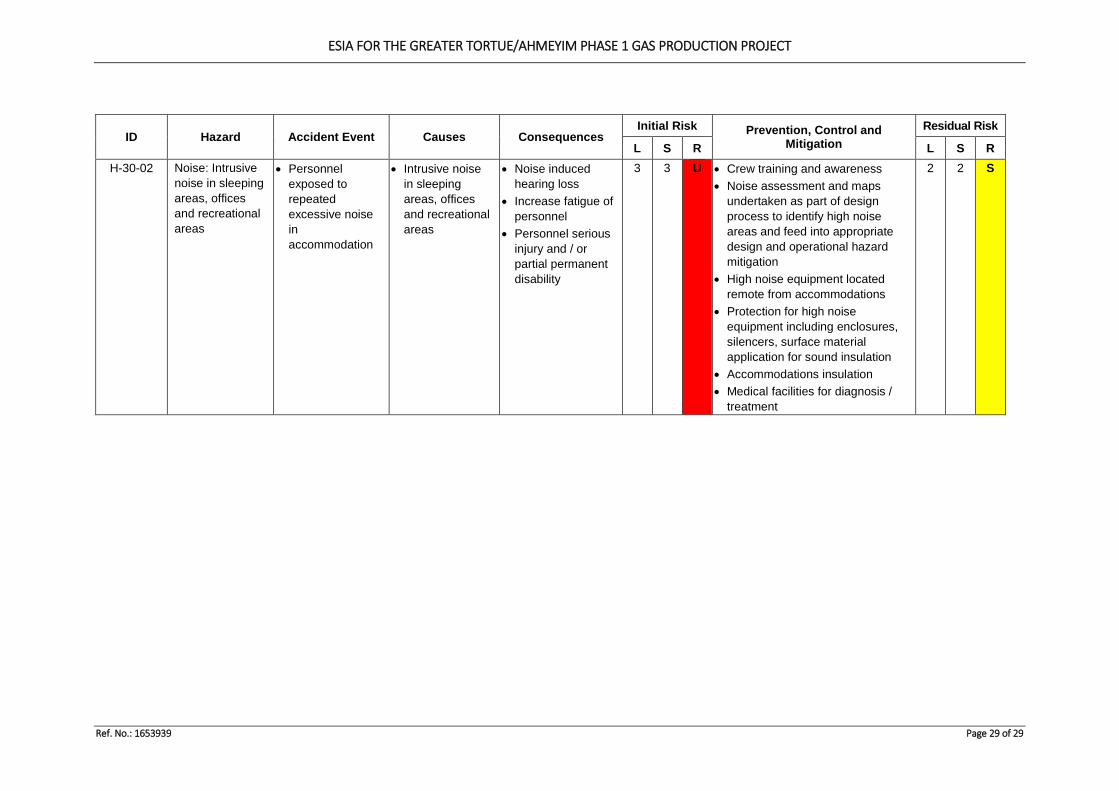
ESIA FOR THE GREATER TORTUE/AHMEYIM PHASE 1 GAS PRODUCTION PROJECT
Ref. No.: 1653939 Page 29 of 29
ID Hazard Accident Event Causes Consequences Initial Risk Prevention, Control and
Mitigation Residual Risk
L S R L S R H-30-02 Noise: Intrusive
noise in sleeping areas, offices and recreational areas
• Personnel exposed to repeated excessive noise in accommodation
• Intrusive noise in sleeping areas, offices and recreational areas
• Noise induced hearing loss
• Increase fatigue of personnel
• Personnel serious injury and / or partial permanent disability
3 3 U • Crew training and awareness • Noise assessment and maps
undertaken as part of design process to identify high noise areas and feed into appropriate design and operational hazard mitigation
• High noise equipment located remote from accommodations
• Protection for high noise equipment including enclosures, silencers, surface material application for sound insulation
• Accommodations insulation • Medical facilities for diagnosis /
treatment
2 2 S
ESIA FOR THE GREATER TORTUE/AHMEYIM PHASE 1 GAS PRODUCTION PROJECT
Ref. No.: 1653939
APPENDIX O-5 : FAULT/EVENT TREE BOWTIE APPROACH EXAMPLE (D-01 BLOWOUT OR WELL RELEASE)
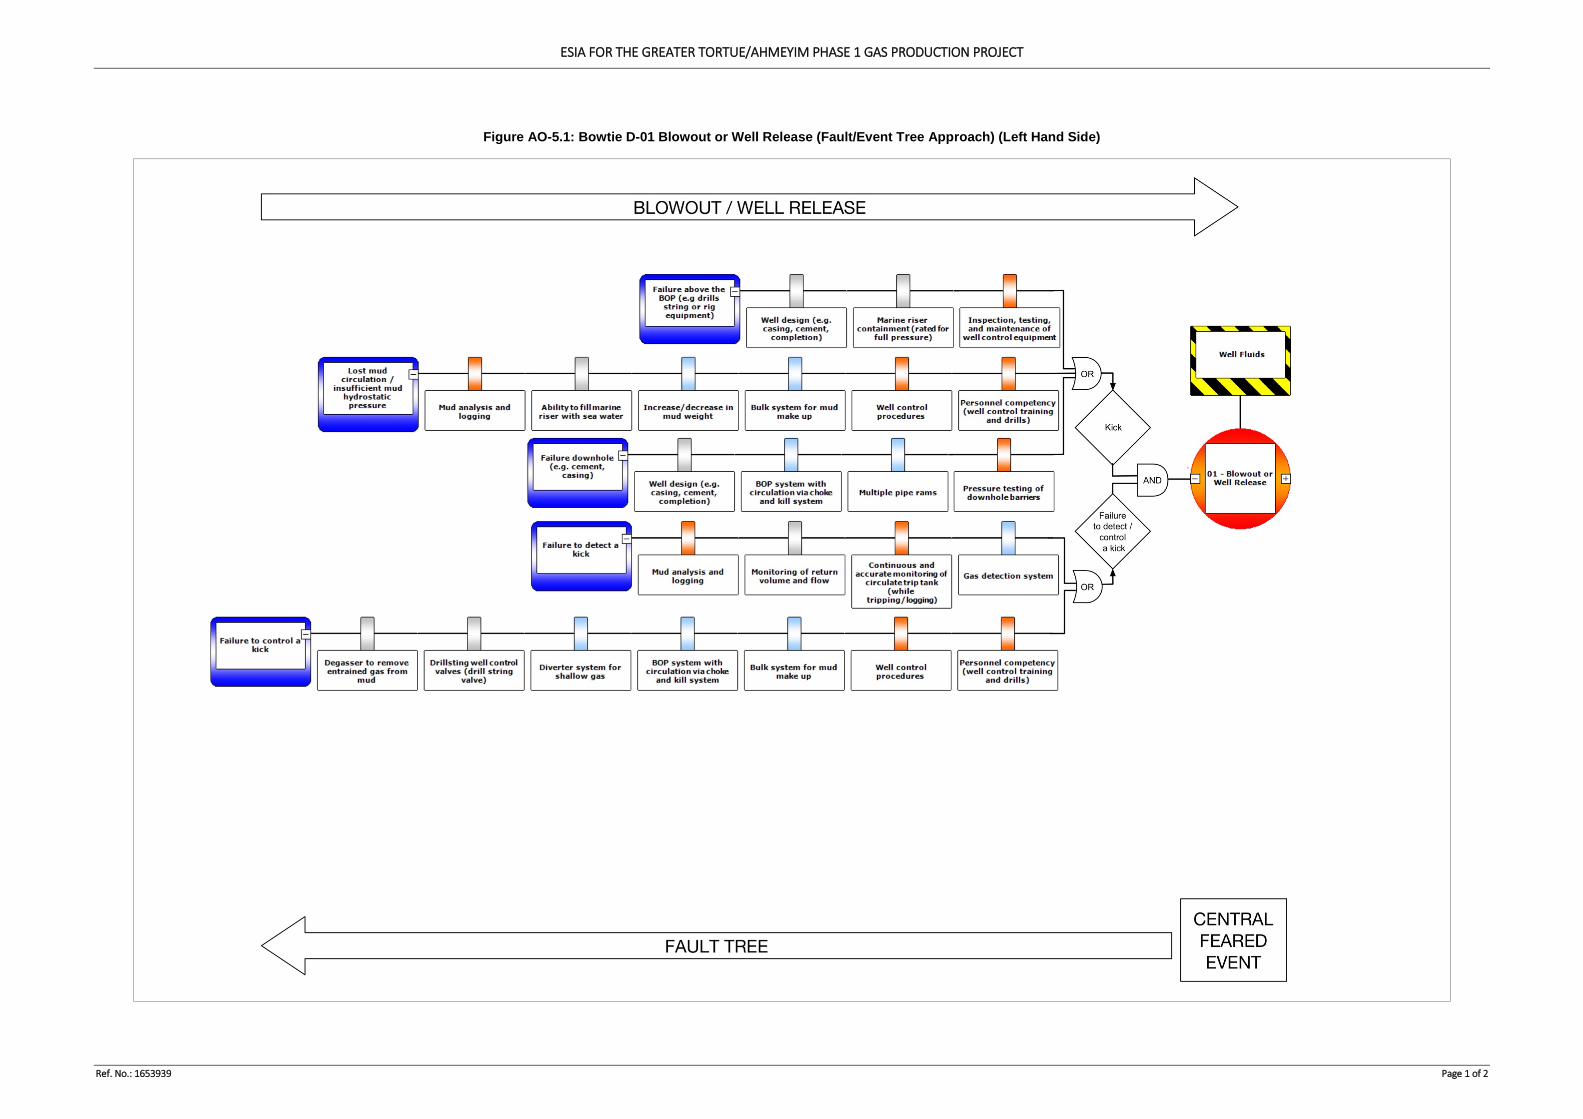
ESIA FOR THE GREATER TORTUE/AHMEYIM PHASE 1 GAS PRODUCTION PROJECT
Ref. No.: 1653939 Page 1 of 2
Figure AO-5.1: Bowtie D-01 Blowout or Well Release (Fault/Event Tree Approach) (Left Hand Side)
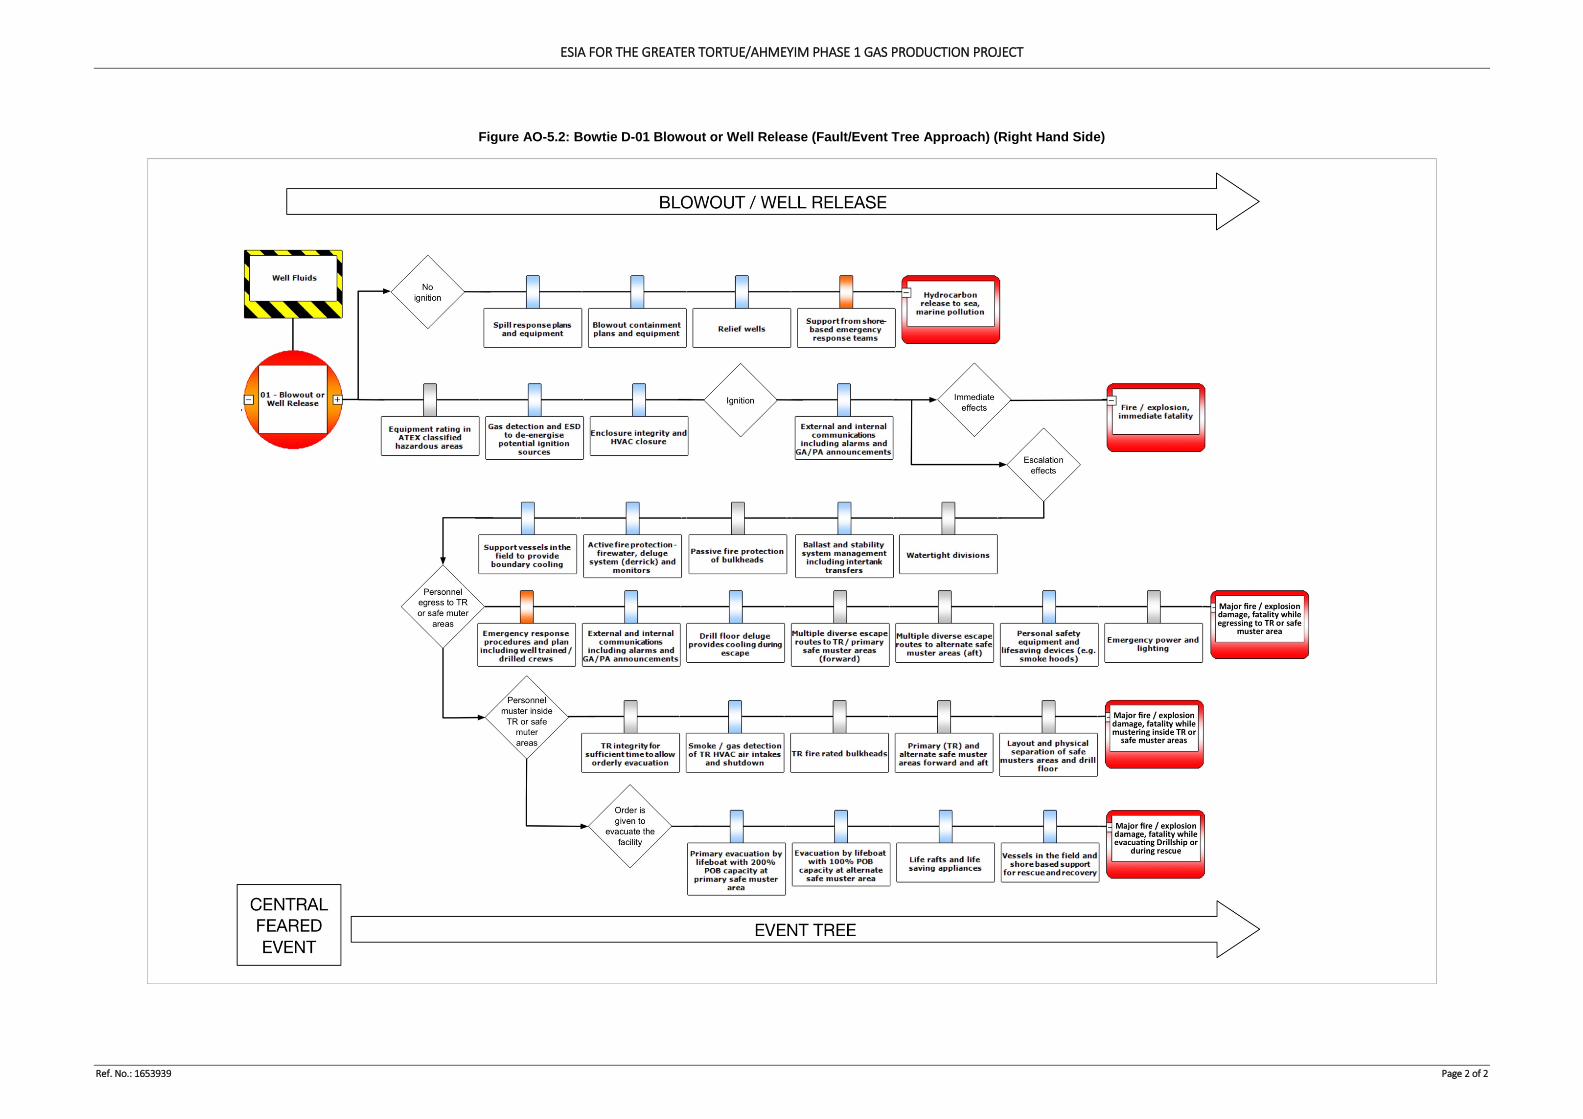
ESIA FOR THE GREATER TORTUE/AHMEYIM PHASE 1 GAS PRODUCTION PROJECT
Ref. No.: 1653939 Page 2 of 2
Figure AO-5.2: Bowtie D-01 Blowout or Well Release (Fault/Event Tree Approach) (Right Hand Side)

golder.com