entrepreneurial service vision in a franchised
TRANSCRIPT
ENTREPRENEURIAL SERVICE VISION IN A FRANCHISED HOME ENTERTAINMENT
ENVIRONMENT
PHOEBUS ALEXANDER MARITZ
Submitted in the fulfilment of the requirements for the degree
DOCTOR COMMERCII (BUSINESS MANAGEMENT)
in the
DEPARTMENT OF BUSINESS MANAGEMENT
FACULTY OF ECONOMIC AND MANAGEMENT SCIENCES
at the
UNIVERSITY OF PRETORIA
PROMOTER: Professor G.H. Nieman
Pretoria, South Africa April 2005

i
ACKNOWLEDGEMENTS
I would like to express my sincere gratitude towards the following people/organisations
for their support and assistance, without whom this international doctoral thesis would not
have been possible:
• God for his guidance, life experience and direction
• My promoter Professor Gideon Nieman for his leadership, support and advice
through this project.
• My colleague and friend, Dr Andries du Plessis, who motivated me to commence
and continue with this study.
• My colleagues at Unitec New Zealand, who afforded me the support, time and
resources to complete the study. In addition, Tim, Ingvild, Paul and Helen who
assisted with many of the research administration issues. Dean and Howard for the
silent, yet proud hand
• Special appreciation to Professor Pieter Nel for his professional guidance,
direction, and quiet belief
• Karin, my lovely wife, for her moral support
• My son Simon, for his moral, technical and being there support
• Peter Scott, Executive Chairman of Mr. VIDEO, who kindly assisted with the
implementation of the survey
• Lynn Spray, who assisted with the proof-reading.
Whilst acknowledging individuals, I do apologize if I have not mentioned many others
who have been instrumental towards the completion of this study. This thesis is dedicated
to my Mom, Gawie and my late Dad; together with the Maritz, Grobbelaar, Kruger and
Dwyer families. And last but not least, my daughter Courtney, so far yet so close.
This report is confidential and will not be released for general use for a period of two
years. Any reproduction or divulgence of any of its content without the prior written
consent of the author and the Ethics Committee of the Faculty of Economic and
Management Sciences at the University of Pretoria is prohibited.

ii
SUMMARY
ENTREPRENEURIAL SERVICE VISION IN A FRANCHISED HOME ENTERTAINMENT ENVIRONMENT
By
PHOEBUS ALEXANDER MARITZ
Promoter: Professor G.H. Nieman Department: Business Management Degree: Doctor Commercii
Entrepreneurship is the creative and innovative process of creating incremental wealth.
This wealth is created by individuals who possess an entrepreneurial orientation;
assuming the major risks in terms of equity, time and commitment. The process may not
be new or unique, but must be infused by the entrepreneur toward securing and allocating
the required resources. Franchising is an entrepreneurial option which develops new
ventures; whilst strategic service initiatives are entrepreneurial implementations
facilitating sustainability, growth and wealth creation. This study identifies
entrepreneurial orientation within a defined franchise system; with synergistic links to a
strategic service vision.
The research objectives are to investigate the current situation of entrepreneurial
orientation in a franchise system, together with examining the contribution of a strategic
service vision in relation to service quality. The purpose is to identify entrepreneurial
behaviour amongst franchisees; franchising as an entrepreneurial option, and to identify
relationships between elements of service quality, the service profit chain, relationship
marketing and best practice. The outcome is the development of a conceptual matrix, to
be initiated within the defined franchise system. Objectives are evaluated via research
hypotheses, using empirical statistical techniques.
Theoretically, the value the investigation provides is in the understanding that the home
entertainment industry is worthy of developing a body of knowledge, to be shared by all
industry participants. As a contribution to practice, the entrepreneurial service vision will
enhance the sustainability of the industry, notwithstanding the opportunity to share the
vision with related industries. This study, the first of its kind in the home entertainment
industry and in the specific franchise system, will smooth the way for implementation of
entrepreneurial franchise service initiatives in the organisation. On a national level,
successful implementation will enhance industry participation and competition; together

iii
with entrepreneurial contributions towards the creation of wealth, economic growth and
creation of employment in a dynamic, yet turbulent developing economy such as South
Africa.
Research methodology comprises the survey approach, using electronic media and
Surveypro analysis. This is facilitated by descriptive and inferential statistical techniques
using SPSS version 11.0 data analysis. Inferential significance tests include the ANOVA
Kruskal-Wallis hypothesis test; based on the approximation of the chi-square distribution
with k-1 degrees of freedom. Internal-consistency reliability is measured by the
Cronbach’s coefficient alpha, measuring overall inter-item correlation between the
identified constructs. Exploratory research, in the form of the literature review and
previous empirical studies, are used as background and facilitating data.
Hypothesis tests highlight the absence of statistically significant entrepreneurial
orientation in the franchise system, despite a significant orientation in a multiple-outlet
proposition analysis. Franchising is seen as a significant option for creating and
developing ventures, and strategic service initiatives (service profit chain, relationship
marketing and best practice) are all significantly positively associated with service
quality. These constructs constitute the development of an entrepreneurial service vision
in a franchise system.
Recommendations include the implementation of an entrepreneurial service vision within
the defined franchise system. Limitations, however, include limited availability of
appropriate data on the home entertainment industry, together with that of entrepreneurial
orientation in franchise systems. Recommendations for future research include cross-
industry and multi-national studies of similar substance, together with follow-up research
regarding the successful implementation of the entrepreneurial service vision matrix.

iv
OPSOMMING
ENTREPRENEURIESE DIENSVISIE IN ’N TUISVERMAAKTE
AGENTSKAPSTELSEL
Deur
PHOEBUS ALEXANDER MARITZ
Promotor: Professor G.H. Nieman
Departement: Ondernemingsbestuur
Graad: Doctor Commercii
Entrepreneurskap is ’n kreatiewe en innoverende proses om inkrementele welvaart te
skep. Hierdie welvaart word geskep deur individue wat ’n entrepreneuriese orientasie het;
insluitend van die aanvaarding van risiko met betrekking tot waarde, tyd en toewyding.
Die proses mag wel nie uniek of enig wees nie; maar om die verkryging en toewysing van
noodsaaklike bronne te bekom, moet dit deur die inspirasie van die entrepreneur teweeg-
gebring word. Agentskappe is ‘n entrepreneuriese opsie wat die skepping en ontwikkeling
van nuwe geleenthede daarstel, terwyl strategiese diens inisiatiewe entrepreneuriese
implementering gebruik om volhoudbaarheid, groei en welvaartskepping te laat geskied.
Hierdie studie identifiseer entrepreneuriese oriëntasie binne ‘n afgebakende
agentskapstelsel met sinergistiese skakelings na ’n strategiese diensvisie.
Die navorsingsdoelwitte is om die huidige entrepreneuriese orientasie situasie in ‘n
agentskapstelsel te ondersoek, asook ’n oorsig rakende die bydrae van ‘n strategiese
diensvisie met betrekking tot dienskwaliteit. Die doel is om entrepreneuriese gedrag
tussen agentskaphouers asook agentskappe as ’n entrepreneuriese opsie te identifiseer.
Dit sluit ook in om verhoudinge tussen elemente van dienskwaliteit, die diens-winsketting
en verhoudingsbemarking en beste praktyke te identifiseer. Die resultaat is die
ontwikkeling van ‘n konseptuele matriks wat geïnisieer word binne ‘n gedefinieërde
agentskapstelsel. Doelwitte word geëvalueer via navorsings en hipoteses deur die
gebruikmaking van empiriese statistiese tegnieke.
Teoreties is die waarde van die ondersoek die toevoeging van kennis en ‘n beter begrip
van die Tuisvermaak Bedryf wat belangrik genoeg geag word om ‘n kennisveld daarin te
ontwikkel en wat dus ook deur alle bedryfsdeelnemers gedeel kan word. Die bydrae tot

v
die praktyk van die entrepreneuriese diensvisie is ook daarin geleë dat dit die
volhoudbaarheid van die industrie kan uitbou nieteenstaande die geleentheid om die visie
met verbandhoudende bedrywe te deel. Hierdie studie is die eerste van sy soort in die
Tuisvermaak Bedryf en spesifiek in die agentskapstelsel, wat die weg kan baan vir
makliker implementering van entrepreneuriese agentskap inisiatiewe in ‘n organisasie.
Op ‘n nasionale vlak sal die suksesvolle implementering van die studie se resultate
bedryfsdeelname aanspoor. Dit sal ook kompetisie sowel as entrepreneuriese bydraes tot
welvaartskepping, ekonomiese groei en skepping van indiensneming in ‘n dinamiese
maar tog onstuimige ontwikkelende ekonomie soos die van Suid-Afrika, bevorder.
Die navorsingsmetodologie behels die ondersoek metode sowel as die gebruikmaking
van elektroniese media en Surveypro ontledings. Dit word bewerkstel deur beskrywende
en inverensiële statistiese tegnieke sowel as die gebruikmaking van uitgawe 11.0 van die
SPSS om data ontledings te doen. Invirensiële toetse vir beduidenheid sluit die ANOVA
Kruskall- Wallis hipotese toets in, gebaseer op die bepaling van die chi-vierkantswortel
distribusie met k–1 grade van vryheid. Interne konstantheid en betroubaarheid is gemeet
by wyse van die Cronbach alpha koëffisiënt wat algehele inter item korrelasie tussen
verskillende konstrukte identifiseer. Eksploratiewe navorsing in die vorm van ‘n
literatuur oorsig sowel as vorige empiriese studies is gebruik vir agtergrond oorsig
doeleindes wat ook fasiliseringsdata insluit.
Hipotese toetse beklemtoon die afwesigheid van ‘n statisties beduidende entrepreneuriese
orientasie in die agentskapstelsel, ongeag ‘n beduidende oriëntasie in die veelvoudige
eenheid proporsionele analise. Agentskappe word gesien as ‘n belangrike opsie met die
skepping en ontwikkeling van sakevestiging en strategiese diens inisiatiewe (dienswins
ketting, verhoudinge bemarking en beste praktyke) wat almal beduidend aan
dienskwaliteit verwant is. Hierdie konstrukte behels die ontwikkeling van ‘n
entrepreneuriese diensvisie in 'n agentskapstelsel.
Aanbevelings sluit die implementering van ‘n entrepreneuriese diensvisie in die
afgebakende agentskapstelsel in. Beperkings sluit egter die beperkte beskikbaarheid van
toepaslike data op die Tuisvermaak Bedryf in, asook ‘n entrepreneuriese oriëntasie in
agentskapstelsels.Aanbevelings vir toekomstige navorsing sluit meerdere industrieë asook
multi nasionale studies van ‘n soortgelyke aard in, sowel as opvolgnavorsing met
betrekking tot die suksesvolle implementering van die entrepreneuriese matriks wat
diensvisie betref.
vi
TABLE OF CONTENTS
CHAPTER 1: BACKGROUND AND ORIENTATION OF THE PROBLEM ................ 1
1.1 INTRODUCTION ...................................................................................................... 1
1.2 BACKGROUND OF THE STUDY........................................................................... 2
1.2.1 Limitations of the study .................................................................................. 5
1.3 IMPORTANCE OF THE STUDY ............................................................................. 6
1.4 DEFINITION OF THE RESEARCH PROBLEM..................................................... 7
1.4.1 Research questions.......................................................................................... 8
1.4.1.1 Primary research question................................................................ 8
1.4.1.2 Secondary research questions .......................................................... 8
1.4.2 Key terminology ............................................................................................. 9
1.4.3 Research objectives ...................................................................................... 10
1.4.4 Hypotheses to be tested ................................................................................ 10
1.4.4.1 Primary hypothesis ........................................................................ 11
1.4.4.2 Secondary hypotheses.................................................................... 11
1.5 RESEARCH DESIGN.............................................................................................. 12
1.5.1 Applicable design process ............................................................................ 13
1.5.2 Sources of data.............................................................................................. 13
1.5.3 Data collection format .................................................................................. 13
1.5.3.1 The survey method ........................................................................ 14
1.5.3.2 The sampling plan.......................................................................... 14
1.5.4 Measurement scales ...................................................................................... 15
1.5.5 Instrument design.......................................................................................... 15
1.5.6 Data analysis ................................................................................................. 16
1.6 RESEARCH FINDINGS AND RECOMMENDATIONS ...................................... 17
1.7 OUTLINE OF THE THESIS.................................................................................... 17
1.7.1 Chapter One: Background and orientation of the problem........................... 18
1.7.2 Chapter Two: Entrepreneurial orientation ................................................... 18
1.7.3 Chapter Three: The franchise paradox ........................................................ 19
vii
1.7.4 Chapter Four: Putting the service profit chain to work ............................... 19
1.7.5 Chapter five: Integrating service quality, relationship marketing and
benchmarking for best practice..................................................................... 20
1.7.6 Chapter Six: Research methodology ........................................................... 20
1.7.7 Chapter Seven: Research findings .............................................................. 21
1.7.8 Chapter Eight: Summary, conclusions and recommendations ................... 21
1.7.9 Appendices ................................................................................................... 22
1.8 CONCLUSION......................................................................................................... 22
CHAPTER 2: ENTREPRENEURIAL ORIENTATION ................................................. 23
2.1 INTRODUCTION .................................................................................................... 23
2.2 ENTREPRENEURIAL ORIENTATION ................................................................ 24
2.3 NATURE AND DEVELOPMENT OF ENTREPRENEURSHIP ........................... 24
2.4 ENTREPRENEURIAL PARTICIPATION RATES................................................ 29
2.5 DEFINITION OF THE ENTREPRENEUR............................................................. 32
2.6 THE NATURE, CHARACTERISTICS AND BEHAVIOUR OF THE
ENTREPRENEUR ................................................................................................... 35
2.6.1 Intuition and entrepreneurial behaviour........................................................ 37
2.6.2 Behavioural traits and characteristics ........................................................... 37
2.6.3 Creativity, innovation and entrepreneurship................................................. 39
2.6.4 The entrepreneurial personality .................................................................... 41
2.6.5 Comparison of entrepreneurs, intrapreneurs and traditional managers ........ 45
2.6.6 Entrepreneurial synthesis (three factors) ...................................................... 49
2.6.6.1 What entrepreneurs are like: the personality factors ..................... 49
2.6.6.2 Where entrepreneurs come from: the environmental factors ........ 50
2.6.6.3 What entrepreneurs do: the action factors ..................................... 51
2.6.7 Entrepreneurial talent, temperament and technique ..................................... 53
2.6.7.1 The entrepreneur among others ..................................................... 53
2.6.7.2 Linking talent, temperament and technique................................... 54
2.6.7.3 Gallup’s ‘life themes’ .................................................................... 55
2.6.7.4 Gallup’s ‘entrepreneur-perceiver’ interview ................................. 55

viii
2.6.7.5 Towards a profile of the entrepreneur: talent, temperament and
technique........................................................................................ 56
2.6.7.6 The well of talent ........................................................................... 58
2.6.8 The entrepreneur’s character themes ............................................................ 59
2.6.8.1 Entrepreneurs, managers and leaders ............................................ 59
2.6.8.2 Talent, temperament and technique............................................... 60
2.6.8.3 Focus.............................................................................................. 60
2.6.8.4 Advantage ...................................................................................... 61
2.6.8.5 Creativity ....................................................................................... 61
2.6.8.6 Ego................................................................................................. 62
2.6.8.7 Team .............................................................................................. 63
2.6.8.8 Social ............................................................................................. 63
2.6.9 Application of the facets ............................................................................... 65
2.6.9.1 Facets interaction ........................................................................... 65
2.6.9.2 The entrepreneur and the leader .................................................... 66
2.6.9.3 Risk ................................................................................................ 67
2.6.9.4 Extreme presence........................................................................... 67
2.6.10 The character theme questionnaire ............................................................... 68
2.6.10.1 Character themes 20-question profile ............................................ 68
2.6.10.2 Character theme questionnaire ...................................................... 69
2.7 CONCLUSION......................................................................................................... 70
CHAPTER 3: THE FRANCHISE PARADOX................................................................. 72
3.1 INTRODUCTION .................................................................................................... 72
3.2 NATURE AND DEVELOPMENT OF FRANCHISING........................................ 73
3.2.1 Franchising link to entrepreneurship ............................................................ 74
3.2.2 Franchise rationale........................................................................................ 78
3.2.2.1 Real estate development ................................................................ 79
3.2.2.2 Construction specifications and supervision ................................. 79
3.2.2.3 Training.......................................................................................... 79
3.2.2.4 Pre-opening support....................................................................... 80
3.2.2.5 Continuing support ........................................................................ 80
3.2.2.6 Performance standards and monitoring ......................................... 81

ix
3.2.2.7 Field support .................................................................................. 81
3.2.2.8 Operational research and development.......................................... 81
3.2.2.9 Marketing, advertising and promotions......................................... 82
3.2.2.10 Product purchase provision............................................................ 82
3.2.2.11 The operations manual................................................................... 83
3.2.2.12 Specialist support........................................................................... 84
3.2.2.13 Territorial rights............................................................................. 84
3.2.2.14 Terms of the agreement ................................................................. 85
3.2.3 Challenges to growth: nothing new under the sun........................................ 90
3.2.3.1 Internal issues ................................................................................ 90
3.2.3.2 External challenges........................................................................ 91
3.3 FRANCHISE SYSTEM RELATIONSHIPS ........................................................... 93
3.3.1 Macro trends influencing relationships ........................................................ 94
3.3.2 Basic principles of franchise relationships ................................................... 94
3.3.3 Franchise system cooperation....................................................................... 94
3.3.4 Franchise leadership ..................................................................................... 95
3.3.5 Franchise relationships as products of conscious efforts.............................. 96
3.3.6 Guidelines for optimal franchise system relationships................................. 96
3.3.7 Common franchise system conflict areas ..................................................... 97
3.3.8 Resolving franchise system disputes ............................................................ 98
3.3.9 Franchise relationships and quality control ................................................ 100
3.3.10 Franchise system relationships require a solid foundation ......................... 101
3.3.11 Franchise system advisory association/council .......................................... 102
3.3.12 Franchise system networking ..................................................................... 104
3.3.13 Franchise system merits.............................................................................. 105
3.4 ENTREPRENEURIAL ORIENTATION IN A FRANCHISE SYSTEM ............. 107
3.4.1 Franchisee entrepreneurial orientation literature ........................................ 108
3.4.2 Franchisee entrepreneurial orientation: an empirical review...................... 116
3.4.2.1 Proactiveness ............................................................................... 117
3.4.2.2 Innovativeness ............................................................................. 117
3.4.2.3 Risk-taking................................................................................... 117
3.5 CONCLUSION....................................................................................................... 119
x
CHAPTER 4: PUTTING THE SERVICE PROFIT CHAIN TO WORK ..................... 121
4.1 INTRODUCTION .................................................................................................. 121
4.2 PROFIT AND LONG TERM GROWTH .............................................................. 122
4.3 CAPITALISING ON THE SERVICE PROFIT CHAIN ....................................... 124
4.3.1 Profit and growth link to customer loyalty ................................................. 124
4.3.2 Customer loyalty link to customer satisfaction .......................................... 126
4.3.3 Customer satisfaction link to service value ................................................ 127
4.3.4 Service value link to employee productivity .............................................. 128
4.3.5 Employee productivity link to loyalty ........................................................ 129
4.3.6 Employee loyalty link to employee satisfaction......................................... 130
4.3.7 Employee satisfaction link to internal quality of work life ........................ 132
4.4 SERVICE PROFIT CHAIN MANAGEMENT IMPLICATIONS ........................ 133
4.4.1 Measuring across operating units ............................................................... 133
4.4.2 Developing a balanced scorecard ............................................................... 134
4.4.3 Communication of results........................................................................... 135
4.4.4 Performance management .......................................................................... 135
4.4.5 Encouraging internal best practice exchanges............................................ 136
4.5 MANAGING CUSTOMER SATISFACTION...................................................... 138
4.5.1 Customer feedback, complaint and suggestion systems............................. 141
4.5.2 Lost customer analysis................................................................................ 142
4.5.3 Customer satisfaction surveys .................................................................... 143
4.5.4 Ghost shopping ........................................................................................... 143
4.6 THE CUSTOMER VALUE EQUATION.............................................................. 145
4.6.1 The components of the customer value equation ....................................... 147
4.6.1.1 Results produced for customers................................................... 148
4.6.1.2 Service process quality ................................................................ 148
4.6.1.3 Price and acquisition costs........................................................... 150
4.6.2 Requirements to add value.......................................................................... 151
4.6.3 Linking the strategic service vision and the service profit chain................ 152
4.7 CUSTOMER LOYALTY....................................................................................... 153
4.7.1 Determinants of customer loyalty............................................................... 154
xi
4.7.2 The relationship between customer loyalty and profit and growth ............ 154
4.7.3 Customer loyalty and customer satisfaction ............................................... 154
4.7.4 Enhancing loyalty ....................................................................................... 155
4.7.5 Recognition and rewards ............................................................................ 156
4.7.5.1 Empowering employees............................................................... 157
4.7.5.2 Relationship marketing................................................................ 158
4.7.5.3 Customer loyalty strategies.......................................................... 159
4.7.6 Lifetime value............................................................................................. 161
4.7.6.1 Retention strategies...................................................................... 162
4.7.6.2 Related sales of new products and services................................. 166
4.7.6.3 Referrals....................................................................................... 166
4.8 ENHANCING SERVICE PROFIT CHAIN INITIATIVES.................................. 172
4.8.1 Spending time on the front line .................................................................. 172
4.8.2 Putting employees first ............................................................................... 173
4.8.3 Leading personal development ................................................................... 173
4.8.4 Supporting greater job latitude ................................................................... 173
4.8.5 Reducing labour costs by paying higher wages.......................................... 174
4.8.6 Investing in customers ................................................................................ 174
4.8.7 Maintaining measures and rewards that influence behaviour..................... 174
4.8.8 Communicating the message ...................................................................... 174
4.9 CONCLUSION....................................................................................................... 175
CHAPTER 5: INTEGRATING SERVICE QUALITY, RELATIONSHIP
MARKETING AND BENCHMARKING FOR BEST PRACTICE ...... 177
5.1 INTRODUCTION .................................................................................................. 177
5.2 SERVICE QUALITY............................................................................................. 178
5.2.1 Defining service quality.............................................................................. 179
5.2.2 The dimensionality of service quality......................................................... 180
5.2.3 The integrated gaps model of service quality ............................................. 182
5.2.4 Organizing and implementing service quality............................................ 185
5.2.5 Managing the services marketing mix for service quality.......................... 186
5.2.6 Setting service standards............................................................................. 187
5.2.7 Integration of service quality relationships................................................. 189
xii
5.2.7.1 Service quality and market orientation ........................................ 189
5.2.7.2 Service quality and loyalty .......................................................... 190
5.2.7.3 Service quality and customer satisfaction.................................... 193
5.2.7.4 Service quality and marketing culture ......................................... 195
5.2.7.5 Service quality and previous experience ..................................... 196
5.2.7.6 Service quality and internal marketing ........................................ 197
5.2.7.7 Service quality and future consumer behaviour .......................... 198
5.2.7.8 Service quality and culture .......................................................... 198
5.2.8 Measuring service quality: current thinking and future requirements........ 200
5.2.8.1 SERVQUAL................................................................................ 201
5.2.8.2 SERVPERF.................................................................................. 203
5.2.8.3 Auxiliary measurement methods ................................................. 204
5.3 RELATIONSHIP MARKETING........................................................................... 206
5.3.1 The customer market domain ..................................................................... 208
5.3.2 The supplier and alliance market domain................................................... 210
5.3.3 The referral and influence market domains ................................................ 211
5.3.4 The recruitment and internal market domains ............................................ 212
5.3.5 Creating and implementing relationship marketing strategies ................... 214
5.4 BENCHMARKING FOR BEST PRACTICES...................................................... 215
5.4.1 Home entertainment industry best practices............................................... 218
5.4.1.1 Best practice one: Understanding markets and customers .......... 219
5.4.1.2 Best practice two: Develop vision and strategy........................... 220
5.4.1.3 Best Practice three: Refine store product offerings ..................... 221
5.4.1.4 Best practice four: Implement marketing plan ............................ 221
5.4.1.5 Best practice five: Offer excellent customer service ................... 222
5.4.1.6 Best practice six: Create promotions and in-store
merchandising.............................................................................. 222
5.4.1.7 Best practice seven: Have clear in-store operations .................... 223
5.5 CONCLUSION....................................................................................................... 224
xiii
CHAPTER 6: RESEARCH METHODOLOGY ............................................................ 226
6.1 INTRODUCTION .................................................................................................. 226
6.2 THE RESEARCH PROCESS ................................................................................ 227
6.3 PROBLEM FORMULATION ............................................................................... 229
6.3.1 The applicable research question................................................................ 230
6.3.1.1 Primary research question............................................................ 231
6.3.1.2 Secondary research questions ...................................................... 231
6.3.2 Key terms of entrepreneurial orientation, franchising and strategic
service vision .............................................................................................. 232
6.3.3 Research objectives .................................................................................... 233
6.3.4 Hypotheses to be tested .............................................................................. 233
6.3.4.1 Primary hypothesis ...................................................................... 234
6.3.4.2 Secondary hypotheses.................................................................. 234
6.4 RESEARCH DESIGN............................................................................................ 235
6.4.1 Classification of research design ................................................................ 237
6.4.1.1 Exploratory research.................................................................... 239
6.4.1.2 Conclusive research ..................................................................... 240
6.4.1.3 Descriptive research..................................................................... 241
6.5 METHODOLOGY ................................................................................................. 242
6.5.1 Sources of data............................................................................................ 242
6.5.1.1 Secondary data............................................................................. 243
6.5.1.2 Primary data................................................................................. 244
6.5.2 Data collection format ................................................................................ 245
6.5.2.1 Quantitative research ................................................................... 247
6.5.2.2 The survey method ...................................................................... 249
6.5.3 The sampling plan....................................................................................... 251
6.5.3.1 Defining the target population ..................................................... 252
6.5.3.2 Determination of the sampling frame .......................................... 253
6.5.3.3 Determination of sampling technique and sample size ............... 253
6.5.4 Measurement scales .................................................................................... 256
6.5.5 Instrument design and testing ..................................................................... 260

xiv
6.5.5.1 Constructing the questionnaire .................................................... 262
6.5.5.2 The linkage between the questions, research objectives and
hypotheses.................................................................................... 266
6.6 DATA ANALYSIS ................................................................................................ 266
6.6.1 Editing and coding...................................................................................... 267
6.6.2 Reliability and Validity............................................................................... 268
6.6.3 Descriptive or summary measures.............................................................. 271
6.6.3.1 Frequency distributions and modes (questionnaire section A).... 271
6.6.3.2 Means and medians (questionnaire section B-G) ........................ 271
6.6.3.3 Measures of variability (questionnaire section B-G)................... 272
6.6.3.4 Bivariate measures of association (questionnaire section A-G) .. 272
6.6.3.5 Graphical representations ............................................................ 273
6.6.4 Inferential statistics ..................................................................................... 273
6.6.4.1 Significance tests (hypotheses tests)............................................ 273
6.6.4.2 Factor analysis ............................................................................. 275
6.6.4.3 Cronbach’s Alpha (α) .................................................................. 275
6.7 CONCLUSION....................................................................................................... 276
CHAPTER 7: RESEARCH FINDINGS ........................................................................ 278
7.1 INTRODUCTION .................................................................................................. 278
7.2 REALISATION, RESPONSE AND REPRESENTATION OF RESULTS.......... 279
7.3 SECTION A: DEMOGRAPHIC AND BIOGRAPHIC INFORMATION ............ 280
7.3.1 Gender of franchisees ................................................................................. 280
7.3.2 Race of franchisees ..................................................................................... 281
7.3.3 Region/Province of franchised outlets........................................................ 281
7.3.4 Period of participation in the franchise system........................................... 282
7.3.5 Employees in the franchised outlets ........................................................... 283
7.3.6 Number of franchised outlets per franchisee .............................................. 284
7.3.7 Family members active in the franchised outlets ....................................... 286
7.4 SECTION B: ENTREPRENEURIAL ORIENTATION IN A FRANCHISE
SYSTEM................................................................................................................. 286
7.4.1 Entrepreneurial score ratings ...................................................................... 287

xv
7.4.2 Reliability analysis – scale Cronbach’s Alpha ........................................... 288
7.4.3 Item analysis ............................................................................................... 288
7.4.3.1 Inventor........................................................................................ 289
7.4.3.2 Inventor + entrepreneur ............................................................... 289
7.4.3.3 Entrepreneur ................................................................................ 290
7.4.3.4 Entrepreneur + leader .................................................................. 292
7.4.3.5 Leader .......................................................................................... 293
7.4.3.6 Entrepreneur enabler.................................................................... 294
7.4.3.7 Non-entrepreneur......................................................................... 295
7.4.4 Entrepreneurial orientation significance..................................................... 296
7.4.5 Multiple-outlet distribution......................................................................... 297
7.4.5.1 Multiple-outlet entrepreneurial score ratings............................... 298
7.4.5.2 Multiple-outlet entrepreneurial ratings by region........................ 301
7.4.5.3 Entrepreneurial orientation significance in multiple-outlets ....... 303
7.5 SECTION C: THE FRANCHISE PARADOX ...................................................... 305
7.5.1 Franchise paradox descriptive and inferential analysis .............................. 306
7.5.2 Item analysis ............................................................................................... 308
7.5.2.1 Entrepreneurship + innovation .................................................... 309
7.5.2.2 Entrepreneurship + creativity ...................................................... 310
7.5.2.3 Entrepreneurship + proactivity .................................................... 310
7.5.2.4 Entrepreneurship + performance ................................................. 311
7.5.2.5 Relationships and the franchise paradox ..................................... 312
7.5.2.6 Entrepreneurship + ventures ........................................................ 314
7.5.2.7 Management + objectives ............................................................ 316
7.5.3 Franchising and venture creation significance ........................................... 317
7.6 SECTION D: THE SERVICE PROFIT CHAIN.................................................... 318
7.6.1 Service profit chain descriptive and inferential statistics ........................... 319
7.6.2 Item analysis ............................................................................................... 321
7.6.2.1 SPC links (satisfaction 1 and 2)................................................... 321
7.6.2.2 SPC links (best practice).............................................................. 322
7.6.2.3 Retention (feedback).................................................................... 322
7.6.2.4 SPC links (quality of work life-QWL) ........................................ 323
7.6.2.5 Retention (relationships 1 and 2) ................................................. 323
7.6.2.6 Related sales ................................................................................ 324
xvi
7.6.2.7 Referrals (word of mouth-WOM)................................................ 325
7.6.2.8 Retention (lifetime value) ............................................................ 325
7.6.3 Service profit chain significance ................................................................ 326
7.7 SECTION F: RELATIONSHIP MARKETING .................................................... 327
7.7.1 Relationship marketing descriptive and inferential statistics ..................... 327
7.7.2 Item analysis ............................................................................................... 329
7.7.2.1 Customer markets 1 and 2 ........................................................... 329
7.7.2.2 Internal markets 1 and 2 .............................................................. 330
7.7.2.3 Referral markets 1 and 2.............................................................. 330
7.7.2.4 Internal markets 3 and 4 .............................................................. 331
7.7.2.5 Recruitment markets 1 and 2 ....................................................... 332
7.7.3 Relationship management significance ...................................................... 333
7.8 SECTION G: INDUSTRY BEST PRACTICE ...................................................... 334
7.8.1 Best practice descriptive and inferential statistics ...................................... 334
7.8.2 Item analysis ............................................................................................... 336
7.8.2.1 Understanding customer markets ................................................ 336
7.8.2.2 Developing strategy and vision 1 and 2....................................... 337
7.8.2.3 Implementing the marketing plans 1 and 2 and 3........................ 338
7.8.2.4 Promotion and in-store merchandising........................................ 339
7.8.2.5 Clear in-store operations 1 and 2 ................................................. 339
7.8.3 Best practice significance ........................................................................... 340
7.9 SECTION E: SERVICE QUALITY ...................................................................... 341
7.9.1 Service quality descriptive and inferential statistics................................... 342
7.9.2 Item analysis ............................................................................................... 343
7.9.2.1 Reliability 1 and 2........................................................................ 344
7.9.2.2 Responsiveness 1 and 2 ............................................................... 344
7.9.2.3 Assurance 1 and 2........................................................................ 344
7.9.2.4 Empathy 1 and 2 .......................................................................... 345
7.9.2.5 Tangibles...................................................................................... 345
7.9.2.6 Empathy 3.................................................................................... 345
7.10 KEY CONSTRUCT SUMMARY STATISTICS .................................................. 346
7.11 CONCLUSION....................................................................................................... 346
xvii
CHAPTER 8: SUMMARY, CONCLUSIONS AND RECOMMENDATIONS ........... 348
8.1 INTRODUCTION .................................................................................................. 348
8.2 A REVIEW OF THE LITERATURE RESEARCH .............................................. 349
8.3 CONCLUSIONS AND IMPLICATIONS OF THE EMPIRICAL RESEARCH .. 352
8.3.1 Realisation, response and representation of results .................................... 352
8.3.2 Section A: Demographic and biographic information................................ 352
8.3.3 Section B: Entrepreneurial orientation ....................................................... 353
8.3.3.1 Overall system entrepreneurial orientation.................................. 353
8.3.3.2 Multiple-outlet entrepreneurial orientation.................................. 355
8.3.4 Section C: The franchise paradox............................................................... 355
8.3.5 Section D: The service profit chain ............................................................ 356
8.3.6 Section F: Relationship marketing.............................................................. 357
8.3.7 Section G: Industry best practice................................................................ 357
8.3.8 Section E: Service quality........................................................................... 358
8.4 THE RESEARCH HYPOTHESES REVISITED .................................................. 359
8.5 RECOMMENDATIONS........................................................................................ 361
8.5.1 Section A: Demographic and biographic recommendations ...................... 362
8.5.2 Section B: Entrepreneurial orientation recommendations.......................... 363
8.5.3 Section C: The franchise paradox recommendations ................................. 364
8.5.4 Section D: The service profit chain recommendations............................... 365
8.5.5 Section F: Relationship marketing recommendations ................................ 366
8.5.6 Section G: Industry best practice recommendations .................................. 366
8.5.7 Section E: Service quality recommendations ............................................. 367
8.5.8 Development and recommendation of an entrepreneurial service vision... 368
8.6 LIMITATIONS OF THE STUDY ......................................................................... 370
8.6.1 Limitations based on the literature review.................................................. 370
8.6.2 Limitations based on the empirical research phase of the study ................ 370
8.7 RECOMMENDATIONS FOR FUTURE RESEARCH ........................................ 371
8.8 WRAP-UP CONCLUDING REMARKS............................................................... 372
8.9 CONCLUSION....................................................................................................... 373

xviii
BIBLIOGRAPHY............................................................................................................ 374
APPENDICES
Appendix 1 - Mr. VIDEO franchised outlets
Appendix 2 - Pearson’s correlation coefficients for service vision constructs
and variables:
Table A1: Service profit chain and service quality
Table A2: Relationship marketing and service quality
Table A3: Best practice and service quality
Appendix 3 - Questionnaire

xix
LIST OF TABLES
TABLE 2.1 The evolution of entrepreneurial thought ..................................................... 29
TABLE 2.2 Comparison of entrepreneurs, intrapreneurs and traditional managers ........ 46
TABLE 2.3 Relative differences between traditional management practice and
entrepreneurial approach to business management ................................... 47
TABLE 2.4 The entrepreneur among others .................................................................... 54
TABLE 2.5 The original Gallup entrepreneurial themes ................................................. 56
TABLE 2.6 Profiling the entrepreneur ............................................................................. 57
TABLE 2.7 The opportunity-spotter and the project champion: talent, temperament
and technique ............................................................................................. 58
TABLE 2.8 Role identification of entrepreneurs, managers and leaders ......................... 60
TABLE 2.9 Facets approach to character themes ............................................................ 64
TABLE 2.10 Entrepreneurial character themes................................................................ 65
TABLE 2.11 Character themes of the entrepreneur and leader........................................ 66
TABLE 2.12 Character themes to evaluate entrepreneurial orientation........................... 70
TABLE 3.1 Guidelines for optimal franchisor-franchisee relationships.......................... 97
TABLE 3.2 Franchise system potential areas of conflict and resolutions........................ 98
TABLE 3.3 The main advantages and disadvantages of buying a franchise as a
means of business start-up ....................................................................... 107
TABLE 3.4 Entrepreneurial orientation of franchisees in a franchise system: a review
of the literature across disciplines (entrepreneurship and franchising) ... 110
TABLE 3.5 The intrapreneur and franchisee: an adaptation of literature on the
disciplines ................................................................................................ 114
TABLE 5.1 Linking perceived service quality and service loyalty: an entertainment
industry perspective ................................................................................. 192
TABLE 5.2 Service quality measurement debate: summary of areas of disagreement . 201
TABLE 6.1 Differences between exploratory and conclusive research......................... 238
TABLE 6.2 A comparison of basic research designs ..................................................... 240
TABLE 6.3 A comparison of primary and secondary data ............................................ 243
TABLE 6.4 Criteria for evaluating secondary data ........................................................ 244
TABLE 6.5 Qualitative versus quantitative research ..................................................... 247
TABLE 6.6 Conditions favouring either census or sample............................................ 255
TABLE 6.7 Primary scales of measurement .................................................................. 257
TABLE 6.8 The linkage between the sections, questions and hypotheses..................... 267
xx
TABLE 7.1 Regional response and realization rates...................................................... 279
TABLE 7.2 Entrepreneurial orientation scorecard......................................................... 287
TABLE 7.3 Item analyses for entrepreneurial orientation character themes ................. 288
TABLE 7.4 Character themes represented by franchisee agreement by number of
outlets....................................................................................................... 298
TABLE 7.5 Factor associations by number of stores ..................................................... 299
TABLE 7.6 Entrepreneurial associations combined by number of outlets (per
centage).................................................................................................... 299
TABLE 7.7 Mean scores per outlet distribution............................................................. 300
TABLE 7.8 Factor associations by number of outlets (mean scores) ............................ 301
TABLE 7.9 Weighted entrepreneurial orientation mean scores..................................... 301
TABLE 7.10 Entrepreneurial associations by character theme...................................... 302
TABLE 7.11 Factor associations by region.................................................................... 302
TABLE 7.12 Entrepreneurial associations combined .................................................... 303
TABLE 7.13 Item analyses for entrepreneurial orientation character themes
(multiple-outlets) ..................................................................................... 304
TABLE 7.14 Franchise paradox descriptive statistics.................................................... 306
TABLE 7.15 Pearson correlation coefficients for the franchise paradox construct ....... 307
TABLE 7.16 Item reliability analyses for franchise paradox themes ............................ 308
TABLE 7.17 Respondents in agreement with items ...................................................... 308
TABLE 7.18 Service profit chain descriptive statistics.................................................. 319
TABLE 7.19 Item reliability analyses for service profit chain themes .......................... 320
TABLE 7.20 Relationship marketing descriptive statistics............................................ 328
TABLE 7.21 Item reliability analyses for relationship marketing themes..................... 329
TABLE 7.22 Best practice descriptive statistics ............................................................ 335
TABLE 7.23 Item reliability analyses for best practice themes..................................... 336
TABLE 7.24 Service quality descriptive statistics ......................................................... 342
TABLE 7.25 Item reliability analyses for service quality .............................................. 343
TABLE 7.26 Construct summary statistics .................................................................... 346
xxi
LIST OF FIGURES
FIGURE 4.1 Elements of the service profit chain.......................................................... 122
FIGURE 4.2 The service profit chain............................................................................. 124
FIGURE 4.3 Components of the value mix.................................................................... 146
FIGURE 5.1 Consumer perception of technical and functional quality applied to an
optician’s practice.................................................................................... 180
FIGURE 5.2 The gaps model of service quality............................................................. 183
FIGURE 5.3 The conceptual model of market orientation effects on service quality
and business performance........................................................................ 190
FIGURE 5.4 The six markets framework....................................................................... 208
FIGURE 5.5 Core competencies for internal services marketing .................................. 213
FIGURE 5.6 The relationship management chain.......................................................... 215
FIGURE 6.1 A combined classification of research design ........................................... 237
FIGURE 6.2 A classification of market research data ................................................... 246
FIGURE 6.3 A conceptual model of quantitative research ............................................ 248
FIGURE 6.4 A schematic overview of the tailored survey design perspective ............. 250
FIGURE 6.5 The current research project approach to instrument development .......... 260
FIGURE 7.1 Gender of franchisees................................................................................ 280
FIGURE 7.2 Region/province of franchised outlets....................................................... 282
FIGURE 7.3 Years as a franchisee in the Mr. VIDEO system....................................... 282
FIGURE 7.4 Full-time employees.................................................................................. 284
FIGURE 7.5 Part-time employees.................................................................................. 284
FIGURE 7.6 Outlet representations in the system.......................................................... 285
FIGURE 7.7 Franchising as an entrepreneurial option (single outlet responses)........... 315
FIGURE 7.8 Franchising as an entrepreneurial option (multiple-outlet responses) ...... 315
FIGURE 7.9 Single outlet satisfaction responses........................................................... 317
FIGURE 7.10 Multiple-outlet satisfaction responses ..................................................... 317
FIGURE 7.11 Single outlet strategy responses .............................................................. 338
FIGURE 7.12 Multiple-outlet strategy responses .......................................................... 338
FIGURE 8.1 A conceptual matrix of an entrepreneurial service vision in the
franchised home entertainment system.................................................... 369
1
1 CHAPTER 1: BACKGROUND AND ORIENTATION OF THE PROBLEM
“Entrepreneurship is the dynamic process of creating incremental wealth. This wealth is
created by individuals who assume the major risks in terms of equity, time and/or career
commitment of providing value for some product or service. The product itself may or
may not be new or unique but must somehow be infused by the entrepreneur by securing
and allocating the necessary skills and resources.” (Ronstadt, 1996: 28)
1.1 INTRODUCTION
Chapter one introduces the background and orientation of the problem, identifying the
theme for the balance of the study. An entrepreneurial service vision in a franchised home
entertainment environment encapsulates the disciplines of entrepreneurship, franchising
and strategic marketing. Within the constraints of this research project, strategic
marketing is in turn represented by strategic service initiatives of the service profit chain,
service quality, relationship marketing and best practice initiatives. The aim of the study
is to empirically evaluate the association of these disciplines toward the development of a
conceptual matrix of an entrepreneurial service vision within a defined franchised system.
The background of the study identifies the subject area, together with the primary
objective of identifying entrepreneurship and entrepreneurial orientation within a defined
franchise system; with synergistic links to a strategic service vision. Entrepreneurship is
seen as an integrated concept permeating enterprise in an innovative and creative manner,
whereas franchising is regarded as an entrepreneurial option for creating and developing
ventures. The strategic service vision links the service profit chain, service quality,
relationship marketing and best practice initiatives towards achieving organisational profit
and growth objectives. The defined franchise system is Mr. VIDEO, the market leader in
the home entertainment industry on the African continent. The organisation commands an
eighteen per cent market share, consisting of over one hundred and fifty franchised
outlets. The study is limited to this franchise system, and cognisance is taken of the
limited availability of literature on the defined disciplines in the home entertainment
industry.
The importance of the study revolves around its contribution not only to enhancing
understanding of the dynamics of the industry on the African continent, but also to

2
conceptualising an entrepreneurial service vision in the home entertainment industry. The
contribution of such a strategic service vision will facilitate competitive advantage
throughout the supply chain; involving distributors, retailers (primarily franchise based)
and the interaction with customers. Theoretically, the value the investigation will provide
will be in understanding that the home entertainment industry is worthy of developing a
body of knowledge, to be shared by all industry participants.
The primary and secondary research questions, together with research objectives, are
complemented with primary and secondary hypotheses. The research questions,
objectives and hypotheses all revolve around an entrepreneurial orientation and strategic
service vision in a franchised home entertainment environment. The research
methodology and design are depicted as the sequence of stages underlying the design and
implementation of the research project, including the establishment of the research
purpose and objectives, information value estimation, research design and
implementation. Design includes sources of data, data collection format, measurement
scales and instrument design. Data analysis incorporates descriptive and inferential
statistics, with the aid of computer software including SPSS version 11.0 and Surveypro.
Research results and conclusions elaborate the findings based on the literature review and
empirical analysis, towards the development of a conceptual entrepreneurial service
matrix.
The thesis consists of eight chapters. Chapter one represents the background and
orientation to the problem; chapters two to five represent a literature review on the
disciplines identified; and chapters six to eight represent the research methodology,
research results, conclusions, interpretation and recommendations.
1.2 BACKGROUND OF THE STUDY
The subject areas of the study include entrepreneurship, entrepreneurial orientation,
franchising, service quality dimensions, the service profit chain, relationship marketing
and best practice initiatives.
The primary objective of the research project is to identify entrepreneurship and
entrepreneurial orientation within a defined franchise system; with synergistic links to a
strategic service vision. The strategic service vision in turn includes service quality, the
3
service profit chain, relationship management and best practice initiatives. Upon
identification of the links and relationships amongst constructs, factors and variables; the
opportunity exists to develop a matrix to facilitate service-oriented decision-making
within the franchise system.
Kuratko and Hodgetts (2004: 3) introduce entrepreneurship as, “an integrated concept that
permeates an individual’s business in an innovative manner”. Entrepreneurs are
individuals who recognize opportunities, often being aggressive change catalysts within
the marketplace. In high growth, global, competitive economies the ability to grow
businesses, create wealth, and sustain competitive advantage has become imperative (Acs,
Arenius, Hat & Minniti, 2005: 12). Entrepreneurship is associated with adaptation and
change of economic systems, often contributing to national economic growth (Bygrave,
Reynolds & Autio, 2004: 5). Gartner (2001: 11) highlighted a dual approach to
entrepreneurship; consisting of behavioural and trait approaches. He further went on to
identify behavioural approaches as a set of activities involved in organisation creation,
while in trait approaches an entrepreneur has a set of personality traits and characteristics.
Complementing the trait approach, Bolton and Thompson (2004: 100) developed the
temperament, talent and technique matrix; identifying facets of focus, advantage,
creativity, team, social and ego. Bolton and Thompson (2003: 49) define an entrepreneur
as “a person who habitually creates and innovates to build something of value around
perceived opportunities”. To this end, their definition is not only limited to the creation of
new ventures, but also the exploitation of opportunities. Thompson (2002) identified
character themes of the entrepreneur, applicable to the current study.
Franchising is seen as an entrepreneurial option towards creating and developing ventures
(Bygrave: 1997). Michael (2003: 61) in agreement herewith, mentions franchising as a
technique for entrepreneurs in service industries to assemble resources in order to rapidly
create large chains and gain first mover advantage. Franchising is an arrangement
between two parties whereby the franchisor grants the franchisee certain rights to sell a
firm’s products or services, as per guidelines set down by the franchisor (Nieman, 1998:
3). The franchise association of Southern Africa defines franchising as “a grant by the
franchisor to the franchisee, entitling the latter to the use of a complete business package
containing all the elements necessary to establish a previously untrained person in the
franchised business and enable him or her to run it on an ongoing basis, according to
guidelines supplied, efficiently and profitably”. Mendelsohn (2003) emphasises that a

4
franchise relationship is not self-sustaining, with basic issues being that the franchise
cannot succeed without successful franchisees, franchisors to devote resources to enhance
franchisor/franchisee relations, franchisor duty to establish and sustain a viable business,
a franchisors code of ethics, and a commitment that the franchisor must promote the basic
principles upon which franchising is based. Franchisors in many sectors have recognised
the benefits of multiple-unit franchisees (Johnson, 2004: 36), and this is seen as an
entrepreneurial continuation of the franchise trend. Lindsay and McStay (2004: 3) further
explored the entrepreneurial orientation of franchisees, together with the entrepreneurial
drivers of franchisee performance. Their findings indicated a proactiveness regarding
entrepreneurial orientation, together with a risk-taking entrepreneurial orientation.
The economic growth in service quality, related profit and competitive advantage
potential has accelerated the competitive opportunities for companies who can excel in
this discipline. The search for new approaches to enhance service quality and customer
satisfaction led to the development of the scale SERVQUAL (Parasuraman, Berry &
Zeithaml: 1988) that measures the discrepancy between consumers’ perceptions and
expectations. Zeithaml and Bitner (2003: 93) developed this model further, identifying
five service quality dimensions, along with the scale developed to measure them.
Dimensions include reliability, responsiveness, assurance, empathy and tangibles. In
context, these dimensions represent how consumers perceive service quality. An
adaptation is the development of SERVPERF (Cronin & Taylor: 1994), a service quality
instrument applicable to the research project on hand.
Whilst service quality is directed towards customer satisfaction, the link to profit and
growth of organisations led to the development of the service profit chain (Heskett, Sasser
& Schlesinger, 1997: 12). This is a strategic service vision whereby there is a strong and
direct relationship between customer satisfaction, customer loyalty and the value of the
goods and services delivered to customers. Furthermore, there is a strong link between
these elements and overall profit and growth of an organisation. Heskett et al (1997) also
identified three strategic implementation initiatives of retention, related sales and
referrals; as integral components of the service profit chain.
Relationships between value chain participants (Porter: 1995) led to developments in the
field of relationship marketing. Peck, Payne, Christopher and Clark (1999: 22) developed
a revised version of the six markets model; which included internal, referral, influence,

5
recruitment and supplier/alliance markets. The six markets model identifies all facets of
internal and external relationships that can contribute towards an organisation’s
marketplace effectiveness.
Complementing the service vision further led to development of best practice initiatives,
often adopted by innovative firms in competitive industries and environments. Such
initiatives were regarded as pivotal for survival and achievement of competitive
advantage (Porter: 1998). The Video Software Dealers Association of America (VSDA:
2001) identified best practice in the industry, as identified by Arthur Andersen Business
consultants. These were wide ranging, including understanding customers and markets,
developing vision and strategy, refining store product offerings, implementing the
marketing plan, creating promotions and in-store merchandising, and clear in-store
operations. Customer service findings included that best customer service is one-to-one,
and strong relationships and loyalty are developed between staff and customers through
consistency of management and staff, and personalising customer service.
An entrepreneurial orientation within a defined franchised system, coupled with service
vision components, has been evaluated in the South African home entertainment industry.
The industry has an oligopolistic supply channel, dominated by two corporate
distributors. Retailers are in turn dominated by a few franchisors, operating on a national
(and rest of Africa) basis. The market leader, Mr. VIDEO, was founded ten years ago, and
has experienced this domination for the past five years. Mr. VIDEO has a market share of
approximately eighteen per cent. Entrepreneurial behaviour will be evaluated within the
context of this franchise system. The industry is a major contributor to employment and
income, with the market valued at approximately R 600 million per annum. Since the
home entertainment market is a product of technology, it aptly fits with the
entrepreneurial characteristics of innovation and creativity.
1.2.1 Limitations of the study
A major limitation in this study is the limited existence of literature and material
regarding the South African home entertainment industry, notwithstanding
competitiveness in the supply channel due to oligopolistic market forces. Whilst the study
is on the franchised system within the Mr. VIDEO network; it is the opinion of the
researcher that the study cannot be extended to the entire franchised home entertainment
6
industry, primarily due to confidential marketing strategies. Different franchised groups
would not be willing to share their competitive strategies outside their own franchise
grouping. This limits this study to a single franchised group, in this case, the market
leader (approximately three times larger than its closest competitor). Furthermore, the
researcher was the managing director of the second largest franchised group in the
industry, and participants may question ethical considerations. Ideally, the entire home
entertainment market would have been the optimal population; opening avenues for
further research.
Limitations of the applicable research project recommendations rest upon the motivation
and entrepreneurial orientation of implementation within a franchised environment, which
is ultimately in the hands of the franchisee. The franchisor, however, has to be seen as the
change-catalyst towards strategic implementation.
1.3 IMPORTANCE OF THE STUDY
In this study, business management frameworks regarding aspects of an entrepreneurial
service vision within a franchised environment are systematically recommended. The
conceptual framework is empirically tested and within this framework important
conclusions are made, providing insight into these disciplines. Specific implications are
tested, with recommendations regarding aspects of implementation within the context of
selected South African organisations. The value of this study therefore rests on theoretical
and practical levels.
Whilst the existing body of knowledge has influenced strategic service visions in many
service related industries; entrepreneurship and the service profit chain, together with
other strategic initiatives have received minimal formal research in the lucrative South
African home entertainment industry. To date, no published entrepreneurial service vision
within this industry is to be found in reviews, standing operating procedures, nor any
literature search. This study will not only enhance understanding of the dynamics of the
industry on the African continent, but also conceptualise an entrepreneurial service vision
in the home entertainment industry. The contribution of such a strategic service vision
will facilitate competitive advantage throughout the supply chain; involving distributors,
retailers (primarily franchise based) and the interaction with customers.

7
Theoretically, the value the investigation provides will be in understanding that the home
entertainment industry is worthy of developing a body of knowledge, to be shared by all
industry participants. Similarly, linking entrepreneurship, franchising and strategic service
in the form of a matrix may be of interest and application to other academic disciplines.
This will facilitate both researchers and students in related business management
disciplines.
As a contribution to practice, the entrepreneurial service vision will enhance the longevity
of the industry, while sharing entrepreneurial service vision recommendations with all
industry participants. As such, the general oligopolistic nature of major industry
participants will be dissolved; making the industry more accessible, creating more
employment, and increasing industry participants. Since the industry is a product of
technology, the identification of entrepreneurial behaviour of franchisor/franchisees will
highlight the re-defining of industry practices.
This study, the first of its kind in the home entertainment industry and in the specific
organisation, will smooth the way for implementation of entrepreneurial franchise service
initiatives in the organisation. It will also assist franchisees in their advancement in the
organisation and could be used to complement other programmes within the home
entertainment, entrepreneurial and franchised communities.
On a macro level, successful implementation of the matrix will enhance industry
participation; together with entrepreneurial contributions towards the creation of wealth,
economic growth and creation of employment in a dynamic, yet turbulent developing
economy such as South Africa. In addition, the study will enhance South African
companies’ competitive advantage in an international marketing environment.
1.4 DEFINITION OF THE RESEARCH PROBLEM
The research problem is the determination of an entrepreneurial orientation of participants
in a defined franchise system, coupled with the association of strategic service vision
constructs. Once explored, the entrepreneurial orientation, franchise system and service
vision constructs will be synergised to develop an entrepreneurial service vision within a
franchised home entertainment environment. The research problem is further segregated
8
into primary and secondary research questions, key terminology, research objectives and
hypotheses to be tested.
1.4.1 Research questions
The purpose of the investigation is to determine the entrepreneurial orientation of
participants in a franchised system, coupled with the association of service vision
constructs. Once explored, the entrepreneurial orientation and service vision constructs
will be synergised to develop an entrepreneurial service vision within a franchised
environment.
1.4.1.1 Primary research question
To determine the entrepreneurial orientation within a franchised system.
Question 1: Does entrepreneurial orientation exist within a franchised system, and if so, to
what extent?
1.4.1.2 Secondary research questions
To determine the contribution of franchising as an entrepreneurial option towards creating
and developing ventures.
Question 2: Does franchising lead to an entrepreneurial option towards creating and
developing ventures?
To determine the contribution of the service profit chain to service quality.
Question 3: Do service profit chain initiatives lead to service quality?
To determine the contribution of relationship marketing to service quality.
Question 4: Does relationship marketing lead to service quality?
To determine the contribution of best practice to service quality.
Question 5: Does best practice lead to service quality?
To determine service quality in a franchise system.
Question 6: What is the level of service quality in a franchise system?
9
1.4.2 Key terminology
The view of integrating entrepreneurial activity and strategic service within a franchised
system may best be explained in the context of networks. The most widely held view of
‘network’ refers to an organized system of relationships, linking a defined set of persons,
objects or events (Nelson: 1988; Szarka: 1990). This networking in small business serves
to provide owner-managers with the necessary support, contacts, and credibility (Ostgarrd
& Birley: 1996). Consequently, the owner-managers will benefit from obtaining
necessary information and will learn more about their own competitive capabilities
relative to their competition, thereby minimizing the harsh lessons the market place may
present (Dilts: 2000). As such, networking is seen as a major tool for achieving desired
business results, and as a key source of resources that are typically outside the reach of
many entrepreneurs (Zhao & Aram: 1995). This network view correlates entrepreneurship
and franchising, yet the study of entrepreneurial orientation amongst franchisees in the
franchise system requires investigation. In this context, the study includes an
entrepreneurial character theme analysis based on twenty associated themes; as developed
by Bolton and Thompson (2003). In addition, franchising as an entrepreneurial option
towards creating and developing ventures will be evaluated within the defined franchise
system.
Extensive literature in the areas of customer satisfaction and loyalty are abounds, yet few
link the disciplines of service quality, the service profit chain, relationship marketing and
best practice. The development of a service vision matrix (incorporating these disciplines)
involves an investigation into the relationship and association between these constructs
independently and as a stratified matrix. Such a study will include strategic service
initiatives of service quality (Zeithaml & Bitner: 2003), the service profit chain (Heskett
et al: 1997), the relationship marketing six markets framework (Peck et al: 1999), and
best practice principles (VSDA: 2001).
An important aspect of the study is synergising the overall entrepreneurial orientation of
the franchised system within the framework of a strategic service vision.
10
1.4.3 Research objectives
The research objectives are to investigate the current situation of entrepreneurial
orientation in a franchise environment, together with examining the contribution of a
strategic service vision to service quality. The purpose is thus to identify entrepreneurial
behaviour amongst franchisees, franchising as an entrepreneurial option; and to identify
elements of service quality, service profit chain, relationship management and best
practice and finally, to develop a matrix of an entrepreneurial service vision, to be
initiated within the defined franchise system.
The first objective of investigating entrepreneurial orientation within the franchise system
is based around the entrepreneurial character themes as depicted by Bolton and
Thompson (2003: 62-80). The outcome of orientation will facilitate decision-making and
implementation of the strategic service vision.
The second objective, consisting of the four constructs (service profit chain; service
quality, relationship management and best practice) associated with the vision; include
investigation on issues relating to relationships within and between the constructs. An
additional construct, the franchise paradox, measures the contribution of the franchise
system as an entrepreneurial option towards creating and developing ventures (Bygrave:
1997).
The final objective is the development of an entrepreneurial service vision, based upon
the findings of the first two objectives. Such a matrix may be described as a full
representation or description of the set of associations between these factors, including
statements about the assumptions and interactions in the matrix (Page & Meyer, 2000: 7).
1.4.4 Hypotheses to be tested
Hypothesis testing uses statistical techniques to support predictions arising from theory.
This is done at a statistically significant level, in that hypotheses (predictions) are either
accepted or rejected. Page and Meyer (2000: 23) define a hypothesis as “a testable
speculative statement delineating the relations between all the elements of a theory”. The
two hypotheses involved in hypothesis testing are the null and alternate hypothesis

11
(represented by H0 and H1 respectively). H1 represents the research hypothesis, whilst
H0 assumes the research hypothesis is false (Page & Meyer, 2000: 166).
The hypotheses supplement the research questions and objectives:
1.4.4.1 Primary hypothesis
The primary hypothesis postulates that there is evidence of entrepreneurial orientation in
a franchise system.
H1: Entrepreneurial orientation exists in a franchise system.
H0: Entrepreneurial orientation does not exist in a franchise system.
A proposition is introduced:
P1: Entrepreneurial orientation exists in a multiple-outlet franchise system.
1.4.4.2 Secondary hypotheses
The secondary hypotheses postulate that there is evidence of a positive association
between:
• The franchise system and an entrepreneurial option towards creating and
developing ventures
• The service profit chain and service quality
• Relationship marketing and service quality
• Best practice and service quality.
H2: The franchise system is an entrepreneurial option towards creating and developing
ventures.
H0: The franchise system is not an entrepreneurial option towards creating and
developing ventures.
H3: Service profit chain initiatives are positively associated with service quality.
H0: Service profit chain initiatives are not positively associated with service quality.

12
H4: Relationship marketing initiatives are positively associated with service quality.
H0: Relationship marketing initiatives are not positively associated with service
quality.
H5: Best practice initiatives are positively associated with service quality.
H0: Best practice initiatives are not positively associated with service quality.
Hypotheses testing include non-parametric testing, indicative of the assumption that the
dependent variable does not necessarily have a normal distribution (bell-shaped).
Hypothesis tests produce P-values, measuring significance, whereby there is a chance that
the null hypothesis is true (Malhotra et al: 2002). Hypothesis tests will include the
Kruskal-Wallis one way ANOVA test, together with interaction tests for greater than one
independent variables (Page & Meyer: 2003). Service quality, the dependent variable,
will be measured using similar inferential statistics as the stated hypotheses.
1.5 RESEARCH DESIGN
The study commences with an exploratory search of published data in the disciplines of
entrepreneurship and franchising. Related literature is reviewed, with particular reference
to entrepreneurial orientation and characteristics linked to the franchise paradox. In
addition, experts and well informed people with respective credentials in these arenas are
canvassed for their opinions and thoughts relating to the research objectives. This not
only includes academia, but industry knowledgeable individuals. Published data includes
books and journals, in addition to international academic conference proceedings.
The literature review (secondary data) forms the foundation on which the research is
built, and Neuman (1997) informs that it should integrate and analyse what is known in
the specific area by synthesizing different prior studies. To combine a literature study of
the service profit chain, service quality, relationship management and best practice; there
is in the first place a theoretical perspective investigation to the process of a strategic
service vision. Thereafter a theoretical disposition evolves incorporating these factors into
a strategic vision.
Research design is the general form or system according to which the study is executed,
with surveys enabling the researcher to collect data in a standardized format from a
13
census. It is done in such a way that it is possible to make generalizations to the
population. The survey will be implemented to collect data about a great number of
similar cases, executed in a circumscribed area at a given time. The survey follows a
deductive approach, whereby it commences with a theoretical or applied research
problem and ends with empirical measurement and data analysis (Neuman, 1997: 109).
A composite ideology from three methodology authorities is proposed (Malhotra et al:
2002; Page & Meyer: 2003; Dillon et al: 1993). What follows is the intention to provide
insight into the practical ways and methods that will be employed in gathering the
information for the empirical part of this study.
1.5.1 Applicable design process
Research designs may be classified as either being exploratory or conclusive (Malhotra et
al: 2002). Conclusive research design is further classified as descriptive and causal
research. This research project will be conclusive in nature; where the primary objective
is to test hypotheses of entrepreneurial orientation and a strategic service vision (service
profit chain, service quality, relationship marketing and industry best practice). This
however does not negate the use of exploratory data, originally used in this study to
develop hypotheses and develop questions (framework).
1.5.2 Sources of data
Information sources available to the researcher can be classified as primary or secondary
data (Dillon et al: 1993: 78). Aaker, Kumar and Day (2001) postulate that these methods
may be used either singly or in combination. They explain secondary data as being
already available, being collected for some purpose other than solving the present
problem; whilst primary data are collected especially to address a specific research
objective. Applicability to the current research project is the criterion for both secondary
and primary data.
1.5.3 Data collection format
The relationship between qualitative and quantitative research should not be considered in
terms of a mutually exclusive dichotomy but rather as a continuum of complementary

14
paradigms (Borland: 2001). This complementarily is a point of view shared by Page et al
(2003), placing emphasis on the research objectives as a guiding formation. The
applicability of the current research project is quantitative in nature, despite the
advantages and merits of qualitative research being complementary. The two were
synergized, evaluated and then determined to construct a niche setting with clear research
objectives. Qualitative data was primarily used during the exploratory phase, followed by
quantitative primary data to test hypotheses.
1.5.3.1 The survey method
The survey method is identified as the preferred format of data collection (Borland:
2001). The approaches identified by Malhotra et al (2002), Aaker et al (2001) and the
tailored design method of Dillman (2000) were instrumental in the design of the survey
applicable to the research project on hand.
1.5.3.2 The sampling plan
Aaker et al (2001) identify sampling as the process of surveying only a sample of the
population to make inferences about the whole population. Application to the current
research project identifies the Mr. VIDEO franchise system within the home
entertainment industry as a sample unit and element. The time period is 2004 and 2005,
with size indicative of franchise system participants in the home entertainment industry.
Martins et al (1996) identify the sampling frame as a record of all the sample units
available for selection at a given stage of the sampling process. In this research project,
the sampling frame will include all of the Mr. VIDEO franchised outlets (one hundred
and sixty two stores, one hundred and ten franchisees).
A census is a complete enumeration of the elements of a population, whilst a sample is a
subgroup of the population selected for participation in the study. Advantages to using a
census primarily revolve around the large variance in the characteristic of interest being
large; the high cost of sampling error; and ultimately a small sample (Malhotra et al:
2002). The best sample designs ensure that the sampled data represent the research
population efficiently and reliably (Page & Meyer: 2003). A census is obtained by
collecting information about each member of the group (de Vaus: 1995); applicable to all
Mr. VIDEO franchisees in the current research project. Since the sample unit and sample

15
frame consist of all Mr. VIDEO franchisees, a census was done of the population
elements and all 125 franchisees were included in this study.
1.5.4 Measurement scales
Page and Meyer (2003: 72) refer to measurement scales as, “a set of measures where
some level of value or intensity or characteristic is conveyed by a position, usually a
number, on the scale”. Four variable measurement scales, namely, nominal, ordinal,
interval and ratio scales are identified (Aaker et al: 2001). In a nominal variable scale,
numbers represent a particular characteristic, despite numbers not conveying any sense of
order or value in the measurement (Page & Meyer: 2003). Ordinal variable scales provide
some order to the values of the variable being measured, providing more information than
nominal scales. Whilst nominal scales do not have the property of order among them,
ordinal scales have the property of order among scale points (Sudman & Blair: 1998:
448). Interval variable scales measure variables whereby the measurement units are
equidistant, but there is not necessarily a defining beginning point to the measure. There
is no true zero point to embed numerical calculations (Page & Meyer: 2003). Ratio scales
are an advanced type of interval scale, whereby the spaces between measuring units are
exactly the same, with the advantage of an absolute zero point. Ratio measurement scales
provide an increasing depth of information about a variable, having order among scaling
points, equal distances among all adjacent scale points, and an absolute zero (Sudman &
Blair: 1998). Applicability to the current research project involved a bi-variable
measurement approach; that of nominal and interval measurement scales. The current
research project will predominantly make use of a standard five-point Likert-scale,
facilitating consistency and ease of completion.
1.5.5 Instrument design
This section details the use and applicability of the questionnaire to the current research
project. Since this research is of a descriptive and exploratory nature, the questionnaire is
deemed to be a feasible data collection alternative (Saunders et al: 1997). Self-
administration has the advantages of foregoing interviewer bias and geographical
dispersion; and due to expected response rates, the instrument is deemed to be effective
(Neuman: 1997). The design of questions, structure of the questionnaire and rigor of pilot

16
testing are determinants of the validity and reliability of collected data (Saunders et al:
1997).
The questionnaire takes a two-tiered approach, and is divided into seven distinct sections.
The first tier undertakes collection of data regarding franchisee classification,
entrepreneurial orientation and franchising; whilst the second tier has responsibility for
collection of strategic service data (service quality, service profit chain, relationship
management and best practice). The questionnaire can be observed on page 1 in
Appendix 1. The sections are depicted as follows:
• Section A: Franchisee demographics and details, questions 1-8
• Section B: Entrepreneurial orientation, questions 9-28
• Section C: Franchise system, questions 29-38
• Section D: The service profit chain, questions 39-48
• Section E: Service quality, questions 49-58
• Section F: Relationship marketing, questions 59-68
• Section G: Best practice, questions 69-78.
1.5.6 Data analysis
Simply defined, data analysis is a statistical procedure employed in coding, editing,
analyzing and interpreting data (Aaker et al: 2001). Editing entails a thorough and critical
review of a completed questionnaire in terms of compliance with the criteria for
collecting meaningful data; and deals with questionnaires not duly completed (Martins et
al, 1996: 295). Coding is the conversion of questionnaire responses into numeric form in
order to allow quantitative analysis (Page & Meyer: 2003).
Reliability and validity were evaluated as integral prerequisites for the research data on
hand to avoid possible shortcomings and pitfalls in research results. Reliability involves
the quality of measurement and refers to the amount of agreement between independent
attempts to measure the same theoretical concept (Martins et al: 1996; Brien: 1995).
Validity relates to the ability of a measurement instrument to measure what it purports to
measure (Brien et al: 1995). Martins et al (1996: 26) relate validity specifically to
measuring instruments.

17
Descriptive statistical techniques identify the application of univariate (single variable)
measures of centre and spread and bivariate (two-variable) measures of association.
Measures include the mean, standard error of the mean, standard deviation, kurtosis and
cross tabulations. Inferential statistics include relevance tests (hypotheses tests),
identifying implementation of the Kruskal-Wallis one-way analysis of variance
(ANOVA). Cronbach’s Alpha is introduced as a construct reliability measure, identifying
overall inter-item correlation. The Pearson correlation coefficient is analysed across
constructs. Applicable software used for the collection and analysis of data include
Surveypro and SPSS version 11.0.
1.6 RESEARCH FINDINGS AND RECOMMENDATIONS
Synthesis and interpretation concludes the theoretical component of research
methodology, and is followed by an analysis of research results. This provides an analysis
of the results and interpretation of data, together with the outcome of the primary and
secondary hypotheses formulated in Section 1.4.4. Furthermore; constructs, factors and
variables are evaluated, correlated and examined within the survey framework. The final
outcome is portrayed as conclusions and recommendations, identifying and detailing the
recommendation of an entrepreneurial service vision matrix in a franchised home
entertainment environment.
1.7 OUTLINE OF THE THESIS
The investigation commences with an exploratory to specific review of literature in the
disciplines of entrepreneurship, entrepreneurial orientation, franchising, service profit
chain, service quality, relationship marketing and best practice initiatives. This is
followed by research methodology, identifying the systematic and objective analysis of
observations that lead to the development of generalizations and predictions. The
penultimate section constitutes the analysis of research results, followed by conclusions
and recommendations. The outcome is the recommendation of a conceptual matrix of an
entrepreneurial service vision in a franchised home entertainment environment. The
programme of investigation is depicted in eight chapters, with complementary
appendices.

18
1.7.1 Chapter One: Background and orientation of the problem
This chapter offers background to the focus of the study within a franchised environment
in the home entertainment industry in South Africa. The analogy commences with a
background of the study, including the limitation of the study. The background identifies
key aspects of entrepreneurship, entrepreneurial orientation, franchising, the service profit
chain, service quality, relationship marketing and best practice. The study highlights the
scarcity of available literature in the home entertainment industry, and the opportunity of
enhancing the understanding of the dynamics of the industry. The research problem is
defined; identifying primary and secondary research questions, key terminology, research
objectives and finally primary and secondary hypotheses to complement the research
questions. Research design places emphasis on the empirical nature of the research
project; identifying the applicable design process, sources of data, data collection format
(survey and sampling), measurement scales, instrument design and data analysis.
Descriptive and inferential statistical techniques are identified. The chapter culminates in
a brief description of research results and recommendations. Final comments follow on
the outline followed in the study.
1.7.2 Chapter Two: Entrepreneurial orientation
The second chapter covers a broad spectrum of existing literature on entrepreneurship,
culminating in empirical studies on entrepreneurial orientation. The literature commences
with the nature and development of entrepreneurship, including entrepreneurial
participation rates. The review is supported by data from The Global Entrepreneurship
Monitor (GEM), identifying assessment of national entrepreneurial activity. Various
definitions of the entrepreneur are evaluated, followed by the nature, characteristics and
behaviour of the entrepreneur. Comparisons of entrepreneurs, intrapreneurs and
traditional managers are highlighted. The talent, temperament and technique of the
entrepreneur are introduced, with linkage to Gallup’s life themes. Finally, character
themes to evaluate entrepreneurial orientation (Thompson: 2002) are discussed with
relevance to empirical evidence. An adaptation of this empirical research is implemented
as an entrepreneurial orientation measurement tool in this study.
19
1.7.3 Chapter Three: The franchise paradox
This chapter introduces franchising as an entrepreneurial option towards creating and
developing ventures. The nature and development of franchising is examined, together
with the franchising link to entrepreneurship. Franchise rationale is developed from
existing literature, depicting operational constructs within a franchise system. Rationale
includes, but is not limited to, constructs of real estate development, training, continuing
support, performance standards, research and development, marketing, operations
manual, specialist support, territorial rights and terms of agreement. Franchise system
relationships are evaluated in the context of trends, cooperation, leadership, effort,
conflict, disputes, quality control, foundation, associations, networks and franchise
system merits. The chapter culminates with a literature review of an entrepreneurial
orientation in a franchise system, followed by an empirical review of proactivity,
innovation and risk-taking in a franchise environment.
1.7.4 Chapter Four: Putting the service profit chain to work
The fourth chapter identifies the service profit chain (Heskett et al: 1997) as a strategic
service vision, identifying customer satisfaction and loyalty to long term organisational
profitability and growth. The literature review commences with an overview of profit and
growth related to the components of the service profit chain. Capitalising on the service
profit chain identifies links in the chain, consisting of profit and growth link to customer
loyalty, loyalty link to customer satisfaction, satisfaction link to service value, value link
to employee productivity, productivity link to loyalty, loyalty link to employee
satisfaction, and satisfaction link to internal quality of work life. Service profit chain
implications are highlighted, lending management theories from many related disciplines.
The management of customer satisfaction is reviewed, together with methods used to
track customer satisfaction. The customer value equation is introduced, placing emphasis
on requirements to add value. Customer loyalty receives emphasis from a determinants
point of view, together with loyalty enhancing measures. The lifetime value of customers
is analysed, identifying strategic initiatives of retention, related sales and referrals. The
final section incorporates the enhancement of service profit chain initiatives, identifying
eight strategies which facilitate service profit chain implementation.
20
1.7.5 Chapter five: Integrating service quality, relationship marketing and
benchmarking for best practice
This chapter identifies the disciplines of service quality, relationship marketing and best
practice as three separate constructs. Service quality is most often conceptualised as the
comparison of service expectations with actual performance perceptions. The various
definitions of service quality are evaluated against the backdrop of the dimensionality of
service quality, together with the integrated gaps model as identified by Zeithaml and
Bitner (2003). Various service quality initiatives are assessed, highlighting service quality
relationships. Of particular relevance, is the evaluation of service quality measurement.
SERVQUAL and SERVPERF are two measurement instruments identified as being
optimal for the study on hand.
A literature review was conducted on relationship marketing, with particular emphasis on
the revised version of the six markets model (Peck et al: 1999). The six markets reviewed
were customer, internal, referral, influence, recruitment and supplier/alliance markets.
Each market domain was evaluated, with links to related literature from various sources
in the discipline. Best practice initiatives included a review from generic literature, with
particular emphasis on best practice in the home entertainment industry in the United
States of America. The Video Software Association of America (VSDA: 2001) identified
best practice in the industry, as identified by Arthur Andersen Business consultants.
These initiatives were wide ranging, including understanding customers and markets,
developing vision and strategy, refining store product offering, implementing the
marketing plan, creating promotions and in-store merchandising, and clear in-store
operations.
The strategic service constructs identified in this research study include the service profit
chain, service quality, relationship marketing and best practice. Service quality represents
the dependent variable, whereas the other three identified constructs represent the
independent variable.
1.7.6 Chapter Six: Research methodology
The sixth chapter explains the research methodology as aligned with the research design.
The chapter describes the research process, and details the problem formulation, research

21
objectives and hypotheses to be tested. Research design clarifies classification of
research; whereas methodology incorporates sources of data, the data collection format,
sampling plan, measurement scales and instrument design and testing. The chapter
culminates in data analysis evaluation; consisting of editing and coding, reliability and
validity, descriptive measures and inferential statistics. Hypotheses tests are supported
using P-values, Kruskal-Wallis tests and Cronbach’s Alpha. Synthesis and interpretation
concludes the theoretical component of research methodology.
1.7.7 Chapter Seven: Research findings
Chapter seven reflects an empirical analysis of the data obtained in this study. The first
section explains the demographic and biographic profile of the franchisee respondents
(section A of the questionnaire). The next section evaluates the entrepreneurial orientation
of franchisees, followed by an empirical investigation in the franchise paradox (sections B
and C in the questionnaire, respectively). A proposition is proposed, evaluating
entrepreneurial orientation in a multiple-outlet franchise environment. The following
section tests hypotheses and evaluates relationships between the service profit chain,
relationship marketing and best practice (independent variables) and service quality
(dependent variable). These constructs are identified in sections D, E, F and G of the
questionnaire. Constructs, factors and variables are evaluated using the descriptive and
inferential statistical techniques identified in Chapter six. Computer aided software
facilitation in this research study include SPSS version 11.0 and Surveypro.
1.7.8 Chapter Eight: Summary, conclusions and recommendations
The final chapter portrays confirmation of the results based on literature and empirical
information. The hypotheses tested are discussed, and accepted or rejected based upon
empirical analysis. Significant associations and differences amongst respondents,
constructs, factors and variables are identified towards the development of a conceptual
matrix of an entrepreneurial service vision in a franchised home entertainment
environment. The chapter culminates with recommendations regarding the
implementation of the conceptual matrix. Opportunity for further research; based on the
conceptual matrix, concludes the chapter.
22
1.7.9 Appendices
The appendices add value as contributory literature to the depicted chapters. Of particular
reference is the questionnaire, the Mr. VIDEO franchised outlet distribution and
correlation analysis of constructs. The bibliography depicts the extensive first instance
reference source of literature used for the research study on hand.
1.8 CONCLUSION
This introductory chapter provided an overview of the research project, highlighting the
background against which the study is based. Terminology such as entrepreneurism,
entrepreneurial orientation, the franchise paradox, the service profit chain, service quality,
relationship marketing and best practice were introduced against the backdrop of the
research objectives. The research project involves a study of the entrepreneurial
orientation of franchisees within a defined franchise system in the home entertainment
industry; coupled with a strategic service vision. The strategic service vision incorporates
the synergistic contribution of service profit chain, service quality, relationship marketing
and best practice initiatives.
The study has highlighted the scarcity of available literature in the home entertainment
industry, together with the opportunity of enhancing the understanding of the dynamics of
the industry. The research problem is defined; identifying primary and secondary research
questions, key terminology, research objectives and finally primary and secondary
hypotheses to complement the research questions. Research design places emphasis on
the empirical nature of the research project; identifying the applicable design process,
sources of data, data collection format (survey and sampling), measurement scales,
instrument design and data analysis. Descriptive and inferential statistical techniques are
identified. The chapter culminates in a brief description of research findings and
recommendations. Comment is relayed on the chapter outline used in the study. The
outcome is a conceptual matrix of an entrepreneurial service vision in a franchised home
entertainment environment; a contribution to the development of the body of knowledge
to be shared by all industry participants.
Chapter 2 provides a literature review of entrepreneurship, entrepreneur themes and
entrepreneurial orientation in a franchise system
23
2 CHAPTER 2: ENTREPRENEURIAL ORIENTATION
2.1 INTRODUCTION
Kuratko and Hodgetts (2004: 3) introduce entrepreneurship as, “an integrated concept that
permeates an individual’s business in an innovative manner”. Entrepreneurs are
individuals who recognize opportunities, being aggressive change catalysts within the
marketplace.
In high growth, global, competitive economies the ability to grow businesses, create
wealth, and sustain competitive advantage has become imperative. Entrepreneurship is
associated with adaptation and change of economic systems, often contributing to
national economic growth (Bygrave, Reynolds & Autio, 2004: 5). Gartner (2001: 11)
highlighted a dual approach to entrepreneurship; consisting of behavioural and trait
approaches. He further went on to identify behavioural approaches as a set of activities
involved in organisation creation, while in trait approaches an entrepreneur has a set of
personality traits and characteristics. Complementing the trait approach, Bolton and
Thompson (2004: 76) developed the temperament, talent and technique matrix;
identifying facets of focus, advantage, creativity, team, social and ego. Bolton and
Thompson (2003: 49) define an entrepreneur as, “a person who habitually creates and
innovates to build something of value around perceived opportunities”. To this end, their
definition of entrepreneurship is not limited to the creation of new ventures, but includes
the exploitation of opportunities.
Thompson, in Global Entrepreneurship Monitor (2003: 34) further developed a twenty-
question character theme matrix to measure entrepreneurial orientation. The empirical
research, based on the character theme matrix, was published in the Global
Entrepreneurship Monitor 2003 (GEM). A character theme is a personality attribute or
characteristic that defines our normal, expected behaviour. Thompson’s (2002) set of
themes forms our inner psychological core and defines things we do most readily and
instinctively. These themes shall be examined and adapted for this study.
Themes consist of mastery, creativity, opportunity taking, urgency, performance
orientation, networking, focus, time focus, ego, courage, team, strategic, envisioning,
empowering, influencing, developer, systematic, disciplined, woo and relator. The
24
association of these themes relate to inventor, entrepreneur, leader, enabler and non-
entrepreneurial associations. The objective is to evaluate franchisees against these themes
and associations.
2.2 ENTREPRENEURIAL ORIENTATION
“It’s not the critic who counts, nor the observer who watches from a safe distance. Wealth
is created only by doers in the arena who are marred with dirt, dust, blood and sweat.
These are producers who strike out on their own, who know high highs and low lows,
great devotions, and who overextend themselves for worthwhile causes. Without
exception, they fail more than they succeed and appreciate this reality even before
venturing out on their own. But when these producers of wealth fail, they at least fail with
style and grace, and then their gut soon recognizes that failure is only a resting place, not
a place in which to spend a life-time. Their places will never be with those nameless souls
who know neither victory nor defeat, who receive weekly paycheques regardless of their
week’s performance, who are hired hands in the labour in someone else’s garden. These
doers are producers and no matter what their lot is at any given moment, they’ll never
take a place beside the takers, for theirs is a unique place, alone, under the sun.
They are entrepreneurs! ”
Joseph R. Mancuso
Center for Entrepreneurial Management
Nieman, Hough and Nieuwenhuizen (2003: 11) advise that entrepreneurial orientation is
critical to the survival and growth of organisations, notwithstanding the importance to
prosperity of economic advantage. They further inform that entrepreneurial orientation is
focussed by a unique combination of factors, including culture, role models, family,
education, work experience and personal orientation. Personal orientation includes factors
such as creativity and innovation, risk taking, autonomy, pro-activeness and achievement
orientation.
2.3 NATURE AND DEVELOPMENT OF ENTREPRENEURSHIP
Gartner (2001) identifies two main approaches to entrepreneurial behaviour. In
behavioural approaches, the study of entrepreneurship is seen as a set of activities
involved in organisation creation, whereas in the trait approaches, an entrepreneur is seen
25
as possessing a set of personality traits and characteristics. Freel and Deaken (2003: 2)
however base their concern on three approaches, being the contributions of economic
writers, the psychological trait approach on personality characteristics of the entrepreneur,
and a social-behavioural approach, stressing the influence of the social environment as
well as personality traits.
In examining conventional economic theory, the term ‘entrepreneur’ is noticeably absent.
The development of the theory of entrepreneurship parallels to a great extent the
development of the term ‘entrepreneurship’ (Hisrich, Peters & Shepherd, 2004: 6). The
word entrepreneur originates from French, and literally translated, means “go-between”
or “between-taker”. Identifying an entrepreneur as an individual, a literal meaning might
translate as “one who takes between”. Looking back through the ages, entrepreneurship
development may be the result of many activities:
• Earliest period; early trading had many examples of go-betweens, Marco Polo
being an early example. He attempted to establish trade routes to the East, dealing
with merchant-adventurers. Activities included trading, physical and emotional
risk, profiteering, notwithstanding the risks associated with pioneering itself
• Middle ages; during this period, the term entrepreneur was used to describe an
actor and an individual who managed large projects. Such an example was the
cleric, the person in charge of great architectural constructions, such as,
cathedrals, abbeys and castles. The element of risk was however not prevalent
• 17th Century; the entrepreneurial connection with risk developed during this
period, whereby the individual went into contractual arrangements with
governments
• 18th Century; this period was characterised by the industrialization of the world,
with the person with capital being differentiated from the one requiring capital.
Thus, the entrepreneur was distinguished from the capital provider (present day
venture capitalist). Examples included inventions by Eli Whitney (developer of
the cotton gin) and Thomas Edison (electricity and chemistry), both being capital
users (entrepreneurs) and not capital providers (venture capitalists)
• 19th and 20th Centuries; during this period, entrepreneurs and managers were
closely associated and undifferentiated from an economic perspective (Hisrich &
Peters: 1998). An example was Andrew Carnegie, whilst inventing nothing,
adapted new technologies into products to achieve economic vitality. In the mid

26
20th century however, the link between entrepreneurship and innovation came to
the fore. Innovation is however not a new phenomenon, being existent through
history, from the Egyptians (pyramids made out of stone blocks, weighing many
tons each), to the Apollo lunar module, to laser beam technology.
Whilst Freel and Deakins (2003) recognise the economic approach to entrepreneurship,
they also recognise the significant role the entrepreneur has had in economic
development. This is emphasised by writers outside mainstream economic thinking:
• Richard Cantillon, a noted economist and author in the 1700s, developed one of
the earliest theories of the entrepreneur, and is often regarded as the founder of the
term. Together with Say (1803), the entrepreneur was regarded as an organizer of
factors of production, with additional insights reflecting the entrepreneur as a
catalyst for economic change. Cantillon also regarded the entrepreneur as a risk-
taker. Both Cantillon and Say belonged to the French school of thought known as
‘physiocrats’ (the physical nature of the then agrarian economy)
• The Kirznerian entrepreneur makes use of opportunities for trade, the entrepreneur
being alert to profitable opportunities. Kirzner is one of the initial Austrian school
writers who researched the characteristics of the entrepreneur. He further went on
to identify the entrepreneur as having additional knowledge in providing
opportunities for creative discoveries. Criticism levelled at Kirzner was that
anyone could potentially possess the additional knowledge. Despite this, his
identification of the key role of the entrepreneur as an opportunity spotter,
together with insights regarding the entrepreneur’s key ability in creative
alertness, laid the foundation for current day entrepreneurial thinking
• Whilst also being of the Austrian school of writers, Joseph Schumpeter identified
the key role of the entrepreneur as being an innovator (Schumpeter, 1949). He
believed that only certain people have the ability to be entrepreneurs, changing
convention through innovative activity. In contrast to the Kirznerian entrepreneur,
who operates on opportunities that arise out of new technology, the Schumpeter
entrepreneur develops new technology. An additional insight according to his
theory was the entrepreneur being regarded as a ‘hero’ figure. The best example of
the Schumpeter school of thought was the explosive growth of the internet in 1999
and 2000, where dotcom entrepreneurs were seen to be innovative, pioneering
new ways of trading using new technology. He however predicted the demise of

27
the function of the entrepreneur, in that large monopolistic firms have distinct
advantages over small firms in the technological process. The concept that the
entrepreneur is someone ‘special’, someone ‘different’ is important. Many writers
have carried this forward to distinguish entrepreneurs from those simply running
their own business (those wishing to merely remain self-employed)
• Knight; the entrepreneur was introduced as being a risk-taker, with additional
insights highlighting the risk-reward relationship. He placed emphasis on the
opportunity for profit arising out of environmental uncertainty, and identified that
the entrepreneur is someone who is prepared to undertake risk in an uncertain
world. Knight also made an important distinction between risk and uncertainty.
Risk is associated with uncertain outcomes, but those outcomes can be predicted
with a certain degree of probability. He further informs that the entrepreneur is
someone who is willing to accept risk when outcomes are uncertain. This
distinction helps to distinguish an entrepreneur from a small firm manager/owner.
The Knightian entrepreneur is an individual who is prepared to undertake the risk
of setting up their own business, as well as being a risk taker. This dual risk-taking
activity leads to criticism of the Knight theory, despite the importance of risk-
taking behaviour on modern entrepreneurial thinking. Knight described the
entrepreneur as confident and ventursome to make judgements about the uncertain
future, with profit being the reward
• The viewpoint of uncertainty and imperfect information is crucial in Shackle’s
model of entrepreneurship. He identifies the entrepreneur as being someone who
is creative, imaginative and original. Imagination is important for identifying
opportunities. Shackle identifies that a host of factors responsible for creativity,
including personal background, education and attitudes. It is only recently that
pre-entrepreneurial experiences such as education, employment and learning are
beginning to be recognized as important influences on nascent (pre-start)
entrepreneurs (Reynolds & White: 1997). Shackle’s additional insights include the
notion of uncertainty creating opportunities for profit
• The entrepreneur is seen as an organizer of resources, and Casson attempts to
synergize the attributes and concepts of the major writers above. Identifying the
different skill sets of entrepreneurs enables the entrepreneur to make judgements
and coordinate scarce resources. A resource-based view dominates his theory, in
that lack of capital is regarded as a barrier to successful entrepreneurship. His
views are closer to Knight’s than any of the other writers. The main link is that the
28
entrepreneur coordinates demand and supply under uncertainty (associated risk).
Casson views change as an accompaniment to entrepreneurship, with additional
insights highlighting key influences of the environment
• Thunen; many other economic writers and theorists considered developments of
entrepreneurial activity and the role of the entrepreneur. Thunen for example, built
upon Knight methodology, seeing the entrepreneur as a risk-taker, innovator and
problem solver.
From the writings of these theorists, a consensus emerged that the entrepreneur is a key
factor in the economy, particularly in conditions of uncertainty and change. Two major
avenues of thought evolved from these theorists, that of the Knightian approach, and that
of the Schumpeterian approach. The Knightian approach highlights the risk-bearing and
uncertainty-reducing role of entrepreneurs; whilst the Schumpeterian approach highlights
the entrepreneur as an innovator. Overall, other distinct roles identified include co-
ordination, business creation, access to resources and participation rates.
Kao, Kao and Kao (2002: 45) identified the evolution of entrepreneurial thought into six
distinct stages; early thoughts, incubation, growth and ideas, a confusing proliferation of
ideas, consolidation, and maturation. Their definition of entrepreneurism (section 2.5)
highlights a self-reliant individual, an agent of creation and innovation; the spirit
pervading all economic entities. Kao et al (2002: 43) regard entrepreneurship as being
interdisciplinary, feeding off all disciplines, including virtually all branches of social
science. Entrepreneurship assists in wealth creation for the individual, and contributes to
the common good at the same time. Table 2.1 identifies the evolution of entrepreneurship,
and is presented on the following page.
The next section identifies entrepreneurship from the Global Entrepreneurship Monitor
(GEM).
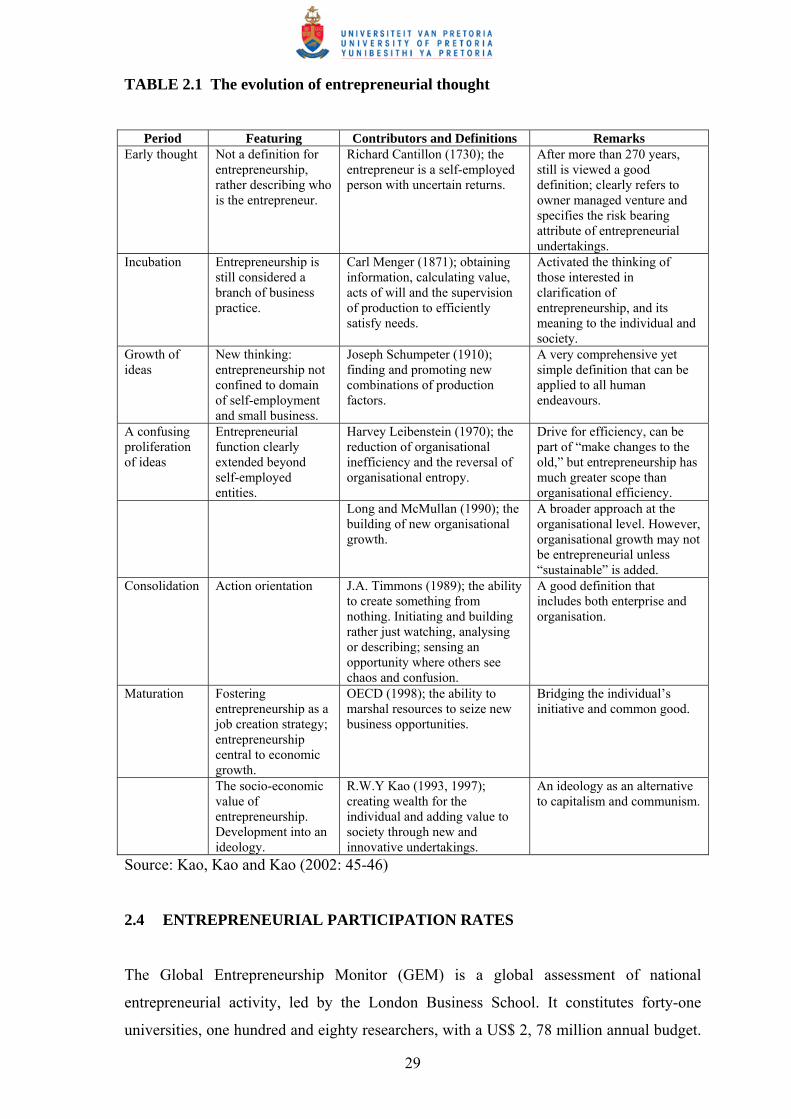
29
TABLE 2.1 The evolution of entrepreneurial thought
Period Featuring Contributors and Definitions Remarks
Early thought Not a definition for entrepreneurship, rather describing who is the entrepreneur.
Richard Cantillon (1730); the entrepreneur is a self-employed person with uncertain returns.
After more than 270 years, still is viewed a good definition; clearly refers to owner managed venture and specifies the risk bearing attribute of entrepreneurial undertakings.
Incubation Entrepreneurship is still considered a branch of business practice.
Carl Menger (1871); obtaining information, calculating value, acts of will and the supervision of production to efficiently satisfy needs.
Activated the thinking of those interested in clarification of entrepreneurship, and its meaning to the individual and society.
Growth of ideas
New thinking: entrepreneurship not confined to domain of self-employment and small business.
Joseph Schumpeter (1910); finding and promoting new combinations of production factors.
A very comprehensive yet simple definition that can be applied to all human endeavours.
A confusing proliferation of ideas
Entrepreneurial function clearly extended beyond self-employed entities.
Harvey Leibenstein (1970); the reduction of organisational inefficiency and the reversal of organisational entropy.
Drive for efficiency, can be part of “make changes to the old,” but entrepreneurship has much greater scope than organisational efficiency.
Long and McMullan (1990); the building of new organisational growth.
A broader approach at the organisational level. However, organisational growth may not be entrepreneurial unless “sustainable” is added.
Consolidation Action orientation J.A. Timmons (1989); the ability to create something from nothing. Initiating and building rather just watching, analysing or describing; sensing an opportunity where others see chaos and confusion.
A good definition that includes both enterprise and organisation.
Maturation Fostering entrepreneurship as a job creation strategy; entrepreneurship central to economic growth.
OECD (1998); the ability to marshal resources to seize new business opportunities.
Bridging the individual’s initiative and common good.
The socio-economic value of entrepreneurship. Development into an ideology.
R.W.Y Kao (1993, 1997); creating wealth for the individual and adding value to society through new and innovative undertakings.
An ideology as an alternative to capitalism and communism.
Source: Kao, Kao and Kao (2002: 45-46)
2.4 ENTREPRENEURIAL PARTICIPATION RATES
The Global Entrepreneurship Monitor (GEM) is a global assessment of national
entrepreneurial activity, led by the London Business School. It constitutes forty-one
universities, one hundred and eighty researchers, with a US$ 2, 78 million annual budget.
30
The GEM “world” consists of 41 participating countries, which account for two thirds of
world population, and ninety per cent of Gross Domestic Product (GDP). Core
entrepreneurial drivers have been identified as access to finance, access to innovation,
education, training, skills, opportunity, motivation, culture, networks and economic
climate (Acs et al, GEM 2004 executive report; Bygrave et al, GEM 2003 executive
report). GEM methodology includes adult population surveys, national expert interviews,
national expert questionnaires and standardized national data (for example, International
Monetary Fund, World Bank, United Nations).
GEM (2004) identifies two types of entrepreneurs:
• Opportunity entrepreneurs are people who spot an opportunity and pursue it
• Necessity entrepreneurs are people who create self-employment in response to job
loss or redundancy (Maritz: 2004a)
GEM (2003) participation rates highlight the following (Bygrave et al: 2003):
• The most entrepreneurial countries include Chile, Korea, New Zealand, Uganda
and Venezuela. The next most active are Brazil, China, India and Mexico. The
intermediate group includes Argentina, Australia, Canada, Denmark, Hong Kong,
Hungary, Iceland, Ireland, Slovenia, Spain, Singapore, Thailand, United Kingdom
and the United States. The below average group includes Belgium, Finland,
Germany, Greece, Israel, Italy, Norway, South Africa, Sweden and Switzerland.
The least entrepreneurial countries are Chinese Taipei (Taiwan), Croatia, France,
The Netherlands, Japan, Russia and Poland. The most entrepreneurial group of
countries is three to six times higher than the least entrepreneurial group on all
measures of entrepreneurial activity
• Job creation is highly correlated with the level of start-up activity, and there is a
positive, statistically significant association between national economic growth
and entrepreneurship
• Men are twice as likely to pursue start-ups than women, and younger adults (25-
34 years old) are the most active
• There are at least three ways national entrepreneurial activity may have
consequences for a country. These include the scope of activity, job creation and
association to economic growth

31
GEM (2003) South Africa participation rates highlight the following main findings
(Orford, Wood, Fischer, Herrington & Segal: 2003):
• Levels of necessity entrepreneurship are significantly lower compared to other
developing countries, despite similar or worse levels of poverty and income
equality in South Africa
• Total entrepreneurial activity of men are significantly lower than in other GEM
developing countries
• Total entrepreneurial activity rates in South Africa are lower than other
developing countries particularly due to participation rates of men 18-44 years of
age
• The proportion of men who believe they have the skills to start a new business is
much lower than other developing countries. This reflects lower education levels
and a lower probability of South African men who associate with entrepreneurs
• One of the principal constraints on formal black-owned businesses is the lack of
finance. Cash shortages are widespread among Black African, Indian and
Coloured entrepreneurs with small and medium registered businesses. Of those
that have secured overdraft finance, close to half have exhausted their overdraft
facilities in the last six months
• Within the GEM countries, South Africa has the second lowest income per capita
and the second highest level of income equality
• Two thirds of South African entrepreneurs claim to be taking advantage of
business opportunities (opportunity entrepreneurs), the remaining thirty-seven per
cent were necessity entrepreneurs
• Indians dominate contribution by ethnicity, primarily due to their proportionally
high necessity entrepreneurship rates. Black Africans have the lowest activity
rates, predominantly due to their low opportunity entrepreneurship rates
• There is considerable variation in total entrepreneurial activity across the regions.
Gauteng and Western Cape have the highest level of entrepreneurial activity, and
the Free State and the Eastern Cape experience similar activity rates (just over half
the rate in Gauteng). Kwazulu Natal is not significantly different to the rates in
Western Cape
• A positive relationship between educational attainment and entrepreneurial
activity was evident.
32
2.5 DEFINITION OF THE ENTREPRENEUR
More recent approaches to entrepreneurship (built upon theories from the pre-Schumpeter
era) include those of McClelland (1961), viewing entrepreneurs as energetic and
moderate risk takers. Drucker (1964) placed emphasis on the entrepreneur maximizing
opportunities, with Shapero (1975) viewing the entrepreneur as taking initiative and
accepting the risks of failure. Karl Vesper (1980) raised the notion that economists,
psychologists, businesspersons and politicians see entrepreneurs differently. Pinchot
(1983) identified the intrapreneur as an entrepreneur within an already established
organisation. Robert Hisrich (1985) defined entrepreneurship as the process of creating
something different with value by devoting the necessary time and effort, assuming the
accompanying financial, psychological, and social risks, and receiving the resultant
rewards of monetary and personal satisfaction.
The concept of an entrepreneur is however further refined when considered from a
business, managerial and personal perspective. Hisrich et al (2004: 9) state that when
defining entrepreneurship, most definitions talk about behaviour including initiative
taking, the organisation of social and economic mechanisms to turn resources and
situations to practical account and the acceptance of risk or failure. They further place
emphasis on entrepreneurship being a dynamic process of creating incremental wealth.
Individuals taking the risks, whilst providing value for some product or service create
wealth.
Hisrich et al (2004: 9) define entrepreneurship as, “the process of creating something new
with value by devoting the necessary time and effort, assuming the accompanying
financial, psychological, and social risks, and receiving the resulting rewards of monetary
and personal satisfaction and independence”. This definition stresses four basic aspects
of being an entrepreneur, which are that entrepreneurship:
• Involves the creation process, which has to have value to it’s target market
• Requires the devotion of the necessary time and effort
• Necessitates assuming the risks
• Delivers the rewards of being an entrepreneur.
33
Schaper and Volery (2004: 6) define entrepreneurship as, “the process brought about by
individuals of identifying new opportunities and converting them into marketable
products or services”. They highlight factors that are most commonly cited for
entrepreneurship to occur, being an individual, an act, an organisation and innovation.
Kuratko and Hodgetts (2004: 3) introduce entrepreneurship as, “an integrated concept that
permeates an individual’s business in an innovative manner”. Entrepreneurs are
individuals who recognize opportunities, being aggressive change catalysts within the
marketplace. Bygrave (1997: 2) defines an entrepreneur as, “someone who perceives an
opportunity and creates an organisation to pursue it”. He further defines the
entrepreneurial process as, “involving all the functions, activities, and actions associated
with perceiving opportunities and creating organisations to pursue them”. Bygrave (1997)
believes the new business is much more likely to be of the incremental kind, as opposed
to a revolutionary creation.
Halloran (1994: 4) defines an entrepreneur on a broad basis, as “one who assumes the risk
of gaining profits or incurring losses in the undertaking of commercial transactions.” This
definition includes entrepreneurs from all walks of life, and it may be useful to
incorporate ‘calculated’ risk to make the definition more meaningful to successful
entrepreneurs.
Kao (1993: 69) defines entrepreneurship as “the process of doing something new
(creation), and/or something different (innovation) for the purpose of creating wealth for
the individual and adding value to society”. He defines the entrepreneur as, “a person who
undertakes a wealth-creating and value-adding process, through developing ideas,
assembling resources and making things happen”. Here it is recognized that
entrepreneurship is a process of wealth-creation and adding value. This includes small
business, but small business does not automatically make for an entrepreneurial
undertaking (Kao, Kao & Kao, 2002: 42). The development of entrepreneurism; seeded in
the broad application of entrepreneurship, is defined by Kao et al (2002: 44) as,
“entrepreneurism is not just a way of conducting business; it is an ideology originating
from basic human needs and desires: the need to create wealth for oneself and to add
value to society. In practice, entrepreneurism can be considered as the application of
ingenuity for self-interest and for the common good. This entails discovering the new,
while changing, adapting and preserving the best of the old. It champions the rights of the

34
individual to acquire ownership through the freedom to make decisions. Although capital
will always be an important factor, entrepreneurism is unlike capitalism, which facilitates
capital accumulation and delivers ownership to the rich. Likewise, although the
community and the good of the state are key concepts, entrepreneurism is like
communism, which provokes class struggle through the revolution, taking ownership
away from the individual and giving it to the state”.
Entrepreneurism is a societal orientation, whereby every individual is encouraged to be
self-reliant, and an agent of creation and innovation. This spirit pervades all economic
entities (Kao et al, 2002: 46). Zimmerer & Scarborough (1996: 3) point out that, “an
entrepreneur, in the face of risk and uncertainty, combines resources in new and different
ways to create value, often accomplished via the formation and development of a new
business venture. Entrepreneurship is also very much alive in existing companies. It can
be found in all sectors of society, not just in business”.
Lumpkin and Dess (1996: 137) refer to entrepreneurial orientation (EO) as the
organisational processes, methods, styles, practices and decision-making activities
employed by entrepreneurs that lead to new ventures. Contingent on environmental and
organisational factors, various studies demonstrate a positive EO relationship in
entrepreneurial firms (Lumpkin & Dess: 1996; Miller: 1983; Covin & Slevin: 1989).
Various authors concur on OE measures. Miller (1983); Lumpkin & Dess (1996); Covin
and Slevin (1989) and Wiklund (1999) regard EO measures as including:
• Proactiveness
• Innovativeness
• Risk taking.
Bolton and Thompson (2004: 16) define an entrepreneur as, “a person who habitually
creates and innovates to build something of recognized value around perceived
opportunities”.
The definition comprises six important elements:
• ‘a person’ who
• ‘habitually’

35
• ‘creates and innovates’
• ‘to build’ something of
• ‘recognised value’ around
• ‘perceived opportunities’.
They inform that ‘a person’ can also be a group of people as it is possible to describe
teams and even organisations as entrepreneurial. ‘Habitually’ distinguishes entrepreneurs
from owner-managers or people who build business simply to achieve a comfortable
lifestyle. ‘Create and innovates’ is used to place emphasis on the entrepreneur starting
something new. ‘To build something’ describes the output, whilst the words ‘habitually
creates and innovates’ refer to the process. ‘Something’ means an entity that can be
identified, not just an idea or a concept (despite it starting as that). ‘Of recognized value’
broadens the definition, not limiting it to commercial gain only; but including social and
aesthetic capital or value. ‘Perceived opportunities’ are important as it provides direction
and focus.
An important implication of this definition is the link between entrepreneurs and
enterprise. Bolton and Thompson (2000: 238) believe that, “entrepreneurs are the people
who possess the imagination and flexibility to ensure that there is a causal link between
them and the enterprise”.
2.6 THE NATURE, CHARACTERISTICS AND BEHAVIOUR OF THE
ENTREPRENEUR
Entrepreneurs are all around us. They are the people who make a difference and affect the
world around them. Some can be found starting new businesses that grow and prosper
because the entrepreneur has identified, engaged and exploited a valuable new
opportunity. But it is often entrepreneurs who drive change and develop new initiatives in
larger, established corporations. Social entrepreneurs are found at work in the community
sector.
Moreover, not everyone who starts a new business is, in reality, an entrepreneur. Those
concerned may be enterprising, but there is a subtle difference. The world needs both, but
they are different. True entrepreneurs, then, are people who habitually create and innovate
to build something of recognised value around perceived opportunities. ‘Build’ implies
36
growth. Some start-up businesses, though, do not do or achieve anything new or different.
There may be an apparently good idea that never finds many customers. The business
survives at best, but often disappears. In other cases a real opportunity is identified but
again a growth business does not emerge. Perhaps it is inadequately financed. Perhaps it
is badly managed. Perhaps the person starting it is the wrong person to do it alone and he
or she fails to recognise the vital importance of building an entrepreneurial team of people
with complementary abilities. The ability to identify a good potential opportunity does not
automatically guarantee a successful business, let alone a growth business, however
committed the so-called entrepreneur might be.
At the same time many people have more entrepreneurial talents than they realise. They
do not appreciate what they could achieve if they took ‘the first step’. They need a trigger
event to set them off on their journey. If the wrong people spot an opportunity, set off and
then fail to build an entrepreneurial team, their chances of survival are low. People who
set off ‘by necessity’ may well find themselves being successful because they were
entrepreneurs in waiting.
The key to understanding the character and potential of any person lies in those
behaviours that are habitual, that come naturally and is done well. Each of us has a
particular set of character themes that makes us the way we are - that means we excel in
some roles but not in others. Thus a character theme is a personality attribute or
characteristic that defines our normal, expected behaviour. Our set of themes forms our
inner psychological core and defines the things we do most readily and instinctively. In
all aspects of our lives we demonstrate our particular set of character themes in the ways
we behave - we can’t help it.
The relevant character themes (Bolton & Thompson: 2003) for the entrepreneur, or
entrepreneur team, invariably demonstrated by those who are successful, concern:
• Their reason for doing what they do - their motivation
• Their ability to spot, discriminate, select and prioritise opportunities
• Their ability to gather the necessary resources and to build a suitable team.
An approach towards identifying entrepreneurial orientation (Nieman et al, 2003: 11) is to
identify certain personality characteristics or traits that appear to be possessed by

37
successful entrepreneurs (Deakins & Freel: 2003). This correlates with the trait approach
of Gartner (2001). In the trait approach the entrepreneur is assumed to be a particular
personality, whilst in behavioural approaches the entrepreneur is seen as a set of activities
involved in organisation creation.
2.6.1 Intuition and entrepreneurial behaviour
Allinson, Chell and Hayes (2000) proposed that entrepreneurs could be differentiated
from non-entrepreneurs on the basis of intention, despite intention not always translating
into entrepreneurial performance outcomes. Intuition is referred to as a person’s preferred
way of gathering, processing and evaluating information. They further state that owner
managers are not a homogenous group and that not all owner managers are entrepreneurs.
The results of their study support the notion that entrepreneurs are more intuitive than
members of the general population and middle and junior managers, but in terms of
cognitive style, are similar to senior managers. These findings provide empirical support
in that entrepreneurs adopt an intuitive approach to information processing. This is
notwithstanding the view that entrepreneurs process information differently to salaried
employees. Other entrepreneurial activities highlighted by Allinson et al (2000: 34)
include recognition of wealth-creating opportunities, judging which opportunities to
pursue, persistence and non-traditional focus, impulsive synthesis, lateral reasoning and
idea generators.
2.6.2 Behavioural traits and characteristics
Thompson (1999: 210) informs that it has become traditional to associate entrepreneurs
with certain behavioural traits and characteristics. He identifies entrepreneurs as those
with initiative (Lumpkin & Dess: 1996), imagination, achievement orientation,
pragmatism, independence, risk takers (Miller: 1983; Covin & Slavin: 1989), creativity,
flexibility, conceptual, and see change as an opportunity (Bygrave: 1998). Thompson
(1999) identifies ten key points of key research findings:
• Entrepreneurs are individuals who make a difference. Entrepreneurs transform a
simple idea into an opportunity that works (Kets de Vries: 1997). These may be
individuals who create new ventures or those that entrepreneurially champion
38
change within the organisation. They have a true vision, which stretches beyond
mere ideas
• Entrepreneurship is about spotting and exploiting opportunities. Visionaries are
those individuals who spot and act on opportunities that others miss. They are able
to synthesise available information and clarify patterns that escape others. Two
schools of thought are related in this instance to that of the entrepreneur disrupting
stability with innovations (Schumpeter: 1949); and the view of creating
equilibrium in an environment of instability (Kirzner: 1973)
• Entrepreneurs find the resources required to exploit opportunities.
Entrepreneurship foundations are rooted in flexibility, and when resources are not
‘state-of-the-art’, entrepreneurs will select those that will perform satisfactorily.
Within a systems context, the system should become increasingly knowledge-
based, to support sharing and learning (Lindsay & McStay: 2004)
• Entrepreneurs add value. Sometimes instinctively, entrepreneurs adapt their
offerings to the needs and wants of markets, whilst they add value through a
transformation process. Value-adding requires performance measures, which is
outcome-driven. Added value may be measured in many ways, which brings
rewards of some form (Ostgard & Birley: 1996)
• Entrepreneurs are good networkers. This notion supports the paradigm that ideas
can be found anywhere at any time, and entrepreneurs are alert to opportunities.
Whilst being constrained by limited resources, the entrepreneur uses creativity,
social networking and bargaining to obtain deals and activity (Perry: 2002)
• Entrepreneurs have ‘know-how’ and ‘know-who’. Gibb (1998) informs that
entrepreneurs are also aware of where they can obtain the required resources
(‘know where’)
• Entrepreneurs create capital. Adding value, networking and acquisition of
resources constitute the entrepreneur’s intellectual capital. These attributes are
used to create financial capital, social capital and aesthetic capital (Covin &
Slavin: 1989)
• Entrepreneurs manage risk. Risk must be taken in context, being risks that the
entrepreneur can understand and manage (Linsay & McStay: 2004; Lumpkin &
Dees: 1996). However, over-valuation of risk and avoiding downside risk may
result in opportunities being missed (Miller, 1983: 771)
• Entrepreneurs are determined in the face of adversity. Elements of self-belief,
determination and motivation are inherent in entrepreneurial success.

39
Entrepreneurs however have high faith in their own ability, often resulting in
failures (in that they often believe they are infallible and can almost do anything).
Successful entrepreneurs most often are able to deal with unexpected obstacles.
There is a school of thought, which paradoxically, suggests that some
entrepreneurs can perceive failure as the price of their success (Kets de Vries:
1997)
• Entrepreneurship involves creativity and innovation. Creativity and innovation are
means whereby entrepreneurs make a difference. The creativity and innovation
link is manifested in the ability of entrepreneurs to harness the potential of new
technologies in turbulent environments (Lumpkin & Dess, 1996: 142).
Thompson (1999) informs that entrepreneurs and entrepreneurial activity can be found
everywhere, including, but not limited to: business; the community, consisting
particularly of individual initiatives, social entrepreneurship and public sector initiatives;
science; theatre and the arts; sport; military service; and exploration and adventure.
A concluding remark regarding the synthesis of key research findings (Thompson: 1999)
is that not all entrepreneurs succeed. There are failed entrepreneurs, some of whom
disappear from sight and others who return with new ideas and ventures.
2.6.3 Creativity, innovation and entrepreneurship
Successful entrepreneurs come up with ideas and then find ways to make them work to
solve a problem or to fill a need (Covin & Dess: 1997). In a world that is changing faster
than most of us could ever have imagined, creativity and innovation are vital to a
company’s success-and survival (Zimmerer & Scarborough: 1996). Creativity is the
ability to develop new ideas and develop new ways of approaching problems and
opportunities. Innovation is the ability to apply creativity to those problems and
opportunities. Entrepreneurship is the result of a disciplined, systematic process of
applying creativity and innovation to exploit opportunities in the market. Entrepreneurs
are a constant source of creative ideas and innovations, and Zimmerer and Scarborough
(1996) have depicted a set of ‘rules’ for entrepreneurs to live by: create, innovate and
activate; always be on the lookout for new opportunities; keep it simple; try it, fix it, do it;
shoot for the top; don’t be ashamed to start small; don’t fear failure; never give up; get on
with it.

40
They went on to identify the following entrepreneurial characteristics:
• Commitment and determination
• Desire for responsibility
• Opportunity obsession
• Tolerance for risk, ambiguity, and uncertainty
• Self-confidence
• Creativity and flexibility
• Desire for immediate feedback
• High level of energy
• Motivation to excel
• Orientation to the future
• Willingness to learn from failure
• Leadership ability.
Schaper and Volery (2004) identified a behaviourist approach to studying characteristics
of entrepreneurs, highlighting the following:
• Self-confidence
• Risk-taking propensity
• Flexibility
• Independence of mind
• Energy and diligence
• Hard-work ethic
• Creativity
• The need for achievement
• Internal locus of control
• Tolerance of ambiguity
• Responsiveness to suggestions
• Dynamic leadership qualities
• Initiative
• Resourcefulness
• Good communication skills
• Perseverance
41
• Profit-orientation
• Perception with foresight.
Amongst an almost endless list of entrepreneurial traits, Schaper and Volery (2004), in
agreement with Gartner (1989), believe that only three show a high level of validity, the
need for achievement, internal locus of control, and a risk-taking propensity.
Nieman and Bennett (2002: 58) identify key concepts from a number of definitions,
which include identifying an opportunity; innovation and creativity; acquiring resources;
creating and growing a venture; taking risks; being rewarded and managing the business.
2.6.4 The entrepreneurial personality
Deakins and Freel (2003) highlight the notion that many of the entrepreneurial
characteristics are the same abilities and skills that could be applied to most successful
managers, hence the difficulty to separate out specific characteristics of entrepreneurs.
They do however list key competencies of successful entrepreneurs:
• Proactivity: initiative and assertiveness
• Achievement orientation: ability to see and act on opportunities
• Commitment to others
• McClelland’s need for achievement
• Calculated risk-taker
• High internal locus of control
• Creativity
• Innovative
• Need for autonomy
• Ambiguity of tolerance
• Vision.
Nieman et al (2003: 29) also identify similar entrepreneurial characteristics, and inform
that they can be acquired through life experience. Dominant characteristics include:
• Passion

42
• Locus of control
• Need for independence
• Need for achievement
• Risk taking and uncertainty
• Creativity and innovation
• Determination and persistence.
Criticism of the personality characteristics approach as expressed by Deakins and Freel
(2003: 15):
• Inappropriate to search for a significant individual trait
• Ignores environmental factors that may be more important than personality
• Comprises an essentially static analysis approach to the dynamic process of
entrepreneurship
• Ignores the role of learning, preparation and serendipity in the process of
entrepreneurship.
The negative entrepreneurial characteristic of non-conformist (deviant personality) is
associated with Kets de Vries (1997), being individuals who do not easily fit in with their
existing environment. Timmons (2004) cited additional attributes that are more innate:
• High energy coupled with emotional stability
• Creative and innovative ability
• Conceptual ability
• Vision combined with capacity to inspire.
Deakins and Freel (2003:29) highlight the notion of attempts to develop tests on
entrepreneurial characteristics which owes something to the development of theories on
entrepreneurship. These include the theories of Shackle (creator), Schumpeter
(innovator), Knight (calculated risk-taker), Casson (co-ordinator) and Kirzner (autonomy,
internal locus of control).
Halloran (1994) outlines a four-step approach towards identifying entrepreneurial
behaviour:
43
• Goal orientation. Only after achieving goals, does financial reward kick in as a
secondary objective. Much of what entrepreneurs accomplish is through sheer
determination. The late Sam Walton, founder of Wal-Mart, put it very simply as,
“knowing where you want to go and being willing to do what it takes to get there”
• Creative energy. The majority of successful entrepreneurs are individuals who
serve existing markets in better ways. Better ways is emphasized, not necessarily
reinventing the wheel. Entrepreneurs have certain flair to the way they approach
things (Lumpkin & Dees: 1996)
• Abundance of self-confidence. Making decisions requires confidence, and
entrepreneurs are decision makers in their enterprises. Cognisance must be taken
of the fact that entrepreneurs are not afraid of making the wrong decision. Self-
confidence is evident when wrong decisions are made one day, and the individual
is confident that the correct decisions will be made the next day (Miller: 1983)
• Determination. The notion of try and try again emerges. Halloran (1994: 6) states
that when determination is coupled with creativity, the entrepreneur may only be
successful on try number 100.
Kirby (2003) seperates the literature on entrepreneurial characteristics, behavioural traits
and patterns into a seven-notion framework:
• Risk-taking ability. Classical economic theory suggests that entrepreneurs are
risk-takers, and by the very nature of their activities and roles in society, cannot be
averse to risk. Koh’s (1996) research suggests that entrepreneurially inclined
individuals have higher risk scores (Miller: 1983). Busenitz (1999) indicated that
entrepreneurs are more confident than managers in large organisations; and as a
consequence tend to distort their perception of risk. This introduces the concept of
self-confidence, which Koh (1996) believes is a prerequisite for successful
entrepreneurship
• Need for achievement (nAch). McClelland (1961) suggested that entrepreneurs
are highly achievement orientated, and will choose situations characterised by
individual responsibility, moderate risk-taking, knowledge of results of decisions,
novel instrumental activity and anticipation of future possibilities. Empirical
research supporting McClelland’s theory of nAch (1961) is conflicting, with many
researchers suggesting that entrepreneurs do not portray significantly different
44
scores to others (Koh: 1996). Entrepreneurship is however a way of thinking and
behaving, and entrepreneurial behaviour is not confined to single traits only
• Locus of control. Internal control individuals are those who believe achievements
are dependent on personal characteristics and behaviour (Rotter: 1966). External
control individuals are those who believe achievements are dependent on luck,
fortune and other people’s action. Whilst somewhat inconclusive (Cromie: 2000),
entrepreneurs are believed to possess a high internal locus of control
• Desire for autonomy. Entrepreneurs value individualism and freedom more than
others, as they have a general dislike of rules, procedures and social norms (Kirby:
2003). Cromie (2000) observes that some entrepreneurs are even deviants
• Deviancy. Entrepreneurial financial benefits and drives do not always lead to
personal satisfaction and happiness, being a result of negative characteristics and
drives (Kets de Vries: 1977). According to Kets de Vries (1977a: 41) an
entrepreneur is “an anxious individual, a non-conformist poorly organized and not
a stranger to self-destructive behaviour.” As a consequence, the entrepreneur
becomes a person with low self-esteem, lacks the ability to reflect critically, and
who dreams of being in total control, and independent of everything and everyone.
This explains the risk-taking and start-up behaviour of entrepreneurs
• Creativity and opportunism. Entrepreneurs tend to think in non-conventional
ways, challenge existing assumptions, being adaptable and flexible in their
problem-solving. These traits are integral to the creative process (Kirton: 1976),
though some would argue that entrepreneurs are not so much creative as
opportunistic (Holt: 1983). Research by Utsch and Rauch (2000) however suggest
the powerful link between innovativeness and venture performance, particularly in
high technology ventures
• Intuition. Entrepreneurs prefer an intuitive approach that requires synthesis and
lateral thinking, rather than sequential reasoning and random methods of
exploration (Kirby: 2003). Carland (1982) contested that entrepreneurs are
intuitive rather than rational thinkers.
Whilst many knowledgeable in the area of entrepreneurship agree on common personal
qualities and traits of successful entrepreneurs, Kuratko & Hodgetts (1992) provided the
following entrepreneur profile:
• Commitment, determination and perseverance
45
• Drive to achieve and opportunity orientation
• Initiative and responsibility
• Persistent problem solving and seeking feedback
• Internal locus of control and tolerance to ambiguity
• Calculated risk taking
• Integrity and reliability
• Tolerance for failure
• High energy level
• Creativity and innovativeness
• Vision, self-confidence and optimism
• Independence
• Team building
• Managerial skill development for entrepreneurs.
Kuratko and Hodgetts (2004) identify managerial skill development for entrepreneurs as
including marketing skills, operations/technical skills, financial skills, administrative
skills, interpersonal and team skills, and knowledge of applicable law. An extensive
survey on entrepreneurial traits and characteristics dates back to Gartner (1989: 36), “be
aggressive, be competitive, be goal-oriented, be confident, be egocentric, make decisions,
be an achiever early in life, be a loner in your final decision, put family and friends
second to business, be an opportunist, do not be security-oriented, be persistent, have
determination, be an optimist (to an extreme), have desire to achieve, be hyperactive
mentally, be a dreamer, be a calculated risk-taker, want power, learn from previous
mistakes, be a perfectionist and be intuitive”.
2.6.5 Comparison of entrepreneurs, intrapreneurs and traditional managers
Intrapreneurship is entrepreneurial activity within an organisational context, receiving
sanction and resource commitment for the purpose of innovative results (Kuratko &
Hodgetts: 2004). The intrapreneur acts within the confines of an existing business, and is
typically the intra-organisational revolutionary- challenging the status quo and fighting to
change the system from within (Nieman et al, 2003: 347). Corporate entrepreneurship or
intrapreneurship, is a term used to describe entrepreneurial behaviour inside established
midsized and large organisations (Morris & Kuratko, 31: 2002). Management is the
process of planning, organizing, leading and controlling resources to achieve goals
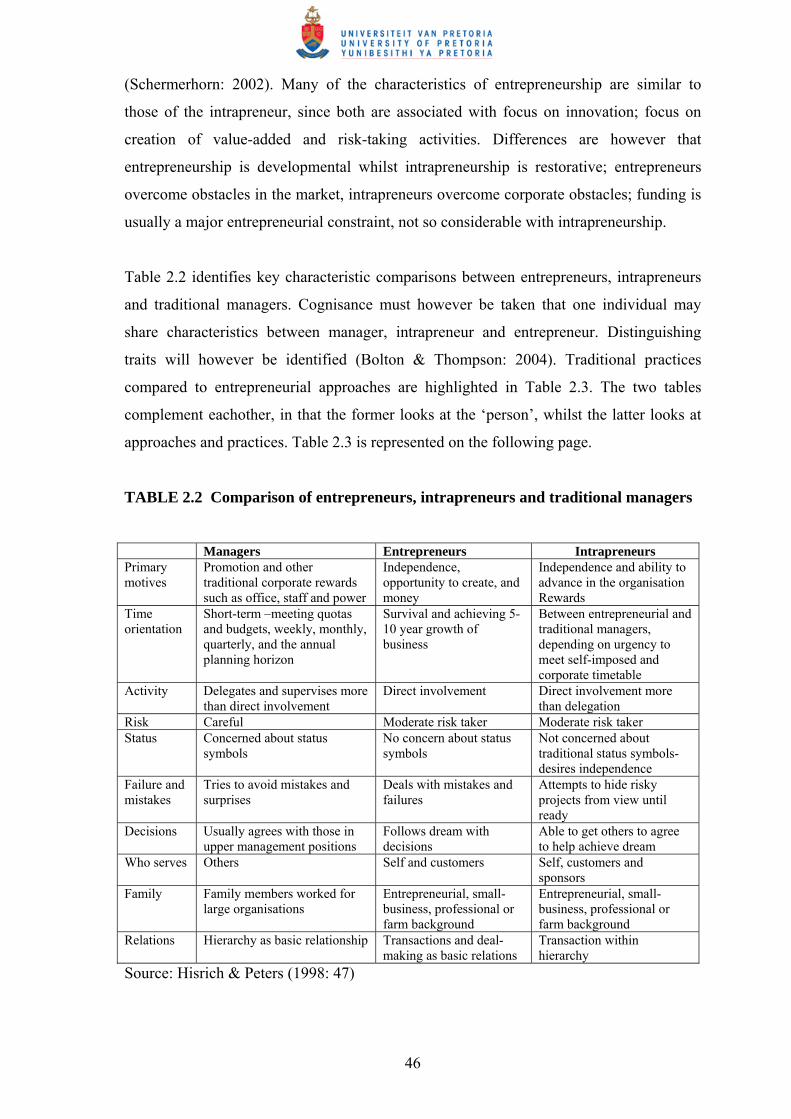
46
(Schermerhorn: 2002). Many of the characteristics of entrepreneurship are similar to
those of the intrapreneur, since both are associated with focus on innovation; focus on
creation of value-added and risk-taking activities. Differences are however that
entrepreneurship is developmental whilst intrapreneurship is restorative; entrepreneurs
overcome obstacles in the market, intrapreneurs overcome corporate obstacles; funding is
usually a major entrepreneurial constraint, not so considerable with intrapreneurship.
Table 2.2 identifies key characteristic comparisons between entrepreneurs, intrapreneurs
and traditional managers. Cognisance must however be taken that one individual may
share characteristics between manager, intrapreneur and entrepreneur. Distinguishing
traits will however be identified (Bolton & Thompson: 2004). Traditional practices
compared to entrepreneurial approaches are highlighted in Table 2.3. The two tables
complement eachother, in that the former looks at the ‘person’, whilst the latter looks at
approaches and practices. Table 2.3 is represented on the following page.
TABLE 2.2 Comparison of entrepreneurs, intrapreneurs and traditional managers
Managers Entrepreneurs Intrapreneurs Primary motives
Promotion and other traditional corporate rewards such as office, staff and power
Independence, opportunity to create, and money
Independence and ability to advance in the organisation Rewards
Time orientation
Short-term –meeting quotas and budgets, weekly, monthly, quarterly, and the annual planning horizon
Survival and achieving 5-10 year growth of business
Between entrepreneurial and traditional managers, depending on urgency to meet self-imposed and corporate timetable
Activity Delegates and supervises more than direct involvement
Direct involvement Direct involvement more than delegation
Risk Careful Moderate risk taker Moderate risk taker Status Concerned about status
symbols No concern about status symbols
Not concerned about traditional status symbols-desires independence
Failure and mistakes
Tries to avoid mistakes and surprises
Deals with mistakes and failures
Attempts to hide risky projects from view until ready
Decisions Usually agrees with those in upper management positions
Follows dream with decisions
Able to get others to agree to help achieve dream
Who serves Others Self and customers Self, customers and sponsors
Family Family members worked for large organisations
Entrepreneurial, small- business, professional or farm background
Entrepreneurial, small-business, professional or farm background
Relations Hierarchy as basic relationship Transactions and deal-making as basic relations
Transaction within hierarchy
Source: Hisrich & Peters (1998: 47)

47
A point of view of Kao et al (2002: 40) is that a previously unmentioned (in this study)
term of ‘interpreneurship’ concerns how the entrepreneurial environment and activities
are found in family businesses. Whilst managed by family members, there is expected to
be a continuing entrepreneurial drive inherited from the founders of the business. In the
context of the franchise system, this interpreneurial orientation exists in many
organisations. A South African example is that of Famous Brands (formerly Steers
Holdings), whereby the founders are part of the Halamandres family, and the current
Chairman, Peter Halamandares (note surname difference) being an entrepreneurial family
member.
Kao et al (2002: 18) inform that entrepreneurism focuses on people, the environment and
promoting sustainable growth. It differs from traditional management in the fundamentals
of management philosophy, and thereby in the process as well. Table 2.3 summarizes the
differences of business management practices in respect to a traditional versus an
entrepreneurial approach.
TABLE 2.3 Relative differences between traditional management practice and
entrepreneurial approach to business management
Management
Practice Traditional Entrepreneurial
Economic system Market economy: capitalistic Market economy: entrepreneurial Ownership Private ownership. Capital
accumulation and ownership augmentation.
Individual ownership. Enterprise creation, personal dedication and pursuit of entrepreneurial value.
Value system Individuals benefit from the harvest of their efforts. Satisfy consumer needs (sometimes generated through advertising).
Individuals create wealth for themselves and add value to society. Concern for the common good.
Business culture Maximization, guided by marginal theory. System approach.
Optimization, guided by personal belief. Judgement approach. Self-reliant wherever and whenever feasible.
Mode of managing
Serving investors’ needs for return on investment. Market driven.
Driven by entrepreneurial need to create and innovate.
Rules for managing
Management separate from ownership. Employees serve the interest of capital investors.
All individuals assume decision-making responsibility. Individuals perceived as stakeholders, with or without capital investment.
The goal of the business entity
To make money. Re-invest for development and growth.
Management practice decision guide
Maximization principle. Optimisation principle.
Attitude toward resources
Resources are for exploitation. Resources are limited. Consideration of future generations.
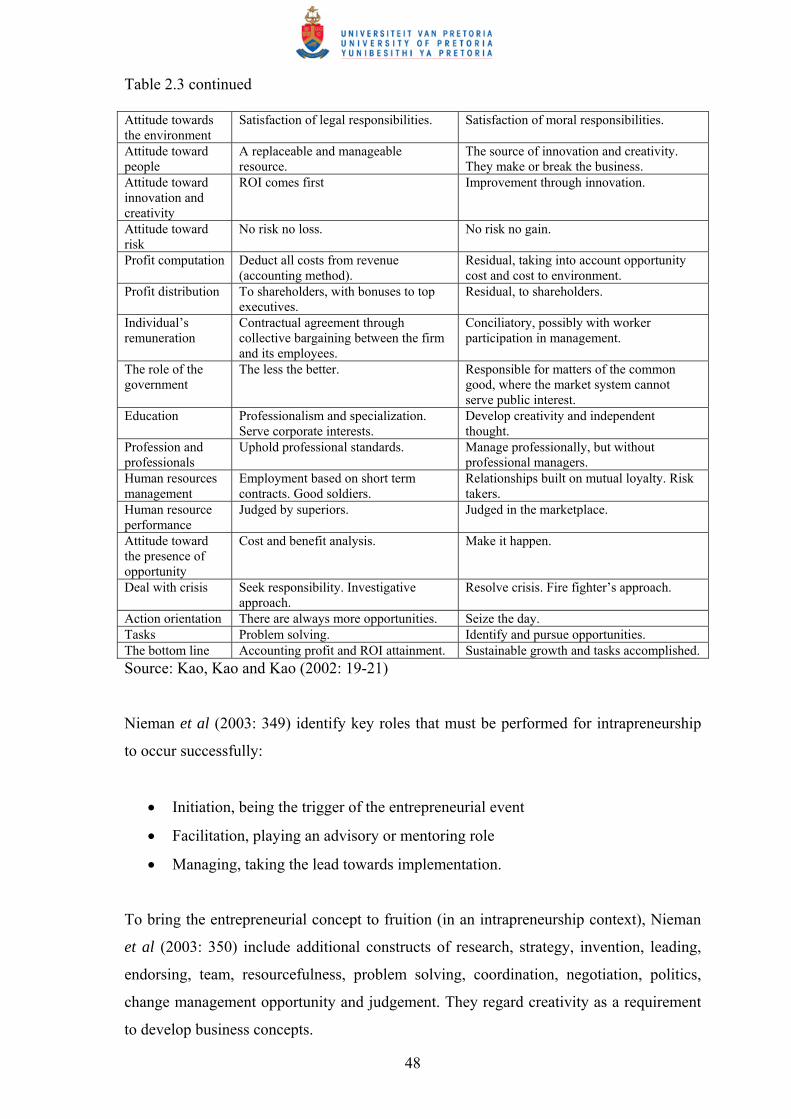
48
Table 2.3 continued Attitude towards the environment
Satisfaction of legal responsibilities. Satisfaction of moral responsibilities.
Attitude toward people
A replaceable and manageable resource.
The source of innovation and creativity. They make or break the business.
Attitude toward innovation and creativity
ROI comes first Improvement through innovation.
Attitude toward risk
No risk no loss. No risk no gain.
Profit computation Deduct all costs from revenue (accounting method).
Residual, taking into account opportunity cost and cost to environment.
Profit distribution To shareholders, with bonuses to top executives.
Residual, to shareholders.
Individual’s remuneration
Contractual agreement through collective bargaining between the firm and its employees.
Conciliatory, possibly with worker participation in management.
The role of the government
The less the better. Responsible for matters of the common good, where the market system cannot serve public interest.
Education Professionalism and specialization. Serve corporate interests.
Develop creativity and independent thought.
Profession and professionals
Uphold professional standards. Manage professionally, but without professional managers.
Human resources management
Employment based on short term contracts. Good soldiers.
Relationships built on mutual loyalty. Risk takers.
Human resource performance
Judged by superiors. Judged in the marketplace.
Attitude toward the presence of opportunity
Cost and benefit analysis. Make it happen.
Deal with crisis Seek responsibility. Investigative approach.
Resolve crisis. Fire fighter’s approach.
Action orientation There are always more opportunities. Seize the day. Tasks Problem solving. Identify and pursue opportunities. The bottom line Accounting profit and ROI attainment. Sustainable growth and tasks accomplished. Source: Kao, Kao and Kao (2002: 19-21)
Nieman et al (2003: 349) identify key roles that must be performed for intrapreneurship
to occur successfully:
• Initiation, being the trigger of the entrepreneurial event
• Facilitation, playing an advisory or mentoring role
• Managing, taking the lead towards implementation.
To bring the entrepreneurial concept to fruition (in an intrapreneurship context), Nieman
et al (2003: 350) include additional constructs of research, strategy, invention, leading,
endorsing, team, resourcefulness, problem solving, coordination, negotiation, politics,
change management opportunity and judgement. They regard creativity as a requirement
to develop business concepts.
49
2.6.6 Entrepreneurial synthesis (three factors)
Bolton and Thompson (2004) provide an apt synthesis regarding the main conclusions
about entrepreneurs and entrepreneurship, based on several people who have studied the
subject. They group their findings into three sections, identified below.
2.6.6.1 What entrepreneurs are like: the personality factors
Butler and McManus (1998) inform that studies and research into what we do, why we
are often alike, yet so different are questions that psychologists have been studying for
some time. Bolton and Thompson (2004) identify four main themes:
• Motivation and emotion
• The born or made debate
• Behavioural characteristics
• Personality attributes.
McClelland (1961) looked at the psychological and social elements that drove economic
development. He linked motivation of individuals as a crucial factor, linking it to the need
for achievement, the need for power and need for affiliation. Thematic Apperception
Tests (TAT) concluded that entrepreneurs had a high need for achievement; however,
despite being an important finding, a high need for achievement would not necessarily
make good entrepreneurs. Competitiveness, a well recognized motivation factor, has
received little attention regarding entrepreneurs, as a character trait of successful
entrepreneurs. The entrepreneur’s ultimate motivator is however striving towards
independence, developing their own ideas without having to answer to others (Roberts:
1991).
The born or made debate raises the question of whether entrepreneurs are a product of
nature or nurture. Personality is understood to have an inborn (inherited) and an
environmental component, hence, the conclusion that entrepreneurs are both born and
made. Contrary to the findings of psychologists sharing this view, Burns and Dewhurst:
1989) are of the opinion that entrepreneurs are ‘made’. Kuratko and Hodgetts (2004)
however say that it is a myth of entrepreneurship that entrepreneurs are born and not
50
made. They state that entrepreneurship is a discipline that can be taught and mastered like
any other.
Behavioural characteristics have received much attention from researchers over the years.
Hornaday (1982) compiled a list of forty-two characteristics including perseverance and
determination; need to achieve; creativity; independence; honesty and integrity;
orientation to clear goals; initiative and taking responsibility; and ability to take
calculated risks. The list, albeit rather long, surprisingly excluded opportunity orientation
persistent problem-solving and internal locus of control, identified by Kuratko and
Hodgetts (1992; 2004). Honesty and integrity may be doubtful to some, as entrepreneurs
are often associated with taking of opportunities without too much thought as to the
consequences of others. Entrepreneurs are however networkers who most often rely upon
trust, highlighting the fast emerging ethical component of entrepreneurial education.
Personality attributes have been studied extensively and a wide range of tests are
available to measure them. Examples of such tests, termed ‘psychometric testing’, are the
Cattell sixteen personality factors (PF); and the Myers-Briggs Type Indicator (MBTI).
Roberts (1991) conducted research on seventy-three people, with about two-thirds of the
sample known to be entrepreneurs (all were however interested in entrepreneurship). His
research highlighted personality traits of extroversion (E), intuition (N), thinking (T) and
perceiving (P). Whilst this test does does not point to a definable entrepreneurial
personality, other associated tests, including judging (J) and sensation (S) may be used for
start-up programmes.
2.6.6.2 Where entrepreneurs come from: the environmental factors
Entrepreneurs’ roots and surrounding influences are highlighted. The environmental
factors mould the entrepreneur, and are generally ‘static’ in nature. This excludes
‘dynamic’ environmental factors such as redundancy and other changing circumstances.
Bolton and Thompson (2000) group this category into three sections; family background;
education and age; and work experience.
Family background has an influence on the entrepreneurial heritage, an idea developed by
Roberts (1991) to describe the importance of family background for the entrepreneur. He
identified many family influences, the father’s career being the strongest of the influences
51
on entrepreneurship. Research has indicated that if entrepreneurial activity dominated the
household, it was most likely that this would be conveyed to offspring (Hisrich: 1990;
Timmins: 1986; Hisrich & Brush: 1984). A disproportionate number of entrepreneurs are
the sons and daughters of entrepreneurs (Roberts: 1991). However, whilst these family
influences can be important they are by no means deciding factors.
Education and age appear to have no relevance to entrepreneurial activity, with the only
notion that the entrepreneur is likely to do it sooner rather than later. This is in agreement
with Larson and Rogers (1986) who have experienced and studied the Silicon Valley
story, whereby they concluded that, “anybody, even an eleven-year-old, can become an
entrepreneur”.
Regarding work experience, studies have shown that ninety-per cent of entrepreneurs start
their own business in similar markets/industries to those they are working in (Brockhaus:
1982). It is also well known that entrepreneurs process through the ‘university of life’ or
‘the school of hard knocks’, as this is what develops their entrepreneurial nature.
2.6.6.3 What entrepreneurs do: the action factors
Bolton and Thompson (2004) examine ten key roles associated with entrepreneurs and
entrepreneurship, regardless of the context:
• Entrepreneurs are individuals who make a significant difference (Nieman et al:
2003: 16)
• Entrepreneurs are creative and innovative (Lumpkin & Dess, 1996: 142)
• Entrepreneurs spot and exploit opportunities (Covin & Dess: 1997)
• Entrepreneurs find the resources required to spot opportunities (Nieman et al:
2003: 9)
• Entrepreneurs are good networkers (Nieman et al: 2003: 19)
• Entrepreneurs are determined in the face of adversity (Nieman et al: 2003: 17)
• Entrepreneurs manage risk (Miller: 1983; Deakes & Freel, 2003: 69)
• Entrepreneurs have control of the business (Nieman et al: 2004: 48)
• Entrepreneurs put the customer first (Nieman et al: 2003: 18)
• Entrepreneurs create capital (Acs et al: 2005).

52
Entrepreneurs transform a simple, ill-defined idea into a workable solution (Kets de
Vries: 1997). They disturb the status quo, initiating change whilst enjoying what they do.
The other factors listed by Bolton and Thompson (2004) all contribute towards
entrepreneurs making a significant difference. Creativity and innovation are
distinguishing foundations of entrepreneurship. True entrepreneurship may take the
premise that the best way to the future is to invent it (George Bernard Shaw, Man and
Superman, Act IV). The entrepreneur thrives on chaos (Peters: 1989). Creativity entails
seeking new ways of doing things, being a continuous activity. Innovation is to create a
new idea, and make it work in practice.
Entrepreneurs often see or craft opportunities that others miss, being comfortable with
ambiguity. The entrepreneur is the person who exploits the opportunity (Nieman et al:
2003) and turns it into a reality. Limited resources do not put off entrepreneurs; they
make it their business to exploit all resources available (Lindsay & McStay: 2004).
Entrepreneurs are able to timeously locate required resources via networking capabilities.
Larson and Rogers (1986) identified the close networks that characterize Silicon Valley,
giving the region an advantage over other areas. Entrepreneurs are motivated to succeed,
with high levels of determination and self-belief. In times of adversity, entrepreneurs use
their creative and innovative skills to overcome hurdles.
The words of Mark Twain best describe the entrepreneur’s view on managing risk; there
are two times in a man’s life when he should not speculate – when he cannot afford it –
and when he can. Entrepreneurs certainly do take risks, but risks they understand and can
afford. Whilst not being risk averse, they are willing to accept responsibility for their
decisions.
In evaluating the state of their business, entrepreneurs vary in style; however, they do
know the state of their business and have a tendency to spot the issues that really matter
(Williams: 1994). There is a direct link between entrepreneurship and customer retention;
with entrepreneurs being able and willing to respond to what customers are telling them
(Bolton & Thompson: 2004). Entrepreneurs create not only financial capital, but also
social and aesthetic capital.
The entrepreneurial process consists of the ten key roles identified by Bolton and
Thompson (2004), condensing the action factors into two distinct stages:

53
• Spotting the opportunity
• Project championing the opportunity (Nieman et al: 2004).
The opportunity spotter is the enterprising person who realizes and seizes the opportunity.
The interests and values of the opportunity spotter and the personal environment affect
the direction of the venture or project. The project champion is the person who makes
things happen. Differentiating small business from entrepreneurs, small-business people
spot an opportunity, and choose to exploit it – but essentially that is where it stops. The
opportunity does not have real growth potential, and they are not regarded as true project
champions. Nor do they behave habitually to keep finding further new opportunities.
Managers who champion change in larger organisations are often project champions,
acting on behalf of the organisation. When encouraged to come up with new ideas and see
them through to fruition, they are referred to as internal entrepreneurs, or intrapreneurs
(Hisrich & Peters: 2004).
2.6.7 Entrepreneurial talent, temperament and technique
Towards profiling the entrepreneur, a five-phase explanation is required. This commences
with identifying the entrepreneur amongst others; linking talent, temperament and
technique; Gallup’s ‘life themes’; Gallup’s ‘entrepreneurial perceiver’ interview; towards
a profile of the entrepreneur; and the well of talent (Bolton & Thompson: 2004).
2.6.7.1 The entrepreneur among others
“What is special about the entrepreneur is the possession of a range of talents and a
temperament profile that together with a specific skill set enables an individual to create
and innovate to build something of recognized vale” (Bolton & Thompson, 2000: 31).
Each individual has a grouping of different talents and temperaments; which together
with techniques that are learned enable the fulfilment of a particular role, such as
entrepreneur, inventor or leader.
Table 2.4 on the following page; breaks the three elements of talent, temperament and
technique into some of their constituent parts. It can be seen that whilst the entrepreneur
possesses all these characteristics to some degree the others only possess some of them
(Bolton & Thompson: 2003). The true entrepreneur, like the the inventor, has creative

54
talent, whereas the leader typically has little or none. Similarly, the temperament that is
high on urgency differentiates the leader from the entrepreneur and inventor, where
urgency is an important characteristic of a leader. It must however be noted that
environmental influences may alter a set state, such as in hostile situations. In such cases,
the entrepreneur may accommodate uncharacteristic behaviour of courage.
TABLE 2.4 The entrepreneur among others
Element The
entrepreneur ‘Entrepreneurial’
behaviour The inventor The leader
Talent Creativity Yes Yes Probably not Opportunity Yes Yes Possibly Courage No Possibly Yes Temperament Urgency No No Yes Risk-taking Yes No Possibly Ego drive Possibly Possibly Yes Technique Finance skills No No Possibly Planning skills No No Yes Personal skills No No Yes Source: Bolton and Thompson (2000: 31)
2.6.7.2 Linking talent, temperament and technique
Talent is described as an innate ability, characterised by strength, expertise and
exceptional abilities (Woods: 1998). Temperament can be defined in terms of moods that
typify our emotional life (Goleman: 1996), our emotional landscape (Whybrow: 1999)
and ‘highways through the brain’ (Buckingham & Coffman: 1999) that are formed as one
grows up in the environment and experiences, but relate to a genetic template. Both talent
and temperament are inborn, but talent has the potential to develop. The role of technique
is to train talent and temperament so that both are enhanced to achieve the desired
outcomes.
To clarify which elements of talent, technique and temperament are most commonly
associated with successful entrepreneurs; towards identifying an entrepreneur’s profile,
Gallup’s life themes analysis provides a valuable and robust framework for
accomplishing this.
55
2.6.7.3 Gallup’s ‘life themes’
Gallup uses the term ‘life theme’ for talent which he describes as a ‘person’s innate
behaviour, thoughts and feelings’ (Garret: 1998). It may also be reviewed as a consistent
pattern of behaviour. Gallup places emphasis on excellence, being the capacity for
recurrent high levels of performance. Gallup works out life themes for particular roles by
using focus groups made up of prominent achievers in the applicable role. Each role is
identified as having its own life themes, and excellence is achieved in a role by
individuals who possess some but not all of these themes to an exceptional degree. The
leadership role for example has twenty distinct life themes, made up of unsuppressible
themes, habitual themes, and themes achievable with effort. Buckingham and Coffman
(1999) have summarised the work of Gallup (SRI) over the last twenty-five years, and use
the word talent when referring to themes. They in turn group the talents into three basic
categories:
• Striving talents, explaining the why of a person
• Thinking talents, explaining the how of a person
• Relating talents, explaining the who of a person.
A selection of Gallup’s life themes, are identified by grouping. Striving talents (six
selected from eleven) include achiever, competition, belief, mission, service and vision.
Thinking talents (seven selected from fourteen) include focus, responsibility, performance
orientation, strategic thinking, problem-solving, formulation and creativity. Relating
talents (seven selected from fourteen) include woo, multirelator, interpersonal, individual
perception, team, activator and courage.
2.6.7.4 Gallup’s ‘entrepreneur-perceiver’ interview
Twelve life themes of the entrepreneur were identified by SRI (1986) from a series of
focus groups and interviews with successful entrepreneurs. In practice many of these
themes should not be seen in isolation, for example, courage and focus come together so
that the entrepreneur can target an outcome with confidence and accuracy. Similarly,
creativity and focus are combined. As with the general Gallup approach; the successful
entrepreneur will possess only some of these life themes to an exceptional degree
(different for each entrepreneur); hence the diversity amongst entrepreneurs. This again

56
brings the inter-connectivity of life themes into context of opportunity spotting (creating
ideas and going for opportunities) and project championing (building support and doing).
Table 2.5 depicts these entrepreneurial themes identified, with themes from the striving,
thinking and relating talents represented with an asterix.
TABLE 2.5 The original Gallup entrepreneurial themes
Entrepreneurial life themes Summary description
1. Dedication 2. Focus* 3. Profit orientation 4. Ego drive 5. Urgency 6. Courage* 7. Activator* 8. Opportunity 9. Creativity* 10. Expertise orientation 11. Team 12. Individual perception*
Consumed by a goal or purpose Discriminates and targets Advantage focused Wants to make a recognized difference No time to waste, must take action now Determined in the face of adversity Wants to make it happen Sees possibilities not problems Buzzing with ideas Knows own limits and finds experts Gets the right people together Sees and uses strengths in others
Source: Bolton and Thompson (2000: 37)
2.6.7.5 Towards a profile of the entrepreneur: talent, temperament and technique
The Gallup/SRI ‘entrepreneurial perceiver’ has eighty-four questions in all, representing
seven questions across each of the twelve themes (Table 2.5). Bolton and Thompson
(2000) analysed these questions, cross tabulating and correlating them to the talent,
temperament and technique themes. Whilst many questions correlated across themes, 30
per cent correlated to talent; temperament aspects in 70 per cent and technique in less than
15 per cent. Table 2.6 depicts Bolton and Thompson’s (2000) preferred list of life themes
to those already identified for the entrepreneur. To reduce the list to a more manageable
size, relevant themes have been grouped, for example, creativity, formulation and
problem-solving under creativity.
Their work with the themes continues, constructing a new questionnaire to identify
strengths in each of the areas. The next phase is re-introducing the earlier distinction
between the opportunity-spotter, the project champion and the entrepreneur.
Table 2.6 is depicted on the following page.
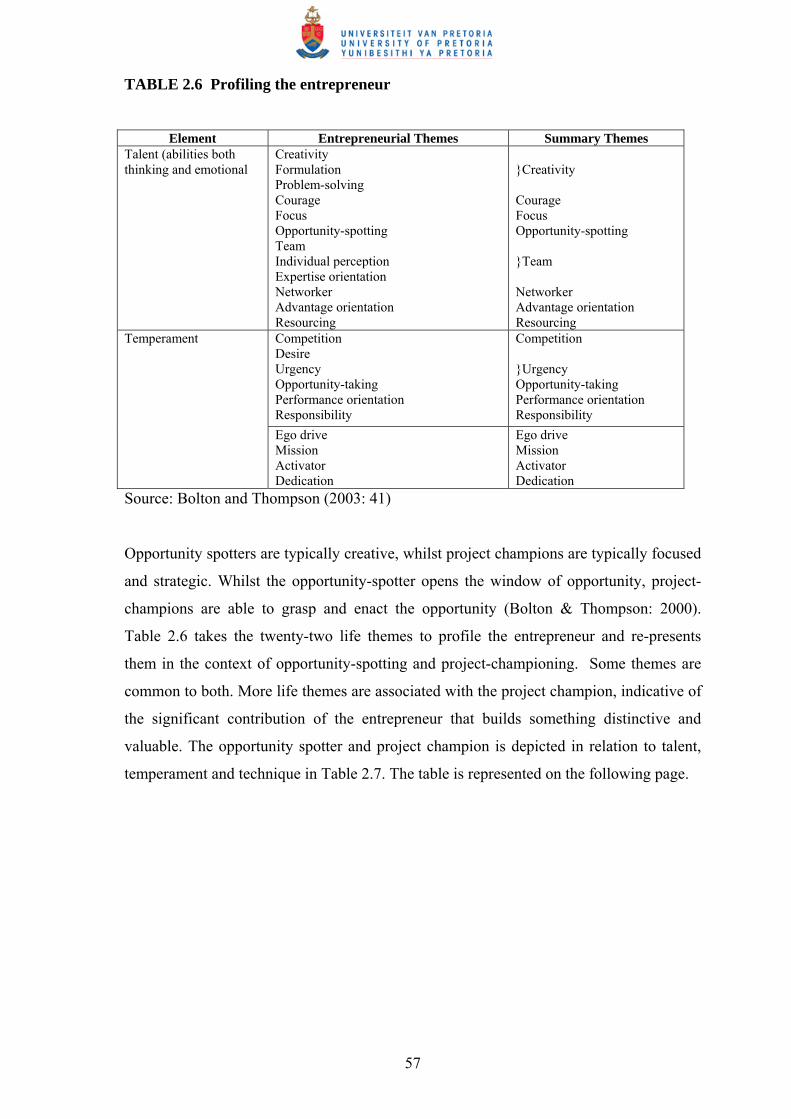
57
TABLE 2.6 Profiling the entrepreneur
Element Entrepreneurial Themes Summary Themes
Talent (abilities both thinking and emotional
Creativity Formulation Problem-solving Courage Focus Opportunity-spotting Team Individual perception Expertise orientation Networker Advantage orientation Resourcing
}Creativity Courage Focus Opportunity-spotting }Team Networker Advantage orientation Resourcing
Competition Desire Urgency Opportunity-taking Performance orientation Responsibility
Competition }Urgency Opportunity-taking Performance orientation Responsibility
Temperament
Ego drive Mission Activator Dedication
Ego drive Mission Activator Dedication
Source: Bolton and Thompson (2003: 41)
Opportunity spotters are typically creative, whilst project champions are typically focused
and strategic. Whilst the opportunity-spotter opens the window of opportunity, project-
champions are able to grasp and enact the opportunity (Bolton & Thompson: 2000).
Table 2.6 takes the twenty-two life themes to profile the entrepreneur and re-presents
them in the context of opportunity-spotting and project-championing. Some themes are
common to both. More life themes are associated with the project champion, indicative of
the significant contribution of the entrepreneur that builds something distinctive and
valuable. The opportunity spotter and project champion is depicted in relation to talent,
temperament and technique in Table 2.7. The table is represented on the following page.
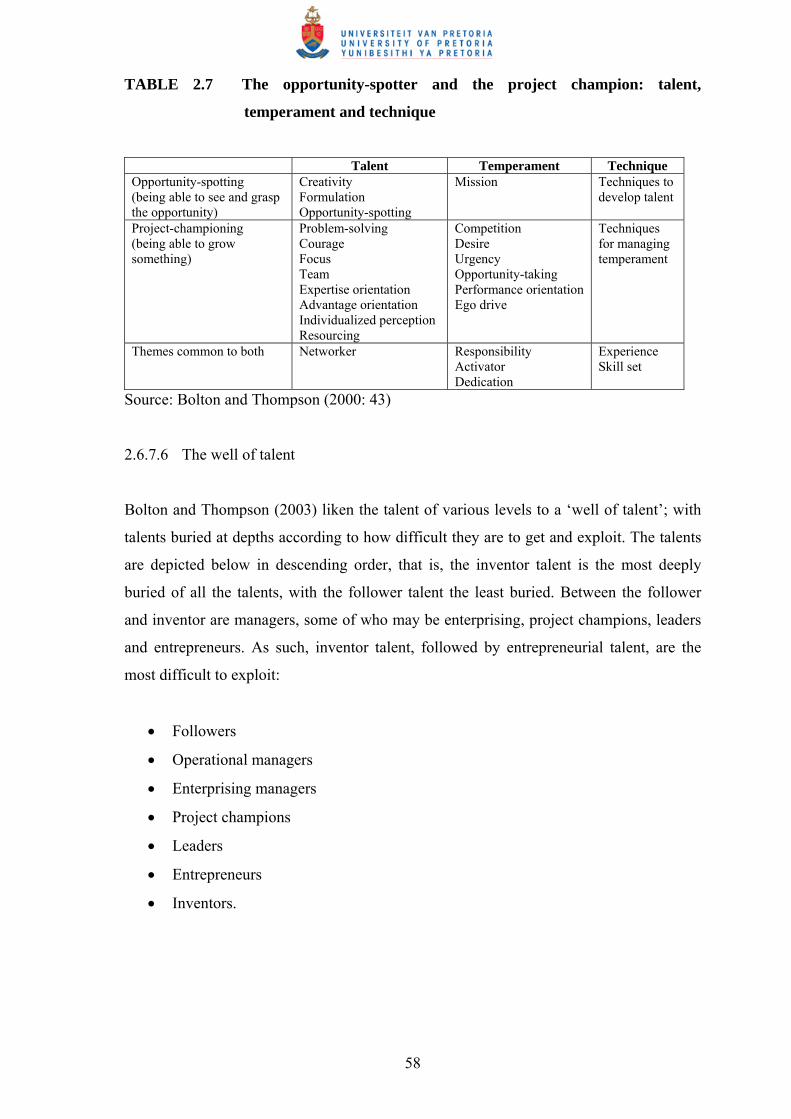
58
TABLE 2.7 The opportunity-spotter and the project champion: talent,
temperament and technique
Talent Temperament Technique Opportunity-spotting (being able to see and grasp the opportunity)
Creativity Formulation Opportunity-spotting
Mission Techniques to develop talent
Project-championing (being able to grow something)
Problem-solving Courage Focus Team Expertise orientation Advantage orientation Individualized perception Resourcing
Competition Desire Urgency Opportunity-taking Performance orientation Ego drive
Techniques for managing temperament
Themes common to both Networker Responsibility Activator Dedication
Experience Skill set
Source: Bolton and Thompson (2000: 43)
2.6.7.6 The well of talent
Bolton and Thompson (2003) liken the talent of various levels to a ‘well of talent’; with
talents buried at depths according to how difficult they are to get and exploit. The talents
are depicted below in descending order, that is, the inventor talent is the most deeply
buried of all the talents, with the follower talent the least buried. Between the follower
and inventor are managers, some of who may be enterprising, project champions, leaders
and entrepreneurs. As such, inventor talent, followed by entrepreneurial talent, are the
most difficult to exploit:
• Followers
• Operational managers
• Enterprising managers
• Project champions
• Leaders
• Entrepreneurs
• Inventors.

59
2.6.8 The entrepreneur’s character themes
Bolton and Thompson (2003) went on to develop the FACETS model, representing
entrepreneurial character themes. This was based upon the foundations of the talent,
temperament and technique paradigm (Bolton & Thompson, 2000). The entrepreneur has
six main character themes, being the reason why entrepreneurs are what they are, and do
what they do:
• F for Focus
• A for Advantage
• C for Creativity
• E for Ego
• T for Team
• S for Social.
Analysing the mix, number and relative strength of the themes determine the proportional
measures of business or social entrepreneurship. Often referred to as the ‘face’ of the
entrepreneur; the Focus, Advantage, Creativity and Ego facets are found in all
entrepreneurs. It is what we see when looking at an entrepreneur, being the entrepreneur’s
character theme set. Successful entrepreneurs require aptitude and ability in these four
facets. The facets of team and social supplement the basic entrepreneur profile, and create
some important differences. The Team facet is predominantly responsible for growth
potential of the business or venture.
2.6.8.1 Entrepreneurs, managers and leaders
Some of the facets are shared. The Focus facet for example, is shared with the manager,
and both the Focus and Team facets, with the leader. It is thus possible to have an
entrepreneurial manager or an entrepreneurial leader. Table 2.8 identifies role
identification amongst the three classifications. The table is represented on the following
page.

60
TABLE 2.8 Role identification of entrepreneurs, managers and leaders
The entrepreneur The manager The leader
has fun manages leads innovates administers innovates creates maintains develops focuses on the business focuses on systems focuses on people builds a team relies on control inspires trust sees opportunities sees problems sees the future asks how and when asks how and when asks what and why acts short term acts short term thinks long term does the right things does things right uses influence
Source: Bolton and Thompson (2003: 74)
2.6.8.2 Talent, temperament and technique
Bolton and Thompson (2003) link talent, temperament and technique with the facets of
the entrepreneur. Talent is represented in the facets of Focus, Advantage, Creativity and
Team. These facets are inborn, we either have them or we don’t. Temperament is linked
to the facets of Ego and Social. These facets are both inborn and acquired, being a case of
nature and nurture. All the facets can be enhanced and developed by the learning and
application of techniques.
2.6.8.3 Focus
The entrepreneur requires the ability to concentrate for long periods and to be dedicated
to the end objective. Three shades of focus are depicted, target focus, time focus and
action focus. Target focus refers to the ability to concentrate on what is important, and not
be distracted by other influences. Characteristics include perseverance and single-
mindedness. The project champion is strong on target focus and discriminates between
triviality and importance. Time focus reflects upon urgency, and getting things done
within certain time constraints. Some entrepreneurs live on a knife-edge when time focus
becomes a mania (Kirby: 2003). People weak on this shade will procrastinate, which is
not a characteristic of the entrepreneur. Action focus is allied to energy and getting things
done. The downside is impatience, which could lead to all sorts of problems.
Entrepreneurs are considered to be doers rather than thinkers (Hisrich & Peters: 1998).

61
2.6.8.4 Advantage
Due to being advantage-oriented, entrepreneurs create economic, social and aesthetic
capital. They see the advantage in a course of action, and make it happen. Without a
strong advantage facet, the entrepreneur will find it difficult to focus (Bolton &
Thompson, 2003: 89). The advantage facet centralises opportunity selection, and radiates
four elements. These consist of benefit orientation, performance orientation, resourcing
and vision. Opportunity selection incorporates spotting, selecting and targeting
opportunities. Selecting the right opportunity at the right time is pivotal to the Advantage
facet. Benefit orientation goes hand in hand with profit orientation. A major aspect of
benefit orientation is the ability to select and get the right deal. Performance orientation is
likened to achieving budgets, hence the importance for the corporate entrepreneur. Being
high on performance orientation, the entrepreneur aims for personal advantage rather than
advantage to the company. Resourcing is managing scarcity, and the entrepreneur does
not see resources as a barrier. Entrepreneurs find ways of limiting resourcing problems,
often turning them into opportunities- an example of the combination of Creative and
Advantage facets. Vision reflects on the way entrepreneurs see things, and combined with
the Advantage facet; see the future in new ways. They use these insights to gain
advantage.
2.6.8.5 Creativity
Creativity may be triggered by a problem to solve; the answer can come in a moment of
insight; there is delight and excitement in finding the answer; and creativity needs the
right environment (inventors and scientists are still having their Eureka moments).
Creativity is referred to as a servant talent, expressing itself through other talents (Bolton
& Thompson: 2003). Creativity fuels the other facets, provides the opportunities, whilst
Advantage selects, and Focus delivers. The creativity facet, being ideas, opportunities and
solutions, provides three important outputs. Ideas span across many disciplines, and those
entrepreneurs strong on ideas will have some of the characteristics of the inventor. The
downfalls are that many ideas are out-dated and that most ideas are impractical or have
limited commercial value. Entrepreneurs thrive on opportunities, many of which their
Creativity facet has revealed. Opportunities differentiate the entrepreneur from the
inventor. An opportunity is one step up from an idea, and can be classified and analysed.
62
Solutions and problem solving go hand in hand, with solutions being the output of
creative ability. Solutions are an indispensable element of the Creativity facet.
2.6.8.6 Ego
The Ego facet provides the temperament to align the Focus, Advantage, Creativity and
Team facets to build something of recognised value. A strong Ego facet is important to
the entrepreneur, and without it, talent is simply wasted. Bolton and Thompson (2003)
divide the Ego facet into two shades, the inner and outer shades. The inner shade explains
the entrepreneur on the inside, whilst the outer shade explains how the entrepreneur deals
with the outside. The inner shade is made up of self-assurance, dedication and motivation.
The outer shade is made up of responsibility, accountability and courage. The outer group
all come from the entrepreneur’s locus of control, a key entrepreneurial characteristic.
Self-assurance is a key attribute, meaning the inner confidence in one’s own abilities and
values (Nieman et al, 2003: 17). This goes hand in hand with confidence (Schaper &
Volery, 2004: 35). Dedication refers to the passion that affects what people do, and many
entrepreneurs have used dedication to the customer as their competitive advantage.
Motivation is a strong trait seen in entrepreneurs, being self-starters, achieving, winning,
and proving something (Hisrich et al: 2004). The main motivation behind entrepreneurs is
their need for independence, followed by the challenge of the task (Morris & Kuratko:
2002). Making money is not a primary motivator, despite being a distinct measure of
achievement (Bygrave: 1997).
Those with an external locus of control expect others to take control for them.
Entrepreneurs have an internal locus of control. Responsibility follows directly from the
locus of control, being willingness to take responsibility for one’s actions. This
personality characteristic usually shines through in entrepreneurs. Accountability reflects
on personal accountability of all aspects of entrepreneurial activity, taking responsibility
one-step further. Courage is the most important of the external shade of the Ego facet, as
it is what gets the entrepreneur started. Three strands are identified in entrepreneurs; the
courage to confront situations, the courage to face reality, and the courage to stand by
your beliefs. Courage faces up to problems, whilst creativity finds solutions. Courage to
deal with emotions is of a higher order than courage associated with general business
issues.

63
2.6.8.7 Team
Whilst deciding on what type of entrepreneur a person is, the Team facet is optional for
the entrepreneur. With a strong team facet, the entrepreneur is able to create social capital
as well. The Team facet is seen as being a multiplier facet, as it enables the entrepreneur
to multiply their effectiveness (Bolton & Thompson: 2003). This is done in two ways.
Team members can either build upon facet strengths missing in the entrepreneur, or
expand the business in a way that is not possible alone.
The Team facet has four elements, but it is the combination of these elements that really
makes the differences. Elements consist of picking good people, working through a team,
using experts-the extended team, and networking. Entrepreneurs and leaders benefit from
a strong Team facet. Leaders however have two elements of their own. Gathering
followers and empowering others. Linked with the ability to pick good people, working
through a team produces a powerful combination. An added social dimension can be
achieved in working through a team. When using experts, communication problems may
occur, as these specialists have a different mindset to that of the entrepreneur. Despite
this, their specialisation (such as accountants, lawyers) usually adds advantage to the
entrepreneur, specifically when the entrepreneur is incompetent in that speciality or
discipline. Entrepreneurs who are strong in picking good people and using experts have
an ideal combination. Networking is usually the strongest element in the entrepreneur’s
Team facet. Networking contributes towards finding the right people and experts,
notwithstanding valuable publicity opportunities. Empowering others is characteristic of
the leader, despite the entrepreneurial trait of working through others (Nel et al: 2004).
2.6.8.8 Social
Whilst not essential, most entrepreneurs have the Social facet present to some degree.
Entrepreneurs with a Social facet create social capital by meeting challenging social
needs, making the world a better place for all. The need for commercial viability will
always be difficult to accept if the entrepreneur’s Social facet dominates the other facets.
Some social entrepreneurs do not succeed (finance capital) because the profit versus
social need conflict is not resolved (Morris & Kuratko: 2002). Nieman et al (2003: 39)
inform that a major problem with social entrepreneurs is finding start-up capital. The
Social facet depicts four building blocks; belief, values, mission and service to others.
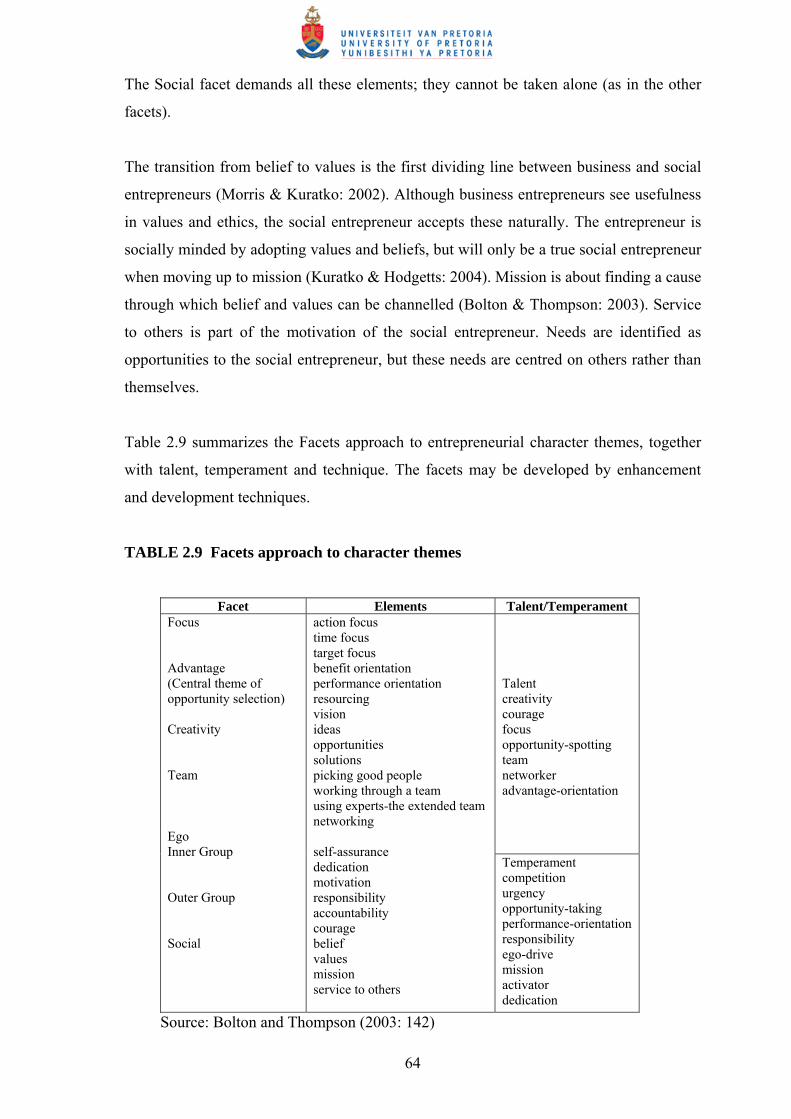
64
The Social facet demands all these elements; they cannot be taken alone (as in the other
facets).
The transition from belief to values is the first dividing line between business and social
entrepreneurs (Morris & Kuratko: 2002). Although business entrepreneurs see usefulness
in values and ethics, the social entrepreneur accepts these naturally. The entrepreneur is
socially minded by adopting values and beliefs, but will only be a true social entrepreneur
when moving up to mission (Kuratko & Hodgetts: 2004). Mission is about finding a cause
through which belief and values can be channelled (Bolton & Thompson: 2003). Service
to others is part of the motivation of the social entrepreneur. Needs are identified as
opportunities to the social entrepreneur, but these needs are centred on others rather than
themselves.
Table 2.9 summarizes the Facets approach to entrepreneurial character themes, together
with talent, temperament and technique. The facets may be developed by enhancement
and development techniques.
TABLE 2.9 Facets approach to character themes
Facet Elements Talent/Temperament
Talent creativity courage focus opportunity-spotting team networker advantage-orientation
Focus Advantage (Central theme of opportunity selection) Creativity Team Ego Inner Group Outer Group Social
action focus time focus target focus benefit orientation performance orientation resourcing vision ideas opportunities solutions picking good people working through a team using experts-the extended team networking self-assurance dedication motivation responsibility accountability courage belief values mission service to others
Temperament competition urgency opportunity-taking performance-orientation responsibility ego-drive mission activator dedication
Source: Bolton and Thompson (2003: 142)
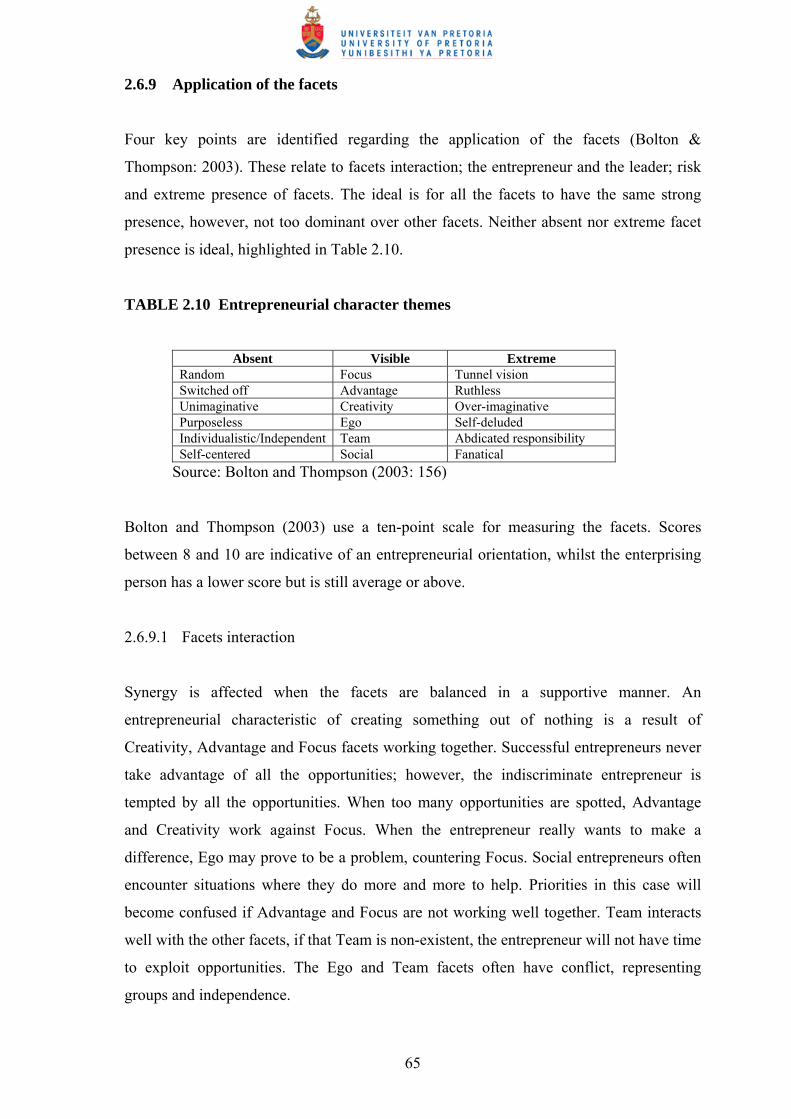
65
2.6.9 Application of the facets
Four key points are identified regarding the application of the facets (Bolton &
Thompson: 2003). These relate to facets interaction; the entrepreneur and the leader; risk
and extreme presence of facets. The ideal is for all the facets to have the same strong
presence, however, not too dominant over other facets. Neither absent nor extreme facet
presence is ideal, highlighted in Table 2.10.
TABLE 2.10 Entrepreneurial character themes
Absent Visible Extreme
Random Focus Tunnel vision Switched off Advantage Ruthless Unimaginative Creativity Over-imaginative Purposeless Ego Self-deluded Individualistic/Independent Team Abdicated responsibility Self-centered Social Fanatical
Source: Bolton and Thompson (2003: 156)
Bolton and Thompson (2003) use a ten-point scale for measuring the facets. Scores
between 8 and 10 are indicative of an entrepreneurial orientation, whilst the enterprising
person has a lower score but is still average or above.
2.6.9.1 Facets interaction
Synergy is affected when the facets are balanced in a supportive manner. An
entrepreneurial characteristic of creating something out of nothing is a result of
Creativity, Advantage and Focus facets working together. Successful entrepreneurs never
take advantage of all the opportunities; however, the indiscriminate entrepreneur is
tempted by all the opportunities. When too many opportunities are spotted, Advantage
and Creativity work against Focus. When the entrepreneur really wants to make a
difference, Ego may prove to be a problem, countering Focus. Social entrepreneurs often
encounter situations where they do more and more to help. Priorities in this case will
become confused if Advantage and Focus are not working well together. Team interacts
well with the other facets, if that Team is non-existent, the entrepreneur will not have time
to exploit opportunities. The Ego and Team facets often have conflict, representing
groups and independence.

66
2.6.9.2 The entrepreneur and the leader
The facets identified some overlaps and distinguishing differences between the
entrepreneur and leader (identified in Table 2.11). Dependency on trust is depicted in
italics.
TABLE 2.11 Character themes of the entrepreneur and leader
Character themes specific to the entrepreneur
Character themes shared by the entrepreneur and the leader
Character themes specific to the leader
Creativity Advantage
Focus Ego Team Social
strategic visioning envisioning empowering influencing
Source: Bolton and Thompson (2003: 161)
Creativity and Advantage are character themes essential for the entrepreneur, and not
normally associated with the leader. Focus discriminates and grasps the opportunity, and
Ego, together with sub-themes (courage, dedication and responsibility) is shared by
entrepreneur and leader, as is Team. Networking is more important for leaders, but not as
prominent in entrepreneurs.
Four character themes are identified for the leader that does not define the entrepreneur.
Strategies are a means to an end, consisting of a range of activities, competition in areas
of activity, integration of activities, and how the organisation will manage change and
implement strategies. Strategic positioning is closely related to the entrepreneurs
Advantage, however, more complex. Jack Welsh may be described as a strategic
visionary for his insight into diversification at General Electric. Leaders are able to
communicate their strategies and gain support as they continue with the process
(envisioning). Being team dependent, the leader has to delegate authority and
responsibility (Nel et al: 2004), empowering individuals in the process. The leader also
gathers others together, organizes and manages resources, achieving things by influencing
others (Schermerhorn: 2002). Strategic visioning, envisioning, empowering and
influencing are important determinants of the leader; and of utmost importance for the
leader-entrepreneur and entrepreneurial leader (Morris & Kuratko: 2002).
Power and effective leadership are dependent on trust (Nel et al: 2004), indicating the
confidence and respect people have in each other. The Team and Social facets of the
67
entrepreneur, together with leader themes of envisioning, empowering and influencing are
dependent on trust. Others, indicative of strong Focus, Advantage, Creativity and Ego
facets; but weak in Team and Social facets, do not trust those entrepreneurs.
2.6.9.3 Risk
Most entrepreneurs ‘handle’ risks rather than ‘take’ risks (Wiklund: 1999). Those
entrepreneurs with a strong Ego facet are not risk-aware, portraying self-confidence, and
being in charge of their own destiny. Those entrepreneurs strong on Creativity and Ego
facets take the view that one cannot plan for chaos in uncertain environments. They rather
equip themselves with good resources and preventative measures. Creativity, innovation
and courage can be used to find a way around obstacles and setbacks (Bolton &
Thompson: 2003). Those entrepreneurs high on Advantage believe in the notion of
calculated risk (Lumpkin & Dess: 1996). Advantage may also add to the belief that the
opportunity cannot fail, highlighting extreme courage, and a sense of invincibility.
2.6.9.4 Extreme presence
Regarding extremities, moderation is excluded from reality. Extreme Focus relates to
tunnel vision, ignoring influences that might be very important. Focus keeps the
entrepreneur on course, whereas extreme Advantage means wanting to accommodate
every opportunity arising. Extreme Creativity results in over-imagination, but
entrepreneurs need to evaluate only those opportunities that can add value (Nieman &
Pretorius: 2004). This extremity is apparent in many science fiction writers. When
coupled with greed, extreme Ego is the most difficult facet to cope with. Entrepreneurs
with extreme Ego are self-opinionated, and come across as arrogant. Extreme Ego is also
damaging in that according to the themes of talent and temperament, Ego is regarded as
temperament. When temperament is destructive, it negatively affects the exploitation of
talents.
Extreme Team facet is seen when one of the team elements dominates the others. An
example is someone high on networking will spend time at conferences whilst neglecting
the business. Fanaticism may be the result of extreme Social facet, being an obsession
with a cause. Those not sharing the same passion portray impatience. Those with extreme
facets across the board will be very driven, very ambitious and very profit-oriented, being
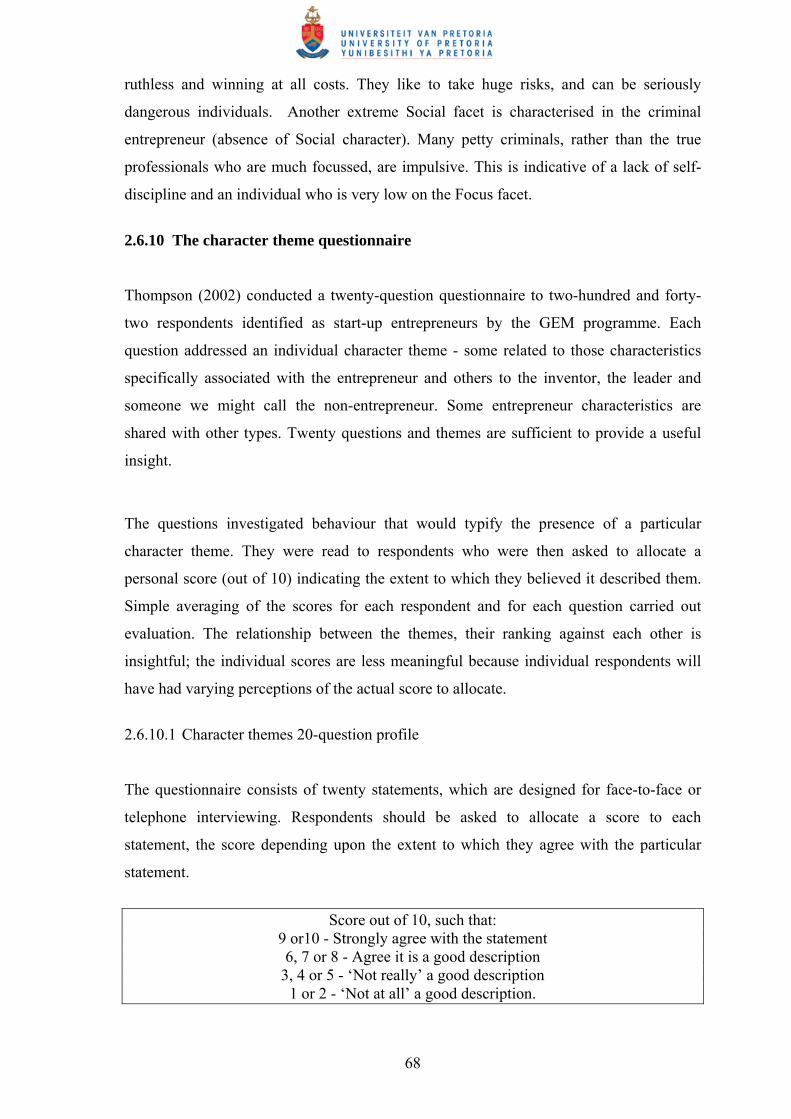
68
ruthless and winning at all costs. They like to take huge risks, and can be seriously
dangerous individuals. Another extreme Social facet is characterised in the criminal
entrepreneur (absence of Social character). Many petty criminals, rather than the true
professionals who are much focussed, are impulsive. This is indicative of a lack of self-
discipline and an individual who is very low on the Focus facet.
2.6.10 The character theme questionnaire
Thompson (2002) conducted a twenty-question questionnaire to two-hundred and forty-
two respondents identified as start-up entrepreneurs by the GEM programme. Each
question addressed an individual character theme - some related to those characteristics
specifically associated with the entrepreneur and others to the inventor, the leader and
someone we might call the non-entrepreneur. Some entrepreneur characteristics are
shared with other types. Twenty questions and themes are sufficient to provide a useful
insight.
The questions investigated behaviour that would typify the presence of a particular
character theme. They were read to respondents who were then asked to allocate a
personal score (out of 10) indicating the extent to which they believed it described them.
Simple averaging of the scores for each respondent and for each question carried out
evaluation. The relationship between the themes, their ranking against each other is
insightful; the individual scores are less meaningful because individual respondents will
have had varying perceptions of the actual score to allocate.
2.6.10.1 Character themes 20-question profile
The questionnaire consists of twenty statements, which are designed for face-to-face or
telephone interviewing. Respondents should be asked to allocate a score to each
statement, the score depending upon the extent to which they agree with the particular
statement.
Score out of 10, such that:
9 or10 - Strongly agree with the statement 6, 7 or 8 - Agree it is a good description
3, 4 or 5 - ‘Not really’ a good description 1 or 2 - ‘Not at all’ a good description.

69
Whilst the questionnaire can be administered directly to a person, the ‘prospective
entrepreneur’, it might be more useful in the first instance if the respondent is someone
who knows the ‘entrepreneur’ particularly well. A personal or business partner whom
they trust. In which case, of course, the ‘I’s’ would need to be read as ‘he/she’s’. A more
detailed follow-up with the person in question is then appropriate.
2.6.10.2 Character theme questionnaire
1. I enjoy being able to do things that others can’t and to be seen as something of an
expert.
2. I am naturally impatient and often think I am not doing as much as I should.
3. My motto is ‘When the going gets tough, the tough get going’ - because setbacks give
me stimulation.
4. My mind is always full of ideas and I enjoy doing unusual things.
5. When I have what I think is a good idea I find I can sell it to other people.
6. I appreciate you have to influence people and situations to make things happen and I
am good at it.
7. I am uncomfortable with constant change and uncertainty and prefer a substantial
degree of routine and order in my life.
8. When faced with a deadline I find it easy to concentrate my time and effort and meet
it.
9. I thrive on uncertainty and can find ways to achieve my goals.
10. I can trust people to take responsibility for things and I am happy to delegate this
responsibility to them.
11. I am naturally gregarious, quickly relating to other people, and thinking of things we
could work on together.
12. If I can see how something can be improved I want to get on and do it.
13. People would describe me as systematic and organized for I have a keen eye for
detail.
14. I set personal targets for myself all the time and check on my progress.
15. I get an extra kick at work when other people visibly approve of the way I do things.
16. I generally know what’s important and so I limit my options and stick with these
priority tasks.
17. It matters to me whether I achieve more in life than my parents and my close friends.
18. I enjoy working closely with people I know well.
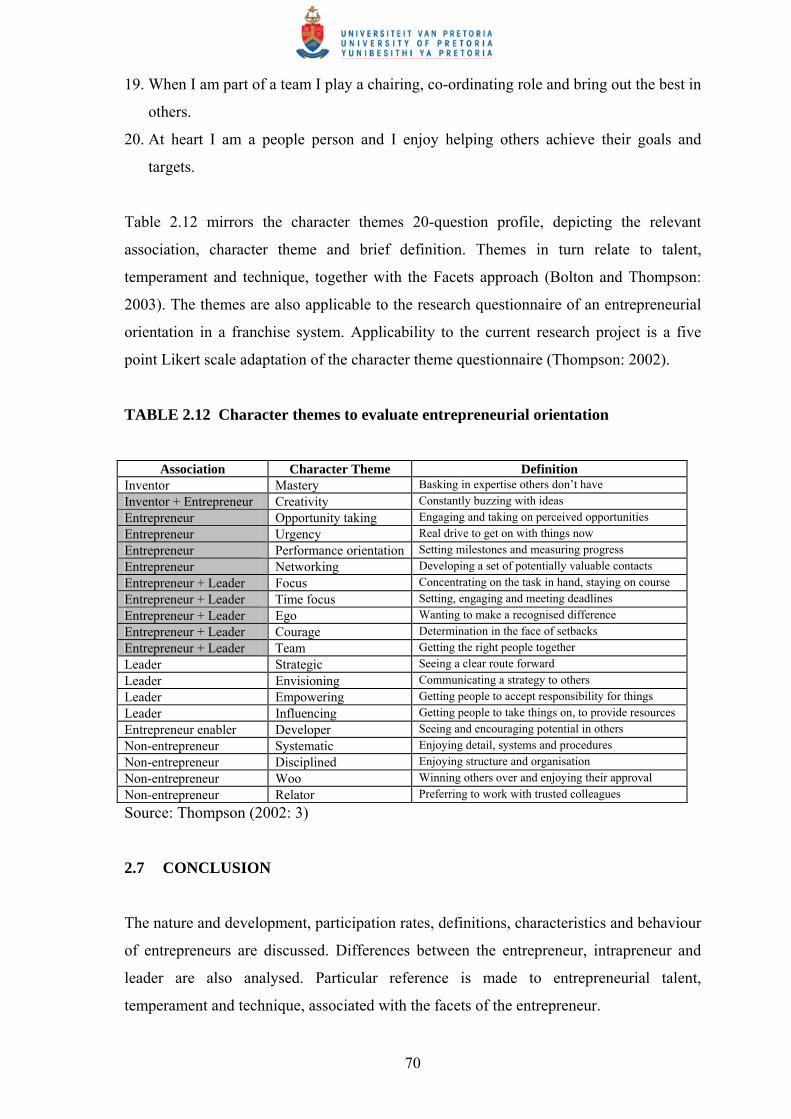
70
19. When I am part of a team I play a chairing, co-ordinating role and bring out the best in
others.
20. At heart I am a people person and I enjoy helping others achieve their goals and
targets.
Table 2.12 mirrors the character themes 20-question profile, depicting the relevant
association, character theme and brief definition. Themes in turn relate to talent,
temperament and technique, together with the Facets approach (Bolton and Thompson:
2003). The themes are also applicable to the research questionnaire of an entrepreneurial
orientation in a franchise system. Applicability to the current research project is a five
point Likert scale adaptation of the character theme questionnaire (Thompson: 2002).
TABLE 2.12 Character themes to evaluate entrepreneurial orientation
Association Character Theme Definition Inventor Mastery Basking in expertise others don’t have Inventor + Entrepreneur Creativity Constantly buzzing with ideas Entrepreneur Opportunity taking Engaging and taking on perceived opportunities Entrepreneur Urgency Real drive to get on with things now Entrepreneur Performance orientation Setting milestones and measuring progress Entrepreneur Networking Developing a set of potentially valuable contacts Entrepreneur + Leader Focus Concentrating on the task in hand, staying on course Entrepreneur + Leader Time focus Setting, engaging and meeting deadlines Entrepreneur + Leader Ego Wanting to make a recognised difference Entrepreneur + Leader Courage Determination in the face of setbacks Entrepreneur + Leader Team Getting the right people together Leader Strategic Seeing a clear route forward Leader Envisioning Communicating a strategy to others Leader Empowering Getting people to accept responsibility for things Leader Influencing Getting people to take things on, to provide resources Entrepreneur enabler Developer Seeing and encouraging potential in others Non-entrepreneur Systematic Enjoying detail, systems and procedures Non-entrepreneur Disciplined Enjoying structure and organisation Non-entrepreneur Woo Winning others over and enjoying their approval Non-entrepreneur Relator Preferring to work with trusted colleagues
Source: Thompson (2002: 3)
2.7 CONCLUSION
The nature and development, participation rates, definitions, characteristics and behaviour
of entrepreneurs are discussed. Differences between the entrepreneur, intrapreneur and
leader are also analysed. Particular reference is made to entrepreneurial talent,
temperament and technique, associated with the facets of the entrepreneur.
71
Entrepreneurs have distinct character themes (individual and combination thereof) that
separate them from others. They also share certain character themes with the leader.
These include intuition, behavioural traits, personality traits, talent, temperament,
technique and entrepreneurial facets. Character themes for franchise analysis are
introduced in the character theme questionnaire.
In Chapter 3 the franchise paradox is discussed. In an entrepreneurial context, franchising
is viewed as an influencing factor on entrepreneurship development. Franchising is a
relatively low-cost means of setting up a new-venture that has grown rapidly in recent
years, both in South Africa and internationally. The entrepreneurial link to small business
is facilitated by franchising, whereby a business owner sells to another the right to operate
the same business in another location. The chapter concludes with a literature study of
entrepreneurial orientation in a franchised environment.
72
3 CHAPTER 3: THE FRANCHISE PARADOX
“Challenge to Growth: Nothing New Under the Sun”
Martin Mendelsohn, 2001
“ That which hath been is that which shall be, and that which hath been done is that which
shall be done; and there is nothing new under the sun, Is there a thing whereof it is said:
See this is new?—it hath been already in the ages which went before us”
Ecclesiastes 1:9-10
3.1 INTRODUCTION
Franchising is seen as an entrepreneurial option towards creating and developing ventures
(Bygrave: 1997). Michael (2003: 61) in agreement herewith, mentions franchising as a
technique for entrepreneurs in service industries to assemble resources in order to rapidly
create large chains and gain first mover advantage. Nieman et al (2004: 156) view
franchising as a method of entrepreneurial expansion.
Franchising is an arrangement between two parties whereby the franchisor grants the
franchisee certain rights to sell a firm’s products or services, as per guidelines set down
by the franchisor (Nieman, 1998: 3). The Franchise Association of Southern Africa
(FASA) defines franchising as, “a grant by the franchisor to the franchisee, entitling the
latter to the use of a complete business package containing all the elements necessary to
establish a previously untrained person in the franchised business and enable him or her
to run it on an ongoing basis, according to guidelines supplied, efficiently and profitably”.
Mendelsohn (2003: 17) emphasises that a franchise relationship is not self sustaining,
with basic issues being that the franchise cannot succeed without successful franchisees,
franchisors to devote resources to enhance franchisor/franchisee relations, franchisor duty
to establish and sustain a viable business, franchisors code of ethics, and that the
franchisor must promote the basic principles upon which franchising is based. Franchisors
in many sectors have recognised the benefits of multiple-unit franchisees (Johnson, 2004:
36), and this is seen as an entrepreneurial continuation of the franchise trend. Lindsay and
McStay (2004: 3) further explored the entrepreneurial orientation of franchisees, together
with the entrepreneurial drivers of franchisee performance. Their findings indicated a
73
proactiveness regarding entrepreneurial orientation, together with a risk-taking
entrepreneurial orientation.
In an entrepreneurial context, franchising is viewed as an influencing factor on
entrepreneurship development (Nieman et al: 2003). Franchising is a relatively low-cost
means of setting up a new-venture that has grown rapidly in recent years (Kirby, 2003:
67), both in South Africa and internationally. The entrepreneurial link to small business is
facilitated by franchising, whereby a business owner sells to another the right to operate
the same business in another location (Schermerhorn, 2002: 125).
The final section of the chapter investigates entrepreneurial orientation within a franchise
system (franchisee specific); from a literature and empirical perspective. Tentative review
is indicative of a relationship between the entrepreneur, intrapreneur and franchisee. Final
analysis is however subject to an empirical study within a defined franchise system.
3.2 NATURE AND DEVELOPMENT OF FRANCHISING
Franchising is a method of marketing goods and services, which knows almost no
boundaries (Mendelsohn: 2004). Franchising is considered as one of the most effective
systems for distribution of goods and services (Nieman: 1998). In context of
entrepreneurship, franchising has been argued to be a technique for entrepreneurs to
assemble resources in order to rapidly create large chains and gain first mover advantage
(Michael: 2003).
Dhir and Bruno (2004: 20) inform that franchising is an extraordinary international
success story, generating millions of jobs and billions of dollars in economic activity.
Franchising is enormous, especially in developing countries where discretionary income
is increasing. Towards facilitating entrepreneurial growth, Johnson (2004: 35) advises
that multiple-unit and multiple-brand franchising offer successful operators both the
possibility of spreading risk over multiple units or brands and economies of scale. An
example of this success is apparent within the Famous Brands (formerly Steers Holdings)
franchise portfolio; housing Steers, Debonairs Pizza, Wimpy, Whistle-Stop, House of
Coffees, Fish-Aways and Church’s Chicken brands (excluding shareholding in
Blockbusters Video). These multiple-brand franchise outlets dominate the South African
74
franchise food sector, and have won more Franchise Association of South Africa (FASA)
awards than any of their competitors.
Franchising dates back to 200BC when Chinese businessman Los Kas created a
franchised chain-store concept for the distribution of branded food items throughout
China. However, the concept of franchising as we know it today originated in the United
States where in the 1860’s, the Singer Sewing Machine Company established a franchised
network of dealers (Mendelsohn: 1992). The United States is regarded as being the full
accreditors of developing the franchise system internationally. They are undoubted
leaders in the exporting of franchise systems. Franchising in some form exists in over one
hundred countries around the world, and is continuously growing.
From a pure historical point of view, the extensive ‘pub’ network in the United Kingdom
may be the oldest franchise system in the world. This dates back to 740-750, during the
Roman occupation of Britain. By 957 King Edgar decided there were too many alehouses,
and decreed a limit of one per village. Standards were instituted and a monitoring system
established, with fines levied against violators. Franchising was born (Monckton, 1969:
87). After the 1840’s, two types of franchising evolved in the United States. Product
franchising involved durable goods manufacturers integrating vertically, developing their
own distribution channels. Business format franchising, created in the 1950’s, results
from evidence that the outlet itself could be a vehicle for entrepreneurial activity
(Spinelli: 1997).
Three categories of a franchise system are identified; franchisor-operated outlets;
franchisee-operated outlets or a combination thereof. Types of businesses generally
included in business format franchising include food and non-food retailing, business
services, restaurants and business services. Petrol stations and soft drink bottlers are
excluded from business format franchising as they incorporate other forms of licensing
and development arrangements. The International Franchise Association (1997) predicted
that close to forty-three per cent of USA retail sales will be attributable to franchise sales.
3.2.1 Franchising link to entrepreneurship
Franchising is seen as an entrepreneurial option towards creating and developing ventures
(Bygrave: 1997). Franchising is an arrangement between two parties whereby the

75
franchisor grants the franchisee certain rights to sell a firm’s products or services, as per
guidelines set down by the franchisor (Nieman, 1998: 3). The Franchise Association of
Southern Africa (FASA) define franchising as, “a grant by the franchisor to the
franchisee, entitling the latter to the use of a complete business package containing all the
elements necessary to establish a previously untrained person in the franchised business
and enabling him or her to run it on an ongoing basis, according to guidelines supplied,
efficiently and profitably”.
Mendelsohn (2003: 145) emphasises that a franchise relationship is not self sustaining,
with basic issues being that the franchise cannot succeed without successful franchisees,
franchisors to devote resources to enhance franchisor/franchisee relations, franchisor duty
to establish and sustain a viable business, franchisors code of ethic, and that the franchisor
must promote the basic principles upon which franchising is based. Lindsay and McStay
(2004: 3) further explored the entrepreneurial orientation of franchisees, together with the
entrepreneurial drivers of franchisee performance. Their findings indicated a
proactiveness regarding entrepreneurial orientation, together with a risk-taking
entrepreneurial orientation.
Sherman and Dewis (2003: 34) define franchising from a strategic viewpoint: “a
franchising system is a distribution channel; a licensing of brands and systems by the
franchisor to a dedicated network of franchisees who pay initial and ongoing fees
(typically expressed as a per centage of gross sales) to operate businesses under
contractually prescribed systems and standards. From a strategic perspective, franchising
is a popular method of leveraging a company’s intellectual capital by opening up new
markets with a highly motivated owner-operator who will work harder than the average
salaried manager to ensure the success of a particular location”. The link to
entrepreneurship is in that franchising is a capital efficient growth model. It provides the
franchisor/entrepreneur with the opportunity to leverage the capital invested and the
equity of the local franchisee operator to build and strengthen brands and systems of the
franchisor.
The leadership and team facets (Bolton & Thompson: 2003) of entrepreneurship are
interrelated with franchising in that a strong management team that is experienced in
building brands and developing and enforcing operational and IT systems can operate
with relatively low overhead. Healthy profit margins may be yielded when predictable
76
revenue streams provided by royalty payments are linked with this cost structure.
Revenue growth platforms are opportunistic- ranging from sales to franchisees, to
international expansion and acquisition of additional brands in the franchise system.
Franchising is not a business itself, but a way of doing business (Williams, 2000: 12). It is
a marketing concept, being an innovative method of distributing goods and services. A
rising sense of entrepreneurism among key groups within the American population
(1950’s), together with increasing limits on the ability of companies to expand by more
rational means, provided a growing pool of potential franchisees and franchisors willing
to undertake new ventures in response to these business opportunities. The term
franchising describes a wide variety of different practices, which are used in different
ways and with varying degrees of sophistication in many different industries.
Robert T. Justis, Professor of Franchising at the University of Nebraska, defines
franchising as, “a business opportunity by which the owner, producer, or distributor
(franchisor) of a service or trademarked product grants exclusive rights to an individual
(franchisee) for the local distribution of the product or service, and in return receives a
payment or royalty and conformance to quality standards”. A direct link to
entrepreneurship is the unique association of corporate organisations and a unique form of
raising capital. This is all part of the Facets entrepreneurial terminology (Bolton &
Thompson: 2003); consisting of issues of dynamic relationships (between franchisor and
franchisee), congruent goals, interdependence and focus.
Schaper and Volery (2004: 19) define franchising as, “an arrangement whereby the
originator of a business product or operating system permits another business owner to
sell the goods and/or to use the business operating system on the originator’s behalf”. The
most common form of franchising is business system franchising, whereby there is an
arrangement in which the franchisor not only supplies the product, but also gives
comprehensive guidelines as to how the business is to be run. Whilst entrepreneurial
activity is linked to the franchisor, the link to the franchisee may be questioned. Non-
entrepreneurial activities such as restricted growth, moderate flexibility and low
flexibility in decision-making are representative of the franchisee (Schaper & Volery:
2004).

77
Hisrich et al (2004) inform that an advantage of buying a franchise (that is, as a
franchisee) is that the entrepreneur does not have to incur all the risks often associated
with starting a business from scratch. Typically, entrepreneurs often have problems in
starting new ventures in the areas of product acceptance, management expertise,
knowledge of the market, operating controls, and meeting capital requirements. These are
all negated (to a large extent) in a successful franchise system. The disadvantage to the
entrepreneur is that problems often occur between franchisor and franchisee, negating the
entrepreneurial independence motive. The formal relationship may not be to the
entrepreneur’s liking. Seltz (1982: 1) defines franchising as, “an arrangement whereby the
manufacturer or sole distributor of a trade-marked product or service gives exclusive
rights of local distribution to independent retailers in return for their payment of royalties
and conformance to standardized operating procedures”. The franchisee is given the
opportunity to enter a new business with a better chance to succeed than if he/she were to
commence a start-up business (Hisrich et al: 2004).
Halloran (1994: 40) considers franchising as a way of becoming an entrepreneur with a
built-in market and proven product. However, the downside is in the restrictions and
regulations of many franchisors; taking away the feeling of independence and the
satisfaction of self-determination that comes from new venture creation. He defines a
franchise agreement as, “when one party, the franchisor, grants to another party, the
franchisee, the rights to market/distribute a trademarked product or service in exchange
for payment or royalties. Or in some cases the franchisee is granted the right to offer, sell,
or distribute goods or services under a marketing format designed by the franchisor”.
Whilst the term trademark regularly appears in American texts, this may be somewhat
misleading in a South African context. Many South African successful franchised
organisations, particularly in the home entertainment industry; started out in franchising
prior to trademark registration (Mr. VIDEO, Blockbusters, Stax Video and Video Town
being examples). This however does not negate the importance of trademarks and
registration whatsoever.
Deakins and Freel (2003) regard franchising as another market entry route, yet not always
associated with entrepreneurship. Despite the loss of control in a franchise (as a
franchisee), the popularity of franchising has mirrored the importance and growth of
small firms in the economy. The franchisor undertakes much of the venture creation
activities, including idea formulation, opportunity recognition, pre-start planning and
78
market research. Tikoo (1996: 78) places emphasis on the massive growth of franchised
start-ups, with one in two franchise systems being less than five years old. The
International Franchise Association (1997) estimate that one new franchise open every
eight minutes. Dickie (1993), in an international franchise study, informed that forty-three
per cent of franchises have fewer than ten outlets. Nieman et al (2004) regard franchising
as an entrepreneurial expansion opportunity, placing emphasis on the expansion of the
distribution channel.
The appeal of the reduced risk, while still retaining elements of entrepreneurship has been
a powerful motivating factor for entrepreneurs, and the growth of franchising appears
likely to continue unabated in the new millennium (Deakins & Freel, 2003: 69). The
potential of franchising within the emerging entrepreneurial sector in the South African
context is supported by government initiatives towards sustainable development of small
to medium and micro enterprises (SMME). Economic empowerment and the upliftment
of the redistribution of wealth to the previously disadvantaged make franchising a unique
and competitive means of development (Nieman et al, 2003: 207). Emerging
entrepreneurs, particularly in developing rural areas, may benefit from the franchise
system. Franchising is seen as a key determinant towards the upliftment and development
of the micro- and small business sector growth in South Africa (FASA 2002).
3.2.2 Franchise rationale
Prior to looking into the merits and demerits of a franchise system, becoming a franchisee
versus starting a stand-alone business requires evaluation. Spinelli (1997) informs that
this evaluation hinges on the mitigation of risk by the trademark value, operating system,
economies of scale, support process of the franchise and the personality/management
style to sharing decision-making responsibilities within the system. To quantify the
evaluation, Spinelli (1997: 365) derived the following:
Franchise Fee + PV of royalty = PV of the increased net income from the value of the
franchise trademark. PV is the present value of a sum of money. An analysis of services
provided by the franchisor requires review.

79
3.2.2.1 Real estate development
Many business format-franchising systems include a real estate ingredient, therefore sight
selection and development is an integral part of franchising. This predominantly surfaced
during second generation franchising in the 1950’s, when Harlan Sanders (Kentucky
Fried Chicken) and Ray Kroc (McDonalds) built national chains along the developing
interstate networks. Ray Kroc is generally recognised as the founder of business format
franchising, and based his initial model on real estate development (Williams, 2000: 7).
Market research into the primary target audience (PTA) includes viability studies
including the market that will patronize the franchise outlet. Real estate development
includes:
• Cost, location standards for successful expansion
• Population, how wide a market area, PTA members, pro forma market share
• Traffic volume, pedestrians, traffic flow, shoppers
• Traffic patterns, timing, bottlenecks, peaks and troughs, seasonality
• Visibility, impulse, signage, building, entrance
• Zoning and permits, local councils, governing bodies, landlords
• Ingress and Egress, entrance to and from the site
• Location success factors, link to business format, rental relationship.
3.2.2.2 Construction specifications and supervision
The franchisor usually has a standard set of blueprints, despite modifications per site.
Those strong on brand reputation and consumer sovereignty will include building
contracts, specifications, and usually supply their own, or accredited outsourced partners
to do the construction and layout.
3.2.2.3 Training
The licence agreement should stipulate the time and cost of trading, pre-opening and
ongoing training, and specifying the form in which the franchisors responsibilities span
(Spinelli, 1997: 372). The trademark and name are the most important assets in a
franchise system, and franchisees should be adequately trained to uphold the desired
value. A poor training regime will inevitably dilute the standardized and consistent

80
delivery, and reduce or tarnish trade name value. Mendelsohn (2003: 113) informs that
franchisees must be trained in the system and business methods which the franchisor has
developed, including any special methods of production/value added, processes to be
applied to goods, methods of preparation and manner of providing services. Training is
also to be provided in methods of marketing and merchandising.
3.2.2.4 Pre-opening support
Preopening support is a concentrated, multifunctional program to launch the new
franchise (Spinelli: 1997). The franchisor has the expertise in place to provide
sophisticated start-up assistance, and is leveraged in a partnership association, to the
benefit of franchisee and franchisor alike. After training, assistance will be given in
getting the business ready to open for trading (Mendelsohn, 1992: 4).
To develop the local target market in the area of the new franchise, the franchisor is
obliged to assist the franchisee in localised marketing communications. The new
franchisee is unlikely to have the competence to implement this task, thus necessitating
franchisor assistance (Nieman, 1998: 33).
3.2.2.5 Continuing support
Not only must the franchisor create a market for the brand/service, but also all
participants in the system must be sustained and nurtured (Spinelli: 1997). As such, the
actions of each franchisee have bearing on overall franchise performance. Unfortunately,
the degree of franchisor support is usually inversely proportionate; in that struggling
franchisees receive more attention and support. A key ingredient for success is a balance
of franchisor resources. Apart from the proper level of support in the business operation,
the franchisor should be creating good franchisor-franchisee relations on an ongoing
basis. Mendelsohn (2003: 153) suggests a range of ongoing services to include:
• Monitoring and support
• Training
• ‘Head office’ organisation
• Market research
• Advertising and promotion
81
• Communications.
3.2.2.6 Performance standards and monitoring
By developing and implementing a variety of financial and operational information
systems, the franchisor may identify exceptional and sub-par performance. The franchisor
has to support and maintain the business format, image and quality of services provided in
the franchise system (Nieman, 1998: 134). The entire franchise system should deliver the
same quality to the customer. This is also facilitated by monitoring relationships and
performance management (Section 2.8.4). Sophisticated computer interface management
information systems not only provide a channel of franchise communications, but that of
management interaction. This is a distinct advantage of network communication not
available to individual or stand-alone outlets.
3.2.2.7 Field support
Franchisor staff to regularly interact with franchisees in relation to trade, activities
including operating procedures, business and performance reviews, field training,
relationship management, supplier compliance, local marketing and overall operations
audit. Field visits go a long way towards franchisees justifying royalty payments.
Advantages include corrective action when franchisees are not following the system
correctly. Mendelsohn (1992: 112) recommends that the franchisee should contact his
field support representative from time to time if he has not been visited, even if just to
catch up on other successes within the franchise operation.
3.2.2.8 Operational research and development
Although standards and operational management maintenance across operating units must
be adhered to, it must not be seen as a hindrance to change and innovation. A benefit
regarding research and development centres on economies of scale in a franchised system,
being optimally achieved through centralized and monitored inputs. The franchiser should
constantly be seeking innovative methods for improving the business of the franchised
network (Mendelsohn, 2003: 113). Important research and development activities can
include the exploitation of new sources of supply, good quality materials and products for
the franchise system, facilitating both quality and cost.
82
3.2.2.9 Marketing, advertising and promotions
Varying amongst franchisors, the standard format is a group-advertising fund, resultant
from franchisee royalty payments (Nieman: 1998). Management thereof is usually
contractual, either at the discretion of the franchisor, or most often in the control of a
franchise council or franchisee representation of sorts. Mendelsohn (2003: 86) advises
that there are three alternative methods of dealing with the expense when the franchisor
undertakes the obligation to advertise and promote:
• The franchisee is charged a sum calculated as a per cent of the franchisee’s gross
income (similar to franchise fees)
• The advertising expense is included within the continuing franchise fee and
undertakes to spend not less than a minimum per centage of such fees
• The franchisor undertakes all marketing communications activity without
collecting a contribution for this purpose.
3.2.2.10 Product purchase provision
Economies of scale take effect, particularly regarding quantity discounts, group buying
and related discounts and trading terms. Rebates and confidential allowances are usually
paid to the franchisor, and depending upon contractual obligations, may be shared
between the franchisees. Confidential allowances have been an issue of contention in the
industry, being the reason for ethical evaluation into franchise business practices.
Included may be contractual provision for approved suppliers and distributors, and
method of procurement. Franchise system purchasing usually covers three areas (Nieman,
1998: 86):
• Purchases of the franchisor/franchisee
• Group purchase programmes
• Product and supply restrictions.
The report of the competitions board (Act 96 of 1979) is relevant, investigating
acquisitions, monopolies and restrictive practices. The home entertainment industry was
subject to such investigation in 1997/8, with respect to restrictive sale of intellectual
property.

83
3.2.2.11 The operations manual
Often the heart of the franchise asset, as it delineates the manner in which the trade name
and mark are to be delivered to the customer (Spinelli: 1997). Failure to operate within
the confines of the manual often leads to dispute within the franchise system. To this end,
an operations manual should include a dispute resolution process. Williams (2000: 17)
advises that the operations manual should be supplemented with administration/reporting
manuals; corporate identity manuals; speciality manuals, training manuals; trouble-
shooting guide; Franchisor manuals and ongoing development and upgrading of system.
Nieman (1998: 51) informs that as the franchise system develops, the operations manual
usually becomes the backbone of the system. Together with the trade name, the know-
how detailed in the manual is the most important asset of the franchise. Mendelsohn
(2003: 183) lists an overview of suggested operating instructions, to be included in the
manual:
• Hours of operation
• Trading patterns, peaks and troughs
• Franchisee involvement and staff schedules
• Standard forms and procedures (including invoicing and brand-name
communication)
• Staff appearance (such as uniforms)
• Staff training procedures
• Employment of staff (statutory requirements included)
• Disciplining staff
• Product, pricing and promotional policies
• Customer service policies
• In-store appearance and ambiance
• Purchasing policies
• Product standards
• Customer complaint procedures, such as listening posts
• Service standards
• Staff duties, including job descriptions, methods of performing responsibilities
• Payment of franchise fees, calculation and timing thereof
• Accounting, generally accepted accounting practices
84
• Marketing communications, local marketing, group cohesion and offering, selling
techniques, customer retention
• Use of trade-name, trademark usage in course of business
• Operational policies and procedures
• Communication channels within the franchise system.
3.2.2.12 Specialist support
Depending on the nature of the business, the franchisor should provide the necessary
professional support. Not only related to business activity or discipline, this also includes
participation in industry initiatives and proactive market environment activities. Such
examples involve membership and participation in FASA, Video Software Dealers
Association of America (VSDA), representative bodies in training, financial institutions
and governance.
3.2.2.13 Territorial rights
Robinson (2004: 79) informs that the setting and operation of territories is one of the
more complicated components within franchise systems. Second only to fees, territories
are potentially the most contentious issue for franchsise networks. Demographics are a
constantly evolving factor, hence the true market area will inevitably change (Spinelli:
1997). A relocation clause is most often associated to territorial issues, contained within
an exclusive territory clause or operations clause. Robinson (2004: 80) identifies different
basic structures and applications in territory allocation:
• No territory, with no territorial or geographic restrictions, but may be limited to
specific location only
• Regional territories, possibly limiting the number of franchisees per region
• Non-exclusive territories, nominal territories in which the franchisee operates,
normally restrictions of sort
• Exclusive territories, no other franchise of the same system can be established or
operate in a given territory. Issues involve the right to establish further territories,
right to expand trading operations, right to subdivide territories and sub-
franchising.

85
When developing territories, Robinson (2004) highlights the inclusion of:
• Population size
• Number of dwellings
• Growth of an area (normally via population or dwellings)
• Number of businesses/commercial premises
• Number of businesses within certain industry types
• Level of income/economic strata
• Other demographic data such as racial mix, age, psychographics
• Price of housing
• Road traffic, foot traffic
• Amount of competition in the area
• Proximity to other key influencers or sources of business, such as shopping malls
• Planned roading changes or shopping complexes
• Market media used to attract/secure business, such as direct mail areas, television
regions.
A territory may be defined in a number of ways. The most common way of dividing
physical territories is via a detailed map, which is often appended to the franchise
agreement. Some franchisors set their territories to toll free number areas and then use
that toll-free number for all promotion, secure in the knowledge that responses can be
directed to the correct territory (Robinson: 2004). Entrepreneurs are quick to adapt and
accept new technologies, and the internet may not only provide opportunistic distribution
channels, but conflict within the distribution channel (Porter: 2001). The key to success
with territories and the internet is to take a fair and long-term approach, either directing
the business from the internet to the relevant franchisee, or involve a specialist internet
franchisee. Another possible option is that franchisees should each own a share of the
internet marketing channel so that they can all profit from internet sales (Robinson:
2004).
3.2.2.14 Terms of the agreement
At the heart of almost every franchise relationship is a lengthy legal document, the
franchise agreement. Agmen-Smith (2003) explains the franchise agreement as setting out

86
the rules by which the franchisor (who owns the franchise network) and the franchisee
will have to live by for the period of the franchise. It is by far the most important of the
franchise legal documents. Mendelsohn (2003: 184) refers to the franchise agreement as
the moment of truth, where the franchisee and franchisor formally agree to their
relationship. It should be read alongside the franchise operations manual, which every full
format franchise will have. The franchise agreement usually refers to the operations
manual and disclosure document, binding the franchisee (and franchisor) to certain
obligations within the manual. The operations manual usually forms an integral part of
the franchise relationship, and requires that the franchisee operate the business according
to the systems and methods set out in the manual. Franchise agreements start by
identifying the parties, a background to the agreement itself, then a rendition of the main
terms. At the end, there are schedules including specific duties such as dates, values,
territory boundaries and renewal rights. Other documents may include non-disclosure
agreements; together with a disclosure statement, providing financial and other
information about the franchisor. Successful franchised systems should include a full
presale disclosure in a document that provides information about aspects of a franchise
offering (Hisrich & Peters, 1998: 554). Kauffmann & Robbins (1991: 100-105)
summarize a twenty-point disclosure document:
• Identification of the franchisor, affiliates and business experience
• Business experience of each of the franchisor’s officers, directors, management
and personnel responsible for services, training and other aspects of the franchise
• Lawsuits in which the franchisor and its officers have been involved
• Previous bankruptcies of franchisor officers
• Initial franchise fee and other initial fees to obtain the franchise
• The continuing payments that franchisees are required to make after the franchise
opens
• Any restrictions on the quality of goods and services used in the franchise and
where they may be purchased, including restrictions requiring purchases from the
franchisor or its affiliates
• Any assistance available from the franchisor or its affiliates in financing the
purchase of the franchise
• Restrictions on the goods or services franchisees are permitted to sell
• Any restrictions on the customers with whom franchisees may deal
• Any territorial protection that will be granted to the franchisee

87
• The conditions under which the franchise may be repurchased or refused renewal
by the franchisor, transferred to a third party by the franchisee, and terminated or
modified by either party
• The training programs provided to the franchisee
• The involvement of any celebrities or public figures in the franchise
• Any assistance in selecting a site for the franchise that will be provided by the
franchisor
• Statistical information about the present number of franchises; the number of
franchises projected for the future; and the number of franchises terminated, the
number the franchisor has decided not to renew, and the number repurchased in
the past
• The financial statement of the franchisor
• The extent to which the franchisees must personally participate in the operation of
the franchise
• A complete statement of the basis of any earnings claims made to the franchisee,
including the per centage of existing franchises that have actually achieved the
results that are claimed
• A list of the names and addresses of other franchises.
Should a franchise have a consolidated and accurate disclosure document, the franchise
contract will be understood more easily. The Federal Trade Commission (USA) requires
all franchisors to supply prospective franchisees with the disclosure document at least ten
days before entering a purchase contract (Halloran, 1994: 44). The franchise agreement
between the franchisor and franchisee is the legal document that details the franchise
relationship. It also shows how the information in the disclosure document applies to the
franchisee.
The franchise agreement is often an exhaustive, lengthy and sometimes complex legal
document, the most important contents being:
• Period of grant of rights. The franchise agreement is usually established on a long-
term basis, with a 15-20 year period being the norm (Spinelli: 1997). The key is
however in the renewal rights, and absence thereof is indicative that the franchisor
is predisposed not to grant renewals. Renewal provision includes required notice
periods; payment of a renewal fee; allowing the franchisor to change the wording
88
of the franchise agreement upon renewal and allowing the franchisor to change the
size of the territory of the franchisee. The franchise may be likened to a lease,
allowing the franchisee to ‘rent’ the right to the franchise system for a set number
of years (Agmen-Smith, 2003: 31)
• Payments and fees. A large initial up-front payment is usually required, most often
consisting of a registration or acceptance fee. The identification hereof will
depend on the franchise package (Mendelsohn, 2004: 85). The sale of the
franchise package may be that of turnkey methodology, whereby the franchisor is
involved in acquiring the premises, shopfitting and equipping so that it is ready for
the franchisee at the commencement of business (Mendelsohn, 2003: 93). This
also includes set-up and other initial fees, all dependent on the type of franchise.
This follows ongoing payments during the franchise term. These are primarily
made up of royalty payments on a regular basis (usually monthly), based upon
gross turnover, a set amount (flat fee), or combination thereof. Other fees include
levies for advertising and training; with obligations for brand renewals, re-
launches, conferences and meetings. Marketing (includes advertising and
promotions) costs are usually provided for from contributions of the franchisee, by
the way of a levy. There are often agreements on what the funds may be spent on,
with the franchisor usually having full discretion. This is an avenue of conflict
within the system, hence the formation of franchise councils, acting as a
communication conduit between franchisor and franchisees. Franchisees are
usually required to co-operate with major promotions, such as recommended price
discounts and ‘specials’
• Opening. Most often there are requirements for the franchisee to spend a specified
minimum amount on store launch promotions. Store layouts and fitment is usually
a prerequisite of the franchisor, together with working capital requirements. This
includes, but is not limited to signage, décor, shopfitting, landlord requirements
and municipal costs
• Premises, leases and mobiles. Since location plays a vital role in the success of the
franchise, the franchisor is most often actively involved in site selection. The
franchise agreement will usually contain various provisions relating to leases
(Agmen-Smith: 2003). The leaseholder may be the franchisee or franchisor,
dependent on the objectives of the franchisor. Regarding mobile franchises, the
franchisee may be required to implement vehicle sign writing, and the franchisee
may be required to purchase the fully set-up vehicle from the franchisor.

89
Mendelsohn (2003: 95) regards leasing as “a complex aspect of franchising, with
problems which arise not only from the legal implications but also the attitudes,
practices and balances of negotiation power which are prevalent in the property
market at the relevant time”. This notion is predominant in the South African
context, where Franchisors have standing relationships with landlords, often
negotiating prime sites at competitive rates
• The franchise business. Both the term ‘business’ and the term ‘system’ (which
refers to the method of operating the business) will be formally defined and
regularly referred to in the contract. The operations manual usually defines and
explains many of the franchise business terms
• The manual. Most often initial training programmes review a ‘how to do it’
manual, a blueprint for franchise operations. The agreement normally provides
that a manual will be supplied, normally remaining the property of the franchisor;
to be returned at the end of the term. The agreement will allow for the manual to
be updated from time to time
• Obligations. These include clauses setting out initial and ongoing obligations of
both franchisor and franchisee. There will invariably be strict obligations on the
franchisee to keep accurate and up-to-date accounting records (Agmen-Smith,
2003: 33), with requirements of electronic linking of point of sale systems to the
franchisor
• Intellectual property rights. These are legal rights, which have developed to
protect ownership of inventions and creations of various types. These include
copyright, trademarks, designs, layout designs and patents
• Sale or termination. Totally dependent on the terms of agreement, and the type of
business. Most agreements will allow for the sale of the business during term, with
the franchisor usually having first option to repurchase. Spinelli (1997: 379) refers
to this as right of first refusal, whereby the price should be equal to or a premium
of the bona fide third-party offer. Upon sale of an existing franchise, the incoming
franchisee must be approved by the franchisor, and undertake the required
training. A new transfer or approval fee may be applicable. The franchise
agreement may run its original term, or a new contract drawn up. The agreement
may also be terminated prematurely. Events such as death or incapacity of the
franchisee (Spinelli: 1997), bankruptcy, liquidation, criminal convictions,
termination of lease of franchise premises, and failure to pay money due to the

90
franchisor, as well as breaches of party obligations may also qualify for
termination
• Disputes. Most agreements now provide for mediation or arbitration should
disputes not be resolved by discussion. The objective is minimising disturbances
to franchise operations, whilst maintaining harmonious franchise relationships
• Cooling-off periods. Many Franchise Associations, such as Franchise Association
of South Africa (FASA) and Franchise Association of New Zealand (FANZ)
requires its members to provide an option for franchisees to withdraw from the
agreements. This is currently within a 7-day period after signing the agreement.
Inclusions of such clauses are usually a favourable indication of the franchiser’s
intentions and approach (Agmen-Smith: 2003).
Parties are not always limited to franchisor and franchisee, but may include master
franchisors, sub-franchisors or area franchisees. A franchisee may also elect to open up a
franchise in the name of a limited liability company or partnership.
3.2.3 Challenges to growth: nothing new under the sun
Franchising is a relatively low-cost means of creating new ventures which has grown
rapidly internationally (Kirby, 2003: 67). Mendelsohn (2001: 16) breaks down the growth
challenges of franchise systems into two headings, internal and external issues.
3.2.3.1 Internal issues
Within the franchise system, it is the opinion of Mendelsohn (2001: 16) that many
franchisees confronted with problems treat the symptoms and not the underlying cause.
As such, once realizing what they have done, the problem has multiplied from its original
complexity. Franchisors are well advised to go back to the basics (issues addressed in
Section 2.8.3) before addressing the symptoms. In going off the beaten track, there is a
chance that franchisees have been receiving conflicting messages. The franchisees join
the life cycle of the franchise system, keen to get started. Some stay keen and succeed,
others do not achieve such levels of success and most often demand a disproportionate
share of the system (franchisor) resources. Mendelsohn (2001: 16) further identifies two
major ingredients of internal issues:

91
• The product. The challenge for the franchise system is in appreciating that the
product offering has a life-cycle, and that strategic initiatives are in place to
anticipate market demands; prior to being forced to making changes. Proactivity
and not reactivity is the key. Market research, market testing, innovation and
opportunity spotting should receive priority from the franchisor. These issues
relate to the facets of the entrepreneur as well (Bolton & Thompson: 2003)
• Systems growth. With growth in franchisees, there will come a time when
franchisor and franchisee disagree. It is the duty of the franchisor to ensure
principles of relationship management are maintained, resulting in strong and
well-founded relationships. Franchisees should in turn feel proud to belong to the
system, and that the value they receive is greater than the price they pay for it
(Mendelsohn, 2001: 16). It is however difficult to analyse why a franchisee is
failing or has failed. It may be location, but since much of a franchisee’s success is
in his own hands, the franchisee that faces up to his responsibilities will do best
(Mendelsohn, 1995: 66).
3.2.3.2 External challenges
These challenges are generally not in the direct control of the franchise system, mostly
part of the macro-external environment. These predominantly refer to opportunities and
threats:
• Economic downturns. Cyclical trends should be analysed, and the franchisor must
ensure that they have capacity during peaks, together with market stimulation
activity during troughs. The problem is often that of motivating franchisees during
times of uncertainty
• Regulatory and legal issues. The unfortunate intervention of regulatory and legal
issues in many cases is the product of a lack of information and not founded on
any market behaviour, which needs correction (Mendelsohn, 2001: 17). This is not
an issue of dominance in the South African context, as the franchise system is
relatively well developed (Mendelsohn, 1997: 46). Mendelsohn (1995: 66) relates
that the lesson to be learned from the USA is that legislation, regulation and
contention should be avoided. He believes such measures stifle franchise
opportunities. Mendelsohn (1997: 46), after a visit to South Africa assumed that

92
according to indication that the government will continue to take a keen interest in
franchising, making entry prospects good
• Availability of franchisees. Real estate availability is the biggest threat in most
South African franchised systems. As such, there are not always sufficient
prospective franchisees available to meet the requirements of franchise systems
• Market forces. The franchise environment is very competitive, with many
franchise systems not effectively differentiating. The result is many new systems
opening, which are not significantly different from existing systems.
Notwithstanding this, competitors still eat into the systems market share. Due to
the lack of differentiation, many of these systems compete on price alone. This in
turn places stress on the franchisor to negotiate better terms with suppliers. Other
alternatives are to achieve competitive advantage by being the cost leader or
differentiation (Porter: 1995). Another response is the expansion of current
offerings, replacing that which has become unpopular.
Mendelsohn (2001: 17) concludes by stating that the basic principles of franchising
have not changed since 1964. Mendelsohn (2003: 24) identifies these basics as:
• Only franchisors with successful franchisees succeed
• The franchisor must establish a viable and successful business
• The franchisor’s support role must provide value in excess of the cost thereof to
the franchisee
• The franchisor must recognize and promote the basic principles upon which
franchising is based
• The franchisor must initiate relationship marketing, enhancing networks and
ensuring franchisor/franchisee relationships are at a high level of mutual
cooperation.
The author of Ecclesiastes was right, there is nothing new. Emphasis is placed on
strategising, using the past as a gauge. “The task is meeting the challenges with an open
mind and a sense of historical experience” (Mendelsohn, 2001: 17).

93
3.3 FRANCHISE SYSTEM RELATIONSHIPS
The franchise system constitutes a long-term relationship from the moment of first
contact to the development and continuation of a mature network (Mendelsohn, 2004:
153). This research study however examines relationships in the continuation of mature
networks phase (Ostgarrd & Birly: 1996). Mendelsohn (1992: 142) advises that
franchising involves the development of a multiple chain of outlets in multiple ownership.
It however does not involve multiple ownership of a multiplicity of subtly different
outlets. As such, it would appear that franchise agreements are rigid, with minimal
qualification. This notion facilitates objectivity within the system. Mendelsohn (2003:
148) identifies that mutual respect (franchisor/franchisee) must be present, particularly in
the following areas:
• Respect by both parties for the basic marketing principles on which the franchise
system is based
• Respect by the franchisee for guidance provided by the franchisor, particularly in
respect to the intellectual property of the name, system and know-how
• Respect by the franchisor for achievements and contributions of the franchisee.
Good franchisor-franchisee relationships require a conscious effort (Mendelsohn, 1992:
150) from both parties, with the economic motive being enhanced accordingly. In taking
cognisance of the maturity phase (Nieman, 1998: 130) of relationships, the following is
identified:
• Macro trends influencing relationships
• Basic principles of franchise system relationships
• Cooperation within the system
• Franchise system leadership
• The product of conscious efforts
• Guidelines for good franchise relations
• Common franchise relationship problem areas and resolving franchise disputes
• Relationships and quality control and relationships requiring a solid foundation
• Franchise councils and franchise system network.

94
Bloom (2003) informs that successful franchise systems are the result of strong
relationships built upon careful listening and mutual respect between franchisors and
franchisees (Szarka: 1990). Amos (2003: 20) identifies franchising as one of the most
synergistic relationships in all business.
3.3.1 Macro trends influencing relationships
Four primary macro-trends are seen as influencing franchise relationships in the new
millennium (Amos, 2003: 21). The fist is the globalisation of franchising, followed by the
evolvement of mega-franchisees as multiple-franchise owners. Third is the emergence of
self-regulation within the franchise community; and fourthly, as key to franchising in the
new millennium, relationships between the franchisor and franchisee.
3.3.2 Basic principles of franchise relationships
The basic premise of respect between franchisor and franchisee is of paramount
importance to both parties. Mendelsohn (2003: 145) identifies respect based on basic
principles of the franchise system itself; franchisor respect for achievement and
contribution of franchisees, and franchisee respect for achievements and guidance of
franchisors. Without this mutual respect, a relationship of trust will not be possible.
3.3.3 Franchise system cooperation
Other than trust and respect (Mendelsohn: 2003), it has become apparent that franchisors
are listening more than ever to franchisees. Moreover both are cooperating to build brand
identity and integrity, which is essential to a profitable and lasting franchise system
(Amos & James, 2003: 21). A study was conducted by Maritz (2004) which highlighted
the cooperation and trust involved in the branding decisions of co-branded franchise
systems. Cooperation was evaluated as one of the most important aspects of the co-
branding venture. Mentoring and cooperative programmes have played a major role in
facilitating these open relationships. Amos and James (2003) also identify how
franchisors and franchisees are cooperating more often on marketing efforts and effective
training programs for franchisees.
95
Das & Teng (1998: 492) examined confidence in partner cooperation, highlighting two
distinct sources; trust and control. In generating confidence, these two sources were seen
as supplementary. The benefits of trust in franchise relationships appear wide ranging in
character, including lowering transaction costs (Gulati, 1995: 87), inducing desirable
behaviour (Madhok, 1995: 127), reducing the extent of formal contracts (Larson, 1992:
79), and facilitating dispute resolution (Ring & Van de Ven, 1994: 111). Lane (1996: 371)
however argued that, whereas trust is a contributor in partner cooperation, along with
control, certainty of partner cooperation cannot be equated with trust, which is merely
about positive expectations of partner motives. Since trust and control are the two
contributory factors of confidence in partner cooperation, either one by itself is
insufficient to explain this confidence.
3.3.4 Franchise leadership
Amos and James (2003: 20) inform that leadership in a franchise system is about being
solution-oriented as opposed to conflict-oriented. They inform of a leadership approach
being that of an art, practiced with care, concern and diligence. Leadership is however
lacking at most levels of franchise relationships, and the deficit may be felt exceptionally
hard in the world of franchising. Amos and James (2003) believe this to be the result of
the requirement for enlightened leadership that is necessary to mange the franchisee-
franchisor relationship. They inform that this leadership is neither top-down nor bottom-
up; recognising that business is more about people than it is about pro-forma models, net-
present values and spreadsheets. Identified are elevated levels of integrity, values,
motivation and performance. They further identify focus on softer business issues,
recognizing that core values have a greater potential to influence behaviour than process
or system. Amos and James (2003) identify culture as being the glue that holds any
organisation together, reflecting the beliefs and values of the people making up the
system. They place emphasis that these values and beliefs are set by leadership and
executed with the permission of the culture. The importance of the macro-trends is further
amplified whereby enlightened leadership at all levels of the franchise system are
recognizing how critical this relationship is and how important it is to the continued
growth of the most powerful economic engine in the world (Amos & James, 2003: 21).
Amos and James (2003: 22) conclude as follows, “the essence of practising the leadership
art of franchise relationships is to always be faithful to a set of core values and traditions
that has the greater good in view for the greater number”.

96
3.3.5 Franchise relationships as products of conscious efforts
Ties that bind: Franchise relationships, like marriages, are products of conscious effort. A
USA national survey, “Franchise Relationships, The State of the Nation 2003”, revealed
that 39 per cent of all franchisees rate their franchisors fair or poor overall. Nearly half
would not recommend their franchise to a friend or family member, and more than two in
five franchisees would not purchase their franchise again if they had known then what
they know now. It is obvious that many franchise relationships are in need of repair-even
major overhaul (Johnson, 2003: 22). Johnson (2003) believes that one of the best
strategies is to head off problems before they start by creating avenues for meaningful
franchisee participation. Examples are advisory councils and policy boards; together with
giving franchisees advance say in store policies and procedures. Johnson (2003: 24)
advises that one of the most important rules for franchisors is simply to follow through on
promises; facilitated by an environment of respect.
Johnson (2003) further comments on the role of franchisees, placing emphasis on the
importance of letting go of old grudges and biases that have nothing to do with the people
and situations at hand. In agreement with Amos and James (2003); Johnson (2003)
believes the best franchise systems are those in which mutual trust and shared objectives
are the norm. The requirement is the open, resolute and ongoing application of specific
policies that affirm the value of franchisor and franchisee goals and abilities. Meaningful
communication and growth is the result when franchisees and franchisors join forces to
each other’s mutual benefit.
3.3.6 Guidelines for optimal franchise system relationships
Nieman (1998: 129) makes mention of the notion that the franchisee is in business with
someone else, and not by themselves. This special relationship should be one of mutual
trust and independence, notwithstanding the performance motive. A guiding coalition
between the two parties facilitates this independence. Towards a guideline hereof, Justis
& Judd (2002; 1989) developed an independent framework, identified in Table 3.1 on the
following page.
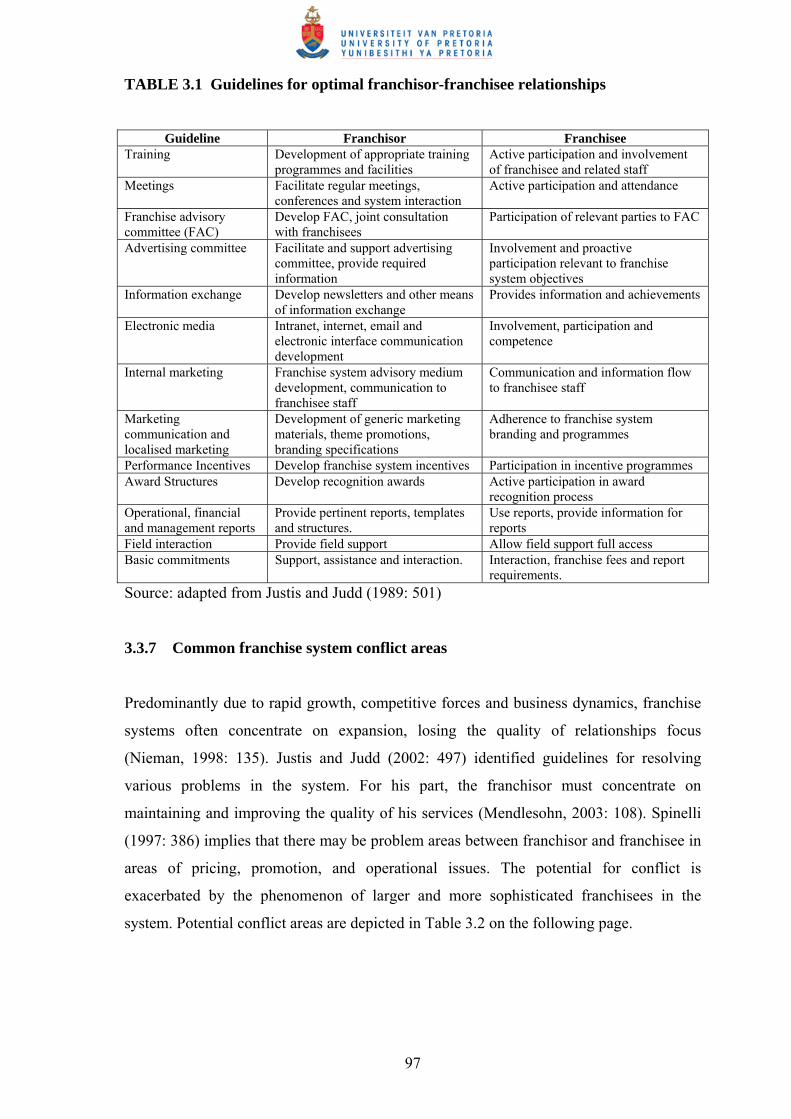
97
TABLE 3.1 Guidelines for optimal franchisor-franchisee relationships
Guideline Franchisor Franchisee
Training Development of appropriate training programmes and facilities
Active participation and involvement of franchisee and related staff
Meetings Facilitate regular meetings, conferences and system interaction
Active participation and attendance
Franchise advisory committee (FAC)
Develop FAC, joint consultation with franchisees
Participation of relevant parties to FAC
Advertising committee Facilitate and support advertising committee, provide required information
Involvement and proactive participation relevant to franchise system objectives
Information exchange Develop newsletters and other means of information exchange
Provides information and achievements
Electronic media Intranet, internet, email and electronic interface communication development
Involvement, participation and competence
Internal marketing Franchise system advisory medium development, communication to franchisee staff
Communication and information flow to franchisee staff
Marketing communication and localised marketing
Development of generic marketing materials, theme promotions, branding specifications
Adherence to franchise system branding and programmes
Performance Incentives Develop franchise system incentives Participation in incentive programmes Award Structures Develop recognition awards Active participation in award
recognition process Operational, financial and management reports
Provide pertinent reports, templates and structures.
Use reports, provide information for reports
Field interaction Provide field support Allow field support full access Basic commitments Support, assistance and interaction. Interaction, franchise fees and report
requirements. Source: adapted from Justis and Judd (1989: 501)
3.3.7 Common franchise system conflict areas
Predominantly due to rapid growth, competitive forces and business dynamics, franchise
systems often concentrate on expansion, losing the quality of relationships focus
(Nieman, 1998: 135). Justis and Judd (2002: 497) identified guidelines for resolving
various problems in the system. For his part, the franchisor must concentrate on
maintaining and improving the quality of his services (Mendlesohn, 2003: 108). Spinelli
(1997: 386) implies that there may be problem areas between franchisor and franchisee in
areas of pricing, promotion, and operational issues. The potential for conflict is
exacerbated by the phenomenon of larger and more sophisticated franchisees in the
system. Potential conflict areas are depicted in Table 3.2 on the following page.

98
TABLE 3.2 Franchise system potential areas of conflict and resolutions
Conflict areas Resolutions
Training standards and implementation Revamp training in accordance to franchise system objectives and franchisee needs analysis
Operations manual Update and revise appropriateness of operations manual Information disclosure Improve facets of internal marketing, franchisee communication
(see Table 2.13) Availability of advice Develop channels of clear communication, training for
franchisor staff, improve field services Marketing communications Franchisee involvement in advertising committee Marketing and industry research Implement research activities (inclusion of advertising
committee involvement) Ongoing support Franchise Advisory Council (FAC) and advertising committee
recommendations). Renew standing operating procedures. Site selection Optimal site selection, in accordance with franchise system
requirements, leasing facilities and availability Dicrimatory practices Evaluate deviations by franchisee, uniformity in accordance to
franchise agreements Source: adapted from Justis and Judd (1989: 502)
3.3.8 Resolving franchise system disputes
Franchising is an ongoing relationship between two or more parties and it is inevitable
that disputes will periodically arise. Newton (2003: 71) identifies disputes commonly
arising, together with recommended methods of resolving them:
• Quality, price or delivery of products or services, recommended or required by the
franchisor. A franchisor can legitimately require franchisees to source their
supplies from a particular supplier where this is relevant to uniformity of the
quality or nature of the franchise system
• Franchisee royalties and payments due. Franchisees may fail to pay the franchisor
amounts due, which may be a reflection of the fact that the franchise is just not
proving financially viable for the franchisee. It may also be due to some other
dispute as a result of which the franchisee withholds payment of royalties or other
amounts
• Alleged misrepresentations, misleading conduct or unconscionable conduct by the
Franchisor. These allegations are often raised as an expression of the frustration of
franchisees in a dispute situation. Mediation, arbitration or the courts however
often resolve perceptions of the franchisees. Newton (2003) advises that the
dispute is usually about something else and these allegations are raised as a
supplementary item
99
• Other disputes, including, but not limited to disputes about the franchised
territory, termination of the franchise agreement, franchisor advertising, franchisor
competing with the franchisee, franchisee not following the franchised system,
franchisor communication, rent or lease obligation (franchise system dependent),
initial franchisor disclosure, provision of operations manuals and/or other
information and amount of the franchise royalties.
Newton (2003: 72) goes on to advise on negotiating solutions to franchise problems:
• Negotiating with the person who can do something about the problem
• Research and preparation of facts prior to negotiation
• Identify value of the franchise relationship, highlighting positive aspects
• Briefly state the problem objectively (non-blaming, neutral)
• Listen to responses, asking for disclosure of reasons for their point of view
• Concentrate on the problem (issue on hand), leave personalities out of it
• Acknowledge your understanding of the process thus far
• Assert an objective rendition of the problem from a point of view, providing
reasons and details
• Focus on needs and objectives rather than rights
• Attempt to understand the other party’s needs and objectives
• Attempt to identify realistic solutions that meet both parties’ objectives
• Be prepared to consider more than one alternative
• If not successful at first, attempt to negotiate with higher authority.
The negotiating meeting itself requires factors including timing; agenda items; venue;
freedom of interruptions; representation equality; final decision-makers and participants.
Legal action is advisable where one side is using trade marks without permission; has
been fraudulent; refuses to negotiate or enter mediation; or has failed to implement an
agreement at mediation.
Most literature reviewed however holds the opinion that successful franchise relationships
are borne on pro-active participation, and identifying issues prior to reaching conflict
(Mendelsohn, 2003; Newton, 1993; Spinelli, 1997; Johnson, 2003; Justis & Judd, 2002;
Bloom, 2003; Agmen-Smith, 2003).
100
3.3.9 Franchise relationships and quality control
Franchising involves the marketing of goods and services. It is a powerful and effective
marketing strategy, placing emphasis on networks (Kirby, 2003: 68) and market entry
methods (Kirby, 2003: 223). It is also about good marketing and business practices which
must be of a high standard, and franchisors and franchisees must understand that they are
in the relationship business (Germann, 2002: 39). He proclaims the relationship between
franchisor and franchisee built on trust and respect. Germann (2002) informs that all
franchise relationships require a purpose, a sense of belonging and the wish to be treated
with respect and good relationships allow businesses to expand and flourish so that all
parties succeed. He places emphasis in the fact that there is quality control at all levels in
franchise relationships. Customer retention depends on this quality aspect, with customer
satisfaction a result thereof. Germann (2002: 39) identifies the franchise system
relationship link to customer service:
• Accepting that it is everyone in the franchise system’s responsibility to keep
the customer happy
• Customer service is the key issue in franchise system survival
• Customer satisfaction is the key to long term success
• Give authority to staff in the front line as no person can do everything
themselves
• Bad news travels fast and good news rarely overtakes it
• Dissatisfied customers tell eight to ten others of their dissatisfaction and one in
five will tell twenty people. Five will tell a total of sixty people, some of
whom will tell others
• It costs six times as much to attract a new customer as it does to keep an
existing customer
• Sixty per cent of customers say that a company does not pay enough attention
to them and does not value them
• The majority of customers are reasonable people and all you require is the first
chance to satisfy them.
Together with franchise system links to customer satisfaction, Germann (2002: 40)
believes the link to quality is an essential component. Towards this justification, he
regards quality in the following light: quality defined as conformance and not goodness;
101
all non-conformances are caused; anything that can be caused can be prevented; and it has
been known for generations that organisations that do what they promise to do, and take
good care of their franchisees in the process, always come out top. Germann (2002)
concludes by stating it is essential for both franchisors and franchisees to have a policy on
quality which should be along the lines that they will deliver defect-free products and
services to customers, both internal and external, on time and thereby show reliability.
3.3.10 Franchise system relationships require a solid foundation
Only three elements must be present in a transaction for a business to be considered a
legal franchise: trademark licensing; substantial assistance with the business’s operations;
and the payment of a franchise fee; according to Washington, D.C. based franchise
attorney Andrew A. Caffey. While this definition is technically true, the relationship
between franchisor and franchisee is far more complicated (Haneborg, 2003: 35). Crucial
elements such as trust, communication and relationship-building must be present for both
franchisor and franchisee to reach their fullest earning potential (Gulati: 1995; Larson:
1992; Ring & Van de Ven: 1994: Madhok: 1995). While franchise relations issues exist in
any economic condition, bear markets are indicative of shrinking profits, tough
competition, taking its toll on franchise system relationships.
Haneborg (2003) believes that adhering to team mentality; facilitating open
communication and practicing the basics, are primary factors that determine the long-term
viability of the relationship. With regard to field franchised operational staff, Haneborg
(2003) believes that they, together with the franchisee’s staff, should know what the
organisation’s goals and objectives are, and the role each person plays to achieve those
goals. Both the franchisor and franchisee are in the business to make money and grow.
The franchisee wants to grow their business, while the franchisor is working to grow the
brand.
Haneborg (2003: 36) believes communicating is more than just talking; not just hearing,
but listening to franchisees, and asking how the franchisor can assist in creating a
solution. Many franchisees believe in the notion that ‘a franchisor needs to remember that
the franchisee is closest to the dollar’. She concludes that it is up to the franchisor to
foster a symbiotic relationship; listen to all comments and complaints, and to take action;
and reinforce the basics of the business that will ensure their relationship is built on a

102
solid foundation. Mendelsohn (1992: 151) believes the franchisor must not only give the
franchisee value for money, but the franchisee must perceive the value as greater than the
money paid to the franchisor. This requires rock-solid communication between the
parties.
3.3.11 Franchise system advisory association/council
Two distinct groupings are identified as external and internal associations. External
associations refer to governing bodies for the industry, examples being the Franchise
Association of South Africa (FASA), Franchise Association of Australia (FAA),
Franchise Association of New Zealand (FANZ) and the International Franchise
Association (IFA). Of pertinence in this study are the internal associations, those formed
within a particular franchise system, commonly referred to as Franchise Advisory
Councils (FACs). Bloom (2003: 27) regards FACs as franchisee organisations formed to
provide valuable input into different operational aspects of their franchise system,
ensuring that franchisees can accomplish this goal in an organized manner.
Franchisors may also then be in a position to realize that franchisees have valuable
contributions into operational issues, including marketing campaigns, new product
development, training, or any franchise system functions. Patel (2000: 56) informs that
the FAC is an idea intended to benefit both parties. Instead, it too often causes frustration
for franchisees and fear for franchisors. The FAC is either subsidized by the franchisor or
is independent and funded by the franchisees. The disadvantage of the former is that the
franchisor controls the activities; whilst the drawback of the latter is that the FAC is seen
as a threat by the franchisor. Patel (2000: 56) recommends that for a FAC to be truly
effective, the following factors must be synergized:
• Candid, complete and continuing communication, between FAC members
themselves, and also between the members they represent
• The advice offered by the FAC should be taken and considered seriously by
the franchisor, tokenism is unsatisfactory
• In their dealings and discussions, both sides must be realistic, mature and
flexible.

103
The primary role of the FAC for franchisees is that of access to other franchisees, access
to franchise executives and access to franchise data. These usually revolve around the
collection of franchise fees and funds available for marketing communications support.
The primary role of the FAC for the franchisor is also access based, being access to
franchisee feedback. Patel (2000: 57) thus informs that the overriding objective of the
FAC is access, and this should be the driving force behind the council. Apart from access,
the FAC can be valuable in replacing dysfunctional relationships with co-dependency
(Justis & Judd, 2002: 496). There is a connotation that the name is inappropriate to
relationship management, with suggestions for a name change to “franchise-owners
council” or “franchise-relations council” (Patel, 2000: 57).
Mendelsohn (2003: 158) informs that FACs born out of frustration and dissatisfaction of
franchisees should be avoided at all costs. These allow for hostile positions between the
parties, however, they may be a means of resort for franchisees. Mendlesohn (2003: 159)
identifies areas in which the FAC can operate effectively:
• Communication; improvements, ideas, new technologies, identification of
barriers to communication, style and content of communication
• Franchisee experience in the field may be relayed to the franchisor, facilitating
functionalities
• Sharing of new ideas and franchise system innovations via franchise grouping
• Suggestions for improvement of procedures, an example being the operations
manuals
• Training, re-training procedures, training needs from franchisees
• Field support recommendations and requirements
• Reporting and accounting opportunities and problems, identified and rectified
• Proposals for contractual changes
• Marketing communications funding and allocations
• New product, development and research initiatives including franchisee
participation
• Raising topics of concern to franchisees.
Patel (2001: 21) identifies the merits of the FAC as three tiered towards evaluating,
reviewing and revising franchise systems from the franchisee’s point of view.

104
3.3.12 Franchise system networking
The view of integrating entrepreneurial activity and strategic service within a franchised
system may best be explained in the context of networks. The most widely held view of
‘network’ refers to an organized system of relationships, linking a defined set of persons,
objects or events (Nelson: 1988; Szarka: 1990). This networking in small business serves
to provide owner-managers with the necessary support, contacts, and credibility (Ostgarrd
& Birley: 1996). Consequently, the owner-managers will benefit from obtaining
necessary information and will learn more about their own capabilities relative to their
competition, thereby minimizing the harsh lessons the market place may present (Dilts:
2000). As such, networking is seen as a major tool for achieving desired business results,
and as a key source of resources that are typically outside the reach of many entrepreneurs
(Zhao & Aram: 1995). This network view correlates entrepreneurship and franchising, yet
entrepreneurial orientation amongst franchisees in the franchise system requires
investigation.
Relationship management within the franchise system will be incomplete without
prioritising the effect of the internet and electronic commerce on strategy (Porter, 2001:
63). Perry (2002: 27) identifies that technical and social bonds contribute to the success of
a relationship. He identifies social bonds as including trust, commitment, equity, conflict
and benevolence. Technical bonds identified include competence (the degree to which
business transactions meet performance expectations) and investment. Perry (2002)
postulates that the trend to invest in information technology to replace mail, fax,
telephone and face-to-face contact may make the relationship between buyers and
suppliers technically and economically more efficient, whilst simultaneously enhancing
the social bonds between the parties.
Information must flow freely for franchise arrangements to be successful. Such examples
include the franchisor informing franchisees about new procedures, prices, products,
marketing information and training. Franchisees too must regularly communicate
performance information to the franchisor. There must also be communication with
external parties such as suppliers, banks, advertising agencies and consultants.

105
3.3.13 Franchise system merits
In an entrepreneurial context, franchising is viewed as an influencing factor on
entrepreneurship development. Franchising is a relatively low-cost means of setting up a
new-venture and has grown rapidly in recent years (Kirby, 2003: 67), both in South
Africa and internationally. The entrepreneurial link to small business is facilitated by
franchising, whereby a business owner sells to another the right to operate the same
business in another location (Schermerhorn, 2002: 125). Franchising is a means of
expansion using limited equity finance (Nieman et al: 2004: 157).
Franchisees join franchise systems because of the advantages offered (Lindsay &
McStay, 2004: 2). These include affiliation with a trademark or trade name (Knight,
1986: 7; Stanworth: 1977), franchisor support (Hough: 1986), proven business format
(Withane, 1991: 24), established name, lower development costs, and training (Peterson
& Dant, 1990: 49). Mendelsohn (2003: 19) informs that the failure rate of new franchise
businesses is one-tenth that of non-franchised new businesses. The risk inherent of a new
business is reduced, but by no means totally marginalized. In evaluating reasons to
purchase a franchise, Lord (2003: 8) identifies the following:
• Many managers/workers are specialists and do not have the knowledge to
successfully operate a new venture. Franchising provides the training and ‘know-
how’ to overcome this weakness
• Franchising offers a freedom of lifestyle, a choice between indoors/outdoors; an
office or shop; premises/home; alone or with spouse; the opportunities are
virtually endless
• The opportunity to use existing skills in another context
• Transformation from employment to self-employment made easier in that you are
part of a group, in business for yourself, but not by yourself (Nieman: 1998)
• Large variety of opportunities, with the initial investment most often proportional
to the possible return
• Part-time or full-time, with many start-ups being run by one person, with a second
only entering the system once the start-up has grown
• Regional franchises offer opportunity for the more experienced individuals, when
a higher risk-reward is sought. This may be more applicable to entrepreneurs.

106
Master franchises are usually a longer term investment, with high financial
outlays.
Hisrich et al (2004: 486) consider the merits of franchising from the point of view of the
franchisee and the franchisor. They consider these merits from the point of view of
entrepreneurial activity. One of the most important advantages of buying a franchise is
that the entrepreneur does not have to incur all the risks often associated with starting a
business from scratch. Entrepreneurs typically have problems with starting new ventures
in the areas of product acceptance; management expertise; meeting capital requirements;
knowledge of the market, and operating and structural controls (Hisrich & Peters, 1998:
548). Franchising minimizes the risk associated with these factors through the franchise
relationship.
From the point of view of the franchisor, advantages to the entrepreneur are related to
expansion risk, capital requirements, and cost advantages due to extensive buying power.
However, Schermerhorn (2002: 237), in agreement with Hisrich and Peters (1998: 550)
and Hisrich et al (2004: 488), advise that the franchisor must have established an entity of
value and credibility that someone else is willing to buy.
Mendelsohn (2003: 36) believes that the proven success formula leads to a number of
advantages from which the franchisee may benefit. On the other hand, certain
disadvantages to the franchisee may be seen. Freel & Deakins (2003: 69) also evaluate
similar advantages and disadvantages, however from an entrepreneurial perspective. The
main salient activities from Medelsohn (2003) and Deakins and Freel (2003) are depicted
in Table 3.3.
Deakins and Freel (2003) conclude that despite the loss of control in a franchise; the
reduction of risk while still retaining elements of entrepreneurship, has been a powerful
motivating factor and the growth of franchising appears likely to continue unabated in the
new millennium.
Table 3.3 is represented on the following page.

107
TABLE 3.3 The main advantages and disadvantages of buying a franchise as a
means of business start-up
Advantages Disadvantages
Franchise usually based on a proven recipe for success
A proven recipe for success usually comes at a price, at a premium to the franchisee
Benefit from economies of scale, such as marketing and group buying
Although the business may be sold to another taking over your role as franchisee, this may be less than could be achieved with de novo entrepreneurship
Market research usually undertaken by the franchisor
Trading limited to a geographical area and location, with marginal growth capabilities
Training provided by the franchisor Possibility of franchise disputes with the franchisor or fellow franchisees
Early stage advice, as the franchisor may act as a mentor
Innovation and creativity limited due to the franchise operating to strict formula for production, sales and marketing
The franchise package most often includes a turn-key operation, facilitating a time and effort advantage
The turn-key advantage comes at a price, and the franchisee may not agree with certain initial undertakings, such as computer systems
Benefits from a strong brand name Brand image of the franchisor may be tarnished, reflecting on all the franchisees
Franchised systems are often favoured by investors and banks due to established track records
Entrepreneurs may feel confined working within the systems, guidelines and requirements of the franchisor
The franchisee has the disposal of the franchisor’s expertise
Imposition of control, disturbing the facets approach of the entrepreneur
The franchisee has the services of field staff from the franchisor, to assist with any problems which may arise
Difficult to assess the quality of the franchisor
Usually a lower investment than setting up a new venture, due to experience gained by the franchisor from pilot and other operations
The franchisee may become too dependent on the franchisor, failing to produce the required personal drive
Guidance of regional activities, including municipal approvals, regional council grants, planning zones, shop fitting, refurbishments
Franchisor’s policies may affect the franchisees proactivity regarding local marketing initiatives
Social entrepreneurial activities of integrating opportunities from fellow franchisees
Although relatively independent, the entrepreneur is not master of his own destiny in a franchise environment, always bound by the intellectual property of the franchisor
Source: adapted from Deakins & Freel (2003: 69) and Mendelsohn (2003: 32-33)
3.4 ENTREPRENEURIAL ORIENTATION IN A FRANCHISE SYSTEM
The global contribution and growth of the franchised system has been the subject of much
research; however, the research exploring entrepreneurial orientation (EO) in these
systems is scant (Lindsay & McStay, 2004: 1). Lumpkin & Dess (1996: 137) refer to EO
as the organisational processes, methods, styles, practices and decision-making activities
employed by entrepreneurs that lead to new ventures. Bird (1991) identifies new ventures
as a start-up firm, via an existing firm, or internally via a larger corporation. Lumpkin &
Dess (1996) advise that entering new or established markets with new or existing goods
or services can attain new ventures.
108
3.4.1 Franchisee entrepreneurial orientation literature
From an entrepreneurial perspective, franchising is seen as an entrepreneurial route
towards starting and expending new ventures (Bygrave: 1997; Deakins & Freel: 2003).
Franchising literature is however dominant in the areas of franchise system relationships
(Hopkinson & Hogarth-Scott: 1997; Lewis & Lambert: 1991; Fayerman: 2002;
Mendelsohn: 2003; Amos: 2003); franchise system functioning and objectives (Sherman
& Dewis: 2003; Deakins & Freel: 2003; Nieman & Pretorius: 2004; Mendelsohn: 2001);
and the development of franchising in an international arena (Dhir & Bruno: 2004;
Nieman: 1998). Limited literature is available regarding entrepreneurial orientation of
franchisees (Lindsay & McStay: 2004).
Entrepreneurial orientation from the franchisor’s point of view is not disputed (Bygrave:
1997; Spinelli: 1997; Sherman: 2003); however, this orientation is questioned from a
franchisee point of view (Hisrich et al: 2004; Kuratko & Hodgetts: 2004). Klein (2002)
believes that individuals with an entrepreneurial personality should think twice about
entering the franchise system as franchisees. Michael Seid (in Klein :2002), a franchising
consultant based in West Hartford, Connecticut; emphasizes that franchisees often think
of themselves as entrepreneurs, but they are not. His justification is that entrepreneurs
want to start new businesses and they want to make their own decisions. They like to
experiment and have the need to operate and market their business based upon their own
vision of how things should be done. Franchisees, on the other hand, are contractually
obliged not to deviate from the operational plans of the franchisor (Newton: 2003).
Deakins and Freel (2003) however believe that despite the appeal of reduced risk;
elements of entrepreneurial activity in a franchise system are motivators for prospective
franchisees. Halloran (1994) believes franchising is a way of becoming an entrepreneur
with a built-in market and proven formula. Spinelli (1997) developed a value model
depicting merits and demerits of entrepreneurs becoming franchisees, concluding that if
the present value of the outcome is positive; the franchise system route is recommended.
It is the objective of this study to empirically demonstrate the entrepreneurial orientation
of franchisees, with the author of the opinion that franchisees do exhibit an
entrepreneurial orientation in certain situations. This will however not apply to all
franchisees in all franchise systems, but is largely dependent on character themes
(Thompson: 2003).

109
In justification of this point of view, a review shall be conducted; identifying
entrepreneurial thought from existing literature (Nieman et al: 2003; Hisrich et al: 2004;
Kao et al: 2004; Kuratka & Hodgetts: 2004; Lumpkin & Dess: 1996; Bolton &
Thompson: 2003; Bolton & Thompson: 2000; Thompson: 2003) coupled with a review of
the franchise system literature (Mendelsohn: 2003; Nieman: 1998; Nieman et al: 2003;
Deakins & Freel: 2003). Thereafter, an empirical study on constructs of proactivity,
innovation and risk-taking is recommended (Lindsay & McStay: 2004). Links between
entrepreneurship and franchising, with specific reference to franchisee entrepreneurial
orientation revolves around highlighted relationships prior to empirical investigation. The
literature analysis is depicted in Table 3.4 on the following page.
Cognisance must however be taken of the nature of entrepreneurial activity, varying
between opportunity, necessity and social entrepreneurs (Bygrave et al: 2004). This
classification identifies reasons for entering entrepreneurial activity, coupled with
relevant entrepreneurial background (Frederick: 2001). Comparisons of entrepreneurial
behaviour between the entrepreneur, intrapreneur and traditional manager also affect
franchisee involvement in entrepreneurial activity (Hisrich & Peters: 1998). Nieman et al
(2003) define an entrepreneur as an individual who establishes and manages a business
for the main purpose of profit and growth; characterized by innovative and strategic
behaviour. Pivotal to the definition is the creation of incremental wealth (Hisrich et al:
2004). Intrapreneurship in turn is entrepreneurial activity within an organisational
context, receiving sanctions and resource commitment for the purpose of innovative
results (Kuratko & Hodgetts: 2004). An assumption is made not to distinguish between
entrepreneur and intrapreneur in the franchise context, as both involve entrepreneurial
activity.
Notwithstanding this assumption, it must however be highlighted that franchisees may
well be intrapreneurs, particularly when commanding senior positions on franchise
councils and advisory associations (Bloom: 2003). Franchisors may well delegate the
necessary authority to relevant franchisees for the purpose of innovative results in the
franchise system (Morris & Kuratko: 2002). The franchisor may well motivate an
intrapreneurial environment, including the encouragement of new ideas; limited
opportunity parameters; resource availability and accessibility and operations on the
frontiers of technology (Hisrich & Peters: 1998).

110
TABLE 3.4 Entrepreneurial orientation of franchisees in a franchise system: a
review of the literature across disciplines (entrepreneurship and
franchising)
Entrepreneurial Orientation Franchise System (Franchisee Involvement)
An individual who establishes and manages a business for the main purpose of profit and growth (Nieman et al: 2003); profit-orientation (Schaper & Volery: 2004); leadership ability (Zimmerer & Scarborough: 1996)
Franchisees and franchisors are interdependent, the higher the franchisee income, the better for the franchisor (Tikoo: 1996); ignores the role of learning, preparation and serendipity in the process of entrepreneurship (Deakins & Freel: 2003). Franchising is the product of conscious efforts towards enhancing franchise system relationships (Nieman: 1998); Amos and James (2003) inform that leadership of franchisees is about being solution-oriented, corresponding to focus traits of the entrepreneur (Thompson: 1999)
Innovative behaviour, employing strategic management practices in business (Carland, Hoy, Boulton & Carland: 1984); entrepreneurship involves creativity and innovation (Thompson: 1999); creativity and flexibility (Zimmerer & Scarborough: 1996)
The creativity and innovation link is manifested in the ability of entrepreneurs to harness the potential of new technologies in turbulent environments (Lumpkin & Dess: 1996). Innovation is seen to be in the hand of the franchisor, whilst creativity a distinct franchisee trait (Lindsay & McStay: 2004); franchisees are an important part in the franchise system, enabling entrepreneurs in service industries to assemble resources in order to rapidly create large chains and gain first mover advantage (Mendelsohn: 2003)
An individual who sees an opportunity in the market, gathers resources and creates and grows a business venture (Nieman et al: 2003); maximizing opportunities (Drucker: 1964; Shapero: 1975); the process of doing something new (creation) or something different (innovation) for the purpose of creating wealth and adding value to society (Kao: 1993); creating value for oneself and adding value to society (Kao et al: 2002); entrepreneur as a leader (Kotter: 1999)
Bygrave (1997) believes the new business is much more likely to be of the incremental kind, as opposed to a revolutionary creation; the creation of mega franchisee multi-store ventures (Amos: 2003); The franchisee is in business for themselves with others (Nieman: 1998), and that the special relationship should be one of trust and mutual independence, notwithstanding the performance motive; Traditional entrepreneur stumbling blocks (knowledge of the market, management expertise, structural controls) eradicated by becoming a franchisee (Hisrich & Peters: 1998); Franchisee benefit from economies of scale, marketing and group buying (Deakins & Freel: 2003); Franchise leadership makes the difference, with franchisees being informal leaders in the system (Frith: 2004)
Taking Risk (Nieman & Bennet: 2002); Innovative risk-takers (McClelland: 1961); accepting risk of failures (Shapero: 1975); one who assumes the risk of gaining profits or incurring losses in the undertaking of commercial transactions (Halloran: 1994); Entrepreneurs manage risk (Thompson: 1999); calculated risk-taker (Deakins & Freel: 2003)
Halloran’s (1994) definition of an entrepreneur includes entrepreneurs from all walks of life, and may be useful to incorporate ‘calculated risk’. Risk must be taken in context, being risks that the franchisee as entrepreneur can understand and manage (Lindsay & McStay: 2004; Lumpkin & Dees: 1996). Calculated risk due to benefits from an existing brand (Mendelsohn: 2003); franchise system often favoured by investors and banks (Deakins & Freel: 2003)
Being rewarded (Nieman & Bennet: 2002); wealth creating opportunities, judging which opportunities to pursue, idea generators (Allinson et al:2000); creating incremental wealth (Hisrich et al: 2004)
Macro trends on franchisee performance include globalisation of franchising and evolvement of mega-franchisees as multiple franchise owners (Amos: 2003), indicative of new venture creation (Bygrave: 1997); proven recipe for success (Mendelsohn: 1992); franchisees are undoubtedly wealth creators, often more successful than the franchisor (Dhir & Bruno: 2004)
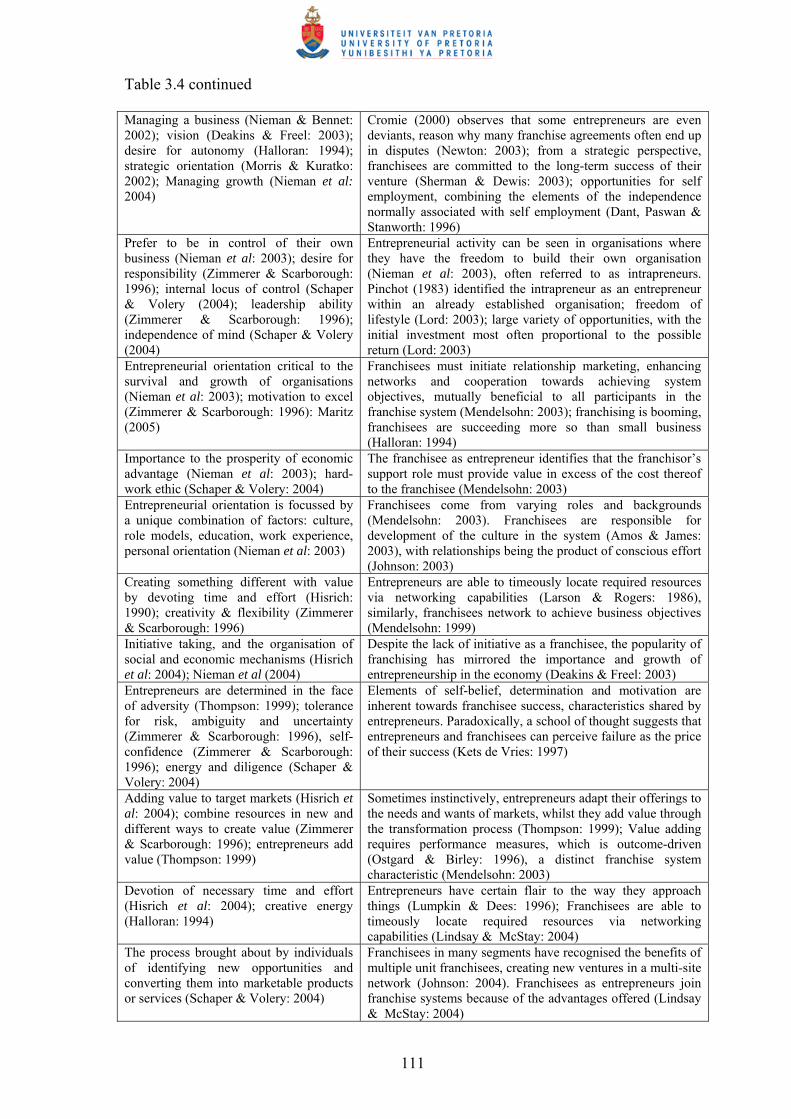
111
Table 3.4 continued Managing a business (Nieman & Bennet: 2002); vision (Deakins & Freel: 2003); desire for autonomy (Halloran: 1994); strategic orientation (Morris & Kuratko: 2002); Managing growth (Nieman et al: 2004)
Cromie (2000) observes that some entrepreneurs are even deviants, reason why many franchise agreements often end up in disputes (Newton: 2003); from a strategic perspective, franchisees are committed to the long-term success of their venture (Sherman & Dewis: 2003); opportunities for self employment, combining the elements of the independence normally associated with self employment (Dant, Paswan & Stanworth: 1996)
Prefer to be in control of their own business (Nieman et al: 2003); desire for responsibility (Zimmerer & Scarborough: 1996); internal locus of control (Schaper & Volery (2004); leadership ability (Zimmerer & Scarborough: 1996); independence of mind (Schaper & Volery (2004)
Entrepreneurial activity can be seen in organisations where they have the freedom to build their own organisation (Nieman et al: 2003), often referred to as intrapreneurs. Pinchot (1983) identified the intrapreneur as an entrepreneur within an already established organisation; freedom of lifestyle (Lord: 2003); large variety of opportunities, with the initial investment most often proportional to the possible return (Lord: 2003)
Entrepreneurial orientation critical to the survival and growth of organisations (Nieman et al: 2003); motivation to excel (Zimmerer & Scarborough: 1996): Maritz (2005)
Franchisees must initiate relationship marketing, enhancing networks and cooperation towards achieving system objectives, mutually beneficial to all participants in the franchise system (Mendelsohn: 2003); franchising is booming, franchisees are succeeding more so than small business (Halloran: 1994)
Importance to the prosperity of economic advantage (Nieman et al: 2003); hard-work ethic (Schaper & Volery: 2004)
The franchisee as entrepreneur identifies that the franchisor’s support role must provide value in excess of the cost thereof to the franchisee (Mendelsohn: 2003)
Entrepreneurial orientation is focussed by a unique combination of factors: culture, role models, education, work experience, personal orientation (Nieman et al: 2003)
Franchisees come from varying roles and backgrounds (Mendelsohn: 2003). Franchisees are responsible for development of the culture in the system (Amos & James: 2003), with relationships being the product of conscious effort (Johnson: 2003)
Creating something different with value by devoting time and effort (Hisrich: 1990); creativity & flexibility (Zimmerer & Scarborough: 1996)
Entrepreneurs are able to timeously locate required resources via networking capabilities (Larson & Rogers: 1986), similarly, franchisees network to achieve business objectives (Mendelsohn: 1999)
Initiative taking, and the organisation of social and economic mechanisms (Hisrich et al: 2004); Nieman et al (2004)
Despite the lack of initiative as a franchisee, the popularity of franchising has mirrored the importance and growth of entrepreneurship in the economy (Deakins & Freel: 2003)
Entrepreneurs are determined in the face of adversity (Thompson: 1999); tolerance for risk, ambiguity and uncertainty (Zimmerer & Scarborough: 1996), self-confidence (Zimmerer & Scarborough: 1996); energy and diligence (Schaper & Volery: 2004)
Elements of self-belief, determination and motivation are inherent towards franchisee success, characteristics shared by entrepreneurs. Paradoxically, a school of thought suggests that entrepreneurs and franchisees can perceive failure as the price of their success (Kets de Vries: 1997)
Adding value to target markets (Hisrich et al: 2004); combine resources in new and different ways to create value (Zimmerer & Scarborough: 1996); entrepreneurs add value (Thompson: 1999)
Sometimes instinctively, entrepreneurs adapt their offerings to the needs and wants of markets, whilst they add value through the transformation process (Thompson: 1999); Value adding requires performance measures, which is outcome-driven (Ostgard & Birley: 1996), a distinct franchise system characteristic (Mendelsohn: 2003)
Devotion of necessary time and effort (Hisrich et al: 2004); creative energy (Halloran: 1994)
Entrepreneurs have certain flair to the way they approach things (Lumpkin & Dees: 1996); Franchisees are able to timeously locate required resources via networking capabilities (Lindsay & McStay: 2004)
The process brought about by individuals of identifying new opportunities and converting them into marketable products or services (Schaper & Volery: 2004)
Franchisees in many segments have recognised the benefits of multiple unit franchisees, creating new ventures in a multi-site network (Johnson: 2004). Franchisees as entrepreneurs join franchise systems because of the advantages offered (Lindsay & McStay: 2004)

112
Table 3.4 continued An integrated concept that permeates an individual’s business in an innovative manner (Kuratko & Hodgetts: 2004); vision combined with capacity to inspire (Timmons: 2004); goal orientation (Halloran: 1994)
Franchisees make it their business to exploit all the resources available (Lindsay & McStay: 2004); Halloran (1994) considers franchising as a way of becoming an entrepreneur with a built-in market and proven product; the opportunity to use existing skills in another area (Lord: 2003); franchisees and franchisors interdependent to achieve system vision (Sherman & Dewis: 2003)
Someone who perceives an opportunity and creates an organisation to pursue it (Bygrave: 1997); Entrepreneurship is about spotting and exploiting opportunities (Schumpeter: 1949; Kirzner: 1973); Entrepreneurs find the resources to exploit opportunities (Kirby: 2003)
Entrepreneurship foundations are rooted in flexibility, and when resources are not ‘state-of-the-art’, entrepreneurs will select those that will perform satisfactorily. Within a systems context, such as franchising, the system should become increasingly knowledge based, to support sharing and learning (Lindsay & McStay: 2004)
A social orientation, whereby each individual is encouraged to be self-reliant, and an agent of innovation and creation (Kao et al: 2002); conceptual ability (Timmons: 2004)
The franchisee as entrepreneur is given the opportunity to enter a new business with a better chance to succeed than if he/she were to commence a start-up business (Hisrich & Peters: 2004); the franchisee as entrepreneur is involved in a relationship, being one of the most synergistic relationships in all business (Amos: 2003)
Entrepreneurism is also very much alive in existing companies (Zimmerer & Scarborough: 1996)
Entrepreneurism can be found in all sectors of society, not just in new ventures (Zimmerer & Scarborough: 1996); the franchise system network correlates entrepreneurship and franchising (Zhao & Aram: 1995)
Organisational processes, methods, styles, and decision-making activities employed by entrepreneurs that lead to new ventures (Lumpkin & Dess: 1996)
Contingent on environmental and organisational factors, various studies demonstrate a positive EO relationship in entrepreneurial organisations (Covin & Slevin: 1989); Franchisees are instrumental in developing marketing entry methods (Kirby: 2003)
Proactivity, innovativeness and risk-taking activities (Wiklund: 1999; Miller: 1983: Covin & Slevin: 1999); Nieman et al (2003)
Franchisees exhibit proactive and risk-taking behaviour (Lindsay & McStay: 2004); ignores environmental factors that may be more important than personality (Deakins & Freel: 2003); regional franchises offer opportunity for the more experienced entrepreneur, when a higher risk-reward is sought (Lord: 2003)
A person who habitually creates and innovates to build something of recognized value around perceived opportunities (Bolton & Thompson: 2000); perception with foresight (Schaper & Volery: 2004)
Bolton and Thompson (2000) inform that a person can also be a group of people as it is possible to describe teams and even organisations as entrepreneurial. They also believe entrepreneurs are the people who possess the imagination and flexibility to ensure there is a causal link between them and the enterprise (such as a franchise system)
Initiative, imagination, achievement orientation, pragmatism, independence, flexibility (Thompson: 1999)
Inappropriate to search for a significant individual trait, comprises an essentially static approach to the dynamic process of entrepreneurship (Deakins & Freel: 2003)
Entrepreneurs are individuals who make a difference (Thompson: 1999); the need for achievement (Schaper & Volery: 2004)
Entrepreneurs transform a simple idea into an opportunity that works (Kets de Vries: 1997), similar to idea generation in franchise councils (Amos 2003); Justis and Judd (2002) provide guidelines for franchisees on advertising committees; advising on involvement and proactive participation
Entrepreneurs are good networkers (Thompson: 1999); good communication skills (Schaper & Volery: 2004)
Whilst being constrained by limited resources, the entrepreneur uses creativity, social networking and bargaining to obtain deals and activity (Perry: 2002); evident of franchisee participation in system decision-making (Johnson: 2003)
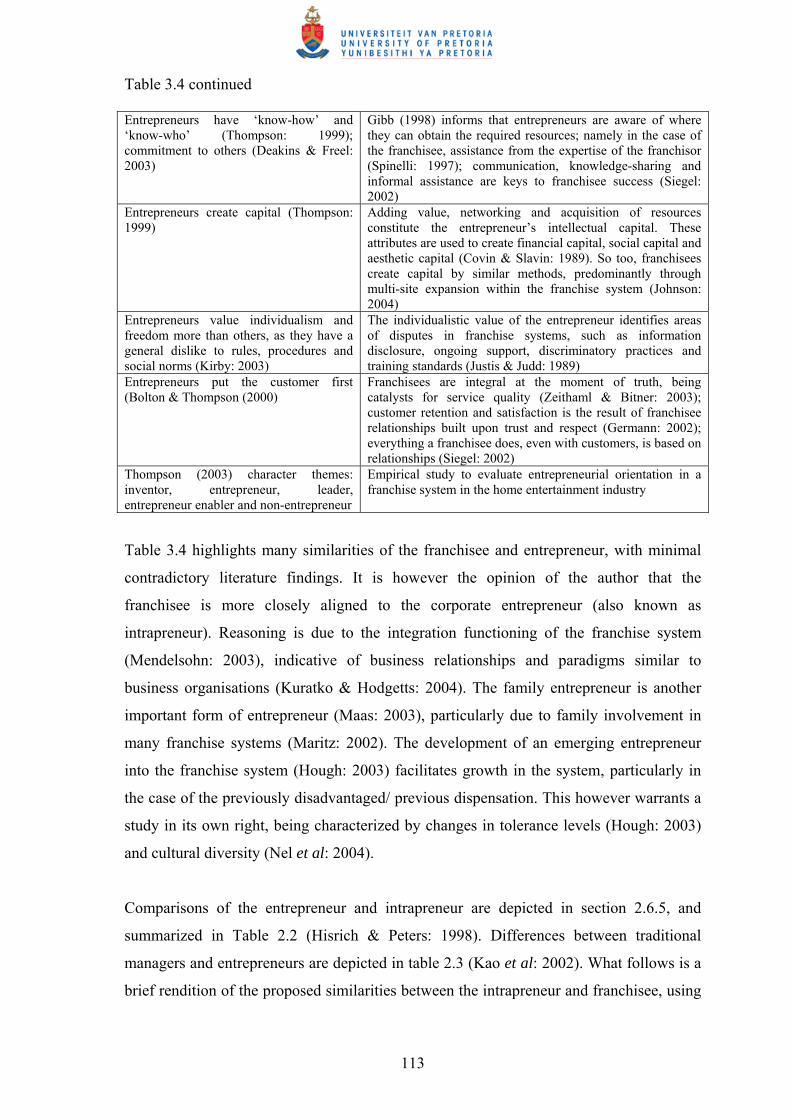
113
Table 3.4 continued Entrepreneurs have ‘know-how’ and ‘know-who’ (Thompson: 1999); commitment to others (Deakins & Freel: 2003)
Gibb (1998) informs that entrepreneurs are aware of where they can obtain the required resources; namely in the case of the franchisee, assistance from the expertise of the franchisor (Spinelli: 1997); communication, knowledge-sharing and informal assistance are keys to franchisee success (Siegel: 2002)
Entrepreneurs create capital (Thompson: 1999)
Adding value, networking and acquisition of resources constitute the entrepreneur’s intellectual capital. These attributes are used to create financial capital, social capital and aesthetic capital (Covin & Slavin: 1989). So too, franchisees create capital by similar methods, predominantly through multi-site expansion within the franchise system (Johnson: 2004)
Entrepreneurs value individualism and freedom more than others, as they have a general dislike to rules, procedures and social norms (Kirby: 2003)
The individualistic value of the entrepreneur identifies areas of disputes in franchise systems, such as information disclosure, ongoing support, discriminatory practices and training standards (Justis & Judd: 1989)
Entrepreneurs put the customer first (Bolton & Thompson (2000)
Franchisees are integral at the moment of truth, being catalysts for service quality (Zeithaml & Bitner: 2003); customer retention and satisfaction is the result of franchisee relationships built upon trust and respect (Germann: 2002); everything a franchisee does, even with customers, is based on relationships (Siegel: 2002)
Thompson (2003) character themes: inventor, entrepreneur, leader, entrepreneur enabler and non-entrepreneur
Empirical study to evaluate entrepreneurial orientation in a franchise system in the home entertainment industry
Table 3.4 highlights many similarities of the franchisee and entrepreneur, with minimal
contradictory literature findings. It is however the opinion of the author that the
franchisee is more closely aligned to the corporate entrepreneur (also known as
intrapreneur). Reasoning is due to the integration functioning of the franchise system
(Mendelsohn: 2003), indicative of business relationships and paradigms similar to
business organisations (Kuratko & Hodgetts: 2004). The family entrepreneur is another
important form of entrepreneur (Maas: 2003), particularly due to family involvement in
many franchise systems (Maritz: 2002). The development of an emerging entrepreneur
into the franchise system (Hough: 2003) facilitates growth in the system, particularly in
the case of the previously disadvantaged/ previous dispensation. This however warrants a
study in its own right, being characterized by changes in tolerance levels (Hough: 2003)
and cultural diversity (Nel et al: 2004).
Comparisons of the entrepreneur and intrapreneur are depicted in section 2.6.5, and
summarized in Table 2.2 (Hisrich & Peters: 1998). Differences between traditional
managers and entrepreneurs are depicted in table 2.3 (Kao et al: 2002). What follows is a
brief rendition of the proposed similarities between the intrapreneur and franchisee, using
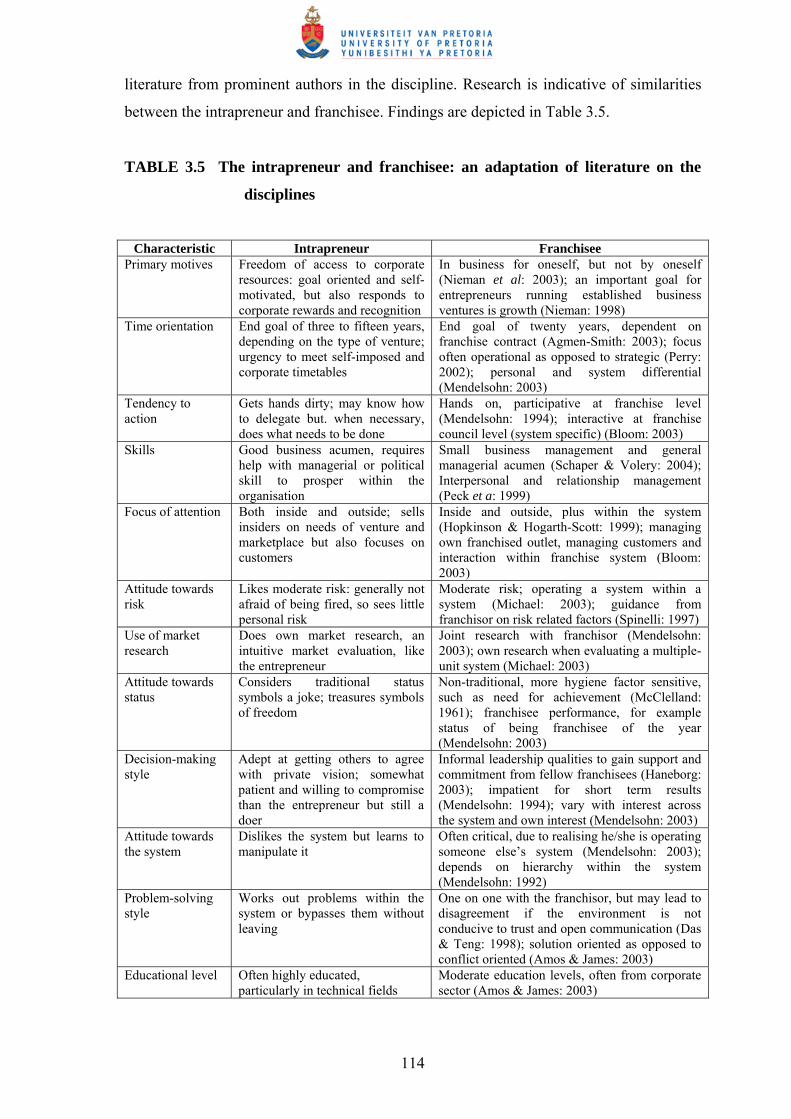
114
literature from prominent authors in the discipline. Research is indicative of similarities
between the intrapreneur and franchisee. Findings are depicted in Table 3.5.
TABLE 3.5 The intrapreneur and franchisee: an adaptation of literature on the
disciplines
Characteristic Intrapreneur Franchisee
Primary motives Freedom of access to corporate resources: goal oriented and self-motivated, but also responds to corporate rewards and recognition
In business for oneself, but not by oneself (Nieman et al: 2003); an important goal for entrepreneurs running established business ventures is growth (Nieman: 1998)
Time orientation End goal of three to fifteen years, depending on the type of venture; urgency to meet self-imposed and corporate timetables
End goal of twenty years, dependent on franchise contract (Agmen-Smith: 2003); focus often operational as opposed to strategic (Perry: 2002); personal and system differential (Mendelsohn: 2003)
Tendency to action
Gets hands dirty; may know how to delegate but. when necessary, does what needs to be done
Hands on, participative at franchise level (Mendelsohn: 1994); interactive at franchise council level (system specific) (Bloom: 2003)
Skills Good business acumen, requires help with managerial or political skill to prosper within the organisation
Small business management and general managerial acumen (Schaper & Volery: 2004); Interpersonal and relationship management (Peck et a: 1999)
Focus of attention Both inside and outside; sells insiders on needs of venture and marketplace but also focuses on customers
Inside and outside, plus within the system (Hopkinson & Hogarth-Scott: 1999); managing own franchised outlet, managing customers and interaction within franchise system (Bloom: 2003)
Attitude towards risk
Likes moderate risk: generally not afraid of being fired, so sees little personal risk
Moderate risk; operating a system within a system (Michael: 2003); guidance from franchisor on risk related factors (Spinelli: 1997)
Use of market research
Does own market research, an intuitive market evaluation, like the entrepreneur
Joint research with franchisor (Mendelsohn: 2003); own research when evaluating a multiple-unit system (Michael: 2003)
Attitude towards status
Considers traditional status symbols a joke; treasures symbols of freedom
Non-traditional, more hygiene factor sensitive, such as need for achievement (McClelland: 1961); franchisee performance, for example status of being franchisee of the year (Mendelsohn: 2003)
Decision-making style
Adept at getting others to agree with private vision; somewhat patient and willing to compromise than the entrepreneur but still a doer
Informal leadership qualities to gain support and commitment from fellow franchisees (Haneborg: 2003); impatient for short term results (Mendelsohn: 1994); vary with interest across the system and own interest (Mendelsohn: 2003)
Attitude towards the system
Dislikes the system but learns to manipulate it
Often critical, due to realising he/she is operating someone else’s system (Mendelsohn: 2003); depends on hierarchy within the system (Mendelsohn: 1992)
Problem-solving style
Works out problems within the system or bypasses them without leaving
One on one with the franchisor, but may lead to disagreement if the environment is not conducive to trust and open communication (Das & Teng: 1998); solution oriented as opposed to conflict oriented (Amos & James: 2003)
Educational level Often highly educated, particularly in technical fields
Moderate education levels, often from corporate sector (Amos & James: 2003)

115
Table 3.5 continued Relationship with others
Perceives transactions within hierarchy as basic relationship
Essential to a profitable and lasting franchise system (Amos & James: 2003), the franchisee facilitates open relationships
Attitude toward courage and destiny
Self-confident and courageous; many are cynical about the system but optimistic about their ability to outwit it
Confident in own capabilities (Hisrich & Peters: 1998), but sceptical about franchisor and system if not involved in the decision-making process (Johnson: 2003)
Attitude towards failure and mistakes
Sensitive to need to appear orderly; attempts to hide risky projects from view so as to learn from mistakes without political cost of public failure
Open to constructive criticism from system participants (Das & Teng: 1998), confidence in partner cooperation, trust and control. However, resistance to adhering to non-agreed upon system initiatives (Madhok: 1995)
Source: original intrapreneur characteristics adapted from Pinchot (1985) and Morris and
Kuratko (2002)
Contingent on environmental and organisational factors, various studies demonstrate a
positive EO relationship in entrepreneurial firms (Lumpkin & Dess: 1996; Miller: 1983;
Covin & Slevin: 1989). Entrepreneurial firms are actively involved in product-market
innovations, participate in ventures requiring risk, and are proactive (Miller, 1983: 771).
In contrast, non-entrepreneurial firms innovate very little, are risk averse, and imitate
competitors (Miller, 1983: 771).
Research in the area of the franchise system lacks consensus of EO of franchisees in the
system. Whilst the merits of the franchising system are primarily focussed upon risk
reduction (Mendelsohn, 2003: 31; Deakins & Freel, 2003: 69), this somewhat negates the
risk facet of the entrepreneur (Bolton & Thompson: 2003). The demerits of the system
(Table 3.3) are also indicative of minimizing entrepreneurial creative and innovative
talent (Bolton and Thompson: 2000).
Intrapreneurial leadership characteristics, most often shared by the entrepreneurial
franchisee include (Hisrich et al: 2004): understanding the environment; visionary and
flexibility; creating management options; encouraging teamwork; encouraging open
discussion; building a coalition of supporters and persistence. Of the dominating traits, it
can be identified that relationship management (Peck et al: 1999) is paramount towards
the achievement of personal and system objectives. Without mutual respect, a relationship
of trust towards the smoothly operating system will not be possible (Mendelsohn: 2003).
Whilst many similarities are evident in the intrapreneur and franchisee relationship, the
talent, temperament and technique (Bolton & Thompson: 2004) of all individuals differ.

116
The empirical research shall analyse these individual traits (Chapter 7). As a concluding
remark on the literature review of franchisee and entrepreneurial orientation; the author
supports the following characteristics of entrepreneurial (intrapreneurs included) and
franchisee mindset (McGrath & MacMillan: 2000):
• They passionately seek new opportunities, staying alert and profiting from change
• They pursue opportunities with enormous discipline, and act on these
opportunities
• They pursue only the very best opportunities and avoid exhausting themselves and
their organisation by chasing after every option, being ruthlessly disciplined
• They focus on execution- specifically adaptive execution, exploiting real
opportunities
• They engage the energies of everyone in their domain, relationship management
in pursuit of their opportunities
Additional studies linking franchising and entrepreneurship have been investigated by
Maritz (2005; 2005a). These included a link between GEM entrepreneurs and the
franchise system, with the entrepreneurial link to small business facilitated by franchising.
Findings were also indicative of franchise system entrepreneurs being significantly prone
to ecommerce capability. Both studies identified an entrepreneurial orientation within the
franchised system; together with franchising being an entrepreneurial option towards
creating and developing ventures.
What follows is an empirical study conducted on the EO of franchisees Lindsay and
McStay (2004), specifically on the entrepreneurial constructs of innovation, creativity and
risk-taking.
3.4.2 Franchisee entrepreneurial orientation: an empirical review
Lindsay and McStay (2004: 3) relate that from the franchise system perspective, benefits
in maintaining system integrity may be achieved by constraining franchisee
entrepreneurial behaviour. However, they advise that this will be costly to both franchisor
and franchisee from a performance perspective. Those organisations demonstrating
entrepreneurial activities, contingent upon environmental and organisational factors,
experience improved performance (Covin & Slevin, 1989: 77; Lumpkin & Dess, 1996:

117
434). EO is furthermore an essential feature of high performance organisations (Lumpkin
& Dess: 1996). Various authors concur on OE measures. Morris and Kuratko (2002);
Miller (1983); Lumpkin and Dess (1996); Covin and Slevin (1989) and Wiklund (1999)
regard EO measures as including proactiveness, innovativeness and risk-taking.
3.4.2.1 Proactiveness
Seen as an opportunity-seeking and forward-looking perspective in anticipating future
demand (Morris & Kuratko: 2002). Whilst not necessarily meaning ‘first to market’
(Lumpkin & Dess: 1996), proactivity represents an aggressive competitive orientation
(Covin & Dess: 1997). Morris and Kuratko consider proactiveness as being concerned
with implementation, with taking responsibility and doing whatever is necessary to bring
an entrepreneurial concept to fruition. It is manifested as acting on rather than reacting
(Miller: 1983) from a corporate entrepreneurship perspective. The essence of
proactiveness is captured in the well known Nike slogan “just do it”. The author is
however of the opinion that proactiveness would better be described as “just did it”.
3.4.2.2 Innovativeness
Viewed as the basic willingness to venture beyond current paradigms or state of the art;
departing from existing technologies or practices (Lumpkin & Dess, 1996: 142). Often
associated with creativity, Nieman et al (2003) add that something new and different is
required. Seven perspectives of creation and innovation are identified by Morris (1998):
creation of wealth; creation of enterprise; creation of innovation; creation of change;
creation of employment; creation of value and creation of growth. Morris and Kuratko
(2002) inform that innovation is concerned with combinations of resources that make
existing methods or products obsolete.
3.4.2.3 Risk-taking
A tendency to unfold bold, yet calculated dynamism to achieve goals. Such activities
include venturing into new and unknown markets and entering ventures with uncertain
outcomes (Lumpkin & Dess: 1996). Nieman et al (2003) identify risk as involving
personal and financial sacrifice. Morris and Kuratko (2002) consider risk-taking as
involving anything new, or some likelihood that actual results will differ from

118
expectations. They advise that emphasis is usually placed on risks that are moderate and
calculated.
A combination of these three dimensions makes unique contributions to an organisation’s
entrepreneurial orientation (Miller: 1983; Covin & Slavin: 1989). In evaluating these
three dimensions within the franchise system, Lindsay and McStay (2004) developed
hypotheses to research EO within the system. They inform that franchisees will need to be
proactive in scanning the environment to highlight opportunity areas for franchisor
approval or implementation. Franchisors are protective of their intellectual property, not
allowing franchisees opportunity to innovate franchisor capital. Although innovations
may originate from the franchisee, Lindsay and McStay (2004) believe innovation will
only be implemented with franchisor approval. Despite the risk reduction elements of the
franchise system (Mendelsohn: 1992), franchisees will still need to engage in risk taking
activities within their environments in the pursuit of profits (Lindsay & McStay, 2004: 4).
Lindsay and McStay (2004: 6) inform that results demonstrate that franchisee
organisations are capable of demonstrating an EO, in spite of the constraints of the
franchise system. Depending on specific surrounds and context, the entrepreneurial
dimensions can vary independently. The results provided support that proactivensss and
risk taking are inherent dimensions within the franchise system (Mendelsohn: 2003),
whilst innovation is primarily at the hand of the franchisor. Both proactiveness and risk -
taking were found to drive franchisee performance.
Managerial implications highlight the need for entrepreneurial freedom so that
franchisees may respond to uncertainty, change and complexity. The research examined
the EO construct and EO- performance relationship with respect to franchisees. Research
findings are indicative that franchisees may not be dissimilar to entrepreneurs (Lindsay &
McStay, 2004: 7; Freel & Deakins, 2003: 69).
Section 3.4 concludes two chapters on entrepreneurship and franchising, identifying the
causal relationship between the two disciplines. The seven perspectives on the nature of
entrepreneurship (Morris & Kuratko: 2002) are by implication applicable to the
entrepreneur, intrapreneur and franchisee. These are identified as:

119
• Creation of wealth
• Creation of enterprise
• Creation of innovation
• Creation of change
• Creation of employment
• Creation of value
• Creation of growth.
The seven perspectives (Morris & Kuratko: 2002) are identified in Section 3.4, and in
Tables 3.4 and 3.5. Predominant literature (franchise system specific) identifying the
causal relationship revolves around Mendelsohn (2003); Nieman (1998); Nieman et al
(2003); Bygrave (1997); Michael (2003); Lindsay & McStay (2004); Spinelli (1997);
Schaper and Volery (2004); Hisrich et al (2004); Deakins and Freel (2003); Amos and
James (2003) and Johnson (2003). Empirical analysis will identify the strength of the
relationship in a pre-determined franchise system; albeit the opinion of the author that
such a relationship in fact exists.
3.5 CONCLUSION
Franchising is a market initiative facilitating entrepreneurial new venture development,
primarily reducing associated risk. It is seen as an entrepreneurial option towards creating
and developing ventures, and is seen as a relatively low-cost means of creating new
ventures.
The nature and development of franchising is examined, together with a link of
franchising and entrepreneurship. Franchise rationale is analysed, consisting of franchise
agreements, franchise manuals and disclosure documents. Challenges to growth are
analysed, highlighting franchisor and franchisee interaction.
Franchise system relationships are the driving force of franchise activity, highlighting
merits and demerits of the franchise system. Entrepreneurial orientation has been
analysed within the franchise system. An entrepreneurial orientation of the franchisee is
evaluated by means of a literature review on the disciplines. Whilst there is evidence of
entrepreneurial orientation on behalf of the franchisor, such evidence is scant regarding
the franchisee. The literature review is indicative of an entrepreneurial orientation

120
amongst the entrepreneur, intrapreneur and franchisee. An empirical study will however
validate the opinion of the author. Research is indicative of proactive and risk taking
dimensions on franchisee performance; whereas innovation is the prime responsibility of
the franchisor.
In Chapter 4, the service profit chain is discussed within the context of the franchise
system. The service profit chain primarily includes customer and employee satisfaction,
loyalty and value; identifying strategic initiatives of referrals, retention and related sales.
Customer loyalty is introduced as experiencing a positive relationship with profit,
highlighting determinants, relationships, and methods of enhancing loyalty. The chapter
concludes with an entrepreneurial spirit of service profit chain enhancement, identifying
strategies to facilitate service profit chain implementation.
121
4 CHAPTER 4: PUTTING THE SERVICE PROFIT CHAIN TO WORK
“The service profit chain unveils a great model that managers can use to maximize both
customer loyalty and profit. It links an action plan for managing all elements of a business
with a thorough process for measuring results”.
John B. McCoy, Chairman and CEO, Bank One Corporation, USA.
4.1 INTRODUCTION
The service profit chain is a well-received model to explain the sustainable
competitiveness of many service organisations (Lau, 2000: 422). The model attributes a
service organisation’s financial and market performance to its relationships with its
customers and employees (Heskett: 2002). Internal service quality serves the foundation
of the model, igniting a chain effect to an organisation’s growth and profit (Silvestro:
2002).
The Service Profit Chain is a strategic service vision, whereby there is a strong and direct
relationship between customer satisfaction (Andreassen: 1994), customer loyalty (de
Ruyter & Bloemer: 1999) and the value (Silvestro & Cross: 2000) of goods and services
delivered to customers. Furthermore, there is a strong link between these elements and
overall profit and growth of an organisation (Heskett, Sasser & Schlesinger, 1997: 11).
Organisational profit and growth are linked to customer loyalty, satisfaction and value via
the strategic implementation of referral, related sales and retention strategies (Heskett,
Jones, Loveman, Sasser & Schlesinger: 1994).
In contrast to economic market forces (Porter: 1998), whereby competitors believe a high
correlation between profitability and market share prevail, many management authors
(Reichheld & Sasser: 1990) are of the opinion that it is quality of market share which is
important (Andreassen: 1994), and a high correlation actually occurs between service
value and profitability (Maranto & Reynoso: 2003; Ho & Cheng: 1999). This correlation
was evident in Southwest Airlines (USA), who never made the top five largest in its
industry, but has over the years been the most consistently profitable (Herbert D.
Kelleher, Chairman, President and CEO of Southwest Airline Company). The Service
profit chain identifies direct and strong relationships between profit, customer
satisfaction, employee satisfaction and capability (Heskett et al: 1994).

122
The customer value equation is pivotal to the other two elements of the service profit
chain, with the employee at one end, and the customer at the other (Ho & Cheng: 1999).
The employee links productivity and quality of output with employee loyalty, satisfaction
and capability (Andreassen: 1994; Sivestro: 2002). The customer value equation equates
results plus process quality against price plus customer access costs, linking profitability
and growth with customer satisfaction and customer loyalty (Ruyter & Bloemen (1999).
In service settings, these relationships are self-reinforcing; whereby satisfied customers
contribute to employee satisfaction and vice versa (Reichheld: 2001).
Figure 4.1 identifies the elements of the service profit chain, depicting the centralisation
of the customer value equation. Internal service quality serves the foundation of the
model (Lau, 2000: 422), represented by employee loyalty, satisfaction and capability
(Silvestro: 2002). The output is depicted on the lateral flank, represented by customer
satisfaction and loyalty; resulting in organisational revenue growth and profitability
(Heskett et al: 1997).
FIGURE 4.1 Elements of the service profit chain
Source: Heskett, Sasser and Schlesinger (1997:12)
4.2 PROFIT AND LONG TERM GROWTH
Walker, Boyd and Larrache (1999), highlight that marketing is ultimately the art of
attracting and keeping profitable customers. Kotler (2000: 55) further identifies a
profitable customer as, "a person, household, or company that over time yields a revenue
123
stream that exceeds by an acceptable amount the company's cost stream of attracting,
selling, and servicing that customer." The emphasis is not on the profit from a particular
transaction, but from the lifetime stream of revenue and cost (Sherden: 1994).
Hayes (1993) highlighted the Taco Bell (a leading Mexican take-out chain in USA)
retention strategy, whereby their managers help employees understand the value of
keeping customers satisfied. Although tacos cost less than a dollar each, one wouldn't
think they would fret over lost customers. Yet, executives at Taco Bell have determined
that a repeat customer is worth as much as $ 11,000. Service Profit Chain implementation
is seen as a means towards achieving long-term profit and growth (Heskett et al: 1997).
Figure 4.2 (overleaf) identifies internal and external components of the service profit
chain, further segmented into four core sections:
• Operating strategy and service delivery system; consisting of internal employee’s
loyalty, productivity, service quality, capability and satisfaction. Inputs include
workplace design, job design/decision making latitude, selection and
development, rewards and recognition, information and communication, and
adequate ‘tools’ to serve customers (Lau: 2000; Silvestro: 2002)
• The service concept; consisting of service value, identifying quality and
productivity improvements that yield higher service quality and lower cost (Ho &
Cheng: 1999)
• The target market; consisting of external customer satisfaction and loyalty (de
Ruyter & Bloemer: 1999). Inputs include attractive value, designed service,
lifetime value (McDougal, Wyner & Vazdauskas: 1997), retention (Ahmad &
Buttle: 2002), repeat business and referrals (Helm: 2003)
• Profitability represented by organisational revenue growth (Bowen & Chen:
2001).
Figure 4.2 is represented on the following page.

124
FIGURE 4.2 The service profit chain
Source: Heskett, Sasser and Schlesinger (1997: 19)
4.3 CAPITALISING ON THE SERVICE PROFIT CHAIN
Heskett et al (1997) identify issues linking profit and growth, stating that when
companies put employees and customers first; a radical shift occurs in the way they
manage and measure success. Heskett et al (1994) identify the links in the service profit
chain, commencing with the primary stimulation of customer loyalty. A closer analysis of
each link reveals how the service profit chain functions as a whole.
4.3.1 Profit and growth link to customer loyalty
The principle of market share equals profit is replaced by the opinion of Reichheld and
Sasser (1990), concluding that customer loyalty is a more important determinant of profit
than market share in a wide range of industries. As such, they believed that quality of
market share, measured in terms of customer loyalty, deserves as much attention as
quantity of market share. Loyal customers are customers who hold favourable attitudes
toward the company, commit to repurchase the product/service, and recommend the
product to others (Bowen & Chen: 2001). It has been regarded as the sine qua non of an
effective business strategy (Heskett: 2002). Hallowell (1996) identifies loyalty from a

125
cognitive (attitudinal) and behavioural point of view. Customer loyalty is purchase
behaviour, unlike customer satisfaction, which is an attitude (Griffin: 1996). Duffy (1998)
identifies loyalty marketing as more than just a program, being a state of mind and a
business strategy. Southwest Airlines, the leading budget ‘no frills' American airline,
implement loyalty programmes, primarily by keeping in touch with their customers at the
front-line. As Colleen Barrett, Executive Vice President at Southwest, puts it, "Once
customers fly on us three times they're hooked”. This contributes to Southwest's record of
being the only U.S. airline to report twenty-four straight years of profitability. When
properly embraced, developed and implemented, loyalty marketing strategies become
integrally linked to the product (Duffy: 1998).
Reichheld and Sasser (1990) found that when a company retains just five per cent more of
its customers, profits increase by twenty-five per cent to one hundred and twenty-five per
cent. Gould (1995) consolidated the interest in loyalty through his research that supported
Reichheld and Sasser’s work. The increased profit from loyalty comes from reduced
marketing costs, increased sales and reduced operational costs (Bowen & Chen: 2001).
Loyal customers are less likely to to switch because of price and they make more
purchases than similar non-loyal customers (Reichheld: 2001; Reichheld & Sasser: 1990).
Loyal customers will also provide strong word-of-mouth, create referrals, provide
references and portray a positive image of the organisation (Bowen & Chen: 2001).
Finally, loyal customers cost less to serve, in part because they know the product/service
and require less information (Heskett et al: 1994). The results of the Bowen and Chen
(2001) study supported the contentions that there is a positive correlation between loyal
customers and profitability.
Hallowell’s (1996) regression analysis also supports the inference of a relationship
between customer loyalty and profitability. Heskett (2002) believes there is a real
opportunity to build loyalty from a core of apostles and owners who have extraordinary
lifetime value for the provider of goods and services. Marketers use loyalty-building
strategies to help increase customer retention and boost share of customer (Mulhern &
Duffy: 2004). Loyalty behaviour such as increased scale or scope of relationship,
relationship continuance, and word-of-mouth (recommendation) result from customers’
beliefs that the quantity of value received from one supplier is greater than that available
from other suppliers (Hallowell: 1996). Duffy (2003) identifies benefits of loyalty to

126
include cost savings, referrals, complain rather than defect, channel migration, unaided
awareness and greater awareness of brand assets.
The financial performance and customer loyalty link demonstrates strong correlation,
indicating that retailers with loyal customers are more profitable than those with less loyal
customers (Silvestro & Cross: 2000). Heskett et al (1997) emphasized the importance of
evaluating the lifetime value of the customer. Service providers need to consider retaining
customers in a continuing relationship through consumer orientated initiatives of
retention, related sales and referrals (Lau: 2000).
4.3.2 Customer loyalty link to customer satisfaction
Leading companies quantify customer satisfaction; often revealing that there is no
constant link between customer satisfaction and loyalty (Soderlund: 1998). Based on
recent research, this link has been found to be the least reliable in the service profit chain
(Heskett et al: 1997). Customer satisfaction (or dissatisfaction) results from experiencing
a service quality encounter and comparing that encounter with what was expected
(Caruana, Money & Berthon: 2000). Reichheld (1996) expressed the suspicion that those
things satisfying customers may not be the same things that enhance loyalty to the
provider. He further informs of short-term tactics, such as price discounting, which may
entice satisfied customers to migrate to competitors. Hallowell’s (1996) regression results
support the inference of customer satisfaction and customer loyalty relationship. Results
are however ambiguous regarding the role of price satisfaction in predicting customer
loyalty. Support for a view that the effects of customer satisfaction on loyalty are different
depending on the level of satisfaction is offered by Jones and Sasser (1995). They argue
that the relationship is non-linear, being subject to different patterns depending on the
product/service. Soderlund (1998) concludes that the relationship between customer
satisfaction and loyalty is different at different levels of satisfaction.
Van der Wiele, Boselie and Hesselink (2002) relayed empirical data finding evidence that
there is a positive relationship between customer satisfaction and organisational
performance indicators (albeit not very strong), and that there is a significant time-lag
effect on the relationship. Considerable research has focussed on service quality
dimensions as the primary determinants of customer satisfaction (Parasuraman et al:
1998; Ziethaml & Bittner: 2003). There is a correlation between satisfaction and service
127
quality, emphasized by cross-tabulation analysis (Sureshchander, Rajendran &
Anantharaman: 2002). The two constructs do however exhibit independence, and are
different constructs from the customer’s point of view. McDougall and Levesque (2000)
empirically identified a strong relationship between loyalty and satisfaction, suggesting
the importance of perceived value to loyalty and, in turn, to profitability. It is further well
understood that increasing customer loyalty is positively correlated with increasing
profitability (Heskett et al: 1997; Reichheld: 1996). Andreassen (1994), in agreement
with Soderlund (1998) identifies the satisfaction and loyalty link dependent on the nature
of the product/service. Silvestro and Cross (2000) do not suggest a significant relationship
between customer satisfaction and loyalty, except for the link between satisfaction and a
customer’s propensity to recommend services to friends and relatives.
Due to the link between customer service and loyalty being the weakest in the chain, the
relationship between them is not constant, with varying relationships dependent on
complexities of the situation (Heskett, et al: 1997). The service profit chain however
reflects the behavioural side of customer loyalty, as opposed to attitudinal loyalty
(Hallowell: 1996); which can only be reinforced by increased customer satisfaction (Lau:
2000).
4.3.3 Customer satisfaction link to service value
The value-orientation of customers is emphasized as a driver of customer satisfaction
(Andreassen: 1994; Heskett et al: 1994). Value is seen as the primary motivator, again
evidenced at Southwest Airlines, where customer perceptions of value are very high, even
though the airline does not offer all the services and amenities provided by its
competition. Similarly, value at American Express (AMEX) Travel Services is a
combination of results produced for customers; such as quick and accurate ticketing
(Heskett et al: 1997). Customers today are strongly value-oriented and they seek results
and service process quality that far exceed the price and acquisition costs they incur for
that service (Heskett et al: 1997). Winning value combinations comprise good results,
superb process quality, reasonable pricing and product quality (Jones & Sasser: 1995).
Service value is the customer’s overall assessment of the utility of a product based on
perceptions of what is received and what is given (Zeithaml: 1988). The author identifies
value as low price, whatever I want in a product, the quality I get for the price I pay, and

128
what I get for what I give. Empirical results from Caruana et al (2000) suggest that the
effect of quality on satisfaction is not just direct but is also moderated by value. Value
however does not have a strong independent effect on satisfaction. The negative
coefficient for the interaction between service quality and value implies that this factor
can have a negative impact on satisfaction. Ho and Cheng (1999) developed a new
concept called the value mix, focussing on the customer’s perception of the value of a
product or service in terms of function, quality and price. Value is suggested as integral to
strategy in pursuing customer satisfaction. Heinonen (2004) proposed and empirically
investigated a conceptual model of customer perceived value, highlighting dimensions of
location and time frame of service offerings. An important implication of this is that value
dimensions can be used to target customers in a new way.
The connection between perceived value and customer satisfaction contends that value
has a direct impact on satisfaction (Heskett et al: 1997). From an empirical perspective,
perceived value should be recognized as a contributing factor to satisfaction and loyalty
(McDougall & Levesque: 2000). They identify that the strong relationship between
loyalty and satisfaction suggests the importance of perceived value to loyalty, and in turn,
to profitability. McDougall et al (1997) reflect that customers differ widely in the long-
term value they represent to a company, and the optimal customers are often many times
more valuable than the average ones. They identify value components of acquisition cost,
revenue stream, cost stream and length of relationships. In agreement with Heskett et al
(1997), they too identify the service value link to the lifetime value of the customer.
Silvestro and Cross (2000) identified a strong positive correlation between customer
satisfaction and perceived service value at the 95 per cent level. Customers appear to be
strongly value-driven, suggesting a strategy of improving service value to customers.
When customers perceive a high service value they are more likely to display loyal
behaviour, including relationship continuance, word of mouth and recommendations
(Hallowell: 1996).
4.3.4 Service value link to employee productivity
Highlighting the link between quality service and the productivity of employees (Lau:
2000), Southwest Airlines can board many more passengers per employee than any other
major U.S. airline. Even pilots have been known to assist with baggage for late

129
departures. A recent study indicated that Southwest served 50% more passengers per
employee than its closest competitor (Heskett et al: 1997). Similarly, at American
Express Travel Services, productivity is defined in terms valued by customers (Heskett:
2002), for example, the speed and accuracy with which tickets are prepared. As such,
quality of service and high productivity most often go hand in hand (Escover: 1993).
Through their long tenure serving specific groups of customers, loyal employees make it
easier to create increased profit through enhanced services, reduced costs of acquiring
customers, and lower customer-price sensitivity (Reicheld & Sasser: 1990). The result of
enhanced communications and employee involvement is increased productivity and
employee satisfaction. Escover (1993) regards the process as involving negotiating
expectations, objectives, levels of performance and pay for performance. Gomez-Mejia
(1990) developed a model highlighting performance appraisal and reward systems in
enhancing employee performance. He further argued that feedback is a powerful
instrument in performance enhancement. Honeycutt (1989) identified service value and
employee productivity by providing open channels of communication, interpersonal trust
and acceptance, which are the building blocks to construct motivation, productivity and
commitment.
Schermerhorn (2002) identifies productivity as the quantity and quality of work
performance, with performance effectiveness being an output measure of task/goal
accomplishment. He applies the individual performance equation (Schermerhorn, 2002:
392), which includes individual ability, support and effort. Sivestro and Cross (2000: 249)
identified a strong correlation (r= 0.92) between service value and productivity. Friendly
service encounters were seen as determinants for efficient purchasing, enhancing service
value.
4.3.5 Employee productivity link to loyalty
Employee loyalty is highlighted at Southwest Airlines, whereby the airline was voted one
of the 10 best places to work in the United States. This was coupled with their high levels
of employee productivity; and the highest staff retention in the industry (Heskett et al:
1997). A study by VSDA (2001), found that strong relationships and loyalty are
developed between staff and customers through consistency of management and staff.
Through their long tenure services, loyal employees tend to develop personal

130
relationships with their customers (Lau: 2000). These relationships serve as the
foundation for a reinforcing cycle of positive interactions between the service employees
and customers (Reichheld: 1993). Choosing the right employees is the first step in
retaining productive employees (Lau: 2000). Traditional measures of losses incurred by
high employee turnover related to cost of recruiting, hiring and training replacements. In
most service positions, the real cost is the loss of productivity and decreased customer
satisfaction (Heskett et al: 1994).
Reichheld (1996) deems that increasing employee loyalty, in terms of length of service,
should reduce costs and improve profitability. Loveman (1998) found a positive link
between employee tenure and financial performance. Loyalty is however a construct of
two dimensions; length of service, and employees’ stated willingness to refer the place of
employment to friends and colleagues (Nel et al: 2004). Silvestro (2002) empirically
tested the loyalty relationship, postulating that the only measure of employee loyalty
which correlated significantly with hard measures of performance was length of service.
There was a significant and negative correlation with profit and all the productivity
measures. These conflicting results suggest that the link between employee loyalty and
profit is more complex than originally stated by Heskett et al (1997). There appears to be
a significant rift between employee loyalty and the rest of the service profit chain
(Silvestro & Cross, 2000: 249).
4.3.6 Employee loyalty link to employee satisfaction
This link raises the question of what employee satisfaction is linked to. Employee
satisfaction levels at Southwest Airlines are high and cultivated by management. Many
companies characterize themselves as big families; often seen in after-work activities
such as involvement with charities, sports, events and the like. This tends towards
satisfied employees, making them less vulnerable to leaving the employ of the company
(Heskett et al: 1997). Schermerhorn (2002) identifies employee satisfaction as the degree
to which an individual feels positively or negatively about their employment.
Bitner (1990) believes that inferior performance will lead to customer dissatisfaction, firm
switching and negative word of mouth communication on the part of the customers about
the employee and the firm. Rogers, Clow and Kash (1994) conceptualised a satisfaction
model, highlighting the loyalty and profitability link. Constructs consisted of empathy;

131
job satisfaction; job tension; conflict and role clarity. Contrary to compelling evidence
(Heskett et al: 1997), the model conceptualised by Vilares and Coelho (2003) does not
consider the business climate; or more specifically, the cause and effect relationship
between employee behaviour and customer satisfaction. They however incorporate
satisfaction, loyalty and commitment as a construct, as they are perceived by customers
(ECSI model). The effects of the positive encounter cycle correlate employee and
customer attitudes (Heskett: 2002).
The retention of employees who develop continuing positive interactions with customers
will become even more critical in the future (Rust & Stewart: 1996). They present a
customer satisfaction measurement approach to evaluating employee satisfaction and
retention, providing a foundation towards the ultimate link to profit and growth (Heskett
et al: 1994). A study by Schlesinger and Zornitsky (1991) showed that the potential
turnover rate of dissatisfied employees is three times higher than that of satisfied
employees. High employee turnover can be costly. Solomon (1998) reported that
separation, replacement and training costs are up to two-and-a-half-times annual salary
for each leaving employee.
Silvestro (2002) however revealed striking employee satisfaction results (albeit a small
sample). Employee satisfaction was negatively and significantly correlated with profit
margins, and with the productivity indicator. This however is applicable to a busy retail
environment, indicative of employees being over-stretched in retail outlets. This notion
does not accord with the assumption in management literature that empowered staff are
better equipped to meet customer needs and more likely to find job satisfaction (Nel et al:
2004; Heskett: 2002; Hisrich & Peters: 1998; Hamel & Prahalad: 1995; Lindsay &
McStay: 2004; Ring & Van de Ven: 1994; Ziethaml & Bitner: 2003). In a separate study,
Silvestro & Cross (2000) found no significant correlation between any of the measures of
employee loyalty and overall staff satisfaction at retail level. They did however suggest
that employee satisfaction and loyalty are linked, even though the correlation was not
statistically significant.

132
4.3.7 Employee satisfaction link to internal quality of work life
Internal quality of work life is measured by the feelings that employees have toward their
jobs, colleagues, and companies. This includes the attitudes that employees have towards
each other. Many companies successfully implement teambuilding to enhance this link,
which includes conferences, group sport events and social clubs. According to the service
profit chain, internal service quality serves the foundation of the model and it ignites a
chain effect leading to an organisation’s growth and profitability (Lau: 2000). Heskett et
al (1994) referred internal service quality to the quality of work environment that
contributes to employee satisfaction, which has also been known as quality of work life
(QWL).
Schermerhorn (2002) identifies quality of work life opportunities in the areas of career
development, career planning, work-life balance, compensation and benefits, retention
and turnover, and labour-management relations. Internal quality of work is most often
identified with internal marketing (Kang, James & Alexandris: 2002). They propose that a
critical component of internal marketing is the provision of internal service quality. Their
study modified the SERVQUAL instrument (Parasuraman et al: 1988; Ziethaml & Bitner:
2003) for a service setting and empirically tested and confirmed that it is appropriate for
measuring internal service quality. They identified distinct and conceptually clear
dimensions of reliability, assurance, tangibles, empathy and responsiveness.
Internal marketing focuses on identifying and satisfying employees’ needs as individuals
and as service providers (Varey: 1995), just as external marketing focuses on identifying
and satisfying the external customers’ needs (Kang et al: 2002). Yoon, Beatty and Suh
(2001) empirically indicated that in addition to job satisfaction, employees’ work effort
plays a strong, central role in determining customers’ perception of employee service
quality. Their study investigates two components for successful implementation of
internal marketing, service climate and supportive management.
Common beliefs support the contention that quality of work life will positively nurture a
more flexible, loyal and motivated workforce (Bassi & Vanburen: 1997; Meyer & Cooke:
1993). Lau (2000) empirically analysed the quality of work life (QWL) construct, and
found that QWL companies indeed enjoy higher growth rates than those not portraying
QWL, and their differences are statistically significant. With regards to profit, QWL

133
companies managed to have a higher average profit margin than their counterparts,
however, the difference was not statistically significant (p= 0.1977). QWL is an important
issue as it determines the ability of an organisation to attract and retain prospective
employees (Lau: 2000).
These links highlight the interaction between the customer; value; and the employee-
attributing towards the implementation of the service profit chain within leading
organisations (Heskett et al: 1997). The connection between employee satisfaction and
customer satisfaction is conceptually strong because of many active interactions between
them (Lau: 2000). The threat is however that the ‘human resources trap’ may result in the
belief that all good (and bad) things that happen to customers in a service business are
caused by human resource policies, practices and procedures (Schneider & Bowen: 1995).
It must however be that some of the concepts linked together in the chain are not single
constructs which can be linked together in the simplistic way proposed by Heskett et al’s
(1997) model (Silvestro & Cross: 2000). Bloemer and Kasper (1995) demonstrated that
the relationship between some of these concepts could vary depending on the nature of
the construct, as well as being contingent upon environmental and operational variables.
4.4 SERVICE PROFIT CHAIN MANAGEMENT IMPLICATIONS
Leadership underlies the success of the service profit chain, and leaders who understand
the concept develop initiatives to develop and maintain a service culture around
customers and employees (Heskett et al: 1997). Implications of the service profit chain
vary according to situational factors (Bloemer & Kasper: 1995), but most often
incorporate guidelines depicted by Heskett et al (1994). These include inter-
organisational activities.
4.4.1 Measuring across operating units
System orientation (Perry: 2002) is particularly evident when an organisation has multiple
outlets (Mendelsohn: 2001), an example being franchising. The objective is to maintain
high levels of service across the franchise chain, linking satisfaction to consistency
throughout the network (Heskett, Sasser & Hart: 1990). Such measurement is facilitated
by implementing customer satisfaction surveys throughout the network, highlighting
134
correlations and variances. Similarly, employee satisfaction is usually obtained through
direct periodic surveys (Kang et al: 2002).
4.4.2 Developing a balanced scorecard
Kaplan and Norton (1993; 1996a; 1996b) recommend not only using financial measures,
but also non-financial outcomes as innovation, human resources effectiveness, and
customer satisfaction or loyalty. Although the service profit chain places emphasis on the
overall link to growth and profitability (Heskett: 2002), other less tangible factors have to
be monitored (Meyer & Cook: 1993). Such examples include strategic alliances for long-
term benefit, whereby financial means are not readily available for analysis (Porter:
2001). Low, Siesfeld and Larcker (1999) place emphasis on new technologies and e-
commerce, stating that corporate wealth is now being accumulated through non-financial
measures by electronic webs formed through corporate alliances and joint ventures.
According to Brinker (1999) a company’s competitive advantage is defined by the know-
how, relationships, secrets and collective knowledge of its employees. The balanced
scorecard (BSC) is a performance management indicator, whereby strategy-focused
organisations thrive in new business environments (Kaplan: 2000). The balanced
scorecard calls on managers to make a commitment to introduce an array of measures or
scorecards that will guide their decisions away from narrowly focussed financial
measures. In agreement with Heskett et al (1997), Sim and Koh (2001) advise that the
balanced scorecard serves to guide business into greater profitability as managers position
themselves to better serve their customers, employees and shareholders at large. The
rationale behind the balanced scorecard appeals to managers who face new challenges in
the current business climate (Hasan & Tibbits: 2000). The scorecard views four business
aspects, being management (financial), external (customers), operations (internal
business) and organisational (innovation and learning) (Kaplan & Norton: 1996b).
The balanced scorecard and management by objectives are similar in nature, as both are
based on the development of strategic measures, despite BSC being more explicit about
the measures (Dinesh & Palmer: 1998). No organisation has made a more comprehensive
effort to measure performance and relationships using BSC and the service profit chain
than the fast-food company, Taco Bell (Heskett et al: 1994). The integration of the BSC
and service profit chain depends not only on placing hard values on soft measures, but

135
also on linking those individual measures together into a comprehensive service picture
(Heskett et al: 1997).
4.4.3 Communication of results
Satisfaction monitoring and results are communicated throughout the organisation,
enabling management and employees to facilitate corrective measures, together with
building upon opportunities (Heskett et al: 1997). Many organisations provide a base for
sharing information, triggering a best practice approach between operating units. This
aspect correlates to internal marketing, an important approach for fostering a service and
customer oriented culture in an organisation (Kang et al: 2002). Schneider and Bowen
(1985) suggested that employees would deliver excellent service to customers when the
organisation provides them with the necessary resources, including logistical,
administrative, equipment, and management support. Internal communication of results is
communication within distinct organisational units or the people working in these
departments, to other units or employees within the organisation (Stauss: 1995).
The provision of optimal communication and internal services to employees is crucial to
the overall success of an organisation (Heskett: 2002; Schlesinger & Heskett: 1991;
Schneider & Bowen: 1985). The link to the service profit chain is that satisfied employees
are a critical prerequisite to the satisfaction of external customers (Kang et al: 2002).
Internal marketing includes those activities that improve internal communications and
customer consciousness among employees, and the link between these activities and
external market-place performance (Hogg, Carter & Dunne: 1998).
4.4.4 Performance management
Performance Management goes hand in hand with designing efforts to enhance
performance (Kaplan & Norton: 1996b; Heskett et al: 1997). Terminology such as
business process re-engineering and paradigm shifts (Hamel & Prahalad: 1995); are often
associated with improvements (Porter: 1996). Whilst service profit chain initiatives do not
necessarily have to be of such a magnitude, implementation can be guided by simple
training and development, change in policies and procedures, reorganisation and redesign
of processes (Heskett: 2002). Methods of performance management also include
management by objectives and the balanced scorecard approaches (Dinesh & Palmer:

136
1998). In the context of the service profit chain, performance management is about
designing efforts to enhance performance (Heskett et al: 1997). Performance management
entails setting standards, assessing results, and planning for performance improvements
(Nel et al: 2004).
Performance appraisal is the process of evaluating performance and providing feedback to
an employee (Schermerhorn: 2002). Service profit chain performance objectives may be
centred on customer/employee satisfaction, loyalty and value (Heskett et al: 1994), using
techniques such as behaviourally anchored rating scales (Grote: 1999), critical-incident
technique, a multiple comparison or 360 degree feedback (Edwards & Ewin: 1996). Kang
et al (2002) identified SERVQUAL as an appropriate performance management study
regarding internal service quality. Yoon et al (2001) identify performance issues centred
on work effort; service climate; supportive management; job satisfaction and employee
service quality. This equates to the service profit chain link of internal quality of work
life.
Levering and Moskowitz (1999) identified five characteristics of performance
management areas; more employee participation, more sensitivity to work/family issues,
more two-way communication, more sharing of the wealth, and more fun. They also
identify quality of work life performance around pay and benefits; opportunities; job
security; pride in work and company; openness and fairness; and camaraderie and
friendliness. Similarly, Lau (2000) identifies links in the service profit chain as integral to
performance management. In agreement with Heskett et al (1994), these include internal
service quality, employee satisfaction, employee loyalty, employee productivity, service
value, customer satisfaction and customer loyalty.
4.4.5 Encouraging internal best practice exchanges
This is particularly useful when dealing with geographically dispersed units or branches,
such as the franchise system (Siegel: 2002). Managers are motivated to discuss issues
with other business units, sharing success stories. Bank One, a leading retail bank in the
U.S; purposely budget high travel and communication costs to encourage operating unit
heads to talk frequently to discuss ways of improving their performance (Heskett et al:
1994). Heskett et al (1997: 37) state that, "it's this process of continual improvement
137
through internal best practice comparisons that utilizes the full competitive advantage of a
large organisation with multiple operating sites".
A best practice perspective towards managing customer satisfaction is described by Zairi
(2000) as a total concept which not only encapsulates the measurement aspects of
customer satisfaction per se but also as a long-term pursuit of improvement; a culture
change that can yield to competitive advantage in the higher order. To support the process
of developing a customer-focused culture, Zairi (2000) believes there are some key
drivers. These are based on best practice and used to measure business excellence at
world-class level; identifying who the customer is; identifying and evaluating market
dynamics, competition, opportunities, threats and environmental factors and identifying
methods of creating customer focus.
Davies and Kochhar (2000) developed a structural framework of best practice,
encouraged by their having a strong relationship with performance objectives, with no
major adverse effects and having the necessary supporting practices in place for the
desired practice to be implemented successfully. Their framework can be used to identify
best practices with the strongest effect on the area to be improved, together with a
sequence of desired practices. Also highlighted is the need to consider the dependency
relationships that exist between the practices themselves.
Best practice is often associated with benchmarking, a concept whereby one learns from
others (Heskett et al: 1990). Andersen, Fagerhaug, Randmoel and Prenninger (1999)
identify this learning from others using terminology of measurement, comparison,
learning and improvement. Benchmarking emphasizes attaining so-called breakthrough
improvements, usually accomplished by introducing best practices that are new to an
industry, through generic benchmarking (Andersen & Pettersen: 1995).
Andersen et al (1999) advise that the primary information from benchmarking activities
are flow charts and process descriptions. In developing benchmarking, the following steps
are identified (Andersen & Randmoel: 1997):
• Plan: critical success factors, select a process for benchmarking
• Search: find benchmarking partners

138
• Observe: understand and document the partners’ process, both performance and
practice
• Analyze: identify gaps in performance and find the root causes for the
performance gaps
• Adapt: choose best practice, adapt to the company’s conditions, and implement
changes.
Jarrar and Zairi (2000) refer to best practice as those practices that have been shown to
produce superior results; selected by a systematic process and judged as exemplary, good
or successfully demonstrated. They identify a six stage process for the effective transfer
of best practice, somewhat similar to the Andersen and Randmoel (1997) process:
searching, evaluating, validating, implementing (transfer and enabling), review and
routinising.
They identify internal transfer of best practices as arguably the most difficult stage.
Transfer is identifying and learning from best practice and applying them in the new
setting/location (O’Dell & Grayson: 1997). In addition to removing obstacles and
barriers, organisations must create enabling structures for the effective transfer of best
practices (Jarrar & Zairi: 2000). Best practice is further studied in chapter 5.
4.5 MANAGING CUSTOMER SATISFACTION
One in four customers has a problem with products purchased. If the item purchased is
relatively low in price, only one in five will register a complaint. Research indicates that
thirty-five per cent of customers will return and purchase the product/service if they are
not actually satisfied with the service they have received (Eccles & Durand: 1998). In
theory, this suggests that if customers are dissatisfied, two-thirds will not return. When a
successful service recovery process is in place, the statistics somewhat change; eighty per
cent of customers will return if satisfied with the response to a complaint (Plymire: 1992).
Kotler (2000: 36) identifies satisfaction as, “a person's feelings of pleasure or
disappointment resulting from comparing a product's perceived performance (or outcome)
in relation to his or her expectations”. Zeithaml and Bitner (2003) review satisfaction as
the customer’s evaluation of a product or service in terms of meeting needs and
expectations. Oliver (1997) identifies customer satisfaction as the consumer’s fulfilment

139
response. Customer satisfaction is the leading criterion for determining the quality that is
actually delivered to customers through the product/service and by the accompanying
servicing (Vavra: 1997). Vavra’s (1997: 4) outcome definition of customer service
characterises satisfaction as the end-state resulting from the experience of consumption.
Customer satisfaction is influenced by specific product or service features and by
perceptions of quality (Parasuraman et al: 1998). Satisfaction is also influenced by
customers’ emotional responses, attributions and perceptions of equity (Zeithaml &
Bitner: 2003). Sureshchandar et al (2002) further identify five factors of customer
satisfaction as core services or service product; human element of service delivery;
systematization of service delivery (non-human element); tangibles of service
(servicescapes) and social responsibility.
Zairi (2000) believes organisations need to indicate that they are truly focussed on their
customers through deeds and actions. He places emphasis on a customer-focused culture,
highlighting the following guidelines:
• Customer focus is not necessarily a written statement
• The focus intention will have to be examined in terms of appropriateness and
degree of seriousness to instigate a culture of customer focus
• Customer focus is a statement of intent, enabling the intent of a company to
challenge existing operations, and adopt new innovations
• Creating new systems, benchmarking, best practices, and by doing the right things
right first time and on time
• An evolutionary rather than revolutionary process
• A state of mind rather than an absolute concept which indicates optimised
performance and reaching the pinnacle of success.
Zairi (2000) believes being customer focussed means having a clear service strategy
which is deployed with vision, purpose and goals. He further identified benchmarking and
best practice guidelines, depicted in Section 4.4.5.
In order to track customer satisfaction, companies need to monitor their competitors'
performance in similar areas. For example, a company cannot be content when it receives
an 80% satisfaction vote in a survey; when compared to a direct competitor, who receives
a 90% satisfaction vote, notwithstanding that the competitor was aiming for a 95%
140
satisfaction score (Heskett et al: 1997). The dialogue created with customers has to be
based on a strong system, constantly seeking views, feedback, future needs, putting action
plans into place, monitoring satisfaction levels and drivers; enhancing loyalty and
retention (Zairi: 2000). Hallowell (1996) in agreement with Duffy (1998; 2003), Helm
(2003), Heskett (2002), Zairi (2000) and Bitner (1990) reflect on the many studies
whereby customer satisfaction influences purchase intentions as well as post-purchase
attitude. Various other studies also identified that customer satisfaction is strongly
correlated to repurchase intentions, the willingness to recommend the company and to
improve cross buying (Reichheld: 1996; van der Wiele et al: 2002; Parasuraman et al:
1998; Yu & Dean: 2001). The relationship and link of customer satisfaction to customer
loyalty and value are represented in Sections 4.3.2 and 4.3.3 respectively. At the opposite
end, researchers have also found that there is a strong link between dissatisfaction and
disloyalty or defection (Anderson & Mittal: 2000).
Van der Wiele et al (2002) focused on the analysis of empirical data on customer
satisfaction and the relationship with organisational performance data, finding evidence of
a positive relationship between the two constructs. Hallowel (1996) identified that higher
customer satisfaction translates into higher than normal market share growth, the ability
to charge higher prices, improved customer loyalty with a strong link to improved
profitability, and lower transaction costs.
For customer-oriented companies, customer satisfaction is both an objective and a
marketing tool (Ziethaml & Bitner: 2003). Companies with high customer satisfaction
rankings make sure their target market knows it (Kotler: 2000). Cognisance must be taken
that striving for superior customer service must be in synergy with the strategy of the
company, as maximizing customer satisfaction may have a negative effect on profit,
should the company offer substantial discounts (Porter: 1996). The opposite rings true, in
that issues such as enhanced research and development, or improvements in
manufacturing processes may also lead to improved profits, emphasizing company wide
initiatives to increase profits; not customer satisfaction on its own (Heskett: 2002). Kotler
(2000) identifies the total resource approach, whereby the company must ultimately
operate on the philosophy of achieving high levels of customer satisfaction, subject to
delivering acceptable levels of satisfaction to the stakeholders within the constraints of its
total resources.

141
The Dell Computer Corporation's direct-to-customer business model has resulted in high
levels of customer satisfaction due to quick response levels, coupled with their business
ethic of being accessible, fast and effective. Zairi (2000) summarizes the impact of
customer satisfaction on repeat purchase, loyalty and retention:
• Satisfied customers are more likely to share their experiences with other people to
the order of five or six people, as opposed to dissatisfied customers to the order of
ten people
• Many customers do not complain, either accepting poor service, or migrating to
competitors
• Whilst dealing with customer satisfaction/complaint is costly, it costs as much as
25 per cent more to recruit new customers.
Another point of view is that of Williams and Visser (2002), who inform that, customers
are more and more being rewarded for being dissatisfied. Research has indicated that the
most loyal customers are those who complain and report, subsequently, that their
complaints have been well attended to by the company concerned (Goodman,
Broetzmann & Ward: 1993). Yu and Dean (2001) believe that the emotional component
of satisfaction serves as a better predictor of loyalty than the cognitive component. They
postulate that negative emotions are negatively related to positive word of mouth and
willingness to pay more, and positively associated with switching behaviour.
Organisations use many methods to track customer satisfaction (Heskett et al: 1997). An
overview of such methods follows.
4.5.1 Customer feedback, complaint and suggestion systems
Such systems make it easy for customers to deliver suggestions and complaints. Zeithaml
and Bitner (2003: 128) identify complaint solicitation as identifying and attending to
dissatisfied customers and common service failure points. The data is qualitative in
nature, relatively low cost in value and time, and of continuous frequency. The feedback
can take many forms, including on-site customer complaints, calls to toll-free customer-
response phone numbers, and customer comment cards; most often facilitating two way
communications. In each of these forms, the feedback information is either unsolicited or
passively solicited (Sampson: 1998). Customers generally appeal to passive solicitation as
focus is not directed on any specific customer. Sampson (1998) identifies the internet as
142
an effective means of gathering customer feedback. Complaints provide crucial
information feedback which organisations should respond to positively (Andreassen:
1997). There is a distinct need for employee training in handling information feedback, to
provide people with the skills, encourage positive attitudes and so bring about the
behavioural change that will ensure converted, loyal customers (Bitner: 1990).
Organisations are seen to be paying lip service to customers and their complaints, while
the lack of customer focus in design of systems and procedures is a cause for the
complaint in itself (Heinonen: 2004). Ironically, the front line of many organisations faces
as many battles internally as hassles from external customers. Additionally, some reward
systems actively discourage effective complaint handling (Schlesinger & Heskett: 1991).
Plymire (1992) advises that the complaints-generation process results in a customer-
focused culture in which complaints are viewed as a source of opportunities.
4.5.2 Lost customer analysis
Organisations contact customers who no longer portray patronage, to discover with their
reasons for defection (Heskett: 2002). Zeithaml & Berry (2003) identify lost customer
analysis as identifying reasons for customer defections, being qualitative in nature, low
monetary and time congruence, and continuous frequency. Bolfing (1989) proposes ways
of managing customer complaints of harmful types of dissatisfaction and for maximizing
opportunities to develop loyal customer bases through effective handling of problems.
Focussing on customer defections and service failures can assist organisations in
improving service quality and improving long-term retention (Mack, Mueller, Crotts &
Broderick: 2000). Keaveney (1995) empirically analysed (critical incident) service
customers to study defections, finding eight general categories for switching: price;
inconvenience; core service failures; service encounter failures; competitive issues; failed
employee response to service failures; ethical problems and involuntary factors.
Fifty-five per cent of the respondents in the Keaveney (1995) study reported complex
switching incidents due to more than one category, which were often interactive.
Keaveney (1995) pointed out that six of the eight factors are controllable by the firm, and
he identified suggested actions to prevent switching. High levels of successful recovery
are positively associated with high levels of customer satisfaction (Bitner: 1990; Heskett:
1994). Sundaram, Jurowski and Webster (1997) used hypothetical service failure

143
recovery efforts to identify the positive association with quality and satisfaction. Banwari
and Walfred (1998) suggest that unsatisfied customers may not wish to defect, however,
satisfied customers may look for other suppliers because they can get an even better
service level elsewhere (Trubik & Smith: 2000). It is estimated that 35 per cent of
defecting customers defect as a result of uncontrollable external factors (Varney: 1996),
with controllable factors including those identified by Keaveney (1995). Database
management is a crucial method of analysing defections, together with studying retention
strategies (Trubik & Smith: 2000). Zairi (2000a) believes effective management of
defection strategies may turn around into customer loyalty and retention.
4.5.3 Customer satisfaction surveys
Surveys are conducted with emphasis on service related issues of importance to
customers, representative of the entire customer base (Parasuraman et al: 1998). The
qualitative and quantitative measurement of customer perceptions about the quality of a
product or service are important element of conducting a business (Hayes: 1997). Active
solicitation is accomplished at moderate cost (such as mail surveys) to high cost (such as
personal interviews) (Churchill: 1995). Zeithaml and Bitner (2003: 128) identify
relationship surveys and SERVQUAL surveys as identifying customer requirements in
various settings:
• As input for quantitative research (qualitative and periodic frequency)
• Monitoring and tracking service performance (quantitative and infrequent)
• Assessing overall company performance (quantitative and infrequent)
• Compared with that of competition (triangulation and situational)
• Determination of links between satisfaction and behaviour intentions
• To assess gaps between customer expectations and perceptions.
4.5.4 Ghost shopping
Often referred to as mystery shoppers, the company ascertains the degree of service in a
real life shopping experience, together with gauging the level of employee competence
(Heskett et al: 1997). The mystery shopper evaluation is a formal observation method,
gathering primary data by physically recording a designated aspect of behaviour. Grove
and Fiske (1992) identify this form of research as unique to services, whereby
144
experienced researchers evaluate service as though they were customers. Mystery
shoppers deliver objective assessment about service performance by completing
questionnaires about service standards (Zeithaml & Berry: 2003). Mystery shopping is a
technique used to measure individual employee performance for evaluation, recognition
and rewards; and to identify systematic strengths and weaknesses in customer-contact-
service (Zeithaml & Berry: 2003). Data is most often quantitative, relatively low in time
and value, and optimally, quarterly in frequency. Au Bon Pain, a take out convenience
food outlet sends mystery shoppers to their stores to evaluate service and the servicescape
(Heskett et al: 1997). Servers are evaluated on standards including the following
(Zeithaml & Bitner, 2003: 142):
• Acknowledged pleasantly
• Acknowledged within three seconds after reaching first place in line
• Server suggested additional items
• Server requested payment prior to delivering order
• Received receipt and received correct change
• Correct order received.
The mystery shopper is also used by Au Bon Pain as a key element in its compensation
and reward system (Heskett et al: 1997). Mystery shopping can be a very effective way of
reinforcing service standards (Zeithaml & Bitner: 2003); however, when more than one
mystery shopper is involved, steps need to be taken to ensure that the measurements being
taken are uniform for all observers - this is otherwise known as inter-rater reliability
(Page & Meyer: 2003).
Measuring customer satisfaction can be tracked by means of 'listening posts' such as
formal marketing research; customer surveys; feedback from customers; frontline reports;
and most importantly, by the actual customer involvement in certain organisational issues
(Heskett et al: 1997). The importance however rests on the interpretation and analysis of
these mechanisms, coupled with the appropriate corrective measures to be implemented
(Page & Meyer: 2003). Becoming customer oriented does not mean achieving high scores
on ratings, but gaining an awareness of the needs of customers (van der Wiele et al:
2002). Pizam and Ellis (1999) empirically evaluated customer satisfaction in hospitality
enterprises, concluding that, if properly administered and analyzed, the process of

145
monitoring customer satisfaction can be beneficial to any enterprise and make the
difference between offering a mediocre product and an excellent quality product.
4.6 THE CUSTOMER VALUE EQUATION
A central link to the service profit chain is that of customer value, representing the results
created for the customer, together with the quality of the process to deliver the results
(Heskett et al: 1997). This is in relation to the price and acquisition of the service offered.
Value defined in this way is related to customer satisfaction, identifying the customer
satisfaction link to service value (McDougall & Levesque: 2000). This link was depicted
in section 4.2.3, evaluating the research of Heskett et al (1997), Caruana et al (2000), Ho
and Cheng (1999), Andreassen (1994), Heinonen (2004) and McDougall and Levesque
(2000). Zeithaml and Bitner (2003) believe consumer value is a component of a myriad of
attributes, appearing to be highly personal and idiosyncratic. They attribute four customer
meanings to value:
• Value is low price; indicating that what consumers have to give up in terms of
money is most salient in their perception of value
• Value is whatever I want in a product or service; negating money, but
incorporating the benefits they receive from a product/service as the most
important component of value
• Value is quality I get for the price I pay; whereby other consumers see value as a
trade-off between money they give up and the quality they receive
• Value is what I get for what I give; indicating that some consumers consider all
benefits they receive as well as all sacrifice components (money, time, effort)
when describing value.
These four components may be captured in a single definition, consistent with the concept
of utility. Utility theory (Lancaster: 1971) provides the theoretical underpinning for the
value construct. Zeithaml and Bitner (2003: 491) define perceived value as, “the
consumer’s overall assessment of the utility of a service based on perceptions of what is
received and what is given”. In other words, value has been seen as the trade-off between
benefit and the sacrifice in an offering (Heinonen: 2004). Customers will derive value
according to the utility provided by the combination of attributes less the disutility
represented by the final price (Heskett et al: 1994; Caruana et al: 2000). In a study
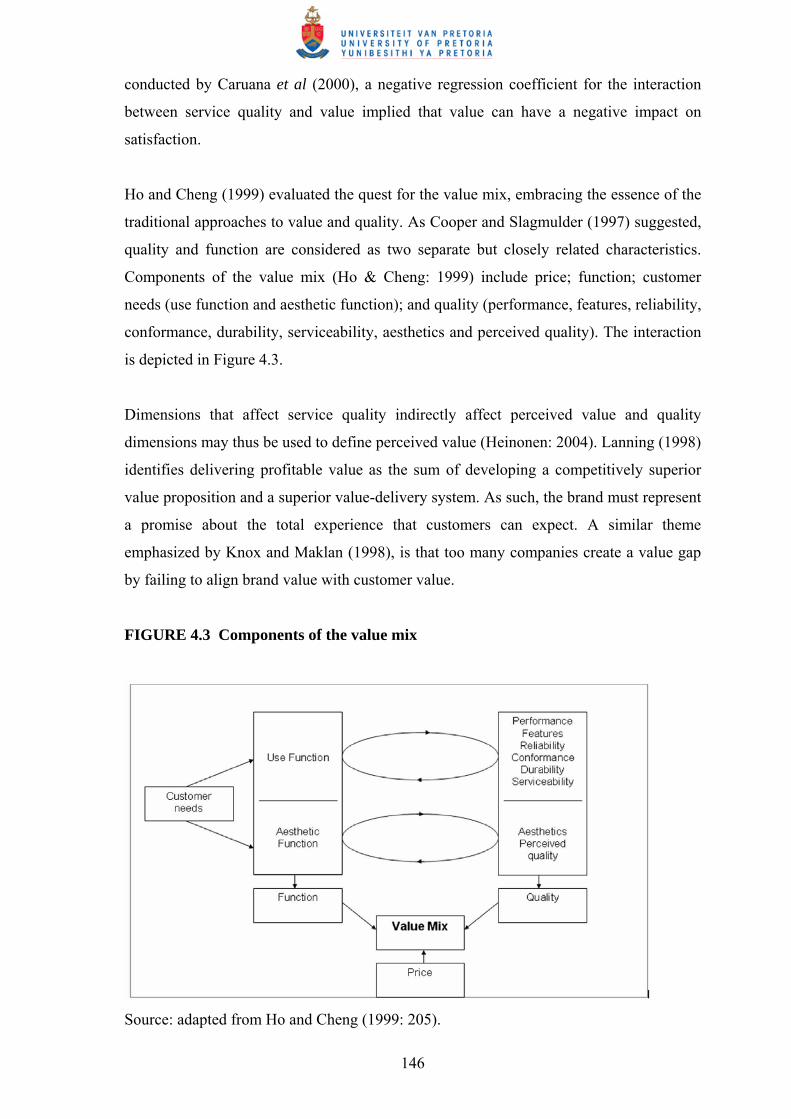
146
conducted by Caruana et al (2000), a negative regression coefficient for the interaction
between service quality and value implied that value can have a negative impact on
satisfaction.
Ho and Cheng (1999) evaluated the quest for the value mix, embracing the essence of the
traditional approaches to value and quality. As Cooper and Slagmulder (1997) suggested,
quality and function are considered as two separate but closely related characteristics.
Components of the value mix (Ho & Cheng: 1999) include price; function; customer
needs (use function and aesthetic function); and quality (performance, features, reliability,
conformance, durability, serviceability, aesthetics and perceived quality). The interaction
is depicted in Figure 4.3.
Dimensions that affect service quality indirectly affect perceived value and quality
dimensions may thus be used to define perceived value (Heinonen: 2004). Lanning (1998)
identifies delivering profitable value as the sum of developing a competitively superior
value proposition and a superior value-delivery system. As such, the brand must represent
a promise about the total experience that customers can expect. A similar theme
emphasized by Knox and Maklan (1998), is that too many companies create a value gap
by failing to align brand value with customer value.
FIGURE 4.3 Components of the value mix
Source: adapted from Ho and Cheng (1999: 205).

147
The value concept is achieved with maximum benefit for customers, employees, partners,
and investors through an operating strategy that seeks to leverage results over costs by
means of such factors as organisation; policies; processes; practices; measures; controls
and incentives (Heskett et al: 1994). The strongest predictors of customer satisfaction are
those conditions that support process value (Brooks: 2000). He sees internal process
value as a product of the organisation’s tools; information systems; policies and
procedures’ collaboration among departments; management support; goal alignment,
training; communication and appropriate recognition and reward for delivering value.
Ultimately, the higher the company's value-creation ability; the more efficient internal
operations activity, and the greater its competitive advantage, the higher the profits will
be (Heskett et al: 1997). This is all viewed from the perspective of the customer, and is
incorporated in the customer value equation.
4.6.1 The components of the customer value equation
Customers don't simply purchase products and services, but purchase the results they
wish to achieve (Ho & Cheng: 1999). As such, in the case of home entertainment, they
are purchasing home relaxation, satisfaction, enjoyment and entertainment (Maritz:
2003a,b). Heskett et al (1997) conceptualised the value equation, placing emphasis on the
conceptual link between strategic service vision and service profit chain. In line with the
principles of the service profit chain, viewed from the perspective of the customer, the
value equation may be depicted as follows:
Value = Results produced for the customer + Process Quality Price to the customer + Costs of Acquiring the Service
The four integral dimensions of the value chain as identified by Heskett et al (1997) are
central to the service profit chain. The value chain suggests that the value of goods and
services delivered to customers is equivalent to the results created for them (Caruana et
al: 2000) as well as the quality of the processes used to deliver the results (Ho & Cheng:
2004), all in relation to the price of a service (Zeithaml & Bitner: 2003) to the customer
148
and other costs incurred by the customer in acquiring the service (Cooper & Slagmulder:
1997). The four integral dimensions are now detailed (Heskett et al: 1997).
4.6.1.1 Results produced for customers
Customers buy results, not products (McDougall & Levesque: 2000). As such, it is the
benefit of the transaction which is of importance, not the product itself. An example is the
purchase of petrol for a vehicle, the desired result being transportation, not the petrol
itself. The value attached to results varies with the size of the service task, together with
its importance to the customer (Ho & Cheng: 1999). This again highlights the value trade-
off between benefit and sacrifice (Heinonen: 2004). Utility is of importance, dating back
to economic theory postulated by Lancaster (1971). Caruana et al (2000) also added to
derived value as a product of utility provided by the combination of attributes.
4.6.1.2 Service process quality
Placing emphasis on the way in which the service is delivered, is often being as important
as results (Zeithaml & Bitner: 2003). Five universal dimensions of service process quality
(SERVQUAL) were identified by Parasuraman et al (1988):
• Dependability/Reliability; did the service provider do as promised?
• Responsiveness; was the service provided in a timely manner?
• Authority/Assurance; did the service provider elicit a feeling of confidence in the
customer during the service process?
• Empathy; was the service provider able to take the customer’s point of view?
• Tangible evidence; was evidence left that the service was indeed performed?
Other research (Lau: 2000), Heskett (2002), Silvestro and Cross (2000), Maranto and
Reynoso (2003) is indicative of the profound implications for service providers, including
the following findings:
• Process quality is abstract, not absolute (Kang et al: 2002)
• Process quality is determined by the customer, not the service provider (Zairi:
2000)
• Process quality varies from one customer to another (Yu & Dean: 2000)

149
• Process quality can be enhanced by action to control expectations; or by meeting
or exceeding customer expectations (Andreassen: 1994).
Process quality and customer satisfaction are the key to competitive advantage
(Sureschandar et al: 2002). Building upon SERVQUAL, Sureschandar et al (2002)
identified five factors of service process quality as critical from the customers’ point of
view. These included the core service or product; human element of delivery;
systemization of service delivery (non-human element); tangibles of service
(servicescape) and social responsibility.
From a best value perspective, the measurement of process quality should take into
account customer expectations of service as well as perceptions of service (Wisniewski:
2001). It is generally agreed that process quality is an attitude or global judgement about
the superiority of a process, although the exact nature of this attitude is not agreed
(Robinson: 1999). Some suggest that it stems from a comparison of expectations with
performance perceptions (disconfirmation) (Parasuraman et al: 1988), whilst others argue
that it is derived from a comparison of performance with the ideal processes (Teas: 1993)
or from perceptions of performance alone (Cronin & Taylor: 1992). This is made evident
by the variety of models for process quality measurement (Kang et al: 2002; Zairi: 2000;
Yu & Dean: 2000; Andreassen: 1994; Lau: 2000; Silvestro & Cross: 2000).
Cronin and Taylor (1992) believe literature lends more support to performance measures
of process quality, as opposed to the notion of the expectations-performance gap, as
identified by Parasuraman et al (1998). They believe the adequacy-importance attitude
model is the most appropriate if the main objective is to predict behaviour (Mazis, Ahtola
& Klipel: 1975). In this model performance is weighted by importance to define an
individual’s attitude, and expectations are not considered. Not all studies however reach
the conclusion that performance-only measures provide the greatest predictive power
(Robinson: 1999).
Using SERVQUAL as a measurement of process quality has been empirically tested
(Parasuraman et al: 1998; McDougall et al: 2000; Heinonen: 2004); however, cognisance
must be taken of areas of debate. These include diagnostic or predictive purpose, the
nature of attitude, measuring expectations or not, and whether the five dimension model is
correct for its original context (Robinson: 1999). As a concluding remark on process
150
quality, there is no value in a product or service until it is in the hands of its customers
(Li, Tan & Xie: 2003). Process quality is determined by the interaction of all those factors
that affect the process of making products/services available to the customer (Christopher:
1998).
4.6.1.3 Price and acquisition costs
Whilst many customers and service providers measure their costs only in terms of price,
the costs of acquiring a service may in some cases outweigh the price. Added value, such
as range extensions; convenience; adaptability and portability often allow the service
provider to negate price as the only measure of cost (Palmer; 2001). Service providers
however need to convince customers of the value of such efforts (Caruana et al: 2000).
Managing by the customer value equation is a way of life in outstanding service
organisations (Heskett et al: 1997). The customer value equation suggests that service
value to customers can be enhanced by increasing either (or both) results delivered or
process quality, while reducing either (or both) prices or service acquisition costs.
Regarding price, British Airways do not seek to charge the lowest airfares, but have won
many awards for superior service (Heskett et al: 1997). Their ‘putting people first’
campaign went a long way to enhancing customer value, via the increase in customer
satisfaction levels. This was however a long process, involving a reduction in service
acquisition costs, together with an enhancement of results delivered. Organisational
influence on pricing incorporates a wide variation in the objectives they seek to achieve.
Palmer (2001) identifies the following objectives for price decisions: profit maximisation;
market share maximization; survival and social considerations.
In practice, organisations work to a number of objectives simultaneously (Kotler: 2000).
Rather than seeing each customer transaction in isolation, the development of ongoing
buyer-seller relationships is becoming a much more important part of business strategy
(McDougall et al: 1997). Customer lifetime pricing may be an accepted strategy to
develop lifetime value customers over the long term (Palmer: 2001; Heskett: 2002;
Reichheld: 2001).
151
4.6.2 Requirements to add value
Heskett et al (1997) identify various requirements which facilitate the implementation and
adoption of the customer value equation. Whilst not limited to these requirements only,
organisations implement the following as groundwork essentials:
• Understanding customer needs. Although customer needs can be gauged by
traditional forms of marketing research, modern business practices actually
involve customers in the design and ways in which services are delivered (Kotler:
2000). British Airways place emphasis on more traditional research methods,
including on-board customer service surveys, together with focus groups. Of
paramount importance, however, is the interpretation and analysis thereof.
Customers are also encouraged to register complaints with the airline, via
numerous listening posts. Moral and ethical development in business has been
integral to the development of global consumerism (Boone & Kurts: 2000), and
forms an important part of the marketing concept (Chaston: 2000). Meeting the
needs and wants of the consumer, together with a societal responsibility (Kotler:
2000), are key inputs into the marketing strategy. Nieman et al (2004) mention the
importance of product leadership, differentiation and market domination toward
managing growth
• Influencing attitudes towards the value equation. Company wide initiatives
involve a customer service orientation throughout the organisation, whereby even
the lowest ranking employees are trained regarding handling of customer queries
(Vilares & Coelho: 2003). The Sheraton Hotel chain regularly develops such skills
with their cleaning and maintenance staff; as these employees come face to face
with most customer complaints. Of importance is the recording of complaints
registered by customers, along with potential root causes, providing a basis for
establishing priorities for timeous corrective action (Brooks: 2000). Influencing
attitudes consists of communication within and outside the organisation (Boone &
Kurts: 2000), and consists primarily of empowering employees in the form of
sharing information, sharing decision-making authority and linking rewards to
company performance (Nel et al: 2004)
• Establishing a return on value-enhancing initiatives. This relates primarily to
service quality improvements (Zeithaml & Bitner: 2003), and measurement of root
causes of complaints (Heskett et al: 1997). British Airways (BA), for example,
152
received complaints from 30% of customers regarding seat allocations and
overbooking. These customers indicated that they would seek alternative airlines
that do not continually have these problems (Heskett et al: 1997). Measuring these
problems, resulted in an anticipated loss of over eight million pounds sterling in
revenue, should these problems not be rectified. As a result of such measurement,
BA estimated that for every pound spent on customer retention, the Airline would
net two pounds in revenue
• Developing different value packages for various market segments. Different
sectors of the market demand different service offerings at varied prices (Walker
et al: 1999). The airline industry discriminates on value and price with regards
their first, business and economy modes of flying. Although it is said that the real
profits on airlines are made from those flying up front (business and first class), all
other passengers contribute to the vast overheads. Customers travelling in the
different classes have distinctively different needs, together with value
expectations. Problems can however arise when companies have multiple
offerings, for example, when passengers compare the different options while
travelling in adjacent seats. In differentiated marketing, the firm operates in
several market segments and develops different programs for each segment
(Chaston: 2000), and differentiated marketing typically creates more total sales
than undifferentiated marketing (Kotler, 2000: 276)
• Establishing that value can be provided at a profit. Little margin for error exists in
establishing value (Caruana et al: 2000), as once a customer defects, the cost of
re-acquiring their patronage comes at a huge cost, relative to retaining current
customers (Brooks: 2000). To deliver value at a profit, it is necessary to link the
value equation to the strategic service vision (Heinonen: 2004). Customer value
and loyalty is a prime determinant of long-term financial performance of firms
(McDougall & Levesque: 2000).
4.6.3 Linking the strategic service vision and the service profit chain
The margin between the cost of providing the service, and the provision itself, is deemed
necessary for the long-term survival of the business (Duffy: 1998). It is the margin
between value and cost that represents a profit opportunity to the service provider.
Heskett et al. (1997) suggest that the value equation serves as a conceptual link between
the service profit chain and the strategic service vision. The strategic service vision

153
incorporates all activities of the organisation, and their overall objectives towards the
realization of superior service and value (Waker et al: 1999). This includes the service
delivery system, operating strategy, service concept, and target market; linking profit,
value to the customer, and overall organisational growth (Heskett: 2002).
4.7 CUSTOMER LOYALTY
Previous mention was made of leading service organisations' link of profitability and
quality of customer service (Maranto & Reynoso: 2003; Ho & Cheng: 1999), together
with not equating profitability only with market share (Andreassen: 1994). It is an
objective to have true and faithful customers (Bowen & Chen: 2001), however, this is
only possible upon the implementation of superior service and value initiatives (Duffy:
1998). Sections 4.2.1 and 4.2.2 identifu the profit and growth link to loyalty; and the
loyalty link to satisfaction.
Peck et al (1999) identified the customer loyalty ladder, depicting two extremes of
customer loyalty. The bottom extreme, with emphasis on one-off transactions is
represented by the prospector, through purchaser, through client. The upper extreme, with
emphasis on long-term loyalty, is represented by the supporter, advocate and ultimately
partner. It is generally held that there are three distinctive approaches to measuring
loyalty; being behavioural, attitudinal and composite measurements (Bowen & Chen:
2001).
From a composite point of view, loyal customers are those who hold favourable attitudes
toward the company, commit to repurchase the product/service, and recommend the
product to others (Bowen & Chen: 2001). Customer loyalty is purchase behaviour, unlike
customer satisfaction, which is an attitude (Griffin: 1996). Customer loyalty, a key
mediating variable in explaining customer retention (Pritchard & Howard: 1997), is
concerned with the likelihood of a customer returning, making business referrals,
providing strong word-of-mouth, as well as providing reference and publicity (Bowen &
Shoemaker: 1998). Loyal customers are less likely to switch to a competitor due to a
given price inducement, and these customers make more purchases compared to less loyal
customers (Baldinger & Robinson: 1996).

154
Duffy (2003) identifies benefits of loyalty as cost savings, referrals complain rather than
defect, channel migration, unaided awareness, greater awareness of brand assets, and turn
left rather than turn right. The latter represents the subtle, psychological reluctance to
defect created by a loyalty strategy. Duffy (1998) sees building customer loyalty as a
business strategy, not just a marketing programme. He states that all businesses should
seek to boost loyalty and maximize share of customer. A service organisation’s long term
success in a market is essentially determined by its ability to expand and maintain a large
and loyal customer base (Wong & Sohal: 2003). They found that the most significant
predictor of customer loyalty at a company level is tangibles, while the most significant
predictor of customer loyalty at an interpersonal level is empathy.
4.7.1 Determinants of customer loyalty
Adopting the belief of processing the ability to relate to customers, latitude of front-line
judgment, together with the rewards for doing so (Caruana et al: 2000). This was
implemented in Au Bon Pain restaurants, resulting in reduced employee turnover, and
increased customer satisfaction. The link between employee and customer loyalty is
highlighted in this example (Reichheld: 1996).
4.7.2 The relationship between customer loyalty and profit and growth
As emphasized in the Service Profit Chain, once again highlighting leading service
organisations' approach of negating the profit and market share relationship, with that of
customer loyalty (Heskett: 2002).
4.7.3 Customer loyalty and customer satisfaction
Also linked in the Service Profit Chain, however of all the links, this is the least reliable.
Competitive prices, locality marketing and other competitive initiatives have made
satisfied customers migrate/defect to opposition outlets, somewhat questioning the
loyalty/satisfaction relationship (Silvestro & Cross: 2000).
155
4.7.4 Enhancing loyalty
This includes learning opportunities from those customers defecting to opposition service
providers (Sundaram et al: 1997). The reasons for defecting may be lengthy; however,
root causes have to be identified. In addition, incentivising front-line staff, not only for
signing up new customers, but retaining existing clientele, requires continual analysis
(Heskett et al: 1994). This again emphasizes the link between employee and customer
loyalty (Rogers et al: 1994).
The satisfaction/loyalty relationship advocates how an organisation approaches the
competitive environment with particular reference to defectors. Heskett (2002) identifies
the fruits of loyalty through three customer behaviours; commitment, apostle-like
behaviour and ownership. Committed customers are not only loyal, but tell others of their
satisfaction (Helm: 2003). Apostles are not only viral, but convincing. They possess
credibility and a certain degree of authority in the eyes of others (Heskett et al: 1997).
‘Owners’ are defined as those loyal customers that take responsibility for the continuing
success of a product or service offering. Gremler and Brown (1999) identified the loyalty
ripple effect, highlighting the behaviours and effects they have on margins and
profitability.
Heskett (2001) also identified how a committed customer as an apostle or owner can
generate the same lifetime value of as many as one hundred customers who are merely
loyal but who do not recruit other customers or provide ideas for product or service
improvement. Heskett (2002) informs that explicit efforts can be made to develop
‘owners’. They involve a hierarchy of initiatives to fast-track customer loyalty, one that
complements in some ways the hierarchy of customer behaviours. First level strategy to
develop extraordinary loyalty is transactional, involving product warranties and service
guarantees. Higher-order strategy (strategic) involves repositioning the business to deliver
solutions rather than products or services. A third level, reflected as cultural, involves the
linking of operational functions, such as product development and improvement, to
customers or suppliers, often regarded as partners.
The top of the hierarchy is represented by organic strategies designed to develop
customers who regard themselves as owners. At such levels, efforts are made to identify
such customers as well as ensure they are treated in a manner that leads them to believe
156
they are part of a community of preferred customers who are able to influence company
strategies. An example of this is the input loyal customers have in selecting cabin
assistants at Southwest Airlines. Heskett (2002) further postulates that the potential
payoff from building commitment, apostle-like behaviour, and ownership among
customers is so great that it often outweighs the potential costs. He concludes that mere
loyalty is not enough; and that there is a real opportunity to build loyalty from a core of
apostles and owners who have extraordinary lifetime values for the provider of goods and
services.
The extreme on the other end of the scale are referred to as 'terrorists', indicative of very
dissatisfied customers with low loyalty and low retention behaviour. This is in contrast to
apostles indicating a zone of affection, with highly satisfied and loyal customers. Upon
evaluating terrorist motives, particularly those with reasonable and pertinent service
issues, effort must be made to conform them from an area of defection; through the zone
of indifference, to that of apostles in the zone of affection (Heskett et al: 1997). To this
end, Xerox (USA) found that a high rating on customer satisfaction led to a higher
probability of repurchase from Xerox.
4.7.5 Recognition and rewards
This construct involves a double barrel approach, incorporating both customers and
employees, aligning the customer and employee performance link to long term
profitability (Lau 2000). Employee Recognition and Rewards include implementation of
performance appraisals, profit share, incentives, training and development, participation
in decision-making, involvement, towards the achievement of overall organisational
objectives (Bassi & Vanburen: 1997). Customer recognition and rewards include
enhancement of the current loyalty programme, birthday and special event cards, frequent
viewer initiatives, and most of all, superior service at the point of rental, for example,
thanking the customer for using the services of the particular service provider (Heskett:
2001).
Kotler (2000) places emphasis on customer satisfaction as a method of strengthening
customer retention. The task of creating enhanced customer loyalty is referred to as
relationship marketing; embracing all those steps that companies undertake to understand
their valued customers better. Relationship marketing centres on developing more loyal

157
customers, thereby increasing revenues (Heskett: 2002). The introduction of loyalty
programmes facilitates this element of retention, however, if not administered correctly,
could actually have adverse effects. South African Airways employ a loyalty programme
known as Voyager, whereby commuters are rewarded for flights on the airline. The
redemption of award certificates is, however, cumbersome, together with continual non-
availability of free seats on selected flights. This negates the entire programme, resulting
in passengers migrating to opposition airlines.
Adding financial benefits facilitates additional usage, together with retention (Heskett et
al: 1997). Frequency marketing programmes are produced to reward loyal customers who
use a company's services in substantial amounts. This is an acknowledgement of the fact
that eighty per cent of the company's business is done by twenty per cent of its customers
(pareto-analysis). Typically, the first company to introduce such programmes in an
industry stands to gain the most benefit; however, after competitors respond, the
frequency programmes may become a financial burden to all the offering companies.
Another form of loyalty programme includes club membership, which is aimed at
bonding customers closer to the company. Such affinity clubs also have the advantage of
developing a customer database. Harley-Davidson, the world famous motorcycle
company, sponsors the Harley Owners Group (HOG), being in the region of half a million
members. First time Harley Davidson buyers receive a free one-year membership, which
includes free magazines, handbooks, insurance, discount hotel rates, and other related
services. And, of course, the 'stigma' attached to being a ‘HOG' member. In relation to
recognition and rewards, three constructs are developed.
4.7.5.1 Empowering employees
The positive relationship between quality of work life (QWL) and growth and
profitability is emphasised by Lau (2000). QWL will positively nurture a more flexible,
loyal and motivated workforce, which is essential in determining the company’s
competitiveness (Meyer & Cooke: 1993). Positive associations have also been found
between progressive human resources practices, such as training, staffing selectivity,
empowering employees and common firm performance measures (Nel et al: 2004).
Empowerment refers to the educational, training and developmental activities of
employees towards the achievement of objectives (Nel et al: 2004), with particular

158
emphasis on training and employee development in this context. Towards the successful
implementation of internal marketing, service climate and supportive management are
two pre-requisites (Yoon et al: 2001). They identify employee empowerment as one of
the key constructs. Employee perception of work climate not only influences
organisational variables such as work effort and job satisfaction, but also affects service
evaluation by customers. Yoon et al (2001) believe it necessary to explicitly design and
establish various organisational policies such as employee empowerment, detailed service
codes, service performance reward/award, and employee education/training, in order to
develop a system that will facilitate service-oriented environment and supportive
management.
Empowerment is when management promotes this goal by giving employees authority
and responsibility to make decisions about their work without traditional managerial
approval and control. Managers empower employees by sharing company information,
delegating decision-making authority and rewarding employees based on company
performance (Boone & Kurtz: 2000). The concept of empowerment is truly implemented
when employees have the power to make decisions that influence their work procedures
in ways that are linked to organisational strategy, not only in suggesting improvements,
but allowing employees to turn ideas into actions (Boon & Kurtz: 2000). Wal-Mart’s
computer and communications technology puts information in the hands of employees.
Every employee knows the price of the products, their mark-ups, and how many are sold.
Sharing information results in high-quality communication among employees and
between Wal-Mart and its customers.
4.7.5.2 Relationship marketing
Whilst the discipline of relationship marketing is worthy of its own chapter, relevance to
loyalty will be emphasized. From this point of view, relationship marketing is viewed as a
philosophy of doing business that focuses on keeping and improving (retaining) current
customers rather than on acquiring new customers (Zeithaml & Bitner: 2003).
Relationship marketing has evolved from an acquisition and transaction focus toward a
retention focus (Webster: 1992). The primary goal of relationship marketing is to build
and maintain a base of committed customers who are profitable for the organisation, and
to achieve this, organisations will use attraction, retention and enhancement strategies
(Berry: 1983).

159
Benefits of effective relationship management revolve around value, where consumers
evaluate the trade off between receiving and giving. Apart from receiving service value,
other customer benefits include confidence benefits (trust and confidence in the provider),
social benefits (familiarity, social support system), and special treatment benefits (benefit
of doubt, preference) (Gwinner, Gremler & Bitner: 1998). Benefits to the organisation are
that relationship-oriented service firms achieve higher overall returns on their investment
than do transaction-oriented firms (Kumar: 1999). Other benefits include increased
customer purchases over time (Reichheld: 2001), lower costs (Zeithaml & Bitner: 2003),
free advertising through word of mouth (Helm: 2003) and the indirect effect of employee
retention (Lau: 2000). Relationship marketing is further evaluated in Chapter 5.
4.7.5.3 Customer loyalty strategies
Specific application is geared towards loyalty marketing and programmes in the context
of the service profit chain (Heskett et al: 1997). The aim of loyalty programmes is to
extend the customer’s life with a company so that their lifetime profitability is increased
(Palmer: 1998). Loyalty programmes create communities of customers that are organized
and initiated by companies (Butscher & Muller: 1999; Diller (1997). The current
customers are approached for a potential membership to enable a steady direct
communication and to intensify the relationship during the total time of business
relationship (Tomzcak & Dittrich: 1999). A loyalty programme is regarded as a suitable
platform to increase the interaction frequency between company and customer (customer
interaction effect) by creating contact and feedback opportunities (Diller: 1997). The
customer’s willingness for membership depends on the distinct advantage to them
(customer benefit effect), and most often only if the cost-benefit-calculation leads to a
positive result (Strauss, Chojnacki, Decker & Hoffmann: 2001).
Building customer loyalty is a business strategy, not just a program. Structuring customer
loyalty strategies centres on share of the customer. Customers from whom you get twenty
per cent to eighty per cent share represent the best opportunity for growth (Duffy: 1998).
He informs that the effort to boost share of customer in the middle is considerably less
than at the low end and high end of the share-of-customer scale. Loyalty programmes
commercially started in the airline industry in 1978, due to airlines struggling for a point
of differentiation. Remarkably, it has been said that frequent flyer programs have played a
significant role in the demise of many post-deregulation airline start-ups (GAO Report:

160
1996). A characteristic of airline loyalty marketing is the term promotional currency,
being miles or points earned as the member spends. The promotional currency is
redeemed for something of value- in this case free travel, accommodation and related
services. When effectively developed and implemented, loyalty marketing strategies
become integrally linked to the product/service (Reichheld: 2001).
Loyalty strategies seek to enhance customer relationships, which in turn facilitate
customers to have a point of contact for product/service concerns; rather than quietly
defecting (Duffy: 1998). As a result, this may result in customers becoming advocates or
disciples (Heskett et al: 1997). Duffy (1998) postulates that loyalty strategies can create a
reluctance to defect, particularly when the customer may associate loss of a benefit in so
doing. Duffy (1998) further explores and recommends typical loyalty strategy initiatives:
• Name the promotional currency. This may be referred to as miles or points, rule of
thumb being simplicity
• Select an appropriate unit of measure. Not too large and not too small
• Select an appropriate tier structure. The first approach is tiers based on spending
(the more you spend the more you earn, motivates spending); the second approach
is tiers based on balance (the more you save the more it’s worth, motivates
spending and saving)
• Require redemption in fixed units. Guarantees members will mostly have a
balance remaining after redemption, and be reluctant to defect
• Use redemption to drive sales. Mechanisms must be built in to ensure that loyalty
programs build business, being incremental sales
• Program accounting. Contrary to being a database only, the system requires full
accounting capability.
Strauss et al (2001) confirm that the essential result of their study is the fact that a loyalty
programme cannot only obtain an indirect retention effect for an organisation because of
the use of an improved customer data base, but that a direct retention effect actually can
be achieved with regard to higher relationship satisfaction and customer retention.
Loyalty club members definitely show a higher degree of relationship satisfaction and
customer retention than non-members, once again highlighting the customer satisfaction
and loyalty link to long term growth and profit (Heskett: 2002).

161
4.7.6 Lifetime value
The discussion on customer value in section 4.4.1 revolves around the customer value
equation, whereas the lifetime value reflects the equation over a strategic period, with
long-term implications for the organisation (Heskett et al: 1997). Customer equity is the
total of the discounted lifetime values summed over all of the organisation’s customers,
and is the most important determinant of the long term value of the firm (Zeithaml &
Bitner: 2003).
Towards lifetime values, McDougall, Wyner and Vazdauskas (1997) indicate four basic
components to customer value:
• Acquisition costs. The sum of sales, advertising and communications mix
elements spent in acquiring the customer
• Revenue stream. The total revenue generated by the customer through the
purchase of products and services
• Cost stream. The cost to provide these products and services to the customer
(including customer service costs)
• Length of relationship. How long the customer remains a customer of the
organisation.
McDougall et al (1997) identify three essential steps in performing customer valuation,
consisting of defining the relevant customer universe, collecting data (based on relevant
behavioural and economic components of lifetime value), and determining overall value
(integrating these components into overall measures of value). TeleCheck, a large cheque
acceptance company in USA calculated a 33 per cent increase in profit with a 5 per cent
increase in their retention rate (Heskett et al, 1997: 200-201). Value based customer
segments can be used in aspects of strategic planning, share goals (retention, win-back,
acquisitions), new product development (needs and behaviours of most valuable customer
segment/s), brand management (most appropriate communications strategy, competitive
differentiation, brand repositioning) and customer service (depending on expected
lifetime value to the company) (McDougall et al: 1997).
Reichheld (2002) links loyalty to profitability via the lifetime value of the customer.
McDougall et al (1997) argue that by understanding and managing lifetime customer

162
value, a company not only allocates resources to its customers more effectively, but also
becomes better able to focus on developing long-term customer relationships. Heskett et
al (1997) identify the strategies of retention, related sales and referrals towards achieving
the lifetime value objective.
4.7.6.1 Retention strategies
Retention can be defined as a commitment by customers to do business or exchange with
a particular company on an ongoing basis (Zineldin: 2000). Customer retention brings
with it benefits such as employee retention and satisfaction, better service, lower costs
(Reichheld: 1996), lower price sensitivity, positive word-of-mouth, higher market share,
higher efficiency and higher productivity (Zineldin: 2000). Retention of current customers
refers to the ability of organisations to maintain active relationships with their current
customer base (Ruyter & Bloemer: 1999). In return, the revenue received becomes
increasingly profitable, due to less effort required to analyse their needs (Andreassen:
1994). The key to retaining customers is relationship marketing, highlighted in the
previous section. MBNA (USA), a large insurance company, had one of the lowest
defection rates in the industry, and as a result, achieved phenomenal profits, despite no
acquisitions or mergers.
The higher the employee and customer retention rates (loyalty) the higher the profit
(Brooks: 2000). Not paying attention to all major stakeholders’ results in a hidden cost to
cash flow resulting from the churn in fickle customers, disinterested employees and short-
term owners. While satisfaction may be an important retention driver, trust and brand
switching barriers are also likely to influence retention, both independently and in tandem
(Ranaweera & Prabhu: 2003). In their empirical investigation on the effect of these
constructs on retention, the following was highlighted:
• In a low customer contact, mass service setting, satisfaction is the strongest driver
of customer retention
• Results confirm the expected positive effect of trust on retention
• No evidence that trust, as a direct determinant of retention, is more important than
satisfaction, not even in a continuous purchasing setting more suited to trust
relationships
163
• Trust can be lost in the event of service failure, despite a satisfying service
recovery experience
• Customers appear to be willing to accept the apology and compensation offered
by the service provider to offer a trouble free service in the future
• The main and the interaction effects of switching barriers on retention were highly
significant. The suggestion is that, in an industry with switching barriers, service
providers are likely to be able to retain even those customers who are less than
satisfied
• Customers could become resentful to switching barriers especially if these barriers
lead to a scenario of complete entrapment
• While switching barriers could be thought of as an alternative means of retaining
customers, they could also be a complementary source of satisfaction through the
provision of added value to the service bundle.
In an empirical study conducted by Hansemark and Albinsson (2004), they found the
strongest connections between satisfaction and retention pertaining to the experiences of
relationships and confidence, and frequent contact accompanied by open dialogue.
Complaint handling was also strongly connected to both concepts. Appiah-Adu (1999)
finds that the most critical element in retaining customers is the company’s customer
philosophy. He also stresses that there is a difference between satisfaction and complete
satisfaction, the goal being to achieve the latter. Ranaweera & Neely (2003) empirically
showed that increasing service quality perceptions strengthen the rate of retention of even
those who are unhappy about price. They do however inform that there are price ceiling
which negate perceived service quality.
Many studies have revealed that attracting new customers is at least five times more
expensive than retaining existing ones (Bowen & Chen: 2001; Mulhern & Duffy: 2004;
Wong & Sohal: 2003). To this end, even though incentives should be put in place to
procure new customers at the point of purchase and to increase usage, companies should
also implement retention incentives to frontline and support personnel.
Kotler (2000) identifies the tendency of most companies to concentrate on attracting new
customers rather than on retaining existing ones. Many companies, however, have always
cared passionately about customer retention, and are determined not to lose customers. To
this end, Sherden (1994) identifies key questions regarding customer defections. The
164
analysis commences with internal records, followed by extending defection research to
outside sources. Key questions include:
• Do customers defect at different rates during the year?
• What is the relationship between defection rates and changes in price?
• What are retention and defection norms of the industry?
• Which Competitor in the industry enjoys the highest retention rates?
• Where do defection customers go?
• Does defection vary by outlet or location?
Heskett et al (1997) identify the use of listening posts, facilitating retention via open
communication channels between companies and customers. Such listening posts are not
only implemented for customer complaints, but also for recommendations, ideas, requests
and the like. Albrecht and Zemke (1985: 67) emphasized that listening is not enough; but
that companies must respond quickly and constructively to complaints and requests. They
also link retention with referrals as, “of the customers who register a complaint, between
54 and 70 per cent will do business again with the organisation if their complaint is
resolved. The figure goes up to a staggering 95 per cent if the customer feels that the
complaint was resolved quickly. Customers who have complained to an organisation and
had their complaints satisfactorily resolved tell an average of five people about the good
treatment they received”.
As loyal customers account for a substantial amount of company profits (Heskett: 2002),
a company should not risk losing a customer by ignoring grievances and queries.
However, a small per centage of customers will never be content with service offerings,
no matter when and where they shop. Wal-Mart actually have a strategy where they 'fire'
customers, yet only as a last resort. In such cases, and only upon confirmation from
management, the customer is requested to use the services of another retailer, who might
be able to satisfy their needs (Heskett et al: 1997).
Reichheld (1996) identifies some interesting facts bearing on customer retention:
• The average company loses 10 per cent of its customers per annum
• Acquiring new customers can cost at least five times more than retaining existing
ones

165
• Profits can increase by twent-five to eighty-five per cent (industry dependent) by
having a five per cent reduction in the customer defection rate
• The customer profit rate tends to increase over the life-cycle of existing
customers.
Computing the cost of lost customers identifies eight steps in attempting to reduce the
defection rate. These include (Reichheld: 1996):
• The organisation must define and measure its retention rate
• The organisation must distinguish causes of defection, and identify those causes
that can be managed better
• The organisation needs to estimate loss in profits per defection, which involves the
lifetime value, being the present value of the profit stream that the company would
have realized, had the customer not defected prematurely
• Changing channels of distribution
• Minimising adverse selection of customers through creative filtering
• Rewarding the sales force for retaining customers, not just winning new customers
• Designing special programmes to attract and hold the most valuable customers
• Finally, the company needs to ascertain the costs involved to reduce the defection
rate. As long as the cost is less than the loss in profit from defections, the
company should expend that amount to reduce the defection rate.
Reichheld (1996) places emphasis on retaining the right employees, suggesting measures
such as designing career paths for maximum productivity, adopting a concept of
partnership that aligns the company’s interests with the employees, making a proactive
effort to keep its best employees, and recruiting staff carefully; staff that will maintain
and improve the character and integrity of the firm. Reichheld (1996) identifies the third
tier of involvement as attracting and keeping investors. In this regard, he advises as
follows: educating current investors, and attracting the right kind of core owner, that is,
those that have a long term view. Those organisations that implement competitive
advantage and succeed; deliver high customer value and satisfaction, which leads to high
repeat purchasers, and, therefore, higher profitability (Heskett: 2002).

166
4.7.6.2 Related sales of new products and services
It is more profitable to sell new products and services to the existing customer base than
to new customers (Reichheld: 2001). Given the existence of a loyal customer base, there
is a strong incentive to exploitation, by developing related products and services that
appeal to it (Heskett et al: 1997). Many companies have diversified to accommodate
related sales, thus enhancing their product offering, in turn improving profitability
(Gibson: 1998). Whilst Ster-Kinekor theatres are in the business of movie exhibition,
their related services include the sale of confectionery items, which account for twenty-
seven per cent of their profits. Whilst related sales are directed at the lifetime customer,
organisations may be in the position to leverage their core product (Porter: 1985),
whereby additional revenue streams may be introduced. These streams are not always
directed at the customer. Such leverage occurs at Ster-Kinekor theatres, where substantial
revenues are a result of advertising opportunities within theatres and theatre foyers
(CineMark). Similarly, Exclusive Books have introduced coffee shops in all their outlets;
affording their customers the opportunity of reading books in a friendly and convenient
location.
From a strategic marketing perspective, related sales may be aligned to extending volume
growth via extended usage in current markets (Walker et al: 1999). The aim is to get
current customers to spend more, either by increasing consumption on current products or
services, or introducing new products or services (Kotler: 2000). Implementation may
centre on affordability, convenience, needs, complementarity, notwithstanding impulse
purchases. Whilst related sales are aimed at an existing customer base (lifetime value),
increased penetration and market expansion are not relevant in this case. A study of
purchase intentions in the home entertainment industry (Maritz: 2002; 2003a,b) found
that customers had idle cash on hand once receiving change from transactions. The
objective was to convince the customer to spend that change in-store; via related sales of
confectionery, phone cards, movie paraphernalia and accessory items.
4.7.6.3 Referrals
Referral is used to describe communications (either positive or negative) between groups
such as the product provider, independent experts, family and friends and the actual or
potential consumer. Word-of-mouth is a similar concept, except that it constitutes verbal

167
communication (Hel & Schlei: 1998). Referrals from existing customers to other
consumers rate amongst the highest form of positive communication (Stokes & Lomax:
2002). This necessitates efforts to enhance customer satisfaction, not only for repeat
business, but also for the high value of referrals (Soderlund: 1998). Reichheld & Sasser
(1990) found that recommendations from friends and acquaintances carry twice the
impact of paid advertising when consumers make purchasing decisions. The U.S. Office
of Consumer Affairs identified that dissatisfied customers tell at least eleven other people
of their dissatisfaction, whereas satisfied customers only tell five other people of their
satisfaction (Heskett et al: 1997). Reichheld (2001) reported that research indicates that
people only tell eight friends about a truly satisfying experience, whilst a bad experience
may be communicated to twelve people. Soderlund (1998) is of the opinion that the
explanation is due to the theory of asymmetrical effects of positive and negative events.
Word-of- mouth (WOM) is regarded as the primary referral medium (Ennew, Banerjee &
Li: 2000).
Zeithaml and Bitner (2003) believe that people regularly turn to others for information
rather than to traditional marketing channels; which may be due to services often being
high in experience and credence properties. Referrals from satisfied customers go a long
way in developing the trust needed for a new customer to purchase a service that may
appear risky (Heskett: 2002). Word-of- mouth is considered more credible than other
sources of information, and satisfied, loyal customers are likely to provide an organisation
with strong word-of-mouth endorsements (Zeithaml & Bitner: 2003). Palmer (1998)
recommends that opinion leaders be used to convey positive word-of-mouth, as this is
seen as credible to the consumer.
Haywood (1989) examined the importance of the verbal exchange of positive and
negative information about an organisation’s products and services. He further presented
suggestions for learning what is said and how to gain systematic control over the word-of-
mouth process. This was depicted in a model of interpersonal communication among a
variety of stakeholder groups. Stokes and Lomax (2002) builds upon this model,
highlighting that marketing in entrepreneurial contexts relies heavily on WOM
recommendations for customer acquisition. Their research identified two sets of
dissonance, one between input WOM types and sources, the other between output WOM
content and targets. They conclude that WOM effectiveness can be improved through a

168
variety of interventions, thus demonstrating that WOM can be an effective part of a
marketing strategy.
Ennew et al (2000) inform that positive WOM from satisfied customers can increase
purchases; while negative comments from dissatisfied customers can decrease purchases.
They believe dissatisfaction can serve as an antecedent to negative WOM, relating to
customer loyalty being a WOM antecedent. They further provide insights into why
consumers use WOM (risk reduction), and why they might engage in WOM (satisfaction,
loyalty). Customer referral campaigns (CRC’s) are identified as one of the most direct
forms of managing WOM and promoting acquisitions, identified by organisations
incentivising existing customers to introduce new customers (Ennew et al: 2000).
Haywood (1989) identified a plan for the management of WOM directly through
acquisition and indirectly through retention. Constructs included: listen and question
effectively, interact with customers on a personal level, consumer orientation, deliver on
promises, targeting of opinion leaders, working with suppliers, joint advertising
campaigns, helping potential customers with information, competitor analysis and
development programmes.
Wilson (1994) considers the referral system as an interpersonal network and is one of the
most important business communication mediums. She recommends a methodology of
stimulating referrals: identify sources of referrals, offer reciprocation where appropriate,
compile a centralised list of referrers, keep referrers informed of progress, and establish
reasons for referral. Helm (2003) identifies different approaches to the calculation (value)
of positive WOM, leading to a monetary referral value of an organisation’s customers.
She however concludes that the cost of monetizing referral value will probably outweigh
the positive potential of WOM in a lot of cases, and that lifetime values are more
pertinent. The effect of referral strategies on lifetime values and overall organisational
long term and growth indicates a positive relationship between the constructs, facilitated
by the focus on developing long-term relationships (McDougall et al: 1997). Furthermore,
the positive association between WOM, customer and employee satisfaction and loyalty
are emphasised (Ennew et al: 2000).
The objective of retaining the customer, enhancing referrals and providing related sales,
leads to an increase in profitability which is threefold to base profits (Heskett: 2002). This
is in agreement with Reichheld (1996: 2001), whereby he analysed the lifetime

169
profitability of customers. Managing the lifetime value requires management of retention,
related sales and referrals (Heskett et al: 1997). Such initiatives, most of which have been
identified in some context within this chapter, include:
• Creating listening posts. This involves the creation, identification and
enhancement of listening posts. Listening posts include any form of medium
which facilitates the handling of queries, for example, toll-free help lines, service
counters, satisfaction surveys, salespeople, reception areas, point of purchase, and
data base management (Bolfing: 1989). One of the most effective ways of creating
listening posts is loyalty programmes, such as frequent-flyer models by the
airlines (Duffy: 1998). In return for communicating special offers, discounts and
promotions, the airlines create information processing from their customer details.
In addition, special training of staff to identify problems and opportunities has
been installed at many leading organisations, including the Ritz-Carlton chain of
luxury hotels. This listening mode forms a central part of the hotel's strategy
(Ahmad & Buttle: 2002). Sampson (1998) identifies active solicitation and passive
solicitation as means of creating listening posts. He sees e commerce capability as
great opportunity for the use of feedback in quality monitoring and improvement
processes. The digital nature of the medium lends itself to the establishment of
automatic customer feedback collection and response database systems, or what
one might call customer feedback information systems. Plymire (1992) regards the
creation of listening posts as a sure way to a customer-focused culture. Zairi
(2000) demonstrates that the effective management of listening posts can deliver
customer loyalty and satisfaction
• Measuring and communicating lifetime values. The key is to highlight lifetime
values as opposed to transaction based revenues (McDougall et al: 1997). The
reality is to think of customers in terms of their present value over a lifetime,
which places emphasis on the importance of retaining customers (Brooks: 2000).
This excludes the effect of referrals from satisfied customers, which will increase
lifetime values substantially (Ennew et al: 2000). Phil Bressler, one of Dominos
Pizza's most successful franchisees in the Baltimore area, calculated the lifetime
value of a loyal Pizza buyer in the region of $4000. Employees were encouraged
to have this figure in mind when serving customers, leading to policies of trusting
customer's judgement on delivery-time, for which they received guarantees.
McDougall et al (1997) argues that by understanding and managing lifetime

170
customer value, a company not only allocates resources to its customers more
effectively, but also becomes better able to focus on developing long-term
customer relationships. Employees should be motivated to enhance lifetime
relationships with customers, by understanding the benefits of repeat business and
making customers less likely to shop around for the best deals than non-loyal
customers (Bowen & Chen: 2001)
• Customer defections as learning opportunities. Vital information can be provided
by customers leaving an organisation, including how to get them back. Bolfing
(1989) proposes ways of managing customer complaints, and for controlling the
more harmful types of dissatisfaction experienced from customers that have
defected. Mack et al (2000) inform that focusing on service failures and defections
can assist organisations in improving service quality and improving long-term
customer retention. They identify potential failure points in the service process
(from defectors) and identify methods to prevent, as well as recover, these failures
to prevent negative customer perceptions and the ensuing customer loss and
potential negative word of mouth. Trubik and Smith (2000) identified implications
for organisations of the costs of retaining customer rather than acquiring them as
new, and the resulting increased profitability of customers the longer they are with
the organisation. The objective is to identify root causes for defections, enabling
management to implement corrective action, instead of basing initiatives on
management intuition
• Incentives to enhance customer loyalty. This reflects not only on business
generated, but also on the ability to maintain and develop loyal customers. At
MBNA, incentives are in place to reduce customer defection rates. Contributing
towards a bonus pool for predetermined standards of performance are common
practice in many leading service organisations, which also link customer loyalty to
employee loyalty (Lau: 2000). Eccles and Durand (1998) consider factors such as
the reason for complaints; reciprocity and complaint handling and ways to instil a
service recover strategy, for enhancing customer retention and satisfaction. Mack
et al (2000) postulate that focusing on service failures can improve service quality
and improve long-term customer loyalty. Carr (1994: 13) identifies database
marketing (‘talking directly to our listening clients’) as an integral connection to
customer loyalty. Zairi (2000) sees the issue of complaints handling and
management as essential for achieving retention and loyalty. A retail study (Wong
& Sohal: 2003) empirically evaluated the connection between incentivizing staff

171
and associated customer loyalty, and a positive association was found. The link of
employee satisfaction, loyalty and internal quality of worklife to customer loyalty
is emphasized with the introduction of incentives to employees; towards retaining
current customers (Lau: 2000)
• Relationship marketing. In essence, relationship marketing is based on building
customer loyalty (Zeithaml & Bitner: 2003). It is a strategy, which advocates
actions to seek lifetime relationships with loyal customers, rather than merely
transacting with them (Peck et al: 1999). Loyalty programmes and clubs form an
integral part of relationship marketing, as highlighted in the section on recognition
and rewards (Section 4.7.5)
• Potential-based marketing. This combines measures of loyalty with data
describing potential levels of usage (Walker et al: 1999). Its goals are to increase
penetration and increase purchases by customers who have the greatest need, or
exhibit strong loyalty to the service provider. In turn, such organisations attempt
to extend the relationship through increased sales, lengthen the relationship, and
increase profitability at each opportunity (Reichheld: 2001). Section 4.7.2.2
identifies related sales as an opportune strategy towards increasing customer share
in mature markets (Maritz: 2002; 2003a).
Attracting customers and customer acquisitions are paramount to any company wishing to
grow their revenues and profits (Kotler: 2000). Customer acquisitions require substantial
skills in lead generations, whereby the company places adverts/promotions in the media
to reach new prospects. The chain continues to lead qualification; whereby a prospective
customer is introduced to the company, followed by account conversion, whereby the
prospective customer becomes an active customer of the company (Palmer: 1998).
The cost of attracting a new customer is estimated to be five times the cost of keeping an
existing customer happy (Heskett: 2002). The challenge, however, is not to produce
satisfied customers, as several organisations can do this (Reichheld: 2001). The challenge
is to produce loyal customers who will contribute to lifetime value (McDougall et al:
1997).

172
4.8 ENHANCING SERVICE PROFIT CHAIN INITIATIVES
Customers should no longer be satisfied, they must be delighted (Kotler: 2000). This is in
agreement with Heskett et al. (1997), whereby loyalty, satisfaction and value are linked
with long term organisational profit and growth. Total customer value is enhanced when
benefits expected are met or exceeded, complementing satisfaction; which is the reaction
towards the actual satisfaction derived, as compared to the perceived or expected
satisfaction (Caruana et al: 2000).
Heskett et al. (1997) identified beliefs of leading service organisations such as Wal-Mart,
Southwest Airlines, Taco Bell and British Airways. These organisations have a common
belief in the values relating to:
• Customers buy results (Ho & Cheng: 1999)
• Employees with the right attitude, the right incentives, the right training, and the
right amount of latitude who will listen to customers are the key to designing and
providing services that create such results (Lau: 2000)
• Because financial performance is the result of past performance, measurement and
incentives must concentrate on determinants of future performance, customer and
employee satisfaction and loyalty (Reichheld: 2001)
• The real payoff from listening to customers is not just results-driven service
design and delivery that produces outstanding current performance, it is
maintenance of a strong, adaptive organisation culture that insures continued
excellence (Zairi: 2000).
These; and other leading service organisations believe in communicating the basics, and
to this end, eight core strategies are identified, all of which facilitate service profit chain
implementation (Heskett et al: 1997). This is concluded with communication of the
initiatives.
4.8.1 Spending time on the front line
Executives should periodically circulate and be involved at the point of purchase. Much
too often management do not have a hands on approach, and therefore are not in touch
with their customers (Rogers, Clow & Kash: 1994). Chairman William Pollard and his
173
colleagues at Service Master clean customers' hospital operating rooms at least one day a
year. Pollard states that it reminds them of what their business is about.
4.8.2 Putting employees first
The links identified between loyal employees and loyal customers (Silvestro: 2002, Lau:
2000, Vilares & Coelho: 2001) necessitate careful attention and recognition of employees.
Putting employees first necessitates management to spend unusually large amounts of
time at the front line with employees, personally attending to customers, and making
front-liners more successful at what they do (Rogers et al: 1994).
4.8.3 Leading personal development
Service Masters leaders invest personally in the development of a core of promising
managers. This is in tandem with spending time on the front line and developing
employees to the limits of their capabilities. Personal development is aligned to quality of
work life, supporting the contention that quality of work life will positively nurture a
more flexible, loyal and motivated workforce, which is essential in determining an
organisation’s competitiveness (Lau: 2000; Bassi & Vanburen: 1997).
4.8.4 Supporting greater job latitude
Employees are encouraged to portray greater latitude, together with employers facilitating
training and developmental programmes to implement such latitude (Nel et al: 2004).
Southwest Airlines have mastered the enhancement of greater job latitude, resulting in
productivity levels twenty per cent higher than the average in the industry. They have
achieved this by broadly defined jobs, whereby employees are trained in multi-
functioning across the organisation (Heskett et al: 1997). Section 4.6.1 refers, relating to
empowerment of employees (Lau: 2000; Nel et al: 2004). Boon and Kurtz (2000) identify
the importance of empowerment of employees on quality of work life (Lau: 2000),
whereby employees turn ideas into action.
174
4.8.5 Reducing labour costs by paying higher wages
This is usually achieved by eliminating unnecessary jobs, and providing technological
support to enhance productivity. Heskett et al (1997) identify efforts which make
employees more successful at what they do and increase their continuity on the job are
regarded as the primary means to insure that customers will be served well. The employee
satisfaction link to customer satisfaction is again highlighted (Silvestro: 2002).
4.8.6 Investing in customers
The value equation places emphasis on identifying and understanding customers' needs.
Another objective is to retain customers, realizing the lifetime value (Reichheld: 2001).
Customer needs are identified in terms of results sought by customers, process quality,
product/service package price and access costs (Heinonen: 2004); along dimensions
suggested by the value equation. Ensuring customer retention is implemented by Taco
Bell, where they are called 'safety nets', periodic surveys of customer satisfaction are
conducted and acted upon. At Service Master, there are annual customer reviews. At Wal-
Mart, they include greeting senior citizens at the door, and low-price guarantees for the
organisation’s retail customers (Heskett et al: 1997).
4.8.7 Maintaining measures and rewards that influence behaviour
These measures are regarded as drivers of growth and profitability, directed at employees
and customers (Lau: 2000; Yoon, Beatty & Suh: 2001). The financial results may take
time to fruition; however, leading service organisations believe that profits will follow
good performance on the non-financial measures (Heskett: 2002; Reichheld: 2001), and
that the result is worth waiting for.
4.8.8 Communicating the message
Role models are important in any organisation (Stokes & Lomax: 2002), and related
hereto, is the communication of superior customer service to employees and customers
(Zeithaml & Bitner: 2003). Of importance is the effective communication of the service
strategy of the organisation, and underlying reasons for the implementation thereof. The

175
communication process is that of a combination of external and internal, placing emphasis
on the service profit chain links (Heskett et al: 1997).
4.9 CONCLUSION
The service profit chain is a strategic service vision, whereby organisational profit and
growth are linked to customer value, satisfaction and loyalty. Implementation is via the
strategic initiatives of retention, related sales and referrals. Capitalising on the service
profit chain entails analysing the links in the chain. The construct of long term profit and
growth is linked to customer loyalty, satisfaction and service value. The construct of the
employee is analysed in context of employee productivity, loyalty, satisfaction and
quality of work-life; as a determinant of long term organisational profit.
Service profit chain management implications include measuring across operating units,
developing a balanced scorecard, communication of results, performance management
and encouraging internal best practice. The management of customer satisfaction
incorporates customer feedback and suggestion systems, lost customer analysis,
satisfaction surveys and mystery shoppers. Central to the service profit chain; the
customer value equation is a factor of results produced for customers, process quality and
price and acquisition costs. Requirements adding to value are introduced as understanding
customer needs, influencing attitudes, and return on value enhancing initiatives,
developing differentiation amongst market segments, and establishing value at a profit.
Customer loyalty is introduced as experiencing a positive relationship with profit,
highlighting determinants, relationships, and methods of enhancing loyalty. The lifetime
value of the customer is identified, together with links to satisfaction, value and loyalty.
Strategic initiatives of retention, related-sales and referral strategies are evaluated.
Management of lifetime value includes creating listening posts, communicating lifetime
values, customer defection reasons, loyalty enhancement, relationship marketing and
potential-based initiatives.
The chapter concludes with an entrepreneurial spirit of service profit chain enhancement;
identifying strategies to facilitate service profit chain implementation.

176
In Chapter 5, service quality, relationship marketing and best practice is discussed.
Service quality is studied from an integrated gaps model perspective; identifying
dimensions of tangibility, reliability, assurance, empathy and responsiveness.
Relationship management is studied from a six model framework, consisting of customer,
internal, referral, influence, recruitment and supplier/alliance markets. Benchmarking for
best practice is evaluated from a cross-industry perspective, culminating in a home
entertainment industry best practice initiative from an international context. The objective
of the chapter is to synergize and link service quality, relationship management and best
practice with entrepreneurial orientation, the franchise system and the service profit chain.

177
5 CHAPTER 5: INTEGRATING SERVICE QUALITY, RELATIONSHIP MARKETING AND BENCHMARKING FOR BEST PRACTICE
Improving service quality (Zeithaml & Bitner: 2003) is a strategy for keeping customers
as well as getting them in the first place (Ballantyne, Christopher & Payne: 1995). This
has been expressed as a developmental approach to relationship marketing (Gronroos:
1984; Payne et al: 1999); via benchmarking for best practice (TBE: 2004; Jarrar & Zairi:
2000).
5.1 INTRODUCTION
Service quality is often conceptualised as the comparison of service expectations with
actual performance perceptions (Zeithaml & Bitner: 2003). Emphasis is placed on the
combined attitudinal construct of service quality, highlighting constituents of both
cognitive and affective components. Parasuraman et al (1998) tend to delineate service
quality using more cognitive items, whereas Edwards (1990) found that the affective
attitudes exhibited more change under affective means of persuasion than under cognitive
means of persuasion. Teas (1993), however, argues that service quality is a combination
of transaction and overall attitude.
Research suggests that customers perceive service quality in a multi-dimensional way,
based on multiple factors relevant to the context. Zeithaml and Bitner (2003) identify
dimensions of reliability, assurance, tangibles, empathy and responsiveness. They further
identify the gaps model of service quality, identified in Figure 5.2. The gaps model
provides input into managing the services marketing mix for service quality and setting of
service standards. Integration of service relationships include market orientation; loyalty;
customer satisfaction; marketing culture; previous experience; internal marketing; future
consumer behaviour and culture.
Service quality measurement includes analyses of a number of tools, including
SERVQUAL (Parasuraman et al: 1998); SERVPERF (Cronin & Taylor: 1992); EP/NQ
model (Teas: 1993); Qualitometro (Franceschini & Rossetto (1997); critical factor
approach (Sureshchander et al: 2002); bank service quality (Bahia & Nantel: 2000); and
two-way model (Schvaneveldt et al: 1991). It is proposed to evaluate the merits of each
approach, and implement an applicable measurement tool for this study.
178
Relationships between value chain participants (Porter: 1995) led to developments in the
field of relationship marketing. Peck et al (1999: 22) developed a revised version of the
relationship management six markets model; which includes customer, internal, referral,
influence, recruitment and supplier/alliance markets. The six markets model identifies all
facets of internal and external relationships that can contribute towards an organisation’s
marketplace effectiveness.
The purpose of evaluating relationship marketing is to analyse the effect of networks and
relationships towards customer satisfaction and loyalty (Heskett: 2002; Reichheld: 2001).
Literature from franchise systems relationships (Section 3.3) is combined with the six
markets relationship model (Peck et al: 1999); together with entrepreneurial orientation in
a franchised system (Bolton & Thompson: 2003; Lindsay & McStay: 2004) represented
in sections 2.6.10 and 3.4.
Complementing the service vision further led to development of best practice initiatives,
often initiated by innovative firms in competitive industries and environment. Such
initiatives were regarded as pivotal in survival and achievement of competitive advantage
(Porter: 1998). The Video Software Association of America (VSDA: 2001) identified best
practice in the industry, as identified by Arthur Andersen Business Consultants. These
were wide ranging, including understanding customers and markets; developing vision
and strategy; refining store product offering; implementing the marketing plan; creating
promotions and in-store merchandising; and clear in-store operations. Customer service
findings included the best customer service is one-to-one, strong relationships and loyalty
are developed between staff and customers through consistency of management and staff,
and personalising customer service.
5.2 SERVICE QUALITY
Service quality is an attitude or global judgement about the superiority of a service,
although the exact nature of this attitude is not agreed (Robinson: 1999). Viewpoints
differ regarding the origins, suggesting that it stems from a comparison with ideal
standards (Teas: 1993); from perceptions of performance alone (Cronin & Taylor: 1994),
to a comparison of expectations with performance perceptions/disconfirmation
(Parasuraman et al: 1988). This is made evident by the variety of service quality
measurement models and dimensions, discussed in section 5.2.2. Service quality differs

179
from customer satisfaction in that service quality is an overall attitude towards a service
organisation (Caruana et al: 2000), whilst customer satisfaction is specific to an
individual service encounter (Zeithaml & Bitner: 2003).
5.2.1 Defining service quality
Service quality is most often conceptualised as the comparison of service expectations
with actual performance perceptions (Zeithaml & Bitner: 2003; Parasuraman et al: 1998).
Hung-Chang (2002) placed emphasis on the combined attitudinal construct of service
quality, highlighting constituents of both cognitive and affective components.
Parasuraman et al (1998) tend to delineate service quality using more cognitive items,
whereas Edwards (1990) found that the affective attitudes exhibited more change under
affective means of persuasion than under cognitive means of persuasion. Meanwhile,
Teas (1993) argues that service quality is not just an overall attitude, but that it is also
transaction specific.
Palmer (2001) identifies a two-series approach to defining service quality; that of
conforming to requirements and that of fitness for use. The latter is based primarily on
satisfying customers’ needs, and the former on complying with specifications. This
approach may be united in the concept of customer perceived service quality; whereby
quality can only be defined by customers, occurring when an organisation supplies
services to a specification satisfying their needs.
Gronroos (1984) defines service quality as the difference between service expectations
and perceived standard of delivery. He identified technical and functional quality as being
two principle components of quality. Technical quality is the relatively quantifiable
aspects of a service received by interacting with organisations; examples being waiting
time at check-out counters and reliability of public transport services. Services also
however involve consumer-producer interaction, identifying the method of delivering
technical quality. This perception is referred to as functional quality, and cannot be
measured as objectively as the elements of technical quality (Mels, Boshoff & Deon:
1997). Figure 5.1 illustrates diagrammatically Gronroos’ conceptualisation of service
quality, as applied to an optician’s practice. The figure is represented on the following
page.
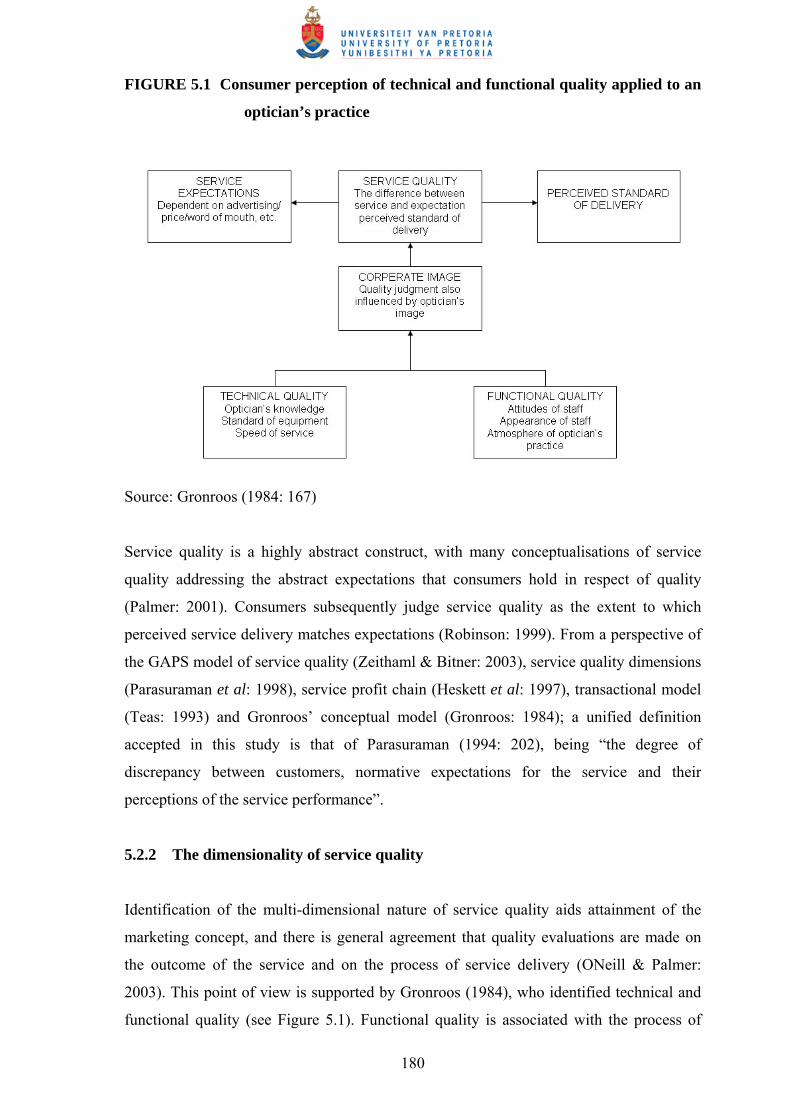
180
FIGURE 5.1 Consumer perception of technical and functional quality applied to an
optician’s practice
Source: Gronroos (1984: 167)
Service quality is a highly abstract construct, with many conceptualisations of service
quality addressing the abstract expectations that consumers hold in respect of quality
(Palmer: 2001). Consumers subsequently judge service quality as the extent to which
perceived service delivery matches expectations (Robinson: 1999). From a perspective of
the GAPS model of service quality (Zeithaml & Bitner: 2003), service quality dimensions
(Parasuraman et al: 1998), service profit chain (Heskett et al: 1997), transactional model
(Teas: 1993) and Gronroos’ conceptual model (Gronroos: 1984); a unified definition
accepted in this study is that of Parasuraman (1994: 202), being “the degree of
discrepancy between customers, normative expectations for the service and their
perceptions of the service performance”.
5.2.2 The dimensionality of service quality
Identification of the multi-dimensional nature of service quality aids attainment of the
marketing concept, and there is general agreement that quality evaluations are made on
the outcome of the service and on the process of service delivery (ONeill & Palmer:
2003). This point of view is supported by Gronroos (1984), who identified technical and
functional quality (see Figure 5.1). Functional quality is associated with the process of
181
service delivery, whereas technical quality is associated with the actual output of the
service (Palmer: 2001).
Research suggests that customers perceive quality in a multi-dimensional way, based on
multiple factors relevant to the context (Zeithaml & Bitner: 2003). The early works of
Berry, Zeithaml and Parasuraman (1985) provide a strong foundation for understanding
the dimensionality of service quality. Their original qualitative study identified ten key
dimensions, each of which relates not only to the service consumed, but also to the
customers’ confidence in those providing the service. These included tangibles,
reliability, responsiveness, competence, courtesy, credibility, security, access,
communication and empathy. Over the years, the authors have distilled this list into five
broader categories. These dimensions represent how consumers perceive service quality,
and may use all or a combination of dimensions (Zeithaml & Berry: 2003). Widely
referred to as SERVQUAL, the five elements include reliability, assurance, tangibles,
empathy and responsiveness.
• Reliability; the ability to perform the promised service dependably and accurately.
Of the five dimensions, reliability has been identified as the most important
determinant of perception of service quality. Reliability means that the
organisation delivers on its promises, particularly promises about the service
outcomes and core service attributes (Heskett: 2002)
• Assurance; the knowledge and courtesy of employees and their ability to inspire
trust and confidence. This is a particularly important dimension for services with
high risk perceptions. Relationship management forms an integral part of the
assurance dimension (Peck et al: 1999)
• Tangibles; the physical facilities, equipment, and appearance of personnel. This
dimension is particularly important in service quality perceptions of new
customers (Zeithaml & Bitner: 2003), with emphasis on hospitality industries such
as restaurants, retail stores and entertainment organisations. The tangible
dimension is mostly used in combination with other service quality dimensions to
enhance quality perceptions
• Empathy; the caring and individualised attention given to customers. The essence
of empathy is conveying to consumers that they are unique and special, via
personalized or customized service offerings (Zeithaml & Bitner: 2003). Business-
to-business services are particularly prone to the empathy dimension
182
• Responsiveness; the willingness of service providers to help customers and
provide prompt service. This dimension captures the notion of flexibility and
ability to customize the service to consumer requirements, and emphasizes
attentiveness and promptness in dealing with the consumer (Zeithaml & Bitner:
2003).
The various statistical analyses conducted in constructing SERVQUAL revealed
considerable correlation among items representing several of the original ten dimensions
for evaluating service quality (Zeithaml, Parasuraman & Berry: 1990). The authors
believe that these five dimensions are a more concise representation of the “core criteria
that customers employ in evaluating service quality”. They are represented further in the
chapter under service quality in Figure 5.3.
SERVQUAL has however been challenged on a number of grounds, such as an absolute
measure of attitudes (Cronin & Taylor: 1994); the inductive nature of original research
(Andersson: 1992) and the psychometric properties of the instrument (Carman: 1990). All
this provides further evidence of the complexity of the service quality construct and that
it cannot be defined in any one way for all service encounters (O’Neill & Palmer: 2003).
SERVQUAL, however, is discussed as a measurement tool in Section 5.2.8.
Hung-Chang (2002) emphasised the cognitive and affective dimensions of service quality.
Cognitive dimensions included a seventeen point scale, including promises,
dependability, performance, correctness, information, prompt service, active contact,
response, correcting errors, convenience, modern equipment, personnel appearance,
comfortable environment, appealing facilities, convenience, integrated services and
reliability. The second construct of affective components included a thirteen point scale,
consisting of attention, care, best interest, customer needs, confidence, willingness,
courtesy, safety, honour, treatment, self-esteem, societal and self-actualization.
5.2.3 The integrated gaps model of service quality
The gaps model of service quality positions key concepts in services marketing that
commences with the consumer and builds the organisation’s tasks around requirements to
close the gap between customer expectations and perceptions (Zeithaml & Bitner: 2003).
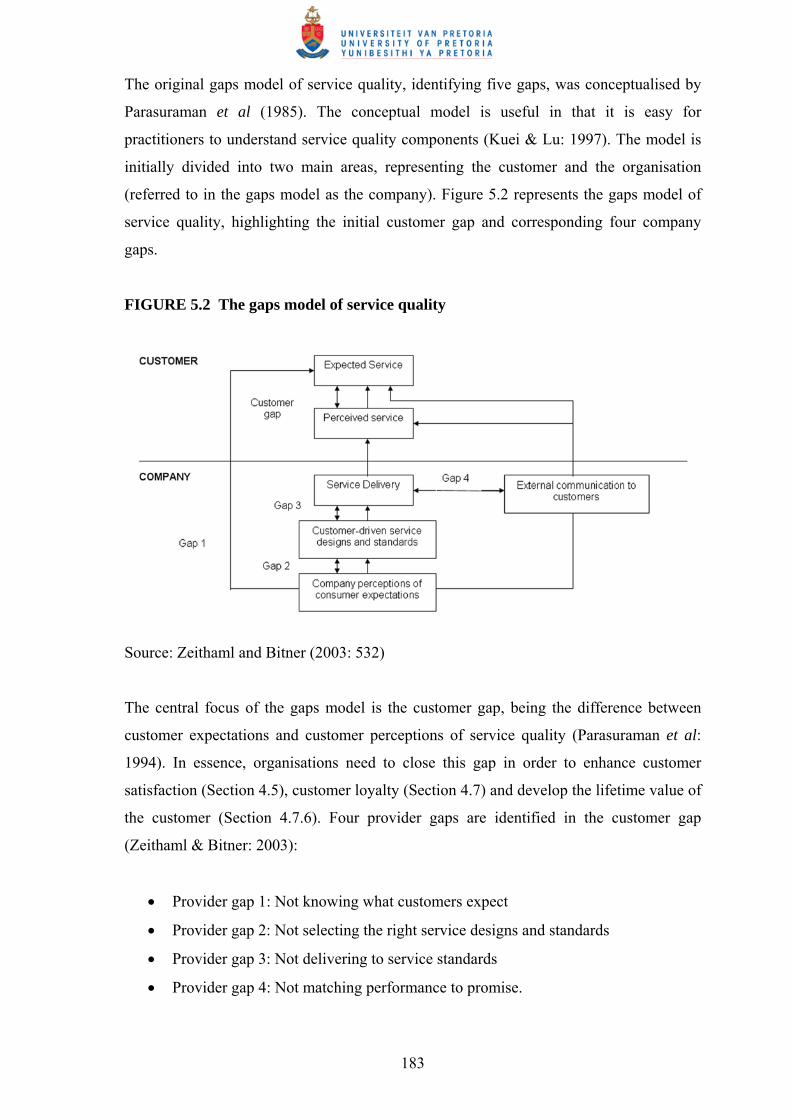
183
The original gaps model of service quality, identifying five gaps, was conceptualised by
Parasuraman et al (1985). The conceptual model is useful in that it is easy for
practitioners to understand service quality components (Kuei & Lu: 1997). The model is
initially divided into two main areas, representing the customer and the organisation
(referred to in the gaps model as the company). Figure 5.2 represents the gaps model of
service quality, highlighting the initial customer gap and corresponding four company
gaps.
FIGURE 5.2 The gaps model of service quality
Source: Zeithaml and Bitner (2003: 532)
The central focus of the gaps model is the customer gap, being the difference between
customer expectations and customer perceptions of service quality (Parasuraman et al:
1994). In essence, organisations need to close this gap in order to enhance customer
satisfaction (Section 4.5), customer loyalty (Section 4.7) and develop the lifetime value of
the customer (Section 4.7.6). Four provider gaps are identified in the customer gap
(Zeithaml & Bitner: 2003):
• Provider gap 1: Not knowing what customers expect
• Provider gap 2: Not selecting the right service designs and standards
• Provider gap 3: Not delivering to service standards
• Provider gap 4: Not matching performance to promise.

184
To close the customer gap, the model suggests that four other gaps, the provider gaps,
also need to be closed (Zeithaml et al: 1990). These are represented as gaps 1, 2, 3 and 4
in Figure 5.2. Key factors leading to provider gap one include (Zeithaml & Bitner: 2003):
• Inadequate marketing research orientation
• Lack of upward communication
• Insufficient relationship focus
• Inadequate service recovery.
Provider gap two is the gap between customer-driven service designs and standards and
management perceptions of customer expectations. Key factors leading to provider gap
two include (Zeithaml & Bitner: 2003):
• Poor service design
• Absence of customer-defined standards
• Inappropriate physical evidence and servicescape.
Not delivering to service standards is core to gap three, the gap between service delivery
and customer-driven service designs and standards. Key reasons leading to provider gap
three include (Zeithaml & Bitner: 2003):
• Deficiencies in human resource policies
• Failure to match supply and demand
• Customers not fulfilling roles
• Problems with service intermediaries.
When promises do not match performance, Zeithaml and Bitner (2003) identify key
reasons for provider gap four:
• Lack of integrated services marketing communications
• Ineffective management of customer expectations
• Over-promising
• Inadequate horizontal communications.
185
Zeithaml and Bitner (2003) believe the foundation of the gaps model emphasis is
warranted; due to the strong focus on the customer and the need to use knowledge about
the customer to drive business strategy. Using the background of the gaps model,
management of service quality follows.
5.2.4 Organizing and implementing service quality
Organisations need to develop strategies to enhance the delivery of consistent and high-
level service quality (O’Neill & Palmer: 2003). Kotler (2000) researched successful
service organisations in the United States of America, and proposed the following
requirements:
• A strategic concept which is customer-focused
• A history of senior management commitment to quality
• The setting of high standards and communication of these standards to employees
• Systems for monitoring performance
• Systems for satisfying complaining customers
• Satisfying employees as well as customers.
Service employees have emerged as a key element in the process of quality management
(Palmer: 2001). This is in tandem with the line of thought represented in Section 4.7,
highlighting an entrepreneurial spirit to enhancing service profit chain initiatives (Heskett
et al: 1997). Emphasis on the employee as service provider is emphasized in Section
4.2.7, highlighting positive quality of work-life effects on successful organisations (Lau:
2000). Vilares and Coelho (2001) identify the notion of putting employees first; Bassi and
Vanburen (1997) explain organisational competitiveness as a result of a motivated
workforce; whilst Nel et al (2004) discuss training and development programmes in
supporting greater job latitude. Services marketing mix decisions (Kotler: 2000) of
personnel, price, promotion and distribution require additional insight towards closing the
gaps.

186
5.2.5 Managing the services marketing mix for service quality
Service quality management is the process of limiting the gap between consumer
expectations and the perceived service delivery (Palmer: 2001). He informs that the
marketing mix is at the forefront of implementations towards this objective. Firstly, the
marketing mix formulation and communication thereof should be as realistic as possible,
not enhancing false expectations (Walker et al: 1999). Secondly, non-marketer dominated
factors such as referrals (for example, word of mouth) also require consideration as their
presence may also effect increasing expectations (Heskett: 2002). Finally, there is the
importance of recognizing the dynamic relationship between customers’ perceptions and
expectations (Zeithaml & Bitner: 2003).
Services marketing mix management is concerned with closing the quality gap over time,
either by improving the service offer, or restraining customers’ expectations (Palmer:
2001). All elements of the mix can affect the level of customer expectations and
perceptions, and the elements should not be taken in isolation (Kotler: 2000). Elements of
the mix, together with synergies towards narrowing the service quality gap include
(Palmer: 2001):
• Front-line contact personnel are particularly important elements of consumers’
perceptions of functional quality; making the buyer-seller interaction vital in
service settings. This again highlights the service profit chain links identifying the
employee as an integrated and important element (Heskett et al: 1997). Training
and development go a long way in providing employee latitude, enhancing quick
decision making (Nel et al: 2004)
• Place (distribution); often regarded as accessibility in services, can affect
customers’ expectations of quality as well as actual performance. A poor quality
service offered through a high-quality provider may increase expectations;
similarly, a high quality service offered through a low-quality provider may
decrease perceptions. This places emphasis on the recruitment of service
providers, monitoring a network of intermediaries who are able to share the
service principal’s commitment to quality standards. Such is the case in
franchising, whereby the franchisor should recruit service oriented franchisees
towards adhering and maintaining expected service standards (Mendelsohn: 2003)

187
• Pricing decisions affect both customer’s expectations and perceptions of service
quality. With all other factors being equal, price is often used by potential
customers as a basis for judging service quality. Low price may however lead to
insufficient margins to provide high quality service. Price is an important link to
the customer value equation, highlighted in the service profit chain (section 4.6.6).
Added value, convenience and portability often allow the service provider to
negate price as the only measure of cost. Caruana et al (2000) however inform that
service providers need to convince customers of the value of such efforts. This
rotates back to customer expectations
• Promotion. Decisions have the effect of enhancing consumers’ expectations of
service quality. The message and communication medium may have a significant
contribution to quality expectations. To a lesser degree, promotion may also
enhance perceptions of service quality, such as value added, loyalty cards and
membership schemes. Promotion is linked to the strategic initiatives of retention
and related sales in the service profit chain (Heskett et al: 1997). This is
highlighted in Section 4.7.6, identifying the lifetime value of the customer
(Reichheld: 2002).
In order to communicate the standard of service quality a customer can expect to receive,
service providers implement precise specifications of service standards. This is discussed
in setting service standards.
5.2.6 Setting service standards
The general manner in which an organisation promotes itself may give a general
impression as to the service quality it wishes to deliver; however, more specific standards
can be stated in a variety of ways (Palmer: 2001):
• At most basic, service providers can rely on its terms of business as a basis for
determining the service quality level. This may be as a result of business
strategies, identifying generic competitive advantage of low cost or specialisation
(Porter: 1998). The franchise agreement, for example, may state the franchise
system terms of service quality, to be adhered to by all system members
(Mendelsohn: 2003). Customers can thus expect a similar service quality standard
throughout the network (Justis & Judd: 2002)
188
• Customer charters go beyond the basic terms of business, by stating in a general
manner the standards of performance which the organisation aims to achieve. This
specific standard may be likened to creating listening posts and avenues of
customer complaints in the service profit chain (Heskett et al: 1997), identified in
Section 4.5. This may also be likened to the charters provided by many franchise
organisations, whereby toll-free communication is provided for customers to air
complaints directly to the franchisor (Zairi: 2000). Mack et al (2000) postulate
that focusing on customer complaints and service failures can assist in improving
service quality
• Specific guarantees of service performance are most often offered in respect of
service outcomes. As an example, the Blockbusters franchise display specific
customer service quality guarantees, such as being addressed by name, receiving
prompt attention, and assurance of an enjoyable home entertainment experience
(Maritz: 2003). Compensation is promised if certain specified services are not
delivered correctly. These specific guarantees are however inevitably dependent
on employee capability and attitudes, a primary driver being employee motivation
and quality of work-life (Nel et al: 2004). The link to the employee in the service
profit chain is once again highlighted (Heskett et al: 1997). The operations manual
is a means of stating the service requirements in a franchised environment, often a
bone of contention between the relationship parties (Germann: 2002)
• Many services organisations belong to a professional association, incorporating
the association’s code of conduct into their own service offering. The code of
conduct provides consumer reassurance to potential customers, and a statement of
minimum standards to employees. In the franchised environment, such
associations may include the Franchise Association of South Africa (FASA:
2002), or in the home entertainment industry, the Video Software Dealers
Association of America (VSDA: 2001). A home entertainment association does
however not exist in South Africa, making membership to an international
association somewhat meaningless in the mind of the consumer (Maritz: 2002)
• General trade affiliations, safety associations, charitable associations and social
responsibility associations also go a long way to enhancing customer loyalty
(Reichheld: 2001). Whilst not directly associated to service quality, these
initiatives impose a sense of integrity, effecting expectations and perceptions of
service quality (Zeithaml & Bitner: 2003).
189
Service quality is associated and linked to many strategic marketing initiatives, placing
emphasis on the synergistic approach between all the dimensions of service quality (as
depicted in Section 5.2.2).
5.2.7 Integration of service quality relationships
Much has been researched and written on the various service quality relationships (Tung-
Zong & Su-Jane: 1998; Heskett et al: 1997; Peck et al: 1999; Mendelsohn: 2003;
Chaston: 2003; VSDA: 2003; Bolton & Thompson: 2003), particularly due to service
quality being a factor that has a significant impact on business performance (Silvestro &
Cross: 2000; Duffy: 2003). The link between entrepreneurial orientation (Chapter 2), the
franchise paradox (Chapter 3), and the service profit chain (Chapter 4) are integral to the
formulation of a proposed strategic service vision. Furthermore, the link and relationship
between best practice and relationship marketing facilitates a synergistic service vision.
Prior to linking service quality with the depicted chapters, peripheral links are examined.
5.2.7.1 Service quality and market orientation
The implementation of a market-oriented campaign has an immediate effect on how a
firm meets its customers’ perceived expectations (Tung-Zong & Su-Jane: 1998). They
inform that service quality is specifically found to be the most influential determinant of a
strategic business unit’s performance. Heskett (2002) found that service quality has a
strong positive relationship with loyalty, and a negative effect on propensity to switch.
Both market orientation and service quality moderate service offerings and have a
positive association on business profitability (Maranto & Reynoso: 2003; Silvestro:
2002).
Market orientation implies that an organisation obtains information from consumers about
their needs and wants, and then takes appropriate action based on the information (Kotler:
2000). In a dynamic environment, organisations continuously modify their offering mix in
response to and/or in anticipation of changing needs and competitors’ actions (Tung-Zong
& Su-Jane: 1998). Such consistent efforts narrow the perceptual gap between the
organisation and its customers (Zeithaml et al: 1990). They also state that in the long run,
a market-oriented organisation may produce higher profits through superior service
quality, which, in turn, leads to higher productivity and stronger loyalty. Tung-Zong and
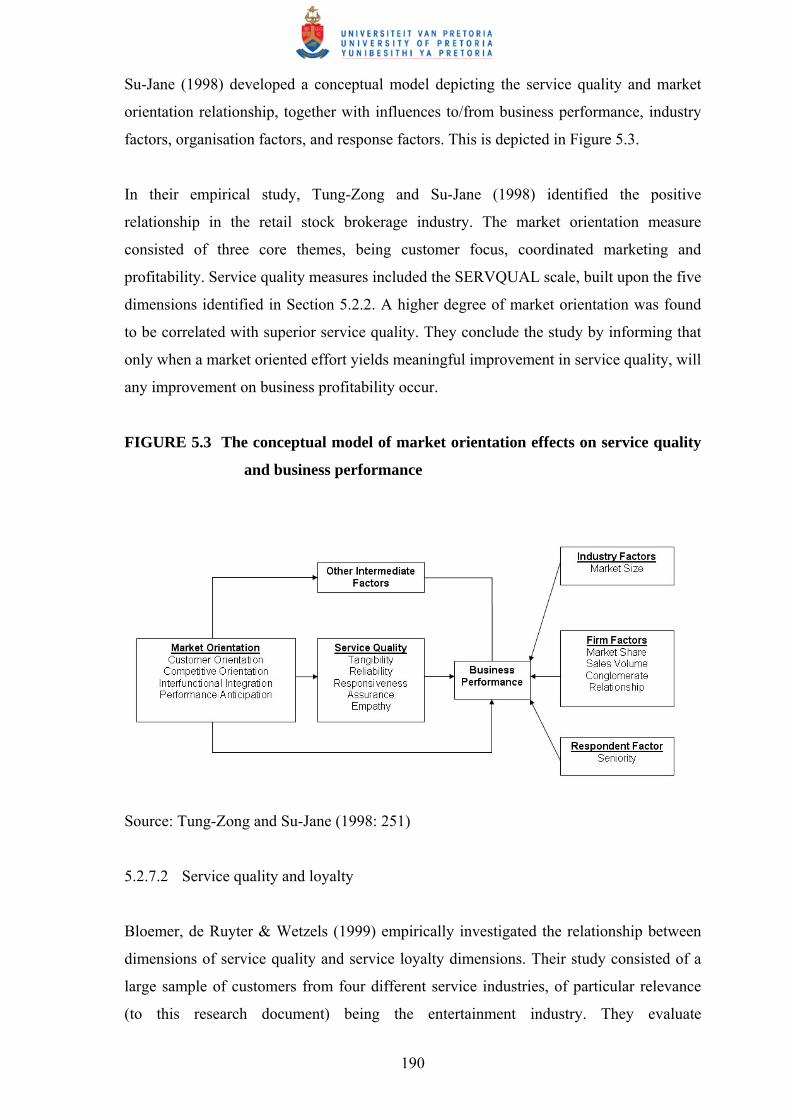
190
Su-Jane (1998) developed a conceptual model depicting the service quality and market
orientation relationship, together with influences to/from business performance, industry
factors, organisation factors, and response factors. This is depicted in Figure 5.3.
In their empirical study, Tung-Zong and Su-Jane (1998) identified the positive
relationship in the retail stock brokerage industry. The market orientation measure
consisted of three core themes, being customer focus, coordinated marketing and
profitability. Service quality measures included the SERVQUAL scale, built upon the five
dimensions identified in Section 5.2.2. A higher degree of market orientation was found
to be correlated with superior service quality. They conclude the study by informing that
only when a market oriented effort yields meaningful improvement in service quality, will
any improvement on business profitability occur.
FIGURE 5.3 The conceptual model of market orientation effects on service quality
and business performance
Source: Tung-Zong and Su-Jane (1998: 251)
5.2.7.2 Service quality and loyalty
Bloemer, de Ruyter & Wetzels (1999) empirically investigated the relationship between
dimensions of service quality and service loyalty dimensions. Their study consisted of a
large sample of customers from four different service industries, of particular relevance
(to this research document) being the entertainment industry. They evaluate
191
preconceptions, whereby Zeithaml et al (1990) report such a relationship; whereas Cronin
and Taylor (1992) failed to find one. Bloemer et al (1999) further identified that to date
no studies have addressed the link between the individual dimensions of service quality
and service loyalty. The relationship between overall service quality and individual
service loyalty dimensions has however been empirically examined (Cronin & Taylor:
1992; Boulding, Kalra, Staelin & Zeithaml: 1993). Cronin and Taylor (1992) focussed
solely on repurchase intentions, whereas Boulding et al (1993) focused on willingness to
recommend and repurchase intentions. Whilst Cronin and Taylor (1992) found no
significant relationship, the extended model of Boulding et al (1993) found a positive
relationship between service loyalty and overall service quality.
The empirical study (Bloemer et al: 1999) identified dimensions of service loyalty and
service quality. Zeithaml et al (1996) proposed a comprehensive multi-dimensional
framework of customer behavioural intentions in services, which Bloemer et al (1999)
adapted to represent service loyalty. Initial dimensions across a 13-item scale included:
• Word-of-mouth communications; which includes recommendations, positive and
encouraging stimuli to support an organisation. This may be similar to referrals in
the service profit chain (Section 4.7.6.3), where similar constructs are evaluated
by Heskett (2002), Stokes and Lomax (2002), Ennew et al (2002) and Heskett et
al (1997). Stokes and Lomax (2002) identify word-of-mouth recommendations in
an entrepreneurial environment, linking service quality, customer service and the
service profit chain
• Purchase intentions, representing customer intention to re-purchase and lifetime
values. The empirical study of Cronin and Taylor (1992) refers. The link to the
service profit chain (Heskett et al: 1997) is measuring and communicating lifetime
values (McDougall et al: 1997) and retaining customers (Brooks: 2000)
• Price sensitivity, indicative of defection behaviour, and customer responsiveness
to pricing. Linking the service profit chain is represented in Section 4.6,
identifying the customer value equation (Heskett et al: 1997), and the study on
switching behaviour by Ranaweera and Prabhu (2003), Section 4.7.6.1
• Complaining behaviour; including avenues of customer complaints, and
associated behaviour. Service profit chain linkages are customer feedback,
complaint and suggestion systems (Zeithaml & Berry: 2003); lost customer
analysis (Mack et al: 2000); represented in Section 4.5.2. The creation of listening

192
posts (Ahmad & Buttle: 2002; Zairi: 2000), represented in Section 4.7.6.3
identifies strategies to complement this loyalty factor.
On the basis of factor analysis on the 13-item scale, five dimensions were identified (Zeithaml et al: 1996):
• Loyalty to company
• Propensity to switch
• Willingness to pay more
• External response to problem
• Internal response to problem.
Bloemer et al (1999) however questioned the factor analysis of Zeithaml et al (1996), and
made use of the 13-item behavioural intention battery. Perceived service quality was
measured on the basis of the 22-item SERVPERF instrument with a nine-point scale
(Cronin & Taylor: 1992). Descriptive analysis, entertainment industry specific, is
depicted in Table 5.1.
TABLE 5.1 Linking perceived service quality and service loyalty: an entertainment
industry perspective
Quality/Loyalty Mean Standard Deviation
Quality dimensions Reliability 6.58 1.56 Responsiveness 6.60 1.57 Assurance 6.59 1.75 Empathy 6.33 1.51 Tangibles 7.09 1.32 Loyalty dimensions Word-of-mouth 6.72 1.87 Purchase intention 6.07 2.10 Price sensitivity 4.46 1.91 Complaining behaviour 5.28 1.53 n=203
Source: adapted from Bloemer et al (1999: 1090)
Findings varied across the four identified service industries, with entertainment industry
specifics including (Bloemer: 1999):
• Word-of-mouth is positively affected by responsiveness (y12=0,44) and tangibles
(y15=0,36)
193
• Purchase intentions are primarily determined in a positive manner by reliability
(y21=0,44), responsiveness (y22=0,39) and tangibles (y25=0,32)
• Prompt service (for instance, no waiting lines) is a key factor in determining
customer preference and recommendation to others
• Tangible service attributes form the core element of the entertainment service
experience, and are a key determinant of both word-of-mouth and purchase
intentions
• As far as purchase intentions are concerned, it appears that reliability is crucial in
determining whether or not customers will return to the entertainment venue
• Considerations about the core service are decisive in determining a customer’s
own behaviour as compared to the willingness to recommend the service to others.
The importance of a multi-dimensional and cross-industry approach to service loyalty is
emphasised by Bloemer et al (1999), due to different relationships between service
quality and loyalty dimensions. Managerial implications highlighted by Bloemer et al
(1999) are indicative of the service quality-customer loyalty link providing actionable
benchmarks that individual organisations may use to guide their service policies, aimed at
securing customer loyalty. An adaptation of this empirical research is implemented in this
research project.
5.2.7.3 Service quality and customer satisfaction
A literature review reveals that the terms quality and satisfaction are often used
interchangeably, enhancing debate concerning the relationship between the constructs
(Zeithaml & Bitner: 2003; Palmer: 2001; Parasuraman: 1998; Sureshchandar et al: 2002).
Customer satisfaction has been dealt with in relation to the service profit chain (Heskett et
al: 1997) in Section 4.5. Oliver (1997) identifies conceptual definitions to the two
constructs:
• Service quality is a comparison to excellence in service by a customer
• Customer satisfaction is a process (based on expectancy disconfirmation) yielding
a state of fulfilment related to reinforcement or arousal.
The majority of literature suggests that service quality is a vital antecedent to customer
satisfaction (Cronin & Taylor: 1992; Parasuraman et al: 1998; Oliver: 1997). There is
194
also strong evidence that customer satisfaction is an antecedent to service quality (Bitner:
1990; Bolton and Drew: 1991). Lee, Lee & Yoo (2000) empirically found that service
quality as an antecedent of customer satisfaction and that customer satisfaction exerts a
stronger influence on purchase intention than service quality. Regardless of which view is
taken, the relationship between service quality and satisfaction is strong when examined
from either direction.
Caruana et al (2000) included the possible role of value as a moderating variable. Their
empirical results suggest that the effect of quality on satisfaction is not just direct but is
also moderated by value. Implications are in agreement with the service profit chain
(Heskett et al: 1997; Heinonen: 2004), concerning the important effect of price and
therefore value (refer to the value equation, section 4.6; and the customer satisfaction link
to service value in Section 4.3.3).
Zeithaml & Bitner (2003) identify strategies to enhance service quality perceptions and
customer satisfaction, most in agreement with service profit chain implications (refer to
section 4.5, managing customer satisfaction). Approaches include:
• Measure and manage customer satisfaction and service quality. This includes
tracking trends to diagnose problems and to link to other customer-focused
strategies. Other strategies, linking the service profit chain, include employee
training (Nel et al: 2004); reward systems (Heskett: 2002); internal process
metrics (Lau: 2000); organisation structure and leadership goals (Hamel &
Prahalad: 1995)
• Aim for customer quality and satisfaction in every service encounter. The service
encounter may be seen as the period of time during which a consumer directly
interacts with a service (Joseph: 1996). Themes underlying
satisfaction/dissatisfaction in service encounters (recovery, adaptability,
spontaneity and coping) suggest specific types of actions that would aid an
organisation aiming for zero defects (Zeithaml & Bitner: 2003). Planning for
effective recovery highlight service failures and subsequent recovery efforts which
create strong memories for customers and employees. Facilitation, adaptability
and flexibility are paralleled in the service profit chain by giving employees
latitude and responsibility (Heskett: 2002). Encouraging spontaneity is primarily
uncontrollable in service encounters, usually facilitated by hiring employees with
195
a strong service orientation (Lau: 2000). This is of interest in the selection of
franchisees along similar guidelines (Mendelsohn: 2003). Helping employees cope
with problem customers requires that employees are taught appropriate coping and
problem-solving skills to handle difficult customers as well as their own feelings
is such situations (Schlesinger & Zornitsky: 1991). Managing the dimensions of
quality at the encounter level is the ability of employees to relate dimensions of
service quality, reliability, responsiveness, assurance, empathy and tangibles to
each individual encounter. The interaction is reflective of the moment of truth
(Zeithaml & Bitner: 2003). Every episode where a customer interacts with a
service provider represents a moment of truth because each episode can shape a
customer’s impressions and judgements about the organisation (Joseph: 1996)
• Manage the evidence of service to reinforce perceptions. The evidence of service,
(people, process and physical evidence), provides a framework for implementation
of customer satisfaction strategies. This may also include maintaining measures
and rewards that influence behaviour (Yoon, Beatty & Suh: 2001).
Service profit chain synergies include enhancement activities in section 4.8, including
putting employees first (Lau: 2000); spending time on the front line (Heskett: 2002);
leading personal development (Bassi & Vanburen: 1997); supporting greater job latitude
(Nel et al: 2004; Boon & Kurtz: 2000); investing in customers (Reichheld: 2001);
communicating the message (Stokes & Lomax: 2002) and reducing labour costs by
paying higher wages (Silvestro: 2002).
5.2.7.4 Service quality and marketing culture
Whilst this construct may be closely related to marketing orientation, marketing culture is
more of a set of unwritten decrees, rituals and a shared pattern of shared values and norms
which permeate an organisation (Deshpande & Webster: 1989). Albrect and Zempke
(1985) use the term service culture for marketing culture and reiterate that contribution of
marketing culture to service organisations as providing the only effective means to win
employees commitments to serving customers. Strauss (1995) identified the challenge to
services marketing as being the positive link between marketing culture and successful
marketing in cultivating and sustaining a service culture. It urges service marketers to
implant service culture among service employees. However, marketing culture is the
result of careful planning and involves a series of ongoing training activities (Luk: 1997).
196
Webster (1990) identified marketing culture in terms of six dimensions: service quality,
interpersonal relationship, interpersonal communications, innovativeness, organisation
and selling tasks. This operational dimensionality allows measurement of an
organisation’s marketing culture, to discover its nature, and to identify linkages with
service performance. Empirical research conducted by Luk (1997) indicated that high
quality service can only be delivered when organisations successfully foster a customer-
oriented marketing culture characterized by emphasis on service quality orientation and
interpersonal relationship. The positive relationship confirms that perceived service
quality is a function of marketing culture.
5.2.7.5 Service quality and previous experience
O’Neill and Palmer (2003) empirically investigated the role of experience on the
dimensions of service quality; postulating that the service quality construct for a type of
service is positively related to consumers’ experience of consuming that type of service.
Van Der Wagen (1994) informs that customers have many different perceptions which
are influenced by their education, upbringing, experience and many other factors.
Similarly, Williams and Visser (2002) suggest that experience depends on and influences
perception, since it involves changes in behaviour which necessitate meaning and order
being given to sensory data. Blythe (1997) refers to this process as cognitive mapping or a
construct of the imagination, wherein consumers analyse purchase and post-purchase
situations taking into account previous experiences, and make evaluative judgements
based on these experiences. Consumers normally bring with them all of their previous
knowledge and experience, which they use to try to make sense of the mass of conflicting
stimuli with which they are bombarded (Chisnall: 1985). He informs that perception is
seldom an objective scientific assessment of comparative values.
Analysis of service quality dimensions related to experience found that consumer
perceptions of service quality may to a large extent be influenced by the degree of prior
experience the consumer has or acquires in relation to a particular service. The degree of
prior experience with a particular service provider, type of service provided or particular
attribute of a service also has a bearing on the extent of any perceptual change over time.
Findings (O’Neill & Palmer: 2003) suggest that inexperience may limit the
dimensionality of quality, which is implicit in consumers’ evaluations. They recommend
197
that practitioners include experience variables in their measurement instruments of
service quality, thereby not relying on performance only variables.
5.2.7.6 Service quality and internal marketing
Kang et al (2002) identify internal marketing as an important approach for fostering a
service and customer oriented culture in an organisation. They see the provision of
internal service quality as a critical component of internal marketing. The link to the
service profit chain is emphasized in Section 4.3.7, identifying the employee satisfaction
link to internal quality of work life (Lau: 2000); together with the work of Yoon et al
(2001), empirically indicating the positive relationship between employees’ work effort
and customers’ perception of employee service quality. The Kang et al (2002) empirical
results confirm the five-factor SERVQUAL model as a valid and reliable tool for
measuring internal service quality. While many service quality attributes may influence
an employee’s perception of service quality, the results are indicative of some attributes
having a greater impact on the overall perception of internal service quality.
The dimensions of reliability and responsiveness were found to be critical to the overall
internal service quality perceptions. It is therefore a prerequisite to have support
employees providing services accurately and quickly to front-line employees, and having
knowledgeable and service-oriented employees (Lau: 2000; Bassi & Vanburen: 1997).
Joseph (1996) informs that internal service quality is not the responsibility of just one
department or individual; but is organisation-wide and involves all members of a service
organisation. Frost and Kumar (2000) developed the Internal Service Quality Model
(Intservqual), based on the original GAP model (Zeithaml & Bitner: 2003). Their
empirical investigation found that perceptions and expectations of internal customers and
internal suppliers play a major role in recognising the level of internal service quality
perceived.
Corresponding with many service profit chain initiatives of internal marketing (Heskett et
al: 1997); Joseph (1996) identifies initiatives in the healthcare industry towards building
internal service quality. Initiatives include listening to internal customers (Lau: 2000),
involving, empowering and enfranchising (Nel et al: 2004), senior management to the
front lines (Heskett: 2002), fostering team spirit (Reichheld: 1996), and communicating
formally and informally (related to communication of results, Heskett: 2001; and
198
franchise system relationships; Mendelsohn: 2003). Joseph (1996) also identified the
positive relationship between internal marketing and service quality.
5.2.7.7 Service quality and future consumer behaviour
Headley and Miller (1993) empirically evaluated the existence of the significant
relationship between perceived service quality and intent to repurchase, complement,
complain, recommend, switch and non-use of services. They inform that if resources for
improving service quality are limited; ensuring that the promised service is performed
accurately, dependably, and with caring, individualized attention offers the best return in
customer satisfaction and bonding for repeat business. Their study included measurement
efforts based on SERVQUAL, advising that the measure is appropriate for the services
field, but that practitioners should take note in unique situations that call for adaptation
(Bloemer et al: 1999; Robinson: 1999).
Headley and Miller (1993) confirm that anticipated relationships between perceived
service quality and various consumer intentions suggest that perceived higher service
quality will generate favourable intentions (such as, repurchase, complementing) and that
perceived lower service quality will lead to unfavourable intentions (such as,
complaining, switching, and non-use of any services). Their study is related to the service
profit chain in many ways, primarily involving retention strategies (Section 4.7.6.1).
Synergies include customer commitment (Zineldin: 2000), employee retention
(Reichheld: 1996), active relationships with customers (Ruyter & Bloemer: 1999), less
effort in need analysis (Andreassen: 1994), retention rates (Brooks: 2000), switching
barriers (Ranaweera & Prabhu: 2003), customer confidence (Hansemark & Albinsson
(2004), pricing (Ranaweera & Neely: 2003), defections (Sherden: 1994), and profitability
(Heskett: 2002).
5.2.7.8 Service quality and culture
Imrie, Cadogen and McNaughton (2002) inform that the eagerness of global marketers to
establish a competitive advantage based upon service quality within emerging markets
(such as South Africa and the rest of Africa) displays a degree of naiveté in respect to the
influence of environmental factors upon consumption behaviour. Shortcomings of the
SERVQUAL model, identified by Parasuruman (1998) include the exclusion of the
199
possible influence of the variety of cultures found in international markets. The results of
the Imrie et al (2002) empirical study indicate that not only do cultural values influence
the hierarchy of service quality dimensions, but also that Parasuraman et al’s (1988)
SERVQUAL conceptual model does not capture the breadth of criteria utilised by many
globally spread consumers. They inform that interpersonal relations are highlighted as a
dimension of service quality that is not adequately addressed by SERVQUAL.
Culture has been described as an accumulation of learned meaning or values within a
human population, contending that these values endow individuals with rules that provide
guidance in their behaviour as consumers (Soderland: 1998). Imrie et al (2002) in
particular identified interpersonal relations as a dimension of service quality, with the
emergence of three major themes. These themes included sincerity (an assessment of the
genuineness with which service personnel performed tasks in order to gratify consumer
preferences); politeness (associated with a customer’s social status, giving appropriate
respect, and service employees adherence to their respective roles within the service
encounter); and generosity (need anticipation and service employees’ unsolicited service
provision as active service delivery). The research of Imrie et al (2002) converges with
Rust & Oliver (2000) in acknowledgement that delighting the customer raises
expectations, such that it may be difficult to exceed customer expectations in future
encounters.
The integration of service quality relationships has identified strong synergies with
elements of the service profit chain (Heskett et al: 1997). Furthermore, these synergies are
complemented with developmental links to entrepreneurship (Kuratka & Hodgetts: 2004;
Bolton & Thompson: 2003) and franchising as a form of business venturing for
entrepreneurs (Mendelsohn: 2003; Spinelli: 1997).
Notwithstanding positive evidence of measuring service quality, together with contrasting
points of view, the literature lends itself to the merits of measurement towards the
attainment of organisational performance objectives (Palmer: 2001; Zeithaml & Bitner:
2003).

200
5.2.8 Measuring service quality: current thinking and future requirements
It is generally agreed that service quality is an attitude or global judgement about the
superiority of a service, being distinct from customer satisfaction (Kang et al: 2002;
Parasuruman et al: 1998). Despite varying measures of evaluating service quality, all
agree that some measure of perceived performance is important in assessing service
quality (Robinson: 1999). Popular measurement tools include SERVQUAL (Parasuruman
et al: 1998), SERVPERF (Cronin et al: 1992), QUALITOMETRO (Franceschini, Rosetto
& Caldara: 1998), evaluated performance model, NQ (normed quality) (Teas: 1993),
behavioural intent (Headley & Miller: 1993), GAP model (Zeithaml & Bitner: 2003) and
critical factor approach (Sureshchandar et al: 2002).
In the past decade SERVQUAL has proved to be the most popular instrument for
measuring service quality, despite areas of disagreement amongst many researchers
(Robinson: 1999). A summary of areas of disagreement is depicted in Table 5.2. Despite
SERVQUAL’s popularity, a number of criticisms are levelled on the conceptual and
operational level (O’Neill & Palmer: 2003). Cronin and Taylor (1992; 1994) and Teas
(1993) in particular, are particularly vociferous in their critique, both developing their
own measurement instruments. From the results of their empirical investigation Cronin
and Taylor (1992) conclude that the unweighted SERVPERF measure (performance only)
performs better than any other measure of service quality.
Teas (1993) proposes and empirically tests two alternative perceived service quality
models, concluding out-performance of SERVQUAL. Parasuruman (1998) defended and
made changes to the SERVQUAL model in response to the criticism and additional
empirical research. What is apparent is that the debate over how best to measure service
quality is far from complete (Robinson: 1999).
Table 5.2 is represented on the following page.
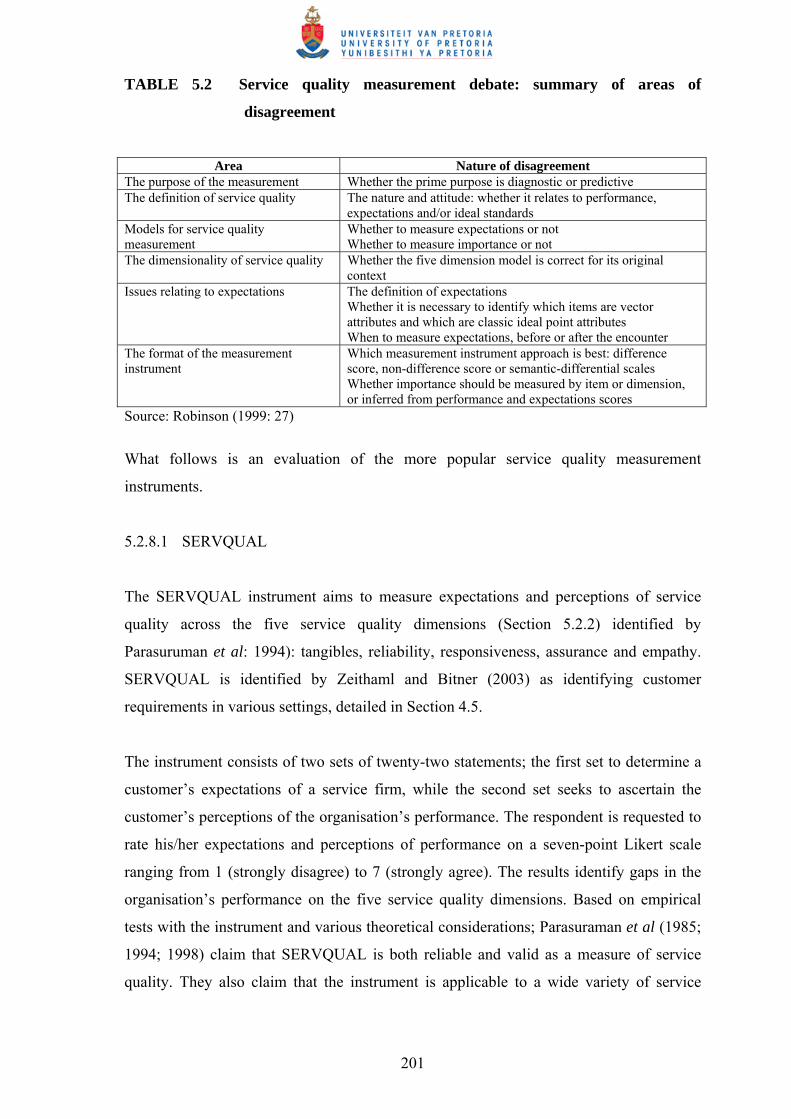
201
TABLE 5.2 Service quality measurement debate: summary of areas of
disagreement
Area Nature of disagreement
The purpose of the measurement Whether the prime purpose is diagnostic or predictive The definition of service quality The nature and attitude: whether it relates to performance,
expectations and/or ideal standards Models for service quality measurement
Whether to measure expectations or not Whether to measure importance or not
The dimensionality of service quality Whether the five dimension model is correct for its original context
Issues relating to expectations The definition of expectations Whether it is necessary to identify which items are vector attributes and which are classic ideal point attributes When to measure expectations, before or after the encounter
The format of the measurement instrument
Which measurement instrument approach is best: difference score, non-difference score or semantic-differential scales Whether importance should be measured by item or dimension, or inferred from performance and expectations scores
Source: Robinson (1999: 27)
What follows is an evaluation of the more popular service quality measurement
instruments.
5.2.8.1 SERVQUAL
The SERVQUAL instrument aims to measure expectations and perceptions of service
quality across the five service quality dimensions (Section 5.2.2) identified by
Parasuruman et al: 1994): tangibles, reliability, responsiveness, assurance and empathy.
SERVQUAL is identified by Zeithaml and Bitner (2003) as identifying customer
requirements in various settings, detailed in Section 4.5.
The instrument consists of two sets of twenty-two statements; the first set to determine a
customer’s expectations of a service firm, while the second set seeks to ascertain the
customer’s perceptions of the organisation’s performance. The respondent is requested to
rate his/her expectations and perceptions of performance on a seven-point Likert scale
ranging from 1 (strongly disagree) to 7 (strongly agree). The results identify gaps in the
organisation’s performance on the five service quality dimensions. Based on empirical
tests with the instrument and various theoretical considerations; Parasuraman et al (1985;
1994; 1998) claim that SERVQUAL is both reliable and valid as a measure of service
quality. They also claim that the instrument is applicable to a wide variety of service

202
industries, although it may be necessary to reword or augment some of the measurement
items.
Kang et al (2002) empirically tested the application of the SERVQUAL instrument,
concluding that the instrument is appropriate for measuring internal service quality. Lins
and Brooks (1998) also proposed that the SERVQUAL instrument may be an appropriate
tool to measure the quality of service delivered by internal suppliers to their internal
customers, and to assess the effectiveness of internal marketing. Headley and Miller
(1993) empirically examined the positive reliability and validity of SERVQUAL to future
consumer behaviour, whilst Kuei and Lu (1997) empirically tested SERVQUAL as an
integrated approach to service quality improvement. Reichheld and Sasser (1990)
evaluated SERVQUAL as a measure of service quality for evaluating loyalty,
complemented by the similar study of Heskett (2002). Mehta and Durvasula (1998)
identified SERVQUAL as an appropriate tool in measuring the relationship between
service quality dimensions and organisational performance in the case of a business-to-
business service environment. Despite empirical evidence of the appropriateness of
SERVQUAL, critique has met with much enthusiasm (Robinson: 1999).
Disconfirmation models of service quality have challenged SERVQUAL on a number of
grounds (Palmer: 2001). Numerous criticisms of SERVQUAL are based on the inductive
nature of the original research in that it failed to draw on the theory base in the disciplines
of psychology, social sciences and economics (Andersson: 1992; Sureschandar et al:
2002). O’Neill and Palmer (2003) identify one stream of objections suggesting that
absolute measures of attitudes provide a more appropriate measure of quality than
explanations based disconfirmation models (Cronin & Taylor: 1994). Criticism against
the psychometric properties of the instrument and the stability of its five-factor structure
across industry sectors are widespread (Cronin & Taylor: 1992; Carman: 1990). Imrie et
al (2002) critique SERVQUAL on a lack of consideration of the possible influence of
cultures found in international markets.
Buttle (1996) summarized the major criticisms of SERVQUAL in two broad categories-
theoretical and operational. Theoretical objections included:
• Paradigmatic objections: SERVQUAL is based on a disconfirmation paradigm
rather than an attitudinal paradigm; and SERVQUAL fails to draw on established
203
economic, statistical and psychological theory (Cronin & Taylor: 1992; 1994;
Andersson: 1992)
• Gaps model in that there is little evidence that customers assess service quality in
terms of perception-expectation gaps (Zeithaml & Bitner: 2003)
• Process orientation, focussing on service delivery and not outcomes of the service
encounter (Cronin & Taylor: 1992)
• Dimensionality, in that the SERVQUAL five dimensions are not universals and a
high degree of intercorrelation between the five dimensions (Carman: 1990).
Operational objections cited by Buttle (1996) included:
• Expectations: consumers use standards other than expectations to evaluate service
quality, and SERVQUAL fails to evaluate absolute service quality expectations
(Gronroos: 1984; Teas: 1993)
• Item composition, in that four or five items cannot capture the variability within
each service quality dimension (Bloemer et al: 1999)
• Moments of truth, whereby customers’ assessments of service quality may vary
from service interaction to service interaction (Carman: 1990)
• Polarity, in that the reversed polarity of items in the scale cause respondent error
(Babakus & Mangold: 1992)
• Scale points: the seven-point Likert scale is flawed (Babakus & Mangold: 1992)
• Two administrations of the instrument causes respondent boredom and confusion
(Gronroos: 1984; Carman: 1990; Cronin & Taylor: 1994)
• Variance extracted: the overall SERVQUAL score accounts for a disappointing
proportion of item variances (Carman: 1990; Bouman & van der Wiele: 1992).
The criticism levied against SERVQUAL provides evidence of the complexity of the
service quality construct and the fact that it cannot be defined in any one way for all
service encounters (O’Neill & Palmer: 1999).
5.2.8.2 SERVPERF
Cronin and Taylor (1992) suggest that the conceptualization and operationalization of
SEVQUAL is adequate. They believe little if any theoretical or empirical evidence
supports the relevance of the expectations-performance gap as the basis for measuring
204
service quality (Carman: 1990). They do however believe that the 22 performance items
identified by SERVQUAL adequately define the domain of service quality, and propose
an alternative to the SERVQUAL scale. An empirical investigation into service quality
suggests that service quality should be conceptualized and measured as an attitude, and
that the literature clearly supports the performance-only (SERVPERF) approach (Lee et
al: 2000; Cronin & Taylor: 1992; 1994).
The main feature of SERVPERF is its focus on customers’ perceptions (Franceschini et
al: 1998). Service quality is evaluated by perceptions only without expectations and
without importance weights (Cronin & Taylor: 1994). In an empirical investigation of the
determinants of perceived service quality and its relationship with satisfaction across four
service industries, Lee et al (2000) found SERVPERF to be an adequate measurement
tool. Their result implies that service managers should place emphasis on performance
perceived by customers (SERVPERF) rather than the difference between perceived
performance and prior expectation (SERVQUAL). Extending the research on service
quality in health care, and constructs of satisfaction and purchase intentions,
McAlexander, Kaldenberg and Koenig (1994) conclude that SERVPERF methods are
superior to SERVQUAL methods. Bloemer et al (1999) also empirically tested the 22-
item SERVPERF scale in an entertainment setting, relevant to the relationship between
service quality and loyalty dimensions.
Similar to SERVQUAL, the SERVPERF approach requires the customer to rate an
organisation’s performance across a five point scale. Unlike SERVQUAL, however, it
does not seek to estimate difference in scores and is a one-off set of items addressing
post-consumption perceptions only (Palmer: 2001). SERVPERF is seen as an absolute
rating of perceived service quality (O’Neill & Palmer: 2003; Cronin & Taylor: 1994).
5.2.8.3 Auxiliary measurement methods
SERVQUAL and SERVPERF dominate service quality literature (Cronin & Taylor:
1994; Parasuraman et al: 1994), however, other measurement methods abound
(Franceschini et al: 1988; Palmer: 2001).
Teas (1993) developed the evaluated performance model (EP model) and normative
quality model (NQ model). The EP model incorporates the classic ideal point concepts

205
into a perceived quality model while the NQ model integrates the classic ideal point
concept with the SERVQUAL revised expectation concept (Lee et al: 2000). Teas’ (1993)
empirical investigation indicated that the criterion and construct validity of the EP model
was higher than the concurrent and construct validity of both the SERVQUAL and NQ
model. Teas (1993) inform that expectations may be interpreted by customers in two
different ways: at the ideal level, by giving each attribute the highest score, or at the
feasible level when considered under the actual conditions in which service may be
delivered. The NQ method focuses customers’ attention towards two kinds of
expectations, but asks the customer another set of questions, stimulating potential
idiosyncratic effects.
QUALITOMETRO is a service quality tool conceived for evaluation and on-line service
quality control by Franceschini and Rossetto (1997). An integral feature of this method is
the possibility of a separate measurement of expected and perceived quality without the
potential of cross-influence (Franceschini et al: 1998). The QUALITOMETRO method is
based on service quality dimensions proposed by Parasuraman et al (1994), allowing
online quality monitoring of differential quality between expected and perceived quality.
Franceschini et al (1998) empirically evaluated tools for service quality evaluation,
suggesting that QUALITOMETRO appears easy to use in comparison to SERVQUAL.
Sureshchandar et al (2002) developed a new model to improve understanding of the way
in which customers perceive service quality. They adopt a critical factor approach,
identifying core service or service product; human element of service delivery;
systematization of service delivery (non-human element); tangibles of service; and social
responsibility. Forty-one items are identified across these five factors, in the context of
the financial services industry. The instrument has been empirically tested for
undimensionality, reliability and construct validity using a confirmatory factor analysis
approach; offering a systematic procedure that could provide insights on conceptual
comprehension of customer perceived service quality (Sureshchandar et al: 2002).
Bahia and Nantel (2000) developed the bank service quality scale (BSQ) for perceived
service quality in bank services. Possible adaptation is however possible across other
service industries. Their scale comprises thirty-one items which span six dimensions:
effectiveness and assurance; access; price; tangibles; service portfolio and reliability.
Their empirical investigation compared favourably to SERVQUAL, producing a six-
206
dimension scale which covers a broader range of marketing variables. Reliability (0.78 ≤
ά ≥ 0.98) and loading (0.57 to 0.89 for all the 31 variables) far surpass these measures in
the SERVQUAL scale.
Schvaneveldt, Enkawa and Miyakawa (1991) evaluated service quality from two
perspectives. The first involved the presence or absence of a particular quality dimension,
representing an objective approach. The second perspective involved the users’ resulting
sense of satisfaction or dissatisfaction, representing a subjective approach (Franceschini et
al: 1998). Their model is represented as the Two-Way service quality model.
Schvaneveldt et al (1991) identified five dimensions: performance; security;
completeness; ease of use and emotively/environment across a five-point semantic
response scale. In contrast to SERVQUAL and SERVPERF (22+22 and 22 items
respectively), Two-Way expectations and perception items are not declared.
Brown, Churchill and Peter (1993) developed the non-difference score measure,
postulating that the calculation of a difference score in the SERVQUAL measure could
lead to several psychometric problems. Their empirical investigation indicated that the
reliability of SERVQUAL was below that of a non-difference score measure and that a
non-difference score displayed better discriminant validity (SERVQUAL could not
achieve discriminant validity). Brown et al (1993) in agreement with Cronin and Taylor
(1993), confirmed that a non-difference score measure outperformed SERVQUAL on
other psychometric considerations while requiring subjects to respond to only half as
many items. In addition, variance restrictions were exhibited in using SERVQUAL (Lee
et al: 2000).
A suggestion is to incorporate merits from each method (SERVPERF and SERVQUAL in
particular), linked to service profit chain initiatives (Heskett et al: 1997) and contributing
service quality integration and links (identified in Section 5.2.7). A contribution will be
evaluated taking best practice/benchmarking and relationship management into account.
5.3 RELATIONSHIP MARKETING
Relationships between value chain participants (Porter: 1995) led to developments in the
field of relationship marketing. Peck et al (1999: 22) developed a revised version of the
six markets model; which included customer, internal, referral, influence, recruitment and

207
supplier/alliance markets. The six markets model identifies all facets of internal and
external relationships that can contribute towards an organisation’s marketplace
effectiveness.
The purpose of evaluating relationship marketing is to analyse the effect of networks and
relationships towards customer satisfaction and loyalty (Heskett: 2002; Reichheld: 2001).
Literature from franchise systems relationships (Section 3.3) is combined with the six
markets relationship model (Peck et al: 1999); together with entrepreneurial orientation in
a franchised system (Bolton & Thompson: 2003; Lindsay & McStay: 2004) represented
in Sections 2.6.10 and 3.4. The empirical study of Kang et al (2002) into the measurement
of internal service quality may be mirrored in a franchise system, with franchisees
representing the internal marketing arm of the system (Mendelsohn: 2003). This in turn
links internal service quality (Lau: 2000) to the service profit chain (Heskett et al: 1997)
and service quality (Zeithaml & Bitner: 2003). Hopkinson and Hogarth-Scott (1999) in
turn identify franchise relationship quality from a micro-economic perspective. They
empirically examine the behavioural implications of the three main micro-economic
explanations of resource constraint, agency theory and search cost theory – for
franchising. The outcome of the study is a conceptual model, linking strategic direction,
franchise motivation and relational quality.
Operationalizing the six markets model, Peck et al (1999) addressed each market domain
in greater detail, consisting of key participants; research to identify expectations and
needs of key participants; current and proposed level of emphasis in each market; and the
formulation of a desired relationship strategy. The six markets framework is represented
in Figure 5.4. What follows is a review of each of the domains.
Table 5.4 is represented on the following page.

208
FIGURE 5.4 The six markets framework
Source: Peck, Payne, Christopher and Clark (1999: 220)
5.3.1 The customer market domain
This domain is integral in managing relationships with buyers, intermediaries and
consumers. Within the domain, Webster and Wind (1972) identify the decision-making
unit, comprising users, influencers, deciders, approvers, buyers and gatekeepers.
Customer acquisition and retention highlights a move from a transaction focus to
relationship focus, involving customer retention (Zineldin: 2000); customer value
(McDougall & Levesque: 2000); customer service (Zairi: 2000) and service quality
(Zeithaml & Bitner: 2003). The customer market domain (Peck et al: 1999) relates
directly to the service profit chain (Heskett et al: 1997) and service quality (Zeithaml &
Bitner: 2003).
The customer market domain links to customer relationship management (CRM), being
an organisational wide business strategy designed to optimize revenue and customer
satisfaction by organizing the institution around customer segments (Fayerman: 2002).
From a knowledge management perspective, CRM allows for better understanding of

209
customers and providing the means to achieve competitive advantage through improved
customer tracking and responsiveness. Andrade (2003) postulates that CRM strategies
help organisations redefine their business processes to be more customer-centred and
more efficient. He identifies benefits as including: greater customer loyalty as a result of
more personal and efficient service (Reichheld: 2001); more effective sales efforts
through better management of the sales process; and improved success rates for
marketing campaigns through better targeting (Kotler: 2000).
Crosby (2002) initiated a study of myths associated with customer relationship
management strategy, identifying realities of competitive advantage:
• Customer relationship marketing/management is a comprehensive business
strategy (Heskett: 2002)
• Customer relationship strategy begins with segmentation and ends with the
individual customer
• Measures of service quality differ in the level of relationship commitments, and
none is a bona fide indicator of relationship strength (Kang et al: 2002)
• Customer relationship strategy and brand strategy are intimately connected and
serve a common purpose (Chaston: 2002)
• Adequate interpretation of customer data is essential for efficient customer
relationship strategies (Storbacka, Strandvik & Gronroos: 1994)
• The success of a customer relationship strategy hinges on the leadership team
taking ownership of the strategy and building the organisational competencies
necessary to compete on this basis.
Storbacka et al (1994) emphasize that in order to enable an organisation to capitalize on
available customer relationship economics opportunities, and to manage its customer
relationships at a profit; the dynamic nature of such relationships has to be understood.
Relationship management and conceptualization of the relationship marketing chain
(Peck et al: 1999) go a long way to understanding these dynamic relationships (Palmer:
2001).
210
5.3.2 The supplier and alliance market domain
Supplier markets or vendors are the providers of resources to an organisation, whereas the
alliance market is also seen as suppliers, but typically supply competencies and
capabilities (Buono: 1997). Strategic outsourcing is identified as a component of the
alliance domain, with motivation to engage in such activity a factor of competitive
advantage, being either cost or value (Porter: 1998; 1995). Supplier development is also
integral to competitive advantage, identifying optimization of value-chain analysis
(Porter: 1995), with partnerships based upon commitment, trust and continuous
improvement (Mockler: 2001). As the critical role of suppliers and alliance partners
evolves, the need for formal processes to manage the supply chain emerges.
Supply chain management is regarded as the management of upstream and downstream
relationships with suppliers, distributors and customers to achieve greater customer value
at less cost (Christopher: 1997). Stevens (1989) identified four stages of the
transformation process towards supply chain partnership: the baseline organisation; the
functionally integrated organisation; the internally integrated company; and the externally
integrated company. Advantages and benefits of strong partnerships include ongoing cost
reductions; quality improvements; reduced design cycle times; increased operating
flexibility; more value for customers; enhanced leverage with technology; and more
powerful competitive strategies (Lewis: 1995). Quinn (1992) suggested foundations for
successful alliances: jointly developed goals and plans; avoiding niche collisions;
structuring the team; clear communication links; understanding cultures; and a structural
learning process.
Traditional alliance relationships recommended in a study by Buono (1997) span across
long-term and sustainable time frame; strategic outsourcing orientation; leader-team
member inter-firm relationship; two-way information flow; consensus-oriented decision
making; planning involving many managers, line and staff; ever-changing fluid service
improvements; multi-disciplinary teamwork control; quality, price and timing as a
primary objective; and mutually controlled profit orientation. Buono (1997) further
stipulates that if alliances are to be successful, the relationship between network
participants must be characterized and structured by trust, norms of reciprocity,
investment in mutually beneficial goals and a sense of organisational interdependence.
211
Chaston (2000a), in an empirical study on relationship marketing and the orientation
customers require of suppliers; suggests that service quality satisfaction will be highest
where there is convergence between the relationship orientation required of a supplier and
a customer’s perception of the style exhibited by the supplier. He also suggests that in
some service situations, namely those where the customers require a transactional
orientation from suppliers, the supplier can expect to receive a lower service quality
rating from customers who perceive the supplier is exhibiting a relationship oriented
marketing style.
Usefulness of alliances is primarily seen as a method or enabler for growing and
prospering. Mockler (2001) identifies key merits: enabler of expansion and providing
access to new markets; add value to an organisation’s service offering; expand
distribution and provide access to materials; develop and improve operations, such as new
technologies; provide additional financial resources; decrease risk; create new
opportunities and reduce competition. It is apparent that many of these benefits are
associated merits to the franchise system (Mendelsohn: 2003). Such alliances, in the form
of licensing agreements, are identified as an equity relationship of inter-firm collaborative
relationships (Mockler: 2001). Sydow (1998) regards franchise systems as strategic
networks and alliances, and indicates that network organisations require very careful
interpersonal relationship management, and that leadership by the central firm
(franchisor) cannot be assumed to control network processes.
5.3.3 The referral and influence market domains
Referral is used to describe communications (either positive or negative) between groups
such as the service provider, independent experts, family and friends and the actual or
potential consumer. The referral market domain consists of customer and non-customer
referral sources (Peck et al: 1999). Customer referrals consist of current or potential
customers (such as word-of-mouth), while non-customer referral sources include
networks, multipliers, connectors, third party introducers and agencies. The nature of the
influence market domain usually has the most diverse range of constituent groups,
consisting of shareholders, financial analysts, stockbrokers, and media and
consumer/business groups.

212
The referral domain is expanded upon in Section 4.7.6.3, in the context of the service
profit chain (Heskett et al: 1997) and Section 5.2.7 on the integration of service quality
relationships. The link to loyalty and service quality has received much attention (Ennew
et al: 2000). With regard to the influence market domain, marketing orientation and
marketing culture (Tung-Zong & Su-Jane: 1998; Luk: 1997), together with internal
marketing (Kang et al: 2002), play an integral part in portraying and influencing
positiveness about the organisation. This is highlighted in the internal market domain.
Retention, referrals and related sales are strategic initiatives of the service profit chain
(Heskett et al: 1997), linking loyalty to long term profit and growth (Bowen & Chen:
2001). Similarly, the referral and influence market domains link relationship initiatives
towards organisational performance objectives (Peck et al: 1999).
5.3.4 The recruitment and internal market domains
Recruitment markets represent potential employees who possess the necessary skills and
attributes required to match the profile that the company wishes to portray to its
customers (Peck et al: 1999). The recruitment market domain includes the high cost of
recruitment (Nel et al: 2004); finding the best employees (Schermerhorn: 2002); selection
techniques (Mendelsohn: 2003, franchise specific); training and development (Nieman:
1998, franchise specific); and recruitment monitoring and evaluation (Wright & Story:
1994).
Internal markets involve two key aspects; that of employees working together to achieve
organisational objectives, and that of the internal customer, whereby employees are
regarded as employee and customer (Peck et al: 1999). Judd (1987) categorizes different
levels of employees within the organisation depending on the degree and type of contact
they have with external customers: contactors; modifiers; influencers and isolateds. Varey
(1995) attempts to present a model of internal marketing as a process or mechanism for
integrated market-oriented management; which does not assume pre-existence of
structures of organisation. This is represented in Figure 5.5 on the following page.

213
FIGURE 5.5 Core competencies for internal services marketing
Source: adapted from Vary (1995: 47)
Peck et al (1999) further identify a range of inter-related internal marketing activities
towards implementing effective internal marketing:
• Organisational design conducive to internal marketing concepts and philosophies
• Regular staff surveys which assess the internal service culture
• Internal customer segmentation relating to level of customer contact (Judd: 1987)
• Personal development and training focused on core competencies for internal
marketing (Nel et al: 2004)
• Empowerment and involvement enables employees, and improves service quality
(Zeithaml & Bitner: 2003)
• Recognition and rewards based on employees’ contribution to service excellence
(Heskett et al: 1997)
• Internal communications provides a mechanism for cross-functional participation
• Performance measures towards achieving key success factors, such as the
balanced scorecard (Kaplan: 2000)
• Building supportive working relationships for employees, enhancing internal
quality of work-life (Lau: 2000).
Internal marketing is discussed in Section 5.2.7 (integration of service quality
relationships), placing emphasis on the relationship marketing and service quality link.
The service profit chain also recommends initiatives towards enhancing internal
marketing relationships (Lau: 2000; Nel et al: 2003; Bassi & Vanburen: 1997; Vilares &
Coelho: 2001). Kang et al (2002) identified an adapted SERVQUAL battery as
214
appropriate application to internal service quality relationships, identifying internal
marketing as an important approach for fostering a service and customer-oriented culture
in an organisation.
Due to the network nature of the franchise system (Mendelsohn: 2003), franchising and
franchise relationships are an integral component of internal marketing (Bloom: 2003).
Franchise system relationships are evaluated in section 3.3. Justin and Judd (2002, table
3.1) developed guidelines for optimal relationships in the franchise system, which mirror
those recommendations of internal marketing by Peck et al (1999). Lewis and Lambert
(2001) present a model of the interrelationship of channel member performance,
dependence and satisfaction. The internal marketing constructs showed empirically that
financial dependence influences the degree to which franchisees meet performance goals
prescribed by the franchisor. In addition, it showed that performance leads to satisfaction
with the franchisor’s performance and yields positive consequences for the relationship.
5.3.5 Creating and implementing relationship marketing strategies
Towards the implementation of a relationship marketing plan (as opposed to transactional
based), Peck et al (1999) draw on the strategies of operational excellence, service
leadership and customer intimacy (Treacy & Wiersema: 1995). Peck et al (1999)
developed the relationship management chain, highlighting the value proposition;
identifying appropriate customer value segments; designing value delivery systems and
managing and maintaining delivered satisfaction. Their adapted model is represented in
Figure 5.6. Facilitating the model, Zineldin (1998) introduced concepts of cooperation
and effectiveness towards an ecological collaborative relationship management
perspective.
The relationship model (Peck et al: 1999) places emphasis on the six markets framework,
which links elements of the service profit chain (Heskett et al: 1997); service quality
(Zeithaml & Bitner: 2003); franchise relationships (Mendelsohn: 2003) and
entrepreneurial orientation (Bolton & Thompson: 2003). Best practice and benchmarking
initiatives will add value to the model, to be discussed in Section 5.4.
Figure 5.6 is represented on the following page.
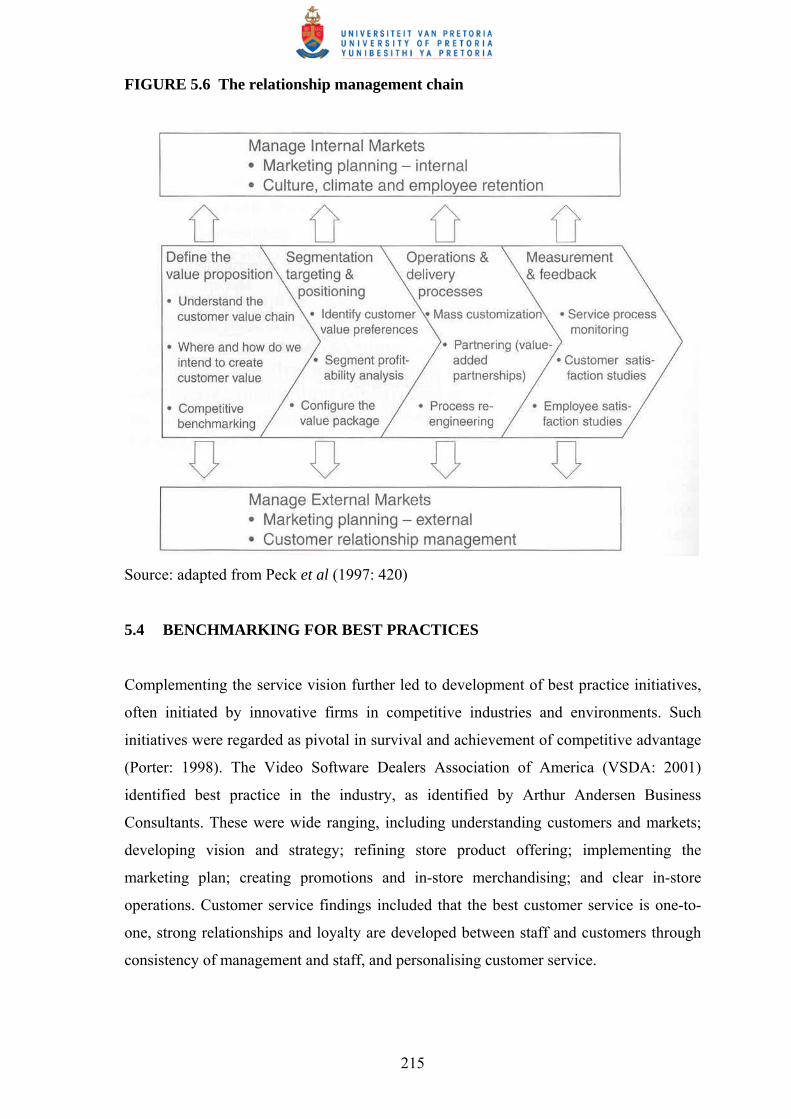
215
FIGURE 5.6 The relationship management chain
Source: adapted from Peck et al (1997: 420)
5.4 BENCHMARKING FOR BEST PRACTICES
Complementing the service vision further led to development of best practice initiatives,
often initiated by innovative firms in competitive industries and environments. Such
initiatives were regarded as pivotal in survival and achievement of competitive advantage
(Porter: 1998). The Video Software Dealers Association of America (VSDA: 2001)
identified best practice in the industry, as identified by Arthur Andersen Business
Consultants. These were wide ranging, including understanding customers and markets;
developing vision and strategy; refining store product offering; implementing the
marketing plan; creating promotions and in-store merchandising; and clear in-store
operations. Customer service findings included that the best customer service is one-to-
one, strong relationships and loyalty are developed between staff and customers through
consistency of management and staff, and personalising customer service.
216
Section 4.4.5 on encouraging internal best practice exchanges evaluates the discipline
from the service profit chain (Heskett et al: 1997) point of view. Cognisance is taken of
best practice initiatives in the franchise system (Mendelsohn: 2003), developing an
entrepreneurial orientation to implementation (Bolton & Thompson: 2003). What follows
is an overview of best practice and benchmarking in perspective.
The benchmarking exchange (TBE, 2004: 2) defines benchmarking as, “the process of
identifying, understanding, and adapting outstanding practices from organisations
anywhere in the world to help your organisation improve its performance. It is a highly
respected practice in the business world. It is an activity that looks outward to find best
practice and high performance and then measures actual business operations against those
goals”. Customer service quality and satisfaction rates as the second most used discipline
of benchmarking and business process best practice (TBE: 2004). A best practice is a
generally accepted best way of doing something (Wilkins: 2003), examples being ISO
and Six Sigma processes; both force adoption of applying best practices; neither is
applied exactly the same across an industry or organisation. Macky and Johnson (2003)
identify best practice benchmarking as reviewing what other successful organisations are
doing and adapting it to one’s own situation.
Benchmarking is the practice of being humble enough to admit that someone else is better
at something, and being wise enough to learn how to match them and even surpass them,
implementing the new behaviour as a best practice (Andersen et al: 1999). They identify
the core of implementation as being measurement of one’s own and the benchmarking
partner’s performance level, both for comparison and registering improvements;
comparison of performance levels, processes and practices; learning from the
benchmarking partner to introduce improvements in the new applicable organisation; and
improvement, which is the goal of any benchmarking study. In the Andersen et al (1999)
empirical investigation, it was suggested that service providers often find it more
important to find best practices than numerical performance data.
Jarrar and Zairi (2000) identify best practices as those that have been shown to produce
superior results; selected by a systematic process; and judged as exemplary, good or
successfully demonstrated. They portray the effective transfer of best practice, from
searching, evaluating, validating, implementing (transferring and enabling), reviewing to
routinizing. Transfer involves identifying and learning from best practices and applying

217
them in a new configuration or venue (O’Dell & Grayson: 1997). In their empirical study
of internal transfer of best practice for performance excellence, Jarrar and Zairi (2000)
indicate a wide spread of benchmarking applications across geographical and sectoral
borders. It is the intention to adapt an international best practice study (customer
satisfaction) into the context of a South African franchised home entertainment
organisation.
Zairi (2000) empirically investigated the management of customer satisfaction from a best
practice perspective; postulating that organisations need to see the process as a long-term
pursuit of improvement, a culture change that can yield to competitive outcomes of the
highest order. Achieving and maintaining an effective customer-focussed culture requires
(Zairi: 2000):
• Getting closer to the customer, and having a feel for their future needs (Heskett:
2002)
• Promoting feedback on how well the organisation is performing from the
customer’s perspective (Parasuraman: 1998)
• Being aware of new introductions and innovations to satisfy future customer
requirements (Ruyter & Bloemer: 1999)
• Identifying organisational strengths and weaknesses from a competitive
perspective (Porter: 1998)
• Gauging employee performance and the most appropriate reward and recognition
systems (Lau: 2000).
An audit tool, aimed at specifically measuring loyalty and retention, was developed by
Blazey (1997). For instance, the tool analyzes the measurement aspects of customer
satisfaction; the quality of information and data used; the external orientation aspects of
focusing on customer satisfaction and the decision-making process itself. Zairi (2000)
further provides thoughts on customer focus on a best practice perspective: having a clear
service strategy which is deployed with vision, purpose and objectives; key drivers based
on best practice, including market dynamics, competition and environmental factors;
creating clear and open dialogue with customers; and monitoring customer satisfaction,
loyalty, service quality and retention.

218
Service quality management has been considered a major driver in enhancing business
performance (Zeithaml & Bitner: 2003). In service organisations, customer-perceived
service quality is considered as one of the key determinants of business performance
(Hung-Chan: 2002; Parasuraman: 1998; Teas: 1993; Palmer: 2001). Sureshchandar et al
(2002) empirically investigated the relationship between management’s perception of
total quality service and customer perceptions of service quality from a best practice
perspective. Their results were indicative of total quality service dimensions being good
predictors of service quality. Furthermore, the soft issues of total quality services (such as
human resources, customer focus, service culture, employee satisfaction, top management
commitment, leadership, and social responsibility) seem to be more vital than do the hard
issues in positively influencing customer-perceived service quality.
Within the best practice framework (TBE:2004) and Baldridge National Quality Program
(NIST: 2004) identify generic best practice core values and concepts. These include
visionary leadership; customer-driven excellence; organisational and personal learning;
valuing employees and partners; agility; focus on the future; managing for innovation;
management by fact; social responsibility; focus on results and creating value and a
systems perspective. Many of these core values are represented in allied disciplines, such
as entrepreneurial activity (visionary leadership and innovation); service quality and the
service profit chain (customer-driven excellence, valuing employees and partners);
franchising (systems perspective) and relationship management (social responsibility,
organisational and personal learning). Home entertainment industry best practices are
specifically identified.
5.4.1 Home entertainment industry best practices
The Video Software Association of America (VSDA) retained Arthur Andersen Business
Consultants to identify the best practices among the top performing independent home
entertainment retailers in a study conducted in 2000 (VSDA: 2001). The report is
formatted with a table of contents so that retailers may locate specific information. On-
site interviews were conducted with the owners/operators of the most profitable
independent retailers across five geographically dispersed market areas (based on
benchmarking results): upstate New York; southwest Florida; central Ohio; Kansas City,
MO; and San Francisco, CA. The retailers represented a wide range of operations:
219
• Revenue: $ 100,000 to $ 1,200,000 per annum
• Competitive situation: no competition to ultra competitive
• Number of stores: one to multiple store locations
• VHS and DVD purchases: no revenue sharing to revenue sharing
• Location: small town to urban locations
• Product offerings: DVD, VHS, related consumables and services
• Adult entertainment: no adult to significant adult offerings.
The above dimensions are applicable to the current research project. The VSDA (2001)
project is complemented with the findings of a customer satisfaction study conducted in a
leading home entertainment retailer in South Africa (Maritz: 2002; 2003a; 2003b). VSDA
(2001) identified seven core areas of best practice, with corresponding recommendations
for implementation.
5.4.1.1 Best practice one: Understanding markets and customers
Finding 1: To understand changes in your business, continually evaluate your markets
and customers.
By continually evaluating your market and customers, you allow yourself to refine your
product offerings and services to meet the changing needs of your customers, and assist
you in more effectively marketing your existing customers and potential customers. The
most profitable participants keep in touch by using the following methods: trade journals;
customer research; survey cards; mystery shopperss; employee feedback sessions.
Finding 2: Customers want a fun and convenient shopping experience.
Customers now want and expect in-stock movies. They know that they can find the movie
they want at other locations. They expect both new releases and library/catalog titles to be
in-stock. Customers also want and expect personal customer service. They want to be
greeted by staff and appreciated for their business. Knowledgeable sales staff makes a
difference with the customers. Convenience in the customers’ mind goes well beyond
having a convenient location. It is defined in terms of in-stock movies; hours of operation;
drop boxes and rental terms. To give customers a fun, convenient in-store experience,

220
consider your store’s visual impact. Make sure it is clean with well-kept surroundings.
Your product lines should be organized with a logical, easy-to-follow layout.
Finding 3: Have rental terms that focus on customer expectations.
Clearly define your rental terms and policies for customers and staff. Measure and
understand changes in rental terms. The most profitable retailers have developed well
thought-out strategies based on their customers’ needs and based on their competition.
Finding 4: Of the four home entertainment store selection drivers, price is ranked last.
Measure and understand the impact of price changes. The most profitable retailers are not
averse to price increases under the right circumstances.
Finding 5: The most profitable home entertainment retailers in this study were price
leaders in their markets.
The most profitable retailers interviewed in this survey had well developed thought-out
pricing strategies for all formats of merchandise based on competition and the economics
of their marketplace.
5.4.1.2 Best practice two: Develop vision and strategy
Finding 1: The most profitable retailers have developed the vision and strategy for their
businesses both on a short term and long term basis.
This process defines the products and services that will be offered to customers and
insures that they are in line with the business strategy. Each goes through a process, best
characterized as a strengths, weaknesses, opportunities and threats analysis (SWOT), to
evaluate the current and future state of the business.
Finding 2: The most profitable retailers define a mission for their store.
Missions include value, availability, selection, experience; dependent on specialization in
a particular market.

221
5.4.1.3 Best Practice three: Refine store product offerings
Finding 1: Determine the products and offerings to deliver your mission.
This finding is facilitated by adding products and services to support the mission;
eliminating products and services that are adverse to the mission; remaining customer
focussed and balancing short and long term profitability.
Finding 2: Product and service offerings focus on customer satisfaction through meeting
or exceeding expectation. Best stores changed product purchases over the past couple of
years to meet copy depth expectations of consumers.
The goals and current practices used by the most profitable participants to maximize their
customer satisfaction are meeting consumer demand for rental product in week one
(goal); and meeting total demand on a movie by week two or three (current practice). This
may be achieved by revenue-sharing initiatives, or purchasing rates averaged at a
minimum of thirty per cent of rental revenue. Interactive gaming practice is to carry the
three dominant game platforms: Playstation, Nintendo 64 and X-Box.
5.4.1.4 Best practice four: Implement marketing plan
Finding 1: Strong focus on community involvement drives awareness and loyalty.
Implementations include point of difference versus national chains, reinforcing activities
in-store and focussing on different customer segments. Segments may include high
schools and tertiary institutions (teens); boy scouts/girl scouts (families); performing arts
(young adults/families) and chamber of commerce (business).
Finding 2: Direct mail is a cost-effective tool used to drive frequency for two customer
groups: active customers and inactive customers.
The most effective offers have been determined and used to market to the appropriate
customer groups. Both types, dedicated direct mail pieces as well as random are being
used.

222
5.4.1.5 Best practice five: Offer excellent customer service
Finding 1: The best customer service is one-to-one
Motivate staff to develop one-to-one relationships with your customers. Initiatives include
greeting customers upon entering the store; greeting the regular customers by name;
providing expert advice on movies; and reservations for best customers.
Finding 2: Strong relationships and loyalty are developed between staff and customers
through consistency of management and staff.
Many of the most profitable retailers have employees with lengths of service ranging
from two to ten years in the store. Many also have generational staffing.
5.4.1.6 Best practice six: Create promotions and in-store merchandising
Finding 1: The use of customer-driven merchandising bring ease of use and convenience
to the rental experience.
Initiatives include new releases on the outer wall sorted alphabetically; library/catalogue
sorted alphabetically; DVD in a separate section sorted alphabetically; interactive games
in a separate section sorted alphabetically; adult entertainment in a separate room, sorted
by category and alphabetically within each category; and previously viewed titles sorted
alphabetically.
Finding 2: A range of in-store promotions programmes have helped maintain loyalty of
consumers despite competitive store openings. These programmes help bring a point of
differentiation to the in-store experience. Examples include free popcorn and ‘happy-
hour’.
Finding 3: A pleasing store is important to keeping your customers coming back.
Have consistent appearance of merchandising materials to correspond with your store
décor. This includes clear, singular messages per merchandising piece; update or change
every six to eight weeks; and minimize clutter of the message. All category and pricing

223
signage is professionally produced and consistent throughout the store with no
handwritten signs. The interior of the store should reflect the image that needs to be
projected to your customer.
Finding 4: The best stores regularly remodel/update stores to reinforce a strong and
positive image to customers.
Implementations include replacing carpets; painting; updating fixtures; exterior signage
and category signage.
5.4.1.7 Best practice seven: Have clear in-store operations
Finding 1: Store operating procedures are clearly documented in an operations manual
for consistency of execution by staff.
Procedures include the store opening; cash management; customer service; cash wrap or
check out; merchandising; loss prevention; setting the store-street date; and safety and
security. Store hours of operations were found to have consistent opening times of 09h00
or 10h00. Closing times vary depending on community from 22h00 to midnight on
Sunday through Thursday and 23h00 to midnight on Friday and Saturday.
Finding 2: Staffing procedures and requirements vary by store depending on volume and
location.
Finding 3: Store guidelines have an overall focus of serving the customer.
Findings indicate that customers expect to wait in lines at major outlets, but not at home
entertainment outlets. Home entertainment outlets are perceived to be havens of
personalized, friendly service every time.
Most of the findings relate to operating processes that can be segmented into five key
areas: understand markets and customers; develop vision and strategy; refine products and
services; market and sell; and in-store operations. These five key best practice processes
have been identified by Arthur Andersen under a process classification scheme, ten steps
to success (VSDA: 2001). They are operational processes and focus on the ‘front of the
224
house’ that directly impacts the customer experience such as store offerings and customer
service. These processes have direct bottom line impact. The report is concluded with a
handy checklist of operational best practices for home entertainment retailers.
The practicality of these best practices aligns with literature on the service profit chain
(develop vision and strategy); service quality (understanding markets and customers);
relationship management (offer excellent customer service); benchmarking (have clear in-
store operations); and franchising (clearly documented operations manual). Overall,
service quality (Zeithaml & Bitner: 2003), relationship management (Peck et al: 1999)
and best practice/benchmarking (TBE: 2004; VSDA: 2001) are consolidated to enhance
customer satisfaction and loyalty.
5.5 CONCLUSION
Service quality is an attitude or global judgement about the superiority of a service,
identifying dimensions of reliability, assurance, tangibles, empathy and responsiveness.
The integrated gaps model of service quality is introduced, identifying five gaps;
representing the organisation and the customer. The foundation of the model revolves
around customer service expectations and perceptions of service quality. Implementing
service quality is discussed from a generic marketing and services marketing perspective.
Integration of service quality relationships places emphasis on market orientation, loyalty,
customer satisfaction, marketing culture, previous experience, internal marketing and
future consumer behaviour. Measurement scales of service quality evaluated include
SERVQUAL, SERVPERF, EP/NQ, Qualitometro, critical factor approach, bank service
quality, and the two-way model.
Relationship management primarily evaluated the six markets model; which includes
customer, internal, referral, influence, recruitment and supplier/alliance markets. The six
markets model identifies all facets of internal and external relationships that can
contribute to an organisation’s marketplace effectiveness. The purpose of evaluating
relationship marketing is to analyse the effect of networks and relationships on customer
satisfaction and loyalty. The relationship management chain is introduced as highlighting
the value proposition; identifying appropriate customer value segments; designing value
delivery systems and managing and maintaining delivered satisfaction.

225
Benchmarking is the process of identifying, understanding, and adapting outstanding
practices from organisations anywhere in the world, to help an organisation improve its
performance. Best practice and benchmarking are identified from the perspectives of
customer satisfaction, service quality, business performance and values. The Video
Software Association of America (VSDA: 2001) identified best practice in the home
entertainment industry, as identified by Arthur Andersen Business consultants. Most of
the findings relate to operating processes that can be segmented into five key areas:
understanding markets and customers; developing vision and strategy; refining products
and services; marketing and selling; and in-store operations.
The overall assessment of the chapter is the synergy between service quality, relationship
management, best practice and entrepreneurial orientation, the service profit chain, and
the franchise system.
In Chapter 6 research methodology and design is discussed. The study commences with
an exploratory search of literature, followed by an empirical investigation to scientifically
validate hypotheses. Methodology includes sampling techniques, instrument design and
analysis of questionnaire design. Data collection and analysis techniques follow; inclusive
of descriptive measures, frequencies, range, measures of association, graphical
representations, significance tests, factor analysis and correlation.
226
6 CHAPTER 6: RESEARCH METHODOLOGY
“The creation of knowledge, regardless of the context, requires the collection and
analysis of data. Quality knowledge will result only if the research process is systematic
and follows the scientific method” (Borland, 2001: 5).
6.1 INTRODUCTION
Research methodology is regarded as the sequence of stages underlying the design and
implementation of a research project , including the establishment of the research purpose
and objectives, information value estimation, research design and implementation (Aaker
et al: 2001). The term methodology is closely related to the term epistemology, which
stems from the Greek word episteme; which is their term for knowledge and is the
philosophy of how we come to know. Trochim (1997) identifies the intimate relationship
between epistemology and methodology; the former involving the philosophy of how we
come to know the world and the latter involving the practice. This chapter aims to provide
insight into the practical methods employed in gathering information for the empirical
section of this research project.
The research process is identified as a sequential process foro conducting a research
study. The research problem is developed into research questions, objectives and,
ultimately, hypotheses. Hypotheses are, in turn, identified as primary and secondary
hypotheses; evaluating entrepreneurial orientation in a franchise system and strategic
service initiatives. Exploratory and conclusive research design is evaluated with
applicability to the current research project, followed by methodology employed in this
research project. Sources of data and data collection highlight a quantitative approach,
identifying the survey method. The sampling frame includes a census approach,
representative of the population. A questionnaire is developed using a combination of
nominal, ordinal and interval scales; identifying permissible descriptive and inferential
statistical analysis. Questionnaire questions, sections and links are discussed, followed by
instrument editing, coding, reliability and validity.
Descriptive statistical techniques identify the application of univariate (single variable)
measures of centre and spread and bivariate (two-variable) measures of association.
Inferential statistics include relevance tests (hypotheses tests), identifying implementation

227
of the Kruskal-Wallis one-way analysis of variance (ANOVA). Cronbach’s Alpha is
introduced as a construct reliability measure, identifying overall inter-item correlation.
Applicable software used for the collection and analysis of data include Surveypro and
SPSS version 11.0. Synthesis and interpretation concludes the research methodology
chapter.
6.2 THE RESEARCH PROCESS
Best and Kahn (1998: 18) define research as, “the systematic and objective analysis and
recording of controlled observations that may lead to the development of generalizations,
principles, or theories, resulting in prediction and possibly ultimate control of events”.
Page and Meyer (2003: 321) identify pure research as research conducted for the purpose
of adding to the body of knowledge, and building theory. This is in contrast to applied
research, which is research with a specific application in mind (Page & Meyer: 2003:
312).
Malhotra, Hall, Shaw and Oppenheim (2002: 32) define the research process as a
sequential process which defines the tasks to be accomplished in conducting a research
study. They identify six key steps in the process:
• Problem (or opportunity) definition, consisting of collecting background
information; research problem formulation; and setting the decision criteria.
• Development of an approach to the problem, establishing theoretical foundations;
developing conceptual and analytical models, setting the research questions;
specifying appropriate hypotheses and specifying research objectives
• Research design formulation, involving type of research design (exploratory,
descriptive or causal); establishing costs; definition of target population; sampling
process and sample size; sources of data (secondary and primary); methods of data
collection (qualitative and quantitative); questionnaire design and data analysis
approach
• Field work or data collection, with objectives of minimising interviewing errors
and maintaining field work quality
• Data preparation and analysis, which includes the checking editing, coding
transcription and verification of data
228
• Report preparation and presentation, addressing the specific research question/s
identified, together with interpretation of results.
Dillon, Madden and Firtle (1993: 24) define the research process as a sequence of stages
that provide a general framework to follow when implementing a research study. Whilst
similar to the definition of Malhotra et al (2002: 32) and that of Churchill (1996); they
identify a process which differs only slightly from these authors. The Dillon et al (1993)
research process is set out in seven stages:
• Formulate the problem
• Determine the research design
• Preparation of data, comprising determination of the source of data; determining
the data collection format; designing of the sampling plan and designing the
questionnaire
• Implementing the field work
• Processing the data, including editing and coding
• Tabulation and analysis of the data
• Preparation of the research report.
Page and Meyer (2003) in turn identify a five step sequence to the research process:
• Generating ideas
• Building a theoretical framework
• Research design, consisting of translation of research questions into research
variables; appropriate sampling and data-collection methods; analysis methods;
time frame; budget and writing the research proposal
• Management of the research process, with contributory factors of preparation;
funding issues; ethical issues, data management and people management
• Evaluating and reporting results.
Despite similarities between the identified research processes (Page & Meyer: 2003;
Malhotra et al: 2002 and Dillon et al: 1993), it is the decision of the researcher to
combine the processes, and not follow the research process of any individual author/s. As
such, a combination of the processes will be followed in this methodological paradigm.
229
Distinct characteristics will be identified from each, leading to an objective and
systematic evaluation of the process, identifying the research strategy. In addition, the
tailored design methodology identified by Dillman (2000) is primarily implemented as a
mail and internet survey tool. This will facilitate the purpose of this research study, with
the outcome categorised as a combination of scientifically adding to the body of
knowledge whilst solving an immediate specific problem (Page & Meyer, 2003: 19).
6.3 PROBLEM FORMULATION
Malhotra et al (2002) identify this stage as steps one and two, in their research process
model. This consists of problem (or opportunity) definition and development of an
approach to the research problem. Martins, Loubser and van Wyk (1996) see problem
formulation as the most important step in the research project, whilst Trochim (1997)
identifies it as one of the most difficult (and least discussed) steps. Malhotra et al (2002)
are also of the opinion that inadequate problem definition is a leading cause in the failure
of research projects.
The background discussion in Chapter 1 highlights the requirement of the
conceptualisation of an entrepreneurial strategic vision in the franchised home
entertainment system. Whilst the existing body of knowledge has influenced strategic
service visions in many service related industries; entrepreneurship and the service profit
chain, together with other strategic initiatives have received minimal formal research in
the lucrative South African home entertainment industry. To date, no published
entrepreneurial service vision within this industry is to be found in reviews, standing
operating procedures, nor any literature search. This study will not only enhance
understanding of the dynamics of the industry on the African continent, but also
conceptualise an entrepreneurial service vision in the home entertainment industry. The
contribution of such a strategic service vision will facilitate competitive advantage
throughout the supply chain; involving distributors, retailers (primarily franchise based)
and the interaction with customers.
Theoretically, the value the investigation provides will be in understanding that the home
entertainment industry is worthy of developing a body of knowledge, to be shared by all
industry participants. Similarly, linking entrepreneurship, franchising and strategic service
in the form of a matrix may be of interest and application to other academic disciplines.

230
This will facilitate both researchers and students in related business management
disciplines.
As a contribution to practice, the entrepreneurial service vision will enhance the longevity
of the industry, together with sharing entrepreneurial service vision recommendations to
all industry participants. As such, the general oligopolistic nature of major industry
participants will be dissolved; making the industry more accessible, creating more
employment, and increasing industry participants. Since the industry is a product of
technology; the identification of entrepreneurial and relationship behaviour of
franchisor/franchisees will highlight the re-defining of industry practices.
This study, the first of its kind in the home entertainment industry and in the specific
organisation, will smooth the way for implementation of entrepreneurial franchise service
initiatives in the organisation. It will also assist franchisees in their advancement in the
organisation and could be used to complement other programmes within the home
entertainment, entrepreneurial and franchised communities.
On a macro level, successful implementation of the matrix will enhance industry
participation; together with entrepreneurial contributions towards the creation of wealth,
economic growth and creation of employment in a dynamic, yet turbulent developing
economy such as South Africa. As such, the study will enhance South African companies’
competitive advantage in an international marketing environment. Limitations however
rest upon the motivation and entrepreneurial orientation of implementation within a
franchised environment, ultimately in the hands of the franchisee.
Problem formulation applicable to the current research project involves the research
question, key terms (background), research objectives and development of hypotheses.
6.3.1 The applicable research question
The purpose of the investigation is to determine the entrepreneurial orientation of
participants in a franchised environment, coupled with the association of service vision
factors. Once explored, the entrepreneurial orientation and service vision factors will be
synergised to develop an entrepreneurial service vision within a franchised environment.

231
6.3.1.1 Primary research question
To determine the entrepreneurial orientation within a franchised system.
Question 1: Does entrepreneurial orientation exist within a franchised system, and if
so, to what extent?
6.3.1.2 Secondary research questions
To determine the contribution of franchising as an entrepreneurial option towards creating
and developing ventures.
Question 2: Does franchising lead to an entrepreneurial option for creating and
developing ventures?
To determine the contribution of the service profit chain to service quality.
Question 3: Do service profit chain initiatives lead to service quality?
To determine the contribution of relationship marketing to service quality.
Question 4: Does relationship marketing lead to service quality?
To determine the contribution of best practice to service quality.
Question 5: Does best practice lead to service quality?
To determine service quality in a franchise system
Question 6: What is the level of service quality in a franchise system?
Entrepreneurial orientation is however also proposed from a multiple franchisee point of
view; being franchisees that operate more than one franchised unit (multiple-outlet
franchising).
232
6.3.2 Key terms of entrepreneurial orientation, franchising and strategic service
vision
Integrating entrepreneurial activity and strategic service within a franchised system may
best be explained in the context of networks. The most widely held view of ‘network’
refers to an organized system of relationships, linking a defined set of persons, objects or
events (Nelson: 1988; Szarka: 1990). This networking in small business serves to provide
owner-managers with the necessary support, contacts, and credibility (Ostgard & Birley:
1996). Consequently, the owner-managers will benefit from obtaining necessary
information and will learn more about their own competitive capabilities relative to their
competition, thereby minimizing the harsh lessons the market place may present (Dilts:
2000). As such, networking is seen as a major tool for achieving desired business results,
and as a key source of resources that are typically outside the reach of many entrepreneurs
(Zhao & Aram: 1995). This network view correlates entrepreneurship and franchising, yet
the study of entrepreneurial orientation amongst franchisees in the franchise system
requires investigation. In this context, the study will include an entrepreneurial character
theme analysis, based on twenty associated themes, developed by Thompson and Bolton
(2003). In addition, franchising as an entrepreneurial option for creating and developing
ventures will be evaluated within the defined franchise system.
Extensive literature in the areas of customer satisfaction and loyalty abound, yet few link
the disciplines of service quality, the service profit chain, relationship management and
best practice. The development of a service vision matrix (incorporating these disciplines)
involves an investigation into the relationship and association between these constructs
independently and as a stratified matrix. Such a study will include strategic service
initiatives of service quality (Zeithaml & Bitner: 2003), the service profit chain (Heskett
et al: 1997), the relationship marketing six markets framework (Peck et al: 1999), and
best practice principles (VSDA: 2001).
An important aspect of the study will be synergising the overall entrepreneurial
orientation of the franchised system within the framework of a strategic service vision.
233
6.3.3 Research objectives
The research objectives are to investigate the current situation of entrepreneurial
orientation in a franchise system, together with examining the contribution of a strategic
service vision to service quality. The purpose is thus to identify entrepreneurial behaviour
amongst franchisees, franchising as an entrepreneurial option; and to identify elements of
service quality, service profit chain, relationship management and best practice;
and,finally, to develop a matrix of an entrepreneurial service vision, to be initiated within
the franchise system.
The first objective of investigating entrepreneurial orientation within the franchise system
is based around the entrepreneurial character themes as depicted by Bolton and
Thompson (2003: 62-80). The outcome of orientation will facilitate decision-making and
implementation of the strategic service vision. Multiple-outlet entrepreneurial orientation
is proposed.
The second objective, consisting of the four constructs (service profit chain; service
quality, relationship management and best practice) associated with the vision; include
investigation of issues relating to relationships within and between the constructs. An
additional construct, the franchise paradox, measures the contribution of the franchise
system as an entrepreneurial option for creating and developing ventures.
The final objective is the development of an entrepreneurial service vision, based upon
the findings of the first two objectives. Such a matrix may be described as a full
representation or description of the set of associations between these factors, including
statements about the assumptions and interactions in the matrix (Page & Meyer, 2000: 7).
6.3.4 Hypotheses to be tested
Hypothesis testing uses statistical techniques to support predictions arising from theory.
This is done at a statistically significant level, in that hypotheses (predictions) are either
accepted or rejected. Page and Meyer (2000: 23) define a hypothesis as “a testable
speculative statement delineating the relations between all the elements of a theory”. The
two hypotheses involved in hypothesis testing are the null and alternate hypothesis
234
(represented by H0 and H1 respectively). H1 represents the research hypothesis, whilst
H0 assumes the research hypothesis is false (Page and Meyer, 2000: 166).
The hypotheses supplement the research questions and objectives:
6.3.4.1 Primary hypothesis
The primary hypothesis postulates that there is evidence of entrepreneurial orientation in
a franchise system.
H1: Entrepreneurial orientation exists in a franchise system.
H0: Entrepreneurial orientation does not exist in a franchised system.
A proposition is introduced with reference to multiple-outlet franchising.
P1: Entrepreneurial orientation exists in a multiple-outlet franchise syatem.
6.3.4.2 Secondary hypotheses
The secondary hypotheses postulate that there is evidence of a positive association
between:
• The franchise system is an entrepreneurial option towards creating and developing
ventures
• The service profit chain and service quality
• Relationship marketing and service quality
• Best practice and service quality
H2: The franchise system is an entrepreneurial option towards creating and developing
ventures.
H0: The franchise system is not an entrepreneurial option towards creating and
developing ventures.
H3: Service profit chain initiatives are positively associated with service quality.
H0: Service profit chain initiatives are not positively associated with service quality.
235
H4: Relationship marketing initiatives are positively associated with service quality.
H0: Relationship marketing initiatives are not positively associated with service
quality.
H5: Best practice initiatives are positively associated with service quality.
H0: Best practice initiatives are not positively associated with service quality.
Hypotheses testing will include non-parametric testing, indicative of the assumption that
the dependent variable does not necessarily have a normal distribution (bell-shaped).
Hypothesis tests produce P-values, measuring significance, whereby there is a chance that
the null hypothesis is true (Malhotra et al: 2002). Hypothesis tests will include the
Kruskal-Wallis one way ANOVA test , together with interaction tests for greater than one
independent variables (Page & Meyer: 2003). Service quality, the dependent variable,
will be measured using similar inferential statistics as the stated hypotheses.
6.4 RESEARCH DESIGN
Neuman (1997: 62) portrays a paradigm as a basic orientation to research and theory,
distinguishing between quantitative and qualitative methodology. This is not to be
confused with qualitative and quantitative analysis. The term research methodology refers
to the procedure employed when research is undertaken and constitutes the blueprint for
the gathering, measurement and analysis of data (Mouton: 2001). The research design is
in turn a framework for conducting a research project (Malhotra et al: 2002). Churchill
(1996) identifies it as the blueprint that is followed in the completion of a study. A
research design lays the foundation and building blocks for conducting the research (Page
& Meyer: 2003).
The study commences with an exploratory search of published data in the disciplines of
entrepreneurship and franchising. Related literature is reviewed, with particular reference
to entrepreneurial orientation and characteristics, linked to the franchise paradox. In
addition, experts and well informed people with credentials in these arenas are canvassed
for their opinions and thoughts relating to the research objectives. This not only includes
academia, but also industry-knowledgeable individuals. Published data reviewed includes
books and journals, in addition to international academic conference proceedings.

236
The literature review (secondary data) forms the foundation on which the research is
built, and Neuman (1997) informs that it should integrate and analyse what is known in
the specific area by synthesizing different prior studies. To combine a literature study of
the service profit chain, service quality, relationship management and best practice; there
is in the first place a theoretical perspective investigation into the process of a strategic
service vision. Thereafter a theoretical disposition evolves incorporating these factors into
a strategic vision.
Literature on the home entertainment market is scarce, and very little research has been
conducted in this industry on the African content. Analysis however is to be conducted
from the Video Software Association of America (VSDA), together with formal research
in leading South African market participants. Customer satisfaction data is however
available from one of the leading home entertainment retailers in the South African
market (conducted previously by the researcher, as Managing Director of the second
largest market participant).
An empirical investigation (primary data) follows hereon. Grounded on theoretical
investigation, empirical research is conducted to scientifically validate hypotheses as
depicted. Quantitative methodology shall be employed to test hypotheses, with
measurement in terms of numerical, interval and ordinal data; being data that is in the
form of numbers from precise measurement. Theory is causal and deductive, with
analysis proceeding with tables and statistics; discussing how this relates to the
hypotheses.
Research design is the general form or system according to which the study is executed,
with surveys enabling the researcher to collect data in a standardized format from a
census (Struwig & Stead: 2001). It is done in such a way that it is possible to make
generalizations to the population. The survey will be implemented to collect data about a
great number of similar cases, executed in a circumscribed area at a given time. The
survey follows a deductive approach, whereby it commences with a theoretical or applied
research problem and ends with empirical measurement and data analysis (Neuman,
1997: 109).
Whilst the identified authors vary on their inclusion of factors into this stage, a composite
ideology from all three is proposed (Malhotra et al: 2002; Page & Meyer: 2003; Dillon et

237
al: 1993). What follows is intended to provide insight into the practical ways and methods
that will be employed in gathering the information for the empirical part of this study.
This commences with research and design, followed by the next chapter on data
processing, analysis and proposed evaluation of results.
6.4.1 Classification of research design
Research designs may be classified as either being exploratory or conclusive (Malhotra et
al: 2002). Conclusive research design is further classified as descriptive and causal
research. Page and Meyer (2003) advise that whether research is pure or applied, the
purpose of the study can be descriptive, exploratory, comparative, or to test specific
hypotheses (predictions) generated by theory. This study will incorporate a combination
of the points of view of Malhotra et al (2002) and that of Page and Meyer (2003). The
combined classification (adapted from these sources) is depicted in Figure 6.1.
FIGURE 6.1 A combined classification of research design
Source: adapted from Malhotra et al (2002: 33) and Page and Meyer (2003: 35)
Towards identifying the research classification appropriate to this study, a broad
differential viewpoint is required. Exploratory research is used in cases when the problem
must be defined more precisely, relevant courses of action must be clarified or additional
insights must be gained before an approach can be developed. The primary objective of
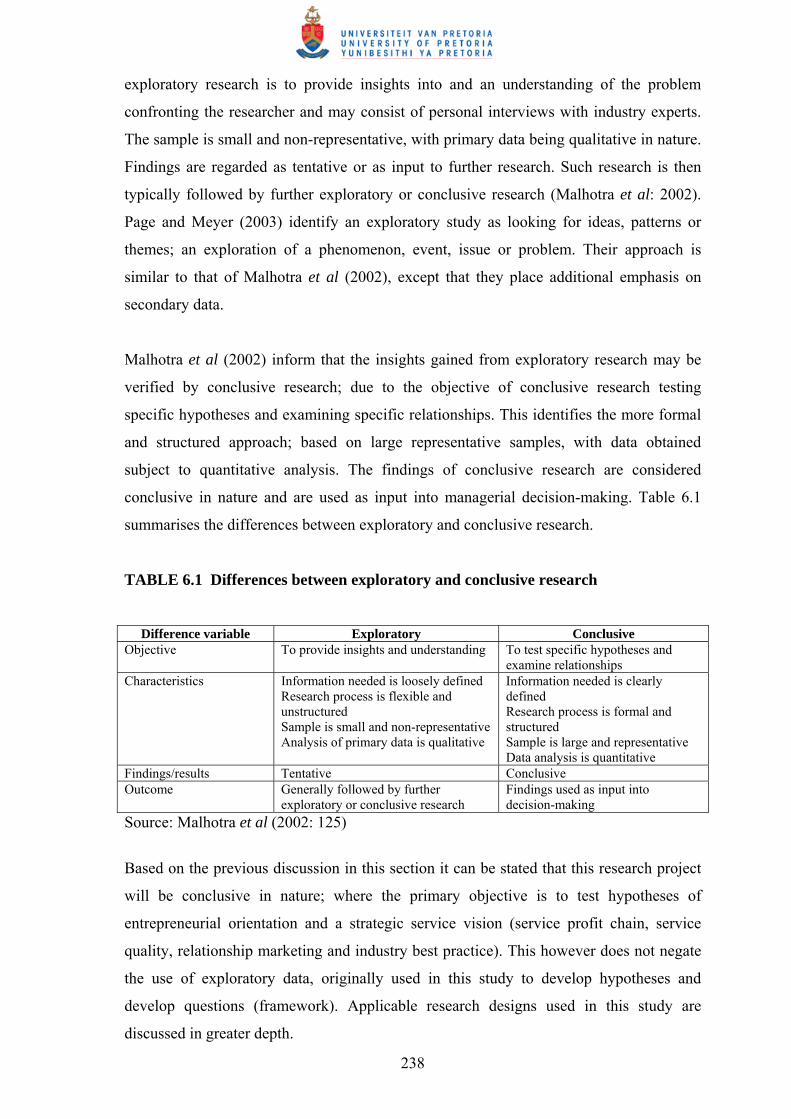
238
exploratory research is to provide insights into and an understanding of the problem
confronting the researcher and may consist of personal interviews with industry experts.
The sample is small and non-representative, with primary data being qualitative in nature.
Findings are regarded as tentative or as input to further research. Such research is then
typically followed by further exploratory or conclusive research (Malhotra et al: 2002).
Page and Meyer (2003) identify an exploratory study as looking for ideas, patterns or
themes; an exploration of a phenomenon, event, issue or problem. Their approach is
similar to that of Malhotra et al (2002), except that they place additional emphasis on
secondary data.
Malhotra et al (2002) inform that the insights gained from exploratory research may be
verified by conclusive research; due to the objective of conclusive research testing
specific hypotheses and examining specific relationships. This identifies the more formal
and structured approach; based on large representative samples, with data obtained
subject to quantitative analysis. The findings of conclusive research are considered
conclusive in nature and are used as input into managerial decision-making. Table 6.1
summarises the differences between exploratory and conclusive research.
TABLE 6.1 Differences between exploratory and conclusive research
Difference variable Exploratory Conclusive
Objective To provide insights and understanding To test specific hypotheses and examine relationships
Characteristics Information needed is loosely defined Research process is flexible and unstructured Sample is small and non-representative Analysis of primary data is qualitative
Information needed is clearly defined Research process is formal and structured Sample is large and representative Data analysis is quantitative
Findings/results Tentative Conclusive Outcome Generally followed by further
exploratory or conclusive research Findings used as input into decision-making
Source: Malhotra et al (2002: 125)
Based on the previous discussion in this section it can be stated that this research project
will be conclusive in nature; where the primary objective is to test hypotheses of
entrepreneurial orientation and a strategic service vision (service profit chain, service
quality, relationship marketing and industry best practice). This however does not negate
the use of exploratory data, originally used in this study to develop hypotheses and
develop questions (framework). Applicable research designs used in this study are
discussed in greater depth.
239
6.4.1.1 Exploratory research
Whist only constituting a small part of the project, this approach was used on an
exploratory level; due to the original lack of a clear idea to the problem. The objective of
exploratory research is meaningful in any situation where the researcher does not have
enough understanding of the research project (Malhotra et al: 2002). This process
enabled the researcher, through exploration, to develop concepts more clearly, establish
priorities, develop operational definitions, and improve the final research design. Formal
protocols and procedures were not used, highlighting the flexibility and versatility of this
approach (Churchill: 1996). Although the focus of investigation shifted constantly, the
main topic themes remained constant. Methods of exploratory research used in this study
included survey of experts (home entertainment and discipline specific); pilot surveys
(franchisee and pre-test specific); and secondary data (entrepreneurial orientation,
franchise paradox, service profit chain, relationship marketing and best practice specific).
The purpose of exploratory research was based on the findings of Churchill (1996):
formulating a problem for more precise investigation; developing hypotheses as a result
of the initial investigation; establishing priorities for further research; gathering
information about the practical problems of carrying out research on particular issues;
increasing the researcher’s familiarity with the problem; clarifying concepts.
Applicability to the current research project included a background study of the home
entertainment industry (applying Porter’s five forces model); customer satisfaction levels
in the industry (Maritz: 2002); identifying the relevant franchise system; measurement
instruments and designs for various constructs (Thompson: 2003; Zeithaml et al: 2003;
Heskett et al: 1997; Peck et al: 1997; VSDA: 2001); developing hypotheses (based on
exploratory research in the home entertainment industry); practical solution for carrying
out research (such as identifying studies in related disciples, an example being the self
evaluation by management of service quality (Chang & Chen: 1998); and exploratory
research conducted with home entertainment industry participants and academia
regarding specific disciplines. The disciplined exploratory research included interaction
with academia specialising in the discipline areas at international conferences and
symposiums.
Cognisance is however taken of the exploratory, tentative and insightful nature of this
research; which is followed by conclusive research (Page & Meyer: 2003).

240
6.4.1.2 Conclusive research
As highlighted, this research project is primarily conclusive in nature; being more formal
and structured. It is based on large, representative samples and the data obtained are
subjected to quantitative analysis. The findings from this empirical research are
considered to be conclusive in that they are used as input into managerial decision-
making (Malhotra et al: 2002). Applicability to this study is the testing of hypotheses,
followed by the development of a conceptual matrix, proposing an entrepreneurial service
vision in the franchised home entertainment sector. Malhotra et al (2002) identify
conclusive research as being either descriptive or causal; whereas Page et al (2003) also
include alternatives of hypotheses testing and comparative research. Table 6.2 shows the
difference between these research designs.
TABLE 6.2 A comparison of basic research designs
Comparison
variable Exploratory Descriptive Causal Hypotheses Comparative
Objective Discovery of ideas and insights
Describe market characteristics or functions
Determine cause and effect relationships
Accept or reject pre-determined hypotheses
Comparison with what would be expected in theory
Characteristics Flexible and versatile Often the front end of total research design
Marked by prior formulation of specific hypotheses Preplanned and structured design
Manipulation of one or more independent variables Control of other mediating variables
Marked by prior formulation of specific hypotheses Preplanned and structured design
Experimental groups compared with control groups Preplanned and structured design
Methods Expert surveys Pilot surveys Secondary data Qualitative research
Secondary data Surveys Panels Observations and other data
Experiments Statistical techniques
Secondary data Surveys Panels Observations and other data
Source: adapted from Malhotra et al (2002) and Page and Meyer (2003)
The comparisons in Table 6.2 identify similarities among descriptive, hypotheses and
comparative research in particular. To avoid semantics, the researcher will incorporate
hypotheses and descriptive research into the descriptive research portfolio. The
operational difference between causal and descriptive research is the manipulation of
independent variables (in the former), lending itself to experimentation (Malhotra et al:
2002). Applicability to the current research project involves hypotheses testing, using

241
secondary data, survey approach and describing the relationships of constructs identified
(section 6.3.1). What follows is justification of the descriptive approach for this study.
6.4.1.3 Descriptive research
Often referred to as the phenomenological approach, a descriptive study sets out to
describe a phenomenon or event as it exists, without manipulation or control of any
elements involved in the phenomenon or event under study (Page & Meyer, 2003: 22).
This type of research presents a picture of the specific details of a situation, creating a set
of categories or classification types (Neuman, 1997: 19). Malhotra et al (2002) define
descriptive research as a type of conclusive research which describes market
characteristics or functions, following a pre-planned and structured approach. They
reason that descriptive research is applicable as follows:
• To describe the characteristics of relevant groups; with applicability to the current
research project describing the entrepreneurial orientation of franchisees
(Thompson: 2003) and franchising as an entrepreneurial option
• To determine the perception of service characteristics; with applicability being
perception of service quality (Zeithaml & Bitner: 2003); service profit chain
(Heskett et al: 1997); relationship marketing (Peck et al: 1999) and best practice
(VSDA: 2001)
• To determine the degree to which behaviour and marketing variables are
associated; application being the association between variables of the constructs
identified in this study
• To make specific predictions; with applicability to the current research project
being the acceptance or rejection of hypotheses (section 6.3.4)
• To estimate the percentage of units in a specified population exhibiting a certain
behaviour, with applicability being entrepreneurial orientation by character themes
(Thompson: 2003) of franchisees within a defined franchise system.
Prior knowledge of the problem situation was obtained from exploratory research
(Section 6.4.1.1). Descriptive research, in contrast to exploratory research, is marked by a
clear statement of the problem (Section 6.3.1); specific hypotheses (Section 6.3.4) and
detailed information needs (Malhotra et al: 2002). The survey method is identified as
appropriate for descriptive design (Neuman: 1997), and will be used in the current
242
research project. Descriptive research using the methods in table 6.2 can further be
classified into cross-sectional and longitudinal research (Figure 6.1). Cross-sectional
research involves the collection of information from any given sample of population
elements only once; whereas longitudinal design involves a fixed sample of population
elements, which is measured repeatedly (Malhotra et al: 2002). Cross sectional design is
further differentiated into single and cross-sectional design. The former, as its singular
connotation implies, refers to design in which one sample of respondents is drawn from
the target population and information is obtained from the sample once. The latter
involves two or more samples of respondents and information from each sample is
obtained once only. Applicability to the current research project will involve single cross-
sectional design, using a census approach. Although a census will be used (single cross-
sectional), data is stratified by region (geographical and franchise location stratification).
This section highlighted stage 1 and 2 in the research process (Section 6.2) identified by
Dillon et al (1993), namely, determining the research design. Section 6.5 will concentrate
on stage 3 in the process, being sources of data; data collection; sampling plan and
instrument design. These sections are incorporated under the heading methodology,
where-after data processing and analysis will be discussed.
6.5 METHODOLOGY
Dillon et al (1993) refer to this stage as preparation of data; comprising determination of
the source of data, determining the data collection format, designing of the sampling plan
and designing the questionnaire. This section however falls under research design and
formulation (Malhotra et al: 2002; Page & Meyer: 2003). Section 6.5 shall however
follow the Dillon et al (1993) paradigm.
6.5.1 Sources of data
Information sources available to the researcher can be classified as primary or secondary
data (Dillon et al: 1993: 78). Aaker, Kumar and Day (2001) postulate that these methods
may be used either singly or in combination. They explain secondary data as being
already available, being collected for some purpose other than solving the present
problem; whilst primary data are collected especially to address a specific research
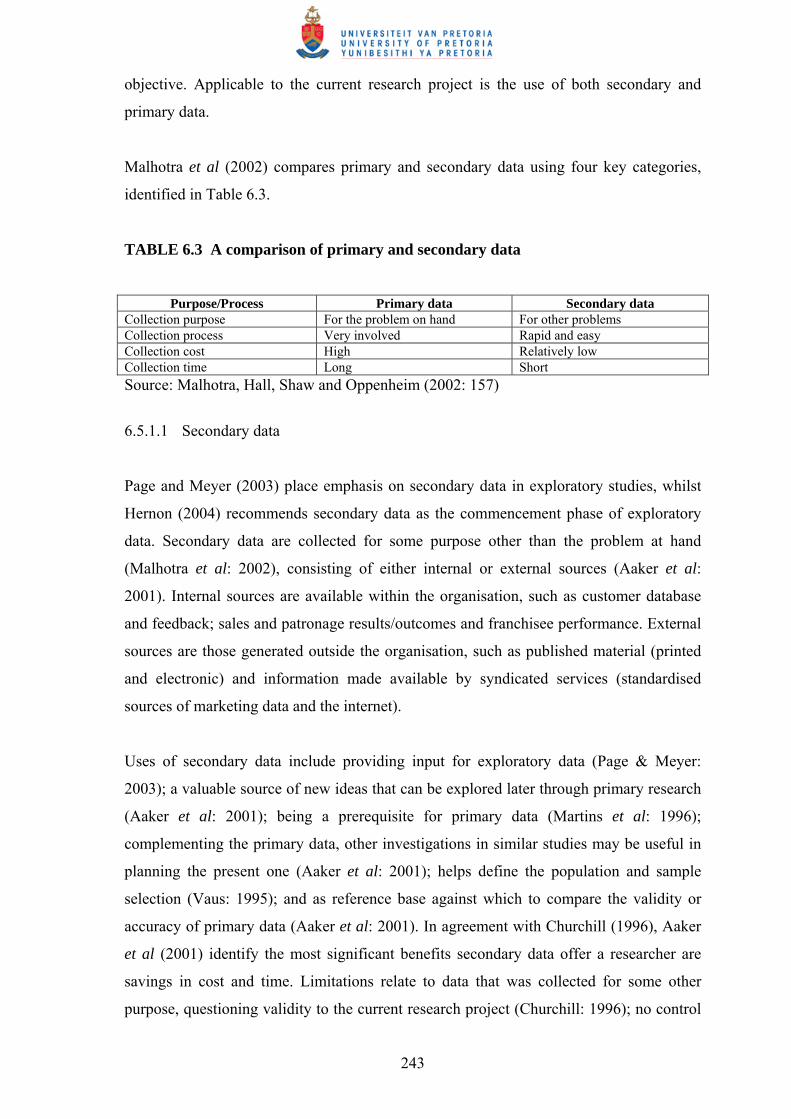
243
objective. Applicable to the current research project is the use of both secondary and
primary data.
Malhotra et al (2002) compares primary and secondary data using four key categories,
identified in Table 6.3.
TABLE 6.3 A comparison of primary and secondary data
Purpose/Process Primary data Secondary data
Collection purpose For the problem on hand For other problems Collection process Very involved Rapid and easy Collection cost High Relatively low Collection time Long Short Source: Malhotra, Hall, Shaw and Oppenheim (2002: 157)
6.5.1.1 Secondary data
Page and Meyer (2003) place emphasis on secondary data in exploratory studies, whilst
Hernon (2004) recommends secondary data as the commencement phase of exploratory
data. Secondary data are collected for some purpose other than the problem at hand
(Malhotra et al: 2002), consisting of either internal or external sources (Aaker et al:
2001). Internal sources are available within the organisation, such as customer database
and feedback; sales and patronage results/outcomes and franchisee performance. External
sources are those generated outside the organisation, such as published material (printed
and electronic) and information made available by syndicated services (standardised
sources of marketing data and the internet).
Uses of secondary data include providing input for exploratory data (Page & Meyer:
2003); a valuable source of new ideas that can be explored later through primary research
(Aaker et al: 2001); being a prerequisite for primary data (Martins et al: 1996);
complementing the primary data, other investigations in similar studies may be useful in
planning the present one (Aaker et al: 2001); helps define the population and sample
selection (Vaus: 1995); and as reference base against which to compare the validity or
accuracy of primary data (Aaker et al: 2001). In agreement with Churchill (1996), Aaker
et al (2001) identify the most significant benefits secondary data offer a researcher are
savings in cost and time. Limitations relate to data that was collected for some other
purpose, questioning validity to the current research project (Churchill: 1996); no control
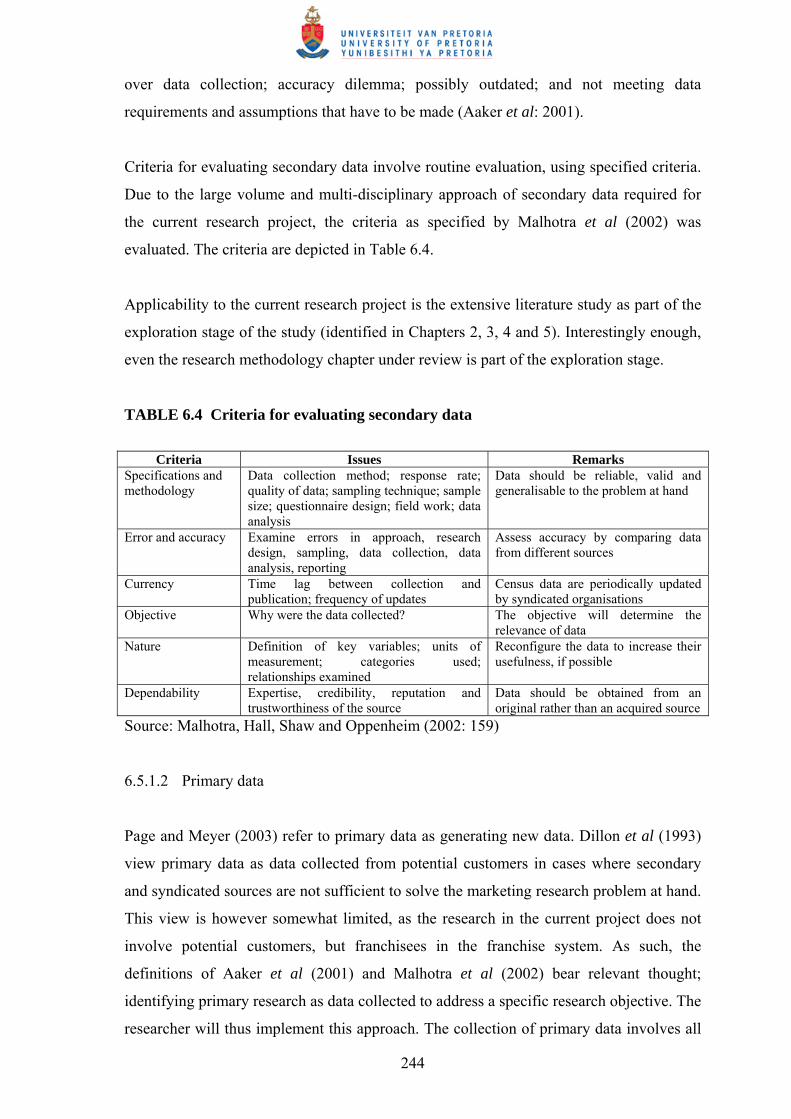
244
over data collection; accuracy dilemma; possibly outdated; and not meeting data
requirements and assumptions that have to be made (Aaker et al: 2001).
Criteria for evaluating secondary data involve routine evaluation, using specified criteria.
Due to the large volume and multi-disciplinary approach of secondary data required for
the current research project, the criteria as specified by Malhotra et al (2002) was
evaluated. The criteria are depicted in Table 6.4.
Applicability to the current research project is the extensive literature study as part of the
exploration stage of the study (identified in Chapters 2, 3, 4 and 5). Interestingly enough,
even the research methodology chapter under review is part of the exploration stage.
TABLE 6.4 Criteria for evaluating secondary data
Criteria Issues Remarks
Specifications and methodology
Data collection method; response rate; quality of data; sampling technique; sample size; questionnaire design; field work; data analysis
Data should be reliable, valid and generalisable to the problem at hand
Error and accuracy Examine errors in approach, research design, sampling, data collection, data analysis, reporting
Assess accuracy by comparing data from different sources
Currency Time lag between collection and publication; frequency of updates
Census data are periodically updated by syndicated organisations
Objective Why were the data collected? The objective will determine the relevance of data
Nature Definition of key variables; units of measurement; categories used; relationships examined
Reconfigure the data to increase their usefulness, if possible
Dependability Expertise, credibility, reputation and trustworthiness of the source
Data should be obtained from an original rather than an acquired source
Source: Malhotra, Hall, Shaw and Oppenheim (2002: 159)
6.5.1.2 Primary data
Page and Meyer (2003) refer to primary data as generating new data. Dillon et al (1993)
view primary data as data collected from potential customers in cases where secondary
and syndicated sources are not sufficient to solve the marketing research problem at hand.
This view is however somewhat limited, as the research in the current project does not
involve potential customers, but franchisees in the franchise system. As such, the
definitions of Aaker et al (2001) and Malhotra et al (2002) bear relevant thought;
identifying primary research as data collected to address a specific research objective. The
researcher will thus implement this approach. The collection of primary data involves all
245
six steps of the research process as identified by Malhotra et al (2002), reflected in
Section 6.2. Primary data forms an integral constituent of the balance of this chapter,
identifying requirements of the current research project. The data collection format
follows, identifying qualitative and quantitative methodology.
6.5.2 Data collection format
Data collection methods include both secondary and primary data, and the emphasis on
the balance of the chapter concerns primary data. Primary data collection methods are
essentially divided into four main categories: verbal communication; written
communication; observation and experimentation (Martins et al: 1996). Within these
categories, quantitative and qualitative methodologies are identified (Malhotra et al:
2002; Page & Meyer: 2003). Qualitative research provides insights and understanding of
the problem setting, whereas quantitative research seeks to quantify the data and apply
some form of statistical analysis. The identification of primary data being qualitative or
quantitative in nature is depicted in Figure 6.2 (represented on the following page).
Malhotra et al (2002) inform that the distinction between qualitative and quantitative
research closely parallels the distinction between exploratory and conclusive research
(refer Table 6.1). The relationship between qualitative and quantitative research should
not be considered in terms of a mutually exclusive dichotomy but rather as a continuum
of complementary paradigms (Borland: 2001). This complementarity is a point of view
shared by Page et al (2003), however, placing emphasis on the research objectives as a
guiding formation.
Figure 6.2 is represented on the following page.

246
FIGURE 6.2 A classification of market research data
Source: Malhotra, Hall, Shaw and Oppenheim (2002: 191)
The applicability of the current research project is quantitative in nature, despite the
advantages and merits of qualitative research being complementary. The two were
synergized, evaluated and then determined to construct a niche setting with clear research
objectives. Qualitative data was primarily used during the exploratory phase, followed by
primary data to test hypotheses. Malhotra et al (2002) postulate variables against which
qualitative and quantitative may be evaluated. Theses are depicted in Table 6.5
(represented on the following page), together with input from Borland’s (2001) study.
Analyses again highlight the parallel between the distinction between exploratory and
conclusive research. Applicability to the current research project is emphasized in the
final outcome of both conclusive and quantitative research; that of recommending a final
course of action. Applicability will be the acceptance or rejection of hypotheses, leading
the development of an entrepreneurial strategic service vision. Quantitative data
methodology used in this project will now be evaluated.
Table 6.5 is represented on the following page.
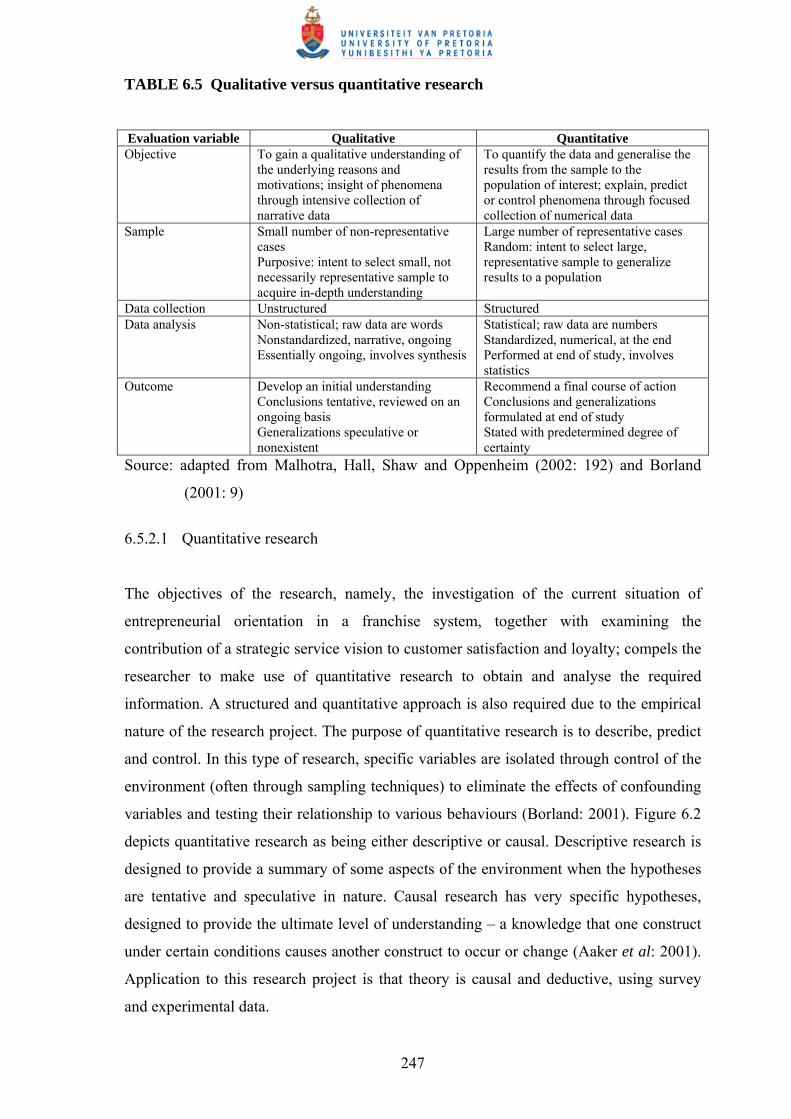
247
TABLE 6.5 Qualitative versus quantitative research
Evaluation variable Qualitative Quantitative Objective To gain a qualitative understanding of
the underlying reasons and motivations; insight of phenomena through intensive collection of narrative data
To quantify the data and generalise the results from the sample to the population of interest; explain, predict or control phenomena through focused collection of numerical data
Sample Small number of non-representative cases Purposive: intent to select small, not necessarily representative sample to acquire in-depth understanding
Large number of representative cases Random: intent to select large, representative sample to generalize results to a population
Data collection Unstructured Structured Data analysis Non-statistical; raw data are words
Nonstandardized, narrative, ongoing Essentially ongoing, involves synthesis
Statistical; raw data are numbers Standardized, numerical, at the end Performed at end of study, involves statistics
Outcome Develop an initial understanding Conclusions tentative, reviewed on an ongoing basis Generalizations speculative or nonexistent
Recommend a final course of action Conclusions and generalizations formulated at end of study Stated with predetermined degree of certainty
Source: adapted from Malhotra, Hall, Shaw and Oppenheim (2002: 192) and Borland
(2001: 9)
6.5.2.1 Quantitative research
The objectives of the research, namely, the investigation of the current situation of
entrepreneurial orientation in a franchise system, together with examining the
contribution of a strategic service vision to customer satisfaction and loyalty; compels the
researcher to make use of quantitative research to obtain and analyse the required
information. A structured and quantitative approach is also required due to the empirical
nature of the research project. The purpose of quantitative research is to describe, predict
and control. In this type of research, specific variables are isolated through control of the
environment (often through sampling techniques) to eliminate the effects of confounding
variables and testing their relationship to various behaviours (Borland: 2001). Figure 6.2
depicts quantitative research as being either descriptive or causal. Descriptive research is
designed to provide a summary of some aspects of the environment when the hypotheses
are tentative and speculative in nature. Causal research has very specific hypotheses,
designed to provide the ultimate level of understanding – a knowledge that one construct
under certain conditions causes another construct to occur or change (Aaker et al: 2001).
Application to this research project is that theory is causal and deductive, using survey
and experimental data.
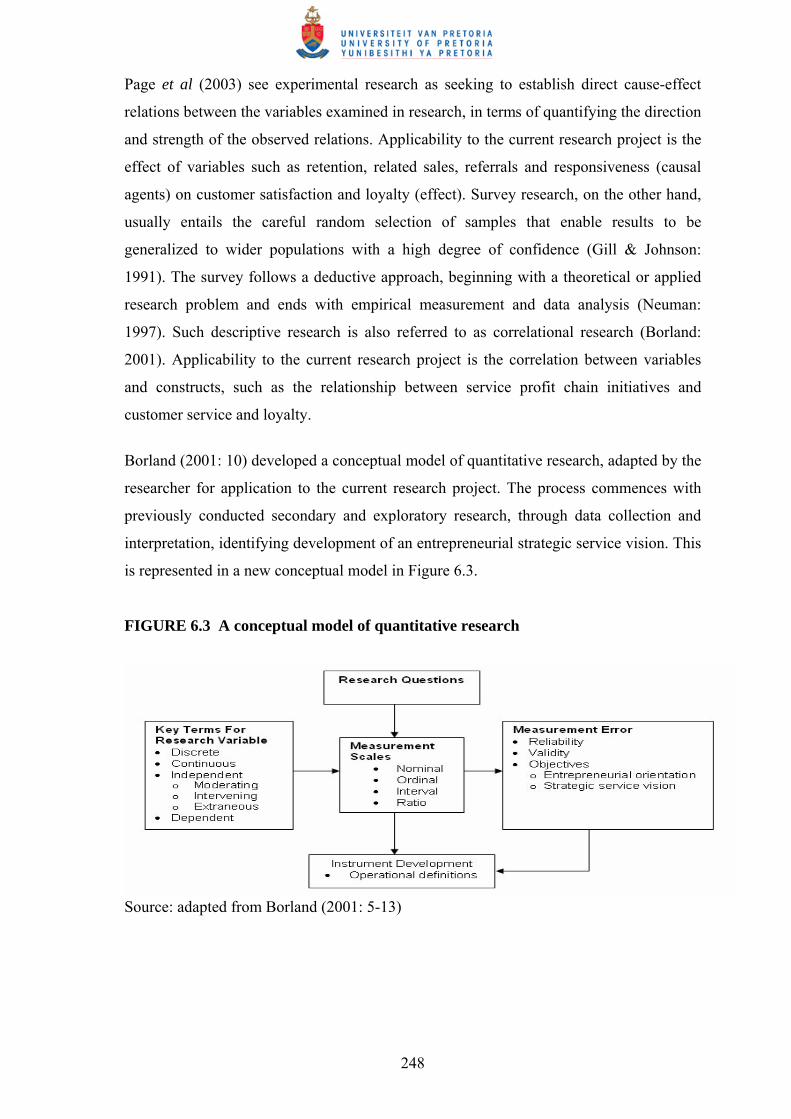
248
Page et al (2003) see experimental research as seeking to establish direct cause-effect
relations between the variables examined in research, in terms of quantifying the direction
and strength of the observed relations. Applicability to the current research project is the
effect of variables such as retention, related sales, referrals and responsiveness (causal
agents) on customer satisfaction and loyalty (effect). Survey research, on the other hand,
usually entails the careful random selection of samples that enable results to be
generalized to wider populations with a high degree of confidence (Gill & Johnson:
1991). The survey follows a deductive approach, beginning with a theoretical or applied
research problem and ends with empirical measurement and data analysis (Neuman:
1997). Such descriptive research is also referred to as correlational research (Borland:
2001). Applicability to the current research project is the correlation between variables
and constructs, such as the relationship between service profit chain initiatives and
customer service and loyalty.
Borland (2001: 10) developed a conceptual model of quantitative research, adapted by the
researcher for application to the current research project. The process commences with
previously conducted secondary and exploratory research, through data collection and
interpretation, identifying development of an entrepreneurial strategic service vision. This
is represented in a new conceptual model in Figure 6.3.
FIGURE 6.3 A conceptual model of quantitative research
Source: adapted from Borland (2001: 5-13)
249
6.5.2.2 The survey method
The previous section on quantitative research identified the survey as the preferred format
of data collection. The survey method of obtaining information is based on questioning of
respondents. Respondents are asked a variety of questions regarding their behaviour,
intentions, attitudes, awareness, motivations, demographics and lifestyle characteristics.
Questions may be verbal, in writing or electronic. The questions are typically structured
and in this type of research a formal questionnaire is used and questions are asked in a
pre-arranged order (Malhotra et al: 2002). Janes (2001) believes that surveys can do a
good job of describing a population, eliciting reliable answers to the same set of questions
by all respondents.
Malhotra et al (2002) classify survey methods by the nature of survey interaction; and
mode of administration of the questionnaire. Nature of survey interaction identifies the
manner in which the interviewee interacts during the survey; whilst mode of
administration refers to the technology or approach used to conduct the survey.
Classification by nature of survey interaction involves either of person-to-person;
computer assisted or self-completion. Classification by mode of administration includes
personal interviewing; telephone interviewing; electronic interviewing and mail
interviewing. Aaker et al (2001) identify the choice of survey methods as being a factor
of sampling plan to be employed; the type of population to survey; the response rates
required and available resources. These factors are discussed in the next section, entitled
sampling plan.
Applicability to the current research project was that of classification according to nature
of survey interaction via electronic interviewing (web interviews) through self-
completion. Self-completion via an electronic web-mail interview was found as
appropriate in this franchise system. The email was however used as a secondary and
auxiliary medium. Surveypro, an online software application, was used to present the
questionnaire at http://www.survey.unitec.ac.nz/mrvideo.
Dillman (2000) argues that the use of a tailored design method (TDM) perspective
accounts for higher response rates. An adaptation of Dillman’s (2000: 27) model is
represented in Figure 6.4 (represented on the following page); highlighting tailored
design, social exchange and respondent behaviour, creating trust, influencing the
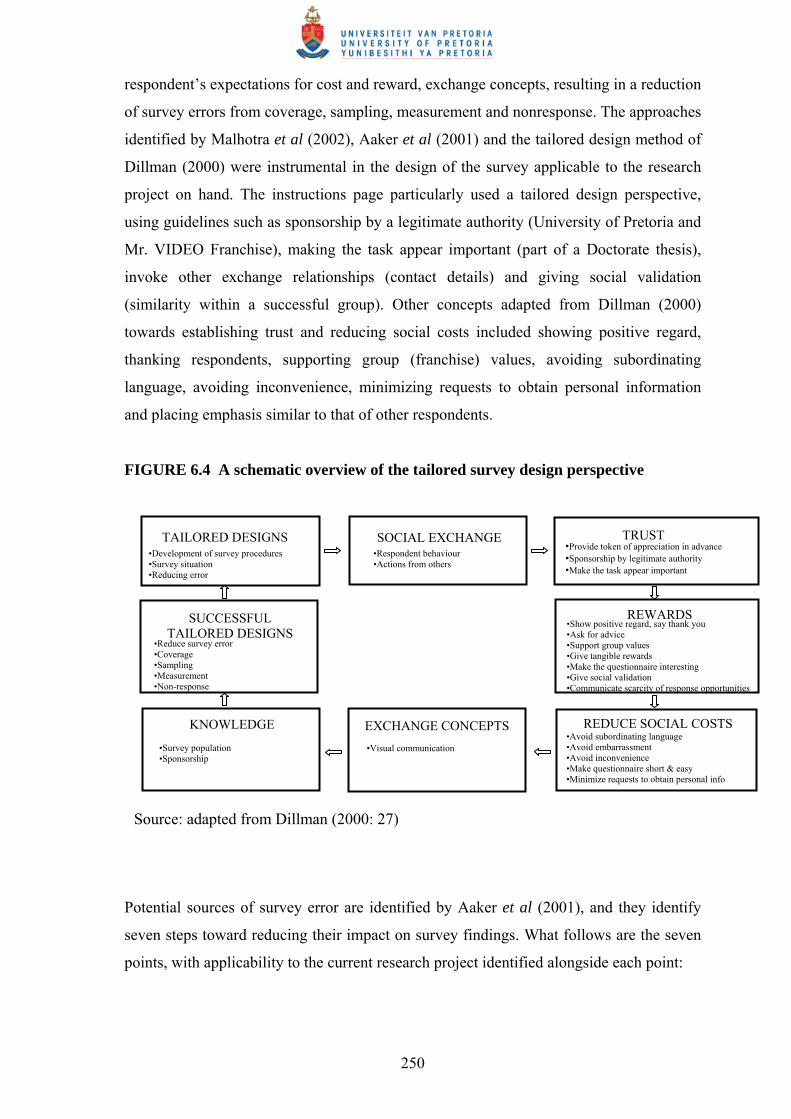
250
respondent’s expectations for cost and reward, exchange concepts, resulting in a reduction
of survey errors from coverage, sampling, measurement and nonresponse. The approaches
identified by Malhotra et al (2002), Aaker et al (2001) and the tailored design method of
Dillman (2000) were instrumental in the design of the survey applicable to the research
project on hand. The instructions page particularly used a tailored design perspective,
using guidelines such as sponsorship by a legitimate authority (University of Pretoria and
Mr. VIDEO Franchise), making the task appear important (part of a Doctorate thesis),
invoke other exchange relationships (contact details) and giving social validation
(similarity within a successful group). Other concepts adapted from Dillman (2000)
towards establishing trust and reducing social costs included showing positive regard,
thanking respondents, supporting group (franchise) values, avoiding subordinating
language, avoiding inconvenience, minimizing requests to obtain personal information
and placing emphasis similar to that of other respondents.
FIGURE 6.4 A schematic overview of the tailored survey design perspective
Potential sources of survey error are identified by Aaker et al (2001), and they identify
seven steps toward reducing their impact on survey findings. What follows are the seven
points, with applicability to the current research project identified alongside each point:
SOCIAL EXCHANGE
TRUST
SUCCESSFUL TAILORED DESIGNS
REWARDS
KNOWLEDGE
EXCHANGE CONCEPTS
REDUCE SOCIAL COSTS
•Reduce survey error •Coverage •Sampling •Measurement •Non-response
•Provide token of appreciation in advance •Sponsorship by legitimate authority •Make the task appear important
•Show positive regard, say thank you •Ask for advice •Support group values •Give tangible rewards •Make the questionnaire interesting •Give social validation •Communicate scarcity of response opportunities
•Avoid subordinating language •Avoid embarrassment •Avoid inconvenience •Make questionnaire short & easy •Minimize requests to obtain personal info
Source: adapted from Dillman (2000: 27)
TAILORED DESIGNS
•Development of survey procedures •Survey situation •Reducing error
•Respondent behaviour •Actions from others
•Visual communication •Survey population •Sponsorship
251
• Population has been defined correctly: Mr. VIDEO franchise system (franchisees)
in South Africa
• Sample is representative of the population: census application, identified in the
following section
• Respondents selected to be interviewed/researched are available and willing to
cooperate: an initiative requested jointly by the Chairman of Mr. VIDEO and the
Mr. VIDEO franchise council
• Respondents understand the questions: the questionnaire will be explained and
discussed with all participants at Mr. VIDEO regional franchise meetings
• Respondents have the knowledge, opinions, attitudes, or facts required: all
participants are active Mr. VIDEO franchisees
• Respondents are willing and able to respond: feedback of results and development
of an entrepreneurial service vision, for application in the franchise system used as
a motivator to elicit response
• Interviewer understands and records the responses correctly; self-administered
questionnaires to avoid this bias.
Additional survey error factors include ambiguity of questions and inaccuracy in response
(Hernon: 2004). These will be discussed in the section entitled instrument design. The
questionnaire is a popular method of data collection in a structured direct survey; with
most questions being fixed-response alternative questions that require the respondent to
select from a predetermined set of responses (Fink: 1995c). In a survey the questionnaire
is relatively simple to administer and the data obtained seen as reliable and valid because
responses are limited to the alternatives stated (Page & Meyer: 2003). Applicability to the
current research project is the use of a structured questionnaire distributed to franchisees
in a franchise system. Details of the instrument design and sampling plan follow.
6.5.3 The sampling plan
Aaker et al (2001) identify sampling as the process of surveying only a sample of the
whole population to make inferences about the population. Samples can reflect the
populations from which they are drawn with varying degrees of accuracy; and a sample
accurately reflecting its population is referred to as being a representative sample (de
Vaus: 1995). Sample characteristics, referred to as statistics, are then used to make
inferences about the population parameters. The inferences that link sample
252
characteristics and population parameters are estimation procedures and tests of
hypotheses (Malhotra et al: 2002). To achieve an overview and discipline topic related
structure, the steps in sampling as identified by Martins et al (1996) include defining the
population; identifying the sampling frame; selecting the sample method; determining the
sample size and selecting the sampling elements. Saunders, Lewis and Thornhill (1997:
126) identify a similar overview, incorporating identifying a suitable sampling frame
based on the research objectives; deciding on a suitable sample size; selecting the most
appropriate sampling technique; and checking that the sample is representative of the
population. Whilst not following this sequence, the researcher will elaborate on these
sampling disciplines with applicability to the current research project.
Cognisance must however be taken that the current research project identifies
entrepreneurial orientation and strategic service initiatives in a defined franchised system,
with contradictory opinions regarding the population as a census or sampling determinant
(Churchill: 1996). This will be evaluated in the following sections, however; highlighting
the defined franchise system of one hundred and sixty four franchised outlets (cognisance
of multiple unit franchisees).
6.5.3.1 Defining the target population
Sampling refers to only selecting a part of the research population (Page & Meyer, 2000:
43); and since most concepts are not directly observable or testable in the field, these
concepts need to be represented by indicators or measures. The target population is the
collection of elements that possess the information sought by the researcher and about
which inferences are to be made. Elements are in turn objects that possess the information
sought by the researcher and about which inferences are to be made. A sampling unit is
the basic unit that is available for selection during the research process (Malhotra et al:
2002). The sampling unit and elements are integral components of the target population.
A similar point of view is postulated by Martins et al (1996: 251), defining the target
population in terms of elements, sample units, time and size.
The current research project identifies the Mr. VIDEO franchise system within the home
entertainment industry as sample unit and element. The time period is 2004 and 2005,
with size indicative of franchise system participants in the home entertainment industry.
Retailing in the industry is dominated by a few franchisors, operating on a national (and
253
rest of Africa) basis. The market leader, Mr. VIDEO, was founded ten years ago, and has
experienced this domination for the past five years. Mr. VIDEO has a market share of
approximately 18 per cent, and is the largest franchised home entertainment rental chain
in Africa. This chain was identified as appropriate for this study, particularly as they are
seen by industry participants as leaders in the industry.
6.5.3.2 Determination of the sampling frame
Once the target population has been defined, the next step entails obtaining a frame of the
population (Page et al: 2003). The sampling frame can be seen as a complete list of all the
cases in the population from which the sample will be drawn (Saunders et al, 1997: 127).
Martins et al (1996) identify the sampling frame as a record of all the sample units
available for selection at a given stage of the sampling process. In this research project,
the sampling frame will include all of the Mr. VIDEO franchised outlets (one hundred
and sixty four stores, one hundred and ten franchisees). Annexure 2 depicts the outlets
and distribution by region.
6.5.3.3 Determination of sampling technique and sample size
Martins et al (1996: 253) divide sampling techniques into probability and non-probability
sampling. De Vaus (1995), Page and Meyer (2003), Fink (1995), Aaker et al (2001),
Saunders et al (1997) and Hernon (2004) also support this methodology. Malhotra et al
(2002) however depict a broader nature to sampling technique; in that the researcher must
decide whether to use a Bayesian or traditional sampling approach. In the Bayesian
approach, the elements are selected sequentially; with explicit prior information about
population parameters, as well as costs and probabilities associated with making wrong
decisions. The approach is theoretically appealing, however practical application difficult
due to the required information on costs and probabilities not being readily available. In
traditional sampling approaches, the sample is selected before data collection begins. The
traditional approach consists of sampling with replacement and sampling without
replacement. The former is a sampling technique whereby an element can be included in
the sample more than once; whereas the latter is a sampling technique in which an
element cannot be included in the sample more than once. Malhotra et al (2002) do
however believe that the most important choice of sampling technique is between
probability and non-probability sampling, an important component of traditional sampling
254
methodology. Prior to evaluating probability choices, applicability to the current research
project will follow the traditional approach; however, certain Bayesian factors, such as
prior information about population parameters will be considered.
For non-probability samples there are no real controls on the sample selection process,
samples may be unrepresentative of the population and the researcher will therefore be
unable to generalize the results of the sample to the population of interest with any degree
of confidence. (Page & Meyer: 2003). The opposite is true for probability samples. Aaker
et al (2001) identify non-probability sampling as any sampling method where the
probability of any population’s element’s inclusion is unknown, such as judgemental or
convenience sampling. In contrast, they identify probability sampling as any sampling
method where the probability of any population element’s inclusion is known and is
greater than zero. These two sampling techniques involve population sub-division into
smaller sections (Saunders et al: 1997), whereas a census is a survey of the whole
population (Page & Meyer: 2003).
Hair, Bush and Ortinau (2000: 343) advocate that if the population size is five hundred
elements or fewer, a census should be conducted on the population elements rather than
estimating the correct sample size. Malhotra et al (2002: 361) however do not stipulate
the actual number of elements, but advise that in most cases, accuracy considerations
would favour a sample over a census. The high cost of non-sampling error favour
sampling (Fink: 1995c; de Vaus: 1995). Conditions favouring the sample include a small
budget; short time constraints; small variance in characteristic; and low cost of sampling
errors. Despite the varying opinions (Hair et al: 200; Malhotra et al: 2002), the scientific
and empirical nature of the current research project requires vigorous application.
A census is a complete enumeration of the elements of a population, whilst a sample is a
subgroup of the population selected for participation in the study. Advantages to using a
census primarily revolve around the variance in the characteristic of interest being large;
the high cost of sampling error; and ultimately a small sample. (Malhotra et al: 2002).
Table 6.6 (overleaf) identifies conditions favouring the use of a sample or census. The
best sample designs ensure that the sampled data represent the research population
efficiently and reliably (Page & Meyer: 2003). A census is obtained by collecting
information about each member of the group (de Vaus: 1995); applicable to all Mr.
VIDEO franchisees in the current research project. Since the sample unit and sample
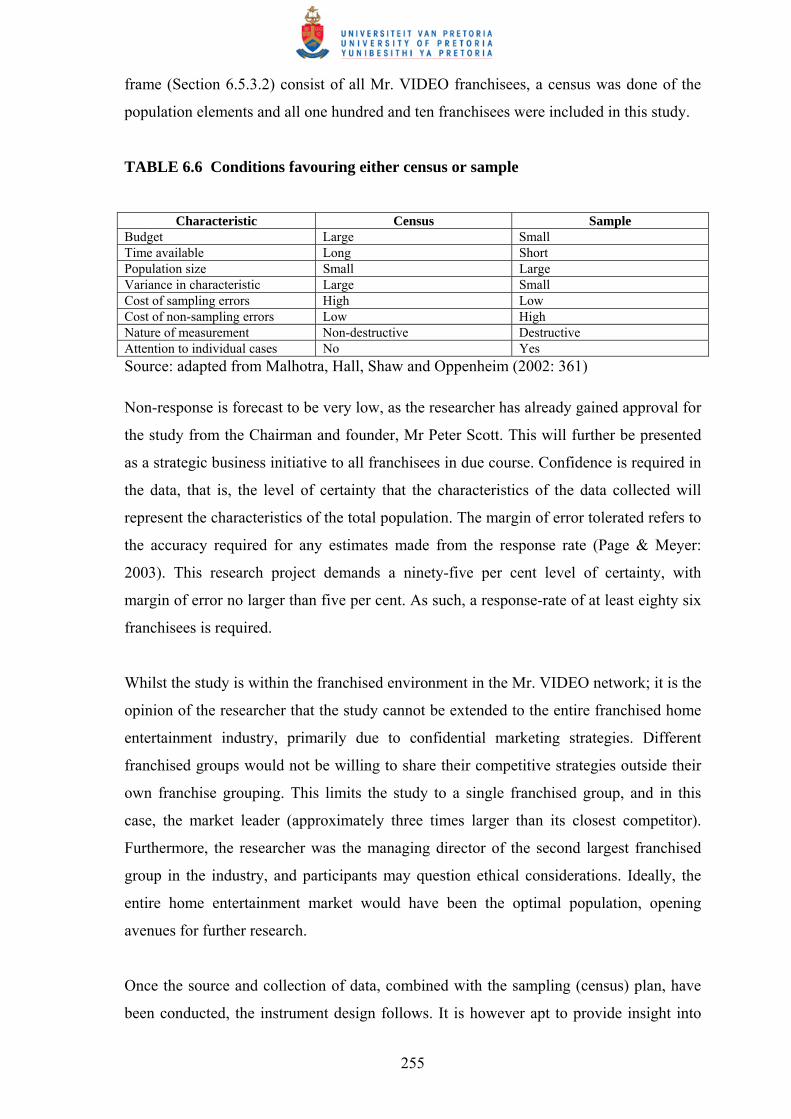
255
frame (Section 6.5.3.2) consist of all Mr. VIDEO franchisees, a census was done of the
population elements and all one hundred and ten franchisees were included in this study.
TABLE 6.6 Conditions favouring either census or sample
Characteristic Census Sample
Budget Large Small Time available Long Short Population size Small Large Variance in characteristic Large Small Cost of sampling errors High Low Cost of non-sampling errors Low High Nature of measurement Non-destructive Destructive Attention to individual cases No Yes Source: adapted from Malhotra, Hall, Shaw and Oppenheim (2002: 361)
Non-response is forecast to be very low, as the researcher has already gained approval for
the study from the Chairman and founder, Mr Peter Scott. This will further be presented
as a strategic business initiative to all franchisees in due course. Confidence is required in
the data, that is, the level of certainty that the characteristics of the data collected will
represent the characteristics of the total population. The margin of error tolerated refers to
the accuracy required for any estimates made from the response rate (Page & Meyer:
2003). This research project demands a ninety-five per cent level of certainty, with
margin of error no larger than five per cent. As such, a response-rate of at least eighty six
franchisees is required.
Whilst the study is within the franchised environment in the Mr. VIDEO network; it is the
opinion of the researcher that the study cannot be extended to the entire franchised home
entertainment industry, primarily due to confidential marketing strategies. Different
franchised groups would not be willing to share their competitive strategies outside their
own franchise grouping. This limits the study to a single franchised group, and in this
case, the market leader (approximately three times larger than its closest competitor).
Furthermore, the researcher was the managing director of the second largest franchised
group in the industry, and participants may question ethical considerations. Ideally, the
entire home entertainment market would have been the optimal population, opening
avenues for further research.
Once the source and collection of data, combined with the sampling (census) plan, have
been conducted, the instrument design follows. It is however apt to provide insight into
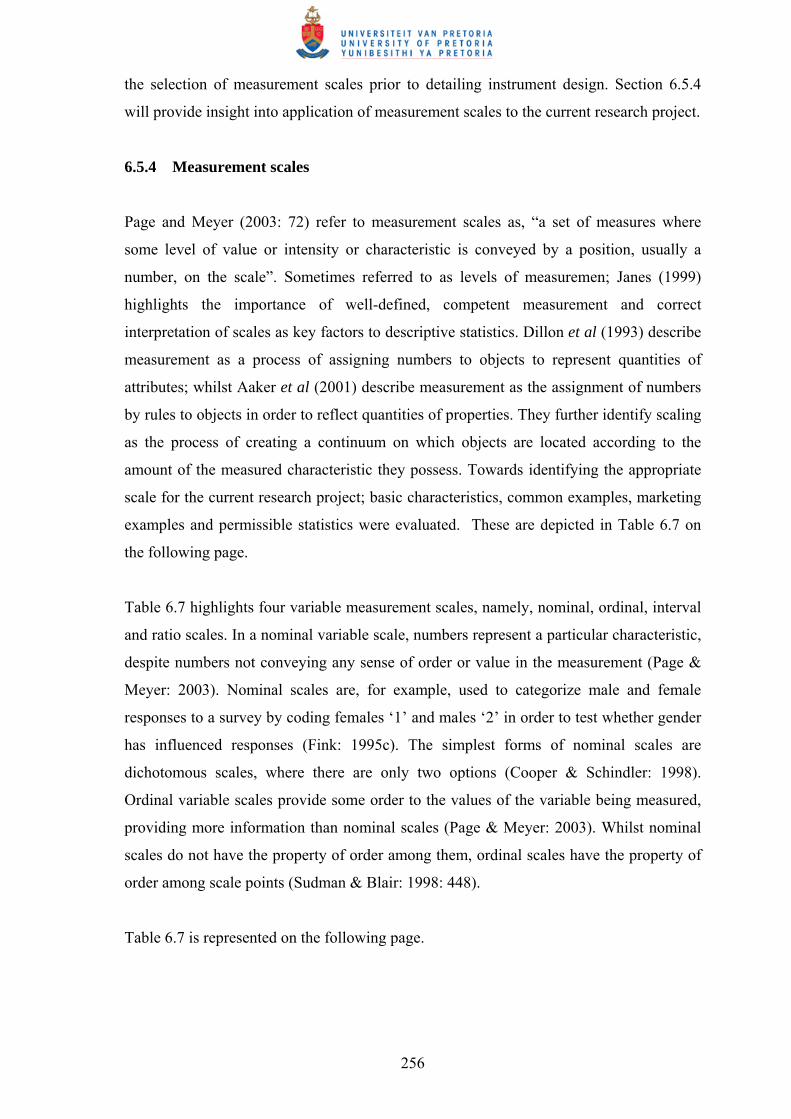
256
the selection of measurement scales prior to detailing instrument design. Section 6.5.4
will provide insight into application of measurement scales to the current research project.
6.5.4 Measurement scales
Page and Meyer (2003: 72) refer to measurement scales as, “a set of measures where
some level of value or intensity or characteristic is conveyed by a position, usually a
number, on the scale”. Sometimes referred to as levels of measuremen; Janes (1999)
highlights the importance of well-defined, competent measurement and correct
interpretation of scales as key factors to descriptive statistics. Dillon et al (1993) describe
measurement as a process of assigning numbers to objects to represent quantities of
attributes; whilst Aaker et al (2001) describe measurement as the assignment of numbers
by rules to objects in order to reflect quantities of properties. They further identify scaling
as the process of creating a continuum on which objects are located according to the
amount of the measured characteristic they possess. Towards identifying the appropriate
scale for the current research project; basic characteristics, common examples, marketing
examples and permissible statistics were evaluated. These are depicted in Table 6.7 on
the following page.
Table 6.7 highlights four variable measurement scales, namely, nominal, ordinal, interval
and ratio scales. In a nominal variable scale, numbers represent a particular characteristic,
despite numbers not conveying any sense of order or value in the measurement (Page &
Meyer: 2003). Nominal scales are, for example, used to categorize male and female
responses to a survey by coding females ‘1’ and males ‘2’ in order to test whether gender
has influenced responses (Fink: 1995c). The simplest forms of nominal scales are
dichotomous scales, where there are only two options (Cooper & Schindler: 1998).
Ordinal variable scales provide some order to the values of the variable being measured,
providing more information than nominal scales (Page & Meyer: 2003). Whilst nominal
scales do not have the property of order among them, ordinal scales have the property of
order among scale points (Sudman & Blair: 1998: 448).
Table 6.7 is represented on the following page.
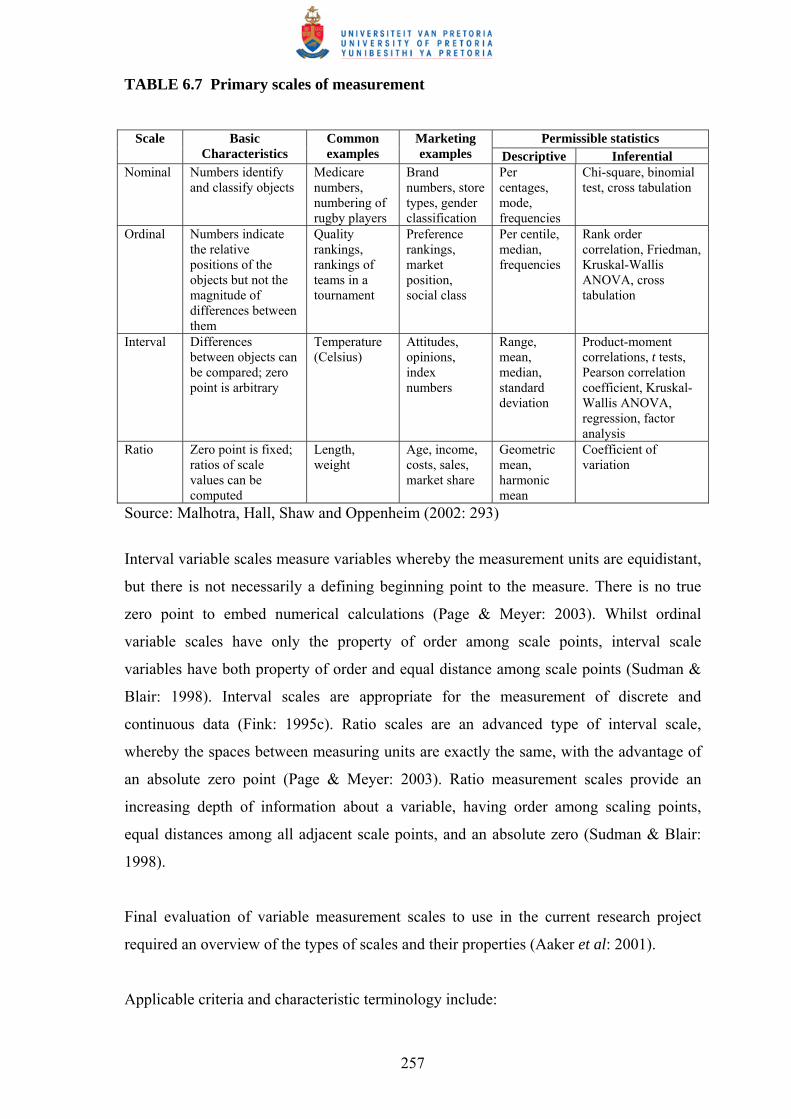
257
TABLE 6.7 Primary scales of measurement
Permissible statistics Scale Basic
Characteristics Common examples
Marketing examples Descriptive Inferential
Nominal Numbers identify and classify objects
Medicare numbers, numbering of rugby players
Brand numbers, store types, gender classification
Per centages, mode, frequencies
Chi-square, binomial test, cross tabulation
Ordinal Numbers indicate the relative positions of the objects but not the magnitude of differences between them
Quality rankings, rankings of teams in a tournament
Preference rankings, market position, social class
Per centile, median, frequencies
Rank order correlation, Friedman, Kruskal-Wallis ANOVA, cross tabulation
Interval Differences between objects can be compared; zero point is arbitrary
Temperature (Celsius)
Attitudes, opinions, index numbers
Range, mean, median, standard deviation
Product-moment correlations, t tests, Pearson correlation coefficient, Kruskal-Wallis ANOVA, regression, factor analysis
Ratio Zero point is fixed; ratios of scale values can be computed
Length, weight
Age, income, costs, sales, market share
Geometric mean, harmonic mean
Coefficient of variation
Source: Malhotra, Hall, Shaw and Oppenheim (2002: 293)
Interval variable scales measure variables whereby the measurement units are equidistant,
but there is not necessarily a defining beginning point to the measure. There is no true
zero point to embed numerical calculations (Page & Meyer: 2003). Whilst ordinal
variable scales have only the property of order among scale points, interval scale
variables have both property of order and equal distance among scale points (Sudman &
Blair: 1998). Interval scales are appropriate for the measurement of discrete and
continuous data (Fink: 1995c). Ratio scales are an advanced type of interval scale,
whereby the spaces between measuring units are exactly the same, with the advantage of
an absolute zero point (Page & Meyer: 2003). Ratio measurement scales provide an
increasing depth of information about a variable, having order among scaling points,
equal distances among all adjacent scale points, and an absolute zero (Sudman & Blair:
1998).
Final evaluation of variable measurement scales to use in the current research project
required an overview of the types of scales and their properties (Aaker et al: 2001).
Applicable criteria and characteristic terminology include:

258
• Nominal scale; dichotomous (yes/no) scales, objects are either identical or
different, typical classification (by sex, geographic area, social class) using per
centages, mode or chi-square
• Ordinal scale; comparative, rank order, paired comparison, objects are greater or
smaller, rankings (preference, class standing) using per centile, median, rank-order
correlation, Friedman, ANOVA
• Interval scale; Likert, Thurstone, associative, semantic-differential, intervals
between adjacent ranks are equal, index numbers, attitude measurement using
mean, standard deviation, product moment correlations, t tests, ANOVA,
regression and factor analysis
• Ratio scale; certain scales with special instructions, comparative and absolute
magnitudes possible due to an absolute zero, using geometric and harmonic mean
and coefficient of variation.
Applicability to the current research project involved a bi-variable measurement
approach; that of nominal and interval measurement scales. Application is identified as
follows:
• Nominal scales; appropriate when there are multiple options and only one sought.
Objects are assigned to be mutually exclusive, labelled categories, but there are no
necessary relationships among the categories. The only arithmetic operation that
can be performed on such a scale is a count of each category (Aaker et al: 2001).
Such scales produce nominal data, such as franchisee demographics. Nominal
scales may also be referred to as the multiple choice, single response scale (Fink:
1995c). Application is the demographic and biographical information section of
the questionnaire
• Interval scales; the numbers used to rank the objects also represent equal
increments of the attribute being measured (Aaker et al: 2001). Malhotra et al
(2002) confirm the numerically equal distances, representing equal values in the
characteristic being measured. Application will be the use of interval scales for
franchisee evaluation of strategic initiatives, including the service profit chain,
service quality, relationship marketing and best practice. Interval scales are also
applicable for the questionnaire sections on entrepreneurial orientation and
franchise system. The measurement scale applicable for the collection of interval
data will be the Likert scale (Aaker et al: 2001).

259
The Likert-style rating-style rating scale is used in this study on a conjoint rating and
attitudinal scale (Fink: 1995a). The former asks respondents to rate or rank items, whilst
the latter measures attitudes and perceptions. Likert scales, identifying a five-point scale,
are often used to measure the same construct, across varying numbers of items (referred
to as themes in this study). The Likert scale is preferred to nominal and ordinal scales as
the latter scales limit the use of statistical techniques that may be used to analyse the data
(Page et al, 2000: 125). This scale is the most frequently used variation of the summated
rating scale, being statements that express either a favourable or unfavourable attitude
toward the object of interest (Aaker et al: 2001). The respondent is asked to agree or
disagree with each statement. Each response is given a numerical score to reflect its
degree of conformity and totalled at the end. Malhotra et al (2002) identify advantages of
using the Likert scale in that it is reasonably easy to construct and administer and
respondents readily understand how to use the scale. The main disadvantage however is
that it takes longer to complete than other rating scales. They further highlight the use of a
consistent scoring procedure, so that a high (or low) score consistently reflects a
favourable response.
The Likert scale also lends itself to potential sources of error (Churchill: 1996). Cooper
and Schindler (1998: 190) identify three of the most common tendencies to cause errors:
• The error of leniency; resulting in the respondent being an easy rater or hard rater
• Central tendency; whereby the respondent is reluctant to give extreme judgement
• Halo effect; when a respondent introduces systematic biases by carrying over a
generalised impression of the subject from one rating to the other.
It is imperative to stress that no measures are perfect; however, measurement error in
research is a critical issue and is an insescapable weakness that needs to be recognised
and reduced as far as possible (Page & Meyer: 2003). Applicability to the current research
project will be the use of a standard five-point Likert-scale, facilitating consistency and
ease of completion. The applicable measurement scales have been identified, and what
follows is a discussion on the instrument design.
260
6.5.5 Instrument design and testing
Section 6.3 highlights that the existing body of knowledge has limited exposure with
regard to entrepreneurial orientation and strategic service in the home entertainment
industry. In combination with the objectives of the current research project, the aim of the
measurement instrument is to obtain meaningful data, from which inferences to the
population may be made. Section 6.4 identifies the research design, noting the use of a
questionnaire as a measuring instrument. This section details the use and applicability of
the questionnaire to the current research project. The development of the questionnaire is
linear to the research process in Sections 6.3, 6.4 and preceding section. This process is
depicted in a conceptual model followed by the researcher, adapted from Page and Meyer
(2003). Figure 6.5 diagrammatically represents the process referred to. The process
commences with the research question (Section 6.3.1), and a unilateral process of key
data terminology determinants (Sections 6.4 and 6.5). Measurement scales were evaluated
in context (Section 6.5.4), leading to measurement error (reliability and validity), to be
evaluated this section. Instrument development follows.
FIGURE 6.5 The current research project approach to instrument development
Source: adapted from Page and Meyer (2003: 95)

261
There are many different measuring instruments that can be utilized to quantify the
variables and indicators being researched. Since this research is of a descriptive and
exploratory nature, the questionnaire is deemed to be a feasible data collection alternative
(Saunders: 1997). In descriptive research, questionnaires will assist to identify and
describe the variability in different phenomena. Exploratory research however aims to
examine and explain relationships between different variables. Due to a relatively small
population, self-administered questionnaires shall be used. Self-administration has the
advantages of foregoing interviewer bias, geographical dispersion, and due to expected
response rates, the instrument is deemed to be effective (Neuman: 1997).
The questionnaire is a formalised set of questions for obtaining information from
respondents (Malhotra et al: 2002), and may be identified by administration. Self-
administered questionnaires are those completed by the respondent without assistance
from the researcher; whilst interviewer-administered questionnaires have researcher
interaction (Saunders et al: 1997). Attributes of the self-administered questionnaire
include (Saunders et al: 1997):
• Suitable for population characteristics where target respondents can be selected
with ease
• May be contaminated by consultation with others
• Response rate moderately high, with 30-50% being reasonable.
• Feasible length of questionnaire 8-10 A4 pages
• Question suitability favouring closed questions but not too complex, simple
sequencing, of interest to the respondent
• The role of the interviewer/fieldworker is to enhance participation.
These attributes correspond to applicable requirements of the current research project,
hence the use of self-administered, closed questions. Dillon et al (1993) relate obvious
advantages of close-ended questions as being their ease of use in the field, their ability to
reduce interviewer bias and their ability to reduce bias based on differences in how
articulate respondents are. Neuman (1997) further adds that closed questions are easy to
code and that less articulate respondents can easily answer the questionnaire. The
disadvantages however include misinterpretation of questions that may go unnoticed, and
that respondents with no opinion on a particular issue may still give an answer (Neuman:
1997). It is the researcher’s opinion that despite the Likert scale shortcomings, these

262
disadvantages are negated by the careful design of interval scales. Saunders et al (1997)
list questionnaire design issues, identified within this research project. The following
were taken into account:
• Characteristics of respondents that the researcher wishes to collect
• Importance for the researcher to reach a particular respondent
• Importance of answers not being contaminated or distorted
• Sample size requirement (applicability to census)
• Types of questions to be answered to collect the appropriate data
• The number of questions to be asked.
The design of questions, structure of the questionnaire and rigor of pilot testing are
determinants of the validity and reliability of collected data (Saunders et al: 1997).
Reliability refers to the random error component of the questionnaire (Aaker et al: 2001),
and total reliability is achieved when the instrument provides identical repeated measures
relating to some constant factor (Page & Meyer: 2003). Validity is the ability of a
questionnaire to measure what it purports to measure (Aaker et al: 2001). Reliability and
validity are however detailed in the section on data analysis. Individual questions
(current research project specific) were designed by adopting questions used in other
questionnaires; adapting questions used in other questionnaires and developing discipline
specific new questions. Principles of good question writing were evaluated from many
researchers and authors, with an overview reflected by Neuman (1997). Main
considerations included the avoidance of jargon, ambiguity, confusion, vagueness,
emotional language, double-barrelled questions, leading questions, false premises, double
negatives, future intentions, unbalanced or overlapping response categories and asking
questions beyond the respondents’ capabilities.
6.5.5.1 Constructing the questionnaire
The questionnaire includes a two-tiered approach, divided into seven distinct sections.
The first tier includes collection of data regarding franchisee classification,
entrepreneurial orientation and franchising; whilst the second section tier deeming
responsibility for collection of strategic service data (service quality, service profit chain,
relationship management and best practice). The questionnaire can be observed on page 1
in Appendix 3. The sections are depicted as follows:
263
• Section A: Franchisee demographics and details, questions 1-8
• Section B: Entrepreneurial orientation, questions 9-28
• Section C: Franchise system, questions 29-38
• Section D: The service profit chain, questions 39-48
• Section E: Service quality, questions 49-58
• Section F: Relationship marketing, questions 59-68
• Section G: Best practice, questions 69-78.
Questions in Section A: Questions 1 to 8 are classification questions, formulated to
distinguish demographic, geographic and franchise-system specific determinants
(nominal data).
Questions in Section B: Bolton and Thompson (2003: 69) identified entrepreneurial
character themes, constituting the facets of the entrepreneur. These consisted of focus,
advantage, creativity, ego, team and social facets. Thompson (in Global Entrepreneurship
Monitor, 2003: 34) further developed a twenty-question character theme matrix to
measure entrepreneurial orientation. The empirical research, based on the character theme
matrix, was published in the Global Entrepreneurship Monitor 2003 (GEM). A character
theme is a personality attribute or characteristic that defines our normal, expected
behaviour. Thompson’s (2002) set of themes forms our inner psychological core and
defines things we do most readily and instinctively. These themes were adapted for this
study. The objective is to evaluate franchisees against these themes and associations,
facilitating support of the hypothesis.
Twenty questions were included; each addressing an individual character theme- some
related to those characteristics specifically associated with the entrepreneur and others to
the inventor, the leader and someone we might call the non-entrepreneur. The questions
describe behaviour that would typify the presence of a particular character theme.
Respondents were requested to allocate a personal score (out of five) indicating the extent
to which they believe it describes them. The relationship between themes should also be
insightful, notwithstanding the anticipated variation between franchisor and franchisee
associations. Entrepreneurial orientation was considered the dependent variable, with the
themes considered independent variables (interval data).
264
Questions in Section C: The end result of the study is to develop a conceptual model of an
entrepreneurial service vision in a franchised environment. Towards applicability of this
objective, the franchisee is ultimately responsible for service implementation. This
section will thus focus on the franchise paradox, identifying franchising as an
entrepreneurial option towards creating and developing ventures. Mendelsohn (2003)
identified various relationship and operational factors within the franchise system,
coupled with entrepreneurial orientation within the system (Lindsay & McStay: 2004).
Ten questions are set on a Likert scale, being part of five factors (entrepreneurship link to
franchising, franchise rationale, franchise relationships franchise system cooperation and
franchise leadership); representing interval data.
Questions in Section D: Heskett et al (1997) identify links in the service profit chain,
many coinciding with the SERVQUAL (Ziethaml et al: 2003) perception items. A
distinguishing characteristic of the service profit chain model is the relationship to profit,
and implementation of strategic initiatives. This study focuses on the links in the service
profit chain, together with strategic initiatives of retention, related-sales and referrals.
These strategic initiatives are referred to as factors, with themes developing from each
factor. Franchisees were requested to gauge their perceptions of each of these factors
(with a total of 10 themes included) in a Likert scale, representative of interval data.
Sections D to G evaluate the relationship with service quality (identified in Chapters 4
and 5; representing the dependent variable).
Questions in Section E: Ziethaml et al (2003: 136-137) identify twenty-one perception
items (SERVQUAL) that are distributed throughout the five quality dimensions. The five
quality dimensions, referred to as factors, include reliability, responsiveness, assurance,
empathy and tangibles. Each factor identifies themes (10 in total), represented in a likert-
style rating-style rating scale (Likert) response, representing interval data. One will
represent ‘strongly disagree’, whilst at the other end, five will represent ‘strongly agree’.
An adaptation of the empirical study of Tung-Zong and Su-Jane (1998) using
SERVPERF will be implemented; a management self-evaluation of service quality. In
addition, the empirical study of Bloemer et al (1999) in the entertainment industry will
also be adapted for implementation in this research project. This construct represents the
dependent variable.

265
Questions in Section F: Peck et al (1999: 23) identified a six markets model in
researching relationship management. Once again, many perception items mirror that of
the SERVQUAL scale. Each market will be analysed as a factor, with identifiable themes
under each. Factors include internal markets, referral markets, influence markets,
recruitment markets, and supplier/alliance markets. Similarly, ten themes shall be
presented in a Likert scale, identifying interval data.
Questions in section G: The Video Software Dealers Association of America (VSDA)
2001 commissioned Arthur Andersen Management consultants to conduct research into
industry best practice. They identified seven core issues, to be identified as factors in this
study. These factors include understanding markets and customers, developing vision and
strategy, refining store product offerings, implementing the marketing plan, creating
promotions and in-store merchandising, and clear in-store operations. The seven factors
will be used to develop twenty themes to be represented in a Likert scale, representative
of interval data.
Validity and reliability of collected data depend on issues of question design, question
structure and rigour of pilot testing. Designing individual questions will require
adaptation from other questionnaires or models (for example SERVQUAL/SERVPERF
and entrepreneurial orientation), together with researcher development of personal
questions. According to Neuman (1997), there is however always a possibility that certain
questions could cause problems. This identifies the need for questionnaire testing to
identify and eliminate such problems.
Pre-testing of the questionnaire requires that the instrument is tested on an appropriate
group before the major study. A small sub-group (6-12 respondents) of the target
population is appropriate for pre-testing (Page & Meyer: 2003). The researcher was
however concerned that such pre-testing consisted of twelve per cent of the final
population, enough to introduce a systematic bias into the responses of the final study (de
Vaus: 1995). As such, another group with similar characteristics was used in the pilot
study. Although the advice of pre-testing is not empirical, conventional wisdom is sound
in facilitating corrective action and revision of adapted questions. Insights and ideas for
refining the questionnaire resulted from thoroughness in this approach. Among the
purpose of the pre-test were determining respondent interest, discovering whether the
questions have meaning for the respondent, examining question continuity and flow,
266
experimenting with question sequencing patterns, collecting early warning data on item
variability and evaluating length and timing of the instrument. An overall objective was to
ensure accuracy (validity) and consistency (reliability). The questionnaire was adapted
after the pilot phase, with the necessary corrections to enhance validity and reliability.
6.5.5.2 The linkage between the questions, research objectives and hypotheses
The synergies of the various disciplines applicable to the current research project have
been discussed and empirically tested throughout the literature review. Links have also
been identified between the disciplines, which have been carried through to the
questionnaire. Table 6.8 on the following page identifies these links, together with linkage
to research objectives and hypotheses.
Figure 6.5 highlights the instrument development process as conceptualised by the
researcher. Following on from instrument development; Malhotra et al (2002), Dillon et
al (1993) and Page and Meyer (2003) identify the data analysis process as the penultimate
phase in the research process. This involves statistics, being the science that deals with
the collection, classification, and use of numerical facts or data, bearing on a subject or
matter (Brien, Correll, Olsson, Hall & Sutton: 1995). Section 6.6 evaluates applicability
of data analysis to the current research project.
6.6 DATA ANALYSIS
Simply defined, data analysis is a statistical procedure employed in coding, editing,
analyzing and interpreting data (Aaker et al: 2001). Cooper and Emory (1995: 379)
identify two steps in statistical analysis; the first is data preparation, which includes
editing, coding and data entry; and the second step involves preliminary data analysis,
breakdown, inspecting, and rearranging data to start the search for meaningful
descriptions, patterns and relationships. Prior to statistical analysis, editing and coding of
raw data is discussed.
Table 6.8 is represented on the following page.

267
TABLE 6.8 The linkage between the sections, questions and hypotheses
Sections and questions linked to hypotheses Direct linkage Indirect linkage
Demographic and biographic franchisee information
Section A B-G
H1 Entrepreneurial orientation exists in a franchise system
Section B A,C
H2 The franchise system is an entrepreneurial option towards creating and developing ventures
Section C A,B,D,E,F,G
H3 Service profit chain initiatives are positively associated with service quality
Section D A,B,C,E,F,G
Dependent variable: Service quality is positively associated with the service profit chain, relationship marketing and best practice
Section E A,B,C,D,F,G
H4 Relationship management initiatives are positively associated with service quality
Section F A,B,C,D,E,G
H5 Best practice initiatives are positively associated with service quality
Section G A,B,C,D,E,F
Questions linked to factors and themes Hypotheses/Questions Questions Entrepreneurial orientation H1; 10-19 1, 11-28 Franchise paradox H2; 29-32 10,11,13,61,62,65,66,77,78 Franchise relationships H2; 33-36 14,61,66 Franchise leadership H2; 37,38 19,61,62,65,66 Service profit chain links H3; 39-43 33-36,65,66,74 Retention strategies H3; 42,44,45,48 49-60,64,64,68,71 Referral strategies H3; 47,48 63,64,69 Related sales strategies H3; 46 71 Reliability 49,50 41,48,59,60 Assurance 53,54 42,59,60 Tangibles 57 59,60,75,76 Empathy 55,56,58 43,59,60 Responsiveness 51,52 44,59,60 Customer markets H4; 59,60 39,40,44,45,48-59 Internal markets H4; 61,62,66,65 11,14,33-36,41,43,74 Referral markets H4; 63,64 47,48,69 Influence markets H4; 63-66 42,44,45,48 Recruitment markets H4; 67,68 61,62 Supplier and alliance markets H4; 61,62 14 Understanding markets and customers H5; 69 47,48,59,60 Developing strategy and vision H5; 70,78 32,48,67 Refining offerings H5; 71 46,60 Implementing the marketing plan H5; 72-74 42,44,46,47,49-58 Promotions and in-store merchandising H5; 75 46,57 Clear in-store operations H5; 76,77 25,26,41 6.6.1 Editing and coding
Editing entails a thorough and critical review of a completed questionnaire in terms of
compliance with the criteria for collecting meaningful data; to deal with questionnaires
not duly completed (Martins et al, 1996: 295). Aaker et al (2001) introduce editing prior
to data analysis, informing that data have to be checked for any error that might have
come from the process of data entry. Once the data are error free, statistical adjustments
to the data can be made. Whilst appropriate for a researcher to complete a missing answer

268
(de Vaus: 1995; Martins et al: 1996); it is the opinion of the researcher to defect from this
practice as it could bias responses (Fink: 1995c). All completed questionnaires were
vigorously checked for completeness and accuracy. The facilitation of reliability and
validity will be discussed in the data analysis section.
Coding is the conversion of questionnaire responses into numeric form in order to allow
quantitative analysis (Page & Meyer: 2003). Similarly, Aaker et al (2001) regards coding
as the categorization and numbering of responses. Since coding refers to the process
whereby codes are assigned to the answers of the respondents (Martins et al: 299);
applicability to the current research project includes numerical values assigned during
questionnaire design. A coding frame was developed, facilitating data capture.
Martins et al (1996) and Brien et al (1995) postulate that researchers often neglect to
point out possible shortcomings and pitfalls in research results. Reliability and validity are
a prerequisite for research data to be useful and it is therefore important to prove
reliability and validity.
6.6.2 Reliability and Validity
Reliability involves the quality of measurement and refers to the amount of agreement
between independent attempts to measure the same theoretical concept (Martins et al:
1996; Brien: 1995). In agreement herewith, Page and Meyer (2003) regard reliability
being achieved when the questionnaire provides identical repeated measures relating to
some constant factor; relating to consistence of a method in its ability to yield
reproducible results (Martins et al, 1996: 26). Techniques have been developed to
establish the degree of reliability in a questionnaire, on the premise that no written
instrument will have perfect reliability (Page & Meyer: 2003). Reliability techniques are
identified by Page and Meyer (2003):
• Test-retest reliability: whereby the researcher tests the same group of people
repeatedly, and compares the different sets of responses for the groups and
individuals. Correlation between responses is an appropriate measure. Trochim
(1997) recommends ways of implementation, consisting of measuring the
instrument twice for multiple persons; computing correlations between the two

269
measures, assuming there is no change in the underlying trait between the first and
second time
• Split-half reliability: refers to the testing of summed ordinal scales (indices). Index
items are split, creating two separate sets of items, for the purpose of correlating
one half with the other
• Inter-item reliability: where items in the questionnaire deemed to be measuring the
same thing ought to be highly correlated to each other. Application to this research
project is reliant on inter-item reliability, as many of the items have proposed
synergies.
Bagozzi (1994: 18) distinguishes between two types of reliability, being internal and
external consistency. Cooper and Emory (1995: 153) purport that reliability means many
things to many people, but in most contexts, the notion of consistence emerges.
Validity is the ability of a measurement instrument to measure what it purports to
measure (Brien et al: 1995), whilst Martins et al (1996: 26) relate validity specifically to
measuring instruments. Bagozzi (1994) is of the opinion that a measure is valid to the
extent that it measures what it is intended to measure. Trochim (1997) however notes that
it is technically incorrect to prove validity. Validity is usually discussed in terms of
internal and external validity (Page & Meyer: 2003: 86). Internal validity refers to the
extent to which the measure can be said to reflect changes in response to manipulation of
the independent variables. Manipulation refers to changing levels, values and hence
influencing the outcome. In this instance, validity is the degree of accuracy with which
the research has measured the cause-effect relationship (Page & Meyer: 2003). External
validity refers to the extent to which the results are relevant to individuals and settings
beyond the study conditions, accepting the assumption of generalisability.
Validity application to the current research project requires discussion (Page and Meyer,
2003: 86):
• Face validity: established by determining on face value whether the items are
logically and conceptually accurate, usually with help of a panel of experts in the
area. Application includes input from industry experts and relevant academic
experts
270
• Content validity: where items are shown to represent fully the area under study
with no omissions. Exploratory and secondary research facilitated in this regard
• Construct/congruent validity: relating to how well the variables were selected and
defined with regard to the construct being measured. Best practice and prior
empirical studies facilitated in this regard
• Criterion-related validity: where the measures taken by the instrument correlate
highly with another instrument or measure of a construct. Similar studies
(construct specific), adapted for this research project, facilitated criterion-related
validity. Criterion-related validity is often referred to as predictive validity, due to
their similarity.
Validity is summarized as the extent to which differences in response scale scores reflect
true differences among objects on the characteristics being measured, rather than
systematic or random errors (Malhotra et al: 2002). Regarding validity and reliability,
Page and Meyer (2003: 87) believe a process of refinement is called for, whereby the
relevance of the items can be determined, and the problematic or weak items discarded or
replaced.
The following section evaluates basic data analysis and theoretical evaluation of results.
Quantitative data analysis essentially involves the ascription of numbers to data;
henceforth the connotation “exploring the numbers” (Page et al, 2000: 143). Similar to
the data collection phase, a linear approach to methodology has been implemented. This
may be summarized as follows: summarising the data, using graphs and descriptive
measures for each variable, measures of spread (mean, median, mode, standard
deviation), graphical representation (pie charts, bar graphs, histograms), bivariate analysis
(relationships between variables), appropriate measures of association (correlation
coefficients and cross-tabulations), and graphs (scattergraphs). In general the objective of
descriptive measures is to summarise responses; the objective of graphs to display
response distributions and relationships, and hypothesis tests to test whether sample
results can be generalised to the population (Page et al, 2000: 144). Descriptive and
inferential measures appropriate to the current research project are depicted in Table 6.7.
Data analysis was evaluated using SPSS version 11.0 (Coakes & Steed: 2004).

271
6.6.3 Descriptive or summary measures
Descriptive measures are particularly for useful comparing the response pattern for
different questions, as well as different groups (refer geographical stratification of Mr.
VIDEO outlets). Descriptive statistics commences with the construction of a frequency
distribution for each variable of interest. Univariate (single variable) measures of centre
and spread and bivariate (two-variable) measures of association are calculated.
6.6.3.1 Frequency distributions and modes (questionnaire section A)
Modes are useful measures of the centre for discrete data (nominal data), whereas
frequency distributions are useful for multi-modal situations (Page et al, 2000: 149). The
mode is a measure of central tendency given as the value that occurs the most in a census
distribution (Malhotra et al, 2002: 473). Frequency distributions give an indication of data
spread. The frequency distribution’s objective is to obtain a count of the number of
responses associated with different values of one variable and to express these counts in
per centage terms (Malhotra et al, 2002: 468). Absolute (simple counts) or relative (per
centage) terms are used to indicate how often the different values are encountered in the
census. Cumulative frequencies result in adding of the frequencies associated with a
particular value to the sum of the frequencies corresponding to all preceding values
(Diamantopoulos & Schlegelmilch, 1997: 65). Frequency distribution will be used to
describe the data in Sections A of the questionnaire as a measure of centre and spread.
Similarly, modes will be used in this section as a measure of centre; with per centages
used to depict distribution of responses.
6.6.3.2 Means and medians (questionnaire section B-G)
The mean is referred to as the average, whilst the median refers to middle value after the
scales have been sorted in order (ascending or descending). Histograms will be used to
explain the skew distribution. Right-skew distributions have unusual high/top values,
whilst left-skew distributions have low/bottom values. In situations of a normal
distribution (bell shaped), the mean score gives a more reliable central indication than the
median (Page and Meyer, 2000:149). Malhotra et al (2002: 473) identify the mean as the
most appropriate measure of central tendency for interval data, applicable to

272
questionnaire Sections B-G (trimmed mean specifically). Due to right-skew proposition,
the median will however also be considered.
6.6.3.3 Measures of variability (questionnaire section B-G)
Measures of variability are a statistic that indicates the distribution’s dispersion,
calculated on interval data. Malhotra et al (2002: 474) identify measures such as range,
interquartile range, variance or standard deviation and coefficient of variation.
Applicability to the current research project will make use of standard deviations and
kurtosis (questionnaire Sections B-G specific). The standard deviation measures the
square root of the average deviation from the mean, whilst the standard error of the mean
measures the standard deviations for the sample mean (Page et al, 2000: 151). The range
is the difference between the minimum and maximum responses, whilst the interquartile
range measures the range for the middle fifty-per cent of data (Malhotra et al: 2002). The
greater the dispersion of scores, the greater the variance. Variances will also be calculated
in the strategic service component, being the square of the standard deviation. Kurtosis is
a measure of the peakedness or flatness of the curve designed by the frequency
distribution. Applicability will involve analysis across all sections.
6.6.3.4 Bivariate measures of association (questionnaire section A-G)
Sections 6.6.3.1 to 6.6.3.3 calculated univariate (single-variable) measures of centre and
measures of spread, whereas this section identifies bivariate (two-variable) measures of
association. Association measures are important to analyse association between two
discrete variables (cross tabulation), and association between any two continuous
variables (correlation coefficient). It is important that association is being measured and
not causation. Cross tabulation is a statistical technique that describes two or more
variables simultaneously and results in tables that reflect the joint distribution of two or
more variables with a limited number of categories or distinct values (Malhotra et al,
2002: 477). Page and Meyer (2003) advise that cross-tabulation is an appropriate
association measure for nominal and ordinal data. Applicability of cross-tabulation to the
current research project will be throughout the questionnaire.
The measure of the relationship between two interval variables in a straight line is
referred to as the Pearson correlation coefficient. This measure is however inappropriate
273
for non-linear relationships (Page & Meyer: 2003). When using ranks (instead of actual
values), the Pearson correlation coefficient may be calculated as a measure of association
(de Vaus: 1995). Positive results in Pearson and Pearson analysis depict some form of
association, with a near zero value suggesting a relatively weak linear relationship. The
sample correlation coefficient r is an estimate of the population correlation coefficient p
(Aaker et al, 2001: 504). Applicability to the Pearson correlation coefficient (at 0.01
level) will be bivariate analysis in Sections B-G of the questionnaire.
6.6.3.5 Graphical representations
Recommended graphs will consist of univariate (single variable distribution) and
bivariate (relationship between two variables). In essence, graphical representation will
facilitate a quick birds-eye view and overview of summary measures. Univariate
distributions will primarily include pie charts (applicable to variables in section A of the
questionnaire), bar charts (applicable to variables in Section B of the questionnaire), and
histograms and box-plots for interval continuous variables (applicable to variables in
Section B-G of the questionnaire). Bivariate associations will include two pie charts
(section A), stacked or clustered bar charts (Section B), and box-plots and scatter plots for
continuous and interval variables (Section B-G).
Interpretation and presentation of descriptive statistics will be presented in Chapter 7.
6.6.4 Inferential statistics
Descriptive measures depicted in Section 6.6.3 are now combined to make inferences and
associations about the census. Inferential measures appropriate to the current research
project include significance tests (hypotheses testing), factor analysis and Cronbach’s
Alpha.
6.6.4.1 Significance tests (hypotheses tests)
Only when a hypothesis test has given a statistically significant result can a conclusion
extend beyond the immediate set of data to the research census (Page & Meyer: 2003).
The hypotheses to be tested in this research project are depicted in Section 6.3.4.
Hypothesis testing is the measurement of an unproven statement or proposition about a

274
factor or phenomenon that is of interest to the researcher (Malhotra et al: 2002).
Hypothesis tests are primarily differentiated into parametric and non-parametric tests
(Page & Meyer: 2003). Parametric tests are prone to rigid assumptions; such as the
independent variable being at least interval (continuous) and the dependent variable
having a normal (bell-shaped) distribution with the same standard deviation for each
population group. Non-parametric hypotheses tests make no assumption about the
distribution of the dependent variable (Page and Meyer: 2003). Applicability to the
current research project is the use of non-parametric tests. Non-parametric tests will
include the Kruskal-Wallis test (identified later in this section).
Hypotheses tests produce P-values, being the probability of obtaining results no more
supportive of H0 than those found in the sample, when the null hypothesis is true (Page &
Meyer: 2003). A significant test result is produced if P is less than 5 per cent, that is, then
it is most unlikely that the null hypothesis is true (at the 95 per cent confidence interval).
The test statistic is however optimal at a one per cent cut off, but applicability of this
research project will be a five per cent cut-off. P-values of greater than five per cent
represent the null hypothesis as not being unlikely, therefore not rejecting the null
hypothesis (referred to as a non-significant test result).
The Kruskal-Wallis one-way analysis of variance (ANOVA) will be used in comparing
ordinal variables (H1) and interval variables (H1-H6). It is applied to a census of values
for one independent discrete variable and one dependent continuous variable (Page &
Meyer: 2003). The Kruskal-Wallis test is a non-parametric test used when the parametric
assumptions are not valid. It is appropriate for data that are collected on an ordinal scale
or for interval data that do not meet F-assumptions, that cannot be transformed, or that for
some other reason prove to be unsuitable for a parametric test (Diamantopoulos &
Schlegelmilch, 1997: 65). The K-W one-way ANOVA is based on an approximation of
the chi-square distribution with k-1 degrees of freedom, where k is the number of groups
compared. In this test, all data are sorted in ascending order, with ranks assigned to each
observation. A test statistic (H) is defined in order to compare the ranks for the census.
The interpretation will be presented in Chapter 7.

275
6.6.4.2 Factor analysis
Hair et al (2000) introduce factor analysis as a generic name for a group of multivariate
statistical methods whose primary purpose is to define the underlying structure of a set of
variables and to reduce a set of variables, measures or items to a smaller set of common
factors. Many authors agree that the process ultimately ends with a reduced number of
packages of variables (Page & Meyer: 2003; de Vaus: 1995; Churchill: 1995). Since
factors are being recognised in the second section of the questionnaire, exploratory factor
analysis was necessary. Outputs of factor analysis include factor loadings, factor scores,
factor communalities and variable communalities. Whilst initially proposing a factor
analysis approach, exploratory research identified that variables being used as
appropriate, which negated the use of factor analysis for this research project. It is
deemed that descriptive and inferential statistics used in this research project are
appropriate to evaluate current constructs, factors and variables; without reducing more
variables. Cronbach’s Alpha is one such measure, testing for internal consistency of
identified factors (Page & Meyer: 2003).
6.6.4.3 Cronbach’s Alpha (α)
The identified constructs (entrepreneurial orientation, franchise paradox, service profit
chain, service quality, relationship management and best practice) were tested for
reliability (internal consistency) using Cronbach’s Alpha. Results of the Cronbach’s
Alpha are provided in the research findings in Chapter 7. This measure is defined as an
overall measure of inter-item correlation (Page & Meyer, 2003: 198). Alpha values
should ideally exceed 0, 80; however, a value of 0, 70 is satisfactory for exploratory
research (Nunnally & Bernstein, 1994: 265). Reliability is estimated from the consistency
of all items in the sum scales, and the reliability coefficient computed in this manner is
also referred to as the internal-consistency reliability (Cooper & Emory, 1995: 155).
The proportion of true score variance that is captured by the items could be estimated by
comparing the sum of items variances with the variance of the sum scale. The formula for
calculating Cronbach’s Alpha (α) is:

276
= (k/k-1) [1-∑(si²)s²sum]
Where Si² = the variance for the k individual items; and
S²sum = the variance for the sum of all items
If there is no true score but only error in the items (esoteric and unique, uncorrelated
across subjects) then the variance of the sum will be the same as the sum of variance of
the individual items. Coefficient alpha will therefore be equal to zero. If all items are
perfectly reliable and measure the same thing (true score), then coefficient alpha is equal
to 1. Specifically, 1-∑(si²)²sum will become equal to (k-1)/k; if multiplied by k/ (k-1) 1 is
obtained (Cooper & Emory, 1995: 155).
Since the objective of this research project is to evaluate relationships between
loyalty/satisfaction (dependent variable) and strategic service constructs (independent
variables), correlation analysis will be used. This involves measuring the strength of the
relationship between two or more variables (correlation coefficient). Since this research
project is not predicting the dependent variable, regression analysis will not be
implemented (Aaker et al, 2001: 525). Towards wrapping up the data analysis section,
synthesis and interpretation requires mention. Synthesis is the synergy of all research
efforts in the applicable research project; being an amalgam of previous research efforts,
the current research and future research needs (Page & Meyer, 2003: 238). Applicability
to the current research project will include exploratory and previous related studies,
secondary and primary sources; and future research opportunities such as regression
analysis and industry wide research projects.
6.7 CONCLUSION
This chapter provided a description of research methodology applicable to the current
research project. This research study can be classified as conclusive, where the primary
objective is to test hypotheses of entrepreneurial orientation in a franchised system; and a
strategic service vision (service profit chain, service quality, relationship management and
industry best practice). This however does not negate the use of exploratory research,
originally used in this research study to develop hypotheses and questions. A quantitative
methodology is implemented, adopting the survey method. The sampling frame consists
of a census, with questionnaires distributed to all Mr. VIDEO franchisees. Measurement

277
scales in the questionnaire consist of nominal, ordinal and interval scales, identifying
permissible descriptive and inferential statistics. The various questions and sections in the
questionnaire were discussed, together with linkages.
The study tests hypotheses, making use of descriptive and inferential statistics. Research
editing, coding, reliability and validity were discussed. Descriptive statistics identified
univariate and bivariate measures of association. Inferential statistics identified
significance tests (hypotheses tests), highlighting the use of a Kruskal-Wallis one-way
analysis of variance (ANOVA). The Cronbach alpha has been introduced as a measure of
internal consistency and overall measure of inter-item correlation. Applicable software
used for data collection and analysis included Surveypro and SPSS version 11.0.
Synthesis and interpretation concludes the theoretical component of research
methodology.
The next chapter will provide a discussion on the research findings and interpretation of
data analysis; together with the outcomes of the different hypotheses as formulated in the
introductory chapter and substantiated in Chapter 6.

278
7 CHAPTER 7: RESEARCH FINDINGS
7.1 INTRODUCTION
An empirical analysis of the data collected from the questionnaire is conducted in this
chapter. Data was coded and captured from an online survey via Surveypro software; and
configured into SPSS version 11.0. The aim of the analysis chapter is to empirically test
hypotheses as stated in the previous chapter, together with evaluating associations
between data sets.
Realisation, response and representation of results identify appropriateness for the current
research project. Demographic and biographic information is relayed, facilitated by pie-
charts and graphs for ease of differentiation. Descriptive statistics are computed to
facilitate interpretation and analysis. Highlights include white male domination, with
franchised outlets predominantly distributed in three regions. The average franchise
tenure is three to five years, with single outlets dominating number of outlets.
Descriptive and inferential statistics are computed in SPSS version 11.0 to test the
hypotheses and associations of the data set. Measures include the mean, standard error of
the mean, standard deviation, kurtosis, Cronbach’s Alpha, Pearson’s correlation
coefficient and the Kruskal-Wallis ANOVA test of significance. Cross-tabulations are
used to facilitate interpretation and evaluation of data.
The primary hypothesis of entrepreneurial orientation in a franchised system is rejected;
however, a proposal of entrepreneurial orientation in a multiple-outlet franchised system
is accepted. A secondary hypothesis involving the franchise paradox; being an
entrepreneurial option towards creating and developing ventures is accepted. Other
secondary hypotheses involving the positive association between the service profit chain,
relationship marketing, best practice and service quality are accepted.
The chapter concludes with key summary construct statistics, facilitating a bird’s-eye
view of the empirical results.
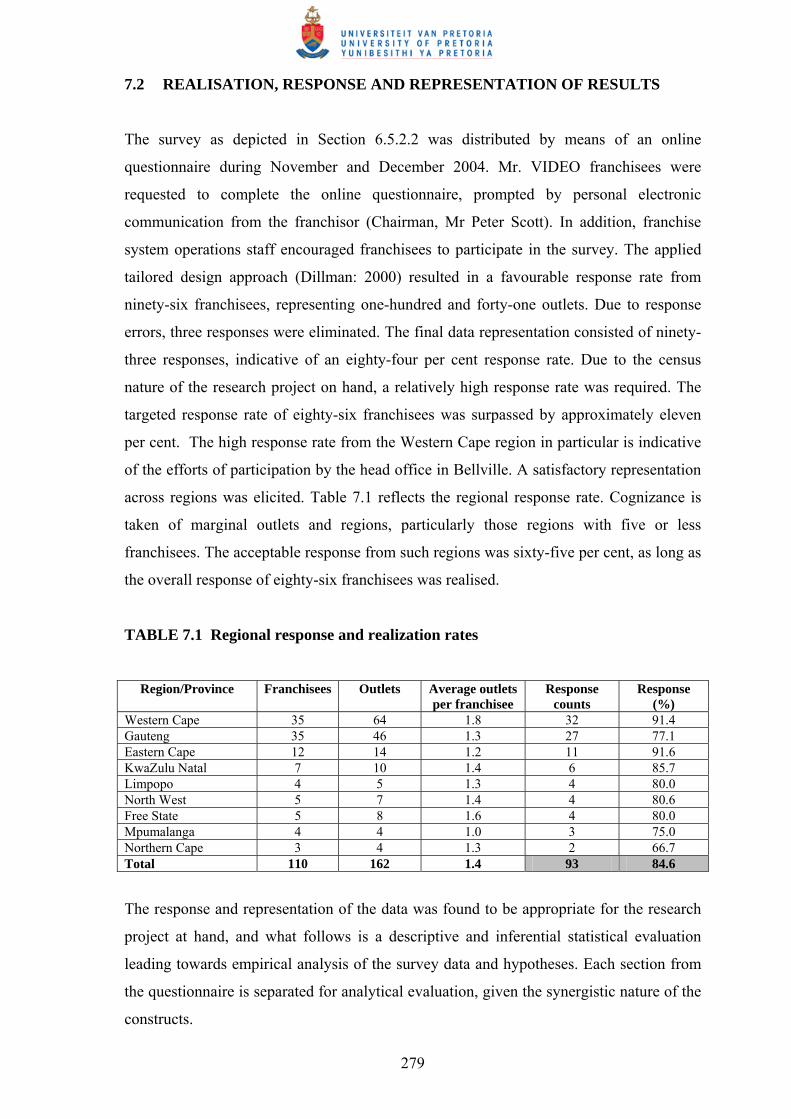
279
7.2 REALISATION, RESPONSE AND REPRESENTATION OF RESULTS
The survey as depicted in Section 6.5.2.2 was distributed by means of an online
questionnaire during November and December 2004. Mr. VIDEO franchisees were
requested to complete the online questionnaire, prompted by personal electronic
communication from the franchisor (Chairman, Mr Peter Scott). In addition, franchise
system operations staff encouraged franchisees to participate in the survey. The applied
tailored design approach (Dillman: 2000) resulted in a favourable response rate from
ninety-six franchisees, representing one-hundred and forty-one outlets. Due to response
errors, three responses were eliminated. The final data representation consisted of ninety-
three responses, indicative of an eighty-four per cent response rate. Due to the census
nature of the research project on hand, a relatively high response rate was required. The
targeted response rate of eighty-six franchisees was surpassed by approximately eleven
per cent. The high response rate from the Western Cape region in particular is indicative
of the efforts of participation by the head office in Bellville. A satisfactory representation
across regions was elicited. Table 7.1 reflects the regional response rate. Cognizance is
taken of marginal outlets and regions, particularly those regions with five or less
franchisees. The acceptable response from such regions was sixty-five per cent, as long as
the overall response of eighty-six franchisees was realised.
TABLE 7.1 Regional response and realization rates
Region/Province Franchisees Outlets Average outlets
per franchisee Response
counts Response
(%) Western Cape 35 64 1.8 32 91.4 Gauteng 35 46 1.3 27 77.1 Eastern Cape 12 14 1.2 11 91.6 KwaZulu Natal 7 10 1.4 6 85.7 Limpopo 4 5 1.3 4 80.0 North West 5 7 1.4 4 80.6 Free State 5 8 1.6 4 80.0 Mpumalanga 4 4 1.0 3 75.0 Northern Cape 3 4 1.3 2 66.7 Total 110 162 1.4 93 84.6
The response and representation of the data was found to be appropriate for the research
project at hand, and what follows is a descriptive and inferential statistical evaluation
leading towards empirical analysis of the survey data and hypotheses. Each section from
the questionnaire is separated for analytical evaluation, given the synergistic nature of the
constructs.
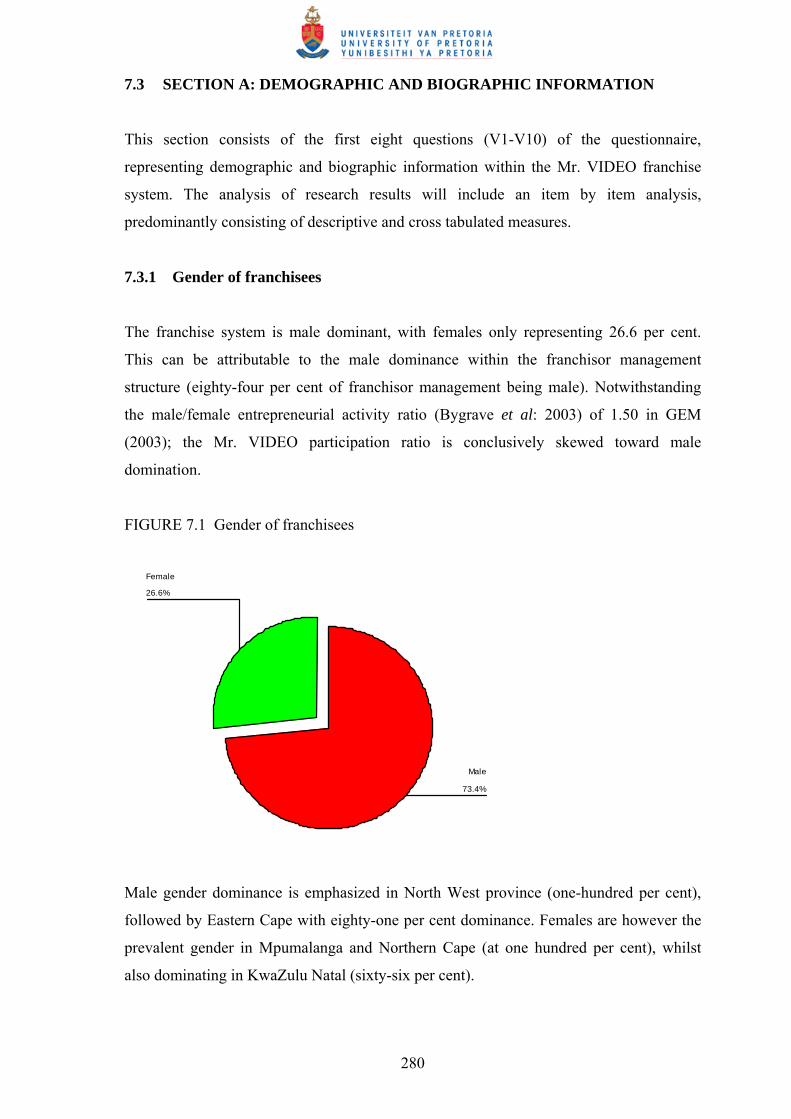
280
7.3 SECTION A: DEMOGRAPHIC AND BIOGRAPHIC INFORMATION
This section consists of the first eight questions (V1-V10) of the questionnaire,
representing demographic and biographic information within the Mr. VIDEO franchise
system. The analysis of research results will include an item by item analysis,
predominantly consisting of descriptive and cross tabulated measures.
7.3.1 Gender of franchisees
The franchise system is male dominant, with females only representing 26.6 per cent.
This can be attributable to the male dominance within the franchisor management
structure (eighty-four per cent of franchisor management being male). Notwithstanding
the male/female entrepreneurial activity ratio (Bygrave et al: 2003) of 1.50 in GEM
(2003); the Mr. VIDEO participation ratio is conclusively skewed toward male
domination.
FIGURE 7.1 Gender of franchisees
26.6%
73.4%
Female
Male
Male gender dominance is emphasized in North West province (one-hundred per cent),
followed by Eastern Cape with eighty-one per cent dominance. Females are however the
prevalent gender in Mpumalanga and Northern Cape (at one hundred per cent), whilst
also dominating in KwaZulu Natal (sixty-six per cent).
281
7.3.2 Race of franchisees
Ninety-eight per cent of respondents are white, which can be attributed to the fact that the
organisation is not in the process of transformation. Once again, it is indicative of
franchisor management being wholly white. Black and Coloured represent two per cent of
respondents (one-a-piece); nowhere near representative of GEM (SA) 2003 participation
rates (Orford et al: 2003).
7.3.3 Region/Province of franchised outlets
Table 7.1 represents respondents by region. The Western Cape dominates by region (34.4
per cent), which can be attributed to the location of Mr. VIDEO head office in Bellville.
Gauteng follows at twenty-nine per cent, followed by Eastern Cape at close to twelve per
cent contribution. The Eastern Cape skew can be attributable to the foundation of Mr.
VIDEO to the region. The regional distribution of franchisees and outlets does not align
with GEM (SA) 2003 participation rates (Orford et al: 2003). Table 7.1 indicates that
Western Cape also dominates in multiple-outlet franchisees, being franchisees that own
more than one franchised system outlet. This is an important classification, as much of the
analysis to follow reflects on multiple-outlet franchisees. Whilst marginally contributing
to national distribution, cognizance is however taken of high multiple-outlet franchisees
in smaller regions as well. Cross tabulations regarding distribution of franchised outlets
are evaluated across entrepreneurial orientation, franchise paradox and strategic service
constructs in the sections to follow. Figure 7.2 reflects the seventy-five per cent
distribution contribution of the three dominant regions.
Figure 7.2 is represented on the following page.
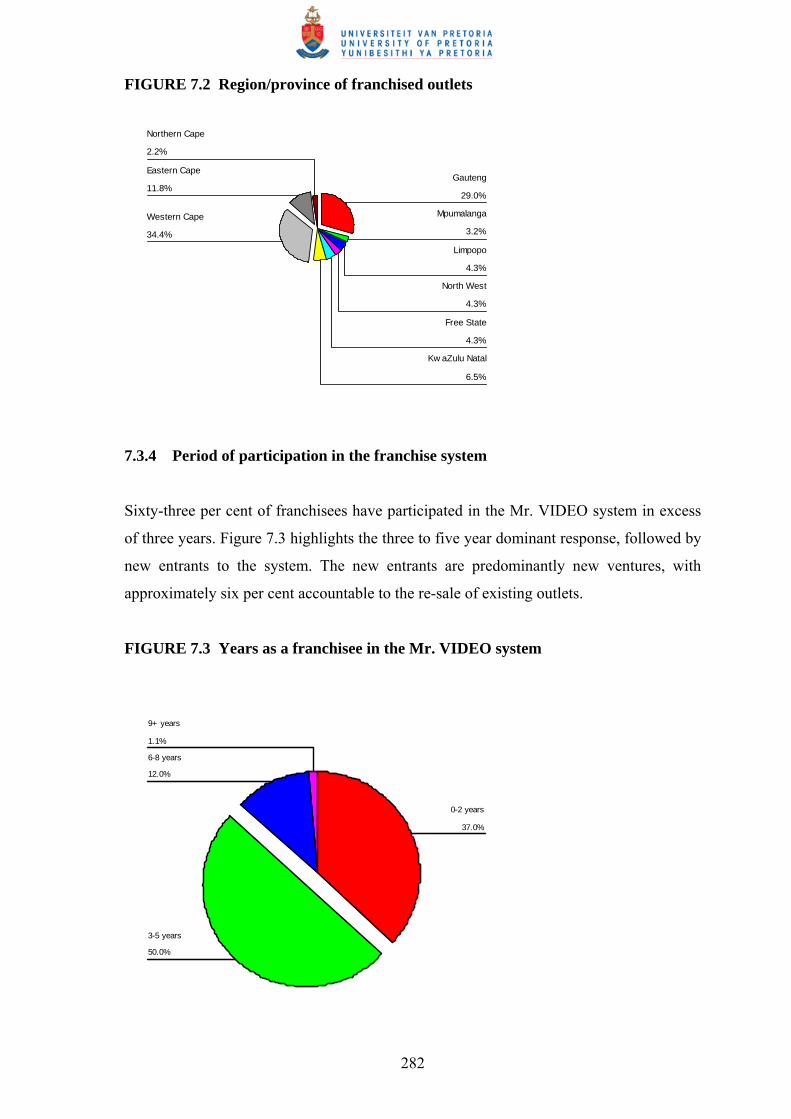
282
FIGURE 7.2 Region/province of franchised outlets
2.2%
11.8%
34.4%
6.5%
4.3%
4.3%
4.3%
3.2%
29.0%
Northern Cape
Eastern Cape
Western Cape
Kw aZulu Natal
Free State
North West
Limpopo
Mpumalanga
Gauteng
7.3.4 Period of participation in the franchise system
Sixty-three per cent of franchisees have participated in the Mr. VIDEO system in excess
of three years. Figure 7.3 highlights the three to five year dominant response, followed by
new entrants to the system. The new entrants are predominantly new ventures, with
approximately six per cent accountable to the re-sale of existing outlets.
FIGURE 7.3 Years as a franchisee in the Mr. VIDEO system
1.1%
12.0%
50.0%
37.0%
9+ years
6-8 years
3-5 years
0-2 years

283
Cross tabulation of years in the system to number of outlets (multiple-outlet franchisees)
indicates that of those franchisees in the system for two or fewer years, eighty-seven per
cent only have one outlet. This can be attributed to new franchisees entering the system
taking time before venturing into additional outlets. Franchisees in the system for three to
five years account for doubling multiple-outlet distribution, representing twenty-eight per
cent with multiple-outlets. Those franchisees in the six to eight year category represent
sixty-four per cent of multiple-outlets; whilst those in the nine-plus category all own
multiple-outlets. The three dominant regions (Western Cape, Gauteng and Eastern Cape),
together with Northern Cape, are the only regions with franchisees in the system for
longer than five years.
7.3.5 Employees in the franchised outlets
This section incorporates questions six and seven (V8 and V9) of the questionnaire;
identifying the number of full and part time employees in the employ of franchisees.
Sixty-eight per cent of franchisees employ two or fewer full time staff, with a mean score
of 1.52 employees. The part-time employment contribution is similar to the full-time
complement, in that franchisees employ similar numbers of full-time and part-time
employees. This can be attributable to the staffing requirements for peak periods. Part-
time employment is however marginally higher, with a mean score of 1.72. The standard
deviation is respondingly higher for part-time employment, indicative of the part-time
employment requirements of multiple-outlets. The kurtosis, measuring the relative
peakedness of the curve defined by the frequency distribution, is proportionally higher for
full-time employees. This can be attributed to the full-time staffing skewness of dominant
single outlet franchisees. Full-time and part-time participation rates are further influenced
by family members active in the system. Those outlets with more than one family
member in the system employ fewer full time staff. Figure 7.4 (represented on the
following page) depicts the distribution of full-time employees (standard deviation =
0.892), whilst Figure 7.5 (also represented on the following page) depicts the distribution
of part-time employees (standard deviation equals 0.925).
Figures 7.4 and 7.5 are represented on the following page.

284
FIGURE 7.4 Full-time employees
9+ employees6-8 employees3-5 employees1-2 employees
Perc
ent
80
60
40
20
0
FIGURE 7.5 Part-time employees
9+ employees6-8 employees3-5 employees1-2 employees
Perc
ent
60
50
40
30
20
10
0
Cross tabulating full-time employees with number of outlets is indicative of ninety-one
per cent of franchisees with one outlet employing no more than two full-time employees.
Seventy-nine per cent of franchisees with two outlets however employ no more than five
employees; whilst seventy eight per cent of franchisees with three to five outlets employ
no more than eight full-time employees. Those franchisees with six or more outlets all
employ more than nine full-time employees.
7.3.6 Number of franchised outlets per franchisee
The mean score of 1.41 outlets per franchisee (standard deviation of 0.758) is further
amplified by seventy three per cent of franchisees owning only one outlet. Fifteen per
cent of franchisees own two outlets, ten per cent own three to five outlets, and only two
per cent own six or more outlets. Average outlets per region are depicted in Table 7.1.
Due to the single outlet domination, the kurtosis of the distribution is relatively peaked
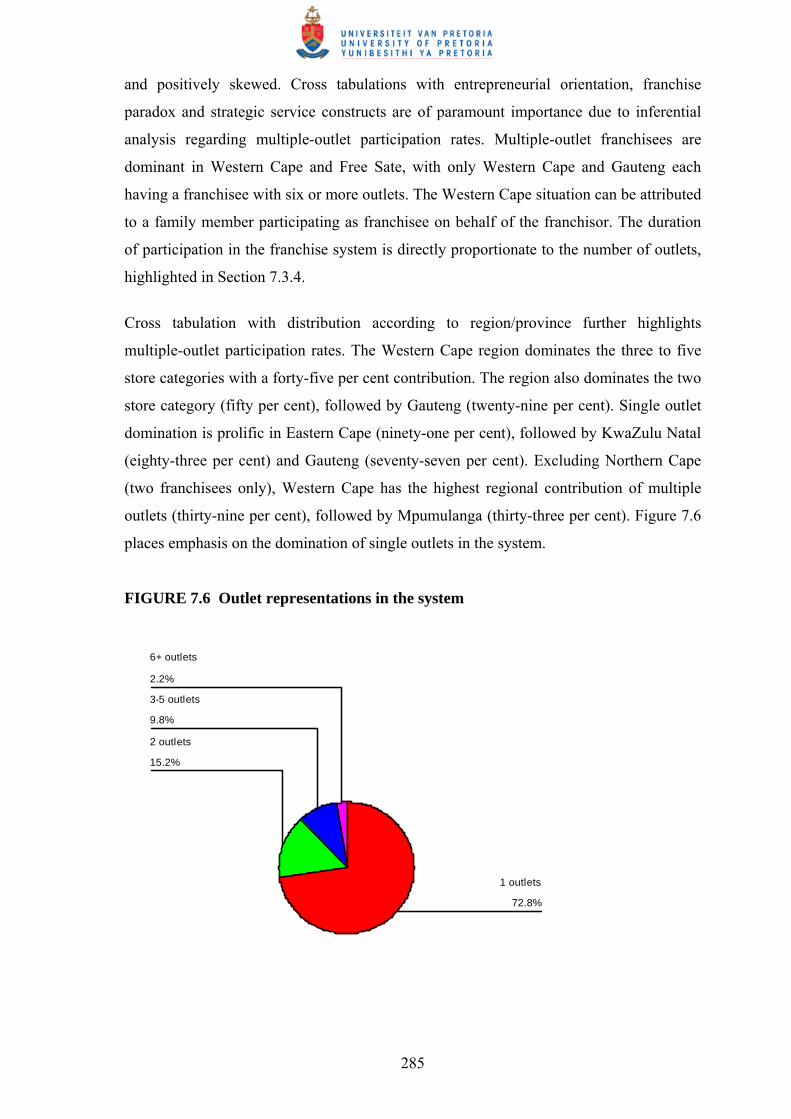
285
and positively skewed. Cross tabulations with entrepreneurial orientation, franchise
paradox and strategic service constructs are of paramount importance due to inferential
analysis regarding multiple-outlet participation rates. Multiple-outlet franchisees are
dominant in Western Cape and Free Sate, with only Western Cape and Gauteng each
having a franchisee with six or more outlets. The Western Cape situation can be attributed
to a family member participating as franchisee on behalf of the franchisor. The duration
of participation in the franchise system is directly proportionate to the number of outlets,
highlighted in Section 7.3.4.
Cross tabulation with distribution according to region/province further highlights
multiple-outlet participation rates. The Western Cape region dominates the three to five
store categories with a forty-five per cent contribution. The region also dominates the two
store category (fifty per cent), followed by Gauteng (twenty-nine per cent). Single outlet
domination is prolific in Eastern Cape (ninety-one per cent), followed by KwaZulu Natal
(eighty-three per cent) and Gauteng (seventy-seven per cent). Excluding Northern Cape
(two franchisees only), Western Cape has the highest regional contribution of multiple
outlets (thirty-nine per cent), followed by Mpumulanga (thirty-three per cent). Figure 7.6
places emphasis on the domination of single outlets in the system.
FIGURE 7.6 Outlet representations in the system
2.2%
9.8%
15.2%
72.8%
6+ outlets
3-5 outlets
2 outlets
1 outlets

286
7.3.7 Family members active in the franchised outlets
Sixty-six per cent of franchisees are single family members involved in the franchise
system. Thirty-four per cent have two or three family members active in their outlets,
with no franchisees exceeding three family members in the system. Cross tabulation with
number of outlets per franchisee is indicative of multiple family members accountable for
multiple-outlet distribution. Only fifteen per cent of single family member franchisees
have two or more outlets, whereas fifty per cent of franchisees with two or more family
members operate multiple-outlet franchises. The remaining fifty per cent of family
franchisees operate single outlets, most often resulting in employing fewer full-time staff.
Exploratory operational research highlighted the requirement for introducing family
members to multiple-outlets due to trust and confidentiality at outlet level. Franchisees of
multiple-outlets attributed the lack of trustworthy staff as a main reason for not expanding
their networks. The negative kurtosis is attributable to distribution of this variable being
flatter than a normal distribution, with a mean score of 1.34.
Analysis on entrepreneurial orientation in a franchise system follows (Section B of the
questionnaire). The section correlates Section 7.3 with many demographic and biographic
details in the form of cross tabulations and inferential statistics.
7.4 SECTION B: ENTREPRENEURIAL ORIENTATION IN A FRANCHISE
SYSTEM
This section involves the analysis of data from Section B of the questionnaire; using
descriptive and inferential statistics. The measurement instrument is an adaptation of the
Thompson (2003) character theme matrix (reference to Table 2.12). The twenty character
themes integrate the facets approach of entrepreneurial talent, temperament and technique
(Bolton & Thompson: 2003). The entrepreneurial orientation is portrayed in Chapter 2;
and the contextual link to franchising is discussed in Chapter 3. Cross tabulations with
results from section A of the questionnaire are evaluated to identify the existence (or non-
existence of entrepreneurial orientation). The analysis commences with the
entrepreneurial orientation (EO) construct descriptives, followed by an analysis on an
item (variable) by item basis.
The hypotheses to be tested include:

287
H1: Entrepreneurial orientation exists in a franchised system.
H0: Entrepreneurial orientation does not exist in a franchised system.
A proposition is introduced and tested:
P1: Entrepreneurial orientation exists in a multiple-outlet franchised system.
7.4.1 Entrepreneurial score ratings
Item descriptive statistics are depicted in Table 7. 2. The score rating column indicates
item mean scores, with 1 indicative of the highest mean response, and 20 indicative of the
lowest score rating across the ninety-three respondent franchisees. Factor mean scores
combine the responses amongst factors of inventor, inventor + entrepreneur, entrepreneur,
entrepreneur + leader, leader, entrepreneur enabler, and non-entrepreneur. Factor ratings
identify dominant entrepreneurial orientation factors in order (1 representing the highest).
The left hand column (association) represents the twenty question matrix; represented as
questions nine to twenty-eight (V13-V32) of the questionnaire. Highlighted variables
include directly associated entrepreneurial orientations.
TABLE 7.2 Entrepreneurial orientation scorecard
Association Character Theme Score
Rating Item Mean
Standard Deviation
Factor Mean
Factor Rating
Inventor Mastery 19 3.06 1.144 3.06 7 Inventor + Entrepreneur Creativity 13 3.33 1.101 3.33 5 Entrepreneur Opportunity taking 20 3.03 1.137 Entrepreneur Urgency 12 3.34 1.141 Entrepreneur Performance orient 6 3.55 1.132 Entrepreneur Networking 7 3.53 0.977
3.41 3
Entrepreneur + Leader Focus 9 3.48 0.943 Entrepreneur + Leader Time focus 16 3.14 0.884 Entrepreneur + Leader Ego 17 3.12 1.115 Entrepreneur + Leader Courage 15 3.17 0.991 Entrepreneur + Leader Team 10 3.40 0.872
3.26 6
Leader Strategic 4 3.59 0.725 Leader Envisioning 3 3.62 0.624 Leader Empowering 14 3.22 0.952 Leader Influencing 2 3.68 1.144
3.53 2
Entrepreneur enabler Developer 11 3.37 0.870 3.37 4 Non-entrepreneur Systematic 8 3.52 0.826 Non-entrepreneur Disciplined 18 3.12 1.495 Non-entrepreneur Woo 5 3.56 0.890 Non-entrepreneur Relator 1 3.97 0.873
3.54 1
Construct descriptive n=93 3.39 0.995
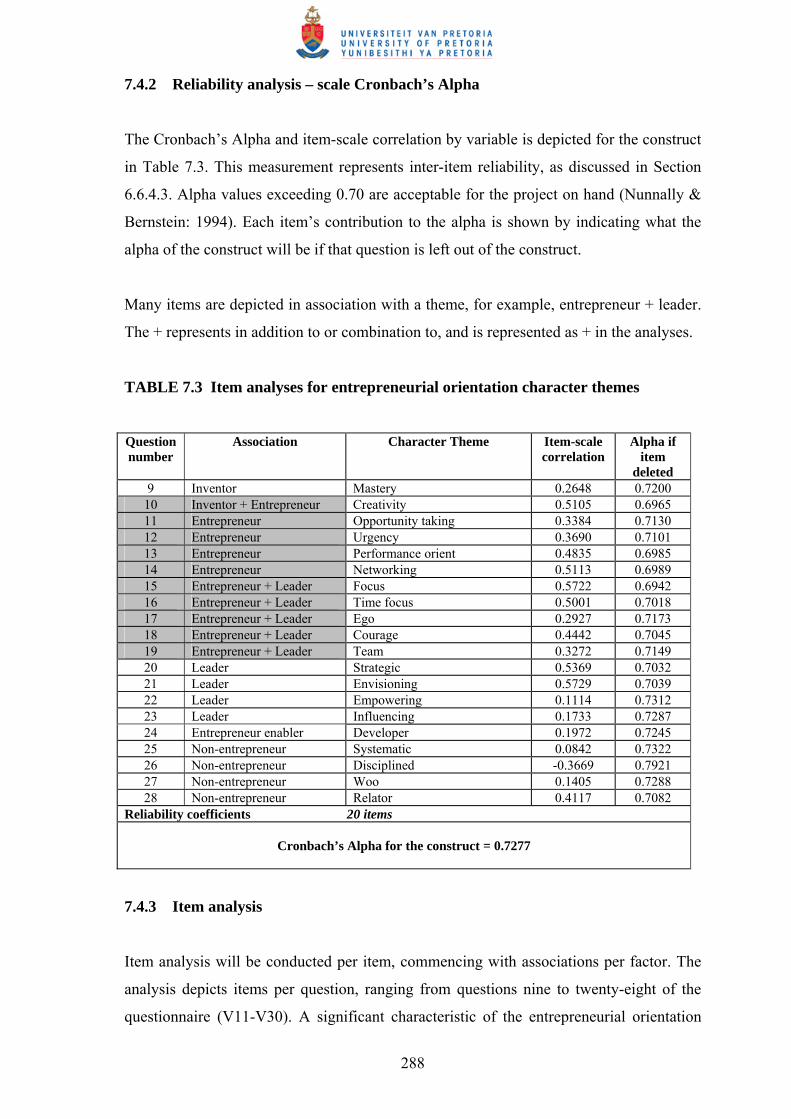
288
7.4.2 Reliability analysis – scale Cronbach’s Alpha
The Cronbach’s Alpha and item-scale correlation by variable is depicted for the construct
in Table 7.3. This measurement represents inter-item reliability, as discussed in Section
6.6.4.3. Alpha values exceeding 0.70 are acceptable for the project on hand (Nunnally &
Bernstein: 1994). Each item’s contribution to the alpha is shown by indicating what the
alpha of the construct will be if that question is left out of the construct.
Many items are depicted in association with a theme, for example, entrepreneur + leader.
The + represents in addition to or combination to, and is represented as + in the analyses.
TABLE 7.3 Item analyses for entrepreneurial orientation character themes
Question number
Association Character Theme Item-scale correlation
Alpha if item
deleted 9 Inventor Mastery 0.2648 0.7200
10 Inventor + Entrepreneur Creativity 0.5105 0.6965 11 Entrepreneur Opportunity taking 0.3384 0.7130 12 Entrepreneur Urgency 0.3690 0.7101 13 Entrepreneur Performance orient 0.4835 0.6985 14 Entrepreneur Networking 0.5113 0.6989 15 Entrepreneur + Leader Focus 0.5722 0.6942 16 Entrepreneur + Leader Time focus 0.5001 0.7018 17 Entrepreneur + Leader Ego 0.2927 0.7173 18 Entrepreneur + Leader Courage 0.4442 0.7045 19 Entrepreneur + Leader Team 0.3272 0.7149 20 Leader Strategic 0.5369 0.7032 21 Leader Envisioning 0.5729 0.7039 22 Leader Empowering 0.1114 0.7312 23 Leader Influencing 0.1733 0.7287 24 Entrepreneur enabler Developer 0.1972 0.7245 25 Non-entrepreneur Systematic 0.0842 0.7322 26 Non-entrepreneur Disciplined -0.3669 0.7921 27 Non-entrepreneur Woo 0.1405 0.7288 28 Non-entrepreneur Relator 0.4117 0.7082
Reliability coefficients 20 items
Cronbach’s Alpha for the construct = 0.7277
7.4.3 Item analysis
Item analysis will be conducted per item, commencing with associations per factor. The
analysis depicts items per question, ranging from questions nine to twenty-eight of the
questionnaire (V11-V30). A significant characteristic of the entrepreneurial orientation

289
construct is the overall flatness of the curve defined by the frequency of distribution
(construct kurtosis of -0.339). This is applicable to all variables, with the exclusion of the
non-entrepreneur variable of relator (q28). The significant characteristic of a distribution
flatter than normal is attributable to multiple-outlet distribution; whereby single outlet
franchisees have perceptions varying to that of multiple-outlet franchisees. This variance
has a distinct significance on entrepreneurial orientation. Once all factors have been
evaluated, the hypothesis will be tested using the non-parametric ANOVA Kruskal-Wallis
test. This will be followed by a cross tabulation of entrepreneurial orientation by multiple-
outlets and by region/province.
7.4.3.1 Inventor
The associated character theme of mastery ranked second to last of all items in the
analysis, with sixty-three per cent of respondents not agreeing with association of the
inventor. The respondents identified the lack of “basking in expertise” that other don’t
have. The relatively high standard deviation and variance (1.308) is confirmed in the
response of thirteen per cent of franchisees strongly agreeing with the item. This will
however be dealt with when dealing with multiple-outlet franchisees.
The inventor variable is significantly correlated (-0.647 at 0.01 level) to the non
entrepreneur character theme of systematic, linking expertise, systems and procedures.
Other significant correlations include opportunity taking (0.560 at 0.01 level) and
envisioning (0.540 at 0.01 level).
As far as the inventor is evaluated as a factor, it ranks seventh (last) of all entrepreneurial
associations. The factor ratings for the research project on hand are depicted in the last
column of Table 7.2. Construct reliability is only marginally affected (Cronbach’s Alpha)
if the item is deleted, indicative of appropriate inter-item reliability.
7.4.3.2 Inventor + entrepreneur
The associated character theme of creativity ranked thirteenth of all items; with fifty three
per cent of respondents not agreeing with the association of creativity. The respondents
identified the lack of “constantly buzzing with ideas”. A mean score of 3.33 is mirrored
by a relatively high standard deviation and variance (1.213); confirmed by forty-one per

290
cent of franchisees in agreement with the item. Negative skewness is elaborated against
the distribution around the mean, despite twenty-seven per cent of respondents indicating
a neutral (undecided) response. The creativity character theme is most often associated to
innovativeness (Nieman et al: 2003), and the outcome of this item is in agreement with
the empirical research of Lindsay and McStay (2004). Details of their findings are
represented in Section 3.4.2.
Inventor is significantly correlated with inventor (0.658 at 0.01 level), a result of related
concepts of mastery, and creativity. A significant correlation is also exhibited between
inventor and entrepreneur association of opportunity taking (0.534 at 0.01 level). This is
in agreement with the entrepreneurial characteristics of creativity and engaging in
perceived opportunities (Nieman et al: 2003).
As far as the inventor + entrepreneur are evaluated as a factor, it ranks third last (fifth
overall) of all entrepreneurial associations. Reference is made to the seventh column in
Table 7.2. Construct reliability is only marginally affected (Cronbach’s Alpha) if the item
is deleted, indicative of appropriate inter-item reliability.
7.4.3.3 Entrepreneur
The entrepreneur factor consists of items represented in questions eleven to fourteen
(inclusive). These associations are directly related to entrepreneurial orientation,
consisting of four character themes:
• Opportunity taking: ranking last in responses, and is linked to entrepreneurial
uncertainty and risk. It involves engaging and taking on perceived opportunities.
This item is not in agreement with a risk-taking orientation of franchisees
(Lindsay & McStay: 2004). Franchisees in this system responded negatively to an
uncertainty and risk-taking orientation, characterized by a mean score of 3.03.
Sixty-three per cent of respondents were not in agreement with the opportunity
taking variable. The variable is significantly associated to other entrepreneur
character themes, including urgency (0.660 at 0.01 level) and performance
orientation (0.583 at 0.01 level). The opportunity variable is also significantly
correlated to the entrepreneur + leader variable of courage (0.583 at 0.01 level)

291
• Urgency: ranking twelfth out of the twenty items, with a mean score of 3.34. The
response to the real drive to get things done now received a fifty-six per cent
response rate not in favour of this variable. A neutral response of thirty-one per
cent however renders the variable difficult to evaluate, characterized by a negative
kurtosis. This in turn represents a distribution flatter than the normal distribution
around the mean. Sixty-nine per cent of responses were actually not in
disagreement (inclusive of neutral responses). Significant correlations include ego
(0.619 at 0.01 level) and disciplined (-0.625 at 0.01 level)
• Performance orientation: ranking sixth, with a direct correlation to proactivity.
Lindsay and McStay (2004) favourably evaluated a proactive orientation in
franchisees, amplified in this research project. Performance orientation involves
setting milestones and measuring progress; most often an integral part of the
franchise agreement and operational procedures (Mendelsohn: 2003). A mean
score of 3.55 is supported by a majority response agreeing to the variable.
Seventy-seven per cent of respondents were either in agreement or neutral in their
response. Similar to performance orientation, negative kurtosis in this variable is
associated with a flat distribution around the agreement prompt. The variable is
significantly correlated to networking (0.634 at 0.01 level) and focus (0.571 at
0.01 level)
• Networking: ranking seventh, just below performance orientation. This variable
includes developing a set of valuable contacts, and received a sixty-three per cent
favourable response. Only seventeen per cent of respondents disagreed with the
variable. The scale ‘agree’ received a high response from fifty-two per cent of
respondents. The relatively low standard deviation and variance (0.955), coupled
with negative kurtosis is testament to this. Networking is significantly correlated
to performance and focus variables (previously identified).
The entrepreneur factor ranks third (of seven factors), with a mean score of 3.41.
Construct inter-item reliability is however marginally decreased should any of the items
be deleted, highlighting appropriate reliability of each item. The Cronbach’s Alpha is
depicted in Table 7.13. An overriding characteristic of the first three factors (inventor,
inventor + entrepreneur and entrepreneur) is their relatively large standard deviation.
When compared to the other factors (mostly below 1.00), the three factors in question
require investigation into the wide range of responses. This will be evaluated in the
sections involving cross tabulations with multiple-outlets.
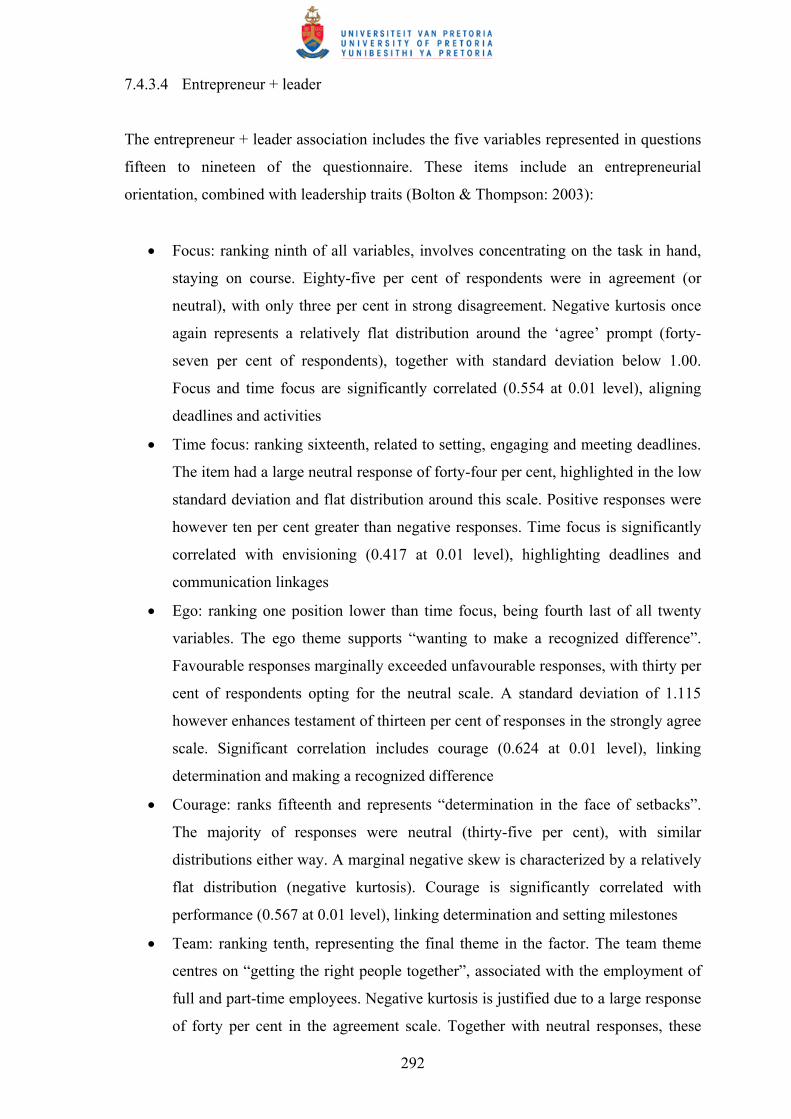
292
7.4.3.4 Entrepreneur + leader
The entrepreneur + leader association includes the five variables represented in questions
fifteen to nineteen of the questionnaire. These items include an entrepreneurial
orientation, combined with leadership traits (Bolton & Thompson: 2003):
• Focus: ranking ninth of all variables, involves concentrating on the task in hand,
staying on course. Eighty-five per cent of respondents were in agreement (or
neutral), with only three per cent in strong disagreement. Negative kurtosis once
again represents a relatively flat distribution around the ‘agree’ prompt (forty-
seven per cent of respondents), together with standard deviation below 1.00.
Focus and time focus are significantly correlated (0.554 at 0.01 level), aligning
deadlines and activities
• Time focus: ranking sixteenth, related to setting, engaging and meeting deadlines.
The item had a large neutral response of forty-four per cent, highlighted in the low
standard deviation and flat distribution around this scale. Positive responses were
however ten per cent greater than negative responses. Time focus is significantly
correlated with envisioning (0.417 at 0.01 level), highlighting deadlines and
communication linkages
• Ego: ranking one position lower than time focus, being fourth last of all twenty
variables. The ego theme supports “wanting to make a recognized difference”.
Favourable responses marginally exceeded unfavourable responses, with thirty per
cent of respondents opting for the neutral scale. A standard deviation of 1.115
however enhances testament of thirteen per cent of responses in the strongly agree
scale. Significant correlation includes courage (0.624 at 0.01 level), linking
determination and making a recognized difference
• Courage: ranks fifteenth and represents “determination in the face of setbacks”.
The majority of responses were neutral (thirty-five per cent), with similar
distributions either way. A marginal negative skew is characterized by a relatively
flat distribution (negative kurtosis). Courage is significantly correlated with
performance (0.567 at 0.01 level), linking determination and setting milestones
• Team: ranking tenth, representing the final theme in the factor. The team theme
centres on “getting the right people together”, associated with the employment of
full and part-time employees. Negative kurtosis is justified due to a large response
of forty per cent in the agreement scale. Together with neutral responses, these

293
two scales represent seventy-four per cent of total responses. This item was one of
three receiving no strongly disagree responses. The variable is significantly
correlated with the influencing variable (0.437 at 0.01 level), linking the human
resource aspect of entrepreneurial orientation.
The entrepreneur + leader factor ranks second last (sixth) of all entrepreneurial orientation
factors. It does not suggest a lack of entrepreneurship + leadership, but merely a ranking
against the other factors. Standard deviation for the factor is lower than the previous three
factors, justified by the predominant grouping of responses between one or two scales. As
such, the relatively flat distribution is not characterized by high variances in the first three
factors. Inter-item reliability is only marginally affected if any of the items are excluded
from the analysis, adding to the justification of appropriate reliability as depicted by the
Cronbach’s Alpha in Table 7.3.
7.4.3.5 Leader
The leader factor comprises four variables, represented in questions twenty to twenty-
three of the questionnaire. These variables are most associated with corporate
entrepreneurship (intrapreneurs) and traditional managers, discussed in Section 2.6.5.
These range from strategic initiatives to operational planning:
• Strategic: ranking fourth, and representing “vision and seeing a clear route
forward”. The variable is characterized by a response of forty-seven per cent of
franchisees in the agreement scale, together with a thirty-nine per cent response in
the neutral scale. The negative kurtosis amplifies the flat distribution around these
two response scales. The variable is one of three with no strongly disagree
responses, with only five per cent of respondents disagreeing. The strategic
variable is significantly correlated with the envisioning variable (0.453 at 0.01
level), combining strategy into action
• Envisioning: ranking third highest, and in response to question twenty-one. The
variable includes communicating a strategy to others, highlighting an orientation
to achieving objectives in a strategic manner. This variable received the second
highest response to a single scale (fifty-six per cent in agreement scale). Coupled
with a thirty-six per cent neutral response, this variable correlates highly to the
strategic variable. The two scales constitute ninety-three per cent of responses,
294
representative of negative kurtosis and a low standard deviation. The envisioning
variable is also one of three with no strongly disagreeing respondents
• Empowering: ranking fourteenth, representing “responsibility and getting people
to accept responsibility for things”. The distribution is relatively flat (negative
kurtosis), characterized by ninety-two per cent of responses across the three
middle scales. Empowering is significantly correlated to associated variables of
influencing (0.562 at 0.01 level) and developer (0.573 at 0.01 level), all related to
mobilizing people
• Influencing: ranking second highest of all variables, representing “the art of
delegation, resource allocation and getting people to take things on”. The variable
is characterized by a thirty per cent response rate in the strongly agree scale, with
only twenty per cent of respondents in disagreement. The standard deviation is
larger than the preceeding variables, due to the range of responses between
multiple-outlet franchisees. Nonetheless, a high mean score of 3.68 substantiates
overall agreement with the variable. The variable is significantly associated to the
non entrepreneur theme of woo (0.594 at 0.01 level), highlighting the involvement
of others in ventures.
The leader factor is characterized by relatively low standard deviations (with the
exception of influencing), together with negative kurtosis. Ranking second highest of all
factors (factor mean of 3.53), franchising may be seen to be closely associated with
intrapreneurship (Hisrich & Peters: 1998). Inter-item reliability is marginally affected if
any of the items are deleted. Reliability coefficients are depicted in Table 7.3, with
Cronbach’s Alpha readings in excess of the desired 0.7.
7.4.3.6 Entrepreneur enabler
The entrepreneur enabler describes the notion of seeing and encouraging potential in
others. The related character theme is developer. The variable is represented in question
twenty-four of the questionnaire. Ranking eleventh of all variables (mean score of 3.37);
the enabler is characterized by a high agreement response of forty-four per cent. Together
with a neutral response of thirty-four per cent, these two scales constitute seventy-eight
per cent of responses. The result is a negative kurtosis and low standard deviation. This
variable correlates significantly (0.407 at the 0.01 level) with the team variable,
highlighting the team and participative nature of the two variables. The two variables also
295
share similar means and standard deviations. Enabler is significantly correlated to woo,
associating potential in others to gaining their approval. As a factor, entrepreneur enabler
is ranked fourth of seven factors, marginally below the entrepreneur factor. As a
reliability measure, Cronbach’s Alpha is only marginally affected if the item is deleted,
highlighting the appropriateness of inter-item reliability.
7.4.3.7 Non-entrepreneur
The non-entrepreneur factor is a combination of four associations, represented by
questions twenty-five to twenty-eight. The variables are associated by traditional non-
entrepreneurial themes, not characteristic of the nature and behaviour of the entrepreneur
(Section 2.6). Furthermore, the factor may be related to traditional management and
leadership. Franchisees are evaluated against their responses to these themes:
• Systematic: ranking eighth out of the twenty items, related to question twenty-
five. This variable evaluates the franchisee as enjoying detail, systems and
procedures. Similar to the developer character theme (entrepreneur enabler), this
variable has seventy-nine per cent of responses distributed around scales of agree
and neutral. A low standard deviation results in negative kurtosis, with a mean
score of 3.52
• Disciplined: ranking third last (eighteenth), clearly depicting the lack of enjoying
structure and organisation. A distinguishing characteristic of this variable is that
whilst twenty per cent of respondents strongly disagree with the question, twenty-
four per cent strongly agree. Franchisee responses varied widely amongst the
scales, resulting in the highest standard deviation of all variables. This is
associated with multiple-outlet responses, to be addressed in the following cross
tabulation section. “Disciplined” is significantly correlated to “woo” (0.486 at
0.01 level), linking approval within defined constraints
• Woo: ranking fifth of all variables, this item includes “winning others over and
enjoying their approval”. A modest fifty-six per cent of franchisees responded
positively to the agree scale, with only one franchisee strongly disagreeing with
the variable. A negative kurtosis is represented by a relatively flat distribution,
centred around the agree scale. Fifteen per cent of respondents selected
disagreement responses, which shall be evaluated in cross tabulation analysis

296
• Relator: ranking top of all the variables, weighted close to eight per cent above the
second highest variable (leader associated with influencing). The character theme
of relator is “preferring to work with trusted colleagues”, and is significantly
correlated to woo (0.594 at the 0.01 level) and leader association of influencing
(0.583 at the 0.01 level). Relator experiences the highest response rates in agree
and strongly agree scales (sixty-three and twenty-two per cent respectively). Eight
per cent of franchisees however responded unfavourably to the variable; which is
attributable to multiple-outlet franchisees. The strength of the domination of this
variable (mean score of 3.97) is emphasized by its seventeen per cent advantage
relative to the construct mean (3.39). This variable is also the only item within the
construct demonstrating a significant peakedness of distribution, with a kurtosis of
3.270.
The non entrepreneurial factor dominates factor standings (mean score of 3.54) by a mere
quarter per cent over the leader factor. A high factor standard deviation (1.021) correlates
closely to the variances of the entrepreneur factor. Since they are opposites and contrast in
entrepreneurial orientation, cross tabulation is necessary to evaluate the variances. This
will be dealt with in the following section. Inter-item reliability is actually marginally
enhanced if the systematic, disciplined and woo variables are excluded. For the purpose
of this study, it was however decided to retain the variables, as the desired Cronbach’s
Alpha depicts a reliability coefficient in excess of the desired 0.7. Similarly, the relator
variable attains an appropriate inter-item coefficient. Whilst every item should have a
positive item total correlation with scale scores of at least 0.3, cognizance is taken of
measurement being on opposite scales (entrepreneurial orientation versus non-
entrepreneurial orientation). Another reason for the variance is that multiple-outlet
distribution affects the scale.
7.4.4 Entrepreneurial orientation significance
Table 7.2 depicts the factor mean scores and factor rankings. Whilst factor means are all
above three, no statistical significance exists between the factor associations. The non
entrepreneur association dominates, followed by leader associations. Using factor mean
scores, it may thus be inferred that a non entrepreneurial orientation exists within the
franchise system (due to non entrepreneurial mean score domination). Although the
entrepreneur factor association is positive (factor mean score of 3.26), the non

297
entrepreneur association is four per cent stronger (factor mean score of 3.54). Taking all
respondents within the defined franchise system into account, it may be concluded that
there is no statistically significant variation between entrepreneurial orientation factors,
despite non entrepreneurial associations exhibiting more favourable responses.
The Kruskal-Wallis test is used to test the hypothesis of entrepreneurial orientation in a
franchised system (H1). This non-parametric test produces P-values (Section 6.6.4.1) and
measures significance of the statistical significance of entrepreneurial orientation. Whilst
no significant statistical difference was found in the mean score ratings, the Kruskal-
Wallis significance test measures the value of the significance. The test significance
evaluates the chi-square, degrees of freedom and asymp. significance.
Test statistic a.b Entrepreneurial
Orientation Chi-Square df Asymp.Sig
18.876 4
0.01 c. Kruskal-Wallis test d. Grouping variable: EO
Since the P-value of 0.01 is less than five per cent, the null hypothesis is likely, therefore
rejecting the alternate hypothesis and accepting the null hypothesis.
It can therefore be concluded that we reject the alternate hypothesis (H1) and accept the
null hypothesis: entrepreneurial orientation does not exist in a franchised system. The
above conclusion is verified for the complete data set (ninety-three franchisee
respondents), but cross tabulations are indicative of multiple-outlet franchisees being
responsible for scale variations. Since single outlet franchisees dominate distribution of
outlets (seventy-three per cent), responses are skewed towards single outlet franchisees. A
comparative analysis will now be evaluated between single and multiple-outlet
franchisees.
7.4.5 Multiple-outlet distribution
Responses from multiple-outlet franchisees differ significantly from single outlet
franchisees. Such variations will be analysed from an entrepreneurial orientation point of
view. The number of franchised outlets per franchisee in Section 7.3.6 bears significance.

298
Weighted analysis is however applicable since multiple-outlets represent only twenty-
seven per cent of all franchisees in the franchise system. Concluding remarks will also be
delivered with regard to entrepreneurial orientation by region.
7.4.5.1 Multiple-outlet entrepreneurial score ratings
A two-fold analysis is depicted, using per centage of franchisees in agreement with each
EO question (9-28), and mean scores associated with each variable. The per centage
agreement analysis excludes neutral and disagree scales, whilst in agreement consists of
agree and strongly agree. Table 7.4 depicts the associated character themes, together with
per centage respondents in agreement with the applicable character theme. These are
broken down into categories, as per question seven of the questionnaire. Highlighted cells
depict dominant agreement responses. As only two franchisees are in the six plus outlet
category, highlighted cells exclude this category. The three to five outlet category
dominates entrepreneurial character themes (questions ten to nineteen), whilst the single
outlet category dominates the non-entrepreneurial character themes (questions twenty-
five to twenty-eight).
TABLE 7.4 Character themes represented by franchisee agreement by number of
outlets
Association Character Theme Per centage of franchisees in agreement 1 Outlet 2 Outlets 3-5 Outlets 6+ Outlets Inventor Mastery 25.3 64.2 66.7 100 Inventor + Entrepreneur Creativity 40.3 64.3 55.5 100 Entrepreneur Opportunity taking 27.3 50.0 66.7 100 Entrepreneur Urgency 32.8 42.8 77.8 100 Entrepreneur Performance orient 47.8 78.6 77.8 100 Entrepreneur Networking 55.4 78.5 77.8 100 Entrepreneur + Leader Focus 51.5 61.5 66.6 100 Entrepreneur + Leader Time focus 30.8 28.6 44.4 100 Entrepreneur + Leader Ego 25.3 57.2 77.8 50.0 Entrepreneur + Leader Courage 23.9 78.6 66.6 100 Entrepreneur + Leader Team 56.7 28.6 33.3 50.0 Leader Strategic 50.5 64.2 66.7 100 Leader Envisioning 55.2 71.4 77.8 100 Leader Empowering 47.8 42.9 11.1 0 Leader Influencing 73.8 35.7 22.2 0 Entrepreneur Enabler Developer 59.1 42.9 0 50.0 Non-entrepreneur Systematic 58.2 57.2 22.2 50.0 Non-entrepreneur Disciplined 57.6 35.7 22.2 0 Non-entrepreneur Woo 75.8 42.9 22.2 0 Non-entrepreneur Relator 89.6 85.7 44.4 100

299
The following step in the analysis combines the associations into their relevant factors
(depicted in the left hand column of Table 7.4). The table again represents extrapolated
per centages from cross tabulations by number of outlets. The factor associations are
depicted in Table 7.5. With the exclusion of the six plus outlet category, the three to five
outlet category dominates entrepreneurial associations. Conversely, the single outlets
dominate the non-entrepreneurial associations. The dominations are once again
highlighted.
TABLE 7.5 Factor associations by number of stores
Association Mean Sd Per centage of franchisees in agreement 1 Outlet 2 Outlets 3-5 Outlets 6+ Outlets Inventor 3.06 1,144 25.3 64.2 66.7 100 Inventor + Entrepreneur 3.33 1.101 40.3 64.3 55.5 100 Entrepreneur 3.41 1.096 40.8 62.5 75.0 100 Entrepreneur + Leader 3.26 0.961 37.6 50.9 57.7 80.0 Leader 3.53 0.861 56.8 53.6 44.5 50.0 Entrepreneur Enabler 3.37 0.870 59.1 42.9 0 50.0 Non-entrepreneur 3.54 1.021 70.3 55.4 27.8 37.5 Construct Descriptives 3.39 0.995 N 93 68 14 9 2
Further analysis involves the weighted summation of entrepreneurial orientation
associations only. These are the highlighted associations in the left hand column of Table
7.5. Table 7.6 depicts the weighted per centages of entrepreneurial orientation by number
of outlets.
TABLE 7.6 Entrepreneurial associations combined by number of outlets (per
centage)
Entrepreneur Factors Combined N
3.3
93
1.053
39.6
68
59.2
14
62.7
9
93.3
2
Descriptive statistics portray that as the number of outlets increase, so too does the per
centage of entrepreneurial orientation. Single outlets portray close to forty per cent
entrepreneurial orientation, whereas six plus outlet franchisees portray a ninety-three per
cent entrepreneurial orientation. If the multiple-outlets are combined, a weighted
agreement response to entrepreneurial orientation character themes of sixty-three per cent
prevails. Multiple-outlet franchisees thus have a fifty-nine per cent higher entrepreneurial
orientation than single outlet franchisees.
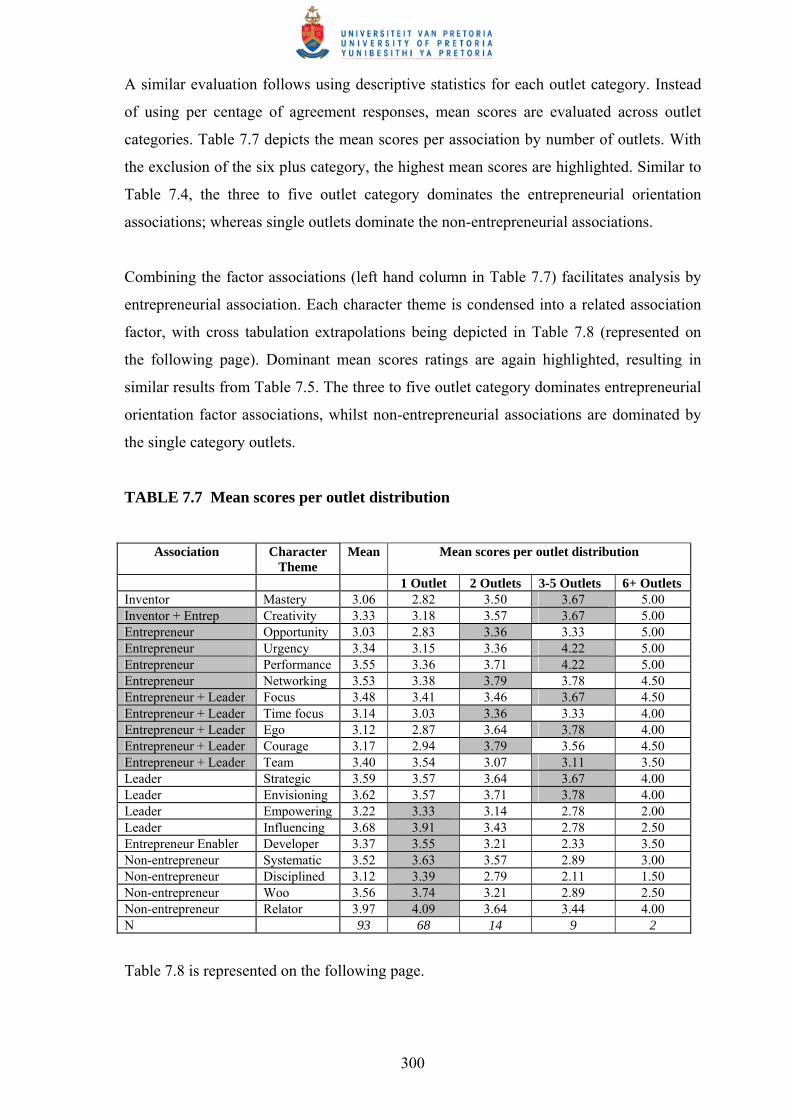
300
A similar evaluation follows using descriptive statistics for each outlet category. Instead
of using per centage of agreement responses, mean scores are evaluated across outlet
categories. Table 7.7 depicts the mean scores per association by number of outlets. With
the exclusion of the six plus category, the highest mean scores are highlighted. Similar to
Table 7.4, the three to five outlet category dominates the entrepreneurial orientation
associations; whereas single outlets dominate the non-entrepreneurial associations.
Combining the factor associations (left hand column in Table 7.7) facilitates analysis by
entrepreneurial association. Each character theme is condensed into a related association
factor, with cross tabulation extrapolations being depicted in Table 7.8 (represented on
the following page). Dominant mean scores ratings are again highlighted, resulting in
similar results from Table 7.5. The three to five outlet category dominates entrepreneurial
orientation factor associations, whilst non-entrepreneurial associations are dominated by
the single category outlets.
TABLE 7.7 Mean scores per outlet distribution
Association Character Theme
Mean Mean scores per outlet distribution
1 Outlet 2 Outlets 3-5 Outlets 6+ Outlets Inventor Mastery 3.06 2.82 3.50 3.67 5.00 Inventor + Entrep Creativity 3.33 3.18 3.57 3.67 5.00 Entrepreneur Opportunity 3.03 2.83 3.36 3.33 5.00 Entrepreneur Urgency 3.34 3.15 3.36 4.22 5.00 Entrepreneur Performance 3.55 3.36 3.71 4.22 5.00 Entrepreneur Networking 3.53 3.38 3.79 3.78 4.50 Entrepreneur + Leader Focus 3.48 3.41 3.46 3.67 4.50 Entrepreneur + Leader Time focus 3.14 3.03 3.36 3.33 4.00 Entrepreneur + Leader Ego 3.12 2.87 3.64 3.78 4.00 Entrepreneur + Leader Courage 3.17 2.94 3.79 3.56 4.50 Entrepreneur + Leader Team 3.40 3.54 3.07 3.11 3.50 Leader Strategic 3.59 3.57 3.64 3.67 4.00 Leader Envisioning 3.62 3.57 3.71 3.78 4.00 Leader Empowering 3.22 3.33 3.14 2.78 2.00 Leader Influencing 3.68 3.91 3.43 2.78 2.50 Entrepreneur Enabler Developer 3.37 3.55 3.21 2.33 3.50 Non-entrepreneur Systematic 3.52 3.63 3.57 2.89 3.00 Non-entrepreneur Disciplined 3.12 3.39 2.79 2.11 1.50 Non-entrepreneur Woo 3.56 3.74 3.21 2.89 2.50 Non-entrepreneur Relator 3.97 4.09 3.64 3.44 4.00 N 93 68 14 9 2
Table 7.8 is represented on the following page.

301
TABLE 7.8 Factor associations by number of outlets (mean scores)
Association Mean Sd Mean scores by number of outlets 1 Outlet 2 Outlets 3-5 Outlets 6+ Outlets Inventor 3.06 1,144 2.82 3.50 3.67 5.00 Inventor + Entrepreneur 3.33 1.101 3.18 3.57 3.67 5.00 Entrepreneur 3.41 1.096 3.18 3.56 4.10 4.90 Entrepreneur + Leader 3.26 0.961 3.16 3.46 3.49 4.10 Leader 3.53 0.861 3.60 3.48 3.25 1.13 Entrepreneur Enabler 3.37 0.870 3.55 3.21 2.33 3.50 Non-entrepreneur 3.54 1.021 3.71 3.30 2.83 2.75 Construct Descriptives 3.39 0.995
To facilitate entrepreneurial orientation analysis, multiple outlets mean scores are
accordingly weighted to compare single and multiple-outlet franchisees. Entrepreneurial
associations are depicted in Table 7.9.
TABLE 7.9 Weighted entrepreneurial orientation mean scores
Entrepreneur Factors Weighted Mean Scores
3.33
n=93
1.053 3.17
n=68
3.53
n=14
3.75
n=9
4.67
n=2
Table 7.9 resembles Table 7.6; identifying both methods of evaluating entrepreneurial
orientation as appropriate. Due to a weighted average for multiple-outlets being
appropriate due to fewer outlets in the three plus categories, the entrepreneurial
orientation of multiple-outlets is evaluated using a weighted mean score. A resultant
weighted mean score of 3.70 is evidence of a significant number of multiple-outlets
experiencing a seventeen per cent higher entrepreneurial orientation relative to single
outlet franchisees.
Prior to using inferential statistics in the form of significance tests to evaluate
entrepreneurial orientation in a multiple-outlet setting, an evaluation of entrepreneurial
orientation by region is applicable.
7.4.5.2 Multiple-outlet entrepreneurial ratings by region
The classifications depicted in Section 7.3.3 are appropriate for regional distribution of
franchised outlets. What follows is an evaluation of entrepreneurial associations by
region, similar to classifications used in Table 7.4. Per centage of agreement scales are

302
used per region, depicted in Table 7.10. Highlighted cells represent regional domination
by character theme.
TABLE 7.10 Entrepreneurial associations by character theme
Association Per centage of franchisees in agreement by region GP MP LP NW FS KZN WC EC NC Inventor 51.8 33.3 50.0 50.0 25.0 33.3 28.2 18.2 100 Inventor + Entrepreneur 62.9 33.3 75.0 50.0 50.0 16.7 43.7 36.4 0 Entrepreneur 46.1 0 50.0 25.0 25.0 33.4 34.4 36.4 50.0 Entrepreneur 44.4 33.3 50.0 50.0 25.0 33.4 40.6 36.4 50.0 Entrepreneur 66.6 33.3 75.0 50.0 50.0 33.4 56.2 63.7 50.0 Entrepreneur 74.1 66.7 50.0 75.0 50.0 66.7 67.7 20.0 100 Entrepreneur + Leader 56.0 66.6 75.0 50.0 50.0 83.4 56.3 45.5 50.0 Entrepreneur + Leader 38.5 33.3 50.0 25.0 0 50.0 32.3 27.3 50.0 Entrepreneur + Leader 37.0 33.3 50.0 50.0 25.0 33.3 43.8 18.2 50.0 Entrepreneur + Leader 40.7 33.3 50.0 25.0 25.0 50.0 37.5 36.4 50.0 Entrepreneur + Leader 44.4 33.3 75.0 50.0 0 50.0 46.9 72.7 50.0 Leader 59.2 66.6 50.0 25.0 50.0 66.7 46.9 72.7 100 Leader 70.4 66.7 75.0 50.0 25.0 66.7 59.4 45.5 50.0 Leader 40.7 33.3 50.0 25.0 75.0 16.7 43.8 54.6 0 Leader 55.5 66.7 50.0 25.0 75.0 66.6 60.0 80.0 50.0 Entrepreneur Enabler 40.7 66.7 33.3 50.0 75.0 16.7 56.3 63.6 0 Non-entrepreneur 51.8 66.7 50.0 50.0 50.0 56.7 56.3 43.5 50.0 Non-entrepreneur 29.6 66.6 50.0 50.0 50.0 66.7 58.1 54.6 50.0 Non-entrepreneur 59.3 66.6 50.0 50.0 75.0 50.0 68.8 80.0 50.0 Non-entrepreneur 85.2 100.0 50.0 75.0 75.0 66.6 90.6 100 50.0 N= 93 27 3 4 4 4 6 32 11 2
Character themes are further broken down into factor associations by region; represented
in Table 7.11. Highlighted cells depict dominant regions by factor association.
Cognisance is taken of those regions having only a few franchised outlets, which may
substantially skew the results. Notwithstanding this, on a per region basis, the evaluation
makes for interesting inferences, particularly to the franchisor.
TABLE 7.11 Factor associations by region
Association Per centage of franchisees in agreement by region GP MP LP NW FS KZN WC EC NC Inventor 51.8 33.3 50.0 50.0 25.0 33.3 28.2 18.2 100 Inventor + Entrepreneur 62.9 33.3 75.0 50.0 50.0 16.7 43.7 36.4 0 Entrepreneur 57.8 33.3 56.3 50.0 37.5 41.7 49.7 39.1 62.5 Entrepreneur + Leader 43.3 40.0 60.0 40.0 20.0 53.3 43.4 40.0 50.0 Leader 56.5 58.3 56.3 31.3 56.3 54.2 52.5 63.2 50.0 Entrepreneur Enabler 40.7 66.7 33.3 50.0 75.0 16.7 56.3 63.6 0 Non-entrepreneur 49.9 75.0 50.0 56.3 56.3 60.0 68.5 69.5 50.0

303
The associations are then combined to evaluate overall entrepreneurial orientation by
region. The associations are merely a descriptive analysis, however, weighted descriptives
are analysed using weighted scores to make meaningful inferences. The descriptive
factors are depicted in the first row of Table 7.12, whereas the weighted scores are
depicted in the second row of Table 7.12.
TABLE 7.12 Entrepreneurial associations combined
EO descriptives EO weighted scores
54.7 15.9
35.5 1.1
63.8 2.7
46.7 2.0
35.8 1.5
37.2 2.4
45.6 15.7
38.5 4.5
37.5 0.8
Although Limpopo Province franchisees have the highest per centage of entrepreneurial
orientation agreement scale responses, they only represent 4.3% of all respondents. The
weighted scores are more indicative for inferential analysis by region. The weighted
scores identify Gauteng and Western Cape as the dominant entrepreneurial orientation
regions, followed by Eastern Cape.
The final entrepreneurial orientation analysis section will evaluate inferential statistics by
using significance tests to test the newly identified proposition: entrepreneurial
orientation exists in a franchise environment. In addition, the Cronbach’s Alpha will be
evaluated for inter-item construct reliability.
7.4.5.3 Entrepreneurial orientation significance in multiple-outlets
Inferential statistics are now implemented to evaluate the entrepreneurial orientation of
multiple-outlet franchisees. The hypothesis of entrepreneurial orientation in the franchise
system has been rejected (Section 7.4.4), but it is proposed that an entrepreneurial
orientation exists in the multiple-outlet category of the franchise system. The multiple-
outlet category excludes all single outlet franchisees. The multiple outlet system contains
twenty-five franchisees; comprising sixty-three outlets (mean score of 2.52). Descriptive
statistics of entrepreneurial associations by the segregated multiple-outlet categories are
depicted in Table 7.4. The inferential analysis will comprise reliability tests (Cronbach’s
Alpha) and significance tests (Kruskal-Wallis).

304
These measures will evaluate the following proposition:
Proposition 1: entrepreneurial orientation exists in a multiple-outlet franchised system
The Cronbach’s Alpha and item-scale correlation by variable is depicted in Table 7.13.
The overall construct alpha for multiple-outlets is significantly higher than when single
outlets were included in the analysis (refer to Table 7.3). Similarly, the inter-item alpha is
significantly higher for multiple-outlets. The significant construct alpha of 0.8533,
coupled with alphas exceeding 0.8295 if any item is deleted, is appropriate for the
multiple-outlet significance.
TABLE 7.13 Item analyses for entrepreneurial orientation character themes
(multiple-outlets)
Question number
Association Character Theme Item-scale correlation
Alpha if item
deleted 9 Inventor Mastery 0.6222 0.8388
10 Inventor + Entrepreneur Creativity 0.7380 0.8358 11 Entrepreneur Opportunity taking 0.3895 0.8490 12 Entrepreneur Urgency 0.4568 0.8468 13 Entrepreneur Performance orient 0.6704 0.8359 14 Entrepreneur Networking 0.7045 0.8363 15 Entrepreneur + Leader Focus 0.6637 0.8374 16 Entrepreneur + Leader Time focus 0.8647 0.8295 17 Entrepreneur + Leader Ego 0.3446 0.8544 18 Entrepreneur + Leader Courage 0.4882 0.8449 19 Entrepreneur + Leader Team 0.6632 0.8387 20 Leader Strategic 0.7868 0.8358 21 Leader Envisioning 0.7029 0.8413 22 Leader Empowering 0.3852 0.8525 23 Leader Influencing 0.4185 0.8476 24 Entrepreneur enabler Developer 0.3725 0.8526 25 Non-entrepreneur Systematic 0.3093 0.8630 26 Non-entrepreneur Disciplined 0.3975 0.8894 27 Non-entrepreneur Woo 0.3368 0.8541 28 Non-entrepreneur Relator 0.6663 0.8361
Reliability coefficients 20 items
Cronbach’s Alpha for the construct = 0.8533
The significance of the proposition may be tested using the ANOVA Kruskal-Wallis test.
This test rejected entrepreneurial orientation in the total franchise system (Section 7.4.4),
but the proposed proposition of entrepreneurial orientation excluding single franchised
outlets is now being tested.
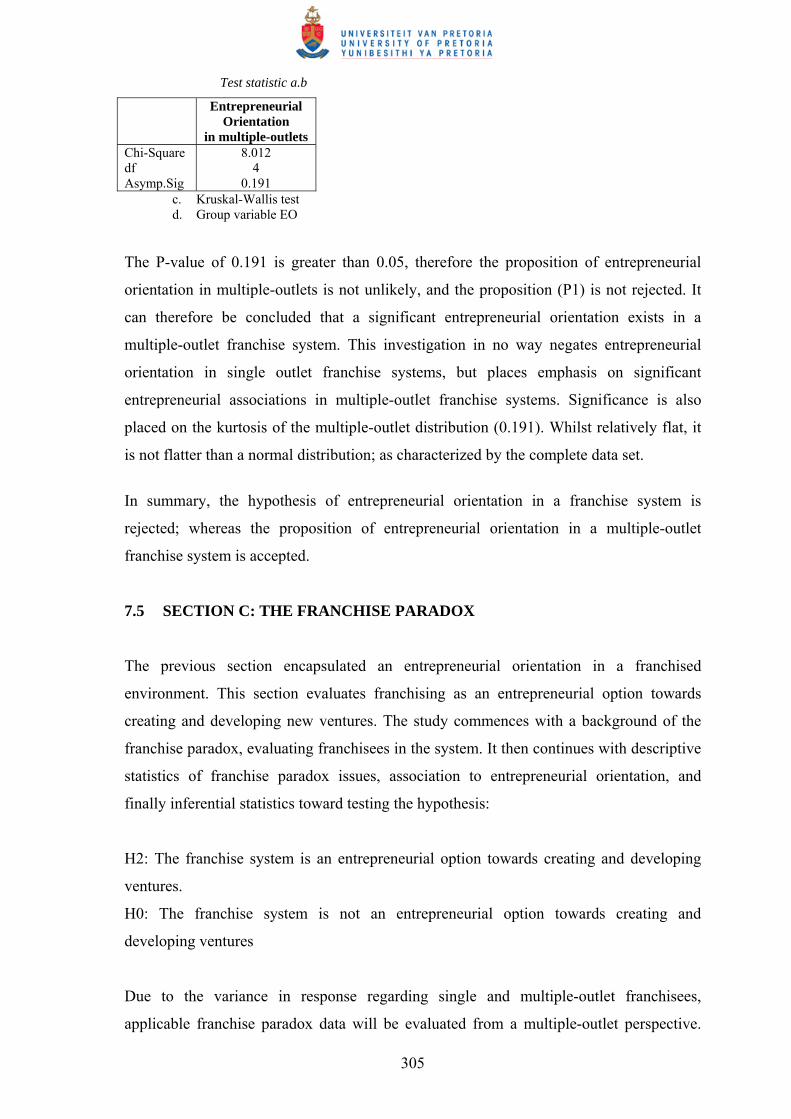
305
Test statistic a.b
Entrepreneurial Orientation
in multiple-outlets Chi-Square df Asymp.Sig
8.012 4
0.191 c. Kruskal-Wallis test d. Group variable EO
The P-value of 0.191 is greater than 0.05, therefore the proposition of entrepreneurial
orientation in multiple-outlets is not unlikely, and the proposition (P1) is not rejected. It
can therefore be concluded that a significant entrepreneurial orientation exists in a
multiple-outlet franchise system. This investigation in no way negates entrepreneurial
orientation in single outlet franchise systems, but places emphasis on significant
entrepreneurial associations in multiple-outlet franchise systems. Significance is also
placed on the kurtosis of the multiple-outlet distribution (0.191). Whilst relatively flat, it
is not flatter than a normal distribution; as characterized by the complete data set.
In summary, the hypothesis of entrepreneurial orientation in a franchise system is
rejected; whereas the proposition of entrepreneurial orientation in a multiple-outlet
franchise system is accepted.
7.5 SECTION C: THE FRANCHISE PARADOX
The previous section encapsulated an entrepreneurial orientation in a franchised
environment. This section evaluates franchising as an entrepreneurial option towards
creating and developing new ventures. The study commences with a background of the
franchise paradox, evaluating franchisees in the system. It then continues with descriptive
statistics of franchise paradox issues, association to entrepreneurial orientation, and
finally inferential statistics toward testing the hypothesis:
H2: The franchise system is an entrepreneurial option towards creating and developing
ventures.
H0: The franchise system is not an entrepreneurial option towards creating and
developing ventures
Due to the variance in response regarding single and multiple-outlet franchisees,
applicable franchise paradox data will be evaluated from a multiple-outlet perspective.
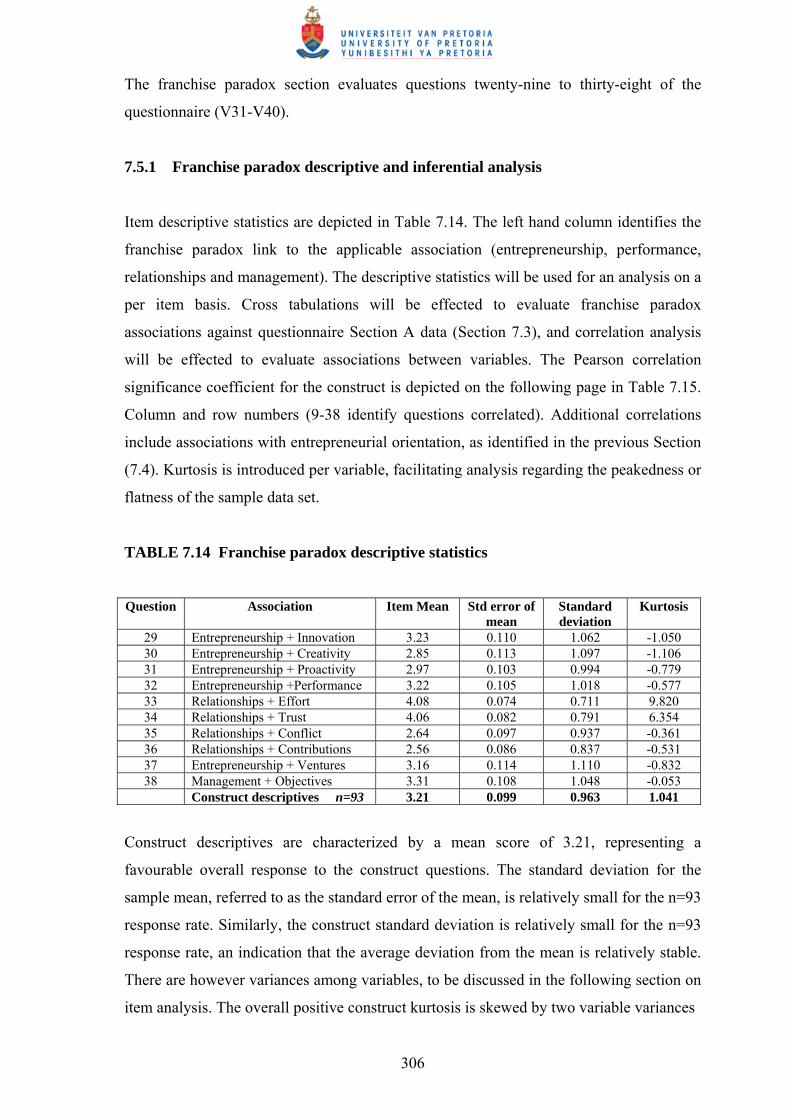
306
The franchise paradox section evaluates questions twenty-nine to thirty-eight of the
questionnaire (V31-V40).
7.5.1 Franchise paradox descriptive and inferential analysis
Item descriptive statistics are depicted in Table 7.14. The left hand column identifies the
franchise paradox link to the applicable association (entrepreneurship, performance,
relationships and management). The descriptive statistics will be used for an analysis on a
per item basis. Cross tabulations will be effected to evaluate franchise paradox
associations against questionnaire Section A data (Section 7.3), and correlation analysis
will be effected to evaluate associations between variables. The Pearson correlation
significance coefficient for the construct is depicted on the following page in Table 7.15.
Column and row numbers (9-38 identify questions correlated). Additional correlations
include associations with entrepreneurial orientation, as identified in the previous Section
(7.4). Kurtosis is introduced per variable, facilitating analysis regarding the peakedness or
flatness of the sample data set.
TABLE 7.14 Franchise paradox descriptive statistics
Question Association Item Mean Std error of
mean Standard deviation
Kurtosis
29 Entrepreneurship + Innovation 3.23 0.110 1.062 -1.050 30 Entrepreneurship + Creativity 2.85 0.113 1.097 -1.106 31 Entrepreneurship + Proactivity 2.97 0.103 0.994 -0.779 32 Entrepreneurship +Performance 3.22 0.105 1.018 -0.577 33 Relationships + Effort 4.08 0.074 0.711 9.820 34 Relationships + Trust 4.06 0.082 0.791 6.354 35 Relationships + Conflict 2.64 0.097 0.937 -0.361 36 Relationships + Contributions 2.56 0.086 0.837 -0.531 37 Entrepreneurship + Ventures 3.16 0.114 1.110 -0.832 38 Management + Objectives 3.31 0.108 1.048 -0.053
Construct descriptives n=93 3.21 0.099 0.963 1.041
Construct descriptives are characterized by a mean score of 3.21, representing a
favourable overall response to the construct questions. The standard deviation for the
sample mean, referred to as the standard error of the mean, is relatively small for the n=93
response rate. Similarly, the construct standard deviation is relatively small for the n=93
response rate, an indication that the average deviation from the mean is relatively stable.
There are however variances among variables, to be discussed in the following section on
item analysis. The overall positive construct kurtosis is skewed by two variable variances

307
(questions 33 and 34). Eighty per cent of the variables are characteristic of a distribution
flatter than normal distribution, whereas twenty per cent of the variables identify a peaked
distribution.
TABLE 7.15 Pearson correlation coefficients for the franchise paradox construct
Q 9 10 11 12 13 14 29 30 31 32 33 34 35 36 37 38 9 1
10 .658 1 11 .472 .534 1 12 .560 .509 .660 1 13 .371 .585 .583 .493 1 14 .394 .496 .444 .402 .634 1 29 .376 .260 .255 .306 .297 .288 1 30 .273 .335 .382 .221 .448 .377 .274 1 31 .211 .375 .236 .201 .353 .236 .003 .620 1 32 .283 .298 .266 .295 .312 .186 .119 .483 .574 1 33 .273 .286 .201 .235 .326 .413 .267 .035 .035 .142 1 34 .222 .225 .096 .167 .262 .351 .147 .024 .024 .144 .803 1 35 .062 .117 .207 .076 .008 .011 .032 .289 .289 .469 .283 .231 1 36 .232 .228 .084 .045 .099 .038 .078 .456 .347 .469 .089 .056 .551 1 37 .348 .387 .301 .339 .288 .337 .132 .444 .446 .825 .164 .162 .531 .481 1 38 .208 .218 .261 .163 .226 .124 .056 .480 .446 .711 .013 .081 .706 .535 .734 1
Correlation is significant at the 0.01 level for all values of 0.260 and above. Correlation is significant at the 0.05 level for all values of 0.207 and above. All values for Q 29 are negative.
Not all variables are intended to be analysed from a Pearson correlation point of view; all
variables are merely listed for completion of the table purposes. Appropriate correlations
will be discussed in the per item evaluations. Inter-item reliability is analysed by means of
the Cronbach’s Alpha, with values depicted in Table 7.16. The table includes the
corrected item-total correlation, and alpha if the item is deleted. The Cronbach’s Alpha
reliability coefficient is appropriate for the project at hand (0.7748). Should any item be
deleted, alpha is only marginally affected; confirming the decision to include all
variables.
Table 7.16 is represented on the following page; and highlights the negative item-scale
correlation for question twenty-nine, which shall be evaluated in the following section on
item analysis. The item analysis will also include evaluation of cross-tabulations between
the franchise paradox variables and demographic and biographical information as per
section A of the questionnaire. Particular emphasis is placed on multiple-outlet
franchisees. Table 7.17 depicts response rates from franchisees in agreement with each
question (agree + strongly agree), represented as a per centage of responses to each
question. Neutral and disagree scales are disregarded in the table. The table is further split
into single and multiple-outlet responses.

308
TABLE 7.16 Item reliability analyses for franchise paradox themes
Question Association Item-scale
correlation Alpha if
item deleted 29 Entrepreneurship + Innovation -1.805 0.8350 30 Entrepreneurship + Creativity 0.5353 0.7422 31 Entrepreneurship + Proactivity 0.5617 0.7393 32 Entrepreneurship +Performance 0.7750 0.7073 33 Relationships + Effort 0.0899 0.7896 34 Relationships + Trust 0.1036 0.7907 35 Relationships + Conflict 0.5171 0.7460 36 Relationships + Contributions 0.5561 0.7432 37 Entrepreneurship + Ventures 0.7550 0.7066 38 Management + Objectives 0.7682 0.7069
Reliability coefficients 10 items
Cronbach’s Alpha for the construct = 0.7748
It must be noted from Table 7.17 that question 29 was designed to elicit a response about
innovation in the hands of the franchisor. Agreement responses are therefore indicative of
franchisees favouring this association in the hand of the franchisor. In other words, sixty-
per cent of multiple-outlets see innovation as their responsibility. Question thirty-five is
characterized by a high neutral ranking of fifty per cent of all respondents.
TABLE 7.17 Respondents in agreement with items
Question Association Responses in agreement (%)
Total Single outlets Multiple-outlets 29 Entrepreneurship + Innovation 56.5 61.2 44.0 30 Entrepreneurship + Creativity 35.9 26.9 60.0 31 Entrepreneurship + Proactivity 33.2 28.4 52.0 32 Entrepreneurship +Performance 51.1 44.8 68.0 33 Relationships + Effort 94.5 98.5 84.0 34 Relationships + Trust 92.3 97.0 80.0 35 Relationships + Conflict 14.1 11.9 20.0 36 Relationships + Contributions 13.0 7.5 28.0 37 Entrepreneurship + Ventures 51.0 41.8 76.0 38 Management + Objectives 59.8 55.2 72.0
N 932 68 25
7.5.2 Item analysis
Item analysis will be conducted per item, representative of questions twenty-nine to
thirty-eight of the questionnaire. This shall be analysed within the item associations
depicted in Figures 7.14 to 7.17. Once all items have been evaluated, the hypothesis will
be tested using the non-parametric ANOVA Kruskal-Wallis test. Correlation analysis for
the remaining constructs is represented in Appendix 2.
309
7.5.2.1 Entrepreneurship + innovation
The themes of innovation and creativity of this item closely associate with the mastery
and creativity themes of entrepreneurial orientation (Table 7.2). It evaluates the
franchisee as inventor + entrepreneur. The question involves franchisee perceptions
regarding innovation and creativity in the hands of the franchisor. The majority of
respondents are of the opinion that innovation and creativity are the responsibility of the
franchisor (56.5%), with a mean score of 3.23 and standard deviation of 1.062. The
relatively large standard deviation is due to the variation of response as a result of
differences between single and multiple-outlets. Sixty-one per cent of single outlets are in
agreement, whereas only forty-four per cent of multiple-outlet franchisees are in
agreement. The single outlet mean score is 3.37 and the multiple-outlet mean is 2.96. The
response requests perceptions about the franchisor, henceforth, negative correlations are
recorded (other responses request franchisee perceptions). As such, -1 indicates a perfect
straight-line relationship with negative slope across all variables (Table 7.15). The
negative item-scale is depicted in Table 7.16, and should this variable be deleted, the
alpha for the construct increases. Taking the nature of the variable into account, it was
decided to retain the question as an appropriate alpha coefficient is still to be realised. The
kurtosis is flatter than a normal distribution (-1.050), with ninety per cent of responses
distributed across three scales.
The item is significantly correlated with the mastery character theme (question 9) at 0.01
level. Other significant correlations at 0.01 level include creativity (question 10), urgency
(question 12), performance (question 13), and networking (question 14). These
correlations significantly associate the item responses to the association of entrepreneurial
orientation. Due to the negative correlation, it is appropriate to take cognizance of
disagree scale responses, thus evaluating the franchisees’ innovation responsibility. The
item is also significantly correlated (0.01 level) with question 30 (entrepreneurship +
creativity), placing emphasis on the significant association with entrepreneurial
orientation.
It may thus be concluded that the total system does not perceive innovation and creativity
as their responsibility; however, multiple-outlets differ totally with the overall response.
Sixty per cent of multiple-outlets see innovation and creativity as their responsibility,
whereas only thirty-nine per cent of single outlets see it as their responsibility.

310
7.5.2.2 Entrepreneurship + creativity
This item is representative of question thirty of the questionnaire, idea generation and
creativity to the inventor + entrepreneur (Table 7.2). The overall mean rating of 2.85 is
characterized by a relatively large standard deviation (1.097), representative of variance
amongst respondents. The kurtosis is flatter than a normal distribution (-1.106), with
responses spread across all five scales. Pearson correlations with the entrepreneurship
orientation associations (Table 7.2) are significant. These are represented in Table 7.15.
Of particular significance (at 0.01) are mastery (question 9), creativity (question 10),
opportunity taking (question 11), performance (question 13) and networking (question
14). Correlations that are significant (0.01 level) within the construct include
entrepreneurship + innovation (question 29), entrepreneurship + proactivity (question 31),
entrepreneurship + performance, relationships + conflict + contributions (questions
35/36), entrepreneurship + ventures (question 37) and management + objectives (question
38).
Overall item-scale correlation of 0.5353 is depicted in Table 7.16. Should the item be
deleted, it only marginally affects the Cronbach’s Alpha for the construct, validating the
reliability coefficient. Total construct agreement with the question represents thirty-six
per cent of respondents (Table 7.17), with single outlets responding positively at twenty-
seven per cent. Similar to the previous item, sixty per cent of multiple-outlets believe that
creativity (idea generation) is a responsibility of the franchisee.
It may be concluded that the overall item does not significantly portray the franchisee as
an idea generator. Multiple-outlet franchisees however significantly portray idea
generation as a franchisee function.
7.5.2.3 Entrepreneurship + proactivity
The item representing question thirty-one includes entrepreneurial themes of opportunity
taking and risk. Only thirty-three per cent of respondents are in agreement with the
variable, represented by a mean score of 2.97 (Table 7.14). The distribution is flatter than
a normal distribution (Kurtosis of -0.779) with ninety per cent of responses across three
scales (standard deviation of 0.994). Significant correlations associated with
entrepreneurial orientation (at 0.01 level) include creativity (question 10) and

311
performance (question 13). Within the construct, significant correlations (at 0.01 level)
include entrepreneurship + performance (question 32), relationships + conflict =
contribution (questions 35/6), entrepreneurship plus ventures (question 37) and
management and objectives (question 38).
Item-scale correlation of 0.5617 is appropriate for the study, with the overall construct
alpha being marginally affected should the item be deleted. Entrepreneurship +
proactivity is thus appropriately included (Table 7.16). Only thirty-three per cent of
franchisees responded positively to the item, represented by twenty-eight per cent of
single outlets agreeing (mean score 2.85). Fifty-two per cent of multiple-outlets however
responded positively (mean score 3.29).
It is concluded that entrepreneurship + proactivity is not significantly enhanced in the
franchise system. Multiple-outlets do however perceive the item as significant.
7.5.2.4 Entrepreneurship + performance
Question thirty-two links the entrepreneurial orientation theme of performance orientation
(question 13). It relates to setting milestones and measuring progress, with a link to the
stimulation of incremental wealth. Thirty-five per cent of franchisees responded
positively to the variable, with thirty-two per cent being neutral in their response. The
mean of 3.22 is characterized by a relatively large standard deviation (1.018) and
distribution flatter than a normal curve (Kurtosis of -0.577). Ninety per cent of responses
are distributed across three scales. Significant correlations (at 0.01 level) are achieved
across all entrepreneurial orientation variables (questions 9 to 13). Inter-construct
significance is achieved across entrepreneurship + creativity + proactivity (questions 30
and 31), relationships + conflict + contributions (questions 35 and 36), entrepreneurship +
ventures (question 37) and management and objectives (question 38).
Item-scale correlation of 0.7750 is the highest of all construct items. Whilst the construct
alpha is affected by approximately ten per cent if the item is deleted, the item has been
included as the appropriate Cronbach’s Alpha is still achieved (in excess of 0.7). Fifty-
one per cent of franchisees responded positively to the item, whereas only forty-five per
cent of those with one outlet responded positively. Sixty-eight per cent of multiple-outlet
franchisees however responded positively to the variable.

312
It is concluded that entrepreneurship and performance is enhanced within the franchise
system, albeit not significantly in a single outlet environment. Multiple-outlets however
significantly associate performance and the stimulation of incremental wealth within the
system.
The data in this section is in agreement with the hypothesis of entrepreneurial orientation
in the previous section. The franchise paradox links to entrepreneurship conclude that a
significant entrepreneurial orientation is not identified in the franchise system, although it
is significant in a multiple-outlet franchise system. It must again be emphasized that this
does not negate entrepreneurial orientation, but that the orientation is not significant.
7.5.2.5 Relationships and the franchise paradox
Questions thirty-three to thirty-six involve various aspects of relationships with regard to
the franchise paradox. Mendelsohn (2003) emphasizes that the franchise relationship is
not self sustaining; and these items measure franchisee reponses in this regard. These
items link to the relationship marketing construct (questions 59-68). Each question is
represented as an item:
• Relationships and effort: This question relates to the conscious effort of franchisee
and franchisor. An overall positive response was realized (mean score of 4.08),
with a small standard deviation (0.711). The result is a peaked distribution
(kurtosis of 9.820), represented by seventy-five per cent of responses in a single
scale (agree). The item is significantly correlated to the relationships + trust
variable (0.803 at 0.01 level) as well as the relationships + conflict variable (0.283
at 0.01 level). Significant correlations (0.01 level) with the relationship marketing
construct (section F of the questionnaire) revolve around customer markets
(questions 59 and 60), internal markets (question 61 and 65), referral markets
(question 63 and 64), and recruitment markets (question 68). These relationships
not only cover franchise relationships, but relationships with all stakeholders. The
Cronbach’s Alpha (Table 7.16) is marginally affected if the item is deleted, and
inter-item reliability is appropriate if the item is not deleted
• Relationships and trust: This item (question 34) has a distribution very similar to
that of the previous item. A mean score of 4.06 is characterized by a relatively
small standard deviation (0.791) and peaked distribution (kurtosis of 6.354).
313
Ninety-two per cent of responses are distributed across two scales (agree and
strongly agree). This item represents the highest strongly agree response rate in
the entire questionnaire (twenty-three per cent). This is evidence of the strong
necessity for trust in the franchise system. The item does not measure trust in the
system, but the perception of the importance of trust in the system. Inter construct
significant association is that of relationships and effort (previous item).
Significant correlations (0.01 level) with the relationship marketing construct
include customer markets (question 59), internal markets (question 61), referral
markets (questions 63 and 64), and influence markets (questions 65 and 66). The
Cronbach’s Alpha is marginally affected if the item is deleted (Table 7.16), thus it
is appropriate to retain the item
• Relationships and conflict: This item evaluates the handling of conflicts in the
defined franchise system (question 35 of the questionnaire). The item has a
distinguishingly high proportion of neutral responses (fifty-per cent of
respondents), which is perhaps indicative of being unsure of the conflict handling
process. One can assume that those who have not encountered conflict, may well
have responded in this scale. A mean score of 2.64 is realised, evidence of overall
discontent with the handling of conflict in the system. The distribution is
marginally flatter than a normal distribution (kurtosis of -0.361), with responses in
all scales. Correlation is significant (0.01 level) across all relationship items, as
well as management + objectives (question 38). Significant correlations with the
relationship construct include internal markets (question 62), influence markets
(question 66) and recruitment markets (questions 67 and 68). If the item is deleted,
the Cronbach’s Alpha is reduced, thus regarding the inclusion as appropriate
• Relationships and contributions: This item measures the encouragement of
franchisee suggestions in the franchise system. The distribution is characterized by
seventy-seven per cent of franchisees responding on two scales (disagree and
neutral). Only thirteen per cent of franchisees agreed to the item. The result is a
low mean score of 2.56, and relatively flat distribution (kurtosis of -0.361). The
item is significantly correlated (0.01 level) with the previous item and
management + objectives (question 38). Significant correlations (0.01 level) with
the relationship marketing construct include customer markets (question 60),
internal markets (question 62), referral markets (question 63), influence markets
(question 66) and recruitment markets (questions 67 and 68). The alpha is

314
marginally affected if the item is deleted, and inclusion is regarded as appropriate
(Cronbach’s Alpha above 0.7).
The franchise paradox and relationship associations depict two major areas of concern
within the franchise system. These centre around the handling of conflict (question 35)
and the perceived lack of contributions and suggestions within the system (question 36).
The associations do however exhibit significant correlations with the various markets
included in the relationship marketing construct.
7.5.2.6 Entrepreneurship + ventures
Bygrave (1997) informs that franchising is seen as an entrepreneurial option to creating
and developing ventures. In question thirty-seven, franchisees respond on their perception
of the notion. Fifty-one per cent of franchisees responded positively (excluding a
seventeen per cent neutral response), resulting in a mean of 3.16. A varied response
across all scales is represented by a relatively high standard deviation (1.110), together
with relatively flat distribution (kurtosis of – 0.832). The distribution is attributable to the
number of franchised outlets per franchisee. Forty-two per cent of single outlet
franchisees responded positively to the item (mean score of 2.93), whereas seventy-six
per cent of multiple-outlet franchisees responded positively to the item (mean score of
3.72). The distribution is represented in Figures 7.7 and 7.8, representing the responses of
single outlets versus multiple-outlets to the entrepreneurship + ventures variable. The two
figures are represented on the following page.
Significant correlations (0.01 level) are across all entrepreneurial orientation associations
(questions 9-14) and entrepreneurship associations within the franchise paradox construct
(questions 30-32). A high significance is associated with management and objectives
(question 38), encapsulating business objectives with growth and developing new
ventures. The item-scale correlation of 0.7550 appropriately results in a marginal affect
on the Cronbach’s Alpha if the item is deleted (Table 7.16). It is thus appropriate to
include the item in the construct.

315
FIGURE 7.7 Franchising as an entrepreneurial option (single outlet responses)
1.5%
40.3%
19.4%
26.9%
11.9%
Strongly Agree
Agree
Neutral
Disagree
Strongly Disagree
FIGURE 7.8 Franchising as an entrepreneurial option (multiple-outlet responses)
12.0%
64.0%
12.0%
8.0%
4.0%Strongly Agree
Agree
Neutral
Disagree
Strongly Disagree
An interesting response from the KwaZulu Natal (KZN) region in particular skews the
distribution. Fifty per cent of KZN respondents disagree with the item (17% neutral). This
may be attributed to no regional office representation of the franchisor, together with
KZN franchisees rating high with dissatisfaction regarding the handling of conflict (83 %
disapproval). It may be concluded that franchising is an entrepreneurial option towards
creating and developing ventures. This statement is however more significant in a
multiple-outlet franchise environment.
316
7.5.2.7 Management + objectives
The item represents the final question (38) of the franchise paradox construct. It is an
overall measure of the franchise system meeting the business objectives of the franchisee.
Sixty per cent of respondents identified satisfaction with the item (17% neutral), with
twenty-three per cent registering dissatisfaction with the system. The overall response
reflects a mean score of 3.31, with a relatively high standard deviation of 1.048. The
kurtosis represents a relatively flat distribution (-0.053). The variation results from
multiple-outlet franchisees. Fifty-five per cent of single outlet franchisees are satisfied
with their objectives being met (mean score of 3.15); whilst seventy-two per cent of
multiple-outlet franchisees are satisfied (mean score of 3.68). This is represented
diagrammatically in Figure 7.9 and Figure 7.10 on the following page.
The item is significantly correlated (0.01 level) with the entrepreneurial items within the
construct (questions 30-32). Table 7.16 identifies an item-scale correlation of 0.7682;
together with appropriate alpha should the item be deleted. Inclusion of the item is thus
appropriate. A regional cross-tabulation identifies the KZN region as being responsible
for the regional skew of the item (67% dissatisfaction response). This may once again be
attributed to lack of a franchise regional office, as highlighted in the previous section..
It may be concluded that overall the franchise system meets the business needs of the
franchise system. This is however more significant in multiple-outlet franchisees;
correlating multiple-outlets with the creation and development of new ventures.
Figure 7.9 and Figure 7.10 are represented on the following page.

317
FIGURE 7.9 Single outlet satisfaction responses
1.5%
53.7%
16.4%
14.9%
13.4%
Strongly Agree
Agree
Neutral
Disagree
Strongly Disagree
FIGURE 7.10 Multiple-outlet satisfaction responses
4.0%
68.0%
20.0%
8.0%
Strongly Agree
Agree
Neutral
Disagree
7.5.3 Franchising and venture creation significance
In Sections 7.5.1 and 7.5.2 the franchise paradox construct was analysed using descriptive
and inferential statistics. Items were analysed, evaluating their associations with inter-
construct items, together with associations with other constructs. The opportunity now
avails itself to empirically analyse the franchise paradox in light of an association to the
creation and development of ventures. The applicable alternate and null hypotheses are
represented as:
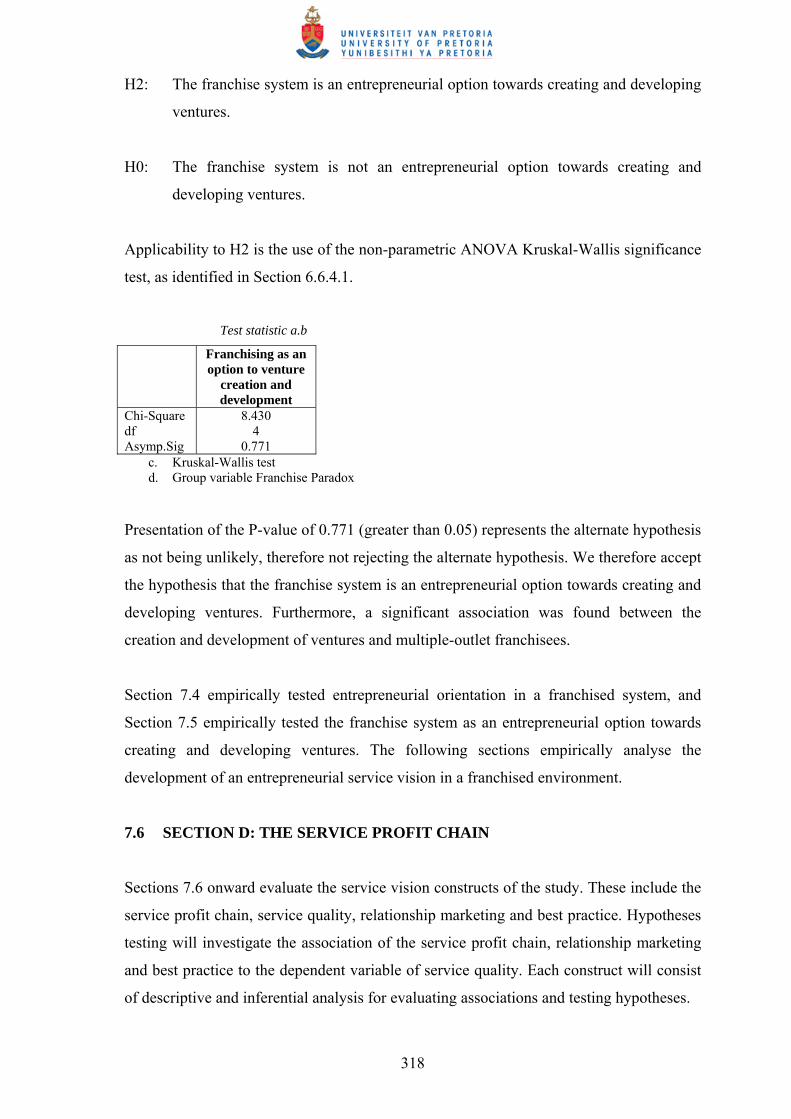
318
H2: The franchise system is an entrepreneurial option towards creating and developing
ventures.
H0: The franchise system is not an entrepreneurial option towards creating and
developing ventures.
Applicability to H2 is the use of the non-parametric ANOVA Kruskal-Wallis significance
test, as identified in Section 6.6.4.1.
Test statistic a.b
Franchising as an option to venture
creation and development
Chi-Square df Asymp.Sig
8.430 4
0.771 c. Kruskal-Wallis test d. Group variable Franchise Paradox
Presentation of the P-value of 0.771 (greater than 0.05) represents the alternate hypothesis
as not being unlikely, therefore not rejecting the alternate hypothesis. We therefore accept
the hypothesis that the franchise system is an entrepreneurial option towards creating and
developing ventures. Furthermore, a significant association was found between the
creation and development of ventures and multiple-outlet franchisees.
Section 7.4 empirically tested entrepreneurial orientation in a franchised system, and
Section 7.5 empirically tested the franchise system as an entrepreneurial option towards
creating and developing ventures. The following sections empirically analyse the
development of an entrepreneurial service vision in a franchised environment.
7.6 SECTION D: THE SERVICE PROFIT CHAIN
Sections 7.6 onward evaluate the service vision constructs of the study. These include the
service profit chain, service quality, relationship marketing and best practice. Hypotheses
testing will investigate the association of the service profit chain, relationship marketing
and best practice to the dependent variable of service quality. Each construct will consist
of descriptive and inferential analysis for evaluating associations and testing hypotheses.
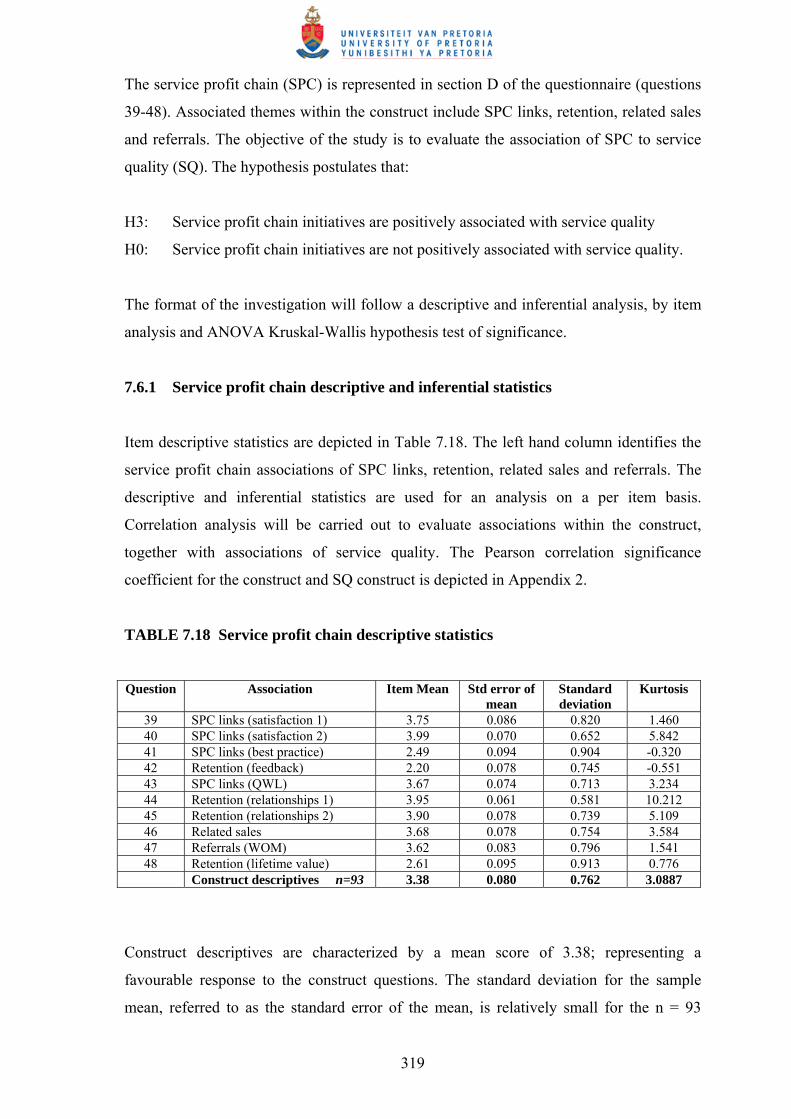
319
The service profit chain (SPC) is represented in section D of the questionnaire (questions
39-48). Associated themes within the construct include SPC links, retention, related sales
and referrals. The objective of the study is to evaluate the association of SPC to service
quality (SQ). The hypothesis postulates that:
H3: Service profit chain initiatives are positively associated with service quality
H0: Service profit chain initiatives are not positively associated with service quality.
The format of the investigation will follow a descriptive and inferential analysis, by item
analysis and ANOVA Kruskal-Wallis hypothesis test of significance.
7.6.1 Service profit chain descriptive and inferential statistics
Item descriptive statistics are depicted in Table 7.18. The left hand column identifies the
service profit chain associations of SPC links, retention, related sales and referrals. The
descriptive and inferential statistics are used for an analysis on a per item basis.
Correlation analysis will be carried out to evaluate associations within the construct,
together with associations of service quality. The Pearson correlation significance
coefficient for the construct and SQ construct is depicted in Appendix 2.
TABLE 7.18 Service profit chain descriptive statistics
Question Association Item Mean Std error of
mean Standard deviation
Kurtosis
39 SPC links (satisfaction 1) 3.75 0.086 0.820 1.460 40 SPC links (satisfaction 2) 3.99 0.070 0.652 5.842 41 SPC links (best practice) 2.49 0.094 0.904 -0.320 42 Retention (feedback) 2.20 0.078 0.745 -0.551 43 SPC links (QWL) 3.67 0.074 0.713 3.234 44 Retention (relationships 1) 3.95 0.061 0.581 10.212 45 Retention (relationships 2) 3.90 0.078 0.739 5.109 46 Related sales 3.68 0.078 0.754 3.584 47 Referrals (WOM) 3.62 0.083 0.796 1.541 48 Retention (lifetime value) 2.61 0.095 0.913 0.776
Construct descriptives n=93 3.38 0.080 0.762 3.0887
Construct descriptives are characterized by a mean score of 3.38; representing a
favourable response to the construct questions. The standard deviation for the sample
mean, referred to as the standard error of the mean, is relatively small for the n = 93

320
response rate; an indication that the average deviation from the mean is relatively stable.
Standard deviations are relatively low (all variables below 1.0), indicative of the majority
of responses distributed closely around the mean score. Kurtosis is indicative of a fairly
normal distribution, with the exception of variable forty-four. Excluding variable forty-
four would result in a construct kurtosis of 2.30, being more representative of the data set.
Seventy per cent of the variables are characteristic of a peaked distribution, whilst twenty
per cent have a distribution marginally flatter than a normal distribution.
Not all variables are intended to be analysed from a Pearson correlation point of view; all
variables are merely listed for completion of the table purposes. Appropriate correlations
will be discussed in the per item evaluations. Inter-item reliability is analysed by means of
the Cronbach’s Alpha, with values depicted in Table 7.19. The table includes the
corrected item-total correlation, and alpha if the item is deleted. The Cronbach’s Alpha
reliability coefficient is appropriate for the project at hand (0.7748). Should any item be
deleted, alpha is only marginally affected; confirming the decision to include all
variables.
TABLE 7.19 Item reliability analyses for service profit chain themes
Question Association Item-scale
correlation Alpha if
item deleted 39 SPC links (satisfaction 1) 0.6755 0.8025 40 SPC links (satisfaction 2) 0.6104 0.8132 41 SPC links (best practice) 0.3750 0.8369 42 Retention (feedback) 0.2935 0.8397 43 SPC links (QWL) 0.5690 0.8145 44 Retention (relationships 1) 0.6097 0.8140 45 Retention (relationships 2) 0.6328 0.8094 46 Related sales 0.4248 0.8284 47 Referrals (WOM) 0.5045 0.8204 48 Retention (lifetime value) 0.6831 0.8003
Reliability coefficients 10 items
Cronbach’s Alpha for the construct = 0.8335
Table 7.19 identifies an appropriate construct Cronbach’s Alpha of 0.8335 (above desired
0.7). The distribution is also characterised by appropriate reliability should any item be
deleted. Item-scale correlations are also all appropriate (above 0.3). The result is therefore
the inclusion of all service profit chain items.
321
7.6.2 Item analysis
Item analysis will be conducted per item, representative of questions thirty-nine to forty
eight of the questionnaire. This shall be analysed within the item associations depicted in
Tables 7.18 and 7.19, together with correlations in Appendix 2. Once all items have been
evaluated, the hypothesis will be tested using the non-parametric ANOVA Kruskal-Wallis
test.
7.6.2.1 SPC links (satisfaction 1 and 2)
Questions thirty-nine and forty refer to the SPC association of satisfaction. The two items
have similar descriptives, with the former representing customer satisfaction, and the
latter representing employee satisfaction. Correlated item-total correlation for each
variable is high (both in excess of 0.61); with coefficient alpha being reduced if any of the
items are deleted. The two items are significantly correlated (0.784 at 0.01 level). The
associated mean of the two variables is 3.87.
• SPC links (satisfaction 1): Sixty-six per cent of respondents are in agreement with
the variable (29% neutral response), representative of a mean score of 3.75. A
relatively flat distribution with moderate standard deviation (96% of responses
within 3 scales) is realised. Inter-construct significant correlations (0.01 level)
include QWL (Q43), relationships 1 and 2 (Q44 and 45), WOM (Q47) and
lifetime value (Q48). The most significant of the inter-construct correlations is
that with the other satisfaction variable (Q39). The satisfaction 1 variable also has
the second highest item-total correlation in the construct (0.6755). Significant
correlations in the service quality construct (0.01 level) include all variables in the
construct (Q 49-58); with an average correlation of 0.542 at 0.01 level. Significant
correlations in the relationship marketing construct include customer markets 1
(Q59), internal markets 1 and 3 (Q61 and 65), and referral markets 1 and 2 (Q63
and 64). Significant correlations with the best practice construct include all
variables with the exception of questions 69, 70, 73 and 77
• SPC links (satisfaction 2): Eighty-nine per cent of respondents are in agreement
with the link between employee and customer satisfaction. A high mean score of
3.99 is realised, with a small standard deviation, attributable to eighty-nine per
cent of responses within two scales. This in turn results in a peaked distribution

322
(Kurtosis of 5.842). Inter-construct correlations parallel those of the satisfaction 1
variable, correlating significantly with the same variables. Significant correlations
(0.01 level) with the service quality construct also include all variables; with an
average correlation of 0.535 at 0.01 level. Signifant correlations across the
relationship management construct include all variables with the exception of
questions 62, 67 and 68. Significant correlations across the best practice construct
include refining offerings (q71), implementing the marketing plan 1 and 3 (q72
and 74), promotion and in-store merchandising (q75) and clear in-store operations
(76).
The two satisfaction variables correlate significantly to the service quality variables,
which is indicative of a positive association. The other variables of the SPC are now
evaluated to establish inter-construct associations; together with appropriate associations
with other construct variables.
7.6.2.2 SPC links (best practice)
Question forty-one of the questionnaire measures the perception of franchisees with
regard to the encouragement of best practice exchanges. Fifty-six per cent of franchisees
responded negatively to this variable (29% neutral). The result is a relatively low mean
score of 2.49, and correspondingly high standard deviation. The curve is marginally
flatter than a normal distribution (-0.320). Inter-construct significant correlations (0.01
level) are limited to feedback (q42) and lifetime value (q48). Significant correlations with
the SQ construct include responsiveness 1 (q51) and tangibles (q57). Relationship
marketing construct significant correlations include customer markets (q59), internal
markets 1 and 2 (q 61 and 62), referral markets 1 (q63) and recruitment markets (q68).
Best practice construct correlations include all but three variables (q71, 72 and 75).
7.6.2.3 Retention (feedback)
The feedback variable is one of four related retention variables within the construct. The
variable evaluates effective customer feedback as a retention initiative. It has the lowest
mean score response in the construct (2.20), with seventy-four per cent of franchisees
responding negatively to the question (q42). Only seven per cent of respondents are in
agreement with the system having optimal customer feedback channels (20% neutral
323
response). Eighty-one per cent of responses are across two scales, representative of a
relatively small standard deviation. The item-scale correlation is only just appropriate for
construct reliability (0.2935), with an appropriate alpha coefficient should the item be
included. Significant inter-construct correlation (0.01 level) is only apparent with the
retention association of lifetime value (q48). The variable does not significantly correlate
with the SQ construct, with the exception of reliability 2 (q50). Relationship marketing
variables significantly associated include internal markets 2 (q62) and recruitment
markets 2 (q68). Best practice construct variables significantly correlated with the
feedback variable include understanding customer markets (q69), developing strategy and
vision 1(q70), implementing the marketing plan (q73), clear in-store operations 1 and 2
(q76 and 77) and developing strategy and vision 2 (q78).
7.6.2.4 SPC links (quality of work life-QWL)
Sixty-eight per cent of franchisees are in agreement with the positive effect of quality of
work life on employee loyalty. Twenty-seven per cent of respondents however were
neutral in response. A high mean score of 3.67 is characterised by a peaked distribution
with relatively small standard deviation. Inter-construct significant correlations (0.01
level) include all variables with the exception of the feedback variable (q42). The QWL
variable has a high item-total correlation of 0.6328. Significant correlations (0.01 level) in
the SQ construct are across all variables, with the most significant being responsiveness 2
(q52). This association correlates QWL with employees providing prompt response. The
significant correlations within the relationship marketing construct include customer
markets 1 (q59), internal markets 2 (q62), referral markets 1 and 2 (q63 and 64) and
internal markets 3 (q65). Best practice significant correlations are found in refining
offerings (q71), implementing the marketing plan 1 and 3 (q72 and 74), promotions and
in-store merchandising (q75) and clear in-store operations (q76). The above associations
all include a link between employees and QWL.
7.6.2.5 Retention (relationships 1 and 2)
These two closely associated variables are represented in questions forty-four and forty-
five of the questionnaire (respectively). The questions directly relate to relationships and
retention of existing customers. The two variables have item-total correlations within the
top quarter in the construct, well above the appropriate level (0.6097 and 0.6328
324
respectively). Next to the satisfaction 1 and 2 correlation, the relationship variables
portray the second most significant correlation (0.715 at 0.01 level). Should either of the
variables be deleted from the construct, the total Cronbach’s Alpha will be reduced, hence
the appropriateness of including the two variables. The two variables have a high mean
score between 3.90 and 3.95; and correspondingly low standard deviations. Agreement
responses are in excess of seventy-six per cent of franchisees, representative of peaked
distributions (kurtosis of 10.21 and 5.109 respectively). Relationships 1 in particular, has
an exceptionally peaked distribution, with eighty-five per cent of responses in one scale
(agree). The two variables are significantly correlated (0.01 level) within the construct to
all variables excluding best practice (q41), feedback (q42) and lifetime value (q58). Both
variables are significantly correlated to all variables within the service quality construct.
Significant correlations in the relationship construct are shared between internal markets
1(q61), referral markets 2(q64) and internal markets 3 (q65). This association is
attributable to strong links between retention, referrals and internal marketing initiatives.
The two variables share an abundance of significant correlations with the best practice
construct; refining offerings (q71), implementing the marketing plan 1 and 3 (q72 and
74), promotions and in-store merchandising (q75) and clear in-store operations 1 (q76).
These associations are attributable to the as mentioned in the literature link of customer
relationships and best practice initiatives.
7.6.2.6 Related sales
Question forty-six of the questionnaire incorporates the broadened service offerings
within the franchise system. Sixty-seven per cent of franchisees are in agreement with the
variable, with a resulting mean score of 3.68. The distribution is relatively peaked
(kurtosis of 3.584) around the agree and neutral scales. An appropriate reliability
Cronbach’s Alpha is still maintained if the item is included in the construct. Inter-
construct significant correlation is around satisfaction 1 (q39), QWL (q43), relationships
1 and 2 (q44 and 45), and WOM (q47). The referrals link is thus associated to SRC links
and retention. Service quality construct correlations of significance (0.01) include
reliability 1 (q49), assurance 1 and 2 (q53 and 54), and empathy 2 and 3 (q56 and 58).
These associations are attributable to related sales offering the customer a wider range of
services, highlighting the caring and sharing initiative. Relationship marketing construct
correlations are significant in customer markets (q59), exhibiting related sales as a means
of competitive advantage. The correlation is significantly demonstrated to the best
325
practice construct in understanding customers and markets (q69), developing strategy and
vision 1 (q70), refining offerings (q71) and influencing the marketing plan 1 and 3 (q72
and q74).
7.6.2.7 Referrals (word of mouth-WOM)
Word of mouth communication is emphasized in question forty-seven of the
questionnaire. The variable received a sixty-four per cent positive response, with a mean
score of 3.62. The distribution is marginally peaked (kurtosis of 1.541) around the agree
and neutral scales, also indicative of a relatively small standard deviation. Cronbach’s
Alpha is appropriate if the variable is not deleted. Inter-construct correlations are
significant (0.01 level) across all variables with the exception of best practice (q42) and
feedback (q42). Service quality correlations include significance across all variables.
Relationship marketing construct correlation is significant through all variables, with the
exception of internal markets 2 (q62) and recruitment markets 2 (q68). This highlights the
retention association with the various relationship markets. Best practice construct
correlations are significant in refining offerings (q71), implementing the marketing plan 1
and 3 (q72 and 74), promotions and in-store merchandising (q75) and clear in-store
operations 1 (q76).
7.6.2.8 Retention (lifetime value)
The final construct question seeks perceptions of the measurement of lifetime customers.
This variable raised a large neutral response (thirty-five per cent). It appears that
franchisees are uncertain how to measure the value of loyal customers. Forty-eight per
cent of franchisees responded in disagreement, resulting in a mean score of 2.61. This
represents a relatively flat distribution (kurtosis of 0.776), albeit only marginally
positively skewed. The variable however elicits the highest item-total correlation within
the construct (0.6831). The deletion of the variable decreases the reliability coefficient,
hence the appropriateness of retaining the variable in the construct. Significant correlation
(0.01 level) within the construct is experienced across all but two variables (q44 and 46).
Service quality significant correlations are experienced through all variables,
demonstrating the association between service quality factors and customer loyalty.
Relationship marketing construct correlation is significant across all but two variables
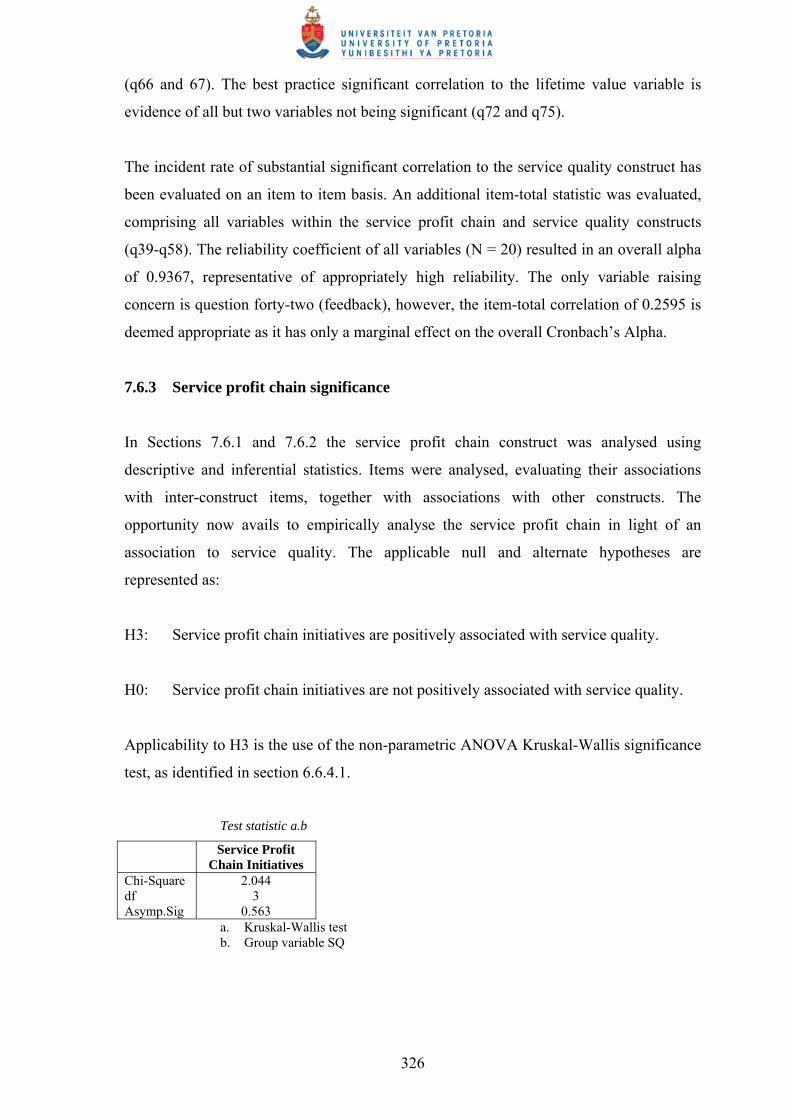
326
(q66 and 67). The best practice significant correlation to the lifetime value variable is
evidence of all but two variables not being significant (q72 and q75).
The incident rate of substantial significant correlation to the service quality construct has
been evaluated on an item to item basis. An additional item-total statistic was evaluated,
comprising all variables within the service profit chain and service quality constructs
(q39-q58). The reliability coefficient of all variables (N = 20) resulted in an overall alpha
of 0.9367, representative of appropriately high reliability. The only variable raising
concern is question forty-two (feedback), however, the item-total correlation of 0.2595 is
deemed appropriate as it has only a marginal effect on the overall Cronbach’s Alpha.
7.6.3 Service profit chain significance
In Sections 7.6.1 and 7.6.2 the service profit chain construct was analysed using
descriptive and inferential statistics. Items were analysed, evaluating their associations
with inter-construct items, together with associations with other constructs. The
opportunity now avails to empirically analyse the service profit chain in light of an
association to service quality. The applicable null and alternate hypotheses are
represented as:
H3: Service profit chain initiatives are positively associated with service quality.
H0: Service profit chain initiatives are not positively associated with service quality.
Applicability to H3 is the use of the non-parametric ANOVA Kruskal-Wallis significance
test, as identified in section 6.6.4.1.
Test statistic a.b
Service Profit Chain Initiatives
Chi-Square df Asymp.Sig
2.044 3
0.563 a. Kruskal-Wallis test b. Group variable SQ
327
Presentation of the P-value of 0.563 (greater than 0.05) represents the alternate hypothesis
as being likely, therefore rejecting the null hypothesis. We therefore accept the hypothesis
that service profit chain initiatives are positively associated with service quality.
Section 7.4 empirically tested entrepreneurial orientation in a franchised system, and
Section 7.5 empirically tested the franchise system as an entrepreneurial option towards
creating and developing ventures. Section 7.6 empirically tested the positive association
between the service profit chain and service quality. The following section empirically
analyses the association of relationship marketing to service quality.
7.7 SECTION F: RELATIONSHIP MARKETING
Relationship marketing (RM) is represented in section F of the questionnaire (questions
59-68). Associated themes within the construct include customer markets, internal
markets, referral markets and recruitment markets. The objective of the study is to
evaluate the association of RM to service quality (SQ). The hypothesis postulates that:
H4: Relationship marketing initiatives are positively associated with service quality
H0: Relationship marketing initiatives are not positively associated with service
quality.
The format of the investigation will follow a descriptive and inferential analysis, by item
analysis and ANOVA Kruskal-Wallis hypothesis test of significance.
7.7.1 Relationship marketing descriptive and inferential statistics
Item descriptive statistics are depicted in Table 7.20 on the following page. The left hand
column identifies the relationship marketing associations of customer markets, internal
markets, referral markets and recruitment markets. The descriptive and inferential
statistics are used for an analysis on a per item basis. Correlation analysis will be used to
evaluate associations within the construct, together with associations of service quality.
The Pearson correlation significance coefficient for the construct and SQ construct is
depicted in Appendix 2.
Construct descriptives are characterized by a mean score of 3.17, representing a neutral
response to the construct questions. Thirty-eight per cent of total construct responses were

328
in the neutral scale, indicative of relationship marketing apathy within the franchise
system. The standard deviation for the sample mean, referred to as the standard error of
the mean, is relatively small for the n = 93 response rate; an indication that the average
deviation from the mean is relatively stable. Standard deviations are relatively low (all
variables below 1.0), indicative of the majority of responses distributed closely around the
mean score.
TABLE 7.20 Relationship marketing descriptive statistics
Question Association Item Mean Std error of
mean Standard deviation
Kurtosis
59 Customer markets 1 3.32 0.070 0.678 1.492 60 Customer markets 2 3.41 0.067 0.647 0.308 61 Internal markets 1 3.11 0.094 0.902 -0.585 62 Internal markets 2 2.32 0.090 0.864 -0.081 63 Referral markets 1 3.40 0.077 0.731 0.704 64 Referral markets 2 3.97 0.068 0.654 9.682 65 Internal markets 3 3.67 0.073 0.697 1.841 66 Internal markets 4 3.66 0.083 0.801 2.752 67 Recruitment markets 1 2.82 0.067 0.642 0.956 68 Recruitment markets 2 2.03 0.091 0.878 2.983
Construct descriptives n=93 3.17 0.071 0.749 2.005
Kurtosis is indicative of a fairly normal distribution, with the exception of variable sixty-
four. Excluding variable sixty-four would result in a construct kurtosis of 1.152, being
more representative of the data set. Seventy per cent of the variables are characteristic of
a peaked distribution, whilst twenty per cent have a distribution marginally flatter than a
normal distribution.
Not all variables are intended to be analysed from a Pearson correlation point of view; all
variables are merely listed for completion of the table purposes. Appropriate correlations
will be discussed in the per item evaluations. Inter-item reliability is analysed by means of
the Cronbach’s Alpha, with values depicted in Table 7.21 (represented on the following
page). The table includes the corrected item-total correlation, and alpha if the item is
deleted. The Cronbach’s Alpha reliability coefficient is appropriate for the project at hand
(0.7937). Should any item be deleted, alpha is only marginally affected; confirming the
decision to include all variables.
Table 7.21 identifies an appropriate construct Cronbach’s Alpha of 0.7937 (above desired
0.7). The distribution is also characterised by appropriate reliability should any item be
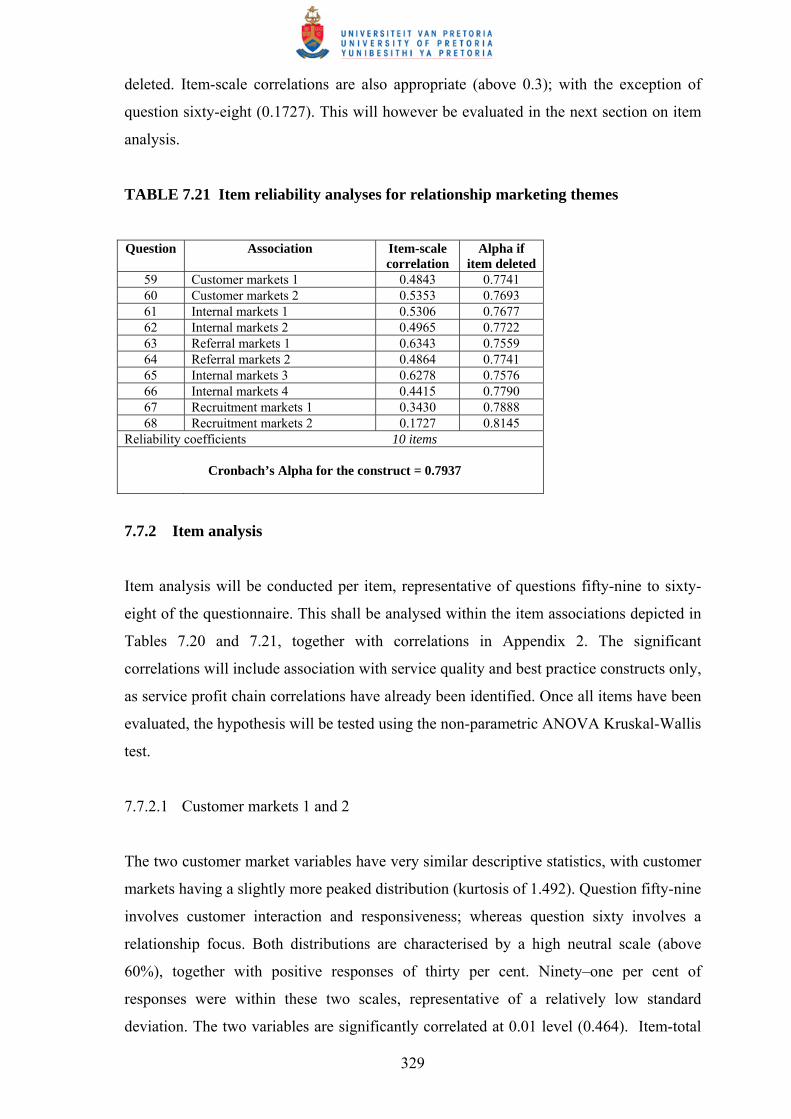
329
deleted. Item-scale correlations are also appropriate (above 0.3); with the exception of
question sixty-eight (0.1727). This will however be evaluated in the next section on item
analysis.
TABLE 7.21 Item reliability analyses for relationship marketing themes
Question Association Item-scale
correlation Alpha if
item deleted 59 Customer markets 1 0.4843 0.7741 60 Customer markets 2 0.5353 0.7693 61 Internal markets 1 0.5306 0.7677 62 Internal markets 2 0.4965 0.7722 63 Referral markets 1 0.6343 0.7559 64 Referral markets 2 0.4864 0.7741 65 Internal markets 3 0.6278 0.7576 66 Internal markets 4 0.4415 0.7790 67 Recruitment markets 1 0.3430 0.7888 68 Recruitment markets 2 0.1727 0.8145
Reliability coefficients 10 items
Cronbach’s Alpha for the construct = 0.7937
7.7.2 Item analysis
Item analysis will be conducted per item, representative of questions fifty-nine to sixty-
eight of the questionnaire. This shall be analysed within the item associations depicted in
Tables 7.20 and 7.21, together with correlations in Appendix 2. The significant
correlations will include association with service quality and best practice constructs only,
as service profit chain correlations have already been identified. Once all items have been
evaluated, the hypothesis will be tested using the non-parametric ANOVA Kruskal-Wallis
test.
7.7.2.1 Customer markets 1 and 2
The two customer market variables have very similar descriptive statistics, with customer
markets having a slightly more peaked distribution (kurtosis of 1.492). Question fifty-nine
involves customer interaction and responsiveness; whereas question sixty involves a
relationship focus. Both distributions are characterised by a high neutral scale (above
60%), together with positive responses of thirty per cent. Ninety–one per cent of
responses were within these two scales, representative of a relatively low standard
deviation. The two variables are significantly correlated at 0.01 level (0.464). Item-total

330
correlations are 0.4843 and 0.535 respectively. Significant correlations within the
relationship construct include internal markets 1 and 3 (q61 and 65), and referral markets
1 and 2 (q63 and 64). The two customer markets variables are significantly correlated
with all the variables in the service quality construct. Best practice construct correlations
include significant associations with all variables, with the exception of implementing the
marketing plan 1 and 2 (q72 and 73) and developing strategy and vision (q78).
7.7.2.2 Internal markets 1 and 2
These two variables are represented in questions sixty-one and sixty-two. Whilst sharing
similar standard deviations (0.902 and 0.864) and similar flat distributions (-0.585 and
0.081), their means differ somewhat (3.11 and 2.32 respectively). Both have neutral
responses of thirty-eight per cent, but internal markets 1 has a predominant agree scale
(31% of respondents), while internal markets 2 has a predominant disagree scale of thirty-
eight per cent. Whilst agreeing on suppliers adding value, an issue of integrity is raised.
This is attributable to the evidence of strong conviction to trust in the franchise system,
identified in Section 7.5.2.5. Significant correlations differ for the two variables within
the construct. Whilst both have item-total correlations around 0.50, they do not
significantly correlate to all variables. Joint significant correlations (0.01 level) include
customer markets 2 (q60), referral markets 1 (q63) and internal markets 3 (q65). Internal
markets 1 correlate significantly to customer markets 1 (q59) and internal markets 2
(q62). Internal markets significantly correlate to internal markets 4 (q66) and recruitment
markets 2 (q68). Correlations of significance for internal markets 1 to service quality
include all SQ variables. Significance for internal markets 2 consist of reliability 2 (q50),
responsiveness 1 (q51), empathy 1 (q55), tangibles 2 (q57) and empathy 3 (q58). Best
practice variables shared by both internal markets include clear in-store operations 1 and
2 (q76 and 77), developing strategy and vision 1 and 2 (q70 and 78). Internal markets 1
has significant correlations with developing strategy and vision 1 (q70), implementing the
marketing plans 3 (q75), and promotions and in-store merchandising (q76). Internal
markets 2 has significant correlation with implementing the marketing plan 2 (q73).
7.7.2.3 Referral markets 1 and 2
Questions sixty-three and sixty-four incorporate the two referral markets variables. Both
variables are favourably reviewed by respondents, with referral markets 2 experiencing

331
the highest mean score in the construct (3.97). Despite similar standard deviations,
referral markets 2 has a distinctively peaked distribution (kurtosis of 9.682). This is due to
eighty-two per cent of franchisees responding positively to the variable (within one scale).
Item-total correlations are also appropriate for the two variables (well above the 0.3
required statistic). The two variables are significantly correlated to each other (0.471 at
0.01 level), and share correlations with all relationship construct variables with the
exception of questions sixty-two, sixty-seven and sixty-eight. Both variables share
significant correlations with all variables within the service quality construct. The two
variables are significantly correlated with the best practice construct via the variables of
refining offerings (q71), implementing the marketing plan 1 and 3 (q72 and 74),
promotions and in-store merchandising (q75), and clear in-store operations 1 (q76).
Referral markets 1 has further significant correlations with regard to clear in-store
operations 2 (q77) and developing strategy and vision 2 (q78).
7.7.2.4 Internal markets 3 and 4
These two variables complement the other two internal markets variables in section
7.7.2.2. Questions sixty-five and sixty-six incorporate a spectrum of QWL and internal
relationships. The two variables are exceptionally closely related, sharing mean scores
within 0.01 of each other. They also share similar standard deviations and relatively
peaked distributions. Both variables have responses of over sixty per cent in the agree
scale, together with neutral responses of twenty per cent and over. Their item-total
correlations are also appropriate for the study (0.6278 and 0.4415 respectively). Deleting
the items only marginally affects the coefficient alpha, hence the inclusion of the two
variables. The two internal markets variables are also significantly correlated (0.481 at
0.01 level). They are also significantly correlated to the two previous internal markets
variables (q 62 and 63). Internal markets 3 is significantly correlated with all relationship
marketing variables, with the exception of recruitment markets 2 (q68). Internal markets 4
is also correlated to the variables within the relationship marketing construct, with the
exception of questions fifty-nine, sixty, sixty-one and sixty-eight. The two variables are
significantly correlated to all the variables of the service quality construct; with the
exception of internal markets 3 not sharing significance with forty-nine and fifty-one.
Best practice construct correlation significance is shared with refining offerings (q72),
influencing the marketing plan 3 (q74), promotion and in-store merchandising (q75) and
clear in-store operations 1 (q76).

332
7.7.2.5 Recruitment markets 1 and 2
The two recruitment market variables both received responses well below the construct
mean. Recruitment markets 2 achieved the lowest mean score (2.03) in the construct. This
variable is also characterised with a relatively peaked distribution, with eighty-three per
cent of franchisees disagreeing on the measurement of satisfaction levels. Recruitment
markets 1 is in turn characterised by sixty-six per cent of franchisees responding in the
neutral scale. Either respondents do not have associations with other industry participants,
or are not sure of their involvement. This apathy has however been highlighted
throughout the analysis.
Whilst recruitment markets 1 has an appropriate item-total correlation; recruitment
markets 2 has an item-total correlation (0.1727) below the required statistical level of 0.3.
It has however been decided to retain the variable, as it only marginally affects the
Cronbach’s Alpha if deleted. Inclusion is also vital due to the importance of corrective
action required, to be dealt with in the recommendations section. Recruitment markets 1
is significantly correlated to all variables in the relationship marketing construct, with the
exception of questions fifty-nine, sixty and sixty-one. Recruitment markets 2 only shares
significance with internal markets 2 (q62). Recruitment markets 1 correlates significantly
to the service quality construct via responsiveness 2 (q52), empathy 1 and 3 (q55 and 58).
The only correlation recruitment markets 1 has with the service quality construct is via
responsiveness 1 (q51), however at the o.o5 significance level. A best practice construct
significant correlation is evident in understanding customers and markets (q69) and
developing strategy and vision (q70). Additional significance relating to the best practice
construct is evident in recruitment markets 2 via implementing the marketing plan 2
(q73), promotions and in-store merchandising (q75), clear in-store operations 2 (q77) and
developing strategy and vision (q78).
The incident rate of substantial significant correlation to the service quality construct has
been evaluated on an item to item basis. An additional item-total statistic was evaluated,
comprising all variables within the relationship marketing and service quality constructs
(q49-68). The reliability coefficient of all variables (N = 20) resulted in an overall alpha
of 0.9294, representative of appropriately high reliability. The only variable raising
concern is question sixty-eight (recruitment markets 2), however, the item-total
correlation below 0.3 is deemed appropriate as it has only a marginal effect on the overall
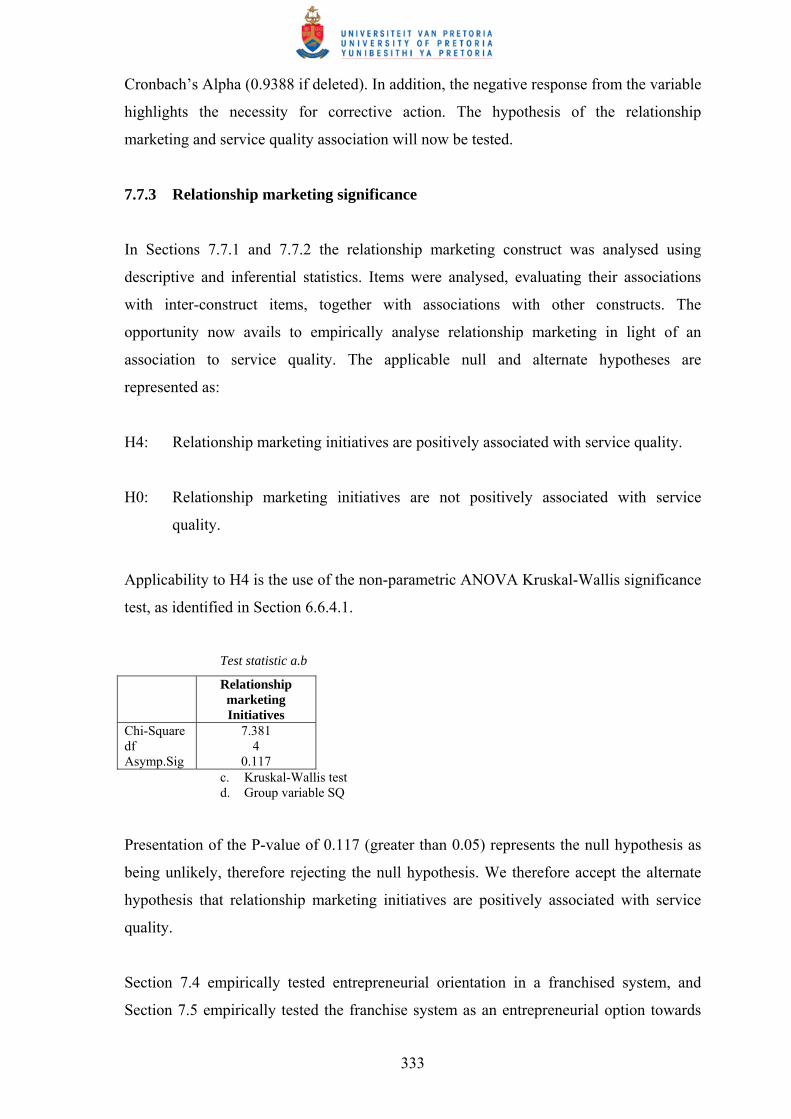
333
Cronbach’s Alpha (0.9388 if deleted). In addition, the negative response from the variable
highlights the necessity for corrective action. The hypothesis of the relationship
marketing and service quality association will now be tested.
7.7.3 Relationship marketing significance
In Sections 7.7.1 and 7.7.2 the relationship marketing construct was analysed using
descriptive and inferential statistics. Items were analysed, evaluating their associations
with inter-construct items, together with associations with other constructs. The
opportunity now avails to empirically analyse relationship marketing in light of an
association to service quality. The applicable null and alternate hypotheses are
represented as:
H4: Relationship marketing initiatives are positively associated with service quality.
H0: Relationship marketing initiatives are not positively associated with service
quality.
Applicability to H4 is the use of the non-parametric ANOVA Kruskal-Wallis significance
test, as identified in Section 6.6.4.1.
Test statistic a.b
Relationship marketing Initiatives
Chi-Square df Asymp.Sig
7.381 4
0.117 c. Kruskal-Wallis test d. Group variable SQ
Presentation of the P-value of 0.117 (greater than 0.05) represents the null hypothesis as
being unlikely, therefore rejecting the null hypothesis. We therefore accept the alternate
hypothesis that relationship marketing initiatives are positively associated with service
quality.
Section 7.4 empirically tested entrepreneurial orientation in a franchised system, and
Section 7.5 empirically tested the franchise system as an entrepreneurial option towards

334
creating and developing ventures. Section 7.6 empirically tested the positive association
between the service profit chain and service quality. Section 7.7 empirically tested the
positive association between relationship marketing and service quality. The following
section empirically analyses the association of best practice to service quality.
7.8 SECTION G: INDUSTRY BEST PRACTICE
Industry best practice (BP) is represented in section G of the questionnaire (questions 69-
78). Associated themes within the construct include understanding customer markets,
developing strategy and vision 1 and 2, refining offerings, influencing the marketing plan
1 and 2 and 3, promotion and in-store merchandising, and clear in-store operations 1 and
2. The objective of the study is to evaluate the association of BP to service quality (SQ).
The hypothesis postulates that:
H4: Best practice initiatives are positively associated with service quality
H0: Best practice initiatives are not positively associated with service quality.
The format of the investigation will follow a descriptive and inferential analysis, by item
analysis and ANOVA Kruskal-Wallis hypothesis test of significance.
7.8.1 Best practice descriptive and inferential statistics
Item descriptive statistics are depicted overleaf in Table 7.22. The left hand column
identifies the best practice associations of understanding customer markets, developing
strategy and vision 1 and 2, refining offerings, influencing the marketing plan 1 and 2 and
3, promotion and in-store merchandising, and clear in-store operations 1 and 2. The
descriptive and inferential statistics are used for an analysis on a per item basis.
Correlation analysis will be used to evaluate associations within the construct, together
with associations of service quality. The Pearson correlation significance coefficient for
the construct and SQ construct is depicted in Appendix 2.
Construct descriptives are characterized by a mean score of 3.31; representing an overall
positive response to the construct questions. Forty-one per cent of construct responses
were in the agree scale, indicative of the relative peakedness of the construct distribution
(kurtosis of 2.123). The standard deviation for the sample mean, referred to as the

335
standard error of the mean, is relatively small for the n = 93 response rate; an indication
that the average deviation from the mean is relatively stable. Standard deviations are
relatively low (all variables below 1.0), indicative of the majority of responses distributed
closely around the mean score. Kurtosis is indicative of a relatively peaked distribution;
with variable seventy-five indicative of substantial peakedness. Excluding variable
seventy-five would result in a construct kurtosis of 1.503, being more representative of
the data set. Sixty per cent of the variables are characteristic of a peaked distribution,
whilst twenty per cent have a distribution marginally flatter than a normal distribution.
TABLE 7.22 Best practice descriptive statistics
Question Association Item Mean Std error of
mean Standard deviation
Kurtosis
69 Understanding customers and markets
3.04 .092 0.779 0.044
70 Developing strategy and vision 1 2.86 0.103 0.944 -0.578 71 Refining offerings 3.73 0.064 0.668 2.614 72 Implementing the marketing
plan 1 4.15 0.075 0.779 2.891
73 Implementing the marketing plan 2
2.36 0.070 0.933 0.391
74 Implementing the marketing plan 3
3.83 0.097 0.673 3.729
75 Promotion and in-store merchandising
4.15 0.081 0.722 7.704
76 Clear in-store operations 1 3.80 0.070 0.616 4.483 77 Clear in-store operations 2 2.85 0.098 0.988 -0.388 78 Developing strategy and vision 2 2.31 0.081 0.884 0.336
Construct descriptives n=93 3.31 0.083 0.799 2.123
Not all variables are intended to be analysed from a Pearson correlation point of view; all
variables are merely listed for completion of the table purposes. Appropriate correlations
will be discussed in the per item evaluations. Inter-item reliability is analysed by means of
the Cronbach’s Alpha, with values depicted in Table 7.23. The table includes the
corrected item-total correlation, and alpha if the item is deleted. The Cronbach’s Alpha
reliability coefficient is appropriate for the project at hand (0.7893). Should any item be
deleted, alpha is only marginally affected; confirming the decision to include all
variables. Table 7.23 is represented on the following page.
Table 7.23 identifies an appropriate construct Cronbach’s Alpha of 0.7893 (above desired
0.7). The distribution is also characterised by appropriate reliability should any item be
deleted. Item-scale correlations are also appropriate (above 0.3); an average item-scale
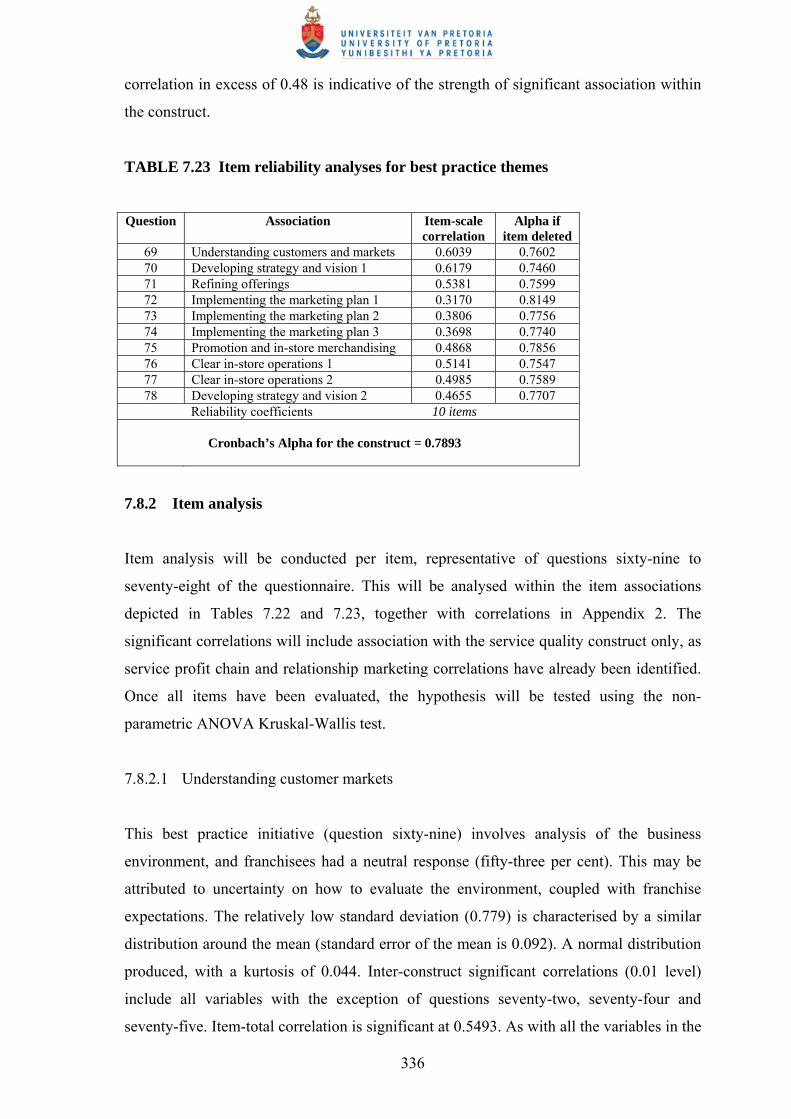
336
correlation in excess of 0.48 is indicative of the strength of significant association within
the construct.
TABLE 7.23 Item reliability analyses for best practice themes
Question Association Item-scale
correlation Alpha if
item deleted 69 Understanding customers and markets 0.6039 0.7602 70 Developing strategy and vision 1 0.6179 0.7460 71 Refining offerings 0.5381 0.7599 72 Implementing the marketing plan 1 0.3170 0.8149 73 Implementing the marketing plan 2 0.3806 0.7756 74 Implementing the marketing plan 3 0.3698 0.7740 75 Promotion and in-store merchandising 0.4868 0.7856 76 Clear in-store operations 1 0.5141 0.7547 77 Clear in-store operations 2 0.4985 0.7589 78 Developing strategy and vision 2 0.4655 0.7707
Reliability coefficients 10 items
Cronbach’s Alpha for the construct = 0.7893
7.8.2 Item analysis
Item analysis will be conducted per item, representative of questions sixty-nine to
seventy-eight of the questionnaire. This will be analysed within the item associations
depicted in Tables 7.22 and 7.23, together with correlations in Appendix 2. The
significant correlations will include association with the service quality construct only, as
service profit chain and relationship marketing correlations have already been identified.
Once all items have been evaluated, the hypothesis will be tested using the non-
parametric ANOVA Kruskal-Wallis test.
7.8.2.1 Understanding customer markets
This best practice initiative (question sixty-nine) involves analysis of the business
environment, and franchisees had a neutral response (fifty-three per cent). This may be
attributed to uncertainty on how to evaluate the environment, coupled with franchise
expectations. The relatively low standard deviation (0.779) is characterised by a similar
distribution around the mean (standard error of the mean is 0.092). A normal distribution
produced, with a kurtosis of 0.044. Inter-construct significant correlations (0.01 level)
include all variables with the exception of questions seventy-two, seventy-four and
seventy-five. Item-total correlation is significant at 0.5493. As with all the variables in the

337
construct, the Cronbach’s Alpha coefficient is appropriate should the item be included.
Service quality construct significant associations at 0.01 level include tangibles (q57).
Significant correlations at 0.05 level include reliability 2 (q50) and responsiveness (q51).
7.8.2.2 Developing strategy and vision 1 and 2
The two best practice strategy variables are represented in questions seventy and seventy-
eight of the questionnaire. They are characterised by mean scores below the construct
average (2.86 and 2.31 respectively). The former has a distribution flatter than normal,
whereas the latter portrays a relatively normal distribution. They are also characterised by
similar standard deviations (0.944 and 0.884 respectively). Cross tabulation with the
number of outlets (q7) to the outlet implementing a strategy in the long term (q70)
produces an interesting finding. Whilst fifty-eight per cent of single outlet franchisees
were in disagreement with the variable, only thirteen per cent of multiple-outlet
franchisees were in disagreement. This distinction may be associated to the
entrepreneurial orientation of multiple-outlet franchisees. The variance between the
number of franchised outlets is represented in Figures 7.11 and Figure 7.12 on the
following page.
Significant inter-construct correlations (0.01 level) for the two variables include
understanding customers and markets (q69), implementing the marketing plan 2 (q73),
clear in-store operations 1 and 2 (q76 and 77). Significant correlations with the service
quality construct variables include responsiveness 1 (q51) and tangibles (q57).
Developing strategy and vision is also significantly correlated to empathy 1 and 2 (q55
and 56). The two variables have a significant correlation of 0.514.
Figures 7.11 and Figure 7.12 are represented on the following page.
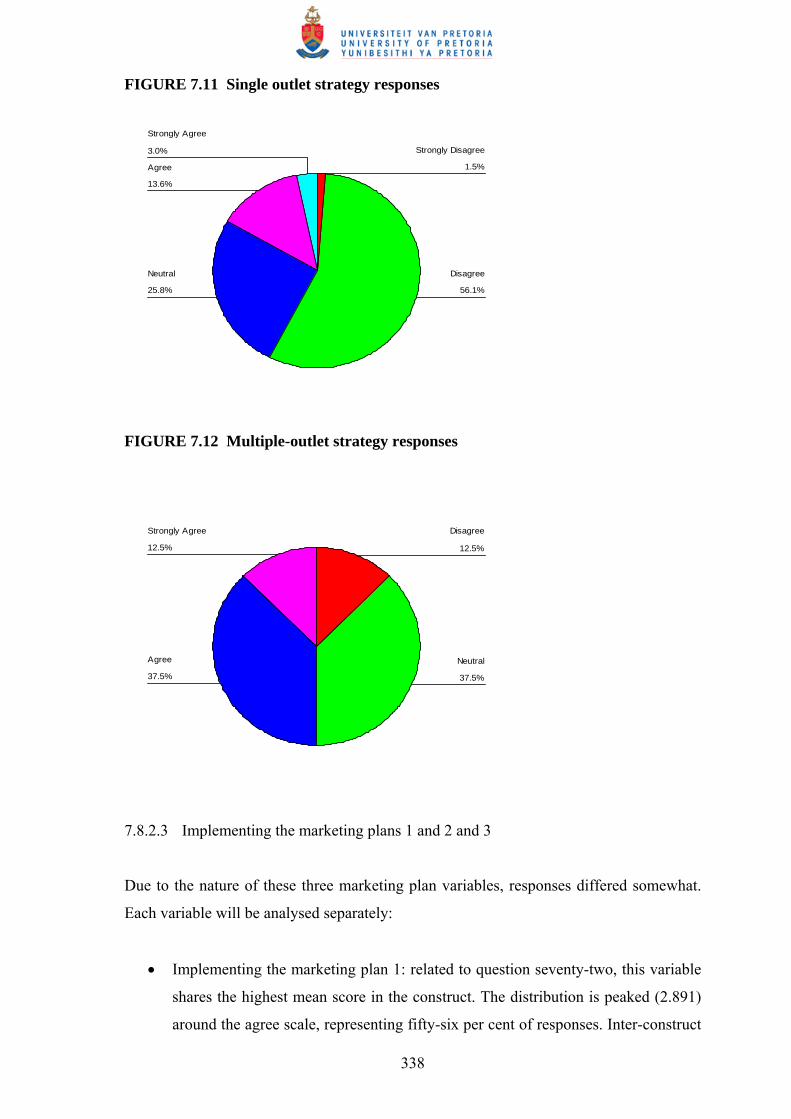
338
FIGURE 7.11 Single outlet strategy responses
3.0%
13.6%
25.8% 56.1%
1.5%
Strongly Agree
Agree
Neutral Disagree
Strongly Disagree
FIGURE 7.12 Multiple-outlet strategy responses
12.5%
37.5% 37.5%
12.5%
Strongly Agree
Agree Neutral
Disagree
7.8.2.3 Implementing the marketing plans 1 and 2 and 3
Due to the nature of these three marketing plan variables, responses differed somewhat.
Each variable will be analysed separately:
• Implementing the marketing plan 1: related to question seventy-two, this variable
shares the highest mean score in the construct. The distribution is peaked (2.891)
around the agree scale, representing fifty-six per cent of responses. Inter-construct

339
significant correlation (0.01 level) includes refining offerings (q71), implementing
the marketing plans 3 (q74), promotion and in-store merchandising (q75) and
clear in-store operations 1 (q76). Service quality significant correlation includes
all but one (responsiveness 1) variable
• Implementing the marketing plan 2: characterised by seventy per cent of
respondents disagreeing using direct mail (mean score of 2.36). The negative
response is due to the franchisor believing that localized marketing is the
responsibility of the franchisee. A moderate standard deviation (0.933) is
characterised by a relatively flat distribution (kurtosis of 0.391). Inter construct
significant correlation includes understanding customers and markets (q69),
developing strategy and vision 1 and 2 (q70 and 78) and clear in-store operations
1 and 2 (q76 and 77). Service quality correlations are not significant at 0.01 level
• Implementing the marketing plan 3: represented in question seventy four of the
questionnaire. Seventy-one per cent of respondents are in agreement with the
relationships between employees and customers, represented by a mean score of
3.83. The low standard deviation (0.673) accounts for a peaked distribution
(kurtosis of 3.729). This variable is significantly correlated with all but one of the
relationship marketing constructs variables. The variable is correlated significantly
within the construct, with relevance to questions seventy-one, seventy-two,
seventy-six, seventy-seven and seventy-eight. Implementing the marketing plan 3
is significantly correlated to all variables within the service quality construct.
7.8.2.4 Promotion and in-store merchandising
Question seventy-five received a positive response regarding the tangibles component of
the outlet. A mean score of 4.15 is represented by ninety-six per cent of respondents in
agreement. The high positive response is reason for the exceptionally peaked distribution
(7.704). Inter-construct significant associations include questions seventy-one, seventy-
two, seventy-four and seventy-six. Service quality variables are correlated significantly
across the construct.
7.8.2.5 Clear in-store operations 1 and 2
These two variables (questions 76 and 77) received varying responses, due to the
diversified nature of in-store activity:

340
• Clear in-store operations 1: the image portrayed to customers received a positive
response, with a mean score of 3.80. Seventy-seven per cent of respondents are in
agreement, characterised by a small standard deviation and peaked distribution
(kurtosis of 4.483). This variable is significantly correlated (0.01 level) to all
variables within the construct. Significant correlations are also realized across all
variables of the service quality construct.
• Clear in-store operations 2: the operations manual received a forty-two per cent
negative response, coupled with a thirty-three per cent neutral response. With only
twenty-five per cent of franchisees in favour of the operations manual, it is
assumed that the manual is inappropriate for use. The distribution has a moderate
standard deviation, with corresponding distribution marginally flatter than normal.
Inter-construct significant correlation is evident across all variables, with the
exception of question seventy-two and seventy-five. Service quality significant
correlations are seen across all variables, with the exception of empathy 1 and 2
(q55 and 56) and reliability 1 (q49).
The incident rate of substantial significant correlation to the service quality construct has
been evaluated from an item to item basis. An additional item-total statistic was
evaluated, comprising all variables within the best practice and service quality constructs
(q49-68). The reliability coefficient of all variables (N = 20) resulted in an overall alpha
of 0.9113, representative of appropriately high reliability. The only variable raising
concern is question seventy-three (implementing the marketing plan 2); however, the
item-total correlation below 0.3 is deemed appropriate as it has only a marginal affect on
the overall Cronbach’s Alpha (0.9151 if deleted). In addition, the negative response from
the variable highlights the necessity for corrective action. The hypothesis of the best
practice and service quality association will now be tested.
7.8.3 Best practice significance
In Sections 7.8.1 and 7.8.2 the relationship marketing construct was analysed using
descriptive and inferential statistics. Items were analysed, evaluating their associations
with inter-construct items, together with associations with other constructs. The
opportunity now avails to empirically analyse best practice in light of an association to
service quality. The applicable alternate and null hypotheses are represented as:
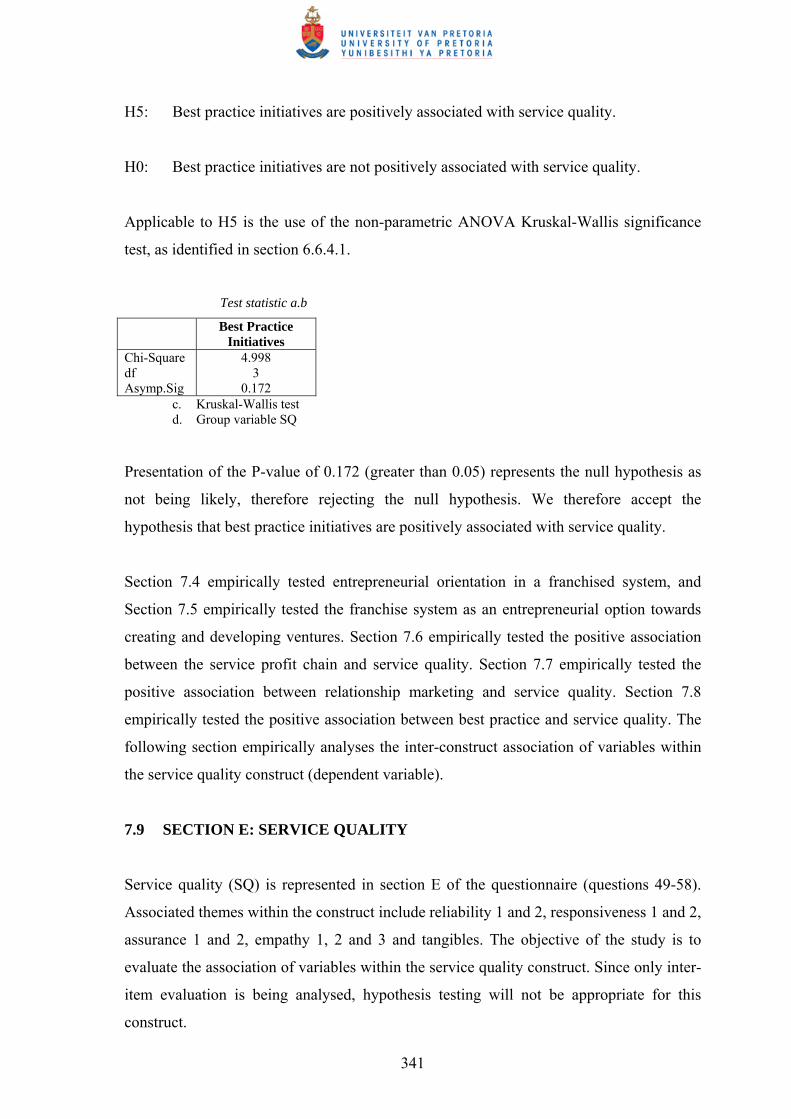
341
H5: Best practice initiatives are positively associated with service quality.
H0: Best practice initiatives are not positively associated with service quality.
Applicable to H5 is the use of the non-parametric ANOVA Kruskal-Wallis significance
test, as identified in section 6.6.4.1.
Test statistic a.b
Best Practice Initiatives
Chi-Square df Asymp.Sig
4.998 3
0.172 c. Kruskal-Wallis test d. Group variable SQ
Presentation of the P-value of 0.172 (greater than 0.05) represents the null hypothesis as
not being likely, therefore rejecting the null hypothesis. We therefore accept the
hypothesis that best practice initiatives are positively associated with service quality.
Section 7.4 empirically tested entrepreneurial orientation in a franchised system, and
Section 7.5 empirically tested the franchise system as an entrepreneurial option towards
creating and developing ventures. Section 7.6 empirically tested the positive association
between the service profit chain and service quality. Section 7.7 empirically tested the
positive association between relationship marketing and service quality. Section 7.8
empirically tested the positive association between best practice and service quality. The
following section empirically analyses the inter-construct association of variables within
the service quality construct (dependent variable).
7.9 SECTION E: SERVICE QUALITY
Service quality (SQ) is represented in section E of the questionnaire (questions 49-58).
Associated themes within the construct include reliability 1 and 2, responsiveness 1 and 2,
assurance 1 and 2, empathy 1, 2 and 3 and tangibles. The objective of the study is to
evaluate the association of variables within the service quality construct. Since only inter-
item evaluation is being analysed, hypothesis testing will not be appropriate for this
construct.
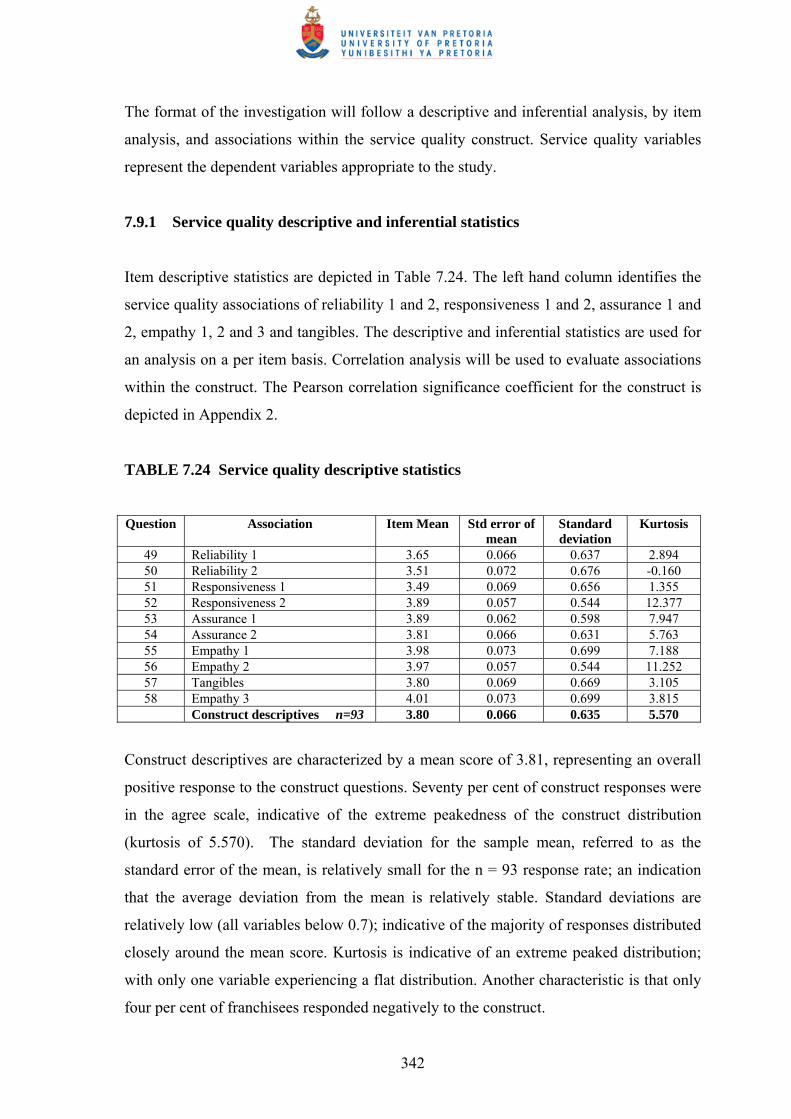
342
The format of the investigation will follow a descriptive and inferential analysis, by item
analysis, and associations within the service quality construct. Service quality variables
represent the dependent variables appropriate to the study.
7.9.1 Service quality descriptive and inferential statistics
Item descriptive statistics are depicted in Table 7.24. The left hand column identifies the
service quality associations of reliability 1 and 2, responsiveness 1 and 2, assurance 1 and
2, empathy 1, 2 and 3 and tangibles. The descriptive and inferential statistics are used for
an analysis on a per item basis. Correlation analysis will be used to evaluate associations
within the construct. The Pearson correlation significance coefficient for the construct is
depicted in Appendix 2.
TABLE 7.24 Service quality descriptive statistics
Question Association Item Mean Std error of
mean Standard deviation
Kurtosis
49 Reliability 1 3.65 0.066 0.637 2.894 50 Reliability 2 3.51 0.072 0.676 -0.160 51 Responsiveness 1 3.49 0.069 0.656 1.355 52 Responsiveness 2 3.89 0.057 0.544 12.377 53 Assurance 1 3.89 0.062 0.598 7.947 54 Assurance 2 3.81 0.066 0.631 5.763 55 Empathy 1 3.98 0.073 0.699 7.188 56 Empathy 2 3.97 0.057 0.544 11.252 57 Tangibles 3.80 0.069 0.669 3.105 58 Empathy 3 4.01 0.073 0.699 3.815
Construct descriptives n=93 3.80 0.066 0.635 5.570
Construct descriptives are characterized by a mean score of 3.81, representing an overall
positive response to the construct questions. Seventy per cent of construct responses were
in the agree scale, indicative of the extreme peakedness of the construct distribution
(kurtosis of 5.570). The standard deviation for the sample mean, referred to as the
standard error of the mean, is relatively small for the n = 93 response rate; an indication
that the average deviation from the mean is relatively stable. Standard deviations are
relatively low (all variables below 0.7); indicative of the majority of responses distributed
closely around the mean score. Kurtosis is indicative of an extreme peaked distribution;
with only one variable experiencing a flat distribution. Another characteristic is that only
four per cent of franchisees responded negatively to the construct.
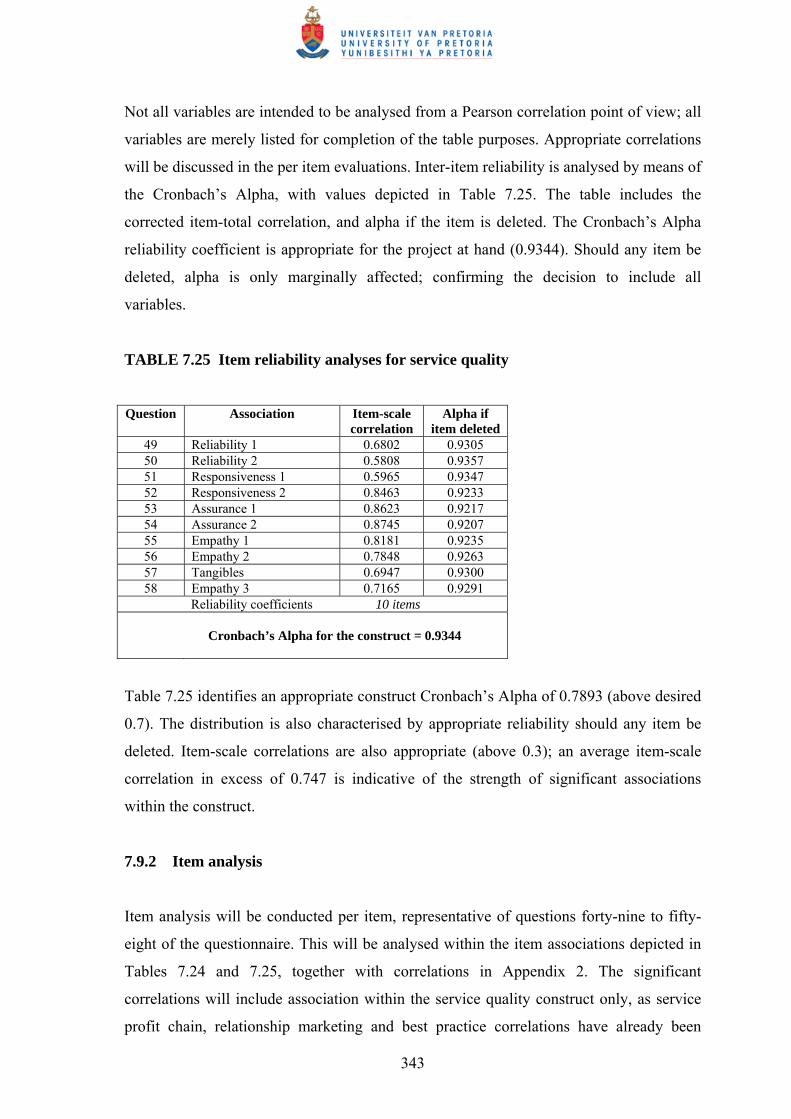
343
Not all variables are intended to be analysed from a Pearson correlation point of view; all
variables are merely listed for completion of the table purposes. Appropriate correlations
will be discussed in the per item evaluations. Inter-item reliability is analysed by means of
the Cronbach’s Alpha, with values depicted in Table 7.25. The table includes the
corrected item-total correlation, and alpha if the item is deleted. The Cronbach’s Alpha
reliability coefficient is appropriate for the project at hand (0.9344). Should any item be
deleted, alpha is only marginally affected; confirming the decision to include all
variables.
TABLE 7.25 Item reliability analyses for service quality
Question Association Item-scale
correlation Alpha if
item deleted 49 Reliability 1 0.6802 0.9305 50 Reliability 2 0.5808 0.9357 51 Responsiveness 1 0.5965 0.9347 52 Responsiveness 2 0.8463 0.9233 53 Assurance 1 0.8623 0.9217 54 Assurance 2 0.8745 0.9207 55 Empathy 1 0.8181 0.9235 56 Empathy 2 0.7848 0.9263 57 Tangibles 0.6947 0.9300 58 Empathy 3 0.7165 0.9291
Reliability coefficients 10 items
Cronbach’s Alpha for the construct = 0.9344
Table 7.25 identifies an appropriate construct Cronbach’s Alpha of 0.7893 (above desired
0.7). The distribution is also characterised by appropriate reliability should any item be
deleted. Item-scale correlations are also appropriate (above 0.3); an average item-scale
correlation in excess of 0.747 is indicative of the strength of significant associations
within the construct.
7.9.2 Item analysis
Item analysis will be conducted per item, representative of questions forty-nine to fifty-
eight of the questionnaire. This will be analysed within the item associations depicted in
Tables 7.24 and 7.25, together with correlations in Appendix 2. The significant
correlations will include association within the service quality construct only, as service
profit chain, relationship marketing and best practice correlations have already been

344
identified. Emphasis is placed on significant correlation (0.01 level) between all the
variables in the service quality construct.
7.9.2.1 Reliability 1 and 2
The two reliability variables share similar characteristics, except for the peakedness of
their distributions. Delivering on customer promises is represented in reliability 1 (q49).
Sixty-nine per cent of franchisees responded positively to the variable, with a twenty-
seven per cent neutral response. The result is a peaked distribution around the agree scale
(kurtosis of 2.894). Performing adequately is represented in reliability 2 (q50). Forty-
seven per cent of franchisees responded positively in the agree scale, with a similar
proportion in the neutral scale. This again highlights the apathy regarding responsibility at
outlet level. This variable is the only variable that has a relatively flat distribution
(kurtosis of -0.160). A significant correlation (0.01 level) of 0.408 is exhibited between
these two variables.
7.9.2.2 Responsiveness 1 and 2
Prompt service and willingness to help customers are represented in questions fifty-one
and fifty-two. Whilst both variables experience similar standard deviations, they differ
remarkably in distribution. Responsiveness 1 (q51) is characterised by a high neutral
response (fifty-per cent), attributable to the lack of measurement of customer satisfaction
at outlet level. Ninety-four per cent of franchisees responded over two scales, indicative
of a fairly peaked distribution (kurtosis of 1.355). Responsiveness 2 (q52) is characterised
by eighty-eight per cent of franchisees responding in the agreement scale; hence an
exceptionally high kurtosis of 12.377. A significant correlation (0.01 level) of 0.494 is
exhibited between the variables.
7.9.2.3 Assurance 1 and 2
The two assurance variables produce similar descriptives in all regards, together with
minimal deviation from overall construct descriptives. Distributions are characterised by
peaked positive distributions, with small standard deviations. The franchisees rate
response to integrity of service highly, as opposed to overall integrity within the franchise
system. The franchise paradox variable on trust (q34) received similar responses, with a
345
significant correlation (0.01 level) of 0.738 to the assurance variables. The two variables
are represented in questions fifty-three and fifty-four. The conviction to trust is enhanced
by minimal neutral responses. Both variables experience over eighty per cent of
franchisees responding positively to the questions, with means of 3.89 and 3.81
respectively. Significant correlation between the two variables is 0.819.
7.9.2.4 Empathy 1 and 2
The two empathy variables revolve around having the customer’s best interest at heart;
represented by questions fifty-five and fifty-six. Both have mean scores above the
construct descriptives (3.98 and 3.97), together with peaked distributions. Empathy 2, in
particular, has an extremely peaked distribution (11.252). This is the result of eighty-three
per cent of responses in the agree scale. The significant correlation (0.01 level) between
the two variables is 0.667).
7.9.2.5 Tangibles
The tangibles variable involves the outlet’s physical facilities and closely resembles the
construct descriptives. The variable is represented in question fifty-seven, and also has a
relatively peaked distribution (kurtosis of 3.105). It has an appropriate item-total
correlation of 0.6947.
7.9.2.6 Empathy 3
Whilst associated with the other two empathy variables, the variable revolves around
customer needs. Eighty-six per cent of franchisees responded positively to the variable;
represented in the peaked distribution (kurtosis of 3.815). Empathy 3 has the highest item
mean score in the construct (4.01). Item-total correlation is significant at 0.7165.
Service quality variables have been evaluated as an appropriate measure of the service
quality construct; exhibiting significant item-total correlation and reliability coefficients
(in excess of 0.93). The variables are thus appropriate to test the associations to the
service profit chain, relationship marketing and best practice constructs.
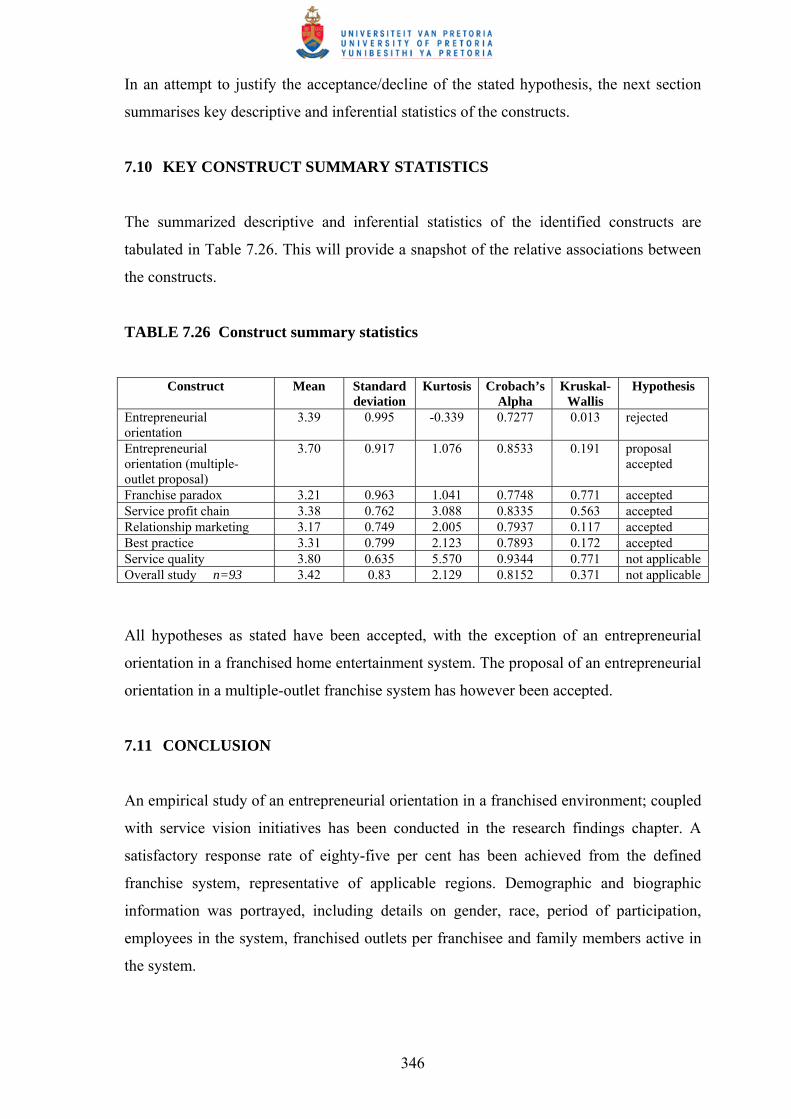
346
In an attempt to justify the acceptance/decline of the stated hypothesis, the next section
summarises key descriptive and inferential statistics of the constructs.
7.10 KEY CONSTRUCT SUMMARY STATISTICS
The summarized descriptive and inferential statistics of the identified constructs are
tabulated in Table 7.26. This will provide a snapshot of the relative associations between
the constructs.
TABLE 7.26 Construct summary statistics
Construct Mean Standard
deviation Kurtosis Crobach’s
Alpha Kruskal-
Wallis Hypothesis
Entrepreneurial orientation
3.39 0.995 -0.339 0.7277 0.013 rejected
Entrepreneurial orientation (multiple-outlet proposal)
3.70 0.917 1.076 0.8533 0.191 proposal accepted
Franchise paradox 3.21 0.963 1.041 0.7748 0.771 accepted Service profit chain 3.38 0.762 3.088 0.8335 0.563 accepted Relationship marketing 3.17 0.749 2.005 0.7937 0.117 accepted Best practice 3.31 0.799 2.123 0.7893 0.172 accepted Service quality 3.80 0.635 5.570 0.9344 0.771 not applicable Overall study n=93 3.42 0.83 2.129 0.8152 0.371 not applicable
All hypotheses as stated have been accepted, with the exception of an entrepreneurial
orientation in a franchised home entertainment system. The proposal of an entrepreneurial
orientation in a multiple-outlet franchise system has however been accepted.
7.11 CONCLUSION
An empirical study of an entrepreneurial orientation in a franchised environment; coupled
with service vision initiatives has been conducted in the research findings chapter. A
satisfactory response rate of eighty-five per cent has been achieved from the defined
franchise system, representative of applicable regions. Demographic and biographic
information was portrayed, including details on gender, race, period of participation,
employees in the system, franchised outlets per franchisee and family members active in
the system.
347
Descriptive and inferential statistics tested hypotheses and associations through six
constructs. Constructs consisted of entrepreneurial orientation, franchise paradox, service
profit chain, relationship marketing, best practice and service quality.
The primary hypothesis of an entrepreneurial orientation existing in a franchise system
has been rejected, and a proposal of entrepreneurial orientation in a multiple-outlet
franchise system has been accepted.
H1: Entrepreneurial orientation exists in a franchised system (rejected).
P1: Entrepreneurial orientation exists in a multiple-outlet franchised system
(accepted).
The secondary hypotheses involving the franchise paradox, service profit chain,
relationship marketing and best practice were empirically tested and accepted.
H2: The franchise system is an entrepreneurial option towards creating and developing
ventures (accepted).
H3: Service profit chain initiatives are positively associated with service quality
(accepted).
H4: Relationship marketing initiatives are positively associated with service quality
(accepted).
H5: Best practice initiatives are positively associated with service quality (accepted).
Service quality is identified as the dependent variable, and was appropriately tested for
reliability.
The next and final chapter will discuss recommendations and conclusions based on the
research results. Significant associations and differences amongst respondents, constructs,
factors and variables are identified in the development of a conceptual matrix of an
entrepreneurial service vision in a franchised home entertainment environment. Final
comments will include recommendations regarding the implementation of the matrix.

348
8 CHAPTER 8: SUMMARY, CONCLUSIONS AND RECOMMENDATIONS
8.1 INTRODUCTION
Conclusions and implications are depicted from a theoretical and empirical perspective.
From a theoretical perspective, the constructs of entrepreneurial orientation, the franchise
paradox, the service profit chain, relationship marketing, best practice and service quality
are summarized from the literature reviews in Chapters two to five. Emphasis is placed on
the link between entrepreneurship and franchising, together with linking service vision
constructs of the service profit chain, relationship marketing, best practice and service
quality. Conclusions and implications of the empirical research include the same
constructs, in addition to realization, response and representation of results. Demographic
and biographic research results are summarized, highlighting the lack of diversity within
the defined system. Emphasis is also placed on the multiple-outlet findings within the
constructs, particularly regarding entrepreneurial orientation.
Questions and findings are linked to the research objectives, and results of hypotheses are
summarized. The proposal of the existence of an entrepreneurial orientation in multiple-
outlets is introduced. Recommendations are provided from a construct viewpoint,
together with recommendations from a demographic and biographic viewpoint. Also
included are creation and developmental initiatives. Highlights of the findings include the
possibility of enhancing diversity within the system, increasing multiple-outlet
participation rates and implementation of an entrepreneurial service vision. Limitations of
the study are again provided from a theoretical and empirical viewpoint; including limited
availability of literature and the study being confined to the defined franchise system.
Recommendations for future national and international research are motivated by the
backdrop of increasing participants in the industry. Related entrepreneurial and
franchising studies are also purposed.
The chapter concludes with a wrap-up comment regarding the applicability and
contribution of the research project. This highlights the overall value of the research
project to society, business and the home entertainment industry.
349
8.2 A REVIEW OF THE LITERATURE RESEARCH
The literature reviews conducted in Chapters 2 to 5 develop a framework for the
empirical investigation section of the research project. The objective is to appropriately
link, integrate and synergise the theory, research and implementation in a methodological
continuum. Conclusions are depicted as major findings and implications for each
theoretical chapter. Chapters two and three discuss an entrepreneurial orientation in a
franchised environment. Chapters four and five discuss strategic service initiatives,
consisting of the service profit chain, service quality, relationship marketing and industry
best practice.
Chapter 2 provides a broad spectrum of existing literature on entrepreneurship,
culminating in empirical studies on entrepreneurial orientation. The literature commences
with the nature and development of entrepreneurship, including entrepreneurial
participation rates. The review is supported by data from The Global Entrepreneurship
Monitor (GEM), identifying assessment of national entrepreneurial activity. Various
definitions of the entrepreneur are evaluated, followed by the nature, characteristics and
behaviour of the entrepreneur. Comparisons of entrepreneurs, intrapreneurs and
traditional managers are highlighted. The talent, temperament and technique of the
entrepreneur are introduced; with linkage to Gallup’s life themes. Finally, character
themes to evaluate entrepreneurial orientation (Thompson: 2002) are discussed with
relevance to empirical evidence.
The character theme analysis (Thompson: 2002) identifies twenty entrepreneurial
character themes, with seven entrepreneurial associations. The associations include
inventor, inventor + entrepreneur, entrepreneur, entrepreneur + leader, leader,
entrepreneur enabler and non-entrepreneur. An adaptation of this empirical research is
implemented as an entrepreneurial orientation measurement tool in this study. The
objective is to evaluate entrepreneurial orientation within a defined franchise system.
Franchising is introduced as an entrepreneurial option towards creating and developing
ventures. The nature and development of franchising is examined, together with the
franchising link to entrepreneurship. Franchise rationale is developed from existing
literature, depicting operational constructs within a franchise system. Rationale includes,
but is not limited to, constructs of real estate development, training, continuing support,

350
performance standards, research and development, marketing, operations manual,
specialist support, territorial rights and terms of agreement. Franchise system
relationships are evaluated within the context of trends, cooperation, leadership, effort,
conflict, disputes, quality control, foundation, associations, networks and franchise
system merits.
The franchising chapter culminates with a literature review of an entrepreneurial
orientation in a franchise system, followed by an empirical review of proactivity,
innovation and risk-taking in a franchise environment. The study is further developed
with an overview of theory, linking entrepreneurship with franchising. The objective of
this study is to evaluate the franchise system as an entrepreneurial option for creating and
developing ventures.
The fourth chapter identifies the service profit chain (Heskett et al: 1997) as a strategic
service vision, identifying customer satisfaction and loyalty to long term organisational
profitability and growth. The literature review commences with an overview of profit and
growth related to the components of the service profit chain. Capitalising on the service
profit chain identifies links in the chain, cnamely the profit and growth link to customer
loyalty, loyalty link to customer satisfaction, satisfaction link to service value, value link
to employee productivity, productivity link to loyalty, loyalty link to employee
satisfaction, and satisfaction link to internal quality of work life. Service profit chain
implications are highlighted, lending management theories from many related disciplines.
The management of customer satisfaction is reviewed, together with methods used to
track customer satisfaction. The customer value equation is introduced, placing emphasis
on requirements to add value. Customer loyalty receives emphasis from a determinants
point of view, together with loyalty enhancing measures. The lifetime value of customers
is analysed, identifying strategic initiatives of retention, related sales and referrals.
The final section incorporates the enhancement of service profit chain initiatives,
identifying eight strategies which facilitate service profit chain implementation. The
literature review provides a theoretical disposition of the link between the service profit
chain and service quality. One of the objectives of this research study has been to evaluate
the association between the service profit chain and service quality.

351
Chapter five delineated the disciplines of service quality, relationship marketing and best
practice as three separate constructs. Service quality is most often conceptualised as the
comparison of service expectations with actual performance perceptions. The various
definitions of service quality were evaluated against the backdrop of the dimensionality of
service quality, together with the integrated gaps model as identified by Zeithaml and
Bitner (2003). Various service quality initiatives were assessed, highlighting service
quality relationships. Of particular application relevance, was the evaluation of service
quality measurement. SERVQUAL and SERVPERF were two measurement instruments
identified as being optimal for the study on hand. The objective of this study was to
evaluate service quality levels within the defined franchise system.
A literature review was conducted on relationship marketing, with particular emphasis on
the revised version of the six markets model (Peck et al: 1999). The six markets reviewed
included customer, internal, referral, influence, recruitment and supplier/alliance markets.
Each market domain was evaluated, with links to related literature from various sources
in the discipline. Best practice initiatives included a review from generic literature, with
particular emphasis on best practice in the home entertainment industry in the United
States of America. The Video Software Association of America (VSDA: 2001) identified
best practice in the industry, as identified by Arthur Andersen Business Consultants.
These initiatives were wide ranging, including understanding customers and markets,
developing vision and strategy, refining store product offering, implementing the
marketing plan, creating promotions and in-store merchandising, and clear in-store
operations. The objective was to evaluate the relationship marketing and best practice
association to service quality.
The strategic service constructs identified in this research study included the service profit
chain, service quality, relationship marketing and best practice. Service quality
represented the dependent variable, whereas the other three identified constructs
represented the independent variable/s. The literature was reviewed from a holistic point
of view, and synergised within the research constructs. The research design implemented
key concepts as identified in the review.

352
8.3 CONCLUSIONS AND IMPLICATIONS OF THE EMPIRICAL RESEARCH
Chapter six provided an overview of the research methodology applicable to this research
project; whereas Chapter seven provided an empirical analysis of the data obtained. The
first section explained the demographic and biographic profile of the franchisee
respondents (section A of the questionnaire). The next section evaluates the
entrepreneurial orientation of franchisees, followed by an empirical investigation in the
franchise paradox (sections B and C in the questionnaire, respectively). The following
section tested hypotheses and evaluated relationships between the service profit chain,
relationship marketing and best practice (independent variables) and service quality
(dependent variable). These constructs were identified in sections D, E, F and G of the
questionnaire. Constructs, factors and variables were evaluated using the descriptive and
inferential statistical techniques identified in chapter six. Computer aided software used in
this research study included SPSS version 11.0 and Surveypro. Conclusions have been
depicted as section summaries and implications in the following sections.
8.3.1 Realisation, response and representation of results
The use of a Surveypro electronic media questionnaire was facilitated by instruction from
the franchise system management to duly complete the questionnaire. A satisfactory
representation across regions was elicited; with the overall response rate achieved eleven
per cent over the targeted response rate. The response and representation of the data was
found to be appropriate for the research project at hand.
8.3.2 Section A: Demographic and biographic information
Eight demographic and biographic variables were evaluated in Section A. Highlights
included:
• White male domination of franchisees within the defined franchise system.
Females represent only twenty-six per cent of franchisees; whilst franchisees of
colour only represent two per cent of franchisees. The defined franchise system is
in a position of vulnerability regarding legal aspects of transformation in South
Africa
353
• The Western Cape, Gauteng and Eastern Cape dominate franchise system
distribution; being accountable for seventy-five per cent of outlets.
• The majority of franchisees have been in the defined system in excess of three
years, and new entrants are predominantly new ventures, as opposed to the sale of
existing outlets
• Part-time and full-time employee contributions are similar. Those outlets
employing more than one family member employ less full-time staff. Franchisees
with one outlet employ no more than two full-time employees; whilst multiple-
outlet franchisees employ no more than nine employees
• Seventy-three per cent of franchisees own only one outlet. Multiple-outlet
franchisees dominate in Western Cape and Free State. Western Cape and Gauteng
are the only regions with six or more outlets belonging to a single franchisee
• Sixty-three per cent of franchisees are solo family members involved in the
franchise system.
An overall highlight regarding demographic and biographic responses was the variance
between single and multiple-outlet franchisees. These variances are acknowledged in the
following section.
8.3.3 Section B: Entrepreneurial orientation
The measurement instrument used to evaluate entrepreneurial orientation in the defined
franchise system was an adaptation of the Thompson (2002) character theme framework.
The objective was to evaluate entrepreneurial orientation in a franchised environment.
The study involved a two-tiered approach, from an overall and multiple-outlet
perspective. The defined franchise system was characterised by a predominantly single
outlet distribution of franchisees. This had a distinct implication on the entrepreneurial
orientation of the system, with each tier identifying different character themes.
8.3.3.1 Overall system entrepreneurial orientation
The non-entrepreneurial association factor, closely followed by the leader association
factor, dominated the responses. It was found that entrepreneurial orientation is not
denied within the system, however, it is not significantly justified either. Highlights
included:
354
• The non-entrepreneurial character theme of “relator” dominates score ratings. The
implication is that franchisees prefer to work with trusted colleagues, most often
associated to networks and relationships
• The leader character theme of “influencing” is next, placing emphasis on
providing resources and getting people to take things on. This is followed by the
character themes of envisioning and strategy, also from the leader association
• The entrepreneur character theme of “opportunity taking” ranks as the least
desirable of all themes, implying that franchisees are not prone to engaging and
taking on perceived opportunities. The inventor character theme of “mastery”
ranks second to last, implying that franchisees do not bask in expertise others
don’t have
• Seven of the entrepreneurial orientation themes do not feature in the top ten
themes favoured by respondents. These include creativity, opportunity taking,
urgency, time focus, ego and courage
• The only character themes of entrepreneurial orientation featuring in the top ten of
responses include “performance orientation”, “networking” and “focus”. None are
however in the top ten preferences.
The dominant non-entrepreneur association, coupled with leader association may be
related to themes within the intrapreneur focus. As franchising involves a network
system, it closely resembles a corporate identification, with linkage to entrepreneurship
(franchisees as distribution outlet owners). Whilst factor means are all above three, no
statistical significance exists between the factor associations. The non-entrepreneur
association dominates, followed by leader associations. Using factor mean scores, it may
thus be inferred that a non-entrepreneurial orientation exists within the franchise system
(due to non entrepreneurial mean score domination). Although the entrepreneur factor
association is positive (factor mean score of 3.26), the non entrepreneur association is
four per cent stronger (factor mean score of 3.54). Taking all respondents within the
defined franchise system into account, it may be concluded that there is no statistical
significant variation between entrepreneurial orientation factors, despite non
entrepreneurial associations exhibiting more favourable responses.

355
8.3.3.2 Multiple-outlet entrepreneurial orientation
The reponses from multiple-outlet franchisees differed significantly from single outlet
franchisees. The same measuring instrument is analysed, using cross tabulation to identify
variances. Highlights included:
• Entrepreneurial character themes of “urgency” and “performance” dominate
character theme ratings for multiple-outlets
• Non-entrepreneurial character theme of “relator” dominates character theme
ratings for single outlets
• The non-entrepreneurial character theme of relator is significant in multiple-outlet
responses. This is attributable to the functionality of the franchise system, and
interaction with trusted colleagues. Trust and relationships are further highlighted
in subsequent sections
• The entrepreneur association is the strongest of the associations for multiple-
outlets
• The non-entrepreneur association is the dominant association for single outlets
• The greater the number of multiple-outlets per franchisee, the greater the
entrepreneurial association
• Weighted regional contributions identify Gauteng and Western Cape as dominant
regions.
It can therefore be concluded that a significant entrepreneurial orientation exists in a
multiple-outlet franchise system. This investigation in no way negates entrepreneurial
orientation in single outlet franchise systems, but places emphasis on significant
entrepreneurial associations in a multiple-outlet franchise system.
8.3.4 Section C: The franchise paradox
This section evaluated franchising as an entrepreneurial option for creating and
developing new ventures. The study commenced with a background of the franchise
paradox, evaluating franchisees in the system and finally the paradox link to franchising.
Highlights included:
356
• Relationships + effort ranked the highest of all franchise paradox associations;
closely associated to relationships + trust. The implication is the importance of
franchise relationships not being self-sustaining
• Entrepreneurship associations rated relatively poorly compared to other variables.
Multiple-outlet responses however favoured entrepreneurial associations
• The majority of franchisees rejected entrepreneurial associations of creativity and
productivity in the system. Multiple-outlets however favoured these associations
• Eighty-seven per cent of franchisees believe conflict handling and franchisee
contributions are not optimal in the system
• The majority of franchisees believe the system meets with their business
objectives
• The majority of franchisees believe that the defined franchise system is an
entrepreneurial option for creating and developing ventures, particularly so in the
case of multiple-outlet franchisees.
It can, therefore, be concluded that the franchise system is seen as an entrepreneurial
option for creating and developing ventures. This association is however most significant
in a multiple-outlet environment.
8.3.5 Section D: The service profit chain
The service profit chain (SPC) was represented in section D of the questionnaire
(questions 39-48). Associated themes within the construct included SPC links, retention,
related sales and referrals. The objective of the study was to evaluate the association of
SPC to service quality (SQ). Highlights included:
• SPC links and satisfaction is the dominant association, implying significant
correlation between employee and customer satisfaction
• Retention and relationships are the next most dominant association, implying
significant correlation between retaining customers and internal marketing
• Retention and lifetime value of customers are not adequately measured in the
franchise system, implying neglect to loyal customers
• SPC links and best practice initiatives are not adequately communicated in the
system, an implication of poor performance management on behalf of the
franchisor
357
• Retention and feedback is depicted as inadequate in the system; implying the lack
of optimal customer feedback channels.
Despite a few associations being inadequate within the defined franchise system, service
profit chain initiatives were positively associated with service quality.
8.3.6 Section F: Relationship marketing
Relationship marketing (RM) was represented in section F of the questionnaire.
Associated themes within the construct included customer markets, internal markets,
referral markets and recruitment markets. The objective of the study was to evaluate the
association of RM to service quality (SQ). Highlights included:
• Referral markets dominate response ratings. The implication is the associated
positive link to word-of-mouth, lifetime value and loyal customers
• Internal markets rated high in the relationship associations, implying the relative
importance of quality of worklife and relationships between franchisee and
franchisor
• Recruitment markets dominate dissatisfaction in the system, implying discontent
with optimal association and industry alliances. Furthermore, franchisees identify
the measurement of franchisee satisfaction levels as dismal
• Internal markets rated poorly in the supply chain, with franchisees doubting the
integrity of major suppliers
In conclusion, relationship marketing initiatives were positively associated with service
quality.
8.3.7 Section G: Industry best practice
Industry best practice (BP) was represented in section G of the questionnaire. Associated
themes within the construct included understanding customer markets, developing
strategy and vision 1 and 2, refining offerings, influencing the marketing plan 1 and 2 and
3, promotion and in-store merchandising, and clear in-store operations 1 and 2. The
objective of the study was to evaluate the association of BP to service quality (SQ).
Highlights include:
358
• Promotion and in-store merchandising dominate the best practice associations,
implying the importance of physical evidence tangibles in the service offering
• Implementing the marketing plan with regard to community involvement also
dominates best practice associations; indicative of the link between localized
marketing and awareness and loyalty
• Clear in-store operations regarding operating procedures are regarded as poorly
documented by the majority of franchisees; as is the use of direct mail
• Best practice initiatives are not adequately communicated within the defined
franchise system, implying discontent with overall communication within the
system
• Developing strategy and vision is regarded as undeveloped, particularly regarding
single outlet franchisees. Implications include lack of long-term business
planning, vision and direction.
In conclusion, best practice initiatives were positively related to service quality.
8.3.8 Section E: Service quality
Service quality (SQ) was represented in section E of the questionnaire. Associated themes
within the construct included reliability 1 and 2, responsiveness 1 and 2, assurance 1 and
2, empathy 1, 2 and 3 and tangibles. The objective of the study was to evaluate the
association of variables within the service quality construct. Highlights included:
• High responses across all themes, with the highest being empathy. The implication
is that of employees meeting the needs and wants of the consumer
• Exceptionally high correlation between all variables within the construct
• Only four per cent of franchisees responded negatively to the entire construct.
In conclusion, service quality variables were evaluated as an appropriate measure of the
service quality construct; exhibiting significant item-total correlation and reliability
coefficients. The variables were thus considered appropriate to test the associations to the
service profit chain, relationship marketing and best practice constructs.

359
8.4 THE RESEARCH HYPOTHESES REVISITED
The purpose of the investigation was to determine the entrepreneurial orientation of
participants in a franchised environment, coupled with the association of service vision
factors. Once explored, the entrepreneurial orientation and service vision factors will be
synergised to develop an entrepreneurial service vision within a franchised environment.
Research questions included:
Question 1: Does entrepreneurial orientation exist within a franchised system, and if
so, to what extent?
Question 2: Does franchising lead to an entrepreneurial option for creating and
developing ventures?
Question 3: Do service profit chain initiatives lead to service quality?
Question 4: Does relationship marketing lead to service quality?
Question 5: Does best practice lead to service quality?
Question 6: What is the level of service quality in a franchise system?
Entrepreneurial orientation was however also investigated from a multiple franchisee
point of view; that is, franchisees that operate more than one franchised unit (multiple-
outlet franchising).
The hypotheses supplemented the research questions and objectives:
The primary hypothesis postulates that there was evidence of entrepreneurial orientation
in a franchise system.
H1: Entrepreneurial orientation exists in a franchise system.
H0: Entrepreneurial orientation does not exist in a franchised system.
It was concluded that the alternate hypothesis (H1) is rejected and the null hypothesis
(H0) accepted; that entrepreneurial orientation does not exist in a franchised system.
A proposition was introduced with reference to multiple-outlet franchising.
P1: Entrepreneurial orientation exists in a multiple-outlet franchised system.
360
It can be concluded that the proposition of entrepreneurial orientation in multiple-outlets
is not unlikely, and the proposition (P1) is not rejected. It can therefore be concluded that
a significant entrepreneurial orientation exists in a multiple-outlet franchise system.
The secondary hypotheses postulated that there is evidence of a positive association
between:
• The franchise system is an entrepreneurial option towards creating and developing
ventures
• The service profit chain and service quality
• Relationship marketing and service quality
• Best practice and service quality.
H2: The franchise system is an entrepreneurial option for creating and developing
ventures.
H0: The franchise system is not an entrepreneurial option towards creating and
developing ventures.
In conclusion, the hypothesis that the franchise system is an entrepreneurial option for
creating and developing ventures was accepted. Furthermore, a significant association
was found between the creation and development of ventures and multiple-outlet
franchisees.
H3: Service profit chain initiatives are positively associated with service quality.
H0: Service profit chain initiatives are not positively associated with service quality.
It was concluded that the null hypothesis is unlikely, therefore rejecting the null
hypothesis. We accept the hypothesis that service profit chain initiatives are positively
associated with service quality.
H4: Relationship marketing initiatives are positively associated with service quality.
H0: Relationship marketing initiatives are not positively associated with service
quality.
361
We conclude the null hypothesis as not being likely, therefore rejecting the null
hypothesis. We accept the hypothesis that relationship marketing initiatives are positively
associated with service quality.
H5: Best practice initiatives are positively associated with service quality.
H0: Best practice initiatives are not positively associated with service quality.
Inferential statistics represent the null hypothesis as not being likely, therefore rejecting
the null hypothesis. We therefore accept the hypothesis that best practice initiatives are
positively associated with service quality.
The literature review highlighted many synergies, which were explored in the empirical
stage of the study. These points of view were supported, with the exception of
entrepreneurial orientation in the franchise system. Data analysis however highlighted an
entrepreneurial orientation in sub-section of franchisees. It must however be highlighted
that this study does not examine personality characteristics of franchisees, which may in
itself lend toward an entrepreneurial orientation.
All hypotheses as stated have been accepted, with the exception of an entrepreneurial
orientation in a franchised home entertainment system. The proposal of an entrepreneurial
orientation in a multiple-outlet franchise system has however been accepted. Construct
summary statistics are depicted in Table 7.26; highlighting an overview of associations
between the constructs.
8.5 RECOMMENDATIONS
The culmination of the chapter revolves around recommendations regarding the
implementation of the conceptual entrepreneurial service vision matrix. The primary
objective of the research project was to identify entrepreneurship and entrepreneurial
orientation within a defined franchise system; with synergistic links to a strategic service
vision. The strategic service vision in turn includes service quality, the service profit
chain, relationship management and best practice initiatives. Upon identification of the
links and relationships amongst constructs, factors and variables; the opportunity exists to
develop a matrix to facilitate service-oriented decision-making within the franchise
system.

362
The final objective and outcome is the development of an entrepreneurial service vision,
based upon the findings of entrepreneurial orientation and the franchise paradox. Such a
matrix may be described as a full representation or description of the set of associations
between these factors, including statements about the assumptions and interactions in the
matrix (Page & Meyer, 2000: 7). The imperative is to link the theory, empirical
investigation, industry know how and expertise within the industry. Recommendations
are provided by section as in the previous section, and then integrated to synergise the
entrepreneurial orientation of a strategic service vision in a franchised home
entertainment environment.
8.5.1 Section A: Demographic and biographic recommendations
Whilst this section provided background information regarding franchisees in the system,
the data analysis identified various opportunity areas. Recommendations include:
• Not only a recommendation, but an immediate proactive initiative is required to
adhere to diversity and transformation within a new South Africa. This includes
not only franchisees entering the defined system, but employment equity and
Affirmative Action within the franchisor. Recommendations include the
development of markets to cater for franchisees of the previously disadvantaged,
together with enhancement of developing female participation in the franchise
system
• Development of the home entertainment market in areas not dominated by the
franchise system; areas such as Soweto, Soshenguvi, Alexandria, Cape Flats, to
name but a few. This will not only facilitate growth, but develop the emerging
black market. Whilst only a suggestion, the possibility exists to acquire or joint
venture initiatives developed by Ster Kinekor Home Entertainment in this regard.
Such development will also allow expansion, therefore not depending on three
regions for over seventy-per cent of revenue
• Retain current franchisees, as it is seen that longer tenured franchisees are
accountable for development of multiple-outlets. Specific initiatives and
recommendations will be discussed in the following sections
• Attempt to introduce additional family members into the system, reducing
overheads of employing additional staff. Introducing additional family members

363
also enhance development of multiple-outlets, facilitating trust and integrity to
expand
• Encourage existing franchisees to develop new outlets. There are currently no
franchisor incentives for franchisees to expand. Such initiatives may include
relaxing the development costs, or a marginal reduction in franchise fees for
multiple-outlets. Possible benefits to the franchisor and franchisee are huge,
including reduction of training time, industry know how, induction and
competitive activity.
The franchise system has an immediate priority of social responsibility in the form of
actively promoting and enhancing diversity. This will facilitate family member
involvement, multiple-outlet development and prosperity within the franchise system.
8.5.2 Section B: Entrepreneurial orientation recommendations
The detailed item analysis in Section 7.4 depicts that entrepreneurial orientation is not
significant within the defined franchise system, despite a significant entrepreneurial
orientation in multiple-outlet franchisees. An overall objective would be to enhance
entrepreneurial orientation within the entire system; due to the associated benefits of this
orientation (Section 2.6.6.3: What entrepreneurs do: the action factors). Benefits will
include associated roles; such as entrepreneurs making a difference, being creative and
innovative, being good networkers, managing risk, exploiting opportunities, to name but a
few. Developing entrepreneurial orientation within the system will also facilitate the
objective to develop more multiple-outlet franchisees. Recommendations to enhance
entrepreneurial orientation include:
• Mobilising the action factors: entrenching entrepreneurial action factors into
franchisees. This will include training and advising franchisees of associated
action factors, and the related benefits. Benefits will include: entrepreneurs able to
timeously locate required resources via networking capabilities (Larson & Rogers:
1986); entrepreneurs making it their business to exploit all resources available
(Lindsay & McStay: 2004); and the entrepreneur is the person who exploits the
opportunity and turns it into reality (Kets de Vries: 1997)
• Communicating the nature, characteristics and behaviour of the entrepreneur to
franchisees (Section 2.6). Once again, highlighting benefits of entrepreneurial

364
orientation. Specific characteristics include intuition (Section 2.6.1); behavioural
traits (Section 2.6.2); creativity and innovation (Section 2.6.3); the entrepreneurial
personality (Section 2.6.4); entrepreneurial synthesis (Section 2.6.6) and
entrepreneurial talent, temperament and technique (Section 2.6.7)
• Identify franchisees against traditional and entrepreneurial management
approaches (Table 2.3); placing emphasis on the benefits of entrepreneurial
orientation per management practice
• Identify associations and themes within the character theme framework
(Thompson: 2002) which align to the franchise system growth strategies and
vision. Themes in this study include creativity, opportunity taking, urgency, time
focus, ego and courage
• The themes and findings in Section 8.3.3.2 (Multiple-outlet entrepreneurial
orientation) are to be conveyed and taught to franchisees, in the form of learning
organisations
• Align the franchisee towards entrepreneurship orientation from an
intrapreneurship point of view. This may consist of a phasing approach, as many
franchisees already share many intrapreneurial character traits (Table 2.2).
The overall objective is to increase the distribution of multiple-outlet franchisees; and by
developing an entrepreneurial orientation amongst franchisees, this objective will be self-
sustaining. It is proposed entrepreneurial orientation development be in the form of
regional training sessions, conducted by professional facilitators.
8.5.3 Section C: The franchise paradox recommendations
The empirical results in Section 7.5 identify franchising as an entrepreneurial option for
creating and developing ventures. This facilitates the objective of enhancing
entrepreneurial orientation within the system (previous section). Section C however also
incorporates the franchise paradox, and the relationships and operational mechanisms of
the system. Towards the objective of system growth (creating and developing new
outlets), the following franchise paradox recommendations are put forward:
• Recommendations in Section 8.5.3 are emphasised towards enhancing
entrepreneurial associations within the franchise paradox (Section 3.4)
• Develop an open communication and conflict-handling procedure (Section 3.3.8)

365
• Enhance integrity, trust and interdependence within the system, particularly from
the franchisor’s implementation point of view
• Continually develop internal marketing and communication channels within the
system, as franchise relationships are not self sustaining
• Implement a recommendations and suggestions medium within the system,
whereby franchisees may electronically interact with the franchisor and other
franchisees (Section 3.3). Develop guidelines for optimal franchise relationships
(Table 3.1)
• Formalise a franchise advisory council, whereby nominated franchisees represent
fellow franchisees regarding important franchise issues (Section 3.3.11)
• Communicate success stories within the system; particularly the value of
incremental wealth of multiple-outlet franchisees.
The overall franchise paradox objectives are two-fold; that is, enhancing entrepreneurial
orientation, and enhancing relationships within the system. The former is incorporated
into Section 8.5.2 objectives, and the latter are depicted above. A proposal is that the
franchise system develops an intranet to facilitate the sustaining of relationships within
the system.
8.5.4 Section D: The service profit chain recommendations
Significant positive associations between service profit chain initiatives of retention,
related sales and referrals are experienced relative to customer satisfaction and service
quality (Section 7.6). Service profit chain recommendations include:
• Developing and implementing a SPC programme across retention, related sales
and referrals within the system
• Implement measurement of loyalty within the system; particularly regarding the
lifetime value of customers (Section 4.7.6)
• Develop customer feedback and complaint systems (listening posts), such as
introducing a franchise toll-free number (Section 4.5.1)
• Communicate the value of SPC enhancement, and the links to profit and growth
(Section 4.4)
• Entrench customer value to all employees in the system, identifying the value mix
(Section 4.6 and Figure 4.3)

366
• Enhance SPC initiatives, such as spending time with customers, putting
employees first, investing in customers and communication the message within
the franchise system.
The overall objective of the SPC is to link initiatives of retention, referrals and related
sales with the other links within the chain. These include satisfaction, loyalty, value and
long-term growth.
8.5.5 Section F: Relationship marketing recommendations
Relationship marketing initiatives are positively associated with service quality (Section
7.7). To facilitate a strategic service vision, the following relationship marketing
initiatives are recommended:
• Integrate and implement a relationship marketing programme, consisting of
customer markets, internal markets, referral markets, influence markets, supplier
and alliance markets and recruitment markets
• Evaluate and identify areas of discontent within the supply chain. Particular
emphasis to be placed on areas of trust and reciprocity between franchisees and
major suppliers. Thereafter develop a relationship management chain (Figure 5.6)
• Develop core competencies for internal services marketing (Figure 5.5), including
the measurement of franchisee satisfaction levels
• Develop alliances with strategic intent; such as alliance with a major take-out fast
food chain such as Nando’s and supply alliance with international content
providers.
The research project has identified particular opportunities of internal marketing,
particularly regarding relationships between franchisor and franchisee. The development
of a relationship management chain, together with development of a core competencies
matrix; will facilitate all themes across the relationship management construct.
8.5.6 Section G: Industry best practice recommendations
It has been shown that industry best practice initiatives enhance service quality (Section
7.8). Taking a lead from the studies of the Video Software Dealers Association of
367
America (VSDA), and in conjunction with empirical findings of this research report,
recommendations include:
• Develop and implement a best practice and benchmarking guideline for
franchisees (Section 5.4.1). Themes are to include understanding markets and
customers, developing vision and strategy, refining outlet offerings, implementing
the marketing plan, excellent customer service, creating promotions and in-store
merchandising, and clear in-store operations. These guidelines will not take the
place of an operations manual, but are intended to supplement it
• Update the franchise operations manual, with the appropriate training in
communication and of new initiatives
• Facilitate training and development regarding business planning at franchisee
level
• Link best practice communication and interaction with SPC and relationship
marketing initiatives (such as intranet and internal marketing core competencies
matrix).
Best practice initiatives are integrally linked to the relationship marketing, service profit
chain and service quality constructs. Overall, a guideline of best practices, communicated
formally to franchisees; will go a long way toward enhancing both customer and
franchisee satisfaction.
8.5.7 Section E: Service quality recommendations
Although service quality is regarded as the dependent variable; themes of tangibles,
reliability, assurance, empathy and responsiveness further enhance strategic service
initiatives. Most of these themes correlate to the other service vision constructs, so
implementation of recommendations in one construct will ultimately have a positive
association to the service quality construct. Service quality recommendations however
include:
• Communicating technical and functional quality consumer perceptions to
franchisees (Figure 5.1)
• Instilling service quality dimensions as ongoing improvement measures within the
system (Section 5.2.2)

368
• Setting service standards and integration of service quality relationships (Sections
5.2.6 and 5.2.7). This includes developing a system model of market orientation
(Figure 5.3)
• Identifying a service quality and internal marketing link (Section 5.2.7.6)
• Measuring service quality within the system. An integration of SERVQUAL and
SERVPERF is proposed (Section 5.2.8).
The overall service quality objective with regard to recommendations is the ultimate link
to service loyalty (Table 5.1); notwithstanding the importance of a customer centric
approach.
8.5.8 Development and recommendation of an entrepreneurial service vision
The constructs of entrepreneurial orientation, franchise paradox, service profit chain,
relationship marketing, best practice and service quality are now combined towards the
development of a conceptual entrepreneurial service vision matrix. The matrix is a full
representation of the set of associations between these constructs; linking the theory,
empirical research and recommendations. Figure 8.1 represents the conceptual matrix.
Figure 8.1 is represented on the following page.
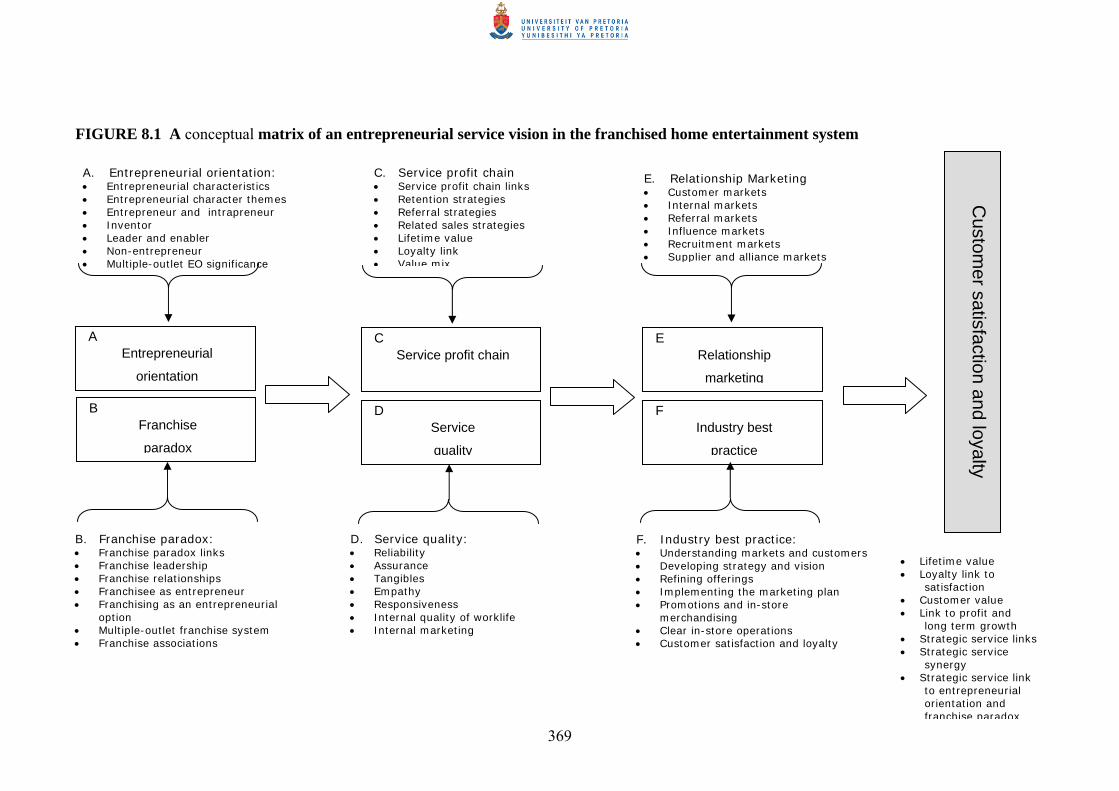
369
FIGURE 8.1 A conceptual matrix of an entrepreneurial service vision in the franchised home entertainment system
A. Entrepreneurial orientation: • Entrepreneurial characteristics • Entrepreneurial character themes • Entrepreneur and intrapreneur • Inventor • Leader and enabler • Non-entrepreneur • Multiple-outlet EO significance
B. Franchise paradox: • Franchise paradox links • Franchise leadership • Franchise relationships • Franchisee as entrepreneur • Franchising as an entrepreneurial
option • Multiple-outlet franchise system • Franchise associations
Custom
er satisfaction and loyalty
D. Service quality: • Reliability • Assurance • Tangibles • Empathy • Responsiveness • Internal quality of worklife • Internal marketing
F. Industry best practice: • Understanding markets and customers • Developing strategy and vision • Refining offerings • Implementing the marketing plan • Promotions and in-store
merchandising • Clear in-store operations • Customer satisfaction and loyalty
• Lifetime value • Loyalty link to
satisfaction • Customer value • Link to profit and
long term growth • Strategic service links • Strategic service
synergy • Strategic service link
to entrepreneurial orientation and franchise paradox
Entrepreneurial
orientation
A
Franchise
paradox
B
Service profit chain C
Service
quality
D
Relationship
marketing
E
Industry best
practice
F
C. Service profit chain • Service profit chain links • Retention strategies • Referral strategies • Related sales strategies • Lifetime value • Loyalty link • Value mix
E. Relationship Marketing • Customer markets • Internal markets • Referral markets • Influence markets • Recruitment markets • Supplier and alliance markets
370
8.6 LIMITATIONS OF THE STUDY
Limitations are based on the theoretical and empirical aspects of the study. The study has
met with the research objectives; despite constraints surrounding the research
methodology and availability of information. The two avenues are elaborated upon in the
next two sections.
8.6.1 Limitations based on the literature review
The primary limitation based on the theory revolves around specific information and data
availability on the home entertainment industry. Generic literature and material were
analysed towards evaluating entrepreneurial orientation, the franchise paradox and service
vision constructs. Limited data is however available on best practice and service quality
on an international basis. Whilst the existing body of knowledge has influenced strategic
service visions in many service related industries; entrepreneurship and the service profit
chain, together with other strategic initiatives, have received minimal formal research in
the lucrative South African home entertainment industry. To date, no published
entrepreneurial service vision within this industry is to be found in reviews, standing
operating procedures, nor any literature search.
The secondary limitation on theory is the limited existence of literature and material on
entrepreneurial orientation, particularly with regard to franchising. Furthermore, the
scarcity of literature on franchising in the home entertainment industry leads to
generalisations from other closely related industries.
8.6.2 Limitations based on the empirical research phase of the study
Linked to limitations based on theory, the research phase also highlighted generalisations
due to certain limitations. Primary research limitations revolve around the population of
the data set, consisting of a study within a defined franchise system. Whilst the study is
within the franchised environment within the Mr. VIDEO network; it is the opinion of the
researcher that the study cannot be extended to the entire franchised home entertainment
industry, primarily due to confidential marketing strategies. Different franchised groups
would not be willing to share their competitive strategies outside their own franchise
grouping. This limited this study to a single franchised group, and in this case, the market
371
leader (approximately three times larger than its closest competitor). Furthermore, the
researcher was the managing director of the second largest franchised group in the
industry, and participants may question ethical considerations.
Secondary limitations included the measuring instrument; with reference to service vision
data collection from the franchisees perceptions, as opposed to the consumer. Self-
evaluation by franchisees was however deemed appropriate from an empirical point of
view (Chang & Chen: 1998). Representation limitations are a result of a lack of diversity
within the defined system. Distribution limitations are due to different numbers of
franchisees per region, with the required assumptions and weightings applied.
Limitations of the applicable research project recommendations rested upon the
motivation and entrepreneurial orientation of implementation within a franchised
environment, which is ultimately in the hands of the franchisee. The franchisor, however,
has to be seen as the change-catalyst towards strategic implementation.
8.7 RECOMMENDATIONS FOR FUTURE RESEARCH
Future research opportunities primarily revolve around the identified limitations discussed
in the previous section. The sample size of the data sets needs to be increased. This may
be implemented by a number of alternatives. Firstly, similar studies should be conducted
within other home entertainment franchise systems in the South African market.
Secondly, similar studies should be conducted within other industry franchise systems in
the South African market. Thirdly, similar studies should be conducted within other
franchise systems on an international basis.
It is further proposed that the international link should be explored between Australia,
New Zealand and South Africa (due to the residential status of the author):
• Additional in-depth empirical research on multiple-outlet franchising and the link
to entrepreneurial orientation across industries and cultures
• Research on an action learning approach to entrepreneurial training and
development in a franchise system
• Entrepreneurial orientation of franchise systems based upon the entrepreneurial
orientation of the franchisor and/or founder

372
• Follow-up research on the effectiveness of implementation of the proposed
entrepreneurial service vision matrix
• A similar study, comparing service vision initiative perceptions, but from the point
of view of the customer (as opposed to franchisee).
Future research recommendations are facilitated by the researcher’s motivation to publish
journal articles in the area of entrepreneurship and strategic marketing. Concluding wrap-
up remarks provide final input regarding the importance of the research project.
8.8 WRAP-UP CONCLUDING REMARKS
Theoretically, the value the investigation provides will be in understanding that the home
entertainment industry is worthy of developing a body of knowledge, to be shared by all
industry participants. Similarly, linking entrepreneurship, franchising and strategic service
in the form of a matrix may be of interest and application to other academic disciplines.
This will facilitate both researchers and students in related business management
disciplines.
As a contribution to practice, the entrepreneurial service vision will enhance the longevity
of the industry, together with sharing entrepreneurial service vision recommendations to
all industry participants. As such, the general oligopolistic nature of major industry
participants will be dissolved; making the industry more accessible, creating more
employment, and increasing industry participants. Since the industry is a product of
technology, the identification of entrepreneurial behaviour of franchisor/franchisees will
highlight the re-defining of industry practices.
This study, the first of its kind in the home entertainment industry and in the specific
organisation, will smooth the way for implementation of entrepreneurial franchise service
initiatives in the organisation. It will also assist franchisees in their advancement in the
organisation and could be used to complement other programmes within the home
entertainment, entrepreneurial and franchised communities.
On a macro level, successful implementation of the matrix will enhance industry
participation; together with entrepreneurial contributions towards the creation of wealth,
economic growth and creation of employment in a dynamic, yet turbulent developing
373
economy such as South Africa. As such, the study will enhance South African companies’
competitive advantage in an international marketing environment.
8.9 CONCLUSION
The final chapter provides a summary of the theoretical and empirical aspects of the
research project. Conclusions and implications are evaluated across literature review
constructs of entrepreneurial orientation, the franchise paradox, the service profit chain,
relationship marketing, best practice and service quality. This is facilitated by a similar
evaluation of the empirical research phase, with the inclusion of demographic and
biographic information of the defined franchise system. Highlights of the research results
include acceptance of all hypotheses with the exception of entrepreneurial orientation in a
franchise system. Entrepreneurial orientation, however, exists in a multiple-outlet
franchise system.
Questions and findings are linked to the research objectives, once again summarising the
hypotheses tests. The entrepreneurial orientation proposal of multiple-outlet franchisees is
accepted as statistically significant. Recommendations based upon empirical evidence are
provided by construct, including demographic and biographic data. Highlights include
creation and developmental activities; that of increasing multiple-outlet distribution, and
that of implementing an entrepreneurial service vision.
Limitations of the study are explained from a theoretical and empirical point of view, and
include limited availability of literature on the applicable topics and disciplines, coupled
with a study in the defined system. Recommendations for future research are motivated,
with particular reference to increasing the study across other industries and cultures.
The following sections consist of the bibliography and the appendices.
374
BIBLIOGRAPHY
Aaker, D.A., Kumar, V., Day, G.S. 2001. Marketing Research, 7th edition. John Wiley
and Sons New York, NY.
Acs, Z.J., Arenius, P., Hay, M., Minniti. 2005. Global Entrepreneurship Monitor:
2004 Executive report. Babson College: London.
Agmen-Smith, M. 2003. What’s in the franchise agreement? Franchise New Zealand,
12(3), 30-35.
Ahmad, R., Buttle, F. 2002. Customer retention management: A reflection of theory
and practice, Marketing Intelligence and Planning, 20(3), 149-161.
Albrecht, K., Zemke, R. 1985. Service America. Dow Jones: Illinois.
Allinson, C.W., Chell, E., Hayes, J. 2000. Intuition and entrepreneurial behaviour.
European Journal of Work and Organisational Psychology, 9(1), 31-43.
Amos, J.R., James, H. 2003. Leadership and relationships in franchising. Franchising
World, 35(6), 20-22.
Andersen, B., Fagerhaug, T., Randmoel, S., Prenninger, J. 1999. Benchmarking for
best practice. Journal of Business and Industrial Marketing, 14(5), 378-389.
Andersen, B., Randmoel, S. 1997. Questionnaire for the benchmarking visits.
SMArTMAN SME Document, Trondheim, Norway.
Andersen, B., Pettersen, P.G. 1995 The Benchmarking Handbook: Step-by-Step
Instructions. Chapman & Hall: London.
Anderson, E.W., Mittal, V. 2000. Strengthening the satisfaction-profit chain. Journal
of Service Research, 3, 107-120.
375
Andersson, T.D. 1992. Another model of service quality: a model of causes and
effects of service quality tested on a case within the restaurant industry, in Kunst, P.,
Lemmink, J. (Eds). Quality Management in Service, van Goraum, Assen, 41-48.
Andrade, S. 2003. Using customer relationship management strategies. Applied
Cinical Trials, 4, 37-53.
Andreassen, T.W 1997. Satisfaction, loyalty and reputation as indicators of customer
orientation in the public sector. International Journal of Public Sector Management,
7(2), 16-34.
Appiah-Adu, K. 1999. Marketing effectiveness and customer retention in the service
sector. The Service Industry Journal, 19(3), 26-41.
Babakus, E., Mangold, W.G. 1992. Adapting the SERVQUAL scale to hospital
services: an empirical investigation. Health Services Research, 26(2), 767-786.
Bagozzi, R.P. 1994. Measurement in Marketing Research: Basic Principles of
Questionnaire Design. In, Bagozzi, R.P. (ed: 1994). Principles of Marketing
Research. Blackwell Business: Cambridge.
Bahia, K., Nantel, J. 2000. A reliable and valid measurement scale for the perceived
service quality of banks. International Journal of Bank Marketing, 18(2), 84-91.
Baldinger, A.L., Rubinson, J. 1996. Brand loyalty: the link between attitude and
behaviour. Journal of Advertising Research, 36(6), 22-34.
Baldrige National Quality Programme (NIST) 2004. Criteria for Performance
Excellence, URL: http://www.baldridge.nist.gov
Ballantyne, D., Christopher, M., Payne, A. 1995. Improving the quality of services
marketing: service (re)design is the critical link. Journal of Marketing Management,
11, 7-24.
Banwari, M., Walfied, L. 1998. Why do customers switch? The dynamics of
satisfaction versus loyalty. The Journal of Services Marketing, 12(3), 177-194.

376
Bassi, L.J., Vanburen, M.E. 1997. Sustaining high-performance in bad times. Training
and Development, 51(6), 31-42.
Berry, L.L. 1983. Relationship marketing. American Marketing Association, 25-28.
Berry, L.L., Zeithaml, V.A., Parasuraman, A. 1985. Quality counts in services too.
Business Horizons, 28(3), 44-52.
Best, J.W., Kahn, J.V. 1998. Research in Education, 8th edition. Allyn and Bacon:
Boston.
Bird, B. 1989. Entrepreneurial Behaviour. Scott Foresman and Company: Glenview,
IL.
Bitner, M.J. 1990. Evaluating service encounters: the effects of physical surroundings
and employee responses. Journal of Marketing, 54(4), 69-82.
Blazey, M.L. 1997. Insights to Performance Excellence, American Society for Quality
(ASQ), Quality Press: Milwaukee, WI.
Bloemer, J.M.M., de Ruyter, K., Wetzels, M. 1999. Linking perceived service quality
and service loyalty: a multi-dimensional perspective. European Journal of Marketing,
33(11/12), 1082-1106.
Bloemer, J.M.M., Kasper, H.D.P. 1995. The complex relationship between consumer
satisfaction and brand loyalty. Journal of Economic Psychology, 16, 311-329.
Bloom, B, V. 2003. Cooperation: The key to building lasting franchise relationships.
Franchising World. 35(1), 27-29.
Blythe, J. 1997. The Essence of Consumer Behaviour, Prentice-Hall: London.
Bolfing, C.P. 1989. How do customers express dissatisfaction and what can services
marketers do about it? Journal of Services Marketing, 3(2), 117-128.
377
Bolton, B., Thompson, J. 2004. Entrepreneurs, Talent, Temperament, Technique, 2nd
Edition, Butterworth Heinemann: Oxford.
Bolton, B., Thompson, J. 2003. The Entrepreneur in Focus, Thomson: London.
Bolton, B., Thompson, J. 2000. Entrepreneurs, Talent, Temperament, Technique,
Butterworth Heinemann: Oxford.
Bolton, R.N., Drew, J.H. 1991. A longitudinal analysis of the impact of service
changes on customer attitudes. Journal of Marketing, 55(1), 1-9.
Boone, L.E., Kurtz, D.L. 1999. Contemporary Business 2000, The Dryden Press:
Orlando, FL.
Borland, K.W. 2001: Qualitative and quantitative research: a complementary balance.
New Directions for Institutional Research, 112, 5-13.
Boulding, W., Kalra, A., Staelin, R., Zeithaml, V.A. 1993. A dynamic process model
of service quality: from expectations to behavioural intentions. Journal of Marketing
Research, 30, 7-27.
Bowen, J.T., Chen, S. 2001. The relationship between customer loyalty and customer
satisfaction. International Journal of Contemporary Hospitality Management, 13(5),
213-217.
Bowen, J.T., Shoemaker, S. 1998. Loyalty: a strategic commitment. Cornell and
Hotel Restaurant Administration Quarterly, 39(1), 12-25.
Brien, C.J., Correll, M.J., Olsson, M,J., Hall, R.E., Sutton, D.J. 1995. Quantitative
Methods in Business, Prentice Hall: Sydney.
Brinker, B. 1999. Intellectual capital tomorrow’s asset, today’s challenge. CPA
Working Paper, URL http://www.cpavision.org/vision/.

378
Brockhaus, R.H. 1982. The psychology of the Entrepreneur. In Encyclopaedia of
Entrepreneurship. (Kent, C.A., Sexton, D., Vesper, K. eds), Prentice Hall: New
Jersey.
Brown, T.J., Churchill, G.A., Peter, J.P. 1993. Improving the measurement of service
quality. Journal of Retailing, 69(1), 127-139.
Buckingham, M., Coffman, C. 1999. First, Break all the Rules. Simon and Schuster:
London.
Buono, A.F. 1997. Enhancing strategic partnerships. Journal of Organisational
Change Management, 10(3), 251-266.
Butscher, S.A., Muller, L.R. 1999. “ Kundenbindung durch Kundenclubs”, in
Hinterhuber, H.H., Matzler. K. (Eds), Kundenorientierte Unternehmensfuhrung,
Gablen: Wiesbaden.
Buttle, F. 1996. SERVQUAL: review, critique, research agenda. European Journal of
Marketing, 30(1), 8-32.
Brooks, R. 2000. Why loyal employees and customers improve the bottom line.
Association for Quality and Participation, 6(4), 40-44.
Burns, P., Dewhurst, J. 1989. Small Business and Entrepreneurship. Macmillan
Education: New York.
Busenitz, L.W. 1999. Entrepreneurial risk and strategic decision making: It’s a matter
of perspective. Journal of Applied Behavioural Science, 35(3), 325-40.
Butler, G., McManus, F. 1998. Psychology, Oxford University Press.
Bygrave, W.D. 1997. The Portable MBA in Entrepreneurship, 2nd Edition, John
Wiley: London.
379
Bygrave, W.D., Reynolds, P.D., Autio, E. 2004. Global Entrepreneurship Monitor,
2003 Executive Report, Babson College: London.
Carland, J.W., Hoy, F., Boulton,W.F., Carland, J.C. 1984. Differentiating
entrepreneurs from small business owners: a conceptualization. Academy of
Management Review, 9(2), 354-359.
Carland, J.W. 1982. Entrepreneurship in a Small Business Setting: An Exploratory
Study. Unpublished doctoral dissertation. Athens GA: University of Georgia.
Carman, J.M. 1990. Consumer perceptions of service quality: an assessment of the
SERVQUAL dimensions. Journal of Retailing, 66(1), 33-55.
Carr, M. Database Marketing: Talking direct to our listening customers. Marketing
Intelligence and Planning, 12(6), 12-14.
Caruana, A., Money, H., Berthon. 2000. Service quality and satisfaction - the
moderating role of value. European Journal of Marketing, 34(11), 1338-1352.
Chaston, I. 2000. Entrepreneurial Marketing: Competing by Challenging Convention,
Macmillan: United Kingdom.
Chaston, I. 2000a. Relationship marketing and the orientation customers require of
suppliers. The Services Industries Journal, 20(3), 147-166.
Chisnall, P.M. 1985. Marketing:A Behavioural Analysis, MCGraw-Hill Book
Company (UK): Maidenhead.
Christopher, M. 1998. Logistics and Supply Chain Management: Strategies for
Reducing Cost and Improving Service, Pitman Publishing: London.
Christopher, M. 1977. Marketing Logistics, Butterworth-Heinemann: Oxford.
Churchill, G.A. 1996. Basic Marketing Research, 3rd edition, The Dryden Press:
Orlando.
380
Churchill, G.A. 1995. Marketing Research: Methodological Foundations, 6th edition,
The Dryden Press: Chicago, IL.
Coakes, S.J., Steed, L.G. 2004. SPSS: Analysis without Anguish, version 11.0 for
windows, John Wiley & Sons: Sydney.
Competitions Board. Report Number 45 n-d-1995 Pretoria. Department of Trade and
Industry.
Cooper, D.R., Emory, C.W. 1995. Business Research Methods, 5th Edition, Irwin:
Chicago.
Cooper, D.R., Schindler, P.S. 1998. Business Research Methods, McGraw-Hill:
Boston.
Cooper, R., Slagmulder, R 1997. Target Costing and Value Engineering, Productivity
Press: Portland, OR.
Covin, J.G., Slevin, D.P. 1991. A conceptual model of entrepreneurship as firm
behaviour. Entrepreneurship Theory and Practice Fall, 7-25.
Covin, J.G., Slevin, D.P. 1989. Strategic management of small firms in hostile and
benign environments. Strategic Journal, 10, 75-87.
Cromie, S. 2000. Assessing entrepreneurial implications: some approaches and
empirical evidence. European Journal of Work and Organisational Psychology, 9 (1),
7-30.
Cronin. J.J., Taylor, S.A. 1994. SEVPERF versus SERVQUAL: reconciling
performance-based and perceptions-minus-expectations measurement of service
quality. Journal of Marketing, 58(1), 125-131.
Cronin. J.J., Taylor, S.A. 1992. Measuring service quality: a re-examination and
extension. Journal of Marketing, 56(7), 55-68.
381
Crosby, L.A. 2002. Exploring some myths about customer relationship management.
Managing Service Quality, 12(5), 271-277.
Dant, R.P., Paswan, A.K., Stanworth. 1996. Ownership redirection trends in
franchising. International Journal of Entrepreneurial Behaviour & Research, 2(3),
48-67.
Das, T.K., Teng, B.S. 1998. Between trust and control: developing confidence in
partner cooperation in alliances. Academy of Management Review, 23(3), 491-512.
Davies, A.J., Kochhar, A.K. 2000. A framework for the selection of best practices.
International Journal of Operations and Production Management, 20(10), 1203-
1217.
Deakins, D., Freel, M. 2003. Entrepreneurship and Small Firms, 3rd Edition,
McGraw-Hill Education: Berkshire.
De Ryker, K., Bloemer, J. 1999. Customer loyalty in extended service settings,
International Journal of Service Industry Management, 10(3), 320-336.
Deshpande, R., Webster, F.E. 1989. Organisational culture and marketing: defining
the research agenda. Journal of Marketing, 53, 3-15.
De Vaus, D.A. 1995. Surveys in Social Research, 4th edition, Allen and Unwin: NSW.
Dhir, S., Bruno, D. 2004. Global franchising: Making good business sense,
Franchising World, April, 20-21.
Diamantopoulos, A., Schlegelmilch, B.B. 1997. Taking the Fear out of Data Analysis,
The Dryden Press: London.
Dickie, S. 1993. Franchising in America: the development of a business method, The
University of North Carolina Press: North Carolina.
Diller, H. 1997. Was leisten Kundenclubs. Marketing ZFP, 19(1), 33-41.
382
Dillman, D.A. 2000. Mail and Internet Surveys, the Tailored Design Method, 2nd
Edition, John Wiley & Sons: New York.
Dillon, W.R., Madden, T.J., Firtle, N.H. 1993. Essentials of Marketing Research,
Irwin: Homewood, IL.
Dilts, J.C. 2000. The citizens volunteers assisting SME’s in Russia democracy Corp,
Journal of Small Business Management, 38(1), 108-114.
Dinesh, D., Palmer, E. 1998. Management by objectives and the balanced scorecard:
will Rome fall again? Management Decision, 36(6), 363-369.
Duffy, D.L. 2003. Internal and external factors which affect customer loyalty. Journal
of Consumer Marketing, 20(5), 480-485.
Duffy, D.L. 1998. Customer loyalty strategies. Journal of Consumer Marketing,
15(5), 435-448.
Eccles, G., Durand, P. 1998. Complaining customers, service recovery and continuous
improvement. Managing Service Quality, 8(1), 68-71.
Edwards, K. 1990. The interplay of affect and cognition in attitude formation and
change. Journal of Personality and Social Psychology, 59, 202-216.
Edwards, M.R., Ewen, A.J. 1996. 360 degree feedback: the powerful new tool for
employee feedback and performance improvement. AMACOM, 221-246.
Ennew, C.T., Banerjee, A.K., Li, D. 2000. Managing word of mouth communication:
empirical evidence from India. International Journal of Bank Marketing, 18(2), 75-
83.
Escover, J.L. 1993. Productivity plus. Management Decision, 31(7), 74-86.
383
Fayerman, M. 2002. Customer relationship management. New Directions Institutional
Research, 113, 57-67.
File, K.M., Judd, B.B., Prince, R.A. 1992. Interactive marketing: The influence of
participation on positive word-of-mouth and referrals. Journal of Services Marketing,
6(4), 116-129.
Fink, A. 1995a. How to report on surveys, Sage Publications: London.
Fink, A. 1995b. How to ask survey questions, Sage Publications: London.
Fink, A. 1995c. How to analyze survey data, Sage Publications: London.
Fink, A. 1995d. How to sample in surveys, Sage Publications: London.
Franceschini, F., Cignetti, M., Caldara, M. 1998. Comparing tools for service quality
evaluation. International Journal of Quality Science, 3(4), 356-367.
Franchise Association of South Africa (FASA) 2002. The Franchising Handbook of
Southern Africa, FASA: Johannesburg.
Frederick, H.H., Thompson, J., Mellalieu, P.J. 2004. New Zealand Perspectives of
International Entrepreneurship in Dana, L (ed), Handbook of Research on
International Entrepreneurship, Edward Elgar Publishing: Cheltenham.
Frederick, H.H. 2001. Communication behaviour amongst entrepreneurs.
International Association for Media and Communication Research, Budapest.
Frith, R.J. 2004. State of Franchising 2004: Leadership makes the difference.
Franchising World, 36(1), 4-6.
Frost, F.A., Kumar, M. 2000. Interservqual- an internal adaptation of the GAP model
in a large service organisation. Journal of Services Marketing, 14(5), 351-377.
384
GAO Report 1996. Airline deregulation: barriers to entry continue to limit
competition in several key domestic markets, October.
Garret, J. 1998. Gallup’s discoveries about leaders. At work together, Spring Harvest
Conference, Sheffield.
Gartner, W.B. 1989. Some Suggestions for Research on Entrepreneurial Traits and
Characteristics, Entrepreneurship Theory and Practice, (Fall), 27-38.
Gartner, W.B. 2001. Who is an Entrepreneur, is the Wrong Question. American
Journal of Small Business.
George, W.R. 1990. Internal marketing and organisational behaviour: a partnership in
developing customer-conscious employees at every level. Journal of Business
Research, 20(1), 63-70.
Germann, S. 2002. Franchise relationships and quality control. Franchising World,
34(6), 39-42.
Gibb, A. 1998. In Management Development for Small and Medium Enterprises
Setting out the Challenge, TEC National Council Policy Paper, July.
Gibson, R. 1998. Rethinking the Future, Nicholas Brealey: Naperville.
Gill, J., Johnson, P. 1991. Research Methods for Managers, Paul Chapman
Publishing: London.
Goleman, D. 1996. Emotional Intelligence, Bloomsbury: London.
Gomez-Mejia, L. 1990. Increasing productivity: performance appraisal and reward
systems. Personnel Review, 19(2), 117-131.
Goodman, J.A., Broetzmann, S.M., Ward, D.S. 1993. Preventing TQM problems:
measured steps toward customer-driven quality improvement. National Productivity
Review, 12(4), 555-571.
385
Gould, G. 1995. Why it is customer loyalty that counts (and how to measure it).
Managing Service Quality, 7(4), 4-26.
Gremler, D., Brown, S. 1999. The loyalty ripple effect: appreciating the full value of
customers. International Journal of Service Industry Management, 10(3), 271-291.
Griffen, J. 1996. The internet’s expanding role in building customer loyalty. Direct
Marketing, 59(7), 50-53.
Gronroos, C. 1984. A service quality model and its marketing implications. European
Journal of Marketing, 18(4), 36-43.
Grote, D. 1999. Performance appraisal reappraised. Harvard Business Review, March-
April.
Grove, S.J., Fiske, R.P. 1992. Observational data collection methods for services
marketing: an overview. Journal of the Academy of Marketing Science, 20, 117-214.
Gulati, R. 1995. Does familiarity breed trust? The implication of repeated ties for
contractual choice in alliances. Academy of Management Journal, 38, 85,112.
Gwinner, K.P., Gremler, D.D., Bitner, M.J. 1998. Relational benefits in service
industries: The customer perspective. Journal of the Academy of Marketing Science,
26(2), 101-114.
Hair, J.F., Bush, R., Ortinau, D.J. 2000. Marketing Research: A Practical Approach to
the New Millennium, McGraw-Hill: Boston.
Hall, D. 1999. In the Company of Heroes: An Insiders’ Guide to Entrepreneurs at
Work, Kogan: London.
Halloran, J.W. 1994. Entrepreneurship, McGraw-Hill: New York.

386
Hallowell, R. 1996. The relationship of customer satisfaction, customer loyalty, and
profitability: an empirical study. International Journal of service Industry
Management, 7(4), 27-42.
Hamel, G., Prahalad, C.K. 1995. Competing for the Future, Harvard Business School
Press: United Kingdom.
Hanenborg, L. 2003. Good franchise relationships require a solid foundation.
Franchising World, 35(7), 35-38.
Hansemark., O.C., Albinsson, M. 2004. Managing Service Quality, 14(1), 40-57.
Hart, W.L., Heskett, J.L., Sasser, W.E. 1990. The profitable art of service recovery.
Harvard Business Review, July-August, 148-156.
Hasan, H., Tibbits, H. 2000. Strategic management of electronic commerce: an
adaptation of the balanced scorecard. Internet Research: Electronic Networking
Applications and Policy, 10(5), 439-450.
Hayes, B.O. 1997. Measuring Customer Satisfaction: Survey Designs, Use, and
Statistical Analysis Methods, 2nd edition, ASQC Quality Press: Milwaukee, WL.
Hayes, L.O. 1993. Quality is worth $ 11,000 in the bank, Restaurant Hospitality,
March, 68.
Haywood, M. 1989. Managing word of mouth communications. The Journal of
Services Marketing, 3(2), 55-67.
Headley, D.E., Miller, S.J. 1993. Measuring service quality and its relationship to
future consumer behaviour. Journal of Health Care Marketing, 13(4), 32-39.
Heinonen, K. 2004. Reconceptualizing customer perceived value: the value of time
and place. Managing Service Quality, 14(2), 205-215.

387
Helm, S. 2003. Calculating the value of customers’ referrals. Managing Service
Quality, 13(2), 124-133.
Hernon, P. 2004. Research Methods, in Lewis-Beck, M.S., Bryman, A., Liao, T.F.
The Sage Encyclopaedia of Social Science Research Methods, Sage Publications:
Thousand Oaks, CA.
Heskett, J.L. 2002. Beyond customer loyalty. Managing Service Quality, 12(6), 355-
357.
Heskett, J.L. 2001. Planet Feedback: The Voice of One…The Power of Many (A),
Case No. 9-901-051, Harvard Business School Publishing, Boston, MA.
Heskett, J.L., Sasser, W.E., Hart. 1990: Service Breakthroughs: Changing the Rules of
the Game. The Free Press: New York.
Heskett, J.L., Sasser, W.E., Schlesinger, L 1997. The Service Profit Chain, Free Press:
New York.
Heskett, J.L., Jones, T.O., Loveman, G.W., Sasser, W.E., Schlesinger, L 1994. Putting
the service profit chain to work. Harvard Business Review, March-April.
Hisrich, R.D. 1990. Entrepreneurship/Intrapreneurship, American Psychologist,
February, 209-222.
Hisrich, R.D., Brush, C. 1984: The Women Entrepreneurs. Journal of Small Business
Management, 22 (1), 31-37.
Hisrich, R.D., Peters, M.P., Shepherd, D.A. 2004. Entrepreneurship, 6th edition, Irwin
McGraw Hill: Boston.
Hisrich, R.D., Peters, M.P. 1998. Entrepreneurship, 4th Edition, Irwin McGraw Hill:
Boston.

388
Ho, C.K., Cheng, W.L. 1999. Quest for value mix. Managing Service Quality, 9(3),
204-208.
Hogg, G., Carter, S., Dunne, A. 1998. Investing in people: internal marketing and
corporate culture. Journal of Marketing Management, 4, 879-895.
Holt, K. 1983. Product Innovation Management. Butterworth: London.
Honeycutt, A. 1989. Maximising the employee productivity factor. International
Journal of Manpower, 10(4), 28-39.
Hopkinson, G.C., Hogarth-Scott, S. 1999. Franchise relationships quality: micro-
economic explanations. European Journal of Marketing, 33(9), 827-843.
Hornaday, J.A. 1982. Research about Living Entrepreneurs. In Encyclopaedia of
Entrepreneurship (C.A. Kent., D.L. Sexton., K. Vesper. Eds), Prentice-Hall: New
Jersey.
Hough, J. 2002. International business opportunities; in Nieman, G., Hough, J.,
Niewenhuizen, C. (Eds). Van Schaik Publishers: Pretoria.
Hough, J. 1986. Power and Authority and their Consequences in Franchise
Organisations- A Study of the Relationship between Franchisors and Franchisees,
Unpublished PhD Thesis, University of Westminster: London.
Hung-Chang, C. 2002. A study on the cognitive and affective components of service
quality. Total Quality Management, 13(2), 265-274.
Hunger, J.D., Wheelen, T, L. 2003. Essentials of Strategic Management, 3rd Edition,
Prentice Hall: New Jersey.
Imrie, B.C., Cadogen, J.W., McNaughton, R. 2002. The service quality construct on a
global stage. Managing Service Quality, 12(1), 10-18.
International Franchising Association 1997. Franchising Industry Report, IFA:USA.

389
Jamieson, D. 1994. The TQM Magazine, 6(5), 11-13.
Janes, J. 2001. Survey research design. Library Hi Tech, 19(4), 419-421.
Janes, J. 1999. Survey construction. Library Hi Tech, 17(3), 321-325.
Jarrar, Y.F., Zairi, M. 2000. Internal transfer of best practice for performance
excellence: a global survey. Benchmarking: An International Journal, 7(4), 239-246.
Johnson, D.M. 2004: In the mainstream, multi-unit and multi-concept franchising,
Franchising World, April.
Johnson, J. 2003. Franchise relationships are products of conscious effort. Restaurant
News, November 2-3.
Jones, T.O., Sasser, W.E. 1995. Why satisfied customers defect. Harvard Business
Review, November-December, 88-99.
Joseph, W.B. 1996. Internal marketing builds service quality. Journal of Health Care
Marketing, 16(1), 54-59.
Judd, V.C. 1987. Differentiate with the 5th P: People. Industrial Marketing
Management, 16, 241-247.
Justis, R.T., Judd, R.J. 2002. Franchising, 2nd Edition, Dame Publications: USA.
Justis, R.T., Judd, R.J. 1989. Franchising, South Western Publishing: Cincinnati.
Kang, G.D., James, J., Alexandris, K. 2002. Measurement of internal service quality:
application of the SERVQUAL battery to internal service quality. Managing Service
Quality, 12(5), 278-291.
Kao, R.W.Y., Kao, K.R., Kao, R.R. 2002. Entrepreneurism for the Market Economy,
Imperial College Press: London.
390
Kao, R.W.Y 1993. Entrepreneurship. Journal of Creativity and Innovation, 1(3), 69-
71.
Kaplan, R.S. 2000. The Strategy Focussed Organisation: How balanced scorecard
companies thrive in the new business environment, Harvard Business School Press:
Cambridge, MA.
Kaplan, R.S., Norton, D.P. 1996a. Using the balanced scorecard as a strategic
management system. Harvard Business Review, January-February, 75-85.
Kaplan, R.S., Norton, D.P. 1996b. The Balanced Scorecard: Translating Strategy into
Action, Harvard Business School Press: Cambridge, MA.
Kaplan, R.S., Norton, D.P. 1993. Putting the balanced scorecard to work. Harvard
Business Review, September, 134-147.
Kaufmann, D.J., Robbins, D.E. 1991. Now Read This. Entrepreneur, 1(10), 100-105.
Keaveney, S.M. 1995. Customer switching behaviour in service industries: an
exploratory study. Journal of Marketing, 59(4), 71-81.
Kent, C.A. 1984. The Environment of Entrepreneurship, Lexington Books:
Kentucky.
Kets de Vries, M.F.R. 1997. Creative rebels with a cause in Birley, S. and Muzyka,
D. (Eds), Mastering Enterprise, Financial Times/Pitman: London.
Kets de Vries, M.F.R. 1997a. The Entrepreneurial Personality: A Person at the
Crossroads. Journal of Management Studies, February, 34-57.
Kirby, D.A. 2003. Entrepreneurship, McGraw Hill Education: Berkshire.
Kirton, M. 1976: Adaptors and Innovators: A description and Measure. Journal of
Applied Psychology, 61, 622-9.

391
Kirzner, L.M. 1973. Competition and Entrepreneurship, Chicago University Press:
Chicago, IL.
Klein, K.E. 2002. The pros and cons of a franchise. Business Week Online, 1-3.
Knight, R.M. 1986. Franchising from the franchisor and franchisee points of view,
Journal of Small Business Management, July, 8-15.
Knox, S., Maklan, S. 1998. Competing on Value, Financial Times: London.
Koh, H.C. 1996. Testing hypotheses of entrepreneurial characteristics. Journal of
Managerial Psychology, (11), 12-25.
Kotler, P. 2000. Marketing Management, The Millennium Edition, Prentice Hall: New
Jersey.
Kotter, J.P. 1999. What Leaders Really Do, Harvard Business School Press: Boston.
Kuei, C., Lu, M.H. 1997. An integrated approach to service quality improvement.
International Journal of Quality Science, 2(1), 24-36.
Kumar, P. 1999. The impact of long-term client relationships on the performance of
business service firms. Journal of Service Research, 2(1), 4-18.
Kuratko, D.F., Hodgetts, R, M. 2004. Entrepreneurship, Theory, Process, Practice,
6th Edition, Thomson/South-Western: London.
Kuratko, D.F., Hodgetts, R.M. 1992. Entrepreneurship, a Contemporary approach,
2nd Edition, The Dryden Press: Orland, FL.
Lancaster, K. 1971. Consumer Demand: A New Approach, Columbia University
Press: New York, NY.
Lane, C. 1996. The constitution of trust: Supplier relations in Britain and Germany.
Organisation Studies, 17, 365-395.

392
Lanning, M.J. 1998. Delivering Profitable Value, Capstone: Oxford.
Larson, A. 1992. Network dyads in entrepreneurial settings: A study of the
governance of exchange relationships. Administrative Science Quarterly, 37, 76-104.
Larson, J.K., Rogers, E.M. 1986. Silicon Valley Fever, Unwin Counterpoint: Phoenix.
Lau, R.S.M. 2000. Quality of work life and performance- an ad hoc investigation of
two key elements in the Service Profit Chain Model, International Journal of Service
Industry Management, 11 (5), 422-437.
Lee, H., Lee, Y., Yoo, D. 2000. The determinants of perceived service quality and its
relationship with satisfaction. Journal of Services Marketing, 14(3), 217-231.
Levering, R., Moskowitz, M. 1999. The 100 best companies to work for in America.
Fortune, 118-144.
Lewis, M.C., Lambert, D.M. 2001. A model of channel member performance,
dependence, and satisfaction. Journal of Retailing, 67(2), 205-225.
Lewis, J. 1995. The Connected Corporation, The Free Press: New York.
Li, Y.N., Tan, K.C., Xie, M. 2003. Factor analysis of service dimension shifts in the
information age. Managerial Auditing Journal, 18(4), 297-302.
Lindsay, N.J., McStay, D. 2004. Should franchises be entrepreneurial? The influence
of entrepreneurial orientation on franchise performance, AGSE Babson Research
Exchange, Melbourne.
Lings, I.N., Brooks, R.F. 1998. Implementing and measuring the effectiveness of
internal marketing. Journal of Marketing Management, 14, 325-351.
Lord, S. 2003. Good reasons to buy a franchise. Franchise New Zealand, 12(3), 7-10.
393
Lovemore, G.W. 1998. Employee satisfaction, customer loyalty, and financial
performance: an empirical examination of the service profit chain in retail banking.
Journal of Service Research, 1, 18-31.
Low, J., Siesfeld, T., Larcker, D. 1999. Capital thinking. Forbes, 199(9), 141-145.
Luk, T.K. 1997. An examination of the role of marketing culture in service quality.
International Journal of Contemporary Hospitality Management, 9(1), 13-20.
Lumpkin, G.T., Dess, G.G. 1996. Clarifying the entrepreneurial construct and linking
it to performance. Academy of Management Review, 21(1), 135-72.
Maas, G. 2002. Entering the family business; in Nieman, G., Hough, J.,
Nieuwenhuizen (Eds). Entrepreneurship: A South African Perspective, Van Schaik
Publishers: Pretoria.
Mack, R., Mueller, R., Crotts, J., Broderick, A. 2000. Perceptions, corrections and
defections: implications for service recovery in the restaurant industry. Managing
Service Quality, 10(6), 339-346.
Macky, K., Johnson, G. 2003. Managing Human Resources in New Zealand, 2nd
edition, McGraw Hill: North Ryde, NSW.
Madhok, A. 1995. Revisiting multinational firms’ tolerance for joint ventures: A trust-
based approach. Journal of International Business Studies, 26, 117-137.
Malhotra, N.K., Hall, J., Shaw, M., Oppenheim, P. 2001. Marketing Research: an
Applied Orientation, 2nd edition. Prentice Hall: Frenchs Forest, NSW.
Maranto, D., Reynoso, J. 2003. Understanding the service profit chain in Latin
America: managerial perspective from Mexico. Journal of Service Quality, 13(2),
134-147.
Maritz, P.A. 2005. Entrepreneurial orientation in a franchised system. International
Business and Economy Conference, Conference proceedings, January: Hawaii.
394
Maritz, P.A. 2004. Relationship and co-branding alliance in perspective. Academy of
World Business, Marketing and Management Development, Conference proceedings,
July: Gold Coast.
Maritz, P.A. 2004a. Tri-nations entrepreneurial scorecard. International Journal of
Entrepreneurship and Small Business, 1(3/4), 230-238.
Maritz, P.A. 2003a. Investigating customer service levels to achieve competitive
advantage in the SME home entertainment rental industry. Small Enterprise
Association of Australia and New Zealand (SEAANZ), Conference proceedings,
September: Ballarat.
Maritz, P.A. 2003b. Service profit chain implementation towards achieving
competitive advantage. Australia and New Zealand Association of Management
(ANZAM), Conference proceedings, December: Perth.
Maritz, P.A. 2002. Investigating customer service levels to achieve competitive
advantage. Unpublished MBA Dissertation, Thames Valley University: London.
Maritz, P.A., Nieman, G.H. 2005. The franchise system as entrepreneurial options.
AGSE Regional Entrepreneurship and Innovation Research Exchange, Conference
proceedings, February: Melbourne.
Martins, J.H., Loubser, M., van Wyk, H deJ. 1996. Marketing Research, a South
African Approach, University of South Africa: Pretoria.
Mazis, M.B., Ahtola, O.T., Klippel, R.E. 1975. A comparison of four multi-attribute
models in the prediction of consumer attitudes. Journal of Consumer Research, 2(6),
38-52.
McAlexander, J.H., Kaldenberg, D.O., Koenig, H.F. 1994. Service Quality
Measurement. Journal of Health Care Marketing, 14(3), 34-39.
395
McClelland, D.C. 1961. The Achieving Society. Van Nostrand: Princeton NJ.
McDougall, D., Wyner, G., Vazdauskas, D. 1997. Customer valuation as foundation
for growth. Managing Service Quality, 7, 5-11.
McGrath, R., MacMillan, I. 2000. The Entrepreneurial Mindset. Harvard Business
School Press: Boston.
Mehta, S.C., Durvasula, S. 1998. Relationship between SERVQUAL dimensions and
organisational performance in the case of a business-to-business service. Journal of
Business and Industrial Marketing, 13(1), 40-53.
Mells, G., Boshoff, C., Deon, N. 1997. The dimensions of service quality: The
original European perspective revisited. The Service Industries Journal, 17(1), 173-
189.
Mendelsohn, M. 2004. Legal update: franchising in Europe. Franchising World, 36
(2), 72-74.
Mendelsohn, M. 2003. The Guide to Franchising, 6th Edition, Reprinted 2003 by
Thompson Learning: London.
Mendelsohn, M. 2001. Challenges to growth: nothing new under the sun. Franchising
World, 33(8), 16.
Mendelsohn, M. 1999. European and UK franchise surveys offer useful information.
Franchise World, 31(4), 52.
Mendelsohn, M. 1997. South Africa continues warm welcome for franchising.
Franchising World, 29(5), 46.
Mendelsohn, M. 1995. Learning from the U.S. experience. Franchising World, 33 (8),
16.
Mendelsohn, M. 1994. Back to basics, Franchising World, 26(6), 62.

396
Mendelsohn, M. 1992. The Guide to Franchising, 5th Edition, Cassel: London.
Meyer, G.D., Heppard, K.A. 2000. Entrepreneurship as Strategy, Sage Publications,
London.
Meyer, D.G., Cooke, W.N. 1993. US labour relations in transition: emerging
strategies and company performance. British Journal of Industrial Relations, 31(4),
531-552.
Michael, S.C. 2003. First mover advantage through franchising. Journal of Business
Venturing, 18(1), 61.
Miller, D. 1983. The correlates of entrepreneurship in three types of firms.
Management Science, 29, 770-791.
Mockler, R.J. 2001. Making decisions on enterprise-wide strategic alignment in
multinational alliances. Management Decision, 39(2), 90-98.
Monckton, H.A. 1969. The History of the English Public House, Bodley House
Publishing: London.
Morris, M.H., Kuratko, D.E. 2002. Corporate Entrepreneurship. Harcourt College
Publishers: Orlando, FL.
Morris, M.H. 1998. Entrepreneurial intensity. Quorum Books: Westport.
Mouton, J. 2001. How to succeed in your master’s and doctoral studies: A South
African resource book. Van Schaik Publishers: Pretoria.
Mulhern, T., Duffy, D. 2004. Building loyalty at things remembered. Journal of
Consumer Marketing, 21(1), 62-66.
Nel, P.S., van Dyk, P.S., Haasbroek, G.D., Schultz, H.B., Sono, T., Werner, A. 2004.
Human Resources Management, 6th Edition, Oxford University Press: Cape Town.
397
Nelson, R.E. 1988. Social network analysis as intervention tool. Group and
Organisational Studies, 1(3), 39-58.
Neuman, W.L. 1997. Social Research Methods, 3rd Edition: Allyn and Bacon:
London.
Nieman, G.H., Pretorius, M. 2004. Managing Growth: A Guide for Entrepreneurs,
Juta and Company: Cape Town.
Nieman, G.H., Hough, J., Nieuwenhuizen, C. 2003. Entrepreneurship: A South
African Perspective, Van Schaik Publishers: Pretoria.
Nieman, G.H., Bennett, A (Eds).2002. Business Management: A Value Chain
Approach, Van Schaik: Pretoria.
Nieman, G.H. 1998. The Franchise Option: How to Franchise your Business, Creda
Communications: Eppindust 2, SA.
Nunnally, J.C., Bernstein, I.H. 1994. In Psychometric Theory, Mcgraw-Hill: New
York.
O’Dell, J., Grayson, P. 1997. Identifying and transferring best practices. Best Practice
White Paper, APQC, Houston, TX.
Oliver, R.L. 1997. Satisfaction, a Behavioural Perspective on the Consumer,
McGraw-Hill: New York.
O’Neill, M., Palmer, A. 2003. An exploratory study of the effects of experience on
consumer perceptions of the service quality construct. Managing Service Quality,
13(3), 187-196.
Orford, J., Wood, E., Fischer, C., Herrington, M., Segal. 2003. Global
Entrepreneurship Monitor: South African Executive Report 2003, UCT Graduate
School of Business, Ince: Cape Town.
398
Ostgard, T.A., Birley, S. 1996. New venture growth and personal networks, Journal
of Business Research, 36(1), 37-50.
Ottaviano, M. 2004. The development of a tool to improve corporate innovation
capability, AGSE-Babson Research Exchange, Melbourne.
Page, C., Meyer, D. 2000. Applied Research Design for Business and Management,
McGraw-Hill: NSW, Australia.
Palmer, A. 2001. Principles of Services Marketing, 3rd edition, McGraw-Hill:
Berkshire.
Parasuraman, A., Ziethaml, V.A., Berry, L.L. 1998. A multiple-item scale for
measuring consumer perceptions of service quality. Journal of Retailing, March, 12-
40.
Parasuraman, A., Ziethaml, V.A., Berry, L.L. 1994. Alternative scales for measuring
service quality: a comparative assessment based on psychometric and diagnostic
criteria. Journal of Retailing, 70(3), 201-230.
Parasuraman, A., Ziethaml, V.A., Berry, L.L. 1985. A conceptual model of service
quality and its implications for future research. Journal of Marketing, 49, 41-50.
Patel, B. 2000. Franchise-advisory councils need tune-up to be effective. Hotel and
Hotel Management, 215(10), 56.
Patel, D. 2001. It’s time to evaluate, review and revise fair-franchising issues. Hotel
and Motel Management, 216(9), 21-23.
Peck, H., Payne, A., Christopher, M., Clark, M. 1999. Relationship Marketing:
Strategy and Implementation, Butterworth Heinemann: Oxford.
Perry, T.S. 2002. Technical and social bonds in franchise relationships. Journal of
Business and Industrial Marketing, 17(1), 27-39.
399
Peter, T. 1989. Thriving on Chaos, Pan Books: New York.
Peterson, A., Dant, R. 1990. Perceived advantages of the franchise option from the
franchisee perspective: Empirical insights from a service franchise. Journal of Small
Business Management, 28(3), 46-61.
Pinchot 111, G. 1985. Intrapreneuring, Harper and Row: New York.
Pizam, A., Ellis, T. 1999. Customer satisfaction and its measurement in hospitality
enterprises. International Journal of Contemporary Hospitality Management, 11(7),
326-339).
Plymire, J. 1992. Complaints as opportunities. Journal of Product and Brand
Management, 1(4), 27-38.
Porter, M.E. 2001. Strategy and the internet. Harvard Business Review, March 2001,
63-79.
Porter, M.E. 1996. What is strategy? Harvard Business Review, November, product
no.4134.
Porter, M.E. 1998. On Competition, Harvard Business School Press: Boston.
Porter, M. 1995: Competitive Advantage, Creating and Sustaining Superior
Performance, Free Press: New York.
Price, S. 1997. The Franchise Paradox, New Directions, Different Strategies, Cassel:
London.
Pritchard, M.P., Howard, D.R. 1997. The loyal traveller: examining a typology of
service patronage. Journal of Travel Research, Spring, 2-10.
Quinn, J.B. 1992. Intelligent Enterprise, The Free Press: New York.

400
Ranaweera, C., Neely, A. 2003. Some moderating effects on the service quality-
customer retention link. International Journal of Operations and Production
Management, 23(2), 230-248.
Ranaweera, C., Prbhu, J. 2003. The influence of satisfaction, trust and switching
barriers on customer retention in a continuous purchasing setting. International
Journal of Service Industry Management, 14(4), 374-395.
Reichheld, F.F. 2001. Loyalty Rules! Harvard Business School Press: Boston.
Reichheld, F.F. 1996. Learning from customer defectors. Harvard Business Review,
March-April, 56-69.
Reichheld, F.F. 1993. Loyalty-based management. Harvard Business Review, 64-73.
Reichheld, F.F., Sasser, W.E. 1990. Zero defections. Harvard Business Review, Sept-
Oct, 105-111.
Reynolds, P.D., White, S.B. 1997. The Entrepreneurial Process: Economic Growth,
Men, Women and Minorities, Quorum: Westport.
Ring, P.S., Van de Ven, A.H. 1994. Development process of cooperative
interorganisational relationships. Academy of Management Review, 19, 90 -118.
Roberts, E.B. 1991. Entrepreneurs in High-Technology, Oxford University Press.
Robinson, S. 1999. Measuring service quality: current thinking and future
requirements. Marketing Intelligence and Planning, 17(1), 21-32.
Robinson, W. 2004. Who goes where, Franchise New Zealand, 12(4), 79-83.
Rogers, J.D., Clow, K.E., Kash, T.J. 1994. Journal of Services Marketing, 8(1), 14-26.
Ronstadt, R.C. 1996. Entrepreneurship. South Western: New York.

401
Rotter, J.B. 1996. Generalised Expectancies for Internal versus External Control of
Reinforcement. Psychological Monographs 80 (whole No. 609).
Rust, R.T., Oliver, R.L. 2000. Should we delight the customer? Journal of Academy
Sciences, 28(1), 86-94.
Rust, R.T., Stewart, G.L. 1996. The satisfaction and retention of frontline employees,
a customer satisfaction measurement approach. International Journal of Service
Industry Management, 7(5), 62-80.
Ruyter, K., Bloemer, J. 1999. Customer loyalty in extended service settings,
International Journal of Service Industry Management, 10(3), 320-336.
Sampson, S.E. 1998. Gathering customer feedback via the internet: instruments and
prospects. Industrial Management and Data Systems, 98(2), 71-82.
Saunders, M., Lewis, P., Thornhill, A. 1997. Research Methods for Business
Research, Pitman: London.
Schaper, M., Volery, T. 2004. Entrepreneurship and Small Business, a Pacific Rim
Perspective, Wiley and Sons: Queensland.
Schermerhorn, J.R. 2002. Management, 7th Edition, John Wiley & Sons: New York.
Seid, M. 2002. Franchisees as entrepreneurs, in Klein, K.E. 2002. The pros and cons
of a franchise, 1-3.
Schlesinger, L.A., Zornitsky, J.J. 1991. Job satisfaction, service capability, and
customer satisfaction: an examination of linkages and management implications.
Human Resources Planning, 14(2), 141-149.
Schlesinger, L.A., Heskett, J.L. 1991. The service-driven service company? Harvard
Business review, September-October, 71-81.
402
Schneider, B., Bowen, D.E. 1995. Winning the service game, Harvard Business
School Press: Boston, MA.
Schneider, B., Bowen, D.E. 1985. Employee and customer perceptions of service in
banks: replication and extension. Journal of Applied Psychology, 70, 423-433.
Schumpeter, J. 1949: The Theory of Economic Development, Harvard University
Press. (Original German edition, 1911).
Schvanaveldt, S.J., Enkawa, T., Miyakawa, M. 1991. Consumer evaluation
perspectives of service quality: evaluation factors and two-way model of quality.
Total Quality Management, 2(2), 11-30.
Shapero, A. 1975. Entrepreneurship and economic development, Project ISEED,
LTD. Milwaukee, W1: Center for Venture Management, Summer, 187.
Sherden, W.A. 1994. When customers leave. Small Business Report, November, 45.
Sherman, A., Dewis, K. 2003. Guidelines for investing in, or acquiring, an established
franchising system. Venture Economics, 9(12), 34-37.
Siegel, W. 1983. Franchising, John Wiley & Sons: New York.
Siegel, S. 2002. Fostering franchise relations. Franchising World, 34(6), 4-6.
Silvestro, R. 2002. Dispelling the modern myth: employee satisfaction and loyalty
drive service profitability. International Journal of Operations and Production
Management, 22(1), 30-49.
Silvestro, R., Cross, S. 2000. Applying the service profit chain in a retail environment:
challenging the satisfaction mirror. International Journal of service Industry
Management, 11(3), 244-268.
Sim, K.L., Koh, H.C. 2001. Balanced scorecard: a rising trend in strategic
performance measurement. Measuring Business Excellence, 5(2), 18-27.

403
Soderland, M. 1998. Customer satisfaction and it’s consequences on customer
behaviour revisited. International Journal of Service Industry Management, 9(2), 169-
188.
Solomon, J. 1998. Companies try measuring cost savings from new types of corporate
benefits. The Wall Street Journal, B1.
Spinelli, S. 1997. Franchising, in Bygrave, W.D. (Ed). The Portable MBA in
Entrepreneurship, 2nd Edition, John Wiley: New York.
Stanworth, J. 1977. A Sstudy of Franchising in Britain, University of Westminister:
London.
Stevens, G. 1989. Integrating the supply chain. International Journal of Physical
Distribution and Materials Management, 19(8), 3-8.
Stokes, D., Lomax, W. 2002. Taking control of word of mouth marketing: the case of
an entrepreneurial hotelier. Journal of Small Business and Enterprise Development,
9(4), 349-357.
Storbacka, K., Strandvik, T., Gronroos, C. 1994. Managing customer relationships for
profit: the dynamics of relationship quality. Managing Customer Relationships, 5(5),
21-38.
Strauss, B. 1995. Internal services: classification and quality management. Journal of
Service Industry Management, 6(2), 62-78.
Strauss, B., Chojnacki, K., Decker, A., Hoffman, F. 2001. Retention effects of a
customer club. International Journal of Service Industry Management, 12(1), 7-19.
Struwig, F.W, Stead, G.B. 2001. Planning, designing and reporting research, Pearson
Education: Cape Town.
Sudman, S., Blair, E. 1998. Marketing Research: A problem-solving approach, 1st
Edition, McGraw-Hill: Boston.

404
Sundaram, C.S., Jurowski, C., Webster, C. 1997. Service failure recovery efforts in
restaurant dining: the role of criticality of service consumption. Hospitality Research
Journal, 20(3), 137-149.
Sureshchandar, G.S., Rajendran, C., Anantharaman, R.N. 2002. The relationship
between service quality and customer satisfaction-a factor specific approach. Journal
of Services Marketing, 16(4), 363-379.
Sydow, J. 1998. Franchise systems as strategic networks studying network leadership
in the service sector. Asia Pacific Journal of Marketing and Logistics, 10(2), 108-120.
Szarka, J. 1990. Networking and small firms. International Small Business Journal,
2(1), 10-22.
Teas, R.K. 1994. Expectations as a comparison standard in measurement of service
quality; an assessment of a reassessment. Journal of Marketing, 58(1), 28-43.
Teas, R.K. 1993. Expectations, performance, evaluation, and consumers’ perceptions
of quality. Journal of Marketing, 57(4), 18-34.
Temporal, P., Trott, M. 2001. Romancing the Customer: Maximizing Brand Value
Through Powerful Relationship Management, Wiley & Sons: Singapore.
The Benchmarking Exchange (TBE) 2004. Benchmarking and Best Practices, URL:
http://www.benchnet.com/wib.htm
Thompson, J.L. 1999. The World of the Entrepreneur - a new perspective. Journal of
Workplace Learning: Employee Counselling Today, 11(6), 209-224.
Thompson, J.L. 2002. The Character of the New Zealand Entrepreneur, in Bartercard
New Zealand Global Entrepreneurship Monitor 2002.
Tikoo, S. 1996. Assessing the franchise option. Business Horizons, 9(3), 78.
405
Timmons, J.A. 1997. Opportunity Recognition, in Bygrave, W.D. (Ed). The Portable
MBA in Entrepreneurship, 2nd Edition, John Wiley: New York.
Timmons, J.A. 1986. Growing up Big: Entrepreneurship and the Creation of High
Potential Ventures, in Sexton, D., Smilor, R.W. (Eds). The Art and Science of
Entrepreneurship, Ballinger: London
Timmons, J.A., Spinelli, S. 2004. New Venture Creation: Entrepreneurship for the
21st Century, Irwin McGraw-Hill, Boston.
Tomzcak, T., Dittrich, S. 1999. “ Kundenclubs als Kundenbindungsinstrument” in
Bruhn, M., Homburg, C. (Eds), Handbuch Kundenbindungsmanagement, 2nd Ed,
Gabler: Wiesbaden.
Treacy, M., Wierema, F. 1995. The Discipline of Market Leaders, HarperCollins:
London.
Trochim, W.M.K. 1997. Knowledge Base: An Online Research Textbook:
Introduction to Evaluation, Cornell University.
Trubik, E., Smith, M. 2000. Developing a model of customer defection in the
Australian banking industry. Managerial Auditing Journal, 15(5), 199-208.
Tung-Zong, C., Su-Jane, C. 1998. Market orientation, service quality and business
profitability: a conceptual model and empirical evidence. The Journal of Services
Marketing, 12(4), 246-264.
Utsch, A., Rauch, A. 2000. Innovativeness and initiatives as mediators between
achievement orientation and venture performance. European Journal of Work and
Organisational Psychology, 9(1), 45-62.
Van Der Wagen, L. 1994. Building Quality Service with Competency Based Human
Resource Management. Butterworth-Heinemann: Port Melbourne.

406
Van der Wiele, T., Boselie, P., Hesselink, M. 2002. Empirical evidence for the
relationship between customer satisfaction and business performance. Managing
Service Quality, 12(3), 184-193.
Van Rensburg. 2002. Finding your way in academic writing. Van Schaik Publishers:
Pretoria.
Varey, R.J. 1995. Internal marketing: a review and some interdisciplinary research
challenge. Journal of Service Industry Management, 6(1), 40-63.
Varney, S. 1996. Database marketing predicts customer loyalty. Datamation, 42(17),
50-53.
Vavra, T.G. 1997. Improving Your Measurement of Customer Satisfaction: A Guide to
Creating, Conducting, Analyzing, and Reporting Customer Satisfaction Measurement
Programs. ASQ Quality Press: Sydney.
Vilares, M.J., Coelho, P.S. 2003. The employee-customer satisfaction chain in the
ECSI model. European Journal of Marketing, 37(11), 1703-1722.
VSDA 2001. An Annual Report on the Home entertainment industry 2001, Corporate
Creative, Inc: Northridge.
Walker, O., Boyd, H., Larreche, J. 1999. Marketing Strategy-Planning and
Implementation, Mcgraw-Hill: Singapore.
Webster, C. 1990. Towards the measurement of marketing culture of a service firm.
Journal of Business Research, 21(12), 345-346.
Webster, F.E. 1992. The changing role of marketing in the corporation. Journal of
Marketing, October, 1-17.
Webster, F.E., Wind, Y. 1972. Organisational Buying Behaviour, Prentice Hall:
Engelwood Cliffs, NJ.
407
Whybrow, P.C. 1999: A Mood Apart, Picador: Epping.
Wicking, N. 1995. Leveraging core competencies, Business Franchise, October.
Wicklund, J. 1999. The sustainability of the entrepreneurial orientation performance
relationship. Entrepreneurship Theory and Practice, 24(1), 37-48.
Wilkins, M.J. 2003. Learning from the other guy: benchmarking and best practices.
Control Engineering, 50(1), 17-23.
Williams, E. 2000. Franchising the New Zealand Way, Institute of Chartered
Accountants of New Zealand, Excel: Wellington, NZ.
Williams, R., Visser, R. 2002. Customer satisfaction: it is dead but will not lie down.
Managing Service Quality, 12(3), 194-200.
Williams, S. 1998. Break-Out: Life beyond the Corporation, Penguin: London.
Wilson, A. 1994. Stimulating referrals. Management Decision, 32(7), 13-15.
Wilson, R.M.S., Gilligan, C. 1997. Strategic Marketing Management: Planning,
Implementation and Control, 2nd Edition, Butterworth Heinemann: Oxford.
Wisniewski, M 2001. Using SERVQUAL to assess customer satisfaction with public
sector services. Managing Service Quality, 11(6), 380-388.
Withane, S. 1991. Franchising and franchise behaviour. An examination of opinions,
personal characteristics, and motives of Canadian franchisee entrepreneurs. Journal of
Small Business Management, 29(1), 22-29.
Wong, A., Sohal, A. 2003. Service quality and customer loyalty perspectives on two
levels of retail relationships. Journal of Services Marketing, 17(5), 495-513.
Woods, B. 1998. Applying Psychology in Sport, Hodder and Stoughton: London.
408
Wright, M., Storey, J. 1994. Recruitment. In Beardwell, I., Holder, L. (eds), Human
Resource Management, Pitman: London.
Yoon, M.H., Beatty, S.E., Suh, J. 2001. The effect of work climate on critical
employee and customer outcomes: an employee-level analysis. International Journal
of Service Industry Management, 12(5), 500-521.
Yu, Y., Dean, A. 2001. The contribution of emotional satisfaction to consumer
loyalty. International Journal of Service Industry Management, 12(3), 234-250.
Zairi, M. 2000. Managing customer satisfaction: a best practice perspective. The TQM
Magazine, 12(6), 289-394.
Zairi, M. 2000a. Managing customer dissatisfaction through effective complaints
management systems. The TQM Magazine, 12(5), 331-335.
Zeithaml, V.A., Bitner, M.J. 2003. Services Marketing, Integrating Customer Focus
Across The Firm, 3rd Edition, McGraw-Hill Irwin: New York.
Zeithaml, V.A. 1988. Consumer perceptions of price, quality and value: a means-end
model and synthesis of evidence. Journal of Marketing, 52(7), 2-22.
Zeithaml, V.A., Berry, L.L., Parasuraman, A. 1996. The behavioural consequences of
service quality. Journal of Marketing, 60, 31-46.
Zeithaml, V.A., Parasuraman, A., Berry, L. 1990. Delivering Quality Service:
Balancing Customer Perceptions and Expectations, The Free Press: New York, NY.
Zhao, L., Aram, J.D. 1995. Networking and growth of young technology intense
ventures in China. Journal of Business Venturing, 10(5), 349-370.
Zimmerer, T.W., Scarborough, N.M. 1996. Entrepreneurship and New Venture
Formation, Prentice-Hall International: New Jersey.
Zineldin, M. 2000. TRM Total Relationship Management, Studentlitteratur: Lund.

409
Zineldin, M. 1998. Towards an ecological collaborative relationship management, a
co-operative perspective. European Journal of Marketing, 32(11/12), 1138-1164.

APPENDIX 1: MR. VIDEO FRANCHISED OUTLETS
Region/Province Owner Region/Province Owner
Western Cape Athlone M. Mukudden Rondebosch P. Grater Atlantis A. Moorhouse Rylands M. Mukudden Belhar* M. Japhta Saldanha F and A. Truter Bellville 1* E. Scott Somerset-West* K. Joubert Bellville 2* E. Scott Stellenbosch* K. Joubert Bothasig* E. Scott Strand* J. Retief Bishop Lavis* M. Japtha Strandfontein* J. Retief Brackenfell A. Grobler Table View* E. Scott Bredarsdorp* H. van Deventer Tokai O. Lawson Brooklyn W. Peterson Vredendal P. Marais Cape Gate* E. Scott Vredenburg E. Joubert Caledon M. van Rooyen Vrijzee* E. Scott Ceres L. Joubert Wellington P. Beukes Claremont* G. Scarles Woodstock* D. Bosch Cravenby* M. Japhta Worcester* D. Bosch Delft* M. Japhta Durbanville* J. Wheeler/ G. Fischer Northern Cape EersteRivier D. Sullivan Beaconsfield* V and R. Mckaizer Elsiesrivier* E. Scott Kimberley* V and R. Mckaizer Fishhoek D. Swart Springbok W. de Villiers Flamingo Vlei G and C. Blackbeard Upington K. Loubser Gardens* J. Wheeeler/ G. Fischer Goodwood* E. Scott Eastern Cape Gordons Bay* J. Retief East London M. Marais Grabouw S. Bosch George* A. Esterhuizen Grassy Park* E. Kotze George East* A. Esterhuizen Helderview* K. Joubert Jeffreys Bay J. van der Linde Hermanus J. Visser Linton Grange P. Wessels Hout Bay L. Kuhlmann/ P. Grater Lorraine L and I. Olivier Kraaifontein 1* E. Scott Mossel Bay T. Vermaas Kraaifontein 2* E. Scott Oudtshoorn N and L. Breytenbach Kuilsrivier 1* E. Scott Port Elizabeth R. Clark/ N. Hughes Kuilsrivier 2* E. Scott Uitenhage C. Lotriet Lansdowne I. Safodien Umtata B. Mhlungu Lentegeur* R. Kloppers/ D. Botha Umtata 2 E. Mngxali Malmesbury J. Slabber Grahamstown* R. Mckaiser Milnerton V. Esterhuizen Riversdal A. Esterhuizen Modderdam D. Botha Ottery C. Correia Observatory G and B. Gerber Namibia Paarl* E. Scott Windhoek E. Brand Panorama* E. Scott Parklands V. Esterhuizen Botswana Parow* E. Scott Francistown M. Matjola Plumstead* G. Scarles Ravensmead* M. Japhta Retreat* E. Kotze Rocklands* D. Botha/ R. Kloppers Robertson* H. van Deventer * multiple unit franchisee

APPENDIX 1: MR. VIDEO FRANCHISED OUTLETS (continued)
Region/Province Owner Region/Province Owner Gauteng Kwazulu Natal Alberton* C and S. Freire Durban North L. Reeves Alberton South P. Coates Kloof M. Harty Atlasville* J. Eloff Margate R. Sharp Birchleigh* C and S. Freire Northdale* J. Joubert Blackheath* A and T. Savides Pelham* J. Joubert Blairgowrie J. da Silva Pietermaritzburg* J. Joubert Boksburg* J. Eloff Westville R. Munsami Bryanston B. Spindler Winkelspruit L and R. Hulley Carltonville G. Payne Hilton Quarry R and D. Downs Centurion* S. Belluigi Malvern M. Harty Dainfern* J. Le Bihan Freestate Eden Glen C and V Jooste Bethlehem F and C. van der Merwe Faerie Glen H. du Toit Bloemgate* P and W. Vogel Fourways* J. Le Bihan Fleurdal G. Victor Hans Strydom N. Swart Kroonstad J and S. Grobbelaar Hatfield C. Menrinos Ladybrand J. Taljaard Hennopspark* S. Belluigi Naval Hill* P and W. Vogel Witfield N. Roets Welkom H. de Waal Kempton Park A. Cronje Willows* P and W. Vogel Kensington* S. Belluigi Krugersdorp C. Heintje Lakeside R Steyn Northern Province Les Marais H. Adendorff Pietersburg* M. Bezuidenhout Little Falls L and E. Dematos Potgietersrus W. Reed Lynnwood* G. Belluigi Tzaneen* M. Bezuidenhout Zambezi A. Fox Warmbaths A. Beyers Mondeor* A and T. Savides Polekwane* M. Bezuidenhout Morning Glen D. Nicholsen Murrayfield H. du Toit North West Noordheuwel C. Heintje Brits W. Viktor Pretoria North J. Wen Flamwood* N. King Panorama S. de Villiers Klerksdorp* N. King Pretoria West* S. Belluigi Potchefstroom* N. King Primrose M. Moser Rustenburg R. Malherbe Randfontein P. Dick Thabazimbi* A and T. Voges Rynfield B. Hilton Vryburg M. Kriek/ R. Pretorius Senderwood* G. Belluigi Sunnyside T. Claasen Mpumalanga Sunward Park L and T. Parsons Middelburg J. Vorster Vanderbijl Park* J. Visser Nelspruit Crossing D. Bezuidenhoud Vereeniging* J. Visser Standerton G and M. Vienning Weltevredenpark L. Haltmann Witbank* A and T. Voges Wilro Gate* A. Savides Westonaria H. Vierra Waverley M. Swart Winkelspruit L and R. Hulley * multiple unit franchisee

APPENDIX 2: PEARSON’S CORRELATION COEFFICIENTS FOR SERVICE VISION CONSTRUCTS AND VARIABLES TABLE A1: Service profit chain and service quality correlation coefficient analysis
Q 39 40 41 42 43 44 45 46 47 48 49 50 51 52 53 54 55 56 57 58
39 1
40 .784 1
41 .214 .163 1
42 -.016 -.054 .616 1
43 .688 .609 .102 -.090 1
44 .505 .562 -.032 .020 .488 1
45 .612 .655 -.004 .032 .609 .715 1
46 .256 .176 -.050 .091 .289 .583 .343 1
47 .352 .340 .038 .105 .413 .454 .434 .456 1
48 .497 .351 .540 .432 .371 .195 .314 .227 .470 1
49 .504 .511 .127 .063 .521 .543 .553 .318 .393 .280 1
50 .398 .380 .233 .298 .431 .319 .499 .037 .412 .465 .408 1
51 .520 .433 .325 .204 .451 .333 .295 .174 .351 .466 .497 .445 1
52 .554 .663 .067 -.012 .588 .677 .595 .260 .639 .329 .620 .488 .494 1
53 .568 .628 .140 -.037 .583 .580 .578 .360 .578 .400 .618 .488 .475 .770 1
54 .420 .518 .192 .050 .539 .575 .455 .264 .610 .411 .642 .494 .530 .842 .819 1
55 .572 .704 .122 -.005 .519 .568 .610 .195 .502 .309 .533 .478 .510 .779 .809 .786 1
56 .450 .474 .167 -.044 .514 .586 .443 .347 .530 .388 .542 .320 .539 .768 .695 .787 .667 1
57 .472 .487 .439 .213 .386 .421 .413 .170 .427 .613 .421 .515 .461 .509 .624 .595 .555 .553 1
58 .462 .540 .077 -.051 .533 .512 .508 .336 .518 .398 .524 .475 .339 .635 .704 .627 .591 .547 .633 1 Correlation is significant at 0.01 level for all values of 0.260 and above.
Correlation is significant at 0.05 level for all values of 0.207 and above.
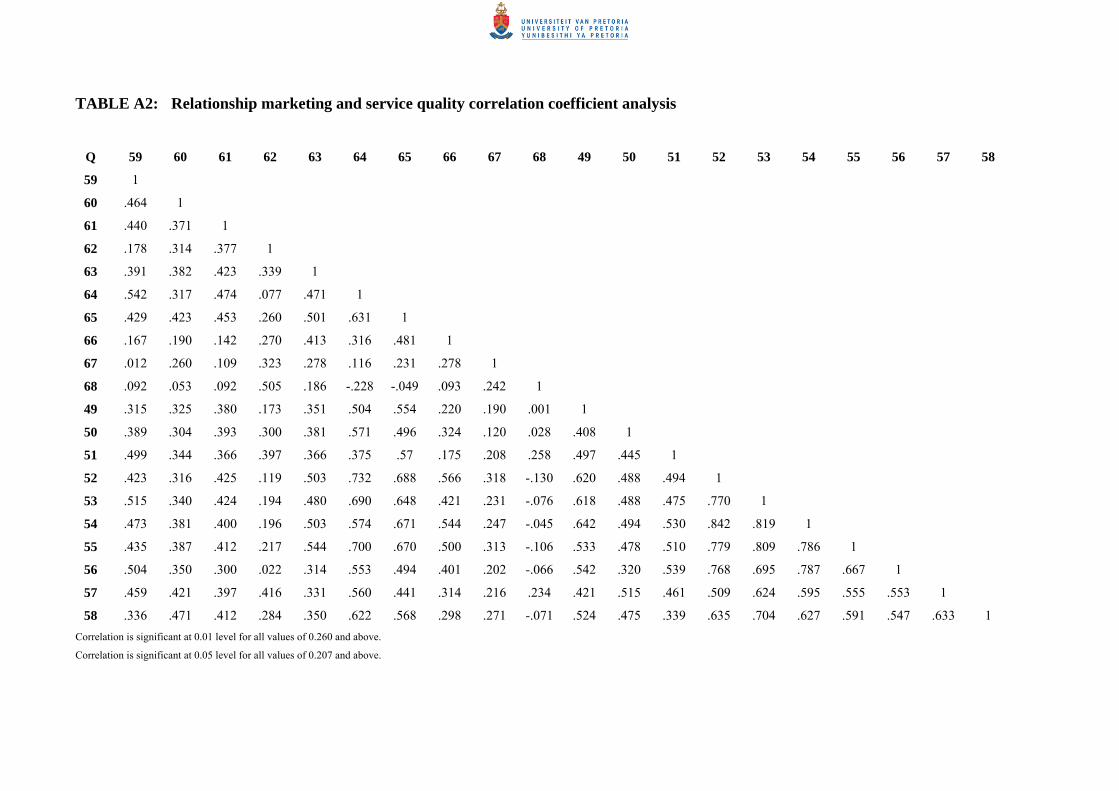
TABLE A2: Relationship marketing and service quality correlation coefficient analysis
Q 59 60 61 62 63 64 65 66 67 68 49 50 51 52 53 54 55 56 57 58
59 1
60 .464 1
61 .440 .371 1
62 .178 .314 .377 1
63 .391 .382 .423 .339 1
64 .542 .317 .474 .077 .471 1
65 .429 .423 .453 .260 .501 .631 1
66 .167 .190 .142 .270 .413 .316 .481 1
67 .012 .260 .109 .323 .278 .116 .231 .278 1
68 .092 .053 .092 .505 .186 -.228 -.049 .093 .242 1
49 .315 .325 .380 .173 .351 .504 .554 .220 .190 .001 1
50 .389 .304 .393 .300 .381 .571 .496 .324 .120 .028 .408 1
51 .499 .344 .366 .397 .366 .375 .57 .175 .208 .258 .497 .445 1
52 .423 .316 .425 .119 .503 .732 .688 .566 .318 -.130 .620 .488 .494 1
53 .515 .340 .424 .194 .480 .690 .648 .421 .231 -.076 .618 .488 .475 .770 1
54 .473 .381 .400 .196 .503 .574 .671 .544 .247 -.045 .642 .494 .530 .842 .819 1
55 .435 .387 .412 .217 .544 .700 .670 .500 .313 -.106 .533 .478 .510 .779 .809 .786 1
56 .504 .350 .300 .022 .314 .553 .494 .401 .202 -.066 .542 .320 .539 .768 .695 .787 .667 1
57 .459 .421 .397 .416 .331 .560 .441 .314 .216 .234 .421 .515 .461 .509 .624 .595 .555 .553 1
58 .336 .471 .412 .284 .350 .622 .568 .298 .271 -.071 .524 .475 .339 .635 .704 .627 .591 .547 .633 1 Correlation is significant at 0.01 level for all values of 0.260 and above.
Correlation is significant at 0.05 level for all values of 0.207 and above.
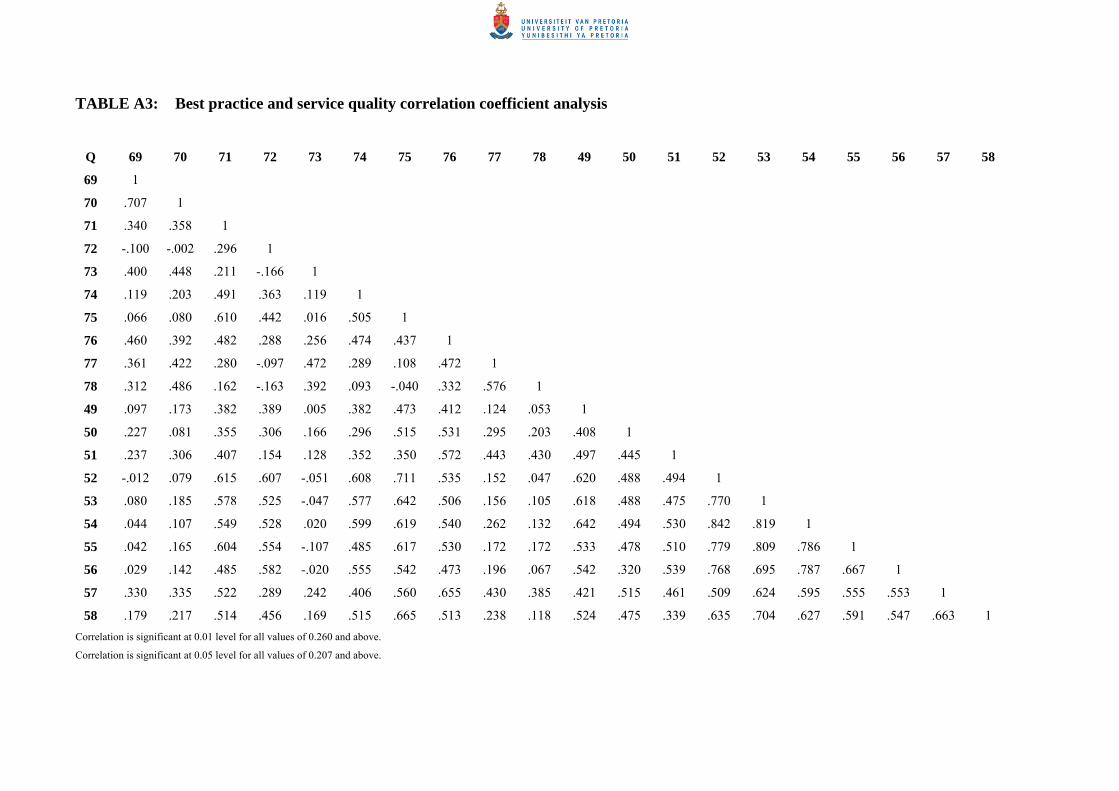
TABLE A3: Best practice and service quality correlation coefficient analysis
Q 69 70 71 72 73 74 75 76 77 78 49 50 51 52 53 54 55 56 57 58
69 1
70 .707 1
71 .340 .358 1
72 -.100 -.002 .296 1
73 .400 .448 .211 -.166 1
74 .119 .203 .491 .363 .119 1
75 .066 .080 .610 .442 .016 .505 1
76 .460 .392 .482 .288 .256 .474 .437 1
77 .361 .422 .280 -.097 .472 .289 .108 .472 1
78 .312 .486 .162 -.163 .392 .093 -.040 .332 .576 1
49 .097 .173 .382 .389 .005 .382 .473 .412 .124 .053 1
50 .227 .081 .355 .306 .166 .296 .515 .531 .295 .203 .408 1
51 .237 .306 .407 .154 .128 .352 .350 .572 .443 .430 .497 .445 1
52 -.012 .079 .615 .607 -.051 .608 .711 .535 .152 .047 .620 .488 .494 1
53 .080 .185 .578 .525 -.047 .577 .642 .506 .156 .105 .618 .488 .475 .770 1
54 .044 .107 .549 .528 .020 .599 .619 .540 .262 .132 .642 .494 .530 .842 .819 1
55 .042 .165 .604 .554 -.107 .485 .617 .530 .172 .172 .533 .478 .510 .779 .809 .786 1
56 .029 .142 .485 .582 -.020 .555 .542 .473 .196 .067 .542 .320 .539 .768 .695 .787 .667 1
57 .330 .335 .522 .289 .242 .406 .560 .655 .430 .385 .421 .515 .461 .509 .624 .595 .555 .553 1
58 .179 .217 .514 .456 .169 .515 .665 .513 .238 .118 .524 .475 .339 .635 .704 .627 .591 .547 .663 1 Correlation is significant at 0.01 level for all values of 0.260 and above.
Correlation is significant at 0.05 level for all values of 0.207 and above.
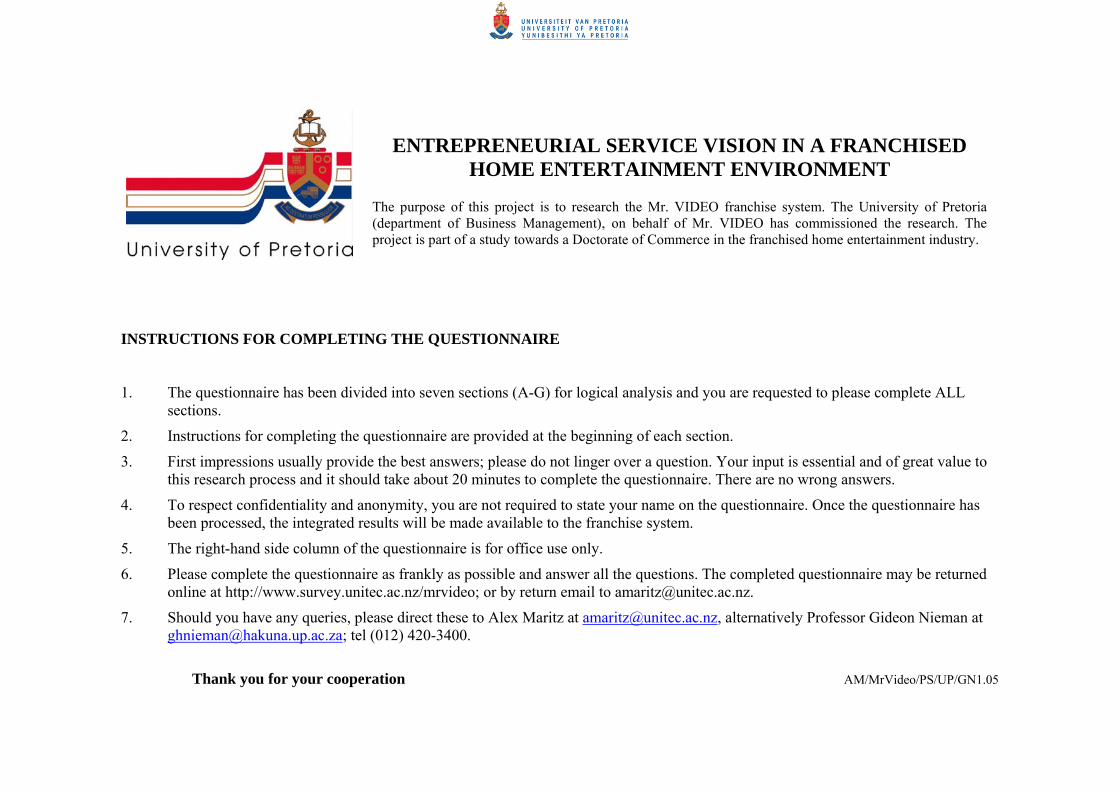
ENTREPRENEURIAL SERVICE VISION IN A FRANCHISED
HOME ENTERTAINMENT ENVIRONMENT The purpose of this project is to research the Mr. VIDEO franchise system. The University of Pretoria (department of Business Management), on behalf of Mr. VIDEO has commissioned the research. The project is part of a study towards a Doctorate of Commerce in the franchised home entertainment industry.
INSTRUCTIONS FOR COMPLETING THE QUESTIONNAIRE 1. The questionnaire has been divided into seven sections (A-G) for logical analysis and you are requested to please complete ALL
sections.
2. Instructions for completing the questionnaire are provided at the beginning of each section.
3. First impressions usually provide the best answers; please do not linger over a question. Your input is essential and of great value to this research process and it should take about 20 minutes to complete the questionnaire. There are no wrong answers.
4. To respect confidentiality and anonymity, you are not required to state your name on the questionnaire. Once the questionnaire has been processed, the integrated results will be made available to the franchise system.
5. The right-hand side column of the questionnaire is for office use only.
6. Please complete the questionnaire as frankly as possible and answer all the questions. The completed questionnaire may be returned online at http://www.survey.unitec.ac.nz/mrvideo; or by return email to [email protected].
7. Should you have any queries, please direct these to Alex Maritz at [email protected], alternatively Professor Gideon Nieman at [email protected]; tel (012) 420-3400.
Thank you for your cooperation AM/MrVideo/PS/UP/GN1.05

UNIVERSITY OF PRETORIA (department of Business Management) RESEARCH QUESTIONNAIRE
SECTION A: Demographic and biographical information Please answer the questions below by encircling the appropriate code. 1. Gender of Franchisee
Male 1 V1 1-3 Female 2 V2 4
2. Race of Franchisee
White 1 Black 2 Asian 3 Coloured 4 V3 5
3. Region/Province of Franchised Outlets
Gauteng 1 Mpumalanga 2 Limpopo 3 North West 4 Free State 5 KwaZulu Natal 6 Western Cape 7 Eastern Cape 8 Northern Cape 9 V4 6
4. Years as a Franchisee in the Mr. VIDEO franchise system
0-2 years 1 3-5 years 2 6-8 years 3 9+ years 4 V6 8

5. Number of full time employees in your outlet/s as at November 2004
1-2 employees 1 3-5 employees 2 6-8 employees 3 9+ employees 4 V7 9
6. Number of part time employees in your outlet/s as at November 2005
1-2 employees 1 3-5 employees 2 6-8 employees 3 9+ employees 4 V8 10
7. Number of Mr. VIDEO outlets of which you are the Franchisee
1 outlet 1 2 outlets 2 3-5 outlets 3 6+ outlets 4 V9 11
8. Family members (including yourself) active in your franchised outlet/s
1 1 2-3 2 4 + 3 V10 12

SECTION B: Entrepreneurial orientation Please indicate your agreement/disagreement with the following statements reflecting your personal viewpoint.
Statements
Strongly disagree
1
Disagree 2
Un- decided
3
Agree
4
Strongly agree
5
9. I enjoy having the expertise to be able do things others cannot do V11 13 10. My mind is always full of ideas and I enjoy doing unusual things V12 14 11. I thrive on uncertainty and take on opportunities to achieve my goals V13 15 12. I am naturally impatient and often think I am not doing as much as I should V14 16 13. I set personal targets for myself all the time and check on my progress V15 17 14. I appreciate you have to influence people and situations to make things happen and I am good at it
V16 18
15. I generally know what’s important and so I limit my options and stick with these priority tasks
V17 19
16. When faced with a deadline I find it easy to concentrate my time and effort and meet it
V18 20
17. It matters to me whether I achieve more in life and business than my parents and my close friends
V19 21
18. My motto is ‘when the going gets tough, the tough get going’ - because setbacks give me stimulation
V20 22
19. I am naturally gregarious, quickly relating to other people, and thinking of things we could work on together
V21 23
20. I pride myself with being able to envision a clear route forward, taking necessary action to achieve that vision
V22 24
21. When I have what I think is a good idea I find I can sell it to other people V23 25 22. I can trust people to take responsibility for things and I am happy to delegate this responsibility to them
V24 26
23. At heart I am a people person and I enjoy helping others achieve their goals and targets
V25 27
24. When I am part of a team, I play a chairing, co-ordinating role and bring out the best in others
V26 28
25. People would describe me as systematic and organized for I have a keen eye for detail
V27 29
26. I prefer structure and routine and am uncomfortable with constant change and uncertainty
V28 30
27. I get an extra kick at work when other people visibly approve of the way I do things
V29 31
28. I enjoy working closely with people I trust and know well V30 32

SECTION C: The franchise system Please indicate your agreement/disagreement with the following statements reflecting your personal viewpoint.
Statements Strongly disagree
1
Disagree
2
Un-decided
3
Agree
4
Strongly Agree
5
29. In the Mr. VIDEO franchise system, innovation and creativity is solely the responsibility of the franchisor
V31 33
30. Franchisees are seen as idea generators in the Mr. VIDEO franchise system
V32 34
31. Proactivity and risk taking of franchisees is enhanced in the Mr. VIDEO franchise system
V33 35
32. Incremental wealth is stimulated at franchisee level within the Mr. VIDEO franchise system
V34 36
33. Good franchise relationships require a conscious effort from franchisee and franchisor
V35 37
34. Trust and respect in the Mr. VIDEO franchise system is essential towards fostering a good relationship
V36 38
35. Areas of disputes and conflicts are adequately handled within the Mr. VIDEO franchise system
V37 39
36. Franchisee contributions and suggestions are encouraged by the franchisor
V38 40
37. The Mr. VIDEO franchise system is an entrepreneurial option towards creating and developing new ventures
V39 41
38. Overall, the Mr. VIDEO franchise meets my business objectives and expectations
V40 42
Any other comments you would like to make regarding the Mr. VIDEO franchise system? V41 43-44

SECTION D: The service profit chain Please indicate your agreement/disagreement with the following statements reflecting your personal viewpoint.
Statements Strongly disagree
1
Disagree
2
Un-decided
3
Agree
4
Strongly Agree
5
39. Customer satisfaction leads to long term profitability of your franchised outlet/s
V42 45
40. Employee satisfaction leads to customer satisfaction V43 46 41. The Mr. VIDEO franchise system encourages franchisee best practice exchanges and interaction
V44 47
42. The Mr. VIDEO franchise system has optimal customer feedback, complaint and suggestion systems
V45 48
43. Empowering employees and enhancing quality of worklife lead to employee loyalty
V46 49
44. My outlet/s maintain active relationships with current customers
V47 50
45. My outlet/s concentrate on retaining existing customers V48 51 46. My customers are encouraged to purchase related services, such as confectionary and video accessories
V49 52
47.My outlet/s implement strategies to encourage referral and word of mouth communication
V50 53
48. My outlet/s measure the lifetime value of customers (loyal customers that return time after time)
V51 54
Any other comments you would like to make regarding the service profit chain? V52 55-56

SECTION E: Service quality Please indicate your agreement/disagreement with the following statements reflecting your personal viewpoint.
Statements Strongly disagree
1
Disagree
2
Un-decided
3
Agree
4
Strongly Agree
5
49. My outlet/s delivers on customer promises V53 57 50. My outlet/s performs the service right the first time V54 58 51. Employees of my outlet/s are always willing to help customers
V55 59
52. Employees of my outlet/s provide prompt service V56 60 53. Customers feel safe in their transactions with my outlet/s V57 61 54. The behaviour of employees in my outlet/s instils confidence in customers
V58 62
55. My outlet/s has the customers best interest at heart V59 63 56. My outlet/s has employees who give customers individual attention
V60 64
57. My outlet/s physical facilities are visually appealing V61 65 58. It is realistic to expect my outlet’s employees to know what the needs of the customer are
V62 66
Any other comments you would like to make regarding service quality? V63 67-68

SECTION F: Relationship marketing Please indicate your agreement/disagreement with the following statements reflecting your personal viewpoint.
Statements Strongly disagree
1
Disagree
2
Un-decided
3
Agree
4
Strongly Agree
5
59. My outlet achieves competitive advantage against opposition home entertainment outlets through improved customer interaction and responsiveness
V64 69 60. My outlet/s is prone to relationship focus as opposed to transaction focus
V65 70
61. Superior supplier relationships add value to my outlet’s service offering
V66 71
62. The supply chain relationships between the Mr. VIDEO system and the major suppliers are built on trust and reciprocity
V67 72
63. Marketing orientation and marketing culture of my outlet/s influence positiveness about the organisation (Mr. VIDEO franchise system)
V68 73 64. Retaining existing customers leads to customer loyalty and lifetime customers
V69 74
65. Internal marketing initiatives such as enhancing internal quality of work-life are encouraged by my outlet/s
V70 75
66. Franchise system relationships between franchisee and franchisor are an integral component of Mr. VIDEO internal marketing and communication
V71 76 67. My outlet/s have optimal associations and alliances with other industry participants
V72 77
68. Mr. VIDEO Franchise measure franchisee satisfaction levels V73 78 Any other comments you would like to make regarding relationship marketing?
V74 79-80

SECTION G: Industry best practice Please indicate your agreement/disagreement with the following statements reflecting your personal viewpoint.
Statements Strongly disagree
1
Disagree
2
Un-decided
3
Agree
4
Strongly Agree
5
69. My outlet/s continually evaluate it’s markets and customers V75 81 70. My outlet/s has a developed vision and strategy in the long term
V76 82
71. My outlet/s focus product and service offerings on customer satisfaction through meeting or exceeding expectations
V77 83
72. My outlet/s believes that strong focus on community involvement drives awareness and loyalty
V78 84
73. Direct mail is used as a cost effective tool used to drive frequency of active and inactive customers
V79 85
74. Strong relationships and loyalty are developed between employees and customers of my outlet/s through consistency of management and staff
V80 86 75. A pleasing outlet is important to keeping your customers coming back
V81 87
76. I regularly remodel and update my outlet/s to reinforce a strong and positive image to customers
V82 88
77. My outlet/s operating procedures are clearly documented for consistency of execution from staff in an operations manual
V83 89
78. Mr. VIDEO franchise encourage the communication of best practice initiatives within the franchise system
V84 90
Any other comments that you would like to make regarding home entertainment industry best practice?
V85 91-92 V86 93-94
THANK YOU FOR YOUR COOPERATION