emergence of thermodynamic restriction and its implications for full-scale reverse osmosis processes
TRANSCRIPT

• " z ~ ' ~ " " : e w~l_
E L S E V I E R Desalination 155 (2003) 213-228
DESALINATION
www.elsevier.com/locate/desal
Emergence of thermodynamic restriction and its implications for full-scale reverse osmosis processes
Lianfa Song a*, J.Y. Hu a, S.L. Ong a, W.J. Ng ", Menachem Elimelech b, Mark Wilt ~ *'Department of Civil Engineering, Water and Biotreatment Group, National University of Singapore,
10 Kent Ridge Crescent, Singapore 119260 Tel. + 65 6874-8796; Fax: + 65 6779-1635; email: cvesl)~nus.edu.sg
~'Department of Chemical Engineering, Environmental Engineering Program, Yale University, PO Box 208286, New Haven, CT 06520-8286, USA
CHydranautics, 401 Jones Road, Oceanside, CA 92054, USA
Received 6 November 2002; accepted 20 December 2002
Abstract
The production rate of permeate in a reverse osmosis (RO) process controlled by mass transfer is proportional to the net driving pressure and the total membrane surface area. This linear relationship may not be the only mechanism controlling the performance of a full-scale membrane process (typically a pressure vessel holding six 1 -m-long modules in series) which utilizes highly permeable membranes. The mechanisms that control the performance of an RO process under various conditions were carefully examined in this study. It was demonstrated that thermodynamic equilibrium can impose a strong restriction on the performance of a full-scale RO process under certain circumstances. This thermodynamic restriction arises from the significant increase in osmotic pressure downstream of an RO membrane channel due to the accumulation of rejected salt within the RO channel as a result of permeate water production. Concentration polarization is shown to have a weaker influence on the full-scale RO process performance than the thermodynamic restriction. The behavior of the process under thermodynamic restriction is quite different from the corresponding behavior that is controlled by mass transfer. The transition pressure for an RO process to shift from a mass transfer controlled regime to a thermodynamically restricted regime was determined by the basic parameters of the full-scale RO process.
Keywords." Reverse osmosis; RO process design performance; Mass transfer; Thermodynamic restriction; Full-scale RO; Theory; RO process design
*Corresponding author.
0011-9164/03/$- See front matter © 2003 Elsevier Science B.V. All rights reserved PII: S0011-9164(03)00300-x

214 L. Song et al. /Desalination 155 (2003) 213-228
I. Introduction
The early reverse osmosis (RO) membranes used for desalination were characterized by very low permeability [ 1 ]. This characteristic dictated that a primary task for module design was to increase mass (water) transfer coefficient and to squeeze as large a membrane surface area as possible into a module. In practical applications, up to six or seven membrane modules in series (usually held inside a pressure vessel) were necessary to achieve a reasonable recovery (e.g., around 40% or above in a stage). The full-scale RO processes with low permeability membranes were typical cases where the performance was controlled by mass (water) transfer through the membranes.
In the last two decades, RO membrane permeability has been significantly increased (at least one order of magnitude) with the advent of new membrane materials and surface modifi- cations [2-4]. With more permeable membranes, it was expected that the production rate per unit membrane area could be significantly increased. However, the outcome was rather disappointing in this respect: the average permeate flux of a long pressure vessel was virtually unchanged. Instead, the working pressures employed for the newer generation RO membranes are sub- stantially lowered than before. This has led to the emergence of the so-called low-pressure reverse osmosis (LPRO) and ultra-low-pressure reverse osmosis (ULPRO) membranes. Although the decrease of working pressure is beneficial, an increase in water production rate is desirable as well. Naturally, there is a question to ask: why can't the permeate flux of the RO process be significantly increased?
Concentration polarization is commonly blamed for lowering the production rate of the RO process. Numerous studies have been carried out in order to advance the understanding of concentration polarization and its effect on the performance of the RO process. One way to
quantify this effect is to refine the calculations of the mass transfer coefficient by accounting for concentration polarization [5-8]. The basic assumption here is that the RO process is governed by mass (both water and solute) transport through the membrane, and a better quantification of the mass transfer coefficient would eventually improve the accuracy of RO performance prediction.
Concentration polarization is a recognized mechanism that reduces the permeate flux [9,10]. It was demonstrated that in a channel free of spacers, the salt concentration at the membrane surface could be a few times higher than that in the bulk for high feed salt concentrations [ 10,11 ]. However, concentration polarization effects become weaker as the feed salt concentration decreases. Owing to the large diffusion coeffi- cient of salt, the narrow channel height, and the presence of spacers to promote mixing, concen- tration polarization is unlikely to develop signi- ficantly in a spiral-wound membrane module at low range of feed salt concentrations.
Recently, Song et al. [12] suggested that mass transfer alone was not sufficient to describe a full-scale RO process. Variations of process parameters along the membrane surface must be considered in process simulation. It was demon- strated that the performance of a full-scale RO water desalination plant with spiral-wound membranes could be more accurately predicted when the local variations of process parameters along the membrane channel were incorporated. In the simulation of the full-scale RO process, a linear relationship between the osmotic pressure and the salt concentration was used. Results demonstrated that the average permeate flux of the full-scale RO process deviates significantly from a linear dependence on the transmembrane pressure. Concentration polarization could not be the cause of the non-linearity found in that study because it was not considered. It was presumed in that study that concentration polarization would not develop significantly in the spiral-wound

L. Song et al./ Desalination 155 (2003)213-228 215
membrane module. The observed non-linearity between permeate flux and transmembrane pressure of the full-scale RO process is likely attributed to thermodynamic restriction. Thermo- dynamic restriction means that the osmotic pressure of the concentrate can increase to the same level as the transmembrane pressure within the RO channel. As a result, all permeate that could be produced by the RO process would permeate out of the membrane before the flow reaches the end of the channel; the remaining portion of the membrane channel would not produce any more permeate.
With continuous improvements in membrane permeability, thermodynamic restriction will play an increasingly important role in a full-scale RO process for water desalination. Furthermore, thermodynamic restriction seems to provide a new angle to explain many phenomena that are often observed in full-scale RO processes. Lack of awareness or knowledge of thermodynamic restriction in the RO process may lead to inefficient process design that cannot fully utilize the capacity of the highly permeable membranes.
The objective of this paper is to rigorously demonstrate that thermodynamic restriction is a limiting factor of RO processes under common conditions. For this purpose, the governing equations for the performance of an RO process controlled by different mechanisms were formulated. The critical conditions on which the process shifts from mass transfer limited regime to thermodynamic equilibrium controlled regime were derived. A simple design example is presented to illustrate that thermodynamic restriction, rather than mass transfer, usually determines the operating conditions (e.g., trans- membrane pressure) in the second and third stages of a full-scale RO process. The features of an RO process operated in the thermodynamic restriction regime are discussed, and further studies on thermodynamic restriction in RO process are suggested.
2. Theoretical development
The performance of an RO is usually assessed in terms of water quality and permeate quantity. Water quality of permeate is usually not a serious problem in an RO process because the currently used membranes can easily attain a salt rejection higher than 99%. One of the primary concerns of an RO process is the quantity of water produced by the process because it is usually desirable that as much as possible water is produced from an RO process. The mechanisms that eventually control the production rate of an RO process are discussed and the pertinent governing equations developed below.
In most chemical or industrial separation processes, the production rate is determined by one of the two major controlling mechanisms, namely kinetics and equilibrium. The production rate is limited by kinetics for slow reactions and processes whereas it is determined by equili- brium for fast ones. Similarly, an RO process can also be controlled by either mass transfer (kinetics) or thermodynamic equilibrium. The term "mass transfer", as used in this paper, refers to the process of water passing through the RO membrane [ 13].
In the following section, theories for the per- formance of an RO process are developed for both mass transfer controlled and thermo- dynamic equilibrium restricted cases. The effect of concentration polarization on the performance of the mass transfer controlled RO process is also considered. Water recovery of the RO process is used as the major performance parameter in the following derivation. The permeate flux, if desired, can be calculated directly from the recovery.
2.1. Mass transfer limited RO process
The permeate flux v through RO membrane can be calculated from

216 L. Song et a l . / Desalination 155 (2003) 213-228
v - A p - a n Rm (1)
where R,, is the membrane resistance, Ap is the transmembrane pressure, and Arc is the osmotic pressure difference between the feed and the permeate.
Let u0 indicate the feed flow velocity to an RO channel of length L and height H, the feed flow rate (per unit width), Q:, is given by
Qf = UoH (2)
When the process is controlled by mass transfer, the variation of the net driving force across the membrane channel is negligible. The permeate flow rate (per unit width), Qp, can be calculated with
Qp = Lv = L Ap-A R (3/
m
r = F(Ap-A~) (6)
Eq. (6) is the theoretical basis for the linear dependence of recovery on the net driving pressure in a mass transfer limited RO process.
2.2. Concentration polarization in a mass transfer limited RO process
Concentration polarization is a phenomenon inherent in all membrane processes. To clarify the effect of concentration polarization on the performance of a full-scale RO process, a rigorous formulation for permeate recovery is developed below. The mass transfer limited case and constant cross-flow velocity are assumed to simplify the derivation.
From the principle of mass balance for salt, the following equation holds at any point x along the filtration channel [9,10]
Thus, the recovery of this process is determined by
r - m
C Qf uoH ~ = u°HR" ( 4 )
It can be seen from Eq. (4) that the recovery of an RO process is proportional to the net driving pressure (Ap-An). The coefficient is determined by the rest of the parameters of the membrane system, except the net driving pressure. Obviously, the membrane filtration process is characterized by this coefficient. For this reason, the coefficient will be named the filter coefficient F, i.e.,
L F - - - (5)
uoHR m
The recovery for the mass transfer limited RO process, therefore, becomes
n x
f uo C dy = r: f 0 0
(7)
where C (=c-c0) is the concentration of the retained salt [9], c is the salt concentration, co is the feed salt concentration, and rj is the salt rejection. In a spiral-wound RO membrane module, the cross-flow velocity can be assumed to be uniformly distributed across the sectional area of the channel because of the turbulence enhancing spacers. The distribution of the retained salt in the transverse direction of the channel can be written as [9]
vy
C : Ae -6 (8)
where A is a coefficient to be determined and D is the salt diffusion coefficient. The value of A can be determined by substituting Eq. (8) into Eq. (7):

L. Song et a l . / Desalination 155 (2003) 213-228 217
A = x X
c0v f vd== 5c: Duo[1-exp(-vZ/D)] o Duo o
(9)
The value of the term in the square brackets is about unity in most cases.
Substituting Eq. (9) into Eq. (8) results in
affected by concentration polarization can then be determined as
r = 2,,(,'p-,,,,o)
I I 2ano(AP-ano) L (14) uoHR m 1 + 1 + 2 Uo E R.,
X r .t, 0 . ,
C = j u exp (-vy/D)v Jvdx Duo o
(lO)
The wall (membrane surface) concentration is determined by lettingy = 0 in Eq. (10):
x
,Co v f C w - Duo o
(11)
The osmotic pressure is usually assumed to be linearly related to the salt concentration. Hence, the osmotic pressure at the membrane surface is
,,,, ::o,(Co+C.)
=Arc 0 1+ rj v vdx DUo o
(12)
2. 3. Thermodynamic (equilibrium) controlled RO process
A full-scale RO process usually has a long membrane channel and a high recovery rate. Salt concentration of the concentrate can reach an equilibrium value inside the filtration channel for a given transmembrane pressure and remain unchanged throughout the rest of the channel. This process is then said to be at thermodynamic equilibrium. This phenomenon is illustrated in Fig. 1. The highest net driving pressure (Ap- A~z) occurs at the entrance end of the channel because of the low osmotic pressure of the feed water. As the osmotic pressure of the feed water increases downstream due to the increasing salt concen- tration, the local net driving pressure decreases along the membrane channel. If the membrane is
wherefo, is the osmotic pressure coefficient and An0 is the feed (bulk) osmotic pressure.
Combining Eqs (1) and (12), the flux v at any point x in a filtration channel can be written as
1
R m
/ /] A p - A n o 1 + J, v f vdx D.o 'o )
(13)
Eq. (13) can be solved for the local permeate velocity v and the average permeate V (see Appendix A). The recovery of an RO process
"--•,•flux, v
" ~ ( _4,0 - J x = 0
O0 net driving I V pressure I A
X
Fig. 1. S c h e m a t i c de sc r i p t i on o f t h e r m o d y n a m i c res t r ic -
t ion in a fu l l - sca le R O p roces s .

218 L. Song eta]./Desalination 155 (2003) 213-228
sufficiently permeable and the channel is sufficiently long, it is possible for the osmotic pressure to become equal to the transmembrane pressure within the RO membrane channel. The part of membrane channel under zero driving pressure will not contribute to the permeate production. In this case, the performance of the RO process is quite different from the mass transfer controlled process. The recovery under the restriction of thermodynamic restriction can be determined as follows.
To simplify the derivation, complete salt rejection is assumed, which leads to
Q: =Q:Co (15)
where Qc and cc are the flow rate (per unit width) and salt concentration of the concentrate, respectively. From Eq. (15), one gets
Qc CO - (16)
Qs Cc When the osmotic pressure of the concentrate is equal to the transmembrane pressure, the salt concentration in the concentrate can be calcu- lated by
Ap (17) cc='Xc- fo,
where f,,~ is the osmotic coefficient that relates salt concentration to osmotic pressure. The recovery is then given with
r - QP - 1 - Q~- : l - ~ ° (18) Q: Q: where Ar~ 0 =fo~Co is the osmotic pressure of the feed solution.
Eq. (18) shows that when thermodynamic equilibrium is established in a full-scale RO process, the recovery of the system is determined only by thermodynamic parameters, namely, the
osmotic pressure of the feed water and the trans- membrane pressure. Other process parameters of the RO system, such as channel length, feed flow rate, and membrane resistance, have no effect on water recovery.
3. Resu l t s a n d d i s cus s ion
Performance of a full-scale RO process under various operating conditions was simulated with the equations developed in the previous section. The main purpose of the simulations was to illustrate the dominant mechanisms of the RO process under various conditions. The particular behavior of the membrane process under different control mechanisms is discussed.
Parameter values used as default in the simu- lations are listed in Table 1. Any values that are different from the table will be explicitly indi- cated. For the mass transfer limited process, the change in salt concentration along the feed channel is negligible. Consequently, the osmotic pressure A~ in such cases is approximately equal to the osmotic pressure of the feed Ar~ o (when neglecting concentration polarization effects). The default membrane resistance of 1.5 × 10¹¹ Pa- s/m used in this study is a conservative choice.
Table 1 Parameter values for model simulation
Parameter Value
Temperature, °C 25 Universalgas constant, Pa-l.mol-~.K -~ 8.314×10³ Feed channel height, m 5× 10 -4 Total length of membrane, m 6 Membrane resistance paos.m- ~ 1.5 × 10 H Membrane salt rejection, % 99% Salt concentration, mol/1 (ppm) 0.05 (2925) Salt diffusion coefficient, m2/s 1.0× 10 -9 Cross-flow velocity, m/s 0.1 Transmembrane pressure, Pa (ps i ) 3.5×10⁶ (500)

L. Song et al. / Desalination 155 (2003) 213-228 219
Nowadays, RO membranes can easily have a resistance of around 1.0x l 0 II Pa-s/m, and lower pressure RO membranes can have an even smaller resistance.
The van't Hoffequation was used to calculate the osmotic pressure, i.e., the osmotic pressure coefficient as defined in Eq. (17) is determined as
fo, = 2 R T (19)
where R is the universal gas constant and Tis the absolute temperature. It is noted that some empirical equations are often used to estimate the osmotic pressure of feed water. These equations can be used in place of Eq. (19) for better accuracy.
3.1. Mass transfer limited regime and thermo- dynamic equilibrium controlled regime
Four recoveries for the mass transfer limited cases for different membrane resistances are shown in Fig. 2 with a recovery under thermody- namic restriction. The thermodynamic restricted recovery profile is a curved line that approaches unity as the transmembrane pressure increases to infinity. In contrast, the recoveries of the mass transfer limited processes increase linearly with pressure and the increasing rate is dependent on the membrane resistance. A full-scale RO process is controlled by mass transfer at low pressure while thermodynamic restriction becomes the controlling mechanism of the process at high pressure. In addition, there is a transition region between these two regimes where the two mechanisms have equal or similar importance. Therefore, the real recovery profile should be a smooth curve below these two recovery lines, as schematically illustrated in Fig. 3.
Membrane resistance plays an important role on whether a full-scale RO is operated in a mass transfer controlled regime or the thermodynamic restricted regime. As can be seen in Fig. 2, the thermodynamic restriction regime appears at a
lower transmembrane pressure in RO processes with more permeable membranes. It can be seen from Fig. 2 that the thermodynamic regime can occur at a pressure as low as 0.80x10⁶ Pa (l 15 psi) for membranes of resistance 1 x 10 it Pa- s/m. For membranes with moderate resistance of 3.0x101~ and 6.0x10 I1 Pa-s/m, the starting pressures for thermodynamic restriction to take
> o o o~ n,
1,0
0.8
0.6
0,4
0.2
0.0 0
. / . . . . . . . j . . . . .
3x10 Pa s rn ~ "
,, / ° : o " - ' m
l x 1 0 B 2x10 6 3 x 1 0 8 4 x 1 0 8 5x10 B 6x10 e
Pressure (Pa)
Fig. 2. Thermodynamic restricted recovery (dashed line) and mass transfer limited recoveries for four different membrane resistances (indicated in figure). Other para- meter values used in the simulation are summarized in Table 1.
mass-transfer i t controlled ~ _ _
. J I
o o ID / %
I'Y / thermodynamic-equilibrium restricted
Transmembrane pressure
Fig. 3. Schematic presentation of the controlling mechanisms of an RO process operating under different pressure ranges. Recovery is limited by mass transfer at low pressure but restricted by thermodynamic equilibrium at high pressure.
220 L. Song et aL / Desalination 155 (2003) 213-228
control are 2.5x10⁶ and 5.0×10⁶ Pa (358 and 716 psi), respectively.
The old generation membranes, on the other hand, usually have a resistance higher than 1012 Pa-s/m. As shown in Fig. 2, the performance controlling mechanism for such membranes is mass transfer throughout the pressure range [up to 7.0x 10⁶ Pa (1000 psi)]. Therefore, there is no need to consider thermodynamic restriction for RO processes employing old generation RO membranes.
When a process is operated in the mass- transfer regime, the recovery can be increased by means that could enhance mass transfer. Thermo- dynamic equilibrium represents the ultimate limit of the RO process. In this case, the recovery cannot be increased by further improving mass transfer conditions or increasing membrane surface area.
3.2. Condition for regime transition
The pressure at which an RO process shifts from a mass transfer controlled regime to a thermodynamic restricted regime is of special importance to the design of full-scale RO process. Eliminating r C from Eqs. (6) and (18), one obtains
1 UHRm Apt - - - - (20)
F L
where Apt is the transition pressure. It is the reciprocal of the filter coefficient. When the transmembrane pressure is less than the transition pressure, the process performance is controlled by the mass transfer mechanism. Otherwise, it is restricted by thermodynamic equilibrium.
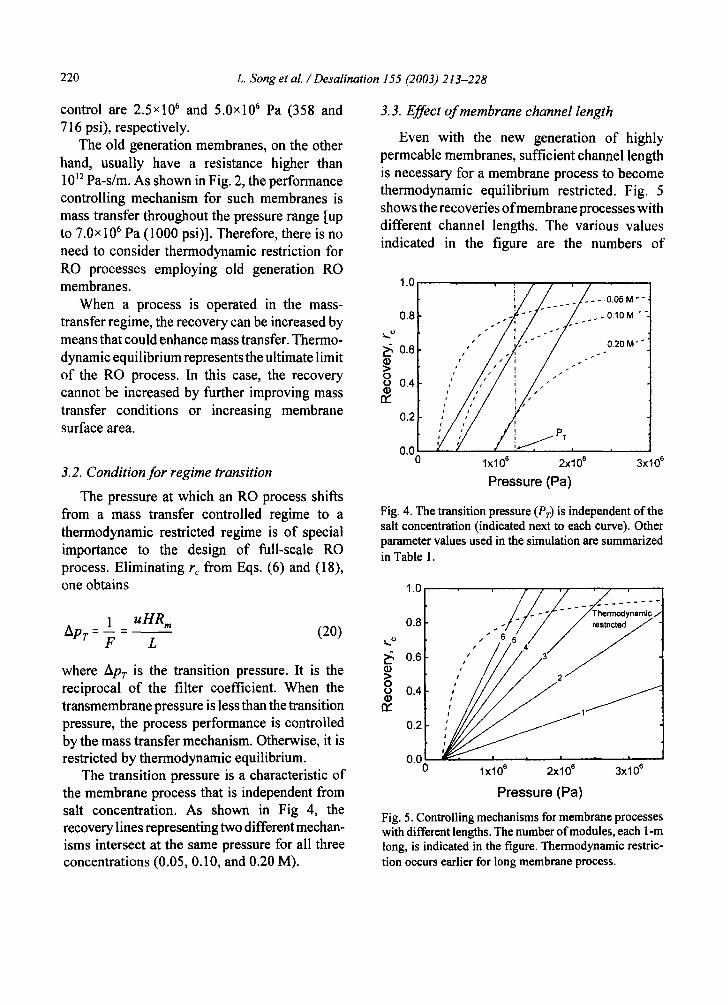
The transition pressure is a characteristic of the membrane process that is independent from salt concentration. As shown in Fig 4, the recovery lines representing two different mechan- isms intersect at the same pressure for all three concentrations (0.05, 0.10, and 0.20 M).
3.3. Effect of membrane channel length
Even with the new generation of highly permeable membranes, sufficient channel length is necessary for a membrane process to become thermodynamic equilibrium restricted. Fig. 5 shows the recoveries of membrane processes with different channel lengths. The various values indicated in the figure are the numbers of
o.= I . . - / / . # .... o.,o,i,
t ,,"74 / i 0.4 , " "
=o f 2 / / . t ~ / , ' / t l /IT
o.ol '/'/ / i , - " S , 0 l x 1 0 ~ 2x10 e 3x10 6
Pressure (Pa)
Fig. 4. The transition pressure (Pr) is independent of the salt concentration (indicated next to each curve). Other parameter values used in the simulation are summarized in Table 1.
1.0
0.8 . / / . - - f ° " /Thermoclyna ' c t
~'~ , " " 7 ] " ¢4 "a / /
0.4 / 0.2 ~
0.(1 0 l x 1 0 6 2 x 1 0 8 3 x 1 0 6
Pressure (Pa) Fig. 5. Controlling mechanisms for membrane processes with different lengths. The number of modules, each 1-m long, is indicated in the figure. Thermodynamic restric- tion occurs earlier for long membrane process.

L. Song et al. / Desafination 155 (2003) 213-228 221
modules connected in series in the RO processes. Each module is 1 m long, the standard length of commercial RO modules. The curvilinear line is the recovery under thermodynamic restriction. It can be seen from Fig. 5 that the mass transfer limited recoveries with one and two modules do not intersect with the curve representing thermo- dynamic equilibrium restriction. The recoveries in these two processes are controlled by mass transfer and therefore increase linearly with pressure in the entire pressure range shown in the figure.
The lines representing the processes with three modules or more intersect with the equili- brium recovery. This means the recoveries in these processes cannot continue to increase linearly with pressure over the entire pressure range studied. In the thermodynamic restriction regime, the recovery increases with pressure only marginally. More strikingly, the recovery for the latter is no longer dependent on the length of the membrane process. For instance, Fig. 5 shows that the processes with four, five, and six modules are all operated under the thermo- dynamic regime at an operating pressure of 2.0x 10 6 Pa. Therefore, the recoveries of the three processes are exactly the same at this operating pressure. When the recovery is controlled by thermodynamic limitation, a pressure vessel with six modules will not produce a drop of water more than the pressure vessel with four modules.
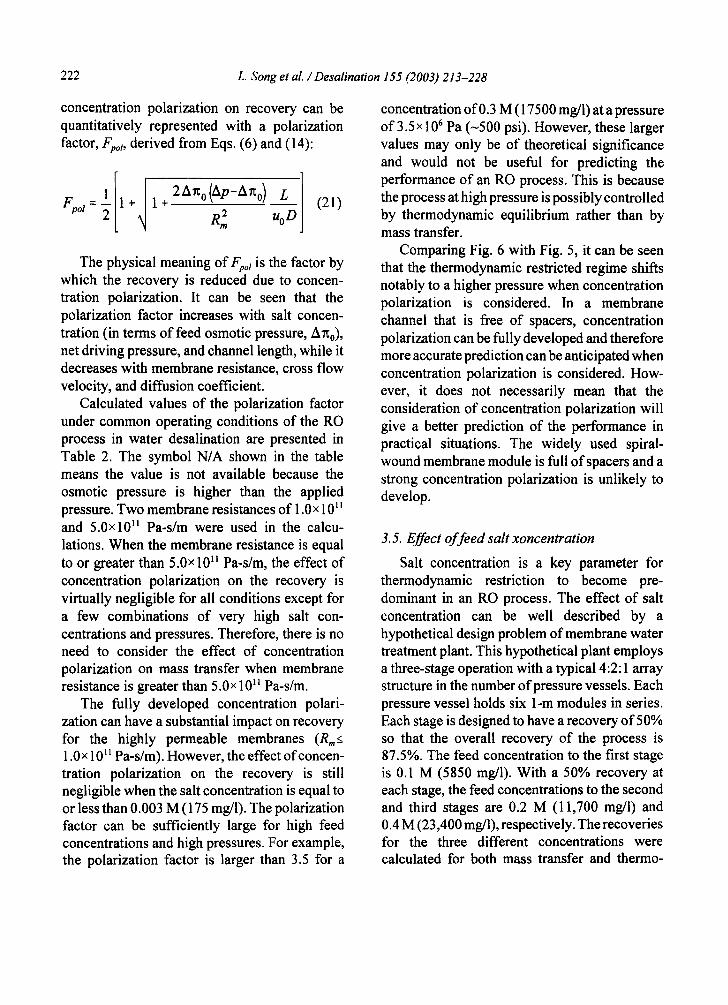
3.4. Effect of concentration polarization
Concentration polarization has long been an important consideration in the RO process. It has been treated as a critical factor in determination of the mass transfer coefficient in membrane processes. The effect of concentration polariza- tion was simulated with Eq. (14) for the mass transfer controlled recoveries of processes with different channel lengths. The results are shown in Fig. 6 along with the thermodynamic restricted recovery. The numbers of the modules used in
1.0 Thermodynamicj,// ~ restricted ~..
O.8 " ' " 6' / k.~ ° ., "" / j
0.6 ' ,4
n-
0.2
o,o 0 lx10 ~ 2x10 6 3x10 8
Pressure (Pa)
Fig. 6. The effect of concentration polarization on the controlling mechanisms of membrane process. The number of modules, each 1 m long, is indicated in the figure. Other parameter values used in the simulation are summarized in Table 1.
these processes are indicated in the figure. The recoveries vs. pressure under the influence of concentration polarization increase at rates slower than the corresponding rates obtained without considering concentration polarization (i.e., the linear case shown in Fig. 5). However, there are still two distinct regimes: the mass transfer controlled regime at low operating pressure and the thermodynamic restricted regime which occurs at high pressure. The effect of pressure on recovery is much smaller in the thermodynamic restricted regime than in the mass transfer controlled regime.
Concentration polarization is a complex phenomenon influenced by many factors, such as the solution properties and operational condi- tions. It is known that higher pressure will result in more severe salt polarization because of the larger permeate flux induced. The effect of concentration polarization on process perfor- mance will be stronger at higher feed salt concentration. Geometry of the membrane channel, the cross flow velocity, and the diffu- sion coefficient of the salt will also affect polarization to some extent. The effect of
222 L. Song et al. / Desalination 155 (2003) 213-228
concentration polarization on recovery can be quantitatively represented with a polarization factor, Fpot, derived from Eqs. (6) and (14):
lIjl 1 FP°t = 2 2 Uo D Rm
(21)
The physical meaning of Fpot is the factor by which the recovery is reduced due to concen- tration polarization. It can be seen that the polarization factor increases with salt concen- tration (in terms of feed osmotic pressure, A~0), net driving pressure, and channel length, while it decreases with membrane resistance, cross flow velocity, and diffusion coefficient.
Calculated values of the polarization factor under common operating conditions of the RO process in water desalination are presented in Table 2. The symbol N/A shown in the table means the value is not available because the osmotic pressure is higher than the applied pressure. Two membrane resistances of 1.0 x 10 H and 5.0x10 H Pa-s/m were used in the calcu- lations. When the membrane resistance is equal to or greater than 5.0x 10 ~1 Pa-s/m, the effect of concentration polarization on the recovery is virtually negligible for all conditions except for a few combinations of very high salt con- centrations and pressures. Therefore, there is no need to consider the effect of concentration polarization on mass transfer when membrane resistance is greater than 5.0x 10 ~ Pa-s/m.
The fully developed concentration polari- zation can have a substantial impact on recovery for the highly permeable membranes (Rm_< 1.0 x 10 H Pa-s/m). However, the effect of concen- tration polarization on the recovery is still negligible when the salt concentration is equal to or less than 0.003 M (175 mg/l). The polarization factor can be sufficiently large for high feed concentrations and high pressures. For example, the polarization factor is larger than 3.5 for a
concentration of 0.3 M (17500 mg/l) at a pressure of 3.5x 10⁶ Pa (-500 psi). However, these larger values may only be of theoretical significance and would not be useful for predicting the performance of an RO process. This is because the process at high pressure is possibly controlled by thermodynamic equilibrium rather than by mass transfer.
Comparing Fig. 6 with Fig. 5, it can be seen that the thermodynamic restricted regime shifts notably to a higher pressure when concentration polarization is considered. In a membrane channel that is free of spacers, concentration polarization can be fully developed and therefore more accurate prediction can be anticipated when concentration polarization is considered. How- ever, it does not necessarily mean that the consideration of concentration polarization will give a better prediction of the performance in practical situations. The widely used spiral- wound membrane module is full of spacers and a strong concentration polarization is unlikely to develop.
3.5. Effect o f f eed salt xoncentration
Salt concentration is a key parameter for thermodynamic restriction to become pre- dominant in an RO process. The effect of salt concentration can be well described by a hypothetical design problem of membrane water treatment plant. This hypothetical plant employs a three-stage operation with a typical 4:2:1 array structure in the number of pressure vessels. Each pressure vessel holds six 1-m modules in series. Each stage is designed to have a recovery of 50% so that the overall recovery of the process is 87.5%. The feed concentration to the first stage is 0.1 M (5850 mg/1). With a 50% recovery at each stage, the feed concentrations to the second and third stages are 0.2 M (11,700 mg/l) and 0.4 M (23,400 mg/l), respectively. The recoveries for the three different concentrations were calculated for both mass transfer and thermo-

L. Song et al. / Desalination 155 (2003) 213-228
Table 2 Polarization factor (Fpol) under various operating conditions
223
Pressure, Pa Salt concentration, mol/l
0.001 0.003 0.01 0.03 0.1 0.3
Membrane resistance, Rm = 1.0 x 10 u Pa-s/m
3.50x 10⁵ 1.01 1.01 1.04 1.08 N/A N/A 7.00x 10⁵ 1.01 1.03 1.09 1.20 1.24 N/A 1.05x 10⁶ 1.02 1.04 1.13 1.31 1.54 N/A 1.40x 10⁶ 1.02 1.06 1.17 1.40 1.76 N/A
1.75x 10⁶ 1.03 1.07 1.21 1.48 1.95 1.69
2.10x 10⁶ 1.03 1.09 1.24 1.56 2.12 2.23 2.45x 10⁶ 1.04 1.10 1.28 1.63 2.28 2.63 2.80x 10⁶ 1.04 1.11 1.31 1.70 2.42 2.97 3.15 x 10⁶ 1.04 1.12 1.34 1.76 2.55 3.27 3.50x 10⁶ 1.05 1.14 1.37 1.82 2.67 3.54
Membrane resistance, R~, = 5.0 x 10 u Pa-s/m
3.50x 10⁵ 1.00 1.00 1.00 1.00 N/A N/A 7.00x 10⁵ 1.00 1.00 1.00 1.01 1.01 N/A 1.05x 10⁶ 1.00 1.00 1.01 1.02 1.03 N/A 1.40x 10⁶ 1.00 1.00 1.01 1.02 1.05 N/A 1.75x 10⁶ 1.00 1.00 1.01 1.03 1.07 1.05 2.10x 10⁶ 1.00 1.00 1.01 1.03 1.09 1.10 2.45 x 10⁶ 1.00 1.00 1.01 1.04 t. 11 1.15 2.80x 10⁶ 1.00 1.00 1.02 1.05 1.12 1.20 3.15x 10⁶ 1.00 1.01 1.02 1.05 1.14 1.24 3.50 x 10⁶ 1.00 1.01 1.02 1.06 1.15 1.28
dynamic equilibrium controlled cases. The results are represented with straight and curvilinear lines shown in Fig. 7, respectively. The horizontal dotted line indicates the position of 50% recoveries. If the recoveries for all the three con- centrations were controlled by mass transfer mechanism, the design of the process would be straightforward. The working pressures for the first, second, and third stages would be 1.25 × 10⁶, 1.75×10⁶, and 2.25×10⁶ Pa, respectively, as calculated from Eq. (6).
However, Fig. 7 shows that the mechanism that controls the recovery varies with the feed salt
concentration. The working pressures in the dif- ferent stages have to be determined considering different mechanisms. In the first stage, mass transfer controls the process performance at a 50% recovery. From the mass transfer recovery line, it is found the required working pressure is 1.25x10⁶ Pa. In the second and third stages, however, the recoveries are controlled by thermo- dynamic equilibrium. Consequently, the working pressures in these two stages have to be determined from the curves representing the thermodynamic restricted recoveries, which are 2.0 × 10⁶ and 4.0 x 10⁶ Pa for the second and third

224 L. Song et al. / Desalination 155 (2003) 213-228
1.0
0.8
~ 0.6
0.4
0.2
0.0 0
' " / ' t " ' / " ' " ' "
0 . 1MO.2M 0 .4M . . . . O .1M- - " ~/w-" . - 0 . 2 M - "
, ~ / . 0 .4 M w - / t /
lx10 6 2x10 6 3×10 e 4x10 6 5×10 6 6×10 6
Pressure (Pa)
Fig. 7. Controlling mechanisms (for different feed concentrations) in different stages of a hypothetical membrane water treatment plant. Mass transfer controls the recovery in the first stage while thermodynamic equilibrium restricts the recoveries in the second and third stages. The horizontal dotted line indicates the position of 50% recoveries.
stages, respectively. Comparing these values with those obtained from mass transfer limited cases, it can be seen that without considering thermodynamic restriction, the operating pres- sures for the second and third stages could be substantially underestimated.
4. Implications of thermodynamic restriction to reverse osmosis
The behavior of the RO process under thermo- dynamic restriction is quite different from that in the mass transfer controlled regime. As most of the principles and procedures for membrane module and process design were developed for mass transfer limited membrane processes, the emergence of thermodynamic restriction in the RO process suggests that many of the concepts and theories have to be re-examined. A few important problems in the RO process that can be better understood with the help of this novel concept are briefly discussed below.
4.1. Mass transfer coefficient and concentration polarization
The mass transfer coefficient has been one of the most important parameters in an RO process. It is usually believed that the performance of an RO process is controlled by the mass transfer coefficient, and the mass transfer coefficient can be significantly reduced by the development of concentration polarization. A popular topic in membrane research is how to reduce concen- tration polarization in the RO process in order to improve mass (water) transfer coefficient. For a long time, concentration polarization appeared to be the only reason for the non-linearity between flux and pressure observed at high salt concen- trations and pressures. It seems very logical that the linear relationship can be maintained if the concentration polarization in the process could be brought under control.
With the emergence of thermodynamic restriction in the RO process with highly per- meable membranes, the mass transfer coefficient becomes less important to the process. Actually, the emergence of thermodynamic restriction itself means the mass transfer coefficient is sufficiently large. Mass transfer is no longer the limiting factor and any effort to improve mass transfer coefficient will not be rewarded. The role of concentration polarization in the full-scale RO process was most likely overstated. Even when old-generation membranes were used, the added resistance due to the concentration polarization layer was relatively small compared to the mem- brane resistance. With new membranes of high permeability, thermodynamic equilibrium appears to be a much stronger restriction on process performance. However, more rigorous work needs to be done to further clarify this problem.
4.2. Module and process design
The spiral-wound membrane module is the

L. Song et al./ Desalination 155 (2003) 213-228 225
predominant configuration used in water treat- ment. The spiral-wound module can provide more membrane area in a given space than other configurations. Long pressure vessel holding several modules in series is another way to increase membrane area. The major underlying driving force for such arrangements is the low membrane permeability, which ensures that these processes are invariably mass transfer controlled.
These arrangements may not always be beneficial with the highly permeable membranes used today. As discussed earlier, RO systems with a large number of membrane elements in series may be operating, at certain conditions, under thermodynamic restriction. If the salt concentration and the transmembrane pressure are kept invariant, the recovery will not be affected by operating parameters, such as feed cross-flow velocity, membrane resistance, channel height, and module length. An appro- priate increase in the channel height to reduce the membrane area in a module will not affect the total permeate production but increase the production rate of per unit membrane area. Reduction of the number of modules in series can have a similar effect in increasing the production rate per unit membrane area. However, benefits of using a smaller membrane area would have to be weighed against the potential higher mem- brane fouling at a higher flux rate operation.
The reported hydraulic imbalance problem [3,4] with low-pressure and ultra-low-pressure RO membranes is an indication that the process has approached thermodynamic restriction. A little increase in pressure will definitely push the system into thermodynamic restricted regime. Eq. (20) can be used to design a more balanced process with these highly permeable membranes. With a fixed membrane resistance, a balanced process can be achieved by manipulating the feed velocity, the channel height, and the channel length to make the ApT much higher than the designed working pressure.
4. 3. Further research needs
Although thermodynamic equilibrium appears more as a restriction on the performance of an RO process, some features of the process under thermodynamic restriction (e.g., system stability) may be beneficial to the process under certain circumstances. It is of paramount importance to understand the full-scale RO process with highly permeable membranes. More rigorous studies are needed to explore this emerging feature of mem- brane technology. The features of the RO process in the thermodynamic controlled regime need to be further delineated. These features are not only of fundamental importance to understand the principles of the RO process, but also critical to improve the design and operation of the RO process in very practical ways.
Fouling in an RO process under thermo- dynamic restriction is another topic of funda- mental and practical interest. The insensitivity of the performance of the RO process under thermodynamic restriction to the membrane resistance may pose a problem in fouling characterization. Similarly, the assessment of the effectiveness of membrane cleaning methods will be difficult, too. New methodologies or tech- niques have to be developed in this area.
Thermodynamic restriction has already caused serious problems in the design and operation of the RO process. It will become more serious as the membrane permeability is being further improved. Substantial efforts are required in this new but vitally important direction of membrane research.
5. Conclusions
With the use of highly permeable membranes in full-scale water treatment plants, thermo- dynamic restriction emerges as a real and serious limitation to the performance of an RO process. There is a transition pressure for every RO process that is determined by the process

226 L. Song et al. / Desalination 155 (2003) 213-228
parameters except for the feed salt concentration. The process performance is limited by mass transfer rate when the pressure is smaller than the transition pressure whereas it is controlled by thermodynamic equilibrium when the pressure is higher than the transition pressure.
The effect of concentration polarization on permeate production in a full-scale RO process may not be as strong as expected. At a low pressure, the resistance to permeate flow due to the concentration polarization layer would be small compared with the membrane resistance. As the pressure increases, the effect of concen- tration polarization may become stronger. However, the process may become thermo- dynamic equilibrium restricted at high pressure where the effect of concentration polarization can be completely blocked.
There are new features of the RO process under thermodynamic restriction. In the thermo- dynamic controlled regime, the recovery of an RO process is determined only by salt concen- tration (osmotic pressure) and transmembrane pressure. Consequently, membrane fouling may become undetectable from system performance viewpoint as long as the process is operated in the thermodynamic controlled regime. When the recovery rate or the permeate flux is notably reduced, the membrane must have been seriously fouled (membrane resistance has increased) so that the process has shifted from thermodynamic equilibrium controlled regime to the mass transfer controlled regime.
Thermodynamic restriction is a new topic in membrane research. It imposes an urgent task and serious challenge to those engaged in membrane technology. A much better understanding of the RO process in full-scale operation can be achieved when the features and implications of thermodynamic restriction in the process are fully appreciated.
6. Symbols
A - - Solution coefficient to be determined, Eq. (9)
C - - Concentration of the retained salt, M c - - Salt concentration, M Co - - Feed salt concentration, M cp - - Permeate salt concentration, M cc - - Retentate salt concentration, M C,, - - Excess concentration of retained salt
at the membrane surface, mol/l D - - Diffusion coefficient, m2/s F - - Filter coefficient (Pa -1) defined by
Eq. (5) fob - - Osmotic pressure coefficient, Pa-
mo1-1 Fpo~ - - Polarization factor defined by Eq. (21) H - - Channel height, m L - - Length of membrane channel, m Qj - - Feed flow rate, mS/s Qe - - Permeate flow rate, m3/s Qc ~ Retentate flow rate, m3/s R - - Universal gas constant, Pa.l.mol- ~.K -~ rc - - Water recovery rj - - Salt rejection R,, - - Membrane resistance, Pa-s/m T - - Absolute temperature, K u o - - Average feed (crossflow) velocity,
m/s V - - Average permeate flux, m/s v - - Permeate flux, m/s v 0 - - Local permeate flux (m/s) at the
channel entrance x - - Distance from the channel entrance, m y - - Distance from membrane surface, m
Greek
AP m Constant defined by Eq. (A3) Net driving pressure (Pa) defined by Eq. (A.2)

L. Song et al. / Desalination 155 (2003) 213-228 227
Ap - - Transmembrane pressure, Pa Apt - - Transition pressure (Pa) defined by
Eq. (20) Ax - - Osmotic pressure difference, Pa Ax 0 - - Feed osmotic pressure, Pa
[13] J.S. Taylor and E.P. Jacobs, Reverse osmosis and nanofiltration, in: Water Treatment: Membrane Pro- cesses, AWWA Research Foundation, McGraw Hill, New York, 1996.
References
[ 1 ] K. Scott, Handbook of Industrial Membranes, 1 st ed., Elsevier Advanced Technology, Oxford, 1995.
[2] M. Wilfand K. Klinko, Performance of commercial seawater membranes, Desalination, 96 (1994) 465- 478.
[3] M. Wilf, Design consequences of recent improve- ments in membrane performance, Desalination, 113 (1997) 157-163.
[4] J.E. Nemeth, Innovative system designs to optimize performance of ultra-low pressure reverse osmosis membrane, Desalination, 118 (1998) 63-71.
[5] Z.V.P. Murthy and S.K. Gupta, Estimation of mass transfer coefficient using a combined nonlinear mem- brane transport and film theory model, Desalination, 109 (1997) 39-49.
[6] N.M. AI-Bastaki and A. Abbas, Predicting the per- formance of RO membranes, Desalination, 132 (2000) 181-187.
[7] M. Taniguchi, M. Kurihara and S. Kimura, Behavior of a reverse osmosis plant adopting a brine conver- sion two-stage process and its computer simulation, J. Membr. Sci., 183 (2001) 249-257.
[8] G. Schock and A. Miquel, Mass transfer and pressure loss in spiral-wound modules, Desalination, 64 (1987) 339-352.
[9] L.F. Song and M. Elimelech, Theory ofconcentration polarization in cross-flow filtration, J. Chem. Soc. Faraday Trans., 91(19) (1995) 3389-3398.
[ 10] L.F. Song and S.C. Yu, Concentration polarization in cross-flow reverse osmosis, AIChE J., 45 (1999) 921-928.
[11] L.F. Song, Thermodynamic modeling of solute trans- port through reverse osmosis membrane, Chem. Eng. Comm., 180 (2000) 145-167.
[12] L.F. Song, S.K. Hong, S.L. Ong, W.J. Ng and J.Y. Hu, Simulations of a full-scale reverse osmosis desalination system, J. Environmental Engineering ASCE, 128(10) (2002) 960-966.
APPENDIX A - - Solution for recovery in the presence of concentration polarization
Eq. (13) in Section 2.2 can be rearranged as x
AP = Rmv + ~v f v~x (A1)
0
Here AP is the net driving pressure given as
Ap = Ap- 4 = 0 (A2)
and
A ~ o
- D u o (A3)
Taking derivatives o f both sides o fEq . (A1) with respect to x yields
o: R.+I3 vdx - +13v 2 0
(A4)
Combining Eqs. (A1) and (A4) results in
d v _ [~ I) 3
dx AP (A5)
which upon integration gives
1 1 2~ (A6) - - - + - - = - X
v 2 v 2 A P
Then the local permeate flux v is given by

2 2 8 L. Song et al. / Desalination 155 (2003) 213-228
= Vo
~ 1+ 215 v2x AP
(A7)
The average permeate velocity of the channel is calculated from
1 ~ 2Vo V = _ _ v d x =
3 L 0 l+II+Ap215 V2o L
because
(A8)
AP % - R m
Substituting Eqs. (A9), (A2), and Eq. (AS) yields
V= 2(~p-Ano)
(A9)
(A3) into
R m 1+ 1+ 2 Uo D Rm
(A10)
Eq. (A10) can be used to determine the process recovery, i.e., Eq. (14), as shown in Section 2.2.