electronic supplementary information - edge-exposed mos2
TRANSCRIPT

Electronic supplementary Information
Edge-exposed MoS2 nano-assembled structures as an efficient electrocatalyst for hydrogen evolution reaction
Dong Young Chunga,b, Seung-Keun Parkc, Young-Hoon Chunge, Seung-Ho Yua,b, Dong-Hee Lime, Namgee Junge, Hyung Chul Hame, Hee-Young Parke, Yuanzhe Piaoc,d, Sung Jong Yooe* and Yung-Eun Sunga,b*
Electronic Supplementary Material (ESI) for NanoscaleThis journal is © The Royal Society of Chemistry 2013
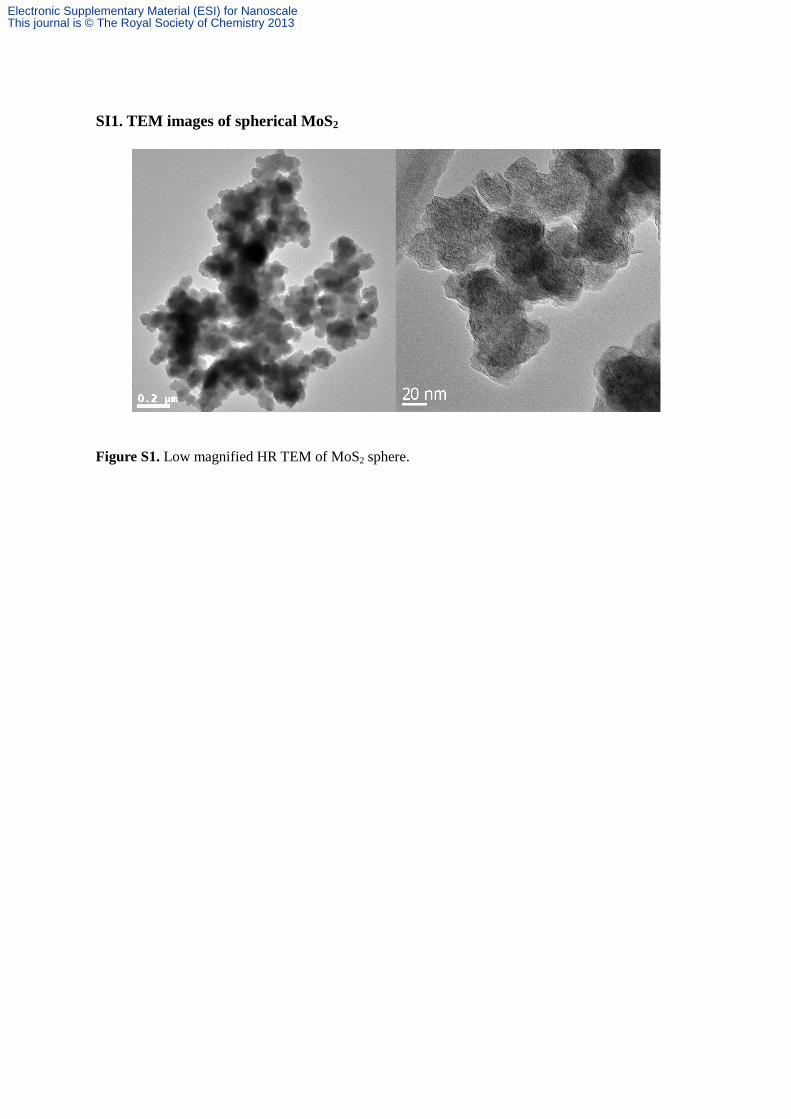
SI1. TEM images of spherical MoS2
Figure S1. Low magnified HR TEM of MoS2 sphere.
Electronic Supplementary Material (ESI) for NanoscaleThis journal is © The Royal Society of Chemistry 2013

SI2. SEM images and EDS results.
Figure S2. SEM images and EDS results of (a) MoS2 nanosphere and (b) MoS2 nanosheet
Electronic Supplementary Material (ESI) for NanoscaleThis journal is © The Royal Society of Chemistry 2013

SI3. Raman images.
Figure S3. Raman images and EDS results of (a) bulk MoS2, (b) MoS2 nanosphere and (c)
MoS2 nanosheet
Electronic Supplementary Material (ESI) for NanoscaleThis journal is © The Royal Society of Chemistry 2013

SI4. XANES analysis
Figure S4 First derivatives of XANES results to confirm the oxidation state of Mo.
From the derivatives on the XANES spectra, there are no significant changes in the onset and
edge of the normalized absorbance profiles, which means that the oxidation states of each Mo
is similar. The oxidation states of sphere and sheet samples could be estimated 4+ due to the
oxidation state of Mo on bulk MoS2 is 4+.
Electronic Supplementary Material (ESI) for NanoscaleThis journal is © The Royal Society of Chemistry 2013

SI5. EXAFS analysis reuslts.
Table S1. EXAFS fitting parameters.
Mo-S interatomic distance (Å) /
Debye-Waller factor (σ2 / Å2)
Coordination number (N)
Mo-Mo interatomic distance(Å) / Debye-Waller factor (σ2 / Å2)
Coordination number (N)
R factor
(%)
Bulk 2.4249 ± 0.0114
/ 0.0032
5.98 3.1614 ± 0.0121
/ 0.0030
5.97 0.059
Nano-assembled sphere
2.4004 ± 0.0131
/ 0.0025
3.74 3.1589 ± 0.0089
/ 0.0104
3.35 0.020
Nanosheet
2.4033 ± 0.0102
/ 0.0022
4.43 3.1644 ± 0.0145
/ 0.0039
4.39 0.015
Electronic Supplementary Material (ESI) for NanoscaleThis journal is © The Royal Society of Chemistry 2013

SI6. Coordination number calculation for EXAFS analysis.
Figure S5. Quantification of nearest neighbor atoms with Mo K edge absorption (a) Mo edge
and (b) S edge. The large (gray), and the small (yellow) spheres represent Mo and,
respectively. Solid red line indicates the absorption Mo atom.
Electronic Supplementary Material (ESI) for NanoscaleThis journal is © The Royal Society of Chemistry 2013

SI7. Effect of Heat treatment
Figure S6. HER activities of synthesized MoS2 sample before/after heat trearment
As reported that the heat treatment affects the edge site in REF is important issue, however
we expect that edge deformation through heat treatment is minor effect in our cases. The
removal of impurity enhanced the activity of our samples. Residual organic molecules in the
sources of sulfur may block the surface which can deactivate the HER activity.
Electronic Supplementary Material (ESI) for NanoscaleThis journal is © The Royal Society of Chemistry 2013

SI8. DFT analysis.
Spin-polarized density functional theory calculations were performed using the Vienna ab
initio Simulation Package (VASP)1-4 with the projector-augmented wave (PAW)5, 6 method.
Electron exchange-correlation functionals were represented with the generalized gradient
approximation (GGA), and the model of Perdew, Burke and Ernzerhof (PBE)7 was used for
the nonlocal corrections. A kinetic energy cutoff of 300 eV was used with a plane-wave basis
set. MoS2 nanoparticle structures were derived from a bulk MoS2 (space group of R3m with
the lattice constant of 3.16 Å) determined by Schonfeld et al.8 An orthorhombic supercell of
22 × 22 × 15 Å was used for MoS2 nanoparticles with a vacuum space of 12.0 Å. As shown
in Figure 5 in manuscript, two types of MoS2 nanoparticles were considered: S-terminated
and Mo-terminated. The integration of the Brillouin zone was carried out for the Γ-point only.
In order to mimic the effect of bulk MoS2 without the edge effect, a trigonal supercell of 6.33
× 6.33 × 15.00 Å with periodic boundary conditions was used with a vacuum space of 11.9 Å.
The Brillouin zone integration of the trigonal structure was conducted using a 8×8×1
Monkhorst-Pack grid9 with the Γ-point included and first-order Methfessel-Paxton smearing10
with a width of 0.1 eV. All atoms were fully relaxed and optimized until total energy change
upon two steps of the electronic self-consistent loop less than 10-4 eV.
The adsorption energy (Eads) of atomic hydrogen is defined as Eads = EMoS2+H – EMoS2 – EH2 / 2,
where EMoS2+H, EMoS2, and EH2 are the total energies of MoS2 systems with adsorbed H, bare
MoS2 systems, and a gas phase H2 molecule. A negative adsorption energy indicates that
adsorption is exothermic (stable) with respect to the free gas phase hydrogen.
Electronic Supplementary Material (ESI) for NanoscaleThis journal is © The Royal Society of Chemistry 2013

Figure S7. Optimized structures of S edge terminated MoS2 nanoparticles wuth adsorbed H
and adsorption energies depending on adsorption sites
(1) Kresse, G.; Hafner, J., Ab initio molecular dynamics for liquid metals. Physical
Review B 1993, 47, 558-561.
(2) Kresse, G.; Hafner, J., Ab initio molecular-dynamics simulation of the liquid-metal
amorphous-semiconductor transition in germanium. Physical Review B 1994, 49, 14251-
14269.
(3) Kresse, G.; Furthmüller, J., Efficient iterative schemes for ab initio total-energy
calculations using a plane-wave basis set. Physical Review B 1996, 54, 11169-11186.
(4) Kresse, G.; Furthmüller, J., Efficiency of ab-initio total energy calculations for metals
and semiconductors using a plane-wave basis set. Computational Materials Science 1996, 6,
15-50.
(5) Blöchl, P. E., Projector augmented-wave method. Physical Review B 1994, 50,
Electronic Supplementary Material (ESI) for NanoscaleThis journal is © The Royal Society of Chemistry 2013

17953-17979.
(6) Kresse, G.; Joubert, D., From ultrasoft pseudopotentials to the projector augmented-
wave method. Physical Review B 1999, 59, 1758-1775.
(7) Perdew, J. P.; Burke, K.; Ernzerhof, M., Generalized gradient approximation made
simple. Physical Review Letters 1996, 77, 3865-3868.
(8) Schonfeld, B.; Huang, J. J.; Moss, S. C., ANISOTROPIC MEAN-SQUARE
DISPLACEMENTS (MSD) IN SINGLE-CRYSTALS OF 2H-MOS2 AND 3R-MOS2. Acta
Crystallographica Section B-Structural Science 1983, 39, 404-407.
(9) Monkhorst, H. J.; Pack, J. D., Special points for Brillouin-zone integrations. Physical
Review B 1976, 13, 5188-5192.
(10) Methfessel, M.; Paxton, A. T., High-precision sampling for Brillouin-zone integration
in metals. Physical Review B 1989, 40, 3616-3621.
Electronic Supplementary Material (ESI) for NanoscaleThis journal is © The Royal Society of Chemistry 2013