hiteshri jgr supplementary information
TRANSCRIPT

Impacts of Urbanization on Indian Summer Monsoon Rainfall Extremes
Hiteshri Shastri1,2 , Supantha Paul1 , Subimal Ghosh1,3,* and Subhankar Karmakar1,4
1. Interdisciplinary Program in Climate Studies, Indian Institute of Technology Bombay,
Mumbai, India.
2. Department of Civil Engineering, Chandubhai S. Patel Institute of Technology, Charotar
University of Science and Technology, Anand, India.
3. Department of Civil Engineering, Indian Institute of Technology Bombay, Mumbai,
India.
4. Centre for Environmental Science and Engineering, Indian Institute of Technology
Bombay, Mumbai, India. * Corresponding Author: Department of Civil Engineering, Indian Institute of Technology
Bombay, Powai, Mumbai, Email: [email protected], Phone: +91 22 2576 7319, Fax: +91
22 2576 7302

Supplementary Information 1
S1. Urbanization Impacts on Rainfall Extremes over Mumbai at Western Coast with ERA Interim 2
data 3
4
To address the sources of data uncertainty, which stems from the use of multiple reanalysis data 5
(Kannan et al., 2014), we have used ERA-Interim reanalysis data provided by European Centre for 6
Medium-range Weather Forecasts (ECMWF) (Dee et al., 2011). The variables namely atmospheric 7
pressure, air temperature, specific humidity and vertical wind field, as well as 500 HPa pressure level 8
eastward and northward wind field are used as predictors in regression model formulation. Gridded data 9
for these six predictors are obtained at 1° latitude×1° longitude spatial resolution for time period 1979 to 10
2008. The areal extent of parameters is delimited by 10°–30° N in latitude and 60°–80° E in longitude. 11
Figure S1 shows spatial extent of ERA-Interim reanalysis grid points (total 441 points, 21X21) over the 12
map of India along with location of stations Santacruz (Mumbai) and Alibaug. The statistical 13
relationship is established between ERA-Interim variables and precipitation with 99, 95, 90, 85 and 80 14
quantiles of precipitation for both Mumbai and Alibaug applying the methodology presented in figure 7. 15
The large scale circulation types (classes) over western coast during monsoon are obtained using 16
unsupervised classification technique, k–means clustering (McQueen 1967). Optimum number of 17
classes/clusters is obtained as three corresponding to the highest value of cluster validation measure 18
namely Dunn’s index (Dunn 1973). Predictor data is divided into three groups with respective cluster 19
ID. The climate variables corresponding to the three cluster centroids are presented in figure S2. 20
Differences are observed between the cluster centroids for all the variables that show the existence of 21
multiple circulation patterns. The rainfall distributions of Mumbai and Alibaug, corresponding to the 22
clusters of circulation patterns/types are presented in figure S3. For both the stations, cluster 2 is 23

observed to be associated with extreme rainfall with a heavy tail. Cluster 3 is associated with low 24
rainfall, and the cluster 1 result into low and medium rainfall. To understand the impacts of 25
urbanization, we divide the data for availability period, 1979–2008, in two equal halves. The second 26
half, i.e., years 1994–2008 is considered to be more urbanized as compared to years 1979-1993. The 27
high dimensionality resulting by six climate variables, at 441 grid points, is reduced with Principal 28
Component Analysis (PCA). We select 155 principal components representing about 95% of variance of 29
the combined ERA field. The quantile coefficients obtained on basis of the model fit for each cluster is 30
applied to the centroidal locations of the cluster to estimate the quantile value. 31
The model performance assessed with Quantile verification skill score of censored QR model (CQVSSτ) 32
with linear regression model outputs as reference, are provided in figure S4. The results show an 33
improved model performance for higher quantiles with skill of about 90% obtained for 99th
quantile. 34
About 10% skill score is obtained at 80th
quantile. Quantile values estimated for all the circulation 35
patterns, and both time periods for Mumbai and Alibaug are given in figure S5. We observe that over 36
cluster 2, (which is associated with extremes) for Mumbai, the circulation pattern in post urbanization 37
period results into high rainfall quantiles as compared to those in pre–urbanization period. On the other 38
hand non-urbanized area Alibaug observes almost no change over 99 quantiles for cluster 2, over 39
urbanized period. This confirms the intensification of extremes in Mumbai due to urbanization as 40
obtained and discussed using NCEP reanalysis data. Mumbai rainfall quantiles also show increase 41
for cluster 1 in post urbanization period. Here the quantile values could not be computed for the 42
cluster 1 for Alibaug over post urbanization time period as the same typically corresponds to equal 43
probability of occurrence and non occurrence of rainfall events. For cluster 3 (which is associated with 44
low rainfall) in post urbanization period results into low rainfall quantiles as compared to those in pre–45
urbanization period. 46

Both the reanalysis products give the same conclusion and hence it can be concluded that uncertainty 47
may not have significant impacts on the key conclusion derived from the work. 48
49
S2. Quality control of station data with standard double-mass curve method 50
51
Double mass analysis is a commonly used approach for investigating the behavior of records made of 52
hydrological or meteorological data at a number of locations. It is used to determine the requirement for 53
corrections to the data to account for changes in data collection procedures or other local conditions. 54
This method is based on the hypothesis that each of the recorded data of a population is consistent. The 55
double mass curve is obtained by plotting accumulated precipitation on the station under 56
consideration with average accumulated precipitation on nearby stations. Inconsistency in data is 57
demonstrated by a distinct change in the slope of the double mass curve and may be due to a 58
change in instrument location or exposure or measurement technique. The data can be made 59
consistent by adjusting so that there is no break in the resulting double mass curve. It is usual practice to 60
adjust the earlier part of the record so that the entire record is consistent with the present and continuing 61
record. 62
The quality control of the station data has been performed by India Meteorological Department. Here we 63
have used the data available at nearby station Colaba to check consistency of observed precipitation at 64
station Santacruz. Annual accumulated precipitation of station Santacruz is plotted with that of station 65
Colaba. A typical straight line fit is obtained, the test confirms the data to be consistent. The result of 66
test is presented in figure S6. 67
68

69 70 71 72
S1. The ERA-Interim grids are overlaid on the map of India. 73 74
75 76 77 78
79 80
81
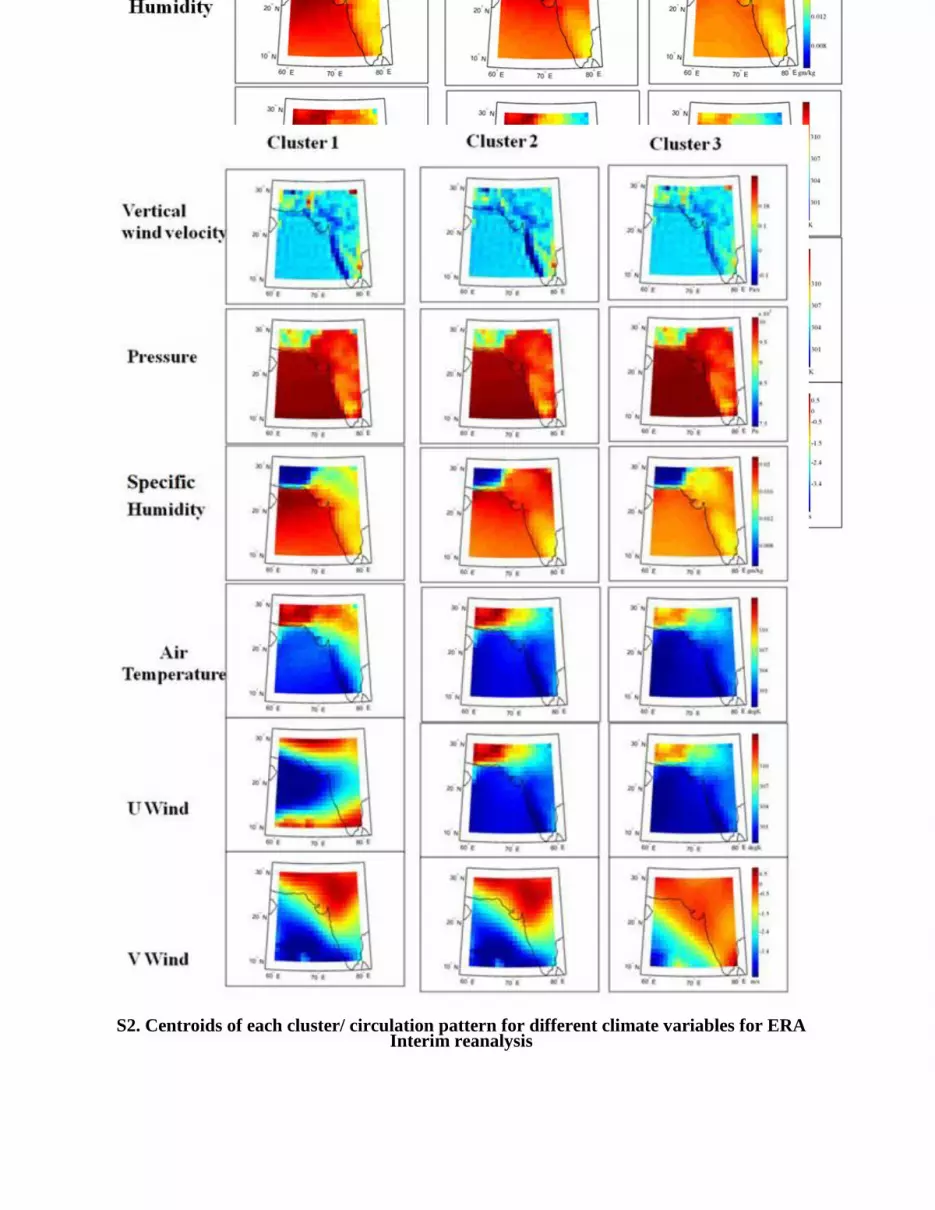
S2. Centroids of each cluster/ circulation pattern for different climate variables for ERA
Interim reanalysis

S3. Rainfall distribution in Mumbai and Alibaug corresponding to four circulation
patterns ERA interim

S4. Quantile regression model performance (CQVSS) for Mumbai and
Alibaug, corresponding to different circulation patterns, during periods 1979-
93 and 1994-2008.

S5. Rainfall quantiles in Mumbai and Alibaug, corresponding to different circulation
patterns, for periods 1979-93 and 1994-2008.

S6. Double Mass Curve

S7. Configuration of the WRF model domains

Table S1 Model configuration and setup
References
1. Thompson, Gregory, Paul R. Field, Roy M. Rasmussen, William D. Hall, 2008:
Explicit Forecasts of Winter Precipitation Using an Improved Bulk Microphysics
Scheme. Part II: Implementation of a New Snow Parameterization. Mon. Wea. Rev.,
136, 5095–5115.
2.Kain, John S., 2004: The Kain–Fritsch convective parameterization: An update. J.
Appl. Meteor., 43, 170–181.
3.Janjic, Zavisa I., 1994: The Step–Mountain Eta Coordinate Model: Further
developments of the convection, viscous sublayer, and turbulence closure schemes.
Mon. Wea. Rev., 122, 927–945.
Physics Setup
Cloud Micro physics Thompson scheme (Thompson et. al., 2008)
Sub grid scale cloud Kain-Fritsch (new Eta) scheme (Kain, John S., 2004)
Boundary-layer Mellor-Yamada-Janjic TKE scheme (Janjic and Zavisa I.,
1994,Janjic 1994, 2002)
Long wave radiation RRTM scheme (Mlawer et al.,1997)
Short wave radiation Dudhia scheme(Dudhia, J., 1989)
Surface-layer Monin-Obukhov -Janjic scheme (Monin A. S., and A. M. Obukhov,
1954,
Janjic, Z. I., 1994)
Land-surface Unified Noah land-surface model(Tewari et al. 2004)
Urban
Parameterization
Single-layer, UCM (Kusaka et al. 2001)

4.Janjic, Z. I., 1994: The step-mountain Eta coordinate model: further developments of
the convection, viscous sublayer and turbulence closure schemes. Mon. Wea. Rev.,
122, 927–945.
5.Janjic, Z. I., 2002: Nonsingular implementation of the Mellor-Yamada Level 2.5
Scheme in the NCEP Meso model. NCEP Office Note No. 437, 61 pp.
6.Dudhia, J., 1989: Numerical study of convection observed during the Winter
Monsoon Experiment using a mesoscale two–dimensional model. J. Atmos. Sci., 46,
3077–3107.
7.Mlawer, Eli. J., Steven. J. Taubman, Patrick. D. Brown, M. J. Iacono, and S. A.
Clough., 1997: Radiative transfer for inhomogeneous atmospheres: RRTM, a
validated correlated–k model for the longwave. J. Geophys. Res., 102, 16663–16682.
8.Monin A. S., and A. M. Obukhov, 1954: Basic laws of turbulent mixing in the surface
layer of the atmosphere. Contrib Geophys Inst Acad Sci USSR 151:163–187 (in
Russian)
9.Tewari, M., F. Chen, W. Wang, J. Dudhia, M. A. LeMone, K. Mitchell, M. Ek, G.
Gayno, J. Wegiel, and R. H. Cuenca, 2004: Implementation and verification of the
unified NOAH land surface model in the WRF model. 20th conference on weather
analysis and forecasting/16th conference on numerical weather prediction, pp. 11–15.
10.Kusaka, H. and F. Kimuara, 2004: Coupling a single–layer urban canopy model
witha simple atmospheric model: Impact on urban heat island simulation for an
idealized case. Jou. Meteor. Soc. Japan, 82, 67-80.