el niño episodes and agricultural productivity in gujarat
TRANSCRIPT
Technical Bulletin: 01/2014-15
El Niño episodes and agricultural
productivity in Gujarat
Authors
Contributors
Department of Agricultural Meteorology
B. A. College of Agriculture Anand Agricultural University
Anand - 388 110
N.J. Chaudhari
Viral Dave
Bharti Suthar
Anil Kumar
Deepak Patil
H. R. Patel
M. M. Lunagaria
Vyas Pandey
B. Bapuji Rao
V. U.M. Rao
P. K. Sharma
National Initiative on Climate Resilient Agriculture (NICRA)
All India Coordinated Research Project on Agrometeorology
and Centre for Weather Forecasting and Climate Change
Technical Bulletin: 01/2014-15
El Niño episodes and agricultural
productivity in Gujarat
Department of Agricultural Meteorology
B. A. College of Agriculture Anand Agricultural University
Anand - 388 110
Authors
Contributors
N.J. Chaudhari
Viral Dave
Bharti Suthar
Anil Kumar
Deepak Patil
H. R. Patel
M. M. Lunagaria
Vyas Pandey
V.
B. Bapuji Rao
U.M. Rao
P. K. Sharma
National Initiative on Climate Resilient Agriculture (NICRA)
All India Coordinated Research Project on Agrometeorology
and Centre for Weather Forecasting and Climate Change

FORWARD
The inter-annual variability of Indian monsoon rainfall has profound influence on
agriculture and national economy. Occurrences of droughts and floods associated with the
inter-annual variability of Indian monsoon affects the agriculture, water resources and
financial sectors. This inter-annual variability of Indian monsoon is also largely affected
under the influence of occurrences of El Nino episodes. This phenomenon affects wind
patterns and trigger floods and droughts in different parts of the world. El Nino is an unusual
warming of ocean surface along coast of Ecuador over northern Peru. It is well established that
El Nino affect monsoon circulation and thereby rainfall over India.
A strong El Nino can cause drought -like conditions. About 60 per cent of net sown
area of the country is rain-fed. With every one per cent deficit in rains, the country's gross
domestic produce falls by 0.35 per cent. Under the El Nino monsoon situation operational
contingent crop planning on a regional basis should be adopted to minimize crop losses to
certain extent. This may include seed availability, alternate crops, crop insurance, rain water
harvesting and suggesting various efficient management practices.
Gujarat receives rainfall mainly through SW monsoon which is likely to be affected
by El Nino event, and thereby effect on crop production. The relationship between El Nino and
its effects on Gujarat rainfall and agricultural production, however, was not been established.
Hence, such work have been undertaken by the Dept. of Agril. meteorology , AAU, Anand.
The efforts of the team of National Initiative on Climate Resilient Agriculture
(NICRA)AICRP on Agrometeorology and Centre for Weather Forecasting and Climate
Change AAU, Anand to brought out this Bulletin on "El Nino episodes, rainfall pattern and
crop production inter linkages in recent past of Gujarat state" is really not worthy. I
congratulate them and wish that this publication will be useful to state
scientists/farmers/planners of the Gujarat state.
I appreciate the efforts put in by NICRA AICRP and Centre for Weather
Forecasting and Climate Change team in compilation of data and bringing out this valuable
bulletin.
Date: 06/06/2014
Place: Anand
(K.B. Kathiria)
Vice-ChancellorAnand Agricultural University
Title Page
1
Introduction
01
1.1 El Niño, La
Nina and ENSO
01
1.2 El Niño episodes and south-west monsoon rainfall
03
1.3 El Niño episodes and Indian foodgrain production
04
2
Methodology
07
2.1 Rainfall data
07
2.2 Crop yield data
07
3
Results
09
3.1 Rainfall distribution
09
3.2 Crop productivity vis-a-vis
El Niño episodes in Gujarat
15
3.2.1 Paddy
15
3.2.2 Groundnut
15
3.2.3 Maize
16
3.2.4 Cotton
16
3.2.5 Sugarcane
17
3.2.6 Castor
17
3.2.7 Bajra
18
3.2.8 Wheat
18
3.2.9 Mustard
19
4
Summary
5
References
CONTENTS
20
22

1. INTRODUCTION
Agriculture continues to be the primary occupation in the Gujarat state where two
thirds of the population is engaged in agriculture and earn their livelihood from this
occupation. More than 52% of total workforce of the state is engaged in agriculture
directly. Moreover, agriculture provides indirect employment to large portion of
population in agro-based sectors. Thus, prosperity and well being of people in Gujarat are
closely linked with agriculture and allied activities. The state has distinguished agriculture
seasons that can be broadly divided into kharif, rabi and summer seasons. Out of 125.82
lakh hectares of gross cropped area, 70 % area is cultivated during kharif,25 % area during
rabi and 25% area during summer seasons. Most of the kharif crops depend on rainfall, but
good crop harvests are associated with one or two life saving irrigations due to the erratic
nature of rain. Rabi and summer crops are mostly grown under limited irrigation except in
“Bhal” and other low laying areas.
1.1 El Niño, La Nina and ENSO
The term El Niño (Spanish for “the Christ Child”) was originally used by
fishermen along the coasts of Ecuador and Peru to refer to a warm ocean current that
typically appears around Christmas time and lasts for several months. Fish are less
abundant during these warm intervals, so fishermen often take a break to repair their
equipment and spend time with their families. In some years, however, the water is
especially warm and the break in the fishing season persists into May or even June. Over
the years, the term “El Niño” has come to be reserved for these exceptionally strong warm
intervals that not only disrupt the normal lives of the fishermen, but also bring heavy rains.
El Niño normally occurs around Christmas and usually lasts for a few weeks to a
few months. Sometimes an extremely warm event can develop that lasts for much longer
time periods. In the 1990s, strong El Niños developed in 1991 and lasted until 1995, and
from fall 1997 to spring 1998.
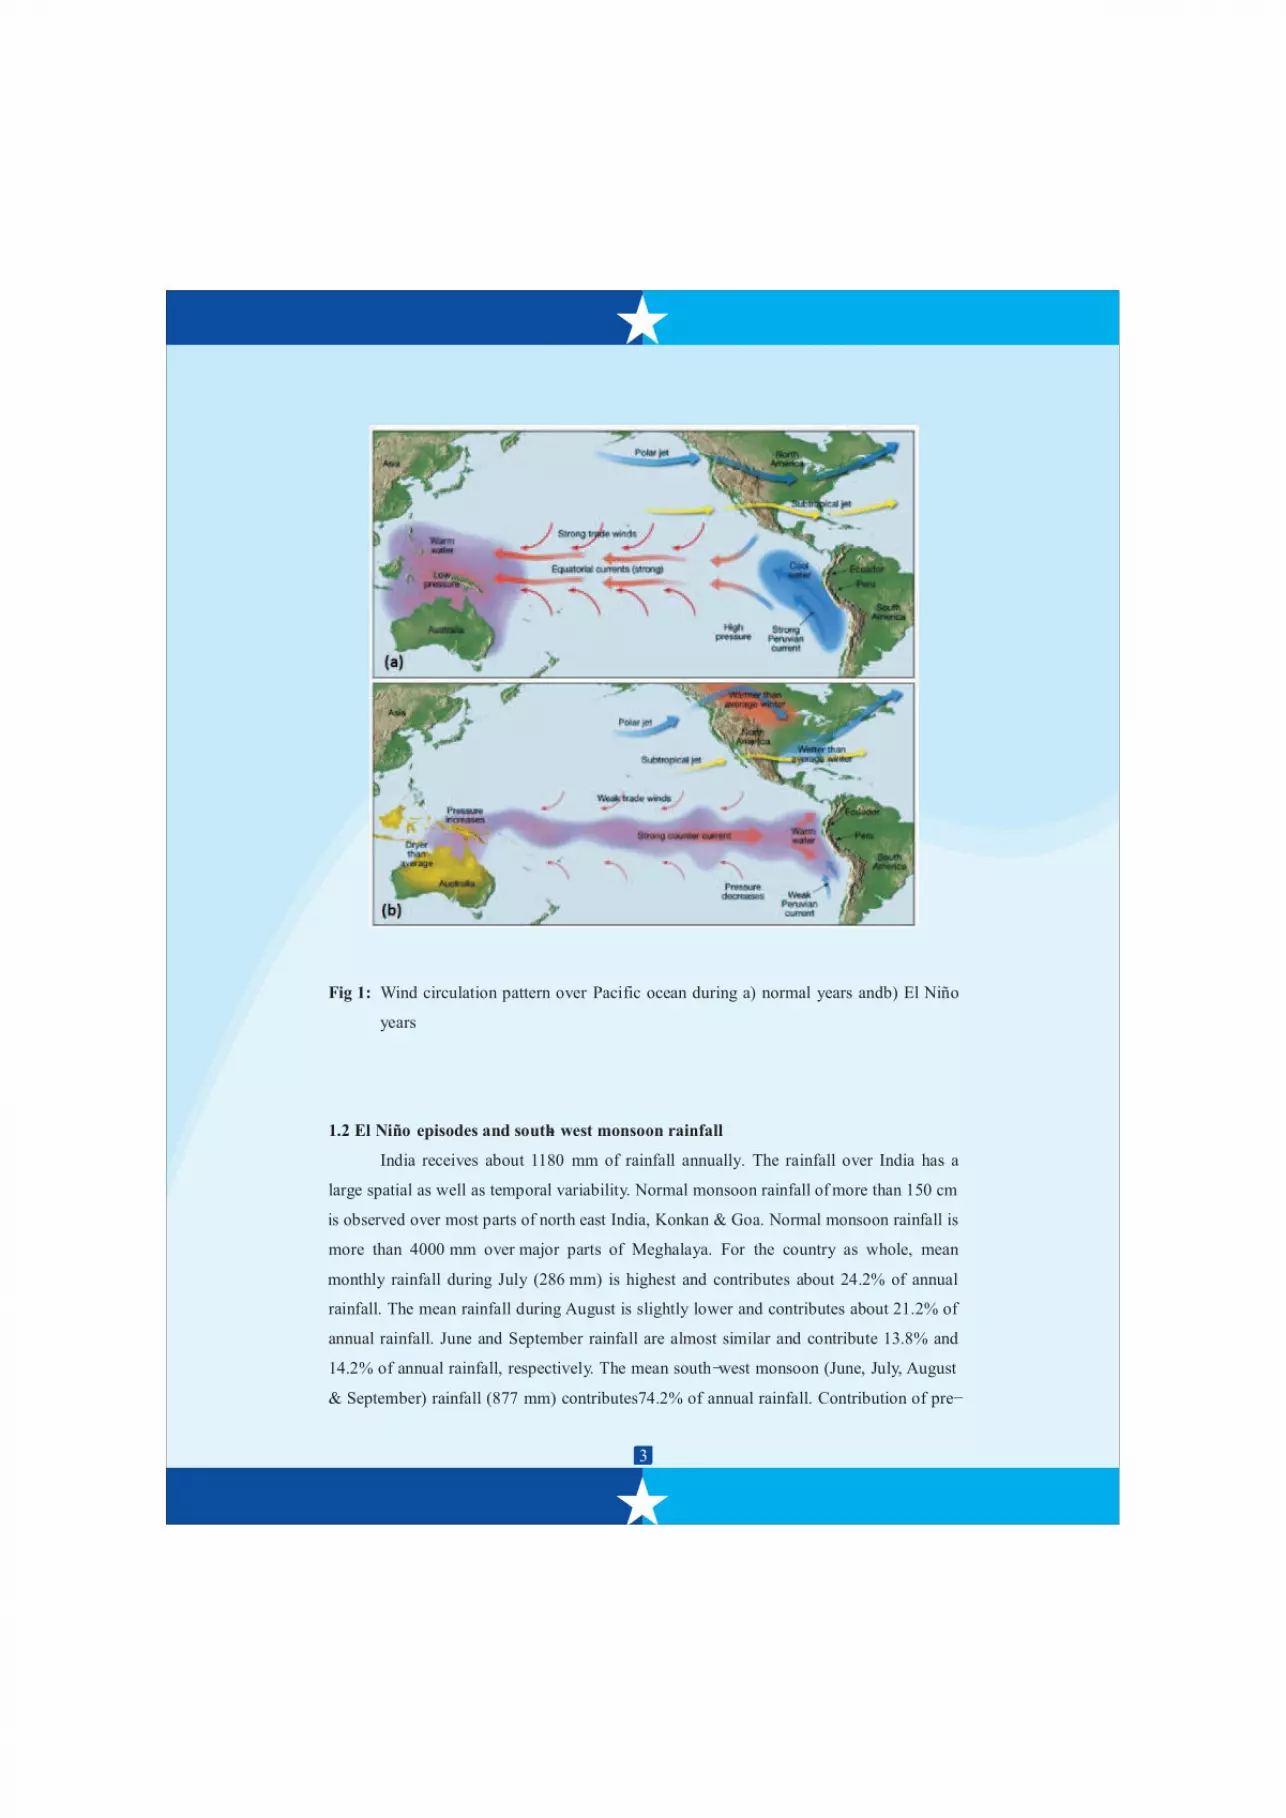
The formation of an El Niño is linked with the cycling of a Pacific Ocean
circulation pattern known as the southern oscillation. In a normal year, a surface low
pressure develops in the region of northern Australia and Indonesia and a high pressure
1
2
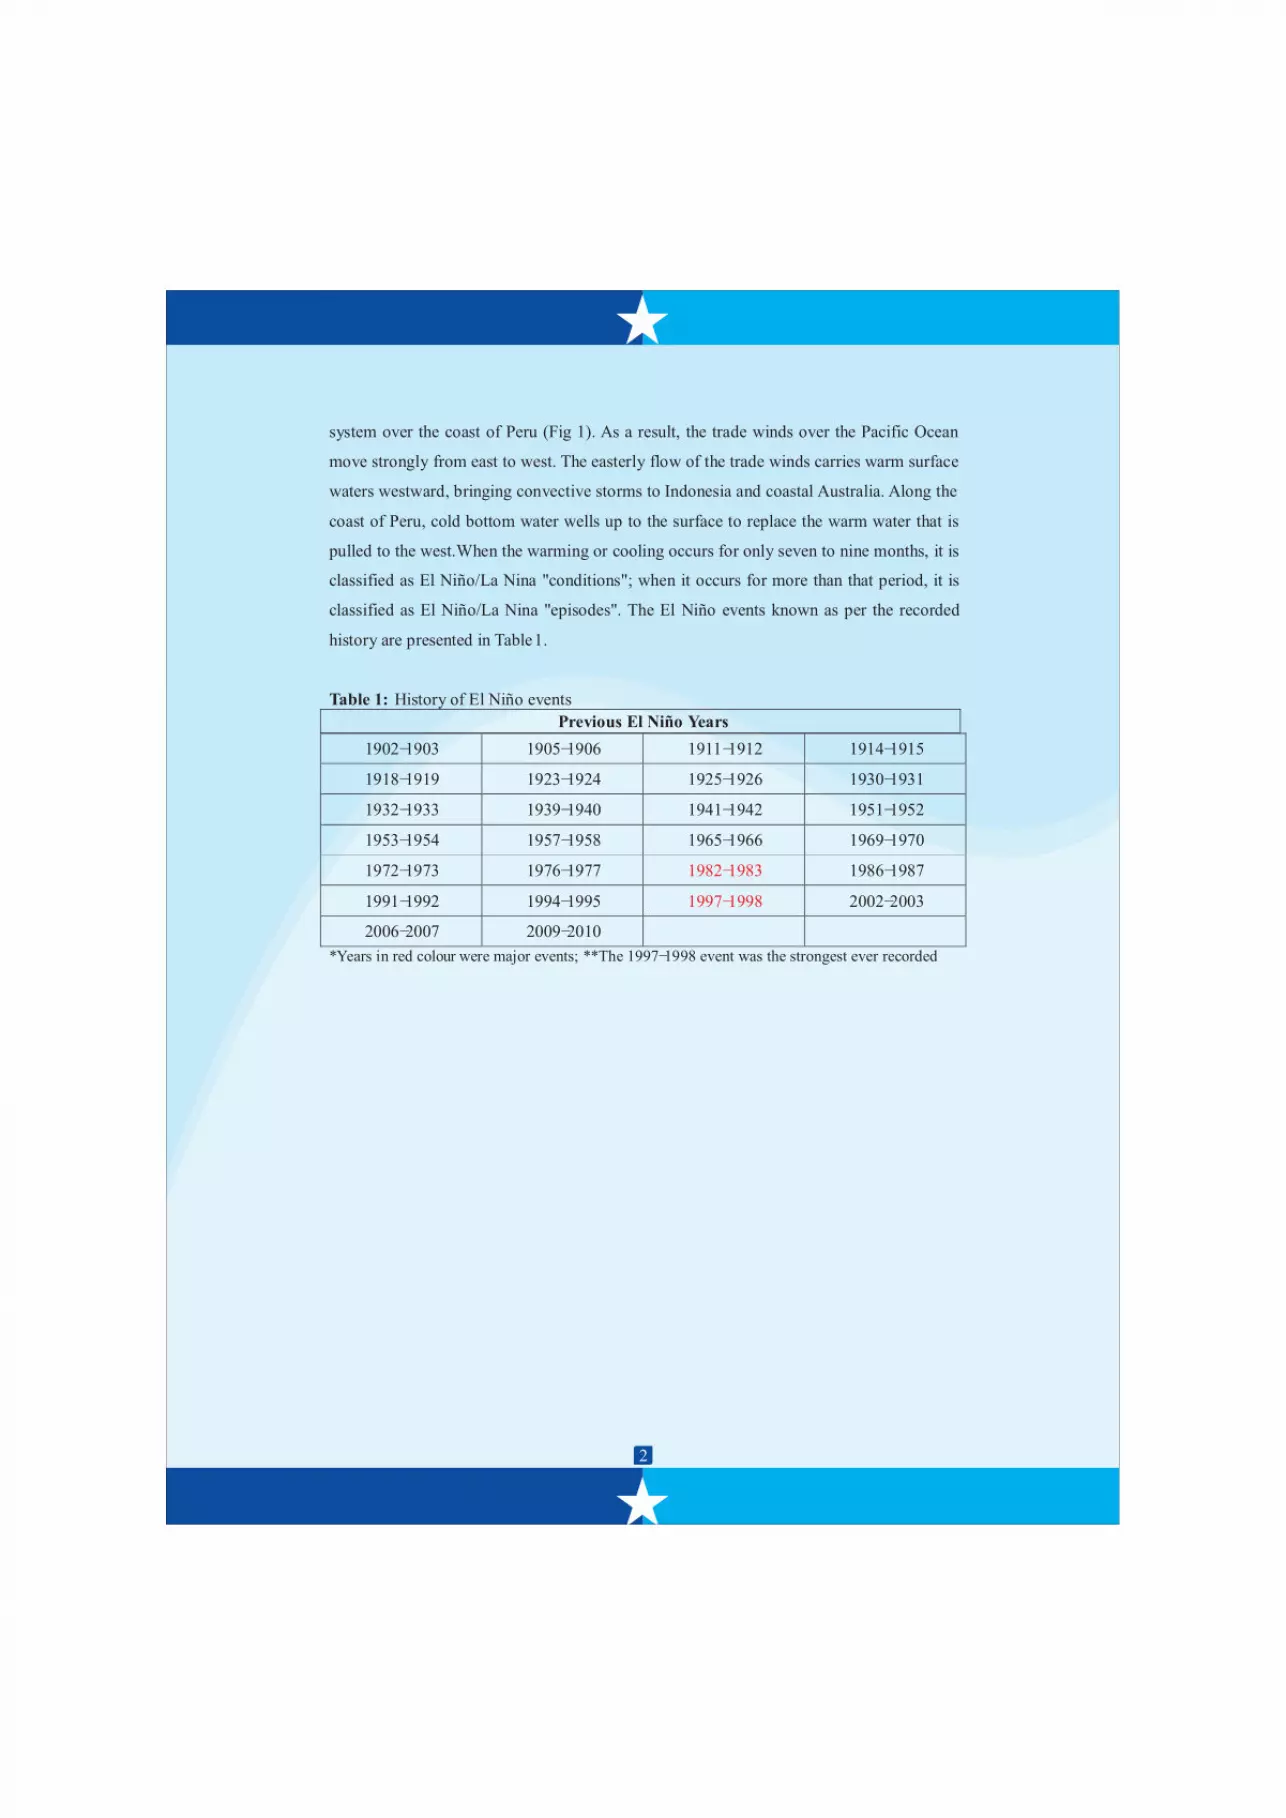
system over the coast of Peru (Fig 1). As a result, the trade winds over the Pacific Ocean
move strongly from east to west. The easterly flow of the trade winds carries warm surface
waters westward, bringing convective storms to Indonesia and coastal Australia. Along the
coast of Peru, cold bottom water wells up to the surface to replace the warm water that is
pulled to the west.When the warming or cooling occurs for only seven to nine months, it is
classified as El Niño/La Nina "conditions"; when it occurs for more than that period, it is
classified as El Niño/La Nina "episodes". The El Niño events known as per the recorded
history are presented in Table1.
Table 1: History of El Niño events
Previous El Niño Years
1902-1903 1905-1906 1911-1912 1914-1915
1918-1919 1923-1924 1925-1926 1930-1931
1932-1933 1939-1940 1941-1942 1951-1952
1953-1954 1957-1958 1965-1966 1969-1970
1972-1973 1976-1977 1982-1983 1986-1987
1991-1992 1994-1995 1997-1998 2002-2003
2006-2007 2009-2010
*Years in red colour were major events; **The 1997-1998 event was the strongest ever recorded
3
Fig 1: Wind circulation pattern over Pacific ocean during a) normal years andb) El Niño
years
1.2 El Niño episodes and south- west monsoon rainfall
India receives about 1180 mm of rainfall annually. The rainfall over India has a
large spatial as well as temporal variability. Normal monsoon rainfall of more than 150 cm
is observed over most parts of north east India, Konkan & Goa. Normal monsoon rainfall is
more than 4000 mm over major parts of Meghalaya. For the country as whole, mean
monthly rainfall during July (286 mm) is highest and contributes about 24.2% of annual
rainfall. The mean rainfall during August is slightly lower and contributes about 21.2% of
annual rainfall. June and September rainfall are almost similar and contribute 13.8% and
14.2% of annual rainfall, respectively. The mean south-west monsoon (June, July, August
& September) rainfall (877 mm) contributes74.2% of annual rainfall. Contribution of pre-
4
monsoon (March, April & May) rainfall and post-monsoon (October, November &
December) rainfall in annual rainfall is mostly the same (11%). Coefficient of variation is
higher during the months of November, December, January and February.
Gujarat receives about 919 mm rainfall annually, of which 95% (874 mm) comes
through southwest monsoon season. Among the different agroclimatic regions of the state,
there is a large variation in rainfall amounts. For instance, north-west zone receives 250 to 500
mm rainfall, while south Gujarat receives greater than 1500 mm. Parts of Valsad
district receives rainfall in the range of 1400-1800 mm whereas, entire Kutch district and
Dwarika of Jamnagar district and Dhari of Amreli district receives in the range of 200-
400 mm.
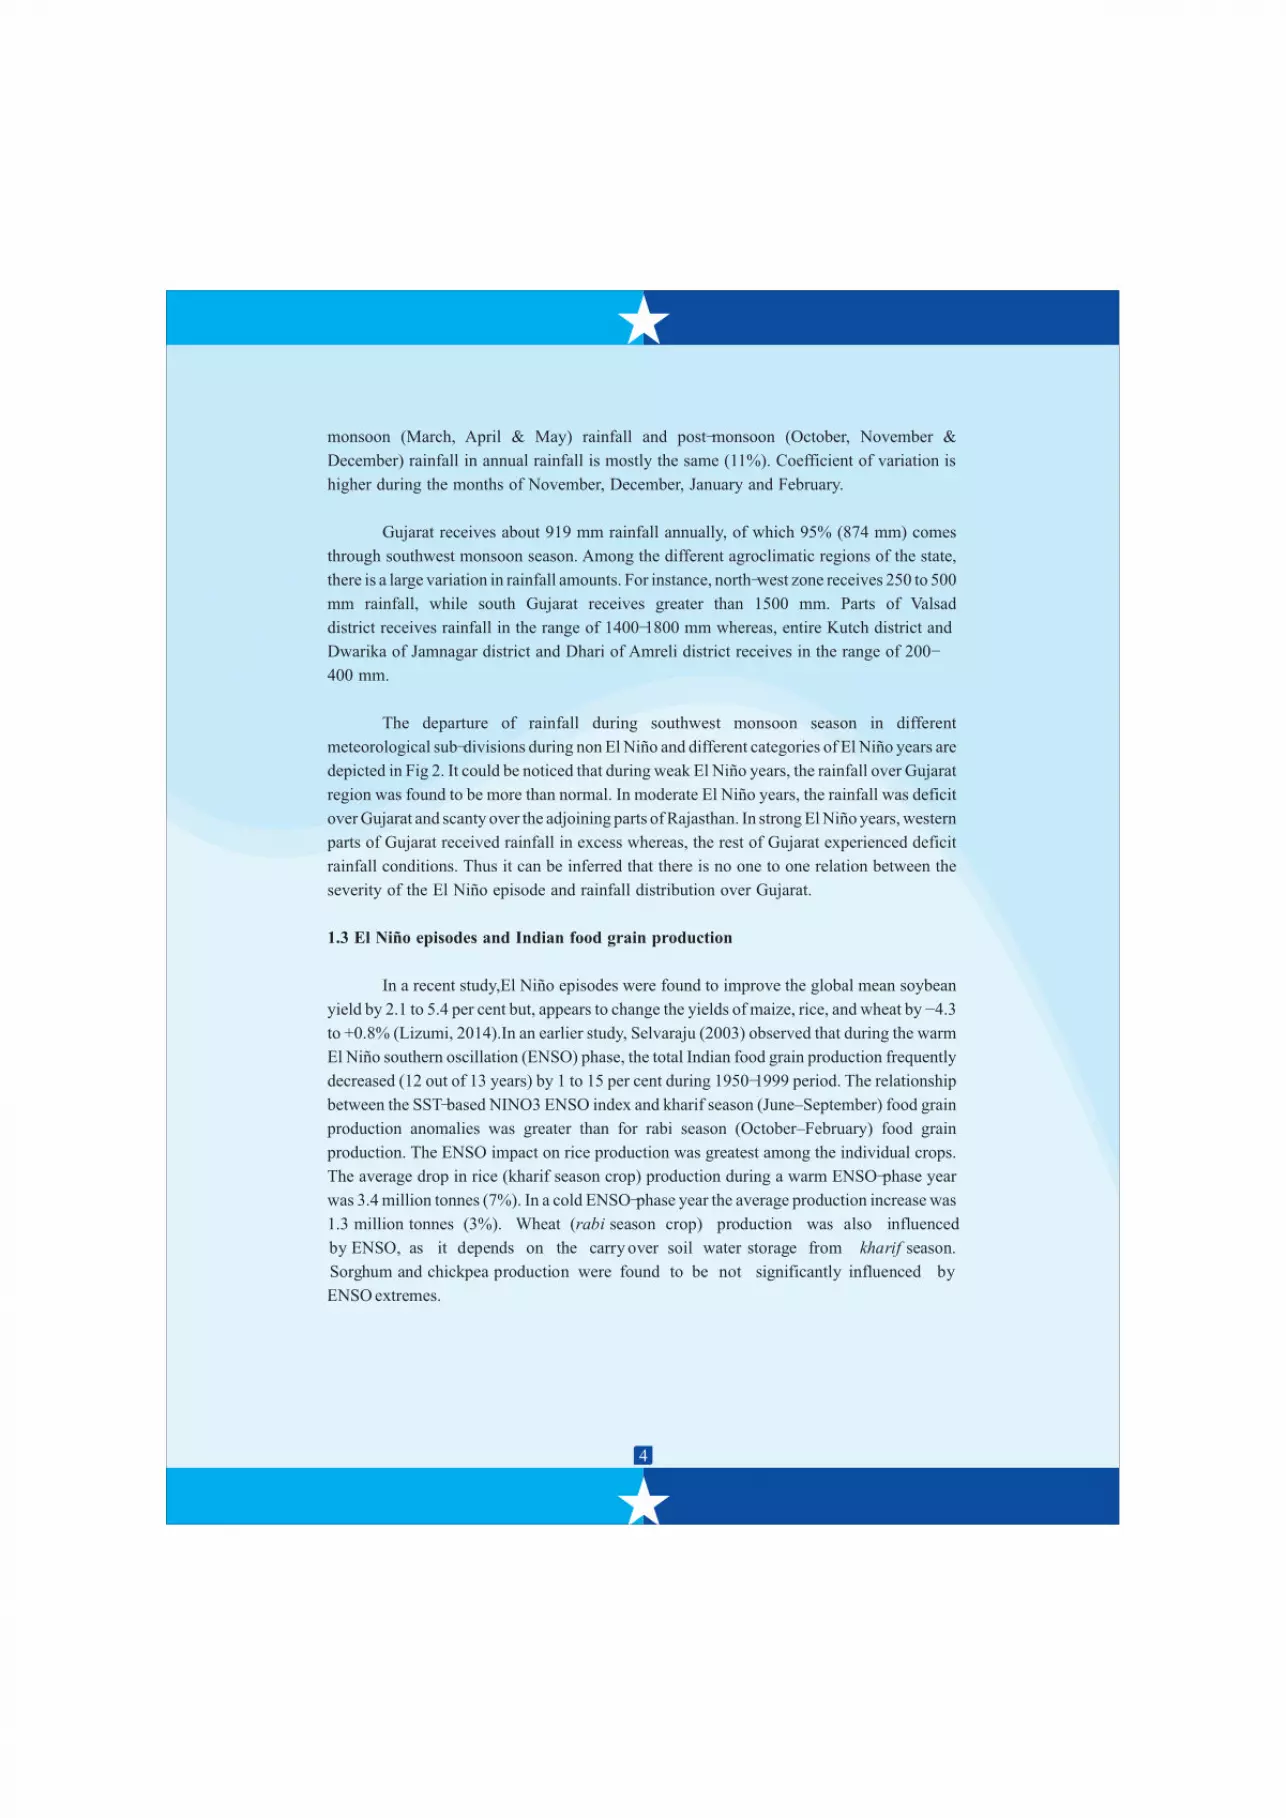
The departure of rainfall during southwest monsoon season in different
meteorological sub-divisions during non El Niño and different categories of El Niño years are
depicted in Fig 2. It could be noticed that during weak El Niño years, the rainfall over Gujarat
region was found to be more than normal. In moderate El Niño years, the rainfall was deficit
over Gujarat and scanty over the adjoining parts of Rajasthan. In strong El Niño years, western
parts of Gujarat received rainfall in excess whereas, the rest of Gujarat experienced deficit
rainfall conditions. Thus it can be inferred that there is no one to one relation between the
severity of the El Niño episode and rainfall distribution over Gujarat.
1.3 El Niño episodes and Indian food grain production
In a recent study,El Niño episodes were found to improve the global mean soybean
yield by 2.1 to 5.4 per cent but, appears to change the yields of maize, rice, and wheat by - 4.3
to +0.8% (Lizumi, 2014).In an earlier study, Selvaraju (2003) observed that during the warm
El Niño southern oscillation (ENSO) phase, the total Indian food grain production frequently
decreased (12 out of 13 years) by 1 to 15 per cent during 1950-1999 period. The relationship
between the SST-based NINO3 ENSO index and kharif season (June–September) food grain
production anomalies was greater than for rabi season (October–February) food grain
production. The ENSO impact on rice production was greatest among the individual crops.
The average drop in rice (kharif season crop) production during a warm ENSO-phase year
was 3.4 million tonnes (7%). In a cold ENSO-phase year the average production increase was
1.3 million tonnes (3%). Wheat (rabi season crop) production was also influenced
by ENSO, as it depends o n th e c arry o ver soil water storage from k harif season.
Sorghum and chickpea production were found to be n ot significantly in fluenced by
ENSO extremes.

5
The above review suggests that, during El Niño years there is a large spatial
variability in the rainfall distribution in the country as well as productivity of different
crops. In the light of India Meteorological Department's forecast of a 60 % probable El
Niño episode during the current year (2014) along with a below normal monsoon
projection, we felt that it is opt to analyse rainfall pattern and agricultural productivity in
Gujarat state in relation to the El Niño episodes.
6
Fig 2: Departure of sub-divisional southwest monsoon season rainfall during a) non-El
Niño year; b) weak El Niño year (2006); c) moderate El Niño year (2002) and d)
strong year (2009)El Niño
7
2 METHODOLOGY.
2.1 Rainfall data
Daily rainfall data recorded at 26 agromet observatories of SAUs, geographically
distributed over the Gujarat state for the period 1978-2011 were used in the present
analysis. The geographical location of these observatories is depicted in Fig 3. The length
of weather data time series was in range of 10 to 33 years for different stations. The daily
rainfall data were converted into first monthly and then into different seasons viz.,summer
(March to May), southwest (June to September), rabi (October to December) and winter
(January to February).
We have classified the El Niño years into weak (0.5 to 0.9), moderate(1.0 to 1.4)
and strong (above 1.5), based on the threshold values that persisted for at least 3 months
and placed the rainfall data in the group accordingly (Table 2).The years of the rainfall
record thus categorized as normal years (non El Niño years), weak El Niño years,
moderate El Niño years and strong El Niño years. During year 1978 to 2011, there were 2
weak El Niño years, 4 moderate El Niño years and 4 strong El Niño years. The mean
rainfall for different El Niño years for each district was deduced by averaging the
corresponding rainfall data.
Table 2: Classification of El Niño years based on the SST anomaly
Intensity Years
Weak 1951,1963,1968,1969,1976,1977,2004,2006
Moderate 1986,1987,1994,2002
Strong 1957,1965,1972,1982,1991,1997,2009
2.2 Crop yield data
The time series data on the area, production and productivity of different crops at
district scale of Gujarat state are sourced from Director of Agriculture, Ahmedabad. The
particulars of data used are presented in Table 3.
Table 3: Time series of crop data used in the present analysis
Crop Period
Paddy, sugarcane, maize, cotton, bajra and groundnut 1960-61 to 2010-11
Wheat 1960-61 to 2009-10
Castor and bajra 1960-61 to 2005-06
Mustard 1960-61 to 2004-05
Time series yield data may feature strong trends that mask seasonal fluctuations
likely to be associated with year on year variations in climate. Researchers have isolated
these seasonal fluctuations by fitting and removing trends with polynomial and other
parametric functions. For example, Parthasarathyet al. (1992) employed an exponential
function to filter the All India Foodgrain Production Statistics. Bapuji Rao et al.(2014)
used a fourth degree polynomial to remove the technology trend in country level paddy

8
Fig 3:Geographical location of meteorological stations selected for rainfall data
yields. We also used a fourth to sixth degree polynomial in the present investigation to
remove the technology trend in various crops.

9
3 . RESULTS
3.1 Rainfall distribution
The changes in rainfall pattern at different locations and time scales under the
influence of the intensity of El Niño are presented in Tables 4 to 7. During El Niño years,
both the annual and seasonal rainfall received at the state level in the past was more than
the rainfall received during non-El Niño years (Table 4). However, a large spatial
variability is noticed in both the rainfall amounts (Fig. 4). During monsoon season rainfall
over Godhra and Bhuj during El Niño years was about 25% deficit compared to non-El
Niño years. In other districts the deficit ranged from -2 to -14, with Rajkot recorded
highest deficit. Compared to monsoon season rainfall, the spatial variability in annual
rainfall was found to be high and widespread. The magnitude of deficit was about 30% at
Bhuj followed by Godhra (25%). The number of stations that showed deficit rainfall was
more for annual figures (14) compared to seasonal rainfall (10). This implies that, rainfall
during El Niño years may exhibit large spatial variability compared to the non-El Niño
years.
Fig 4: Spatial variability in a) annual and b) monsoon season rainfall anomalies
10
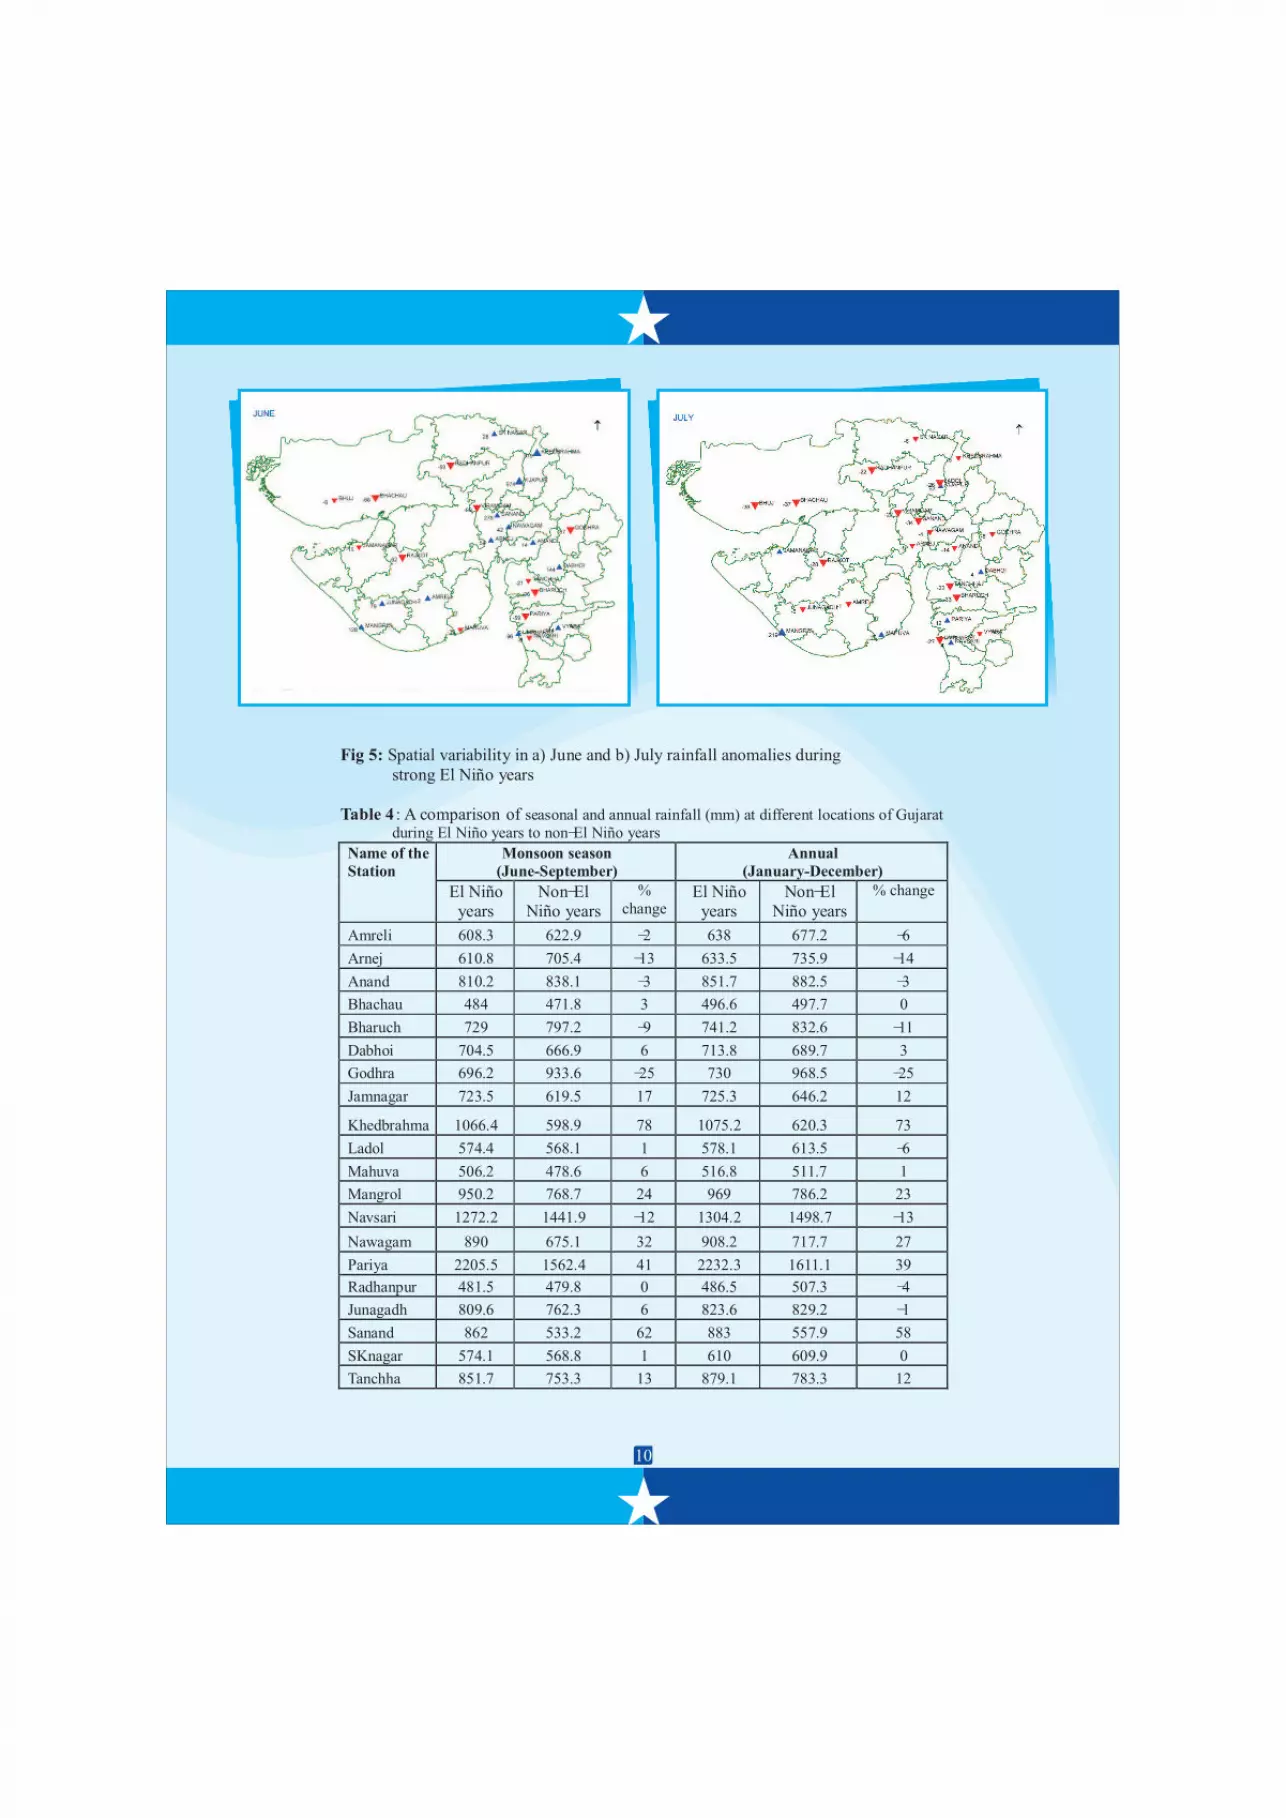
Fig 5: Spatial variability in a) June and b) July rainfall anomalies during
strong El Niño years
Table 4 : A comparison of seasonal and annual rainfall (mm) at different locations of Gujarat during El Niño years to non-El Niño years
Name of the
Station
Monsoon season
(June-September)
Annual
(January-December)
El Niño years
Non-El Niño years
%
change El Niño
years Non-El
Niño years
% change
Amreli 608.3 622.9 -2 638 677.2 -6
Arnej 610.8 705.4 -13 633.5 735.9 -14
Anand 810.2 838.1 -3 851.7 882.5 -3
Bhachau 484 471.8 3 496.6 497.7 0
Bharuch 729 797.2 -9 741.2 832.6 -11
Dabhoi 704.5 666.9 6 713.8 689.7 3
Godhra 696.2 933.6 -25 730 968.5 -25
Jamnagar 723.5 619.5 17 725.3 646.2 12
Khedbrahma 1066.4 598.9 78 1075.2 620.3 73
Ladol 574.4 568.1 1 578.1 613.5 -6
Mahuva 506.2 478.6 6 516.8 511.7 1
Mangrol 950.2 768.7 24 969 786.2 23
Navsari 1272.2 1441.9 -12 1304.2 1498.7 -13
Nawagam 890 675.1 32 908.2 717.7 27
Pariya 2205.5 1562.4 41 2232.3 1611.1 39
Radhanpur 481.5 479.8 0 486.5 507.3 -4
Junagadh 809.6 762.3 6 823.6 829.2 -1
Sanand 862 533.2 62 883 557.9 58
SKnagar 574.1 568.8 1 610 609.9 0
Tanchha 851.7 753.3 13 879.1 783.3 12
11
Umbhrat 1152.9 1144.5 1 1161.2 1180.5 -2
Vijapur 1036.7 521.5 99 1048.3 610.5 72
Viramgam 546.5 640.7 -15 553.1 663.8 -17
Vyara 1116.7 1212.1 -8 1128.9 1256.3 -10
Bhuj 253.2 334 -24 270.4 386.9 -30
Rajkot 454.1 530.4 -14 480.4 563.5 -15
The success of agriculture under Indian conditions largely depends not only on the
quantum of seasonal rainfall, but on its temporal distribution. Thus, there is a need to
assess the impact of El Niño episodes on rainfall at monthly time scales. When the El Niño
episodes are segregated into weak, moderate and severe, their respective influence on the
rainfall pattern at different locations could be studied in depth. During the weak El Niño
years, southwest monsoon rainfall for the entire state was about 25% more than that of
normal years (Table 5). During the months of June, July and August, the departures were
positive, but in the month of September, these were turned negative at most of the
locations.Even during the month of June, the rainfall at four locations (Dabhoi, Godhra,
Jamnagar, Nawagam) was deficit by more than 50% (Fig 5). During July, the number of
stations showing greater than 50% deficit came down to three (i.e.Vyara, Viramgam and
Godhra). These were further reduced to two (Vyara and Mahuva) in case of August
rainfall. A peculiar rainfall pattern was noticed at Vyara. At this location, the rainfall
decreased drastically beyond June month in the weak El Niño years.
Table 5:A comparison of monthly rainfall (mm) at different locations of Gujarat during weak El Niño years against non-El Niño years
Name of the
station
June July August September
Weak
El
Niño
year
Non-
El
Niño
year
Anomaly
(%)
Weak
El
Niño
year
Non-
El
Niño
year
Anomaly
(%)
Weak
El
Niño
year
Non-
El
Niño
year
Anomaly
(%)
Weak
El
Niño
year
Non-
El
Niño
year
Anomaly
(%)
Amreli 199.6 107.2 357.7 193 111.9 162.2 -31 82.7 160.5
Arnej 62.9 106.4 329.7 233.9 299.2 222.3 35 86.1 142.8
Anand 185.8 114.3 370.6 302.2 366.1 253.9 44 87.7 167.6
Bhachau - 170.1 - 199.6 - 32.2 - - 70
Bharuch 130.6 148.5 776.2 306.4 270.6 153.3 77 100.4 188.9
Dabhoi 24 55.1 433.9 242.8 316.2 194.8 62 83.1 174.2
Godhra 39.1 78.5 154.5 354.9 487 320 52 68.1 180.3
Jamnagar 13.5 90.5 392.8 281.3 283 152.4 86 92.5 95.3
Khedbrahma 158.2 63.5 292.8 309 841.8 114 638 293.8 112.4
Ladol 71 60 330 306.3 537 161 234 87 40.8
Mahuva 305 102.2 304 162 44 110.2 -60 20 104.2
Mangrol 216 163.5 424 290.3 111 219.6 -49 86 95.2
Navsari 408 246.9 1012 553.5 314.4 405.6 -22 151.8 235.9
Nawagam 58.6 125.9 429.3 240.7 549.9 176.2 212 57 132.3
Pariya - 425.4 - 615.8 - 297.3 - - 223.9 -
Radhanpur 66.4 51.7 121.4 226.8 416.5 151.9 174 0 49.3
Junagadh 132.4 129.4
-
-
86
-41
63
-12
-56
-50
-85
149
18
198
32
65
-53
28
2 569 294.9
-
-
85
41
23
153
79
-56
40
-5
8
88
46
83
78
-46
93 299.2 189.4 58 238.2 148.5
-
-48
-40
-48
-47
-52
-62
-3
161
113
-81
-10
-36
-57
-100
60
12
Sanand - 54.2 - - 244.7 - - 176.3 - - 58.1 -
SKnagar 90 42.7 111 131.2 228.7 -43 485.2 187.4 159 57.2 110.1
Tanchha 190.2 151.2 26 495 301.7 64 373.2 152.2 145 124 148.2
Umbhrat 328.7 271.8 21 633.1 446.9 42 130.3 238.4 -45 115.9 187.3
Vijapur - 53.7 - - 233.3 - - 108.4 - - 126.1 -
Viramgam 72.7 96.3 -25 134.5 287.5 -53 283.8 147.6 92 145.3 109.4
Vyara 177.8 168.7 5 40 517 -92 35.9 317 -89 75.2 209.4
Bhuj 49 49.1 0 97 115.2 -16 153.9 112.3 37 45.8 57.4
Rajkot 107.4 99.1 8 328.6 203 62 241.8 120.3 101 119.9 108
-48
-16
-38
33
-64
-20
11
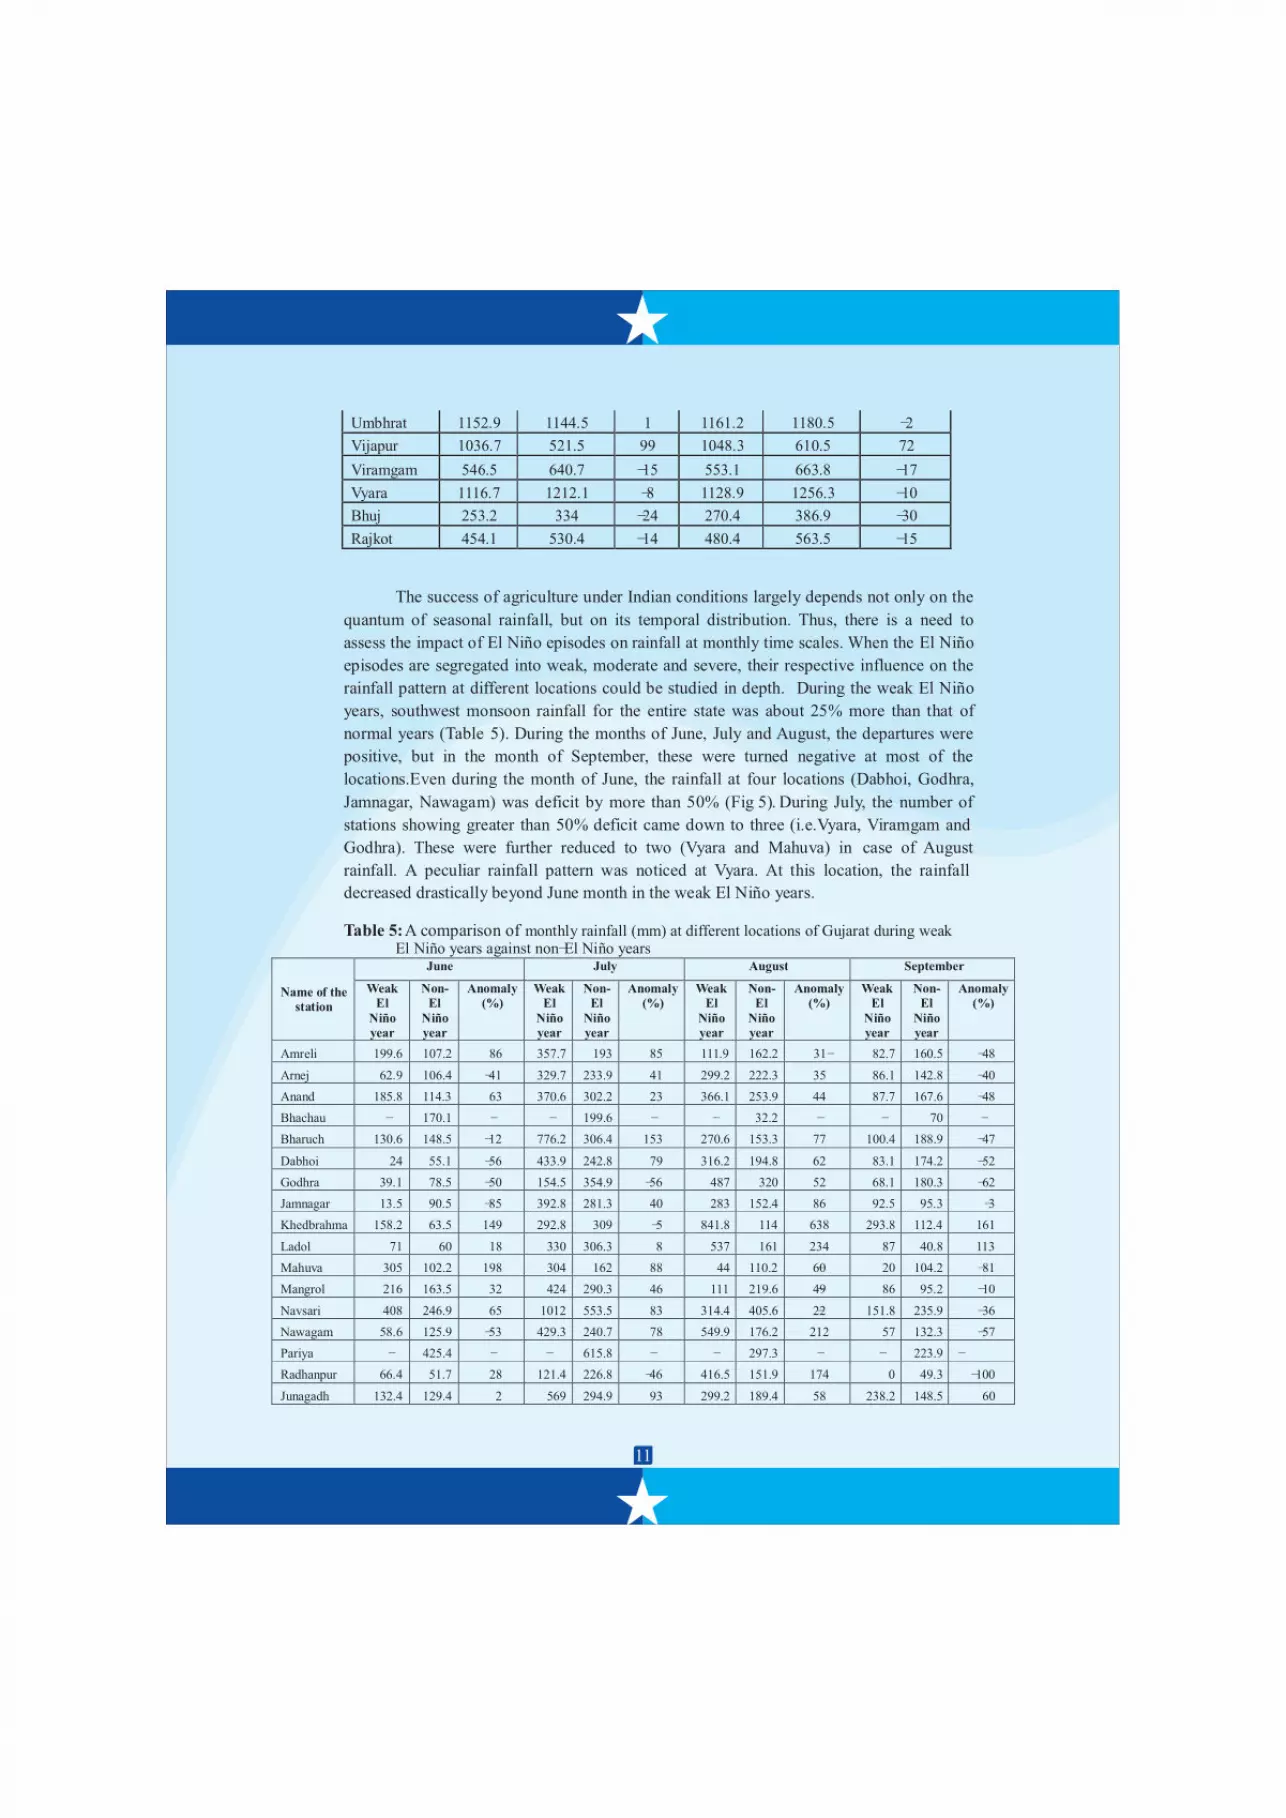
Fig 6: Spatial variability in a) August and b) September rainfall anomalies during strong
El Niño years

13
Table 6:A comparison of monthly rainfall (mm) at different locations of Gujarat during moderate El Niño years against non-El Niño years
Name of
the
station
June July August September
Moderate
El
Nino
year
Non-
El Niño
year
Anoma
ly (%)
Moderate
El
Nino
year
Non-
El Niño
year
Anoma
ly (%)
Moderate
El
Nino
year
Non-
El
Niño
year
Anoma
ly (%)
Moderate
El
Nino
year
Non-
El
Niño
year
Anom
aly
(%)
Amreli 291.9 107.2 172 171.6 193 -11 139.6 162.2 -14 56.7 160.5 -65
Arnej 66.6 106.4 -37 131.2 233.9 -44 138.6 222.3 -38 169.8 142.8 19
Anand 106.9 114.3 -6 166.3 302.2 -45 220.9 253.9 -13 105.3 167.6 -37
Bhachau 26.6 170.1 -84 330.5 199.6 66 171.8 32.2 434 240 70 243
Bharuch 251.5 148.5 69 195.7 306.4 -36 239.5 153.3 56 175.4 188.9 -7
Dabhoi 189.7 55.1 244 141.8 242.8 -42 186.9 194.8 -4 164.1 174.2 -6
Godhra 240 78.5 206 82.5 354.9 -77 207 320 -35 139.5 180.3 -23
Jamnagar 74.6 90.5 -18 390.9 281.3 39 181.6 152.4 19 122.8 95.3 29
Khedbrah
ma 169.9 63.5 168 167.1 309 -46 331.5 114 191 216 112.4 92
Ladol 129 60 115 5 306.3 -98 107.7 161 -33 11.5 40.8 -72
Mahuva 129.8 102.2 27 164.2 162 1 199 110.2 81 40.4 104.2 -61
Mangrol 147.1 163.5 -10 150.5 290.3 -48 96.5 219.6 -56 173 95.2 82
Navsari 272.9 246.9 11 531.4 553.5 -4 286.7 405.6 -29 96.6 235.9 -59
Nawagam 126.8 125.9 1 436 240.7 81 222.6 176.2 26 374.2 132.3 183
Pariya 722.3 425.4 70 651.4 615.8 6 720.3 297.3 142 132.4 223.9 -41
Radhanpur 92.3 51.7 79 80.5 226.8 -65 120.3 151.9 -21 80.3 49.3 63
Junagadh 149.4 129.4 15 321.1 294.9 9 109.4 189.4 -42 82.4 148.5 -45
Sanand 25.8 54.2 -52 426.4 244.7 74 336.4 176.3 91 413.2 58.1 611
SKnagar 66.2 42.7 55 125.6 228.7 -45 227.6 187.4 21 98.1 110.1 -11
Tanchha 312.5 151.2 107 151.9 301.7 -50 257 152.2 69 138.8 148.2 -6
Umbhrat 469.7 271.8 73 77.2 446.9 -83 359.6 238.4 51 60.6 187.3 -68
Vijapur 86.8 53.7 62 180.8 233.3 -23 277.3 108.4 156 281.8 126.1 123
Viramgam - 96.3 - - 287.5 - - 147.6 - - 109.4 -
Vyara 809.2 168.7 380 702.2 517 36 443.4 317 40 103.3 209.4 -51
Bhuj 27 49.1 -45 117.5 115.2 2 29.2 112.3 -74 56.5 57.4 -2
Rajkot 207.5 99.1 109 4.8 203 -98 91 120.3 -24 6.1 108 -94
Table 7:A comparison of monthly rainfall (mm) at different locations of Gujarat during strong El Niño years against non-El Niño years
Name of the
station
June July August September
Strong
El
Niño
Year
Non-
El
Niño
year
Anomaly
(%)
Strong
El
Niño
Year
Non-
El
Niño
year
Anomaly
(%)
Strong
El
Niño
Year
Non-
El
Niño
year
Anomaly
(%)
Strong
El
Niño
Year
Non-
El
Niño
year
Anomaly
(%)
Amreli 109.7 107.2 2 191.2 193 -1 65 162.2 -60 47.4 160.5 -70
Arnej 164.3 106.4 54 213.1 233.9 -9 128.7 222.3 -42 63.2 142.8 -56
Anand 129.9 114.3 14 259.5 302.2 -14 275.3 253.9 8 34.3 167.6 -80
Bhachau 53.8 170.1 -68 125.3 199.6 -37 104 32.2 223 58.5 70 -16
Bharuch 5.9 148.5 -96 206.5 306.4 -33 174.1 153.3 14 70.7 188.9 -63
Dabhoi 134.5 55.1 144 252.9 242.8 4 191.3 194.8 -2 38.8 174.2 -78
Godhra 10 78.5 -87 336.6 354.9 -5 296.5 320 -7 27.2 180.3 -85
14
Jamnagar 76.8 90.5 -15 283.8 281.3 1 114 152.4 -25 173.5 95.3 82
Khedbrahma 431 63.5 579 155.8 309 -50 164.4 114 44 159 112.4 41
Ladol - 60 - 227 306.3 -26 209 161 30 9 40.8 -78
Mahuva 68.6 102.2 -33 189.9 162 17 111.8 110.2 1 53.1 104.2 -49
Mangrol 372.5 163.5 128 927 290.3 219 27.5 219.6 -87 63 95.2 -34
Navsari 48.5 246.9 -80 773.9 553.5 40 245.6 405.6 -39 112.5 235.9 -52
Nawagam 178.4 125.9 42 144 240.7 -40 212.2 176.2 20 39.1 132.3 -70
Pariya 176 425.4 -59 1352.6 615.8 120 441 297.3 48 173 223.9 -23
Radhanpur 21 51.7 -59 176.8 226.8 -22 155.2 151.9 2 114.3 49.3 132
Junagadh 231.7 129.4 79 281.5 294.9 -5 92 189.4 -51 217.3 148.5 46
Sanand 203.5 54.2 275 161.3 244.7 -34 209.2 176.3 19 174.8 58.1 201
SKnagar 131.4 42.7 208 214.5 228.7 -6 114.2 187.4 -39 63.1 110.1 -43
Tanchha 119.3 151.2 -21 234.1 301.7 -22 186.6 152.2 23 138.1 148.2 -7
Umbhrat 533 271.8 96 324.7 446.9 -27 171.9 238.4 -28 254.1 187.3 36
Vijapur 576.5 53.7 974 448.9 233.3 92 166.2 108.4 53 55.3 126.1 -56
Viramgam 1.4 96.3 -99 224 287.5 -22 131.8 147.6 -11 9.8 109.4 -91
Vyara 360.4 168.7 114 363.4 517 -30 162.2 317 -49 77.3 209.4 -63
Bhuj 19.4 49.1 -60 73.5 115.2 -36 20.2 112.3 -82 47.3 57.4 -18
Rajkot 37.4 99.1 -62 146 203 -28 44 120.3 -63 46 108 -57
In moderate El Niño years also, the mean seasonal rainfall of all these stations was
above than that of non-El Niño years and the magnitude of difference was about 10%.
Except for the month of July, the rainfall during all other monsoonal months was above the
non-El Niño years. As the case with weak El Niño years, the spatial variability during
moderate El Niño years was also found exists (Table 6). Rainfall during the month of July
was found deficit at majority of locations with the magnitude of deficit ranging from -4 to
-98. At stations like, Ladol, Rajkot, Umbhrat, Godhra and Radhanpur the activity of
monsoon was very much subdued during July.
In strong El Niño years, the mean seasonal rainfall of all the stations was slightly
(1%) lower than that of non-El Niño years. Though the June and July rainfall during strong
El Niño years was more than normal, the rainfall during the 2nd half (August and
September) were in deficit (Table 7). The magnitude of deficit was more during
September. The number of districts that experienced deficit rainfall and magnitude of
deficits were more in the month of September. This implies that during strong El Niño
years, there is a chance of early withdrawal of monsoon from parts of Gujarat which may
induce terminal moisture stress in kharif crops.
In sum, large spatial variability is noticed both in annual and seasonal rainfall
during El Niño years in comparison to non-El Niño years. During weak and strong El Niño
years, the rainfall towards the end of the monsoon season was deficit at most of the
locations. However, in moderate El Niño years, the July rainfall was deficit indicating a
break in monsoon activity.
15
3.2 Crop productivity vis-a-visEl Niño episodes in Gujarat
Considering the dependence of Indian food grain production on the performance of
southwest monsoon, it is natural to expect the influence of the El Niño episodes on
productivity of different crops of Gujarat state. The following discussion focus on this
aspect and the presentation is made crop-wise.
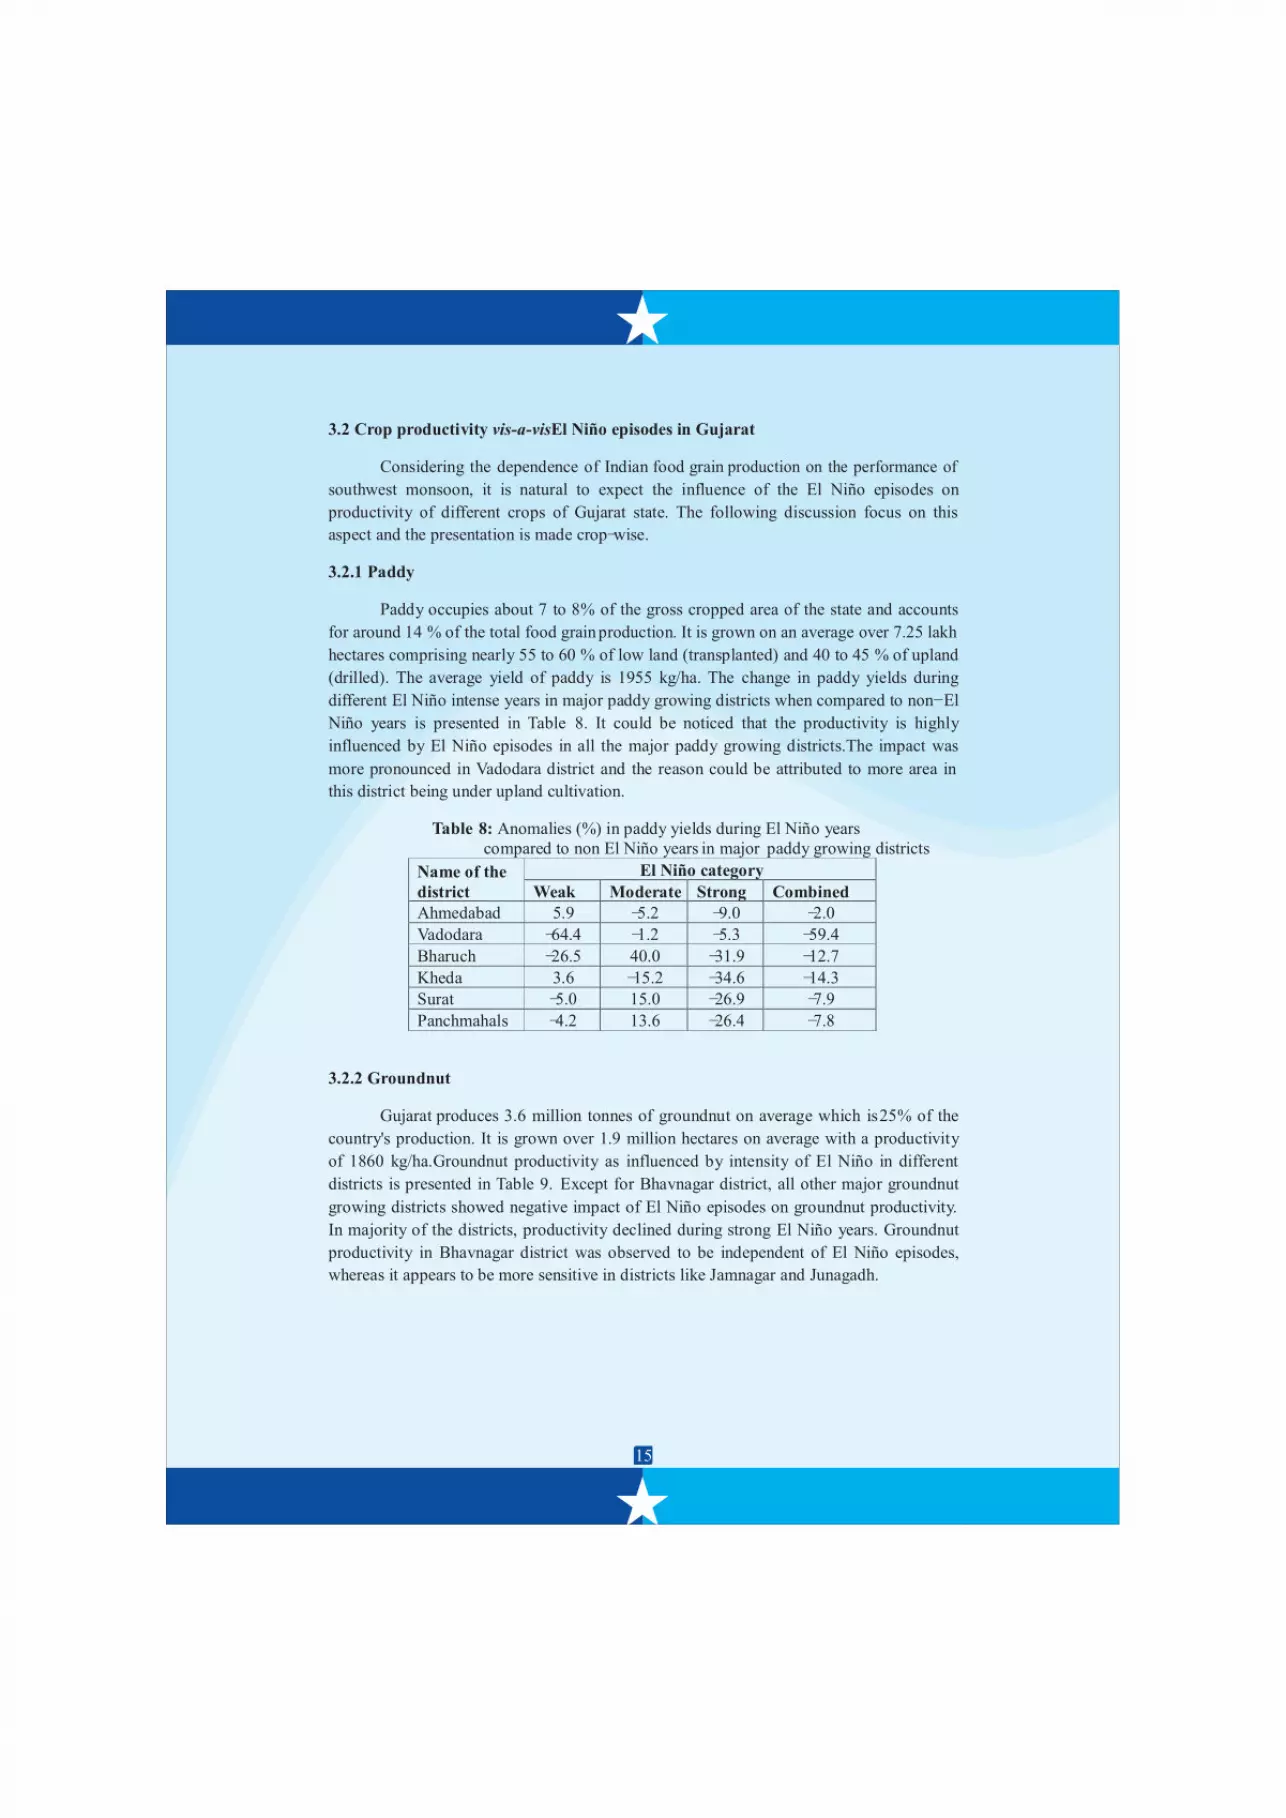
3.2.1 Paddy
Paddy occupies about 7 to 8% of the gross cropped area of the state and accounts
for around 14 % of the total food grain production. It is grown on an average over 7.25 lakh
hectares comprising nearly 55 to 60 % of low land (transplanted) and 40 to 45 % of upland
(drilled). The average yield of paddy is 1955 kg/ha. The change in paddy yields during
different El Niño intense years in major paddy growing districts when compared to non- El
Niño years is presented in Table 8. It could be noticed that the productivity is highly
influenced by El Niño episodes in all the major paddy growing districts.The impact was
more pronounced in Vadodara district and the reason could be attributed to more area in
this district being under upland cultivation.
Table 8: Anomalies (%) in paddy yields during El Niño years
compared to non El Niño years in major paddy growing districts
Name of the
district
El Niño category
Weak Moderate Strong Combined
Ahmedabad 5.9 -5.2 -9.0 -2.0
Vadodara -64.4 -1.2 -5.3 -59.4
Bharuch -26.5 40.0 -31.9 -12.7
Kheda 3.6 -15.2 -34.6 -14.3
Surat -5.0 15.0 -26.9 -7.9
Panchmahals -4.2 13.6 -26.4 -7.8
3.2.2 Groundnut
Gujarat produces 3.6 million tonnes of groundnut on average which is 25% of the
country's production. It is grown over 1.9 million hectares on average with a productivity
of 1860 kg/ha.Groundnut productivity as influenced by intensity of El Niño in different
districts is presented in Table 9. Except for Bhavnagar district, all other major groundnut
growing districts showed negative impact of El Niño episodes on groundnut productivity.
In majority of the districts, productivity declined during strong El Niño years. Groundnut
productivity in Bhavnagar district was observed to be independent of El Niño episodes,
whereas it appears to be more sensitive in districts like Jamnagar and Junagadh.
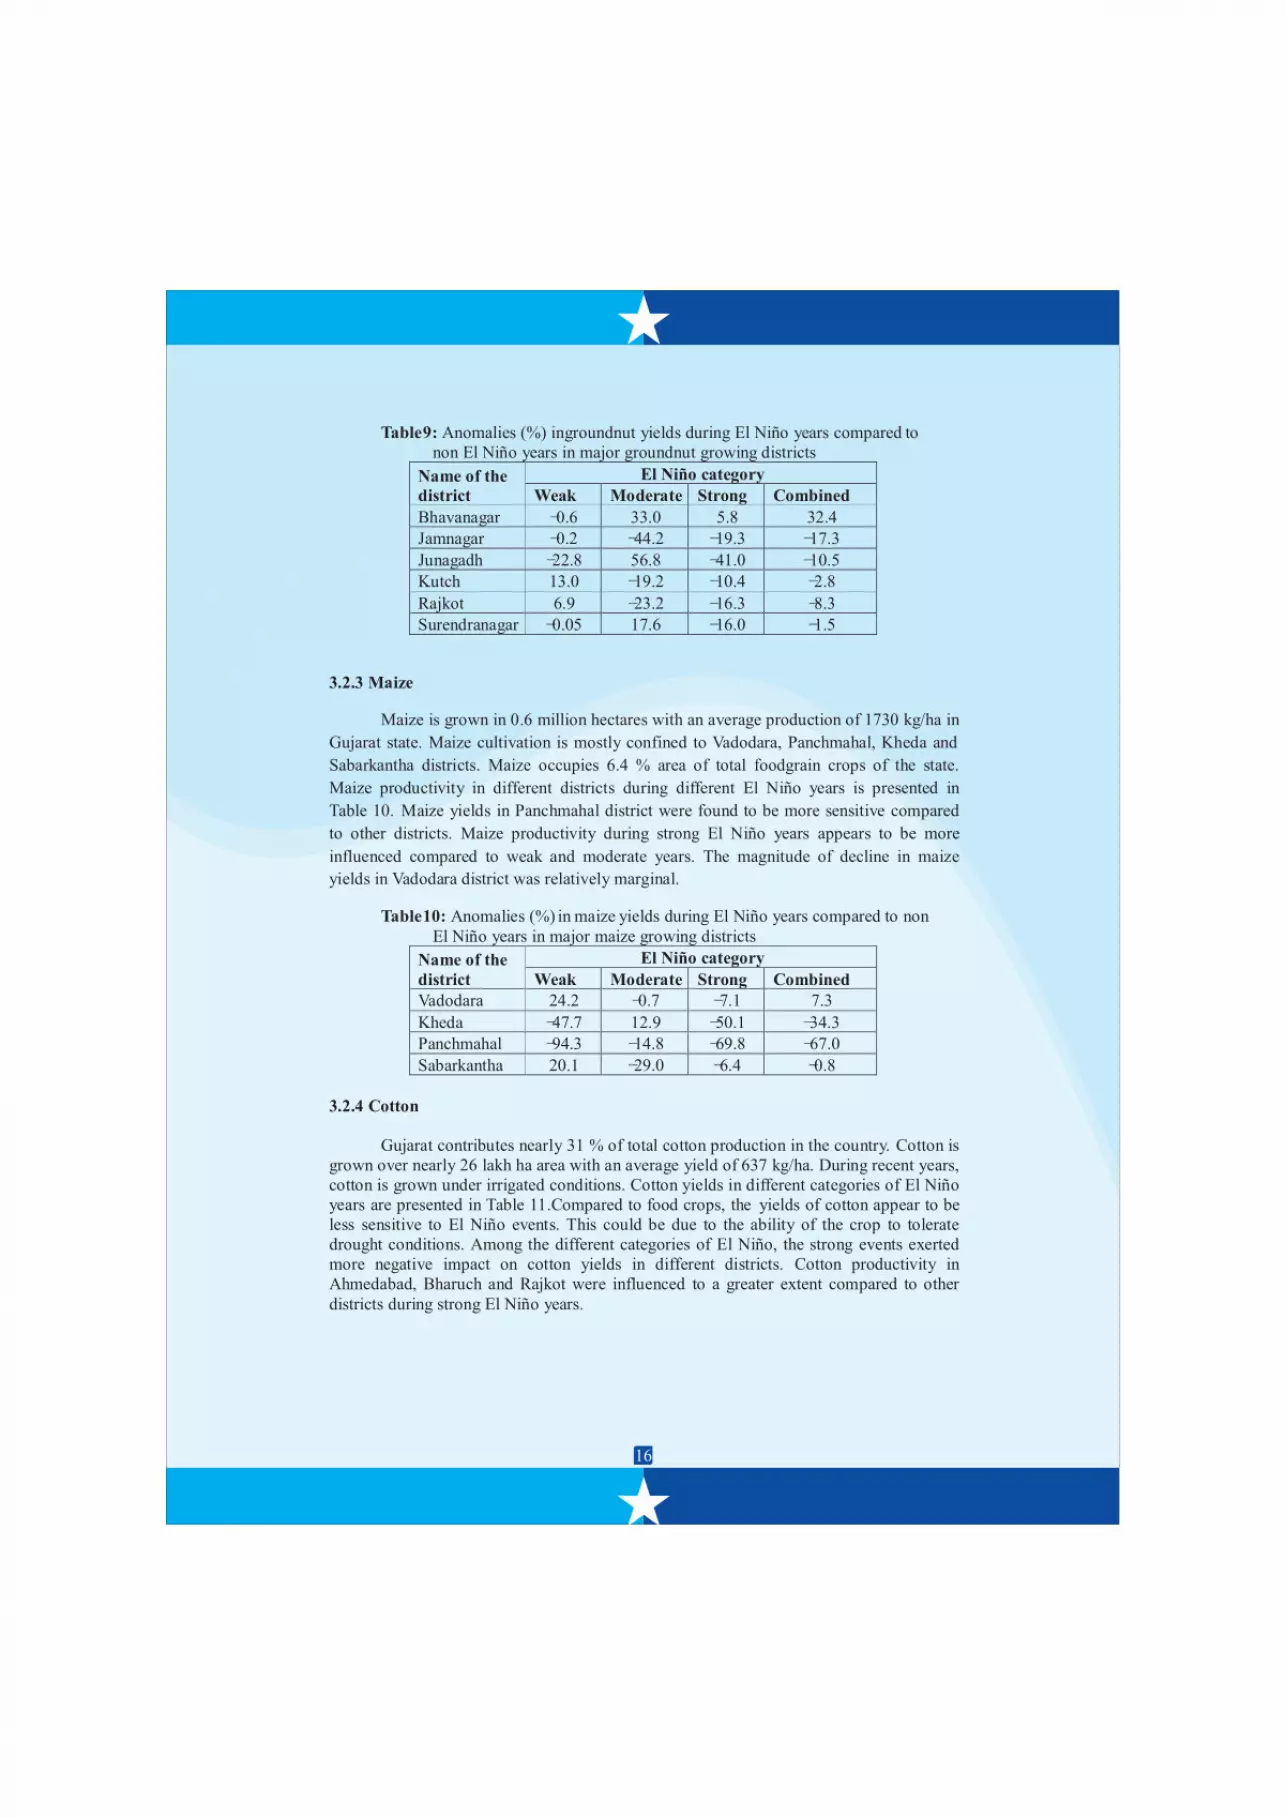
16
Table9: Anomalies (%) ingroundnut yields during El Niño years compared to
non El Niño years in major groundnut growing districts
Name of the
district
El Niño category
Weak Moderate Strong Combined
Bhavanagar -0.6 33.0 5.8 32.4
Jamnagar -0.2 -44.2 -19.3 -17.3
Junagadh -22.8 56.8 -41.0 -10.5
Kutch 13.0 -19.2 -10.4 -2.8
Rajkot 6.9 -23.2 -16.3 -8.3
Surendranagar -0.05 17.6 -16.0 -1.5
3.2.3 Maize
Maize is grown in 0.6 million hectares with an average production of 1730 kg/ha in
Gujarat state. Maize cultivation is mostly confined to Vadodara, Panchmahal, Kheda and
Sabarkantha districts. Maize occupies 6.4 % area of total foodgrain crops of the state.
Maize productivity in different districts during different El Niño years is presented in
Table 10. Maize yields in Panchmahal district were found to be more sensitive compared
to other districts. Maize productivity during strong El Niño years appears to be more
influenced compared to weak and moderate years. The magnitude of decline in maize
yields in Vadodara district was relatively marginal.
Table10: Anomalies (%) in maize yields during El Niño years compared to non
El Niño years in major maize growing districts
Name of the
district
El Niño category
Weak Moderate Strong Combined
Vadodara 24.2 -0.7 -7.1 7.3
Kheda -47.7 12.9 -50.1 -34.3
Panchmahal -94.3 -14.8 -69.8 -67.0
Sabarkantha 20.1 -29.0 -6.4 -0.8
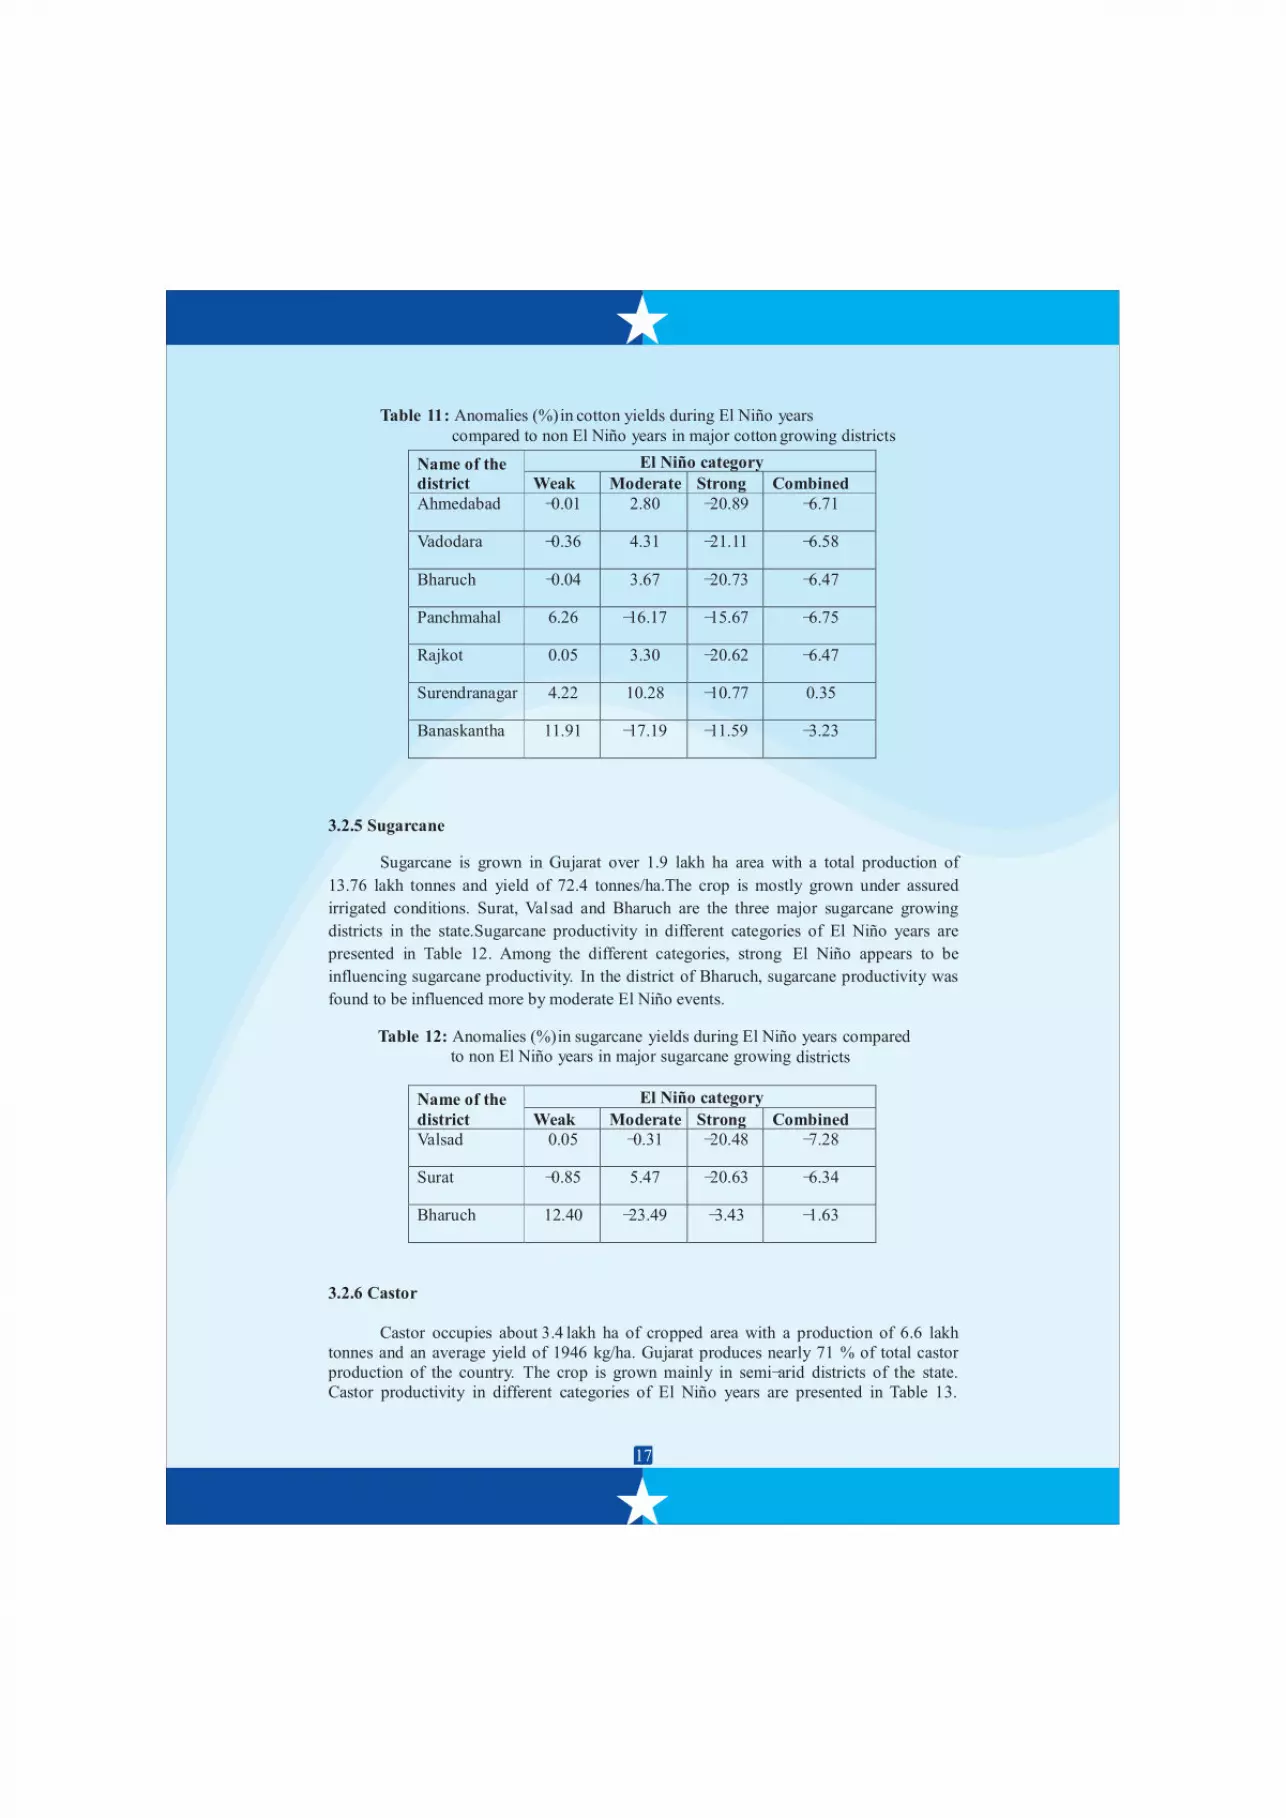
3.2.4 Cotton
Gujarat contributes nearly 31 % of total cotton production in the country. Cotton is
grown over nearly 26 lakh ha area with an average yield of 637 kg/ha. During recent years,
cotton is grown under irrigated conditions. Cotton yields in different categories of El Niño
years are presented in Table 11.Compared to food crops, the yields of cotton appear to be
less sensitive to El Niño events. This could be due to the ability of the crop to tolerate
drought conditions. Among the different categories of El Niño, the strong events exerted
more negative impact on cotton yields in different districts. Cotton productivity in
Ahmedabad, Bharuch and Rajkot were influenced to a greater extent compared to other
districts during strong El Niño years.
17
Table 11: Anomalies (%) in cotton yields during El Niño years
compared years major growing districtsto non El Niño in cotton
Name of the
district
El Niño category
Weak Moderate Strong Combined
Ahmedabad -0.01 2.80 -20.89 -6.71
Vadodara -0.36 4.31 -21.11 -6.58
Bharuch -0.04 3.67 -20.73 -6.47
Panchmahal 6.26 -16.17 -15.67 -6.75
Rajkot 0.05 3.30 -20.62 -6.47
Surendranagar 4.22 10.28 -10.77 0.35
Banaskantha 11.91 -17.19 -11.59 -3.23
3.2.5 Sugarcane
Sugarcane is grown in Gujarat over 1.9 lakh ha area with a total production of
13.76 lakh tonnes and yield of 72.4 tonnes/ha.The crop is mostly grown under assured
irrigated conditions. Surat, Valsad and Bharuch are the three major sugarcane growing
districts in the state.Sugarcane productivity in different categories of El Niño years are
presented in Table 12. Among the different categories, strong El Niño appears to be
influencing sugarcane productivity. In the district of Bharuch, sugarcane productivity was
found to be influenced more by moderate El Niño events.
Table 12: Anomalies (%) in sugarcane yields during El Niño years compared
to non El Niño years in major sugarcane growing districts
Name of the
district
El Niño category
Weak Moderate Strong Combined
Valsad 0.05 -0.31 -20.48 -7.28
Surat -0.85 5.47 -20.63 -6.34
Bharuch 12.40 -23.49 -3.43 -1.63
3.2.6 Castor
Castor occupies about 3.4 lakh ha of cropped area with a production of 6.6 lakh
tonnes and an average yield of 1946 kg/ha. Gujarat produces nearly 71 % of total castor
production of the country. The crop is grown mainly in semi-arid districts of the state.
Castor productivity in different categories of El Niño years are presented in Table 13.
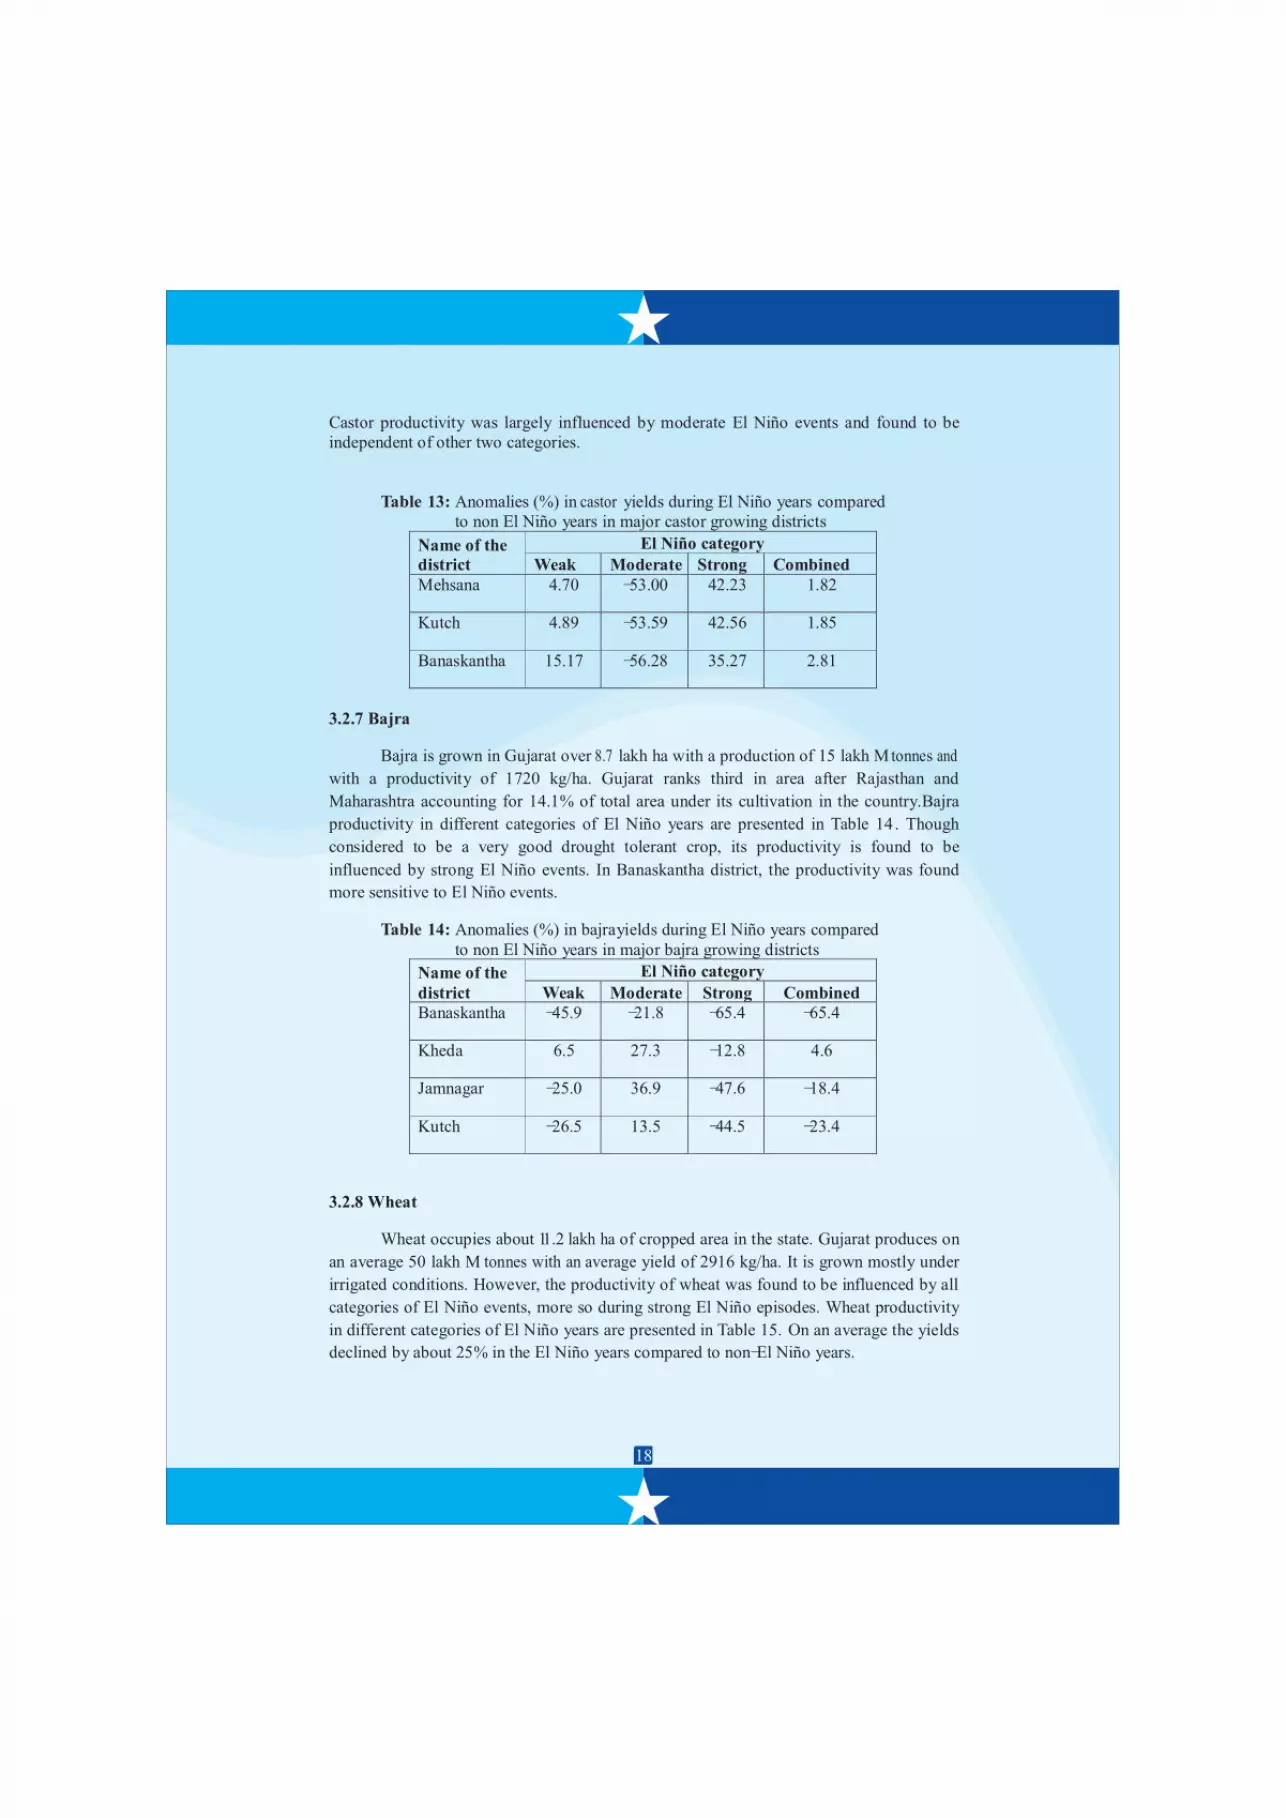
18
Castor productivity was largely influenced by moderate El Niño events and found to be
independent of other two categories.
Table 13: Anomalies (%) in castor yields during El Niño years compared
to non El Niño years in major castor growing districts
Name of the
district
El Niño category
Weak Moderate Strong Combined
Mehsana 4.70 -53.00 42.23 1.82
Kutch 4.89 -53.59 42.56 1.85
Banaskantha 15.17 -56.28 35.27 2.81
3.2.7 Bajra
Bajra is grown in Gujarat over 8.7 lakh ha with a production of 15 lakh M tonnes and
with a productivity of 1720 kg/ha. Gujarat ranks third in area after Rajasthan and
Maharashtra accounting for 14.1% of total area under its cultivation in the country.Bajra
productivity in different categories of El Niño years are presented in Table 14. Though
considered to be a very good drought tolerant crop, its productivity is found to be
influenced by strong El Niño events. In Banaskantha district, the productivity was found
more sensitive to El Niño events.
Table 14: Anomalies (%) in bajra yields during El Niño years compared
to non El Niño years in major bajra growing districts
Name of the
district
El Niño category
Weak Moderate Strong Combined
Banaskantha -45.9 -21.8 -65.4 -65.4
Kheda 6.5 27.3 -12.8 4.6
Jamnagar -25.0 36.9 -47.6 -18.4
Kutch -26.5 13.5 -44.5 -23.4
3.2.8 Wheat
Wheat occupies about 11.2 lakh ha of cropped area in the state. Gujarat produces on
an average 50 lakh M tonnes with an average yield of 2916 kg/ha. It is grown mostly under
irrigated conditions. However, the productivity of wheat was found to be influenced by all
categories of El Niño events, more so during strong El Niño episodes. Wheat productivity
in different categories of El Niño years are presented in Table 15. On an average the yields
declined by about 25% in the El Niño years compared to non-El Niño years.
19
El Niño years in major wheat growing districts
Name of the
district
El Niño category
Weak Moderate Strong Combined
Ahmedabad -18.8 -9.2 -43.8 -25.3
Banaskantha -16.1 -12.7 -42.7 -24.7
Vadodara -17.3 -13.6 -40.9 -24.8
Bharuch -17.2 -13.1 -41.2 -24.7
Gandhinagar -17.7 -13.5 -42.1 -25.3
Kheda -20.9 -9.9 -46.1 -27.2
Mehsana -17.7 -13.0 -42.0 -25.2
Panchmahal -17.1 -13.1 -41.8 -24.9
Sabarkantha -17.3 -13.3 -41.9 -25.1
Bhavnagar -15.0 -15.0 -39.0 -23.5
Junagadh -17.6 -13.4 -41.5 -25.0
Rajkot -17.7 -14.1 -41.3 -25.2
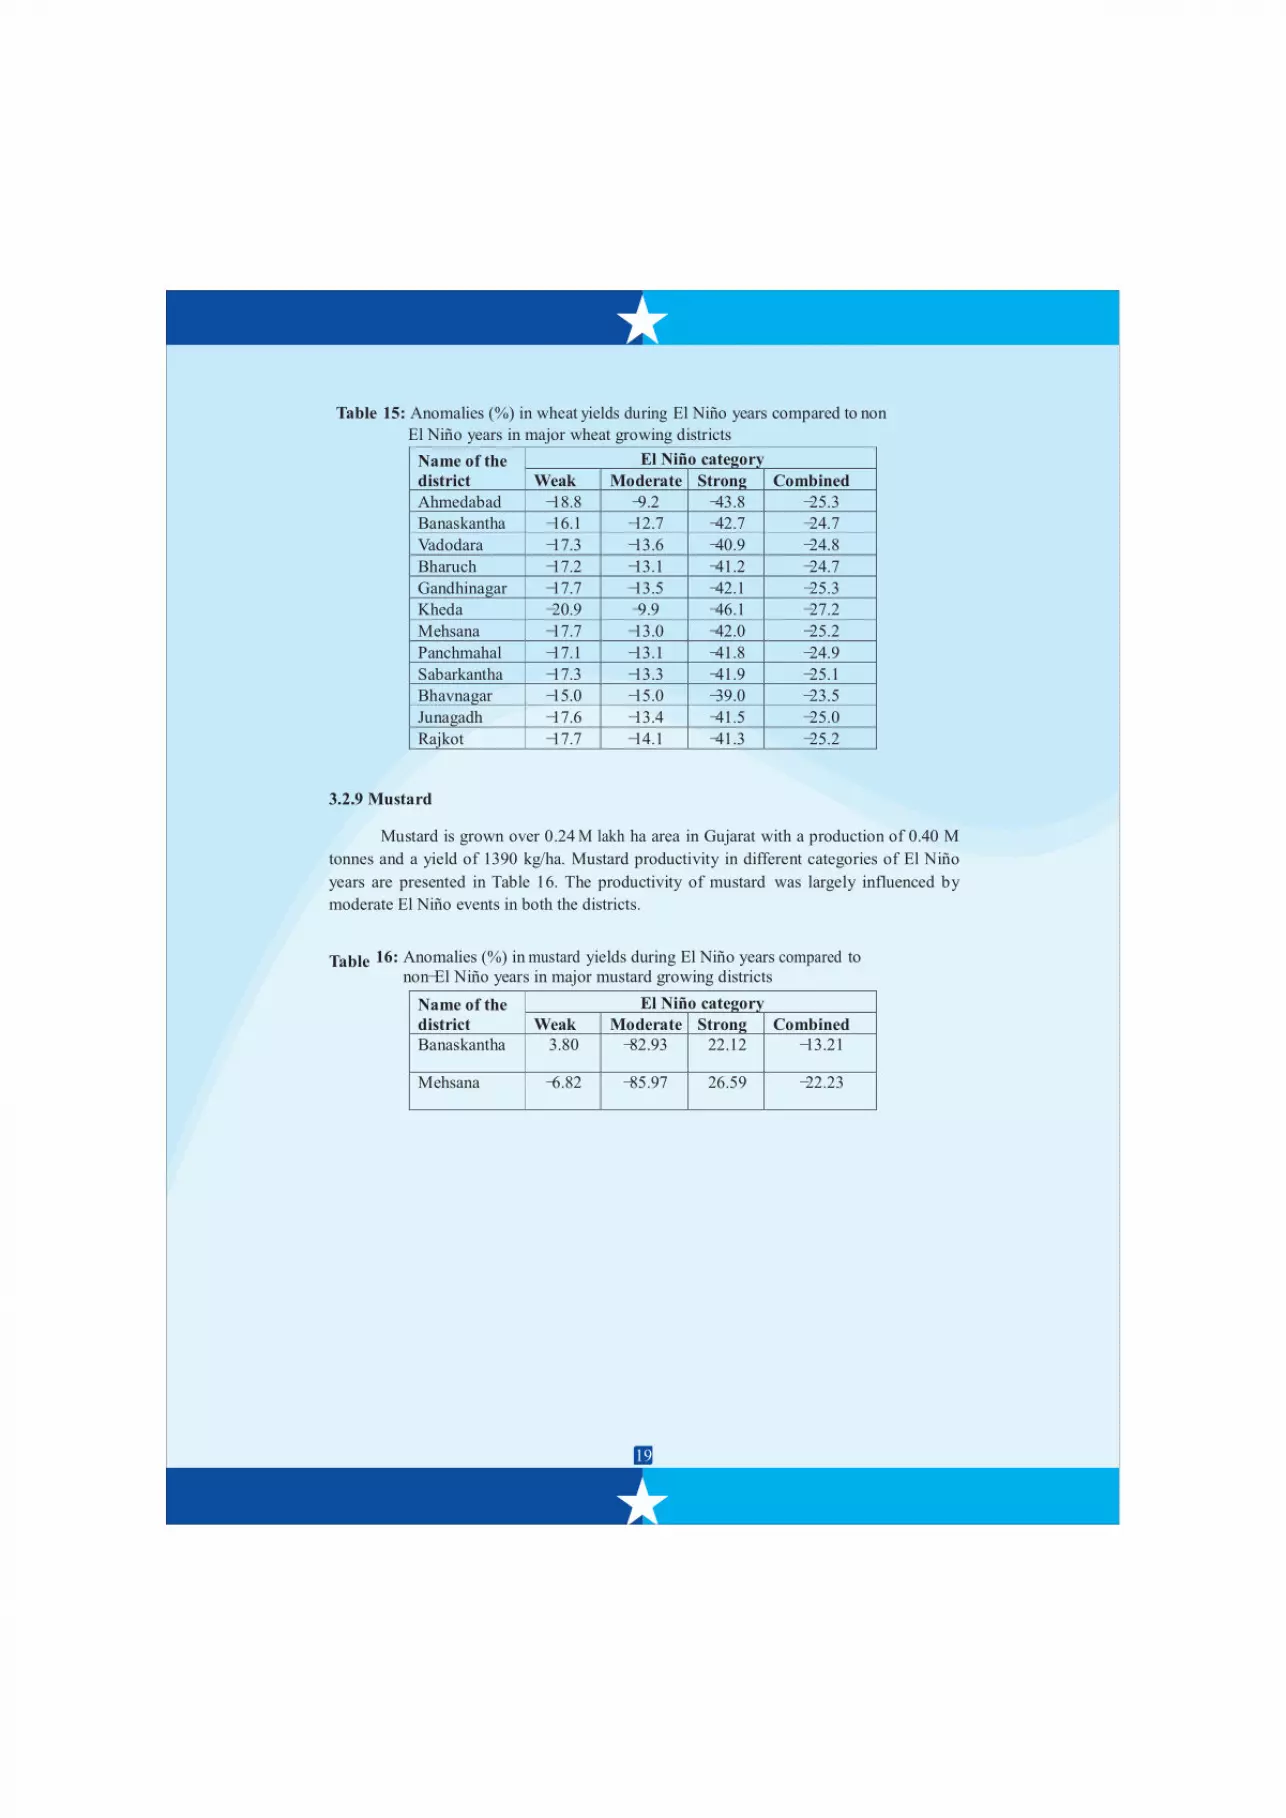
3.2.9 Mustard
Mustard is grown over 0.24 M lakh ha area in Gujarat with a production of 0.40 M
tonnes and a yield of 1390 kg/ha. Mustard productivity in different categories of El Niño
years are presented in Table 16. The productivity of mustard was largely influenced by
moderate El Niño events in both the districts.
Table 16: Anomalies (%) in mustard yields during El Niño years compared to
non-El Niño years in major mustard growing districts
Name of the
district
El Niño category
Weak Moderate Strong Combined
Banaskantha 3.80 -82.93 22.12 -13.21
Mehsana -6.82 -85.97 26.59 -22.23
Table 15: Anomalies (%) in wheat yields during El Niño years compared to non

20
4. SUMMARY
Agriculture is a major enterprise in Gujarat providing employment to more than 52% of
the work force. Productivity of kharif crops in the state mainly depends on the spatial and
temporal distribution of Southwest monsoon seasonal rainfall, as this is the main rainy
period during which 74% of annual rainfall is receiving. Among the different climatic
zones of the state, there is a large spatial variability ranging from 200 to 1500 mm.
El Niño, which indicates a band of warm ocean water temperatures that
periodically develops off the Pacific coast of South America, is found to influence the
performance of south west monsoon in India during some years. Some studies indicate its
influence on agricultural productivity at global and national level. In the light of IMD's
forecast of a 60% probable El Niño episode during 2014, an attempt has been made to
study the influence of different intensities of El Niño of the past on the rainfall pattern and
productivity of different agricultural crops of Gujarat state.
During El Niño years both annual and seasonal rainfall when aggregated at state
level was more than that received during non El Niño years. A large spatial variability is
noticed with monsoon rainfall deficit by 25% over Godhra and Bhuj during El Niño years.
In other districts, it ranged from -2 to -14. Variability was still high and widespread in
annual rainfall indicating the influence of El Niño. In strong El Niño years, there is a
chance of early withdrawal of monsoon from parts of Gujarat which may induce terminal
moisture stress in kharif crops. During weak and strong El Niño years, the rainfall towards
the end of the monsoon season was deficit at most of the locations studied. However, in
moderate El Niño years, the July rainfall was deficit indicating a break in monsoon
activity.
Influence of El Niño episodes on agricultural productivity of different crops of
Gujarat state when analysed has indicated that paddy was highly influenced by El Niño
episodes. The impact was more pronounced in Vadodara district probably due to more area
being under upland cultivation. In majority of the districts, paddy productivity declined
during strong El Niño years. Groundnut productivity appears to be more sensitive to El
Niño in districts like Jamnagar and Junagadh. Maize yields in Panchmahal district were
more sensitive compared to other districts. Maize productivity during strong El Niño years
were more influenced compared to weak and moderate years. Among the different
categories of El Niño, strong events exerted more negative impact on cotton yields
especially in districts like Ahmedabad, Bharuch and Rajkot. Strong El Niño events
influenced sugarcane productivity. In Bharuch, it's productivity was found to be influenced
more by moderate El Niño events. Castor productivity was largely influenced by moderate
El Niño events. Productivity of bajra was influenced by strong El Niño events and in
Banaskantha district its productivity was found more sensitive. Wheat yields declined by
about 25% in the El Niño years compared to non-El Niño years. Productivity of mustard
was largely influenced by moderate El Niño events.

21
The present study indicates an alteration in the spatial and temporal variability of
rainfall induced by El Niño and its intensity. Sensitivity of crops to El Niño episodes is not
uniform across locations. This calls for further analysis of rainfall and crop data at micro
level preferably block or taluka. This may probably enable all the stake holders to become
prepared with contingency plans to overcome the likely El Niño impacts.
22
5. REFERENCES
Bapuji Rao B, Santhibhushan Chowdary P, Sandeep VM, Rao VUM, Venkateswarlu B
(2014) Rising minimum temperature trends over India in recent decades:
Implications for agricultural production. Global and Planetary Change, 117: 1-8.
Iizumi T, Luo JJ, Challinor AJ, Sakurai G, Yokozawa M, Sakuma H, Brown ME,
Yamagata T (2014) Impacts of El Niño Southern Oscillation on the global yields
of major crops. Nature communications 5. doi: 10.1038/ncomms 4712
Parthasarathy B, Rupa Kumar K,Munot, A.A.,1992. Forecast of rainy season food grain
production based on monsoon rainfal. Indian Journal of Agricultural Sciences, 62:
1-8.
Selvaraju R. (2003) Impact of El Niño–southern oscillation on Indian foodgrain
production. International Journal of Climatology, 23: 187-206.
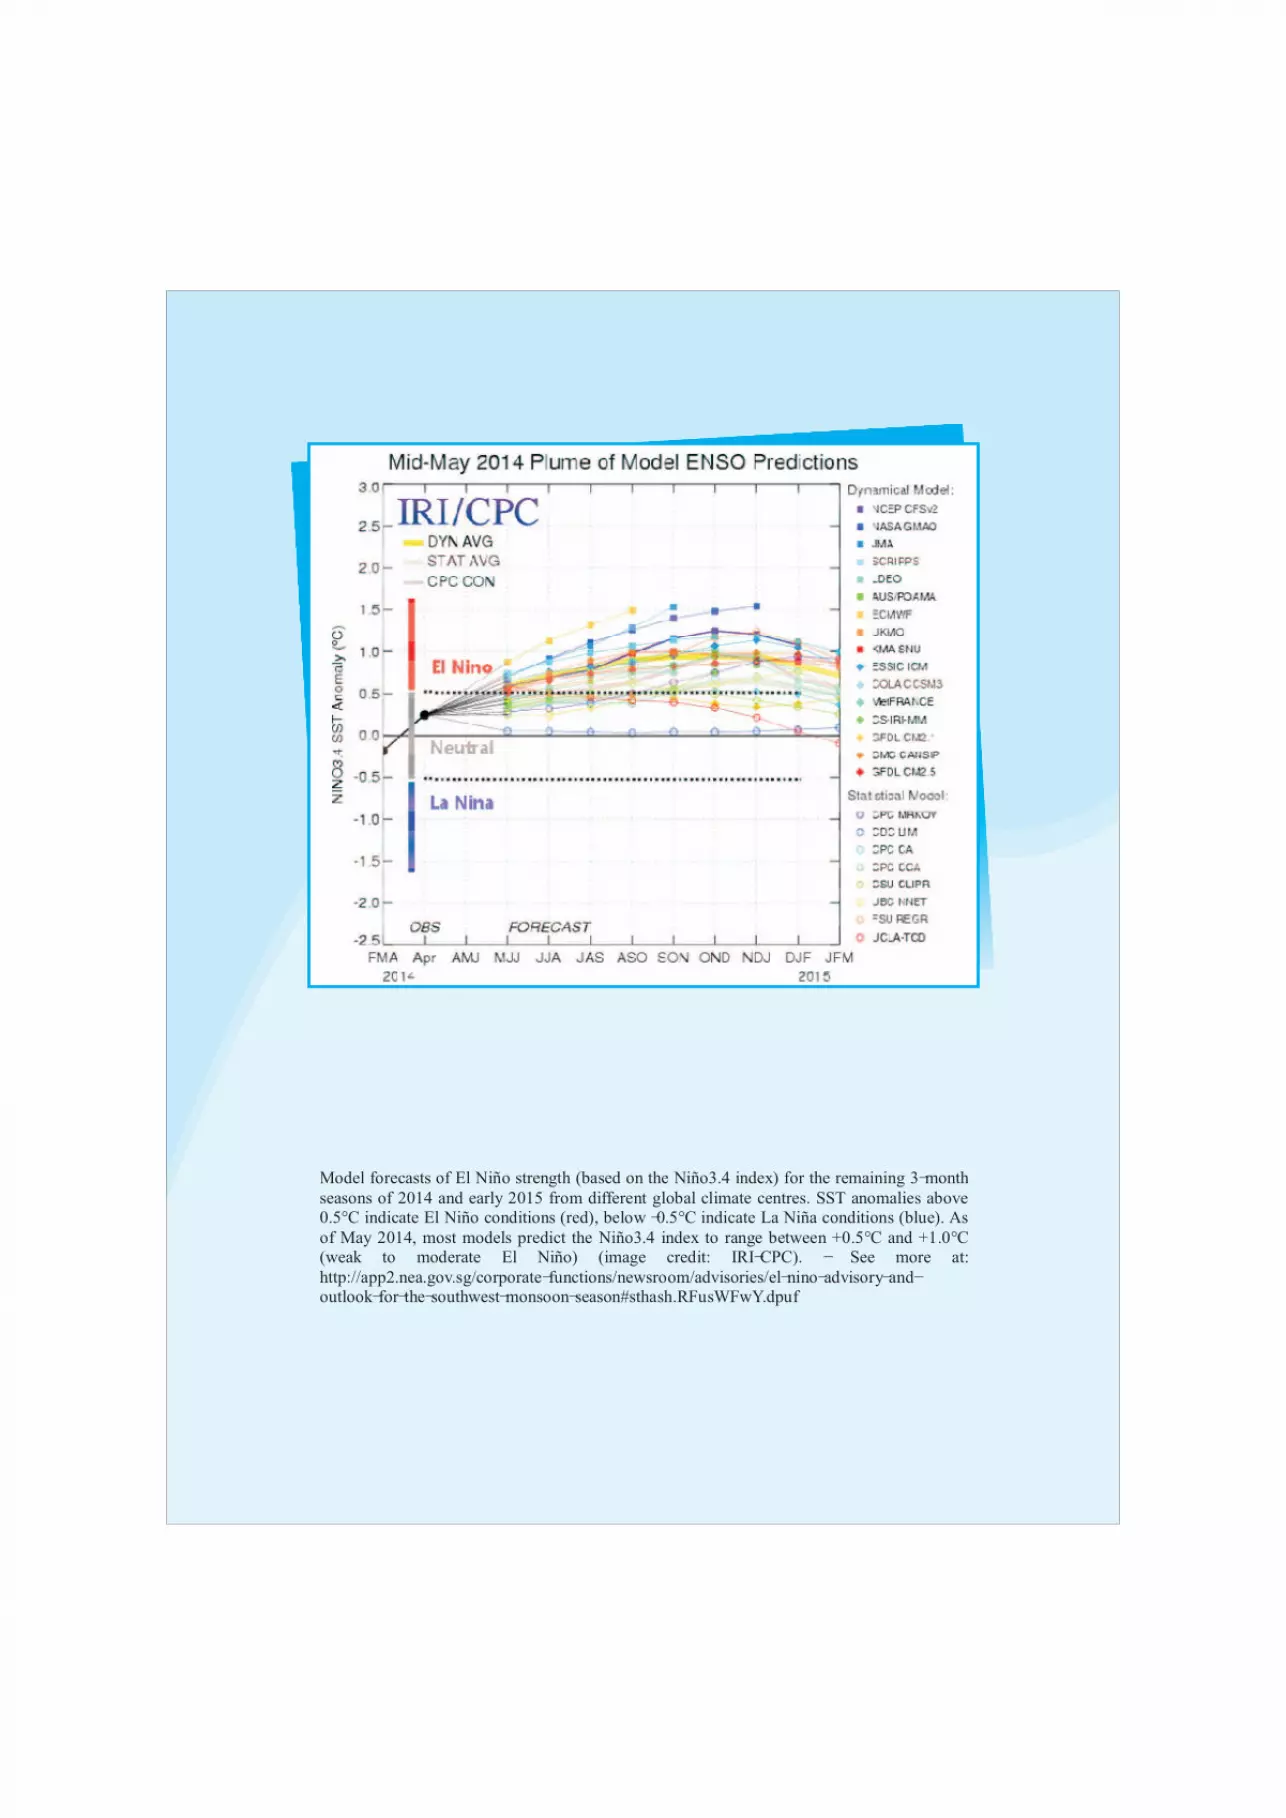
Model forecasts of El Niño strength (based on the Niño3.4 index) for the remaining 3-month
seasons of 2014 and early 2015 from different global climate centres. SST anomalies above 0.5°C indicate El Niño conditions (red), below -0.5°C indicate La Niña conditions (blue). As
of May 2014, most models predict the Niño3.4 index to range between +0.5°C and +1.0°C (weak to moderate El Niño) (image credit: IRI-CPC). - See more at:
http://app2.nea.gov.sg/corporate-functions/newsroom/advisories/el-nino-advisory-and-outlook-for-the-southwest-monsoon-season#sthash.RFusWFwY.dpuf
