ecocare_infrastructure... - gujarat pollution control
TRANSCRIPT

M/
s.
E
CO
CA
RE
I
NF
RA
ST
RU
CT
UR
ES
P
VT
.
LT
D.
DRAFT ENVIRONMENTAL IMPACT ASSESSMENT AND EMP REPORT
FOR Proposed Expansion of Common Hazardous Waste Management Facility (Landfill Capacity – 7,20,000 MT to 57,20,000 MT) AT Survey No. 203 to 212, 247, 251, 253, 255 to 259, 262 & 298, Village: Ghaspur, Taluka: Dasada (Patdi), District: Surendranagar, Gujarat PROJECT CATEGORY: B, 7 (d), Common Hazardous Waste Treatment, Storage and Disposal Facilities BASELINE STUDY PERIOD: December 2019 to February 2020 BASELINE STUDY CARRIED BY: Entech Laboratories (NABL Certificate No.: TC-5556) & Unistar Environment & Research Labs Pvt. Ltd. (NABL Certificate No.: TC-7753) PROJECT PROPONENT: M/s. Ecocare Infrastructures Pvt. Ltd.
PREPARED BY: ENVISION ENVIRO TECHNOLOGIES PVT. LTD. 3rd Floor, Shree Ram Complex, Above Bank of India, Near Kargil Chowk, Surat-Dumas Road, Piplod, Surat – 395007, Gujarat.
Phone No.: (0261) 2223003, 2224004 Email Add.: [email protected] Website: www.en-vision.in Accreditation by QCI / NABET Certificate No. NABET/EIA/1821/RA 0102 (Rev. 02) valid till 06.12.2020
August, 2020 RPT120013_1

M/S. ECOCARE INFRASTRUCTURES PVT. LTD., SURENDRANAGAR, GUJARAT
DECLARATION BY EXPERTS CONTRIBUTING TO THE EIA/EMP
REPORT
For Proposed Expansion of Common Hazardous Waste Management Facility at Survey No. 203 to 212,
247, 251, 253, 255 to 259, 262 & 298, Village: Ghaspur, Taluka: Dasada (Patdi), District: Surendranagar,
Gujarat by M/s. Ecocare Infrastructures Pvt. Ltd.
I, hereby, certify that I was a part of the EIA team in the following capacity that developed the above EIA.
EIA sector number as per NABET 32 Name of Sector Common Hazardous Waste
Treatment, Storage and Disposal
Facilities
EIA Coordinator
Name : Jignesh Patel
Signature :
Period of Involvement : October 2019 to Ongoing
Team Member – EIA Coordinator
Name : Mayur Harsora
Period of Involvement : October 2019 to Ongoing
Contact information : ENVISION ENVIRO TECHNOLOGIES PVT. LTD.
3rd
Floor, Shree Ram Complex, Above Bank of India,
Near Kargil Chowk, Surat-Dumas Road, Piplod,
Surat – 395007, Gujarat.
Phone No.: (0261) 2223003, 2224004
Email Add.: [email protected]
Website: www.en-vision.in
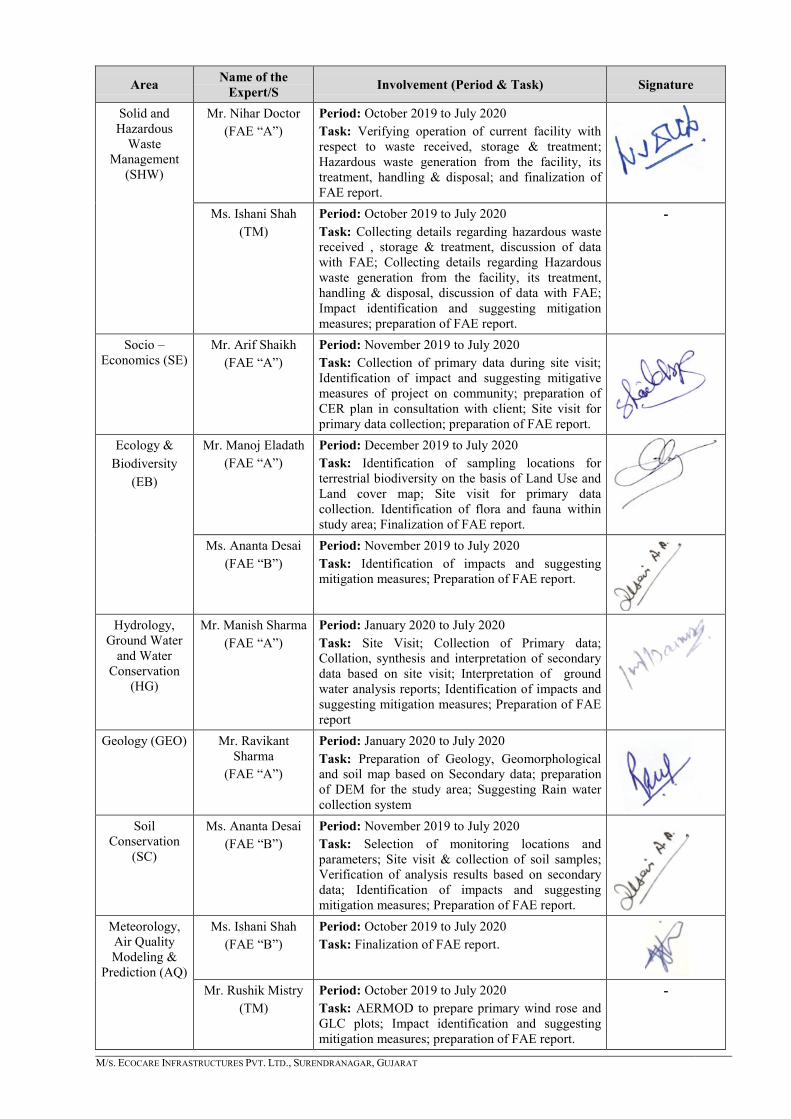
Functional Area Experts
Area Name of the
Expert/S Involvement (Period & Task) Signature
Air Pollution
Monitoring,
Prevention &
Control
(AP)
Mr. Nihar Doctor
(FAE “A”)
Period: October 2019 to July 2020
Task: Reviewing selected monitoring location and
parameters; Finalization of FAE Report.
Ms. Ishani Shah
(TM)
Period: October 2019 to July 2020
Task: Selection of monitoring locations and
parameters; Evaluation of ambient air quality
results; Impact identification and suggesting
mitigation measures; preparation of FAE report.
-
Water Pollution
Monitoring,
Prevention &
Control
(WP)
Ms. Ishani Shah
(FAE “A”)
Period: October 2019 to July 2020
Task: Collection of data regarding water
consumption, wastewater generation, treatment of
wastewater; Verification of data provided by
proponent; Selection of monitoring locations and
parameters; Site visit & collection of water samples;
Evaluation of water quality results; Impact
identification and suggesting mitigation measures;
finalization of FAE Report.
M/S. ECOCARE INFRASTRUCTURES PVT. LTD., SURENDRANAGAR, GUJARAT
Area Name of the Expert/S Involvement (Period & Task) Signature
Solid and Hazardous
Waste Management
(SHW)
Mr. Nihar Doctor (FAE “A”)
Period: October 2019 to July 2020 Task: Verifying operation of current facility with respect to waste received, storage & treatment; Hazardous waste generation from the facility, its treatment, handling & disposal; and finalization of FAE report.
Ms. Ishani Shah (TM)
Period: October 2019 to July 2020 Task: Collecting details regarding hazardous waste received , storage & treatment, discussion of data with FAE; Collecting details regarding Hazardous waste generation from the facility, its treatment, handling & disposal, discussion of data with FAE; Impact identification and suggesting mitigation measures; preparation of FAE report.
-
Socio – Economics (SE)
Mr. Arif Shaikh (FAE “A”)
Period: November 2019 to July 2020 Task: Collection of primary data during site visit; Identification of impact and suggesting mitigative measures of project on community; preparation of CER plan in consultation with client; Site visit for primary data collection; preparation of FAE report.
Ecology & Biodiversity
(EB)
Mr. Manoj Eladath (FAE “A”)
Period: December 2019 to July 2020 Task: Identification of sampling locations for terrestrial biodiversity on the basis of Land Use and Land cover map; Site visit for primary data collection. Identification of flora and fauna within study area; Finalization of FAE report.
Ms. Ananta Desai (FAE “B”)
Period: November 2019 to July 2020 Task: Identification of impacts and suggesting mitigation measures; Preparation of FAE report.
Hydrology,
Ground Water and Water
Conservation (HG)
Mr. Manish Sharma (FAE “A”)
Period: January 2020 to July 2020 Task: Site Visit; Collection of Primary data; Collation, synthesis and interpretation of secondary data based on site visit; Interpretation of ground water analysis reports; Identification of impacts and suggesting mitigation measures; Preparation of FAE report
Geology (GEO) Mr. Ravikant Sharma
(FAE “A”)
Period: January 2020 to July 2020 Task: Preparation of Geology, Geomorphological and soil map based on Secondary data; preparation of DEM for the study area; Suggesting Rain water collection system
Soil Conservation
(SC)
Ms. Ananta Desai (FAE “B”)
Period: November 2019 to July 2020 Task: Selection of monitoring locations and parameters; Site visit & collection of soil samples; Verification of analysis results based on secondary data; Identification of impacts and suggesting mitigation measures; Preparation of FAE report.
Meteorology, Air Quality Modeling &
Prediction (AQ)
Ms. Ishani Shah (FAE “B”)
Period: October 2019 to July 2020 Task: Finalization of FAE report.
Mr. Rushik Mistry
(TM) Period: October 2019 to July 2020 Task: AERMOD to prepare primary wind rose and GLC plots; Impact identification and suggesting mitigation measures; preparation of FAE report.
-
M/S. ECOCARE INFRASTRUCTURES PVT. LTD., SURENDRANAGAR, GUJARAT
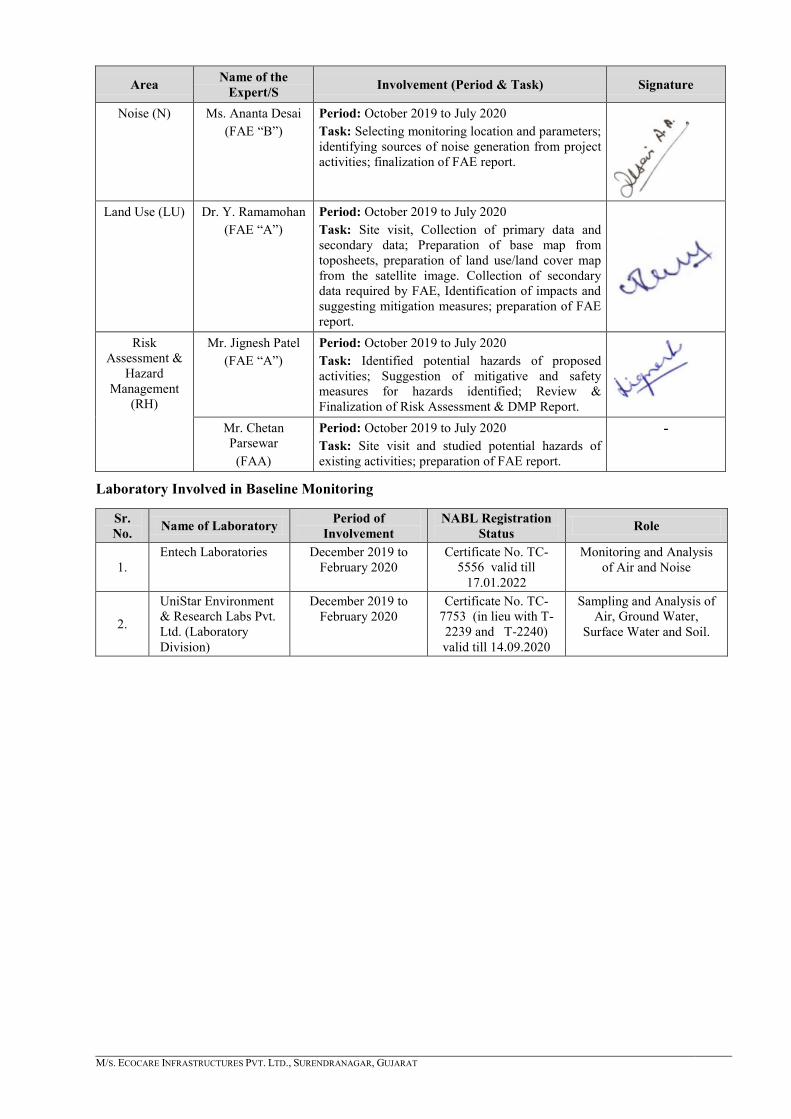
Area Name of the Expert/S Involvement (Period & Task) Signature
Noise (N) Ms. Ananta Desai (FAE “B”)
Period: October 2019 to July 2020 Task: Selecting monitoring location and parameters; identifying sources of noise generation from project activities; finalization of FAE report.
Land Use (LU) Dr. Y. Ramamohan
(FAE “A”) Period: October 2019 to July 2020 Task: Site visit, Collection of primary data and secondary data; Preparation of base map from toposheets, preparation of land use/land cover map from the satellite image. Collection of secondary data required by FAE, Identification of impacts and suggesting mitigation measures; preparation of FAE report.
Risk Assessment &
Hazard Management
(RH)
Mr. Jignesh Patel (FAE “A”)
Period: October 2019 to July 2020 Task: Identified potential hazards of proposed activities; Suggestion of mitigative and safety measures for hazards identified; Review & Finalization of Risk Assessment & DMP Report.
Mr. Chetan Parsewar (FAA)
Period: October 2019 to July 2020 Task: Site visit and studied potential hazards of existing activities; preparation of FAE report.
-
Laboratory Involved in Baseline Monitoring
Sr. No. Name of Laboratory Period of
Involvement NABL Registration
Status Role
1. Entech Laboratories December 2019 to
February 2020 Certificate No. TC-
5556 valid till 17.01.2022
Monitoring and Analysis of Air and Noise
2.
UniStar Environment & Research Labs Pvt. Ltd. (Laboratory Division)
December 2019 to February 2020
Certificate No. TC-7753 (in lieu with T-2239 and T-2240) valid till 14.09.2020
Sampling and Analysis of Air, Ground Water,
Surface Water and Soil.

M/S. ECOCARE INFRASTRUCTURES PVT. LTD., SURENDRANAGAR, GUJARAT
Declaration by the Head of the accredited consultant organization/ Authorized Person
I, Nihar Doctor, hereby, confirm that the above mentioned experts prepared the EIA of Proposed Expansion of Common Hazardous Waste Treatment, Storage and Disposal Facility by “M/s. Ecocare Infrastructures Pvt. Ltd.”. I also confirm that EC has gone through the report, and the consultant organization shall be fully accountable for any mis-leading information mentioned in this statement. It is certified that no unethical practices including plagiarism have been carried out and external data / text has not been used without proper acknowledgement, while preparing this EIA report.
Signature :
Name : Nihar Doctor Designation : Director
Name of the EIA consultant organization
: Envision Enviro Technologies Pvt. Ltd.
NABET Certificate No. & Issue Date
: NABET/EIA/1821/RA 0102 (Rev. 02) valid up to December 06, 2020


en-vιsιn
M/S. ECOCARE INFRASTRUCTURES PVT. LTD., SURENDRANAGAR, GUJARAT I-1
TABLE OF CONTENTS
CHAPTER 1 INTRODUCTION ................................................................................................................. 1-1
1.1 Purpose of EIA ................................................................................................................... 1-1
1.2 Identification of the Project and Project Proponent ........................................................... 1-1
1.2.1 Project Proponent and their Background ....................................................................... 1-1
1.3 Brief Description of Nature, Size, Location of the Project ................................................ 1-2
1.4 Scope of Study ................................................................................................................... 1-3
1.5 Regulatory Frame Work .................................................................................................... 1-4
1.5.1 Legal Compliances of Existing Unit .............................................................................. 1-6
1.5.1.1 Current EC & It‟s Compliance ................................................................................ 1-6
1.5.1.2 Current CCA & It‟s Compliance ............................................................................. 1-6
1.5.1.3 Show Cause Notice; Direction; Closure Notice Issued ........................................... 1-6
CHAPTER 2 PROJECT DESCRIPTION .................................................................................................... 2-1
2.1 Type of Project ................................................................................................................... 2-1
2.2 Need for the Project and its Importance to the Country and/or Region ............................. 2-1
2.3 Location ............................................................................................................................. 2-2
2.3.1 Project Site History ........................................................................................................ 2-6
2.3.2 Justification of Site Selection and Key Infrastructure Features and Settlements ........... 2-6
2.3.3 Project Land and Plant Layout ....................................................................................... 2-9
2.4 Magnitude of Operation & Project Cost .......................................................................... 2-11
2.4.1 Landfill Capacity ......................................................................................................... 2-11
2.4.2 Project Cost .................................................................................................................. 2-11
2.5 Project Implementation Schedule .................................................................................... 2-11
2.5.1 Pre-Construction Activities .......................................................................................... 2-12
2.5.2 Construction Activities ................................................................................................ 2-12
2.6 Process Component .......................................................................................................... 2-12
2.6.1 Membership Procedure ................................................................................................ 2-12
2.6.2 Manifest System........................................................................................................... 2-12
2.6.3 Transportation of Hazardous Solid Waste from Generation Site to TSDF .................. 2-13
2.6.4 Weighing and Waste Acceptance Criteria ................................................................... 2-13
2.6.5 Operation of TSDF Disposal Area ............................................................................... 2-14
2.6.6 Ground Water Sampling and Analysis......................................................................... 2-14
2.6.7 Leachate Management System..................................................................................... 2-14
2.6.8 Gaseous Emission Management .................................................................................. 2-14
2.6.9 Closure & Post Closure Maintenance for Closed Cells ............................................... 2-14
2.6.10 Storm Water Drainage System ..................................................................................... 2-14
2.6.11 Landfill Cells ............................................................................................................... 2-15

en-vιsιn
M/S. ECOCARE INFRASTRUCTURES PVT. LTD., SURENDRANAGAR, GUJARAT I-2
2.7 Resource Optimization / Recycling and Reuse in the Project ......................................... 2-15
2.8 Requirement of Resources ............................................................................................... 2-15
2.8.1 Electricity / Power ........................................................................................................ 2-15
2.8.2 Manpower .................................................................................................................... 2-16
2.8.3 Water ............................................................................................................................ 2-16
2.8.4 Utilities and Fuel Requirement .................................................................................... 2-16
2.9 Pollution Potential and Mitigation Measures ................................................................... 2-17
2.9.1 Water Environment ...................................................................................................... 2-17
2.9.1.1 Wastewater Treatment & Disposal ........................................................................ 2-22
2.9.2 Air Environment .......................................................................................................... 2-23
2.9.2.1 Flue Gas Emission ................................................................................................. 2-23
2.9.2.2 Process Gas Emission ............................................................................................ 2-24
2.9.2.3 Fugitive Emission .................................................................................................. 2-24
2.9.2.4 Odor Control Action Plan ...................................................................................... 2-24
2.9.3 Noise Environment ...................................................................................................... 2-24
2.9.3.1 Mode of Transportation ......................................................................................... 2-25
2.9.4 Solid and Hazardous Waste Management ................................................................... 2-26
2.10 Details of Existing Greenbelt ........................................................................................... 2-28
CHAPTER 3 DESCRIPTION OF ENVIRONMENT .................................................................................... 3-1
3.1 Introduction ........................................................................................................................ 3-1
3.1.1 Objectives of Baseline Monitoring ................................................................................ 3-1
3.1.2 Methodology for Data Collection .................................................................................. 3-1
3.1.3 Study Area ..................................................................................................................... 3-2
3.2 Meteorological Environment ............................................................................................. 3-3
3.2.1 Climate of Study Area ................................................................................................... 3-3
3.2.1.1 Predominant Wind Direction ................................................................................... 3-3
3.2.1.2 Site Specific Micro-Meteorology Data ................................................................... 3-5
3.3 Air Environment ................................................................................................................ 3-7
3.3.1 Sampling Methodology and Analysis ............................................................................ 3-7
3.3.2 Selection of Monitoring Locations ................................................................................ 3-8
3.3.3 Results .......................................................................................................................... 3-11
3.3.4 Discussions .................................................................................................................. 3-12
3.4 Water Environment .......................................................................................................... 3-14
3.4.1 Sampling Methodology and Analysis .......................................................................... 3-14
3.4.2 Selection of Monitoring Location ................................................................................ 3-14
3.4.3 Results-Ground Water and Surface Water ................................................................... 3-19
3.4.4 Results of Natural Drain during Rainy Season ............................................................ 3-26
3.4.5 Discussions .................................................................................................................. 3-28
en-vιsιn
M/S. ECOCARE INFRASTRUCTURES PVT. LTD., SURENDRANAGAR, GUJARAT I-3
3.4.5.1 Ground Water ........................................................................................................ 3-28
3.4.5.2 Surface Water ........................................................................................................ 3-28
3.4.5.3 Monitoring of Natural Drain ................................................................................. 3-28
3.5 Noise Environment .......................................................................................................... 3-29
3.5.1 Selection of Monitoring Locations and Results ........................................................... 3-30
3.5.2 Discussion of Noise Levels .......................................................................................... 3-33
3.5.3 Traffic Study ................................................................................................................ 3-33
3.5.3.1 Selection of Study Location .................................................................................. 3-33
3.5.3.2 Methodology ......................................................................................................... 3-34
3.5.3.3 Results ................................................................................................................... 3-34
3.5.3.4 Discussion ............................................................................................................. 3-35
3.6 Soil Environment ............................................................................................................. 3-36
3.6.1 Sampling Methodology and Analysis .......................................................................... 3-36
3.6.2 Sampling Locations and Results .................................................................................. 3-37
3.6.3 Discussions .................................................................................................................. 3-41
3.7 Land Environment ........................................................................................................... 3-42
3.7.1 Methodology of Study ................................................................................................. 3-42
3.7.1.1 Pre-Field Interpretation ......................................................................................... 3-42
3.7.1.2 Site / Ground Truthing .......................................................................................... 3-42
3.7.1.3 Post Field Work ..................................................................................................... 3-42
3.7.2 Data Used ..................................................................................................................... 3-43
3.7.3 Land Use / Land Cover Map ........................................................................................ 3-43
3.8 Hydrology and Groundwater ........................................................................................... 3-46
3.8.1 Geology ........................................................................................................................ 3-46
3.8.2 Geomorphology ........................................................................................................... 3-48
3.8.3 Drainage ....................................................................................................................... 3-48
3.8.4 Factors affecting Ground Water Occurrence ............................................................... 3-51
3.8.4.1 Soil ........................................................................................................................ 3-51
3.8.4.2 Climate & Meteorology ......................................................................................... 3-52
3.8.5 Geo Hydrology............................................................................................................. 3-52
3.8.5.1 Assessment of Primary Data ................................................................................. 3-52
3.8.6 Observations ................................................................................................................ 3-55
3.9 Ecology and Bio-diversity ............................................................................................... 3-56
3.9.1 Period of the study and Study area............................................................................... 3-56
3.9.2 Methodology ................................................................................................................ 3-56
3.9.3 Presence –Absence ....................................................................................................... 3-57
3.9.4 DAFOR Scale .............................................................................................................. 3-57
3.9.5 Biodiversity of Terrestrial Environment ...................................................................... 3-57
en-vιsιn
M/S. ECOCARE INFRASTRUCTURES PVT. LTD., SURENDRANAGAR, GUJARAT I-4
3.9.5.1 Habitats Description of the Project Site and its Immediate Surroundings ............ 3-57
3.9.5.2 Habitats description of the area (10 Km): ............................................................. 3-60
3.9.6 Floral Diversity of the Study Area ............................................................................... 3-63
3.9.6.1 Trees ...................................................................................................................... 3-64
3.9.6.2 Shrubs .................................................................................................................... 3-65
3.9.6.3 Herbs ..................................................................................................................... 3-67
3.9.6.4 Climbers and Twiners ........................................................................................... 3-69
3.9.6.5 Cultivated Plants in the Study Area ....................................................................... 3-70
3.9.6.6 Horticulture Practices and fruit grown .................................................................. 3-71
3.9.6.7 Rare and Endangered flora in the study area ......................................................... 3-71
3.9.6.8 Endemic plants of the study area ........................................................................... 3-71
3.9.6.9 Status of Forest and their category in the study area ............................................. 3-71
3.9.7 Faunal Diversity of Study Area ................................................................................... 3-71
3.9.7.1 Birds of the Study Area ......................................................................................... 3-71
3.9.7.2 Herpetofauna ......................................................................................................... 3-75
3.9.7.3 Mammals ............................................................................................................... 3-75
3.9.7.4 Migratory Birds / Winter Visitors in the Study Area: ........................................... 3-76
3.9.7.5 Butterflies from the study area: ............................................................................. 3-76
3.9.7.6 As per Indian Wild Life (Protection) Act, 1972 .................................................... 3-77
3.9.8 Rare and Endangered Fauna of the Study Area ........................................................... 3-78
3.9.9 Conservation Measures for Schedule-I fauna: ............................................................. 3-79
3.10 Socio-economic Environment .......................................................................................... 3-80
3.10.1 Major Objectives of the Study ..................................................................................... 3-80
3.10.2 Identification of Stakeholders ...................................................................................... 3-80
3.10.3 Methodology ................................................................................................................ 3-80
3.10.3.1 Primary Data Collection: Tools and Techniques ................................................... 3-81
3.10.3.2 Secondary Data Collection .................................................................................... 3-81
3.10.3.3 Data analysis and Interpretation ............................................................................ 3-81
3.10.4 Limitations ................................................................................................................... 3-82
3.10.5 The Project Influence Area .......................................................................................... 3-82
3.10.5.1 Overview of Study Area ........................................................................................ 3-85
3.10.6 Findings of Community Consultations ........................................................................ 3-85
3.10.6.1 Population .............................................................................................................. 3-85
3.10.6.2 Population Density ................................................................................................ 3-85
3.10.6.3 Sex Ratio ............................................................................................................... 3-86
3.10.6.4 Literacy Rate ......................................................................................................... 3-86
3.10.6.5 Economic Profile ................................................................................................... 3-86
3.10.6.6 Infrastructure Facilities .......................................................................................... 3-86

en-vιsιn
M/S. ECOCARE INFRASTRUCTURES PVT. LTD., SURENDRANAGAR, GUJARAT I-5
3.10.6.7 Educational Facility ............................................................................................... 3-87
3.10.6.8 Sanitation ............................................................................................................... 3-87
3.10.6.9 Water Supply ......................................................................................................... 3-87
3.10.6.10 Health Care facility ............................................................................................... 3-87
3.10.6.11 Culture ................................................................................................................... 3-87
3.10.6.12 Quality of Life (QoL) ............................................................................................ 3-87
3.10.7 People‟s Perception ...................................................................................................... 3-88
3.10.7.1 Conclusions Socio-Economic Survey ................................................................... 3-90
CHAPTER 4 ANTICIPATED ENVIRONMENT IMPACTS AND MITIGATION MEASURES ....................... 4-1
4.1 Introduction ........................................................................................................................ 4-1
4.1.1 Objective ........................................................................................................................ 4-1
4.1.2 Environmental Aspects .................................................................................................. 4-1
4.1.3 Environmental Impacts .................................................................................................. 4-1
4.1.4 Environmental Indices ................................................................................................... 4-1
4.1.5 Environmental Impact Assessment Study ...................................................................... 4-2
4.1.5.1 Identification of Impacts.......................................................................................... 4-2
4.1.5.2 Ecological Impact Assessment Considered the Following Stages .......................... 4-2
4.1.5.3 Component Wise Environment Risk Assessment and Mitigation ........................... 4-2
4.1.5.4 Cumulative Significance ......................................................................................... 4-2
4.2 Impact Identification and Assessment ............................................................................... 4-3
4.2.1 Identification Matrix ...................................................................................................... 4-3
4.2.2 Impact Assessment and Quantification .......................................................................... 4-7
4.2.2.1 Scoring the Overall Impact Severity/Consequence ................................................. 4-7
4.2.2.2 Quantifying the Probability of Occurrence of the Impact ....................................... 4-8
4.2.2.3 Quantifying Environmental Impact Risk ................................................................. 4-8
4.2.2.4 Identifying Activities Causing Unacceptable Levels of Environmental Risk ......... 4-9
4.2.3 Environmental Attributes & Relative Importance ......................................................... 4-9
4.3 Significance of Impacts & Proposed Mitigation Measures ............................................. 4-11
4.3.1 Impact Summary .......................................................................................................... 4-23
4.4 Projection of Proposed Traffic ......................................................................................... 4-23
4.5 Air Quality Modeling ....................................................................................................... 4-24
4.5.1 AERMOD .................................................................................................................... 4-25
4.5.2 Methodology ................................................................................................................ 4-25
4.5.3 Mixing Height .............................................................................................................. 4-26
4.5.4 Maximum Ground Level Concentration – Existing Source ......................................... 4-26
4.5.4.1 Conclusion ............................................................................................................. 4-31
4.5.5 Maximum Ground Level Concentration – Proposed Source ....................................... 4-31
4.5.5.1 Conclusion ............................................................................................................. 4-36

en-vιsιn
M/S. ECOCARE INFRASTRUCTURES PVT. LTD., SURENDRANAGAR, GUJARAT I-6
CHAPTER 5 ANALYSIS OF ALTERNATIVES (TECHNOLOGY AND SITE) .............................................. 5-1
5.1 Project Alternative ............................................................................................................. 5-1
5.2 Site Alternative .................................................................................................................. 5-1
5.2.1 Knockout Criteria TSDF ................................................................................................ 5-1
5.2.2 Siting Criteria for TSDF ................................................................................................ 5-2
5.3 Water Supply alternative.................................................................................................. 5-11
CHAPTER 6 ENVIRONMENTAL MONITORING PROGRAM ................................................................... 6-1
6.1 Monitoring Procedure ........................................................................................................ 6-1
6.2 Reporting Procedure .......................................................................................................... 6-5
6.3 Laboratory Facility ............................................................................................................ 6-6
6.4 Operation of TSDF as per CPCB Guideline ...................................................................... 6-6
6.5 Continuous Emission Monitoring System (CEMS) ......................................................... 6-12
CHAPTER 7 ADDITIONAL STUDIES .................................................................................................... 7-13
7.1 Public Consultation .......................................................................................................... 7-13
7.2 Social Impact Assessment and R & R Action Plan ......................................................... 7-13
7.3 Risk Assessment .............................................................................................................. 7-13
7.3.1 Introduction .................................................................................................................. 7-13
7.3.2 Objective ...................................................................................................................... 7-13
7.3.3 Methodology ................................................................................................................ 7-14
7.4 Risk and Hazard Study .................................................................................................... 7-14
7.4.1 Storage of Hazardous substances ................................................................................. 7-14
7.4.2 Regulatory Permission Required For Storage of Chemicals ........................................ 7-14
7.4.2.1 PESO Permission .................................................................................................. 7-14
7.4.2.2 Applicability of MSIHC Rules .............................................................................. 7-15
7.5 Qualitative Risk Assessment............................................................................................ 7-15
7.5.1 Hazard Identification and Risk Assessment ................................................................. 7-17
7.6 Quantitative Risk Assessment.......................................................................................... 7-19
7.6.1 Consequence analysis .................................................................................................. 7-19
7.6.2 Damage Criteria ........................................................................................................... 7-19
7.6.3 Scenarios (Vulnerability Area Identification) .............................................................. 7-21
7.6.4 Software Used for Calculations ................................................................................... 7-22
7.6.5 Scenario of Consequence Analysis .............................................................................. 7-23
7.6.6 Summary ...................................................................................................................... 7-24
7.6.7 Hazard Identification Studies to be Carried out by Unit based on Risk Assessment ... 7-24
7.6.8 Fire Fighting System .................................................................................................... 7-24
7.6.9 Minimization of the Manual Handling of Hazardous Substance ................................. 7-25
7.6.10 Use of Personal Protective Equipment ......................................................................... 7-25
7.6.11 Hazard Identification Studies ....................................................................................... 7-26
en-vιsιn
M/S. ECOCARE INFRASTRUCTURES PVT. LTD., SURENDRANAGAR, GUJARAT I-7
7.7 Disaster Management Plan .............................................................................................. 7-26
7.7.1 Statutory Provisions ..................................................................................................... 7-26
7.7.2 Onsite Emergency Plan ................................................................................................ 7-26
7.7.2.1 Objectives of the Plan ............................................................................................ 7-26
7.7.2.2 Types of Overall Emergencies .............................................................................. 7-27
7.7.2.3 Emergency Control System ................................................................................... 7-27
7.7.2.4 Communication Facilities ...................................................................................... 7-28
7.7.2.5 Sequence of Action in Emergency ........................................................................ 7-29
7.7.3 Offsite Emergency Preparedness Plan ......................................................................... 7-33
7.7.3.1 Role of the Facility Management .......................................................................... 7-33
7.7.3.2 Role of the Emergency Co-ordinating Officer ...................................................... 7-33
7.7.3.3 Role of the Local Authority ................................................................................... 7-33
7.7.3.4 Role of the Fire Authorities ................................................................................... 7-33
7.7.3.5 Role of the Police and Evacuation Authorities ...................................................... 7-34
7.7.3.6 Role of Health Authorities..................................................................................... 7-34
7.7.3.7 Role of „Mutual Aid‟ Agencies ............................................................................. 7-34
7.7.3.8 Role of a Factory Inspector ................................................................................... 7-34
7.8 Occupational Health Surveillance Program ..................................................................... 7-36
7.8.1 Health Management within Unit .................................................................................. 7-36
7.8.2 Occupational Health Monitoring ................................................................................. 7-36
7.8.3 Medical Facilities ......................................................................................................... 7-37
7.9 Specific Safety Measures to be Taken for General Public Living in the Vicinity ........... 7-37
CHAPTER 8 PROJECT BENEFITS .......................................................................................................... 8-1
8.1 Social Benefits ................................................................................................................... 8-1
8.1.1 Physical Infrastructure ................................................................................................... 8-1
8.1.2 Social Infrastructure ....................................................................................................... 8-1
8.1.2.1 Corporate Social Responsibility (CSR) ................................................................... 8-2
8.1.2.2 Corporate Environment Responsibility (CER) ........................................................ 8-2
8.1.3 Employment Potential .................................................................................................... 8-4
8.2 Other Tangible Benefits (Financial Benefits) .................................................................... 8-4
8.3 Environmental Benefits ..................................................................................................... 8-4
CHAPTER 9 ENVIRONMENTAL COST BENEFIT ANALYSIS.................................................................. 9-1
9.1 Investment In Project ......................................................................................................... 9-1
9.2 Cost Benefit Analysis ........................................................................................................ 9-1
9.3 Environmental Cost Analysis ............................................................................................ 9-2
CHAPTER 10 ENVIRONMENTAL MANAGEMENT PLAN (EMP)........................................................... 10-1
10.1 Introduction ...................................................................................................................... 10-1
10.1.1 Objectives of EMP ....................................................................................................... 10-1

en-vιsιn
M/S. ECOCARE INFRASTRUCTURES PVT. LTD., SURENDRANAGAR, GUJARAT I-8
10.1.2 Components of EMP .................................................................................................... 10-1
10.2 Environment Management Plan ....................................................................................... 10-2
10.2.1 Pre Construction & Construction Phase ....................................................................... 10-2
10.2.2 Operation Phase & Post Closure Phase ........................................................................ 10-5
10.3 Rain Water Collection ................................................................................................... 10-11
10.4 Greenbelt Development ................................................................................................. 10-12
10.4.1 Selection of Plant Species .......................................................................................... 10-12
10.4.2 Guidelines for plantation ............................................................................................ 10-12
10.5 Reuse/recycle and Cleaner Production Technologies .................................................... 10-15
10.5.1 Cleaner Production Technologies .............................................................................. 10-15
10.5.2 Renewable Energy Methods ...................................................................................... 10-15
10.5.3 Waste Minimization Methods .................................................................................... 10-15
10.6 Environmental Management Cell (EMC) ...................................................................... 10-16
10.6.1 Environment Policy and its Standard Operating Procedure ....................................... 10-18
10.6.2 Reporting System to the Director............................................................................... 10-18
10.6.3 Record Keeping and Reporting .................................................................................. 10-18
10.7 Budget for Environment Protection ............................................................................... 10-18
CHAPTER 11 SUMMARY & CONCLUSION ............................................................................................ 11-1
11.1 Justification for Implementation of the Project................................................................ 11-1
11.2 Conclusions ...................................................................................................................... 11-3
CHAPTER 12 DISCLOSURE OF CONSULTANTS ENGAGED ................................................................... 12-1
12.1 Experts Involved in the EIA ............................................................................................ 12-3

en-vιsιn
M/S. ECOCARE INFRASTRUCTURES PVT. LTD., SURENDRANAGAR, GUJARAT I-9
LIST OF ANNEXURES
Annexure I Terms of Reference ................................................................................................... A-2
Annexure II Land Possession Documents ..................................................................................... A-6
Annexure III 1st NOC ................................................................................................................... A-16
Annexure IV Current CTE ............................................................................................................ A-27
Annexure V CCA and it‟s Compliance ....................................................................................... A-29
Annexure VI NOC from CGWA .................................................................................................. A-45
Annexure VII Membership of CETP and CHWIF ......................................................................... A-47
Annexure VIII PLI Policy ............................................................................................................... A-50
Annexure IX Medical Report ........................................................................................................ A-52
Annexure X Electricity Bill ......................................................................................................... A-59
Annexure XI Conservation Plan for schedule – I Species ............................................................ A-60
Annexure XII Climatological Normals 1981-2010 for Ahmedabad Station .................................. A-69
Annexure XIII Raw data of all AAQ Parameters of all Stations as per Frequency ......................... A-71
Annexure XIV Membership Certificate Issued to Member Units ................................................... A-79
Annexure XV GWRDC Certificate ................................................................................................ A-80
Annexure XVI Proof Checking Report by SVNIT .......................................................................... A-81
Annexure XVII Hazardous Waste Manifest – Member Unit Copy ................................................. A-85
Annexure XVIII Hazardous Waste Manifest – Occupier Copy ........................................................ A-86
Annexure XIX Logbook .................................................................................................................. A-87
Annexure XX TREM Card ............................................................................................................. A-89
Annexure XXI EHS Policy .............................................................................................................. A-92
Annexure XXII Analysis of Groundwater around the Landfill ........................................................ A-93
Annexure XXIII Pre Draft CZMP Map .............................................................................................. A-97
Annexure XXIV Current EC & it‟s compliance ................................................................................. A-98
Annexure XXV Show Cause Notice, Direction, General Letter and it‟s Reply .............................. A-104

en-vιsιn
M/S. ECOCARE INFRASTRUCTURES PVT. LTD., SURENDRANAGAR, GUJARAT I-10
LIST OF TABLES
Table 1-1: Scope of Baseline Study ............................................................................................................. 1-3
Table 1-2: Status of all the applicable rules, acts, regulation, clearances .................................................... 1-4
Table 1-3: Show Cause Notice and its reply ................................................................................................ 1-6
Table 2-1: Data Summary of last 4 years ..................................................................................................... 2-2
Table 2-2: Key Infrastructure Features ........................................................................................................ 2-6
Table 2-3: Area Break-up ............................................................................................................................ 2-9
Table 2-4: Details of Size or Magnitude of Operation ............................................................................... 2-11
Table 2-5: Break-up of Capital Cost of Project ......................................................................................... 2-11
Table 2-6: Project Implementation Schedule for Proposed Works ............................................................ 2-11
Table 2-7: Waste Acceptance Criteria ....................................................................................................... 2-13
Table 2-8: Technical Data of Landfill Cell ................................................................................................ 2-15
Table 2-9: Electricity Requirement ............................................................................................................ 2-16
Table 2-10: Manpower Requirement ......................................................................................................... 2-16
Table 2-11: Utilities and Fuel Requirement ............................................................................................... 2-16
Table 2-12: Water Requirement ................................................................................................................. 2-17
Table 2-13: Wastewater Generation .......................................................................................................... 2-17
Table 2-14: ETP Design Parameters-Existing ........................................................................................... 2-22
Table 2-15: ETP Design Parameters – Total after Expansion ................................................................... 2-22
Table 2-16: ETP Treatment Units .............................................................................................................. 2-22
Table 2-17: Details of Flue Gas Stacks ...................................................................................................... 2-23
Table 2-18: Details of Solid & Hazardous Waste Management ................................................................ 2-26
Table 3-1: Summary of Site Specific Meteorological Data ......................................................................... 3-5
Table 3-2: Air – Parameters Analyzed and Sampling Duration .................................................................. 3-7
Table 3-3: Ambient Air Quality - Methodology .......................................................................................... 3-7
Table 3-4: Ambient Air Monitoring Locations ............................................................................................ 3-8
Table 3-5: Ambient Air Quality Status ...................................................................................................... 3-11
Table 3-6: Sample Collection and Analysis of Water Sample ................................................................... 3-14
Table 3-7: Monitoring Locations for Ground Water and Surface Water ................................................... 3-15
Table 3-8: Water Quality – Physico-chemical Analysis of Ground Water ................................................ 3-19
Table 3-9: Water Quality – Physico-chemical Analysis of Surface Water ................................................ 3-23
Table 3-10: Water Quality of Natural Drain in Rainy Season ................................................................... 3-26
Table 3-11: Noise Monitoring Methodology ............................................................................................. 3-29
Table 3-12: Ambient Noise Quality Standards for Different Areas/Zones ................................................ 3-30
Table 3-13: Noise Monitoring Locations ................................................................................................... 3-30
Table 3-14: Noise Levels ........................................................................................................................... 3-32
Table 3-15: Noise Level due to Transportation ......................................................................................... 3-33
Table 3-16: Traffic Counts at survey point ................................................................................................ 3-35
Table 3-17: Existing Traffic Scenario and Level of Services .................................................................... 3-35
Table 3-18: Level of Service ...................................................................................................................... 3-35
Table 3-19: Methodology of Testing of Soil Samples ............................................................................... 3-36
en-vιsιn
M/S. ECOCARE INFRASTRUCTURES PVT. LTD., SURENDRANAGAR, GUJARAT I-11
Table 3-20: Soil Sampling Location .......................................................................................................... 3-37
Table 3-21: Physicochemical Characteristics of the Soil ........................................................................... 3-39
Table 3-22: Details of Sources & the Maps Prepared ................................................................................ 3-43
Table 3-23: Land Use / Land Cover Statistics of the Study Area (10 km Radius) .................................... 3-43
Table 3-24: Geological Succession in Surendranagar District, Gujarat..................................................... 3-46
Table 3-25: Well Inventory ........................................................................................................................ 3-53
Table 3-26: Trees in the Study area ........................................................................................................... 3-64
Table 3-27: List of the Shrubs in the Study Area ...................................................................................... 3-65
Table 3-28: List of Herbaceous Species Observed in the Study Area ....................................................... 3-67
Table 3-29: List of Climbers observed in the Study Area ......................................................................... 3-69
Table 3-30: Birds of the Study Area .......................................................................................................... 3-71
Table 3-31: Reptiles in the Study Area ...................................................................................................... 3-75
Table 3-32: Mammals in the Study Area ................................................................................................... 3-75
Table 3-33: Winter visitors in the study area ............................................................................................. 3-76
Table 3-34: Butterflies in the Study Area .................................................................................................. 3-76
Table 3-35: Species provided Protection as per Wild Life Protection Act 1972 ....................................... 3-77
Table 3-36: Threatened Fauna of the Study Area ...................................................................................... 3-79
Table 3-37: list of villages where Socio-economic study conducted ......................................................... 3-80
Table 3-38: List of Villages in PIA ............................................................................................................ 3-83
Table 4-1: Environmental Impacts ............................................................................................................... 4-3
Table 4-2: Overall Impact Scoring System due to the proposed activities .................................................. 4-7
Table 4-3: Impact scoring for Ecology and Biodiversity ............................................................................. 4-7
Table 4-4: Occurrence Frequency Assessment- Ecological ......................................................................... 4-8
Table 4-5: Occurrence Frequency Assessment-Others ................................................................................ 4-8
Table 4-6: Environmental Impact Significance Criteria .............................................................................. 4-9
Table 4-7: Environmental Risk Categorization ........................................................................................... 4-9
Table 4-8: Ecological Risk Categorization .................................................................................................. 4-9
Table 4-9: Activity, Impact-Aspect & Mitigation Measures ..................................................................... 4-11
Table 4-10 Cumulative Impact of Proposed Expansion Project ................................................................ 4-23
Table 4-11: Assessment of Proposed Traffic Load .................................................................................... 4-24
Table 4-12: Details of Stacks ..................................................................................................................... 4-24
Table 4-13: Maximum Ground Level Concentration from Existing Source (Average 24 hourly) ............ 4-26
Table 4-14: Contribution from Existing Source ........................................................................................ 4-31
Table 4-15: Maximum Ground Level Concentration from Proposed Source (Average 24 hourly) .......... 4-31
Table 4-16: Short Term Incremental Concentrations from Proposed Source ............................................ 4-36
Table 6-1: Environmental Monitoring Program & Budget for Implementation .......................................... 6-2
Table 6-2: Parameters Monitored by the Existing Laboratory ..................................................................... 6-6
Table 6-3: Status of Compliance of CPCB Guideline for Operation & Monitoring of TSDF..................... 6-6
Table 7-1: Storage Details of Hazardous Substances ................................................................................ 7-14
Table 7-2: Risk Matrix ............................................................................................................................... 7-16
Table 7-3: Risk Acceptability Criteria ....................................................................................................... 7-16
Table 7-4: HIRA Worksheet ...................................................................................................................... 7-17
Table 7-5: Damages to Human Life Due to Heat Radiation ...................................................................... 7-20

en-vιsιn
M/S. ECOCARE INFRASTRUCTURES PVT. LTD., SURENDRANAGAR, GUJARAT I-12
Table 7-6: Effects Due to Incident Radiation Intensity ............................................................................. 7-20
Table 7-7: Damage Due to Peak over Pressure .......................................................................................... 7-21
Table 7-8: Possible Accident Scenario ...................................................................................................... 7-21
Table 7-9: Summary of Consequence Analysis ......................................................................................... 7-23
Table 7-10: List of Personal Protective Equipments.................................................................................. 7-25
Table 7-11: Offsite Action Plan ................................................................................................................. 7-35
Table 7-12: Occupational Health Monitoring ............................................................................................ 7-36
Table 8-1: Amount Spent by Unit under CSR ............................................................................................. 8-2
Table 8-2: Corporate Environment Responsibility (CER) Plan for Five Years ........................................... 8-3
Table 9-1: Cost Benefit Analysis (Operation Phase) ................................................................................... 9-1
Table 9-2: Cost Benefit Analysis (Post Closure Phase) ............................................................................... 9-1
Table 10-1: Quantity of Rain water to be harvested ................................................................................ 10-11
Table 10-2: Details of Rain Water Available from premises ................................................................... 10-11
Table 10-3: Rain Water to be harvested Outside Premises ...................................................................... 10-11
Table 10-4: Greenbelt Development Plan ................................................................................................ 10-13
Table 10-5: Recommended Plant Species for Green Belt Development ................................................. 10-13
Table 10-6: Species for Plantation along the roadside ............................................................................. 10-14
Table 10-7: List of Suitable Ornamental Climbers/ shrubs as plantation inside the garden and open spaces10-15
Table 10-8: Roles and Responsibility of in EMC Cell ............................................................................ 10-16
Table 10-9: Record Keeping Requirement .............................................................................................. 10-18
Table 10-10: Break-up of Capital and Recurring cost for Environment Protection Measures for Proposed Expansion project .................................................................................................................. 10-18

en-vιsιn
M/S. ECOCARE INFRASTRUCTURES PVT. LTD., SURENDRANAGAR, GUJARAT I-13
LIST OF FIGURES
Figure 1-1: Google Image showing Project Site with nodes ........................................................................ 1-3
Figure 2-1: Incremental Increase of Hazardous waste generation ............................................................... 2-1
Figure 2-2: Location of the Project .............................................................................................................. 2-3
Figure 2-3: Google Image showing 10 km Radius Study area of Project Site ............................................. 2-4
Figure 2-4: Topo Map Showing Location of Project Site ............................................................................ 2-5
Figure 2-5: Google Image Showing Locations of key Infrastructure Facilities within 10 km Radius Study Area ........................................................................................................................................... 2-7
Figure 2-6: Google Image Showing Locations of key Infrastructure Facilities outside 10 km Radius Study Area ........................................................................................................................................... 2-7
Figure 2-7: Plant Layout ............................................................................................................................ 2-10
Figure 2-8: Water Balance Diagram - Existing ......................................................................................... 2-19
Figure 2-9: Water Balance Diagram – Revised Existing ........................................................................... 2-20
Figure 2-10: Water Balance Diagram – After Total Expansion ................................................................ 2-21
Figure 2-11: Process Block Diagram of Effluent Treatment Plant ............................................................ 2-23
Figure 3-1: Annual Wind Rose of Daily Surface Data recorded at 8:30 a.m. at Ahmedabad Station (1971-2000) .......................................................................................................................................... 3-4
Figure 3-2: Annual Wind Rose of Daily Surface Data recorded at 5:30 p.m. at Ahmedabad Station (1971-2000) .......................................................................................................................................... 3-4
Figure 3-3: Primary Wind rose Diagram (December 2019- February 2020) ............................................... 3-6
Figure 3-4: Google Image Showing Ambient Air Quality Locations and Windrose ................................. 3-10
Figure 3-5: Google Image Showing Ambient Air Quality Locations ........................................................ 3-11
Figure 3-6: Google Image Showing Ground Water Sampling Locations .................................................. 3-18
Figure 3-7: Google Image Showing Surface Water Sampling Locations .................................................. 3-18
Figure 3-8: Google Image Showing Noise Monitoring Locations ............................................................. 3-32
Figure 3-9: Google Image Showing Location of Traffic Survey ............................................................... 3-34
Figure 3-10: Google Image Showing Soil Sampling Locations ................................................................ 3-38
Figure 3-11: Land use/Land Cover Map of 10 km Radius Study Area ..................................................... 3-44
Figure 3-12: Satellite Imaginary of 10 km Radius Study Area .................................................................. 3-45
Figure 3-13: Geological Map of Surendranagar District ........................................................................... 3-47
Figure 3-14: Geological Map of Study Area ............................................................................................. 3-47
Figure 3-15: Digital Elevation Model of the study area ............................................................................ 3-48
Figure 3-16: Drainage Map of Surendranagar District .............................................................................. 3-49
Figure 3-17: Drainage Map of Study Area ................................................................................................ 3-50
Figure 3-18: Soil Map of Dasada Taluka ................................................................................................... 3-51
Figure 3-19: Google Image Showing Soil Type of Study Area ................................................................. 3-52
Figure 3-20: Google Image Showing Locations of Well Inventory........................................................... 3-54
Figure 3-21: Google Image Showing 10 km Radius Study Area for Ecology-Biodiversity Survey ......... 3-60
Figure 3-22: Villages in Study Area .......................................................................................................... 3-81
Figure 4-1: Spatial Distribution of 24-Hour Average PM10 Concentration from Existing Source (μg/m3) 4-27
Figure 4-2: Spatial Distribution of 24-Hour Average SO2 Concentration from Existing Source (μg/m3) . 4-28
Figure 4-3: Spatial Distribution of 24-Hour Average NOx Concentration from Existing Source (μg/m3) 4-29
en-vιsιn
M/S. ECOCARE INFRASTRUCTURES PVT. LTD., SURENDRANAGAR, GUJARAT I-14
Figure 4-4: Spatial Distribution of 24-Hour Average NH3 Concentration from Existing Source (μg/m3) 4-30
Figure 4-5: Spatial Distribution of 24-Hour Average PM10 Concentration from Proposed Source (μg/m3)4-32
Figure 4-6: Spatial Distribution of 24-Hour Average SO2 Concentration from Proposed Source (μg/m3) 4-33
Figure 4-7: Spatial Distribution of 24-Hour Average NOx Concentration from Proposed Source (μg/m3)4-34
Figure 4-8: Spatial Distribution of 24-Hour Average NH3 Concentration from Proposed Source (μg/m3)4-35
Figure 7-1: Threat zone of Maximum Credible Scenario for Diesel – Puddle Fire ................................... 7-23
Figure 7-2: Threat zone of Worst Case Scenario for Diesel – Puddle Fire ................................................ 7-24
Figure 10-1: Environment Management Cell .......................................................................................... 10-17
en-vιsιn
M/S. ECOCARE INFRASTRUCTURES PVT. LTD., SURENDRANAGAR, GUJARAT I-15
LIST OF PHOTOGRAPHS
Photograph 2-1: Photographs of Existing Facility and New land for expansion ......................................... 2-8
Photograph 2-2: Photographs showing Existing Greenbelt developed within premises ........................... 2-30
Photograph 3-1: Ambient Air Quality Monitoring .................................................................................... 3-10
Photograph 3-2: Surface & Ground Water Sampling ................................................................................ 3-17
Photograph 3-3: Noise Monitoring ............................................................................................................ 3-32
Photograph 3-4: Soil Sampling .................................................................................................................. 3-37
en-vιsιn
M/S. ECOCARE INFRASTRUCTURES PVT. LTD., SURENDRANAGAR, GUJARAT A-1
ABBREIVATION AND ACRONYMS
AAQ Ambient Air Quality
AERMOD Atmospheric Dispersion Modelling System
ALOHA Areal Locations of Hazardous Atmospheres
BDL Below Detectable Limit
BOD Biological Oxygen Demand
CCA Consolidated Consent to Authorization
CEES Centre for Explosive and Environment Safety
CER Corporate Environment Responsibility
CHWIF Common Hazardous Waste Incineration Facility
COD Chemical Oxygen Demand
CPCB Central Pollution Control Board
CSR Corporate Social Responsibility
CTE Consent to Establish
dBA A-weighted Decibel
DG Diesel Generator
DGFASLI Directorate General, Factory Advice and Labour Institutes
DGFT Directorate General of Foreign Trade
DMP Disaster Management Plan
DRDO Defense Research and Development Organization
EC Environmental Clearance
EIA Environmental Impact Assessment
EMPs Environmental Management Plans
EHS Environment, Health and Safety
ETP Effluent Treatment Plant
FAE Functional Area Expert
FAA Functional Area Associate
GFR Gujarat Factories Rules
GPCB Gujarat Pollution Control Board
GLC Ground Level Concentration
HAZOP Hazard and Operability Study
IDLH Immediately Dangerous to Life or Health
IMD India Meteorological Department
IS Indian Standard
IUCN International Union for Conservation of Nature
KLD Kilo Liters per Day
MAH Major Accident Hazards

en-vιsιn
M/S. ECOCARE INFRASTRUCTURES PVT. LTD., SURENDRANAGAR, GUJARAT A-2
MoEF&CC Ministry of Environment, Forests & Climate Change
MT Metric Tonne
NAAQS National Ambient Air Quality Standards
NABET National Accreditation Board for Education and Training
NABL National Accreditation Board for Testing and Calibration Laboratories
NOC No Objection Certificate
OSHA Occupational Safety and Health Administration
PEL Permissible Exposure Limits
PESO Petroleum and Explosive Safety Organization
PGVCL Paschim Gujarat Vij Corporation Limited
PM Particulate Matter
PPEs Personnel Protective Equipment
R&R Resettlement and Rehabilitation
SEIAA State Level Environmental Impact Assessment Authorities
SEPL Sanand Eco Project Limited
SLF Secured Land Fill
SPCB State Pollution Control Board
SOP Standard Operating Procedure
TDS Total Dissolved Solid
TLV Threshold Limit Value
TM Team Member
ToR Terms of References
TPA MT per Annum
TPD MT per Day
TPM MT per Month
TREM Transport Emergency Card
TSDF Treatment, Storage and Disposal Facility
UTPCC Union Territory Pollution Control Committee
VOC Volatile Organic Compounds
QCI Quality Council of India
QoL Quality of Life
QRA Quantitative Risk Assessment
en-vιsιn
M/S. ECOCARE INFRASTRUCTURES PVT. LTD., SURENDRANAGAR, GUJARAT C-1
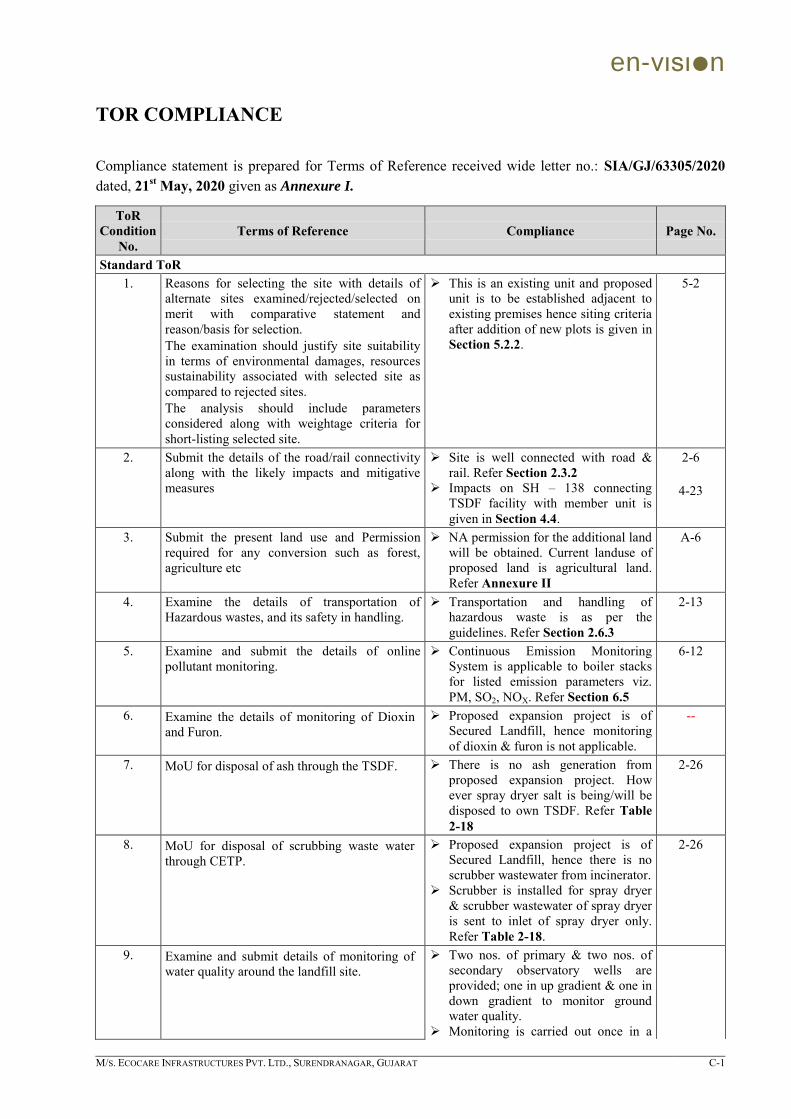
TOR COMPLIANCE
Compliance statement is prepared for Terms of Reference received wide letter no.: SIA/GJ/63305/2020 dated, 21st May, 2020 given as Annexure I.
ToR Condition
No. Terms of Reference Compliance Page No.
Standard ToR 1. Reasons for selecting the site with details of
alternate sites examined/rejected/selected on merit with comparative statement and reason/basis for selection. The examination should justify site suitability in terms of environmental damages, resources sustainability associated with selected site as compared to rejected sites. The analysis should include parameters considered along with weightage criteria for short-listing selected site.
This is an existing unit and proposed unit is to be established adjacent to existing premises hence siting criteria after addition of new plots is given in Section 5.2.2.
5-2
2. Submit the details of the road/rail connectivity along with the likely impacts and mitigative measures
Site is well connected with road & rail. Refer Section 2.3.2
Impacts on SH – 138 connecting TSDF facility with member unit is given in Section 4.4.
2-6
4-23
3. Submit the present land use and Permission required for any conversion such as forest, agriculture etc
NA permission for the additional land will be obtained. Current landuse of proposed land is agricultural land. Refer Annexure II
A-6
4. Examine the details of transportation of Hazardous wastes, and its safety in handling.
Transportation and handling of hazardous waste is as per the guidelines. Refer Section 2.6.3
2-13
5. Examine and submit the details of online pollutant monitoring.
Continuous Emission Monitoring System is applicable to boiler stacks for listed emission parameters viz. PM, SO2, NOX. Refer Section 6.5
6-12
6. Examine the details of monitoring of Dioxin and Furon.
Proposed expansion project is of Secured Landfill, hence monitoring of dioxin & furon is not applicable.
--
7. MoU for disposal of ash through the TSDF. There is no ash generation from proposed expansion project. How ever spray dryer salt is being/will be disposed to own TSDF. Refer Table 2-18
2-26
8. MoU for disposal of scrubbing waste water through CETP.
Proposed expansion project is of Secured Landfill, hence there is no scrubber wastewater from incinerator.
Scrubber is installed for spray dryer & scrubber wastewater of spray dryer is sent to inlet of spray dryer only. Refer Table 2-18.
2-26
9. Examine and submit details of monitoring of water quality around the landfill site.
Two nos. of primary & two nos. of secondary observatory wells are provided; one in up gradient & one in down gradient to monitor ground water quality.
Monitoring is carried out once in a
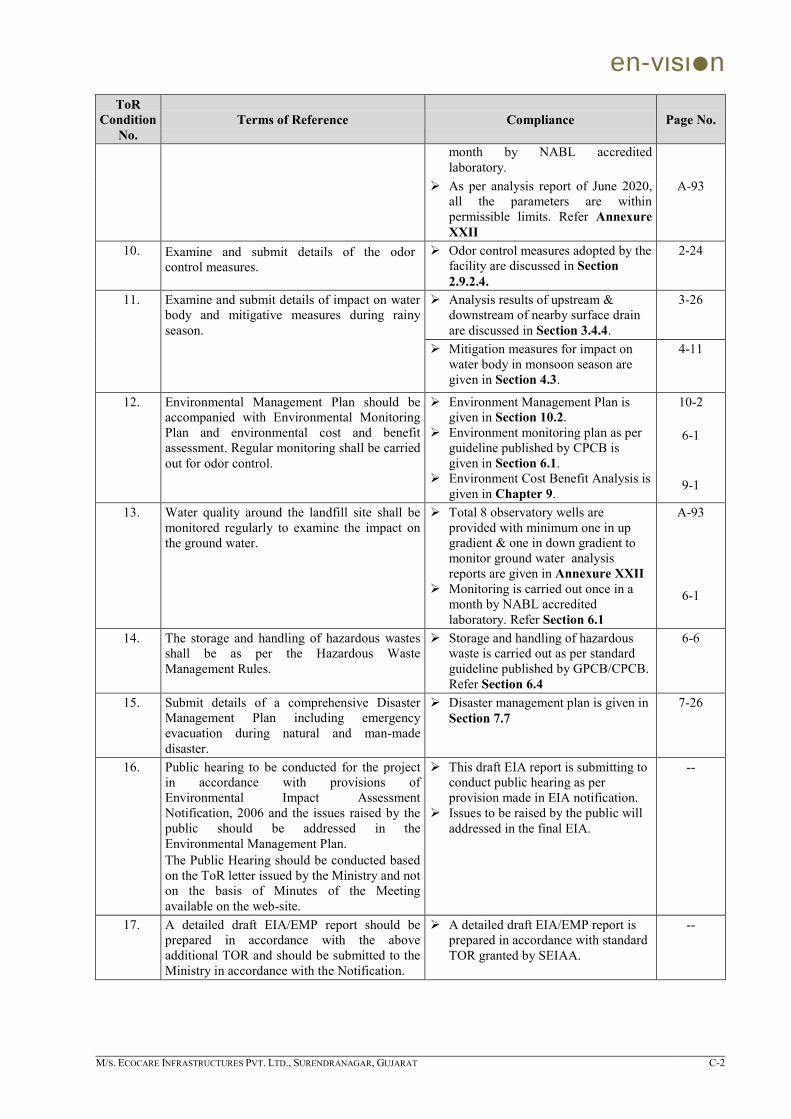
en-vιsιn
M/S. ECOCARE INFRASTRUCTURES PVT. LTD., SURENDRANAGAR, GUJARAT C-2
ToR Condition
No. Terms of Reference Compliance Page No.
month by NABL accredited laboratory.
As per analysis report of June 2020, all the parameters are within permissible limits. Refer Annexure XXII
A-93
10. Examine and submit details of the odor control measures.
Odor control measures adopted by the facility are discussed in Section 2.9.2.4.
2-24
11. Examine and submit details of impact on water body and mitigative measures during rainy season.
Analysis results of upstream & downstream of nearby surface drain are discussed in Section 3.4.4.
3-26
Mitigation measures for impact on water body in monsoon season are given in Section 4.3.
4-11
12. Environmental Management Plan should be accompanied with Environmental Monitoring Plan and environmental cost and benefit assessment. Regular monitoring shall be carried out for odor control.
Environment Management Plan is given in Section 10.2.
Environment monitoring plan as per guideline published by CPCB is given in Section 6.1.
Environment Cost Benefit Analysis is given in Chapter 9.
10-2
6-1
9-1
13. Water quality around the landfill site shall be monitored regularly to examine the impact on the ground water.
Total 8 observatory wells are provided with minimum one in up gradient & one in down gradient to monitor ground water analysis reports are given in Annexure XXII
Monitoring is carried out once in a month by NABL accredited laboratory. Refer Section 6.1
A-93
6-1
14. The storage and handling of hazardous wastes shall be as per the Hazardous Waste Management Rules.
Storage and handling of hazardous waste is carried out as per standard guideline published by GPCB/CPCB. Refer Section 6.4
6-6
15. Submit details of a comprehensive Disaster Management Plan including emergency evacuation during natural and man-made disaster.
Disaster management plan is given in Section 7.7
7-26
16. Public hearing to be conducted for the project in accordance with provisions of Environmental Impact Assessment Notification, 2006 and the issues raised by the public should be addressed in the Environmental Management Plan. The Public Hearing should be conducted based on the ToR letter issued by the Ministry and not on the basis of Minutes of the Meeting available on the web-site.
This draft EIA report is submitting to conduct public hearing as per provision made in EIA notification.
Issues to be raised by the public will addressed in the final EIA.
--
17. A detailed draft EIA/EMP report should be prepared in accordance with the above additional TOR and should be submitted to the Ministry in accordance with the Notification.
A detailed draft EIA/EMP report is prepared in accordance with standard TOR granted by SEIAA.
--
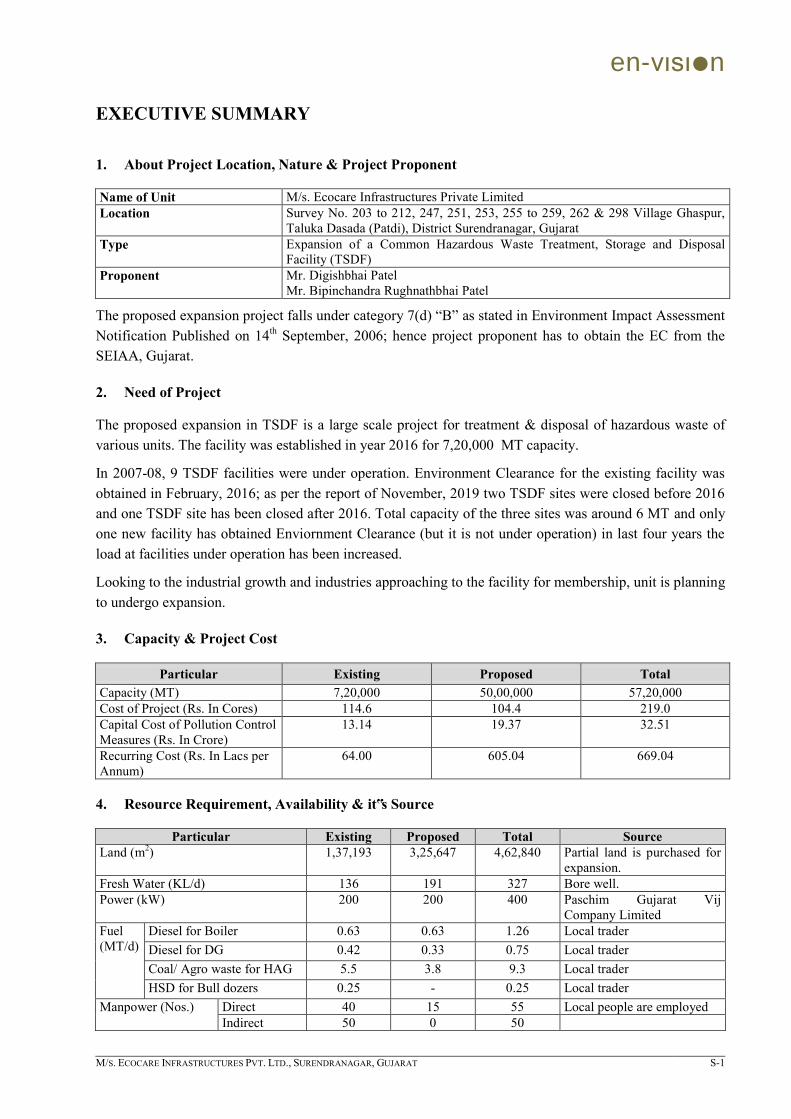
en-vιsιn
M/S. ECOCARE INFRASTRUCTURES PVT. LTD., SURENDRANAGAR, GUJARAT S-1
EXECUTIVE SUMMARY
1. About Project Location, Nature & Project Proponent
Name of Unit M/s. Ecocare Infrastructures Private Limited Location Survey No. 203 to 212, 247, 251, 253, 255 to 259, 262 & 298 Village Ghaspur,
Taluka Dasada (Patdi), District Surendranagar, Gujarat Type Expansion of a Common Hazardous Waste Treatment, Storage and Disposal
Facility (TSDF) Proponent Mr. Digishbhai Patel
Mr. Bipinchandra Rughnathbhai Patel
The proposed expansion project falls under category 7(d) “B” as stated in Environment Impact Assessment Notification Published on 14th September, 2006; hence project proponent has to obtain the EC from the SEIAA, Gujarat.
2. Need of Project
The proposed expansion in TSDF is a large scale project for treatment & disposal of hazardous waste of various units. The facility was established in year 2016 for 7,20,000 MT capacity.
In 2007-08, 9 TSDF facilities were under operation. Environment Clearance for the existing facility was obtained in February, 2016; as per the report of November, 2019 two TSDF sites were closed before 2016 and one TSDF site has been closed after 2016. Total capacity of the three sites was around 6 MT and only one new facility has obtained Enviornment Clearance (but it is not under operation) in last four years the load at facilities under operation has been increased.
Looking to the industrial growth and industries approaching to the facility for membership, unit is planning to undergo expansion.
3. Capacity & Project Cost
Particular Existing Proposed Total Capacity (MT) 7,20,000 50,00,000 57,20,000 Cost of Project (Rs. In Cores) 114.6 104.4 219.0 Capital Cost of Pollution Control Measures (Rs. In Crore)
13.14 19.37 32.51
Recurring Cost (Rs. In Lacs per Annum)
64.00 605.04 669.04
4. Resource Requirement, Availability & it‟s Source
Particular Existing Proposed Total Source Land (m2) 1,37,193 3,25,647 4,62,840 Partial land is purchased for
expansion. Fresh Water (KL/d) 136 191 327 Bore well. Power (kW) 200 200 400 Paschim Gujarat Vij
Company Limited Fuel (MT/d)
Diesel for Boiler 0.63 0.63 1.26 Local trader Diesel for DG 0.42 0.33 0.75 Local trader Coal/ Agro waste for HAG 5.5 3.8 9.3 Local trader HSD for Bull dozers 0.25 - 0.25 Local trader
Manpower (Nos.) Direct 40 15 55 Local people are employed Indirect 50 0 50

en-vιsιn
M/S. ECOCARE INFRASTRUCTURES PVT. LTD., SURENDRANAGAR, GUJARAT S-2
5. Pollution / Waste from Project it‟s Treatment & Disposal
5.1 Wastewater
Source Quantity (KL/d)
Treatment & Disposal Existing Proposed Total
Total 30.5 12.3 43.6 Domestic waste water generated is treated through septic tank/soak pit. Industrial except scrubber bleed (from spray dryer scrubber) to ETP followed by Spray Dryer. Scrubber bleed disposed through spray dryer.
Domestic 4.0 0.8 4.8
Industrial 26.5 13.1 38.8
5.2 Hazardous Waste Waste Quantity (MT/Annum) Treatment & Disposal Existing Proposed Total
Used or Spent Oil 0.02 0.02 0.04 Collection, Storage, Transportation and sale to authorized end users
ETP sludge 15.0 3.0 18.0 Collection, storage and disposal in landfill
Spray dryer salt 508 421 929 Collection, storage and disposal in landfill
Scrubber bleed 550 550 1100 Disposed through spray dryer Stripper residue 220 220 440 Collection, storage and
disposal to CHWIF
5.3 Flue Gas Emission
Sr. No. Stack Attached to
Stack Height
(m) Air Pollution Control Measure Parameter &
Permissible Limit
Existing – as per CCA 1 D. G. Set (200 kVA x 1 No.) 11 Adequate stack height PM -150 mg/NM3
SO2 -100 ppm NOx -50 ppm
2 Boiler (0.5 TPH) 15 Dust Collector followed by adequate stack height
PM -150 mg/NM3 SO2 -100 ppm NOx -50 ppm
3 HAG (10,00,000 kcal/h) followed by Spray dryer (1092 kg/h)
20 Twin Cyclone & Venturi Scrubber (2 Nos.) followed by adequate stack height
PM –150 mg/NM3 SO2 – 40 mg/NM3 NOx –25 mg/NM3 NH3 – 175 mg/NM3
HC – 15 mg/NM3
VOC – Nil Proposed
4 D. G. Set (100 kVA x 1 No.) 11 Adequate stack height PM – 150 mg/NM3 SO2 – 100 ppm NOx – 50 ppm
5 Boiler (0.5 TPH) 15 Adequate stack height PM – 150 mg/NM3 SO2 – 100 ppm NOx – 50 ppm
6 HAG (10,00,000 cal/h) followed by Spray dryer (1140 kg/h)
20 Twin Cyclone & Venturi Scrubber (2 Nos) followed by adequate stack height
PM –150 mg/NM3 SO2 – 40 mg/NM3 NOx – 25 mg/NM3 NH3 – 175 mg/NM3

en-vιsιn
M/S. ECOCARE INFRASTRUCTURES PVT. LTD., SURENDRANAGAR, GUJARAT S-3
Sr. No. Stack Attached to
Stack Height
(m) Air Pollution Control Measure Parameter &
Permissible Limit
HC – 15 mg/NM3
VOC - Nil
Bull dozers (30-40 MT x 2 Nos.) are being used for compaction of waste which consumes HSD. As cells are operated one after another same dozers will be used for proposed cells.
5.4 Fugitive Emission
To control fugitive emissions in form of particulate matter following measures are adopted to ensure compliance and further reductions wherever possible, same shall be continued after expansion:
Limiting vehicle speed,
Spraying water on road
Applying daily soil cover or spraying of water on powder type waste
5.5 Odor Control Action Plan
There is odor due to handling of hazardous waste at landfill cell. Following measures are adopted in the existing unit to control the odor and the same will be followed after expansion.
Covering of newly deposits waste with soil at regular interval to reduce odors.
Greenbelt is developed which helps to reduce odor.
Spraying of odor suppression chemicals like deodorant at odor generating areas like around a landfill site, temporary waste storage/handling area, ETP area etc.
6. Baseline Data
Study period: 1st December 2019 to 29th February 2020
Attribute Monitoring or Sampling
Location Observations
Micro-Meteorology
Project Site Temperature: 37 °C (Max.) and 10 °C (Min.) Relative Humidity:
- Morning: 32.5 % to 48.5 % - Evening: 24.8 % to 38.7 %
Average wind speed: 6.68 km/h Predominant Wind Direction: NE
Ambient Air Quality
Eight PM10 : 47.3 – 79.1 g/m3 PM2.5 : 28.9 – 43.5 g/m3 SO2 : 12.3 – 19.9 g/m3 NOx : 19.5 – 30.6 g/m3 VOC : 0.1 – 2.9 ppm CO : 1.0 – 1.8 mg/m3 NH3: BDL (DL = 1 mg/m3) Methane: BDL (DL = 1 ppm) H2S: BDL (DL = 5 mg/m3) High levels of PM10 & PM2.5 were observed at Project Site, Ghaspur and Jhund village as approach road to Project site is kuccha road and vehicular movement is high, at Ghaspur road construction work is observed and Jhund falls in predominant direction of Project Site while high levels of SO2 & NOx were observed at Project Site due to usage of bull dozers and high vehicular movement. Although all the results were found to be below the NAAQS limits.
Ground Water Eight pH: 6.10 – 7.10

en-vιsιn
M/S. ECOCARE INFRASTRUCTURES PVT. LTD., SURENDRANAGAR, GUJARAT S-4
Attribute Monitoring or Sampling
Location Observations
Total Suspended Solids: 6 – 12 mg/l Total hardness: 279.7 – 353.3 mg/l Total Dissolved solids: 1185 - 1422 mg/l Chlorides: 237.0 – 284.4 mg/l Fluorides: 0.30 – 0.45 mg/l TDS and Total Hardness are found higher than desirable limit at all location. Chlorides are found higher than desirable limit at Project Site, Porda, Jhund, Dumana and Navrangpura. Hence, chlorides, hardness and TDS level reduction to desirable limit is necessary to use water for drinking purpose.
Surface Water Eight pH: 6.50 – 8.00 Dissolved Oxygen: 3.5 – 5.8 mg/l Biological Oxygen Demand: 2.8 – 12.5 mg/L Chemical Oxygen Demand: 7.0 – 31.2 mg/L As per Surface Water Quality Standard of IS 2296:1992 all the surface bodies fall under Class B (water for outdoor bathing) except Narmada Canal which falls under Class A.
Noise & Traffic
Eight (Ambient)
40.8 dBA (Min.) & 62.4 dBA (Max.) in daytime 36.7 dBA (Min.) & 52.4 dBA (Max.) in nighttime Out of 8 locations, noise level recorded in daytime at Project Site and SH -138 are found on the higher side because of high vehicular movement. At other location noise level results at other locations are found within standards during daytime and nighttime.
One (Traffic)
65.7 dBA (From 10 m edge of the road.) & 61.4 dBA (From 20 m edge of the road.) in daytime 55.8 dBA (From 10 m edge of the road.) & 53.7 dBA (From 20 m edge of the road.) in night time
Soil Eight pH: 7.1 to 8.2 Nitrogen: 110.9 to 234.0 mg/kg Phosphorous: 13.4 – 20.1 mg/kg Potassium: 67.2 – 132.1 mg/kg The moderate to high porosity and water holding capacity were on account of clay loam to clay texture of soils. Available phosphorus is Low and available potassium is in the High range. Soil salinity class based on electrical conductivity is non-saline in nature.
Land use pattern
Study area Major land use in the study area is single crop. Study area also consists of settlements, Industrial, River/Canal/Pond, land with scrub, land without scrub area.
Ecology & Biodiversity
Study area No National park, wild life sanctuary present within 10 km radius. 47 tree species belong to 21 families, 33 shrubs belong to 17 families, 79
species of herbs belonging to 30 families and 25 climbers/twiners belong to 6 families are enumerated from the study area. No rare and endangered flora was observed.
65 types of birds, 9 types of Reptiles, 7 types of Mammals, 8 types of winter visitor birds and 19 types of butterflies. None of the sighted faunal species can be assigned endemic species category of the study area.
Pea fowl (Pavo cristatus) among the birds in the study area and Indian mud or flap shell turtle (Lissemys punctate), are included in Schedule I of Wild life protection Act (1972).
Socio Economic
Environment
Study area Findings of study area based on Census 2011: Total population : 79,718
Males: 41,275 Females: 38,443
Population density: 245 persons per km2. Sex ratio : 931 Average literacy rate : 78.43 %

en-vιsιn
M/S. ECOCARE INFRASTRUCTURES PVT. LTD., SURENDRANAGAR, GUJARAT S-5
7. Impact & Mitigation Measure
7.1 Pre Construction & Construction Phase Activity Probable Impact Mitigation Measure
Site Cleaning Removal of vegetation may lead to Change in Landuse to industrial purpose
from agricultural or barren land disturbance to local faunal species
Currently there is no farming activity. Presence of prosopis ingressed open
scrub has been observed during field survey.
Development of greenbelt in 33% of proposed acquired land will help restoration of local faunal species
Change in drainage pattern & disturbance to soil layers due to excavation.
Proper leveling of site confirming natural slope of the area.
Construction of drain surrounding proposed site to collect rain water & same shall be diverted to natural drain nearby
Transportation of material, excess soil & construction waste
Fugitive emissions during transportation of material & waste can affect: Air quality Road side flora People passing by
Trucks carrying construction material shall be covered with tarpaulin.
Storage & handling of material, excess soil & construction waste
Fugitive emissions during storage & handling of material & waste can affect: Air quality of air Local fauna Construction workers People working in nearby farms
Construction site shall be covered & sprinkling of water so that fugitive emission does not go outside the premises.
Excavation, construction, fabrication
Change soil pattern of the area due to disposal of excess soil.
Excess soil shall be utilized for back filling, leveling so as to retain existing soil quality.
Change the LU pattern of the area due to disposal of construction waste.
Reuse construction waste in internal road construction.
Temporary employment generation due to transportation & construction
Preference to local people
Water source is bore well. Main source of irrigation & drinking water
is ground water hence depletion in resource (ground water level) will affect the community.
Study area is safe zone as per CGWA. Care shall be taken that water wastage is
minimum.
Disposal of sewage in existing soak pit will pollute soil & ground water.
Septic tank is provided before soak pit to arrest solid particles.
Fugitive Emission during construction can deteriorate air quality.
Barrier sheet will be provided to avoid dispersion of dust in surrounding area.
Construction work shall be carried out in day time only.
Workers shall be given PPE„s such as helmets, mask, gloves, gum boots etc. during various activities.
Noise from the machinery & fugitive emissions can affect: Local fauna Construction workers People working in nearby farms
Construction workers are susceptible to accidental injuries.
7.2 Operation Phase Activity Probable Impact Mitigation Measure
Transportation of fuel, hazardous waste, effluent & materials
Fugitive & flue gas emissions from vehicular movement; hazardous waste & material spillage during transportation can affect : Air quality
Only vehicles with PUC are allowed for transportation.
Vehicles are covered while transportation of material.
Care is taken to close the lid properly
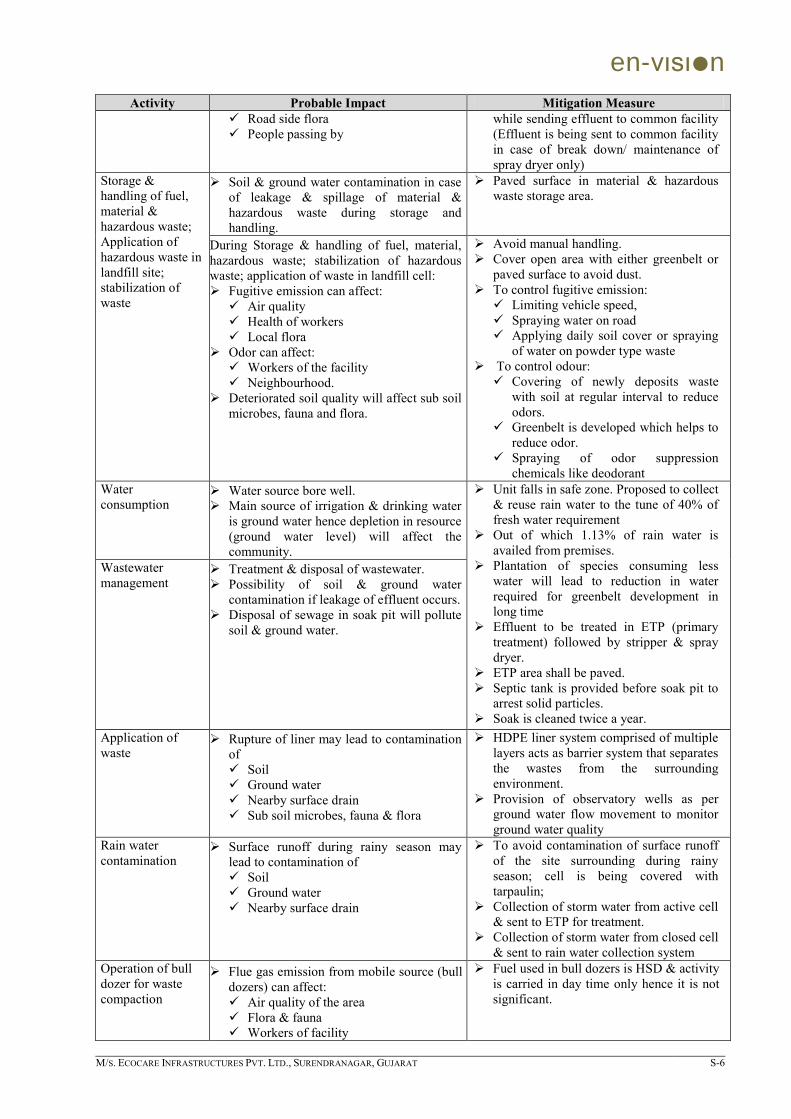
en-vιsιn
M/S. ECOCARE INFRASTRUCTURES PVT. LTD., SURENDRANAGAR, GUJARAT S-6
Activity Probable Impact Mitigation Measure Road side flora People passing by
while sending effluent to common facility (Effluent is being sent to common facility in case of break down/ maintenance of spray dryer only)
Storage & handling of fuel, material & hazardous waste; Application of hazardous waste in landfill site; stabilization of waste
Soil & ground water contamination in case of leakage & spillage of material & hazardous waste during storage and handling.
Paved surface in material & hazardous waste storage area.
During Storage & handling of fuel, material, hazardous waste; stabilization of hazardous waste; application of waste in landfill cell: Fugitive emission can affect: Air quality Health of workers Local flora
Odor can affect: Workers of the facility Neighbourhood.
Deteriorated soil quality will affect sub soil microbes, fauna and flora.
Avoid manual handling. Cover open area with either greenbelt or
paved surface to avoid dust. To control fugitive emission: Limiting vehicle speed, Spraying water on road Applying daily soil cover or spraying
of water on powder type waste To control odour: Covering of newly deposits waste
with soil at regular interval to reduce odors.
Greenbelt is developed which helps to reduce odor.
Spraying of odor suppression chemicals like deodorant
Water consumption
Water source bore well. Main source of irrigation & drinking water
is ground water hence depletion in resource (ground water level) will affect the community.
Unit falls in safe zone. Proposed to collect & reuse rain water to the tune of 40% of fresh water requirement
Out of which 1.13% of rain water is availed from premises.
Plantation of species consuming less water will lead to reduction in water required for greenbelt development in long time
Effluent to be treated in ETP (primary treatment) followed by stripper & spray dryer.
ETP area shall be paved. Septic tank is provided before soak pit to
arrest solid particles. Soak is cleaned twice a year.
Wastewater management
Treatment & disposal of wastewater. Possibility of soil & ground water
contamination if leakage of effluent occurs. Disposal of sewage in soak pit will pollute
soil & ground water.
Application of waste
Rupture of liner may lead to contamination of Soil Ground water Nearby surface drain Sub soil microbes, fauna & flora
HDPE liner system comprised of multiple layers acts as barrier system that separates the wastes from the surrounding environment.
Provision of observatory wells as per ground water flow movement to monitor ground water quality
Rain water contamination
Surface runoff during rainy season may lead to contamination of Soil Ground water Nearby surface drain
To avoid contamination of surface runoff of the site surrounding during rainy season; cell is being covered with tarpaulin;
Collection of storm water from active cell & sent to ETP for treatment.
Collection of storm water from closed cell & sent to rain water collection system
Operation of bull dozer for waste compaction
Flue gas emission from mobile source (bull dozers) can affect: Air quality of the area Flora & fauna Workers of facility
Fuel used in bull dozers is HSD & activity is carried in day time only hence it is not significant.

en-vιsιn
M/S. ECOCARE INFRASTRUCTURES PVT. LTD., SURENDRANAGAR, GUJARAT S-7
Activity Probable Impact Mitigation Measure Operation of boiler, HAG, DG set
Maximum GLC of flue gas will fall on land with shrub
Flue gas emission can affect: Air quality of the area Flora & fauna Workers of facility Surrounding land
Adequate stack height to boiler. Adequate stack height to DG. Two stage water scrubber & cyclone
followed by adequate stack height to HAG.
Operation of plant machinery
Noise from plant & machinery can affect: Flora & fauna Workers of facility
Use of PPE‟s by workers. Regular maintenance of the machineries
and equipments. Minimum manual intervention. Installation of proper fire fighting system. Safety training to the workers. Development of greenbelt to reduce
dispersion of noise outside the premises.
Operational hazards can affect Workers of the facility Settlements, crops, water bodies etc.
Manpower requirement
Generation of permanent employment. Priority shall be given to local people.
7.3 Post Closure Phase Activity Probable Impact Mitigation Measure
End of life cycle of cell or waste is applied to the design capacity
Rupture of after end of life cycle may lead to contamination of Soil Ground water Nearby surface drain
Monitoring of ground water quality In case of any leakage, remedial action
plan to be taken.
Treatment of leachate from capped cell Leachate is collected & treated in ETP. Over a period of time leachate generation will get reduced.
Odor can affect: Workers of the facility Neighbourhood.
Spraying of chemicals to suppress odor. Last layer of waste is covered with
different layers as per guidelines. Continuous monitoring of vent of capped
cell.
7.4 Ambient Air Quality Modeling
Ambient air quality modeling has been carried out to estimate GLC from the existing and proposed flue & process gas emission sources.
In boiler, diesel is used as fuel and in HAG coal/agro waste is utilized as fuel. Coal is considered as worst case scenario is modelling of HAG stack
Under observed meteorological condition; 24 hours average maximum GLC of PM10, SO2, NOx & NH3 is located at 1.75 km in SW direction from existing and proposed source.
Resultant GLC for monitored locations are found to be well below the permissible NAAQS norms. Hence, the proposed expansion activity will not have any significant adverse impact on the air environment.
8. Risk Assessmnet and Occupational Health & Safety
Major Hazardous chemicals used in existing unit is: Diesel which will be utilized after expansion also.
Worst Case Scenario of Diesel Storage - Maximum distance of fire threat zone observed is 13 m from project site. As per contours of risk assessment study, unit has potential for damage to those inside the premises.
Above consequence might be controlled by effective fire-fighting and safety arrangements. Based on consequence analysis following safety measures has been provided:
Good Housekeeping is maintained Spillage/leak attended
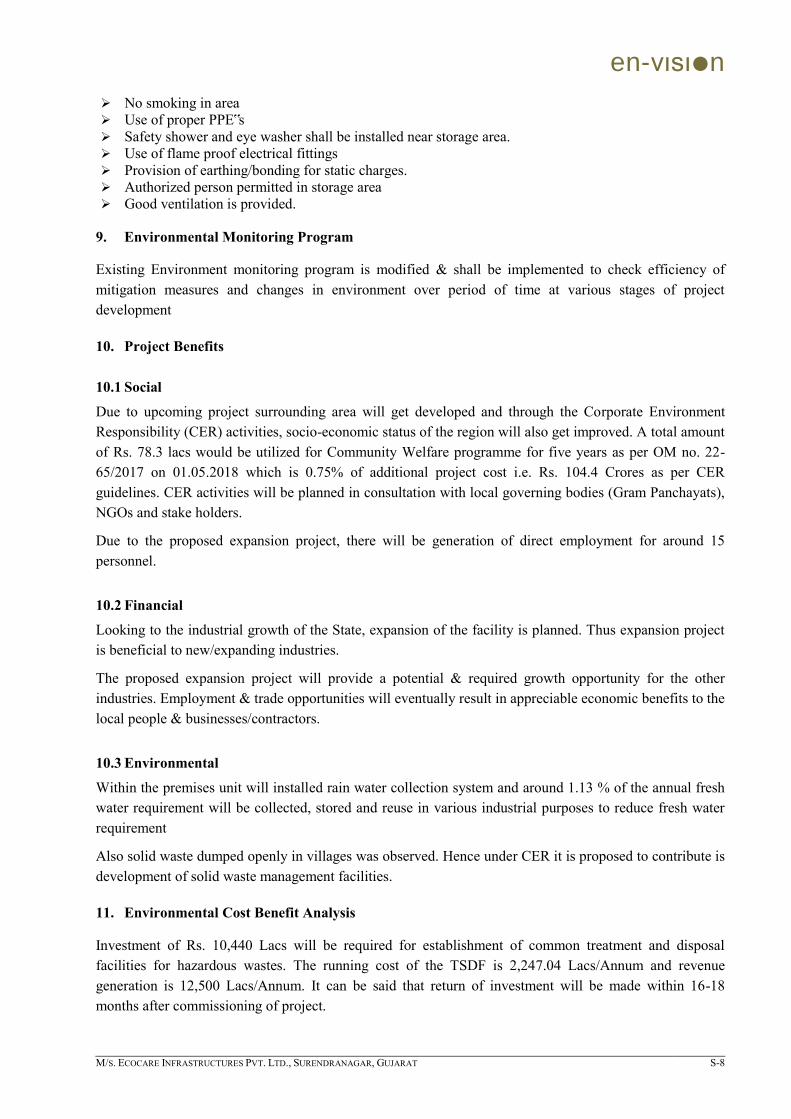
en-vιsιn
M/S. ECOCARE INFRASTRUCTURES PVT. LTD., SURENDRANAGAR, GUJARAT S-8
No smoking in area Use of proper PPE‟s Safety shower and eye washer shall be installed near storage area. Use of flame proof electrical fittings Provision of earthing/bonding for static charges. Authorized person permitted in storage area Good ventilation is provided.
9. Environmental Monitoring Program
Existing Environment monitoring program is modified & shall be implemented to check efficiency of mitigation measures and changes in environment over period of time at various stages of project development
10. Project Benefits
10.1 Social
Due to upcoming project surrounding area will get developed and through the Corporate Environment Responsibility (CER) activities, socio-economic status of the region will also get improved. A total amount of Rs. 78.3 lacs would be utilized for Community Welfare programme for five years as per OM no. 22-65/2017 on 01.05.2018 which is 0.75% of additional project cost i.e. Rs. 104.4 Crores as per CER guidelines. CER activities will be planned in consultation with local governing bodies (Gram Panchayats), NGOs and stake holders.
Due to the proposed expansion project, there will be generation of direct employment for around 15 personnel.
10.2 Financial
Looking to the industrial growth of the State, expansion of the facility is planned. Thus expansion project is beneficial to new/expanding industries.
The proposed expansion project will provide a potential & required growth opportunity for the other industries. Employment & trade opportunities will eventually result in appreciable economic benefits to the local people & businesses/contractors.
10.3 Environmental
Within the premises unit will installed rain water collection system and around 1.13 % of the annual fresh water requirement will be collected, stored and reuse in various industrial purposes to reduce fresh water requirement
Also solid waste dumped openly in villages was observed. Hence under CER it is proposed to contribute is development of solid waste management facilities.
11. Environmental Cost Benefit Analysis
Investment of Rs. 10,440 Lacs will be required for establishment of common treatment and disposal facilities for hazardous wastes. The running cost of the TSDF is 2,247.04 Lacs/Annum and revenue generation is 12,500 Lacs/Annum. It can be said that return of investment will be made within 16-18 months after commissioning of project.

en-vιsιn
M/S. ECOCARE INFRASTRUCTURES PVT. LTD., SURENDRANAGAR, GUJARAT S-9
In post closure phase it is proposed to install solar panel on capped cell. Investment for installation of solar panel on capped cell of proposed project cost will be around 1,416.67 Lacs. Benefit from the installation of solar panel would be around Rs. 476.94 Lacs/Annum. It is seen that return of investment will be made within 2-3 years after commissioning of solar plant.
12. Environmental Management Plan
An Environmental Management Plan has been prepared & implemented to identify mitigation measures of adverse impacts. It describes objective, responsibility, resources, monitoring related to mitigations measures for identified impact. It also includes details of greenbelt development, rain water harvesting etc.
13. Conclusion
Insignificant impacts will occur on air quality. However, all the necessary air pollution control measures will be provided.
No ecological damage will occur. No adverse impacts will occur on water environment. Local employment opportunities will increase. Various other environment parameters like Forest/ National Park/ Sanctuary and Religious / Historical
Places will not be affected. Environment Management Plan has been formulated to control all the pollutant parameters and
Environment Management Cell has been set-up to ensure that these parameters do not exceed the norms set out by the concerned authorities.
After commissioning of the proposed project the Environmental Management Cell will take care of all the pollution control measures.
It can be concluded that positive implementation of mitigation measures and environmental management plan during the operational phase, there will be insignificant impact on the environment.
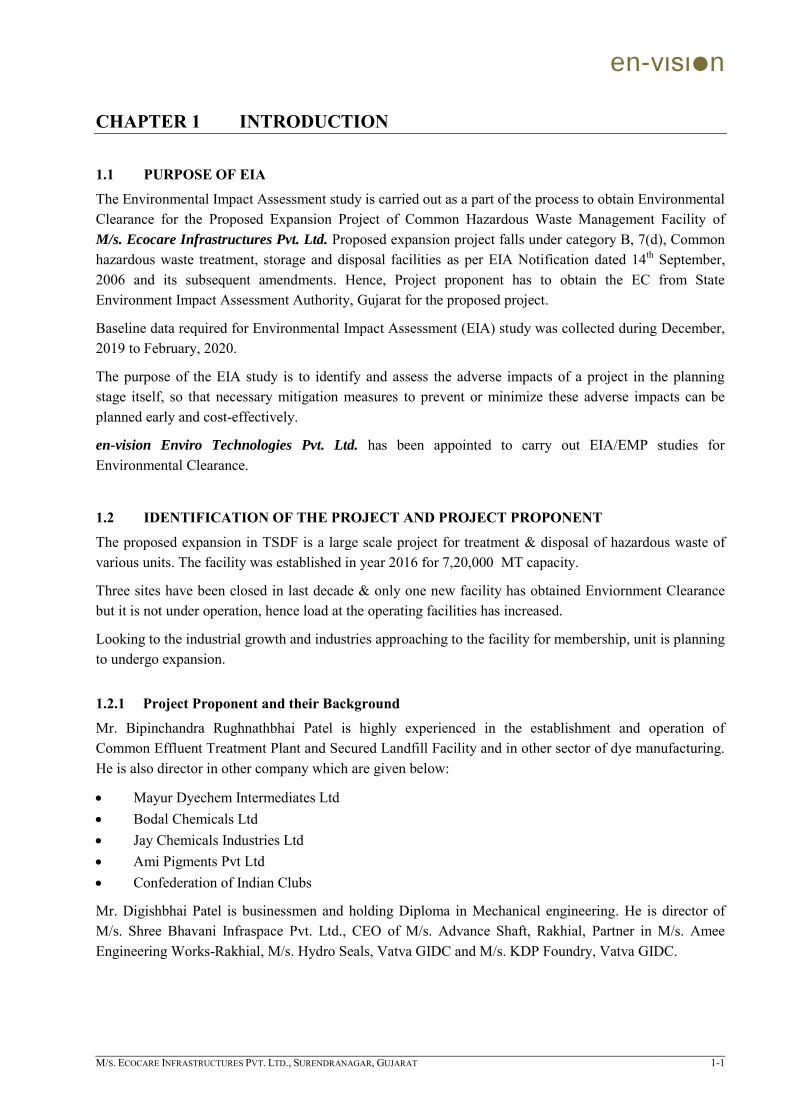
en-vιsιn
M/S. ECOCARE INFRASTRUCTURES PVT. LTD., SURENDRANAGAR, GUJARAT 1-1
CHAPTER 1 INTRODUCTION
1.1 PURPOSE OF EIA
The Environmental Impact Assessment study is carried out as a part of the process to obtain Environmental Clearance for the Proposed Expansion Project of Common Hazardous Waste Management Facility of M/s. Ecocare Infrastructures Pvt. Ltd. Proposed expansion project falls under category B, 7(d), Common hazardous waste treatment, storage and disposal facilities as per EIA Notification dated 14th September, 2006 and its subsequent amendments. Hence, Project proponent has to obtain the EC from State Environment Impact Assessment Authority, Gujarat for the proposed project.
Baseline data required for Environmental Impact Assessment (EIA) study was collected during December, 2019 to February, 2020.
The purpose of the EIA study is to identify and assess the adverse impacts of a project in the planning stage itself, so that necessary mitigation measures to prevent or minimize these adverse impacts can be planned early and cost-effectively.
en-vision Enviro Technologies Pvt. Ltd. has been appointed to carry out EIA/EMP studies for Environmental Clearance.
1.2 IDENTIFICATION OF THE PROJECT AND PROJECT PROPONENT
The proposed expansion in TSDF is a large scale project for treatment & disposal of hazardous waste of various units. The facility was established in year 2016 for 7,20,000 MT capacity.
Three sites have been closed in last decade & only one new facility has obtained Enviornment Clearance but it is not under operation, hence load at the operating facilities has increased.
Looking to the industrial growth and industries approaching to the facility for membership, unit is planning to undergo expansion.
1.2.1 Project Proponent and their Background
Mr. Bipinchandra Rughnathbhai Patel is highly experienced in the establishment and operation of Common Effluent Treatment Plant and Secured Landfill Facility and in other sector of dye manufacturing. He is also director in other company which are given below:
Mayur Dyechem Intermediates Ltd Bodal Chemicals Ltd Jay Chemicals Industries Ltd Ami Pigments Pvt Ltd Confederation of Indian Clubs
Mr. Digishbhai Patel is businessmen and holding Diploma in Mechanical engineering. He is director of M/s. Shree Bhavani Infraspace Pvt. Ltd., CEO of M/s. Advance Shaft, Rakhial, Partner in M/s. Amee Engineering Works-Rakhial, M/s. Hydro Seals, Vatva GIDC and M/s. KDP Foundry, Vatva GIDC.
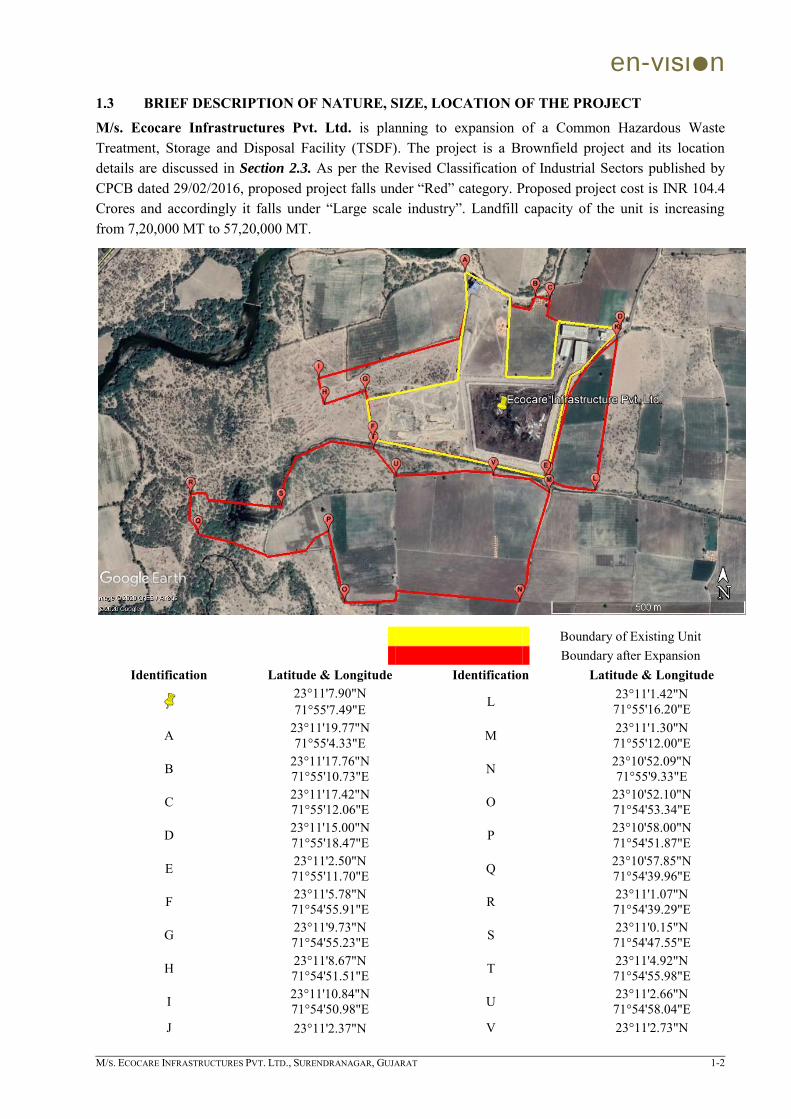
en-vιsιn
M/S. ECOCARE INFRASTRUCTURES PVT. LTD., SURENDRANAGAR, GUJARAT 1-2
1.3 BRIEF DESCRIPTION OF NATURE, SIZE, LOCATION OF THE PROJECT
M/s. Ecocare Infrastructures Pvt. Ltd. is planning to expansion of a Common Hazardous Waste Treatment, Storage and Disposal Facility (TSDF). The project is a Brownfield project and its location details are discussed in Section 2.3. As per the Revised Classification of Industrial Sectors published by CPCB dated 29/02/2016, proposed project falls under “Red” category. Proposed project cost is INR 104.4 Crores and accordingly it falls under “Large scale industry”. Landfill capacity of the unit is increasing from 7,20,000 MT to 57,20,000 MT.
Boundary of Existing Unit Boundary after Expansion
Identification Latitude & Longitude Identification Latitude & Longitude
23°11'7.90"N 71°55'7.49"E L 23°11'1.42"N
71°55'16.20"E
A 23°11'19.77"N 71°55'4.33"E M 23°11'1.30"N
71°55'12.00"E
B 23°11'17.76"N 71°55'10.73"E N 23°10'52.09"N
71°55'9.33"E
C 23°11'17.42"N 71°55'12.06"E O 23°10'52.10"N
71°54'53.34"E
D 23°11'15.00"N 71°55'18.47"E P 23°10'58.00"N
71°54'51.87"E
E 23°11'2.50"N 71°55'11.70"E Q 23°10'57.85"N
71°54'39.96"E
F 23°11'5.78"N 71°54'55.91"E R 23°11'1.07"N
71°54'39.29"E
G 23°11'9.73"N 71°54'55.23"E S 23°11'0.15"N
71°54'47.55"E
H 23°11'8.67"N 71°54'51.51"E T 23°11'4.92"N
71°54'55.98"E
I 23°11'10.84"N 71°54'50.98"E U 23°11'2.66"N
71°54'58.04"E J 23°11'2.37"N V 23°11'2.73"N

en-vιsιn
M/S. ECOCARE INFRASTRUCTURES PVT. LTD., SURENDRANAGAR, GUJARAT 1-3
71°55'11.92"E 71°55'6.91"E
K 23°11'14.12"N 71°55'18.18"E
Figure 1-1: Google Image showing Project Site with nodes
1.4 SCOPE OF STUDY
Environment Impact Assessment and Environment Management Plan Report have been prepared in line with Terms of Reference (ToR) suggested by SEIAA, Gujarat vide letter No. SIA/GJ/63305/2020 dated, 21st May, 2020 attached as Annexure I & as per the guidelines, the generic structure of EIA is given in EIA notification dated 14th September, 2006 is maintained.
The EIA study includes determination of:
Justification of the proposed expansion activities. Pollution load due to existing activity and change in pollution load due to proposed expansion. Existing baseline conditions. Field sampling of environmental attributes at various locations in the study area to establish the
baseline status. Collect & compile secondary data.
Assessment of the existing impacts on the environment and projection of the same due to the construction and operation activities of the proposed expansion project. Identification, assessment and evaluation of the beneficial and adverse impacts on surrounding
environment due to proposed project activities considering the existing baseline status and secondary data, by using scientifically developed and widely accepted models.
Identification and assessment of risks associated with the proposed expansion project and their appropriate management through modification of existing Risk Assessment (RA) and Disaster Management Plan (DMP).
Making recommendations on the preventive measures to minimize the impact to acceptable levels and preparation of post project monitoring plan. Modification of existing Environmental Management Plan (EMP) to mitigate the predicted
impacts. Identify critical environmental attributes required to be monitored during the project execution and
to suggest post project monitoring.
The scope of baseline study for the proposed expansion unit (based on MoEF&CC / CPCB guidelines) is tabulated below;
Table 1-1: Scope of Baseline Study Environmental
Attributes Nos. of
Locations Observations
Meteorology 1 One season site specific meteorological status of the study was carried out for prediction of ground level concentration in downwind direction.
Ambient Air Quality 8 The prevailing ambient air quality status was established through a network of stations monitored during the period of December 2019 to February 2020. The ambient air quality monitoring as per the parameters prescribed in ToR was carried out within the study area of 10 km. Prediction of impacts on air quality due to proposed operations were carried out through application of air quality models.
Water 8 Surface Water & 8 Ground
Water
The water quality data with respect to physico-chemical, biological parameters and heavy metals were analyzed to established baseline water quality of study area of 10 km. The wastewater generation, its characterization and management were carried out which was used in assessing the impact of the project on water environment.
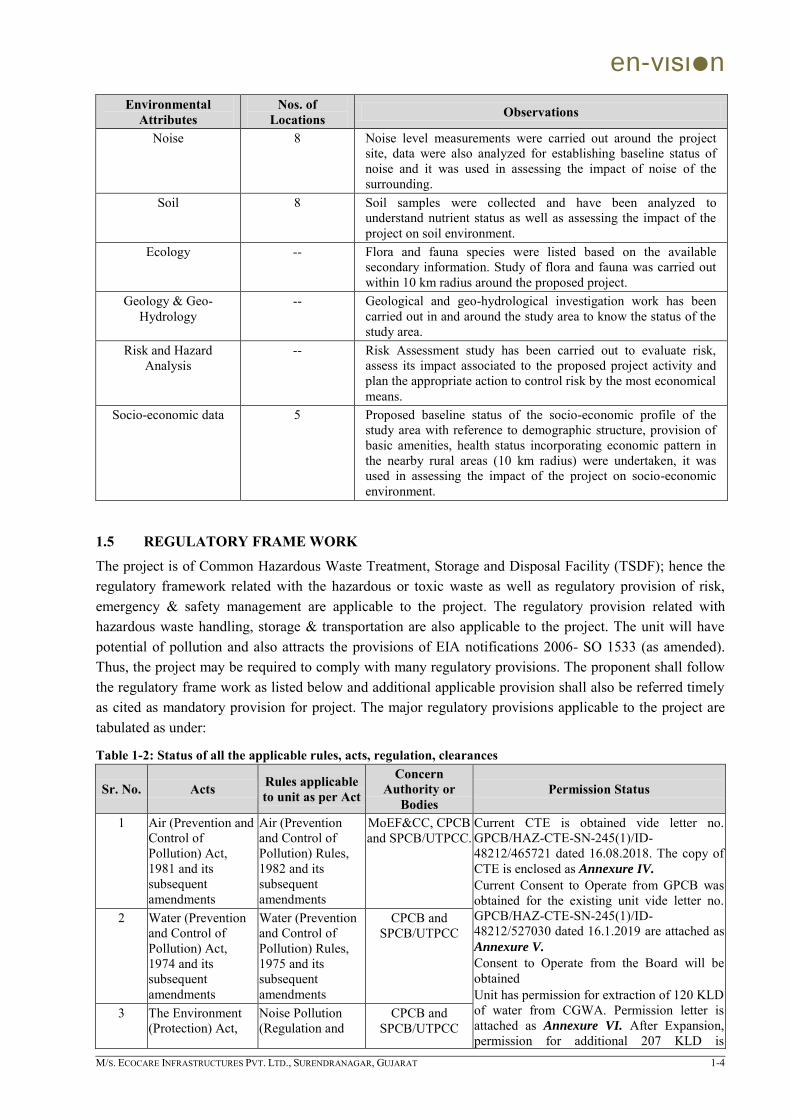
en-vιsιn
M/S. ECOCARE INFRASTRUCTURES PVT. LTD., SURENDRANAGAR, GUJARAT 1-4
Environmental Attributes
Nos. of Locations Observations
Noise 8 Noise level measurements were carried out around the project site, data were also analyzed for establishing baseline status of noise and it was used in assessing the impact of noise of the surrounding.
Soil 8 Soil samples were collected and have been analyzed to understand nutrient status as well as assessing the impact of the project on soil environment.
Ecology -- Flora and fauna species were listed based on the available secondary information. Study of flora and fauna was carried out within 10 km radius around the proposed project.
Geology & Geo-Hydrology
-- Geological and geo-hydrological investigation work has been carried out in and around the study area to know the status of the study area.
Risk and Hazard Analysis
-- Risk Assessment study has been carried out to evaluate risk, assess its impact associated to the proposed project activity and plan the appropriate action to control risk by the most economical means.
Socio-economic data 5 Proposed baseline status of the socio-economic profile of the study area with reference to demographic structure, provision of basic amenities, health status incorporating economic pattern in the nearby rural areas (10 km radius) were undertaken, it was used in assessing the impact of the project on socio-economic environment.
1.5 REGULATORY FRAME WORK
The project is of Common Hazardous Waste Treatment, Storage and Disposal Facility (TSDF); hence the regulatory framework related with the hazardous or toxic waste as well as regulatory provision of risk, emergency & safety management are applicable to the project. The regulatory provision related with hazardous waste handling, storage & transportation are also applicable to the project. The unit will have potential of pollution and also attracts the provisions of EIA notifications 2006- SO 1533 (as amended). Thus, the project may be required to comply with many regulatory provisions. The proponent shall follow the regulatory frame work as listed below and additional applicable provision shall also be referred timely as cited as mandatory provision for project. The major regulatory provisions applicable to the project are tabulated as under:
Table 1-2: Status of all the applicable rules, acts, regulation, clearances
Sr. No. Acts Rules applicable to unit as per Act
Concern Authority or
Bodies Permission Status
1 Air (Prevention and Control of Pollution) Act, 1981 and its subsequent amendments
Air (Prevention and Control of Pollution) Rules, 1982 and its subsequent amendments
MoEF&CC, CPCB and SPCB/UTPCC.
Current CTE is obtained vide letter no. GPCB/HAZ-CTE-SN-245(1)/ID-48212/465721 dated 16.08.2018. The copy of CTE is enclosed as Annexure IV. Current Consent to Operate from GPCB was obtained for the existing unit vide letter no. GPCB/HAZ-CTE-SN-245(1)/ID-48212/527030 dated 16.1.2019 are attached as Annexure V. Consent to Operate from the Board will be obtained Unit has permission for extraction of 120 KLD of water from CGWA. Permission letter is attached as Annexure VI. After Expansion, permission for additional 207 KLD is
2 Water (Prevention and Control of Pollution) Act, 1974 and its subsequent amendments
Water (Prevention and Control of Pollution) Rules, 1975 and its subsequent amendments
CPCB and SPCB/UTPCC
3 The Environment (Protection) Act,
Noise Pollution (Regulation and
CPCB and SPCB/UTPCC

en-vιsιn
M/S. ECOCARE INFRASTRUCTURES PVT. LTD., SURENDRANAGAR, GUJARAT 1-5
Sr. No. Acts Rules applicable to unit as per Act
Concern Authority or
Bodies Permission Status
1986 & its subsequent amendments
Control) Rules, 2000 and its amendments
required. Application to abstract additional quantity is submitted and attached as Annexure VI. Unit has obtained permission from SEPL CETP and GESCSL MEE for disposal of treated effluent. Permission for additional quantity from SEPL and GESCSL Vatva is under process. Unit will dispose residue from stripper to CHWIF of NECL. Permission letter for the same is attached as Annexure VII.
4 The Environment (Protection) Rules, 1986 & its subsequent amendments,
MoEF&CC, SPCB/UTPCC
Environment Clearance: Environment Clearance for the current operation was obtained from SEIAA vide letter no. SEIAA/GUJ/EC/7(d)/155/2016 dated 19.02.2016. The copy of the letter is attached as Annexure XXIV. This application is for expansion in EC.
5 EIA Notification, 2006 and its subsequent Amendments
MoEF&CC, CPCB, GPCB, SEAC, SEIAA
6 Hazardous and Other Wastes (Management and Transboundary Movement) Rules, 2016
MoEF&CC, CPCB,
SPCB/UTPCC, DGFT, Port
Authority and Customs Authority
Landfillable waste shall be disposed in its own facility. Membership application from CHWIF for disposal of stripper residue is attached as Annexure VII.
7 Corporate Environment Responsibility (CER)
MoEF&CC, SEIAA, SPCB
A total amount of Rs. 78.3 lacs would be utilized for Community Welfare programme as per OM no. 22-65/2017 on 01.05.2018 which is 0.75 % of proposed project i.e. Rs. 104.4 Crores as per CER guidelines.
8 The Indian Boilers Act 1923 & its subsequent amendments
Boiler Attendants Rules, 2011 & its subsequent amendments
Deputy Director of Boiler
Not applicable as unit has installed non-IBR boiler of 0.5 TPH and additionally 0.5 TPH non-IBR boiler will be installed.
9 Motor Vehicle Act, 1989
The Central Motor Vehicle Rules, 1989 and its subsequent amendments
Ministry of Shipping, Road Transport and
Highways
Unit is receiving waste through truck based on GPCB rules. Unit is strictly complying with the rules and regulations with Motor Vehicle Act & Rules.
10 Public Liability Insurance Act, 1991 & its subsequent amendments
Public Liability Insurance Rules, 1991 & its subsequent amendments
MoEF&CC, District Collector
PLI Policy is obtained by the unit and is attached as Annexure VIII.
11 The Factories Act, 1948
Gujarat Factories Rules, 1963
Ministry of Labor, DGFASLI and Directorate of
Industrial Safety and
Health/Factories Inspectorate
Pre-employment and periodical medical examination for all workers is carried out once in a year as per section-41-C of the Factories Act and Rule- 68-T of Gujarat Factories Rules and records are maintained in Form 32 & 33. Last checkup was conducted in February 2020; Medical reports are attached as Annexure IX.
12 The Companies Act, 2013 (Section 135 & 469)
Companies (Corporate Social Responsibility
Ministry of Corporate Affairs
(MCA)
Total amount spent is Rs. 10.3 lacs by the unit under CSR. Breakup of CSR amount spent is given in Table 8-1
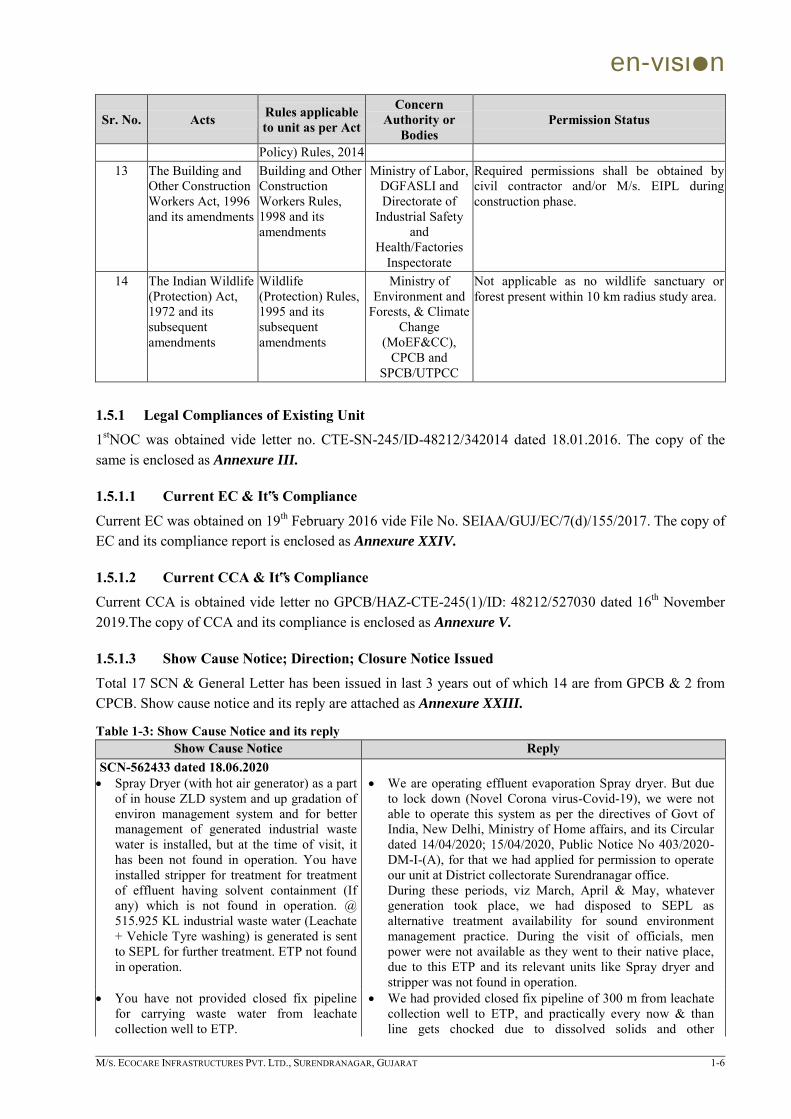
en-vιsιn
M/S. ECOCARE INFRASTRUCTURES PVT. LTD., SURENDRANAGAR, GUJARAT 1-6
Sr. No. Acts Rules applicable to unit as per Act
Concern Authority or
Bodies Permission Status
Policy) Rules, 2014 13 The Building and
Other Construction Workers Act, 1996 and its amendments
Building and Other Construction Workers Rules, 1998 and its amendments
Ministry of Labor, DGFASLI and Directorate of
Industrial Safety and
Health/Factories Inspectorate
Required permissions shall be obtained by civil contractor and/or M/s. EIPL during construction phase.
14 The Indian Wildlife (Protection) Act, 1972 and its subsequent amendments
Wildlife (Protection) Rules, 1995 and its subsequent amendments
Ministry of Environment and
Forests, & Climate Change
(MoEF&CC), CPCB and
SPCB/UTPCC
Not applicable as no wildlife sanctuary or forest present within 10 km radius study area.
1.5.1 Legal Compliances of Existing Unit
1stNOC was obtained vide letter no. CTE-SN-245/ID-48212/342014 dated 18.01.2016. The copy of the same is enclosed as Annexure III.
1.5.1.1 Current EC & It‟s Compliance
Current EC was obtained on 19th February 2016 vide File No. SEIAA/GUJ/EC/7(d)/155/2017. The copy of EC and its compliance report is enclosed as Annexure XXIV.
1.5.1.2 Current CCA & It‟s Compliance
Current CCA is obtained vide letter no GPCB/HAZ-CTE-245(1)/ID: 48212/527030 dated 16th November 2019.The copy of CCA and its compliance is enclosed as Annexure V.
1.5.1.3 Show Cause Notice; Direction; Closure Notice Issued
Total 17 SCN & General Letter has been issued in last 3 years out of which 14 are from GPCB & 2 from CPCB. Show cause notice and its reply are attached as Annexure XXIII.
Table 1-3: Show Cause Notice and its reply
Show Cause Notice Reply SCN-562433 dated 18.06.2020 Spray Dryer (with hot air generator) as a part
of in house ZLD system and up gradation of environ management system and for better management of generated industrial waste water is installed, but at the time of visit, it has been not found in operation. You have installed stripper for treatment for treatment of effluent having solvent containment (If any) which is not found in operation. @ 515.925 KL industrial waste water (Leachate + Vehicle Tyre washing) is generated is sent to SEPL for further treatment. ETP not found in operation.
We are operating effluent evaporation Spray dryer. But due
to lock down (Novel Corona virus-Covid-19), we were not able to operate this system as per the directives of Govt of India, New Delhi, Ministry of Home affairs, and its Circular dated 14/04/2020; 15/04/2020, Public Notice No 403/2020-DM-I-(A), for that we had applied for permission to operate our unit at District collectorate Surendranagar office. During these periods, viz March, April & May, whatever generation took place, we had disposed to SEPL as alternative treatment availability for sound environment management practice. During the visit of officials, men power were not available as they went to their native place, due to this ETP and its relevant units like Spray dryer and stripper was not found in operation.
You have not provided closed fix pipeline for carrying waste water from leachate collection well to ETP.
We had provided closed fix pipeline of 300 m from leachate collection well to ETP, and practically every now & than line gets chocked due to dissolved solids and other
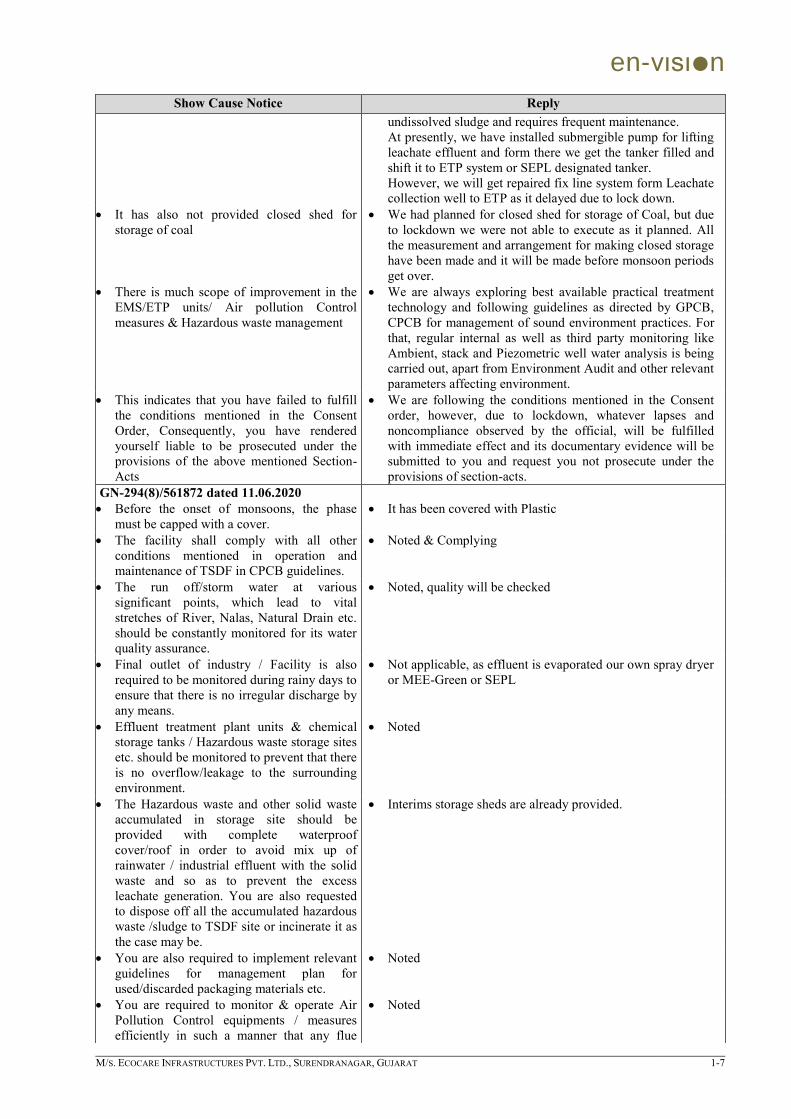
en-vιsιn
M/S. ECOCARE INFRASTRUCTURES PVT. LTD., SURENDRANAGAR, GUJARAT 1-7
Show Cause Notice Reply undissolved sludge and requires frequent maintenance. At presently, we have installed submergible pump for lifting leachate effluent and form there we get the tanker filled and shift it to ETP system or SEPL designated tanker. However, we will get repaired fix line system form Leachate collection well to ETP as it delayed due to lock down.
It has also not provided closed shed for storage of coal
We had planned for closed shed for storage of Coal, but due to lockdown we were not able to execute as it planned. All the measurement and arrangement for making closed storage have been made and it will be made before monsoon periods get over.
There is much scope of improvement in the EMS/ETP units/ Air pollution Control measures & Hazardous waste management
We are always exploring best available practical treatment technology and following guidelines as directed by GPCB, CPCB for management of sound environment practices. For that, regular internal as well as third party monitoring like Ambient, stack and Piezometric well water analysis is being carried out, apart from Environment Audit and other relevant parameters affecting environment.
This indicates that you have failed to fulfill the conditions mentioned in the Consent Order, Consequently, you have rendered yourself liable to be prosecuted under the provisions of the above mentioned Section-Acts
We are following the conditions mentioned in the Consent order, however, due to lockdown, whatever lapses and noncompliance observed by the official, will be fulfilled with immediate effect and its documentary evidence will be submitted to you and request you not prosecute under the provisions of section-acts.
GN-294(8)/561872 dated 11.06.2020 Before the onset of monsoons, the phase
must be capped with a cover.
It has been covered with Plastic
The facility shall comply with all other conditions mentioned in operation and maintenance of TSDF in CPCB guidelines.
Noted & Complying
The run off/storm water at various significant points, which lead to vital stretches of River, Nalas, Natural Drain etc. should be constantly monitored for its water quality assurance.
Noted, quality will be checked
Final outlet of industry / Facility is also required to be monitored during rainy days to ensure that there is no irregular discharge by any means.
Not applicable, as effluent is evaporated our own spray dryer or MEE-Green or SEPL
Effluent treatment plant units & chemical storage tanks / Hazardous waste storage sites etc. should be monitored to prevent that there is no overflow/leakage to the surrounding environment.
Noted
The Hazardous waste and other solid waste accumulated in storage site should be provided with complete waterproof cover/roof in order to avoid mix up of rainwater / industrial effluent with the solid waste and so as to prevent the excess leachate generation. You are also requested to dispose off all the accumulated hazardous waste /sludge to TSDF site or incinerate it as the case may be.
Interims storage sheds are already provided.
You are also required to implement relevant guidelines for management plan for used/discarded packaging materials etc.
Noted
You are required to monitor & operate Air Pollution Control equipments / measures efficiently in such a manner that any flue
Noted
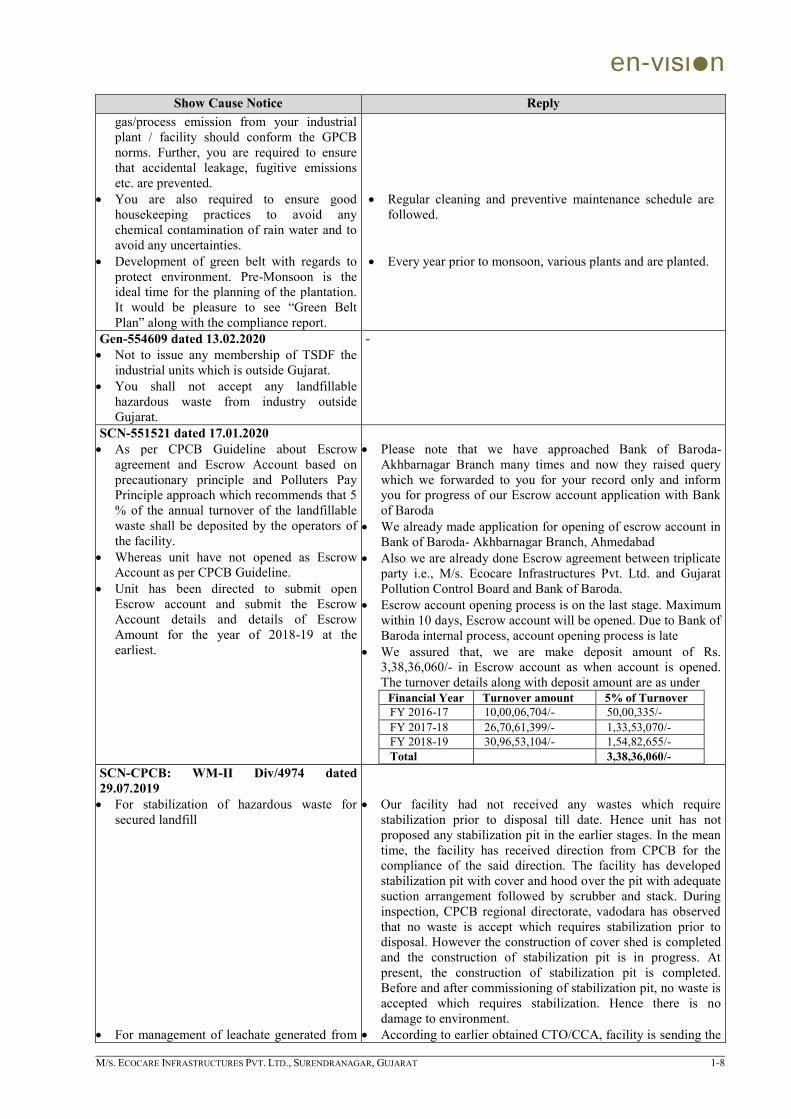
en-vιsιn
M/S. ECOCARE INFRASTRUCTURES PVT. LTD., SURENDRANAGAR, GUJARAT 1-8
Show Cause Notice Reply gas/process emission from your industrial plant / facility should conform the GPCB norms. Further, you are required to ensure that accidental leakage, fugitive emissions etc. are prevented.
You are also required to ensure good housekeeping practices to avoid any chemical contamination of rain water and to avoid any uncertainties.
Regular cleaning and preventive maintenance schedule are followed.
Development of green belt with regards to protect environment. Pre-Monsoon is the ideal time for the planning of the plantation. It would be pleasure to see “Green Belt Plan” along with the compliance report.
Every year prior to monsoon, various plants and are planted.
Gen-554609 dated 13.02.2020 Not to issue any membership of TSDF the
industrial units which is outside Gujarat. You shall not accept any landfillable
hazardous waste from industry outside Gujarat.
-
SCN-551521 dated 17.01.2020 As per CPCB Guideline about Escrow
agreement and Escrow Account based on precautionary principle and Polluters Pay Principle approach which recommends that 5 % of the annual turnover of the landfillable waste shall be deposited by the operators of the facility.
Whereas unit have not opened as Escrow Account as per CPCB Guideline.
Unit has been directed to submit open Escrow account and submit the Escrow Account details and details of Escrow Amount for the year of 2018-19 at the earliest.
Please note that we have approached Bank of Baroda-
Akhbarnagar Branch many times and now they raised query which we forwarded to you for your record only and inform you for progress of our Escrow account application with Bank of Baroda
We already made application for opening of escrow account in Bank of Baroda- Akhbarnagar Branch, Ahmedabad
Also we are already done Escrow agreement between triplicate party i.e., M/s. Ecocare Infrastructures Pvt. Ltd. and Gujarat Pollution Control Board and Bank of Baroda.
Escrow account opening process is on the last stage. Maximum within 10 days, Escrow account will be opened. Due to Bank of Baroda internal process, account opening process is late
We assured that, we are make deposit amount of Rs. 3,38,36,060/- in Escrow account as when account is opened. The turnover details along with deposit amount are as under
Financial Year Turnover amount 5% of Turnover FY 2016-17 10,00,06,704/- 50,00,335/- FY 2017-18 26,70,61,399/- 1,33,53,070/- FY 2018-19 30,96,53,104/- 1,54,82,655/- Total 3,38,36,060/-
SCN-CPCB: WM-II Div/4974 dated 29.07.2019 For stabilization of hazardous waste for
secured landfill For management of leachate generated from
Our facility had not received any wastes which require
stabilization prior to disposal till date. Hence unit has not proposed any stabilization pit in the earlier stages. In the mean time, the facility has received direction from CPCB for the compliance of the said direction. The facility has developed stabilization pit with cover and hood over the pit with adequate suction arrangement followed by scrubber and stack. During inspection, CPCB regional directorate, vadodara has observed that no waste is accept which requires stabilization prior to disposal. However the construction of cover shed is completed and the construction of stabilization pit is in progress. At present, the construction of stabilization pit is completed. Before and after commissioning of stabilization pit, no waste is accepted which requires stabilization. Hence there is no damage to environment.
According to earlier obtained CTO/CCA, facility is sending the

en-vιsιn
M/S. ECOCARE INFRASTRUCTURES PVT. LTD., SURENDRANAGAR, GUJARAT 1-9
Show Cause Notice Reply secured landfill site. leachate generated from the secured landfills to the common
spray dryer facility of M/s. GESCSL, Vatva and M/s. SEPL, Sanand.
SCN-529054 dated 04.12.2019 There is much scope of Improvements in the
EMS / ETP Units / Air Pollution Control Measures & hazardous Waste Management.
Housekeeping was found poor Failed to fulfill the conditions mentioned in
the Consent Order.
As per EC condition, ETP provided with primary, secondary &
tertiary treatment facility for gardening/plantation but as per CTE/CCA & its amendment and GPCB officer not permitted for the same. Instructed to send effluent in common evaporation facility i.e. Vatva Green MEE-Unit and Sanand Eco Project. Membership certificate of the same obtained. As per CPCB notification and GPCB office instruction, Unit has installed Spray Dryer with adequate Air pollution control device. For that, CTE/CCA Amendment obtained.
Continue improving in Housekeeping. Leachate quantity is very less so, not possible to operate spray
dryer and leachate collected in collection tank. SCN-511443 dated 27.06.2019 There is much scope of Improvements in the
EMS / ETP Units / Air Pollution Control Measures & hazardous Waste Management.
Housekeeping was found poor
As per EC condition, ETP provided with primary, secondary &
tertiary treatment facility for gardening/plantation but as per CTE/CCA & its amendment and GPCB officer not permitted for the same. Instructed to send effluent in common evaporation facility i.e. Vatva Green MEE-Unit and Sanand Eco Project. Membership certificate of the same obtained. As per CPCB notification and GPCB office instruction, Unit has installed Spray Dryer with adequate Air pollution control device. For that, CTE/CCA Amendment obtained.
Continue improving in Housekeeping SCN-508470 dated 29.05.2019 There is much scope of Improvements in the
EMS / ETP Units / Air Pollution Control Measures & hazardous Waste Management.
Housekeeping was found poor
As per EC condition, ETP provided with primary, secondary &
tertiary treatment facility for gardening/plantation but as per CTE/CCA & its amendment and GPCB officer not permitted for the same. Instructed to send effluent in common evaporation facility i.e. Vatva Green MEE-Unit and Sanand Eco Project. Membership certificate of the same obtained. As per CPCB notification and GPCB office instruction, Unit has started to install Spray Dryer. For that, CTE/CCA Amendment obtained
Continue improving in Housekeeping SCN-462412 dated 20.07.2018 As per CPCB Guideline about Escrow
agreement and Escrow Account based on precautionary principle and Polluters Pay Principle approach which recommends that 5 % of the annual turnover of the landfillable waste shall be deposited by the operators of the facility.
Whereas unit have maintained only 2 % of total annual turnover as Escrow fund as FDR in bank instead of 5 % of the total turnover of the landfillable waste.
Unit has been directed to submit open Escrow account and submit the Escrow Account details and details of Escrow Amount for the year of 2017-18 at the earliest.
We were directed to maintain 5% of the annual turnover of the
landfillable waste as escrow fund as FDR in bank and to submit the details for the year 2017-18. As per the direction we now have maintained and submit the details to your office as per the guidelines of MoEF and CPCB.
SCN-461868 dated 16.07.2018 Not operating ETP efficiently and regularly
As per the EC we had the provision for primary, secondary and
tertiary treatment for use of treated water in gardening/plantation, but in CTE and CCA the Board did not permitted for the same and instructed to send the effluent to

en-vιsιn
M/S. ECOCARE INFRASTRUCTURES PVT. LTD., SURENDRANAGAR, GUJARAT 1-10
Show Cause Notice Reply Improvements in the EMS / ETP Units / Air
Pollution Control Measures & hazardous Waste Management
common evaporation facility of GESCSL, Vatva for further treatment of evaporation. As per the compliance we are sending our primary treated effluent to common evaporation facility of GESCSL, Vatva. We have also obtained membership of Sanand Eco Projects Limited which is also effluent treatment facility and it is also having spray dryer. In case of maintenance in Green MEE spray dryer, we are sending our effluent there for further treatment of evaporation. We have also submitted CTE Amendment application to Board for in house ZLD system
We are upgrading our EMS time to time and we are also exploring latest technology for treatment of effluent. As part of the same we have planned for in house ZLD and already submitted CTE Amendment application for the same.
SCN-CPCB: HWMD/2786-92 dated 13.06.2018 a) The operator shall commission any of the
following system for stabilization of the hazardous waste by15th Oct 2018:
i) Mechanized cover system having arrangement of waste conveyor system, mixing unit with mechanized mixing arrangement , suction duck/hood, scrubber system & stack or
ii) Stabilization in pit by mixing with excavator/backhoe loader having hood over the pit with adequate suction arrangement followed by scrubber & stack
We will not accept any waste which requires stabilization.
However, as per the guidelines, we have already provided stabilization pit in our facility and also provided necessary facilities require for the same.
b) The operator shall commission any of the following option for management for leachate generated from secured landfill by 15th Oct 2018:
i) Solar Evaporation Pond: may be used provided suitable size pond be installed with double liner system and leachate pumping system arrangement and adequate size standby pond in case failure of the liner system
ii) Multi Effect Evaporator: may be used for treatment of leachate. The condensate water to be managed as per the condition stipulated in the consent to operate. The MEE residue maybe disposed into secured landfill after proper encapsulation
iii) Spray dryer of common hazardous waste incinerator: may be used in quenching of flue gas from secondary chamber of the incinerator as leachate has high TDS which will be helpful in exchanging heat
iv) Effluent Treatment Plant: ETP having advance oxidation or other technology since leachate has high COD & TDS so as to manage as per the condition stipulated in the Consent to Operate.
Currently, Unit is operating ETP for the treatment of leachate/effluent and treated effluent is sent to CETP for further treatment. Further we have already installed the spray drying facility for the treatment of leachate/effluent generated from the unit with the capacity of 1000 lit/hr for the better treatment. Residues generated from the spray dryer will be disposed in the TSDF site. Hence, there will no disposal of waste/wastewater outside the plant premises
c) Incase of violation of the above directions, environmental compensation will be levied on the operator for each day of violations based on pollution index
As per the direction the unit has already installed the stabilization pit for the stabilization of hazardous waste and the spray drying facility for the better performance of ETP and to maintain ZLD.
SCN-441908 dated 18.01.2018 Vehicle Tire washing facilities inadequate.
Upgraded Vehicle Tire washing facilities as per instruction.

en-vιsιn
M/S. ECOCARE INFRASTRUCTURES PVT. LTD., SURENDRANAGAR, GUJARAT 1-11
Show Cause Notice Reply Not submitted the quarterly Protocol for
Performance Evaluation of Common Hazardous waste TSDF report for the year of 2016-l7 i.e. April-l7 to June and July l7 to September l7.
As per instruction, submitted the quarterly Protocol for Performance Evaluation of Common Hazardous waste TSDF.
SCN-441463 dated 12.01.2018 5149.005 MT waste is found stored in
interim shed area.
Interim shed area is made completely with impervious system
RCC under the roof and its volumetric facility more than 10000 MT. Also provided leachate collection drain in interim storage area. Due to monsoon, Cell is cover with tarpaulin. So waste collected in interim storage area by intimating to GPCB. And continue improving in housekeeping.
SCN-441461 dated 12.01.2018 5149.005 MT waste is found stored in
interim shed area.
1. Housekeeping was found poor.
Interim shed area is made completely with impervious system
RCC under the roof and its volumetric facility more than 10000 MT. Also provided leachate collection drain in interim storage area. Due to monsoon, Cell is cover with tarpaulin. So waste collected in interim storage area by intimating to GPCB. And continue improving in housekeeping.
SCN-426835 dated 06.11.2017 Not operating ETP efficiently and regularly
Improvements in the EMS / ETP Units / Air Pollution Control Measures & hazardous Waste Management.
As per the EC we had the provision for primary, secondary and
tertiary treatment for use of treated water in gardening/plantation, but in CTE and CCA the Board did not permitted for the same and instructed to send the effluent to common evaporation facility of GESCSL, Vatva for further treatment of evaporation. As per the compliance we are sending our primary treated effluent to common evaporation facility of GESCSL, Vatva. We have also obtained membership of Sanand Eco Projects Limited which is also effluent treatment facility and it is also having spray dryer. In case of maintenance in Green MEE spray dryer, we are sending our effluent there for further treatment of evaporation. We have also submitted CTE Amendment application to Board for in house ZLD system
We are upgrading our EMS time to time and we are also exploring latest technology for treatment of effluent. As part of the same we have planned for in house ZLD and already submitted CTE
SCN-412650 dated 17.05.2017 Primary treatment unit and other ETP unit
not in operation
Vehicle Tire washing facilities inadequate Not submitted leachate generation and
disposal data
As per EC condition, ETP with primary & secondary treatment
is provided for on land (greenbelt) discharge. As per existing CCA condition under water act, entire waste water sent to Vatva Green MEE-Unit and/or Sanand Eco Project after primary treatment. Hence, other ETP unit not in operation.
Upgraded Vehicle Tire washing facilities as per instruction Leachate generation and disposal data submitted and updated in
GPCB XGN site. SCN-409281 dated 11.04.2017 Not installed fixed AAQM station Vehicle Tire washing facilities inadequate Not obtained Public Liability Policy Not submitted copy of site notification by
MoEF Not submitted notarized undertaking
regarding ZLD Not submitted base line data of ground water
and Ambient Air monitoring
Fixed AAQM location as per instruction Upgraded Vehicle Tire washing facilities as per instruction PLI policy is obtained. Application letter for the same submitted at MoEF. Notarized Undertaking regarding ZLD submitted. Base line data of ground water and Ambient Air monitoring
submitted in EIA report and also submitted as per instruction.

en-vιsιn
M/S. ECOCARE INFRASTRUCTURES PVT. LTD., SURENDRANAGAR, GUJARAT 2-1
CHAPTER 2 PROJECT DESCRIPTION
2.1 TYPE OF PROJECT
M/s. Ecocare Infrastructures Pvt. Ltd. is planning to expansion of a Common Hazardous Waste Treatment, Storage and Disposal Facility (TSDF). The project is a Brownfield and falls under Category “B” of activity 7(d), Common hazardous waste treatment, storage and disposal facilities as it is located outside notified industrial area.
2.2 NEED FOR THE PROJECT AND ITS IMPORTANCE TO THE COUNTRY AND/OR
REGION
During the earlier EC application, report on National Inventory of Hazardous Wastes Generating Industries & Hazardous Waste Management in India, February 2009 of Central Pollution Control Board Hazardous Waste management Division, Delhi, in Gujarat was considered as Base. Total hazardous waste to the tune of 17,92,789 MT/Annum was reported for the duration of 2006-07 from 7,751 industries.
As per report on National Inventory of Hazardous Wastes Generating Industries & Hazardous Waste Management in India, November 2019 of Central Pollution Control Board Hazardous Waste management Division, Delhi, in Gujarat Total hazardous waste to the tune of 1,44,90,351.1 MT/Annum was reported for the duration of 2015-16 from 11,200 industries
From reports it was observed that there is increase in hazardous waste generating units by 1.4 times; which has lead to increase hazardous waste generation by 8.08 times. During the decade action were taken to achieve maximum reuse/recycle of the waste generated as a result of which; “ratio of landfillable waste to total hazardous waste generation is decreased to 49.11% from 61.75%” & “ratio of incinerable waste to total hazardous waste generation is decreased to 3.82% from 32.19%.
Figure 2-1: Incremental Increase of Hazardous waste generation

en-vιsιn
M/S. ECOCARE INFRASTRUCTURES PVT. LTD., SURENDRANAGAR, GUJARAT 2-2
In 2007-08, 9 TSDF facilities were under operation. Environment Clearance for the existing facility was obtained in February, 2016; as per the report of November, 2019 two TSDF sites were closed before 2016 and one TSDF site has been closed after 2016. Total capacity of the three sites was around 6 MT and only one new facility has obtained Enviornment Clearance (but it is not under operation) in last four years hence the load at facilities under operation has been increased.
In last 4 years nos. of member units have been increased by 4.7 times but % of member sending the waste is ranging between 50-60% of the registered members.
Table 2-1: Data Summary of last 4 years
Sr. No. Year Waste Received (MT/Annum)
Registered Members as on 31st
March (Nos.)
Active Members (Nos.)
Category & Percentage of Waste received from
Members (in %) 1 2016-17 74,247.119 372 185 35.3 as 91.66%
37.2 as 02.29% 33.1 as 01.43% 26.1 as 01.73% 26.2 as 01.15% Others as 1.74%
2 2017-18 2,06,529.224 886 538 35.3 as 89.81% 36.1 as 04.58% 37.2 as 01.75% Others as 3.86%
3 2018-19 1,82,085.554 1,318 698 35.3 as 86.14% 37.2 as 01.86% 33.1 as 01.15% 26.1 as 05.57% 29.2 as 01.91% Others as 3.37%
4 2019-20 1,95,043.951 1,755 749 35.3 as 86.77% 37.2 as 01.46% 26.1 as 04.45% 29.2 as 01.16% Others as 6.16%
Category of Hazardous waste as per Schedule – I, Hazardous and Other Wastes (Management and Transboundary Movement) Rules, 2016. 26.1: Process waste sludge/residues containing acid, toxic metals, organic compounds 26.2: Dust from air filtration system 29.2: Sludge containing residual pesticides 33.1: Empty barrels/containers/liners contaminated with hazardous chemicals /wastes 35.3: Chemical sludge from waste water treatment 36.1: Any process or distillation residue 37.2: Ash from incinerator and flue gas cleaning residue
Looking to continual industrial development, increase in waste generation in last decade & subsequently closing of the 3 facilities there is need of expansion of current facilities/ set up of new facilities.
2.3 LOCATION
M/s. Ecocare Infrastructures Private Limited is planning to expand the existing Common Hazardous Waste Treatment, Storage and Disposal Facility (TSDF) at Survey No. 203 to 212, 247, 251, 253, 255 to 259, 262 & 298, Village Ghaspur, Taluka Dasada (Patdi), District Surendranagar. It is situated at 23°11'7.90"N latitude and 71°55'7.49"E longitude. An index map showing project site is given in Figure
2-2, Google image and topography map showing 10 km radius study area of project site is given in Figure
2-3 & Figure 2-4 respectively.

en-vιsιn
M/S. ECOCARE INFRASTRUCTURES PVT. LTD., SURENDRANAGAR, GUJARAT 2-3
Figure 2-2: Location of the Project

en-vιsιn
M/S. ECOCARE INFRASTRUCTURES PVT. LTD., SURENDRANAGAR, GUJARAT 2-4
Figure 2-3: Google Image showing 10 km Radius Study area of Project Site
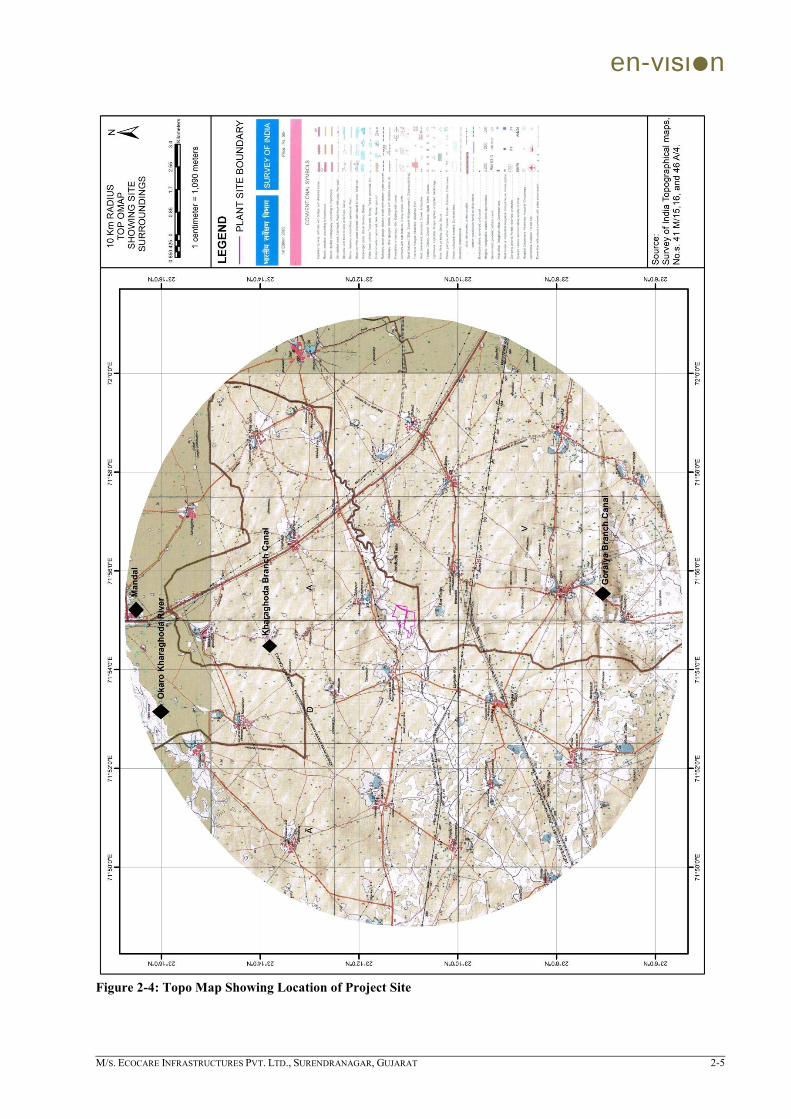
en-vιsιn
M/S. ECOCARE INFRASTRUCTURES PVT. LTD., SURENDRANAGAR, GUJARAT 2-5
Figure 2-4: Topo Map Showing Location of Project Site

en-vιsιn
M/S. ECOCARE INFRASTRUCTURES PVT. LTD., SURENDRANAGAR, GUJARAT 2-6
2.3.1 Project Site History
Current land use of the plot no. 203, 206, 255, 258, 259 and 298 is barren land and no activity is observed. As per Google Earth Image after 2008 agriculture activity is observed at plot no. 204, 205, 207 to 212, 247, 251, 253, 257 and 262. According to site visit, crops are grown only during premonsoon season. Crops grown are Castor Oil, Cotton, Jeeru, Wheat, Cattle feed, etc.
2.3.2 Justification of Site Selection and Key Infrastructure Features and Settlements
This project is for expansion of existing landfill site by addition of new adjoining plots. Unit has already established basic infrastructure like water, roads, transportation, power, etc.
There is no protected area notified under the Wild Life (Protection) Act (1972) & Eco-sensitive area notified under Section 3 of the Environment (Protection) Act- 1986 exists within 10 km radius areas from the project site.
As expansion project will come on adjacent land of the existing project site, no other site was envisaged. But siting criteria from the final boundary after addition of plots is given in Chapter 5.
There is no industry in 10 km radius area of Landfill site. The nearest industrial area is Viramgam Co-op. Industrial Estate Ltd. (17.2. km in ESE) and Hansalpur GIDC (17.5 km in SE).
Table 2-2: Key Infrastructure Features
Tag Nearest Infrastructure Feature Infrastructure Distance from Project
Site (km) Direction
A Water Body Drain 0.06 NW
B Road Transportation SH – 138 0.58 WNW
C Water Body Jhund Pond 0.82 SSE
D Habitat Ghaspur Village 0.99 NNE
E Rail Transportation Western Railway Line 1.89 S
F Rail Transportation Jhund Railway Station 2.70 SE
G Water Body Minor Narmada Canal 4.57 NW
H Water Body Okaro Kharaghoda River 8.93 NW
I Road Transportation NH – 947 10.82 S
J Habitat Viramgam Town 13.0 ESE
K Wildlife Sanctuary Wild Ass Sanctuary 16.34 W
L Air Transportation Ahmedabad Airport 71.9 E

en-vιsιn
M/S. ECOCARE INFRASTRUCTURES PVT. LTD., SURENDRANAGAR, GUJARAT 2-7
Figure 2-5: Google Image Showing Locations of key Infrastructure Facilities within 10 km Radius Study Area
Figure 2-6: Google Image Showing Locations of key Infrastructure Facilities outside 10 km Radius Study Area

en-vιsιn
M/S. ECOCARE INFRASTRUCTURES PVT. LTD., SURENDRANAGAR, GUJARAT 2-8
Cell – 1 (Closed)
Cell – 2
Leachate Management System
Hazardous Waste Storage Area
Greenbelt
Vehicle Washing Facility
Existing Facility
Land for Expansion
Photograph 2-1: Photographs of Existing Facility and New land for expansion

en-vιsιn
M/S. ECOCARE INFRASTRUCTURES PVT. LTD., SURENDRANAGAR, GUJARAT 2-9
2.3.3 Project Land and Plant Layout
The expansion project will be established in existing unit with addition of plots. Current facility is setup on survey no. 251 & 262 while proposed facility will be setup on survey no. 203 to 212, 247, 253, 255 to 259 & 298 out of which survey no. 204, 206 and 298 have been acquired by the proponent. Land Possession documents are given as Annexure II. Total plot area of the project is 4,62,840 m2 from which 45,350 m2 is developed as greenbelt by the unit and additional 1,52,804 m2 will be developed as greenbelt, thus 33% of total land area will be covered with greenbelt. The breakup of land area of the proposed project is given in Table; while plant layout showing infrastructure of the faculties is given as Figure 2-7.
Table 2-3: Area Break-up
Sr. No. Particular Area (m2)
Existing Proposed Total after Expansion
1 TSDF cell-1 49,207.00 - 49,207.00 2 TSDF cell-2 23,365.00 - 23,365.00 3 TSDF cell-3 - 38,600.00 38,600.00 4 TSDF cell-4 - 1,01,700.00 1,01,700.00 5 TSDF cell-5 - 31,300.00 31,300.00 6 TSDF cell-6 - 15,000.00 15,000.00 7 Watchman cabin 9.00 9.00 18.00 8 Weighing bridge cabin 9.00 9.00 18.00 9 Office, Laboratory & health centre 130.50 - 130.50 10 Waste segregation 1,590.00 - 1,590.00 11 Wash Area-1 98.00 - 98.00 12 Wash Area-2 - 98.00 98.00 13 Leachate treatment plant 500.00 - 500.00 14 Temporary Storage area 800.00 - 800.00 15 Waste stabilization pit 800.00 - 800.00 16 Hazardous waste storage area 800.00 - 800.00 17 Primary leachate well 7.00 - 7.00 18 Secondary leachate well 7.00 - 7.00 19 Vehicle maintenance 140.00 - 140.00 20 Canteen 48.00 - 48.00 21 Staff quarters 90.00 - 90.00 22 Spray dryer-1 125.00 - 125.00 23 Spray dryer-2 - 125.00 125.00 24 Parking-1 270.00 - 270.00 25 Parking-2 - 280.00 280.00 A Total built-up 77,995.50 1,87,121.00 2,65,116.50
B Greenbelt Area 45,350.00 1,07,454.00 1,52,804.00 C Road/Paved Area 13,847.50 16,197.00 30,044.50 D Open Area - 14,875.00 14,875.00
Total Area 1,37,193.00 3,25,647.00 4,62,840.00

en-vιsιn
M/S. ECOCARE INFRASTRUCTURES PVT. LTD., SURENDRANAGAR, GUJARAT 2-10
Figure 2-7: Plant Layout

en-vιsιn
M/S. ECOCARE INFRASTRUCTURES PVT. LTD., SURENDRANAGAR, GUJARAT 2-11
2.4 MAGNITUDE OF OPERATION & PROJECT COST
After expansion capacity of the facility will be 57,20,000 MT. The cost of the proposed expansion will be around Rs. 104.4 Crores, so it is categorized as “Large Scale Project”.
2.4.1 Landfill Capacity
Details of the existing and proposed landfill capacity are given in below table.
Table 2-4: Details of Size or Magnitude of Operation S. No. Facility Size/Magnitude
1 Existing Landfill Capacity 7,20,000 MT 2 Proposed Landfill Capacity 50,00,000 MT
2.4.2 Project Cost
The project cost for proposed expansion will be around Rs. 104.4 Crores. It includes cost of land, construction of landfill cell and Environment Protection Measures. Breakup of the investment is given in Table 2-5.
Table 2-5: Break-up of Capital Cost of Project
Sr. No. Description Cost (Rs. in Crore)
Existing Proposed Total 1 Land 25.00 15.00 40.00 2 Pit 62.60 65.30 127.90 3 Plant & Machinery 13.86 1.10 14.96 4 Environment Protection Measures 13.14 19.37 32.51 5 Miscellaneous - 3.63 3.63 Total 114.6 104.4 219
2.5 PROJECT IMPLEMENTATION SCHEDULE
Implementation of project within a pre-determined time frame is an important factor for the success of a project. Timely implementation may save on various costs like interest, administrative overheads and helps to realize the goals as per pre-determined objectives.
The implementation of the project will involve major activities like preparation of specification / drawings, issue of tenders, receipt of quotations, scrutiny of tenders, placing of orders, civil & structural construction, delivery & erection of equipment, test trial runs of various items of equipment and commissioning of the plant & equipment. Completion of the project will take place after getting the necessary clearances from concerned authorities.
A tentative schedule indicating the commencement, duration and completion of various activities, is presented in Table 2-6.
Table 2-6: Project Implementation Schedule for Proposed Works
Sr. No. Particulars Expected Date of Commencement from EC
Expected Date of Completion from EC
1 Land Acquisition Land will be acquired before EC
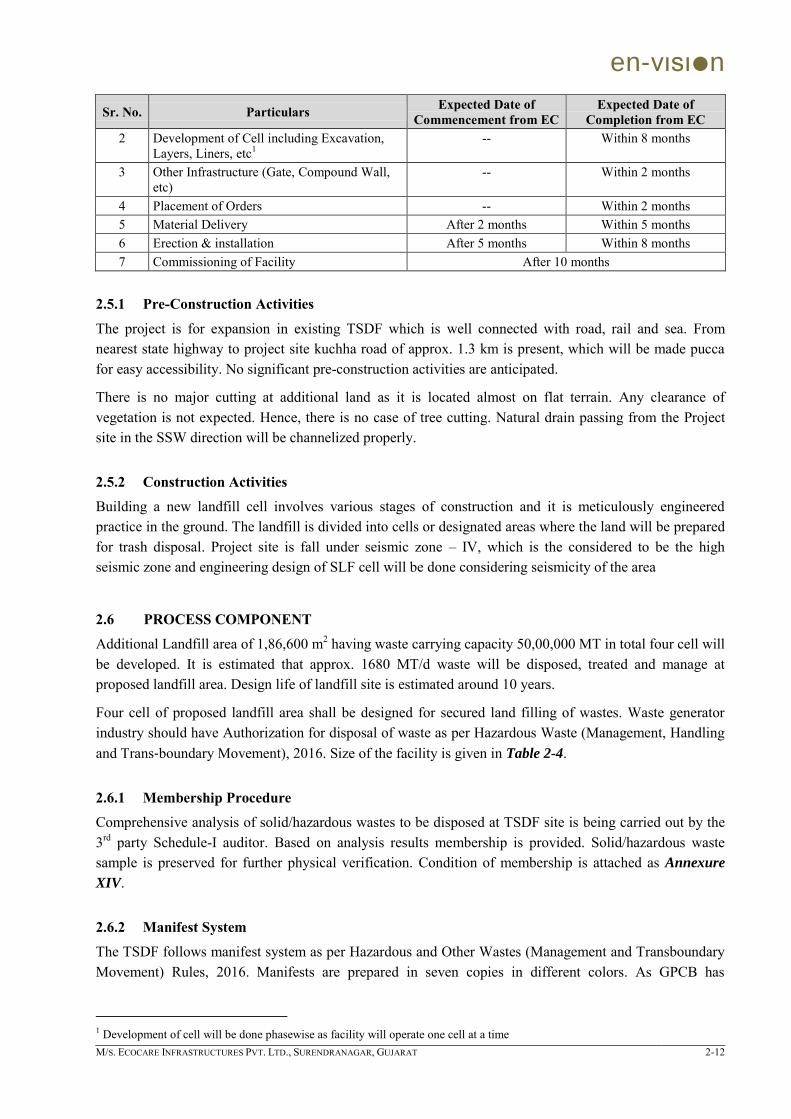
en-vιsιn
M/S. ECOCARE INFRASTRUCTURES PVT. LTD., SURENDRANAGAR, GUJARAT 2-12
Sr. No. Particulars Expected Date of Commencement from EC
Expected Date of Completion from EC
2 Development of Cell including Excavation, Layers, Liners, etc1
-- Within 8 months
3 Other Infrastructure (Gate, Compound Wall, etc)
-- Within 2 months
4 Placement of Orders -- Within 2 months 5 Material Delivery After 2 months Within 5 months 6 Erection & installation After 5 months Within 8 months 7 Commissioning of Facility After 10 months
2.5.1 Pre-Construction Activities
The project is for expansion in existing TSDF which is well connected with road, rail and sea. From nearest state highway to project site kuchha road of approx. 1.3 km is present, which will be made pucca for easy accessibility. No significant pre-construction activities are anticipated.
There is no major cutting at additional land as it is located almost on flat terrain. Any clearance of vegetation is not expected. Hence, there is no case of tree cutting. Natural drain passing from the Project site in the SSW direction will be channelized properly.
2.5.2 Construction Activities
Building a new landfill cell involves various stages of construction and it is meticulously engineered practice in the ground. The landfill is divided into cells or designated areas where the land will be prepared for trash disposal. Project site is fall under seismic zone – IV, which is the considered to be the high seismic zone and engineering design of SLF cell will be done considering seismicity of the area
2.6 PROCESS COMPONENT
Additional Landfill area of 1,86,600 m2 having waste carrying capacity 50,00,000 MT in total four cell will be developed. It is estimated that approx. 1680 MT/d waste will be disposed, treated and manage at proposed landfill area. Design life of landfill site is estimated around 10 years.
Four cell of proposed landfill area shall be designed for secured land filling of wastes. Waste generator industry should have Authorization for disposal of waste as per Hazardous Waste (Management, Handling and Trans‐boundary Movement), 2016. Size of the facility is given in Table 2-4.
2.6.1 Membership Procedure
Comprehensive analysis of solid/hazardous wastes to be disposed at TSDF site is being carried out by the 3rd party Schedule-I auditor. Based on analysis results membership is provided. Solid/hazardous waste sample is preserved for further physical verification. Condition of membership is attached as Annexure
XIV.
2.6.2 Manifest System The TSDF follows manifest system as per Hazardous and Other Wastes (Management and Transboundary Movement) Rules, 2016. Manifests are prepared in seven copies in different colors. As GPCB has
1 Development of cell will be done phasewise as facility will operate one cell at a time
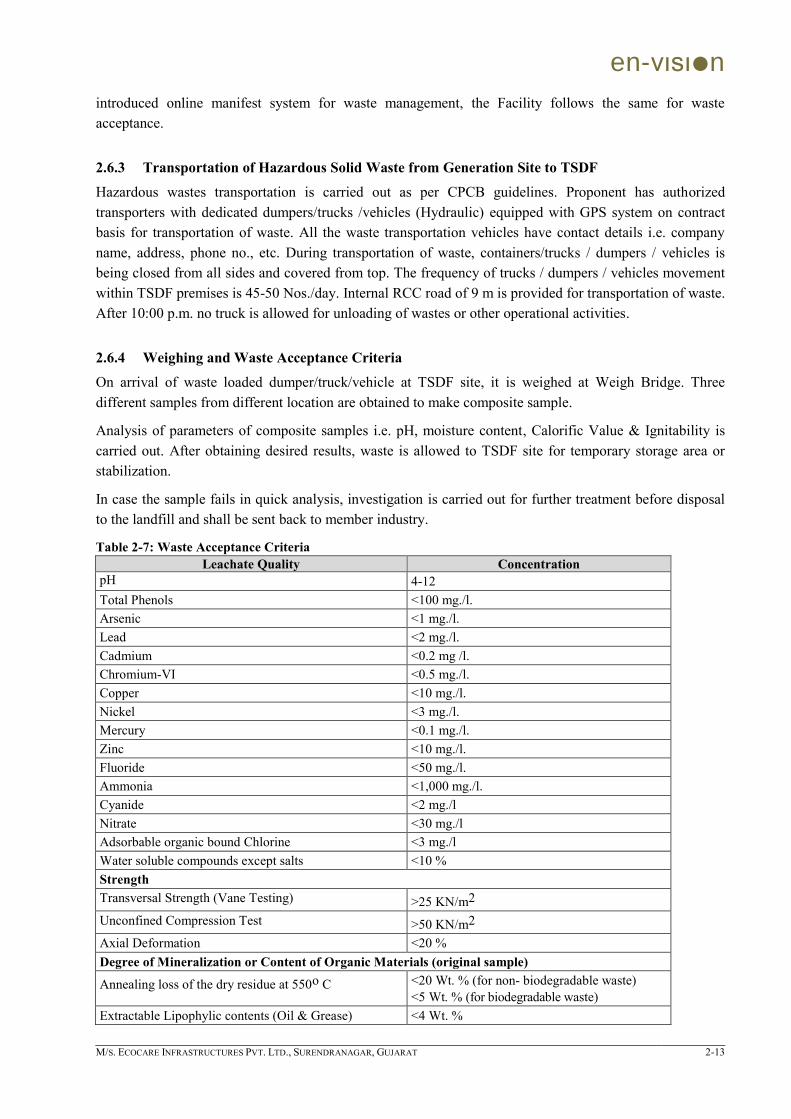
en-vιsιn
M/S. ECOCARE INFRASTRUCTURES PVT. LTD., SURENDRANAGAR, GUJARAT 2-13
introduced online manifest system for waste management, the Facility follows the same for waste acceptance.
2.6.3 Transportation of Hazardous Solid Waste from Generation Site to TSDF
Hazardous wastes transportation is carried out as per CPCB guidelines. Proponent has authorized transporters with dedicated dumpers/trucks /vehicles (Hydraulic) equipped with GPS system on contract basis for transportation of waste. All the waste transportation vehicles have contact details i.e. company name, address, phone no., etc. During transportation of waste, containers/trucks / dumpers / vehicles is being closed from all sides and covered from top. The frequency of trucks / dumpers / vehicles movement within TSDF premises is 45-50 Nos./day. Internal RCC road of 9 m is provided for transportation of waste. After 10:00 p.m. no truck is allowed for unloading of wastes or other operational activities.
2.6.4 Weighing and Waste Acceptance Criteria
On arrival of waste loaded dumper/truck/vehicle at TSDF site, it is weighed at Weigh Bridge. Three different samples from different location are obtained to make composite sample.
Analysis of parameters of composite samples i.e. pH, moisture content, Calorific Value & Ignitability is carried out. After obtaining desired results, waste is allowed to TSDF site for temporary storage area or stabilization.
In case the sample fails in quick analysis, investigation is carried out for further treatment before disposal to the landfill and shall be sent back to member industry.
Table 2-7: Waste Acceptance Criteria Leachate Quality Concentration
pH 4-12 Total Phenols <100 mg./l. Arsenic <1 mg./l. Lead <2 mg./l. Cadmium <0.2 mg /l. Chromium-VI <0.5 mg./l. Copper <10 mg./l. Nickel <3 mg./l. Mercury <0.1 mg./l. Zinc <10 mg./l. Fluoride <50 mg./l. Ammonia <1,000 mg./l. Cyanide <2 mg./l Nitrate <30 mg./l Adsorbable organic bound Chlorine <3 mg./l Water soluble compounds except salts <10 % Strength Transversal Strength (Vane Testing) >25 KN/m2 Unconfined Compression Test >50 KN/m2 Axial Deformation <20 % Degree of Mineralization or Content of Organic Materials (original sample)
Annealing loss of the dry residue at 550o C <20 Wt. % (for non- biodegradable waste) <5 Wt. % (for biodegradable waste)
Extractable Lipophylic contents (Oil & Grease) <4 Wt. %

en-vιsιn
M/S. ECOCARE INFRASTRUCTURES PVT. LTD., SURENDRANAGAR, GUJARAT 2-14
Note:
1) Leachate quality is based on water leachate test (i.e Leachability tests are conducted by preparing a suspension of waste and water (i.e taking 100 gm of waste and filling up to 1 liter with distilled water), stirring or shaking for 24 hrs, filtering the solids and analyzing the filtrate)
2) Calorific value of the landfillable hazardous wastes should be less than 2500 kcal/Kg
2.6.5 Operation of TSDF Disposal Area
Once the waste consignment meets the acceptance criteria, the dumper/truck/vehicle is allowed to go to the operational area for unloading of waste by mechanical means. The waste is spread and/or compacted with the help of Bull Dozer. As per design of landfill cell, soil is being spread between layers of waste.
2.6.6 Ground Water Sampling and Analysis
Total 8 nos. of observatory wells are provided in the existing cells; considering 2 nos. in up gradient & 2 nos. in down gradient per cell of ground water flow for ground water monitoring. After proposed expansion, same practices shall be followed.
2.6.7 Leachate Management System Leachate from secured landfill site is collected in leachate collection well. For each landfill cell, one primary and one secondary leachate collection wells are provided. HDPE perforated pipe is used for efficient conveyance of leachate of secured landfill site. Any leachate generated in the cell is pumped into effluent treatment plant with the help of submersible pump. After proposed expansion, same practices shall be followed.
2.6.8 Gaseous Emission Management
A gas control system is used to collect and extract gas from the landfill. Vent whole pipe network is installed for the same. Total 11 vents are provided at capped cell – 1. After proposed expansion, same practices shall be followed.
2.6.9 Closure & Post Closure Maintenance for Closed Cells Once landfill cell reach its full capacity, cell will be closed with final cover as mentioned in Table 2-8. Final check shall be made for the proper functioning of all interconnected systems. After completion of the phase, installation of solar panel will be undertaken.
During monsoon season, main operational cell is being covered with tarpaulin sheet and separate rain water collection system is provided.
2.6.10 Storm Water Drainage System
The storm water drainage system is provided at the site and the same will be further improved. The surface runoff from closed cell shall be collected through storm water collection system along with roof top water of admin building laboratory etc and after filtration shall be stored & reused within premises, otherwise it is sent to ETP.
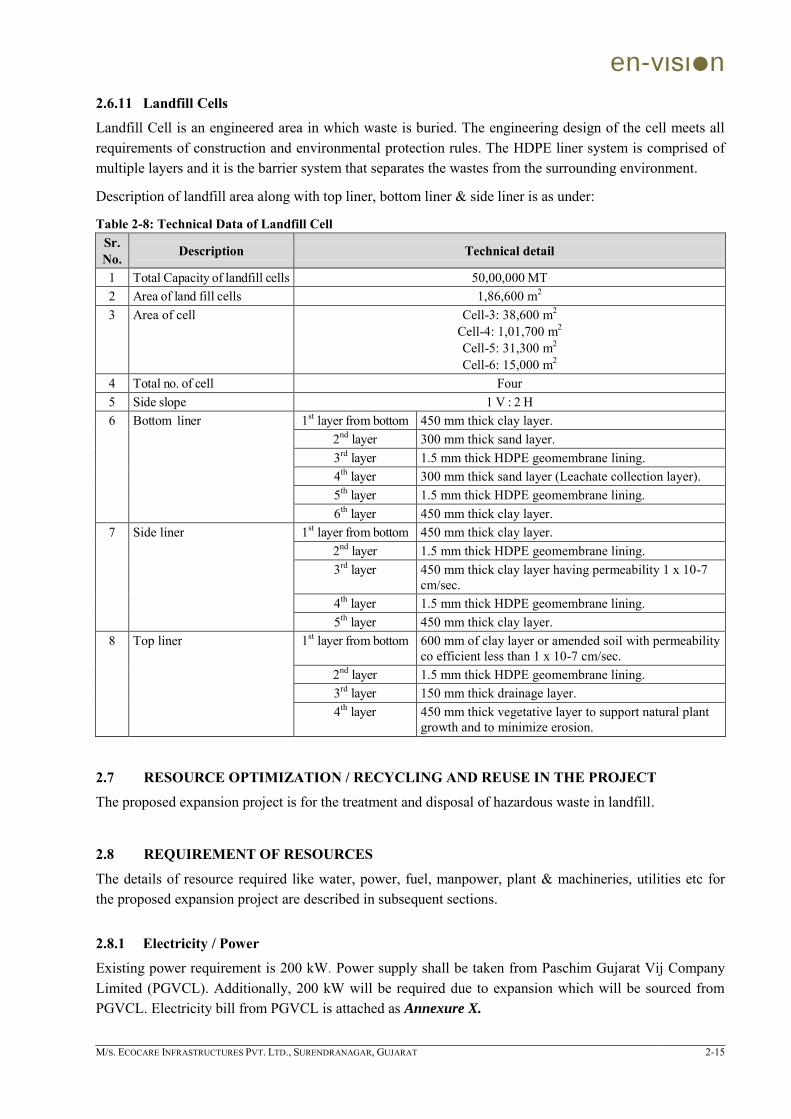
en-vιsιn
M/S. ECOCARE INFRASTRUCTURES PVT. LTD., SURENDRANAGAR, GUJARAT 2-15
2.6.11 Landfill Cells
Landfill Cell is an engineered area in which waste is buried. The engineering design of the cell meets all requirements of construction and environmental protection rules. The HDPE liner system is comprised of multiple layers and it is the barrier system that separates the wastes from the surrounding environment.
Description of landfill area along with top liner, bottom liner & side liner is as under:
Table 2-8: Technical Data of Landfill Cell Sr. No. Description Technical detail
1 Total Capacity of landfill cells 50,00,000 MT 2 Area of land fill cells 1,86,600 m2 3 Area of cell Cell-3: 38,600 m2
Cell-4: 1,01,700 m2 Cell-5: 31,300 m2 Cell-6: 15,000 m2
4 Total no. of cell Four 5 Side slope 1 V : 2 H 6 Bottom liner 1st layer from bottom 450 mm thick clay layer.
2nd layer 300 mm thick sand layer. 3rd layer 1.5 mm thick HDPE geomembrane lining. 4th layer 300 mm thick sand layer (Leachate collection layer). 5th layer 1.5 mm thick HDPE geomembrane lining. 6th layer 450 mm thick clay layer.
7 Side liner 1st layer from bottom 450 mm thick clay layer. 2nd layer 1.5 mm thick HDPE geomembrane lining. 3rd layer 450 mm thick clay layer having permeability 1 x 10⁻⁷
cm/sec. 4th layer 1.5 mm thick HDPE geomembrane lining. 5th layer 450 mm thick clay layer.
8 Top liner 1st layer from bottom 600 mm of clay layer or amended soil with permeability co efficient less than 1 x 10⁻⁷ cm/sec.
2nd layer 1.5 mm thick HDPE geomembrane lining. 3rd layer 150 mm thick drainage layer. 4th layer 450 mm thick vegetative layer to support natural plant
growth and to minimize erosion.
2.7 RESOURCE OPTIMIZATION / RECYCLING AND REUSE IN THE PROJECT
The proposed expansion project is for the treatment and disposal of hazardous waste in landfill.
2.8 REQUIREMENT OF RESOURCES
The details of resource required like water, power, fuel, manpower, plant & machineries, utilities etc for the proposed expansion project are described in subsequent sections.
2.8.1 Electricity / Power
Existing power requirement is 200 kW. Power supply shall be taken from Paschim Gujarat Vij Company Limited (PGVCL). Additionally, 200 kW will be required due to expansion which will be sourced from PGVCL. Electricity bill from PGVCL is attached as Annexure X.
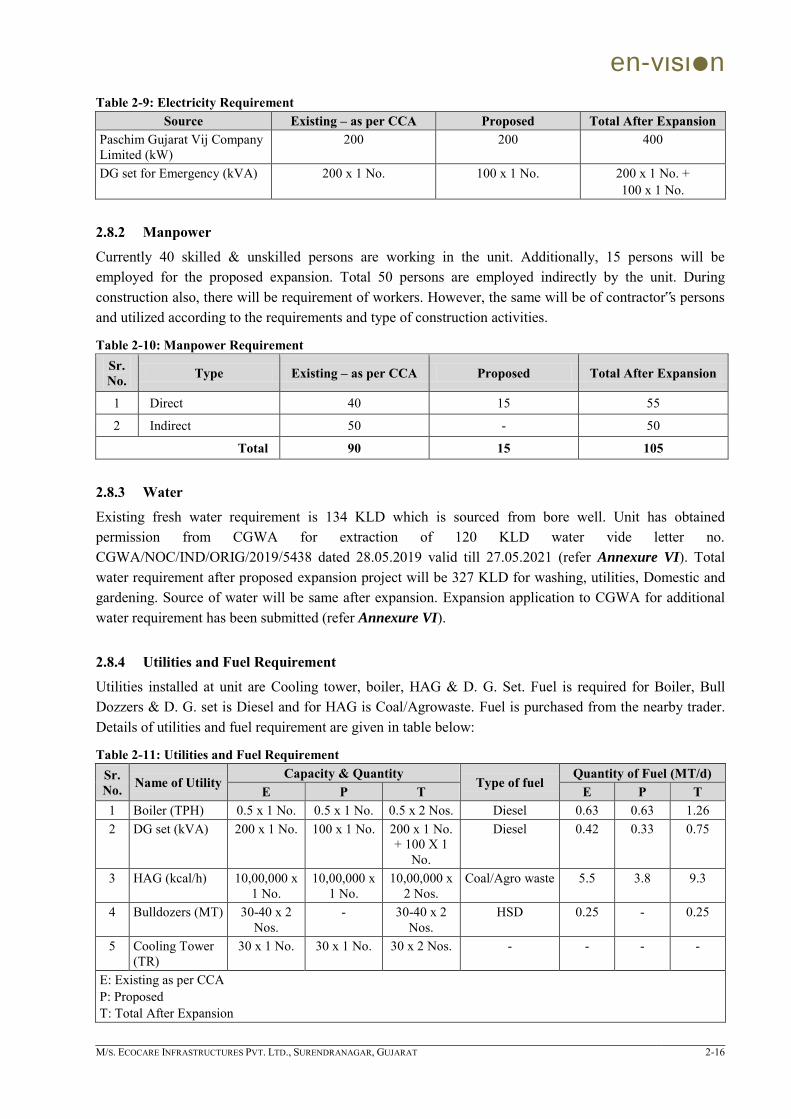
en-vιsιn
M/S. ECOCARE INFRASTRUCTURES PVT. LTD., SURENDRANAGAR, GUJARAT 2-16
Table 2-9: Electricity Requirement Source Existing – as per CCA Proposed Total After Expansion
Paschim Gujarat Vij Company Limited (kW)
200 200 400
DG set for Emergency (kVA) 200 x 1 No. 100 x 1 No. 200 x 1 No. + 100 x 1 No.
2.8.2 Manpower
Currently 40 skilled & unskilled persons are working in the unit. Additionally, 15 persons will be employed for the proposed expansion. Total 50 persons are employed indirectly by the unit. During construction also, there will be requirement of workers. However, the same will be of contractor‟s persons and utilized according to the requirements and type of construction activities.
Table 2-10: Manpower Requirement Sr. No. Type Existing – as per CCA Proposed Total After Expansion
1 Direct 40 15 55
2 Indirect 50 - 50
Total 90 15 105
2.8.3 Water
Existing fresh water requirement is 134 KLD which is sourced from bore well. Unit has obtained permission from CGWA for extraction of 120 KLD water vide letter no. CGWA/NOC/IND/ORIG/2019/5438 dated 28.05.2019 valid till 27.05.2021 (refer Annexure VI). Total water requirement after proposed expansion project will be 327 KLD for washing, utilities, Domestic and gardening. Source of water will be same after expansion. Expansion application to CGWA for additional water requirement has been submitted (refer Annexure VI).
2.8.4 Utilities and Fuel Requirement
Utilities installed at unit are Cooling tower, boiler, HAG & D. G. Set. Fuel is required for Boiler, Bull Dozzers & D. G. set is Diesel and for HAG is Coal/Agrowaste. Fuel is purchased from the nearby trader. Details of utilities and fuel requirement are given in table below:
Table 2-11: Utilities and Fuel Requirement Sr. No. Name of Utility
Capacity & Quantity Type of fuel
Quantity of Fuel (MT/d) E P T E P T
1 Boiler (TPH) 0.5 x 1 No. 0.5 x 1 No. 0.5 x 2 Nos. Diesel 0.63 0.63 1.26 2 DG set (kVA) 200 x 1 No. 100 x 1 No. 200 x 1 No.
+ 100 X 1 No.
Diesel 0.42 0.33 0.75
3 HAG (kcal/h) 10,00,000 x 1 No.
10,00,000 x 1 No.
10,00,000 x 2 Nos.
Coal/Agro waste 5.5 3.8 9.3
4 Bulldozers (MT) 30-40 x 2 Nos.
- 30-40 x 2 Nos.
HSD 0.25 - 0.25
5 Cooling Tower (TR)
30 x 1 No. 30 x 1 No. 30 x 2 Nos. - - - -
E: Existing as per CCA P: Proposed T: Total After Expansion
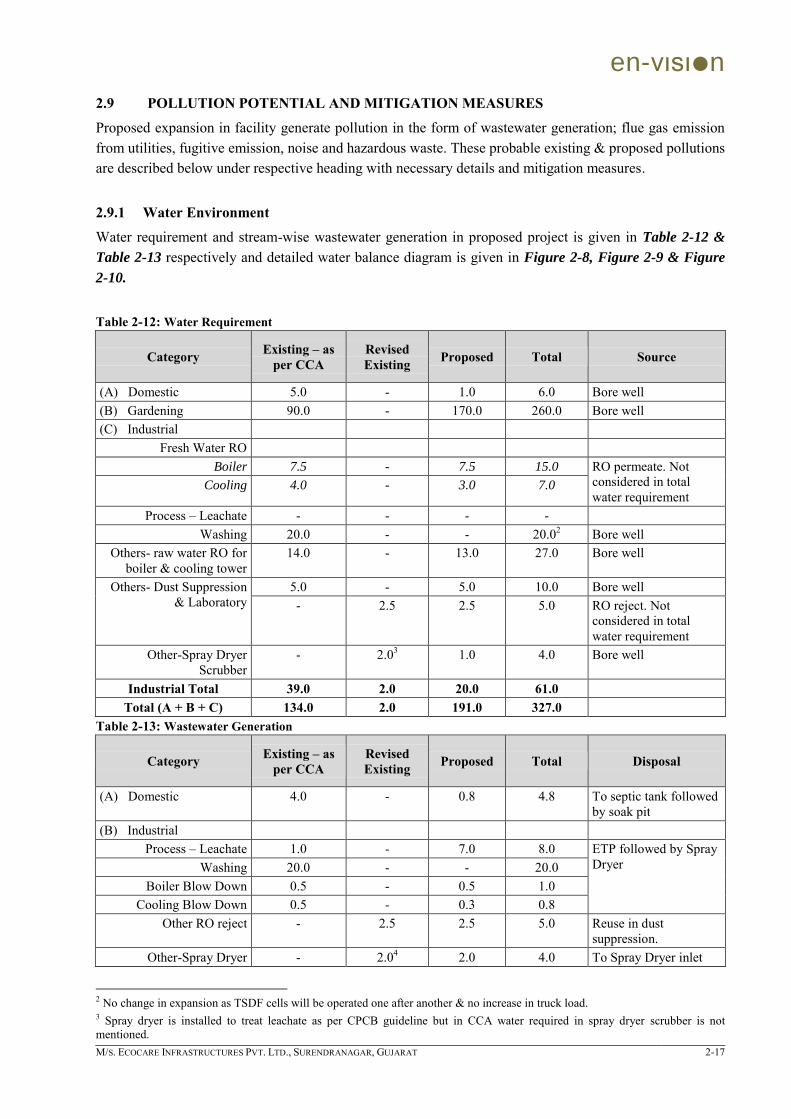
en-vιsιn
M/S. ECOCARE INFRASTRUCTURES PVT. LTD., SURENDRANAGAR, GUJARAT 2-17
2.9 POLLUTION POTENTIAL AND MITIGATION MEASURES
Proposed expansion in facility generate pollution in the form of wastewater generation; flue gas emission from utilities, fugitive emission, noise and hazardous waste. These probable existing & proposed pollutions are described below under respective heading with necessary details and mitigation measures.
2.9.1 Water Environment
Water requirement and stream-wise wastewater generation in proposed project is given in Table 2-12 &
Table 2-13 respectively and detailed water balance diagram is given in Figure 2-8, Figure 2-9 & Figure
2-10.
Table 2-12: Water Requirement
Category Existing – as per CCA
Revised Existing Proposed Total Source
(A) Domestic 5.0 - 1.0 6.0 Bore well (B) Gardening 90.0 - 170.0 260.0 Bore well (C) Industrial
Fresh Water RO Boiler 7.5 - 7.5 15.0 RO permeate. Not
considered in total water requirement
Cooling 4.0 - 3.0 7.0
Process – Leachate - - - - Washing 20.0 - - 20.02 Bore well
Others- raw water RO for boiler & cooling tower
14.0 - 13.0 27.0 Bore well
Others- Dust Suppression & Laboratory
5.0 - 5.0 10.0 Bore well - 2.5 2.5 5.0 RO reject. Not
considered in total water requirement
Other-Spray Dryer Scrubber
- 2.03 1.0 4.0 Bore well
Industrial Total 39.0 2.0 20.0 61.0
Total (A + B + C) 134.0 2.0 191.0 327.0 Table 2-13: Wastewater Generation
Category Existing – as per CCA
Revised Existing Proposed Total Disposal
(A) Domestic 4.0 - 0.8 4.8 To septic tank followed by soak pit
(B) Industrial Process – Leachate 1.0 - 7.0 8.0 ETP followed by Spray
Dryer Washing 20.0 - - 20.0 Boiler Blow Down 0.5 - 0.5 1.0
Cooling Blow Down 0.5 - 0.3 0.8 Other RO reject - 2.5 2.5 5.0 Reuse in dust
suppression. Other-Spray Dryer - 2.04 2.0 4.0 To Spray Dryer inlet
2 No change in expansion as TSDF cells will be operated one after another & no increase in truck load. 3 Spray dryer is installed to treat leachate as per CPCB guideline but in CCA water required in spray dryer scrubber is not mentioned.
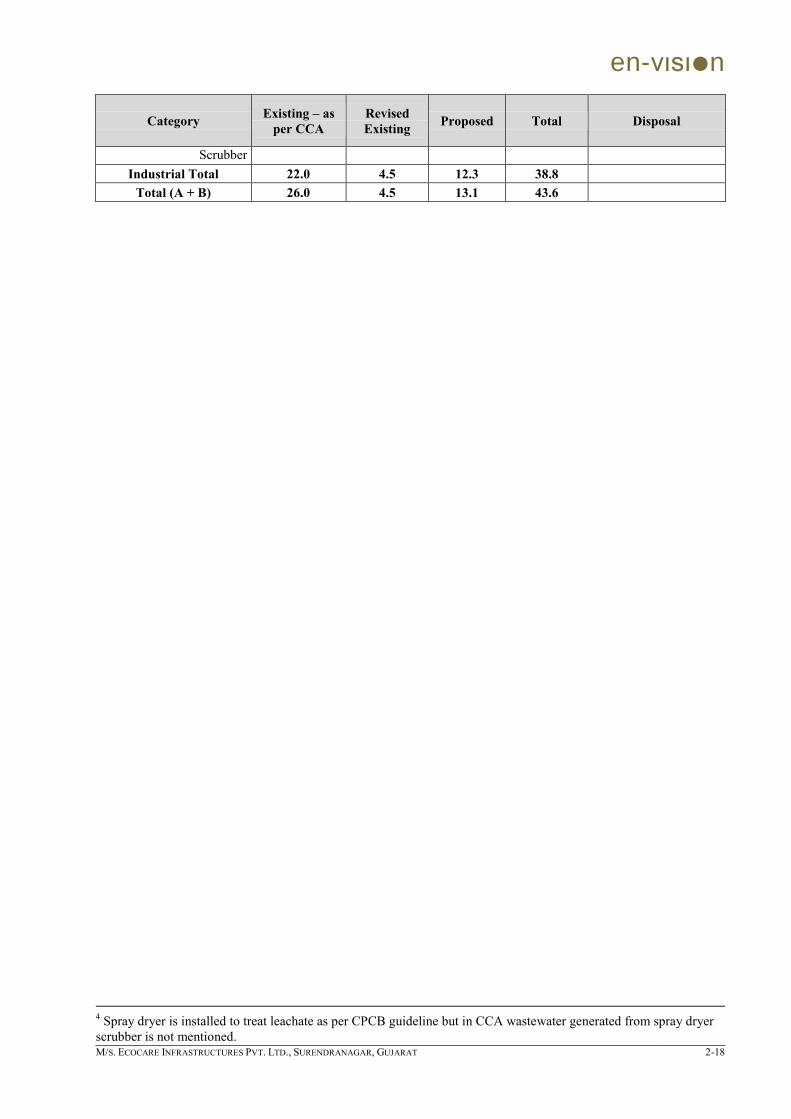
en-vιsιn
M/S. ECOCARE INFRASTRUCTURES PVT. LTD., SURENDRANAGAR, GUJARAT 2-18
Category Existing – as per CCA
Revised Existing Proposed Total Disposal
Scrubber Industrial Total 22.0 4.5 12.3 38.8
Total (A + B) 26.0 4.5 13.1 43.6
4 Spray dryer is installed to treat leachate as per CPCB guideline but in CCA wastewater generated from spray dryer scrubber is not mentioned.
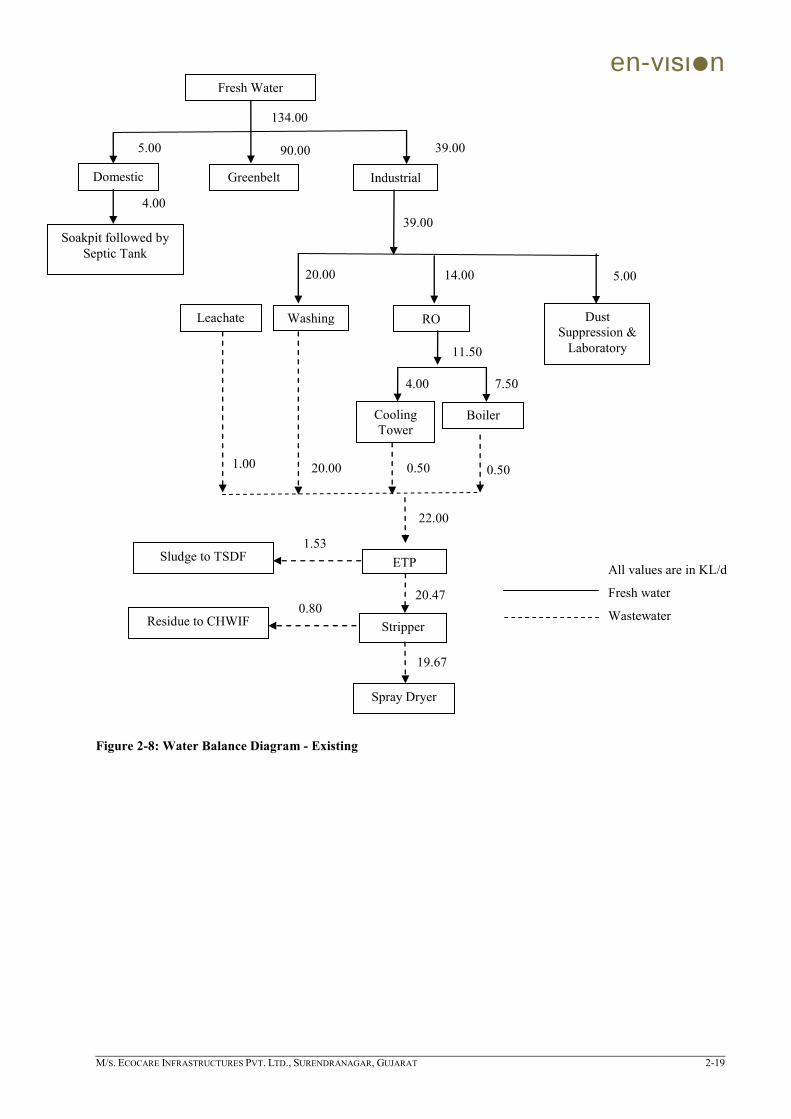
en-vιsιn
M/S. ECOCARE INFRASTRUCTURES PVT. LTD., SURENDRANAGAR, GUJARAT 2-19
Figure 2-8: Water Balance Diagram - Existing
Soakpit followed by
Septic Tank
Fresh Water
Industrial Greenbelt Domestic
Leachate Washing
Cooling
Tower Boiler
ETP
Stripper
Spray Dryer
Residue to CHWIF
134.00
4.00
90.00 39.00 5.00
39.00
1.00 20.00 0.50 0.50
14.00 20.00
22.00
0.80 20.47
19.67
All values are in KL/d
Fresh water
Wastewater
Dust
Suppression &
Laboratory
5.00
Sludge to TSDF 1.53
RO
11.50
4.00 7.50
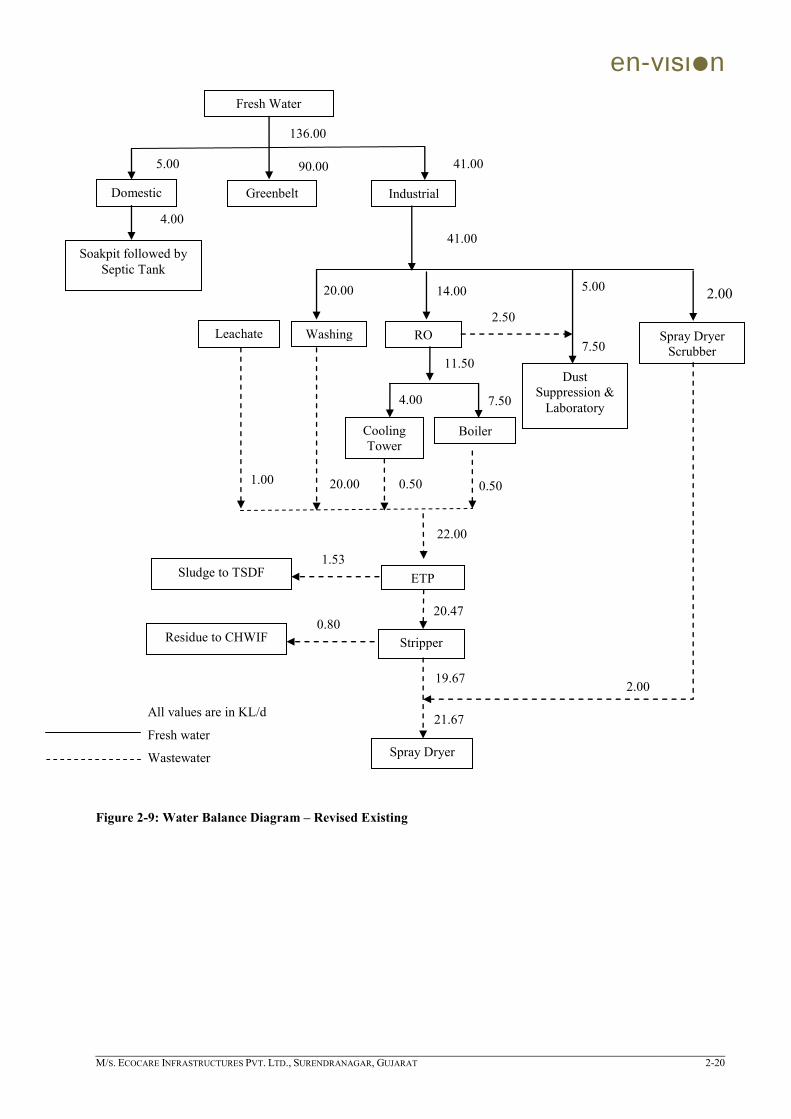
en-vιsιn
M/S. ECOCARE INFRASTRUCTURES PVT. LTD., SURENDRANAGAR, GUJARAT 2-20
Figure 2-9: Water Balance Diagram – Revised Existing
2.00
Spray Dryer Scrubber
All values are in KL/d
Fresh water
Wastewater
Soakpit followed by
Septic Tank
Fresh Water
Industrial Greenbelt Domestic
Leachate Washing
Cooling
Tower Boiler
ETP
Stripper
Spray Dryer
Residue to CHWIF
136.00
4.00
90.00 41.00 5.00
41.00
1.00 20.00 0.50 0.50
14.00 20.00
22.00
0.80 20.47
19.67
Dust
Suppression &
Laboratory
5.00
Sludge to TSDF 1.53
RO
11.50
4.00 7.50
2.50
7.50
2.00
21.67

en-vιsιn
M/S. ECOCARE INFRASTRUCTURES PVT. LTD., SURENDRANAGAR, GUJARAT 2-21
Figure 2-10: Water Balance Diagram – After Total Expansion
1.00
All values are in KL/d
Fresh water
Wastewater
Spray Dryer
Scrubber
Soakpit followed by
Septic Tank
Fresh Water
Industrial Greenbelt Domestic
Leachate Washing
Cooling
Tower Boiler
ETP
Stripper
Spray Dryer
Residue to CHWIF
327.00
4.80
260.00 61.00 6.00
61.00
8.00 20.00 0.80 1.00
27.00 20.00
29.80
0.80 28.04
27.24
Dust
Suppression &
Laboratory
10.00
Sludge to TSDF 1.76
RO
22.00
7.00 15.00
5.00
15.00
4.00
31.24
4.00

en-vιsιn
M/S. ECOCARE INFRASTRUCTURES PVT. LTD., SURENDRANAGAR, GUJARAT 2-22
2.9.1.1 Wastewater Treatment & Disposal
Domestic waste water generated is treated through septic tank/soak pit.
Effluent generated from various processes is/will be collected in Collection Tank and mixed properly. Effluent is/will be passed through filter press for removal of sludge. Sludge generated is/will be disposed in in-house landfill cell. Treated effluent will be passed through stripper and evaporated in spray dryer. In case of emergency (failure/ maintenance of spray dryer effluent is being/ will be sent to common MEE of SEPL or GESCSL, Vatva).
Wastewater from scrubber of spray dryer is disposed through spray dryer.
Table 2-14: ETP Design Parameters-Existing Sr. No. Parameters ETP Inlet Stripper Feed Spray Dryer Feed
1 Flow (KL/d) 22.00 20.47 21.67 2 Design Flow (KL/d) 22.00 22.50 21.90 3 pH 6.5-8.5 6.5-8.5 6.5-8.5 4 TSS (mg/L) 2,000-2,500 60-75 <50 5 TDS (mg/L) 12,000-15,000 12,000-15,000 12,000-15,000 6 BOD (mg/L) 8,500-9,000 7,650-8,100 6,500-7,500 7 COD (mg/L) 25,500-26,500 21,000-23,000 17,500-20,000
Table 2-15: ETP Design Parameters – Total after Expansion Sr. No. Parameters ETP Inlet Stripper Feed Spray Dryer Feed
1 Flow (KL/d) 29.80 28.04 31.24 2 Design Flow (KL/d) 30.00 37.50 39.00 3 pH 6.5-8.5 6.5-8.5 6.5-8.5 4 TSS (mg/L) 2,000-2,200 60-70 <50 5 TDS (mg/L) 40,000-42,000 40,000-42,000 40,000-42,000 6 BOD (mg/L) 8,500-8,600 7,650-7,750 6,500-7,000 7 COD (mg/L) 25,000-26,500 21,000-23,000 17,500-20,000
Table 2-16: ETP Treatment Units
S. No. Name of the Unit Quantity (Nos.)
Capacity of Each
Unit
Retention Time/ Working hrs. Remark
Existing Total after Expansion
1 Collection Tank 3 12.0 m3 1.6 d 1.2 d Existing is Adequate to cater proposed flow
2 Filter Press-1 1 - - - Existing 3 Filter Press-2 1 - - New unit 4 Treated Effluent
Collection Tank 1 120.0 m3 5.3 d 3.2 d Existing is
Adequate to cater proposed flow
5 Stripper-1 1 1500 kg/h 15 h 13.9 h Existing 6 Stripper-2 1 1200 kg/h - New unit 7 Spray Dryer-1 1 1092 kg/h 20.1 h 17.5 h Existing 8 Spray Dryer-2 1 1140 kg/h - New unit
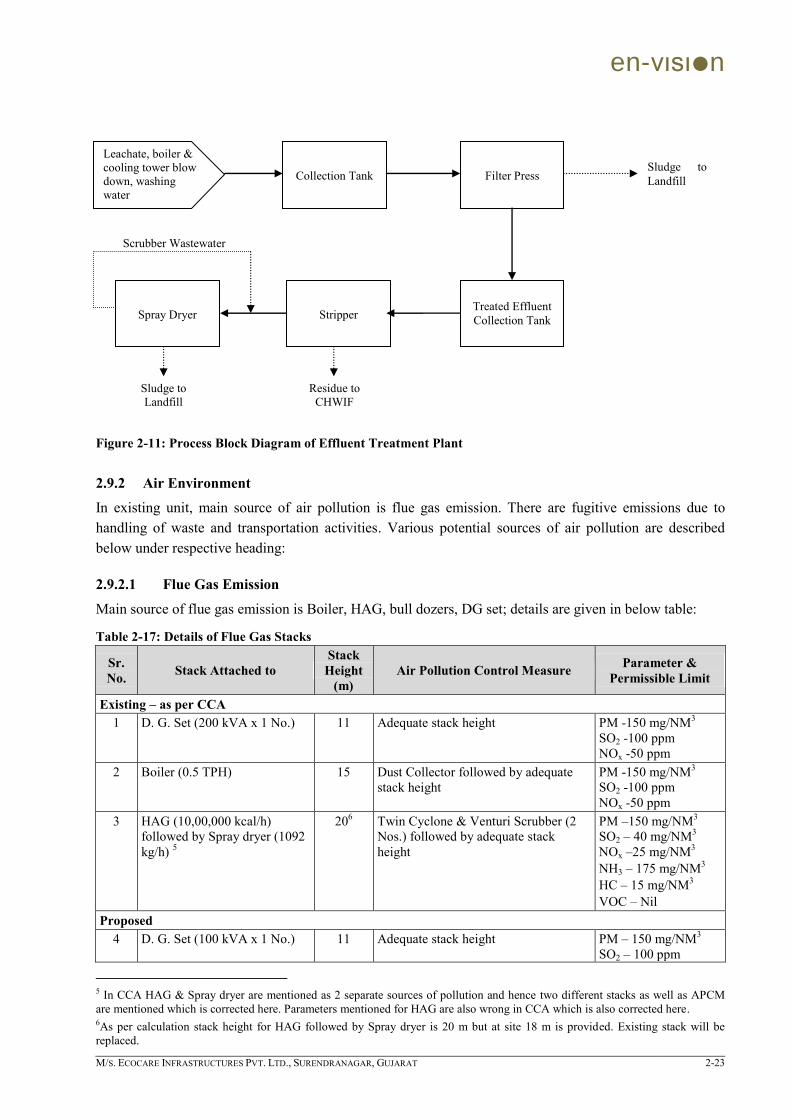
en-vιsιn
M/S. ECOCARE INFRASTRUCTURES PVT. LTD., SURENDRANAGAR, GUJARAT 2-23
Figure 2-11: Process Block Diagram of Effluent Treatment Plant
2.9.2 Air Environment
In existing unit, main source of air pollution is flue gas emission. There are fugitive emissions due to handling of waste and transportation activities. Various potential sources of air pollution are described below under respective heading:
2.9.2.1 Flue Gas Emission
Main source of flue gas emission is Boiler, HAG, bull dozers, DG set; details are given in below table:
Table 2-17: Details of Flue Gas Stacks
Sr. No. Stack Attached to
Stack Height
(m) Air Pollution Control Measure Parameter &
Permissible Limit
Existing – as per CCA 1 D. G. Set (200 kVA x 1 No.) 11 Adequate stack height PM -150 mg/NM3
SO2 -100 ppm NOx -50 ppm
2 Boiler (0.5 TPH) 15 Dust Collector followed by adequate stack height
PM -150 mg/NM3 SO2 -100 ppm NOx -50 ppm
3 HAG (10,00,000 kcal/h) followed by Spray dryer (1092 kg/h) 5
206 Twin Cyclone & Venturi Scrubber (2 Nos.) followed by adequate stack height
PM –150 mg/NM3 SO2 – 40 mg/NM3 NOx –25 mg/NM3 NH3 – 175 mg/NM3
HC – 15 mg/NM3
VOC – Nil Proposed
4 D. G. Set (100 kVA x 1 No.) 11 Adequate stack height PM – 150 mg/NM3 SO2 – 100 ppm
5 In CCA HAG & Spray dryer are mentioned as 2 separate sources of pollution and hence two different stacks as well as APCM are mentioned which is corrected here. Parameters mentioned for HAG are also wrong in CCA which is also corrected here. 6As per calculation stack height for HAG followed by Spray dryer is 20 m but at site 18 m is provided. Existing stack will be replaced.
Leachate, boiler & cooling tower blow down, washing water
Collection Tank
Filter Press
Sludge to Landfill
Spray Dryer
Stripper
Treated Effluent Collection Tank
Residue to CHWIF
Sludge to Landfill
Scrubber Wastewater
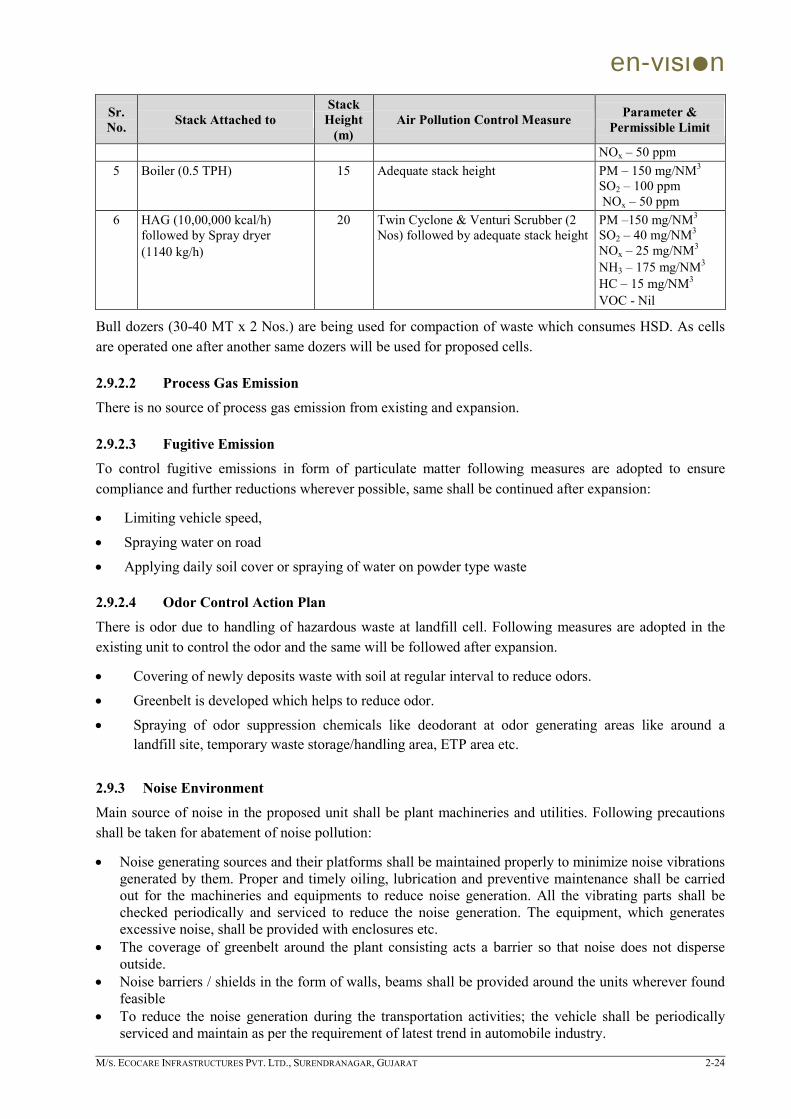
en-vιsιn
M/S. ECOCARE INFRASTRUCTURES PVT. LTD., SURENDRANAGAR, GUJARAT 2-24
Sr. No. Stack Attached to
Stack Height
(m) Air Pollution Control Measure Parameter &
Permissible Limit
NOx – 50 ppm 5 Boiler (0.5 TPH) 15 Adequate stack height PM – 150 mg/NM3
SO2 – 100 ppm NOx – 50 ppm
6 HAG (10,00,000 kcal/h) followed by Spray dryer (1140 kg/h)
20 Twin Cyclone & Venturi Scrubber (2 Nos) followed by adequate stack height
PM –150 mg/NM3 SO2 – 40 mg/NM3 NOx – 25 mg/NM3 NH3 – 175 mg/NM3
HC – 15 mg/NM3
VOC - Nil
Bull dozers (30-40 MT x 2 Nos.) are being used for compaction of waste which consumes HSD. As cells are operated one after another same dozers will be used for proposed cells.
2.9.2.2 Process Gas Emission
There is no source of process gas emission from existing and expansion.
2.9.2.3 Fugitive Emission
To control fugitive emissions in form of particulate matter following measures are adopted to ensure compliance and further reductions wherever possible, same shall be continued after expansion:
Limiting vehicle speed,
Spraying water on road
Applying daily soil cover or spraying of water on powder type waste
2.9.2.4 Odor Control Action Plan
There is odor due to handling of hazardous waste at landfill cell. Following measures are adopted in the existing unit to control the odor and the same will be followed after expansion.
Covering of newly deposits waste with soil at regular interval to reduce odors.
Greenbelt is developed which helps to reduce odor.
Spraying of odor suppression chemicals like deodorant at odor generating areas like around a landfill site, temporary waste storage/handling area, ETP area etc.
2.9.3 Noise Environment
Main source of noise in the proposed unit shall be plant machineries and utilities. Following precautions shall be taken for abatement of noise pollution:
Noise generating sources and their platforms shall be maintained properly to minimize noise vibrations generated by them. Proper and timely oiling, lubrication and preventive maintenance shall be carried out for the machineries and equipments to reduce noise generation. All the vibrating parts shall be checked periodically and serviced to reduce the noise generation. The equipment, which generates excessive noise, shall be provided with enclosures etc.
The coverage of greenbelt around the plant consisting acts a barrier so that noise does not disperse outside.
Noise barriers / shields in the form of walls, beams shall be provided around the units wherever found feasible
To reduce the noise generation during the transportation activities; the vehicle shall be periodically serviced and maintain as per the requirement of latest trend in automobile industry.
en-vιsιn
M/S. ECOCARE INFRASTRUCTURES PVT. LTD., SURENDRANAGAR, GUJARAT 2-25
Noise monitoring shall be carried out regularly at prominent places in the plant through NABL approved laboratory.
Personnel working near the noisy machines in different plant locations shall be provided with well designed ear muffs / plugs (effective noise reduction 10-15 dBA).
2.9.3.1 Mode of Transportation
Current daily max truck load for hazardous waste is 45-50 nos. there will not be increase in this as cells will be operated one after another. Current load of trucks/ tankers for transportation of waste, wastewater, fuel is 1 No. per day due to expansion there will be increase in trucks/ tankers by 2 Nos. per day.
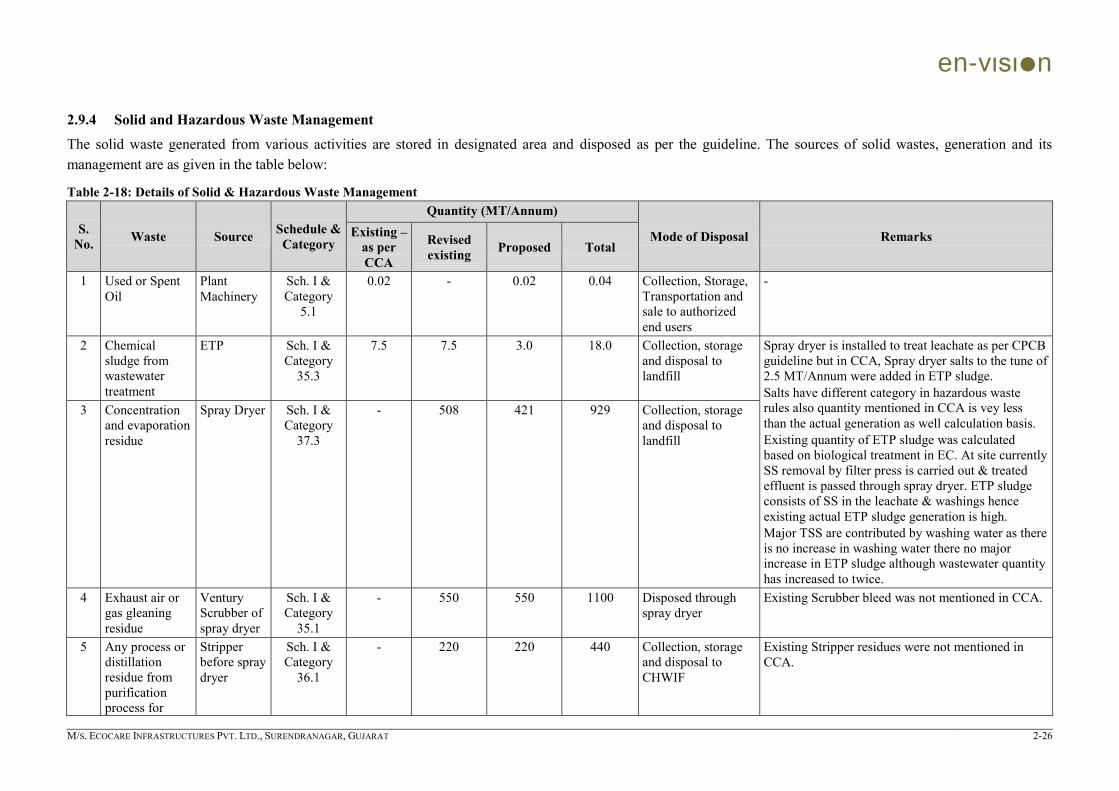
en-vιsιn
M/S. ECOCARE INFRASTRUCTURES PVT. LTD., SURENDRANAGAR, GUJARAT 2-26
2.9.4 Solid and Hazardous Waste Management
The solid waste generated from various activities are stored in designated area and disposed as per the guideline. The sources of solid wastes, generation and its management are as given in the table below:
Table 2-18: Details of Solid & Hazardous Waste Management
S. No. Waste Source Schedule &
Category
Quantity (MT/Annum)
Mode of Disposal Remarks Existing – as per CCA
Revised existing Proposed Total
1 Used or Spent Oil
Plant Machinery
Sch. I & Category
5.1
0.02 - 0.02 0.04 Collection, Storage, Transportation and sale to authorized end users
-
2 Chemical sludge from wastewater treatment
ETP Sch. I & Category
35.3
7.5 7.5 3.0 18.0 Collection, storage and disposal to landfill
Spray dryer is installed to treat leachate as per CPCB guideline but in CCA, Spray dryer salts to the tune of 2.5 MT/Annum were added in ETP sludge. Salts have different category in hazardous waste rules also quantity mentioned in CCA is vey less than the actual generation as well calculation basis. Existing quantity of ETP sludge was calculated based on biological treatment in EC. At site currently SS removal by filter press is carried out & treated effluent is passed through spray dryer. ETP sludge consists of SS in the leachate & washings hence existing actual ETP sludge generation is high. Major TSS are contributed by washing water as there is no increase in washing water there no major increase in ETP sludge although wastewater quantity has increased to twice.
3 Concentration and evaporation residue
Spray Dryer Sch. I & Category
37.3
- 508 421 929 Collection, storage and disposal to landfill
4 Exhaust air or gas gleaning residue
Ventury Scrubber of spray dryer
Sch. I & Category
35.1
- 550 550 1100 Disposed through spray dryer
Existing Scrubber bleed was not mentioned in CCA.
5 Any process or distillation residue from purification process for
Stripper before spray dryer
Sch. I & Category
36.1
- 220 220 440 Collection, storage and disposal to CHWIF
Existing Stripper residues were not mentioned in CCA.

en-vιsιn
M/S. ECOCARE INFRASTRUCTURES PVT. LTD., SURENDRANAGAR, GUJARAT 2-27
S. No. Waste Source Schedule &
Category
Quantity (MT/Annum)
Mode of Disposal Remarks Existing – as per CCA
Revised existing Proposed Total
organic compound /solvent
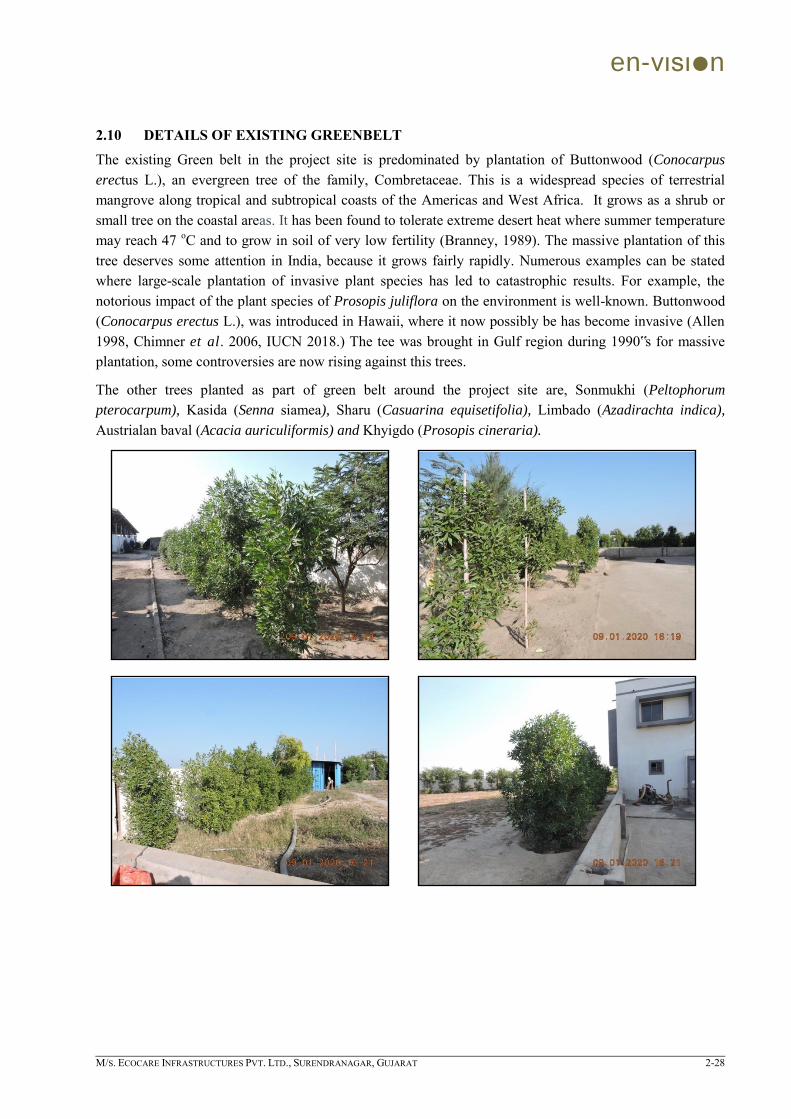
en-vιsιn
M/S. ECOCARE INFRASTRUCTURES PVT. LTD., SURENDRANAGAR, GUJARAT 2-28
2.10 DETAILS OF EXISTING GREENBELT
The existing Green belt in the project site is predominated by plantation of Buttonwood (Conocarpus
erectus L.), an evergreen tree of the family, Combretaceae. This is a widespread species of terrestrial mangrove along tropical and subtropical coasts of the Americas and West Africa. It grows as a shrub or small tree on the coastal areas. It has been found to tolerate extreme desert heat where summer temperature may reach 47 oC and to grow in soil of very low fertility (Branney, 1989). The massive plantation of this tree deserves some attention in India, because it grows fairly rapidly. Numerous examples can be stated where large-scale plantation of invasive plant species has led to catastrophic results. For example, the notorious impact of the plant species of Prosopis juliflora on the environment is well-known. Buttonwood (Conocarpus erectus L.), was introduced in Hawaii, where it now possibly be has become invasive (Allen 1998, Chimner et al. 2006, IUCN 2018.) The tee was brought in Gulf region during 1990‟s for massive plantation, some controversies are now rising against this trees.
The other trees planted as part of green belt around the project site are, Sonmukhi (Peltophorum pterocarpum), Kasida (Senna siamea), Sharu (Casuarina equisetifolia), Limbado (Azadirachta indica), Austrialan baval (Acacia auriculiformis) and Khyigdo (Prosopis cineraria).

en-vιsιn
M/S. ECOCARE INFRASTRUCTURES PVT. LTD., SURENDRANAGAR, GUJARAT 2-29
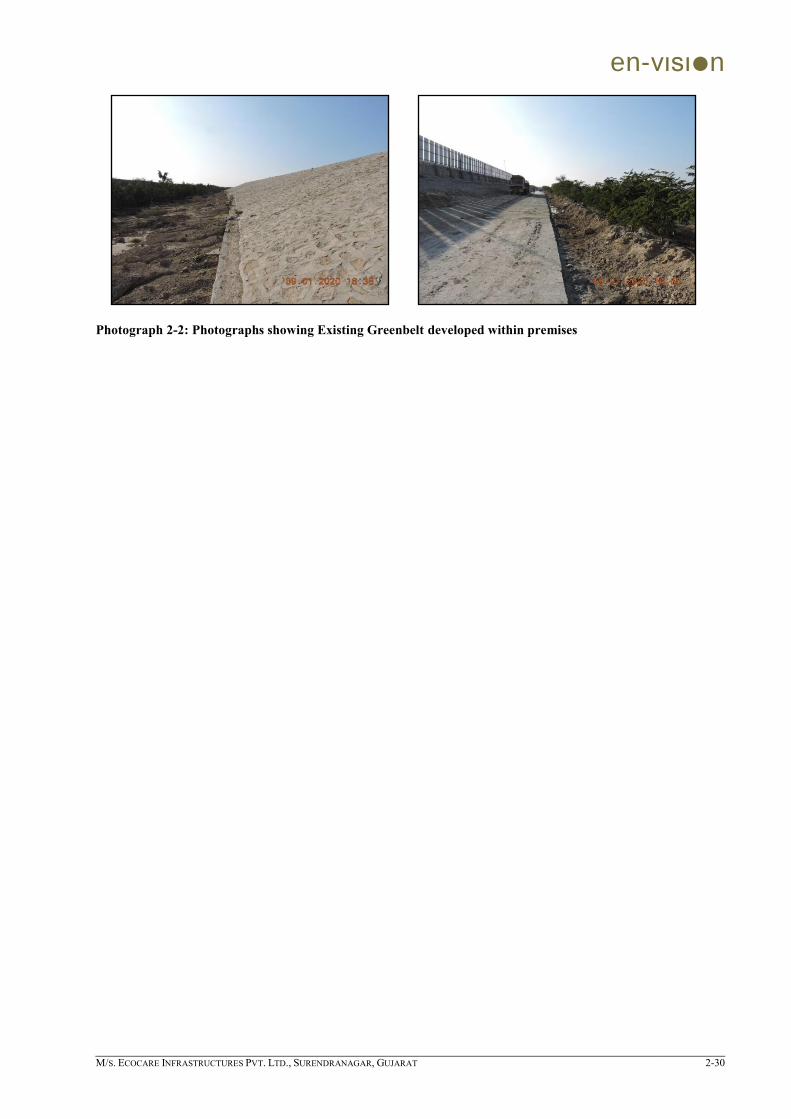
en-vιsιn
M/S. ECOCARE INFRASTRUCTURES PVT. LTD., SURENDRANAGAR, GUJARAT 2-30
Photograph 2-2: Photographs showing Existing Greenbelt developed within premises
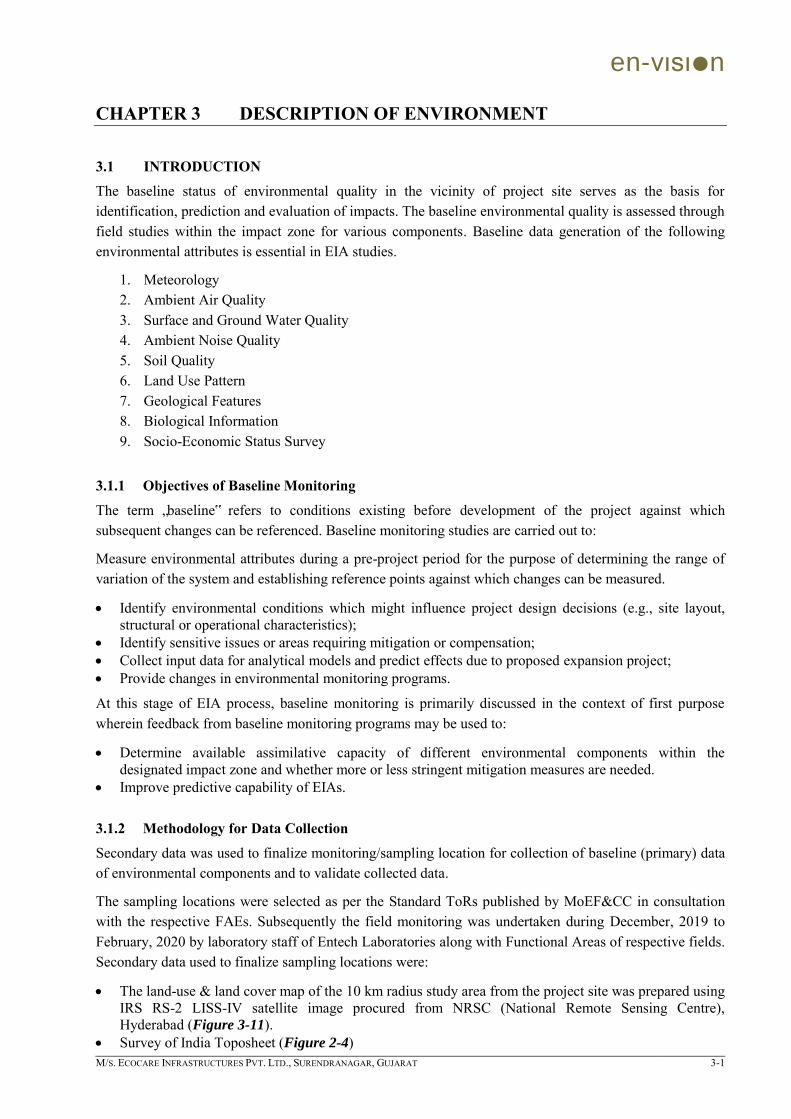
en-vιsιn
M/S. ECOCARE INFRASTRUCTURES PVT. LTD., SURENDRANAGAR, GUJARAT 3-1
CHAPTER 3 DESCRIPTION OF ENVIRONMENT
3.1 INTRODUCTION
The baseline status of environmental quality in the vicinity of project site serves as the basis for identification, prediction and evaluation of impacts. The baseline environmental quality is assessed through field studies within the impact zone for various components. Baseline data generation of the following environmental attributes is essential in EIA studies.
1. Meteorology 2. Ambient Air Quality 3. Surface and Ground Water Quality 4. Ambient Noise Quality 5. Soil Quality 6. Land Use Pattern 7. Geological Features 8. Biological Information 9. Socio-Economic Status Survey
3.1.1 Objectives of Baseline Monitoring
The term „baseline‟ refers to conditions existing before development of the project against which subsequent changes can be referenced. Baseline monitoring studies are carried out to:
Measure environmental attributes during a pre-project period for the purpose of determining the range of variation of the system and establishing reference points against which changes can be measured.
Identify environmental conditions which might influence project design decisions (e.g., site layout, structural or operational characteristics);
Identify sensitive issues or areas requiring mitigation or compensation; Collect input data for analytical models and predict effects due to proposed expansion project; Provide changes in environmental monitoring programs.
At this stage of EIA process, baseline monitoring is primarily discussed in the context of first purpose wherein feedback from baseline monitoring programs may be used to:
Determine available assimilative capacity of different environmental components within the designated impact zone and whether more or less stringent mitigation measures are needed.
Improve predictive capability of EIAs.
3.1.2 Methodology for Data Collection
Secondary data was used to finalize monitoring/sampling location for collection of baseline (primary) data of environmental components and to validate collected data.
The sampling locations were selected as per the Standard ToRs published by MoEF&CC in consultation with the respective FAEs. Subsequently the field monitoring was undertaken during December, 2019 to February, 2020 by laboratory staff of Entech Laboratories along with Functional Areas of respective fields. Secondary data used to finalize sampling locations were:
The land-use & land cover map of the 10 km radius study area from the project site was prepared using IRS RS-2 LISS-IV satellite image procured from NRSC (National Remote Sensing Centre), Hyderabad (Figure 3-11).
Survey of India Toposheet (Figure 2-4)

en-vιsιn
M/S. ECOCARE INFRASTRUCTURES PVT. LTD., SURENDRANAGAR, GUJARAT 3-2
Secondary macro-meteorological data from India Meteorological Department (Section 3.2.1)
Primary data has been collected through field monitoring for meteorological conditions, ambient air quality, water quality, noise quality, soil quality, etc, which includes major portion of the baseline environmental studies. In addition to these important studies, further studies like land use, socio-economic studies, ecological and biodiversity studies, etc. are covered during the study period. The collected data were analyzed and interpreted using field observation and Secondary data.
3.1.3 Study Area
To carry out Environment Baseline Monitoring and to generate baseline environmental data study area of 10 km radial distance from existing project site has been selected has been selected for all attribute except noise; as noise will be limited to site surrounding. Base line data of Ambient air quality, water quality; land use & land cover, topography, ecology as well as socio economic status was collected for study area of 10 km.
The details of the study period, frequency of sampling & method of environmental sampling & analysis are given below in subsequent sections under respective titles.

en-vιsιn
M/S. ECOCARE INFRASTRUCTURES PVT. LTD., SURENDRANAGAR, GUJARAT 3-3
3.2 METEOROLOGICAL ENVIRONMENT
Air borne pollutants is dispersed by atmospheric motion. Knowledge of these motions, which ranges from turbulent diffusion to long-range transport by weather systems. Dispersion of different air pollutants released into the atmosphere has significant impacts on the neighborhood air environment of project and forms an important part of impact assessment studies. Meteorological conditions of the site regulates the transport and diffusion of air-pollutants released into the atmosphere.
Ambient temperature, wind speed, wind direction, humidity, precipitation and pressure are called Meteorological Parameters because the dispersion and diffusion of pollutants depend mainly on these parameters. Atmospheric stability is secondary meteorological parameters as it controls the dispersion of the pollutants indirectly by affecting primary parameters. This data is useful for proper interpretation of the baseline information as well as serves as an input, to predictive models for air quality impacts.
It is imperative that one should work with idealized condition and all analysis pertaining to air turbulence and ambient air should be done with meteorological conditions, which can be best expected to occur.
3.2.1 Climate of Study Area
The general agro-climatic zone of the study area is dry sub humid. Information presented in subsequent paragraphs is from the most recently published Long Term Climatologically Tables for the nearest observatory, Ahmedabad by the India Meteorological Department (IMD)7. A copy of the long-term Climatological data is given in Annexure XII.
Month Mean Daily Temperature
(°C) Humidity
(%) Rainfall (mm) Mean Wind Speed (km/h)
Max Min Morning Evening
January 28.1 12.4 63 35 1 6.2
February 30.8 14.3 56 26 0.8 6.4
March 35.8 19.5 50 21 0.6 7.1
April 39.6 23.9 56 20 2.4 8.3
May 41.6 27 65 25 7 11.3
June 38.8 27.5 74 44 80 12.3
July 33.6 25.9 85 69 291.2 10.7
August 32 25 87 72 266.2 9.1
September 33.8 24.7 82 60 86.8 7.4
October 35.7 21.4 65 41 11.7 4.8
November 32.9 16.7 57 36 2.3 4.7
December 29.5 13.4 61 37 1 5.4
Annual Mean 34.4 21.0 67 41 62.6 7.8
3.2.1.1 Predominant Wind Direction
As per Atlas of wind roses, 1971-2000 published by India Meteorological Department (IMD), the annual variations in average wind speed recorded at Ahmedabad station at 8.30 am and 5.30 pm indicates that the predominant wind direction is E.
7 Climatological normals 1981-2010, issued by office of the additional director general of meteorology (Research) India Meteorological Department, Pune-5
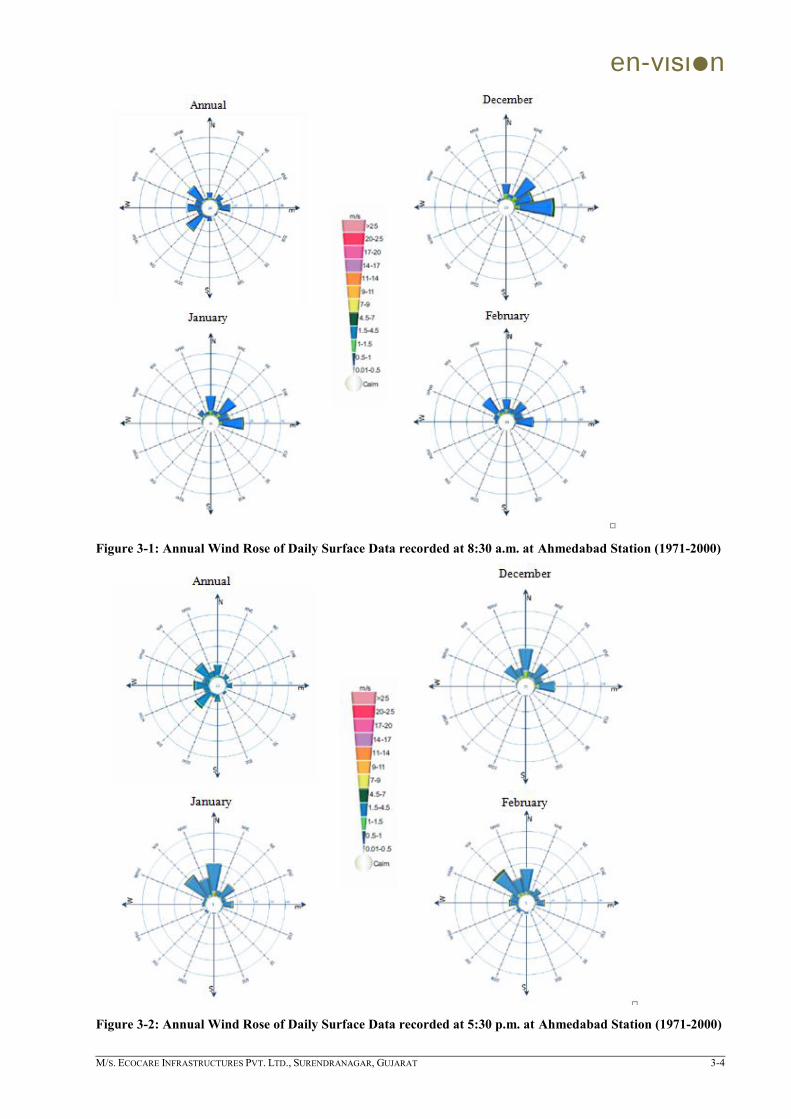
en-vιsιn
M/S. ECOCARE INFRASTRUCTURES PVT. LTD., SURENDRANAGAR, GUJARAT 3-4
Figure 3-1: Annual Wind Rose of Daily Surface Data recorded at 8:30 a.m. at Ahmedabad Station (1971-2000)
Figure 3-2: Annual Wind Rose of Daily Surface Data recorded at 5:30 p.m. at Ahmedabad Station (1971-2000)

en-vιsιn
M/S. ECOCARE INFRASTRUCTURES PVT. LTD., SURENDRANAGAR, GUJARAT 3-5
3.2.1.2 Site Specific Micro-Meteorology Data
Micrometeorological conditions with respect to temperature, precipitation, relative humidity, wind speed and direction that regulate the dispersion and dilution of air pollutants in the atmosphere are collected at the admin building of the existing unit. Site-specific mean meteorological data is given in Table 3-1 and the wind rose diagram processed by ISC-AERMOD view software from data collected at site is shown in Figure 3-3.
Table 3-1: Summary of Site Specific Meteorological Data
From site specific meteorological data it is seen that there is minor deviation in temperature, relative humidity & wind speed as compare to IMD data. This may be because the IMD station is located at Ahmedabad while project location is near Ghaspur village, Surendranagar district; the distance between two locations is around 65 km.
Meteorological Parameter Period: Month of Year 2019 and 2020
December January February
Temperature (0C)
Min. 12 10 12 Max. 32 32 37 Avg. 22.5 20.2 24.76
Relative Humidity (%) Morning 41.6 48.5 32.5 Evening 36.5 38.7 24.8
Wind Speed (km/h) Min. 0.0 0.0 0.0 Max. 15.0 17.0 19.0 Avg. 5.9 6.7 7.3
Predominant Wind Direction NE Precipitation Nil

en-vιsιn
M/S. ECOCARE INFRASTRUCTURES PVT. LTD., SURENDRANAGAR, GUJARAT 3-6
Figure 3-3: Primary Wind rose Diagram (December 2019- February 2020)
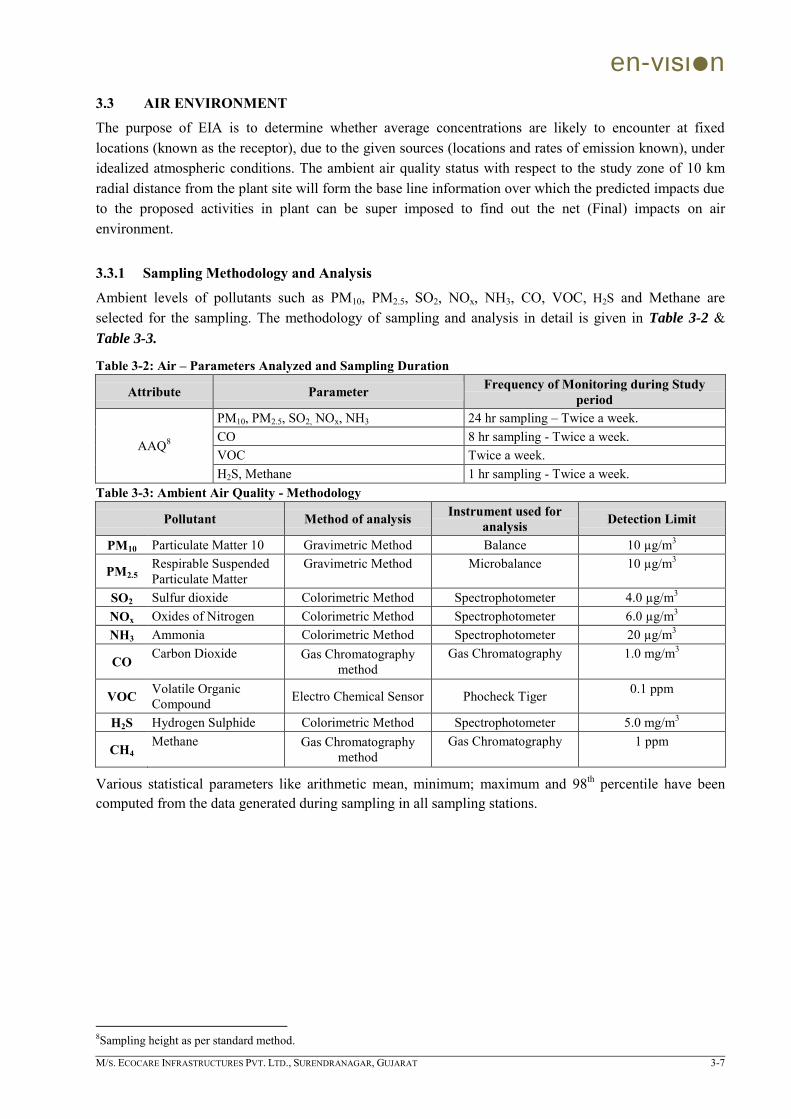
en-vιsιn
M/S. ECOCARE INFRASTRUCTURES PVT. LTD., SURENDRANAGAR, GUJARAT 3-7
3.3 AIR ENVIRONMENT
The purpose of EIA is to determine whether average concentrations are likely to encounter at fixed locations (known as the receptor), due to the given sources (locations and rates of emission known), under idealized atmospheric conditions. The ambient air quality status with respect to the study zone of 10 km radial distance from the plant site will form the base line information over which the predicted impacts due to the proposed activities in plant can be super imposed to find out the net (Final) impacts on air environment.
3.3.1 Sampling Methodology and Analysis
Ambient levels of pollutants such as PM10, PM2.5, SO2, NOx, NH3, CO, VOC, H2S and Methane are selected for the sampling. The methodology of sampling and analysis in detail is given in Table 3-2 & Table 3-3.
Table 3-2: Air – Parameters Analyzed and Sampling Duration
Attribute Parameter Frequency of Monitoring during Study period
AAQ8
PM10, PM2.5, SO2, NOx, NH3 24 hr sampling – Twice a week. CO 8 hr sampling - Twice a week. VOC Twice a week. H2S, Methane 1 hr sampling - Twice a week.
Table 3-3: Ambient Air Quality - Methodology
Pollutant Method of analysis Instrument used for analysis Detection Limit
PM10 Particulate Matter 10 Gravimetric Method Balance 10 µg/m3
PM2.5 Respirable Suspended Particulate Matter
Gravimetric Method Microbalance 10 µg/m3
SO2 Sulfur dioxide Colorimetric Method Spectrophotometer 4.0 µg/m3 NOx Oxides of Nitrogen Colorimetric Method Spectrophotometer 6.0 µg/m3 NH3 Ammonia Colorimetric Method Spectrophotometer 20 µg/m3
CO Carbon Dioxide Gas Chromatography method
Gas Chromatography
1.0 mg/m3
VOC Volatile Organic Compound Electro Chemical Sensor Phocheck Tiger 0.1 ppm
H2S Hydrogen Sulphide Colorimetric Method Spectrophotometer 5.0 mg/m3
CH4 Methane Gas Chromatography
method Gas Chromatography
1 ppm
Various statistical parameters like arithmetic mean, minimum; maximum and 98th percentile have been computed from the data generated during sampling in all sampling stations.
8Sampling height as per standard method.

en-vιsιn
M/S. ECOCARE INFRASTRUCTURES PVT. LTD., SURENDRANAGAR, GUJARAT 3-8
3.3.2 Selection of Monitoring Locations
The baseline status of the ambient air quality in the impact zone is assessed thorough scientifically designed ambient air quality monitoring network. Air quality monitoring was carried out during 1st December, 2019 to 29th February, 2020. The design of monitoring network in the air quality surveillance program was designed based on the following considerations:
Predominant direction is decided on the basis of secondary data which determines ambient air monitoring location (Refer Figure 3-1 & Figure 3-2). Topography of the study area. Representation of regional background levels. Representation of valid cross sectional distribution in the downward direction. Influence of the proposed sources if any, will be kept at minimum. Inclusion of densely populated areas within the region.
Minimum one location within 1-5 km radius of study area was fixed. 8 monitoring locations were identified and the sites are depicted in the Table 3-4 & Figure 3-5, recorded AAQ levels are given in Table 3-5.
Table 3-4: Ambient Air Monitoring Locations
Location Distance (km) Direction Located in
GPS Coordinates Type of Area Description With respect to Project Site
Project Site (A1) - - - 23°11'14.54"N 71°55'16.94"E
Industrial Machine was kept on terrace of Admin building of Unit. Regular of movement of Trucks is observed. Kuchha Road is observed outside the premises
Kadvasan (A2) 6.8 NW Crosswind 23°14'26.43"N 71°52'55.72"E
Residential Machine was kept on terrace of Mr. Govind‟s house. House is located on the main road of the village which is kuccha road
Porda (A3) 7.5 SW Predominant downwind
23° 7'42.35"N 71°52'10.05"E
Residential Machine was kept in compound of the house. Kuchha road is observed outside the house.
Dhakdi (A4) 6.3 E Upwind 23°10'57.55"N 71°58'59.15"E
Residential Machine was kept on terrace of Mr. Bikhabhai Makwana‟s house. House is surrounded by trees from North and West direction Kuchha road is observed adjacent to house
Jhund (A5) 1.9 SE Crosswind 23°10'5.58"N 71°55'56.41"E
Residential Machine was kept in the compound of the temple The temple premise is covered with paved surface and unpaved surface.

en-vιsιn
M/S. ECOCARE INFRASTRUCTURES PVT. LTD., SURENDRANAGAR, GUJARAT 3-9
Location Distance (km) Direction Located in
GPS Coordinates Type of Area Description With respect to Project Site
Temple premise is covered with trees. Outside the premises kuchha road is observed
Dumana (A6) 8.3 SE Crosswind 23° 7'53.73"N 71°58'46.59"E
Residential Machine was kept on terrace of anganwadi. Adjacent to anganwadi kuchha road is observed. Cross junction of road is observed near to anganwadi
Navrangpura (A7) 1.7 W Downwind 23°11'23.34"N 71°53'52.94"E
Residential Machine was kept on terrace of Mr. Bikhabhai Parmar‟s house. Kuchha road is observed adjacent to house.
Ghaspur (A8) 1.2 N Upwind 23°11'57.90"N 71°55'19.62"E
Residential Machine was kept on terrace of Mr. Vikram‟s house. Kuchha road is observed adjacent to house. Road construction is observed.
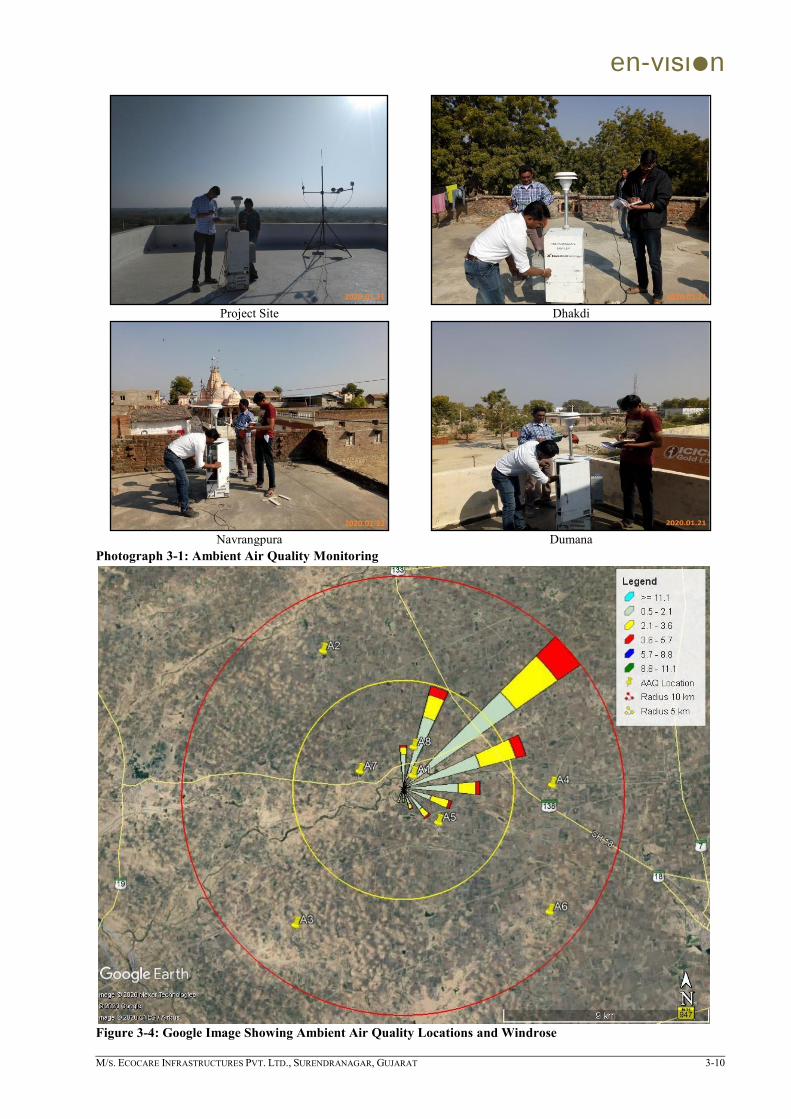
en-vιsιn
M/S. ECOCARE INFRASTRUCTURES PVT. LTD., SURENDRANAGAR, GUJARAT 3-10
Project Site
Dhakdi
Navrangpura
Dumana
Photograph 3-1: Ambient Air Quality Monitoring
Figure 3-4: Google Image Showing Ambient Air Quality Locations and Windrose
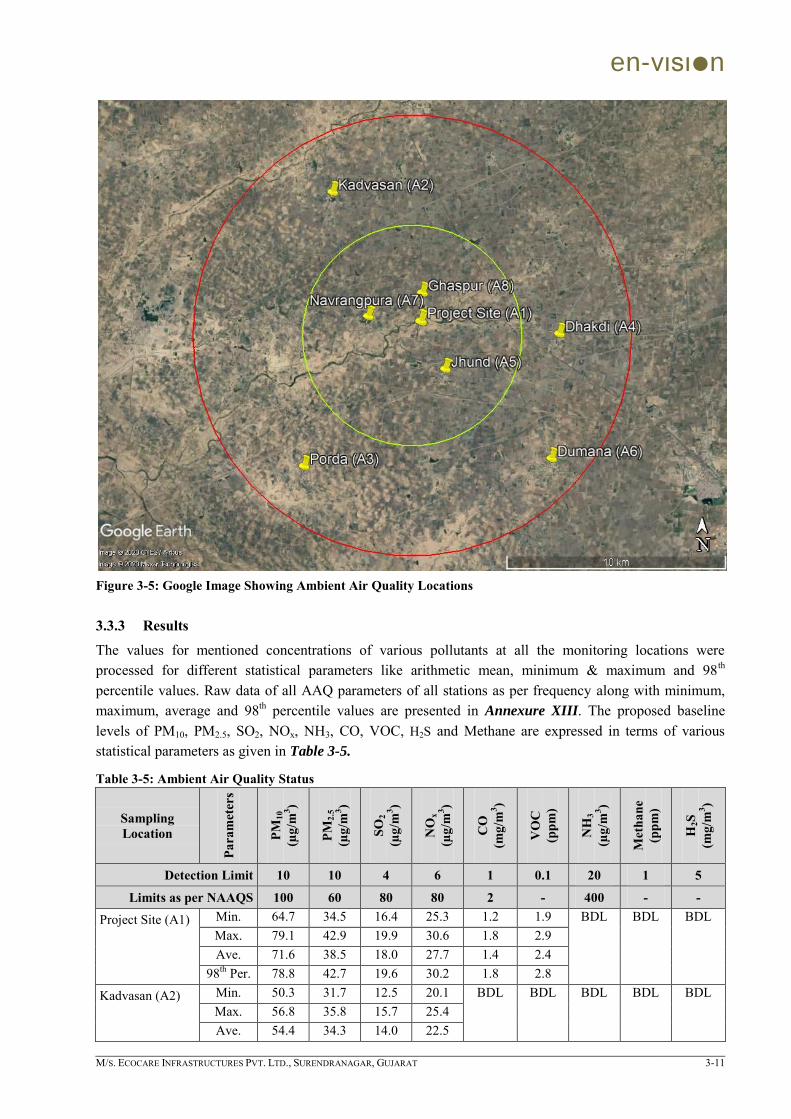
en-vιsιn
M/S. ECOCARE INFRASTRUCTURES PVT. LTD., SURENDRANAGAR, GUJARAT 3-11
Figure 3-5: Google Image Showing Ambient Air Quality Locations
3.3.3 Results
The values for mentioned concentrations of various pollutants at all the monitoring locations were processed for different statistical parameters like arithmetic mean, minimum & maximum and 98th percentile values. Raw data of all AAQ parameters of all stations as per frequency along with minimum, maximum, average and 98th percentile values are presented in Annexure XIII. The proposed baseline levels of PM10, PM2.5, SO2, NOx, NH3, CO, VOC, H2S and Methane are expressed in terms of various statistical parameters as given in Table 3-5.
Table 3-5: Ambient Air Quality Status
Sampling Location
Para
met
ers
PM10
(µ
g/m
3 )
PM2.
5 (µ
g/m
3 )
SO2
(µg/
m3 )
NO
x (µ
g/m
3 )
CO
(m
g/m
3 )
VO
C
(ppm
)
NH
3 (µ
g/m
3 )
Met
hane
(p
pm)
H2S
(m
g/m
3 )
Detection Limit 10 10 4 6 1 0.1 20 1 5
Limits as per NAAQS 100 60 80 80 2 - 400 - -
Project Site (A1) Min. 64.7 34.5 16.4 25.3 1.2 1.9 BDL BDL BDL Max. 79.1 42.9 19.9 30.6 1.8 2.9 Ave. 71.6 38.5 18.0 27.7 1.4 2.4
98th Per. 78.8 42.7 19.6 30.2 1.8 2.8
Kadvasan (A2) Min. 50.3 31.7 12.5 20.1 BDL BDL BDL BDL BDL Max. 56.8 35.8 15.7 25.4 Ave. 54.4 34.3 14.0 22.5
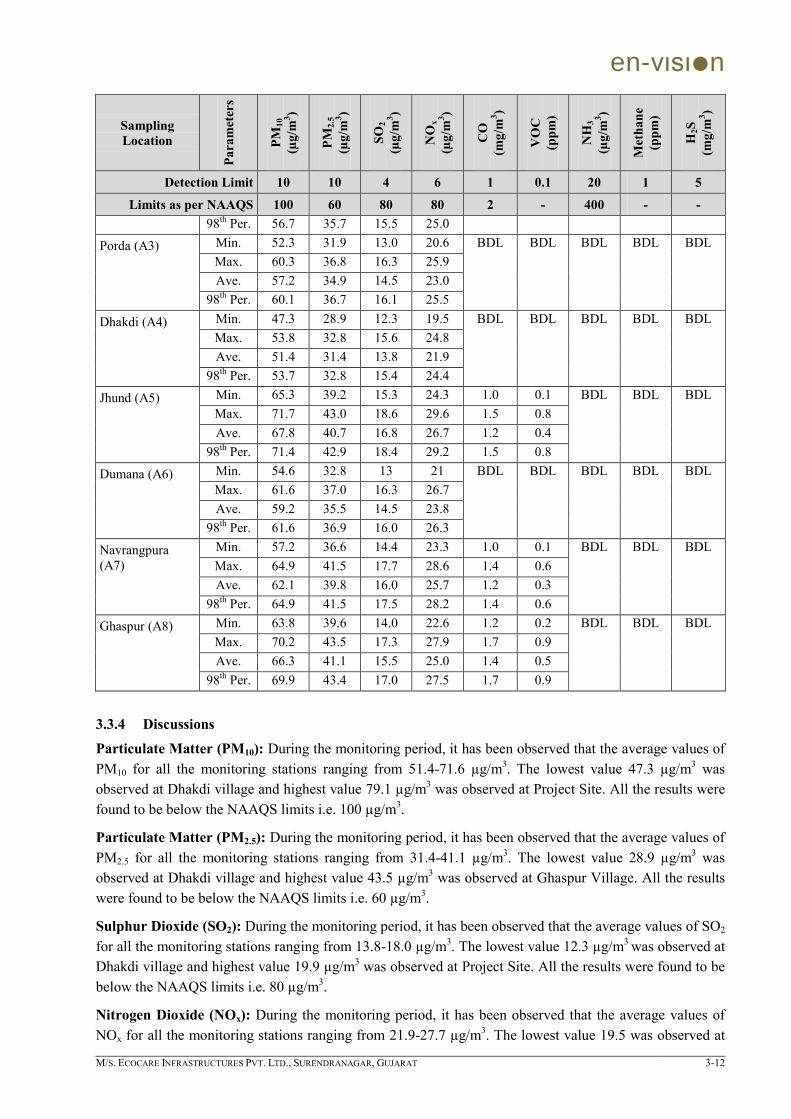
en-vιsιn
M/S. ECOCARE INFRASTRUCTURES PVT. LTD., SURENDRANAGAR, GUJARAT 3-12
Sampling Location
Para
met
ers
PM10
(µ
g/m
3 )
PM2.
5 (µ
g/m
3 )
SO2
(µg/
m3 )
NO
x (µ
g/m
3 )
CO
(m
g/m
3 )
VO
C
(ppm
)
NH
3 (µ
g/m
3 )
Met
hane
(p
pm)
H2S
(m
g/m
3 )
Detection Limit 10 10 4 6 1 0.1 20 1 5
Limits as per NAAQS 100 60 80 80 2 - 400 - - 98th Per. 56.7 35.7 15.5 25.0
Porda (A3) Min. 52.3 31.9 13.0 20.6 BDL BDL BDL BDL BDL Max. 60.3 36.8 16.3 25.9 Ave. 57.2 34.9 14.5 23.0
98th Per. 60.1 36.7 16.1 25.5
Dhakdi (A4) Min. 47.3 28.9 12.3 19.5 BDL BDL BDL BDL BDL Max. 53.8 32.8 15.6 24.8 Ave. 51.4 31.4 13.8 21.9
98th Per. 53.7 32.8 15.4 24.4
Jhund (A5) Min. 65.3 39.2 15.3 24.3 1.0 0.1 BDL BDL BDL Max. 71.7 43.0 18.6 29.6 1.5 0.8 Ave. 67.8 40.7 16.8 26.7 1.2 0.4
98th Per. 71.4 42.9 18.4 29.2 1.5 0.8
Dumana (A6) Min. 54.6 32.8 13 21 BDL BDL BDL BDL BDL Max. 61.6 37.0 16.3 26.7 Ave. 59.2 35.5 14.5 23.8
98th Per. 61.6 36.9 16.0 26.3
Navrangpura (A7)
Min. 57.2 36.6 14.4 23.3 1.0 0.1 BDL BDL BDL Max. 64.9 41.5 17.7 28.6 1.4 0.6 Ave. 62.1 39.8 16.0 25.7 1.2 0.3
98th Per. 64.9 41.5 17.5 28.2 1.4 0.6
Ghaspur (A8) Min. 63.8 39.6 14.0 22.6 1.2 0.2 BDL BDL BDL Max. 70.2 43.5 17.3 27.9 1.7 0.9 Ave. 66.3 41.1 15.5 25.0 1.4 0.5
98th Per. 69.9 43.4 17.0 27.5 1.7 0.9
3.3.4 Discussions
Particulate Matter (PM10): During the monitoring period, it has been observed that the average values of PM10 for all the monitoring stations ranging from 51.4-71.6 µg/m3. The lowest value 47.3 µg/m3 was observed at Dhakdi village and highest value 79.1 µg/m3 was observed at Project Site. All the results were found to be below the NAAQS limits i.e. 100 µg/m3.
Particulate Matter (PM2.5): During the monitoring period, it has been observed that the average values of PM2.5 for all the monitoring stations ranging from 31.4-41.1 µg/m3. The lowest value 28.9 µg/m3 was observed at Dhakdi village and highest value 43.5 µg/m3 was observed at Ghaspur Village. All the results were found to be below the NAAQS limits i.e. 60 µg/m3.
Sulphur Dioxide (SO2): During the monitoring period, it has been observed that the average values of SO2 for all the monitoring stations ranging from 13.8-18.0 µg/m3. The lowest value 12.3 µg/m3 was observed at Dhakdi village and highest value 19.9 µg/m3 was observed at Project Site. All the results were found to be below the NAAQS limits i.e. 80 µg/m3.
Nitrogen Dioxide (NOx): During the monitoring period, it has been observed that the average values of NOx for all the monitoring stations ranging from 21.9-27.7 µg/m3. The lowest value 19.5 was observed at
en-vιsιn
M/S. ECOCARE INFRASTRUCTURES PVT. LTD., SURENDRANAGAR, GUJARAT 3-13
Dhakdi village and highest value 30.6 µg/m3 was observed at Project Site. All the results were found to be below the NAAQS limits i.e. 80 µg/m3.
Volatile Organic Compounds (VOC): During the monitoring period, it has been observed that VOC is found below detection limit at Kadvasan, Porda, Dhakdi and Dumana village, the average values of VOC for all the monitoring stations ranging from 0.3-2.4 ppm. The lowest value 0.1 ppm was observed at Navrangpura and Jhund village and highest value 2.9 ppm was observed at Project Site.
Carbon Monoxide (CO): During the monitoring period, it has been observed that CO is found below detection limit at Kadvasan, Porda, Dhakdi and Dumana village, the average values of CO for all the monitoring stations ranging from 1.2-1.4 mg/m3. The lowest value 1.0 mg/m3 was observed at Navrangpura and Jhund village and highest value 1.8 mg/m3 was observed at Project Site.
Ammonia (NH3): NH3 is found below detectable limit (BDL) at all locations.
Methane (CH4): CH4 is found below detectable limit (BDL) at all locations.
Hydrogen Sulphide (H2S): H2S is found below detectable limit (BDL) at all locations.
High levels of PM10 & PM2.5 were observed at Project Site, Ghaspur and Jhund village as approach road to Project site is kuccha road and vehicular movement is high, at Ghaspur road construction work is observed and Jhund falls in predominant direction of Project Site while high levels of SO2 & NOx were observed at Project Site due to usage of bull dozers and high vehicular movement. Although all the results were found to be below the NAAQS limits.

en-vιsιn
M/S. ECOCARE INFRASTRUCTURES PVT. LTD., SURENDRANAGAR, GUJARAT 3-14
3.4 WATER ENVIRONMENT
Water of high quality is essential to human life, and water of acceptable quality is essential for Agricultural, industrial, domestic and commercial uses; in addition, most recreation is water based. The objective of this report is to define the present environment in which the proposed action is to occur, to evaluate all possible eventualities, to ensure that all negative impacts are minimized, and to demonstrate that proposed project has been appropriately announced to all interested parties so that their concerns can be considered. Water quality studies have been carried out in the study area to understand the availability of water resources, possibility of water contamination and existing water quality.
3.4.1 Sampling Methodology and Analysis
The water resources in the study area may be classified into two major categories like Surface and Ground water sources.
Water samples were collected at 16 locations within 10 km radius from project site, out of which 8 samples from surface water and 8 samples from ground water sources for physico-chemical and biological parameters.
Following procedures were used while sampling and & Methodologies adopted in assessing quality of water is presented in following Table 3-6.
Washing the bottles/cans with distilled water prior to the sampling Before collection of water the bottles/cans are again washed 2-3 times with the same water For surface water, Bottles were lowered to a minimum depth of 30 cm below water surface At each point, different sets of water samples were collected so as to cover all the parameters Meticulous attention is taken in proper numbering at the site Sterilized bottles were used for the samples that are to be analyzed for bacteria Civil supply water pipeline taps are sterilized before collection for bacteriological analysis Parameters like pH, TDS and temperature were analyzed in the field conditions. There are specific
instruments for measuring TDS and pH in the field. These are portable. These instruments were calibrated at laboratory before use. The results were reconfirmed after getting to the laboratory. DO is fixed and titrated in the field itself.
Appropriate preservatives are added, depending upon the elements to be analyzed and marked accordingly (APHA / IS: 3025 (part I))
All the water samples collected in the ice box, were immediately transported to the laboratory and freezed at <5 oC for analysis.
Field observations were noted in the field notebook Table 3-6: Sample Collection and Analysis of Water Sample
Parameter Frequency Sampling Methodology
Preservation Method Analysis Method Prescribed
Standard pH, TDS and Temperature
Once in a baseline period
IS 3025 (Part I)
Not applicable Onsite measurement IS 10500:2012 for ground water & IS
2296:1992 for Surface water
Other physico-chemical and
biological parameters
IS 3025 (Part I)
„Standard Methods for Examination of Water and Wastewater‟ Published by American Public Health Association (APHA) / IS
3025/EPA
3.4.2 Selection of Monitoring Location
To identify Ground Water availability and type of structure used in study area Census-2011 was used. Surface water locations were identified using topo map (Figure 2-4). List of sampling locations are
mentioned in Table 3-7 while sampling locations are shown in Figure 3-6 and Figure 3-7.
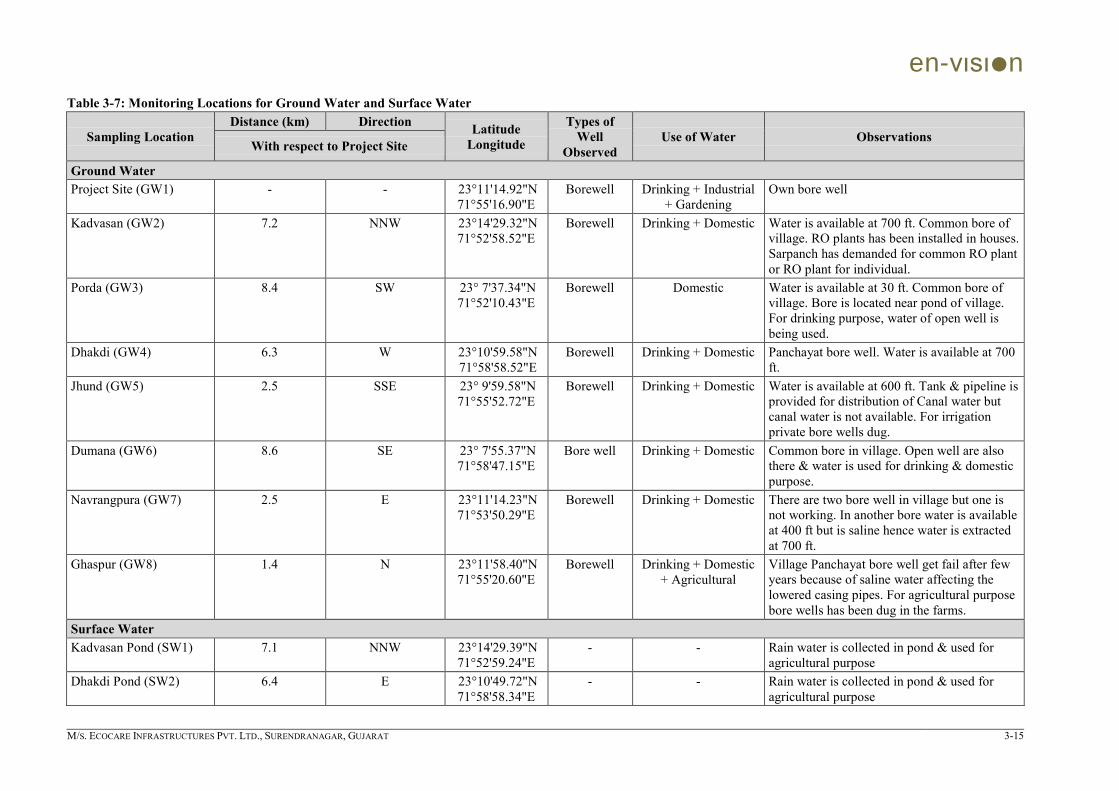
en-vιsιn
M/S. ECOCARE INFRASTRUCTURES PVT. LTD., SURENDRANAGAR, GUJARAT 3-15
Table 3-7: Monitoring Locations for Ground Water and Surface Water
Sampling Location Distance (km) Direction Latitude
Longitude
Types of Well
Observed Use of Water Observations
With respect to Project Site
Ground Water Project Site (GW1) - - 23°11'14.92"N
71°55'16.90"E Borewell Drinking + Industrial
+ Gardening Own bore well
Kadvasan (GW2) 7.2 NNW 23°14'29.32"N 71°52'58.52"E
Borewell Drinking + Domestic Water is available at 700 ft. Common bore of village. RO plants has been installed in houses. Sarpanch has demanded for common RO plant or RO plant for individual.
Porda (GW3) 8.4 SW 23° 7'37.34"N 71°52'10.43"E
Borewell Domestic Water is available at 30 ft. Common bore of village. Bore is located near pond of village. For drinking purpose, water of open well is being used.
Dhakdi (GW4) 6.3 W 23°10'59.58"N 71°58'58.52"E
Borewell Drinking + Domestic Panchayat bore well. Water is available at 700 ft.
Jhund (GW5) 2.5 SSE 23° 9'59.58"N 71°55'52.72"E
Borewell Drinking + Domestic Water is available at 600 ft. Tank & pipeline is provided for distribution of Canal water but canal water is not available. For irrigation private bore wells dug.
Dumana (GW6) 8.6 SE 23° 7'55.37"N 71°58'47.15"E
Bore well Drinking + Domestic Common bore in village. Open well are also there & water is used for drinking & domestic purpose.
Navrangpura (GW7) 2.5 E 23°11'14.23"N 71°53'50.29"E
Borewell Drinking + Domestic There are two bore well in village but one is not working. In another bore water is available at 400 ft but is saline hence water is extracted at 700 ft.
Ghaspur (GW8) 1.4 N 23°11'58.40"N 71°55'20.60"E
Borewell Drinking + Domestic + Agricultural
Village Panchayat bore well get fail after few years because of saline water affecting the lowered casing pipes. For agricultural purpose bore wells has been dug in the farms.
Surface Water Kadvasan Pond (SW1) 7.1 NNW 23°14'29.39"N
71°52'59.24"E - - Rain water is collected in pond & used for
agricultural purpose Dhakdi Pond (SW2) 6.4 E 23°10'49.72"N
71°58'58.34"E - - Rain water is collected in pond & used for
agricultural purpose

en-vιsιn
M/S. ECOCARE INFRASTRUCTURES PVT. LTD., SURENDRANAGAR, GUJARAT 3-16
Sampling Location Distance (km) Direction Latitude
Longitude
Types of Well
Observed Use of Water Observations
With respect to Project Site
Navrangpura Pond (SW3) 2.5 W 23°11'25.49"N 71°53'51.63"E
- - Rain water is collected in pond & used for agricultural purpose
Okaro Kharaghoda River (SW4)
9.4 NNW 23°15'21.92"N 71°52'5.92"E
- - Pumps have been installed in river & water is sent to farms.
Natural Drain Downstream to Project Site (SW5)
1.2 W 23°11'10.70"N 71°54'30.54"E
- - Water is used for agricultural purpose
Ghaspur Pond (SW6) 1.2 N 23°11'52.25"N 71°55'23.84"E
- - Rain water is collected in pond & used by animals.
Natural Drain Upstream to Project Site (SW7)
0.7 NE 23°11'36.07"N 71°55'28.71"E
- - Water is used for agricultural purpose
Narmada Canal (SW8) 6.5 ESE 23° 9'17.81"N 71°58'25.38"E
- - Water is supplied for agricultural purpose.

en-vιsιn
M/S. ECOCARE INFRASTRUCTURES PVT. LTD., SURENDRANAGAR, GUJARAT 3-17
Kadvasan
Dumana
Dhakdi
Ground Water
Kadvasan Pond
Porda Pond
Narmada Canal
Okaro Kharaghoda River
Surface Water Photograph 3-2: Surface & Ground Water Sampling

en-vιsιn
M/S. ECOCARE INFRASTRUCTURES PVT. LTD., SURENDRANAGAR, GUJARAT 3-18
Figure 3-6: Google Image Showing Ground Water Sampling Locations
Figure 3-7: Google Image Showing Surface Water Sampling Locations

en-vιsιn
M/S. ECOCARE INFRASTRUCTURES PVT. LTD., SURENDRANAGAR, GUJARAT 3-19
3.4.3 Results-Ground Water and Surface Water
Parameters were selected based on Guidelines for Water Quality Monitoring by Central Pollution Control Board, Parivesh Bhawan, East Arjun Nagar, Delhi-32
published in December 2007 & Protocol for Performance Evaluation and Monitoring of the Common Hazardous Waste Treatment Storage and Disposal Facilities
including Common Hazardous Waste Incinerators by Central Pollution Control Board published in 06th Oct 2009. Analysis results for Ground and Surface water are
given in Table 3-8 & Table 3-9. The results of Ground water samples results were compared with the Indian Standard specification for drinking water, IS 10500:2012 and that of surface water samples results were compared with the Indian Standard specification for different uses, IS 2296:1992.
Table 3-8: Water Quality – Physico-chemical Analysis of Ground Water
Sr. No.
Test Parameters Units Detection
Limit
Sample Code & Location IS 10500:2012
Project Site (GW1)
Kadvasan (GW2)
Porda (GW3)
Dhakdi (GW4)
Jhund (GW5)
Dumana (GW6)
Navrangpura (GW7)
Ghaspur (GW8)
Des
irab
le
Perm
issib
le
1 pH - 2.0 7.00 7.00 7.00 6.70 6.60 7.00 6.10 7.10 6.5-8.5 No Relaxation
2 Temperature °C Ambient 31 30 32 31 33 31 30 31 -- -- 3 Colour Pt-Co. 5.0 BDL BDL BDL BDL BDL BDL BDL BDL 5 15 4 Odor -
Qua
ntita
tive
(obj
ectio
nabl
e/
unob
ject
iona
ble)
Uno
bjec
tiona
ble
Uno
bjec
tiona
ble
Uno
bjec
tiona
ble
Uno
bjec
tiona
ble
Uno
bjec
tiona
ble
Uno
bjec
tiona
ble
Uno
bjec
tiona
ble
Uno
bjec
tiona
ble
Agr
eeab
le
Agr
eeab
le
5 Taste -
Agr
eeab
le/
Dis
agre
eabl
e
Agr
eeab
le
Agr
eeab
le
Agr
eeab
le
Agr
eeab
le
Agr
eeab
le
Agr
eeab
le
Agr
eeab
le
Agr
eeab
le
Agr
eeab
le
Agr
eeab
le
6 Turbidity NTU 0.1 BDL BDL BDL BDL BDL BDL BDL BDL 1 5 7 Total Solid
(TS) mg/L 4.0 1285.6 1198.2 1433.6 1191.0 1270.1 1391.0 1306.7 1209.5 -- --
8 Total Suspended
mg/L 4.0 10.6 8.2 11.6 6.0 10.1 11.0 10.7 9.5 -- --
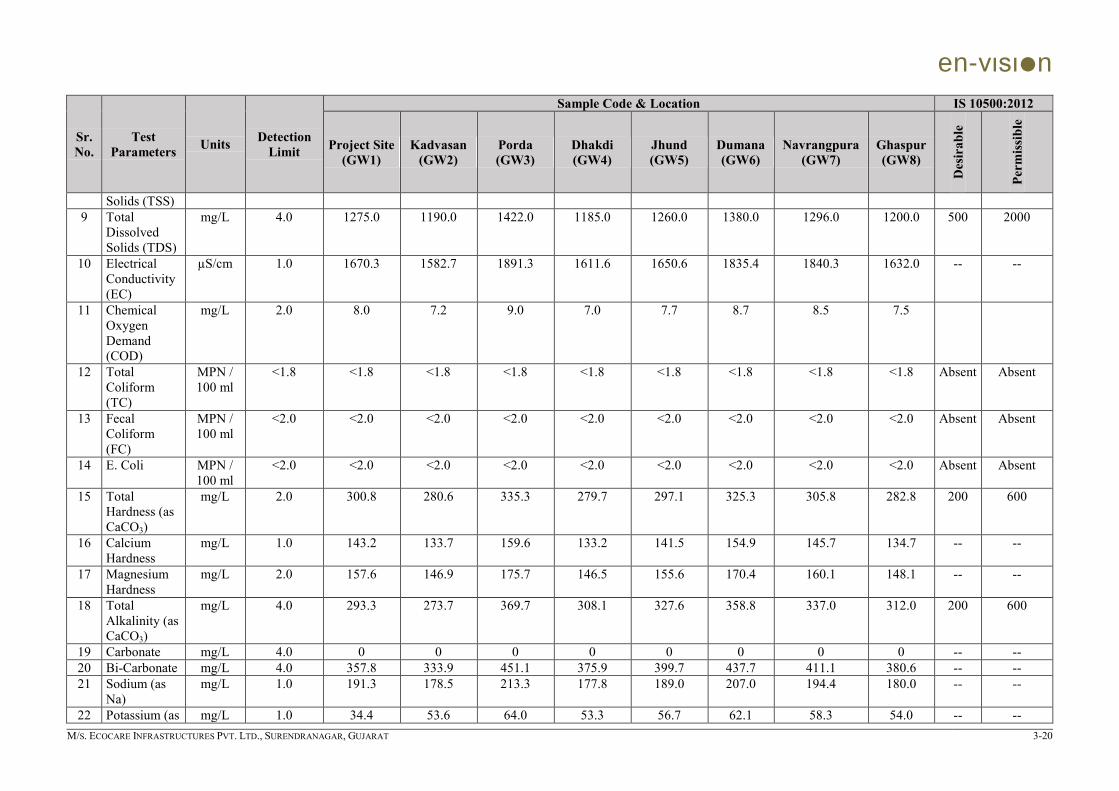
en-vιsιn
M/S. ECOCARE INFRASTRUCTURES PVT. LTD., SURENDRANAGAR, GUJARAT 3-20
Sr. No.
Test Parameters Units Detection
Limit
Sample Code & Location IS 10500:2012
Project Site (GW1)
Kadvasan (GW2)
Porda (GW3)
Dhakdi (GW4)
Jhund (GW5)
Dumana (GW6)
Navrangpura (GW7)
Ghaspur (GW8)
Des
irab
le
Perm
issib
le
Solids (TSS) 9 Total
Dissolved Solids (TDS)
mg/L 4.0 1275.0 1190.0 1422.0 1185.0 1260.0 1380.0 1296.0 1200.0 500 2000
10 Electrical Conductivity (EC)
µS/cm 1.0 1670.3 1582.7 1891.3 1611.6 1650.6 1835.4 1840.3 1632.0 -- --
11 Chemical Oxygen Demand (COD)
mg/L 2.0 8.0 7.2 9.0 7.0 7.7 8.7 8.5 7.5
12 Total Coliform (TC)
MPN / 100 ml
<1.8 <1.8 <1.8 <1.8 <1.8 <1.8 <1.8 <1.8 <1.8 Absent Absent
13 Fecal Coliform (FC)
MPN / 100 ml
<2.0 <2.0 <2.0 <2.0 <2.0 <2.0 <2.0 <2.0 <2.0 Absent Absent
14 E. Coli MPN / 100 ml
<2.0 <2.0 <2.0 <2.0 <2.0 <2.0 <2.0 <2.0 <2.0 Absent Absent
15 Total Hardness (as CaCO3)
mg/L 2.0 300.8 280.6 335.3 279.7 297.1 325.3 305.8 282.8 200 600
16 Calcium Hardness
mg/L 1.0 143.2 133.7 159.6 133.2 141.5 154.9 145.7 134.7 -- --
17 Magnesium Hardness
mg/L 2.0 157.6 146.9 175.7 146.5 155.6 170.4 160.1 148.1 -- --
18 Total Alkalinity (as CaCO3)
mg/L 4.0 293.3 273.7 369.7 308.1 327.6 358.8 337.0 312.0 200 600
19 Carbonate mg/L 4.0 0 0 0 0 0 0 0 0 -- -- 20 Bi-Carbonate mg/L 4.0 357.8 333.9 451.1 375.9 399.7 437.7 411.1 380.6 -- -- 21 Sodium (as
Na) mg/L 1.0 191.3 178.5 213.3 177.8 189.0 207.0 194.4 180.0 -- --
22 Potassium (as mg/L 1.0 34.4 53.6 64.0 53.3 56.7 62.1 58.3 54.0 -- --
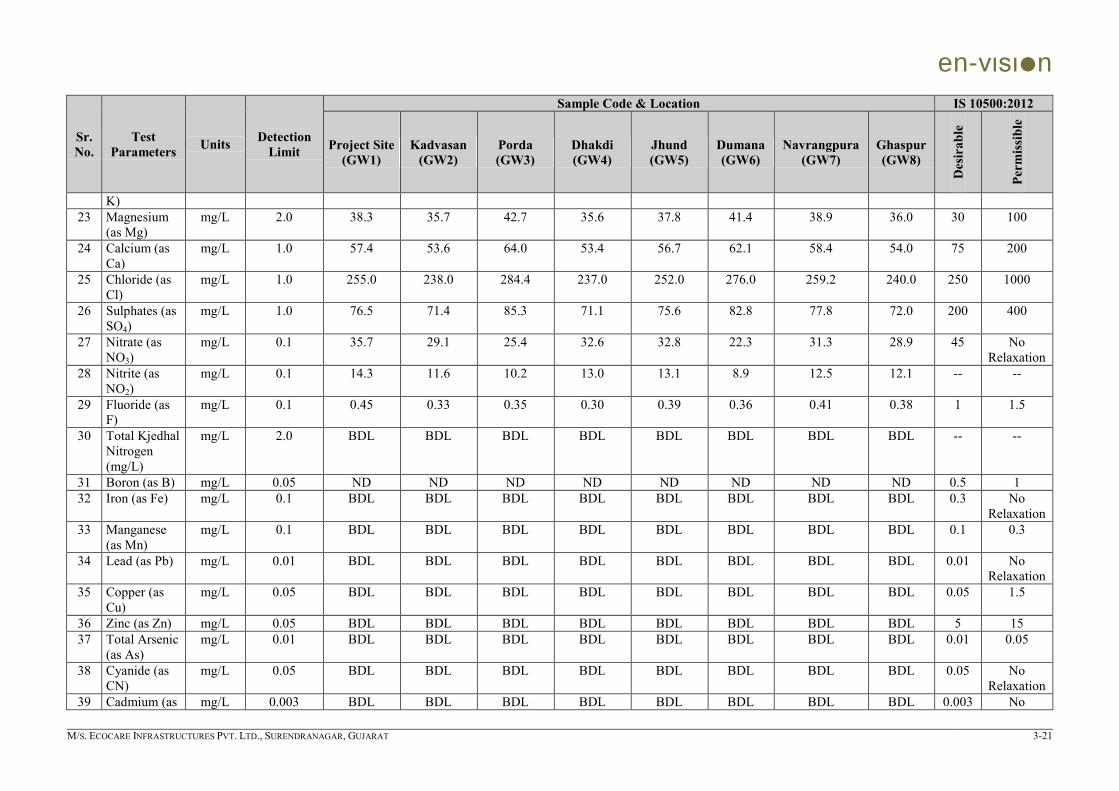
en-vιsιn
M/S. ECOCARE INFRASTRUCTURES PVT. LTD., SURENDRANAGAR, GUJARAT 3-21
Sr. No.
Test Parameters Units Detection
Limit
Sample Code & Location IS 10500:2012
Project Site (GW1)
Kadvasan (GW2)
Porda (GW3)
Dhakdi (GW4)
Jhund (GW5)
Dumana (GW6)
Navrangpura (GW7)
Ghaspur (GW8)
Des
irab
le
Perm
issib
le
K) 23 Magnesium
(as Mg) mg/L 2.0 38.3 35.7 42.7 35.6 37.8 41.4 38.9 36.0 30 100
24 Calcium (as Ca)
mg/L 1.0 57.4 53.6 64.0 53.4 56.7 62.1 58.4 54.0 75 200
25 Chloride (as Cl)
mg/L 1.0 255.0 238.0 284.4 237.0 252.0 276.0 259.2 240.0 250 1000
26 Sulphates (as SO4)
mg/L 1.0 76.5 71.4 85.3 71.1 75.6 82.8 77.8 72.0 200 400
27 Nitrate (as NO3)
mg/L 0.1 35.7 29.1 25.4 32.6 32.8 22.3 31.3 28.9 45 No Relaxation
28 Nitrite (as NO2)
mg/L 0.1 14.3 11.6 10.2 13.0 13.1 8.9 12.5 12.1 -- --
29 Fluoride (as F)
mg/L 0.1 0.45 0.33 0.35 0.30 0.39 0.36 0.41 0.38 1 1.5
30 Total Kjedhal Nitrogen (mg/L)
mg/L 2.0 BDL BDL BDL BDL BDL BDL BDL BDL -- --
31 Boron (as B) mg/L 0.05 ND ND ND ND ND ND ND ND 0.5 1 32 Iron (as Fe) mg/L 0.1 BDL BDL BDL BDL BDL BDL BDL BDL 0.3 No
Relaxation 33 Manganese
(as Mn) mg/L 0.1 BDL BDL BDL BDL BDL BDL BDL BDL 0.1 0.3
34 Lead (as Pb) mg/L 0.01 BDL BDL BDL BDL BDL BDL BDL BDL 0.01 No Relaxation
35 Copper (as Cu)
mg/L 0.05 BDL BDL BDL BDL BDL BDL BDL BDL 0.05 1.5
36 Zinc (as Zn) mg/L 0.05 BDL BDL BDL BDL BDL BDL BDL BDL 5 15 37 Total Arsenic
(as As) mg/L 0.01 BDL BDL BDL BDL BDL BDL BDL BDL 0.01 0.05
38 Cyanide (as CN)
mg/L 0.05 BDL BDL BDL BDL BDL BDL BDL BDL 0.05 No Relaxation
39 Cadmium (as mg/L 0.003 BDL BDL BDL BDL BDL BDL BDL BDL 0.003 No
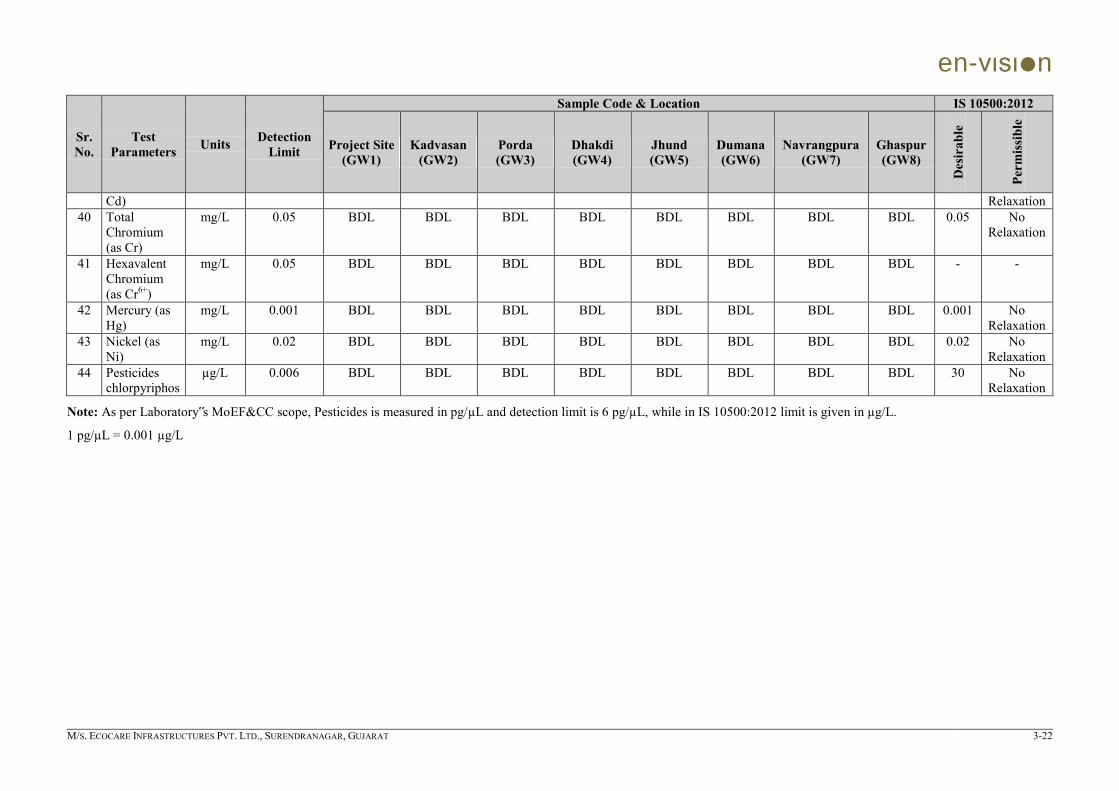
en-vιsιn
M/S. ECOCARE INFRASTRUCTURES PVT. LTD., SURENDRANAGAR, GUJARAT 3-22
Sr. No.
Test Parameters Units Detection
Limit
Sample Code & Location IS 10500:2012
Project Site (GW1)
Kadvasan (GW2)
Porda (GW3)
Dhakdi (GW4)
Jhund (GW5)
Dumana (GW6)
Navrangpura (GW7)
Ghaspur (GW8)
Des
irab
le
Perm
issib
le
Cd) Relaxation 40 Total
Chromium (as Cr)
mg/L 0.05 BDL BDL BDL BDL BDL BDL BDL BDL 0.05 No Relaxation
41 Hexavalent Chromium (as Cr6+)
mg/L 0.05 BDL BDL BDL BDL BDL BDL BDL BDL - -
42 Mercury (as Hg)
mg/L 0.001 BDL BDL BDL BDL BDL BDL BDL BDL 0.001 No Relaxation
43 Nickel (as Ni)
mg/L 0.02 BDL BDL BDL BDL BDL BDL BDL BDL 0.02 No Relaxation
44 Pesticides chlorpyriphos
µg/L 0.006 BDL BDL BDL BDL BDL BDL BDL BDL 30 No Relaxation
Note: As per Laboratory‟s MoEF&CC scope, Pesticides is measured in pg/µL and detection limit is 6 pg/µL, while in IS 10500:2012 limit is given in µg/L.
1 pg/µL = 0.001 µg/L

en-vιsιn
M/S. ECOCARE INFRASTRUCTURES PVT. LTD., SURENDRANAGAR, GUJARAT 3-23
Table 3-9: Water Quality – Physico-chemical Analysis of Surface Water
Sr. No.
Test Parameters Units Detection
Limit
Sample Code & Location IS 2296:1992
Kad
vasa
n Po
nd
(SW
1)
Dha
kdi P
ond
(SW
2)
Nav
rang
pura
Po
nd (S
W3)
Oka
ro
Kha
ragh
oda
Riv
er (S
W4)
Nat
ural
Dra
in
Dow
nstr
eam
to
Proj
ect S
ite
(SW
5)
Gha
spur
Pon
d (S
W6)
Nat
ural
Dra
in
Ups
trea
m to
Pr
ojec
t Site
(S
W7)
Nar
mad
a C
anal
(S
W8)
Class
A B C D E
1 pH - 5.0 6.50 6.50 7.00 7.00 8.00 7.00 8.00 7.00 6.5-8.5
6.5-8.5
6.0-9.0
6.5-8.5
6.0-8.5
2 Temperature °C Ambient 32.0 33.0 31.0 30.5 31.0 33.0 30.0 31.0 3 Colour Pt-Co. 5.0 BDL BDL BDL BDL BDL BDL BDL BDL 10 300 300 - - 4 Odor --
Qua
ntita
tive
(obj
ectio
nabl
e/un
obj
ectio
nabl
e)
Uno
bjec
tiona
ble
Uno
bjec
tiona
ble
Uno
bjec
tiona
ble
Uno
bjec
tiona
ble
Uno
bjec
tiona
ble
Uno
bjec
tiona
ble
Uno
bjec
tiona
ble
Uno
bjec
tiona
ble
Uno
bjec
tiona
ble
Uno
bjec
tiona
ble - - -
5 Taste -
Agr
eeab
le/
Dis
agre
eabl
e
Agr
eeab
le
Agr
eeab
le
Agr
eeab
le
Agr
eeab
le
Agr
eeab
le
Agr
eeab
le
Agr
eeab
le
Agr
eeab
le
Tast
eles
s
- - - -
6 Turbidity NTU 0.1 1.7 0.8 2.4 1.5 2.7 2.0 2.2 0.3 7 Total Solid
(TS) mg/L 4.0 546.8 520.1 597.3 532.2 589.6 551.3 568.2 157.0
8 Total Suspended Solids (TSS)
mg/L 4.0 36.8 30.1 42.3 32.2 46.6 39.3 40.2 10.0
9 Total Dissolved Solids (TDS)
mg/L 4.0 510.0 490.0 555.0 500.0 543.0 512.0 528.0 147.0 500 - 1500
- 2100
10 Electrical Conductivity (EC)
µS/cm 1.0 719.1 641.9 754.8 680.0 738.5 696.3 718.1 208.7 - - - - 2250
11 Dissolved Oxygen (DO)
mg/L 0.2 4.3 4.7 3.5 4.6 3.7 4.0 3.9 5.8 6 5 4 4 -

en-vιsιn
M/S. ECOCARE INFRASTRUCTURES PVT. LTD., SURENDRANAGAR, GUJARAT 3-24
Sr. No.
Test Parameters Units Detection
Limit
Sample Code & Location IS 2296:1992
Kad
vasa
n Po
nd
(SW
1)
Dha
kdi P
ond
(SW
2)
Nav
rang
pura
Po
nd (S
W3)
Oka
ro
Kha
ragh
oda
Riv
er (S
W4)
Nat
ural
Dra
in
Dow
nstr
eam
to
Proj
ect S
ite
(SW
5)
Gha
spur
Pon
d (S
W6)
Nat
ural
Dra
in
Ups
trea
m to
Pr
ojec
t Site
(S
W7)
Nar
mad
a C
anal
(S
W8)
Class
A B C D E
12 Biological Oxygen Demand (BOD)
mg/L 1.0 8.6 7.1 12.5 7.6 12.3 10.2 11.7 2.8 2 3 3 - -
13 Chemical Oxygen Demand (COD)
mg/L 2.0 21.3 17.6 31.2 19.0 30.6 25.3 29.2 7.0
14 Total Coliform (TC)
MPN / 100 ml
<1.8 42 22 62 31 55.0 49 52 15 50 500 5000
- -
15 Fecal Coliform (FC)
MPN / 100 ml
<2.0 25 13 37 19 33 29 31 9
16 E. Coli MPN / 100 ml
<2.0 13 7 19 9 17 15 16 5
17 Total Hardness (as CaCO3)
mg/L 2.0 109.2 105.6 119.1 107.7 116.9 109.9 113.2 30.5 200 - - - -
18 Calcium Hardness
mg/L 1.0 22.0 21.2 24.0 21.7 23.5 22.2 22.7 6.2 200 - - - -
19 Magnesium Hardness
mg/L 2.0 87.2 84.4 95.1 86.0 93.4 87.7 90.5 24.3 200 - - - -
20 Total Alkalinity ( as CaCO3)
mg/L 4.0 171.8 166.4 187.3 169.5 184.3 173.3 179.0 47.5
21 Carbonate mg/L 4.0 0 0 0 0 0 0 0 0 22 Bi-Carbonate mg/L 4.0 209.5 203.1 228.6 206.8 224.8 211.4 218.4 58.0 23 Sodium (as
Na) mg/L 1.0 94.9 92.0 103.5 93.7 101.9 95.8 98.9 26.9
24 Potassium (as K)
mg/L 1.0 28.5 27.6 31.1 28.1 30.6 28.7 29.7 7.9
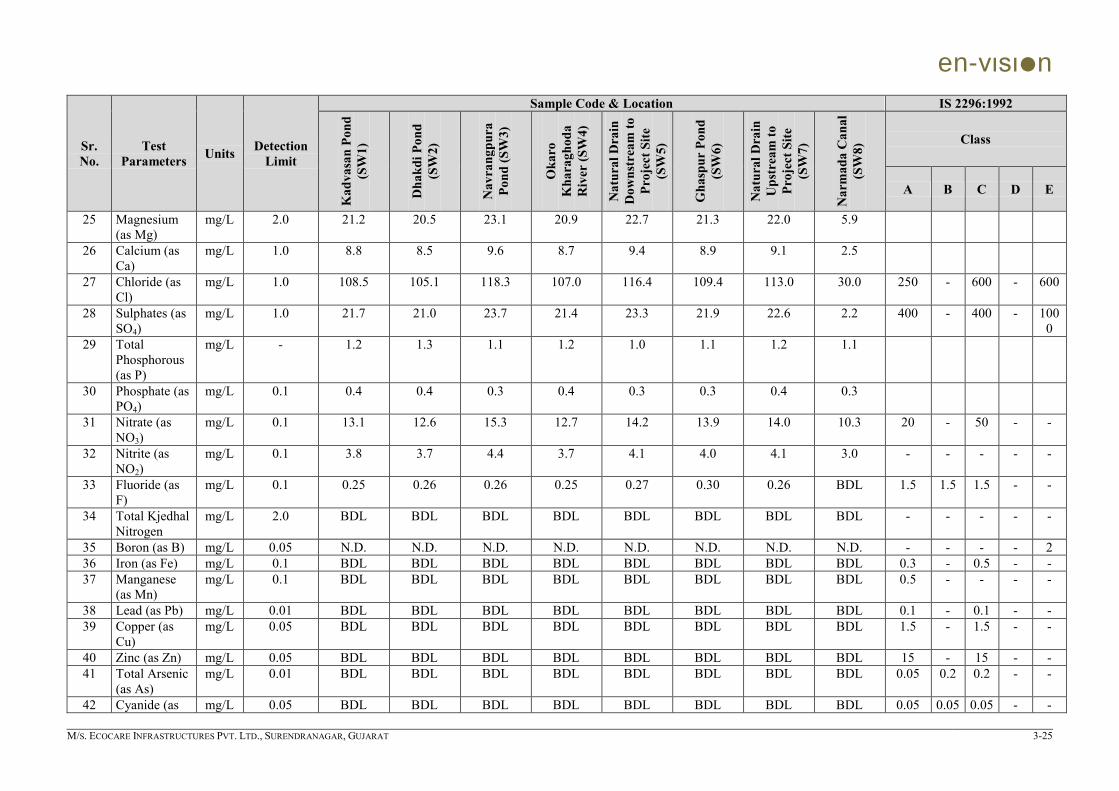
en-vιsιn
M/S. ECOCARE INFRASTRUCTURES PVT. LTD., SURENDRANAGAR, GUJARAT 3-25
Sr. No.
Test Parameters Units Detection
Limit
Sample Code & Location IS 2296:1992
Kad
vasa
n Po
nd
(SW
1)
Dha
kdi P
ond
(SW
2)
Nav
rang
pura
Po
nd (S
W3)
Oka
ro
Kha
ragh
oda
Riv
er (S
W4)
Nat
ural
Dra
in
Dow
nstr
eam
to
Proj
ect S
ite
(SW
5)
Gha
spur
Pon
d (S
W6)
Nat
ural
Dra
in
Ups
trea
m to
Pr
ojec
t Site
(S
W7)
Nar
mad
a C
anal
(S
W8)
Class
A B C D E
25 Magnesium (as Mg)
mg/L 2.0 21.2 20.5 23.1 20.9 22.7 21.3 22.0 5.9
26 Calcium (as Ca)
mg/L 1.0 8.8 8.5 9.6 8.7 9.4 8.9 9.1 2.5
27 Chloride (as Cl)
mg/L 1.0 108.5 105.1 118.3 107.0 116.4 109.4 113.0 30.0 250 - 600 - 600
28 Sulphates (as SO4)
mg/L 1.0 21.7 21.0 23.7 21.4 23.3 21.9 22.6 2.2 400 - 400 - 1000
29 Total Phosphorous (as P)
mg/L - 1.2 1.3 1.1 1.2 1.0 1.1 1.2 1.1
30 Phosphate (as PO4)
mg/L 0.1 0.4 0.4 0.3 0.4 0.3 0.3 0.4 0.3
31 Nitrate (as NO3)
mg/L 0.1 13.1 12.6 15.3 12.7 14.2 13.9 14.0 10.3 20 - 50 - -
32 Nitrite (as NO2)
mg/L 0.1 3.8 3.7 4.4 3.7 4.1 4.0 4.1 3.0 - - - - -
33 Fluoride (as F)
mg/L 0.1 0.25 0.26 0.26 0.25 0.27 0.30 0.26 BDL 1.5 1.5 1.5 - -
34 Total Kjedhal Nitrogen
mg/L 2.0 BDL BDL BDL BDL BDL BDL BDL BDL - - - - -
35 Boron (as B) mg/L 0.05 N.D. N.D. N.D. N.D. N.D. N.D. N.D. N.D. - - - - 2 36 Iron (as Fe) mg/L 0.1 BDL BDL BDL BDL BDL BDL BDL BDL 0.3 - 0.5 - - 37 Manganese
(as Mn) mg/L 0.1 BDL BDL BDL BDL BDL BDL BDL BDL 0.5 - - - -
38 Lead (as Pb) mg/L 0.01 BDL BDL BDL BDL BDL BDL BDL BDL 0.1 - 0.1 - - 39 Copper (as
Cu) mg/L 0.05 BDL BDL BDL BDL BDL BDL BDL BDL 1.5 - 1.5 - -
40 Zinc (as Zn) mg/L 0.05 BDL BDL BDL BDL BDL BDL BDL BDL 15 - 15 - - 41 Total Arsenic
(as As) mg/L 0.01 BDL BDL BDL BDL BDL BDL BDL BDL 0.05 0.2 0.2 - -
42 Cyanide (as mg/L 0.05 BDL BDL BDL BDL BDL BDL BDL BDL 0.05 0.05 0.05 - -

en-vιsιn
M/S. ECOCARE INFRASTRUCTURES PVT. LTD., SURENDRANAGAR, GUJARAT 3-26
Sr. No.
Test Parameters Units Detection
Limit
Sample Code & Location IS 2296:1992
Kad
vasa
n Po
nd
(SW
1)
Dha
kdi P
ond
(SW
2)
Nav
rang
pura
Po
nd (S
W3)
Oka
ro
Kha
ragh
oda
Riv
er (S
W4)
Nat
ural
Dra
in
Dow
nstr
eam
to
Proj
ect S
ite
(SW
5)
Gha
spur
Pon
d (S
W6)
Nat
ural
Dra
in
Ups
trea
m to
Pr
ojec
t Site
(S
W7)
Nar
mad
a C
anal
(S
W8)
Class
A B C D E
CN) 43 Cadmium (as
Cd) mg/L 0.003 BDL BDL BDL BDL BDL BDL BDL BDL 0.01 - 0.01 - -
44 Total Chromium (as Cr)
mg/L 0.05 BDL BDL BDL BDL BDL BDL BDL BDL - - - - -
45 Hexavalent Chromium (as Cr6+)
mg/L 0.05 BDL BDL BDL BDL BDL BDL BDL BDL 0.05 - 0.05 - -
46 Mercury (as Hg)
mg/L 0.001 BDL BDL BDL BDL BDL BDL BDL BDL 0.001 - - - -
3.4.4 Results of Natural Drain during Rainy Season
Unit has appointed NABL Accredited Laboratory for monitoring of Natural drain in upstream and downstream during rainy season and the same is compared with Baseline results.
Table 3-10: Water Quality of Natural Drain in Rainy Season
Sr. No. Test Parameters Units Sampling Location
Natural Drain Downstream to Project Site Natural Drain Upstream to Project Site During Rainy Season During Non Rainy Season During Rainy Season During Non Rainy Season
1 pH - 8.18 8.00 8.26 8.00 2 Colour Pt-Co. 7 BDL (DL:5) 5 BDL (DL:5) 3 Turbidity NTU 9 2.2 10 2.7 4 Total Suspended Solids (TSS) mg/L 110 40.2 115 46.6 5 Total Dissolved Solids (TDS) mg/L 345 528.0 392 543.0 6 Electrical Conductivity (EC) µS/cm 449 718.1 510 738.5 7 Dissolved Oxygen (DO) mg/L 4.2 3.9 4.1 3.7 8 Biological Oxygen Demand
(BOD) mg/L 2 11.7 4 12.3

en-vιsιn
M/S. ECOCARE INFRASTRUCTURES PVT. LTD., SURENDRANAGAR, GUJARAT 3-27
Sr. No. Test Parameters Units Sampling Location
Natural Drain Downstream to Project Site Natural Drain Upstream to Project Site During Rainy Season During Non Rainy Season During Rainy Season During Non Rainy Season
9 Chemical Oxygen Demand (COD) mg/L 14 29.2 16 30.6 10 Total Hardness (as CaCO3) mg/L 114 113.2 118 116.9 11 Total Alkalinity ( as CaCO3) mg/L 106 179.0 112 184.3 12 Chloride (as Cl) mg/L 48 113.0 68 116.4 13 Sulphates (as SO4) mg/L 19 22.6 20 23.3 14 Iron (as Fe) mg/L BDL BDL (DL:1.0) BDL BDL (DL:1.0) 15 Manganese (as Mn) mg/L BDL BDL (DL:1.0) BDL BDL (DL:1.0) 16 Lead (as Pb) mg/L BDL BDL (DL:0.01) BDL BDL (DL:0.01) 17 Copper (as Cu) mg/L BDL BDL (DL:0.05) BDL BDL (DL:0.05) 18 Zinc (as Zn) mg/L BDL BDL (DL:0.05) BDL BDL (DL:0.05) 19 Total Arsenic (as As) mg/L BDL BDL (DL:0.01) BDL BDL (DL:0.01) 20 Cyanide (as CN) mg/L BDL BDL (DL:0.05) BDL BDL (DL:0.05) 21 Cadmium (as Cd) mg/L BDL BDL (DL:0.003) BDL BDL (DL:0.003) 22 Total Chromium (as Cr) mg/L BDL BDL (DL:0.05) BDL BDL (DL:0.05) 23 Mercury (as Hg) mg/L BDL BDL (DL:0.001) BDL BDL (DL:0.001)

en-vιsιn
M/S. ECOCARE INFRASTRUCTURES PVT. LTD., SURENDRANAGAR, GUJARAT 3-28
3.4.5 Discussions
3.4.5.1 Ground Water
The pH varied in the range of 6.10-7.10. TSS levels varied in the range of 6.0-12.0 mg/L.
Total hardness varied in the range of 279.7-335.3 mg/L, it is higher than desirable limit but within permissible limits at all location and TDS varied in the range of 1185.0-1422.0 mg/L, TDS is higher than desirable limit but within permissible limits at all location; hence hardness and TDS level reduction to desirable limit is necessary to use water for drinking purpose.
Alkalinity varied in the range of 273.7-369.7 mg/L, alkalinity is higher than the desirable limit but within the permissible limit at all location. The conductivity levels varied in the range of 1582.7 -1891.3 µS/cm.
Magnesium varied in the range of 35.6-42.7 mg/L, Magnesium is higher than the desirable limit but within the permissible limit at all location. Chlorides varied in the range of 237.0-284.4 mg/L, Chlorides is higher than higher than the desirable limit but within the permissible limit at all location except Kadvasan, Dhakdi and Ghaspur. Fluorides are found at all locations in the range of 0.30-0.45 which is within desirable limit. Coliform bacteria were measured as Total Coliform, Fecal Coliform and E. coli; these bacteria are absent in all the samples.
At all locations, common bores are being operated by Panchayat & water is supplied to household via over head tanks. The water quality index is excellent at all location.
From above results it can be concluded that as per Drinking water standard of IS 10500:2012 ground water is suitable for domestic purpose. But removal of TDS and hardness is required at all location using filtration, RO and UV techniques can be used for removal of same.
3.4.5.2 Surface Water
The pH varied is from 6.50-8.00, the turbidity varied from 0.3 – 2.7 NTU, the total dissolved solids varied from 147.0-555.0 mg/L, Conductivity varied from 208.7-754.8 µS/cm, The total alkalinity varied from 47.5-187.3 mg/L, calcium varied from 2.5-9.6 mg/L, chloride varied from 30.0-118.3 mg/L and the sulphate varied from 2.2-23.7 mg/L. The total hardness varied from 30.5-119.1 mg/L.
The results indicate that the nutrient values in the form of nitrate were found at all locations. The value for DO varied from 3.5-5.8 mg/L. The levels of heavy metals viz. Copper, Lead, Chromium, Phenolic Compound, Manganese and Zinc were found to be BDL. Coliform bacteria were measured as Total Coliform, Fecal Coliform and E. coli; these bacteria are present in all the samples.
As per the water index quality of all location is unsuitable for drinking purpose except of Narmada Canal. Water is not suitable for drinking due to higher concentration of EC, TDS, Alkalinity & BOD than the permissible limits.
From above results it can be concluded that as per Surface Water Quality Standard of IS 2296:1992 all the surface bodies falls under Class B (water for outdoor bathing) except of Narmada Canal which falls under Class A.
3.4.5.3 Monitoring of Natural Drain
Turbidity in rainy season is found to be higher than non rainy season in both upstream and downstream due to soil particles carried away by runoff of the catchment area. Heavy Metals are found to be below deteaction limit in both the seasons. During rainy season TDS, COD, BOD and Alkalinity are found lower than non rainy season.

en-vιsιn
M/S. ECOCARE INFRASTRUCTURES PVT. LTD., SURENDRANAGAR, GUJARAT 3-29
3.5 NOISE ENVIRONMENT
Noise is unpleasant, unexpected, or undesired with various frequencies over the audible range due to the regular activities of the mankind. The source of most outdoor noise worldwide is mainly evolved from Industries, constructions and transportation systems, including motor vehicle noise, aircraft noise and rail noise, poor urban planning may give rise to noise pollution.
Industrial Noise resulting to noise pollution has many reasons such as industries being close to human habitats which prevent the noise from decaying before it reaches human ear.
A determination is made of the micro scale impact by predicting anticipated noise levels for each alternative during both construction and operational phases. Predicted noise levels are compared with applicable standards or criteria in order to assess the impact.
The physical description of sound concerns its loudness as a function of frequency. Noise generally consists of many frequency components with varying loudness over the audible frequency range.
The objective of noise pollution survey around the project site was to identify existing noise sources and to measure background noise levels. The study was carried out in the following steps:
Reconnaissance Identification of noise sources and measurement of noise levels Measurement of transportation and community noise levels
Monitoring of noise is done by identifying suitable number of noise quality monitoring locations. Background noise quality is monitored in dB (A) Leq (d) and dB (A) Leq (n) at the selected locations.
One day monitoring was carried out at all the locations. The frequency of monitoring was set at an interval of one hour for 24-hours.
Table 3-11: Noise Monitoring Methodology
Environment Component Sampling Frequency Methodology
Sample Collection Sampling
Parameter Sampling Equipment Range Resolution
Ambient Noise
Once during the study (Hourly reading for 24 hours at each location)
IS 9989:1981 (RA. 2016):2016
Sound level meter
30 dB(A) to 134 dB(A)
0.1 dB Decibels – dB (A)
Equivalent Sound Levels or Equivalent Continuous Equal Energy Level (Leq)
There is large number of noise scales and rating methods based on some sort of average of weighted average quantities derived from the detailed noise characteristics. Equivalent sound levels or Equivalent continuous equal energy level (Leq) is a statistical value of sound pressure level that can be equated to any fluctuating noise level and forms a useful measure of noise exposure and forms basis of several of the noise indices used presently.
Leq is defined as the constant noise level, which over a given time, expands the same amount of energy, as is expanded by the fluctuating level over the same time. This value is expressed by the equation:

en-vιsιn
M/S. ECOCARE INFRASTRUCTURES PVT. LTD., SURENDRANAGAR, GUJARAT 3-30
Leq = 10 log (10)Li/10 ti
Where,
n = Total number of sound samples,
Li = Noise level of any ith sample
ti = Time duration of ith sample,
Expressed as fraction of total sample time
Leq has gained wide spread acceptance as a scale for the measurement of long term noise exposure. Hourly equipment noise levels in the identified impact zone are monitored for day and time separately using sound level meter. All the values are reported in Leq and in case of equipment noise, Sound pressure level are monitored 1.5 m away from the machine and assessed with respect to standard prescribed in factory Act.
3.5.1 Selection of Monitoring Locations and Results
Ambient noise monitoring was carried out in 10 km study area. Sensitive locations (as defined in The Noise Pollution (Regulation and Control) Rules, 2000 and its subsequent amendments) were identified and ambient monitoring was done at a distance more than 100 m from the identified location.
Table 3-12: Ambient Noise Quality Standards for Different Areas/Zones Ambient Air Quality
Standards in Respect of Noise
Area Code Category
Limits in dB (A) Leq9
Day Time10 Night Time11
The Noise Pollution (Regulation and Control)
Rules, 2000 and its subsequent amendments
A Industrial 75.0 70.0 B Commercial 65.0 55.0 C Residential 55.0 45.0 D Silence12 50.0 40.0
Keeping in view of various local activities, 8 noise level measurement locations were identified and the sites are depicted in the Figure 3-8 & Table 3-13. Recorded sound levels are given in Table 3-14.
Traffic noise levels were also measured in January, 2020. The equivalent noise level Leq (60 min average) measured at a distance of 10 m and 20 m from the edge of the road are presented in Table 3-15.
Table 3-13: Noise Monitoring Locations
Code Sampling Location Category
With reference to the Project Site Latitude
Longitude
Distance of possible Major Noise Source from
the selected location Distance Direction
N1 Project Site Industrial - - 23°11'13.96"N 71°55'17.19"E
Noise levels were recorded at Entrance of the TSDF Facility; major Source of noise is Vehicular
9dB (A) Leq*: denotes the time weighted average of the level of sound in decibels on scale A which is relatable to human hearing. Day Time: 6:00 AM to 10:00 PM and Night Time: 10:00 PM to 6:00 AM 10 6:00 a.m. to 10:00 p.m. 11 10:00 p.m. to 6:00 a.m. 12Area comprising not less than 100 mt around Hospitals, educational institutions, courts, religious places or any other area which is declared as such by the competent authority.
i=n
i=1
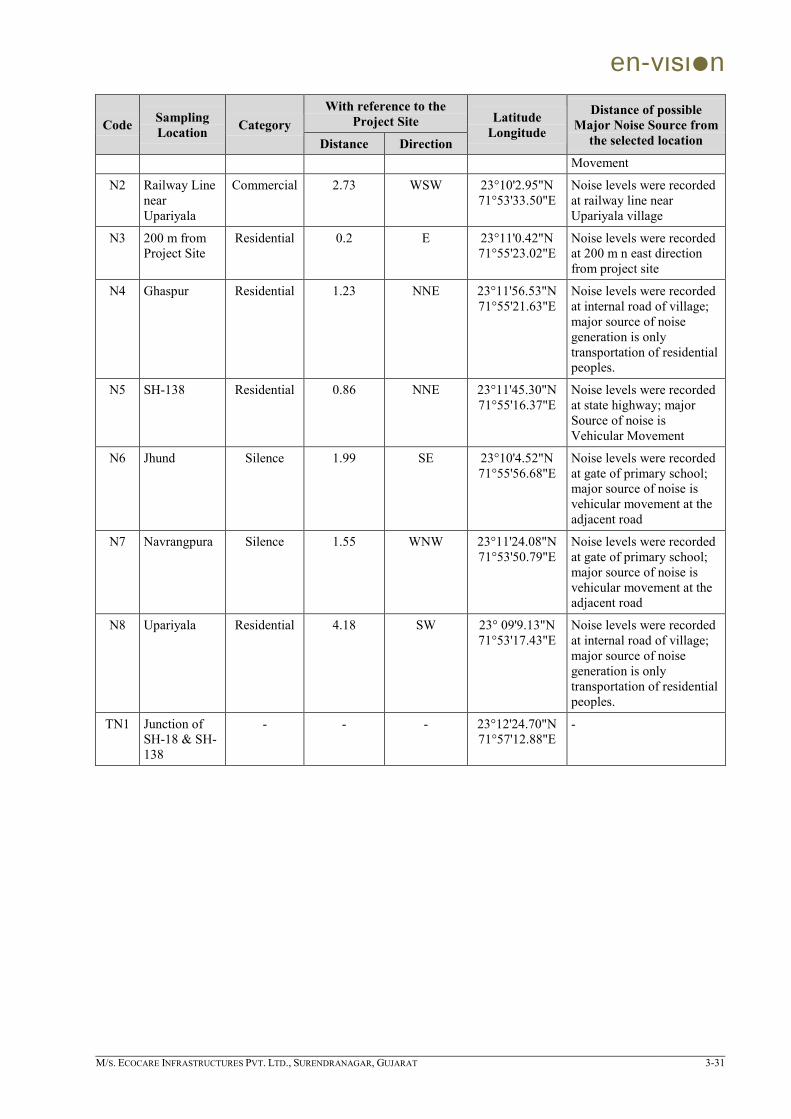
en-vιsιn
M/S. ECOCARE INFRASTRUCTURES PVT. LTD., SURENDRANAGAR, GUJARAT 3-31
Code Sampling Location Category
With reference to the Project Site Latitude
Longitude
Distance of possible Major Noise Source from
the selected location Distance Direction Movement
N2 Railway Line near Upariyala
Commercial 2.73 WSW 23°10'2.95"N 71°53'33.50"E
Noise levels were recorded at railway line near Upariyala village
N3 200 m from Project Site
Residential 0.2 E 23°11'0.42"N 71°55'23.02"E
Noise levels were recorded at 200 m n east direction from project site
N4 Ghaspur Residential 1.23 NNE 23°11'56.53"N 71°55'21.63"E
Noise levels were recorded at internal road of village; major source of noise generation is only transportation of residential peoples.
N5 SH-138 Residential 0.86 NNE 23°11'45.30"N 71°55'16.37"E
Noise levels were recorded at state highway; major Source of noise is Vehicular Movement
N6 Jhund Silence 1.99 SE 23°10'4.52"N 71°55'56.68"E
Noise levels were recorded at gate of primary school; major source of noise is vehicular movement at the adjacent road
N7 Navrangpura Silence 1.55 WNW 23°11'24.08"N 71°53'50.79"E
Noise levels were recorded at gate of primary school; major source of noise is vehicular movement at the adjacent road
N8 Upariyala Residential 4.18 SW 23° 09'9.13"N 71°53'17.43"E
Noise levels were recorded at internal road of village; major source of noise generation is only transportation of residential peoples.
TN1 Junction of SH-18 & SH-138
- - - 23°12'24.70"N 71°57'12.88"E
-
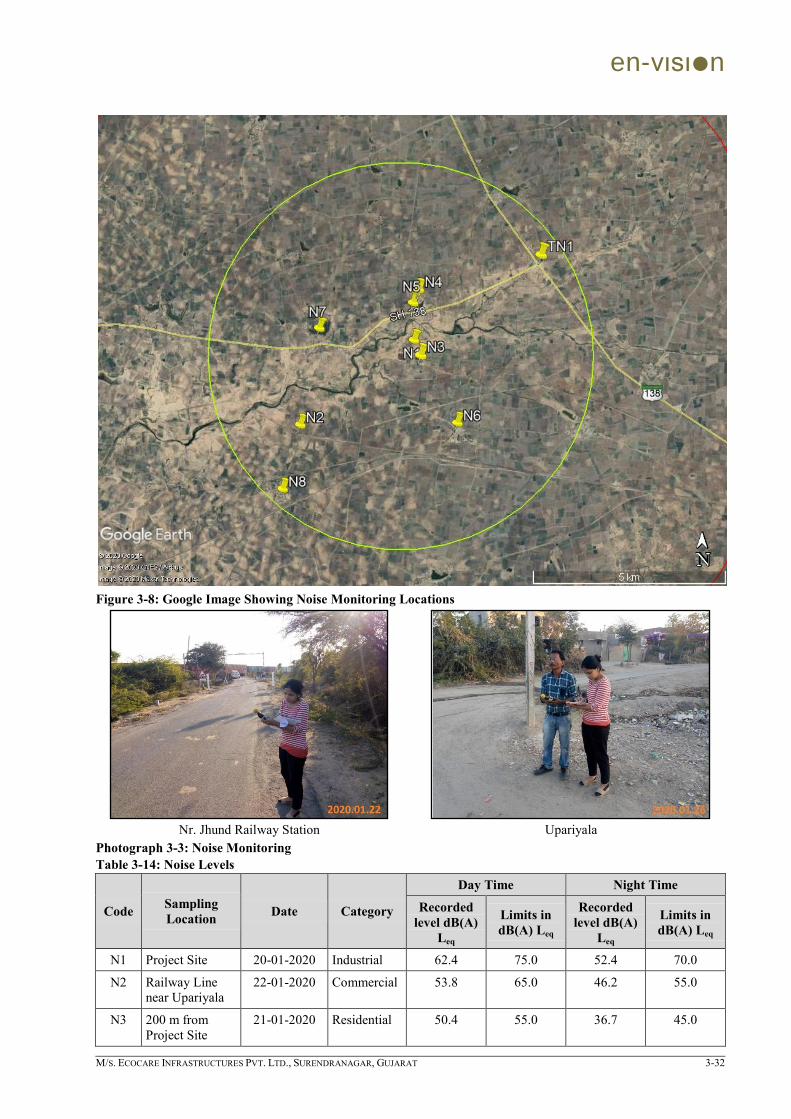
en-vιsιn
M/S. ECOCARE INFRASTRUCTURES PVT. LTD., SURENDRANAGAR, GUJARAT 3-32
Figure 3-8: Google Image Showing Noise Monitoring Locations
Nr. Jhund Railway Station
Upariyala
Photograph 3-3: Noise Monitoring Table 3-14: Noise Levels
Code Sampling Location Date Category
Day Time Night Time
Recorded level dB(A)
Leq
Limits in dB(A) Leq
Recorded level dB(A)
Leq
Limits in dB(A) Leq
N1 Project Site 20-01-2020 Industrial 62.4 75.0 52.4 70.0
N2 Railway Line near Upariyala
22-01-2020 Commercial 53.8 65.0 46.2 55.0
N3 200 m from Project Site
21-01-2020 Residential 50.4 55.0 36.7 45.0
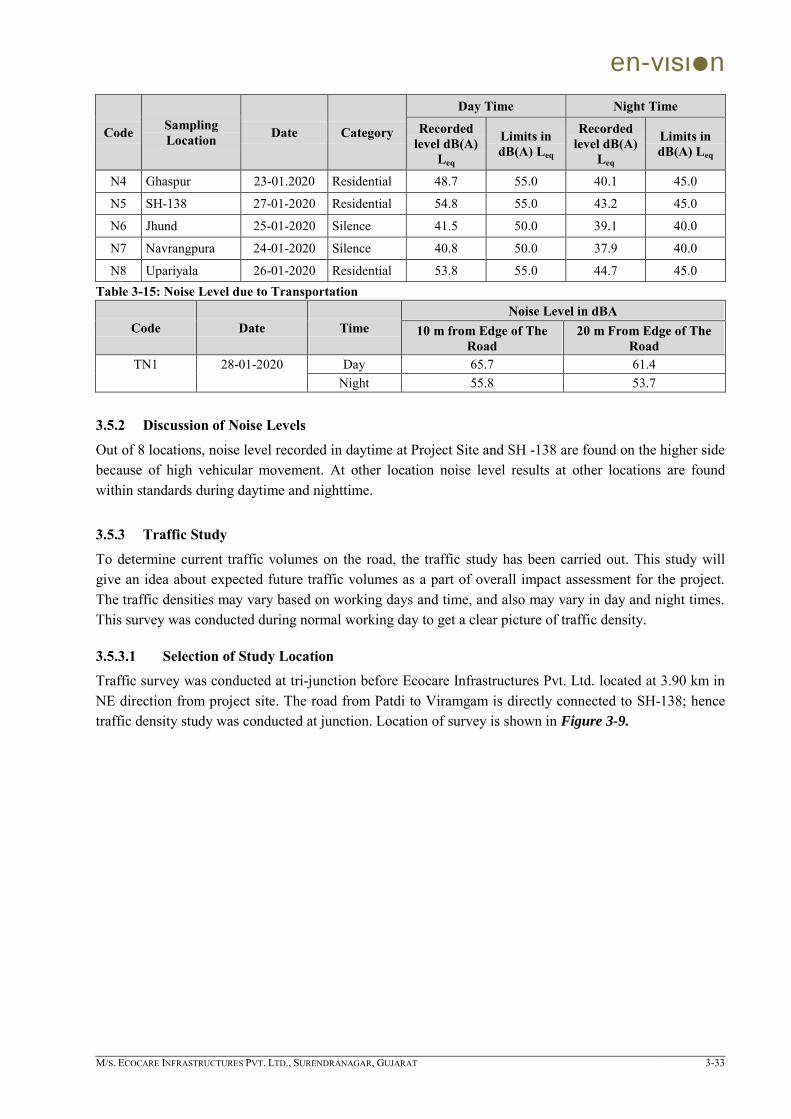
en-vιsιn
M/S. ECOCARE INFRASTRUCTURES PVT. LTD., SURENDRANAGAR, GUJARAT 3-33
Code Sampling Location Date Category
Day Time Night Time
Recorded level dB(A)
Leq
Limits in dB(A) Leq
Recorded level dB(A)
Leq
Limits in dB(A) Leq
N4 Ghaspur 23-01.2020 Residential 48.7 55.0 40.1 45.0
N5 SH-138 27-01-2020 Residential 54.8 55.0 43.2 45.0
N6 Jhund 25-01-2020 Silence 41.5 50.0 39.1 40.0
N7 Navrangpura 24-01-2020 Silence 40.8 50.0 37.9 40.0
N8 Upariyala 26-01-2020 Residential 53.8 55.0 44.7 45.0 Table 3-15: Noise Level due to Transportation
Code Date Time Noise Level in dBA
10 m from Edge of The Road
20 m From Edge of The Road
TN1 28-01-2020 Day 65.7 61.4 Night 55.8 53.7
3.5.2 Discussion of Noise Levels
Out of 8 locations, noise level recorded in daytime at Project Site and SH -138 are found on the higher side because of high vehicular movement. At other location noise level results at other locations are found within standards during daytime and nighttime.
3.5.3 Traffic Study
To determine current traffic volumes on the road, the traffic study has been carried out. This study will give an idea about expected future traffic volumes as a part of overall impact assessment for the project. The traffic densities may vary based on working days and time, and also may vary in day and night times. This survey was conducted during normal working day to get a clear picture of traffic density.
3.5.3.1 Selection of Study Location
Traffic survey was conducted at tri-junction before Ecocare Infrastructures Pvt. Ltd. located at 3.90 km in NE direction from project site. The road from Patdi to Viramgam is directly connected to SH-138; hence traffic density study was conducted at junction. Location of survey is shown in Figure 3-9.

en-vιsιn
M/S. ECOCARE INFRASTRUCTURES PVT. LTD., SURENDRANAGAR, GUJARAT 3-34
Figure 3-9: Google Image Showing Location of Traffic Survey
3.5.3.2 Methodology
3.5.3.2.1 VEHICULAR COUNT
The vehicles moving in both the directions were counted continuously for 24 hours at one location. The vehicles were counted every hour and recorded under respective category. The maximum traffic count in an hour is termed as peak hour traffic.
3.5.3.2.2 CATEGORIZATION OF TRAFFIC
The vehicles were categorized under various heads like heavy motor vehicles such as buses, trucks and tankers, light motor vehicles (cars, jeeps), three wheelers (auto rickshaws, tempo etc.) two wheelers (scooters, motor cycles etc.).
3.5.3.3 Results
The summary of daily traffic density in terms of PCU for the locations were monitored during the study period is summarized below and % of composition of the vehicles is given below. It was observed that the Light commercial vehicles and two wheelers form the major volume of the traffic. The overall total traffic PCU of this road is minimal.
The present level of traffic in terms of Passenger Car Units (PCU) at these locations as per the conversion factors stipulated by Indian Road Congress (IRC) is presented below:

en-vιsιn
M/S. ECOCARE INFRASTRUCTURES PVT. LTD., SURENDRANAGAR, GUJARAT 3-35
Table 3-16: Traffic Counts at survey point
Type of Vehicles During peak hr (From Patdi to Viramgam)
Nos. of Vehicles/hr Equivalent PCU Factor Converted PCU
Heavy (Bus, Truck, etc) 75 3.7 277.5
Light commercial vehicles 86 2 172
Passenger car, Pickup Van 61 1 61
3 Wheeler (Rickshaw) 17 2 34
2 Wheeler (Scooter, motorcycle, cycle etc)
112 0.75 84
Total 351 - 628.5
Type of Vehicles During peak hr (From Viramgam to Patdi)
Nos. of Vehicles/hr Equivalent PCU Factor Converted PCU
Heavy (Bus, Truck, etc) 81 3.7 299.7
Light commercial vehicles 97 2 194
Passenger car, Pickup Van 54 1 54
3 Wheeler (Rickshaw) 15 2 30
2 Wheeler (Scooter, motorcycle, cycle etc)
124 0.75 93
Total 371 - 670.7
Table 3-17: Existing Traffic Scenario and Level of Services
Particular Existing Traffic Scenario and Level of Services
From Patdi to Viramgam From Viramgam to Patdi
Road type 2 lane without divider 2 lane without divider
Capacity as per IRC (PUC‟s /h)
1500 1500
Existing total volume during peak hr (Nos.) 628.5 670.7
Existing volume / capacity ratio 0.42 0.45
Level of Service “C” (Good) “C” (Good) Table 3-18: Level of Service
Sr. No. Existing Volume / Capacity Ratio Level of Service
1. 0.0 to 0.2 “A” (Excellent) 2. 0.2 to 0.4 “B” (Very good) 3. 0.4 to 0.6 “C” (Good) 4. 0.6 to 0.8 “D” (Fair) 5. 0.8 to 1.0 “E” (Poor)
3.5.3.4 Discussion
The above traffic reveals the LOS (Levels of Service) as “C” Good for the Patdi to Viramgam, which is 2 lane road without divider. For management of traffic, adequate parking space will be providing at project site. Transportation activity will be carried out during non-peak hours only and trained driver will be appointed for transportation.
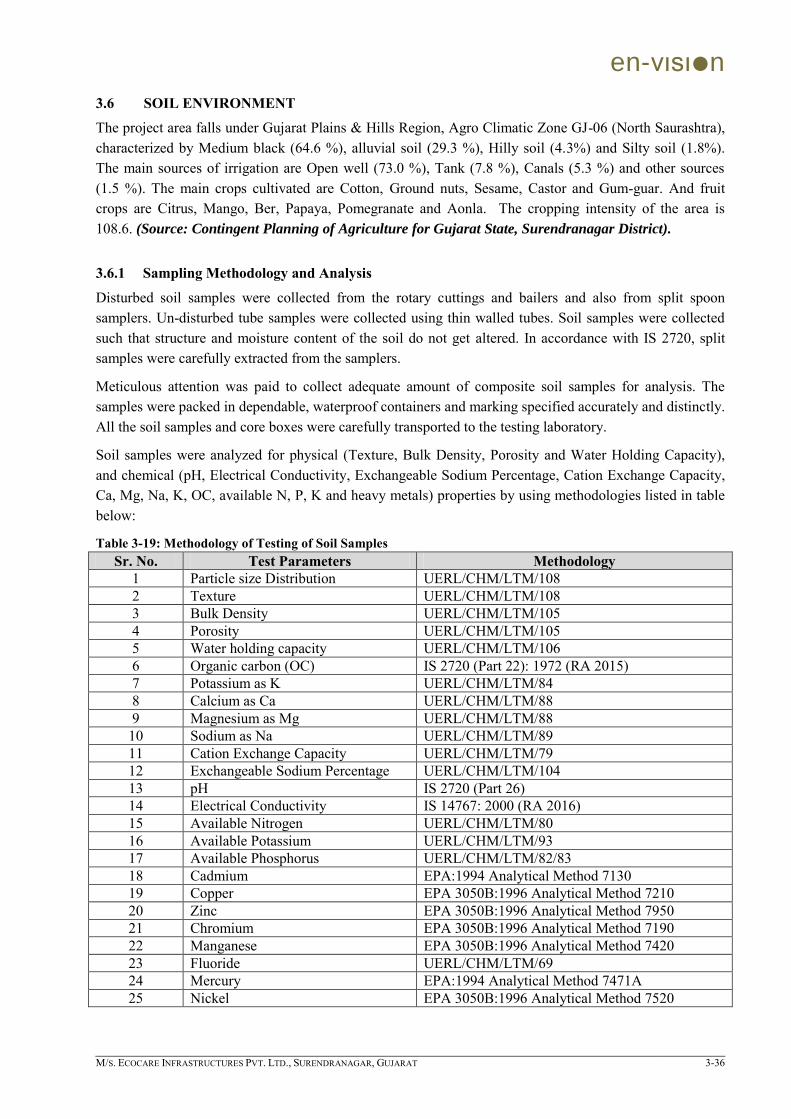
en-vιsιn
M/S. ECOCARE INFRASTRUCTURES PVT. LTD., SURENDRANAGAR, GUJARAT 3-36
3.6 SOIL ENVIRONMENT
The project area falls under Gujarat Plains & Hills Region, Agro Climatic Zone GJ-06 (North Saurashtra), characterized by Medium black (64.6 %), alluvial soil (29.3 %), Hilly soil (4.3%) and Silty soil (1.8%). The main sources of irrigation are Open well (73.0 %), Tank (7.8 %), Canals (5.3 %) and other sources (1.5 %). The main crops cultivated are Cotton, Ground nuts, Sesame, Castor and Gum-guar. And fruit crops are Citrus, Mango, Ber, Papaya, Pomegranate and Aonla. The cropping intensity of the area is 108.6. (Source: Contingent Planning of Agriculture for Gujarat State, Surendranagar District).
3.6.1 Sampling Methodology and Analysis
Disturbed soil samples were collected from the rotary cuttings and bailers and also from split spoon samplers. Un-disturbed tube samples were collected using thin walled tubes. Soil samples were collected such that structure and moisture content of the soil do not get altered. In accordance with IS 2720, split samples were carefully extracted from the samplers.
Meticulous attention was paid to collect adequate amount of composite soil samples for analysis. The samples were packed in dependable, waterproof containers and marking specified accurately and distinctly. All the soil samples and core boxes were carefully transported to the testing laboratory.
Soil samples were analyzed for physical (Texture, Bulk Density, Porosity and Water Holding Capacity), and chemical (pH, Electrical Conductivity, Exchangeable Sodium Percentage, Cation Exchange Capacity, Ca, Mg, Na, K, OC, available N, P, K and heavy metals) properties by using methodologies listed in table below:
Table 3-19: Methodology of Testing of Soil Samples Sr. No. Test Parameters Methodology
1 Particle size Distribution UERL/CHM/LTM/108 2 Texture UERL/CHM/LTM/108 3 Bulk Density UERL/CHM/LTM/105 4 Porosity UERL/CHM/LTM/105 5 Water holding capacity UERL/CHM/LTM/106 6 Organic carbon (OC) IS 2720 (Part 22): 1972 (RA 2015) 7 Potassium as K UERL/CHM/LTM/84 8 Calcium as Ca UERL/CHM/LTM/88 9 Magnesium as Mg UERL/CHM/LTM/88
10 Sodium as Na UERL/CHM/LTM/89 11 Cation Exchange Capacity UERL/CHM/LTM/79 12 Exchangeable Sodium Percentage UERL/CHM/LTM/104 13 pH IS 2720 (Part 26) 14 Electrical Conductivity IS 14767: 2000 (RA 2016) 15 Available Nitrogen UERL/CHM/LTM/80 16 Available Potassium UERL/CHM/LTM/93 17 Available Phosphorus UERL/CHM/LTM/82/83 18 Cadmium EPA:1994 Analytical Method 7130 19 Copper EPA 3050B:1996 Analytical Method 7210 20 Zinc EPA 3050B:1996 Analytical Method 7950 21 Chromium EPA 3050B:1996 Analytical Method 7190 22 Manganese EPA 3050B:1996 Analytical Method 7420 23 Fluoride UERL/CHM/LTM/69 24 Mercury EPA:1994 Analytical Method 7471A 25 Nickel EPA 3050B:1996 Analytical Method 7520
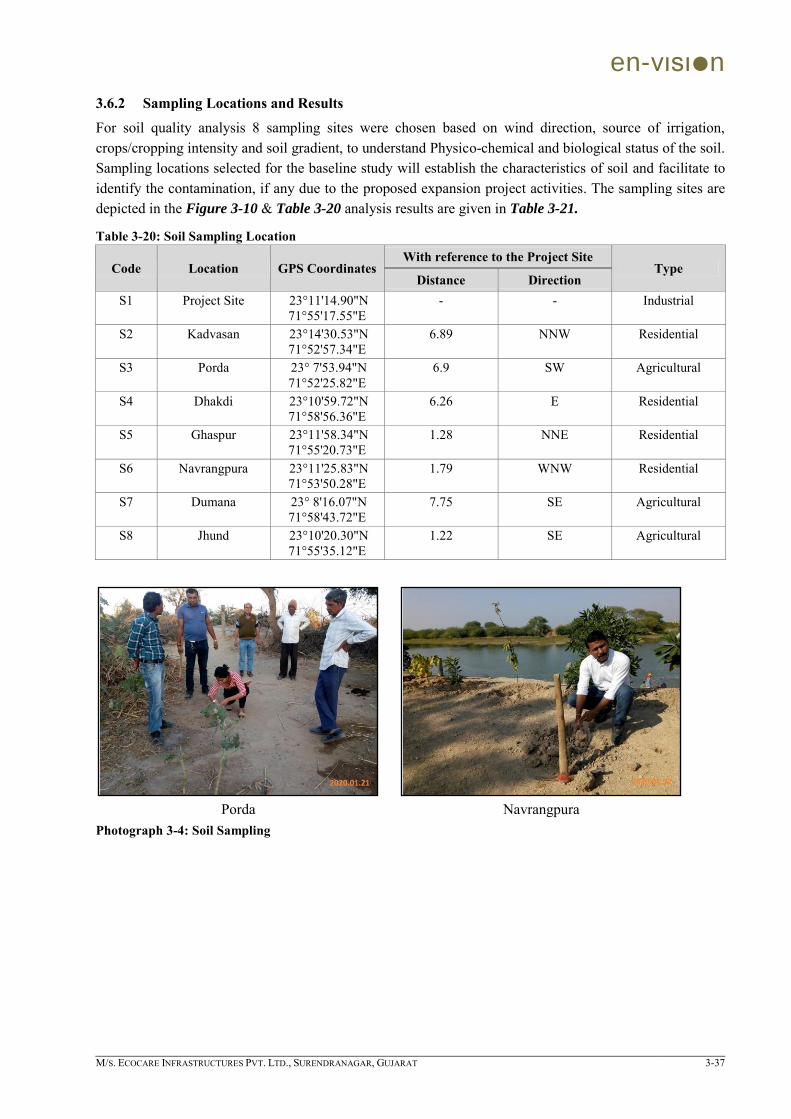
en-vιsιn
M/S. ECOCARE INFRASTRUCTURES PVT. LTD., SURENDRANAGAR, GUJARAT 3-37
3.6.2 Sampling Locations and Results
For soil quality analysis 8 sampling sites were chosen based on wind direction, source of irrigation, crops/cropping intensity and soil gradient, to understand Physico-chemical and biological status of the soil. Sampling locations selected for the baseline study will establish the characteristics of soil and facilitate to identify the contamination, if any due to the proposed expansion project activities. The sampling sites are depicted in the Figure 3-10 & Table 3-20 analysis results are given in Table 3-21.
Table 3-20: Soil Sampling Location
Code Location GPS Coordinates With reference to the Project Site
Type Distance Direction
S1 Project Site 23°11'14.90"N 71°55'17.55"E
- - Industrial
S2 Kadvasan 23°14'30.53"N 71°52'57.34"E
6.89 NNW Residential
S3 Porda 23° 7'53.94"N 71°52'25.82"E
6.9 SW Agricultural
S4 Dhakdi 23°10'59.72"N 71°58'56.36"E
6.26 E Residential
S5 Ghaspur 23°11'58.34"N 71°55'20.73"E
1.28 NNE Residential
S6 Navrangpura 23°11'25.83"N 71°53'50.28"E
1.79 WNW Residential
S7 Dumana 23° 8'16.07"N 71°58'43.72"E
7.75 SE Agricultural
S8 Jhund 23°10'20.30"N 71°55'35.12"E
1.22 SE Agricultural
Porda
Navrangpura
Photograph 3-4: Soil Sampling

en-vιsιn
M/S. ECOCARE INFRASTRUCTURES PVT. LTD., SURENDRANAGAR, GUJARAT 3-38
Figure 3-10: Google Image Showing Soil Sampling Locations

en-vιsιn
M/S. ECOCARE INFRASTRUCTURES PVT. LTD., SURENDRANAGAR, GUJARAT 3-39
Table 3-21: Physicochemical Characteristics of the Soil
Sr. No. Test Parameters Units Detection
Limit
Sample Code & Location
Project Site (S1)
Kadvasan (S2)
Porda (S3)
Dhakdi (S4)
Ghaspur (S5)
Navrangpura (S6)
Dumana (S7)
Jhund (S8)
1 Particle size Distribution -
a Sand % 34 34.6 46.2 31.8 32.1 30.2 42.3 31
b Silt % 31.2 32.5 29.7 32.6 30.6 28.7 31.7 28.7
c Clay % 34.8 32.9 24.1 35.6 37.3 41.1 26 40.3
2 Texture Qualitative Sandy
Loam Sandy Loam
Sandy Soil Sandy Clay Loam
Sandy Clay Loam
Clay Sandy Soil
Clay
3 Bulk Density g/cc 1 1.4 1.2 1.1 1.3 1.5 1.2 1.4 1.2
4 Porosity % - 45.6 52.6 56.1 50.2 41.2 53.13 44.1 52.6
5 Water holding capacity % 5 37 28 35 22 39 25 32 36
6 Organic carbon (OC) % 0.5 0.67 0.81 0.66 BDL 0.72 BDL 0.67 0.58
7 Potassium as K mg/kg 5 48.9 32.6 40.5 32.8 41.9 45.7 43.1 44.6
8 Calcium as Ca mg/kg 5 25.8 34.2 28.9 30.2 32.6 35.6 34.7 29.5
9 Magnesium as Mg mg/kg 5 24.7 20.9 23.8 26.7 21.8 25.6 24.1 23.6
10 Sodium as Na mg/kg 5 98.1 87.5 89.2 95.2 96.7 90.3 88.7 86.2
11 Cation Exchange Capacity
meq/100g 5 BDL BDL BDL BDL BDL BDL BDL BDL
12 Exchangable Sodium Percentage
% 1 10.5 7.8 5.5 12.3 8.5 9.1 10.4 11.2
13 pH - 2 7.4 7.5 7.7 8.1 7.3 7.6 8.2 7.1
14 Electrical Conductivity µS/cm 1 451 312 567 356 293 567 413 289
15 Available Nitrogen mg/kg 5 123.5 234 156.3 BDL 135.2 BDL 127.8 110.9
16 Available Potassium mg/kg 5 78.1 67.2 89.3 105.8 132.1 106.2 79.1 93.4
17 Available Phosphorus mg/kg 1 13.4 17.8 20.1 16.7 19.2 20.1 15.3 15.7
18 Cadmium mg/kg 1 BDL BDL BDL BDL BDL BDL BDL BDL
19 Copper mg/kg 1 BDL BDL BDL BDL BDL BDL BDL BDL
20 Zinc mg/kg 1 BDL BDL BDL BDL BDL 1.2 1 0.84
21 Chromium mg/kg 2 ND ND ND ND ND ND ND ND
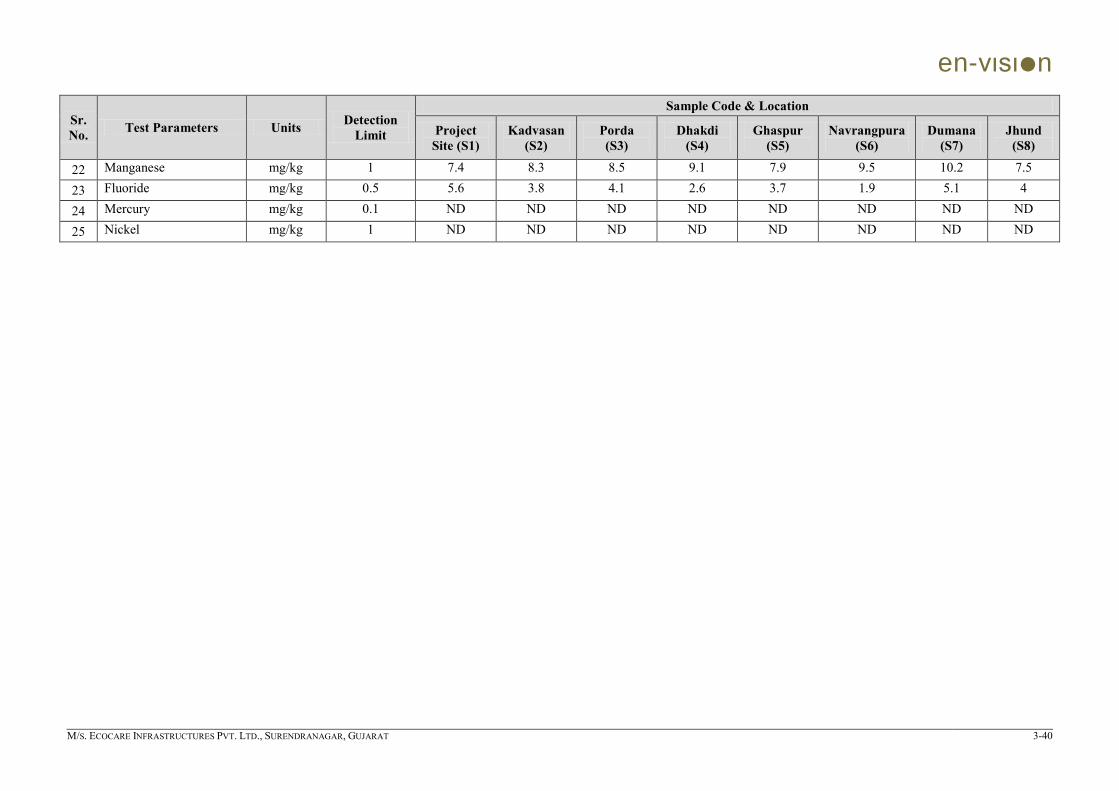
en-vιsιn
M/S. ECOCARE INFRASTRUCTURES PVT. LTD., SURENDRANAGAR, GUJARAT 3-40
Sr. No. Test Parameters Units Detection
Limit
Sample Code & Location
Project Site (S1)
Kadvasan (S2)
Porda (S3)
Dhakdi (S4)
Ghaspur (S5)
Navrangpura (S6)
Dumana (S7)
Jhund (S8)
22 Manganese mg/kg 1 7.4 8.3 8.5 9.1 7.9 9.5 10.2 7.5
23 Fluoride mg/kg 0.5 5.6 3.8 4.1 2.6 3.7 1.9 5.1 4
24 Mercury mg/kg 0.1 ND ND ND ND ND ND ND ND
25 Nickel mg/kg 1 ND ND ND ND ND ND ND ND
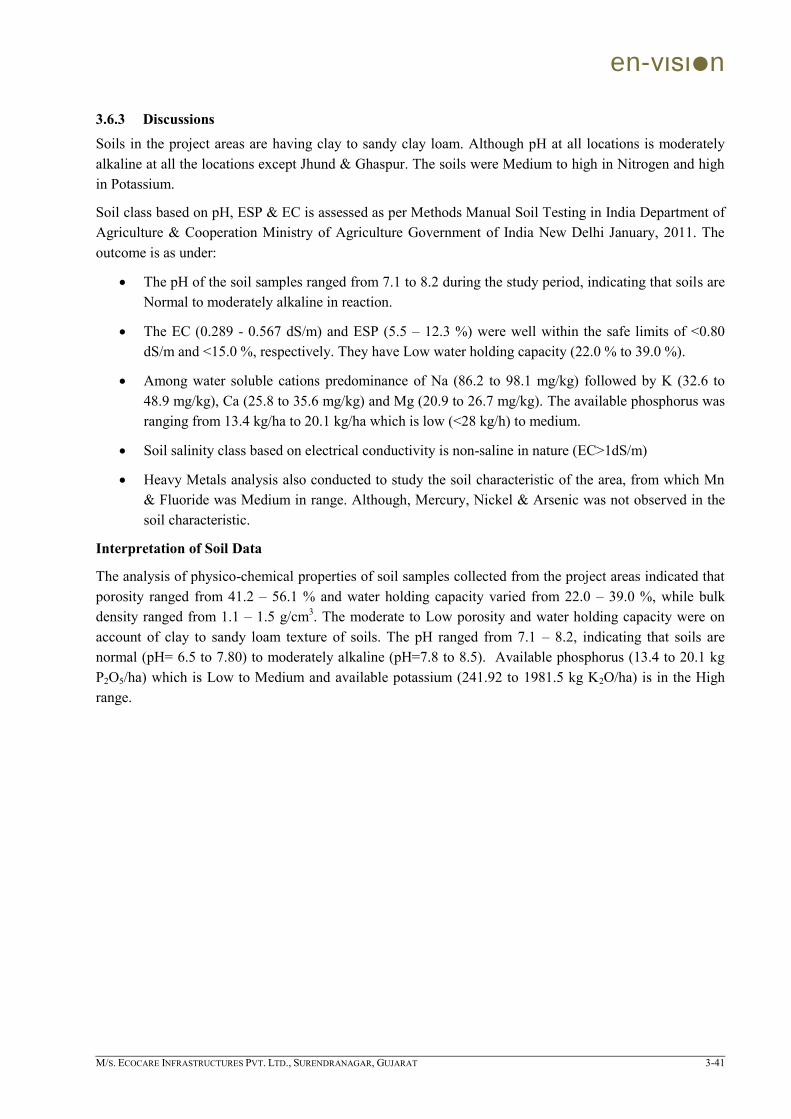
en-vιsιn
M/S. ECOCARE INFRASTRUCTURES PVT. LTD., SURENDRANAGAR, GUJARAT 3-41
3.6.3 Discussions
Soils in the project areas are having clay to sandy clay loam. Although pH at all locations is moderately alkaline at all the locations except Jhund & Ghaspur. The soils were Medium to high in Nitrogen and high in Potassium.
Soil class based on pH, ESP & EC is assessed as per Methods Manual Soil Testing in India Department of Agriculture & Cooperation Ministry of Agriculture Government of India New Delhi January, 2011. The outcome is as under:
The pH of the soil samples ranged from 7.1 to 8.2 during the study period, indicating that soils are Normal to moderately alkaline in reaction.
The EC (0.289 - 0.567 dS/m) and ESP (5.5 – 12.3 %) were well within the safe limits of <0.80 dS/m and <15.0 %, respectively. They have Low water holding capacity (22.0 % to 39.0 %).
Among water soluble cations predominance of Na (86.2 to 98.1 mg/kg) followed by K (32.6 to 48.9 mg/kg), Ca (25.8 to 35.6 mg/kg) and Mg (20.9 to 26.7 mg/kg). The available phosphorus was ranging from 13.4 kg/ha to 20.1 kg/ha which is low (<28 kg/h) to medium.
Soil salinity class based on electrical conductivity is non-saline in nature (EC>1dS/m)
Heavy Metals analysis also conducted to study the soil characteristic of the area, from which Mn & Fluoride was Medium in range. Although, Mercury, Nickel & Arsenic was not observed in the soil characteristic.
Interpretation of Soil Data
The analysis of physico-chemical properties of soil samples collected from the project areas indicated that porosity ranged from 41.2 – 56.1 % and water holding capacity varied from 22.0 – 39.0 %, while bulk density ranged from 1.1 – 1.5 g/cm3. The moderate to Low porosity and water holding capacity were on account of clay to sandy loam texture of soils. The pH ranged from 7.1 – 8.2, indicating that soils are normal (pH= 6.5 to 7.80) to moderately alkaline (pH=7.8 to 8.5). Available phosphorus (13.4 to 20.1 kg P2O5/ha) which is Low to Medium and available potassium (241.92 to 1981.5 kg K2O/ha) is in the High range.

en-vιsιn
M/S. ECOCARE INFRASTRUCTURES PVT. LTD., SURENDRANAGAR, GUJARAT 3-42
3.7 LAND ENVIRONMENT
Land Use (LU) refers to man‟s activities and various uses, which are carried on land. Land Cover (LC) refers to natural vegetation, water bodies, rock / soil, artificial cover and others resulting due to land transformation. Although land use is generally inferred based on the cover, yet both the terms land use and land cover are closely related and interchangeable.
Information on the rate and kind of change in the use of land resources is essential to the proper planning, management and regulation of the use of such resources. Knowledge about the existing land use and trends of change is essential if the nation is to tackle the problems associated with the haphazard and uncontrolled growth. A systematic framework is needed for updating the land use and land cover maps that will be timely, relatively inexpensive and appropriate for different needs at both national and state levels. The developing technology of remote sensing offers an efficient and timely approach to the mapping and collection of basic land use and land cover data over large area. The satellite imageries are potentially more amenable to digital processing because the remote sensor output can be obtained in digital format. Land use data are needed in the analysis of environmental processes and problems that must be understood if living conditions and standards are to be improved from or maintained at current levels.
It is required to carry out the land use / land cover study for the project study area (10 km radius) to obtain the necessary environmental clearances from statutory authorities. The objective of the study is to carryout land use / land cover study for the proposed project. The LU / LC study is carried out using the Satellite Imageries (IRS RS2 LISS IV) in addition to Survey of India Toposheet. Appropriate guidelines are followed while preparing the LU / LC map for the project study area.
3.7.1 Methodology of Study
3.7.1.1 Pre-Field Interpretation
Collection of Survey of India Topographical maps on 1: 50,000 scale from Survey of India (SoI). Procurement of Satellite Imagery from National Remote Sensing Centre (NRSC) site Geo Co-
ordinates from site center taken 10 km radius. Using ERDAS image processing software processed the raw satellite data. Using ARCGIS software converting the all base features from the Toposheet, and overlaying the same
features on the satellite imagery. Using remote Sensing techniques tone, color, texture and shadow etc. draft land use map is prepared. Before site / ground truthing randomly mark field data checked. With which field work will be carried
out.
3.7.1.2 Site / Ground Truthing
Site visit - capture the Geo-Coordinates of Boundary Pillars and record in field note book. Take traverses and observe the land use categories and map it on the field map on draft map with field
photographs. Observe the each land use category like single crop/double crop, industrial area, settlements, forest
lands, water bodies, waste lands and etc. The buffer zone area will randomly traverse for correlating mapping units. Collecting secondary data from agricultural department and local people.
3.7.1.3 Post Field Work
Using ARCGIS software plotting the data collected during ground truth maps. Preparation of maps Preparation of report incorporating identification of impacts, quantification of impacts and suggesting
mitigative measures in consultation with other FAEs.

en-vιsιn
M/S. ECOCARE INFRASTRUCTURES PVT. LTD., SURENDRANAGAR, GUJARAT 3-43
3.7.2 Data Used
The data is used for the preparation of different maps for the study natural resources. The data is used by using the application of Remote Sensing and GIS technologies.
Table 3-22: Details of Sources & the Maps Prepared Sr. No. Source Maps Prepared
1. Survey of India‟s topographic maps and satellite imageries
Base map and Drainage map
2. Satellite Imageries Land use / Land cover
3.7.3 Land Use / Land Cover Map
Land use / land cover map is prepared by visual interpretation of high-resolution satellite data with the help of Survey of India Topographic maps on 1:50,000 scale. Two seasons‟ data (winter year 2019-2020) is used for the delineation of different units. The project site is confirmed by the ground truth/field visits.
Level-II classification of National Resources Information System (NRIS) has been followed for the delineation of units.
The adjoining area of project site is industrial land, covering 1.715 km2 of the total area. The land use for settlement is mostly confined to the settlement (built up-rural) 7.546 km2 and land without scrub feature 9.947 km2 of the total area. 281.946 km2 of the total area is agricultural land (dominant category of land use) covering single including Kharif, Rabi and summer crop.
Active River, canal and ponds covers about 21.609 km2 of the total project area. Land use / Land cover map of the study area (Figure 3-11) is integrated with village map and analyzed with the help of GIS to get the village wise findings of the present land use of the study area, which is given elaborately in the table below:
Table 3-23: Land Use / Land Cover Statistics of the Study Area (10 km Radius) Sr. No. Land Use Area (km2) Area (%)
1 Built-Up Land
a. Settlements 7.546 2.2
b. Industrial Area 1.715 0.5
2 Water Bodies
a. River/Major Canal, etc 21.609 6.3
3 Crop Land
a. Single Crop 281.946 82.2
4 Wastelands
a. Land With Scrub 20.237 5.9
b. Land Without Scrub 9.947 2.9
Total 343.000 100.0
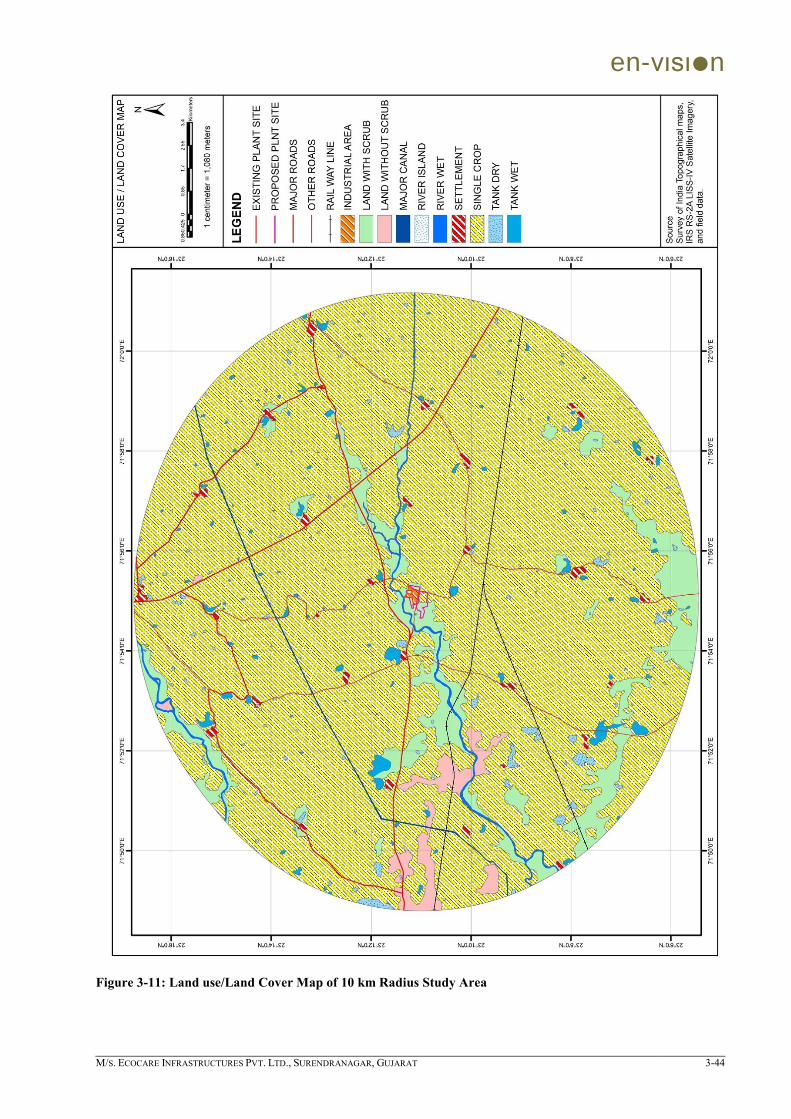
en-vιsιn
M/S. ECOCARE INFRASTRUCTURES PVT. LTD., SURENDRANAGAR, GUJARAT 3-44
Figure 3-11: Land use/Land Cover Map of 10 km Radius Study Area
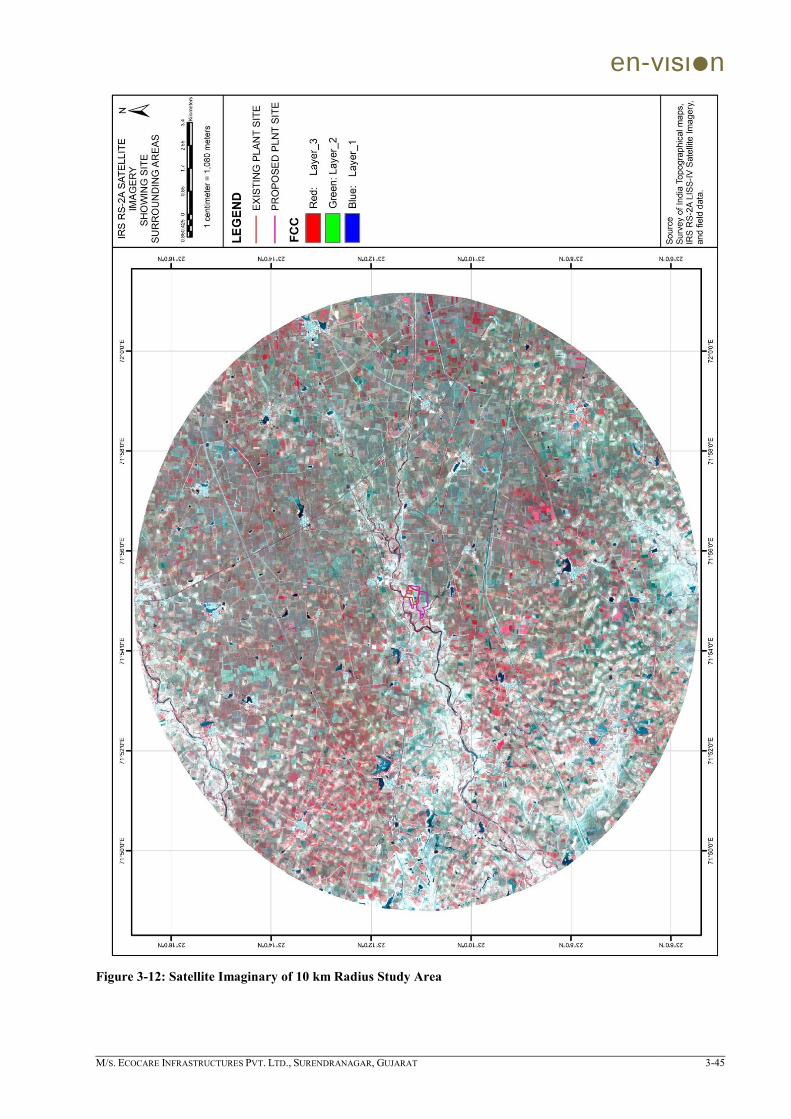
en-vιsιn
M/S. ECOCARE INFRASTRUCTURES PVT. LTD., SURENDRANAGAR, GUJARAT 3-45
Figure 3-12: Satellite Imaginary of 10 km Radius Study Area
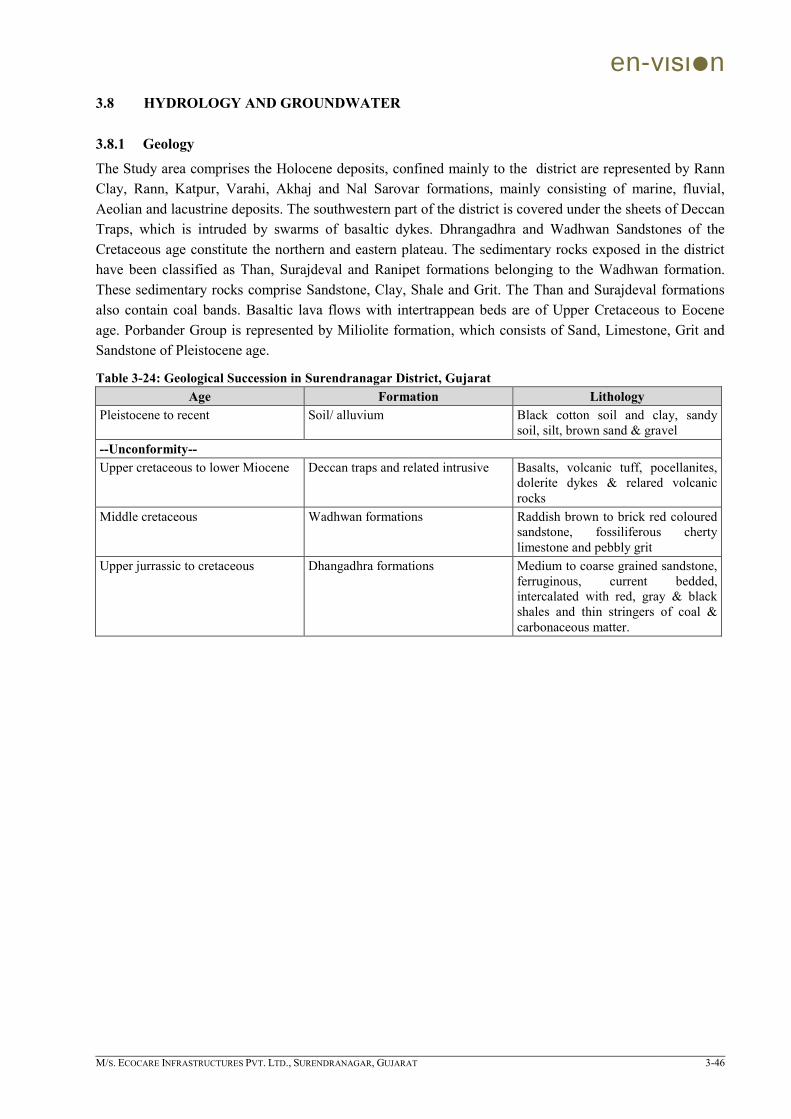
en-vιsιn
M/S. ECOCARE INFRASTRUCTURES PVT. LTD., SURENDRANAGAR, GUJARAT 3-46
3.8 HYDROLOGY AND GROUNDWATER
3.8.1 Geology
The Study area comprises the Holocene deposits, confined mainly to the district are represented by Rann Clay, Rann, Katpur, Varahi, Akhaj and Nal Sarovar formations, mainly consisting of marine, fluvial, Aeolian and lacustrine deposits. The southwestern part of the district is covered under the sheets of Deccan Traps, which is intruded by swarms of basaltic dykes. Dhrangadhra and Wadhwan Sandstones of the Cretaceous age constitute the northern and eastern plateau. The sedimentary rocks exposed in the district have been classified as Than, Surajdeval and Ranipet formations belonging to the Wadhwan formation. These sedimentary rocks comprise Sandstone, Clay, Shale and Grit. The Than and Surajdeval formations also contain coal bands. Basaltic lava flows with intertrappean beds are of Upper Cretaceous to Eocene age. Porbander Group is represented by Miliolite formation, which consists of Sand, Limestone, Grit and Sandstone of Pleistocene age.
Table 3-24: Geological Succession in Surendranagar District, Gujarat Age Formation Lithology
Pleistocene to recent Soil/ alluvium Black cotton soil and clay, sandy soil, silt, brown sand & gravel
--Unconformity-- Upper cretaceous to lower Miocene Deccan traps and related intrusive Basalts, volcanic tuff, pocellanites,
dolerite dykes & relared volcanic rocks
Middle cretaceous Wadhwan formations Raddish brown to brick red coloured sandstone, fossiliferous cherty limestone and pebbly grit
Upper jurrassic to cretaceous Dhangadhra formations Medium to coarse grained sandstone, ferruginous, current bedded, intercalated with red, gray & black shales and thin stringers of coal & carbonaceous matter.
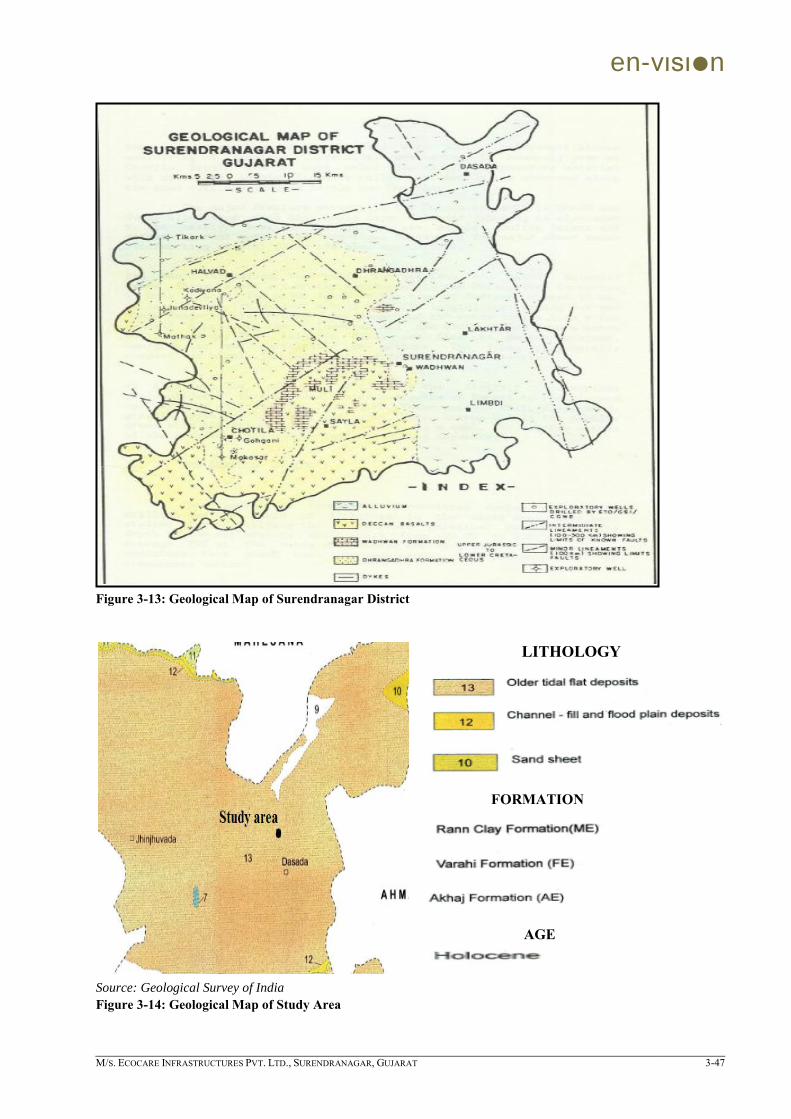
en-vιsιn
M/S. ECOCARE INFRASTRUCTURES PVT. LTD., SURENDRANAGAR, GUJARAT 3-47
Figure 3-13: Geological Map of Surendranagar District
LITHOLOGY
FORMATION
AGE
Source: Geological Survey of India
Figure 3-14: Geological Map of Study Area
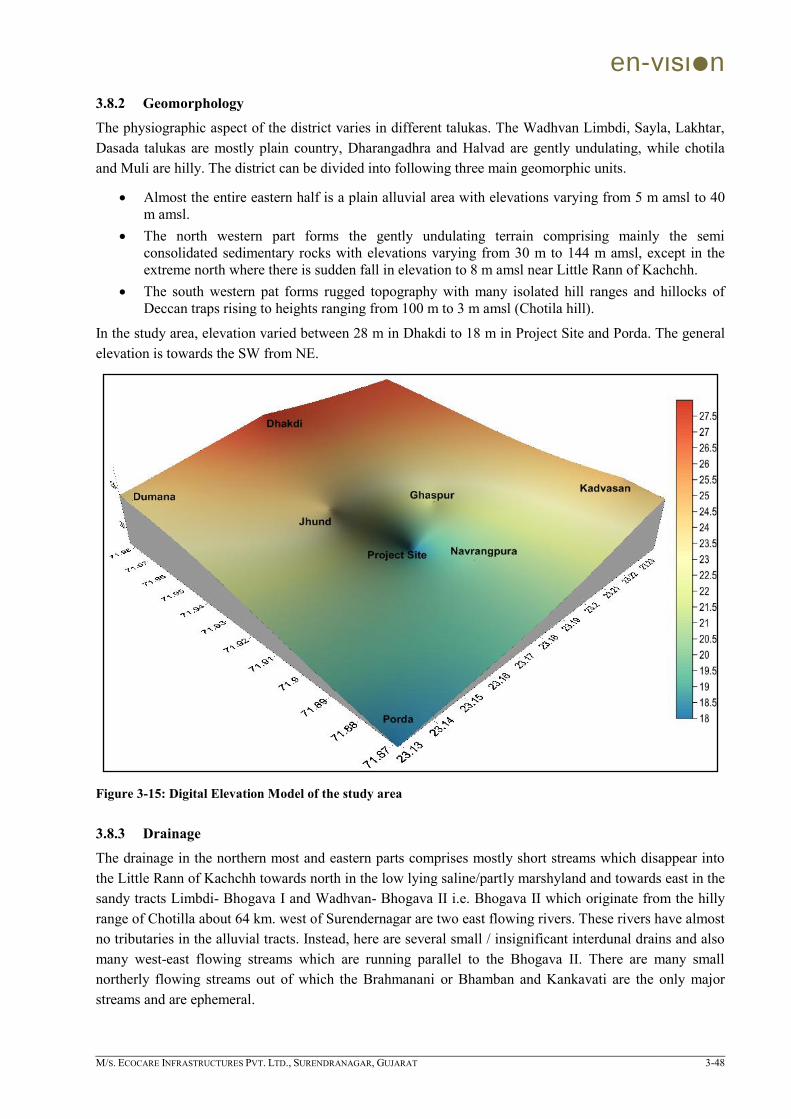
en-vιsιn
M/S. ECOCARE INFRASTRUCTURES PVT. LTD., SURENDRANAGAR, GUJARAT 3-48
3.8.2 Geomorphology
The physiographic aspect of the district varies in different talukas. The Wadhvan Limbdi, Sayla, Lakhtar, Dasada talukas are mostly plain country, Dharangadhra and Halvad are gently undulating, while chotila and Muli are hilly. The district can be divided into following three main geomorphic units.
Almost the entire eastern half is a plain alluvial area with elevations varying from 5 m amsl to 40 m amsl.
The north western part forms the gently undulating terrain comprising mainly the semi consolidated sedimentary rocks with elevations varying from 30 m to 144 m amsl, except in the extreme north where there is sudden fall in elevation to 8 m amsl near Little Rann of Kachchh.
The south western pat forms rugged topography with many isolated hill ranges and hillocks of Deccan traps rising to heights ranging from 100 m to 3 m amsl (Chotila hill).
In the study area, elevation varied between 28 m in Dhakdi to 18 m in Project Site and Porda. The general elevation is towards the SW from NE.
Figure 3-15: Digital Elevation Model of the study area
3.8.3 Drainage
The drainage in the northern most and eastern parts comprises mostly short streams which disappear into the Little Rann of Kachchh towards north in the low lying saline/partly marshyland and towards east in the sandy tracts Limbdi- Bhogava I and Wadhvan- Bhogava II i.e. Bhogava II which originate from the hilly range of Chotilla about 64 km. west of Surendernagar are two east flowing rivers. These rivers have almost no tributaries in the alluvial tracts. Instead, here are several small / insignificant interdunal drains and also many west-east flowing streams which are running parallel to the Bhogava II. There are many small northerly flowing streams out of which the Brahmanani or Bhamban and Kankavati are the only major streams and are ephemeral.

en-vιsιn
M/S. ECOCARE INFRASTRUCTURES PVT. LTD., SURENDRANAGAR, GUJARAT 3-49
Source: Geological Survey of India
Figure 3-16: Drainage Map of Surendranagar District
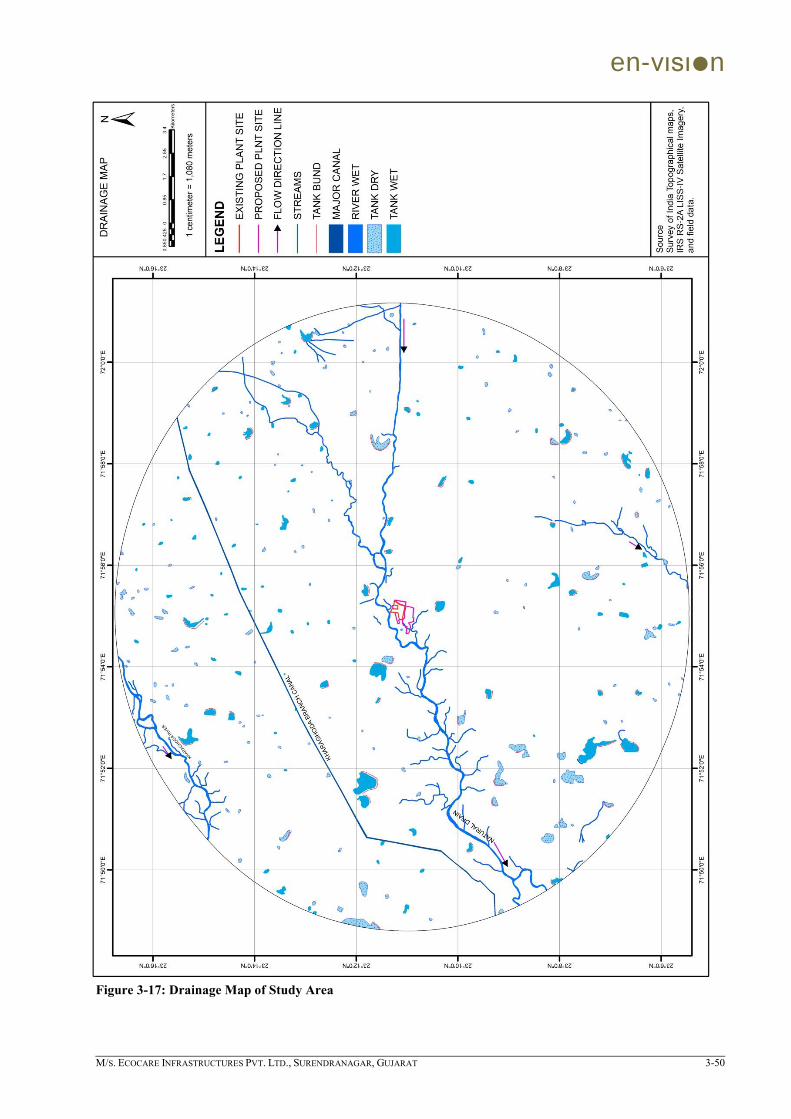
en-vιsιn
M/S. ECOCARE INFRASTRUCTURES PVT. LTD., SURENDRANAGAR, GUJARAT 3-50
Figure 3-17: Drainage Map of Study Area

en-vιsιn
M/S. ECOCARE INFRASTRUCTURES PVT. LTD., SURENDRANAGAR, GUJARAT 3-51
3.8.4 Factors affecting Ground Water Occurrence
The behavior of groundwater systems in different setups varies considerably. Movement of ground water depends on aquifer type while quantity, quality and water holding capacity of sub structure are phenomenon of soil type. Climatic conditions i.e. rainfall reflects amount of rain water available for recharge and thus increasing groundwater levels.
3.8.4.1 Soil
The soils of Surendranagar district may be classified into three main categories:
Medium black soils Red Sandy soils Silty soils
Medium black soils generally occur at shallow depths (less than 5m) where basalts/shale forms the main rock unit and is exposed on the surface in the south, southwest and central part of the area. These soils are good in fertility but not suitable for heavy irrigation. The red sandy soils occur in north east, east and south east part of the area. The silty soils are found along a narrow strip close to the little Rann of Kachchh in the north east and along shallow alluvial tracts and hard rock areas in central uplands has appreciable content of sand.
Total 8 soil samples were collected by laboratory in presence of soil expert and as per analysis results (Table 3-21) soil of the project site is sandy loam and Sandy clay loam to caly between W to E & sandy soil in SW & SE region.
Source: Geological Survey of India
Figure 3-18: Soil Map of Dasada Taluka

en-vιsιn
M/S. ECOCARE INFRASTRUCTURES PVT. LTD., SURENDRANAGAR, GUJARAT 3-52
Figure 3-19: Google Image Showing Soil Type of Study Area
3.8.4.2 Climate & Meteorology
The climate of the Surendranagar district is characterised by dry sub humid; hot summer and general dryness except during the southwest monsoon seasons. The year can be divided into four seasons. The period from March to May is the hot season (summer) followed by southwest monsoon from June to September. October and November constitute the post-monsoon. The cold season (winter) starts from December and ends in February. Long Term Climatologically Tables for the nearest observatory, Ahmedabad by the Indian Meteorological Department (IMD) is given in section 3.2.1.
3.8.5 Geo Hydrology
3.8.5.1 Assessment of Primary Data
The area is well known as “Salt desert” persisting highly saline sodic nature soil. Groundwater quality in the studied area is highly saline (brackish to saline) and not good for cultivation purpose, saline to marginal far from coastal banks. So in the area water harvesting practices are being used by the villagers. They have developed ponds, nadies, dugout ponds, etc. for rain water collection and meet their water requirement for cattle‟s as well domestic uses.
Drinking Water supply of surrounding 10 km radius of project site is fulfilled by government bore wells of depth approx 600 ft to 900 ft below ground which gives sufficient yield and comparatively better quality from upper aquifer zones. The water from all village bore wells drilled by Panchayat is collected and transferred to overhead tank and then supplied to villagers through pipeline. No handpumps were observed in 10 km periphery of studied area due to high saline water quality in upper horizons.

en-vιsιn
M/S. ECOCARE INFRASTRUCTURES PVT. LTD., SURENDRANAGAR, GUJARAT 3-53
Life of bore well is not more than 10 years as lowered casing pipe (cement/ms) gets rusted and damaged due to high saline water and leak the casing assembly in between and high saline water gets intermingle with deep better quality water.
The studied area comes in fusion zone of sea and fresh water intrusion. Groundwater prospects in the area is highly saline but in some area alluvium plains indicates better quality in east and north east of proposed area. The quality of groundwater is slightly better when move towards eastern periphery or far from coastal bank. So, in alluvial plains & flood plains quality is slightly better and farmers are using for cultivation of two crops in a year with the help of individual deep bore wells with deep lowering of casing pipe (blind / slotted).
The ground water in the area having total dissolved salts more than 500 ppm hence quality of water is not suitable for drinking purpose. So drinking water supply in villager‟s area as well as in domestic area is through government from deep bore well of 600 ft to 1000 ft depth. Some of the villages use packed RO water for drinking purpose. Farmers are not depending on open well in the area. Villagers are using own private deep borewells water for agricuture uses. Shallow ground water quality is more saline than deeper horizons.
The depth of groundwater level is ranging between 4 m to 16 m, which depends on topography as well coastal bank distance. However, in tube wells it varies from 10 m to 25 m. The average rise in water level between pre monsoon and post monsoon period is about 2 m to 6 m. The litho unit comprises older and younger tidal flat deposits.
The general direction of groundwater flow is north east to south west or westerly or towards Gulf of Kachchh passes through little Rann. One main nalla flows with trend of north east to south west in north of proposed area. No main perennial river flows surrounding the proposed area. Number of bore wells are abandoned due to quality problem and almost all farmers nearby proposed area depends on rains. In pond area number of open wells were constructed but out of these only few wells are yielding water with less saline quality. Mainly farmers uses pond water/nalla water/canal water for cultivation through pipe line and diesel engine. After leakage in casing pipe due to high salinity, farmers drill a new bore well of more depth this is a general practice in the area.
In Ghaspur village no open well/no hand pump exist in the area. 6 to 7 bore wells are yielding well at depth ranges from 600 ft to 900 ft bgl. Village Panchayat drinking water supply borewell also get failure after few years because of saline water affecting the lowered casing pipes.Total 8 wells were inventoried in and around the study area in the February 2020. Well inventory & google image showing monitoring locations is as under:
Table 3-25: Well Inventory
Well No. Location Elevation (m) SWL (m) Total Depth (m) Diameter (m) RWL (m)
1 Project Site 18 129.0 240.0 0.20 -111.000 2 Ghaspur 22 127.0 225.0 0.20 -105.000 3 Navrangpura 20 107.3 200.0 0.20 -87.300 4 Jhund 24 118.6 230.0 0.20 -94.600 5 Porda 18 111.5 179.0 0.25 -93.500 6 Kadvasan 25 101.0 220.0 0.20 -76.000 7 Dhakdi 28 116.0 205.0 0.20 -88.000 8 Dumana 24 115.0 215.0 0.20 -91.000

en-vιsιn
M/S. ECOCARE INFRASTRUCTURES PVT. LTD., SURENDRANAGAR, GUJARAT 3-54
Figure 3-20: Google Image Showing Locations of Well Inventory
All Values in mg/L except pH & EC. EC in µS/cm
pH – 7.00 TDS – 1190.0
EC – 1582.7 Chlorides – 238.0
Sulphates – 71.4 Total Hardness – 280.6
Alkalinity – 273.7
pH – 7.00 TDS – 1190.0 EC – 1582.7 Chlorides – 238.0 Sulphates – 71.4 Total Hardness – 280.6 Alkalinity – 273.7
pH – 7.00 TDS – 1422.0
EC – 1891.9 Chlorides – 284.4
Sulphates – 85.3 Total Hardness – 335.3
Alkalinity – 369.7
pH – 7.00 TDS – 1380.0
EC – 1835.4 Chlorides – 276.0
Sulphates – 82.8 Total Hardness – 325.3
Alkalinity – 358.8
pH – 6.70 TDS – 1185.0 EC – 1611.6 Chlorides – 237.0 Sulphates – 71.1 Total Hardness – 308.1 Alkalinity – 279.7
pH – 6.60 TDS – 1260.0 EC – 1650.6 Chlorides – 252.0 Sulphates – 75.6 Total Hardness – 297.1 Alkalinity – 327.6
pH – 6.10 TDS – 1296.0
EC – 1840.3 Chlorides – 259.2
Sulphates – 77.8 Total Hardness – 305.8
Alkalinity – 337.0
pH – 7.10 TDS – 1200.0 EC – 1632.0 Chlorides – 240.0 Sulphates – 72.0 Total Hardness – 282.8 Alkalinity – 312.0
en-vιsιn
M/S. ECOCARE INFRASTRUCTURES PVT. LTD., SURENDRANAGAR, GUJARAT 3-55
From the analysis reports of ground water samples collected by Laboratory & water expert it is revealed that Quality of groundwater is not good (saline) surrounding proposed area. As per inventory groundwater quality becomes highly saline upto 500 ft depth or more. Ground water movement is towards west and south west area which is towards little Rann and ultimately to Gulf of Kachchh. Water is hard in nature hence TDS & hardness removal is necessary for drinking purpose.
3.8.6 Observations
No electrical /low or high tension line passes through from proposed area. No major botanical species has been found in proposed area during investigation. No airport surrounding core zone of proposed area. No religious centre nearby proposed area. Proposed TSDF area does not falls in flood prone area. No major river nearby proposed area, So on the above basis, it is concluded that the proposed area is feasible for TSDF.
Geologically, the study area is comprised of Quaternary sediment include Oolitic to sandy lime stone with intercalated Girt and sand stone (Milliolite Formation and minor isolated outcrops of Variegate Clay, Silt Stone and marl (Vend Formation) of Pleistocene age sediments of Holocene age comprise Rann clay formation.
Geohydrologically, ground water is available in unconfined to semi confined aquifer in the study area. Alluvium is the prevalent aquifer in the study area.

en-vιsιn
M/S. ECOCARE INFRASTRUCTURES PVT. LTD., SURENDRANAGAR, GUJARAT 3-56
3.9 ECOLOGY AND BIO-DIVERSITY
Biodiversity is often considered synonymous with species richness of the area. Identifying, measuring, and monitoring biodiversity is a complex exercise. The Biodiversity assessment generally concern with, conducting biodiversity inventories; inventories for assessing existing biodiversity or stock taking. This provides the information on the biodiversity richness of the area under consideration. The biodiversity resources have never been so impoverished, largely as a result of agriculture intensification. In addition, development pressure as a result of industrialization, human population expansion and resultant increases in the “ecological foot print” of our own species has taken toll on biodiversity. A baseline survey is carried out to determine the habitats and species present on a site and their current condition.
3.9.1 Period of the study and Study area
The baseline survey for the evaluation of the floral and faunal biodiversity of the terrestrial environment was done within 10 km radius of the proposed expansion project of M/s. Ecocare Infrastructures Pvt. Ltd. is located in near Ghaspur village, Taluka: Dasada, District: Surendranagar, Gujarat was conducted during, 7th-10th Januray, 2020.
3.9.2 Methodology
For purpose of Environment Impact assessment (EIA) studies, the term biodiversity survey defines collection of spatial and or temporal data about species/ community or a habitat. The information from the survey provides a snap shot of presence or absence and spatial distribution of important species. In EIA studies the survey data are used to evaluate the ecological resources on a site and its immediate surroundings, which is then assessed or evaluated. Impacts are consider in respect to this resources and assessed for significance.
The primary objective of the present survey was to describe the floristic and faunal communities within the study area. Survey conducted for EIA studies aimed to provide information on the following:
What species and habitat occur in the project site and surroundings? Whether any threatened flora and fauna occur in the study area? If so, where do they occur?
Extrapolation and prediction techniques were used to limit the number of sites to be assessed. The knowledge of species habitats requirement, soil type, terrain, vegetation etc. were used to predict species occurrence.
This Extrapolation assessment Programme conducts preliminary for the assessment of biological value of poorly known area. The biological value of an area can be characterized by the species richness, degree of spices endemism, uniqueness of the ecosystem and magnitude of threats of extinction. This Rapid biodiversity assessment were undertaken by identifying potentially rich sites from satellite imaginary (Google Earth) and conducting the field survey in the potential habitats. GPS was utilized for locating field sample plots as well as gathering positional attributes of sighted flora and faunal species.
For Floral survey, sample plots have been randomly distributed across the suitable stratum within 10 km radius of project site. Tree species were sampled using 10 m x10 m or 5 m x 5 m plots depending upon the stratum variability on the ground and tree species occurrence. For sampling shrub species, two plots of size of 5 m x 5 m at two opposite corner of tree plots or the same 5 m x 5 m plot of tree plots were taken. For herbaceous plant five plots of 1 m x 1 m at four corners of tree plots and one at centre
The methodology adopted for faunal survey involve; faunal habitat assessment, random intensive survey, opportunistic observations, diurnal bird observation, active search for reptiles, active search for scats and foot prints and review of previous studies. The aim was to set baselines in order to monitor and identify

en-vιsιn
M/S. ECOCARE INFRASTRUCTURES PVT. LTD., SURENDRANAGAR, GUJARAT 3-57
trends after the commencement of project activity. Emphasis has been placed on presence of rare, endemic, migratory and threatened species, if any present in the study area. Desktop literature review was conducted to identify the representative spectrum of threatened species, population and ecological communities as listed by IUCN, ZSI, BSI and in Indian wild Life Protection act, 1972. The threat status of individual species was assessed using the revised IUCN category system.
3.9.3 Presence –Absence
Monitoring all species was not clearly feasible during a short duration biological baseline survey. Therefore the most commonly used species based attributes of habitat composition are species presences or absences, abundance of typical species or vegetation communities, and the distribution (range) of a species/ species.
The simplest target for a species is that its presence at the site or at defined location within the surrounding of it is maintained. This normally straightforward to monitor, but there are occasions, when difficulties may arise: especially when the species that are inconspicuous, difficult to identify or rare, or those that inhabit in inaccessible areas or species that are migratory not present during the time of survey. The distribution (range) of a species across a site can be monitored by assessing presence –absence across a number of locations (grids).
3.9.4 DAFOR Scale
The most commonly collected data during biological baseline survey are Nominal and Ordinal. In nominal survey, each survey location was assigned predefined category, species are recorded as being present or absent at allocation or a habitat. In ordinal survey, this is an extension of nominal data in which categories are ordered. Here the abundance of a Flora species at a location (study area) is classified in an ordered scale as per their occurrence in quadrates studied such as Rare, Occasional, Frequent, Abundant or Dominant – the co-called DAFOR scale. (David Hill etal., 2005)
While abundance of a fauna species at a location (study area) is classified in an ordered scale as per their occurrence/ opportunistic sighting during the study period as: VCom: Very common, Com: Common, LCom: Locally common, UnCom: Un Common and Rar; Rare.
3.9.5 Biodiversity of Terrestrial Environment
3.9.5.1 Habitats Description of the Project Site and its Immediate Surroundings
Proposed expansion of TSDF of M/s. Eco care Infrastructures Private Limited Located at Survey No. 127/1, 127/2, 128, 132/1, 132/2, 131, 132/2/2, 125/6, 125/3 in village Ghaspur, Taluka Dasada (Patdi), District Surendranagar, Gujarat. (23°11'07.9"N 71°55'05.9"E) is within the boundary of the developed TSDF site. The nearest habitations located far away from the impact zone of this project. One small stream is passing near the project site
No eco-sensitive area like, birds nesting and brooding sites, habitat of any rare and endangered flora and fauna observed in the project site or within the close proximity of the project site.
Even though, most of the surrounding area of TSDF site is dominated by prosopis ingressed open scrub lands, few agriculture fields are observed near the project site. More over one small stream is passing near the project site.

en-vιsιn
M/S. ECOCARE INFRASTRUCTURES PVT. LTD., SURENDRANAGAR, GUJARAT 3-58
Project site
Project site is surrounded by mostly prosopis ingressed open scrub lands and few agriculture fileds

en-vιsιn
M/S. ECOCARE INFRASTRUCTURES PVT. LTD., SURENDRANAGAR, GUJARAT 3-59
Cassia auriculata the other dominalt shrubs
Immediated surrunding of the TSDF site
Few agriculture land are located at nearby with Ricinus and wheat cultivations
Cotton other dominant crops in the surrounding agriculture
fields Natural Drain is passing through the immediate
surroundings of the project site Photographs 3-1: Photographs showing existing unit and its immediate surrounding

en-vιsιn
M/S. ECOCARE INFRASTRUCTURES PVT. LTD., SURENDRANAGAR, GUJARAT 3-60
3.9.5.2 Habitats description of the area (10 Km):
The dominating feature of the study area was large area dedicated for agriculture activities with Cotton (Gossypium herbaceum) and Castor (Ricinus communis) as dominant crop during the study period in January, 2020. The road side ditches are covered with Hygrophila schulli (Kanatashelio), Ipomoea aquatica and Typha angustata. Few fields were observed with wheat cultivation. Trees in the study area are restricted to /homestead/farmland /road side plantation.Growing trees, in homestead, farmlands, sacred places, along the courses of water bodies and roads is an old age practice in India. The most dominant farm land plantation and road side plantation of this area were Ailanthus excels (Aurdso), Salvadora persica (Piludo), Salvadora oleoides (Piludi), Prosopis cineraria (Khyigdo) and Azadirachta indica (Limbado). Open scrub land mostly covered by the ingression of Prosopis juliflora was observed at Goriya village (23°08'18.1"N 71°55'48.8"E), and Joravapura village (23°09'14.8"N, 71°52'11.2"E). Many inland water bodies were observed in the study area, most of them harbor a good population of Indian mud or flap shell turtle (Lissemys punctate). One large wet land were observed between Kamalpur and Porda village(23°07'22.4"N, 71°52'23.2"E) and one near Patdi village (23°11'28.1"N, 71°48'17.7"E). These wetland harbour a good population of waterfowls.
Figure 3-21: Google Image Showing 10 km Radius Study Area for Ecology-Biodiversity Survey

en-vιsιn
M/S. ECOCARE INFRASTRUCTURES PVT. LTD., SURENDRANAGAR, GUJARAT 3-61
The agriculture fields is dominant land use of the study
area with good farm land plantation dominated by Neem and Salvadora sps.
Cotton (Gossypium herbaceum) was the dominant crop observed during the survey period
Ricinus comminis (Castor) another major crop Catharanthus tinctorius safflower localy known as
Kusumba cultivated in some part of the study area especially near Trent village
One of the Many large inland water Inland water bodies
observed in the study area Kharaghoda Okara near Mandal Village

en-vιsιn
M/S. ECOCARE INFRASTRUCTURES PVT. LTD., SURENDRANAGAR, GUJARAT 3-62
Open scrub land near Goraiya village Natural drain near Ghaspur village
A large wet land observed near Porda and Kamlapur
Villages harbor good number of waterfowls A large inland waterbody near Patdi village harbour an
good population of Purple Moorhen
Common Peafowl (Pavo cristatus) Spot-Billed Duck (Anas poecilorhyncha)
Indian Moorhen (Gallinula chloropus) Pied Kingfisher (Ceryle rudis )
Root Parasites (Campbellia cytinoides) observed at few
agriculture fields Common Mongoose/Indian Grey Mongoose (Herpestes
edwardsi)

en-vιsιn
M/S. ECOCARE INFRASTRUCTURES PVT. LTD., SURENDRANAGAR, GUJARAT 3-63
Indian Mud or Flap Shell Turtle ( Lissemys punctate) Rose-Ringed Parakeet ( Psittacula krameri )
Black-Headed Ibis (Threskiornis melanocephalus) Purple Heron (Ardea purpurea )
Purple Swamphen (Porphyrio porphyria) Common Coot (Fulica atra )
Photographs 3-2: Photographs Showing Biodiversity of 10 km Radius Area
3.9.6 Floral Diversity of the Study Area
The objective this floral inventory of the study area is to provide necessary information on floristic structure in the study area for formulating effective management and conservation measures. The climatic, edaphic and biotic variations with their complex interrelationship and composition of species, which are adapted to these variations, have resulted in different vegetation cover, characteristic of each region. The following account of floral inventory has been, based on the field survey conducted for a short duration in the 7th -10th January, 2020. , is not very comprehensive data and is aimed only to give a general pattern of vegetation of this region during the study period as a baseline data. Listing of the endangered, threatened and endemic species of flora in a locality and drawing the attention to the occurrence of such species, would aid in creating awareness amongst the local people as a whole to protect such species from
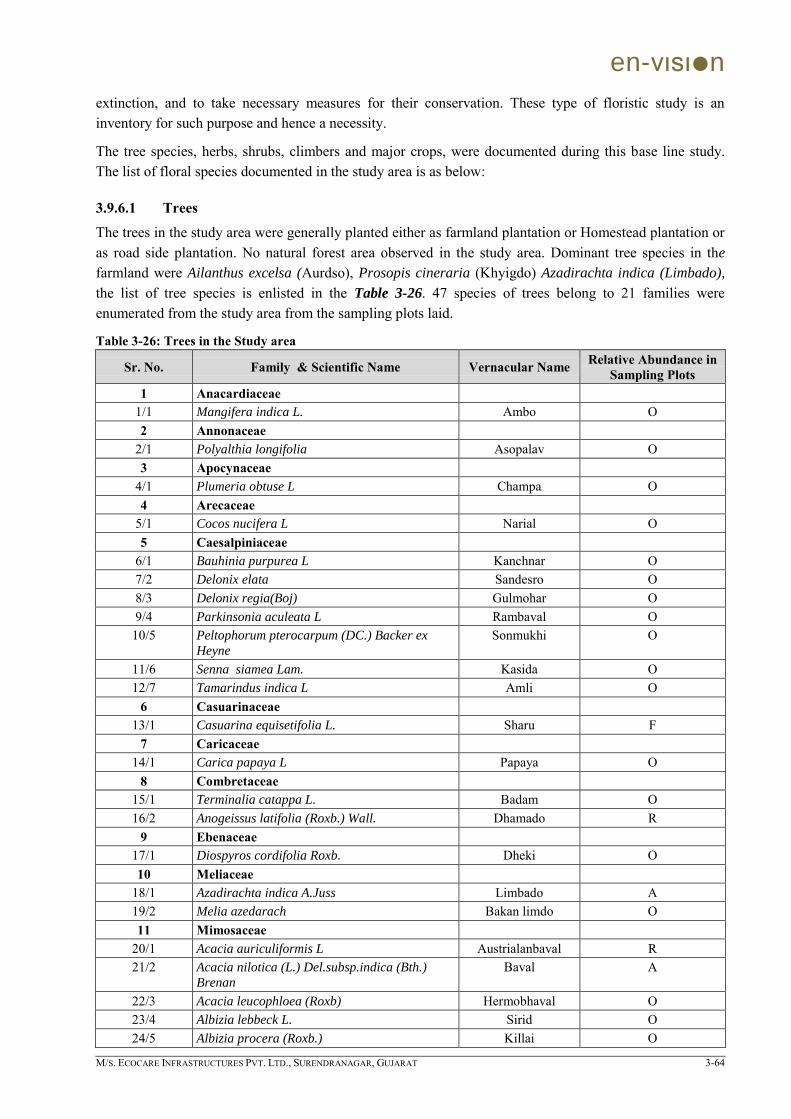
en-vιsιn
M/S. ECOCARE INFRASTRUCTURES PVT. LTD., SURENDRANAGAR, GUJARAT 3-64
extinction, and to take necessary measures for their conservation. These type of floristic study is an inventory for such purpose and hence a necessity.
The tree species, herbs, shrubs, climbers and major crops, were documented during this base line study. The list of floral species documented in the study area is as below:
3.9.6.1 Trees
The trees in the study area were generally planted either as farmland plantation or Homestead plantation or as road side plantation. No natural forest area observed in the study area. Dominant tree species in the
farmland were Ailanthus excelsa (Aurdso), Prosopis cineraria (Khyigdo) Azadirachta indica (Limbado),
the list of tree species is enlisted in the Table 3-26. 47 species of trees belong to 21 families were enumerated from the study area from the sampling plots laid.
Table 3-26: Trees in the Study area
Sr. No. Family & Scientific Name Vernacular Name Relative Abundance in Sampling Plots
1 Anacardiaceae 1/1 Mangifera indica L. Ambo O 2 Annonaceae
2/1 Polyalthia longifolia Asopalav O 3 Apocynaceae
4/1 Plumeria obtuse L Champa O 4 Arecaceae
5/1 Cocos nucifera L Narial O 5 Caesalpiniaceae
6/1 Bauhinia purpurea L Kanchnar O 7/2 Delonix elata Sandesro O 8/3 Delonix regia(Boj) Gulmohar O 9/4 Parkinsonia aculeata L Rambaval O
10/5 Peltophorum pterocarpum (DC.) Backer ex
Heyne
Sonmukhi O
11/6 Senna siamea Lam. Kasida O 12/7 Tamarindus indica L Amli O
6 Casuarinaceae 13/1 Casuarina equisetifolia L. Sharu F
7 Caricaceae 14/1 Carica papaya L Papaya O
8 Combretaceae 15/1 Terminalia catappa L. Badam O 16/2 Anogeissus latifolia (Roxb.) Wall. Dhamado R
9 Ebenaceae 17/1 Diospyros cordifolia Roxb. Dheki O 10 Meliaceae
18/1 Azadirachta indica A.Juss Limbado A 19/2 Melia azedarach Bakan limdo O 11 Mimosaceae
20/1 Acacia auriculiformis L Austrialanbaval R 21/2 Acacia nilotica (L.) Del.subsp.indica (Bth.)
Brenan
Baval A
22/3 Acacia leucophloea (Roxb) Hermobhaval O 23/4 Albizia lebbeck L. Sirid O 24/5 Albizia procera (Roxb.) Killai O

en-vιsιn
M/S. ECOCARE INFRASTRUCTURES PVT. LTD., SURENDRANAGAR, GUJARAT 3-65
Sr. No. Family & Scientific Name Vernacular Name Relative Abundance in Sampling Plots
25/6 Leucaena leucocephala (Lam.) De Pardesi Baval O 26/7 Prosopis cineraria (L.) Druce Khyigdo A 27/8 Pithecellobium dulce (Roxb.) Bth. Gorasmli O 12 Moraceae
28/1 Ficus bengalensis L Vad O 29/2 Ficus drupacea Thunb. Var. pubescens (Roth)
Corner
Pipli O
30/3 Ficus hispida L.f. Dhedh Umardo R 31/4 Ficus racemosa L. Umaro R 32/5 Ficus religiosa L Piplo O 13 Moringaceae
33/1 Moringa pterygosperma Gaertn., Fruct Saragvo R 14 Myrtaceae
34/1 Callistemon cistrinus L Bottle brush R 35/2 Eucalyptus citriodora Hk. Nilgari F 15 Papilionaceae
36/1 Dalbergia latifolia Roxb Sisam R 37/2 Pongamia pinnata (L.)Pierre Karanji O 38/3 Sesbania sesban (L.)Merr. Shevari O 16 Rhamnaceae
39/1 Zizyphus glabrata Heyne ex Roth Bor O 40/2 Zizyphus mauritiana Lam Bordi O 17 Family:Rutaceae
41/1 Limonia acidissima L Kothi, Khota R 18 Salvadoraceae
42/1 Salvadora persica L. Piludo A 43/2 Salvadora oleoides Decne Piludi A 19 Sapotaceae
44/1 Manilkara hexandra (Roxb.) Rayan O 45/2 Manilkara zapota L Chikoo O 20 Simaroubaceae
46/1 Ailanthus excelsa Roxb. Aurdso O 21 Verbenaceae
47/1 Tectona grandis L. Sag R
Relative abundance in sampling plots DAFOR scale. : Dominant, Abundant , Frequent, , Occasional, Rare, . (David Hill etal., 2005); Botanical Survey of India, 2003
3.9.6.2 Shrubs
Shrubs observed during the present survey are given in the Table 3-27. 33 shrub species belong to 17 families were observed in the sampling plots laid in study area. The dominant shrub community in this area was represented by, Prosopis juliflora (Gando baval), C. gigantea (Akado), C. procera, Ipomoea fistulosa
(Nasarmo), and Lawsonia inermis (Mendhi).
Table 3-27: List of the Shrubs in the Study Area
Sr. No. Family & Scientific Name Vernacular Name Relative Abundance in Sampling Plots
1 Apocynaceae 1/1 Nerium indicum Mill Lalkaren O 2 Asclepiadaceae
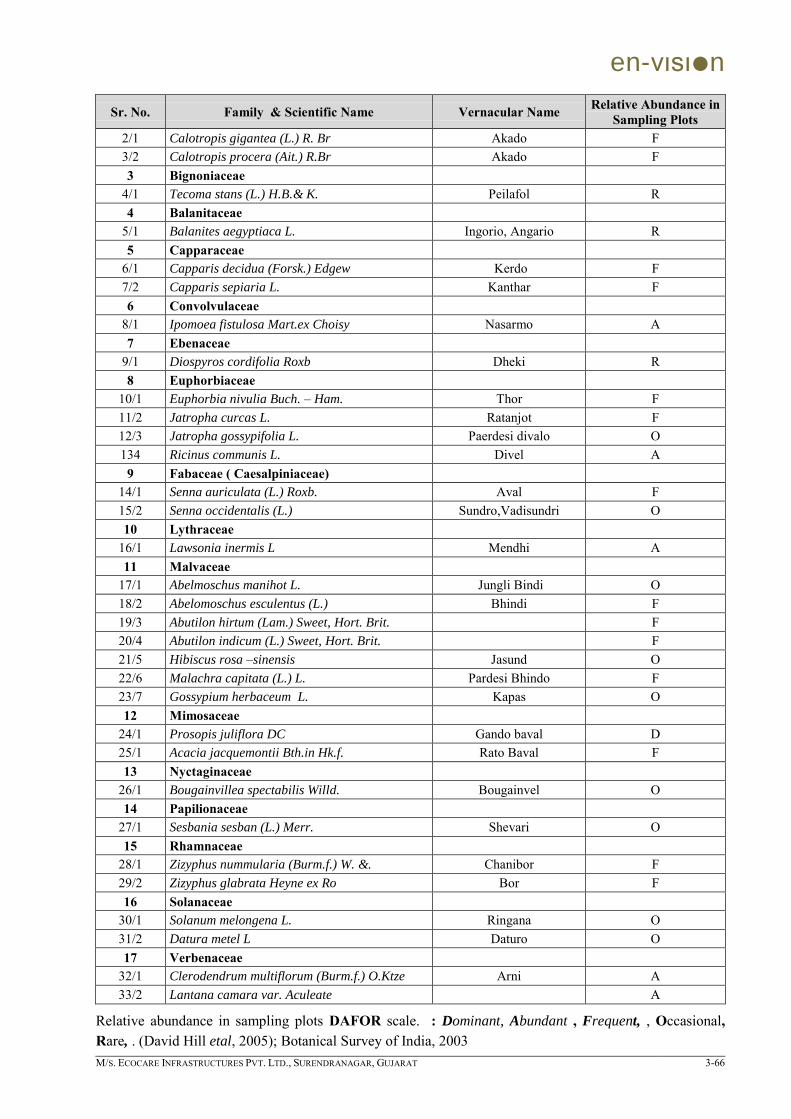
en-vιsιn
M/S. ECOCARE INFRASTRUCTURES PVT. LTD., SURENDRANAGAR, GUJARAT 3-66
Sr. No. Family & Scientific Name Vernacular Name Relative Abundance in Sampling Plots
2/1 Calotropis gigantea (L.) R. Br Akado F 3/2 Calotropis procera (Ait.) R.Br Akado F 3 Bignoniaceae
4/1 Tecoma stans (L.) H.B.& K. Peilafol R 4 Balanitaceae
5/1 Balanites aegyptiaca L. Ingorio, Angario R 5 Capparaceae
6/1 Capparis decidua (Forsk.) Edgew Kerdo F 7/2 Capparis sepiaria L. Kanthar F 6 Convolvulaceae
8/1 Ipomoea fistulosa Mart.ex Choisy Nasarmo A 7 Ebenaceae
9/1 Diospyros cordifolia Roxb Dheki R 8 Euphorbiaceae
10/1 Euphorbia nivulia Buch. – Ham. Thor F 11/2 Jatropha curcas L. Ratanjot F 12/3 Jatropha gossypifolia L. Paerdesi divalo O 134 Ricinus communis L. Divel A
9 Fabaceae ( Caesalpiniaceae) 14/1 Senna auriculata (L.) Roxb. Aval F 15/2 Senna occidentalis (L.) Sundro,Vadisundri O 10 Lythraceae
16/1 Lawsonia inermis L Mendhi A 11 Malvaceae
17/1 Abelmoschus manihot L. Jungli Bindi O 18/2 Abelomoschus esculentus (L.) Bhindi F 19/3 Abutilon hirtum (Lam.) Sweet, Hort. Brit. F 20/4 Abutilon indicum (L.) Sweet, Hort. Brit. F 21/5 Hibiscus rosa –sinensis Jasund O 22/6 Malachra capitata (L.) L. Pardesi Bhindo F 23/7 Gossypium herbaceum L. Kapas O 12 Mimosaceae
24/1 Prosopis juliflora DC Gando baval D 25/1 Acacia jacquemontii Bth.in Hk.f. Rato Baval F 13 Nyctaginaceae
26/1 Bougainvillea spectabilis Willd. Bougainvel O 14 Papilionaceae
27/1 Sesbania sesban (L.) Merr. Shevari O 15 Rhamnaceae
28/1 Zizyphus nummularia (Burm.f.) W. &. Chanibor F 29/2 Zizyphus glabrata Heyne ex Ro Bor F 16 Solanaceae
30/1 Solanum melongena L. Ringana O 31/2 Datura metel L Daturo O 17 Verbenaceae
32/1 Clerodendrum multiflorum (Burm.f.) O.Ktze Arni A 33/2 Lantana camara var. Aculeate A
Relative abundance in sampling plots DAFOR scale. : Dominant, Abundant , Frequent, , Occasional, Rare, . (David Hill etal, 2005); Botanical Survey of India, 2003

en-vιsιn
M/S. ECOCARE INFRASTRUCTURES PVT. LTD., SURENDRANAGAR, GUJARAT 3-67
3.9.6.3 Herbs
The herbs observed in the sampling plots, during the survey period have been enlisted in the Table 3-28. 79 species of herbs belongs to 30 families were documented from the sampling plots laid in different habitats. Most dominant herbaceous cover in the study area was Gorakhanjo (Aerva sanguinolenta), Akaro
(Hygrophila schulli), Gokhru (Xanthium strumarium) and Zipto (Triumfetta rotundifolia).
Table 3-28: List of Herbaceous Species Observed in the Study Area
Sr. No. Family & Scientific Name Vernacular Name Relative Abundance in Sampling Plots
1 Acanthaceae 1/1 Barleria sp. --- O 2/2 Hygrophila schulli (Buch.-Ham.) M. R. Akaro D 2 Amaranthaceae
3/1 Achyranthes aspera L. Anghedi, Anghedo A 4/2 Aerva javanica (Burm.f.)Juss. Bur,Gorakhganjo A 5/3 Aerva lanata (L.) Juss. ex Schult., F 6/4 Aerva sanguinolenta (L.) Blume, Karadia, Gorakhanjo D 7/5 Amaranthus hybridus sub. Cruentus (L.) Rajgaro O 8/6 Amaranthus spinosus L O 9/7 Celosia argentea L., F 3 Asteraceae
10/1 Blumea eriantha DC. Kalhar F 11/2 Echinops echinatus Roxb Shulio A 12/3 Eclipta prostrata (L.) Bhangro A 13/4 Catharanthus tinctorius L Safflower Kusumba O 14/5 Parthenium hysterophorus L -- A 15/6 Tridax procumbens L Pardesi Bhangro A 16/7 Xanthium strumarium L. Gokhru A
4 Araceae 17/1 Colocasia esculenta (L.) O
5 Balsiminaceae 18/2 Impatiens balsamina L. var. coccinea O
6 Boraginaceae 19/1 Trichodesma indicum R. Br. Undha Fuli A
7 Cactaceae 20/1 Opuntia elatior Mill. Thor O
8 Cucurbitaceae 21/1 Coccinia grandis (L.) Voigt Ghiloda O 22/2 Cucumis callosus Cogn Kothimdu O 23/3 Coccinia SP. R
9 Convolvulaceae 24/1 Cressa cretica L. Palio, Rudanti D 25/2 Convolvulus arvensis L. F 26/3 Evolvulus alsinoides (L.) F 10 Commelinaceae
27/1 Commelina benghalensis L -- A 11 Cyperaceae
28/1 Cyperus sp. -- F 29/2 Fimbristylis sp. -- F 12 Euphorbiaceae
30/1 Chrozophora rottleri (Geis.) Juss. -- O

en-vιsιn
M/S. ECOCARE INFRASTRUCTURES PVT. LTD., SURENDRANAGAR, GUJARAT 3-68
Sr. No. Family & Scientific Name Vernacular Name Relative Abundance in Sampling Plots
31/2 Euphorbia hirta L. -- A 13 Fabaceae ( sub family Caesalpiniodae)
32/1 Senna tora (L.) A 14 Fabaceae ( sub family Papilionodeae)
33/1 Alysicarpus bupleurifolius (L.) DC., F 34/2 Alysicarpus vaginalis F 35/3 Cortalaria juncea A 36/4 Indigofera cardifoila Heyne ex Roth A 37/5 Indigofera oblongifolia Forks. A 38/6 Indigofera sp. A 39/7 Tehrosia purpurea L. A 40/8 Tephrosia sps. A 41/9 Medicago sativa L O 15 Liliaceae O
42/1 Aloe barbadensis Mill. Kunvarpato O 16 Lamiaceae
43/1 Leootis nepetifolia (L) R 44/2 Leucas aspera (Willd) Kubi R 45/3 Ocimum sanctum L. Tulsi O 46/4 O. canum Sims Ratonulsi O 47/5 O .basilicum L. Damro O 17 Malvaceae
48/1 Abutilon indicum L. Khapat,Dabaliar A 49/2 Sida sp. -- A 50/1 Gossypium herbaceum Kapas 18 Mimosaceae
51/1 Neputntia oleracea L. Panilajalu R 19 Nyctaginaceae
52/1 Boerhavia diffusa L. Satodi O 53/2 Boerhavia chinensis Druce -- O 20 Nymphaeaceae
54/1 Nymphaea pubescens Wild Kamal O 21 Papaveraceae
55/1 Argemone mexicana L. Darudi O 22 Poaceae
56/1 Aleuropus lagopoides (L) -- D 57/2 Aristida sp. -- A 58/3 Cynodon barberi Rang. -- A 59/4 Cynodon dactylon (L.) -- A 60/5 Phragmites kara (Retz.) -- A 61/6 Panicm notatum Retz Narhali 62/7 Pennisetum typhoides BUrm. Bajri 63/8 Oryza staiva L. Choka D 64/7 Sorghum bicolor (L.) Jowar O 65/8 Triticum aestivum Goghu 66/9 Zea mays Makai R 23 Pontederiaceae
67/1 Eichhornia crassipes (Mart.) Kanphutti A 24 Potamogetonaceae
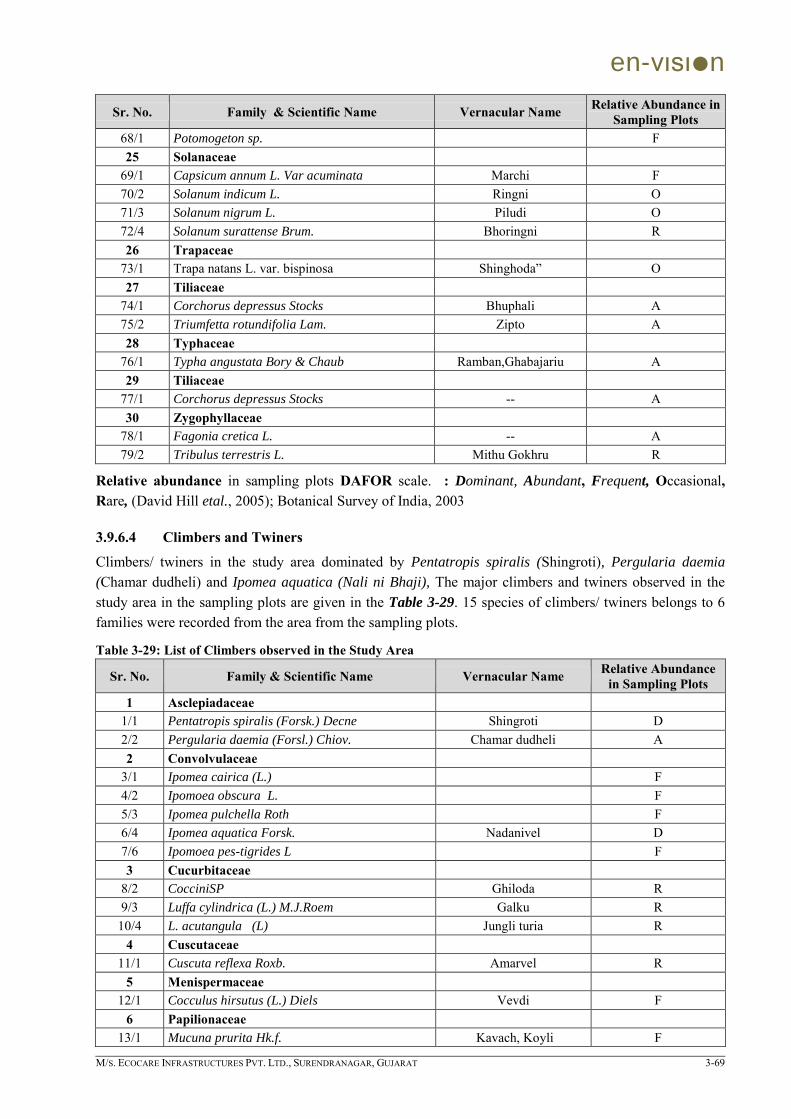
en-vιsιn
M/S. ECOCARE INFRASTRUCTURES PVT. LTD., SURENDRANAGAR, GUJARAT 3-69
Sr. No. Family & Scientific Name Vernacular Name Relative Abundance in Sampling Plots
68/1 Potomogeton sp. F 25 Solanaceae
69/1 Capsicum annum L. Var acuminata Marchi F 70/2 Solanum indicum L. Ringni O 71/3 Solanum nigrum L. Piludi O 72/4 Solanum surattense Brum. Bhoringni R 26 Trapaceae
73/1 Trapa natans L. var. bispinosa Shinghoda” O 27 Tiliaceae
74/1 Corchorus depressus Stocks Bhuphali A 75/2 Triumfetta rotundifolia Lam. Zipto A 28 Typhaceae
76/1 Typha angustata Bory & Chaub Ramban,Ghabajariu A 29 Tiliaceae
77/1 Corchorus depressus Stocks -- A 30 Zygophyllaceae
78/1 Fagonia cretica L. -- A 79/2 Tribulus terrestris L. Mithu Gokhru R
Relative abundance in sampling plots DAFOR scale. : Dominant, Abundant, Frequent, Occasional, Rare, (David Hill etal., 2005); Botanical Survey of India, 2003
3.9.6.4 Climbers and Twiners
Climbers/ twiners in the study area dominated by Pentatropis spiralis (Shingroti), Pergularia daemia
(Chamar dudheli) and Ipomea aquatica (Nali ni Bhaji), The major climbers and twiners observed in the study area in the sampling plots are given in the Table 3-29. 15 species of climbers/ twiners belongs to 6 families were recorded from the area from the sampling plots.
Table 3-29: List of Climbers observed in the Study Area
Sr. No. Family & Scientific Name Vernacular Name Relative Abundance in Sampling Plots
1 Asclepiadaceae 1/1 Pentatropis spiralis (Forsk.) Decne Shingroti D 2/2 Pergularia daemia (Forsl.) Chiov. Chamar dudheli A 2 Convolvulaceae
3/1 Ipomea cairica (L.) F 4/2 Ipomoea obscura L. F 5/3 Ipomea pulchella Roth F 6/4 Ipomea aquatica Forsk. Nadanivel D 7/6 Ipomoea pes-tigrides L F 3 Cucurbitaceae
8/2 CocciniSP Ghiloda R 9/3 Luffa cylindrica (L.) M.J.Roem Galku R
10/4 L. acutangula (L) Jungli turia R 4 Cuscutaceae
11/1 Cuscuta reflexa Roxb. Amarvel R 5 Menispermaceae
12/1 Cocculus hirsutus (L.) Diels Vevdi F 6 Papilionaceae
13/1 Mucuna prurita Hk.f. Kavach, Koyli F
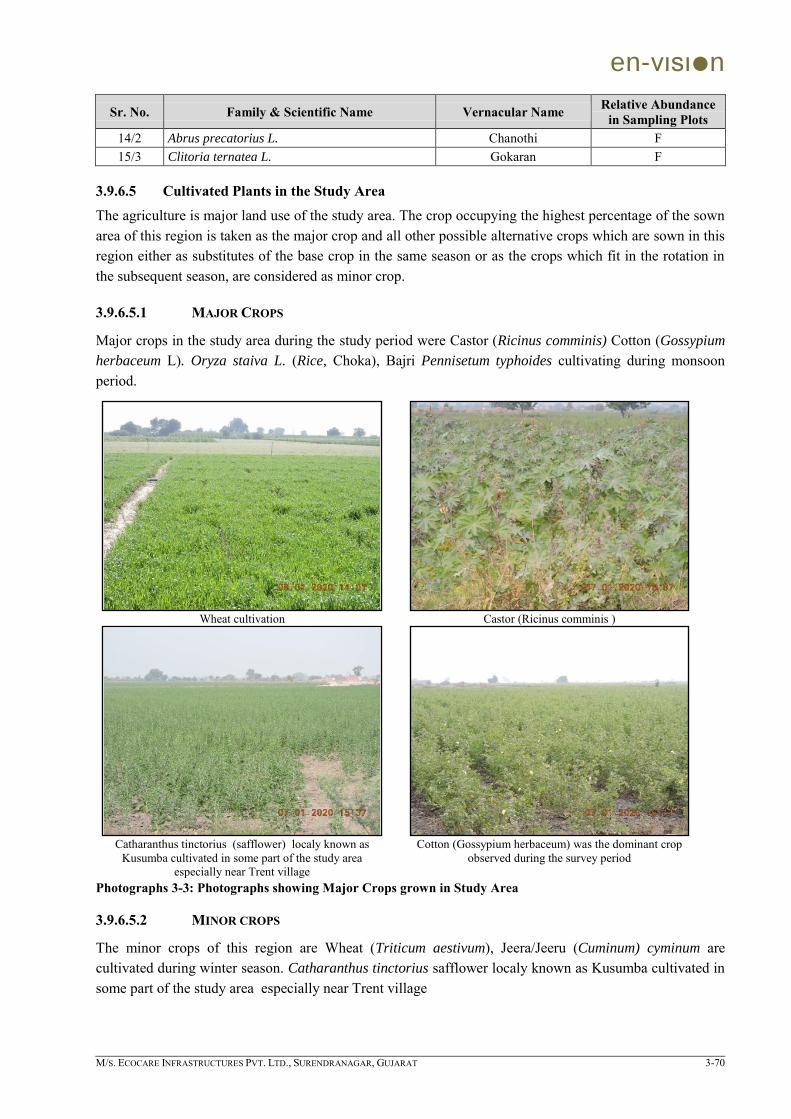
en-vιsιn
M/S. ECOCARE INFRASTRUCTURES PVT. LTD., SURENDRANAGAR, GUJARAT 3-70
Sr. No. Family & Scientific Name Vernacular Name Relative Abundance in Sampling Plots
14/2 Abrus precatorius L. Chanothi F 15/3 Clitoria ternatea L. Gokaran F
3.9.6.5 Cultivated Plants in the Study Area
The agriculture is major land use of the study area. The crop occupying the highest percentage of the sown area of this region is taken as the major crop and all other possible alternative crops which are sown in this region either as substitutes of the base crop in the same season or as the crops which fit in the rotation in the subsequent season, are considered as minor crop.
3.9.6.5.1 MAJOR CROPS
Major crops in the study area during the study period were Castor (Ricinus comminis) Cotton (Gossypium
herbaceum L). Oryza staiva L. (Rice, Choka), Bajri Pennisetum typhoides cultivating during monsoon period.
Wheat cultivation Castor (Ricinus comminis )
Catharanthus tinctorius (safflower) localy known as
Kusumba cultivated in some part of the study area especially near Trent village
Cotton (Gossypium herbaceum) was the dominant crop observed during the survey period
Photographs 3-3: Photographs showing Major Crops grown in Study Area
3.9.6.5.2 MINOR CROPS
The minor crops of this region are Wheat (Triticum aestivum), Jeera/Jeeru (Cuminum) cyminum are cultivated during winter season. Catharanthus tinctorius safflower localy known as Kusumba cultivated in some part of the study area especially near Trent village

en-vιsιn
M/S. ECOCARE INFRASTRUCTURES PVT. LTD., SURENDRANAGAR, GUJARAT 3-71
3.9.6.6 Horticulture Practices and fruit grown
Horticulture activity is not predominant in this region
3.9.6.7 Rare and Endangered flora in the study area
The IUCN Red List is the world's most comprehensive inventory of the global conservation status of plant and animal species. It uses a set of criteria to evaluate the extinction risk of thousands of species and subspecies. These criteria are relevant to all species and all regions of the world. With its strong scientific base, the IUCN Red List is recognized as the most authoritative guide to the status of biological diversity.
Among the enumerated flora in the study area, none of them were assigned any threat category, by RED data book of Indian Plants. (Nayarand Sastry, 1990) and Red list of threatened Vascular plants (IUCN, 2010, BSI, 2003)
3.9.6.8 Endemic plants of the study area
De Candolle (1855) first used the concept of “Endemic”, which is defined as an area of a taxonomic unit, especially a species which has a restricted distribution or habitat, isolated from its surrounding region through geographical, ecological or temporal barriers.
Among recorded plant species, during the survey period, none can be assigned the status of endemic plant of this region.
3.9.6.9 Status of Forest and their category in the study area
No natural forest land was observed in the study area except a scrub forest. Wild Ass sanctuary boundary is located at Kharagodha village (23° 11' 01.8"N, 71° 44' 44.6"E), towards Little Ran of Kutch is more than 17.6 km from the project site.
3.9.7 Faunal Diversity of Study Area
For the documentation of the faunal biodiversity of the study area with respect to birds, reptiles, amphibians, and butterfly species, a baseline survey had been conducted in 7th -10th January 2020.
3.9.7.1 Birds of the Study Area
The most commonly spotted bird species of this area were; Red-wattled Lapwing, Black-winged Stilt, Cattle Egret, Blue Rock Pigeon, Ring Dove etc. Systematic account of the birds in the study area with the status of occurrence is given in the Table 3-30.
Table 3-30: Birds of the Study Area
Old Common Name
New Common Name Scientific Name Distribution
Status
Relative Aabundance
in Study Area
IUCN Status Ver 3.1
I ORDER: ANSERIFORMES Common Pochard
Common Pochard
Aythya ferina W UC Least Concern
Common Shelduck
Common Shelduck
Tadorna tadorna W UC Least Concern
Common Teal Common Teal Anas crecca W UC Least Concern Greylag Goose Greylag Goose Anser anser W UC Least Concern
Shoveller Northern Shoveller
Anas clypeata W UC Least Concern
Brahminy duck or Ruddy
Ruddy Shelduck
Tadorna ferruginea rw UC Least Concern

en-vιsιn
M/S. ECOCARE INFRASTRUCTURES PVT. LTD., SURENDRANAGAR, GUJARAT 3-72
Old Common Name
New Common Name Scientific Name Distribution
Status
Relative Aabundance
in Study Area
IUCN Status Ver 3.1
shield duck Spotbill Spot-billed
Duck Anas
poecilorhyncha R UC Least Concern
II ORDER: APODIFORMES Family: Apodidae (swifts)
Common Swift
Common Swift Apus apus R LC Least Concern
House swift Little Swift Apus affinis R C Least Concern III. ORDER: FALCONIFORMES Family: Accipitridae (vulture, Sparrow hawk, Eagle, Harrier, Kite and Vulture)
Shikra Shikra Accipiter badius R Uc Least Concern Black-winged
Kite Black-winged
Kite Elanus caeruleus R C Least Concern
Sparrow-hawk Eurasian Sparrow-hawk
Accipiter nisus R UC Least Concern
IV. ORDER: : CICONIIFORMES Family: Anhingidae Family: Ardeidae (heron, Egret, Bittern)
Cattle Egret Cattle Egret Bubulcus ibis R C Least Concern Little Egret Little Egret Egretta garzetta R C Least Concern Large Egret Great Egret Ardea alba R C Least Concern Pond Heron Indian Pond-
Heron Ardeola grayii R LC Least Concern
Purple Heron Purple Heron Ardea purpurea Family: Charadriidae (Plover, Stilt, Oystercatcher, Lapwing, Avocet ) Black-winged
Stilt Black-winged
Stilt Himantopus himantopus
R LC Least Concern
Red-wattled Lapwing
Red-wattled Lapwing
Vanellus indicus R LC Least Concern
Family: Phalacrocoracidae (Cormorant) Indian Shag Indian
Cormorant Phalacrocorax
fuscicollis R LC Least Concern
Little Cormorant
Little Cormorant
Phalacrocorax niger R LC Least Concern
Family: Podicipedidae (Grebe) Little Grebe Little Grebe Tachybaptus
ruficollis R UC Least Concern
Family: Pteroclidae (Sandgrouse) Indian
Sandgrouse Chestnut-
bellied sandgrouse
Pterocles exustus R UC Least Concern
Family: Threskiornithidae (Spoonbill and Ibis) Black Ibis Red-naped Ibis Pseudibis papillosa R UC Least Concern White Ibis Black-headed
Ibis Threskiornis
melanocephalus R UC Near Threatened
V. ORDER: COLUMBIFORMES Family: Columbidae (Pigeon, Dove)
Blue Rock Pigeon
Rock Pigeon Columba livia R C Least Concern
Spotted Dove Western Spotted Dove
Streptopelia suratensis
R C Least Concern

en-vιsιn
M/S. ECOCARE INFRASTRUCTURES PVT. LTD., SURENDRANAGAR, GUJARAT 3-73
Old Common Name
New Common Name Scientific Name Distribution
Status
Relative Aabundance
in Study Area
IUCN Status Ver 3.1
Ring Dove Eurasian Collared-Dove
Streptopelia decaocto
R C Least Concern
Rufous Turtle Dove
Oriental Turtle-Dove
Streptopelia orientalis
R LC Least Concern
VI Order: Coraciiformes Family: Alcedinidae (King fisher)
Small Blue King Fisher
Common Kingfisher
Alcedo atthis R LC Least Concern
Family: Cerylidae Pied
Kingfisher Pied Kingfisher Ceryle rudis R UC Least Concern
Family: Dacelonidae (King fisher) White breasted
Kingfisher White-throated
Kingfisher Halcyon smyrnensis R UC Least Concern
Family: Coraciidae (Roller) BlueJay or
Roller Indian Roller Coracias
benghalensis R UC Least Concern
Family: Meropidae (Bee Eater) Small Green
bee-eater Little Green
Bee-eater
Merops orientalis R LC Least Concern
VII.ORDER: CUCULIFORMES Family: Centropodidae (Cocucal
Crow-Pheasant or
Coucal
Greater Coucal Centropus sinensis R UC Least Concern
Family: Cuculidae (cuckoo, Koel) Koel Asian
Koel/Wetsern Koel
Eudynamys scolopacea
R UC Least Concern
Indian Cuckoo Indian Cuckoo Cuculus micropterus
R UC Least Concern
VIII ORDER: GALLIFORMES Family: Phasianidae (Peafowl , Patridge)
Common Peafowl
Indian Peafowl Pavo cristatus R LC Least Concern
IX ORDER: GRUIFORMES Family: Rallidae ( Waterhen, coot, crake water cock, Moorhen, Rail,)
White-breasted Water
hen
White-breasted Water hen
Amaurornis phoenicurus
R LC Least Concern
Coot Common Coot Fulica atra R LC Least Concern Indian
Moorhen Common Moorhen
Gallinula chloropus R UC Least Concern
Purple Moorhen
Purple Swamphen
Porphyrio porphyrio R LC Least Concern
X. ORDER: PASSERIFORMES Family: Paridae (Tit )
Grey Tit Great Tit Parus major R LC Least Concern Family: Corvidae Large Cuckoo-
shrike Large Cuckoo-shrike/Black
Coracina novaehollandiae
R UC Least Concern

en-vιsιn
M/S. ECOCARE INFRASTRUCTURES PVT. LTD., SURENDRANAGAR, GUJARAT 3-74
Old Common Name
New Common Name Scientific Name Distribution
Status
Relative Aabundance
in Study Area
IUCN Status Ver 3.1
faced Cuckoo-shrike
Raven Common Raven
Corvus corax R Least Concern
House Crow House Crow Corvus splendens R LC Least Concern Family: Laniidae (shrike) Rufous backed
Shrike Long-tailed
Shrike Lanius schach R LC Least Concern
Grey Shrike Northern Shrike Lanius excubitor R LC Least Concern Family: Muscicapidae ( Short wing, Chat, Robin, Shama) Indian Robin Indian Robin Saxicoloides
fulicata R LC Least Concern
Magpie-Robin Oriental Magpie-Robin
Copsychus saularis R UC Least Concern
Pied Bushchat Pied Bushchat Saxicola caprata R LC Least Concern Desert
Wheatear Desert
Wheatear Oenanthe deserti R UC Least Concern
Family: Nectariniidae ( Sun Birds, Flower pecker, Spider hunter) Purple Sunbird Purple Sunbird Nectarinia asiatica R LC Least Concern Small Sunbird Crimson-
backed Sunbird Nectarinia minima R LC Least Concern
Family: Passeridae ( Avadavat, Pipit, Wagtail, Munia, Snowfinch, sparrow) House
Sparrow House Sparrow Passer domesticus R LC Least Concern
Family: Pycnonotidae (Bulbul, finchbil) Red-whiskered
Bulbul Red-whiskered
Bulbul Pycnonotus jocosus R LC Least Concern
Red-vented Bulbul
Red-vented Bulbul
Pycnonotus cafer R LC Least Concern
Family: Sturnidae (Myna, Starling) Bank Myna Bank Myna Acridotheres
ginginianus R LC Least Concern
Indian Myna Common Myna Acridotheres tristis R LC Least Concern Rosy pastor Rosy Starling Sturnus roseus rW UC Least Concern
Family: Sylviidae ( Warbler, Browning, Fulvetta ,Babbler, Laughing thrash, Tailor birds) Common Babbler
Common Babbler
Turdoides caudatus R LC Least Concern
Jungle Babbler Jungle Babbler Turdoides indica R LC Least Concern Tailorbird Common
Tailorbird Orthotomus sutorius R LC Least Concern
XI. ORDER: PSITTACIFORMES Family: Psittacidae (Parrot and Parakeet)
Rose-ringed Parakeet
Rose-ringed Parakeet
Psittacula krameri R LC Least Concern
XII. Order: Upupiformes Family: Upupidae
Hoopoe Eurasian Hoopoe
Upupa epops R UC Least Concern
Note: Distribution status: R = Widespread Resident, WM: winter migrant Ref WCMC, Check list of Indian Birds
IUCN 2018, Bird Life International. 2018, Bird Life International. 2016; Zoological Survey of India
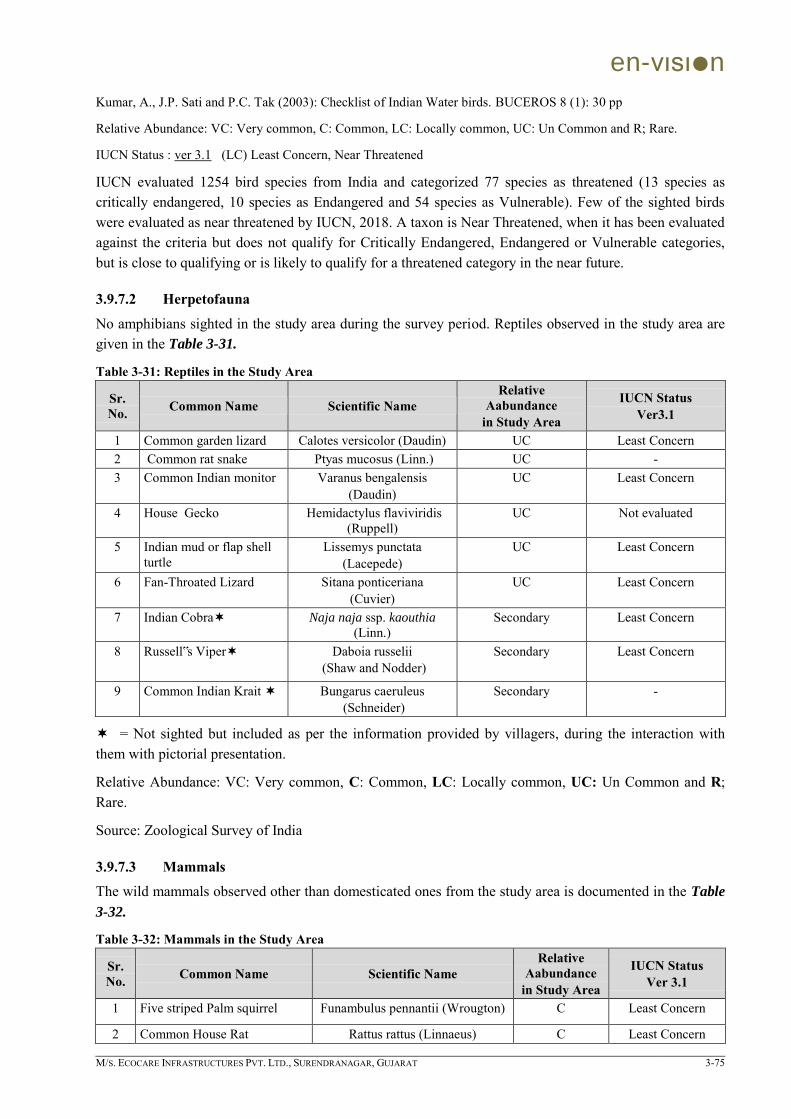
en-vιsιn
M/S. ECOCARE INFRASTRUCTURES PVT. LTD., SURENDRANAGAR, GUJARAT 3-75
Kumar, A., J.P. Sati and P.C. Tak (2003): Checklist of Indian Water birds. BUCEROS 8 (1): 30 pp
Relative Abundance: VC: Very common, C: Common, LC: Locally common, UC: Un Common and R; Rare.
IUCN Status : ver 3.1 (LC) Least Concern, Near Threatened
IUCN evaluated 1254 bird species from India and categorized 77 species as threatened (13 species as critically endangered, 10 species as Endangered and 54 species as Vulnerable). Few of the sighted birds were evaluated as near threatened by IUCN, 2018. A taxon is Near Threatened, when it has been evaluated against the criteria but does not qualify for Critically Endangered, Endangered or Vulnerable categories, but is close to qualifying or is likely to qualify for a threatened category in the near future.
3.9.7.2 Herpetofauna
No amphibians sighted in the study area during the survey period. Reptiles observed in the study area are given in the Table 3-31.
Table 3-31: Reptiles in the Study Area
Sr. No. Common Name Scientific Name
Relative Aabundance
in Study Area
IUCN Status Ver3.1
1 Common garden lizard Calotes versicolor (Daudin) UC Least Concern
2 Common rat snake Ptyas mucosus (Linn.) UC - 3 Common Indian monitor Varanus bengalensis
(Daudin) UC Least Concern
4 House Gecko Hemidactylus flaviviridis (Ruppell)
UC Not evaluated
5 Indian mud or flap shell turtle
Lissemys punctata (Lacepede)
UC Least Concern
6 Fan-Throated Lizard Sitana ponticeriana (Cuvier)
UC Least Concern
7 Indian Cobra Naja naja ssp. kaouthia (Linn.)
Secondary Least Concern
8 Russell‟s Viper Daboia russelii (Shaw and Nodder)
Secondary Least Concern
9 Common Indian Krait Bungarus caeruleus (Schneider)
Secondary -
= Not sighted but included as per the information provided by villagers, during the interaction with them with pictorial presentation.
Relative Abundance: VC: Very common, C: Common, LC: Locally common, UC: Un Common and R; Rare.
Source: Zoological Survey of India
3.9.7.3 Mammals
The wild mammals observed other than domesticated ones from the study area is documented in the Table
3-32.
Table 3-32: Mammals in the Study Area
Sr. No. Common Name Scientific Name
Relative Aabundance
in Study Area
IUCN Status Ver 3.1
1 Five striped Palm squirrel Funambulus pennantii (Wrougton) C Least Concern
2 Common House Rat Rattus rattus (Linnaeus) C Least Concern

en-vιsιn
M/S. ECOCARE INFRASTRUCTURES PVT. LTD., SURENDRANAGAR, GUJARAT 3-76
Sr. No. Common Name Scientific Name
Relative Aabundance
in Study Area
IUCN Status Ver 3.1
3 Common Mongoose/Indian Grey Mongoose
Herpestes edwardsi (Geoffroy) UC Least Concern
4 Nilgai Boselaphus tragocamelus (Pallas) Secondary Least Concern
5 Indian Hare Lepus nigricollis F. Cuvier UC Least Concern
6 Common Langur Semnopithecus entellus
(Dufresne, 1797) UC Least Concern
7 Wild Boars Sus scrofa (Linnaeus) Secondary -
= Not sighted but included as per the information provided by villagers, during the interaction with them with pictorial presentation.
Relative Abundance: VC: Very common, C: Common, LC: Locally common, UC: Un Common and R; Rare.
Zoological Survey of India
3.9.7.4 Migratory Birds / Winter Visitors in the Study Area:
This area attract many birds during the winter season, due to the presence of many shallow inland water bodies and lakes Winter visiting ( Migratory) birds observed during the study period are documented in the Table 3-33.
Table 3-33: Winter visitors in the study area
Old Common Name New Common Name Scientific Name Distribution Status
IUCN Status Ver3.1
Coot Common Coot Fulica atra Resident and winter visitor
Least Concern
Rosy pastor Rosy Starling Sturnus roseus Winter Visitor, Least Concern Common Pochard Common Pochard Aythya ferina Winter Visitor, Least Concern Common Shelduck Common Shelduck Tadorna tadorna Winter Visitor, Least Concern Common Teal Common Teal Anas crecca Winter Visitor, Least Concern Greylag Goose Greylag Goose Anser anser Winter Visitor, Least Concern Shoveller Northern Shoveller Anas clypeata Winter Visitor, Least Concern Brahminy duck or Ruddy shield duck
Ruddy Shelduck Tadorna ferruginea Resident and winter visitor
Least Concern
3.9.7.5 Butterflies from the study area:
Butterflies observed during the present study are documented in the Table 3-34.
Table 3-34: Butterflies in the Study Area
Sr. No. Scientific Name & Family Common Name Relative Aabundance in Study Area
1 Papilionidae 1/1 Papilio polytes Linnaeus Common Mormon LC 2/2 Papilio demoleus Linnaeus Lime butterfly UC 2 Pieridae
3/1 Eurema hecabe Linnaeus Common Grass yellow LC 4/2 Catopsilia pomona Fabricius Common Emigrant LC 5/3 Catopsilia pyranthe Linnaeus Mottled Emigrant LC 6/4 Delias eucharis Drury Common Jezebel UC 7/5 Cerpora nerissa Fabricius Common Gull UC 8/6 Ixias mariane Cramer White orange tip UC

en-vιsιn
M/S. ECOCARE INFRASTRUCTURES PVT. LTD., SURENDRANAGAR, GUJARAT 3-77
Sr. No. Scientific Name & Family Common Name Relative Aabundance in Study Area
9/7 Ixias pyrene Linnaeus Yellow orange tip UC 10/8 Colotis danae Fabricus Crimson tip UC
3 Nymphalidae 11/1 Melanitis leda Linnaeus Common evening Brown LC 12/2 Danaus chrysippus Plain Tiger LC 13/3 Danaus genutia Cramer Stripped Tiger LC 14/4 Hypolimanas misippus Danaid egg fly LC 15/5 Mycalesis perseus Common bush brown LC 16/6 Junonia lemonias Linnaeus Lemon pancy LC 17/7 Junonia almanac Linnaeus Peacock pancy UC 18/8 Junonia orithya Linnaeus Blue pancy UC 19/9 Junonia hierta Fabricius Yellow pancy UC
Relative Abundance: VC: Very common, C: Common, LC: Locally common, UC: Un Common and R; Rare.
3.9.7.6 As per Indian Wild Life (Protection) Act, 1972
Wild Life (Protection) Act, 1972, as amended on 17th January 2003, is an Act to provide for the protection of wild animals, birds and plants and for matters connected therewith or ancillary or incidental thereto with a view to ensuring the ecological and environmental security of the country.
Some of the sighted fauna were given protection by the Indian Wild Life (Protection) Act, 1972 by including them in different schedules. Among the birds in the study area, Pea fowl (Pavo cristatus) is included in schedule I of Wild life protection Act (1972), while many other birds are included in schedule IV.
Among the reptiles, Indian mud or flap shell turtle (Lissemys punctate), is protected as schedule –I Reptile, while Indian Cobra (Naja naja), and Common Rat Snake (Ptyas mucosus) were provided protection as per Schedule-II of Wild life protection act, (1972).
Among mammals; Bengal Hanuman langur/ Common langur (Semnopithecus entellus) and Common Mongoose (Herpestes edwardsi), are schedule –II mammals. Nilgai (Boselaphus tragocamelus) and Wild Boars (Sus scrofa) are provided protection by incorporating them in schedule–III. Hares and five stripped squirrels are included in schedule IV of Wild Life Protection act 1972.
Table 3-35: Species provided Protection as per Wild Life Protection Act 1972
Group Species Nearest Village Coordinates Number
Schedule Wild Life
Protection Act 1972.
Birds Pea fowl (Pavo cristatus),
Kaliyana 23º 10‟ 01.7”N 71º 58‟ 04.1”E
2 Peacock 4 Pea hen
Schedule I
Navagam 23º 15‟ 26.5”N 71º 52‟ 20.5”E
2 Peacock
Upariyala 23º 09‟ 22.1”N 71º 53‟ 19.8”E
Vadgas 23º 04‟ 48.2”N 71º 57‟ 17.8”E
2 Pea hen
Jarvala 23º 11‟ 25.0”N 71º 51‟ 46.0”E
6 Peacock 1 Pea hen
Navrangpura 23º 11‟ 30.8”N 71º 53‟ 42.6”E
2 Pea hen

en-vιsιn
M/S. ECOCARE INFRASTRUCTURES PVT. LTD., SURENDRANAGAR, GUJARAT 3-78
Group Species Nearest Village Coordinates Number
Schedule Wild Life
Protection Act 1972.
few other birds Various localities the study area
Schedule-IV
Reptiles
Indian Cobra (Naja naja),
Secondary Schedule-II
Indian mud or flap shell turtle (Lissemys
punctate),
Navagam 23º 15‟ 26.5”N 71º 57‟ 20.9”E
>20 Schedule I
Dumana 23º 07‟ 55.7”N 71º 58‟ 47.9”E
>100
Daulatpur 23º 06‟ 23.9”N 71º 54‟ 58.5”E
>10
Navrangpura 23º 11‟ 15.0”N 71º 53‟ 52.6”E
6
Upariyala 23º 09‟ 09.0”N 71º 53‟ 16.7”E
>20
Common rat snake (Ptyas mucosus)
Secondary Schedule-II
Mammals
Common Mongoose (Herpestes edwardsi),
Navrangpura 23º 11‟ 15.0”N 71º 53‟ 52.6”E
2 adult
Schedule-II
Bengal Hanuman langur (Semnopithecus entellus)
Kaliyana 23º 10‟ 01.7”N 71º 58‟ 04.8”E
1 Schedule-II
Five striped Palm squirrel (Funambulus pennanii (Wroughton))
Many places -
>20
Schedule-IV
Nilgai (Boselaphus tragocamelus)
Secondary - Schedule-III
Wild Boars (Sus scrofa Linnaeus
Secondary - Schedule-III
Sources: Wild Life Protection Act, 1972 and its amendments
3.9.8 Rare and Endangered Fauna of the Study Area
The IUCN Red List is the world's most comprehensive inventory of the global conservation status of plant and animal species. It uses a set of criteria to evaluate the extinction risk of thousands of species and subspecies. These criteria are relevant to all species and all regions of the world. With its strong scientific base, the IUCN Red List is recognized as the most authoritative guide to the status of biological diversity.
Of the total 63,837 species globally assessed by IUCN in 2012, 3,947 are classified as Critically Endangered, 81 as Extinct, 63 as Extinct in the Wild. In the lower risk categories, there were 5766 species in Endangered, 10,104 in Vulnerable and 4,467 in Near Threatened categories. Scientific data regarding 10,497 species was not available and hence classified as Data Deficient.
IUCN, (2007) has evaluated 1976 animal species from India, among them 313 have in recognized as threatened species. Among them one species is considered as extinct, while 44 species are in critically endangered (CR) category, 88 is in endangered category (EN), while 181 is considered as vulnerable (VU).
As per IUCN RED LIST (2019), among birds, Black headed ibis, (Threskiornis melanocephalus) is grouped under near threatened category.

en-vιsιn
M/S. ECOCARE INFRASTRUCTURES PVT. LTD., SURENDRANAGAR, GUJARAT 3-79
Table 3-36: Threatened Fauna of the Study Area
Species Habitat Located at Coordinates Number Threat status (IUCN, 2019)
Black-headed Ibis (Threskiornis
melanocephalus)
Shallow water bodies, and agriculture fields
Goraiya Village
23º 08‟ 09.3”N 71º 55‟ 54.8”E
8
Near threatened ver.3.1
Shallow water bodies, and agriculture fields
Daulatpur 23º 06‟ 23.9”N 71º 54‟ 58.5”E
1
Shallow water bodies, and agriculture fields
Jivangadh 23º 07‟ 12.8”N 71º 53‟ 12.7”E
6
Shallow water bodies, and agriculture fields
Surajpura 23º 11‟ 33.6”N 71º 50‟ 35.0”E
6
Source: The IUCN Red List of Threatened Species. Version 2019-1. <www.iucnredlist.org>. Downloaded on 12th January 2020
3.9.9 Conservation Measures for Schedule-I fauna:
Only two fauna that falls under the scheduled-I category was reported from the study area Peacock or Indian peafowl (Pavo cristatus) and Indian mud or flap shell turtle (Lissemys punctate). The rest of the fauna reported from the study area, falls under either in schedule-II, Schedule-III or Schedule-IV of the wild Life Protection Act 1972. Most of these species are not conservation dependent in Gujarat, and they are proliferating itself in its own habitats. Few of them like Nilgai and have become threat to the farmers as they are invading their crops very frequently in this region. Hence conservation measures are not provided for these animals. Unit has submitted Conservation plan to Chief Warden for authentification. Inward copy of submission of conservation plan and conservation measures for Indian peafowl and Indian mud or flap shell turtle is given in Annexure XI.

en-vιsιn
M/S. ECOCARE INFRASTRUCTURES PVT. LTD., SURENDRANAGAR, GUJARAT 3-80
3.10 SOCIO-ECONOMIC ENVIRONMENT
The baseline socio - economic data collected for the study region, has been identified for the four major indicators viz. demography, civic amenities, economy and social culture. Baseline study is done to analyze intended and unintended social consequences, both positive and negative, of planned interventions i.e. policies, programs, plans, projects. The baseline status of the above indicators is compiled in forthcoming sections.
3.10.1 Major Objectives of the Study
To understand the socio-economic status of the villages To study the perceptions of people about the impact of proposed project To suggest CER plan for the development of communities
3.10.2 Identification of Stakeholders
Any project usually has some negative impacts on the local population. Displacement and/or health/socioeconomic hazard are traumatic experience in spite of compensation paid and mitigation measures adopted. Therefore proper identification of stakeholders and appropriate consultation on the implementation plan and participation of affected people in decision making are of utmost importance. This helps the stakeholders in understanding the project objectives and needs; and in communicating their willingness, views and preferences. Thus it ensures increased participation of people through better acceptance of the project. Stakeholders' consultation was done during Socio-Economic study at the project locations and nearby area within 10 km radius area of the proposed expansion project. Planned Corporate Environment Responsibility (CER) activities are suggested based on findings of this Socio-economic study report.
3.10.3 Methodology
Socio-Economic aspects report was prepared by following methodology given as under:
1. A detailed desk review of the reports and secondary data related to the socio-economic context of the project.
2. Reviewing census records. 3. Reconnaissance visits to the project site were made. 4. Screening of potential social impacts in the project influence area was carried out.
During the reconnaissance visit, Public Consultations, Focused Group Discussion (FGD) and Personal Interview were conducted to gather feedback from the local people on the proposed development and perceived socio-economic impacts.
Study area is consisting total 34 villages with 2 talukas in two districts of Surendranagar and Ahmedabad. Total 5 villages have been selected as sample size (i.e. 14%) out of 34 villages. Table 3-37: list of villages where Socio-economic study conducted
Sr. No. Villages Sub-District District From the Project Site Wind Direction Distance Direction 1 Ghaspur
Dasada Surendranagar 1.5 NNE Upwind
2 Navrangpura 1.9 WNW Downwind 3 Upariyala 4.5 SW Upwind 4 Dediyasan Viramgam Ahmedabad 3 E Downwind 5 Jhund 2.4 SE Downwind
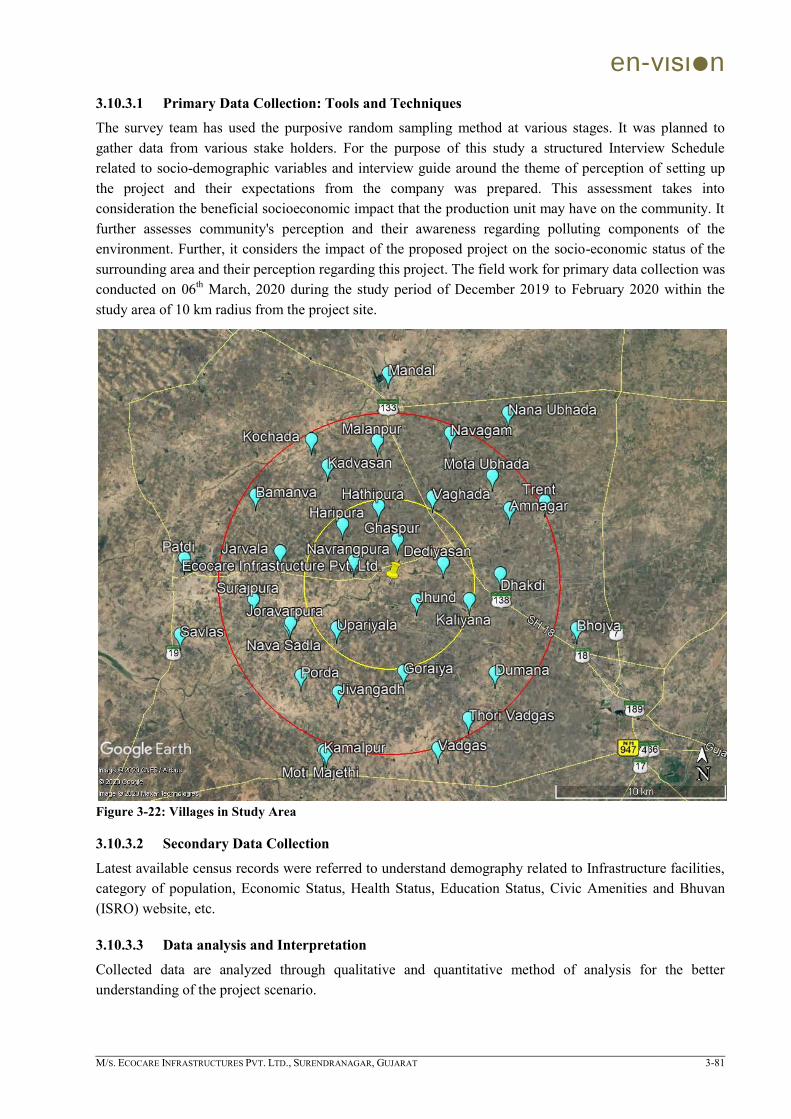
en-vιsιn
M/S. ECOCARE INFRASTRUCTURES PVT. LTD., SURENDRANAGAR, GUJARAT 3-81
3.10.3.1 Primary Data Collection: Tools and Techniques
The survey team has used the purposive random sampling method at various stages. It was planned to gather data from various stake holders. For the purpose of this study a structured Interview Schedule related to socio-demographic variables and interview guide around the theme of perception of setting up the project and their expectations from the company was prepared. This assessment takes into consideration the beneficial socioeconomic impact that the production unit may have on the community. It further assesses community's perception and their awareness regarding polluting components of the environment. Further, it considers the impact of the proposed project on the socio-economic status of the surrounding area and their perception regarding this project. The field work for primary data collection was conducted on 06th March, 2020 during the study period of December 2019 to February 2020 within the study area of 10 km radius from the project site.
Figure 3-22: Villages in Study Area
3.10.3.2 Secondary Data Collection
Latest available census records were referred to understand demography related to Infrastructure facilities, category of population, Economic Status, Health Status, Education Status, Civic Amenities and Bhuvan (ISRO) website, etc.
3.10.3.3 Data analysis and Interpretation
Collected data are analyzed through qualitative and quantitative method of analysis for the better understanding of the project scenario.

en-vιsιn
M/S. ECOCARE INFRASTRUCTURES PVT. LTD., SURENDRANAGAR, GUJARAT 3-82
3.10.4 Limitations
Study is limited to the 10 km radius with purposive random sampling from the proposed expansion project site.
3.10.5 The Project Influence Area
The Project Influenced Area (PIA) for the concerned industry comprises 34 minor, major villages and urban area in 10 km radial distance from the proposed project. Demographical details as per census 2011 of the study area are given in table below:
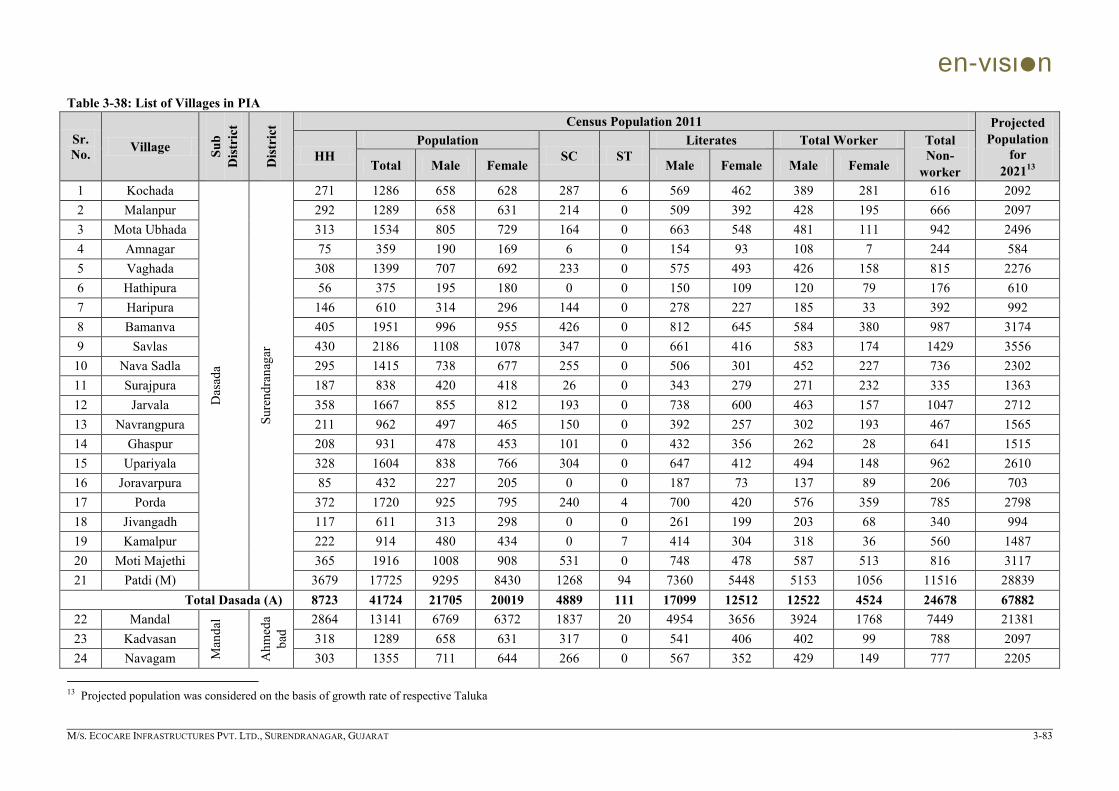
en-vιsιn
M/S. ECOCARE INFRASTRUCTURES PVT. LTD., SURENDRANAGAR, GUJARAT 3-83
Table 3-38: List of Villages in PIA
Sr. No. Village Su
b D
istr
ict
Dis
tric
t Census Population 2011 Projected Population
for 202113
HH Population
SC ST Literates Total Worker Total
Non- worker Total Male Female Male Female Male Female
1 Kochada
Das
ada
Sure
ndra
naga
r
271 1286 658 628 287 6 569 462 389 281 616 2092 2 Malanpur 292 1289 658 631 214 0 509 392 428 195 666 2097 3 Mota Ubhada 313 1534 805 729 164 0 663 548 481 111 942 2496 4 Amnagar 75 359 190 169 6 0 154 93 108 7 244 584 5 Vaghada 308 1399 707 692 233 0 575 493 426 158 815 2276 6 Hathipura 56 375 195 180 0 0 150 109 120 79 176 610 7 Haripura 146 610 314 296 144 0 278 227 185 33 392 992 8 Bamanva 405 1951 996 955 426 0 812 645 584 380 987 3174 9 Savlas 430 2186 1108 1078 347 0 661 416 583 174 1429 3556 10 Nava Sadla 295 1415 738 677 255 0 506 301 452 227 736 2302 11 Surajpura 187 838 420 418 26 0 343 279 271 232 335 1363 12 Jarvala 358 1667 855 812 193 0 738 600 463 157 1047 2712 13 Navrangpura 211 962 497 465 150 0 392 257 302 193 467 1565 14 Ghaspur 208 931 478 453 101 0 432 356 262 28 641 1515 15 Upariyala 328 1604 838 766 304 0 647 412 494 148 962 2610 16 Joravarpura 85 432 227 205 0 0 187 73 137 89 206 703 17 Porda 372 1720 925 795 240 4 700 420 576 359 785 2798 18 Jivangadh 117 611 313 298 0 0 261 199 203 68 340 994 19 Kamalpur 222 914 480 434 0 7 414 304 318 36 560 1487 20 Moti Majethi 365 1916 1008 908 531 0 748 478 587 513 816 3117 21 Patdi (M) 3679 17725 9295 8430 1268 94 7360 5448 5153 1056 11516 28839
Total Dasada (A) 8723 41724 21705 20019 4889 111 17099 12512 12522 4524 24678 67882 22 Mandal
Man
dal
Ahm
eda
bad
2864 13141 6769 6372 1837 20 4954 3656 3924 1768 7449 21381 23 Kadvasan 318 1289 658 631 317 0 541 406 402 99 788 2097 24 Navagam 303 1355 711 644 266 0 567 352 429 149 777 2205
13 Projected population was considered on the basis of growth rate of respective Taluka
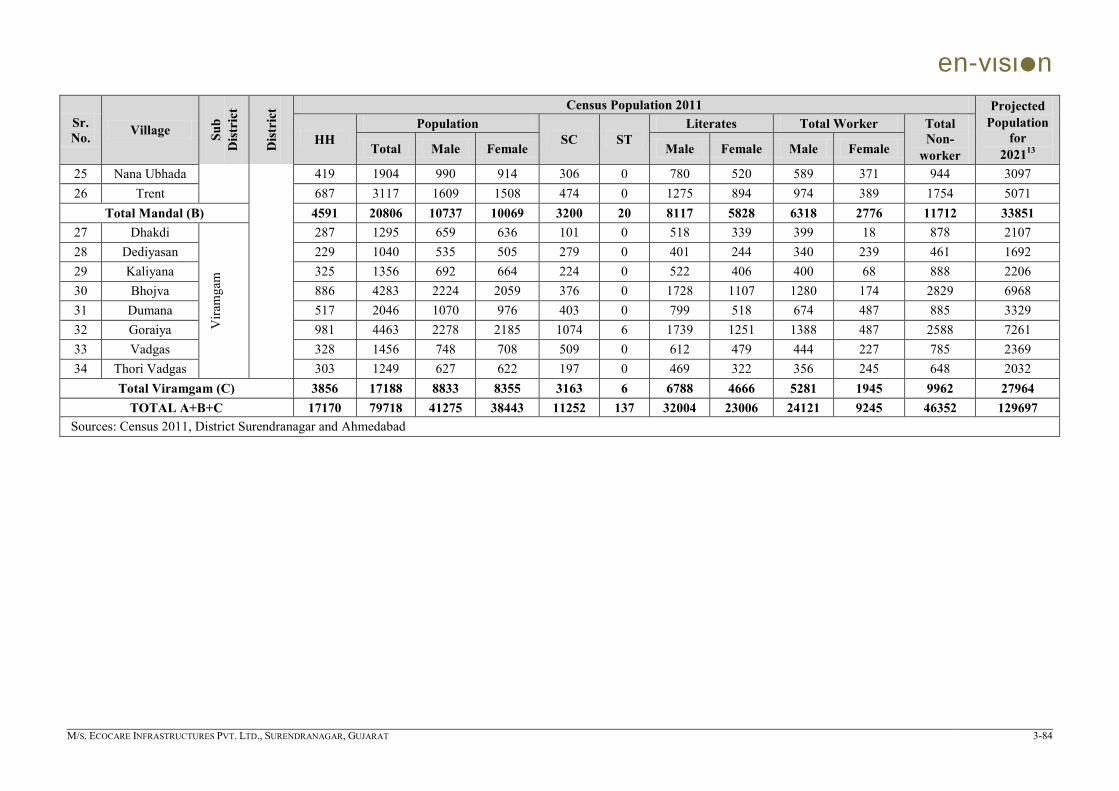
en-vιsιn
M/S. ECOCARE INFRASTRUCTURES PVT. LTD., SURENDRANAGAR, GUJARAT 3-84
Sr. No. Village Su
b D
istr
ict
Dis
tric
t Census Population 2011 Projected Population
for 202113
HH Population
SC ST Literates Total Worker Total
Non- worker Total Male Female Male Female Male Female
25 Nana Ubhada 419 1904 990 914 306 0 780 520 589 371 944 3097 26 Trent 687 3117 1609 1508 474 0 1275 894 974 389 1754 5071
Total Mandal (B) 4591 20806 10737 10069 3200 20 8117 5828 6318 2776 11712 33851 27 Dhakdi
Vira
mga
m
287 1295 659 636 101 0 518 339 399 18 878 2107 28 Dediyasan 229 1040 535 505 279 0 401 244 340 239 461 1692 29 Kaliyana 325 1356 692 664 224 0 522 406 400 68 888 2206 30 Bhojva 886 4283 2224 2059 376 0 1728 1107 1280 174 2829 6968 31 Dumana 517 2046 1070 976 403 0 799 518 674 487 885 3329 32 Goraiya 981 4463 2278 2185 1074 6 1739 1251 1388 487 2588 7261 33 Vadgas 328 1456 748 708 509 0 612 479 444 227 785 2369 34 Thori Vadgas 303 1249 627 622 197 0 469 322 356 245 648 2032
Total Viramgam (C) 3856 17188 8833 8355 3163 6 6788 4666 5281 1945 9962 27964 TOTAL A+B+C 17170 79718 41275 38443 11252 137 32004 23006 24121 9245 46352 129697
Sources: Census 2011, District Surendranagar and Ahmedabad
en-vιsιn
M/S. ECOCARE INFRASTRUCTURES PVT. LTD., SURENDRANAGAR, GUJARAT 3-85
3.10.5.1 Overview of Study Area
The project site is located at Dasada (Patdi) taluka of Surendranagar District and it is near to Viramgam city which is approx 15 km away from the proposed site in South-East direction in Ahmedabad district. Proposed project site is about 01 km from the Ghaspur bus stop in South direction.
3.10.6 Findings of Community Consultations
Socio-economic survey was conducted with the help of predesigned tool to measure the socio-economic status of the people in the study area. On the basis of purposive random sampling, adult males/females from these villages were selected to collect the information related to socio-economic status. Individual interviews with the adult male/female, common meetings were conducted in which heads of the villages, panchayat representatives, and other stakeholders like, school teacher, anganwadi sevika, PHC in charge, gramsevak, etc were present.
The findings of the quick socioeconomic survey and various consultations at community level are presented below:
3.10.6.1 Population
Project Influence Area does consist two districts viz. Surendranagar and Ahmedabad and three talukas i.e. Dasada taluka of Surendranagar and Viramgam and Mandal talukas of Ahmedabad district.
In 2011 Census, Surendranagar had population of 17,56,268 from which male and female were 9,09,917 and 8,46,351 respectively. In 2001 census, Surendranagar had a population of 15,15,148 from which males were 7,87,650 and remaining 7,27,498 were females. There was change of 15.91 percent in the population compared to population as per 2001. In the previous census of India 2001, Surendranagar district recorded increase of 25.34 percent to its population compared to 1991.
In 2011 Census, Ahmedabad had population of 72,14,225 from which male and female were 37,88,051 and 34,26,174 respectively. In 2001 census, Ahmedabad had a population of 58,16,519 from which males were 30,74,556 and remaining 27,41,963 were females. There was change of 24.03 percent in the population compared to population as per 2001. In the previous census of India 2001, Ahmedabad district recorded increase of 27.25 percent to its population compared to 1991.
Demographical data of the study area are shown in Table 3-38. Populations in villages of study area located in Dasada of Surendranagar district and Mandal and Viramgam talukas of Ahmedabad district were 1,80,641; 15,121 and 1,93,283 respectively as per census 2011. Total population in the study area was 79,718 as per the Census 2011 from which 41,275 are males and 38,443 are females. 11,252 Schedule Caste population and 137 were Schedule Tribes population in the study area as per census 2011.
3.10.6.2 Population Density
As per census 2011 India, shows that density of Surendranagar district was 168 people per sq. km. In 2001, Surendranagar district density was at 144 people per sq. km. Surendranagar district administers 10,423 square kilometers of areas. As per census 2011 India, shows that density of Ahmedabad district was 890 people per sq. km. In 2001, Ahmedabad district density was at 719 people per sq. km. Ahmedabad district administers 8,107 square kilometers of areas. Total population density of study area is 254 persons per sq. km as per census 2011.

en-vιsιn
M/S. ECOCARE INFRASTRUCTURES PVT. LTD., SURENDRANAGAR, GUJARAT 3-86
3.10.6.3 Sex Ratio
As per 2011 census data of Surendranagar district, sex ratio Surendranagar was stood at 930 per 1000 male in 2011 census compared to 2001 census figure of 924. Child sex ratio is 896 girls per 1000 boys in 2011 census compared to figure of 886 girls per 1000 boys of 2001 census data. As per 2011census data of Ahmedabad district, sex ratio Ahmedabad was stood at 904 per 1000 male in 2011 census compared to 2001 census figure of 892. Child sex ratio is 857 girls per 1000 boys in 2011 census compared to figure of 836 girls per 1000 boys of 2001 census data. The average national sex ratio in India was 940 as per latest reports of Census 2011. Sex ratio of the study area as per census 2011 was 931 female population per 1000 male population.
3.10.6.4 Literacy Rate
Average literacy rate of Surendranagar in 2011 were 72.13 compared to 61.61 of 2001. If things are looked out at gender wise, male and female literacy were 81.11 and 69.45 respectively. For 2001 census, the same figures stood at 74.19 and 48.10 in Surendranagar district. Total literate in Surendranagar district were 10,93,626 of which male and female were 6,43,221 and 4,50,405 respectively. Average literacy rate of Ahmedabad in 2011 were 85.31 compared to 79.50 of 2001. If things are looked out at gender wise, male and female literacy were 90.74 and 79.35 respectively. For 2001 census, the same figures stood at 87.31 and 70.83 in Ahmedabad district. Total literate in Ahmedabad district were 54,35,760 of which male and female were 30,25,463 and 24,10,297 respectively.
As informed by the respondents, literacy level of the study area was comparatively good. Average literacy rate of the study area was 78.43% as per census 2011. New generation are having more educated than old generation. Girls and boys education is similar in the study area. Education levels of the students of the area were observed good. Proposed expansion project will be provided employment opportunity to local literates.
3.10.6.5 Economic Profile
It can be concluded that majorly occupations were observed in this region is agricultural activities. Main crops of the region are cotton, castor, cumin, sorghum, wheat, etc. Animal husbandry and labour work are also the source of livelihood in study area. Proposed expansion project will increase direct or indirect employment opportunities in the area.
3.10.6.6 Infrastructure Facilities
It is assessed that the study area is having available basic infrastructural facilities like, drinking water, sanitation, drainage, health care centre, dairy centers, anganwadi centre, educational facility, electricity, bank, post office, transportation facility, etc. But some villages of the study area these infrastructural facilities still need to be developed. There are transport facilities like buses, auto-rickshaw and railways. Villages are connected with major highways and approach roads but some interior parts of village need to be developed. Improvement is required for proper management of solid waste.
Cumin farm
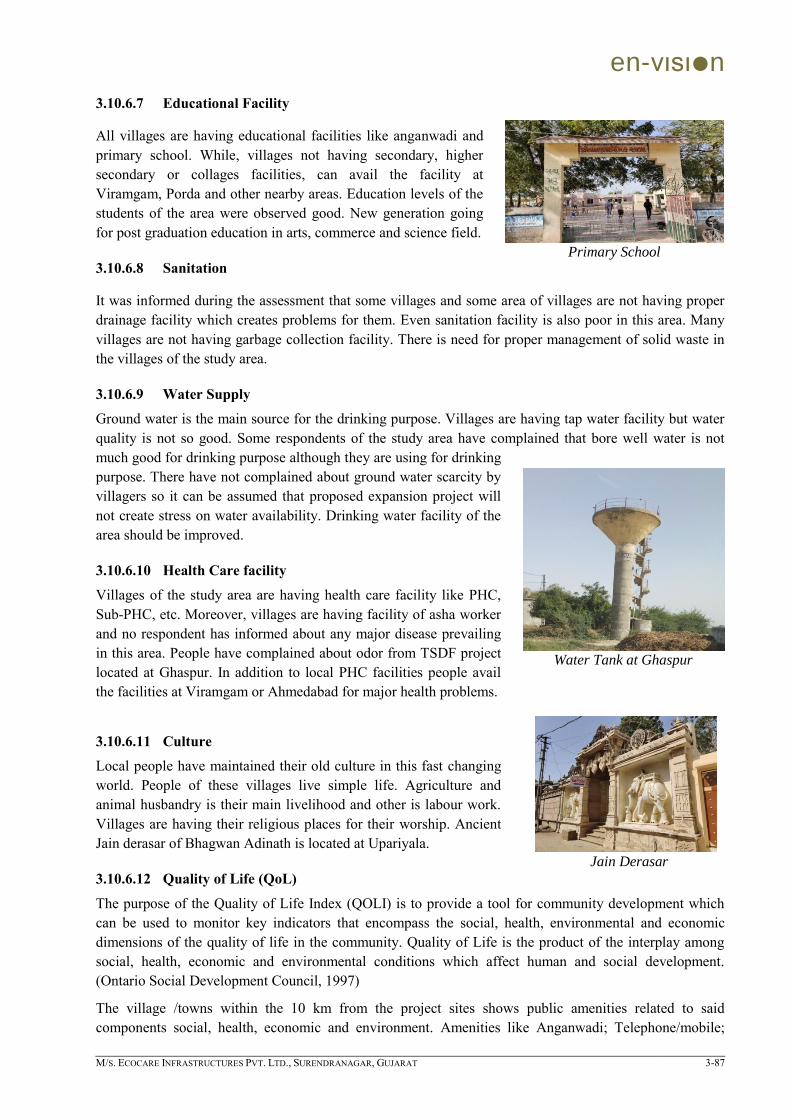
en-vιsιn
M/S. ECOCARE INFRASTRUCTURES PVT. LTD., SURENDRANAGAR, GUJARAT 3-87
3.10.6.7 Educational Facility
All villages are having educational facilities like anganwadi and primary school. While, villages not having secondary, higher secondary or collages facilities, can avail the facility at Viramgam, Porda and other nearby areas. Education levels of the students of the area were observed good. New generation going for post graduation education in arts, commerce and science field.
3.10.6.8 Sanitation
It was informed during the assessment that some villages and some area of villages are not having proper drainage facility which creates problems for them. Even sanitation facility is also poor in this area. Many villages are not having garbage collection facility. There is need for proper management of solid waste in the villages of the study area.
3.10.6.9 Water Supply
Ground water is the main source for the drinking purpose. Villages are having tap water facility but water quality is not so good. Some respondents of the study area have complained that bore well water is not much good for drinking purpose although they are using for drinking purpose. There have not complained about ground water scarcity by villagers so it can be assumed that proposed expansion project will not create stress on water availability. Drinking water facility of the area should be improved.
3.10.6.10 Health Care facility
Villages of the study area are having health care facility like PHC, Sub-PHC, etc. Moreover, villages are having facility of asha worker and no respondent has informed about any major disease prevailing in this area. People have complained about odor from TSDF project located at Ghaspur. In addition to local PHC facilities people avail the facilities at Viramgam or Ahmedabad for major health problems.
3.10.6.11 Culture
Local people have maintained their old culture in this fast changing world. People of these villages live simple life. Agriculture and animal husbandry is their main livelihood and other is labour work. Villages are having their religious places for their worship. Ancient Jain derasar of Bhagwan Adinath is located at Upariyala.
3.10.6.12 Quality of Life (QoL)
The purpose of the Quality of Life Index (QOLI) is to provide a tool for community development which can be used to monitor key indicators that encompass the social, health, environmental and economic dimensions of the quality of life in the community. Quality of Life is the product of the interplay among social, health, economic and environmental conditions which affect human and social development. (Ontario Social Development Council, 1997)
The village /towns within the 10 km from the project sites shows public amenities related to said components social, health, economic and environment. Amenities like Anganwadi; Telephone/mobile;
Primary School
Water Tank at Ghaspur
Jain Derasar

en-vιsιn
M/S. ECOCARE INFRASTRUCTURES PVT. LTD., SURENDRANAGAR, GUJARAT 3-88
Government Primary School; Public Private Mode of Transportation; Black Topped Road; and power supply are largely witnessed in 100% of the villages. While river and canal (3%); Govt. PHC/SC (20.59%); Commercial bank (3%); Agriculture credit society in (55.88%); Total Sanitation Campaign (47.6%); Forest Area (11.76%); Permanent Pastures and Other Grazing Land Area (64.71%) and Land under Miscellaneous Tree Crops etc Area 5.88% of the villages within the study area. Thus, total average of amenities cumulatively social, health, economic and environment components is 58, according to this it can be concluded that quality of life in the area is moderately good.
3.10.7 People‟s Perception
In the process of Social Assessment study, focus group discussion and personal interviews were scheduled with local people with an objective of understanding the present as well as subsequent situation faced by villagers after setting up an industry. It is observed that people perceive this project positively. People have large expectations of generations of employment from upcoming industries to improve better quality of life and to reduce unemployment of the area. Further, during assessment, no respondent has complained for the pollution as the study area is not influenced by industries. People are not against the development only it should not create pollution. Further, people consider agriculture on industrial job if agricultural water facility sufficiently provided.
Date: 06/03/2020 Village: Ghaspur
During the discussion with village people, it was informed that village is having all basic infrastructural facilities available. Village is having educational facility up to 8 standard, for further education students have to go at Fulki and other nearby villages. Village is having drinking water facility but TDS is high as informed. Drainage system is available in village but partially is pending. Village is having availability of healthcare facility. There is no major health related issued reported by locals. Main occupations of the village are agriculture and labor work. Cotton, cumin, etc are main crops of the area. TSDF project is falls within this village area and employment in TSDF is informed. No pollution felt is reported in the village.
Date: 06/03/2020 Village: Upariyala
Field assessment was done at Upariyala village and it was informed that major occupation of the village agriculture and major crops are cotton, cumin, wheat, sorghum, etc. Nearest major agricultural market is situated at Patdi and Viramgam. Drinking water facility is available in village through tap water and bore well dug in farms for cultivation purpose. Drainage facility is available in village but it need to be completed in entire village. Health care facilities are available in village. No major health related issues are reported. Village is also having ancient Jain Derasar.
Discussion at Ghaspur
Consultation at Upariyala

en-vιsιn
M/S. ECOCARE INFRASTRUCTURES PVT. LTD., SURENDRANAGAR, GUJARAT 3-89
Date: 06/03/2020 Village: Navrangpura
Agriculture and animal husbandry are main income sources for villagers. Cotton, cumin, castor, etc are the main agriculture crops of village. Village is having basic infrastructural facilities still some facilities need to be developed. Anganwadi and primary school facilities are available in village. Education scenario is good in study area, girls‟ education is higher compared to boys. Village is having availability of health care facility of PHC at Upariyala and Asha worker in village. It is also reported that pollution is felt due to TSDF project. Village is having street light, it is report that solid waste is being collected and disposed at the edge of village called as ukardo. Village is having total sanitation and individual toilet and village is free from open defecation and village is having partially drainage facility which needs to be developed.
Date: 06/03/2020 Village: Dediyasan
During the assessment it was informed that village is having basic infrastructural facilities. Major source of income are agricultural activity and animal husbandry. Village is having drinking water facility, tap water through bore well, educational facility- anganwadi and primary school up to 8 standard and mid day meal programme is also running, for getting higher education students go to Viramgam and Mandal. Village is having drainage facility, street light, healthcare facilities are available in village and no major health related issues are informed. Villagers have complained about pollution faced due to TSDF project located at Ghaspur village during wind direction towards this village.
Date: 06/03/2020 Village: Jhund
Jhund village is part of Goraiya village; Main occupation of the village is agricultural activity and animal husbandry while major crops are cotton, castor, cumin, etc. Bore well is the source of water for agriculture and bore water through tap water is source of drinking water purpose, but water quality is somewhat hard. Village is having basic infrastructural facilities like, educational facilities up to 8 standard and for further education, students go to Viramgam. Village is having road, street light, drainage facility, etc. But there is no management of solid waste by panchayat. Panchayat is planning to install CCTV camera in village. Village is having availability of healthcare facility at Goraiya and asha worker in village, there is no complain about health related issues. No pollution from the TSDF project and no employment to this village.
Consultation at Navrangpura
Discussion with Sarpanch and
villagers and Teachers, Dediyasan
Gram Panchayat Jhund
en-vιsιn
M/S. ECOCARE INFRASTRUCTURES PVT. LTD., SURENDRANAGAR, GUJARAT 3-90
3.10.7.1 Conclusions Socio-Economic Survey
All the respondents across all socio-economic groups, age, gender and locations have expressed their views about the location. According to them, all villages are having basic infrastructural facilities but some villages need to be improved in some areas like, drainage, solid waste management, sanitation, water, etc. For sanitation, village panchayats can use Swachh Bharat Mission scheme. Some villages have expressed their experience about the project that it is pollutes the environment so no expansion should be there but others have expressed that project is running legally and providing employment to people but expansion project should not be creating pollution. It will improve quality of life by increasing indirect employment opportunities and also by bringing about a positive change like developmental activities, indirect employment, etc. The Company needs to undertake various activities in education, infrastructure development, and health and environment area as a part of Corporate Environment Responsibility (CER) for the development of the society.