egyptian revolution a demographic structural analysis korotayev zinkina
TRANSCRIPT
ENTELEQUIAENTELEQUIArevista interdisciplinarrevista interdisciplinar
Andrey V. Korotayev *
Julia V. Zinkina
EGYPTIAN REVOLUTION: A DEMOGRAPHIC STRUCTURAL ANALYSIS **
REVOLUCIÓN EN EGIPTO: UN ANÁLISIS DEMOGRÁFICO ESTRUCTURAL
AbstractHighlighting the events of Egyptian Revolution 2011, various massmedia tried to explain what had caused the riots. Most explanations followed the same pattern, blaming economic stagnation, poverty, inequality, corruption and unemployment. A typical explanation is that “Egyptians have the same complaints that drove Tunisians onto the streets: surging food prices, poverty, unemployment and authoritarian rule that smothers public protests quickly and often brutally”. Such unanimity incited us to investigate to what extent those accusations reflected the Egyptian reality. So we decided to take each of the above mentioned “revolution causes” and to look into the actual dynamics of the relevant socioeconomic indicators in the years preceding the Egyptian revolution.Keywords: Egypt, revolution, demography.
ResumenEn los titulares de los eventos de la Revolución egipcia de 2011, varios medios de masas intentaron explicar qué había causado los disturbios. La mayoría de las explicaciones seguían el mismo patrón, protestas por el estancamiento económico, pobreza, desigualdad, corrupción y desempleo. Una explicación típica es que “Los egipcios tienen las mismas quejas que llevaron a los tunecinos a las calles: precios galopantes de los alimentos, pobreza, desempleo y reglas autoritarias que silenciaron las protestas públicas rápida y a menudo brutalmente”.Esa unanimidad nos incitó a investigar hasta qué punto esas actuaciones reflejaban la realidad Egipcia. Así que decidimos tomar cada una de las mencionadas “causas de la revolución” y mirar en la actual dinámica de los indicadores relevantes de la socioeconomía, en los días previos a la revolución egipcia.
Palabras clave: Egipto, revolución, demografía.
JEL: E24, D72, I39.
* Andrey Korotayev (Андрей Витальевич Коротаев, nacido en 1961) es un antropólogo, economista, historiador, y sociólogo, con importantes contribuciones a la teoría del sistema mundial y modelos matemáticos de macrodinámicas sociales y económicas. http://es.wikipedia.org/wiki/Andrey_Korotayev
** This research has been supported by the Russian Foundation for Basic Research (Project # 10–06–00344: «Forecasting Risks and Threats to Stability of Sociopolitical Systems»).
eumed•netwww.eumed.net/entelequia
Korotayev – Zinkina Korotayev – Zinkina / / 139139 Núm. 13 (primavera 2011) Núm. 13 (primavera 2011)
ENTELEQUIAENTELEQUIArevista interdisciplinarrevista interdisciplinar
1. Economic stagnation?
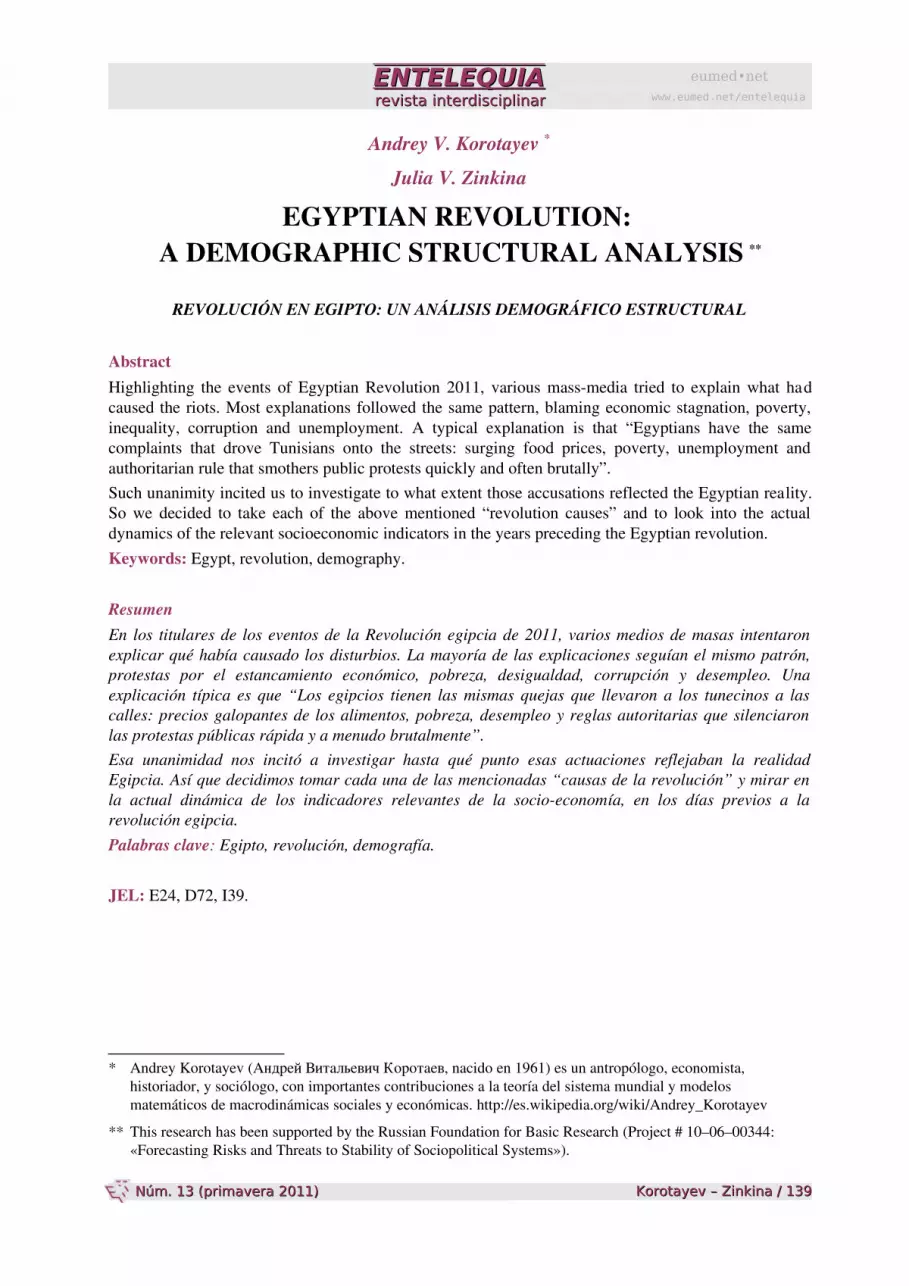
et us first consider the dynamics of the most general economic performance indicator, namely GDP, in Mubarak’s epoch (Fig. 1): L
Fig. 1. GDP production dynamics in Egypt (blns of 2005 dollars, PPP), 1980–20101
Evidently, during Mubarak’s reign (1981–2011) the Egyptian economy was developing rather dynamically. The growth by 4.5 times during 30 years was one of the best results among the Third World countries at the time2. Economic growth rates accelerated particularly visibly after July 2004 when the new government managed to attract a group of talented economists who worked out an effective program of economic reforms. These reforms provided for a substantial acceleration of Egyptian economic growth3.
Regarding Fig. 1, particular attention should be given to the fact that during the world financialeconomic crisis the Egyptian GDP did not fall, but continued growing at a rather high rate. Annual economic growth rates slowed down somewhat, from 7.2% to 4.6% (though many countries would dream of achieving 4.5% rate of economic growth even in crisisless years!). Nevertheless, Egyptian government did succeed in preventing any economic collapse. In 2010 Egyptian economic growth rates increased again.
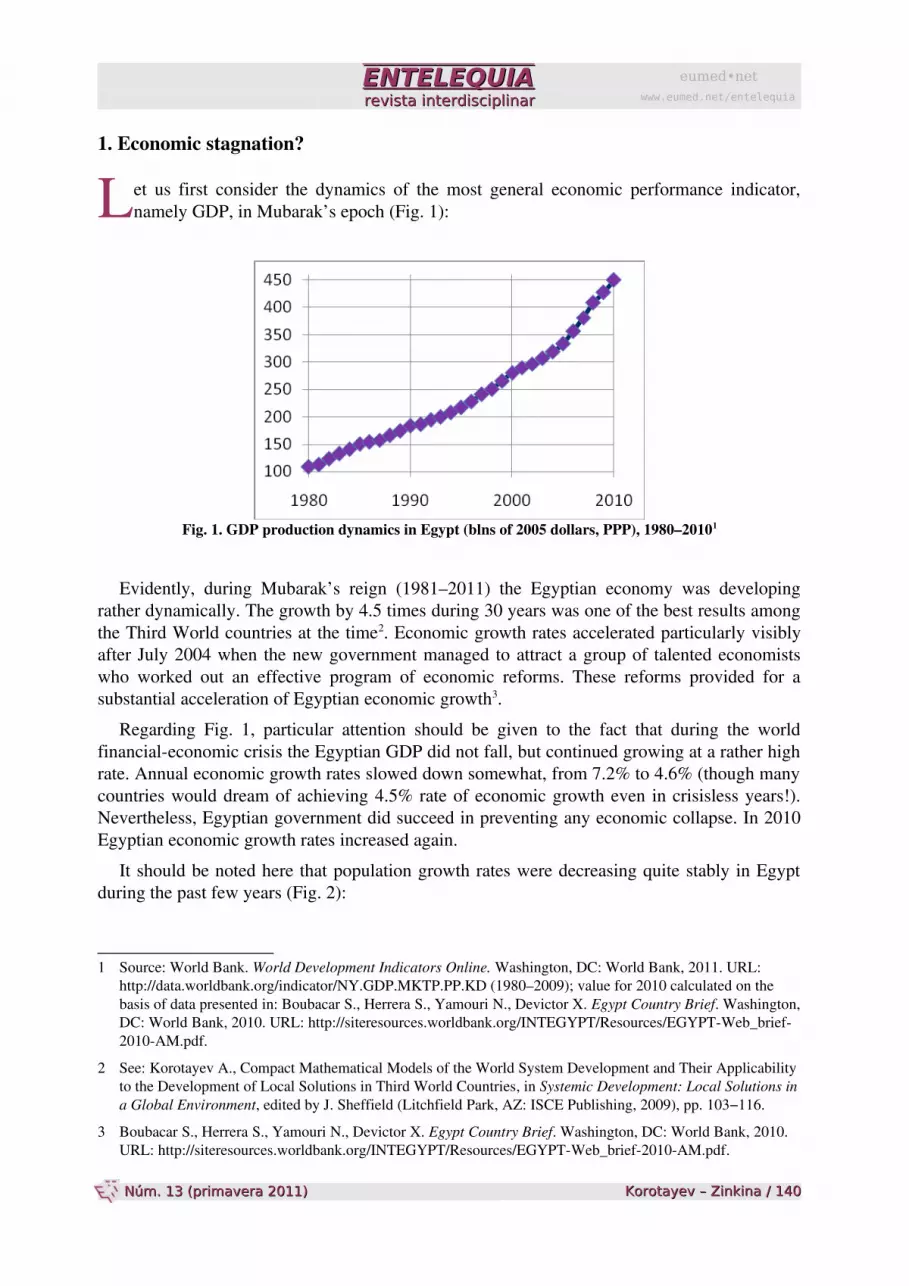
It should be noted here that population growth rates were decreasing quite stably in Egypt during the past few years (Fig. 2):
1 Source: World Bank. World Development Indicators Online. Washington, DC: World Bank, 2011. URL: http://data.worldbank.org/indicator/NY.GDP.MKTP.PP.KD (1980–2009); value for 2010 calculated on the basis of data presented in: Boubacar S., Herrera S., Yamouri N., Devictor X. Egypt Country Brief. Washington, DC: World Bank, 2010. URL: http://siteresources.worldbank.org/INTEGYPT/Resources/EGYPTWeb_brief2010AM.pdf.
2 See: Korotayev A., Compact Mathematical Models of the World System Development and Their Applicability to the Development of Local Solutions in Third World Countries, in Systemic Development: Local Solutions in a Global Environment, edited by J. Sheffield (Litchfield Park, AZ: ISCE Publishing, 2009), pp. 103−116.
3 Boubacar S., Herrera S., Yamouri N., Devictor X. Egypt Country Brief. Washington, DC: World Bank, 2010. URL: http://siteresources.worldbank.org/INTEGYPT/Resources/EGYPTWeb_brief2010AM.pdf.
eumed•netwww.eumed.net/entelequia
Korotayev – Zinkina Korotayev – Zinkina / / 140140 Núm. 13 (primavera 2011) Núm. 13 (primavera 2011)
ENTELEQUIAENTELEQUIArevista interdisciplinarrevista interdisciplinar
Fig. 2. Relative population growth rates in Egypt, % per year, 200320094
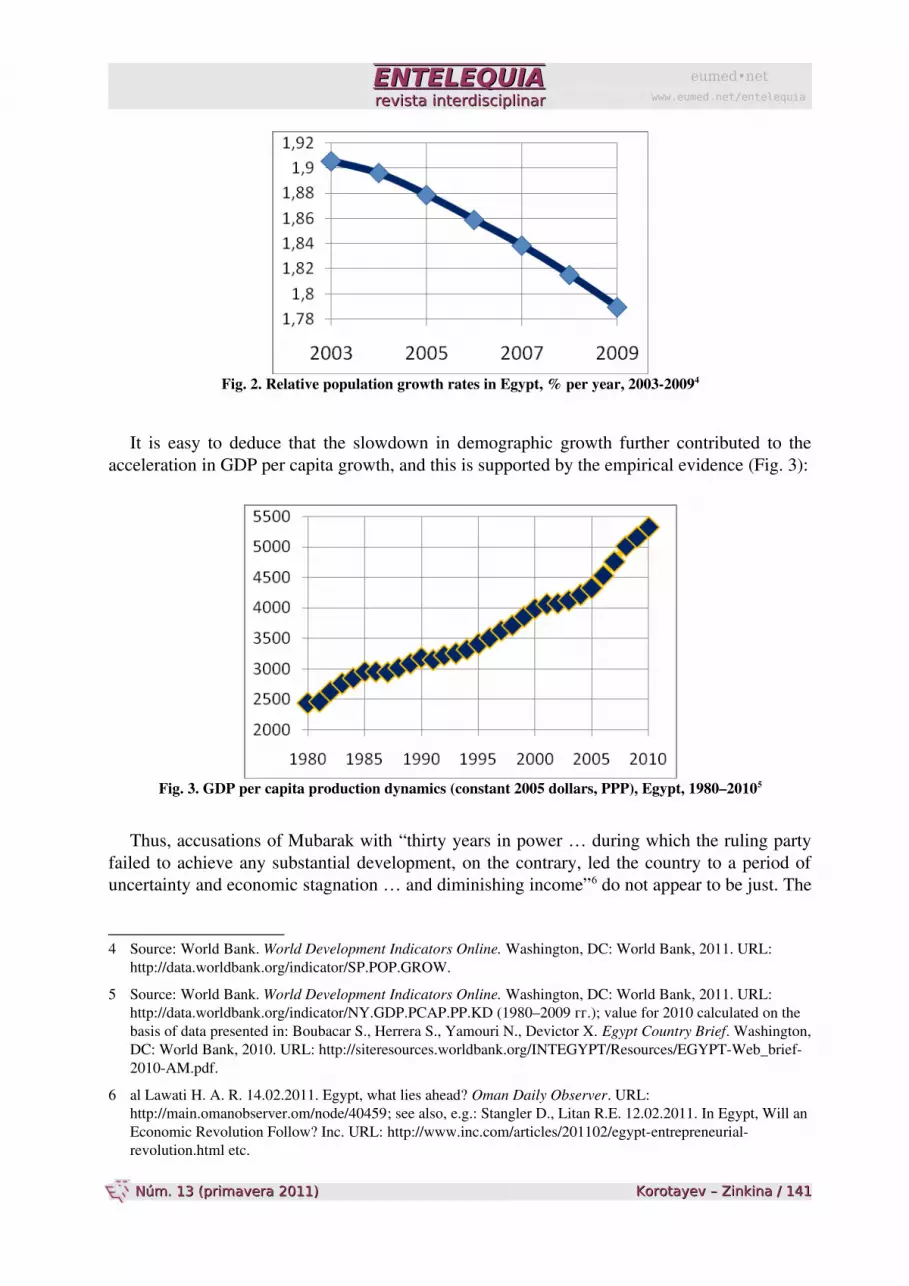
It is easy to deduce that the slowdown in demographic growth further contributed to the acceleration in GDP per capita growth, and this is supported by the empirical evidence (Fig. 3):
Fig. 3. GDP per capita production dynamics (constant 2005 dollars, PPP), Egypt, 1980–20105
Thus, accusations of Mubarak with “thirty years in power … during which the ruling party failed to achieve any substantial development, on the contrary, led the country to a period of uncertainty and economic stagnation … and diminishing income”6 do not appear to be just. The
4 Source: World Bank. World Development Indicators Online. Washington, DC: World Bank, 2011. URL: http://data.worldbank.org/indicator/SP.POP.GROW.
5 Source: World Bank. World Development Indicators Online. Washington, DC: World Bank, 2011. URL: http://data.worldbank.org/indicator/NY.GDP.PCAP.PP.KD (1980–2009 гг.); value for 2010 calculated on the basis of data presented in: Boubacar S., Herrera S., Yamouri N., Devictor X. Egypt Country Brief. Washington, DC: World Bank, 2010. URL: http://siteresources.worldbank.org/INTEGYPT/Resources/EGYPTWeb_brief2010AM.pdf.
6 al Lawati H. A. R. 14.02.2011. Egypt, what lies ahead? Oman Daily Observer. URL: http://main.omanobserver.om/node/40459; see also, e.g.: Stangler D., Litan R.E. 12.02.2011. In Egypt, Will an Economic Revolution Follow? Inc. URL: http://www.inc.com/articles/201102/egyptentrepreneurialrevolution.html etc.
eumed•netwww.eumed.net/entelequia
Korotayev – Zinkina Korotayev – Zinkina / / 141141 Núm. 13 (primavera 2011) Núm. 13 (primavera 2011)
ENTELEQUIAENTELEQUIArevista interdisciplinarrevista interdisciplinar
contrary will be much closer to reality, i.e. before Mubarak’s regime collapse Egypt was one of the most dynamically developing countries of the Third World.
Notably, new Egyptian government that came to power as a result of the revolution promised that it “would not retreat from economic reform or change the basic economic philosophy it has followed since it adopted a liberal reform programme in 2004”7, thus admitting that the economic policy of Mubarak’s administration was essentially correct.
2. Corruption?
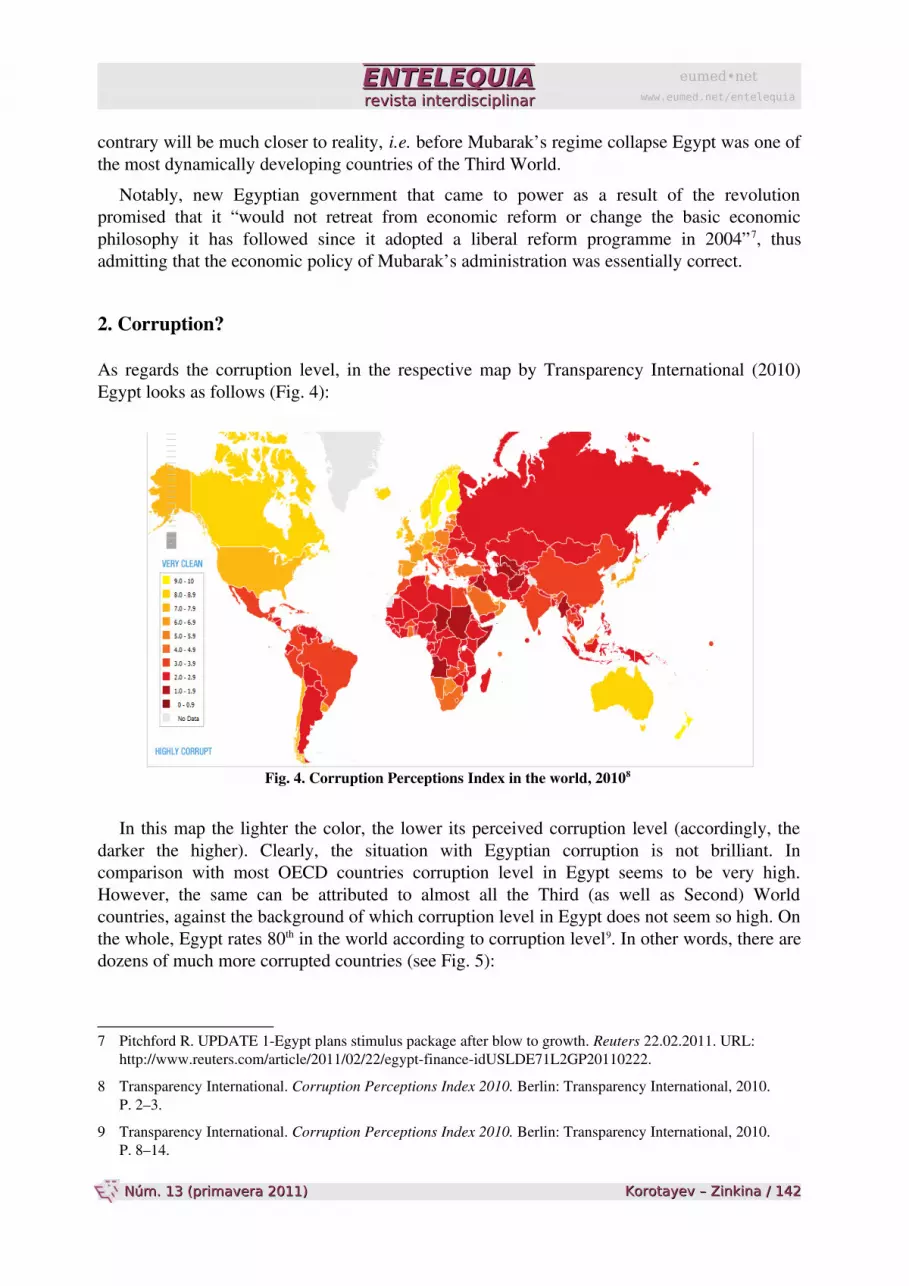
As regards the corruption level, in the respective map by Transparency International (2010) Egypt looks as follows (Fig. 4):
Fig. 4. Corruption Perceptions Index in the world, 20108
In this map the lighter the color, the lower its perceived corruption level (accordingly, the darker the higher). Clearly, the situation with Egyptian corruption is not brilliant. In comparison with most OECD countries corruption level in Egypt seems to be very high. However, the same can be attributed to almost all the Third (as well as Second) World countries, against the background of which corruption level in Egypt does not seem so high. On the whole, Egypt rates 80th in the world according to corruption level9. In other words, there are dozens of much more corrupted countries (see Fig. 5):
7 Pitchford R. UPDATE 1Egypt plans stimulus package after blow to growth. Reuters 22.02.2011. URL: http://www.reuters.com/article/2011/02/22/egyptfinanceidUSLDE71L2GP20110222.
8 Transparency International. Corruption Perceptions Index 2010. Berlin: Transparency International, 2010. P. 2–3.
9 Transparency International. Corruption Perceptions Index 2010. Berlin: Transparency International, 2010. P. 8–14.
eumed•netwww.eumed.net/entelequia
Korotayev – Zinkina Korotayev – Zinkina / / 142142 Núm. 13 (primavera 2011) Núm. 13 (primavera 2011)
ENTELEQUIAENTELEQUIArevista interdisciplinarrevista interdisciplinar
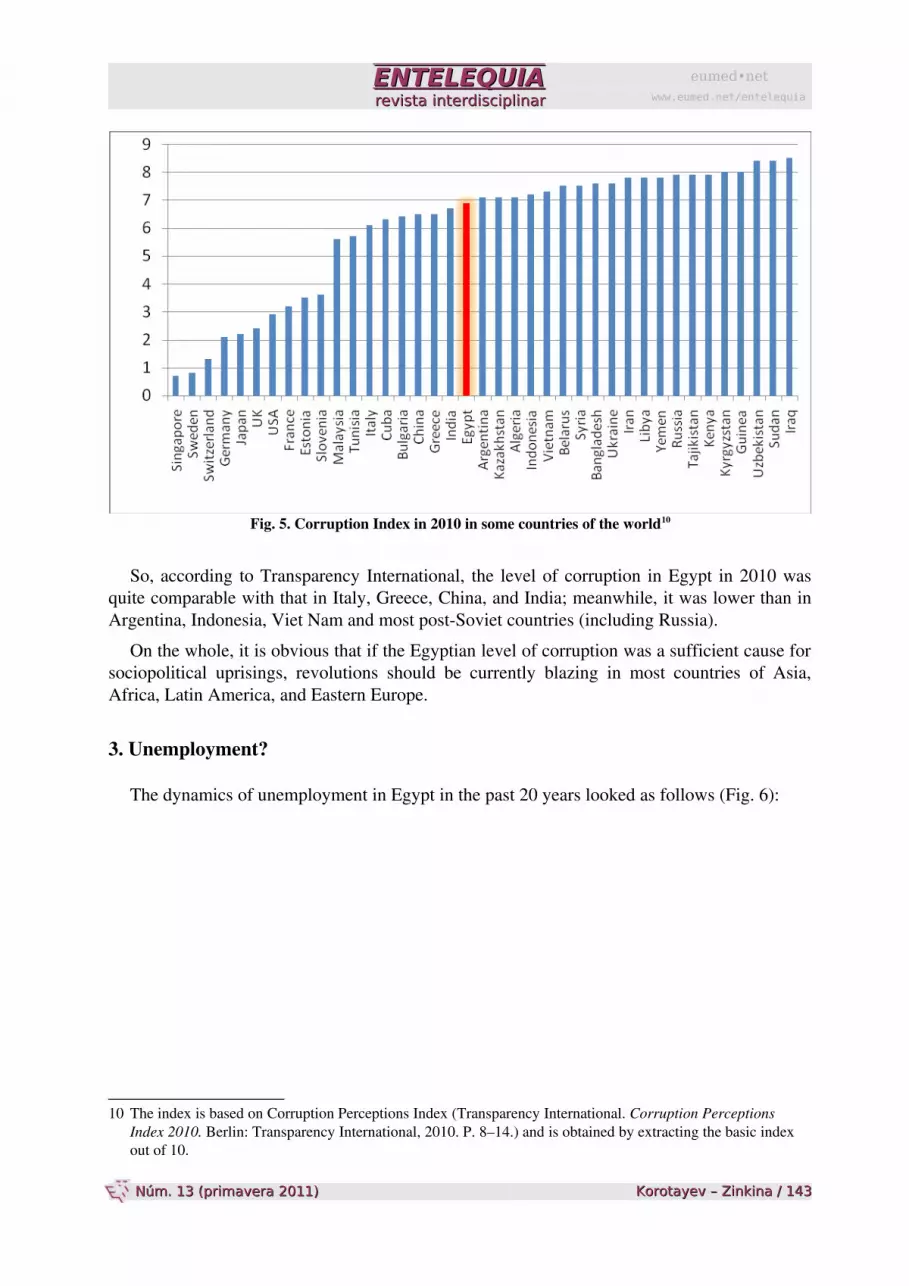
Fig. 5. Corruption Index in 2010 in some countries of the world10
So, according to Transparency International, the level of corruption in Egypt in 2010 was quite comparable with that in Italy, Greece, China, and India; meanwhile, it was lower than in Argentina, Indonesia, Viet Nam and most postSoviet countries (including Russia).
On the whole, it is obvious that if the Egyptian level of corruption was a sufficient cause for sociopolitical uprisings, revolutions should be currently blazing in most countries of Asia, Africa, Latin America, and Eastern Europe.
3. Unemployment?
The dynamics of unemployment in Egypt in the past 20 years looked as follows (Fig. 6):
10 The index is based on Corruption Perceptions Index (Transparency International. Corruption Perceptions Index 2010. Berlin: Transparency International, 2010. P. 8–14.) and is obtained by extracting the basic index out of 10.
eumed•netwww.eumed.net/entelequia
Korotayev – Zinkina Korotayev – Zinkina / / 143143 Núm. 13 (primavera 2011) Núm. 13 (primavera 2011)
ENTELEQUIAENTELEQUIArevista interdisciplinarrevista interdisciplinar
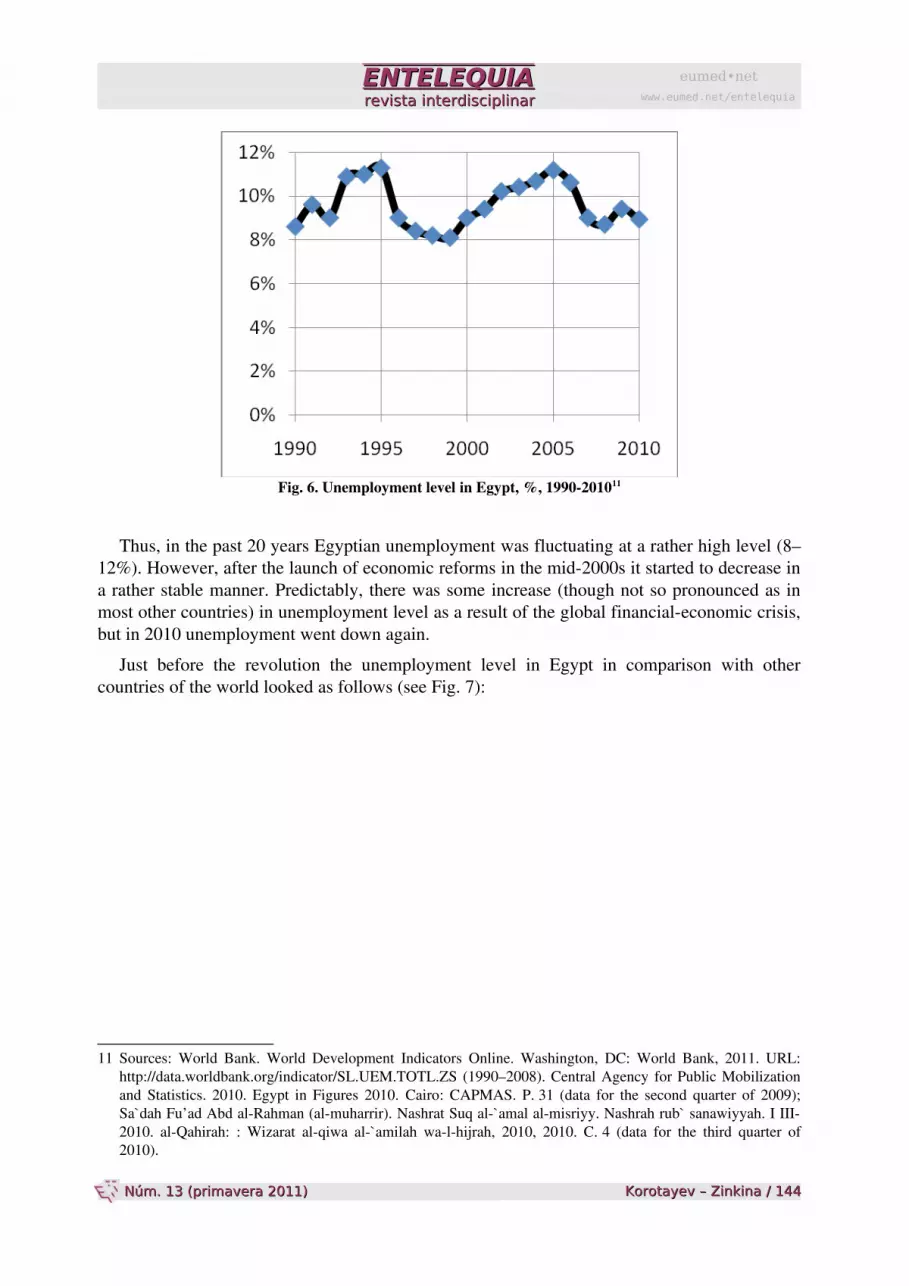
Fig. 6. Unemployment level in Egypt, %, 1990201011
Thus, in the past 20 years Egyptian unemployment was fluctuating at a rather high level (8–12%). However, after the launch of economic reforms in the mid2000s it started to decrease in a rather stable manner. Predictably, there was some increase (though not so pronounced as in most other countries) in unemployment level as a result of the global financialeconomic crisis, but in 2010 unemployment went down again.
Just before the revolution the unemployment level in Egypt in comparison with other countries of the world looked as follows (see Fig. 7):
11 Sources: World Bank. World Development Indicators Online. Washington, DC: World Bank, 2011. URL: http://data.worldbank.org/indicator/SL.UEM.TOTL.ZS (1990–2008). Central Agency for Public Mobilization and Statistics. 2010. Egypt in Figures 2010. Cairo: CAPMAS. P. 31 (data for the second quarter of 2009); Sa`dah Fu’ad Abd alRahman (almuharrir). Nashrat Suq al`amal almisriyy. Nashrah rub` sanawiyyah. I III2010. alQahirah: : Wizarat alqiwa al`amilah walhijrah, 2010, 2010. C. 4 (data for the third quarter of 2010).
eumed•netwww.eumed.net/entelequia
Korotayev – Zinkina Korotayev – Zinkina / / 144144 Núm. 13 (primavera 2011) Núm. 13 (primavera 2011)

ENTELEQUIAENTELEQUIArevista interdisciplinarrevista interdisciplinar
Fig. 7. Unemployment level in some countries, %, 201012
As we see, unemployment level in prerevolutionary Egypt could not be called “extremely low”, but against the global background Egypt compared rather well. Its unemployment level was less than in the USA, the EU, France, Poland, Turkey, Ireland, almost twice lower than in Latvia and Spain etc.
4. Inequality?
Gini index is most frequently used for measuring the level of economic inequality. Egypt had the following dynamics of Gini index (Fig. 8):
12 Data on Iraq is given for 2009, data on Mauritania and Afghanistan is given for 2008. Sources. Egypt: Sa`dah Fu’ad Abd alRahman (almuharrir). Nashrat Suq al`amal almisriyy. Nashrah rub` sanawiyyah. I III2010. alQahirah, 2010. P. 4 (data for 3rd quarter of 2010). Russia: Federal State Statistics Agency. Employment and Unemployment. (data for December 2010). URL: http://www.gks.ru/bgd/regl/b10_01/IssWWW.exe/Stg/d12/32.htm. Switzerland: State Secretariat for Economic Affairs. Gradual Economic Recovery – Increased Risks for 2011. Bern, 08.06.2010. URL: http://www.seco.admin.ch/aktuell/00277/01164/01980/index.html?lang=en&msgid=33511. China: Xinhua News Agency. China's unemployment down to 4.1% at end of Q3. English.xinhuanet.com 20101022. URL: http://news.xinhuanet.com/english2010/china/201010/22/c_13570193.htm. Austria, Belgium, Bulgaria, Cyprus, Czech Republic, Denmark, EU, Finland, Greece, Hungary, Ireland, Italy, Japan, Lithuania, Norway, Poland, Portugal, Slovenia, Sweden, Turkey, UK, USA: European Commission. Eurostat. Your key to European statistics. Brussels: European Commission, 2011. URL: http://epp.eurostat.ec.europa.eu/tgm/table.do?tab=table&language=en&pcode=teilm020&tableSelection=1&plugin=1 (data for September–December 2010). Afghanistan, Albania, Bosnia, Columbia, Croatia, Iraq, Jordan, Mauritania, Singapore, South Africa, Tunisia: Central Intelligence Agency. The World Factbook. Country Comparison: unemployment rate. Washington, DC: CIA, 2011. URL: https://www.cia.gov/library/publications/theworldfactbook/rankorder/2129rank.html.
eumed•netwww.eumed.net/entelequia
Korotayev – Zinkina Korotayev – Zinkina / / 145145 Núm. 13 (primavera 2011) Núm. 13 (primavera 2011)
ENTELEQUIAENTELEQUIArevista interdisciplinarrevista interdisciplinar
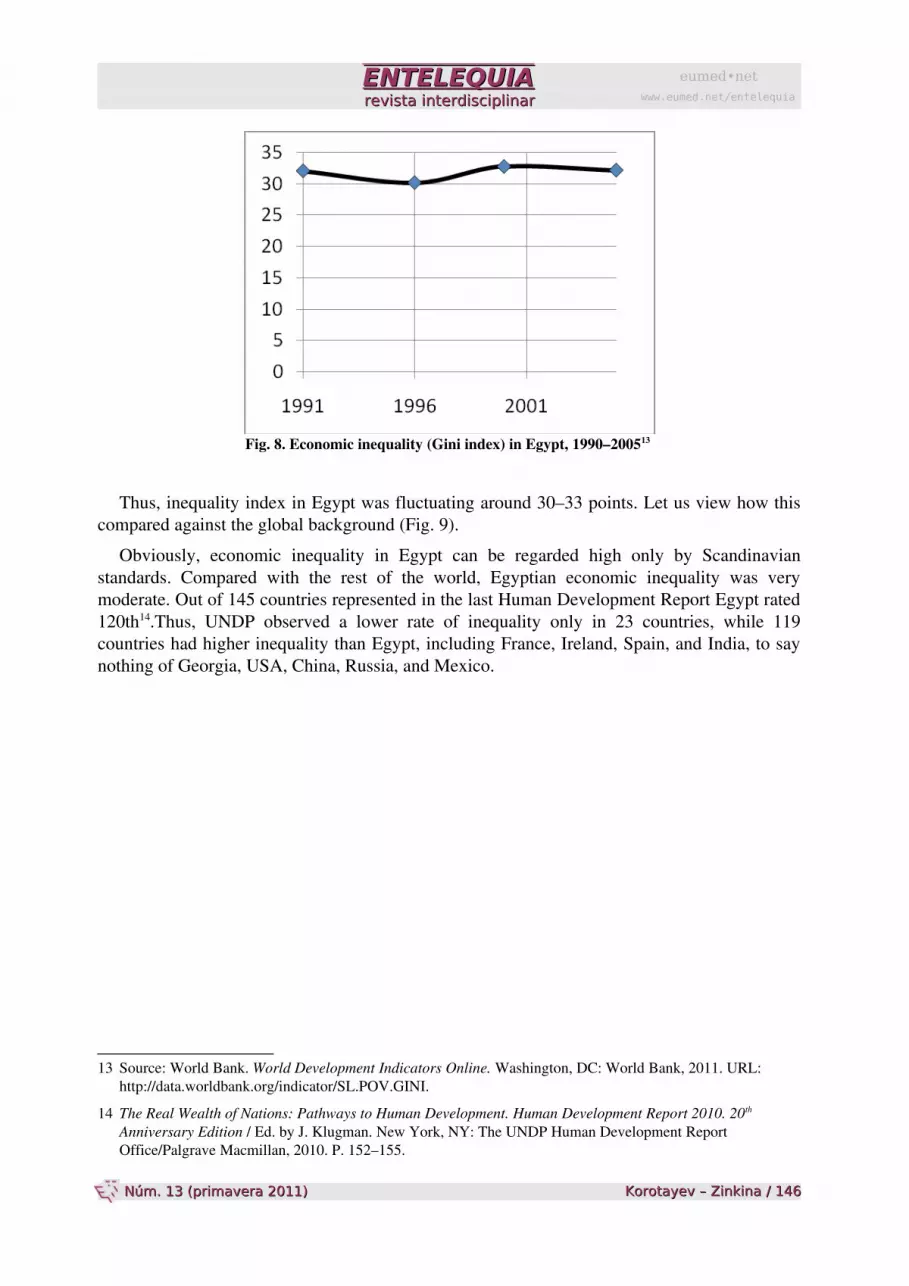
Fig. 8. Economic inequality (Gini index) in Egypt, 1990–200513
Thus, inequality index in Egypt was fluctuating around 30–33 points. Let us view how this compared against the global background (Fig. 9).
Obviously, economic inequality in Egypt can be regarded high only by Scandinavian standards. Compared with the rest of the world, Egyptian economic inequality was very moderate. Out of 145 countries represented in the last Human Development Report Egypt rated 120th14.Thus, UNDP observed a lower rate of inequality only in 23 countries, while 119 countries had higher inequality than Egypt, including France, Ireland, Spain, and India, to say nothing of Georgia, USA, China, Russia, and Mexico.
13 Source: World Bank. World Development Indicators Online. Washington, DC: World Bank, 2011. URL: http://data.worldbank.org/indicator/SL.POV.GINI.
14 The Real Wealth of Nations: Pathways to Human Development. Human Development Report 2010. 20th
Anniversary Edition / Ed. by J. Klugman. New York, NY: The UNDP Human Development Report Office/Palgrave Macmillan, 2010. P. 152–155.
eumed•netwww.eumed.net/entelequia
Korotayev – Zinkina Korotayev – Zinkina / / 146146 Núm. 13 (primavera 2011) Núm. 13 (primavera 2011)
ENTELEQUIAENTELEQUIArevista interdisciplinarrevista interdisciplinar
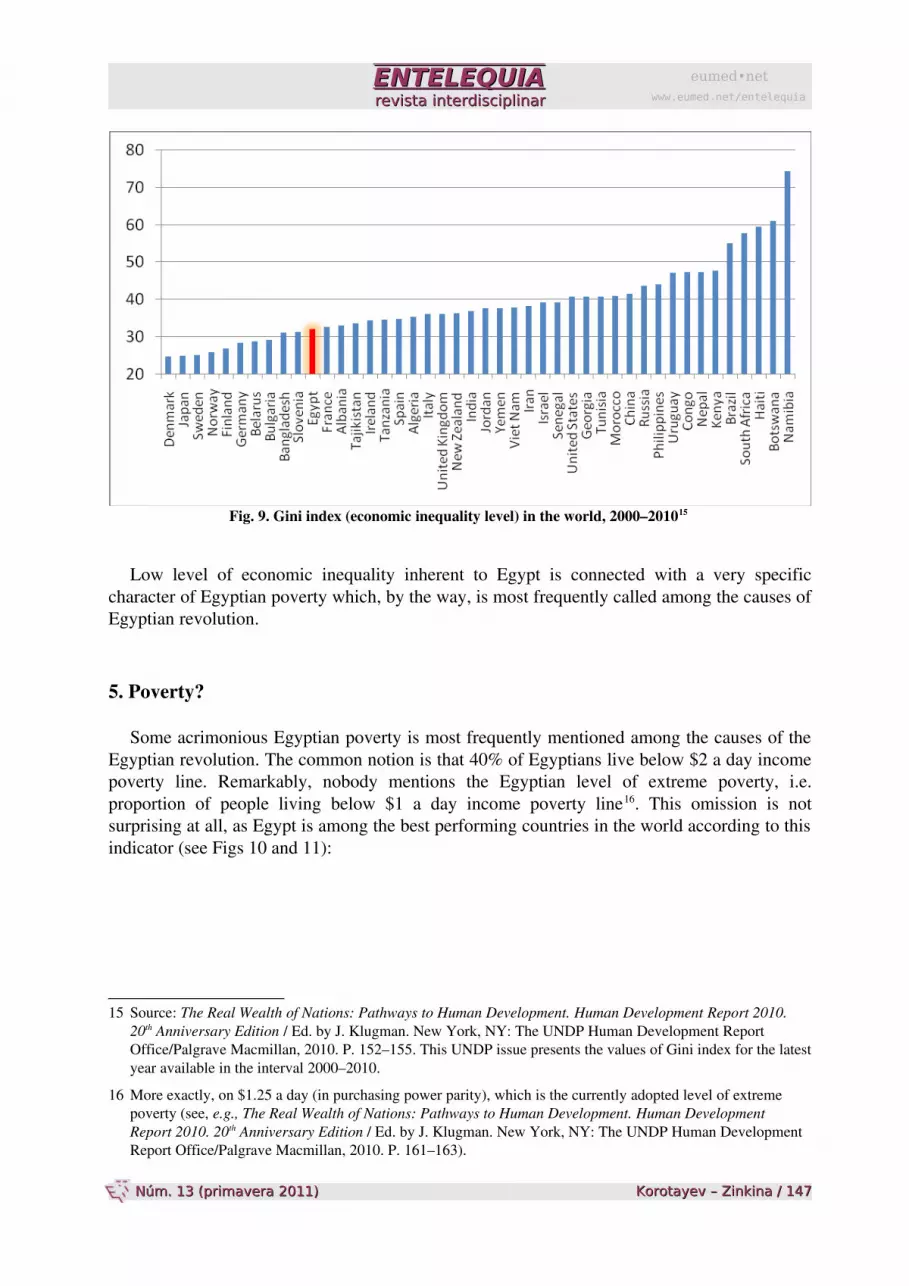
Fig. 9. Gini index (economic inequality level) in the world, 2000–201015
Low level of economic inequality inherent to Egypt is connected with a very specific character of Egyptian poverty which, by the way, is most frequently called among the causes of Egyptian revolution.
5. Poverty?
Some acrimonious Egyptian poverty is most frequently mentioned among the causes of the Egyptian revolution. The common notion is that 40% of Egyptians live below $2 a day income poverty line. Remarkably, nobody mentions the Egyptian level of extreme poverty, i.e. proportion of people living below $1 a day income poverty line16. This omission is not surprising at all, as Egypt is among the best performing countries in the world according to this indicator (see Figs 10 and 11):
15 Source: The Real Wealth of Nations: Pathways to Human Development. Human Development Report 2010. 20th Anniversary Edition / Ed. by J. Klugman. New York, NY: The UNDP Human Development Report Office/Palgrave Macmillan, 2010. P. 152–155. This UNDP issue presents the values of Gini index for the latest year available in the interval 2000–2010.
16 More exactly, on $1.25 a day (in purchasing power parity), which is the currently adopted level of extreme poverty (see, e.g., The Real Wealth of Nations: Pathways to Human Development. Human Development Report 2010. 20th Anniversary Edition / Ed. by J. Klugman. New York, NY: The UNDP Human Development Report Office/Palgrave Macmillan, 2010. P. 161–163).
eumed•netwww.eumed.net/entelequia
Korotayev – Zinkina Korotayev – Zinkina / / 147147 Núm. 13 (primavera 2011) Núm. 13 (primavera 2011)
ENTELEQUIAENTELEQUIArevista interdisciplinarrevista interdisciplinar
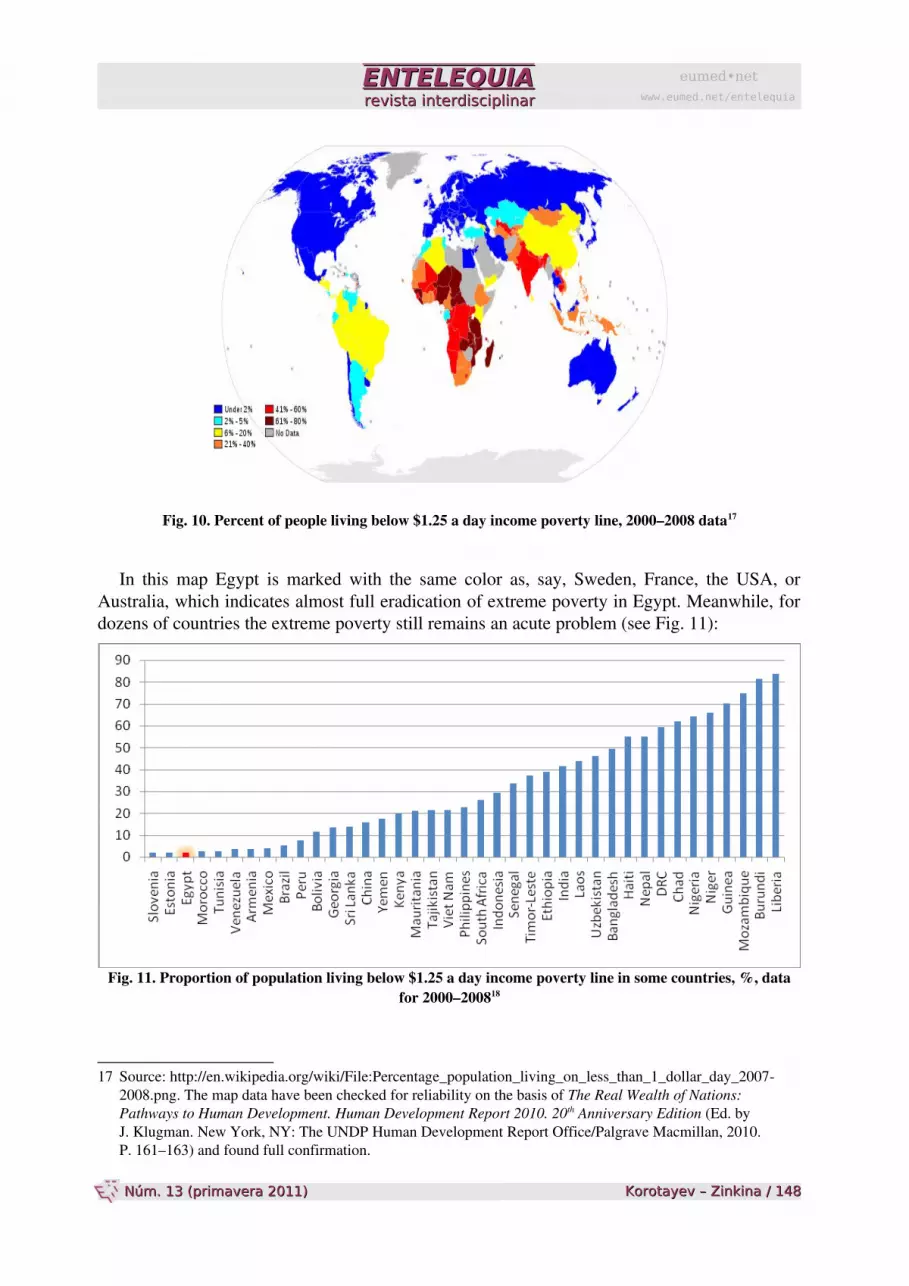
Fig. 10. Percent of people living below $1.25 a day income poverty line, 2000–2008 data17
In this map Egypt is marked with the same color as, say, Sweden, France, the USA, or Australia, which indicates almost full eradication of extreme poverty in Egypt. Meanwhile, for dozens of countries the extreme poverty still remains an acute problem (see Fig. 11):
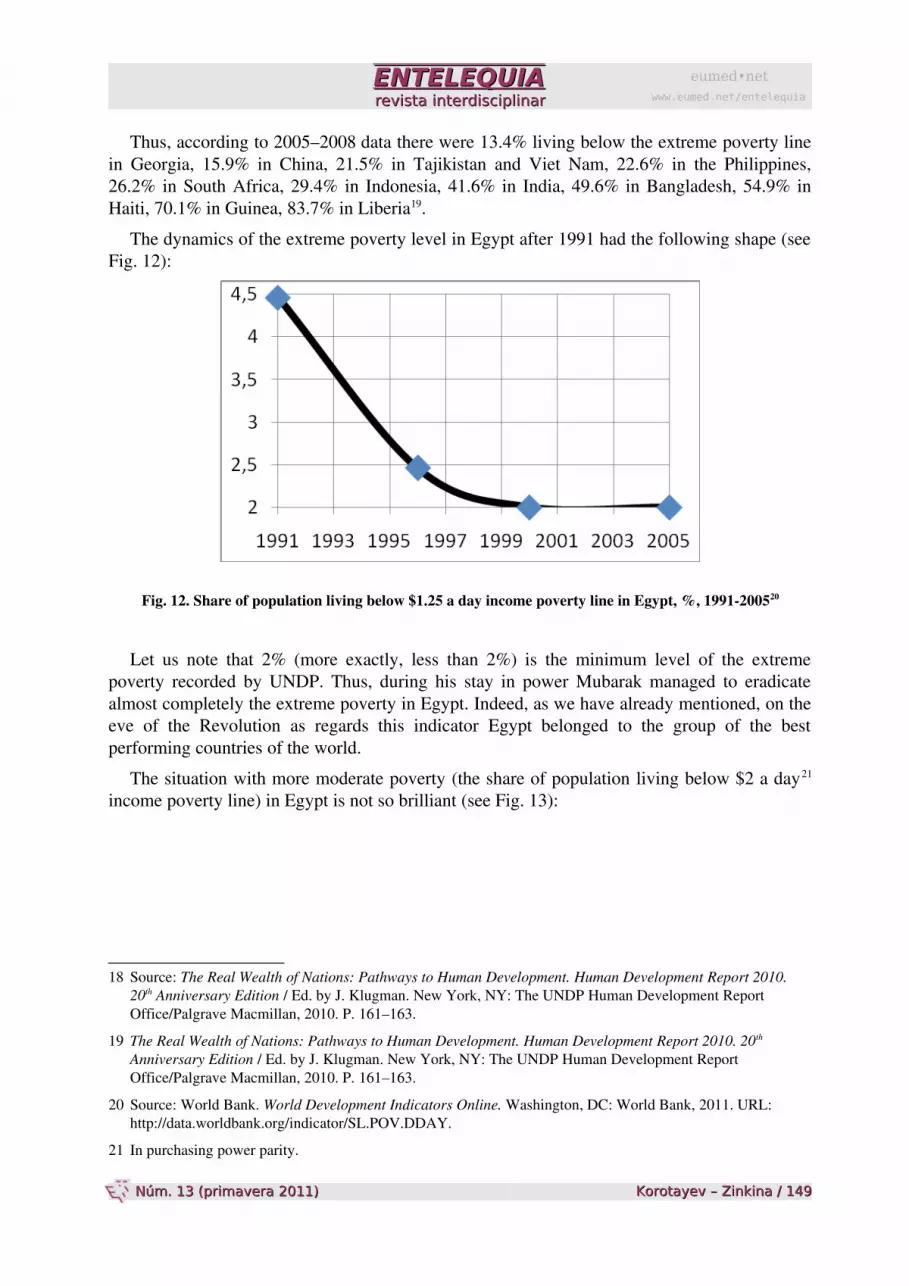
Fig. 11. Proportion of population living below $1.25 a day income poverty line in some countries, %, data for 2000–200818
17 Source: http://en.wikipedia.org/wiki/File:Percentage_population_living_on_less_than_1_dollar_day_20072008.png. The map data have been checked for reliability on the basis of The Real Wealth of Nations: Pathways to Human Development. Human Development Report 2010. 20th Anniversary Edition (Ed. by J. Klugman. New York, NY: The UNDP Human Development Report Office/Palgrave Macmillan, 2010. P. 161–163) and found full confirmation.
eumed•netwww.eumed.net/entelequia
Korotayev – Zinkina Korotayev – Zinkina / / 148148 Núm. 13 (primavera 2011) Núm. 13 (primavera 2011)
ENTELEQUIAENTELEQUIArevista interdisciplinarrevista interdisciplinar
Thus, according to 2005–2008 data there were 13.4% living below the extreme poverty line in Georgia, 15.9% in China, 21.5% in Tajikistan and Viet Nam, 22.6% in the Philippines, 26.2% in South Africa, 29.4% in Indonesia, 41.6% in India, 49.6% in Bangladesh, 54.9% in Haiti, 70.1% in Guinea, 83.7% in Liberia19.
The dynamics of the extreme poverty level in Egypt after 1991 had the following shape (see Fig. 12):
Fig. 12. Share of population living below $1.25 a day income poverty line in Egypt, %, 1991200520
Let us note that 2% (more exactly, less than 2%) is the minimum level of the extreme poverty recorded by UNDP. Thus, during his stay in power Mubarak managed to eradicate almost completely the extreme poverty in Egypt. Indeed, as we have already mentioned, on the eve of the Revolution as regards this indicator Egypt belonged to the group of the best performing countries of the world.
The situation with more moderate poverty (the share of population living below $2 a day21 income poverty line) in Egypt is not so brilliant (see Fig. 13):
18 Source: The Real Wealth of Nations: Pathways to Human Development. Human Development Report 2010. 20th Anniversary Edition / Ed. by J. Klugman. New York, NY: The UNDP Human Development Report Office/Palgrave Macmillan, 2010. P. 161–163.
19 The Real Wealth of Nations: Pathways to Human Development. Human Development Report 2010. 20th
Anniversary Edition / Ed. by J. Klugman. New York, NY: The UNDP Human Development Report Office/Palgrave Macmillan, 2010. P. 161–163.
20 Source: World Bank. World Development Indicators Online. Washington, DC: World Bank, 2011. URL: http://data.worldbank.org/indicator/SL.POV.DDAY.
21 In purchasing power parity.
eumed•netwww.eumed.net/entelequia
Korotayev – Zinkina Korotayev – Zinkina / / 149149 Núm. 13 (primavera 2011) Núm. 13 (primavera 2011)
ENTELEQUIAENTELEQUIArevista interdisciplinarrevista interdisciplinar
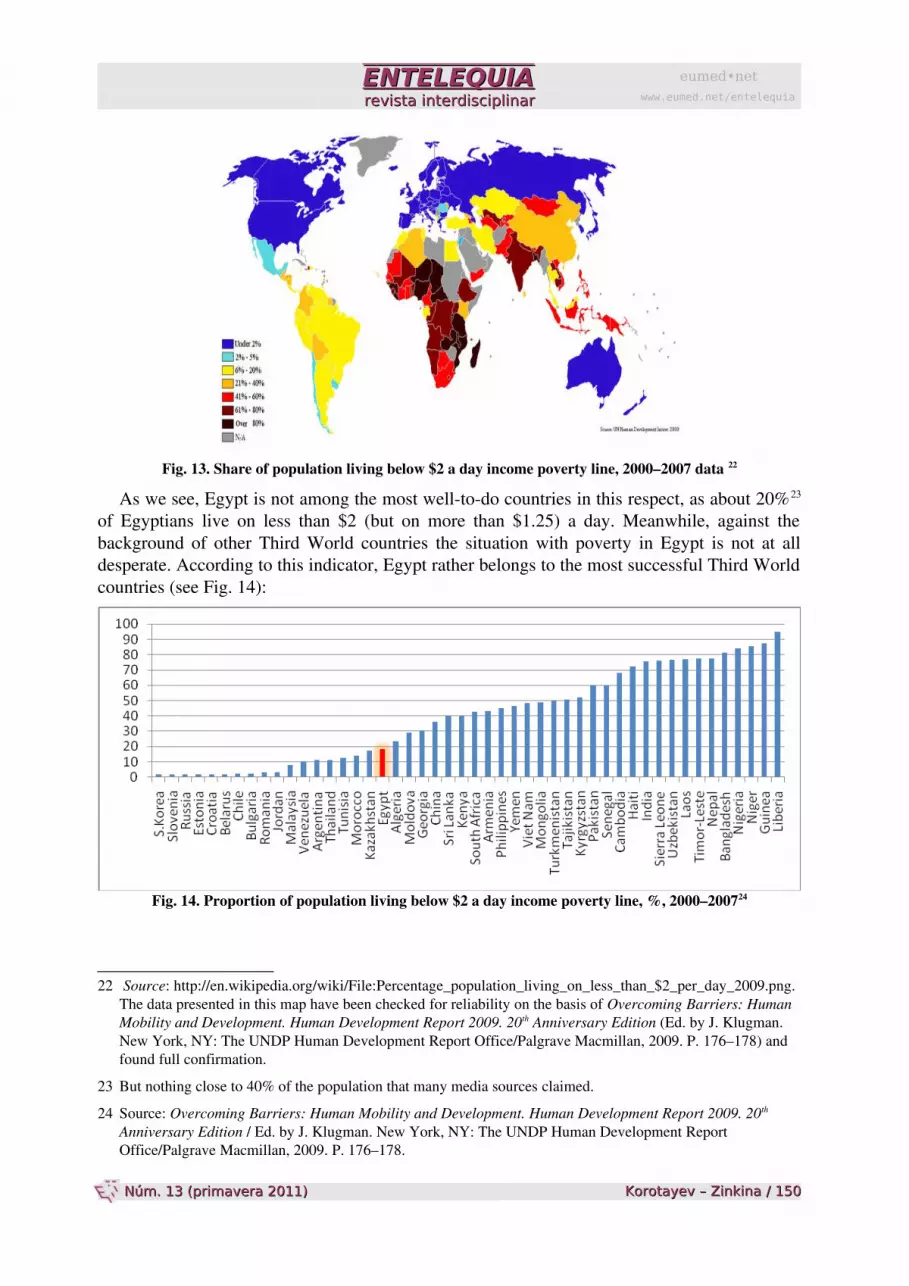
Fig. 13. Share of population living below $2 a day income poverty line, 2000–2007 data 22
As we see, Egypt is not among the most welltodo countries in this respect, as about 20%23 of Egyptians live on less than $2 (but on more than $1.25) a day. Meanwhile, against the background of other Third World countries the situation with poverty in Egypt is not at all desperate. According to this indicator, Egypt rather belongs to the most successful Third World countries (see Fig. 14):
Fig. 14. Proportion of population living below $2 a day income poverty line, %, 2000–200724
22 Source: http://en.wikipedia.org/wiki/File:Percentage_population_living_on_less_than_$2_per_day_2009.png. The data presented in this map have been checked for reliability on the basis of Overcoming Barriers: Human Mobility and Development. Human Development Report 2009. 20th Anniversary Edition (Ed. by J. Klugman. New York, NY: The UNDP Human Development Report Office/Palgrave Macmillan, 2009. P. 176–178) and found full confirmation.
23 But nothing close to 40% of the population that many media sources claimed.
24 Source: Overcoming Barriers: Human Mobility and Development. Human Development Report 2009. 20th
Anniversary Edition / Ed. by J. Klugman. New York, NY: The UNDP Human Development Report Office/Palgrave Macmillan, 2009. P. 176–178.
eumed•netwww.eumed.net/entelequia
Korotayev – Zinkina Korotayev – Zinkina / / 150150 Núm. 13 (primavera 2011) Núm. 13 (primavera 2011)
ENTELEQUIAENTELEQUIArevista interdisciplinarrevista interdisciplinar
Indeed, on the eve of the Revolution about 20% of the Egyptian population lived on less than $2 a day compared with 36.3% in China, 42.9% in South Africa, 43.4% in Armenia, 45% in the Philippines, 48.4% in Viet Nam. In a considerable number of countries more than a half of the population live under $2 poverty line: 50.8% in Tajikistan, 60.3% in Pakistan, 72.1% in Haiti, 75.6% in India, 81.3% in Bangladesh, 87.2% in Guinea, and 94.8% in Liberia.
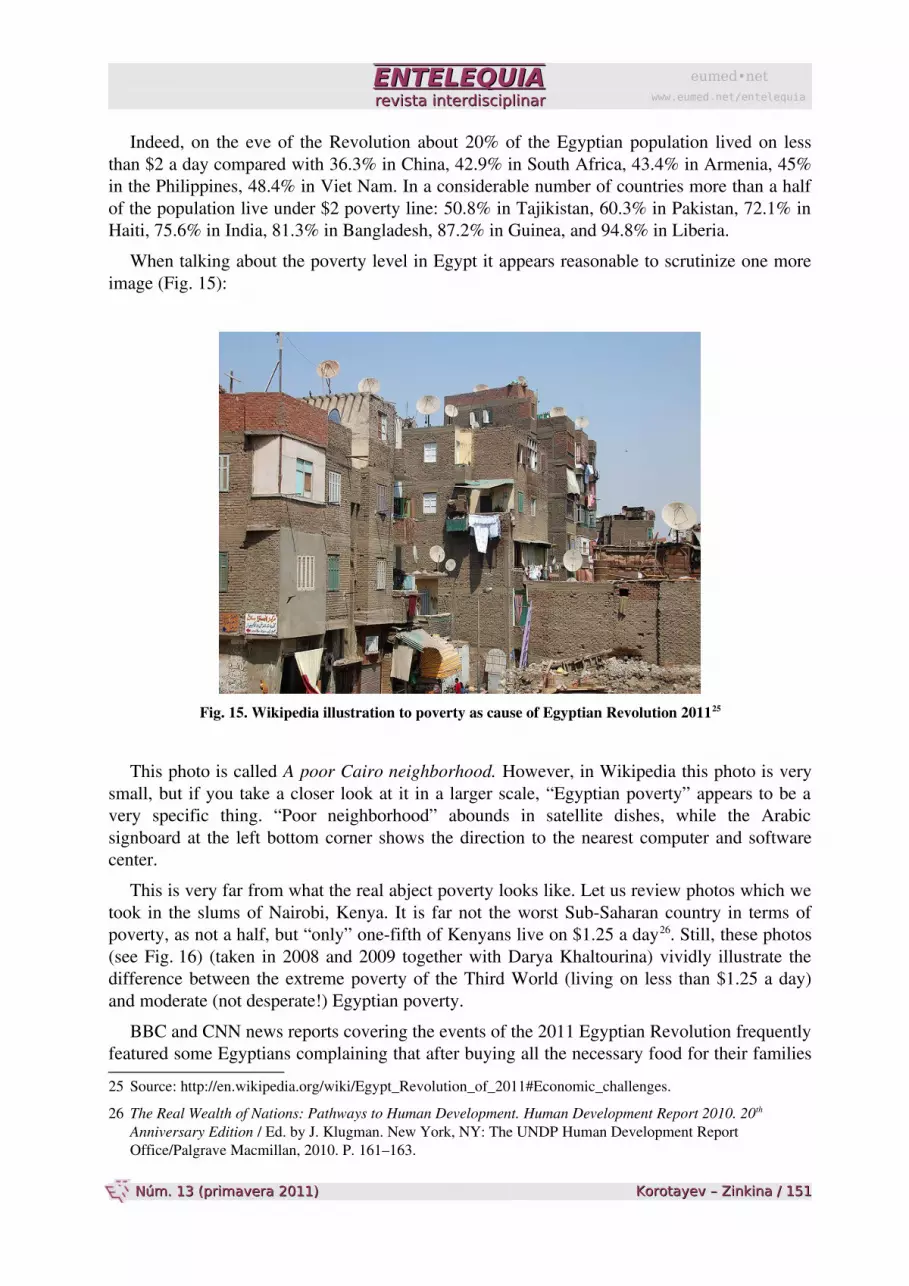
When talking about the poverty level in Egypt it appears reasonable to scrutinize one more image (Fig. 15):
Fig. 15. Wikipedia illustration to poverty as cause of Egyptian Revolution 201125
This photo is called A poor Cairo neighborhood. However, in Wikipedia this photo is very small, but if you take a closer look at it in a larger scale, “Egyptian poverty” appears to be a very specific thing. “Poor neighborhood” abounds in satellite dishes, while the Arabic signboard at the left bottom corner shows the direction to the nearest computer and software center.
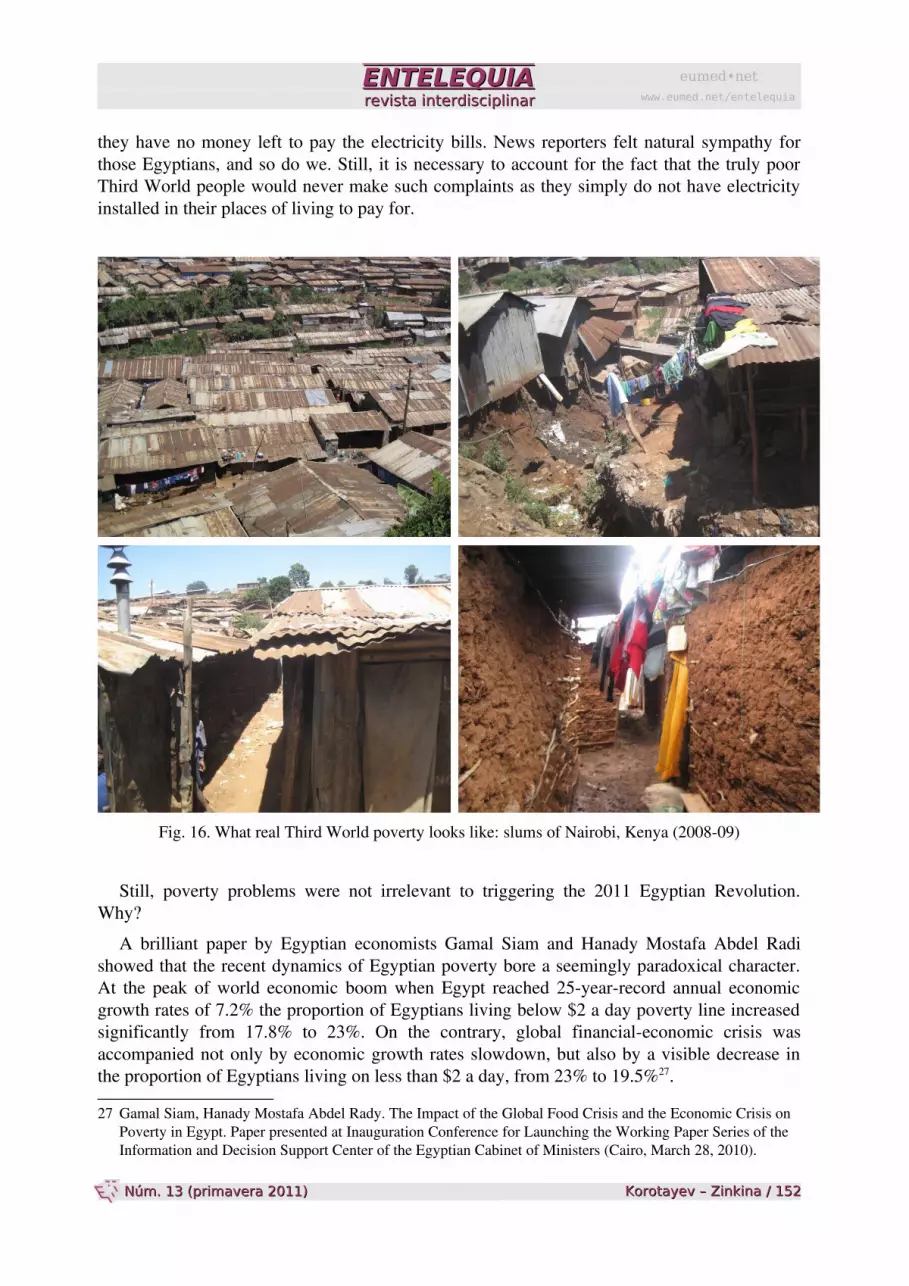
This is very far from what the real abject poverty looks like. Let us review photos which we took in the slums of Nairobi, Kenya. It is far not the worst SubSaharan country in terms of poverty, as not a half, but “only” onefifth of Kenyans live on $1.25 a day26. Still, these photos (see Fig. 16) (taken in 2008 and 2009 together with Darya Khaltourina) vividly illustrate the difference between the extreme poverty of the Third World (living on less than $1.25 a day) and moderate (not desperate!) Egyptian poverty.
BBC and CNN news reports covering the events of the 2011 Egyptian Revolution frequently featured some Egyptians complaining that after buying all the necessary food for their families
25 Source: http://en.wikipedia.org/wiki/Egypt_Revolution_of_2011#Economic_challenges.
26 The Real Wealth of Nations: Pathways to Human Development. Human Development Report 2010. 20th
Anniversary Edition / Ed. by J. Klugman. New York, NY: The UNDP Human Development Report Office/Palgrave Macmillan, 2010. P. 161–163.
eumed•netwww.eumed.net/entelequia
Korotayev – Zinkina Korotayev – Zinkina / / 151151 Núm. 13 (primavera 2011) Núm. 13 (primavera 2011)
ENTELEQUIAENTELEQUIArevista interdisciplinarrevista interdisciplinar
they have no money left to pay the electricity bills. News reporters felt natural sympathy for those Egyptians, and so do we. Still, it is necessary to account for the fact that the truly poor Third World people would never make such complaints as they simply do not have electricity installed in their places of living to pay for.
Fig. 16. What real Third World poverty looks like: slums of Nairobi, Kenya (200809)
Still, poverty problems were not irrelevant to triggering the 2011 Egyptian Revolution. Why?
A brilliant paper by Egyptian economists Gamal Siam and Hanady Mostafa Abdel Radi showed that the recent dynamics of Egyptian poverty bore a seemingly paradoxical character. At the peak of world economic boom when Egypt reached 25yearrecord annual economic growth rates of 7.2% the proportion of Egyptians living below $2 a day poverty line increased significantly from 17.8% to 23%. On the contrary, global financialeconomic crisis was accompanied not only by economic growth rates slowdown, but also by a visible decrease in the proportion of Egyptians living on less than $2 a day, from 23% to 19.5%27.
27 Gamal Siam, Hanady Mostafa Abdel Rady. The Impact of the Global Food Crisis and the Economic Crisis on Poverty in Egypt. Paper presented at Inauguration Conference for Launching the Working Paper Series of the Information and Decision Support Center of the Egyptian Cabinet of Ministers (Cairo, March 28, 2010).
eumed•netwww.eumed.net/entelequia
Korotayev – Zinkina Korotayev – Zinkina / / 152152 Núm. 13 (primavera 2011) Núm. 13 (primavera 2011)
ENTELEQUIAENTELEQUIArevista interdisciplinarrevista interdisciplinar
Paradoxical as it may seem, the answer appears to be most logical and obvious as soon as you know it (though not a single economist whom we asked managed to deduce it). Indeed, a characteristic feature (and product) of economic booms (especially the latest one) is the blowing of price bubbles. On the verge of global financialeconomic crisis start there were a lot of such bubbles; Russians best remember the oil price bubble (especially its burst). However, along with oil price bubble there were lots of others, including copper bubble, nickel bubble, phosphate bubble etc. Basic food commodities were not an exception, as wheat, rice, maize and other food price bubbles started growing. This was a painful strike to all the poor in the world who spend a major part of their household income on buying food. Egypt strongly depends on food imports28, so poor Egyptians felt the price growth very perceptibly. The $2 a day income poverty line is calculated by the UN accounting for purchasing power parity (PPP); as a result, several millions of Egyptians found themselves below this poverty line.
Global financialeconomic crisis was accompanied by bubble bursts (the only “survivor” was the gold price bubble). Food price bubbles were not an exception; prices for many food commodities fell significantly during the crisis. As a result, despite some slowdown in economic growth rates the poor people of Egypt rather benefited from the crisis, and about three millions of poor Egyptian managed to come above the poverty line29.
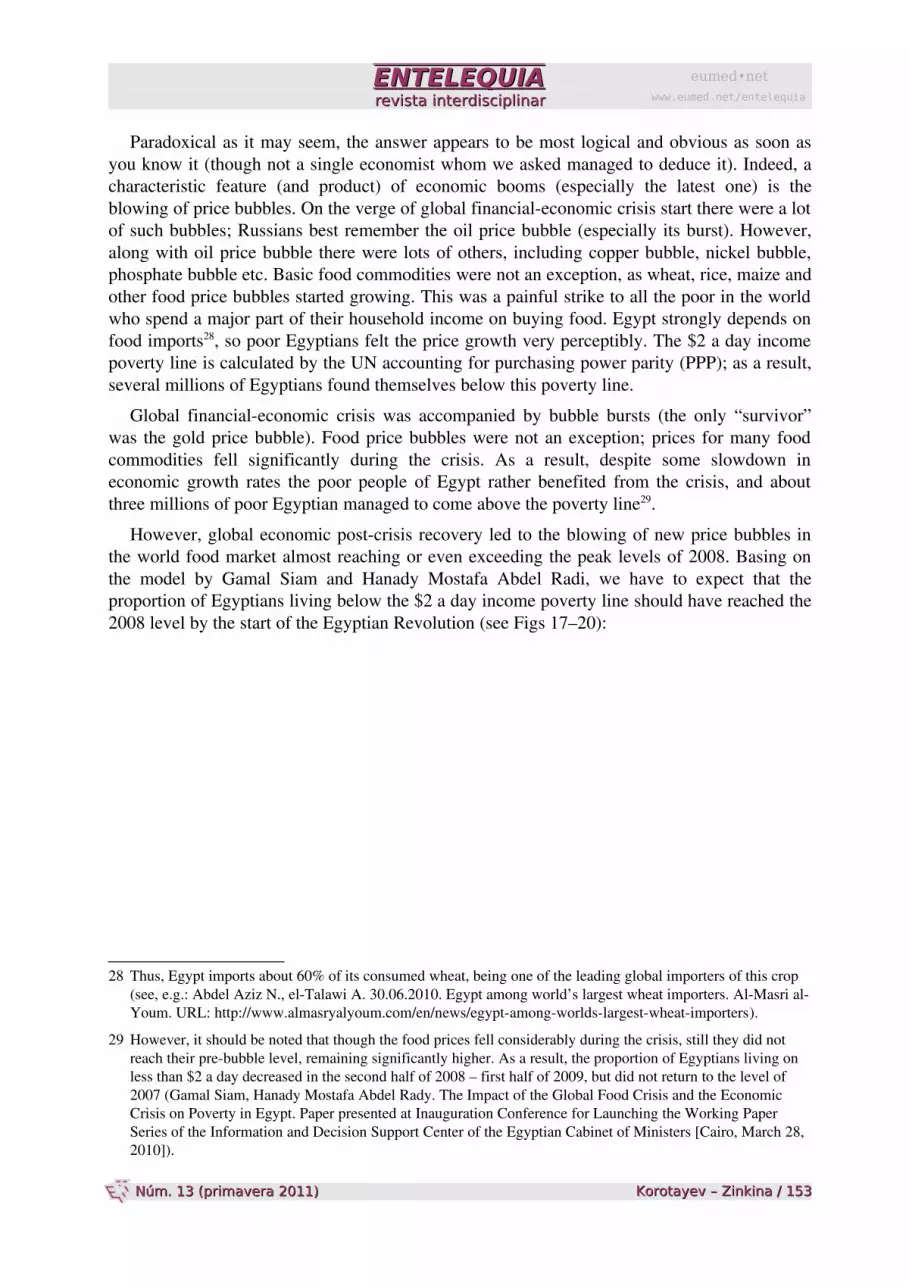
However, global economic postcrisis recovery led to the blowing of new price bubbles in the world food market almost reaching or even exceeding the peak levels of 2008. Basing on the model by Gamal Siam and Hanady Mostafa Abdel Radi, we have to expect that the proportion of Egyptians living below the $2 a day income poverty line should have reached the 2008 level by the start of the Egyptian Revolution (see Figs 17–20):
28 Thus, Egypt imports about 60% of its consumed wheat, being one of the leading global importers of this crop (see, e.g.: Abdel Aziz N., elTalawi A. 30.06.2010. Egypt among world’s largest wheat importers. AlMasri alYoum. URL: http://www.almasryalyoum.com/en/news/egyptamongworldslargestwheatimporters).
29 However, it should be noted that though the food prices fell considerably during the crisis, still they did not reach their prebubble level, remaining significantly higher. As a result, the proportion of Egyptians living on less than $2 a day decreased in the second half of 2008 – first half of 2009, but did not return to the level of 2007 (Gamal Siam, Hanady Mostafa Abdel Rady. The Impact of the Global Food Crisis and the Economic Crisis on Poverty in Egypt. Paper presented at Inauguration Conference for Launching the Working Paper Series of the Information and Decision Support Center of the Egyptian Cabinet of Ministers [Cairo, March 28, 2010]).
eumed•netwww.eumed.net/entelequia
Korotayev – Zinkina Korotayev – Zinkina / / 153153 Núm. 13 (primavera 2011) Núm. 13 (primavera 2011)
ENTELEQUIAENTELEQUIArevista interdisciplinarrevista interdisciplinar
Fig. 17. World wheat prices, $/ton, 20052011 30
Fig. 18. World cooking oil prices (FAO price index, 2002–2004 = 100, deflated), 2003–2011 31
30 Source: IMF. Primary Commodity Prices. Monthly Data. URL: http://www.imf.org/external/np/res/commod/index.asp.
31 Source: FAO ANNUAL REAL FOOD PRICE INDICES. URL: http://typo3.fao.org/fileadmin/templates/worldfood/Reports_and_docs/Food_price_indices_data_deflated.xls.
eumed•netwww.eumed.net/entelequia
Korotayev – Zinkina Korotayev – Zinkina / / 154154 Núm. 13 (primavera 2011) Núm. 13 (primavera 2011)
ENTELEQUIAENTELEQUIArevista interdisciplinarrevista interdisciplinar
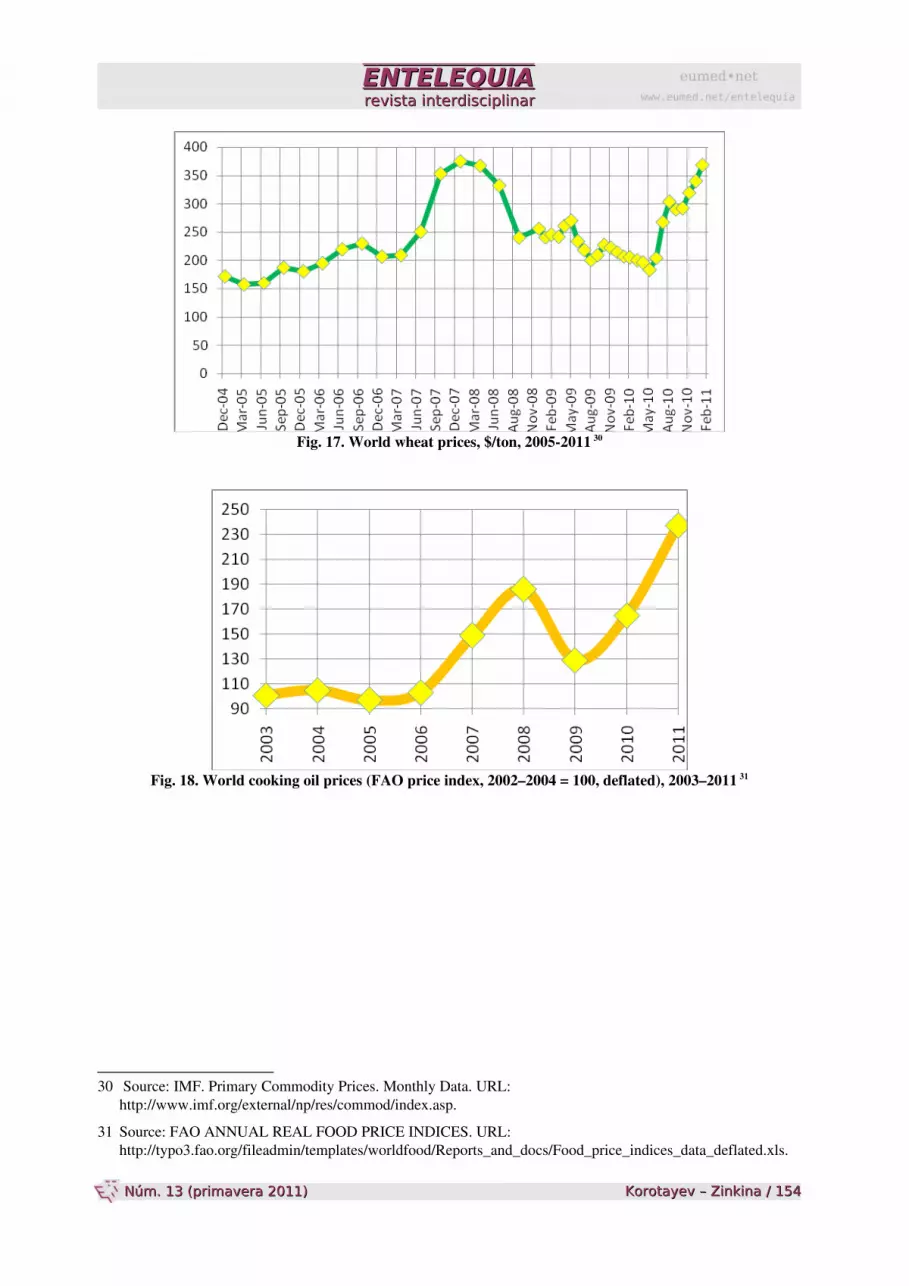
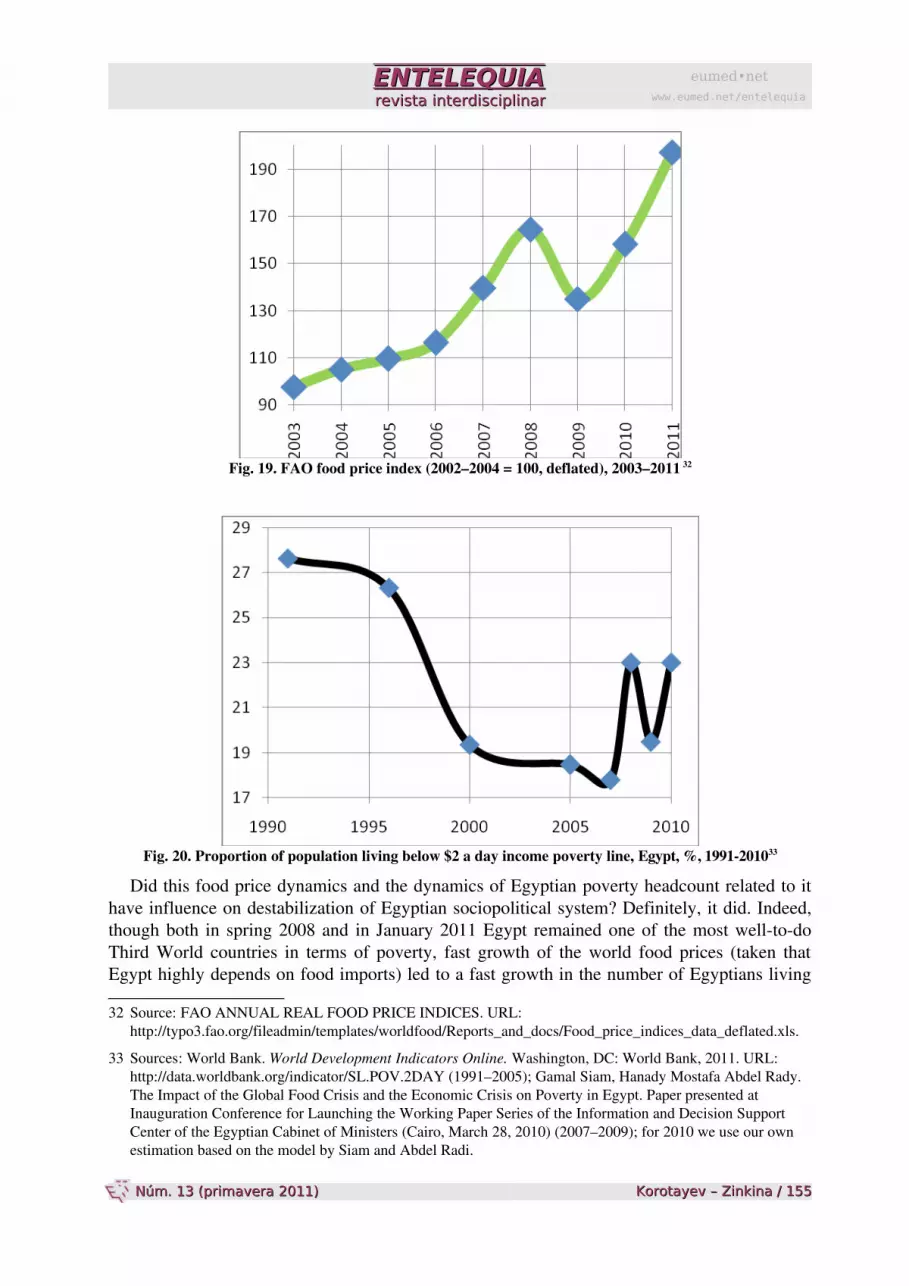
Fig. 19. FAO food price index (2002–2004 = 100, deflated), 2003–2011 32
Fig. 20. Proportion of population living below $2 a day income poverty line, Egypt, %, 1991201033
Did this food price dynamics and the dynamics of Egyptian poverty headcount related to it have influence on destabilization of Egyptian sociopolitical system? Definitely, it did. Indeed, though both in spring 2008 and in January 2011 Egypt remained one of the most welltodo Third World countries in terms of poverty, fast growth of the world food prices (taken that Egypt highly depends on food imports) led to a fast growth in the number of Egyptians living
32 Source: FAO ANNUAL REAL FOOD PRICE INDICES. URL: http://typo3.fao.org/fileadmin/templates/worldfood/Reports_and_docs/Food_price_indices_data_deflated.xls.
33 Sources: World Bank. World Development Indicators Online. Washington, DC: World Bank, 2011. URL: http://data.worldbank.org/indicator/SL.POV.2DAY (1991–2005); Gamal Siam, Hanady Mostafa Abdel Rady. The Impact of the Global Food Crisis and the Economic Crisis on Poverty in Egypt. Paper presented at Inauguration Conference for Launching the Working Paper Series of the Information and Decision Support Center of the Egyptian Cabinet of Ministers (Cairo, March 28, 2010) (2007–2009); for 2010 we use our own estimation based on the model by Siam and Abdel Radi.
eumed•netwww.eumed.net/entelequia
Korotayev – Zinkina Korotayev – Zinkina / / 155155 Núm. 13 (primavera 2011) Núm. 13 (primavera 2011)
ENTELEQUIAENTELEQUIArevista interdisciplinarrevista interdisciplinar
below the internationally recognized poverty line. In both cases more than three millions of Egyptians fell below the poverty line during a short period (several months).
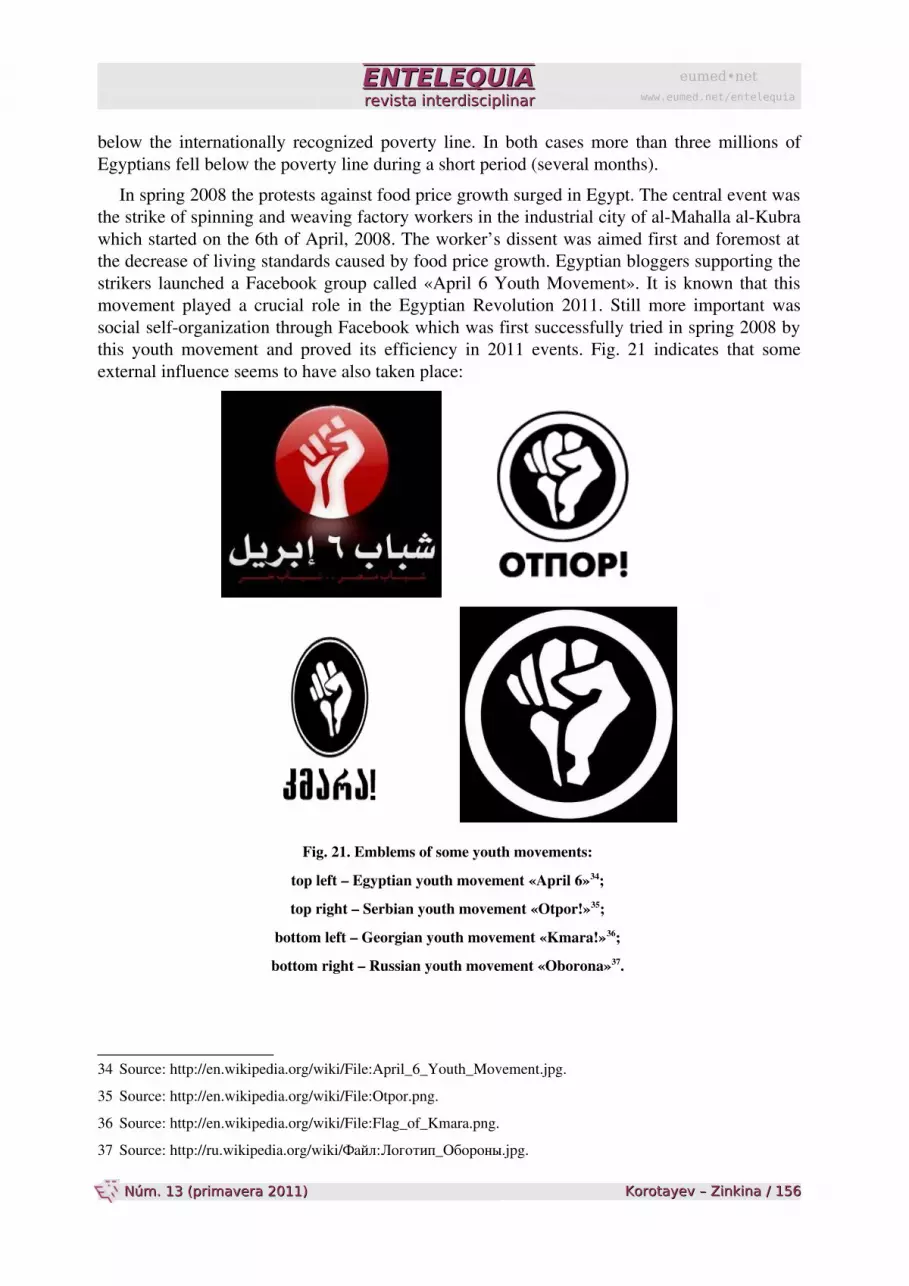
In spring 2008 the protests against food price growth surged in Egypt. The central event was the strike of spinning and weaving factory workers in the industrial city of alMahalla alKubra which started on the 6th of April, 2008. The worker’s dissent was aimed first and foremost at the decrease of living standards caused by food price growth. Egyptian bloggers supporting the strikers launched a Facebook group called «April 6 Youth Movement». It is known that this movement played a crucial role in the Egyptian Revolution 2011. Still more important was social selforganization through Facebook which was first successfully tried in spring 2008 by this youth movement and proved its efficiency in 2011 events. Fig. 21 indicates that some external influence seems to have also taken place:
Fig. 21. Emblems of some youth movements:
top left – Egyptian youth movement «April 6»34;
top right – Serbian youth movement «Otpor!»35;
bottom left – Georgian youth movement «Kmara!»36;
bottom right – Russian youth movement «Oborona»37.
34 Source: http://en.wikipedia.org/wiki/File:April_6_Youth_Movement.jpg.
35 Source: http://en.wikipedia.org/wiki/File:Otpor.png.
36 Source: http://en.wikipedia.org/wiki/File:Flag_of_Kmara.png.
37 Source: http://ru.wikipedia.org/wiki/Файл:Логотип_Обороны.jpg.
eumed•netwww.eumed.net/entelequia
Korotayev – Zinkina Korotayev – Zinkina / / 156156 Núm. 13 (primavera 2011) Núm. 13 (primavera 2011)
ENTELEQUIAENTELEQUIArevista interdisciplinarrevista interdisciplinar
We can see that the emblem of the Egyptian “April 6” youth movement is astonishingly similar with the ones of some other youth movements which played an exceptionally important role in organizing the “color revolutions”, such as Serbian “Otpor!” and Georgian “Kmara!”, which led Mikheil Saakashvili to power. Interestingly, “Kmara” is translated from Georgian as “Enough”, the same as Egyptian “Kifaya!” (predecessor of “April 6” movement) is translated from Arabic.
In late 2010 – early 2011 food prices again reached the same critical level which was observed in spring 2008, and, in our view, this certainly made a contribution to political destabilization in Egypt in January 2011.
Still it is fairly obvious that food price increase is hardly to be recognized as the main cause for the Egyptian events. Indeed, it was a global rather than local phenomenon, and it struck painfully all the poor throughout the Third World, including, say, Latin America, where no wave of revolutions was triggered.
We should also keep in mind that the poor in Egypt were hit by the world food prices rather weaker than in most other Third World countries, since Mubarak's administration took very serious measures to protect them through the system of subsidies.
Currently, the system of food subsidies in Egypt is divided into two types. The first type is subsidizing the "baladi" bread. Since 1989 the government has kept the price for this type of bread at 5 piastres (1 cent!) per loaf (weighing 130 gram). This type of subsidy is universal, i.e. any inhabitant of Egypt has the right to buy 20 loaves of "baladi" bread every day at a low (subsidized) price in the state cooperative stores.38 The second type of subsidies is ration cards. They allow families to purchase every month a certain amount of some basic food commodities (such as sugar, cooking oil, etc.) at a subsidized price.
In the period of rapid growth in world food prices, including wheat prices, Mubarak's regime made heroic (and successful!) efforts to preserve the price of "baladi" bread at the same level. Accordingly, even in the midst of crisis, any Egyptian could still buy 20 loaves (130 grams each) of subsidized bread a day for 1 pound (about 20 cents) – more than 2 kg of bread! So, even for those who live on less than $2 per day starvation was out of question in such a situation. But what then caused the massive protests in the spring of 2008?
Actually, at that time “baladi” bread subsidy system in Egypt began to work with more and more fails as the bakeries did not use much of the statesubsidized flour for making bread, but resold it in the black market, where a sack of flour costs 100 times more than the state price. Accordingly, the bakeries produced significantly less "baladi" bread, which led to huge queues and strong discontent of the poor.
To soothe the strikers the Egyptian administration took several measures, in particular, public sector workers were promised wage increase by 30%. Also several important changes were made to the subsidy system. So, it was decided that the "baladi" bread should not be sold in bakeries, but in special shops (separation of production and retail sales in order to reduce queues). The list of products subsidized through ration cards was amended (unpopular products were removed)39. However, the most important change was that the government significantly increased the number of beneficiaries of subsidies (from 39.5 million to 63 million people), as the system has been expanded also to the Egyptians who were born in 1989–200540.
38 ElFiqi M. 1319.03.2008. Mission: get bread. AlAhram Weekly Online No 888. URL: http://weekly.ahram.org.eg/2008/888/ec1.htm
39 REPORT OF THE 32ND RECA SEMINAR ON FOOD SECURITY – GLOBAL TRENDS AND PERSPECTIVE held at IDACA, Tokyo, Japan, 12–25 July 2010. P. 159.
40 REPORT OF THE 32ND RECA SEMINAR ON FOOD SECURITY – GLOBAL TRENDS AND PERSPECTIVE held at IDACA, Tokyo, Japan, 12–25 July 2010. P. 159.
eumed•netwww.eumed.net/entelequia
Korotayev – Zinkina Korotayev – Zinkina / / 157157 Núm. 13 (primavera 2011) Núm. 13 (primavera 2011)

ENTELEQUIAENTELEQUIArevista interdisciplinarrevista interdisciplinar
Enhanced number of ration card beneficiaries led to a substantial increase in government spending on subsidies. Thus, in 2008/09 fiscal year food subsidizing cost the government a total of LE 21.5 billion41 (of which 16 billion for "baladi" bread), compared with 10 billion in 2007/0842. Expenditures on food subsidies accounted for 1.4% GDP in 2005 and for 1.8% in 200843.
Thus, at the beginning of a new round of world food price increase 100% of the Egyptian people were provided with cheap subsidized bread and nearly 80% had ration cards and bought sugar, butter, and rice at subsidized prices. Interestingly, at the same time, according to Egyptian Demographic and Health Survey (conducted in 2008) 40% of Egyptian women and 18% of men were overweight because of overeating44. Accordingly, it is hardly reasonable to state that insufficient subsidies put a significant portion of the population on the brink of starvation (for the dynamics of per capita food consumption in Egypt see Fig. 22 below).
Nevertheless, though the Egyptian system of subsidies mitigated the strike blown by global food price rises to the poor45, it could not outdo its effect completely. Indeed, the system does not cover all necessary food commodities. Besides, the average Egyptian family having a ration card bought at a subsidized price about 60% of its consumed sugar, 73% of oil and 40% of rice. 46 The rest of these goods the family had to buy at market prices (that are, of course, much higher than the subsidized ones).
Structuraldemographic factors of the 2011 Egyptian Revolution
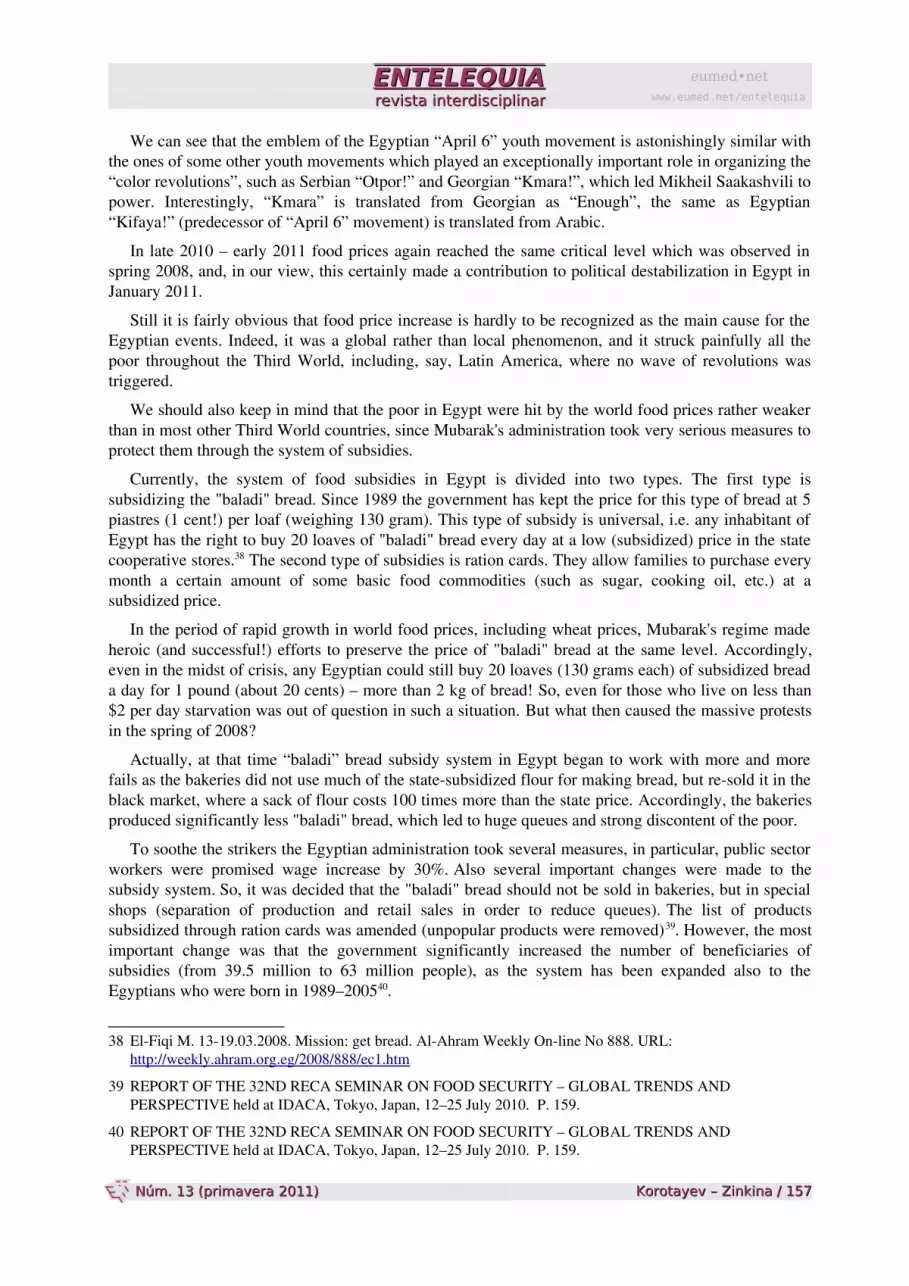
Let us first regard the longterm dynamics of per capita calorie intake in Egypt (Fig. 22):
41 About $4 billion.
42 AfroAsian Rural Development Organization. 2010. REPORT OF THE 32ND RECA SEMINAR ON FOOD SECURITY – GLOBAL TRENDS AND PERSPECTIVE held at IDACA, Tokyo, Japan, 1225 July 2010. P. 159.
43 Adams R.H., Valstar A., Wiles P. 2010. Evaluation Report of Egypt Country Programme 10450.0 (20072011) “Enabling Livelihoods, Nutrition and Food Security”. World Food Program, Office of Evaluation. P. 1.
44 Egypt Ministry of Health, National Population Council, ElZanaty and Associates, and ORC Macro. January 2009. Egypt Demographic and Health Survey (EDHS). 2008.
45 Adams R.H., Valstar A., Wiles P. 2010. Evaluation Report of Egypt Country Programme 10450.0 (20072011) “Enabling Livelihoods, Nutrition and Food Security”. World Food Program, Office of Evaluation. P. 33.
46 El Nakeeb A.M. Egyptian Food Subsidy System Structure, performance and future perspective. Paper presented at World Bank “Social Protection Responses to the Three Waves of Crisis: Finance, Food, and Fuel” SouthSouth Learning Forum, 1518 June 2009, Cairo.
eumed•netwww.eumed.net/entelequia
Korotayev – Zinkina Korotayev – Zinkina / / 158158 Núm. 13 (primavera 2011) Núm. 13 (primavera 2011)
ENTELEQUIAENTELEQUIArevista interdisciplinarrevista interdisciplinar
Fig. 22. Dynamics of per capita calorie intake in Egypt, 1961–2007, kcal/capita/day47
It should be noted that the WHOrecommended rate of per capita food consumption is 2300–2400 kcal per capita per day48. Thus, in Egypt in the early 1960s malnutrition was quite real, and per capita food consumption was lower than the WHO recommended standards. By the mid1960s Egypt came to this level but until 1974 could not exceed it. After 1973 per capita food consumption rocketed up sharply, surpassing the threshold of 3000 kcal in 1982 (one year after the death of Sadat) and never falling below this level. After that, the majority of Egyptians encountered the problem of overeating rather than malnutrition. All this should be associated with Sadat’s administration launching rather successful economic reforms in 1974 (the socalled Infitah).
Thus, we can say that in the 1970s – 1980s Egypt managed to escape the socalled Malthusian trap. Recall that the Malthusian trap49 is a rather typical for preindustrial societies situation when the growth of output (as it is accompanied by a faster demographic growth) does not lead in the longrange perspective to the increase in per capita output and the improvement of living conditions of the majority of population that remains close to the bare survival level.
In complex preindustrial societies the Malthusian trap was one of the main generators of severe political upheavals (up to the state breakdowns).50 However, we have shown that the escape from the Malthusian trap somewhat paradoxically (a social explosion comes amid longterm trends of improving material conditions of life for most people) can also be systematically (and quite naturally) accompanied by serious social and political upheavals (of which many modern revolutions serve as examples). We called this phenomenon "a trap at the escape from
47 Source: FAOSTAT. Food and Agriculture Organization Statistics. URL: http://faostat.fao.org/.
48 See, e.g.: Naiken L. 2002. FAO Methodology for Estimating the Prevalence of Undernourishment. Paper Presented at International Scientific Symposium on Measurement and Assessment of Food Deprivation and Undernutrition, Rome, Italy. URL: www.fao.org.
49 In terms of nonlinear dynamics it can also be called a lowlevel equilibrium attractor) (see: Nelson R. R. 1956. A theory of the low level equilibrium trap in underdeveloped economies. American Economic Review 46: 894–908).
eumed•netwww.eumed.net/entelequia
Korotayev – Zinkina Korotayev – Zinkina / / 159159 Núm. 13 (primavera 2011) Núm. 13 (primavera 2011)
ENTELEQUIAENTELEQUIArevista interdisciplinarrevista interdisciplinar
the trap".51 The 2011 Egyptian Revolution can well be considered as an example of this phenomenon (with some rather specific features).
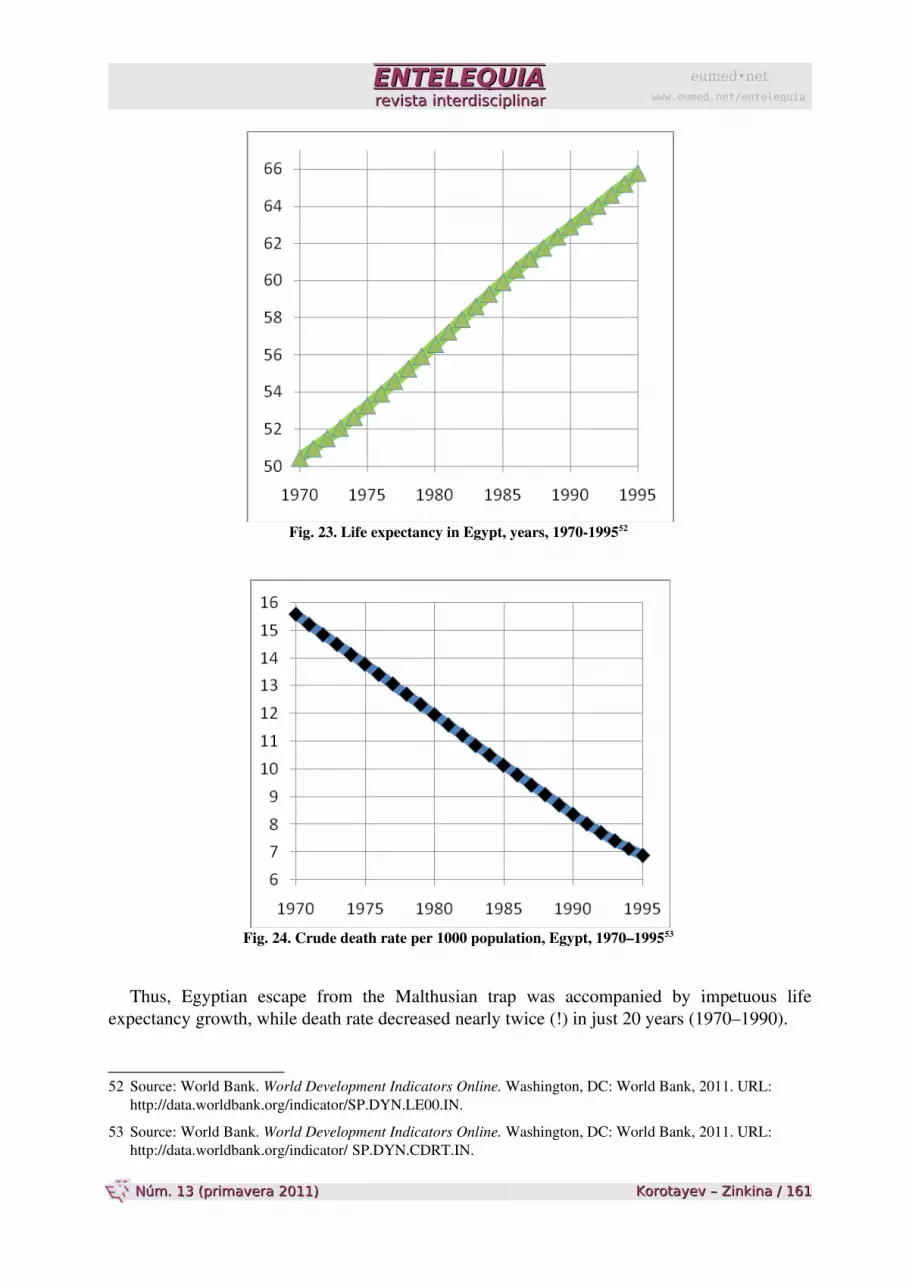
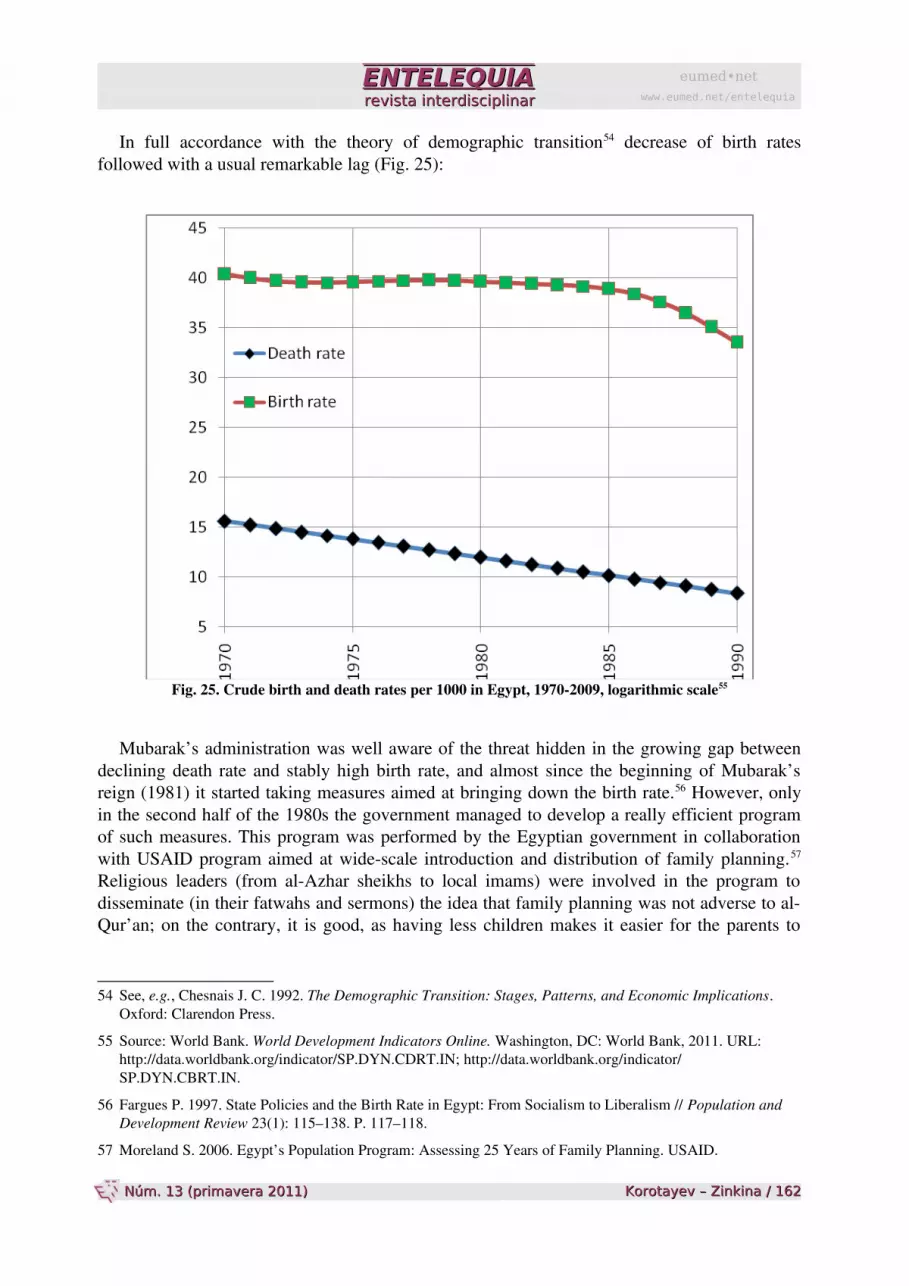
Let us first answer a really simple question: What impact could the escape from the Malthusian trap have on life expectancy and mortality? Naturally, when undernourished people solve the problem of starvation and start eating enough, their life expectancy increases and the death rate of the population decreases. This was observed in all the known cases of the escape from the Malthusian trap, and Egypt was no exception (see Figs 23 and 24):
50 See, e.g., Korotayev A., Malkov A., Khaltourina D. 2006. Introduction to Social Macrodynamics: Secular Cycles and Millennial Trends. Moscow: KomKniga/URSS; Korotayev A., Khaltourina D. 2006. Introduction to Social Macrodynamics: Secular Cycles and Millennial Trends in Africa. Moscow: KomKniga/URSS. Turchin P., Korotayev А. 2006. Population Density and Warfare: A Reconsideration. Social Evolution & History 5/2: 121–158. Turchin P., Nefedov S. 2009 Secular Cycles. Princeton, NJ: Princeton University Press; Turchin P. 2003. Historical Dynamics: Why States Rise and Fall. Princeton, NJ: Princeton University Press; Turchin P. 2005. Dynamical Feedbacks between Population Growth and Sociopolitical Instability in Agrarian States. Structure and Dynamics 1; Artzrouni M., Komlos J. 1985. Population Growth through History and the Escape from the Malthusian Trap: A Homeostatic Simulation Model. Genus 41/3–4: 21–39. Kögel T., Prskawetz A. 2001. Agricultural Productivity Growth and Escape from the Malthusian Trap. Journal of Economic Growth 6: 337–357. Komlos J., Artzrouni M. 1990. Mathematical Investigations of the Escape from the Malthusian Trap. Mathematical Population Studies 2: 269–287. Steinmann G., Komlos J. 1988. Population Growth and Economic Development in the Very Long Run: A Simulation Model of Three Revolutions. Mathematical Social Sciences 16: 49–63. Steinmann G., Prskawetz A., Feichtinger G. 1998. A Model on the Escape from the Malthusian Trap. Journal of Population Economics 11: 535–550. Wood J. W. 1998. A Theory of Preindustrial Population Dynamics: Demography, Economy, and WellBeing in Malthusian Systems. Current Anthropology 39: 99–135.
51 Коротаев А. В., Халтурина Д.А., Малков А.С., Божевольнов Ю.В., Кобзева С.В., Зинькина Ю.В. Законы истории: Математическое моделирование и прогнозирование мирового и регионального развития. М.: ЛКИ/URSS, 2010.; Коротаев А.В., Халтурина Д.А., Кобзева С.В., Зинькина Ю.В. Ловушка на выходе из ловушки? О некоторых особенностях политикодемографической динамики модернизирующихся систем. Проекты и риски будущего. Концепции, модели, инструменты, прогнозы / Ред. А. А. Акаев, А. В. Коротаев, Г. Г. Малинецкий, С. Ю. Малков. М.: Красанд/URSS, 2011. С. 45–88; Korotayev A., Zinkina J., Kobzeva S., Bogevolnov J., Khaltourina D., Malkov A. A trap at the escape from the trap? Some Demographic Structural Factors of Political Instability in Modern Africa. Forecast for 2012–2050. Submitted to Cliodynamics.
eumed•netwww.eumed.net/entelequia
Korotayev – Zinkina Korotayev – Zinkina / / 160160 Núm. 13 (primavera 2011) Núm. 13 (primavera 2011)
ENTELEQUIAENTELEQUIArevista interdisciplinarrevista interdisciplinar
Fig. 23. Life expectancy in Egypt, years, 1970199552
Fig. 24. Crude death rate per 1000 population, Egypt, 1970–199553
Thus, Egyptian escape from the Malthusian trap was accompanied by impetuous life expectancy growth, while death rate decreased nearly twice (!) in just 20 years (1970–1990).
52 Source: World Bank. World Development Indicators Online. Washington, DC: World Bank, 2011. URL: http://data.worldbank.org/indicator/SP.DYN.LE00.IN.
53 Source: World Bank. World Development Indicators Online. Washington, DC: World Bank, 2011. URL: http://data.worldbank.org/indicator/ SP.DYN.CDRT.IN.
eumed•netwww.eumed.net/entelequia
Korotayev – Zinkina Korotayev – Zinkina / / 161161 Núm. 13 (primavera 2011) Núm. 13 (primavera 2011)
ENTELEQUIAENTELEQUIArevista interdisciplinarrevista interdisciplinar
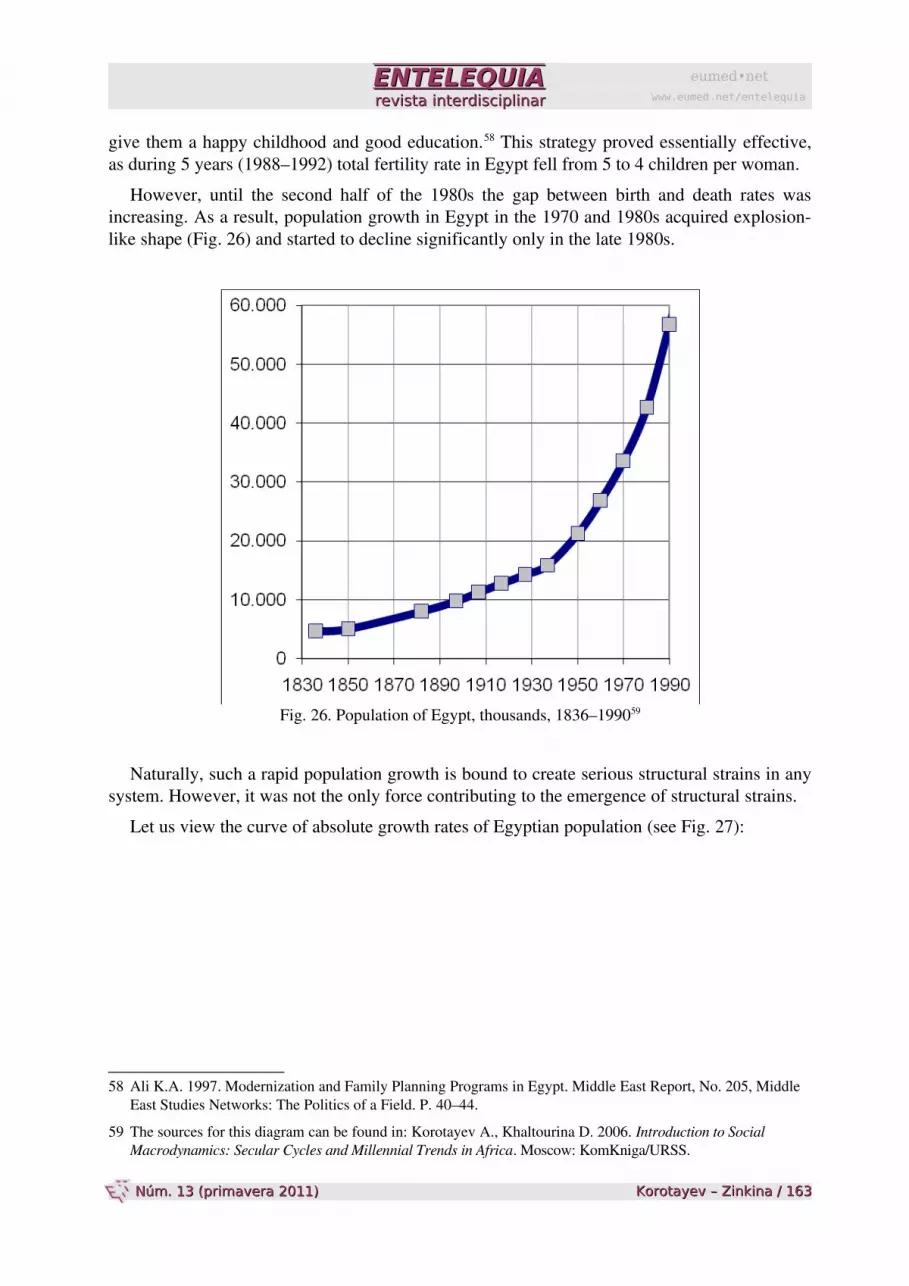
In full accordance with the theory of demographic transition54 decrease of birth rates followed with a usual remarkable lag (Fig. 25):
Fig. 25. Crude birth and death rates per 1000 in Egypt, 19702009, logarithmic scale55
Mubarak’s administration was well aware of the threat hidden in the growing gap between declining death rate and stably high birth rate, and almost since the beginning of Mubarak’s reign (1981) it started taking measures aimed at bringing down the birth rate.56 However, only in the second half of the 1980s the government managed to develop a really efficient program of such measures. This program was performed by the Egyptian government in collaboration with USAID program aimed at widescale introduction and distribution of family planning.57 Religious leaders (from alAzhar sheikhs to local imams) were involved in the program to disseminate (in their fatwahs and sermons) the idea that family planning was not adverse to alQur’an; on the contrary, it is good, as having less children makes it easier for the parents to
54 See, e.g., Chesnais J. C. 1992. The Demographic Transition: Stages, Patterns, and Economic Implications. Oxford: Clarendon Press.
55 Source: World Bank. World Development Indicators Online. Washington, DC: World Bank, 2011. URL: http://data.worldbank.org/indicator/SP.DYN.CDRT.IN; http://data.worldbank.org/indicator/ SP.DYN.CBRT.IN.
56 Fargues P. 1997. State Policies and the Birth Rate in Egypt: From Socialism to Liberalism // Population and Development Review 23(1): 115–138. P. 117–118.
57 Moreland S. 2006. Egypt’s Population Program: Assessing 25 Years of Family Planning. USAID.
eumed•netwww.eumed.net/entelequia
Korotayev – Zinkina Korotayev – Zinkina / / 162162 Núm. 13 (primavera 2011) Núm. 13 (primavera 2011)
ENTELEQUIAENTELEQUIArevista interdisciplinarrevista interdisciplinar
give them a happy childhood and good education.58 This strategy proved essentially effective, as during 5 years (1988–1992) total fertility rate in Egypt fell from 5 to 4 children per woman.
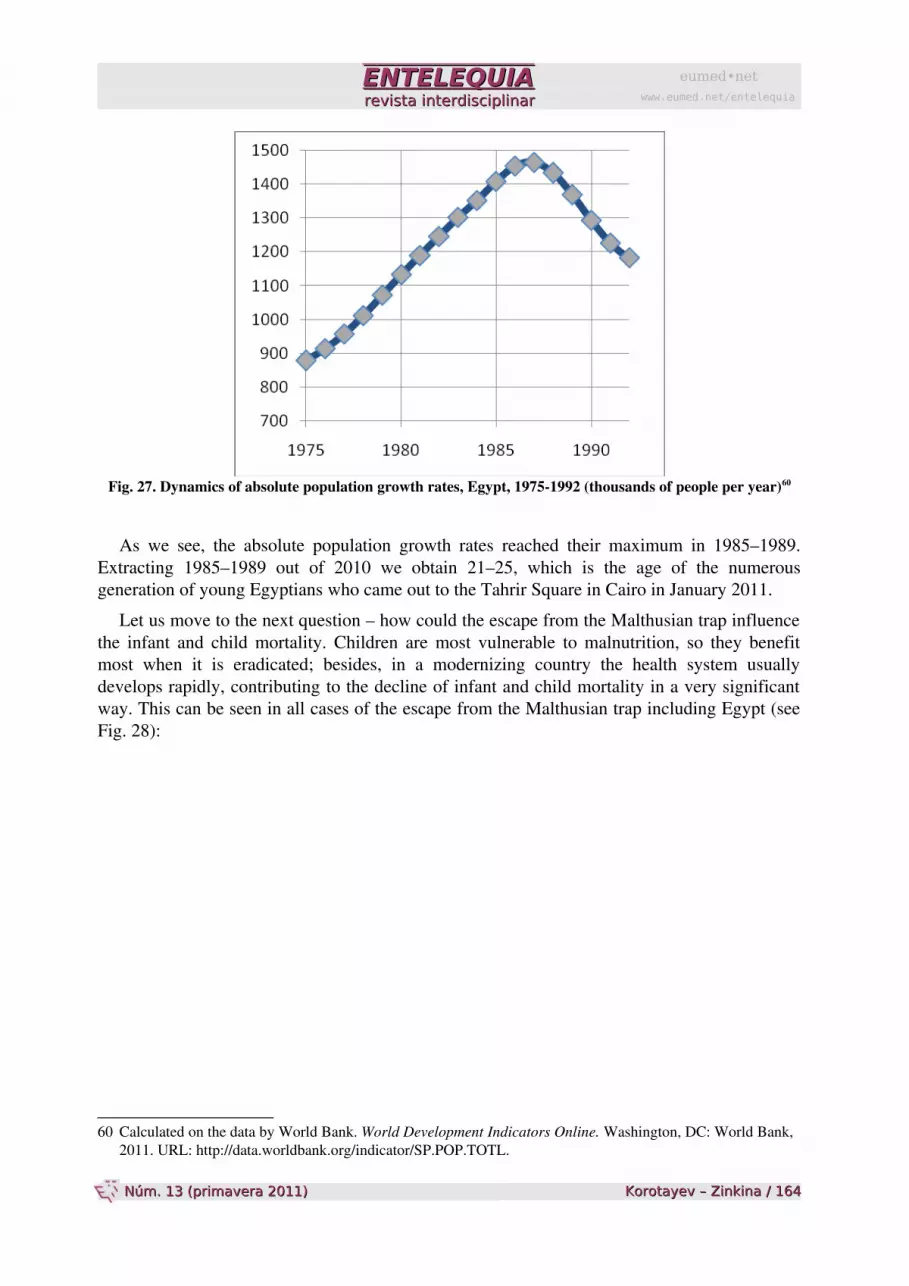
However, until the second half of the 1980s the gap between birth and death rates was increasing. As a result, population growth in Egypt in the 1970 and 1980s acquired explosionlike shape (Fig. 26) and started to decline significantly only in the late 1980s.
Fig. 26. Population of Egypt, thousands, 1836–199059
Naturally, such a rapid population growth is bound to create serious structural strains in any system. However, it was not the only force contributing to the emergence of structural strains.
Let us view the curve of absolute growth rates of Egyptian population (see Fig. 27):
58 Ali K.A. 1997. Modernization and Family Planning Programs in Egypt. Middle East Report, No. 205, Middle East Studies Networks: The Politics of a Field. P. 40–44.
59 The sources for this diagram can be found in: Korotayev A., Khaltourina D. 2006. Introduction to Social Macrodynamics: Secular Cycles and Millennial Trends in Africa. Moscow: KomKniga/URSS.
eumed•netwww.eumed.net/entelequia
Korotayev – Zinkina Korotayev – Zinkina / / 163163 Núm. 13 (primavera 2011) Núm. 13 (primavera 2011)
ENTELEQUIAENTELEQUIArevista interdisciplinarrevista interdisciplinar
Fig. 27. Dynamics of absolute population growth rates, Egypt, 19751992 (thousands of people per year)60
As we see, the absolute population growth rates reached their maximum in 1985–1989. Extracting 1985–1989 out of 2010 we obtain 21–25, which is the age of the numerous generation of young Egyptians who came out to the Tahrir Square in Cairo in January 2011.
Let us move to the next question – how could the escape from the Malthusian trap influence the infant and child mortality. Children are most vulnerable to malnutrition, so they benefit most when it is eradicated; besides, in a modernizing country the health system usually develops rapidly, contributing to the decline of infant and child mortality in a very significant way. This can be seen in all cases of the escape from the Malthusian trap including Egypt (see Fig. 28):
60 Calculated on the data by World Bank. World Development Indicators Online. Washington, DC: World Bank, 2011. URL: http://data.worldbank.org/indicator/SP.POP.TOTL.
eumed•netwww.eumed.net/entelequia
Korotayev – Zinkina Korotayev – Zinkina / / 164164 Núm. 13 (primavera 2011) Núm. 13 (primavera 2011)
ENTELEQUIAENTELEQUIArevista interdisciplinarrevista interdisciplinar
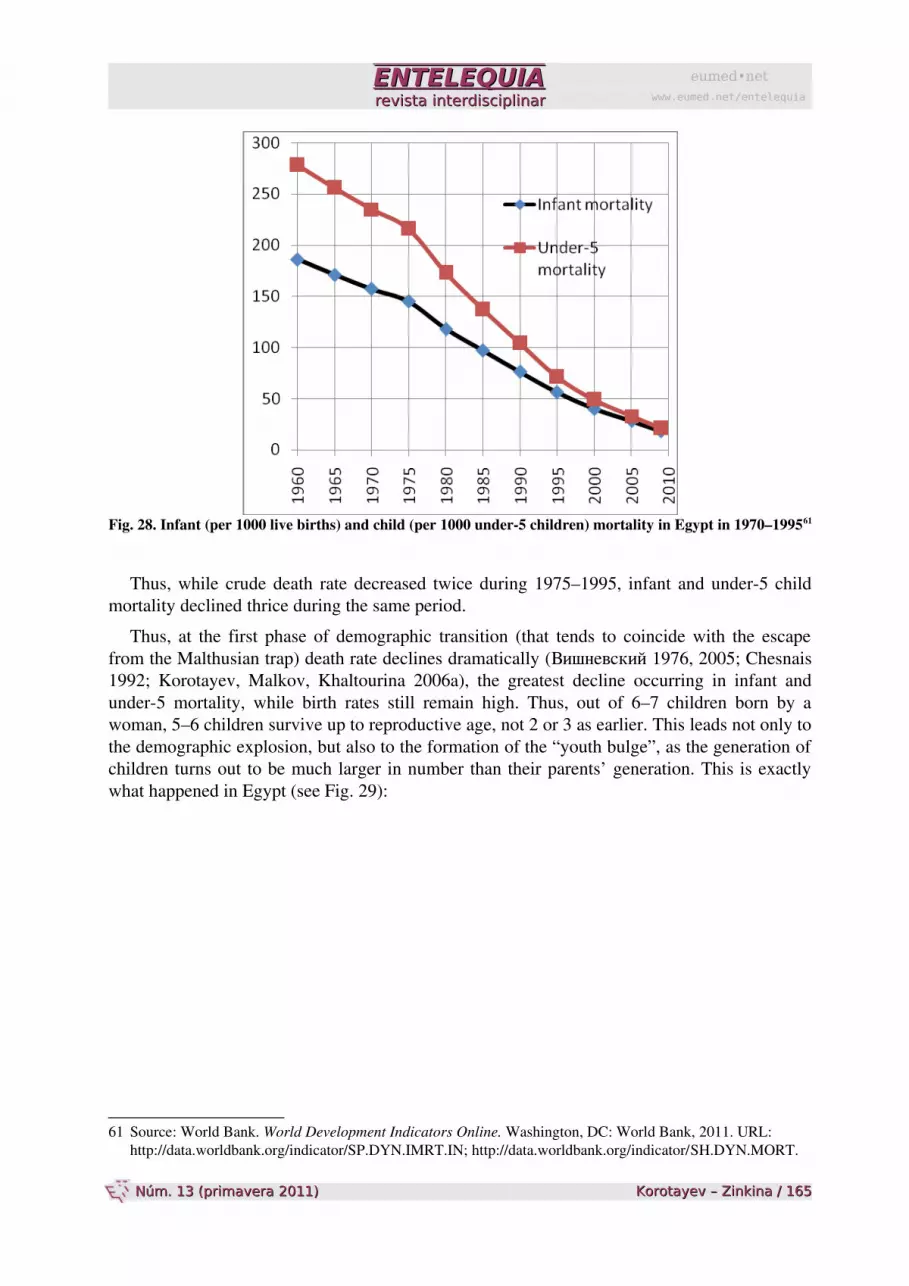
Fig. 28. Infant (per 1000 live births) and child (per 1000 under5 children) mortality in Egypt in 1970–199561
Thus, while crude death rate decreased twice during 1975–1995, infant and under5 child mortality declined thrice during the same period.
Thus, at the first phase of demographic transition (that tends to coincide with the escape from the Malthusian trap) death rate declines dramatically (Вишневский 1976, 2005; Chesnais 1992; Korotayev, Malkov, Khaltourina 2006a), the greatest decline occurring in infant and under5 mortality, while birth rates still remain high. Thus, out of 6–7 children born by a woman, 5–6 children survive up to reproductive age, not 2 or 3 as earlier. This leads not only to the demographic explosion, but also to the formation of the “youth bulge”, as the generation of children turns out to be much larger in number than their parents’ generation. This is exactly what happened in Egypt (see Fig. 29):
61 Source: World Bank. World Development Indicators Online. Washington, DC: World Bank, 2011. URL: http://data.worldbank.org/indicator/SP.DYN.IMRT.IN; http://data.worldbank.org/indicator/SH.DYN.MORT.
eumed•netwww.eumed.net/entelequia
Korotayev – Zinkina Korotayev – Zinkina / / 165165 Núm. 13 (primavera 2011) Núm. 13 (primavera 2011)
ENTELEQUIAENTELEQUIArevista interdisciplinarrevista interdisciplinar
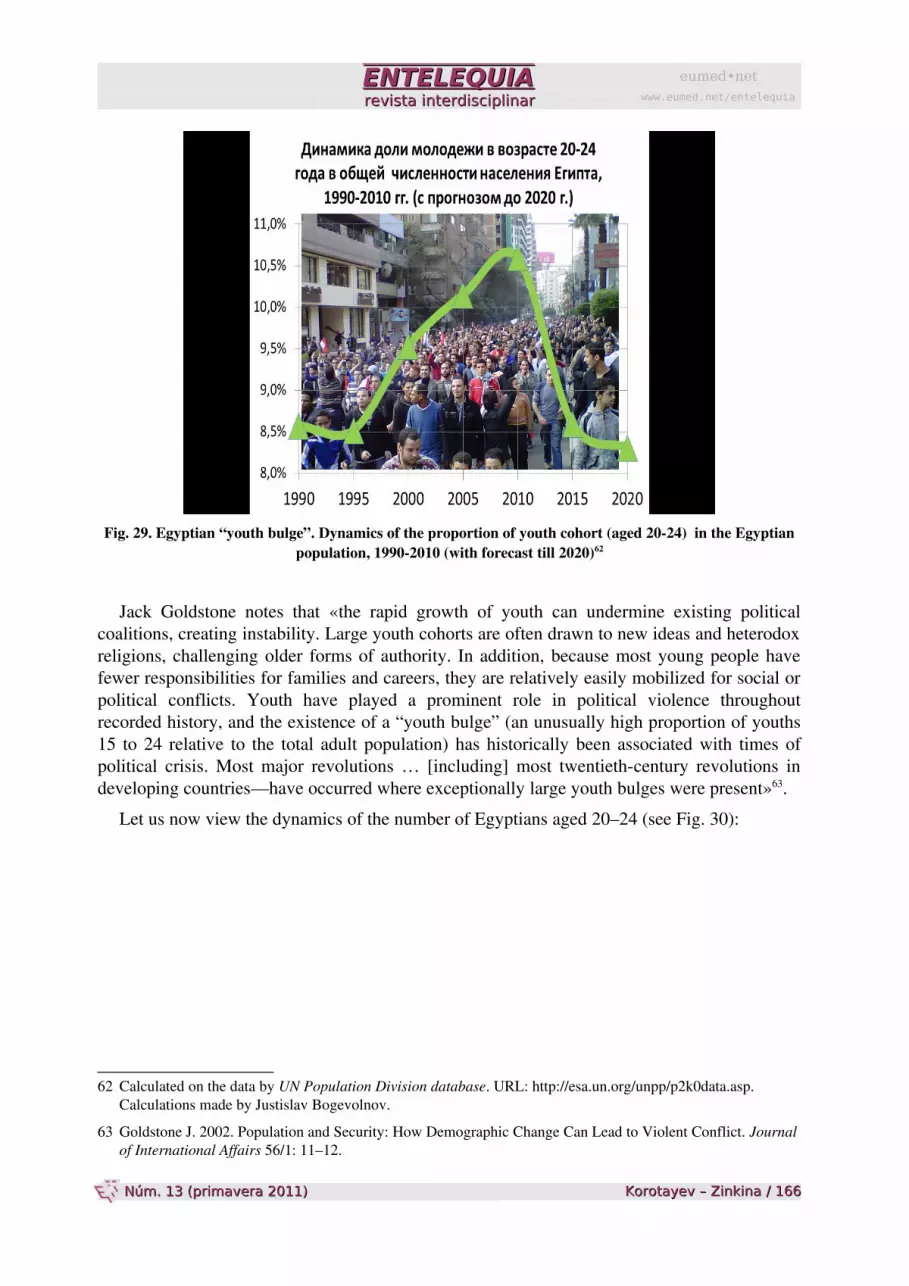
Fig. 29. Egyptian “youth bulge”. Dynamics of the proportion of youth cohort (aged 2024) in the Egyptian population, 19902010 (with forecast till 2020)62
Jack Goldstone notes that «the rapid growth of youth can undermine existing political coalitions, creating instability. Large youth cohorts are often drawn to new ideas and heterodox religions, challenging older forms of authority. In addition, because most young people have fewer responsibilities for families and careers, they are relatively easily mobilized for social or political conflicts. Youth have played a prominent role in political violence throughout recorded history, and the existence of a “youth bulge” (an unusually high proportion of youths 15 to 24 relative to the total adult population) has historically been associated with times of political crisis. Most major revolutions … [including] most twentiethcentury revolutions in developing countries—have occurred where exceptionally large youth bulges were present»63.
Let us now view the dynamics of the number of Egyptians aged 20–24 (see Fig. 30):
62 Calculated on the data by UN Population Division database. URL: http://esa.un.org/unpp/p2k0data.asp. Calculations made by Justislav Bogevolnov.
63 Goldstone J. 2002. Population and Security: How Demographic Change Can Lead to Violent Conflict. Journal of International Affairs 56/1: 11–12.
eumed•netwww.eumed.net/entelequia
Korotayev – Zinkina Korotayev – Zinkina / / 166166 Núm. 13 (primavera 2011) Núm. 13 (primavera 2011)
ENTELEQUIAENTELEQUIArevista interdisciplinarrevista interdisciplinar
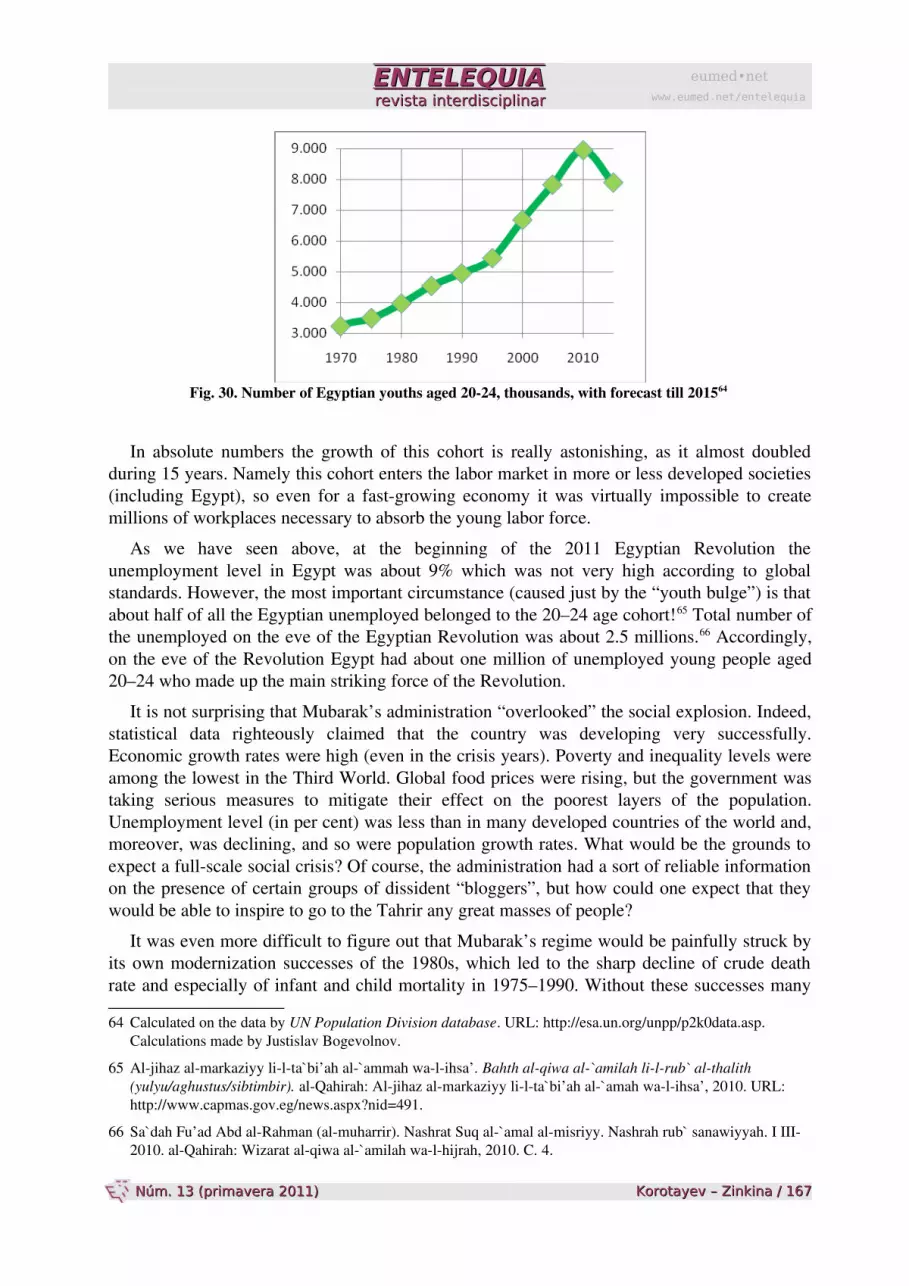
Fig. 30. Number of Egyptian youths aged 2024, thousands, with forecast till 201564
In absolute numbers the growth of this cohort is really astonishing, as it almost doubled during 15 years. Namely this cohort enters the labor market in more or less developed societies (including Egypt), so even for a fastgrowing economy it was virtually impossible to create millions of workplaces necessary to absorb the young labor force.
As we have seen above, at the beginning of the 2011 Egyptian Revolution the unemployment level in Egypt was about 9% which was not very high according to global standards. However, the most important circumstance (caused just by the “youth bulge”) is that about half of all the Egyptian unemployed belonged to the 20–24 age cohort!65 Total number of the unemployed on the eve of the Egyptian Revolution was about 2.5 millions.66 Accordingly, on the eve of the Revolution Egypt had about one million of unemployed young people aged 20–24 who made up the main striking force of the Revolution.
It is not surprising that Mubarak’s administration “overlooked” the social explosion. Indeed, statistical data righteously claimed that the country was developing very successfully. Economic growth rates were high (even in the crisis years). Poverty and inequality levels were among the lowest in the Third World. Global food prices were rising, but the government was taking serious measures to mitigate their effect on the poorest layers of the population. Unemployment level (in per cent) was less than in many developed countries of the world and, moreover, was declining, and so were population growth rates. What would be the grounds to expect a fullscale social crisis? Of course, the administration had a sort of reliable information on the presence of certain groups of dissident “bloggers”, but how could one expect that they would be able to inspire to go to the Tahrir any great masses of people?
It was even more difficult to figure out that Mubarak’s regime would be painfully struck by its own modernization successes of the 1980s, which led to the sharp decline of crude death rate and especially of infant and child mortality in 1975–1990. Without these successes many
64 Calculated on the data by UN Population Division database. URL: http://esa.un.org/unpp/p2k0data.asp. Calculations made by Justislav Bogevolnov.
65 Aljihaz almarkaziyy lilta`bi’ah al`ammah walihsa’. Bahth alqiwa al`amilah lilrub` althalith (yulyu/aghustus/sibtimbir). alQahirah: Aljihaz almarkaziyy lilta`bi’ah al`amah walihsa’, 2010. URL: http://www.capmas.gov.eg/news.aspx?nid=491.
66 Sa`dah Fu’ad Abd alRahman (almuharrir). Nashrat Suq al`amal almisriyy. Nashrah rub` sanawiyyah. I III2010. alQahirah: Wizarat alqiwa al`amilah walhijrah, 2010. C. 4.
eumed•netwww.eumed.net/entelequia
Korotayev – Zinkina Korotayev – Zinkina / / 167167 Núm. 13 (primavera 2011) Núm. 13 (primavera 2011)
ENTELEQUIAENTELEQUIArevista interdisciplinarrevista interdisciplinar
young Egyptians vehemently demanding Mubarak’s resignation (or even death) would have been destined to die in early childhood and simply would not have survived to come out to the Tahrir Square. The rate of unemployment in Egypt stayed almost unchanged, but the number of the young doubled. This means that the absolute number of the unemployed young people also increased at least twice (this, incidentally, indicates how risky this could sometimes be to rely on percentages rather than absolute numbers).
Moreover, the investigation carried out at the end of 2010 by the Egyptian Central Agency for Public Mobilization and Statistics discovered that at the eve of the Revolution more than 43% of the Egyptian unemployed had university degrees!67 Thus, the impact force of the 2011 Egyptian Revolution was not only young, but also very highly educated. We suppose that this circumstance stipulated the relative “nonbloodiness” of the revolution, i.e. a relatively small number of victims. Indeed, though the scale of the events was truly colossal and millions of people were involved for weeks, only 300 were killed (mostly by the security forces and criminal elements employed by the security forces, but not by the rioters). Let us remember that during the “bread riots” of 1977 (when loweducated Egyptian urban youth was the main striking force) 800 people were killed just during two days.68 In this regard the 2011 Egyptian Revolution was closer to the youth uprisings of 1968 type – and “velvet revolutions” – in Europe and North America of the past decades than to violent and bloody (involving dozens and hundreds thousands [if not millions] of the deathtoll) Third World civil wars.
However, the Egyptian Revolution 2011 would hardly have acquired its scale if its protest base had been limited to unemployed highlyeducated youth. The youths were supported by millions of Egyptians (of various age, occupation, and education level) who found themselves below the poverty line as a result of world food price growth (despite all the serious countermeasures undertaken by Mubarak’s administration). Namely this combination created the socially explosive material necessary for the revolution.
However, these were necessary but not sufficient conditions for the Egyptian social explosion. Not only some explosive material, but also some spark was needed. So let us recollect some other factors, without which the revolution might not have happened. First of all, some protesters’ complaints were justified. Thus, the decades of the State of Emergency created the situation of uncontrolled activity of security forces which led to massive usage of tortures against those opposed to the regime. We should also keep in mind the diffusion of the Internet, which supplied Egyptian educated youths with unprecedentedly powerful means of selforganization, as well as the Arabic satellite channels and their talented journalists who translated exceptionally vivid images of people uprisings to all countries of the Arab world. We also share a widespread opinion that the Egyptian events would hardly have been possible if the revolution in Tunisia had not been so fast and bloodless, if it had not created the feeling that changes of power in Arab countries could be fast and nonviolent.
Thus, we suppose that Egyptian Revolution was not possible without certain objective prerequisites, but still it was not unevitable. Indeed, the “youth bulge” in Egypt was bound to start decreasing rapidly (annually weakening the pressure on the labor market). The program of
67 Aljihaz almarkaziyy lilta`bi’ah al`ammah walihsa’. Bahth alqiwa al`amilah lilrub` althalith (yulyu/aghustus/sibtimbir). alQahirah: Aljihaz almarkaziyy lilta`bi’ah al`amah walihsa’, 2010. URL: http://www.capmas.gov.eg/news.aspx?nid=491.
68 See, e.g.: Hirst D. 1977. How High Life and Scandal Rocked Sadat. MERIP Reports 54: 19–20.
eumed•netwww.eumed.net/entelequia
Korotayev – Zinkina Korotayev – Zinkina / / 168168 Núm. 13 (primavera 2011) Núm. 13 (primavera 2011)

ENTELEQUIAENTELEQUIArevista interdisciplinarrevista interdisciplinar
economic reforms allowed to expect Egypt to reach the level of economic miracle growth rates (about 10% annually) just within 3 or 4 forthcoming yeras. All this (together with the political liberalization expected from Gamal Mubarak) was bound to dissolve the social “explosive material” in the forthcoming years.
eumed•netwww.eumed.net/entelequia
Korotayev – Zinkina Korotayev – Zinkina / / 169169 Núm. 13 (primavera 2011) Núm. 13 (primavera 2011)
ENTELEQUIAENTELEQUIArevista interdisciplinarrevista interdisciplinar
AttributionNonCommercialNoDerivs 3.0
You are free:
to Share — to copy, distribute and transmit the work
Under the following conditions:
Attribution — You must attribute the work in the manner specified by the author or licensor1 (but not in any way that suggests that they endorse you or your use of the work).
Noncommercial — You may not use this work for commercial purposes.
No Derivative Works — You may not alter, transform, or build upon this work.
With the understanding that:
Waiver — Any of the above conditions can be waived if you get permission from the copyright holder.
Public Domain — Where the work or any of its elements is in the public domain under applicable law, that status is in no way affected by the license.
Other Rights — In no way are any of the following rights affected by the license:
• Your fair dealing or fair use rights, or other applicable copyright exceptions and limitations;
• The author's moral rights;
• Rights other persons may have either in the work itself or in how the work is used, such as publicity or privacy rights.
Notice — For any reuse or distribution, you must make clear to others the license terms of this work. The best way to do this is
with a link to this web page.2
1 It shall clearly include author(s) name(s) and the text, if applicable, “Article originally published in Entelequia. Revista Interdisciplinar. Available at <http://www.eumed.net/entelequia>”.
2 <http://creativecommons.org/licenses/byncnd/3.0/>
ReconocimientoNoComercialSinObraDerivada 3.0
Usted es libre de:
copiar, distribuir y comunicar públicamente la obra
Bajo las condiciones siguientes:
Reconocimiento — Debe reconocer los créditos de la obra de la manera especificada por el autor o el licenciador 3(pero no de una manera que sugiera que tiene su apoyo o apoyan el uso que hace de su obra).
No comercial — No puede utilizar esta obra para fines comerciales.
Sin obras derivadas — No se puede alterar, transformar o generar una obra derivada a partir de esta obra.
Entendiendo que:
Renuncia — Alguna de estas condiciones puede no aplicarse si se obtiene el permiso del titular de los derechos de autor
Dominio Público — Cuando la obra o alguno de sus elementos se halle en el dominio público según la ley vigente aplicable, esta situación no quedará afectada por la licencia.
Otros derechos — Los derechos siguientes no quedan afectados por la licencia de ninguna manera:
• Los derechos derivados de usos legítimos u otras limitaciones reconocidas por ley no se ven afectados por lo anterior.
• Los derechos morales del auto;
• Derechos que pueden ostentar otras personas sobre la propia obra o su uso, como por ejemplo derechos de imagen o de privacidad.
Aviso — Al reutilizar o distribuir la obra, tiene que dejar bien claro los términos de la licencia de esta obra.
3 Debe incluir claramente el nombre de su autor o autores y, si es aplicable, el texto “Artículo originalmente publicado en Entelequia. Revista Interdisciplinar. Accesible en <http://www.eumed.net/entelequia>”.
eumed•netwww.eumed.net/entelequia