the power revolution - actis
TRANSCRIPT

The Power RevolutionThe Street View
Actis Macro ForumMarch 2021
ac-0173-103028-Macro Forum Mar 2021.indd 1ac-0173-103028-Macro Forum Mar 2021.indd 1 04/03/2021 19:1804/03/2021 19:18

2 The Street View
Ewen Cameron Watt
Editor-in-Chief, London
Barry Lynch
Co-editor, Energy Infrastructure, London
Macro Forum members
Hernan Arrigone
Energy Infrastructure, London
David Cooke
Private Equity, South Africa
Hilaire Dongmo
Real Estate, London
Sherif ElKholy
Private Equity, Egypt
Alberto Estefan
Energy Infrastructure, Mexico
Marcelo Guerra Filho
Energy Infrastructure, Brazil
Stuart Jackson
Knowledge & Information, London
Julian Kim
Real Estate, Seoul
Bruno Moraes
Energy Infrastructure, Brazil
Shami Nissan
Responsible Investment, London
Simon Ogus
CEO, DSG Asia Ltd Hong Kong
Funke Okubadejo
Real Estate, Nigeria
Lisa Pinsley
Energy Infrastructure, South Africa
John Thompson
Communications, London
Actis guest contributors
Preyavart Gadhavi
Energy Infrastructure, London
Ralf Nowack
Energy Infrastructure, London
Liam Smith
Energy Infrastructure, London
Philippe Wind
Energy Infrastructure, Singapore
External guest contributors Production team
Wessel Bakker
Business Director Power Transmission, DNV
Hugo Vits
General Manager, Pelicano, Chile
Christopher Wiig
Business Director, Digital Grid Operations, Energy Systems, DNV
Sarah Douglas
Communications, London
Helen Johnson
London
Debbie Minchington
Rightaligned, London
Welcome
ac-0173-103028-Macro Forum Mar 2021.indd 2ac-0173-103028-Macro Forum Mar 2021.indd 2 04/03/2021 19:1804/03/2021 19:18

3 The Street View
The power revolution 4Ewen Cameron Watt
Transformation in practice 6Barry Lynch
The new generationMoving with the wind 8Liam Smith
Solar technology shining bright 12Liam Smith and Preyavart Gadhavi
Hydrogen delivering sustainable energy 16Hernan Arrigone
New distribution Grid modernisation: A key enabler for energy transition 20Preyavart Gadhavi, Philippe Wind, Wessel Bakker and Christopher Wiig
Energy storage for a green transition 26Preyavart Gadhavi
Actis in practiceRobotic blade inspection 30Hernan Arrigone
Using artificial intelligence and machine learning 32Hernan Arrigone
Big data driving performance 33Hernan Arrigone
Material improvements in Mexico 34Hernan Arrigone
Efficient infra-red inspections of photovoltaic plants 36Ralf Nowack and Hugo Vits
24/7, remote monitoring of assets 38Ralf Nowack
Contents
ac-0173-103028-Macro Forum Mar 2021.indd 3ac-0173-103028-Macro Forum Mar 2021.indd 3 04/03/2021 19:1804/03/2021 19:18
4 The Street View
The power revolutionEwen Cameron WattEditor-in-Chief, London
Welcome to The Street View where Actis pools knowledge and investment perspectives drawn from our global network of colleagues, investee companies and external experts.
Our theme this time is how the electricity industry worldwide generates and delivers a cleaner and more cost-efficient future. On the surface this is a mature and capital-intensive industry. Yet under the skin there is an industrial revolution at work, one where producers and distributors are harnessing new technology and work practices to boost supply, to ‘de-carbonise’ power ecosystems and all whilst inexorably reducing cost. And the pace of change is accelerating every year.
Students of innovation will recognise this pattern. Anyone visiting the Edison Museum in Menlo Park New Jersey will be familiar with the story of innovation moving into application through constant experimentation and cost reduction led by increasing economies of scale. A similar story applies to the Hewlett Packard Garage in Palo Alto California. And even further back in time a visit to the cradle of the first industrial revolution, the Iron Bridge Gorge in Telford, UK fits the pattern. Do visit any one or all of these amazing sites when normal times return.
Technology diffusion - the rate at which technology is adopted - often derives from an increasing reduction in the real cost of supply. What was true for the incandescent lightbulb, the phonograph, the personal computer and even wrought iron, applies today to the power generation and distribution industry. In the pages that follow, our Energy Infrastructure
Operations team – led by Barry Lynch - explore how reductions in cost can influence reliability and improve work practices.
These solutions are rarely easy to implement. They require deep know-how. I personally believe that the 20-year track record of Actis suggests that the specialist authors contributing to this publication can continue to deliver the returns expected by our clients. (This claim does not apply to your editor!).
A more socially distanced post COVID-19 world needs cleaner, more productive power supply and efficient distribution technologies more than ever. This requires new and efficient distribution networks, enhanced storage capabilities and a continued focus on a cleaner energy mix. The ‘ just transition’ to net zero is a laudable aim, but should be one where older industrialised nations do not disadvantage newer economies through imposition of policies largely suited to post-industrial societies. Striking a balance is key to the ‘ just’ part of any transition for developing economies – one size does not fit all!
Happily, there are many examples in this edition of new technology benefitting developing economies; in many cases these economies where we operate are well suited to this technology ‘leapfrogging’. Rapid technology adaptation can be easier without legacy infrastructure. The stories of wind and solar application, enhanced storage solutions, of innovative and cost-effective maintenance practices and the implementation of necessary distribution system improvements abound in our activities…and in this edition. This industrial revolution and the associated investment opportunity has much energy left in it.
Watch this podcast
ac-0173-103028-Macro Forum Mar 2021.indd 4ac-0173-103028-Macro Forum Mar 2021.indd 4 04/03/2021 19:1804/03/2021 19:18

5 The Street View
ac-0173-103028-Macro Forum Mar 2021.indd 5ac-0173-103028-Macro Forum Mar 2021.indd 5 04/03/2021 19:1804/03/2021 19:18
6 The Street View
Transformation in practiceBarry LynchPartner and Head of Operations, Energy Infrastructure
Twenty years ago I started my first job as a mechanical engineer on a power plant construction project. We demolished an old oil-fired power plant and replaced it with a modern combined cycle gas turbine plant. I spent two years on that construction site replacing old technology with new, and this gave me my first insight into the ever-evolving nature of our industry. To paraphrase Heroclitus, “The only constant in the energy industry is change”.
At Actis, we invest in power generation and high growth electricity distribution businesses across Latin America, Africa and Asia. In 2020, we controlled 13 businesses with over 60 projects totalling 12,000MW in construction or operation. This gives us a unique insight into the technologies, asset performance and the challenges of managing the integration of energy projects into electricity grids.
I spent two years on that construction site replacing old technology with new
What’s in this edition?
In this edition of The Street View, our Energy Infrastructure Operations Team will showcase how we are using technology to improve our assets, where we believe the industry is headed and what technologies will take us there.
What is apparent is that no one technology is the total solution in the power industry. Solar PV will account for 30% of global generation by 2050, hydrogen will play a significant role and our electricity grids will increase network coverage by a factor of 2.5 to cope with this change. The industry also has to adapt to a world where - by 2030 - two thirds of the world’s population will live in cities and there will be a 10–fold increase in the deployment of renewables.
no one technology is the total solution in the power industry
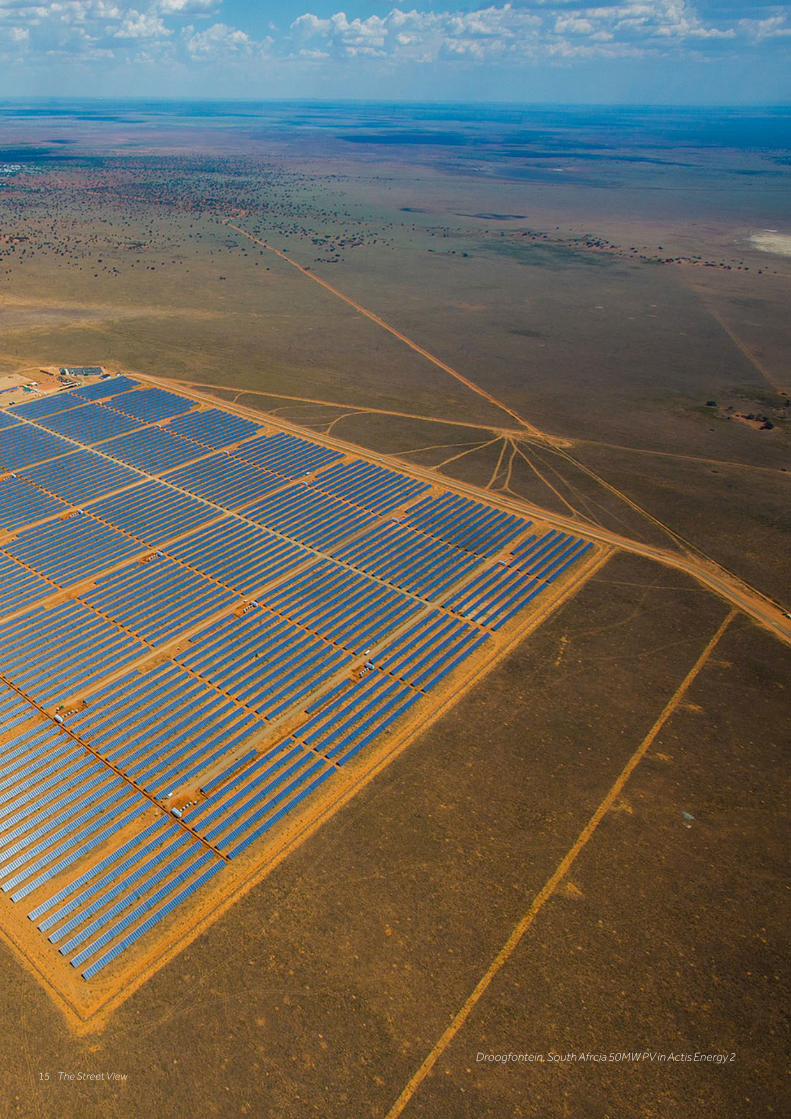
Also in this edition, Liam Smith and Preyavart Gadhavi explain how volume growth has led to huge technological advances in the Solar PV industry. Today’s panel manufacturing efficiencies, generation efficiencies and solar panel prices could never have been predicted ten years ago. I recall in the first round of the South African renewable energy procurement program ten years ago when Actis, in its second energy fund, invested in two 50MW solar PV projects in De Aar and Droogfontein. At the time, a 230-watt solar panel cost $230. The same size PV panel today can generate 450 watts and costs $90. As with many industries pricing drives technology adoption.
In their article, Ralf Nowack and Hernan Arrigone explain how Actis uses drone technology to monitor our solar assets and how we use Artificial Intelligence to improve asset performance.
Liam Smith’s article delves into how the wind industry has evolved from a niche technology to a fully industrialised renewables value chain, including a consolidated group of global manufacturers. The investment in offshore wind technology has also benefitted the onshore business as we see ever-increasing turbine scale.
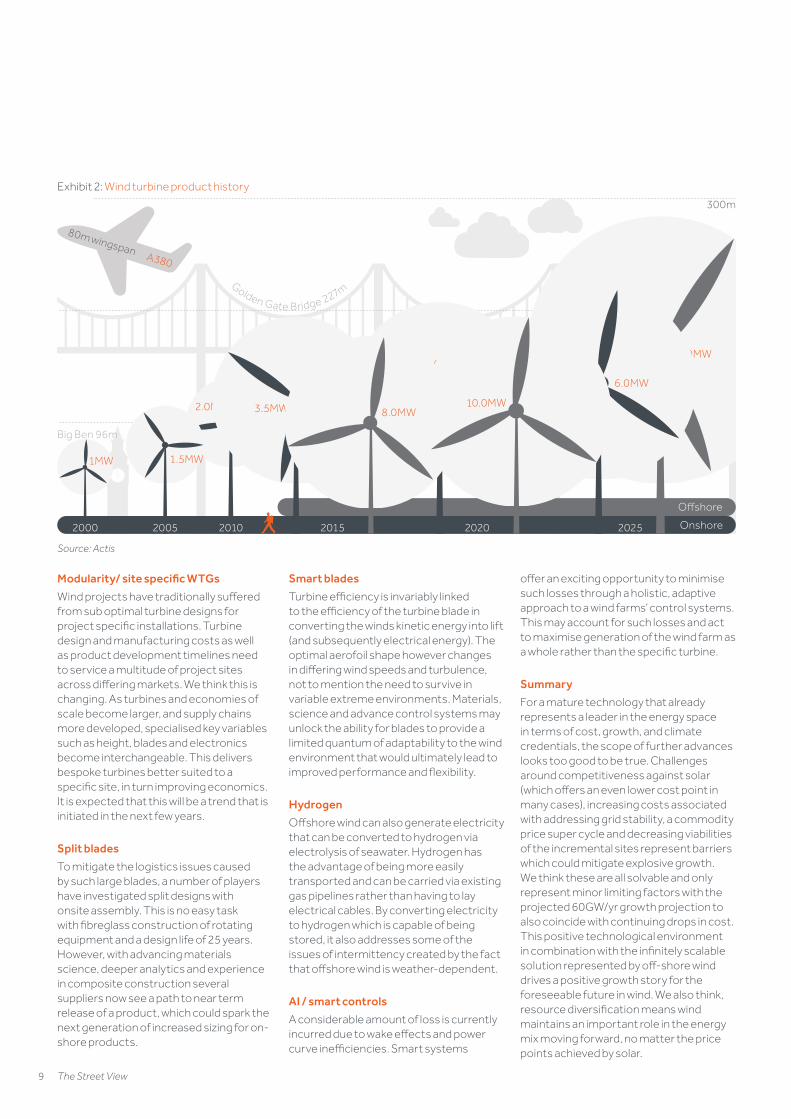
In 2002, as Actis was being formed, wind turbine units being installed were 850kW Vestas units with a 52m rotor diameter. Today in Brazil, we are installing Vestas 4.2MW turbines with a 150m rotor diameter. That equates to a 5-fold larger generator size and an 8–fold increase in the swept area of the turbine rotor.
Many thought that wind turbines would ultimately be limited by material mechanics and the logistics of transporting components. The industry has once again broken down these barriers and shows no signs of stopping anytime soon. At Actis, we do not simply rely on the turbine manufacturers to deliver best practice. We have developed our own AI tools to predict gearbox failure and are using robots and drones to identify blade quality issues. This use of technology not only improves downtime but also leads to a much safer working environment. Previously technicians would abseil down a blade checking for issues and now the technician is safely on the ground controlling a drone which has a high definition camera.
We also invest in efficient gas-fired power generation. We believe in the value this brings particularly where an emerging economy has indigenous gas, using gas as a transition fuel to a cleaner future. Even in gas-fired plants, we are looking for ways to improve performance and we detail how we implement upgrades to our gas turbines, allowing us to generate more MWs from existing power plants.
Watch this podcast
ac-0173-103028-Macro Forum Mar 2021.indd 6ac-0173-103028-Macro Forum Mar 2021.indd 6 04/03/2021 19:1804/03/2021 19:18

7 The Street View
Hydrogen is the simplest and most common element in the universe, so the possibilities are not limited by supply of hydrogen. Rather it is the technical constraints that present challenges. The role of the energy industry’s engineers and scientists is to find a way past these constraints.
Philippe Wind and Preyavart Gadhavi examine the changing nature of electricity grids. The potential we have to rethink how we transmit, store and trade electricity is probably the most difficult aspect of predicting the future of electricity networks. The centralised generation model with a hub and spoke system is being redrawn; in many developing markets, it is being drawn for the first time without the constraints of any existing model. However, the changing nature of our relationship with electricity is a huge factor in this. The vehicles that we will
drive, the green energy we desire and the reliability of supply that we simply demand are all in flux. Consumers expect that electricity grids will be there to answer all these questions – and we intend to play a part in this.
In our view, the greenest energy of all is that which we do not need to produce in the first place. When we think of electricity transmission and distribution grids, we want to see how we can make them more efficient and reduce losses. Every extra kilowatt in loss reduction means one less kilowatt has to be generated and this is something that is often overlooked. At Actis, we invest in both generation and high growth electricity distribution companies so we are well positioned to understand and deliver in this area.
Hernan Arrigone’s article examines the potential for hydrogen to play an increasing role in the energy mix. Hydrogen is the simplest and most common element in the universe, so the possibilities are not limited by supply of hydrogen. Rather it is the technical constraints that present challenges. The role of the energy industry’s engineers and scientists is to find a way past these constraints. Our industry has done it before with every technological challenge that we have faced, and we believe that hydrogen will be no different.
There are some today who will claim that the economic cost of utilising hydrogen is simply too high. We have heard this argument before in relation to wind powered generation and then with solar PV. Our industry has demonstrated repeatedly that we can overcome technology barriers to deliver the lowest cost power. If we cannot deliver low cost power then we as an industry cannot survive.
Thomas Edison said it best when he stated, “We will make electricity so cheap that only the rich will burn candles”. We too want to ensure that electricity is accessible to everyone in a clean, reliable and cost effective way. The candles should be used for ambience only.
It has been one
hundred years since Albert Einstein was awarded the Nobel Prize in Physics for his discovery of the photoelectric effect – which led to the invention of solar panels
10 years ago a 230-watt solar panel cost $230.
TodayThe same size PV panel today can generate 450 watts and costs $90
In 2002wind turbine units were 850kw with a 52m rotor diameter.
Todaywe are installing 4.2MW turbines with a 150m rotor diameter. A 5-fold larger generator size and an 8–fold increase in the swept area of the turbine rotor.
Solar PV penetration will account for 30% of global generation by 2050
By 2030 two thirds of the world’s population will live in cities and there will be a 10–fold increase in the deployment of renewables.
ac-0173-103028-Macro Forum Mar 2021.indd 7ac-0173-103028-Macro Forum Mar 2021.indd 7 04/03/2021 19:1804/03/2021 19:18
8 The Street View
The new generationMoving with the windLiam SmithEnergy Infrastructure, London
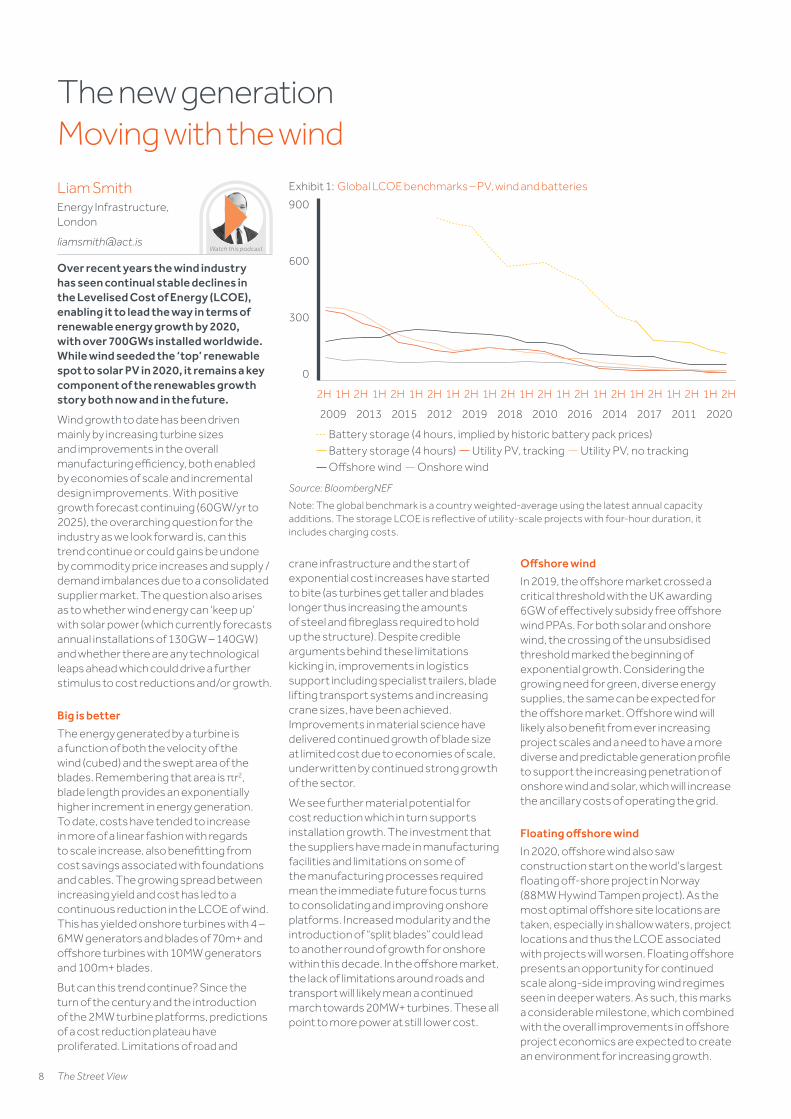
Over recent years the wind industry has seen continual stable declines in the Levelised Cost of Energy (LCOE), enabling it to lead the way in terms of renewable energy growth by 2020, with over 700GWs installed worldwide. While wind seeded the ‘top’ renewable spot to solar PV in 2020, it remains a key component of the renewables growth story both now and in the future.
Wind growth to date has been driven mainly by increasing turbine sizes and improvements in the overall manufacturing efficiency, both enabled by economies of scale and incremental design improvements. With positive growth forecast continuing (60GW/yr to 2025), the overarching question for the industry as we look forward is, can this trend continue or could gains be undone by commodity price increases and supply / demand imbalances due to a consolidated supplier market. The question also arises as to whether wind energy can ‘keep up’ with solar power (which currently forecasts annual installations of 130GW – 140GW) and whether there are any technological leaps ahead which could drive a further stimulus to cost reductions and/or growth.
Big is better
The energy generated by a turbine is a function of both the velocity of the wind (cubed) and the swept area of the blades. Remembering that area is πr2, blade length provides an exponentially higher increment in energy generation. To date, costs have tended to increase in more of a linear fashion with regards to scale increase, also benefitting from cost savings associated with foundations and cables. The growing spread between increasing yield and cost has led to a continuous reduction in the LCOE of wind. This has yielded onshore turbines with 4 – 6MW generators and blades of 70m+ and offshore turbines with 10MW generators and 100m+ blades.
But can this trend continue? Since the turn of the century and the introduction of the 2MW turbine platforms, predictions of a cost reduction plateau have proliferated. Limitations of road and
crane infrastructure and the start of exponential cost increases have started to bite (as turbines get taller and blades longer thus increasing the amounts of steel and fibreglass required to hold up the structure). Despite credible arguments behind these limitations kicking in, improvements in logistics support including specialist trailers, blade lifting transport systems and increasing crane sizes, have been achieved. Improvements in material science have delivered continued growth of blade size at limited cost due to economies of scale, underwritten by continued strong growth of the sector.
We see further material potential for cost reduction which in turn supports installation growth. The investment that the suppliers have made in manufacturing facilities and limitations on some of the manufacturing processes required mean the immediate future focus turns to consolidating and improving onshore platforms. Increased modularity and the introduction of “split blades” could lead to another round of growth for onshore within this decade. In the offshore market, the lack of limitations around roads and transport will likely mean a continued march towards 20MW+ turbines. These all point to more power at still lower cost.
Offshore wind
In 2019, the offshore market crossed a critical threshold with the UK awarding 6GW of effectively subsidy free offshore wind PPAs. For both solar and onshore wind, the crossing of the unsubsidised threshold marked the beginning of exponential growth. Considering the growing need for green, diverse energy supplies, the same can be expected for the offshore market. Offshore wind will likely also benefit from ever increasing project scales and a need to have a more diverse and predictable generation profile to support the increasing penetration of onshore wind and solar, which will increase the ancillary costs of operating the grid.
Floating offshore wind
In 2020, offshore wind also saw construction start on the world’s largest floating off-shore project in Norway (88MW Hywind Tampen project). As the most optimal offshore site locations are taken, especially in shallow waters, project locations and thus the LCOE associated with projects will worsen. Floating offshore presents an opportunity for continued scale along-side improving wind regimes seen in deeper waters. As such, this marks a considerable milestone, which combined with the overall improvements in offshore project economics are expected to create an environment for increasing growth.
Exhibit 1: Global LCOE benchmarks – PV, wind and batteries
0
300
600
900
Battery storage (4 hours, implied by historic battery pack prices)Battery storage (4 hours) Utility PV, tracking Utility PV, no trackingOffshore wind Onshore wind
2H1H2H1H2H1H2H1H2H1H2H1H2H1H2H1H2H1H2H1H2H1H2H
2009 2010 201120122013 20142015 2016 201720182019 2020
Source: BloombergNEF
Note: The global benchmark is a country weighted-average using the latest annual capacity additions. The storage LCOE is reflective of utility-scale projects with four-hour duration, it includes charging costs.
Watch this podcast
Exhibit 2: Wind turbine product history
Golden Gate Bridge 227m
Big Ben 96m
300m
200m
100m
15.0MW5.0MW
2.0MW
1.5MW
3.5MW 8.0MW
1MW
6.0MW
10.0MW
20102005 20152000 2020 2025
Offshore
A380
80m wingspan
Source: Actis
ac-0173-103028-Macro Forum Mar 2021.indd 8ac-0173-103028-Macro Forum Mar 2021.indd 8 04/03/2021 19:1804/03/2021 19:18
9 The Street View
Offshore wind
In 2019, the offshore market crossed a critical threshold with the UK awarding 6GW of effectively subsidy free offshore wind PPAs. For both solar and onshore wind, the crossing of the unsubsidised threshold marked the beginning of exponential growth. Considering the growing need for green, diverse energy supplies, the same can be expected for the offshore market. Offshore wind will likely also benefit from ever increasing project scales and a need to have a more diverse and predictable generation profile to support the increasing penetration of onshore wind and solar, which will increase the ancillary costs of operating the grid.
Floating offshore wind
In 2020, offshore wind also saw construction start on the world’s largest floating off-shore project in Norway (88MW Hywind Tampen project). As the most optimal offshore site locations are taken, especially in shallow waters, project locations and thus the LCOE associated with projects will worsen. Floating offshore presents an opportunity for continued scale along-side improving wind regimes seen in deeper waters. As such, this marks a considerable milestone, which combined with the overall improvements in offshore project economics are expected to create an environment for increasing growth.
Exhibit 2: Wind turbine product history
Golden Gate Bridge 227m
Big Ben 96m
300m
200m
100m
15.0MW5.0MW
2.0MW
1.5MW
3.5MW 8.0MW
1MW
6.0MW
10.0MW
20102005 20152000 2020 2025
Offshore
A380
80m wingspan
Source: Actis
Modularity/ site specific WTGs
Wind projects have traditionally suffered from sub optimal turbine designs for project specific installations. Turbine design and manufacturing costs as well as product development timelines need to service a multitude of project sites across differing markets. We think this is changing. As turbines and economies of scale become larger, and supply chains more developed, specialised key variables such as height, blades and electronics become interchangeable. This delivers bespoke turbines better suited to a specific site, in turn improving economics. It is expected that this will be a trend that is initiated in the next few years.
Split blades
To mitigate the logistics issues caused by such large blades, a number of players have investigated split designs with onsite assembly. This is no easy task with fibreglass construction of rotating equipment and a design life of 25 years. However, with advancing materials science, deeper analytics and experience in composite construction several suppliers now see a path to near term release of a product, which could spark the next generation of increased sizing for on-shore products.
Smart blades
Turbine efficiency is invariably linked to the efficiency of the turbine blade in converting the winds kinetic energy into lift (and subsequently electrical energy). The optimal aerofoil shape however changes in differing wind speeds and turbulence, not to mention the need to survive in variable extreme environments. Materials, science and advance control systems may unlock the ability for blades to provide a limited quantum of adaptability to the wind environment that would ultimately lead to improved performance and flexibility.
Hydrogen
Offshore wind can also generate electricity that can be converted to hydrogen via electrolysis of seawater. Hydrogen has the advantage of being more easily transported and can be carried via existing gas pipelines rather than having to lay electrical cables. By converting electricity to hydrogen which is capable of being stored, it also addresses some of the issues of intermittency created by the fact that offshore wind is weather-dependent.
AI / smart controls
A considerable amount of loss is currently incurred due to wake effects and power curve inefficiencies. Smart systems
offer an exciting opportunity to minimise such losses through a holistic, adaptive approach to a wind farms’ control systems. This may account for such losses and act to maximise generation of the wind farm as a whole rather than the specific turbine.
Summary
For a mature technology that already represents a leader in the energy space in terms of cost, growth, and climate credentials, the scope of further advances looks too good to be true. Challenges around competitiveness against solar (which offers an even lower cost point in many cases), increasing costs associated with addressing grid stability, a commodity price super cycle and decreasing viabilities of the incremental sites represent barriers which could mitigate explosive growth. We think these are all solvable and only represent minor limiting factors with the projected 60GW/yr growth projection to also coincide with continuing drops in cost. This positive technological environment in combination with the infinitely scalable solution represented by off-shore wind drives a positive growth story for the foreseeable future in wind. We also think, resource diversification means wind maintains an important role in the energy mix moving forward, no matter the price points achieved by solar.
ac-0173-103028-Macro Forum Mar 2021.indd 9ac-0173-103028-Macro Forum Mar 2021.indd 9 04/03/2021 19:1804/03/2021 19:18
10 The Street View
Wind Energy Yield Risk: Liam Smith in conversation with Stefanie Bourne
Stefanie Bourne, M.Sc: Business Director, Renewable Energy Project Development
Liam Smith, Energy Infrastructure, Actis, London
A core assumption to any wind investment is ultimately, how much yield will be generated over the life of the asset. To predict this, sophisticated measurement and modelling are used to establish a long-term yield estimate. While impressive, there has been room for both human error and an over reliance on assumptions informed by historical values which are no longer valid in an ever changing technological environment, leading to material underperformance of some assets.
Energy Yield Assessments (EYAs)
An energy yield assessment attempts to assess the future performance of a plant and assigns a probability against achieving differing generation levels over differing periods. This is typically presented as the one year and the ten year P50 and P90 i.e. 50th and 90th percentile of performance over a measurement period.
All EYAs use measurements derived by meteorological masts (’met masts’), that gather data for a period of at least 12 months, but typically around three years. The site specific wind data is adjusted up or down based on correlation to long term meteorological data sets to provide confidence that the measured wind period is representative of longer term norms.
This data is then used to predict the wind speeds associated with the specific wind farm design. Once the wind speeds have been established, the turbine power curve and losses (availability, electrical losses, turbine under-performance etc.) are used to establish how much energy will be generated on a long-term basis.
The track record
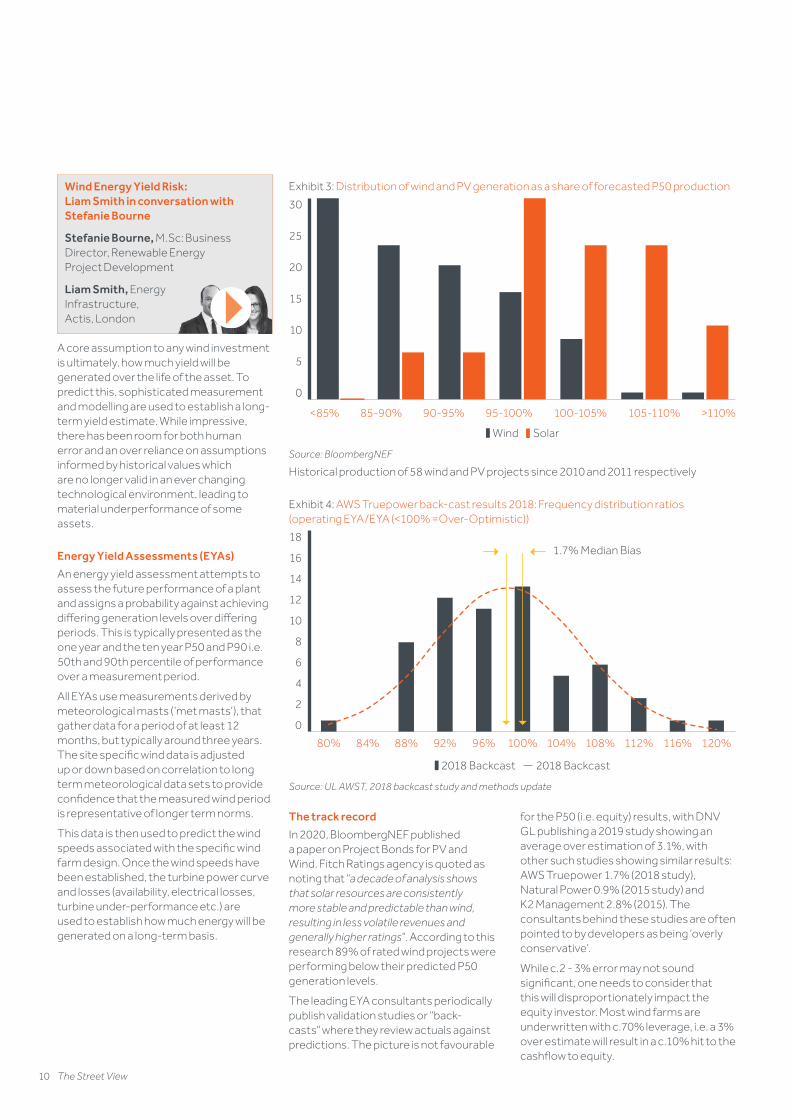
In 2020, BloombergNEF published a paper on Project Bonds for PV and Wind. Fitch Ratings agency is quoted as noting that “a decade of analysis shows that solar resources are consistently more stable and predictable than wind, resulting in less volatile revenues and generally higher ratings”. According to this research 89% of rated wind projects were performing below their predicted P50 generation levels.
The leading EYA consultants periodically publish validation studies or “back-casts” where they review actuals against predictions. The picture is not favourable
for the P50 (i.e. equity) results, with DNV GL publishing a 2019 study showing an average over estimation of 3.1%, with other such studies showing similar results: AWS Truepower 1.7% (2018 study), Natural Power 0.9% (2015 study) and K2 Management 2.8% (2015). The consultants behind these studies are often pointed to by developers as being ‘overly conservative’.
While c.2 - 3% error may not sound significant, one needs to consider that this will disproportionately impact the equity investor. Most wind farms are underwritten with c.70% leverage, i.e. a 3% over estimate will result in a c.10% hit to the cashflow to equity.
Exhibit 3: Distribution of wind and PV generation as a share of forecasted P50 production
0
5
10
15
20
25
30
>110%105-110%100-105%95-100%90-95%85-90%<85%
Wind Solar
Source: BloombergNEF
Historical production of 58 wind and PV projects since 2010 and 2011 respectively
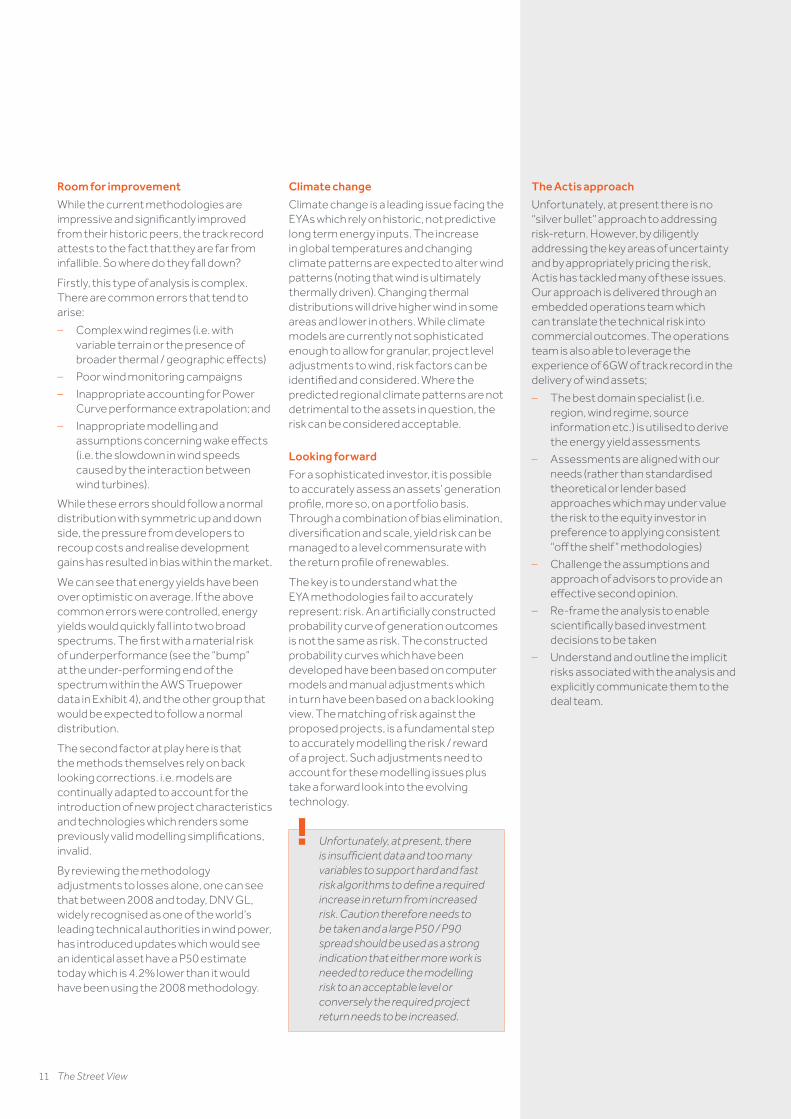
Exhibit 4: AWS Truepower back-cast results 2018: Frequency distribution ratios (operating EYA/EYA (<100% =Over-Optimistic))
2018 Backcast 2018 Backcast
0
2
4
6
8
10
12
14
16
18
80% 84% 88% 92% 96% 100% 104% 108% 112% 116% 120%
1.7% Median Bias
Source: UL AWST, 2018 backcast study and methods update
ac-0173-103028-Macro Forum Mar 2021.indd 10ac-0173-103028-Macro Forum Mar 2021.indd 10 04/03/2021 19:1804/03/2021 19:18
11 The Street View
Room for improvement
While the current methodologies are impressive and significantly improved from their historic peers, the track record attests to the fact that they are far from infallible. So where do they fall down?
Firstly, this type of analysis is complex. There are common errors that tend to arise:
– Complex wind regimes (i.e. with variable terrain or the presence of broader thermal / geographic effects)
– Poor wind monitoring campaigns
– Inappropriate accounting for Power Curve performance extrapolation; and
– Inappropriate modelling and assumptions concerning wake effects (i.e. the slowdown in wind speeds caused by the interaction between wind turbines).
While these errors should follow a normal distribution with symmetric up and down side, the pressure from developers to recoup costs and realise development gains has resulted in bias within the market.
We can see that energy yields have been over optimistic on average. If the above common errors were controlled, energy yields would quickly fall into two broad spectrums. The first with a material risk of underperformance (see the “bump” at the under-performing end of the spectrum within the AWS Truepower data in Exhibit 4), and the other group that would be expected to follow a normal distribution.
The second factor at play here is that the methods themselves rely on back looking corrections. i.e. models are continually adapted to account for the introduction of new project characteristics and technologies which renders some previously valid modelling simplifications, invalid.
By reviewing the methodology adjustments to losses alone, one can see that between 2008 and today, DNV GL, widely recognised as one of the world’s leading technical authorities in wind power, has introduced updates which would see an identical asset have a P50 estimate today which is 4.2% lower than it would have been using the 2008 methodology.
Climate change
Climate change is a leading issue facing the EYAs which rely on historic, not predictive long term energy inputs. The increase in global temperatures and changing climate patterns are expected to alter wind patterns (noting that wind is ultimately thermally driven). Changing thermal distributions will drive higher wind in some areas and lower in others. While climate models are currently not sophisticated enough to allow for granular, project level adjustments to wind, risk factors can be identified and considered. Where the predicted regional climate patterns are not detrimental to the assets in question, the risk can be considered acceptable.
Looking forward
For a sophisticated investor, it is possible to accurately assess an assets’ generation profile, more so, on a portfolio basis. Through a combination of bias elimination, diversification and scale, yield risk can be managed to a level commensurate with the return profile of renewables.
The key is to understand what the EYA methodologies fail to accurately represent: risk. An artificially constructed probability curve of generation outcomes is not the same as risk. The constructed probability curves which have been developed have been based on computer models and manual adjustments which in turn have been based on a back looking view. The matching of risk against the proposed projects, is a fundamental step to accurately modelling the risk / reward of a project. Such adjustments need to account for these modelling issues plus take a forward look into the evolving technology.
! Unfortunately, at present, there is insufficient data and too many variables to support hard and fast risk algorithms to define a required increase in return from increased risk. Caution therefore needs to be taken and a large P50 / P90 spread should be used as a strong indication that either more work is needed to reduce the modelling risk to an acceptable level or conversely the required project return needs to be increased.
The Actis approach
Unfortunately, at present there is no “silver bullet” approach to addressing risk-return. However, by diligently addressing the key areas of uncertainty and by appropriately pricing the risk, Actis has tackled many of these issues. Our approach is delivered through an embedded operations team which can translate the technical risk into commercial outcomes. The operations team is also able to leverage the experience of 6GW of track record in the delivery of wind assets;
– The best domain specialist (i.e. region, wind regime, source information etc.) is utilised to derive the energy yield assessments
– Assessments are aligned with our needs (rather than standardised theoretical or lender based approaches which may under value the risk to the equity investor in preference to applying consistent “off the shelf” methodologies)
– Challenge the assumptions and approach of advisors to provide an effective second opinion.
– Re-frame the analysis to enable scientifically based investment decisions to be taken
– Understand and outline the implicit risks associated with the analysis and explicitly communicate them to the deal team.
ac-0173-103028-Macro Forum Mar 2021.indd 11ac-0173-103028-Macro Forum Mar 2021.indd 11 04/03/2021 19:1804/03/2021 19:18

12 The Street View
The new generationSolar technology shining brightLiam SmithEnergy Infrastructure, London
Preyavart GadhaviEnergy Infrastructure, London
Solar PV is the fastest growing renewable energy technology and is expected to grow thirty-fold by 2050, from being just 2.4% of power generation in 2019, to supplying almost one third of global electricity by 20501. The advance of solar PV technology, resulting from cell efficiency, and ultimately the lowering cost of energy, has consistently exceeded expectation. This impressive evolution has been driven by a 90% reduction in price over the last decade.
Lower costs have been the result of:
– Increasing efficiencies across the value chain driven by competition and economies of scale, combined with;
– The continual improvement of the conversion efficiency of silicon based PV solar panels enabled by a multitude of incremental steps available to the industry
Value chain efficiencies
During 2019, an unexpected demand drop in China (which typically accounts for 40 – 50% of global demand), resulted in an over-supplied market and as such, considerable stress across the whole PV market supply chain. This resulted in a significant price drop, to below what was thought of as at-cost pricing at the time. This broke sticky pricing points and spurred the supply chain into furious competition, rapidly eliminating excessive margins and improving efficiencies. These value chain efficiencies continued in 2020 even under the COVID-19 impact, and were successfully adopted by Chinese suppliers as the solar PV production resumed in Q2 2020, with the Solar PV market again witnessing some of its lowest ever cost points. Although demand slowdown during the early COVID-19 period did contribute
1 DNV GL, Energy Transition Outlook 2020 (DNV estimate)2 Clean Energy Review - https://www.cleanenergyreviews.info/blog/most-efficient-solar-panels
to a price reduction, ‘stock-clearance’ was clearly not the only factor at play. The value chain efficiencies are now well embedded.
Despite supply / demand largely rebalancing as at time of writing, these efficiency improvements have been maintained and margins have not recovered to their previous levels. As most of the constituent components are highly mature technologies (commodity production including silicon, glass, aluminium and silver) it is considered unlikely that any step changes in pricing or production efficiencies will materially move the overall cost of production and there is potentially more downside on pricing than upside as the world possibly enters another commodity super cycle. This pattern of lower costs and prices with demand growth making up for margin squeeze will be familiar to technology investors everywhere.
Conversion efficiency of photovoltaic (PV) cells
The real story behind PV costs is the unrelenting march of increasing conversion efficiencies of crystalline silicon based PV panels (i.e. the amount of solar radiation energy hitting the solar panel that is converted into electrical energy). Economists describe this as heuristic pricing-or more simply more bang for the buck. Over the last five years, crystalline silicon PV cells have improved their efficiency from 15% to 20%2.
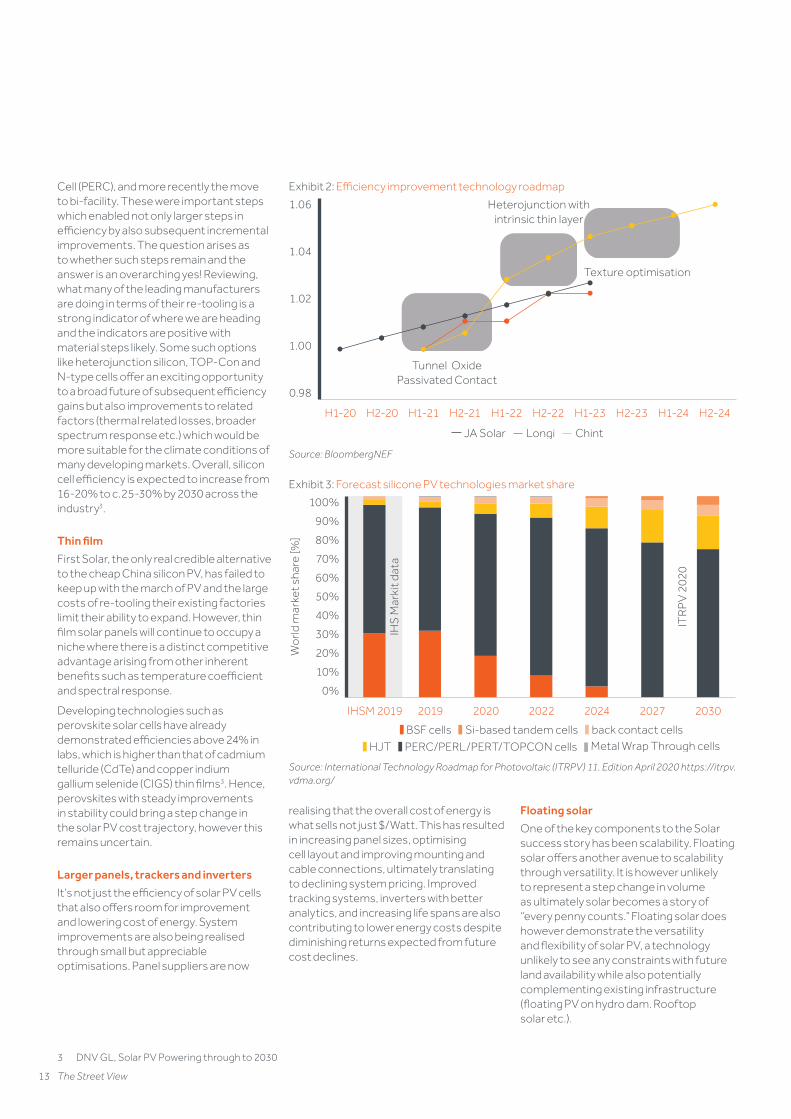
While there are a multitude of technological iterations, it has been the advances in poly and mono silicon PV panels which have driven the technology improvement and price declines leading to rapid growth in deployment of solar PV. R&D, commercialisation, followed by production line retooling, has delivered a classic roadmap of technology take up. While the multitude of technology paths are impossible to predict, the trend is clear and unlike the broader supply chain, the potential for cost reduction remains exponential over the next five to ten years.
A review from the major suppliers’ technology roadmaps (see Exhibit 2) clearly reveals both the trajectory but also the scale of anticipated efficiency improvement which is in turn likely to lead to further cost reductions in what is already the lowest cost of energy available in most of our markets.
Step changes
The breadth of technological change to-date and possibilities moving forward are endless and outside the scope of this article. To avoid swamping the reader with endless technical jargon, we have focused on meaningful trends as it relates to investment, however there are some step changes in technology which facilitate continual growth. To date this has been seen (Jargon warning alert!), with the move from Poly-silicon to mono-silicon, the adoption of Passivate Emitter and Rear
Watch this podcast
Watch this podcast
Exhibit 1: Installed cost of single axis tracking solar PV ($/Wp)
0.0
0.5
1.0
1.5
2.0
2.5
3.0
3.5
‘25‘24‘23‘22‘21‘20‘19‘18‘17‘16‘15‘14‘13‘12‘11‘10
Module Inverter & balance of plantEngineering, procurement & construction Other
Source: BloombergNEF’s Q4 2020 Global PV market outlook (November 2020)
ac-0173-103028-Macro Forum Mar 2021.indd 12ac-0173-103028-Macro Forum Mar 2021.indd 12 04/03/2021 19:1804/03/2021 19:18
13 The Street View
Cell (PERC), and more recently the move to bi-facility. These were important steps which enabled not only larger steps in efficiency by also subsequent incremental improvements. The question arises as to whether such steps remain and the answer is an overarching yes! Reviewing, what many of the leading manufacturers are doing in terms of their re-tooling is a strong indicator of where we are heading and the indicators are positive with material steps likely. Some such options like heterojunction silicon, TOP-Con and N-type cells offer an exciting opportunity to a broad future of subsequent efficiency gains but also improvements to related factors (thermal related losses, broader spectrum response etc.) which would be more suitable for the climate conditions of many developing markets. Overall, silicon cell efficiency is expected to increase from 16-20% to c.25-30% by 2030 across the industry3.
Thin film
First Solar, the only real credible alternative to the cheap China silicon PV, has failed to keep up with the march of PV and the large costs of re-tooling their existing factories limit their ability to expand. However, thin film solar panels will continue to occupy a niche where there is a distinct competitive advantage arising from other inherent benefits such as temperature coefficient and spectral response.
Developing technologies such as perovskite solar cells have already demonstrated efficiencies above 24% in labs, which is higher than that of cadmium telluride (CdTe) and copper indium gallium selenide (CIGS) thin films3. Hence, perovskites with steady improvements in stability could bring a step change in the solar PV cost trajectory, however this remains uncertain.
Larger panels, trackers and inverters
It’s not just the efficiency of solar PV cells that also offers room for improvement and lowering cost of energy. System improvements are also being realised through small but appreciable optimisations. Panel suppliers are now
3 DNV GL, Solar PV Powering through to 2030
realising that the overall cost of energy is what sells not just $/Watt. This has resulted in increasing panel sizes, optimising cell layout and improving mounting and cable connections, ultimately translating to declining system pricing. Improved tracking systems, inverters with better analytics, and increasing life spans are also contributing to lower energy costs despite diminishing returns expected from future cost declines.
Exhibit 2: Efficiency improvement technology roadmap
Longi ChintJA Solar
0.98
1.00
1.02
1.04
1.06
H2-24H1-24H2-23H1-23H2-22H1-22H2-21H1-21H2-20H1-20
Tunnel Oxide Passivated Contact
Heterojunction with intrinsic thin layer
Texture optimisation
Source: BloombergNEF
Exhibit 3: Forecast silicone PV technologies market share
0%
10%
20%
30%
40%
50%
60%
70%
80%
90%
100%
IHSM 2019 2019 2020 2022 2024 2027 2030
Wo
rld m
arke
t sha
re [%
]
BSF cells back contact cellsSi-based tandem cells
PERC/PERL/PERT/TOPCON cellsHJT Metal Wrap Through cells
ITR
PV
202
0
IHS
Mar
kit d
ata
Source: International Technology Roadmap for Photovoltaic (ITRPV) 11. Edition April 2020 https://itrpv.vdma.org/
Floating solar
One of the key components to the Solar success story has been scalability. Floating solar offers another avenue to scalability through versatility. It is however unlikely to represent a step change in volume as ultimately solar becomes a story of “every penny counts.” Floating solar does however demonstrate the versatility and flexibility of solar PV, a technology unlikely to see any constraints with future land availability while also potentially complementing existing infrastructure (floating PV on hydro dam. Rooftop solar etc.).
ac-0173-103028-Macro Forum Mar 2021.indd 13ac-0173-103028-Macro Forum Mar 2021.indd 13 04/03/2021 19:1804/03/2021 19:18
14 The Street View
Summary
Solar PV is expected to continue to have a cost of production logarithmic learning curve of in the range of 15 – 20% moving forward, and as a result continue to gain a larger share in the overall electricity mix. Solar PV capacity additions will roughly equal those of all other power-station types combined by 2050.
Driven by technological advances, solar PV cell efficiency will play a key role. Tandem photovoltaics are targeted as an opportunity to push module efficiency quickly towards 30% which would enhance energy yield and reduce system cost (mounting, trackers etc.). Perovskite tandems have already demonstrated a conversion efficiency of 29%4 and could enable upgrading the efficiency of existing and future silicon technologies (heterojunction silicon, TOP-Con and N-type cells) and leverage the existing infrastructure and supply chain of the crystalline silicon PV industry.4 Physics World - https://physicsworld.
com/a/tandem-solar-cells-break-new-record/
ac-0173-103028-Macro Forum Mar 2021.indd 14ac-0173-103028-Macro Forum Mar 2021.indd 14 04/03/2021 19:1804/03/2021 19:18
15 The Street View
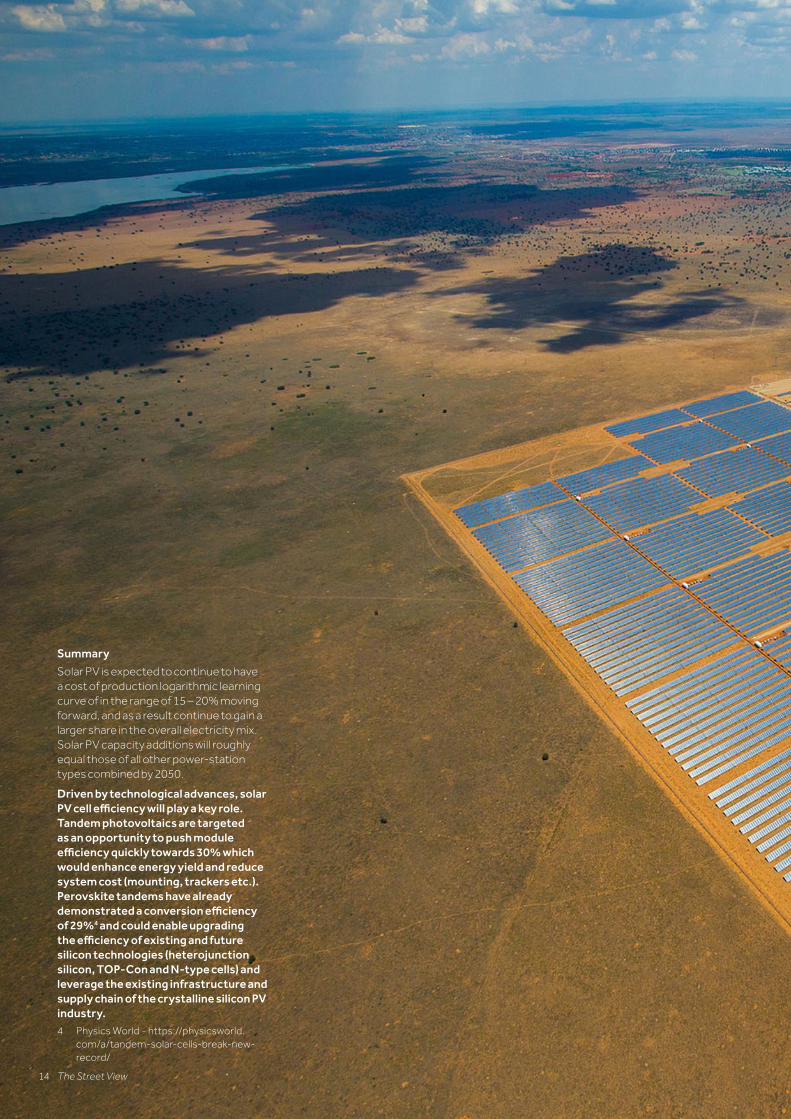
Droogfontein, South Afrcia 50MW PV in Actis Energy 2
ac-0173-103028-Macro Forum Mar 2021.indd 15ac-0173-103028-Macro Forum Mar 2021.indd 15 04/03/2021 19:1804/03/2021 19:18
16 The Street View
The new generationHydrogen delivering sustainable energyHernan ArrigoneEnergy Infrastructure, London
Firstly, why hydrogen?
Society has realised that addressing climate change must be a priority. Rapid decarbonisation and a full-scale transition to a low-carbon future are essential to halt the current direction of travel. As a result, many countries, including China, South Korea, Chile, and the UK have committed to net-zero targets by 2040-2060.
Most of these net-zero plans have energy generation from renewable power as the key driver of decarbonisation. Renewables are low-cost, mature technologies with almost no emissions. Yet, for some sectors this is not enough. For example, transport and power generation need fossil fuels to provide flexibility and allow deeper renewable penetration. Industries including steel, cement, and paper manufacturing need gas as a source of high heat. Chemical processes, such as ammonia and methanol production use natural gas as their main raw material. In most of these cases, electrification is impossible or uneconomic. These are the sectors known as Hard-to-Abate.
Hydrogen offers a solution for the decarbonisation of “hard-to-abate-sectors”
Hydrogen offers a solution for the decarbonisation of these sectors as an alternative to fossil fuels. Examples of hydrogen’s potential include:
– It could become the fuel of seasonal power generation and long-haul trucking, where batteries may not serve well due to capacity and cost constraints;
– Synthetic fuels derived from hydrogen could power aviation and shipping vessels;
– Both heavy industries and district heating could take advantage of hydrogen’s high combustion temperature; and
– Chemical manufacturing and steal production could utilise hydrogen’s reactivity to replace natural gas in their processes.
Hydrogen also offers important benefits. Firstly, it can be produced using renewable power and emits no CO2 when burnt. It could provide energy security to countries that currently rely on foreign oil and boost local economies by creating high-skilled jobs in sectors that will be critical to the future economy. In short, hydrogen could look like the panacea that will solve all the world’s energy problems.
Unfortunately, hydrogen shows a similarly impressive list of disadvantages. Firstly, it is in essence an energy carrier rather than a source, meaning it needs to be derived from water or hydrogen carriers like natural gas, through energy intensive processes. These processes, despite being able to use clean energy like solar or wind, are expensive. For this reason, when comparing the cost of hydrogen to that of fossil fuels, hydrogen is currently at a disadvantage, as fossil fuels demand little to no energy during their extraction.
Hydrogen is also hard to liquefy and transport long distances. Massive energy losses from the liquefaction process make most of its applications unviable. Hydrogen’s small molecular size and high reactivity can also cause issues in its
transportation infrastructure, as hydrogen can diffuse into materials’ molecular structures - for example into iron or steel - causing them to weaken and fail.
An understanding of hydrogen’s advantages and disadvantages helps us explore important considerations around its potential use. Whilst hydrogen’s disadvantages can make the forecast of an extensive hydrogen economy challenging, its advantages could motivate governments and institutions to explore and develop solutions, even if these currently seem remote.
Hydrogen production
When discussing hydrogen, we need to distinguish between four main colours as these inform us of their associated production methods:
– “Grey” or “Brown” hydrogen is produced using natural gas or coal respectively;
– “Blue” hydrogen is produced by cleaning grey or brown hydrogen using carbon capture and storage (“CCS”); and
– “Green” hydrogen is generated by electrolysing water using renewable electricity.
To produce grey and brown hydrogen, fossil fuels are broken down through thermochemical reactions to generate syngas, which is a mixture of CO, CO2, steam, and hydrogen. This gas is then processed, recovering the hydrogen, but leaving behind a considerable amount
Watch this podcast
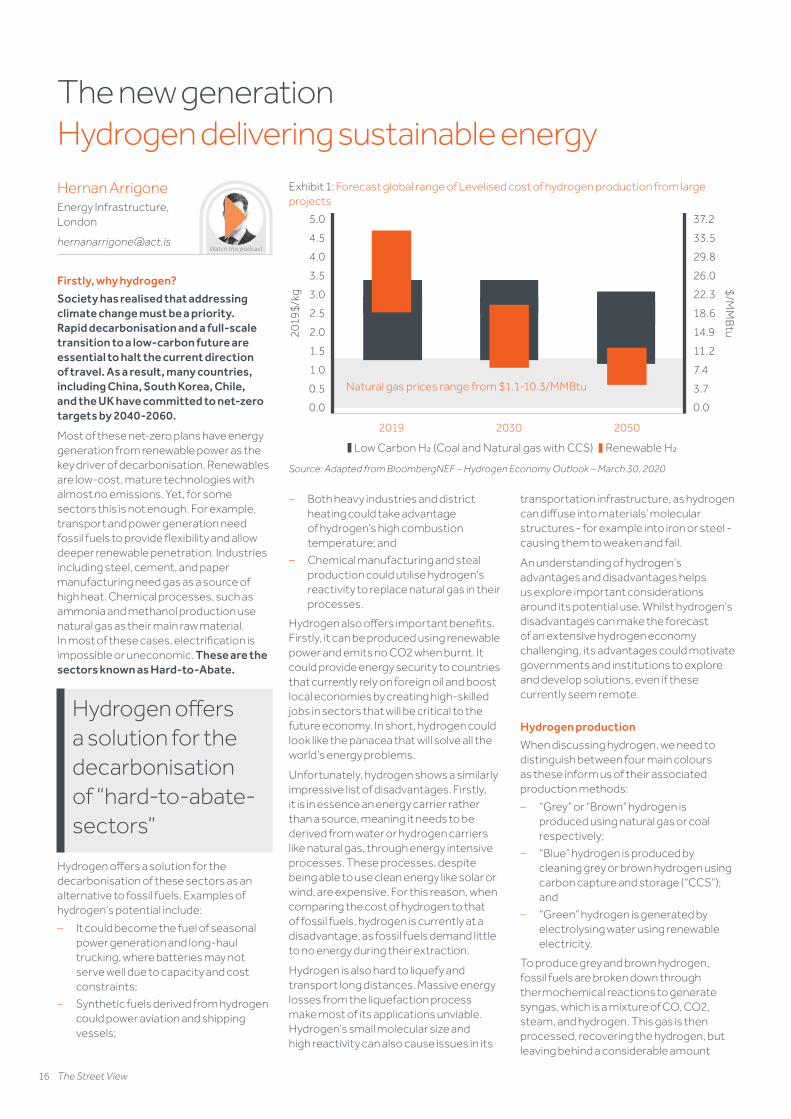
Exhibit 1: Forecast global range of Levelised cost of hydrogen production from large projects
Low Carbon H2 (Coal and Natural gas with CCS) Renewable H2
0.0
3.7
7.4
11.2
14.9
18.6
22.3
26.0
29.8
33.5
37.2
0.0
0.5
1.0
2.0
2.5
3.0
3.5
4.0
4.5
5.0
2019 2030 2050
$/MM
Btu20
19$/
kg
Source: Adapted from BloombergNEF – Hydrogen Economy Outlook – March 30, 2020
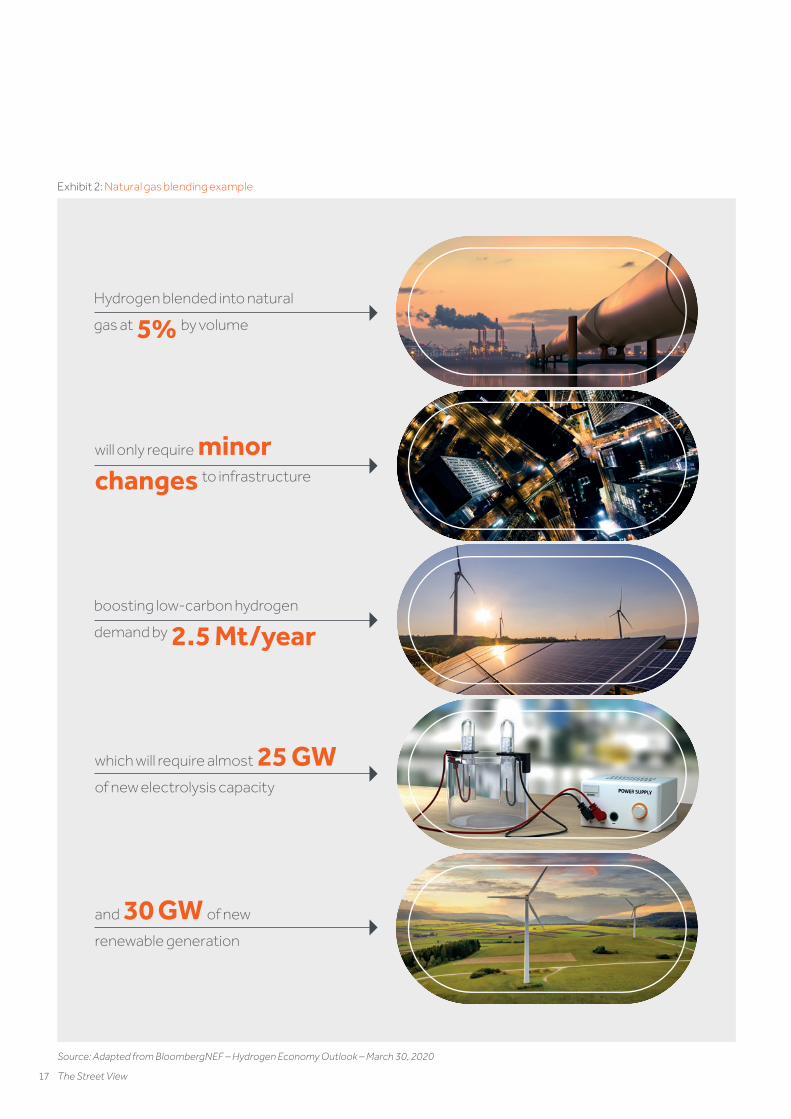
Exhibit 2: Natural gas blending example
Hydrogen blended into natural
gas at 5% by volume
will only require minorchanges to infrastructure
boosting low-carbon hydrogen
demand by 2.5 Mt/year
which will require almost 25 GW of new electrolysis capacity
and 30 GW of new
renewable generation
Source: Adapted from BloombergNEF – Hydrogen Economy Outlook – March 30, 2020
ac-0173-103028-Macro Forum Mar 2021.indd 16ac-0173-103028-Macro Forum Mar 2021.indd 16 04/03/2021 19:1804/03/2021 19:18
17 The Street View
transportation infrastructure, as hydrogen can diffuse into materials’ molecular structures - for example into iron or steel - causing them to weaken and fail.
An understanding of hydrogen’s advantages and disadvantages helps us explore important considerations around its potential use. Whilst hydrogen’s disadvantages can make the forecast of an extensive hydrogen economy challenging, its advantages could motivate governments and institutions to explore and develop solutions, even if these currently seem remote.
Hydrogen production
When discussing hydrogen, we need to distinguish between four main colours as these inform us of their associated production methods:
– “Grey” or “Brown” hydrogen is produced using natural gas or coal respectively;
– “Blue” hydrogen is produced by cleaning grey or brown hydrogen using carbon capture and storage (“CCS”); and
– “Green” hydrogen is generated by electrolysing water using renewable electricity.
To produce grey and brown hydrogen, fossil fuels are broken down through thermochemical reactions to generate syngas, which is a mixture of CO, CO2, steam, and hydrogen. This gas is then processed, recovering the hydrogen, but leaving behind a considerable amount
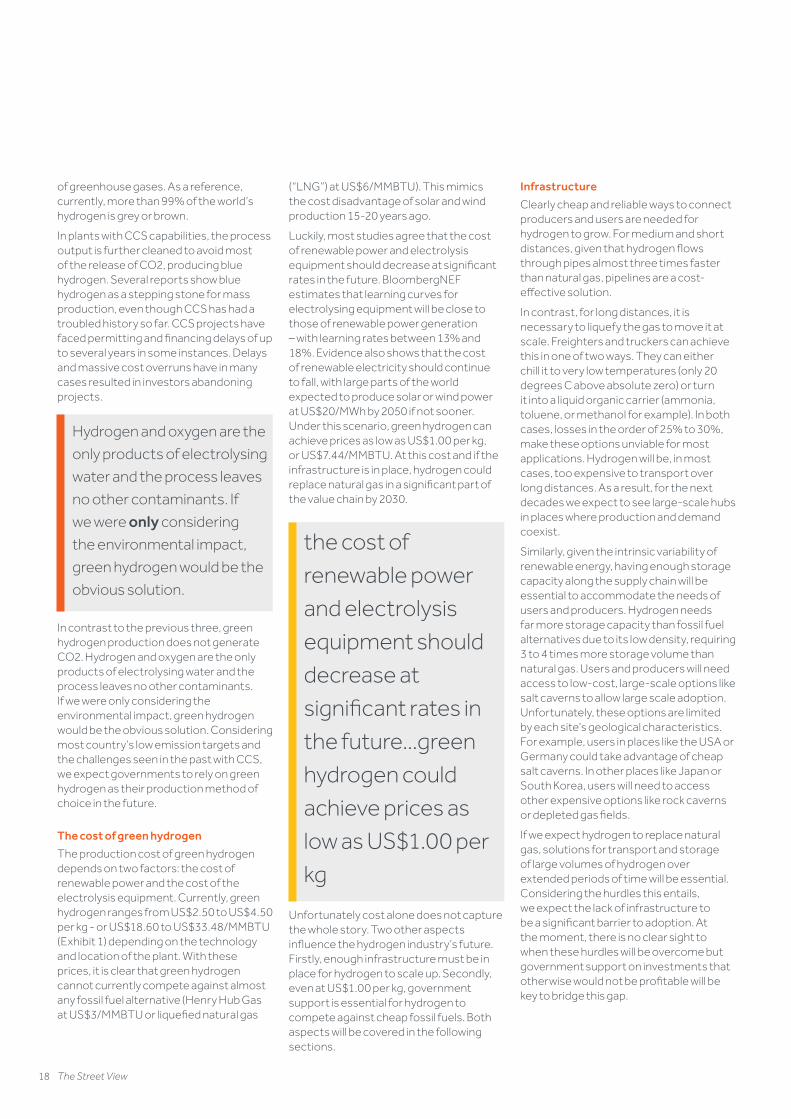
Exhibit 2: Natural gas blending example
Hydrogen blended into natural
gas at 5% by volume
will only require minorchanges to infrastructure
boosting low-carbon hydrogen
demand by 2.5 Mt/year
which will require almost 25 GW of new electrolysis capacity
and 30 GW of new
renewable generation
Source: Adapted from BloombergNEF – Hydrogen Economy Outlook – March 30, 2020
ac-0173-103028-Macro Forum Mar 2021.indd 17ac-0173-103028-Macro Forum Mar 2021.indd 17 04/03/2021 19:1804/03/2021 19:18
18 The Street View
of greenhouse gases. As a reference, currently, more than 99% of the world’s hydrogen is grey or brown.
In plants with CCS capabilities, the process output is further cleaned to avoid most of the release of CO2, producing blue hydrogen. Several reports show blue hydrogen as a stepping stone for mass production, even though CCS has had a troubled history so far. CCS projects have faced permitting and financing delays of up to several years in some instances. Delays and massive cost overruns have in many cases resulted in investors abandoning projects.
Hydrogen and oxygen are the
only products of electrolysing
water and the process leaves
no other contaminants. If
we were only considering
the environmental impact,
green hydrogen would be the
obvious solution.
In contrast to the previous three, green hydrogen production does not generate CO2. Hydrogen and oxygen are the only products of electrolysing water and the process leaves no other contaminants. If we were only considering the environmental impact, green hydrogen would be the obvious solution. Considering most country’s low emission targets and the challenges seen in the past with CCS, we expect governments to rely on green hydrogen as their production method of choice in the future.
The cost of green hydrogen
The production cost of green hydrogen depends on two factors: the cost of renewable power and the cost of the electrolysis equipment. Currently, green hydrogen ranges from US$2.50 to US$4.50 per kg - or US$18.60 to US$33.48/MMBTU (Exhibit 1) depending on the technology and location of the plant. With these prices, it is clear that green hydrogen cannot currently compete against almost any fossil fuel alternative (Henry Hub Gas at US$3/MMBTU or liquefied natural gas
(“LNG”) at US$6/MMBTU). This mimics the cost disadvantage of solar and wind production 15-20 years ago.
Luckily, most studies agree that the cost of renewable power and electrolysis equipment should decrease at significant rates in the future. BloombergNEF estimates that learning curves for electrolysing equipment will be close to those of renewable power generation – with learning rates between 13% and 18%. Evidence also shows that the cost of renewable electricity should continue to fall, with large parts of the world expected to produce solar or wind power at US$20/MWh by 2050 if not sooner. Under this scenario, green hydrogen can achieve prices as low as US$1.00 per kg, or US$7.44/MMBTU. At this cost and if the infrastructure is in place, hydrogen could replace natural gas in a significant part of the value chain by 2030.
the cost of renewable power and electrolysis equipment should decrease at significant rates in the future...green hydrogen could achieve prices as low as US$1.00 per kg
Unfortunately cost alone does not capture the whole story. Two other aspects influence the hydrogen industry’s future. Firstly, enough infrastructure must be in place for hydrogen to scale up. Secondly, even at US$1.00 per kg, government support is essential for hydrogen to compete against cheap fossil fuels. Both aspects will be covered in the following sections.
Infrastructure
Clearly cheap and reliable ways to connect producers and users are needed for hydrogen to grow. For medium and short distances, given that hydrogen flows through pipes almost three times faster than natural gas, pipelines are a cost-effective solution.
In contrast, for long distances, it is necessary to liquefy the gas to move it at scale. Freighters and truckers can achieve this in one of two ways. They can either chill it to very low temperatures (only 20 degrees C above absolute zero) or turn it into a liquid organic carrier (ammonia, toluene, or methanol for example). In both cases, losses in the order of 25% to 30%, make these options unviable for most applications. Hydrogen will be, in most cases, too expensive to transport over long distances. As a result, for the next decades we expect to see large-scale hubs in places where production and demand coexist.
Similarly, given the intrinsic variability of renewable energy, having enough storage capacity along the supply chain will be essential to accommodate the needs of users and producers. Hydrogen needs far more storage capacity than fossil fuel alternatives due to its low density, requiring 3 to 4 times more storage volume than natural gas. Users and producers will need access to low-cost, large-scale options like salt caverns to allow large scale adoption. Unfortunately, these options are limited by each site’s geological characteristics. For example, users in places like the USA or Germany could take advantage of cheap salt caverns. In other places like Japan or South Korea, users will need to access other expensive options like rock caverns or depleted gas fields.
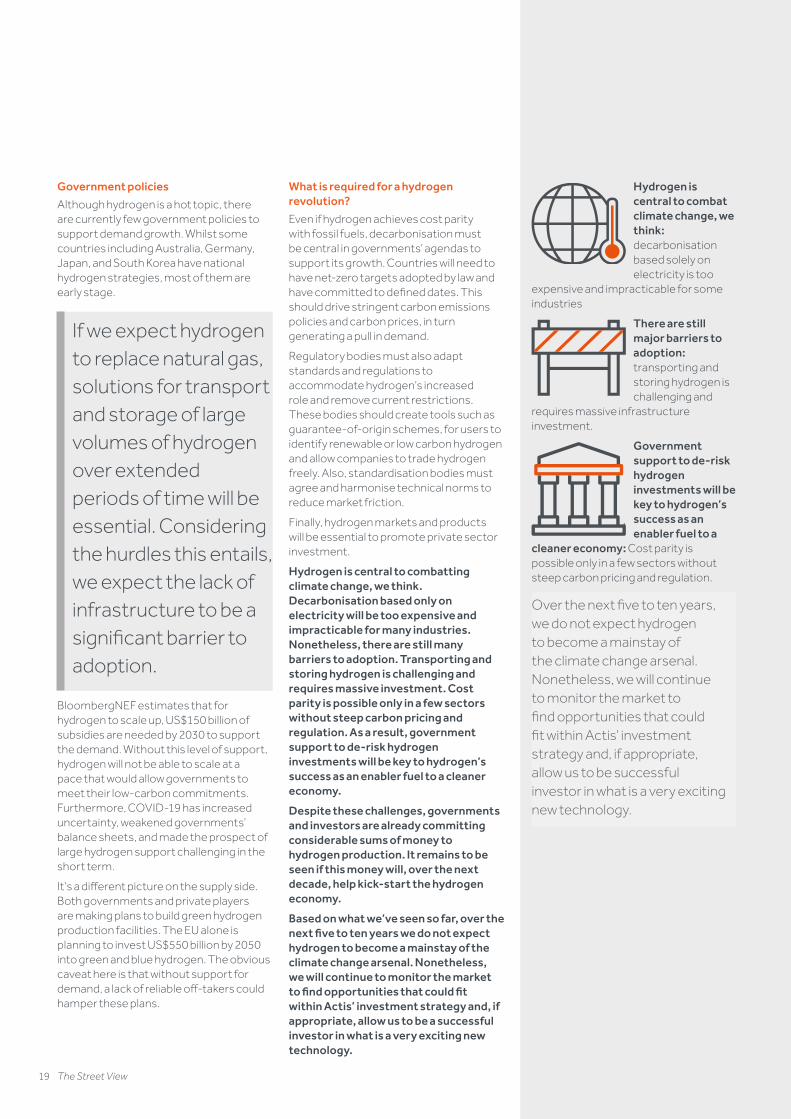
If we expect hydrogen to replace natural gas, solutions for transport and storage of large volumes of hydrogen over extended periods of time will be essential. Considering the hurdles this entails, we expect the lack of infrastructure to be a significant barrier to adoption. At the moment, there is no clear sight to when these hurdles will be overcome but government support on investments that otherwise would not be profitable will be key to bridge this gap.
ac-0173-103028-Macro Forum Mar 2021.indd 18ac-0173-103028-Macro Forum Mar 2021.indd 18 04/03/2021 19:1804/03/2021 19:18
Hydrogen is central to combat climate change, we think: decarbonisation based solely on electricity is too
expensive and impracticable for some industries
There are still major barriers to adoption: transporting and storing hydrogen is challenging and
requires massive infrastructure investment.
Government support to de-risk hydrogen investments will be key to hydrogen’s success as an enabler fuel to a
cleaner economy: Cost parity is possible only in a few sectors without steep carbon pricing and regulation.
Over the next five to ten years, we do not expect hydrogen to become a mainstay of the climate change arsenal. Nonetheless, we will continue to monitor the market to find opportunities that could fit within Actis’ investment strategy and, if appropriate, allow us to be successful investor in what is a very exciting new technology.
19 The Street View
Government policies
Although hydrogen is a hot topic, there are currently few government policies to support demand growth. Whilst some countries including Australia, Germany, Japan, and South Korea have national hydrogen strategies, most of them are early stage.
If we expect hydrogen to replace natural gas, solutions for transport and storage of large volumes of hydrogen over extended periods of time will be essential. Considering the hurdles this entails, we expect the lack of infrastructure to be a significant barrier to adoption.
BloombergNEF estimates that for hydrogen to scale up, US$150 billion of subsidies are needed by 2030 to support the demand. Without this level of support, hydrogen will not be able to scale at a pace that would allow governments to meet their low-carbon commitments. Furthermore, COVID-19 has increased uncertainty, weakened governments’ balance sheets, and made the prospect of large hydrogen support challenging in the short term.
It’s a different picture on the supply side. Both governments and private players are making plans to build green hydrogen production facilities. The EU alone is planning to invest US$550 billion by 2050 into green and blue hydrogen. The obvious caveat here is that without support for demand, a lack of reliable off-takers could hamper these plans.
What is required for a hydrogen revolution?
Even if hydrogen achieves cost parity with fossil fuels, decarbonisation must be central in governments’ agendas to support its growth. Countries will need to have net-zero targets adopted by law and have committed to defined dates. This should drive stringent carbon emissions policies and carbon prices, in turn generating a pull in demand.
Regulatory bodies must also adapt standards and regulations to accommodate hydrogen’s increased role and remove current restrictions. These bodies should create tools such as guarantee-of-origin schemes, for users to identify renewable or low carbon hydrogen and allow companies to trade hydrogen freely. Also, standardisation bodies must agree and harmonise technical norms to reduce market friction.
Finally, hydrogen markets and products will be essential to promote private sector investment.
Hydrogen is central to combatting climate change, we think. Decarbonisation based only on electricity will be too expensive and impracticable for many industries. Nonetheless, there are still many barriers to adoption. Transporting and storing hydrogen is challenging and requires massive investment. Cost parity is possible only in a few sectors without steep carbon pricing and regulation. As a result, government support to de-risk hydrogen investments will be key to hydrogen’s success as an enabler fuel to a cleaner economy.
Despite these challenges, governments and investors are already committing considerable sums of money to hydrogen production. It remains to be seen if this money will, over the next decade, help kick-start the hydrogen economy.
Based on what we’ve seen so far, over the next five to ten years we do not expect hydrogen to become a mainstay of the climate change arsenal. Nonetheless, we will continue to monitor the market to find opportunities that could fit within Actis’ investment strategy and, if appropriate, allow us to be a successful investor in what is a very exciting new technology.
ac-0173-103028-Macro Forum Mar 2021.indd 19ac-0173-103028-Macro Forum Mar 2021.indd 19 04/03/2021 19:1804/03/2021 19:18
20 The Street View
New distribution Grid modernisation: A key enabler for energy transitionPreyavart GadhaviEnergy Infrastructure, Actis, London
Philippe WindEnergy Infrastructure, Actis, Singapore
Wessel BakkerBusiness Director Power Transmission, DNV
Christopher WiigBusiness Director, Digital Grid Operations, Energy Systems, DNV
1 DNV GL Energy Transition Outlook 2020
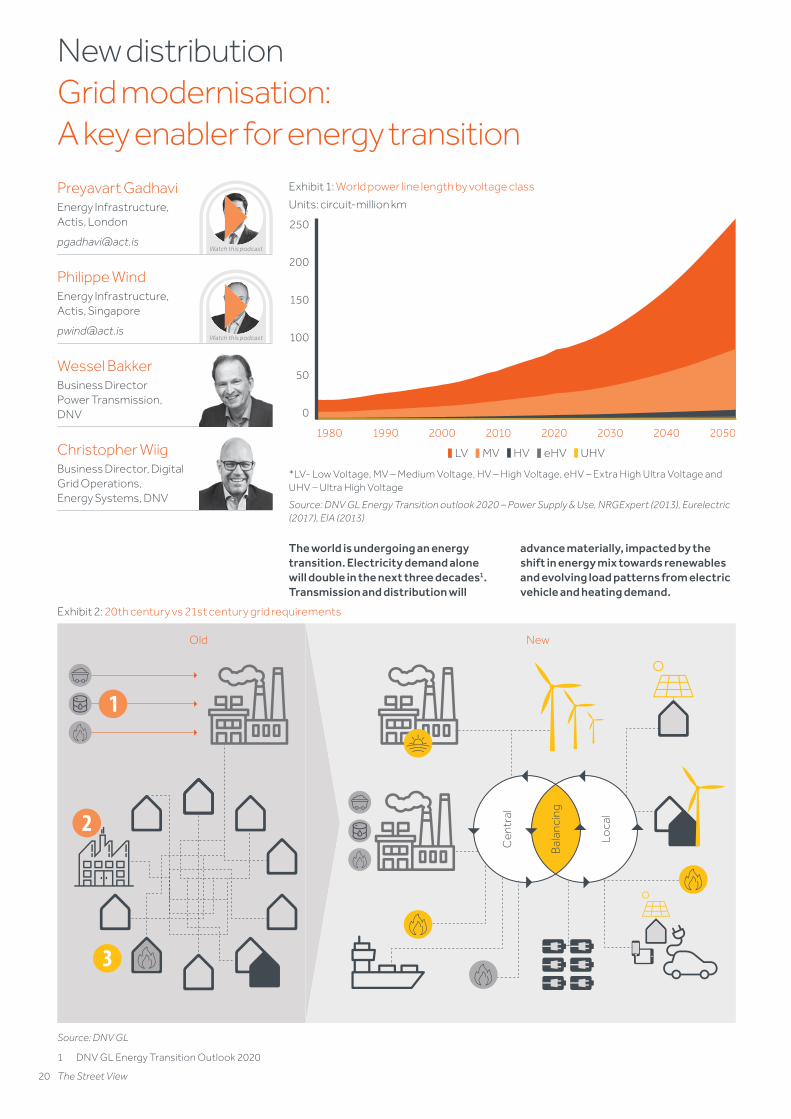
The world is undergoing an energy transition. Electricity demand alone will double in the next three decades1. Transmission and distribution will
advance materially, impacted by the shift in energy mix towards renewables and evolving load patterns from electric vehicle and heating demand.
Exhibit 1: World power line length by voltage class
Units: circuit-million km
HVLV UHVMV eHV
250
200
150
100
50
0
1980 1990 2000 2010 2020 2030 2040 2050
*LV- Low Voltage, MV – Medium Voltage, HV – High Voltage, eHV – Extra High Ultra Voltage and UHV – Ultra High Voltage
Source: DNV GL Energy Transition outlook 2020 – Power Supply & Use, NRGExpert (2013), Eurelectric (2017), EIA (2013)
Exhibit 2: 20th century vs 21st century grid requirements
Old New
Cen
tral
Loca
l
Bal
anci
ng
Source: DNV GL
Exhibit 3: World satellite view of lights at night
Source: Shutterstock
Watch this podcast
Watch this podcast
ac-0173-103028-Macro Forum Mar 2021.indd 20ac-0173-103028-Macro Forum Mar 2021.indd 20 04/03/2021 19:1804/03/2021 19:18

21 The Street View
Preyavart GadhaviEnergy Infrastructure, Actis, London
Philippe WindEnergy Infrastructure, Actis, Singapore
Wessel BakkerBusiness Director Power Transmission, DNV
Christopher WiigBusiness Director, Digital Grid Operations, Energy Systems, DNV
1 DNV GL Energy Transition Outlook 2020
Exhibit 1: World power line length by voltage class
Units: circuit-million km
HVLV UHVMV eHV
250
200
150
100
50
0
1980 1990 2000 2010 2020 2030 2040 2050
*LV- Low Voltage, MV – Medium Voltage, HV – High Voltage, eHV – Extra High Ultra Voltage and UHV – Ultra High Voltage
Source: DNV GL Energy Transition outlook 2020 – Power Supply & Use, NRGExpert (2013), Eurelectric (2017), EIA (2013)
Exhibit 2: 20th century vs 21st century grid requirements
Old New
Cen
tral
Loca
l
Bal
anci
ng
Source: DNV GL
Exhibit 3: World satellite view of lights at night
Source: Shutterstock
Watch this podcast
Watch this podcast
This rapidly evolving energy transition gives developing countries opportunity to create a cleaner and greener energy ecosystem with accessibility for all and self-supported by indigenous renewable resources. Deployment of new technologies, proven concepts and best practices from mature electricity markets will allow developing countries to leapfrog in creating an efficient energy system whilst avoiding costly mistakes. As the energy transition drives the change for power systems, close co-operation between stakeholders, such as governments, utilities, grid operators and investors, is central to the much-needed grid modernisation which ensures energy access for all.
The doubling of electricity demand will be supplied by an almost tenfold increase in renewables’ installed capacity which also needs to be connected to a power grid.
To achieve a combined vision of energy transition, electrification of energy and universal energy access, the transmission and distribution grid (‘T&D’) will need to overcome challenges including:
– Grid stability and the need to maintain stable frequency with variable supply;
– Grid extensions facilitating electrification, power system resilience and security of supply; and
– Grid digitalisation and smart monitoring to improve the level of service, the performance of existing and aging assets, faster reaction time and avoiding brownouts and blackouts.
Increased renewables share in the energy balance has another complication, as renewable power generation comes both from large scale projects like wind or solar farms on transmission lines as well as numerous smaller ones such as residential
PV solar connected on the distribution grids or micro grids that generate and distribute electricity at local level. The old scheme of one main single backbone grid in a ‘star’ configuration is moving towards a central main grid interacting with several local grids and generation units, making grid balancing and management a difficult task.
To manage such dynamic power networks, Actis is seeing an improved focus from grid operators and utilities in the emerging markets to invest in renewables integration, grid modernisation, improved resiliency and reliability, and digital transformation. As physical realisation of grid modernisation can take many years and often lags power generation, all key stakeholders will need to work together much more closely than on the generation side.
ac-0173-103028-Macro Forum Mar 2021.indd 21ac-0173-103028-Macro Forum Mar 2021.indd 21 04/03/2021 19:1804/03/2021 19:18
22 The Street View
Transmission: a panel of technological solutions and best practices
The world power line length and capacity is expected to grow by 2.5x2, with a substantial amount of grid growth in the emerging markets to ensure energy accessibility to the last mile.
Exhibit 1 shows the growth of world’s power line capacity by voltage class.
Although LV and MV lines dominate in terms of the length of lines to be invested in, a strong transmission backbone will also be required to satisfy electricity transport, system balancing needs and trading. As utilities/grid operators in the emerging markets consider transmission grid extension, they can evaluate options aside from straightforward grid extensions listed in Exhibit 4 to meet their key objectives.
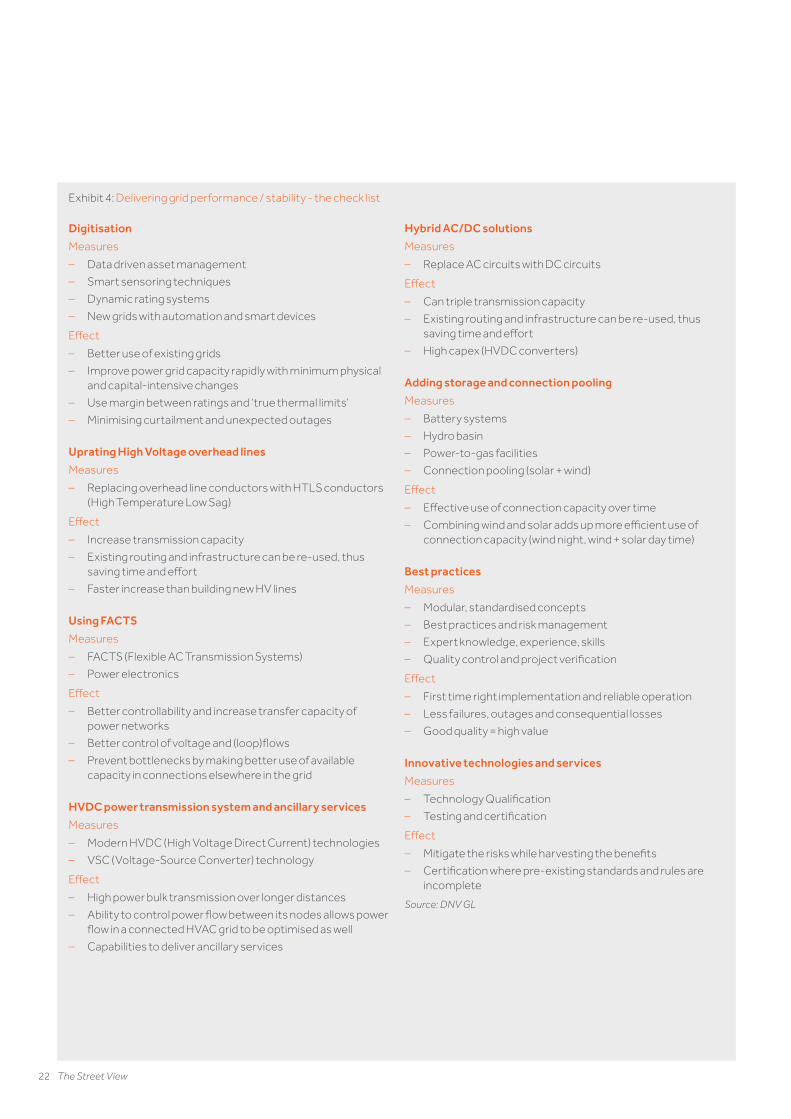
Exhibit 4 provides a list of measures, based on available technologies or best practices, and potential effects, which can be utilised to improve grid performance and/or stability.
Each country’s grid is unique due to their geographical shape, load centres (industries or population) vs. generation centres, topography among several other factors – hence, the evaluation of the most cost-effective solutions (to meet the objective and challenges) will be key.
Increasing renewable grid penetration: matching intermittent generation and fluctuating demand
Variable renewable energy is expected to deliver over 60% of the global power mix in 2050, from wind and solar PV1 raising the question of grids having sufficient stability to meet demand reliably. Unlike fossil fuels that can be cheaply stored for prolonged periods, the supply of, and demand for, electricity over the grid must always be balanced.
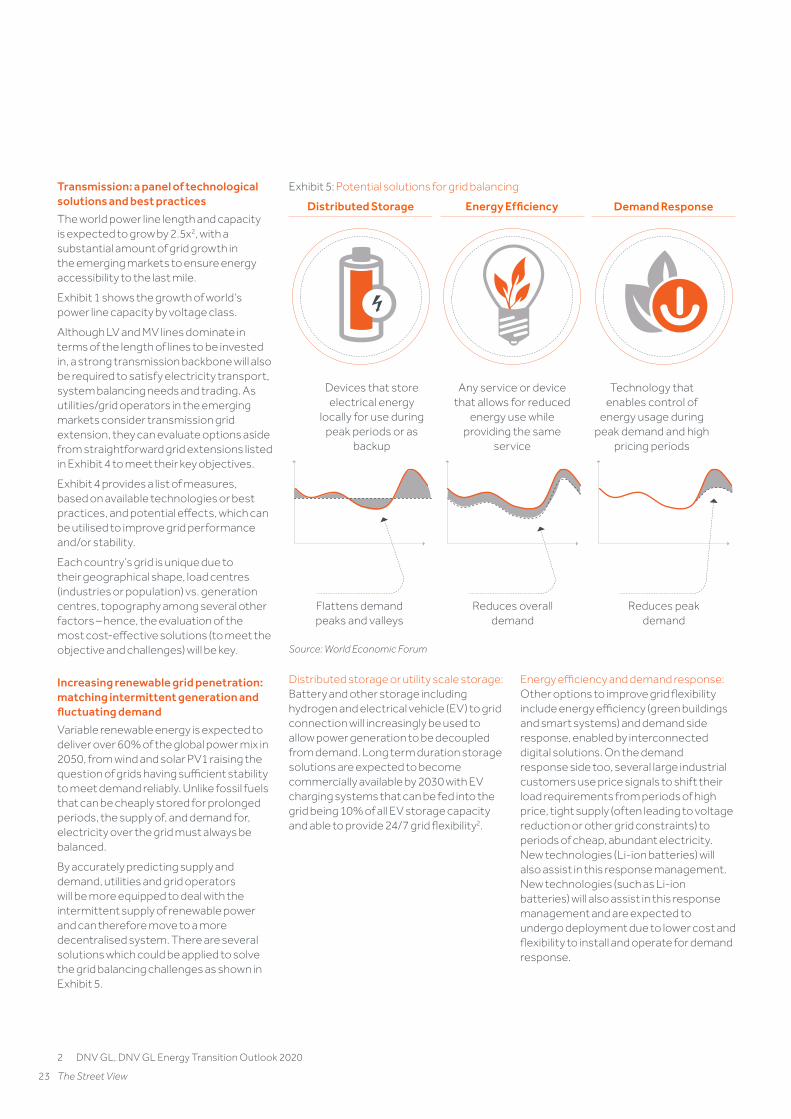
By accurately predicting supply and demand, utilities and grid operators will be more equipped to deal with the intermittent supply of renewable power and can therefore move to a more decentralised system. There are several solutions which could be applied to solve the grid balancing challenges as shown in Exhibit 5.
2 DNV GL, DNV GL Energy Transition Outlook 2020
Exhibit 4: Delivering grid performance / stability - the check list
Digitisation
Measures
– Data driven asset management
– Smart sensoring techniques
– Dynamic rating systems
– New grids with automation and smart devices
Effect
– Better use of existing grids
– Improve power grid capacity rapidly with minimum physical and capital-intensive changes
– Use margin between ratings and ‘true thermal limits’
– Minimising curtailment and unexpected outages
Uprating High Voltage overhead lines
Measures
– Replacing overhead line conductors with HTLS conductors (High Temperature Low Sag)
Effect
– Increase transmission capacity
– Existing routing and infrastructure can be re-used, thus saving time and effort
– Faster increase than building new HV lines
Using FACTS
Measures
– FACTS (Flexible AC Transmission Systems)
– Power electronics
Effect
– Better controllability and increase transfer capacity of power networks
– Better control of voltage and (loop)flows
– Prevent bottlenecks by making better use of available capacity in connections elsewhere in the grid
HVDC power transmission system and ancillary services
Measures
– Modern HVDC (High Voltage Direct Current) technologies
– VSC (Voltage-Source Converter) technology
Effect
– High power bulk transmission over longer distances
– Ability to control power flow between its nodes allows power flow in a connected HVAC grid to be optimised as well
– Capabilities to deliver ancillary services
Hybrid AC/DC solutions
Measures
– Replace AC circuits with DC circuits
Effect
– Can triple transmission capacity
– Existing routing and infrastructure can be re-used, thus saving time and effort
– High capex (HVDC converters)
Adding storage and connection pooling
Measures
– Battery systems
– Hydro basin
– Power-to-gas facilities
– Connection pooling (solar + wind)
Effect
– Effective use of connection capacity over time
– Combining wind and solar adds up more efficient use of connection capacity (wind night, wind + solar day time)
Best practices
Measures
– Modular, standardised concepts
– Best practices and risk management
– Expert knowledge, experience, skills
– Quality control and project verification
Effect
– First time right implementation and reliable operation
– Less failures, outages and consequential losses
– Good quality = high value
Innovative technologies and services
Measures
– Technology Qualification
– Testing and certification
Effect
– Mitigate the risks while harvesting the benefits
– Certification where pre-existing standards and rules are incomplete
Source: DNV GL
Exhibit 5: Potential solutions for grid balancing
Devices that store electrical energy
locally for use during peak periods or as
backup
Any service or device that allows for reduced
energy use while providing the same
service
Technology that enables control of
energy usage during peak demand and high
pricing periods
Reduces peak demand
Flattens demand peaks and valleys
Reduces overall demand
Source: World Economic Forum
ac-0173-103028-Macro Forum Mar 2021.indd 22ac-0173-103028-Macro Forum Mar 2021.indd 22 04/03/2021 19:1804/03/2021 19:18
23 The Street View
Transmission: a panel of technological solutions and best practices
The world power line length and capacity is expected to grow by 2.5x2, with a substantial amount of grid growth in the emerging markets to ensure energy accessibility to the last mile.
Exhibit 1 shows the growth of world’s power line capacity by voltage class.
Although LV and MV lines dominate in terms of the length of lines to be invested in, a strong transmission backbone will also be required to satisfy electricity transport, system balancing needs and trading. As utilities/grid operators in the emerging markets consider transmission grid extension, they can evaluate options aside from straightforward grid extensions listed in Exhibit 4 to meet their key objectives.
Exhibit 4 provides a list of measures, based on available technologies or best practices, and potential effects, which can be utilised to improve grid performance and/or stability.
Each country’s grid is unique due to their geographical shape, load centres (industries or population) vs. generation centres, topography among several other factors – hence, the evaluation of the most cost-effective solutions (to meet the objective and challenges) will be key.
Increasing renewable grid penetration: matching intermittent generation and fluctuating demand
Variable renewable energy is expected to deliver over 60% of the global power mix in 2050, from wind and solar PV1 raising the question of grids having sufficient stability to meet demand reliably. Unlike fossil fuels that can be cheaply stored for prolonged periods, the supply of, and demand for, electricity over the grid must always be balanced.
By accurately predicting supply and demand, utilities and grid operators will be more equipped to deal with the intermittent supply of renewable power and can therefore move to a more decentralised system. There are several solutions which could be applied to solve the grid balancing challenges as shown in Exhibit 5.
2 DNV GL, DNV GL Energy Transition Outlook 2020
Distributed storage or utility scale storage: Battery and other storage including hydrogen and electrical vehicle (EV) to grid connection will increasingly be used to allow power generation to be decoupled from demand. Long term duration storage solutions are expected to become commercially available by 2030 with EV charging systems that can be fed into the grid being 10% of all EV storage capacity and able to provide 24/7 grid flexibility2.
Energy efficiency and demand response: Other options to improve grid flexibility include energy efficiency (green buildings and smart systems) and demand side response, enabled by interconnected digital solutions. On the demand response side too, several large industrial customers use price signals to shift their load requirements from periods of high price, tight supply (often leading to voltage reduction or other grid constraints) to periods of cheap, abundant electricity. New technologies (Li-ion batteries) will also assist in this response management. New technologies (such as Li-ion batteries) will also assist in this response management and are expected to undergo deployment due to lower cost and flexibility to install and operate for demand response.
Exhibit 4: Delivering grid performance / stability - the check list
Digitisation
Measures
– Data driven asset management
– Smart sensoring techniques
– Dynamic rating systems
– New grids with automation and smart devices
Effect
– Better use of existing grids
– Improve power grid capacity rapidly with minimum physical and capital-intensive changes
– Use margin between ratings and ‘true thermal limits’
– Minimising curtailment and unexpected outages
Uprating High Voltage overhead lines
Measures
– Replacing overhead line conductors with HTLS conductors (High Temperature Low Sag)
Effect
– Increase transmission capacity
– Existing routing and infrastructure can be re-used, thus saving time and effort
– Faster increase than building new HV lines
Using FACTS
Measures
– FACTS (Flexible AC Transmission Systems)
– Power electronics
Effect
– Better controllability and increase transfer capacity of power networks
– Better control of voltage and (loop)flows
– Prevent bottlenecks by making better use of available capacity in connections elsewhere in the grid
HVDC power transmission system and ancillary services
Measures
– Modern HVDC (High Voltage Direct Current) technologies
– VSC (Voltage-Source Converter) technology
Effect
– High power bulk transmission over longer distances
– Ability to control power flow between its nodes allows power flow in a connected HVAC grid to be optimised as well
– Capabilities to deliver ancillary services
Hybrid AC/DC solutions
Measures
– Replace AC circuits with DC circuits
Effect
– Can triple transmission capacity
– Existing routing and infrastructure can be re-used, thus saving time and effort
– High capex (HVDC converters)
Adding storage and connection pooling
Measures
– Battery systems
– Hydro basin
– Power-to-gas facilities
– Connection pooling (solar + wind)
Effect
– Effective use of connection capacity over time
– Combining wind and solar adds up more efficient use of connection capacity (wind night, wind + solar day time)
Best practices
Measures
– Modular, standardised concepts
– Best practices and risk management
– Expert knowledge, experience, skills
– Quality control and project verification
Effect
– First time right implementation and reliable operation
– Less failures, outages and consequential losses
– Good quality = high value
Innovative technologies and services
Measures
– Technology Qualification
– Testing and certification
Effect
– Mitigate the risks while harvesting the benefits
– Certification where pre-existing standards and rules are incomplete
Source: DNV GL
Exhibit 5: Potential solutions for grid balancing
Devices that store electrical energy
locally for use during peak periods or as
backup
Any service or device that allows for reduced
energy use while providing the same
service
Technology that enables control of
energy usage during peak demand and high
pricing periods
Reduces peak demand
Flattens demand peaks and valleys
Reduces overall demand
Source: World Economic Forum
ac-0173-103028-Macro Forum Mar 2021.indd 23ac-0173-103028-Macro Forum Mar 2021.indd 23 04/03/2021 19:1804/03/2021 19:18
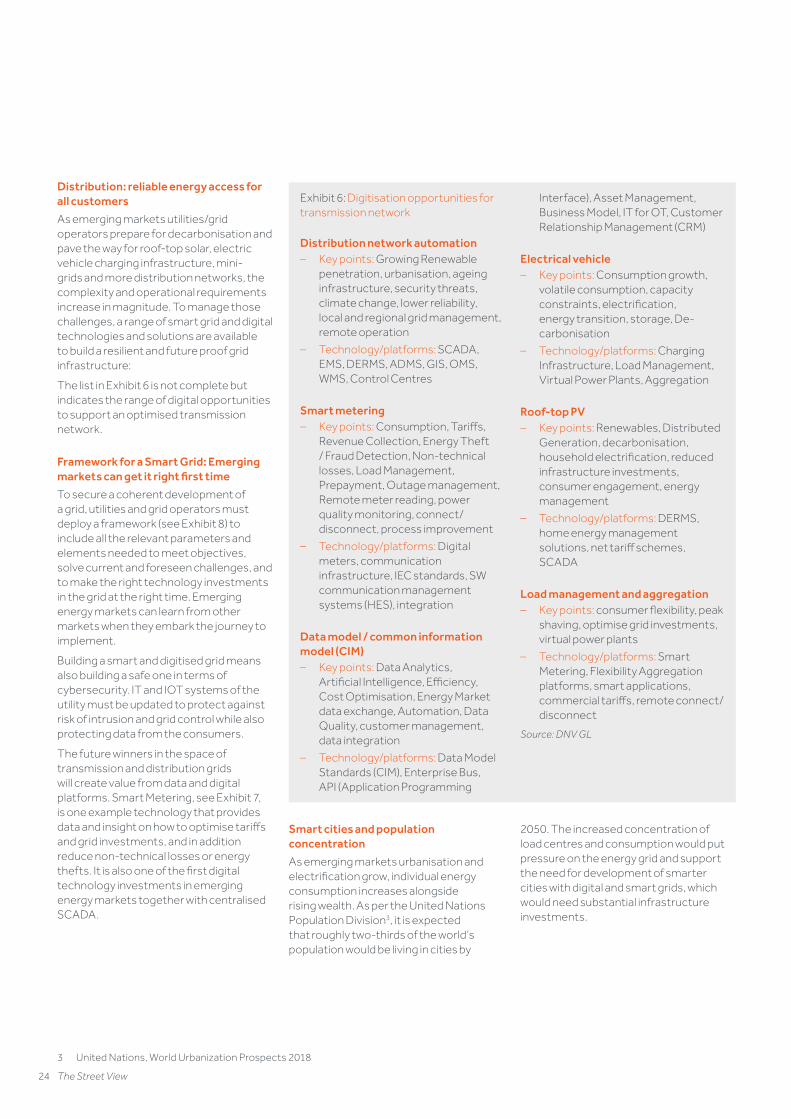
24 The Street View
Distribution: reliable energy access for all customers
As emerging markets utilities/grid operators prepare for decarbonisation and pave the way for roof-top solar, electric vehicle charging infrastructure, mini-grids and more distribution networks, the complexity and operational requirements increase in magnitude. To manage those challenges, a range of smart grid and digital technologies and solutions are available to build a resilient and future proof grid infrastructure:
The list in Exhibit 6 is not complete but indicates the range of digital opportunities to support an optimised transmission network.
Framework for a Smart Grid: Emerging markets can get it right first time
To secure a coherent development of a grid, utilities and grid operators must deploy a framework (see Exhibit 8) to include all the relevant parameters and elements needed to meet objectives, solve current and foreseen challenges, and to make the right technology investments in the grid at the right time. Emerging energy markets can learn from other markets when they embark the journey to implement.
Building a smart and digitised grid means also building a safe one in terms of cybersecurity. IT and IOT systems of the utility must be updated to protect against risk of intrusion and grid control while also protecting data from the consumers.
The future winners in the space of transmission and distribution grids will create value from data and digital platforms. Smart Metering, see Exhibit 7, is one example technology that provides data and insight on how to optimise tariffs and grid investments, and in addition reduce non-technical losses or energy thefts. It is also one of the first digital technology investments in emerging energy markets together with centralised SCADA.
3 United Nations, World Urbanization Prospects 2018
Smart cities and population concentration
As emerging markets urbanisation and electrification grow, individual energy consumption increases alongside rising wealth. As per the United Nations Population Division3, it is expected that roughly two-thirds of the world’s population would be living in cities by
2050. The increased concentration of load centres and consumption would put pressure on the energy grid and support the need for development of smarter cities with digital and smart grids, which would need substantial infrastructure investments.
Exhibit 6: Digitisation opportunities for transmission network
Distribution network automation – Key points: Growing Renewable
penetration, urbanisation, ageing infrastructure, security threats, climate change, lower reliability, local and regional grid management, remote operation
– Technology/platforms: SCADA, EMS, DERMS, ADMS, GIS, OMS, WMS, Control Centres
Smart metering – Key points: Consumption, Tariffs,
Revenue Collection, Energy Theft / Fraud Detection, Non-technical losses, Load Management, Prepayment, Outage management, Remote meter reading, power quality monitoring, connect/disconnect, process improvement
– Technology/platforms: Digital meters, communication infrastructure, IEC standards, SW communication management systems (HES), integration
Data model / common information model (CIM)
– Key points: Data Analytics, Artificial Intelligence, Efficiency, Cost Optimisation, Energy Market data exchange, Automation, Data Quality, customer management, data integration
– Technology/platforms: Data Model Standards (CIM), Enterprise Bus, API (Application Programming
Interface), Asset Management, Business Model, IT for OT, Customer Relationship Management (CRM)
Electrical vehicle – Key points: Consumption growth,
volatile consumption, capacity constraints, electrification, energy transition, storage, De-carbonisation
– Technology/platforms: Charging Infrastructure, Load Management, Virtual Power Plants, Aggregation
Roof-top PV – Key points: Renewables, Distributed
Generation, decarbonisation, household electrification, reduced infrastructure investments, consumer engagement, energy management
– Technology/platforms: DERMS, home energy management solutions, net tariff schemes, SCADA
Load management and aggregation – Key points: consumer flexibility, peak
shaving, optimise grid investments, virtual power plants
– Technology/platforms: Smart Metering, Flexibility Aggregation platforms, smart applications, commercial tariffs, remote connect/disconnect
Source: DNV GL
ac-0173-103028-Macro Forum Mar 2021.indd 24ac-0173-103028-Macro Forum Mar 2021.indd 24 04/03/2021 19:1804/03/2021 19:18

25 The Street View
Grids: a US$20 trillion investment opportunity
Grid investments are primarily driven by greater electricity demand, requirements for new connections for power stations distant from the grid, and the need to reinforce transmission and distribution systems due to expansion of intermittent power generation sources.
As per DNV’s estimate, US$20 trillion will need to be invested over the next 30 years to develop new grids with digital capabilities, from transnational, ultra-high voltage transmission systems to local distribution grids.
Governments and regulators in emerging markets are doing their part by pushing up standards and authorising capex for grid modernisation through the regulatory and policy framework. And the private sector and investors will need to continue playing a key role in proposing feasible and bankable solutions including technical innovations and new business models for realising a smart, reliable and digital grid system to serve future requirements over the next 50 to 100 years.
As an emerging market investor with a track record of investing in, managing and operating national utilities and grids, Actis is well positioned to support the modernisation of grids by identifying the latest technologies and best practices to develop smart grids. For instance, Actis through its investments in Umeme (Uganda), Energuate (Guatemala) and now currently in Eneo (Cameroon) has
undertaken several grid modernising initiatives such as deploying smart meters, installing centralised SCADA (Supervisory Control and Data Acquisition), automating grid substations, and digitalising operations and maintenance processes. Actis’ focus on grid modernisation and digitisation will continue to be a key value driver in future grid investments.
Exhibit 7: Smart Metering integrated into utility Information Systems
Customer
MeterCommunication
InfrastructureHead End
SystemMeter Data
Management
Decision making
CRM Billing ERP WMS GIS DMS SCADA
Source: DNV GL
Exhibit 8: Framework for grid modernisation
External driversCompany
Internal drivers
– Regulation and Compliance are changing
– Societal push for digitalisation
– External cyber threats are more evident
– Consumption patterns are changing
– Renewable energy sources are introduced
– Customers have a stronger voice and expect more
– Pressure to lower cost and increase efficiency
– Digitalisation is requested (and needed) top down
– Challenging to attract new (and required) competences
– Prosumers challenge operations and revenue models
– “Data is the new oil”
Strategic objectives | Smart Grid
Bus
ines
s Work Processes
Capabilities
Tools/IC
T (IT/t
OT
)M
ethodology
Security of supply
Source: DNV GL
ac-0173-103028-Macro Forum Mar 2021.indd 25ac-0173-103028-Macro Forum Mar 2021.indd 25 04/03/2021 19:1804/03/2021 19:18
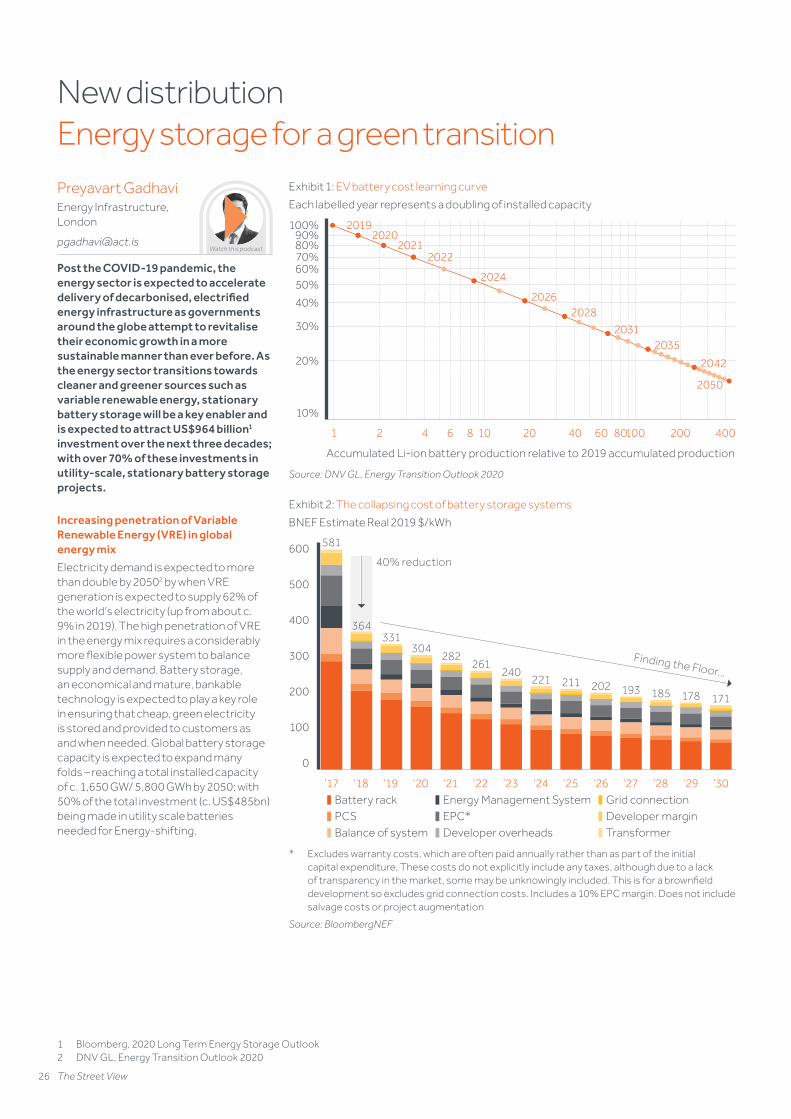
26 The Street View
New distribution Energy storage for a green transitionPreyavart GadhaviEnergy Infrastructure, London
Post the COVID-19 pandemic, the energy sector is expected to accelerate delivery of decarbonised, electrified energy infrastructure as governments around the globe attempt to revitalise their economic growth in a more sustainable manner than ever before. As the energy sector transitions towards cleaner and greener sources such as variable renewable energy, stationary battery storage will be a key enabler and is expected to attract US$964 billion1 investment over the next three decades; with over 70% of these investments in utility-scale, stationary battery storage projects.
Increasing penetration of Variable Renewable Energy (VRE) in global energy mix
Electricity demand is expected to more than double by 20502 by when VRE generation is expected to supply 62% of the world’s electricity (up from about c. 9% in 2019). The high penetration of VRE in the energy mix requires a considerably more flexible power system to balance supply and demand. Battery storage, an economical and mature, bankable technology is expected to play a key role in ensuring that cheap, green electricity is stored and provided to customers as and when needed. Global battery storage capacity is expected to expand many folds – reaching a total installed capacity of c. 1,650 GW/ 5,800 GWh by 2050; with 50% of the total investment (c. US$485bn) being made in utility scale batteries needed for Energy-shifting.
1 Bloomberg, 2020 Long Term Energy Storage Outlook2 DNV GL, Energy Transition Outlook 2020
Watch this podcast
Exhibit 1: EV battery cost learning curve
Each labelled year represents a doubling of installed capacity
100%90%80%70%60%50%
40%
30%
20%
10%
1 2 4 6 8 10 20 40 8060 100 200 400
20192020
20212022
2024
20262028
20312035
2042
2050
Accumulated Li-ion battery production relative to 2019 accumulated production
Source: DNV GL, Energy Transition Outlook 2020
Exhibit 2: The collapsing cost of battery storage systems
BNEF Estimate Real 2019 $/kWh
TransformerDeveloper marginGrid connection
Developer overheadsEPC*Energy Management System
Balance of systemPCSBattery rack
‘30‘29‘28‘27‘26‘25‘24‘23‘22‘21‘20‘19‘18‘17
364331
304282
261240
221 211 202 193 185 178 171
40% reduction
Finding the Floor…
0
100
200
300
400
500
600 581
* Excludes warranty costs, which are often paid annually rather than as part of the initial capital expenditure, These costs do not explicitly include any taxes, although due to a lack of transparency in the market, some may be unknowingly included. This is for a brownfield development so excludes grid connection costs. Includes a 10% EPC margin. Does not include salvage costs or project augmentation
Source: BloombergNEF
ac-0173-103028-Macro Forum Mar 2021.indd 26ac-0173-103028-Macro Forum Mar 2021.indd 26 04/03/2021 19:1804/03/2021 19:18
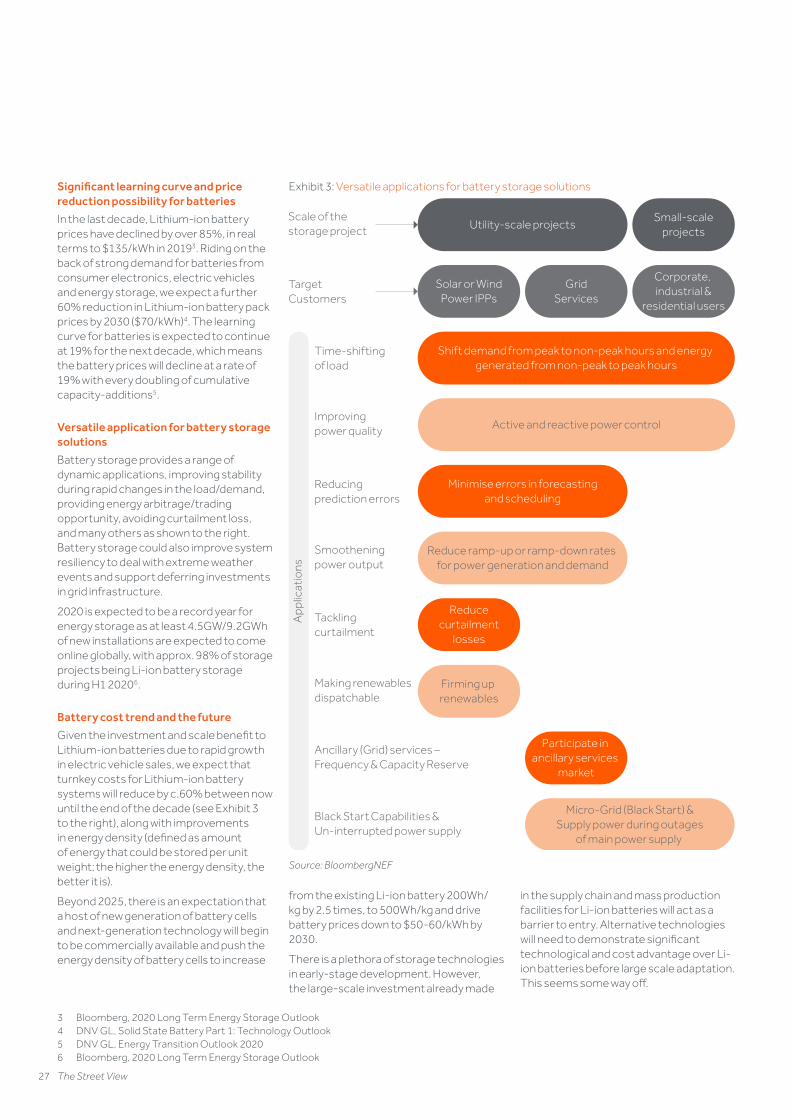
27 The Street View
Significant learning curve and price reduction possibility for batteries
In the last decade, Lithium-ion battery prices have declined by over 85%, in real terms to $135/kWh in 20193. Riding on the back of strong demand for batteries from consumer electronics, electric vehicles and energy storage, we expect a further 60% reduction in Lithium-ion battery pack prices by 2030 ($70/kWh)4. The learning curve for batteries is expected to continue at 19% for the next decade, which means the battery prices will decline at a rate of 19% with every doubling of cumulative capacity-additions5.
Versatile application for battery storage solutions
Battery storage provides a range of dynamic applications, improving stability during rapid changes in the load/demand, providing energy arbitrage/trading opportunity, avoiding curtailment loss, and many others as shown to the right. Battery storage could also improve system resiliency to deal with extreme weather events and support deferring investments in grid infrastructure.
2020 is expected to be a record year for energy storage as at least 4.5GW/9.2GWh of new installations are expected to come online globally, with approx. 98% of storage projects being Li-ion battery storage during H1 20206.
Battery cost trend and the future
Given the investment and scale benefit to Lithium-ion batteries due to rapid growth in electric vehicle sales, we expect that turnkey costs for Lithium-ion battery systems will reduce by c.60% between now until the end of the decade (see Exhibit 3 to the right), along with improvements in energy density (defined as amount of energy that could be stored per unit weight; the higher the energy density, the better it is).
Beyond 2025, there is an expectation that a host of new generation of battery cells and next-generation technology will begin to be commercially available and push the energy density of battery cells to increase
3 Bloomberg, 2020 Long Term Energy Storage Outlook4 DNV GL, Solid State Battery Part 1: Technology Outlook5 DNV GL, Energy Transition Outlook 20206 Bloomberg, 2020 Long Term Energy Storage Outlook
from the existing Li-ion battery 200Wh/kg by 2.5 times, to 500Wh/kg and drive battery prices down to $50-60/kWh by 2030.
There is a plethora of storage technologies in early-stage development. However, the large-scale investment already made
in the supply chain and mass production facilities for Li-ion batteries will act as a barrier to entry. Alternative technologies will need to demonstrate significant technological and cost advantage over Li-ion batteries before large scale adaptation. This seems some way off.
Exhibit 3: Versatile applications for battery storage solutions
App
licat
ions
Improvingpower quality Active and reactive power control
Reducing prediction errors
Minimise errors in forecastingand scheduling
Smootheningpower output
Reduce ramp-up or ramp-down rates for power generation and demand
Tacklingcurtailment
Reducecurtailment
losses
Making renewablesdispatchable
Firming up renewables
Ancillary (Grid) services – Frequency & Capacity Reserve
Participate in ancillary services
market
Black Start Capabilities &Un-interrupted power supply
Micro-Grid (Black Start) &Supply power during outages
of main power supply
Time-shifting of load
Shift demand from peak to non-peak hours and energy generated from non-peak to peak hours
Scale of the storage project Utility-scale projects
Small-scaleprojects
TargetCustomers
Corporate, industrial &
residential users
GridServices
Solar or WindPower IPPs
Source: BloombergNEF
ac-0173-103028-Macro Forum Mar 2021.indd 27ac-0173-103028-Macro Forum Mar 2021.indd 27 04/03/2021 19:1804/03/2021 19:18
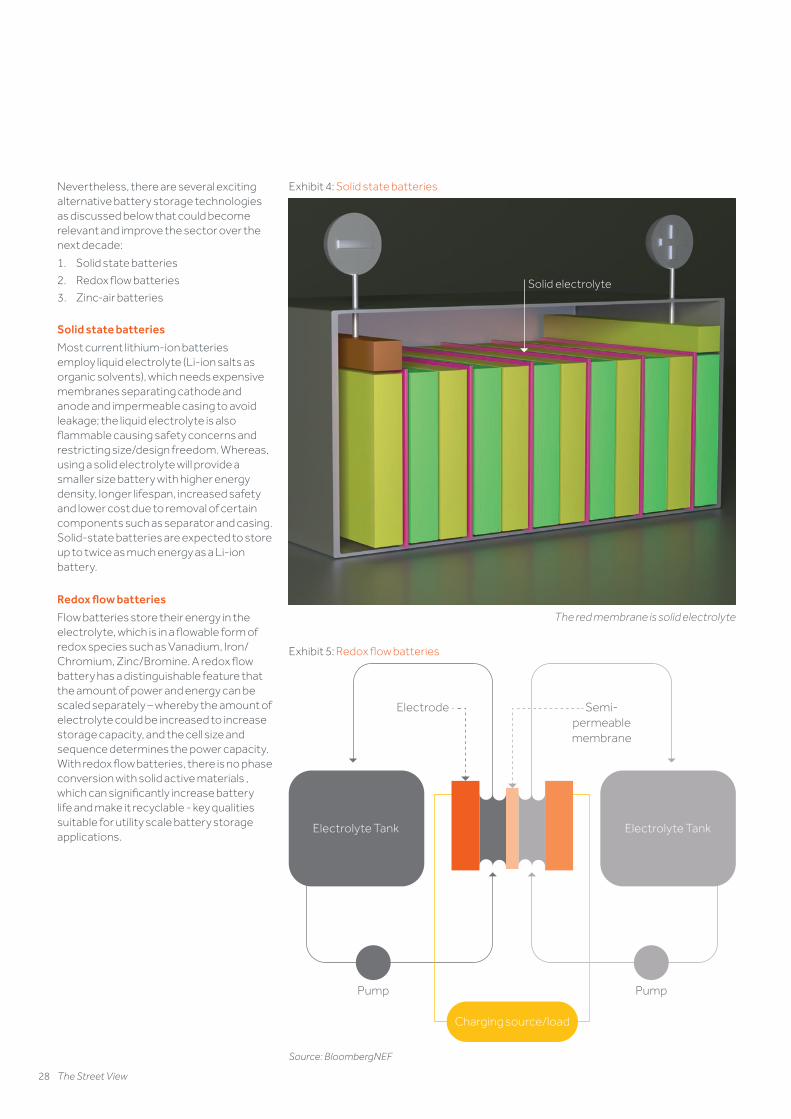
28 The Street View
Nevertheless, there are several exciting alternative battery storage technologies as discussed below that could become relevant and improve the sector over the next decade:
1. Solid state batteries
2. Redox flow batteries
3. Zinc-air batteries
Solid state batteries
Most current lithium-ion batteries employ liquid electrolyte (Li-ion salts as organic solvents), which needs expensive membranes separating cathode and anode and impermeable casing to avoid leakage; the liquid electrolyte is also flammable causing safety concerns and restricting size/design freedom. Whereas, using a solid electrolyte will provide a smaller size battery with higher energy density, longer lifespan, increased safety and lower cost due to removal of certain components such as separator and casing. Solid-state batteries are expected to store up to twice as much energy as a Li-ion battery.
Redox flow batteries
Flow batteries store their energy in the electrolyte, which is in a flowable form of redox species such as Vanadium, Iron/Chromium, Zinc/Bromine. A redox flow battery has a distinguishable feature that the amount of power and energy can be scaled separately – whereby the amount of electrolyte could be increased to increase storage capacity, and the cell size and sequence determines the power capacity. With redox flow batteries, there is no phase conversion with solid active materials , which can significantly increase battery life and make it recyclable - key qualities suitable for utility scale battery storage applications.
Exhibit 4: Solid state batteries
Solid electrolyte
The red membrane is solid electrolyte
Exhibit 5: Redox flow batteries
Electrolyte Tank
Pump
Electrolyte Tank
Pump
Charging source/load
Electrode Semi-permeablemembrane
+ -
Source: BloombergNEF
ac-0173-103028-Macro Forum Mar 2021.indd 28ac-0173-103028-Macro Forum Mar 2021.indd 28 04/03/2021 19:1804/03/2021 19:18
29 The Street View
Zinc-air batteries (ZAB)
The ZAB are from a wider family of batteries that use metal and air – in which the anode is a metal and cathode is carbon-based with a precious metal covering. As air passes freely through the battery, oxygen reacts with the metal and activates an electrolysis process and resultant flow of current. Until recently, ZAB suffered from poor cycle efficiencies (due to dendrite, needles, growing out of anode) and can have imbalanced charging and discharging times, but a substantial amount of R&D is being performed by universities and start-ups around the globe, and there are indications of a commercially viable technology being available by 2025.
There are several other interesting energy storage technologies such as Flywheel, Liquid or Compressed Air Energy Storage, Electrothermal and Gravity storage technologies, which could also evolve to outperform Li-ion battery technology but to date Li-ion enjoys a substantial lead.
Future of long-term/seasonal storage
The current battery storage technologies provide flexibility in the power system to accommodate the hourly or daily volatility but an economical solution for seasonal storage would be key to achieving the highest level of renewable energy penetration. The rationale of seasonal storage is to solve for two key issues:
1. Shifting surplus green electricity from a season of high generation/low demand to a period of high demand/low generation, and
2. Enable a complete decarbonisation of the electricity system in a sustainable manner.
A few viable options mainly differing in the way electricity is converted and stored – as hydrogen, methanol, methane, ammonia or methylcyclohexane are under development. As per DNV’s analysis, storing compressed hydrogen in a depleted gas field is the most cost effective seasonal solution7, and we expect the global policy movement towards Hydrogen to expedite economical and bankable solutions for seasonal storage earlier than thought.
7 DNV GL, The Promise for Seasonal Storage 20208 IFC and Navigant
What’s the opportunity for battery storage in emerging markets?
For emerging markets, the energy storage market is expected to grow to 20GW/60GWh with a US$25 billion revenue opportunity by 20258. Amongst our markets, India is emerging as one of the largest, immediate energy storage markets, with expected c.4GW (estimated 12-16GWh) of new storage capacity to be added to the energy mix (CAGR of 46%) until 2025, requiring approx. $6bn of investments in the next 5-7 years.
In Africa, Actis’ investee companies along with their partners are currently undertaking feasibility studies on two major grid-scale battery storage projects integrated with wind projects in Senegal (Lekela) and Kenya.
Sustainable and Responsible procurement of batteries is possible.
Actis’ Responsible Investment team continues to work with Tier-1 suppliers not only on responsible procurement of rare metals for batteries as well as evaluating recycling and second-life applications for batteries.
Battery storage is a key energy transition enabler
Continued deployment of energy storage will be key for energy transition. The dynamic application of battery storage on the generation and distribution side will help to integrate renewables into the energy mix but also manage grid flexibility and stability, making it an attractive, remunerative and unique solution.
With Actis aiming to supply clean, affordable and reliable electricity to billions of people, battery storage is no longer a potential technology but a competitive, mature and present-day enabler for the global energy transition towards a more sustainable and decarbonised future.
ac-0173-103028-Macro Forum Mar 2021.indd 29ac-0173-103028-Macro Forum Mar 2021.indd 29 04/03/2021 19:1804/03/2021 19:18
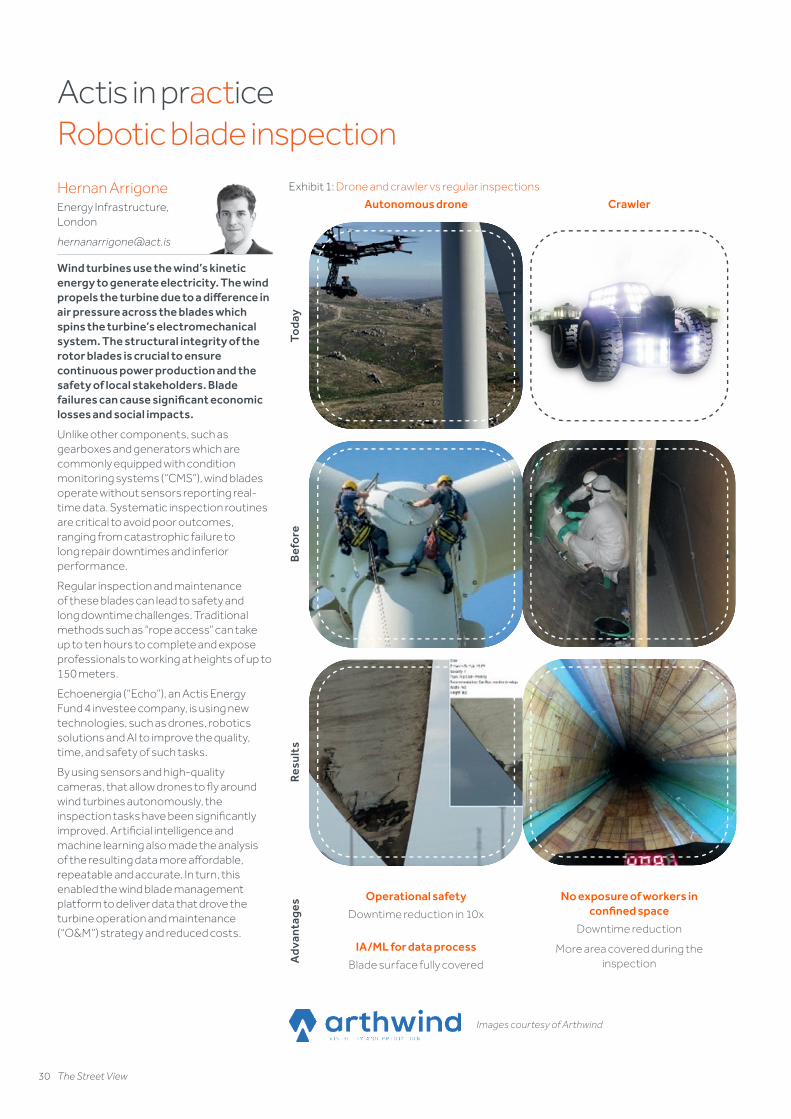
30 The Street View
Actis in practiceRobotic blade inspectionHernan ArrigoneEnergy Infrastructure, London
Wind turbines use the wind’s kinetic energy to generate electricity. The wind propels the turbine due to a difference in air pressure across the blades which spins the turbine’s electromechanical system. The structural integrity of the rotor blades is crucial to ensure continuous power production and the safety of local stakeholders. Blade failures can cause significant economic losses and social impacts.
Unlike other components, such as gearboxes and generators which are commonly equipped with condition monitoring systems (“CMS”), wind blades operate without sensors reporting real-time data. Systematic inspection routines are critical to avoid poor outcomes, ranging from catastrophic failure to long repair downtimes and inferior performance.
Regular inspection and maintenance of these blades can lead to safety and long downtime challenges. Traditional methods such as “rope access” can take up to ten hours to complete and expose professionals to working at heights of up to 150 meters.
Echoenergia (“Echo”), an Actis Energy Fund 4 investee company, is using new technologies, such as drones, robotics solutions and AI to improve the quality, time, and safety of such tasks.
By using sensors and high-quality cameras, that allow drones to fly around wind turbines autonomously, the inspection tasks have been significantly improved. Artificial intelligence and machine learning also made the analysis of the resulting data more affordable, repeatable and accurate. In turn, this enabled the wind blade management platform to deliver data that drove the turbine operation and maintenance (“O&M”) strategy and reduced costs.
Exhibit 1: Drone and crawler vs regular inspections
Autonomous drone Crawler
Operational safety
Downtime reduction in 10x
IA/ML for data process
Blade surface fully covered
No exposure of workers in confined space
Downtime reduction
More area covered during the inspection A
dvan
tage
sTo
day
Bef
ore
Res
ults
Images courtesy of Arthwind
ac-0173-103028-Macro Forum Mar 2021.indd 30ac-0173-103028-Macro Forum Mar 2021.indd 30 04/03/2021 19:1804/03/2021 19:18
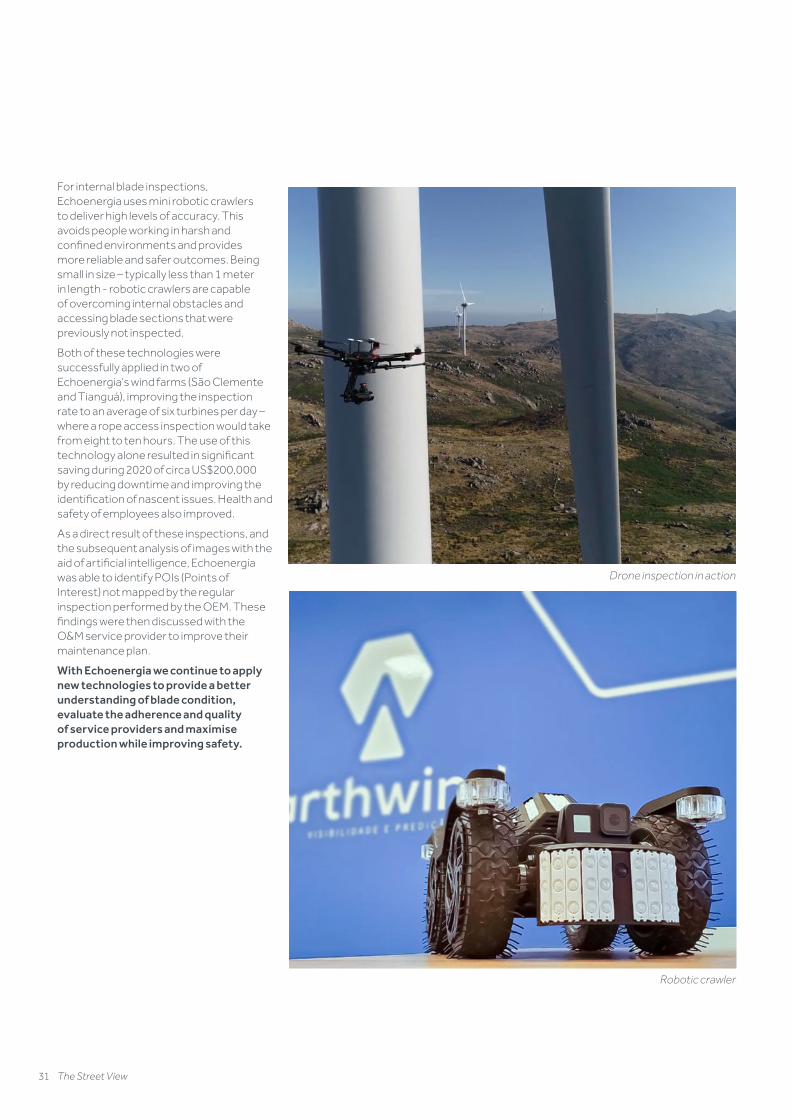
31 The Street View
For internal blade inspections, Echoenergia uses mini robotic crawlers to deliver high levels of accuracy. This avoids people working in harsh and confined environments and provides more reliable and safer outcomes. Being small in size – typically less than 1 meter in length - robotic crawlers are capable of overcoming internal obstacles and accessing blade sections that were previously not inspected.
Both of these technologies were successfully applied in two of Echoenergia’s wind farms (São Clemente and Tianguá), improving the inspection rate to an average of six turbines per day – where a rope access inspection would take from eight to ten hours. The use of this technology alone resulted in significant saving during 2020 of circa US$200,000 by reducing downtime and improving the identification of nascent issues. Health and safety of employees also improved.
As a direct result of these inspections, and the subsequent analysis of images with the aid of artificial intelligence, Echoenergia was able to identify POIs (Points of Interest) not mapped by the regular inspection performed by the OEM. These findings were then discussed with the O&M service provider to improve their maintenance plan.
With Echoenergia we continue to apply new technologies to provide a better understanding of blade condition, evaluate the adherence and quality of service providers and maximise production while improving safety.
Drone inspection in action
Robotic crawler
ac-0173-103028-Macro Forum Mar 2021.indd 31ac-0173-103028-Macro Forum Mar 2021.indd 31 04/03/2021 19:1804/03/2021 19:18
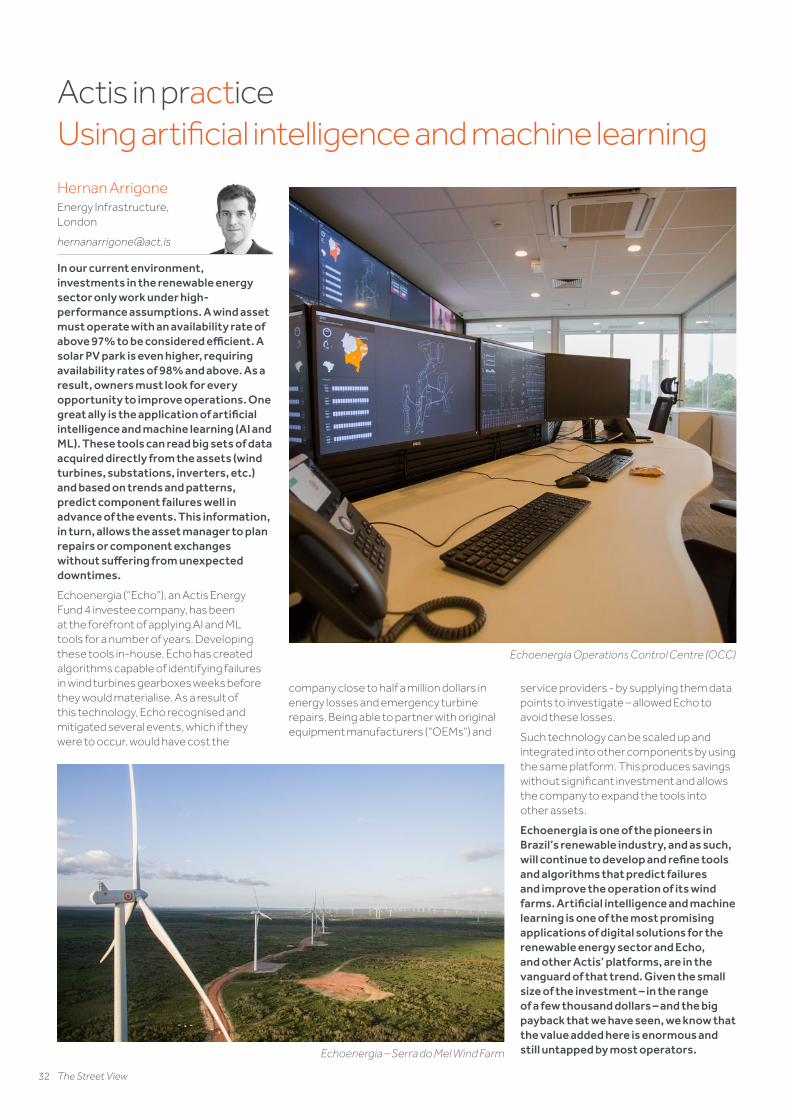
32 The Street View
Actis in practiceUsing artificial intelligence and machine learningHernan ArrigoneEnergy Infrastructure, London
In our current environment, investments in the renewable energy sector only work under high-performance assumptions. A wind asset must operate with an availability rate of above 97% to be considered efficient. A solar PV park is even higher, requiring availability rates of 98% and above. As a result, owners must look for every opportunity to improve operations. One great ally is the application of artificial intelligence and machine learning (AI and ML). These tools can read big sets of data acquired directly from the assets (wind turbines, substations, inverters, etc.) and based on trends and patterns, predict component failures well in advance of the events. This information, in turn, allows the asset manager to plan repairs or component exchanges without suffering from unexpected downtimes.
Echoenergia (“Echo”), an Actis Energy Fund 4 investee company, has been at the forefront of applying AI and ML tools for a number of years. Developing these tools in-house, Echo has created algorithms capable of identifying failures in wind turbines gearboxes weeks before they would materialise. As a result of this technology, Echo recognised and mitigated several events, which if they were to occur, would have cost the
company close to half a million dollars in energy losses and emergency turbine repairs. Being able to partner with original equipment manufacturers (“OEMs”) and
Echoenergia Operations Control Centre (OCC)
Echoenergia – Serra do Mel Wind Farm
service providers - by supplying them data points to investigate – allowed Echo to avoid these losses.
Such technology can be scaled up and integrated into other components by using the same platform. This produces savings without significant investment and allows the company to expand the tools into other assets.
Echoenergia is one of the pioneers in Brazil’s renewable industry, and as such, will continue to develop and refine tools and algorithms that predict failures and improve the operation of its wind farms. Artificial intelligence and machine learning is one of the most promising applications of digital solutions for the renewable energy sector and Echo, and other Actis’ platforms, are in the vanguard of that trend. Given the small size of the investment – in the range of a few thousand dollars – and the big payback that we have seen, we know that the value added here is enormous and still untapped by most operators.
ac-0173-103028-Macro Forum Mar 2021.indd 32ac-0173-103028-Macro Forum Mar 2021.indd 32 04/03/2021 19:1804/03/2021 19:18
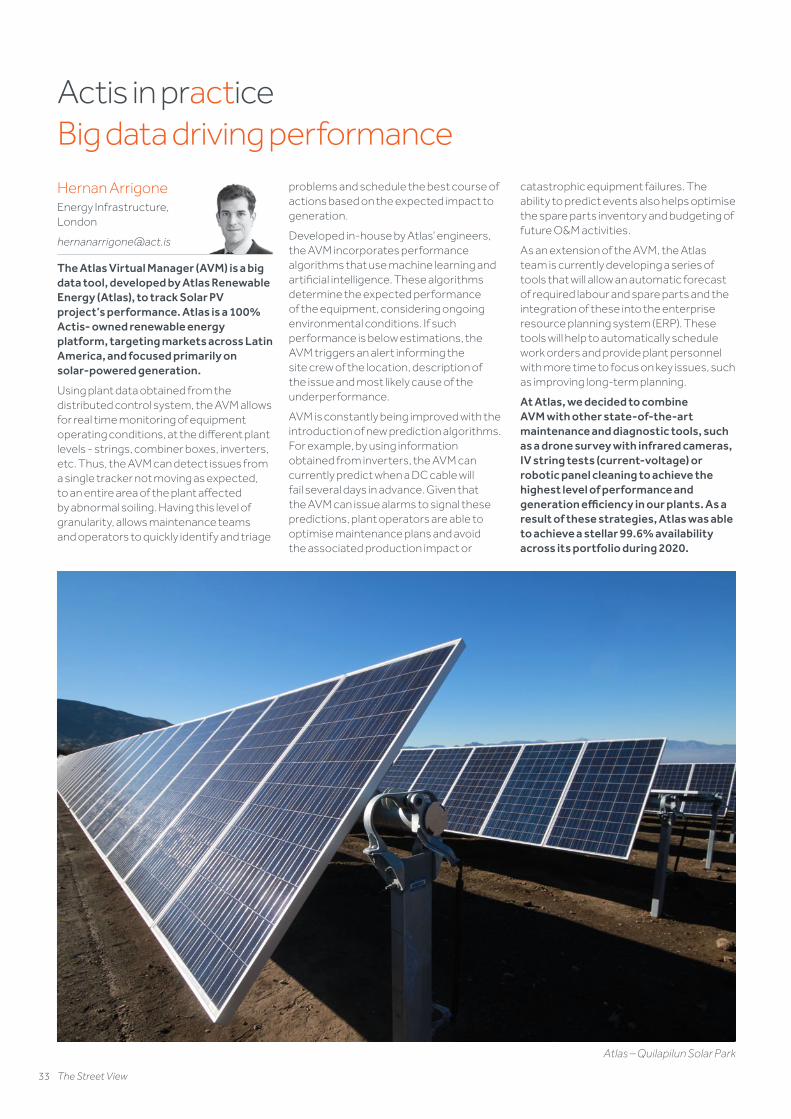
33 The Street View
Actis in practiceBig data driving performanceHernan ArrigoneEnergy Infrastructure, London
The Atlas Virtual Manager (AVM) is a big data tool, developed by Atlas Renewable Energy (Atlas), to track Solar PV project’s performance. Atlas is a 100% Actis- owned renewable energy platform, targeting markets across Latin America, and focused primarily on solar-powered generation.
Using plant data obtained from the distributed control system, the AVM allows for real time monitoring of equipment operating conditions, at the different plant levels - strings, combiner boxes, inverters, etc. Thus, the AVM can detect issues from a single tracker not moving as expected, to an entire area of the plant affected by abnormal soiling. Having this level of granularity, allows maintenance teams and operators to quickly identify and triage
problems and schedule the best course of actions based on the expected impact to generation.
Developed in-house by Atlas’ engineers, the AVM incorporates performance algorithms that use machine learning and artificial intelligence. These algorithms determine the expected performance of the equipment, considering ongoing environmental conditions. If such performance is below estimations, the AVM triggers an alert informing the site crew of the location, description of the issue and most likely cause of the underperformance.
AVM is constantly being improved with the introduction of new prediction algorithms. For example, by using information obtained from inverters, the AVM can currently predict when a DC cable will fail several days in advance. Given that the AVM can issue alarms to signal these predictions, plant operators are able to optimise maintenance plans and avoid the associated production impact or
catastrophic equipment failures. The ability to predict events also helps optimise the spare parts inventory and budgeting of future O&M activities.
As an extension of the AVM, the Atlas team is currently developing a series of tools that will allow an automatic forecast of required labour and spare parts and the integration of these into the enterprise resource planning system (ERP). These tools will help to automatically schedule work orders and provide plant personnel with more time to focus on key issues, such as improving long-term planning.
At Atlas, we decided to combine AVM with other state-of-the-art maintenance and diagnostic tools, such as a drone survey with infrared cameras, IV string tests (current-voltage) or robotic panel cleaning to achieve the highest level of performance and generation efficiency in our plants. As a result of these strategies, Atlas was able to achieve a stellar 99.6% availability across its portfolio during 2020.
Atlas – Quilapilun Solar Park
ac-0173-103028-Macro Forum Mar 2021.indd 33ac-0173-103028-Macro Forum Mar 2021.indd 33 04/03/2021 19:1804/03/2021 19:18
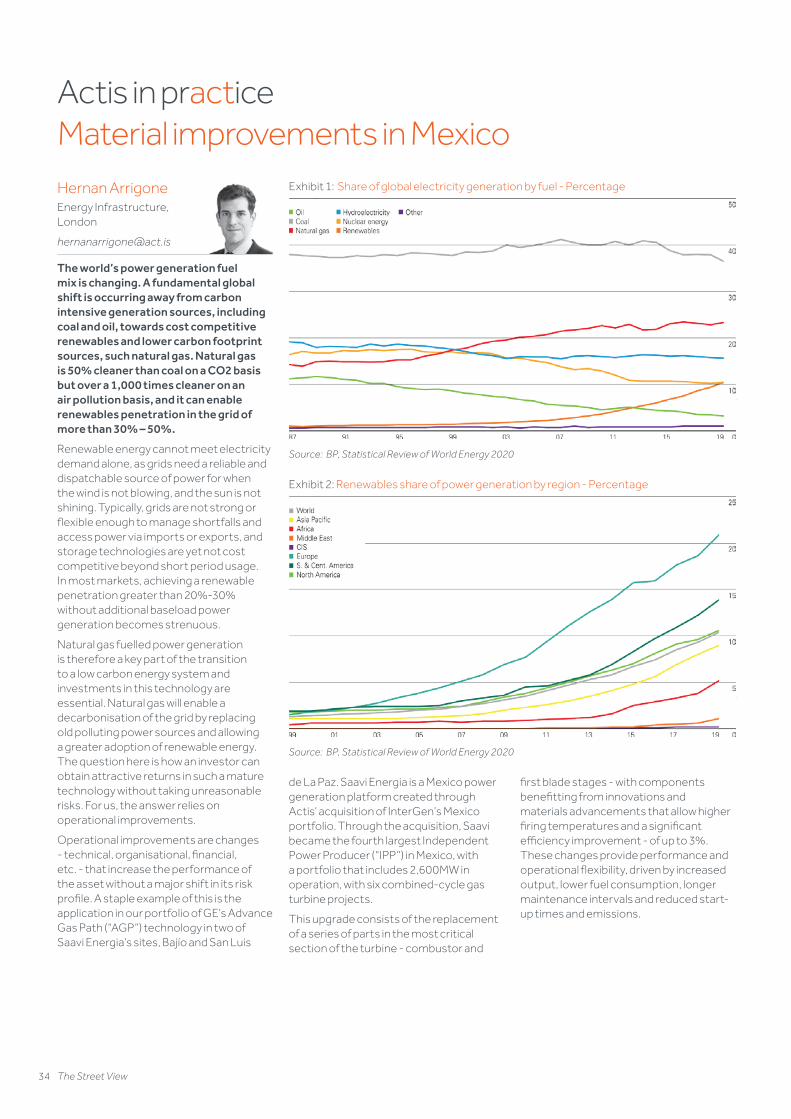
34 The Street View
Actis in practiceMaterial improvements in MexicoHernan ArrigoneEnergy Infrastructure, London
The world’s power generation fuel mix is changing. A fundamental global shift is occurring away from carbon intensive generation sources, including coal and oil, towards cost competitive renewables and lower carbon footprint sources, such natural gas. Natural gas is 50% cleaner than coal on a CO2 basis but over a 1,000 times cleaner on an air pollution basis, and it can enable renewables penetration in the grid of more than 30% – 50%.
Renewable energy cannot meet electricity demand alone, as grids need a reliable and dispatchable source of power for when the wind is not blowing, and the sun is not shining. Typically, grids are not strong or flexible enough to manage shortfalls and access power via imports or exports, and storage technologies are yet not cost competitive beyond short period usage. In most markets, achieving a renewable penetration greater than 20%-30% without additional baseload power generation becomes strenuous.
Natural gas fuelled power generation is therefore a key part of the transition to a low carbon energy system and investments in this technology are essential. Natural gas will enable a decarbonisation of the grid by replacing old polluting power sources and allowing a greater adoption of renewable energy. The question here is how an investor can obtain attractive returns in such a mature technology without taking unreasonable risks. For us, the answer relies on operational improvements.
Operational improvements are changes - technical, organisational, financial, etc. - that increase the performance of the asset without a major shift in its risk profile. A staple example of this is the application in our portfolio of GE’s Advance Gas Path (“AGP”) technology in two of Saavi Energia’s sites, Bajío and San Luis
de La Paz. Saavi Energia is a Mexico power generation platform created through Actis’ acquisition of InterGen’s Mexico portfolio. Through the acquisition, Saavi became the fourth largest Independent Power Producer (“IPP”) in Mexico, with a portfolio that includes 2,600MW in operation, with six combined-cycle gas turbine projects.
This upgrade consists of the replacement of a series of parts in the most critical section of the turbine - combustor and
first blade stages - with components benefitting from innovations and materials advancements that allow higher firing temperatures and a significant efficiency improvement - of up to 3%. These changes provide performance and operational flexibility, driven by increased output, lower fuel consumption, longer maintenance intervals and reduced start-up times and emissions.
Exhibit 1: Share of global electricity generation by fuel - Percentage
xx xx xx xx
label
100
Source: BP, Statistical Review of World Energy 2020
Exhibit 2: Renewables share of power generation by region - Percentage
xx xx xx xx
label
100
Source: BP, Statistical Review of World Energy 2020
ac-0173-103028-Macro Forum Mar 2021.indd 34ac-0173-103028-Macro Forum Mar 2021.indd 34 04/03/2021 19:1804/03/2021 19:18
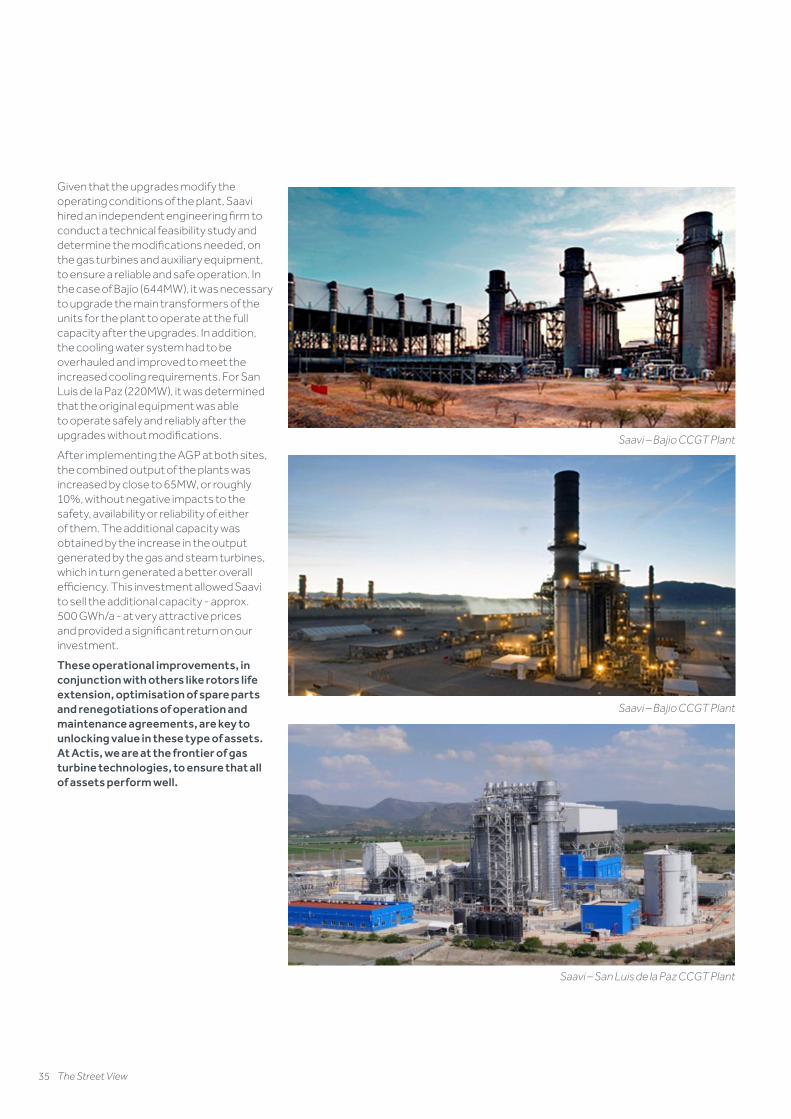
35 The Street View
Given that the upgrades modify the operating conditions of the plant, Saavi hired an independent engineering firm to conduct a technical feasibility study and determine the modifications needed, on the gas turbines and auxiliary equipment, to ensure a reliable and safe operation. In the case of Bajío (644MW), it was necessary to upgrade the main transformers of the units for the plant to operate at the full capacity after the upgrades. In addition, the cooling water system had to be overhauled and improved to meet the increased cooling requirements. For San Luis de la Paz (220MW), it was determined that the original equipment was able to operate safely and reliably after the upgrades without modifications.
After implementing the AGP at both sites, the combined output of the plants was increased by close to 65MW, or roughly 10%, without negative impacts to the safety, availability or reliability of either of them. The additional capacity was obtained by the increase in the output generated by the gas and steam turbines, which in turn generated a better overall efficiency. This investment allowed Saavi to sell the additional capacity - approx. 500 GWh/a - at very attractive prices and provided a significant return on our investment.
These operational improvements, in conjunction with others like rotors life extension, optimisation of spare parts and renegotiations of operation and maintenance agreements, are key to unlocking value in these type of assets. At Actis, we are at the frontier of gas turbine technologies, to ensure that all of assets perform well.
Saavi – Bajio CCGT Plant
Saavi – Bajio CCGT Plant
Saavi – San Luis de la Paz CCGT Plant
ac-0173-103028-Macro Forum Mar 2021.indd 35ac-0173-103028-Macro Forum Mar 2021.indd 35 04/03/2021 19:1804/03/2021 19:18
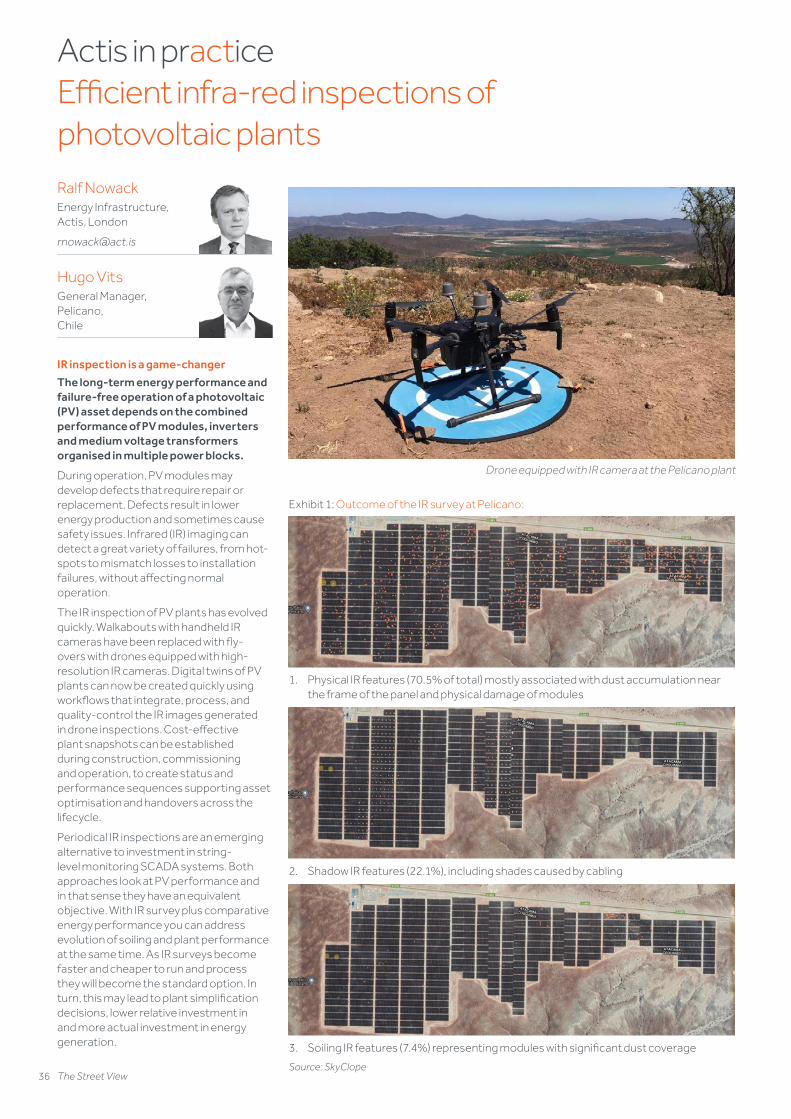
36 The Street View
Actis in practiceEfficient infra-red inspections of photovoltaic plantsRalf NowackEnergy Infrastructure, Actis, London
Hugo VitsGeneral Manager, Pelicano, Chile
IR inspection is a game-changer
The long-term energy performance and failure-free operation of a photovoltaic (PV) asset depends on the combined performance of PV modules, inverters and medium voltage transformers organised in multiple power blocks.
During operation, PV modules may develop defects that require repair or replacement. Defects result in lower energy production and sometimes cause safety issues. Infrared (IR) imaging can detect a great variety of failures, from hot-spots to mismatch losses to installation failures, without affecting normal operation.
The IR inspection of PV plants has evolved quickly. Walkabouts with handheld IR cameras have been replaced with fly-overs with drones equipped with high-resolution IR cameras. Digital twins of PV plants can now be created quickly using workflows that integrate, process, and quality-control the IR images generated in drone inspections. Cost-effective plant snapshots can be established during construction, commissioning and operation, to create status and performance sequences supporting asset optimisation and handovers across the lifecycle.
Periodical IR inspections are an emerging alternative to investment in string-level monitoring SCADA systems. Both approaches look at PV performance and in that sense they have an equivalent objective. With IR survey plus comparative energy performance you can address evolution of soiling and plant performance at the same time. As IR surveys become faster and cheaper to run and process they will become the standard option. In turn, this may lead to plant simplification decisions, lower relative investment in and more actual investment in energy generation.
Drone equipped with IR camera at the Pelícano plant
Exhibit 1: Outcome of the IR survey at Pelícano:
1. Physical IR features (70.5% of total) mostly associated with dust accumulation near the frame of the panel and physical damage of modules
2. Shadow IR features (22.1%), including shades caused by cabling
3. Soiling IR features (7.4%) representing modules with significant dust coverage
Source: SkyClope
ac-0173-103028-Macro Forum Mar 2021.indd 36ac-0173-103028-Macro Forum Mar 2021.indd 36 04/03/2021 19:1804/03/2021 19:18

37 The Street View
IR inspection of the Pelicano PV
Chile is a fast-growing PV market with some 3.5 GW of installed capacity and an additional 2.5GW capacity projected. The ecosystem of local support services is growing accordingly with costs being more competitive.
Actis Long Life Infrastructure Fund acquired the Pelícano PV asset in December 2017, after the plant commissioning. Pelicano is a 111MWdc (105MWac) plant located in the Atacama Desert (Chile), composed of 59 power blocks and 25,554 strings of 10 high-performance (435W) monocrystalline modules each. Module capacity degrades at 0.25%/year according to the manufacturer. The plant has been performing in line with projections.
At Pelícano, the SCADA system acquires the power data at the inverters and not at the string-level. The plant is an ideal candidate for inspection as the IR will complement the SCADA data.
The aerial inspection of infrastructure using drones and fixed wing aircraft is an established service in the mining, energy, and real estate sectors, with different suppliers available. Pelicano chose a supplier with local PV inspection experience that is associated with a survey processor with global footprint.
The key ́ sell´ points of the selected supplier were:
1. Availability to shoot the survey with limited contact with site team during the COVID-19 pandemic;
2. The deep knowledge of defect interpretation using a combination of artificial intelligence algorithms and expert interpretation;
3. The possibility of creating a digital twin with multiple snapshots that are matched module by module in time;
4. The possibility of creating O&M workflows to address repairs and then register the repair in the system for future reference; and
5. The price (23 k$ all-in).
Survey results and O&M actions
The drone pilot was on site at the end of May 2020 and the final ́ digital twin´ report was delivered in one month on a fast turnaround. The O&M and Asset Management teams were granted access and trained on the platform.
All PV strings were operational at Pelícano. This was a first for the 800MW inspected so far in Chile by the drone surveyor. The energy losses associated with the detected anomalies corresponded to 0.1% of total plant generation, which is again a very favourable result.
The survey identified 1,878 thermal anomalies for the 255,540 modules at the plant, which is a very low value. The IR was able to distinguish between Physical anomalies in this case 70.5% of the thermal losses (issues related to module/cell damage), Shadowing anomalies with 22.1% (shadows from cables and other features) and Soiling anomalies with 7.4% (in a plant area that was a candidate for washing at the time).
The O&M contractor analysed the results and incorporated actions in the maintenance schedule. No disconnected cables were found and all strings were operational which was a first for plants in Chile. The execution of remedial actions identified three damaged modules in the field with many of the physical features reclassified as soil spot accumulations, located close to the module frame and 6 modules were replaced.
Lessons learned and value improvement
The outcome of the IR survey was very favourable for El Pelicano asset. It provided the necessary certainty on the current plant operational status, with a limited number of issues identified at the module-level affecting the energy output of the plant. The IR survey represents an efficient option to deliver an operational snapshot.
Pelicano had considered retrofitting the plant with string-level monitoring as a value improvement option with a capex estimate of $400k. The IR survey supports a decision to cancel this option.
The IR survey will serve as a baseline to monitor the evolution of the plant status. As the number of actual features was limited and the plant performance remains solid, the next survey is now deferred for late 2021 or early 2022.
The learnings will be transferred to other PV assets of the Energy and ALLIF portfolios, including surveys during commissioning and due diligence processes.
ac-0173-103028-Macro Forum Mar 2021.indd 37ac-0173-103028-Macro Forum Mar 2021.indd 37 04/03/2021 19:1804/03/2021 19:18
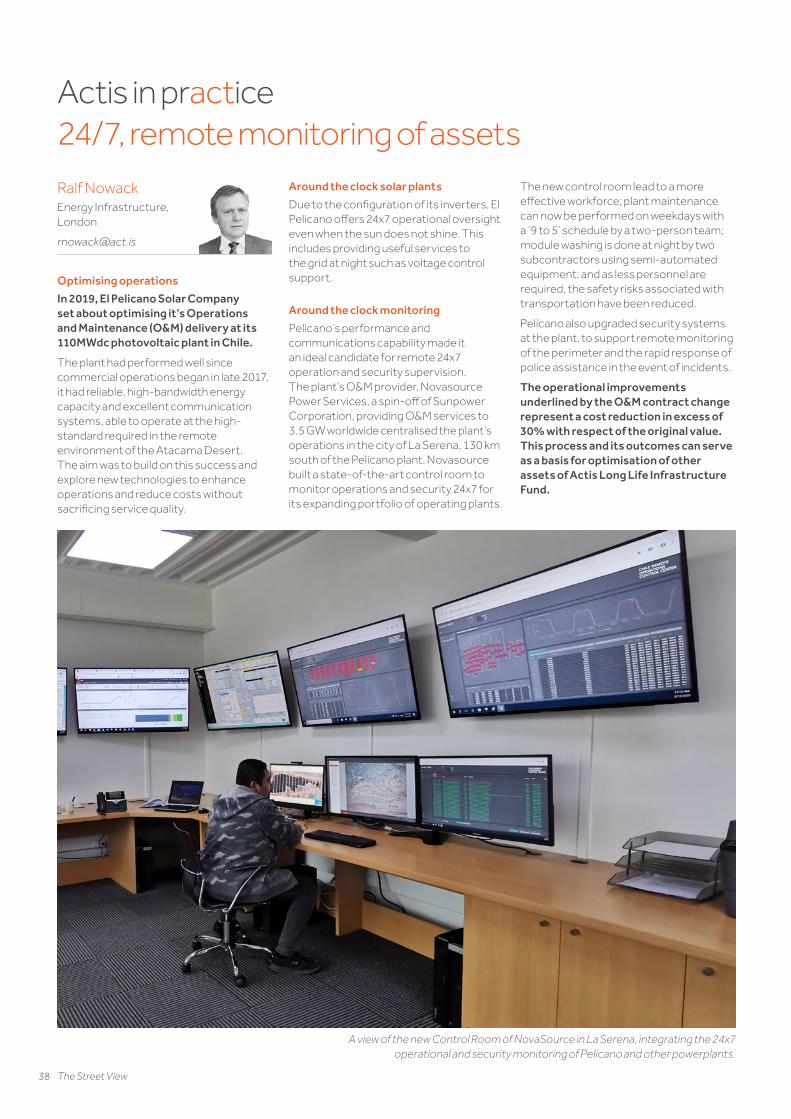
38 The Street View
Actis in practice24/7, remote monitoring of assetsRalf NowackEnergy Infrastructure, London
Optimising operations
In 2019, El Pelicano Solar Company set about optimising it’s Operations and Maintenance (O&M) delivery at its 110MWdc photovoltaic plant in Chile.
The plant had performed well since commercial operations began in late 2017, it had reliable, high-bandwidth energy capacity and excellent communication systems, able to operate at the high-standard required in the remote environment of the Atacama Desert. The aim was to build on this success and explore new technologies to enhance operations and reduce costs without sacrificing service quality.
Around the clock solar plants
Due to the configuration of its inverters, El Pelicano offers 24x7 operational oversight even when the sun does not shine. This includes providing useful services to the grid at night such as voltage control support.
Around the clock monitoring
Pelicano´s performance and communications capability made it an ideal candidate for remote 24x7 operation and security supervision. The plant’s O&M provider, Novasource Power Services, a spin-off of Sunpower Corporation, providing O&M services to 3.5 GW worldwide centralised the plant’s operations in the city of La Serena, 130 km south of the Pelicano plant. Novasource built a state-of-the-art control room to monitor operations and security 24x7 for its expanding portfolio of operating plants.
The new control room lead to a more effective workforce; plant maintenance can now be performed on weekdays with a ́ 9 to 5´ schedule by a two-person team; module washing is done at night by two subcontractors using semi-automated equipment; and as less personnel are required, the safety risks associated with transportation have been reduced.
Pelícano also upgraded security systems at the plant, to support remote monitoring of the perimeter and the rapid response of police assistance in the event of incidents.
The operational improvements underlined by the O&M contract change represent a cost reduction in excess of 30% with respect of the original value. This process and its outcomes can serve as a basis for optimisation of other assets of Actis Long Life Infrastructure Fund.
A view of the new Control Room of NovaSource in La Serena, integrating the 24x7 operational and security monitoring of Pelicano and other powerplants.
ac-0173-103028-Macro Forum Mar 2021.indd 38ac-0173-103028-Macro Forum Mar 2021.indd 38 04/03/2021 19:1804/03/2021 19:18

For more information, please contactStuart Jackson [email protected] up to receive news from our Macro Forumhttps://www.act.is/macro-forum-the-street-view/newsletter-signup/
Other Actis target markets since 1998
Actis officeCountries in which Actis has invested since 1998
New York
Mexico City
São Paulo
London
CairoDubai
JohannesburgPort Louis
NairobiLagos
Mumbai
Singapore
New Delhi
Cape Town
Hong KongShanghai
Seoul
ac-0173-103028-Macro Forum Mar 2021.indd 39ac-0173-103028-Macro Forum Mar 2021.indd 39 04/03/2021 19:1804/03/2021 19:18

ac-0173-103028-Macro Forum Mar 2021.indd 40ac-0173-103028-Macro Forum Mar 2021.indd 40 04/03/2021 19:1804/03/2021 19:18