effects of market segmentation and bank concentration on mutual fund expenses and returns: evidence...
TRANSCRIPT

Effects of Market Segmentation andBank Concentration on Mutual FundExpenses and Returns: Evidence fromFinland
Timo P. Korkeamaki and Thomas I. Smythe, Jr.School of Business Administration, Gonzaga University, Spokane, WA 99258–0009, USA
e-mail: [email protected]; [email protected]
Abstract
A tremendous amount of research examines US mutual funds, but fund marketsalso thrive in other countries. However, research about these fast growing marketsis lacking. This study addresses Finnish funds. Fast growth of the Finnish fundindustry, strong bank dominance in the industry and recent EU membership makeit an interesting market to examine. The Finnish fund market is also of particularinterest since it had the fastest growth among the EU countries during 1996–2000.We find evidence that bank-managed and older funds charge higher expenses butinvestors are not compensated for paying higher expenses with higher risk-adjustedreturns, suggesting a potential agency problem. Overall, Finnish fund expenseshave decreased over time, consistent with EU membership reducing marketsegmentation and generating competition.
Keywords: mutual funds; fees; returns; international
JEL classification: G15, G18, G20
1. Introduction
Mutual funds are the dominant vehicle individual investors use to participate in UScapital markets. With the dramatic growth in fund ownership in the 1990’s has come aplethora of research concentrated in the areas of fund returns and fund costs. While
We would like to thank seminar participants at the University of South Carolina, the 2001 Eastern
Finance Association meeting, the 2001 European FMA meeting, and a joint seminar of the
Swedish School of Economics and Business Administration and the Helsinki School of
Economics. Special thanks go to Matti Keloharju, Chuck Kwok, Eva Liljeblom, Ted Moore,
Greg Niehaus, Eddie O’Neal, Eric Powers, Vesa Puttonen, an anonymous referee, and John
Doukas (the editor), for helpful comments. Earlier versions of this paper were circulated under
the title ‘An Empirical Analysis of Finnish Mutual Fund Expenses and Returns.’ Any remaining
errors are the responsibility of the authors. Corresponding author: Timo P. Korkeamaki.
European Financial Management, Vol. 10, No. 3, 2004, 413–438
# Blackwell Publishing Ltd. 2004, 9600 Garsington Road, Oxford OX4 2DQ, UK and 350 Main Street, Malden, MA 02148, USA.

some research focuses on US operated international funds (e.g. see Droms andWalker, 1994; Essayyad and Wu, 1998), research on mutual funds based outside theUS is limited, due in part to the recent development of fund markets in othercountries.1 However, these markets represent those with the fastest growth. Overthe period 1996–2000, asset growth for funds in the 16 countries tracked by theEuropean Federation of Funds and Investment Societies (FEFSI) averaged 32%compared to 25% in the USA.2
The focus of this study is the Finnish mutual fund market. Finland provides aninteresting test ground for examining market growth and evolution, expense levels,and returns in foreign markets. Of the 16 countries followed by FEFSI during1996–2000, Finland’s fund market exhibited the fastest cumulative growth at 71%.Additionally, the introduction of the euro at the end of our sample period allowsus to draw some inferences about how that change has affected fund expense andreturn dynamics. Furthermore, while the Finnish mutual fund market has grown thefastest during our sample period, strong growth potential remains. As of year-end1999, Finnish households held only 4% of their financial assets in mutual funds, while89% were held in individual bonds and/or stocks (50%) and cash deposits (39%).
In addition to the growth characteristics exhibited in the Finnish market, two otherfeatures make it an ideal test market. First, the Finnish market is very new and oursample begins during the market’s infancy.3 This permits an examination of whether arapidly evolving market is becoming more competitive over time, as we would expect.Second, in contrast to the US market, the Finnish financial market, like otherEuropean markets but in contrast to the US market, is bank-dominated. Evidenceof this characteristic is that 39% of Finnish financial assets are held in cash deposits.As discussed below, Finnish retail banks also dominate the fund market. At issue iswhether such concentration leads to wealth maximising benefits for investors or haspotentially adverse competitive effects. While we will not be able to generalise findingsfor the Finnish market to other markets, addressing these two characteristics providesan initial examination of issues that other European markets do or will face.
As such, the current study addresses three specific issues. First, we examine thecross-sectional determinants of fund expenses focusing on three specific hypothesesrelated to the Finnish market. Second, we examine the cross-sectional characteristicsof Finnish fund returns, again addressing specific hypotheses related to the Finnishfund market. Finally in the process of addressing these two issues, we investigate athird, the out of sample testing of cross-sectional models of fund expenses and returnsdeveloped for studies of US funds. Our results demonstrate that while similarities existbetween established fund markets and Finland, there are significant differences. Whenexamining expenses, we find that banks charge higher expenses compared to non-bank asset managers, a finding that contrasts with US studies. However, the evidence
1 Exceptions include Liljeblom and Loflund (1998), Dermine and Roller (1992), and Otten and
Bams (2002).2 The information on European fund growth is found at the FEFSI’s web site (www.fefsi.org)
under the document ‘The state of European investment funds industry.’ The US figure is
calculated from data obtained from Morningstar’s Mutual Funds OnDisc TM for year-end
1995 and Principia Pro for year-end 2000.3 In fact, the law authorising the creation of mutual funds was passed in 1989 and our sample
begins in 1993.
414 Timo P. Korkeamaki and Thomas I. Smythe, Jr
# Blackwell Publishing Ltd, 2004
indicates that competition has reduced expenses over time. In further contrast to USstudies, Finnish domestic equity and balanced funds have higher expenses than theirinternational counterparts, likely reflecting the higher costs of investing in a lessdeveloped market. Furthermore, older funds charge higher fees, which contrastswith US studies that find a ‘learning curve effect’. When examining returns, we findthat bank-managed and older funds do not compensate for higher fees with higherreturns. Finally, we find no evidence of market segmentation with regard to fundreturns. In fact, Finnish registered balanced funds have lower risk-adjusted returnsthan foreign-registered balanced funds.
The rest of the paper is organised as follows. We define research goals and specifichypotheses in Section 2. We describe the data and briefly discuss the Finnish mutualfund industry in Section 3. In Section 4, we analyse the cross-sectional determinants ofFinnish fund expenses, while cross-sectional determinants of fund returns are coveredin Section 5. We provide concluding remarks in Section 6.
2. Research goals and hypothesis development
In this paper, we expand the mutual fund literature in three ways. First, we examinethe cross-sectional determinants of fund expenses. While some work examines thecross sectional determinants of returns in European markets (e.g. Liljeblom andLoflund, 1998), we are aware of no published work examining the determinants ofexpenses charged by funds outside the USA. Our contribution in this area is related tothree specific hypotheses.
Fund companies face barriers when expanding into foreign markets. For example,regulatory structures and fund distribution methods often differ among countries,possibly leading to partial market segmentation. As an example, foreign fund com-panies must be partnered with Swiss banks to conduct business in Switzerland.Finnish funds are directly exposed to international competition due to Finland’smembership in the European Union (EU). Funds registered and operated in otherEU countries can market themselves in Finland while operating under the supervisionof home country regulators. If market segmentation exists such that additional costsare passed on to investors, then foreign-registered funds will have higher expensesthan Finnish funds. Conversely, if foreign registered funds face few entry barriers, andthe funds gain scale and scope economies by registering in another country, then non-Finnish registered funds will have lower expenses.4 So the null hypothesis regardingfund registry is:
H1: Expense ratios for foreign registered funds do not differ from expense ratiosfor Finnish registered funds.
The second focal point is on whether retail bank operation of funds has an impacton expenses. Retail banks introduced the first Finnish funds in 1987 and maintain astrong industry position. There are conflicting predictions as to the impact of bankownership on expenses. One view is that banks charge higher expenses becausecustomers do other business with the bank, and those customers are more interested
4Dahlquist et al. (2000) discusses the tax benefits of being registered in Luxembourg, where
many of the foreign funds in our sample are registered. These tax benefits would also allow such
funds to charge lower fees.
Mutual Fund Expenses and Returns 415
# Blackwell Publishing Ltd, 2004

in convenience than price. Alternatively, banks may gain scope economies from otherbank functions allowing them to charge lower expenses and be more price competi-tive. In US studies, Koppenhaver (2000) finds that bank managed money marketfunds have lower expenses than money market funds offered by other types of firms,and Frye (2001) provides similar evidence for some fixed income fund categories.Lesseig et al. (2001) find that banks offering equity and fixed income funds chargelower fees. Based on the competing views, the null hypothesis is:
H2: Bank owned fund expense ratios are the same as expense ratios for fundsoperated by other types of firms.
The final area of emphasis with regard to expenses is to examine whether theFinnish fund market has become more competitive over time. If so, we should seeexpenses decline over our sample period after controlling for other factors. We exploitthe panel nature of our data and the fact that the early portion of the samplerepresents the industry’s infancy to examine this issue. The formal null hypothesisis:
H3: Fund expense ratios do not differ across sample years.
Differences in expense ratios and thus rejection of any of our expense-relatedhypotheses above may be justified by funds with high expense ratios providing higherreturns. Therefore, our second objective is to examine the cross-sectional determinantsof risk-adjusted returns. Examples of work for US funds include Ippolito (1989) andDellva and Olson (1998). Similarly, Liljeblom and Loflund (1998) and Otten andBams (2002) analyse European fund markets, including Finland. Our study extendsthis work by examining two issues, namely market segmentation and the effect ofbank fund sponsorship on fund returns. We first re-examine market segmentation bycomparing the returns of Finnish and foreign registered funds. Given the opening ofborders associated with EU membership, the Finnish market is moving toward fullintegration, if not already there. If markets are fully integrated, we expect no differ-ence in returns between Finnish and foreign registered funds. However, if managers ofFinnish registered funds gain informational advantages over foreign registered funds,Finnish funds may generate higher risk-adjusted returns.
Two studies shed light on the issue. Shukla and van Inwegen (1995) examinewhether funds sold in the UK investing solely in US equities have returns comparableto domestic equity funds sold and managed in the USA. They find that UK fundsunder perform US funds. However, our study has distinct differences from Shuklaand van Inwegen. First, US investors could not purchase UK funds, while Finnishinvestors can purchase foreign registered funds. Warther (1995) and others demon-strate that fund flows impact fund performance. So to the extent that fund sharedemand differs across markets, fund flows are altered and returns may vary. Second,even though foreign registered funds are managed outside of Finland, the managersdo not face the time and geographic dispersion problems identified in Shukla and vanInwegen (1995), which they suggest leads to greater information asymmetry.
Furthermore, Grinblatt and Keloharju (2001) demonstrate that Finnish investorsare more likely to invest in local stocks, stocks of firms where the primary languagespoken is that of the investor, and stocks of firms whose senior management comesfrom a similar cultural background as investors. Their findings have implications forFinnish fund management. Specifically, the reverse of the Grinblatt and Keloharju
416 Timo P. Korkeamaki and Thomas I. Smythe, Jr
# Blackwell Publishing Ltd, 2004

results could be true. Finnish corporate managers may be more forthcoming withinformation to Finnish fund managers relative to foreign fund managers. If so, therewill be partial segmentation. Based on the discussion, the null hypothesis is:
H4: There is no difference in risk-adjusted returns for funds registered in Finlandwhen compared to foreign registered funds.
Given the central role banks have in the Finnish economy as a whole and themutual fund market in particular, it is possible for banks to gain preferential access toexecutives that lead to informational advantages over competitors and therefore tohigher risk-adjusted returns. Lesseig et al. (2001) conduct a similar analysis for USbased funds and finds little support for this view. As such, the null hypothesis is:
H5: Bank funds have similar risk-adjusted returns when compared to non-bankfunds.
Finally, by addressing our primary objectives of studying expenses and returnsof the Finnish mutual fund market, we also achieve a third objective of conductingout of sample tests of models developed for studies of US funds. Doing so allows forcomparisons across markets and can lead to future extensions of the modelsthemselves.
3. Data source and the Finnish mutual fund industry
Data source
The data source for the study is Rahastoraportti; a monthly periodical published byHelsinki Exchanges Ltd, which provides monthly data on a fund’s net asset value,returns over various horizons, expense ratios, and fund size, similar to commercialdata providers in the USA. Due to the Finnish mutual fund market’s short history,the sample is relatively small, particularly for early years. However, the fact thatRahastoraportti tracks the entire universe of Finnish funds virtually eliminates survi-vorship bias in our sample. Any funds that exit the sample during the 1993–2000period are included in the analysis until their exit.5
Finnish fund market
As of year-end 2000, the Finnish fund market consisted of 150 funds with total marketvalue of approximately $15.5 billion.6 In contrast, Morningstar reported approxi-mately 11,795 US funds at year-end 2000, with total assets of roughly $4.4 trillion.While the earliest Finnish funds invested predominantly in equities, at the end of2000, 56% of Finnish fund assets were in equity funds compared to 77% in the USA.However, funds investing in domestic equities represent 59% of US assets but only
5 See Brown et al. (1992) for a more complete discussion of survivorship bias in US mutual fund
studies.6During our sample period, 5FIM equalled approximately one dollar. However, after 1998,
fund size was quoted in the data source in euros. For 1999 and 2000, we first converted euros to
the markka at the fixed rate of 5.94573.
Mutual Fund Expenses and Returns 417
# Blackwell Publishing Ltd, 2004

12% in Finland. Given the apparent reluctance of Finnish investors to invest in thedomestic equity markets, investment cash flows likely gravitate to alternatives.Finnish international funds comprise 43% of Finnish assets compared to 11% in theUSA.7 Additionally, 21% of Finnish assets are in fixed income funds, even after theirdelayed introduction, compared to 17% in the USA. Finally, balanced funds (fundswith both equity and fixed income securities) represent 23% of Finnish assets com-pared to six% of US assets.
4. Analysis of fund operating expenses
The empirical specification
Our attention turns to the determinants of Finnish fund operational expenses. Toexamine Finnish mutual fund costs, we follow the literature that begins with Ferrisand Chance (1987).8 These studies examine the fund characteristics that explain thelevel of fund expenses using an Ordinary Least Squares (OLS) model. Operationalexpenses compensate fund operators for providing administrative services and activemanagement of assets and represent the ongoing ‘price’ for investors. Services includeaccounting, statement processing, and regulatory filing among others. The manage-ment fee compensates managers for investing expertise. Funds collect fees on anongoing basis, and they are calculated as a percentage of fund assets. Consistentwith prior literature, we use the expense ratio (EXPENSEit) as the dependent variabledefined as the annual percentage expense ratio charged by fund i in year t.
The analytical focus is to test Hypotheses 1 through 3. To examine Hypothesis 1regarding Finnish fund market segmentation, we define FINLAND as an indicatorvariable, equal to one if the fund is registered in Finland and zero otherwise. Underthe null, the coefficient estimate will not differ from zero. To test Hypothesis 2, BANK-FUND identifies funds operated by retail banks and is equal to one if the fund is operatedby a retail bank, and zero otherwise. Results from US studies (e.g. Koppenhaver, 2000)indicate that bank funds charge lower expenses than non-bank funds, consistent withbanks extending gains from scope economies to investors. However, Finnish banks playa more central role in the fund market. Banks control 45% of Finnish fund assetscompared to 6% by banks in the USA. To the extent that Finnish banks have monopolypower, expenses for bank-managed funds may be higher than those for non-bank funds.Finally to test Hypothesis 3, we include YEAR, which takes on the values 93–100 for theyears 1993 through 2000 in the sample. If the market is growing more competitive, therewill be an inverse relationship between YEAR and fund expenses.
In addition to the variables of interest, we include control variables from priorstudies. While Hypotheses 1 through 3 are the focus, this work is the first to ourknowledge examining the determinants of fund expenses for a market outside of theUSA. US studies show that expenses differ among fund types, with equity funds havinghigher expenses (e.g. Malhotra and McLeod, 1997). To control for these differences,
7 The asset percentage for international Finnish funds may be upwardly biased since the funds
are marketed in multiple countries; therefore, the assets do not represent only Finnish investors.
US data is from Morningstar’s Principia Plus -TM as of year-end 1998.8More recent examples include Tufano and Sevick (1997), Dellva and Olson (1998), and Lesseig
et al. (2000).
418 Timo P. Korkeamaki and Thomas I. Smythe, Jr
# Blackwell Publishing Ltd, 2004

we define OBJi as an indicator variable identifying one of the nine investmentobjectives describing the fund’s investment policies.9
Prior studies demonstrate that larger funds achieve economies of scale, which arepassed on to investors as lower expenses (e.g. McLeod and Malhotra, 1994). As such,FUNDSIZE is included and measured as the natural logarithm of fund assets. Recentstudies also include a measure of fund family size to reflect scope economies achievedby sharing resources across funds in one family. FAMSIZE controls for the effect andis measured as the natural logarithm of fund company assets under management.Beginning with Ferris and Chance (1987), studies include a variable to account forlearning curve effects. As with prior studies, the variable AGE is measured as thenatural logarithm of fund age in years since inception.10 In the extant literature, eachvariable generally exhibits an inverse relationship with fund expenses (e.g. McLeodand Malhotra, 1994; Lesseig et al., 2002).
Recent research includes a variable to capture management ability. If managementcapitalises on good past performance by charging higher expenses, funds performingwell in the previous year will have higher expenses than funds with lower laggedreturns. As such, we include LAGRET, measured as a fund’s previous year return. USstudies present mixed results for the variable. Tufano and Sevick (1997) and Smythe(1999) find no relationship between prior year returns and expenses. However, Lesseiget al. (2002) find that higher lagged returns are associated with higher managementfees for US funds.
Studies of US funds include variables identifying different fee structures. Earlystudies only differentiated between funds with a load and those that were no-load.As funds alter distribution methods, later work includes variables identifying specificfee structures. For this study, INSTL is an indicator variable signifying the fund is forinstitutional clients. FELI, REDI, and BOTHFEE are indicator variables identifyingfunds with only a front-end load, only a redemption fee, or having both a front-endload and redemption fee.11 The omitted category represents funds that are targetedfor retail investors and do not have a front-end load or redemption fee.
Institutional funds are expected to have lower expenses as large investors receiveprice reductions in exchange for larger investments and the fact that there are alter-native investments for these investors not available to retail investors. Recent USstudies (e.g. Tufano and Sevick, 1997) find support for this view. Hypotheses regard-ing how other fee structures influence expenses provide conflicting predictions (see
9 The objectives included are short-term bond funds (omitted class), intermediate-term bond
funds (INTBOND), long-term bond funds (LONGBOND), balanced funds (BALANCED),
domestic equity funds (EQUITY), derivative funds (DERIVATIVE), international bond funds
(INTLBOND), international balanced funds (INTLBAL), and international equity funds
(INTLEQUITY).10 It should be noted that AGE and YEAR are not the same variables. First, funds that began
prior to the beginning of our sample will be older than implied by the YEAR variable. Second,
AGE is measured non-linearly while YEAR is a linear measure. To the extent that the two
variables are correlated (collinear), the coefficient estimates would be degraded. However,
collinearity diagnostics did not indicate a problem (see note 13).11Unlike in the US where funds are classified as being for institutional investors, we define
Finnish institutional funds based on minimum investment amounts. A fund is defined as
institutional if the minimum initial investment is greater than FIM500,000. Several cutoff
levels were used and the results were qualitatively similar.
Mutual Fund Expenses and Returns 419
# Blackwell Publishing Ltd, 2004
Ferris and Chance, 1987). Malhotra and McLeod (1997) find that US funds with asales charge, whether a front-end load or redemption fee, have higher expenses. Incontrast, Dellva and Olson (1998) find that front-end load funds have lower expenseswhile funds with redemption fees have higher expenses. Prior studies of US funds donot explicitly control for whether a fund has both a front-end load and a redemptionfee.
The complete specification for examining the impact of fund characteristics onoperational expenses takes the following form:
EXPENSEit ¼�þ�1FINLANDitþ�2BANKFUNDitþ�3YEAR
þX12
i¼4�iðOBJitÞþ�13FUNDSIZEitþ�14FAMSIZEitþ�15AGEit
þ�16LAGRETitþ�17INSTLitþ�18FELIit�19REDIit
þ�20BOTHFEEitþ ": ð1Þ
We combine sample years because each sample year is small, but doing so may leadto correlation among the regressors and error terms when using OLS since fundsappear in the sample up to eight times. To address this concern, we estimate equation(1) using both OLS and a random effects model. We choose random effects over fixedeffects for two reasons. First, while we have almost the entire population of funds inour sample at the outset, we drop observations due to data restrictions. Kennedy(1993) indicates random effects is more appropriate when the sample is not the entirepopulation, but he also suggests using a Hausman test to determine between fixed andrandom effects. Under the null of no correlation between regressors and error terms,random effects is preferred. In all situations, we reject the null of the Hausman test(see Table 2), and as such, random effects is the preferred technique.12
Empirical results
Summary statistics for the full sample and as of year-end 2000 are in Table 1. For thefull sample, average fund expenses are 1.44%, average size is FIM400 million, andaverage age is 5.63 years. Sixty-eight per cent of funds are of Finnish registry, andretail banks operate 45% of funds. The most common fee structure is one with afront-end load and redemption fee (56%) (BOTHFEE). The biggest differencesbetween the full sample and year-end 2000 are with regard to expenses, size, and thepercentage of Finnish registered funds. Year-end 2000 expenses are lower, which mayreflect more competition or more low cost fixed income funds.
The results from estimating equation (1) are presented in Table 2. With regard tomarket segmentation, we cannot reject Hypothesis 1. The coefficient estimate forFINLAND is not statistically significant, consistent with market integration or thatforeign registry leads to benefits that offset additional costs of segmentation. How-ever, being a bank fund significantly increases expenses by 12 basis points, a findinginconsistent with results in Koppenhaver (2000) and Lesseig et al. (2001). Thus, wereject hypothesis two. The result is consistent with the view that banks take advantageof their customers’ desire for convenience and exploit their monopoly power. This is afinding worthy of additional inquiry given the dominant role banks play in Finland
12We also estimate equation (1) using fixed effects, and the results are qualitatively similar to
those presented.
420 Timo P. Korkeamaki and Thomas I. Smythe, Jr
# Blackwell Publishing Ltd, 2004

Table
1
Summary
statisticsfortheentire
sample
ofFinnishfundsandasofyear-end2000.
Mean
S.D
.Minim
um
Maxim
um
Variables
Fullsample
2000
Fullsample
2000
Fullsample
2000
Fullsample
2000
Expense
1.436%
1.344%
0.651
0.628
0.200
0.200
3.300
3.300
Size
400.456
518.524
565.293
675.768
7.500
13.081
4269.629
4269.629
Age
5.631
5.800
3.107
3.510
1.417
1.917
16.083
16.083
Front-EndLoad
0.781
0.811
0.830
0.791
0.000
0.000
3.000
3.000
Redem
ptionFee
0.823
0.784
0.969
0.602
0.000
0.000
5.000
5.000
1-yearlagged
return
22.722
47.411
31.734
41.126
�60.900
�42.800
165.900
165.900
FIN
LAND
0.684
0.771
0.471
0.421
0.000
0.000
1.000
1.000
BANKFUND
0.446
0.443
0.498
0.498
0.000
0.000
1.000
1.000
FELI
0.108
0.107
0.315
0.311
0.000
0.000
1.000
1.000
REDI
0.307
0.262
0.459
0.441
0.000
0.000
1.000
1.000
BOTHFEE
0.558
0.584
0.497
0.495
0.000
0.000
1.000
1.000
Institutional
0.055
0.067
0.229
0.251
0.000
0.000
1.000
1.000
NoFee
0.022
0.040
0.144
0.197
0.000
0.000
1.000
1.000
Thistable
presents
summary
statisticsforthevariablesusedin
ourEXPENSE
empiricalanalysisfortheFullSample
andasofyear-end2000.Thereare
547
observationsacross
allyears
and149observationsin
2000thatmeetthecriteria
thatthefundbeatleast
oneyearold
andhavealagged
one-yearreturn
inadditionto
theother
relevantdata
elem
ents.Expense
istheoperationalexpense
ratioexpressed
asapercentageoffundassets.Sizeistheamountofassetsin
the
fundstatedin
millionsofFIM
.Ageisthefundagein
years.Front-endloadisthestatedup-frontload.Redem
ptionfeeisthestatedfeeto
exitafund.One-year
lagged
return
iseach
fund’sreturn
forthepreviousyear.FIN
LAND
isequalto
1ifthefundisregisteredin
Finlandand0otherwise.BANKFUND
isequalto
1ifthefundisoperatedbyabankand0otherwise.FELIisequalto
1ifthefundonly
hasafront-endloadand0otherwise.REDIisequalto
1ifthefundonly
has
aredem
ptionfeeand0otherwise.BOTHFEEisequalto
1ifthefundhasafront-endloadandaredem
ptionfeeand0otherwise.Institutionalisequalto
1ifthe
fundisforwealthinvestors
and0otherwise.
NoFee
isequalto
1ifthefundhasnofees
andisnotforinstitutionalinvestors
and0otherwise.
Mutual Fund Expenses and Returns 421
# Blackwell Publishing Ltd, 2004

Table 2
Estimates of equation (1) using ordinary least squares (OLS) and random effects (RE’s).
Dependent Variable: EXPENSE OLS RE’sNo. of Observations: 547 Coeff. Est. Coeff. Est.
Independent variables (P-value) (P-value)
CONSTANT5.387[0.000]***
5.916[0.000]***
FINLAND 0.030[0.547]
0.038[0.473]
BANKFUND 0.120[0.015]**
0.108[0.022]**
YEAR �0.039[0.003]***
�0.039[0.002]***
INTBOND �0.030[0.818]
�0.116[0.489]
LONGBOND �0.103[0.257]
�0.069[0.338]
BALANCED 1.041[0.000]***
1.035[0.000]***
EQUITY 0.860[0.000]***
0.897[0.000]***
DERIVATIVE 1.419[0.000]***
1.394[0.000]***
INTLBOND 0.085[0.393]
0.086[0.461]
INTLBAL 0.846[0.000]***
0.904[0.000]***
INTLEQUITY 0.779[0.000]***
0.805[0.000]***
FUNDSIZE 0.029[0.072]*
0.022[0.193]
FAMSIZE �0.081[0.000]***
�0.080[0.001]***
AGE 0.159[0.000]***
0.164[0.000]***
LAGRET 0.001[0.058]*
0.001[0.012]*
INSTL �0.355[0.000]***
�0.366[0.000]***
FELI 0.067[0.495]
0.082[0.484]
REDI �0.011[0.898]
�0.015[0.893]
BOTHFEE 0.151[0.123]
0.152[0.166]
Adjusted R-square 0.678 0.675Hausman Test P-value for RE vs. FE [0.723]
This table presents results for the dependent variable EXPENSE using OLS and random effects. INTBOND,LONGBOND, BALANCED, EQUITY, DERIVATIVE, INTLBOND, INTLBAL, and INTLEQUITYequal 1 if the fund is in the intermediate bond, long-term bond, balanced, domestic equity, derivative,international bond, international balanced, or international equity categories respectively and 0 otherwise.FUNDSIZE, FAMSIZE, AGE are the natural logarithm of fund assets, total fund family assets, and agerespectively. LAGRET is the fund’s previous year return. INSTL, FELI, and REDI equal 1 if the fund is forwealthy investors, has only a FEL, or has only a RED and 0 otherwise. BOTHFEE equals 1 if the fund has aFEL and a RED and 0 otherwise. FINLAND equals 1 if the fund is registered in Finland and 0 otherwise.BANKFUND equals 1 if the fund is operated by a bank and 0 otherwise. YEAR is the two-digit year thefund appears in the sample. Models are estimated using White (1980) standard errors. P-values are inparentheses.*** Significant at the 1% level; ** significant at the 5% level; * significant at the 10% level.
422 Timo P. Korkeamaki and Thomas I. Smythe, Jr
# Blackwell Publishing Ltd, 2004

and other European countries, as it raises questions of whether bank-centred fundindustries are competitive. Finally, the coefficient estimate for YEAR is negative andstatistically significant, leading us to reject hypothesis three. The finding indicates thatexpenses are declining over time, and is consistent with the Finnish market becomingmore competitive.
Consistent with prior studies, wide variation in fund expenses exists based on thefund type. When compared to short-term bond funds, domestic (international)balanced, domestic (international) equity, and derivative funds have statisticallyhigher expenses with funds investing in derivative securities (DERIVATIVE) havingthe highest expenses. The results for domestic (BALANCED) and internationalbalanced funds (INTLBAL), and domestic (EQUITY) and international equityfunds (INTLEQUITY) are of particular interest. For both pairs, international fundshave lower expenses than their domestic counterparts likely reflecting the higher costsof investing in less developed Finnish capital markets. Given the ability to gainbroader diversification by investing in foreign securities, international funds areformidable competitors to domestic funds based on cost. These findings contrastwith studies of US funds, where international funds (only equity) have higherexpenses than domestic funds (e.g. Dellva and Olson, 1998; Koch and Smythe, 1999).
Unlike US funds, Finnish funds do not pass on benefits of fund level scaleeconomies as lower expenses. While the result is unexpected, two possible explana-tions exist. First, Finnish funds may not have reached efficient scale, due to themarket’s infancy. Second, FUNDSIZE and FAMSIZE may be collinear, therebyinflating the standard errors.13 In contrast, funds belonging to larger fund groupshave lower expenses, consistent with Tufano and Sevick (1997) and Lesseig et al.(2002) and with the idea that larger organisations benefit from scope economies.
The results for the variables AGE and LAGRET provide further contrast. Moststudies find an inverse relationship between age and expenses. Here older funds havehigher expenses, even after controlling for whether a bank sponsors the fund, theoldest group of fund providers. However, if older funds have better performance,investors may be paying a premium for superior management, a possibility exploredbelow. The results for lagged returns are consistent with the idea that funds withhigher previous year returns have higher expenses.
The results for the fee structure variables demonstrate that having a front-end load,redemption fee, or both has no influence on expenses. However, consistent withTufano and Sevick (1997), funds designed for institutional investors charge signifi-cantly lower expenses.
In summary, the cross-sectional analysis of expenses allows us to reject hypothesestwo and three and highlights differences with US fund studies. There is no evidence ofmarket segmentation, but in contrast to US studies, Finnish banks charge higherexpenses than other fund operators. Additionally, the Finnish market exhibits evi-dence of increased competition as expenses are declining over the sample period.Equity and balanced funds have higher expenses than fixed income funds, consistentwith US studies. However, domestic equity and balanced funds have higher expenses
13Collinearity was examined using the condition indices of Belsley et al. (1980). There is some
evidence that the statistical power of FUNDSIZE and FAMSIZE is reduced due to inflated
standard errors. We also re-estimated the model by excluding first FUNDSIZE and then
FAMSIZE. The results are qualitatively similar to those presented.
Mutual Fund Expenses and Returns 423
# Blackwell Publishing Ltd, 2004

than similar international funds. Finally, older funds have higher expenses, and largerfunds do not exhibit scale economies, both in contrast to US studies.
5. Analysis of fund returns
Empirical specification
Attention now turns to examining the cross-sectional determinants of risk-adjustedreturns for Finnish funds. The dependent variable RETURN is defined as the alphafrom a model constructed in the spirit of Fama and French (1993). The focus is to testhypotheses four and five regarding market segmentation and bank influence on fundoperations. As with expenses, FINLAND is included to assess the possibility that theFinnish market exhibits segmentation (Hypothesis 4). Under the null, the variableshould have no explanatory power. To test hypothesis five, BANKFUND is includedand is defined as before. Under the null, there will be no difference in performancebetween funds operated by banks and funds operated by other types of firms, i.e.Finnish banks gain no informational advantages over other asset manager types thatlead to higher returns. Koppenhaver (2000), Frye (2001) and Lesseig et al. (2001)examine whether bank ownership influences returns for US funds and find mixedresults. Koppenhaver documents that bank-operated money market funds outper-form money market funds from other providers. Frye finds that some categories ofbank operated bond funds outperform peers managed by non-banks. In contrast,Lesseig et al. (2001) find no evidence of bank funds having superior performance inthe equity or fixed income categories. However, each study focuses on the US fundmarket, where banks have only recently entered the fund market and manage only 6%of assets, compared to 45% in Finland.
The control variables reflect work from previous studies. MKTBETA is a measureof systematic risk, but the variable differs by fund type. For each fund type (i.e.equity, fixed income, and balanced), we estimate an OLS model to determine the risk-adjusted dependent variable RETURN and the variable MKTBETA. Fama andFrench (1993 and subsequent work) demonstrate that a three-factor model is superiorto a one-factor model in explaining stock returns. Carhart (1997) provides similarevidence for a sample of US funds. Finally, Arshanapalli et al. (1998) demonstratethat a three-factor model is better at measuring alpha in international markets. Assuch, we estimate alpha and the market beta using a three (four) factor model forequity (balanced) funds. For fixed income funds, alpha and market beta are estimatedfrom a single index model using the Leonia Bank government bond index as themarket benchmark. To be included, funds must have 24 months of returns. The basicmodel we develop for estimating RETURN and MKTBETA is:
Rit � RFt ¼ �i þ �iðRmt � RFtÞ þ �VGiðRVt � RGtÞ þ �LSiðRLt � RStÞ þ "; ð2Þ
where,Rit¼monthly return for fund i in month t;RFt¼ the three month Helibor rate;Rmt¼ the MSCI World index published by Datastream (Ret) when examining equityfunds and the government bond index calculated by Leonia Bank (formerly PSP)(Rfit) when examining fixed income funds.RVt¼ the monthly Finnish value portfolio returns as reported by Datastream.RGt¼ the monthly Finnish growth portfolio returns as reported by Datastream.
424 Timo P. Korkeamaki and Thomas I. Smythe, Jr
# Blackwell Publishing Ltd, 2004

RLt¼ the monthly Finnish large cap portfolio returns as reported by Datastream.RSt¼ the monthly Finnish small cap portfolio returns as reported by Datastream.
Liljeblom and Loflund (1998) and Kasanen et al. (2001) also use 3-month Heliborto proxy for the risk-free rate. We choose the MSCI World index as our primarymarket benchmark for two reasons. First, during our sample period, Nokia represents60–70% of the Finnish market capitalisation. Even the HEX index, which limits theweight of each individual stock to 10% of the index, has an oversized concentration ofNokia and therefore is not a good representative benchmark for diversified portfolioperformance. Second, growing portions of Finnish equity funds are internationalfunds that do not correlate with local market indices. We are unable to constructFama-French HML and SMB portfolios directly.14 However, we use the portfolioreturns from Datastream specific to Finland for value (RVt), growth (RGt), large (RLt),and small (RSt) stocks that allow us to proxy for the HML and SMB factors. Toaccount for the influence of equity and fixed income risks facing balanced funds, wemodify equation (2) as follows:
Rit � RFt ¼�i þ �eiðRet � RFtÞ þ �VGiðRVt � RGtÞþ �LSiðRLt � RStÞ þ �fiiðRfit � RFtÞ þ ": ð3Þ
When examining bond funds, only the last term in equation (3) is used to estimateexcess returns and fund exposure to fixed income risk. Beginning with funds in 1995,we estimate equations (2) and (3) over 24 months and use the estimates of averagemonthly alpha for RETURN and the estimates of beta for MKTBETA in the analysisbelow. This is repeated for 1996 through 2000.
Indicator variables for fund objectives allow for differences in returns across fundtypes. However, returns are analysed separately for equity, bond, and balanced fundssince RETURN and MKTBETA are calculated using different benchmarks. So, onlyindicators corresponding to the equity, bond, or balanced groups are included whenexamining the categories separately.
A fund’s expense ratio (EXPENSE) for the respective year is included to measuremanagement ability to obtain and exploit information. A positive coefficient estimatewould indicate that spending additional resources leads to higher risk-adjustedreturns. Research is mixed as to the effect expenses have on returns. Using domesticequity funds, Droms and Walker (1996) and Apap and Griffin (1998) find that returnsare positively correlated to higher expenses. In contrast, Dellva and Olson (1998) andIndro et al. (1999) find an inverse relationship between expenses and returns. Finally,Liljeblom and Loflund (1998) and Otten and Bams (2002) find an inverse relationshipbetween expenses and returns examining funds in foreign markets.
Fund size (FUNDSIZE) is included to capture size effects. Some argue that largerfunds lose their ability to outperform peers if size leads to implicit indexing or if fundscan no longer take large positions in any one firm because doing so induces adverseprice moves. If supported, there will be an inverse relationship between fund size andreturns. Studies of US funds generally find no relationship between size and returns.
14HML refers to the portfolios constructed by subtracting the returns of low book to market
stocks from the returns of high book to market stocks. Similarly, SMB refers to portfolios
constructed by subtracting the returns of large stocks from small stocks (see Fama and French
(1993) for a more complete description).
Mutual Fund Expenses and Returns 425
# Blackwell Publishing Ltd, 2004
In contrast, Liljeblom and Loflund (1998) and Otten and Bams (2002) find a positiveand significant relationship between size and returns in their studies of European fundmarkets.
Ang et al. (1999) argue that larger fund families use the same economic data andexperts to interpret data across many funds, leading to scope economies and higherreturns. We argue that larger fund families have another advantage. If larger investorshave more access to company insiders, larger fund families with firm holdings acrossmultiple funds can obtain better information. To capture these advantages, FAM-SIZE is measured as above. If larger families enjoy these benefits, we will see a directrelationship between family size and returns. A fund’s age (AGE) controls for long-term past performance. For funds to become old, they are likely to have a record ofgood past performance. Alternatively, older funds whose past performance has beenstrong may not exert as much effort and ‘coast’ based on past success. Otten andBams (2002) find evidence of the latter effect among European funds.
The final four variables reflect different fee structures. Prior research includesindicator variables for front-end loads and redemption fees, with mixed results.15
Elton et al. (1993) and Apap and Griffin (1998) find no relationship between loadsand returns. In contrast Droms and Walker (1994) find an inverse relationshipbetween loads and returns, but they do not distinguish between a front-end loadand redemption fee. The analysis below extends this aspect of the literature bysegregating Finnish funds into five classes: funds with only a front-end load (FELI),funds with only a redemption fee (REDI), funds with a front-end load and redemptionfee (BOTHFEE), funds for institutional investors (INSTL), and the omitted class offunds with no load fees. To examine the cross-sectional return characteristics ofFinnish funds, we use the following empirical specification:
RETURNit ¼�þ �1FINLANDit þ �2BANKFUNDit þX12
i¼3�iðOBJitÞ
þ �13EXPENSEit þ �14FUNDSIZEit þ �15FAMSIZEit þ �16AGEit
þ �17FELIit þ �18REDIit þ �19BOTHFEEit þ �20INSTLit
þ �20MKTBETAit þ ": ð4Þ
Empirical results
Before examining multivariate results, univariate comparisons of RETURN andMKTBETA are presented in Table 3 where the MSCI World index is the marketbenchmark. When comparing risk-adjusted returns for Finnish versus foreign regis-tered funds in Panel B, Finnish equity and balanced fund returns are higher. Incontrast, foreign registered bond funds outperform Finnish bond funds. The results areconsistent with a rejection of Hypothesis 4. However, we are reluctant to draw strongconclusions from the results for balanced and bond funds given the small number of foreignregistered balanced funds and the marginal significance for bond funds. The univariateresults for bank operated versus non-bank funds suggest a rejection of Hypothesis 5 as well.Non-bank equity and balanced funds have significantly higher risk-adjusted returns thantheir bank peers, while bank bond funds outperform non-bank funds. The results are
15 Some research such as Dellva and Olson (1998) use the actual load levels, which addresses a
question separate from the one being asked here.
426 Timo P. Korkeamaki and Thomas I. Smythe, Jr
# Blackwell Publishing Ltd, 2004

Table
3
Univariate
ComparisonofFundAlphas(R
ETURN)andBetas(M
KTBETA).
RETURN
¼Alpha
Panel
A:Fullsample
Alpha
Equitybeta
Fixed
incomebeta
Mean
STD
Mean
STD
Mean
STD
Equity(n
¼269)
0.992
1.265
0.518
0.414
NA
NA
Bond(n
¼145)
�0.017
0.106
NA
NA
0.625
0.431
Balanced(n
¼76)
0.543
0.933
0.278
0.267
0.513
0.562
Panel
B:Segregatedbyregistry
Alpha
Equity
beta
Fixed
income
beta
FIN
LAND
FOREIG
NDiff.
FIN
LAND
FOREIG
NDiff.
FIN
LAND
FOREIG
NDiff.
Equity(102/167)
1.134
0.759
�0.375**
0.514
0.523
0.0009
NA
NA
NA
Bond(118/27)
�0.031
0.044
0.075*
NA
NA
NA
0.603
0.720
0.117
Balanced(71/5)
0.576
0.071
�0.505**
0.266
0.446
0.180***
0.518
0.441
�0.077
Mutual Fund Expenses and Returns 427
# Blackwell Publishing Ltd, 2004

Table3
Continued.
Panel
C:Segregatedbyfirm
type
Alpha
Equitybeta
Fixed
incomebeta
Bank
Non-bank
Diff.
Bank
Non-bank
Diff.
Bank
Non-bank
Diff.
Equity(117/152)
0.815
1.128
0.313**
0.548
0.494
�0.053
NA
NA
NA
Bond(67/78)
0.015
�0.045
�0.060***
NA
NA
NA
0.653
0.600
�0.053
Balanced(33/43)
0.318
0.716
0.398*
0.313
0.251
�0.062
0.504
0.520
0.017
Thistable
presents
abbreviatedsummary
statisticsformonthly
alphasandmarket
betassegregatedbyfundsthatare
ofFinnishorforeignregistryandbankor
non-bankoperated.The‘D
iff.’columnrepresents
theforeign(non-bank)minustheFinnishregistered(bank)funds.
Statisticalcomparisonsare
madewitha
t-statistic
adjusted
forunequalsample
varianceswhen
appropriate.Thenumbersto
therightofeach
fundtyperepresentthenumber
ofFinnish(bank)versus
foreign(non-bank)observationsin
thesub-samples.Theresultsrepresentacomparisonofalphasandmarket
betaswhen
estimatingaone-factormodelforfixed
incomefunds,athree-factormodel
forequityfunds,andafour-factormodel
(balancedfundsasdescribed
inequations(2)and(3)in
thepaper.
***Significantatthe1
%level;**significantatthe5
%level;*
significantatthe10%
level.
428 Timo P. Korkeamaki and Thomas I. Smythe, Jr
# Blackwell Publishing Ltd, 2004

particularly striking given thatmarket betas are generally not different between Finnish andforeign registered and bank and non-bank operated funds. Even when there is a statisticaldifference for balanced fund equity betas, the difference is counter to that expected.
We have one concern with the results in Table 3. The average sample beta for equityfunds is only 0.518. While the equity beta for balanced funds may deviate substan-tially from one based on a manager’s allocation between equity and bond assetclasses, an average equity fund beta substantially below one raises concerns overmodel fit. We examine this issue in Table 4.
In Panels A and B, we present the average alpha and beta and the average AdjustedR2 when estimating equation (2) with the MSCI World index as the market bench-mark, but also separately using the HEX index as a proxy for the local marketindex.16 We also separate the data both by sample year and also by whether thesample year is before 1999 (pre-euro) or 1999 and after (post-euro). We do thisbecause Finland adopted the euro in January 1999. The results are striking. Whenthe MSCI World index is the market benchmark, two observations stand out. First,the market beta is substantially lower during 1995–1998 but more consistent withexpectations during 1999–2000. Consistent with these findings, model Adjusted R2’sare close to zero prior to 1999 but have risen dramatically since.17 In contrast, there islittle change in estimated betas or Adjusted R2’s when HEX is the market benchmark.
Similar results for balanced funds are presented in Panels C and D of Table 4. Weplace less emphasis on the pre/post euro beta comparisons for balanced funds sincethe betas for equity and fixed income exposure are affected by how fund managersallocate assets among these asset classes. However, we do feel confident in drawingsimilar conclusions as above when examining the Adjusted R2’s for the balanced fundreturn models. Once again, the average statistical fit jumps dramatically. Thereappears to be a structural break in model effectiveness after 1998 when using theMSCI World index. While further analysis of this issue is beyond the scope of thispaper, one possible explanation for the divergence in model results could be that theintroduction of the euro has led to less developed markets such as Finland’s tobecome more fully integrated with world markets.
The univariate results indicate that we must proceed cautiously with the multi-variate analysis. While the results in Table 3 are interesting, many other factorsincluded in equation (4) are likely to explain returns cross-sectionally. Additionally,the Table 4 analysis indicates that while the MSCI World index is the theoreticallyappropriate market benchmark for estimating alpha and beta, doing so may undulybias our cross-sectional results. We address this issue in our robustness tests below.
The initial multivariate results using OLS appear in Table 5 by fund type. We notethat none of the results for the equity and balanced categories include funds with anyload fees. Because of their late introduction, no funds of this type with sufficientreturn data exist. So, the omitted fee structure for these sub-samples represents fundswith a front-end load and redemption fee (BOTHFEE). The results for equity fundsare in column one.
Funds registered in Finland perform better than foreign registered funds, consistentwith the univariate results and suggesting potential market segmentation and a
16We thank the referee for suggesting we examine this issue.17As a reminder, the average estimated values in 1999 are likely biased downward because 1998
monthly returns are included in the estimation.
Mutual Fund Expenses and Returns 429
# Blackwell Publishing Ltd, 2004

Table 4
Univariate comparison of fund alphas (RETURN) and betas (MKTBETA).
Panel A: RETURN¼Fama-French MSCI Values for Equity Funds
Alpha Equity beta Adjusted R2
Mean STD Mean STD Mean STD
Full sample (n¼ 269) 0.992 1.265 0.518 0.414 0.305 0.291
Pre-euro (n¼ 122) 0.822 1.420 0.210 0.329 0.027 0.098
Post-euro (n¼ 147) 1.133 1.105 0.773 0.284 0.536 0.172
1995 (n¼ 18) �0.860 0.271 0.368 0.074 �0.081 0.026
1996 (n¼ 30) 0.833 0.745 0.222 0.174 �0.001 0.084
1997 (n¼ 29) 2.502 0.941 �0.283 0.204 0.113 0.104
1998 (n¼ 45) 0.404 1.179 0.457 0.125 0.033 0.064
1999 (n¼ 64) 0.605 0.844 0.802 0.257 0.448 0.119
2000 (n¼ 83) 1.541 1.114 0.750 0.303 0.605 0.175
Panel B: RETURN¼Fama-French Hex Values for Equity Funds
Alpha Equity beta Adjusted R2
Mean STD Mean STD Mean STD
Full sample (n¼ 269) 0.408 0.879 0.755 0.319 0.662 0.232
Pre-euro (n¼ 122) 0.373 0.878 0.792 0.222 0.683 0.251
Post-euro (n¼ 147) 1.133 1.105 0.773 0.284 0.645 0.213
1995 (n¼ 18) 0.198 0.272 0.844 0.139 0.864 0.090
1996 (n¼ 30) 0.497 0.682 0.729 0.350 0.578 0.342
1997 (n¼ 29) 0.115 0.666 0.908 0.161 0.671 0.235
1998 (n¼ 45) 0.526 1.189 0.738 0.125 0.689 0.195
1999 (n¼ 64) 0.341 0.778 0.666 0.246 0.701 0.169
2000 (n¼ 83) 0.511 0.951 0.770 0.453 0.601 0.234
Panel C: RETURN¼RETURN¼Fama-French MSCI Values for Balanced Funds
Alpha Equity beta Fixed income beta Adjusted R2
Mean STD Mean STD Mean STD Mean STD
Full sample (n¼ 76) 0.543 0.933 0.513 0.562 0.278 0.267 0.341 0.293
Pre-euro (n¼ 39) 0.368 0.958 0.835 0.574 0.107 0.223 0.084 0.103
Post-euro (n¼ 37) 0.727 0.881 0.174 0.283 0.458 0.175 0.599 0.165
1995 (n¼ 6) �0.781 0.516 0.945 0.249 0.213 0.098 0.030 0.076
1996 (n¼ 9) 0.413 0.659 0.520 0.298 0.073 0.116 0.037 0.084
1997 (n¼ 11) 1.489 0.736 0.494 0.605 �0.175 0.084 0.179 0.112
1998 (n¼ 13) �0.082 0.144 1.290 0.491 0.321 0.096 0.060 0.063
1999 (n¼ 14) 0.705 0.955 0.081 0.210 0.521 0.122 0.497 0.098
2000 (n¼ 23) 0.741 0.855 0.230 0.310 0.420 0.194 0.662 0.168
430 Timo P. Korkeamaki and Thomas I. Smythe, Jr
# Blackwell Publishing Ltd, 2004

rejection of Hypothesis 4. The result is economically significant, and indicates thatequity funds registered in Finland generate significantly higher risk-adjusted returns,on the order of 50 basis points. This finding is consistent with the logical argumentsput forth in Grinblatt and Keloharju (2001). Finnish fund managers may gainpreferential access to firm insiders based on cultural and/or linguistic factors thathelp Finnish managers generate higher returns. The coefficient estimate for BANK-FUND indicates that Hypothesis 5 is rejected for equity funds as well. The coefficientestimate is negative and significant, consistent with the univariate results and suggest-ing that bank managed equity funds have lower returns than funds managed by othertypes of firms. This finding, combined with the expense results, reflects poorly onFinnish banks. Equity funds managed by banks cost more to own and they performpoorly, even after controlling for higher expenses. These results are particularlydisturbing given the large bank presence in the Finnish fund market and suggestthat other bank-centred fund markets be closely scrutinised.
Looking at control variables, equity funds with higher systematic risk have lowerrisk-adjusted returns; a perplexing result that occurs even after controlling for size andvalue factors in returns. Larger equity funds have higher returns as indicated by thecoefficient estimate on FUNDSIZE, a finding consistent with Liljeblom and Loflund(1998) and Otten and Bams (2002) but in contrast to US studies. The AGE variableis not a significant determinant of returns in contrast to Otten and Bams (2002).However, their empirical specification does not have the broad range of controlsemployed in this study. When combined with the result that older funds have higherexpenses, investors would be wise to bypass older equity funds. Two fee structuressignificantly influence returns. Equity funds with only a front-end load have margin-ally lower returns, while funds for institutional (INSTL) investors have significantlyhigher returns. This is an interesting finding, suggesting that large investors benefitfrom higher equity fund returns even after controlling for lower expenses. One
Panel D: RETURN¼RETURN¼Fama-French HEX Values for Balanced Funds
Alpha Equity beta Fixed income beta Adjusted R2
Mean STD Mean STD Mean STD Mean STD
Full sample (n¼ 76) 0.202 0.581 0.291 0.499 0.524 0.199 0.779 0.136
Pre-euro (n¼ 39) 0.190 0.394 0.358 0.582 0.565 0.160 0.795 0.123
Post-euro (n¼ 37) 0.214 0.724 0.221 0.389 0.481 0.227 0.762 0.147
1995 (n¼ 6) 0.097 0.294 0.084 0.238 0.629 0.181 0.902 0.024
1996 (n¼ 9) 0.316 0.637 0.128 0.350 0.622 0.168 0.794 0.139
1997 (n¼ 11) 0.102 0.383 0.098 0.671 0.598 0.180 0.741 0.136
1998 (n¼ 13) 0.222 0.199 0.864 0.416 0.467 0.078 0.791 0.105
1999 (n¼ 14) 0.461 0.873 0.479 0.260 0.449 0.120 0.801 0.108
2000 (n¼ 23) 0.063 0.606 0.064 0.374 0.501 0.274 0.739 0.164
This table presents abbreviated summary statistics for monthly alphas and market betas segregatedby sample year and whether the observation is from the period prior to 1999 or 1999 and after. Theresults in Panels A and B represent alphas and market betas when estimating a three-factor (four-factor) model for equity (balanced) funds using the MSCI World index as the market benchmark.The results in Panels C and D represent alphas and market betas when estimating a three-factor(four-factor) model for equity (balanced) funds using the HEX Finnish index as the market bench-mark. In each panel, the last two columns represent the average Adjusted R2 values from estimatingequations (2) and (3) for each fund in the sample during the appropriate time frame.
Mutual Fund Expenses and Returns 431
# Blackwell Publishing Ltd, 2004

explanation is that institutional equity fund managers are signaling their expertise tothe market. This signal is costly because these investors demand lower prices, arelikely to be more sophisticated, and will exit poorly performing funds. This is a newfinding unique to the Finnish market.
The bond fund results are in column two of Table 5. Unlike equity funds and incontrast to univariate results, Finnish registered fixed income fund returns are nodifferent from foreign registered funds. In contrast to the equity fund sub-sample butconsistent with the univariate results, bank operated fixed income funds have higherreturns than funds operated by other asset managers. This finding supports the ideathat banks capitalise on their fixed income management expertise and is consistentwith results in Koppenhaver (2000) and Frye (2001).
Similar to equity funds, fixed income funds with higher levels of systematic riskhave lower returns. The variables identifying different fund categories reveal differ-ences in returns even after accounting for systematic risk factors. Long-term (LONG-BOND) and international (INTLBOND) bond funds have statistically higher returnsthan short-term bond funds. We offer two explanations. First, fund managers may bemore effective at identifying informational asymmetries. Alternatively, the marketbenchmark may not effectively account for duration and international risks. None-theless, given the lack of fixed income market development in Finland, as suggested inPuttonen and Kivisaari (1997), this finding has intuitive appeal.
The coefficient estimate for EXPENSE contradicts other studies. Carhart (1997)(US), Liljeblom and Loflund (1998), and Otten and Bams (2002) (European) find aninverse relationship between expenses and returns, whereas the coefficient estimate isnot significant in any of our samples. Finally, fee structure is also an important factorin explaining fixed income returns, although differently from equity funds. Funds withonly a redemption fee have higher risk-adjusted returns relative to funds with a front-end load and redemption fee.
The results for balanced funds are presented in column three of Table 5. In contrastto the univariate results for balanced funds, Finnish balanced funds under performforeign registered balanced funds when controlling for other factors, although thecoefficient estimate is not statistically significant. Unlike equity and fixed incomefunds, we cannot reject Hypothesis 5 for balanced funds. Bank operated balancedfunds perform no differently from non-bank funds.
Balanced funds with lower fixed income systematic risk have higher returns. Aswith equity funds, larger balanced funds have higher returns, consistent with a fundsize effect, but funds from larger fund families have lower returns in contrast toexpectations. Examining AGE, we find further evidence that older funds are poorinvestment choices. Older balanced funds have a higher cost without producing higherreturns. Finally, fee structure also plays a role in explaining balanced fund returns. Incontrast to equity funds, being an institutional fund leads to lower balanced fundreturns. The result for institutional funds is particularly perplexing and runs counterto our earlier signalling explanation for equity funds.
Robustness tests
Since the data are pooled over six years, and because alpha and beta estimates arecalculated each year from overlapping data, there is likely to be correlation amongregressors and error terms when using OLS. To mitigate the problem, we re-estimateequation (4) using fixed and random effects. To determine which technique to report,
432 Timo P. Korkeamaki and Thomas I. Smythe, Jr
# Blackwell Publishing Ltd, 2004

Table 5
Estimates of equation (4) using OLS for equity, fixed income, and balanced funds separately.
Dependent variable: RETURNFund type: Equity Fixed income Balanced
coeff. est. coeff. est. coeff. est.Independent variables (P-value) (P-value) (P-value)
CONSTANT �5.766[0.001]***
�0.214[0.273]
�0.986[0.552]
FINLAND 0.502[0.026]**
�0.034[0.328]
�0.887[0.113]
BANKFUND �0.565[0.008]***
0.046[0.083]*
�0.417[0.196]
EQBETA �0.527[0.018]**
0.489[0.366]
FIBETA �0.190[0.041]**
�0.827[0.000]***
DERIVATIVE 0.188[0.658]
INTLEQUITY �0.065[0.761]
INTBOND 0.080[0.132]
LONGBOND 0.164[0.053]*
INTLBOND 0.235[0.016]**
INTLBAL �0.445[0.211]
EXPENSE 0.026[0.903]
�0.015[0.775]
0.410[0.178]
FUNDSIZE 0.202[0.024]**
�0.005[0.601]
0.408[0.003]***
FAMSIZE 0.134[0.179]
0.014[0.272]
�0.228[0.036]**
AGE 0.102[0.495]
0.0004[0.985]
�0.345[0.174]
FELI �0.326[0.072]*
0.028[0.414]
0.144[0.630]
REDI �0.099[0.634]
0.042[0.024]**
�0.079[0.701]
BOTHFEE �0.002[0.926]
INSTL 0.852[0.015]**
�0.018[0.449]
�1.101[0.068]*
Adjusted R-square 0.094 0.205 0.342No. of observations 269 145 76
This table presents results for the dependent variable RETURN using OLS. RETURN is the risk-adjusted alpha from estimating equation (2) for equity and fixed income funds and equation (3) forbalanced funds. DERIVATIVE, INTLEQUITY, INTBOND, LONGBOND, INTLBOND, andINTLBAL equal 1 if the fund is in the derivative, international equity, intermediate bond, long-term bond, international bond, or international balanced categories respectively and 0 otherwise.EXPENSE is the expense ratio expressed as a percentage of fund assets. FUNDSIZE, FAMSIZE,AGE are the natural logarithm of fund assets, total fund family assets, and age respectively. BANK-FUND equals 1 if the fund is operated by a bank and 0 otherwise. FINLAND equals 1 if the fund isregistered in Finland and 0 otherwise. FELI, REDI, and INSTL equal 1 if the fund has only a FEL,has only a RED, or is for wealthy investors and 0 otherwise. EQBETA is the equity beta estimatefrom estimating equation (2) (equity) or (3) (balanced) using the MSCI World index. FIBETA is thefixed income beta estimate for the fixed income and balanced sub-samples using the Leonia Bankindex. Models are estimated using White (1980) standard errors. P-values are in parentheses.*** Significant at the 1% level; ** significant at the 5% level; * significant at the 10% level.
Mutual Fund Expenses and Returns 433
# Blackwell Publishing Ltd, 2004
we conduct a Hausman test. Under the null of no correlation between error terms andindependent variables, random effects is the appropriate estimation technique.18 Thenull is only rejected in the case of balanced funds, so random effects results arepresented in Table 6 for the equity and bond sub-samples and fixed effects for thebalanced sub-sample.
While there is some consistency with the results in Table 5, there are differencesworth noting. In the equity sample, the BANKFUND, FINLAND and INSTL coeffi-cient estimates are no longer statistically significant meaning we are unable to rejectHypotheses 4 or 5 for equity funds when using random effects. Given the panel natureof our sample and the fact that the coefficient estimates for FINLAND and BANK-FUND in the random effects model do not approach statistical significance, we findlittle support for market segmentation or bank influence in the returns data for equityfunds. However, larger fund families have funds with returns that are lower, incontrast to expectations but consistent with balanced fund results. The differencesin the fixed income sample are that the coefficient estimates for BANKFUND andREDI are no longer statistically significant, although the change in the BANKFUNDcoefficient estimate is not as dramatic as is the case for equity funds. This suggeststhat banks cannot overcome their cost disadvantage to exploit informational advan-tages and provides additional evidence suggesting that investors should avoid bankfunds. Finally, the primary changes between the OLS and random effects models forbalanced funds are that the FIBETA and INSTL variables are no longer statisticallysignificant, but the equity beta is positively related to returns. More importantly, thecoefficient estimate for FINLAND is now statistically significant, leading to a rejec-tion of Hypothesis 4 but in an unexpected manner. The inverse relationship is incon-sistent with a market segmentation argument. Other variables gain or lose somestatistical power, but the results are otherwise consistent with those using OLS.
The second issue addressed is based on findings from Table 4 when comparingmodel parameters using the MSCI World index and the HEX index separately asmarket benchmarks when estimating equations (2) and (3). While we believe theMSCI World index is the theoretically appropriate benchmark for the three (four)factor model, we cannot ignore the sensitivity of model parameters to the choice ofindex. More importantly, we recognise the potential impact this may have on thecross-sectional analysis. As such, we re-estimate equation (4) where the variablesRETURN and MKTBETA are the output from estimating equations (2) and (3)using the HEX index as the market benchmark. The results are presented in Table 7.
Equity fund results appear in columns one and two. First, the explanatory power isreduced dramatically relative to the results from Tables 5 and 6. When using alphaand beta estimates where HEX is the market benchmark, the cross-sectional model ofreturns explains less than three% of return variation. More importantly, the coeffi-cient estimates for FINLAND and BANKFUND are no longer significant when usingOLS, while the random effects results in Table 7 are consistent with those in Table 6.For the balanced fund sub-sample, the major differences also occur when using theOLS estimation technique. FINLAND is now significantly negative, consistent withthe earlier fixed and current random effects results. Additionally, older funds show asignificant inverse relationship to returns. The random effects results for balancedfunds are largely consistent with those in Table 6.
18 See Kennedy (1993 p. 223).
434 Timo P. Korkeamaki and Thomas I. Smythe, Jr
# Blackwell Publishing Ltd, 2004

Table 6
Estimates of equation (4) using Random Effects (RE’s) or Fixed Effects (FE’s).
Dependent variable: RETURN RE’s RE’s FE’sFund type: Equity Fixed income Balanced
coeff. est. coeff. est. coeff. est.Independent variables (P-value) (P-value) (P-value)
CONSTANT 0.957[0.534]
�0.244[0.266]
FINLAND 0.076[0.677]
�0.031[0.405]
�0.791[0.043]**
BANKFUND �0.062[0.694]
0.041[0.164]
�0.092[0.759]
EQBETA 0.315[0.196]
1.669[0.095]*
FIBETA �0.177[0.001]***
�0.381[0.046]**
DERIVATIVE 0.016[0.957]
INTLEQUITY �0.392[0.019]**
INTBOND 0.075[0.150]
LONGBOND 0.150[0.006]***
INTLBOND 0.225[0.000]***
INTLBAL �0.932[0.005]***
EXPENSE �0.006[0.969]
�0.015[0.825]
0.197[0.376]
FUNDSIZE 0.196[0.001]***
�0.005[0.589]
0.314[0.003]***
FAMSIZE �0.170[0.023]**
0.015[0.210]
�0.263[0.001]***
AGE �0.066[0.600]
0.004[0.848]
�0.461[0.044]**
FELI �0.411[0.061]*
0.026[0.475]
�0.090[0.687]
REDI 0.054[0.726]
0.036[0.263]
�0.147[0.436]
BOTHFEE �0.005[0.888]
INSTL 0.593[0.117]
�0.022[0.473]
�0.473[0.264]
Adjusted R-square 0.450 0.201 0.636No. of Observations 269 145 76Hausman Test P-value for RE vs. FE [0.996] [0.944] [0.000]***
This table presents results for RETURN using random and fixed effects (RE’s). RETURN is the alpha fromestimating equation (2) for equity and fixed income funds and equation (3) for balanced funds. DERIVA-TIVE, INTLEQUITY, INTBOND, LONGBOND, INTLBOND, and INTLBAL equal 1 if the fund is in thederivative, international equity, intermediate bond, long-term bond, international bond, or internationalbalanced categories respectively and 0 otherwise. EXPENSE is expense ratio. FUNDSIZE, FAMSIZE,AGE are the natural logarithm of fund assets, fund family assets, and age. BANKFUND equals 1 if the fundis operated by a bank and 0 otherwise. FINLAND equals 1 if the fund is registered in Finland and 0otherwise. FELI, REDI, and INSTL equal 1 if the fund has only a FEL, has only a RED, or is for wealthyinvestors and 0 otherwise. EQBETA is the equity beta estimate from estimating equation (2) (equity) or (3)(balanced) using the MSCI index. FIBETA is the beta estimate for the fixed income and balanced sub-samples using the Leonia Bank index. P-values are in parentheses.*** Significant at the 1% level; ** significant at the 5% level; * significant at the 10% level.
Mutual Fund Expenses and Returns 435
# Blackwell Publishing Ltd, 2004
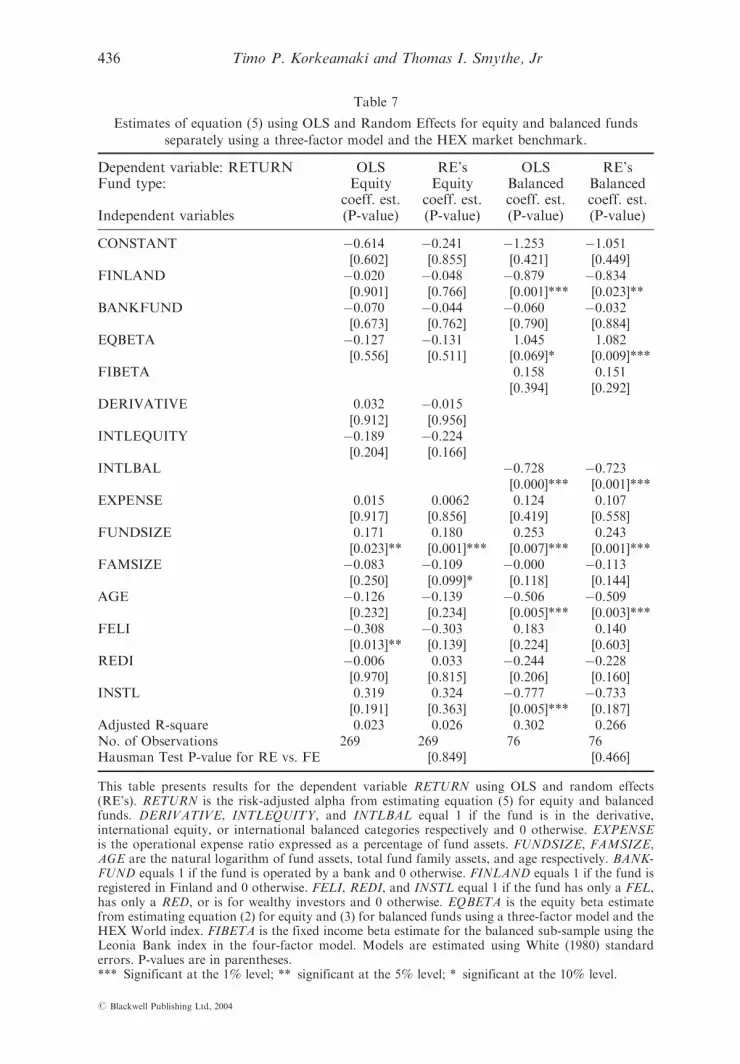
Table 7
Estimates of equation (5) using OLS and Random Effects for equity and balanced funds
separately using a three-factor model and the HEX market benchmark.
Dependent variable: RETURN OLS RE’s OLS RE’sFund type: Equity Equity Balanced Balanced
coeff. est. coeff. est. coeff. est. coeff. est.Independent variables (P-value) (P-value) (P-value) (P-value)
CONSTANT �0.614[0.602]
�0.241[0.855]
�1.253[0.421]
�1.051[0.449]
FINLAND �0.020[0.901]
�0.048[0.766]
�0.879[0.001]***
�0.834[0.023]**
BANKFUND �0.070[0.673]
�0.044[0.762]
�0.060[0.790]
�0.032[0.884]
EQBETA �0.127[0.556]
�0.131[0.511]
1.045[0.069]*
1.082[0.009]***
FIBETA 0.158[0.394]
0.151[0.292]
DERIVATIVE 0.032[0.912]
�0.015[0.956]
INTLEQUITY �0.189[0.204]
�0.224[0.166]
INTLBAL �0.728[0.000]***
�0.723[0.001]***
EXPENSE 0.015[0.917]
0.0062[0.856]
0.124[0.419]
0.107[0.558]
FUNDSIZE 0.171[0.023]**
0.180[0.001]***
0.253[0.007]***
0.243[0.001]***
FAMSIZE �0.083[0.250]
�0.109[0.099]*
�0.000[0.118]
�0.113[0.144]
AGE �0.126[0.232]
�0.139[0.234]
�0.506[0.005]***
�0.509[0.003]***
FELI �0.308[0.013]**
�0.303[0.139]
0.183[0.224]
0.140[0.603]
REDI �0.006[0.970]
0.033[0.815]
�0.244[0.206]
�0.228[0.160]
INSTL 0.319[0.191]
0.324[0.363]
�0.777[0.005]***
�0.733[0.187]
Adjusted R-square 0.023 0.026 0.302 0.266No. of Observations 269 269 76 76Hausman Test P-value for RE vs. FE [0.849] [0.466]
This table presents results for the dependent variable RETURN using OLS and random effects(RE’s). RETURN is the risk-adjusted alpha from estimating equation (5) for equity and balancedfunds. DERIVATIVE, INTLEQUITY, and INTLBAL equal 1 if the fund is in the derivative,international equity, or international balanced categories respectively and 0 otherwise. EXPENSEis the operational expense ratio expressed as a percentage of fund assets. FUNDSIZE, FAMSIZE,AGE are the natural logarithm of fund assets, total fund family assets, and age respectively. BANK-FUND equals 1 if the fund is operated by a bank and 0 otherwise. FINLAND equals 1 if the fund isregistered in Finland and 0 otherwise. FELI, REDI, and INSTL equal 1 if the fund has only a FEL,has only a RED, or is for wealthy investors and 0 otherwise. EQBETA is the equity beta estimatefrom estimating equation (2) for equity and (3) for balanced funds using a three-factor model and theHEX World index. FIBETA is the fixed income beta estimate for the balanced sub-sample using theLeonia Bank index in the four-factor model. Models are estimated using White (1980) standarderrors. P-values are in parentheses.*** Significant at the 1% level; ** significant at the 5% level; * significant at the 10% level.
436 Timo P. Korkeamaki and Thomas I. Smythe, Jr
# Blackwell Publishing Ltd, 2004

6. Conclusions
This paper focuses on similarities and differences between the US and Finnish mutualfund industries. We conduct an empirical analysis of the cross-sectional determinantsof Finnish mutual fund expenses and returns. We specifically test hypotheses regard-ing market integration, the impact of bank ownership on expenses and returns, andwhether the Finnish market has become more competitive. The analysis also providespractical information for Finnish investors on which characteristics are important forchoosing funds.
We find that Finnish international equity and balanced funds tend to have lowerexpenses than their domestic counterparts, indicative of the less developed Finnishmarkets. More importantly for investors, funds from larger families and funds forinstitutional investors have lower expenses. However, older funds and funds operatedby banks have higher expenses. The examination of returns indicates that Finnishregistered equity funds have higher returns but Finnish balanced funds have lowerreturns. Additionally, there is evidence in the case of equity funds that after control-ling for expenses, bank funds have lower risk-adjusted returns. However, these resultsare extremely sensitive to the market benchmark used to estimate alpha and theempirical estimation technique employed. Additionally, equity and balanced fundsthat are larger have higher risk-adjusted returns, while these categories have lowerreturns when the fund belongs to a large fund family.
Finally, our results have public policy implications. Specifically, we find that fundcosts are declining over time, indicative of an increasingly competitive market. How-ever, older funds and funds operated by banks have higher expenses that are not offsetby superior returns. Investigation of these findings is worth additional study not onlyin the Finnish market but other bank-centred markets.
References
Ang, J. S., Chen, A.-S. and Lin, J. W., ‘Information sharing, return characteristics, and
portfolio beta: the case of mutual funds’, Journal of Investing, Vol. 8, 1999, pp. 54–64.
Apap, A. and Griffin, J. M., ‘The impact of expenses on equity mutual fund performance’,
Journal of Financial Planning, Vol. 11, 1998, pp. 76–81.
Arshanapalli, B., Coggin, T. D. and Doukas, J., ‘Multifactor asset pricing analysis of
inter national value investment strategies’, Journal of Portfolio Management, Vol. 24, 1998,
pp. 10–23.
Belsley, D. A., Kuh, E. and Welsch, R.E., Regression Diagnostics (New York: John Wiley,
1980).
Brown, S. J., Goetzmann, W. N., Ibbotson, R. and Ross, S. A., ‘Survivorship bias in perform-
ance studies’, Review of Financial Studies, Vol. 5, 1992, pp. 553–80.
Carhart, M. M., ‘On persistence in mutual fund performance’, Journal of Finance, Vol. 52, 1997,
pp. 56–82.
Dahlquist, M., Engstrom, S. and Soderlind, P., ‘Performance and characteristics of Swedish
mutual funds’, Journal of Financial and Quantitative Analysis, Vol. 35, 2000, pp. 409–423.
Dellva, W. L., and Olson, G. T., ‘The relationship between mutual fund fees and expenses and
their effect on performance’, Financial Review, Vol. 33, 1998, pp. 85–104.
Dermine, J. and Roller, L.-H., ‘Economies of scale and scope in French mutual funds’, Journal
of Financial Intermediation, Vol. 2, 1992, pp. 83–93.
Droms, W. G. and Walker, D. A., ‘Investment performance of international mutual funds’,
Journal of Financial Research, Vol. 17, 1994, pp. 1–14.
Mutual Fund Expenses and Returns 437
# Blackwell Publishing Ltd, 2004
Droms, W. G. and Walker, D. A., ‘Mutual fund investment performance’, Quarterly Review of
Economics and Finance, Vol. 36, 1996, pp. 347–63.
Elton, E. J., Gruber, M. J., Das, S. and Hlavka, M., ‘Efficiency with costly information: a
reinterpretation of evidence from managed portfolios’, Review of Financial Studies, Vol. 6,
1993, pp. 1–22.
Essayyad, M. and Wu, H. K., ‘The performance of US international mutual funds’, Quarterly
Journal of Business and Economics, Vol. 27, 1998, pp. 32–46.
Fama, E. F. and French, K. R., ‘Common risk factors in the returns on stocks and bonds’,
Journal of Financial Economics, Vol. 33, 1993, pp. 3–56.
Ferris, S. P. and Chance, D. M., ‘The effect of 12b-1 plans on mutual fund expense ratios: a
note’, Journal of Finance, Vol. 42, 1987, pp. 1053–73.
Frye, M. B., ‘The performance of bank managed mutual funds’, Journal of Financial Research,
Vol. 24, 2001, pp. 419–42.
Grinblatt, M. and Keloharju, M., ‘How distance, language, and culture influence stockholdings
and trades’, Journal of Finance, Vol. 56, 2001, pp. 1077–82.
Indro, D. C., Jiang, C. X., Hu, M. Y. and Lee, W. Y., ‘Mutual fund performance: does fund
size matter?’ Financial Analysts Journal, Vol. 55, 1999, pp. 74–87.
Ippolito, R. A., ‘Efficiency with costly information: a study of mutual fund performance,
1965–1984’, Quarterly Journal of Economics, Vol. 104, 1989, pp. 1–23.
Kasanen, E., Lipponen, V. and Puttonen, V., ‘What determines mutual fund growth: evidence
from Finland’, Finnish Journal of Business Economics, 2001, pp. 227–59.
Kennedy, P., A Guide to Econometrics, 3rd ed. (Cambridge MA: MIT Press, 1993).
Koch, T. W. and Smythe, T. I., ‘Mutual fund expenses and multiple share class funds’, Working
Paper (University of South Carolina, 1999).
Koppenhaver, G.D., ‘Circle unbroken: bank-affiliated money market mutual funds’, Working
Paper (Iowa State University, 2000).
Lesseig, V. P., Long, D. M. and Smythe, T. I., ‘Gains to mutual fund sponsors offering multiple
share class funds’, Journal of Financial Research, Vol. 25, 2002, pp. 81–98.
Lesseig, V. P., Long, D. M. and Smythe, T. I., ‘The impact of fund company ownership on
mutual fund expense and returns: do you get what you pay for?’ Working Paper (University
of Tennessee at Chattanooga., 2001).
Liljeblom, E. and Loflund, A., ‘Evaluating mutual funds on a small market: is benchmark
selection crucial?’ Scandinavian Journal of Management, 1998, pp. 1–18.
Malhotra, D. K. and McLeod, R.W., ‘An empirical analysis of mutual fund expenses’, Journal
of Financial Research, Vol. 20, 1997, pp. 175–90.
McLeod, R. W. and Malhotra, D.K., ‘A re-examination of the effect of 12b-1 plans on mutual
fund expense ratios’, Journal of Financial Research, Vol. 17, 1994, pp. 231–40.
Otten, R. and Bams, D., ‘European mutual fund performance’, European Financial Manage-
ment, Vol. 8, 2002, pp. 75–101.
Puttonen, V. and Kivisaari, T., Sijoittaminen ja sijoitusrahastot Suomessa (Helsinki: KY-Palvelu
Oy, 1997).
Smythe, T. I., ‘Multiple share class funds: efficiency or exploitation’, unpublished dissertation
(University of South Carolina, 1999).
Shukla, R. K. and van Inwegen, G. B., ‘Do locals perform better than foreigners? An analysis
of UK and US mutual fund managers’, Journal of Economics and Business, Vol. 47, 1995,
pp. 241–54.
Tufano, P. and Sevick, M., ‘Board structure and fee-setting in the US mutual fund industry’,
Journal of Financial Economics, Vol. 46, 1997, pp. 321–55.
Warther, V. A., ‘Aggregate mutual fund flows and security returns’, Journal of Financial
Economics, Vol. 39, 1995, pp. 209–35.
White, H., ‘A heteroskedasticity-consistent covariance matrix estimator and a direct test for
heteroskedasticity’, Econometrica, Vol. 48, 1980, pp. 817–38.
438 Timo P. Korkeamaki and Thomas I. Smythe, Jr
# Blackwell Publishing Ltd, 2004