baniz of finland - helda
TRANSCRIPT

BANIZ OF FINLAND MONTHLY BULLETIN
----------
Vol. 39 No.6 JUNE 1965 --------------
RECENT DEVELOPMENTS THE MONEY MARKET
During 1964 the upswing in ·economic 'activit.y and the sharp rise in prices and CDsts in pal~ticular, created a. considerable demand pressure Dn ,the money market. At the same time t.he grO'wing tDt'al demand was largely directed tDwards impOl"is thus causing a very heavy defieit in the balance of payments on current aCC-Dunt. HDwever, bDrrowing abrnad was increased to' such an extent that the defieit was covered, in addition ;tD which the fDreign exchange reserve was augmented by more than 100 m:iJlJlion marks. The ('JDnsequent increase in the supply Df central bank mDnev made a considerable credit expansion in tl;e banking institutions possible.
In ·the current year the volume Df tDt.al prDductiDn has been growing at -an annual rate of abDut 5 per cent, thus sUistaining the high demand for credit.. On Ithe other hand the inflationary impulses have already spent their force and t11e price increase has sl'O'wed do-wll considerably. SimultaneDusly, there has been a marked change in the course Df development of the foreign exchange reserve. Due to' cDntinuDus expansion Df imponts the balance of payments def~c~t on current aCCDunt ha.s exceeded the deflCl,t fDr the correspDnding months Df 1964, and as the inflow of foreign eapital is faMing off. the foreign exehange reserve has decreased.
1 557(1- -65
Thus during the fi~st fDur months Df this year the Bank's tDtal reserve Df gold and foreign exchange was reduced by as mueh as 117 mil.lion marks.
Deposits in the banking insti,tutions have increased appreciably in recent months. From January to April the t.Dtal deposits Df all banking institutions increased by 357 million marks, against 208 million a year ·earlier. The simultaneDus increase in advances to'
the public w·as 507 miililion marks, against 309 million marks in ,the cDrrespDnding period of 1964. The advances Df the sa.vings banks and cD-operative credit societies gl~ew less than their depDsits, but the increase in loans grant-ed by the cDmmercial banks exceeded new deposits by more than 200 million marks. ObviDu~ly Ithe stl'Dng increase in commercial ba.nk lending reflects the need Df finance fDr the rising investment activity and also fDr grDwing imports.
A credit ,expansion Df this order, ,at a time when ·the foreign exchange reserve is declining and the GDvernment is borrDwing heavily from the public in order tID finance it.s hudgeta.rv deficit., has naturally resulted in a cDnsiderable weakening in the banks' liquidity pDsition. The commercial banks haye, in
On page 18, Finland's Balance of payments----' in 1964
-----------

2
fact, made full Thse of their rediscounting rights such [hllit their net indebtedness to the Bank of Finland increased by 130 mi'llion marks from :the beginning of the year to the end of April, by the end of which period !their rediscounts totalled 548 million marks.
Early in April the Bank of Finland, fohlowing the f.aRl in external liquidity, submit,ted a proposal to the Government Ithllk measures !Of econo.mic policy should be in,troduced to. reduce the deficit in the balance of payments. Acco.rding to ,a plan drawn by the Government - published on May 20 -the emphasis o.f ;the programme for halance o.f payments impro.vement. w.as to. lay in the field of financial and credit policy, with measures aimed at restoring 'equilibrium before HIe end of 1966. At the same !J:jme the Government decided to introduce a munber of special measures calcUll'ated to bring a direct and immedill.lte check in impOl~t demand and ,a rise in expo.rts. The most import-ant o.f these measures were those int,ended to restrict t.he demand for mot.or cars. It may be mentioned that in 1963 tJIe value of impOlts of passenger cars had amounted to 160 miiliJ.ion marks, in 1964 it roso8 to 300 milJion, and during ;the first quarter of the current year it exceeded the corresponding figure for 1964 by about 60 per cent. As early as April 23 the Government tightened the hire purchase terms on motor cars and some other consumer durables. Subsequent1y it also submitted ,a proposal for increasing the tax on passenger cars; this pro.posal was approved by Parliament o.n June 4.
On April 30, the Bank of Finland instructed the banking insrtitutions to. pursue a more selective credit p().licy in order thalt. ;the growtJl in bank advances from
No.6, 1965
the beginning of the year to the end of Octo.ber shoUlld not exceed 9 per cent. If the rediscounlting banks are able to comply with this request, the Bank of Finland has p:vomised to repay the penalty interes,t paid on rediscounts for J,anuary-October. Art tihe ,same ,time the Bank o.f Finland temporarily removed the quantitative limits imposed on rediscounting. In its instructio.ns the Banlr of Finland stressed that the banks should in the first place restrict their advances for financing imports and hire purchase, and consumption in g,eneral. As an ,additjonal inducement for the banks to check the demand for and use o.f credit ithe Bank of Finland further announced that the banks could widen the differentiation of rates of interest on bills and ().verdrafts, and charge up to. 10 per cent, provided their average lending rate did not exceed 7 V2 per cent. The rates on ioans for one year or more "Ye1'e to remain unchanged.
The effects of ,these measures wiilil probabiy nat begin to ,appear until the next few months. In May l1:.he Bank of Finland's foreignexchange reserve dropped 'a further 70 million marks and the banks' rediscounts continued to grow, totalling 597 million marks a:t the end of the month. At this time of the year there is normally an increase in the banl{S' 1ending, but they seem Ito be making serious efforts to bring the tenmonth increase down to the prescribed 9 per cent before the end of October. How the situation develops will largely depend on the Government's financial measures. In this respect the budget for 1966, which is 'a~ready under preparation in the ministries and willl be presented to PaI'Hament in September, is of major importance.
Junl' 4. 1965

No.6, 1965 3
BANK OF FINLAND Mill. mk
I 1964 I 1965
Dec. 31 I April 30 I"-:;;'pril 30 I May 8 I May IS I May 22
I
I BALANCE SHEET
Assets I
;
Ordinary note cover .•...•......•...••. 1 049.7 933.0 937·4 920.2 887.6 I 863.8 Gold ...........................•.. 189.6 144.8 189·7 189.7 189.8 189.8 Foreign exchange ................•.. 783.8 720.1 677·1 659·9 627.0 603·8 Foreign bills ....................... 29·7 28·5 23·8 24.1 24·3 23.6 Foreign bonds ...................... 46.6 39.6 46.8 46·5 46·5 46.6
Supplementary note cover .............. 570.7 435.0 Inland bills discounted
624.7 617.7 631.2 I 697·6
In foreign currency ..............• 55.2 65·1 52.6 52.6 52.6 52.6 In Finnish currency •••• 0 •• 0.0 •••• 67.1 20·9 23.6 20·5 14·3 13·4
Rediscounted bills ••• 0 ••••• 0 •• 0 •• 0 •• 448.4 349·0 548.5 544·6 564.3 631.6
I Other assets .......................... 97·4 111·5 113·0 113·5 109.9 125.3 Finnish bonds ...•.................. 35.8 36.6 24·8 21.7 21·5 32.4
I Cheque accounts .................... 2·5 3·5 4·2 3·5 2.8 4·3 Finnish coin •••• 0.0 e ••••••••••••••• 3.8 6.8 5·8 5·9 6.2 6.1 Other claims ............ , ......... " 55·3 64·6 78.2 82.4 79·4 82·5
Total 1717.8 1479·5 1675.1 I I 651.4 1628·7 I 686.7 I
I Liabilities I
I Notes J'n circulation .. ..•.........••.... 1002·7 905.5 958.1 941.] 939·4 969.5 I
I Liabilities payable on demand , ...... -.. 186.8 102.6 154·3 150.0 127.3 144.6
Foreign exchange accounts •••••••• '0 84·7 17.6 94·6 96.8 83·0 83·1 Mark accounts of holders abroad ..... 28·5 27·9 15·2
I 15·1 15·0 14·8
Cheque accounts
I Treasury ••• 0 ••••••••••••••• 0 •••• 5·4 12·3 1.6 I 4·4 0·9 10·4 ! Post Office Savings Bank 49·6 41.8
I •••••• 00.0 19·3
I 7·5 3·9 12·3
Private banks .0 ••••• 0 ••• 0 •••••••• 16·4 0·7 0.8 3·3 2.0 I 1.6 Other ••••••• 0 ••••••• 0 •••••••••• 0·7 0·3 0.8 0·9 0·7 I 0·9
Other sight liabilities .0 •••••••••••• 1·5 2.0 I 22.0 22.0 21.8
I
21.5 Term liabilities ....................... 64-4
I 64-] 64-] 63·7
I 55·4
I 64-] I Foreign ............................ 54·3 63.3 52.7 52.7
I 52.7 52.1
I Finnish ............................ 1.1 1.1 11.6 11.6 11.6 11.6
Equalization accounts .............•.... 261.8 202-5 278.2 274·9
I 276.0 286.8
I
Bank's own funds .......•........•.... 211.1 204.5 220.2 220·9 221·7 222.1 Capital ............................ 100.0 100.0 100.0 100.0 100.0 100,,0 Reserve fund ....................... 84·8 84.8 97·9 97·9 I 97·9 97·9 Profits undisposed .0 ••••••• 0 •••••••• - 11.2 13·2 13.2 13.2 13·1 Earnings less expenses .............. 26.3 8·5 9·1 9·8 10.6 11.1
Total 1717.8 1479·5 I 1 675.1 I 651.4 1628·7 1686·7
STATEMENT OF NOTE ISSUE Right of Dote issue I I
Ordinary cover ....................... 1049·7 933·0 937·4 920.2 I 887.6 863.8 I I Supplementary cover i
I
(Upper limit 500 mill. mk) ........... 500•0 435.0 500.0 500.0 j 500.0 I 500.0 I Total 1549·7 1368.0 1437·4 1420.2 I 1387.6 1363.8 I
Note issue
I
I Notes in circulation ................... 1002·7 905·5 958.1 941·3
I 939·4 969.5
Liabilities payable on demand ........... 186.8 102.6 154·3 150.0 127.3 144·6
I
Undrawn on cheque credits ...•...••.•. 5·0
I
4.0 2.8 3·5 I 4·3 2.8 Unused right of note issue 355·2 355·9 322.2 325.4
I 316.6 246.9 ............ !
Total 1549·7 1368.0 1437·4 1420.2 : 1387.6 1363.8 Rediscount rate since April 28, 1962. 7 per cent.

4 No.6, 1965
BANK OF FINLAND Mill. mk
Gold and foreign accounts Treasury I I I
End of I year and Gold and Liabilities Foreign Other Other
Net Bills Other Liabilities, N::'~i month foreign on foreign exchange foreign foreign
foreign and claims, Cheque
exchange assets Treasury exchange reserve assets liabilities (3 + 4-S) bonds net account accounts (1-2)
I (7+8-9)
1 2 3 4, 6 6 7 8 9 10 i
1957 384·3 45·7 338.6 176·5 201·9 313.2 160.2 - 39·7 51.4 69.1 i
1958 575·6 21.8 553.8 126.2 160.1 519·9 90·3 - 51.6 71.5 - 32.8 ! i
1959 730.7 21.2 709·5 92.5 158.4 643·6 103·3 37.6 64·2 76.7
I 1960 686.0 40.6 645·4 67·0 142·7 569.7 37·5 32·4 61·9 8.0 1961 691.5 13·4 678.1 87·5 128·4 637·2 27·7 5·9 1.1 32·5 1962 637·7 17·1 620.6 67.7 114·9 573-4 - 28.9 5·5 23·4 ! 1963 752.2 18.2 734.0 65·6 100·5 699.1 - 18.9 0.2 18.7 I 1964 973-4 84·7 888·7 76.3 82.8 882.2 - 8·9 S-4 3·5 I
I I
I 1
1
1964 I I i March 852.5 18·4 834·1 63·6 804·3
I 18.9 13.6
I 93·4
I - 5·3
April 864.9 27·6 847·3 68.1 91.2 824.2 - 18.9 12·3 6.6 May 885·5 17·5 868.0 68.0 90.7 845-3 - r8·9 0.0 18·9
I June 875.9 858·9 64·7 88.6 835·0 I
18.9 4.6 14·3 17·0 -July 889·9 18.9 871.0 64.2 89·1 846.1 - 18·9 1.0 17·9 I
I Aug. 901.0 19·0 882.0 64·3 86.3 860.0 - 18·9 3-3 15.6 I I I i I Sept. 879.1 19.2 859·9 66·9 85·5 841.3 I - 18·9 I 4·3 14·6 I I Oct. 894·4 20.8 873-6 71.8 82.8 862.6 J - 18.9 7·7
i II.2
I
I
Nov. 913.0 40.1 872.9 77-6 85·7 864.8 I - 8·9 4·7 4.2 Dec. 973-4 84·7 888·7 I 76.3 82.8 882.2 -- 8.9 S-4 3·5
I I I
1965 I Jan. 991.6
I 94·7 ! 896.9 75.1 70.8 901.2 - 8·9 2·5 6·4
Feb. I 982.2 104.3 877-9 74·3 70.6 881.6 - 8·9 1.4
I 7·5
March 904.8
I 102.0 802.8 69.0 70.0 801.8 - 8·9 - 8.9
April i 866.8 94.6 772.2 70.6 67·9 774·9 ! - 8.9 1.6 ! 7·3
i For e i g n e x c han g e sit u a t ion, mill. m k
Net holdings, Dec. 31, 1964 Net holdings, April 30, 1965 I Change in
I Bank of I Other I
Total Bank of
I Other
I Total I April I Jan.-Apr.
Finland. Finland I I I
-7J
I Gold ........................ 1 +273 - +273 +273 +273 - -Convertible currencies ........ 1 +7°8 -74 +634 +616 +541 -52 -93 Other currencies .·.· ..... ·· ... 1 -9 +1 -8 -34 +z -32 +5 -24
Gold and foreign exchange ...... \ +972 -73 +899 +855 -73 +782 -47 -II7
~;~ ~~~e. ~~~~~~~ .i~. ~~~ :: I +46 I +46 - -+945 I +828 I -47 -II7

No.6, 1965 5
BANK OF FINLAND Mill. mk
Elld of year and month
1957 1958 1959 1960 1961 1962 1963 1964
1964
Rediscounted
bill.
1
249.1
187.1
47.2 205.1
294.6 401.2
325.3 448.4
Finnish credit institutions
'Liabilities, Cheque accountsl
I Net claims
. Post Office Mortgage I on the PrlVate Savings Bank of banks banks Bank I Finland Oy (I-2-3-4)
2 3 4 6
24.1
14·7 38.6
I 16.8
I 44·71)
- 4·0
I I~:! I , I
i 4.4 1
) !
53·3 I 3·0 !
~.61
-0·4 20.8
2·5 1.6
12·5 0.8
1.2 I 0.6 I
225·4 151.6
6.1 186·7 233.0 351.1 319.8 381.8
Inland bills in Finni"h currency
6
129·1 88.2
38·9 72 .3 70 •8 . 33·5 57.2
67·1
o t he r
Otber advances
Liabilities
7
144.2
143·0 105·0 109·5 107·3 99·6 94·4
103.0
8
5.6 5·3 3·9 3·5 2·9 4·1 1.7 1.6
i . ,'Notes ill
Net claims circulation on the rest
of economYI '1 ,6+7-8) , ,
9 i 10
267.7 606·4 225·9
175.2 129·0 149·9 168·5
I
650.8
694.4 727·4 837.1
774·4 943·7
1 002.7
Marchi April May June i July i Aug. I Sept. Oct. Nov.
Dec. I
316.0 349.0
329·5 403·2
357.8 I
389.7 388.2 40 7.7
-13·2 0·7 5.2
2·7 4·1 3·7
38.2 41.8 0.2
I
2.2 1.7 1·7 2·9 3·7 1.6
288.8
304·8 32 2.4 363·0 327·0 353.6
374·3 380.4 394·6 381.8
23·3 20·9 20·4 19·1 19·0 17·9 , 24·3 41.6 55·6 67.1
III·3
II3·2
119·7 104·3 110.1
104·7 103·9 105·8 III.2
103.0
0·7 0.6
1·3 2·5 1.8
133.9 911.2 133·5 905·5 138.8 945.4
I !
1:.1 Marchi April !
394.2
448·4 !
357·3 416.6
431·7 548.5 I
-1.6 -7.1
-6.8
16·4
5·9 18.1
19·5 0.8
.) Illcluding cash reserve accounts.
23·0 30.8 14·2 33·5
5·4 49.6
2·5 1.6 0.6
19·3
1·3 0·9 1.0 0.6
1.2 1.1 2.0
1·4
347·7 395.8 409.6
527.0 I
48.3 48.4 40.0
23·6
II8.8
II4·1 I' 134.2
125.0
1.3 3·4 0·9 3.1
1.6
32 .9 34.2
32·3 31 .9
120·9 954.9 127.3 918.1 121.3 928.2 124.8 927.3 146·5 964.0
163.7 989.9 168·5 I 002·7
134.2 910•2 128·3 959.2 141.9 92 1.3 II6.7 958.1
-----------------------------_.-------1"1 i II. mrk _____________ . __ -r--______________ ---. Mill. m.l--______________ -.-______________ ---.
1200
1100
ICOO
900
800
700
600 ... 01
Notes in circulation .... , , ... ,; __ , ,,1',/
\ ,'I'
Net claims on other than banks
II I I I I I I I II LL_LLJ I I I 1964 1965
500 I I
400 " ,-, ... ..,'- r'''' 300/\, ... ,-
200 \,' Net claims on banks
100
o ~~~~~~~~~~-------~ _ 10 o Net clai rns an Treo su r'j
, J -.2 00 :...-..L-L I I I I I I .~L_L.l---'--'---'-l---'--L_-'---'-L__'___' 1964 1965'
----------------._--- ------.. ~-

6 No.6, 1965
DEPOSITS BY THE PUBLIC - FOREIGN EXCHANGE RATES Mill. Ink
Sight deposits End of
year Cheq\1e accounts end Postal
month giro commer-I All credit accounts cia! banks institutions
1 2
I
3
1954 349·1 421.1 132.2 [955 365.9 442.8 IIS·5 1956 386.1 459·6 138·4 1957 377.1 461.4 139·3 1958 395·7 495.8 167.7 1959 557·5 678.1 140·9 1960 550.8 680·7 135·9 1961 577·9 720.8 143·8 1962 649·0 800.8 168·5 1963 715·3 876.0 250·3 1964* 683.4 857.0 296.5
1964* April 641.5 777·7 220·5 May 645.2 797·4 256.6 June 640.0 789.1 260·7 July 671.3 833·6 224·9 Aug. 665·6 I 837·3 229·0 Sept. 667·5 826.8 281.0 Oct. 643.6 791.4 256.2 Nov. 668.8 833·3 284·8 Dec. 683·4 857·0 296.5
1965* Jan. 669·9 822.1 285·0 Feb. 632 .2 775.8 367-3 March 680·4 837·5
I 320.1
I i April 629.5 783.0 i 294 8
I Index-tied I deposits High-
End of interest month
100 % I 50 % depos-clause~ its
clause'l tax-free
1964* July 745·5 134·0 639·2 Aug. 817.6 129.0 628·7 Sept. 916.6 120·5 621·4 Oct. 987.1 II9·2 603·7 Nov. 1072·9 II9·6 593·9 Dec. 1166·4 120·3 592.3
1965* I
1= I' 3"·' II3·3
I 592.5
Feb. 1386.5 99.1 591.0 March I 462.8 82·4 603·3 April 1 506.3 75·3 6u.6
Te rm deposits
Co-op. I Post Savings
credit depart-Commer- Savings societies & I Office ments of All credit cial banks banks their cen- Savings co-op. institutions
tral bank Bank stores
;l Ii 6 7 8 9
834·4 921.7 520.5 300.8 134.2 2712.0
977·9 1085·4 6II·4 330 .7 152.6 3 158.4 968.1 1124.0 635·3 341.6 160.1 3229.5
1032.2 1178.6 671.1 339.6 168.2 3390.t 1222.6 1312.6 742.7 381.7 191·9 3851.8 1505.5 1525.5 860·3 431.2 219·1 4541.9 1813.6 1798•6 1052·5 485·2 254·3 5404.5 2105·9 2079·6 1241.0 558.2 285·3 6 270.3 2270.4 2210.8 1325·5 606.6 293·2 6706.7 2441.0 2336.6 1448.0 648.5 310·7 7 185.0 2816·7 2621.0 1680.4 713.8
I 331.3 8163·4
I
I 1
2541.5 2416·7 1551·7 661·7 I 319·6 7491.3 2577·8 2444·7 1576·5 660.0 318.0 7577.1 2569·4 2418.0 1551.4 659·2 314·3 7512.4 2579·9 2430.4 1557·6 660.0 313.1 7541.0 2592.6 2447·7 1569·0 663·9 312.2 7585.4 2610·9 2469·8 1583·8 667.8 316.1 7 648.5 2630.2 2483.0 1591.5 673.1 320.5 7698.5 2662·7 2515.4 1621.2 676.7 323.4 7 800.0 2816·7 2621.0 1680·4 713.8 331.3 8163.4
I 2849.8 2666.0 17II .1 723.5 334·6 8285.2 2885.6 2715.3 1760.2 734.6 339·9 8435·8 2917.3 2756.0 1800.1 744·5 I 8562·9 344·9 2936.0 2760.1 1815.0 739·6 I 343·5 8594.4
Selling rates for fureign exchange
May, 24, [96S
Ink I New York ... IS 3.224 I Zurich ....... 100 Fr
Montreal ..... I $ 2.986 Paris ........ 100FF
London ...... 1£ 9·020 Rome ........ 100 Lit
Stockholm ... 100 Kr 62·78 Vienna .. . .. 100 S
Oslo ......... 100 Kr 45·10 Lisbon ...... 100 Esc
Copenhagen .. 100 Kr 46.62 Reykjavik .... 100Kr
Frankfurt o.M. 100DM 80.90 Madrid ...... 100 Pta
Amsterdam .•• 100 FI 89·61 Moscow, clear. l ) 1 Rbi
Brussels ...... 100 Fr 6·497 Clearing dollars ~) 1 CI S ') Bucharest, Peking . • ) Ankara. Athens, Berlia, BOllota, Budapest, Prague, Sofia, Warlaw.
i I
I I I
I
I Total
I
(2+3+9) I 10
I 3 265.3 3719.7 I 3 827.5 3990.8 4515.3 5360.9 6221.1
I 7134·9 7 676.0 8311.3 9316.9
8489.5 8631.1 8562.2
8599·5 8651.7 8756.3 8746.1 8918.1 9316.9
9392·3 9578.9 9720.5 9 672.2
Ink
74.22
65.80
0.5163
12·49 II.25
7·50
i
I
5·42 3.5667
3·21 I

No.6, 1965 7
ADVANCES TO THE PUBLIC - MONEY SUPPLY Mill. mk
I Granted by Types of advances
Total End of
I I . Co-op. I Money
year and I Post OffIce credit I Loans Cheque (I to 5)
Supply month Commer- Savings Savings societies & Mortgage &
cial banks banks Bank their cen- banks Bills credits (6 and 7)
I I tral bank I I 1 2 3 4 5 6 7 8 9
I 1954
I
1289·6 824.5 221.2 647.0 127.7 2915·1 194·9 3 IIO.O 995.6 1955 1554·4 964·5 248·7 728.7 136.0 3398.0 234·3 3632.3 1 043.0 1956 1626.6 1028·3 262·3 767.6 146·9 3578.0 253·7 3831.7 I 160.0 1957 1603.8 1066·4 260·5 780.6 157·2 3 630.0 238.5 3868·5 I 170.7 1958 1745·4 1154.8 290·3 835.1 219.3 4 0II·5 233·4 4244·9 1302.3
L 1959 2096·9 1327.2 331.4 967.3 325.8 4772·7 275·9 5048.6 1448.4 I 1960 2604.6 1549·3 395·0 1176.0 452.2 5861·9 315.2 6177·1 1494.6
I 1961 3048.0 1817.6 436.8 1462·7 515·2 6928.2 352.1 7280·3 1646.1
! 1962 3299·9 2018·5 508.7 1600.6 614.7 7 680.8 361.6 8042.4 1722.5 L 1963 3472.5 2134.5 544·0 1757·7 664·3 8226.2 346.8 8573-0 1986·5 I
I 1964* 3916.4 2316.6 607.7 2057.5 829.4 9320.4 407.2 9727.6 2046.0
I I
I 1964* April 3 635-3 2170.0 563.1 1806.8 706.6 8473·4 408.4 8881.8 1826.2
I May 3628.6 2190·4 570.0 1827.9 751.1 8599·4 368.6 8968.0 1914.1 June 3 689.8 2200·9 575·3 1859·8 768.2 8688·9 405·1 9094·0 1901.4 July 3706.0 2 219.7 583.0 1876.1 777.1 8771.9 390.0 916r.9 1889·4
i Aug. I 3720.7 2239·4 592.4 1903.8 782·4 8845·8 392·9 9 238.7 1903.2 I I L
Sept. 3761.2 2268.8 601·3 787.2 8967.3 400.6 9367·9 1946.3 I 1949·4
I Oct. 3791.0 2296.0 6n.6 1983.7 810.2 9 067.4 425.1 9492.5 1933.0 Nov. 3819.3 2322.2 607.8 2028.0 824.7 9 203.3 398.7 9602.0 2012.2
I 1 Dec. 3916·4 2316.6 607.7 2057·5 829.4 9320.4 407.2 9727.6 2046.0
1965* Jan. 3900.7 2337.6 614.6 2078.1 827.5 9342·4 416.1 9758.5 1940.9 Feb. 3944·4 2357.1
I
623.6 2100·4 830•1 9437·5 418.1 9855.6 2010·4 March I 4 049.1 2379.6 633·0 2128.6 838.0 9594·4 433·9 10028·3 1997·7 April 4 187.6 2396.9 637.0 2 170.2 843.0 9786.3 448.4 10234·7 , 1949.0
Mill'mk Mill. mk Mill. mk
1200 ~rm deposiT" 1200 Si9ht anti term deposirs 1200 Advances to thi. public
I 000 ~ by the public 1000 by the publ Ie 1000 / 800 I 600 800
600 r 600 600
400 400 400
2.00 200 200
0 0 a
Increase from be9innin9 of ~eor -- 196~ -- 1965

1
8 No.6, 1965
STATE FINANCES Mill. mk
Revenue
I Jan. - Mar.
1964 I 1965 Expenditure
I Jan. - Mar. 1-19-6-4--;-1-19-6-5-
Income and propeny tax (net) ...••. 374 434 Interest on State debt ........... . Gross receipts ...••......•...... (761) (901) Refunds and communal income tax
Other direct taxes .............. ..
( '387) (-467) Child allowances ................ .
4 I The State's share in national pensions I Sales tax ...................... .. 301
1 Impon duties .................. .. Revenue from Alcohol Monopoly .. .
Compensations to war-disabled . . . .. I 92
121
Excise duty on tobacco .......... . Excise duty on liquid fuel ••.•••.. Other excise duties .............. . Tax on automobiles and motor cycles Purchase tax on motor vehicles ... . Stamp duties .................... . Employers' payments for child allow
ances Net receipts of price equalization by I
extra-budgetary funds ......... . Other revenue similar to taxes ..•••
Total toes
2
9
10691
Interest and dividends •.....• _ . . . . 16 Other current revenue ............ 38
73 Subsidies •....................... 64 19. Net payments on price equalization 42 by extra-budgetary funds ....... .
6 State aid to agriculture ........... I 41
State aid to communal and private 93 schools
7 Net loss of State enterprises ..... .
13 Maintenance of roads ............ . 1310
Other current expenditure ........ .
20 Current expenditure ..•.•........ 45
Current revenue .•........••.... I 123 I 375. Real investments ................ .
Capital revenue proper .. . . . . . . . . . . 28 36 Other ca I'tal e diture p expn .......... Decrease in inventories ..... , .. •• .. 45 19 Capital revenue . . . . . . . • • • • • • • . . 73 55 Capital expenditure •..••.•...•.•. --~---------------------+--~~--~I Total revenue ••.•.....••..•••••• 1196 External loans .. . .. .. .. .. .. .. . .. .. 62 Internal loans .......•............ 158 Loans ............................ 220 Short-term credit (increase +) .. + 2 Deficit (+) or surplus (-) ...... + 361
Total 1454
1 4301 12
104 116
-24 +198
1720
Total expenditure ............... / Redemption of external loans ...... I Redemption of internal loans .•..•. Redemption of indemnity bonds etc. Index premiums ................. . Redemptions ................... ..
Total
I 45 1
76
1
55;
301 !
I 12i I i
117
4161
91 71 i
288'
129/ 4171
1 3341
III 100'
I 2:
71 120 1
! I 454!
56
126
II
1
14111
42
3°1 522
1
11001 I
310
171
481'
1581 13
115 2
9 139
17201
1962 1963 1964 Debt ------ I 1965
, 1 March*1 April*
I Mill. m"'kc-__ r-__ -.-__ --,
5600
Dec. Dec. Nov. I Dec.* I I I
External debt ... 803 963 1109 I I 187
Ordinary loans ..•. 936 1109 I 15~ 1
1206 Indemnity bonds etc. 18 II 7 Shon-term credit .. 61 160 271 325 Cash debt (net) .•. - 125 78 108 -4 Internal debt •... 890 1358 1544 1534
Total debt .•••••. 1 I 693 2321 2653 27ZI
Total debt, ITlill. SI 525.4 720.8 . 825.0 845·5
Feb.
11921
I I 188
1200 I 192 7 5
3II 301 201 194
1719 16921
29II 2880 I i
904.7 893-4 ;
1184
1395 5
361
· . · . · . · .
5200
4800
4400
1962. 196~
." .. ..-. .. -.-
196~
12-month totals, plaited to end of period

No.6, 1965 9
FOREIGN TRADE
Val u e m i 11. m k I _______ u_n_i t_v_8_I_u_e_i_n_d_e _x_e_s_I_9_S4_=_I_O.,--0 __ -----;~--11 Articles of export f. o. h.
Surplus of 1 ___ -. ___ -,-___ --;-___ -:--___ 1 Period import. / Articles Terms I
(-) Round W d Paper Metal, en- of import of or exports 00 I gineering c. i. f. Trade,'
Imports Exports c. i. f. f. o. b.
(-I-) Total and hewn industry industry industry , i timber product. product. d ct ' , Iii I ! pro u s i 1
1---~'---~-------~----T_----;;---_.---_.-------7---~----1
1955 I 769.6 I I 812.6 I + 43.0 106 1I0 lOS! lOS 115 I 100 106 I 1956 2 035.6 I 779.9 -255.7 106 IIO 104 109 106 105 101!
i 1957 2279.3 2 123.9 -155.4 u6 1I8 U3 1I9 120 122 95 1958 2 333.0 2 479.3 + 146·3 138 139 133 139 153 140 99
89 I'
1959 2 673.0 2 673.2 + 0.2 130 120 I21 131 152 133 1960 3 403·0 3 164.7 -238·3 133 123 131 132 147 136 98 i 1961 3 690.2 3 374·0 -316.2 135 14S 134 134 140 137 99 i
'1962 3928.7 3 533.1 -395·6 134 146 132 128 150 139 96, 1963 3 866.9/ 3 678.0 -188·9 137 145 142 129 147 II 139 99 l 1964 4816.1 4 132.0 -684.1 144 168 149 134 152 144 100 ,II
I
, Jan.-Mar. I'
1963 688.0 S36.0 -152.0 ! I! I
,1694 1080·4 i 812.61 -267.8 ' t
I 1965* 1244.2 I 922.6 I -321.6 , \ 1964 ,;
i April ! 448.8 339·S I -109·3 '1 I
May 398.7 335·3 - 63·4 J June 412-4 366.4 - 46.0 1
I,
july 362.9 368.6 + 5·7 A 145 171 150 136 ug. 390.2 349·3 - 40.9 I i
174 143 100 143 133 IS2
153 144
!
I 101
Sept. 422.3 408.4 - 13·9 1 I' II Oct. 418.8 400.8 - 18.0 I I
Nov. 432.8 367.2 - 65.6 J 149 164 , 154 13S 172
I Dec. 448.8 383.9 - 64·9 i
1965* Jan. Feb. March
I .. .. I .. I
145 <0, I
383.9 40S·2
455·1 !
317'3
1
- 66.6 1 267.8 -137·4 I 337.5 -II7·6
Mi II. m;.::k _______ -..,,--_______ --,
I mpods e.i.f. Exports fo.b.
5000
::::r .2000
iOOOr I
o ""-'---'-.l.....L-',---L..L~ I 1 , I 1 I I Cumulative ---- 1964- -- 1965
2 5576-65
! , \ I
Indexr-____________ _
Unit value indexes ----I~a.9.sc~: .. II'
1954" 100
150 Impods c.Lf. __ ~ IJ.tO _-- ____ -
130 ~
12.0 L Exports f·o.b : I ~
;~~ ~ ________ .l::r.~::!~::.deJ~; ... ~.~-" . 90 r. -. -.... , .. , .. 1.
t_.-L--L-I ' LLJ 1962 1963 1964
1
1 ,
I

10
FOREIGN TRADE BY MAIN GROUPS
Imports, c.i.f.
Raw I Finished goods Period materials Agri-and pro- I Fuels and cultural
ducer lubricants Investment I Consumer products goods goods good,
I I
1954 864.2 173·4 288.0 195·8 51.5 1955 949·2 215·4 342.2 262.8 38.8 1956 1042.8 274·6 433·6 284.6 62.1 1957 1174·3 402·4 413·5 289.1 101·7 1958 1195·0 326.6 488.0 323.4 106·5 1959 1338.2 281.2 675·4 378.2 148.6 1960 1662.6 330.5 933·4 476·5 160·3 1961 17lI.2 329.9 1034·4 614.7 153·5 1962 1762.6 371.2 1144·9 650.0 144·5 1963 1827·5 373·3 1004·3 661.8 164.8 1964 2 1I0.7 508.4 1395.8 801.2 230.4
Jan.-Mar. 1963 337.6 63.2 162·4
1 J24·8 33.0
1964 477.1 I 126·4 299.0 177·9 49·8 1965* 556.2 IIo.6 365·2 212.2 63·6
I 1964 June 182.9 31.0 126·7 71.8 17·5 July 164·7 31.4 II4·7 52.1 18.1 Aug. 182·4 48.0 109.6 50.2 19·9 Sept. 187.8 44·4 123.4 66·7 17.2 Oct. 179.1 36.4 131.7 71.6 16·7 Nov. 202.8 54·7 105.9 69·4 11.7 Dec. 203.9 51.5 121.3 72.1 28·4
1965* Jan. 184·8 33·2 Ilo·4 55·5 24·3 Feb. 172.2 31.4 128.1
I 73-5 13·7
March 199.2 I 46.0 I 126·7 83.2 25.6
Index I Volume of imporrs - T-----~I' ; i954 = ! OJ 1 _ I
300 1- !F:olshed,]oods :
250r' ." [' t-, I." .. - """" . '''''. ,. 200~. • ....... '"~ ," "..... 1""; ~
I, .. : ,.-"..-, ,,- . - _," to, I 1'-' .
150~-"'- " ; T:Y;.J::mpJrrs!
I "Raw mot-erials; :
, I
100 [- ---- + ---- -:--.cOq, 5;;a--; ~I .1_ ..1 __ 1 .-----L-_ ~1_____1 ____ L _--L -.J
1962 1963 ;9.3-"
March 1963 figures are affected by strikes.
No.6, 1965
Mill. mk
Exports, f.o.b.
I Round Wood Paper I Metal, en-and hewn industry industry gineering Other
timber products producta industry goods products
I 135·8 497-3 616.6 209·9 55·1 199·1 513.2 757·9 248.0 55·6 172·4 404.9 817·8 251.2 71·5 171.0 482.9 976.4 304·3 87·6 193·5 578.2 1151.7 340.3 109·1 162·9 636.6 1170.0 441.5 lI3·6 205·6 840.8 1337.2 473·6 147.2 295.8 840.8 1539·1 386.3 158·5 189·5 770.3 1588.8 662.6 177·4 lI2.8 8lI.8 1752.2 613.8 222.6 89·8 895·8 2019.5 610·5 286.0
11.1 1 71.7 304.6 86·7 28·9 11.6 I 121·4 462.7 II4·9 52.2
8·5 J38·3 501.6 145.8 64.8
8·4 97·1 163·0 55·0 25·4 13·3 lI6·9 156.6 40·9 22.8
14·9 95·7 166.8 28.1 23·9 11.6 97·4 186.1 68.2 27·9 9.0 89.0 192.1 67-5 26·5 6·7 86.2 173·3 56.9 32.4
4·9 75·2 180.1 66.2 29.1
3·7 60·3 169.0 39·9 20.1 2.6 40.4 143·9 45·2 22.0 2.2 I 37·6 188·7 60·7 22·7
Index ,----------------------,-
I Volume of exports 195-4 = 10J
, I 300 f Total exporTS 1 P:JP""- p:\J~"ds - ~'
1 i r .. ___ ------:200 ___ -- , ___ ....
..... " ......• ..' .... I I 0 0 17"~ -----.::\. --~./----~t.-::,; .. '---~
50 ~. t.../~V"CJ ,:("d~:;"" I _. l - £og_ scale I ~_L-__ .i __ , __ L ___ -'-------.J __ L __ I _~j_----.l
1982 ;96:3 196,+
I I

No.6. 1965 II
EXPORTS OF SOME IMPORTANT ARTICLES
Period Round Sawn timber timber
1000 1000 solid cu. m stds
I 1954 3 620 733 1955 4977 786 1956 4424 648 1957 4063 719 1958 3861 762 1959 3 BI2 950 1960 4756 1137 1961 5955 1106 1962 3681 1010 1963 2108 977 1964 1319 990
I
]"'.-M~·I 1963 210 47 1964 165 97 1965* i 123 99
1964* June 143 122 July 218 156 Aug. 202 125 Sept. 169 II6 Oct. 140 97 Nov. 76 93 Dec. 58 73
1965* Jan. 62 52 Feb. 35 25 March 26 I 22
Mill. solid cu.m r-I Round timber
OI~III-U-LJ Cumu lative exports
I I
I Veneers Fibre
and Mechanical Sulphite Sulphate Board building Newsprint Paper, plywood pulp pulp pulp board all kinds
1000 1000 1000 1000 1000 1000 1000 1000 cu. m tons tons tons tons tons tons tons
! I I
I I I
298 193 580 375 101 59 I 392 751 321 183
!
682 447 1I0 61 I 470 905 230 186 679
I
452 106 49 I 537 997 260 165 697 60
, 474 134 S5I 1I08
239 143 725 476 145 83 585 1147 296 139
I 770 549 576 , 142 1I0 1244
358 I76 919 Sao ISO 128 691 1460 329 160 872 569 IS4 146 846 1806 357 ISO 828 731 IS3 IS2 870 1980 384 173 861 893 171 161 882 2126 440 175 971 979 194 165 989 2309
!
i I 80 31 I 149 I 152 31 28 148 381 !
! 105 i
43 ! 238 i 238 41 44 208 521 i
II8 38 i
43 243 i
231 40 I 239 578
I
I 31 20 87 84 IS 12 83 18% 31 II 69 I 67 13 10 76 195 27 12 90 75 15 10
I 76
I 188
39 14 82
I 91 15 13 96 201
41 17 86 97 17 IS 100 I 219 41 13 77
I 73 20 IS 97 I 219
44
I 17 79 93 28 IS 93 192
I
I I 44 13 91
I 95 13
I 14 83
I 189
37 IS 60 54 12 14 75 ISO
37 I IS I 92 82 15 I 10 SI I 209 , I
1000 standards 1000 tons 1000 tons
1200r
1000r
800
600
400
200
Sawn timber
a '"""-...L.l--'--.LJ..----'---L.L-Ll-l
--- 1964 -- 1965
.--------------, .--------------l Chemical pulp Paper I
/~ / I
/ --I
/ I / 1
2000
2000 2500
1500
1500
1000 - / 1000
500
I
12 No.6, 1965
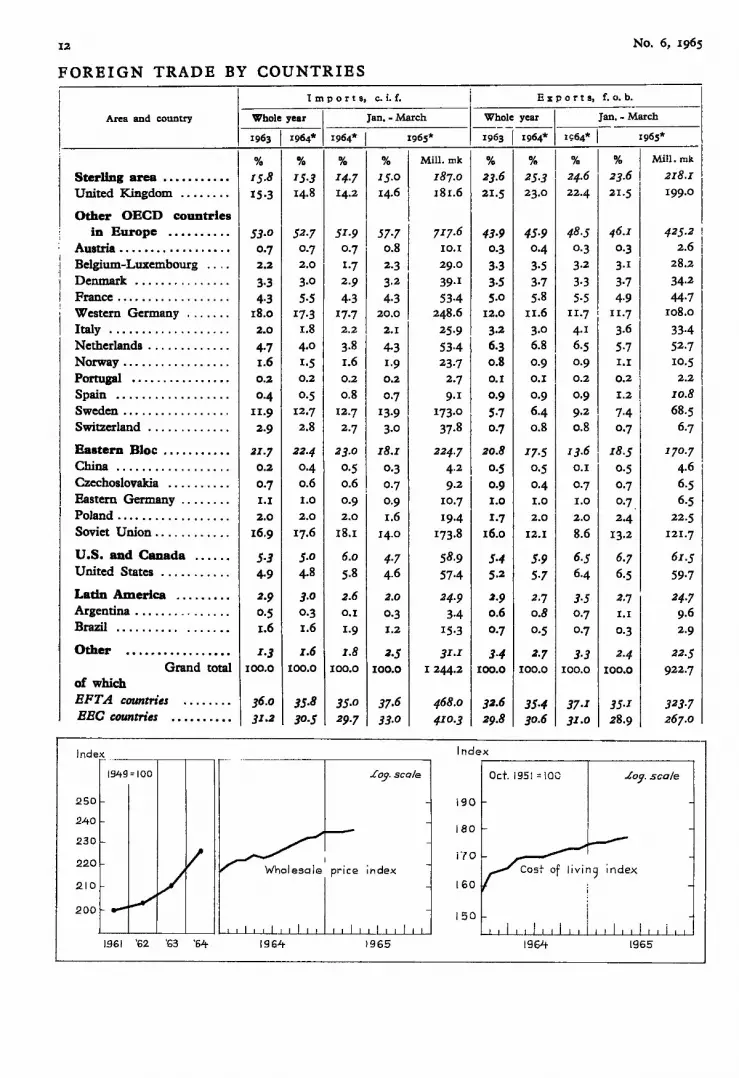
FOREIGN TRADE BY COUNTRIES
Area and country
Sterling area .......... . United Kingdom ....... .
Other OECD countries in Europe ......... .
Austria ....••.........•.. Belgium-Luxembourg ... . Derunark ............. .. France ................. . Western Germany ...... . Italy .................. . Netherlands ............ _ Norway ...... __ ........ . Portugal ............... . Spain ................. . Sweden ................ . Switzerland ........... ..
Eastern Bloc ......... ..
I China ................. . Czechoslovakia ......... . Eastern Germany ....... . Poland ................. . Soviet Union ........... .
u.S. and Canada ..... . United States .......... .
Latin America ........ . Argentina ........ ' ..... . Brazil ................ .
Imp art s, c. i. f. ! E " p 0 r t s, f. o. b. ______ _
Whole year I Jan. - March 1 Whole year I Jan. - March
1963 I 1964* 1964* I 1965* ---;;6~ I 1964* 1~64* 1- 1965*
1~.B I~.3 ~'7 1~.0 I Mi~l~;; I ~.6 ~.3 I ~.6 I ~.61 Mi~;;; 15.3 14.8 14.2 14 6 , I81.6 I 21·5 23.0 22·4 2L5' 199.0 . I
1 53.0 52.7 51.91 57.7/1
0.7 0·7 0.7 0.8 2.2 2.0 1.7 2.3
3·3 4·3
18.0 2.0
4·7 1.6 0.2
0·4 II·9 2·9
:zr·7 0.2
0·7 1.1 2.0
16·9
5-3 4·9
2·9 0·5 1.6
3.0
5·5 17·3
1.8
4·0 1·5 0.2
0·5 12·7 2.8
22·4 0·4 0.6 1.0 2.0
17.6
5.0
4.8
3·0 0·3 1.6
2·9 4·3
17·7 2.2
3·8 1.6 0.2 0.8
12·7 2·7
23.0
0·5 0.6
0·9 2.0
18.1
6.0
5·8
2.6 0.1
1·9
3.2
4·3 20.0
2.1
4·3 1.9 0.2
0·7 13·9 3·0
IB.l
0·3 0·7 0·9 1.6
I4·0
2.0
0·3 1.2
71 7.6 10.1 29.0
39.1
53·4 248.6
25·9 53-4 23·7
224·7 4.2
9.2
1'
10·7 19·4
173·8
5B·9 57·4
24·9 3·4
15·3
43-9
3-5 5·0
12.0
3·2 6·3 0.8 0.1
0·9 5·7 0·7
20.B
0·5 0·9 1.0
1·7 16.0
45·9
3·7 5·8
II.6 3.0
6.8
0·9 II
0.1
0·9 6·4 0.8
17·5 0·5 0·4 1.0 2.0
12.1
5·9 5·7
2·7 o.B
0·5
0·3 3·2
3·3 ! 5·5
11.7 4. 1
6·5 0·9 0.2
9.2
0.81 13·6 I 0.1
0·7 1.0 2.0 8.6
6·5 6·4
3·5 0·7 0·7
~:; II
4·9 IL7 3·6 5·7 1.1 0.2 1.2
7·4 0·7
IB·5 0·5 0·7 0·7 2·4
13·2
6·7 6·5
2·7 1.1
0·3
425.2
2.6
28.2
34.2
44·7 108.0
33·4 52 .7 10·5
2.2
10.B 68·5
6·7
170 .7
4·6 6·5 6·5
22·5 121.7
61·5 59·7
24·7 9.6
2·9
Other .• ..••... .. .. .••. 1.3 1.6 I.B 2-5 31 .1 3·4 2·7 3·3 2·4 22·5
922.7 Grand total 100.0 100.0 100.0 100.0 I 244.2 100.0 100.0 100.0 100.0 of which EFT A countries EEe countries ••••••.•••
~::~"-I·;g=IOO 240
230
36.0 35·B 35.0 37.6 31.2 30.5 29·7 ]3.0
.. _--------_._-,------...,
LOll-scale
220 1
:~:L---'_--L_....L_-' L-L.L.L.L.J..'WJ...
hO
',.,'] :',",., ',":.,Le,.LX---,--,---,-,
1961 '62 'G3 '64 1964 1965
46B.o 32.6 410.3 29·B
Index
35·4 37.1
30.6 31.0 35·1 I'
28·9
oct. 1951 =IOC Loy. scale
190
180
170
livin9 index j' J..L..L.JL.L.I .1..1 .... 1 ,LI ..'-1 .L
160
150
1964 1965
No.6. 1965
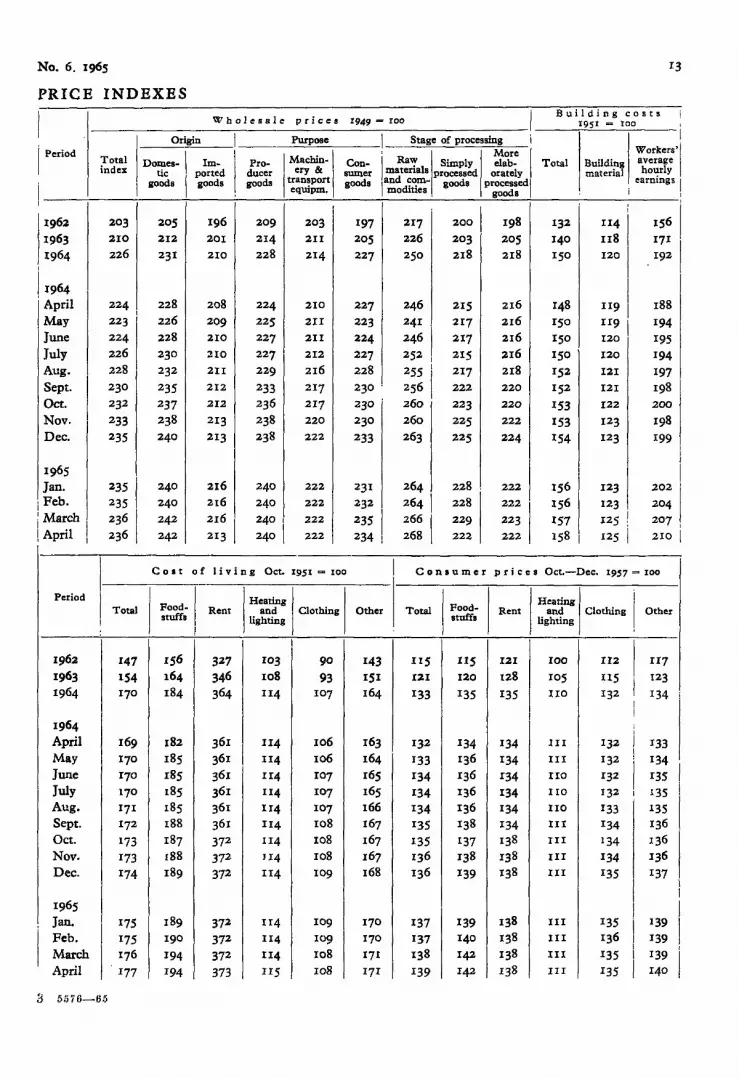
PRICE INDEXES
Period
1964
April I May June July Aug. Sept. Oct. Nov. Dec.
1965 Jan. Feb. I March I
April I
Total index
203 210 226
224 223 224 226 228
230
232
233 235
Whole. ale p ric e I I949 = IOO
1
__ ~o-=-ri,,,,gi:c:n __ I ____ P_UI--,-,-p':"08_e-,-___ 1 Stage of processing i
Do"!'es- \ Im- II Pro- I Machin-I Con- 'I Ra,! I Simply 1 ~~~ I tic ported I ducer ery & 1 sumer materials processed orately
I goods 1 goods goods 1 tran~port goods ,and ~~- goods processed I
205 212
231
228 226 228
230
232
235 237 238 240
240 240 242 242 ,
196 201 210
d 210 210
211 212 212 21 3 213
216 216
216
1 213
209 214 228
224 225
I
227
2271 229
233 236 238 238
240 I'
240
eqwpm. I modltles , goods
203 211
214
210
211 I 211 212 216 217 217 220 222
222 i 222 222 222
197 205 227
! 2171'
226
227 223 224 227
231
;
232
2351: 234
241 " 246 252 ,
255
1' 256 260
260
263
264
264 I 266
1 268
200 I 203 218
215
217 217 215 217 222 223 225 225
228 228 229 222
I 205 218
216 216 216 216 218 220 220 222
224
222
2221 223 222
13
Building costs 1951 = 100
Total
132
140
ISO
148 150 ISO
ISO
152 152
153 153 154
156 I 156
1 157 158 I
Workers' I Building average '\ material hourly
. earnings I , ,
114 I 118 1 120
119
120 120
121 121 122
12 3 123
123 123 125
I \
I I ,
125 i
188
194 195
1
194
197
198,1 200
198
199
202 204 207
, J
I
I 210 i
I ___ -,--C_o_"_t-----,-o f I i v i n g Oct. 1951 = 100 leo n I u mer prj c e s Oct.-Dec. 1957 = 100
I ToW 1 ~~; I--R-e-n-t --;-11-7g-~-i-t-:---;-C-I-ot-hi-.n-g---;--O-th-er-1 T_I ~~ R~' ~': C"'"~ I Period
1964 April May June July Aug. Sept. Oct. Nov. Dec.
1965 Jan. I
I, Feb. ,I
March April
3 51;76-65
147 154 170
175 175 176 177
156 I 327 103 I 90 143 lIS lIS 121 100 II2 I 164 346 108 93 151 121 120 128 105 IlS 184 364 114 107 164 133 135 135 IIO
182
185 185 [85 185 188 187 188 189
189 190
194 194
372
372 372
373
1I4 1I4 II4 114 1I4 114 114 1I4 114
114 114
114 II5
106
106
107 107 107 108 108 108 109
109 I 109 108
108
163 164 I 165 165 166 167
167 167 168
170 170
171 171 I
132
133 134 134 134 135 135 136 136
137 137 138 139
139 140 142 142
134 134 134
134 134 134 138 138
138
III
III no IIO IIO III III
III III
III III
III III
i 132 I
I !
132 132 132
132
133 I'
134 , 134 134 135
1
I 135 I:
136
135 II
135
Other
117
123 ,
134 i
133 134 I
I 135 135 135 136
139
139 139
1
1 I , \
I I

14 No.6, 1956
PRODUCTION - INTERNAL TRADE
Index of industrial production I959=IOO Commer- Wholesale trade
volume index
cial
Period , I Total, timber
goods goods goods . Wood . Paper . Metal Oth seasonal piled Total
1954=IOO II Invest- Other I Special indexes of manufacturing adjusted fellings
ment producer Consumer - I I I for normal I 000
, i Industry Industry Industry er variation. cu m I------~I ----~-----7I-----+I----~-----+----~----~----~----~~--· --~------I
I
::. ::: ::: :~ :;~ ::~ :~~ :: :~ :~' :~;:: I 1964* 150 140 156 140 124 168 148 143 149 53200
1963*
Ii, July
Aug.
I Sept. ! Oct. ! Nov.
Dec.
1964* Jan. Feb. March April May June July Aug. Sept. Oct. Nov. Dec.
1965* Jan. Feb. March
106 143 148 162 151 133
147 146 157 144 143 lI6
150 162 167 163
'
I
150 I
152
153 I 170
,--Inde< ,----------
83 137 146 160 145 127
146 144 139 150 133 141 77
134 157
154 I 15
6 I 143
II4 142 151 167 157
139 I
154 152 152
161
149 146 128 154 168 176 172
158
161 160
178
96 147 141 152 141 123
139 I 103
~~; I 152 147 133
134 140 ISS
I
II2
108 III
132 lIO
!I8
II7 II
127 121 ISO 127 137 u8 100 121 125 I 121 I 123
123 131 151
163 162 162
169 164 142-168 173 182 190
182 160
174 172 195
--------T
83 137 151 166 152 132
153 152
147 158 139 145 85
140 167 165 164 160
154 II
160 174
138
137 137 153 138 141 107 153 155 160 156 139
137 141 158
139 142-143 145 143 144
154 155 153
1299 1936 2192 3189 3915 4534
5552 6031 6500 , 5469
11353 1863 1327 1846 2335 292 6
3462 4536
4822 6095 6342 !
----I
I Total index of industrial production, 1959; 100
!bO L I
I
150 ~ !
! 140 I ,.-
i 130 ~
I 120 I
LL--1 __ LLLL_LU. I 1961
I Adjusted for normal seasonal variations
I
I
I I £09- scale -1
. ..L1---'--.L.L-l-lI---'--1 .1.1 ..Li ...1.1--11---'--1 d __ LLLL.L.l.L.L.l..l_L.~L....J 19E?3 1964 1965
160 169 156
153 183 176 181 173 201
II4 143 142 161
154 150
145 170
173 169 164 183
120 147
March 1963 figures are affected by strikes. Seasonally adjusted series are corrected for estimated strike effects.
No.6, 1965 IS
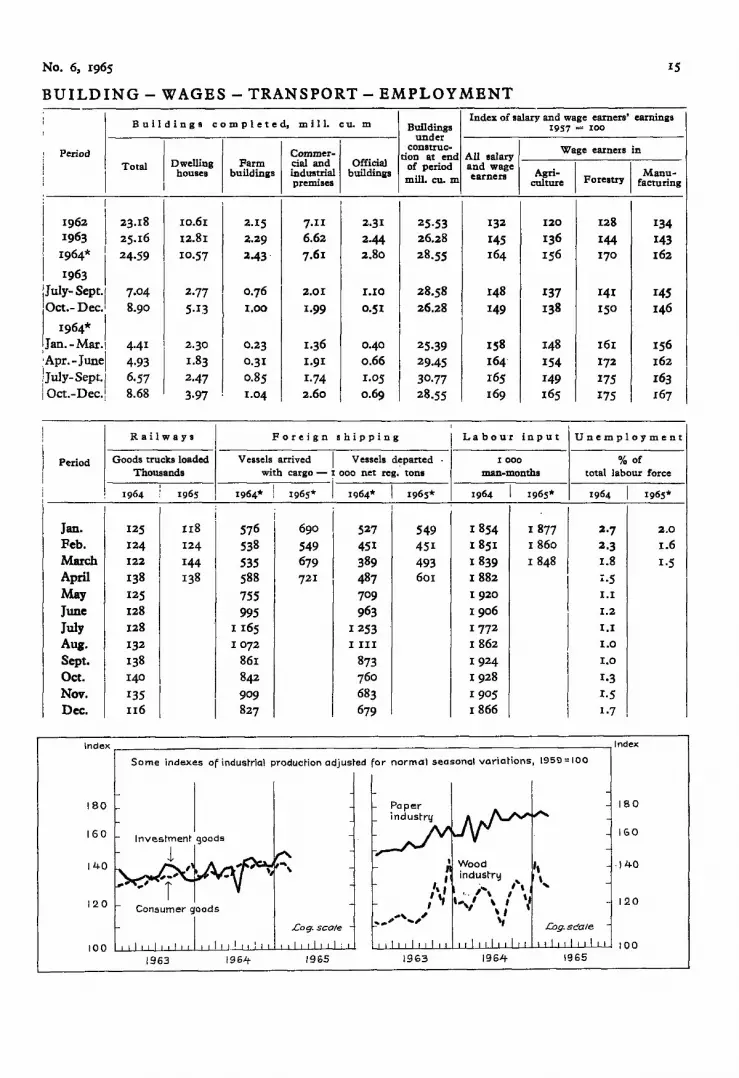
BUILDING - WAGES - TRANSPORT - EMPLOYMENT I Inde" of salary and wage earners' earnings
1
__ B_U_i_l.,-d_i_n_g_B_C ~_m_p_I_e_t_e-,d:-,_m_i_I_I.-;-~_U_. _m_._ B~!~i~gs 1957 = 100
Period I I construe- Wage earners in
I [ Commer- tion at end All salary
Total Dwelling I Farm cial and Official of period and wage I I I I
house. huildings industrial buildings Agri- I Manu-premises mill. cu. m earners culture Foreatry facturing
I I
1962 I 1963 I
1964* II
1963 July- Sept.r Oct.-Dec.'
1964* I Jan.-Mar.! Apr.-Junel July-Sept.: Oct.-Dec.!
4·41 4·93 6·57 8.68
10.61 12.81
10·57
2·77 5·13
2·30 1.83
2·47 3·97
2.15 2.29
2·43'
0.23 0·31 0.85 1.0 4
7.11
6.62
7.61
2.01
1·99
1·36 1.91
1·74 2.60
2·31 2·44
2.80
1.10
0·51
0·40 0.66 1.05 0.69
25·53 26.28
28·55
28.58 26.28
25·39 29.45
30
.77 J'
28.55
132 145 164
148 149
137 138
148 I54 149 165
I R a i I way s I For e i g n • hip pin g i Lab a u'r in put
Goods trucks loaded ,---v-es-s-el-s-a-rr-iv-e-d--'I--v-e-ss-e-IS-d-e-p-a-rt-e-d- 1000 Period
Jan. Feb. March April May June July Aug. Sept. Oct. Nov. Dec.
Thousands with cargo - I 000 net reg. tons man-months
1964* I; 1965* I' 1964* I' 1965* I ~ 1964 : 1965 I 1964 1965*
125 124 122
138 125 128 128
132
138 140
135 116
II8 124 144 138
576 538 535 588
755 995
1165 1072
861 842
909 827
I
721 I 709 963
1253 1 III
873 760 683 679
549 45 1
493 601
1854 1851
1839 1882 1920 1906
1772 1862
192 4 1928 190 5 1866
1877 III 1860 1848
I
I I
I
128 I44
170
141 150
161 172 175 175
134 143 162
Unemployment
% of total labour force
2.7 2.0 2.3 1.6 1.8 1.5
··5 1.1
1.2
1.1
1.0
1.0
1·3 1·5 1.7 ,
Index,-________________________________________ -,Index
180
160
140
120
100
Some indexes of industrial production adjusted for normal seasonal variations, 19S!) = 100
Consumer goods
I II I
1963 196J;- 1965 1963
I,
,', ' ... \ / 'I , I
" 196Jt 1965
180
IGO
·140
-- 120
100
16 No.6, 1965
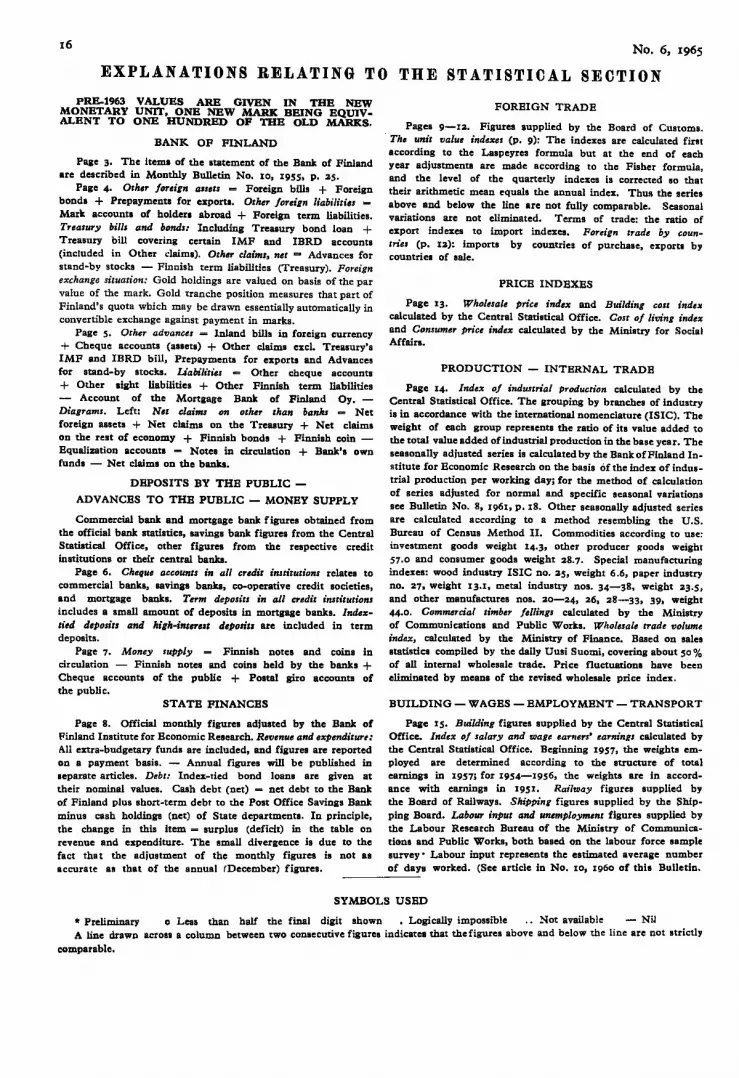
EXPLANATIONS RELATING TO THE STATISTICAL SECTION
PRE-1963 VALUES ARE GIVEN IN THE NEW MONETARY UNIT. ONE NEW MARK BEING EQUIVALENT TO ONE HUNDRED OF THE OLD MARKS.
BANK OF FINLAND
Page 3. The itema of the atatement of the Bank of Finland are described in Monthly Bulletin No. 10, 1955, p. :as.
Page 4. Orh .. for';gn .. , .. u = Foreign bills + Foreign bonds + Prepayments for export.. Oth.r fo,.ign liabiliti" = Mark accounts of holder. abroad + Foreign term liabilities. T,.a,u,y bill. and bond" Including Treasury bond loan + Treasury bill covering certain IMF and IBRD accounts (included in Other claims). Oth., claims, n.t - Advances for stand-by stocks - Finnish term liabilities (Treasury). Foreign exchange situation: Gold holdings are valued on basis of the par value of the mark. Gold tranche position measures that part of Finland's quota which may be drawn essentially automatically in convertible exchange against payment in marks.
Page 5. Orhe, advanc.. = Inland hill. in foreign currency + Cheque accounts (assets) + Other claims excl. Treasury's IMF and IBRD bill, Prepayments for exports and Advances for stand-by Rtocks. Uabi/iti.. - Other cheque accounts + Other aight liabilities + Other Finnish term liabilities - Account of the Mortgage Bank of Finland Oy.Diagram.. Left: Nor claim. on oth., than b .. nk, = Net foreign assets + Net claims on the Treasury + Net claims on the rest of economy + FinniRh bonds + Finnish coin -Equalization account. = NoteR in circulation + Bank's own funds - Net claims on the banks.
DEPOSITS BY THE PUBLIC -
ADVANCES TO THE PUBLIC - MONEY SUPPLY
Commercial bank and mortgage hank figureR obtained from the official bank statistics, RavingR bank figures from the Central Statistical Office, other figures from the reRpective credit institutions or their central banks.
Page 6. Chequ. accounts in .. 1/ cr.dit in .. itution. relates to commercial bankR, savings banks, co-operative credit societies, and mortgage banks. Term depo.itl in a/l cr.dit institution. includes a Rmall amount of deposits in mortgage banks. Ind.xti.d d.po.itl and high-int.,,,, d,poritl are included in term depoRits.
Page 7. Money .upply = Finnish notes and coins in circulation - FinniRh noteR and coins held by the banks + Cheque accounts of the public + PORtal giro accountR of the public.
STATE FINANCES
Page 8. Official monthly figures adjusted by the Bank of Finland Institute for Economic Researro. R.venu. and .xp.nditurt: All extra-budgetary funds are included, and figures are reported on a payment basis. - Annual figures will be published in leparate articles. D.bt: Index-tied bond loans are given at their nominal values. Cash debt (net) = net debt to the Bank of Finland plus short-term debt to the Post Office Savings Bank minus cash holdings (net) of State departments. In principle, the change in this item = surplus (deficit) in the table on revenue and expenditure. The small divergence is due to the fact tha t the adjustment of the monthly figures is not as accurate a. that of the annual (December) figures.
FOREIGN TRADE
Pages 9-1:a. Figures supplied by the Board of Customs . . Th. unit valu. ind.xes (p. 9): The indexes are calculated first according to the Laspeyres formula but at the end of each year adjustments are made according to the FiRher formula, and the level of the quarterly indexes i. corrected so that their arithmetic mean equals the annual index. Thus the series above and below the line are not fully comparable. Seasonal variations are not eliminated. Terms of trade: the ratio of export indexes to import indexes. Foreign trad. by countri., (p. l:a): imports by countries of purchase, exporto by countries of aale.
PRICE INDEXES
Page 13. Whol .. al. price ind.x and Building cost ind." calculated by the Central Statistical Office. co.t of living ind." and Con.urn., pri .. ind.x calculated by the Ministry for Social Affairs.
PRODUCTION - INTERNAL TRADE
Page 14. Ind." of industrial production calculated by the Central Statistical Office. The grouping by branches of industry is in accordance with the international nomenclature (ISIC). The weight of each group represents the ratio of its value added to the total value added of industrial production in the base year. The seasonally adjusted series is calculated by the Bank of Finland Institute for Economic Research on the basis of the index of industrial production per working day; for the method of calculation of series adjusted for normal and specific seasonal variations see Bulletin No.8. 1961, p. 18. Other seasonally adjusted series are calculated according to a method resembling the U.S. Bureau of Census Method II. Commodities according to use: investment goods weight 14.3, other producer goods weight 57.0 and consumer goods weight :as. 7. Special manufacturing indexes: wood industry ISIC no. :as, weight 6.6. paper industry no. :a7, weight 13.1, metal industry nos. 34-3S, weight :a3.S. and other manufactures nos. :a0-24, :a6, :a8-33, 39, weight 44.0. Comm.rcial timber felling. calculated by the Ministry of Communications and Public Works. Whol .. al. trade volume ind.", calculated by the Ministry of Finance. Based on aales statistics compiled by the daily Uusi Suomi, covering about so % of all internal wholesale trade. Price fluctuations have been eliminated by means of the revised wholesale price index.
BUILDING - WAGES - EMPLOYMENT - TRANSPOR T
Page 15. Building figures supplied by the Central Statistical Office. Ind.x of ,alary and wag •• arner,' .a,ning. calculated by the Central Statistical Office. Beginning 1957, the weights employed are determined according to the 8tructure of total earnings in 1957; for 1954-1956, the weights are in accordance with earnings in 1951. Railway figures supplied by the Board of Railways. Shipping figures supplied by the Shipping Board. Labour inpUt and uR.mploym.nt figures supplied by the Labour Research Bureau of the Ministry of Communications and Public Works, both based on the labour force sample survey' Labour input represents the estimated average number of days worked. (See article in No. 10, 1960 of this Bulletin.
-----
SYMBOLS USED
* Preliminary 0 Less than half the final digit shown • Logically impossible .. Not available - Nil A line drawn across a column between tWO consecutive figureB indicatea that thefigureB above and below the line are not Btricd,
comparable.

No.6, 1965 17
SOME PARTICULARS ABOUT FINLAND FORM OF GOVERNMENT
From IIS4 to 1809 Finland formed a pan of the kingdom of Sweden. It then became an autonomous Grand Duchy connected with Russia until December 6, 1917, the date of Finland's declaration of independence. The republican con.titulion was adopted in 1919. The legislative power of the country is vested in Parliament and the President. The highest executive power is held by the President. elected for a period of 6 years. The President for the current period, March I, 1962, to March I, 1968, is Urho Kekkonen.
Parliament, comprising 200 members, is elected by universal luffrage for a period of 4 years. The number of seats of the different parties in Parliament elected in 1962 are as follows: Agrarians S3, People's Democrats 47, Social Democrats 38, Conservatives 32, Swedish Party 14, Finnisb People's Party 13. Social Democratic League 2 and Liberal League I.
LAND
THE AREA is 337 000 square kilometres (Great Britain's ,.rea is 245 000 sq. km and Italy's area 301 000 sq. km). Of the total, inland waters form 9.4 %. On an average IS.8 % of the land in the South of Finland is cultivated (1960), 2.3 % in the North and 9.2 % of the land as a whole. Of the land area 21.8 mill. ha (S3,9 mill. acres), or 71.3 %. are covered by forests.
OWNERSHIP OF LAND (1960): The total land area was distributed among different clas.... of owners approximately as follows: private 60.9 %. State 31.8 %, joint stock companies etc. S.6 %. communes and parishes 1.7 %.
POPULATION
NUMBER OF INHABITANTS (1963): 4.6 million. Sweden 7.6, Switzerland S.8, Denmark 4.7 and Norway 3.7 million.
DENSITY OF POPULATION (1963): In South Finland 2S.4, in North Finland 4.2 and in the whole country an average of 14.9 i1thabitants to the square kilometre.
DISTRIBUTION BY AREA (1963): S8 % of the population inhabit the rural areas, 42 % towns and urban districts. The largest towns are: Helsinki (Helsingfols), the capital 488 300 inhabitants, Tampere (Tammerfors) 136 200, Turku (Abo) 135 000.
OCCUPATIONS (1960): Agriculture arid forestry 32 %, industry and construction 31 %, commerce 9 %. transport and communications 7 %, services II %, economically inactive persons II %.
LANGUAGE (1960): Finnish speaking 92.4 %. Swedish speaking 7.4 %, others 0.2 %.
EDUCATION (1963): Practically all persons over 15 years of age are literate. There are 6 universities (the oldest founded in 1640), 6 colleges of university standard, and 2 teachers' training colleges. besides teacher-training departments in two of the universities.
INCREASE OF POPULATION (1963): births 18.1 '/ ... deaths 9.2 ,/." increase 8.6 '/ ... Deaths in France II.7 '/ .. and Great Britain 12.2 '/ ...
TRADE AND TRANSPORT
NATIONAL INCOME (1963, in million marks) Gross domestic product at market prices 18 667 (excl. repairs and maintenance). Net domestic product at factor cost, by industrial origin: agriculture I 592 (10 %), foreotry and fishing I 462 (10 %). manufacturing 4683 (31 %). construction 1540 (10 %), transport and communications II78 (8 %), commerce, banking and insurance 2 017 (13 %). general government I 900 (12 %). other services 907 (6 %), total IS 279. Index of real domestic product 133 (1957 = 100).
FOREST RESOURCES (1960-1963): The growing stock comprised I 410 million of solid cu. m incl. bark (49 797 million
cu. ft), of which pine 43 % and spruce 38 %, the rest 19 % being leaf-trees, chiefly birch. Of the growing stock 13 300 million cu. ft, 56 % of them pine, was up to the standard required for logs. The annual growth is 43 million solid cu. m green wood excl. bark (I S19 mill. cu. ft). The total removal in 1963 =alculated according to the use of wood was 51 million cu. m excl. bark (I 815 million cu. ft.)
AGRICULTURE (1960): Cultivated land 2.6 millioo hectares of which holdings of len than 5 ha amount to 17 %. 5 to IS ha 48 %, 15 to 50 ha 30 % and more than so ha 5 %. Number of holdings 388 000, of which 184 000 are of more than S ha. Iodex of agricultural production 127 for 1963 (1954 = 100). Measure of self-sufficiency in bread cereals 69 % in the crop year 1963/64.
INDUSTR Y (1962): Grols value of industrial production 14 500 mill. marks, number of workers 352 000, salaried employees 71 100, motive power (1962) 5.0 mill. HP. Index of industrial production 133 for 1962 (1959 = 100).
RAILWAYS (Jan. I, 1965): Length 5463 km, of which S 389 km are State and 74 km private railways. The gauge of State railways 1.524 m.
MERCHANT FLEET (Apr. 30, 1965): Steamers 152 (257 702 gross reg. tons), motor vessels 379 (728 361 gross reg. taos). sailing vessels with auxiliary engines 35 (4 3S7 gros. reg. tons). Total 566 (990 420 gross reg. tons).
MOTOR VEHICLES (Dec. 31, 1964): Private carB 364 800, lorries and delivery vans 78 600. buses 6 900, others 14 000, Total 464 300.
SCHEDULED AIR TRAFFIC OF FINNISH COMPANIES (1964): Kilometres flown 12.0 million, passengers carried 639 700, passenger kilometres 311.2 million. and ton kilometres of freight and mail 5.4 million.
FINANCE AND BANKING CURRENCY. Since 1860, Finland has had its own mooetary
system. From 1877 until 1914 the country was on the gold standard, and returned to it in 1926. In 1931, Central Bank's duty to redeem bank notes in gold was suspended and at the end of 1962 was entirely cancelled. The monetary unit is the mark (Finnish markka). On Jan. I, 1963, the value of the mark was raised to one hundred times its former value. The official par value of the new unit is 3.20 marks to the U.S. dollar. Finland has been a member of the International Monetary Fund since 1948.
MUNICIPAL FINANCES. In the finance accountl for 1963 expenditure amounted to 2776 mill. marks. Total revenue was 2 775 million, of which income from taxation I 393 million. The municipal income tax (non-progressive) averaged 11.91 % of the ratepayers' taXable income.
THE CENTRAL BANK. The Bank of Finland functions under the guarantee and supervision of parliament. Its Board of Management is appointed by the President of the Republic; the Bank Supervisors, nine in number. are elected by Parliament. The Bank has a head offic~ in Helsinki and 12 branches in other towns.
OTHER CREDIT INSTITUTIONS (Dec. 31, 1964). There are two big and four small commercial banks with in ali 721 offices, 378 savings banks, 493 cooperative credit 8o::ictlcs and meir central bank, six mortgage societies, and POSB. The savings departments of the cooperative stores accept deposits from the public. The National Pensions Institution and sixty-five private insurance companies also grant credits.
RATES OF INTEREST (May I, 1964). Bank of Finland discount rates 6-7 'I, %. Other credit institutions: term deposits 4 'I, %, 12 months' deposits 6 %, 100 per cent index-tied deposits 2 y. %, So per cent index-tied deposits 4 %; highest lend· ina rate 8 ~,.

FINLAND'S BALANCE OF PAYMENTS IN 1964
BY
KALEVI KAILASVUORI, M. Se. (Eeon.)
FJ<;LLOW OF THE BANK OF }<'INLAND INSTITUTE FOR ECONOlIUC. RESEARCH
CURRENT TRANSACTIONS
In the world economy the year 1964 presented a fairly favoul'able picture. The gross national produet expanded by 4.8 per cent in the United States and the European economy expanded at the rate of 5.5 per cent, despite a number of anti-inflationary measUl1es taken by some west European g'overnments. Finland followed the over~all economic trend with the domestic product growing by an estimated 5.5 per cent in real terms, a distinct improV'ement over 1962 and 1963 (see Monthly BU!lletin 4/1965). The manufacturing sector, bolstered by the strong world market for sawn softwood, pulp and paper, led the upswing with an expansion 01 nearly 8 per cent.
Last year the increase in world trade was somewhat around 10-12 per cent in volume ii:.erms. Finland's foreign t.rade grew even more - bot.h exports and imports. Exports, led by agricult.ural products, pulp, paper and wood industry products, mse by 12.3 per cent in value, while the value of impOl'ts jumped by 24.5 per cent, with machinery, industrial supplies, fuels and [ubricants, p'llissenger cars and one~time items such as aircraft for Finnair showing the biggest gains (see Monthly Bulletin 5/] 965). The unit price index of exports rose by 5.1 pCI' cent ~ompared with a raither modest rise of 3.6 pel' cent in impOl~t. prices.
The performanc,e of exports was by no means disappointing, engineering goods, machinery and ships excluded. But Finland's
._--- .. _-_ ... _.
Figure 1. The Trade Balance in 1959-64, seasonally adjusted quarterly figures, million marks
50
o r--~-+----r----+---~----r--~
-50
-100
-150
-200
1959 1960 1961 '" 1962 1963 1964

No. 6, 1965 19
TABLE 1. BAI,ANCE OF PAYMENTS SUlIIMARY 1) 1960-1964, MILLION MARKS
1960 1961 1962 1963 1964
EXpOl.tS 2) f.o.b . ................. , .............. +31100 +33'716 +3,53<6 :+,3,6'81 +4136 Imports 3) c.i.f . •••••••••••••••••••• 0 ••••• 0 •• 0 ••
-34]2 -3,700 -3948 -38718 -48;;30 Trade balance •• "0 '0 ••••••• 0.0 •• , •••••••••• 0 ••• rU4 324 412 197 695 Services: receipts •• 0 •••••••••••••••• ', •••••• ,,0 + '57:3 :+ 65i6 + 748 + 808 + 898 Sm'vices: payment.s ••••••••• 0 •••••••• 0' •••••• '0' 472 i549 ,63,3 68,2 753 Invisible balance 4) 0.0 ••••••••••••••••• 0 ••••••• + 101 + 107 ,+ 115 + 126 + 145 Transfers payments. net ••••••••••• 0 •••••••••••• + 9 + 7 + 5 + 6 + 6
A. BALANCE OF CURRENT TRANSACTIONS 1.'14 2HJ 292 65 54·,1 .B. BAJ,ANCE OF LONG-TERM CAPITAL 5) + 7!6 + 1719 ,+ 128 + 3,2;6 + 49:2
BASIC BALANCE (A+ B) 58 31 1'64 + ,2,61 5:2
Pl'ivate Sh01't-term capital, net • ,,0 •••••••••••••• + 81 ,+ 35 98 .127 + 126 El'rors and omissions ••••••• 00 ••••••• 0.0 •••••••• 0 + 30 11 + 2 27 + 83 A uthoj'ized E:change Deal61'S' foreign assets, net .. 37 + 95 :+ 140 26 37 Official short-term capital •••••••• 0 ••• 0.0 ••• 0 •• 0 + 17 + 18 C. BAT,ANCE OF SHORT-TERM CAPITAL ...... ,., . + i4 + 119 + 44 1'6i3 + 190
OVER-ALL BALANCE (A + B +C) + 1,6 + 88 120 + 9:8 + lilR .D. OFFICIAL MONETARY MOVEillIENTS, NET (incl',-) }6 8'8 + 120 918 138
1) Plus sign indicates credit; minus sign indicates debit. 2) Exports include stevedoring expenses n.i.e. and granJts in kind. 3) Imports include seamens' duty free imports, nOll-monetal'Y gold and grallts in kind; ill addiJtioll
adjustment is made to allow for smuggling. 4) Induding factor income. u) Including loans drawn hy banks n.i.e,
l'('Jlatiye international compeHtive position appeared to deteriorate somewhat. 'When the domest.ic upswing was gathering momentum with private investment especially accelerating and growing demand continuing to press on available resoureBS, the economy which was already operating near full capacit.y ('ould not meet. tllis kind of impact without using imports as safety-valve. Furthermore, the propensity of consumers to purchase impoded goods was exceptionally high and Finnish imports seem to have received additional stimulus from the increased stockbuilding at home. In addition, substantial price rises of coffee and sugar were not offset. hy dedines in volume, ,since the demand for such produets seems to he rather inelastic.
With the expansion of the domestic economy, t.he ba[anceof payments of Finland thus began again to deteriorate after a transient period of improvement in 1963 !and during the course of 1964 'a large current a('('onnt deficit was developing.
Foreign trade statistics reveal that imports c.i.f. exceeded expOl~s f.o.b. by 684 million marks. In 1962 and 1963 the trade deficit was 396 and 189 million marks respectively. The development of the trade deficit, seasonaNy adjusted, is shown in figure 1.
As can be seen from table 1, the invisible surplus, of 145 million marks including f.actor income, was again a little higher than during the previous year. In spite of this, the deficit in the ba[anee of payments on current account including ,transfer payments soared to a record level of 544 million marks. This compares with a tot-al current deficit of 65 milHon marks for 1963 and 292 milHon marks for 1962.
There were two aspects to the Finnish payments deficit: how it was to be financed ,and how it was to be cured. Last year the first problem was solved with relative ease. Thanks ,to the favourable attitude on foreign capital mailmts towards Finnish loans, the

20 No.6, 1965
TABLE 2. GOODS AND SERVlm;S. AND TRANS]<'ER PAYlIIEN'rS. lIIILLIOK :&IARKS
1963
Receipts Payments
Merchandise .............. 3,681 38'78 NOll·molletary gold ., ...... 0 Transport •••••••••••• 0 ••• 308'5 165 Travel .................... 90 190 Illvestment income ........ ~;5 93 Government ............... 23 1.l1 NOll·merchandise insurance .. 122 HI Other services ............ 163, 1012
Total goods and services .. 4489 4560
Transfer paymellts ........ 13 'i
Total current transactions .. 4/;02 4567
Er,rors and omissions
Tot(~l
deficit on. current account was more .than offset by the heavy borrowing abroad, especially by t.he Government. Thus, Finland's convertiblle currency reserves actually showed an increase. These developments will he analysed more fully below.
The second problem is to great extent a reflection of long-run difficulties and involves effecting structural changes and making efforts to improve the productivity of Finnish industries.
The short-run at.tempts used to reduce the current account deficit included indirect credit and monetary measures affecting impor.ts ,and tightened hire purchase regulations aimed at reducing the sales of passenger cars. The weakening of rthe balance of p'ayments was largely attributable to Ian extremely sharp increase in. imports of motor vehicles after .the [iberalisrution which took place in the middle of 1962. In N ovembm: 1964 the minimum down-payment was raised and maximum repayment per10d was shortened. Furthermore, the system whereby a payment abroad has to be effected or a corresponding deposit has to be made before Cus;toms clearance is granted for c-el'li:.ain dUl'a~
ble consumer goods, which w,as introduced in Oct.ober 1962, is still in force.
1964
Xet receipt.s Receipts PaYIl1ents )f et receipt s
-19,7 4 ],3'5 4830 --,fi9t5 - 0 0 - 0 +220 46i 1\39 +3(}8 -100 10i 2212 -1115 -68 2.7 1:25 - 98 + 2 125 20 + 5 + 11. 1'22 11.1 + H + :61 ]50 H6 + 34
- 71 5033 5583 -550
+ 6 14 8 + 6
- 65 5047 5591 -544
- 27 + 83,
- 92 -461
The slight improvement in the invisible balance from 126 to 145 million marks was entil'ely due to the increased net receipts from transportation since t.he trend of other invisible items was in the opposite direction.
The favourable development of the net shipping rec-eipts must. of course be seen against the background of both exports and imports being ak record levels. In addition, it is to be attributed paI"tiy to higher freight rates and the slightly increased share of Finnish tonnage in transportation.
The tot311 volume of sea transportation was 23.1 million tons, which represents 'a 15 per cent increase on a year-1:.o-year basis. The total volume of goods transported by Finnish ships increased by 18 per cent .to 12.5 million tons. The share of Finnish tonnage decreased in the import shippings from 66 per cent to 63 per cent. A.s regards export shippings, the share of' Finnish t.onnage increased from 40 per cent ito 43 per cent. Thus the share of Finnish tonnage in the total amount of transportation was raised from 53 to 58 per ceni;.
The advance in travel receipts outp'aced that in travel payments: receipts rose by 18.8 per cent and payments by 16.8 per cent. In spite of this the net deficit on travel

No.6, 1965
increased from 100 mhll.ion marks to 115 million marks since ,the lev'ol of expenditure is about twice that of travel earnings.
The increase in interest payments on foreign loans was both absolut.ely and in percentage terms much gl'eater in 1964 than in any other year. Last. year they amounted to 125 mi'llion marks. The rise was 32 miJ.Hon marks or 34.4 per cent over 1963. This is only 'a natural reflection of the heavily increased foreign indebtedness which Fi~land has recently incurred. Since the exchange reserves of convertible currencies stood at the end of 1964 at a markedilv higher ievel than one year previously, ,th~ investment income receipts also increased by 2 milllion marks. The net payments on investment income rose consequently by 30 million marks. Another factor contributing towards the deterioration of the current bal'ance came from the catch-aU-account of "other services": the fact.or income in the form of wages derived from the construction of the electric power plant at Tuuloma fm the USSR decreased from 42.1 million marks to 33.8 million marks.
21
BASIC BALANCE
Finland's heavy borrowing abroad last year has 'already been referred t.o above. In total the net import of long-term capitaJ in the form of loans, credits and direct investments covOl'ed a large part. of the deficit of current transactions and the basic balance amounted to a deficit of only 52 million marks.
The ,avaiIability of funds on foreign capital markets for Finnish requirements contributed significantly to tile short-run solution of Finland's balance of payments prob-1ems and thus eased the pressure on the foreign exchange market. The net increase in foreign long-term borrowing was 492 million marks. Loans totailling 762 million mal'lrs were drawn and repayments amountino' to ')'18 . IIi '" ..,~ ml· on marks Wel"B made on caTHer loans. These figures compare with a net increase of 326 million marks, drawings on new loans of 513 million marks and amortisations of 164 million marks in 1963.
The relative ease of raising loans abroad was partily due to the fact that Finland is
TABLE 3, MOVEMEN'l'S OF CAPITAL AND ]\,[oNl~'rARY GOLD, MILT"ION MARKS
1963 1964 Assets Liabilities Net assMs Assets Liabilities Net assets
incl'ease- increase + increase - increase - increase + increase -decrease + decrease - decrease + decl'ease + <lecrease - oeel'ease +
NON-MONE'l'ARY Sl!:CTORS
Prit'ate •••••••• 0 ••••••••• -9 + 41 + 32 + 39 +342 +381
Long-term capital + 1 +1'58- +1'59 - 24 +279 +255 Loans drawn .......... +29:2 +29:2 +418 +418 Loans repaid .0 •••••••• -112 -112 -1.23 -123 Other ., ............... + 1 - 2.2 - 21 - :24 - lo6 - 40
8hOJ,t-'term ca,pital •••••• 0' -10 -117 -1:27 + :63 + 63 +126
Publ'ic (central ancl local gov(Jmments) . _ •.... __ . , . + 4 +167 +171 - 2 +218 +216
Loans. drawn ••••••• 0 •• +lo9.Q -t:lo90 +2.91 +291 Loans repaid .......... - 41 - 41 - 8-g - Sg Other ••• 0 ••••••••••••• + 4 + 118 + 22 2 + 15 + 13
MONETARY S~:CTOR
Banks (including the Bank of Finland) ••• 00 ••••• -88 - 23 -111 -218 + 82 -136
Loans drawn .......... + 31 + 31 + 53 + 53 Loans repaid .......... -13 -13, - 17 -Ii
Other ................. -88 - 41 -129 -218 + 46 -172
Total -93 +185 + 92 -181 +642 +461.
22
exempted from the United States' Interest Equalization Tax on foreign securities proposed in July 1963 to curb the net. outflow of priv,ate long-term capital from the U.S.A. This measure for all practical purposes closed the market for new European issues and stimulated activity on Western European ·capit,al markets. Thus, Finland wa,s also successful in borrowing on European capital markets. In total ,ten new bond issues Wel'e placed last year on the New York 'and Western European capital markets. The proceeds of these issues amolIDted to 335 million marks 00mpared with 54 minion mark,s in 1963. In May Finland made a 12 year bond issue of 15 milllion dollars or 48 million marks on the New York market 'and th1s was followed by a 15 year loan of the same amount in December. Both were at a rat,e of interest of 6 per cent. These loam marked the second and third offer of Finnish bonds in the United States sin0e 1934. The first offer of 12.5 million dollars 10 year Donds was made in March 1963. In addition, Finland made a bond issue in Western Germany in March through the intermediary of a number of West German banks and banking;houses. This loan amounted to DM 40 milllion or 32 million marks, the currency periiQd was 15 % years and ,the rate of interest 6 1,4 per cent. This issue was followed by a Isimilar 15 % year bond issue in Western Germany in July at the rate of interest. of 6 per cent. The amount of the second loan was DM 50 mhllion or 40 million marks.
In addition, a West German banking consortium granted 'a 15 year bond loan of DM 40 million or 32 million marks to the Industrial MOlltgage Bank iQf Finland to be rel'ent to medilUnsize and large industrial concerns (other than paper and pulp industries) in the form of mortgage [oans. Al,so some private companies raised capital abroad by bond issues.
No.6, I965
The loans granted previously by the World Bank were drawn i1)o the amount of 43 mil'lion marks and repaid by 22 million marks. In July the World Bank granted Finland a new loan equivalent to 28.5 million dollars or 91 mi~lion marks for the construction, paving, maintenance and further moderniz'ation of Finland's road network, but this loan was not drawn unW 1965.
Other financial long-term 10ans were drmvn to the net amount of 74 million marks and delivery credits were utilized to a net amount of 44 million marks. The drawings of delivery credits increased from 107 million marks in 1963 ,to 123 million marks in 1964, ilargelly as a consequence of the sharp rise in imports of finished investment goods and equipment. The ,so-caJl1ed "rouble credit" granted by the Soviet Union in 1959 was drawn to the net amount of 62 million marks.
Mov,ements of capital representing changes in the foreign assets and liabilities related to direct investment have only reccnt[y begun Ito pLay a role in :the statistical analysis of Fin1and's bailance of payments developments. However, the statistical sources and data on such movements 'of capital 'are still at present. somewhat uncertain and awaiting further calculation. The preliminary 'estimates indicate that direct investments in Finnish business enterpr1ses controlled by foreignCl~ increased clearly last year. 'l'he figure is around 15 million marks representing 11 million marks of investments in new projects and 4 million marks in increases in the share capitail attributable presumably in several cases to utilization of undistributed profits. The tota:l figure compares with 2 million marks in 1962 and 1963.
New Finnish direct investment abl10ad rose from 11 mi.illion marks in 1963 to 17 mil~ion marks last year and was higher than during pl1evious years. Thjs figure only includes such cases, where the domestic investor can be considered to acquire a controlling interest

No.6, 1965
in the foreign subsidiary. The credits given separat.ely to foreign subsidiaries amounted last ~·car ;to ,some 11 million marks.
Another item 'which has recently become significant in the statistics. is ,the Ilong-term export credi,ts. At the beginning of 1963 an existing export cl'edit company founded in 1956 was reorganized as Suomen Vientiluotto Oy ,and its share capital, hitherto owned entirely by ,a number of Finnish commercial banks and industrial concerns, was raised by State subscription to the new slmlles. In addition ,the State and the commercia[ banks subscribed t'<) debentures issued by the company. Last year the credits provided by the comp.any re,pl'esented a net export of capital of 33 million marks.
SHORT· TERM FLOWS OF CAPITAL AND THE
FINANCING OF THE DEFICIT
A }al'ge pa11t of the basic deficit for 1964 was financed by short-term borrowing of various kinds. Private short-term flows of funds, which in 1963 had represented a net
-_ ... __ .... _---
23
outflow of 127 million marks, became an in:f1ow of the same magnitude. In fact all components of the identified leads and lags in commercia!l payments cont.ributed to this effect taken the year 1964 as a whole, even if there were exports of short-term capital ,especial'ly in the form of export c:r:edits granted during ,the second and third quarIters. The pressure on the foreign exchange market was eased particularity by the shortterm import credits, which increased in 1964 by 54 million mar~s, 'and by short-term export credits, which declined by 48 million marks. In addition, there was some inflow of capital in Ithe form of pre-payments for export.s and dimiillshed pre-payments for imports. Without these short~term flows of ftmds the excess demand for foreign exchange would have been considerably larger. It may also be llJSSumed thrut the net figure for unrecorded transactions consists largely of unrecorded changes in Finnish private cl.ai.m.s on foreigners. In 1963 this item indicated a net c'apital outflow of some 27 mill1ion marks. In the second half of 1964
Figure 2. Bank of Finland Foreign Exchange Reserve in 1959-64, seasonally adjusted, million marks
---- Total gold and foreign exchange ----- Gold and convertible currencies .......•.......... Other currencies
1000 -
800 I ./~ i ..-r" ----- ~ """""\~ J' / 600 f..--'- ,_ , __ ,_ . /'
,--' ....... --... ----,,-' ........ ',~ .... '-... ..,. .... -.... --...... -,.,.~ -400 ~'-'~
.Q 0 a ......................... _ ........... ............. ........ . ................. ~ .......... ~ .......... . . _ ................ .
O~----+-----~-----r-----+-----t----~
-2.00 -
1959 1960 1961 1962 1963 196~

24
the "errors and omissions" item reversed rapidly. It thus suggests that volatile capital imports up to a net amount of some 80 million marks may have taken place in addition to the recorded private capital flows, which all were credit items last year.
The government short-term account ailso showed a small import of capital. Finnish commercial banks continued to utilise the faciaities .offered by the Euro-dollar market for short-term borrowing. Towards the -end of 1964 ,the Euro-d.ollar deposits accepted by them declined somewhat. The net effect was, hQwever, a small increase in both their short-term foreign assets and liabilities.
No.6, 1965
l\
ITEMS
Agreement on territorial waters. Upon the initiaJtive of the Finnish Government negotiations were opened at the end of April between Finland and the Sovi.et Union on questions pertaining to territorial waters in the Finnish Gu'l:f and fishing rights in cCl'tain parts of the Gullf. The negotia;tions resulted in t11e signing on May 20 of an Agreement on the limiJts of the territorial w:a,ters 'and the continental shelf of Finland and the Soviet Union in the Finnish Gulf, and a protocol, whereby the Soviet Union permits fishi11O' for Finnish fishers within their o
territorial Wiat.ers in an area east of Suur-. saari.
According :to the agreement Finland 'and the Soviet Union willI not extend their territorial watel'S or their fi,shing rights or other zones ov,er ,a boundary which, wes.t of Suursaari follows a line based upon the half-way line princip'le of the Geneva Conv,ention on .territorial seas of 1958, to which both Finland 'and the Soviot Union have uc0eded. In spite of the new agreement Finland is not considering the ext.ension of its four mile territ.orial waters. The new boundary cuts in five areas the former spheres of Soviet territorial wa[,ers, thus .opening substantial new areas for Finnish fisheries.
In ,the protocol the Soviet Union grants the right for Finnish fishers to fish within a considerable area of their territorial wat.ers eaSJt of Suursaari.
The .agreement and the protocol are subject to ratification by both Governments.
* Ship service between Helsinki and Tal
linn. On May 25 an agreement was signed
in Leningrad by which a daily ship service between Hed,&inki and Tallinn will be inaugurarted on July 7. Sailings on this rourte will be made by Soviet and Finnish ships and the crossing willI t;ake about f,our hours.
Trade agreement. On March 24 an agreeIIlCnt was signed between Finland and the PeopLe's Republic of China regulating the exchange of goods during 1965. Finnish expOllta ,and imports wi:ll each :amount to 10 million roubles. Finland's export list includes products of the metal, shipbuilding 'and machinery industries, chemica:l pulp, mechanical wood pulp, paper, paper and cardboard prodnctl'l, copper semipro ducts, rayon s'tapl,e fibre, pIlywood ,etc. Her import list includes soya, rice, various .tinned foods, text.iles, tin, chemicals, pharmaceutical products etc.
Domestic bond issues. In May the Government decided on the fallowing two bond issues.
The 1965 Forest Improvement Loan of ~o million marks. The loan is divided into two groups of 10 million. The bonds of the first group ,ar.e dwed June 1 and those of the second group September 1. Both groups wiill mruture in 16 years. The rate of intel~e.'3t
is 21;2 percentage points above the general mte of six month deposits in the two largest commercial banks. The loan as ti,ed ;to 1he cost of living index to the e:x:tent of 50 per cent,. - This is the first loan issued as recommended in the Mena-programme. The Government, will relend the proceeds of the

issue to forest Qwners fo.r .appro.ved forest impro.vement projects. (See Bulletin 10/1964, pp. 1-2).
The issue of 11 million marks f.or subscription by the Labour PensilOns Funds of farming, forest works, and construc.tion. The bonds carry int,erestas from July 1, 1965, at a rate which is 2 % percentage points above the general !'ate of six month deposits in the two largest commercial hanks. The loan ~s current f.or a period of 10 years and is tied ,to. the cost of living dndex to the extent of 50 per cent.
In May Industriall Mortgage Bank of F'inland Ltd was authorized to make a privwte bond :issue of 25 milliQn marks. The [oan is current for a period Qf 12 years and bears interest 'at a rate which is 2 % percentage ,Points abQve the general rate o.f six month deposits in the three larg·est commerci<al banks. The [oan is ,tied to ,the wholesal,e price index to the ·extent of 50 per cent.
*
No.6, I965
Publicatio.ns of the Bank of Finland. So. far the fQllowing publications have appeared in English in series D - Mimeographed St.udi,es - of the Publications issued by the Bank of Finland Institute for Econorruic Research: Pertti Kukkonen, "On the Measurement Qf Seasonal Variations"; "The Index Clause System in the Finnish Mo.ney and Ca.pital Markets"; J. J. Paunio, "Adjustment o.f Prices t.o. W,ages"; Heikki Vaivanne and Jruakko Lassila, "The Taxation of Business Enterprises and the Deve'lopment of Financli.al Markets in Finland"; Heikki Valvanne, "The Framework -of the Bank of Finla.nd's Monetary Policy".
"Finnish Bond Issues 1964" has been published ina common Finnish, Swedish and Engli'3hed1tion. It contains detaiiled descriptions of the 32 loans issued in 1964 o.f which 21 were denominaJted in Finnish marks and launched in Finland and 11 in foreign currency issued in the USA ,and the West European capital markets.
BANK OF FINLAND
BOARD OF MANAGEMENT
ESKO K. LEINONEN
KLAUS WARIS,
G0'IJ6T1Ior
AIiTI KARJALAINEN
(Absent as a member of Government)
A. SIMONEN
REINO ROSSI
HEIKKI VALVANNE
ad into
SECRETARIES
U. A. VATANEN PERTTI TAMMIVUORI
JOUKO J. VOUTILAINEN JAAKKO S. LASSILA
K. IGNATIUS J ORMA ARANKO
HEADS OF DEPARTMENT
G. ENGBERG,
Personnel
P. BLOMQUIST,
Central Accounting
A. KAJANTIE,
Internal Audit
ARTHUR ASPELUND,
Cash
K. ErROI,A,
I.Iccounts
C. G. SUNDMAN,
Foreign exchange (trade)
P.-E. OSTERLUND,
Foreign exchange (services)
HELGE LINDSTROM
Credits
EINO JUSSILA,
Office
A. NENONEN,
Foreign correspondence
INSTITUTE FOR ECONOMIC RESEARCH
J. J. PAUNIO,
llead of department
HEIKKI VALVANNE,
Director
TIMO HELELii.
1l ead of department
Helsinki 1965. Government Printing Office