utbildingsprogram – degree programme psychology te - helda
TRANSCRIPT

Tiedekunta – Fakultet – Faculty Faculty of Medicine
Koulutusohjelma – Utbildingsprogram – Degree Programme Psychology
Tekijä – Författare – Author Tero Pulkkinen
Työn nimi – Arbetets titel – Title Preadolescent general psychopathology and its use in prediction of substance use in adolescence
Oppiaine/Opintosuunta – Läroämne/Studieinriktning – Subject/Study track Psychology
Työn laji – Arbetets art – Level Master’s thesis
Aika – Datum – Month and year 29.11.2019
Sivumäärä – Sidoantal – Number of pages 34
Tiivistelmä – Referat – Abstract
Background:
In recent years, research on dimensional models of psychopathology has substantially increased. Some of the most promising
models have included a dimension of general psychopathology that is often called the p factor. However, the research on the
practical uses of such models is still scarce, as is the evaluation of models beyond their goodness-of-fit indexes. This study aims to
contribute to filling this gap by examining the underlying structure of preadolescent psychopathology and answering an important
practical question: whether such models of preadolescent psychopathology can be used in predicting substance use in
adolescence, which is a critical period in the development of substance use disorders. In addition, the model containing the p
factor is evaluated with methods that have been seldom used but that can provide a more nuanced picture of psychopathology.
Methods:
Using the data from the UK Household longitudinal study, the underlying structure of psychopathology was first modelled with
three confirmatory factor analyses (n = 3437). The models in question were a two-factor model consisting of internalizing and
externalizing; a one-factor model consisting of the p factor; and a bifactor model consisting of internalizing, externalizing and the p
factor. The bifactor model was also evaluated with several bifactor model indices. Then the models that exhibited at least
acceptable statistical fit were used to predict the use of several substances in adolescence (n = 1610).
Results and conclusions:
The two-factor model and the bifactor provided an acceptable fit to the data. Both the externalizing factor in the two-factor model
and the p factor in the bifactor model were also able to predict the use of all substances. However, the bifactor model had issues
with interpretation and contrary to theorizing, it could be characterized as primarily unidimensional. Future research is encouraged
to compare the practical utilities of different models of psychopathology and to evaluate bifactor models in more detail.
Avainsanat – Nyckelord – Keywords general psychopathology, p factor, substance use
Ohjaaja tai ohjaajat – Handledare – Supervisor or supervisors Kia Gluschkoff
Säilytyspaikka – Förvaringställe – Where deposited
Muita tietoja – Övriga uppgifter – Additional information

Tiedekunta – Fakultet – Faculty Lääketieteellinen tiedekunta
Koulutusohjelma – Utbildingsprogram – Degree Programme Psykologian koulutus
Tekijä – Författare – Author Tero Pulkkinen
Työn nimi – Arbetets titel – Title Varhaisnuoruuden yleinen psykopatologia ja sen käyttö nuorten päihteidenkäytön ennustamisessa
Oppiaine/Opintosuunta – Läroämne/Studieinriktning – Subject/Study track Psykologia
Työn laji – Arbetets art – Level Pro gradu -tutkielma
Aika – Datum – Month and year 29.11.2019
Sivumäärä – Sidoantal – Number of pages 34
Tiivistelmä – Referat – Abstract
Tausta:
Viime vuosina psykopatologian dimensionaalisia malleja koskeva tutkimus on lisääntynyt runsaasti. Jotkut kaikkein lupaavimmista
malleista ovat sisältäneet yleisen psykopatologian ulottuvuuden, jota kutsutaan usein p-faktoriksi. Tutkimus tällaisten mallien
käytännön hyödyistä on kuitenkin vielä vähäistä, kuten on myös mallien arvioiminen muuten kuin sopivuusindekseillä. Tämä
tutkimus tähtää täyttämään tutkimuskirjallisuuden aukkoa tarkastelemalla varhaisnuorten latenttia psykopatologiaa ja vastaamalla
tärkeään käytännön kysymykseen: voidaanko varhaisnuorten psykopatologian malleja hyödyntää päihteidenkäytön
ennustamisessa nuoruusiässä, joka on kriittinen vaihe päihdeongelmien kehityksessä. Lisäksi mallia, joka sisältää p-faktorin
arvioidaan menetelmillä, joita ei olla käytetty paljoa, mutta jotka voivat auttaa muodostamaan yksityiskohtaisempaa kuvaa
psykopatologiasta.
Menetelmät:
Tutkimuksessa hyödynnettiin aineistoa UK household longitudinal study -hankkeesta ja mallinnettiin ensin psykopatologian
rakennetta kolmella konfirmatorisella faktorianalyysilla (n = 3437). Kyseiset mallit olivat kaksifaktorinen malli, joka koostui
internalisoinnista ja eksternalisoinnista; yksifaktorinen malli, joka koostui p-faktorista; ja bifaktorimalli, joka koostui
internalisoinnista, eksternalisoinnista ja p-faktorista. Bifaktorimallia myös arvioitiin useilla bifaktorimallien arviointiin tarkoitetuilla
menetelmillä. Sitten malleilla, jotka olivat sopivuusindekseiltään vähintään hyväksyttäviä, ennustettiin erilaisten päihteiden käyttöä
nuoruusiässä (n = 1610).
Tulokset ja johtopäätökset:
Kaksifaktorimalli ja bifaktorimalli sopivat aineistoon hyväksyttävällä tavalla. Sekä eksternalisointifaktori kaksifaktorimallissa että p-
faktori bifaktorimallissa myös ennustivat kaikkien tutkittujen päihteiden käyttöä. Bifaktorimallissa oli kuitenkin tulkinnallisia ongelmia
ja teoretisoinnin vastaisesti sitä voisi kuvaillla pääasiassa yksiulotteiseksi. Tulevaa tutkimusta kannustetaan vertailemaan
psykopatologian eri mallien käytännön hyödynnettävyyksiä ja arvioimaan bifaktorimalleja aiempaa yksityiskohtaisemmin.
Avainsanat – Nyckelord – Keywords yleinen psykopatologia, p-faktori, päihteiden käyttö
Ohjaaja tai ohjaajat – Handledare – Supervisor or supervisors Kia Gluschkoff
Säilytyspaikka – Förvaringställe – Where deposited
Muita tietoja – Övriga uppgifter – Additional information

Preadolescent general psychopathology and its use in prediction of substance use in adolescence
Tero Olavi Pulkkinen
Master’s thesis
Psychology
Faculty of Medicine
29.11.2019
Supervisor: Kia Gluschkoff

Contents
1. Introduction ................................................................................................................................... 1
1.1. Background Assumptions of Categorical Classifications of Mental Disorders ........................ 1
1.2. The Proposed Latent Structures of Psychopathology ............................................................... 4
1.2.1. The general factor of psychopathology. ................................................................................ 5
1.3. Substance Use ........................................................................................................................... 8
1.4. Research Questions ................................................................................................................... 9
2. Methods ...................................................................................................................................... 10
2.1. Participants .............................................................................................................................. 10
2.2. Measures ................................................................................................................................. 10
2.3. Procedure ................................................................................................................................ 11
2.4. Statistical Analyses ................................................................................................................. 11
2.4.1. Confirmatory factor analyses, model fit and properties of the models. .............................. 12
2.4.2. Structural equation models. ................................................................................................. 13
3. Results......................................................................................................................................... 15
3.1. Confirmatory Factor Analyses and Model Statistics .............................................................. 15
3.2. Structural Equation Models and Prediction of Substance Use ............................................... 18
4. Discussion ................................................................................................................................... 20
4.1. Limitations .............................................................................................................................. 23
4.2. Conclusion .............................................................................................................................. 24
5. References ................................................................................................................................... 26
1
1. Introduction
In recent years, research on latent factors underlying all psychopathology has increased
substantially along with discontentment towards categorical classifications. As a result, several
competing dimensional models of latent structure of psychopathology have emerged. One of the
most promising developments has been the surfacing of the so-called general psychopathology
factor (p factor) – a general factor analogous to the general intelligence factor (g).
So far research concerning the p factor has examined in depth which factor models are viable in
terms of statistical fit. It has been found that a model including a p factor can be applied to
adolescents (e.g. Carragher et al., 2016; Caspi et al., 2014; Gomez, Stavropoulos, Vance, &
Griffiths, 2019; Lahey et al., 2012) and possibly to preadolescents or children as well (Gomez et al.,
2019; Lahey et al., 2015; Martel et al., 2016; Olino et al., 2018). However, fit indexes alone cannot
determine whether a model is viable or useful. When trying to figure out the most appropriate way
to model psychopathology, research should also examine other important model properties, such as
the replicability of factors, and the practical uses of the models.
One area where models of underlying psychopathology could prove practical lies in predicting
negative outcomes before they even occur. For example, adolescence is a critical period in the
development of substance use disorders. Early substance use is a significant risk factor for later
substance use disorders (Jordan & Andersen, 2017), which are in many ways burdensome for the
individual and share a high comorbidity with other mental disorders (Kessler, Chiu, Demler, &
Walters, 2005). Thus, knowledge of risk factors could be used for early prevention and intervention.
The aim of this study is to examine the viability and practicality of models underlying adolescent
psychopathology. The statistical fit of several factor models of psychopathology is investigated.
Then the models with at least acceptable fit are used to predict the use of various substances
approximately three years later in adolescence.
1.1. Background Assumptions of Categorical Classifications of Mental Disorders
Traditionally mental disorders have been classified as categorical, discrete and assumedly distinct
entities, which can be diagnosed on the basis of symptoms. This practice is in line with the standard
nosological style of the rest of medicine, in which disorders are conceptualized as dichotomous
entities, which either affect a person or do not.
2
The standard categorical approach remains highly influential to this day. The classifications in the
current diagnostic manuals, The Diagnostic and Statistical Manual of Mental Disorders (5th ed.;
DSM-5; American Psychiatric Association, 2013) and International Classification of Diseases (10th
ed.; ICD-10; World Health Organization, 1992), provide clinicians, researchers and the general
public alike with crucial tools for practice and thinking. For example, for clinicians and researchers
discrete categories serve as means to classify complex phenomena and convey information about
them in a systematic and generally agreed way. In folk psychology diagnostic classes have made
their way into everyday speech in explaining aberrant behaviour. In some cases, being classified as
either having or not having a mental disorder can even have judicial consequences.
However, despite their wide usage, categorical classifications of mental disorders have been a
subject to a wide array of criticism (see Carragher, Krueger, Eaton, & Slade, 2015 for review). In
short, most issues are related to the validity of such classifications. The commonly set objectives for
classifications of mental disorders is that they should accurately describe how the human
psychopathology functions or at least serve as instrumentally effective tools in practice (Zachar &
Kendler, 2010). However, several flaws in the core assumptions of DSM and ICD might make that
an improbable aspiration.
First, Carragher et al. (2015) point out that mental disorders are putatively distinct, yet they have a
high level of comorbidity. The concept of comorbidity is often used in two ways: it can mean that a
person meets the diagnostic criteria of more than one disorder, or that if someone can be classified
as having a mental disorder, that person has more than one disorder with a higher probability than
would be expected by chance alone (Lilienfeld, Waldman, & Israel, 1994). It is especially the latter
meaning of the term that is both evident and problematic in the case of mental disorders. For
example, in a nationally representative study of comorbidity of English-speaking adults in US, over
70 % of connections between 19 common mental and substance abuse disorders were positive and
statistically significant (Kessler, Chiu, et al., 2005). On a more detailed level, some disorders co-
occur more commonly than others, and in some cases comorbidity between specific disorders is
rather the rule than an exception. As another example of this from the same nationally
representative data from US, around two thirds of those with a DSM-IV diagnosed major depressive
disorder also met the criteria of at least one another diagnosis when the depression had lasted at
least 12 months (Kessler et al., 2003). The rates were the highest for anxiety disorders and then for
impulse control and substance abuse disorders, with co-occurrence percentages being 57.5 %, 16.6
% and 8.5 %, respectively. This indicates that assumedly distinct categories are significantly
overlapping and not, in fact, distinct.
3
Another related issue with categorical classifications lies with heterogeneity of symptoms within a
single disorder, as pointed out by Carragher et al. (2015). The diagnostic categories of categorical
mental disorders are polythetic in nature: they are diagnosed on the basis of various symptoms, but
one does not need to have all the symptoms associated with a certain disorder in order to be
diagnosed with the disorder. This brings about heterogeneity within disorder categories, because
two people diagnosed with the same disorder might share only few common symptoms. To
illustrate, in the case of DSM-5 major depressive disorder, two patients might share only one
common symptom (American Psychiatric Association, 2015). Despite this, it is often thought that a
single category describes a single mental disorder. This is a problematical assumption if several
seemingly separate phenomena map into a single disorder category or if one phenomenon underlies
several categories.
In the exemplary case of depression, there is evidence of both. In a study examining the factor
structure of common measures developed for tools in diagnosing depression, it was found that the
number of factors varied from three to six (Fried et al., 2016). This suggests that the symptoms of
depression are multidimensional rather than unidimensional. On the other hand, research suggests
that some factors, such as executive functions, underlie several mental disorders (Snyder, Miyake,
& Hankin, 2015), including major depressive disorder (MDD) (Cotrena, Branco, Shansis, &
Fonseca, 2016), yet executive functions are not explicitly included in the diagnostic criteria of
MDD. This hints that current diagnostic categories might not include some relevant aspects integral
to psychopathology.
Lack of validity brings about consequences both theoretical and practical in nature. If people having
very different problems are lumped into one category when they should be split into several or vice
versa, then it can be argued that the categorical classification in question is not able to claim the
benefits by which the categorical classification systems are often defended: easing clinical work and
aiding research (see Fried, 2015).
This criticism does not mean that current categorical classification systems do not have their merits.
In fact, as Lilienfeld (2014) points out, the DSM-5 has made considerable efforts to take into
account contemporary research. For example, it has deleted some problematic diagnostic categories,
such as schizophrenia subtypes, which have shown poor validity, poor stability over time, poor
interrater reliability and little utility (Reddy, Horan, & Green, 2014). Also, DSM-5 acknowledges
the potential of some dimensional models by mentioning a hybrid dimensional-categorical model
4
for diagnosing personality disorders under “Emerging Measures and Models” – a section which is
aimed at improving awareness and guiding research on potentially beneficial topics (APA, 2013).
Despite these efforts, many researchers have turned to dimensional approaches of mental disorders,
which can avoid some of the issues categorical classifications face. For example, latent factors
formed of an extensive number of measured symptoms and consisting of few, broad-band factors,
can be understood as a way for taking account the pervasive comorbidity and correlation of
different mental disorders (Eaton, South & Krueger, 2010). In a similar manner, dimensional
models avoid problems of heterogeneity by not being polythetic.
1.2. The Proposed Latent Structures of Psychopathology
Numerous factor models underlying psychopathology have been proposed with varying
methodologies and samples. Especially with regards to children and adolescent populations, a
model consisting of two factors – internalizing and externalizing – has been used for decades to
model childhood psychopathology (Achenbach, 1966; Achenbach & Edelbrock, 1978). This model
has been often dubbed as the two-factor model, and it exhibits both good fit and stability over time
(for review, see Eaton, Rodriguez-Seijas, Carragher, & Krueger, 2015), as well as invariance across
genders, cultures, age and sexual orientation (Carragher et al., 2015). The factors have been
interpreted as ways to explain comorbidity across psychiatric diagnoses or symptoms, as underlying
core psychopathological processes (Caspi et al., 2014) and even as reflections of genetic etiology
(Krueger, 1999).
The internalizing factor denotes liability to undergo depressive disorders and various anxiety
disorders, such as generalized anxiety disorder, panic disorder, specific phobias, eating disorders
and bipolar disorders, while the externalizing factor does the same for substance abuse disorders
and disorders related to problems of behavioural, antisocial, or impulsive kind. Some disorders,
such as borderline personality (Eaton et al., 2011; Forbush & Watson, 2013) and post-traumatic
stress disorder (Carragher et al., 2015) seem to cross-load for both factors, which indicates
heterogeneity in the disease categories. The internalizing factor is sometimes further divided into
highly correlating fear and distress subfactors, but whether this bifurcated model exhibits better
model fit compared to the two-factor model remains an open question (Eaton et al., 2015). Although
the factors in the two-factor and the bifurcated models are deemed distinct, a correlation between
the factors is often allowed. The correlations appear to be from moderate to strong: studies have
5
typically shown a moderate correlation of .4–.6 between the internalizing and externalizing factors
(Forbush & Watson, 2013; Krueger, 1999; Patalay et al., 2015) and as demonstrated by Krueger
(1999), a strong connection (r = .73) between the subfactors of internalizing.
Sometimes other similar factors are added to the models as well. The most common of these factors
is the psychotic or the thought disorder factor. The principle remains the same as with the two-
factor and bifurcated factor models: three correlating factors explain comorbidity across various
symptoms and disorders. The psychotic factor is often omitted for practical reasons, since
commonly research focuses on more common forms of psychopathology and most psychiatric
surveys do not assess psychotic symptoms (Caspi et al., 2014). However, models containing the
thought disorder factor have exhibited good fit (Kotov et al., 2011; Markon, 2010). Bipolar
disorders and manic episodes seem to cross-load on the psychotic factor as well as the distress
subfactor of internalizing, which is also theoretically plausible given the depressive–psychotic
nature of bipolar disorders (for review, see Carragher et al., 2015). Similarly to the correlations of
internalizing and externalizing factors, the thought disorder factor exhibits a significant correlation
of around 0.6 with the internalizing factor (Wright et al., 2013).
1.2.1. The general factor of psychopathology.
Despite the good statistical fit of all the aforementioned models, the correlations among the factors
could indicate the existence of a higher-level factor or several factors. This observation has
generated research on a possible general psychopathology factor, which is sometimes called the p
factor. A close analogy to the p factor is the general intelligence factor (g), which putatively
explains why some people do well on a wide range of cognitive tasks. If understood via this
analogy, the p factor could explain individual differences on a wide range of separate
psychopathological symptoms.
The p factor has also been interpreted in more theoretical detail. For example, in a longitudinal
study by Caspi et al. (2014) it was suggested that the p factor “summarizes individuals’ propensity
to develop any and all forms of common psychopathology”. In the same study this interpretation
seems to be backed by the association of general psychopathology and psychiatric history in family,
as well as its association to high neuroticism, low conscientiousness and agreeableness and its
ability to predict life impairment and compromised brain functionality. The p factor can also be
interpreted as an indication of severity of psychopathology, for a rather obvious reason: since the p
6
factor is usually modelled with psychopathological symptom measures and symptom items
generally load positively to the p factor, higher scores on the p factor reflect greater symptoms. This
interpretation has been suggested by several researchers (cf. Arrindell et al., 2017; Caspi et al.,
2014; Haltigan, 2019).
It should be noted that distinguishing a liability to psychopathology from the severity of
psychopathology can be difficult, since phenomena such as psychopathological symptoms, criminal
activity, other forms of life impairment and the use of substances can be plausibly interpreted as
indications for both. However, the different interpretations might have their theoretical and possibly
practical differences: for example, conceptualizing the p factor as a susceptibility factor could direct
research into how negative life outcomes could be avoided by reducing the p factor, while the
severity perspective could encourage clinicians into utilizing scales that measure the p factor in
order to gain vital information about the depth of a patient’s difficulties.
There is further evidence for all the theoretical interpretations mentioned above. First, the p factor
explains comorbidity in itself by accounting for variance across different psychopathological
disorders or symptoms. An early-emerging p factor is also able to prospectively predict school and
global functioning, which indicates that the p factor acts as a susceptibility to negative life outcomes
(Lahey et al., 2015). In support of the severity interpretation, De Raykeer et al. (2018) found that
the p factor predicted suicide attempts in adults in a relatively short time period of three years. This
indicates that higher levels of general psychopathology indeed reflect higher severity of
psychopathology, not just susceptibility to develop mental disorders in distant future. Conway et al.
(2019) found similar results with the severity of p factor predicting suicidality and self-injury during
the past year.
In addition to having several possible interpretations, the p factor can also be formed in several
models. For example, a model could consist only of the p factor. In that scenario, all items should
load to the p factor. However, research suggests that a one-factor model consisting of the general
psychopathology factor usually exhibits less than acceptable goodness-of-fit (Arrindell et al., 2017;
Caspi et al., 2014; Patalay et al., 2015). A classic bifactor model consisting of both, the p factor and
internalizing and externalizing (and perhaps thought disorder) factors, on the hand, often fits the
data even better than various correlated-factors models without a general factor (Arrindell et al.,
2017; Carragher et al., 2016; Lahey et al., 2012; Patalay et al., 2015). As such, all items should load
to the p factor and either to the internalizing, externalizing or thought disorder factors, and by
convention the model is usually fully orthogonal. If the bifactor model is formed this way, the role
7
of internalizing and externalizing factors can be understood as accounting for variability not fully
accounted by the p factor (van Bork, Epskamp, Rhemtulla, Borsboom, & van der Maas, 2017). As
demonstrated by Caspi et al. (2014), Lahey et al. (2012) and Patalay et al. (2015), bifactor models
often show superior fit compared to correlated two- or three-factor models.
However, the classic bifactor model described above is not the only bifactor model that can be
formed, and it is worth noticing that different bifactor models can have radically different
interpretations. For example, the internalizing and externalizing factors can be allowed to correlate,
or the p factor can be understood as a higher-order factor for the lower-level factors, such as
internalizing, externalizing and thought disorders (see Blanco et al., 2015; van Bork et al., 2017). In
the higher-order bifactor model the lower-level factors load onto the p factor while some of the
observed variables, such as questionnaire items, load to the lower-level factors. In this case, the
lower level factors explain the variance in their indicator items, while the p factor explains the
variance that the lower-level factors share (van Bork et al., 2017).
As pointed out by van Bork et al. (2017), however, because model fit is measured by comparing
observed variance–covariance matrix to the theoretical matrix postulated in the model, different
higher-order and bifactor models are statistically highly similar and usually exhibit highly similar fit
indexes. If fit indexes were the sole reason to prefer one model over others, this would result in a
large risk of biased conclusions: small differences in the studied samples could lead one higher-
order or bifactor model to emerge more fitting than the rest. This means that even a small sampling
variability could lead to massively different theories of psychopathology, if models were compared
based on just their fit indexes.
Focusing on the fit indexes is further complicated by bifactor models’ tendency to fit virtually any
data. Bonifay and Cai (2017) demonstrate that bifactor models have a proclivity to fit the data even
when the data follows a random pattern. This indicates that while bifactor models are successful in
terms of fit indexes, this could be a symptom of overfitting and ability to model noise (Bonifay,
Lane, & Reise, 2017).
Partly because of these concerns, it is beneficial to examine different bifactor model properties
above and beyond model fit, such as the external validity and practical applications of different
models. This does not mean that goodness-of-fit of the models should not be used as evidence when
comparing models – rather it means that a significant part of what makes one model better than
others lies in its usefulness. Despite this, attempts to compare the usefulness of different models of
psychopathology are still scarce. For example, if such models were able to predict how and what
8
kind of psychopathology at an early age affects later negative life outcomes, there might be a
possibility to prevent such outcomes before they manifest. As a demonstration of this, it has been
observed that externalizing disorders in preadolescence predict substance use in adolescence (King,
Iacono, & McGue, 2004). Since early substance use can continue into adulthood (e.g. Jordan &
Andersen, 2017) and lead into other negative consequences, interventions to underlying
psychopathology could have highly impactful results. However, to the knowledge of the author of
this study, similar research as in the study of King et al. (2004) has not been conducted with
dimensional models of psychopathology.
1.3. Substance Use
On a general level, categorical diagnostic classes of substance use disorders (SUDs) are highly
comorbid with other mental disorders (Degenhardt, Hall, & Lynskey, 2001; Kessler, Chiu, et al.,
2005). This type of comorbidity can be called “heterotypic comorbidity”, since in it disorders from
two different diagnostic groupings co-occur. There is also “homotypic comorbidity” in different
substances, because often the users diagnosed with one substance-related disorder are more likely to
exceed the criteria for other DSM-IV defined substance abuse or substance dependence disorders as
well (Degenhardt et al., 2001). When it comes to diagnostic classes of substance use disorders, it
should be noted that in DSM-5, unlike in DSM-IV, there is no distinction between substance abuse
and substance dependence disorders but combines them into single category of SUDs. These DSM-
5 defined SUDs vary in severity, ranging from mild, moderate to severe on the basis of the number
of different substance use related symptoms.
The use of substances such as tobacco, alcohol and drugs cause considerable stress to affected
individuals, their families and the entire society. Tobacco alone causes around 5 million annual
deaths worldwide (Davis, Wakefield, Amos, & Gupta, 2007), whereas excessive alcohol
consumption is one of the leading causes for premature mortality around the world (Leon et al.,
2007; Rehm et al., 2007; Stahre, Roeber, Kanny, Brewer, & Zhang, 2014). Drug use, on the other
hand, can cause several significant negative consequences such as unemployment, poor health and
mental disorders (Das, Salam, Arshad, Finkelstein, & Bhutta, 2016).
In the development of SUDs or nicotine dependency, adolescence is a critical period. Nationally
representative studies suggest that 50 % of SUDs begin by the age of 15–20 (Kessler, Berglund, et
al., 2005; Merikangas et al., 2010). Early substance use can also continue into adulthood and further
9
develop into a SUD: research suggests that teens or children that use substances before the age of
14 have a higher risk of developing a substance dependence (Jordan & Andersen, 2017). There is
also evidence that people who start using cannabis by the age of 17 are more likely to use, abuse or
get dependent on drugs, and the same applies for alcohol dependence (Lynskey et al., 2003). It also
has been estimated that each year early use of drugs is delayed, the risk of a lifelong drug abuse or
dependency is decreased by around 4–5 % (Grant & Dawson, 1998).
From a dimensional perspective, the high homotypic comorbidity between different substance use
disorders suggests that there could be one or several factors that help to explain the comorbidity.
Indeed, studies have frequently found that there might be an underlying common factor behind
SUDs (cf. Hasin, Fenton, Beseler, Park, & Wall, 2012; Huba, Wingard, & Bentler, 1981). However,
the latent factor could also encompass more than just SUDs. It has also been noted that substance
use often co-occurs with tendencies for impulsivity and aggression as well as antisocial personality,
which has led some researchers to suggest that these tendencies form a latent factor of externalizing
(Krueger, Markon, Patrick, Benning, & Kramer, 2007). This is supported by confirmatory factor
analyses that have found that SUDs often load highly to externalizing as well as the p factor
(Greene & Eaton, 2017; Ignatyev, Baggio, & Mundt, 2019).
Due to the critical nature of preadolescence in development of SUDs, the burden of SUDs and the
high comorbidity of SUDs and other mental disorders, research on predicting substance use and
abuse before it even starts could yield important real-life applications. These reasons also make the
topic an ideal candidate for examining the usefulness of dimensional models of psychopathology.
1.4. Research Questions
The aim of this study is to study whether several factor models of psychopathology that have been
proposed in previous literature are viable in terms of statistical fit, and which models emerge useful
in predicting early experimentations of alcohol, tobacco, marijuana, glue and other drugs. More
specifically, the models examined are the oblique two-factor model, the unidimensional general
psychopathology factor model and the orthogonal bifactor model.
10
2. Methods
2.1. Participants
The data of this study is from the UK Household Longitudinal Survey, a longitudinal study which
consists of members of approximately 40 000 households in United Kingdom. The data collection
started in 2009 and has taken and will take place in 8 waves with the last wave being collected in
2019. The participants of this study participated in the initial measurements in waves 1 and 3
(collected in 2009–2010 and 2011–2012, respectively) and in the follow-up measurements in waves
4 and 6 (in 2012–2013 and 2014–2015, respectively).
The target sample of this study consisted of 3648 (49.5 % female) preadolescents aged from 10 to
12 years (mean = 11.0, sd = 0.77) at the time of the initial measurement. Due to a drop-out rate, at
second phase of the study the sample consisted of 2244 participants aged from 12 to 16 years (mean
= 13.91, sd = 0.91).
2.2. Measures
The psychiatric symptoms were measured by the Strengths and Difficulties Questionnaire (SDQ),
which is a widely used method for assessing the behaviour, emotions and relationships of 4–16-
year-olds. SDQ can be used for clinical screening or assessment as well as for research (Goodman,
2001). SDQ boasts good psychometric properties (Goodman, Meltzer, & Bailey, 1998), and it has
been successfully used to model latent factors of psychopathology (Carragher et al., 2016; Patalay
et al., 2015).
In this study, 15 items from the SDQ were used, although the original questionnaire consists of 25
items in total. Originally the 25 items were intended to form 5 subscales (emotional problems, peer
problems, conduct problems, hyperactivity and prosociality), each consisting of 5 items. Example
items include questions such as “I worry a lot” and “I am often accused of lying or cheating”. In this
study, the items forming the prosociality subscale were omitted, since they are not measuring
psychiatric symptoms. The remaining four subscales also included 5 items in total which are
reverse-worded and measure strengths instead of psychiatric symptoms. Because the correlation
among these reverse-coded items and the other items assessing problems has been shown to be
weaken the coefficient alpha and thus potentially cause problems to the factor solutions (Van De
Looij-Jansen, Goedhart, De Wilde, & Treffers, 2011), these items were also omitted from the
11
analyses of this study. All SDQ are answered on a 3-point scale (1 = “Not true”, 2 = “Somewhat
true”, 3 = “Certainly true”).
Of the 15 items used, internalizing was assessed with 8 items (α = .88) and externalizing with 7
items (α = .85). General psychopathology was assessed with all 15 items (α = .92). The decision on
which items were categorized as internalizing and which as externalizing was based on previous
studies employing the same measure in study of factors underlying psychopathology (Carragher et
al., 2016; Patalay et al., 2015).
The early use of alcohol, tobacco, cannabis, glue or solvent sniffing and any other illegal drugs was
assessed with questions such as “Have you ever had an alcoholic drink? That is a whole drink, not
just a sip.”, and in all items the participants had to choose from two choices: “Yes” and “No”.
2.3. Procedure
The participants took part at either waves 1 and 4 or 3 and 6, and the data from all waves was
pooled. At the initial measurements at waves 1 or 3, the participants completed an extensive
questionnaire concerning their life and answered the Strengths and Difficulties Questionnaire,
among other items.
On the follow-up phase (waves 4 or 6) the procedure was identical except for the contents of the
questionnaire – this time it included, among other items, questions about substance use. If and only
if a person was given the questionnaire containing SDQ items at wave 1, then questionnaire
containing the substance use items was administrated around 3 years later in wave 4; and similarly,
if and only if the questionnaire containing SDQ was administrated at wave 3, substance use items
followed around three years later in wave 6. At all waves the contents of the questionnaires also
included items not relevant to this study.
2.4. Statistical Analyses
The analyses can be summarized into two steps. First, confirmatory factor analyses (CFAs) were
conducted. In this step, the goodness-of-fit of the models and other model statistics – namely
omega, omega hierarchical and H index – were also examined. In the second step, structural
12
equation models were conducted to predict whether adolescents had had early experiences with
substances. Both the SEMs and the CFAs were conducted using the R package lavaan version 0.6-
5. SDQ items and substance use items were treated as categorical variables, given the skewness of
the variables and that the former has only three and the latter only two levels. The estimation
method for both the CFAs and SEMs was diagonally weighted least squares, because it fares better
than maximum likelihood equations when data is ordinal (Li, 2016).
2.4.1. Confirmatory factor analyses, model fit and properties of the models.
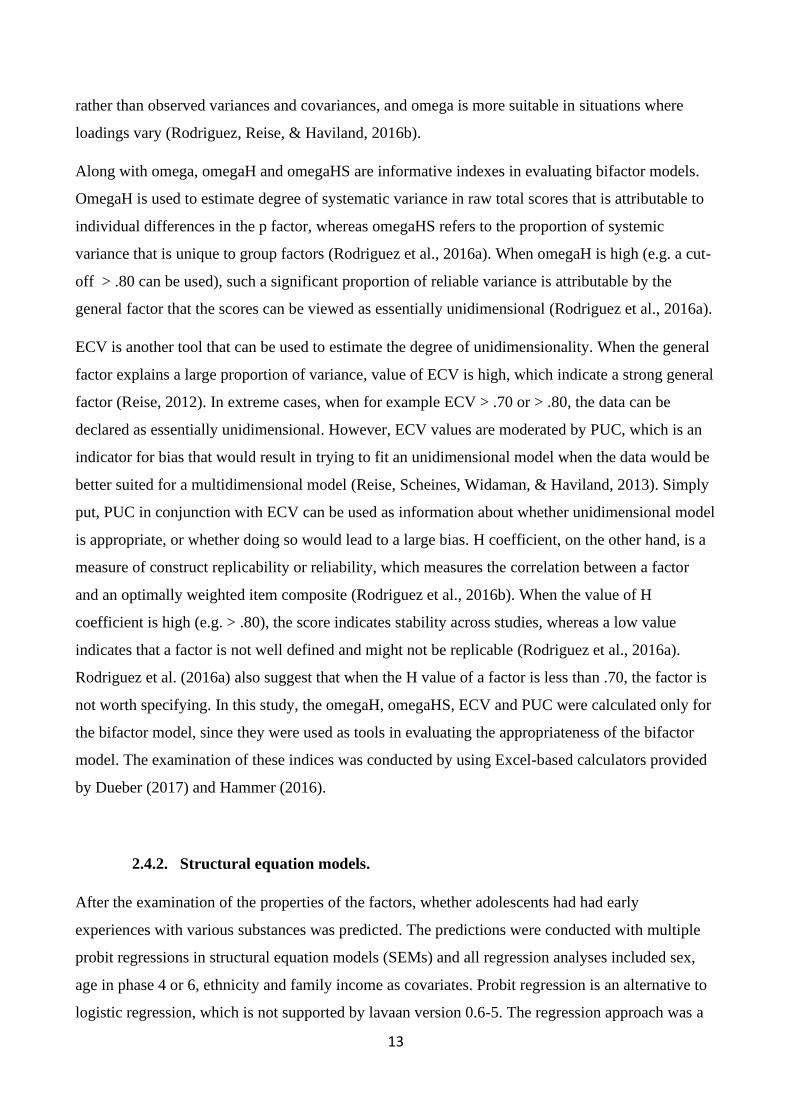
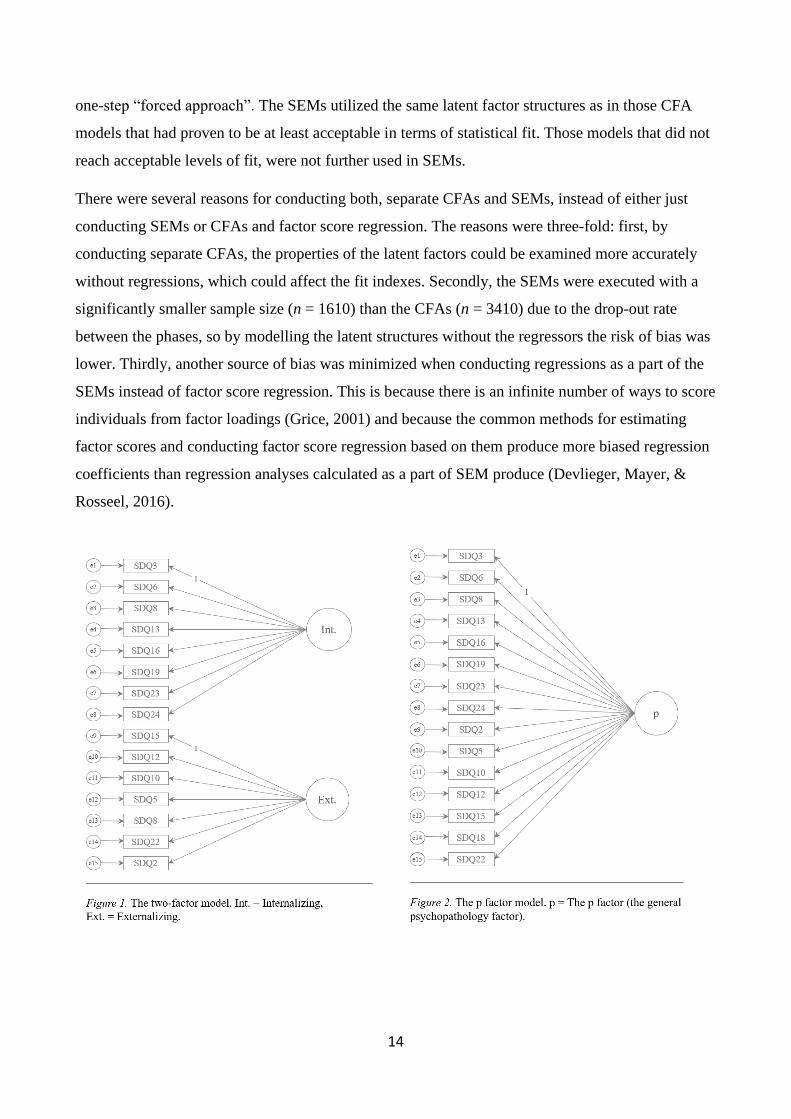
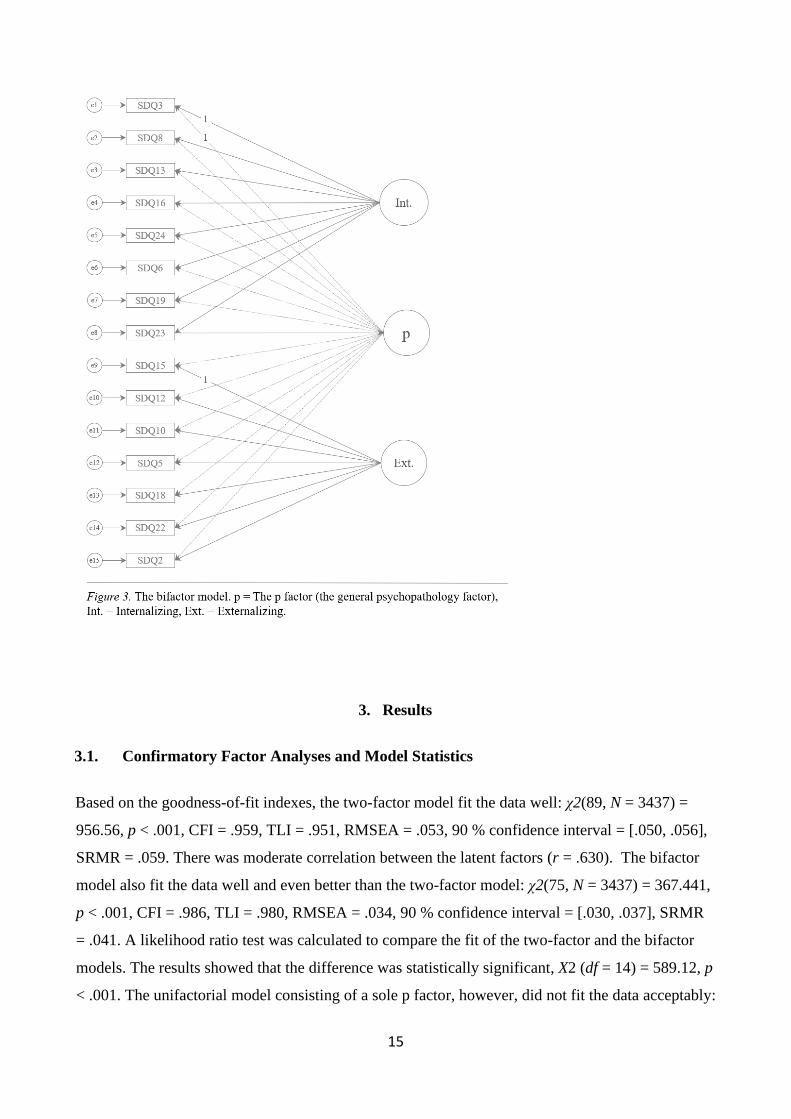
Underlying structure of psychopathology was first modelled with three confirmatory factor
analyses. The models were the two-factor model consisting of correlating internalizing and
externalizing factors; the one-factor model consisting of the p factor model; and the orthogonal
bifactor model consisting of all three: the internalizing and externalizing factors and the p factor.
The models are presented visually in Figure 1, Figure 2 and Figure 3. After that, the goodness-of-fit
indexes of the models were examined. While there is no clear consensus regarding strict cut-offs in
fit indexes, often RMSEA values below .05 are deemed reasonably good in terms of fit, whereas
values below .1 should be rejected (Brown, 2006). Similarly, comparative fit index (CFI) and
Tucker–Lewis index (TLI) values above .95 can be understood to signify good fit and values
between .9 and .95 can be called “acceptable”, whereas values below .9 should be rejected (Brown,
2006). In the case or SRMR, it has been suggested that .08 is required for a relatively good fit (Hu
& Bentler, 1999). For the purposes of this study, RMSEA and SRMR values below .1 and .08,
respectively, and CFI and TLI values above .9 are considered acceptable.
Since bifactor models have a tendency to overfit data (Bonifay et al., 2017), it is important to
evaluate bifactor models with methods that have been specifically designed for evaluating bifactor
models. Thus, properties of the CFA models in this study, especially the bifactor model, were also
examined with omega, omega subscale (omegaS), omega hierarchical (omegaH), omega
hierarchical subscale (omegaHS), explained common variance (ECV), percentage of
uncontaminated correlations (PUC) and H indices. Omega subscale is a tool for estimating the
internal reliability of a factor analytic model, and it can be applied to both: the whole model or the
subscales of the model, hence the distinction to omega and omega subscales (Rodriguez, Reise, &
Haviland, 2016a). Omega resembles the standard coefficient alpha that is widely used in
psychological research. However, there are two differences: omega is based on factor loadings
13
rather than observed variances and covariances, and omega is more suitable in situations where
loadings vary (Rodriguez, Reise, & Haviland, 2016b).
Along with omega, omegaH and omegaHS are informative indexes in evaluating bifactor models.
OmegaH is used to estimate degree of systematic variance in raw total scores that is attributable to
individual differences in the p factor, whereas omegaHS refers to the proportion of systemic
variance that is unique to group factors (Rodriguez et al., 2016a). When omegaH is high (e.g. a cut-
off > .80 can be used), such a significant proportion of reliable variance is attributable by the
general factor that the scores can be viewed as essentially unidimensional (Rodriguez et al., 2016a).
ECV is another tool that can be used to estimate the degree of unidimensionality. When the general
factor explains a large proportion of variance, value of ECV is high, which indicate a strong general
factor (Reise, 2012). In extreme cases, when for example ECV > .70 or > .80, the data can be
declared as essentially unidimensional. However, ECV values are moderated by PUC, which is an
indicator for bias that would result in trying to fit an unidimensional model when the data would be
better suited for a multidimensional model (Reise, Scheines, Widaman, & Haviland, 2013). Simply
put, PUC in conjunction with ECV can be used as information about whether unidimensional model
is appropriate, or whether doing so would lead to a large bias. H coefficient, on the other hand, is a
measure of construct replicability or reliability, which measures the correlation between a factor
and an optimally weighted item composite (Rodriguez et al., 2016b). When the value of H
coefficient is high (e.g. > .80), the score indicates stability across studies, whereas a low value
indicates that a factor is not well defined and might not be replicable (Rodriguez et al., 2016a).
Rodriguez et al. (2016a) also suggest that when the H value of a factor is less than .70, the factor is
not worth specifying. In this study, the omegaH, omegaHS, ECV and PUC were calculated only for
the bifactor model, since they were used as tools in evaluating the appropriateness of the bifactor
model. The examination of these indices was conducted by using Excel-based calculators provided
by Dueber (2017) and Hammer (2016).
2.4.2. Structural equation models.
After the examination of the properties of the factors, whether adolescents had had early
experiences with various substances was predicted. The predictions were conducted with multiple
probit regressions in structural equation models (SEMs) and all regression analyses included sex,
age in phase 4 or 6, ethnicity and family income as covariates. Probit regression is an alternative to
logistic regression, which is not supported by lavaan version 0.6-5. The regression approach was a
14
one-step “forced approach”. The SEMs utilized the same latent factor structures as in those CFA
models that had proven to be at least acceptable in terms of statistical fit. Those models that did not
reach acceptable levels of fit, were not further used in SEMs.
There were several reasons for conducting both, separate CFAs and SEMs, instead of either just
conducting SEMs or CFAs and factor score regression. The reasons were three-fold: first, by
conducting separate CFAs, the properties of the latent factors could be examined more accurately
without regressions, which could affect the fit indexes. Secondly, the SEMs were executed with a
significantly smaller sample size (n = 1610) than the CFAs (n = 3410) due to the drop-out rate
between the phases, so by modelling the latent structures without the regressors the risk of bias was
lower. Thirdly, another source of bias was minimized when conducting regressions as a part of the
SEMs instead of factor score regression. This is because there is an infinite number of ways to score
individuals from factor loadings (Grice, 2001) and because the common methods for estimating
factor scores and conducting factor score regression based on them produce more biased regression
coefficients than regression analyses calculated as a part of SEM produce (Devlieger, Mayer, &
Rosseel, 2016).
15
3. Results
3.1. Confirmatory Factor Analyses and Model Statistics
Based on the goodness-of-fit indexes, the two-factor model fit the data well: χ2(89, N = 3437) =
956.56, p < .001, CFI = .959, TLI = .951, RMSEA = .053, 90 % confidence interval = [.050, .056],
SRMR = .059. There was moderate correlation between the latent factors (r = .630). The bifactor
model also fit the data well and even better than the two-factor model: χ2(75, N = 3437) = 367.441,
p < .001, CFI = .986, TLI = .980, RMSEA = .034, 90 % confidence interval = [.030, .037], SRMR
= .041. A likelihood ratio test was calculated to compare the fit of the two-factor and the bifactor
models. The results showed that the difference was statistically significant, X2 (df = 14) = 589.12, p
< .001. The unifactorial model consisting of a sole p factor, however, did not fit the data acceptably:
16
χ2(90, N = 3437) = 1911.799, p < .001, CFI = .913, TLI = .899, RMSEA = .077, 90 % confidence
interval = [.074, .080], SRMR = .084. This means that based on TLI and SRMR values, the one-
factor model exhibited less than acceptable fit and was not used in further SEMs to predict future
substance use.
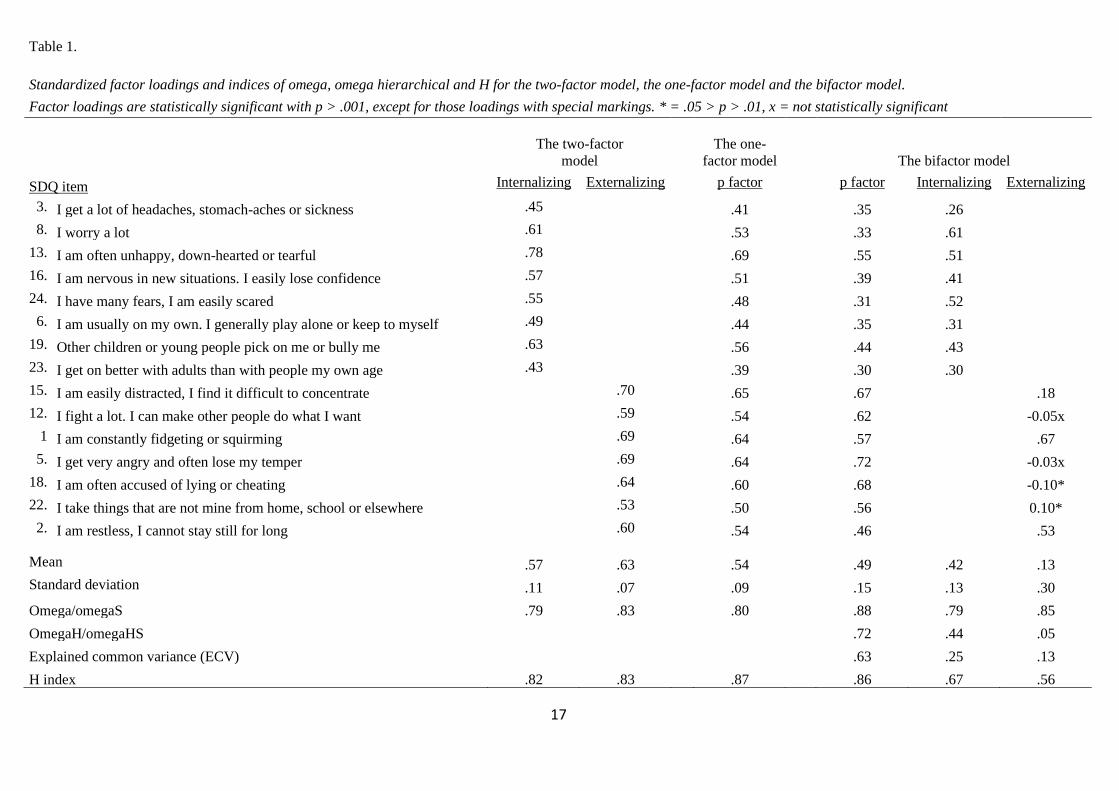
Standardized factor loadings, their means and standard deviations as well as the values of omega,
omega hierarchical and H index are presented in Table 1. For the two-factor and one-factor models,
all of the standardized factor loadings were positive and above 0.3, with only one loading being
below 0.4. For the bifactor model, however, especially on the externalizing factor the standardized
factor loadings were lower, with 2 out of 7 being non-significant and a total of 5 being below 0.2.
Due to convergence issues, the factor loading of the SDQ item number 15 to the externalizing
factor was set to 1.0 in the CFAs that had an externalizing factor, even though usually by
convention the first item in numerical order is fixed to 1.0 if one of the factor loadings to a latent
factor is fixed in the first place.
The inspection of omegaH in the bifactor model also revealed that most of the variance of raw total
scores was attributable to the general factor, while only a small portion was attributable to the group
factors after taking into account the variability attributed to the general factor (cf. Reise, Bonifay, &
Haviland, 2013). To be more specific, the percentage of reliable variance caused by internalizing
and externalizing in total scores can be calculated by simply by subtracting the omegaH score
(.715) of the p factor from its omega score (.881) (Rodriguez et al., 2016b). This results in 16.6 %
of reliable variance being attributable to internalizing and externalizing subscores. In a similar
manner, Rodriguez et al. (2016b) instruct that the proportion of reliable variance that can be
attributed to the general factor can be calculated by dividing the p factor’s omegaH score (variance
due to the p factor) with its omega score (variance due to all factors in the model). This results in
almost all reliable variance (81.1 %) being attributable to the general factor. These results are
further supported by the results concerning the ECV in general factor (ECV = .63) and PUC (PUC
= .53) in the bifactor model. Reise et al. (2013) suggest that when PUC is lower than .80, ECV of a
general factor is greater than .60 and omegaH is greater than .70, the bifactor model can be
interpreted as unidimensional. In this study, these criteria were met.
17
Table 1.
Standardized factor loadings and indices of omega, omega hierarchical and H for the two-factor model, the one-factor model and the bifactor model.
Factor loadings are statistically significant with p > .001, except for those loadings with special markings. * = .05 > p > .01, x = not statistically significant
The two-factor
model
The one-
factor model The bifactor model
SDQ item Internalizing Externalizing p factor p factor Internalizing Externalizing
3. I get a lot of headaches, stomach-aches or sickness .45 .41 .35 .26
8. I worry a lot .61 .53 .33 .61
13. I am often unhappy, down-hearted or tearful .78 .69 .55 .51
16. I am nervous in new situations. I easily lose confidence .57 .51 .39 .41
24. I have many fears, I am easily scared .55 .48 .31 .52
6. I am usually on my own. I generally play alone or keep to myself .49 .44 .35 .31
19. Other children or young people pick on me or bully me .63 .56 .44 .43
23. I get on better with adults than with people my own age .43 .39 .30 .30
15. I am easily distracted, I find it difficult to concentrate .70
.65 .67 .18
12. I fight a lot. I can make other people do what I want .59
.54 .62 -0.05x
1 I am constantly fidgeting or squirming .69
.64 .57 .67
5. I get very angry and often lose my temper .69
.64 .72 -0.03x
18. I am often accused of lying or cheating .64
.60 .68 -0.10*
22. I take things that are not mine from home, school or elsewhere .53
.50 .56 0.10*
2. I am restless, I cannot stay still for long .60
.54 .46 .53
Mean .57 .63 .54 .49 .42 .13
Standard deviation .11 .07 .09 .15 .13 .30
Omega/omegaS .79 .83 .80 .88 .79 .85
OmegaH/omegaHS .72 .44 .05
Explained common variance (ECV) .63 .25 .13
H index .82 .83 .87 .86 .67 .56

18
3.2. Structural Equation Models and Prediction of Substance Use
Two SEMs were conducted to predict substance use, namely has the person ever tried alcohol,
tobacco, glue or solvents, cannabis or other drugs. By the time the regressions were conducted, 8.0
% had already tried smoking, 33.1 % had tried alcohol, 1.7 % had sniffed solvent or glue, 3.1 % had
tried marijuana and finally, 0.5 % had tried other drugs. The latent structures used for predictions
were the two factors in the two-factor model and the three factors in the bifactor model. Similar to
the CFAs, the factor loading of the SDQ item number 15 to the externalizing factor was set to 1.0 in
both models due to convergence issues.
Adding the regressions reduced the goodness-of-fit of both models. In the case of the two-factor
SEM model, CFI and TLI seemingly decreased, while RMSEA and SRMR increased: χ2(214, N =
1610) = 959.59, p < .001, CFI = .930, TLI = .938, RMSEA = .047, 90 % confidence interval =
[.044, .050], SRMR = .069. The bifactor model χ2(195, N = 1610) = 652.56, p < .001, CFI = .957,
TLI = .958, RMSEA = .038, 90 % confidence interval = [.035, .041], SRMR = .057. Similarly, the
goodness-of-fit also changed in the bifactor model by adding the regressions, with CFI and TLI
decreasing and RMSEA and SRMR increasing: χ2(195, N = 1610) = 652.56, p < .001, CFI = .957,
TLI = .958, RMSEA = .038, 90 % confidence interval = [.035, .041], SRMR = .057. This means
that the fit of both models worsened slightly by adding the multiple regressions but remained
acceptable in both models.
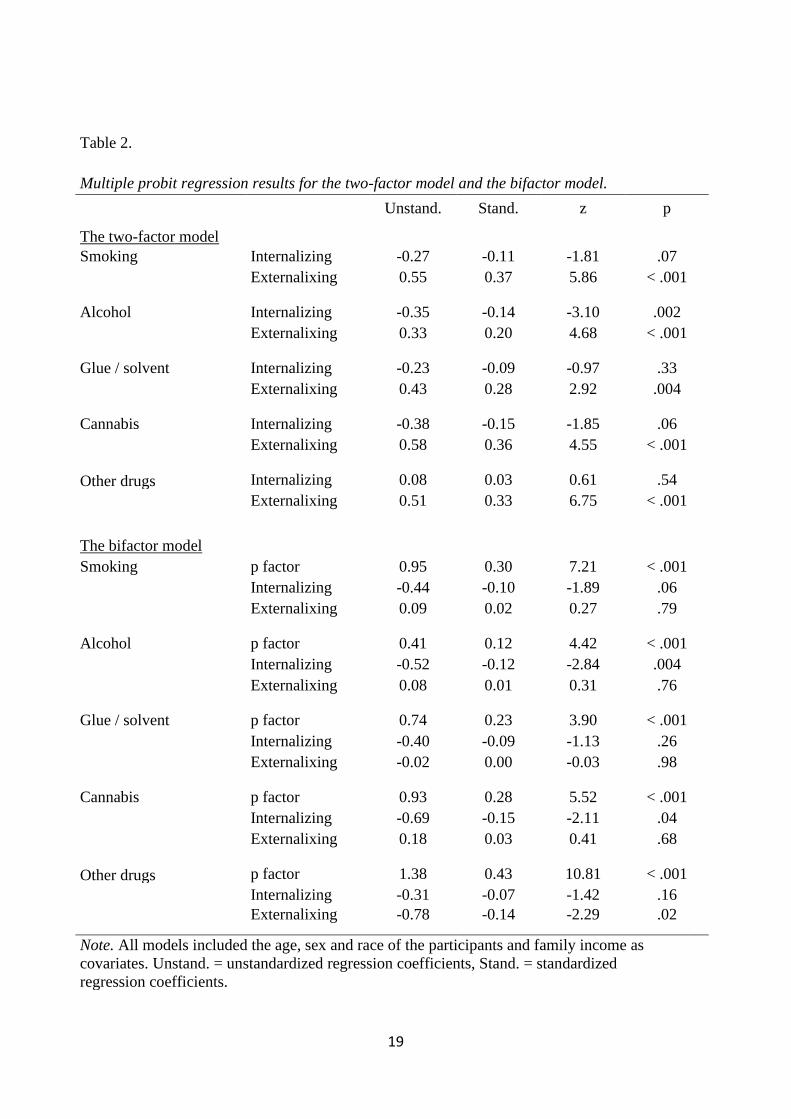
The regression coefficients and other regression test statistics for multiple probit regressions are
presented in Table 2. In the two-factor model, the externalizing factor was a statistically significant
and positive predictor of the use of all types of substances, as was the p factor in the bifactor model.
19
Table 2.
Multiple probit regression results for the two-factor model and the bifactor model.
The two-factor model
Unstand. Stand. z p
Smoking Internalizing -0.27 -0.11 -1.81 .07 Externalixing 0.55 0.37 5.86 < .001
Alcohol Internalizing -0.35 -0.14 -3.10 .002 Externalixing 0.33 0.20 4.68 < .001
Glue / solvent Internalizing -0.23 -0.09 -0.97 .33 Externalixing 0.43 0.28 2.92 .004
Cannabis Internalizing -0.38 -0.15 -1.85 .06 Externalixing 0.58 0.36 4.55 < .001
Other drugs Internalizing 0.08 0.03 0.61 .54 Externalixing 0.51 0.33 6.75 < .001
The bifactor model
Smoking p factor 0.95 0.30 7.21 < .001 Internalizing -0.44 -0.10 -1.89 .06 Externalixing 0.09 0.02 0.27 .79
Alcohol p factor 0.41 0.12 4.42 < .001
Internalizing -0.52 -0.12 -2.84 .004 Externalixing 0.08 0.01 0.31 .76
Glue / solvent p factor 0.74 0.23 3.90 < .001 Internalizing -0.40 -0.09 -1.13 .26 Externalixing -0.02 0.00 -0.03 .98
Cannabis p factor 0.93 0.28 5.52 < .001 Internalizing -0.69 -0.15 -2.11 .04
Externalixing 0.18 0.03 0.41 .68
Other drugs p factor 1.38 0.43 10.81 < .001
Internalizing -0.31 -0.07 -1.42 .16
Externalixing -0.78 -0.14 -2.29 .02
Note. All models included the age, sex and race of the participants and family income as
covariates. Unstand. = unstandardized regression coefficients, Stand. = standardized
regression coefficients.
20
4. Discussion
This study examined the structure of psychopathology in preadolescence and the viability of
competing latent factor models in predicting substance use in adolescence. Both the two-factor
model and the bifactor model, in which all items loaded to general psychopathology, were viable
solutions for the underlying structure of psychopathology in terms of fit, whereas the
unidimensional general factor model was not. Both viable models were also able to predict future
substance use.
In the two-factor model, more severe externalizing symptoms predicted all forms of early substance
use, namely the use of cigarettes, alcohol, cannabis and any other illegal drugs as well as sniffing of
glue or solvent, whereas in the bifactor model more severe general psychopathology managed the
same. These results corroborate the findings that higher levels of externalizing are indeed linked to
increased substance use (Greene & Eaton, 2017; Ignatyev et al., 2019; Krueger et al., 2007). It is
notable that of all substances, experimentation with alcohol was the weakest prediction for both: the
general factor in the bifactor model and the externalizing factor in the two-factor model. This is
likely because at the time of the measurement around a third had already tried alcohol, and thus
many adolescents who do not have particularly severe psychopathological symptoms had probably
also experimented with it. On the other hand, more severe general psychopathology predicted the
use of other drugs more strongly than the use of other substances, whereas in the two-factor model,
more severe externalizing symptoms predicted the use of cigarettes more strongly than the use of
other substances. This suggests that the use of highly hazardous drugs such as heroin, cocaine and
methamphetamine reflects the severity of an individual’s psychopathological symptoms more so
than the use of other substances, such as alcohol, cigarettes or marijuana.
The strength of the predictions between the models could not be compared due an inherent
difficulty in comparing the results of different probit or logistic regression models (Karlson, Holm,
& Breen, 2012), but incipient research has suggested that correlated factors models are in many
cases comparably good in predicting negative life outcomes, though there may be specific areas
where one model performs better than others. Laceulle, Chung, Vollebergh and Ormel (2019)
examined how different models of psychopathology predicted a variety of life outcomes, ranging
from e.g. education level to use of cigarettes, alcohol or cannabis. The models that were analyzed in
depth were a three-factor model consisting of correlating internalizing, externalizing and thought
disorders and a bifactor model that consisted of a general psychopathology factor to which all items
loaded in addition to the three group factors. The researchers found that higher levels of
21
externalizing in the correlated-factors model predicted the use of cigarettes, alcohol and cannabis
better than the general factor in the bifactor model did, although generally neither of the models
came out superior. Caspi et al. (2014) also studied the associations of two models underlying
psychopathology with different types of life impairment, namely suicide attempt, psychiatric
hospitalization, duration of social-welfare benefit use and convictions of violent crimes. They found
that both examined models – which were structurally the same as the two in the study of Laceulle et
al. (2019) – had factors that were substantially positively associated to all measured types of life
impairment. While more severe general psychopathology was more strongly associated to most
types of life impairment than any of the factors in the correlated factors model, the differences were
small, and in the case of convictions of violent crimes, the association to externalizing in the three-
factor model was slightly stronger than it was to the p factor in the bifactor model. In sum, these
results suggest that although in general the models fare comparably well, in prediction of substance
use the two-factor model might be more useful. However, more research is needed to verify or
falsify this conclusion.
It is also worth noticing that while the bifactor model in this study did fit the data better than the
two-factor model, bifactor models have a tendency to fit due to their greater ability to capture noise
and random patterns (Bonifay & Cai, 2017; Bonifay et al., 2017). Therefore, the better goodness-of-
fit of the bifactor model does not directly indicate that it reflects the structure of psychopathology
better than the two-factor model. Nevertheless, especially in the case of the bifactor model, the
good fit of the model is noteworthy due to the young age of the participants (mean = 11.02 years).
This is younger than, to the knowledge of the author of this article, the average age in all but three
studies that have found the p factor (Lahey et al., 2015; Martel et al., 2016; Olino et al., 2018), with
one article coming close (Gomez et al., 2019). This corroborates the yet-scarce literature that
modeling preadolescence psychopathology with a bifactor model can be viable. The lackluster fit of
the one-factor model has also been established before (Arrindell et al., 2017; Carragher et al., 2016;
Caspi et al., 2014; Martel et al., 2016; Patalay et al., 2015), which suggests that as with adults and
adolescents, it is not feasible to model psychopathology in preadolescence with only an
unidimensional structure.
Despite the unidimensional model not being viable, curiously enough, according to a heuristic
proposed by Reise et al. (2013), the bifactor model in this study can be considered unidimensional
due to the strength of the general psychopathology factor. In other words, although in principle the
theoretical role of internalizing and externalizing group factors in the bifactor model is to help to
explain aspects of psychopathology not comprehensively explained by the p factor (Bonifay et al.,
22
2017; van Bork et al., 2017), in this study their role in explanation was rather negligible. Especially
the externalizing factor explained very little of the common variance or the systematic reliable
variance that is independent of the general factor. In a similar manner, the group factors in the
bifactor model should not be interpreted independently of the general factor (cf. Rodriguez et al.,
2016a). This puts the theorist who is trying to choose the most theoretically sound model in a
difficult spot: the unidimensional model is not feasible, yet the feasible bifactor model is primarily
unidimensional – but in it the feasibility comes with the cost of including “methodological
nuisance” factors, which cannot be given meaningful theoretical interpretations (cf. Bonifay et al.,
2017). The two-factor model, on the other hand, can be more easily interpreted as consisting of
internalizing and externalizing, since in it both factors were well-formed.
It should be kept in mind, however, that the results concerning the strength of the p factor have been
mixed. In a study by Gomez et al. (2019) the findings did not support the unidimensionality of the
examined bifactor models and, with the exception of internalizing in adolescence, all factors were
well-defined and could be given meaningful interpretations. A study by Arrindell et al. (2017),
however, did suggest very low levels of reliable variance attributable solely to the group factors in
two separate bifactor models. According to another heuristic (PUC > .80) put forward by Reise et
al. (2013), both bifactor models in the study could also be interpreted as unidimensional. A third
study on the matter also concluded that a bifactor model examined in the study had interpretative
issues similar to those in this study, since the p factor explained most of the variance, which led to
unreliability of the group factors (Conway, Mansolf, & Reise, 2019). The mixed results go to show
that bifactor derived indices should be calculated by default in research on bifactor models. This
would aid in answering, for example, are the results replicable or specific to the used measures.
In addition to issues with interpretation, it is also difficult to apply the group factors to practice due
to the low reliability and proportion of explained variance of the group factors, alongside with the
fact that the group factors are not well defined. Researchers of Wechsler’s cognitive skills tests
have warned that the subscales of Wechsler’s intelligence tests should be interpreted with caution
(Kush & Canivez, 2019; McGill, Dombrowski, & Canivez, 2018) and a similar suggestion is in
place with the group factors of the bifactor model, since the results in this study are similar to that
of the Wechsler literature. This goes against the conclusions of Carragher et al. (2016), who
examined structurally a very similar bifactor model partly with a same measure (SDQ) as in this
study and suggested that in clinical practice both the p factor and the group factors should be
assessed to “provide detailed information about a patient’s [risk] profile”. Carragher et al. (2016),
23
however, did not examine any of the bifactor indices utilized in this study, which could have
affected the authors’ conclusions.
The residualized nature of the group factors in the bifactor model is also a likely explanation to
some counterintuitive findings in this study. Some items in externalizing in the bifactor model had
negative or statistically non-significant factor loadings for externalizing and lower levels of
externalizing predicted early experiments with other drugs. This could be a result of the relative
strength of the general psychopathology factor: since it explains most of the common variance, the
externalizing factor loses its original meaning. Conway et al. (2019), who had similar interpretative
issues, arrived at similar conclusions concerning the group factors in their study. It should be noted,
however, that lower levels of internalizing predicted early experiments with alcohol in both the
bifactor and the two-factor model and early experiments with marijuana in the bifactor model. The
association between marijuana and internalizing in the two-factor model was also very close to
being statistically significant (p = .06). This suggests that those preadolescents higher in
internalizing symptoms might be at a reduced risk of using substances, at least when it comes to
alcohol and perhaps to cannabis as well, even though the severity of their psychopathological
symptoms at large would make them more susceptible to use alcohol and cannabis at an early age in
adolescence. While the internalizing factor in the bifactor model was not well-defined, the results
from the two-factor model corroborate that the results with the bifactor model could be meaningful.
It is also intuitively plausible: the internalizing items in SDQ reflecting introversion and problems
with peers, which could limit adolescents’ access to alcohol, as well as other substances.
4.1. Limitations
Since the SDQ does not assess psychotic symptoms, a model consisting of a thought disorder factor
could not be examined. Including psychotic symptoms into a model of latent psychopathology
would be important, however, due to the high comorbidity of psychotic symptoms and their
economic consequences (Carragher et al., 2016; Caspi et al., 2014). It is also worth noticing that the
participants’ answers to both, the SDQ and the questions about substance use were self-reported.
This could have biased the results by, for example, some participants not answering truthfully about
their use of substances or about their difficulties measured by the SDQ. There is also a risk of bias
due to the drop-out rate between the first and the second time of measurement.
On a different SDQ-related matter, due to the categorical nature of the SDQ items and items
measuring substance use, direct comparison of models was difficult. As in logistic regression, in
24
probit regressions the proportion of explained variance (R2) cannot be calculated. Some alternatives
to the standard R2 have been developed for logistic and probit regressions, but in general they are
estimates of goodness-of-fit and do not purport to explain shared variance (Veall & Zimmermann,
1994). Also, lavaan version 0.6-5 does not support the calculation any type of pseudo-R2 in the first
place, which is why no pseudo-R2s were calculated in this study. Similarly, because the predictions
were conducted with multiple probit regressions, reporting intuitively understandable effect sizes
was not possible and the regression coefficients between the two-factor model and the bifactor
model could not be compared straightforwardly by examining the strength of the standardized
regression coefficients (Karlson et al., 2012). Karlson et al. (2012) explain that this is because in
probit and logit models, adding or removing any variable affects the error variance of the whole
model. This in turn will cause the regression coefficients to be on different scales, which makes
direct comparison between different models unviable without further analyses. A method developed
by Karlson et al. (2012) makes it possible to compare probit regression coefficients, but it could not
be conducted in lavaan 0.6-5. On the other hand, goodness-of-fit indexes were calculated for SEMs
that included the regressions, but in order to compare the regression coefficients or variance
explained in competing models, future research might be better off opting for data that can be
analysed with linear regression.
4.2. Conclusion
While the group factors in the bifactor model were not well-formed and could not be interpreted,
the bifactor model seems like a possible way to model preadolescent psychopathology. The value of
bifactor models of psychopathology often seems to boil down to the predictive power of the general
factor, and this study indeed corroborated the general factor’s ability to predict important outcomes,
namely the use of different substances in adolescence. However, the two-factor model without the
general factor was also successful in predicting substance use and was less problematic in terms of
interpretation. Earlier research also suggests that externalizing in a correlated factors model, where
a general factor does not take away systematic variance explained by externalizing, might be
superior in predicting the use of substances (Laceulle et al., 2019). However, further research is
needed to examine this. In sum, while the bifactor model has its merits in predicting life outcomes,
the theoretically simpler correlated-factor alternatives seem to be at least comparably useful with
regards to the use of substances. Future research should compare the practical utilities of different
models of psychopathology and examine bifactor model indices, such as omega hierarchical and

25
explained common variance by default, so we can reach a more nuanced understanding of
psychopathology.
26
5. References
Achenbach, T. M. (1966). The classification of children’s psychiatric symptoms: a factor-analytic
study. Psychological Monographs, 80(7), 1–37. https://doi.org/10.1037/h0093906
Achenbach, T. M., & Edelbrock, C. (1978). The classification of child psychopahology: a review
and analysis of empirical efforts. Psychological Bulletin, 85(85), 1275–1301.
Arrindell, W. A., Urbán, R., Carrozzino, D., Bech, P., Demetrovics, Z., & Roozen, H. G. (2017).
SCL-90-R emotional distress ratings in substance use and impulse control disorders: One-
factor, oblique first-order, higher-order, and bi-factor models compared. Psychiatry Research,
255(May), 173–185. https://doi.org/10.1016/j.psychres.2017.05.019
Blanco, C., Wall, M. M., He, J. P., Krueger, R. F., Olfson, M., Jin, C. J., … Merikangas, K. R.
(2015). The Space of Common Psychiatric Disorders in Adolescents: Comorbidity Structure
and Individual Latent Liabilities. Journal of the American Academy of Child and Adolescent
Psychiatry, 54(1), 45–52. https://doi.org/10.1016/j.jaac.2014.10.007
Bonifay, W., & Cai, L. (2017). On the Complexity of Item Response Theory Models. Multivariate
Behavioral Research, 52(4), 465–484. https://doi.org/10.1080/00273171.2017.1309262
Bonifay, W., Lane, S. P., & Reise, S. P. (2017). Three Concerns With Applying a Bifactor Model as
a Structure of Psychopathology. Clinical Psychological Science, 5(1), 184–186.
https://doi.org/10.1177/2167702616657069
Brown, T. A. (2006). Confirmatory Factor Analysis for Applied Research (Methodology in the
Social Sciences). In D. A. Kenny (Ed.), Confirmatory Factor Analysis for Applied Research
(2nd ed., p. 475). Retrieved from
https://search.proquest.com/docview/1918051852?accountid=14166%0Ahttp://xg9ax2jm9j.sea
rch.serialssolutions.com?ctx_ver=Z39.88-2004&ctx_enc=info:ofi/enc:UTF-
8&rfr_id=info:sid/ProQuest+Dissertations+%26+Theses+Global&rft_val_fmt=info:ofi/fmt:ke
v:mtx:dissert
Carragher, N., Krueger, R. F., Eaton, N. R., & Slade, T. (2015). Disorders without borders: current
and future directions in the meta-structure of mental disorders. Social Psychiatry and
Psychiatric Epidemiology, 50(3), 339–350. https://doi.org/10.1007/s00127-014-1004-z
Carragher, N., Teesson, M., Sunderland, M., Newton, N. C., Krueger, R. F., Conrod, P. J., … Slade,
T. (2016). The structure of adolescent psychopathology: A symptom-level analysis.
27
Psychological Medicine, 46(5), 981–994. https://doi.org/10.1017/S0033291715002470
Caspi, A., Houts, R. M., Belsky, D. W., Goldman-Mellor, S. J., Harrington, H., Israel, S., …
Moffitt, T. E. (2014). The p factor: One general psychopathology factor in the structure of
psychiatric disorders? Clinical Psychological Science, 2(2), 119–137.
https://doi.org/10.1177/2167702613497473
Conway, C. C., Mansolf, M., & Reise, S. P. (2019). Ecological validity of a quantitative
classification system for mental illness in treatment-seeking adults. Psychological Assessment,
31(6), 730–740. https://doi.org/10.1037/pas0000695
Cotrena, C., Branco, L. D., Shansis, F. M., & Fonseca, R. P. (2016). Executive function
impairments in depression and bipolar disorder: Association with functional impairment and
quality of life. Journal of Affective Disorders, 190, 744–753.
https://doi.org/10.1016/j.jad.2015.11.007
Das, J. K., Salam, R. A., Arshad, A., Finkelstein, Y., & Bhutta, Z. A. (2016). Interventions for
Adolescent Substance Abuse: An Overview of Systematic Reviews. Journal of Adolescent
Health, 59(2), S61–S75. https://doi.org/10.1016/j.jadohealth.2016.06.021
Davis, R. M., Wakefield, M., Amos, A., & Gupta, P. C. (2007). The Hitchhiker’s Guide to Tobacco
Control: a global assessment of harms, remedies, and controversies. Annual Review of Public
Health, 28, 171–194. https://doi.org/10.1146/annurev.publhealth.28.021406.144033
De Raykeer, R. P., Hoertel, N., Blanco, C., Olfson, M., Wall, M., Seigneurie, A. S., … Limosin, F.
(2018). Effects of psychiatric disorders on suicide attempt: Similarities and differences
between older and younger adults in a national cohort study. Journal of Clinical Psychiatry,
79(6), 11–12. https://doi.org/10.4088/JCP.17m11911
Degenhardt, L., Hall, W., & Lynskey, M. (2001). Alcohol, cannabis and tobacco use among
australians: A comparison of their associations with other drug use and use disorders, affective
and anxiety disorders, and psychosis. Addiction, 96(11), 1603–1614.
https://doi.org/10.1046/j.1360-0443.2001.961116037.x
Devlieger, I., Mayer, A., & Rosseel, Y. (2016). Hypothesis Testing Using Factor Score Regression:
A Comparison of Four Methods. Educational and Psychological Measurement, 76(5), 741–
770. https://doi.org/10.1177/0013164415607618
Dueber, D. M. (2017). Bifactor Indices Calculator: A Microsoft Excel-based tool to calculate
28
various indices relevant to bifactor CFA models. https://doi.org//10.13023/edp.tool.01
Eaton, N. R., Krueger, R. F., Keyes, K. M., Skodol, A. E., Markon, K. E., Grant, B. F., & Hasin, D.
S. (2011). Borderline personality disorder co-morbidity: Relationship to the internalizing-
externalizing structure of common mental disorders. Psychological Medicine, 41(5), 1041–
1050. https://doi.org/10.1017/S0033291710001662
Eaton, Nicholas R., Rodriguez-Seijas, C., Carragher, N., & Krueger, R. F. (2015). Transdiagnostic
factors of psychopathology and substance use disorders: a review. Social Psychiatry and
Psychiatric Epidemiology, 50(2), 171–182. https://doi.org/10.1007/s00127-014-1001-2
Forbush, K. T., & Watson, D. (2013). The structure of common and uncommon mental disorders.
Psychological Medicine, 43(1), 97–108. https://doi.org/10.1017/S0033291712001092
Fried, E. I. (2015). Problematic assumptions have slowed down depression research: Why
symptoms, not syndromes are the way forward. Frontiers in Psychology, 6(MAR), 1–11.
https://doi.org/10.3389/fpsyg.2015.00309
Fried, E. I., van Borkulo, C. D., Epskamp, S., Schoevers, R. A., Tuerlinckx, F., & Borsboom, D.
(2016). Measuring depression over time...or not? lack of unidimensionality and longitudinal
measurement invariance in four common rating scales of depression. Psychological
Assessment, 28(11), 1354–1367. https://doi.org/10.1037/pas0000275
Gomez, R., Stavropoulos, V., Vance, A., & Griffiths, M. D. (2019). Re-evaluation of the Latent
Structure of Common Childhood Disorders: Is There a General Psychopathology Factor (P-
Factor)? International Journal of Mental Health and Addiction, 17(2), 258–278.
https://doi.org/10.1007/s11469-018-0017-3
Goodman, R. (2001). Psychometric properties of the strengths and difficulties questionnaire.
Journal of the American Academy of Child and Adolescent Psychiatry, 40(11), 1337–1345.
https://doi.org/10.1097/00004583-200111000-00015
Goodman, R., Meltzer, H., & Bailey, V. (1998). The Strengths and Difficulties Questionnaire: A
pilot study on the validity of the self-report version. International Review of Psychiatry, 15(1–
2), 173–177. https://doi.org/10.1080/0954026021000046137
Grant, B. F., & Dawson, D. A. (1998). Age of onset of drug use and its association with DSM-IV
drug abuse and dependence: Results from the national longitudinal alcohol epidemiologic
survey. Journal of Substance Abuse, 10(2), 163–173. https://doi.org/10.1016/S0899-
29
3289(99)80131-X
Greene, A. L., & Eaton, N. R. (2017). The temporal stability of the bifactor model of comorbidity:
An examination of moderated continuity pathways. Comprehensive Psychiatry, 72, 74–82.
https://doi.org/10.1016/j.comppsych.2016.09.010
Grice, J. W. (2001). Computing and evaluating factor scores. Psychological Methods, 6(4), 430–
450. https://doi.org/10.1037/1082-989x.6.4.430
Haltigan, J. D. (2019). Editorial: Putting Practicality Into “p”: Leveraging General Factor Models of
Psychopathology in Clinical Intervention. Journal of the American Academy of Child and
Adolescent Psychiatry, 58(8), 751–753. https://doi.org/10.1016/j.jaac.2019.03.005
Hammer, J. H. (n.d.). Construct Replicability Calculator: A Microsoft Excel-based tool to calculate
the Hancock and Mueller (2001) H index. Retrieved from http://drjosephhammer.com
Hasin, D. S., Fenton, M. C., Beseler, C., Park, J. Y., & Wall, M. M. (2012). Analyses related to the
development of DSM-5 criteria for substance use related disorders: 2. Proposed DSM-5
criteria for alcohol, cannabis, cocaine and heroin disorders in 663 substance abuse patients.
Drug and Alcohol Dependence, 122(1–2), 28–37.
https://doi.org/10.1016/j.drugalcdep.2011.09.005
Hu, L. T., & Bentler, P. M. (1999). Cutoff criteria for fit indexes in covariance structure analysis:
Conventional criteria versus new alternatives. Structural Equation Modeling, 6(1), 1–55.
https://doi.org/10.1080/10705519909540118
Huba, G. J., Wingard, J. A., & Bentler, P. M. (1981). A comparison of two latent variable causal
models for adolescent drug use. Journal of Personality and Social Psychology, 40(1), 180–
193. https://doi.org/10.1037/0022-3514.40.1.180
Ignatyev, Y., Baggio, S., & Mundt, A. P. (2019). The Underlying Structure of Comorbid Mental
Health and Substance Use Disorders in Prison Populations. Psychopathology, 52(1), 2–9.
https://doi.org/10.1159/000495844
Jordan, C. J., & Andersen, S. L. (2017). Sensitive periods of substance abuse: Early risk for the
transition to dependence. Developmental Cognitive Neuroscience, 25, 29–44.
https://doi.org/10.1016/j.dcn.2016.10.004
Karlson, K. B., Holm, A., & Breen, R. (2012). Comparing Regression Coefficients Between Same-
sample Nested Models Using Logit and Probit: A New Method. Sociological Methodology,
30
42(1), 286–313. https://doi.org/10.1177/0081175012444861
Kessler, R. C., Berglund, P., Demler, O., Jin, R., Koretz, D., Merikangas, K. R., … Wang, P. S.
(2003). The Epidemiology of Major Depressive Disorder. Results From the National
Comorbidity Survey Replication (NCS-R). American Medical Association, 289(23), 3095–
3105.
Kessler, R. C., Berglund, P., Demler, O., Jin, R., Merikangas, K. R., & Walters, E. E. (2005).
Lifetime prevalence and age-of-onset distributions of DSM-IV disorders in the national
comorbidity survey replication. Archives of General Psychiatry, 62(6), 593–602.
https://doi.org/10.1001/archpsyc.62.6.593
Kessler, R. C., Chiu, W. T., Demler, O., & Walters, E. E. (2005). Prevalence, Severity, and
Comorbidity of 12-Month DSM-IV Disorders in the National Comorbidity Survey Replication.
Arch Gen Psychiatry, 62(6), 617–627. https://doi.org/10.1001/archpsyc.62.6.617
King, S. M., Iacono, W. G., & McGue, M. (2004). Childhood externalizing and internalizing
psychopathology in the prediction of early substance use. Addiction, 99(12), 1548–1559.
https://doi.org/10.1111/j.1360-0443.2004.00893.x
Kotov, R., Ruggero, C. J., Krueger, R. F., Watson, D., Yuan, Q., & Zimmerman, M. (2011). New
Dimensions in the Quantitative Classification of Mental Illness. Archives of General
Psychiatry, 68(10), 1003–1011. https://doi.org/10.1001/archgenpsychiatry.2011.107
Kotov, Roman, Chang, S. W., Fochtmann, L. J., Mojtabai, R., Carlson, G. A., Sedler, M. J., &
Bromet, E. J. (2011). Schizophrenia in the internalizing-externalizing framework: A third
dimension? Schizophrenia Bulletin, 37(6), 1168–1178. https://doi.org/10.1093/schbul/sbq024
Krueger, R. F. (1999). The structure of common mental disorders. Archives of General Psychiatry,
56, 921–926. https://doi.org/10.1001/archpsyc.56.10.921
Krueger, R. F., Markon, K. E., Patrick, C. J., Benning, S. D., & Kramer, M. D. (2007). Linking
antisocial behavior, substance use, and personality: An integrative quantitative model of the
adult externalizing spectrum. Journal of Abnormal Psychology, 116(4), 645–666.
https://doi.org/10.1037/0021-843X.116.4.645
Kush, J. C., & Canivez, G. L. (2019). Construct validity of the WISC–IV Italian edition: A bifactor
examination of the standardization sample: Chi niente sa, di niente dubita. International
Journal of School & Educational Psychology, (2013), 1–15.
31
https://doi.org/10.1080/21683603.2019.1638854
Laceulle, O. M., Chung, J. M., Vollebergh, W. A. M., & Ormel, J. (2019). The wide-ranging life
outcome correlates of a general psychopathology factor in adolescent psychopathology.
Personality and Mental Health, 6, 22–32. https://doi.org/10.1002/pmh.1465
Lahey, B. B., Applegate, B., Hakes, J. K., Zald, D. H., Hariri, A. R., & Rathouz, P. J. (2012). Is
there a general factor of prevalent psychopathology during adulthood? Journal of Abnormal
Psychology, 121(4), 971–977. https://doi.org/10.1037/a0028355
Lahey, B. B., Rathouz, P. J., Keenan, K., Stepp, S. D., Loeber, R., & Hipwell, A. E. (2015).
Criterion validity of the general factor of psychopathology in a prospective study of girls.
Journal of Child Psychology and Psychiatry and Allied Disciplines, 56(4), 415–422.
https://doi.org/10.1111/jcpp.12300
Leon, D. A., Saburova, L., Tomkins, S., Andreev, E., Kiryanov, N., McKee, M., & Shkolnikov, V.
M. (2007). Hazardous alcohol drinking and premature mortality in Russia: a population based
case-control study. Lancet, 369(9578), 2001–2009. https://doi.org/10.1016/S0140-
6736(07)60941-6
Li, C. H. (2016). Confirmatory factor analysis with ordinal data: Comparing robust maximum
likelihood and diagonally weighted least squares. Behavior Research Methods, 48(3), 936–
949. https://doi.org/10.3758/s13428-015-0619-7
Lilienfeld, S. O. (2014). DSM-5: Centripetal Scientific and Centrifugal Antiscientific Forces.
Clinical Psychology: Science and Practice, 21(3), 269–279.
https://doi.org/10.1111/cpsp.12075
Lilienfeld, S. O., Waldman, I. D., & Israel, A. C. (1994). A Critical Examination of the Use of the
Term and Concept of Comorbidity in Psychopathology Research. Clinical Psychology:
Science and Practice, 1(1), 71–83. https://doi.org/10.1111/j.1468-2850.1994.tb00007.x
Lynskey, M. T., Heath, A. C., Bucholz, K. K., Slutske, W. S., Madden, P. A. F., Nelson, E. C., …
Martin, N. G. (2003). Escalation of drug use in early-onset cannabis users vs co-twin controls.
Journal of the American Medical Association, 289(4), 427–433.
https://doi.org/10.1001/jama.289.4.427
Markon, K. E. (2010). Modeling psychopathology structure: A symptom-level analysis of Axis i
and II disorders. Psychological Medicine, 40(2), 273–288.
32
https://doi.org/10.1017/S0033291709990183
Martel, M., Pan, P. M., Hoffman, M., Gadelha, A., Rosario, M., Mari, J. de J., … Salum, G. A.
(2016). A general psychopathology factor (p-factor) in children: Structural model analysis and
external validation through familial risk and child executive function (under review). Journal
of Abnormal Psychology, 126(1), 137–148.
McGill, R. J., Dombrowski, S. C., & Canivez, G. L. (2018). Cognitive profile analysis in school
psychology: History, issues, and continued concerns. Journal of School Psychology,
71(October), 108–121. https://doi.org/10.1016/j.jsp.2018.10.007
Merikangas, K. R., He, J. P., Burstein, M., Swanson, S. A., Avenevoli, S., Cui, L., … Swendsen, J.
(2010). Lifetime prevalence of mental disorders in U.S. adolescents: Results from the national
comorbidity survey replication-adolescent supplement (NCS-A). Journal of the American
Academy of Child and Adolescent Psychiatry, 49(10), 980–989.
https://doi.org/10.1016/j.jaac.2010.05.017
Olino, T. M., Bufferd, S. J., Dougherty, L. R., Dyson, M. W., Carlson, G. A., & Klein, D. N.
(2018). The Development of Latent Dimensions of Psychopathology across Early Childhood:
Stability of Dimensions and Moderators of Change. Journal of Abnormal Child Psychology,
46(7), 1373–1383. https://doi.org/10.1007/s10802-018-0398-6
Patalay, P., Fonagy, P., Deighton, J., Belsky, J., Vostanis, P., & Wolpert, M. (2015). A general
psychopathology factor in early adolescence. British Journal of Psychiatry, 207(1), 15–22.
https://doi.org/10.1192/bjp.bp.114.149591
Reddy, L. F., Horan, W. P., & Green, M. F. (2014). Revisions and Refinements of the Diagnosis of
Schizophrenia in DSM-5. Clinical Psychology: Science and Practice, 21(3), 236–244.
https://doi.org/10.1111/cpsp.12071
Rehm, J., Sulkowska, U., Mańczuk, M., Boffetta, P., Powles, J., Popova, S., & Zatoński, W. (2007).
Alcohol accounts for a high proportion of premature mortality in central and eastern Europe.
International Journal of Epidemiology, 36(2), 458–467. https://doi.org/10.1093/ije/dyl294
Reise, S. P. (2012). The Rediscovery of Bifactor Measurement Models. Multivariate Behavioral
Research, 47(5), 667–696. https://doi.org/10.1080/00273171.2012.715555
Reise, S. P., Bonifay, W. E., & Haviland, M. G. (2013). Scoring and modeling psychological
measures in the presence of multidimensionality. Journal of Personality Assessment, 95(2),
33
129–140. https://doi.org/10.1080/00223891.2012.725437
Reise, S. P., Scheines, R., Widaman, K. F., & Haviland, M. G. (2013). Multidimensionality and
Structural Coefficient Bias in Structural Equation Modeling: A Bifactor Perspective.
Educational and Psychological Measurement, 73(1), 5–26.
https://doi.org/10.1177/0013164412449831
Rodriguez, A., Reise, S. P., & Haviland, M. G. (2016a). Applying Bifactor Statistical Indices in the
Evaluation of Psychological Measures. Journal of Personality Assessment, 98(3), 223–237.
https://doi.org/10.1080/00223891.2015.1089249
Rodriguez, A., Reise, S. P., & Haviland, M. G. (2016b). Evaluating bifactor models: Calculating
and interpreting statistical indices. Psychological Methods, 21(2), 137–150.
https://doi.org/10.1037/met0000045
Snyder, H. R., Miyake, A., & Hankin, B. L. (2015). Advancing understanding of executive function
impairments and psychopathology: Bridging the gap between clinical and cognitive
approaches. Frontiers in Psychology, 6(MAR). https://doi.org/10.3389/fpsyg.2015.00328
Stahre, M., Roeber, J., Kanny, D., Brewer, R. D., & Zhang, X. (2014). Contribution of Excessive
Alcohol Consumption to Deaths and Years of Potential Life Lost in the United States.
Preventing Chronic Disease, 11, 130293. https://doi.org/10.5888/pcd11.130293
van Bork, R., Epskamp, S., Rhemtulla, M., Borsboom, D., & van der Maas, H. L. J. (2017). What is
the p-factor of psychopathology? Some risks of general factor modeling. Theory and
Psychology, 27(6), 759–773. https://doi.org/10.1177/0959354317737185
Van De Looij-Jansen, P. M., Goedhart, A. W., De Wilde, E. J., & Treffers, P. D. A. (2011).
Confirmatory factor analysis and factorial invariance analysis of the adolescent self-report
Strengths and Difficulties Questionnaire: How important are method effects and minor factors?
British Journal of Clinical Psychology, 50(2), 127–144.
https://doi.org/10.1348/014466510X498174
Veall, M. R., & Zimmermann, K. F. (1994). Evaluating Pseudo-R2’s for binary probit models.
Quality & Quantity, 28(2), 151–164. https://doi.org/10.1007/BF01102759
Wright, A. G. C., Krueger, R. F., Hobbs, M. J., Markon, K. E., Eaton, N. R., & Slade, T. (2013).
The structure of psychopathology: Toward an expanded quantitative empirical model. Journal
of Abnormal Psychology, 122(1), 281–294. https://doi.org/10.1037/a0030133

34
Zachar, P., & Kendler, K. S. (2010). Philosophical Issues in the Classification of Psychopathology.
In T. Millon, R. F. Krueger, & E. Simonsen (Eds.), Contemporary Directions in
Psychopathology: Scientific Foundations of the DSM–V and ICD–11. (pp. 127–148). New
York: The Guilford Press.