research returns redux: a meta-analysis of the returns to agricultural r\u0026d
TRANSCRIPT

RESEARCH RETURNS REDUX:A META-ANALYSIS OF THE RETURNS TO AGRICULTURAL
R&D
Julian M. Alston, Michele C. Marra,Philip G. Pardey, and T. J. Wyatt
EPTD DISCUSSION PAPER NO. 38
Environment and Production Technology Division
International Food Policy Research Institute2033 K Street, N.W.
Washington, D.C. 20006 U.S.A.
November 1998
EPTD Discussion Papers contain preliminary material and research results, and are circulatedprior to a full peer review in order to stimulate discussion and critical comment. It is expected thatmost Discussion Papers will eventually be published in some other form, and that their content mayalso be revised.

ABSTRACT
A total of 294 studies of returns to agricultural R&D (including extension) werecompiled and these studies provide 1,858 separate estimates of rates of return. Thisincludes some extreme values, which are implausible. When the highest and lowest 2.5percent of the rates of return were set aside, the estimated annual rates of return averaged73 percent overall–88 percent for research only, 45 percent for research and extension,and 79 percent for extension only. But these averages reveal little meaningful informationfrom a large and diverse body of literature, which provides rate-of-return estimates thatare often not directly comparable. The purpose of this study was to go behind theaverages, and try to account for the sources of differences, in a meta-analysis of thestudies of returns to agricultural R&D. The results conform with the theory and priorbeliefs in many ways. Several features of the methods used by research evaluators matter,in particular assumptions about lag lengths and the nature of the research-induced supplyshift.
i
CONTENTS
1. Introduction . . . . . . . . . . . . . . . . . . . . . . . . . . . . . . . . . . . . . . . . . . . . . . . . . . . . . . . 1
2. Measurement Issues and Problems in Rate-of-return Studies . . . . . . . . . . . . . . . . . . . 6Conceptualizing Bias and Precision . . . . . . . . . . . . . . . . . . . . . . . . . . . . . . . . . . . 6Mis-measured Costs and Benefits . . . . . . . . . . . . . . . . . . . . . . . . . . . . . . . . . . . . . 7Selection Bias . . . . . . . . . . . . . . . . . . . . . . . . . . . . . . . . . . . . . . . . . . . . . . . . . . . 9Other Sources of Error . . . . . . . . . . . . . . . . . . . . . . . . . . . . . . . . . . . . . . . . . . . . 9
3. A Model of the Determinants of Estimated Rates of Return to Agricultural R&D . . . . . . . . . . . . . . . . . . . . . . . . . . . . . . . . . . . . . . . . . . . . 10Characteristics of the Rate of Return Itself . . . . . . . . . . . . . . . . . . . . . . . . . . . . . 11Analyst Characteristics . . . . . . . . . . . . . . . . . . . . . . . . . . . . . . . . . . . . . . . . . . . . 11Research Characteristics . . . . . . . . . . . . . . . . . . . . . . . . . . . . . . . . . . . . . . . . . . 12Evaluation Characteristics . . . . . . . . . . . . . . . . . . . . . . . . . . . . . . . . . . . . . . . . . 13
4. Overview of the Literature—the Meta-dataset . . . . . . . . . . . . . . . . . . . . . . . . . . . . 15First-author Characteristics . . . . . . . . . . . . . . . . . . . . . . . . . . . . . . . . . . . . . . . . 17Research Characteristics . . . . . . . . . . . . . . . . . . . . . . . . . . . . . . . . . . . . . . . . . . 17Evaluation Characteristics . . . . . . . . . . . . . . . . . . . . . . . . . . . . . . . . . . . . . . . . . 21
5. Meta-analysis of Returns to Agricultural R&D . . . . . . . . . . . . . . . . . . . . . . . . . . . . 24Data for the Analysis . . . . . . . . . . . . . . . . . . . . . . . . . . . . . . . . . . . . . . . . . . . . . 24The Regression Model . . . . . . . . . . . . . . . . . . . . . . . . . . . . . . . . . . . . . . . . . . . . 27Estimation Results . . . . . . . . . . . . . . . . . . . . . . . . . . . . . . . . . . . . . . . . . . . . . . . 30
Characteristics of the Rate-of-return Measure . . . . . . . . . . . . . . . . . . . . . . 33Characteristics of the Analyst . . . . . . . . . . . . . . . . . . . . . . . . . . . . . . . . . . 34Characteristics of the Research . . . . . . . . . . . . . . . . . . . . . . . . . . . . . . . . . 35Characteristics of the Research Evaluation . . . . . . . . . . . . . . . . . . . . . . . . 37
6. Conclusion . . . . . . . . . . . . . . . . . . . . . . . . . . . . . . . . . . . . . . . . . . . . . . . . . . . . . . . 39
References . . . . . . . . . . . . . . . . . . . . . . . . . . . . . . . . . . . . . . . . . . . . . . . . . . . . . . . . . . 42

The authors are employed, respectively, in the Department of Agricultural and*
Resource Economics (and Giannini Foundation), University of California, Davis, theDepartment of Agricultural and Resource Economics, North Carolina State University, theInternational Food Policy Research Institute, and the International Center for Research inthe Semi-Arid Tropics, Sahelian Center, Niger. They are listed alphabetically, and seniorauthorship is not implied. The authors wish to thank Connie Chan-Kang for her excellentresearch assistance as well as V. Kerry Smith and Jerry Carlson for their helpfulsuggestions. Partial funding support for this work was obtained from the TechnicalAdvisory Committee of the Consultative Group on International Agricultural Research,from the U.S. Agency for International Development, and from the University ofCalifornia’s Pacific Rim Project.
RESEARCH RETURNS REDUX:A META-ANALYSIS OF THE RETURNS TO AGRICULTURAL R&D
Julian M. Alston, Michele C. Marra, Philip G. Pardey, and T J Wyatt*
1. INTRODUCTION
Agricultural science administrators and those to whom they answer have been
interested in measures of the economic benefits from agricultural R&D for a long time.
McMillen’s (1929, p. 141) account of the first-known attempt to evaluate U.S.
agricultural R&D, illustrates some issues that have continued to plague the endeavor:
During the last of his three notable terms as Secretary of Agriculture,
“Tama Jim” Wilson directed his bureau chiefs to compile a report that would
provide a picture of what, if any, profit could be shown to the country on the
expenditures for research through the Department of Agriculture.
Careful studies accompanied the compilation of the report. Numerous
interests and industries were asked to estimate conservatively the value of such of
the department’s findings as affected their operations. Finally the expenditures
were totaled in one column, the estimates of the returns in another, and the sheets
placed before the venerable secretary.
“This will never do!” he protested. “No one will swallow these figures!”

-2-
The report revealed that for every single dollar that had been spent for
scientific research in the Department of Agriculture, the nation was reaping an
annual increase of nearly a thousand dollars in new wealth.
“Cut it down to $500,” insisted Wilson. “That’s as much as we can expect
the public, or Congress to believe.”
The more recent literature has its roots in work by Schultz (1953) and Griliches
(1957). Since then, hundreds of studies have reported measures of the returns to
agricultural R&D. Although a great deal of effort and money has been spent on assessing
the impacts of agricultural R&D, questions persist about what the resulting evidence
means, its accuracy, and how it can be used.
Most agricultural economists and other agricultural scientists appear to believe
that, in general, public-sector agricultural R&D has paid handsome dividends for society.
In any event, that is the position most frequently stated and one rarely sees or hears a
counter-view posited (exceptions include Pasour and Johnson 1982 and Kealey 1996);
critics are more often concerned about distributional effects of socially profitable research.
Nevertheless, even among agricultural scientists, who have a vested interest in the view
that what they do for a living is good for the world, there is a range of subjective views
about just how profitable the investment in agricultural R&D has been, or will be, for
society as a whole. The rate-of-return evidence has no doubt played a part in defining the
distribution of opinion, and refining what that evidence means can lead to a shift in general
perceptions.
The past studies potentially provide a rich source of information, but limited
advantage has been taken of this potential. Only partial periodic tabulations (e.g.,

-3-
Evenson, Waggoner, and Ruttan 1979, Echeverría 1990, Alston and Pardey 1996, and
Evenson 1998) have been made. The previous reviews have typically considered a
selected subset of the data, and the same core selection of studies has been common
among such reviews. As a result, the conventional wisdom has been based on much less
than the full amount of information that has been generated by economists on the rate of
return to agricultural R&D, its variation among different types of research, and the
consequences of other factors such as the evaluation methods used. For example,
Evenson, Waggoner, and Ruttan (1979) tabulated results from 30 studies, Echeverría
(1990) considered these same studies as well as some others, making a total of 124, while
Alston and Pardey (1996) tabulated only a subset of these, 24 studies related to U.S.
agricultural research; likewise, Fuglie et al. (1996) considered only 19 studies.
These selections are only a small fraction of the 294 studies considered in the
present study. They imply a much smaller range of rates of return than the full set of
literature contains, a distorted perception of the evidence. For instance, Fuglie et al.
(1996, 28), like many before them, concluded that “Most studies that have estimated the
aggregate social rate of return to research consistently found rates of return between 40
and 60 percent.” While these authors discussed some exceptions, the clear impression is
one of an empirical consensus whereas the more complete set of literature contains a much
greater range of results.
Pulling together this body of work and subjecting it to systematic, quantitative
scrutiny can help us to develop a clearer sense of the distribution(s) of the rate of return
estimates and to answer a range of more specific questions that are of direct importance to

-4-
national and international decision-makers concerned with agricultural R&D. Common
questions include: (1) Has the rate of return to agricultural R&D declined over time? (2)
Do the rates of return to agricultural R&D differ (a) between less-developed and
more-developed countries, or (b) between national agricultural research systems and
international centers? (3) Does the rate of return to research vary according to its
problematic focus (e.g., between crop and livestock research, among different crops, or
between natural resources and commodity-related R&D)? (4) Does the rate of return vary
between basic and more-applied research, and extension? (5) Is systematic bias built into
the estimates from particular evaluation techniques and estimation details, from other
aspects of the analysis, or according to who does it (e.g., self-analysis versus external
evaluation)?
Our aim has been to analyze the returns to agricultural R&D literature
systematically and provide insights to these questions. A comprehensive review of the
evidence is needed both to minimize the risk of the selection bias inherent in partial,
qualitative summaries, and to allow a comparative assessment of the relative returns
among alternatives within agricultural R&D. In addition, a comprehensive analysis of the
literature can provide a basis for understanding why rates of return differ among studies,
over time, and among research fields, and so on. This comprehensive analysis should be
based on a methodology that seeks to ensure unbiased, clearly understood evidence.
The appropriate methodology is meta-analysis (Hedges and Olkin 1985). Meta-
analysis is, essentially, an analysis of analyses. The idea is to amass research findings
statistically and elicit from them the “weight of the evidence” of the past studies. The

-5-
array of statistical procedures used to analyze any type of data can be applied in a meta-
analysis, although usually some modifications are required for statistical inference with a
meta-dataset.
Statistical research synthesis, or meta-analysis, is a relatively young methodology.
Prior to its inception, an accumulation of what was known about a particular research area
depended upon narrative reviews and tabular compilations of results from a selection of
studies. The selection usually was made by a researcher writing a new article in the area
or an expert asked to provide a review for a journal or book, with few attempts at being
exhaustive. This practice is still the norm in many disciplines. In the economic disciplines,
meta-analysis has been used consistently only in the area of market research to analyze
consumer response to various external stimuli such as advertising (Farley and Lehman
1986). In agricultural and resource economics, meta-analyses have been limited so far to
syntheses of studies measuring the value of a natural resource (Boyle et al. 1994, Smith
and Kaoru 1990, Smith and Osborne 1993, Smith and Huang 1995) and the effect of farm
size on measures of crop yield risk (Marra and Schurle 1994). All of these studies used
multiple regression techniques to meta-analyze the effect of several factors on the study
outcomes. The same approach is employed here.
2. MEASUREMENT ISSUES AND PROBLEMS IN RATE-OF-RETURNSTUDIES
Some economists suspect that some of the estimated rates of return to R&D in the
literature may have been systematically biased upwards by the procedures used (e.g.,

-6-
Alston and Pardey 1996, chapter 6). In assessing the rate-of-return evidence, it is useful
to distinguish between two types of error, systematic error or bias that we can attribute to
a decision in the analysis, and unavoidable, random error that we cannot account for
explicitly and that varies in unpredictable ways from one analysis to another or from one
project to another.
CONCEPTUALIZING BIAS AND PRECISION
To see this distinction more clearly, let us define the measured rate of return for a
particular project or program, p, (m ) as being equal to the true rate of return (m ) plus ap p*
measurement error (v ). That isp
m = m + v .p p p*
An ideal measure is one that has a very small error. Different estimation approaches will
imply different characteristics of the distribution of errors, which we can think of in terms
of bias (the expected value of v , which is zero for an unbiased measure) and precision (thep
variance of v , which is zero for an exact estimate of m ). We would expect m forp p i* *
project i to differ from m for project j, according to the different characteristics of thej*
projects. The idea is to identify and account for those systematic differences. At the same
time, characteristics of the program or the evaluation study will also affect the
measurement errors, v , and it is important to account for these effects as much as possiblep
to get meaningful information on the determinants of the rate of return.

-7-
MIS-MEASURED COSTS AND BENEFITS
A number of factors might cause an estimate to depart systematically from the true
rate of return. Some problems relate to the measurement of the streams of benefits and
costs in ways such that the measures match up to the concepts they are meant to
represent. Some of these issues are straightforward. For instance, many studies attribute
all of the growth in productivity in a particular industry, in a particular place, to local
public-sector expenditures on agricultural R&D specific to that commodity. This
approach ignores the contribution of private-sector R&D (including the cost of
development work to allow the results from public- and private-sector R&D to be
adopted), fails to count the costs of basic R&D that may underpin the commodity-specific
applied work, does not count the costs of extension, and assumes that the gains resulted
from the local commodity-specific research rather than as a result of spillovers from the
same industry in other places or from other industries.
A comprehensive evaluation would take into account all of the relevant costs and
all of the relevant benefits. This can be very tricky to do. For instance, it is hard to know
in many cases what is the source of a particular idea that led to an innovation.
Apportioning overhead costs among projects or programs is not straightforward,
especially when individual scientists are engaged in multiple activities (e.g., research and
teaching). Studies that evaluate entire institutions can avoid the problem of apportioning
costs but run into different problems. For instance, in ex ante assessments different
scientists may be working on different projects that are mutually exclusive (e.g., different
varieties of the same crop that cannot both be adopted in the same place), and the total

-8-
benefits are not simply the sum of the benefits of all the projects (actually this is a problem
with the evaluation of the individual projects that is often revealed only when we consider
them together). Further, an institution-level evaluation will avoid the problem of selection
bias, in which only the successful projects are evaluated (i.e., counting all of the benefits
against only a fraction of the costs).
Another set of problems arises in institutions that have multiple roles—such as
land grant colleges, which are engaged in teaching, research, and extension, or the centers
of the Consultative Group on International Agricultural Research (CGIAR) with their
roles in technology creation, scientist training, germplasm preservation, and institution
building. When measuring the returns to the R&D activities, we should count an
appropriate part, but not all, of the total costs, and some of the costs are hard to apportion
appropriately. On the other hand, if we are assessing the entire set of the institution’s
investments, how do we measure the benefits from institution-building programs, say? In
principle what to do is clear. In practice, the benefits and attributable costs are diffuse and
difficult to measure.
SELECTION BIAS
It is likely that, within any large portfolio of research projects, there will be a wide
range of rates of return, including some failures. In ex post evaluation, it is natural for
some to focus on the successful projects or programs. This is only a problem if the rate of
return to the “winners” is misinterpreted as representing the overall rate of return. The
problem of selection bias can be perceived as the converse of the problem of apportioning

-9-
costs, and avoiding double-counting benefits, so that the streams of benefits and costs are
appropriately matched.
Still, in a meta-analysis we would like to be able to make use of the fact that some
studies may have deliberately selected “winners” for evaluation. Many of the studies are
based on production function analyses of aggregate data, including many research
evaluation studies that evaluated not just selected projects but all of the research over
specified time periods in particular research institutions or in particular industries. If
selection bias matters, we may expect to find systematically lower rates of return for these
more aggregative studies.
OTHER SOURCES OF ERROR
As Alston, Norton, and Pardey (1995) discuss in detail, the critical determinants of
the measured benefits from a particular research program can be distilled into (1) the size
of the industry affected, (2) the nature of the research-induced supply shift, (3) k, the
percentage research-induced reduction in costs of production when the results are
adopted, and (4) the timing of the flows of benefits (i.e., the research lags). Errors are
likely to be small in estimating the value of production in the industry, at least for
developed countries. The analyst chooses how to model the research-induced supply shift,
and whether a pivotal or parallel supply shift is chosen will affect the size of the estimated
benefits. How k is determined (e.g., measured directly using econometric methods,
measured indirectly using industry or experimental yields, or given by expert opinion)
matters, and problems in the estimation of k are sometimes related to other aspects of the

-10-
model specification. For example, problems can arise if the relevant counterfactual, given
by the cost side of the analysis, is not properly reflected in the measurement of k (Alston,
Norton, and Pardey 1995). The choice of lag length, especially the inappropriate
truncation of lags in econometric studies, also can have serious implications for the results
(Alston, Craig and Pardey 1998).
3. A MODEL OF THE DETERMINANTS OF ESTIMATED RATES OF RETURNTO AGRICULTURAL R&D
The factors that might account for the variation in measured returns to agricultural
R&D can be grouped into four broad categories: (1) a vector of characteristics of the
analysts performing the evaluation (a), (2) a vector of characteristics of the research
being evaluated (r), (3) a vector of features of the evaluation (e), and (4) random
measurement errors, u. The general hypothesized functional relationship (f) between the
rate of return measure (m) and the explanatory variables is:
m = m (r) + v(a, r, e, u) = f(a, r, e) + u.*
In other words, the measure, m, is equal to the true rate of return, m , plus the*
measurement error, v. The true measure, m, depends only on the characteristics of the
research being evaluated, while the measurement error, v, depends on the same
characteristics of the research but also on various other explanatory factors, as well as the
purely random component, u. In some instances a particular explanatory variable is
associated only with the true part, or only with the error part, of the measure, but, in many
cases, a particular explanatory variable can be expected to play multiple roles.

-11-
Some studies do not report a rate of return but do report a benefit-cost ratio (BC)1
from which we computed an approximately equivalent internal rate of return (irr) basedon the formula for pricing an annuity and a discount factor (i) as: irr = BC×i (see Alston,Marra, Pardey, and Wyatt 1998 for derivations).
CHARACTERISTICS OF THE RATE OF RETURN ITSELF
Studies vary in how they define and measure the internal rate of return, so certain
characteristics of the rate of return are relevant as explanatory variables to account for
variation in rates of return among studies. These include whether the rate of return was
real or nominal, marginal or average, or social or private. Also, we distinguish between
whether the rate of return was synthesized by us or computed in the original study.1
ANALYST CHARACTERISTICS
Whether the work represents a self-evaluation or not is an aspect that may tend to
bias results favorably or unfavorably (as we saw in the opening quote). On the other hand,
it may merely mean that the analyst is comparatively well informed. Thus, the
characteristics of the analyst may provide information on possible biases, or greater
precision, arising from the person or group who measures a rate of return either having an
interest in certain results from the study, or having access to relatively good information
about the research being evaluated. This set of effects can be captured by a dummy
variable to represent the particular individual or group, but this treatment will not allow us
to identify the two separate elements.
A related issue is whether the work was published or not and, if published, in what
type of publication. These aspects will reflect the types of reviewer scrutiny to which the

-12-
work was subjected, but the publication process may also discriminate against studies that
either generate rates of return that fall outside the range of “conventional wisdom”
prevailing in the profession at the time, or may not be desirable to publish for some other
reason. That is, there may be a type of selection bias involved here—the so-called “file-
drawer problem.” An objective in meta-analysis is to ensure that all studies (both published
and unpublished) have an equal likelihood of being selected for the analysis.
RESEARCH CHARACTERISTICS
The rate of return is likely to vary systematically with changes in the
characteristics of the research itself. These characteristics include (1) whether it is specific
to a particular field of science (e.g., basic, applied, extension, all fields), (2) whether it
relates to a particular commodity class (e.g., crops, livestock, all commodities), (3) the
geographic region where the R&D was conducted and, not the same thing, the geographic
region where the results were adopted (especially important for international agricultural
research centers, for instance), (4) the type of institution that conducted the R&D (e.g.,
university or research institute), and (5) the scope of the research being evaluated (i.e.,
was it an entire national agricultural research system, the entire portfolio for an institute, a
particular program, or a single project?).
EVALUATION CHARACTERISTICS
As discussed above, several characteristics of the evaluation have implications for
the measure of the research-induced change in yield, productivity, or the supply shift;

-13-
others for the size of measured benefits and costs of R&D, for a given research-induced
supply shift. A primary distinction concerns whether the study involves an explicit
economic surplus analysis, with a formal supply and demand model, or leaves the model
implicit and uses an approximation based on a percentage research-induced supply shift
multiplied by the initial value of production. Studies that use explicit surplus measures
involve choices about the functional forms of supply and demand (e.g., linear or constant
elasticity) and the nature of the research-induced supply shift (e.g., whether it was pivotal
or parallel). Other market characteristics defined in such studies include whether the
relevant commodity market is open or closed to trade, and, relatedly, whether prices are
endogenous or exogenous, undistorted or subject to government programs.
A further set of specification choices relate to the research lag distribution,
including its structure, shape, and length. These choices are often determined jointly with
the size of the k shift, especially in econometric studies (the lag structure defines the
pattern of the shifts over time and these are estimated jointly, econometrically; in other
studies the k shift may refer to a maximum shift, which is combined with adoption
percentages in the lag profile to determine the entire distribution of supply shifts over
time).
Some studies allow for spillover effects of research. Research conducted in one
place, say California, may yield results that are adopted in other states or internationally
(i.e., spillouts), which will increase global benefits but will reduce California’s benefits if
California is an exporter of the affected commodity and will increase California’s benefits
for an imported good. Thus the theoretical effects on the rate of return of the

-14-
See Fullerton (1991) and Ballard and Fullerton (1992) for views on the2
appropriate value for *.
consideration of spillouts in the analysis are ambiguous. Conversely, California agriculture
benefits from spillins of agricultural research results from other states and internationally,
as well as nonagricultural research results, and an evaluation of the local returns to
California’s research may be biased up if these spillins are ignored.
A final set of choices concern what allowance is made for the effects of market
distortions on the measures of benefits and costs. One such choice is whether to assume a
dollar of public expenditure on research costs society one dollar or, alternatively,
following Fox (1985), to allow for the deadweight costs of taxation (* cents per dollar of
revenue raised) and charge 1+* dollars of marginal social cost per dollar of government
spending. In addition, some studies of research benefits allow for the effects of distorted2
exchange rates, government commodity programs, or environmental externalities.
Allowing for the deadweight losses from taxation will reduce the rate of return, other
factors held constant, while the effects of allowing for commodity programs, exchange
rate distortions, or other distortions, are less clear and will depend on other aspects of the
analysis.
4. OVERVIEW OF THE LITERATURE—THE META-DATASET
We compiled a comprehensive collection and listing of the empirical literature on
rates of return to agricultural R&D (including both published articles and reports, and

-15-
A complete listing is available from the authors upon request.3
Initially two coders scored an identical subset of studies and their results were4
compared. The degree of consistency between the two led us to conclude that coder biaswould not be a problem, and one of the two went on to score the entire dataset.
unpublished, “gray” literature). This collection comprises 294 studies that provided3
quantitative estimates of returns to research. Many of the studies provide more than one
estimate, so the data base for analysis comprises 1,858 observations; an average of 6.3
estimates per published study.
We reviewed all of the relevant papers and scored each estimate according to (1)
author details, including when and where the study was published, (2) institutional details
of the agency doing the research being evaluated (e.g., national government, near
government, international, private), (3) aspects of the research being evaluated, including
its focus (commodity orientation, natural resource focus), period during which the
research was performed, nature of technology (e.g., biological, chemical, mechanical),
nature of R&D (e.g., basic, applied, extension), and sector to which it applies (e.g., input
supply, on-farm, post-harvest), (4) country/regional focus, and (5) technical estimation
details (nature of lag structure, lag length, inflation adjustment, method of estimation, and
treatment of price distortions).4
About one-third of the publications compiled for our study are refereed journal
articles. Over 60 percent of the publications are discussion papers, working papers,
reports, and various other gray literature. The pace of publishing rate-of-return studies
has picked up considerably over the years: each decade published twice as much as the
previous one, a classic pattern for early-stage diffusion. During the period 1958-69 a total
-16-
of seven studies were published, an average of less than one publication per year. During
1970-79, 38 studies were published, at a rate of almost four per year, and during the next
decade, 86 studies were published at a rate of more than eight per year. This grew to a
total of 163 publications during the 1990-98 period, an average publication rate of 20 per
annum. The balance of publication outlets has shifted, along with the rate of publications,
with what appears to be faster growth in the gray literature. Much of the early literature
was published in relatively formal outlets, reflecting the fact that the first studies were
breaking methodological ground or that early gray literature was eventually published or
lost.
FIRST-AUTHOR CHARACTERISTICS
Sometimes it is instructive to know who is doing the evaluating. Evaluators
having certain institutional affiliations may approach the research evaluation differently or
may tend to have strong prior views (i.e., pre-set biases) about the rate of return to a
particular type of research. First-author employment is one measure of the general
institutional bent of an evaluation. Just over one-half of the first-author evaluators were
employed by universities, with about one-half of those being U.S. land-grant universities.
Government evaluators made up almost one-quarter of the first authors, and international
researchers, almost 10 percent. The rest of the first authors were either affiliated with
international funding institutions or private corporations, or their affiliation was not

-17-
Alston, Marra, Pardey, and Wyatt (1998) provide further details. In the 955
percent sample of studies, which left out the highest and lowest 2.5 percent of rates ofreturn, the average rate of return across the 267 estimates that were classed as selfevaluations was 57.2 percent per annum, compared with 74.8 percent per annum for the1,019 estimates from studies that were classified as independent, and 77.2 percent perannum for the 396 estimates for which it was not clear whether they were independent orself evaluations.
The distinctions between basic and applied research are not always clear. Rates of6
return were identified as applying to “basic” or “applied (or maintenance)” research only ifreported as such by the authors of the evaluation studies.
identified. Almost 28 percent of the evaluations were self evaluations, while over one-half
were not (the rest could not be categorized).5
RESEARCH CHARACTERISTICS
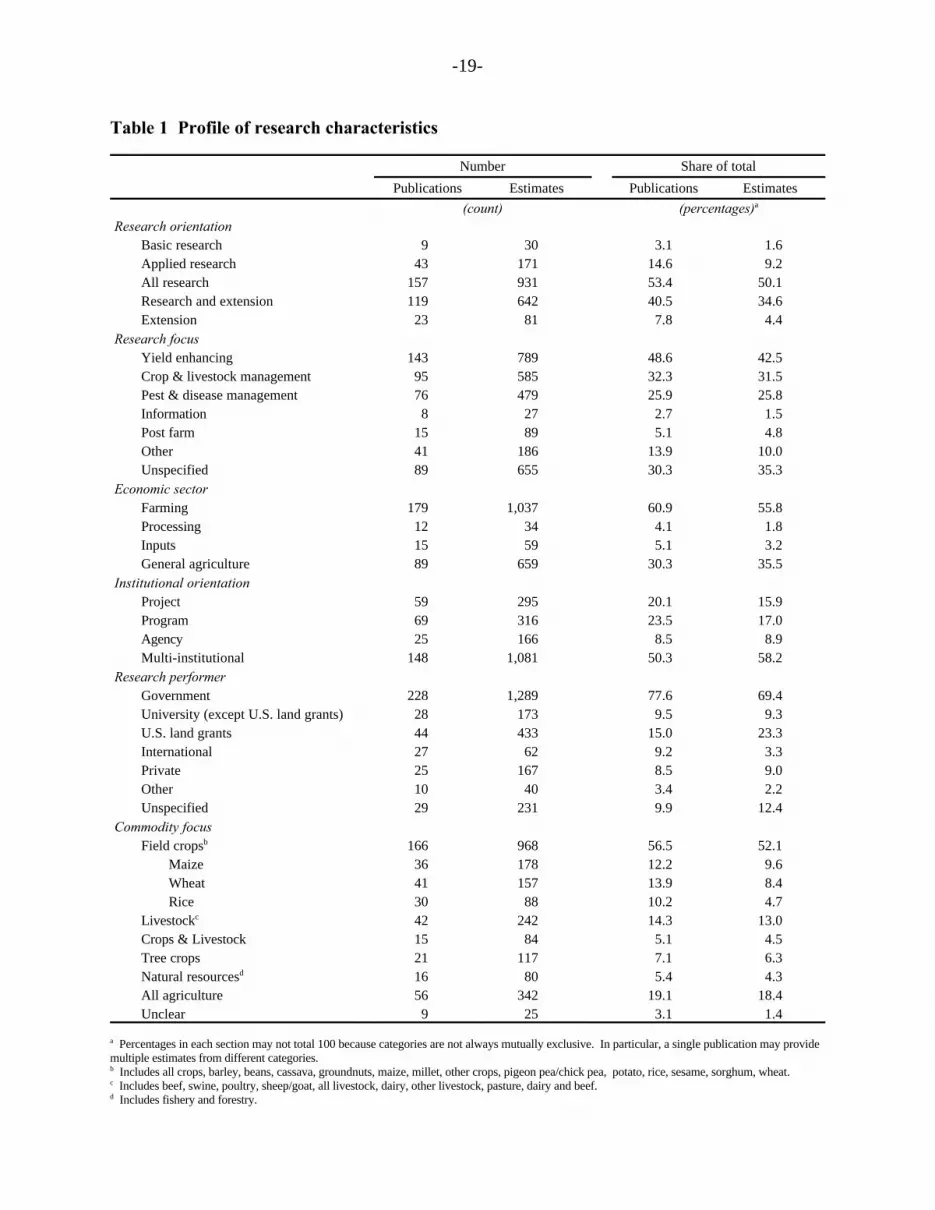
Table 1 reports the numbers of publications and numbers of rate-of-return
estimates according to the nature of the research being evaluated. In the meta-analysis,
the unit of observation is the estimate and, unless otherwise noted, the categories are
mutually exclusive. At the publication level, however, few categories are mutually
exclusive since a single publication might estimate separate returns to, say, basic and
applied research or for research related to different commodities.
The first category is research orientation. Very few studies evaluated basic
research or extension; most computed returns to either all types of research, or research
and extension. In terms of the research focus categories, which are not mutually6
exclusive, the lion’s share concerned yield-enhancing R&D, followed by crop and
livestock management, and pest and disease management. Farming technology is the main
focus among economic sectors; the few studies of off-farm R&D are evenly divided

-18-
between pre- and post-farm technology. Only 80 estimates, 4.3 percent, related to natural
resources (i.e., research into forestry, fisheries, soil, and so on). The institutional
orientation of research evaluation studies is mostly multi-institutional, although significant
numbers of studies concerned a specific project (295 estimates), program (316 estimates),
or organization (166 estimates). Among the research performer categories, which also
are not mutually exclusive, government is the dominant category (228 studies, 1,289
estimates), followed by universities (72 studies of research done by U.S. land grant and
other universities), while international research was evaluated in 27 studies (around 9
percent of the total). These categories all represent public research performers; only 25
-19-
Table 1 Profile of research characteristics
Number Share of total
Publications Estimates Publications Estimates
(count) (percentages)a
Research orientationBasic research 9 30 3.1 1.6Applied research 43 171 14.6 9.2All research 157 931 53.4 50.1Research and extension 119 642 40.5 34.6Extension 23 81 7.8 4.4
Research focusYield enhancing 143 789 48.6 42.5Crop & livestock management 95 585 32.3 31.5Pest & disease management 76 479 25.9 25.8Information 8 27 2.7 1.5Post farm 15 89 5.1 4.8Other 41 186 13.9 10.0Unspecified 89 655 30.3 35.3
Economic sectorFarming 179 1,037 60.9 55.8Processing 12 34 4.1 1.8Inputs 15 59 5.1 3.2General agriculture 89 659 30.3 35.5
Institutional orientationProject 59 295 20.1 15.9Program 69 316 23.5 17.0Agency 25 166 8.5 8.9Multi-institutional 148 1,081 50.3 58.2
Research performerGovernment 228 1,289 77.6 69.4University (except U.S. land grants) 28 173 9.5 9.3U.S. land grants 44 433 15.0 23.3International 27 62 9.2 3.3Private 25 167 8.5 9.0Other 10 40 3.4 2.2Unspecified 29 231 9.9 12.4
Commodity focusField crops 166 968 56.5 52.1b
Maize 36 178 12.2 9.6Wheat 41 157 13.9 8.4Rice 30 88 10.2 4.7
Livestock 42 242 14.3 13.0c
Crops & Livestock 15 84 5.1 4.5Tree crops 21 117 7.1 6.3Natural resources 16 80 5.4 4.3d
All agriculture 56 342 19.1 18.4Unclear 9 25 3.1 1.4
Percentages in each section may not total 100 because categories are not always mutually exclusive. In particular, a single publication may providea
multiple estimates from different categories. Includes all crops, barley, beans, cassava, groundnuts, maize, millet, other crops, pigeon pea/chick pea, potato, rice, sesame, sorghum, wheat.b
Includes beef, swine, poultry, sheep/goat, all livestock, dairy, other livestock, pasture, dairy and beef.c
Includes fishery and forestry.d
-20-
studies explicitly evaluated privately performed research although many more studies
made some kind of ad hoc adjustment for private research. Last, consider the commodity
focus. Overwhelmingly, evaluations relate to research into crops. Over half the estimates
(166 studies, 968 estimates) are for field crops research (rice, wheat, and maize research
together account for almost one quarter of the data base). Only 16 studies (80 estimates)
reported returns to research with a natural resource focus. About 75 percent of the
studies related to an identifiable commodity or equivalent focus; 56 studies related to all
agriculture, and nine left the focus undefined.
Does the rate of return to R&D depend on where the research is carried out or
where the results are adopted? These and other geographical aspects of research subject
to evaluation, are documented by Alston, Marra, Pardey, and Wyatt (1998). As it
happens, most research is used where it was conducted, so this distinction is not very
helpful. The data also can be used to assess the connection between investment in R&D
and investment in R&D evaluation studies. For instance, the pattern of R&D evaluations
across the less-developed regions of the world appears to be more uniform than the
pattern of agricultural production and is not congruent with R&D spending. The users of
the results of research that was evaluated are, perhaps surprisingly, more often found in
less-developed countries (i.e., 53.1 percent of the rate-of-return studies, and 43.3 percent
of the rates of return relate to R&D adopted in LDCs). This is especially so when North
America, which is the user of the results of 29.9 percent of the research evaluated, is set
aside. Other developed countries are identified as the user of the results for only 12.9
percent of the research that has been evaluated; less-developed countries use the rest.

-21-
EVALUATION CHARACTERISTICS
As discussed above, method matters. Table 2 documents some primary
modeling choices. It documents the distribution of the evaluation evidence according to
one set of characteristics of the evaluation, those related to model specification. A
primary distinction is between rates of return derived from econometric models, especially
where the lag structure has been estimated econometrically, and those derived from
economic surplus models in which the lag structure was assumed and imposed, along with
other aspects. These are not mutually exclusive categories since some studies have used
both methods.
Table 2 Model specification characteristics, evaluating benefits
Number Share of total
Publications Estimates Publications Estimates
(count) (percentages)
Modeling approach
Econometric 99 729 33.7 39.2
Analytical 92 695 31.3 37.4
Simulated 8 34 2.7 1.8
Economic surplus 200 1129 68.0 60.7
Implicit 90 467 30.6 25.1
Explicit 117 650 39.8 35.0
Unspecified 2 12 0.7 0.6
Number of markets, explicit
Single 113 624 38.4 33.6
Multi-horizontal 6 16 2.0 0.9
Multi-vertical 5 21 1.7 1.1
Unclear 1 1 0.3 0.1
Trade structure, explicit surplusmodel
Closed 67 385 22.8 20.7
Open
Large 17 53 5.8 2.9
Small 53 223 18.8 12.0
Unclear 1 1 0.3 0.1

-22-
A total of 99 studies used econometric estimates, but only eight of these simulated
counterfactual research programs to generate rates of return; almost all deduced a rate of
return analytically, as an algebraic transformation of estimated parameters. As shown by
Alston, Norton, and Pardey (1995, pp. 193-206), the analytical approach is hard to get
right. Among the 200 studies that used some form of economic surplus, almost half (90)
used a simple approximation originally proposed by Griliches (1957), Gross Annual
Research Benefits (GARB) equal to k times the value of production–an implicit economic
surplus measure. Further, most used closed-economy models or a simple small-country
model. Only 17 studies allowed for an effect of research on world trading prices.
A key determinant of the estimate of the annual benefits from the adoption of a
new technology is the measure of the research-induced shift in supply (or increase in
productivity), sometimes referred to as k, as above. Table 3 shows also the distribution
among studies of methods for estimating this shift. Among the 131 studies using
econometric methods, most used production functions or productivity functions. Among
the 173 studies using non-econometric methods, about half used experimental yields, and a
further quarter used industry yields. Only a handful of studies allowed for spillins and
spillouts of research effects when estimating the supply shift(s) to be attributed to local
R&D in the computation of rates of return.
In a non-econometric analysis, excessive truncation of the lag will reduce the rate
of return because some future benefits will be ignored. In an econometric study, are
however, the opposite can (and indeed does) happen because larger short-term benefits
estimated when a (probably inappropriately) truncated lag is used. Alston, Marra,

-23-
Table 3 Estimation of research-induced supply shifts
Number Share of total
Publications Estimates Publications Estimates
(count) (percentages)
Econometric approach 131 940 44.6 50.6
Production 58 416 19.7 22.4
Productivity 43 329 14.6 17.7
Cost 7 51 2.4 2.7
Supply 18 110 6.1 5.9
Non-parametric 2 4 0.7 0.2
Other 10 34 3.4 1.8
Non-econometric approach 173 931 58.8 50.1
Experimental yields 94 463 32.0 24.9
Industry yields 47 220 16.0 11.8
Experimental productivity 5 89 1.7 4.8
Other 45 203 15.3 13.9a
Incremental costs included 82 496 27.9 26.7
Spilloversb
Spillins 41 324 13.9 17.4
Spillouts 11 94 3.7 5.1
No spillovers 260 1,484 88.4 79.9
Supply shift calculated by other means (e.g. direct measurement) or by cost reduction. a
Some estimates have spillover effects both ways.b
Pardey, and Wyatt (1998) report that more than half of the estimates do not even clearly
specify this element. Polynomial lags are the most frequent choice in those studies that do
specify the lag structure. Of the 873 estimates with an explicit research lag structure, 342
did not include any gestation lag between the time when research expenditure is incurred
and the time when the resulting benefits begin to flow. Perhaps the most important
difference among the studies, however, is the lag length. Among the studies that used an
explicit lag structure, most used research lag lengths of less than 20 years; extension lag
lengths were mostly less than 10 years.

-24-
Investing $1 at an internal rate of return of 700,000 percent per annum would7
generate $7,000 after one year, $49 million after two years, $343 billion after three years,and $2,401 trillion after four years. The GDP of the world in 1994 was $25.3 trillion. Ifthe investment of $1.21 billion in 1980 in U.S. public agricultural R&D had earned aninternal rate of return of 38 percent per annum, the mean for aggregate U.S. studies in the95 percent range, the accumulated stream of benefits would be worth $759 billion (1980dollars) by the year 2000, nearly nine years’ worth of agricultural GDP.
All of the study characteristics discussed above can be expected to have some
influence over the measured rate of return—either by affecting the true rate of return or
the measurement error. In the next section we attempt to quantify some of the more
important effects.
5. META-ANALYSIS OF RETURNS TO AGRICULTURAL R&D
DATA FOR THE ANALYSIS
One feature of the evidence on rates of return is the relatively small signal-to-noise
ratio. The rates of return range from small negative numbers to an extreme and
implausible rate of more than 700,000 percent per year. This range might reflect7
differences in typical rates of return among different sets of studies—differences among
groups such as applied versus basic research, or research on natural resources versus
commodities. Unfortunately, however, the range of rates of return is similarly large within
each of the primary groups of studies of interest here; the large range reflects variation
within more than among groups. This large within-group variation makes it more difficult
to discern statistically significant differences among groups.

-25-
In the regression analysis, further observations were lost if they failed to include8
information on all of the explanatory variables to be included in the model. This meantthat the number of feasible observations depended in part on the details of the statisticalmodel, and that the number of observations in the 95 percent and the <500 percentsamples used in the econometric analysis are smaller than the corresponding samples in thetabulated, descriptive analysis reported above. See notes to table 5 for additional details.
In order to reduce the role of the extreme observations in masking the information
content of the data, we discarded various fractions of the sample. For instance,
considering rates of return to research alone, when we discarded 5 percent of the data (2.5
percent from each tail) or 10 percent of the data (5 percent from each tail), the resulting
95 percent and 90 percent ranges were still large (from 2.6 to 1,480 percent per annum or
8.2 to 430 percent per annum, respectively), but a more meaningful representation than
when all the observations were included. Table 4 shows the distributions of rates of return
to research, extension, and both research and extension for various subsets of the meta-
dataset.
Below we report results for two subsets of the data: (1) the 95-percent dataset, as
described above, from which the lowest and highest 2.5 percent of observations of all rates
of return (research, extension, and both) were excluded, and (2) a second dataset from
which all observations of rates of return greater than 500 percent per annum were
excluded. The second dataset contains 1,181 observations, whereas the 95-percent
dataset contains 1,144 observations.8

-26-
Table 4 Ranges of rates of return
Number of Lowest Highestobservations Mean observation observation
Rate of return
(count) (percentages)
Research only
100 percent of sample 1,114 1,160.0 -7.4 724,323a
95 percent of sample 1,083 88.0 2.6 1,480b
90 percent of sample 1,027 71.8 8.2 430c
<500 percent rate of return 1,084 70.7 -7.4 470d
Research and extension
100 percent of sample 628 47.6 -100.0 430e
95 percent of sample 600 44.6 0.4 150b
90 percent of sample 567 43.4 4.3 122c
<500 percent rate of return 628 47.6 -100.0 430d
Extension only
100 percent of sample 79 85.5 0.0 636f
95 percent of sample 77 79.4 1.3 350b
90 percent of sample 73 76.0 3.2 202c
<500 percent rate of return 78 78.4 0.0 350d
All observations
100 percent of sample 1,821 729.8 -100.0 724,323g
95 percent of sample 1,760 72.8 0.4 1,480b
90 percent of sample 1,667 62.3 3.2 430c
<500 percent rate of return 1,790 63.0 -100.0 470d
Sample excludes five observations that reported unspecified, less-than-zero percent rate of return, onea
observation that is greater-than-zero percent, and 21 observations that are greater-than-one hundred percent. Sample excludes the upper and lower 2.5 percent of the observations.b
Sample excludes the upper and lower 5 percent of the observations.c
Sample excludes observations that reported rate of returns greater-than-five-hundred percent.d
Sample excludes three observations that reported unspecified less-than-zero rate of return percent.e
Sample excludes one observation that reported unspecified, less-than-zero rate of return percent, and onef
observation that is greater-than-one hundred percent. Sample excludes nine observations that reported unspecified, less-than-zero percent rate of return, oneg
observation that is greater-than-zero percent, and 22 observations that are greater-than-one hundred percent.

-27-
Conditional mean rates of return associated with each variable, representing the
mean rate of return among those observations for which the variable is present, are shown
in Table 5. In the 95 percent dataset, the overall average rate of return across all 1,144
observations was 58.6 percent per annum, with a standard deviation of 51.7 (the estimated
annual rates of return averaged 64.2 percent for research only, 46.3 percent for research
and extension combined, and 75.6 percent for extension only). In the second dataset the
overall average rate of return across all 1,181 observations was 63.4 percent per annum
with a standard deviation of 66.7 (the rate of return averaged 70.5 percent for research
only, 49.7 percent for research and extension, and 75.6 percent for extension only).
THE REGRESSION MODEL
The regression equation is a linear model of the form:
m = b + b X + , , where0NN
b is the intercept, b is the vector of slope coefficients, X is the matrix of explanatory0
variables included in the model, and , is the error term. All of the explanatory variables
are dichotomous dummy variables, which indicate the presence or absence of particular
characteristics.
The model was estimated by ordinary least squares (OLS) regression. We
considered two types of potential problems with the regression errors that might affect the
OLS estimates. First, the nature of the data may give rise to heteroskedasticity. Second,

-28-
Table 5 Conditional mean rates of return for the variables in the meta-dataset
Defaultcategory
95 percent dataset Rate of return <500 95 percent datasetExplanatory
variable included
Rate of return <500
Number Mean deviation Number Mean deviation Number Mean deviation Number Mean deviationaStandard Standard Standard Standard
a a a
Nominal 226 68.47 56.47 231 72.91 68.46 Real 918 56.12 50.24 950 61.07 66.04Average 677 52.83 47.39 700 57.13 65.00 Marginal 467 66.86 56.49 481 72.48 68.05Private 24 34.94 39.39 24 34.94 39.39 Social 1,120 59.07 51.87 1,157 63.97 66.99Research only 687 64.18 58.41 703 70.50 75.56 Extension only 60 75.58 66.15 60 75.58 66.15
Both research & extension 397 46.26 30.24 418 49.66 45.25Reported 1,086 57.47 47.46 1,113 59.77 56.00 Derived from a B-C ratio 58 79.09 101.77 68 122.56 149.79First author affiliation - Government 195 52.61 55.57 203 61.68 76.44
private sector or University 808 62.07 51.96 837 66.61 67.14unknown 23 21.77 16.89 23 21.77 16.89 International research center 73 50.19 29.62 73 50.19 29.62
International funding body 41 55.12 62.51 41 55.12 62.51Independent assessment 887 61.42 53.31 920 66.58 68.64 Self evaluation 257 48.68 44.61 261 52.13 57.87Other research Government research performer 831 57.78 50.44 854 60.38 60.09performer, University research performer 299 58.68 62.30 317 74.55 93.74
including private 137 50.55 50.25 138 50.19 50.25 International researchorganization 50 60.62 52.06 50 60.62 52.06
All agriculture 300 58.70 55.01 314 67.67 73.17 Tree crops 34 66.12 87.65 34 66.12 87.65All field crops 583 61.58 50.58 604 65.67 67.10Livestock 142 56.48 35.94 142 56.48 35.94All other research foci 19 55.08 46.12 19 55.08 46.12Natural resources 66 32.87 46.46 68 38.62 69.00
Other than basic research 1,133 58.37 51.37 1,168 62.96 65.54 Basic research 11 77.61 82.95 13 100.72 132.93 Public research 955 58.25 51.45 990 63.66 67.77 Private research 13 79.77 68.11 13 79.77 68.11
Both private and public 176 58.70 51.98 178 60.65 60.13research
Developing country users 457 55.89 46.32 468 55.63 51.63 Developed country users 645 60.49 55.05 671 69.12 75.83Multiple country users 39 58.97 56.90 39 58.97 56.90
Developing countryperformer 429 55.54 41.31 439 54.34 42.69 Developed country performer 715 60.37 57.03 742 68.73 76.95
Single project evaluated 148 66.62 71.33 161 87.31 110.87 Research program evaluated 211 42.24 36.65 218 40.23 37.85Research institution evaluated 56 63.92 40.95 57 66.10 43.79Multiple research institutions
evaluated 729 61.24 50.61 745 64.78 59.65

-29-
Table 5 (continued)
Default Explanatory variable includedCategory
95 percent dataset Rate of return <500 95 percent dataset Rate of return <500
Number Mean deviation Number Mean deviation Number Mean deviation Number Mean deviationaStandard Standard Standard Standard
a a a
Evaluation published as a book or chapter, discussion paper, Evaluation published as an report, or other 739 59.33 55.27 765 62.88 66.93 article in a refereed journal 405 57.15 44.60 416 64.32 66.23
Non-econometric study 544 51.83 49.04 566 57.28 69.64 supply shift 600 64.66 53.38 615 69.00 63.33Econometrically estimated
Benefits calculations: Using explicit surplus model Directly from with a pivotal supply shift 226 47.57 30.41 227 47.11 31.12econometric model 466 66.94 57.30 480 72.57 68.72 Using explicit surplus model
without a pivotal supply shift 12 57.33 18.85 12 57.33 18.85
Using an implicit surplus model 255 62.34 61.45 275 72.70 91.38Industry data for Experimental data for
supply shift 816 58.97 50.11 841 62.12 60.39 supply shift 328 57.54 55.64 340 66.50 80.09Long lag ( $15 years) 692 54.33 53.44 708 59.66 68.94 Short lag (< 15 years) 452 65.03 48.35 473 68.96 62.75
Short lag and econometrically estimated supply shift 600 64.66 53.38 615 69.00 63.33
Spillovers not considered 944 52.40 46.96 980 58.11 65.65 Spillins only 166 85.01 56.89 166 85.00 56.89
Distortions not considered 948 59.77 53.06 972 65.43 68.44 Farm program distortions 74 59.11 36.28 74 59.11 36.28
Spillouts only 21 106.75 104.33 22 119.37 177.77Both spillins and spillouts 13 90.15 35.15 13 90.15 35.15
Exchange rate distortions 58 45.64 34.55 67 37.13 39.27Deadweight losses from
taxation 17 84.89 78.33 19 98.85 85.78Environmental impacts 11 84.25 81.58 12 115.31 132.77Other distortions considered 47 29.06 10.68 48 32.37 25.26
Overall average rate of return 1,144 58.56 51.74 1,181 63.38 66.66
Note: The 95 percent sample reported here (and used in the regression analysis) excludes 169 observations for which the reported lag length was undefined, 72 observations that did not identifyauthor affiliations, and 358 observations that did not clarify if the study was done independently or self-evaluated. This <500 percent sample excludes 222 observations for which the reported laglength was undefined, 73 observations that did not identify author affiliations, and 314 observations that did not clarify if the study was done independently or a self-evaluation.

-30-
we might expect to find a common variance and some covariance among certain “clusters”
of errors, such as those coming from the same study or studies using the same or similar
data, but still expect these errors to be independent of and have a different variance from
other errors or clusters of errors. If both types of error problems are suspected, it is
difficult to tell what the overall effect might be on the estimated parameters and their
standard errors. Also, there is no proven way to correct for the second problem, although
ad hoc methods have been suggested (e.g., Hall 1984; Hall, Horowitz, and Jing 1995).
Since our meta-dataset is relatively large, the potential distortions might be expected to be
small so we did not correct the error-covariance matrix for either problem.
ESTIMATION RESULTS
The results of the meta-analysis proper are given in Table 6. The model includes
all of the variables that economic theory and experience led us to believe to be most
important for explaining the variation in the rate of return, as well as some that are the
subject of some debate among research evaluators. A high proportion of the estimated
coefficients in the model have plausible magnitudes and signs. We now turn to a
discussion of these results. In each case we discuss specifically the results from the 95-
percent dataset. Most of the coefficients were similar in sign, magnitude and significance
in the two regressions, but where important differences arose with the second (less than
500 percent per annum) dataset, these are discussed as well.

-31-
Table 6 The Meta-analysis results
Default category Explanatory variable included 2.5 percent deleted Rate of return <500
Highest and lowest
Intercept term 29.50 50.89* **
Characteristics of the rate of return measure
Nominal Real -3.39 -5.26
Average Marginal 10.30 15.04* **
Private Social 13.87 12.61
Research only Extension only -0.86 -7.17
Both research and extension -13.53 -15.45*** ***
Reported Derived from a benefit-cost ratio 55.54 98.08*** ***
Characteristics of the analyst
First author affiliation, Government 33.02 39.59
private sector or unknown University 27.81 28.78
International research center 22.17 26.54
International funding body 15.54 16.53
***
***
*
***
**
Independent assessment Self evaluation -19.62 -27.48*** ***
Characteristics of the research
Other research performer, Government research performer -3.59 -8.59
including private University research performer -7.28 -1.26
International research organization 14.80 14.06
**
*
***
All agriculture Tree crops 3.30 -9.56
All field crops 5.65 2.53
Livestock -3.01 -13.03
All other research foci -14.26 -25.52
Natural resources (forestry and fisheries) -57.22 -89.09
***
*
**
***
Other than basic research Basic research -4.75 -12.62
Public research Private research 21.44 14.86
Both private and public research 9.85 7.98
**
Developing country users Developed country users -26.23 -30.47
Multiple country users -0.91 -6.16
*** ***
Developing country performer Developed country performer 20.14 23.63** **

-32-
Table 6 continued
Default category Explanatory variable included Rate of return <500Highest and lowest
2.5 percent deleted
Characteristics of the research evaluation
Single project evaluation Research program evaluated -17.64 -28.02
Research institution evaluated - 2.82 -12.12
Multiple research institutions evaluated -14.04 -24.90
***
**
***
***
Evaluation published as a book Evaluation published in a refereed -9.59 -12.02or chapter, discussion paper, journalreport, or other
*** ***
Non-econometric study Econometrically estimated supply shift -1.64 - 7.32
Benefits calculations:
Directly from econometric Using explicit surplus model with a 3.28 4.67model pivotal supply shift
Using explicit surplus model without a pivotal supply shift
Using an implicit surplus model
13.50 16.60
17.46 20.65*** ***
Industry data for supply shift Experimental data for supply shift 1.51 4.40
Long lag (>15 years) Short lag (< 15 years) 3.64 - 0.55
Short lag and econometrically estimated 18.47 29.55supply shift
***
***
Spillovers not considered Spillins only 16.43 14.47
Distortions not considered Exchange rate distortions -21.88 -35.25
Spillouts only 64.37 77.80
Both spillins and spillouts 27.66 19.89
Farm program distortions 4.84 3.87
Deadweight losses from taxation 17.70 26.77
Environmental impacts 36.53 64.88
Other distortions considered -11.12 -4.57
***
***
**
***
**
**
***
***
**
***
MODEL R = 0.19 0.232
NUMBER OF OBSERVATIONS 1,144 1,181
* Significant at the 90 percent confidence level.
** Significant at the 95 percent confidence level.
*** Significant at the 99 percent confidence level.

-33-
Characteristics of the Rate-of-Return Measure
As expected, real rates of return tend to be lower than nominal rates of return (the
difference reflecting, approximately, the general rate of inflation). The point estimate
indicates that everything else equal, real rates of return were about 3 percent per annum
lower than the default, nominal rates (5 percent in the second dataset). This effect is not
statistically significant, however. Marginal rates of return were 10 percent per annum
higher than average rates of return (15 percent using the second dataset). A finding that
marginal rates of return are significantly higher than average rates of return could be
simply a reflection of the methods used to compute them. Otherwise, such evidence
indicates that research resources have been mis-allocated.
Economists have suggested that social rates of return to research should be greater
than private rates, because social rates take into account spillovers within the economy of
interest. It is not clear, however, in our data, what was meant by the original authors in
their distinctions between social and private returns, and whether they meant to distinguish
between publicly funded (or executed) and privately funded (or executed) research, as
opposed to giving consideration to the distribution of the benefits (see Alston and Pardey
1996, pp. 202-3 for further discussion on this point). In any event, the regression
indicates that the so-called social rates of return are not significantly higher, although the
point estimates indicate social rates of return are about 13 percentage points higher than
the “private” rates.

-34-
Comparing the conditional means, on average across studies the rate of return to
extension alone or research alone was higher than that to research and extension
combined. This result is echoed in the regression estimate: the rate of return to the
combined research and extension investment is lower by about 14 percent per annum,
compared with research alone. Finally, some internal rates of return were calculated by
translating from reported estimates of benefit-cost ratios, and the regression results
indicate that rates of return computed in this fashion were 56 percent per annum (98
percent for the second dataset) higher than when rates of return were reported in the
original studies, other things equal.
Characteristics of the Analyst
Characteristics of the analyst had large, and mostly statistically significant, effects
on the rate of return. In the second dataset, the effects were generally similar, always with
the same sign and results on statistical significance, and with coefficients slightly larger in
magnitude than their counterparts in the 95-percent dataset discussed next. Relative to the
default, government analysts estimated rates of return that were about 33 percent per
annum higher; university analysts, 28 percent per annum higher; and international research
centers, 22 percent per annum higher. The point estimates suggest that analysts employed
by international research donor organizations also obtained higher rates of return than
those in the default category, but the difference was not statistically significant.
It is not clear whether these differences among analysts reflect differences in
competence, or simply differences in what was being analyzed that have not been
-35-
More generally we might expect to find a bias towards the conventional wisdom,9
with “low” estimates being biased up and “high” estimates being biased down.
otherwise accounted for, rather than bias. However, it can be seen that the effect of a self-
evaluation, a more direct measure of any tendency to bias estimates, is to significantly
reduce the rate of return, not to increase it. At first blush, it may seem surprising to find
that self evaluations yield rates of return that are 20 percent per annum lower than more
independent studies (28 percent per annum in the second dataset). An explanation could
be that self-evaluators are simply better informed, have access to better data, and are less
biased as a result. As can be seen in the opening quote from Wheeler McMillen, another
explanation is that self-evaluators want to be plausible and are inclined to bias their
estimates down (noting that many find the typical estimates too high to be really plausible)
for that reason. It could also be that self-evaluation is picking up an interaction effect9
with some other characteristic, such as the employment status (e.g., tenure) of the
evaluator, which has not been captured completely with the simple specification used here.
Characteristics of the Research
The regression results suggest that the returns to research are similar across
different research performers, although the point estimates for research done by
international agencies are larger in both datasets.
Using both datasets, the estimated coefficients on the variables representing the
research focus suggest that on average, the rates of return were similar across categories,
apart from natural resources. The coefficient on natural resources (mostly forestry and

-36-
some fisheries research), indicates a 57 percent per annum lower rate of return to research
relative to the default, and even lower relative to most other categories (e.g., 63 percent
per annum lower than research into field crops). In the second dataset, the absolute value
of the coefficient for natural resources is even larger, indicating an 89 percent per annum
lower rate of return. There is no significant difference in rates of return in either dataset
related to whether studies reported basic or other categories of research or whether it was
public or private in nature.
The regression results indicate that it matters where the research was conducted
and where it was adopted. The rate of return was significantly lower (by 26 percent per
annum; 31 percent in the second dataset) when the research was adopted in developed
countries. If the research took place in a developed country, the rate of return was higher
by 20 percent per annum in the 95-percent dataset and 24 percent per annum in the second
dataset, perhaps because of better research infrastructure or better research training. Most
of the research evaluated was used in the same region where it was developed, thus these
two variables may not be independent, and the large parameters may merely reflect off-
setting effects.
Characteristics of the Research Evaluation
The results confirm some of our predictions concerning the implications of certain
modeling assumptions, although several results are qualitatively different between the two
datasets. First, as anticipated, in both datasets more aggregative studies generally mean
lower rates of return. The significant and negative coefficients for evaluations of entire
-37-
programs of research or research by multi-institutional agencies, support the view that
rates of return are lower for evaluations of more aggregated research investments. This is
likely to be a reflection of selection bias in the less-aggregative studies (i.e., evaluating
only impressive projects or parts thereof).
A published result may be expected to have been more-heavily scrutinized and this
might lead to lower rates of return. This hypothesis is supported in both regressions,
where a rate of return published in a journal is 10 percent per annum lower (12 percent per
annum in the second dataset) than one that is not.
The next block of variables refers to the approach used to compute benefits,
relative to the default, which is when benefits were estimated directly from an econometric
model. Everything else equal, a pivotal supply shift is known to result in smaller estimates
of research benefits than a parallel one, the most popular alternative, so it is not surprising
that the increase in the rate of return relative to the default was smaller for the pivotal
supply shift than for the non-pivotal shift, although neither difference was statistically
significant. The use of an implicit surplus model (i.e., GARB = kPQ) rather than an
explicit model or an econometric model to compute benefits, implied a 17 percentage
point higher rate of return. Using experimental yields versus industry yields did not have
any significant effects on the rate of return in either dataset.
As predicted, econometric studies that used short lags found rates of return that
were 18 percent per annum higher than those that used longer lags (30 percent in the
second dataset). This reflects the result that, for the reasons pointed out earlier, truncation
of lags in the stream of net benefits from research biases the rate of return up.

-38-
The next set of coefficients relates to the effects of allowing for research spillovers.
The results are similar between the two datasets. There is a very large positive effect of
including spillouts (the rate of return is higher by 64 percent per annum,78 percent per
annum in the second dataset) and spillins. A positive effect of spillouts might be expected
when computing a global rate of return, a context in which some additional relevant
benefits accrue as a result of spillouts, as may be the case in many of the studies of
international agricultural research. On the other hand, when computing only local
benefits, the effect of spillouts should be zero (in the small-country case) or negative (in a
large-country case). Accounting for spillins would be expected to reduce the rate of return
to research, all other things equal. On the whole, the spillover results are somewhat
surprising.
The final set of coefficients relate to the effects of market distortions. As pointed
out by various theoretical studies, there are no clearcut or general rules about the effects
of market distortions on the size and distribution of research benefits. Hence, it is difficult
to have clear expectations about individual results and it would be foolish to invest in
detailed rationalizations for any particular results. It is worth noting, however, that the
point estimates related to accounting for the effects of exchange rates, the deadweight
losses from taxation, environmental impacts, or other distortions are comparatively large.
The effects of allowing for exchange rate distortions are statistically significant—a
reduction in the rate of return by 22 percent per annum compared with studies that did not
account for any distortions. This is plausible if the effects of the exchange rate distortions
were generally to lower commodity prices, as an overvalued currency will (and exchange
-39-
rate distortions were exclusively a developing-country phenomenon in our dataset). The
effects of allowing for deadweight losses from taxation and environmental impacts were
both positive and statistically significant (except for deadweight losses from taxation in the
95-percent dataset). The latter is due to selection bias; where environmental impacts were
measured they were overwhelmingly positive (a reduction in pollution, say). The positive
effect on the estimated rate of return of accounting for deadweight losses from taxation is
puzzling since they add to research costs. Finally, allowing for other distortions produced
similar rates of return compared with studies that did not account for any distortions.
6. CONCLUSION
This study has compiled for the first time a comprehensive meta-dataset of studies
representing the entire postwar history of quantitative assessment of rates of return to
agricultural research. Compared with previous, narrative reviews, this data base is much
more comprehensive. The consequences for drawing conclusions from this literature are
both good and bad. The range of rates of return is uncomfortably large, which makes it
harder to discern meaningful patterns in the rates of return, and to identify those factors
that account for the systematic variation in the evidence. But, these are the data, and it is
better to use objective and systematic methods to filter the results rather than ad hoc
sample selection, which may entail corresponding bias.
In order to make our assessment of the evidence more meaningful, we excluded
either 5 percent (the lowest and highest 2.5 percent) of the estimated rates of return from

-40-
the statistical analysis, or all of the rates of return greater than 500 percent per annum.
Even still, it was difficult to confidently draw meaningful inferences from the tabulations
and simple pairwise comparisons. It is important to control for some of the systematic
sources of variation in order to isolate a particular effect, especially given the importance
of within-group variability. Nevertheless, there is a close connection between our key
results from the multivariate analysis, and some of the patterns in the conditional means,
and these fit well with our prior beliefs based on theory.
Some issues however are strictly empirical, and these were a significant motivation
for the study. Five questions were stated in the introduction, and we have been able to
answer some of them clearly; others remain the subject of further analysis. (1) There is no
evidence to support the view that the rate of return has declined over time. (2) The rate of
return to research is higher when the research is conducted in more-developed countries
or when it is adopted in less-developed countries. As discussed above, since most
research is adopted where it is conducted this is mostly self-negating. So far, we have
been unable to discern any more-specific effects of this nature (such as between Asia and
Africa or for international research). (3) The rate of return to research varies according to
problematic focus, in ways that make intuitive sense. In general we would expect to see
longer production cycles associated with lower rates of return, and the regression results
indicate a significantly lower rate of return for natural resource management research
(primarily forestry) compared with the other categories. (4) The rate of return is not
significantly different between research and extension included individually, but a lower
rate of return is found in studies that combine research and extension, which we suspect is
-41-
a reflection of omitted variable bias in the other studies. (5) Characteristics of the research
evaluation itself, and the analyst conducting the evaluation, were found to have important
systematic effects on the estimated rates of return, and most of these effects are
reasonable. One of the more important findings here supports the recent results of Alston,
Craig, and Pardey (1998), who showed that in econometric studies of returns to research,
the arbitrary truncation of the lag distribution for the stream of net benefits could lead to
serious upward biases in the estimated rate of return.

-42-
REFERENCES
Alston, J.M. and P.G. Pardey. 1996. Making science pay: The economics of agriculturalR&D policy. Washington D.C.: American Enterprise Institute Press.
Alston, J.M., B.J. Craig, and P.G. Pardey. 1998. Dynamics in the creation anddepreciation of knowledge, and the returns to research. EPTD Discussion PaperNo. 35 (August). Washington D.C.: International Food Policy Research Institute.
Alston, J.M., G.W. Norton, and P.G. Pardey. 1995. Science under scarcity: Principlesand practice for agricultural research evaluation and priority setting. Ithaca, N.Y.:Cornell University Press.
Alston, J.M., M.C. Marra, P.G. Pardey, and T J Wyatt. 1998. Ex pede hurculem? Ameta-analysis of agricultural R&D evaluations. Draft Research Report, October.International Food Policy Research Institute, Washington D.C.
Ballard, C.L. and D. Fullerton. 1992. Distortionary taxes and the provision of publicgoods. Journal of Economic Perspectives 6 (Summer): 117-131.
Boyle, K.J., G.L. Poe, and J.C. Bergstrom. 1994. What do we know about ground watervalues? Preliminary implications from a meta analysis of contingent-valuationstudies. American Journal of Agricultural Economics 76: 1055-1061.
Cook, T.D. H. Cooper, D.S. Cordray, H. Hartmann, L.V. Hedges, R.J. Light, T.A. Louis,and F. Mosteller. 1992. Meta-analysis for explanation: A casebook. New York:Russell Sage Foundation.
Cooper, H.M. and L.V. Hedges (eds.). 1994. Handbook of research synthesis. NewYork: Russell Sage Foundation.
Echeverría, R.G. 1990. Assessing the impact of agricultural research. In Methods fordiagnosing research system constraints and assessing the impact of agriculturalresearch, Vol. II, assessing the impact of agricultural research, ed. R.G.Echeverría. The Hague: ISNAR.
Evenson, R.E. 1998. Economic impact studies of agricultural research and extension.Draft manuscript. Yale Economic Growth Center, Yale University.
Evenson, R.E., P.E. Waggoner, and V.W. Ruttan. 1979. Economic benefits fromresearch: An example from agriculture. Science 205: 1101-1107.

-43-
Farley, J.U. and D.R. Lehmann. 1986. Meta-analysis in marketing. Lexington, Mass.:Lexington Books.
Feldman, K.A. 1971. Using the work of others: Some observations on reviewing andintegrating. Sociology of Education 44: 86-102.
Fox, G.C. 1985. Is the United States really underinvesting in agricultural research?American Journal of Agricultural Economics 67 (November): 806-812.
Fullerton, D. 1991. Reconciling recent estimates of the marginal welfare cost of taxation. American Economic Review 81: 302-308.
Fuglie, K., N. Ballenger, K. Day, C. Klotz, M. Ollinger, J. Reilly, U. Vasavada, and J.Yee. 1996. Agricultural research and development: Public investments underalternative markets and institutions. Agricultural Economic Report No. 735,May. Washington D.C.: USDA-ERS.
Griliches, Z. 1957. Hybrid corn: An exploration in the economics of technologicalchange. Econometrica 25 (4): 501-522.
Hall, P. 1984. Resampling a coverage pattern. Stochastic Processes and TheirApplications 20: 231-246.
Hall, P., J.L. Horowitz, and B.-Y. Jing. 1995. On blocking rules for the bootstrap withdependent data. Biometrika 82: 561-574.
Hedges, L.V. and I. Olkin. 1985. Statistical methods for meta-analysis. New York:Academic Press, Inc.
Kealey, T. 1996. The economic laws of scientific research. Houndmills: MacmillanPress Ltd.
Lakshminarayan, P.G., P.W. Gassman, A. Bouzaher, and R.C. Izaurralde. 1996. Ametamodeling approach to evaluate agricultural policy impact on soil degradationin Western Canada. Canadian Journal of Agricultural Economics 44 : 277-294.
McMillen, W. 1929. Too many farmers: The story of what is here and ahead inagriculture. New York: William Morrow and Company.
Marra, M.C. and B. Schurle. 1994. Wheat yield risk and aggregation: A meta-analysisapproach. Journal of Agricultural and Resource Economics 19 (1): 69-77.

-44-
Milchunas, D.G. and W. K. Lauenroth. 1993. Quantitative effects of grazing onvegetation and soils over a global range of environments. EcologicalEnvironments 63 (4): 327-366.
Pasour, E.C., Jr., and M.A. Johnson. 1982. Bureaucratic productivity: The case ofagricultural research revisited. Public Choice 39 (2): 301-317.
Schultz, T.W. 1953. The economic organization of agriculture. New York: McGraw-Hill.
Smith, V.K. and J.-C. Huang. 1995. Can markets value air quality? A meta-analysis ofhedonic property value models. Journal of Political Economy 103 (11): 209-227.
Smith, V.K. and Y. Kaoru. 1990. Signals or noise: Explaining the variation in recreationbenefit estimates. American Journal of Agricultural Economics 72 (May): 419-433.
Smith, V.K. and L. Osborne. 1993. Do contingent valuation estimates pass a scope test?:A preliminary meta analysis. Selected paper, joint meetings of the AmericanEconomic Association and the Association of Environmental and ResourceEconomists, Boston, Mass.