edinburgh airport airspace change programme
TRANSCRIPT
ED10588 | Issue Number 8 | 3 August 2018 Ricardo in Confidence
Edinburgh Airport Airspace Change Programme Environmental Assessment
Report for Edinburgh Airport Limited
Ricardo Energy & Environment Edinburgh Airport Airspace Change Programme | i
Ref: Ricardo/ED10588/Issue 8 Ricardo in Confidence
Customer: Contact:
Edinburgh Airport Limited James Ellaway Bright Building, First Floor Manchester Science Park Pencroft Way Manchester M15 6GZ.
t: +44 (0) 1235 75 e: [email protected]
Customer reference:
600016375
Confidentiality, copyright & reproduction:
This report is the Copyright of Edinburgh Airport Limited. It has been prepared by Ricardo Energy & Environment, a trading name of Ricardo-AEA Ltd, under contract to Edinburgh Airport Limited dated 30/03/2018. The contents of this report may not be reproduced in whole or in part, nor passed to any organisation or person without the specific prior written permission of Edinburgh Airport Limited. Ricardo Energy & Environment accepts no liability whatsoever to any third party for any loss or damage arising from any interpretation or use of the information contained in this report, or reliance on any views expressed therein.
Authors:
Kieran Whelan, Katherine Cowell, Joe Kenyon, Christine St John Cox, David Birchby, Charles Walker
Approved by:
James Ellaway
Date: 3 August 2018
Ricardo Energy & Environment reference:
Ref: ED10588 Issue 8
Ref: Ricardo/ED10588/Issue 8 Ricardo in Confidence
Ricardo Energy & Environment Edinburgh Airport Airspace Change Programme | i
Non-Technical Summary
Introduction Edinburgh Airport Limited (Edinburgh Airport) is proposing to upgrade its aircraft arrival and departure flight paths and apply new methods of operation as part of its overall Airspace Change Programme (ACP). The aim of this programme is to take advantage of the improved navigational capabilities of aRea NAVigation (RNAV) technology and improve the efficiency and capacity of the airspace surrounding the airport.
This report provides the non-technical summary of the environmental assessment of proposed changes to published flight paths and new methods of operation (referred to hereafter as the proposed programme) in accordance with the procedures set out in the Civil Aviation Authority (CAA) Guidance on the Application of the Airspace Change Process (Civil Aviation Publication (CAP) 725). The objective of the environmental assessment is to assess potential environmental impacts for the proposed programme to inform decision making. The environmental assessment accompanies Edinburgh Airport’s application for airspace change to the CAA.
The proposed programme is required to meet the UK’s Future Airspace Strategy (FAS) (CAA, 2011) and is driven by:
• The requirement to move to the RNAV navigation system.
• The need for more efficient arrivals/departures to enable growth within existing permitted passenger and aircraft movement limits.
This report assesses minor changes from the original ACP proposal which was submitted to the CAA in August 2017. Changes made to the proposed programme comprise amendments to all departures from runway 06 to increase the distance between these flight paths and the residential area of Cramond. Changes have also been made to the patterns of use of all flight paths. Finally, all flight paths will now be implemented in 2019.
The proposed programme
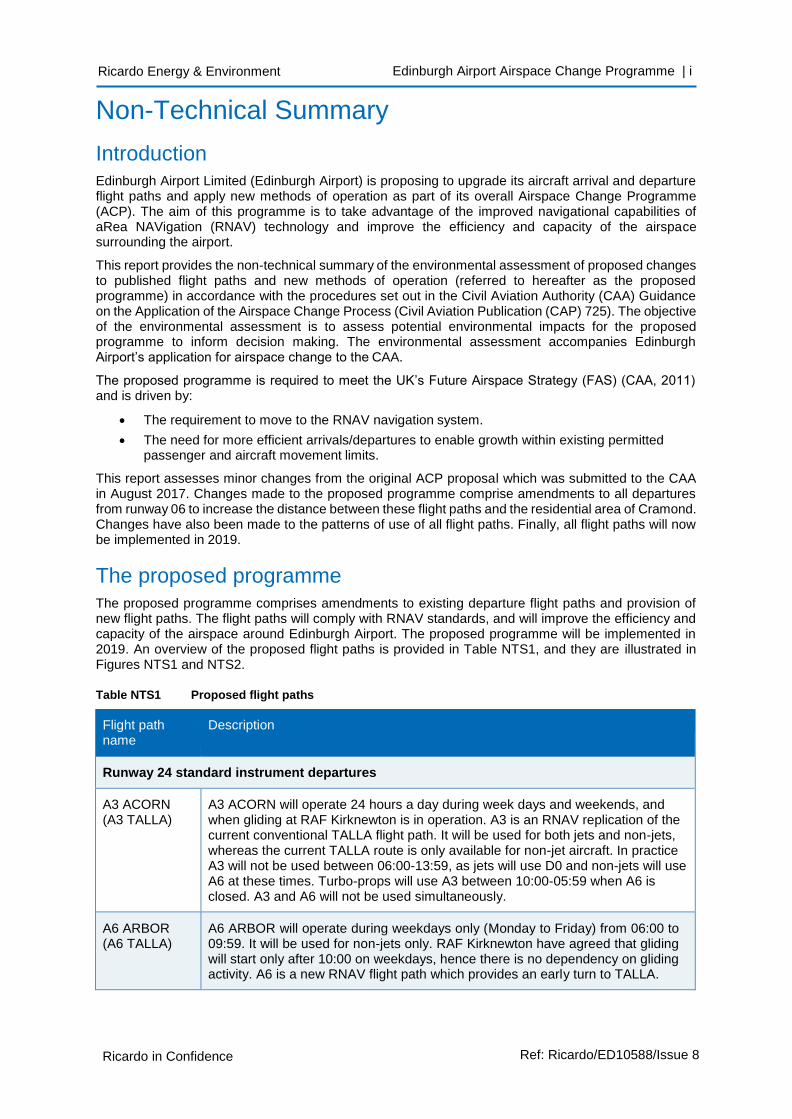
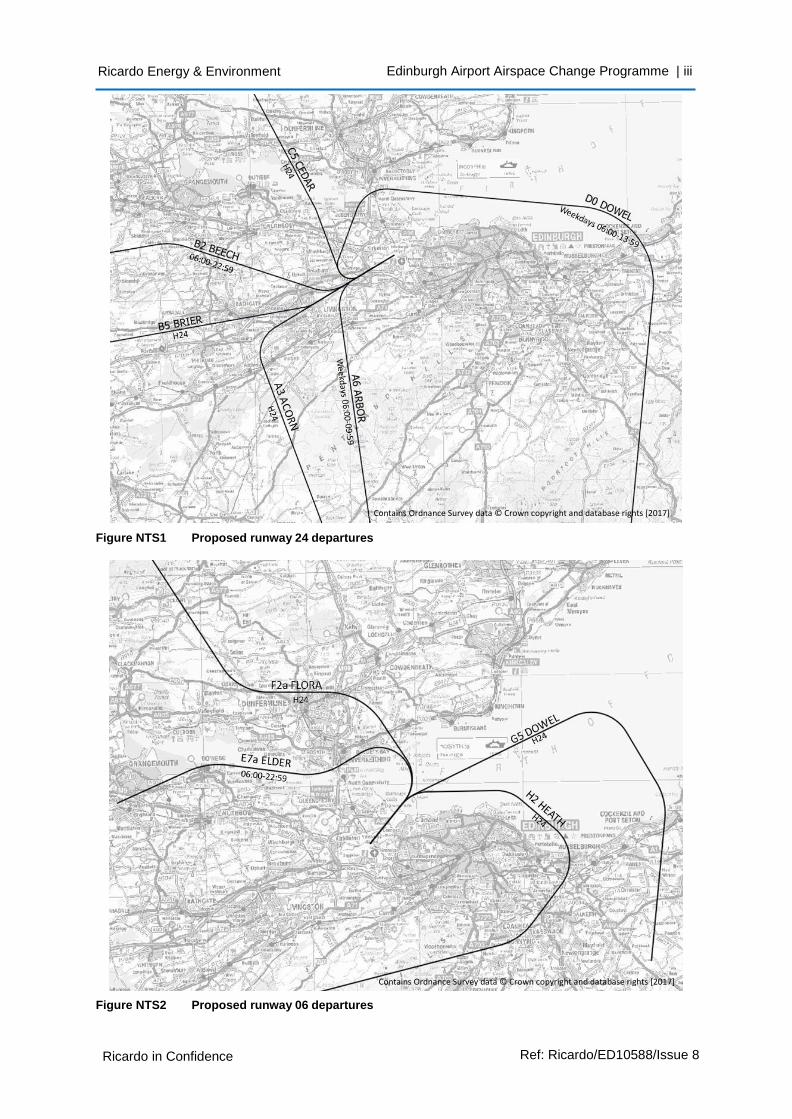
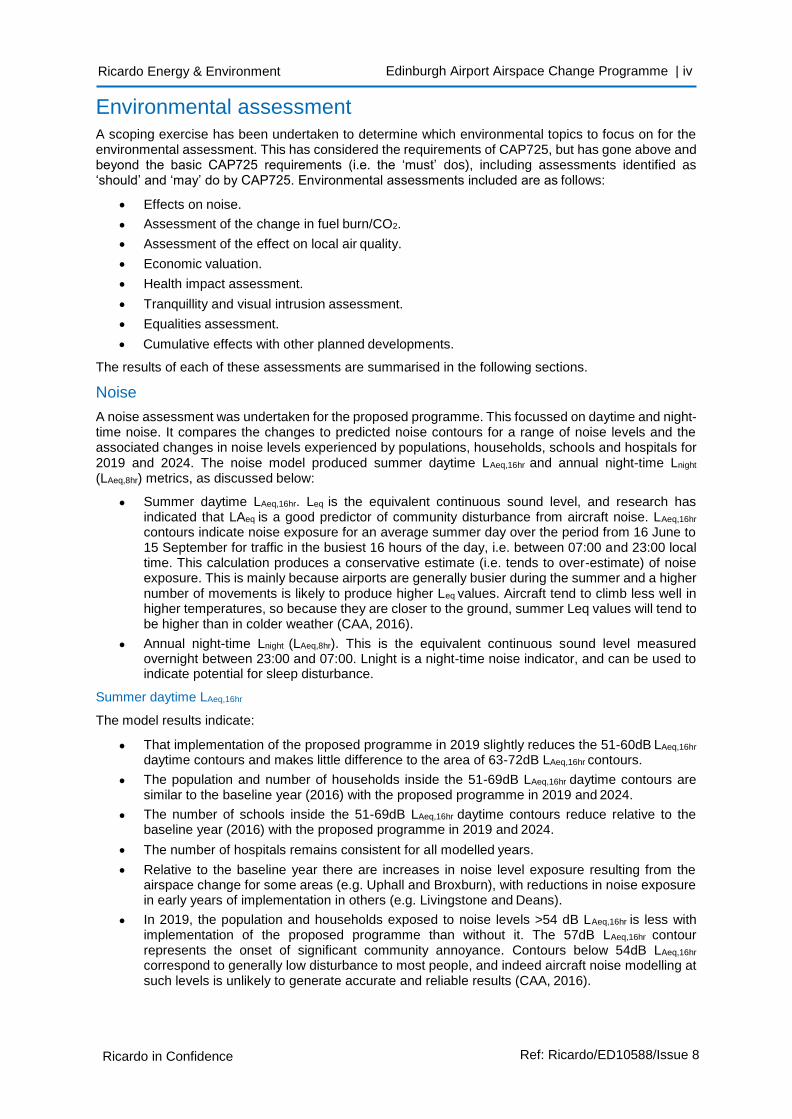
The proposed programme comprises amendments to existing departure flight paths and provision of new flight paths. The flight paths will comply with RNAV standards, and will improve the efficiency and capacity of the airspace around Edinburgh Airport. The proposed programme will be implemented in 2019. An overview of the proposed flight paths is provided in Table NTS1, and they are illustrated in Figures NTS1 and NTS2.
Table NTS1 Proposed flight paths
Flight path name
Description
Runway 24 standard instrument departures
A3 ACORN (A3 TALLA)
A3 ACORN will operate 24 hours a day during week days and weekends, and when gliding at RAF Kirknewton is in operation. A3 is an RNAV replication of the current conventional TALLA flight path. It will be used for both jets and non-jets, whereas the current TALLA route is only available for non-jet aircraft. In practice A3 will not be used between 06:00-13:59, as jets will use D0 and non-jets will use A6 at these times. Turbo-props will use A3 between 10:00-05:59 when A6 is closed. A3 and A6 will not be used simultaneously.
A6 ARBOR (A6 TALLA)
A6 ARBOR will operate during weekdays only (Monday to Friday) from 06:00 to 09:59. It will be used for non-jets only. RAF Kirknewton have agreed that gliding will start only after 10:00 on weekdays, hence there is no dependency on gliding activity. A6 is a new RNAV flight path which provides an early turn to TALLA.
Ref: Ricardo/ED10588/Issue 8 Ricardo in Confidence
Ricardo Energy & Environment Edinburgh Airport Airspace Change Programme | ii
Flight path name
Description
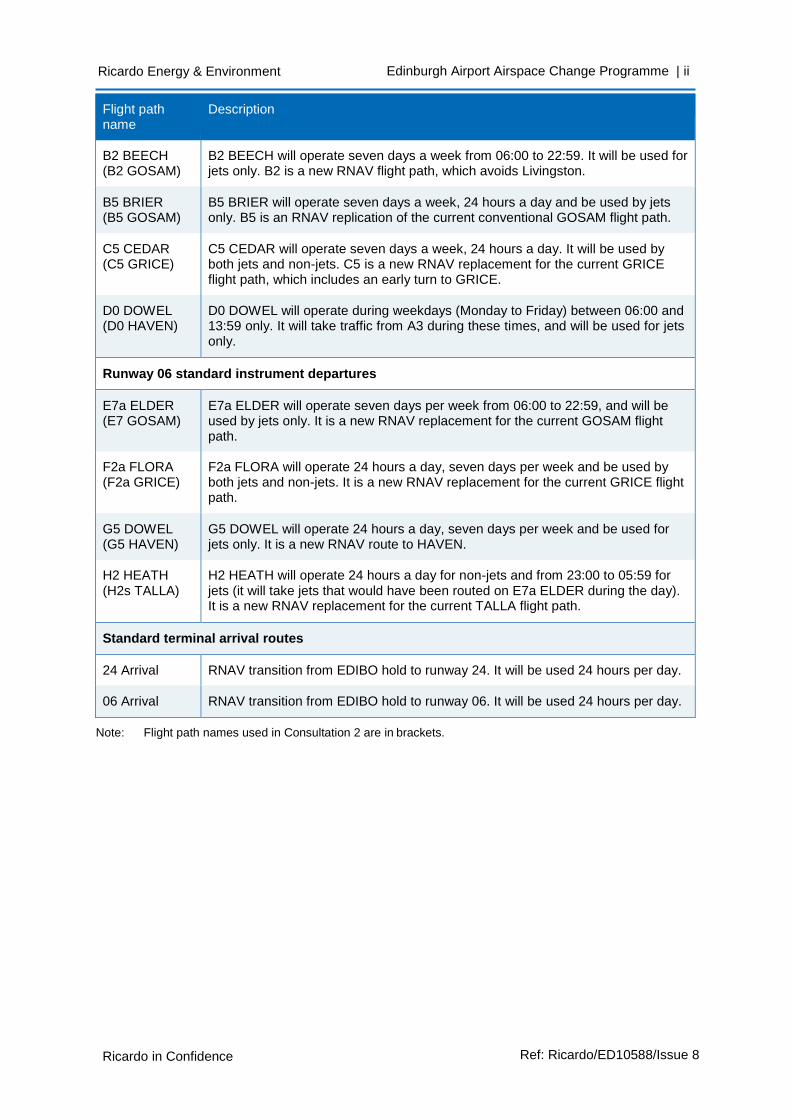
B2 BEECH (B2 GOSAM)
B2 BEECH will operate seven days a week from 06:00 to 22:59. It will be used for jets only. B2 is a new RNAV flight path, which avoids Livingston.
B5 BRIER (B5 GOSAM)
B5 BRIER will operate seven days a week, 24 hours a day and be used by jets only. B5 is an RNAV replication of the current conventional GOSAM flight path.
C5 CEDAR (C5 GRICE)
C5 CEDAR will operate seven days a week, 24 hours a day. It will be used by both jets and non-jets. C5 is a new RNAV replacement for the current GRICE flight path, which includes an early turn to GRICE.
D0 DOWEL (D0 HAVEN)
D0 DOWEL will operate during weekdays (Monday to Friday) between 06:00 and 13:59 only. It will take traffic from A3 during these times, and will be used for jets only.
Runway 06 standard instrument departures
E7a ELDER (E7 GOSAM)
E7a ELDER will operate seven days per week from 06:00 to 22:59, and will be used by jets only. It is a new RNAV replacement for the current GOSAM flight path.
F2a FLORA (F2a GRICE)
F2a FLORA will operate 24 hours a day, seven days per week and be used by both jets and non-jets. It is a new RNAV replacement for the current GRICE flight path.
G5 DOWEL (G5 HAVEN)
G5 DOWEL will operate 24 hours a day, seven days per week and be used for jets only. It is a new RNAV route to HAVEN.
H2 HEATH (H2s TALLA)
H2 HEATH will operate 24 hours a day for non-jets and from 23:00 to 05:59 for jets (it will take jets that would have been routed on E7a ELDER during the day). It is a new RNAV replacement for the current TALLA flight path.
Standard terminal arrival routes
24 Arrival RNAV transition from EDIBO hold to runway 24. It will be used 24 hours per day.
06 Arrival RNAV transition from EDIBO hold to runway 06. It will be used 24 hours per day.
Note: Flight path names used in Consultation 2 are in brackets.
Ref: Ricardo/ED10588/Issue 8 Ricardo in Confidence
Ricardo Energy & Environment Edinburgh Airport Airspace Change Programme | iii
Figure NTS1 Proposed runway 24 departures
Figure NTS2 Proposed runway 06 departures
Contains Ordnance Survey data © Crown copyright and database rights [2017]
Contains Ordnance Survey data © Crown copyright and database rights [2017]
Ref: Ricardo/ED10588/Issue 8 Ricardo in Confidence
Ricardo Energy & Environment Edinburgh Airport Airspace Change Programme | iv
Environmental assessment A scoping exercise has been undertaken to determine which environmental topics to focus on for the environmental assessment. This has considered the requirements of CAP725, but has gone above and beyond the basic CAP725 requirements (i.e. the ‘must’ dos), including assessments identified as ‘should’ and ‘may’ do by CAP725. Environmental assessments included are as follows:
• Effects on noise.
• Assessment of the change in fuel burn/CO2.
• Assessment of the effect on local air quality.
• Economic valuation.
• Health impact assessment.
• Tranquillity and visual intrusion assessment.
• Equalities assessment.
• Cumulative effects with other planned developments.
The results of each of these assessments are summarised in the following sections.
Noise
A noise assessment was undertaken for the proposed programme. This focussed on daytime and night- time noise. It compares the changes to predicted noise contours for a range of noise levels and the associated changes in noise levels experienced by populations, households, schools and hospitals for 2019 and 2024. The noise model produced summer daytime LAeq,16hr and annual night-time Lnight
(LAeq,8hr) metrics, as discussed below:
• Summer daytime LAeq,16hr. Leq is the equivalent continuous sound level, and research has indicated that LAeq is a good predictor of community disturbance from aircraft noise. LAeq,16hr
contours indicate noise exposure for an average summer day over the period from 16 June to 15 September for traffic in the busiest 16 hours of the day, i.e. between 07:00 and 23:00 local time. This calculation produces a conservative estimate (i.e. tends to over-estimate) of noise exposure. This is mainly because airports are generally busier during the summer and a higher number of movements is likely to produce higher Leq values. Aircraft tend to climb less well in higher temperatures, so because they are closer to the ground, summer Leq values will tend to be higher than in colder weather (CAA, 2016).
• Annual night-time Lnight (LAeq,8hr). This is the equivalent continuous sound level measured overnight between 23:00 and 07:00. Lnight is a night-time noise indicator, and can be used to indicate potential for sleep disturbance.
Summer daytime LAeq,16hr
The model results indicate:
• That implementation of the proposed programme in 2019 slightly reduces the 51-60dB LAeq,16hr
daytime contours and makes little difference to the area of 63-72dB LAeq,16hr contours.
• The population and number of households inside the 51-69dB LAeq,16hr daytime contours are similar to the baseline year (2016) with the proposed programme in 2019 and 2024.
• The number of schools inside the 51-69dB LAeq,16hr daytime contours reduce relative to the baseline year (2016) with the proposed programme in 2019 and 2024.
• The number of hospitals remains consistent for all modelled years.
• Relative to the baseline year there are increases in noise level exposure resulting from the airspace change for some areas (e.g. Uphall and Broxburn), with reductions in noise exposure in early years of implementation in others (e.g. Livingstone and Deans).
• In 2019, the population and households exposed to noise levels >54 dB LAeq,16hr is less with implementation of the proposed programme than without it. The 57dB LAeq,16hr contour represents the onset of significant community annoyance. Contours below 54dB LAeq,16hr
correspond to generally low disturbance to most people, and indeed aircraft noise modelling at such levels is unlikely to generate accurate and reliable results (CAA, 2016).
Ref: Ricardo/ED10588/Issue 8 Ricardo in Confidence
Ricardo Energy & Environment Edinburgh Airport Airspace Change Programme | v
• In 2024, the population and households exposed to noise levels >54 dB LAeq,16hr is also lower with implementation of the proposed programme than without it, despite additional growth in aircraft movements.
Annual night-time Lnight (LAeq,8hr)
The modelling results indicate:
• The change of airspace in 2019 increases the area of the Lnight contours. However, in 2019 the population and households exposed to >45dB Lnight is less with the proposed programme than with the existing flight paths.
• Relative to the baseline year, the population is higher in all future years with or without the proposed programme.
• The number of hospitals inside the 45dB Lnight contour remains consistent and is limited to only one hospital, which is predicted to experience a reduction in night-time noise exposure of 1dB.
• In 2024, the population and households exposed to >45dB Lnight is greater with the proposed programme than without it, however these increases are largely due to increases in aircraft movements rather than the proposed programme.
• There are areas that experience an increase in night-time noise levels. These increases are largely due to increases in movements rather than the airspace change. The areas which experience greatest increases to 2024 are Seafield, Broxburn and a non-residential area to the north of the airport.
Once a decision has been made and approved by the CAA regarding preferred routes to be implemented, Edinburgh Airport will engage with communities impacted regarding an update to their Noise Action Plan and Noise Insulation Scheme.
Fuel burn / CO2 emissions
An assessment of changes in fuel burn and CO2 emissions associated with upgrading the aircraft arrival and departure routes into Edinburgh Airport for the proposed programme has been undertaken. This has focussed only on aircraft arrival and departure of aircraft associated with the changes from the proposed programme.
The proposed upgrading of the aircraft arrival and departure routes does not include substantial changes to take-off and landing direction preferences, and therefore the time or length of taxiing won’t change. However, there will be indirect beneficial impacts, as NATS anticipate hold times will reduce by 30 seconds per flight, which will lead to lower emissions. Many of the flight path options chosen enable more direct routing of aircraft and enhanced vertical profiles, which results in reduced fuel burn and CO2 emissions.
The key findings of the assessment are:
• Implementation of the proposed programme in 2019 will provide a fuel benefit of 9,878t in 2019, increasing to 11,037t of fuel in 2024 with expected traffic growth.
• Implementation of the proposed programme in 2019 will provide a CO2 emissions benefit of 31,413t in 2019, increasing to 35,098t CO2 in 2024 with expected traffic growth.
In 2019, the population and number of households exposed to noise levels >54dB LAeq,16hr is similar to the baseline year (2016) with implementation of the proposed programme despite air traffic growth. The number of schools within this contour reduces relative to the baseline. There is a negligible beneficial impact to the local area from implementation of the proposed programme, although noise impacts will increase in some communities and reduce in others.
There are areas that will experience an increase in night-time noise levels. The modelled scenarios without implementation of the proposed programme show increases in night-time noise levels in all years compared to the baseline, due to aircraft traffic growth. The proposed programme will increase this incrementally in 2024, however most of the increase is due to aircraft traffic growth thus this is a minor adverse impact.
Ref: Ricardo/ED10588/Issue 8 Ricardo in Confidence
Ricardo Energy & Environment Edinburgh Airport Airspace Change Programme | vi
Local air quality
The proposed programme includes minor changes to the flight paths of all runway 06 departures. Aircraft on runway 06 departure flight paths will make early turns at 500m above airfield level to avoid Cramond as much as possible. These changes are likely to have minimal impact on ground level concentrations, as local impacts from aircraft emissions are not particularly sensitive to emissions above a height of approximately 200 m (Rogers et. al., 2002).
A greater (positive) impact will come from improvements to aircraft taxiing and hold times that result from the proposed programme. The effects of these changes were considered in a qualitative assessment of air quality.
The key findings of the assessment comprise a predicted saving of 1 to 2 tonnes of NO2 annually with the proposed changes, due to reduced hold times. The reduction in NO2 concentrations is predicted to be less than 0.5% of the air quality assessment level for annual mean NO2. The proposed programme will also have negligible beneficial effects on local PM10 concentrations.
Economic valuation
An economic valuation was undertaken to place a monetary value on impacts associated with the proposed programme. It focused on valuation of impacts on noise, fuel consumption and GHG emissions. It enables a direct comparison of environmental effects by considering them in a consistent way. These monetised effects therefore represent the social value of the associated effects and are produced to help understand the overall effects and aid decision making. These values do not represent a suggested contribution for Edinburgh Airport to make to mitigation measures, offsets or any other compensation measures.
The key findings are as follows:
• In both modelled years (2019 and 2024), the proposed programme is anticipated to deliver a large fuel burn and CO2 saving, with a positive benefit of around £6.8m and £1.5m in 2019 and 2024 respectively.
• The proposed programme will also have an overall net benefit through reductions in exposure to noise in each of the modelled years: the value of the total noise impact differs between the appraisal years and reduces from £1.02m in 2019 to £0.79m in 2024.
• The total noise impact in 2024 is a net effect: the improvements in day-time noise are set against a worsening of night-time noise, which will be associated with an increase in sleep disturbance. However, the daytime improvements outweigh the night time effects delivering an overall net benefit
• Indeed, for both 2019 and 2024, the daytime effects themselves are a net effect: some households experience a worsening of daytime noise. But these effects are outweighed by the number of households which see an improvement in noise levels (and an associated reduction in detrimental health effects).
• Overall, the proposed programme will deliver noise, fuel burn and greenhouse gas emissions impacts in a single year to a total value of £6.31m in 2019, increasing to £9.09m in 2024. These impacts will occur in each year over the lifetime of the option. However, there is uncertainty in the valuation of these effects. In 2019, the annual net benefit could be as low as £3.47m or as high as £20.8m. In 2024, the net benefit could be as low as £5.23m or as high as £23.1m. This
The fuel burn and CO2 emission savings are affected by a reduction in track mileage in some cases, but are largely driven by improvements to vertical trajectories the new flight paths allow. Overall, the analysis shows that despite increases in traffic in 2019 and 2024, the proposed programme will reduce fuel burn and CO2 emissions.
The reduction in NO2 concentrations at the airport boundary and within the Glasgow Rd Air Quality Management Area (AQMA) from the proposed programme is estimated to be less than 0.5% of the air quality assessment level for annual mean NO2. This comprises a negligible beneficial impact, in accordance with EPUK/IAQM (2017) guidance.
Similarly, changes to PM10 concentrations at the airport boundary and within the Glasgow Rd AQMA are estimated to be to be negligible.
Ref: Ricardo/ED10588/Issue 8 Ricardo in Confidence
Ricardo Energy & Environment Edinburgh Airport Airspace Change Programme | vii
range reflects underlying uncertainty in the valuation approaches, rather than around the estimation of the effects themselves. As such this capture uncertainty around, for example: future forecasts of energy prices, policy regarding aviation emissions, the damage caused by climate change in the future, the size of the effects of noise on health and the value individuals attach to good health.
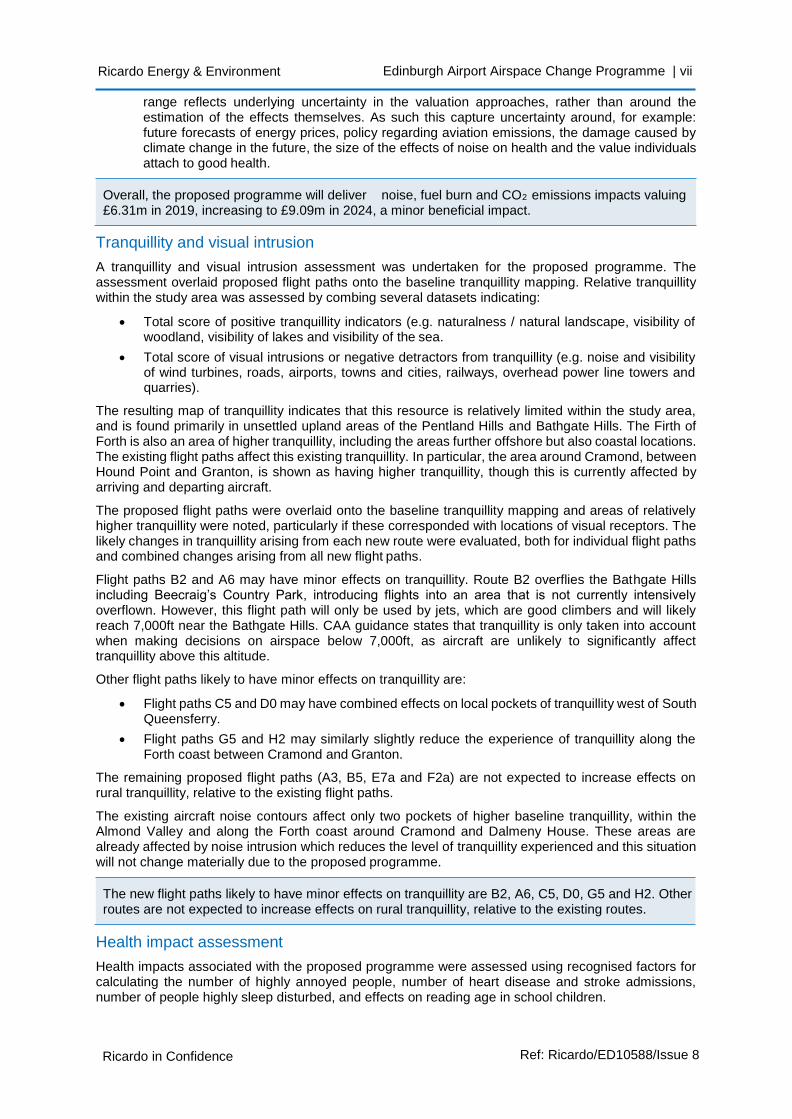
Tranquillity and visual intrusion
A tranquillity and visual intrusion assessment was undertaken for the proposed programme. The assessment overlaid proposed flight paths onto the baseline tranquillity mapping. Relative tranquillity within the study area was assessed by combing several datasets indicating:
• Total score of positive tranquillity indicators (e.g. naturalness / natural landscape, visibility of woodland, visibility of lakes and visibility of the sea.
• Total score of visual intrusions or negative detractors from tranquillity (e.g. noise and visibility of wind turbines, roads, airports, towns and cities, railways, overhead power line towers and quarries).
The resulting map of tranquillity indicates that this resource is relatively limited within the study area, and is found primarily in unsettled upland areas of the Pentland Hills and Bathgate Hills. The Firth of Forth is also an area of higher tranquillity, including the areas further offshore but also coastal locations. The existing flight paths affect this existing tranquillity. In particular, the area around Cramond, between Hound Point and Granton, is shown as having higher tranquillity, though this is currently affected by arriving and departing aircraft.
The proposed flight paths were overlaid onto the baseline tranquillity mapping and areas of relatively higher tranquillity were noted, particularly if these corresponded with locations of visual receptors. The likely changes in tranquillity arising from each new route were evaluated, both for individual flight paths and combined changes arising from all new flight paths.
Flight paths B2 and A6 may have minor effects on tranquillity. Route B2 overflies the Bathgate Hills including Beecraig’s Country Park, introducing flights into an area that is not currently intensively overflown. However, this flight path will only be used by jets, which are good climbers and will likely reach 7,000ft near the Bathgate Hills. CAA guidance states that tranquillity is only taken into account when making decisions on airspace below 7,000ft, as aircraft are unlikely to significantly affect tranquillity above this altitude.
Other flight paths likely to have minor effects on tranquillity are:
• Flight paths C5 and D0 may have combined effects on local pockets of tranquillity west of South Queensferry.
• Flight paths G5 and H2 may similarly slightly reduce the experience of tranquillity along the Forth coast between Cramond and Granton.
The remaining proposed flight paths (A3, B5, E7a and F2a) are not expected to increase effects on rural tranquillity, relative to the existing flight paths.
The existing aircraft noise contours affect only two pockets of higher baseline tranquillity, within the Almond Valley and along the Forth coast around Cramond and Dalmeny House. These areas are already affected by noise intrusion which reduces the level of tranquillity experienced and this situation will not change materially due to the proposed programme.
Health impact assessment
Health impacts associated with the proposed programme were assessed using recognised factors for calculating the number of highly annoyed people, number of heart disease and stroke admissions, number of people highly sleep disturbed, and effects on reading age in school children.
Overall, the proposed programme will deliver noise, fuel burn and CO2 emissions impacts valuing £6.31m in 2019, increasing to £9.09m in 2024, a minor beneficial impact.
The new flight paths likely to have minor effects on tranquillity are B2, A6, C5, D0, G5 and H2. Other routes are not expected to increase effects on rural tranquillity, relative to the existing routes.
Ref: Ricardo/ED10588/Issue 8 Ricardo in Confidence
Ricardo Energy & Environment Edinburgh Airport Airspace Change Programme | viii
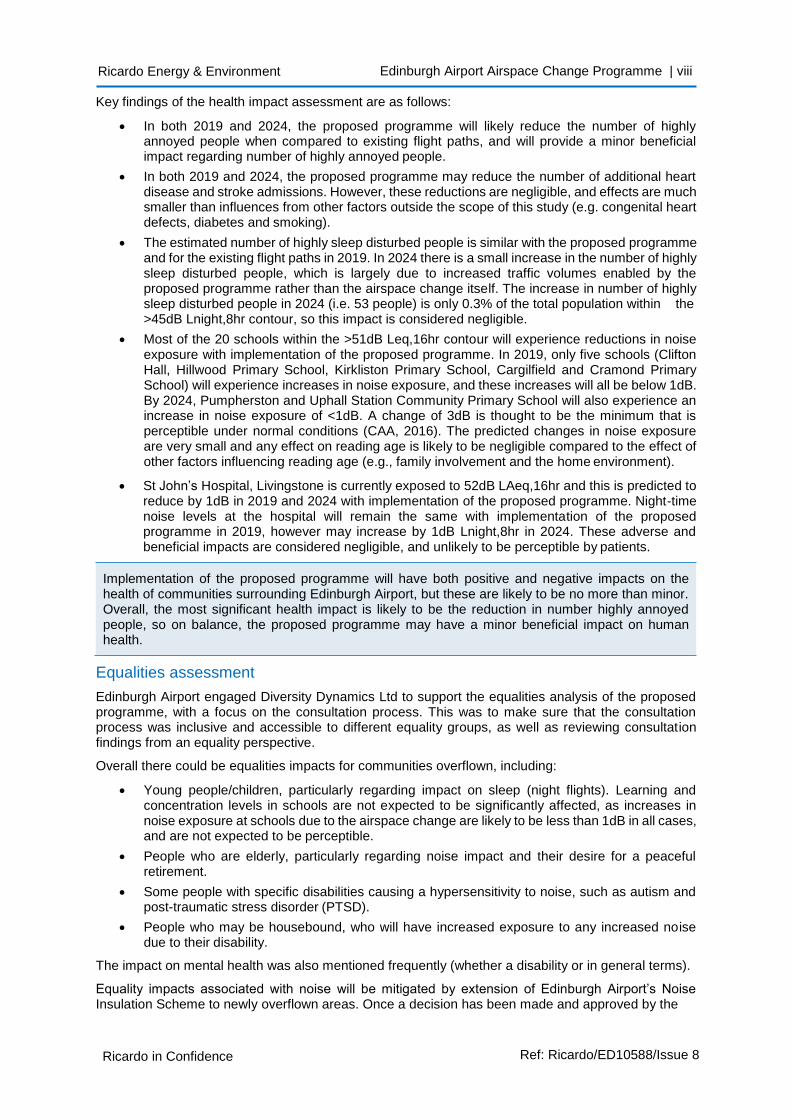
Key findings of the health impact assessment are as follows:
• In both 2019 and 2024, the proposed programme will likely reduce the number of highly annoyed people when compared to existing flight paths, and will provide a minor beneficial impact regarding number of highly annoyed people.
• In both 2019 and 2024, the proposed programme may reduce the number of additional heart disease and stroke admissions. However, these reductions are negligible, and effects are much smaller than influences from other factors outside the scope of this study (e.g. congenital heart defects, diabetes and smoking).
• The estimated number of highly sleep disturbed people is similar with the proposed programme and for the existing flight paths in 2019. In 2024 there is a small increase in the number of highly sleep disturbed people, which is largely due to increased traffic volumes enabled by the proposed programme rather than the airspace change itself. The increase in number of highly sleep disturbed people in 2024 (i.e. 53 people) is only 0.3% of the total population within the >45dB Lnight,8hr contour, so this impact is considered negligible.
• Most of the 20 schools within the >51dB Leq,16hr contour will experience reductions in noise exposure with implementation of the proposed programme. In 2019, only five schools (Clifton Hall, Hillwood Primary School, Kirkliston Primary School, Cargilfield and Cramond Primary School) will experience increases in noise exposure, and these increases will all be below 1dB. By 2024, Pumpherston and Uphall Station Community Primary School will also experience an increase in noise exposure of <1dB. A change of 3dB is thought to be the minimum that is perceptible under normal conditions (CAA, 2016). The predicted changes in noise exposure are very small and any effect on reading age is likely to be negligible compared to the effect of other factors influencing reading age (e.g., family involvement and the home environment).
• St John’s Hospital, Livingstone is currently exposed to 52dB LAeq,16hr and this is predicted to reduce by 1dB in 2019 and 2024 with implementation of the proposed programme. Night-time noise levels at the hospital will remain the same with implementation of the proposed programme in 2019, however may increase by 1dB Lnight,8hr in 2024. These adverse and beneficial impacts are considered negligible, and unlikely to be perceptible by patients.
Equalities assessment
Edinburgh Airport engaged Diversity Dynamics Ltd to support the equalities analysis of the proposed programme, with a focus on the consultation process. This was to make sure that the consultation process was inclusive and accessible to different equality groups, as well as reviewing consultation findings from an equality perspective.
Overall there could be equalities impacts for communities overflown, including:
• Young people/children, particularly regarding impact on sleep (night flights). Learning and concentration levels in schools are not expected to be significantly affected, as increases in noise exposure at schools due to the airspace change are likely to be less than 1dB in all cases, and are not expected to be perceptible.
• People who are elderly, particularly regarding noise impact and their desire for a peaceful retirement.
• Some people with specific disabilities causing a hypersensitivity to noise, such as autism and post-traumatic stress disorder (PTSD).
• People who may be housebound, who will have increased exposure to any increased noise due to their disability.
The impact on mental health was also mentioned frequently (whether a disability or in general terms).
Equality impacts associated with noise will be mitigated by extension of Edinburgh Airport’s Noise Insulation Scheme to newly overflown areas. Once a decision has been made and approved by the
Implementation of the proposed programme will have both positive and negative impacts on the health of communities surrounding Edinburgh Airport, but these are likely to be no more than minor. Overall, the most significant health impact is likely to be the reduction in number highly annoyed people, so on balance, the proposed programme may have a minor beneficial impact on human health.
Ref: Ricardo/ED10588/Issue 8 Ricardo in Confidence
Ricardo Energy & Environment Edinburgh Airport Airspace Change Programme | ix
CAA regarding the programme to be implemented, Edinburgh Airport will engage with communities impacted regarding an update to the Noise Action Plan and Noise Insulation Scheme. Assuming adequate mitigation, adverse impacts on equality associated with the proposed programme should be no more than minor.
Cumulative effects with other planned developments
There following types of cumulative effects have been considered:
• Cumulative effects of the proposed programme together with other planned major developments.
• Cumulative effects between topics.
Information was compiled about other major developments within proximity to the proposed flight paths, accounting for altitudes of aircraft. The potential for cumulative effects was excluded when aircraft were above 7,000ft, consistent with the tranquillity and visual intrusion assessment.
Potential cumulative effects with other major developments are identified for:
• Noise - on sensitive receptors such as residential properties, business premises, schools, hospitals and care homes that are located both beneath the proposed flight paths and within proximity of other major developments.
• Local air quality - sensitive receptors such as residential properties, business premises, schools, hospitals and care homes located both beneath the proposed flight paths and within proximity of other major developments.
• Tranquillity and visual - developments to sensitive receptors such as those using the area for recreation and residents located both beneath the proposed flight paths and within proximity of other developments.
• Health - to sensitive receptors such as residential properties, business premises, schools, hospitals and care homes located both beneath the proposed flight paths and within proximity of other developments.
However, given the largely negligible (beneficial and adverse) impacts associated with implementation of the proposed programme with respect to noise, fuel burn and CO2 emissions, local air quality, tranquillity and health in isolation, it is considered there would be no significant adverse cumulative impacts due to the combined impacts from the proposed programme together with other proposed developments in the area.
There is potential for sensitive receptors such as residents, business premises, schools, hospitals and care homes, within proximity of the airport to experience combined effects associated with noise, air quality and health due to the proposed programme. Towards more rural areas, there would also be tranquillity effects that may also affect these receptors as well as those using areas for recreation. This would be more so closer to the airport where the flight paths would be lower and therefore closer to the receptors. Nevertheless, adverse and beneficial impacts identified for individual topics are largely negligible and no greater than minor, so there would be no significant adverse cumulative impacts cumulative effects between topics.
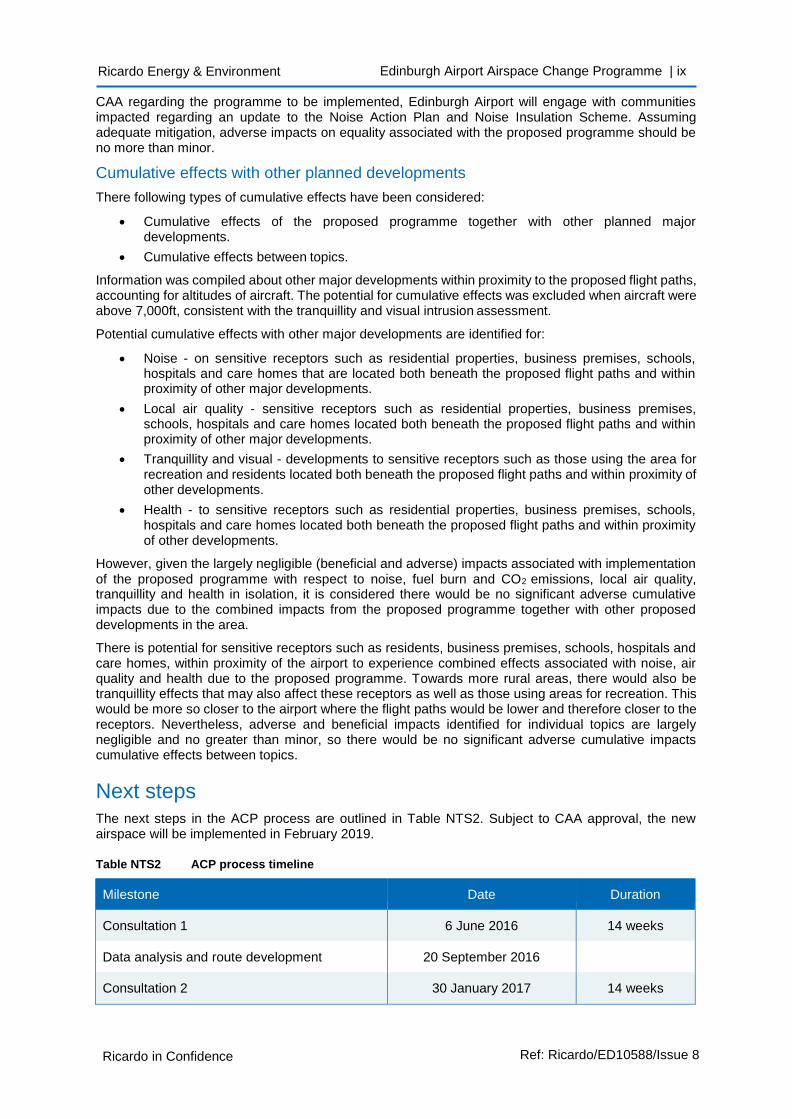
Next steps The next steps in the ACP process are outlined in Table NTS2. Subject to CAA approval, the new airspace will be implemented in February 2019.
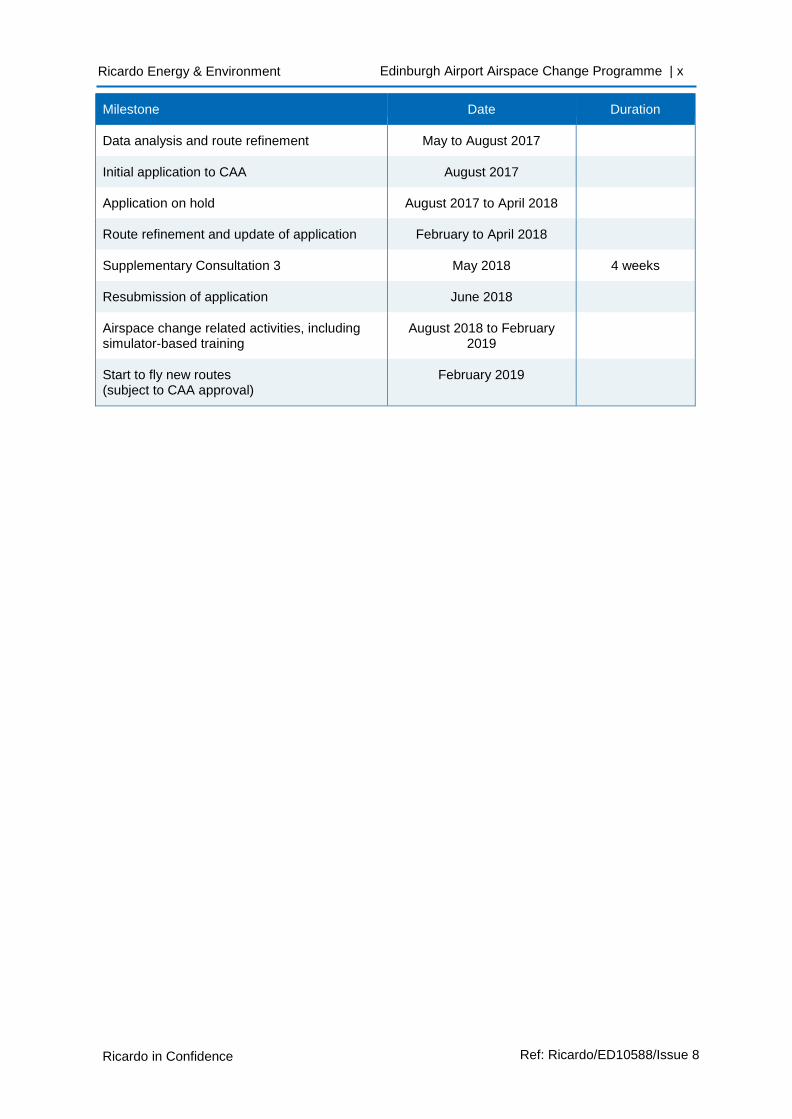
Table NTS2 ACP process timeline
Milestone Date Duration
Consultation 1 6 June 2016 14 weeks
Data analysis and route development 20 September 2016
Consultation 2 30 January 2017 14 weeks
Ref: Ricardo/ED10588/Issue 8 Ricardo in Confidence
Ricardo Energy & Environment Edinburgh Airport Airspace Change Programme | x
Milestone Date Duration
Data analysis and route refinement May to August 2017
Initial application to CAA August 2017
Application on hold August 2017 to April 2018
Route refinement and update of application February to April 2018
Supplementary Consultation 3 May 2018 4 weeks
Resubmission of application June 2018
Airspace change related activities, including simulator-based training
August 2018 to February 2019
Start to fly new routes (subject to CAA approval)
February 2019
Ref: Ricardo/ED10588/Issue 8 Ricardo in Confidence
Ricardo Energy & Environment Edinburgh Airport Airspace Change Programme | xi
Table of contents
Introduction .................................................................................................................................... i
The proposed programme ............................................................................................................. i
Environmental assessment ...........................................................................................................iv
Next steps .....................................................................................................................................ix
1 Introduction ................................................................................................................ 1
1.1 Background ....................................................................................................................... 1
1.2 The applicant: Edinburgh Airport ....................................................................................... 1
1.3 Current operations at Edinburgh Airport ........................................................................... 1
1.4 Programme rationale ......................................................................................................... 6
1.5 Objectives and scoping ..................................................................................................... 7
1.6 Report structure ................................................................................................................. 8
1.7 Definitions of significance .................................................................................................. 8
2 Policy ........................................................................................................................ 10
2.1 CAA Guidance on the Application of the Airspace Change Process (CAP725) ............. 10
2.2 Other relevant guidance and policies .............................................................................. 10
2.3 New airspace change process (CAP1616) ..................................................................... 11
3 Alternatives .............................................................................................................. 12
3.1 No change option ............................................................................................................ 12
3.2 Replicate the current conventional routes ....................................................................... 12
3.3 New flight path options .................................................................................................... 12
3.4 Cramond offset options ................................................................................................... 39
3.5 Non-conventional approach procedures ......................................................................... 40
4 Consultation summary ............................................................................................ 41
4.1 Consultation 1.................................................................................................................. 41
4.2 Consultation 2.................................................................................................................. 41
5 Proposed programme description .......................................................................... 46
5.1 Baseline airspace ............................................................................................................ 46
5.2 Proposed airspace change .............................................................................................. 46
5.3 Predicted operations growth ............................................................................................ 50
5.4 Airspace change programme flight paths ........................................................................ 50
5.5 Design considerations ..................................................................................................... 60
6 Noise ......................................................................................................................... 62
7 Fuel burn and CO2 emissions ................................................................................. 72
7.1 Overview .......................................................................................................................... 72
7.2 Baseline ........................................................................................................................... 72
7.3 Assessment ..................................................................................................................... 72
7.4 Mitigation ......................................................................................................................... 74
Ref: Ricardo/ED10588/Issue 8 Ricardo in Confidence
Ricardo Energy & Environment Edinburgh Airport Airspace Change Programme | xii
7.5 Key findings ..................................................................................................................... 75
8 Local air quality........................................................................................................ 76
8.1 Overview .......................................................................................................................... 76
8.2 Baseline ........................................................................................................................... 76
8.3 Assessment ..................................................................................................................... 77
8.4 Mitigation ......................................................................................................................... 78
8.5 Key findings ..................................................................................................................... 78
9 Economic valuation ................................................................................................. 79
9.1 Overview .......................................................................................................................... 79
9.2 Baseline ........................................................................................................................... 79
9.1 Assessment ..................................................................................................................... 80
9.2 Key findings ..................................................................................................................... 84
10 Tranquillity and visual intrusion ............................................................................. 85
10.1 Overview .......................................................................................................................... 85
10.2 Baseline ........................................................................................................................... 85
10.3 Assessment ..................................................................................................................... 87
10.4 Key findings ..................................................................................................................... 90
11 Health ........................................................................................................................ 91
11.1 Overview .......................................................................................................................... 91
11.2 Baseline ........................................................................................................................... 91
11.3 Assessment ..................................................................................................................... 92
11.4 Mitigation ......................................................................................................................... 95
11.5 Key findings ..................................................................................................................... 95
12 Equalities assessment ............................................................................................. 97
12.1 Overview .......................................................................................................................... 97
12.2 Flight path analysis .......................................................................................................... 97
12.3 Theme analysis ............................................................................................................. 100
12.4 Key findings ................................................................................................................... 101
13 Cumulative impacts ............................................................................................... 103
13.1 Introduction .................................................................................................................... 103
14 Glossary ................................................................................................................. 107
15 References ............................................................................................................. 109
Tables
Table 1.1 Average flight path use, 2016 ............................................................................................ 3
Table 1.2 Significance criteria ........................................................................................................... 9
Table 3.1 Flight path option selection criteria .................................................................................. 13
Table 3.2 Flight path option matrices legend .................................................................................. 14
Table 3.3 Flight path A option matrix ............................................................................................... 14
Ref: Ricardo/ED10588/Issue 8 Ricardo in Confidence
Ricardo Energy & Environment Edinburgh Airport Airspace Change Programme | xiii
Table 3.4 Flight path A option analysis ........................................................................................... 16
Table 3.5 Flight path A specific local issues .................................................................................... 17
Table 3.6 Flight path B option matrix ............................................................................................... 17
Table 3.7 Flight path B option analysis ........................................................................................... 18
Table 3.8 Flight path B specific local issues .................................................................................... 20
Table 3.9 Flight path C option matrix .............................................................................................. 20
Table 3.10 Flight path C option analysis ........................................................................................... 23
Table 3.11 Flight path C specific local issues ................................................................................... 23
Table 3.12 Flight path D option matrix .............................................................................................. 24
Table 3.13 Flight path D option analysis ........................................................................................... 25
Table 3.14 Flight path D specific local issues ................................................................................... 26
Table 3.15 Flight path E option matrix ............................................................................................... 28
Table 3.16 Flight path E option analysis ........................................................................................... 30
Table 3.17 Flight path E specific local issues .................................................................................... 31
Table 3.18 Flight path F option matrix ............................................................................................... 31
Table 3.19 Flight path F option analysis ............................................................................................ 33
Table 3.20 Flight path F specific local issues .................................................................................... 33
Table 3.21 Flight path G option matrix .............................................................................................. 34
Table 3.22 Flight path G option analysis ........................................................................................... 36
Table 3.23 Flight path G specific local issues ................................................................................... 36
Table 3.24 Flight path H option matrix .............................................................................................. 38
Table 3.25 Flight path H option analysis ........................................................................................... 38
Table 3.26 Flight path H specific local issues ................................................................................... 38
Table 5.1 Aircraft types departing from Edinburgh Airport in 2016 ................................................. 46
Table 5.2 Proposed ACP departure flight paths - traffic forecast per route .................................... 47
Table 5.3 Runways 24 and 06 use patterns .................................................................................... 49
Table 5.4 Predicted aircraft traffic growth rates at Edinburgh Airport ............................................. 50
Table 6.1 Summer daytime LAeq,16hr contour areas, populations, households, schools and hospitals, 2016 62
Table 6.2 Annual Lnight (night-time LAeq,8hrs) contour areas, populations, households and hospitals, 2016 62
Table 6.3 Population within summer day contour, Edinburgh Airport ............................................. 65
Table 6.4 Households within summer day contour, Edinburgh Airport ........................................... 65
Table 6.5 Schools within summer day contour, Edinburgh Airport ................................................. 66
Table 6.6 Hospitals within summer day contour, Edinburgh Airport ............................................... 66
Table 6.7 Population within Lnight contours, Edinburgh Airport ........................................................ 68
Table 6.8 Households within Lnight contours, Edinburgh Airport ................................................... 68
Table 6.9 Hospitals within Lnight contour areas, Edinburgh Airport ............................................... 69
Table 7.1 Predicted fuel burn and CO2 emissions with proposed programme, 2019 ..................... 73
Table 7.2 Predicted fuel burn and CO2 emissions with proposed programme, 2024 scenario ....... 74
Ref: Ricardo/ED10588/Issue 8 Ricardo in Confidence
Ricardo Energy & Environment Edinburgh Airport Airspace Change Programme | xiv
Table 9.1 Economic valuation of CO2 / fuel burn impacts ............................................................... 83
Table 9.2 Economic valuation of noise impacts .............................................................................. 83
Table 9.3 Total economic valuation of environmental impacts ....................................................... 84
Table 11.1 Health effects associated with noise ............................................................................... 91
Table 11.2 Comparison of number of highly annoyed people, Edinburgh Airport ............................ 92
Table 11.3 Comparison of heart disease admissions, Edinburgh Airport ......................................... 93
Table 11.4 Comparison of stroke admissions, Edinburgh Airport ..................................................... 93
Table 11.5 Comparison of number of highly sleep disturbed people, Edinburgh Airport .................. 93
Table 11.6 Noise levels (summer daytime LAeq,16hr) at schools surrounding Edinburgh Airport ........ 94
Table 11.7 Noise levels at St John’s Hospital, Livingstone ............................................................... 95
Figures
Figure 1.1 Runway layout ................................................................................................................... 2
Figure 1.2 Current arrival and departure flight tracks ......................................................................... 3
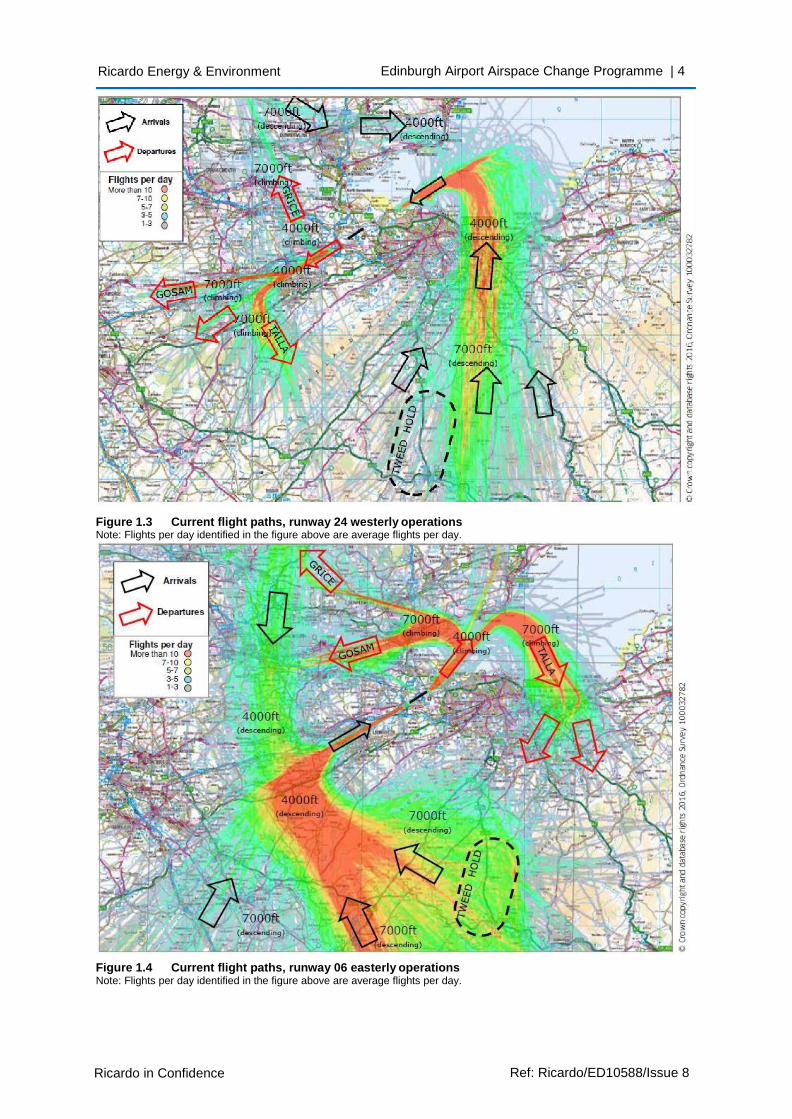
Figure 1.3 Current flight paths, runway 24 westerly operations ......................................................... 4
Figure 1.4 Current flight paths, runway 06 easterly operations .......................................................... 4
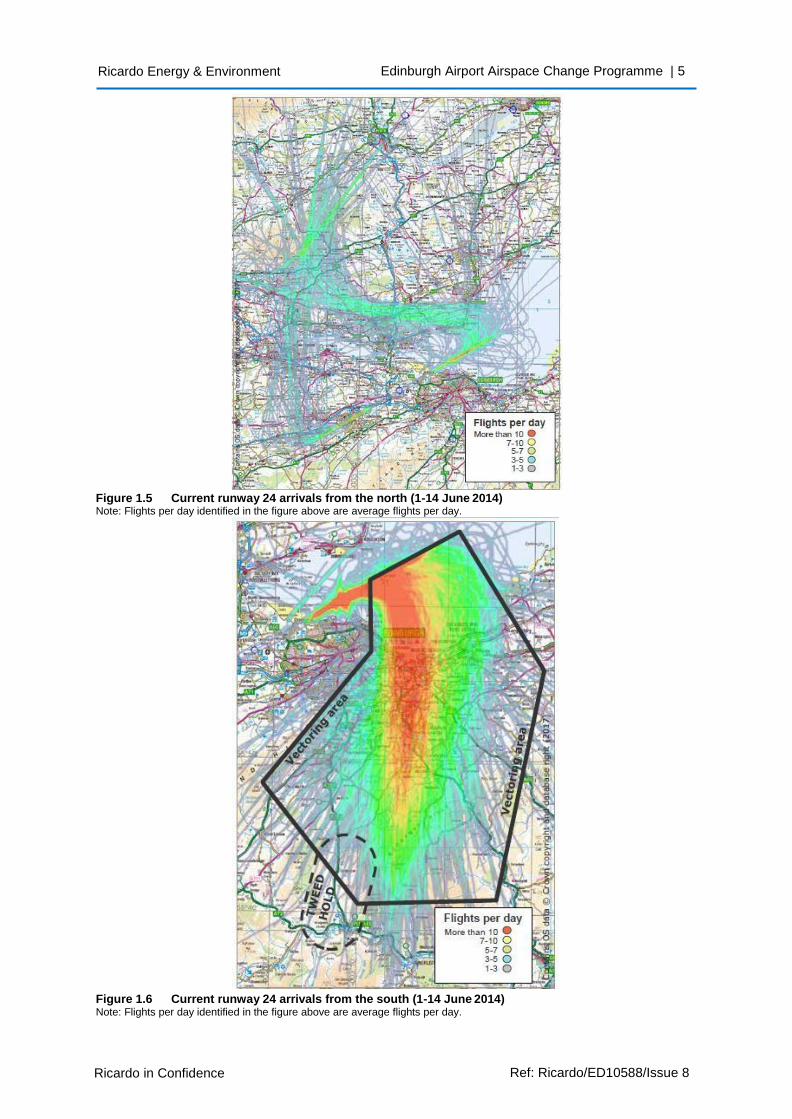
Figure 1.5 Current runway 24 arrivals from the north (1-14 June 2014) ............................................ 5
Figure 1.6 Current runway 24 arrivals from the south (1-14 June 2014) ............................................ 5
Figure 3.1 Current flight tracks, overlaid with flight path options A1 to A7 ....................................... 15
Figure 3.2 Population density, overlaid with flight path options A1 to A7 ......................................... 15
Figure 3.3 Current flight tracks, overlaid with flight path options B1 to B6 ....................................... 19
Figure 3.4 Population density, overlaid with flight path options B1 to B6 ......................................... 19
Figure 3.5 Current flight tracks, overlaid with flight path options C1 to C5 ....................................... 22
Figure 3.6 Population density, overlaid with flight path options C1 to C5 ........................................ 22
Figure 3.7 Current flight tracks, overlaid with flight path options D0 to D5 ....................................... 27
Figure 3.8 Population density, overlaid with flight path options D0 to D5 ........................................ 27
Figure 3.9 Current flight tracks, overlaid with flight path options E1 to E7 ....................................... 29
Figure 3.10 Population density, overlaid with flight path options E1 to E7 ..................................... 29
Figure 3.11 Current flight tracks, overlaid with flight path options F1 to F6 .................................... 32
Figure 3.12 Population density, overlaid with flight path options F1 to F6 ..................................... 32
Figure 3.13 Current flight tracks, overlaid with flight path options G1 to G6 ................................... 35
Figure 3.14 Population density, overlaid with flight path options G1 to G6 .................................... 35
Figure 3.15 Current flight tracks, overlaid with flight path options H1 to H4 ................................... 37
Figure 3.16 Population density, overlaid with flight path options H1 to H4 ..................................... 37
Figure 4.1 Levels of agreement from individuals .............................................................................. 42
Figure 4.2 Levels of agreement from organisations and elected members ..................................... 43
Figure 5.1 Proposed runway 24 departures ..................................................................................... 48
Figure 5.2 Proposed runway 06 departures ..................................................................................... 48
Figure 5.3 Proposed flight paths A3 ACORN and A6 ARBOR ......................................................... 51
Figure 5.4 Proposed flight paths B2 BEECH and B5 BRIER ........................................................... 52
Ref: Ricardo/ED10588/Issue 8 Ricardo in Confidence
Ricardo Energy & Environment Edinburgh Airport Airspace Change Programme | xv
Figure 5.5 Proposed flight path C5 CEDAR ..................................................................................... 53
Figure 5.6 Proposed flight path D0 DOWEL ..................................................................................... 54
Figure 5.7 Proposed flight path E7a ELDER .................................................................................... 55
Figure 5.8 Proposed flight path F2a FLORA .................................................................................... 56
Figure 5.9 Proposed flight path G5 DOWEL .................................................................................... 57
Figure 5.10 Proposed flight path H2 HEATH .................................................................................. 58
Figure 5.11 Current runway 24 arrivals from the south (left) and proposed runway 24 arrival flight path and vectoring area (right) ..................................................................................... 59
Figure 5.12 Current runway 06 arrivals from the south (left) and proposed runway 06 arrival flight path and vectoring area (right) ..................................................................................... 60
Figure 6.1 Summer day (LAeq,16hr) contours, 2016 ............................................................................ 63
Figure 6.2 Annual night-time (LAeq,8hrs) contours, 2016 ..................................................................... 63
Figure 6.3 Difference in summer day LAeq,16hr between 2016 and 2019, Edinburgh Airport ............. 67
Figure 6.4 Difference in summer day LAeq,16hr between 2016 and 2024, Edinburgh Airport ............. 67
Figure 6.5 Difference in Lnight,8hrs between 2016 and 2019, Edinburgh Airport ................................. 69
Figure 6.6 Difference in Lnight, 8hrs between 2016 and 2024, Edinburgh Airport ................................ 70
Figure 8.1 Glasgow Road AQMA ..................................................................................................... 77
Figure 10.1 Tranquillity and visual intrusion study area and proposed flight paths ........................ 85
Figure 10.2 Absolute score of positive and negative indicators of tranquillity in the study area ..... 86
Figure 13.1 Major developments considered in the cumulative effects assessment .................... 104
Appendices
Appendix A Noise assessment
Appendix B Tranquillity and visual intrusion assessment
Appendix C Health assessment
Appendix D Other major developments considered for the cumulative effects assessment
Ricardo Energy & Environment Edinburgh Airport Airspace Change Programme | 1
Ricardo in Confidence Ref: Ricardo/ED10588/Issue 8
1 Introduction
1.1 Background Edinburgh Airport Limited (Edinburgh Airport) is proposing to upgrade its aircraft arrival and departure flight paths and apply new methods of operation as part of its overall Airspace Change Programme (ACP) (hereafter the ‘proposed programme’). The aim of the proposed programme is to take advantage of the improved navigational capabilities of aRea NAVigation (RNAV) technology and improve the efficiency and capacity of the airspace surrounding the airport.
This report provides the environmental assessment of proposed changes to published flight paths and new methods of operation in accordance with the procedures set out in the Civil Aviation Authority (CAA) Guidance on the Application of the Airspace Change Process (Civil Aviation Publication (CAP) 725). This guideline states that an environmental assessment is required to support the application to the CAA for a proposed airspace change. It describes the function of an environmental assessment as being “to ensure that environmental considerations are explicitly addressed and incorporated within the planning and decision making process for an airspace change”. This report goes beyond the minimum CAP725 environmental assessment requirements, in order to address concerns raised by the community during consultation on the proposed programme.
This report assesses minor changes from the original ACP proposal which was submitted to the CAA in August 2017. Changes made to the proposed programme comprise amendments to all departures from runway 06 to increase the distance between these flight paths and the residential area of Cramond. Changes have also been made to the patterns of use of all flight paths. Finally, all flight paths will now be implemented in 2019. As the original application for the airspace change was made under CAP725, the revised application will also be evaluated by the CAA under CAP725 despite publication of new airspace change guidance (CAP1616) in the interim.
1.2 The applicant: Edinburgh Airport
The applicant for the proposed programme is Edinburgh Airport.
Edinburgh Airport opened in 1916 and has since grown to become Scotland’s busiest airport and the 6th busiest in the UK. It has one terminal and its two runways operate 24 hours a day, 365 days a year. The airport caters for an average of 33,880 passengers per day, with an estimated 12.4 million using the airport in 2016 and is continuing to grow. The airport makes a £1 billion contribution to Scotland’s economy and supports over 23,000 jobs across the country.
In the last 10 years, £219 million has been invested in the airport’s development, with another £250 million planned in the next 10 years. Recent investments include a new £25 million landside terminal extension and security hall and £19 million south east pier extension. Furthermore, Edinburgh Airport is currently undertaking a £125 million five-year investment programme to include additional retail in its landside terminal and departure lounge, and provide improved check-in and immigration facilities.
A total of 33 different airlines currently use Edinburgh airport, with 121,800 aircraft movements in 2016; an increase of 6% on 2015 figures. On average, there are over 333 flights per day to and from the airport.
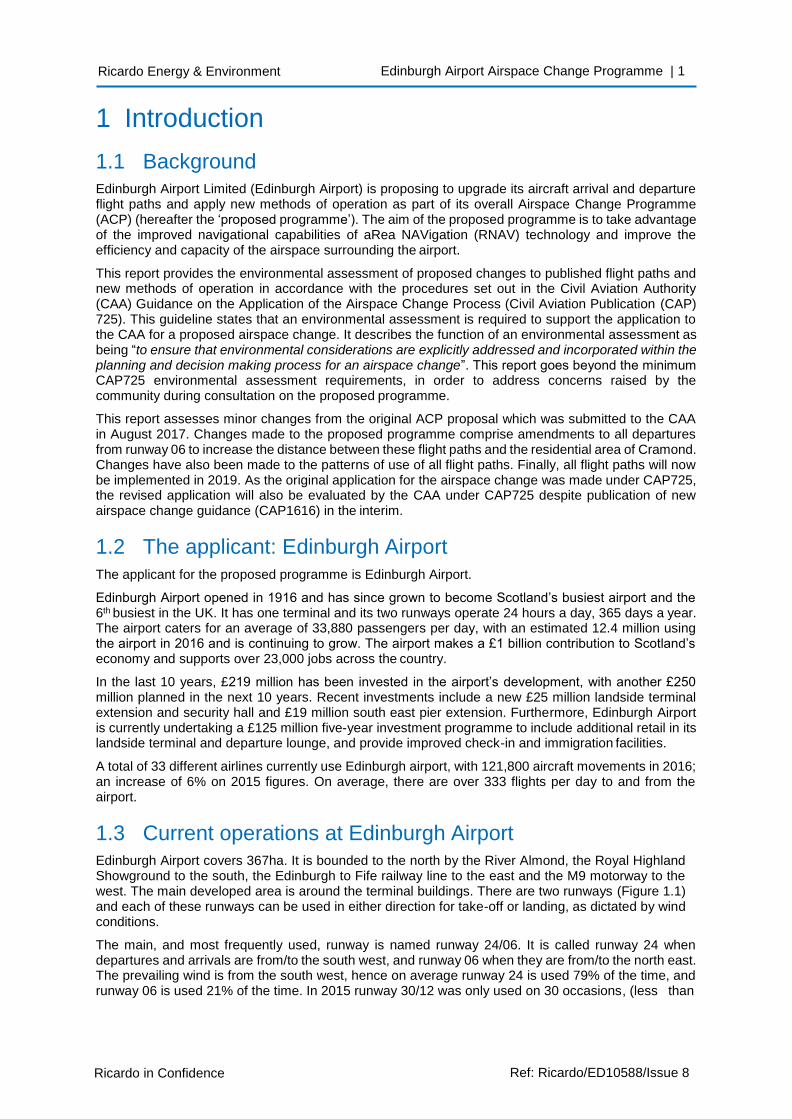
1.3 Current operations at Edinburgh Airport Edinburgh Airport covers 367ha. It is bounded to the north by the River Almond, the Royal Highland Showground to the south, the Edinburgh to Fife railway line to the east and the M9 motorway to the west. The main developed area is around the terminal buildings. There are two runways (Figure 1.1) and each of these runways can be used in either direction for take-off or landing, as dictated by wind conditions.
The main, and most frequently used, runway is named runway 24/06. It is called runway 24 when departures and arrivals are from/to the south west, and runway 06 when they are from/to the north east. The prevailing wind is from the south west, hence on average runway 24 is used 79% of the time, and runway 06 is used 21% of the time. In 2015 runway 30/12 was only used on 30 occasions, (less than
Ricardo Energy & Environment Edinburgh Airport Airspace Change Programme | 2
Ricardo in Confidence Ref: Ricardo/ED10588/Issue 8
0.1% of the time). Runway 30/12 is generally used when the main runway is undergoing maintenance or if wind conditions dictate it is preferable to use this secondary runway.
1.3.1 Current aircraft flight paths
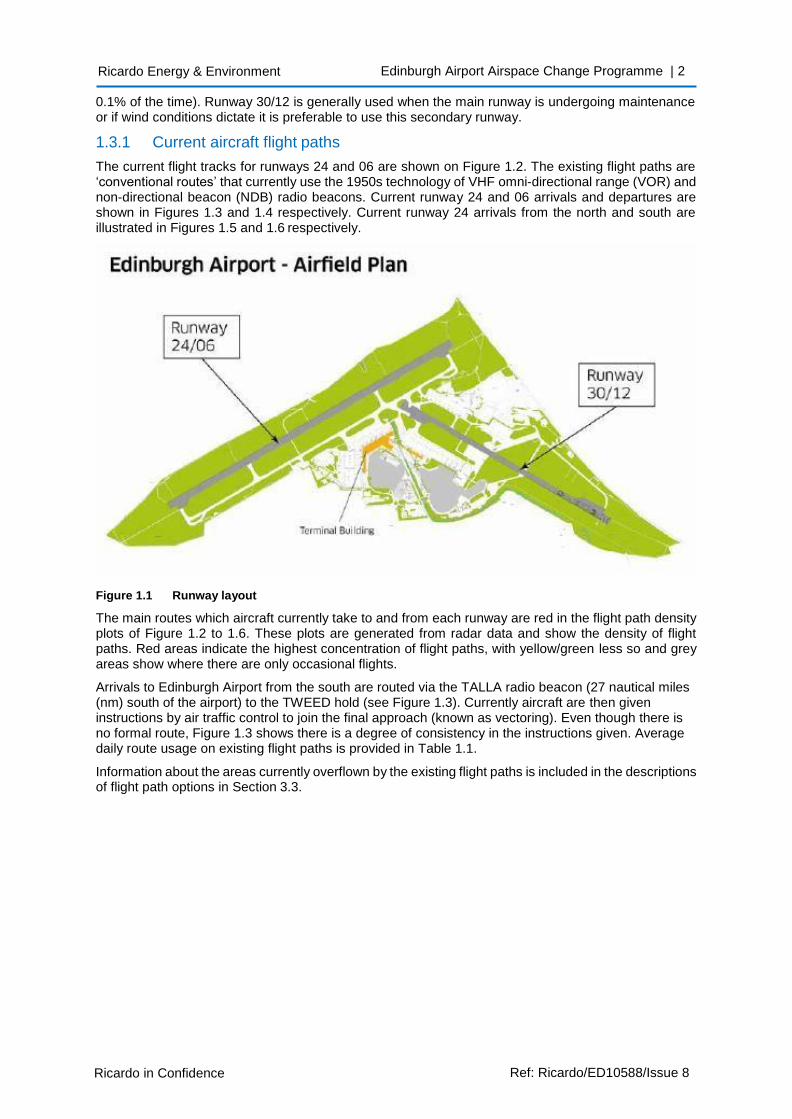
The current flight tracks for runways 24 and 06 are shown on Figure 1.2. The existing flight paths are ‘conventional routes’ that currently use the 1950s technology of VHF omni-directional range (VOR) and non-directional beacon (NDB) radio beacons. Current runway 24 and 06 arrivals and departures are shown in Figures 1.3 and 1.4 respectively. Current runway 24 arrivals from the north and south are illustrated in Figures 1.5 and 1.6 respectively.
Figure 1.1 Runway layout
The main routes which aircraft currently take to and from each runway are red in the flight path density plots of Figure 1.2 to 1.6. These plots are generated from radar data and show the density of flight paths. Red areas indicate the highest concentration of flight paths, with yellow/green less so and grey areas show where there are only occasional flights.
Arrivals to Edinburgh Airport from the south are routed via the TALLA radio beacon (27 nautical miles (nm) south of the airport) to the TWEED hold (see Figure 1.3). Currently aircraft are then given instructions by air traffic control to join the final approach (known as vectoring). Even though there is no formal route, Figure 1.3 shows there is a degree of consistency in the instructions given. Average daily route usage on existing flight paths is provided in Table 1.1.
Information about the areas currently overflown by the existing flight paths is included in the descriptions of flight path options in Section 3.3.
Ricardo Energy & Environment Edinburgh Airport Airspace Change Programme | 3
Ricardo in Confidence Ref: Ricardo/ED10588/Issue 8
Table 1.1 Average flight path use, 2016
Route (existing flight paths) Breakdown by route (%) Average flights per day 2016
Departures
GOSAM 51% 82
TALLA 42% 68
GRICE 7% 11
Arrivals
STIRA 8% 13
TWEED 92% 141
Figure 1.2 Current arrival and departure flight tracks
Note: Flights per day identified in the figure above are average flights per day.
Ricardo Energy & Environment Edinburgh Airport Airspace Change Programme | 4
Ricardo in Confidence Ref: Ricardo/ED10588/Issue 8
Figure 1.3 Current flight paths, runway 24 westerly operations Note: Flights per day identified in the figure above are average flights per day.
Figure 1.4 Current flight paths, runway 06 easterly operations Note: Flights per day identified in the figure above are average flights per day.
Ricardo Energy & Environment Edinburgh Airport Airspace Change Programme | 5
Ricardo in Confidence Ref: Ricardo/ED10588/Issue 8
Figure 1.5 Current runway 24 arrivals from the north (1-14 June 2014) Note: Flights per day identified in the figure above are average flights per day.
Figure 1.6 Current runway 24 arrivals from the south (1-14 June 2014) Note: Flights per day identified in the figure above are average flights per day.
Ricardo Energy & Environment Edinburgh Airport Airspace Change Programme | 6
Ricardo in Confidence Ref: Ricardo/ED10588/Issue 8
1.4 Programme rationale The existing flight paths used by aircraft (termed ‘conventional' routes) rely on 1950s ground based radio beacon technology. RNAV is a well-established and much more accurate form of navigation, which uses a combination of satellite and ground-based navigation technology to permit aircraft to follow a precisely defined path.
When following RNAV flight paths, aircraft can follow flight paths more consistently due to improved track-keeping ability. Improved track keeping enables less dispersion of aircraft either side of the route centre-lines. This reduces the overall area regularly overflown, although increase the concentration of flights in some areas. While RNAV flight paths are flown more accurately, they also open the possibility of designing flight path configurations to specifically address local environmental issues, such as the provision of respite flight paths to share noise impacts more equitably.
The proposed programme is required to meet the UK’s Future Airspace Strategy (CAA, 2011). The Future Airspace Strategy considers the development of the UK’s airspace system from 2011 to 2030. It sets the direction for how the planning, management and regulation of UK airspace should develop to maintain and improve the UK’s high levels of safety whilst addressing the many requirements of the system, and delivering balanced or optimal outcomes and considering those involved in or affected by the use of airspace. The Future Airspace Strategy 2030 vision is to establish ‘Safe, efficient airspace that has the capacity to meet reasonable demand, balances the needs of all users and mitigates the impact of aviation on the environment’. The introduction of RNAV standard instrument departures (SIDs) and arrival transitions at Edinburgh Airport would improve systemisation and upgrade the navigation capability in accordance with the Future Airspace Strategy recommendations.
Three strategic drivers are identified to modernise the UK airspace system, comprising:
• Ensure that there is a culture of continuous improvement regarding aviation safety, in the light of anticipated growing demand for aviation and the introduction of new technology.
• Balance the demand for airspace capacity with supply, to ensure that the availability of airspace capacity does not place an undue constraint on when and where aircraft can fly.
• Enable aircraft to fly in more environmentally efficient ways.
The proposed programme is driven by:
• The requirement to move to the RNAV navigation system.
• The need for more efficient arrivals/departures to allow growth within existing passenger/aircraft movement limits.
Changes to the flight paths may lead to environmental impacts, such as noise, climate change, local air quality, health and tranquillity and visual intrusion. However, Edinburgh Airport has sought to redesign the airspace based on three key requirements (i.e. regulatory, community and operational) to ensure operational benefits with minimal impact on neighbouring communities. These aims have driven the re- designed airspace that is assessed by this report, which will further reduce impacts on communities from that originally proposed in 2017.
The objectives of the proposed programme are:
• Maintain or improve the level of safety for departures and arrivals to Edinburgh Airport.
• Reduce the population overflown below 4,000ft and hence minimise impact of aircraft noise on local population.
• Increase runway capacity for runways 24 and 06 by reducing the departure separations. Current declared runway capacity is 42 movements per hour, the aspiration is to increase this to 50 movements per hour.
• Introduce RNAV1 standard instrument departures (SIDs) and standard terminal arrival routes (STARs) in accordance with Future Airspace Strategy recommendations.
• Reduce delays.
• Not to increase the overall volume of controlled airspace.
• Accord with the DfT environmental objectives relating to noise impact and CO2 emissions.
• Minimise impact on military operations.
Ricardo Energy & Environment Edinburgh Airport Airspace Change Programme | 7
Ricardo in Confidence Ref: Ricardo/ED10588/Issue 8
In line with these objectives, the following requirements are relevant to the designs of the proposed flight paths themselves:
• Improve departure intervals for subsequent departures.
• Maintain or improve the level of safety for departures and arrivals to Edinburgh Airport.
• Minimise impact of aircraft noise on local population.
• Minimise impact on military operations.
• No additional controlled airspace required for changes.
1.4.1 Masterplan 2016
The Edinburgh Airport Masterplan 2016-2040 (Edinburgh Airport, 2016) sets out the strategy for the growth of Edinburgh Airport. The key objectives of the Masterplan are:
• To set out a sound development scenario that will provide clarity and certainty for local communities, passengers, the local authority and neighbouring landowners, amongst others.
• To highlight the prospects for air traffic growth, and associated developments.
• To quantify Edinburgh Airport’s impact upon the environment and how this can be reduced in the future.
• To identify future land uses to allow the airport to expand to handle the forecast growth in passenger numbers.
• To set out the approximate timescales for the phasing of additional capacity requirements.
Over the last 10 years, the number of passengers travelling through Edinburgh Airport has increased significantly. It is anticipated that between 2016 and 2020 passenger numbers will increase to 13.1 million. The proposed programme is necessary to support this growth, by enabling more efficient arrivals and departures within the existing planning permission.
1.5 Objectives and scoping
The objective of this environmental assessment is to identify potential environmental impacts associated with the proposed programme. The environmental assessment report will accompany Edinburgh Airport’s application for airspace change to the CAA.
A scoping exercise has been undertaken to determine which environmental topics to focus on for this environmental assessment. CAP725 sets out the requirements for the environmental assessment for proposed airspace changes (Section 2), and prioritises these requirements as ‘must’, ‘should’ or ‘may’ do. It states that the environmental assessment ‘must’:
Cater for the technical expert and those affected by the changes, who can only be assumed to have a general knowledge of aviation or environmental matters.
Comprise a technical document containing a comprehensive and complete description of the airspace change including the environmental impact.
These and a range of other ‘must’ do requirements such as a description of the airspace change and traffic forecasts are detailed throughout this report. In addition, CAP725 specifies that the environmental assessment documentation ‘should’ include:
An assessment of the effects on noise (Section 6).
An assessment of the change in fuel burn/CO2 (Section 7).
An assessment of the effect on local air quality (Section 8).
An economic valuation of environmental impact, if appropriate (Section 9).
All items in the list above have been scoped into this environmental assessment, meeting the CAP725 requirements. This assessment has gone above and beyond the minimum CAP725 requirements by:
• Exceeding the CAP725 requirements for noise through the provision of Lnight metrics in addition to those identified as ‘must’ do by CAP725.
Delivering a qualitative assessment of potential impacts on local air quality even though the possibility of pollutants breaching legal limits is very low.
Ricardo Energy & Environment Edinburgh Airport Airspace Change Programme | 8
Ricardo in Confidence Ref: Ricardo/ED10588/Issue 8
• Including an assessment of tranquillity and visual intrusion (Section 10), even though measurement of tranquillity is not well developed and this is listed as only a ‘may’ do by CAP725.
Considering potential health impacts associated with the proposed programme, despite not being explicitly required by CAP725 (Section 11).
Providing an equalities assessment (Section 12).
Identifying potential cumulative effects with other planned developments surrounding the airport (Section 13).
Edinburgh Airport also commissioned a Habitats Regulations Assessment (HRA) screening to ensure that it does not adversely affect any designated sites protected by either Council Directive 92/43/EEC on the conservation of natural habitats and of wild fauna and flora (the Habitats Directive) or Council Directive 2009/147/EC on the conservation of wild birds (codified version) (the Birds Directive). This study concluded that the proposed programme would have no likely significant effect to any Natura 2000 sites, so effects on biodiversity have not been considered further in this assessment. The HRA has been submitted as a separate document and is not discussed further in this report.
1.6 Report structure The Non-Technical Summary (NTS) provides a short summary of the key findings of the assessment, written in non-technical language.
Following this introductory section, Section 2 Policy provides a summary of CAP725 requirements and other relevant internal and external policy drivers.
Section 3 provides the description of the proposed programme. It includes a brief description of current operations and describes the proposed changes to the flight paths and operating procedures.
Section 4 provides a description of the alternative flight paths considered, and a summary of the decision-making process that led to the preferred options.
Section 5 describes the consultation process undertaken, which has two stages to date. A supplementary consultation period (Consultation 3) will be conducted in April 2018 for the revised scheme, prior to submission of the final ACP application to the CAA.
Sections 6 to 11 provide summaries of the technical assessments for the following topics:
Noise.
Fuel burn and CO2.
Local air quality
Economic valuation.
Tranquillity and visual intrusion.
Health.
The technical assessment reports themselves are provided as appendices.
Section 12 provides a summary of the Equalities Assessment, which has been submitted to the CAA as a separate document. Potential cumulative effects with other planned developments are assessed in Section 13. Sections 14 and 15 provide the glossary and references respectively.
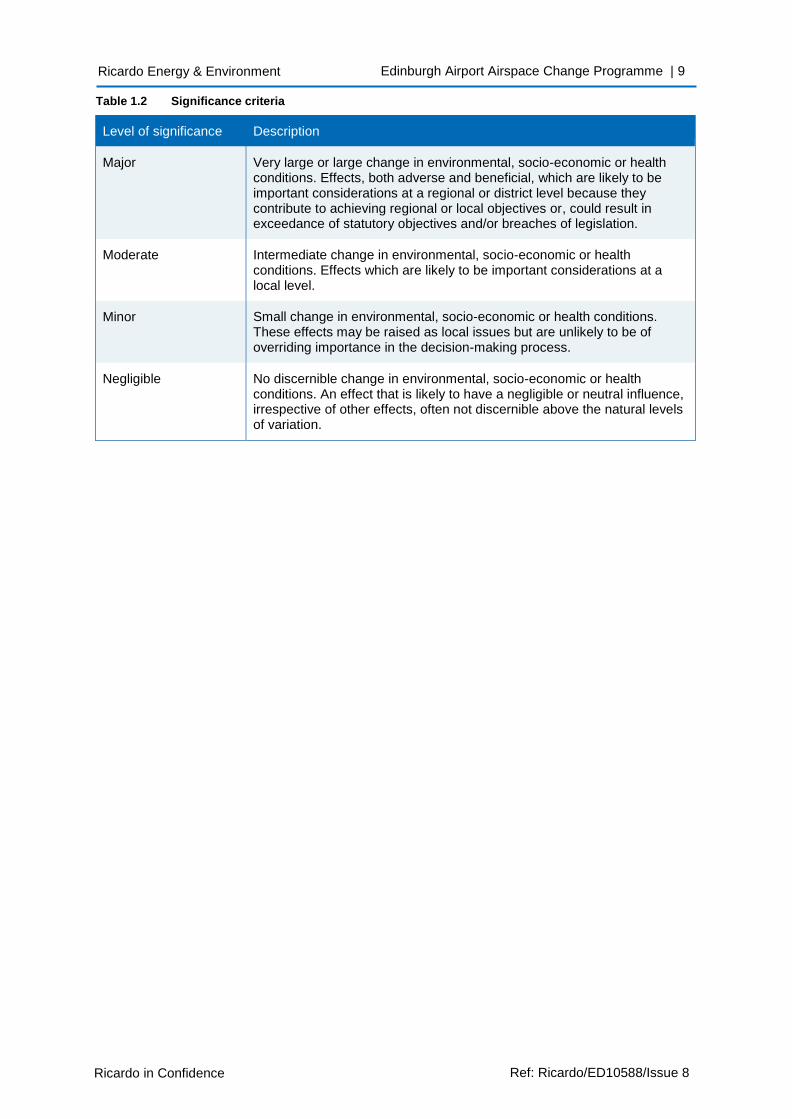
1.7 Definitions of significance The significance of both adverse and beneficial impacts associated with the proposed programme is identified throughout the assessment. The significance criteria presented in Table 1.2 have been adopted for assessments throughout this report.
Ricardo Energy & Environment Edinburgh Airport Airspace Change Programme | 9
Ricardo in Confidence Ref: Ricardo/ED10588/Issue 8
Table 1.2 Significance criteria
Level of significance Description
Major Very large or large change in environmental, socio-economic or health conditions. Effects, both adverse and beneficial, which are likely to be important considerations at a regional or district level because they contribute to achieving regional or local objectives or, could result in exceedance of statutory objectives and/or breaches of legislation.
Moderate Intermediate change in environmental, socio-economic or health conditions. Effects which are likely to be important considerations at a local level.
Minor Small change in environmental, socio-economic or health conditions. These effects may be raised as local issues but are unlikely to be of overriding importance in the decision-making process.
Negligible No discernible change in environmental, socio-economic or health conditions. An effect that is likely to have a negligible or neutral influence, irrespective of other effects, often not discernible above the natural levels of variation.
Ricardo Energy & Environment Edinburgh Airport Airspace Change Programme | 10
Ricardo in Confidence Ref: Ricardo/ED10588/Issue 8
2 Policy
2.1 CAA Guidance on the Application of the Airspace Change Process (CAP725)
The Airspace Change Process was first published within CAP724 – 'The Airspace Charter' in May 1996, enabling any organisation to initiate a change to UK airspace arrangements. It was revised in 2002 and again in 2007 to its current form. Since 2007, CAP725 has formed the guidance for the way in which sponsors progress airspace change proposals and the way in which the CAA judges those proposals.
An airspace change is characterised by a change to notified airspace arrangements in the UK Integrated Aeronautical Information Package (AIP), and is normally characterised by one or more conditions. The condition of relevance to this proposal is:
“The introduction of, or changes to, Standard Instrument Departure flight paths (SIDs), Standard Arrival Routes (STARs) or Noise Preferential Routes (NPRs) within controlled airspace. Standard Departure Routes (SDRs) and NPRs where they exist outside controlled airspace are not covered by this Process. However, aerodrome operators are strongly recommended to adopt the same principles when considering the need for new or amended SDRs and NPRs under these circumstances.”
Appendix B of CAP725 identifies environmental requirements associated with an airspace change proposal. The Civil Aviation Authority (Air Navigation) Directions 2001 (incorporating Variation Direction 2004) (HMG, 2001) requires the CAA to take account of “the need to reduce, control and mitigate as far as possible the environmental impacts of civil aircraft operations and the annoyance and disturbance caused to the public arising from aircraft noise and vibration, and emissions from aircraft engines”. The Safety and Airspace Regulation Group (SARG) requires an environmental assessment to provide sufficient environmental information for public consultation and to inform decision making.
This report has been prepared to meet and exceed the requirements of CAP725 for environmental assessment of an airspace change proposal.
2.2 Other relevant guidance and policies Other relevant guidance, policies and information that have been considered during the preparation of this environmental assessment and supporting material include:
CAP1378: Airspace Design Guidance: Noise Mitigation Considerations when Designing Performance Based Navigation PBN Departure and Arrival Procedures. This considers the impacts and possibilities of using PBN flight paths to mitigate noise impacts.
• CAP1379: Description of Today’s ATC Route Structure and Operational Techniques. This describes some of the Air Traffic Management techniques used to manage air traffic in the UK.
CAP1465b: Airspace Change Process: Information Pack. This provides guidance to stakeholders on what information is considered during an assessment of airspace change and how this will be evaluated by the CAA. Including guidance on legislative framework, statutory duties and functions, current and future airspace change process, roles and responsibilities of those involved, regulatory decision making and transparency/website publication.
• CAP1506a: The 2014 Survey of Noise Attitudes (SoNA) Technical Report. The main objective of this survey was to allow the Department of Transport and other government departments to understand people’s attitudes to noise from various sources and specifically in 2014, from fixed wing civil aircraft. The survey focussed on whether people were disturbed by aircraft noise and if so what aspects of their home life were affected (e.g. study, leisure, quality of life), as well as impacts on health.
Defra 2014 Environmental Noise Valuing Impacts. This is an update to the Defra environmental noise appraisal method. The report details the current understanding of the links between environmental noise and its effects including sleep disturbance, annoyance,
Ricardo Energy & Environment Edinburgh Airport Airspace Change Programme | 11
Ricardo in Confidence Ref: Ricardo/ED10588/Issue 8
hypertension and related diseases. The report presents recommended methods to assess these impacts to support policy, programme and project appraisal.
ERCD Report 0904: Metrics for Aircraft Noise. This provides an overview of metrics used to measure aircraft noise.
ERCD Report 1104: Environmental Metrics for Future Airspace Strategy. This describes a selection of metrics that may be used to quantify and explain environmental impacts.
Irish Aviation Authority and Civil Aviation Authority, 2011, Policy for the Application of Performance Based Navigation in UK/Irish Airspace. In support of the FAS Implementation Programme, this document provides the policy for the application of PBN in UK and Irish airspace.
2.3 New airspace change process (CAP1616)
The CAA introduced a new airspace change process on 13 December 2017. This process is effective from January 2018. Detailed guidance about the airspace change process and how to follow it is available in the new CAA guidance document - Airspace Design: guidance on the regulatory process for changing airspace design including community engagement requirements (CAP1616; CAA, 2017).
As the airspace change process at Edinburgh Airport commenced prior to publication of CAP1616, it has been conducted under CAP725. This approach has been agreed with the CAA. In addition, Consultation 3 will also be conducted in accordance with CAP725, this is on further agreement from the CAA on the process Edinburgh Airport must use.
Ricardo Energy & Environment Edinburgh Airport Airspace Change Programme | 12
Ricardo in Confidence Ref: Ricardo/ED10588/Issue 8
3 Alternatives
This section sets out the alternatives considered by Edinburgh Airport during development of the proposed programme, which comprise:
No change option.
Replicate the existing flight paths.
New flight path options.
Cramond offset options.
Non-conventional approach procedures.
3.1 No change option As described in the introduction, the existing flight paths used by aircraft departing and arriving into Edinburgh Airport are known as ‘conventional flight paths’, which rely on 1950s technology of ground based radio beacons. Upgrading this old technology to use RNAV is essential to accommodate increasingly busier skies and reduce the environmental impact of air traffic. Most aircraft are equipped with RNAV technology, and airlines prefer to use it as it is more accurate. As such, many aircraft already use RNAV versions of conventional arrival and departures, called ‘RNAV overlays’.
By continuing with the conventional flight paths Edinburgh airport would not be meeting the requirements of the UK Future Airspace Strategy, and therefore an application for airspace change to upgrade to RNAV flight paths is inevitable. The no change option therefore cannot be maintained for the medium to long term. Furthermore, the benefits associated to changing to RNAV flight paths (see Section 1.3) will not be realised under this option.
3.2 Replicate the current conventional routes The most basic option would have been to replicate the current day conventional routes using performance based navigation (PBN). Whilst this would protect against the VHF omni directional range (conventional radio navigation beacon, or VOR) rationalisation, it would not permit improvements such as reducing the number of people impacted by aircraft noise and improving the capacity of the airport. While some of the routes proposed are essentially replications of the existing conventional SIDs (i.e. proposed routes A3 and B5) in other cases there was sufficient benefit to justify proposing new flight paths. Hence the option of replication of all conventional routes was not progressed.
3.3 New flight path options Edinburgh Airport conducted an initial consultation to understand the views and concerns of their stakeholders for proposed flight path design envelopes (see Section 4). The main concerns raised included noise, health and environmental impact on local communities. Edinburgh Airport used an independent noise expert to help limit the impact on communities and used population density mapping to help determine the flight paths. This mapping also considered the location of schools and care facilities. To determine the flight paths, Edinburgh Airport also considered a reduction in CO2 emissions, the safety of passengers, staff and communities and ensured that the flight path options meet International Civil Aviation Organization (ICAO) design criteria.
Following Consultation 1 (June 2016), 12 flight path options were identified that maximise operational benefits and minimise community impacts, as discussed in this section. Criteria and matrices were used to enable a range of potential impacts, regulatory requirements and operational requirements to be considered (Table 3.1).
The evaluation matrices for flight path options considered at the time of Consultation 2 (January 2017) are included in the description of the alternatives considered below. Table 3.2 shows the legend for all flight path option matrices, and impacts are assessed with respect to the current flight path.
Following submission of the initial ACP application to the CAA in August 2017, amendments have been made to all runway 06 departure flight paths in order to increase the distance between them and residential areas at Cramond. This involves an early turn in a westerly direction at 500m above airfield level. Route E7 was replaced by Route E7a at this time. The routes of other runway 06 departures (F2a,
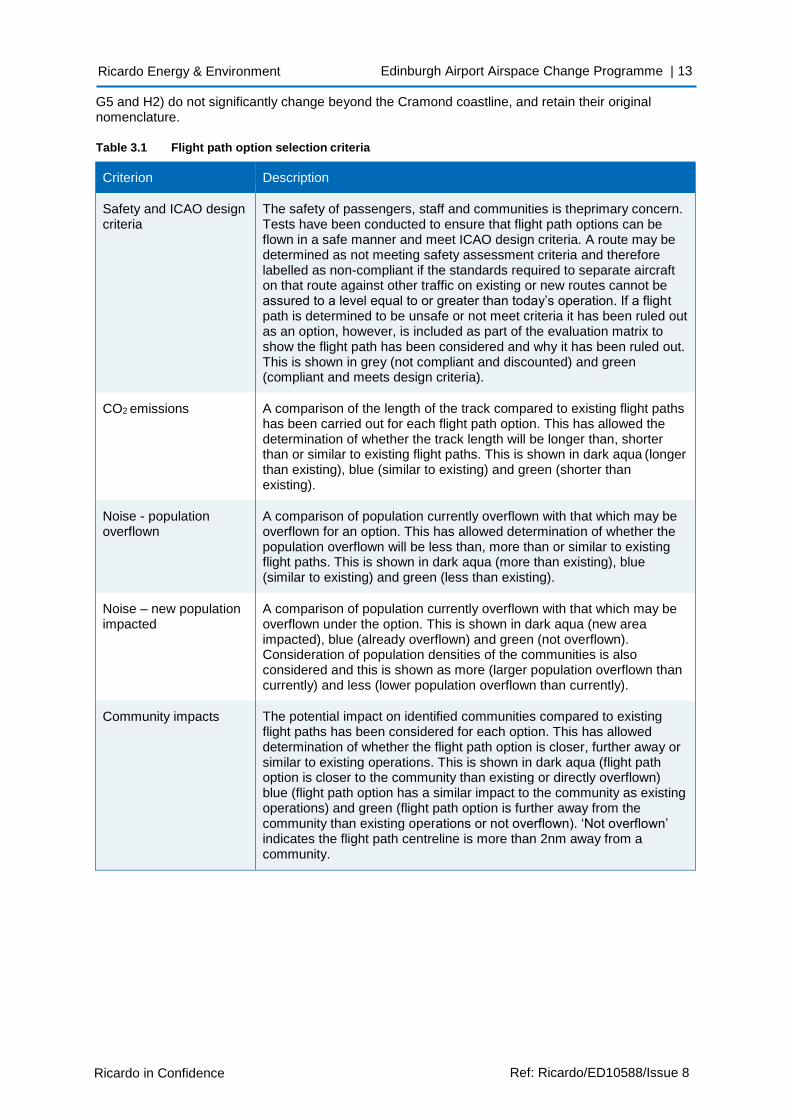
Ricardo Energy & Environment Edinburgh Airport Airspace Change Programme | 13
Ricardo in Confidence Ref: Ricardo/ED10588/Issue 8
G5 and H2) do not significantly change beyond the Cramond coastline, and retain their original nomenclature.
Table 3.1 Flight path option selection criteria
Criterion Description
Safety and ICAO design criteria
The safety of passengers, staff and communities is theprimary concern. Tests have been conducted to ensure that flight path options can be flown in a safe manner and meet ICAO design criteria. A route may be determined as not meeting safety assessment criteria and therefore labelled as non-compliant if the standards required to separate aircraft on that route against other traffic on existing or new routes cannot be assured to a level equal to or greater than today’s operation. If a flight path is determined to be unsafe or not meet criteria it has been ruled out as an option, however, is included as part of the evaluation matrix to show the flight path has been considered and why it has been ruled out. This is shown in grey (not compliant and discounted) and green (compliant and meets design criteria).
CO2 emissions A comparison of the length of the track compared to existing flight paths has been carried out for each flight path option. This has allowed the determination of whether the track length will be longer than, shorter than or similar to existing flight paths. This is shown in dark aqua (longer than existing), blue (similar to existing) and green (shorter than existing).
Noise - population overflown
A comparison of population currently overflown with that which may be overflown for an option. This has allowed determination of whether the population overflown will be less than, more than or similar to existing flight paths. This is shown in dark aqua (more than existing), blue (similar to existing) and green (less than existing).
Noise – new population impacted
A comparison of population currently overflown with that which may be overflown under the option. This is shown in dark aqua (new area impacted), blue (already overflown) and green (not overflown). Consideration of population densities of the communities is also considered and this is shown as more (larger population overflown than currently) and less (lower population overflown than currently).
Community impacts The potential impact on identified communities compared to existing flight paths has been considered for each option. This has allowed determination of whether the flight path option is closer, further away or similar to existing operations. This is shown in dark aqua (flight path option is closer to the community than existing or directly overflown) blue (flight path option has a similar impact to the community as existing operations) and green (flight path option is further away from the community than existing operations or not overflown). ‘Not overflown’ indicates the flight path centreline is more than 2nm away from a community.
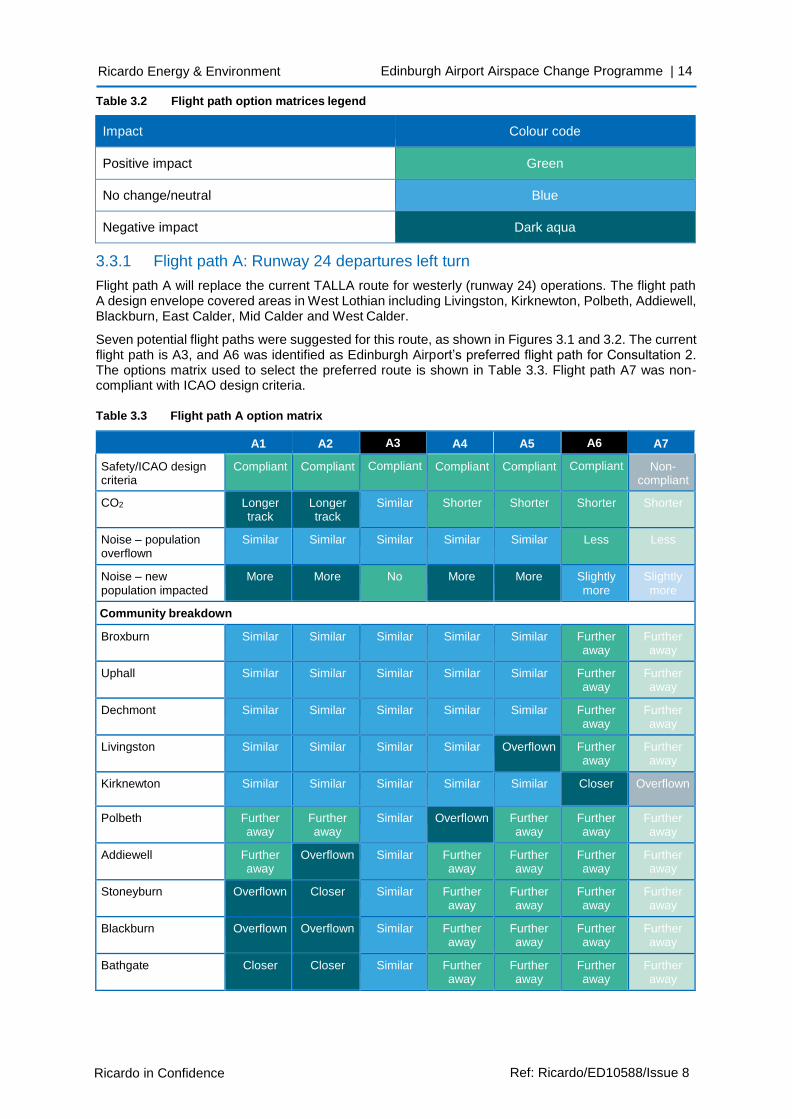
Ricardo Energy & Environment Edinburgh Airport Airspace Change Programme | 14
Ricardo in Confidence Ref: Ricardo/ED10588/Issue 8
Table 3.2 Flight path option matrices legend
Impact Colour code
Positive impact Green
No change/neutral Blue
Negative impact Dark aqua
3.3.1 Flight path A: Runway 24 departures left turn
Flight path A will replace the current TALLA route for westerly (runway 24) operations. The flight path A design envelope covered areas in West Lothian including Livingston, Kirknewton, Polbeth, Addiewell, Blackburn, East Calder, Mid Calder and West Calder.
Seven potential flight paths were suggested for this route, as shown in Figures 3.1 and 3.2. The current flight path is A3, and A6 was identified as Edinburgh Airport’s preferred flight path for Consultation 2. The options matrix used to select the preferred route is shown in Table 3.3. Flight path A7 was non- compliant with ICAO design criteria.
Table 3.3 Flight path A option matrix
A1 A2 A3 A4 A5 A6 A7
Safety/ICAO design criteria
Compliant Compliant Compliant Compliant Compliant Compliant Non- compliant
CO2 Longer track
Longer track
Similar Shorter Shorter Shorter Shorter
Noise – population overflown
Similar Similar Similar Similar Similar Less Less
Noise – new population impacted
More More No More More Slightly more
Slightly more
Community breakdown
Broxburn Similar Similar Similar Similar Similar Further away
Further away
Uphall Similar Similar Similar Similar Similar Further away
Further away
Dechmont Similar Similar Similar Similar Similar Further away
Further away
Livingston Similar Similar Similar Similar Overflown Further away
Further away
Kirknewton Similar Similar Similar Similar Similar Closer Overflown
Polbeth Further away
Further away
Similar Overflown Further away
Further away
Further away
Addiewell Further away
Overflown Similar Further away
Further away
Further away
Further away
Stoneyburn Overflown Closer Similar Further away
Further away
Further away
Further away
Blackburn Overflown Overflown Similar Further away
Further away
Further away
Further away
Bathgate Closer Closer Similar Further away
Further away
Further away
Further away
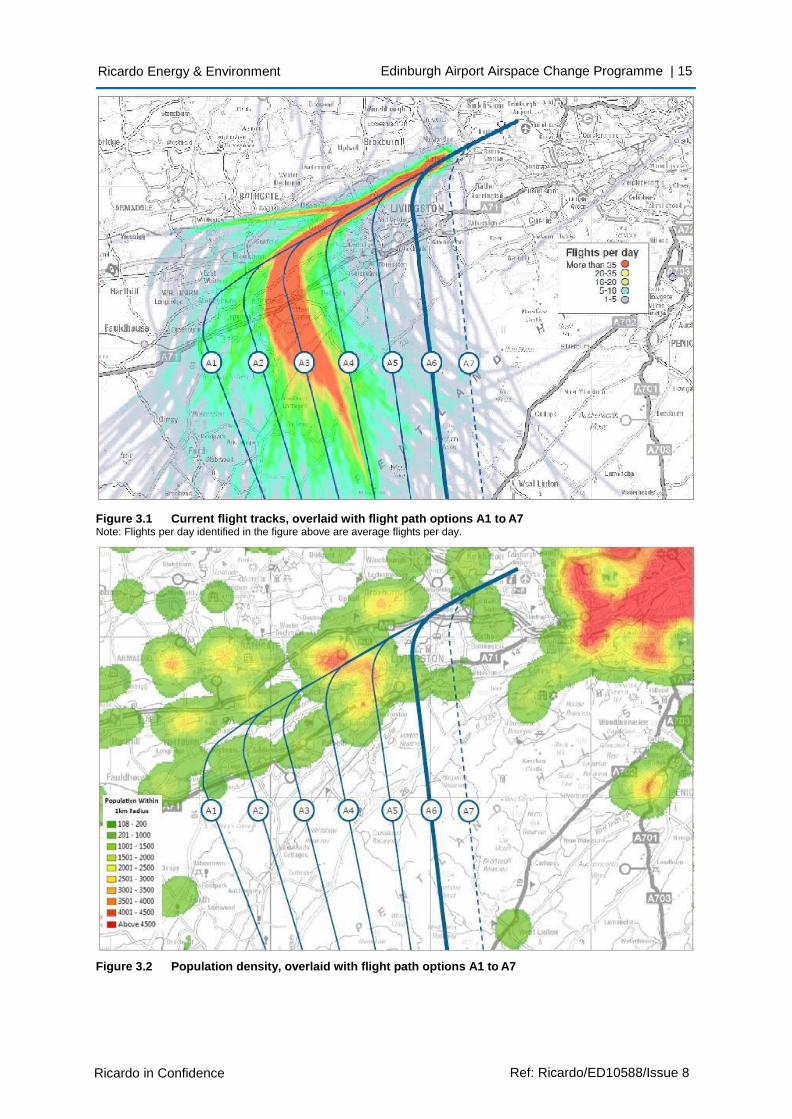
Ricardo Energy & Environment Edinburgh Airport Airspace Change Programme | 15
Ricardo in Confidence Ref: Ricardo/ED10588/Issue 8
Figure 3.1 Current flight tracks, overlaid with flight path options A1 to A7 Note: Flights per day identified in the figure above are average flights per day.
Figure 3.2 Population density, overlaid with flight path options A1 to A7
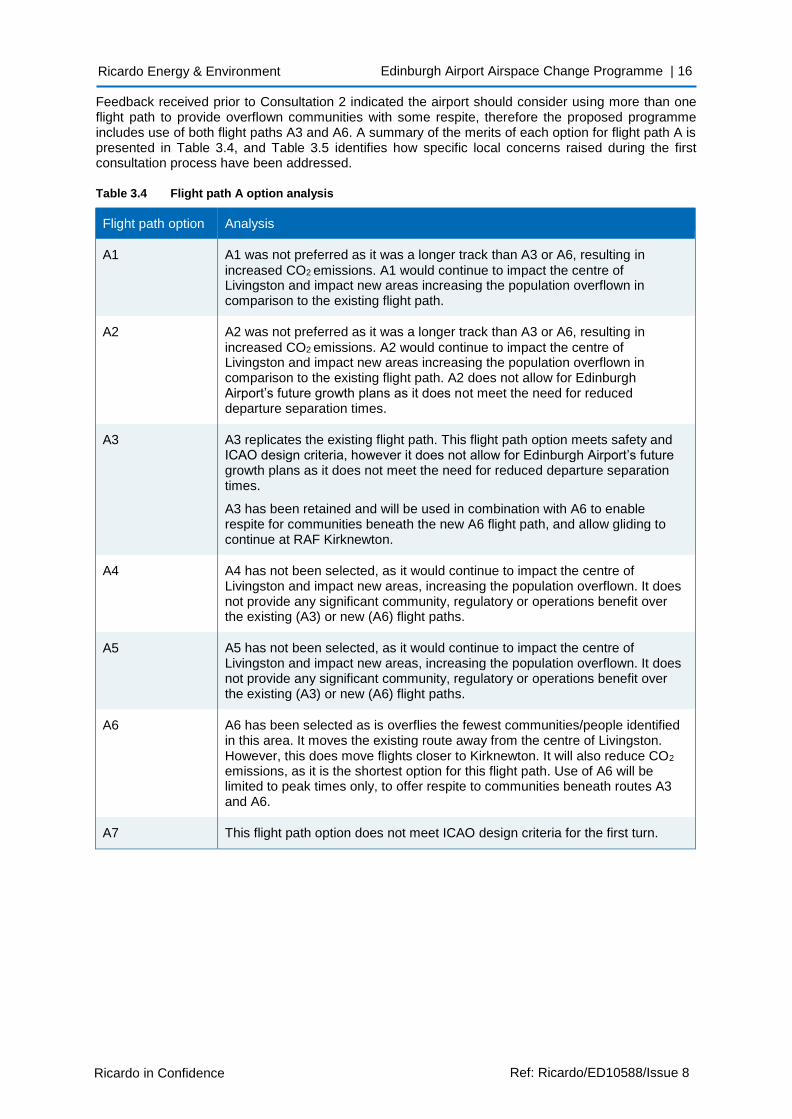
Ricardo Energy & Environment Edinburgh Airport Airspace Change Programme | 16
Ricardo in Confidence Ref: Ricardo/ED10588/Issue 8
Feedback received prior to Consultation 2 indicated the airport should consider using more than one flight path to provide overflown communities with some respite, therefore the proposed programme includes use of both flight paths A3 and A6. A summary of the merits of each option for flight path A is presented in Table 3.4, and Table 3.5 identifies how specific local concerns raised during the first consultation process have been addressed.
Table 3.4 Flight path A option analysis
Flight path option Analysis
A1 A1 was not preferred as it was a longer track than A3 or A6, resulting in
increased CO2 emissions. A1 would continue to impact the centre of Livingston and impact new areas increasing the population overflown in comparison to the existing flight path.
A2 A2 was not preferred as it was a longer track than A3 or A6, resulting in
increased CO2 emissions. A2 would continue to impact the centre of Livingston and impact new areas increasing the population overflown in comparison to the existing flight path. A2 does not allow for Edinburgh Airport’s future growth plans as it does not meet the need for reduced departure separation times.
A3 A3 replicates the existing flight path. This flight path option meets safety and ICAO design criteria, however it does not allow for Edinburgh Airport’s future growth plans as it does not meet the need for reduced departure separation times.
A3 has been retained and will be used in combination with A6 to enable respite for communities beneath the new A6 flight path, and allow gliding to continue at RAF Kirknewton.
A4 A4 has not been selected, as it would continue to impact the centre of Livingston and impact new areas, increasing the population overflown. It does not provide any significant community, regulatory or operations benefit over the existing (A3) or new (A6) flight paths.
A5 A5 has not been selected, as it would continue to impact the centre of Livingston and impact new areas, increasing the population overflown. It does not provide any significant community, regulatory or operations benefit over the existing (A3) or new (A6) flight paths.
A6 A6 has been selected as is overflies the fewest communities/people identified in this area. It moves the existing route away from the centre of Livingston. However, this does move flights closer to Kirknewton. It will also reduce CO2
emissions, as it is the shortest option for this flight path. Use of A6 will be limited to peak times only, to offer respite to communities beneath routes A3 and A6.
A7 This flight path option does not meet ICAO design criteria for the first turn.
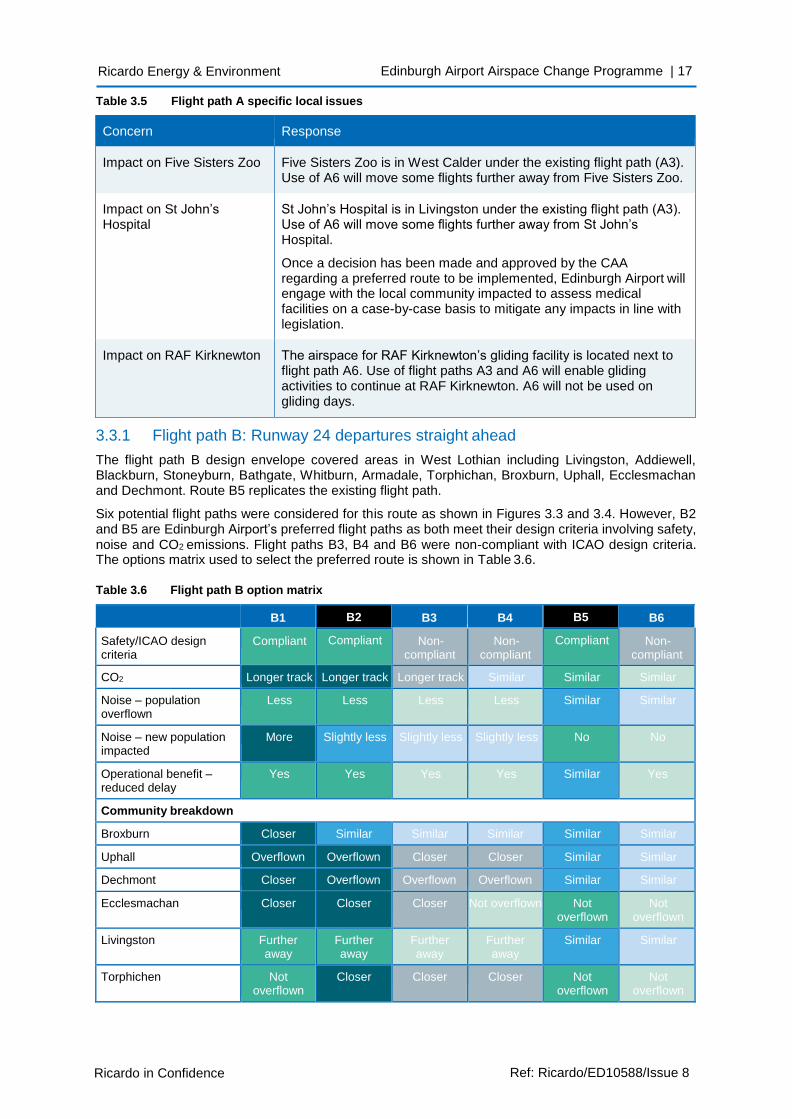
Ricardo Energy & Environment Edinburgh Airport Airspace Change Programme | 17
Ricardo in Confidence Ref: Ricardo/ED10588/Issue 8
Table 3.5 Flight path A specific local issues
Concern Response
Impact on Five Sisters Zoo Five Sisters Zoo is in West Calder under the existing flight path (A3). Use of A6 will move some flights further away from Five Sisters Zoo.
Impact on St John’s Hospital
St John’s Hospital is in Livingston under the existing flight path (A3). Use of A6 will move some flights further away from St John’s Hospital.
Once a decision has been made and approved by the CAA regarding a preferred route to be implemented, Edinburgh Airport will engage with the local community impacted to assess medical facilities on a case-by-case basis to mitigate any impacts in line with legislation.
Impact on RAF Kirknewton The airspace for RAF Kirknewton’s gliding facility is located next to flight path A6. Use of flight paths A3 and A6 will enable gliding activities to continue at RAF Kirknewton. A6 will not be used on gliding days.
3.3.1 Flight path B: Runway 24 departures straight ahead
The flight path B design envelope covered areas in West Lothian including Livingston, Addiewell, Blackburn, Stoneyburn, Bathgate, Whitburn, Armadale, Torphichan, Broxburn, Uphall, Ecclesmachan and Dechmont. Route B5 replicates the existing flight path.
Six potential flight paths were considered for this route as shown in Figures 3.3 and 3.4. However, B2 and B5 are Edinburgh Airport’s preferred flight paths as both meet their design criteria involving safety, noise and CO2 emissions. Flight paths B3, B4 and B6 were non-compliant with ICAO design criteria. The options matrix used to select the preferred route is shown in Table 3.6.
Table 3.6 Flight path B option matrix
B1 B2 B3 B4 B5 B6
Safety/ICAO design criteria
Compliant Compliant Non- compliant
Non- compliant
Compliant Non- compliant
CO2 Longer track Longer track Longer track Similar Similar Similar
Noise – population overflown
Less Less Less Less Similar Similar
Noise – new population impacted
More Slightly less Slightly less Slightly less No No
Operational benefit – reduced delay
Yes Yes Yes Yes Similar Yes
Community breakdown
Broxburn Closer Similar Similar Similar Similar Similar
Uphall Overflown Overflown Closer Closer Similar Similar
Dechmont Closer Overflown Overflown Overflown Similar Similar
Ecclesmachan Closer Closer Closer Not overflown Not overflown
Not overflown
Livingston Further away
Further away
Further away
Further away
Similar Similar
Torphichen Not overflown
Closer Closer Closer Not overflown
Not overflown
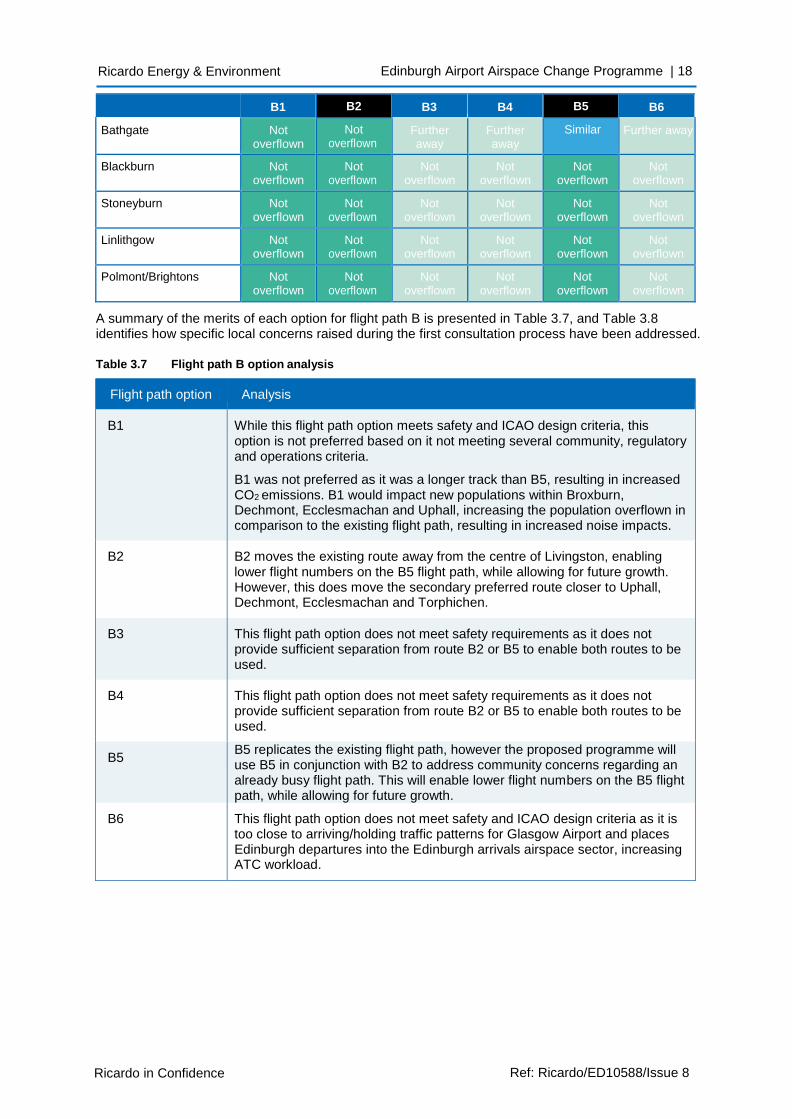
Ricardo Energy & Environment Edinburgh Airport Airspace Change Programme | 18
Ricardo in Confidence Ref: Ricardo/ED10588/Issue 8
B1 B2 B3 B4 B5 B6
Bathgate Not overflown
Not overflown
Further away
Further away
Similar Further away
Blackburn Not overflown
Not overflown
Not overflown
Not overflown
Not overflown
Not overflown
Stoneyburn Not overflown
Not overflown
Not overflown
Not overflown
Not overflown
Not overflown
Linlithgow Not overflown
Not overflown
Not overflown
Not overflown
Not overflown
Not overflown
Polmont/Brightons Not overflown
Not overflown
Not overflown
Not overflown
Not overflown
Not overflown
A summary of the merits of each option for flight path B is presented in Table 3.7, and Table 3.8 identifies how specific local concerns raised during the first consultation process have been addressed.
Table 3.7 Flight path B option analysis
Flight path option Analysis
B1 While this flight path option meets safety and ICAO design criteria, this option is not preferred based on it not meeting several community, regulatory and operations criteria.
B1 was not preferred as it was a longer track than B5, resulting in increased CO2 emissions. B1 would impact new populations within Broxburn, Dechmont, Ecclesmachan and Uphall, increasing the population overflown in comparison to the existing flight path, resulting in increased noise impacts.
B2 B2 moves the existing route away from the centre of Livingston, enabling lower flight numbers on the B5 flight path, while allowing for future growth. However, this does move the secondary preferred route closer to Uphall, Dechmont, Ecclesmachan and Torphichen.
B3 This flight path option does not meet safety requirements as it does not provide sufficient separation from route B2 or B5 to enable both routes to be used.
B4 This flight path option does not meet safety requirements as it does not provide sufficient separation from route B2 or B5 to enable both routes to be used.
B5 B5 replicates the existing flight path, however the proposed programme will use B5 in conjunction with B2 to address community concerns regarding an already busy flight path. This will enable lower flight numbers on the B5 flight path, while allowing for future growth.
B6 This flight path option does not meet safety and ICAO design criteria as it is too close to arriving/holding traffic patterns for Glasgow Airport and places Edinburgh departures into the Edinburgh arrivals airspace sector, increasing ATC workload.
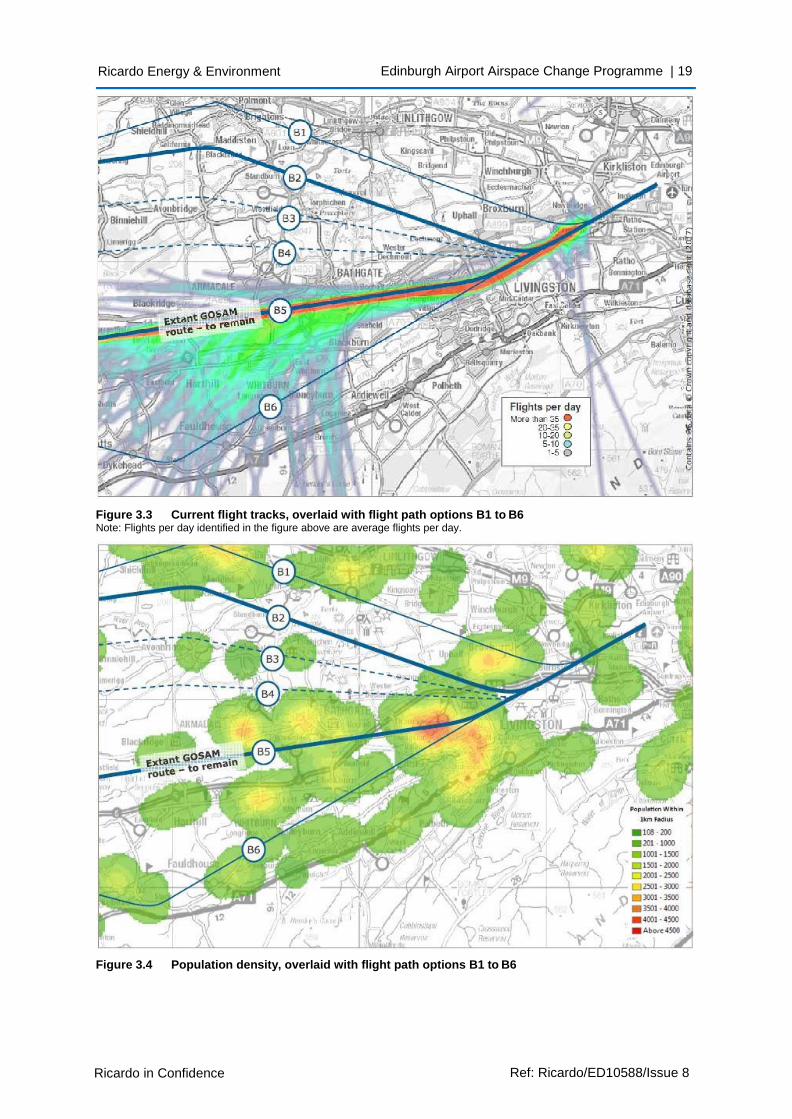
Ricardo Energy & Environment Edinburgh Airport Airspace Change Programme | 19
Ricardo in Confidence Ref: Ricardo/ED10588/Issue 8
Figure 3.3 Current flight tracks, overlaid with flight path options B1 to B6 Note: Flights per day identified in the figure above are average flights per day.
Figure 3.4 Population density, overlaid with flight path options B1 to B6
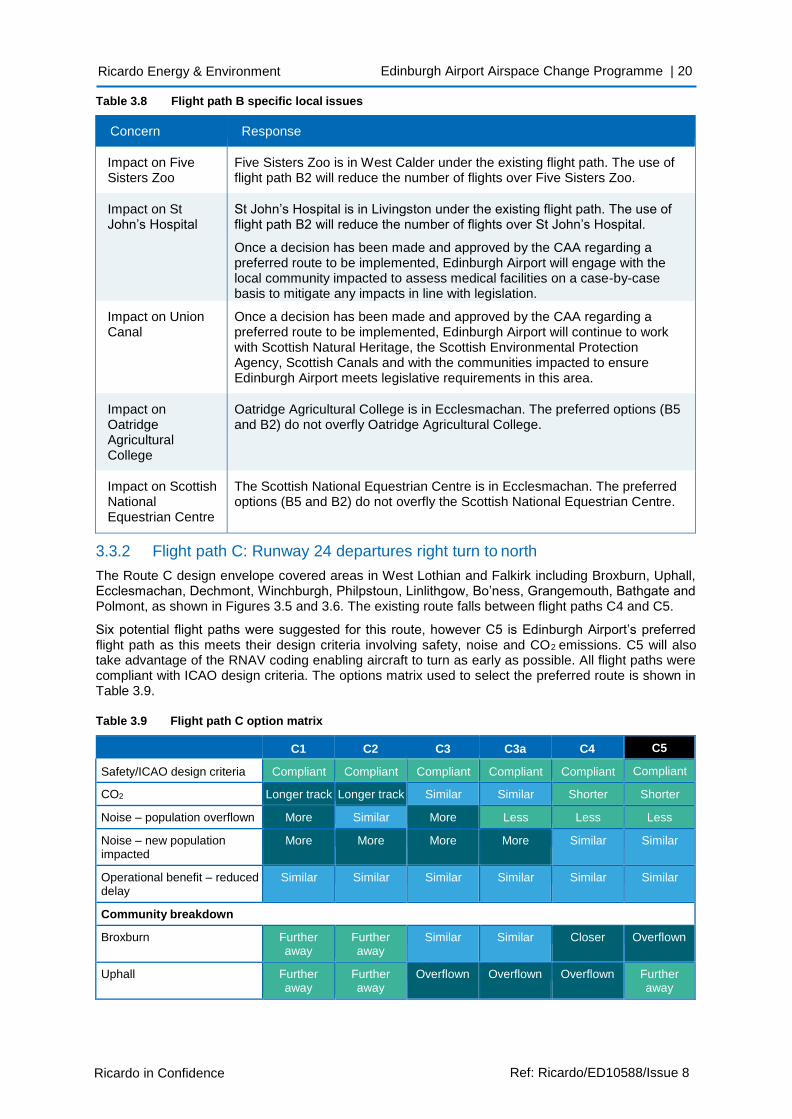
Ricardo Energy & Environment Edinburgh Airport Airspace Change Programme | 20
Ricardo in Confidence Ref: Ricardo/ED10588/Issue 8
Table 3.8 Flight path B specific local issues
Concern Response
Impact on Five Sisters Zoo
Five Sisters Zoo is in West Calder under the existing flight path. The use of flight path B2 will reduce the number of flights over Five Sisters Zoo.
Impact on St John’s Hospital
St John’s Hospital is in Livingston under the existing flight path. The use of flight path B2 will reduce the number of flights over St John’s Hospital.
Once a decision has been made and approved by the CAA regarding a preferred route to be implemented, Edinburgh Airport will engage with the local community impacted to assess medical facilities on a case-by-case basis to mitigate any impacts in line with legislation.
Impact on Union Canal
Once a decision has been made and approved by the CAA regarding a preferred route to be implemented, Edinburgh Airport will continue to work with Scottish Natural Heritage, the Scottish Environmental Protection Agency, Scottish Canals and with the communities impacted to ensure Edinburgh Airport meets legislative requirements in this area.
Impact on Oatridge Agricultural College
Oatridge Agricultural College is in Ecclesmachan. The preferred options (B5 and B2) do not overfly Oatridge Agricultural College.
Impact on Scottish National Equestrian Centre
The Scottish National Equestrian Centre is in Ecclesmachan. The preferred options (B5 and B2) do not overfly the Scottish National Equestrian Centre.
3.3.2 Flight path C: Runway 24 departures right turn to north
The Route C design envelope covered areas in West Lothian and Falkirk including Broxburn, Uphall, Ecclesmachan, Dechmont, Winchburgh, Philpstoun, Linlithgow, Bo’ness, Grangemouth, Bathgate and Polmont, as shown in Figures 3.5 and 3.6. The existing route falls between flight paths C4 and C5.
Six potential flight paths were suggested for this route, however C5 is Edinburgh Airport’s preferred flight path as this meets their design criteria involving safety, noise and CO2 emissions. C5 will also take advantage of the RNAV coding enabling aircraft to turn as early as possible. All flight paths were compliant with ICAO design criteria. The options matrix used to select the preferred route is shown in Table 3.9.
Table 3.9 Flight path C option matrix
C1 C2 C3 C3a C4 C5
Safety/ICAO design criteria Compliant Compliant Compliant Compliant Compliant Compliant
CO2 Longer track Longer track Similar Similar Shorter Shorter
Noise – population overflown More Similar More Less Less Less
Noise – new population impacted
More More More More Similar Similar
Operational benefit – reduced delay
Similar Similar Similar Similar Similar Similar
Community breakdown
Broxburn Further away
Further away
Similar Similar Closer Overflown
Uphall Further away
Further away
Overflown Overflown Overflown Further away
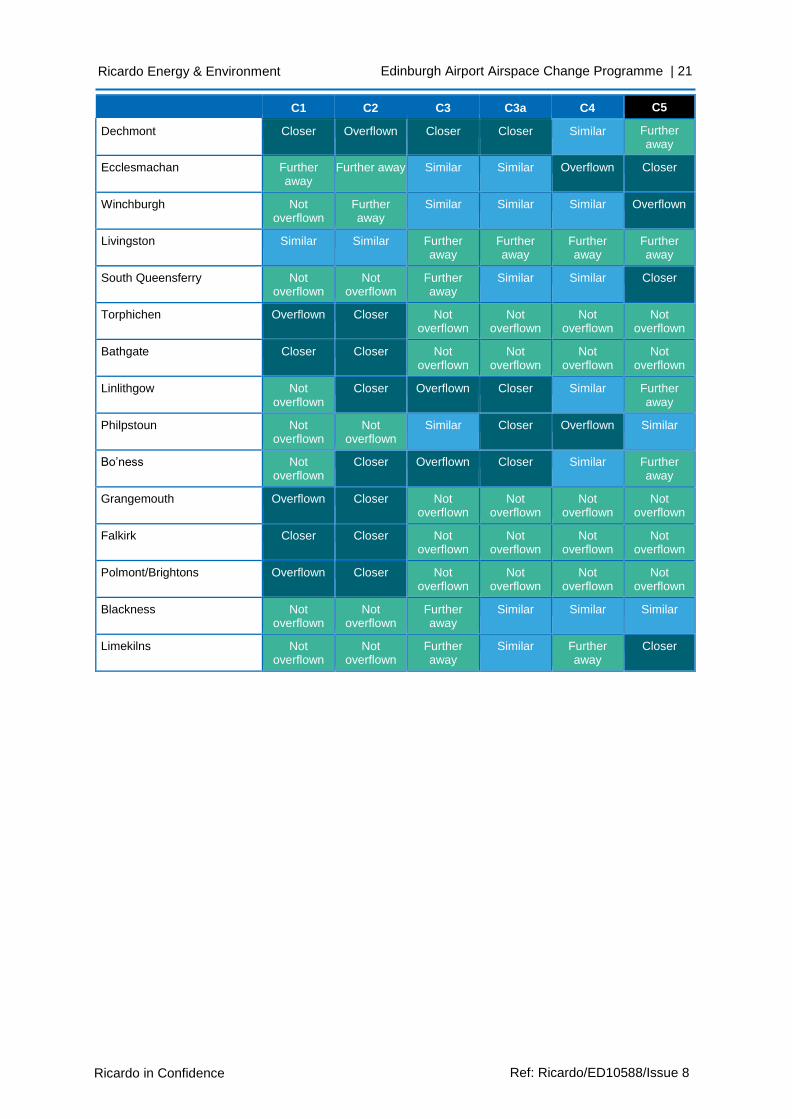
Ricardo in Confidence Ref: Ricardo/ED10588/Issue 8
Ricardo Energy & Environment Edinburgh Airport Airspace Change Programme | 21
C1 C2 C3 C3a C4 C5
Dechmont Closer Overflown Closer Closer Similar Further away
Ecclesmachan Further away
Further away Similar Similar Overflown Closer
Winchburgh Not overflown
Further away
Similar Similar Similar Overflown
Livingston Similar Similar Further away
Further away
Further away
Further away
South Queensferry Not overflown
Not overflown
Further away
Similar Similar Closer
Torphichen Overflown Closer Not overflown
Not overflown
Not overflown
Not overflown
Bathgate Closer Closer Not overflown
Not overflown
Not overflown
Not overflown
Linlithgow Not overflown
Closer Overflown Closer Similar Further away
Philpstoun Not overflown
Not overflown
Similar Closer Overflown Similar
Bo’ness Not overflown
Closer Overflown Closer Similar Further away
Grangemouth Overflown Closer Not overflown
Not overflown
Not overflown
Not overflown
Falkirk Closer Closer Not overflown
Not overflown
Not overflown
Not overflown
Polmont/Brightons Overflown Closer Not overflown
Not overflown
Not overflown
Not overflown
Blackness Not overflown
Not overflown
Further away
Similar Similar Similar
Limekilns Not overflown
Not overflown
Further away
Similar Further away
Closer
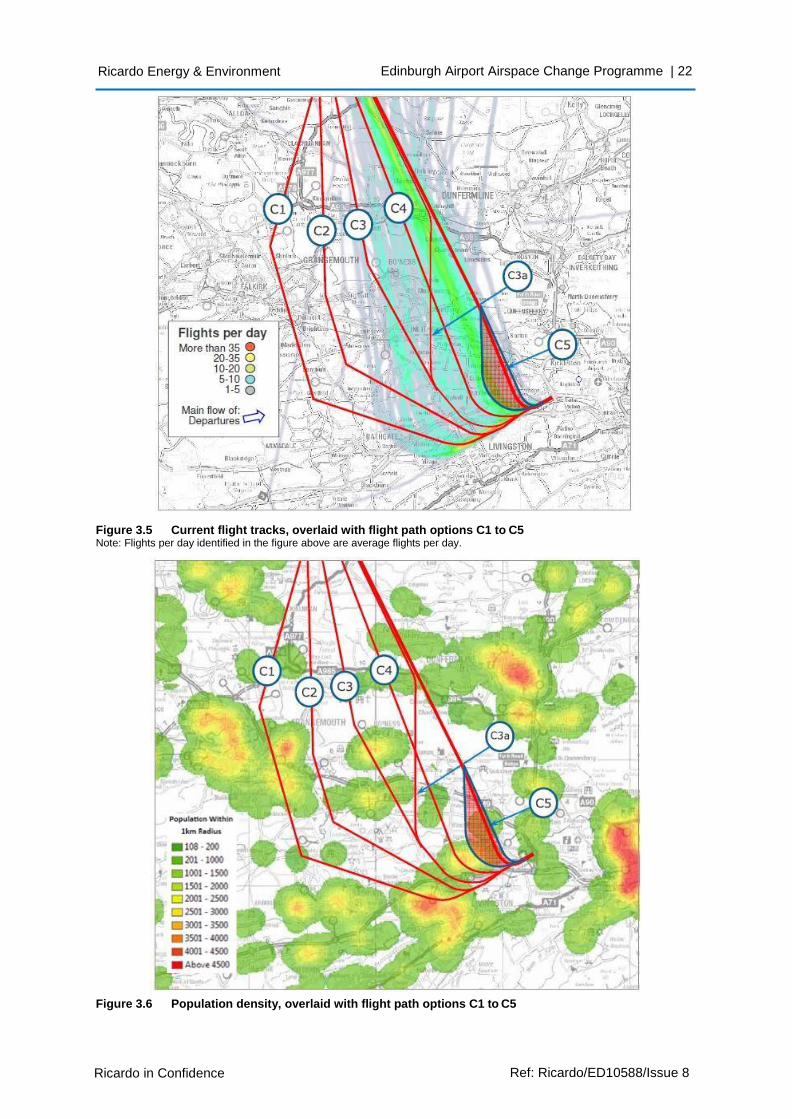
Ricardo in Confidence Ref: Ricardo/ED10588/Issue 8
Ricardo Energy & Environment Edinburgh Airport Airspace Change Programme | 22
Figure 3.5 Current flight tracks, overlaid with flight path options C1 to C5 Note: Flights per day identified in the figure above are average flights per day.
Figure 3.6 Population density, overlaid with flight path options C1 to C5
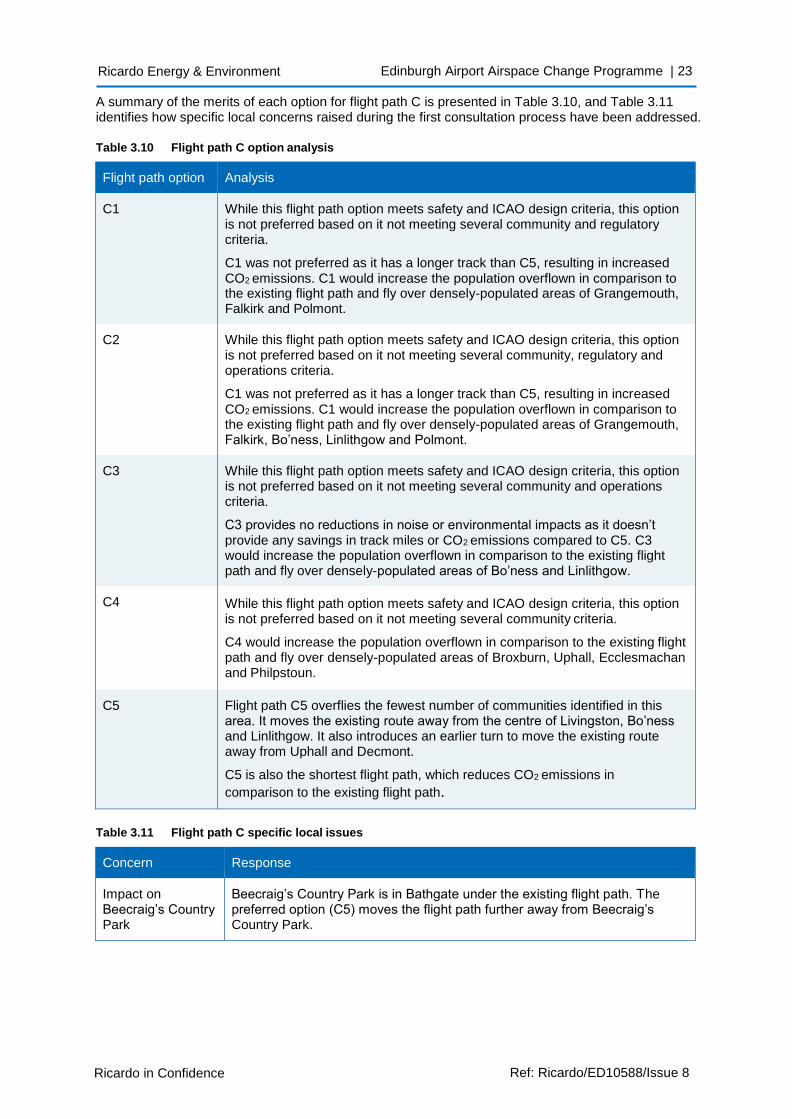
Ricardo in Confidence Ref: Ricardo/ED10588/Issue 8
Ricardo Energy & Environment Edinburgh Airport Airspace Change Programme | 23
A summary of the merits of each option for flight path C is presented in Table 3.10, and Table 3.11 identifies how specific local concerns raised during the first consultation process have been addressed.
Table 3.10 Flight path C option analysis
Flight path option Analysis
C1 While this flight path option meets safety and ICAO design criteria, this option is not preferred based on it not meeting several community and regulatory criteria.
C1 was not preferred as it has a longer track than C5, resulting in increased CO2 emissions. C1 would increase the population overflown in comparison to the existing flight path and fly over densely-populated areas of Grangemouth, Falkirk and Polmont.
C2 While this flight path option meets safety and ICAO design criteria, this option is not preferred based on it not meeting several community, regulatory and operations criteria.
C1 was not preferred as it has a longer track than C5, resulting in increased CO2 emissions. C1 would increase the population overflown in comparison to the existing flight path and fly over densely-populated areas of Grangemouth, Falkirk, Bo’ness, Linlithgow and Polmont.
C3 While this flight path option meets safety and ICAO design criteria, this option is not preferred based on it not meeting several community and operations criteria.
C3 provides no reductions in noise or environmental impacts as it doesn’t provide any savings in track miles or CO2 emissions compared to C5. C3 would increase the population overflown in comparison to the existing flight path and fly over densely-populated areas of Bo’ness and Linlithgow.
C4 While this flight path option meets safety and ICAO design criteria, this option is not preferred based on it not meeting several community criteria.
C4 would increase the population overflown in comparison to the existing flight path and fly over densely-populated areas of Broxburn, Uphall, Ecclesmachan and Philpstoun.
C5 Flight path C5 overflies the fewest number of communities identified in this area. It moves the existing route away from the centre of Livingston, Bo’ness and Linlithgow. It also introduces an earlier turn to move the existing route away from Uphall and Decmont.
C5 is also the shortest flight path, which reduces CO2 emissions in
comparison to the existing flight path.
Table 3.11 Flight path C specific local issues
Concern Response
Impact on Beecraig’s Country Park
Beecraig’s Country Park is in Bathgate under the existing flight path. The preferred option (C5) moves the flight path further away from Beecraig’s Country Park.
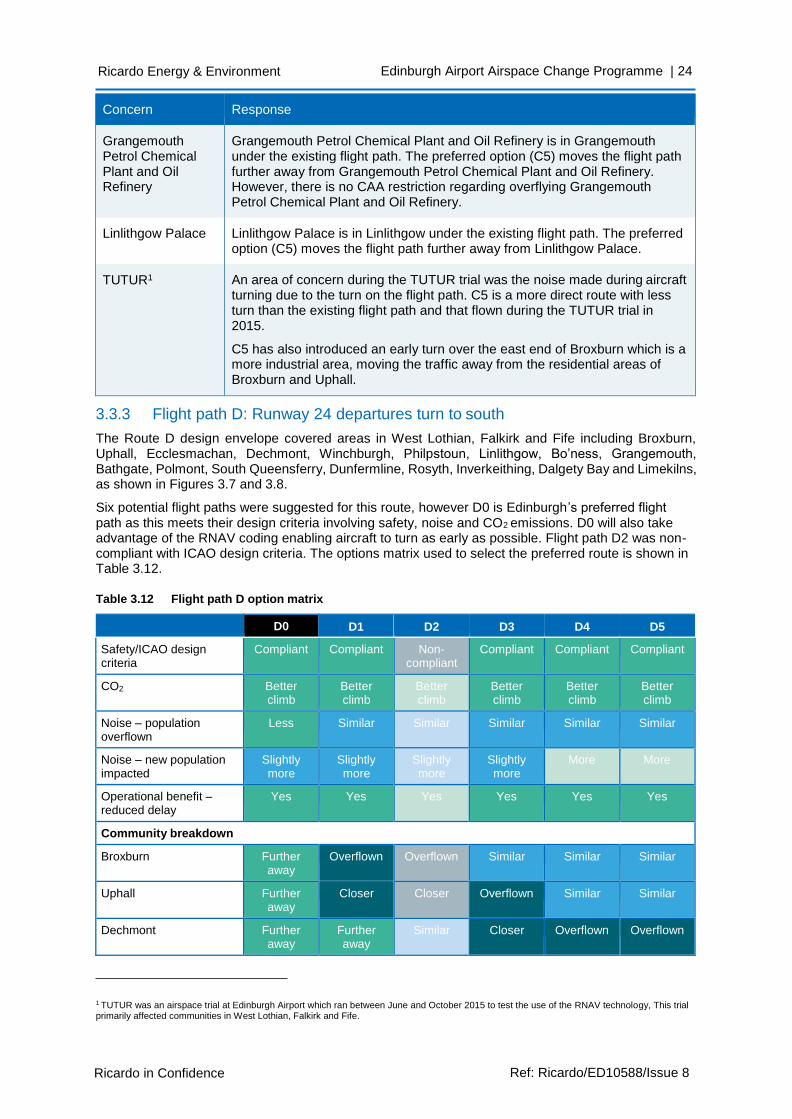
Ricardo in Confidence Ref: Ricardo/ED10588/Issue 8
Ricardo Energy & Environment Edinburgh Airport Airspace Change Programme | 24
Concern Response
Grangemouth Petrol Chemical Plant and Oil Refinery
Grangemouth Petrol Chemical Plant and Oil Refinery is in Grangemouth under the existing flight path. The preferred option (C5) moves the flight path further away from Grangemouth Petrol Chemical Plant and Oil Refinery. However, there is no CAA restriction regarding overflying Grangemouth Petrol Chemical Plant and Oil Refinery.
Linlithgow Palace Linlithgow Palace is in Linlithgow under the existing flight path. The preferred option (C5) moves the flight path further away from Linlithgow Palace.
TUTUR1 An area of concern during the TUTUR trial was the noise made during aircraft turning due to the turn on the flight path. C5 is a more direct route with less turn than the existing flight path and that flown during the TUTUR trial in 2015.
C5 has also introduced an early turn over the east end of Broxburn which is a more industrial area, moving the traffic away from the residential areas of Broxburn and Uphall.
3.3.3 Flight path D: Runway 24 departures turn to south
The Route D design envelope covered areas in West Lothian, Falkirk and Fife including Broxburn, Uphall, Ecclesmachan, Dechmont, Winchburgh, Philpstoun, Linlithgow, Bo’ness, Grangemouth, Bathgate, Polmont, South Queensferry, Dunfermline, Rosyth, Inverkeithing, Dalgety Bay and Limekilns, as shown in Figures 3.7 and 3.8.
Six potential flight paths were suggested for this route, however D0 is Edinburgh’s preferred flight path as this meets their design criteria involving safety, noise and CO2 emissions. D0 will also take advantage of the RNAV coding enabling aircraft to turn as early as possible. Flight path D2 was non- compliant with ICAO design criteria. The options matrix used to select the preferred route is shown in Table 3.12.
Table 3.12 Flight path D option matrix
D0 D1 D2 D3 D4 D5
Safety/ICAO design criteria
Compliant Compliant Non- compliant
Compliant Compliant Compliant
CO2 Better climb
Better climb
Better climb
Better climb
Better climb
Better climb
Noise – population overflown
Less Similar Similar Similar Similar Similar
Noise – new population impacted
Slightly more
Slightly more
Slightly more
Slightly more
More More
Operational benefit – reduced delay
Yes Yes Yes Yes Yes Yes
Community breakdown
Broxburn Further away
Overflown Overflown Similar Similar Similar
Uphall Further away
Closer Closer Overflown Similar Similar
Dechmont Further away
Further away
Similar Closer Overflown Overflown
1 TUTUR was an airspace trial at Edinburgh Airport which ran between June and October 2015 to test the use of the RNAV technology, This trial primarily affected communities in West Lothian, Falkirk and Fife.
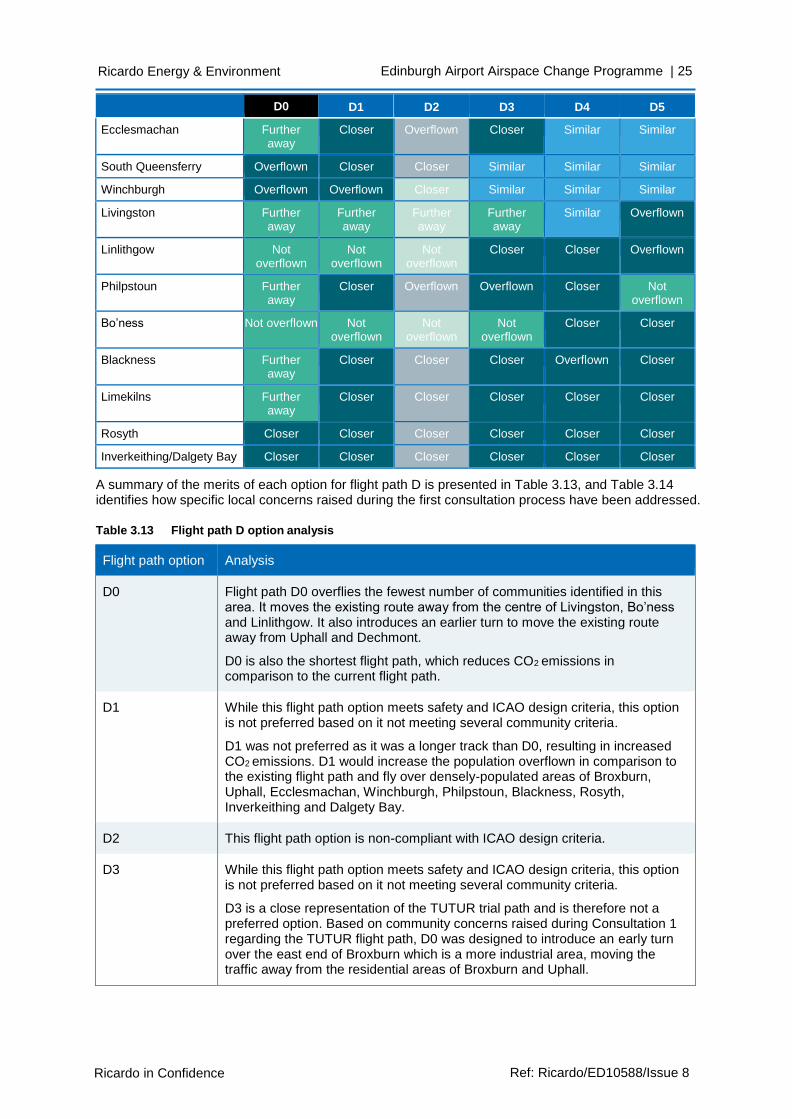
Ricardo in Confidence Ref: Ricardo/ED10588/Issue 8
Ricardo Energy & Environment Edinburgh Airport Airspace Change Programme | 25
D0 D1 D2 D3 D4 D5
Ecclesmachan Further away
Closer Overflown Closer Similar Similar
South Queensferry Overflown Closer Closer Similar Similar Similar
Winchburgh Overflown Overflown Closer Similar Similar Similar
Livingston Further away
Further away
Further away
Further away
Similar Overflown
Linlithgow Not overflown
Not overflown
Not overflown
Closer Closer Overflown
Philpstoun Further away
Closer Overflown Overflown Closer Not overflown
Bo’ness Not overflown Not overflown
Not overflown
Not overflown
Closer Closer
Blackness Further away
Closer Closer Closer Overflown Closer
Limekilns Further away
Closer Closer Closer Closer Closer
Rosyth Closer Closer Closer Closer Closer Closer
Inverkeithing/Dalgety Bay Closer Closer Closer Closer Closer Closer
A summary of the merits of each option for flight path D is presented in Table 3.13, and Table 3.14 identifies how specific local concerns raised during the first consultation process have been addressed.
Table 3.13 Flight path D option analysis
Flight path option Analysis
D0 Flight path D0 overflies the fewest number of communities identified in this area. It moves the existing route away from the centre of Livingston, Bo’ness and Linlithgow. It also introduces an earlier turn to move the existing route away from Uphall and Dechmont.
D0 is also the shortest flight path, which reduces CO2 emissions in comparison to the current flight path.
D1 While this flight path option meets safety and ICAO design criteria, this option is not preferred based on it not meeting several community criteria.
D1 was not preferred as it was a longer track than D0, resulting in increased CO2 emissions. D1 would increase the population overflown in comparison to the existing flight path and fly over densely-populated areas of Broxburn, Uphall, Ecclesmachan, Winchburgh, Philpstoun, Blackness, Rosyth, Inverkeithing and Dalgety Bay.
D2 This flight path option is non-compliant with ICAO design criteria.
D3 While this flight path option meets safety and ICAO design criteria, this option is not preferred based on it not meeting several community criteria.
D3 is a close representation of the TUTUR trial path and is therefore not a preferred option. Based on community concerns raised during Consultation 1 regarding the TUTUR flight path, D0 was designed to introduce an early turn over the east end of Broxburn which is a more industrial area, moving the traffic away from the residential areas of Broxburn and Uphall.
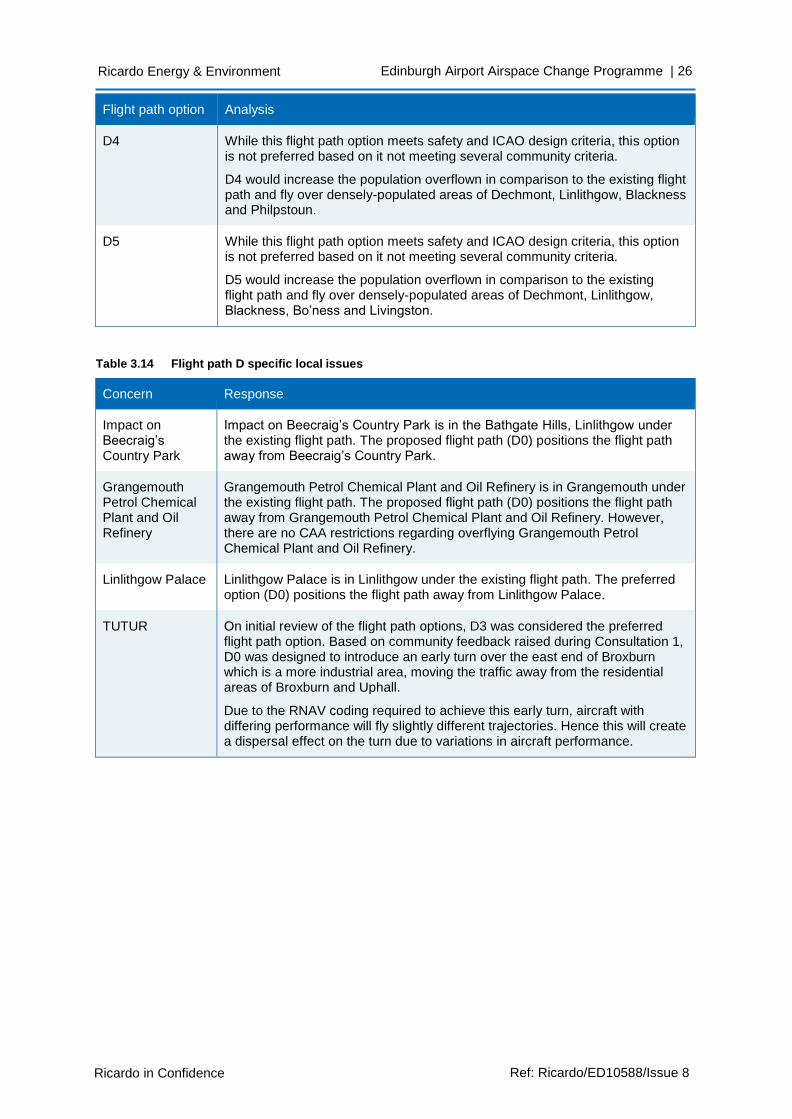
Ricardo in Confidence Ref: Ricardo/ED10588/Issue 8
Ricardo Energy & Environment Edinburgh Airport Airspace Change Programme | 26
Flight path option Analysis
D4 While this flight path option meets safety and ICAO design criteria, this option is not preferred based on it not meeting several community criteria.
D4 would increase the population overflown in comparison to the existing flight path and fly over densely-populated areas of Dechmont, Linlithgow, Blackness and Philpstoun.
D5 While this flight path option meets safety and ICAO design criteria, this option is not preferred based on it not meeting several community criteria.
D5 would increase the population overflown in comparison to the existing flight path and fly over densely-populated areas of Dechmont, Linlithgow, Blackness, Bo’ness and Livingston.
Table 3.14 Flight path D specific local issues
Concern Response
Impact on Beecraig’s Country Park
Impact on Beecraig’s Country Park is in the Bathgate Hills, Linlithgow under the existing flight path. The proposed flight path (D0) positions the flight path away from Beecraig’s Country Park.
Grangemouth Petrol Chemical Plant and Oil Refinery
Grangemouth Petrol Chemical Plant and Oil Refinery is in Grangemouth under the existing flight path. The proposed flight path (D0) positions the flight path away from Grangemouth Petrol Chemical Plant and Oil Refinery. However, there are no CAA restrictions regarding overflying Grangemouth Petrol Chemical Plant and Oil Refinery.
Linlithgow Palace Linlithgow Palace is in Linlithgow under the existing flight path. The preferred option (D0) positions the flight path away from Linlithgow Palace.
TUTUR On initial review of the flight path options, D3 was considered the preferred flight path option. Based on community feedback raised during Consultation 1, D0 was designed to introduce an early turn over the east end of Broxburn which is a more industrial area, moving the traffic away from the residential areas of Broxburn and Uphall.
Due to the RNAV coding required to achieve this early turn, aircraft with differing performance will fly slightly different trajectories. Hence this will create a dispersal effect on the turn due to variations in aircraft performance.
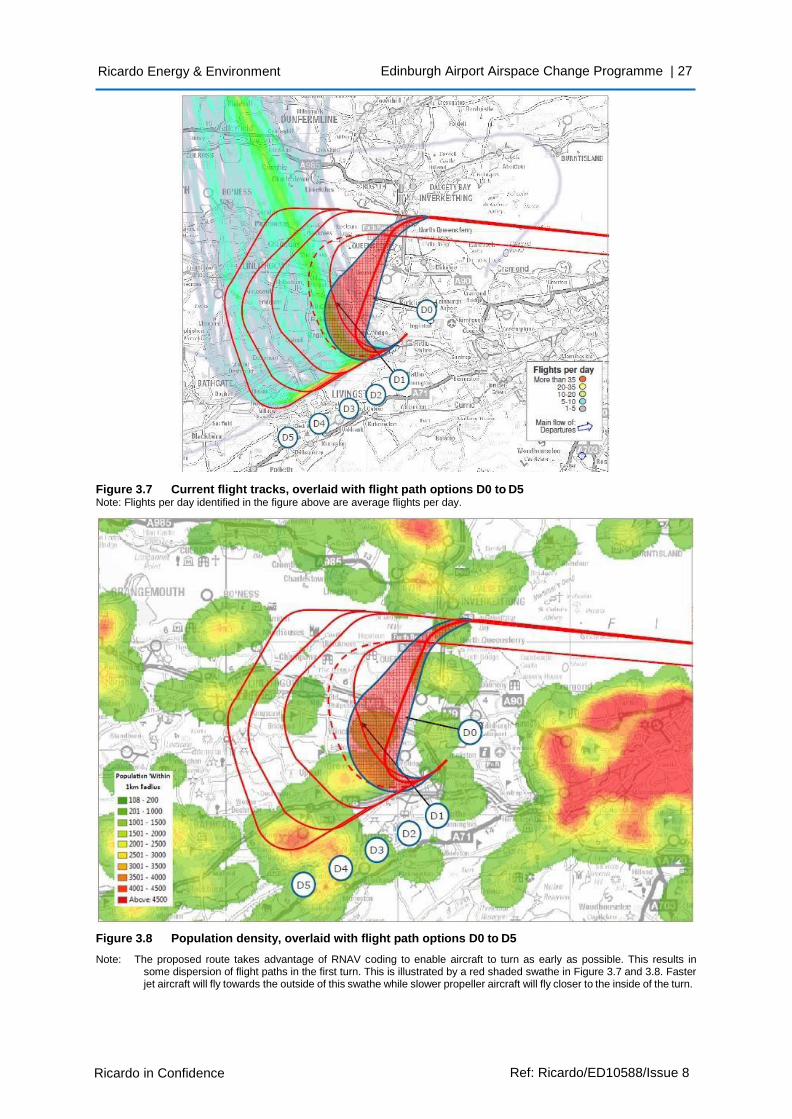
Ricardo in Confidence Ref: Ricardo/ED10588/Issue 8
Ricardo Energy & Environment Edinburgh Airport Airspace Change Programme | 27
Figure 3.7 Current flight tracks, overlaid with flight path options D0 to D5 Note: Flights per day identified in the figure above are average flights per day.
Figure 3.8 Population density, overlaid with flight path options D0 to D5
Note: The proposed route takes advantage of RNAV coding to enable aircraft to turn as early as possible. This results in some dispersion of flight paths in the first turn. This is illustrated by a red shaded swathe in Figure 3.7 and 3.8. Faster jet aircraft will fly towards the outside of this swathe while slower propeller aircraft will fly closer to the inside of the turn.
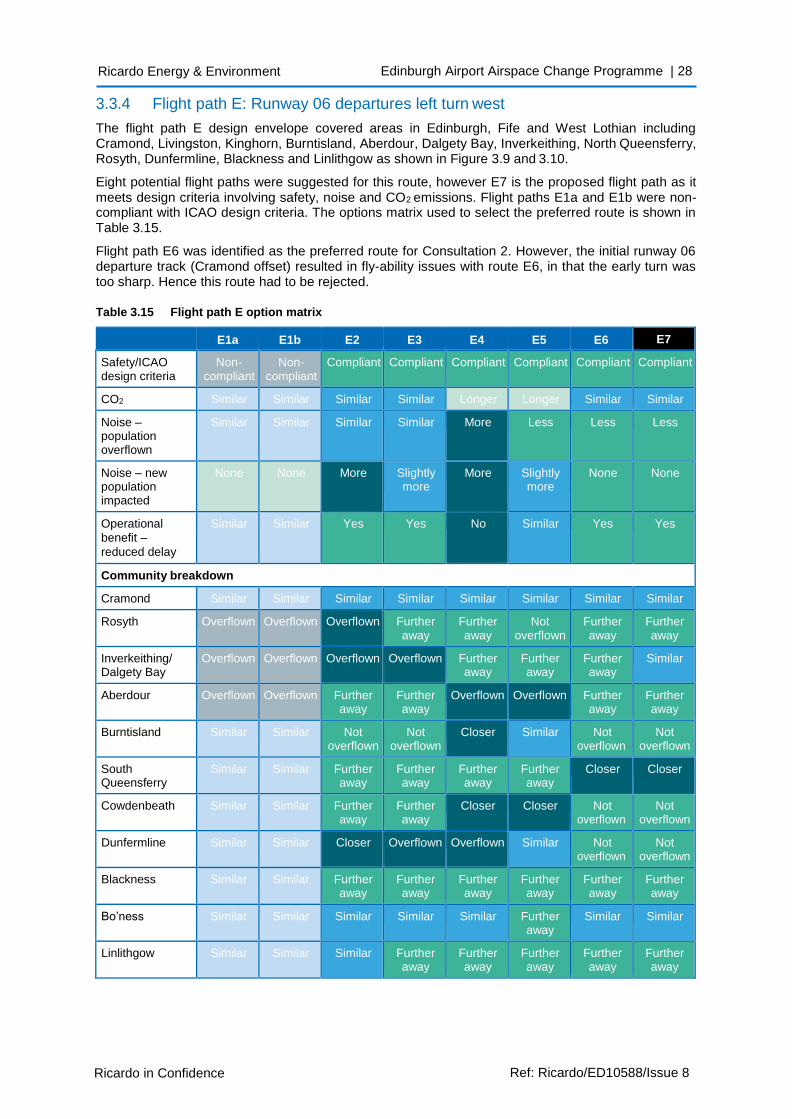
Ricardo in Confidence Ref: Ricardo/ED10588/Issue 8
Ricardo Energy & Environment Edinburgh Airport Airspace Change Programme | 28
3.3.4 Flight path E: Runway 06 departures left turn west
The flight path E design envelope covered areas in Edinburgh, Fife and West Lothian including Cramond, Livingston, Kinghorn, Burntisland, Aberdour, Dalgety Bay, Inverkeithing, North Queensferry, Rosyth, Dunfermline, Blackness and Linlithgow as shown in Figure 3.9 and 3.10.
Eight potential flight paths were suggested for this route, however E7 is the proposed flight path as it meets design criteria involving safety, noise and CO2 emissions. Flight paths E1a and E1b were non- compliant with ICAO design criteria. The options matrix used to select the preferred route is shown in Table 3.15.
Flight path E6 was identified as the preferred route for Consultation 2. However, the initial runway 06 departure track (Cramond offset) resulted in fly-ability issues with route E6, in that the early turn was too sharp. Hence this route had to be rejected.
Table 3.15 Flight path E option matrix
E1a E1b E2 E3 E4 E5 E6 E7
Safety/ICAO design criteria
Non- compliant
Non- compliant
Compliant Compliant Compliant Compliant Compliant Compliant
CO2 Similar Similar Similar Similar Longer Longer Similar Similar
Noise – population overflown
Similar Similar Similar Similar More Less Less Less
Noise – new population impacted
None None More Slightly more
More Slightly more
None None
Operational
benefit –
reduced delay
Similar Similar Yes Yes No Similar Yes Yes
Community breakdown
Cramond Similar Similar Similar Similar Similar Similar Similar Similar
Rosyth Overflown Overflown Overflown Further away
Further away
Not overflown
Further away
Further away
Inverkeithing/ Dalgety Bay
Overflown Overflown Overflown Overflown Further away
Further away
Further away
Similar
Aberdour Overflown Overflown Further away
Further away
Overflown Overflown Further away
Further away
Burntisland Similar Similar Not overflown
Not overflown
Closer Similar Not overflown
Not overflown
South Queensferry
Similar Similar Further away
Further away
Further away
Further away
Closer Closer
Cowdenbeath Similar Similar Further away
Further away
Closer Closer Not overflown
Not overflown
Dunfermline Similar Similar Closer Overflown Overflown Similar Not overflown
Not overflown
Blackness Similar Similar Further away
Further away
Further away
Further away
Further away
Further away
Bo’ness Similar Similar Similar Similar Similar Further away
Similar Similar
Linlithgow Similar Similar Similar Further away
Further away
Further away
Further away
Further away
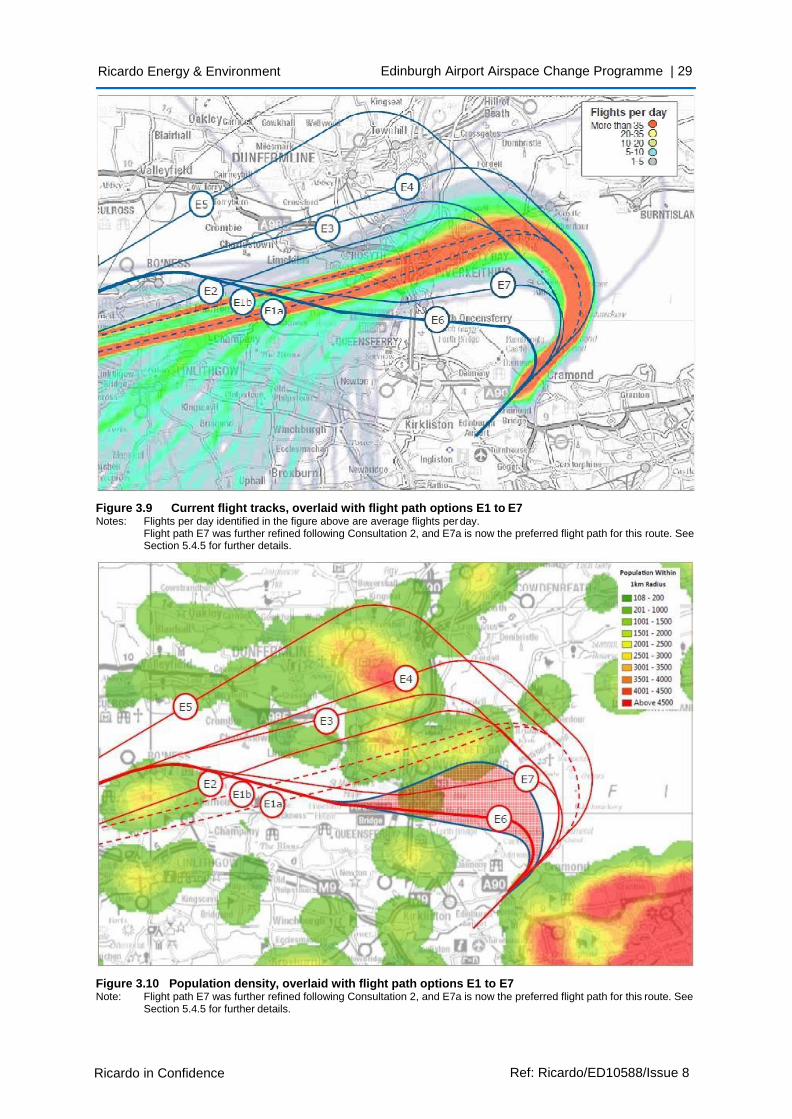
Ricardo in Confidence Ref: Ricardo/ED10588/Issue 8
Ricardo Energy & Environment Edinburgh Airport Airspace Change Programme | 29
Figure 3.9 Current flight tracks, overlaid with flight path options E1 to E7 Notes: Flights per day identified in the figure above are average flights per day.
Flight path E7 was further refined following Consultation 2, and E7a is now the preferred flight path for this route. See Section 5.4.5 for further details.
Figure 3.10 Population density, overlaid with flight path options E1 to E7 Note: Flight path E7 was further refined following Consultation 2, and E7a is now the preferred flight path for this route. See
Section 5.4.5 for further details.
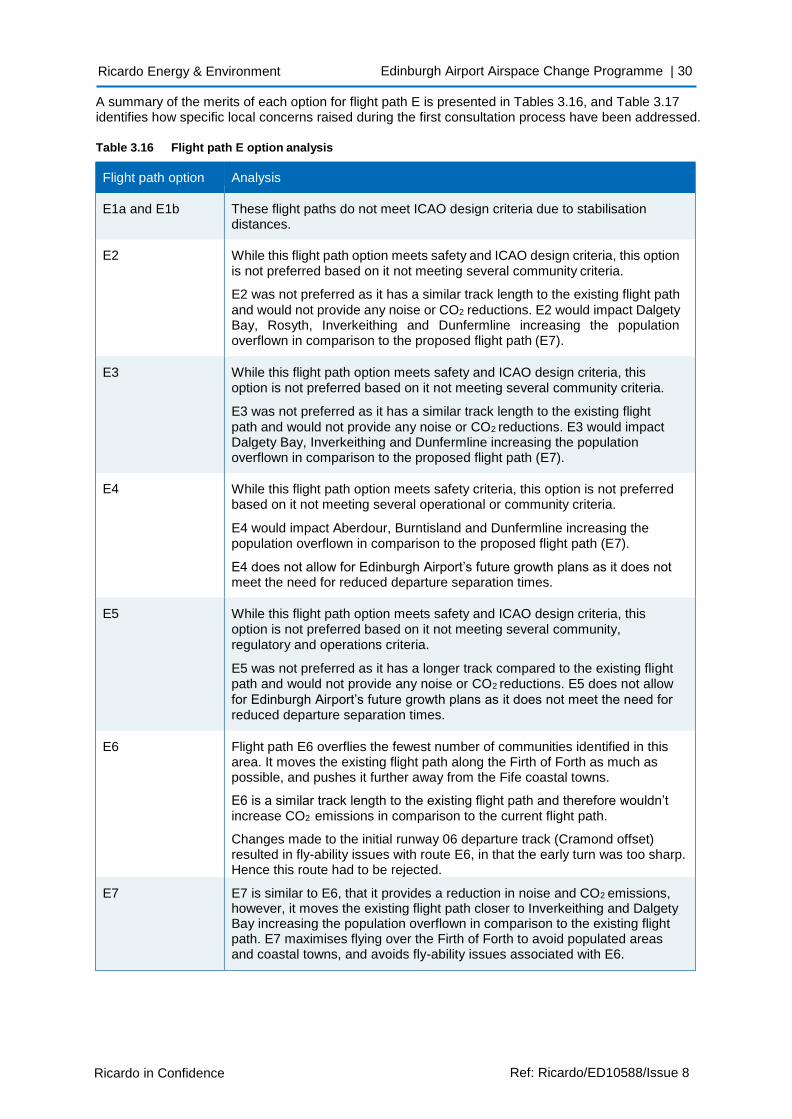
Ricardo in Confidence Ref: Ricardo/ED10588/Issue 8
Ricardo Energy & Environment Edinburgh Airport Airspace Change Programme | 30
A summary of the merits of each option for flight path E is presented in Tables 3.16, and Table 3.17 identifies how specific local concerns raised during the first consultation process have been addressed.
Table 3.16 Flight path E option analysis
Flight path option Analysis
E1a and E1b These flight paths do not meet ICAO design criteria due to stabilisation distances.
E2 While this flight path option meets safety and ICAO design criteria, this option is not preferred based on it not meeting several community criteria.
E2 was not preferred as it has a similar track length to the existing flight path
and would not provide any noise or CO2 reductions. E2 would impact Dalgety Bay, Rosyth, Inverkeithing and Dunfermline increasing the population overflown in comparison to the proposed flight path (E7).
E3 While this flight path option meets safety and ICAO design criteria, this option is not preferred based on it not meeting several community criteria.
E3 was not preferred as it has a similar track length to the existing flight
path and would not provide any noise or CO2 reductions. E3 would impact Dalgety Bay, Inverkeithing and Dunfermline increasing the population overflown in comparison to the proposed flight path (E7).
E4 While this flight path option meets safety criteria, this option is not preferred based on it not meeting several operational or community criteria.
E4 would impact Aberdour, Burntisland and Dunfermline increasing the population overflown in comparison to the proposed flight path (E7).
E4 does not allow for Edinburgh Airport’s future growth plans as it does not meet the need for reduced departure separation times.
E5 While this flight path option meets safety and ICAO design criteria, this option is not preferred based on it not meeting several community, regulatory and operations criteria.
E5 was not preferred as it has a longer track compared to the existing flight path and would not provide any noise or CO2 reductions. E5 does not allow
for Edinburgh Airport’s future growth plans as it does not meet the need for reduced departure separation times.
E6 Flight path E6 overflies the fewest number of communities identified in this area. It moves the existing flight path along the Firth of Forth as much as possible, and pushes it further away from the Fife coastal towns.
E6 is a similar track length to the existing flight path and therefore wouldn’t increase CO2 emissions in comparison to the current flight path.
Changes made to the initial runway 06 departure track (Cramond offset) resulted in fly-ability issues with route E6, in that the early turn was too sharp. Hence this route had to be rejected.
E7 E7 is similar to E6, that it provides a reduction in noise and CO2 emissions, however, it moves the existing flight path closer to Inverkeithing and Dalgety Bay increasing the population overflown in comparison to the existing flight path. E7 maximises flying over the Firth of Forth to avoid populated areas and coastal towns, and avoids fly-ability issues associated with E6.
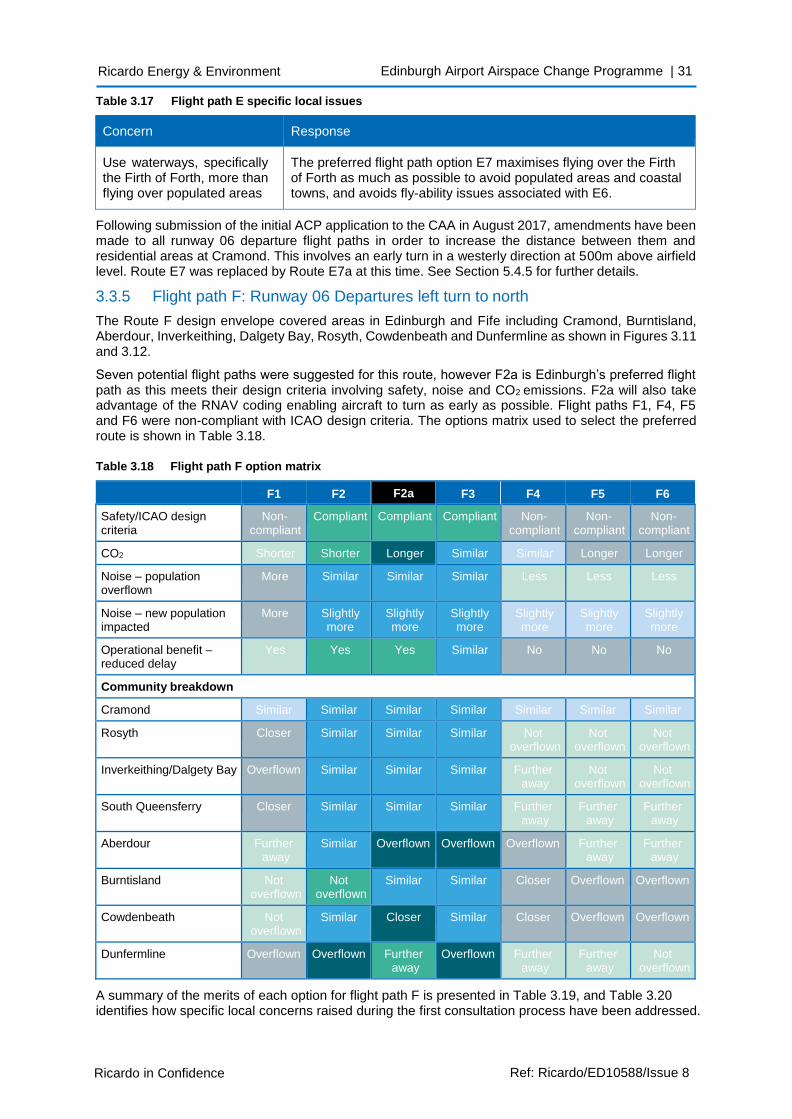
Ricardo in Confidence Ref: Ricardo/ED10588/Issue 8
Ricardo Energy & Environment Edinburgh Airport Airspace Change Programme | 31
Table 3.17 Flight path E specific local issues
Concern Response
Use waterways, specifically the Firth of Forth, more than flying over populated areas
The preferred flight path option E7 maximises flying over the Firth of Forth as much as possible to avoid populated areas and coastal towns, and avoids fly-ability issues associated with E6.
Following submission of the initial ACP application to the CAA in August 2017, amendments have been made to all runway 06 departure flight paths in order to increase the distance between them and residential areas at Cramond. This involves an early turn in a westerly direction at 500m above airfield level. Route E7 was replaced by Route E7a at this time. See Section 5.4.5 for further details.
3.3.5 Flight path F: Runway 06 Departures left turn to north
The Route F design envelope covered areas in Edinburgh and Fife including Cramond, Burntisland, Aberdour, Inverkeithing, Dalgety Bay, Rosyth, Cowdenbeath and Dunfermline as shown in Figures 3.11 and 3.12.
Seven potential flight paths were suggested for this route, however F2a is Edinburgh’s preferred flight path as this meets their design criteria involving safety, noise and CO2 emissions. F2a will also take advantage of the RNAV coding enabling aircraft to turn as early as possible. Flight paths F1, F4, F5 and F6 were non-compliant with ICAO design criteria. The options matrix used to select the preferred route is shown in Table 3.18.
Table 3.18 Flight path F option matrix
F1 F2 F2a F3 F4 F5 F6
Safety/ICAO design criteria
Non- compliant
Compliant Compliant Compliant Non- compliant
Non- compliant
Non- compliant
CO2 Shorter Shorter Longer Similar Similar Longer Longer
Noise – population overflown
More Similar Similar Similar Less Less Less
Noise – new population impacted
More Slightly more
Slightly more
Slightly more
Slightly more
Slightly more
Slightly more
Operational benefit – reduced delay
Yes Yes Yes Similar No No No
Community breakdown
Cramond Similar Similar Similar Similar Similar Similar Similar
Rosyth Closer Similar Similar Similar Not overflown
Not overflown
Not overflown
Inverkeithing/Dalgety Bay Overflown Similar Similar Similar Further away
Not overflown
Not overflown
South Queensferry Closer Similar Similar Similar Further away
Further away
Further away
Aberdour Further away
Similar Overflown Overflown Overflown Further away
Further away
Burntisland Not overflown
Not overflown
Similar Similar Closer Overflown Overflown
Cowdenbeath Not overflown
Similar Closer Similar Closer Overflown Overflown
Dunfermline Overflown Overflown Further away
Overflown Further away
Further away
Not overflown
A summary of the merits of each option for flight path F is presented in Table 3.19, and Table 3.20 identifies how specific local concerns raised during the first consultation process have been addressed.
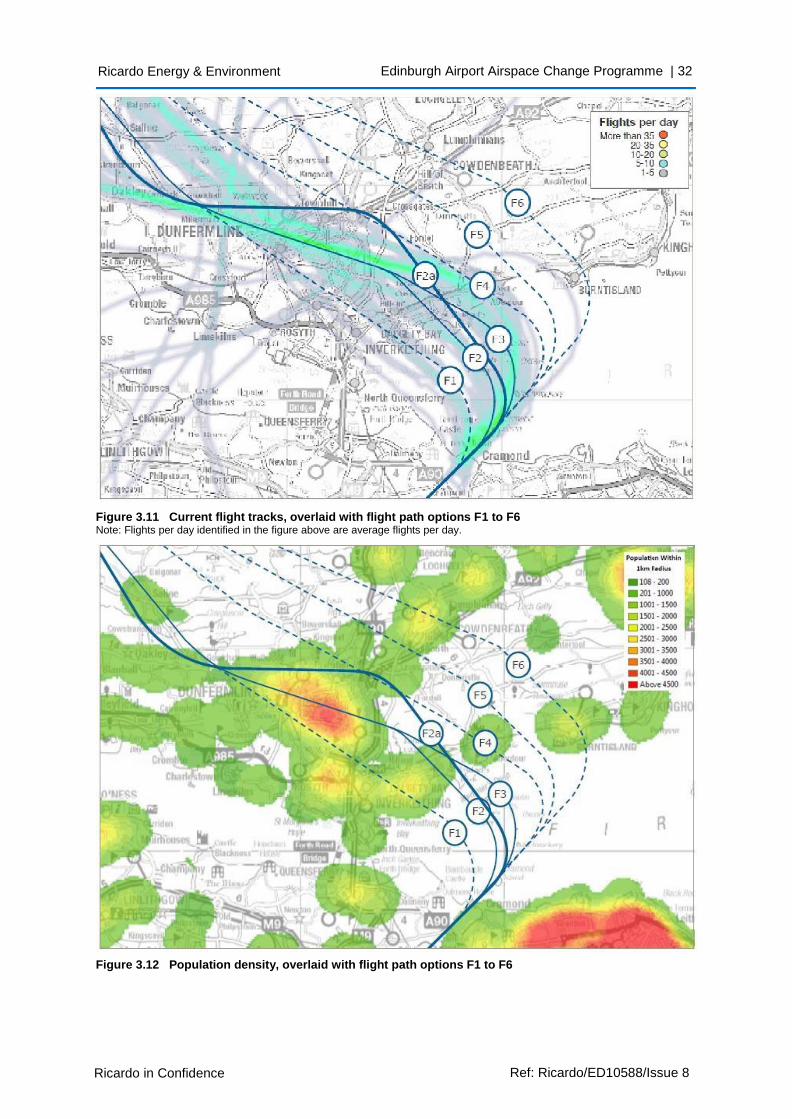
Ricardo in Confidence Ref: Ricardo/ED10588/Issue 8
Ricardo Energy & Environment Edinburgh Airport Airspace Change Programme | 32
Figure 3.11 Current flight tracks, overlaid with flight path options F1 to F6 Note: Flights per day identified in the figure above are average flights per day.
Figure 3.12 Population density, overlaid with flight path options F1 to F6
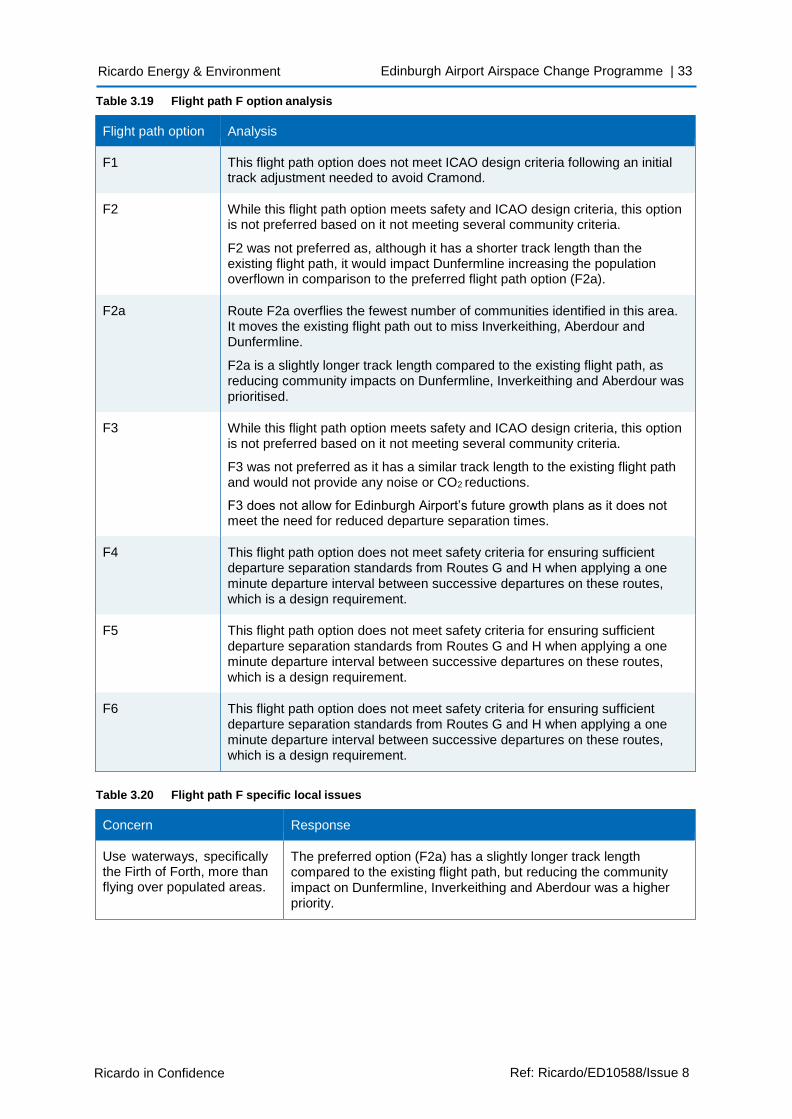
Ricardo in Confidence Ref: Ricardo/ED10588/Issue 8
Ricardo Energy & Environment Edinburgh Airport Airspace Change Programme | 33
Table 3.19 Flight path F option analysis
Flight path option Analysis
F1 This flight path option does not meet ICAO design criteria following an initial track adjustment needed to avoid Cramond.
F2 While this flight path option meets safety and ICAO design criteria, this option is not preferred based on it not meeting several community criteria.
F2 was not preferred as, although it has a shorter track length than the existing flight path, it would impact Dunfermline increasing the population overflown in comparison to the preferred flight path option (F2a).
F2a Route F2a overflies the fewest number of communities identified in this area. It moves the existing flight path out to miss Inverkeithing, Aberdour and Dunfermline.
F2a is a slightly longer track length compared to the existing flight path, as reducing community impacts on Dunfermline, Inverkeithing and Aberdour was
prioritised.
F3 While this flight path option meets safety and ICAO design criteria, this option is not preferred based on it not meeting several community criteria.
F3 was not preferred as it has a similar track length to the existing flight path and would not provide any noise or CO2 reductions.
F3 does not allow for Edinburgh Airport’s future growth plans as it does not meet the need for reduced departure separation times.
F4 This flight path option does not meet safety criteria for ensuring sufficient departure separation standards from Routes G and H when applying a one
minute departure interval between successive departures on these routes, which is a design requirement.
F5 This flight path option does not meet safety criteria for ensuring sufficient
departure separation standards from Routes G and H when applying a one minute departure interval between successive departures on these routes,
which is a design requirement.
F6 This flight path option does not meet safety criteria for ensuring sufficient departure separation standards from Routes G and H when applying a one
minute departure interval between successive departures on these routes, which is a design requirement.
Table 3.20 Flight path F specific local issues
Concern Response
Use waterways, specifically the Firth of Forth, more than flying over populated areas.
The preferred option (F2a) has a slightly longer track length compared to the existing flight path, but reducing the community
impact on Dunfermline, Inverkeithing and Aberdour was a higher priority.
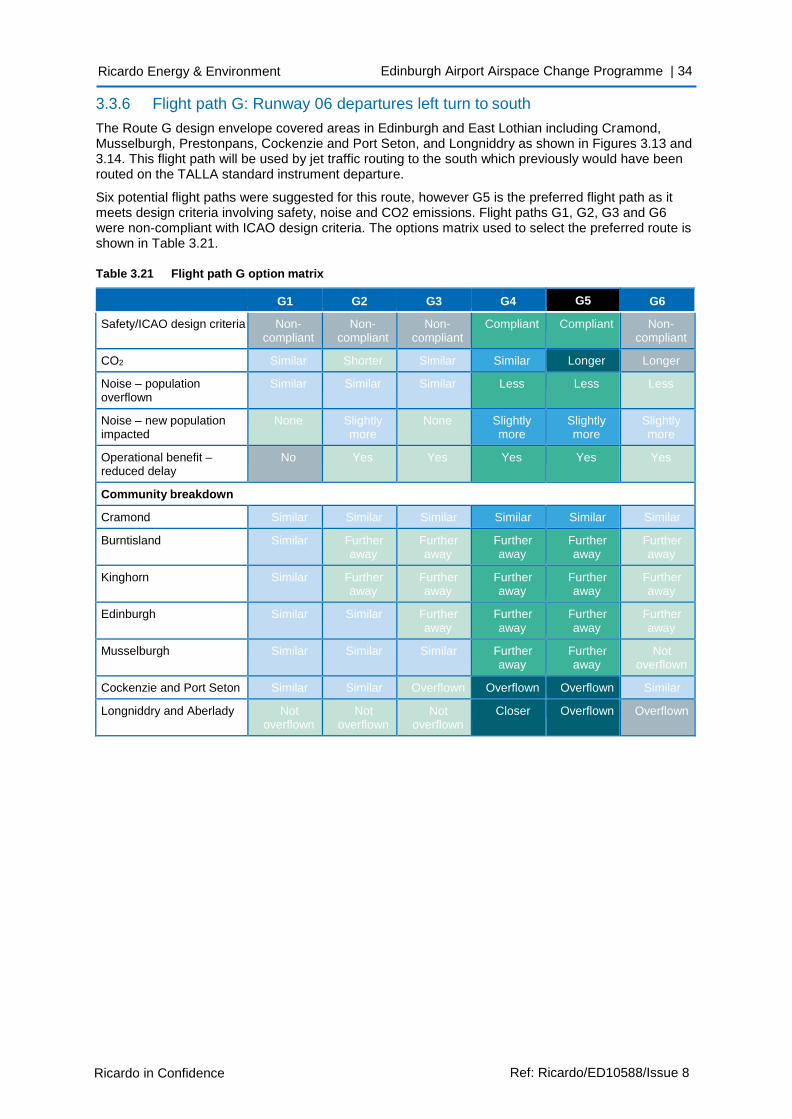
Ricardo in Confidence Ref: Ricardo/ED10588/Issue 8
Ricardo Energy & Environment Edinburgh Airport Airspace Change Programme | 34
3.3.6 Flight path G: Runway 06 departures left turn to south
The Route G design envelope covered areas in Edinburgh and East Lothian including Cramond, Musselburgh, Prestonpans, Cockenzie and Port Seton, and Longniddry as shown in Figures 3.13 and 3.14. This flight path will be used by jet traffic routing to the south which previously would have been routed on the TALLA standard instrument departure.
Six potential flight paths were suggested for this route, however G5 is the preferred flight path as it meets design criteria involving safety, noise and CO2 emissions. Flight paths G1, G2, G3 and G6 were non-compliant with ICAO design criteria. The options matrix used to select the preferred route is shown in Table 3.21.
Table 3.21 Flight path G option matrix
G1 G2 G3 G4 G5 G6
Safety/ICAO design criteria Non- compliant
Non- compliant
Non- compliant
Compliant Compliant Non- compliant
CO2 Similar Shorter Similar Similar Longer Longer
Noise – population overflown
Similar Similar Similar Less Less Less
Noise – new population impacted
None Slightly more
None Slightly more
Slightly more
Slightly more
Operational benefit – reduced delay
No Yes Yes Yes Yes Yes
Community breakdown
Cramond Similar Similar Similar Similar Similar Similar
Burntisland Similar Further away
Further away
Further away
Further away
Further away
Kinghorn Similar Further away
Further away
Further away
Further away
Further away
Edinburgh Similar Similar Further away
Further away
Further away
Further away
Musselburgh Similar Similar Similar Further away
Further away
Not overflown
Cockenzie and Port Seton Similar Similar Overflown Overflown Overflown Similar
Longniddry and Aberlady Not overflown
Not overflown
Not overflown
Closer Overflown Overflown
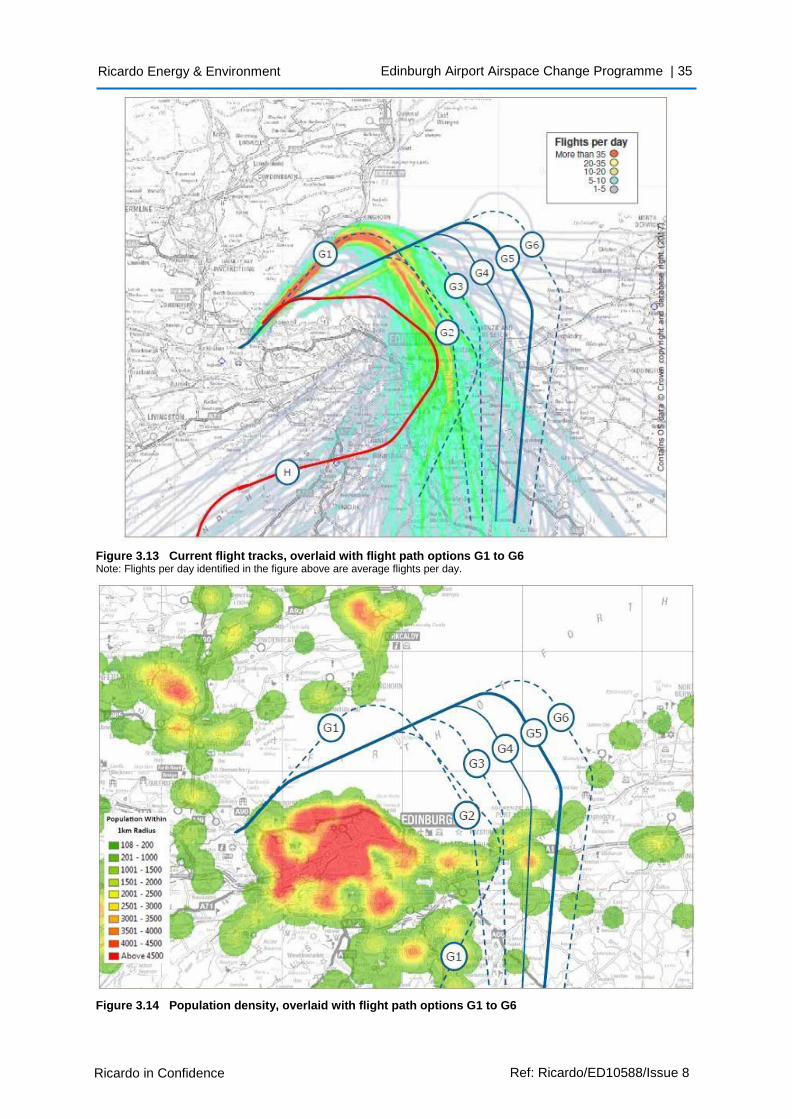
Ricardo in Confidence Ref: Ricardo/ED10588/Issue 8
Ricardo Energy & Environment Edinburgh Airport Airspace Change Programme | 35
Figure 3.13 Current flight tracks, overlaid with flight path options G1 to G6 Note: Flights per day identified in the figure above are average flights per day.
Figure 3.14 Population density, overlaid with flight path options G1 to G6
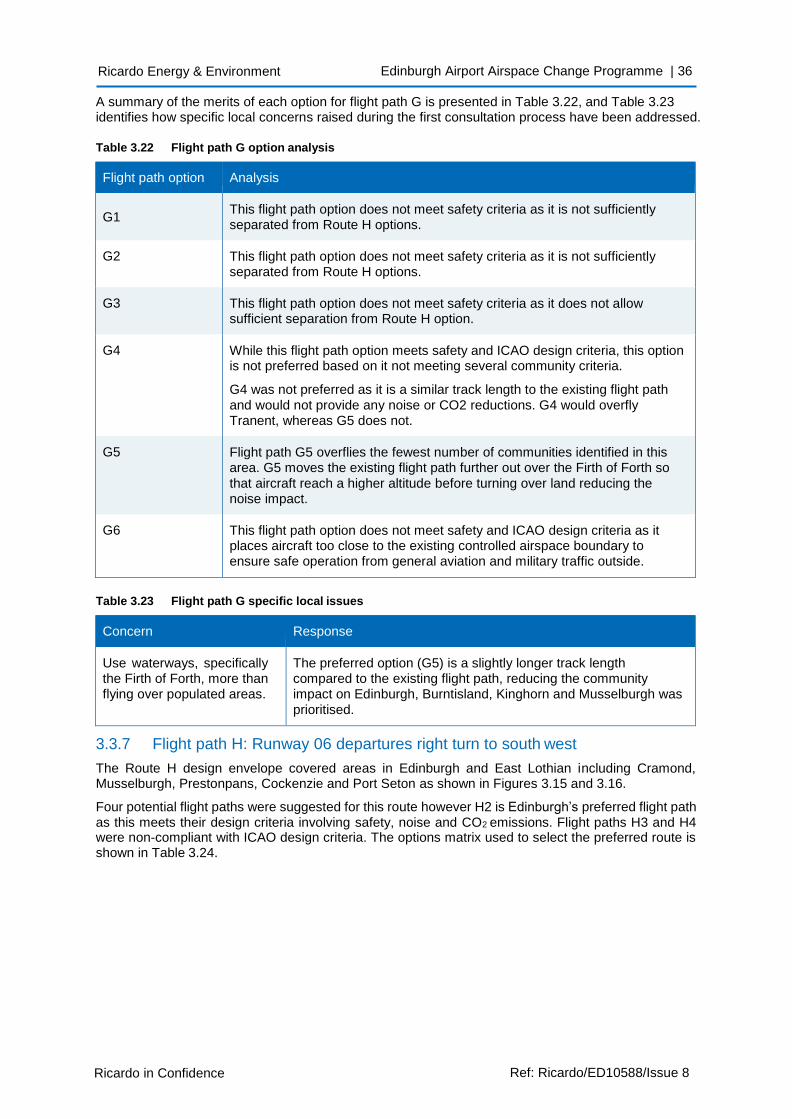
Ricardo in Confidence Ref: Ricardo/ED10588/Issue 8
Ricardo Energy & Environment Edinburgh Airport Airspace Change Programme | 36
A summary of the merits of each option for flight path G is presented in Table 3.22, and Table 3.23 identifies how specific local concerns raised during the first consultation process have been addressed.
Table 3.22 Flight path G option analysis
Flight path option Analysis
G1
This flight path option does not meet safety criteria as it is not sufficiently separated from Route H options.
G2 This flight path option does not meet safety criteria as it is not sufficiently separated from Route H options.
G3 This flight path option does not meet safety criteria as it does not allow sufficient separation from Route H option.
G4 While this flight path option meets safety and ICAO design criteria, this option is not preferred based on it not meeting several community criteria.
G4 was not preferred as it is a similar track length to the existing flight path
and would not provide any noise or CO2 reductions. G4 would overfly Tranent, whereas G5 does not.
G5 Flight path G5 overflies the fewest number of communities identified in this area. G5 moves the existing flight path further out over the Firth of Forth so
that aircraft reach a higher altitude before turning over land reducing the noise impact.
G6 This flight path option does not meet safety and ICAO design criteria as it places aircraft too close to the existing controlled airspace boundary to ensure safe operation from general aviation and military traffic outside.
Table 3.23 Flight path G specific local issues
Concern Response
Use waterways, specifically the Firth of Forth, more than flying over populated areas.
The preferred option (G5) is a slightly longer track length compared to the existing flight path, reducing the community impact on Edinburgh, Burntisland, Kinghorn and Musselburgh was
prioritised.
3.3.7 Flight path H: Runway 06 departures right turn to south west
The Route H design envelope covered areas in Edinburgh and East Lothian including Cramond, Musselburgh, Prestonpans, Cockenzie and Port Seton as shown in Figures 3.15 and 3.16.
Four potential flight paths were suggested for this route however H2 is Edinburgh’s preferred flight path as this meets their design criteria involving safety, noise and CO2 emissions. Flight paths H3 and H4 were non-compliant with ICAO design criteria. The options matrix used to select the preferred route is shown in Table 3.24.
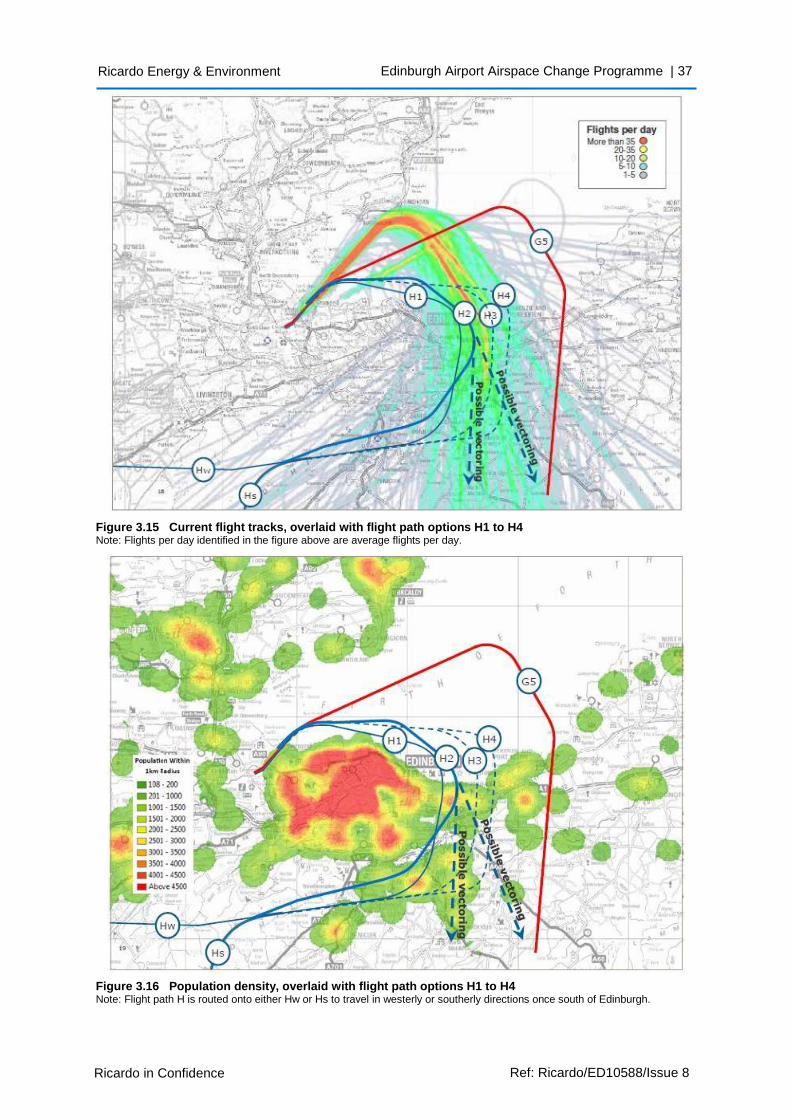
Ricardo in Confidence Ref: Ricardo/ED10588/Issue 8
Ricardo Energy & Environment Edinburgh Airport Airspace Change Programme | 37
Figure 3.15 Current flight tracks, overlaid with flight path options H1 to H4 Note: Flights per day identified in the figure above are average flights per day.
Figure 3.16 Population density, overlaid with flight path options H1 to H4 Note: Flight path H is routed onto either Hw or Hs to travel in westerly or southerly directions once south of Edinburgh.
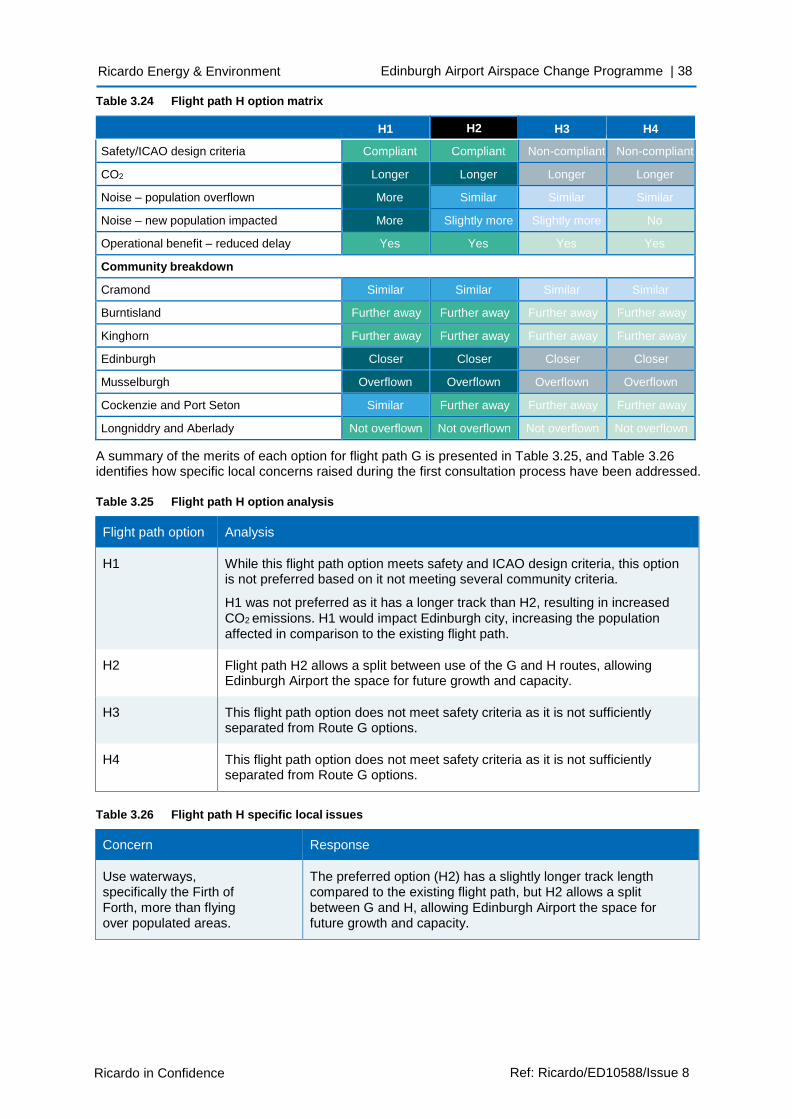
Ricardo in Confidence Ref: Ricardo/ED10588/Issue 8
Ricardo Energy & Environment Edinburgh Airport Airspace Change Programme | 38
Table 3.24 Flight path H option matrix
H1 H2 H3 H4
Safety/ICAO design criteria Compliant Compliant Non-compliant Non-compliant
CO2 Longer Longer Longer Longer
Noise – population overflown More Similar Similar Similar
Noise – new population impacted More Slightly more Slightly more No
Operational benefit – reduced delay Yes Yes Yes Yes
Community breakdown
Cramond Similar Similar Similar Similar
Burntisland Further away Further away Further away Further away
Kinghorn Further away Further away Further away Further away
Edinburgh Closer Closer Closer Closer
Musselburgh Overflown Overflown Overflown Overflown
Cockenzie and Port Seton Similar Further away Further away Further away
Longniddry and Aberlady Not overflown Not overflown Not overflown Not overflown
A summary of the merits of each option for flight path G is presented in Table 3.25, and Table 3.26 identifies how specific local concerns raised during the first consultation process have been addressed.
Table 3.25 Flight path H option analysis
Flight path option Analysis
H1 While this flight path option meets safety and ICAO design criteria, this option is not preferred based on it not meeting several community criteria.
H1 was not preferred as it has a longer track than H2, resulting in increased
CO2 emissions. H1 would impact Edinburgh city, increasing the population
affected in comparison to the existing flight path.
H2 Flight path H2 allows a split between use of the G and H routes, allowing Edinburgh Airport the space for future growth and capacity.
H3 This flight path option does not meet safety criteria as it is not sufficiently separated from Route G options.
H4 This flight path option does not meet safety criteria as it is not sufficiently separated from Route G options.
Table 3.26 Flight path H specific local issues
Concern Response
Use waterways, specifically the Firth of
Forth, more than flying over populated areas.
The preferred option (H2) has a slightly longer track length compared to the existing flight path, but H2 allows a split
between G and H, allowing Edinburgh Airport the space for future growth and capacity.
Ricardo in Confidence Ref: Ricardo/ED10588/Issue 8
Ricardo Energy & Environment Edinburgh Airport Airspace Change Programme | 39
3.3.8 Runway 24 arrivals from the north
There is no change proposed for this route as arrivals from the north represent a small proportion of the overall number of flights. Therefore, alternatives for this route were not considered.
3.3.9 Runway 24 arrivals from the south
There is currently no published route for arrivals from the south, aircraft are instead directed by ATC. Edinburgh Airport intend to publish a flight path for this route which will follow the general pattern of air traffic as it is now. Having a published flight path will enable aircraft to perform continuous descent approaches which reduces CO2 emissions and use less fuel.
3.3.10 Runway 06 arrivals from the north
There is no change proposed for this route as arrivals from the north represent a small proportion of the overall number of flights. Therefore, alternatives for this route were not considered.
3.3.11 Runway 06 arrivals from the south
There is currently no published route for arrivals from the south, aircraft are instead directed by ATC. The flight path for this route which will follow the general pattern of air traffic as it is now. Having a published flight path will enable aircraft to perform continuous descent approaches which reduces CO2
emissions and use less fuel.
3.4 Cramond offset options Due to its proximity to the airport and position, Cramond is overflown by aircraft arriving onto runway 24 and departing from runway 06. The left turn for aircraft departing from runway 06 has been in place since the runway was completed (c.1977) to avoid direct overflight of Cramond by aircraft departing from runway 06 and mitigate the impacts of aircraft noise on the community.
Edinburgh Airport wished to ensure that this turn remained, and to try and improve the situation for Cramond residents where possible. During the airspace design process, much effort was expended to explore the possibilities of varying the offset for departures from runway 06. The objective of this was to attempt to further minimize the noise exposure experienced by the community of Cramond due to departures from runway 06.
The angle of Cramond offset has a knock-on-effect on the subsequent flight path. If the offset angle from the original runway centre-line is increased, the subsequent initial turn gets pushed further towards Fife coast.
The initial design process (submitted to the CAA in August 2017) evaluated two options for the Cramond offset on flight path E:
• ICAO compliant 15° offset. This design would result in a more concentrated track past Cramond with the swathe of aircraft approximately the same distance from Cramond on average. Aircraft would be slightly further away from the west side of Cramond, but slightly closer to the north of Cramond.
• ICAO non-compliant 17.5° offset. This design would move the average track 139m further from Cramond, with the swathe of aircraft shifted to the outside of the current traffic swathe.
The initial design process indicated the non-ICAO compliant 17.5˚ offset would not yield any significant benefit to Cramond. Flight path E7 was preferred over E6 for the proposed programme submitted for approval in August 2017.
Subsequent design work and simulator testing has identified that an early turn at altitude (500m above airfield level) will both direct runway 06 departures further away from Cramond and satisfy CAA and ICAO standards. This approach has been incorporated into the airspace design for the current proposed programme, to be submitted to the CAA for approval in mid-2018. Flight path E7 was replaced by E7a during this redesign. The routes of other runway 06 departures (F2a, G5 and H2) do not significantly change beyond the Cramond coastline, and retain their original nomenclature.
Ricardo in Confidence Ref: Ricardo/ED10588/Issue 8
Ricardo Energy & Environment Edinburgh Airport Airspace Change Programme | 40
3.5 Non-conventional approach procedures Two non-conventional approach procedures were considered with the aim of reducing the noise impact on local communities:
• Steeper approaches.
• Offset arrivals.
These options are not suitable for most airline and aircrafts that use the airport, due to national and international regulatory approval limitations, increased training requirements and inability for the approaches to be used in poor weather conditions. In addition, it was not clear to what extent these options would reduce noise level within three miles of the runway because of pilot throttle adjustment, selection of landing enhancement devices, undercarriage, and imprecision in the final stages of the approach. Overall, technologies and regulatory guidance are not consistent across all aircraft, therefore it is possible mixed mode operations would be required (i.e. operation of non-conventional procedures in parallel with conventional procedures), increasing pilot and air traffic controller workloads at a critical stage of flight. Thus, neither of these non-conventional approach procedures have been included as part of the proposed programme.
Ricardo in Confidence Ref: Ricardo/ED10588/Issue 8
Ricardo Energy & Environment Edinburgh Airport Airspace Change Programme | 41
4 Consultation summary
A two-phase consultation was undertaken to capture feedback from stakeholders and consider potential environmental impacts before developing viable flight path options for the proposed programme. Consultations 1 and 2 informed the airspace design that was submitted for CAA approval in August 2017. A supplementary consultation (Consultation 3) will be conducted in May 2018 to gain feedback from targeted communities on a specific aspect of change, prior to the resubmission of the final ACP application to the CAA.
4.1 Consultation 1 Consultation 1 ran from 6 June to 12 September 2016, a period of 14 weeks. The objective was to understand the views of stakeholders concerning issues that may arise from altering arrival and departure flight paths. Stakeholders were presented with a design envelope for each flight path, which identified the area within which each path may be positioned. Feedback received enabled Edinburgh Airport to develop viable flight path options for the proposed programme to effectively maximise operational benefits and minimise community impacts.
The design envelopes were presented to a variety of stakeholders, of which residents in communities under the design envelopes were key. Other stakeholders included Community Councils, Councillors, Members of Parliament (MPs), Members of the Scottish Parliament (MSPs) and stakeholder organisations. Stakeholder and community meetings were also held with representatives from local authorities and technical stakeholders such as the Edinburgh Airport Flight Operations Safety Group.
Consultation responses were split in to nine regions including West Lothian, Edinburgh City, Fife, Falkirk, Midlothian, East Lothian, Perth and Kinross, Scottish Borders and Lanarkshire (North and South). The following top themes were identified in the overall data analysis: noise, health, local pollution, environment issues and proposed alternative flights paths.
Most responses did not support the ACP due to general concerns over noise pollution, flights at unsociable hours, and increased noise due to aircraft flying at low altitudes. Health concerns were also raised regarding the impact on sleep patterns, mental health and respiratory problems. Concerns regarding local pollution and the environment were also raised, including air quality and a general increase in pollution.
Feedback from the initial consultation enabled identification of preferred flight path options that were introduced during the second round of consultation.
4.2 Consultation 2 Consultation 2 ran from 30 January to 7 May 2017, with the objective of understanding views and concerns regarding the proposed detailed design options for the flight paths and their potential environmental impacts. The preferred flight paths identified for Consultation 2 were:
• Flight path A6 TALLA departures.
• Flight path B2 GOSAM departures.
• Flight path B5 GOSAM departures.
• Flight path C5 GRICE departures.
• Flight path D0 HAVEN departures.
• Flight path E6 GOSAM departures.
• Flight path F2a GRICE departures.
• Flight path G5 HAVEN departures.
• Flight path H2 TALLA departures.
• Runway 06 arrivals.
• Runway 24 arrivals.
The consultation was undertaken through online surveys and paper questionnaires. Specifically, the respondents were asked to provide their reasons for agreeing or disagreeing with a given flight path.
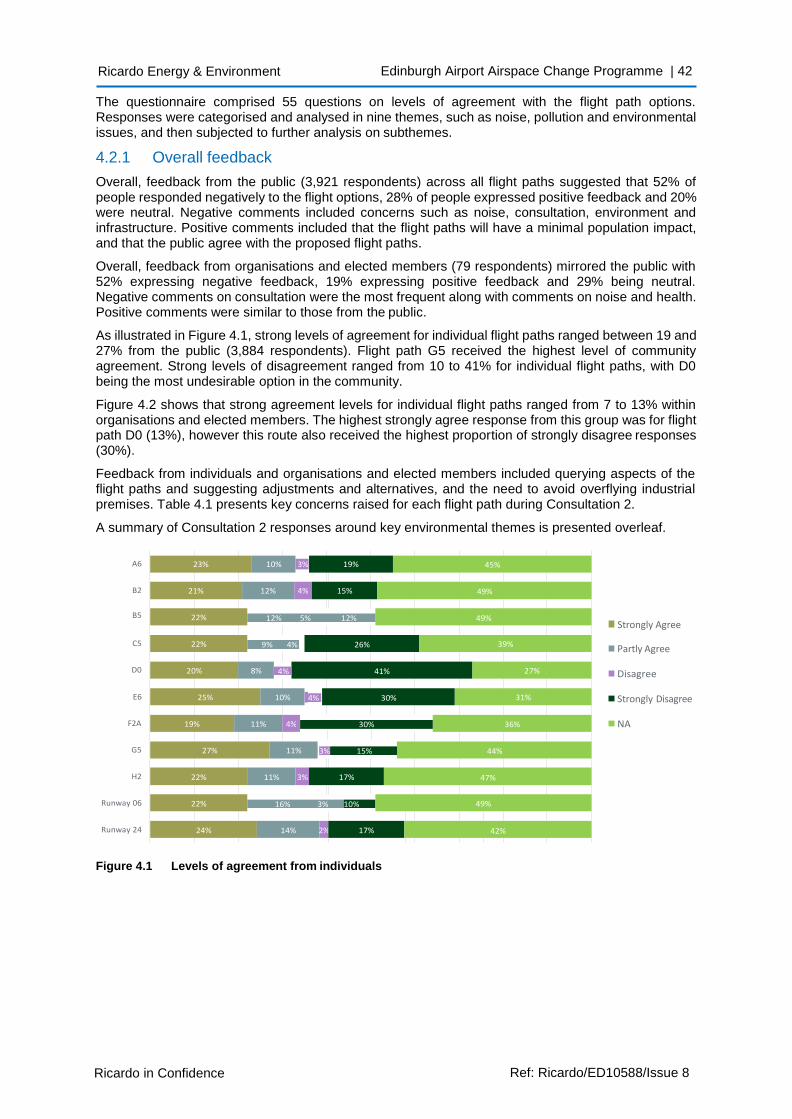
Ricardo in Confidence Ref: Ricardo/ED10588/Issue 8
Ricardo Energy & Environment Edinburgh Airport Airspace Change Programme | 42
10% 19% 23% 3% 45%
21% 12% 4% 15% 49%
22%
22% 39%
20% 8% 27%
25% 10% 31%
19% 11% 4% 30% 36%
27% 11%
22% 11% 3% 17% 47%
22%
24% 14% 2% 17% 42%
12% 5% 12% 49%
9% 4% 26%
4% 41%
4% 30%
3% 15% 44%
16% 3% 10% 49%
The questionnaire comprised 55 questions on levels of agreement with the flight path options. Responses were categorised and analysed in nine themes, such as noise, pollution and environmental issues, and then subjected to further analysis on subthemes.
4.2.1 Overall feedback
Overall, feedback from the public (3,921 respondents) across all flight paths suggested that 52% of people responded negatively to the flight options, 28% of people expressed positive feedback and 20% were neutral. Negative comments included concerns such as noise, consultation, environment and infrastructure. Positive comments included that the flight paths will have a minimal population impact, and that the public agree with the proposed flight paths.
Overall, feedback from organisations and elected members (79 respondents) mirrored the public with 52% expressing negative feedback, 19% expressing positive feedback and 29% being neutral. Negative comments on consultation were the most frequent along with comments on noise and health. Positive comments were similar to those from the public.
As illustrated in Figure 4.1, strong levels of agreement for individual flight paths ranged between 19 and 27% from the public (3,884 respondents). Flight path G5 received the highest level of community agreement. Strong levels of disagreement ranged from 10 to 41% for individual flight paths, with D0 being the most undesirable option in the community.
Figure 4.2 shows that strong agreement levels for individual flight paths ranged from 7 to 13% within organisations and elected members. The highest strongly agree response from this group was for flight path D0 (13%), however this route also received the highest proportion of strongly disagree responses (30%).
Feedback from individuals and organisations and elected members included querying aspects of the flight paths and suggesting adjustments and alternatives, and the need to avoid overflying industrial premises. Table 4.1 presents key concerns raised for each flight path during Consultation 2.
A summary of Consultation 2 responses around key environmental themes is presented overleaf.
A6
B2
B5 Strongly Agree
C5 Partly Agree
D0 Disagree
E6 Strongly Disagree
F2A NA
G5
H2
Runway 06
Runway 24
Figure 4.1 Levels of agreement from individuals
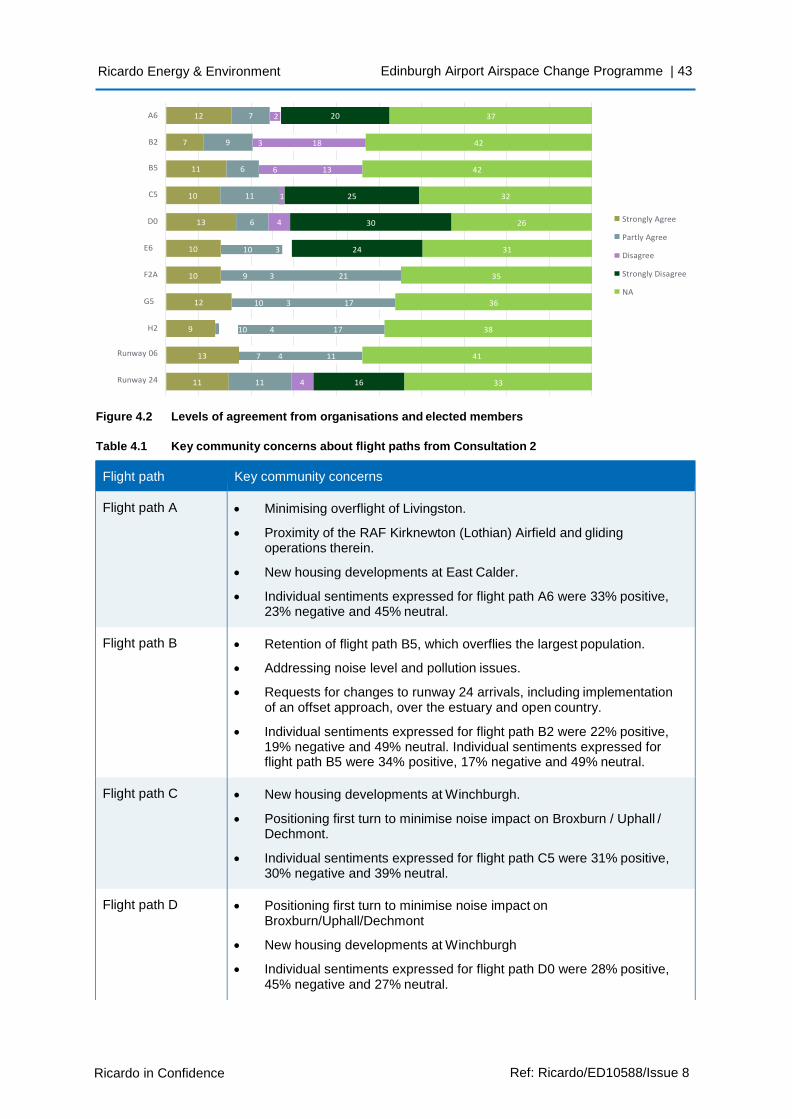
Ricardo in Confidence Ref: Ricardo/ED10588/Issue 8
Ricardo Energy & Environment Edinburgh Airport Airspace Change Programme | 43
12 7 37
3 18 42 7 9
11 6
10 11 1 25 32
13 6 4 30 26
10 24 31
10
12
9
13
11 11 4 16 33
20
42
2
6 13
10 3
9 3 21 35
10 3 17 36
10 4 17 38
7 4 11 41
A6
B2
B5
C5
D0
E6
F2A
G5
Strongly Agree
Partly Agree
Disagree
Strongly Disagree
NA
H2
Runway 06
Runway 24
Figure 4.2 Levels of agreement from organisations and elected members
Table 4.1 Key community concerns about flight paths from Consultation 2
Flight path Key community concerns
Flight path A • Minimising overflight of Livingston.
• Proximity of the RAF Kirknewton (Lothian) Airfield and gliding operations therein.
• New housing developments at East Calder.
• Individual sentiments expressed for flight path A6 were 33% positive, 23% negative and 45% neutral.
Flight path B • Retention of flight path B5, which overflies the largest population.
• Addressing noise level and pollution issues.
• Requests for changes to runway 24 arrivals, including implementation of an offset approach, over the estuary and open country.
• Individual sentiments expressed for flight path B2 were 22% positive, 19% negative and 49% neutral. Individual sentiments expressed for flight path B5 were 34% positive, 17% negative and 49% neutral.
Flight path C • New housing developments at Winchburgh.
• Positioning first turn to minimise noise impact on Broxburn / Uphall / Dechmont.
• Individual sentiments expressed for flight path C5 were 31% positive, 30% negative and 39% neutral.
Flight path D • Positioning first turn to minimise noise impact on Broxburn/Uphall/Dechmont
• New housing developments at Winchburgh
• Individual sentiments expressed for flight path D0 were 28% positive, 45% negative and 27% neutral.
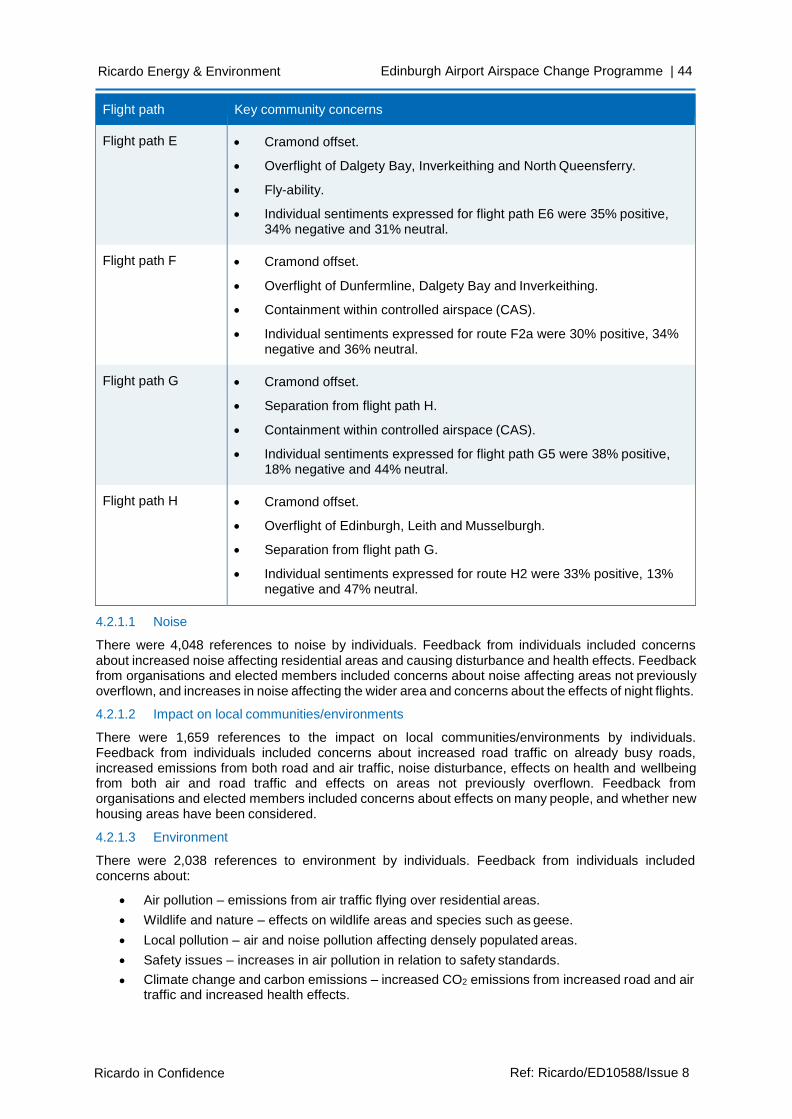
Ricardo in Confidence Ref: Ricardo/ED10588/Issue 8
Ricardo Energy & Environment Edinburgh Airport Airspace Change Programme | 44
Flight path Key community concerns
Flight path E • Cramond offset.
• Overflight of Dalgety Bay, Inverkeithing and North Queensferry.
• Fly-ability.
• Individual sentiments expressed for flight path E6 were 35% positive, 34% negative and 31% neutral.
Flight path F • Cramond offset.
• Overflight of Dunfermline, Dalgety Bay and Inverkeithing.
• Containment within controlled airspace (CAS).
• Individual sentiments expressed for route F2a were 30% positive, 34% negative and 36% neutral.
Flight path G • Cramond offset.
• Separation from flight path H.
• Containment within controlled airspace (CAS).
• Individual sentiments expressed for flight path G5 were 38% positive, 18% negative and 44% neutral.
Flight path H • Cramond offset.
• Overflight of Edinburgh, Leith and Musselburgh.
• Separation from flight path G.
• Individual sentiments expressed for route H2 were 33% positive, 13% negative and 47% neutral.
4.2.1.1 Noise
There were 4,048 references to noise by individuals. Feedback from individuals included concerns about increased noise affecting residential areas and causing disturbance and health effects. Feedback from organisations and elected members included concerns about noise affecting areas not previously overflown, and increases in noise affecting the wider area and concerns about the effects of night flights.
4.2.1.2 Impact on local communities/environments
There were 1,659 references to the impact on local communities/environments by individuals. Feedback from individuals included concerns about increased road traffic on already busy roads, increased emissions from both road and air traffic, noise disturbance, effects on health and wellbeing from both air and road traffic and effects on areas not previously overflown. Feedback from organisations and elected members included concerns about effects on many people, and whether new housing areas have been considered.
4.2.1.3 Environment
There were 2,038 references to environment by individuals. Feedback from individuals included concerns about:
• Air pollution – emissions from air traffic flying over residential areas.
• Wildlife and nature – effects on wildlife areas and species such as geese.
• Local pollution – air and noise pollution affecting densely populated areas.
• Safety issues – increases in air pollution in relation to safety standards.
• Climate change and carbon emissions – increased CO2 emissions from increased road and air traffic and increased health effects.
Ricardo in Confidence Ref: Ricardo/ED10588/Issue 8
Ricardo Energy & Environment Edinburgh Airport Airspace Change Programme | 45
• Farming – effects on outdoor workers and disturbance to livestock.
• Air quality – odour from air emissions from aircraft and effects on health.
• Fuel dumping – damage to the environment.
Feedback from organisations and elected members included concerns about:
• Air pollution – negative and cumulative effect on residential areas.
• Wildlife and nature – overflying of nature reserves and bird roosts at Aberlady.
• Local pollution – local pollution and environmental issues across several areas.
• Safety issues – too close to RAF Kirknewton and therefore effects on safety.
• Climate change and carbon emissions – the need to fulfil criteria set out in the Department for Transport’s document ‘Guidance to the Civil Aviation Authority on Environmental Objectives Relating to the Exercise of its Air Navigation Functions’ regarding greenhouse gas emissions and ozone depleting substances.
4.2.1.4 Health and wellbeing
There were 1,501 mentions of health and wellbeing by individuals. Feedback from individuals included concerns about:
• Health issues – concerns about health effects.
• Quality of life – concerns about effects changes to peace and tranquillity affecting quality of life.
• Disturbed sleep.
• Impact on leisure activities – flight paths should avoid equestrian centre.
• Stress/mental health issues – links between living under flight paths and physical and mental health conditions.
• Impact on existing health issues.
• Breathing/respiratory issues.
• Hospital/care facilities – disruption to facilities.
Feedback from organisations and elected members included concerns about:
• Health issues – increased risk of health issues associated with aircraft noise.
• Quality of life – effects on a large consented development.
• Impact on leisure activities – several establishments would be affected by increased noise.
• Stress/mental health issues – newly affected residents have reported a range of health issues.
• Disturbed sleep.
4.2.1.5 Time
There were 607 references to time. Feedback was mainly associated with restricting night time flights.
4.2.1.6 Schooling
There were 233 mentions of schooling by individuals. Feedback included concerns about the flight paths being over schools and associated noise disturbance and learning and health issues.
Community feedback received during Consultations 1 and 2 was considered when developing the proposed programme, which is described in the following section.
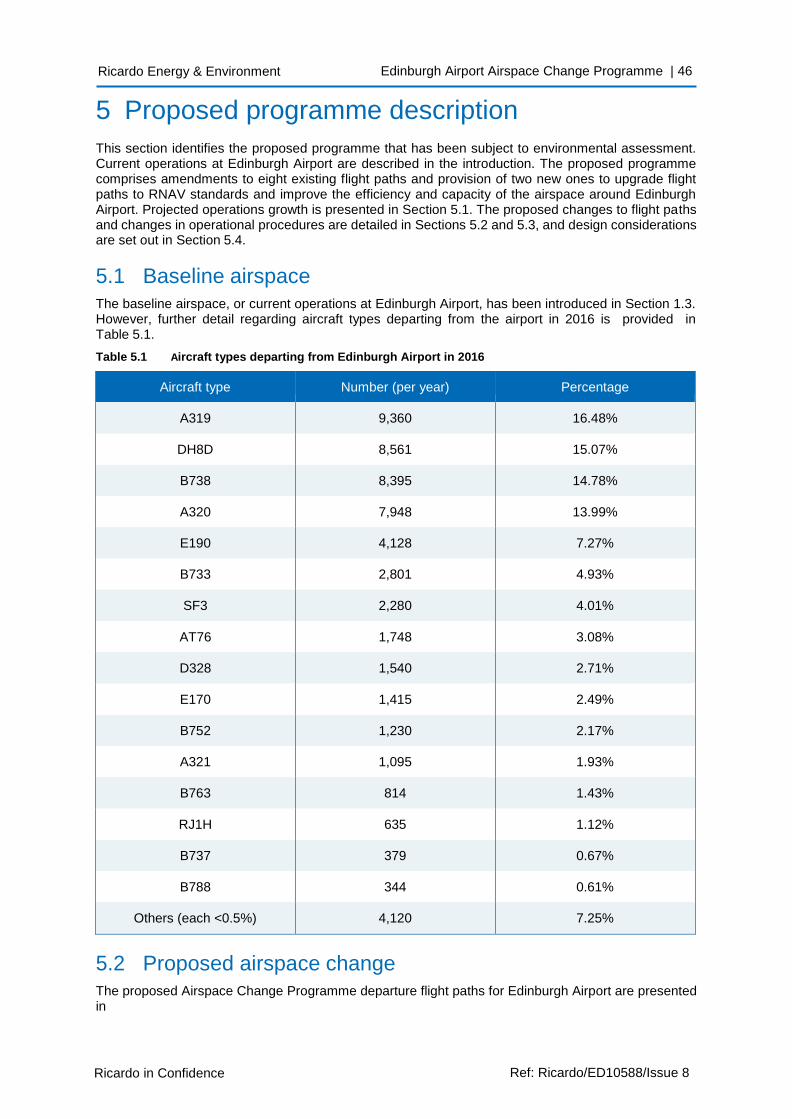
Ricardo in Confidence Ref: Ricardo/ED10588/Issue 8
Ricardo Energy & Environment Edinburgh Airport Airspace Change Programme | 46
5 Proposed programme description
This section identifies the proposed programme that has been subject to environmental assessment. Current operations at Edinburgh Airport are described in the introduction. The proposed programme comprises amendments to eight existing flight paths and provision of two new ones to upgrade flight paths to RNAV standards and improve the efficiency and capacity of the airspace around Edinburgh Airport. Projected operations growth is presented in Section 5.1. The proposed changes to flight paths and changes in operational procedures are detailed in Sections 5.2 and 5.3, and design considerations are set out in Section 5.4.
5.1 Baseline airspace
The baseline airspace, or current operations at Edinburgh Airport, has been introduced in Section 1.3. However, further detail regarding aircraft types departing from the airport in 2016 is provided in Table 5.1.
Table 5.1 Aircraft types departing from Edinburgh Airport in 2016
Aircraft type Number (per year) Percentage
A319 9,360 16.48%
DH8D 8,561 15.07%
B738 8,395 14.78%
A320 7,948 13.99%
E190 4,128 7.27%
B733 2,801 4.93%
SF3 2,280 4.01%
AT76 1,748 3.08%
D328 1,540 2.71%
E170 1,415 2.49%
B752 1,230 2.17%
A321 1,095 1.93%
B763 814 1.43%
RJ1H 635 1.12%
B737 379 0.67%
B788 344 0.61%
Others (each <0.5%) 4,120 7.25%
5.2 Proposed airspace change
The proposed Airspace Change Programme departure flight paths for Edinburgh Airport are presented in
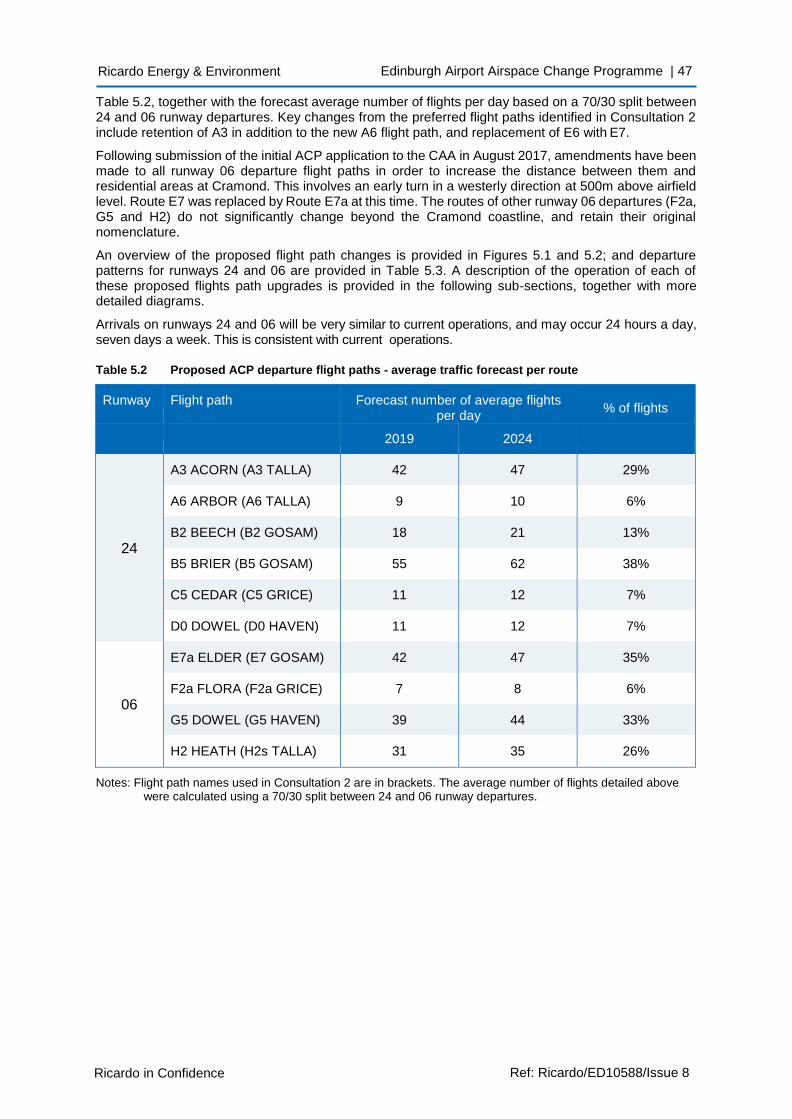
Ricardo in Confidence Ref: Ricardo/ED10588/Issue 8
Ricardo Energy & Environment Edinburgh Airport Airspace Change Programme | 47
Table 5.2, together with the forecast average number of flights per day based on a 70/30 split between 24 and 06 runway departures. Key changes from the preferred flight paths identified in Consultation 2 include retention of A3 in addition to the new A6 flight path, and replacement of E6 with E7.
Following submission of the initial ACP application to the CAA in August 2017, amendments have been made to all runway 06 departure flight paths in order to increase the distance between them and residential areas at Cramond. This involves an early turn in a westerly direction at 500m above airfield level. Route E7 was replaced by Route E7a at this time. The routes of other runway 06 departures (F2a, G5 and H2) do not significantly change beyond the Cramond coastline, and retain their original nomenclature.
An overview of the proposed flight path changes is provided in Figures 5.1 and 5.2; and departure patterns for runways 24 and 06 are provided in Table 5.3. A description of the operation of each of these proposed flights path upgrades is provided in the following sub-sections, together with more detailed diagrams.
Arrivals on runways 24 and 06 will be very similar to current operations, and may occur 24 hours a day, seven days a week. This is consistent with current operations.
Table 5.2 Proposed ACP departure flight paths - average traffic forecast per route
Runway Flight path Forecast number of average flights per day
% of flights
2019 2024
24
A3 ACORN (A3 TALLA) 42 47 29%
A6 ARBOR (A6 TALLA) 9 10 6%
B2 BEECH (B2 GOSAM) 18 21 13%
B5 BRIER (B5 GOSAM) 55 62 38%
C5 CEDAR (C5 GRICE) 11 12 7%
D0 DOWEL (D0 HAVEN) 11 12 7%
06
E7a ELDER (E7 GOSAM) 42 47 35%
F2a FLORA (F2a GRICE) 7 8 6%
G5 DOWEL (G5 HAVEN) 39 44 33%
H2 HEATH (H2s TALLA) 31 35 26%
Notes: Flight path names used in Consultation 2 are in brackets. The average number of flights detailed above were calculated using a 70/30 split between 24 and 06 runway departures.

Ricardo in Confidence Ref: Ricardo/ED10588/Issue 8
Ricardo Energy & Environment Edinburgh Airport Airspace Change Programme | 48
Figure 5.1 Proposed runway 24 departures
Figure 5.2 Proposed runway 06 departures
Contains Ordnance Survey data © Crown copyright and database rights [2017]
Contains Ordnance Survey data © Crown copyright and database rights [2017]
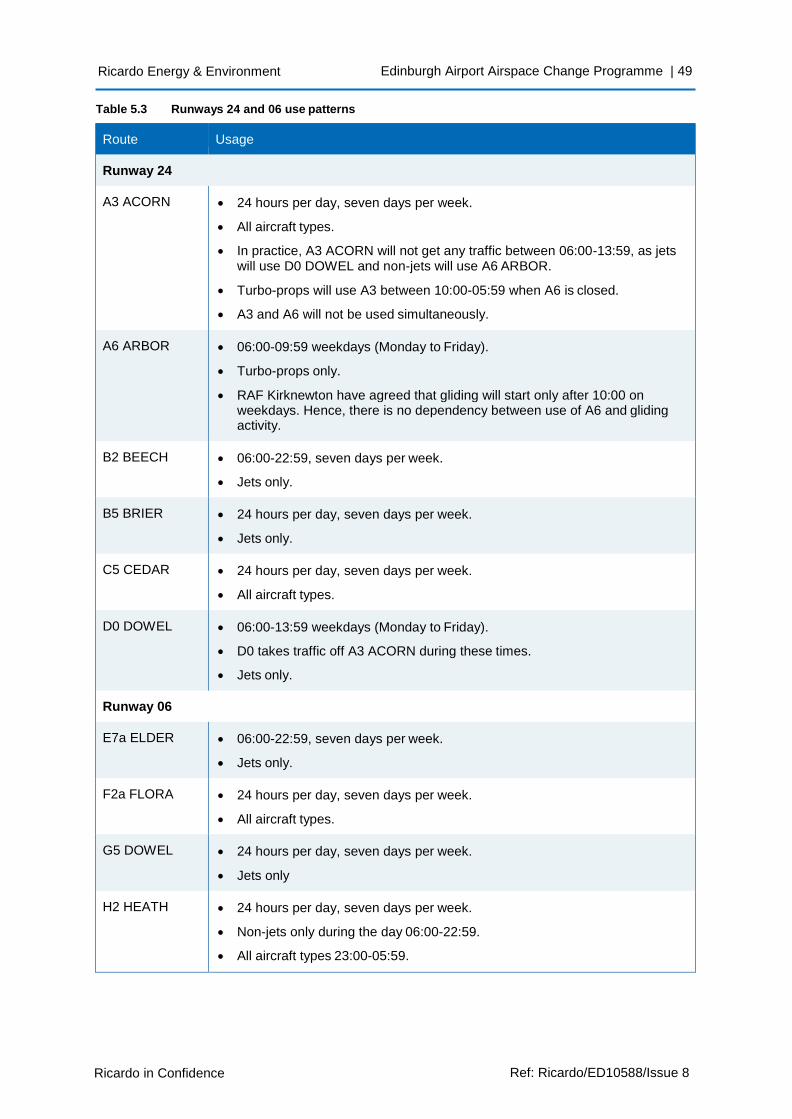
Ricardo in Confidence Ref: Ricardo/ED10588/Issue 8
Ricardo Energy & Environment Edinburgh Airport Airspace Change Programme | 49
Table 5.3 Runways 24 and 06 use patterns
Route Usage
Runway 24
A3 ACORN • 24 hours per day, seven days per week.
• All aircraft types.
• In practice, A3 ACORN will not get any traffic between 06:00-13:59, as jets will use D0 DOWEL and non-jets will use A6 ARBOR.
• Turbo-props will use A3 between 10:00-05:59 when A6 is closed.
• A3 and A6 will not be used simultaneously.
A6 ARBOR • 06:00-09:59 weekdays (Monday to Friday).
• Turbo-props only.
• RAF Kirknewton have agreed that gliding will start only after 10:00 on weekdays. Hence, there is no dependency between use of A6 and gliding activity.
B2 BEECH • 06:00-22:59, seven days per week.
• Jets only.
B5 BRIER • 24 hours per day, seven days per week.
• Jets only.
C5 CEDAR • 24 hours per day, seven days per week.
• All aircraft types.
D0 DOWEL • 06:00-13:59 weekdays (Monday to Friday).
• D0 takes traffic off A3 ACORN during these times.
• Jets only.
Runway 06
E7a ELDER • 06:00-22:59, seven days per week.
• Jets only.
F2a FLORA • 24 hours per day, seven days per week.
• All aircraft types.
G5 DOWEL • 24 hours per day, seven days per week.
• Jets only
H2 HEATH • 24 hours per day, seven days per week.
• Non-jets only during the day 06:00-22:59.
• All aircraft types 23:00-05:59.
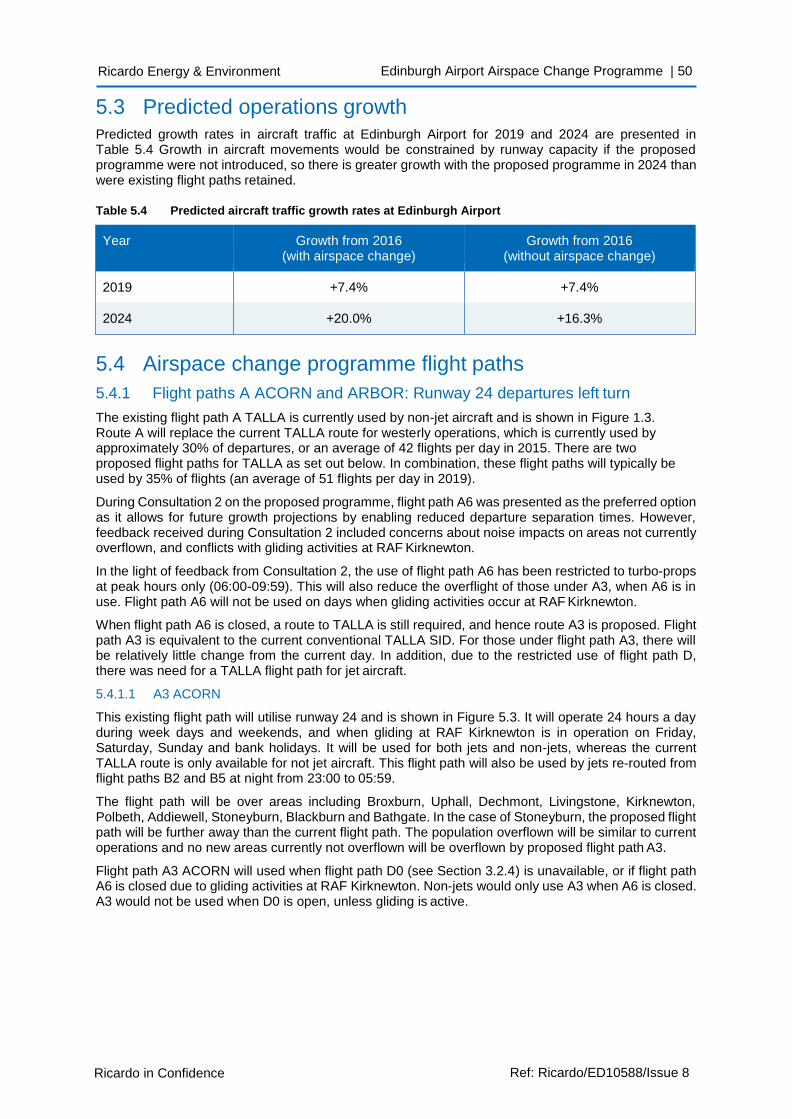
Ricardo in Confidence Ref: Ricardo/ED10588/Issue 8
Ricardo Energy & Environment Edinburgh Airport Airspace Change Programme | 50
5.3 Predicted operations growth Predicted growth rates in aircraft traffic at Edinburgh Airport for 2019 and 2024 are presented in Table 5.4 Growth in aircraft movements would be constrained by runway capacity if the proposed programme were not introduced, so there is greater growth with the proposed programme in 2024 than were existing flight paths retained.
Table 5.4 Predicted aircraft traffic growth rates at Edinburgh Airport
Year Growth from 2016 (with airspace change)
Growth from 2016 (without airspace change)
2019 +7.4% +7.4%
2024 +20.0% +16.3%
5.4 Airspace change programme flight paths
5.4.1 Flight paths A ACORN and ARBOR: Runway 24 departures left turn
The existing flight path A TALLA is currently used by non-jet aircraft and is shown in Figure 1.3. Route A will replace the current TALLA route for westerly operations, which is currently used by approximately 30% of departures, or an average of 42 flights per day in 2015. There are two proposed flight paths for TALLA as set out below. In combination, these flight paths will typically be used by 35% of flights (an average of 51 flights per day in 2019).
During Consultation 2 on the proposed programme, flight path A6 was presented as the preferred option as it allows for future growth projections by enabling reduced departure separation times. However, feedback received during Consultation 2 included concerns about noise impacts on areas not currently overflown, and conflicts with gliding activities at RAF Kirknewton.
In the light of feedback from Consultation 2, the use of flight path A6 has been restricted to turbo-props at peak hours only (06:00-09:59). This will also reduce the overflight of those under A3, when A6 is in use. Flight path A6 will not be used on days when gliding activities occur at RAF Kirknewton.
When flight path A6 is closed, a route to TALLA is still required, and hence route A3 is proposed. Flight path A3 is equivalent to the current conventional TALLA SID. For those under flight path A3, there will be relatively little change from the current day. In addition, due to the restricted use of flight path D, there was need for a TALLA flight path for jet aircraft.
5.4.1.1 A3 ACORN
This existing flight path will utilise runway 24 and is shown in Figure 5.3. It will operate 24 hours a day during week days and weekends, and when gliding at RAF Kirknewton is in operation on Friday, Saturday, Sunday and bank holidays. It will be used for both jets and non-jets, whereas the current TALLA route is only available for not jet aircraft. This flight path will also be used by jets re-routed from flight paths B2 and B5 at night from 23:00 to 05:59.
The flight path will be over areas including Broxburn, Uphall, Dechmont, Livingstone, Kirknewton, Polbeth, Addiewell, Stoneyburn, Blackburn and Bathgate. In the case of Stoneyburn, the proposed flight path will be further away than the current flight path. The population overflown will be similar to current operations and no new areas currently not overflown will be overflown by proposed flight path A3.
Flight path A3 ACORN will used when flight path D0 (see Section 3.2.4) is unavailable, or if flight path A6 is closed due to gliding activities at RAF Kirknewton. Non-jets would only use A3 when A6 is closed. A3 would not be used when D0 is open, unless gliding is active.
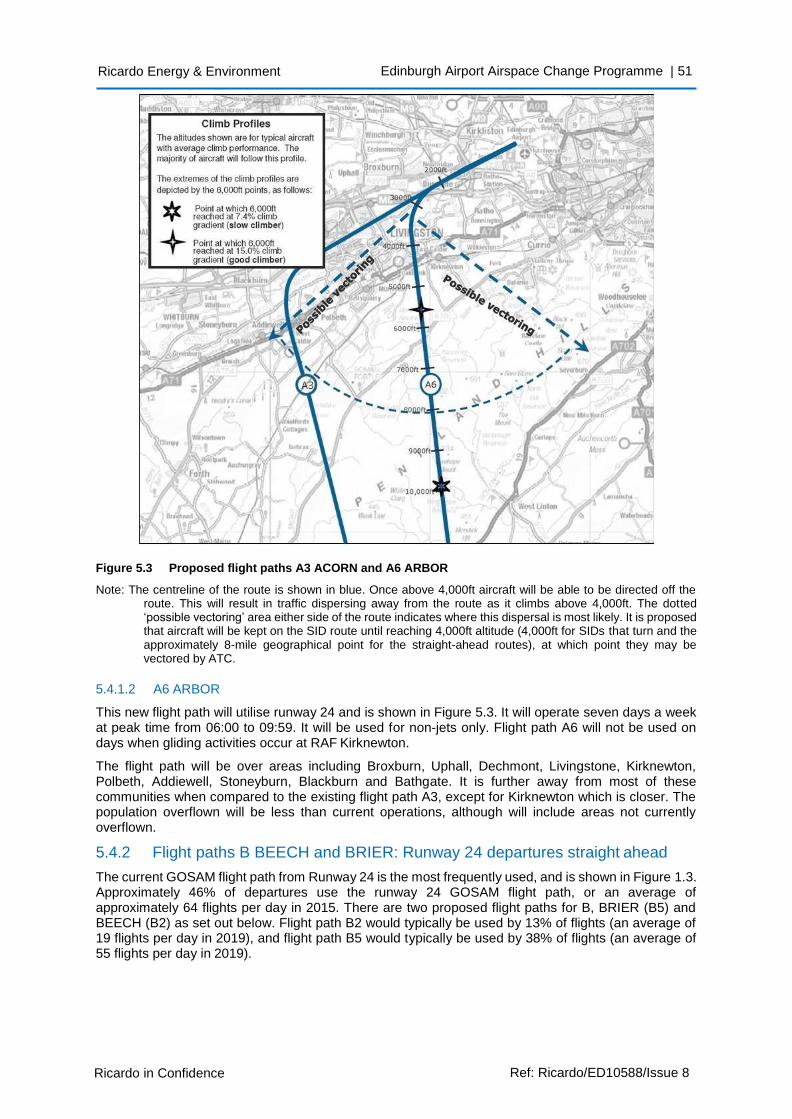
Ricardo in Confidence Ref: Ricardo/ED10588/Issue 8
Ricardo Energy & Environment Edinburgh Airport Airspace Change Programme | 51
Figure 5.3 Proposed flight paths A3 ACORN and A6 ARBOR
Note: The centreline of the route is shown in blue. Once above 4,000ft aircraft will be able to be directed off the route. This will result in traffic dispersing away from the route as it climbs above 4,000ft. The dotted ‘possible vectoring’ area either side of the route indicates where this dispersal is most likely. It is proposed that aircraft will be kept on the SID route until reaching 4,000ft altitude (4,000ft for SIDs that turn and the approximately 8-mile geographical point for the straight-ahead routes), at which point they may be vectored by ATC.
5.4.1.2 A6 ARBOR
This new flight path will utilise runway 24 and is shown in Figure 5.3. It will operate seven days a week at peak time from 06:00 to 09:59. It will be used for non-jets only. Flight path A6 will not be used on days when gliding activities occur at RAF Kirknewton.
The flight path will be over areas including Broxburn, Uphall, Dechmont, Livingstone, Kirknewton, Polbeth, Addiewell, Stoneyburn, Blackburn and Bathgate. It is further away from most of these communities when compared to the existing flight path A3, except for Kirknewton which is closer. The population overflown will be less than current operations, although will include areas not currently overflown.
5.4.2 Flight paths B BEECH and BRIER: Runway 24 departures straight ahead
The current GOSAM flight path from Runway 24 is the most frequently used, and is shown in Figure 1.3. Approximately 46% of departures use the runway 24 GOSAM flight path, or an average of approximately 64 flights per day in 2015. There are two proposed flight paths for B, BRIER (B5) and BEECH (B2) as set out below. Flight path B2 would typically be used by 13% of flights (an average of 19 flights per day in 2019), and flight path B5 would typically be used by 38% of flights (an average of 55 flights per day in 2019).
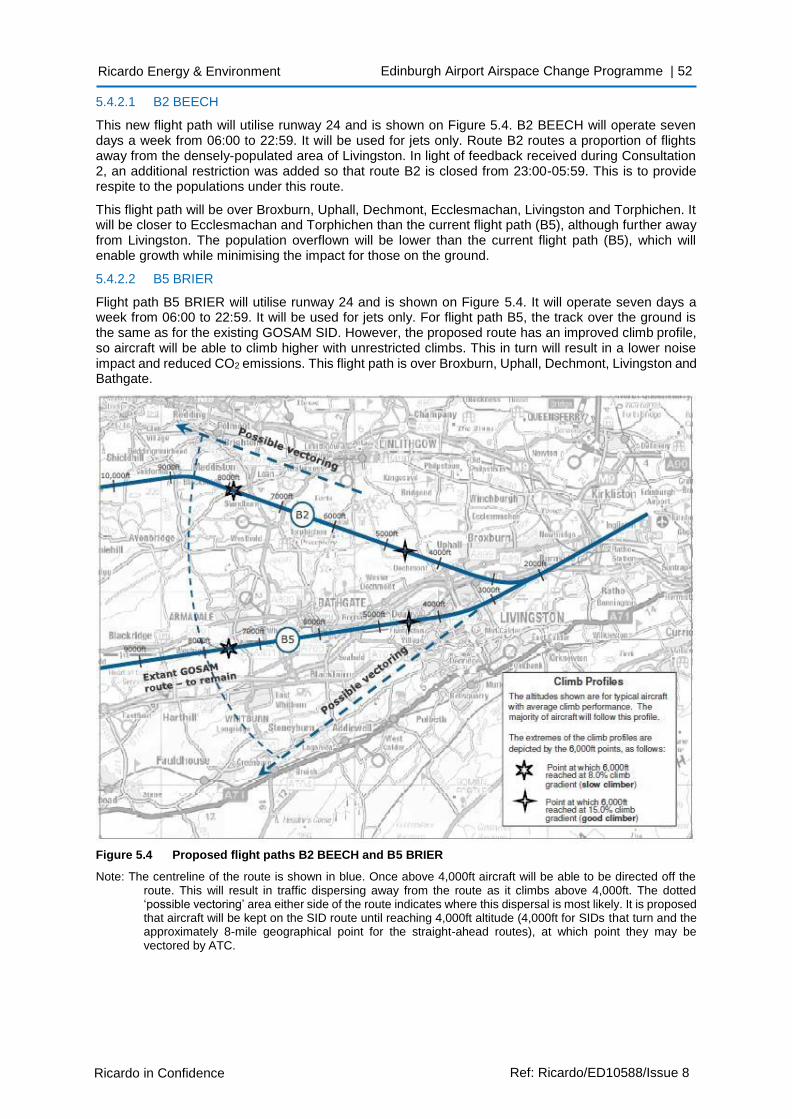
Ricardo in Confidence Ref: Ricardo/ED10588/Issue 8
Ricardo Energy & Environment Edinburgh Airport Airspace Change Programme | 52
5.4.2.1 B2 BEECH
This new flight path will utilise runway 24 and is shown on Figure 5.4. B2 BEECH will operate seven days a week from 06:00 to 22:59. It will be used for jets only. Route B2 routes a proportion of flights away from the densely-populated area of Livingston. In light of feedback received during Consultation 2, an additional restriction was added so that route B2 is closed from 23:00-05:59. This is to provide respite to the populations under this route.
This flight path will be over Broxburn, Uphall, Dechmont, Ecclesmachan, Livingston and Torphichen. It will be closer to Ecclesmachan and Torphichen than the current flight path (B5), although further away from Livingston. The population overflown will be lower than the current flight path (B5), which will enable growth while minimising the impact for those on the ground.
5.4.2.2 B5 BRIER
Flight path B5 BRIER will utilise runway 24 and is shown on Figure 5.4. It will operate seven days a week from 06:00 to 22:59. It will be used for jets only. For flight path B5, the track over the ground is the same as for the existing GOSAM SID. However, the proposed route has an improved climb profile, so aircraft will be able to climb higher with unrestricted climbs. This in turn will result in a lower noise impact and reduced CO2 emissions. This flight path is over Broxburn, Uphall, Dechmont, Livingston and Bathgate.
Figure 5.4 Proposed flight paths B2 BEECH and B5 BRIER
Note: The centreline of the route is shown in blue. Once above 4,000ft aircraft will be able to be directed off the route. This will result in traffic dispersing away from the route as it climbs above 4,000ft. The dotted ‘possible vectoring’ area either side of the route indicates where this dispersal is most likely. It is proposed that aircraft will be kept on the SID route until reaching 4,000ft altitude (4,000ft for SIDs that turn and the approximately 8-mile geographical point for the straight-ahead routes), at which point they may be vectored by ATC.
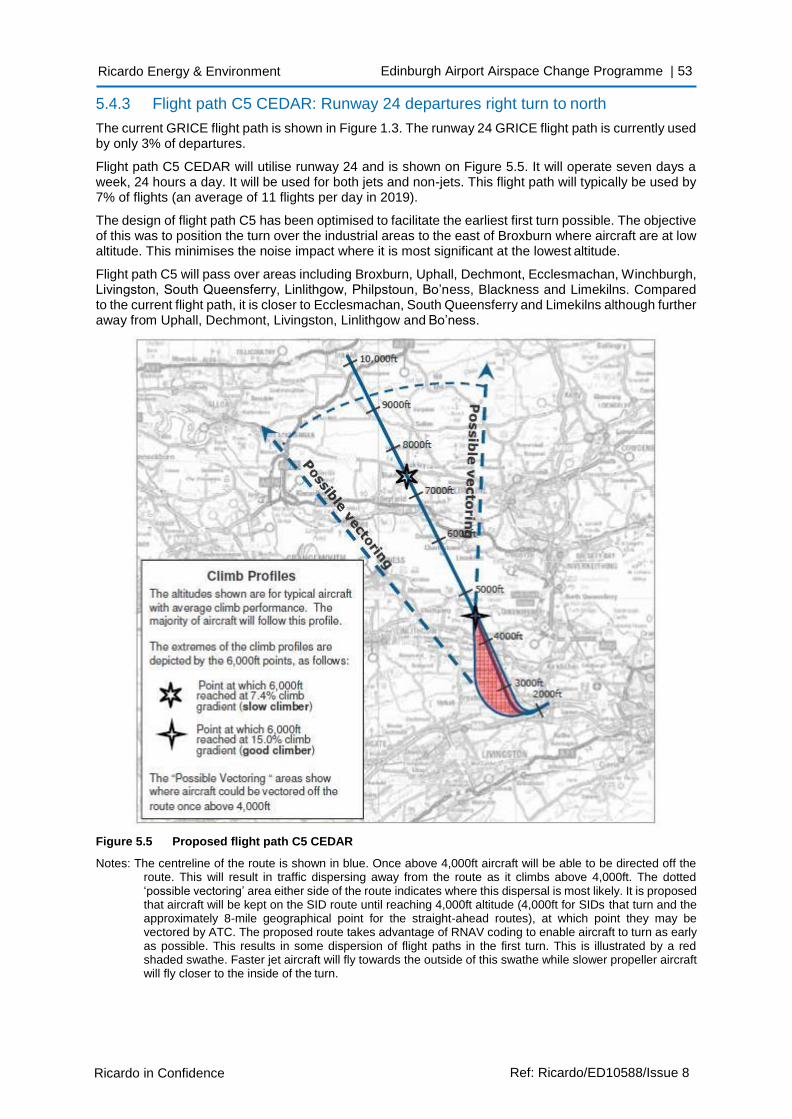
Ricardo in Confidence Ref: Ricardo/ED10588/Issue 8
Ricardo Energy & Environment Edinburgh Airport Airspace Change Programme | 53
5.4.3 Flight path C5 CEDAR: Runway 24 departures right turn to north
The current GRICE flight path is shown in Figure 1.3. The runway 24 GRICE flight path is currently used by only 3% of departures.
Flight path C5 CEDAR will utilise runway 24 and is shown on Figure 5.5. It will operate seven days a week, 24 hours a day. It will be used for both jets and non-jets. This flight path will typically be used by 7% of flights (an average of 11 flights per day in 2019).
The design of flight path C5 has been optimised to facilitate the earliest first turn possible. The objective of this was to position the turn over the industrial areas to the east of Broxburn where aircraft are at low altitude. This minimises the noise impact where it is most significant at the lowest altitude.
Flight path C5 will pass over areas including Broxburn, Uphall, Dechmont, Ecclesmachan, Winchburgh, Livingston, South Queensferry, Linlithgow, Philpstoun, Bo’ness, Blackness and Limekilns. Compared to the current flight path, it is closer to Ecclesmachan, South Queensferry and Limekilns although further away from Uphall, Dechmont, Livingston, Linlithgow and Bo’ness.
Figure 5.5 Proposed flight path C5 CEDAR
Notes: The centreline of the route is shown in blue. Once above 4,000ft aircraft will be able to be directed off the route. This will result in traffic dispersing away from the route as it climbs above 4,000ft. The dotted ‘possible vectoring’ area either side of the route indicates where this dispersal is most likely. It is proposed that aircraft will be kept on the SID route until reaching 4,000ft altitude (4,000ft for SIDs that turn and the approximately 8-mile geographical point for the straight-ahead routes), at which point they may be vectored by ATC. The proposed route takes advantage of RNAV coding to enable aircraft to turn as early as possible. This results in some dispersion of flight paths in the first turn. This is illustrated by a red shaded swathe. Faster jet aircraft will fly towards the outside of this swathe while slower propeller aircraft will fly closer to the inside of the turn.
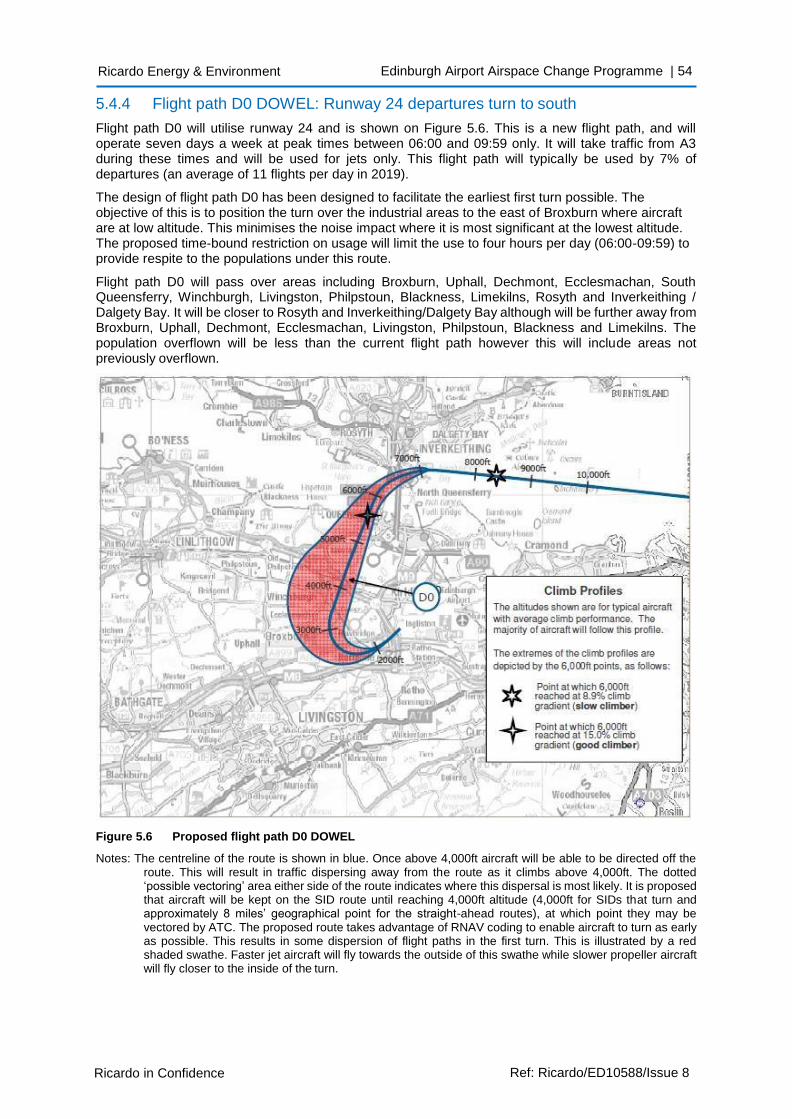
Ricardo in Confidence Ref: Ricardo/ED10588/Issue 8
Ricardo Energy & Environment Edinburgh Airport Airspace Change Programme | 54
5.4.4 Flight path D0 DOWEL: Runway 24 departures turn to south
Flight path D0 will utilise runway 24 and is shown on Figure 5.6. This is a new flight path, and will operate seven days a week at peak times between 06:00 and 09:59 only. It will take traffic from A3 during these times and will be used for jets only. This flight path will typically be used by 7% of departures (an average of 11 flights per day in 2019).
The design of flight path D0 has been designed to facilitate the earliest first turn possible. The objective of this is to position the turn over the industrial areas to the east of Broxburn where aircraft are at low altitude. This minimises the noise impact where it is most significant at the lowest altitude. The proposed time-bound restriction on usage will limit the use to four hours per day (06:00-09:59) to provide respite to the populations under this route.
Flight path D0 will pass over areas including Broxburn, Uphall, Dechmont, Ecclesmachan, South Queensferry, Winchburgh, Livingston, Philpstoun, Blackness, Limekilns, Rosyth and Inverkeithing / Dalgety Bay. It will be closer to Rosyth and Inverkeithing/Dalgety Bay although will be further away from Broxburn, Uphall, Dechmont, Ecclesmachan, Livingston, Philpstoun, Blackness and Limekilns. The population overflown will be less than the current flight path however this will include areas not previously overflown.
Figure 5.6 Proposed flight path D0 DOWEL
Notes: The centreline of the route is shown in blue. Once above 4,000ft aircraft will be able to be directed off the route. This will result in traffic dispersing away from the route as it climbs above 4,000ft. The dotted ‘possible vectoring’ area either side of the route indicates where this dispersal is most likely. It is proposed that aircraft will be kept on the SID route until reaching 4,000ft altitude (4,000ft for SIDs that turn and approximately 8 miles’ geographical point for the straight-ahead routes), at which point they may be vectored by ATC. The proposed route takes advantage of RNAV coding to enable aircraft to turn as early as possible. This results in some dispersion of flight paths in the first turn. This is illustrated by a red shaded swathe. Faster jet aircraft will fly towards the outside of this swathe while slower propeller aircraft will fly closer to the inside of the turn.
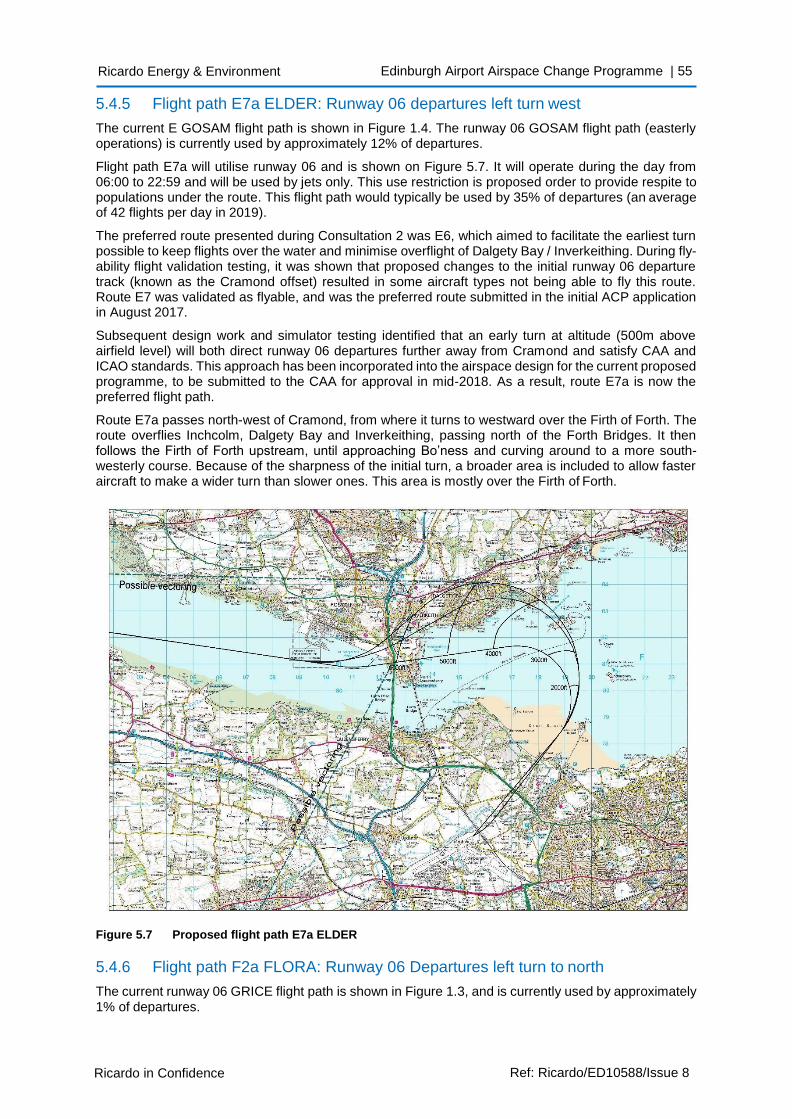
Ricardo in Confidence Ref: Ricardo/ED10588/Issue 8
Ricardo Energy & Environment Edinburgh Airport Airspace Change Programme | 55
5.4.5 Flight path E7a ELDER: Runway 06 departures left turn west
The current E GOSAM flight path is shown in Figure 1.4. The runway 06 GOSAM flight path (easterly operations) is currently used by approximately 12% of departures.
Flight path E7a will utilise runway 06 and is shown on Figure 5.7. It will operate during the day from 06:00 to 22:59 and will be used by jets only. This use restriction is proposed order to provide respite to populations under the route. This flight path would typically be used by 35% of departures (an average of 42 flights per day in 2019).
The preferred route presented during Consultation 2 was E6, which aimed to facilitate the earliest turn possible to keep flights over the water and minimise overflight of Dalgety Bay / Inverkeithing. During fly- ability flight validation testing, it was shown that proposed changes to the initial runway 06 departure track (known as the Cramond offset) resulted in some aircraft types not being able to fly this route. Route E7 was validated as flyable, and was the preferred route submitted in the initial ACP application in August 2017.
Subsequent design work and simulator testing identified that an early turn at altitude (500m above airfield level) will both direct runway 06 departures further away from Cramond and satisfy CAA and ICAO standards. This approach has been incorporated into the airspace design for the current proposed programme, to be submitted to the CAA for approval in mid-2018. As a result, route E7a is now the preferred flight path.
Route E7a passes north-west of Cramond, from where it turns to westward over the Firth of Forth. The route overflies Inchcolm, Dalgety Bay and Inverkeithing, passing north of the Forth Bridges. It then follows the Firth of Forth upstream, until approaching Bo’ness and curving around to a more south- westerly course. Because of the sharpness of the initial turn, a broader area is included to allow faster aircraft to make a wider turn than slower ones. This area is mostly over the Firth of Forth.
Figure 5.7 Proposed flight path E7a ELDER
5.4.6 Flight path F2a FLORA: Runway 06 Departures left turn to north
The current runway 06 GRICE flight path is shown in Figure 1.3, and is currently used by approximately 1% of departures.
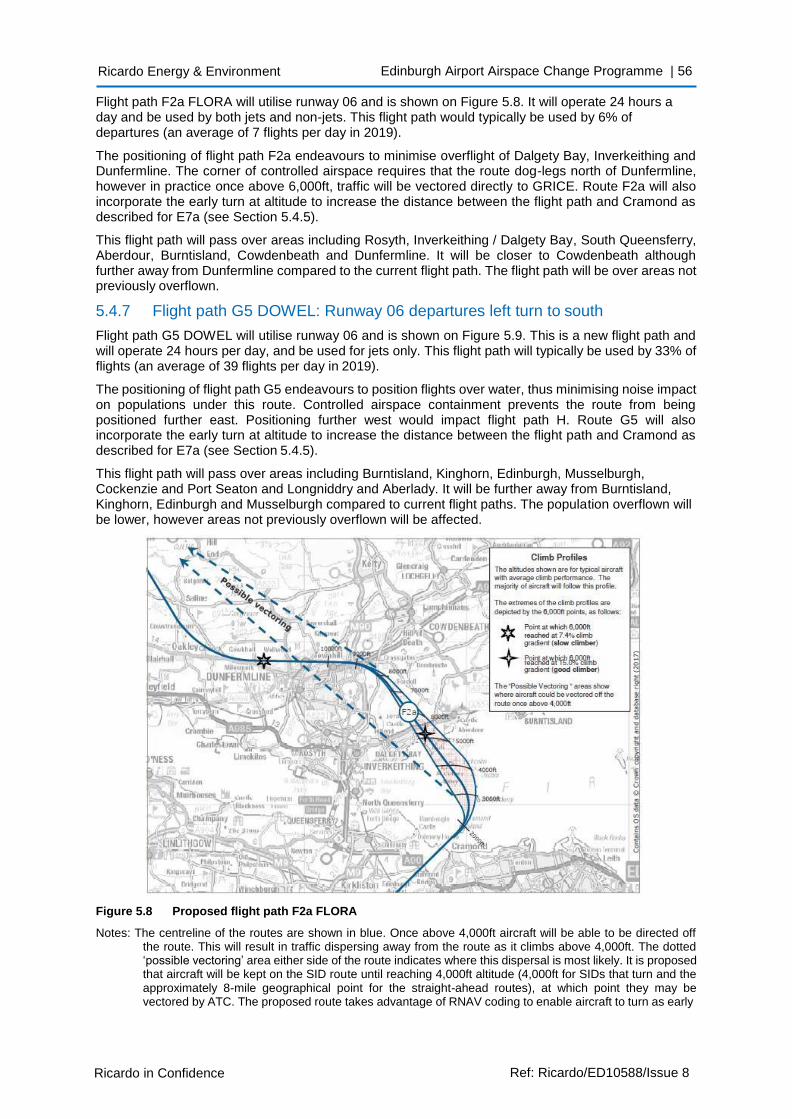
Ricardo in Confidence Ref: Ricardo/ED10588/Issue 8
Ricardo Energy & Environment Edinburgh Airport Airspace Change Programme | 56
Flight path F2a FLORA will utilise runway 06 and is shown on Figure 5.8. It will operate 24 hours a day and be used by both jets and non-jets. This flight path would typically be used by 6% of departures (an average of 7 flights per day in 2019).
The positioning of flight path F2a endeavours to minimise overflight of Dalgety Bay, Inverkeithing and Dunfermline. The corner of controlled airspace requires that the route dog-legs north of Dunfermline, however in practice once above 6,000ft, traffic will be vectored directly to GRICE. Route F2a will also incorporate the early turn at altitude to increase the distance between the flight path and Cramond as described for E7a (see Section 5.4.5).
This flight path will pass over areas including Rosyth, Inverkeithing / Dalgety Bay, South Queensferry, Aberdour, Burntisland, Cowdenbeath and Dunfermline. It will be closer to Cowdenbeath although further away from Dunfermline compared to the current flight path. The flight path will be over areas not previously overflown.
5.4.7 Flight path G5 DOWEL: Runway 06 departures left turn to south
Flight path G5 DOWEL will utilise runway 06 and is shown on Figure 5.9. This is a new flight path and will operate 24 hours per day, and be used for jets only. This flight path will typically be used by 33% of flights (an average of 39 flights per day in 2019).
The positioning of flight path G5 endeavours to position flights over water, thus minimising noise impact on populations under this route. Controlled airspace containment prevents the route from being positioned further east. Positioning further west would impact flight path H. Route G5 will also incorporate the early turn at altitude to increase the distance between the flight path and Cramond as described for E7a (see Section 5.4.5).
This flight path will pass over areas including Burntisland, Kinghorn, Edinburgh, Musselburgh, Cockenzie and Port Seaton and Longniddry and Aberlady. It will be further away from Burntisland, Kinghorn, Edinburgh and Musselburgh compared to current flight paths. The population overflown will be lower, however areas not previously overflown will be affected.
Figure 5.8 Proposed flight path F2a FLORA
Notes: The centreline of the routes are shown in blue. Once above 4,000ft aircraft will be able to be directed off the route. This will result in traffic dispersing away from the route as it climbs above 4,000ft. The dotted ‘possible vectoring’ area either side of the route indicates where this dispersal is most likely. It is proposed that aircraft will be kept on the SID route until reaching 4,000ft altitude (4,000ft for SIDs that turn and the approximately 8-mile geographical point for the straight-ahead routes), at which point they may be vectored by ATC. The proposed route takes advantage of RNAV coding to enable aircraft to turn as early
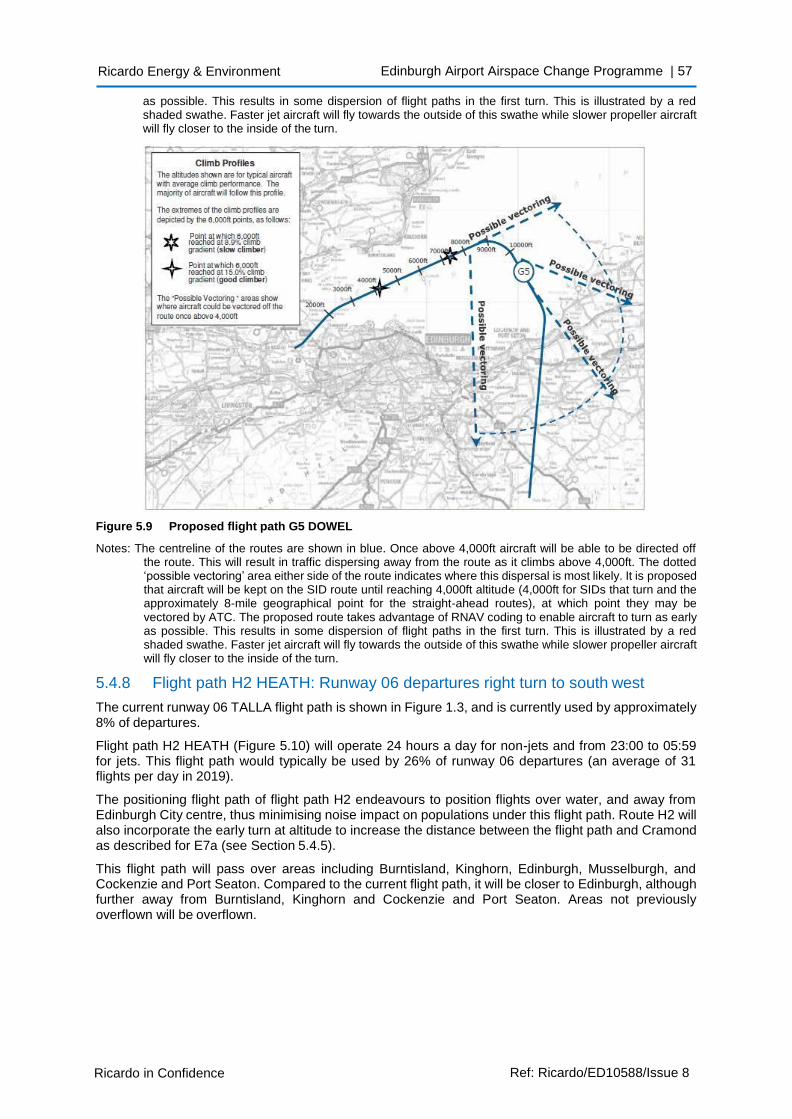
Ricardo in Confidence Ref: Ricardo/ED10588/Issue 8
Ricardo Energy & Environment Edinburgh Airport Airspace Change Programme | 57
as possible. This results in some dispersion of flight paths in the first turn. This is illustrated by a red shaded swathe. Faster jet aircraft will fly towards the outside of this swathe while slower propeller aircraft will fly closer to the inside of the turn.
Figure 5.9 Proposed flight path G5 DOWEL
Notes: The centreline of the routes are shown in blue. Once above 4,000ft aircraft will be able to be directed off the route. This will result in traffic dispersing away from the route as it climbs above 4,000ft. The dotted ‘possible vectoring’ area either side of the route indicates where this dispersal is most likely. It is proposed that aircraft will be kept on the SID route until reaching 4,000ft altitude (4,000ft for SIDs that turn and the approximately 8-mile geographical point for the straight-ahead routes), at which point they may be vectored by ATC. The proposed route takes advantage of RNAV coding to enable aircraft to turn as early as possible. This results in some dispersion of flight paths in the first turn. This is illustrated by a red shaded swathe. Faster jet aircraft will fly towards the outside of this swathe while slower propeller aircraft will fly closer to the inside of the turn.
5.4.8 Flight path H2 HEATH: Runway 06 departures right turn to south west
The current runway 06 TALLA flight path is shown in Figure 1.3, and is currently used by approximately 8% of departures.
Flight path H2 HEATH (Figure 5.10) will operate 24 hours a day for non-jets and from 23:00 to 05:59 for jets. This flight path would typically be used by 26% of runway 06 departures (an average of 31 flights per day in 2019).
The positioning flight path of flight path H2 endeavours to position flights over water, and away from Edinburgh City centre, thus minimising noise impact on populations under this flight path. Route H2 will also incorporate the early turn at altitude to increase the distance between the flight path and Cramond as described for E7a (see Section 5.4.5).
This flight path will pass over areas including Burntisland, Kinghorn, Edinburgh, Musselburgh, and Cockenzie and Port Seaton. Compared to the current flight path, it will be closer to Edinburgh, although further away from Burntisland, Kinghorn and Cockenzie and Port Seaton. Areas not previously overflown will be overflown.
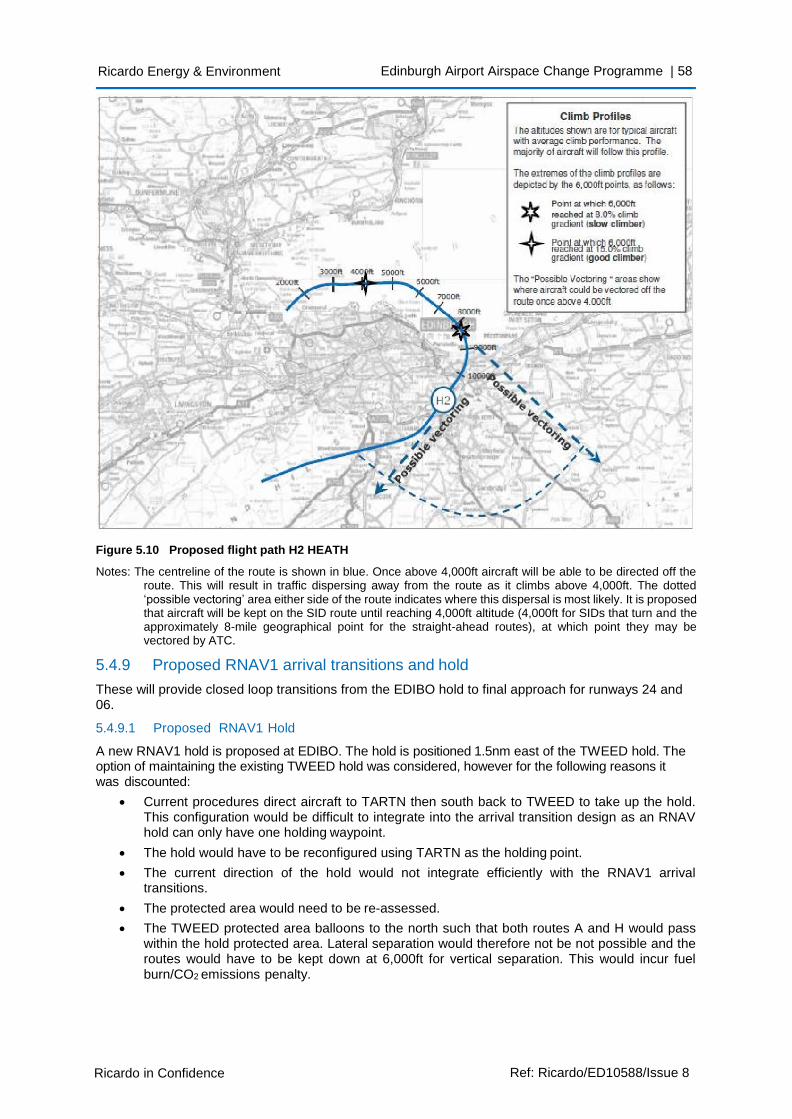
Ricardo in Confidence Ref: Ricardo/ED10588/Issue 8
Ricardo Energy & Environment Edinburgh Airport Airspace Change Programme | 58
Figure 5.10 Proposed flight path H2 HEATH
Notes: The centreline of the route is shown in blue. Once above 4,000ft aircraft will be able to be directed off the route. This will result in traffic dispersing away from the route as it climbs above 4,000ft. The dotted ‘possible vectoring’ area either side of the route indicates where this dispersal is most likely. It is proposed that aircraft will be kept on the SID route until reaching 4,000ft altitude (4,000ft for SIDs that turn and the approximately 8-mile geographical point for the straight-ahead routes), at which point they may be vectored by ATC.
5.4.9 Proposed RNAV1 arrival transitions and hold
These will provide closed loop transitions from the EDIBO hold to final approach for runways 24 and 06.
5.4.9.1 Proposed RNAV1 Hold
A new RNAV1 hold is proposed at EDIBO. The hold is positioned 1.5nm east of the TWEED hold. The option of maintaining the existing TWEED hold was considered, however for the following reasons it was discounted:
• Current procedures direct aircraft to TARTN then south back to TWEED to take up the hold. This configuration would be difficult to integrate into the arrival transition design as an RNAV hold can only have one holding waypoint.
• The hold would have to be reconfigured using TARTN as the holding point.
• The current direction of the hold would not integrate efficiently with the RNAV1 arrival transitions.
• The protected area would need to be re-assessed.
• The TWEED protected area balloons to the north such that both routes A and H would pass within the hold protected area. Lateral separation would therefore not be not possible and the routes would have to be kept down at 6,000ft for vertical separation. This would incur fuel burn/CO2 emissions penalty.
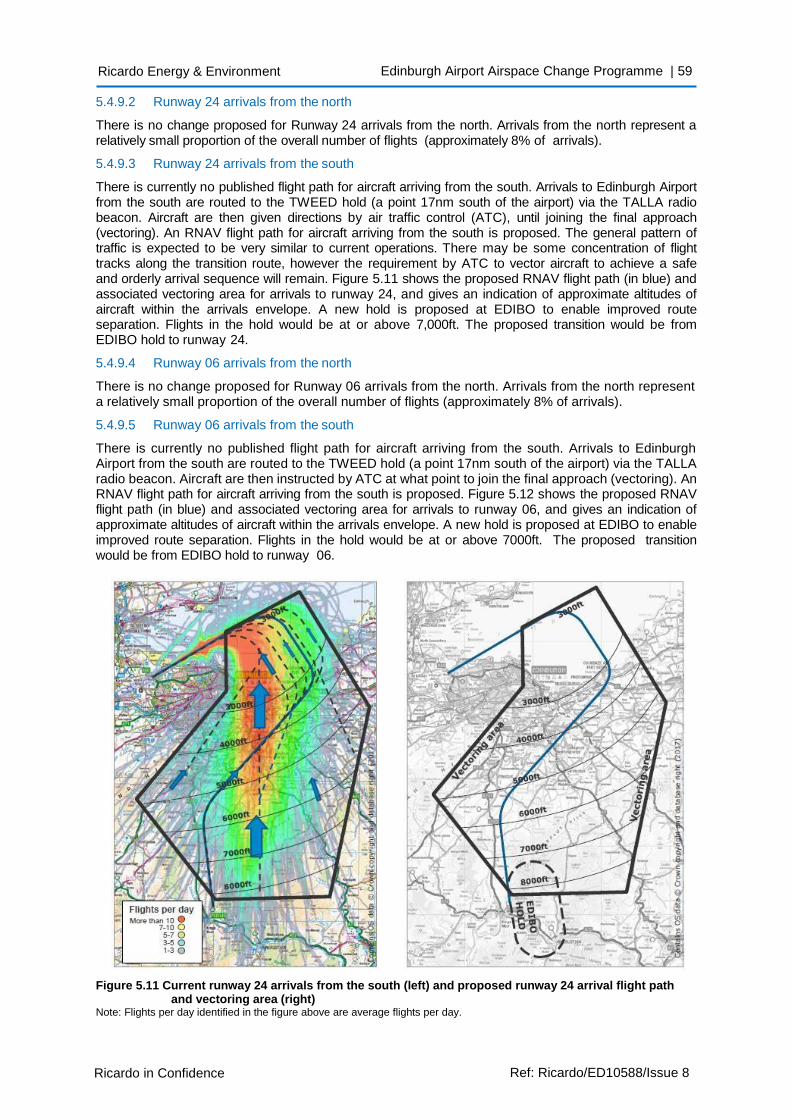
Ricardo in Confidence Ref: Ricardo/ED10588/Issue 8
Ricardo Energy & Environment Edinburgh Airport Airspace Change Programme | 59
5.4.9.2 Runway 24 arrivals from the north
There is no change proposed for Runway 24 arrivals from the north. Arrivals from the north represent a relatively small proportion of the overall number of flights (approximately 8% of arrivals).
5.4.9.3 Runway 24 arrivals from the south
There is currently no published flight path for aircraft arriving from the south. Arrivals to Edinburgh Airport from the south are routed to the TWEED hold (a point 17nm south of the airport) via the TALLA radio beacon. Aircraft are then given directions by air traffic control (ATC), until joining the final approach (vectoring). An RNAV flight path for aircraft arriving from the south is proposed. The general pattern of traffic is expected to be very similar to current operations. There may be some concentration of flight tracks along the transition route, however the requirement by ATC to vector aircraft to achieve a safe and orderly arrival sequence will remain. Figure 5.11 shows the proposed RNAV flight path (in blue) and associated vectoring area for arrivals to runway 24, and gives an indication of approximate altitudes of aircraft within the arrivals envelope. A new hold is proposed at EDIBO to enable improved route separation. Flights in the hold would be at or above 7,000ft. The proposed transition would be from EDIBO hold to runway 24.
5.4.9.4 Runway 06 arrivals from the north
There is no change proposed for Runway 06 arrivals from the north. Arrivals from the north represent a relatively small proportion of the overall number of flights (approximately 8% of arrivals).
5.4.9.5 Runway 06 arrivals from the south
There is currently no published flight path for aircraft arriving from the south. Arrivals to Edinburgh Airport from the south are routed to the TWEED hold (a point 17nm south of the airport) via the TALLA radio beacon. Aircraft are then instructed by ATC at what point to join the final approach (vectoring). An RNAV flight path for aircraft arriving from the south is proposed. Figure 5.12 shows the proposed RNAV flight path (in blue) and associated vectoring area for arrivals to runway 06, and gives an indication of approximate altitudes of aircraft within the arrivals envelope. A new hold is proposed at EDIBO to enable improved route separation. Flights in the hold would be at or above 7000ft. The proposed transition would be from EDIBO hold to runway 06.
Figure 5.11 Current runway 24 arrivals from the south (left) and proposed runway 24 arrival flight path and vectoring area (right)
Note: Flights per day identified in the figure above are average flights per day.
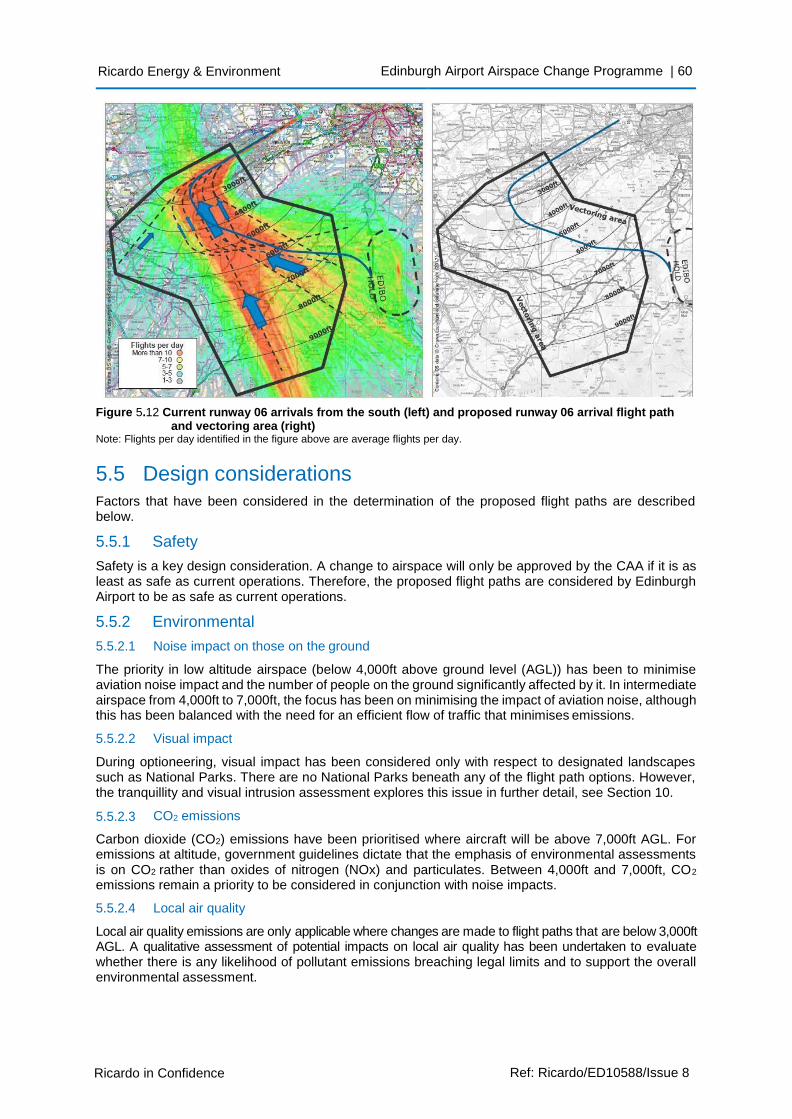
Ricardo in Confidence Ref: Ricardo/ED10588/Issue 8
Ricardo Energy & Environment Edinburgh Airport Airspace Change Programme | 60
Figure 5.12 Current runway 06 arrivals from the south (left) and proposed runway 06 arrival flight path and vectoring area (right)
Note: Flights per day identified in the figure above are average flights per day.
5.5 Design considerations
Factors that have been considered in the determination of the proposed flight paths are described below.
5.5.1 Safety
Safety is a key design consideration. A change to airspace will only be approved by the CAA if it is as least as safe as current operations. Therefore, the proposed flight paths are considered by Edinburgh Airport to be as safe as current operations.
5.5.2 Environmental
5.5.2.1 Noise impact on those on the ground
The priority in low altitude airspace (below 4,000ft above ground level (AGL)) has been to minimise aviation noise impact and the number of people on the ground significantly affected by it. In intermediate airspace from 4,000ft to 7,000ft, the focus has been on minimising the impact of aviation noise, although this has been balanced with the need for an efficient flow of traffic that minimises emissions.
5.5.2.2 Visual impact
During optioneering, visual impact has been considered only with respect to designated landscapes such as National Parks. There are no National Parks beneath any of the flight path options. However, the tranquillity and visual intrusion assessment explores this issue in further detail, see Section 10.
5.5.2.3 CO2 emissions
Carbon dioxide (CO2) emissions have been prioritised where aircraft will be above 7,000ft AGL. For emissions at altitude, government guidelines dictate that the emphasis of environmental assessments is on CO2 rather than oxides of nitrogen (NOx) and particulates. Between 4,000ft and 7,000ft, CO2
emissions remain a priority to be considered in conjunction with noise impacts.
5.5.2.4 Local air quality
Local air quality emissions are only applicable where changes are made to flight paths that are below 3,000ft AGL. A qualitative assessment of potential impacts on local air quality has been undertaken to evaluate whether there is any likelihood of pollutant emissions breaching legal limits and to support the overall environmental assessment.
Ricardo in Confidence Ref: Ricardo/ED10588/Issue 8
Ricardo Energy & Environment Edinburgh Airport Airspace Change Programme | 61
5.5.3 Physical
5.5.3.1 Procedure design limitations
Internationally agreed parameters for design of flight procedures are governed by the International Civil Aviation Organisation (ICAO), and adopted by the UK CAA. These are limits for parameters including terrain / obstacle clearance, maximum climb and descent angles, minimum distances between waypoints, stabilisation distances. All proposed flight paths meet ICAO guidelines.
5.5.3.2 Avoidance of other airspace
Areas such as restricted areas and military danger zones were avoided when designing the proposed flight paths.
5.5.3.3 Minimum turn radii
Minimum turn radii are determined by aircraft speed and maximum bank angle. The minimum turn radii for all proposed flight paths meet ICAO guidelines.
5.5.3.4 Speed
Maximum speeds will be specified for departure and arrival procedures. Below 10,000ft, the maximum speed for aircraft is 250 knots unless otherwise notified.
5.5.4 Efficiency
5.5.4.1 Air traffic controller workload
Each air traffic controller is responsible for a specific sector of airspace. For safety, limits are set on the number of aircraft that can enter each sector thus ensuring that the controller can safely manage the workload. Hence workload can be a limiting factor for how many aircraft can be handled.
5.5.4.2 Pilot workload
For safety, pilot workload must be kept to a manageable level. For example, complex routings can cause an unacceptable increase in pilot workload. Proposed flight paths are as simple as possible, given other restrictions.
5.5.4.3 Airspace capacity
Systemisation, based upon published routes with better navigational accuracy, such that less tactical intervention is required by ATC to maintain optimal climb and descents of aircraft, can result in efficiencies such that the number of aircraft able to be handled in a sector can be increased. Systemisation with RNAV will enable more flights at Edinburgh Airport using the existing runway infrastructure.
5.5.4.4 Runway capacity
Runway capacity is often a limiting factor determining how many aircraft can use each route in a given time. Use of RNAV will enable an increase in runway capacity due to reduced departure separation times.
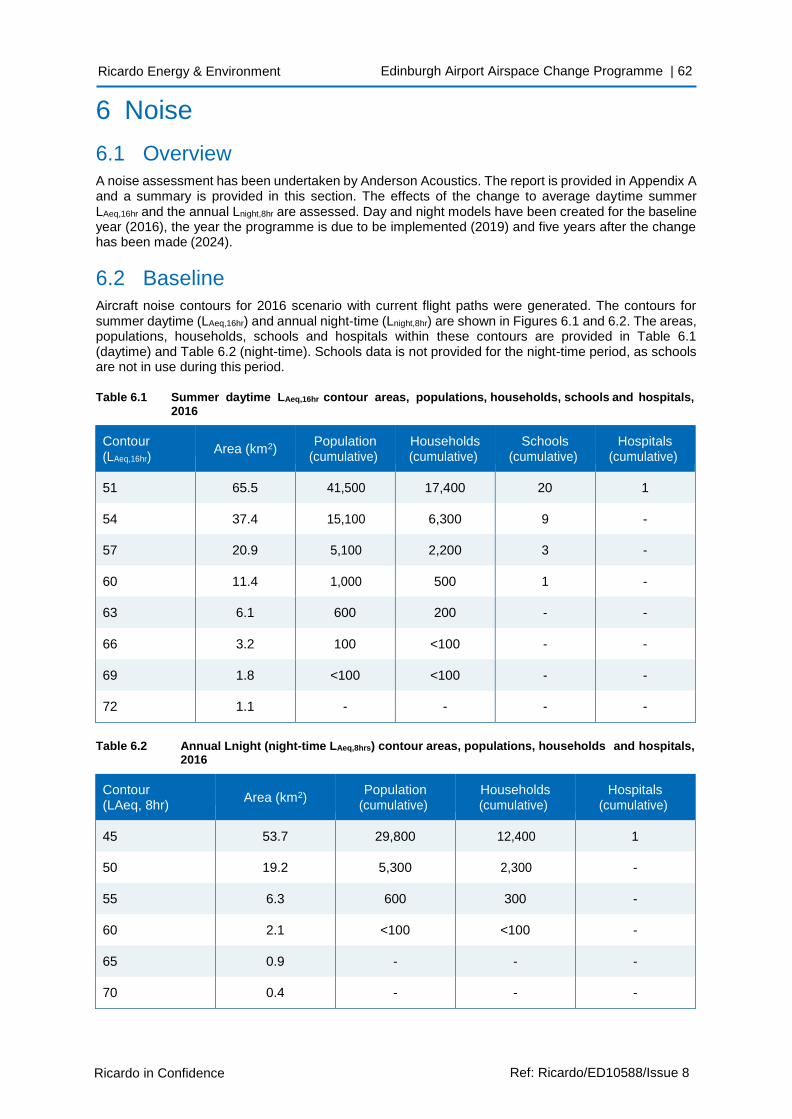
Ricardo in Confidence Ref: Ricardo/ED10588/Issue 8
Ricardo Energy & Environment Edinburgh Airport Airspace Change Programme | 62
6 Noise
6.1 Overview A noise assessment has been undertaken by Anderson Acoustics. The report is provided in Appendix A and a summary is provided in this section. The effects of the change to average daytime summer LAeq,16hr and the annual Lnight,8hr are assessed. Day and night models have been created for the baseline year (2016), the year the programme is due to be implemented (2019) and five years after the change has been made (2024).
6.2 Baseline
Aircraft noise contours for 2016 scenario with current flight paths were generated. The contours for summer daytime (LAeq,16hr) and annual night-time (Lnight,8hr) are shown in Figures 6.1 and 6.2. The areas, populations, households, schools and hospitals within these contours are provided in Table 6.1 (daytime) and Table 6.2 (night-time). Schools data is not provided for the night-time period, as schools are not in use during this period.
Table 6.1 Summer daytime LAeq,16hr contour areas, populations, households, schools and hospitals,
2016
Contour (LAeq,16hr)
Area (km2)
Population (cumulative)
Households (cumulative)
Schools (cumulative)
Hospitals (cumulative)
51 65.5 41,500 17,400 20 1
54 37.4 15,100 6,300 9 -
57 20.9 5,100 2,200 3 -
60 11.4 1,000 500 1 -
63 6.1 600 200 - -
66 3.2 100 <100 - -
69 1.8 <100 <100 - -
72 1.1 - - - -
Table 6.2 Annual Lnight (night-time LAeq,8hrs) contour areas, populations, households and hospitals, 2016
Contour (LAeq, 8hr)
Area (km2)
Population (cumulative)
Households (cumulative)
Hospitals (cumulative)
45 53.7 29,800 12,400 1
50 19.2 5,300 2,300 -
55 6.3 600 300 -
60 2.1 <100 <100 -
65 0.9 - - -
70 0.4 - - -
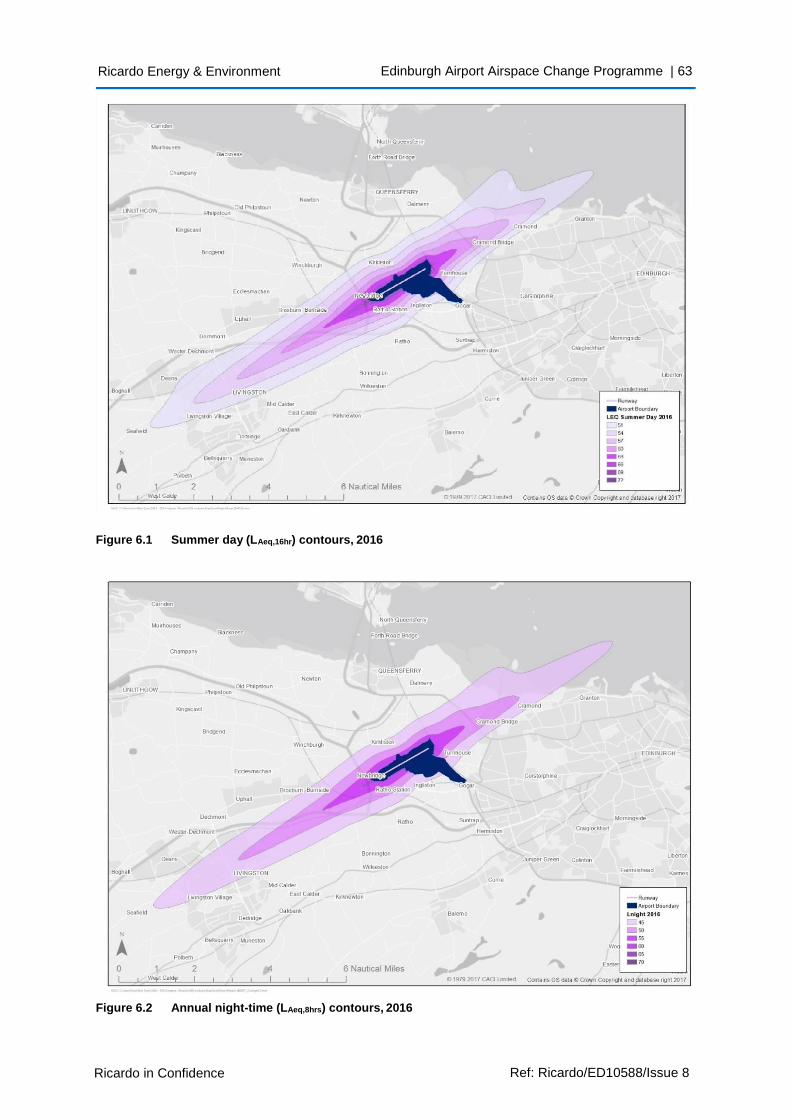
Ricardo in Confidence Ref: Ricardo/ED10588/Issue 8
Ricardo Energy & Environment Edinburgh Airport Airspace Change Programme | 63
Figure 6.1 Summer day (LAeq,16hr) contours, 2016
Figure 6.2 Annual night-time (LAeq,8hrs) contours, 2016
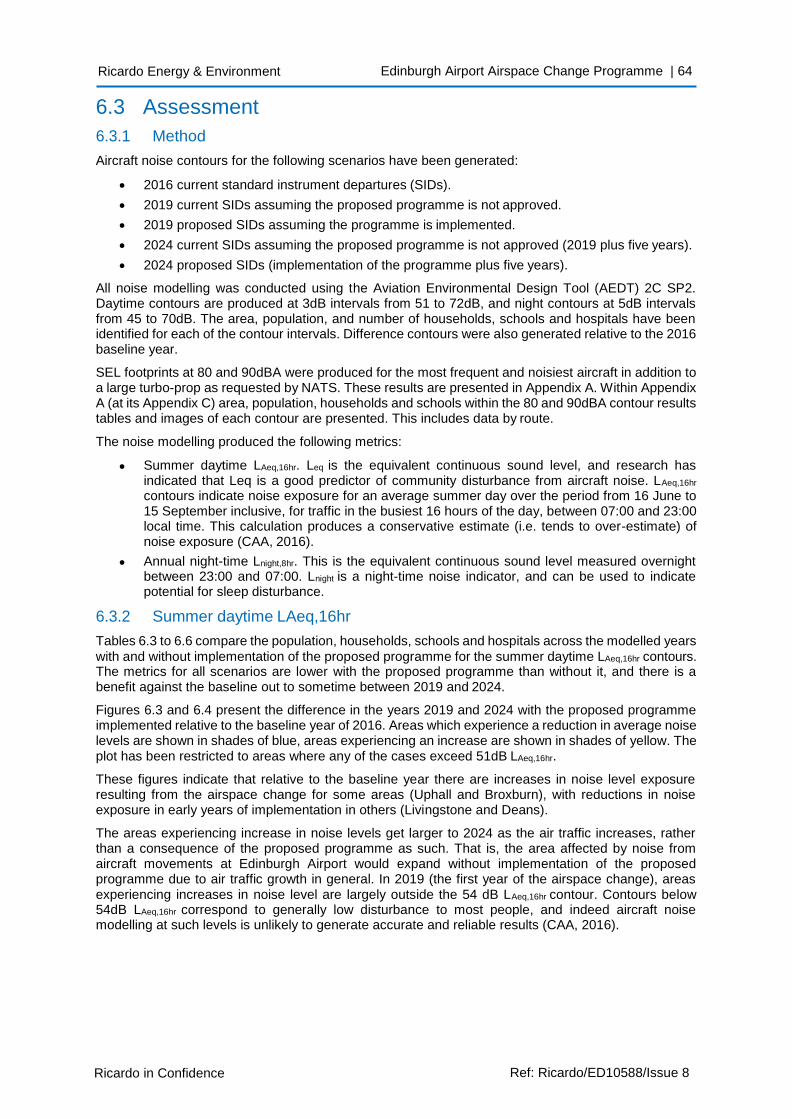
Ricardo in Confidence Ref: Ricardo/ED10588/Issue 8
Ricardo Energy & Environment Edinburgh Airport Airspace Change Programme | 64
6.3 Assessment
6.3.1 Method
Aircraft noise contours for the following scenarios have been generated:
• 2016 current standard instrument departures (SIDs).
• 2019 current SIDs assuming the proposed programme is not approved.
• 2019 proposed SIDs assuming the programme is implemented.
• 2024 current SIDs assuming the proposed programme is not approved (2019 plus five years).
• 2024 proposed SIDs (implementation of the programme plus five years).
All noise modelling was conducted using the Aviation Environmental Design Tool (AEDT) 2C SP2. Daytime contours are produced at 3dB intervals from 51 to 72dB, and night contours at 5dB intervals from 45 to 70dB. The area, population, and number of households, schools and hospitals have been identified for each of the contour intervals. Difference contours were also generated relative to the 2016 baseline year.
SEL footprints at 80 and 90dBA were produced for the most frequent and noisiest aircraft in addition to a large turbo-prop as requested by NATS. These results are presented in Appendix A. Within Appendix A (at its Appendix C) area, population, households and schools within the 80 and 90dBA contour results tables and images of each contour are presented. This includes data by route.
The noise modelling produced the following metrics:
• Summer daytime LAeq,16hr. Leq is the equivalent continuous sound level, and research has indicated that Leq is a good predictor of community disturbance from aircraft noise. LAeq,16hr
contours indicate noise exposure for an average summer day over the period from 16 June to 15 September inclusive, for traffic in the busiest 16 hours of the day, between 07:00 and 23:00 local time. This calculation produces a conservative estimate (i.e. tends to over-estimate) of noise exposure (CAA, 2016).
• Annual night-time Lnight,8hr. This is the equivalent continuous sound level measured overnight between 23:00 and 07:00. Lnight is a night-time noise indicator, and can be used to indicate potential for sleep disturbance.
6.3.2 Summer daytime LAeq,16hr
Tables 6.3 to 6.6 compare the population, households, schools and hospitals across the modelled years
with and without implementation of the proposed programme for the summer daytime LAeq,16hr contours. The metrics for all scenarios are lower with the proposed programme than without it, and there is a benefit against the baseline out to sometime between 2019 and 2024.
Figures 6.3 and 6.4 present the difference in the years 2019 and 2024 with the proposed programme implemented relative to the baseline year of 2016. Areas which experience a reduction in average noise levels are shown in shades of blue, areas experiencing an increase are shown in shades of yellow. The plot has been restricted to areas where any of the cases exceed 51dB LAeq,16hr.
These figures indicate that relative to the baseline year there are increases in noise level exposure resulting from the airspace change for some areas (Uphall and Broxburn), with reductions in noise exposure in early years of implementation in others (Livingstone and Deans).
The areas experiencing increase in noise levels get larger to 2024 as the air traffic increases, rather than a consequence of the proposed programme as such. That is, the area affected by noise from aircraft movements at Edinburgh Airport would expand without implementation of the proposed programme due to air traffic growth in general. In 2019 (the first year of the airspace change), areas experiencing increases in noise level are largely outside the 54 dB LAeq,16hr contour. Contours below 54dB LAeq,16hr correspond to generally low disturbance to most people, and indeed aircraft noise modelling at such levels is unlikely to generate accurate and reliable results (CAA, 2016).
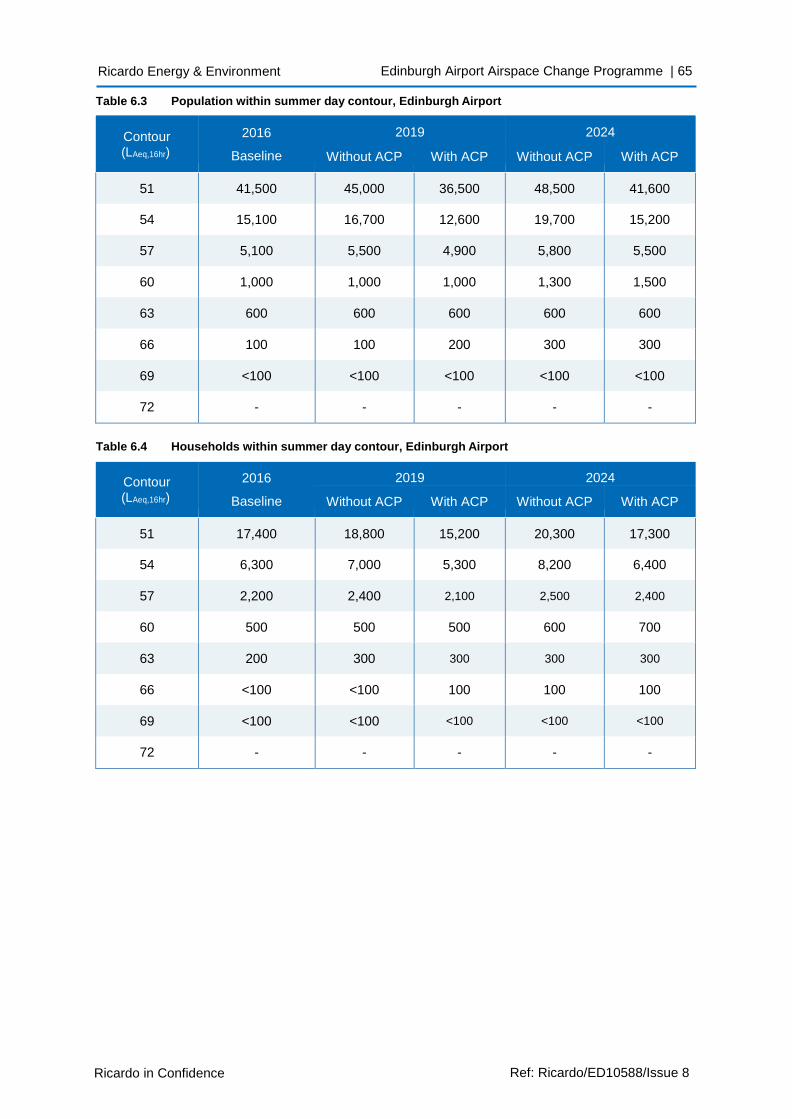
Ricardo in Confidence Ref: Ricardo/ED10588/Issue 8
Ricardo Energy & Environment Edinburgh Airport Airspace Change Programme | 65
Table 6.3 Population within summer day contour, Edinburgh Airport
Contour (LAeq,16hr)
2016
Baseline
2019 2024
Without ACP With ACP Without ACP With ACP
51 41,500 45,000 36,500 48,500 41,600
54 15,100 16,700 12,600 19,700 15,200
57 5,100 5,500 4,900 5,800 5,500
60 1,000 1,000 1,000 1,300 1,500
63 600 600 600 600 600
66 100 100 200 300 300
69 <100 <100 <100 <100 <100
72 - - - - -
Table 6.4 Households within summer day contour, Edinburgh Airport
Contour (LAeq,16hr)
2016
Baseline
2019 2024
Without ACP With ACP Without ACP With ACP
51 17,400 18,800 15,200 20,300 17,300
54 6,300 7,000 5,300 8,200 6,400
57 2,200 2,400 2,100 2,500 2,400
60 500 500 500 600 700
63 200 300 300 300 300
66 <100 <100 100 100 100
69 <100 <100 <100 <100 <100
72 - - - - -
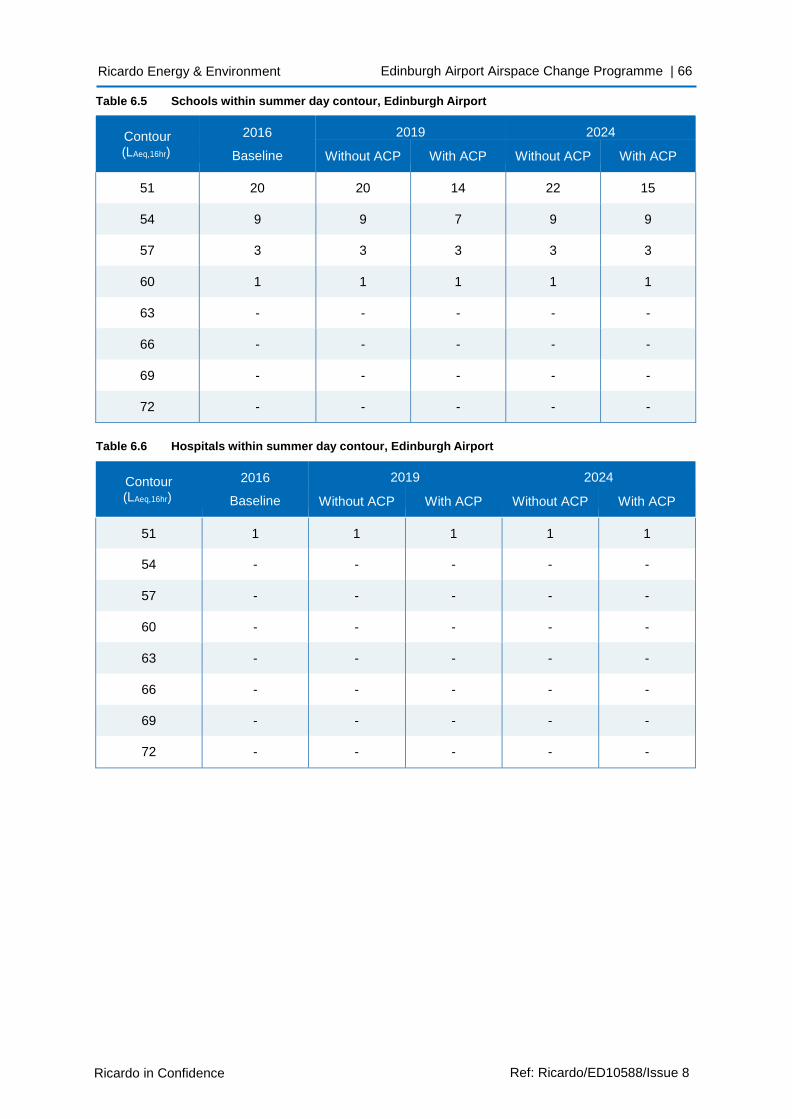
Ricardo in Confidence Ref: Ricardo/ED10588/Issue 8
Ricardo Energy & Environment Edinburgh Airport Airspace Change Programme | 66
Table 6.5 Schools within summer day contour, Edinburgh Airport
Contour (LAeq,16hr)
2016
Baseline
2019 2024
Without ACP With ACP Without ACP With ACP
51 20 20 14 22 15
54 9 9 7 9 9
57 3 3 3 3 3
60 1 1 1 1 1
63 - - - - -
66 - - - - -
69 - - - - -
72 - - - - -
Table 6.6 Hospitals within summer day contour, Edinburgh Airport
Contour (LAeq,16hr)
2016
Baseline
2019 2024
Without ACP With ACP Without ACP With ACP
51 1 1 1 1 1
54 - - - - -
57 - - - - -
60 - - - - -
63 - - - - -
66 - - - - -
69 - - - - -
72 - - - - -
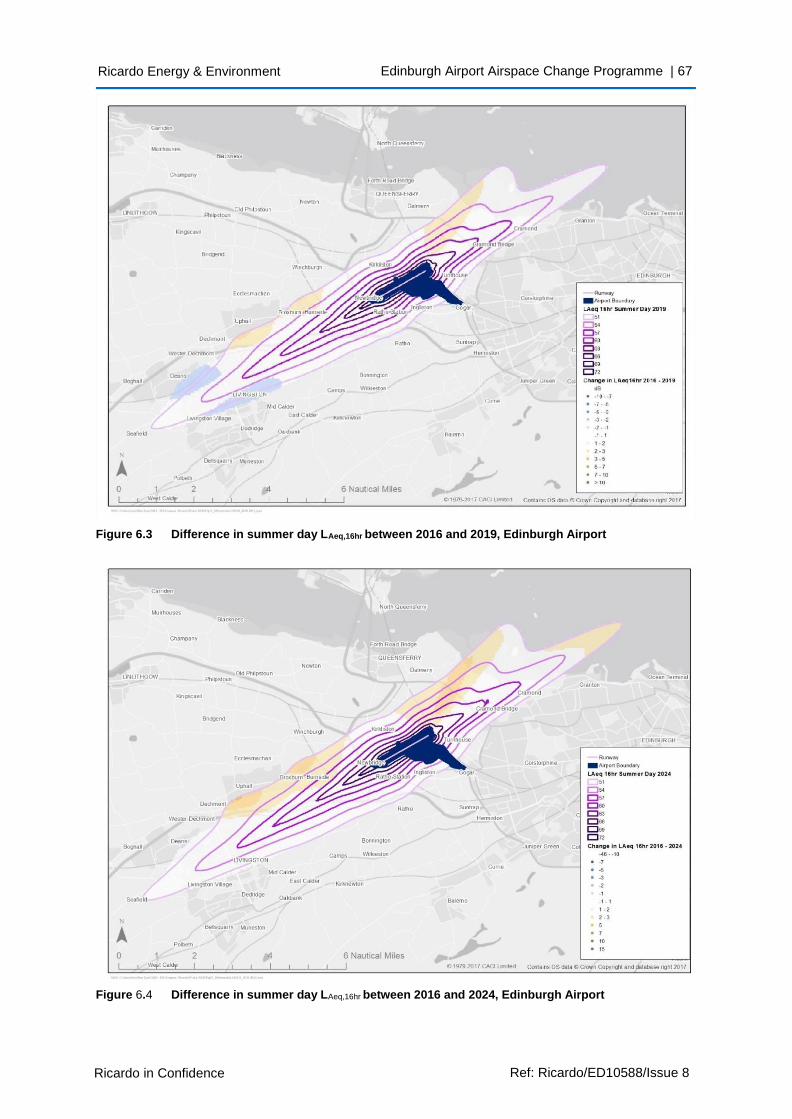
Ricardo in Confidence Ref: Ricardo/ED10588/Issue 8
Ricardo Energy & Environment Edinburgh Airport Airspace Change Programme | 67
Figure 6.3 Difference in summer day LAeq,16hr between 2016 and 2019, Edinburgh Airport
Figure 6.4 Difference in summer day LAeq,16hr between 2016 and 2024, Edinburgh Airport
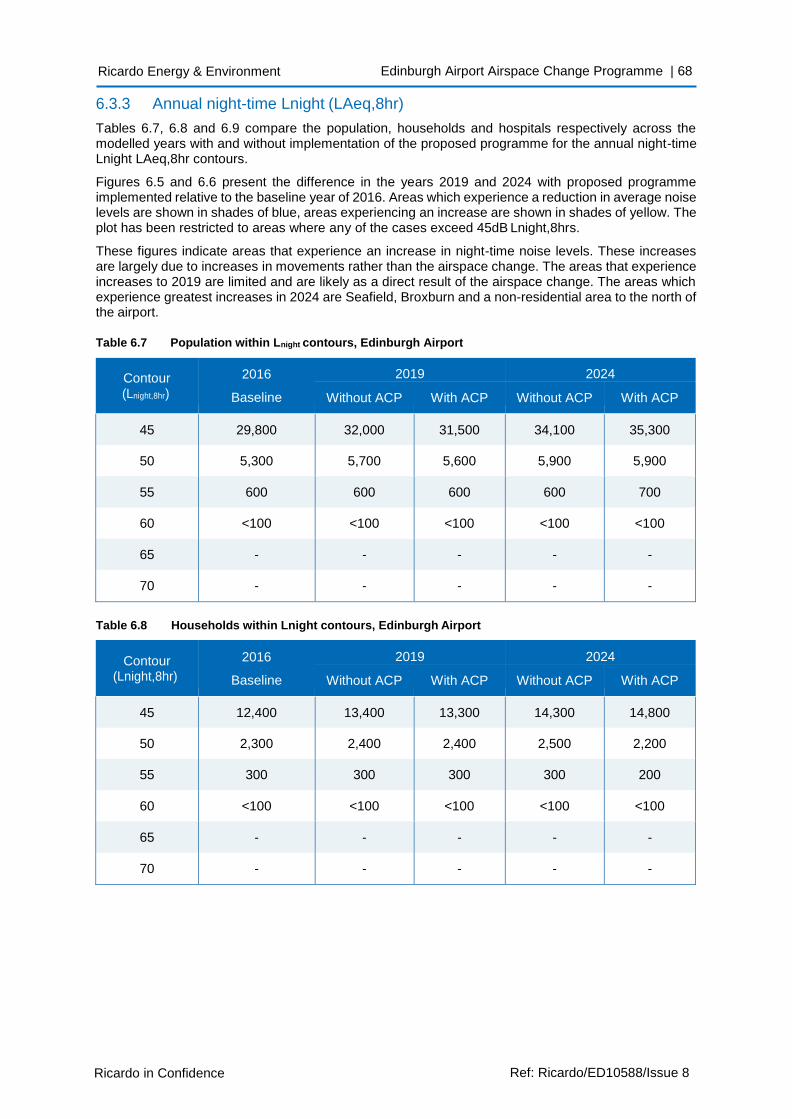
Ricardo in Confidence Ref: Ricardo/ED10588/Issue 8
Ricardo Energy & Environment Edinburgh Airport Airspace Change Programme | 68
6.3.3 Annual night-time Lnight (LAeq,8hr)
Tables 6.7, 6.8 and 6.9 compare the population, households and hospitals respectively across the modelled years with and without implementation of the proposed programme for the annual night-time Lnight LAeq,8hr contours.
Figures 6.5 and 6.6 present the difference in the years 2019 and 2024 with proposed programme implemented relative to the baseline year of 2016. Areas which experience a reduction in average noise levels are shown in shades of blue, areas experiencing an increase are shown in shades of yellow. The plot has been restricted to areas where any of the cases exceed 45dB Lnight,8hrs.
These figures indicate areas that experience an increase in night-time noise levels. These increases are largely due to increases in movements rather than the airspace change. The areas that experience increases to 2019 are limited and are likely as a direct result of the airspace change. The areas which experience greatest increases in 2024 are Seafield, Broxburn and a non-residential area to the north of the airport.
Table 6.7 Population within Lnight contours, Edinburgh Airport
Contour (Lnight,8hr)
2016
Baseline
2019 2024
Without ACP With ACP Without ACP With ACP
45 29,800 32,000 31,500 34,100 35,300
50 5,300 5,700 5,600 5,900 5,900
55 600 600 600 600 700
60 <100 <100 <100 <100 <100
65 - - - - -
70 - - - - -
Table 6.8 Households within Lnight contours, Edinburgh Airport
Contour (Lnight,8hr)
2016
Baseline
2019 2024
Without ACP With ACP Without ACP With ACP
45 12,400 13,400 13,300 14,300 14,800
50 2,300 2,400 2,400 2,500 2,200
55 300 300 300 300 200
60 <100 <100 <100 <100 <100
65 - - - - -
70 - - - - -
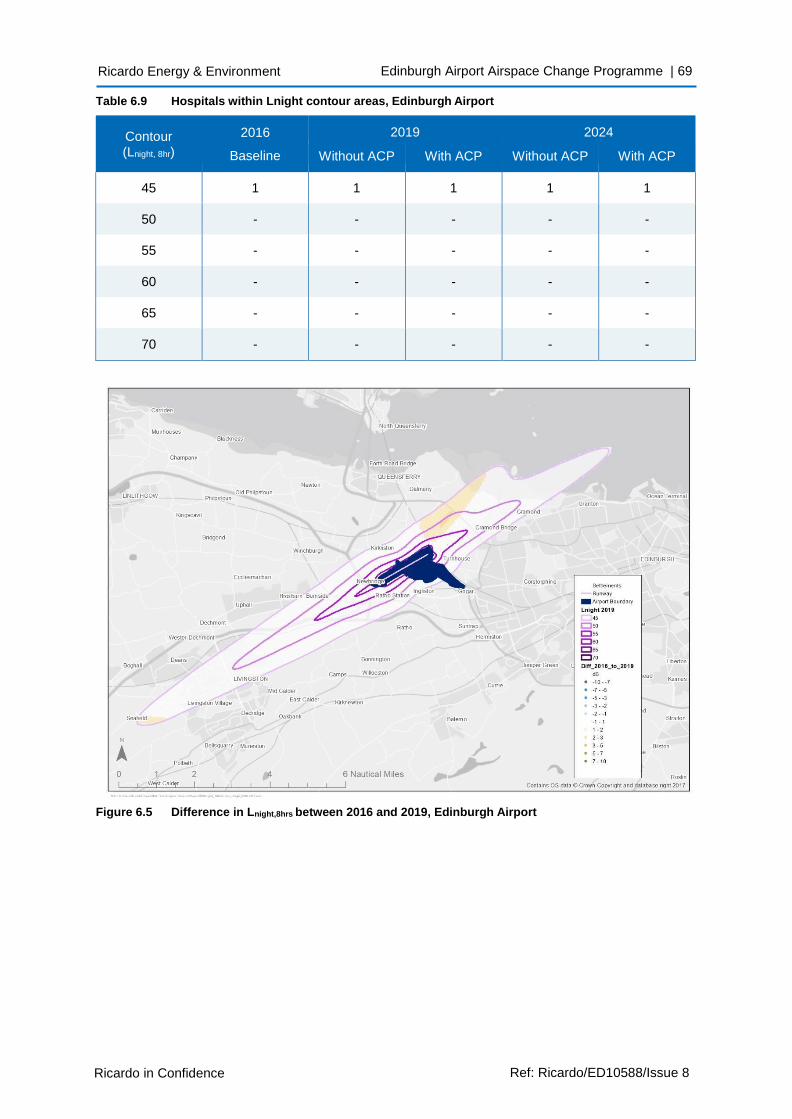
Ricardo in Confidence Ref: Ricardo/ED10588/Issue 8
Ricardo Energy & Environment Edinburgh Airport Airspace Change Programme | 69
Table 6.9 Hospitals within Lnight contour areas, Edinburgh Airport
Contour (Lnight, 8hr)
2016
Baseline
2019 2024
Without ACP With ACP Without ACP With ACP
45 1 1 1 1 1
50 - - - - -
55 - - - - -
60 - - - - -
65 - - - - -
70 - - - - -
Figure 6.5 Difference in Lnight,8hrs between 2016 and 2019, Edinburgh Airport
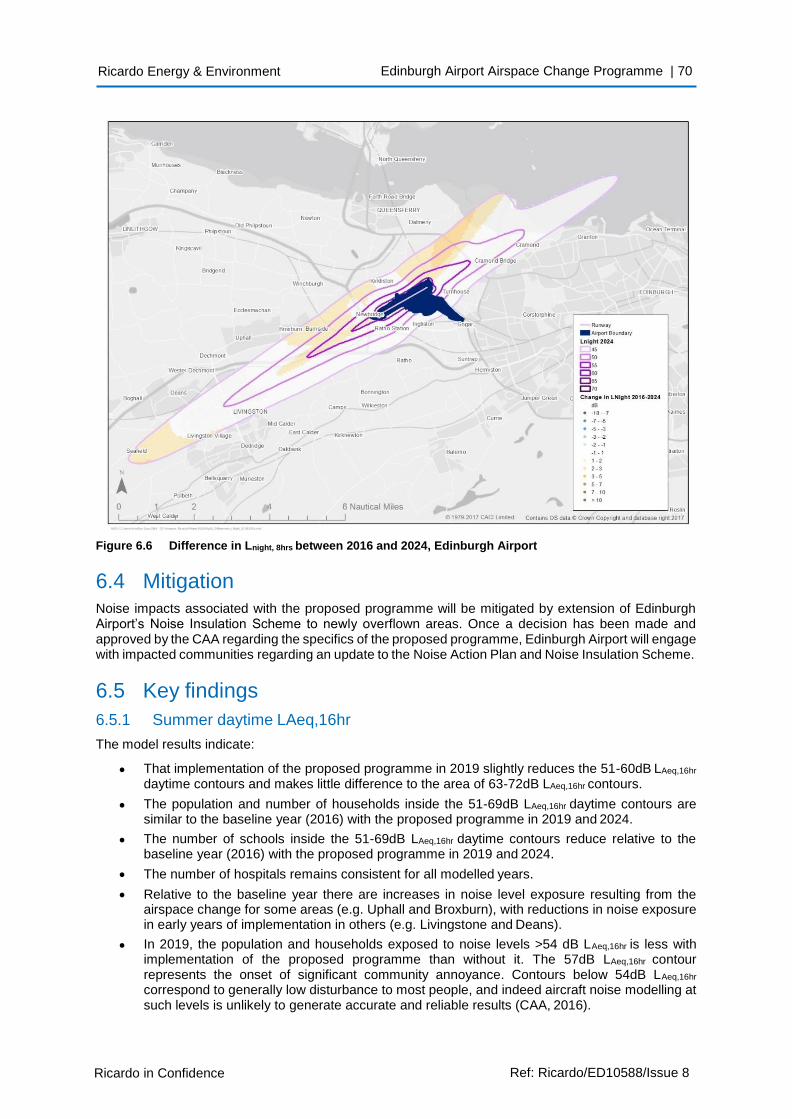
Ricardo in Confidence Ref: Ricardo/ED10588/Issue 8
Ricardo Energy & Environment Edinburgh Airport Airspace Change Programme | 70
Figure 6.6 Difference in Lnight, 8hrs between 2016 and 2024, Edinburgh Airport
6.4 Mitigation Noise impacts associated with the proposed programme will be mitigated by extension of Edinburgh Airport’s Noise Insulation Scheme to newly overflown areas. Once a decision has been made and approved by the CAA regarding the specifics of the proposed programme, Edinburgh Airport will engage with impacted communities regarding an update to the Noise Action Plan and Noise Insulation Scheme.
6.5 Key findings
6.5.1 Summer daytime LAeq,16hr
The model results indicate:
• That implementation of the proposed programme in 2019 slightly reduces the 51-60dB LAeq,16hr
daytime contours and makes little difference to the area of 63-72dB LAeq,16hr contours.
• The population and number of households inside the 51-69dB LAeq,16hr daytime contours are similar to the baseline year (2016) with the proposed programme in 2019 and 2024.
• The number of schools inside the 51-69dB LAeq,16hr daytime contours reduce relative to the baseline year (2016) with the proposed programme in 2019 and 2024.
• The number of hospitals remains consistent for all modelled years.
• Relative to the baseline year there are increases in noise level exposure resulting from the airspace change for some areas (e.g. Uphall and Broxburn), with reductions in noise exposure in early years of implementation in others (e.g. Livingstone and Deans).
• In 2019, the population and households exposed to noise levels >54 dB LAeq,16hr is less with implementation of the proposed programme than without it. The 57dB LAeq,16hr contour represents the onset of significant community annoyance. Contours below 54dB LAeq,16hr
correspond to generally low disturbance to most people, and indeed aircraft noise modelling at such levels is unlikely to generate accurate and reliable results (CAA, 2016).
Ricardo in Confidence Ref: Ricardo/ED10588/Issue 8
Ricardo Energy & Environment Edinburgh Airport Airspace Change Programme | 71
• In 2024, the population and households exposed to noise levels >54 dB LAeq,16hr is also lower with implementation of the proposed programme than without it, despite additional growth in aircraft movements.
6.5.2 Annual night-time Lnight (LAeq,8hr)
The modelling results indicate:
• The change of airspace in 2019 increases the area of the Lnight contours. However, in 2019 the population and households exposed to >45dB Lnight is less with the proposed programme than with the existing flight paths.
• Relative to the baseline year, the population is higher in all future years with or without the proposed programme.
• The number of hospitals inside the 45dB Lnight contour remains consistent and is limited to only one hospital, which is predicted to experience a reduction in night-time noise exposure of 1dB.
• In 2024, the population and households exposed to >45dB Lnight is greater with the proposed programme than without it, however these increases are largely due to increases in aircraft movements rather than the proposed programme.
• There are areas that experience an increase in night-time noise levels. These increases are largely due to increases in movements rather than the airspace change. The areas which experience greatest increases to 2024 are Seafield, Broxburn and a non-residential area to the north of the airport.
Once a decision has been made and approved by the CAA regarding preferred routes to be implemented, Edinburgh Airport will engage with communities impacted regarding an update to their Noise Action Plan and Noise Insulation Scheme.
In 2019, the population and number of households exposed to noise levels >54dB LAeq,16hr is similar to the baseline year (2016) with implementation of the proposed programme despite air traffic growth. The number of schools within this contour reduces relative to the baseline. There is a negligible beneficial impact to the local area from implementation of the proposed programme, although noise impacts will increase in some communities and reduce in others.
There are areas that will experience an increase in night-time noise levels. The modelled scenarios without implementation of the proposed programme show increases in night-time noise levels in all years compared to the baseline, due to aircraft traffic growth. The proposed programme will increase this incrementally in 2024, however most of the increase is due to aircraft traffic growth thus this is a minor adverse impact.
Ricardo in Confidence Ref: Ricardo/ED10588/Issue 8
Ricardo Energy & Environment Edinburgh Airport Airspace Change Programme | 72
7 Fuel burn and CO2 emissions
The aviation industry has a significant impact on the environment through CO2 emissions, which contribute to climate change. Approaches to reducing these impacts include reducing taxiing times, reducing on-ground delays and providing flight path options that are as short and efficient as possible. CO2 emissions were a key consideration when determining preferred flight path options, as discussed in the assessment of flight path alternatives (see Section 4).
This section provides an estimation of changes in fuel burn and CO2 emissions associated with upgrading the aircraft arrival and departure routes into Edinburgh Airport for the ACP. The focus of this assessment is aircraft arrival and departure, and all other CO2 impacts associated with the airport will remain the same. Therefore, the use of airport facilities, all associated utilities and operational logistics, and surface passenger access are excluded from this assessment.
7.1 Overview
To estimate any changes in fuel burn and CO2 emissions associated with upgrading the aircraft arrival and departure routes into Edinburgh Airport, this report draws on research conducted in March 2018 by the National Air Traffic Services (NATS, 2018). The research used simulations to estimate the expected fuel burn and CO2 emissions of aircraft on the proposed routes in 2019 and 2024, and compared this with baseline data from 2016.
The research estimated aircraft fuel burn and CO2 emissions using methods recommended by the CAA. This approach calculated the mass of CO2 emitted by multiplying the mass of kerosene burned during flight by a factor of 3.18.
This report also considered the following questions from CAP725:
• What options are there to reduce fuel burn in the vertical dimension, particularly when fuel burn is high e.g. initial climb?
• What options are there to produce more direct routing of aircraft, so that fuel burn is minimised?
• What arrangements can be made to ensure that aircraft in cruise operate at their most fuel- efficient altitude, possibly varying altitude during this phase of flight?
The CAA recognises that the design of aircraft and engines, growth of air traffic, capacity and load factors of aircraft, airline operating procedures and other factors all have an influence on aircraft emissions but that these factors are outside the scope of the ACP. This report considered the impact the changes will make to ongoing emissions.
7.2 Baseline
The research used Edinburgh departure traffic data extracted from the NATS Data Warehouse Electronic Flight Progress Strip (EFPS) data source for the period 16 December 2015 to 15 December 2016.
7.3 Assessment
7.3.1 Methodology and assumptions
The methodology and assumptions made to estimate the fuel difference for the Edinburgh ACP were as follows:
• Edinburgh departure traffic data was extracted from the NATS Data Warehouse using the Electronic Flight Progress Strip (EFPS) data source.
• This traffic was split into the different current SIDs and, where necessary, split further by aircraft engine type to obtain a 2016 traffic count for each route comparison.
• For each route, aircraft types were grouped into categories of similar typed aircraft with comparable fuel burn rates and the most common type within each category was modelled for the analysis.
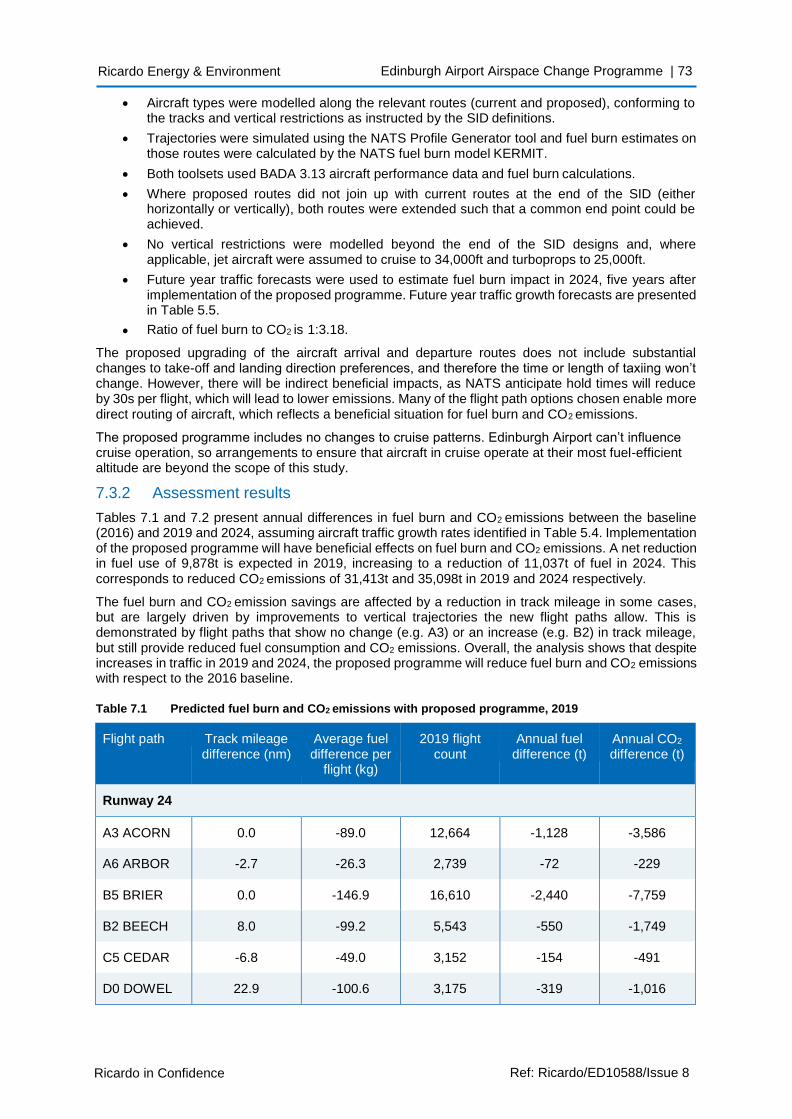
Ricardo in Confidence Ref: Ricardo/ED10588/Issue 8
Ricardo Energy & Environment Edinburgh Airport Airspace Change Programme | 73
• Aircraft types were modelled along the relevant routes (current and proposed), conforming to the tracks and vertical restrictions as instructed by the SID definitions.
• Trajectories were simulated using the NATS Profile Generator tool and fuel burn estimates on those routes were calculated by the NATS fuel burn model KERMIT.
• Both toolsets used BADA 3.13 aircraft performance data and fuel burn calculations.
• Where proposed routes did not join up with current routes at the end of the SID (either horizontally or vertically), both routes were extended such that a common end point could be achieved.
• No vertical restrictions were modelled beyond the end of the SID designs and, where applicable, jet aircraft were assumed to cruise to 34,000ft and turboprops to 25,000ft.
• Future year traffic forecasts were used to estimate fuel burn impact in 2024, five years after implementation of the proposed programme. Future year traffic growth forecasts are presented in Table 5.5.
• Ratio of fuel burn to CO2 is 1:3.18.
The proposed upgrading of the aircraft arrival and departure routes does not include substantial changes to take-off and landing direction preferences, and therefore the time or length of taxiing won’t change. However, there will be indirect beneficial impacts, as NATS anticipate hold times will reduce by 30s per flight, which will lead to lower emissions. Many of the flight path options chosen enable more direct routing of aircraft, which reflects a beneficial situation for fuel burn and CO2 emissions.
The proposed programme includes no changes to cruise patterns. Edinburgh Airport can’t influence cruise operation, so arrangements to ensure that aircraft in cruise operate at their most fuel-efficient altitude are beyond the scope of this study.
7.3.2 Assessment results
Tables 7.1 and 7.2 present annual differences in fuel burn and CO2 emissions between the baseline (2016) and 2019 and 2024, assuming aircraft traffic growth rates identified in Table 5.4. Implementation of the proposed programme will have beneficial effects on fuel burn and CO2 emissions. A net reduction in fuel use of 9,878t is expected in 2019, increasing to a reduction of 11,037t of fuel in 2024. This corresponds to reduced CO2 emissions of 31,413t and 35,098t in 2019 and 2024 respectively.
The fuel burn and CO2 emission savings are affected by a reduction in track mileage in some cases, but are largely driven by improvements to vertical trajectories the new flight paths allow. This is demonstrated by flight paths that show no change (e.g. A3) or an increase (e.g. B2) in track mileage, but still provide reduced fuel consumption and CO2 emissions. Overall, the analysis shows that despite increases in traffic in 2019 and 2024, the proposed programme will reduce fuel burn and CO2 emissions with respect to the 2016 baseline.
Table 7.1 Predicted fuel burn and CO2 emissions with proposed programme, 2019
Flight path Track mileage difference (nm)
Average fuel difference per
flight (kg)
2019 flight count
Annual fuel difference (t)
Annual CO2
difference (t)
Runway 24
A3 ACORN 0.0 -89.0 12,664 -1,128 -3,586
A6 ARBOR -2.7 -26.3 2,739 -72 -229
B5 BRIER 0.0 -146.9 16,610 -2,440 -7,759
B2 BEECH 8.0 -99.2 5,543 -550 -1,749
C5 CEDAR -6.8 -49.0 3,152 -154 -491
D0 DOWEL 22.9 -100.6 3,175 -319 -1,016
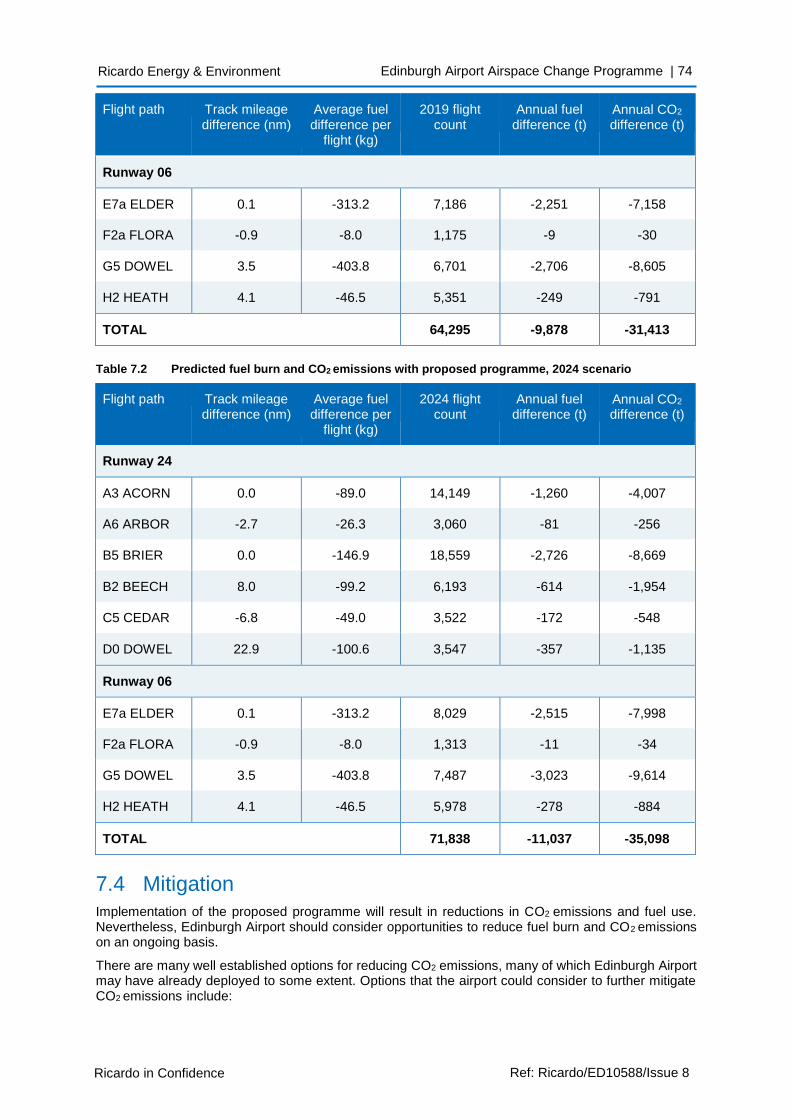
Ricardo in Confidence Ref: Ricardo/ED10588/Issue 8
Ricardo Energy & Environment Edinburgh Airport Airspace Change Programme | 74
Flight path Track mileage difference (nm)
Average fuel difference per
flight (kg)
2019 flight count
Annual fuel difference (t)
Annual CO2
difference (t)
Runway 06
E7a ELDER 0.1 -313.2 7,186 -2,251 -7,158
F2a FLORA -0.9 -8.0 1,175 -9 -30
G5 DOWEL 3.5 -403.8 6,701 -2,706 -8,605
H2 HEATH 4.1 -46.5 5,351 -249 -791
TOTAL 64,295 -9,878 -31,413
Table 7.2 Predicted fuel burn and CO2 emissions with proposed programme, 2024 scenario
Flight path Track mileage difference (nm)
Average fuel difference per
flight (kg)
2024 flight count
Annual fuel difference (t)
Annual CO2
difference (t)
Runway 24
A3 ACORN 0.0 -89.0 14,149 -1,260 -4,007
A6 ARBOR -2.7 -26.3 3,060 -81 -256
B5 BRIER 0.0 -146.9 18,559 -2,726 -8,669
B2 BEECH 8.0 -99.2 6,193 -614 -1,954
C5 CEDAR -6.8 -49.0 3,522 -172 -548
D0 DOWEL 22.9 -100.6 3,547 -357 -1,135
Runway 06
E7a ELDER 0.1 -313.2 8,029 -2,515 -7,998
F2a FLORA -0.9 -8.0 1,313 -11 -34
G5 DOWEL 3.5 -403.8 7,487 -3,023 -9,614
H2 HEATH 4.1 -46.5 5,978 -278 -884
TOTAL 71,838 -11,037 -35,098
7.4 Mitigation
Implementation of the proposed programme will result in reductions in CO2 emissions and fuel use. Nevertheless, Edinburgh Airport should consider opportunities to reduce fuel burn and CO2 emissions on an ongoing basis.
There are many well established options for reducing CO2 emissions, many of which Edinburgh Airport may have already deployed to some extent. Options that the airport could consider to further mitigate CO2 emissions include:
Ricardo in Confidence Ref: Ricardo/ED10588/Issue 8
Ricardo Energy & Environment Edinburgh Airport Airspace Change Programme | 75
• Collaborative Decision Making (CDM) to reduce airfield delays.
• Reduced engine taxiing.
• Optimising climb-out thrusts and cut-back heights.
• Provision of pre-conditioned air at stands to reduce auxiliary power unit use.
The UK government has stringent carbon reduction targets which are set out in carbon budgets. All energy users are expected to make emissions reductions, and Edinburgh Airport actively engages in legislator schemes such as the Carbon Reduction Commitment Energy Efficiency Scheme and the Energy Saving Opportunity Scheme. As well as considering options for reducing emissions, Edinburgh Airport regularly calculates and publishes its emissions.
7.5 Key findings
The key outcomes of the fuel burn and CO2 emission assessment comprise:
• Implementation of the proposed programme in 2019 will provide a fuel benefit of 9,878t in 2019, increasing to 11,037t of fuel in 2024 with expected traffic growth.
• Implementation of the proposed programme in 2019 will provide a CO2 emissions benefit of 31,413t in 2019, increasing to 35,098t CO2 in 2024 with expected traffic growth.
The fuel burn and CO2 emission savings are affected by a reduction in track mileage in some cases, but are largely driven by improvements to vertical trajectories the new flight paths allow. Overall, the analysis shows that despite increases in traffic in 2019 and 2024, the proposed programme will reduce fuel burn and CO2 emissions with respect to the 2016 baseline, and minor beneficial effect.
Ricardo in Confidence Ref: Ricardo/ED10588/Issue 8
Ricardo Energy & Environment Edinburgh Airport Airspace Change Programme | 76
8 Local air quality
8.1 Overview This section provides a qualitative assessment of the changes to air quality associated with the proposed programme. Many areas in the UK have challenges in meeting current objectives for oxides of nitrogen dioxide (NOx) and particulate matter (PM10).
The proposed programme includes minor changes to airport operations below 3,000ft, in all runway 06 departures will make early turns (at 500m above airfield level) to avoid Cramond as much as possible. These changes are likely to have minimal impact on ground level concentrations as local ground level impacts from aircraft emissions are not particularly sensitive to emissions above a height of approximately 200m (Rogers et. al., 2002).
A greater (positive) impact will come from improvements to aircraft taxiing and hold times that result from the proposed programme. The effects of these changes are considered in a qualitative assessment of air quality.
This qualitative assessment considers current monitoring data, predicted airport growth (both with and without the proposed programme), and expected changes to taxiing and hold times. It includes an assessment of the significance that the changes have on air quality, which is consistent with EPUK/IAQM (2017) guidance.
8.2 Baseline The most recent air quality monitoring at Edinburgh Airport (Ricardo-AEA, 2014) showed that annual mean nitrogen dioxide (NO2) concentrations were close to or above the objective level of 40µg/m at four sites within Edinburgh Airport. However, due to their location, the sites were not considered relevant when comparing to the annual mean objective and, therefore, the objective was deemed not to have been breached at any monitoring location.
Edinburgh City Council has declared an Air Quality Management Area (AQMA) for NO2 for the section of the A8 Glasgow Road from Newbridge Roundabout extending east for 915m (Figure 8.1). The AQMA was declared because of emissions from road traffic on the A8. However, some NO2 within the AQMA will be from airport sources due to its proximity to the airport.
The annual mean NO2 concentration measured at the A8 Glasgow Road monitoring site for 2016 was 28µg/m. This is comfortably below the annual mean objective of 40µg/m. There were also no hours measured above the hourly mean limit of 200µg/m. Similarly, there were no exceedances of the PM10
objectives.
Based on 2016 movement data and emissions data from the National Atmospheric Emissions Inventory, we estimate that aircraft currently emit approximately 400 to 500 tonnes of NOx per annum at Edinburgh Airport, with taxiing and hold times accounting for about 10% of these emissions. This level of aircraft emissions is likely to lead to a contribution of less than 5µg/m NO2 at the airport boundary, and less than 2µg/m NO2 in the AQMA.
In comparison, emissions from Heathrow Airport, which are approximately ten times those of Edinburgh Airport, contribute approximately 20µg/m NO2 at its boundary (LHR2) and 10µg/m NO2 at similar distances from its boundary as the A8 Glasgow Road AQMA is from Edinburgh Airport.
The contribution from taxiing and hold emissions is approximately 10% of the total aircraft contribution.
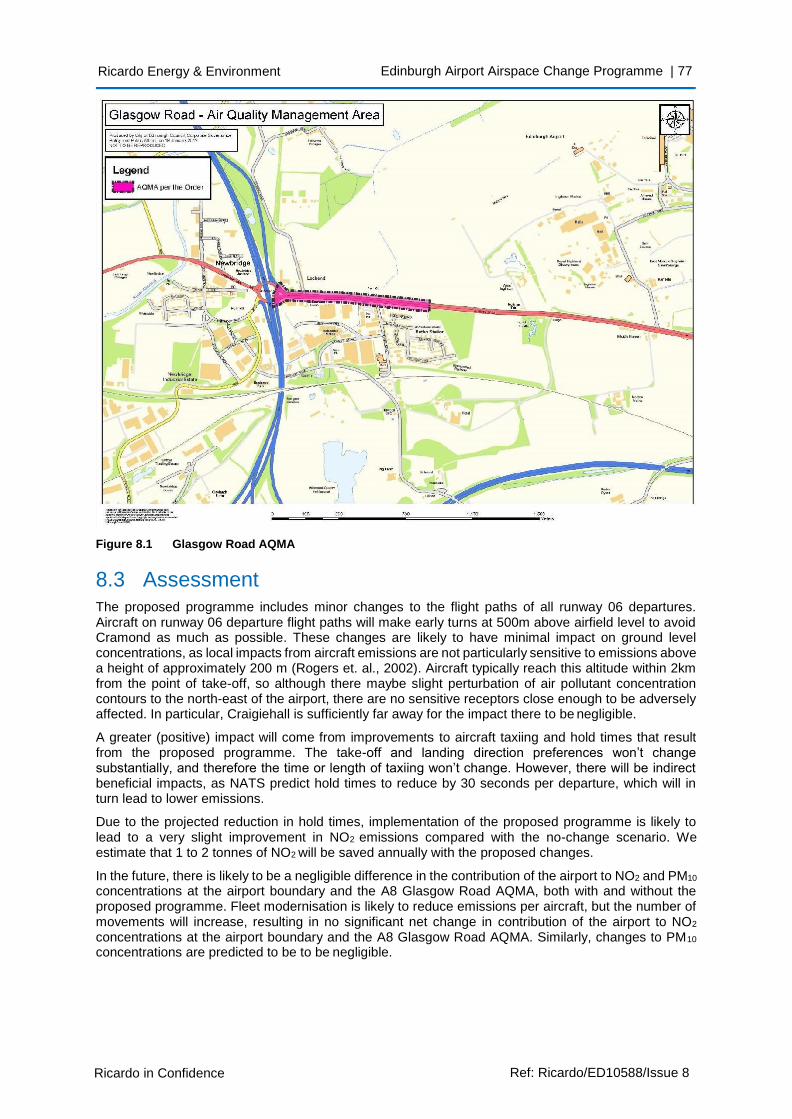
Ricardo in Confidence Ref: Ricardo/ED10588/Issue 8
Ricardo Energy & Environment Edinburgh Airport Airspace Change Programme | 77
Figure 8.1 Glasgow Road AQMA
8.3 Assessment The proposed programme includes minor changes to the flight paths of all runway 06 departures. Aircraft on runway 06 departure flight paths will make early turns at 500m above airfield level to avoid Cramond as much as possible. These changes are likely to have minimal impact on ground level concentrations, as local impacts from aircraft emissions are not particularly sensitive to emissions above a height of approximately 200 m (Rogers et. al., 2002). Aircraft typically reach this altitude within 2km from the point of take-off, so although there maybe slight perturbation of air pollutant concentration contours to the north-east of the airport, there are no sensitive receptors close enough to be adversely affected. In particular, Craigiehall is sufficiently far away for the impact there to be negligible.
A greater (positive) impact will come from improvements to aircraft taxiing and hold times that result from the proposed programme. The take-off and landing direction preferences won’t change substantially, and therefore the time or length of taxiing won’t change. However, there will be indirect beneficial impacts, as NATS predict hold times to reduce by 30 seconds per departure, which will in turn lead to lower emissions.
Due to the projected reduction in hold times, implementation of the proposed programme is likely to lead to a very slight improvement in NO2 emissions compared with the no-change scenario. We estimate that 1 to 2 tonnes of NO2 will be saved annually with the proposed changes.
In the future, there is likely to be a negligible difference in the contribution of the airport to NO2 and PM10
concentrations at the airport boundary and the A8 Glasgow Road AQMA, both with and without the proposed programme. Fleet modernisation is likely to reduce emissions per aircraft, but the number of movements will increase, resulting in no significant net change in contribution of the airport to NO2
concentrations at the airport boundary and the A8 Glasgow Road AQMA. Similarly, changes to PM10
concentrations are predicted to be to be negligible.
Ricardo in Confidence Ref: Ricardo/ED10588/Issue 8
Ricardo Energy & Environment Edinburgh Airport Airspace Change Programme | 78
8.4 Mitigation No mitigation for impacts on local air quality is required for the proposed programme, as overall impacts on NO2 and PM10 concentrations in the local area are predicted to be negligible. Nevertheless, Edinburgh Airport should consider opportunities to reduce air pollution on an ongoing basis, including:
• Collaborative Decision Making (CDM) to reduce airfield delays.
• Reduced engine taxiing.
• Provision of pre-conditioned air at stands to reduce auxiliary power unit use.
8.5 Key findings The key outcomes of the qualitative local air quality assessment comprise:
• A predicted saving of 1 to 2 tonnes of NO2 annually with the proposed changes, due to reduced hold times.
• The reduction in NO2 concentrations at the airport boundary and A8 Glasgow Road AQMA is predicted to be less than 0.5% of the air quality assessment level for annual mean NO2.
• Implementation of proposed programme will have negligible beneficial effects on local NO2 and PM10 concentrations.
The reduction in NO2 concentrations at the airport boundary and within the Glasgow Rd AQMA from the proposed programme is estimated to be less than 0.5% of the air quality assessment level for annual mean NO2. This comprises a negligible beneficial impact, in accordance with EPUK/IAQM (2017) guidance.
Similarly, changes to PM10 concentrations at the airport boundary and within the Glasgow Rd AQMA are estimated to be to be negligible.
Ricardo in Confidence Ref: Ricardo/ED10588/Issue 8
Ricardo Energy & Environment Edinburgh Airport Airspace Change Programme | 79
9 Economic valuation
9.1 Overview Economic valuation aims to place a monetary value on impacts associated with a given policy or change option. By expressing impacts in a common unit (in this case, monetary valuation in pounds), different impacts of a given option can be compared to understand which are more important, and combined to judge the overall effect. Further this technique allows several options to be compared to assess which delivers the largest benefit.
CAP725 notes that: ‘Change Sponsors may wish to conduct an economic appraisal of the environmental impact of airspace change’. This section will satisfy this element of the guidance, and monetising these effects will have several benefits for the wider evidence base:
• By expressing the impacts in a consistent unit, they can be directly compared to understand the relative importance of each of the environmental effects.
• The results can be combined with wider valuation of impacts. Where the costs of the proposals have been quantified, this can be compared to the environmental benefits to calculate the Net Present Value (NPV) and understand whether the proposals are likely to deliver an overall net benefit or cost to society.
In this assessment, the economic analysis has focused on the valuation of the impacts on noise and fuel consumption / greenhouse gas emissions. To do so, this has drawn on the quantification of these effects detailed in the relevant sections of this report above:
• CO2/fuel burn: this report draws on research conducted by the National Air Traffic Services (NATS) and presented in the NATS Analytics report A17032: Edinburgh ACP Departures Emissions Analysis (version 4 dated March 2018).
• Noise: this work draws on underlying research and modelling of the noise impacts conducted by Anderson Acoustics (see Section 6 and Appendix A).
Other environmental impacts are associated with the changes proposed under the ACP as explored in this report, e.g. impacts on air quality and visual intrusion. These have not been captured as part of the economic valuation. The valuation of air quality impacts was excluded as it was considered that there would be a negligible impact at ground level where human exposure (and associated health impacts occur). An agreed and appropriate methodology is not yet available for valuing visual intrusion impacts.
Further, the costs of implementing the changes under the ACP have not been assessed as part of this study as the scope of the assessment focused purely on valuing key environmental benefits. However, cost information (where available) can be compared directly to the monetised environmental benefits estimated here to understand whether the changes proposed would deliver an overall net benefit or cost. However, this was outside the scope of the environmental assessment.
The assessment of these effects has been carried out following the guidance set out in HMT’s Green Book (HMT, 2011), the CAA’s ‘Airspace Design: Guidance on the regulatory process for changing airspace design including community engagement requirements – CAP 1616 (CAA, 2017) and more detailed supplementary guidance as set out below.
9.2 Baseline The baseline used for the economic valuation assessment is identical to those used in the quantitative assessment of environmental impacts elsewhere in this report:
• CO2/fuel burn: The research used Edinburgh departure traffic data extracted from the NATS Data Warehouse Electronic Flight Progress Strip (EFPS) data source for the period 16 December 2015 to 15 December 2016. These counts were then inflated to the respective implementation year of each phase using future year traffic forecasts to estimate fuel burn impact. Growth rates were taken from NATS 2016 traffic forecast.
Ricardo in Confidence Ref: Ricardo/ED10588/Issue 8
Ricardo Energy & Environment Edinburgh Airport Airspace Change Programme | 80
• Noise: contours have been plotted and overlaid with population data for existing SIDs in 2019 and for forecast year 2024 assuming airspace change is not approved (and with traffic growth restrained2).
The impacts of the proposed programme are assessed relative to these baselines. Hence it is the change between the baseline and scenario which is valued as an environmental impact.
9.1 Assessment
9.1.1 Method and assumptions
9.1.1.1 CO2/fuel burn
The proposed programme will influence fuel consumption and greenhouse has emissions, due to re- routing of inbound and outbound flights.
The analysis has applied supplementary Green Book guidance (BEIS, 2017) to value these changes in fuel consumption and GHG emissions. This guidance provides monetary values for GHG emissions to combine with the mass of emissions released to produce an estimated total value. These values or ‘carbon prices’ are derived from a ‘target-consistent’ approach: i.e. the values are based on the estimated abatement costs incurred to meet specific emissions reductions targets3.
This guidance is applied to estimates of CO2 and fuel burn derived for modelled years 2019 and 2024.
Selecting a carbon price for analysis - flights within the EEA
BEIS’ guidance (BEIS, 2017) provides two carbon prices for use in analysis: one where emissions fall in the ‘traded’ sector (i.e. within the scope of the EU Emissions Trading Scheme (EU ETS)) and one where emissions fall in the ‘non-traded’ sector.
Under the current scope of the EU ETS, airlines operating in Europe must surrender allowances covering only emissions from flights within the European Economic Area (EEA) (DG CLIMA, 2017). Those flying to and from the EEA from outside the area are not covered by the EU ETS.
Passenger destination data for Edinburgh Airport from the Scottish Transport Statistics (Transport Scotland, 2017) has been used to split the fuel burn and CO2 data between that associated with flights within the EEA and that to and from other destinations. The calculated split is that 93% of flights are within EEA, and 7% are to/from other international destinations. This split is assumed to apply to all modelled years.
Up to 2020, the analysis applies the traded carbon price from BEIS’ guidance (BEIS, 2017) to emissions from flights to and from the EEA (around £4/tCO2e in 2018).
However, there is uncertainty around policy to reduce GHG emissions from aviation post 2020. There have been ongoing discussions regarding the future treatment of emissions from aviation under the EU ETS in the wake of the proposed development of a global measure by the International Civil Aviation Organisation (ICAO). The current ICAO proposal is to pilot a Carbon Offsetting and Reduction Scheme for International Aviation (CORSIA) starting in 2021 for states that volunteer to participate, with a second scheme phase applying to all states from 2027 (ICAO, 2017). The intention is that under the pilot phase, the scheme will only cover routes connecting states that are both voluntarily participating in the scheme. At this stage there is uncertainty around which states will voluntarily participate in the pilot phase, and around what value for carbon will be generated by the scheme. Hence there is ambiguity around which carbon price to apply to emissions from flights between Edinburgh and EEA destinations in the modelled years after 2020.
2 As airspace change would enable traffic growth, it is appropriate to exclude this growth from the 2024 scenario assuming airspace change is not approved. 3 These values are based on the logic that a reduction in emissions from the new policy option under assessment will displace the need for an existing action (potentially in a different sector) to reduce emissions to work towards the targets. As such, the benefit of the new measure is represented by the cost saving associated with no longer implementing the existing abatement measure which is hypothetically displaced (i.e. the abatement cost)
Ricardo in Confidence Ref: Ricardo/ED10588/Issue 8
Ricardo Energy & Environment Edinburgh Airport Airspace Change Programme | 81
As such, the analysis applies two carbon prices to emissions from intra-EEA flights post-2020:
• A ‘low’ estimate takes the traded carbon price from the BEIS guidance (around £34/tCO2e in 2024; illustrating the case where the UK is not part of an international scheme by 2024 and existing arrangements continue, or where the carbon value generated by such a scheme is relatively low and comparable to that anticipated under the EU ETS).
• A ‘high’ estimate takes the social cost of carbon applied in appraisal by the US EPA (£42/tCO2e in 2024; illustrating a broader estimate of the global damage associated with a tonne of CO2
released to the atmosphere4) (EPA, 2016). Where the US EPA carbon price is adopted, the resulting estimated monetary impact no longer represents the reduction in cost of the UK meeting its climate change targets, but instead is in theory a valuation of the reduction in long- term damage of climate change effects.
The generates a central range of values.
Further an additional sensitivity range around this central range is calculated using low and high carbon prices from each set of values. In this case the central range reflects uncertainty around policy to tackle aviation emissions in the future (and hence which carbon price is appropriate for the analysis). In contrast the wider sensitivity range reflects a broader range of uncertainties which may influence the value of carbon, e.g. oil prices, uncertainty in the quantification of future damages caused by climate change, variation in discount rates applied to these future damages, etc.
Selecting a carbon price for analysis - flights to and from destinations outside the EEA
Regarding international flights (i.e. those to and from destinations outside the EEA), there is ambiguity around what carbon price would be appropriate to apply both pre- and post-2020. Emissions from these flights are not currently included within the EU ETS, as such BEIS’ traded price does not apply. Further, international aviation remains outside the scope of UK’s carbon budgets (DECC, 2012), hence applying the non-traded price is also problematic.
The analysis applies the social cost of carbon derived by the US EPA as a central estimate. This value also represents a central value in between the traded and non-traded values from BEIS’ guidance. In the same way as for intra EEA flights, a wider sensitivity range is produced by applying low and high carbon values from BEIS and US EPA guidance, with the widest range produced presented in the results.
Fuel prices applied in the analysis
Prices for aviation fuel are not directly available from BEIS’ appraisal guidance. Instead:
• Historical prices for jet fuel for 2018 were sourced from the International Air Transport Association (IATA, 2018).
• These were forecast forward using the oil price forecast in BEIS’ appraisal guidance5.
• A sensitivity range around the central jet fuel price was derived using the sensitivity range around the central wholesale oil price in BEIS’ guidance.
The fuel price data used in the analysis represents the average price paid at the refinery for aviation jet fuel. This is consistent with options appraisal guidance published by the CAA which notes market prices are an appropriate estimate of the value of an impact (CAA, 2017a).
9.1.1.2 Noise
Noise (i.e. unwanted sound) and changes in noise levels can have a range of detrimental effects, particularly on human health. The 2011 World Health Organisation (WHO) report ‘Burden of disease from environmental noise’ (WHO, 2011) identified environmental noise as the second largest environmental risk to public health in Western Europe.
4 The social cost of carbon is a measure, in monetary terms, of the long-term damage done by a tonne of CO2e emissions in a given year. It is meant to be a comprehensive estimate of climate change damages and includes a range of impacts, e.g. agricultural productivity, human health, flood risk, etc. However, there are large uncertainties surrounding estimation of such values, and the EPA note that the social costs do not include all important damage effects. 5 Historically prices for jet fuel are seen to move closely with the base oil price (see IATA, 2018)
Ricardo in Confidence Ref: Ricardo/ED10588/Issue 8
Ricardo Energy & Environment Edinburgh Airport Airspace Change Programme | 82
The impacts of the proposed changes have been assessed by applying Defra’s guidance on the appraisal of noise impacts (Defra, 2014a) (supplementary guidance under HMT’s Green Book which is also captured in DfT’s WebTAG guidance (DfT, 2015)).
Defra have produced tools which convert changes in noise exposure into estimated monetary values by applying the impact-pathway approach. These impact values are expressed as a monetised impact, per household, per year, per sustained unit change in Lden and Lnight. These summary values capture a range of health impacts associated with changes in noise levels, namely changes in incidence of:
• Acute myocardial infarction (AMI).
• Hypertension (through increased risk of strokes and dementia).
• Annoyance for changes.
• Sleep disturbance.
Defra’s tools prioritised capturing health impacts based on the importance of impacts, value added, availability of evidence and links to existing data. Noise exposure has also been associated with wider impacts on amenity, productivity and ecosystems, many of which will not be captured in the present analysis as these are not included in Defra’s summary values. Indeed, recent research co-ordinated by Defra suggests that the impacts of noise on productivity could be significant, particularly through sleep disturbance, although gaps in the evidence base require further research to be undertaken before these effects can be valued (Defra, 2014b).
In addition, there are several key areas of uncertainty around Defra’s monetary values. This includes the dose-response functions which translate a change noise into a change in health outcomes, the disability weights used to describe the relative importance of different health outcomes, and the monetary valuation of the effects. For this analysis, a low-high sensitivity range around the central values has been applied to reflect these uncertainties in the analysis.
Further, Defra’s appraisal values are based on several national average assumptions, including household size: the analysis implicitly assumes that these national assumptions are appropriate to the local context.
Given dose-response functions are uncertain at low levels, Defra provides appraisal values for noise levels above 45dB, up to 81dB. This range is sufficient for the noise effects considered in this analysis.
Defra has defined values specifically for changes in aircraft noise. It is these values which have been combined with quantities of households experiencing different changes in noise levels between the with and without the proposed programme in each year, to produce the overall estimate of economic value.
Changes in daytime noise for the proposed programme are only available expressed in the Leq 16hr metric, rather than Lden which is primarily used in the Defra tools. Although this is not the preferred metric, Defra’s guidance notes that the available results can be used as an approximation for the required indicator (i.e. assuming Leq 16hr = Lden).
9.1.2 Assessment results
The tables in this section present the economic valuation of the impacts associated with the proposed programme. In each case, the impact of the proposed programme is compared to the ‘no-ACP’ baseline: hence it is the change in effect between the scenario and baseline which is valued. Table 9.1 presents the economic valuation of CO2 / fuel burn impacts, and Table 9.2 presents the economic valuation of noise impacts. Table 9.3 adds these values together to show the economic valuation of the overall environmental impacts.
The impacts have been assessed for a given modelled year and hence represent the value associated with one year of impacts. In practice, these impacts would occur annually over a longer period depending on the lifetime of the option proposed.
The impacts have not been discounted and are presented in 2017 prices.
In the tables, positive values represent benefits associated with the proposed programme, whereas negative values represent costs (or adverse impacts associated with the change). Further, for each impact a central value and sensitivity range has been calculated: the central value represents the ‘best estimate’ of the value of the effects and is used for the overall assessment, however the sensitivity range illustrates how low or high the potential value could be due to uncertainties in the valuation methodology.
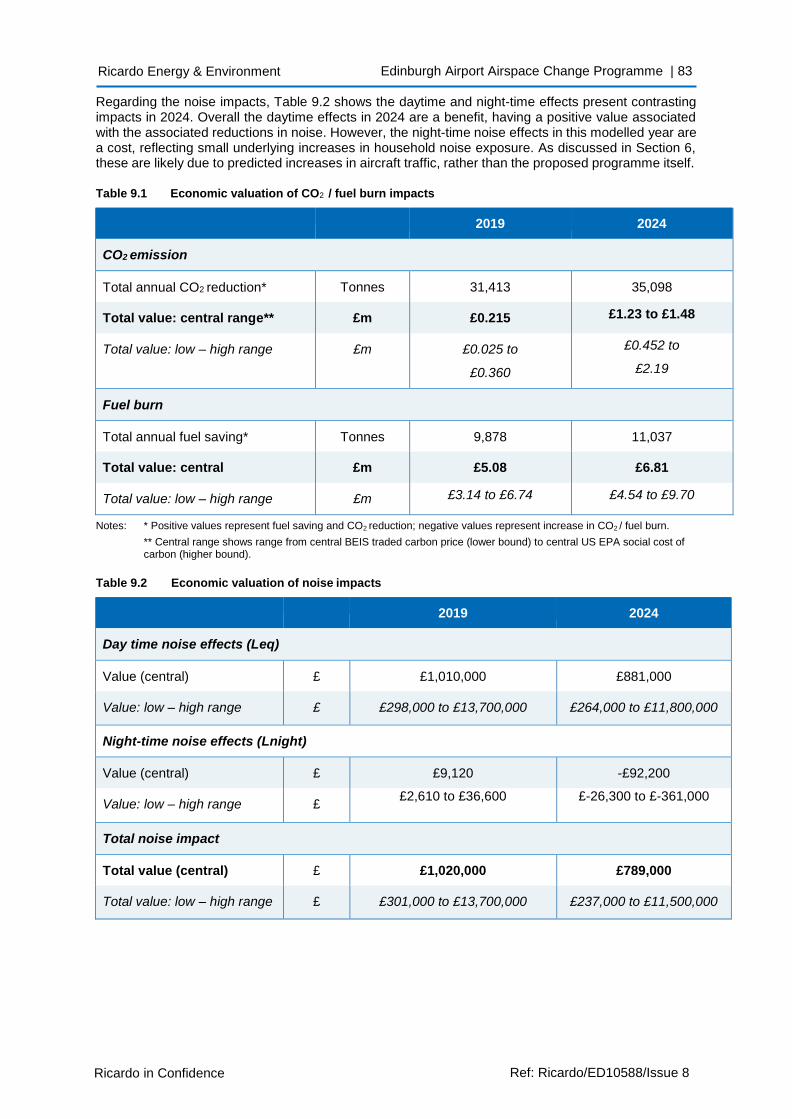
Ricardo in Confidence Ref: Ricardo/ED10588/Issue 8
Ricardo Energy & Environment Edinburgh Airport Airspace Change Programme | 83
Regarding the noise impacts, Table 9.2 shows the daytime and night-time effects present contrasting impacts in 2024. Overall the daytime effects in 2024 are a benefit, having a positive value associated with the associated reductions in noise. However, the night-time noise effects in this modelled year are a cost, reflecting small underlying increases in household noise exposure. As discussed in Section 6, these are likely due to predicted increases in aircraft traffic, rather than the proposed programme itself.
Table 9.1 Economic valuation of CO2 / fuel burn impacts
2019 2024
CO2 emission
Total annual CO2 reduction* Tonnes 31,413 35,098
Total value: central range** £m £0.215 £1.23 to £1.48
Total value: low – high range £m £0.025 to
£0.360
£0.452 to
£2.19
Fuel burn
Total annual fuel saving* Tonnes 9,878 11,037
Total value: central £m £5.08 £6.81
Total value: low – high range £m £3.14 to £6.74 £4.54 to £9.70
Notes: * Positive values represent fuel saving and CO2 reduction; negative values represent increase in CO2 / fuel burn.
** Central range shows range from central BEIS traded carbon price (lower bound) to central US EPA social cost of carbon (higher bound).
Table 9.2 Economic valuation of noise impacts
2019 2024
Day time noise effects (Leq)
Value (central) £ £1,010,000 £881,000
Value: low – high range £ £298,000 to £13,700,000 £264,000 to £11,800,000
Night-time noise effects (Lnight)
Value (central) £ £9,120 -£92,200
Value: low – high range £ £2,610 to £36,600 £-26,300 to £-361,000
Total noise impact
Total value (central) £ £1,020,000 £789,000
Total value: low – high range £ £301,000 to £13,700,000 £237,000 to £11,500,000
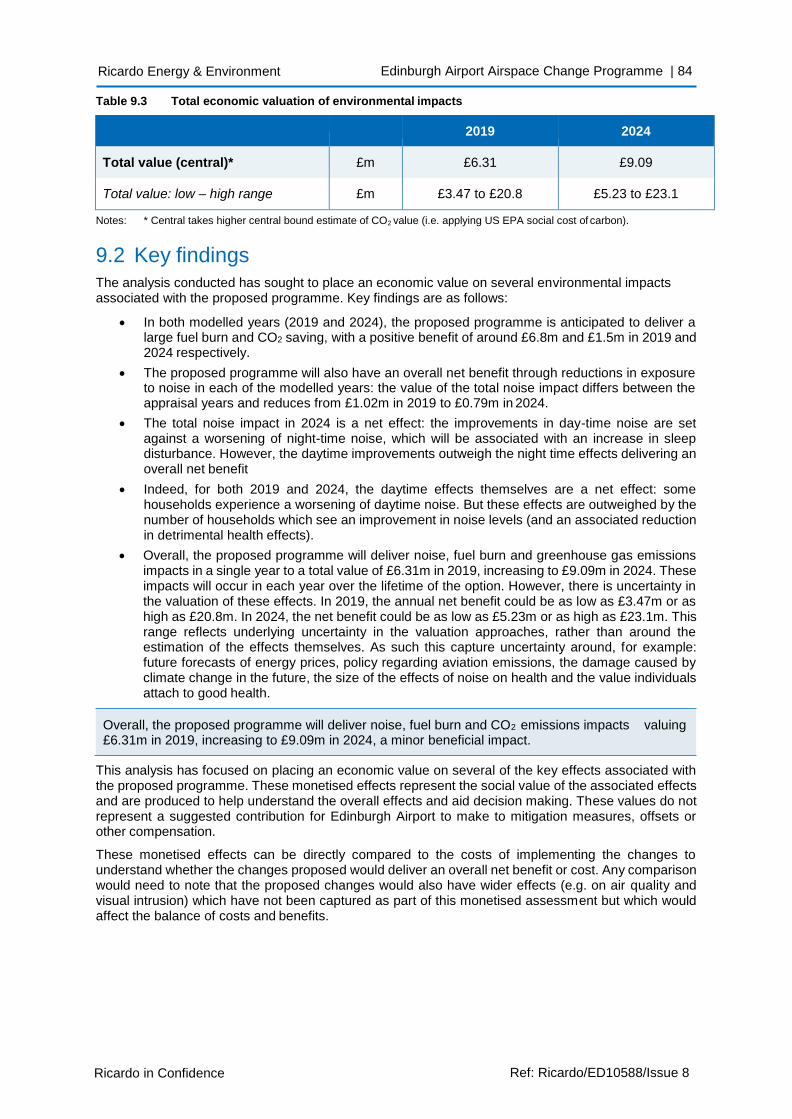
Ricardo in Confidence Ref: Ricardo/ED10588/Issue 8
Ricardo Energy & Environment Edinburgh Airport Airspace Change Programme | 84
Table 9.3 Total economic valuation of environmental impacts
2019 2024
Total value (central)* £m £6.31 £9.09
Total value: low – high range £m £3.47 to £20.8 £5.23 to £23.1
Notes: * Central takes higher central bound estimate of CO2 value (i.e. applying US EPA social cost of carbon).
9.2 Key findings
The analysis conducted has sought to place an economic value on several environmental impacts associated with the proposed programme. Key findings are as follows:
• In both modelled years (2019 and 2024), the proposed programme is anticipated to deliver a large fuel burn and CO2 saving, with a positive benefit of around £6.8m and £1.5m in 2019 and 2024 respectively.
• The proposed programme will also have an overall net benefit through reductions in exposure to noise in each of the modelled years: the value of the total noise impact differs between the appraisal years and reduces from £1.02m in 2019 to £0.79m in 2024.
• The total noise impact in 2024 is a net effect: the improvements in day-time noise are set against a worsening of night-time noise, which will be associated with an increase in sleep disturbance. However, the daytime improvements outweigh the night time effects delivering an overall net benefit
• Indeed, for both 2019 and 2024, the daytime effects themselves are a net effect: some households experience a worsening of daytime noise. But these effects are outweighed by the number of households which see an improvement in noise levels (and an associated reduction in detrimental health effects).
• Overall, the proposed programme will deliver noise, fuel burn and greenhouse gas emissions impacts in a single year to a total value of £6.31m in 2019, increasing to £9.09m in 2024. These impacts will occur in each year over the lifetime of the option. However, there is uncertainty in the valuation of these effects. In 2019, the annual net benefit could be as low as £3.47m or as high as £20.8m. In 2024, the net benefit could be as low as £5.23m or as high as £23.1m. This range reflects underlying uncertainty in the valuation approaches, rather than around the estimation of the effects themselves. As such this capture uncertainty around, for example: future forecasts of energy prices, policy regarding aviation emissions, the damage caused by climate change in the future, the size of the effects of noise on health and the value individuals attach to good health.
This analysis has focused on placing an economic value on several of the key effects associated with the proposed programme. These monetised effects represent the social value of the associated effects and are produced to help understand the overall effects and aid decision making. These values do not represent a suggested contribution for Edinburgh Airport to make to mitigation measures, offsets or other compensation.
These monetised effects can be directly compared to the costs of implementing the changes to understand whether the changes proposed would deliver an overall net benefit or cost. Any comparison would need to note that the proposed changes would also have wider effects (e.g. on air quality and visual intrusion) which have not been captured as part of this monetised assessment but which would affect the balance of costs and benefits.
Overall, the proposed programme will deliver noise, fuel burn and CO2 emissions impacts valuing £6.31m in 2019, increasing to £9.09m in 2024, a minor beneficial impact.
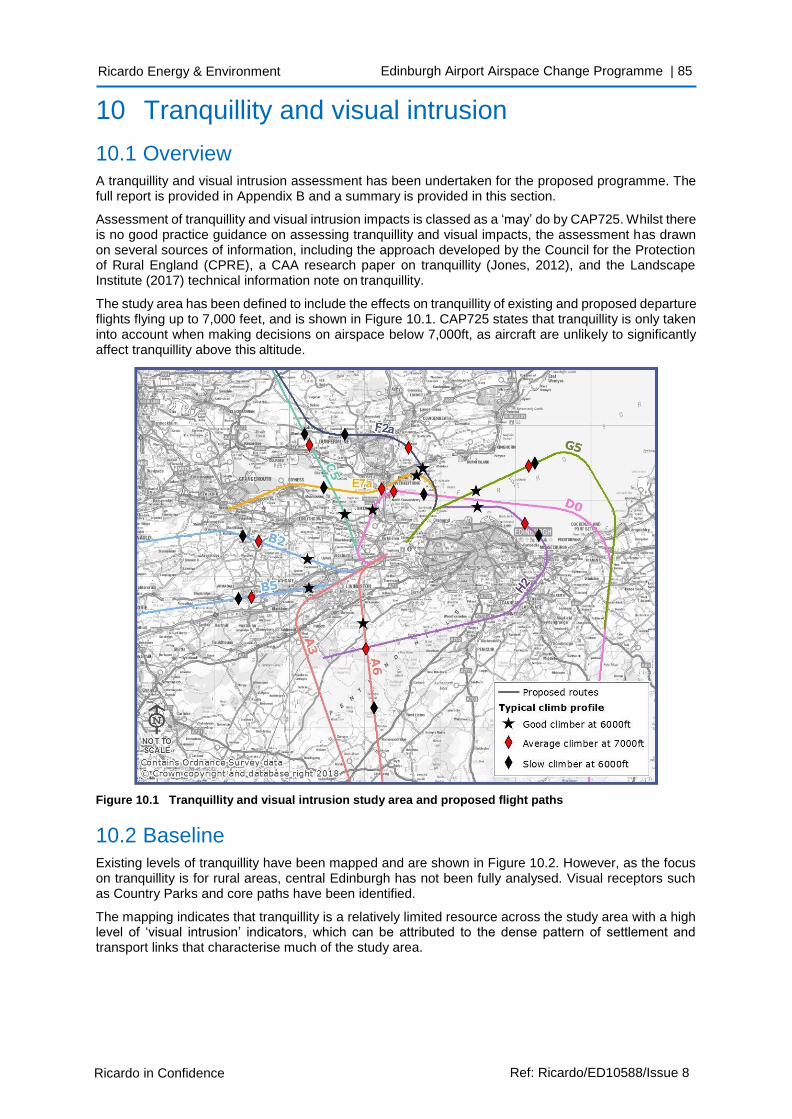
Ricardo in Confidence Ref: Ricardo/ED10588/Issue 8
Ricardo Energy & Environment Edinburgh Airport Airspace Change Programme | 85
10 Tranquillity and visual intrusion
10.1 Overview A tranquillity and visual intrusion assessment has been undertaken for the proposed programme. The full report is provided in Appendix B and a summary is provided in this section.
Assessment of tranquillity and visual intrusion impacts is classed as a ‘may’ do by CAP725. Whilst there is no good practice guidance on assessing tranquillity and visual impacts, the assessment has drawn on several sources of information, including the approach developed by the Council for the Protection of Rural England (CPRE), a CAA research paper on tranquillity (Jones, 2012), and the Landscape Institute (2017) technical information note on tranquillity.
The study area has been defined to include the effects on tranquillity of existing and proposed departure flights flying up to 7,000 feet, and is shown in Figure 10.1. CAP725 states that tranquillity is only taken into account when making decisions on airspace below 7,000ft, as aircraft are unlikely to significantly affect tranquillity above this altitude.
Figure 10.1 Tranquillity and visual intrusion study area and proposed flight paths
10.2 Baseline
Existing levels of tranquillity have been mapped and are shown in Figure 10.2. However, as the focus on tranquillity is for rural areas, central Edinburgh has not been fully analysed. Visual receptors such as Country Parks and core paths have been identified.
The mapping indicates that tranquillity is a relatively limited resource across the study area with a high level of ‘visual intrusion’ indicators, which can be attributed to the dense pattern of settlement and transport links that characterise much of the study area.
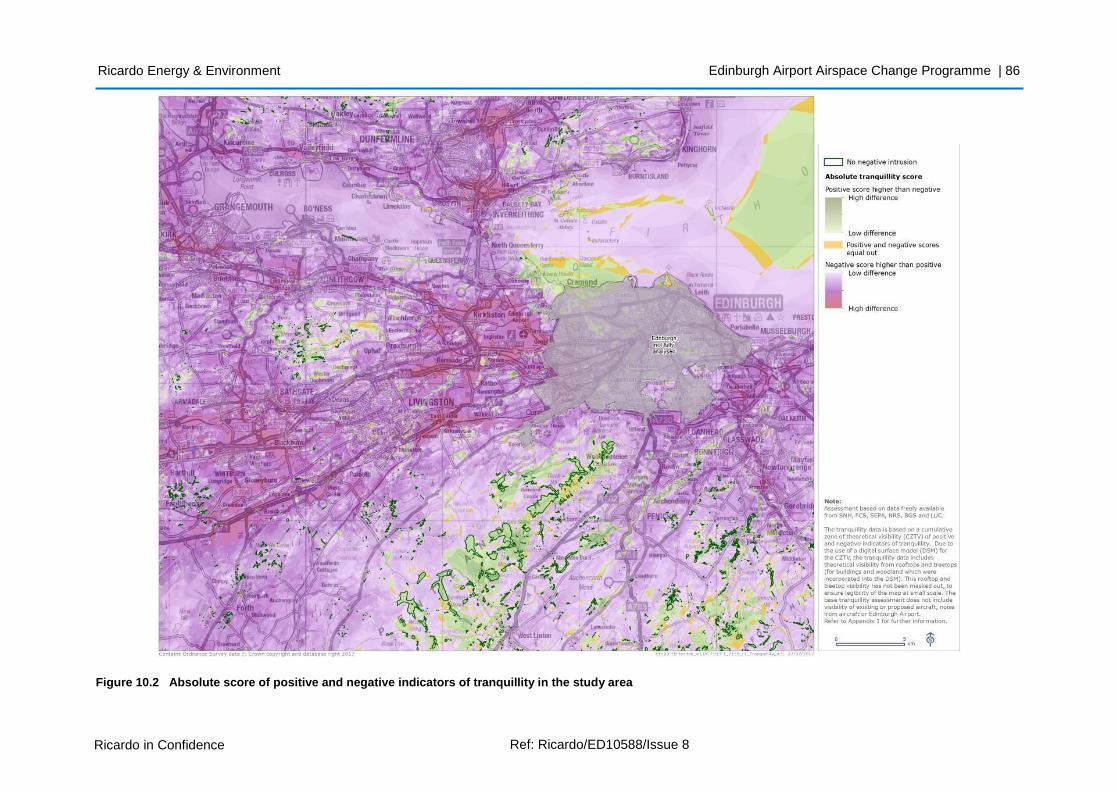
Ricardo in Confidence Ref: Ricardo/ED10588/Issue 8
Ricardo Energy & Environment
Figure 10.2 Absolute score of positive and negative indicators of tranquillity in the study area
Edinburgh Airport Airspace Change Programme | 86
Ricardo Energy & Environment Edinburgh Airport Airspace Change Programme | 87
Ricardo in Confidence Ref: Ricardo/ED10588/Issue 8
Identified areas of tranquillity within the study area are:
• The Firth of Forth – this is the largest single area of higher tranquillity.
• The Forth coastline.
• The spine of the Pentland Hills - the most extensive areas of tranquillity on land.
• The Moorfoot Hills.
• Smaller concentrations of relative tranquillity associated with other less settled upland areas, including the Bathgate Hills in West Lothian, the Slamannan Plateau in Falkirk and the low hills of western Fife.
• Pockets of tranquillity in farmland areas such as the area east of Dunfermline.
• Linear areas of tranquillity are associated with river valleys, notably the Esk in Midlothian, the Almond near Livingston and the Avon west of Linlithgow.
Many of the areas of tranquillity correspond to locations where people go for outdoor recreation, the relative tranquillity being part of the appeal for many such areas. Visual receptors identified are:
• The Pentland Hills – a major outdoor recreation area within the Regional Park and across the hills.
• Country Parks such as Beecraigs in the Bathgate Hills, and Roslin Glen in the Esk Valley.
• Coastal paths on both sides of the Firth of Forth: the John Muir Way on the south side and the Fife Coastal Path to the north.
• Core paths routed along river valleys, such as the Esk and Avon.
Most runway 24 departures fly west or turn southwards, with a smaller number of aircraft flying north. The existing flight paths cause effects on tranquillity in the southern Pentland Hills and the Bathgate Hills. However, the areas most used for recreation do not appear to be intensively overflown at present.
Departures from runway 06 overfly the Firth of Forth, with flight paths spreading out over the water and over southern Fife. These departures affect the tranquillity experienced around Cramond and associated locations along the Forth coast between Hound Point and Granton. This is indicated as a tranquil area, though it is generally affected by aircraft either departing towards or, more commonly, arriving from the north-east.
10.3 Assessment The assessment overlaid proposed flight paths onto the baseline tranquillity mapping. Due to the potential for vectoring, the assessment has considered the area within approximately 1km of the flight paths. The assessment overlaid proposed flight paths onto the baseline tranquillity mapping. Relative tranquillity within the study area was assessed by combining several datasets indicating:
• Total score of positive tranquillity indicators (e.g. naturalness / natural landscape, visibility of woodland, visibility of lakes and visibility of the sea.
• Total score of visual intrusions or negative detractors from tranquillity (e.g. noise and visibility of wind turbines, roads, airports, towns and cities, railways, overhead power line towers and quarries).
The proposed flight paths were overlaid onto the baseline tranquillity mapping and areas of relatively higher tranquillity were noted, particularly if these corresponded with locations of visual receptors. The likely changes in tranquillity arising from each new route were evaluated, both for individual flight paths and combined changes arising from all new flight paths.
10.3.1 Flight path A3 and A6 ACORN
There would be no new impacts on tranquillity and visual intrusion associated with flight path A3. This flight path is essentially the same as the existing situation.
Aircraft on flight path A6 would be some 6-9km further east than aircraft on the existing flight path. Because they would be closer to the airport, aircraft would be at a lower altitude when they overfly the Pentland Hills. These hills are among the most tranquil parts of the study area and represent a popular recreational resource for Edinburgh and its environs. The route passes directly over Harperrig Reservoir, a popular location and access point into the hills, and over West Cairn Hill (562m) and
Ricardo Energy & Environment Edinburgh Airport Airspace Change Programme | 88
Ricardo in Confidence Ref: Ricardo/ED10588/Issue 8
Byrehope Mount (536m). The route is close to enclosed upland valleys that are currently infrequently overflown, including Baddinsgill and West Water. The Thieves Road walking route follows the Baddinsgill valley.
The use of flight path A6 is likely to have an impact on the tranquillity of the Pentland Hills, and would be experienced by people accessing the central and southern hills and using the Thieves Road and nearby paths. However, average climbers will be above 7,000ft before reaching the tranquil areas of the Pentland Hills, so only slow climbers will affect tranquillity in this area. In addition, this flight path would only be used at peak times (06:00 – 09:59), when fewer people are likely to be using the hills. Flight path A6 will also not be used on gliding days at RAF Kirknewton, which are limited to Fridays, Saturdays, Sundays and bank holidays. This will further reduce potential impacts on the tranquillity of the Pentland Hills.
10.3.2 Flight path B2 BEECH and B5 BRIER
There would be no new impacts on tranquillity and visual intrusion associated with flight path B5. This flight path is essentially the same as the existing situation.
Flight path B2 would be in use during daytime hours (06:00 to 21:59), including weekends. Use of this route is likely to have effects on tranquillity and levels of intrusion experienced by people using Beecraig’s Country Park and visiting Cockleroy Hill, a prominent viewpoint at the edge of the country park. To a lesser extent, aircraft may affect the tranquillity experienced by people with the Avon Valley and Muiravonside Country Park, areas that are relatively tranquil. However, these areas are further west of the flight path, so aircraft would be higher and are more obscured by woodland and topography.
10.3.3 Flight path C5 CEDAR
The proposed flight path is further east than the current flight path. Use of flight path C5 would cause a reduction in tranquillity in some small pockets of relatively tranquil landscape including short sections of the Union Canal. There would also be a small increase in tranquillity for some areas to the west of the new flight path including the fringes of the Bathgate Hills, due to fewer aircraft flying over the area west of Ecclesmachan.
10.3.4 Flight path D0 DOWEL
This new flight path passes over areas that are not currently overflown. Aircraft would pass over areas that are largely low in tranquillity to the east of Broxburn and Winchburgh. There are pockets of higher tranquillity to the north of the M9, including the designated landscapes of Dundas House (private) and Hopetoun House. The flight path does not pass over the core of either designated landscape, however it passes over the approach to Hopetoun on the Firth of Forth shore, which is also the route of the John Muir Way.
The Firth of Forth in the region of the Forth Bridges is not particularly tranquil, however there are smaller areas such as Port Laing to the east of North Queensferry where the Fife Coastal Path follows a secluded bay. Most aircraft would have reached 7,000ft by this point, although there may be some that have not. More distant views of these aircraft would be seen from the tranquil coast east of Dalmeny House, although any associated impact on tranquillity is likely to be limited.
10.3.5 Flight path E7a ELDER
Flight path E7a is similar to current flight paths, passing over a sweep of the Firth of Forth and the Fife coast. Aircraft will overfly relatively tranquil areas north and west of Cramond, though this area is already affected by arriving/departing aircraft that use the existing flight paths. Other more tranquil areas overflown include Inchcolm and sections of the Fife Coastal Path near Dalgety Bay. Again, these areas are already overflown by the current flight paths and additional impacts on visual intrusion and tranquillity are not anticipated.
Further west, the route passes over the more settled and busy landscape around Inverkeithing, the Forth Bridges, and the inner Firth of Forth. The coast around Blackness may experience a slight improvement in tranquillity as aircraft will remain over the water, rather than crossing over the coast as they do at present. New impacts on tranquillity in this area will be minimal.
10.3.6 Flight path F2a FLORA
Flight path F2a passes over relatively tranquil areas at Cramond, although this area is affected by existing arriving and/or departing aircraft, and no new effects on tranquillity are predicted. The route
Ricardo Energy & Environment Edinburgh Airport Airspace Change Programme | 89
Ricardo in Confidence Ref: Ricardo/ED10588/Issue 8
also passes over Inchcolm, a popular tourist destination served by a ferry route. Within Fife, there are tranquil areas along the coastline, and inland at Couston Castle and the farmland south of Crossgates. These inland locations are likely to be used for local recreation, and the Fife Coastal Path crosses the coastal locations. As flight path F2a is broadly similar to the existing flight paths, new effects on tranquillity are anticipated to be limited.
10.3.7 Flight path G5 DOWEL
At present, the same flight path is used for both the G and H routes. This continues in a more north- easterly direction, with aircraft turning closer to the Fife Coast near Kinghorn, and returning to the Lothian coast closer to Edinburgh. By routing the new G5 flight path over water, the potential for effects on tranquillity is reduced. However, the flight path is closer to the relatively tranquil coastline of north Edinburgh, between Cramond and Granton, than the existing flight paths. Although aircraft are a familiar part of the scene in this popular recreational area, particularly at Cramond, there may be some limited reduction in tranquillity further east. Further out, Inchkeith and the adjacent waters are indicated as relatively tranquil, but there are few receptors aside from recreational sailors. Flight path G5 may also slightly increase tranquillity on a short section of the Fife coast, due to aircraft being further from this shore.
10.3.8 Flight path H2 HEATH
As described above, the same existing flight path is used for G and H, with aircraft passing close to the Fife coast to turn. Flight path H2 remains over the open water, and effects are likely to be very similar to those noted for route G5 above, including some slight decrease in tranquillity along the popular north Edinburgh coast, balanced by reduced intrusion along the Fife coast.
10.3.9 Combined flight paths
On any given day, aircraft will be using all routes in one direction simultaneously, subject to time restrictions. In addition, aircraft will also be arriving via the existing arrival routes. This section provides a summary of the combined changes in tranquillity associated with use of each runway.
10.3.9.1 Runway 24
Aircraft would arrive via the existing flight paths, which are not anticipated to change. Tranquillity and visual intrusion impacts associated with runway 24 arrivals are not expected to change due to implementation of the proposed programme.
All departure flight paths follow the same course from runway 24, with routes separating out over the first few kilometres. This area south-west of the airport would be most affected, but is the area currently affected by departing aircraft and baseline tranquillity is low. No substantive change in tranquillity is anticipated due to implementation of the proposed programme.
In-combination tranquillity and visual intrusion effects associated with runway 24 departures are as follows:
• Flight paths A3, B5 and E7a follow existing flight paths, and no new effects are anticipated in relation to these flight paths.
• Flight paths A6 and D0 are restricted to peak-time only use. A6 is likely to affect tranquillity within the Pentland Hills, while D0 may affect local pockets of tranquillity west of South Queensferry. From some areas, particularly the Forth coast between Hound Point and Cramond, aircraft departing on route D0 may be seen/heard at the same time as aircraft arriving from the east. From the Pentlands, most arriving traffic is further east and less likely to be seen/heard in combination with aircraft on route A6.
• Flight paths C5 and D0 are in close proximity as they cross the area south of the Forth, and may have some combined effect on local pockets of tranquillity, including areas associated with Hopetoun House, though only during peak hours.
• Flight path B2 is relatively distant from other arrival and departure routes, and combined effects are not anticipated.
10.3.9.2 Runway 06
Aircraft would arrive via the existing flight paths which are not anticipated to change. Tranquillity and visual intrusion impacts associated with runway 06 arrivals are not expected to change due to implementation of the proposed programme.
Ricardo Energy & Environment Edinburgh Airport Airspace Change Programme | 90
Ricardo in Confidence Ref: Ricardo/ED10588/Issue 8
All departing flights from runway 06 will pass over the Firth of Forth near Cramond, with combined effects on this popular and relatively tranquil area. However, aircraft are already a feature in this area, particularly around Cramond. There may be increased effects on tranquillity due to the new flight paths, which are more dispersed across the Firth of Forth than the current flight paths. Flight paths G5 and H2 are relatively closer to the Edinburgh coast and may give rise to some combined effects. Other routes are not in close proximity, and aircraft below 7,000ft are unlikely to be seen/heard in association with arriving aircraft.
10.3.9.3 Noise intrusion
Noise intrusion to tranquil areas is also considered by overlaying proposed daytime and night time noise contours on the baseline tranquillity mapping.
For noise levels during the daytime, the change associated with the proposed programme will be limited. The introduction of the proposed programme will not result in any significant additional noise intrusion within the areas of higher baseline tranquillity (Almond Valley & Cramond) affected by the noise contours, and it will not lead to the reduction of tranquillity of any additional higher tranquillity areas.
For noise levels during the night time, the change associated with the proposed programme will also be limited. The introduction of proposed programme will not result in any significant additional noise intrustion within the areas of higher baseline tranquillity (Almond Valley & Cramond) affected by the noise contours, and it will not lead to the reduction of tranquillity of any additional higher tranquillity areas.
10.4 Key findings
Flight paths B2 and A6 may have minor adverse effects on tranquillity. Route B2 overflies the Bathgate Hills including Beecraig’s Country Park, introducing flights into an area that is not currently intensively overflown. However, this flight path will only be used by jets, which are good climbers and will likely reach 7,000ft near the Bathgate Hills. CAA guidance states that tranquillity is only taken into account when making decisions on airspace below 7,000ft, as aircraft are unlikely to significantly affect tranquillity above this altitude. Thus, the impact of flight path B2 on the Bathgate Hills is unlikely to be more than minor.
Flight path A6 would overfly sections of the Pentland Hills that are of high tranquillity and which are not currently overflown. However, adverse effects would only be caused by slower climbing aircraft. In addition, A6 would only be in use during peak hours (06:00 to 09:59) on weekdays, so will primarily be used when fewer people are likely to be using the hills.
Other flight paths likely to have minor effects on tranquillity are:
• Flight paths C5 and D0 may have combined effects on local pockets of tranquillity west of South Queensferry.
• Flight paths G5 and H2 may similarly slightly reduce the experience of tranquillity along the Forth coast between Cramond and Granton.
The remaining proposed flight paths (A3, B5, E7a and F2a) are not expected to increase effects on rural tranquillity, relative to the existing flight paths.
The existing aircraft noise contours affect only two pockets of higher baseline tranquillity, within the Almond Valley and along the Forth coast around Cramond and Dalmeny House. These areas are already affected by noise intrusion which reduces the level of tranquillity experienced and this situation will not change materially due to the proposed programme.
The new flight paths likely to have minor effects on tranquillity are B2, A6, C5, D0, G5 and H2. Other routes are not expected to increase effects on rural tranquillity, relative to the existing routes.
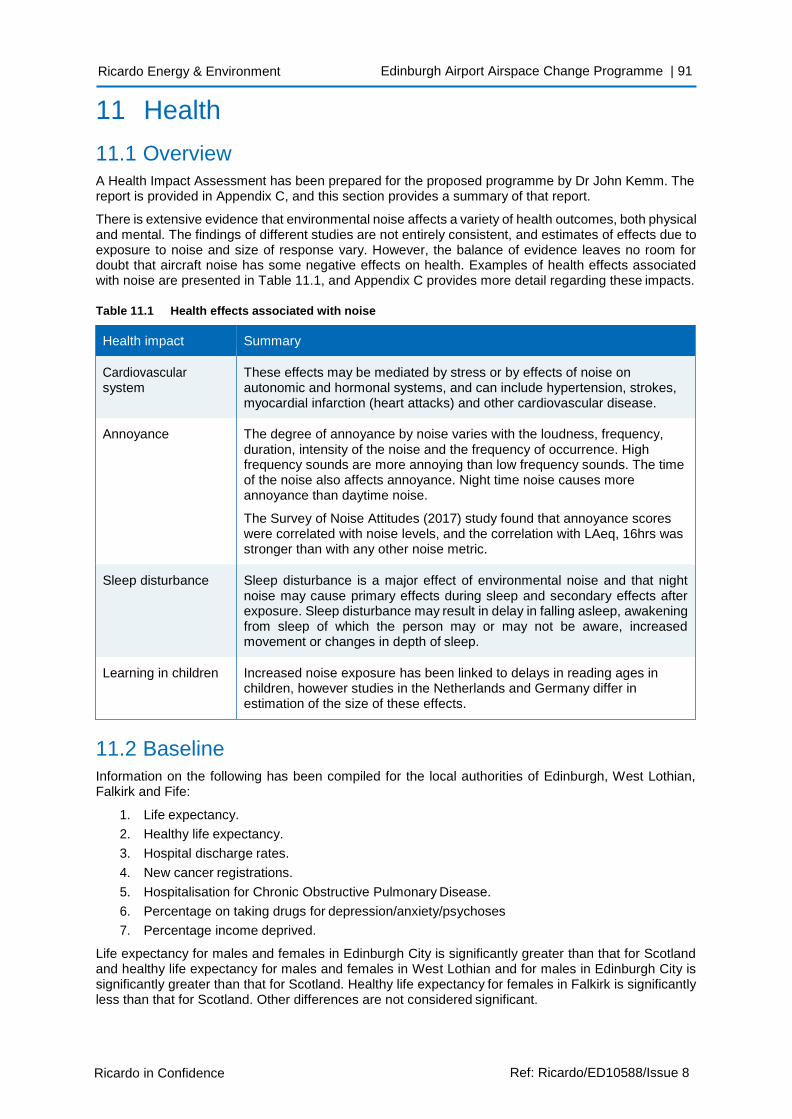
Ricardo Energy & Environment Edinburgh Airport Airspace Change Programme | 91
Ricardo in Confidence Ref: Ricardo/ED10588/Issue 8
11 Health
11.1 Overview A Health Impact Assessment has been prepared for the proposed programme by Dr John Kemm. The report is provided in Appendix C, and this section provides a summary of that report.
There is extensive evidence that environmental noise affects a variety of health outcomes, both physical and mental. The findings of different studies are not entirely consistent, and estimates of effects due to exposure to noise and size of response vary. However, the balance of evidence leaves no room for doubt that aircraft noise has some negative effects on health. Examples of health effects associated with noise are presented in Table 11.1, and Appendix C provides more detail regarding these impacts.
Table 11.1 Health effects associated with noise
Health impact Summary
Cardiovascular system
These effects may be mediated by stress or by effects of noise on autonomic and hormonal systems, and can include hypertension, strokes, myocardial infarction (heart attacks) and other cardiovascular disease.
Annoyance The degree of annoyance by noise varies with the loudness, frequency, duration, intensity of the noise and the frequency of occurrence. High frequency sounds are more annoying than low frequency sounds. The time of the noise also affects annoyance. Night time noise causes more annoyance than daytime noise.
The Survey of Noise Attitudes (2017) study found that annoyance scores were correlated with noise levels, and the correlation with LAeq, 16hrs was stronger than with any other noise metric.
Sleep disturbance Sleep disturbance is a major effect of environmental noise and that night noise may cause primary effects during sleep and secondary effects after exposure. Sleep disturbance may result in delay in falling asleep, awakening from sleep of which the person may or may not be aware, increased movement or changes in depth of sleep.
Learning in children Increased noise exposure has been linked to delays in reading ages in children, however studies in the Netherlands and Germany differ in estimation of the size of these effects.
11.2 Baseline
Information on the following has been compiled for the local authorities of Edinburgh, West Lothian, Falkirk and Fife:
1. Life expectancy.
2. Healthy life expectancy.
3. Hospital discharge rates.
4. New cancer registrations.
5. Hospitalisation for Chronic Obstructive Pulmonary Disease.
6. Percentage on taking drugs for depression/anxiety/psychoses
7. Percentage income deprived.
Life expectancy for males and females in Edinburgh City is significantly greater than that for Scotland and healthy life expectancy for males and females in West Lothian and for males in Edinburgh City is significantly greater than that for Scotland. Healthy life expectancy for females in Falkirk is significantly less than that for Scotland. Other differences are not considered significant.
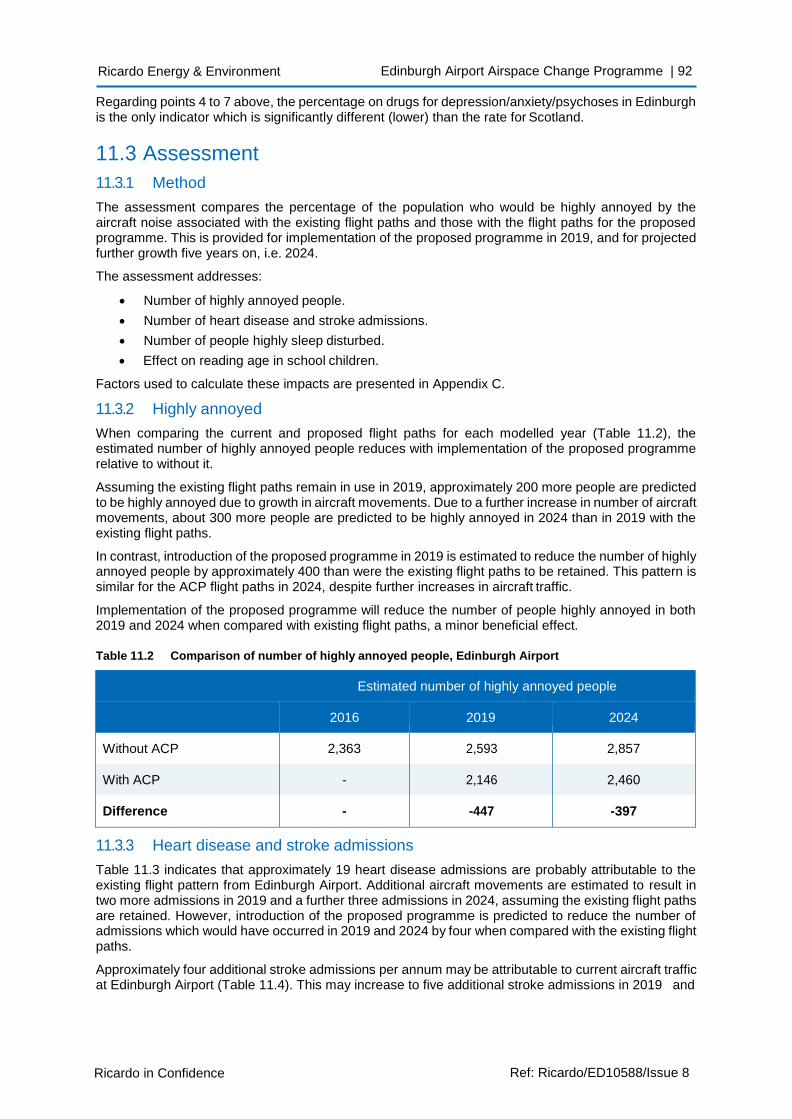
Ricardo Energy & Environment Edinburgh Airport Airspace Change Programme | 92
Ricardo in Confidence Ref: Ricardo/ED10588/Issue 8
Regarding points 4 to 7 above, the percentage on drugs for depression/anxiety/psychoses in Edinburgh is the only indicator which is significantly different (lower) than the rate for Scotland.
11.3 Assessment
11.3.1 Method
The assessment compares the percentage of the population who would be highly annoyed by the aircraft noise associated with the existing flight paths and those with the flight paths for the proposed programme. This is provided for implementation of the proposed programme in 2019, and for projected further growth five years on, i.e. 2024.
The assessment addresses:
• Number of highly annoyed people.
• Number of heart disease and stroke admissions.
• Number of people highly sleep disturbed.
• Effect on reading age in school children.
Factors used to calculate these impacts are presented in Appendix C.
11.3.2 Highly annoyed
When comparing the current and proposed flight paths for each modelled year (Table 11.2), the estimated number of highly annoyed people reduces with implementation of the proposed programme relative to without it.
Assuming the existing flight paths remain in use in 2019, approximately 200 more people are predicted to be highly annoyed due to growth in aircraft movements. Due to a further increase in number of aircraft movements, about 300 more people are predicted to be highly annoyed in 2024 than in 2019 with the existing flight paths.
In contrast, introduction of the proposed programme in 2019 is estimated to reduce the number of highly annoyed people by approximately 400 than were the existing flight paths to be retained. This pattern is similar for the ACP flight paths in 2024, despite further increases in aircraft traffic.
Implementation of the proposed programme will reduce the number of people highly annoyed in both 2019 and 2024 when compared with existing flight paths, a minor beneficial effect.
Table 11.2 Comparison of number of highly annoyed people, Edinburgh Airport
Estimated number of highly annoyed people
2016 2019 2024
Without ACP 2,363 2,593 2,857
With ACP - 2,146 2,460
Difference - -447 -397
11.3.3 Heart disease and stroke admissions
Table 11.3 indicates that approximately 19 heart disease admissions are probably attributable to the existing flight pattern from Edinburgh Airport. Additional aircraft movements are estimated to result in two more admissions in 2019 and a further three admissions in 2024, assuming the existing flight paths are retained. However, introduction of the proposed programme is predicted to reduce the number of admissions which would have occurred in 2019 and 2024 by four when compared with the existing flight paths.
Approximately four additional stroke admissions per annum may be attributable to current aircraft traffic at Edinburgh Airport (Table 11.4). This may increase to five additional stroke admissions in 2019 and
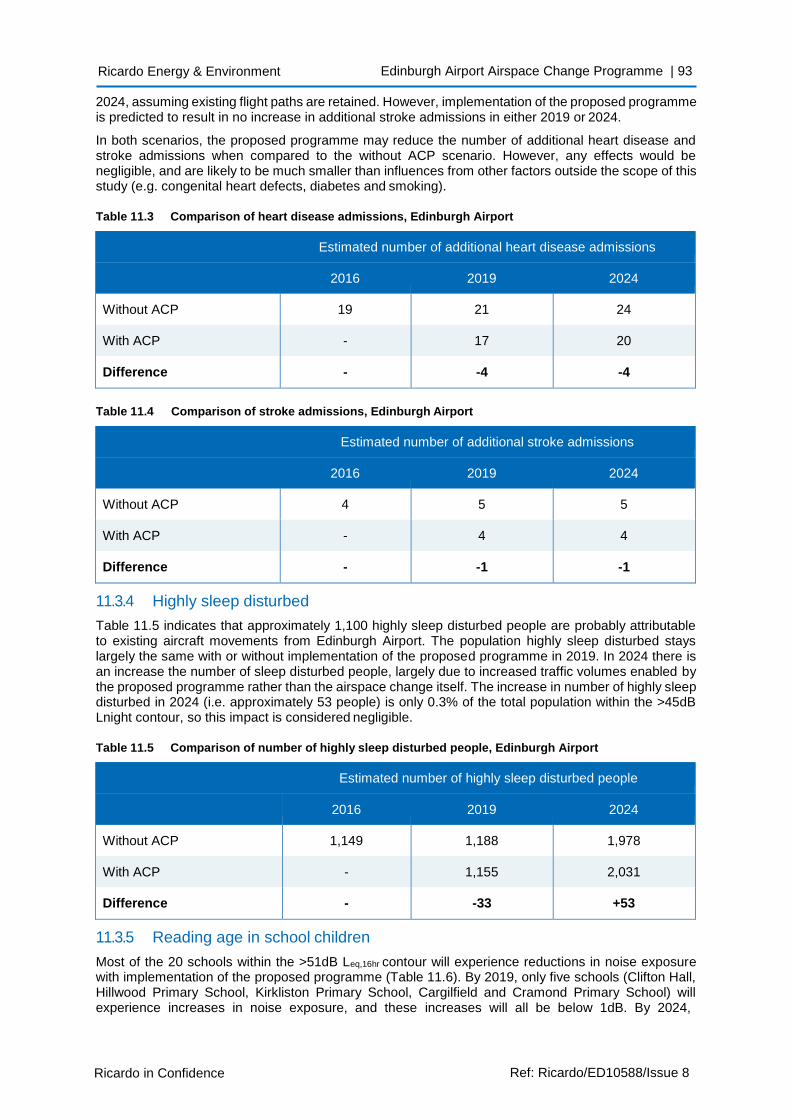
Ricardo Energy & Environment Edinburgh Airport Airspace Change Programme | 93
Ricardo in Confidence Ref: Ricardo/ED10588/Issue 8
2024, assuming existing flight paths are retained. However, implementation of the proposed programme is predicted to result in no increase in additional stroke admissions in either 2019 or 2024.
In both scenarios, the proposed programme may reduce the number of additional heart disease and stroke admissions when compared to the without ACP scenario. However, any effects would be negligible, and are likely to be much smaller than influences from other factors outside the scope of this study (e.g. congenital heart defects, diabetes and smoking).
Table 11.3 Comparison of heart disease admissions, Edinburgh Airport
Estimated number of additional heart disease admissions
2016 2019 2024
Without ACP 19 21 24
With ACP - 17 20
Difference - -4 -4
Table 11.4 Comparison of stroke admissions, Edinburgh Airport
Estimated number of additional stroke admissions
2016 2019 2024
Without ACP 4 5 5
With ACP - 4 4
Difference - -1 -1
11.3.4 Highly sleep disturbed
Table 11.5 indicates that approximately 1,100 highly sleep disturbed people are probably attributable to existing aircraft movements from Edinburgh Airport. The population highly sleep disturbed stays largely the same with or without implementation of the proposed programme in 2019. In 2024 there is an increase the number of sleep disturbed people, largely due to increased traffic volumes enabled by the proposed programme rather than the airspace change itself. The increase in number of highly sleep disturbed in 2024 (i.e. approximately 53 people) is only 0.3% of the total population within the >45dB Lnight contour, so this impact is considered negligible.
Table 11.5 Comparison of number of highly sleep disturbed people, Edinburgh Airport
Estimated number of highly sleep disturbed people
2016 2019 2024
Without ACP 1,149 1,188 1,978
With ACP - 1,155 2,031
Difference - -33 +53
11.3.5 Reading age in school children
Most of the 20 schools within the >51dB Leq,16hr contour will experience reductions in noise exposure with implementation of the proposed programme (Table 11.6). By 2019, only five schools (Clifton Hall, Hillwood Primary School, Kirkliston Primary School, Cargilfield and Cramond Primary School) will experience increases in noise exposure, and these increases will all be below 1dB. By 2024,
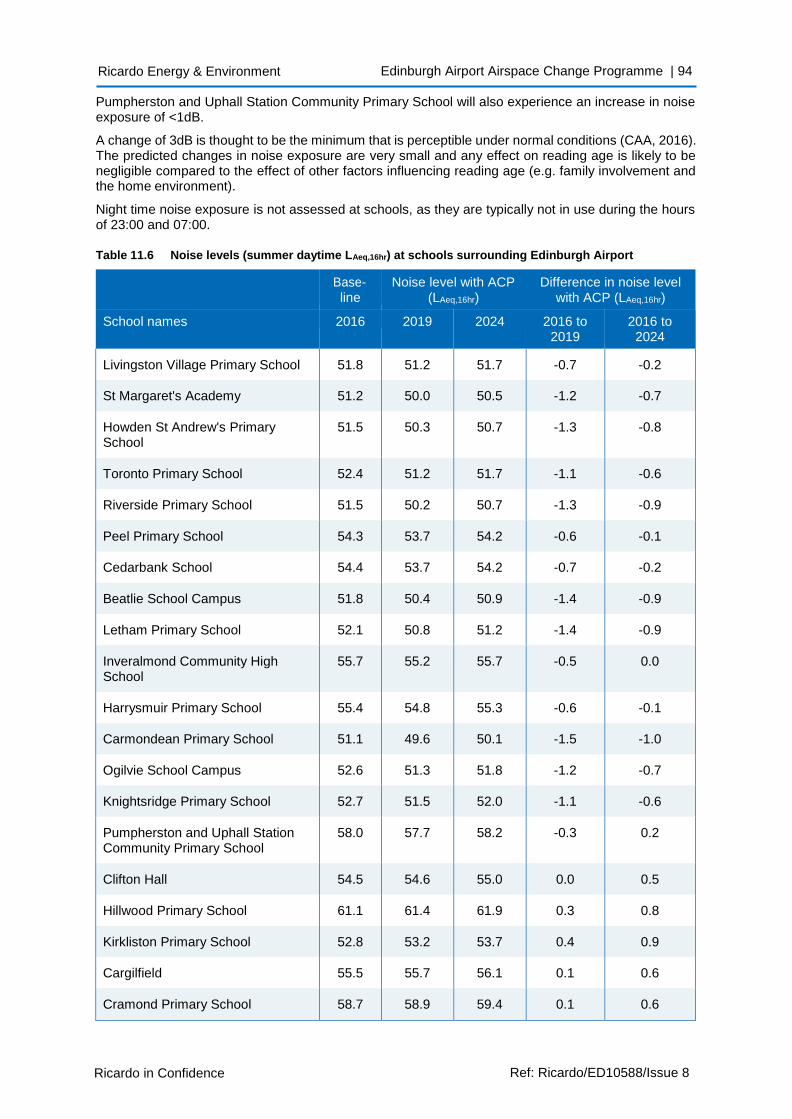
Ricardo Energy & Environment Edinburgh Airport Airspace Change Programme | 94
Ricardo in Confidence Ref: Ricardo/ED10588/Issue 8
Pumpherston and Uphall Station Community Primary School will also experience an increase in noise exposure of <1dB.
A change of 3dB is thought to be the minimum that is perceptible under normal conditions (CAA, 2016). The predicted changes in noise exposure are very small and any effect on reading age is likely to be negligible compared to the effect of other factors influencing reading age (e.g. family involvement and the home environment).
Night time noise exposure is not assessed at schools, as they are typically not in use during the hours of 23:00 and 07:00.
Table 11.6 Noise levels (summer daytime LAeq,16hr) at schools surrounding Edinburgh Airport
Base- line
Noise level with ACP (LAeq,16hr)
Difference in noise level with ACP (LAeq,16hr)
School names 2016 2019 2024 2016 to 2019
2016 to 2024
Livingston Village Primary School 51.8 51.2 51.7 -0.7 -0.2
St Margaret's Academy 51.2 50.0 50.5 -1.2 -0.7
Howden St Andrew's Primary School
51.5 50.3 50.7 -1.3 -0.8
Toronto Primary School 52.4 51.2 51.7 -1.1 -0.6
Riverside Primary School 51.5 50.2 50.7 -1.3 -0.9
Peel Primary School 54.3 53.7 54.2 -0.6 -0.1
Cedarbank School 54.4 53.7 54.2 -0.7 -0.2
Beatlie School Campus 51.8 50.4 50.9 -1.4 -0.9
Letham Primary School 52.1 50.8 51.2 -1.4 -0.9
Inveralmond Community High School
55.7 55.2 55.7 -0.5 0.0
Harrysmuir Primary School 55.4 54.8 55.3 -0.6 -0.1
Carmondean Primary School 51.1 49.6 50.1 -1.5 -1.0
Ogilvie School Campus 52.6 51.3 51.8 -1.2 -0.7
Knightsridge Primary School 52.7 51.5 52.0 -1.1 -0.6
Pumpherston and Uphall Station Community Primary School
58.0 57.7 58.2 -0.3 0.2
Clifton Hall 54.5 54.6 55.0 0.0 0.5
Hillwood Primary School 61.1 61.4 61.9 0.3 0.8
Kirkliston Primary School 52.8 53.2 53.7 0.4 0.9
Cargilfield 55.5 55.7 56.1 0.1 0.6
Cramond Primary School 58.7 58.9 59.4 0.1 0.6
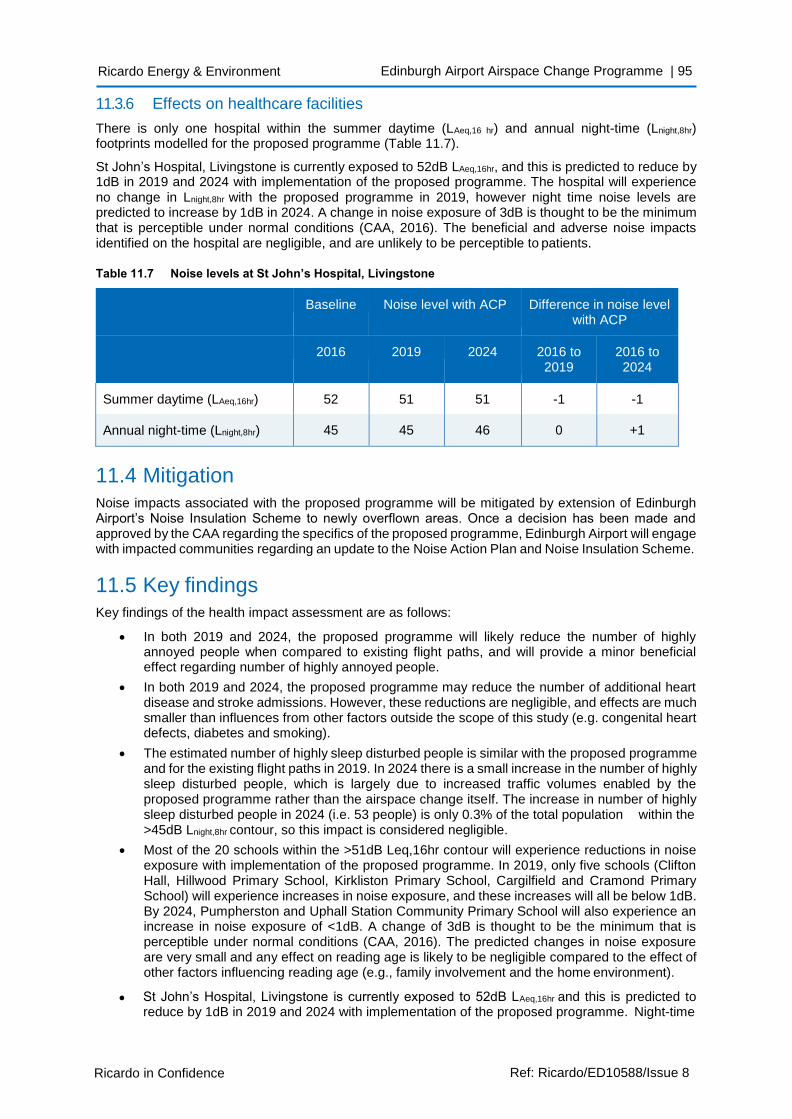
Ricardo Energy & Environment Edinburgh Airport Airspace Change Programme | 95
Ricardo in Confidence Ref: Ricardo/ED10588/Issue 8
11.3.6 Effects on healthcare facilities
There is only one hospital within the summer daytime (LAeq,16 hr) and annual night-time (Lnight,8hr) footprints modelled for the proposed programme (Table 11.7).
St John’s Hospital, Livingstone is currently exposed to 52dB LAeq,16hr, and this is predicted to reduce by 1dB in 2019 and 2024 with implementation of the proposed programme. The hospital will experience no change in Lnight,8hr with the proposed programme in 2019, however night time noise levels are predicted to increase by 1dB in 2024. A change in noise exposure of 3dB is thought to be the minimum that is perceptible under normal conditions (CAA, 2016). The beneficial and adverse noise impacts identified on the hospital are negligible, and are unlikely to be perceptible to patients.
Table 11.7 Noise levels at St John’s Hospital, Livingstone
Baseline Noise level with ACP Difference in noise level
with ACP
2016 2019 2024 2016 to
2019 2016 to 2024
Summer daytime (LAeq,16hr) 52 51 51 -1 -1
Annual night-time (Lnight,8hr) 45 45 46 0 +1
11.4 Mitigation
Noise impacts associated with the proposed programme will be mitigated by extension of Edinburgh Airport’s Noise Insulation Scheme to newly overflown areas. Once a decision has been made and approved by the CAA regarding the specifics of the proposed programme, Edinburgh Airport will engage with impacted communities regarding an update to the Noise Action Plan and Noise Insulation Scheme.
11.5 Key findings Key findings of the health impact assessment are as follows:
• In both 2019 and 2024, the proposed programme will likely reduce the number of highly annoyed people when compared to existing flight paths, and will provide a minor beneficial effect regarding number of highly annoyed people.
• In both 2019 and 2024, the proposed programme may reduce the number of additional heart disease and stroke admissions. However, these reductions are negligible, and effects are much smaller than influences from other factors outside the scope of this study (e.g. congenital heart defects, diabetes and smoking).
• The estimated number of highly sleep disturbed people is similar with the proposed programme and for the existing flight paths in 2019. In 2024 there is a small increase in the number of highly sleep disturbed people, which is largely due to increased traffic volumes enabled by the proposed programme rather than the airspace change itself. The increase in number of highly sleep disturbed people in 2024 (i.e. 53 people) is only 0.3% of the total population within the >45dB Lnight,8hr contour, so this impact is considered negligible.
• Most of the 20 schools within the >51dB Leq,16hr contour will experience reductions in noise exposure with implementation of the proposed programme. In 2019, only five schools (Clifton Hall, Hillwood Primary School, Kirkliston Primary School, Cargilfield and Cramond Primary School) will experience increases in noise exposure, and these increases will all be below 1dB. By 2024, Pumpherston and Uphall Station Community Primary School will also experience an increase in noise exposure of <1dB. A change of 3dB is thought to be the minimum that is perceptible under normal conditions (CAA, 2016). The predicted changes in noise exposure are very small and any effect on reading age is likely to be negligible compared to the effect of other factors influencing reading age (e.g., family involvement and the home environment).
• St John’s Hospital, Livingstone is currently exposed to 52dB LAeq,16hr and this is predicted to reduce by 1dB in 2019 and 2024 with implementation of the proposed programme. Night-time
Ricardo Energy & Environment Edinburgh Airport Airspace Change Programme | 96
Ricardo in Confidence Ref: Ricardo/ED10588/Issue 8
noise levels at the hospital will remain the same with implementation of the proposed programme in 2019, however may increase by 1dB Lnight,8hr in 2024. These adverse and beneficial impacts are considered negligible, and unlikely to be perceptible by patients.
Implementation of the proposed programme will have both positive and negative impacts on the health of communities surrounding Edinburgh Airport, but these are likely to be no more than minor. Overall, the most significant health impact is likely to be the reduction in number highly annoyed people, so on balance, the proposed programme may have a minor beneficial impact on human health.
Ricardo Energy & Environment Edinburgh Airport Airspace Change Programme | 97
Ricardo in Confidence Ref: Ricardo/ED10588/Issue 8
12 Equalities assessment
12.1 Overview Edinburgh Airport engaged Diversity Dynamics Ltd to support the equalities analysis of the proposed programme, with a focus on the consultation process. The emphasis was on making sure that the consultation process was inclusive and accessible to different equality groups, as well as reviewing consultation findings from an equality perspective.
A variety of approaches were used to factor equality considerations into the proposed programme, including analysing population data, reviewing different related equalities analyses (e.g. Jacobs, 2015) and engaging with stakeholder organisations. The accessibility of consultation was improved by:
• A Google Translate option added to on-line communication.
• An Easy Read version of the consultation booklet was made available.
• At least one representative from Diversity Dynamics Ltd attended the open public consultation events.
For Consultation 1, the equality review looked at all responses that referred to equality aspects. For Consultation 2, the review encompassed responses to a specific question on equalities (included part way through the second consultation period), and all responses against preferred flight path options that mentioned equality aspects linked to three key themes:
• Age.
• Disability.
• Religion and Belief.
Of the 5,395 on-line comments made in Consultation 1, a total of 285 were identified that related to equality in some way. This represents 5.28% of all comments.
In Consultation 2, there were 404 comments made in response to the question “Would you like to raise any particular equality considerations or concerns with us?” Due to the late addition of this question, only 1,797 respondents out the 3,963 had the opportunity to answer this question. Once responses not actually relevant to equalities issues with flight paths were excluded, there were 92 responses (5%) regarding equality, and the findings are incorporated into the analysis.
12.2 Flight path analysis A summary of responses concerning equality received during Consultation 2 by preferred flight path is presented in the following sections.
12.2.1 Flight path A3 ACORN
Equality-related consultation responses for flight path A3 are summarised as follows:
• Most concerns regarding A3 were about the impact to young families in the new Housing Development of Calderwood in East Calderwood (which also includes new schools), and whether the extent of the development and subsequent population increases had been factored into decisions on flight path. There were also a couple of mentions of the impact of noise on children’s health.
• Three responses mentioned disability or physical and mental health. These include one respondent mentioning the importance of the peaceful surroundings for supporting people’s mental health, and naming the Pentlands and Almondell Park in particular.
• No comments were made relating to impact on religious or faith institutions.
• Overall, the A3 flight path has generated less concerned responses than the A6 flight path. However, it the impact on schools and young families was of concern to respondents.
Ricardo Energy & Environment Edinburgh Airport Airspace Change Programme | 98
Ricardo in Confidence Ref: Ricardo/ED10588/Issue 8
12.2.2 Flight path A6 ARBOR
Equality-related consultation responses for flight path A6 are summarised as follows:
• The main theme in responses related to age is concern about the impact on schools and young families in the new Calderwood development. Most respondents mentioning the Calderwood development also expressed concern that the increase in population due to the development of the area is taken into due consideration by Edinburgh Airport in decisions around flight paths. As a new, not previously overflown area, there are heightened feelings from residents about the possibility of a new flight path such as A6. Calderwood is a relatively new community and not previously overflown, and some responses suggest that residents who have recently moved there have already gone through a decision-making process to choose an area not heavily affected by flight paths.
• There were six references to disability across five comments, covering mental health effects and also specific individual concerns about a child with autism.
• No comments were made relating to impact on religious or faith institutions.
12.2.3 Flight path B2 BEECH
Equality-related consultation responses for flight path B2 are summarised as follows:
• Most age-related concerns were about impacts to families in Winchburgh, although schools in Broxburn, Uphall and Dechmont were also mentioned alongside California School in Falkirk. Housing development and expansion in Winchburgh was also raised regarding whether Edinburgh Airport had accurately factored this in to decision-making. Respondents commented both on the impact on children’s sleep, and on concentration levels in school. One response also referred to the impact on older people in sheltered housing, regarding early morning noise disturbance.
• One comment was made about the effect of previous trials on a child with autism.
• No comments were made relating to impact on religious or faith institutions.
• Although flight path B2 did not generate a lot of responses related to equality, there were some concerns raised regarding the potential impact on schools and young families in Winchburgh, and due to the TUTUR trial some respondents have a particularly negative perspective.
12.2.4 Flight path B5 BRIER
Equality-related consultation responses for flight path B5 are summarised as follows:
• There were 14 references to age across 5 responses and the focus was particularly about the impact of noise on children and the elderly. The impact of flying over densely populated areas like Livingston developing areas like Winchburgh was also mentioned.
• There was one response relating to disability, but this was the same comment about a child with autism as captured against flight path B2 and it is unclear which flight path would have most impact on this respondent.
• No comments were made relating to impact on religious or faith institutions.
• Whilst some concerns were raised regarding impact of noise, the comment volume was not significant, which may mean this flight path is seen as having less impact by those who responded to consultation.
12.2.5 Flight path C5 CEDAR
Equality-related consultation responses for flight path C5 are summarised as follows:
• Looking at responses that disagreed with flight path C5, there were 124 references to age across 93 responses, and 87 of these responses were specifically about the effect on Winchburgh, particularly for young families and on schools (68 mentions).
• As a developing area with new houses being built and a rapidly expanding population, which was not included in the design envelopes of the initial consultation, there is objection from respondents about this flight path alongside the D0 flight path option. Where age is mentioned the predominant focus in the comments is on young people but some respondents also indicate an impact across all age groups.
Ricardo Energy & Environment Edinburgh Airport Airspace Change Programme | 99
Ricardo in Confidence Ref: Ricardo/ED10588/Issue 8
• There were 14 references to disability across 11 comments, and most references related to the effect on mental health of flight path changes. Respondents were not necessarily commenting from the point of view of having a recognised mental health condition, but were mostly commenting on the stress and negative effect on their mental health that the adoption of flight path C5 may bring. This was mostly regarding noise intrusion. The aggravating of conditions such as asthma was also raised as an issue, due to pollutants.
• Only one comment was made relating to impact on religious or faith institutions and this was about aircraft noise infiltrating buildings such as churches.
• The main theme in responses related to age is concerns about the potential impact on schools and young families in the Winchburgh area. As a new, not previously overflown area, and having been outside the initial design envelope, there are heightened feelings from residents about flight path C5.
12.2.6 Flight path D0 DOWEL
Equality-related consultation responses for flight path D0 are summarised as follows:
• There were 159 references to age across 114 responses, including 60 mentioning children, young people and young families, and 80 mentions of schools or nurseries.
• Concern was raised about disruption to schools and learning, particularly with a North Queensferry primary school building being old and not having double-glazing. Several concerns were also voiced specifically about the impact on Echline Primary School. Concerns were also raised about the learning development of children, particularly those with special educational needs. Concerns were also raised about the impact to elderly residents, particularly in South Queensferry.
• A total of 28 responses included references to disability related keywords, including 22 referring to mental health, and two referring to autism. Several comments noted the link between living under a flight path being detrimental to physical and mental health, and that this would have an impact on the young, the elderly and people with disabilities. One respondent, added that the noise would be likely to exacerbate an existing mental health condition.
• No comments were made relating to impact on religious or faith institutions.
• Changes to this flight path will have an impact on the communities in the areas newly overflown and where they will be overflown closer than before. Respondents’ feelings around impact are exacerbated by the fact that certain areas like Winchburgh were not included in the original design envelope of Consultation 1 nor in population estimates. In terms of equalities impact, these new residential developments are likely to have a high proportion of young families, with nursery and school age children.
12.2.7 Flight path E7a ELDER
Due to the late change in preferred flight path from E6 to E7a, no analysis of equality-related consultation responses for flight path E7a were available.
12.2.8 Flight path F2a FLORA
Equality-related consultation responses for flight path F2a are summarised as follows:
• There were 55 references to age across 30 responses. Most mentions were around children and young people (37) and schools/nurseries (12), but older people were also mentioned (4). Concerns were raised about impact to sleep of children (particularly in Dalgety Bay). Concerns were also raised about impact to health of children and elderly due to ‘overloading’ of Dalgety Bay, Inverkeithing and North Queensferry.
• A total of 10 responses included 11 disability related keywords, 10 relating to concerns about the impact on the mental and physical health of people affected by the flight path. There was concern expresses about how this would affect the large mental health wing at Queen Margaret’s hospital in Dunfermline, however F2a will fly further away from hospital than the current flight path. One respondent expressed their concern about the impact on the home education for their disabled son. A respondent from Aberdour expressed concern about the impact on the mental and physical health of their family caused by the changes.
• One comment related to concern about damage due to noise and vibration on the schools in Barnton and Cramond.
Ricardo in Confidence Ref: Ricardo/ED10588/Issue 8
Ricardo Energy & Environment Edinburgh Airport Airspace Change Programme | 100
• There were several concerns raised regarding the potential impact on young families and children, with requests to avoid schools. Concerns were also raised about the impact on physical and mental health and in one instance, home education of a disabled child.
• There were a number of concerns raised regarding the impact on young families and children, with particular requests to avoid schools. Concerns were also raised about the impact on physical and mental health and in one instance, home education of a disabled child. Liaison with schools and community organisations in affected areas (particularly in Cowdenbeath, with two primary schools and a high school, and Aberdour, with primary school and independent high school) may be required in order to identify the need for any mitigating actions.
12.2.9 Flight path G5 DOWEL
Equality-related consultation responses for flight path G5 are summarised as follows:
• There were 15 references to age across seven responses. There was one further mention when we analysed respondents who agreed with G5. Concerns were raised about the impact to young and elderly people living in Longniddry and Aberlady, which will be newly overflown with G5. One comment raised concern about impact to child care facilities in Cramond, one more regarding the impact on schools in Cramond (Cramond Primary and Royal High schools).
• No comments were made relating to disability.
• No comments were made relating to impact on religious or faith institutions.
• Whilst concerns were raised regarding impact on schools and young families, as well as elderly people living in the area, the relatively low number of responses relating to key word searches and the overall range of responses would suggest relatively low impact. Two comments, included in the keyword search criteria, included requests to curtail night time flights.
12.2.10 Flight path H2 HEATH
Equality-related consultation responses for flight path H2 are summarised as follows:
• A total of 12 responses included 14 age related keywords relating to schools, children, young people or families. These included general concerns about impact on young families and children, including concerns about sleep disturbance and lung health (4). There were also concerns regarding impact on schools (5), including impact on schools and young families in Musselburgh (3), concern about impact on child care facilities in Cramond (1), impact to children in Cramond Primary and Royal High schools (1), as well as impact on schools in Cammo, Barnton and Cramond and areas in Midlothian (1).
• No comments were made relating to disability.
• No comments were made relating to impact on religious or faith institutions.
• Whilst concerns were raised regarding impact on schools and young families, the low number of comments relating to key word searches, and the overall range of responses would suggest relatively low impact, although Musselburgh was specifically mentioned.
12.3 Theme analysis
12.3.1 Age
Most equality related responses concerned age, largely regarding potential noise impact but also pollution. Most of the age-related responses related to impact on sleeping patterns for babies/children (and to a lesser degree the older generation); and the impact on concentration in schools (and to a lesser degree peace in care homes) particularly in expanding areas such as Caldervale and Winchburgh.
Factors to consider include:
• Babies and young children who require more sleep and whose sleep time falls within aircraft main flight times i.e. bedtimes are 3-4 hours earlier than adult’s bedtimes. Research also indicates that children may be more sensitive to noise than adults when asleep and that it may affect their cognitive development (e.g. EC, 2003).
• Aircraft noise may affect concentration levels in educational establishments.
Ricardo in Confidence Ref: Ricardo/ED10588/Issue 8
Ricardo Energy & Environment Edinburgh Airport Airspace Change Programme | 101
• Young people are also disproportionately affected by health conditions such as asthma, and air pollutants are linked as a cause of asthma.
• Retired or semi-retired people often spend more time at home so can be disproportionately affected by aircraft noise.
• Elderly people within care homes could be disproportionately affected by noise as they may have less mobility and/or opportunity to change location.
• Elderly people with health conditions such as asthma as well as COPD and heart disease may be disproportionately affected by air pollutants.
Respondents across all proposed flight paths are concerned about the impact of aircraft noise and pollutants on their children regarding their sleep patterns, education and general health. The concern is also heightened in areas not currently overflown particularly where there is significant residential development and many people have invested in property in relatively recent times with a specific idea about the quality of life they are buying into for their family. (e.g. Caldervale and Winchburgh). The older and post retirement generation also have concerns about noise intrusion.
12.3.2 Disability
Concerns were raised at an individual level relating to the impact on individuals or families within households where someone has a disability. These included people with mental health conditions such as anxiety and depression, as well as conditions such as Asperger’s syndrome, autism and conditions that result in hypersensitivity to noise. The health-related comments are predominantly about the potential impact of noise and pollution affecting people’s health and wellbeing, and inducing stress. It is not known whether respondents have a diagnosed mental health condition; and the comments tend to relate more to general mental health, namely aircraft noise disturbing sleep and preventing individuals from enjoying peaceful surroundings.
Factors to consider include:
• Concentrations of people with mental health problems in specialist hospitals and treatment centres should be considered. However, the noise (Section 6) assessment shows that there is only one hospital (St John’s Hospital, Livingston) within the noise modelling study area, that it is within the lowest Leq,16hr and Lnight,8hr contours, and that implementation of the proposed programme will not increase noise exposure at this hospital.
• Concern about impacts on local schools, particularly for children with autism.
There is a need to be aware of the potential impact of flight path changes and noise on individuals’ general mental health. Clear communication about what will happen and when can alleviate some of the uncertainty that can generate concerns. For the most part, the potential impact on people with disabilities is likely to be individual rather than cross cutting, even for people with shared conditions e.g. one person’s autism may affect them very differently than the next person with the condition.
12.3.3 Religion & belief
During the Consultation 1 there was limited mention of religion and belief issues, relating to a couple of mentions of churches on the flight path. In the second consultation, there only one comment relating to impact on religious or faith institutions, and this was about aircraft noise infiltrating buildings such as churches.
12.4 Key findings Edinburgh Airport conducted two extensive consultation processes, and made considerable efforts to engage with those who will be affected by proposed changes to the airspace including engaging with people whose voices may be harder to hear. However, Edinburgh Airport also recognises that that there are people in areas that were not in the original design envelope detailed in Consultation 1 who might be affected by flight path options presented in the Consultation 2. These include areas such as Winchburgh (concerns raised include those associated with flight paths B2, B5 and C5) and Kirknewton, which are undergoing significant population growth with housing suitable for young families and new schools being planned.
Overall there are likely to be equalities impact for communities overflown, specifically concerning:
Ricardo in Confidence Ref: Ricardo/ED10588/Issue 8
Ricardo Energy & Environment Edinburgh Airport Airspace Change Programme | 102
• Young people/children, particularly regarding impact on sleep (night flights). Learning and concentration levels in schools are not expected to be affected, as increases in noise exposure at schools due to the airspace change are likely to be >1dB in all cases, and are not expected to be perceptible.
• People who are elderly, particularly regarding noise impact and their desire for a peaceful retirement.
• Some people with specific disabilities causing a hypersensitivity to noise such as autism, post- traumatic stress disorder (PTSD).
• People who may be housebound due to their disability will have increased exposure to any increased noise.
The potential for impact on mental health was also mentioned frequently (whether in relation to a diagnosed disability or in general terms).
Equality impacts associated with noise will be mitigated by extension of Edinburgh Airport’s Noise Insulation Scheme to newly overflown areas. Once a decision has been made and approved by the CAA regarding the specifics of the proposed programme, Edinburgh Airport will engage with impacted communities regarding an update to the Noise Action Plan and Noise Insulation Scheme. Assuming adequate mitigation, adverse impacts on equality associated with the proposed programme should be no more than minor.
Ricardo in Confidence Ref: Ricardo/ED10588/Issue 8
Ricardo Energy & Environment Edinburgh Airport Airspace Change Programme | 103
13 Cumulative impacts
13.1 Introduction There is potential for the following types of cumulative effects:
• Cumulative effects of the proposed programme together with other planned major developments.
• Cumulative effects between topics.
Potential effects associated with both these types of cumulative effects are identified in this section.
13.1.1 Cumulative effects of the proposed programme together with other planned major developments
Given the inherent uncertainty associated with other major developments, this assessment aims to provide a broad indication of the potential cumulative effects rather than a detailed assessment.
The study area has been guided by the centrelines of the proposed flight paths and the points along these where aircraft would, on average, be at 7,000ft. The potential for slow climbers at 6,000ft beyond these points has also been considered. Reference to these points is consistent with the study area for the tranquillity and visual intrusion assessment (see Section 10). Beyond 7,000ft effects on tranquillity are lower, therefore the likelihood of contributing to cumulative effects decreases. Therefore, other major developments within proximity of the centrelines and prior to/within proximity of the height markers have been included in the study area.
Information about other planned major developments was compiled during June and July 2017 for the following local authority administrative areas (and reviewed for relevant approved major developments in the vicinity of Edinburgh Airport in April 2018):
• Clackmannanshire Council.
• East Lothian Council.
• Edinburgh City Council.
• Falkirk Council.
• Fife Council.
• Midlothian Council.
• North Lanarkshire Council.
• Scottish Borders Council.
• South Lanarkshire Council.
• West Lothian Council.
This involved searching the planning application databases on each of the above council’s websites, and the website for Transport Scotland. Other sources of information such as the media and information from Edinburgh Airport were also used.
The major developments identified from the data search are set out in Appendix D. Whilst this is not a definitive list, it provides an indication as to the broad location and types of major developments within these areas. As well as approved developments, this list also includes those that are in the planning system but not yet approved, and plans at earlier stages where they might be of relevance due to their scale and location. It identifies 21 other major developments within the study area and six others that are just outside but included for information. Appendix D also identifies other approved major developments in the vicinity of Edinburgh Airport identified in the review undertaken in April 2018.
The other major developments identified include residential and mixed use schemes, leisure/sports centres, infrastructure such as roads and bridges and energy generation such as wind farms. There are also potential developments at Edinburgh Airport itself. The approximate locations of these other major developments in relation to the flight paths for the proposed programme are shown in Figure 13.1.
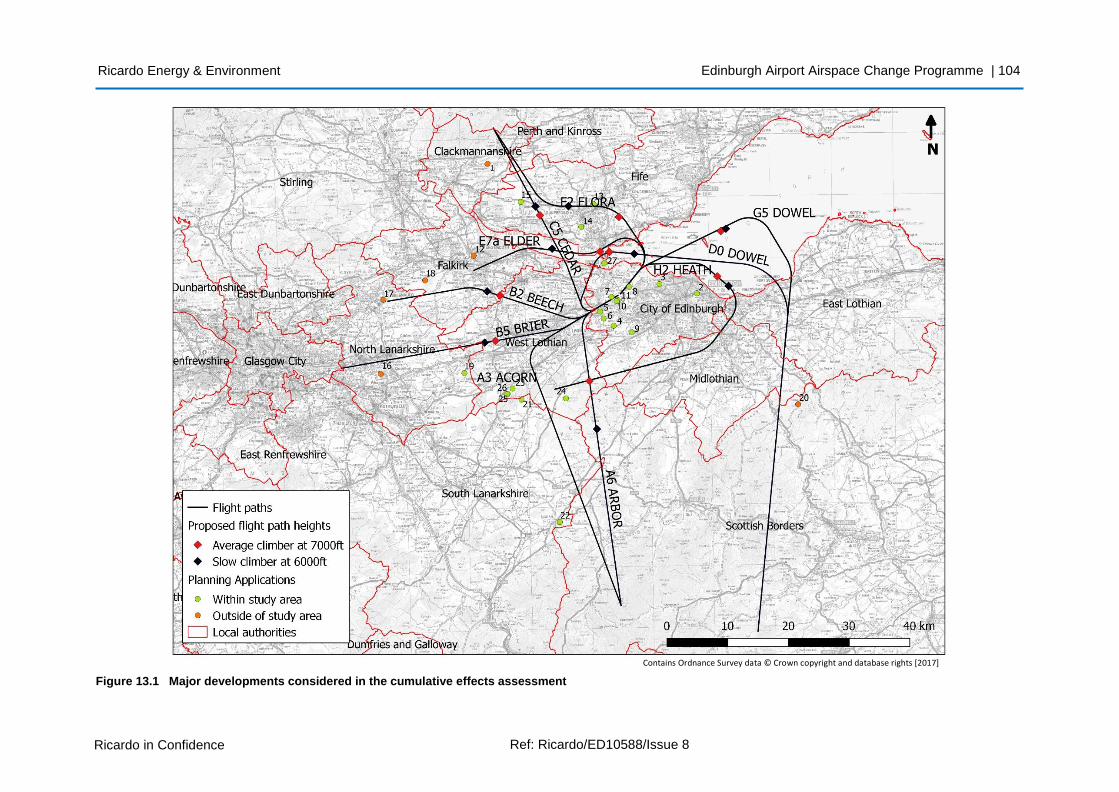
Ricardo in Confidence Ref: Ricardo/ED10588/Issue 8
Ricardo Energy & Environment
Figure 13.1 Major developments considered in the cumulative effects assessment
Edinburgh Airport Airspace Change Programme | 104
Contains Ordnance Survey data © Crown copyright and database rights [2017]
Ricardo Energy & Environment Edinburgh Airport Airspace Change Programme | 105
Ricardo in Confidence Ref: Ricardo/ED10588/Issue 8
There are potential cumulative effects of the proposed programme with other major developments for receptors associated with noise, air quality, tranquillity and visual, and health; as discussed in the following sections:
13.1.1.1 Noise
The other major developments identified may individually generate noise during construction and operation, from sources such as traffic or machinery. There are potential cumulative noise effects resulting from the proposed programme together with other major developments to sensitive receptors such as residential properties, business premises, schools, hospitals and care homes that are located both beneath the proposed flight paths and within proximity of other major developments. The likelihood of cumulative noise effects is higher in the area nearest the airport, because aircraft will be at higher altitudes as they get further from the airport, so the potential for cumulative noise effects would be lower. Figure 13.1 shows other major developments around this area (ten within the administrative area of Edinburgh Council) where there would be the greatest potential for cumulative noise effects. These are described below.
Proposed flight paths A3, A6, B2, B5, C5 and D0 commence on a similar path and are in proximity to potential other developments at Edinburgh Airport itself, i.e. an approved new radar, the recently announced Crosswind scheme (mixed use), developments associated with the Edinburgh Airport Masterplan and an approved anaerobic digestion plant. Also, summer daytime noise contours (see Section 6) show increases in noise compared to existing flight paths to the north west and south of Edinburgh Airport, and potential for cumulative effects associated with flight paths C5, towards the north and D0, A3 and A6 towards the south. There is potential for cumulative noise effects on sensitive receptors located in this area from the combined proposed flight paths and the potential construction and operation of these other major developments.
Proposed flight paths F2a, E7a, H2 and G5 commence on a similar path and are in proximity to a major development comprising a new village comprising 1,200 dwellings, support services/facilities and a transport hub. However, this development is currently undergoing consultation and is not yet consented. It is also in proximity to the starting points for flight paths A3, A6, B2, B5, C5 and D0; and the other potential developments at Edinburgh Airport mentioned above. The summer daytime noise contours (see Section 6) show increases in noise compared to existing flight paths to the north west of Edinburgh Airport, therefore there is the potential for cumulative effects associated with flight path F2a towards the north. Consequently, there are potential cumulative noise effects on sensitive receptors located in this area around the airport from the combined proposed flight paths and the potential construction and operation of these other major developments.
Flight path F2a passes over a proposed major mixed-use scheme at Halbeath. Whilst it is located beyond the point at which average traffic reaches 7,000ft it is before slow climbers reach 6,000ft and therefore there is the potential for cumulative effects associated with noise.
In addition, there is a potential wind farm in proximity to flight path D0. However, this is beyond the height markers and therefore significant cumulative noise effects are unlikely.
Despite the potential for cumulative noise impacts identified above, in each considered year, the population size and number of households and schools exposed to noise levels >54dB LAeq,16hr is less with implementation of the proposed programme than without the proposed programme. There is a net benefit to noise exposure the local area from the proposed programme, although noise impacts will increase in some communities and reduce in others. Overall, cumulative impacts noise with other major developments are expected to be negligible.
13.1.1.2 Local air quality
Other major developments identified, such as residential and mixed use schemes and leisure/sports centres, may generate emissions to air, for example dust emissions during construction and vehicle emissions during operation. However, the qualitative air quality assessment (see Section 8) indicates the proposed programme will have negligible beneficial effects on NO2 and PM10 concentrations. Therefore, there is no potential for cumulative local air quality effects on sensitive receptors located in proximity to Edinburgh Airport due to the proposed programme and other major developments.
13.1.1.3 Tranquillity and visual
Other major developments in the study area, such as construction and operation of wind farms and residential developments, may affect levels of tranquillity and visual amenity in rural areas. Therefore,
Ricardo Energy & Environment Edinburgh Airport Airspace Change Programme | 106
Ricardo in Confidence Ref: Ricardo/ED10588/Issue 8
there are potential cumulative effects on tranquillity resulting from the proposed programme together with other major developments to sensitive receptors such as those using the area for recreation and residents located both beneath the proposed flight paths and within proximity of other developments. Similarly to noise, the likelihood of cumulative tranquillity effects is higher in the area nearest the airport, however this area already has low tranquillity so the magnitude of any effect is likely to be negligible.
Within proximity of flight path H2, there are potential sports and mixed use major developments that are undergoing pre-application consultation just before the point at which, on average, aircraft reach 7,000ft. Proposed flight path C5 passes over pockets of tranquillity and there is a proposed solar farm near the route, although this is beyond the point at which, on average, aircraft reach 7,000ft.
Flight path A6 has a potential impact on tranquillity of the Pentland Hills and another potential wind farm development is within proximity located within the administrative area of West Lothian. Therefore, there are potential cumulative effects to those using the hills for recreation, although the flight path would only be operational between 06:00 and 09:59 on weekdays.
Flight path D0 passes near to one potential wind farm development in the administrative area of Scottish Borders Council. However, aircraft are likely to be over 7,000ft at this point and cumulative effects likely to be negligible.
Flight path F2a passes over a proposed major mixed use scheme at Halbeath. Whilst it is located beyond the point at which average traffic reaches 7,000ft, it is before slow climbers reach 6000ft and therefore there exists the potential for cumulative effects on tranquillity. However, this flight path is broadly similar to the existing flight path, so any effects are likely to be negligible.
Flight path H2 is within proximity of a potential sports centre development and a mixed-use development, however these developments are sufficiently distant from the flight path centre-line for cumulative impacts to be negligible.
13.1.1.4 Health
Other major developments within the study area may also affect population health. For example, there may be a combination of effects on air quality and noise from a range of development types, with implications for health, particularly for sensitive receptors such as residential properties, business premises, schools, hospitals and care homes located both beneath the proposed flight paths and within proximity of other developments.
There are potential cumulative local health effects on sensitive receptors located in the area around the airport from the combined flight paths (which are lowest nearest the airport) and the potential construction and operation of other major developments in proximity to the airport. However, potential effects on health identified in Section 11 range from a minor beneficial reduction in the number of highly annoyed people to negligible adverse impacts on number of highly sleep disturbed, and cumulative impacts on community health with other major developments are not anticipated.
13.1.2 Cumulative effects between topics
There is the potential for sensitive receptors such as residents, business premises, schools, hospitals and care homes located within proximity to the airport to experience combined effects associated with noise and health due to the proposed programme. Towards more rural areas, these receptors may also be affected by tranquillity effects, which may also affect those using areas for recreation.
Given the largely negligible (beneficial and adverse) impacts associated with implementation of the
proposed programme with respect to noise, fuel burn and CO2 emissions, local air quality, tranquillity and health in isolation, it is considered there would be no significant adverse cumulative impacts due to combined impacts from the proposed programme together with other proposed developments in the area.
Adverse and beneficial impacts identified for individual topics are largely negligible and no greater than minor. so significant adverse cumulative effects between topics are unlikely.
Ricardo Energy & Environment Edinburgh Airport Airspace Change Programme | 107
Ricardo in Confidence Ref: Ricardo/ED10588/Issue 8
14 Glossary
ACC Area Control Centre
ACP Airspace Change Process: The full Edinburgh Airport airspace change process which started in June 2016 and will complete in June 2019
AGL Above ground level
AIP UK Integrated Aeronautical Information Package
AQMA Air Quality Management Area
ATC Air traffic control
CAA Civil Aviation Authority
CAP Civil Aviation Publication
CAS Controlled airspace
Consultation 1: Initial consultation (June – October 2016)
Consultation 2: Second consultation (January – May 2017)
Consultation 3: Supplementary third consultation (April-May 2018)
Design envelope The area within which each flight path may be positioned
FAS Future Airspace Strategy
ICAO International Civil Aviation Organisation
Knots Nautical miles (nm) per hour (1nm = 1.15 statute miles, therefore 220knots = 253 miles per hour)
LAeq A-weighted (which matches the frequency response of the human ear), equivalent continuous sound level. research has indicated that LAeq is a good predictor of community disturbance from aircraft noise.
LAeq,16 hour LAeq,16hr contours indicate noise exposure for an average summer day over the period from 16 June to 15 September inclusive, for traffic in the busiest 16 hours of the day, between 07:00 and 23:00 local time. This calculation produces a conservative estimate of (i.e. tends to over-estimate) noise exposure. This is mainly because airports are generally busier during the summer and a higher number of movements is likely to produce higher Leq
values. Aircraft tend to climb less well in higher temperatures, so because they are closer to the ground, Leq values will tend to be higher than in colder weather (CAA, 2016).
Lnight,8 hour This is the equivalent continuous sound level measured overnight between 23:00 and 07:00. Lnight is a night-time noise indicator, and can be used to indicate potential for sleep disturbance.
LTO Landing and take-off
MP Member of Parliament
MSP Members of the Scottish Parliament
NATS National Air Traffic Services. Air Traffic management company providing on- route air traffic control throughout the UK
NDB Non directional beacon (conventional radio navigation beacon)
nm Nautical mile
NO2 Nitrogen dioxide
NOx Oxides of nitrogen
NPR Noise Preferential Route
Ricardo Energy & Environment Edinburgh Airport Airspace Change Programme | 108
Ricardo in Confidence Ref: Ricardo/ED10588/Issue 8
PBN Performance Based Navigation
PM10 Particulate matter of diameter less than or equal to 10 micrometers (microns)
PTSD Post-traumatic stress disorder
RNAV aRea NAVigation
SARG Safety and Airspace Regulation Group (Department of the CAA responsible for regulation of airspace)
SDR Standard Departure Routes
SEL Sound Exposure Level footprints show the extent of noise energy generated from a single aircraft event, for example, an aircraft either taking off or landing (in contrast to the summing of events in noise exposure).
SID Standard instrument departure
STAR Standard terminal arrival route
Vector Tactical routing intervention by ATC, by means of a magnetic heading to be flown by an aircraft
VHF Very high frequency
VOR VHF Omni directional range (conventional radio navigation beacon)
Ricardo Energy & Environment Edinburgh Airport Airspace Change Programme | 109
Ricardo in Confidence Ref: Ricardo/ED10588/Issue 8
15 References
Jacobs. (2015). Health and Equalities Assessment Review. Module 11: Quality of Life. Prepared for the Airports Commission.
CAA. (2011). Future Airspace Strategy for the United Kingdom 2011 to 2030. Civil Aviation Authority.
CAA. (2016). CAP725 Guidance on the Application of the Air Space Change Process. Civil Aviation Authority.
CAA. (2017). CAP1616, Airspace Design: Guidance on the regulatory process for changing airspace design including community engagement requirements. Civil Aviation Authority.
Diversity Dynamics. (2017). Supporting the Equality Analysis of the Airspace Change Programme. Report prepared for Edinburgh Airport.
Edinburgh Airport. (2016). Edinburgh Airport Masterplan 2016-2040. Edinburgh Airport.
Edinburgh Airport. (2016). Airspace Change Programme - Initial Consultation Report. Edinburgh Airport.
Edinburgh Airport. (2017). Airspace Change Programme departure and arrival procedures. Second consultation: 30 January - 30 April 2017. Edinburgh Airport.
Edinburgh Airport Limited. (2017). Second Wave Consultation. Final Data Set. Edinburgh Airport.
EC. (2003). Road traffic and aircraft noise exposure and children's cognition and health: exposure-effect relationships and combined effects. Co-ordinated by Queen Mary and Westfield College. Report funded by the European Commission.
EPUK/IAQM. (2017). Land-Use Planning & Development Control: Planning for Air Quality. Environmental Protection UK and the Institute of Air Quality Management.
IATA. 2018. Jet Fuel Price Monitor. International Air Transport Association http://www.iata.org/publications/economics/fuel-monitor/Pages/index.aspx.
Jones, K. (2012). Tranquillity: An overview. ERCD Report 1207. Civil Aviation Authority.
Landscape Institute. (2017). Tranquillity: An overview. Technical Information Note 01/2017.
NATS. (2018). Edinburgh ACP Departures Emissions Analysis. Analytics Report A17032. March 2018.
Ricardo-AEA. (2014) Air Quality Monitoring at Edinburgh Airport, Nitrogen Dioxide - 2013. Report prepared for Edinburgh Airport.
Ricardo Energy & Environment. (2016). Edinburgh Airport Carbon Footprint 2015. Report produced for Edinburgh Airport Limited.
Rogers, H.L., Lee, D.S., Raper, D.W., de, F., Forster, P.M., Wilson, C.W., Newton, P.J. (2002). The impacts of aviation on the atmosphere. The Aeronautical Journal. 106, 521–546.
Ricardo in Confidence Ref: Ricardo/ED10588/Issue 8
Ricardo Energy & Environment Edinburgh Airport Airspace Change Programme
Appendix A
Noise assessment
EDINBURGH AIRPORT AIRSPACE CHANGE - NOISE ASSESSMENT PHASE 2
RICARDO ENERGY & ENVIRONMENT
JULY 2018
EDINBURGH AIRPORT AIRSPACE CHANGE NOISE ASSESSMENT Our Ref: 3364_002R_1-1
Client: Ricardo Energy & Environment 30 Eastbourne Terrace London
W2 6LA
Report by:
Anderson Acoustics Limited 3 Trafalgar Mews 15-16 Trafalgar Street Brighton East Sussex BN1 4EZ
www.andersonacoustics.co.uk T: 01273 696887
Date: 6 July 2018
Project No: 3364
Status: ISSUED
Author Jack Naumann 13 April 2018
Reviewed Andy Knowles
6 July 2018
Approved
Andy Knowles
6 July 2018
This document has been prepared using all reasonable skill and care. Anderson Acoustics Ltd accepts no responsibility or liability
for any third party data presented in this report, or used for the basis of drawing any conclusions. This document is confidential to
the named client above and Anderson Acoustics Ltd accepts no responsibility or liability resulting from third party use of this
document or for a purpose other than for which it was commissioned.
Ricardo Energy & Environment
Edinburgh Airport Noise Modelling
6 July 2018
Page 3 of 51
REVISION HISTORY
Version Comments Changes made by Approved by
0.1 Draft JN AEK
1.0 First draft issued to Kieran Whelan for comment
JN
AEK
1.1 Final report issued following comments from Ricardo and Edinburgh Airport
JN AEK
1.2 Table numbers in appendix updated according to comments by Ricardo
JN AEK
Ricardo Energy & Environment
Edinburgh Airport Noise Modelling
6 July 2018
Page 4 of 51
PAGE LEFT INTENTIONALLY BLANK
Edinburgh Airport Airspace Change
Ricardo Energy & Environment
3364_002R_1-2
13 August 2017
Page 5 of 51
CONTENTS
1 INTRODUCTION 6
2 AIRSPACE CHANGE 7
3 NOISE MODEL 9
Set-up 9
Model Validation 11
4 NOISE MODELING RESULTS 13
92-day Summer Period, LAeq,16hrs 13
Night-time – Annual LNight (LAeq,8hrs) 19
Differences 24
SEL Footprints 27
5 SUMMARY CONCLUSIONS 28
6 REFERENCES 29
Appendix A 31
Appendix B 37
Appendix C 43
Edinburgh Airport Airspace Change
Ricardo Energy & Environment
3364_002R_1-2
13 August 2017
Page 6 of 51
1 INTRODUCTION
Anderson Acoustics has been appointed, through Ricardo-AEA, to undertake a noise assessment to meet the associated requirements of CAP725[4] of the proposed airspace change at Edinburgh Airport.
The implementation of RNAV technology requires changes to arrival and departure routes. This technology brings improved navigational precision and enables more efficient use of the airspace.
The final airspace proposals have been developed following the outcome of two consultations in addition to a further revision to the departure routes from Runway 06.
This report presents the results of noise modelling of Edinburgh Airport’s preferred route options in accordance with the requirements of CAP725.
Changes to the “average daytime Summer LAeq,16hr” (a requirement of CAP725) and the “annual 8hr LNight” (as requested by Edinburgh Airport) have been derived. Day and night noise models were created for the baseline year, the year each phase is due to be implemented and five years after the changes have been made (2024).
The report is structured as follows: • Section 2 presents an overview of the proposed airspace change.
• Section 3 presents an over of the noise model set-up and validation
• Section 4 the results of the noise modelling for the Summer Day and annual LNight, together with differences compared to the baseline year.
• Section 5 provides a summary of the results
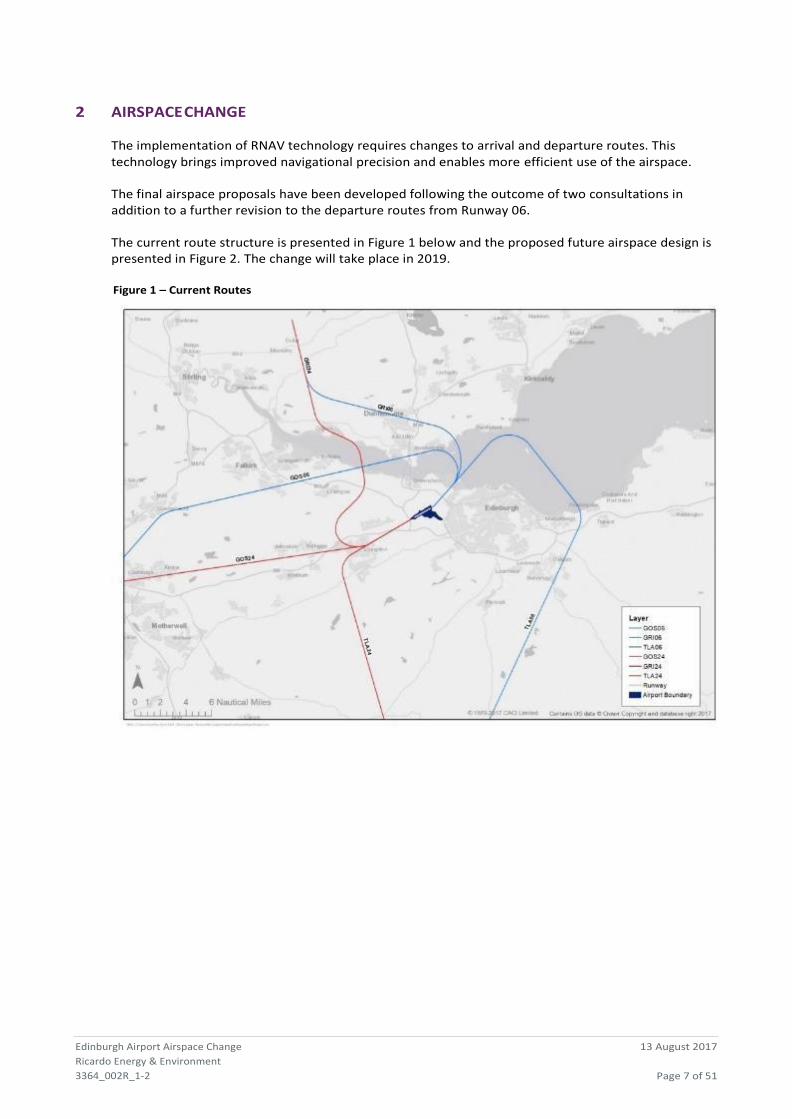
Edinburgh Airport Airspace Change
Ricardo Energy & Environment
3364_002R_1-2
13 August 2017
Page 7 of 51
2 AIRSPACE CHANGE
The implementation of RNAV technology requires changes to arrival and departure routes. This technology brings improved navigational precision and enables more efficient use of the airspace.
The final airspace proposals have been developed following the outcome of two consultations in addition to a further revision to the departure routes from Runway 06.
The current route structure is presented in Figure 1 below and the proposed future airspace design is presented in Figure 2. The change will take place in 2019.
Figure 1 – Current Routes
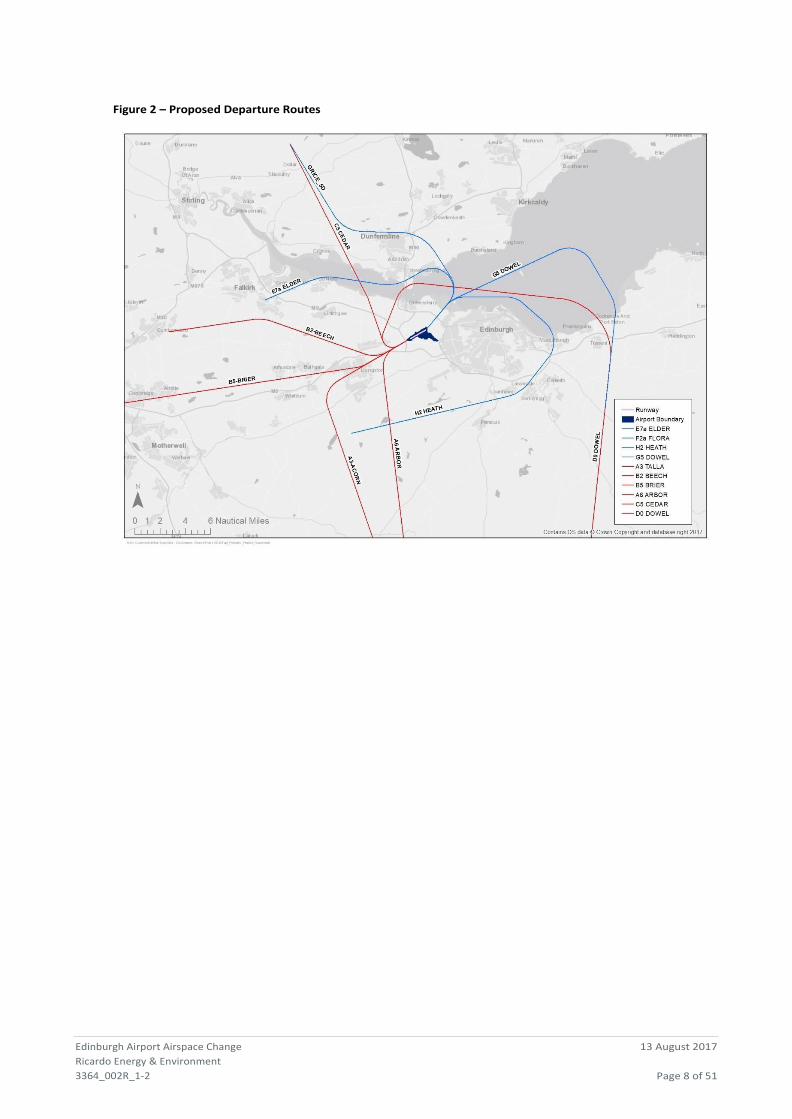
Edinburgh Airport Airspace Change
Ricardo Energy & Environment
3364_002R_1-2
13 August 2017
Page 8 of 51
Figure 2 – Proposed Departure Routes
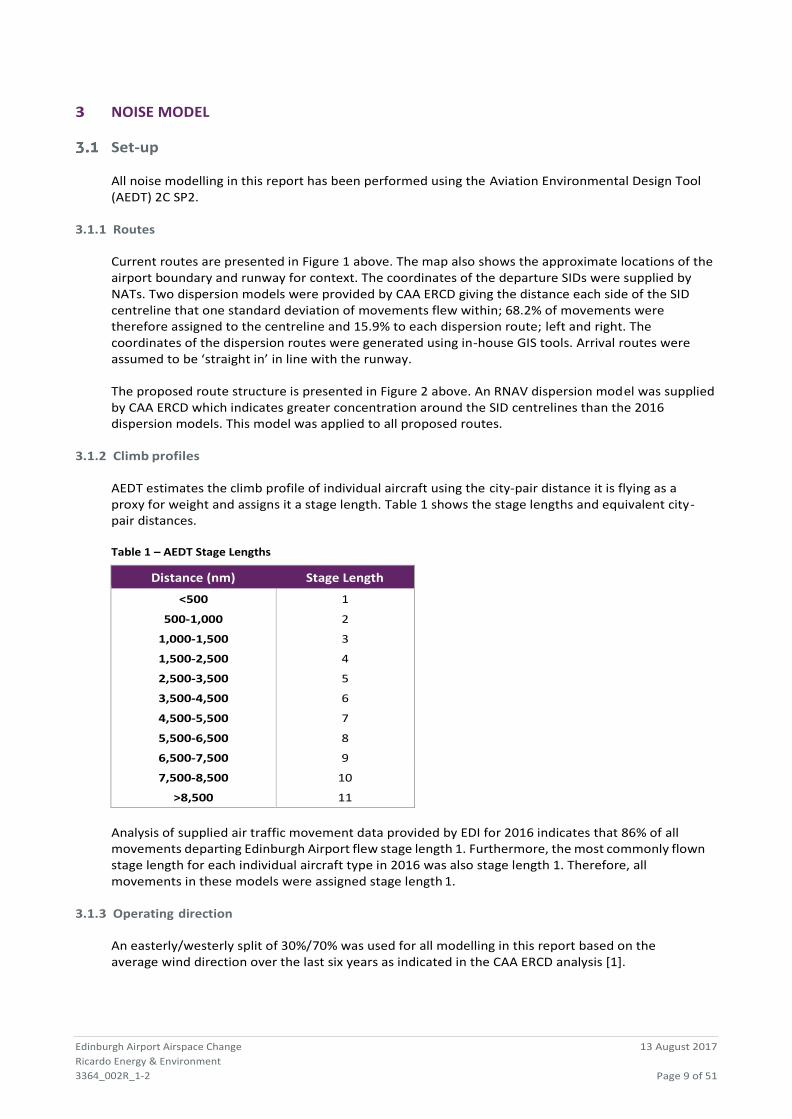
Edinburgh Airport Airspace Change
Ricardo Energy & Environment
3364_002R_1-2
13 August 2017
Page 9 of 51
3 NOISE MODEL
Set-up
All noise modelling in this report has been performed using the Aviation Environmental Design Tool (AEDT) 2C SP2.
3.1.1 Routes
Current routes are presented in Figure 1 above. The map also shows the approximate locations of the airport boundary and runway for context. The coordinates of the departure SIDs were supplied by NATs. Two dispersion models were provided by CAA ERCD giving the distance each side of the SID centreline that one standard deviation of movements flew within; 68.2% of movements were therefore assigned to the centreline and 15.9% to each dispersion route; left and right. The coordinates of the dispersion routes were generated using in-house GIS tools. Arrival routes were assumed to be ‘straight in’ in line with the runway.
The proposed route structure is presented in Figure 2 above. An RNAV dispersion model was supplied by CAA ERCD which indicates greater concentration around the SID centrelines than the 2016 dispersion models. This model was applied to all proposed routes.
3.1.2 Climb profiles
AEDT estimates the climb profile of individual aircraft using the city-pair distance it is flying as a proxy for weight and assigns it a stage length. Table 1 shows the stage lengths and equivalent city- pair distances.
Table 1 – AEDT Stage Lengths
Distance (nm) Stage Length
<500 1
500-1,000 2
1,000-1,500 3
1,500-2,500 4
2,500-3,500 5
3,500-4,500 6
4,500-5,500 7
5,500-6,500 8
6,500-7,500 9
7,500-8,500 10
>8,500 11
Analysis of supplied air traffic movement data provided by EDI for 2016 indicates that 86% of all movements departing Edinburgh Airport flew stage length 1. Furthermore, the most commonly flown stage length for each individual aircraft type in 2016 was also stage length 1. Therefore, all movements in these models were assigned stage length 1.
3.1.3 Operating direction
An easterly/westerly split of 30%/70% was used for all modelling in this report based on the average wind direction over the last six years as indicated in the CAA ERCD analysis [1].
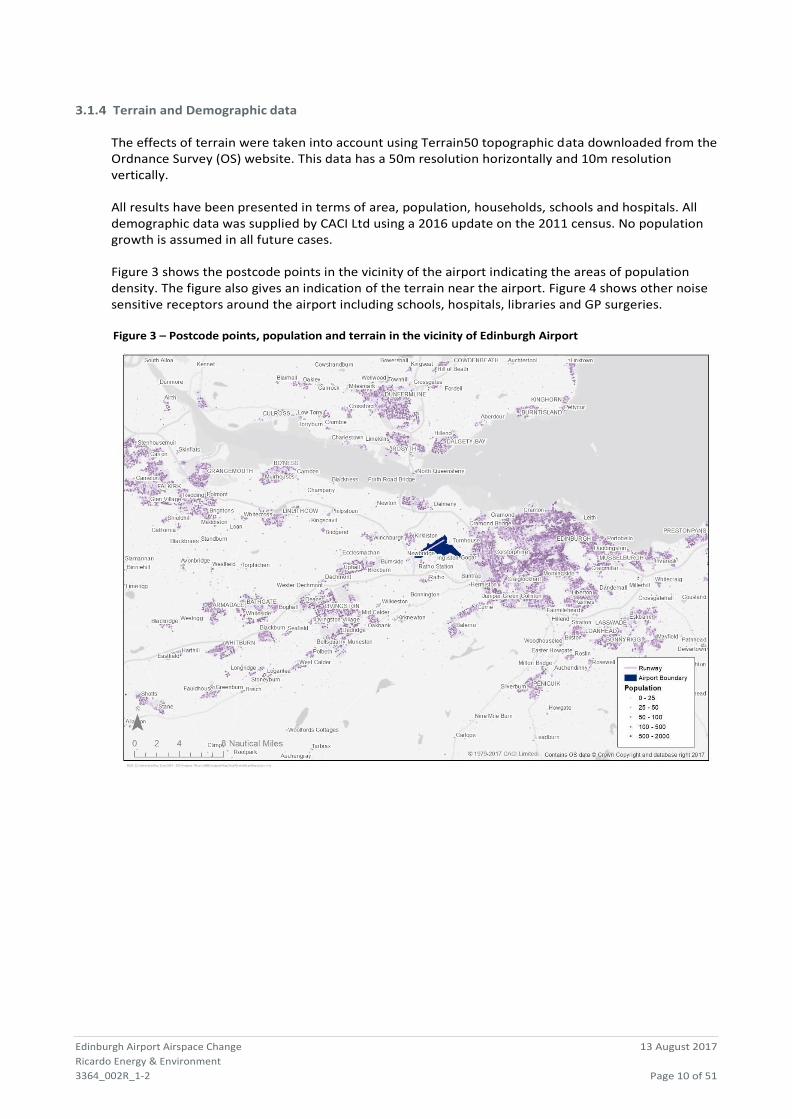
Edinburgh Airport Airspace Change
Ricardo Energy & Environment
3364_002R_1-2
13 August 2017
Page 10 of 51
3.1.4 Terrain and Demographic data
The effects of terrain were taken into account using Terrain50 topographic data downloaded from the Ordnance Survey (OS) website. This data has a 50m resolution horizontally and 10m resolution vertically.
All results have been presented in terms of area, population, households, schools and hospitals. All demographic data was supplied by CACI Ltd using a 2016 update on the 2011 census. No population growth is assumed in all future cases.
Figure 3 shows the postcode points in the vicinity of the airport indicating the areas of population density. The figure also gives an indication of the terrain near the airport. Figure 4 shows other noise sensitive receptors around the airport including schools, hospitals, libraries and GP surgeries.
Figure 3 – Postcode points, population and terrain in the vicinity of Edinburgh Airport
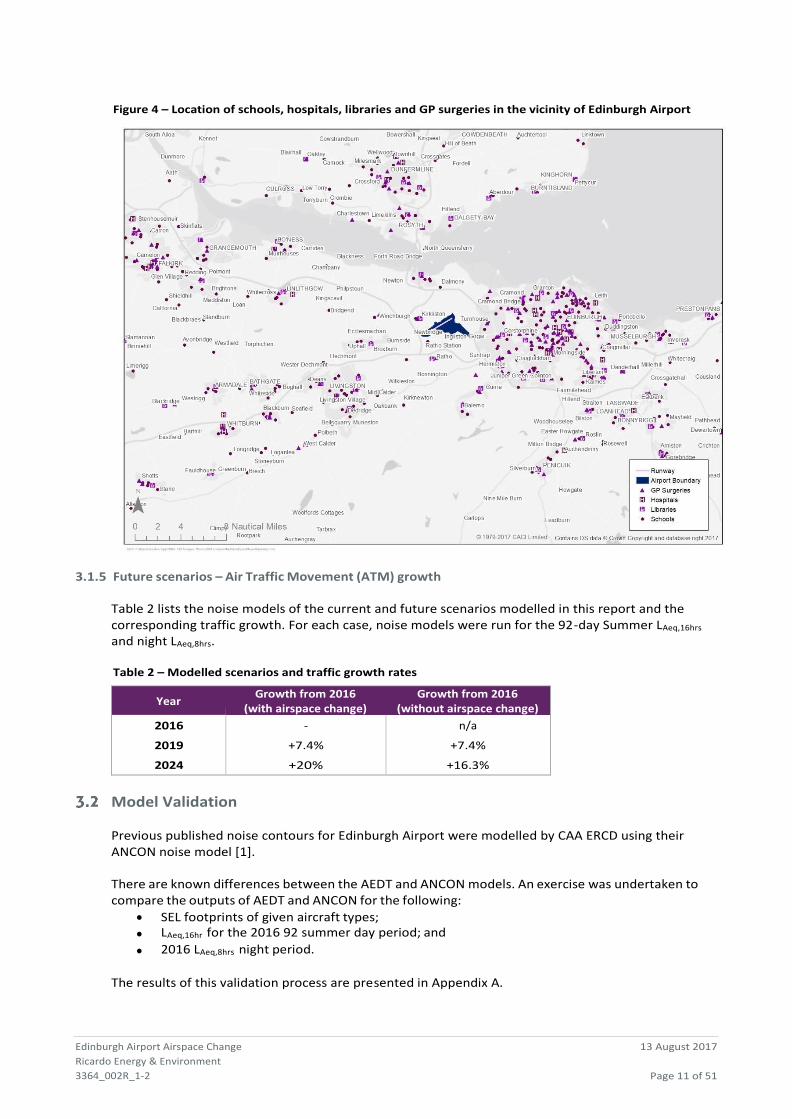
Edinburgh Airport Airspace Change
Ricardo Energy & Environment
3364_002R_1-2
13 August 2017
Page 11 of 51
Figure 4 – Location of schools, hospitals, libraries and GP surgeries in the vicinity of Edinburgh Airport
3.1.5 Future scenarios – Air Traffic Movement (ATM) growth
Table 2 lists the noise models of the current and future scenarios modelled in this report and the corresponding traffic growth. For each case, noise models were run for the 92-day Summer LAeq,16hrs
and night LAeq,8hrs.
Table 2 – Modelled scenarios and traffic growth rates
Year Growth from 2016
(with airspace change) Growth from 2016
(without airspace change)
2016 - n/a
2019 +7.4% +7.4%
2024 +20% +16.3%
Model Validation
Previous published noise contours for Edinburgh Airport were modelled by CAA ERCD using their ANCON noise model [1].
There are known differences between the AEDT and ANCON models. An exercise was undertaken to compare the outputs of AEDT and ANCON for the following:
• SEL footprints of given aircraft types;
• LAeq,16hr for the 2016 92 summer day period; and
• 2016 LAeq,8hrs night period.
The results of this validation process are presented in Appendix A.
Edinburgh Airport Airspace Change
Ricardo Energy & Environment
3364_002R_1-2
13 August 2017
Page 12 of 51
The results indicate differences in the extents of noise levels generated through ANCON and AEDT that are considered to be due to the inherent differences in the modelling tools, which include:
• AEDT contains aircraft types that are not always directly comparable to those used in ANCON and where they are directly comparable the footprints differ;
• AEDT models departing aircraft using full thrust, while ANCON uses reduced thrust settings; and
• there are differences in the way in which the CAA derived departure profile in comparison with AEDT profiles derived for this exercise.
Whilst there are differences, it is considered that the AEDT model outputs are sufficiently consistent and comparable with those produced by ANCON.
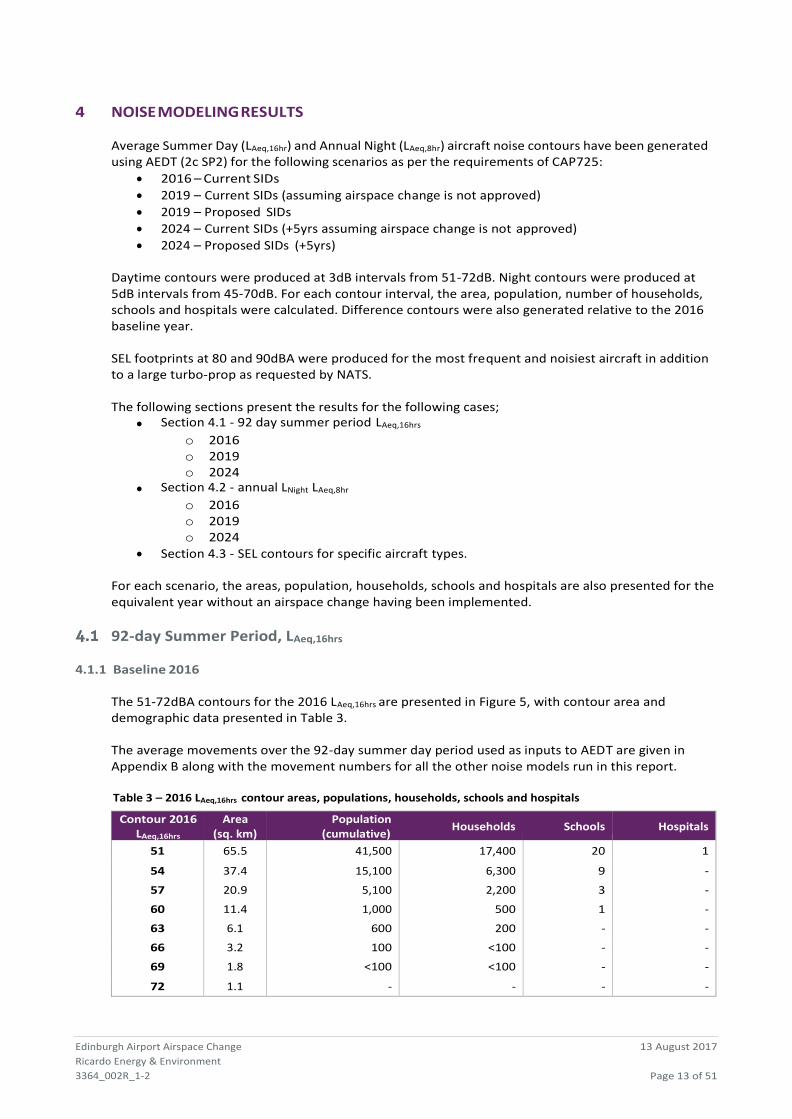
Edinburgh Airport Airspace Change
Ricardo Energy & Environment
3364_002R_1-2
13 August 2017
Page 13 of 51
4 NOISE MODELING RESULTS
Average Summer Day (LAeq,16hr) and Annual Night (LAeq,8hr) aircraft noise contours have been generated using AEDT (2c SP2) for the following scenarios as per the requirements of CAP725:
• 2016 – Current SIDs
• 2019 – Current SIDs (assuming airspace change is not approved)
• 2019 – Proposed SIDs
• 2024 – Current SIDs (+5yrs assuming airspace change is not approved)
• 2024 – Proposed SIDs (+5yrs)
Daytime contours were produced at 3dB intervals from 51-72dB. Night contours were produced at 5dB intervals from 45-70dB. For each contour interval, the area, population, number of households, schools and hospitals were calculated. Difference contours were also generated relative to the 2016 baseline year.
SEL footprints at 80 and 90dBA were produced for the most frequent and noisiest aircraft in addition to a large turbo-prop as requested by NATS.
The following sections present the results for the following cases;
• Section 4.1 - 92 day summer period LAeq,16hrs
o 2016 o 2019 o 2024
• Section 4.2 - annual LNight LAeq,8hr
o 2016 o 2019 o 2024
• Section 4.3 - SEL contours for specific aircraft types.
For each scenario, the areas, population, households, schools and hospitals are also presented for the equivalent year without an airspace change having been implemented.
92-day Summer Period, LAeq,16hrs
4.1.1 Baseline 2016
The 51-72dBA contours for the 2016 LAeq,16hrs are presented in Figure 5, with contour area and demographic data presented in Table 3.
The average movements over the 92-day summer day period used as inputs to AEDT are given in Appendix B along with the movement numbers for all the other noise models run in this report.
Table 3 – 2016 LAeq,16hrs contour areas, populations, households, schools and hospitals
Contour 2016 LAeq,16hrs
Area (sq. km)
Population (cumulative)
Households Schools Hospitals
51 65.5 41,500 17,400 20 1
54 37.4 15,100 6,300 9 -
57 20.9 5,100 2,200 3 -
60 11.4 1,000 500 1 -
63 6.1 600 200 - -
66 3.2 100 <100 - -
69 1.8 <100 <100 - -
72 1.1 - - - -
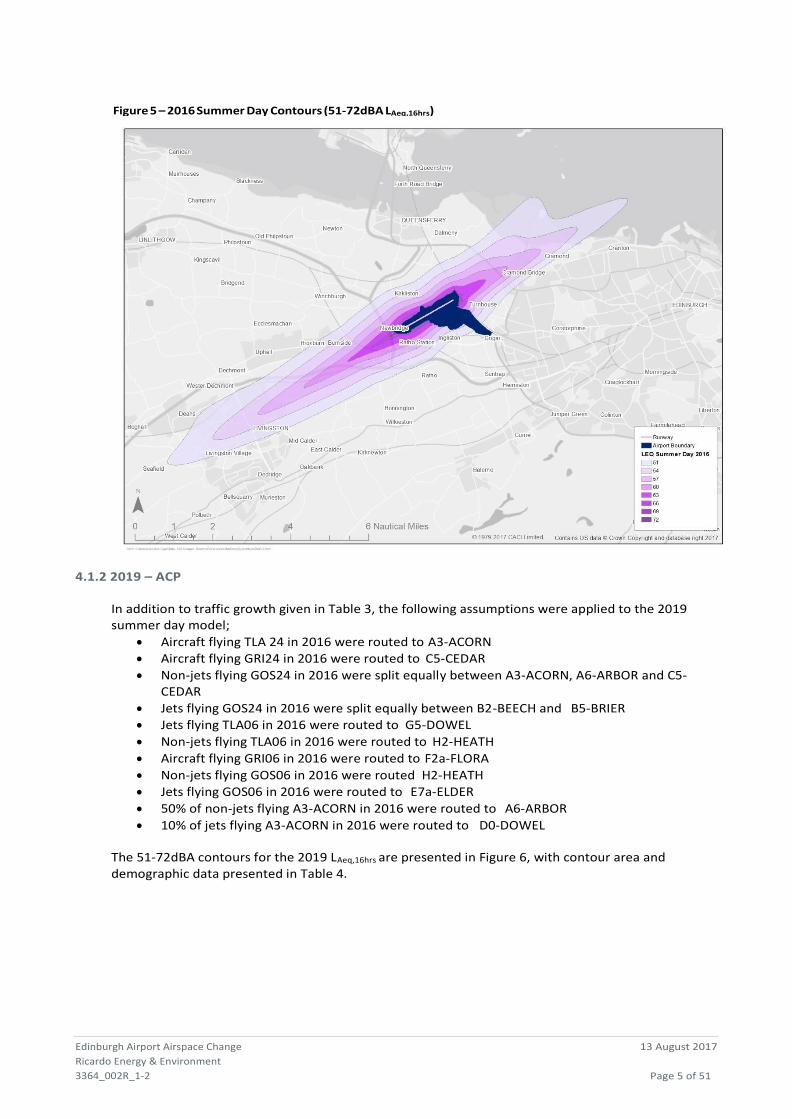
Edinburgh Airport Airspace Change
Ricardo Energy & Environment
3364_002R_1-2
13 August 2017
Page 5 of 51
Figure 5 – 2016 Summer Day Contours (51-72dBA LAeq,16hrs)
4.1.2 2019 – ACP
In addition to traffic growth given in Table 3, the following assumptions were applied to the 2019 summer day model;
• Aircraft flying TLA 24 in 2016 were routed to A3-ACORN
• Aircraft flying GRI24 in 2016 were routed to C5-CEDAR
• Non-jets flying GOS24 in 2016 were split equally between A3-ACORN, A6-ARBOR and C5- CEDAR
• Jets flying GOS24 in 2016 were split equally between B2-BEECH and B5-BRIER
• Jets flying TLA06 in 2016 were routed to G5-DOWEL
• Non-jets flying TLA06 in 2016 were routed to H2-HEATH
• Aircraft flying GRI06 in 2016 were routed to F2a-FLORA
• Non-jets flying GOS06 in 2016 were routed H2-HEATH
• Jets flying GOS06 in 2016 were routed to E7a-ELDER
• 50% of non-jets flying A3-ACORN in 2016 were routed to A6-ARBOR
• 10% of jets flying A3-ACORN in 2016 were routed to D0-DOWEL
The 51-72dBA contours for the 2019 LAeq,16hrs are presented in Figure 6, with contour area and demographic data presented in Table 4.
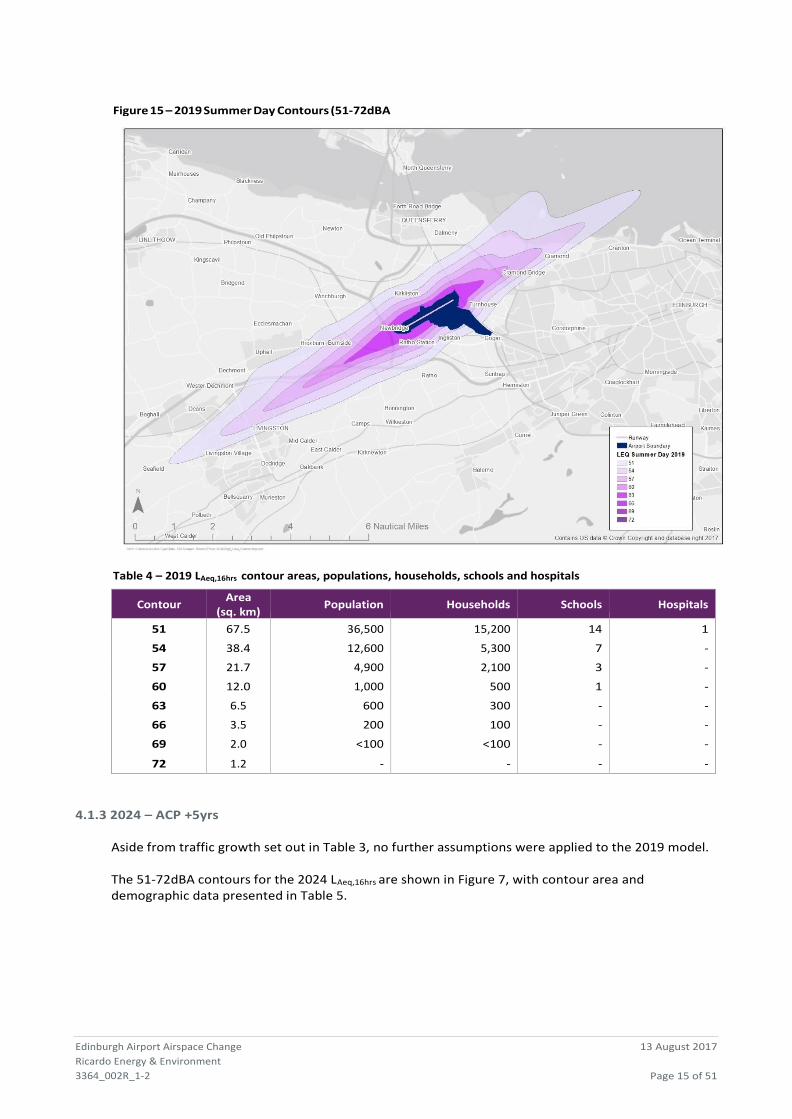
Figure 15 – 2019 Summer Day Contours (51-72dBA LAeq,16hrs)
Edinburgh Airport Airspace Change
Ricardo Energy & Environment
3364_002R_1-2
13 August 2017
Page 15 of 51
Table 4 – 2019 LAeq,16hrs contour areas, populations, households, schools and hospitals
Contour Area
(sq. km) Population Households Schools Hospitals
51 67.5 36,500 15,200 14 1
54 38.4 12,600 5,300 7 -
57 21.7 4,900 2,100 3 -
60 12.0 1,000 500 1 -
63 6.5 600 300 - -
66 3.5 200 100 - -
69 2.0 <100 <100 - -
72 1.2 - - - -
4.1.3 2024 – ACP +5yrs
Aside from traffic growth set out in Table 3, no further assumptions were applied to the 2019 model.
The 51-72dBA contours for the 2024 LAeq,16hrs are shown in Figure 7, with contour area and demographic data presented in Table 5.
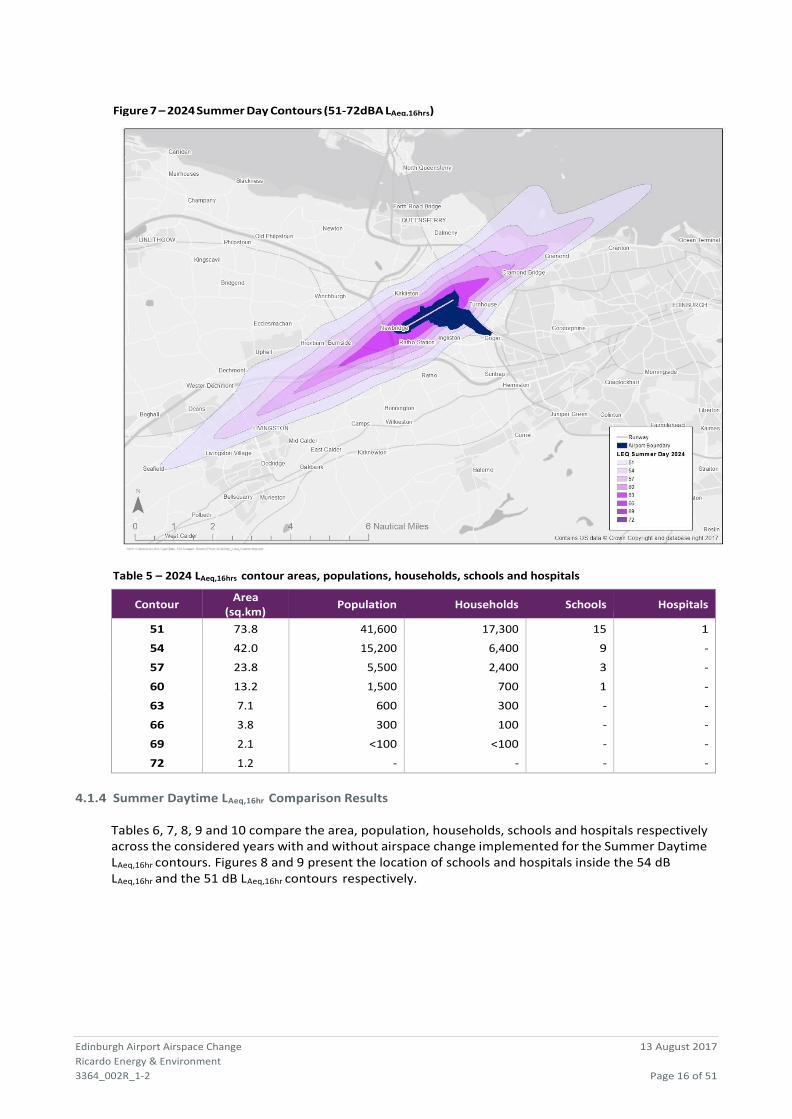
Edinburgh Airport Airspace Change
Ricardo Energy & Environment
3364_002R_1-2
13 August 2017
Page 16 of 51
Figure 7 – 2024 Summer Day Contours (51-72dBA LAeq,16hrs)
Table 5 – 2024 LAeq,16hrs contour areas, populations, households, schools and hospitals
Contour Area
(sq.km) Population Households Schools Hospitals
51 73.8 41,600 17,300 15 1
54 42.0 15,200 6,400 9 -
57 23.8 5,500 2,400 3 -
60 13.2 1,500 700 1 -
63 7.1 600 300 - -
66 3.8 300 100 - -
69 2.1 <100 <100 - -
72 1.2 - - - -
4.1.4 Summer Daytime LAeq,16hr Comparison Results
Tables 6, 7, 8, 9 and 10 compare the area, population, households, schools and hospitals respectively across the considered years with and without airspace change implemented for the Summer Daytime LAeq,16hr contours. Figures 8 and 9 present the location of schools and hospitals inside the 54 dB LAeq,16hr and the 51 dB LAeq,16hr contours respectively.
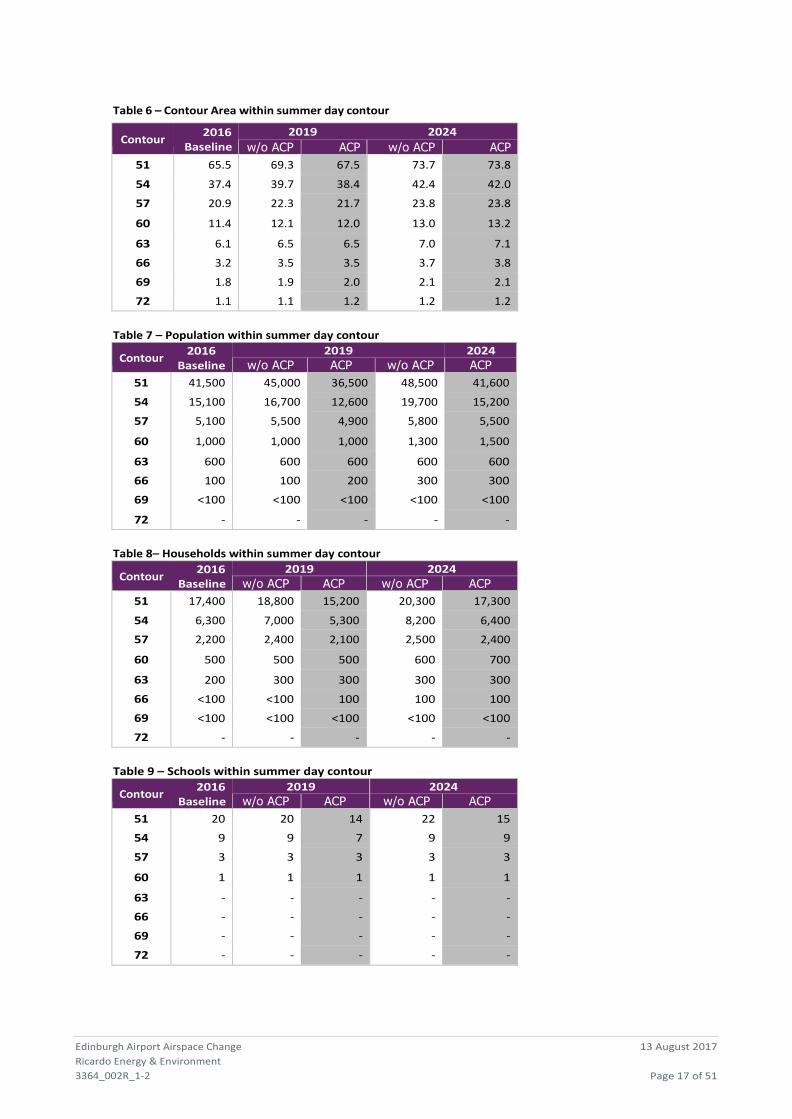
Edinburgh Airport Airspace Change
Ricardo Energy & Environment
3364_002R_1-2
13 August 2017
Page 17 of 51
Table 6 – Contour Area within summer day contour
Contour 2016
Baseline
2019 2024
w/o ACP ACP w/o ACP ACP
51 65.5 69.3 67.5 73.7 73.8
54 37.4 39.7 38.4 42.4 42.0
57 20.9 22.3 21.7 23.8 23.8
60 11.4 12.1 12.0 13.0 13.2
63 6.1 6.5 6.5 7.0 7.1
66 3.2 3.5 3.5 3.7 3.8
69 1.8 1.9 2.0 2.1 2.1
72 1.1 1.1 1.2 1.2 1.2
Table 7 – Population within summer day contour
Contour 2016
Baseline 2019 2024
w/o ACP ACP w/o ACP ACP
51 41,500 45,000 36,500 48,500 41,600
54 15,100 16,700 12,600 19,700 15,200
57 5,100 5,500 4,900 5,800 5,500
60 1,000 1,000 1,000 1,300 1,500
63 600 600 600 600 600
66 100 100 200 300 300
69 <100 <100 <100 <100 <100
72 - - - - -
Table 8– Households within summer day contour
Contour 2016
Baseline 2019 2024
w/o ACP ACP w/o ACP ACP
51 17,400 18,800 15,200 20,300 17,300
54 6,300 7,000 5,300 8,200 6,400
57 2,200 2,400 2,100 2,500 2,400
60 500 500 500 600 700
63 200 300 300 300 300
66 <100 <100 100 100 100
69 <100 <100 <100 <100 <100
72 - - - - -
Table 9 – Schools within summer day contour
Contour 2016
Baseline 2019 2024
w/o ACP ACP w/o ACP ACP
51 20 20 14 22 15
54 9 9 7 9 9
57 3 3 3 3 3
60 1 1 1 1 1
63 - - - - -
66 - - - - -
69 - - - - -
72 - - - - -
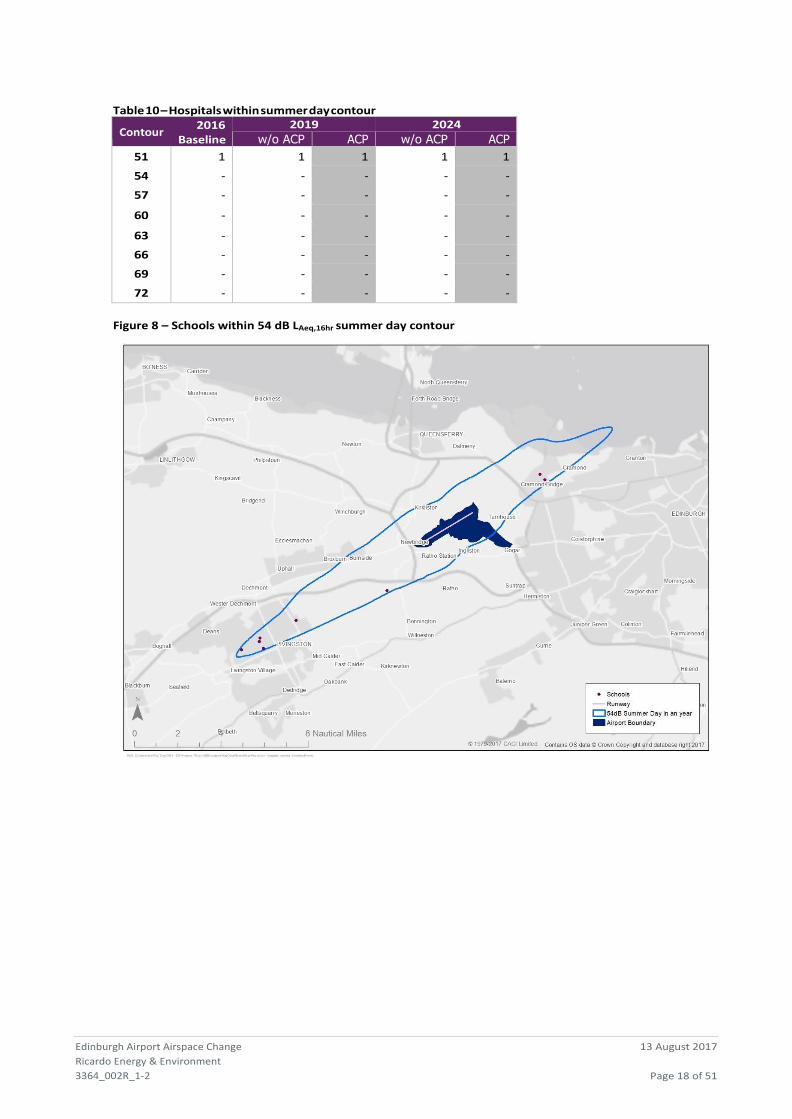
Edinburgh Airport Airspace Change
Ricardo Energy & Environment
3364_002R_1-2
13 August 2017
Page 18 of 51
Table 10 – Hospitals within summer day contour
Contour 2016
Baseline
2019 2024
w/o ACP ACP w/o ACP ACP
51 1 1 1 1 1
54 - - - - -
57 - - - - -
60 - - - - -
63 - - - - -
66 - - - - -
69 - - - - -
72 - - - - -
Figure 8 – Schools within 54 dB LAeq,16hr summer day contour
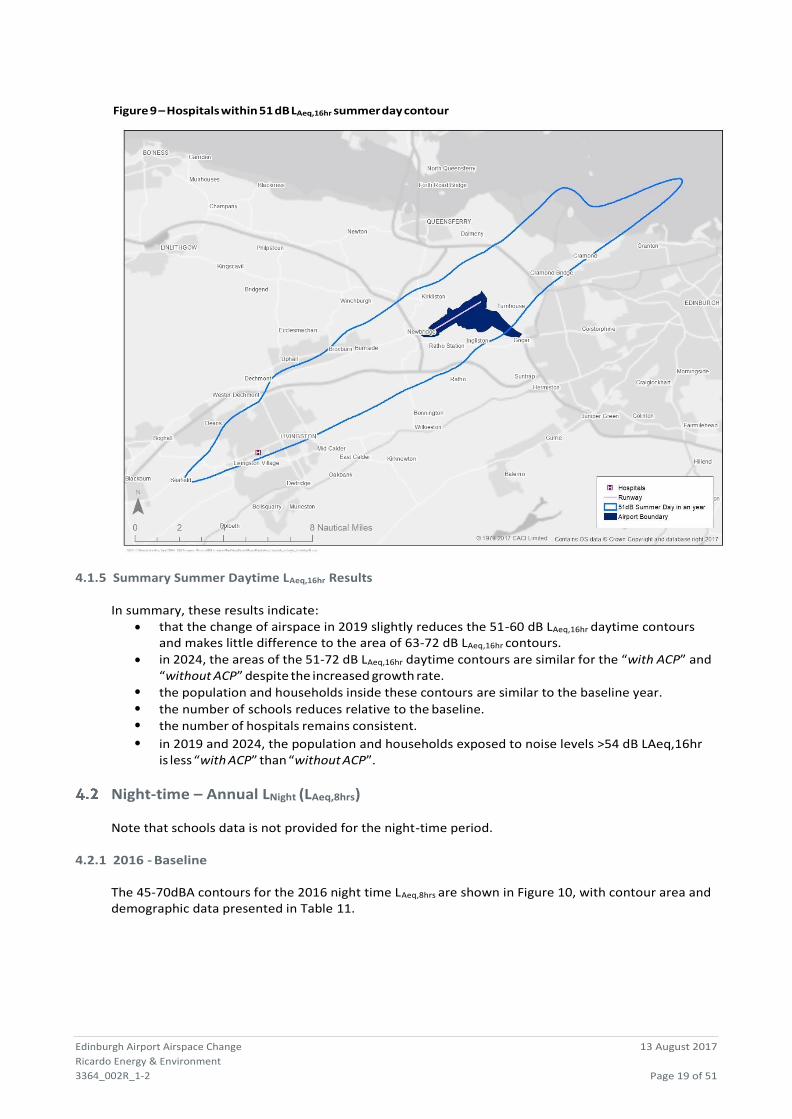
Edinburgh Airport Airspace Change
Ricardo Energy & Environment
3364_002R_1-2
13 August 2017
Page 19 of 51
Figure 9 – Hospitals within 51 dB LAeq,16hr summer day contour
4.1.5 Summary Summer Daytime LAeq,16hr Results
In summary, these results indicate: • that the change of airspace in 2019 slightly reduces the 51-60 dB LAeq,16hr daytime contours
and makes little difference to the area of 63-72 dB LAeq,16hr contours. • in 2024, the areas of the 51-72 dB LAeq,16hr daytime contours are similar for the “with ACP” and
“without ACP” despite the increased growth rate. • the population and households inside these contours are similar to the baseline year. • the number of schools reduces relative to the baseline. • the number of hospitals remains consistent.
• in 2019 and 2024, the population and households exposed to noise levels >54 dB LAeq,16hr is less “with ACP” than “without ACP”.
Night-time – Annual LNight (LAeq,8hrs)
Note that schools data is not provided for the night-time period.
4.2.1 2016 - Baseline
The 45-70dBA contours for the 2016 night time LAeq,8hrs are shown in Figure 10, with contour area and demographic data presented in Table 11.
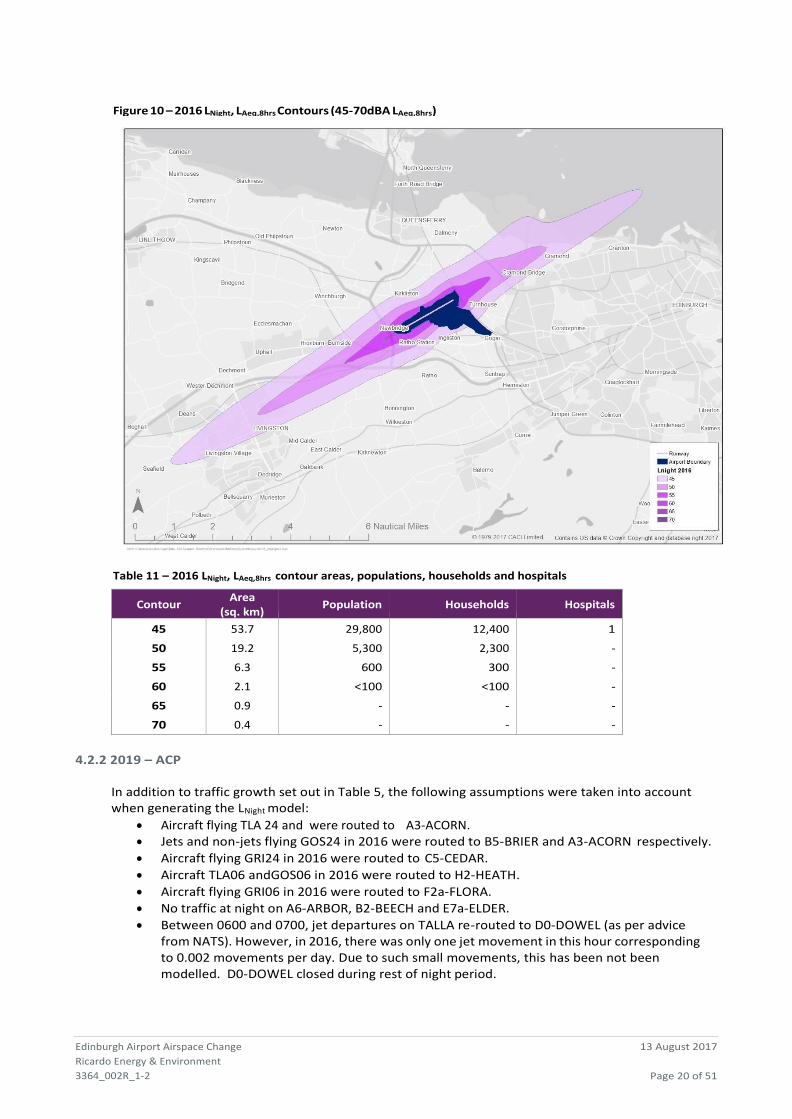
Figure 10 – 2016 LNight, LAeq,8hrs Contours (45-70dBA LAeq,8hrs)
Edinburgh Airport Airspace Change
Ricardo Energy & Environment
3364_002R_1-2
13 August 2017
Page 20 of 51
Table 11 – 2016 LNight, LAeq,8hrs contour areas, populations, households and hospitals
Contour Area
(sq. km) Population Households Hospitals
45 53.7 29,800 12,400 1
50 19.2 5,300 2,300 -
55 6.3 600 300 -
60 2.1 <100 <100 -
65 0.9 - - -
70 0.4 - - -
4.2.2 2019 – ACP
In addition to traffic growth set out in Table 5, the following assumptions were taken into account when generating the LNight model:
• Aircraft flying TLA 24 and were routed to A3-ACORN. • Jets and non-jets flying GOS24 in 2016 were routed to B5-BRIER and A3-ACORN respectively.
• Aircraft flying GRI24 in 2016 were routed to C5-CEDAR.
• Aircraft TLA06 andGOS06 in 2016 were routed to H2-HEATH.
• Aircraft flying GRI06 in 2016 were routed to F2a-FLORA.
• No traffic at night on A6-ARBOR, B2-BEECH and E7a-ELDER.
• Between 0600 and 0700, jet departures on TALLA re-routed to D0-DOWEL (as per advice from NATS). However, in 2016, there was only one jet movement in this hour corresponding to 0.002 movements per day. Due to such small movements, this has been not been modelled. D0-DOWEL closed during rest of night period.
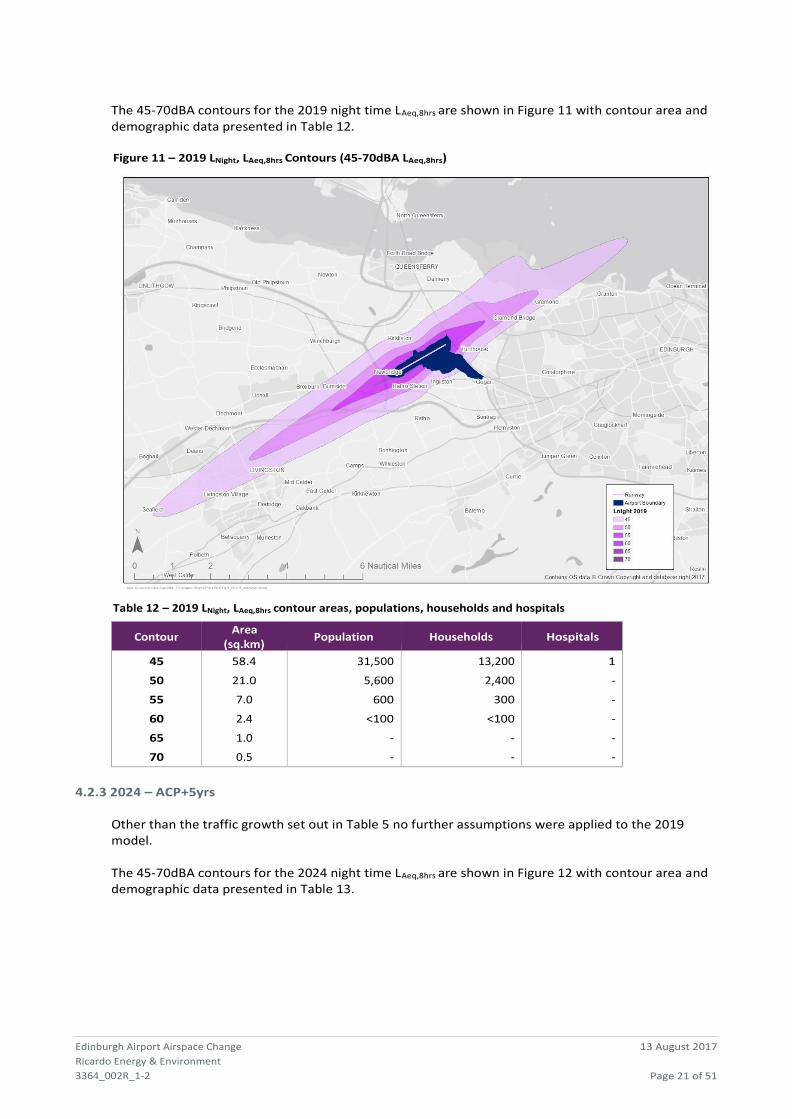
Edinburgh Airport Airspace Change
Ricardo Energy & Environment
3364_002R_1-2
13 August 2017
Page 21 of 51
The 45-70dBA contours for the 2019 night time LAeq,8hrs are shown in Figure 11 with contour area and demographic data presented in Table 12.
Figure 11 – 2019 LNight, LAeq,8hrs Contours (45-70dBA LAeq,8hrs)
Table 12 – 2019 LNight, LAeq,8hrs contour areas, populations, households and hospitals
Contour Area
(sq.km) Population Households Hospitals
45 58.4 31,500 13,200 1
50 21.0 5,600 2,400 -
55 7.0 600 300 -
60 2.4 <100 <100 -
65 1.0 - - -
70 0.5 - - -
4.2.3 2024 – ACP+5yrs
Other than the traffic growth set out in Table 5 no further assumptions were applied to the 2019 model.
The 45-70dBA contours for the 2024 night time LAeq,8hrs are shown in Figure 12 with contour area and demographic data presented in Table 13.
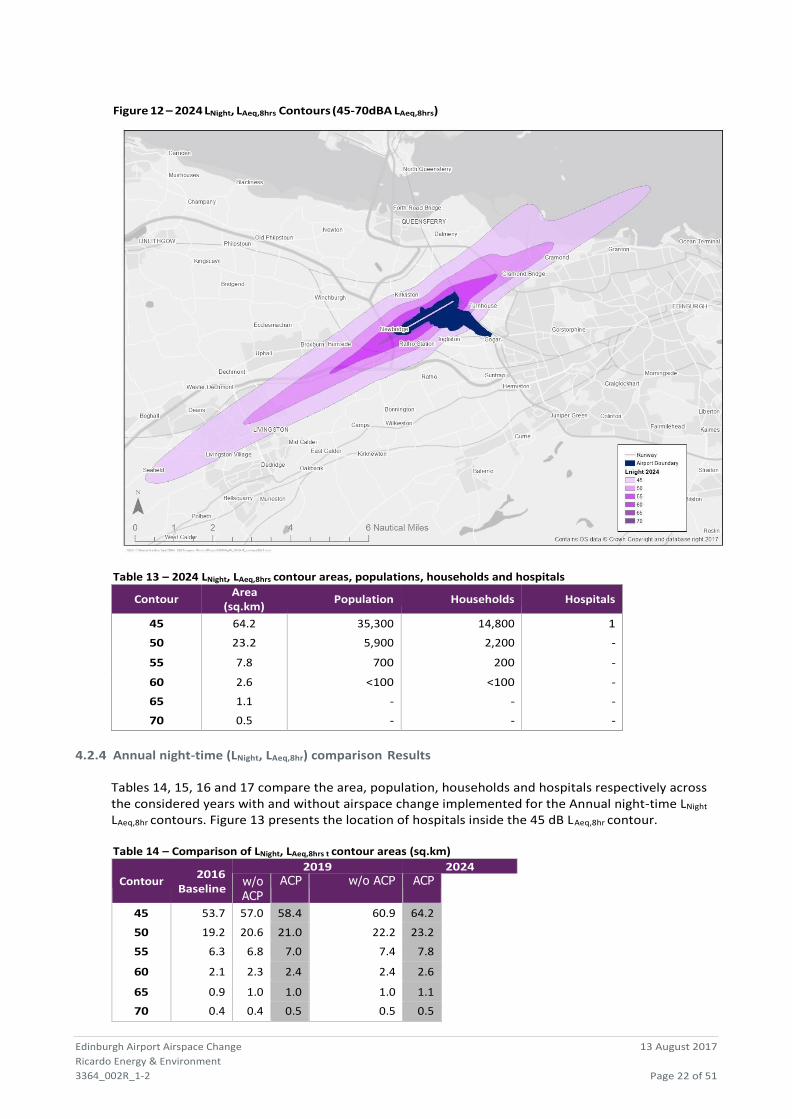
Edinburgh Airport Airspace Change
Ricardo Energy & Environment
3364_002R_1-2
13 August 2017
Page 22 of 51
Figure 12 – 2024 LNight, LAeq,8hrs Contours (45-70dBA LAeq,8hrs)
Table 13 – 2024 LNight, LAeq,8hrs contour areas, populations, households and hospitals
Contour Area
(sq.km) Population Households Hospitals
45 64.2 35,300 14,800 1
50 23.2 5,900 2,200 -
55 7.8 700 200 -
60 2.6 <100 <100 -
65 1.1 - - -
70 0.5 - - -
4.2.4 Annual night-time (LNight, LAeq,8hr) comparison Results
Tables 14, 15, 16 and 17 compare the area, population, households and hospitals respectively across the considered years with and without airspace change implemented for the Annual night-time LNight
LAeq,8hr contours. Figure 13 presents the location of hospitals inside the 45 dB LAeq,8hr contour.
Table 14 – Comparison of LNight, LAeq,8hrs t contour areas (sq.km)
Contour 2016
Baseline
2019 2024
w/o ACP
ACP w/o ACP ACP
45 53.7 57.0 58.4 60.9 64.2
50 19.2 20.6 21.0 22.2 23.2
55 6.3 6.8 7.0 7.4 7.8
60 2.1 2.3 2.4 2.4 2.6
65 0.9 1.0 1.0 1.0 1.1
70 0.4 0.4 0.5 0.5 0.5
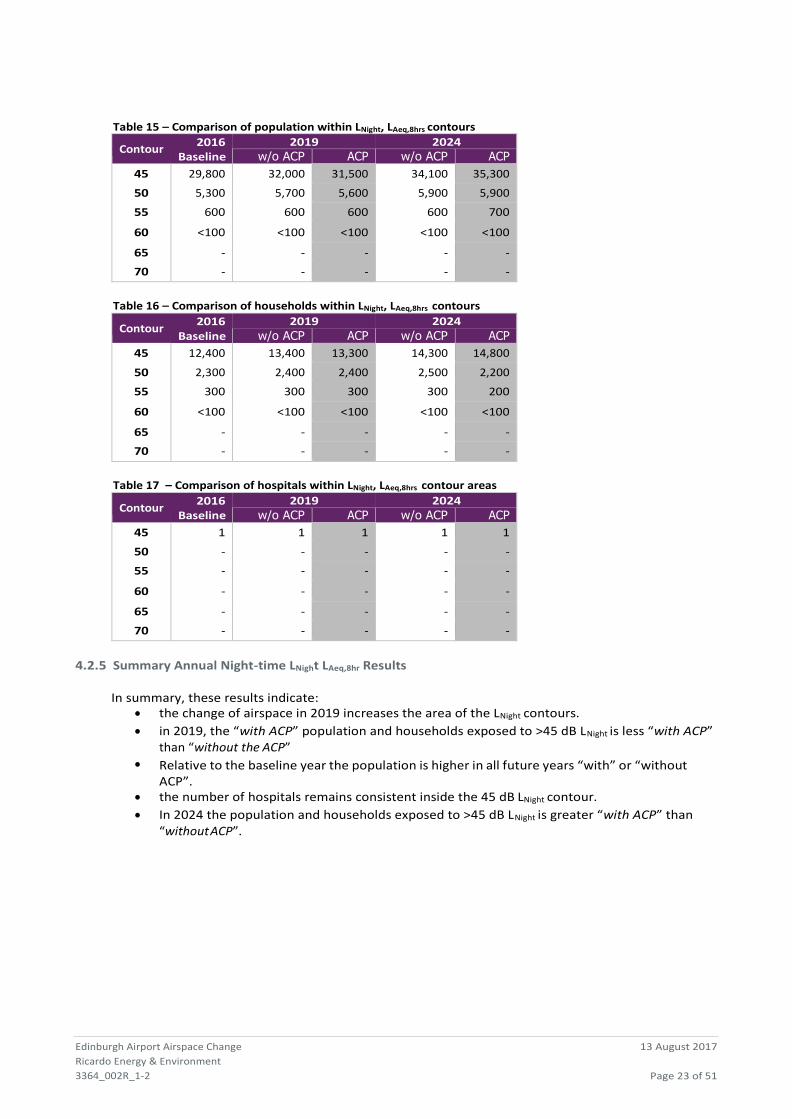
Edinburgh Airport Airspace Change
Ricardo Energy & Environment
3364_002R_1-2
13 August 2017
Page 23 of 51
Table 15 – Comparison of population within LNight, LAeq,8hrs contours
Contour 2016
Baseline 2019 2024
w/o ACP ACP w/o ACP ACP
45 29,800 32,000 31,500 34,100 35,300
50 5,300 5,700 5,600 5,900 5,900
55 600 600 600 600 700
60 <100 <100 <100 <100 <100
65 - - - - -
70 - - - - -
Table 16 – Comparison of households within LNight, LAeq,8hrs contours
Contour 2016
Baseline 2019 2024
w/o ACP ACP w/o ACP ACP
45 12,400 13,400 13,300 14,300 14,800
50 2,300 2,400 2,400 2,500 2,200
55 300 300 300 300 200
60 <100 <100 <100 <100 <100
65 - - - - -
70 - - - - -
Table 17 – Comparison of hospitals within LNight, LAeq,8hrs contour areas
Contour 2016
Baseline 2019 2024
w/o ACP ACP w/o ACP ACP
45 1 1 1 1 1
50 - - - - -
55 - - - - -
60 - - - - -
65 - - - - -
70 - - - - -
4.2.5 Summary Annual Night-time LNight LAeq,8hr Results
In summary, these results indicate: • the change of airspace in 2019 increases the area of the LNight contours.
• in 2019, the “with ACP” population and households exposed to >45 dB LNight is less “with ACP” than “without the ACP”
• Relative to the baseline year the population is higher in all future years “with” or “without ACP”.
• the number of hospitals remains consistent inside the 45 dB LNight contour.
• In 2024 the population and households exposed to >45 dB LNight is greater “with ACP” than “without ACP”.
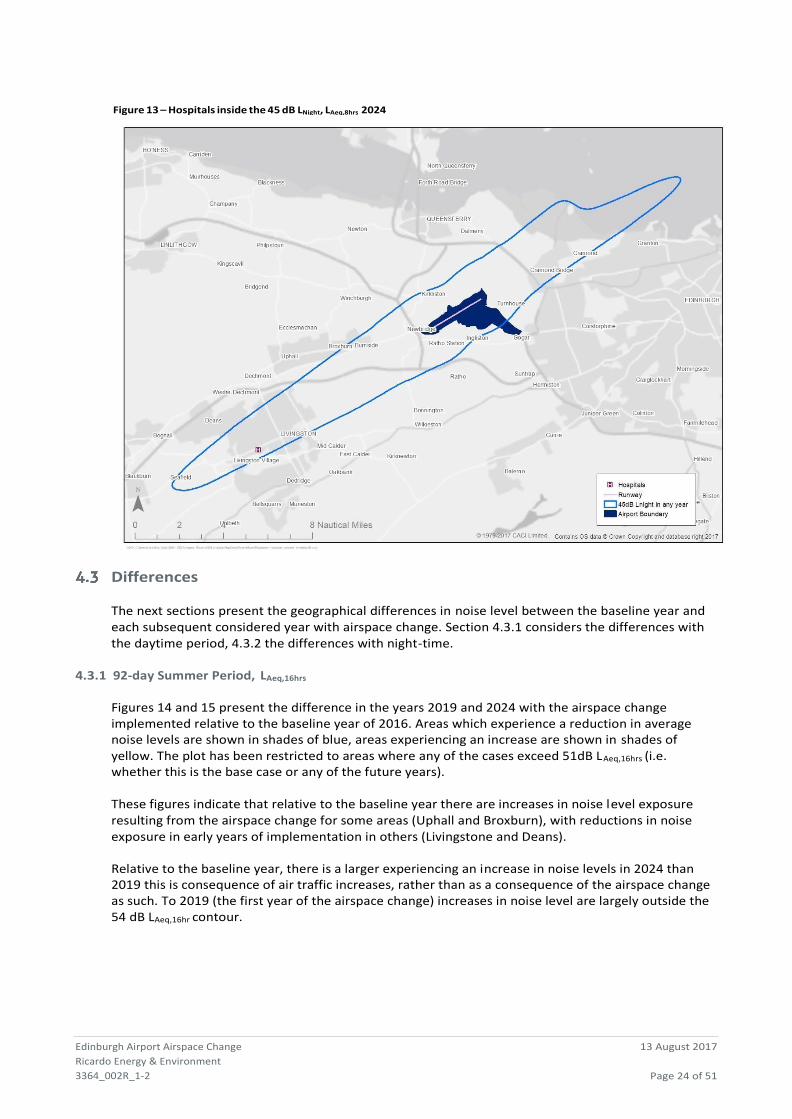
Edinburgh Airport Airspace Change
Ricardo Energy & Environment
3364_002R_1-2
13 August 2017
Page 24 of 51
Figure 13 – Hospitals inside the 45 dB LNight, LAeq,8hrs 2024
Differences
The next sections present the geographical differences in noise level between the baseline year and each subsequent considered year with airspace change. Section 4.3.1 considers the differences with the daytime period, 4.3.2 the differences with night-time.
4.3.1 92-day Summer Period, LAeq,16hrs
Figures 14 and 15 present the difference in the years 2019 and 2024 with the airspace change implemented relative to the baseline year of 2016. Areas which experience a reduction in average noise levels are shown in shades of blue, areas experiencing an increase are shown in shades of yellow. The plot has been restricted to areas where any of the cases exceed 51dB LAeq,16hrs (i.e. whether this is the base case or any of the future years).
These figures indicate that relative to the baseline year there are increases in noise level exposure resulting from the airspace change for some areas (Uphall and Broxburn), with reductions in noise exposure in early years of implementation in others (Livingstone and Deans).
Relative to the baseline year, there is a larger experiencing an increase in noise levels in 2024 than 2019 this is consequence of air traffic increases, rather than as a consequence of the airspace change as such. To 2019 (the first year of the airspace change) increases in noise level are largely outside the 54 dB LAeq,16hr contour.
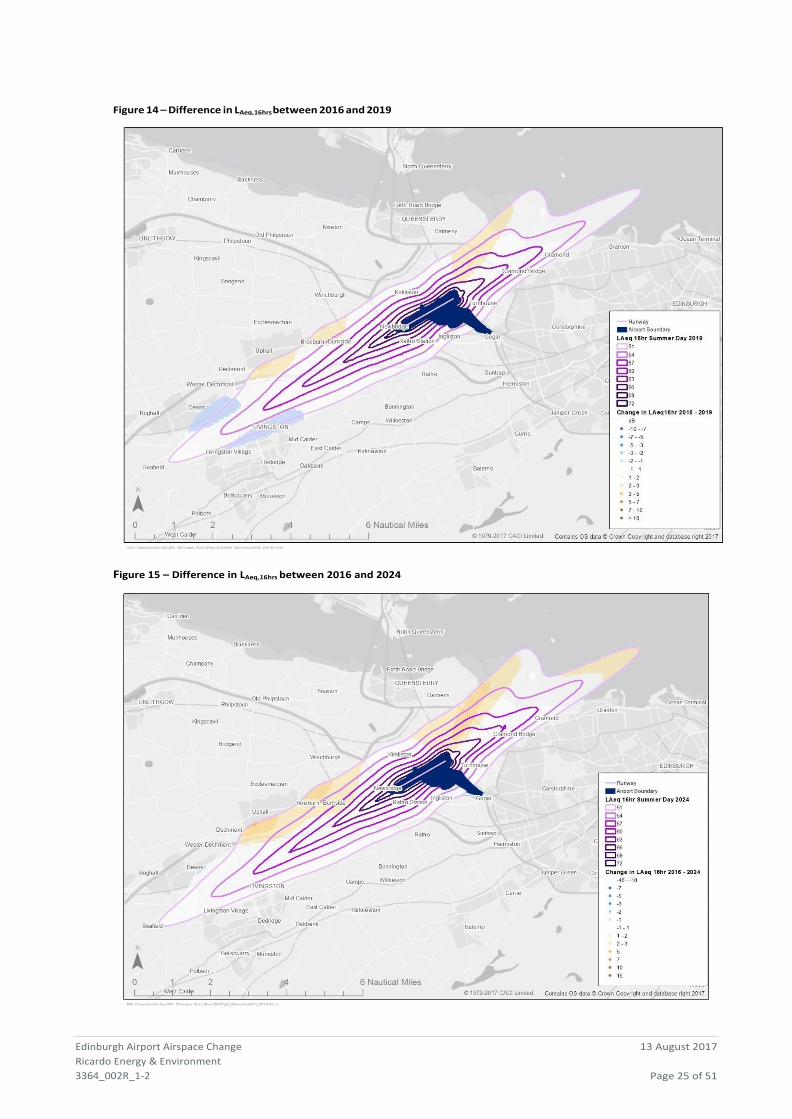
Edinburgh Airport Airspace Change
Ricardo Energy & Environment
3364_002R_1-2
13 August 2017
Page 25 of 51
Figure 14 – Difference in LAeq,16hrs between 2016 and 2019
Figure 15 – Difference in LAeq,16hrs between 2016 and 2024
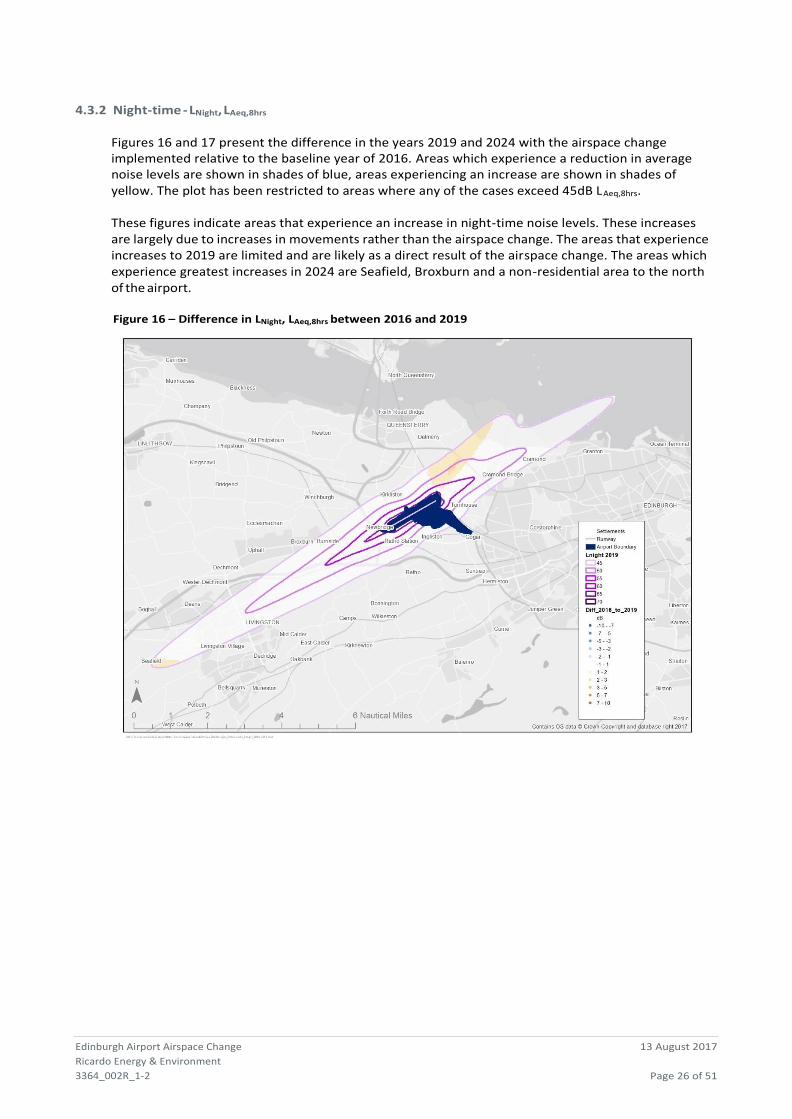
Edinburgh Airport Airspace Change
Ricardo Energy & Environment
3364_002R_1-2
13 August 2017
Page 26 of 51
4.3.2 Night-time - LNight, LAeq,8hrs
Figures 16 and 17 present the difference in the years 2019 and 2024 with the airspace change implemented relative to the baseline year of 2016. Areas which experience a reduction in average noise levels are shown in shades of blue, areas experiencing an increase are shown in shades of yellow. The plot has been restricted to areas where any of the cases exceed 45dB LAeq,8hrs.
These figures indicate areas that experience an increase in night-time noise levels. These increases are largely due to increases in movements rather than the airspace change. The areas that experience increases to 2019 are limited and are likely as a direct result of the airspace change. The areas which experience greatest increases in 2024 are Seafield, Broxburn and a non-residential area to the north of the airport.
Figure 16 – Difference in LNight, LAeq,8hrs between 2016 and 2019
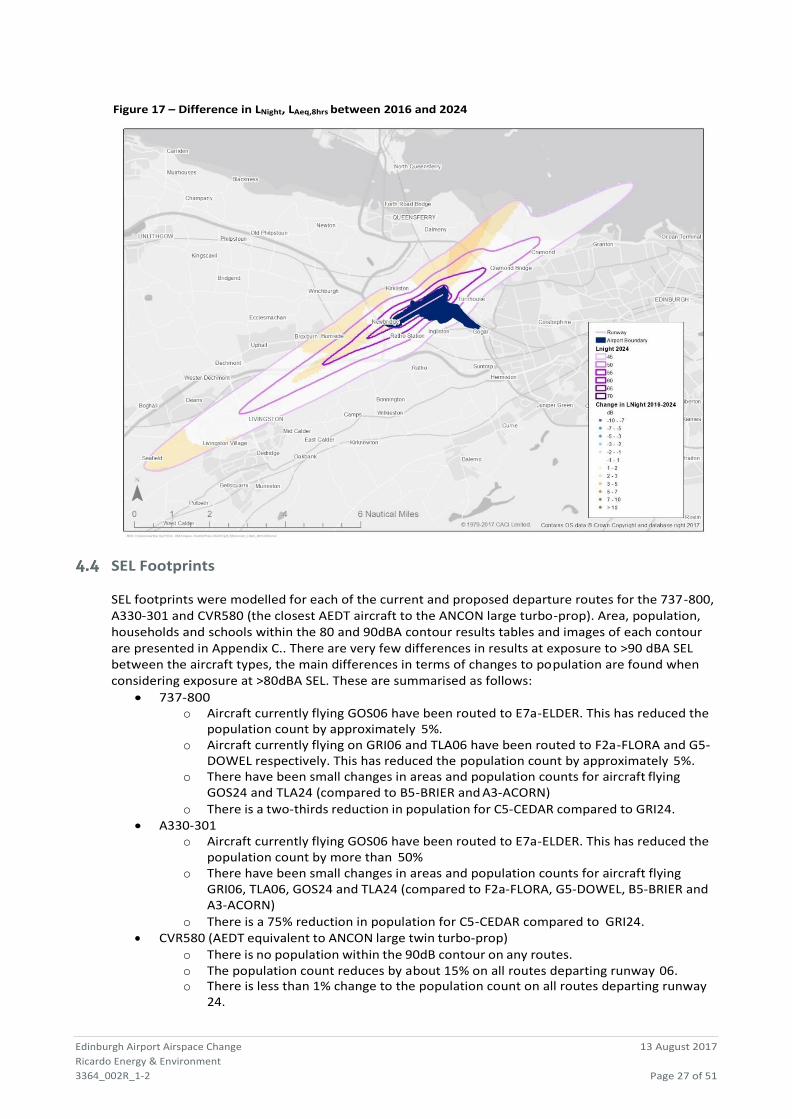
Edinburgh Airport Airspace Change
Ricardo Energy & Environment
3364_002R_1-2
13 August 2017
Page 27 of 51
Figure 17 – Difference in LNight, LAeq,8hrs between 2016 and 2024
SEL Footprints
SEL footprints were modelled for each of the current and proposed departure routes for the 737-800, A330-301 and CVR580 (the closest AEDT aircraft to the ANCON large turbo-prop). Area, population, households and schools within the 80 and 90dBA contour results tables and images of each contour are presented in Appendix C.. There are very few differences in results at exposure to >90 dBA SEL between the aircraft types, the main differences in terms of changes to population are found when considering exposure at >80dBA SEL. These are summarised as follows:
• 737-800 o Aircraft currently flying GOS06 have been routed to E7a-ELDER. This has reduced the
population count by approximately 5%. o Aircraft currently flying on GRI06 and TLA06 have been routed to F2a-FLORA and G5-
DOWEL respectively. This has reduced the population count by approximately 5%. o There have been small changes in areas and population counts for aircraft flying
GOS24 and TLA24 (compared to B5-BRIER and A3-ACORN)
o There is a two-thirds reduction in population for C5-CEDAR compared to GRI24. • A330-301
o Aircraft currently flying GOS06 have been routed to E7a-ELDER. This has reduced the population count by more than 50%
o There have been small changes in areas and population counts for aircraft flying GRI06, TLA06, GOS24 and TLA24 (compared to F2a-FLORA, G5-DOWEL, B5-BRIER and A3-ACORN)
o There is a 75% reduction in population for C5-CEDAR compared to GRI24. • CVR580 (AEDT equivalent to ANCON large twin turbo-prop)
o There is no population within the 90dB contour on any routes. o The population count reduces by about 15% on all routes departing runway 06. o There is less than 1% change to the population count on all routes departing runway
24.
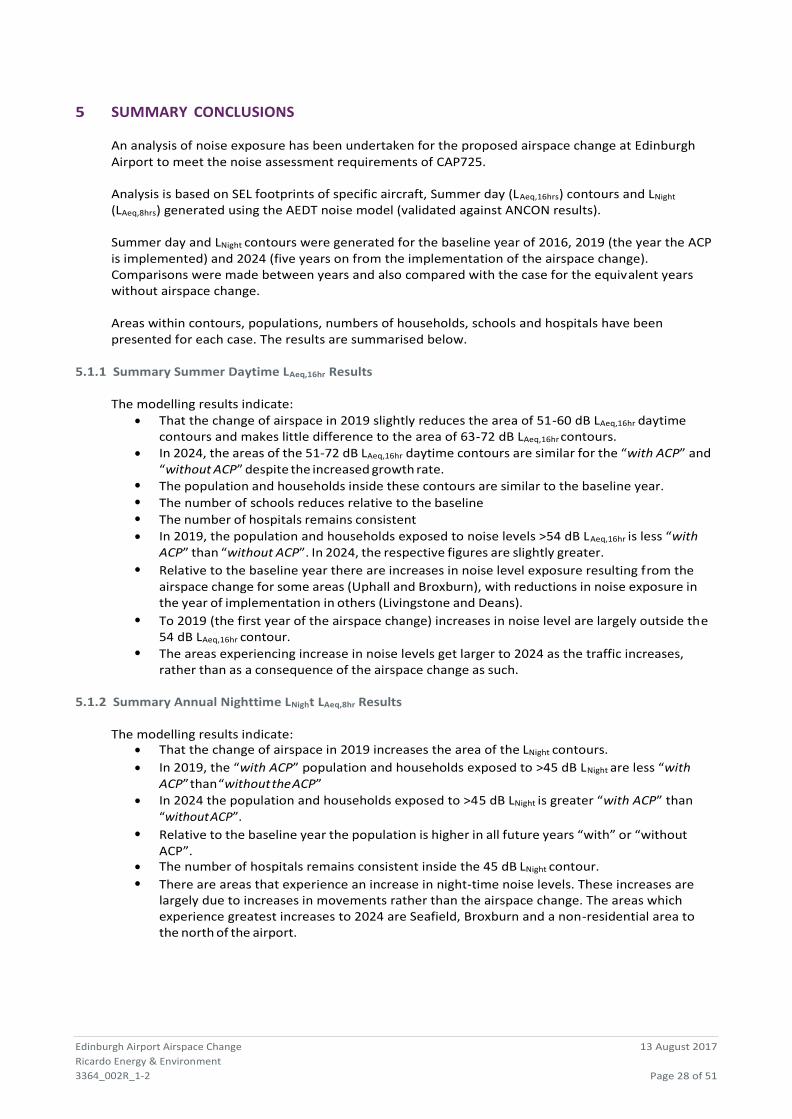
Edinburgh Airport Airspace Change
Ricardo Energy & Environment
3364_002R_1-2
13 August 2017
Page 28 of 51
5 SUMMARY CONCLUSIONS
An analysis of noise exposure has been undertaken for the proposed airspace change at Edinburgh Airport to meet the noise assessment requirements of CAP725.
Analysis is based on SEL footprints of specific aircraft, Summer day (LAeq,16hrs) contours and LNight
(LAeq,8hrs) generated using the AEDT noise model (validated against ANCON results).
Summer day and LNight contours were generated for the baseline year of 2016, 2019 (the year the ACP is implemented) and 2024 (five years on from the implementation of the airspace change). Comparisons were made between years and also compared with the case for the equivalent years without airspace change.
Areas within contours, populations, numbers of households, schools and hospitals have been presented for each case. The results are summarised below.
5.1.1 Summary Summer Daytime LAeq,16hr Results
The modelling results indicate: • That the change of airspace in 2019 slightly reduces the area of 51-60 dB LAeq,16hr daytime
contours and makes little difference to the area of 63-72 dB LAeq,16hr contours. • In 2024, the areas of the 51-72 dB LAeq,16hr daytime contours are similar for the “with ACP” and
“without ACP” despite the increased growth rate. • The population and households inside these contours are similar to the baseline year. • The number of schools reduces relative to the baseline • The number of hospitals remains consistent
• In 2019, the population and households exposed to noise levels >54 dB LAeq,16hr is less “with ACP” than “without ACP”. In 2024, the respective figures are slightly greater.
• Relative to the baseline year there are increases in noise level exposure resulting from the airspace change for some areas (Uphall and Broxburn), with reductions in noise exposure in the year of implementation in others (Livingstone and Deans).
• To 2019 (the first year of the airspace change) increases in noise level are largely outside the 54 dB LAeq,16hr contour.
• The areas experiencing increase in noise levels get larger to 2024 as the traffic increases, rather than as a consequence of the airspace change as such.
5.1.2 Summary Annual Nighttime LNight LAeq,8hr Results
The modelling results indicate: • That the change of airspace in 2019 increases the area of the LNight contours.
• In 2019, the “with ACP” population and households exposed to >45 dB LNight are less “with ACP” than “without the ACP”
• In 2024 the population and households exposed to >45 dB LNight is greater “with ACP” than “without ACP”.
• Relative to the baseline year the population is higher in all future years “with” or “without ACP”.
• The number of hospitals remains consistent inside the 45 dB LNight contour. • There are areas that experience an increase in night-time noise levels. These increases are
largely due to increases in movements rather than the airspace change. The areas which experience greatest increases to 2024 are Seafield, Broxburn and a non-residential area to the north of the airport.
Edinburgh Airport Airspace Change
Ricardo Energy & Environment
3364_002R_1-2
13 August 2017
Page 29 of 51
6 REFERENCES
[1] CAA (2017), Technical Note (v,2): New SIDs ACP Noise Assessment. [2] CAA (1985), DR Report 8402 – United Kingdom Aircraft Noise Index Study: Main Report. [3] WHO Europe (2011), Burden of disease from environmental noise: Quantification of healthy
life years in Europe. [4] CAA Guidance on the Application of the Airspace Change Process. CAP 725. As amended
March 2016.

Edinburgh Airport Airspace Change
Ricardo Energy & Environment
3364_002R_1-2
13 August 2017
Page 30 of 51
PAGE LEFT INTENTIONALLY BLANK
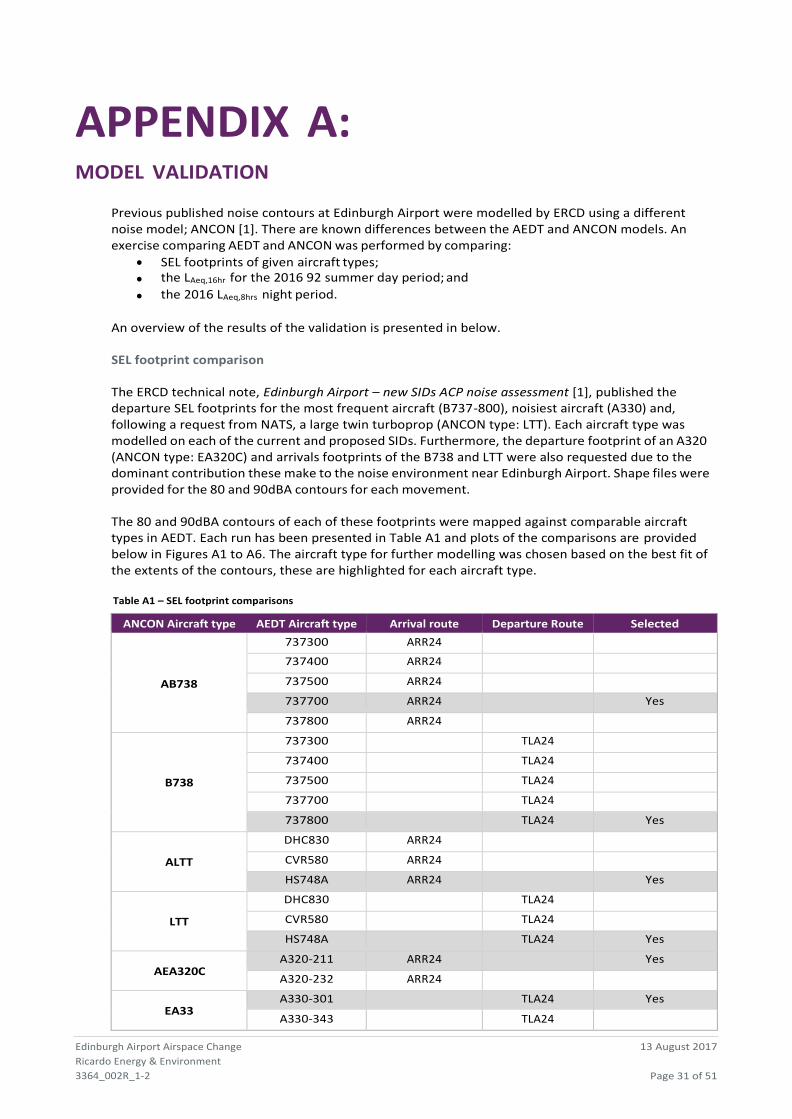
Edinburgh Airport Airspace Change
Ricardo Energy & Environment
3364_002R_1-2
13 August 2017
Page 31 of 51
APPENDIX A: MODEL VALIDATION
Previous published noise contours at Edinburgh Airport were modelled by ERCD using a different noise model; ANCON [1]. There are known differences between the AEDT and ANCON models. An exercise comparing AEDT and ANCON was performed by comparing:
• SEL footprints of given aircraft types;
• the LAeq,16hr for the 2016 92 summer day period; and
• the 2016 LAeq,8hrs night period.
An overview of the results of the validation is presented in below.
SEL footprint comparison
The ERCD technical note, Edinburgh Airport – new SIDs ACP noise assessment [1], published the departure SEL footprints for the most frequent aircraft (B737-800), noisiest aircraft (A330) and, following a request from NATS, a large twin turboprop (ANCON type: LTT). Each aircraft type was modelled on each of the current and proposed SIDs. Furthermore, the departure footprint of an A320 (ANCON type: EA320C) and arrivals footprints of the B738 and LTT were also requested due to the dominant contribution these make to the noise environment near Edinburgh Airport. Shape files were provided for the 80 and 90dBA contours for each movement.
The 80 and 90dBA contours of each of these footprints were mapped against comparable aircraft types in AEDT. Each run has been presented in Table A1 and plots of the comparisons are provided below in Figures A1 to A6. The aircraft type for further modelling was chosen based on the best fit of the extents of the contours, these are highlighted for each aircraft type.
Table A1 – SEL footprint comparisons
ANCON Aircraft type AEDT Aircraft type Arrival route Departure Route Selected
AB738
737300 ARR24
737400 ARR24
737500 ARR24
737700 ARR24 Yes
737800 ARR24
B738
737300 TLA24
737400 TLA24
737500 TLA24
737700 TLA24
737800 TLA24 Yes
ALTT
DHC830 ARR24
CVR580 ARR24
HS748A ARR24 Yes
LTT
DHC830 TLA24
CVR580 TLA24
HS748A TLA24 Yes
AEA320C A320-211 ARR24 Yes
A320-232 ARR24
EA33 A330-301 TLA24 Yes
A330-343 TLA24
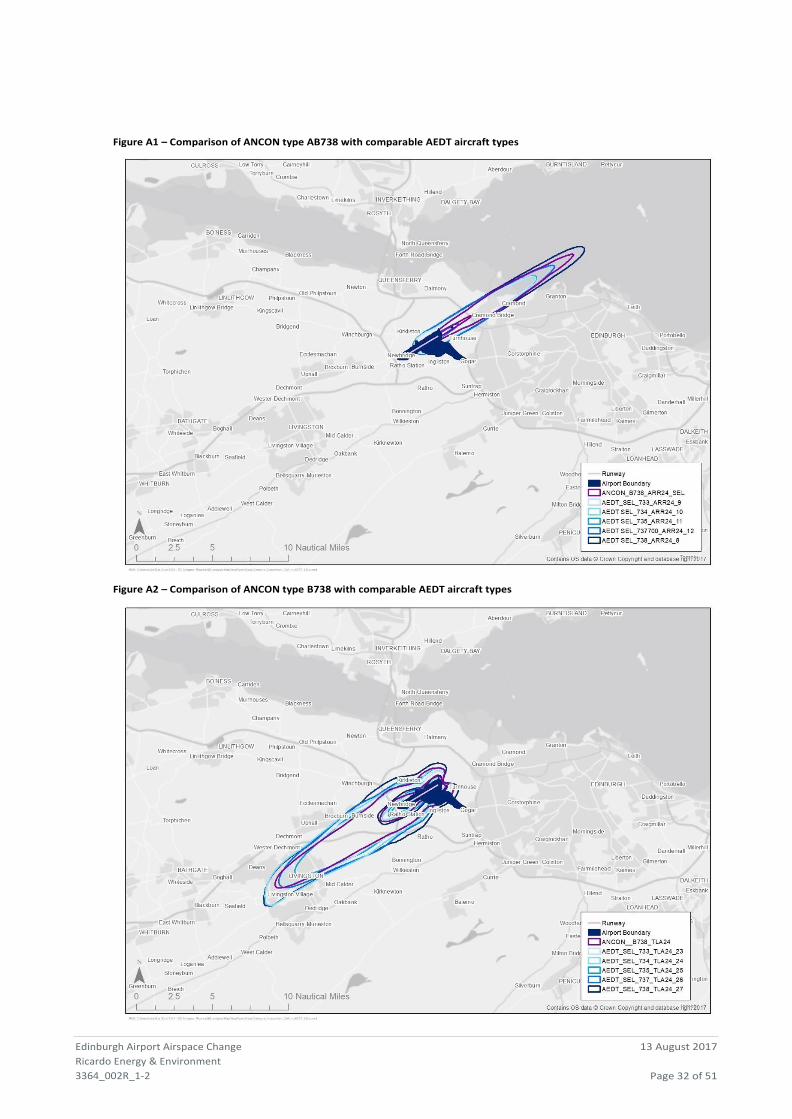
Edinburgh Airport Airspace Change
Ricardo Energy & Environment
3364_002R_1-2
13 August 2017
Page 32 of 51
Figure A1 – Comparison of ANCON type AB738 with comparable AEDT aircraft types
Figure A2 – Comparison of ANCON type B738 with comparable AEDT aircraft types
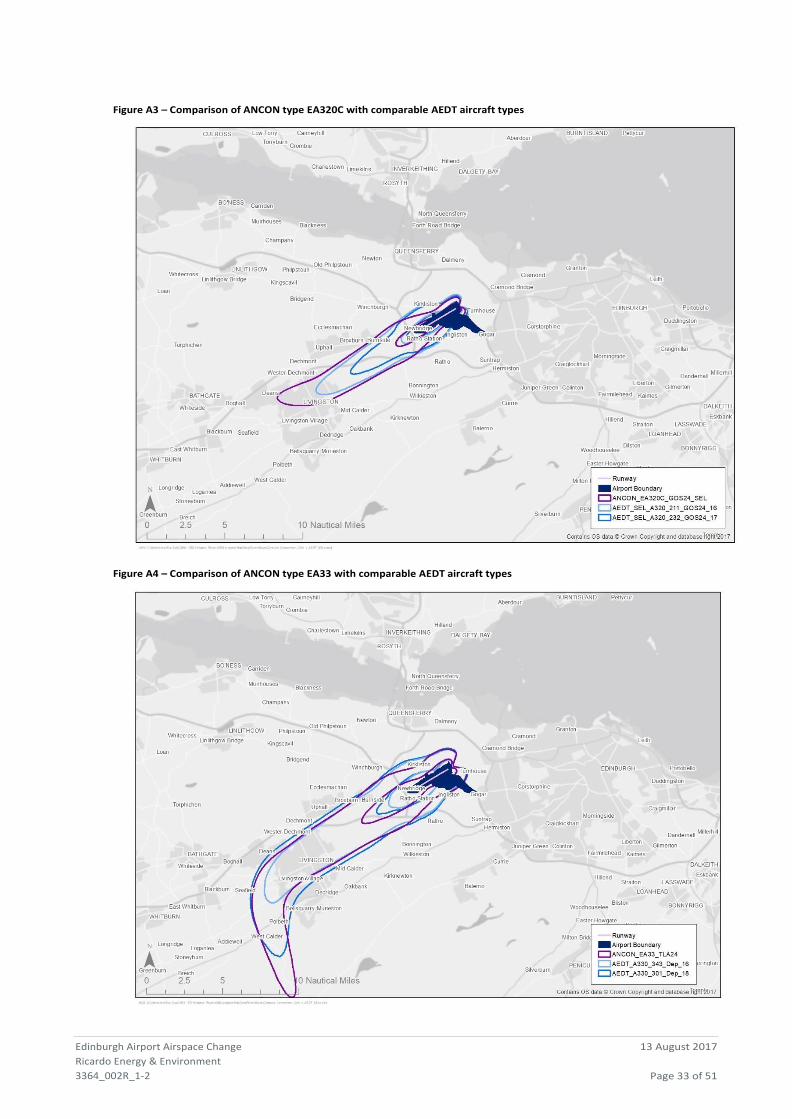
Edinburgh Airport Airspace Change
Ricardo Energy & Environment
3364_002R_1-2
13 August 2017
Page 33 of 51
Figure A3 – Comparison of ANCON type EA320C with comparable AEDT aircraft types
Figure A4 – Comparison of ANCON type EA33 with comparable AEDT aircraft types
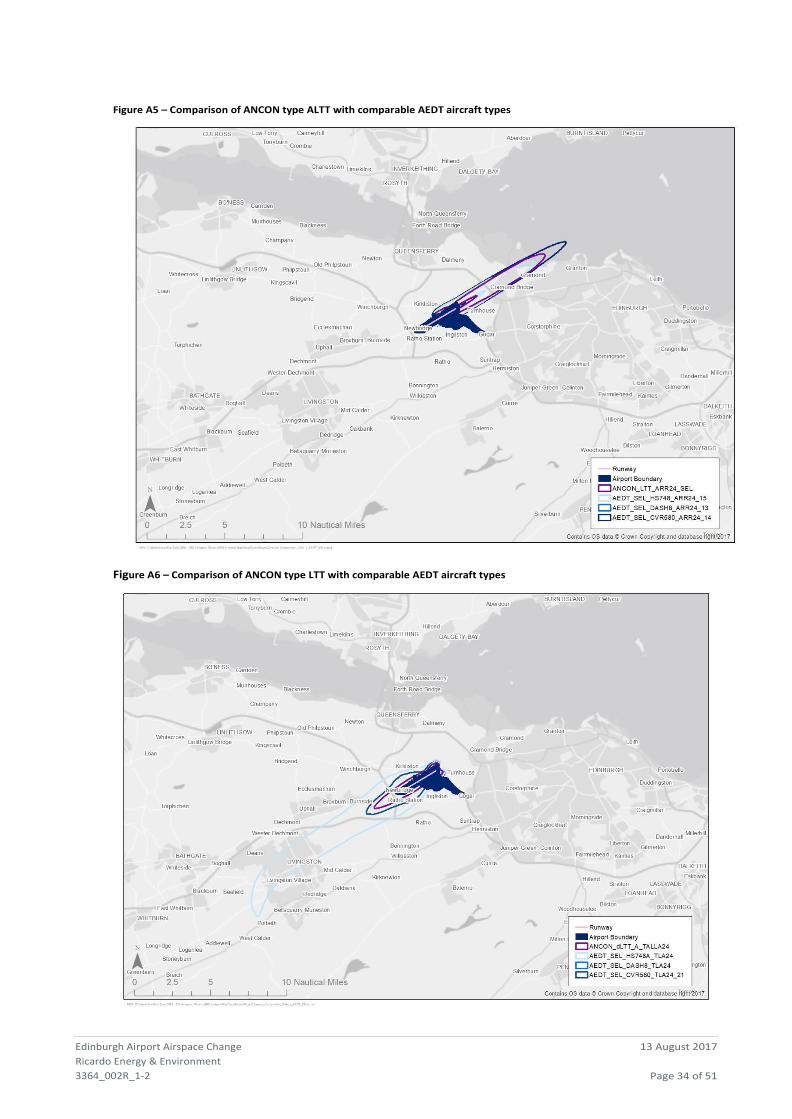
Edinburgh Airport Airspace Change
Ricardo Energy & Environment
3364_002R_1-2
13 August 2017
Page 34 of 51
Figure A5 – Comparison of ANCON type ALTT with comparable AEDT aircraft types
Figure A6 – Comparison of ANCON type LTT with comparable AEDT aircraft types
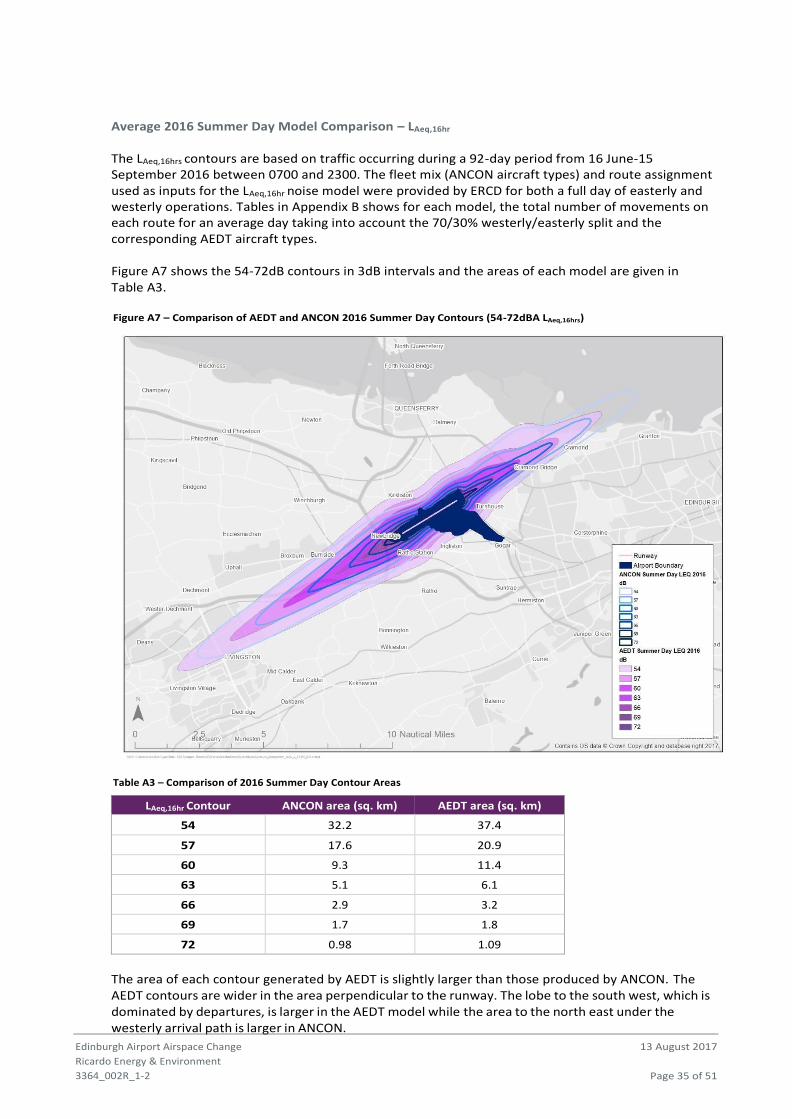
Edinburgh Airport Airspace Change
Ricardo Energy & Environment
3364_002R_1-2
13 August 2017
Page 35 of 51
Average 2016 Summer Day Model Comparison – LAeq,16hr
The LAeq,16hrs contours are based on traffic occurring during a 92-day period from 16 June-15 September 2016 between 0700 and 2300. The fleet mix (ANCON aircraft types) and route assignment used as inputs for the LAeq,16hr noise model were provided by ERCD for both a full day of easterly and westerly operations. Tables in Appendix B shows for each model, the total number of movements on each route for an average day taking into account the 70/30% westerly/easterly split and the corresponding AEDT aircraft types.
Figure A7 shows the 54-72dB contours in 3dB intervals and the areas of each model are given in Table A3.
Figure A7 – Comparison of AEDT and ANCON 2016 Summer Day Contours (54-72dBA LAeq,16hrs)
Table A3 – Comparison of 2016 Summer Day Contour Areas
LAeq,16hr Contour ANCON area (sq. km) AEDT area (sq. km)
54 32.2 37.4
57 17.6 20.9
60 9.3 11.4
63 5.1 6.1
66 2.9 3.2
69 1.7 1.8
72 0.98 1.09
The area of each contour generated by AEDT is slightly larger than those produced by ANCON. The AEDT contours are wider in the area perpendicular to the runway. The lobe to the south west, which is dominated by departures, is larger in the AEDT model while the area to the north east under the
westerly arrival path is larger in ANCON.
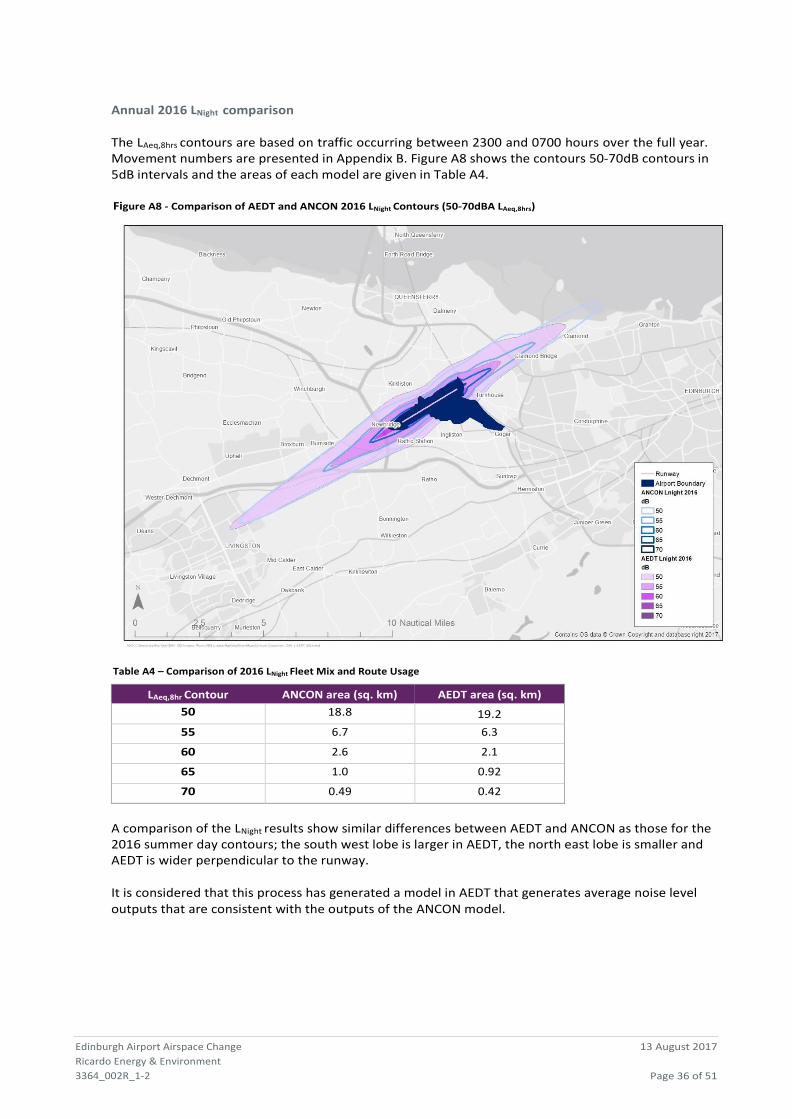
Edinburgh Airport Airspace Change
Ricardo Energy & Environment
3364_002R_1-2
13 August 2017
Page 36 of 51
Annual 2016 LNight comparison
The LAeq,8hrs contours are based on traffic occurring between 2300 and 0700 hours over the full year. Movement numbers are presented in Appendix B. Figure A8 shows the contours 50-70dB contours in 5dB intervals and the areas of each model are given in Table A4.
Figure A8 - Comparison of AEDT and ANCON 2016 LNight Contours (50-70dBA LAeq,8hrs)
Table A4 – Comparison of 2016 LNight Fleet Mix and Route Usage
LAeq,8hr Contour ANCON area (sq. km) AEDT area (sq. km)
50 18.8 19.2
55 6.7 6.3
60 2.6 2.1
65 1.0 0.92
70 0.49 0.42
A comparison of the LNight results show similar differences between AEDT and ANCON as those for the 2016 summer day contours; the south west lobe is larger in AEDT, the north east lobe is smaller and AEDT is wider perpendicular to the runway.
It is considered that this process has generated a model in AEDT that generates average noise level outputs that are consistent with the outputs of the ANCON model.
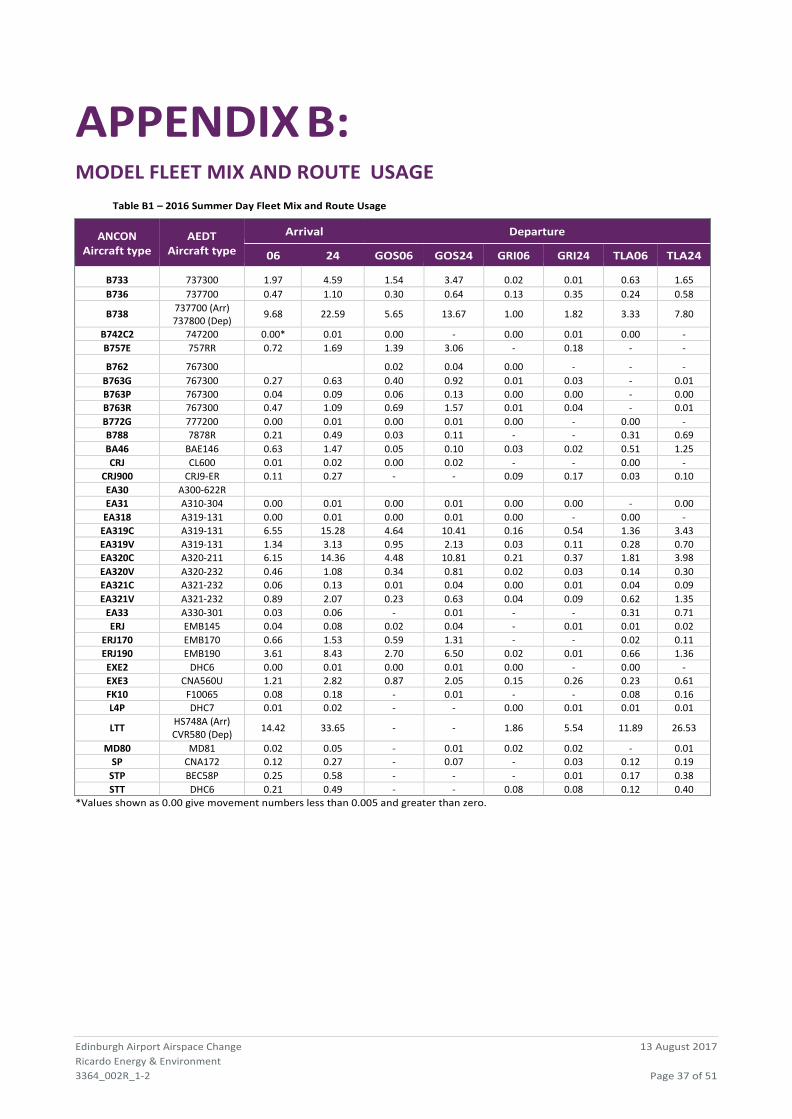
Edinburgh Airport Airspace Change
Ricardo Energy & Environment
3364_002R_1-2
13 August 2017
Page 37 of 51
APPENDIX B: MODEL FLEET MIX AND ROUTE USAGE
Table B1 – 2016 Summer Day Fleet Mix and Route Usage
ANCON Aircraft type
AEDT Aircraft type
Arrival Departure
06 24 GOS06 GOS24 GRI06 GRI24 TLA06 TLA24
B733 737300 1.97 4.59 1.54 3.47 0.02 0.01 0.63 1.65
B736 737700 0.47 1.10 0.30 0.64 0.13 0.35 0.24 0.58
B738 737700 (Arr) 737800 (Dep)
9.68 22.59 5.65 13.67 1.00 1.82 3.33 7.80
B742C2 747200 0.00* 0.01 0.00 - 0.00 0.01 0.00 -
B757E 757RR 0.72 1.69 1.39 3.06 - 0.18 - -
B762 767300 0.02 0.04 0.00 - - -
B763G 767300 0.27 0.63 0.40 0.92 0.01 0.03 - 0.01
B763P 767300 0.04 0.09 0.06 0.13 0.00 0.00 - 0.00
B763R 767300 0.47 1.09 0.69 1.57 0.01 0.04 - 0.01
B772G 777200 0.00 0.01 0.00 0.01 0.00 - 0.00 -
B788 7878R 0.21 0.49 0.03 0.11 - - 0.31 0.69
BA46 BAE146 0.63 1.47 0.05 0.10 0.03 0.02 0.51 1.25
CRJ CL600 0.01 0.02 0.00 0.02 - - 0.00 -
CRJ900 CRJ9-ER 0.11 0.27 - - 0.09 0.17 0.03 0.10
EA30 A300-622R EA31 A310-304 0.00 0.01 0.00 0.01 0.00 0.00 - 0.00
EA318 A319-131 0.00 0.01 0.00 0.01 0.00 - 0.00 -
EA319C A319-131 6.55 15.28 4.64 10.41 0.16 0.54 1.36 3.43
EA319V A319-131 1.34 3.13 0.95 2.13 0.03 0.11 0.28 0.70
EA320C A320-211 6.15 14.36 4.48 10.81 0.21 0.37 1.81 3.98
EA320V A320-232 0.46 1.08 0.34 0.81 0.02 0.03 0.14 0.30
EA321C A321-232 0.06 0.13 0.01 0.04 0.00 0.01 0.04 0.09
EA321V A321-232 0.89 2.07 0.23 0.63 0.04 0.09 0.62 1.35
EA33 A330-301 0.03 0.06 - 0.01 - - 0.31 0.71
ERJ EMB145 0.04 0.08 0.02 0.04 - 0.01 0.01 0.02
ERJ170 EMB170 0.66 1.53 0.59 1.31 - - 0.02 0.11
ERJ190 EMB190 3.61 8.43 2.70 6.50 0.02 0.01 0.66 1.36
EXE2 DHC6 0.00 0.01 0.00 0.01 0.00 - 0.00 -
EXE3 CNA560U 1.21 2.82 0.87 2.05 0.15 0.26 0.23 0.61
FK10 F10065 0.08 0.18 - 0.01 - - 0.08 0.16
L4P DHC7 0.01 0.02 - - 0.00 0.01 0.01 0.01
LTT HS748A (Arr) CVR580 (Dep)
14.42 33.65 - - 1.86 5.54 11.89 26.53
MD80 MD81 0.02 0.05 - 0.01 0.02 0.02 - 0.01
SP CNA172 0.12 0.27 - 0.07 - 0.03 0.12 0.19
STP BEC58P 0.25 0.58 - - - 0.01 0.17 0.38
STT DHC6 0.21 0.49 - - 0.08 0.08 0.12 0.40
*Values shown as 0.00 give movement numbers less than 0.005 and greater than zero.
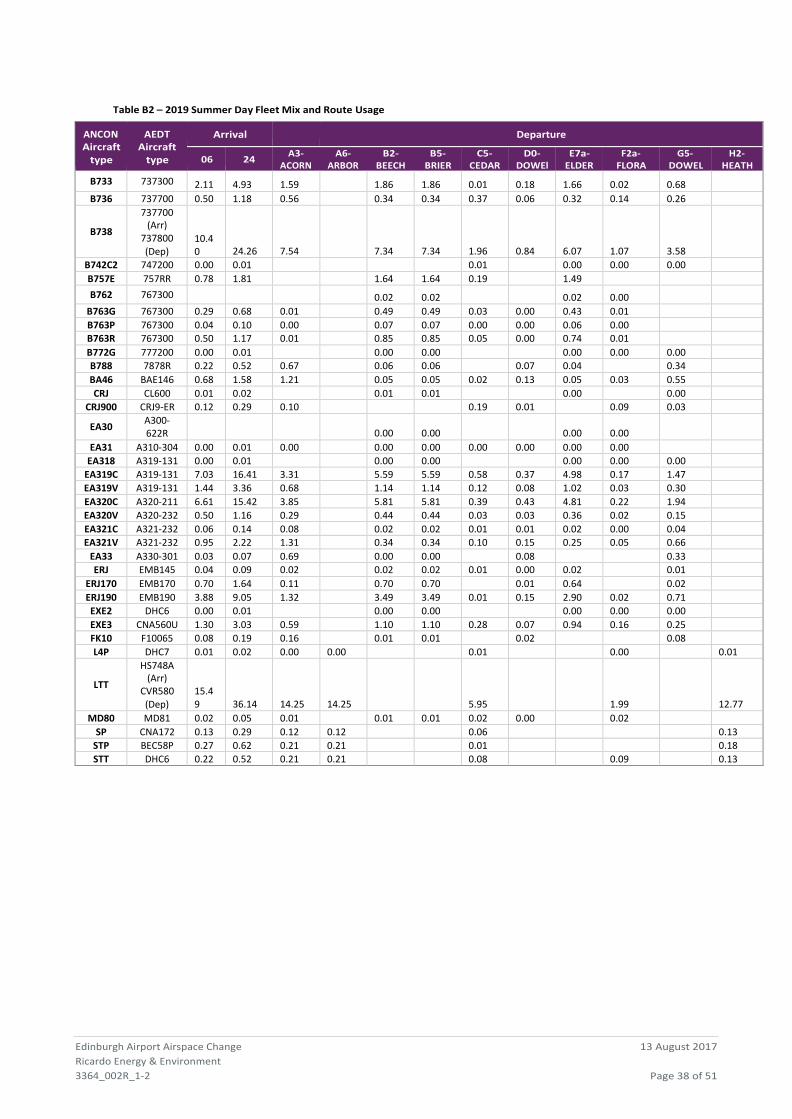
Edinburgh Airport Airspace Change
Ricardo Energy & Environment
3364_002R_1-2
13 August 2017
Page 38 of 51
Table B2 – 2019 Summer Day Fleet Mix and Route Usage
ANCON Aircraft
type
AEDT Aircraft
type
Arrival Departure
06 24 A3-
ACORN A6-
ARBOR B2-
BEECH B5-
BRIER C5-
CEDAR D0-
DOWEl E7a-
ELDER F2a-
FLORA G5-
DOWEL H2-
HEATH
B733 737300 2.11 4.93 1.59 1.86 1.86 0.01 0.18 1.66 0.02 0.68
B736 737700 0.50 1.18 0.56 0.34 0.34 0.37 0.06 0.32 0.14 0.26
B738
737700 (Arr)
737800 (Dep)
10.4 0
24.26
7.54
7.34
7.34
1.96
0.84
6.07
1.07
3.58
B742C2 747200 0.00 0.01 0.01 0.00 0.00 0.00 B757E 757RR 0.78 1.81 1.64 1.64 0.19 1.49 B762 767300 0.02 0.02 0.02 0.00
B763G 767300 0.29 0.68 0.01 0.49 0.49 0.03 0.00 0.43 0.01 B763P 767300 0.04 0.10 0.00 0.07 0.07 0.00 0.00 0.06 0.00 B763R 767300 0.50 1.17 0.01 0.85 0.85 0.05 0.00 0.74 0.01 B772G 777200 0.00 0.01 0.00 0.00 0.00 0.00 0.00 B788 7878R 0.22 0.52 0.67 0.06 0.06 0.07 0.04 0.34 BA46 BAE146 0.68 1.58 1.21 0.05 0.05 0.02 0.13 0.05 0.03 0.55 CRJ CL600 0.01 0.02 0.01 0.01 0.00 0.00
CRJ900 CRJ9-ER 0.12 0.29 0.10 0.19 0.01 0.09 0.03 EA30
A300- 622R
0.00
0.00
0.00
0.00
EA31 A310-304 0.00 0.01 0.00 0.00 0.00 0.00 0.00 0.00 0.00 EA318 A319-131 0.00 0.01 0.00 0.00 0.00 0.00 0.00
EA319C A319-131 7.03 16.41 3.31 5.59 5.59 0.58 0.37 4.98 0.17 1.47 EA319V A319-131 1.44 3.36 0.68 1.14 1.14 0.12 0.08 1.02 0.03 0.30 EA320C A320-211 6.61 15.42 3.85 5.81 5.81 0.39 0.43 4.81 0.22 1.94 EA320V A320-232 0.50 1.16 0.29 0.44 0.44 0.03 0.03 0.36 0.02 0.15 EA321C A321-232 0.06 0.14 0.08 0.02 0.02 0.01 0.01 0.02 0.00 0.04 EA321V A321-232 0.95 2.22 1.31 0.34 0.34 0.10 0.15 0.25 0.05 0.66
EA33 A330-301 0.03 0.07 0.69 0.00 0.00 0.08 0.33 ERJ EMB145 0.04 0.09 0.02 0.02 0.02 0.01 0.00 0.02 0.01
ERJ170 EMB170 0.70 1.64 0.11 0.70 0.70 0.01 0.64 0.02 ERJ190 EMB190 3.88 9.05 1.32 3.49 3.49 0.01 0.15 2.90 0.02 0.71 EXE2 DHC6 0.00 0.01 0.00 0.00 0.00 0.00 0.00 EXE3 CNA560U 1.30 3.03 0.59 1.10 1.10 0.28 0.07 0.94 0.16 0.25 FK10 F10065 0.08 0.19 0.16 0.01 0.01 0.02 0.08 L4P DHC7 0.01 0.02 0.00 0.00 0.01 0.00 0.01
LTT
HS748A (Arr)
CVR580 (Dep)
15.4 9
36.14
14.25
14.25
5.95
1.99
12.77
MD80 MD81 0.02 0.05 0.01 0.01 0.01 0.02 0.00 0.02 SP CNA172 0.13 0.29 0.12 0.12 0.06 0.13
STP BEC58P 0.27 0.62 0.21 0.21 0.01 0.18
STT DHC6 0.22 0.52 0.21 0.21 0.08 0.09 0.13
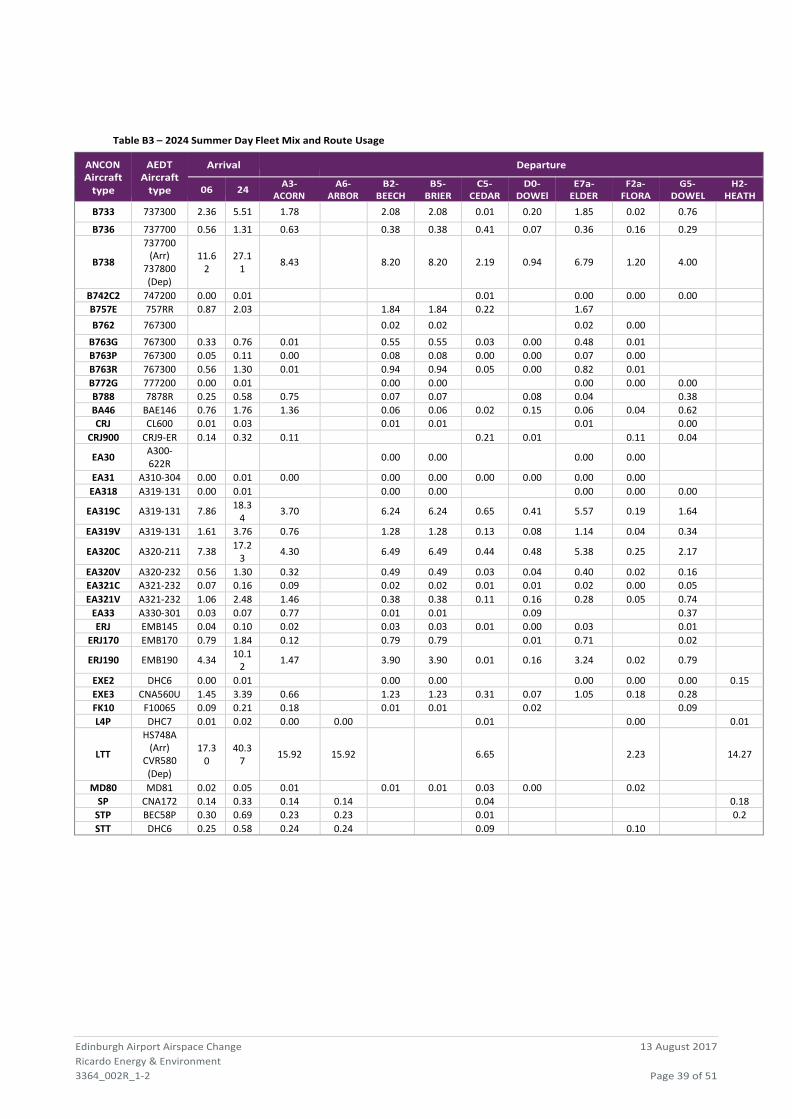
Edinburgh Airport Airspace Change
Ricardo Energy & Environment
3364_002R_1-2
13 August 2017
Page 39 of 51
Table B3 – 2024 Summer Day Fleet Mix and Route Usage
ANCON Aircraft
type
AEDT Aircraft
type
Arrival Departure
06 24 A3-
ACORN A6-
ARBOR B2-
BEECH B5-
BRIER C5-
CEDAR D0-
DOWEl E7a-
ELDER F2a-
FLORA G5-
DOWEL H2-
HEATH
B733 737300 2.36 5.51 1.78 2.08 2.08 0.01 0.20 1.85 0.02 0.76
B736 737700 0.56 1.31 0.63 0.38 0.38 0.41 0.07 0.36 0.16 0.29
B738
737700 (Arr)
737800 (Dep)
11.6 2
27.1 1
8.43
8.20
8.20
2.19
0.94
6.79
1.20
4.00
B742C2 747200 0.00 0.01 0.01 0.00 0.00 0.00 B757E 757RR 0.87 2.03 1.84 1.84 0.22 1.67 B762 767300 0.02 0.02 0.02 0.00
B763G 767300 0.33 0.76 0.01 0.55 0.55 0.03 0.00 0.48 0.01 B763P 767300 0.05 0.11 0.00 0.08 0.08 0.00 0.00 0.07 0.00 B763R 767300 0.56 1.30 0.01 0.94 0.94 0.05 0.00 0.82 0.01 B772G 777200 0.00 0.01 0.00 0.00 0.00 0.00 0.00 B788 7878R 0.25 0.58 0.75 0.07 0.07 0.08 0.04 0.38 BA46 BAE146 0.76 1.76 1.36 0.06 0.06 0.02 0.15 0.06 0.04 0.62 CRJ CL600 0.01 0.03 0.01 0.01 0.01 0.00
CRJ900 CRJ9-ER 0.14 0.32 0.11 0.21 0.01 0.11 0.04 EA30
A300- 622R
0.00 0.00 0.00 0.00
EA31 A310-304 0.00 0.01 0.00 0.00 0.00 0.00 0.00 0.00 0.00 EA318 A319-131 0.00 0.01 0.00 0.00 0.00 0.00 0.00
EA319C A319-131 7.86 18.3
4 3.70 6.24 6.24 0.65 0.41 5.57 0.19 1.64
EA319V A319-131 1.61 3.76 0.76 1.28 1.28 0.13 0.08 1.14 0.04 0.34 EA320C A320-211 7.38
17.2 3
4.30 6.49 6.49 0.44 0.48 5.38 0.25 2.17
EA320V A320-232 0.56 1.30 0.32 0.49 0.49 0.03 0.04 0.40 0.02 0.16 EA321C A321-232 0.07 0.16 0.09 0.02 0.02 0.01 0.01 0.02 0.00 0.05 EA321V A321-232 1.06 2.48 1.46 0.38 0.38 0.11 0.16 0.28 0.05 0.74
EA33 A330-301 0.03 0.07 0.77 0.01 0.01 0.09 0.37 ERJ EMB145 0.04 0.10 0.02 0.03 0.03 0.01 0.00 0.03 0.01
ERJ170 EMB170 0.79 1.84 0.12 0.79 0.79 0.01 0.71 0.02 ERJ190 EMB190 4.34
10.1 2
1.47 3.90 3.90 0.01 0.16 3.24 0.02 0.79
EXE2 DHC6 0.00 0.01 0.00 0.00 0.00 0.00 0.00 0.15
EXE3 CNA560U 1.45 3.39 0.66 1.23 1.23 0.31 0.07 1.05 0.18 0.28 FK10 F10065 0.09 0.21 0.18 0.01 0.01 0.02 0.09 L4P DHC7 0.01 0.02 0.00 0.00 0.01 0.00 0.01
LTT
HS748A (Arr)
CVR580 (Dep)
17.3
0
40.3
7
15.92
15.92
6.65
2.23
14.27
MD80 MD81 0.02 0.05 0.01 0.01 0.01 0.03 0.00 0.02 SP CNA172 0.14 0.33 0.14 0.14 0.04 0.18
STP BEC58P 0.30 0.69 0.23 0.23 0.01 0.2
STT DHC6 0.25 0.58 0.24 0.24 0.09 0.10
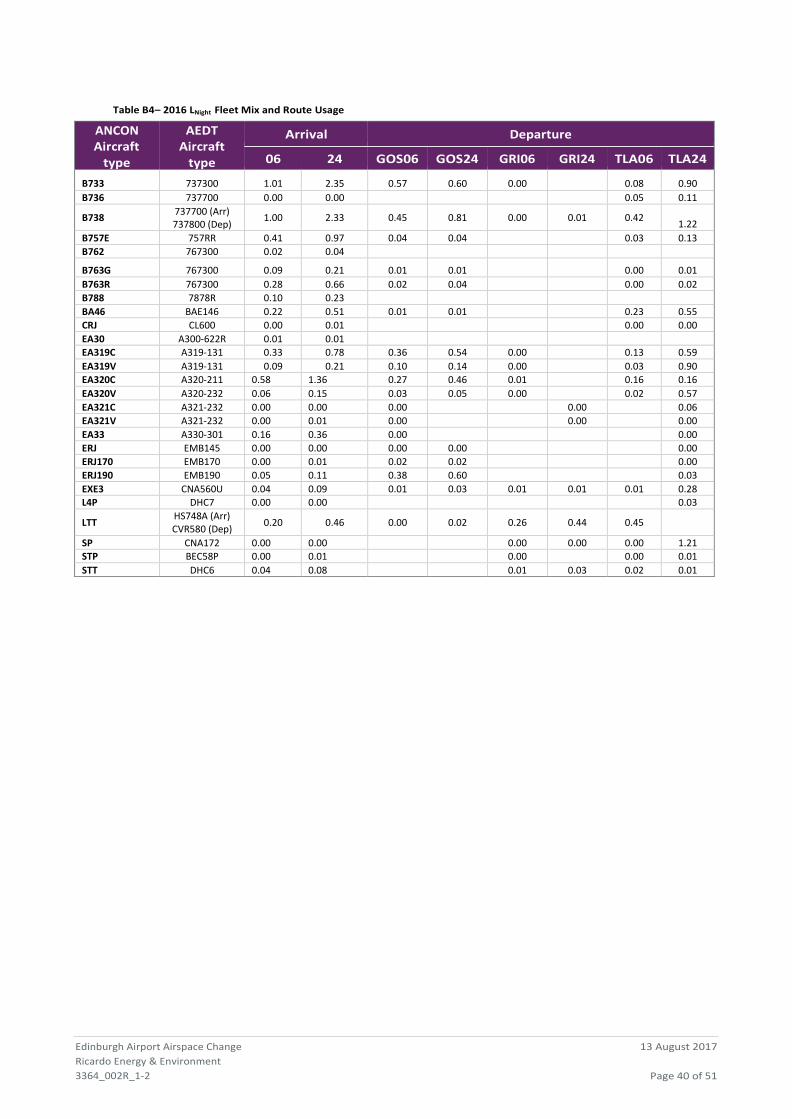
Table B4– 2016 LNight Fleet Mix and Route Usage
Edinburgh Airport Airspace Change
Ricardo Energy & Environment
3364_002R_1-2
13 August 2017
Page 40 of 51
ANCON Aircraft
type
AEDT Aircraft
type
Arrival Departure
06 24 GOS06 GOS24 GRI06 GRI24 TLA06 TLA24
B733 737300 1.01 2.35 0.57 0.60 0.00 0.08 0.90
B736 737700 0.00 0.00 0.05 0.11
B738 737700 (Arr) 737800 (Dep)
1.00 2.33 0.45 0.81 0.00 0.01 0.42
1.22
B757E 757RR 0.41 0.97 0.04 0.04 0.03 0.13
B762 767300 0.02 0.04 B763G 767300 0.09 0.21 0.01 0.01 0.00 0.01
B763R 767300 0.28 0.66 0.02 0.04 0.00 0.02
B788 7878R 0.10 0.23 BA46 BAE146 0.22 0.51 0.01 0.01 0.23 0.55
CRJ CL600 0.00 0.01 0.00 0.00
EA30 A300-622R 0.01 0.01 EA319C A319-131 0.33 0.78 0.36 0.54 0.00 0.13 0.59
EA319V A319-131 0.09 0.21 0.10 0.14 0.00 0.03 0.90
EA320C A320-211 0.58 1.36 0.27 0.46 0.01 0.16 0.16
EA320V A320-232 0.06 0.15 0.03 0.05 0.00 0.02 0.57
EA321C A321-232 0.00 0.00 0.00 0.00 0.06
EA321V A321-232 0.00 0.01 0.00 0.00 0.00
EA33 A330-301 0.16 0.36 0.00 0.00
ERJ EMB145 0.00 0.00 0.00 0.00 0.00
ERJ170 EMB170 0.00 0.01 0.02 0.02 0.00
ERJ190 EMB190 0.05 0.11 0.38 0.60 0.03
EXE3 CNA560U 0.04 0.09 0.01 0.03 0.01 0.01 0.01 0.28
L4P DHC7 0.00 0.00 0.03
LTT HS748A (Arr) CVR580 (Dep)
0.20 0.46 0.00 0.02 0.26 0.44 0.45
SP CNA172 0.00 0.00 0.00 0.00 0.00 1.21
STP BEC58P 0.00 0.01 0.00 0.00 0.01
STT DHC6 0.04 0.08 0.01 0.03 0.02 0.01
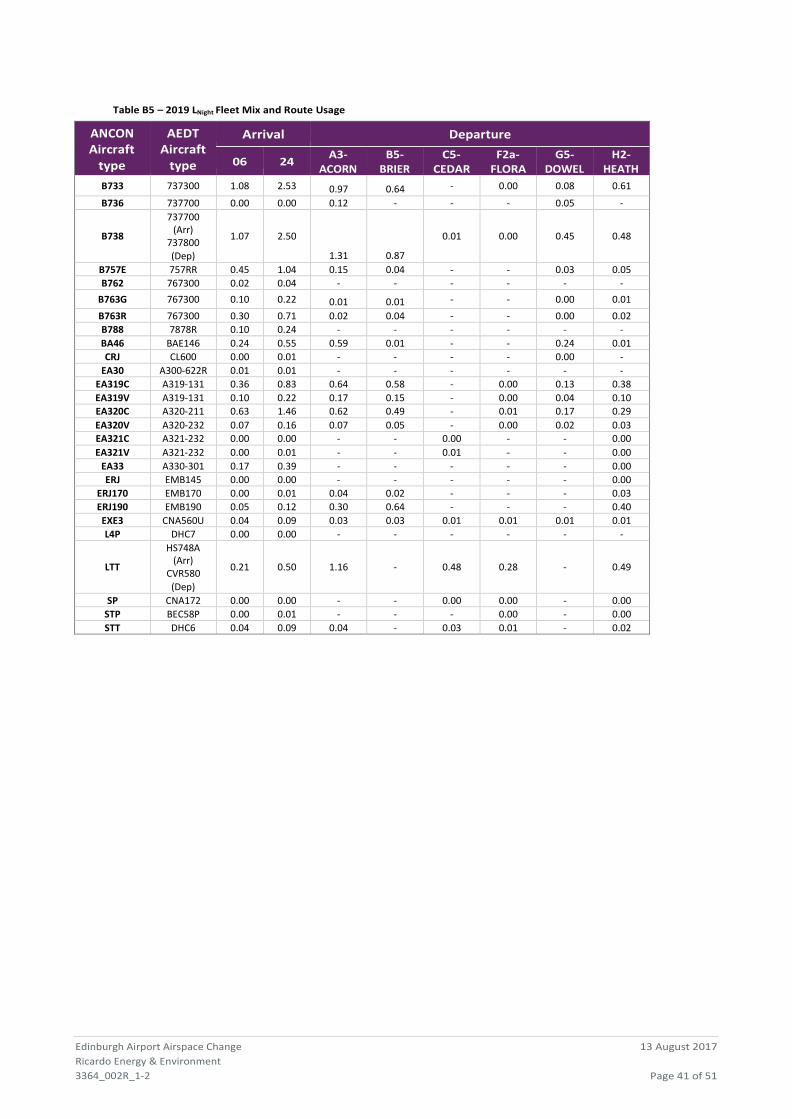
Table B5 – 2019 LNight Fleet Mix and Route Usage
Edinburgh Airport Airspace Change
Ricardo Energy & Environment
3364_002R_1-2
13 August 2017
Page 41 of 51
ANCON Aircraft
type
AEDT Aircraft
type
Arrival Departure
06 24 A3-
ACORN B5-
BRIER C5-
CEDAR F2a-
FLORA G5-
DOWEL H2-
HEATH
B733 737300 1.08 2.53 0.97 0.64 - 0.00 0.08 0.61
B736 737700 0.00 0.00 0.12 - - - 0.05 -
B738
737700 (Arr)
737800 (Dep)
1.07
2.50
1.31
0.87
0.01
0.00
0.45
0.48
B757E 757RR 0.45 1.04 0.15 0.04 - - 0.03 0.05
B762 767300 0.02 0.04 - - - - - -
B763G 767300 0.10 0.22 0.01 0.01 - - 0.00 0.01
B763R 767300 0.30 0.71 0.02 0.04 - - 0.00 0.02
B788 7878R 0.10 0.24 - - - - - -
BA46 BAE146 0.24 0.55 0.59 0.01 - - 0.24 0.01
CRJ CL600 0.00 0.01 - - - - 0.00 -
EA30 A300-622R 0.01 0.01 - - - - - -
EA319C A319-131 0.36 0.83 0.64 0.58 - 0.00 0.13 0.38
EA319V A319-131 0.10 0.22 0.17 0.15 - 0.00 0.04 0.10
EA320C A320-211 0.63 1.46 0.62 0.49 - 0.01 0.17 0.29
EA320V A320-232 0.07 0.16 0.07 0.05 - 0.00 0.02 0.03
EA321C A321-232 0.00 0.00 - - 0.00 - - 0.00
EA321V A321-232 0.00 0.01 - - 0.01 - - 0.00
EA33 A330-301 0.17 0.39 - - - - - 0.00
ERJ EMB145 0.00 0.00 - - - - - 0.00
ERJ170 EMB170 0.00 0.01 0.04 0.02 - - - 0.03
ERJ190 EMB190 0.05 0.12 0.30 0.64 - - - 0.40
EXE3 CNA560U 0.04 0.09 0.03 0.03 0.01 0.01 0.01 0.01
L4P DHC7 0.00 0.00 - - - - - -
LTT
HS748A (Arr)
CVR580
(Dep)
0.21
0.50
1.16
-
0.48
0.28
-
0.49
SP CNA172 0.00 0.00 - - 0.00 0.00 - 0.00
STP BEC58P 0.00 0.01 - - - 0.00 - 0.00
STT DHC6 0.04 0.09 0.04 - 0.03 0.01 - 0.02
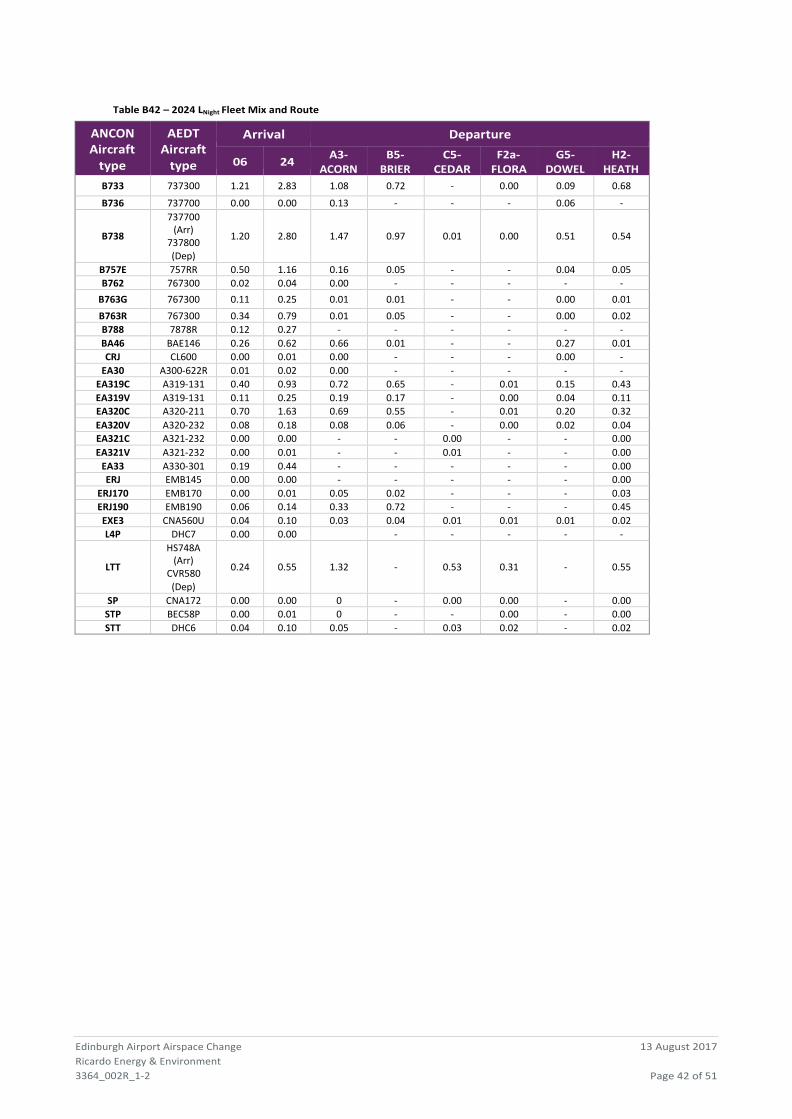
Table B42 – 2024 LNight Fleet Mix and Route Usage
Edinburgh Airport Airspace Change
Ricardo Energy & Environment
3364_002R_1-2
13 August 2017
Page 42 of 51
ANCON Aircraft
type
AEDT Aircraft
type
Arrival Departure
06 24 A3-
ACORN B5-
BRIER C5-
CEDAR F2a-
FLORA G5-
DOWEL H2-
HEATH
B733 737300 1.21 2.83 1.08 0.72 - 0.00 0.09 0.68
B736 737700 0.00 0.00 0.13 - - - 0.06 -
B738
737700 (Arr)
737800 (Dep)
1.20
2.80
1.47
0.97
0.01
0.00
0.51
0.54
B757E 757RR 0.50 1.16 0.16 0.05 - - 0.04 0.05
B762 767300 0.02 0.04 0.00 - - - - -
B763G 767300 0.11 0.25 0.01 0.01 - - 0.00 0.01
B763R 767300 0.34 0.79 0.01 0.05 - - 0.00 0.02
B788 7878R 0.12 0.27 - - - - - -
BA46 BAE146 0.26 0.62 0.66 0.01 - - 0.27 0.01
CRJ CL600 0.00 0.01 0.00 - - - 0.00 -
EA30 A300-622R 0.01 0.02 0.00 - - - - -
EA319C A319-131 0.40 0.93 0.72 0.65 - 0.01 0.15 0.43
EA319V A319-131 0.11 0.25 0.19 0.17 - 0.00 0.04 0.11
EA320C A320-211 0.70 1.63 0.69 0.55 - 0.01 0.20 0.32
EA320V A320-232 0.08 0.18 0.08 0.06 - 0.00 0.02 0.04
EA321C A321-232 0.00 0.00 - - 0.00 - - 0.00
EA321V A321-232 0.00 0.01 - - 0.01 - - 0.00
EA33 A330-301 0.19 0.44 - - - - - 0.00
ERJ EMB145 0.00 0.00 - - - - - 0.00
ERJ170 EMB170 0.00 0.01 0.05 0.02 - - - 0.03
ERJ190 EMB190 0.06 0.14 0.33 0.72 - - - 0.45
EXE3 CNA560U 0.04 0.10 0.03 0.04 0.01 0.01 0.01 0.02
L4P DHC7 0.00 0.00 - - - - -
LTT
HS748A (Arr)
CVR580
(Dep)
0.24
0.55
1.32
-
0.53
0.31
-
0.55
SP CNA172 0.00 0.00 0 - 0.00 0.00 - 0.00
STP BEC58P 0.00 0.01 0 - - 0.00 - 0.00
STT DHC6 0.04 0.10 0.05 - 0.03 0.02 - 0.02
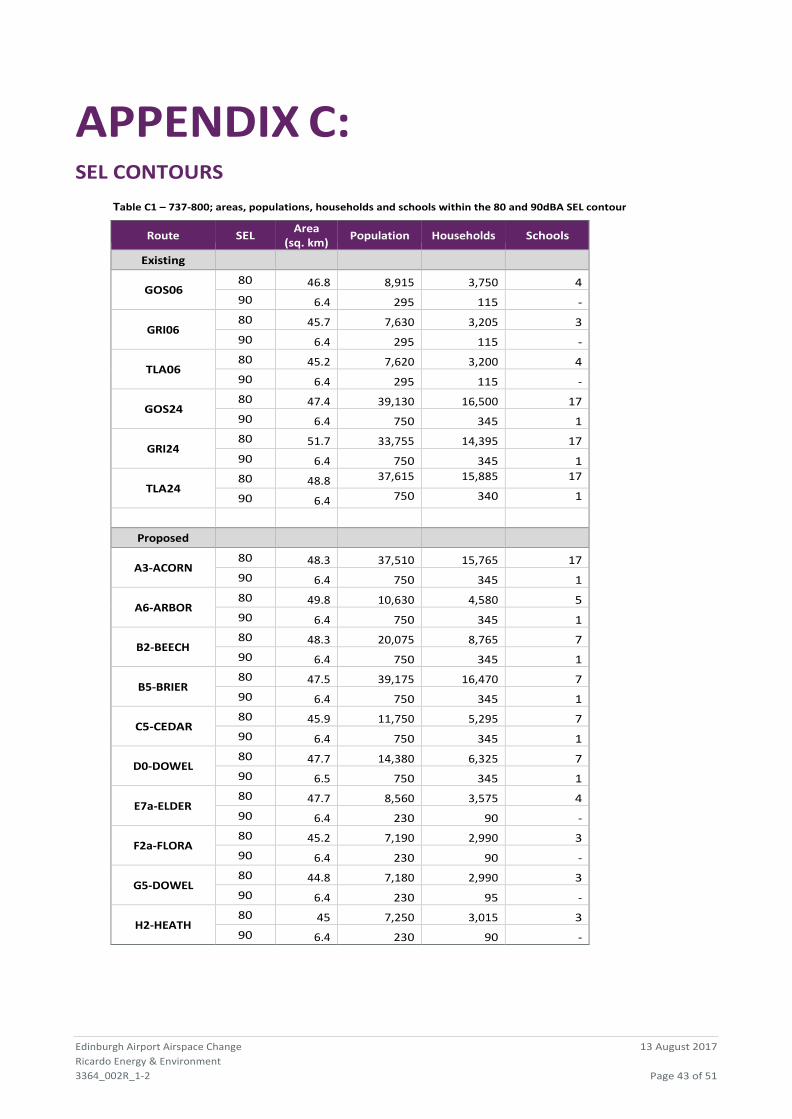
Edinburgh Airport Airspace Change
Ricardo Energy & Environment
3364_002R_1-2
13 August 2017
Page 43 of 51
APPENDIX C: SEL CONTOURS
Table C1 – 737-800; areas, populations, households and schools within the 80 and 90dBA SEL contour
Route SEL Area
(sq. km) Population Households Schools
Existing
GOS06 80 46.8 8,915 3,750 4
90 6.4 295 115 -
GRI06 80 45.7 7,630 3,205 3
90 6.4 295 115 -
TLA06 80 45.2 7,620 3,200 4
90 6.4 295 115 -
GOS24 80 47.4 39,130 16,500 17
90 6.4 750 345 1
GRI24 80 51.7 33,755 14,395 17
90 6.4 750 345 1
TLA24 80 48.8 37,615 15,885 17
90 6.4 750 340 1
Proposed
A3-ACORN 80 48.3 37,510 15,765 17
90 6.4 750 345 1
A6-ARBOR 80 49.8 10,630 4,580 5
90 6.4 750 345 1
B2-BEECH 80 48.3 20,075 8,765 7
90 6.4 750 345 1
B5-BRIER 80 47.5 39,175 16,470 7
90 6.4 750 345 1
C5-CEDAR 80 45.9 11,750 5,295 7
90 6.4 750 345 1
D0-DOWEL 80 47.7 14,380 6,325 7
90 6.5 750 345 1
E7a-ELDER 80 47.7 8,560 3,575 4
90 6.4 230 90 -
F2a-FLORA 80 45.2 7,190 2,990 3
90 6.4 230 90 -
G5-DOWEL 80 44.8 7,180 2,990 3
90 6.4 230 95 -
H2-HEATH 80 45 7,250 3,015 3
90 6.4 230 90 -
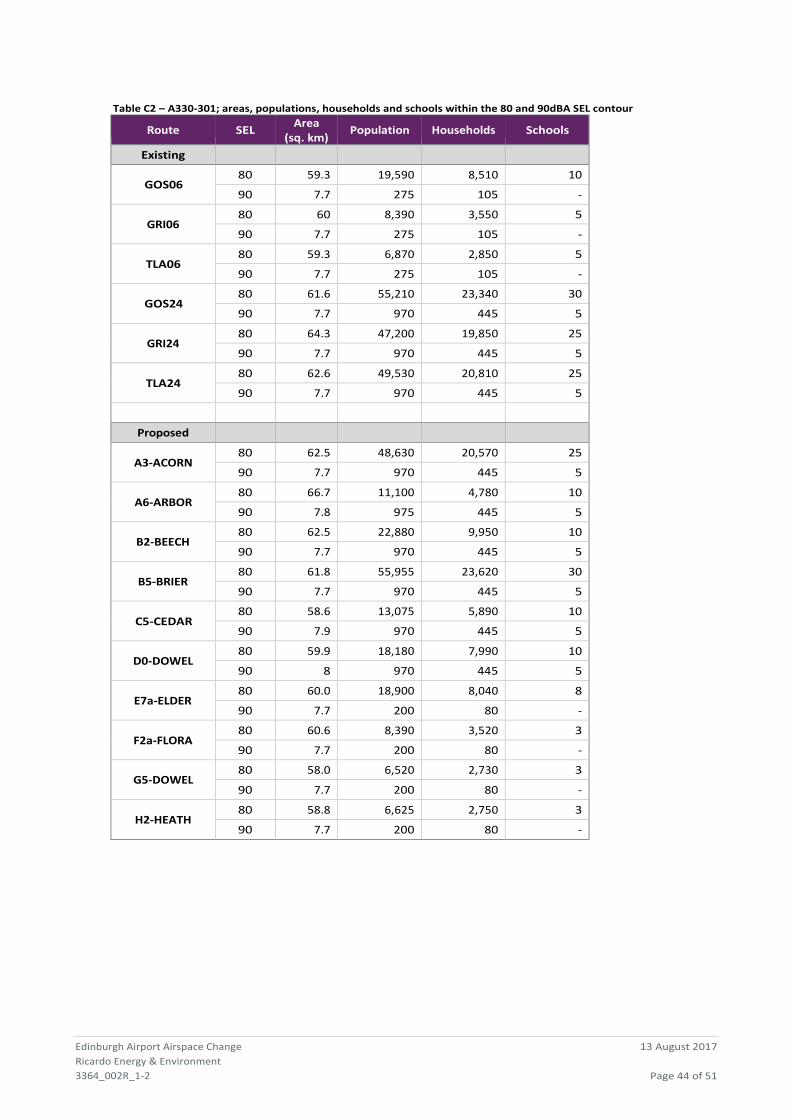
Edinburgh Airport Airspace Change
Ricardo Energy & Environment
3364_002R_1-2
13 August 2017
Page 44 of 51
Table C2 – A330-301; areas, populations, households and schools within the 80 and 90dBA SEL contour
Route SEL Area
(sq. km) Population Households Schools
Existing
GOS06 80 59.3 19,590 8,510 10
90 7.7 275 105 -
GRI06 80 60 8,390 3,550 5
90 7.7 275 105 -
TLA06 80 59.3 6,870 2,850 5
90 7.7 275 105 -
GOS24 80 61.6 55,210 23,340 30
90 7.7 970 445 5
GRI24 80 64.3 47,200 19,850 25
90 7.7 970 445 5
TLA24 80 62.6 49,530 20,810 25
90 7.7 970 445 5
Proposed
A3-ACORN 80 62.5 48,630 20,570 25
90 7.7 970 445 5
A6-ARBOR 80 66.7 11,100 4,780 10
90 7.8 975 445 5
B2-BEECH 80 62.5 22,880 9,950 10
90 7.7 970 445 5
B5-BRIER 80 61.8 55,955 23,620 30
90 7.7 970 445 5
C5-CEDAR 80 58.6 13,075 5,890 10
90 7.9 970 445 5
D0-DOWEL 80 59.9 18,180 7,990 10
90 8 970 445 5
E7a-ELDER 80 60.0 18,900 8,040 8
90 7.7 200 80 -
F2a-FLORA 80 60.6 8,390 3,520 3
90 7.7 200 80 -
G5-DOWEL 80 58.0 6,520 2,730 3
90 7.7 200 80 -
H2-HEATH 80 58.8 6,625 2,750 3
90 7.7 200 80 -
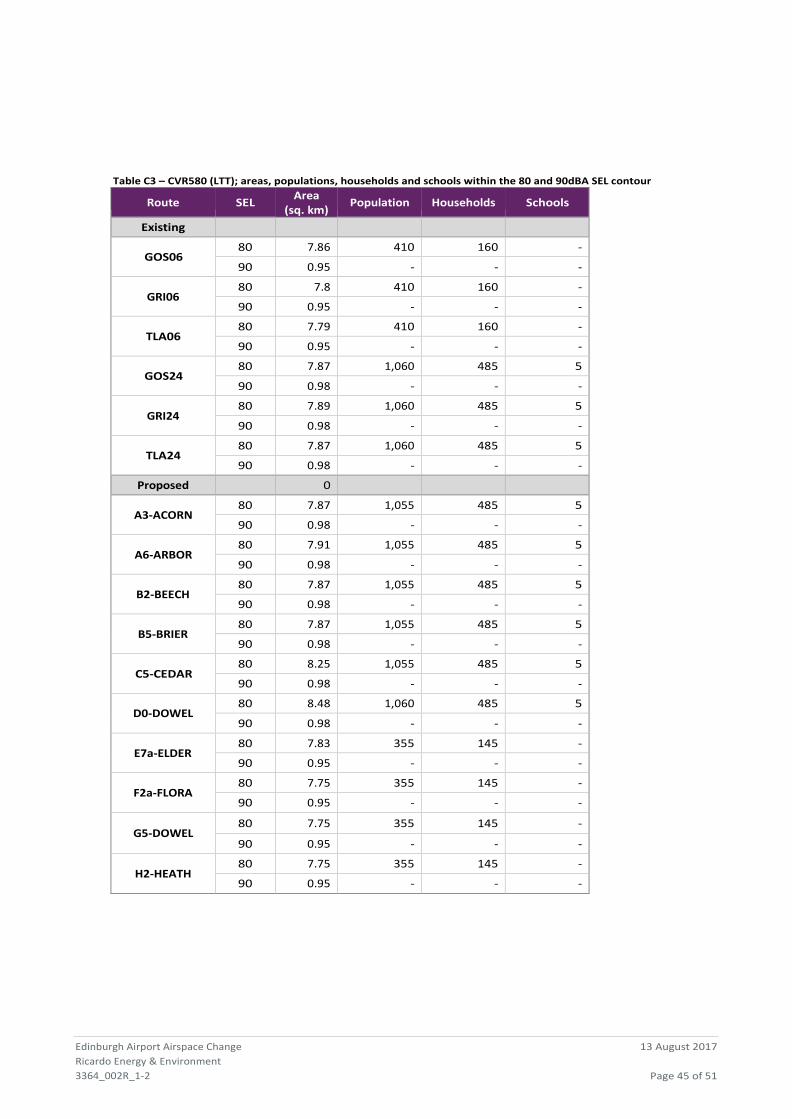
Edinburgh Airport Airspace Change
Ricardo Energy & Environment
3364_002R_1-2
13 August 2017
Page 45 of 51
Table C3 – CVR580 (LTT); areas, populations, households and schools within the 80 and 90dBA SEL contour
Route SEL Area
(sq. km) Population Households Schools
Existing
GOS06 80 7.86 410 160 -
90 0.95 - - -
GRI06 80 7.8 410 160 -
90 0.95 - - -
TLA06 80 7.79 410 160 -
90 0.95 - - -
GOS24 80 7.87 1,060 485 5
90 0.98 - - -
GRI24 80 7.89 1,060 485 5
90 0.98 - - -
TLA24 80 7.87 1,060 485 5
90 0.98 - - -
Proposed 0
A3-ACORN 80 7.87 1,055 485 5
90 0.98 - - -
A6-ARBOR 80 7.91 1,055 485 5
90 0.98 - - -
B2-BEECH 80 7.87 1,055 485 5
90 0.98 - - -
B5-BRIER 80 7.87 1,055 485 5
90 0.98 - - -
C5-CEDAR 80 8.25 1,055 485 5
90 0.98 - - -
D0-DOWEL 80 8.48 1,060 485 5
90 0.98 - - -
E7a-ELDER 80 7.83 355 145 -
90 0.95 - - -
F2a-FLORA 80 7.75 355 145 -
90 0.95 - - -
G5-DOWEL 80 7.75 355 145 -
90 0.95 - - -
H2-HEATH 80 7.75 355 145 -
90 0.95 - - -
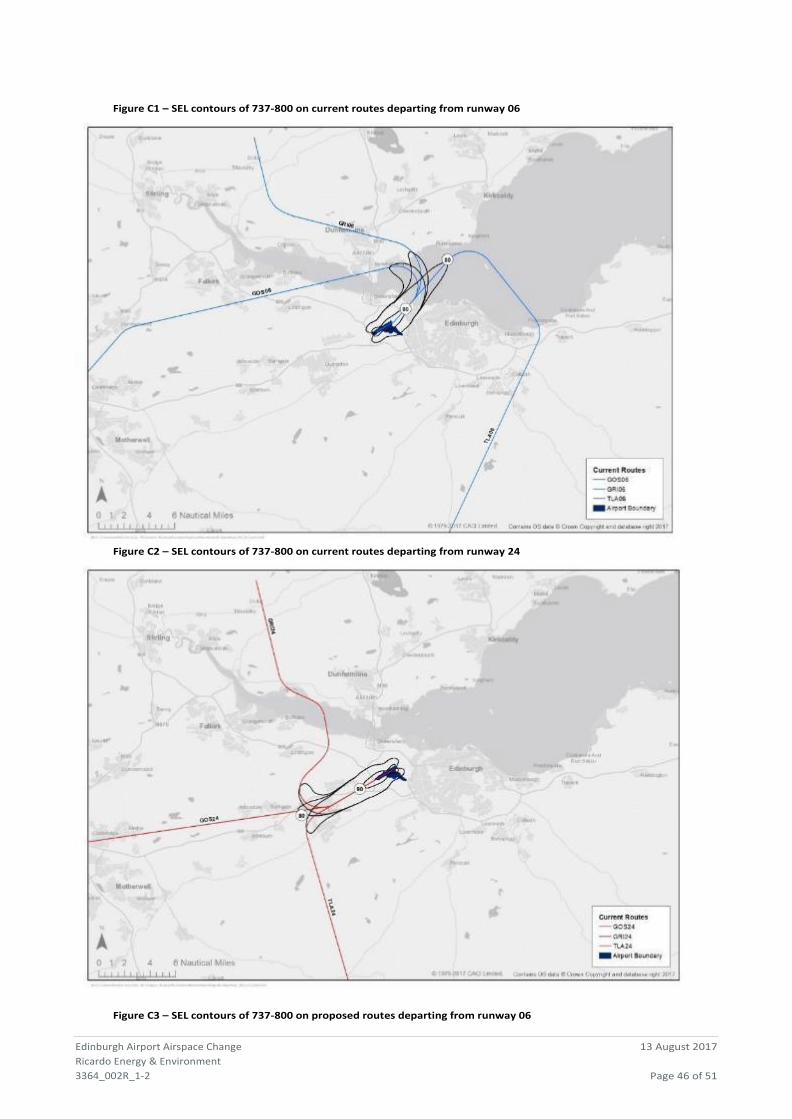
Edinburgh Airport Airspace Change
Ricardo Energy & Environment
3364_002R_1-2
13 August 2017
Page 46 of 51
Figure C1 – SEL contours of 737-800 on current routes departing from runway 06
Figure C2 – SEL contours of 737-800 on current routes departing from runway 24
Figure C3 – SEL contours of 737-800 on proposed routes departing from runway 06
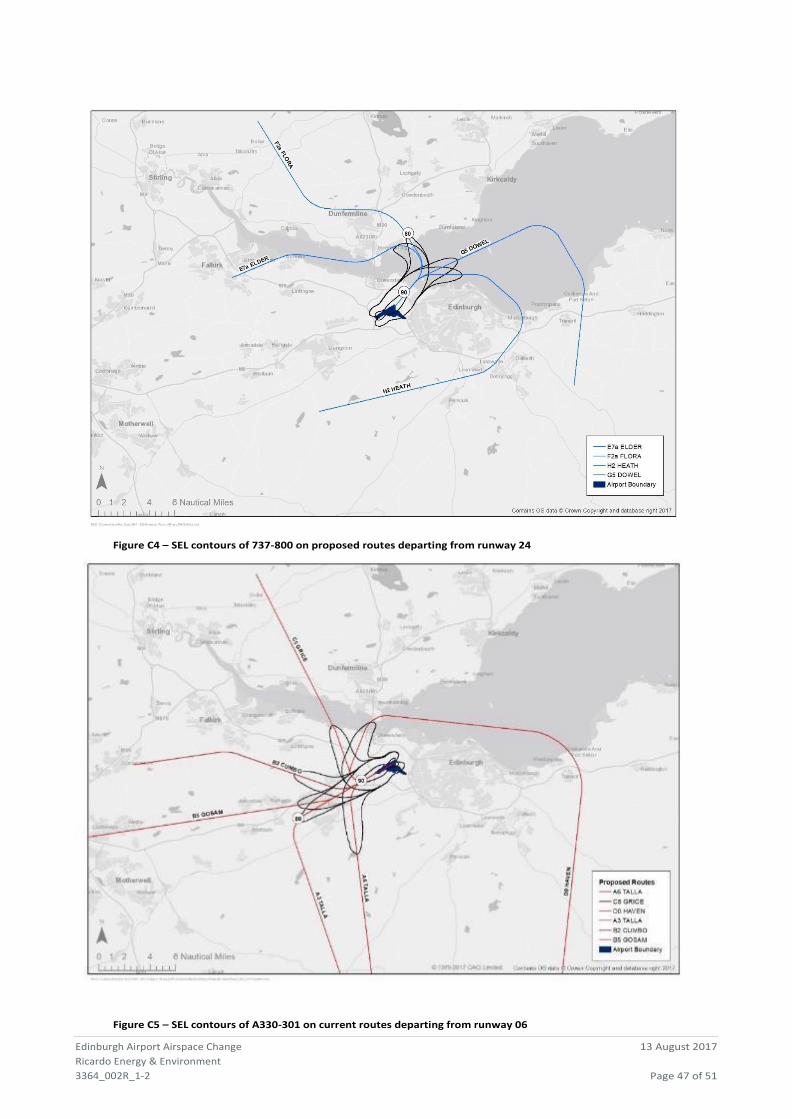
Edinburgh Airport Airspace Change
Ricardo Energy & Environment
3364_002R_1-2
13 August 2017
Page 47 of 51
Figure C4 – SEL contours of 737-800 on proposed routes departing from runway 24
Figure C5 – SEL contours of A330-301 on current routes departing from runway 06
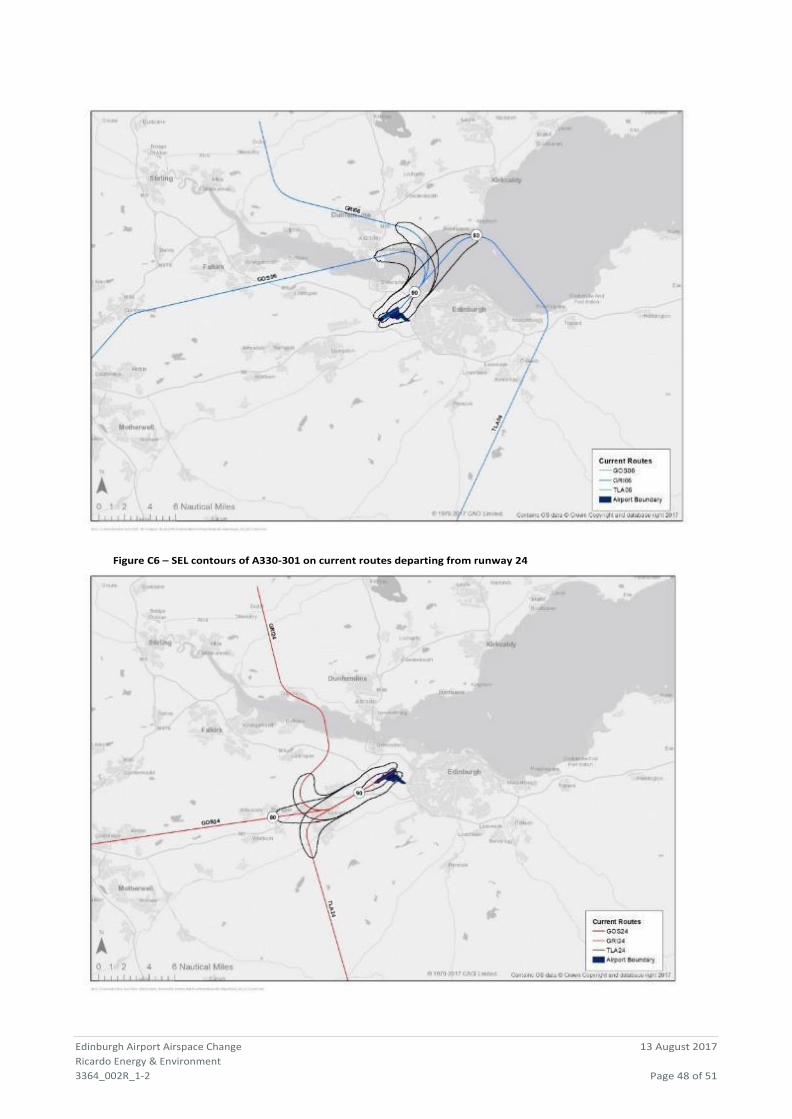
Edinburgh Airport Airspace Change
Ricardo Energy & Environment
3364_002R_1-2
13 August 2017
Page 48 of 51
Figure C6 – SEL contours of A330-301 on current routes departing from runway 24
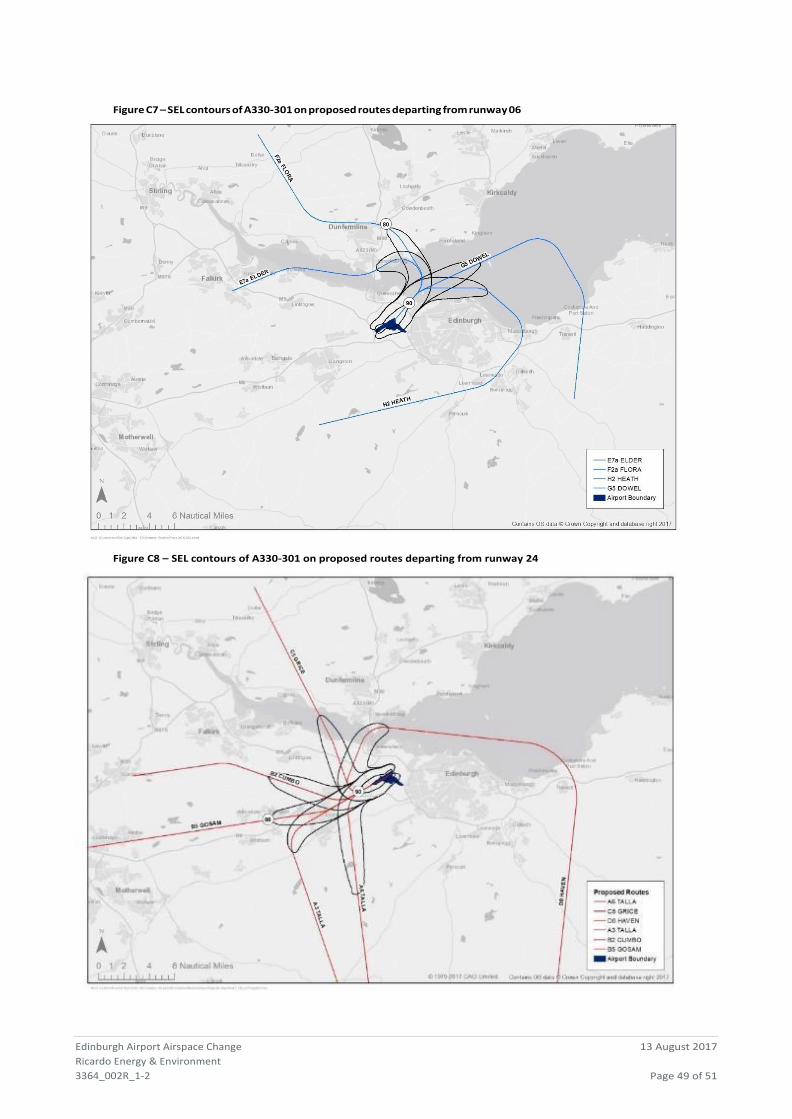
Edinburgh Airport Airspace Change
Ricardo Energy & Environment
3364_002R_1-2
13 August 2017
Page 49 of 51
Figure C7 – SEL contours of A330-301 on proposed routes departing from runway 06
Figure C8 – SEL contours of A330-301 on proposed routes departing from runway 24
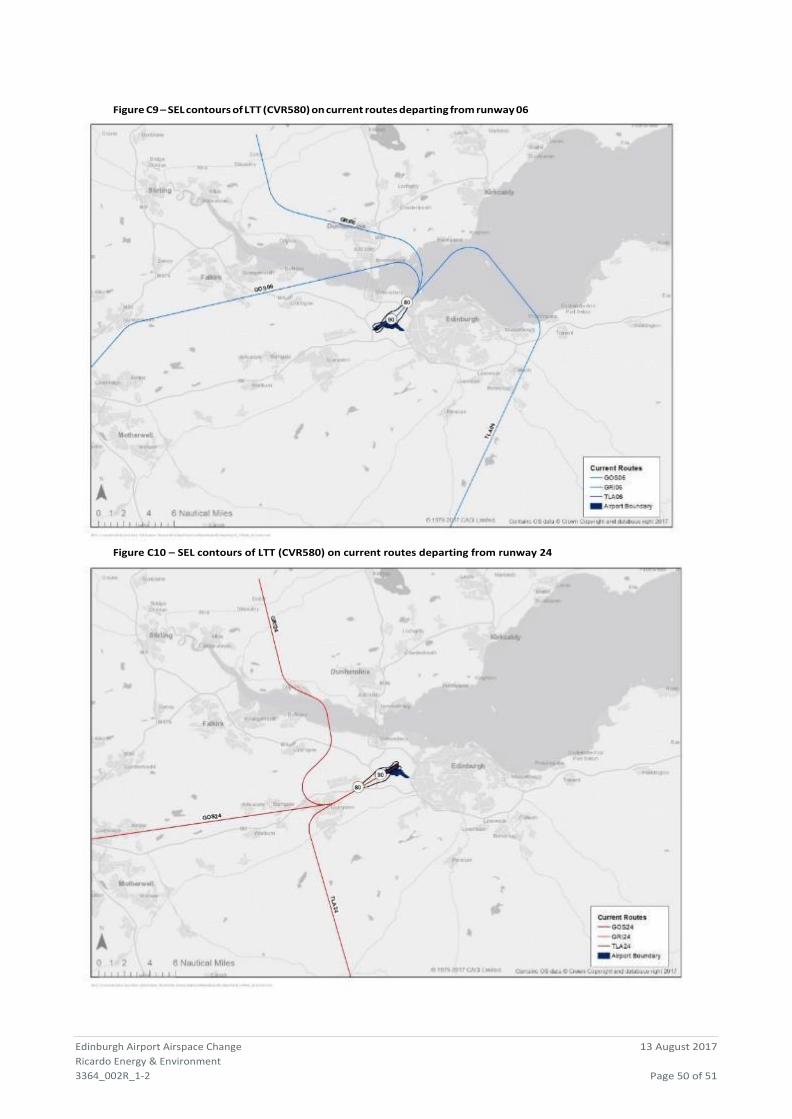
Figure C9 – SEL contours of LTT (CVR580) on current routes departing from runway 06
Edinburgh Airport Airspace Change
Ricardo Energy & Environment
3364_002R_1-2
13 August 2017
Page 50 of 51
Figure C10 – SEL contours of LTT (CVR580) on current routes departing from runway 24
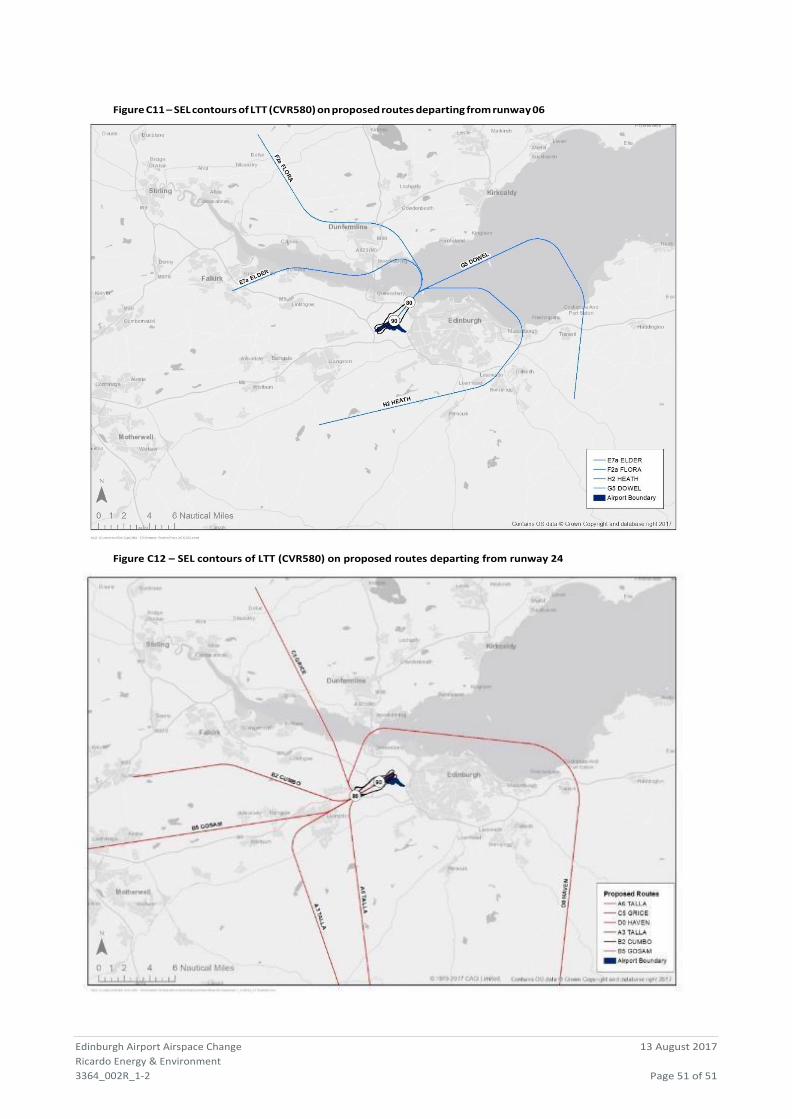
Figure C11 – SEL contours of LTT (CVR580) on proposed routes departing from runway 06
Edinburgh Airport Airspace Change
Ricardo Energy & Environment
3364_002R_1-2
13 August 2017
Page 51 of 51
Figure C12 – SEL contours of LTT (CVR580) on proposed routes departing from runway 24
Ricardo Energy & Environment Edinburgh Airport Airspace Change Programme
Appendix B
Tranquillity and visual intrusion assessment
Ricardo in Confidence Ref: Ricardo/ED10588/Issue 8
Edinburgh Airport Airspace Change Programme:
Tranquillity and Visual Intrusion Assessment
Prepared by LUC on behalf of Ricardo Energy and Environment
July 2018
Project Title: Edinburgh Airport ACP Environmental Report: Tranquillity and Visual Intrusion Report
Client: Ricardo Energy and Environment
Version Date Version Details Prepared by Checked by Approved by
1 21 July 2017 Draft EL PDM SO
2 27 July 2017 Final draft EL SO SO
3 9 Aug 2017 Final EL PDM SO
4 15 Aug 2017 Final EL PDM SO
5 12 April
2018
Revised to reflect
changes in ACP
EL PDM SO
6 31 July 2018 Revised to reflect
‘average’ flight
numbers
EL EL LC
EDI Tranquillity and visual.docx Last saved: 31/07/2018 14:59
Edinburgh Airport Airspace Change Programme:
Tranquillity and Visual Intrusion Assessment
Prepared by LUC on behalf of Ricardo Energy and Environment
July 2018
Planning & EIA Design
Landscape Planning
Landscape Management
Ecology Mapping & Visualisation
LUC EDINBURGH
28 Stafford Street
Edinburgh EH3 7BD T +44 (0)131 202 1616 [email protected]
Offices also in: London
Bristol
Glasgow
FS 566056 EMS 566057
Land Use Consultants Ltd Registered in England Registered number: 2549296 Registered Office: 43 Chalton Street London NW1 1JD
LUC uses 100% recycled paper
Contents
1 Introduction 1
Background 1
Understanding tranquillity and visual intrusion 1
2 Approach 3
Understanding the baseline 3
Evaluation of impacts 5
3 Baseline environment 6
Tranquillity 6
Current flight paths 8
4 Evaluation 9
Introduction 9
Runway 24 Departures 9
Runway 06 Departures 18
Combined routes 25
5 Conclusion 30
Appendix 1 - Tranquillity Assessment – GIS Methodology 31
Visibility Assessment 31
Applying distance weighting 33
Naturalness / Natural landscape 35
Noise 37
Relative tranquillity assessment – example for Pentland Hills 38
Figures
Figure 2.1 Study area and proposed routes 3
Figure 2.2 Absolute score of positive and negative indicators of tranquillity 5
Figure 3.2 Current departure flight paths 8
Figure 4.1 Route A3 & A6 and current departure flight tracks 10
Figure 4.2 Route A3 & A6 and tranquillity mapping 11
Figure 4.3 Route B2 & B5 and current departure flight tracks 12
Figure 4.4 Route B2 & B5 and tranquillity mapping 13
Figure 4.5 Route C5 and current departure flight tracks 14
Figure 4.6 Route C5 and tranquillity mapping 15
Figure 4.7 Route D0 and current departure flight tracks 16
Figure 4.8 Route D0 and tranquillity mapping 17
Figure 4.9 Route E7a and current departure flight tracks 18
Figure 4.10 Route E7a and tranquillity mapping 19
Figure 4.11 Route F2a and current departure flight tracks 20
Figure 4.12 Route F2a and tranquillity mapping 21
Figure 4.13 Route G5 and current departure flight tracks 22
Figure 4.14 Route G5 and tranquillity mapping 23
Figure 4.15 Route H2 and current departure flight tracks 24
Figure 4.16 Route H2 and tranquillity mapping 25
Figure 4.17 Existing noise contours (2016) and tranquillity mapping 27
Figure 4.18 Projected daytime noise contours (2019 and 2024) and tranquillity mapping 28
Figure 4.19 Proposed night noise contours (2019 and 2024) and tranquillity mapping 29
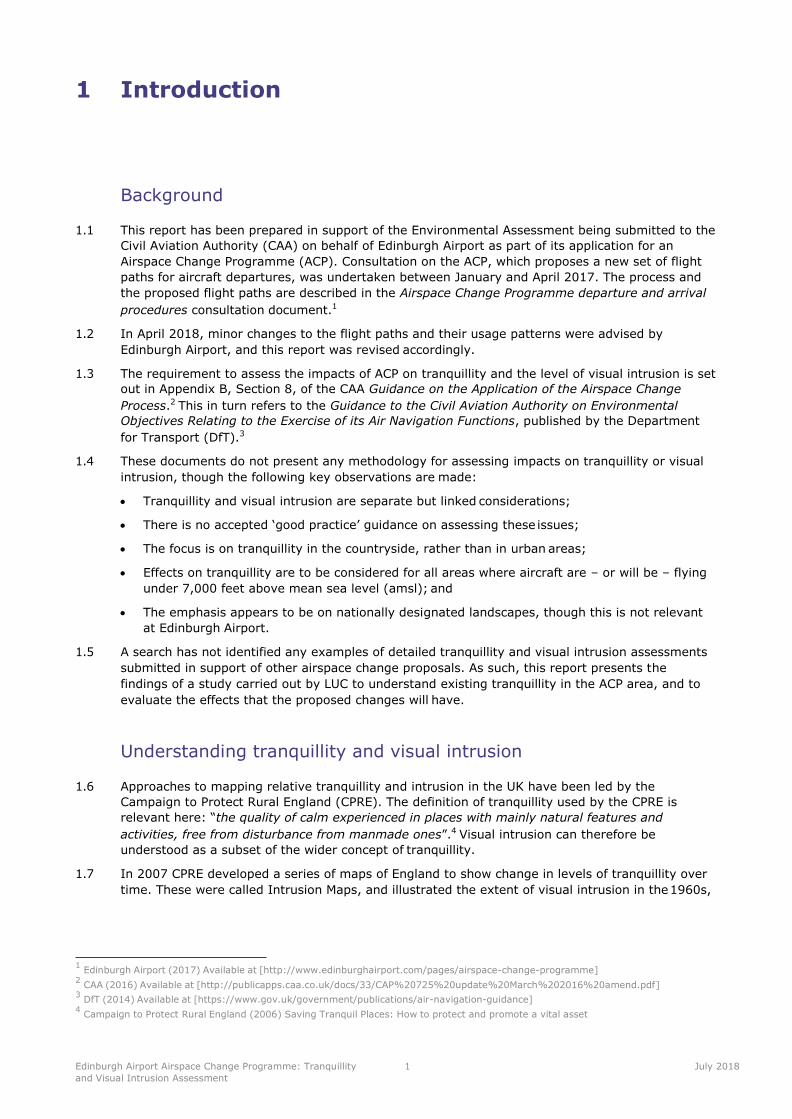
Edinburgh Airport Airspace Change Programme: Tranquillity
and Visual Intrusion Assessment
1 July 2018
1 Introduction
Background
1.1 This report has been prepared in support of the Environmental Assessment being submitted to the
Civil Aviation Authority (CAA) on behalf of Edinburgh Airport as part of its application for an
Airspace Change Programme (ACP). Consultation on the ACP, which proposes a new set of flight
paths for aircraft departures, was undertaken between January and April 2017. The process and
the proposed flight paths are described in the Airspace Change Programme departure and arrival
procedures consultation document.1
1.2 In April 2018, minor changes to the flight paths and their usage patterns were advised by
Edinburgh Airport, and this report was revised accordingly.
1.3 The requirement to assess the impacts of ACP on tranquillity and the level of visual intrusion is set
out in Appendix B, Section 8, of the CAA Guidance on the Application of the Airspace Change
Process.2 This in turn refers to the Guidance to the Civil Aviation Authority on Environmental
Objectives Relating to the Exercise of its Air Navigation Functions, published by the Department
for Transport (DfT).3
1.4 These documents do not present any methodology for assessing impacts on tranquillity or visual
intrusion, though the following key observations are made:
• Tranquillity and visual intrusion are separate but linked considerations;
• There is no accepted ‘good practice’ guidance on assessing these issues;
• The focus is on tranquillity in the countryside, rather than in urban areas;
• Effects on tranquillity are to be considered for all areas where aircraft are – or will be – flying
under 7,000 feet above mean sea level (amsl); and
• The emphasis appears to be on nationally designated landscapes, though this is not relevant
at Edinburgh Airport.
1.5 A search has not identified any examples of detailed tranquillity and visual intrusion assessments
submitted in support of other airspace change proposals. As such, this report presents the
findings of a study carried out by LUC to understand existing tranquillity in the ACP area, and to
evaluate the effects that the proposed changes will have.
Understanding tranquillity and visual intrusion
1.6 Approaches to mapping relative tranquillity and intrusion in the UK have been led by the
Campaign to Protect Rural England (CPRE). The definition of tranquillity used by the CPRE is
relevant here: “the quality of calm experienced in places with mainly natural features and
activities, free from disturbance from manmade ones”.4 Visual intrusion can therefore be
understood as a subset of the wider concept of tranquillity.
1.7 In 2007 CPRE developed a series of maps of England to show change in levels of tranquillity over
time. These were called Intrusion Maps, and illustrated the extent of visual intrusion in the 1960s,
1 Edinburgh Airport (2017) Available at [http://www.edinburghairport.com/pages/airspace-change-programme]
2 CAA (2016) Available at [http://publicapps.caa.co.uk/docs/33/CAP%20725%20update%20March%202016%20amend.pdf]
3 DfT (2014) Available at [https://www.gov.uk/government/publications/air-navigation-guidance]
4 Campaign to Protect Rural England (2006) Saving Tranquil Places: How to protect and promote a vital asset
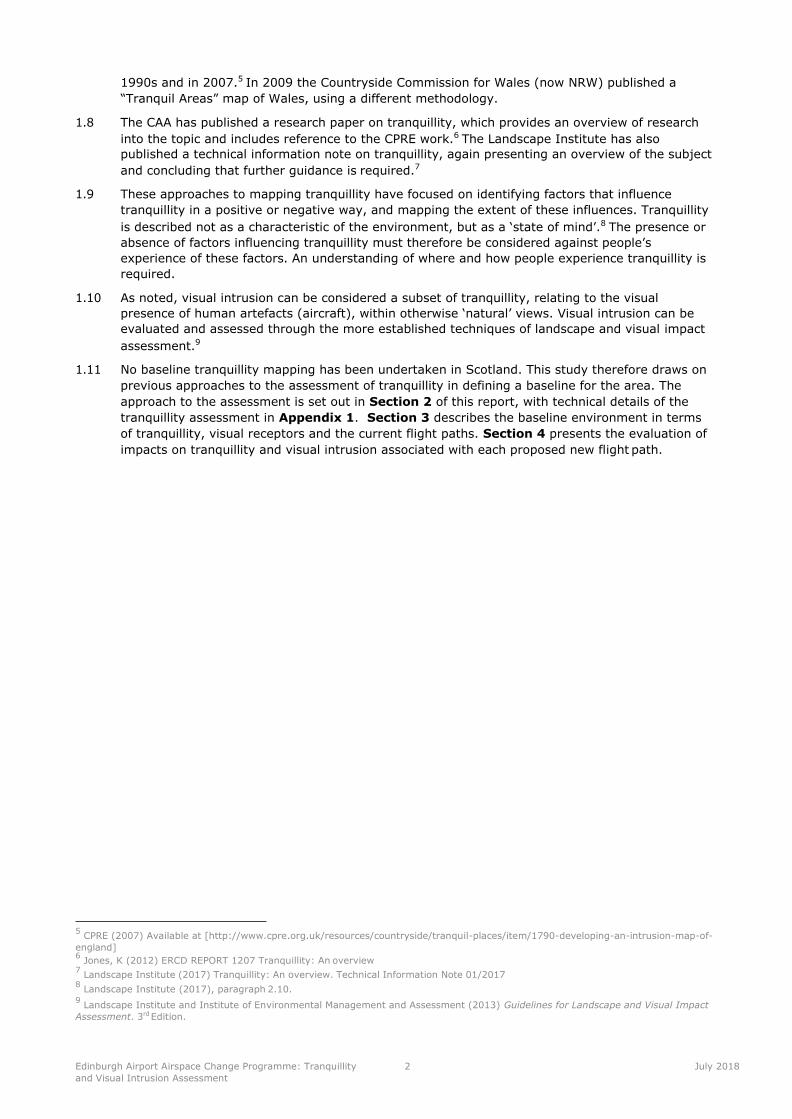
Edinburgh Airport Airspace Change Programme: Tranquillity
and Visual Intrusion Assessment
2 July 2018
1990s and in 2007.5 In 2009 the Countryside Commission for Wales (now NRW) published a
“Tranquil Areas” map of Wales, using a different methodology.
1.8 The CAA has published a research paper on tranquillity, which provides an overview of research
into the topic and includes reference to the CPRE work.6 The Landscape Institute has also
published a technical information note on tranquillity, again presenting an overview of the subject
and concluding that further guidance is required.7
1.9 These approaches to mapping tranquillity have focused on identifying factors that influence
tranquillity in a positive or negative way, and mapping the extent of these influences. Tranquillity
is described not as a characteristic of the environment, but as a ‘state of mind’.8 The presence or
absence of factors influencing tranquillity must therefore be considered against people’s
experience of these factors. An understanding of where and how people experience tranquillity is
required.
1.10 As noted, visual intrusion can be considered a subset of tranquillity, relating to the visual
presence of human artefacts (aircraft), within otherwise ‘natural’ views. Visual intrusion can be
evaluated and assessed through the more established techniques of landscape and visual impact
assessment.9
1.11 No baseline tranquillity mapping has been undertaken in Scotland. This study therefore draws on
previous approaches to the assessment of tranquillity in defining a baseline for the area. The
approach to the assessment is set out in Section 2 of this report, with technical details of the
tranquillity assessment in Appendix 1. Section 3 describes the baseline environment in terms
of tranquillity, visual receptors and the current flight paths. Section 4 presents the evaluation of
impacts on tranquillity and visual intrusion associated with each proposed new flight path.
5 CPRE (2007) Available at [http://www.cpre.org.uk/resources/countryside/tranquil-places/item/1790-developing-an-intrusion-map-of-
england] 6
Jones, K (2012) ERCD REPORT 1207 Tranquillity: An overview 7
Landscape Institute (2017) Tranquillity: An overview. Technical Information Note 01/2017 8
Landscape Institute (2017), paragraph 2.10. 9
Landscape Institute and Institute of Environmental Management and Assessment (2013) Guidelines for Landscape and Visual Impact
Assessment. 3rd Edition.
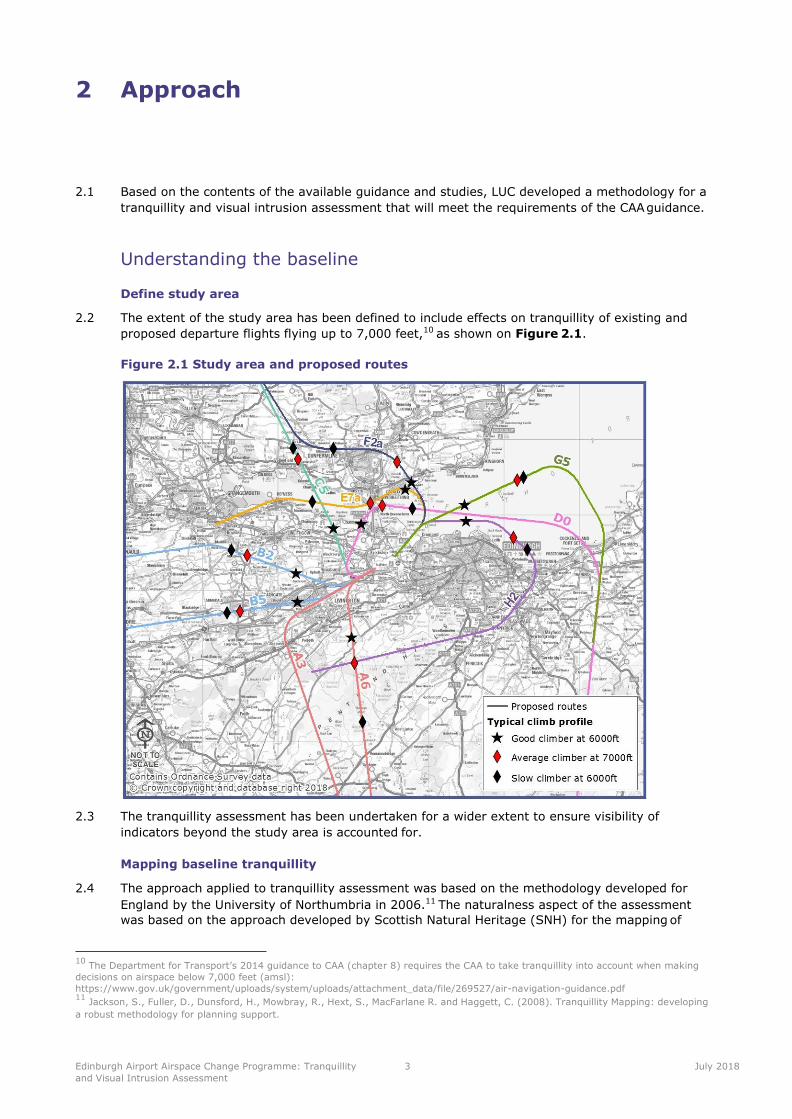
Edinburgh Airport Airspace Change Programme: Tranquillity
and Visual Intrusion Assessment
3 July 2018
2 Approach
2.1 Based on the contents of the available guidance and studies, LUC developed a methodology for a
tranquillity and visual intrusion assessment that will meet the requirements of the CAA guidance.
Understanding the baseline
Define study area
2.2 The extent of the study area has been defined to include effects on tranquillity of existing and
proposed departure flights flying up to 7,000 feet,10 as shown on Figure 2.1.
Figure 2.1 Study area and proposed routes
2.3 The tranquillity assessment has been undertaken for a wider extent to ensure visibility of
indicators beyond the study area is accounted for.
Mapping baseline tranquillity
2.4 The approach applied to tranquillity assessment was based on the methodology developed for
England by the University of Northumbria in 2006.11 The naturalness aspect of the assessment
was based on the approach developed by Scottish Natural Heritage (SNH) for the mapping of
10
The Department for Transport’s 2014 guidance to CAA (chapter 8) requires the CAA to take tranquillity into account when making
decisions on airspace below 7,000 feet (amsl):
https://www.gov.uk/government/uploads/system/uploads/attachment_data/file/269527/air-navigation-guidance.pdf 11
Jackson, S., Fuller, D., Dunsford, H., Mowbray, R., Hext, S., MacFarlane R. and Haggett, C. (2008). Tranquillity Mapping: developing
a robust methodology for planning support.
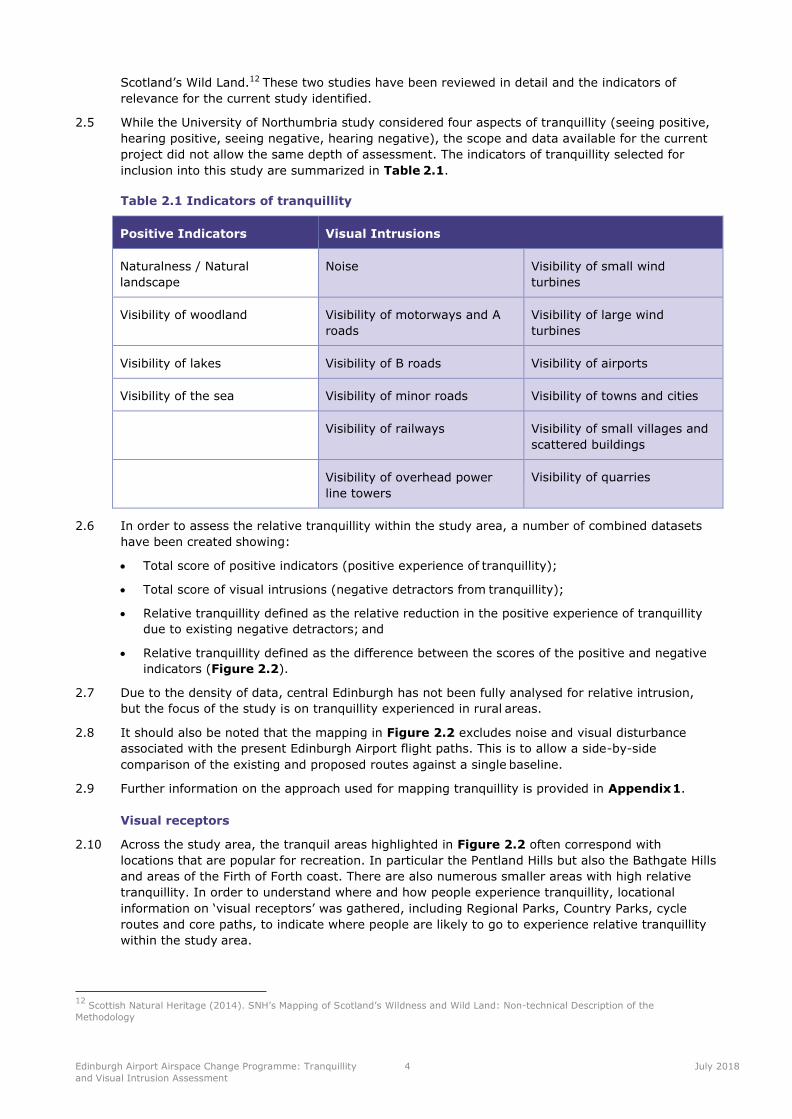
Edinburgh Airport Airspace Change Programme: Tranquillity
and Visual Intrusion Assessment
4 July 2018
Scotland’s Wild Land.12 These two studies have been reviewed in detail and the indicators of
relevance for the current study identified.
2.5 While the University of Northumbria study considered four aspects of tranquillity (seeing positive,
hearing positive, seeing negative, hearing negative), the scope and data available for the current
project did not allow the same depth of assessment. The indicators of tranquillity selected for
inclusion into this study are summarized in Table 2.1.
Table 2.1 Indicators of tranquillity
Positive Indicators Visual Intrusions
Naturalness / Natural
landscape
Noise Visibility of small wind
turbines
Visibility of woodland Visibility of motorways and A
roads
Visibility of large wind
turbines
Visibility of lakes Visibility of B roads Visibility of airports
Visibility of the sea Visibility of minor roads Visibility of towns and cities
Visibility of railways Visibility of small villages and
scattered buildings
Visibility of overhead power
line towers
Visibility of quarries
2.6 In order to assess the relative tranquillity within the study area, a number of combined datasets
have been created showing:
• Total score of positive indicators (positive experience of tranquillity);
• Total score of visual intrusions (negative detractors from tranquillity);
• Relative tranquillity defined as the relative reduction in the positive experience of tranquillity
due to existing negative detractors; and
• Relative tranquillity defined as the difference between the scores of the positive and negative
indicators (Figure 2.2).
2.7 Due to the density of data, central Edinburgh has not been fully analysed for relative intrusion,
but the focus of the study is on tranquillity experienced in rural areas.
2.8 It should also be noted that the mapping in Figure 2.2 excludes noise and visual disturbance
associated with the present Edinburgh Airport flight paths. This is to allow a side-by-side
comparison of the existing and proposed routes against a single baseline.
2.9 Further information on the approach used for mapping tranquillity is provided in Appendix 1.
Visual receptors
2.10 Across the study area, the tranquil areas highlighted in Figure 2.2 often correspond with
locations that are popular for recreation. In particular the Pentland Hills but also the Bathgate Hills
and areas of the Firth of Forth coast. There are also numerous smaller areas with high relative
tranquillity. In order to understand where and how people experience tranquillity, locational
information on ‘visual receptors’ was gathered, including Regional Parks, Country Parks, cycle
routes and core paths, to indicate where people are likely to go to experience relative tranquillity
within the study area.
12
Scottish Natural Heritage (2014). SNH’s Mapping of Scotland’s Wildness and Wild Land: Non-technical Description of the
Methodology
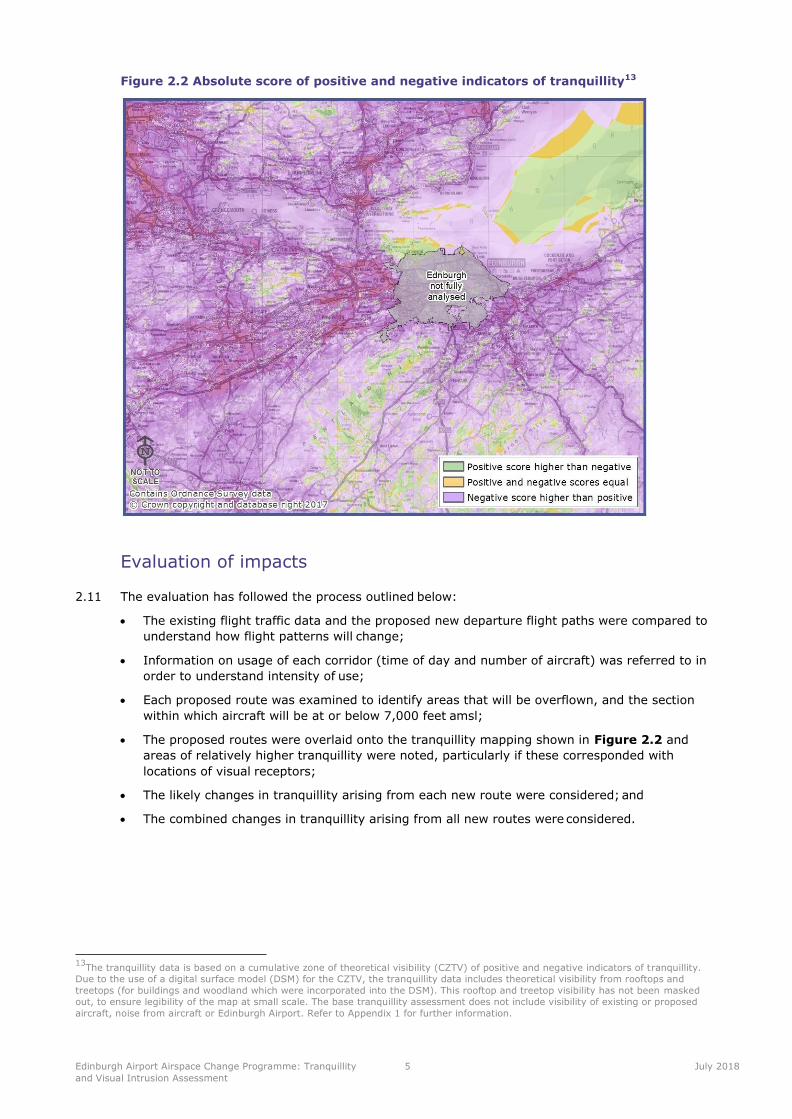
Edinburgh Airport Airspace Change Programme: Tranquillity
and Visual Intrusion Assessment
5 July 2018
Figure 2.2 Absolute score of positive and negative indicators of tranquillity13
Evaluation of impacts
2.11 The evaluation has followed the process outlined below:
• The existing flight traffic data and the proposed new departure flight paths were compared to
understand how flight patterns will change;
• Information on usage of each corridor (time of day and number of aircraft) was referred to in
order to understand intensity of use;
• Each proposed route was examined to identify areas that will be overflown, and the section
within which aircraft will be at or below 7,000 feet amsl;
• The proposed routes were overlaid onto the tranquillity mapping shown in Figure 2.2 and
areas of relatively higher tranquillity were noted, particularly if these corresponded with
locations of visual receptors;
• The likely changes in tranquillity arising from each new route were considered; and
• The combined changes in tranquillity arising from all new routes were considered.
13The tranquillity data is based on a cumulative zone of theoretical visibility (CZTV) of positive and negative indicators of tranquillity.
Due to the use of a digital surface model (DSM) for the CZTV, the tranquillity data includes theoretical visibility from rooftops and
treetops (for buildings and woodland which were incorporated into the DSM). This rooftop and treetop visibility has not been masked
out, to ensure legibility of the map at small scale. The base tranquillity assessment does not include visibility of existing or proposed
aircraft, noise from aircraft or Edinburgh Airport. Refer to Appendix 1 for further information.
Edinburgh Airport Airspace Change Programme: Tranquillity
and Visual Intrusion Assessment
6 July 2018
3 Baseline environment
Tranquillity
3.1 The map of relative tranquillity shown in Figure 2.2 is included as a larger map in Figure 3.1.
This map also identifies areas where there are no ‘visual intrusion’ indicators, as defined in
Table 2.1.
3.2 The mapping indicates that tranquillity is a relatively limited resource across the study area, with
a high level of influence of ‘visual intrusion’ indicators. This can be attributed to the dense pattern
of settlement and transport links that characterise much of the study area.
3.3 The largest single area of higher tranquillity is located within the Firth of Forth, where the effects
of onshore intrusion are reduced. There are also relatively tranquil areas around the Forth
coastline.
3.4 On land, the most extensive areas of tranquillity are along the spine of the Pentland Hills. The
map indicates upland valleys that are currently free from indicators of visual intrusion, with a
relatively low level of visual intrusion across the whole of the hill range. Similarly, relatively
extensive areas of higher tranquillity are indicated in the Moorfoot Hills to the south-east of the
study area. The higher level of tranquillity around Cramond and Dalmeny Park, though in close
proximity of Edinburgh, the airport and major transport links (A90, Forth bridges), is the result of
its high level of naturalness (the presence of broadleaved woodlands and the sea) and the smaller
number of visual intrusions, whose visibility is limited by the woodlands, giving the area a relative
sense of tranquillity.
3.5 Smaller concentrations of relative tranquillity are associated with other less settled upland areas,
including the Bathgate Hills in West Lothian, the Slamannan plateau in Falkirk, and the low hills of
western Fife. There are also pockets of tranquillity in farmland areas such as the area east of
Dunfermline. Linear areas of tranquillity are associated with river valleys, notably the Esk in
Midlothian, the Almond near Livingston, and the Avon west of Linlithgow.
3.6 It should be noted that the assessment of tranquillity illustrated in this report is indicative, and is
based only on analysis of the indicators listed in Table 2.1, using available datasets as described
in Appendix 1. The resulting mapping does contain anomalies, for example the Braefoot Bay oil
terminal on the Fife Coast is indicated as relatively tranquil – partly due to its enclosed, wooded
location, but these anomalies are localised and do not affect the general observations that can be
drawn from the mapping. Overall, the map depicts a pattern of relative tranquillity that
corresponds with expectations and provides a reliable baseline for this assessment.
Visual receptors
3.7 Many of the areas of tranquillity correspond to locations where people go for outdoor recreation,
the relative tranquillity being part of the appeal for many such areas. The Pentland Hills are a
major area for outdoor recreation, not only within the Regional Park but across the hills. There are
several popular summits and walking routes throughout this area. Locations of Country Parks also
correspond to higher tranquillity locations, such as Beecraigs in the Bathgate Hills, and Roslin
Glen in the Esk valley.
3.8 There are coastal paths on both sides of the Firth of Forth: the John Muir Way on the south side
and the Fife Coastal Path to the north. Other core paths are routed along river valleys, such as
the Esk and Avon.
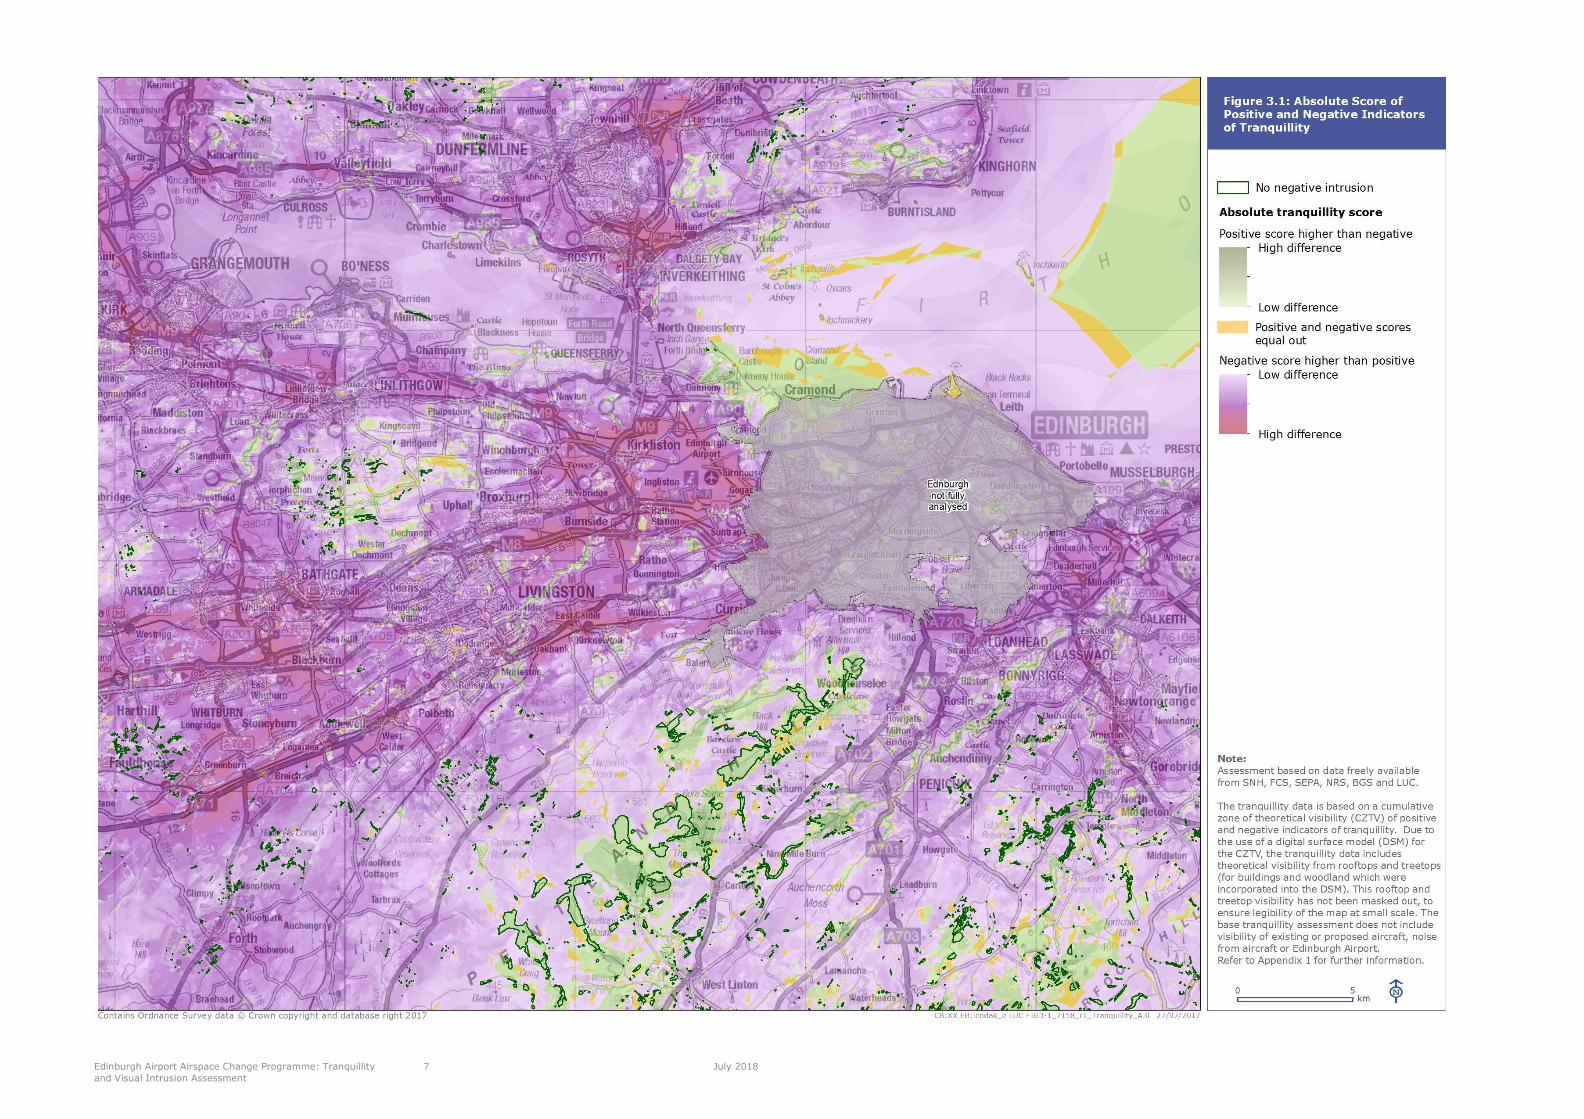
Edinburgh Airport Airspace Change Programme: Tranquillity
and Visual Intrusion Assessment
7 July 2018
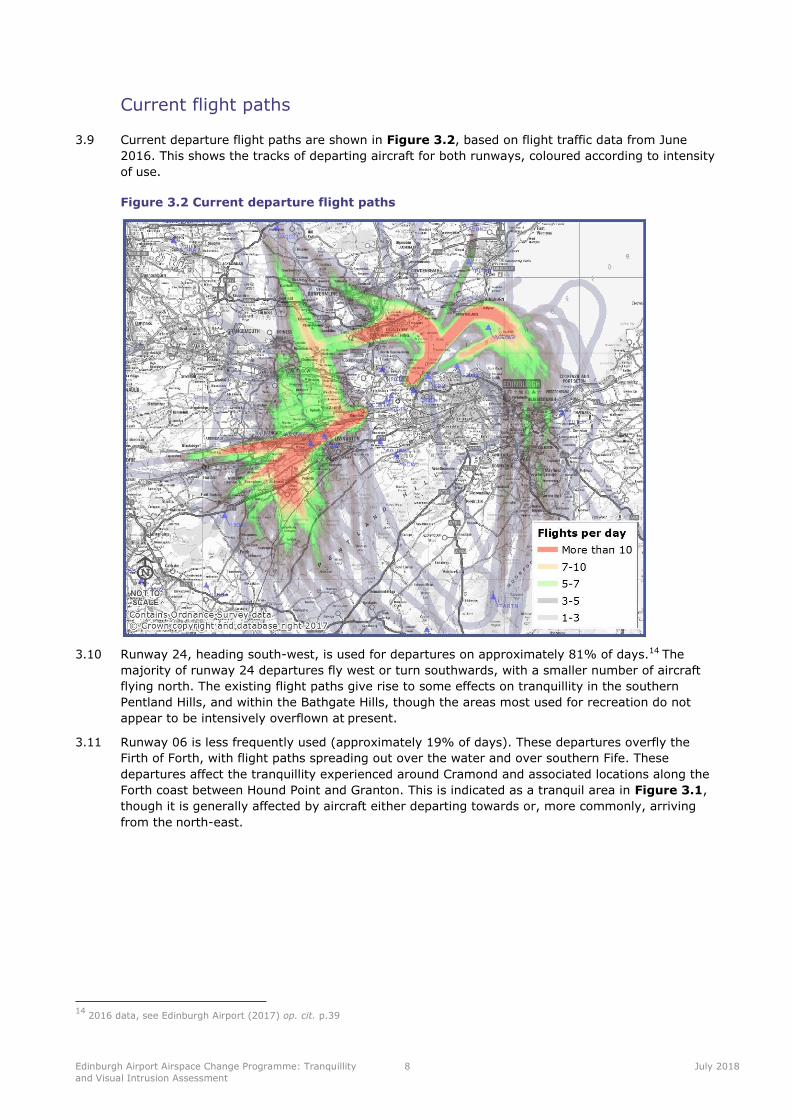
Edinburgh Airport Airspace Change Programme: Tranquillity
and Visual Intrusion Assessment
8 July 2018
Current flight paths
3.9 Current departure flight paths are shown in Figure 3.2, based on flight traffic data from June
2016. This shows the tracks of departing aircraft for both runways, coloured according to intensity
of use.
Figure 3.2 Current departure flight paths
3.10 Runway 24, heading south-west, is used for departures on approximately 81% of days.14 The
majority of runway 24 departures fly west or turn southwards, with a smaller number of aircraft
flying north. The existing flight paths give rise to some effects on tranquillity in the southern
Pentland Hills, and within the Bathgate Hills, though the areas most used for recreation do not
appear to be intensively overflown at present.
3.11 Runway 06 is less frequently used (approximately 19% of days). These departures overfly the
Firth of Forth, with flight paths spreading out over the water and over southern Fife. These
departures affect the tranquillity experienced around Cramond and associated locations along the
Forth coast between Hound Point and Granton. This is indicated as a tranquil area in Figure 3.1,
though it is generally affected by aircraft either departing towards or, more commonly, arriving
from the north-east.
14
2016 data, see Edinburgh Airport (2017) op. cit. p.39
Edinburgh Airport Airspace Change Programme: Tranquillity
and Visual Intrusion Assessment
9 July 2018
4 Evaluation
Introduction
4.1 This section discusses the potential effects of each new flight path in turn. New routes are
discussed with reference to material provided in the 2017 consultation document,15 and additional
information on amended routes and usage of each route supplied by Ricardo in 2018. Predicted
noise contours prepared by Anderson Acoustics were also made available to LUC.
4.2 Because of the possibility of ‘vectoring’, i.e. dynamic direction of aircraft away from the centre line
of each route, the exact density of flights above any location cannot be predicted. The effect of
vectoring will be to extend the area affected by aircraft, but will reduce the intensity of any effect.
The assessment focuses on the area within approximately 1 km of the flight paths shown in
Figure 2.1.
Runway 24 Departures
Route A
4.3 Route A3 will be in use 24 hours a day, carrying an average of approximately 42 flights per day
from 2019 (and an average of 47 flights per day in 2024). Route A6 will be used for non-jet
flights during weekday peak hours (0600 – 0959), carrying an average of 9 flights per day in
2019 (and an average of 10 flights per day in 2024). Routes A3 and A6 will not be used
simultaneously. The routes are shown in Figure 4.1, alongside current flight tracks.
15 Edinburgh Airport (2017) op. cit.
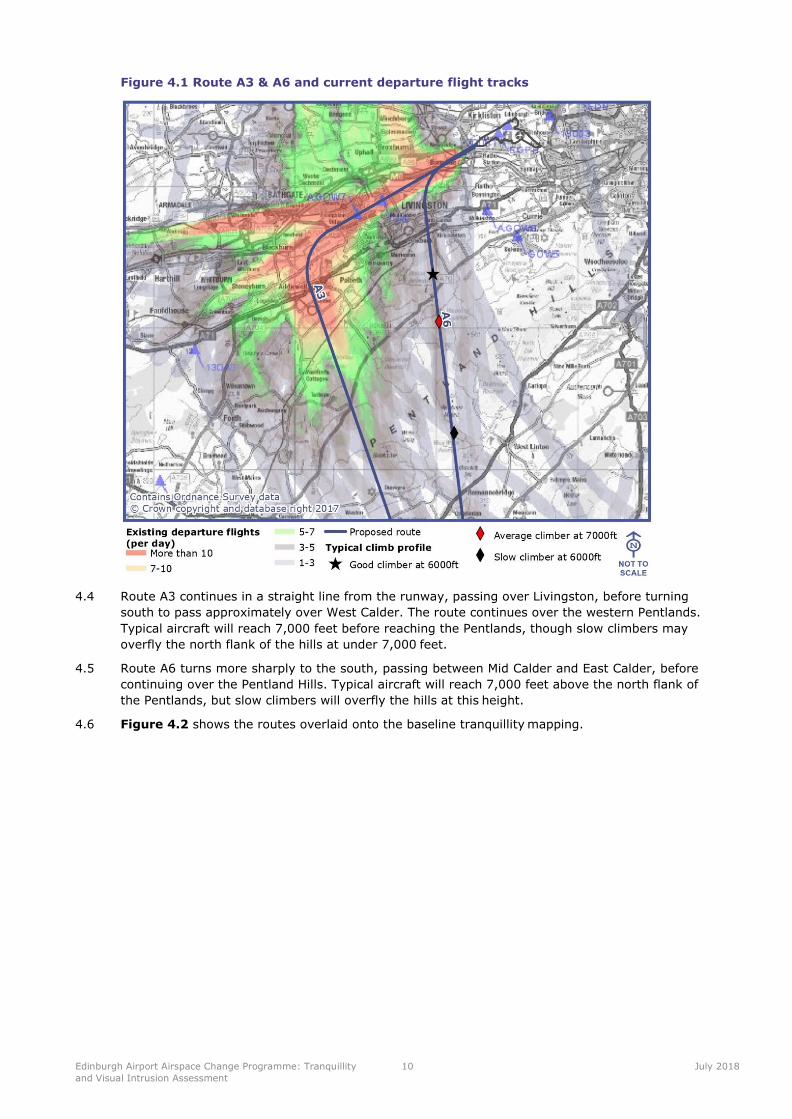
Edinburgh Airport Airspace Change Programme: Tranquillity
and Visual Intrusion Assessment
10 July 2018
Figure 4.1 Route A3 & A6 and current departure flight tracks
4.4 Route A3 continues in a straight line from the runway, passing over Livingston, before turning
south to pass approximately over West Calder. The route continues over the western Pentlands.
Typical aircraft will reach 7,000 feet before reaching the Pentlands, though slow climbers may
overfly the north flank of the hills at under 7,000 feet.
4.5 Route A6 turns more sharply to the south, passing between Mid Calder and East Calder, before
continuing over the Pentland Hills. Typical aircraft will reach 7,000 feet above the north flank of
the Pentlands, but slow climbers will overfly the hills at this height.
4.6 Figure 4.2 shows the routes overlaid onto the baseline tranquillity mapping.
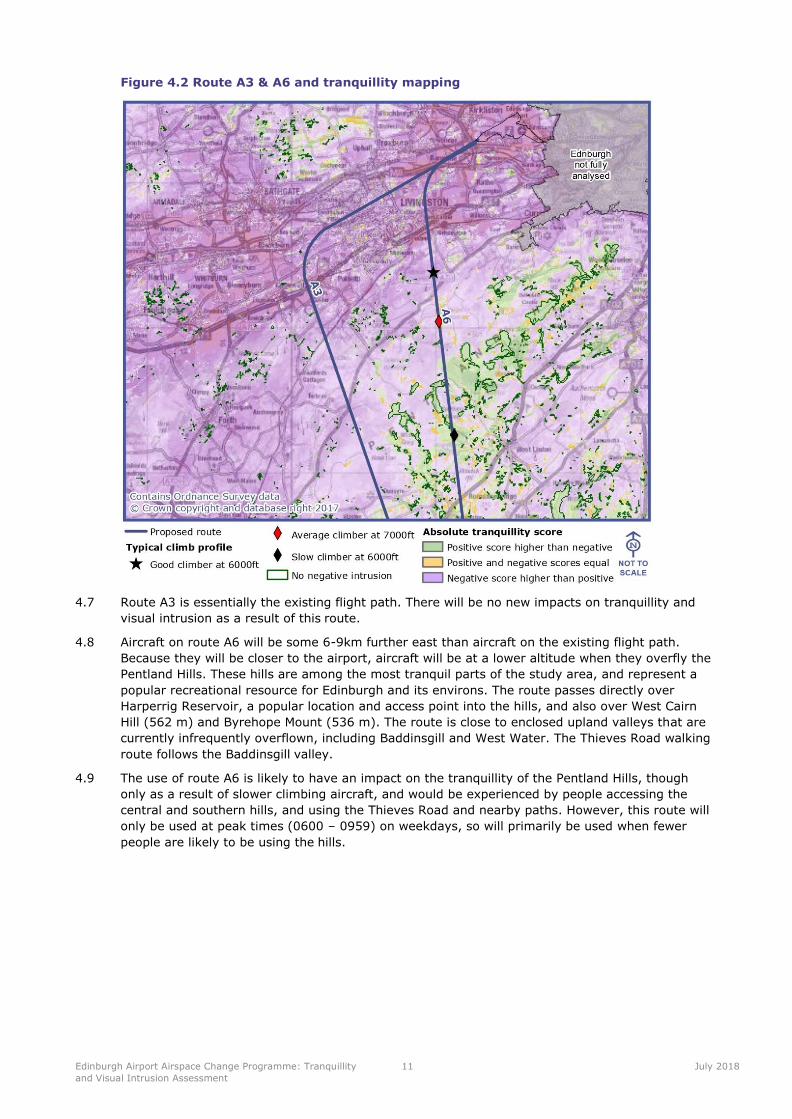
Edinburgh Airport Airspace Change Programme: Tranquillity
and Visual Intrusion Assessment
11 July 2018
Figure 4.2 Route A3 & A6 and tranquillity mapping
4.7 Route A3 is essentially the existing flight path. There will be no new impacts on tranquillity and
visual intrusion as a result of this route.
4.8 Aircraft on route A6 will be some 6-9km further east than aircraft on the existing flight path.
Because they will be closer to the airport, aircraft will be at a lower altitude when they overfly the
Pentland Hills. These hills are among the most tranquil parts of the study area, and represent a
popular recreational resource for Edinburgh and its environs. The route passes directly over
Harperrig Reservoir, a popular location and access point into the hills, and also over West Cairn
Hill (562 m) and Byrehope Mount (536 m). The route is close to enclosed upland valleys that are
currently infrequently overflown, including Baddinsgill and West Water. The Thieves Road walking
route follows the Baddinsgill valley.
4.9 The use of route A6 is likely to have an impact on the tranquillity of the Pentland Hills, though
only as a result of slower climbing aircraft, and would be experienced by people accessing the
central and southern hills, and using the Thieves Road and nearby paths. However, this route will
only be used at peak times (0600 – 0959) on weekdays, so will primarily be used when fewer
people are likely to be using the hills.
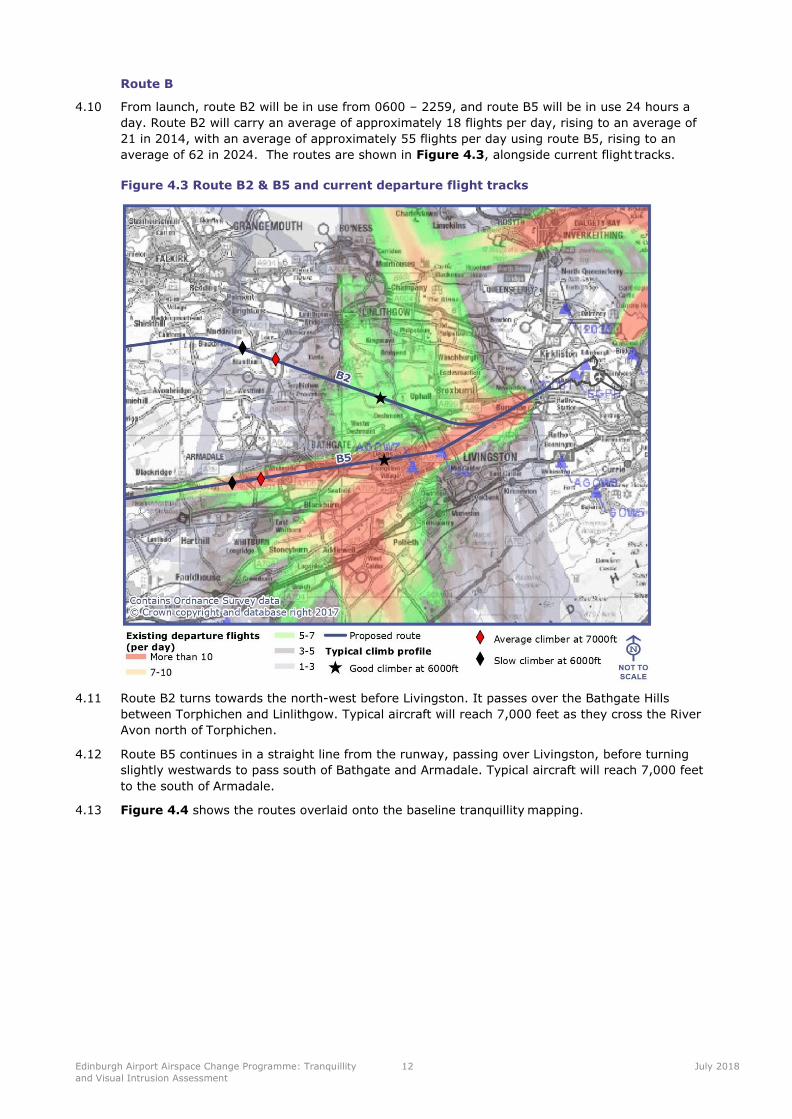
Edinburgh Airport Airspace Change Programme: Tranquillity
and Visual Intrusion Assessment
12 July 2018
Route B
4.10 From launch, route B2 will be in use from 0600 – 2259, and route B5 will be in use 24 hours a
day. Route B2 will carry an average of approximately 18 flights per day, rising to an average of
21 in 2014, with an average of approximately 55 flights per day using route B5, rising to an
average of 62 in 2024. The routes are shown in Figure 4.3, alongside current flight tracks.
Figure 4.3 Route B2 & B5 and current departure flight tracks
4.11 Route B2 turns towards the north-west before Livingston. It passes over the Bathgate Hills
between Torphichen and Linlithgow. Typical aircraft will reach 7,000 feet as they cross the River
Avon north of Torphichen.
4.12 Route B5 continues in a straight line from the runway, passing over Livingston, before turning
slightly westwards to pass south of Bathgate and Armadale. Typical aircraft will reach 7,000 feet
to the south of Armadale.
4.13 Figure 4.4 shows the routes overlaid onto the baseline tranquillity mapping.
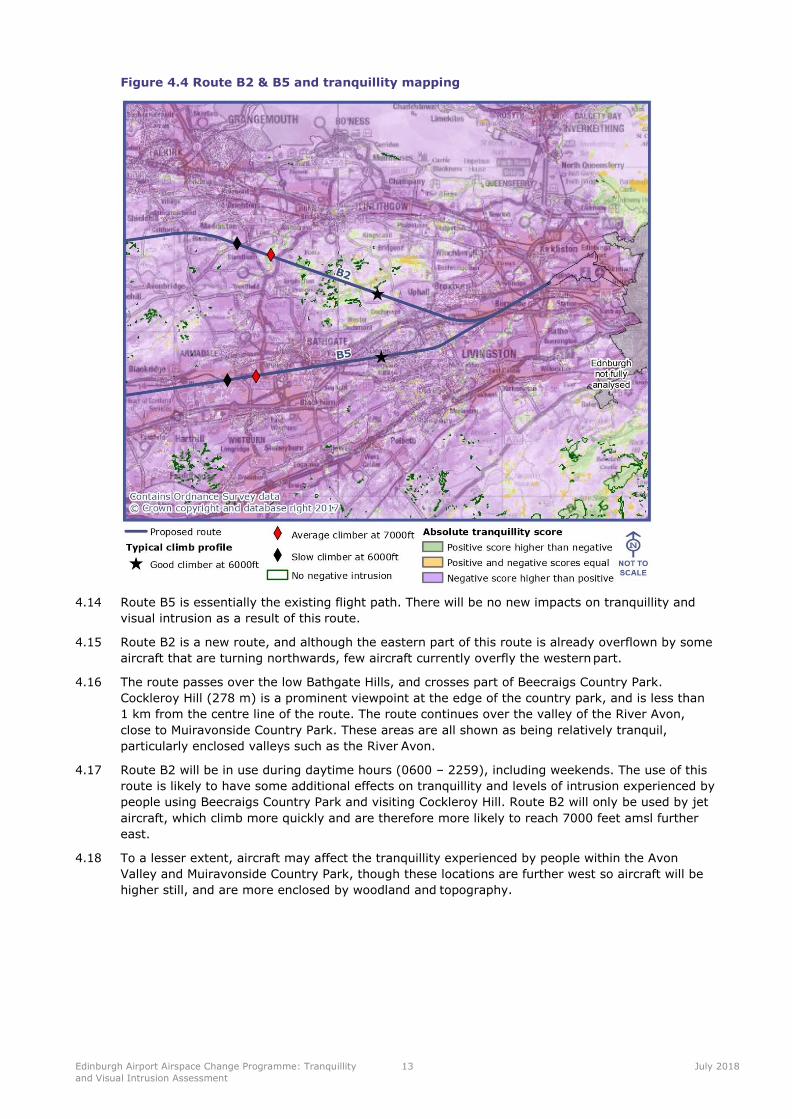
Edinburgh Airport Airspace Change Programme: Tranquillity
and Visual Intrusion Assessment
13 July 2018
Figure 4.4 Route B2 & B5 and tranquillity mapping
4.14 Route B5 is essentially the existing flight path. There will be no new impacts on tranquillity and
visual intrusion as a result of this route.
4.15 Route B2 is a new route, and although the eastern part of this route is already overflown by some
aircraft that are turning northwards, few aircraft currently overfly the western part.
4.16 The route passes over the low Bathgate Hills, and crosses part of Beecraigs Country Park.
Cockleroy Hill (278 m) is a prominent viewpoint at the edge of the country park, and is less than
1 km from the centre line of the route. The route continues over the valley of the River Avon,
close to Muiravonside Country Park. These areas are all shown as being relatively tranquil,
particularly enclosed valleys such as the River Avon.
4.17 Route B2 will be in use during daytime hours (0600 – 2259), including weekends. The use of this
route is likely to have some additional effects on tranquillity and levels of intrusion experienced by
people using Beecraigs Country Park and visiting Cockleroy Hill. Route B2 will only be used by jet
aircraft, which climb more quickly and are therefore more likely to reach 7000 feet amsl further
east.
4.18 To a lesser extent, aircraft may affect the tranquillity experienced by people within the Avon
Valley and Muiravonside Country Park, though these locations are further west so aircraft will be
higher still, and are more enclosed by woodland and topography.
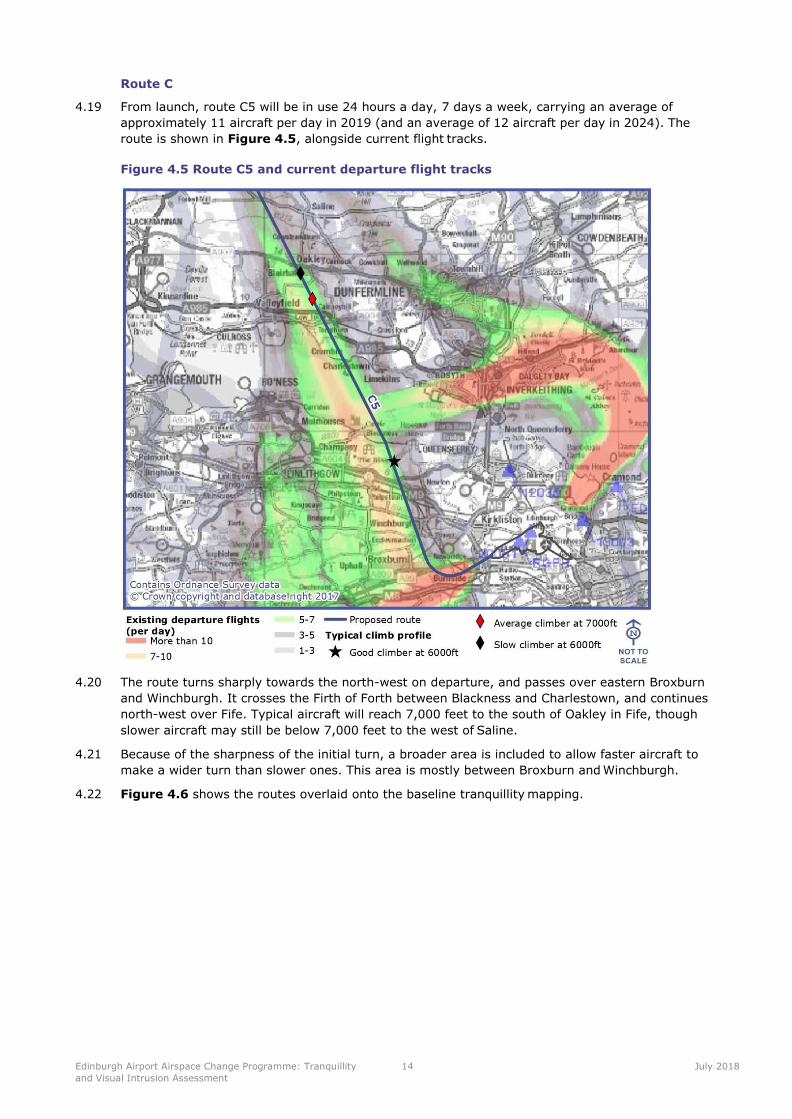
Edinburgh Airport Airspace Change Programme: Tranquillity
and Visual Intrusion Assessment
14 July 2018
Route C
4.19 From launch, route C5 will be in use 24 hours a day, 7 days a week, carrying an average of
approximately 11 aircraft per day in 2019 (and an average of 12 aircraft per day in 2024). The
route is shown in Figure 4.5, alongside current flight tracks.
Figure 4.5 Route C5 and current departure flight tracks
4.20 The route turns sharply towards the north-west on departure, and passes over eastern Broxburn
and Winchburgh. It crosses the Firth of Forth between Blackness and Charlestown, and continues
north-west over Fife. Typical aircraft will reach 7,000 feet to the south of Oakley in Fife, though
slower aircraft may still be below 7,000 feet to the west of Saline.
4.21 Because of the sharpness of the initial turn, a broader area is included to allow faster aircraft to
make a wider turn than slower ones. This area is mostly between Broxburn and Winchburgh.
4.22 Figure 4.6 shows the routes overlaid onto the baseline tranquillity mapping.
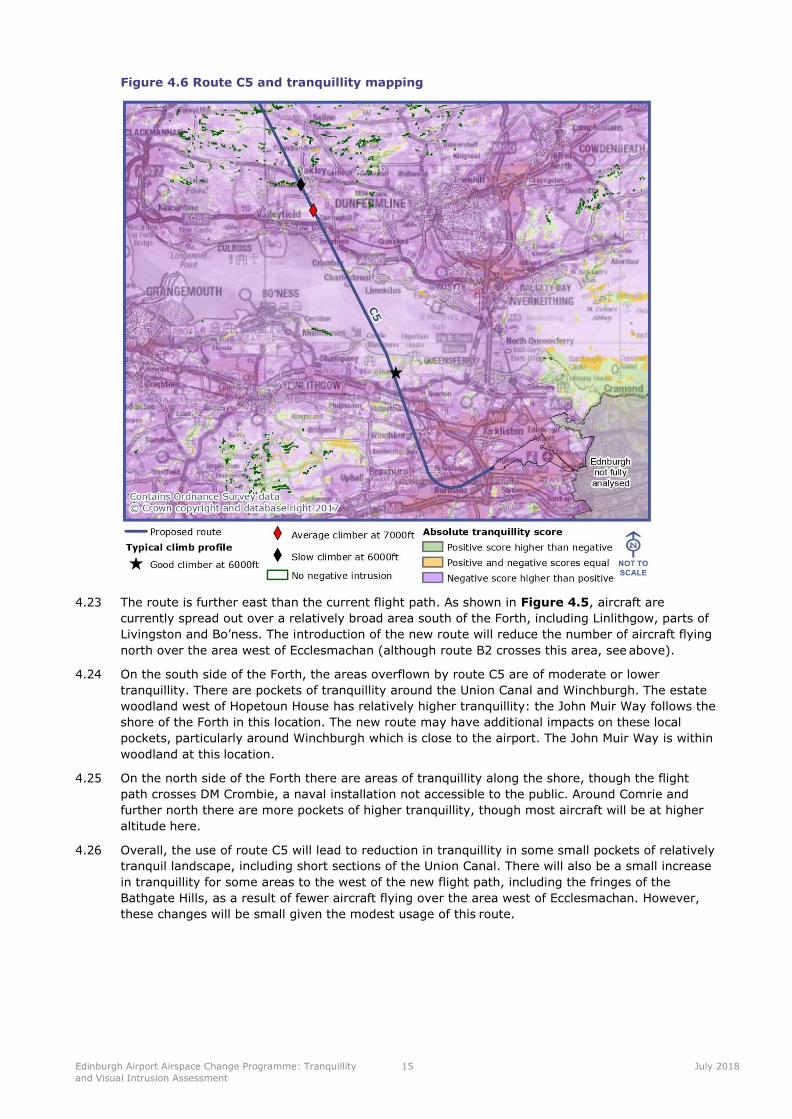
Edinburgh Airport Airspace Change Programme: Tranquillity
and Visual Intrusion Assessment
15 July 2018
Figure 4.6 Route C5 and tranquillity mapping
4.23 The route is further east than the current flight path. As shown in Figure 4.5, aircraft are
currently spread out over a relatively broad area south of the Forth, including Linlithgow, parts of
Livingston and Bo’ness. The introduction of the new route will reduce the number of aircraft flying
north over the area west of Ecclesmachan (although route B2 crosses this area, see above).
4.24 On the south side of the Forth, the areas overflown by route C5 are of moderate or lower
tranquillity. There are pockets of tranquillity around the Union Canal and Winchburgh. The estate
woodland west of Hopetoun House has relatively higher tranquillity: the John Muir Way follows the
shore of the Forth in this location. The new route may have additional impacts on these local
pockets, particularly around Winchburgh which is close to the airport. The John Muir Way is within
woodland at this location.
4.25 On the north side of the Forth there are areas of tranquillity along the shore, though the flight
path crosses DM Crombie, a naval installation not accessible to the public. Around Comrie and
further north there are more pockets of higher tranquillity, though most aircraft will be at higher
altitude here.
4.26 Overall, the use of route C5 will lead to reduction in tranquillity in some small pockets of relatively
tranquil landscape, including short sections of the Union Canal. There will also be a small increase
in tranquillity for some areas to the west of the new flight path, including the fringes of the
Bathgate Hills, as a result of fewer aircraft flying over the area west of Ecclesmachan. However,
these changes will be small given the modest usage of this route.
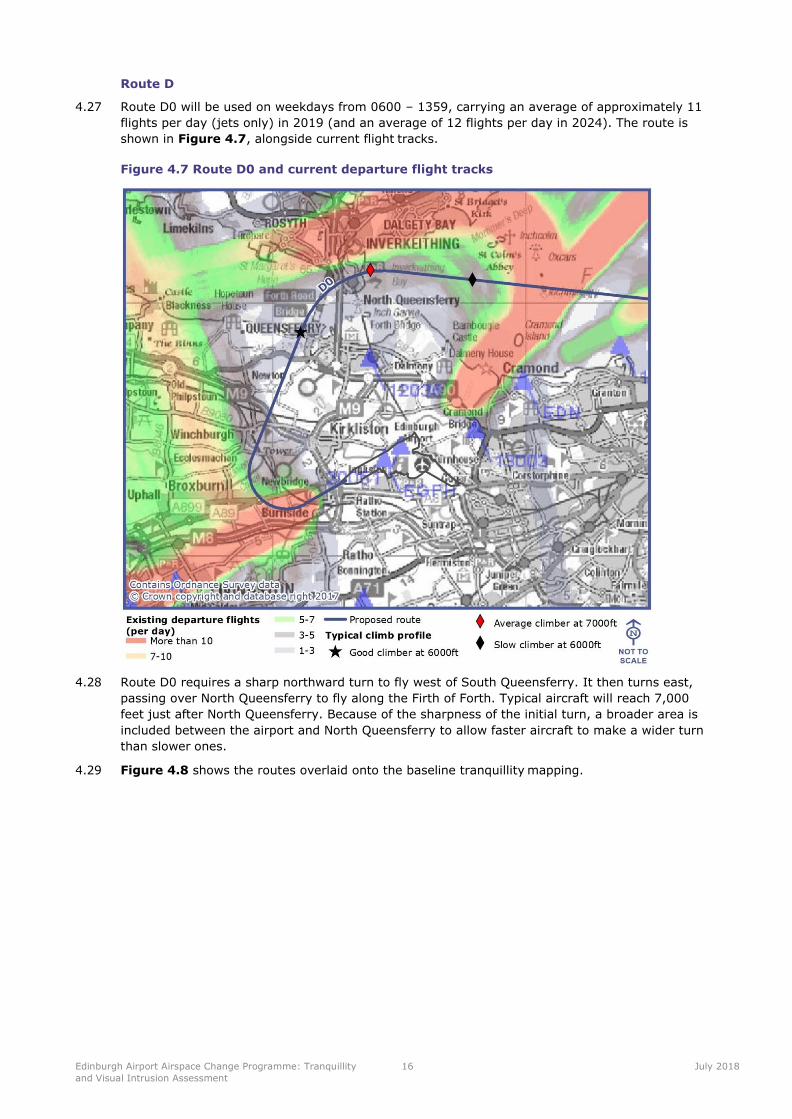
Edinburgh Airport Airspace Change Programme: Tranquillity
and Visual Intrusion Assessment
16 July 2018
Route D
4.27 Route D0 will be used on weekdays from 0600 – 1359, carrying an average of approximately 11
flights per day (jets only) in 2019 (and an average of 12 flights per day in 2024). The route is
shown in Figure 4.7, alongside current flight tracks.
Figure 4.7 Route D0 and current departure flight tracks
4.28 Route D0 requires a sharp northward turn to fly west of South Queensferry. It then turns east,
passing over North Queensferry to fly along the Firth of Forth. Typical aircraft will reach 7,000
feet just after North Queensferry. Because of the sharpness of the initial turn, a broader area is
included between the airport and North Queensferry to allow faster aircraft to make a wider turn
than slower ones.
4.29 Figure 4.8 shows the routes overlaid onto the baseline tranquillity mapping.
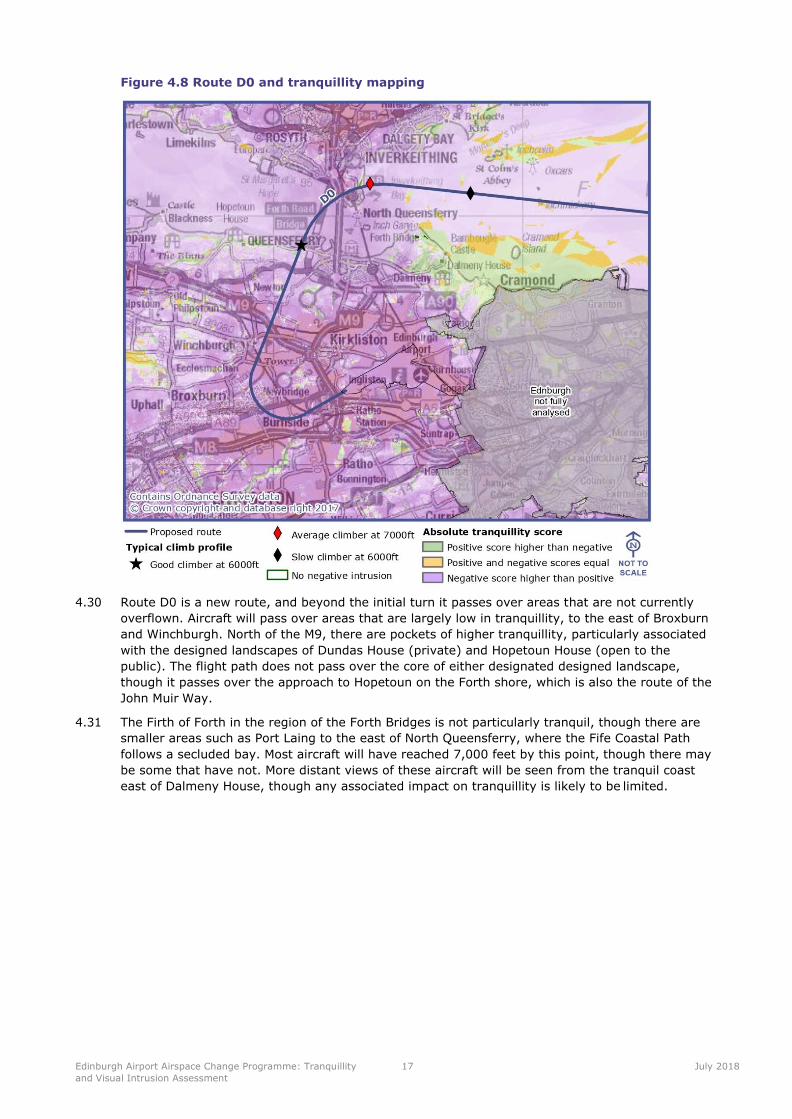
Edinburgh Airport Airspace Change Programme: Tranquillity
and Visual Intrusion Assessment
17 July 2018
Figure 4.8 Route D0 and tranquillity mapping
4.30 Route D0 is a new route, and beyond the initial turn it passes over areas that are not currently
overflown. Aircraft will pass over areas that are largely low in tranquillity, to the east of Broxburn
and Winchburgh. North of the M9, there are pockets of higher tranquillity, particularly associated
with the designed landscapes of Dundas House (private) and Hopetoun House (open to the
public). The flight path does not pass over the core of either designated designed landscape,
though it passes over the approach to Hopetoun on the Forth shore, which is also the route of the
John Muir Way.
4.31 The Firth of Forth in the region of the Forth Bridges is not particularly tranquil, though there are
smaller areas such as Port Laing to the east of North Queensferry, where the Fife Coastal Path
follows a secluded bay. Most aircraft will have reached 7,000 feet by this point, though there may
be some that have not. More distant views of these aircraft will be seen from the tranquil coast
east of Dalmeny House, though any associated impact on tranquillity is likely to be limited.
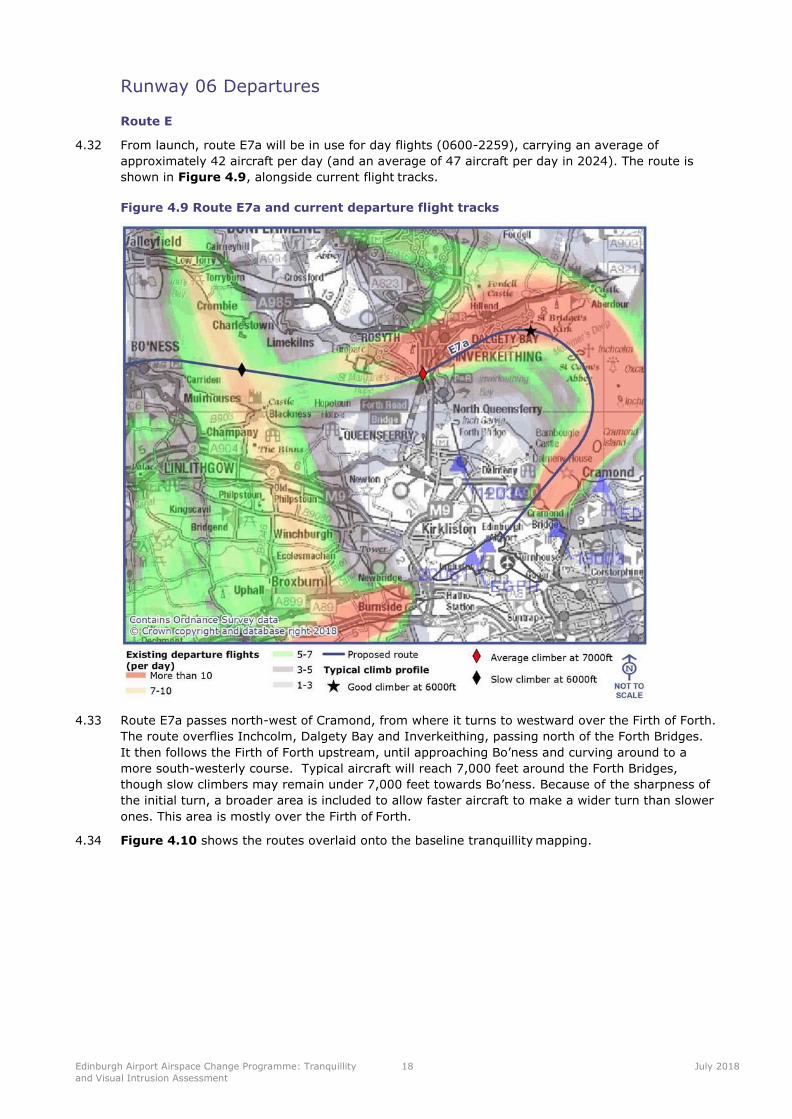
Edinburgh Airport Airspace Change Programme: Tranquillity
and Visual Intrusion Assessment
18 July 2018
Runway 06 Departures
Route E
4.32 From launch, route E7a will be in use for day flights (0600-2259), carrying an average of
approximately 42 aircraft per day (and an average of 47 aircraft per day in 2024). The route is
shown in Figure 4.9, alongside current flight tracks.
Figure 4.9 Route E7a and current departure flight tracks
4.33 Route E7a passes north-west of Cramond, from where it turns to westward over the Firth of Forth.
The route overflies Inchcolm, Dalgety Bay and Inverkeithing, passing north of the Forth Bridges.
It then follows the Firth of Forth upstream, until approaching Bo’ness and curving around to a
more south-westerly course. Typical aircraft will reach 7,000 feet around the Forth Bridges,
though slow climbers may remain under 7,000 feet towards Bo’ness. Because of the sharpness of
the initial turn, a broader area is included to allow faster aircraft to make a wider turn than slower
ones. This area is mostly over the Firth of Forth.
4.34 Figure 4.10 shows the routes overlaid onto the baseline tranquillity mapping.
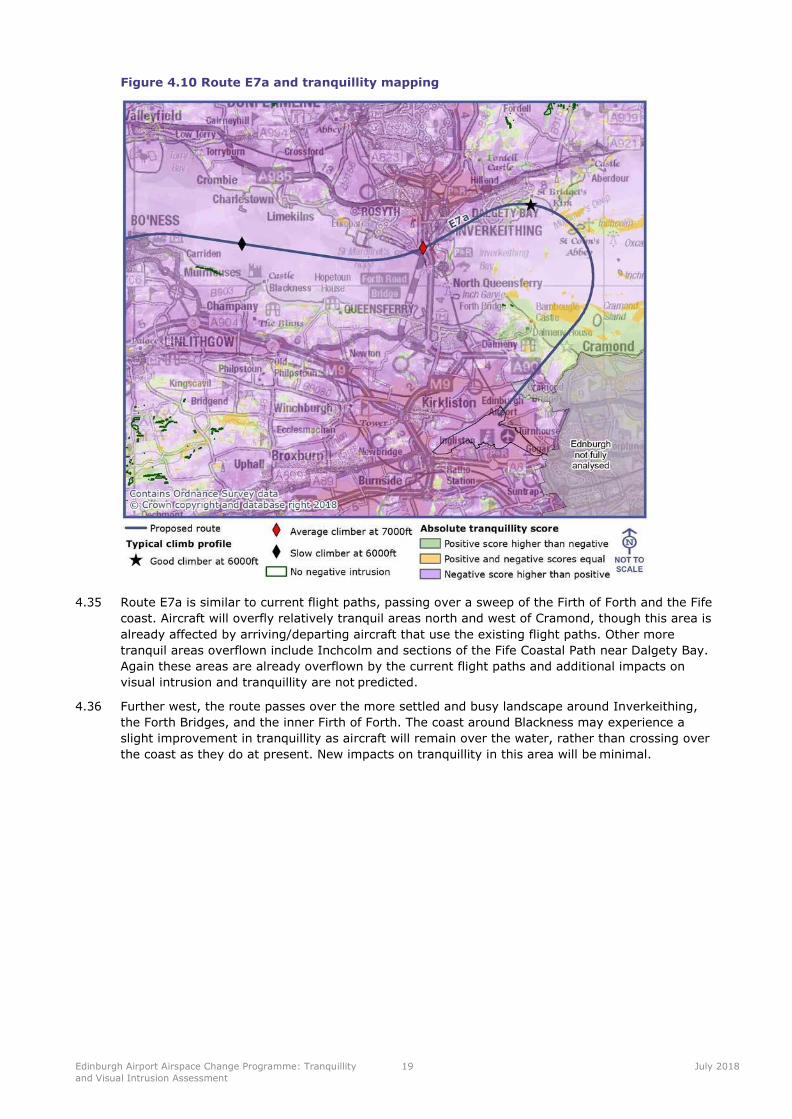
Edinburgh Airport Airspace Change Programme: Tranquillity
and Visual Intrusion Assessment
19 July 2018
Figure 4.10 Route E7a and tranquillity mapping
4.35 Route E7a is similar to current flight paths, passing over a sweep of the Firth of Forth and the Fife
coast. Aircraft will overfly relatively tranquil areas north and west of Cramond, though this area is
already affected by arriving/departing aircraft that use the existing flight paths. Other more
tranquil areas overflown include Inchcolm and sections of the Fife Coastal Path near Dalgety Bay.
Again these areas are already overflown by the current flight paths and additional impacts on
visual intrusion and tranquillity are not predicted.
4.36 Further west, the route passes over the more settled and busy landscape around Inverkeithing,
the Forth Bridges, and the inner Firth of Forth. The coast around Blackness may experience a
slight improvement in tranquillity as aircraft will remain over the water, rather than crossing over
the coast as they do at present. New impacts on tranquillity in this area will be minimal.
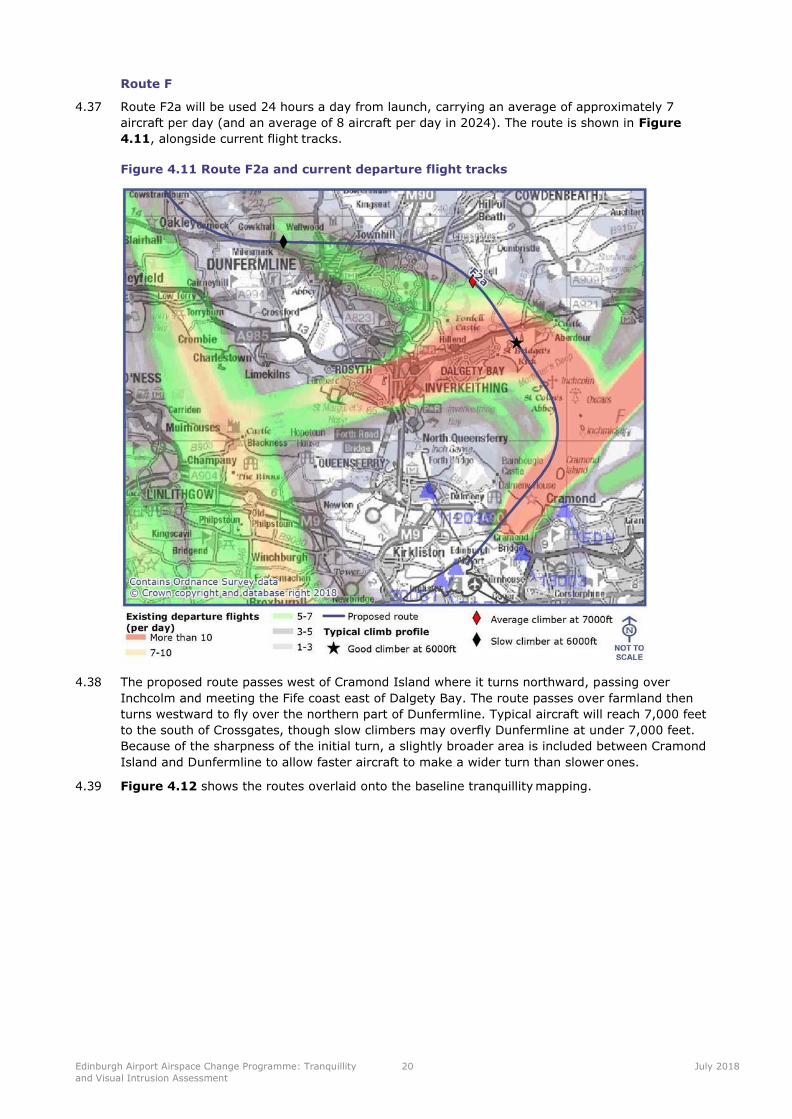
Edinburgh Airport Airspace Change Programme: Tranquillity
and Visual Intrusion Assessment
20 July 2018
Route F
4.37 Route F2a will be used 24 hours a day from launch, carrying an average of approximately 7
aircraft per day (and an average of 8 aircraft per day in 2024). The route is shown in Figure
4.11, alongside current flight tracks.
Figure 4.11 Route F2a and current departure flight tracks
4.38 The proposed route passes west of Cramond Island where it turns northward, passing over
Inchcolm and meeting the Fife coast east of Dalgety Bay. The route passes over farmland then
turns westward to fly over the northern part of Dunfermline. Typical aircraft will reach 7,000 feet
to the south of Crossgates, though slow climbers may overfly Dunfermline at under 7,000 feet.
Because of the sharpness of the initial turn, a slightly broader area is included between Cramond
Island and Dunfermline to allow faster aircraft to make a wider turn than slower ones.
4.39 Figure 4.12 shows the routes overlaid onto the baseline tranquillity mapping.
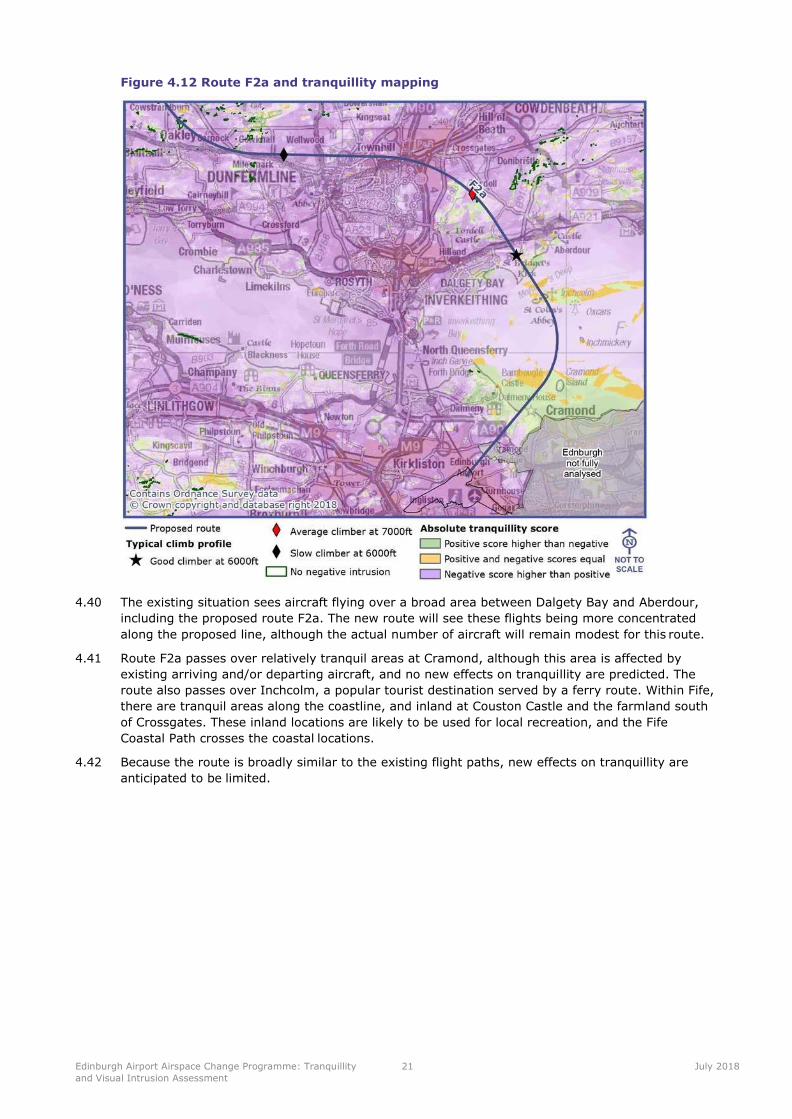
Edinburgh Airport Airspace Change Programme: Tranquillity
and Visual Intrusion Assessment
21 July 2018
Figure 4.12 Route F2a and tranquillity mapping
4.40 The existing situation sees aircraft flying over a broad area between Dalgety Bay and Aberdour,
including the proposed route F2a. The new route will see these flights being more concentrated
along the proposed line, although the actual number of aircraft will remain modest for this route.
4.41 Route F2a passes over relatively tranquil areas at Cramond, although this area is affected by
existing arriving and/or departing aircraft, and no new effects on tranquillity are predicted. The
route also passes over Inchcolm, a popular tourist destination served by a ferry route. Within Fife,
there are tranquil areas along the coastline, and inland at Couston Castle and the farmland south
of Crossgates. These inland locations are likely to be used for local recreation, and the Fife
Coastal Path crosses the coastal locations.
4.42 Because the route is broadly similar to the existing flight paths, new effects on tranquillity are
anticipated to be limited.
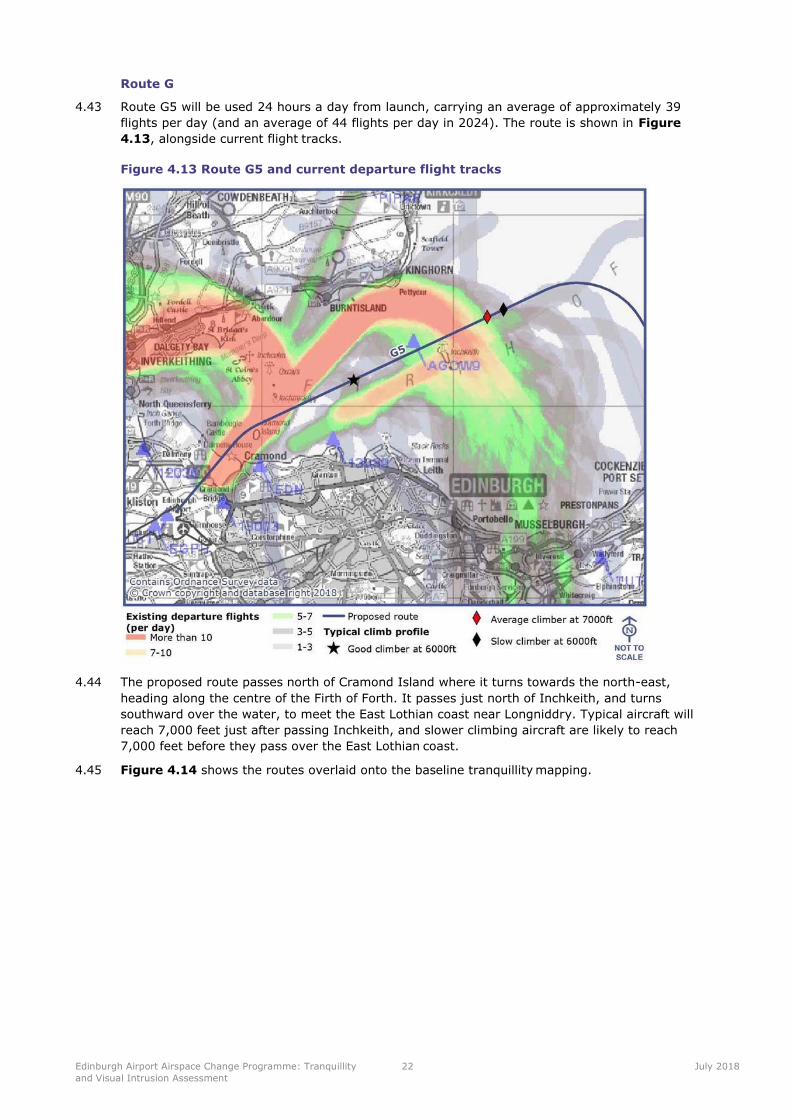
Edinburgh Airport Airspace Change Programme: Tranquillity
and Visual Intrusion Assessment
22 July 2018
Route G
4.43 Route G5 will be used 24 hours a day from launch, carrying an average of approximately 39
flights per day (and an average of 44 flights per day in 2024). The route is shown in Figure
4.13, alongside current flight tracks.
Figure 4.13 Route G5 and current departure flight tracks
4.44 The proposed route passes north of Cramond Island where it turns towards the north-east,
heading along the centre of the Firth of Forth. It passes just north of Inchkeith, and turns
southward over the water, to meet the East Lothian coast near Longniddry. Typical aircraft will
reach 7,000 feet just after passing Inchkeith, and slower climbing aircraft are likely to reach
7,000 feet before they pass over the East Lothian coast.
4.45 Figure 4.14 shows the routes overlaid onto the baseline tranquillity mapping.
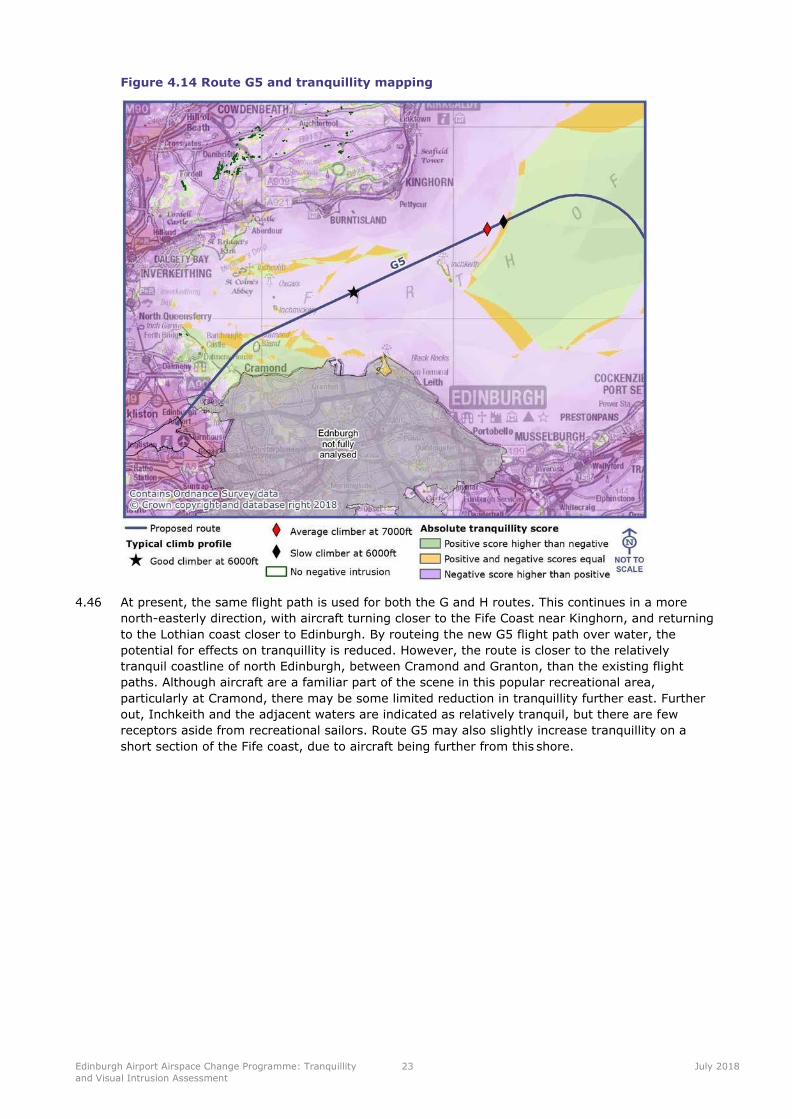
Edinburgh Airport Airspace Change Programme: Tranquillity
and Visual Intrusion Assessment
23 July 2018
Figure 4.14 Route G5 and tranquillity mapping
4.46 At present, the same flight path is used for both the G and H routes. This continues in a more
north-easterly direction, with aircraft turning closer to the Fife Coast near Kinghorn, and returning
to the Lothian coast closer to Edinburgh. By routeing the new G5 flight path over water, the
potential for effects on tranquillity is reduced. However, the route is closer to the relatively
tranquil coastline of north Edinburgh, between Cramond and Granton, than the existing flight
paths. Although aircraft are a familiar part of the scene in this popular recreational area,
particularly at Cramond, there may be some limited reduction in tranquillity further east. Further
out, Inchkeith and the adjacent waters are indicated as relatively tranquil, but there are few
receptors aside from recreational sailors. Route G5 may also slightly increase tranquillity on a
short section of the Fife coast, due to aircraft being further from this shore.
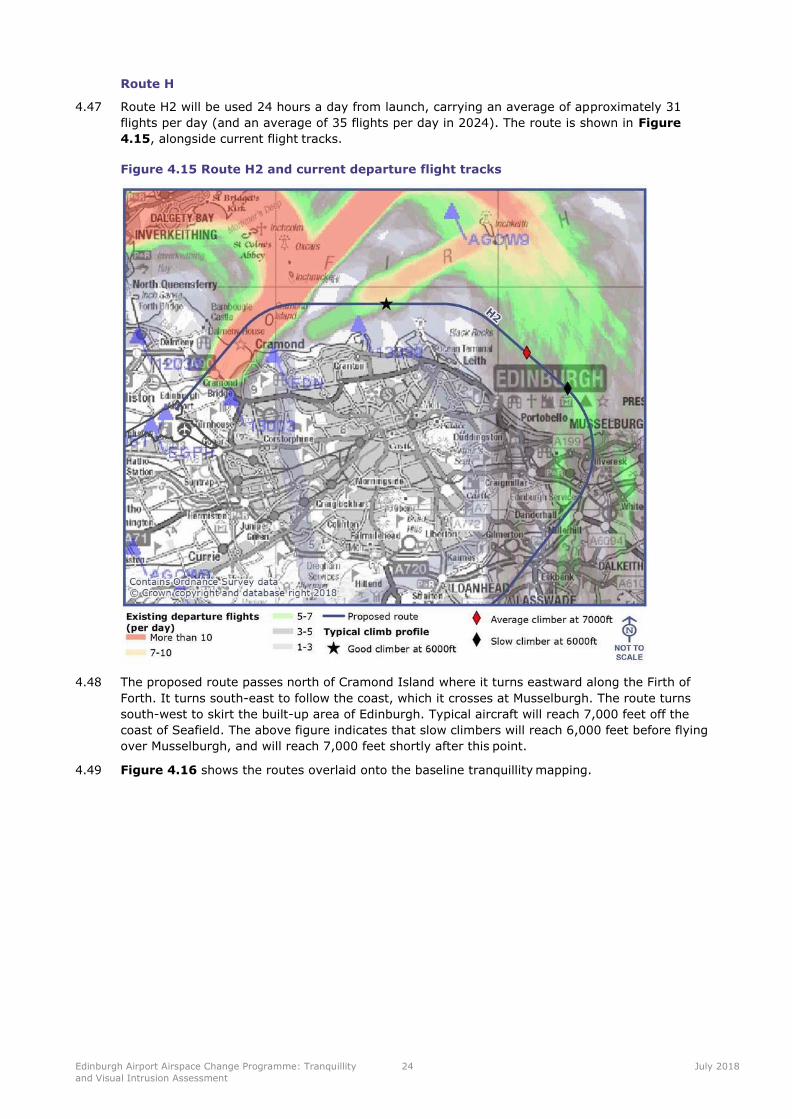
Edinburgh Airport Airspace Change Programme: Tranquillity
and Visual Intrusion Assessment
24 July 2018
Route H
4.47 Route H2 will be used 24 hours a day from launch, carrying an average of approximately 31
flights per day (and an average of 35 flights per day in 2024). The route is shown in Figure
4.15, alongside current flight tracks.
Figure 4.15 Route H2 and current departure flight tracks
4.48 The proposed route passes north of Cramond Island where it turns eastward along the Firth of
Forth. It turns south-east to follow the coast, which it crosses at Musselburgh. The route turns
south-west to skirt the built-up area of Edinburgh. Typical aircraft will reach 7,000 feet off the
coast of Seafield. The above figure indicates that slow climbers will reach 6,000 feet before flying
over Musselburgh, and will reach 7,000 feet shortly after this point.
4.49 Figure 4.16 shows the routes overlaid onto the baseline tranquillity mapping.
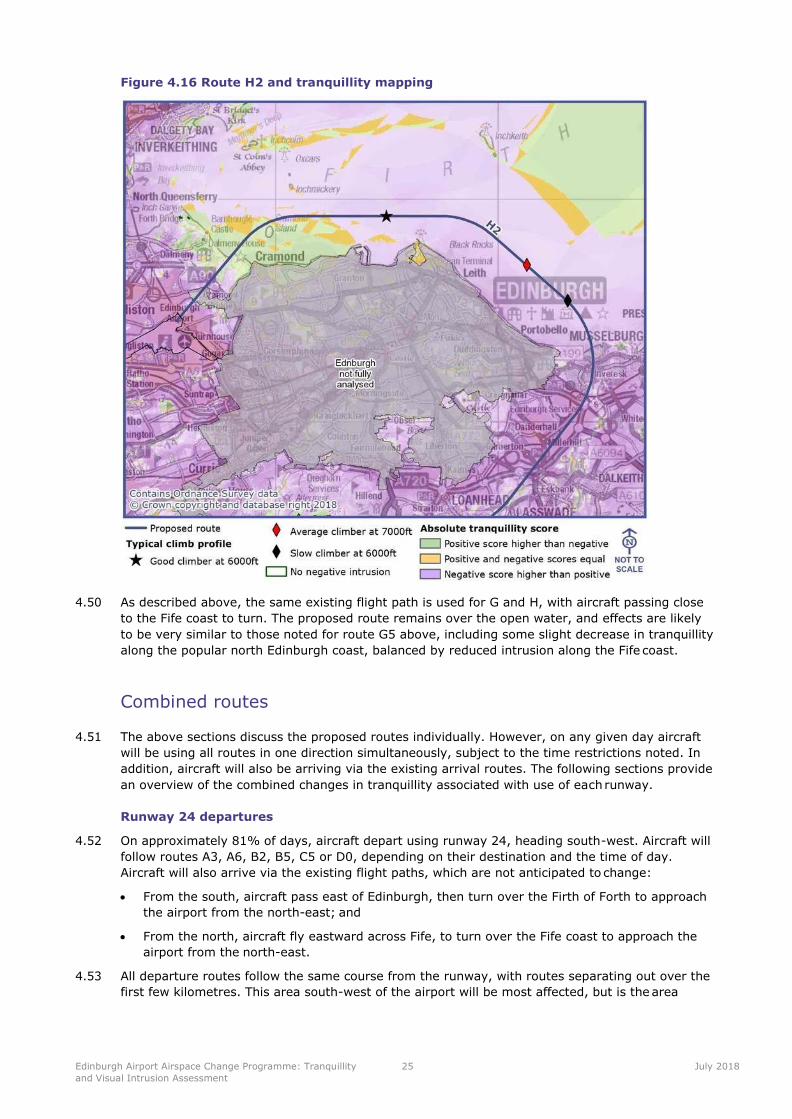
Edinburgh Airport Airspace Change Programme: Tranquillity
and Visual Intrusion Assessment
25 July 2018
Figure 4.16 Route H2 and tranquillity mapping
4.50 As described above, the same existing flight path is used for G and H, with aircraft passing close
to the Fife coast to turn. The proposed route remains over the open water, and effects are likely
to be very similar to those noted for route G5 above, including some slight decrease in tranquillity
along the popular north Edinburgh coast, balanced by reduced intrusion along the Fife coast.
Combined routes
4.51 The above sections discuss the proposed routes individually. However, on any given day aircraft
will be using all routes in one direction simultaneously, subject to the time restrictions noted. In
addition, aircraft will also be arriving via the existing arrival routes. The following sections provide
an overview of the combined changes in tranquillity associated with use of each runway.
Runway 24 departures
4.52 On approximately 81% of days, aircraft depart using runway 24, heading south-west. Aircraft will
follow routes A3, A6, B2, B5, C5 or D0, depending on their destination and the time of day.
Aircraft will also arrive via the existing flight paths, which are not anticipated to change:
• From the south, aircraft pass east of Edinburgh, then turn over the Firth of Forth to approach
the airport from the north-east; and
• From the north, aircraft fly eastward across Fife, to turn over the Fife coast to approach the
airport from the north-east.
4.53 All departure routes follow the same course from the runway, with routes separating out over the
first few kilometres. This area south-west of the airport will be most affected, but is the area
Edinburgh Airport Airspace Change Programme: Tranquillity
and Visual Intrusion Assessment
26 July 2018
currently affected by departing aircraft and baseline tranquillity is low. No substantive change in
tranquillity is anticipated.
4.54 Routes A3 and B5 follow existing flight paths, and no new effects are anticipated in relation to
these routes.
4.55 Routes A6 and D0 are peak-time only routes. A6 is likely to affect tranquillity within the Pentland
Hills, while D0 may affect local pockets of tranquillity west of South Queensferry. From some
areas, particularly the Forth coast between Hound Point and Cramond, aircraft departing on route
D0 may be seen/heard at the same time as aircraft arriving from the east. From the Pentlands,
the bulk of arriving traffic is further east and less likely to be seen/heard in combination with
aircraft on route A6.
4.56 Routes C5 and D0 are in close proximity as they cross the area south of the Forth, and aircraft on
these routes may have some combined effect on local pockets of tranquillity, including areas
associated with Hopetoun House, though only during peak hours.
4.57 Route B2 is relatively distant from other arrival and departure routes, and combined effects are
not anticipated.
Runway 06 departures
4.58 On approximately 19% of days, aircraft depart using runway 06, heading north-east. Aircraft will
follow routes E7a, F2a, G5 or H2, depending on their destination and the time of day. Aircraft will
also arrive via the existing flight paths, which are not anticipated to change:
• From the south, aircraft descend over the southern Pentland Hills, then turn in the vicinity of
Whitburn to approach the airport from the south-west; and
• From the north, aircraft descend over Clackmannan and Grangemouth, turning over West
Lothian to approach the airport from the south-west.
4.59 All departing flights will pass over the Firth of Forth near Cramond, with combined effects on this
popular and relatively tranquil area. However, aircraft are already a feature in this area,
particularly around Cramond. There may be increased effects on tranquillity due to the new flight
paths, which are more dispersed across the Firth of Forth than the current flight paths. Routes G5
and H2 are relatively closer to the Edinburgh coast, and aircraft may give rise to some combined
effects. Other routes are not in close proximity, and aircraft below 7,000 feet are unlikely to be
seen/heard in association with arriving aircraft.
Effects of noise on tranquil areas
4.60 Noise intrusion is covered in detail elsewhere. For the purposes of considering the impacts of
noise on tranquil areas, Figures 4.17 to 4.19 illustrate baseline tranquillity overlaid with:
existing noise contours; projected daytime noise contours; and projected night time noise
contours, respectively.
4.61 The daytime noise contours (LAeq, 16hr) represent the average sound level from aircraft over the
period of 16 hours from 7am until 11pm, based on an average summer day. The current
Government guidance requires noise exposure maps to be prepared for all noise-designated
airports on an annual basis for daytime noise levels of 57dB LAeq and above, which is considered
to mark the approximate onset of significant community annoyance.16 However, airports are
encouraged to map noise exposure to lower levels as well.
4.62 The night noise contours (LAeq, 8hr) represent the average sound level from aircraft over the
period of 8 hours from 11pm until 7am, based on an average summer night. The Government
guidance, in order to improve the monitoring of the impact of night noise, requires the
preparation of these separate night noise contours for designated airports. It is recognised that
night time aircraft noise has a higher cost impact on local communities, especially due to health
costs related to sleep disturbance.17
16 Secretary of State for Transport (2013). Aviation Policy Framework. p.58. Available at
[https://www.gov.uk/government/publications/aviation-policy-framework] 17
Ibid, p.62
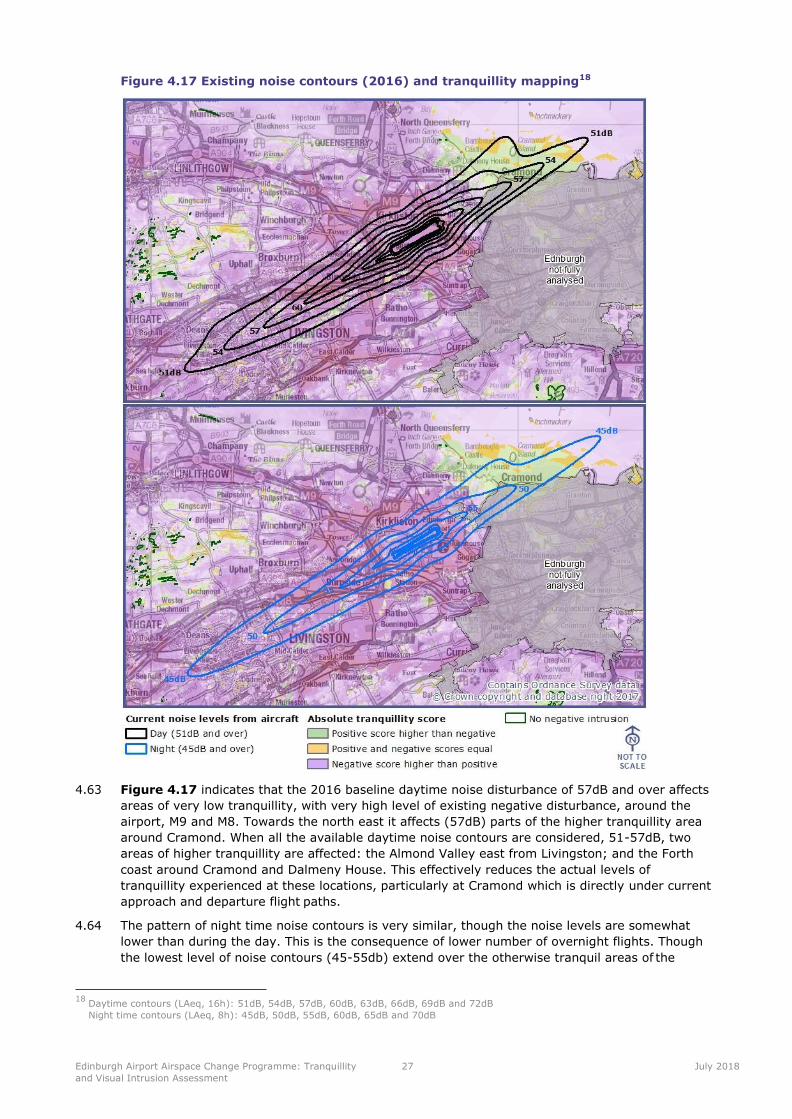
Edinburgh Airport Airspace Change Programme: Tranquillity
and Visual Intrusion Assessment
27 July 2018
Figure 4.17 Existing noise contours (2016) and tranquillity mapping18
4.63 Figure 4.17 indicates that the 2016 baseline daytime noise disturbance of 57dB and over affects
areas of very low tranquillity, with very high level of existing negative disturbance, around the
airport, M9 and M8. Towards the north east it affects (57dB) parts of the higher tranquillity area
around Cramond. When all the available daytime noise contours are considered, 51-57dB, two
areas of higher tranquillity are affected: the Almond Valley east from Livingston; and the Forth
coast around Cramond and Dalmeny House. This effectively reduces the actual levels of
tranquillity experienced at these locations, particularly at Cramond which is directly under current
approach and departure flight paths.
4.64 The pattern of night time noise contours is very similar, though the noise levels are somewhat
lower than during the day. This is the consequence of lower number of overnight flights. Though
the lowest level of noise contours (45-55db) extend over the otherwise tranquil areas of the
18
Daytime contours (LAeq, 16h): 51dB, 54dB, 57dB, 60dB, 63dB, 66dB, 69dB and 72dB
Night time contours (LAeq, 8h): 45dB, 50dB, 55dB, 60dB, 65dB and 70dB
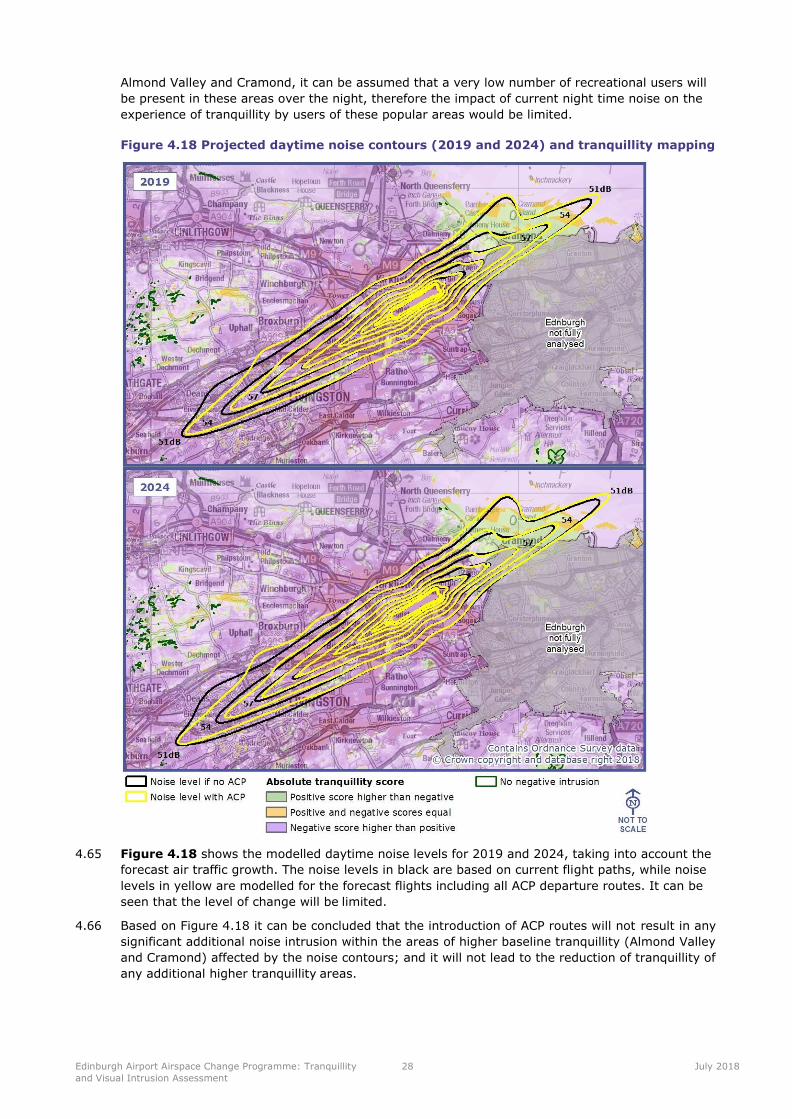
Edinburgh Airport Airspace Change Programme: Tranquillity
and Visual Intrusion Assessment
28 July 2018
Almond Valley and Cramond, it can be assumed that a very low number of recreational users will
be present in these areas over the night, therefore the impact of current night time noise on the
experience of tranquillity by users of these popular areas would be limited.
Figure 4.18 Projected daytime noise contours (2019 and 2024) and tranquillity mapping
4.65 Figure 4.18 shows the modelled daytime noise levels for 2019 and 2024, taking into account the
forecast air traffic growth. The noise levels in black are based on current flight paths, while noise
levels in yellow are modelled for the forecast flights including all ACP departure routes. It can be
seen that the level of change will be limited.
4.66 Based on Figure 4.18 it can be concluded that the introduction of ACP routes will not result in any
significant additional noise intrusion within the areas of higher baseline tranquillity (Almond Valley
and Cramond) affected by the noise contours; and it will not lead to the reduction of tranquillity of
any additional higher tranquillity areas.
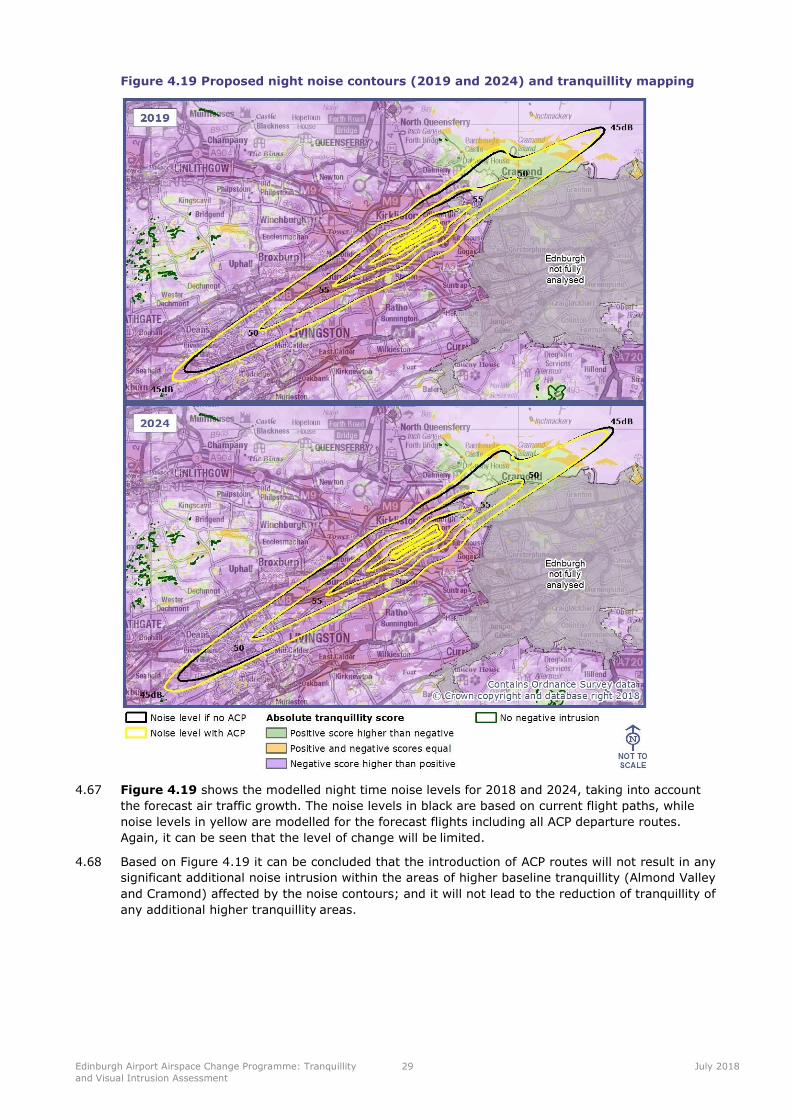
Edinburgh Airport Airspace Change Programme: Tranquillity
and Visual Intrusion Assessment
29 July 2018
Figure 4.19 Proposed night noise contours (2019 and 2024) and tranquillity mapping
4.67 Figure 4.19 shows the modelled night time noise levels for 2018 and 2024, taking into account
the forecast air traffic growth. The noise levels in black are based on current flight paths, while
noise levels in yellow are modelled for the forecast flights including all ACP departure routes.
Again, it can be seen that the level of change will be limited.
4.68 Based on Figure 4.19 it can be concluded that the introduction of ACP routes will not result in any
significant additional noise intrusion within the areas of higher baseline tranquillity (Almond Valley
and Cramond) affected by the noise contours; and it will not lead to the reduction of tranquillity of
any additional higher tranquillity areas.
Edinburgh Airport Airspace Change Programme: Tranquillity
and Visual Intrusion Assessment
30 July 2018
5 Conclusion
5.1 The evaluation of underlying tranquillity mapped this resource based on a series of indicators
representing positive and negative influences on tranquillity. The resulting map of tranquillity
(Figure 2.2) indicates that this resource is relatively limited within the study area, and is found
primarily in unsettled upland areas of the Pentland Hills and Bathgate Hills. The Firth of Forth is
also an area of higher tranquillity, including the areas further offshore but also coastal locations.
5.2 Existing flight paths affect this existing tranquillity. In particular the area around Cramond,
between Hound Point and Granton, is shown as having higher tranquillity, though this is currently
affected by arriving and departing aircraft.
5.3 The evaluation concludes that the new routes likely to have the greatest effects on tranquillity are
B2 and A6. Route B2 overflies the Bathgate Hills, including Beecraigs Country Park, introducing
flights into an area that is not currently intensively overflown. However, only jets will use this
route, and are likely to be approaching 7000 feet amsl over the Bathgate Hills.
5.4 Route A6 will overfly sections of the Pentland Hills that are of high tranquillity and which are not
currently overflown, albeit that this route will only be in use during peak hours (0600 – 0959) on
weekdays.
5.5 Other routes likely to have more modest effects on tranquillity are:
• Routes C5 and D0 may have combined effects on local pockets of tranquillity west of South
Queensferry; and
• Routes G5 and H2 may slightly reduce the experience of tranquillity along the Forth coast
between Cramond and Granton.
5.6 Other routes are not expected to increase effects on rural tranquillity and visual intrusion, relative
to the existing routes.
5.7 The existing aircraft noise contours affect only two pockets of higher baseline tranquillity, within
the Almond Valley and along the Forth coast around Cramond and Dalmeny House. These areas
are already affected by noise intrusion which reduces the level of tranquillity experienced, and this
situation will not change materially as a result of the proposed ACP departure paths.
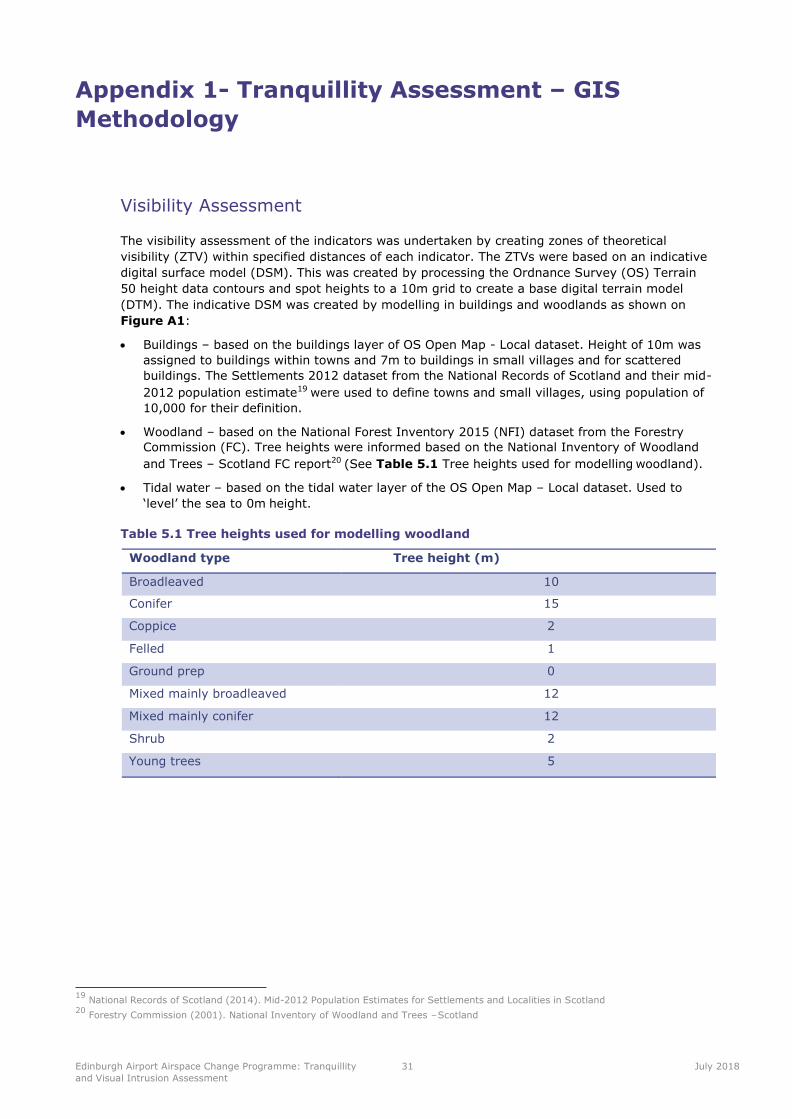
Edinburgh Airport Airspace Change Programme: Tranquillity
and Visual Intrusion Assessment
31 July 2018
Appendix 1- Tranquillity Assessment – GIS
Methodology
Visibility Assessment
The visibility assessment of the indicators was undertaken by creating zones of theoretical
visibility (ZTV) within specified distances of each indicator. The ZTVs were based on an indicative
digital surface model (DSM). This was created by processing the Ordnance Survey (OS) Terrain
50 height data contours and spot heights to a 10m grid to create a base digital terrain model
(DTM). The indicative DSM was created by modelling in buildings and woodlands as shown on
Figure A1:
• Buildings – based on the buildings layer of OS Open Map - Local dataset. Height of 10m was
assigned to buildings within towns and 7m to buildings in small villages and for scattered
buildings. The Settlements 2012 dataset from the National Records of Scotland and their mid-
2012 population estimate19 were used to define towns and small villages, using population of
10,000 for their definition.
• Woodland – based on the National Forest Inventory 2015 (NFI) dataset from the Forestry
Commission (FC). Tree heights were informed based on the National Inventory of Woodland
and Trees – Scotland FC report20 (See Table 5.1 Tree heights used for modelling woodland).
• Tidal water – based on the tidal water layer of the OS Open Map – Local dataset. Used to
‘level’ the sea to 0m height.
Table 5.1 Tree heights used for modelling woodland
Woodland type Tree height (m)
Broadleaved 10
Conifer 15
Coppice 2
Felled 1
Ground prep 0
Mixed mainly broadleaved 12
Mixed mainly conifer 12
Shrub 2
Young trees 5
19 National Records of Scotland (2014). Mid-2012 Population Estimates for Settlements and Localities in Scotland
20 Forestry Commission (2001). National Inventory of Woodland and Trees – Scotland
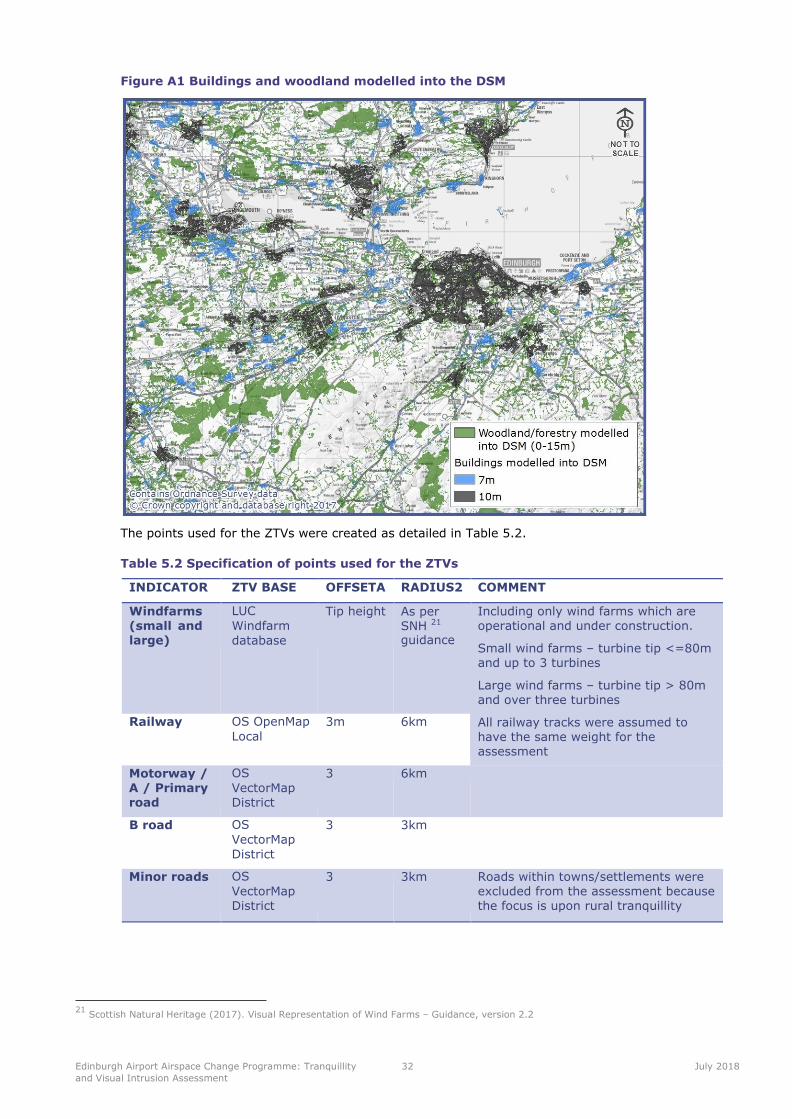
Edinburgh Airport Airspace Change Programme: Tranquillity
and Visual Intrusion Assessment
32 July 2018
Figure A1 Buildings and woodland modelled into the DSM
The points used for the ZTVs were created as detailed in Table 5.2.
Table 5.2 Specification of points used for the ZTVs
INDICATOR ZTV BASE OFFSETA RADIUS2 COMMENT
Windfarms (small and large)
LUC
Windfarm
database
Tip height As per SNH 21
guidance
Including only wind farms which are operational and under construction.
Small wind farms – turbine tip <=80m and up to 3 turbines
Large wind farms – turbine tip > 80m and over three turbines
All railway tracks were assumed to have the same weight for the assessment
Railway OS OpenMap
Local
3m 6km
Motorway / A / Primary road
OS
VectorMap District
3 6km
B road OS
VectorMap
District
3 3km
Minor roads OS
VectorMap District
3 3km Roads within towns/settlements were excluded from the assessment because the focus is upon rural tranquillity
21 Scottish Natural Heritage (2017). Visual Representation of Wind Farms – Guidance, version 2.2
Edinburgh Airport Airspace Change Programme: Tranquillity
and Visual Intrusion Assessment
33 July 2018
Town and cities
OS
VectorMap
District, NRS Localities
0.5 10km The National Records of Scotland
Localities dataset from 2012 and the
mid-2012 population estimate22 per locality was used to define towns and small villages, using a population of 10,000 as the break (as per the approach used by the University of Northampton)
Scattered
buildings
OS
VectorMap District
0.5 1.5km Only scattered buildings over 2km
from towns and villages were considered
Quarry BGS
GeoIndex /
ESRI Aerial
0.5 10km Location of active mines/quarries defined based on the ‘Active mines and
quarries’ layer of BGS’s GeoIndex, their boundary captured based on ESRI aerial imagery
Lochs OS
VectorMap District
0.5m 6km A number of datasets from OS were
used to select out lochs of suitable size, including VectorMap District, Open River and Meridian
Visibility of rivers and streams have not been included as they are small
scale features and their visibility is limited within the study area
Woodland FCS NFI
2015 0 6km Only woodland classified as
broadleaved or mainly broadleaved
and having an area over 2.5ha have been considered within the assessment
The ZTV assessment was not prepared for all indicators within the city of Edinburgh (except along
its 500m edge) because Edinburgh will not be directly affected by the proposed route changes,
and the focus of the work is on rural tranquillity.
Applying distance weighting
The ZTVs were distance-weighted to reflect the greater visual impact of indicators closer to the
observer than those further away.
The distances and scores applied to the different indicators were broadly based on the University
of Northampton 2016 study (page 72), adjusted based on local circumstances and the application
of professional judgement, as shown in the tables below.
22 NRS (2012)
Sea OS OpenMap 0 Local tidal water
50km
Edinburgh Airport
OS
VectorMap
Local
0 15km Airport footprint
Overhead power line
(towers)
OS
VectorMap
District
40m for 400kV
lines and 30m for
other
10km 400kV lines were identified based on online sources
Tower locations were modelled at 400m spacing
Small village OS
VectorMap District, NRS Localities
0.5 6km
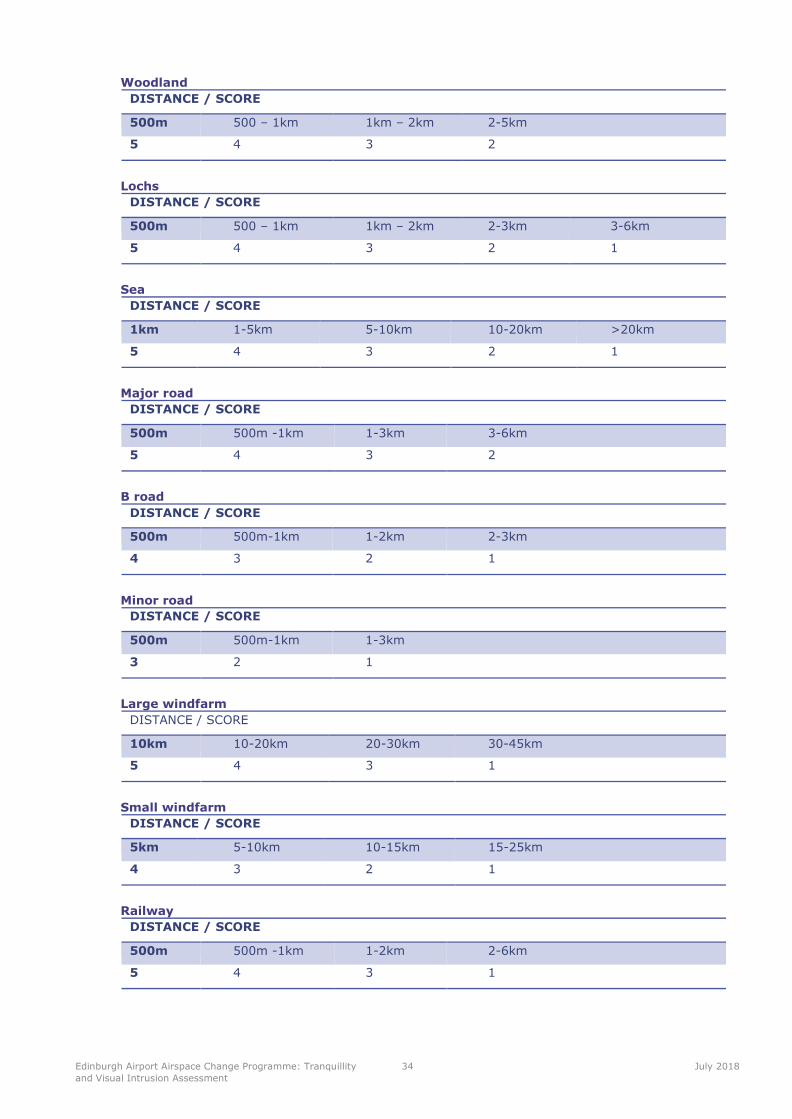
Edinburgh Airport Airspace Change Programme: Tranquillity
and Visual Intrusion Assessment
34 July 2018
Woodland
DISTANCE / SCORE
500m 500 – 1km 1km – 2km 2-5km
5 4 3 2
Lochs
DISTANCE / SCORE
500m 500 – 1km 1km – 2km 2-3km 3-6km
5 4 3 2 1
Sea
DISTANCE / SCORE
1km 1-5km 5-10km 10-20km >20km
5 4 3 2 1
Major road
DISTANCE / SCORE
500m 500m -1km 1-3km 3-6km
5 4 3 2
B road
DISTANCE / SCORE
500m 500m-1km 1-2km 2-3km
4 3 2 1
Minor road
DISTANCE / SCORE
500m 500m-1km 1-3km
3 2 1
Large windfarm
DISTANCE / SCORE
10km 10-20km 20-30km 30-45km
5 4 3 1
Small windfarm
DISTANCE / SCORE
5km 5-10km 10-15km 15-25km
4 3 2 1
Railway
DISTANCE / SCORE
500m 500m -1km 1-2km 2-6km
5 4 3 1
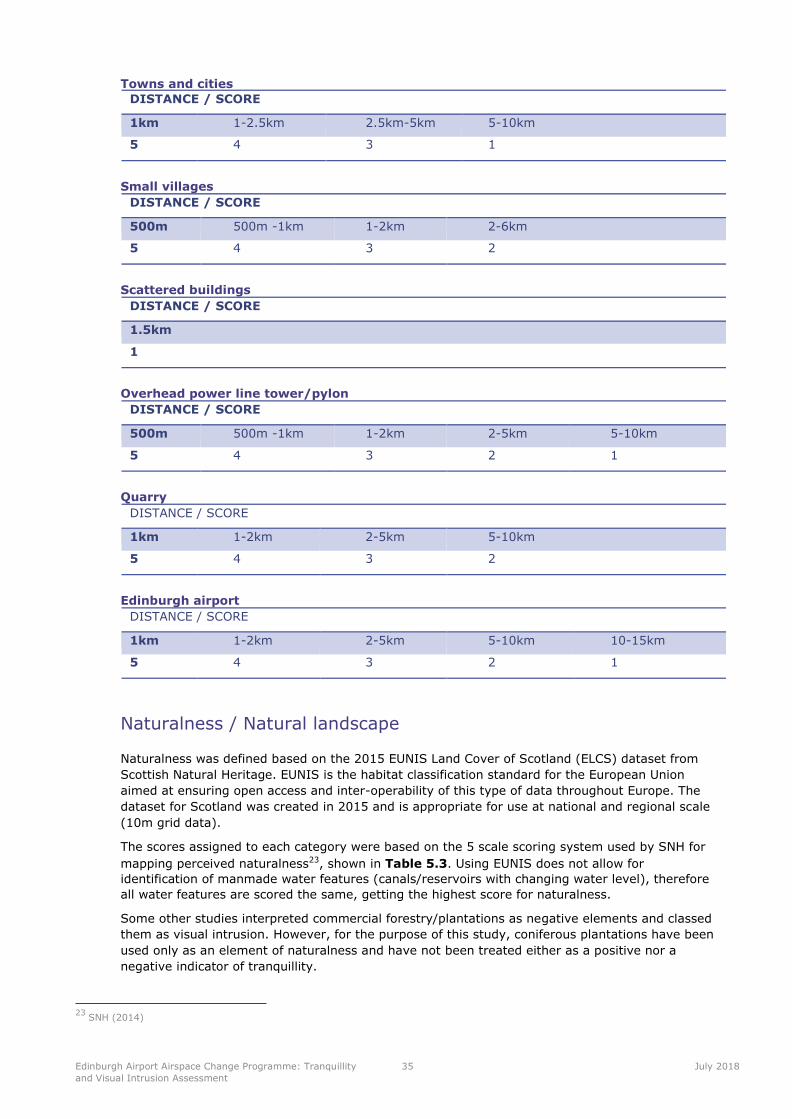
Edinburgh Airport Airspace Change Programme: Tranquillity
and Visual Intrusion Assessment
35 July 2018
Towns and cities
DISTANCE / SCORE
1km 1-2.5km 2.5km-5km 5-10km
5 4 3 1
Small villages
DISTANCE / SCORE
500m 500m -1km 1-2km 2-6km
5 4 3 2
Scattered buildings
DISTANCE / SCORE
1.5km
1
Overhead power line tower/pylon
DISTANCE / SCORE
500m 500m -1km 1-2km 2-5km 5-10km
5 4 3 2 1
Quarry
DISTANCE / SCORE
1km 1-2km 2-5km 5-10km
5 4 3 2
Edinburgh airport
DISTANCE / SCORE
1km 1-2km 2-5km 5-10km 10-15km
5 4 3 2 1
Naturalness / Natural landscape
Naturalness was defined based on the 2015 EUNIS Land Cover of Scotland (ELCS) dataset from
Scottish Natural Heritage. EUNIS is the habitat classification standard for the European Union
aimed at ensuring open access and inter-operability of this type of data throughout Europe. The
dataset for Scotland was created in 2015 and is appropriate for use at national and regional scale
(10m grid data).
The scores assigned to each category were based on the 5 scale scoring system used by SNH for
mapping perceived naturalness23, shown in Table 5.3. Using EUNIS does not allow for
identification of manmade water features (canals/reservoirs with changing water level), therefore
all water features are scored the same, getting the highest score for naturalness.
Some other studies interpreted commercial forestry/plantations as negative elements and classed
them as visual intrusion. However, for the purpose of this study, coniferous plantations have been
used only as an element of naturalness and have not been treated either as a positive nor a
negative indicator of tranquillity.
23 SNH (2014)
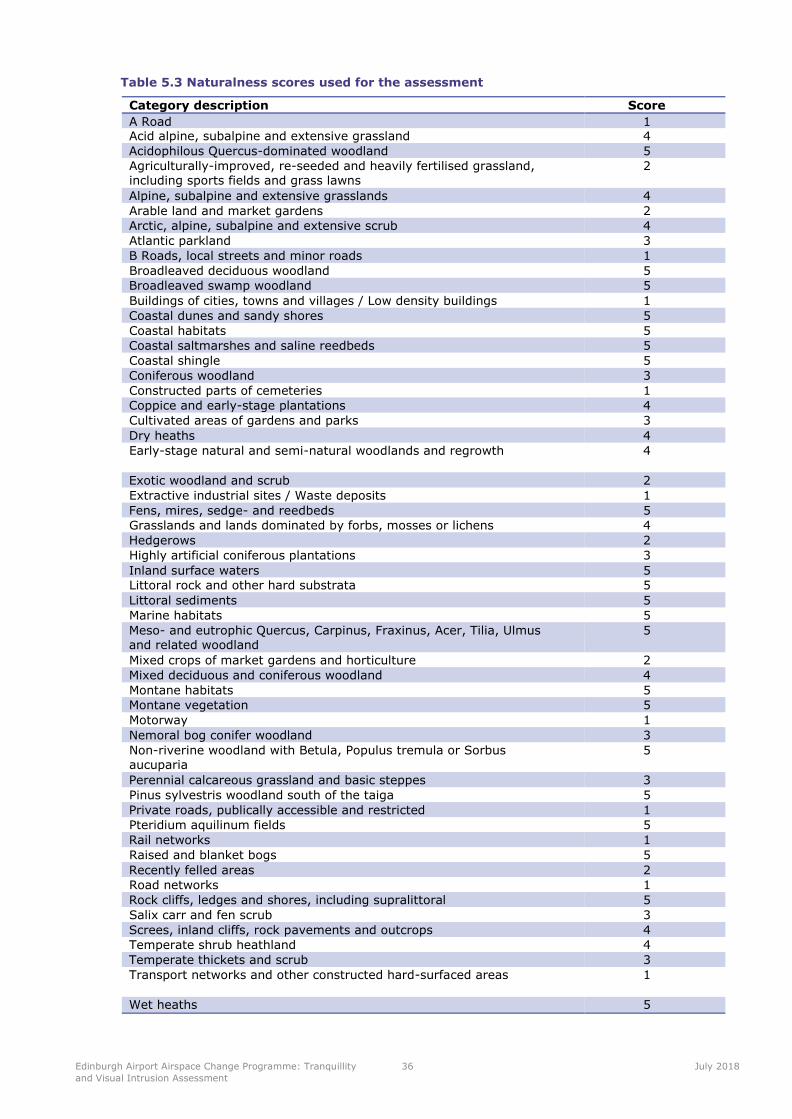
Edinburgh Airport Airspace Change Programme: Tranquillity
and Visual Intrusion Assessment
36 July 2018
Table 5.3 Naturalness scores used for the assessment
Category description Score
A Road 1 Acid alpine, subalpine and extensive grassland 4
Acidophilous Quercus-dominated woodland 5
Agriculturally-improved, re-seeded and heavily fertilised grassland, including sports fields and grass lawns
2
Alpine, subalpine and extensive grasslands 4
Arable land and market gardens 2
Arctic, alpine, subalpine and extensive scrub 4
Atlantic parkland 3
B Roads, local streets and minor roads 1
Broadleaved deciduous woodland 5
Broadleaved swamp woodland 5
Buildings of cities, towns and villages / Low density buildings 1
Coastal dunes and sandy shores 5
Coastal habitats 5
Coastal saltmarshes and saline reedbeds 5
Coastal shingle 5
Coniferous woodland 3
Constructed parts of cemeteries 1
Coppice and early-stage plantations 4
Cultivated areas of gardens and parks 3
Dry heaths 4
Early-stage natural and semi-natural woodlands and regrowth 4
Exotic woodland and scrub 2
Extractive industrial sites / Waste deposits 1
Fens, mires, sedge- and reedbeds 5
Grasslands and lands dominated by forbs, mosses or lichens 4
Hedgerows 2
Highly artificial coniferous plantations 3
Inland surface waters 5
Littoral rock and other hard substrata 5
Littoral sediments 5
Marine habitats 5
Meso- and eutrophic Quercus, Carpinus, Fraxinus, Acer, Tilia, Ulmus and related woodland
5
Mixed crops of market gardens and horticulture 2
Mixed deciduous and coniferous woodland 4
Montane habitats 5
Montane vegetation 5
Motorway 1
Nemoral bog conifer woodland 3
Non-riverine woodland with Betula, Populus tremula or Sorbus aucuparia
5
Perennial calcareous grassland and basic steppes 3
Pinus sylvestris woodland south of the taiga 5
Private roads, publically accessible and restricted 1
Pteridium aquilinum fields 5
Rail networks 1
Raised and blanket bogs 5
Recently felled areas 2
Road networks 1
Rock cliffs, ledges and shores, including supralittoral 5
Salix carr and fen scrub 3
Screes, inland cliffs, rock pavements and outcrops 4
Temperate shrub heathland 4
Temperate thickets and scrub 3
Transport networks and other constructed hard-surfaced areas 1
Wet heaths 5
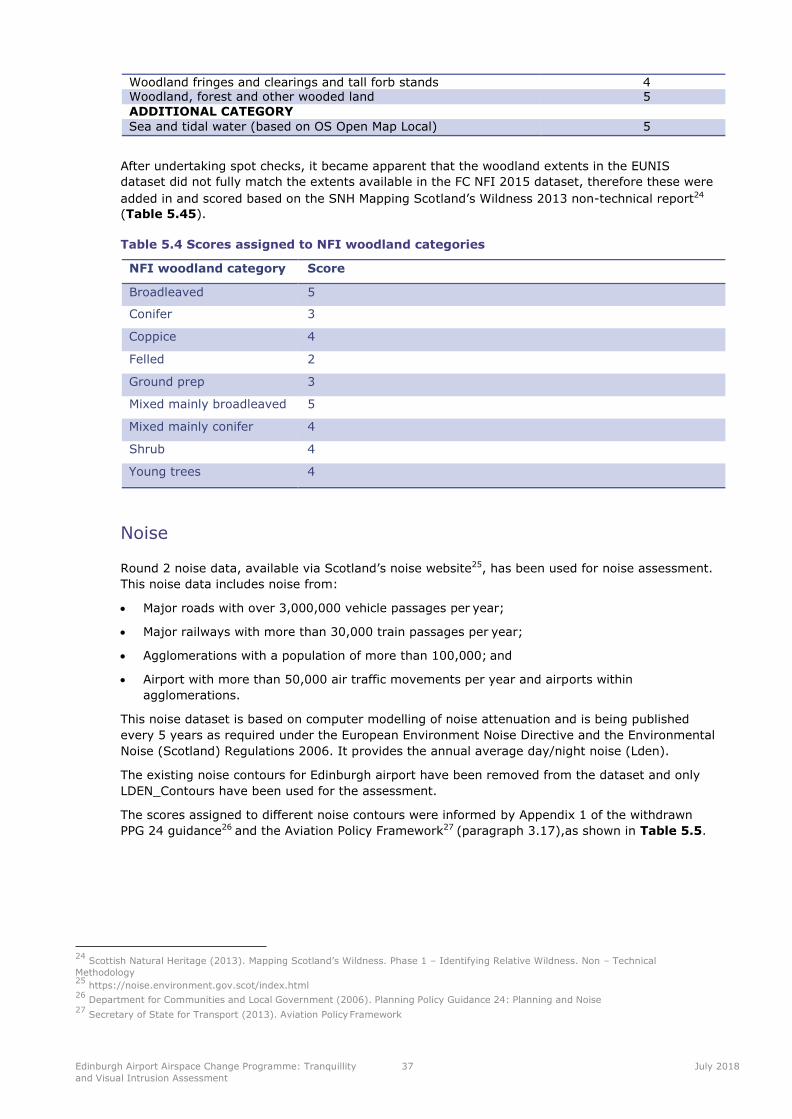
Edinburgh Airport Airspace Change Programme: Tranquillity
and Visual Intrusion Assessment
37 July 2018
Woodland fringes and clearings and tall forb stands 4 Woodland, forest and other wooded land 5
ADDITIONAL CATEGORY Sea and tidal water (based on OS Open Map Local) 5
After undertaking spot checks, it became apparent that the woodland extents in the EUNIS
dataset did not fully match the extents available in the FC NFI 2015 dataset, therefore these were
added in and scored based on the SNH Mapping Scotland’s Wildness 2013 non-technical report24
(Table 5.45).
Table 5.4 Scores assigned to NFI woodland categories
NFI woodland category Score
Broadleaved 5
Conifer 3
Coppice 4
Felled 2
Ground prep 3
Mixed mainly broadleaved 5
Mixed mainly conifer 4
Shrub 4
Young trees 4
Noise
Round 2 noise data, available via Scotland’s noise website25, has been used for noise assessment.
This noise data includes noise from:
• Major roads with over 3,000,000 vehicle passages per year;
• Major railways with more than 30,000 train passages per year;
• Agglomerations with a population of more than 100,000; and
• Airport with more than 50,000 air traffic movements per year and airports within
agglomerations.
This noise dataset is based on computer modelling of noise attenuation and is being published
every 5 years as required under the European Environment Noise Directive and the Environmental
Noise (Scotland) Regulations 2006. It provides the annual average day/night noise (Lden).
The existing noise contours for Edinburgh airport have been removed from the dataset and only
LDEN_Contours have been used for the assessment.
The scores assigned to different noise contours were informed by Appendix 1 of the withdrawn
PPG 24 guidance26 and the Aviation Policy Framework27 (paragraph 3.17),as shown in Table 5.5.
24 Scottish Natural Heritage (2013). Mapping Scotland’s Wildness. Phase 1 – Identifying Relative Wildness. Non – Technical
Methodology 25
https://noise.environment.gov.scot/index.html 26
Department for Communities and Local Government (2006). Planning Policy Guidance 24: Planning and Noise 27
Secretary of State for Transport (2013). Aviation Policy Framework
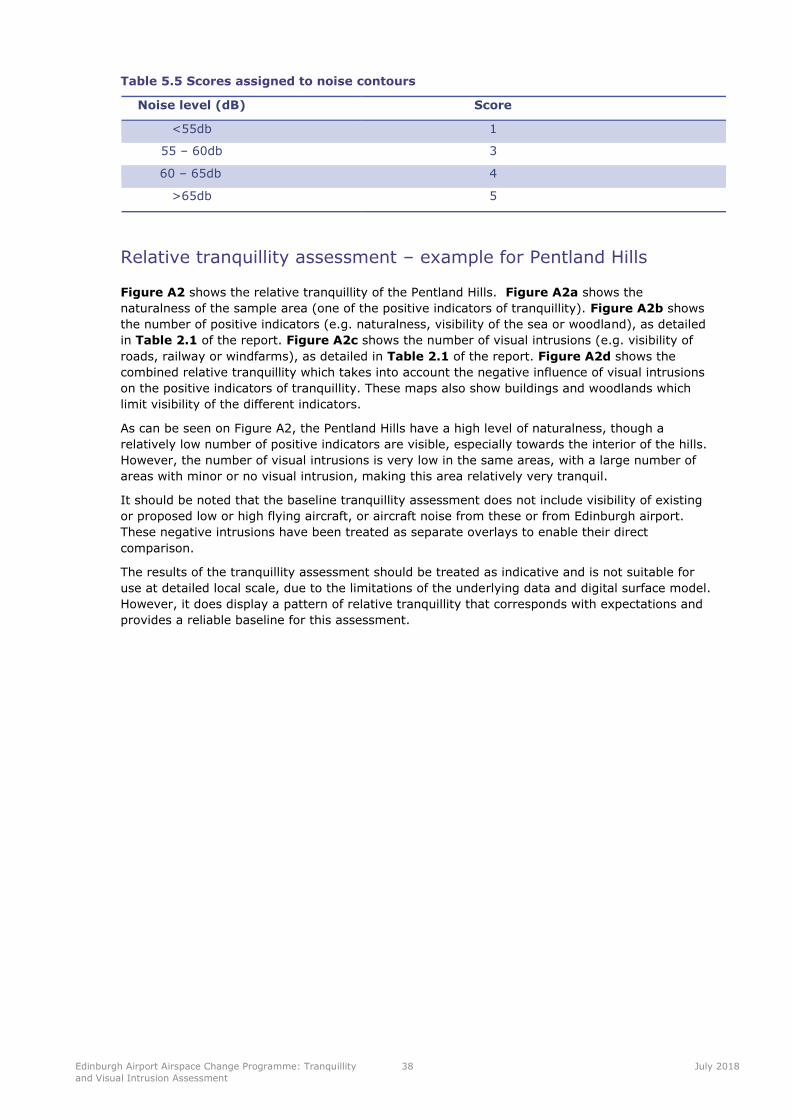
Edinburgh Airport Airspace Change Programme: Tranquillity
and Visual Intrusion Assessment
38 July 2018
Table 5.5 Scores assigned to noise contours
Noise level (dB) Score
<55db 1
55 – 60db 3
60 – 65db 4
>65db 5
Relative tranquillity assessment – example for Pentland Hills
Figure A2 shows the relative tranquillity of the Pentland Hills. Figure A2a shows the
naturalness of the sample area (one of the positive indicators of tranquillity). Figure A2b shows
the number of positive indicators (e.g. naturalness, visibility of the sea or woodland), as detailed
in Table 2.1 of the report. Figure A2c shows the number of visual intrusions (e.g. visibility of
roads, railway or windfarms), as detailed in Table 2.1 of the report. Figure A2d shows the
combined relative tranquillity which takes into account the negative influence of visual intrusions
on the positive indicators of tranquillity. These maps also show buildings and woodlands which
limit visibility of the different indicators.
As can be seen on Figure A2, the Pentland Hills have a high level of naturalness, though a
relatively low number of positive indicators are visible, especially towards the interior of the hills.
However, the number of visual intrusions is very low in the same areas, with a large number of
areas with minor or no visual intrusion, making this area relatively very tranquil.
It should be noted that the baseline tranquillity assessment does not include visibility of existing
or proposed low or high flying aircraft, or aircraft noise from these or from Edinburgh airport.
These negative intrusions have been treated as separate overlays to enable their direct
comparison.
The results of the tranquillity assessment should be treated as indicative and is not suitable for
use at detailed local scale, due to the limitations of the underlying data and digital surface model.
However, it does display a pattern of relative tranquillity that corresponds with expectations and
provides a reliable baseline for this assessment.
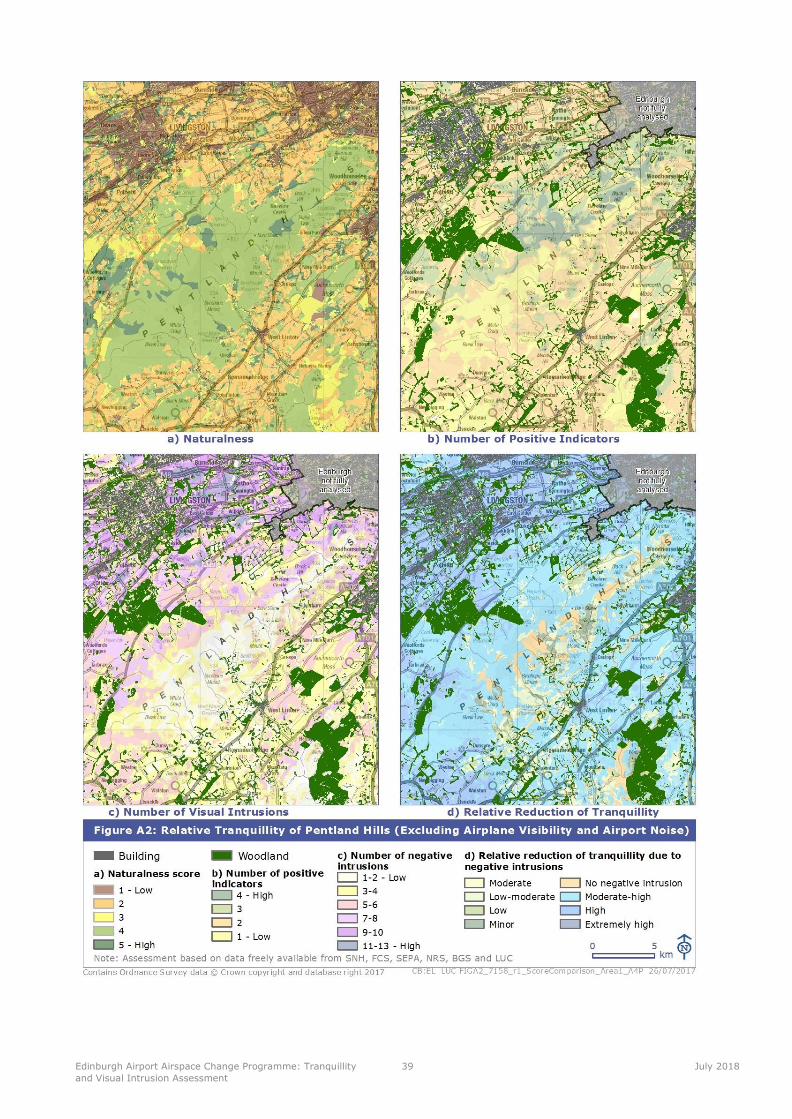
Edinburgh Airport Airspace Change Programme: Tranquillity
and Visual Intrusion Assessment
39 July 2018
Ricardo Energy & Environment Edinburgh Airport Airspace Change Programme
Appendix C
Health assessment
Ricardo in Confidence Ref: Ricardo/ED10588/Issue 8
Health Impacts of Edinburgh Airport
Airspace Change Programme
Dr John Kemm
8 April 2018
This report has been prepared by John Kemm MD, FFPHM, FRCP. John Kemm trained as a doctor
and has worked in public health for 30 years. He has held various senior posts including Senior
Lecturer in Epidemiology and Public Health in University of Birmingham, Consultant in Public Health
in South Birmingham Health Authority, Director of Public Health in Health Promotion Wales,
Assistant Director of Public Health in West Midlands NHS Executive and Director of the West
Midlands Public Health Observatory. He has had an interest in health impact assessment for the
past twenty years, has lead or participated in numerous health impact assessments and has written
several papers and two books on this subject.
Table of Contents
1 Health of population around Edinburgh Airport .......................................................................... 1
2 Health effects of noise .................................................................................................................. 2
2.1 Effects on the cardiovascular system ................................................................................. 4
2.2 Annoyance .......................................................................................................................... 6
2.3 Sleep Disturbance ............................................................................................................. 11
2.4 Children’s learning ............................................................................................................ 14
3 Factors used in estimating health effects associated with noise ............................................... 17
4 Expected consequences of aircraft noise around Edinburgh Airport ......................................... 19
4.1 Number of highly annoyed people ................................................................................... 20
4.2 Number of heart disease admissions ............................................................................... 22
4.3 Number of additional stroke admissions ......................................................................... 24
4.4 Number of people highly sleep disturbed ........................................................................ 26
4.5 Effect on reading age in school children .......................................................................... 28
4.6 Hospitals ........................................................................................................................... 30
5 Summary of health impacts of airspace change programme ..................................................... 31
6. References .................................................................................................................................. 32
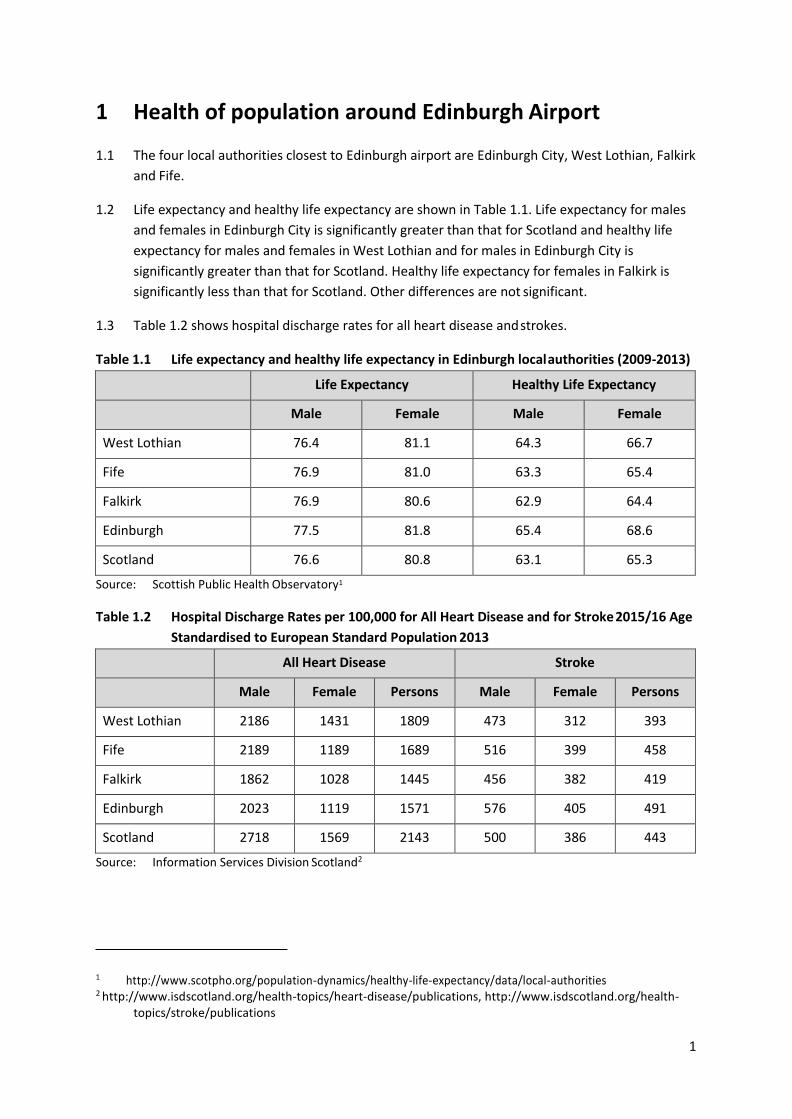
1
1 Health of population around Edinburgh Airport
1.1 The four local authorities closest to Edinburgh airport are Edinburgh City, West Lothian, Falkirk
and Fife.
1.2 Life expectancy and healthy life expectancy are shown in Table 1.1. Life expectancy for males
and females in Edinburgh City is significantly greater than that for Scotland and healthy life
expectancy for males and females in West Lothian and for males in Edinburgh City is
significantly greater than that for Scotland. Healthy life expectancy for females in Falkirk is
significantly less than that for Scotland. Other differences are not significant.
1.3 Table 1.2 shows hospital discharge rates for all heart disease and strokes.
Table 1.1 Life expectancy and healthy life expectancy in Edinburgh local authorities (2009-2013)
Life Expectancy Healthy Life Expectancy
Male Female Male Female
West Lothian 76.4 81.1 64.3 66.7
Fife 76.9 81.0 63.3 65.4
Falkirk 76.9 80.6 62.9 64.4
Edinburgh 77.5 81.8 65.4 68.6
Scotland 76.6 80.8 63.1 65.3
Source: Scottish Public Health Observatory1
Table 1.2 Hospital Discharge Rates per 100,000 for All Heart Disease and for Stroke 2015/16 Age
Standardised to European Standard Population 2013
All Heart Disease Stroke
Male Female Persons Male Female Persons
West Lothian 2186 1431 1809 473 312 393
Fife 2189 1189 1689 516 399 458
Falkirk 1862 1028 1445 456 382 419
Edinburgh 2023 1119 1571 576 405 491
Scotland 2718 1569 2143 500 386 443
Source: Information Services Division Scotland2
1 http://www.scotpho.org/population-dynamics/healthy-life-expectancy/data/local-authorities 2 http://www.isdscotland.org/health-topics/heart-disease/publications, http://www.isdscotland.org/health-
topics/stroke/publications
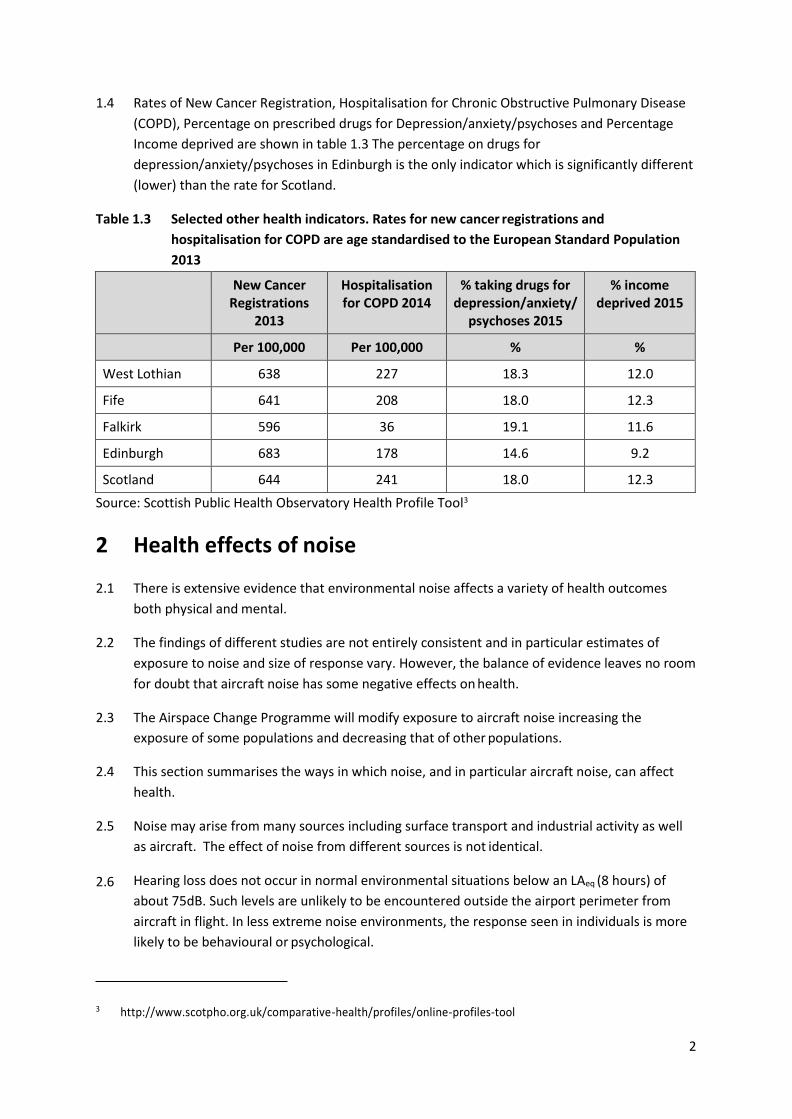
2
1.4 Rates of New Cancer Registration, Hospitalisation for Chronic Obstructive Pulmonary Disease
(COPD), Percentage on prescribed drugs for Depression/anxiety/psychoses and Percentage
Income deprived are shown in table 1.3 The percentage on drugs for
depression/anxiety/psychoses in Edinburgh is the only indicator which is significantly different
(lower) than the rate for Scotland.
Table 1.3 Selected other health indicators. Rates for new cancer registrations and
hospitalisation for COPD are age standardised to the European Standard Population
2013
New Cancer Registrations
2013
Hospitalisation for COPD 2014
% taking drugs for depression/anxiety/
psychoses 2015
% income deprived 2015
Per 100,000 Per 100,000 % %
West Lothian 638 227 18.3 12.0
Fife 641 208 18.0 12.3
Falkirk 596 36 19.1 11.6
Edinburgh 683 178 14.6 9.2
Scotland 644 241 18.0 12.3
Source: Scottish Public Health Observatory Health Profile Tool3
2 Health effects of noise
2.1 There is extensive evidence that environmental noise affects a variety of health outcomes
both physical and mental.
2.2 The findings of different studies are not entirely consistent and in particular estimates of
exposure to noise and size of response vary. However, the balance of evidence leaves no room
for doubt that aircraft noise has some negative effects on health.
2.3 The Airspace Change Programme will modify exposure to aircraft noise increasing the
exposure of some populations and decreasing that of other populations.
2.4 This section summarises the ways in which noise, and in particular aircraft noise, can affect
health.
2.5 Noise may arise from many sources including surface transport and industrial activity as well
as aircraft. The effect of noise from different sources is not identical.
2.6 Hearing loss does not occur in normal environmental situations below an LAeq (8 hours) of
about 75dB. Such levels are unlikely to be encountered outside the airport perimeter from
aircraft in flight. In less extreme noise environments, the response seen in individuals is more
likely to be behavioural or psychological.
3 http://www.scotpho.org.uk/comparative-health/profiles/online-profiles-tool
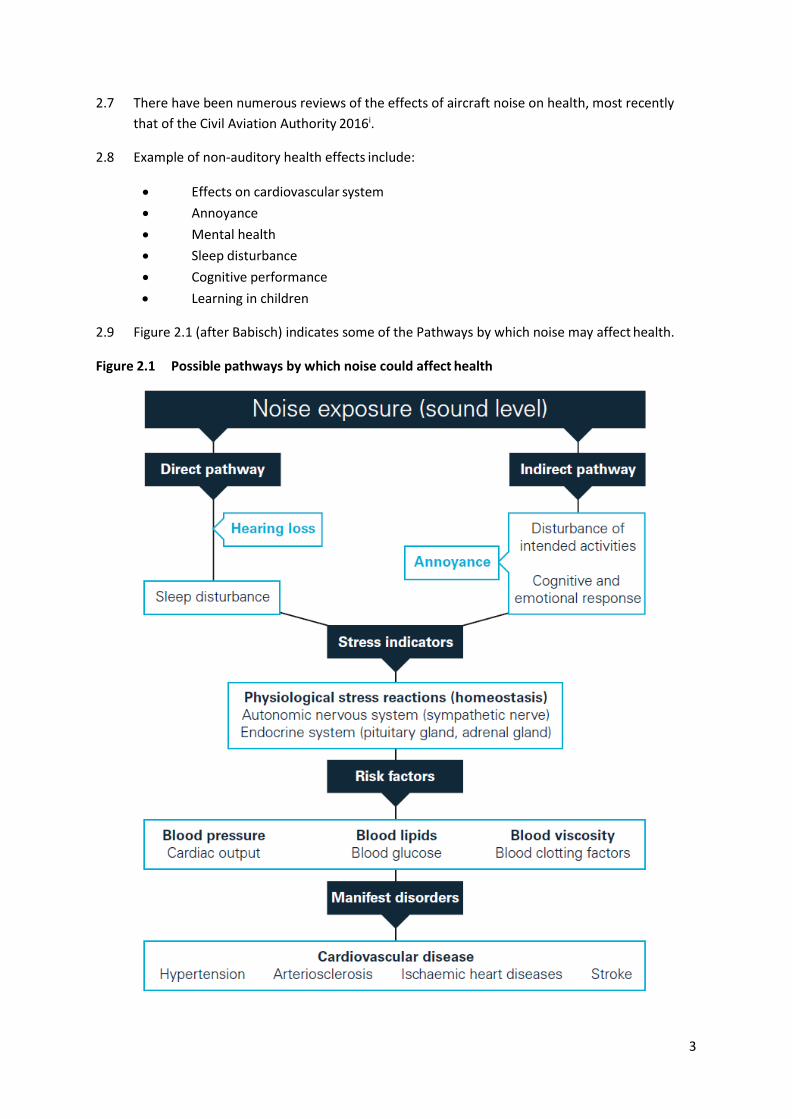
3
2.7 There have been numerous reviews of the effects of aircraft noise on health, most recently
that of the Civil Aviation Authority 2016i.
2.8 Example of non-auditory health effects include:
• Effects on cardiovascular system
• Annoyance
• Mental health
• Sleep disturbance
• Cognitive performance
• Learning in children
2.9 Figure 2.1 (after Babisch) indicates some of the Pathways by which noise may affect health.
Figure 2.1 Possible pathways by which noise could affect health
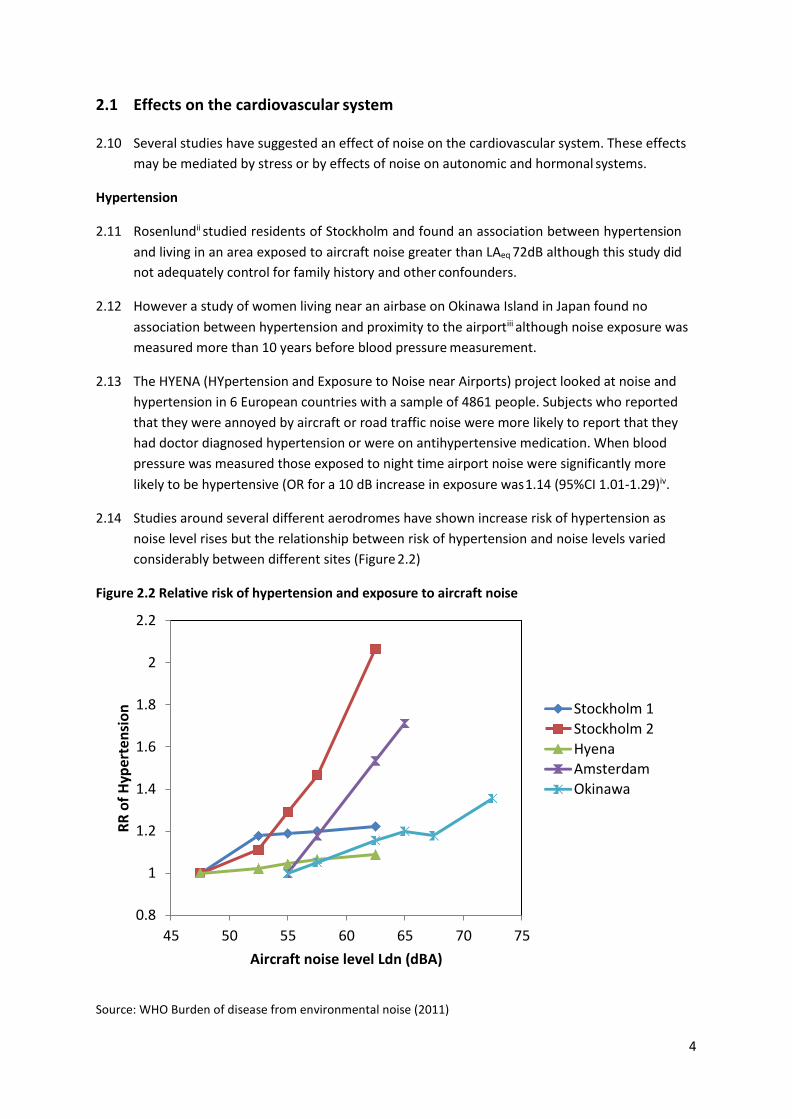
4
2.1 Effects on the cardiovascular system
2.10 Several studies have suggested an effect of noise on the cardiovascular system. These effects
may be mediated by stress or by effects of noise on autonomic and hormonal systems.
Hypertension
2.11 Rosenlundii studied residents of Stockholm and found an association between hypertension
and living in an area exposed to aircraft noise greater than LAeq 72dB although this study did
not adequately control for family history and other confounders.
2.12 However a study of women living near an airbase on Okinawa Island in Japan found no
association between hypertension and proximity to the airportiii although noise exposure was
measured more than 10 years before blood pressure measurement.
2.13 The HYENA (HYpertension and Exposure to Noise near Airports) project looked at noise and
hypertension in 6 European countries with a sample of 4861 people. Subjects who reported
that they were annoyed by aircraft or road traffic noise were more likely to report that they
had doctor diagnosed hypertension or were on antihypertensive medication. When blood
pressure was measured those exposed to night time airport noise were significantly more
likely to be hypertensive (OR for a 10 dB increase in exposure was 1.14 (95%CI 1.01-1.29)iv.
2.14 Studies around several different aerodromes have shown increase risk of hypertension as
noise level rises but the relationship between risk of hypertension and noise levels varied
considerably between different sites (Figure 2.2)
Figure 2.2 Relative risk of hypertension and exposure to aircraft noise
2.2
2
1.8
1.6
1.4
Stockholm 1
Stockholm 2
Hyena Amsterdam
Okinawa
1.2
1
0.8
45 50 55 60 65 70 75
Aircraft noise level Ldn (dBA)
Source: WHO Burden of disease from environmental noise (2011)
RR
of
Hyp
erte
nsi
on
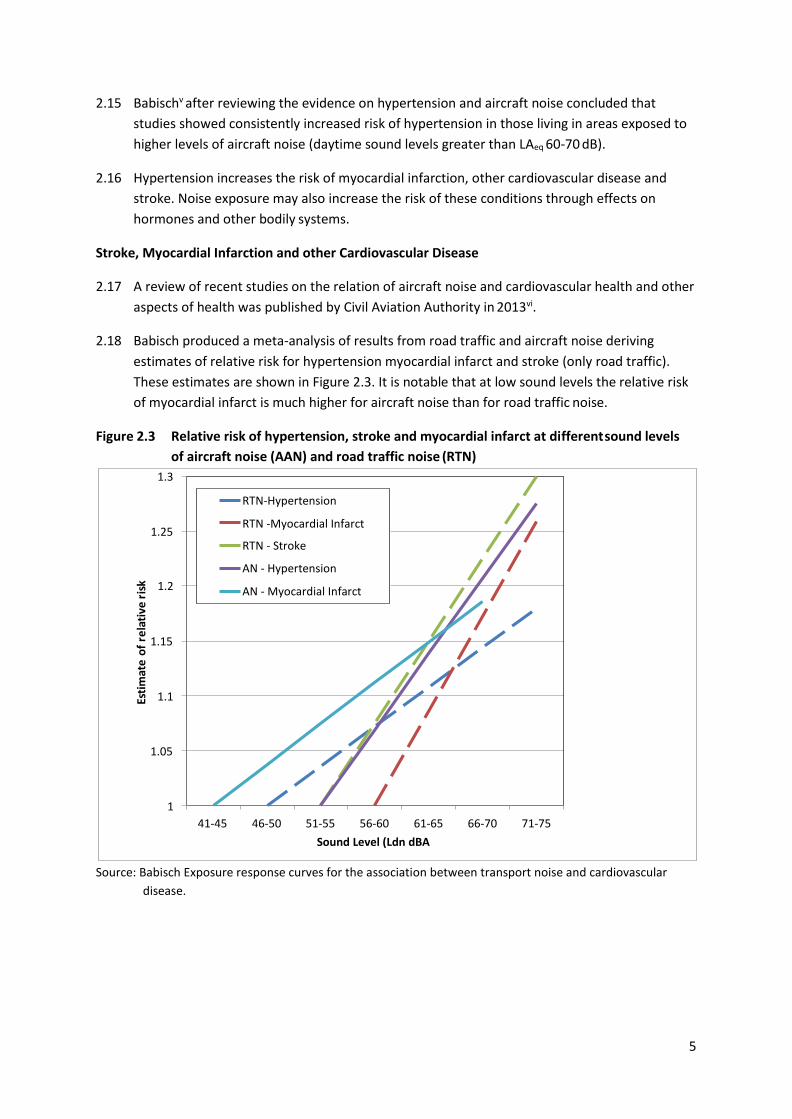
5
2.15 Babischv after reviewing the evidence on hypertension and aircraft noise concluded that
studies showed consistently increased risk of hypertension in those living in areas exposed to
higher levels of aircraft noise (daytime sound levels greater than LAeq 60-70 dB).
2.16 Hypertension increases the risk of myocardial infarction, other cardiovascular disease and
stroke. Noise exposure may also increase the risk of these conditions through effects on
hormones and other bodily systems.
Stroke, Myocardial Infarction and other Cardiovascular Disease
2.17 A review of recent studies on the relation of aircraft noise and cardiovascular health and other
aspects of health was published by Civil Aviation Authority in 2013vi.
2.18 Babisch produced a meta-analysis of results from road traffic and aircraft noise deriving
estimates of relative risk for hypertension myocardial infarct and stroke (only road traffic).
These estimates are shown in Figure 2.3. It is notable that at low sound levels the relative risk
of myocardial infarct is much higher for aircraft noise than for road traffic noise.
Figure 2.3 Relative risk of hypertension, stroke and myocardial infarct at different sound levels
of aircraft noise (AAN) and road traffic noise (RTN)
Source: Babisch Exposure response curves for the association between transport noise and cardiovascular
disease.
1.3
RTN-Hypertension
1.25
1.2
RTN -Myocardial Infarct
RTN - Stroke
AN - Hypertension
AN - Myocardial Infarct
1.15
1.1
1.05
1
41-45 46-50 51-55 56-60 61-65 66-70 71-75
Sound Level (Ldn dBA
Esti
mat
e o
f re
lati
ve r
isk
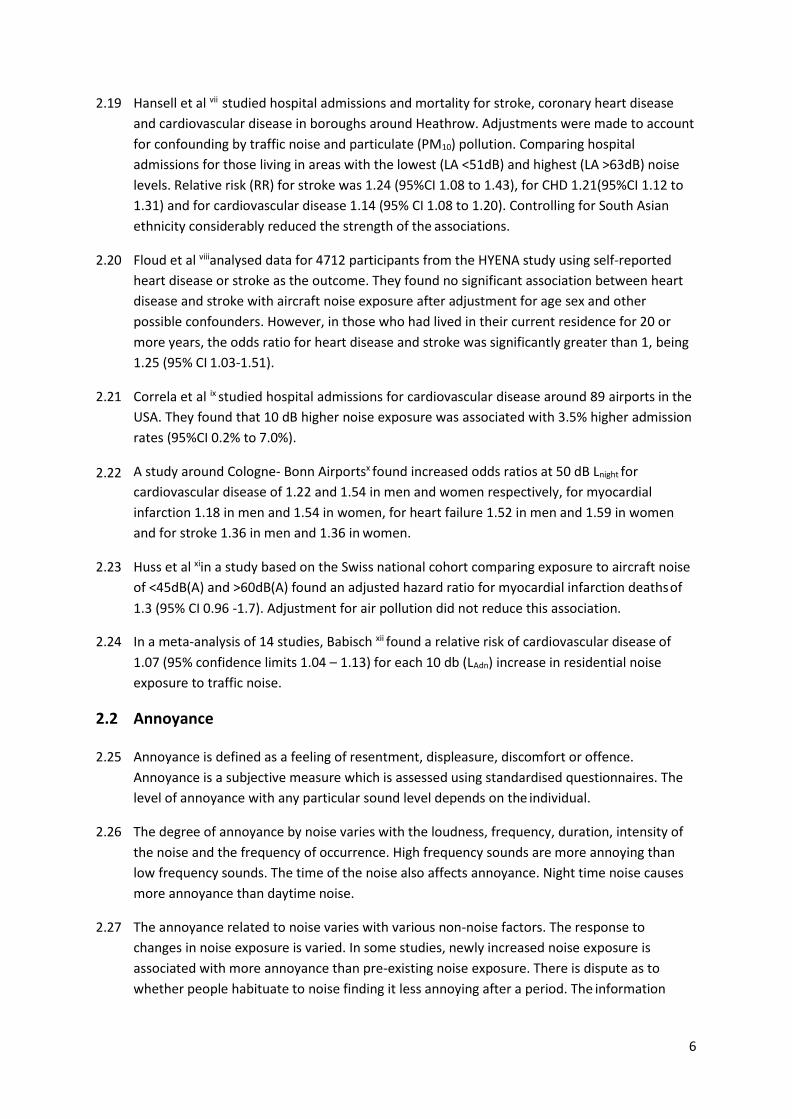
6
2.19 Hansell et al vii studied hospital admissions and mortality for stroke, coronary heart disease
and cardiovascular disease in boroughs around Heathrow. Adjustments were made to account
for confounding by traffic noise and particulate (PM10) pollution. Comparing hospital
admissions for those living in areas with the lowest (LA <51dB) and highest (LA >63dB) noise
levels. Relative risk (RR) for stroke was 1.24 (95%CI 1.08 to 1.43), for CHD 1.21(95%CI 1.12 to
1.31) and for cardiovascular disease 1.14 (95% CI 1.08 to 1.20). Controlling for South Asian
ethnicity considerably reduced the strength of the associations.
2.20 Floud et al viiianalysed data for 4712 participants from the HYENA study using self-reported
heart disease or stroke as the outcome. They found no significant association between heart
disease and stroke with aircraft noise exposure after adjustment for age sex and other
possible confounders. However, in those who had lived in their current residence for 20 or
more years, the odds ratio for heart disease and stroke was significantly greater than 1, being
1.25 (95% CI 1.03-1.51).
2.21 Correla et al ix studied hospital admissions for cardiovascular disease around 89 airports in the
USA. They found that 10 dB higher noise exposure was associated with 3.5% higher admission
rates (95%CI 0.2% to 7.0%).
2.22 A study around Cologne- Bonn Airportsx found increased odds ratios at 50 dB Lnight for
cardiovascular disease of 1.22 and 1.54 in men and women respectively, for myocardial
infarction 1.18 in men and 1.54 in women, for heart failure 1.52 in men and 1.59 in women
and for stroke 1.36 in men and 1.36 in women.
2.23 Huss et al xiin a study based on the Swiss national cohort comparing exposure to aircraft noise
of <45dB(A) and >60dB(A) found an adjusted hazard ratio for myocardial infarction deaths of
1.3 (95% CI 0.96 -1.7). Adjustment for air pollution did not reduce this association.
2.24 In a meta-analysis of 14 studies, Babisch xii found a relative risk of cardiovascular disease of
1.07 (95% confidence limits 1.04 – 1.13) for each 10 db (LAdn) increase in residential noise
exposure to traffic noise.
2.2 Annoyance
2.25 Annoyance is defined as a feeling of resentment, displeasure, discomfort or offence.
Annoyance is a subjective measure which is assessed using standardised questionnaires. The
level of annoyance with any particular sound level depends on the individual.
2.26 The degree of annoyance by noise varies with the loudness, frequency, duration, intensity of
the noise and the frequency of occurrence. High frequency sounds are more annoying than
low frequency sounds. The time of the noise also affects annoyance. Night time noise causes
more annoyance than daytime noise.
2.27 The annoyance related to noise varies with various non-noise factors. The response to
changes in noise exposure is varied. In some studies, newly increased noise exposure is
associated with more annoyance than pre-existing noise exposure. There is dispute as to
whether people habituate to noise finding it less annoying after a period. The information
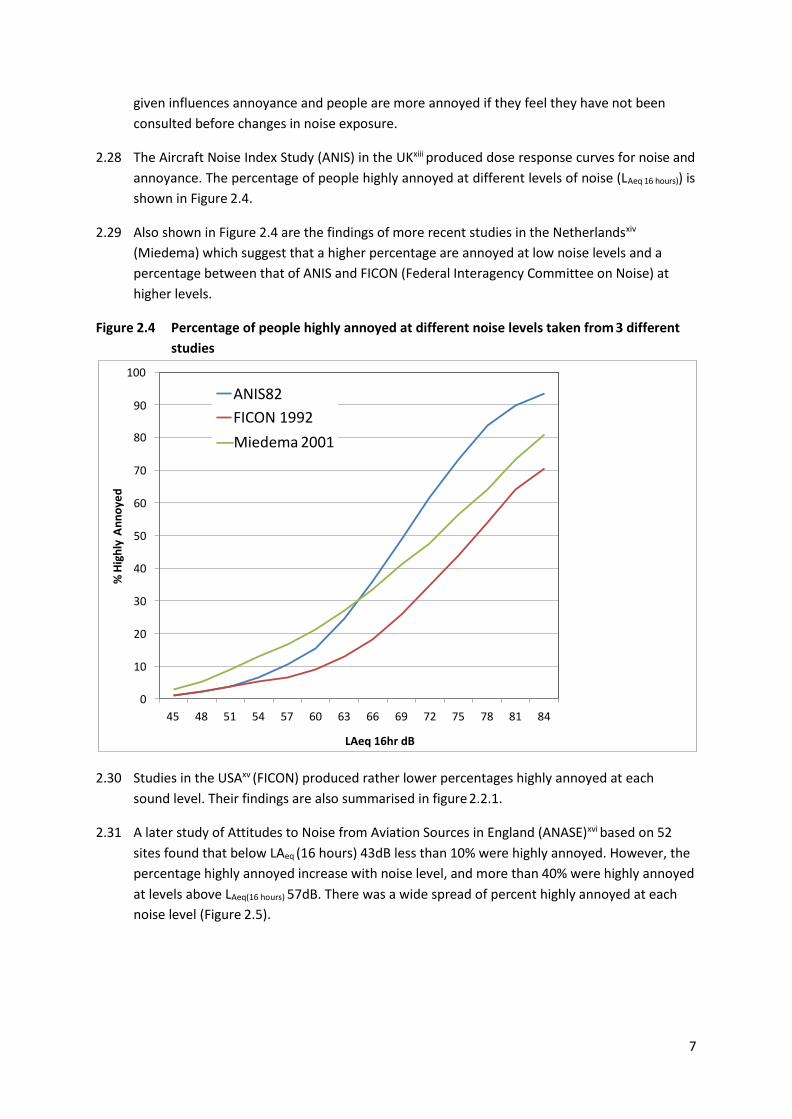
7
given influences annoyance and people are more annoyed if they feel they have not been
consulted before changes in noise exposure.
2.28 The Aircraft Noise Index Study (ANIS) in the UKxiii produced dose response curves for noise and
annoyance. The percentage of people highly annoyed at different levels of noise (LAeq 16 hours)) is
shown in Figure 2.4.
2.29 Also shown in Figure 2.4 are the findings of more recent studies in the Netherlandsxiv
(Miedema) which suggest that a higher percentage are annoyed at low noise levels and a
percentage between that of ANIS and FICON (Federal Interagency Committee on Noise) at
higher levels.
Figure 2.4 Percentage of people highly annoyed at different noise levels taken from 3 different
studies
2.30 Studies in the USAxv (FICON) produced rather lower percentages highly annoyed at each
sound level. Their findings are also summarised in figure 2.2.1.
2.31 A later study of Attitudes to Noise from Aviation Sources in England (ANASE)xvi based on 52
sites found that below LAeq (16 hours) 43dB less than 10% were highly annoyed. However, the
percentage highly annoyed increase with noise level, and more than 40% were highly annoyed
at levels above LAeq(16 hours) 57dB. There was a wide spread of percent highly annoyed at each
noise level (Figure 2.5).
100
90
80
ANIS82
FICON 1992 Miedema 2001
70
60
50
40
30
20
10
0
45 48 51 54 57 60 63 66 69 72 75 78 81 84
LAeq 16hr dB
% H
igh
ly A
nn
oye
d
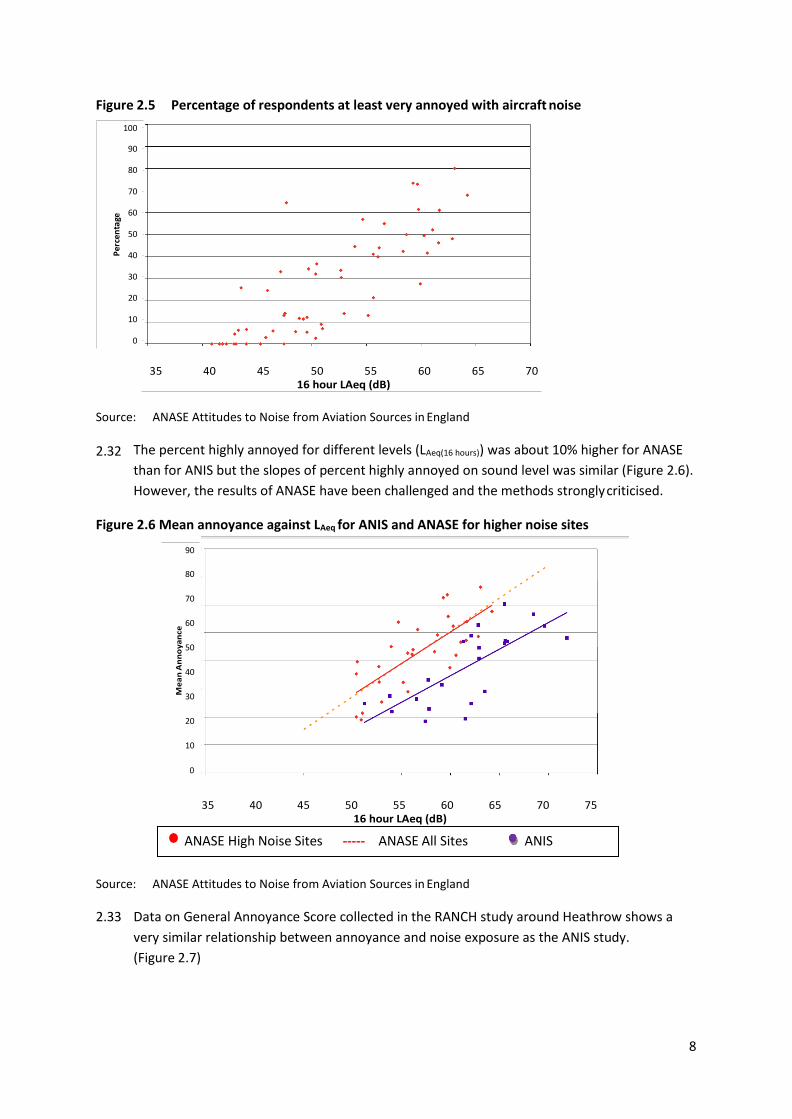
8
Figure 2.5 Percentage of respondents at least very annoyed with aircraft noise
35 40 45 50 55 60 65 70
16 hour LAeq (dB)
Source: ANASE Attitudes to Noise from Aviation Sources in England
2.32 The percent highly annoyed for different levels (LAeq(16 hours)) was about 10% higher for ANASE
than for ANIS but the slopes of percent highly annoyed on sound level was similar (Figure 2.6).
However, the results of ANASE have been challenged and the methods strongly criticised.
Figure 2.6 Mean annoyance against LAeq for ANIS and ANASE for higher noise sites
35 40 45 50 55 60 65 70 75 16 hour LAeq (dB)
Source: ANASE Attitudes to Noise from Aviation Sources in England
2.33 Data on General Annoyance Score collected in the RANCH study around Heathrow shows a
very similar relationship between annoyance and noise exposure as the ANIS study.
(Figure 2.7)
ANASE High Noise Sites ----- ANASE All Sites ANIS
100
90
80
70
60
50
40
30
20
10
0
90
80
70
60
50
40
30
20
10
0
Pe
rcen
tage
Me
an
An
no
ya
nce
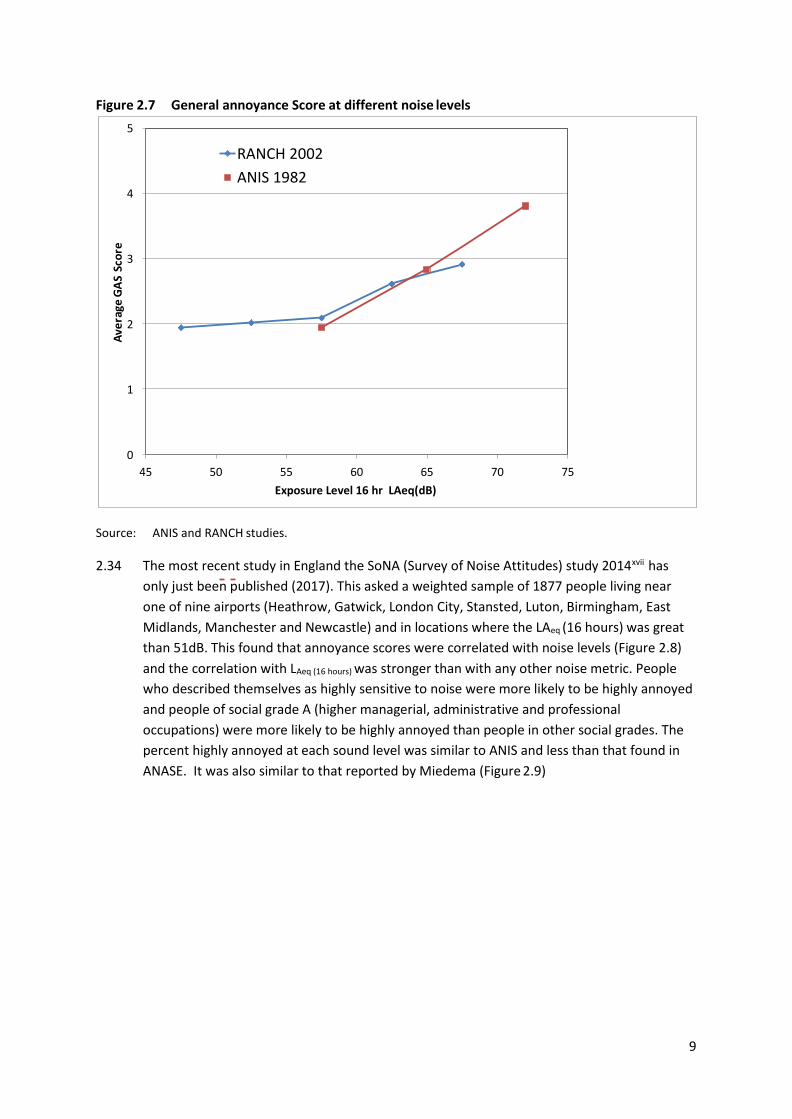
9
Figure 2.7 General annoyance Score at different noise levels
Source: ANIS and RANCH studies.
2.34 The most recent study in England the SoNA (Survey of Noise Attitudes) study 2014xvii has
only just been published (2017). This asked a weighted sample of 1877 people living near
one of nine airports (Heathrow, Gatwick, London City, Stansted, Luton, Birmingham, East
Midlands, Manchester and Newcastle) and in locations where the LAeq (16 hours) was great
than 51dB. This found that annoyance scores were correlated with noise levels (Figure 2.8)
and the correlation with LAeq (16 hours) was stronger than with any other noise metric. People
who described themselves as highly sensitive to noise were more likely to be highly annoyed
and people of social grade A (higher managerial, administrative and professional
occupations) were more likely to be highly annoyed than people in other social grades. The
percent highly annoyed at each sound level was similar to ANIS and less than that found in
ANASE. It was also similar to that reported by Miedema (Figure 2.9)
5
RANCH 2002
ANIS 1982 4
3
2
1
0
45 50 55 60 65 70 75
Exposure Level 16 hr LAeq(dB)
Ave
rage
GA
S Sc
ore
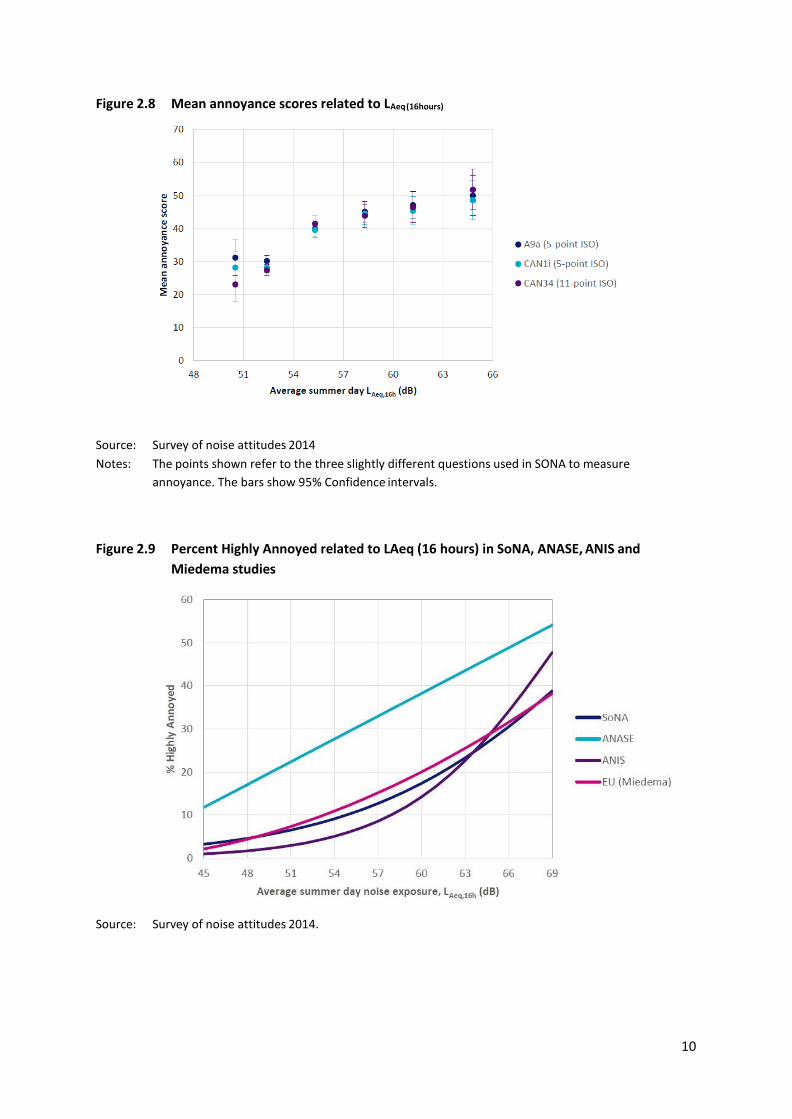
Figure 2.8 Mean annoyance scores related to LAeq (16hours)
10
Source: Survey of noise attitudes 2014
Notes: The points shown refer to the three slightly different questions used in SONA to measure
annoyance. The bars show 95% Confidence intervals.
Figure 2.9 Percent Highly Annoyed related to LAeq (16 hours) in SoNA, ANASE, ANIS and
Miedema studies
Source: Survey of noise attitudes 2014.
11
2.3 Sleep Disturbance
2.35 Sleep is necessary to restore biological processes and sleep disturbances can produce long
term health damage and reduced daytime efficiencyxviii.
2.36 WHO guidelinesxix have advised that sleep disturbance is a major effect of environmental noise
and that night noise may cause primary effects during sleep and secondary effects after
exposure.
2.37 Potential effects of night time aircraft noise can be categorised as:xx
• Acute - sleep disturbance, awakenings, changed depth of sleep.
• Total night effects - overall total night effects - sleep loss, frequent disturbance,
disrupted sleep pattern.
• Next day effects - tiredness, degraded task performance, short term annoyance.
• Long term effects - effects lasting more than one day after disturbed night.
2.38 Sleep disturbance may result in delay in falling asleep, awakening from sleep of which the
person may or may not be aware, increased movement or changes in depth of sleep as
indicated by EEG pattern. People vary widely in their sensitivity to night-time aircraft noise.
Sensitive individuals are up to twice as likely to be awakened by aircraft noise than insensitive
individuals. There is a possibility that non-sensitive individuals may self-select to live near
airports.
2.39 Sleep disturbance depends on the sound energy level (LAmax). LA night is a function of LAmax and
the number of noise events though a large number of quiet LAmax is not the equivalent of a
lower number of loud LAmax. For sleep disturbance the relevant indicator is LAmax indoors, which
is less than LAmax outdoors depending on whether windows are open and the sound insulation
of the house.
2.40 Work on aviation noise and sleep disturbance prior to 2013 has been reviewed by Jones and
Rhodesxxi.
2.41 Studies from the UK found that people were unlikely to be awakened by noise levels below
90dBA (LAmax). With noise levels of 80 -95 dBA (Lmax) there is a 1 in 75 chance of the average
person being woken. There was little relation between numbers reporting awakenings and
overall night time sound levels (Lnight), but there was a significant relation between awakenings
associated with aircraft noise and noise levels xxii(Figure 2.10).
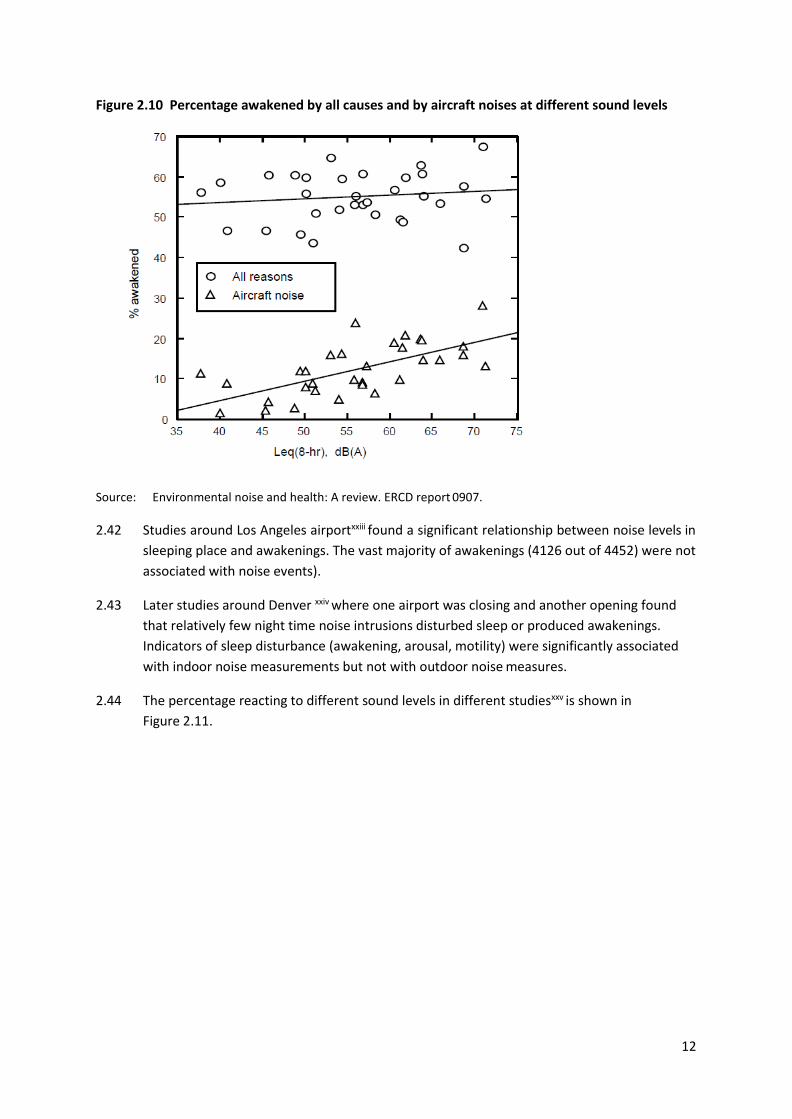
12
Figure 2.10 Percentage awakened by all causes and by aircraft noises at different sound levels
Source: Environmental noise and health: A review. ERCD report 0907.
2.42 Studies around Los Angeles airportxxiii found a significant relationship between noise levels in
sleeping place and awakenings. The vast majority of awakenings (4126 out of 4452) were not
associated with noise events).
2.43 Later studies around Denver xxiv where one airport was closing and another opening found
that relatively few night time noise intrusions disturbed sleep or produced awakenings.
Indicators of sleep disturbance (awakening, arousal, motility) were significantly associated
with indoor noise measurements but not with outdoor noise measures.
2.44 The percentage reacting to different sound levels in different studiesxxv is shown in
Figure 2.11.
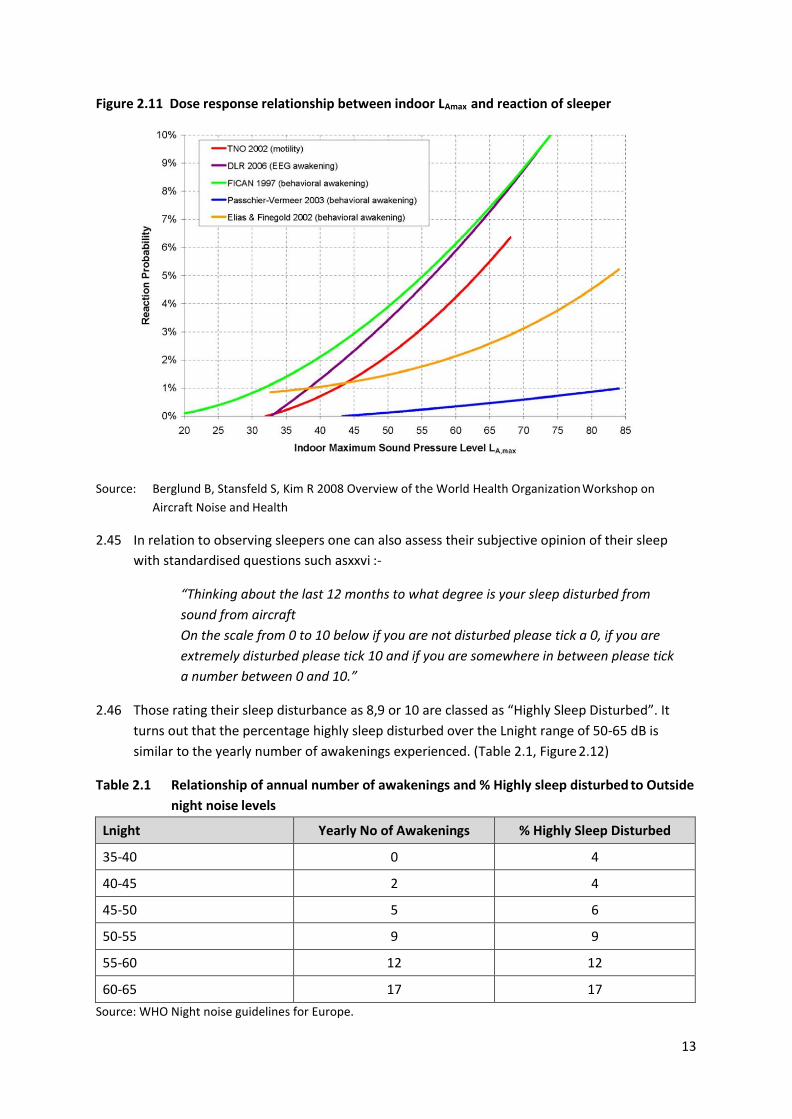
13
Figure 2.11 Dose response relationship between indoor LAmax and reaction of sleeper
Source: Berglund B, Stansfeld S, Kim R 2008 Overview of the World Health Organization Workshop on
Aircraft Noise and Health
2.45 In relation to observing sleepers one can also assess their subjective opinion of their sleep
with standardised questions such asxxvi :-
“Thinking about the last 12 months to what degree is your sleep disturbed from
sound from aircraft
On the scale from 0 to 10 below if you are not disturbed please tick a 0, if you are
extremely disturbed please tick 10 and if you are somewhere in between please tick
a number between 0 and 10.”
2.46 Those rating their sleep disturbance as 8,9 or 10 are classed as “Highly Sleep Disturbed”. It
turns out that the percentage highly sleep disturbed over the Lnight range of 50-65 dB is
similar to the yearly number of awakenings experienced. (Table 2.1, Figure 2.12)
Table 2.1 Relationship of annual number of awakenings and % Highly sleep disturbed to Outside
night noise levels
Lnight Yearly No of Awakenings % Highly Sleep Disturbed
35-40 0 4
40-45 2 4
45-50 5 6
50-55 9 9
55-60 12 12
60-65 17 17
Source: WHO Night noise guidelines for Europe.
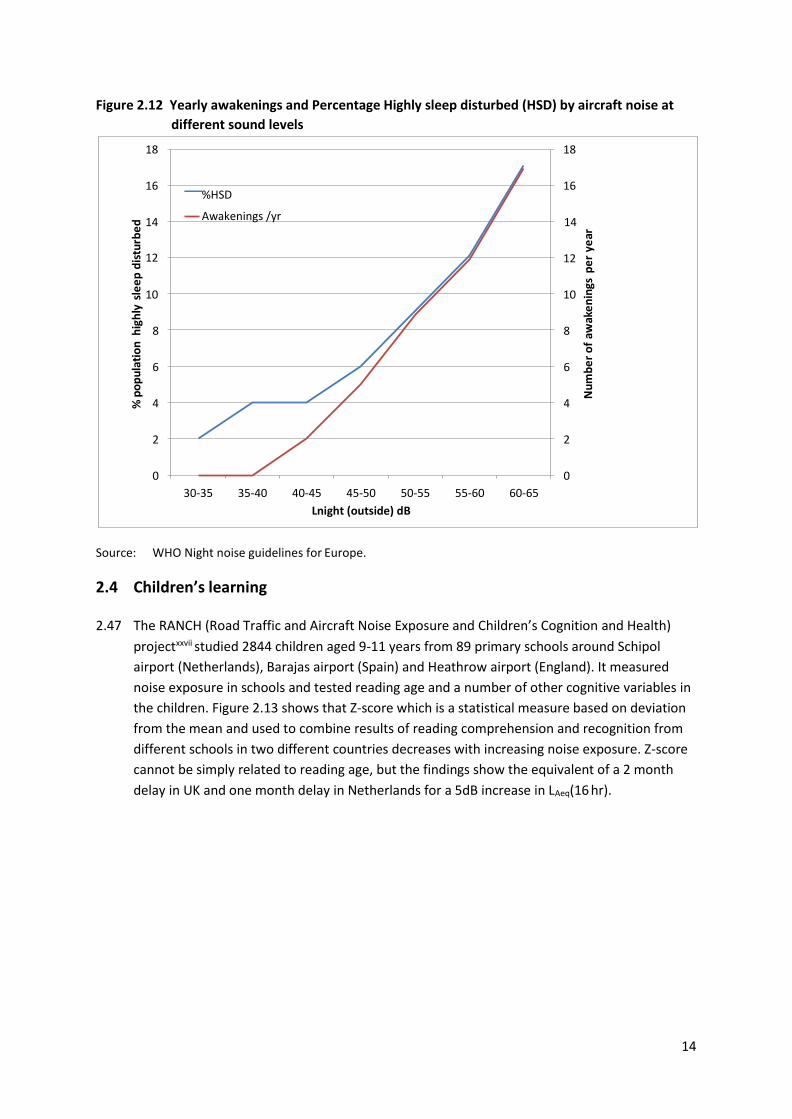
14
Figure 2.12 Yearly awakenings and Percentage Highly sleep disturbed (HSD) by aircraft noise at
different sound levels
Source: WHO Night noise guidelines for Europe.
2.4 Children’s learning
2.47 The RANCH (Road Traffic and Aircraft Noise Exposure and Children’s Cognition and Health)
projectxxvii studied 2844 children aged 9-11 years from 89 primary schools around Schipol
airport (Netherlands), Barajas airport (Spain) and Heathrow airport (England). It measured
noise exposure in schools and tested reading age and a number of other cognitive variables in
the children. Figure 2.13 shows that Z-score which is a statistical measure based on deviation
from the mean and used to combine results of reading comprehension and recognition from
different schools in two different countries decreases with increasing noise exposure. Z-score
cannot be simply related to reading age, but the findings show the equivalent of a 2 month
delay in UK and one month delay in Netherlands for a 5dB increase in LAeq(16 hr).
18 18
16
14
%HSD
Awakenings /yr
16
14
12 12
10 10
8 8
6 6
4 4
2 2
0 0
30-35 35-40 40-45 45-50 50-55 55-60 60-65
Lnight (outside) dB
% p
op
ula
tio
n h
igh
ly s
lee
p d
istu
rbe
d
Nu
mb
er
of
awak
en
ings
pe
r ye
ar
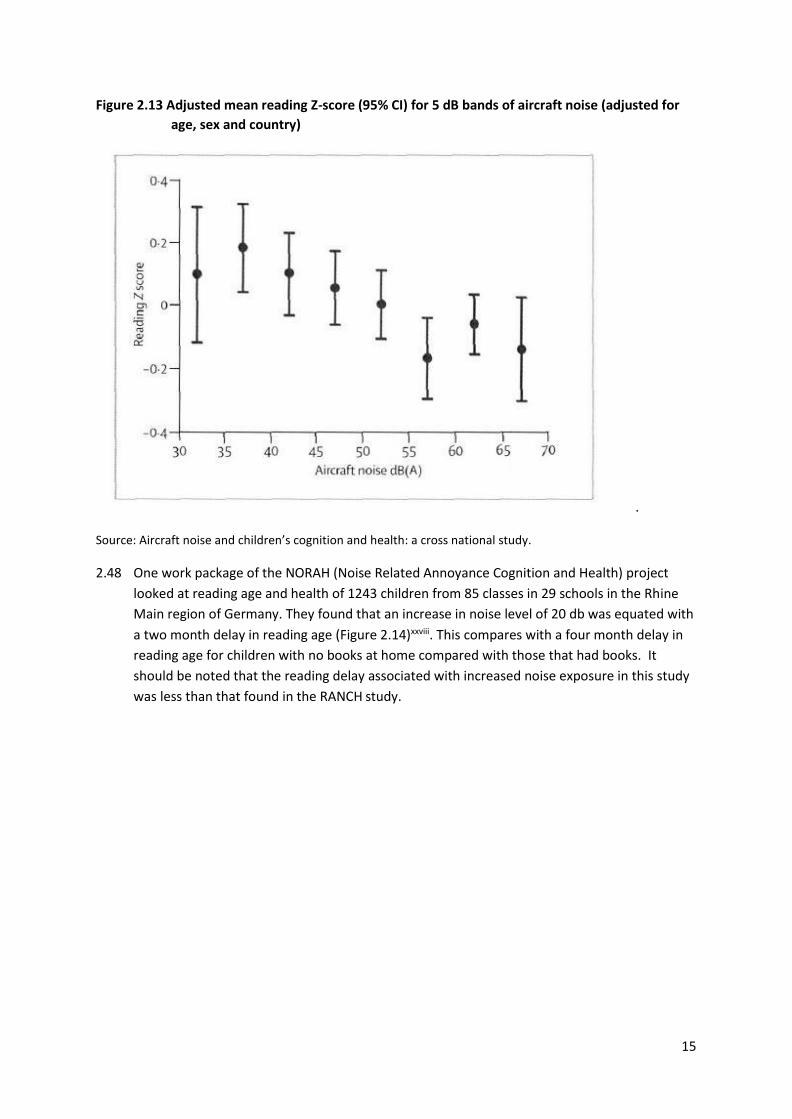
15
Figure 2.13 Adjusted mean reading Z-score (95% CI) for 5 dB bands of aircraft noise (adjusted for
age, sex and country)
.
Source: Aircraft noise and children’s cognition and health: a cross national study.
2.48 One work package of the NORAH (Noise Related Annoyance Cognition and Health) project
looked at reading age and health of 1243 children from 85 classes in 29 schools in the Rhine
Main region of Germany. They found that an increase in noise level of 20 db was equated with
a two month delay in reading age (Figure 2.14)xxviii. This compares with a four month delay in
reading age for children with no books at home compared with those that had books. It
should be noted that the reading delay associated with increased noise exposure in this study
was less than that found in the RANCH study.
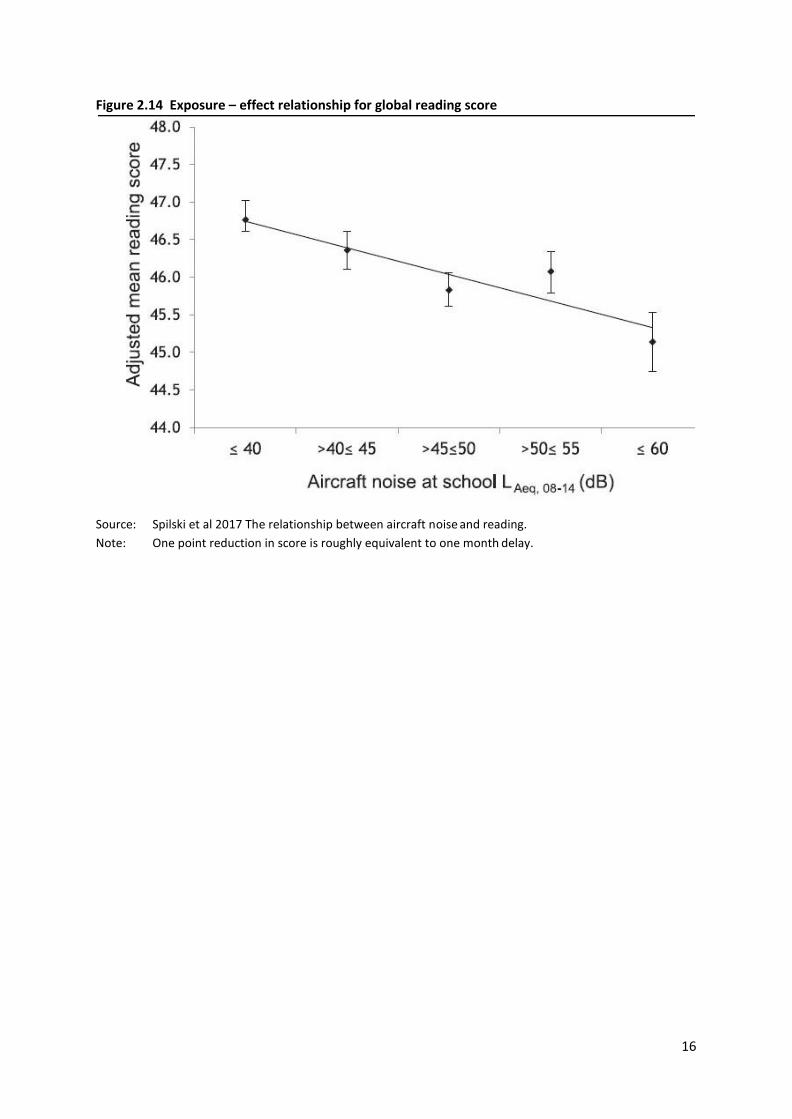
16
Figure 2.14 Exposure – effect relationship for global reading score
Source: Spilski et al 2017 The relationship between aircraft noise and reading.
Note: One point reduction in score is roughly equivalent to one month delay.
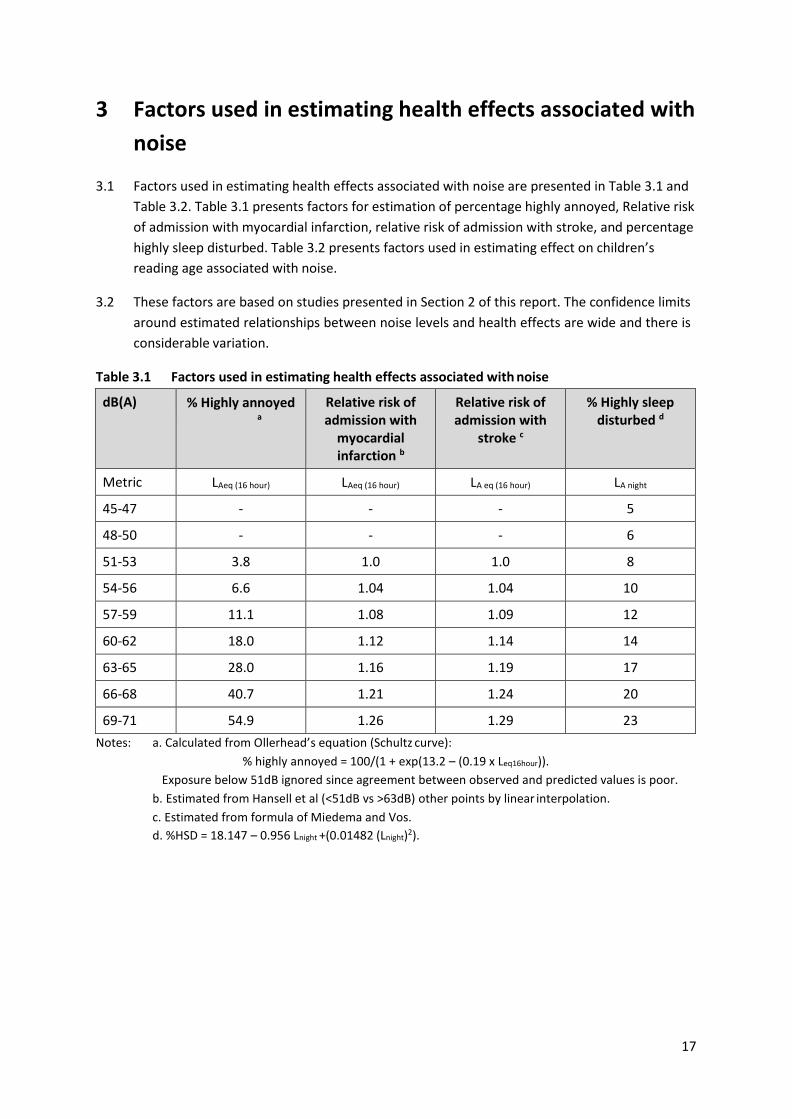
17
3 Factors used in estimating health effects associated with
noise
3.1 Factors used in estimating health effects associated with noise are presented in Table 3.1 and
Table 3.2. Table 3.1 presents factors for estimation of percentage highly annoyed, Relative risk
of admission with myocardial infarction, relative risk of admission with stroke, and percentage
highly sleep disturbed. Table 3.2 presents factors used in estimating effect on children’s
reading age associated with noise.
3.2 These factors are based on studies presented in Section 2 of this report. The confidence limits
around estimated relationships between noise levels and health effects are wide and there is
considerable variation.
Table 3.1 Factors used in estimating health effects associated with noise
dB(A) % Highly annoyed a
Relative risk of admission with
myocardial infarction b
Relative risk of admission with
stroke c
% Highly sleep disturbed d
Metric LAeq (16 hour) LAeq (16 hour) LA eq (16 hour) LA night
45-47 - - - 5
48-50 - - - 6
51-53 3.8 1.0 1.0 8
54-56 6.6 1.04 1.04 10
57-59 11.1 1.08 1.09 12
60-62 18.0 1.12 1.14 14
63-65 28.0 1.16 1.19 17
66-68 40.7 1.21 1.24 20
69-71 54.9 1.26 1.29 23
Notes: a. Calculated from Ollerhead’s equation (Schultz curve):
% highly annoyed = 100/(1 + exp(13.2 – (0.19 x Leq16hour)).
Exposure below 51dB ignored since agreement between observed and predicted values is poor.
b. Estimated from Hansell et al (<51dB vs >63dB) other points by linear interpolation.
c. Estimated from formula of Miedema and Vos.
d. %HSD = 18.147 – 0.956 Lnight +(0.01482 (Lnight)2).
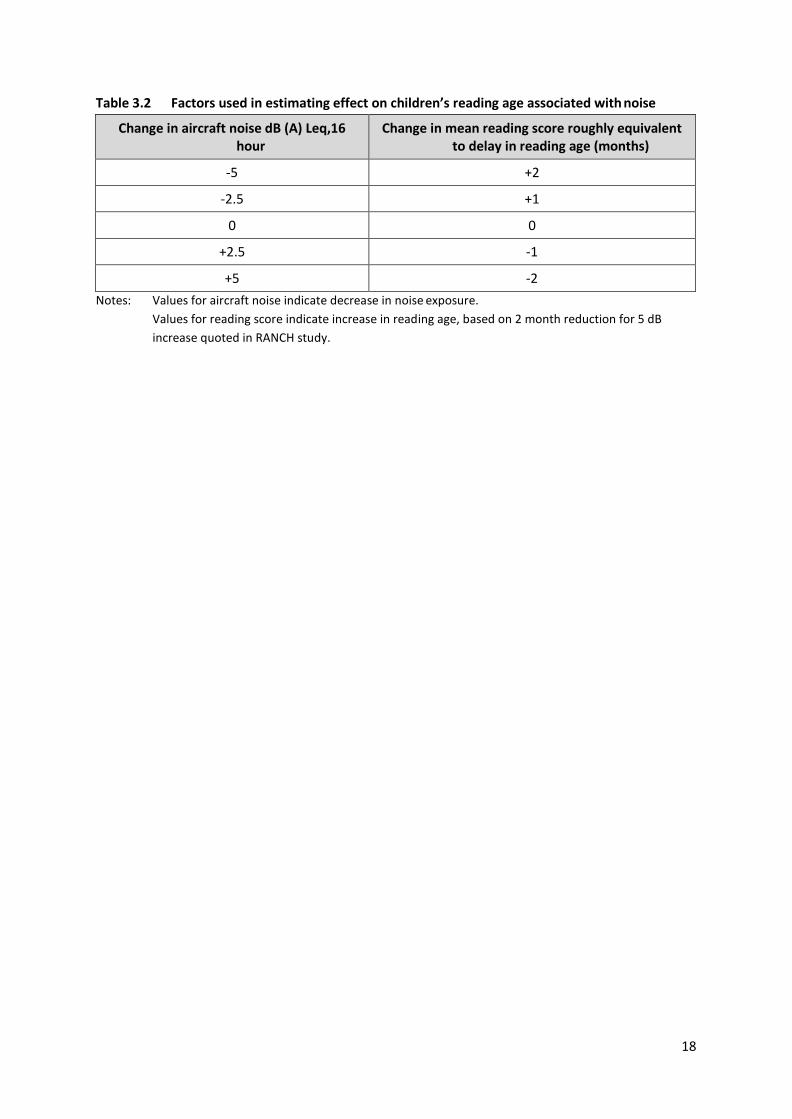
18
Table 3.2 Factors used in estimating effect on children’s reading age associated with noise
Change in aircraft noise dB (A) Leq,16 hour
Change in mean reading score roughly equivalent to delay in reading age (months)
-5 +2
-2.5 +1
0 0
+2.5 -1
+5 -2
Notes: Values for aircraft noise indicate decrease in noise exposure.
Values for reading score indicate increase in reading age, based on 2 month reduction for 5 dB
increase quoted in RANCH study.
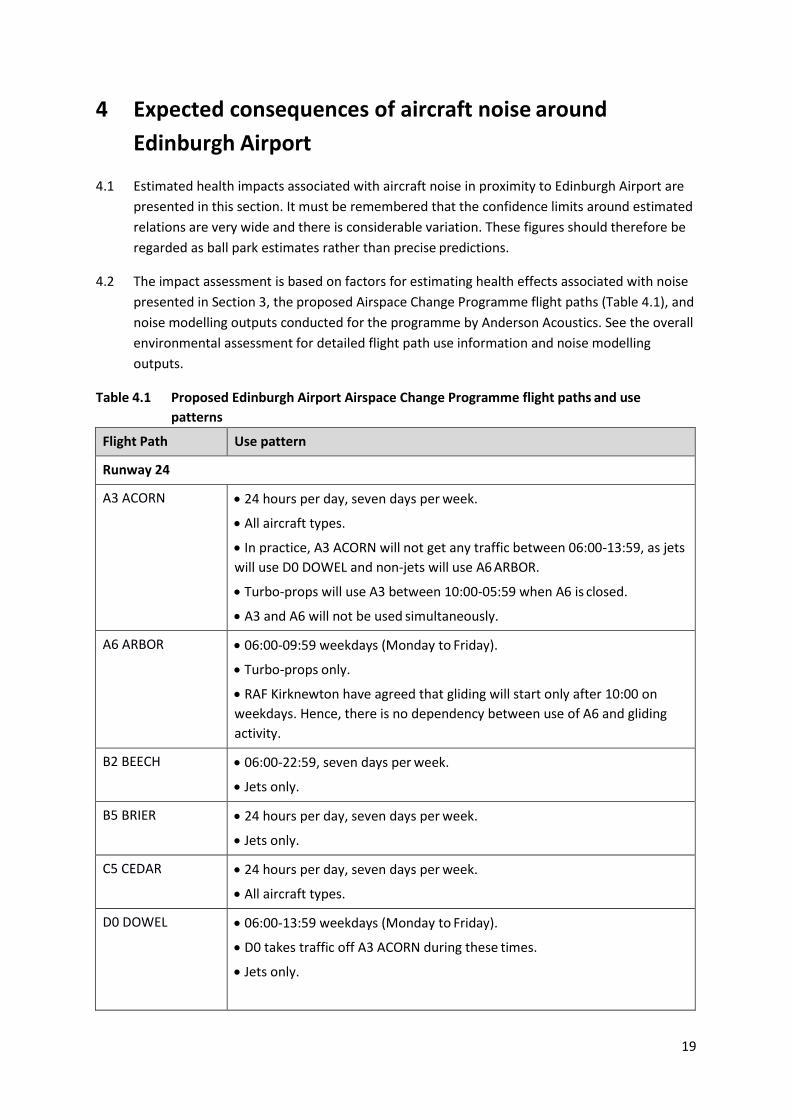
19
4 Expected consequences of aircraft noise around
Edinburgh Airport
4.1 Estimated health impacts associated with aircraft noise in proximity to Edinburgh Airport are
presented in this section. It must be remembered that the confidence limits around estimated
relations are very wide and there is considerable variation. These figures should therefore be
regarded as ball park estimates rather than precise predictions.
4.2 The impact assessment is based on factors for estimating health effects associated with noise
presented in Section 3, the proposed Airspace Change Programme flight paths (Table 4.1), and
noise modelling outputs conducted for the programme by Anderson Acoustics. See the overall
environmental assessment for detailed flight path use information and noise modelling
outputs.
Table 4.1 Proposed Edinburgh Airport Airspace Change Programme flight paths and use
patterns
Flight Path Use pattern
Runway 24
A3 ACORN • 24 hours per day, seven days per week.
• All aircraft types.
• In practice, A3 ACORN will not get any traffic between 06:00-13:59, as jets
will use D0 DOWEL and non-jets will use A6 ARBOR.
• Turbo-props will use A3 between 10:00-05:59 when A6 is closed.
• A3 and A6 will not be used simultaneously.
A6 ARBOR • 06:00-09:59 weekdays (Monday to Friday).
• Turbo-props only.
• RAF Kirknewton have agreed that gliding will start only after 10:00 on
weekdays. Hence, there is no dependency between use of A6 and gliding
activity.
B2 BEECH • 06:00-22:59, seven days per week.
• Jets only.
B5 BRIER • 24 hours per day, seven days per week.
• Jets only.
C5 CEDAR • 24 hours per day, seven days per week.
• All aircraft types.
D0 DOWEL • 06:00-13:59 weekdays (Monday to Friday).
• D0 takes traffic off A3 ACORN during these times.
• Jets only.
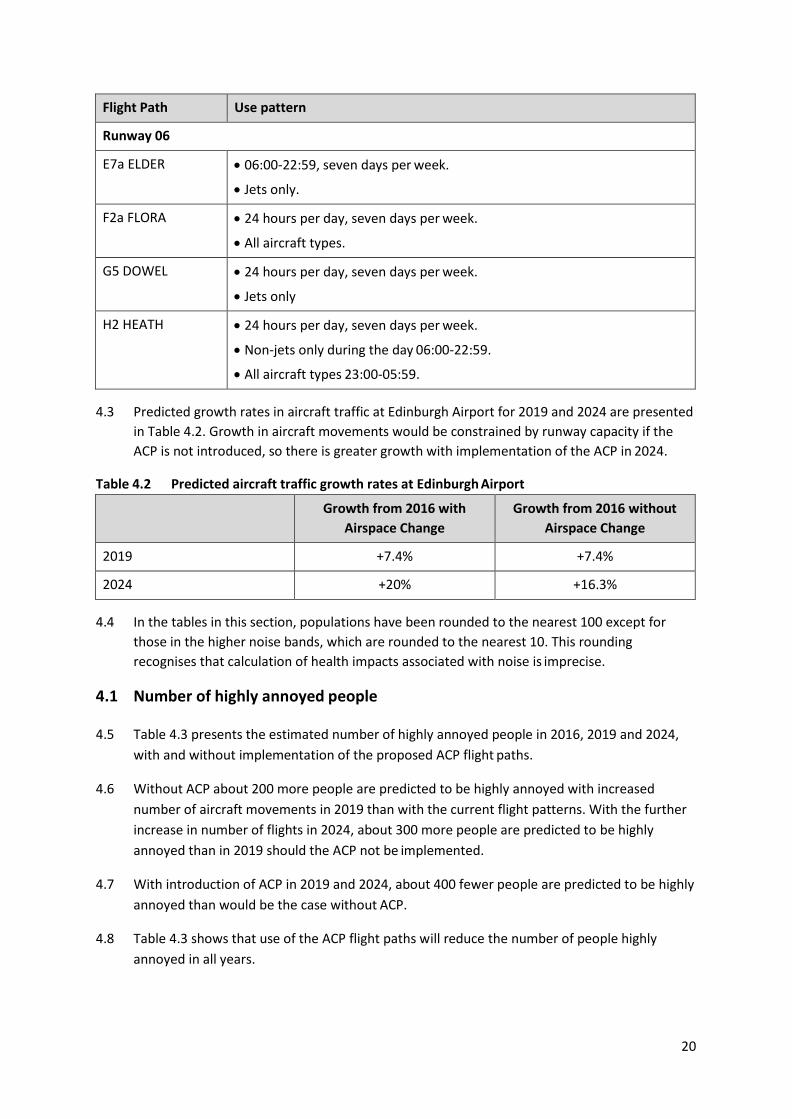
20
Flight Path Use pattern
Runway 06
E7a ELDER • 06:00-22:59, seven days per week.
• Jets only.
F2a FLORA • 24 hours per day, seven days per week.
• All aircraft types.
G5 DOWEL • 24 hours per day, seven days per week.
• Jets only
H2 HEATH • 24 hours per day, seven days per week.
• Non-jets only during the day 06:00-22:59.
• All aircraft types 23:00-05:59.
4.3 Predicted growth rates in aircraft traffic at Edinburgh Airport for 2019 and 2024 are presented
in Table 4.2. Growth in aircraft movements would be constrained by runway capacity if the
ACP is not introduced, so there is greater growth with implementation of the ACP in 2024.
Table 4.2 Predicted aircraft traffic growth rates at Edinburgh Airport
Growth from 2016 with
Airspace Change
Growth from 2016 without
Airspace Change
2019 +7.4% +7.4%
2024 +20% +16.3%
4.4 In the tables in this section, populations have been rounded to the nearest 100 except for
those in the higher noise bands, which are rounded to the nearest 10. This rounding
recognises that calculation of health impacts associated with noise is imprecise.
4.1 Number of highly annoyed people
4.5 Table 4.3 presents the estimated number of highly annoyed people in 2016, 2019 and 2024,
with and without implementation of the proposed ACP flight paths.
4.6 Without ACP about 200 more people are predicted to be highly annoyed with increased
number of aircraft movements in 2019 than with the current flight patterns. With the further
increase in number of flights in 2024, about 300 more people are predicted to be highly
annoyed than in 2019 should the ACP not be implemented.
4.7 With introduction of ACP in 2019 and 2024, about 400 fewer people are predicted to be highly
annoyed than would be the case without ACP.
4.8 Table 4.3 shows that use of the ACP flight paths will reduce the number of people highly
annoyed in all years.
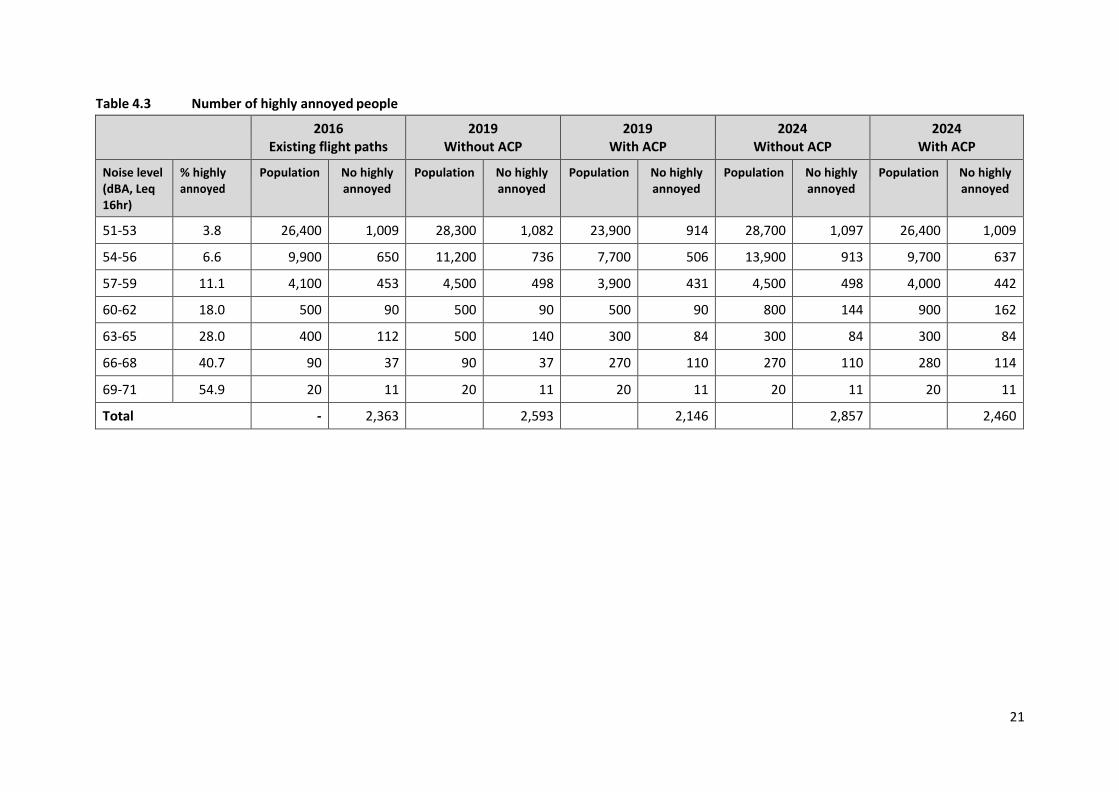
Table 4.3 Number of highly annoyed people
2016 Existing flight paths
2019 Without ACP
2019 With ACP
2024 Without ACP
2024 With ACP
Noise level (dBA, Leq 16hr)
% highly annoyed
Population No highly annoyed
Population No highly annoyed
Population No highly annoyed
Population No highly annoyed
Population No highly annoyed
51-53 3.8 26,400 1,009 28,300 1,082 23,900 914 28,700 1,097 26,400 1,009
54-56 6.6 9,900 650 11,200 736 7,700 506 13,900 913 9,700 637
57-59 11.1 4,100 453 4,500 498 3,900 431 4,500 498 4,000 442
60-62 18.0 500 90 500 90 500 90 800 144 900 162
63-65 28.0 400 112 500 140 300 84 300 84 300 84
66-68 40.7 90 37 90 37 270 110 270 110 280 114
69-71 54.9 20 11 20 11 20 11 20 11 20 11
Total - 2,363 2,593 2,146 2,857 2,460
21
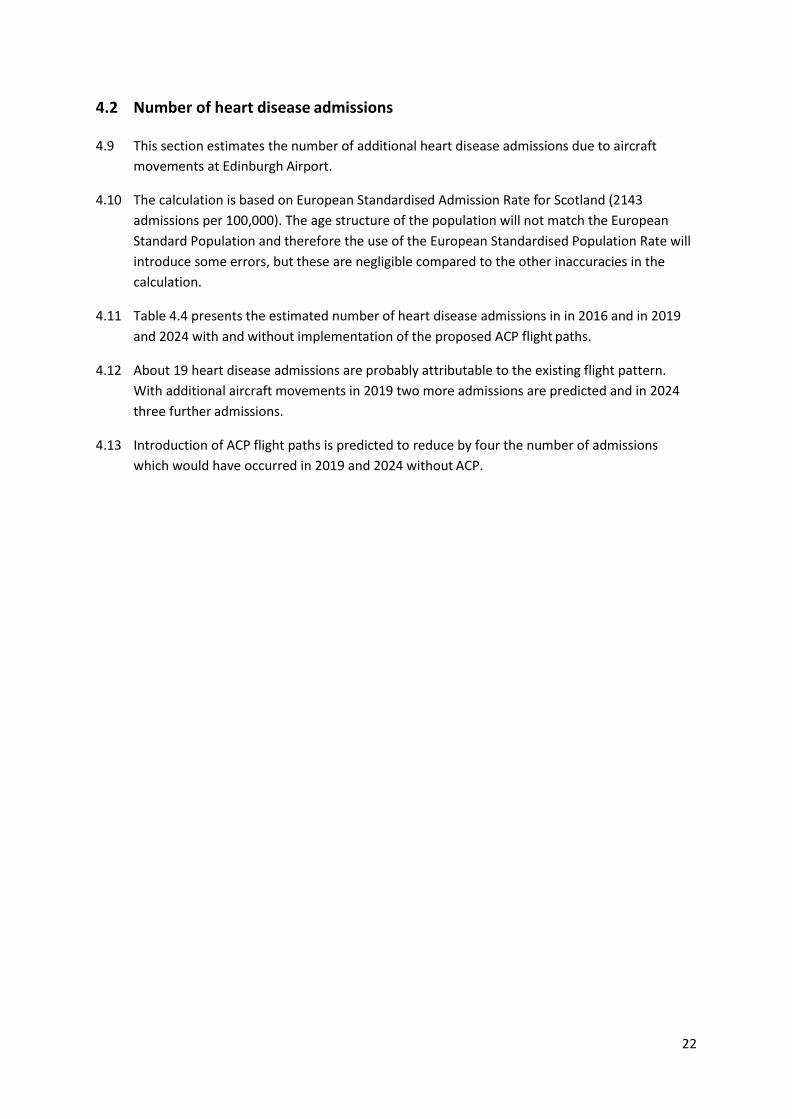
4.2 Number of heart disease admissions
4.9 This section estimates the number of additional heart disease admissions due to aircraft
movements at Edinburgh Airport.
4.10 The calculation is based on European Standardised Admission Rate for Scotland (2143
admissions per 100,000). The age structure of the population will not match the European
Standard Population and therefore the use of the European Standardised Population Rate will
introduce some errors, but these are negligible compared to the other inaccuracies in the
calculation.
4.11 Table 4.4 presents the estimated number of heart disease admissions in in 2016 and in 2019
and 2024 with and without implementation of the proposed ACP flight paths.
4.12 About 19 heart disease admissions are probably attributable to the existing flight pattern.
With additional aircraft movements in 2019 two more admissions are predicted and in 2024
three further admissions.
4.13 Introduction of ACP flight paths is predicted to reduce by four the number of admissions
which would have occurred in 2019 and 2024 without ACP.
22
Table 4.3 Number of heart disease admissions with and without ACP implementation
2016 Existing flight paths
2019 Without ACP
2019 With ACP
2024 Without ACP
2024 With ACP
Noise level (dBA, Leq 16hr)
Relative risk of heart disease admission
Population Additional heart
disease admission
s
Population Additional heart
disease admissions
Population Additional heart
disease admission
s
Population Additional heart
disease admission
s
Population Additional heart
disease admissions
51-53 1 26,400 0 28,300 0 23,900 0 28,700 0 26,400 0
54-56 1.04 9,900 8 11,200 10 7,700 7 13,900 12 9,700 8
57-59 1.08 4,100 7 4,500 8 3,900 7 4,500 8 4,000 7
60-62 1.12 500 1 500 1 500 1 800 2 900 2
63-65 1.16 400 1 500 2 300 1 300 1 300 1
66-68 1.21 90 <1 90 <1 270 1 270 1 280 1
69-71 1.26 20 <1 20 <1 20 <1 20 <1 20 <1
Total1 - 19 - 21 - 17 - 24 - 20
Note: 1. Totals differ slightly from the sum of shown admissions at different exposures due to rounding errors
23
4.3 Number of additional stroke admissions
4.14 This section estimates the number of additional stroke admissions due to aircraft movements
at Edinburgh Airport.
4.15 This calculation is based on European Standardised Admission Rate for Scotland (443
admissions per 100,000). The age structure of the population will not match the European
Standard Population and therefore the use of the European Standardised Population Rate will
introduce some errors but these are negligible compared to the other inaccuracies in the
calculation.
4.16 Table 4.5 presents the estimated number of stroke admissions in 2016, 2019 and 2024; with
and without implementation of the proposed ACP flight paths.
4.17 About four stroke admissions are probably attributable to the current flight patterns. Neither
the increased aircraft movements in 2019 and 2024, nor the introduction of ACP flight paths is
predicted to appreciably affect the number of stroke admissions.
24
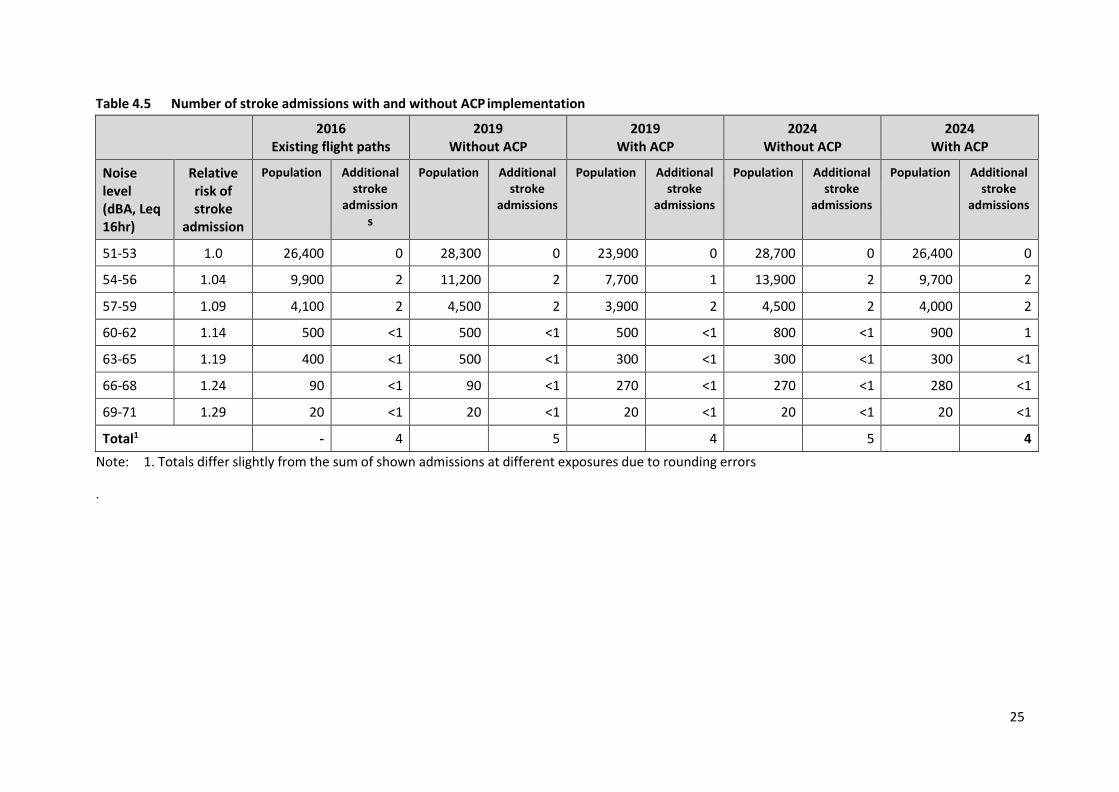
Table 4.5 Number of stroke admissions with and without ACP implementation
2016 Existing flight paths
2019 Without ACP
2019 With ACP
2024 Without ACP
2024 With ACP
Noise level (dBA, Leq 16hr)
Relative risk of stroke
admission
Population Additional stroke
admissions
Population Additional stroke
admissions
Population Additional stroke
admissions
Population Additional stroke
admissions
Population Additional stroke
admissions
51-53 1.0 26,400 0 28,300 0 23,900 0 28,700 0 26,400 0
54-56 1.04 9,900 2 11,200 2 7,700 1 13,900 2 9,700 2
57-59 1.09 4,100 2 4,500 2 3,900 2 4,500 2 4,000 2
60-62 1.14 500 <1 500 <1 500 <1 800 <1 900 1
63-65 1.19 400 <1 500 <1 300 <1 300 <1 300 <1
66-68 1.24 90 <1 90 <1 270 <1 270 <1 280 <1
69-71 1.29 20 <1 20 <1 20 <1 20 <1 20 <1
Total1 - 4 5 4 5 4
Note: 1. Totals differ slightly from the sum of shown admissions at different exposures due to rounding errors
.
25
4.4 Number of people highly sleep disturbed
4.18 This section estimates the number highly sleep disturbed (HSD) people due to aircraft
movements at Edinburgh Airport.
4.19 Table 4.6 presents the estimated number of highly sleep disturbed people in 2016 and in 2019
and 2024 with and without implementation of the proposed ACP flight paths.
4.20 With the existing flight pattern, it seems that about 1,100 people are highly sleep disturbed.
With increasing flight movements and the existing flight paths it is predicted that a few more
people will be highly sleep disturbed in 2019, but about 800 more in 2024. With
implementation of the ACP flight paths in 2019 and 2024, there is little change in the number
of people highly changed compared to the situation without ACP.
26
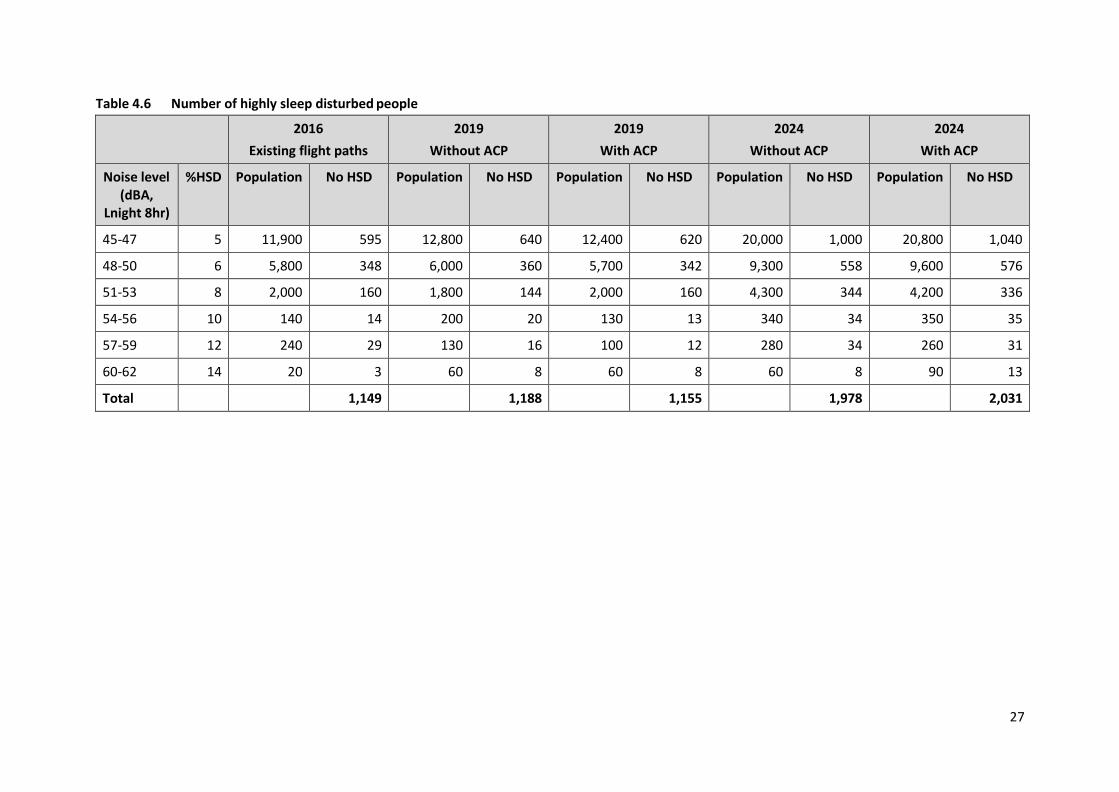
Table 4.6 Number of highly sleep disturbed people
2016
Existing flight paths
2019
Without ACP
2019
With ACP
2024
Without ACP
2024
With ACP
Noise level (dBA,
Lnight 8hr)
%HSD Population No HSD Population No HSD Population No HSD Population No HSD Population No HSD
45-47 5 11,900 595 12,800 640 12,400 620 20,000 1,000 20,800 1,040
48-50 6 5,800 348 6,000 360 5,700 342 9,300 558 9,600 576
51-53 8 2,000 160 1,800 144 2,000 160 4,300 344 4,200 336
54-56 10 140 14 200 20 130 13 340 34 350 35
57-59 12 240 29 130 16 100 12 280 34 260 31
60-62 14 20 3 60 8 60 8 60 8 90 13
Total 1,149 1,188 1,155 1,978 2,031
27
4.5 Effect on reading age in school children
4.21 This section estimates the effect on reading age in school children due to aircraft movements
at Edinburgh Airport.
4.22 There are 352 schools located in the study area, which comprises an area including the
maximum extent of modelled noise contours. The area includes West Lothian and the City of
Edinburgh; and parts of Fife, East Lothian, Midlothian, Scottish Borders, South Lanarkshire,
North Lanarkshire and Falkirk (see Figure 4.1).
4.23 Table 4.7 presents changes in noise levels at schools due to implementation of the proposed
ACP flight paths in 2019 and 2024.
4.24 Currently there are six schools exposed to LAeq (16 hour) of 55 dB or more. These schools are
Harysmuir Primary School (55 dB), Inveralmond Community High School (56 dB), Cargilfield
(56 dB), Pumpherston and Uphall Station C P S (58 dB), Cramond Primary School (59 dB) and
Hillwood Primary School (61 dB). Based on the RANCH study, it is possible that reading age of
children in these schools would be delayed by up to two months. The RANCH study estimated
a two month delay in reading age for a 5 dB increase in exposure between 50 and 55 dB.
4.25 With increased air movements without ACP in 2019 one further school would be exposed to
more than 45dB.
4.26 In 2019 compared to the situation without ACP the introduction of ACP flight paths would
result in decreased noise exposure in 37 schools (16 by 2 dB) and increased noise exposure in
10 schools (2 by 2 dB). In most cases the increase or decrease of exposure is small (1 dB) and
would not be expected to influence reading age.
4.27 In 2024 compared to the situation without ACP the introduction of ACP flight paths would
result in decreased noise exposure in 40 schools (19 by 2 dB) and increased noise exposure in
8 schools (5 by 2 dB). As in 2019 in most cases the increase or decrease of exposure is small (1
dB) and would not be expected to influence reading age.
4.28 Only one school experiences an increase of 3dB. A change of 3dB has been defined as the
minimum that is perceptible under normal conditions4. The effect of changed noise exposure
associated with implementation of the ACP is likely to be much less than the effect of other
changes in the school or the children’s environment.
4 https://www.caa.co.uk/Environment/Noise/Measuring-and-modelling-noise/
28
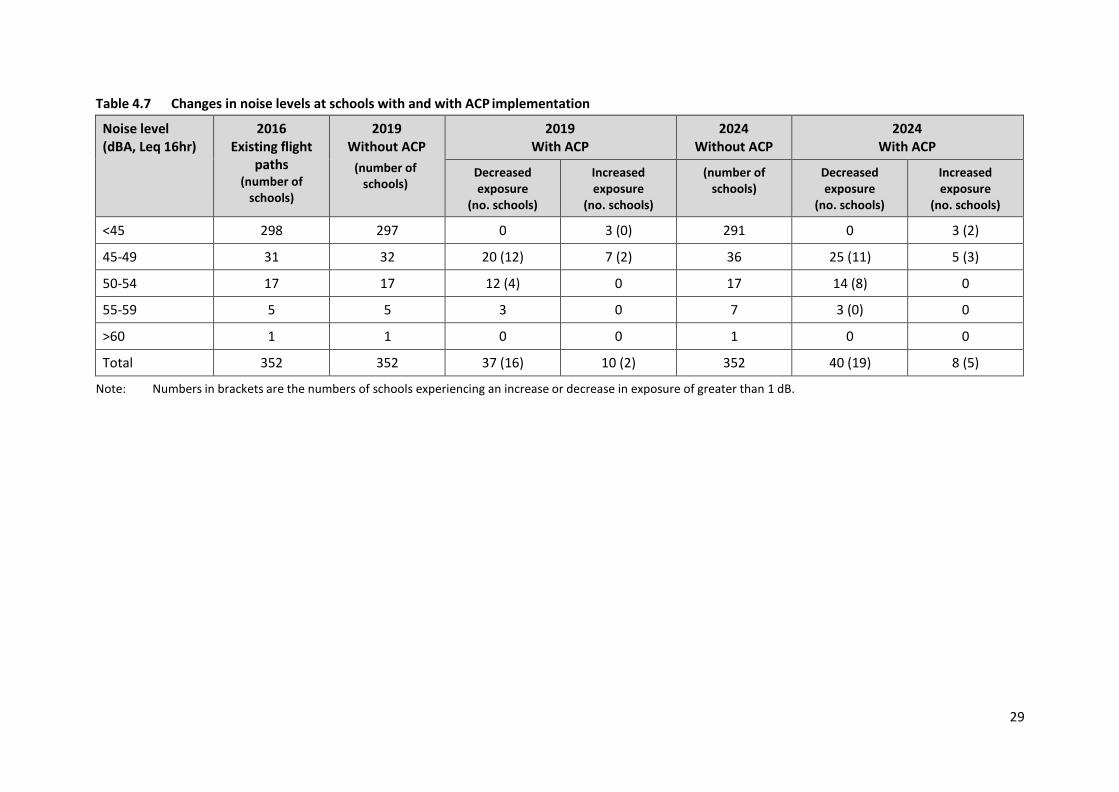
Table 4.7 Changes in noise levels at schools with and with ACP implementation
Noise level (dBA, Leq 16hr)
2016 Existing flight
paths (number of
schools)
2019 Without ACP
(number of schools)
2019 With ACP
2024 Without ACP
2024 With ACP
Decreased exposure
(no. schools)
Increased exposure
(no. schools)
(number of schools)
Decreased exposure
(no. schools)
Increased exposure
(no. schools)
<45 298 297 0 3 (0) 291 0 3 (2)
45-49 31 32 20 (12) 7 (2) 36 25 (11) 5 (3)
50-54 17 17 12 (4) 0 17 14 (8) 0
55-59 5 5 3 0 7 3 (0) 0
>60 1 1 0 0 1 0 0
Total 352 352 37 (16) 10 (2) 352 40 (19) 8 (5)
Note: Numbers in brackets are the numbers of schools experiencing an increase or decrease in exposure of greater than 1 dB.
29
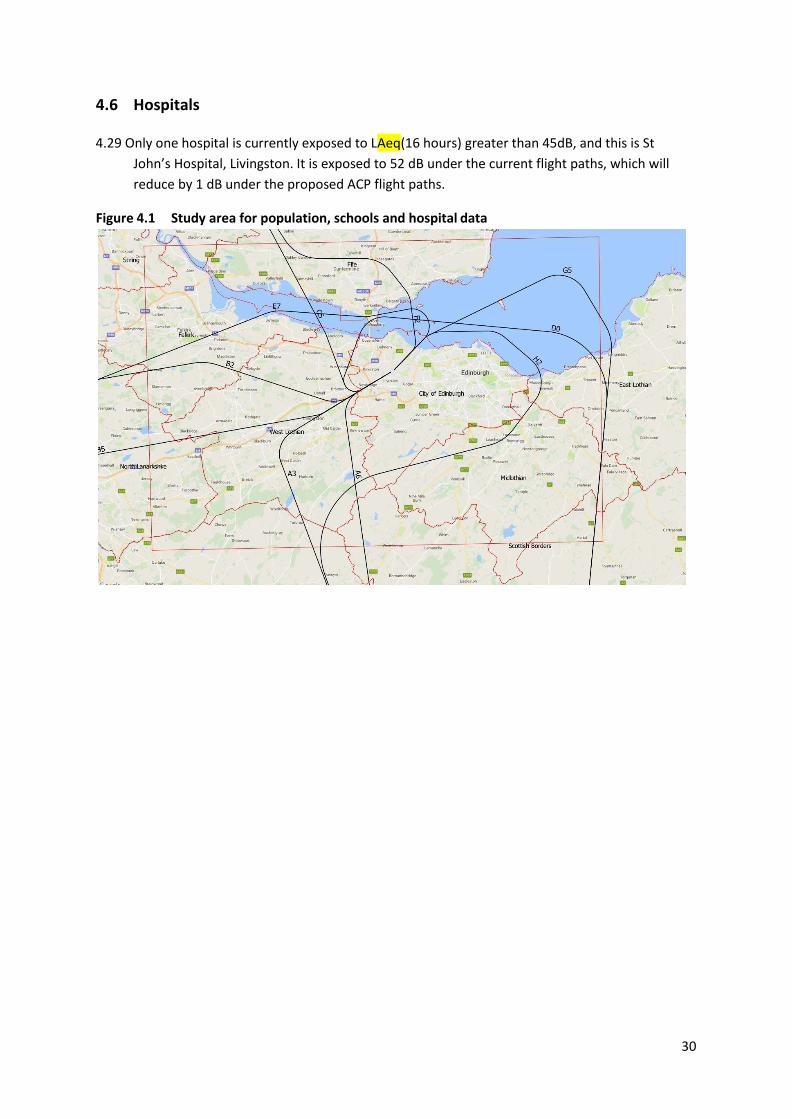
30
4.6 Hospitals
4.29 Only one hospital is currently exposed to LAeq(16 hours) greater than 45dB, and this is St
John’s Hospital, Livingston. It is exposed to 52 dB under the current flight paths, which will
reduce by 1 dB under the proposed ACP flight paths.
Figure 4.1 Study area for population, schools and hospital data
31
5 Summary of health impacts of airspace change
programme
5.1 The airspace change programme will have both positive and negative impacts, but these are
likely to be no more than minor.
5.2 Increased aircraft movements in 2019 and 2024 would result in more people being highly
annoyed under the existing flight paths. However, numbers highly annoyed will decrease with
the introduction of ACP.
5.3 Predicted changes in the number of admissions for heart disease and stroke are too small to
be observed, and much smaller than changes due to other factors outside the scope of this
study (i.e. not associated with noise from Edinburgh Airport).
5.4 Increased aircraft movements would increase the number of people highly sleep disturbed in
2024 with the existing flight paths. Introduction of the ACP has little effect on the number
highly sleep disturbed in 2019 or 2024.
5.5 Some schools will experience increased noise exposure and some decreased noise exposure,
but the changes are small and any effect on reading age is likely to be small compared to the
effect of other factors influencing reading age.
32
6. References
i Civil Aviation Authority (2016) Aircraft noise and health: Recent Findings. CAP 1278
ii Rosenlund et al Increased prevalence of hypertension in a population exposed to aircraft noise. Occupational Environmental Medicine 2001, 58, 769-773.
iii Goto et al Distribution of blood pressure data from people living near an airport. Journal of Sound and Vibration 2002, 250, 145-149.
iv L. Jarup, W Babisch et al Hypertension and Exposure to Noise near airports – the HYENA study Environmental Health Perspectives 2008; 116 ,329-333.
v Babisch W (2013) Exposure response curves for the association betwee transport noise and cardiovascular disease – an overview. First international congress on hygiene and preventative medicine. Belgrade cited in Barrowcliffe R., Phillips C. The Stansted Generation 2 Project: A Health Impact Assessment 2008
vi Civil Aviation Authority Aircraft (2014) Aircraft noise, sleep disturbance and health effects. CAP1164
vii Hansell AL, Blangiardo M, Fortunato L and 12 others. Aircraft noise and cardiovascular disease near Heathrow airport in London : small area study. BMJ 2013; 347 :f5432
viii Floud S, Blangiardo M, Clark C, de Hoogh K and 9 others. Exposure to aircraft and road traffic noise and associations with heart disease and stroke in six European countries: a cross sectional study. Environmental Health 2013: 12, 89-100.
ix Correla AW, Peters JL, Levy JI, Melly S, Dominici F. Residential exposure toi aircraft noise and hospital admissions for cardiovascular diseases: multi airport retrospective study. BMJ 2013; 347:f5561
x Greiser E, Greiser C, Jahnsen K (2011) Risk increase of cardiovascular diseases and impact of aircraft noise – the Cologne-Bonn Airport study. Report of 10th International Congress on Noise as a Public Health Problem ICBEN 2011 Volume 1 Page 362.
xi Huss A, Spoerri A, Egger M, Roosli M. Aircraft noise, air pollution and mortality from myocardial infarction. Epidemiology 2010: 21, 829-836.
xii Babisch W. Updated exposure response relationship between road traffic noise and coronary heart disease – A meta-analysis. Noise and Health 2014; 16. 1-9.
xiii Brooker P, Critchley JB, Monkman DJ, Richmond C. Aircraft Noise Index Study (ANIS) DR Report 8402 CAA 1985
xivMiedema H, Vos H. Exposure response relationships for transportation noise. Journal of Acoustic
Society of America 1998; 104; 3432-3445..
33
xv Federal Interagency Committee on Noise (FICON) Federal Agency Review of Selected Airport Analysis Noise Issues 1992
xvi ANASE Attitudes to Noise from Aviation Sources in England Report for Department for Transport
In Association With John Bates Services, Ian Flindell and RPS 2007
http://webarchive.nationalarchives.gov.uk/20090202201229/http:/dft.gov.uk/pgr/aviation/environ
mentalissues/anase/
xvii Survey of Noise Attitudes 2014: Aviation CAP 1506 2017 http://www.caa.co.uk/cap1506
xviii Halperin D. Environmental noise and sleep disturbance: A threat to health. Sleep Science 2014; 7, 209-212.
xix World Health Organisation Europe. Night Noise Guidelines for Europe. Copenhagen 2009.
xx Environmental noise and health: A review . ERCD report 0907. K. Jones Civil Aviation Authority 2010 https://publicapps.caa.co.uk/docs/33/ERCD0907.pdf
xxi Jones K, Rhodes P. ERCD 1208 Aircraft noise, sleep disturbance and health effects: A review CAA (2013) http://publicapps.caa.co.uk/docs/33/ERCD1208.PDF
xxii R&D report 9964 Adverse effects of night-time aircraft noise Porter ND, Kershaw AD, Ollerhead JB. Civil Aviation Authority 2000. https://publicapps.caa.co.uk/docs/33/ERCD9964.PDF
xxiii Fidell S, Pearsons K, Tabachnick BG, Barber DS Field study of noise induced sleep disturbance Journal of Acoustical Society of America 1995; 98. 1025- 1034.
xxiv Fidell S, Pearsons K, Tabachnick BG, Howe R. Effects on sleep disturbance of changes in aircraft noise near three airports. Journal of Accoustic Society of America 2000: 107 ; 2535-2547.
xxv Berglund B, Stansfeld S, Kim R 2008 Overview of the World Health Organization Workshop on
Aircraft Noise and Health www.icben.org/2008/PDFs/Berglund_et_al.pdf
xxvi Den Berg, Verhangen C, Uttenbroek The relation between scores on nosie annoyance and
disturbed sleep in a public health survey. International Journal 0f Environmental Research and Public
Health 2014; 11, 2314-2327.
xxvii Stansfield SA, Berglund B, Clark c, and 9 others Aircraft noise and children’s cognition and health: a cross national study. Lancet 2005; 365; 1942-1949.
xxviii Spilski J, Bergstrom K, Mayerl J, Mohler U, Lachmann T, Klatte M (2017) The relationship between aircraft noise and reading: Mediator and moderator effects. 12th ICBEN Congress on Noise as a public health problem https://www.norah-studie.de//de/nachrichten-leser/117.html
Ricardo Energy & Environment Edinburgh Airport Airspace Change Programme
Appendix D
Other major developments considered for the cumulative effects assessment
Ricardo in Confidence Ref: Ricardo/ED10588/Issue 8
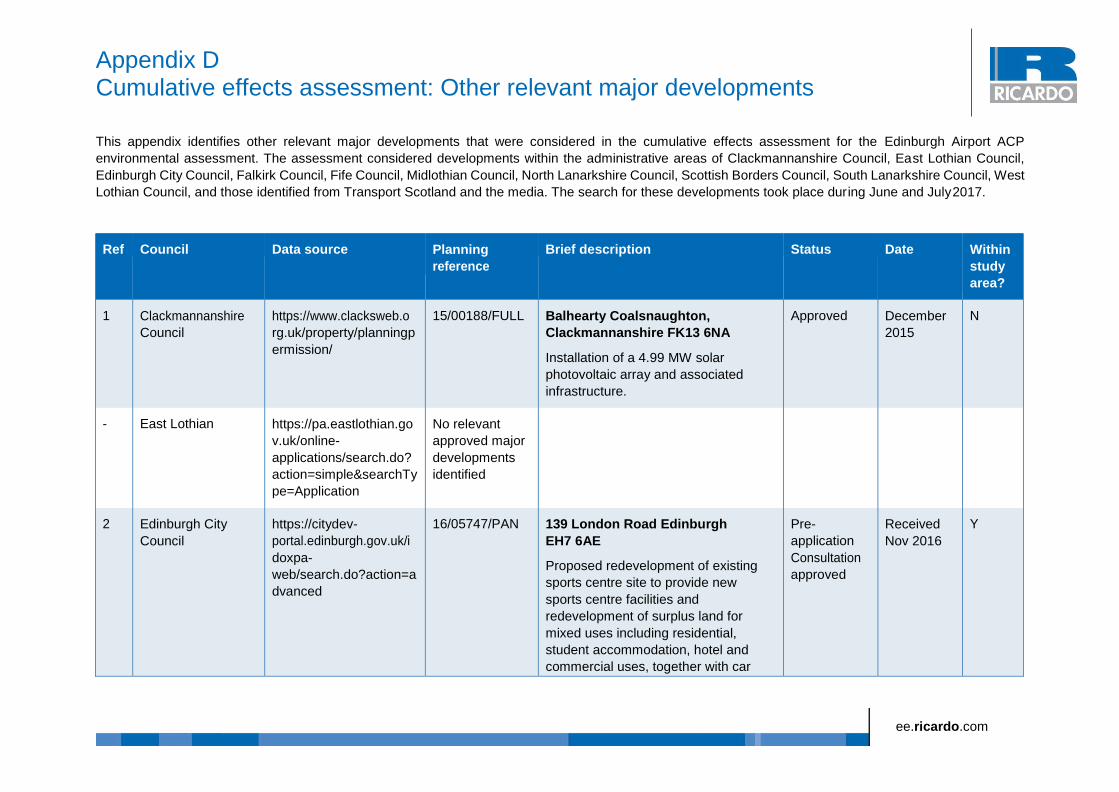
Appendix D Cumulative effects assessment: Other relevant major developments
This appendix identifies other relevant major developments that were considered in the cumulative effects assessment for the Edinburgh Airport ACP
environmental assessment. The assessment considered developments within the administrative areas of Clackmannanshire Council, East Lothian Council,
Edinburgh City Council, Falkirk Council, Fife Council, Midlothian Council, North Lanarkshire Council, Scottish Borders Council, South Lanarkshire Council, West
Lothian Council, and those identified from Transport Scotland and the media. The search for these developments took place during June and July 2017.
Ref Council Data source Planning
reference
Brief description Status Date Within
study
area?
1 Clackmannanshire
Council
https://www.clacksweb.o
rg.uk/property/planningp
ermission/
15/00188/FULL Balhearty Coalsnaughton,
Clackmannanshire FK13 6NA
Installation of a 4.99 MW solar
photovoltaic array and associated
infrastructure.
Approved December
2015
N
- East Lothian https://pa.eastlothian.go
v.uk/online-
applications/search.do?
action=simple&searchTy
pe=Application
No relevant
approved major
developments
identified
2 Edinburgh City
Council
https://citydev-
portal.edinburgh.gov.uk/i
doxpa-
web/search.do?action=a
dvanced
16/05747/PAN 139 London Road Edinburgh
EH7 6AE
Proposed redevelopment of existing
sports centre site to provide new
sports centre facilities and
redevelopment of surplus land for
mixed uses including residential,
student accommodation, hotel and
commercial uses, together with car
Pre-
application
Consultation
approved
Received
Nov 2016
Y
ee.ricardo.com
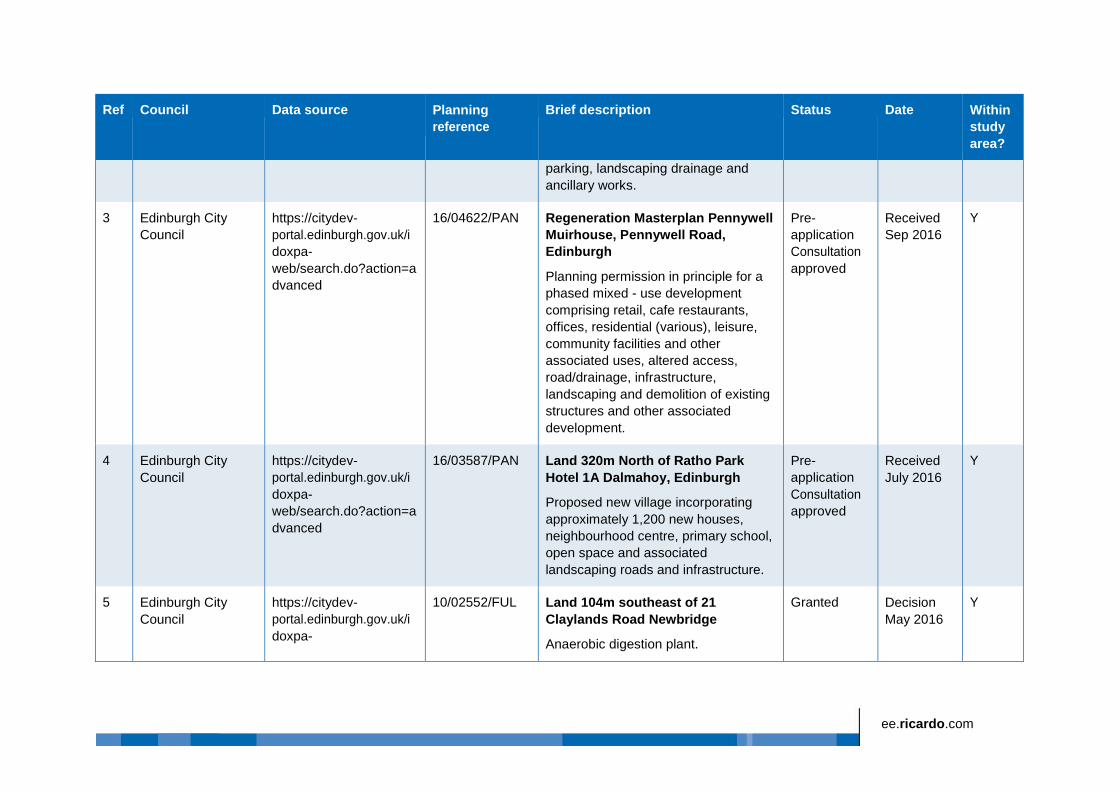
ee.ricardo.com
Ref Council Data source Planning
reference
Brief description Status Date Within
study
area?
parking, landscaping drainage and
ancillary works.
3 Edinburgh City
Council
https://citydev-
portal.edinburgh.gov.uk/i
doxpa-
web/search.do?action=a
dvanced
16/04622/PAN Regeneration Masterplan Pennywell
Muirhouse, Pennywell Road,
Edinburgh
Planning permission in principle for a
phased mixed - use development
comprising retail, cafe restaurants,
offices, residential (various), leisure,
community facilities and other
associated uses, altered access,
road/drainage, infrastructure,
landscaping and demolition of existing
structures and other associated
development.
Pre-
application
Consultation
approved
Received
Sep 2016
Y
4 Edinburgh City
Council
https://citydev-
portal.edinburgh.gov.uk/i
doxpa-
web/search.do?action=a
dvanced
16/03587/PAN Land 320m North of Ratho Park
Hotel 1A Dalmahoy, Edinburgh
Proposed new village incorporating
approximately 1,200 new houses,
neighbourhood centre, primary school,
open space and associated
landscaping roads and infrastructure.
Pre-
application
Consultation
approved
Received
July 2016
Y
5 Edinburgh City
Council
https://citydev-
portal.edinburgh.gov.uk/i
doxpa-
10/02552/FUL Land 104m southeast of 21
Claylands Road Newbridge
Anaerobic digestion plant.
Granted Decision
May 2016
Y
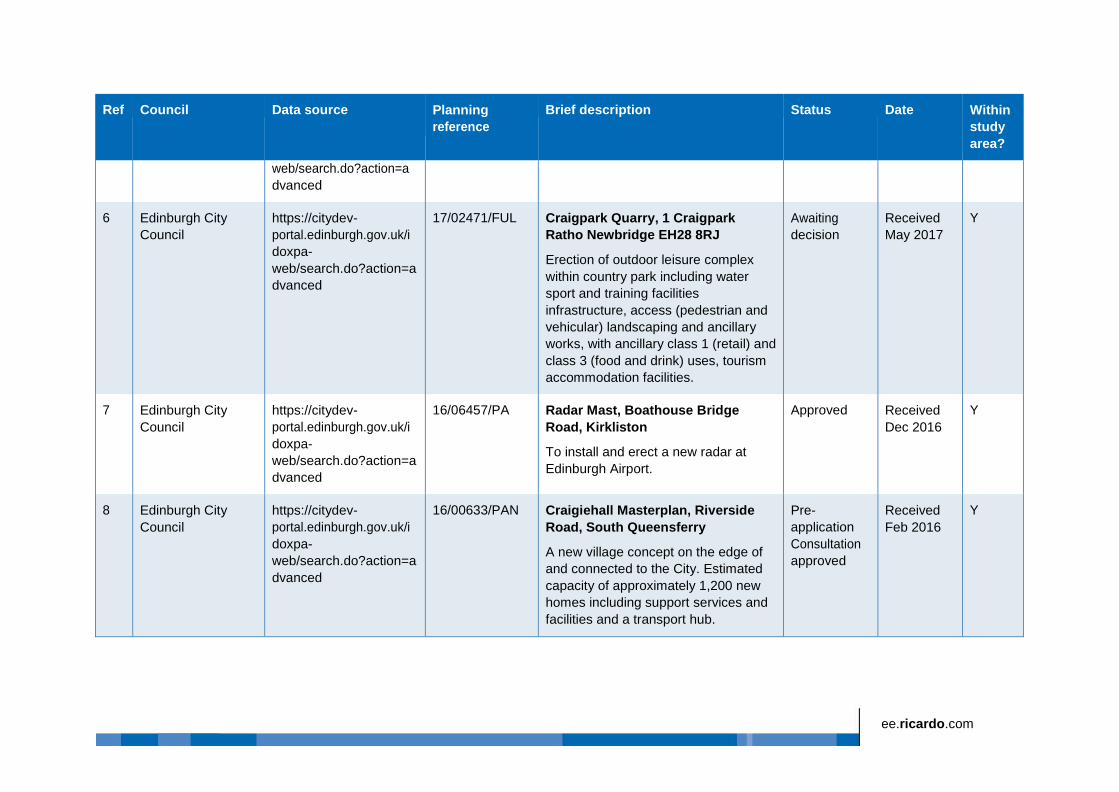
ee.ricardo.com
Ref Council Data source Planning
reference
Brief description Status Date Within
study
area?
web/search.do?action=a
dvanced
6 Edinburgh City
Council
https://citydev-
portal.edinburgh.gov.uk/i
doxpa-
web/search.do?action=a
dvanced
17/02471/FUL Craigpark Quarry, 1 Craigpark
Ratho Newbridge EH28 8RJ
Erection of outdoor leisure complex
within country park including water
sport and training facilities
infrastructure, access (pedestrian and
vehicular) landscaping and ancillary
works, with ancillary class 1 (retail) and
class 3 (food and drink) uses, tourism
accommodation facilities.
Awaiting
decision
Received
May 2017
Y
7 Edinburgh City
Council
https://citydev-
portal.edinburgh.gov.uk/i
doxpa-
web/search.do?action=a
dvanced
16/06457/PA Radar Mast, Boathouse Bridge
Road, Kirkliston
To install and erect a new radar at
Edinburgh Airport.
Approved Received
Dec 2016
Y
8 Edinburgh City
Council
https://citydev-
portal.edinburgh.gov.uk/i
doxpa-
web/search.do?action=a
dvanced
16/00633/PAN Craigiehall Masterplan, Riverside
Road, South Queensferry
A new village concept on the edge of
and connected to the City. Estimated
capacity of approximately 1,200 new
homes including support services and
facilities and a transport hub.
Pre-
application
Consultation
approved
Received
Feb 2016
Y
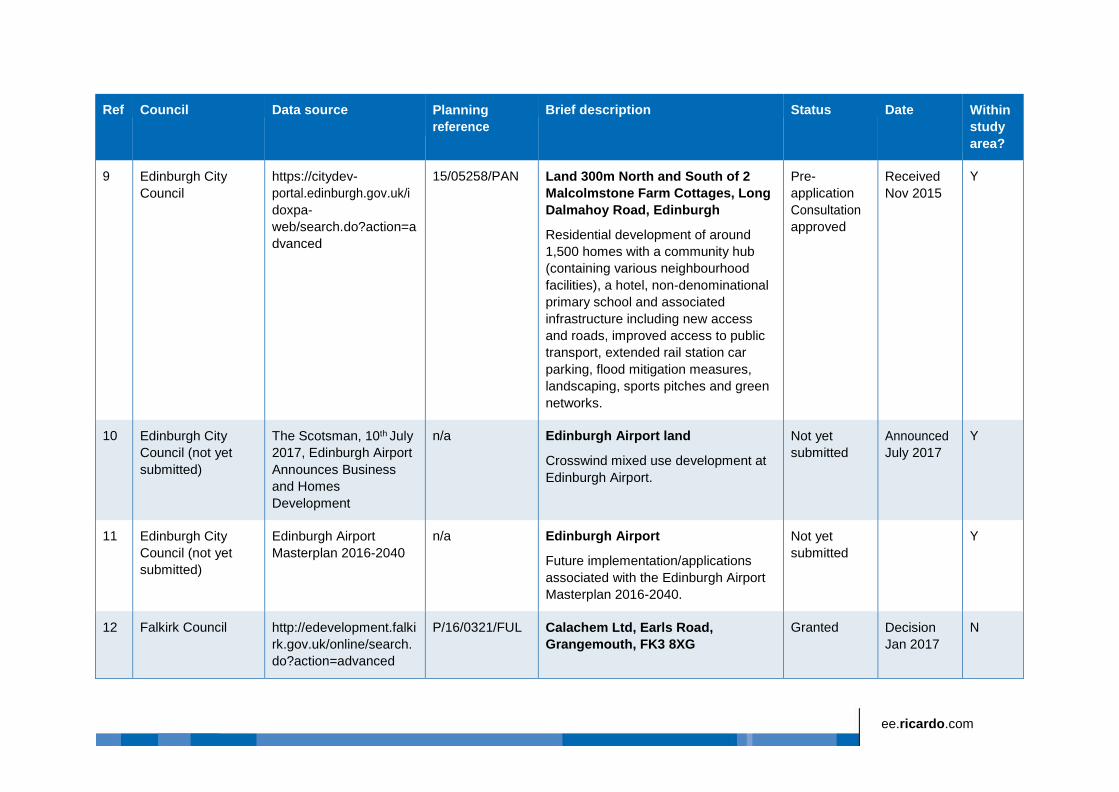
ee.ricardo.com
Ref Council Data source Planning
reference
Brief description Status Date Within
study
area?
9 Edinburgh City
Council
https://citydev-
portal.edinburgh.gov.uk/i
doxpa-
web/search.do?action=a
dvanced
15/05258/PAN Land 300m North and South of 2
Malcolmstone Farm Cottages, Long
Dalmahoy Road, Edinburgh
Residential development of around
1,500 homes with a community hub
(containing various neighbourhood
facilities), a hotel, non-denominational
primary school and associated
infrastructure including new access
and roads, improved access to public
transport, extended rail station car
parking, flood mitigation measures,
landscaping, sports pitches and green
networks.
Pre-
application
Consultation
approved
Received
Nov 2015
Y
10 Edinburgh City
Council (not yet
submitted)
The Scotsman, 10th July
2017, Edinburgh Airport
Announces Business
and Homes
Development
n/a Edinburgh Airport land
Crosswind mixed use development at
Edinburgh Airport.
Not yet
submitted
Announced
July 2017
Y
11 Edinburgh City
Council (not yet
submitted)
Edinburgh Airport
Masterplan 2016-2040
n/a Edinburgh Airport
Future implementation/applications
associated with the Edinburgh Airport
Masterplan 2016-2040.
Not yet
submitted
Y
12 Falkirk Council http://edevelopment.falki
rk.gov.uk/online/search.
do?action=advanced
P/16/0321/FUL Calachem Ltd, Earls Road,
Grangemouth, FK3 8XG
Granted Decision
Jan 2017
N
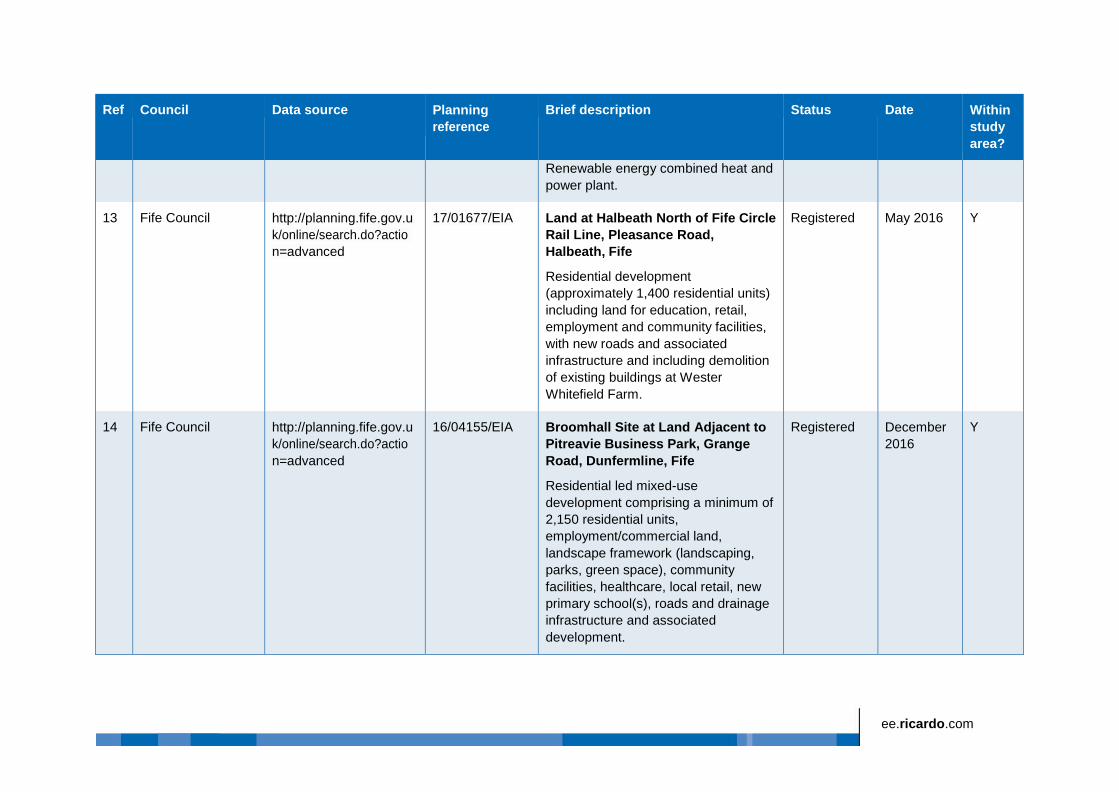
ee.ricardo.com
Ref Council Data source Planning
reference
Brief description Status Date Within
study
area?
Renewable energy combined heat and
power plant.
13 Fife Council http://planning.fife.gov.u
k/online/search.do?actio
n=advanced
17/01677/EIA Land at Halbeath North of Fife Circle
Rail Line, Pleasance Road,
Halbeath, Fife
Residential development
(approximately 1,400 residential units)
including land for education, retail,
employment and community facilities,
with new roads and associated
infrastructure and including demolition
of existing buildings at Wester
Whitefield Farm.
Registered May 2016 Y
14 Fife Council http://planning.fife.gov.u
k/online/search.do?actio
n=advanced
16/04155/EIA Broomhall Site at Land Adjacent to
Pitreavie Business Park, Grange
Road, Dunfermline, Fife
Residential led mixed-use
development comprising a minimum of
2,150 residential units,
employment/commercial land,
landscape framework (landscaping,
parks, green space), community
facilities, healthcare, local retail, new
primary school(s), roads and drainage
infrastructure and associated
development.
Registered December
2016
Y
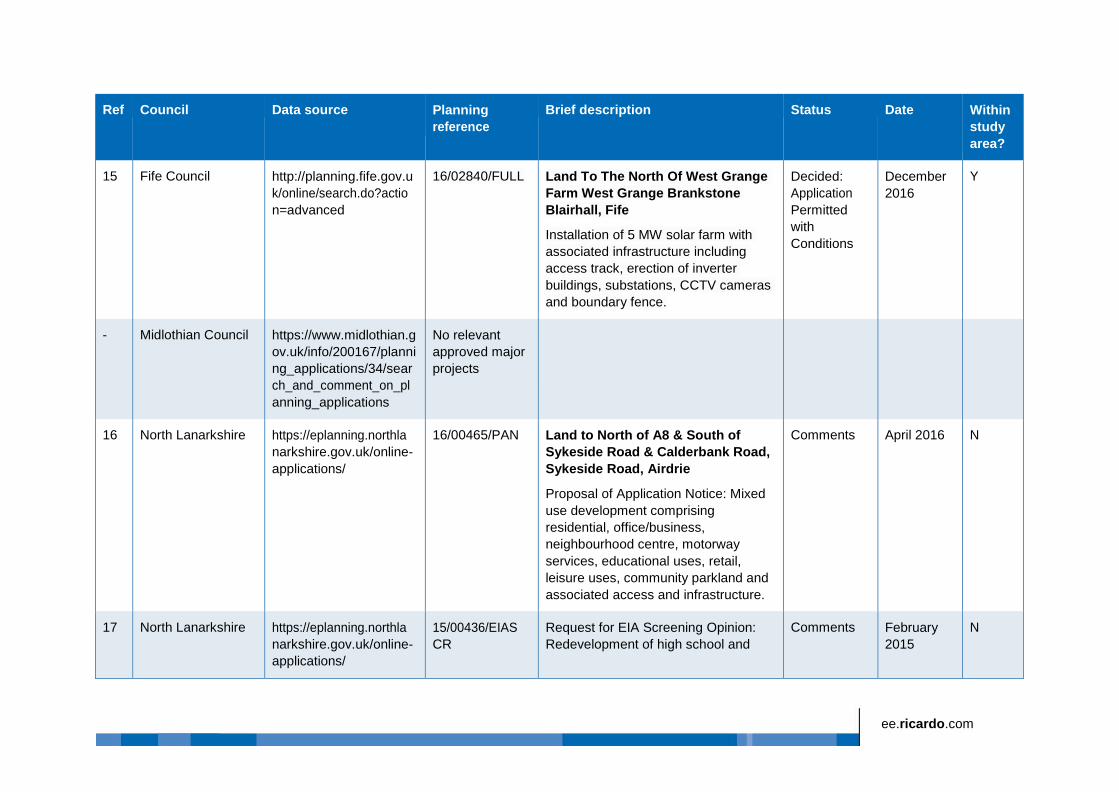
ee.ricardo.com
Ref Council Data source Planning
reference
Brief description Status Date Within
study
area?
15 Fife Council http://planning.fife.gov.u
k/online/search.do?actio
n=advanced
16/02840/FULL Land To The North Of West Grange
Farm West Grange Brankstone
Blairhall, Fife
Installation of 5 MW solar farm with
associated infrastructure including
access track, erection of inverter
buildings, substations, CCTV cameras
and boundary fence.
Decided:
Application
Permitted
with
Conditions
December
2016
Y
- Midlothian Council https://www.midlothian.g
ov.uk/info/200167/planni
ng_applications/34/sear
ch_and_comment_on_pl
anning_applications
No relevant
approved major
projects
16 North Lanarkshire https://eplanning.northla
narkshire.gov.uk/online-
applications/
16/00465/PAN Land to North of A8 & South of
Sykeside Road & Calderbank Road,
Sykeside Road, Airdrie
Proposal of Application Notice: Mixed
use development comprising
residential, office/business,
neighbourhood centre, motorway
services, educational uses, retail,
leisure uses, community parkland and
associated access and infrastructure.
Comments April 2016 N
17 North Lanarkshire https://eplanning.northla
narkshire.gov.uk/online-
applications/
15/00436/EIAS
CR
Request for EIA Screening Opinion:
Redevelopment of high school and
Comments February
2015
N
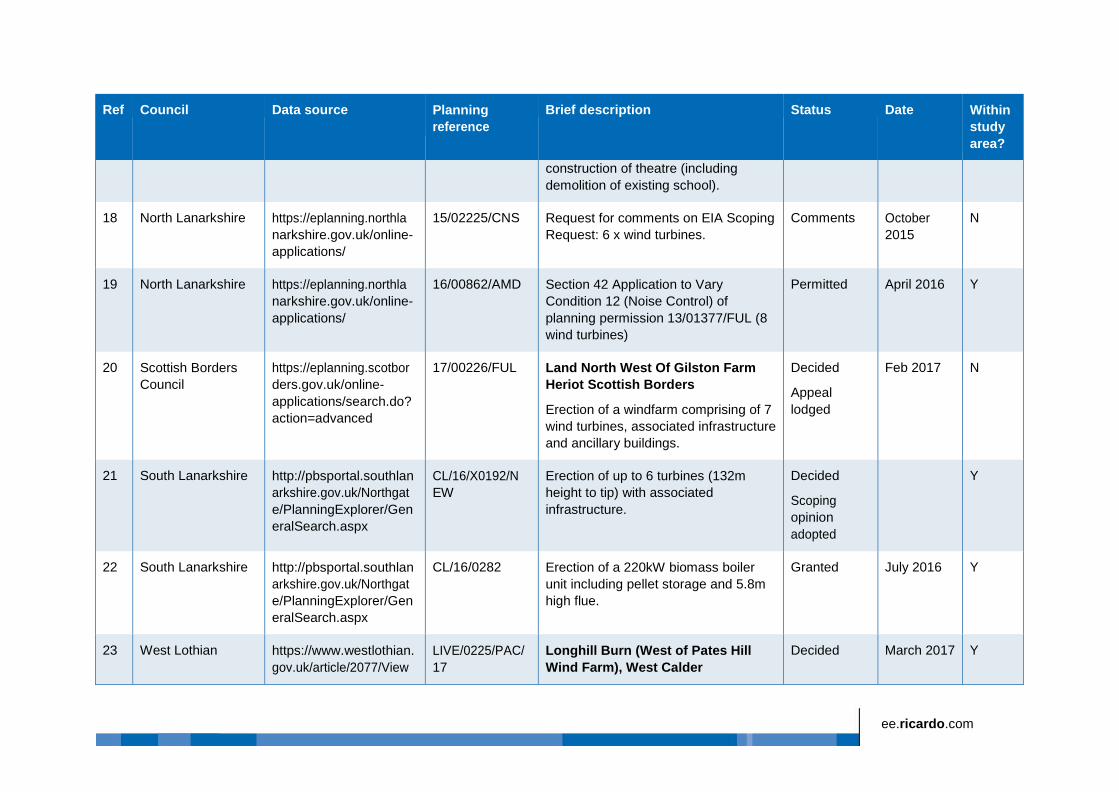
ee.ricardo.com
Ref Council Data source Planning
reference
Brief description Status Date Within
study
area?
construction of theatre (including
demolition of existing school).
18 North Lanarkshire https://eplanning.northla
narkshire.gov.uk/online-
applications/
15/02225/CNS Request for comments on EIA Scoping
Request: 6 x wind turbines.
Comments October
2015
N
19 North Lanarkshire https://eplanning.northla
narkshire.gov.uk/online-
applications/
16/00862/AMD Section 42 Application to Vary
Condition 12 (Noise Control) of
planning permission 13/01377/FUL (8
wind turbines)
Permitted April 2016 Y
20 Scottish Borders
Council
https://eplanning.scotbor
ders.gov.uk/online-
applications/search.do?
action=advanced
17/00226/FUL Land North West Of Gilston Farm
Heriot Scottish Borders
Erection of a windfarm comprising of 7
wind turbines, associated infrastructure
and ancillary buildings.
Decided
Appeal
lodged
Feb 2017 N
21 South Lanarkshire http://pbsportal.southlan
arkshire.gov.uk/Northgat
e/PlanningExplorer/Gen
eralSearch.aspx
CL/16/X0192/N
EW
Erection of up to 6 turbines (132m
height to tip) with associated
infrastructure.
Decided
Scoping
opinion
adopted
Y
22 South Lanarkshire http://pbsportal.southlan
arkshire.gov.uk/Northgat
e/PlanningExplorer/Gen
eralSearch.aspx
CL/16/0282 Erection of a 220kW biomass boiler
unit including pellet storage and 5.8m
high flue.
Granted July 2016 Y
23 West Lothian https://www.westlothian.
gov.uk/article/2077/View
LIVE/0225/PAC/
17
Longhill Burn (West of Pates Hill
Wind Farm), West Calder
Decided March 2017 Y
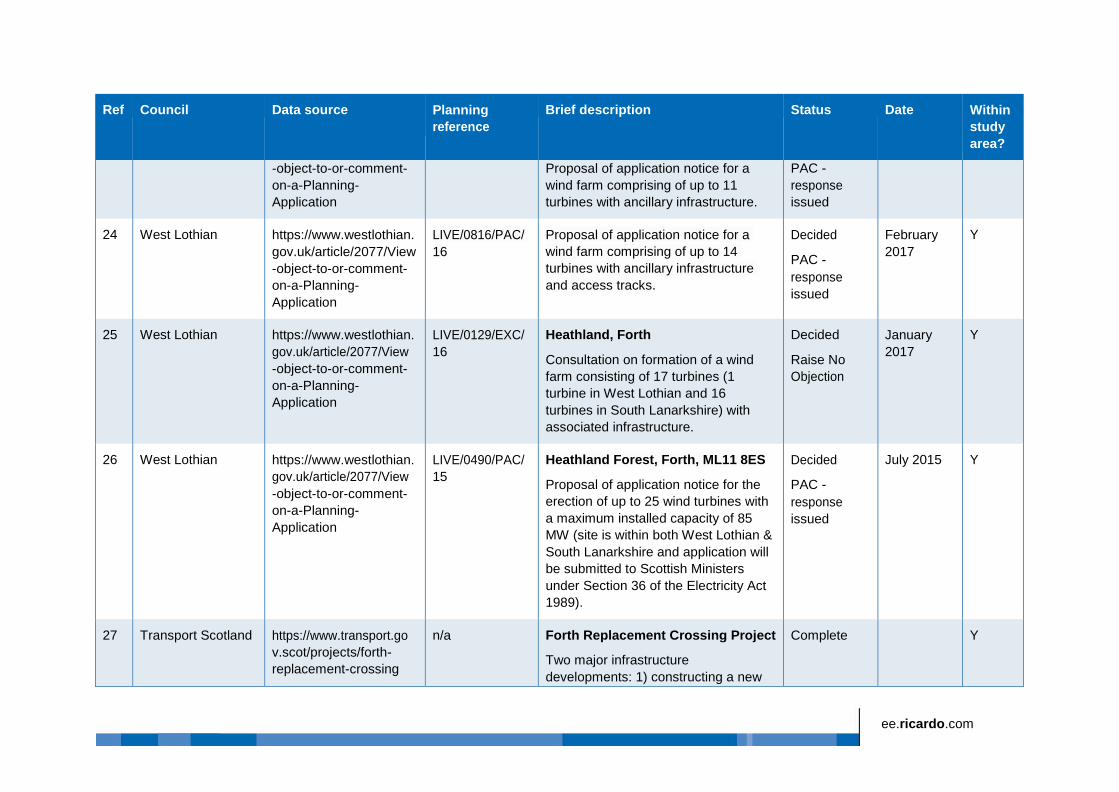
ee.ricardo.com
Ref Council Data source Planning
reference
Brief description Status Date Within
study
area?
-object-to-or-comment-
on-a-Planning-
Application
Proposal of application notice for a
wind farm comprising of up to 11
turbines with ancillary infrastructure.
PAC -
response
issued
24 West Lothian https://www.westlothian.
gov.uk/article/2077/View
-object-to-or-comment-
on-a-Planning-
Application
LIVE/0816/PAC/
16
Proposal of application notice for a
wind farm comprising of up to 14
turbines with ancillary infrastructure
and access tracks.
Decided
PAC -
response
issued
February
2017
Y
25 West Lothian https://www.westlothian.
gov.uk/article/2077/View
-object-to-or-comment-
on-a-Planning-
Application
LIVE/0129/EXC/
16
Heathland, Forth
Consultation on formation of a wind
farm consisting of 17 turbines (1
turbine in West Lothian and 16
turbines in South Lanarkshire) with
associated infrastructure.
Decided
Raise No
Objection
January
2017
Y
26 West Lothian https://www.westlothian.
gov.uk/article/2077/View
-object-to-or-comment-
on-a-Planning-
Application
LIVE/0490/PAC/
15
Heathland Forest, Forth, ML11 8ES
Proposal of application notice for the
erection of up to 25 wind turbines with
a maximum installed capacity of 85
MW (site is within both West Lothian &
South Lanarkshire and application will
be submitted to Scottish Ministers
under Section 36 of the Electricity Act
1989).
Decided
PAC -
response
issued
July 2015 Y
27 Transport Scotland https://www.transport.go
v.scot/projects/forth-
replacement-crossing
n/a Forth Replacement Crossing Project
Two major infrastructure
developments: 1) constructing a new
Complete
Y
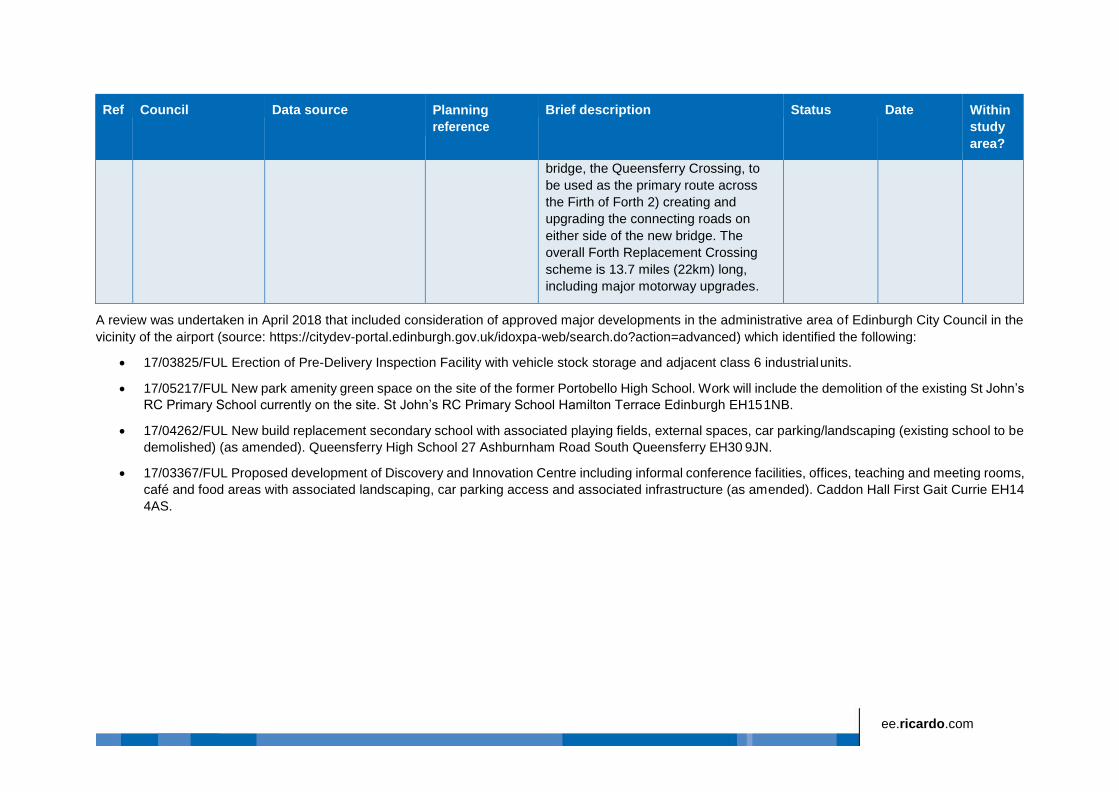
ee.ricardo.com
Ref Council Data source Planning
reference
Brief description Status Date Within
study
area?
bridge, the Queensferry Crossing, to
be used as the primary route across
the Firth of Forth 2) creating and
upgrading the connecting roads on
either side of the new bridge. The
overall Forth Replacement Crossing
scheme is 13.7 miles (22km) long,
including major motorway upgrades.
A review was undertaken in April 2018 that included consideration of approved major developments in the administrative area of Edinburgh City Council in the
vicinity of the airport (source: https://citydev-portal.edinburgh.gov.uk/idoxpa-web/search.do?action=advanced) which identified the following:
• 17/03825/FUL Erection of Pre-Delivery Inspection Facility with vehicle stock storage and adjacent class 6 industrial units.
• 17/05217/FUL New park amenity green space on the site of the former Portobello High School. Work will include the demolition of the existing St John’s
RC Primary School currently on the site. St John’s RC Primary School Hamilton Terrace Edinburgh EH15 1NB.
• 17/04262/FUL New build replacement secondary school with associated playing fields, external spaces, car parking/landscaping (existing school to be
demolished) (as amended). Queensferry High School 27 Ashburnham Road South Queensferry EH30 9JN.
• 17/03367/FUL Proposed development of Discovery and Innovation Centre including informal conference facilities, offices, teaching and meeting rooms,
café and food areas with associated landscaping, car parking access and associated infrastructure (as amended). Caddon Hall First Gait Currie EH14
4AS.

Bright Building, First Floor Manchester Science Park Pencroft Way Manchester M15 6GZ
t: +44 (0) 1235 753154 e: [email protected]
ee.ricardo.com