dwelling on courtyards - tu delft repositories
TRANSCRIPT
182014
Dwelling on CourtyardsExploring the energy efficiency and comfort potential
of courtyards for dwellings in the Netherlands
Mohammad Taleghani

Dwelling on Courtyards Exploring the energy efficiency and comfort potential of courtyards for dwellings in the Netherlands
Mohammad TaleghaniDelft University of Technology, Faculty of Architecture and the Built Environment, Department of Architectural Engineering + Technology
i

i
Dwelling on Courtyards Exploring the energy efficiency and comfort potential of
courtyards for dwellings in the Netherlands
Proefschrift
ter verkrijging van de graad van doctoraan de Technische Universiteit Delft,
op gezag van de Rector Magnificus prof.ir. K.C.A.M. Luyben,voorzitter van het College voor Promoties,
in het openbaar te verdedigen op 3 december 2014 om 12.30 uurdoor Mohammad TALEGHANI
Master of Science in Architecture EngineeringUniversity of Tehran, Tehran, Iran
geboren te Shahrood, Iran
i
Dit proefschrift is goedgekeurd door de promotor: Prof.dr.ir. A.A.J.F. van den Dobbelsteen
Copromotor Dr.ir. M.J. Tenpierik
Samenstelling promotiecommissie:
Rector Magnificus, voorzitterProf.dr.ir. A.A.J.F. van den Dobbelsteen, Technische Universiteit Delft, promotorDr.ir. M.J. Tenpierik, Technische Universiteit Delft, copromotorProf. Dr. D.J. Sailor, Portland State University, USAProf. Dr. K. Steemers, MPhil PhD RIBA University of Cambridge, UKProf.dr.ir. L. Schrijver, University of Antwerp, BelgiumProf.dr.ir. B.J.E. Blocken, Technische Universiteit EindhovenProf.dr.ir. P.M. Bluyssen, Technische Universiteit DelftProf.ir. P.G. Luscuere, Technische Universiteit Delft, reservelid
abe.tudelft.nl
Design: Sirene Ontwerpers, Rotterdam
Cover image: Marrakesh (Bruno Barbey / Magnum Photos)
ISBN 978-94-6186-395-9ISSN 2212-3202
© 2014 Mohammad Taleghani
i

i

Painting by Farzaneh Fakhredin
i

5
سوگند به روز
و به شب چون در آن می آرامد
که پروردگارت هرگز با تو وداع نکرده و تو را تنها نگذاشته
بزودى پروردگارت نعمتی به تو خواهد بخشید که خشنود شوى
مگرنه تو را سرگشته دید و هدایت کرد
و تو را تنگدست دید و بی نیاز گردانید
پس یتیم را هرگز میازار و فقیر را مران و نعمت پروردگار را بر خویش بشمار
سوره ضحی
i

i

7
تقدیم به فاطمه و رضا
i

i

11 Contents
Contents
List of tables 19
List of figures 21
Summary 29
Samenvatting 31
1 Introduction 37
1.1 General Introduction 37
1.2 Terminology 38
1.3 Problem statement 39
1.4 Research objectives 41
1.5 Boundary conditions 41
1.6 Research questions 42
1.7 Research method 43
1.7.1 Research steps and approach 43
1.7.2 Research tools 46
1.8 Dissertation outline 47
i
12 Dwelling on Courtyards
PART 1 Literature review
2 Introduction into courtyard buildings in different climates 53
2.1 Introduction 56
2.1.1 Objectives 56
2.1.2 Research questions 56
2.1.3 Methodology of the literature review 57
2.2 Problem analysis 57
2.2.1 Climate change and buildings 57
2.2.2 The effect of residential buildings and courtyards 58
2.3 Literature overview 59
2.4 Courtyard buildings 62
2.4.1 Definition of courtyard buildings 62
2.4.2 Historical evolution of courtyards 63
2.4.2.1 Ancient civilisations 64
2.4.2.2 Classical civilisations 65
2.4.2.3 The middle ages and renaissance civilisation 66
2.4.2.4 Courtyards in modern era 66
2.5 Impacts of courtyards 67
2.5.1 Social- cultural impacts 67
2.5.2 Formal impacts 68
2.5.3 Environmental impacts 68
2.6 Comparative characteristics of courtyard buildings in four climates 69
2.6.1 The courtyard in a hot arid climate 70
2.6.2 The courtyard in a snow climate 73
2.6.3 The courtyard in a temperate climate 75
2.6.4 The courtyard in a tropical climate 78
2.7 Conclusions and discussion 80
2.7.1 Conclusions 80
2.7.2 Discussion for further studies 81
i
13 Contents
3 Introduction into thermal comfort in buildings 87
3.1 Introduction 90
3.2 Development of the concept of human thermal comfort 90
3.2.1 Steady-state studies 92
3.2.2 Field studies 97
3.3 Adaptive thermal comfort standards 101
3.3.1 ASHRAE 55-2010 103
3.3.2 EN15251 106
3.3.3 ATG 107
3.4 Comparison and discussion 110
3.5 Conclusions 113
PART 2 Indoor study
4 Indoor thermal comfort in different building blocks 123
4.1 Introduction 126
4.2 Method and models 127
4.3 Thermal comfort in summer 132
4.4 Results and discussion 134
4.4.1 Energy consumption 134
4.4.1.1 One storey models 135
4.4.1.2 Multi-storey models 137
4.4.2 Summer thermal comfort 141
4.4.2.1 One-storey models 141
4.4.2.2 Multi-storey models 141
4.4.3 Energy versus comfort 142
4.5 Conclusion 144
i
14 Dwelling on Courtyards
5 Indoor thermal comfort in courtyard buildings 149
5.1 Introduction 152
5.1.1 Thermal behaviour of courtyard buildings 152
5.1.2 Highly reflective materials and cool roofs 153
5.2 Methodology 153
5.2.1 Energy modelling 158
5.2.2 Thermal comfort model 159
5.2.3 Climate of the Netherlands 159
5.3 Results 160
5.3.1 Phase 1: Parametric simulations 160
5.3.1.1 Courtyards with different orientations 160
5.3.1.2 Future climate scenario and heat mitigation strategies 162
5.3.1.3 The position effect 166
5.3.1.4 Detailed analysis of a single family house with different roofs 168
5.3.2 Phase 2: Scale model experiment 170
5.3.3 Phase 3: An actual courtyard house experiment 172
5.4 Conclusions 174
6 Indoor thermal comfort in a courtyard/atrium dwelling 179
6.1 Introduction 182
6.1.1 Background 182
6.1.2 Climate change in the Netherlands 183
6.2 Methodology 186
6.2.1 Modelling and simulations 186
6.2.2 Summer thermal comfort calculation 190
6.2.3 Weather data 191
6.3 Results and discussion 194
6.3.1 Phase zero: The reference model- Building I 194
6.3.2 Phase one: The effect(s) of a courtyard- Buildings IIc and IIIc 197
6.3.3 Phase two: The effect(s) of an atrium- Buildings IIa and IIIa 199
6.3.4 Phase three: Optimisation 202
6.4 Conclusions 205
i
15 Contents
PART 3 Outdoor study
7 Outdoor thermal comfort within different building blocks 211
7.1 Introduction 214
7.1.1 Outdoor thermal comfort indices 214
7.1.2 Urban typology study 216
7.2 Methodology 218
7.2.1 Models 219
7.2.2 Simulations 221
7.2.3 Weather data 224
7.2.4 Validation of ENVI-met 225
7.2.4.1 Measurement versus simulation 225
7.2.4.2 Computational domain size sensitivity check 227
7.2.4.3 Discussion on reliability of ENVI-met 230
7.3 Results and discussion 230
7.4 Conclusions 238
8 Outdoor thermal comfort within different courtyard buildings 245
8.1 Introduction 248
8.2 Background 249
8.3 Methodology 252
8.3.1 Simulations 255
8.3.2 Climatic data 255
8.3.3 Validation of ENVI-met 257
8.3.3.1 Measurement versus simulation 257
8.3.3.2 Calibration of the ENVI-met simulations 259
i
16 Dwelling on Courtyards
8.4 Results 261
8.4.1 Phase 1: Reference study 261
8.4.1.1 Solar radiation 261
8.4.1.2 Mean radiant temperature (Tmrt) 265
8.4.2 Phase 2: the climate of 2050 266
8.4.3 Phase 3: The albedo effect 268
8.4.4 Phase 4: The effect of water 270
8.4.5 Phase 5: The effect of vegetation 270
8.5 Discussion 271
8.6 Conclusions 273
9 Heat mitigation strategies on courtyard buildings in summer 281
9.1 Introduction 284
9.2 2. Literature review on heat mitigation strategies 284
9.3 Methodology 286
9.3.1 Field measurements 288
9.3.2 Simulations 288
9.3.3 Climate of Portland 289
9.4 Results and discussion 290
9.4.1 Scale 1: the campus microclimate 290
9.4.2 Scale 2: the three courtyards 295
9.4.3 Scale 3: Shattuck Hall 299
9.5 Conclusion 304
10 Heat mitigation strategies on courtyard buildings in winter 311
10.1 Introduction 314
10.2 Methodology 315
i
17 Contents
10.3 Results and discussion 319
10.3.1 Summer study, the case of Portland (OR), USA 319
10.3.1.1 The three different courtyards 319
10.3.1.2 Park cool effect in Portland 321
10.3.2 Winter study, the case of Delft, the Netherlands 322
10.3.2.1 The three different courtyards 322
10.3.2.2 Park cool effect in Delft 324
10.3.2.3 Three different roofs 325
10.3.3 Scale model experiment 328
10.4 Conclusions 329
11 Conclusions 335
11.1 Introduction 335
11.2 Answers to the research questions 335
11.2.1 Answers to the sub-research questions 336
11.2.2 Answers to the main research questions 340
11.3 Limitations of this research 342
11.4 Conclusions of findings 343
11.4.1 Indoor thermal comfort and energy use 343
11.4.2 Outdoor thermal comfort 344
11.4.3 Design recommendations based on the results 345
11.5 Recommendations 346
11.5.1 Recommendations for future research 346
11.5.2 Recommendations for the market 346
11.6 Value of this dissertation 347
Acknowledgements 349
Curriculum vitae 351
List of publications 353
i

18 Dwelling on Courtyards i
19 List of tables
List of tables
Chapter 1 Introduction
Table 1 The measurement tools of the dissertation 47
Chapter 2 Introduction into courtyard buildings in different climates
Table 1 Classification of studies done in case of transitional spaces and courtyard buildings. 60
Table 2 Comparative thermal data for the old and new houses at Ghadames (Ahmed et al., 1985). 73
Table 3 Daylight factor % on interior facades and in courtyard (Ntefeh et al, 2003). 77
Table 4 Comparison of courtyard building characteristics in four climates 81
Chapter 3 Introduction into thermal comfort in buildings
Table 1 Chronological development of indices related to thermal comfort (table after [53]) 92
Table 2 The description of comfort vote units based on ASHRAE, Bedford, HSI (Heat Stress Index= the ratio of demand for sweat evaporation to capacity of evaporation (Ereq/Emax), and zone of thermal comfort classification (Table after [53, 54]) 93
Table 3 Recommended operative temperatures for occupants for sedentary activity based on ISO 7730-1984 94
Table 4 Recommended operative temperatures for occupants with sedentary activity, 50% relative humidity and mean air speed less than 0.15 m/s based on ASHRAE 55-1992 95
Table 5 Overview of studies showing differences of comfort temperature between naturally ventilated and conditioned buildings [92] 99
Table 6 Adaptive Comfort Algorithms for individual countries [101]. 106
Table 7 Suggested applicability for the categories and their associated acceptable temperature ranges (table after [100]). 107
Table 8 ATG Comfort bandwidths for the alpha type (table after [104]). 108
Table 9 specified comfort temperature bandwidths for dwellings based on [105]. 110
Table 10 Representative weather data of De Bilt as used in the calculations. 110
Table 11 Comparison of the comfort standards for summer time. 113
Chapter 4 Indoor thermal comfort in different building blocks
Table 1 The wall, roof and glazing properties used in the simulations and calculations. 128
Table 2 The surface to volume ratio of the different models (average values over all storeys). 131
Table 3 Adaptive comfort algorithms for individual countries [29]. 132
Table 4 Suggested applicability for the categories and their associated acceptable temperature ranges (table after [28]). 133
Chapter 5 Indoor thermal comfort in courtyard buildings
Table 1 The properties used in the simulations. 154
Table 2 The data used for the simulation of the green roof in this research. 159
Table 3 Operative temperatures and percentage of discomfort hours in the N-S model. 164
Table 4 Operative temperatures and percentage of discomfort hours in the E-W model. 164
Table 5 The average reductions of discomfort hours in the two models. 164
i

20 Dwelling on Courtyards
Table 6 The operative temperatures of the model with different roofs. 169
Chapter 6 Indoor thermal comfort in a courtyard/atrium dwelling
Table 1 Climate change scenarios for 2050 in the Netherlands [30]. 185
Table 2 (Envelope) surface to (interior) volume ratio of the models. 186
Table 3 The wall and roof properties used in the simulations and calculations. 189
Table 4 Heating schedules, set points and set backs of the thermal zones. 189
Table 5 Representative weather data of De Bilt as used in the calculations. 191
Table 6 Monthly heating energy demand and discomfort hours (based on the current climate scenario). At*=atrium; Cy**= courtyard. 201
Table 7 Monthly heating energy demand and discomfort hours (based on the W+ climate scenario). 202
Table 8 Monthly heating energy demand and discomfort hours (based on the W+ climate scenario). 204
Table 9 Monthly heating energy demand and discomfort hours (based on the W+ climate scenario). 204
Chapter 7 Outdoor thermal comfort within different building blocks
Table 1 Ranges of the thermal indexes predicted mean vote (PMV) and physiological equivalent temperature (PET) for different grades of thermal perception by human beings and physiological stress on human beings; internal heat production: 80 W, heat transfer resistance of the clothing: 0.9 clo [11]. 216
Table 2 Conditions used in the simulations with ENVI-met 3.1. 224
Table 3 Conditions used in the simulations with RayMan 1.2. 224
Table 4 The conditions used in the validation simulations. 226
Table 5 The duration of insolation of the reference points in the models on the 19th of June. 231
Table 6 Averages of the microclimates properties. *= The sum of slightly cool, comfortable and slightly warm hours. 236
Chapter 8 Outdoor thermal comfort within different courtyard buildings
Table 1 The conditions used in the basic simulations (phase one of the parametric study). 255
Table 2 Climate change scenarios for 2050 in the Netherlands [80]. 256
Table 3 The conditions used in the validation simulations. 258
Table 4 The calibration data of models with two different grid sizes. *RMSD= root mean square deviation. 261
Table 5 The average mean radiant temperature (Tmrt), air temperature (Ta) and relative humidity (RH) of the 10*50 m2 EW model. 272
Table 6 The duration of direct sun at the centre of the models in the reference study (Phase 1). h = hour, and m = minute. 274
Chapter 9 Heat mitigation strategies on courtyard buildings in summer
Table 1 The average mean radiant temperature (Tmrt), air temperature (Ta) and relative humidity (RH) of the 10*50 m2 EW model. 291
Table 2 Timing and magnitude of largest UHI (relative to the airport station) as measured at the park and fire station parking lot both at night and during the day. 292
Chapter 10 Heat mitigation strategies on courtyard buildings in winter
Table 1 The summary of the key findings of different heat mitigation studies in summer. * Temperature reduction is a result of the presence of the natural element with a bare surrounding. 315
Table 2 The characteristics and peak temperatures of the Delft roofs. 327
i
21 List of figures
List of figures
Chapter 1 Introduction
Figure 1 Different types of transitional spaces (image after (Chun et al., 2004)) 38
Figure 2 Distribution of courtyards in the World (image after (Vellinga et al., 2007)) 39
Figure 3 Residential energy consumption shown as a percentage of national energy consumption and in relative international form (Saidur et al., 2007) 40
Figure 4 The research scheme. Q= Question number 44
Figure 5 The dissertation outline and the order of the chapters 48
Chapter 2 Introduction into courtyard buildings in different climates
Figure 1 Residential energy consumption shown as a percentage of national energy consumption and in relative international form (Saidur et al., 2007) 58
Figure 2 Different types of transitional spaces. type 1 (left), open space inside the building, type 2 (middle), open space is attached to the building, type 3 (right), open space encloses the building (image after (Chun et al., 2004)) 62
Figure 3 Left: a courtyard, Middle: a patio, Right: an atrium. 63
Figure 4 Distribution of Courtyards in the World (image after Vellinga et al, 2007) 64
Figure 5 Left: Troglodyte Cave Dwellings in Tunisia (from Schoenauer and Seeman 1962). Right: Chinese Underground courtyards in Honan (from Rudofsky, 1964). 65
Figure 6 Courtyard house in terms of access (Rapoport, 2007) 68
Figure 7 A courtyard house in hot arid climate of Iran, city of Kashan (Courtesy of Sara Fadaei). 71
Figure 8 Differences of size of openings between southern façade and northern façade in a courtyard house in hot arid climate of Iran (Courtesy of Authors). 72
Figure 9 Less natural elements in European urban courtyards in cold regions; Stockholm, Sweden. The courtyards are designed to obstruct the cold winds (picture from Google Earth). 74
Figure 10 Two small courtyards (patios) in Amsterdam (left; courtesy of Kees Hummel and right; courtesy of ARHK). 75
Figure 11 Solar simulations; in grey the surfaces receive less than two hours on winter (Ntefeh et al, 2003). 77
Figure 12 Average daylight factor % on facades from ground floor to upper level (Ntefeh et al, 2003). 77
Figure 13 Porous facades and large openings in tropical region of Persian Gulf. The openings facilitate natural ventilation (Courtesy of Sara Fadaei). 79
Figure 14 Average indoor air speed given as Uloc/Uref. Uloc = local air speed, Uref = reference air speed at 10m height. The values are given for both cavities ratios, on the left: W/H = 0.33, on the right: W/H = 0.66 (Tablada et al., 2005). 80
Chapter 3 Introduction into thermal comfort in buildings
Figure 1 An example of a schematic diagram of the passive system used in simulations [59] 96
Figure 2 Schematic view of the ThermoSEM model [68] 96
Figure 3 The difference of comfort predictions between the actual mean vote and the PMV in some field surveys (after [69]) 97
Figure 4 Comfort temperature vs. outside temperature [75] 98
i

22 Dwelling on Courtyards
Figure 5 Observed (BS) and predicted indoor comfort temperature from ASHRAE database for conditioned buildings (top), and naturally ventilated buildings (below) [78]. 99
Figure 6 Comfort temperature as a function of outdoor temperature in free-running buildings (A) and conditioned buildings (B): (left) from the ASHRAE data base from the 1990s [93]; (right) from Humphreys surveys from the 1970s [75]. 102
Figure 7 The Graphic Comfort Zone Method: Acceptable range of operative temperature and humidity for 80% of occupants acceptability (10% of dissatisfied based on PMV-PPD index) for 1.1 met and, 0.5 and 1 clo [97]. 0.5 clo normally refers to summer, and 1 to winter. 103
Figure 8 The geographic distribution of building studies that formed the basis of the adaptive model and adaptive comfort standard of ASHRAE [78]. 104
Figure 9 Comfort bandwidths of ASHRAE 55-2010 [99]. 105
Figure 10 Comfort bandwidths of EN15251 [100]. 107
Figure 11 Diagram for determining the type of building/climate: alpha or beta [103]. 108
Figure 12 Adaptive comfort bandwidths (for naturally ventilated buildings) according to ATG [103]. 109
Figure 13 Representative mean dry bulb outdoor temperature and mean wind speed of De Bilt. 111
Figure 14 Indoor operative thermal comfort temperature estimated by the standards for De Bilt. 111
Figure 15 The upper and lower limits of the thermal comfort standards for 80% of acceptability. 112
Chapter 4 Indoor thermal comfort in different building blocks
Figure 1 Generic urban forms. From left to right: pavilions, slabs, terraces, terrace-courts, pavilion-courts and courts [14]. 127
Figure 2 Monthly average global radiation levels in Rotterdam, split into diffuse radiation and direct radiation. 129
Figure 3 Mean dry bulb outdoor temperature and mean wind speed of Rotterdam as used in the calculations. 130
Figure 4 Mean dry bulb outdoor temperature and mean wind speed of Rotterdam as used in the calculations. 131
Figure 5 Comfort boundaries for a building in Rotterdam in free running mode during a whole year (based on category II from [30]). 134
Figure 6 Wind flow pattern around the three building forms based on the mean wind speed of Rotterdam (5.5 m/s) in the free field (produced by DesignBuilder). 135
Figure 7 Daylight factor in the studied zones; the models are analysed with no blockage of sun, i.e. without any obstruction (produced by Radiance merged in DesignBuilder). 135
Figure 8 From top to bottom: a) heat loss by infiltration (kWh/m2), b) solar gain through exterior windows (kWh/m2), c) daylight factor (%) of the three zone combinations. 136
Figure 9 Ventilation heat loss and solar gains (average values of all the zones are included). 137
Figure 10 Solar access on 21st of Jun (left) and 21st of Dec (right) at 12:00 for the latitude of Rotterdam, 52° N (produced by DesignBuilder). 138
Figure 11 Heating demand in 1-storey models (top left); average of heating demand in 2-storey models (middle left); average of heating demand in 3 storey models (down left); Lighting demand in 1 storey model (top right); average of lighting demand in 2 storey models (middle right); average of lighting demand in 3 storey models (down right). 139
Figure 12 The sum of the annual heating and lighting energy demand of the models for a full year (average of the three storey models). 140
Figure 13 Percentage of discomfort hours of the models based on EN15251 in the summer period; above, the 1 storey; middle, the average of 2 storey zones; down, the average of 3 storey zones. 142
Figure 14 Heating and lighting energy demand of the models and their percentage of thermal comfort hours.. 143
i

23 List of figures
Chapter 5 Indoor thermal comfort in courtyard buildings
Figure 1 The courtyards simulated with different orientations and lengths.. 155
Figure 2 The studied reference models (N-S and E-W), and the interior plan of the Southern zone/dwelling. 156
Figure 3 Up left: the scale model experiment with the halogen light and fan. Up right: the sensors placed in the four sides of the model. Down from left to right: black cardboard, gravel, grass and white cardboard. 157
Figure 4 Up left: An aerial view of the field measurement. The measured courtyard house is highlighted with a star. Up right: The courtyard view. Down left: The whole model of the residential complex in DesignBuilder. Down right: The same view of the courtyard in the computer model. 158
Figure 5 a,b) Solar radiation received through the windows; c,d) Indoor ventilation; e,f) Operative temperature; and g,h) Percentage of thermal discomfort during the summer week. 162
Figure 6 The operative temperature in zones/dwellings with different position and height in the 10*50 E-W model (a and b); and in the 50*10 N-S model (c and d). 167
Figure 7 The average operative temperatures of the house in summer (top), and winter (down). 169
Figure 8 Temperature differences inside the scale model (average of four data loggers on the North, South, East and West side of the model) (a), and within the courtyard (b). 171
Figure 9 Compared temperatures of measurement and simulation in four rooms (a-d left) with their corresponding error plot (a-d right). The air temperatures of the courtyard and the airport are also compared (e left), and the average (averaged for all 31 days of May) temperature difference for each hour during a 24 hour period between the courtyard and the airport is illustrated in a graph (e right).. 173
Chapter 6 Indoor thermal comfort in a courtyard/atrium dwelling
Figure 1 Four climate scenarios for the Netherlands in 2050 [30]. 184
Figure 2 Calculated effects on the number of summer days in case of the four climate scenarios for the Netherlands in 2050 [30]. 184
Figure 3 the research scenario. 187
Figure 4 The Dutch Agentschap NL mid-terraced reference dwellings [33]. 187
Figure 5 The Amsterdam courtyard dwelling (images from Google Map). 188
Figure 6 The Amsterdam courtyard house with its left and right adjacent. 188
Figure 7 Comfort bandwidths of ASHRAE 55-2010 [43]. 190
Figure 8 Climatic data of De Bilt as used for calculations and simulations. 191
Figure 9 Comfort temperatures of De Bilt in the free running time calculated based on ASHRAE 55-2010 standard for 80% of occupants. 192
Figure 10 Monthly energy balance of the reference model representative for the current climate. 195
Figure 11 Monthly average Indoor operative temperature of Building I versus outside dry bulb temperature based on [45] and the four KNMI’06 climate scenarios. 196
Figure 12 Heating energy demand of Building I based on [45] and the four KNMI’06 climate scenarios. 196
Figure 13 Heating energy demand of Building I, IIc and IIIc for the current climate of the Netherlands (dark bars) and the future W+ scenario (white bars inside dark ones). 197
Figure 14 Monthly average indoor operative temperature of the studied models in the context of the severest KNMI’06 climate scenario (W+). 198
Figure 15 Monthly heating energy demand of the courtyard and atrium dwellings for the current climate of the Netherlands (dark bars) and the future W+ scenario (white bars inside dark ones). 200
Figure 16 Indoor operative temperature of the studied models in the context of the severest KNMI’06 climate scenario (W+). 200
i
24 Dwelling on Courtyards
Chapter 7 Outdoor thermal comfort within different building blocks
Figure 1 Singular (left) linear (middle) and courtyard (right) urban forms in the Netherlands. 219
Figure 2 The research method. The simulations are done for the hottest day so far in the Netherlands, 19th of June 2000. 219
Figure 3 Left: the five models and the positions of the reference points (the numbers are in meter); Right: the Sky View Factor (SVF) of all the forms, a) and b) 0.605, c) and d) 0.404 and e) 0.194) (calculated and produced by RayMan). 220
Figure 4 (a)- A schematic overview of the ENVI-met model layout. Z shows the height of the main 3D model, H the height of the 1D model, and D the depth of the model (soil). (b) [72]. 222
Figure 5 Left, drybulb outdoor temperature and wind speed of De Bilt. Right, Percentage frequency of PET in the climate of De Bilt (in the open field and outside an urban form). The comfort ranges, from slightly cool to slightly warm, are highlighted. The comfort range is between 18°C and 23°C, and has occurred in 10 per cents of the year. 225
Figure 6 a) The location of Delft as the place of validation, and De Bilt as the representative climate for the Netherlands (used in further simulations), b) the weather station (Vantage Pro2) used for measurement in situ, c) a view from inside the courtyard. 227
Figure 7 Comparison of simulation (ENVI-met) results with measurements on September 22nd (a) and September 25th (b). The mentioned data are compared in a scatterplot (c). 227
Figure 8 a) the courtyard model 10*10 m2 in 180*180 domain size with similar neighbouring blocks, b) the same courtyard model withought neighbours and in 90*90 domain size, c) the air temperature in 180*180 domain size on 19th of June 2000, d) the air temperature in 90*90 domain size in the same day e) the air temperatures compared in different domain sizes, f) scatterplot of air temperature in 90*90 versus 180*180. 229
Figure 9 Left: insolation of the models; Right: sky views from the reference points (the images are generated by the Chronolux plug-in for Sketchup and by RayMan, respectively). 232
Figure 10 Air temperatures (left) and local air velocities (right) at 16:00h on the 19th of June. 233
Figure 11 Mean radiant temperatures (Tmrt) at the reference points. 234
Figure 12 Air temperatures (Ta) at the reference points. 234
Figure 13 Wind speed at the reference points. 235
Figure 14 PET at the reference points (the comfort range is highlighted with grey). 237
Figure 15 Percentage frequency of PET in accordance with Figure 12 at the reference points. 237
Chapter 8 Outdoor thermal comfort within different courtyard buildings
Figure 1 Urban courtyard blocks in Amsterdam, Rotterdam and The Hague (left to right). 248
Figure 2 Overview of the basic models for the parametric study, E-W (1st row), N-S (2nd row), SW-NE (3rd row) and NW-SE (4th row). The reference models used in phases 2 to 5 are highlighted in grey. The dimensions are for the size of the courtyards, and the buildings have a depth of 9 m. 253
Figure 3 The research method of the chapter. First, the simulation software is validated through field measurement and calibration (left). Second, a comprehensive parametric study with simulation is done (right). In the first phase of the parametric study, 18 courtyard models are simulated in four directions. In the next phases, three reference models which are highlighted in Figure 2 are used for optimisation. 254
Figure 4 a) The weather station (Vantage Pro2) used for measurement in situ, b) the aerial photo of the measured courtyard, and c) the courtyard model and its surroundings in ENVI-met. The red line specifies the location of the weather station in the field and the receptor point in the computer model. 258
Figure 5 Comparison of the simulation results (on 22nd and 25th) with the measurements between 21st and 26th of September (left). The compared two day data are also illustrated in a scattered graph (right). 259
i

25 List of figures
Figure 6 a) the courtyard model 10*50 m2 EW in 180*180 grid with similar neighbouring blocks, b) the same courtyard model withought neighbours and in 90*90 grid size, c) air temperature in different grid sizes, d) the comparison of the air temperatures in a scattered graph, e) mean radiant temperature in different grid sizes, and f) the comparison of the mean radiant temperatures in a scattered graph. 260
Figure 7 The sun rays of the models on 19th of June. The grey regions show the period that direct sun light reaches the centre of the courtyards (between the first and last rays of sun). The Figure is produced by Sketchup (Chronoloux plugin). The data are taken at 1.60 meter height. 263
Figure 8 Air temperature distribution of the urban block models at 16:00 h (time of peak temperature), on the 19th of June. The data are taken at 1.60 meter height. 264
Figure 9 Mean radiant temperature at the height of 1.60 m at the centre of all urban blocks (a) to (d) with the same order as in Figure 7. Ro means that it corresponds to a rotated courtyard. 266
Figure 10 Comparison of air temperature (potential temperature) of the 10*50 m2 EW model in the current climate and in 2050 (on 19 June at 16:00). 267
Figure 11 Mean radiant temperature of reference models in comparison with: a) the 2050 W+ climate scenario; b) higher albedo of plaster; c) courtyards with a water pool; d) courtyards with a green area. 268
Figure 12 The effect of increased surface albedo from brick (0.10) to white marble (0.55) and plaster (0.93) on mean radiant temperature of the 10*50 m2 EW model (left) and reflected solar radiation (right). 269
Figure 13 Mean radiant temperature of the 10*50 m2 EW courtyard model comparing different heat mitigation strategies. 272
Figure 14 Air temperature of the 10*50 m2 EW courtyard model in different phases of the study: a) basic study, b) using high albedo facades, c) using water pool, and d) using grass. 273
Chapter 9 Heat mitigation strategies on courtyard buildings in summer
Figure 1 The research phases: Phase 1 - seven spots on the campus; Phase 2 - three courtyards with different characteristics (from left to right: bare, green and with water); Phase 3 - Shattuck Hall building. 287
Figure 2 HOBO connected to air and globe temperature sensors (left) and in its final appearance in the field, connected to wind sensor (right). 288
Figure 3 The position and climatic conditions of Portland, OR. 289
Figure 4 Thermography of the campus park and the surroundings from a prior study (August 23rd, 2011). 290
Figure 5 Temperature comparison between different locations on the campus. 292
Figure 6 Left, first scenario, the actual situation. Middle, the second scenario, the campus with no vegetation. Right, the third scenario, the park is replaced by water pools. Shattuck Hall Building is highlighted with a white star at the centre. 294
Figure 7 The air temperature of Shattuck Hall courtyard in the three campus scenarios. 295
Figure 8 The three measured courtyards: bare, green and with water pool (points 3, 1 and 7, respectively in Figure 1-Phase 1). 296
Figure 9 Air temperature and relative humidity in the measured courtyards. 297
Figure 10 Air temperature in the three scenarios. Top: the bare courtyard, middle: the courtyard with grass, and bottom: the courtyard with water pond. 298
Figure 11 Air temperature (top) and mean radiant temperature (bottom) at the centre of the Shattuck hall courtyard according to the three scenarios: bare, green and with water pond. 299
Figure 12 The effect of albedo change at different moments. 300
Figure 13 Temperature differences between surfaces of surrounding, white and black pavements and the ambient air. 301
Figure 14 The globe, air and mean radiant temperature when using white and black pavements. 303
i
26 Dwelling on Courtyards
Chapter 10 Heat mitigation strategies on courtyard buildings in winter
Figure 1 Comparison of air temperature and relative humidity in Portland and Delft [32]. 316
Figure 2 The location of Portland in the US (a). The campus of Portland State University, as the first case study in summer (b). A HOBO data logger used in the summer study (c). The location of Delft in the Netherlands and Europe (d). The campus of Delft University of Technology, as the second case study in winter (e). The Escort data loggers shielded with a bin and used in the winter study (f). 317
Figure 3 The scale model with three different roofs and courtyard pavements. 318
Figure 4 The campus of Portland State University, with indication of the green courtyard (a), the bare courtyard (b), and the courtyard with a water pond (c). 320
Figure 5 The air temperature compared in the three Portland courtyards. 320
Figure 6 The air temperature compared between the Portland campus park and the airport in a suburban area. 321
Figure 7 The three courtyards measured in Delft (numbered a to c) and the botanical garden highlighted with a star. 323
Figure 8 The air temperature measured in the Delft courtyards. 323
Figure 9 A comparison of the air temperature in the botanical gardens of Delft and at Rotterdam-The Hague airport in a suburban area. 325
Figure 10 The roofs measured in Delft. 326
Figure 11 The temperatures recorded above of the roofs. 327
Figure 12 The green roof. 327
Figure 13 Temperatures above the roof (a) and within the courtyard model (b). 329
Figure 14 Comparison of the materials used in the scale model experiment. 331
i

i

28 Dwelling on Courtyards i

29 Summary
Summary
The urban heat island (UHI) phenomenon and the dependency of buildings on fossil fuels were the two main issues that formed this dissertation. UHI results in higher air temperatures in dense urban areas compared with their suburbs and rural surroundings. This phenomenon affects human health through thermal discomfort. Furthermore, in the Netherlands, it is estimated that by 2050 the air temperature could be up to 2.3°C warmer as compared to the period of 1981-2010. Besides, the energy consumption of buildings is responsible for 30 to 45% of CO2 emissions. 31% of this consumption belongs to residential buildings. Residential buildings can play a major role in reducing the CO2 emissions caused by fossil fuel consumption.
One of the passive architectural design solutions is the courtyard building form. Courtyards have been used for thousands of years in different climates in the world. In hot climates they provide shading, in humid climates they cause a stack effect helping ventilation, in cold climates they break cold winds and protect their microclimate. In temperate climates (such as of the Netherlands), the thermal behaviour of courtyards has been studied less. In this dissertation, low-rise residential courtyard buildings were therefore studied among (and along) different urban block types in the Netherlands.
As the first step, computer simulations were done as a parametric study for indoor and outdoor thermal comfort. Field measurements were done in actual urban courtyards and in dwellings alongside urban courtyards in the Netherlands (and in a similar temperate climate in the US). A scale model experiment later followed the simulations. Some of these field measurements were used to validate the simulation models. These efforts answered the two main research questions:
1) To what extent is a dwelling alongside an urban courtyard more efficient and thermally comfortable than other dwellings?
2) To what extent do people have a more comfortable microclimate within an urban courtyard block on a hot summer day than within other urban fabric forms?
To answer the first question, the energy performance of and thermal comfort inside dwellings in three types of urban blocks in the Netherlands (each with 1, 2 and 3 stories) were analysed (with an identical floor area). The main objective of the research was to clarify the effect of building geometry on annual heating energy demand, thermal comfort, heat loss, solar gains through external windows and on overheating in summer. The buildings had different surface to volume ratios owing to different shapes: single, linear and courtyard shape. The single shape model is more exposed to its outdoor environment and has the highest surface to volume ratio. The linear
i
30 Dwelling on Courtyards
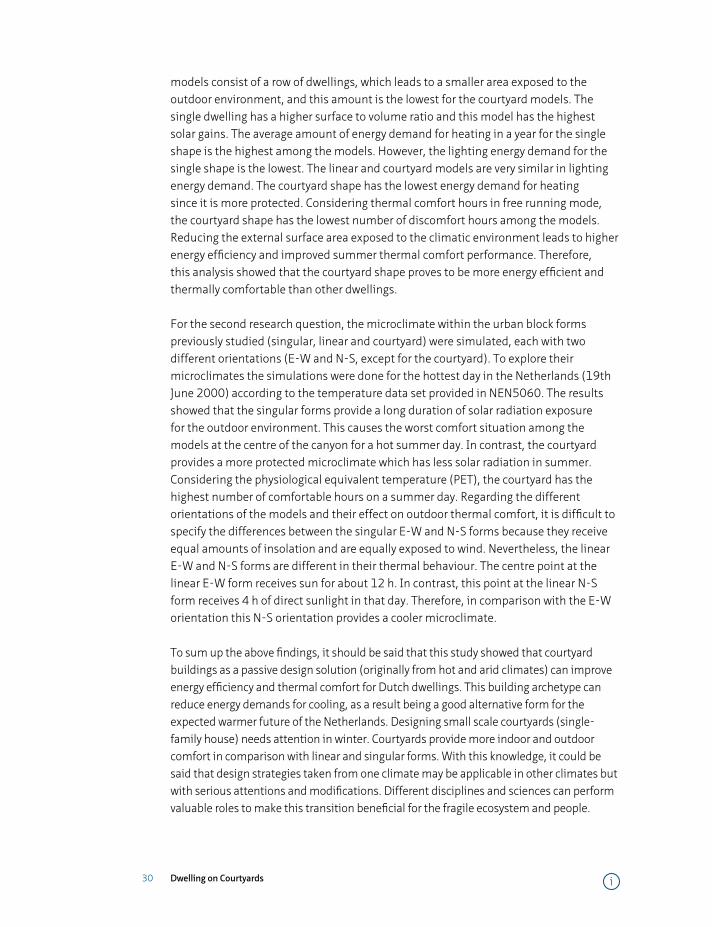
models consist of a row of dwellings, which leads to a smaller area exposed to the outdoor environment, and this amount is the lowest for the courtyard models. The single dwelling has a higher surface to volume ratio and this model has the highest solar gains. The average amount of energy demand for heating in a year for the single shape is the highest among the models. However, the lighting energy demand for the single shape is the lowest. The linear and courtyard models are very similar in lighting energy demand. The courtyard shape has the lowest energy demand for heating since it is more protected. Considering thermal comfort hours in free running mode, the courtyard shape has the lowest number of discomfort hours among the models. Reducing the external surface area exposed to the climatic environment leads to higher energy efficiency and improved summer thermal comfort performance. Therefore, this analysis showed that the courtyard shape proves to be more energy efficient and thermally comfortable than other dwellings.
For the second research question, the microclimate within the urban block forms previously studied (singular, linear and courtyard) were simulated, each with two different orientations (E-W and N-S, except for the courtyard). To explore their microclimates the simulations were done for the hottest day in the Netherlands (19th June 2000) according to the temperature data set provided in NEN5060. The results showed that the singular forms provide a long duration of solar radiation exposure for the outdoor environment. This causes the worst comfort situation among the models at the centre of the canyon for a hot summer day. In contrast, the courtyard provides a more protected microclimate which has less solar radiation in summer. Considering the physiological equivalent temperature (PET), the courtyard has the highest number of comfortable hours on a summer day. Regarding the different orientations of the models and their effect on outdoor thermal comfort, it is difficult to specify the differences between the singular E-W and N-S forms because they receive equal amounts of insolation and are equally exposed to wind. Nevertheless, the linear E-W and N-S forms are different in their thermal behaviour. The centre point at the linear E-W form receives sun for about 12 h. In contrast, this point at the linear N-S form receives 4 h of direct sunlight in that day. Therefore, in comparison with the E-W orientation this N-S orientation provides a cooler microclimate.
To sum up the above findings, it should be said that this study showed that courtyard buildings as a passive design solution (originally from hot and arid climates) can improve energy efficiency and thermal comfort for Dutch dwellings. This building archetype can reduce energy demands for cooling, as a result being a good alternative form for the expected warmer future of the Netherlands. Designing small scale courtyards (single-family house) needs attention in winter. Courtyards provide more indoor and outdoor comfort in comparison with linear and singular forms. With this knowledge, it could be said that design strategies taken from one climate may be applicable in other climates but with serious attentions and modifications. Different disciplines and sciences can perform valuable roles to make this transition beneficial for the fragile ecosystem and people.
i
31 Samenvatting
Samenvatting
Het ‘urban heat island’ (UHI) effect en de afhankelijkheid van gebouwen van fossiele brandstoffen waren de twee belangrijkste redenen om aan dit proefschrift te beginnen. Het UHI effect heeft tot gevolg dat de temperatuur in de stad hoger is dan op het omringende platteland. Dit fenomeen heeft invloed op thermisch comfort en op luchtkwaliteit en op die manier op gezondheid. Daarnaast is de verwachting voor Nederland dat in het jaar 2050 de temperatuur tot 2.3OC hoger is dan in de periode van 1981 tot 2010. Bovendien is het energiegebruik van gebouwen verantwoordelijk voor 30 tot 45% van de CO2 uitstoot; 31% hiervan is afkomstig van woningen. Woningen kunnen daarom een belangrijke rol spelen in het verminderen van de CO2 emissies als gevolg van verbranding van fossiele brandstoffen.
Een van de passieve architectonische ontwerpoplossingen is de binnenhof vorm. Binnenhoven worden wereldwijd al duizenden jaren gebruikt in diverse klimaten. In warmte klimaten zorgen zij voor schaduw, in vochtige klimaten dragen zij bij aan ventilatie door middel van thermische trek, in koude klimaten houden zij koude wind tegen en vormen zo een beschermd microklimaat. In gematigde klimaten (zoals dat van Nederland) is het thermisch gedrag van binnenhoven minder vaak bestudeerd. Deze studie richt zich daarom op lage woningen en woongebouwen met binnenhoven of patio’s in Nederland. Ter vergelijking zijn ook andere stedelijke bouwblokken onderzocht.
Als eerste stap zijn met behulp van computersimulaties parameterstudies uitgevoerd om thermisch comfort binnen en buiten te onderzoeken. Daarna zijn veldmetingen gedaan in bestaande stedelijke binnenhoven en in woningen grenzend aan deze binnenhoven in Nederland (en in een vergelijkbaar gematigd klimaat in de VS). Tot slot is een schaalmodel experiment uitgevoerd. Enkele van deze veldmetingen zijn gedaan ter validatie van de simulatiemodellen. Deze studies zijn gedaan om antwoord te geven op de twee hoofdvragen van dit onderzoek:
1) In welke mate is een woning langs een stedelijke binnenhof energetisch efficiënter en thermisch comfortabeler dan andere woningen?
2) In welke mate hebben mensen op een warme zomerdag in een stedelijke binnenhof een comfortabeler microklimaat dan in andere stedelijke configuraties?
Om een antwoord te geven op de eerste vraag is de energieprestatie van en het thermisch comfort in woningen in drie typen bouwblokken in Nederland (elk met 1, 2 en 3 verdiepingen) geanalyseerd. Het belangrijkste doel van dit onderzoek was om het effect van gebouwgeometrie op het jaarlijks energiegebruik voor verwarming,
i
32 Dwelling on Courtyards
op transmissieverliezen, op zontoetreding door ramen en op oververhitting in de zomer te onderzoeken. De gebouwen hebben elk een andere oppervlak/volume ratio vanwege hun verschillende vorm: enkelvoudige, lineaire, en binnenhof vorm. De enkelvoudige vorm is meer blootgesteld aan het buitenklimaat en heeft een grotere oppervlak/volume ratio. De lineaire vorm bestaat uit een rij woningen leidend tot een kleiner blootgesteld oppervlak; de courtyard vorm heeft echter het kleinste aan het buitenklimaat blootgestelde oppervlak. De enkele woning heeft de grootste oppervlak/volume ratio en tevens de meeste zontoetreding. Door deze grote oppervlak/volume ratio is het energiegebruik voor verwarming van deze woning het grootst. De benodigde energie voor verlichting is echter het kleinst bij deze woning. De rijwoningen en de woningen langs de binnenhof verbruiken ongeveer evenveel energie voor verlichting. De woningen langs de binnenhof hebben het laagste energiegebruik voor verwarming omdat deze meer ingebouwd zijn. Wat betreft thermisch comfort in de zomer, de woningen langs de binnenhof hebben het minst aantal uren met oververhitting. Het verminderen van het gevel- en dakoppervlak dat blootgesteld wordt aan het buitenklimaat leidt daarmee tot een hogere energieprestatie en verbeterd thermisch comfort in de zomer. Deze analyse laat dus zien dat woningen langs een binnenhof energie-efficiënter en thermisch comfortabeler zijn dan andere woningen.
Om een antwoord te geven op de tweede vraag is het microklimaat in de stedelijke configuraties van hiervoor (enkelvoudige, lineaire en binnenhof vorm) gesimuleerd voor twee verschillende oriëntaties (O-W en N-Z, m.u.v. de binnenhof). De simulaties zijn uitgevoerd met ENVI-met voor de warmste dag in Nederland (19 juni 2000) volgens de temperatuur dataset uit NEN5060. De resultaten tonen dat een stedelijk weefsel met losse woningen de langste zonneschijnduur in de buitenruimte kent. Dit leidt in vergelijking tot de andere modellen tot een slechte comfortsituatie op een hete zomerse dag. Daarentegen biedt de binnenhof vorm een meer beschermd microklimaat met minder zoninstraling in de zomer. Op basis van de fysiologische equivalente temperatuur (PET) heeft de binnenhof het hoogste aantal uren met thermisch comfort in de zomer. Met betrekking tot de verschillende oriëntaties van de modellen en hun effect op thermisch comfort in de buitenruimte is het moeilijk om de verschillen tussen de vrijstaande O-W en N-Z modellen aan te geven omdat beide evenveel zonnewarmte ontvangen en evenveel blootgesteld zijn aan wind. De rijwoningen gedragen zich thermisch wel verschillend. Het midden van het O-W model ontvangt directe zonnestralen gedurende 12 uur op de gesimuleerde dag; het midden van het N-Z model slechts gedurende 4 uur. Op een hete zomerse dag heeft daarom het model met N-Z oriëntatie een koeler microklimaat dan het O-W model.
Samengevat kan gesteld worden dat dit onderzoek heeft laten zien dat gebouwen rondom binnenhoven als een passieve ontwerpoplossing (oorspronkelijk komend uit warme en droge klimaten) beide kunnen doen. Dit archetype kan het energiegebruik voor koeling verminderen waardoor het een interessante oplossing is voor het verwachte warmere klimaat van Nederland. De meest efficiënte binnenhoven toe te
i

33 Samenvatting
passen in een gematigd klimaat zijn stedelijke binnenhoven. Toepassing van kleine binnenhoven of patio’s als onderdeel van een individuele woning behoeft aandacht in de winter. Een stedelijk weefsel met veel binnenhoven zorgt voor een hoger thermisch comfort zowel binnen als buiten dan een weefsel gebaseerd op lineaire of vrijstaande elementen. Op basis van deze kennis kan worden gesteld dat ontwerpoplossingen kenmerkend voor een specifiek klimaat ook geschikt kunnen zijn voor andere klimaten mits toegepast met zorgvuldige aandacht en aanpassingen. Verschillende disciplines en wetenschappen kunnen een belangrijke rol vervullen om deze transitie goed te laten verlopen voor fragile ecosystemen en mensen.
i

34 Dwelling on Courtyards
13
خالصه رساله
پدیده جزیره حرارتی شهرى و وابستگی ساختمان ها به انرژى هاى فسیلی، دو موضوع اصلی در شکل گیرى این رسالهمیباشند. جزیره حرارتی شهرى باعث میگردد که مناطق پر تراکم شهر دماى هواى باالترى نسبت به حومه شهر داشته باشند. این پدیده، سالمت انسان ها را از طریق عدم آسایش حرارتی و آلودگی هوا تحت تاثیر قرار می دهد. در کشور هلند پیش بینی
شده است که دماى هوا در سال۲۰۵۰ میالدى، ۲.۳ درجه سانتیگراد باالتر از بازه زمانی۲۰۱۰-۱۹۸۱ خواهد بود. مضاف بر این، ۳۰ تا ۴۵ درصد از انتشار دى اکسید کربن به دلیل مصرف انرژى ساختمان هاست. از این مقدار، ۳۱ درصد آن متعلق
به ساختمانهاى مسکونی می باشد. از این رو، ساختمانهاى مسکونی می توانند نقش برجسته اى در کاهش انتشار دى اکسید کربن ناشی از مصرف سوخت هاى فسیلی ایفا نمایند. یکی از راهکارهاى طراحی غیر فعال، فرم ساختمانی حیاط مرکزى است.
براى هزاران سال است که از حیاط مرکزى در اقلیم هاى مختلف استفاده می گردد. در اقلیم هاى گرم با سایه اندازى، در اقلیم هاى مرطوب به کمک پدیده مکش عمودى و در اقلیم هاى سرد بدلیل بادشکن بودن در برابر باد سرد، خرد اقلیم خود
را محافظت می کنند. در اقلیم هاى معتدل )از جمله هلند(، رفتار حرارتی حیاط مرکزى کمتر مطالعه گردیده است. از این رو، ساختمان هاى حیاط مرکزى مسکونی کم ارتفاع به همراه فرم هاى ساختمانی دیگر در اقلیم هلند در این رساله مطالعه
گردیده است. ۰
در اولین گام، مطالعات پارامتریک توسط شبیه سازى رایانه اى بر روى آسایش حرارتی داخل و خارج انجام گردید. اندازه گیرى هاى میدانی نیز بر روى ساختمانهاى حیاط مرکزى در هلند ) و یک اقلیم معتدل مشابه در ایاالت متحده( انجام گردید.
در ادامه، یک آزمایش تجربی هم به شبیه سازى ها اضافه شد. تعدادى از این مطالعات میدانی براى تایید شبیه سازى هااستفاده شد. نتایج این مطالعات دو سوال اصلی پژوهش را پاسخ دادند: ۰
الف( به چه میزان یک بلوک شهرى حیاط مرکزى از نظر انرژى و آسایش حرارتی نسبت به دیگر ساختمان هاى مسکونیبهینه تر است؟
ب( به چه میزان افراد احساس آسایش حرارتی بهترى در خرد اقلیم یک حیاط مرکزى شهرى نسبت به دیگر فرم هاىساختمانی در یک روز گرم تابستانی دارند؟
براى پاسخ به سوال اول، مصرف انرژى و آسایش حرارتی داخل سه نوع مختلف از بلوک هاى شهرى سه طبقه در هلند تحلیل گردید. هدف اصلی این پژوهش، مطالعه تاثیر فرم بنا بر روى مصرف انرژى سالیانه، آسایش حرارتی، هدر رفت حرارتی،
دریافت تابش خورشید از پنجره ها و گرم شدن بیش از حد ساختمان در تابستان بود. ساختمان هاى مورد مطالعه به سه فرم انفرادى، خطی و حیاط مرکزى بودند که هر کدام نسبت سطح به حجم متفاوتی را شامل می شدند. طرح انفرادى با نسبت
سطح به حجم باالتر، بیشتر در معرض محیط بیرون می باشد. طرح خطی شامل یک ردیف از ساختمان ها می شود، و طرح حیاط مرکزى با کمترین نسبت سطح به حجم، کمترین تاثیر را از محیط خارج می پذیرد. طرح انفرادى با بیشترین تاثیر از
محیط خارج، باالترین میزان تابش خورشیدى را دریافت می کند. از این رو، مصرف روشنایی در این طرح از همه کمتر، اما به دلیل پرت حرارتی باالتر، بیشترین انرژى گرمایشی را نیاز دارد. مصرف انرژى روشنایی براى فرم هاى خطی و حیاط مرکزى
تقریبا مشابه به دست آمد، اما فرم بسته و محفوظ حیاط مرکزى کمترین نیاز را براى گرمایش نشان داد. کاهش نسبت سطح به حجم فرم حیاط مرکزى و ارتباط محدود بنا با محیط خارج موجب شده است تا میزان آسایش حرارتی این فرم در تابستان بیشتر از بقیه بناها باشد. از این رو، این مطالعه نشان داد که فرم حیاط مرکزى از نظر مصرف انرژى و میزان آسایش حرارتی
در تابستان بهینه تر از بقیه فرم هاى مطالعه شده عمل می کند. ۰
درمورد سوال دوم، خرد اقلیم میان بلوک هاى شهرى )که در سوال پیشین مطالعه گردیده بود( با دو جهت گیرى متفاوت )شمالی- جنوبی و شرقی- غربی، بجز در مورد حیاط( شبیه سازى شد. شبیه سازى ها براى گرم ترین روز هلند )۱۹ ژوئن
۲۰۰۰ ( انجام شد. نتایج نشان داد که بیشترین دریافت تابش خورشید در بین خرد اقلیم فرم انفرادى اتفاق می افتد. این مساله به کمترین میزان آسایش حرارتی در یک روز تابستانی گرم در میان این خرد اقلیم منجر می گردد. در نقطه مقابل،
14 Dwelling on Courtyards
حیاط مرکزى با بیشترین محصوریت، خرد اقلیم خود را از تابش آفتاب مصون نگه می دارد. با در نظر گرفتن شاخص دماى معادل فیزیولوژیک، فرم حیاط باالترین میزان آسایش حرارتی در یک روز تابستانی را در مطالعه باال نشان داد. در مورد تاثیر
جهت گیرى فرم هاى این مطالعه روى آسایش حرارتی، مشکل میتوان تفاوتی بین جهت گیرى شمالی- جنوبی و شرقی- غربی در خرد اقلیم انفرادى قایل شد زیرا میزان دریافت تابش خورشیدى در این دو مورد تقریبا یکسان است. با این وجود، این
دو جهت گیرى در مورد فرم خطی رفتار حرارتی متفاوتی را ایجاب میکند. نقطه میانی در فرم خطی شرقی- غربی حدود ۱۲ ساعت تابش خورشید را دریافت میکند، درحالی که این میزان براى فرم شمالی- جنوبی ۴ ساعت است. از این رو، جهت گیرى
شمالی- جنوبی در مقایسه با شرقی- غربی خرد اقلیم خنک ترى را ایجاد می نماید. ۰
براى جمع بندى یافته هاى باال، بایستی خاطر نشان کرد که این مطالعه نشان داد ساختمان هاى حیاط مرکزى بعنوان یک روش طراحی غیر فعال )برگرفته از اقلیم گرم و خشک( می توانند مصرف انرژى و آسایش حرارتی را براى ساختمان هاى مسکونی هلند ارتقا بخشند. این الگوى ساختمانی می تواند با کاهش انرژى سرمایشی، یک گزینه مناسب براى آینده پیش
بینی شده گرم هلند باشد. همچنین باید در طراحی حیاط مرکزى کوچک، زمستان را در نظر داشت. حیاط مرکزى آسایش حرارتی بیشتر و طوالنی ترى را نسبت به فرم هاى خطی و انفرادى میسر می کند. با این دانش بایستی در نظر گرفت که اِعمال راهبردهاى طراحی برگرفته از یک اقلیم در اقلیمی دیگر نیازمند توجه و اصالحات می باشد. در طول این اصالحات
رشته ها و علوم مختلف میتوانند نقش ارزنده اى در منفعت اکوسیستم شکننده و بشریت ایفا نمایند. ۰
i

35
13
خالصه رساله
پدیده جزیره حرارتی شهرى و وابستگی ساختمان ها به انرژى هاى فسیلی، دو موضوع اصلی در شکل گیرى این رسالهمیباشند. جزیره حرارتی شهرى باعث میگردد که مناطق پر تراکم شهر دماى هواى باالترى نسبت به حومه شهر داشته باشند. این پدیده، سالمت انسان ها را از طریق عدم آسایش حرارتی و آلودگی هوا تحت تاثیر قرار می دهد. در کشور هلند پیش بینی
شده است که دماى هوا در سال۲۰۵۰ میالدى، ۲.۳ درجه سانتیگراد باالتر از بازه زمانی۲۰۱۰-۱۹۸۱ خواهد بود. مضاف بر این، ۳۰ تا ۴۵ درصد از انتشار دى اکسید کربن به دلیل مصرف انرژى ساختمان هاست. از این مقدار، ۳۱ درصد آن متعلق
به ساختمانهاى مسکونی می باشد. از این رو، ساختمانهاى مسکونی می توانند نقش برجسته اى در کاهش انتشار دى اکسید کربن ناشی از مصرف سوخت هاى فسیلی ایفا نمایند. یکی از راهکارهاى طراحی غیر فعال، فرم ساختمانی حیاط مرکزى است.
براى هزاران سال است که از حیاط مرکزى در اقلیم هاى مختلف استفاده می گردد. در اقلیم هاى گرم با سایه اندازى، در اقلیم هاى مرطوب به کمک پدیده مکش عمودى و در اقلیم هاى سرد بدلیل بادشکن بودن در برابر باد سرد، خرد اقلیم خود
را محافظت می کنند. در اقلیم هاى معتدل )از جمله هلند(، رفتار حرارتی حیاط مرکزى کمتر مطالعه گردیده است. از این رو، ساختمان هاى حیاط مرکزى مسکونی کم ارتفاع به همراه فرم هاى ساختمانی دیگر در اقلیم هلند در این رساله مطالعه
گردیده است. ۰
در اولین گام، مطالعات پارامتریک توسط شبیه سازى رایانه اى بر روى آسایش حرارتی داخل و خارج انجام گردید. اندازه گیرى هاى میدانی نیز بر روى ساختمانهاى حیاط مرکزى در هلند ) و یک اقلیم معتدل مشابه در ایاالت متحده( انجام گردید.
در ادامه، یک آزمایش تجربی هم به شبیه سازى ها اضافه شد. تعدادى از این مطالعات میدانی براى تایید شبیه سازى هااستفاده شد. نتایج این مطالعات دو سوال اصلی پژوهش را پاسخ دادند: ۰
الف( به چه میزان یک بلوک شهرى حیاط مرکزى از نظر انرژى و آسایش حرارتی نسبت به دیگر ساختمان هاى مسکونیبهینه تر است؟
ب( به چه میزان افراد احساس آسایش حرارتی بهترى در خرد اقلیم یک حیاط مرکزى شهرى نسبت به دیگر فرم هاىساختمانی در یک روز گرم تابستانی دارند؟
براى پاسخ به سوال اول، مصرف انرژى و آسایش حرارتی داخل سه نوع مختلف از بلوک هاى شهرى سه طبقه در هلند تحلیل گردید. هدف اصلی این پژوهش، مطالعه تاثیر فرم بنا بر روى مصرف انرژى سالیانه، آسایش حرارتی، هدر رفت حرارتی،
دریافت تابش خورشید از پنجره ها و گرم شدن بیش از حد ساختمان در تابستان بود. ساختمان هاى مورد مطالعه به سه فرم انفرادى، خطی و حیاط مرکزى بودند که هر کدام نسبت سطح به حجم متفاوتی را شامل می شدند. طرح انفرادى با نسبت
سطح به حجم باالتر، بیشتر در معرض محیط بیرون می باشد. طرح خطی شامل یک ردیف از ساختمان ها می شود، و طرح حیاط مرکزى با کمترین نسبت سطح به حجم، کمترین تاثیر را از محیط خارج می پذیرد. طرح انفرادى با بیشترین تاثیر از
محیط خارج، باالترین میزان تابش خورشیدى را دریافت می کند. از این رو، مصرف روشنایی در این طرح از همه کمتر، اما به دلیل پرت حرارتی باالتر، بیشترین انرژى گرمایشی را نیاز دارد. مصرف انرژى روشنایی براى فرم هاى خطی و حیاط مرکزى
تقریبا مشابه به دست آمد، اما فرم بسته و محفوظ حیاط مرکزى کمترین نیاز را براى گرمایش نشان داد. کاهش نسبت سطح به حجم فرم حیاط مرکزى و ارتباط محدود بنا با محیط خارج موجب شده است تا میزان آسایش حرارتی این فرم در تابستان بیشتر از بقیه بناها باشد. از این رو، این مطالعه نشان داد که فرم حیاط مرکزى از نظر مصرف انرژى و میزان آسایش حرارتی
در تابستان بهینه تر از بقیه فرم هاى مطالعه شده عمل می کند. ۰
درمورد سوال دوم، خرد اقلیم میان بلوک هاى شهرى )که در سوال پیشین مطالعه گردیده بود( با دو جهت گیرى متفاوت )شمالی- جنوبی و شرقی- غربی، بجز در مورد حیاط( شبیه سازى شد. شبیه سازى ها براى گرم ترین روز هلند )۱۹ ژوئن
۲۰۰۰ ( انجام شد. نتایج نشان داد که بیشترین دریافت تابش خورشید در بین خرد اقلیم فرم انفرادى اتفاق می افتد. این مساله به کمترین میزان آسایش حرارتی در یک روز تابستانی گرم در میان این خرد اقلیم منجر می گردد. در نقطه مقابل،
i

36 Dwelling on Courtyards i

37 Introduction
1 Introduction
“Yet, the courtyard is more than just an architectural device for obtaining privacy and protection. It is, like the dome, part of a microcosm that parallels the order of the universe itself.”
Hassan Fathy
§ 1.1 General Introduction
In 1820, Luke Howard discovered the phenomenon of the urban heat island (UHI) for London by simple comparison of two sets of temperature data inside and outside of the city [1]. UHI results in higher air temperatures in dense urban areas compared with their suburbs and rural surroundings. It varies among different cities based on morphology, location and climatic zone [2, 3]. This phenomenon affects human health through thermal discomfort and air pollution [4, 5, 6] and the heating and cooling energy demands of buildings in cities [6, 7, 8]. In recent years, scientific and social interests in the UHI have strongly increased, mostly driven by heat stress–related health problems among citizens in recent summers in the Netherlands. It is estimated that by 2050 the air temperature in the Netherlands could be up to 2.3°C warmer as compared to the period of 1981-2010 [9].
The built environment can intensify or moderate the environment. One of the most commonly used building archetypes in hot climates is the courtyard form. Courtyards also exist in the Netherlands; rarely as single family houses, but mainly as urban blocks. Courtyards provide shading and consequently a cool microclimate within a building block. They can also ease ventilation through the stack effect. The thermal performance of courtyard buildings has extensively been studied in hot and arid climates, but rarely in temperate regions such as the Netherlands. With the warmer future climate estimated for the Netherlands, this study tries to make this archetype climate proof. Therefore, several parametric studies supported and validated with field measurements and experiments will optimise thermal performance of courtyard buildings.
i
38 Dwelling on Courtyards
§ 1.2 Terminology
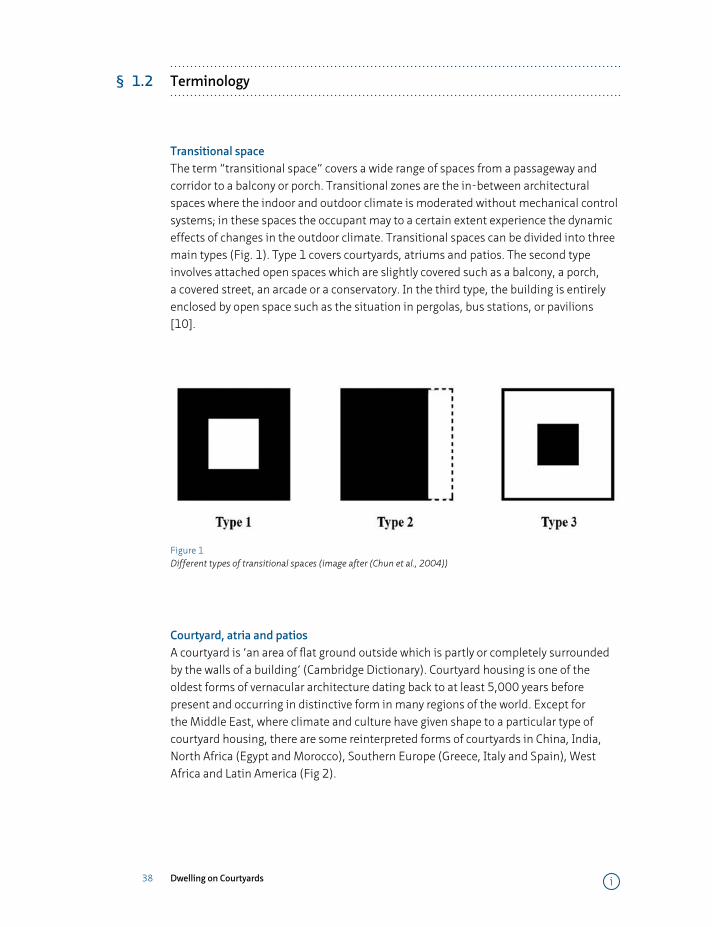
Transitional spaceThe term “transitional space” covers a wide range of spaces from a passageway and corridor to a balcony or porch. Transitional zones are the in-between architectural spaces where the indoor and outdoor climate is moderated without mechanical control systems; in these spaces the occupant may to a certain extent experience the dynamic effects of changes in the outdoor climate. Transitional spaces can be divided into three main types (Fig. 1). Type 1 covers courtyards, atriums and patios. The second type involves attached open spaces which are slightly covered such as a balcony, a porch, a covered street, an arcade or a conservatory. In the third type, the building is entirely enclosed by open space such as the situation in pergolas, bus stations, or pavilions [10].
Figure 1 Different types of transitional spaces (image after (Chun et al., 2004))
Courtyard, atria and patiosA courtyard is ‘an area of flat ground outside which is partly or completely surrounded by the walls of a building’ (Cambridge Dictionary). Courtyard housing is one of the oldest forms of vernacular architecture dating back to at least 5,000 years before present and occurring in distinctive form in many regions of the world. Except for the Middle East, where climate and culture have given shape to a particular type of courtyard housing, there are some reinterpreted forms of courtyards in China, India, North Africa (Egypt and Morocco), Southern Europe (Greece, Italy and Spain), West Africa and Latin America (Fig 2).
i
39 Introduction
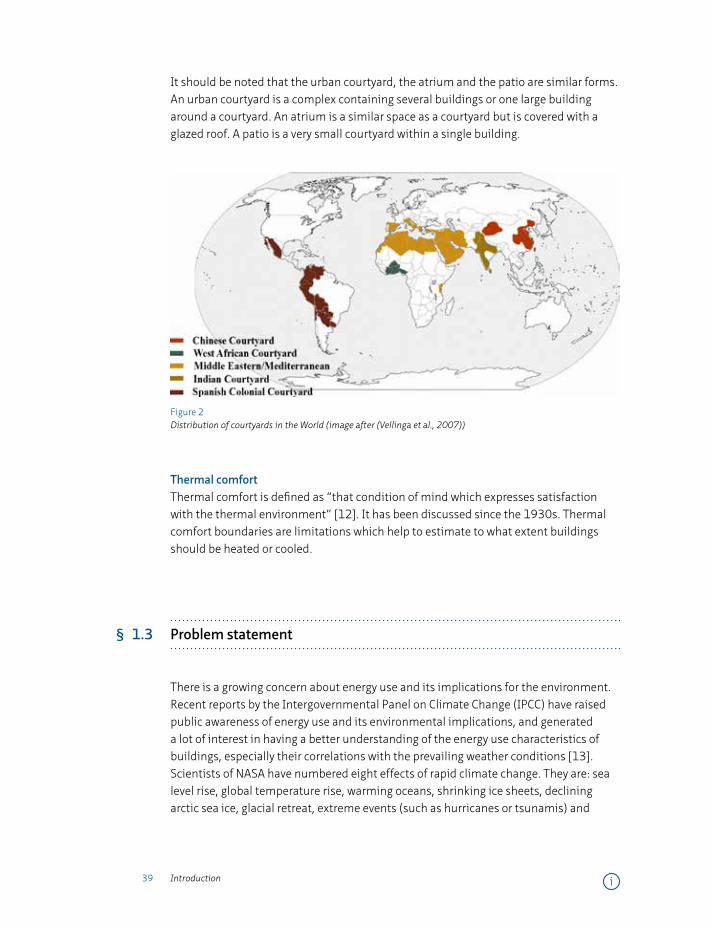
It should be noted that the urban courtyard, the atrium and the patio are similar forms. An urban courtyard is a complex containing several buildings or one large building around a courtyard. An atrium is a similar space as a courtyard but is covered with a glazed roof. A patio is a very small courtyard within a single building.
Figure 2 Distribution of courtyards in the World (image after (Vellinga et al., 2007))
Thermal comfortThermal comfort is defined as “that condition of mind which expresses satisfaction with the thermal environment” [12]. It has been discussed since the 1930s. Thermal comfort boundaries are limitations which help to estimate to what extent buildings should be heated or cooled.
§ 1.3 Problem statement
There is a growing concern about energy use and its implications for the environment. Recent reports by the Intergovernmental Panel on Climate Change (IPCC) have raised public awareness of energy use and its environmental implications, and generated a lot of interest in having a better understanding of the energy use characteristics of buildings, especially their correlations with the prevailing weather conditions [13]. Scientists of NASA have numbered eight effects of rapid climate change. They are: sea level rise, global temperature rise, warming oceans, shrinking ice sheets, declining arctic sea ice, glacial retreat, extreme events (such as hurricanes or tsunamis) and
i

40 Dwelling on Courtyards
ocean acidification. The energy consumption of buildings is responsible for 30 to 45% of CO2 emissions [13]. 31% of this consumption belongs to residential buildings (Figure 3) [14]. Residential buildings can play a major role in reducing the CO2 emissions caused by fossil fuel consumption.
Furthermore, growing urbanisation has a profound impact on the thermal environment in cities. The relatively low reflectivity of urban surfaces combined with high density of construction in cities results in an accumulation of heat in the urban environment. This causes a higher indoor temperature that consequently increases cooling demand and discomfort. The general lack of green (vegetated) areas and surface water also makes cities warmer. As a result, the cooling demand of urban residences increases [15, 16] and the heat stress on pedestrians rises [17, 18]. Promising mitigation strategies have been developed in order to cool urban spaces. These strategies are mainly related to the configuration of the built environment in accordance with (un)favourable solar radiation, construction materials used, and presence of water and urban vegetation
Figure 3 Residential energy consumption shown as a percentage of national energy consumption and in relative international form (Saidur et al., 2007)
Therefore, this dissertation focuses on the two main problems of climate change and UHI. The energy consumption of buildings and urban surfaces that cause the mentioned problems are addressed in this dissertation through optimising courtyard buildings that deal with energy and comfort.
i
41 Introduction
§ 1.4 Research objectives
This dissertation explores the thermal performance of courtyard dwellings in the Netherlands. The two main objectives are:
a To clarify if in the Netherlands a courtyard (as part of a passive strategy) can provide thermally comfortable and energy-efficient indoor environments in low-rise residential buildings, and simultaneously, thermally comfortable outdoor environments for pedestrians within the courtyard;
b If the courtyard form performs thermally well in the Netherlands, to determine what features (orientation, materials, vegetation, etc.) would make this building/block form efficient in terms of thermal comfort and energy use for use in low-rise residential buildings.
§ 1.5 Boundary conditions
This research is narrowed down based on two different boundary conditions that make it more specific.
Firstly, low-rise courtyard buildings with residential activities are studied in this thesis because residential buildings are responsible for 31% of the total worldwide energy consumption. In the perspective of this project a low-rise building means a building with not more than three stories, and the main focus is on urban courtyards (and not small courtyards such as patios). The types of energy consumption discussed in this dissertation are related to the building’s climate design: heating, cooling and lighting.
Secondly, due to the lack of a thermal comfort standard for dwellings this study used ASHRAE-55 and EN-15251 as thermal comfort standards, which were developed mainly based on results from office buildings. The differences between offices and dwellings are the types of activities, clothing, etc. ASHRAE-55 states that this standard is applicable for “occupant-controlled naturally conditioned spaces” [19]. Since the mentioned standards are for free-running offices, they are used in the study of courtyards in free-running mode, as well.
i

42 Dwelling on Courtyards
§ 1.6 Research questions
From these main objectives, the following main research questions arise:
1) To what extent can a courtyard (as part of a passive strategy) provide thermally comfortable and energy ef ficient indoor environments in low-rise residential buildings in the Netherlands, and simultaneously, thermally comfortable outdoor environments for pedestrians within the courtyard?
2) What features (orientation, materials, vegetation, etc.) would make this building/block form ef ficient in terms of thermal comfort and energy use for use in low-rise residential buildings in the Netherlands?
In order to answer these questions, two background questions need to be answered:
a) What are the known thermal impacts and design characteristics of courtyards in different climates?This question will be answered in chapter 2.
b) Which thermal comfort standard(s) can be used for courtyard dwellings?This question will be answered in chapter 3.
Main research question 1) is answered through two chapters in the dissertation. These chapters answer to the following sub-questions:
1-1) To what extent is a dwelling alongside an urban courtyard more ef ficient and thermally more comfortable than other dwellings?This question will be answered in chapter 4.
1-2) To what extent do people have a more comfortable microclimate within an urban courtyard block on a hot summer day than within other urban fabric forms?This question will be answered in chapter 7.
Question 2) is also divided into sub-questions that address different optimisations for courtyard buildings. These are:
2-1) What is the best orientation, roof type and pavement material for a low-rise residential courtyard building in the Netherlands in order to maximise indoor thermal comfort?This question will be answered in chapter 5.
i

43 Introduction
2-2) To what extent can a permanent or temporary glass cover above a courtyard as part of a low-rise residential building in a temperate climate (such as an atrium) make this building more energy ef ficient and comfortable?This question will be answered in chapter 6.
2-3) What is the best orientation and what are the best surface properties of the roof, walls and pavements in order to achieve a high level of summer thermal comfort for people within an urban courtyard block?This question will be answered in chapter 8.
2-4) How and to what extent do heat mitigation strategies improve the microclimate of a courtyard in the Netherlands in summer?This question will be answered in chapter 9.
2-5) How and to what extent do the aforementioned heat mitigation strategies affect the microclimate of a courtyard in the Netherlands in winter?This question will be answered in chapter 10.
§ 1.7 Research method
§ 1.7.1 Research steps and approach
This dissertation is an exploratory research that tests the hypothesis of using courtyards to improve two parameters: the energy demand and thermal comfort. Therefore, the history of using courtyards and their different impacts were studied in different climates from literature. Subsequently, thermal comfort standards were reviewed to find the most appropriate one(s) for this dissertation.
After reviewing the literature, a study on different urban block forms was conducted to determine the thermal behaviour of a courtyard building as compared to other block forms. This study and the next one on residential courtyard buildings with different characteristics (such as orientation, elongation, etc.) were conducted as parametric studies. During these parametric studies, indoor and outdoor thermal comfort along energy consumption were addressed. Besides the parametric studies, field measurements were done to validate the simulation tools used in the parametric studies.
i
44 Dwelling on Courtyards
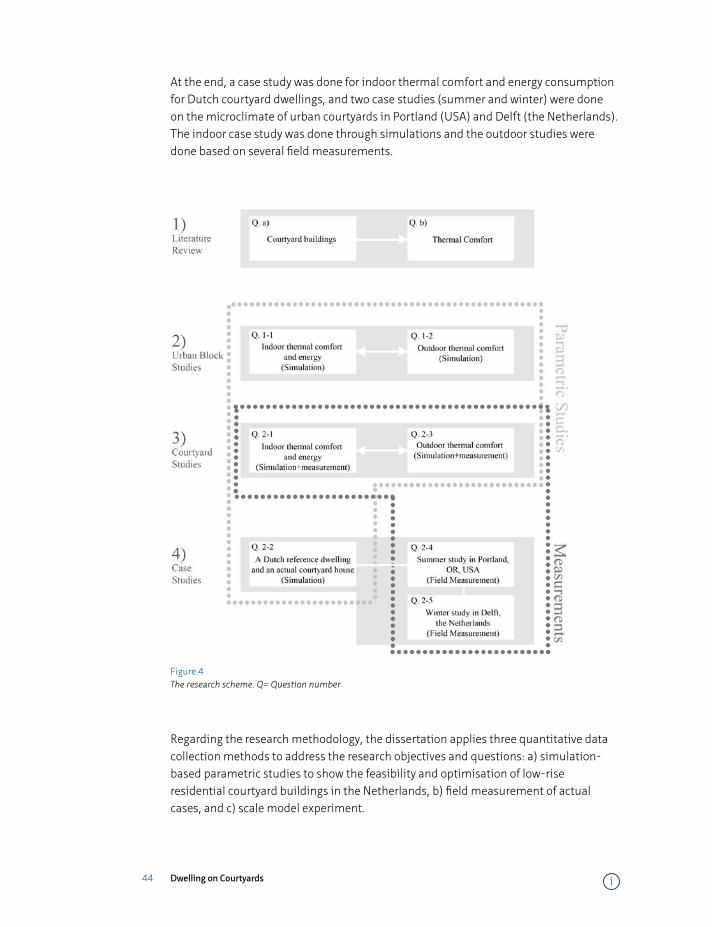
At the end, a case study was done for indoor thermal comfort and energy consumption for Dutch courtyard dwellings, and two case studies (summer and winter) were done on the microclimate of urban courtyards in Portland (USA) and Delft (the Netherlands). The indoor case study was done through simulations and the outdoor studies were done based on several field measurements.
Figure 4 The research scheme. Q= Question number
Regarding the research methodology, the dissertation applies three quantitative data collection methods to address the research objectives and questions: a) simulation-based parametric studies to show the feasibility and optimisation of low-rise residential courtyard buildings in the Netherlands, b) field measurement of actual cases, and c) scale model experiment.
i
45 Introduction
a The parametric studies were simulation-based because the aim was to compare different forms of buildings or blocks in an identical situation (weather and climate, construction properties, floor area, etc.). After comparing courtyard buildings with different building archetypes, further studies were done on low-rise residential courtyard buildings with different parameters. For simulating the indoor environment, DesignBuilder was used. ENVI-met and RayMan were used for the outdoor environment simulation. These programs were used to quantify indoor and outdoor thermal comfort of 1) residential courtyard buildings with different orientations (North-South, East-West, North East- South West and North West- South East) and elongations (10m*10m, 10m*20m, 10m*30m, 10m*40m and 10m*50m) residential courtyard buildings with different roof and pavement properties (black, white, grey (gravel) and green (vegetated)). For the indoor thermal comfort calculations, the operative temperature (°C) was used. The operative temperature is defined as a uniform temperature of a radiantly black enclosure in which an occupant would exchange the same amount of heat by radiation plus convection as in the actual non-uniform environment [20]. For outdoor thermal comfort, the physiological equivalent temperature (PET) (°C) was used. PET is defined as the air temperature at which, in a typical indoor setting (without wind and solar radiation), the heat budget of the human body is balanced with the same core and skin temperature as under the complex outdoor conditions to be assessed. PET enables a layperson to compare the integral effects of complex thermal conditions outdoors with his or her own experience indoors [21]. All of these parameters were studied in the current and future (2050) climate of the Netherlands. Climate of 2050 was simulated using previously published results from KNMI (see ref [22] for details). DesignBuilder and ENVI-met were later validated with actual measurements.
b The field measurements consisted of data collection from actual courtyard buildings in Delft, the Netherlands, and Portland (OR), as a similar temperate climate in the US. The measurements were done in the summer and winter of 2013. The idea was to compare the effect of heat mitigation strategies on courtyards in summer and winter. In the summer study, a black courtyard, a green (vegetated) courtyard and a courtyard with a water pond were compared. Black and white roofs were also measured. In the winter study, similar courtyards were monitored, as well as conventional black (bituminous), green and gravel roofs. In both studies, the cooling effect of a park (park cool island) was associated with a corresponding suburban area.
c An experiment was also done using a 1/100 scale model of an urban courtyard building with different roof and pavement materials. This study followed the previous ones and investigated the effect of dry and wet materials in a lab environment. The experiment is explained comprehensively in chapters 5 and 10.
i
46 Dwelling on Courtyards
§ 1.7.2 Research tools
In this research, computer simulations, field measurements and scale model experiments were done. The tools used are described here in two categories: simulation tools and measurement tools.
A Simulation tools
DesignBuilderAs a graphical interface for EnergyPlus, DesignBuilder was selected for the simulations. Developed by US Department of Energy, EnergyPlus relies on key elements of both the DOE-2 and BLAST programs. Some key features that this research needed (and EnergyPlus is capable of doing) are: text based weather input files, ground heat transfer modelling and green roof modelling. This program can simulate green roofs (developed for EnergyPlus). It considers long and short wave radiative exchange, plant canopy effects on convective heat transfer, evapotranspiration from the soil and plants, and heat conduction (and storage) in the soil layer. This program is used in chapters 4, 5 and 6. The limitation of all software tools are their focus on indoor or outdoor. For instance, DesignBuilder cannot generate outdoor environments. Consequently, this software can only simulate the indoor environment of a courtyard building (not the open space of the courtyard). Operative temperature (°C), air temperature (°C) and solar gain (W) are some of the outputs of this program that are used in this dissertation.
ENVI-metThis program is a three-dimensional microclimate model designed to simulate the interaction between surfaces, plants and air in an urban environment with a typical resolution of 0.5 to 10 m in space and 10 s in time. In this dissertation, the time step of 1 h is used. With this programme, the air temperature (°C), vapour pressure (hPa), relative humidity (%), wind velocity (m/s) and mean radiant temperature (°C) can be calculated. A limitation regarding this program is the lack of PET in the outputs. The other limitation is the lack of the heat storage in building surfaces (which causes overestimation in day temperatures and underestimation in night temperatures [23]). This program was used for chapters 7, 8 and 9.
RayManThis programme considers outdoor conditions and calculates human thermal comfort (PET). Sky view factors are also generated by this program to provide a better
i
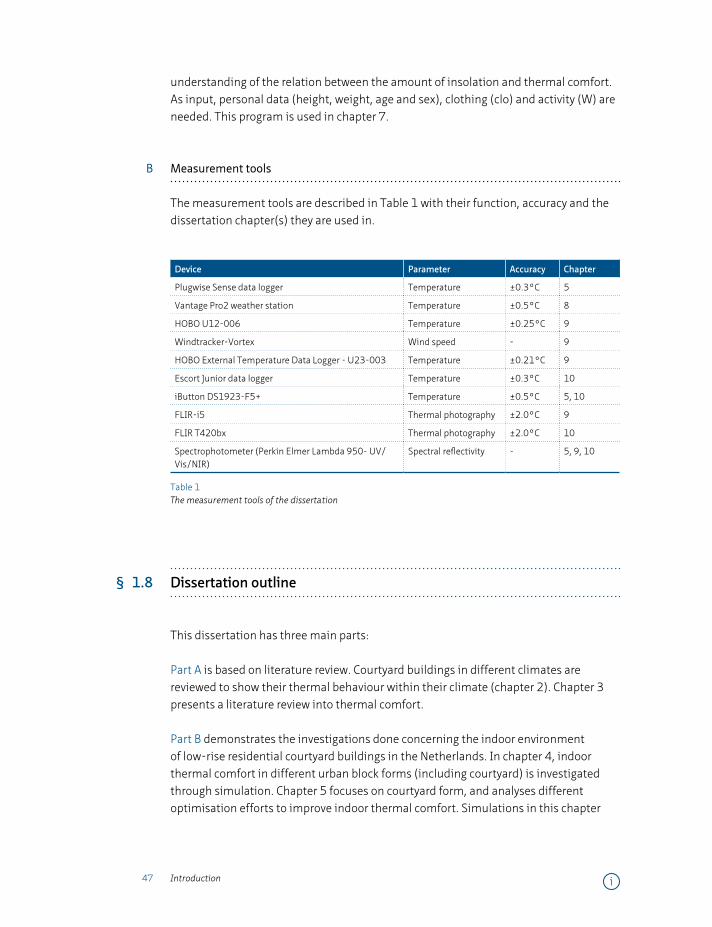
47 Introduction
understanding of the relation between the amount of insolation and thermal comfort. As input, personal data (height, weight, age and sex), clothing (clo) and activity (W) are needed. This program is used in chapter 7.
B Measurement tools
The measurement tools are described in Table 1 with their function, accuracy and the dissertation chapter(s) they are used in.
Device Parameter Accuracy Chapter
Plugwise Sense data logger Temperature ±0.3°C 5
Vantage Pro2 weather station Temperature ±0.5°C 8
HOBO U12-006 Temperature ±0.25°C 9
Windtracker-Vortex Wind speed - 9
HOBO External Temperature Data Logger - U23-003 Temperature ±0.21°C 9
Escort Junior data logger Temperature ±0.3°C 10
iButton DS1923-F5+ Temperature ±0.5°C 5, 10
FLIR-i5 Thermal photography ±2.0°C 9
FLIR T420bx Thermal photography ±2.0°C 10
Spectrophotometer (Perkin Elmer Lambda 950- UV/Vis/NIR)
Spectral reflectivity - 5, 9, 10
Table 1 The measurement tools of the dissertation
§ 1.8 Dissertation outline
This dissertation has three main parts:
Part A is based on literature review. Courtyard buildings in different climates are reviewed to show their thermal behaviour within their climate (chapter 2). Chapter 3 presents a literature review into thermal comfort.
Part B demonstrates the investigations done concerning the indoor environment of low-rise residential courtyard buildings in the Netherlands. In chapter 4, indoor thermal comfort in different urban block forms (including courtyard) is investigated through simulation. Chapter 5 focuses on courtyard form, and analyses different optimisation efforts to improve indoor thermal comfort. Simulations in this chapter
i

48 Dwelling on Courtyards
are validated through a scale model experiment and through field measurements in an actual dwelling alongside a courtyard. Chapter 6 analyses the possibility to improve the thermal performance of an actual courtyard building by converting it to an atrium.
Part C presents the studies related to outdoor thermal comfort. In chapter 7, the same urban blocks as used in chapter 4 were studied for their outdoor thermal comfort using simulation. The courtyard form is further extensively studied in chapter 8 through simulation. The simulations are also validated with field measurements. Chapter 9 explains the field measurements of three courtyards (with different characteristics) in summer in Portland. This study is followed up in chapter 10 by similar measurements in winter in Delft.
=5. Indoor Courtyard Blocks Study
6. An Actual Courtyard Building Study
11. Conclusions
=
8. Outdoor Courtyard Blocks Study
9. Urban Courtyard Study in Summer in Portland (USA)
10. Urban Courtyard Study in Winter in Delft (NL)
7. Outdoor Urban Blocks Study
3. Thermal Comfort
1. Introduction
2. Courtyard Buildings
4. Indoor Urban Blocks Study
Figure 5 The dissertation outline and the order of the chapters
i
49 Introduction
References
1 Howard, L., The climate of London, deduced from meteorological observations made in the metropolis and various
places around it. 1833, London: Harvey and Darton.
2 Oke, T.R., Boundary Layer Climates. 2002: Taylor & Francis.
3 Rosenfeld, A.H., et al., Mitigation of urban heat islands: materials, utility programs, updates. Energy and Buildings,
1995. 22(3): p. 255-265.
4 Santamouris, M., Cooling the cities – A review of reflective and green roof mitigation technologies to fight heat island
and improve comfort in urban environments. Solar Energy, 2014. 103(0): p. 682-703.
5 Hedquist, B.C. and A.J. Brazel, Seasonal variability of temperatures and outdoor human comfort in Phoenix, Arizona,
U.S.A. Building and Environment, 2014. 72(0): p. 377-388.
6 Akbari, H., M. Pomerantz, and H. Taha, Cool surfaces and shade trees to reduce energy use and improve air quality in
urban areas. Solar Energy, 2001. 70(3): p. 295-310.
7 Santamouris, M., et al., On the impact of urban climate on the energy consumption of buildings. Solar Energy, 2001.
70(3): p. 201-216.
8 Akbari, H., et al., Cooling our communities: a guidebook on tree planting and light-colored surfacing. 1992: U.S.
Environmental Protection Agency, Office of Policy Analysis, Climate Change Division.
9 KNMI, in KNMI Klimaatscenarios. Transformatie tijdreeksen. 2012, KNMI: De Bilt.
10 Chun, C., A. Kwok, and A. Tamura, Thermal comfort in transitional spaces—basic concepts: literature review and trial
measurement. Building and Environment, 2004. 39(10): p. 1187-1192.
11 Vellinga, M., P. Oliver, and A. Bridge, Atlas of Vernacular Architecture of the World. 2007: Routledge Chapman & Hall.
12 ISO, International Standard 7730. 1984, ISO Geneva, revised 1990.
13 IPCC, Climate Change 2007, in The physical science basis. Contribution of the working group I to the fourth assessment
report of the intergovernmental panel on climate change, S. Solomon, et al., Editors. 2007: Cambridge.
14 Saidur, R., et al., Energy and associated greenhouse gas emissions from household appliances in Malaysia. Energy
Policy, 2007. 35(3): p. 1648-1657.
15 Akbari, H. and S. Konopacki, Energy effects of heat-island reduction strategies in Toronto, Canada. Energy, 2004.
29(2): p. 191-210.
16 Kolokotroni, M., et al., London’s urban heat island: Impact on current and future energy consumption in office
buildings. Energy and Buildings, 2012. 47(0): p. 302-311.
17 Wallace, R.F., et al., The Effects of Continuous Hot Weather Training on Risk of Exertional Heat Illness. Medicine &
Science in Sports & Exercise, 2005. 37(1): p. 84-90.
18 Pantavou, K., et al., Evaluating thermal comfort conditions and health responses during an extremely hot summer in
Athens. Building and Environment, 2011. 46(2): p. 339-344.
19 ASHRAE, ASHRAE Standard 55–2010 in Thermal Environmental Conditions for Human Occupancy. 2010, ASHRAE
Atlanta, GA.
20 ASHRAE, ASHRAE Terminology Handbook CD. 1999-2002.
21 Höppe, P., The physiological equivalent temperature - A universal index for the biometeorological assessment of the
thermal environment. International Journal of Biometeorology, 1999. 43(2): p. 71-75.
22 KNMI, in Climate Change Scenarios 2006 for the Netherlands. 2006, KNMI publication: WR-2006-01.
23 Ali-Toudert, F. and H. Mayer, Numerical study on the effects of aspect ratio and orientation of an urban street canyon
on outdoor thermal comfort in hot and dry climate. Building and Environment, 2006. 41(2): p. 94-108.
i

50 Dwelling on Courtyards i

51 Literature review
PART 1 Literature review
i
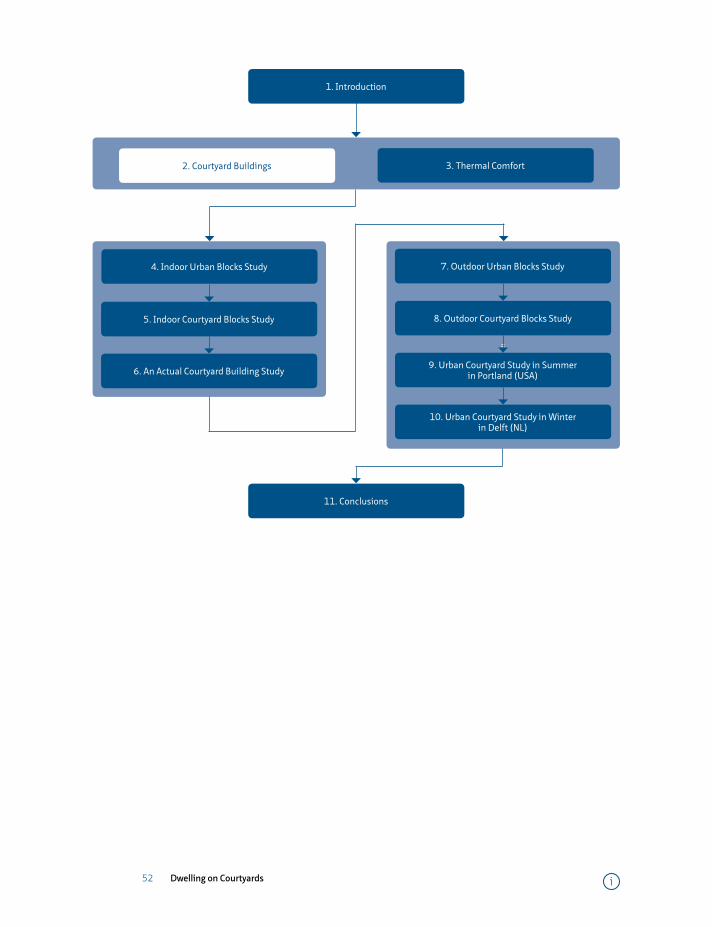
52 Dwelling on Courtyards
=5. Indoor Courtyard Blocks Study
6. An Actual Courtyard Building Study
11. Conclusions
=
8. Outdoor Courtyard Blocks Study
9. Urban Courtyard Study in Summer in Portland (USA)
10. Urban Courtyard Study in Winter in Delft (NL)
7. Outdoor Urban Blocks Study
3. Thermal Comfort
1. Introduction
2. Courtyard Buildings
4. Indoor Urban Blocks Study
i
53 Introduction into courtyard buildings in different climates
2 Introduction into courtyard buildings in different climates
An important background question of this thesis is related to the thermal performance and benefits of courtyard buildings. This chapter reviews the environmental impacts of courtyards in different climates. It is focused on traditional courtyard buildings that are historically integrated into their background, and are modified through centuries and decades. The study is done in the context of hot-arid, snow, temperate and tropical climates. In each climate, the corresponding benefits and the reasons for using courtyards are explained. The different benefits will be the basis for further studies into courtyards and dwellings alongside courtyards in the Netherlands.
i

54 Dwelling on Courtyards i
55 Introduction into courtyard buildings in different climates
Environmental impact of courtyards - A review and comparison of residential courtyard buildings in different climates1
Mohammad Taleghani *1, Martin Tenpierik 1, Andy van den Dobbelsteen 1
1 Faculty of Architecture, Delft University of Technology, Delft, The Netherlands
Abstract
This chapter tries to clarify the environmental impacts of a traditional building form which was developed more than 5000 years ago, under the force of harsh hot climates: courtyard building. A courtyard is an outdoor space which is entirely surrounded by buildings or walls. The main purpose is to show if this building form can reduce the energy demand of low- rise residential buildings in order to reduce CO2 emission which generally considered is the main root of climate change. From a literature review on courtyard buildings several climatic aspects of this building form can be extracted. In this step, the paper focuses on the climatic impact(s) in the context of hot-arid, snow, temperate and tropical climates. Results for different configuration of courtyard building, natural elements used in it and situation of openings in different facades are the most important findings of this review paper.The research is limited to considering residential courtyard buildings in four climates; hot- arid, snow, temperate and tropical (based on Koppen-Geiger climate classification). Practical implications—The results of the paper are general climatic characteristics of courtyard buildings. These characteristics can be used for designing new courtyard dwellings. Although the background information of the chapter is based on literature, the innovation is the comprehensive consideration and comparison of environmental characteristics in different climates which has never been done before.
Keywords
courtyards, environmental impact, different climates, design characteristics
1 Published as: Taleghani M., Tenpierik M., and Dobbelsteen A. (2012), Environmental impact of courtyards- A review and comparison of residential courtyard buildings in different climates, Journal of Green Building, Volume 7, Issue 2, 113-136.
i
56 Dwelling on Courtyards
§ 2.1 Introduction
In the light of energy reduction, courtyard buildings have been recognised as a way to create comfortable environments with limited energy use. A courtyard building typically contains an open space that is surrounded by buildings, rooms or walls. Although there is a wide range of variations in dimensions and shapes of courtyards, this spatial structure generally provides a secluded and private space, and often acts as a source of light, fresh air and heat. In different cultures, it can be used for rest, play with children, worship (meditation), women’s activities and exercise.
This chapter introduces courtyard buildings by presenting their definition, their differences from other similar building types (like atrium and patio), their historical evolution and their different impacts. Among the impacts, climatic issues will be discussed comprehensively. A comparison between different courtyards in different climates helps us to achieve a formal understanding of climate effects of this building type. The differences also show design characteristics which can be utilised in future designs. Moreover, three main climatic functions of courtyard buildings (cooling, lighting and ventilating) are discussed on the basis of three analytical studies.
§ 2.1.1 Objectives
The main objective of this chapter is to understand the climatic aspects of courtyard buildings. This will help us in clarifying if this building shape is efficient in case of energy; further research can consecutively work on actual ways of using and optimising this spatial form. In this regard, it is needed to consider different impacts of courtyard buildings in advance. Moreover, basic ideas and information related to the origins and genesis of courtyard buildings are supposed as background objectives.
§ 2.1.2 Research questions
The main research question that will be answered in this chapter is if a courtyard can reduce the energy demand of low-rise houses. This question is raised in the context of a direct relationship between the energy consumption of residential buildings and climate change phenomena. Since the environmental impact of buildings is not the only effect of the built environment on natural systems, the chapter needs to address and answer other possible aspects and impacts of courtyard buildings as well.
i
57 Introduction into courtyard buildings in different climates
Last but not least, understanding the roots and development of courtyard buildings is a fundamental question of this chapter.
§ 2.1.3 Methodology of the literature review
The research method of this chapter is based first on classifying different chapters and studies according to the type of transitional space they describe (Table 1); and second on studies into courtyard buildings and their impacts (Table 1). Organising recent studies helps other researchers in finding proper references in different approaches of looking to the courtyard buildings. The innovation part of the methodology is to compare different climatic characteristics of courtyard buildings (which are derived from literature) in different climates. The result of this comparison is presented in a table at the end of this chapter. This table can be used by architects as design recommendations.
§ 2.2 Problem analysis
§ 2.2.1 Climate change and buildings
There is a growing concern about energy use and its implications for the environment. Recent reports by the Intergovernmental Panel on Climate Change (IPCC) have raised public awareness of energy use and the environmental implications, and generated a lot of interest in having a better understanding of the energy use characteristics in buildings, especially their correlations with the prevailing weather conditions (IPCC, 2007; Levin et al, 2007).
It was estimated that in the year 2002 buildings worldwide accounted for about 33% of the global greenhouse gas emissions (Levermore, 2008). The European Commission (2000) reported that the 164 million buildings in the EU-15 (193 million in EU-25) accounted for about 40% of the final energy demand and about a third of all greenhouse gas emissions from the EU, of which about two-thirds are attributed to residential and one-third to commercial buildings.
i

58 Dwelling on Courtyards
§ 2.2.2 The effect of residential buildings and courtyards
On a national level, energy consumption of the residential sector accounts for 16–50% of the consumption of all sectors, and averages approximately 30% worldwide as shown in Fig. 1 (Swan & Ugursal, 2009). This significant consumption level warrants a detailed understanding of the residential sector’s consumption characteristics to prepare for and help guide the sector’s energy consumption in an increasingly energy-conscious world: awareness from standpoints of supply, efficient use, and effects of consumption. In response to climate change, high energy prices, and energy supply/demand, there is interest in understanding the detailed consumption characteristics of the residential sector in an effort to promote conservation, efficiency, technology implementation and energy source switching to, for instance, renewable energy harvested on-site.
Figure 1 Residential energy consumption shown as a percentage of national energy consumption and in relative international form (Saidur et al., 2007)
i

59 Introduction into courtyard buildings in different climates
As discussed earlier, buildings normally consume one third of national energy budgets, and residential buildings have a key role in this amount of consumption. Therefore, the energy consumption of residential buildings must be reduced. In this respect, this chapter tries to introduce courtyard building as an effective and passive way to minimize energy consumption in special regions and climates.
§ 2.3 Literature overview
Several studies (Table 1) have shown social, cultural, formal and environmental advantages of courtyard buildings. Future lack of fossil energy and the limited capacity of sustainable energy sources encourage us to investigate passive and efficient building forms; one such building form is the courtyard.
As we can see in table 1, we have different types of transitional spaces including courtyard buildings. Among the different types close to courtyard buildings, the atrium is studied more on the impact to natural lighting (Aizlewood et al., 1997), (Cole, 1990), (Hopkirk, 1999) and natural ventilation (Rundle et al., 2011), (Oosthuizen and Lightstone, 2009), (Qin, 2008). In this regard, natural heating is studied less frequently for atrium buildings (Blesgraaf, 1996).
Generally, in case of courtyard buildings, comprehensive investigations have been executed in the field of social and cultural impacts of this building form. However, specifically in case of environmental effects, most researchers have not yet addressed courtyard buildings’ energy performance in sufficient depth in order to be able to reduce the energy demand for heating, cooling, ventilating and lighting.
Most studies done in the field of energy in courtyard buildings are related to either the role of the glazing type in the thermal performance of courtyard buildings (Aldawoud, 2008), or day lighting in atria (Calcagni and Paroncini, 2004; Mabb, 2008), or courtyard acoustics (Ettouney and Fricke, 1973). Meir (2000) discusses that during the last forty years, there has been an increasing number of publications advocating the use of courtyard spaces as microclimate modifiers, especially in hot arid climates (Saini, 1980), (Mostafa & Costa, 1983), (Moore, 1983), (Talib, 1984), though not always based on actual calculations and field studies. This was claimed by Roaf (1990) to the fact that many of the authors of those papers based their assumptions on Dunham’s thesis (1990) without questioning its theoretical basis in particular, and without checking whether in general the specific research results can be applied to different climatic regions. As a result, an in-depth analysis of the energy performance of (residential) buildings with courtyards is still lacking.
i
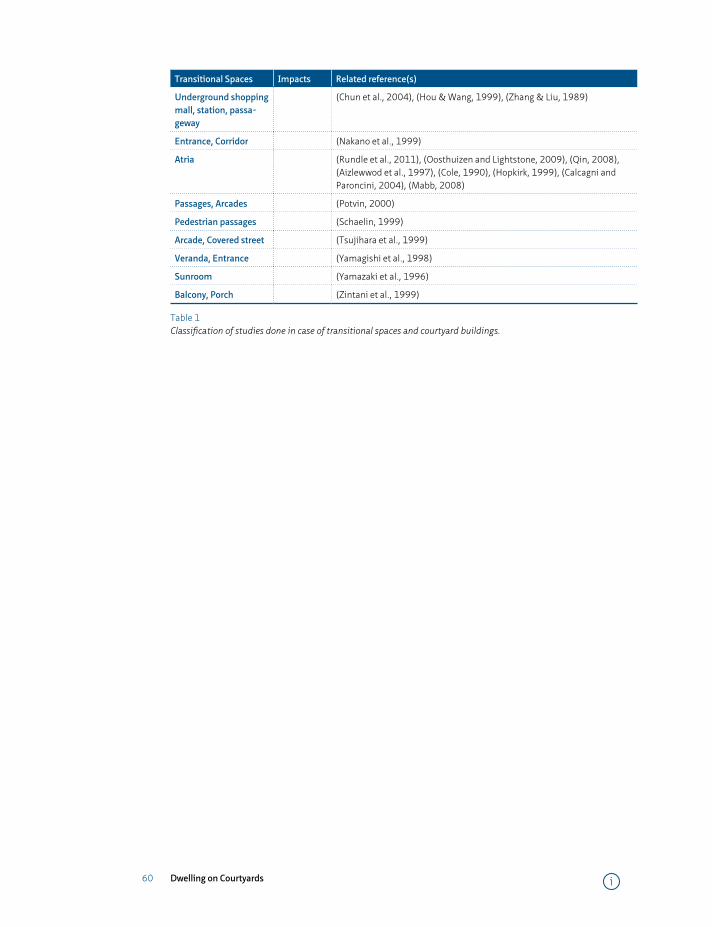
60 Dwelling on Courtyards
Transitional Spaces Impacts Related reference(s)
Underground shopping mall, station, passa-geway
(Chun et al., 2004), (Hou & Wang, 1999), (Zhang & Liu, 1989)
Entrance, Corridor (Nakano et al., 1999)
Atria (Rundle et al., 2011), (Oosthuizen and Lightstone, 2009), (Qin, 2008), (Aizlewwod et al., 1997), (Cole, 1990), (Hopkirk, 1999), (Calcagni and Paroncini, 2004), (Mabb, 2008)
Passages, Arcades (Potvin, 2000)
Pedestrian passages (Schaelin, 1999)
Arcade, Covered street (Tsujihara et al., 1999)
Veranda, Entrance (Yamagishi et al., 1998)
Sunroom (Yamazaki et al., 1996)
Balcony, Porch (Zintani et al., 1999)
Table 1 Classification of studies done in case of transitional spaces and courtyard buildings.
i

61 Introduction into courtyard buildings in different climates
Transitional Spaces Impacts Related reference(s)
Courtyards
Social, Cultural and typological
Afghanistan: (Schadl, 2009)
China: (Knapp, 1989)
India: (Sinha, 1994), (Nangia, 2000), (Sobti, 2009)
Singapore: (Chua, 1998)
Iran: (Ghodar, 1978), (Memarian and Brown, 1996), (Memarian, 2006), (Forouzanmehr & Vellinga, 2011).
Syria: (Al Abidin, 2006), (Wadah, 2006)
Morocco: (Eleb, 2009)
Turkey: (Eldem, 1984), (Lad, 2009), (Bekleyen and Dalkiliç, 2011)
Algeria: (Abdelmalek, 2006)
Egypt: (Scanlon, 1966), (Bey and Gabriel, 1921), (Creswell, 1959), (Behrens-Abouseif, 1993), (Chowdhury, 2009)
North Africa: (Noor, 1991), (Sibley, 2006)
Saudi Arabia: (Bahammam, 2006)
Italy: (Giuliani, 1992), (Petruccioli, 2006)
Spain: (Perez-de-Lama and Cabeza, 1998), (Cadima, 1998), (Reynolds, 2009)
UK: (Edwards, 2006)
S. Korea: (Hwangbo, 2009)
Sri Lanka: (Pieris, 2009)
Comparative analyses: (Rapoport, 1969), (Alexander 1976), (Kamau, 1979), (Banaji and Haynes, 1992), (Reynolds, 2002), (Oliver, 2006), (Rabbat, 2009).
Climatic Hot & arid Climate:(Fathy, 1986), (Bahadori, 1978), (Roaf, 1990), (Etzion, 1990), (Raydan, 2006), (Meir, 2000), (Heidari 2000), (Meir et al., 2004), (Yezioro et al., 2006), (Bagneid, 2006), (Rapoport, 2007), (Rabbat, 2009).
Snow Climate:(Schoenauer and Seeman, 1962), (Manty, 1988).
Tropical Climate:(Das, 2006)
Temperate Climate:(Pfeifer and Brauneck, 2008)
Comparative Studies:(Givoni, 1991), (Brown and DeKay, 2001), (Aldawoud, 2008), (Muhaisen, 2010).
Table 1 Classification of studies done in case of transitional spaces and courtyard buildings.
i
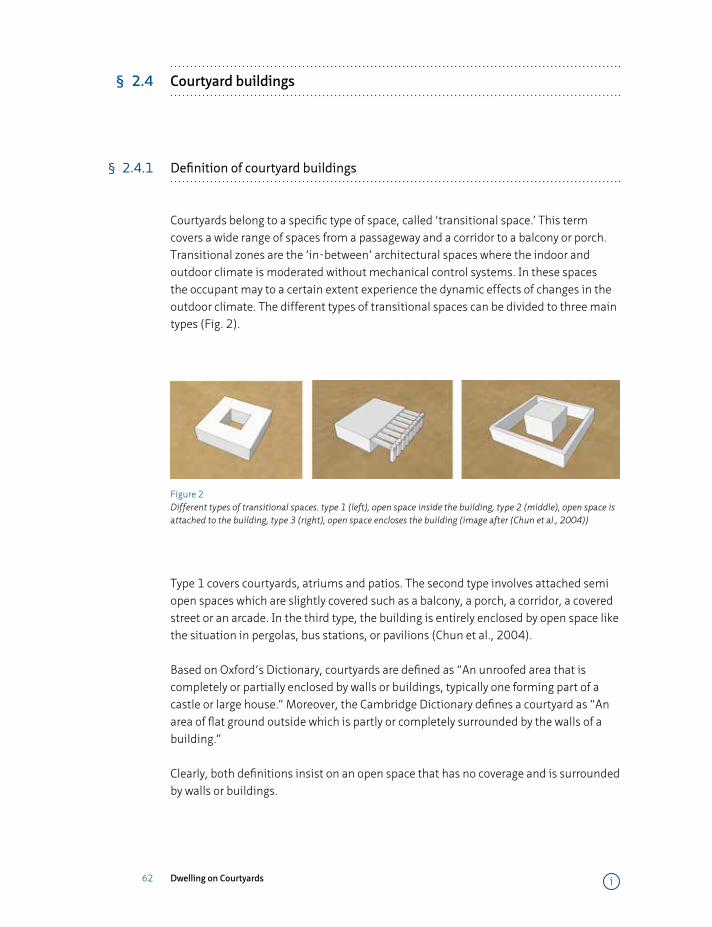
62 Dwelling on Courtyards
§ 2.4 Courtyard buildings
§ 2.4.1 Definition of courtyard buildings
Courtyards belong to a specific type of space, called ‘transitional space.’ This term covers a wide range of spaces from a passageway and a corridor to a balcony or porch. Transitional zones are the ‘in-between’ architectural spaces where the indoor and outdoor climate is moderated without mechanical control systems. In these spaces the occupant may to a certain extent experience the dynamic effects of changes in the outdoor climate. The different types of transitional spaces can be divided to three main types (Fig. 2).
Figure 2 Different types of transitional spaces. type 1 (left), open space inside the building, type 2 (middle), open space is attached to the building, type 3 (right), open space encloses the building (image after (Chun et al., 2004))
Type 1 covers courtyards, atriums and patios. The second type involves attached semi open spaces which are slightly covered such as a balcony, a porch, a corridor, a covered street or an arcade. In the third type, the building is entirely enclosed by open space like the situation in pergolas, bus stations, or pavilions (Chun et al., 2004).
Based on Oxford’s Dictionary, courtyards are defined as “An unroofed area that is completely or partially enclosed by walls or buildings, typically one forming part of a castle or large house.” Moreover, the Cambridge Dictionary defines a courtyard as “An area of flat ground outside which is partly or completely surrounded by the walls of a building.”
Clearly, both definitions insist on an open space that has no coverage and is surrounded by walls or buildings.
i
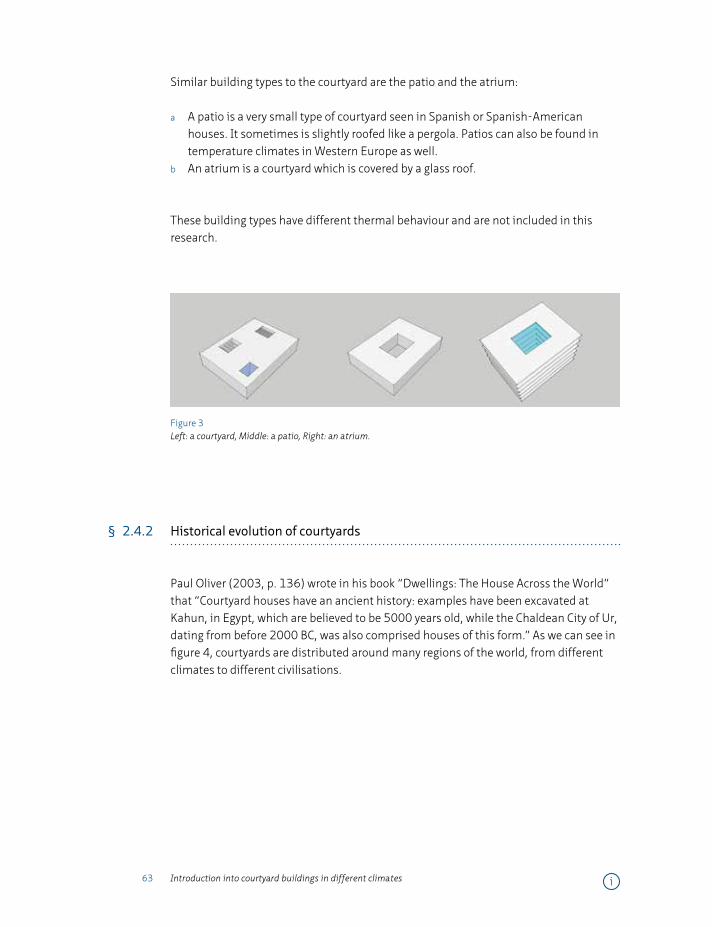
63 Introduction into courtyard buildings in different climates
Similar building types to the courtyard are the patio and the atrium:
a A patio is a very small type of courtyard seen in Spanish or Spanish-American houses. It sometimes is slightly roofed like a pergola. Patios can also be found in temperature climates in Western Europe as well.
b An atrium is a courtyard which is covered by a glass roof.
These building types have different thermal behaviour and are not included in this research.
Figure 3 Left: a courtyard, Middle: a patio, Right: an atrium.
§ 2.4.2 Historical evolution of courtyards
Paul Oliver (2003, p. 136) wrote in his book “Dwellings: The House Across the World” that “Courtyard houses have an ancient history: examples have been excavated at Kahun, in Egypt, which are believed to be 5000 years old, while the Chaldean City of Ur, dating from before 2000 BC, was also comprised houses of this form.” As we can see in figure 4, courtyards are distributed around many regions of the world, from different climates to different civilisations.
i

64 Dwelling on Courtyards
Figure 4 Distribution of Courtyards in the World (image after Vellinga et al, 2007)
Reviewing different literature shows four eras in the historic evolution of courtyards; a) ancient civilisations from North Africa to China, b) Classical civilisations in Greece and Rome, c) the Middle Ages and Renaissance civilisations involving the Islamic world as well, and d) the Modern Era.
§ 2.4.2.1 Ancient civilisations
SSchoenauer and Seeman (1962) suggest in their book “The Court-Garden House” that the most primitive and homogeneous society to build courtyard houses was probably the one that built the Troglodyte villages in the Matmatas of Southern Tunisia. “Each dwelling-unit is built around a crater open to the sky, having sloping walls and a flat bottom, which is the court” (Schoenauer & Seeman, 1962, p13). This primitive building form was preceded by the ‘douars’ in North Africa, the encampments of nomadic tribes in West Africa, the “Kraals of Bechuanaland” in South Africa and the first rectangular dwellings in Morocco. Schoenauer and Seeman consider that the ‘noualas,’ the rectangular compound dwellings of Morocco, mark the transition between the primitive douars and the later conventional courtyard houses.
Around 2000–1500 B.C., similar houses were built in the Indus valley using the same philosophy. The houses were designed as a series of rooms opening on to a central courtyard (Nangia, 2000).
i
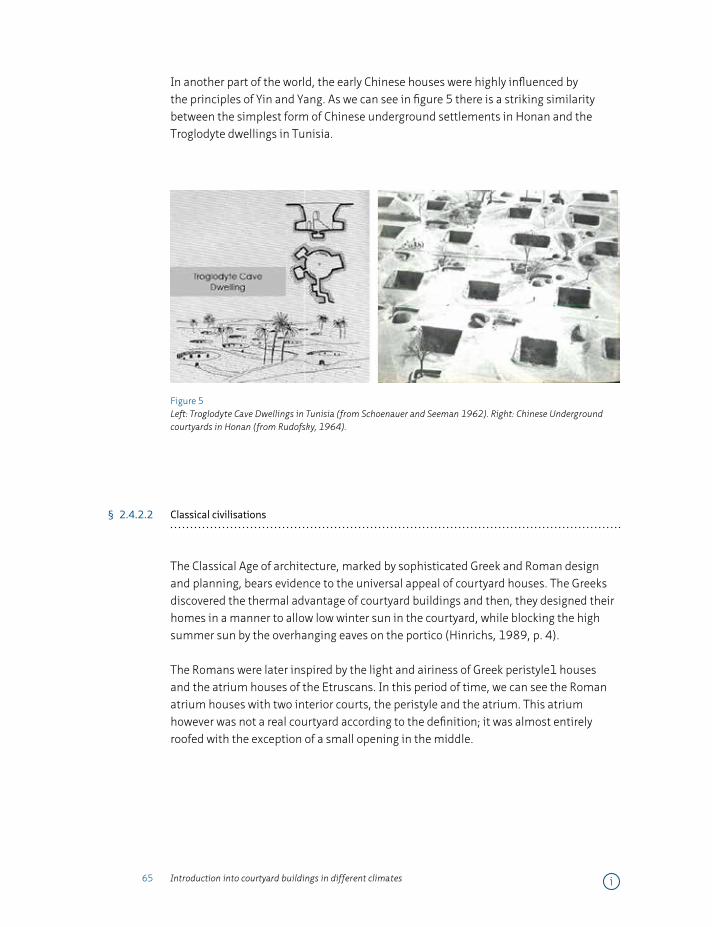
65 Introduction into courtyard buildings in different climates
In another part of the world, the early Chinese houses were highly influenced by the principles of Yin and Yang. As we can see in figure 5 there is a striking similarity between the simplest form of Chinese underground settlements in Honan and the Troglodyte dwellings in Tunisia.
Figure 5 Left: Troglodyte Cave Dwellings in Tunisia (from Schoenauer and Seeman 1962). Right: Chinese Underground courtyards in Honan (from Rudofsky, 1964).
§ 2.4.2.2 Classical civilisations
The Classical Age of architecture, marked by sophisticated Greek and Roman design and planning, bears evidence to the universal appeal of courtyard houses. The Greeks discovered the thermal advantage of courtyard buildings and then, they designed their homes in a manner to allow low winter sun in the courtyard, while blocking the high summer sun by the overhanging eaves on the portico (Hinrichs, 1989, p. 4).
The Romans were later inspired by the light and airiness of Greek peristyle1 houses and the atrium houses of the Etruscans. In this period of time, we can see the Roman atrium houses with two interior courts, the peristyle and the atrium. This atrium however was not a real courtyard according to the definition; it was almost entirely roofed with the exception of a small opening in the middle.
i
66 Dwelling on Courtyards
§ 2.4.2.3 The middle ages and renaissance civilisation
During the Middle Ages the only traces of courtyard houses were found in Italian cortile hDuring the Middle Ages the only traces of courtyard houses were found in Italian cortile2 houses and monastic cloisters. Sullivan (2002, p. 102) observes that the “Benedictine monastery life typically revolved around a central, enclosed, four sided space with a roofed walk about which the monks came to study and to meditate.”
After this period, courtyard houses can be seen in other regions bordering on the Mediterranean (in the Muslim countries of North Africa and the Middle East) (Schoenauer & Seeman, 1962). The four season Persian houses, the more refined interior gardens, the simple Arab houses, the unpretentious exterior with interior splendour of the Syrian (Damascus) houses all are results of the basic Islamic dwelling philosophy of “privacy and seclusion with a minimal display of the occupant’s social status to the outside world” (Schoenauer & Seeman, 1962, p 29). During this period, underground spaces were added to the Middle Eastern courtyard buildings. These spaces were cellars or storages for food and water. Moreover they were used for sleeping in the hot days of the year. Hinrichs (1989) describes the Islamic adaptation of courtyard houses as an ‘oasis concept.’ The proportions of these buildings maintained a beautiful responsiveness to the hot-arid climate in most of the Muslim countries—“where there exists an intentional contrast between the stark, bright, heat of the outside and the intimate confinement, shade, and coolness of the Dar3’s interior” (Hinrichs, 1989, p3).
Courtyard houses were also popular in northern areas around the Mediterranean Sea, especially in southern Spain. The courtyard buildings here appeared in two main forms, gardens and patios. Nowadays, patio buildings can also be seen in Latin American countries like Mexico.
§ 2.4.2.4 Courtyards in modern era
In the last two centuries, the courtyard building form reached the West Coast of North America by the influence of the Spanish Colonial Revival movement in Southern California in the late 19th century. In this regard, Polyzoides et al. (1982) in their book “Courtyard Housing in Los Angeles: A Typological Analysis” argue that the huge influx of immigrants between 1880–1930 created an intense pressure for housing. “Even the availability of land and easy mobility, however, could not deter denser clusters in the form of courtyard housing forms appearing within the city” (Polyzoides et al., 1982, p. 12). Then, the courtyard type moved across the United States to the East Coast
i
67 Introduction into courtyard buildings in different climates
only after the period of Depression, when Marcel Breuer first conceived the idea of separating living and sleeping areas by implementing a courtyard.
In Europe, mass courtyard houses became a popular form though, Macintosh (1973) warns that these dwellings had nothing to do with the earlier precedents in architecture. He observes that the “... symmetrical quadrangular plan has been reworked” (p.8) since the early twentieth century. Generally, the single storey mass courtyard housing in Europe was mainly a social response to the housing demand for the low income working class. In Europe, Macintosh observes that the first modern detached court house overlooking a garden on the south was built by Hugo Haring in 1928. This style was later adopted into an L-shaped plan by two Bauhaus architects, Hannes Meyer and Ludwig Hilberseimer. This L-shaped modification of the quadrangular court-house became popular in both Germany and England by the 1950s and 1960s. Finally, courtyard architecture still survives today in almost all countries of the world, either in its original rectangular form or in modified shapes (Das, 2006).
§ 2.5 Impacts of courtyards
§ 2.5.1 Social- cultural impacts
One of the biggest advantages of courtyards is the privacy caused by surrounding elements (buildings, rooms or walls) (Rapoport, 1969), (Kamau, 1979), (Fathy, 1973). This characteristic provides a safe place for rest, play with children, worship (meditation), women’s activities and exercise. In this regard, different courtyard shapes are suitable for kindergartens, schools, ritual spaces (great mosques, basilicas), hospitals (places which are supposed to provide a quiet area for treating patients) and even prisons. In courtyard houses, the court acts as an outdoor room. This room can be used as an extension of the kitchen during mornings or as an extension of the living room during evenings for instance to entertain guests (Das, 2006). Moreover, visual privacy in a courtyard is an important item in Islamic and Middle Eastern countries. Furthermore, the buildings or rooms around a courtyard attenuate noises from surrounding buildings or from the street. Finally, since most of openings of this building shape is from the centre part, safety and security is increased.
i

68 Dwelling on Courtyards
§ 2.5.2 Formal impacts
Among all of the spaces of a courtyard building, the courtyard has the best view and access to the other spaces. On an urban scale, we can see that a central courtyard can be developed to an arena (or a stadium), a city centre, an urban block or a university campus (Abu Lughod, 1969), (Rapoport, 1986).
Figure 6 Courtyard house in terms of access (Rapoport, 2007)
Rapoport (2007) discusses the formal impact of courtyard houses as an important attribute after their privacy: “the courtyard itself provides a critically important setting or subsystem of settings, within which specific activities occur as part of a larger system of activities, within a larger system of settings (which is the dwelling)” (Rapoport, 2007, p. 59).
§ 2.5.3 Environmental impacts
One of the main reasons that courtyards have survived for more than 5000 years, is their potential to provide a thermally comfortable area for living. Courtyards can be a source of fresh air, light and heat or coolness. They have been generally referred to as a microclimate modifier in the house due to their ability to reduce peak temperatures, to channel breezes and to adjust the degree of humidity. Courtyards have been used in hot, temperate, tropical and snow climates with different characteristics.
i

69 Introduction into courtyard buildings in different climates
The simple idea of including an open space (like a courtyard) in a building comes to mind when we need natural lighting, heating, cooling and ventilating in a solid building. Wadah (2006) numbers three main factors in the climatic function of a courtyard building; sun, wind and humidity.
a Sun: Raydan (2006) discusses that courtyard buildings somewhere are sun collector and somewhere sun protector. In this regard, it is important to consider sunlight in addition to the thermal effect of the sun. Therefore, the correct orientation of the buildings and its court and the proper position of the void (court) in a solid mass (building) should be taken into account.
b Wind: wind has two effects on a courtyard building. First it circulates between exterior space and inside the court; second it ventilates the interior building by the court air. In this regard, in hot areas during the night, warm air rises and exits the court. Then, the cooler air will enter to replace the exiting air. Hence, during the hot day, cool air is circulated to the rooms and the court can be a source of fresh and cool air (Al- Hemiddi & Al-Saud, 2001). In snow regions there is limited circulation between the court and the building. Moreover, in tropical regions, where the temperatures of outside and inside the building are close to each other, the court is used for refreshing the interior air.
c Humidity: different natural elements can be utilised in the courtyard to increase the humidity. Humidity is needed in arid areas to achieve comfort by increasing the relative humidity of the air. Plants and water elements are the major elements used in hot and arid areas. The evaporation and corresponding increase of humidity are a result of sun and wind (Beazley, 1990). Obviously, in other climates in which humidity is not required, fewer natural elements are used.
§ 2.6 Comparative characteristics of courtyard buildings in four climates
In this section, the chapter reviews the characteristics of courtyard buildings in four different climates: a hot climate, a snow climate, a temperate climate and a tropical climate. It is assumed that a courtyard house receives sun and wind from the courtyard only and the outdoor facades of the buildings are not considered as sources of heat, light or wind. Characteristics of courtyards in these climates are different in terms of the following criteria:
a Configuration of courtyardSince a courtyard can be a source of natural heating, cooling, ventilating and lighting, it is important to know the optimum shape and dimensions of the courtyard. The lengths of different facades of the building result from the dimensions of the courtyard. In addition, the size of the courtyard can affect the amount of breeze that can be
i
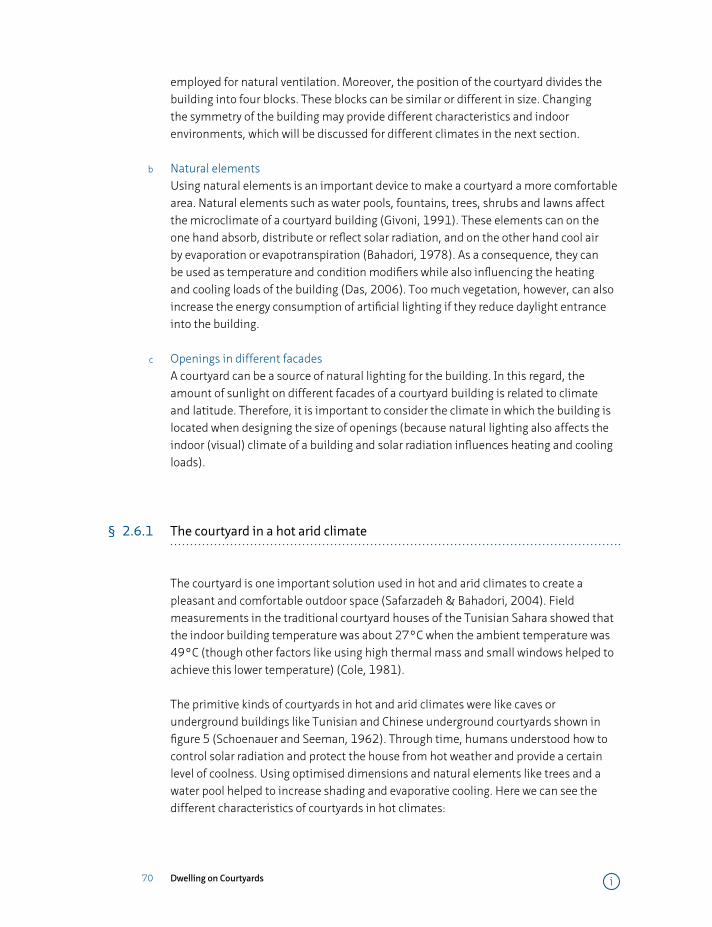
70 Dwelling on Courtyards
employed for natural ventilation. Moreover, the position of the courtyard divides the building into four blocks. These blocks can be similar or different in size. Changing the symmetry of the building may provide different characteristics and indoor environments, which will be discussed for different climates in the next section.
b Natural elementsUsing natural elements is an important device to make a courtyard a more comfortable area. Natural elements such as water pools, fountains, trees, shrubs and lawns affect the microclimate of a courtyard building (Givoni, 1991). These elements can on the one hand absorb, distribute or reflect solar radiation, and on the other hand cool air by evaporation or evapotranspiration (Bahadori, 1978). As a consequence, they can be used as temperature and condition modifiers while also influencing the heating and cooling loads of the building (Das, 2006). Too much vegetation, however, can also increase the energy consumption of artificial lighting if they reduce daylight entrance into the building.
c Openings in different facadesA courtyard can be a source of natural lighting for the building. In this regard, the amount of sunlight on different facades of a courtyard building is related to climate and latitude. Therefore, it is important to consider the climate in which the building is located when designing the size of openings (because natural lighting also affects the indoor (visual) climate of a building and solar radiation influences heating and cooling loads).
§ 2.6.1 The courtyard in a hot arid climate
The courtyard is one important solution used in hot and arid climates to create a pleasant and comfortable outdoor space (Safarzadeh & Bahadori, 2004). Field measurements in the traditional courtyard houses of the Tunisian Sahara showed that the indoor building temperature was about 27°C when the ambient temperature was 49°C (though other factors like using high thermal mass and small windows helped to achieve this lower temperature) (Cole, 1981).
The primitive kinds of courtyards in hot and arid climates were like caves or underground buildings like Tunisian and Chinese underground courtyards shown in figure 5 (Schoenauer and Seeman, 1962). Through time, humans understood how to control solar radiation and protect the house from hot weather and provide a certain level of coolness. Using optimised dimensions and natural elements like trees and a water pool helped to increase shading and evaporative cooling. Here we can see the different characteristics of courtyards in hot climates:
i
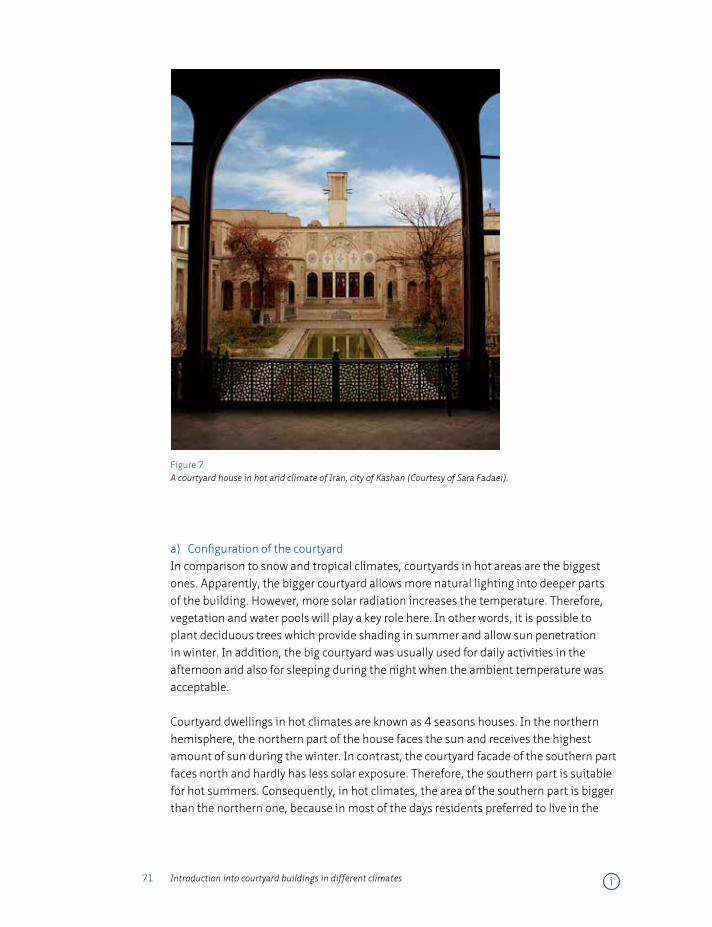
71 Introduction into courtyard buildings in different climates
Figure 7 A courtyard house in hot arid climate of Iran, city of Kashan (Courtesy of Sara Fadaei).
a) Configuration of the courtyardIn comparison to snow and tropical climates, courtyards in hot areas are the biggest ones. Apparently, the bigger courtyard allows more natural lighting into deeper parts of the building. However, more solar radiation increases the temperature. Therefore, vegetation and water pools will play a key role here. In other words, it is possible to plant deciduous trees which provide shading in summer and allow sun penetration in winter. In addition, the big courtyard was usually used for daily activities in the afternoon and also for sleeping during the night when the ambient temperature was acceptable.
Courtyard dwellings in hot climates are known as 4 seasons houses. In the northern hemisphere, the northern part of the house faces the sun and receives the highest amount of sun during the winter. In contrast, the courtyard facade of the southern part faces north and hardly has less solar exposure. Therefore, the southern part is suitable for hot summers. Consequently, in hot climates, the area of the southern part is bigger than the northern one, because in most of the days residents preferred to live in the
i
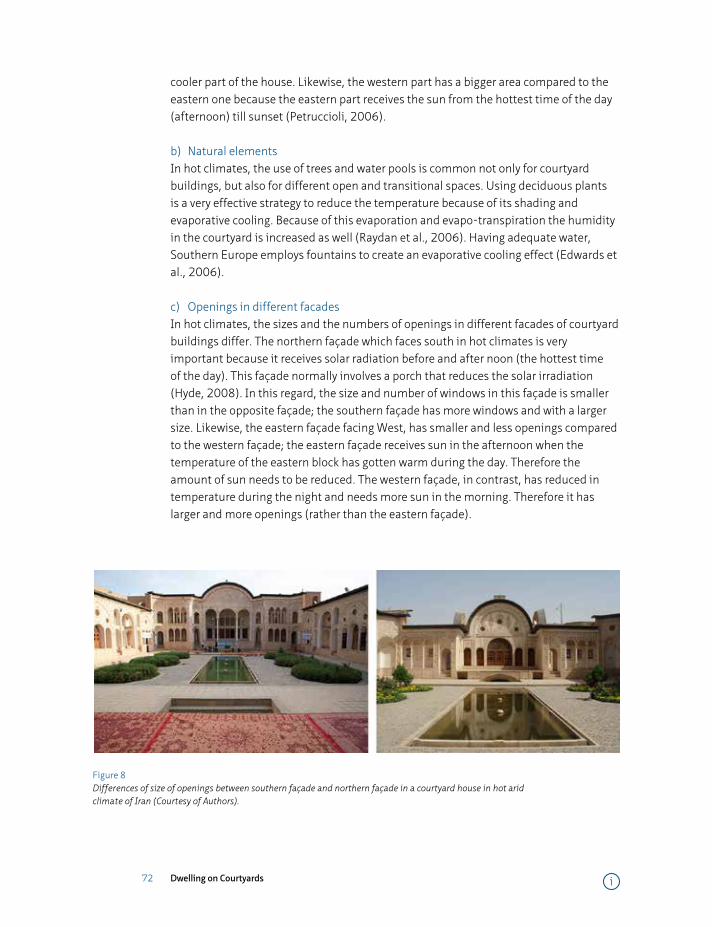
72 Dwelling on Courtyards
cooler part of the house. Likewise, the western part has a bigger area compared to the eastern one because the eastern part receives the sun from the hottest time of the day (afternoon) till sunset (Petruccioli, 2006).
b) Natural elementsIn hot climates, the use of trees and water pools is common not only for courtyard buildings, but also for different open and transitional spaces. Using deciduous plants is a very effective strategy to reduce the temperature because of its shading and evaporative cooling. Because of this evaporation and evapo-transpiration the humidity in the courtyard is increased as well (Raydan et al., 2006). Having adequate water, Southern Europe employs fountains to create an evaporative cooling effect (Edwards et al., 2006).
c) Openings in different facadesIn hot climates, the sizes and the numbers of openings in different facades of courtyard buildings differ. The northern façade which faces south in hot climates is very important because it receives solar radiation before and after noon (the hottest time of the day). This façade normally involves a porch that reduces the solar irradiation (Hyde, 2008). In this regard, the size and number of windows in this façade is smaller than in the opposite façade; the southern façade has more windows and with a larger size. Likewise, the eastern façade facing West, has smaller and less openings compared to the western façade; the eastern façade receives sun in the afternoon when the temperature of the eastern block has gotten warm during the day. Therefore the amount of sun needs to be reduced. The western façade, in contrast, has reduced in temperature during the night and needs more sun in the morning. Therefore it has larger and more openings (rather than the eastern façade).
Figure 8 Differences of size of openings between southern façade and northern façade in a courtyard house in hot arid climate of Iran (Courtesy of Authors).
i
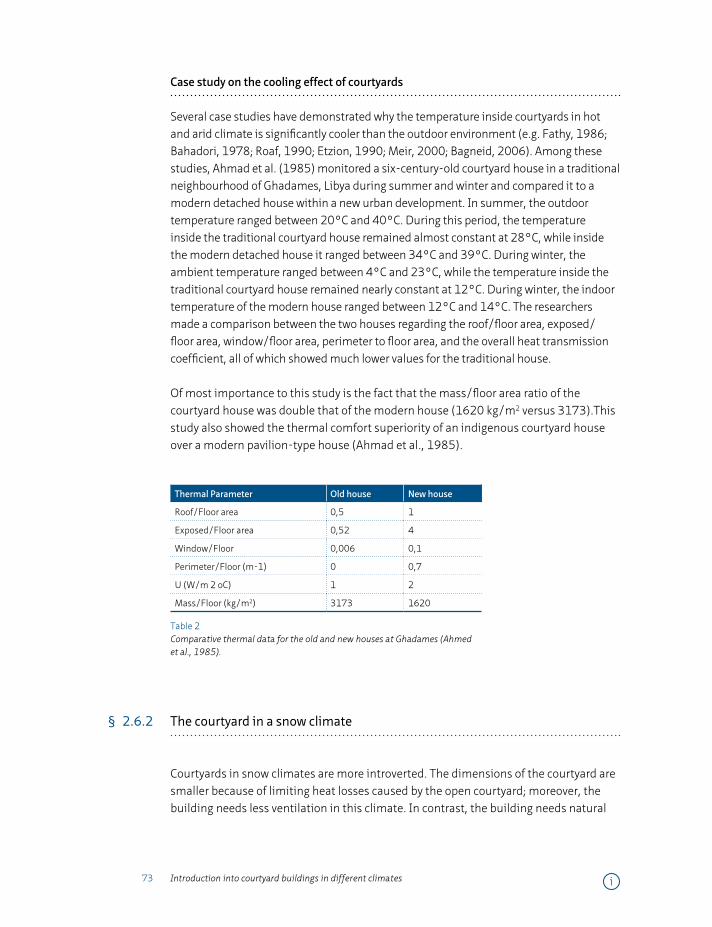
73 Introduction into courtyard buildings in different climates
Case study on the cooling effect of courtyards
Several case studies have demonstrated why the temperature inside courtyards in hot and arid climate is significantly cooler than the outdoor environment (e.g. Fathy, 1986; Bahadori, 1978; Roaf, 1990; Etzion, 1990; Meir, 2000; Bagneid, 2006). Among these studies, Ahmad et al. (1985) monitored a six-century-old courtyard house in a traditional neighbourhood of Ghadames, Libya during summer and winter and compared it to a modern detached house within a new urban development. In summer, the outdoor temperature ranged between 20°C and 40°C. During this period, the temperature inside the traditional courtyard house remained almost constant at 28°C, while inside the modern detached house it ranged between 34°C and 39°C. During winter, the ambient temperature ranged between 4°C and 23°C, while the temperature inside the traditional courtyard house remained nearly constant at 12°C. During winter, the indoor temperature of the modern house ranged between 12°C and 14°C. The researchers made a comparison between the two houses regarding the roof/floor area, exposed/floor area, window/floor area, perimeter to floor area, and the overall heat transmission coefficient, all of which showed much lower values for the traditional house.
Of most importance to this study is the fact that the mass/floor area ratio of the courtyard house was double that of the modern house (1620 kg/m2 versus 3173).This study also showed the thermal comfort superiority of an indigenous courtyard house over a modern pavilion-type house (Ahmad et al., 1985).
Thermal Parameter Old house New house
Roof/Floor area 0,5 1
Exposed/Floor area 0,52 4
Window/Floor 0,006 0,1
Perimeter/Floor (m-1) 0 0,7
U (W/m 2 oC) 1 2
Mass/Floor (kg/m2) 3173 1620
Table 2 Comparative thermal data for the old and new houses at Ghadames (Ahmed et al., 1985).
§ 2.6.2 The courtyard in a snow climate
Courtyards in snow climates are more introverted. The dimensions of the courtyard are smaller because of limiting heat losses caused by the open courtyard; moreover, the building needs less ventilation in this climate. In contrast, the building needs natural
i
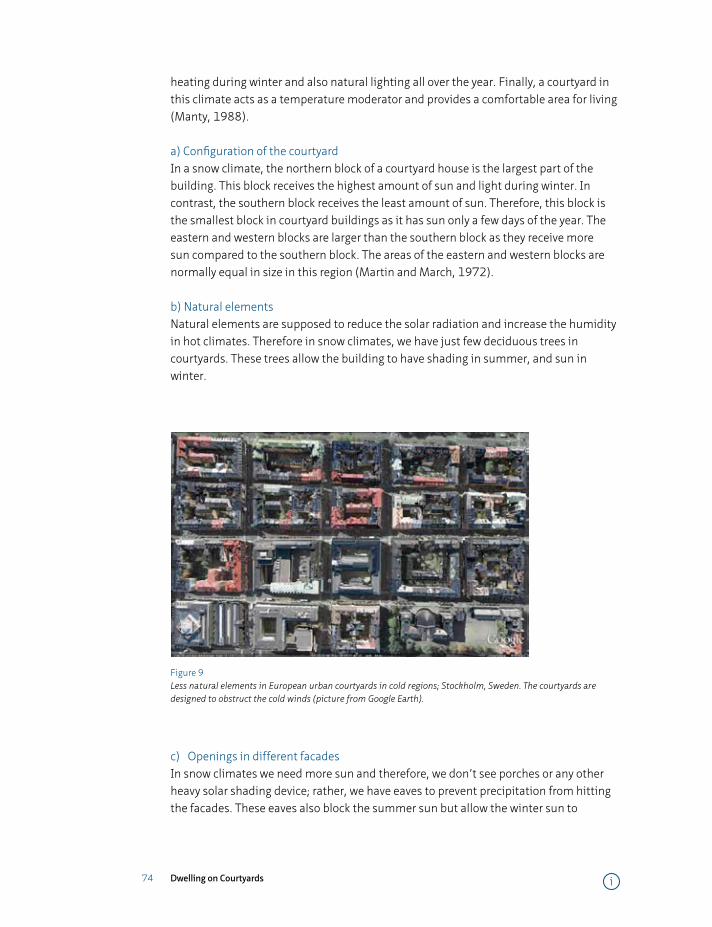
74 Dwelling on Courtyards
heating during winter and also natural lighting all over the year. Finally, a courtyard in this climate acts as a temperature moderator and provides a comfortable area for living (Manty, 1988).
a) Configuration of the courtyardIn a snow climate, the northern block of a courtyard house is the largest part of the building. This block receives the highest amount of sun and light during winter. In contrast, the southern block receives the least amount of sun. Therefore, this block is the smallest block in courtyard buildings as it has sun only a few days of the year. The eastern and western blocks are larger than the southern block as they receive more sun compared to the southern block. The areas of the eastern and western blocks are normally equal in size in this region (Martin and March, 1972).
b) Natural elementsNatural elements are supposed to reduce the solar radiation and increase the humidity in hot climates. Therefore in snow climates, we have just few deciduous trees in courtyards. These trees allow the building to have shading in summer, and sun in winter.
Figure 9 Less natural elements in European urban courtyards in cold regions; Stockholm, Sweden. The courtyards are designed to obstruct the cold winds (picture from Google Earth).
c) Openings in different facadesIn snow climates we need more sun and therefore, we don’t see porches or any other heavy solar shading device; rather, we have eaves to prevent precipitation from hitting the facades. These eaves also block the summer sun but allow the winter sun to
i

75 Introduction into courtyard buildings in different climates
penetrate into the house. Moreover, the size of the openings (windows) in all facades is smaller than in case of the courtyards in hot areas for large openings cause large heat losses (Shokouhian et al., 2007).
§ 2.6.3 The courtyard in a temperate climate
Courtyards in temperate climates are varied in terms of size; they are very small (like patios) and very large (like an urban courtyard). In patios, the dimensions of the courtyard are smaller because there is less need for natural heating or cooling; moreover, the building needs less ventilation in this climate. On the other hand, courtyards on an urban scale have different functions beyond environmental.
a) Configuration of the courtyard
In a temperate climate, different blocks of a courtyard house are similar in case of size and dimensions since they are not deeply dependent on sun to compensate heating or avoid overheating.
Figure 10 Two small courtyards (patios) in Amsterdam (left; courtesy of Kees Hummel and right; courtesy of ARHK).
b) Natural elements
In temperate climates, natural elements only function as greenery. They are rarely used for their cooling effect. Therefore, they are not as important as in hot and arid climates.
i
76 Dwelling on Courtyards
c) Openings in different facades
In temperate climates openings are larger than in hot and snow climates since the temperature is moderated. Therefore, the need for natural lighting and solar heat enlarges the windows (like the conservatories attached to a building to capture more light and solar radiation). Moreover, natural ventilation is not only a cooling strategy for hot climates. Natural ventilation can eliminate or drastically reduce the use of air conditioning in temperate climates.
Case study on the daylighting effect of courtyards
In a study regarding daylight factor in courtyard buildings, Ntefeh (et al, 2003) assessed the performance of different courtyard shapes. Their work presents the influence of the courtyard shape and its orientation on natural lighting duration and illumination levels of the ground and facades. The study was based on simulations with the SOLENE model developed by CERMA laboratory (at Ecole d’Architecture de Nantes). This model uses geometric modelling for the calculation of sunshine duration, and the radiosity method for the calculation of the amount of daylight (Groleau and Miguet, 2002). The choice of shapes studied was based on a group of existing courtyard buildings found in Mediterranean countries. The regular forms of square, rectangle, triangle and circle are mainly used, according to several orientations.
By comparing the different forms, the results show that the rectangle ratio (2:1) has the highest values in case of solar protection on summer and heat gain on winter. As the square form and the rectangle ratio (3:1), it appears more adequate compared to the others. Moreover, the square shows a good illumination of both facades, and the courtyard itself. The rotation angle 90°ccw gives an improvement in terms of solar protection in summer and heat gain in winter, as well as the rotation angle of 60° applied to the triangle. The results obtained in this case are more powerful compared to the triangular one.
On the contrary, the results of the circle are contradictory. This form presents a highest level of illumination and heat gain in winter, and the lowest level of solar protection in summer. Nevertheless, in this shaft form of patio, the upper levels are almost always exposed to the sun, and the four lower floors can’t receive sufficient light and heat gain in winter. It seems that the obstruction of the sky, due to the higher number of levels, has not provided the best solution for the thermal comfort and human use in habitat, especially in terms of heat gain in winter. The degree of openness to the sky is more important for illumination and solar heat gain in winter. By considering the requirements for daylight access in winter, it seems that the apartments should be placed in the sunny part of building on the upper levels or on the western, eastern, or southern facades. This implies a solar protection in summer especially on the last proposition (Ntefeh et al, 2003).
i
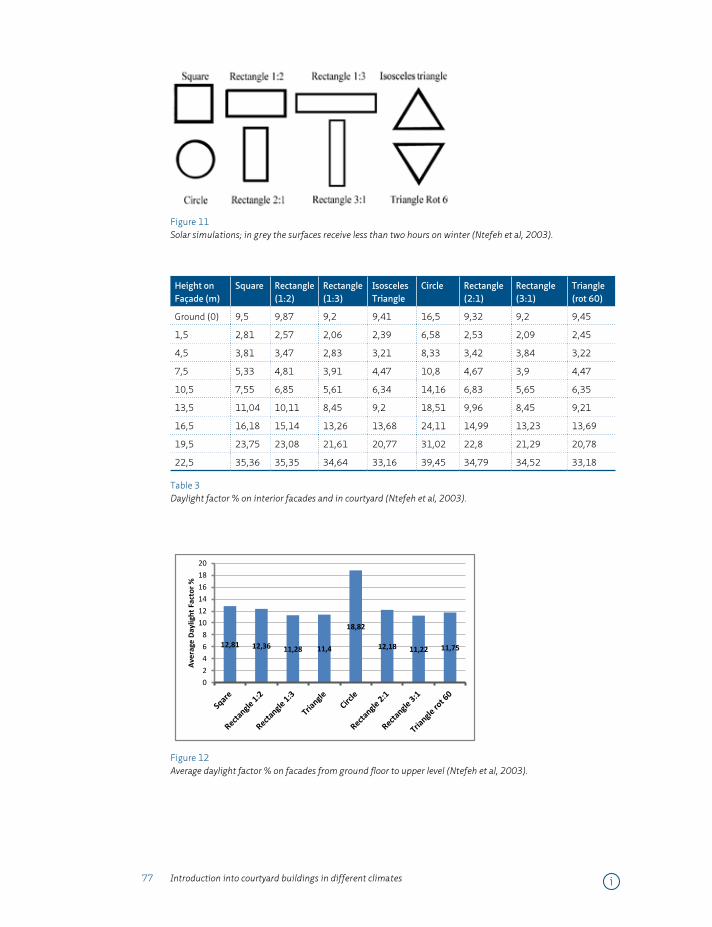
77 Introduction into courtyard buildings in different climates
Figure 11 Solar simulations; in grey the surfaces receive less than two hours on winter (Ntefeh et al, 2003).
Height on Façade (m)
Square Rectangle (1:2)
Rectangle (1:3)
Isosceles Triangle
Circle Rectangle (2:1)
Rectangle (3:1)
Triangle (rot 60)
Ground (0) 9,5 9,87 9,2 9,41 16,5 9,32 9,2 9,45
1,5 2,81 2,57 2,06 2,39 6,58 2,53 2,09 2,45
4,5 3,81 3,47 2,83 3,21 8,33 3,42 3,84 3,22
7,5 5,33 4,81 3,91 4,47 10,8 4,67 3,9 4,47
10,5 7,55 6,85 5,61 6,34 14,16 6,83 5,65 6,35
13,5 11,04 10,11 8,45 9,2 18,51 9,96 8,45 9,21
16,5 16,18 15,14 13,26 13,68 24,11 14,99 13,23 13,69
19,5 23,75 23,08 21,61 20,77 31,02 22,8 21,29 20,78
22,5 35,36 35,35 34,64 33,16 39,45 34,79 34,52 33,18
Table 3 Daylight factor % on interior facades and in courtyard (Ntefeh et al, 2003).
Figure 12: Average daylight factor % on facades from ground floor to upper level (Ntefeh et al, 2003).
12,81 12,36 11,28 11,4
18,82
12,18 11,22 11,75
02468
101214161820
Aver
age
Dayl
ight
Fac
tor %
Figure 12 Average daylight factor % on facades from ground floor to upper level (Ntefeh et al, 2003).
i
78 Dwelling on Courtyards
§ 2.6.4 The courtyard in a tropical climate
Among the four natural climatic functions of courtyards (heating, cooling, ventilating and lighting), heating does not have to be considered in case of courtyards in a tropical climate. In tropical climate, design consideration for ventilation frequently gains precedence over the concerns of shading, unlike in hot-arid climates. The characteristics of these courtyards mainly capture wind and breeze to ventilate the building (Salmon, 1990). Therefore these courtyard buildings are extroverted. Instead of solely considering the sun as in the other climates, in tropical climates, the wind direction for ventilation is mainly considered. Moreover, solar penetration needs to be limited (Fry and Drew, 1964).
a) Configuration of the courtyard
In tropical regions, courtyards are designed to receive less solar radiation because there is no need for heating. Courtyard buildings are taller than in the other climates (Givoni, 1994), (Ghobadian, 1998) and narrow courtyards increase more cross ventilation (Das et al., 2005). The buildings also have tall parapets to block the sun incident on the roof. “The difference between the central yard in this climate and that in hot and dry climate is that there is no entirely closed connection between internal spaces of building and those of External” (Shohouhian and Soflaee, 2005).
b) Natural elements:
In a tropical climate there is a high level of humidity. Therefore natural elements are affected by both humidity and temperature. Water pools are not seen here because evaporation is limited. Besides, if there were some amount of evaporation, the relative humidity would only further increase. In addition, the trees used in these climates have leaves all year round (Akbari et al., 1990).
c) Openings in different facades:
Providing suitable openings is the most important design strategy used in these climates. The facades of courtyard buildings in these climates have the highest level of porosity to capture local winds and breezes for ventilation. These courtyards also have porches in different facades because these semi-open spaces provide a comfortable area being shaded while at the same time receiving natural ventilation.
i
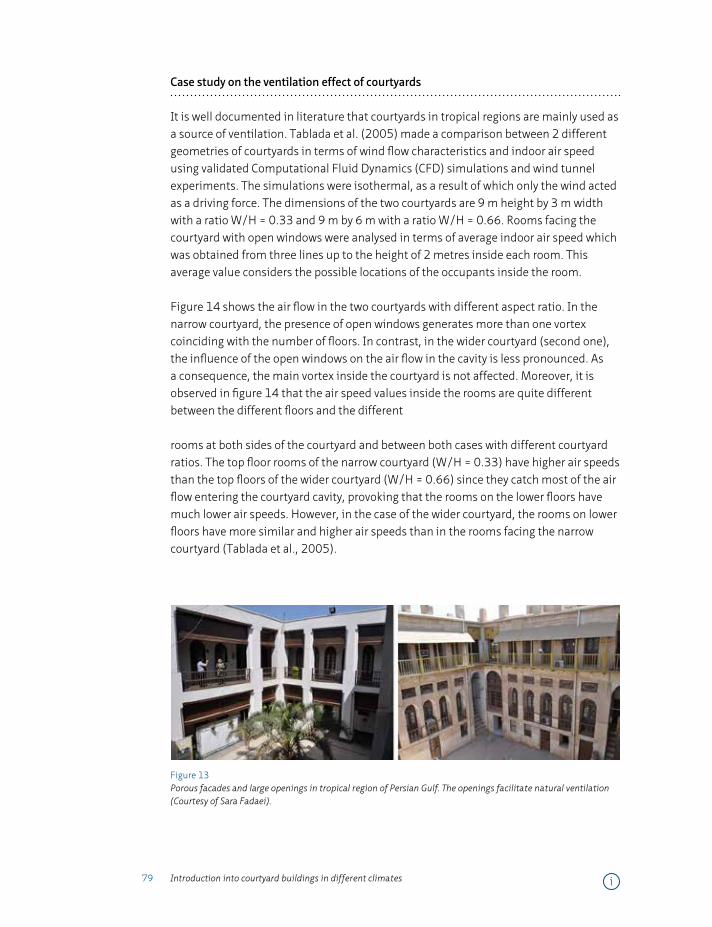
79 Introduction into courtyard buildings in different climates
Case study on the ventilation effect of courtyards
It is well documented in literature that courtyards in tropical regions are mainly used as a source of ventilation. Tablada et al. (2005) made a comparison between 2 different geometries of courtyards in terms of wind flow characteristics and indoor air speed using validated Computational Fluid Dynamics (CFD) simulations and wind tunnel experiments. The simulations were isothermal, as a result of which only the wind acted as a driving force. The dimensions of the two courtyards are 9 m height by 3 m width with a ratio W/H = 0.33 and 9 m by 6 m with a ratio W/H = 0.66. Rooms facing the courtyard with open windows were analysed in terms of average indoor air speed which was obtained from three lines up to the height of 2 metres inside each room. This average value considers the possible locations of the occupants inside the room.
Figure 14 shows the air flow in the two courtyards with different aspect ratio. In the narrow courtyard, the presence of open windows generates more than one vortex coinciding with the number of floors. In contrast, in the wider courtyard (second one), the influence of the open windows on the air flow in the cavity is less pronounced. As a consequence, the main vortex inside the courtyard is not affected. Moreover, it is observed in figure 14 that the air speed values inside the rooms are quite different between the different floors and the different
rooms at both sides of the courtyard and between both cases with different courtyard ratios. The top floor rooms of the narrow courtyard (W/H = 0.33) have higher air speeds than the top floors of the wider courtyard (W/H = 0.66) since they catch most of the air flow entering the courtyard cavity, provoking that the rooms on the lower floors have much lower air speeds. However, in the case of the wider courtyard, the rooms on lower floors have more similar and higher air speeds than in the rooms facing the narrow courtyard (Tablada et al., 2005).
Figure 13 Porous facades and large openings in tropical region of Persian Gulf. The openings facilitate natural ventilation (Courtesy of Sara Fadaei).
i
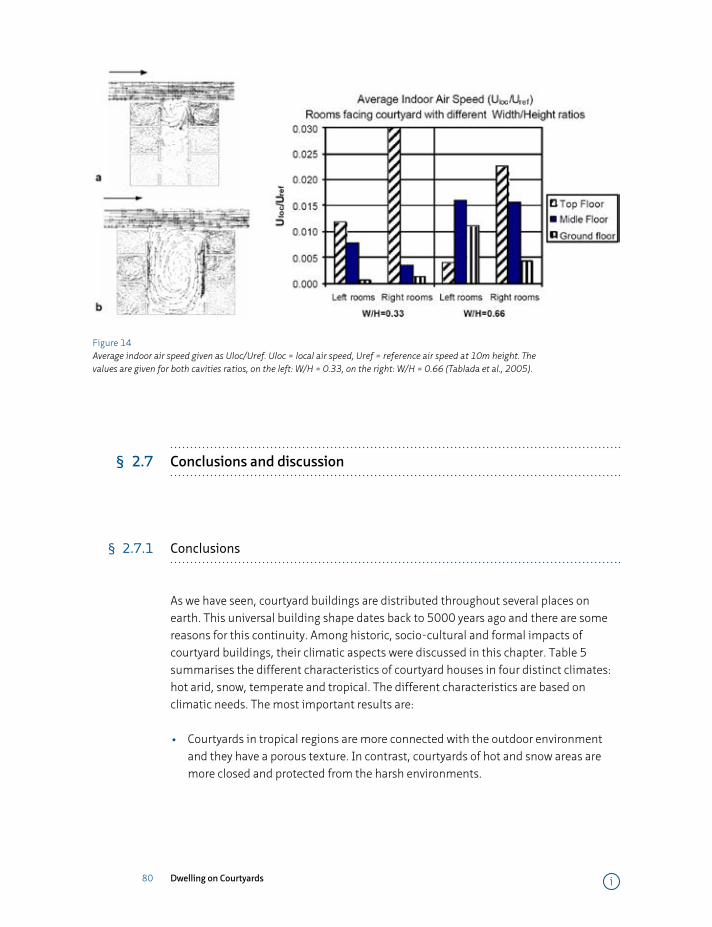
80 Dwelling on Courtyards
Figure 14 Average indoor air speed given as Uloc/Uref. Uloc = local air speed, Uref = reference air speed at 10m height. The values are given for both cavities ratios, on the left: W/H = 0.33, on the right: W/H = 0.66 (Tablada et al., 2005).
§ 2.7 Conclusions and discussion
§ 2.7.1 Conclusions
As we have seen, courtyard buildings are distributed throughout several places on earth. This universal building shape dates back to 5000 years ago and there are some reasons for this continuity. Among historic, socio-cultural and formal impacts of courtyard buildings, their climatic aspects were discussed in this chapter. Table 5 summarises the different characteristics of courtyard houses in four distinct climates: hot arid, snow, temperate and tropical. The different characteristics are based on climatic needs. The most important results are:
• Courtyards in tropical regions are more connected with the outdoor environment and they have a porous texture. In contrast, courtyards of hot and snow areas are more closed and protected from the harsh environments.
i
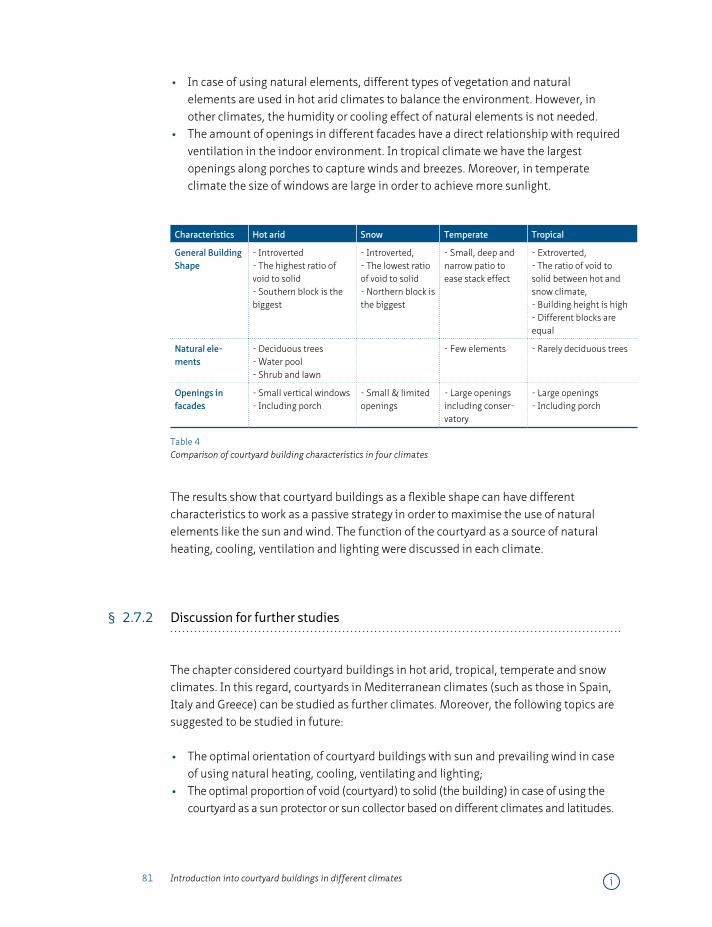
81 Introduction into courtyard buildings in different climates
• In case of using natural elements, different types of vegetation and natural elements are used in hot arid climates to balance the environment. However, in other climates, the humidity or cooling effect of natural elements is not needed.
• The amount of openings in different facades have a direct relationship with required ventilation in the indoor environment. In tropical climate we have the largest openings along porches to capture winds and breezes. Moreover, in temperate climate the size of windows are large in order to achieve more sunlight.
Characteristics Hot arid Snow Temperate Tropical
General Building Shape
- Introverted- The highest ratio of void to solid- Southern block is the biggest
- Introverted,- The lowest ratio of void to solid- Northern block is the biggest
- Small, deep and narrow patio to ease stack effect
- Extroverted,- The ratio of void to solid between hot and snow climate,- Building height is high- Different blocks are equal
Natural ele-ments
- Deciduous trees- Water pool- Shrub and lawn
- Few elements - Rarely deciduous trees
Openings in facades
- Small vertical windows- Including porch
- Small & limited openings
- Large openings including conser-vatory
- Large openings - Including porch
Table 4 Comparison of courtyard building characteristics in four climates
The results show that courtyard buildings as a flexible shape can have different characteristics to work as a passive strategy in order to maximise the use of natural elements like the sun and wind. The function of the courtyard as a source of natural heating, cooling, ventilation and lighting were discussed in each climate.
§ 2.7.2 Discussion for further studies
The chapter considered courtyard buildings in hot arid, tropical, temperate and snow climates. In this regard, courtyards in Mediterranean climates (such as those in Spain, Italy and Greece) can be studied as further climates. Moreover, the following topics are suggested to be studied in future:
• The optimal orientation of courtyard buildings with sun and prevailing wind in case of using natural heating, cooling, ventilating and lighting;
• The optimal proportion of void (courtyard) to solid (the building) in case of using the courtyard as a sun protector or sun collector based on different climates and latitudes.
i
82 Dwelling on Courtyards
The above questions are answered generally in the text, but numerical simulations can address exact proportions for the mentioned questions. Consequently, although some studies have been done in the field of climatic impacts of courtyard buildings, more investigations are needed to understand why this building shape is still working after thousands of years.
References
Abu Lughod, J. “Migrant Adjustment to City Life: The Egyptian Case,” in G. Breese, ed., The City in Newly Developing Countries (Princeton, NJ: Princeton University Press, 1969), pp.376–88.
Ahmad, I., E. Khetrish, and M. Abughres S. 1985. Thermal analysis of the architecture of old and new houses at Ghadames. Building and Environment, 20 (1): 39- 42.
Aizlewood, M.E., Butt, J.D., Isaac, K.A., Littlefair, P.J., 1997. Daylight in atria: a comparison of measurements, theory and simulation. Lux Europa, Amsterdam, 571–584.
Akbari, H., Rosenfeld, A.H. and Taha, H., 1990. “Summer Heat Islands, Urban Trees and White Surfaces,” ASHRAE Transactions, Vol. 96, Pt. 1, American Society of Heating, Refrigeration and Air Conditioning Engineers, Atlanta, GA.
Aldawoud, A., “Thermal performance of courtyard buildings”, Energy and Buildings 40 (2008) 906–910.Alexander, C. (1976) A Pattern Language. Cambridge, MA, MIT Press.Al- Hemiddi N. A. & Al- Saud K. A. M (2001), The effect of a ventilated interior courtyard on the thermal
performance of a house in a hot–arid region, Renewable Energy 24, 581–595.Bagneid, A. (2006), The Creation of a Courtyard Microclimate Thermal Model for the Analysis of Courtyard
Houses. Unpublished thesis in Texas A&M University.Bahadori, M.N. (1978) Passive Cooling Systems in Iranian Architecture. Scientific American 2, 238, 144–52.Beazley, E. (1990) Sun, Shade and Shelter – the Forgotten Art of Planning with the Microclimate in Mind: Part
Three. Landscape Design No. 196, December 1990/January 1991, pp. 41-43.Behrens-Abouseif, D., “Alternatives to Cadaster maps for the study of Islamic Cities: Urban Morphogenesis”, a
special volume of Environmental Design, ed. A. Petruccioli, 1993.Bekleyen A. and Dalkiliç N., 2011, The influence of climate and privacy on indigenous courtyard houses in
Diyarbakır, Turkey. Scientific Research and Essays Vol. 6(4), pp. 908-922.Bey, A. B., and Gabriel, A., Les fouilles d’al Foustat et les origines de la maison arabe en Egypte, Paris, E. De
Boccard, 1921.Blesgraaf, P. (1996), Grote Glasoverkapte Ruimten, Novem, Sittard.Brown G. Z., and DeKay M., (2001), “Sun, Wind & Light: Architectural Design Strategies” 2nd Edition, John
Wiley and Son Inc.Cadima, P., ‘The effect of design parameters on the environmental performance of the urban patio: a case study
in Lisbon’, Building and Environment 30 (1998). 171-174.Calcagni, B., and Paroncini, M., “Daylight factor prediction in atria building designs”, Solar Energy 76 (2004)
669–682.Chun et al., “Thermal comfort in transitional spaces- basic concepts: literature review and trial measurement”,
Building and Environment, 39 (2004) 1187 – 1192Cole, R.S., 1981, Underground dwelling in South Tunisia. In Proceedings of The International the Passive and
Hybrid Cooling Conference, pp. 178–179. Miami Beach, FL.Cole, R.J., 1990. The effect of the surfaces enclosing atria on the daylight in adjacent spaces. Building and
Environment 25 (1), 37–42.Creswell, K. A. E., The Muslim Architecture of Egypt, 2 vols, Oxford, Oxford University Press, 1959, p. 208.Das, N., Coates, G., Todd Gbbard R.T., (2005), Using computer simulation to demonstrate the relation between
aspect ratio and cross ventilation for residential buildings in Calcutta (India). PLEA 2005- the 22nd Conference on Passive and Low Energy Architecture, Beirut, Lebanon.
Das, N., 2006, “Courtyards Houses of Kolkata: Bioclimatic, Typological and Socio-Cultural Study”, unpublished Master of Architecture Thesis, Kansas State University, USA.
Dunham, D. D., ‘The courtyard house as temperature regulator’, New Scientist 8(1990). 663-666.Edwards et al., 2006, “Courtyard Housing: Past, Present & Future”, Taylor & Francis, New York.
i

83 Introduction into courtyard buildings in different climates
Eldem, S.H., Turkish House: Ottoman Period, vol. 1, Istanbul, Eserlerin, 1984.Ettouney S. M. and Fricke F. R., “Courtyard Acoustics”, Applied Acoustics (6) 1973.Etzion, Y., 1990, The thermal behaviour of non-shaded closed courtyards in hot- arid zones. Architectural
Science Review 33, 79- 83.Fathy, H. (1973) Constancy, transportation and change in the Arab city. In L. Carl Brown (ed.) Princeton, NJ,
Darwin Press.Fathy, H. (1986) Natural Energy and Vernacular Architecture. Chicago, University of Chicago Press.Foruzanmehr, Ahmadreza and Vellinga, Marcel (2011) ‘Vernacular architecture: questions of comfort and
practicability’, Building Research & Information, 39: 3, 274- 285.Fry, M. and Drew, J. (1964), Tropical Architecture in the dry and humid zones. New York: Reinholds Pub.Ghobadian, Vahid (1998) Climatic Survey of Traditional buildings of Iran, The University of Tehran Press
(Published in Farsi).Givoni, B., 1991. Modelling a Passive Evaporative Cooling Tower and building cooled by It, University of UCLA,
Los Angeles.Givoni, B., 1991, Urban design for hot humid and hot dry regions, in Architecture and Urban Space, Proceedings
of the Ninth International PLEA Conference, Seville, Spain, 1991 (Edited by S. Alvarez, K. Lopez de Asiain, S, Yannas and O. de Oliviera Fernandes), pp. 19-31, Kluwer Academic, Dordrecht.
Givoni, B, 1994. Urban Design for Hot Humid Regions, Renewable Energy, Vol.5, Part II, pp. 1047-1053.Heidari, S. (2000) Thermal comfort in Iranian courtyard housing. PhD thesis, University of Sheffield, Sheffield.Hinrichs, Craig. “The Courtyard Housing Form as Traditional Dwelling”. The Courtyard As Dwelling. AlSayyad,
Nezar and Jean-Paul Bourdier .ed. 1989. Traditional Dwellings and Settlements Working Paper Series, Volume six, IASTE, WP06-89. Center for Environmental Design Research, University of California, Berkeley. (p 2-38).
Hopkirk, N., 1999. Methodology for the development of a simple design tools for the energy demands in officesadjacent to atria, T21/C4-16/sui/99-05, Swiss Federal Laboratories for Material Testing and Research (EMPA),
Building Section, Duebendorf, Switzerland.Hou J. Y., and Wang J., 1999, Chinese Cave Dwellings, Henan Science and Technology Press, pp. 116-133.Hyde, R., (2008), “Bioclimatic Housing”, Cromwell Press, UK.IPCC, Climate Change 2007. In: Solomon S, Qin D, Manning M, Chen Z, Marquis M, Averyt KB, Tignor M, Miller
HL, editors. The physical science basis. Contribution of the working group I to the fourth assessment report of the intergovernmental panel on climate change. Cambridge: Cambridge University Press; 2007.
Kamau, L. J., “Semi-Public, Private and Hidden Rooms: Symbolic Aspects of Domestic Space in Urban Kenya,” African Urban Studies, Vol.3 (Winter 1978/79), pp.105–15.
Levine M, Urge-Vorsatz D, Blok K, Geng L, Harvey D, Lang S, et al. Residential and commercial buildings. In: Metz B, Davidson OR, Bosch PR, Dave R, Meyer LA, editors. Climate change 2007: mitigation. Contribution of working group III to the fourth assessment report of the intergovernmental panel on climate change. Cambridge: Cambridge University Press; 2007. p. 387- 446.
Mabb, J., 2008, Modification of Atrium Design to Improve Performance: Atrium Building Physics, Berlin: Verlag Dr. Muller.
Mänty, J. (1988) Cities Designed for Winter. Helsinki, Norman Pressman, Building Book Ltd.Martin, L. and March, L. (1972) Urban Space and Structures. Cambridge, UK, Cambridge University Press.Macintosh, D. (1973). The Modern Courtyard House. Architectural Association, London.Megren K. A., et al., “The thermal performance of the internal courtyard in the hot-dry environment in Saudi
Arabia” in Edwards B, Sibley M, Hakmi M, Land P (eds.), Courtyard Housing: Past, Present & Future”, Taylor & Francis, New York, 2006.
Meir I. A., “Courtyard microclimate: A hot arid region case study” in Steemers K. & S. Yannas (eds.) (2000) Architecture-City-Environment. Proc. 17th PLEA Int. Conf. - refereed papers, pp. 218-222.
Meir I. A. et al., (2004), “The Vernacular and the Environment Towards a Comprehensive Research Methodology”, The 21th Conference on Passive and Low Energy Architecture. Eindhoven, The Netherlands, 19 - 22 September 2004.
Moore, F., ‘Learning form the past: passive cooling strategies in traditional contemporary architecture’, in Islamic Architecture and Urbanism, ed. A. Germen (University of Dammam, Saudi Arabia, 1983). 233-238.
Muhaisen, A. S., (2010), “Solar Performance of Courtyard Buildings”, VDM Verlag Dr. Mueller Press.Mustafa A. F., & F.J. Costa, ‘Al Jarudiya: a model for low rise/ high density developments in the Eastern provinces
of Saudi Arabia’, in Islamic Architecture and Urbanism, ed. A. Germen (University of Dammam, Saudi Arabia, 1983). 239-256.
i

84 Dwelling on Courtyards
Nakano JH, Tsutsumi S, Horikawa ST, Kimura K. Field investigation on the transient thermal comfort bu8er zones from outdoor to indoor, Indoor Air ’99. Proceedings of the Eighth International Conference on Indoor Air Quality and Climate, vol. 2, 1999. p. 172–7.
Nangia, Ashish. 2000. Architecture of India: Indus Valley Civilization. Downloaded on September 16, 2005. http://www.boloji.com/architecture/00002a.htm. India Nest.
Noor, M. (1991) The Function and Form of the Courtyard House. The Arab House, University of Newcastle upon Tyne, School of Architecture, CARDO, pp 61–72.
Oliver, P., 2003. Dwellings: The House across the world. Oxford: Phaidon Press Ltd.Oosthuizen PH, Lightstone MF. Numerical analysis of the flow and temperature distributions in an atrium.
In: Proceedings of 2009 international conference on computational methods for energy engineering and environment: ICCM3E, 20-22 November 2009, Sousse, Tunisia; 2009.
Petruccioli, A., “The courtyard house: typological variations over space and time” in Edwards B, Sibley M, Hakmi M, Land P (eds.), Courtyard Housing: Past, Present & Future, Taylor & Francis, New York, 2006.
Pfeifer G., Brauneck P., 2008, “Courtyard Houses, A housing typology”, Birkhauser Verlag AG, Basel.Polyzoides, S., Sherwood r. & Tice J (1996). Courtyard Housing in Los Angeles: A Typological Analysis. Princeton
Architectural Press.Potvin A. Assessing the microclimate of urban transitional spaces. Proceedings of Passive Low Energy
Architecture, 2000. p. 581–6.Perez-de-Lama, J. and Cabeza, J.M. (1998), A holistic approach to the Mediterranean patio— extending the
new method of configuration factors to semi open spaces. Proceedings of the International Conference on Passive and Low Energy Architecture (PLEA) 1998, Lisbon, James & James Ltd.
Qin, T. X. et al., “Numerical simulation of the spread of smoke in an atrium under fire scenario”, Building and Environment 44 (2009) 56–65.
Rapoport, A., House Form and Culture (Englewood Cliffs, NJ: Prentice-Hall, 1969).Rapoport, A., “The Use and Design of Open Spaces in Urban Neighborhoods,” in D. Frick, ed., The Quality of
Urban Life: Social, Psychological and Physical Conditions (Berlin: de Gruyter, 1986), pp.159–75.Rapoport, A., “The Nature of the Courtyard House: A Conceptual Analysis,” Traditional Dwellings and
Settlements Review, Vol.18, No.2 (Spring 2007).Roaf, S., 1990, The traditional technology trap: steriotypes of Middle Eastern traditional building types and
technologies. Trialog 25, 26- 33.Raydan D., et al., “Courtyards: a bioclimatic form?” in Edwards B, Sibley M, Hakmi M, Land P (eds.), Courtyard
Housing: Past, Present & Future, Taylor & Francis, New York, 2006.Roaf, S., ‘The traditional technology trap: stereotypes of Middle Eastern traditional building types and
technologies’, Trialog 25(1990). 26-33Rudofsky, B. (1964), Architecture without architects, a short introduction to non-pedigreed architecture.
Museum of Modern Art, New York.Rundle C. A. et al., 2011, “Validation of computational fluid dynamics simulations for atria geometries”,
Building and Environment 46 (2011) 1343- 1353.Safarzadeh, H. & Bahadori, M. N. (2004), “Passive Cooling Effect of Courtyards”, Building and Environment 40
(2005) 89–104.Saidur R, Masjuki HH, Jamaluddin MY. An application of energy and exergy analysis in residential sector of
Malaysia. Energy Policy 2007; 35(2): 1050–63.Saini, B. S., Building in Hot Dry Climates (John Wiley, Brisbane, 1980).Salmon, C. 1999. Architectural Design for Tropical Regions. John Wiley & Sons, New York.Scanlon, G. T., “Fustat expedition: Preliminary Report 1965”, Journal of the American Research Center in Egypt
5, 1966.Schaelin A. Comfort problems in indoor spaces open to the outdoor environment, Indoor Air ’99. Proceedings of
the Eighth International Conference on Indoor Air Quality and Climate, vol. 2, 1999. p. 54–159.Schoenauer, Nobert and S.Seeman. 1962. The Court Garden House. Montreal McGill University Press.Shokouhian M. and F. Soflaee, “Environmental sustainable Iranian traditional architecture in hot-humid
regions” International Conference “Passive and Low Energy Cooling for the Built Environment”, May 2005, Santorini, Greece.
Shokouhian et al., 2007. “Environmental effect of courtyard in sustainable architecture of Iran (Cold regions)”, 2nd PALENC Conference and 28th AIVC Conference on Building Low Energy Cooling and Advanced Ventilation Technologies in the 21st Century, September 2007, Crete island, Greece.
Sullivan, Chip. 2002. Garden and Climate. New York: McGraw-Hill.
i
85 Introduction into courtyard buildings in different climates
Swan, L. and Ugursal, V. (2009), “Modeling of end-use energy consumption in the residential sector: A review of modeling techniques”, Renewable and Sustainable Energy Reviews 13 (2009) 1819–1835.
Talib, K., Shelter in Saudi Arabia (Academy Editions, London, 1984).Tsujihara M, Nakamura Y, Tanaka M. Proposal of evaluation method of thermal environment inside semi–
outdoor space in city from viewpoint of geographical di8erence. Journal of Architectural Planning and Environmental Engineering, Architectural Institute of Japan 1999; 419:101–8.
Vellinga, M., Oliver, P. and Bridge, A. (2007), Atlas of Vernacular Architecture of the World. Routledge, USA.Yamagishi A, Akabayashi N, Sakaguchi J. Thermal environment and inhabitant’s consider about entry and
laundry dry room in Niigata. Proceedings of Annual AIJ Conference, Architectural Institute of Japan, 1998. p. 175–6.
Yamazaki K, Sato T, Horiuchi Y. Research on design method for transitional space in Hokkaido house. Proceedings of Annual AIJ Conference, Architectural Institute of Japan, 1996. p. 79–80.
Zhang B. T., and Liu Z. Y.(1989), The Dwelling Houses of ShaanXi, Chinese Construction Industry Press 1989, pp. 77-96.
Zintani N, Suda M, Hatsumi M. Transitional space and common contact in apartment house. Proceedings of Annual AIJ Conference, Architectural Institute of Japan, 1999. p. 139–40.
i
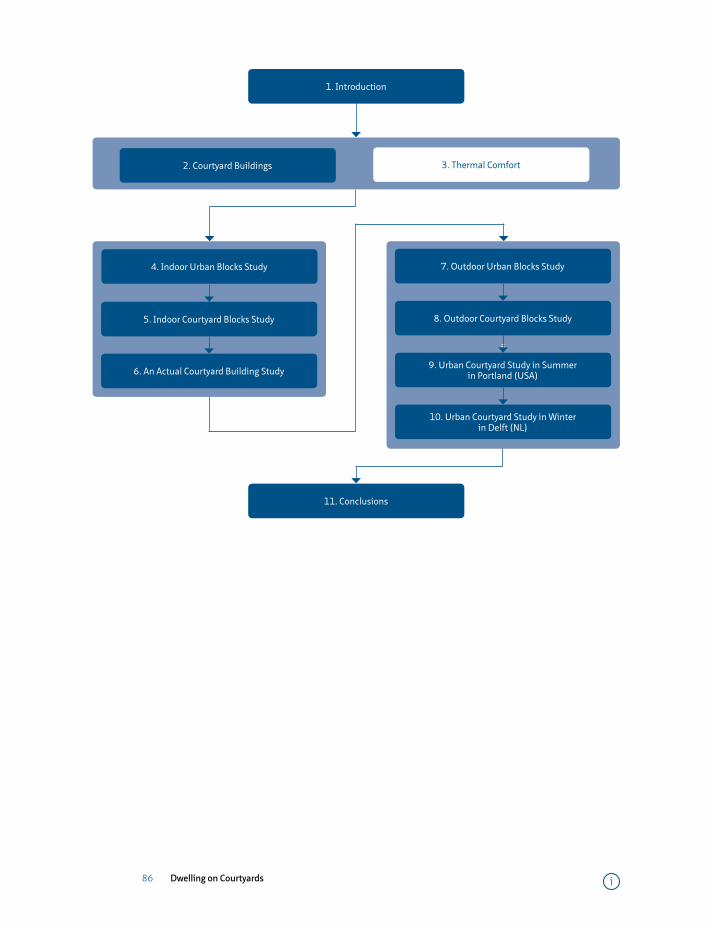
86 Dwelling on Courtyards
=5. Indoor Courtyard Blocks Study
6. An Actual Courtyard Building Study
11. Conclusions
=
8. Outdoor Courtyard Blocks Study
9. Urban Courtyard Study in Summer in Portland (USA)
10. Urban Courtyard Study in Winter in Delft (NL)
7. Outdoor Urban Blocks Study
2. Courtyard Buildings
1. Introduction
3. Thermal Comfort
4. Indoor Urban Blocks Study
i

87 Introduction into thermal comfort in buildings
3 Introduction into thermal comfort in buildings
The previous chapter reviewed the environmental impacts of courtyards. One of the background research questions of this dissertation is related to thermal comfort standards that are applicable for this research. To investigate thermal comfort in courtyard buildings, a choice for a comfort standard needs to be made. This chapter looks back to the history of thermal comfort and reviews the current standards with emphasis on adaptive comfort standards: the American (ASHRAE-55 2010), European (EN-15251: 2007) and Dutch (ATG). For each standard, the corresponding database, equations and comfort boundaries are discussed. At the end, these standards are compared through a case study in the Netherlands.
i

88 Dwelling on Courtyards i
89 Introduction into thermal comfort in buildings
A review into thermal comfort in buildings1
Mohammad Taleghani *1, Martin Tenpierik 1, Stanley Kurvers 1, Andy. van den Dobbelsteen 1
1 Delft University of Technology, Delft, the Netherlands
Abstract
Thermal comfort has been discussed since 1930s. There have been two main approaches to thermal comfort: the steady-state model and the adaptive model. The adaptive model is mainly based on the theory of the human body’s adapting to its outdoor and indoor climate. In this paper, besides the steady-state model, three adaptive thermal comfort standards are comprehensively reviewed: the American ASHRAE 55-2010 standard, the European EN15251 standard, and the Dutch ATG guideline. Through a case study from the Netherlands, these standards are compared. The main differences discussed between the standards are the equations for upper and lower limits, reference temperatures, acceptable temperature ranges and databases.
Keywords
Thermal comfort, ASHRAE 55, EN15251, ATG
1 Published as: Taleghani M., Tenpierik M., Kurvers S., Dobbelsteen A. (2013), “A review into thermal comfort in buildings”, Renewable & Sustainable Energy Reviews, 26(2013) 201-215.
i
90 Dwelling on Courtyards
§ 3.1 Introduction
One of the more unfortunate aspects of modern global development has been the introduction and widespread acceptance of the use of mechanical means for providing desired comfortable temperature for building users. This phenomenon has led to a huge energy consumption in the building stock, and nowadays, around one third of fossil fuels is consumed in buildings [1]. In this regard, thermal comfort boundaries are limitations which help building physicists to estimate to what extent buildings should be heated or cooled. Thermal comfort is defined as ‘that condition of mind which expresses satisfaction with the thermal environment.’[2]. Prediction of the range of temperatures for this comfort condition is complicated and apart from cultural influences it depends on environmental and personal factors. Chronological review of current knowledge on thermal comfort shows two different approaches: climate chamber tests and field studies. The former, which is based on heat exchange processes of the body, has led to steady-state laboratory thermo-physiological models and standards (ASHRAE 55-1992, ISO7730 and …). The latter has concluded to adaptive thermal comfort models and standards: the American ASHRAE 55-2010 standard, the European EN15251 standard, and the Dutch ATG guideline. Today, these standards are increasingly used in research and in practice within the field of thermal comfort. The current chapter tries to clarify the differences behind the mentioned standards through a Dutch case study.
This chapter first reviews the development of the ideas of thermal comfort, starting with the laboratory studies conducted by Fanger and his co-workers. In the next step, field studies which were done on naturally ventilated (and in a non-steady-state situation) and air conditioned buildings will be explained. Then, three adaptive thermal comfort standards are presented with their equations. In section 5, a Dutch representative city will be presented as a case study. In this regard, each one of the adaptive thermal comfort standards provides an estimate of the temperature range for thermal comfort. Through the results of the estimations, the standards will be compared and discussed.
§ 3.2 Development of the concept of human thermal comfort
Research in thermal comfort integrates several sciences such as physiology, building physics, mechanical engineering and psychology. According to Nicol [3], there are three reasons for understanding the importance of thermal comfort:
i
91 Introduction into thermal comfort in buildings
• To provide a satisfactory condition for people,
• To control energy consumption (elaborated by [4, 5],
• To suggest and set standards
Furthermore, Raw and Oseland [6] suggested six aims for developing knowledge in the field of thermal comfort:
• Control over indoor environment by people,
• Improving indoor air quality (dicussed comprehensively by Khodakarami and Nasrollahi [7], [8, 9])
• Achieving energy savings,
• Reducing the harm on the environment by reducing CO2 production,
• Affecting the work efficiency of the building occupants (discussed by Leyten, Kurvers [10]),
• Reasonable recommendation for improving or changing standards.
Our current knowledge of human thermal comfort is developed by engineers and physiologists. The first concept began by a British physician in 1774. Afterwards, engineers and physiologists developed different indices relating temperature to comfort, and now, building physicists use different thermal comfort standards. Apparently, their endeavours were through two basic methods; steady-state studies and field studies. Most of the steady-state studies were prior to the field studies.
In the past, there have been two general approaches for determining thermal comfort: a) climate chamber studies, and b) field studies:
a Climate chamber studies: The aim of these studies is to determine steady-state thermal comfort models. The research is conducted in an environmental test chamber that can vary different climatic parameters. The personal variables (clothing insulation and metabolic rate) are determined by the task, and are normally assumed to be fixed. The most important reason to use such a steady-state situation is the ability to produce the desired environmental conditions (air temperature, radiant temperature, air velocity, humidity) while controlling unwanted variables, which might influence the results. This method has also led to transient body temperature tests which examine body core and skin temperature to estimate comfort perceptions [11].
b Field studies: The aim of these studies is to study thermal comfort in the real world. Research is conducted as subjects go about normally with their work; there is no attempt to control the environment that may have varied from just the air temperature to all factors. In many surveys clothing value and metabolic rate are recorded. Furthermore, a field study will be influenced by other indirect factors, such as cultural and psychological factors. The first aim is to discover what combination of environmental variables best describes the subjective responses of the subjects. The underlying assumption of the field survey is that people are able to control their environment in such a way that they try to reach comfort. Therefore, also the behaviour of the building plays an important role [3].
i
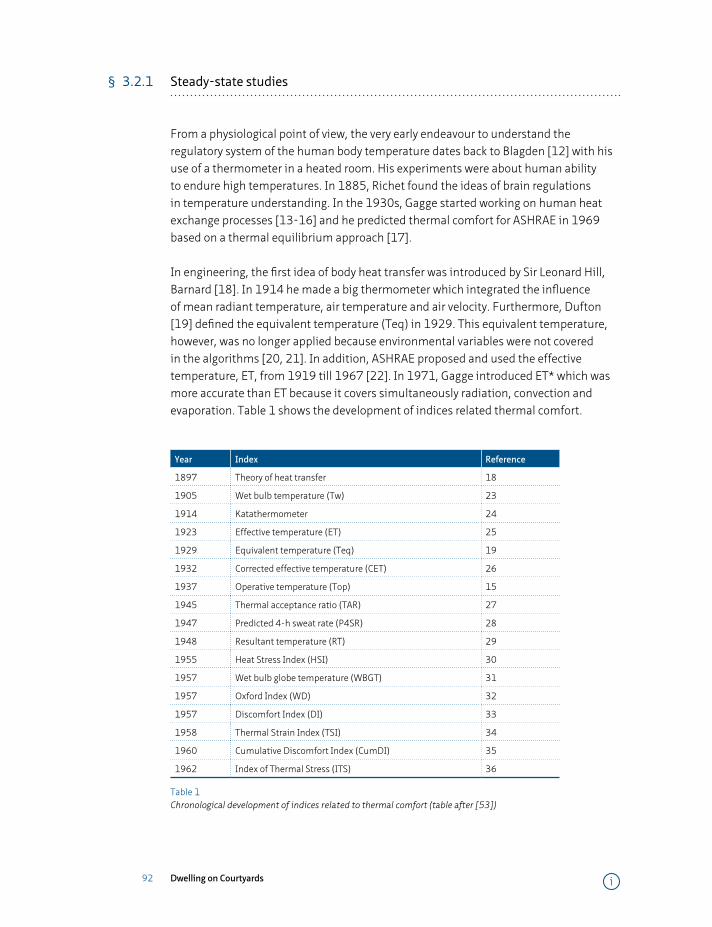
92 Dwelling on Courtyards
§ 3.2.1 Steady-state studies
From a physiological point of view, the very early endeavour to understand the regulatory system of the human body temperature dates back to Blagden [12] with his use of a thermometer in a heated room. His experiments were about human ability to endure high temperatures. In 1885, Richet found the ideas of brain regulations in temperature understanding. In the 1930s, Gagge started working on human heat exchange processes [13-16] and he predicted thermal comfort for ASHRAE in 1969 based on a thermal equilibrium approach [17].
In engineering, the first idea of body heat transfer was introduced by Sir Leonard Hill, Barnard [18]. In 1914 he made a big thermometer which integrated the influence of mean radiant temperature, air temperature and air velocity. Furthermore, Dufton [19] defined the equivalent temperature (Teq) in 1929. This equivalent temperature, however, was no longer applied because environmental variables were not covered in the algorithms [20, 21]. In addition, ASHRAE proposed and used the effective temperature, ET, from 1919 till 1967 [22]. In 1971, Gagge introduced ET* which was more accurate than ET because it covers simultaneously radiation, convection and evaporation. Table 1 shows the development of indices related thermal comfort.
Year Index Reference
1897 Theory of heat transfer 18
1905 Wet bulb temperature (Tw) 23
1914 Katathermometer 24
1923 Effective temperature (ET) 25
1929 Equivalent temperature (Teq) 19
1932 Corrected effective temperature (CET) 26
1937 Operative temperature (Top) 15
1945 Thermal acceptance ratio (TAR) 27
1947 Predicted 4-h sweat rate (P4SR) 28
1948 Resultant temperature (RT) 29
1955 Heat Stress Index (HSI) 30
1957 Wet bulb globe temperature (WBGT) 31
1957 Oxford Index (WD) 32
1957 Discomfort Index (DI) 33
1958 Thermal Strain Index (TSI) 34
1960 Cumulative Discomfort Index (CumDI) 35
1962 Index of Thermal Stress (ITS) 36
Table 1 Chronological development of indices related to thermal comfort (table after [53])
i
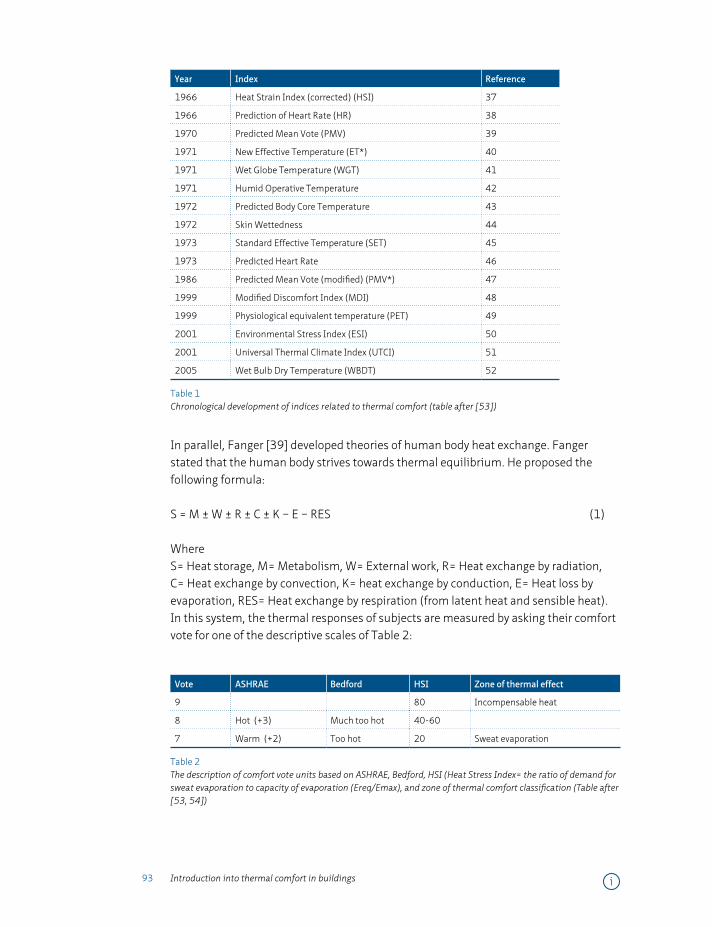
93 Introduction into thermal comfort in buildings
Year Index Reference
1966 Heat Strain Index (corrected) (HSI) 37
1966 Prediction of Heart Rate (HR) 38
1970 Predicted Mean Vote (PMV) 39
1971 New Effective Temperature (ET*) 40
1971 Wet Globe Temperature (WGT) 41
1971 Humid Operative Temperature 42
1972 Predicted Body Core Temperature 43
1972 Skin Wettedness 44
1973 Standard Effective Temperature (SET) 45
1973 Predicted Heart Rate 46
1986 Predicted Mean Vote (modified) (PMV*) 47
1999 Modified Discomfort Index (MDI) 48
1999 Physiological equivalent temperature (PET) 49
2001 Environmental Stress Index (ESI) 50
2001 Universal Thermal Climate Index (UTCI) 51
2005 Wet Bulb Dry Temperature (WBDT) 52
Table 1 Chronological development of indices related to thermal comfort (table after [53])
In parallel, Fanger [39] developed theories of human body heat exchange. Fanger stated that the human body strives towards thermal equilibrium. He proposed the following formula:
S = M ± W ± R ± C ± K – E – RES (1)
WhereS= Heat storage, M= Metabolism, W= External work, R= Heat exchange by radiation, C= Heat exchange by convection, K= heat exchange by conduction, E= Heat loss by evaporation, RES= Heat exchange by respiration (from latent heat and sensible heat).In this system, the thermal responses of subjects are measured by asking their comfort vote for one of the descriptive scales of Table 2:
Vote ASHRAE Bedford HSI Zone of thermal effect
9 80 Incompensable heat
8 Hot (+3) Much too hot 40-60
7 Warm (+2) Too hot 20 Sweat evaporation
Table 2 The description of comfort vote units based on ASHRAE, Bedford, HSI (Heat Stress Index= the ratio of demand for sweat evaporation to capacity of evaporation (Ereq/Emax), and zone of thermal comfort classification (Table after [53, 54])
i
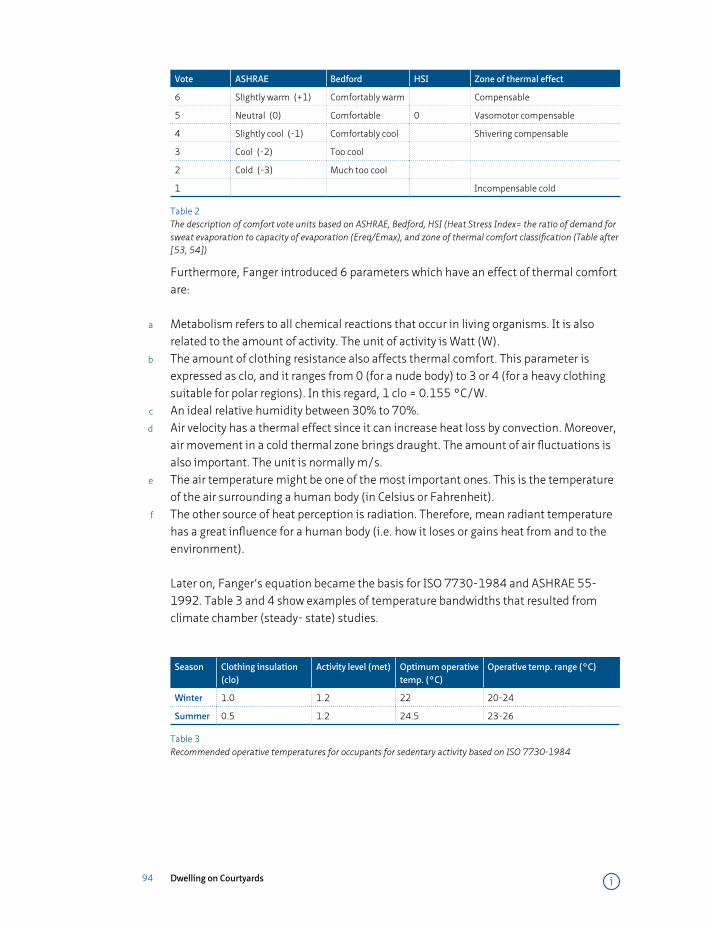
94 Dwelling on Courtyards
Vote ASHRAE Bedford HSI Zone of thermal effect
6 Slightly warm (+1) Comfortably warm Compensable
5 Neutral (0) Comfortable 0 Vasomotor compensable
4 Slightly cool (-1) Comfortably cool Shivering compensable
3 Cool (-2) Too cool
2 Cold (-3) Much too cool
1 Incompensable cold
Table 2 The description of comfort vote units based on ASHRAE, Bedford, HSI (Heat Stress Index= the ratio of demand for sweat evaporation to capacity of evaporation (Ereq/Emax), and zone of thermal comfort classification (Table after [53, 54])
Furthermore, Fanger introduced 6 parameters which have an effect of thermal comfort are:
a Metabolism refers to all chemical reactions that occur in living organisms. It is also related to the amount of activity. The unit of activity is Watt (W).
b The amount of clothing resistance also affects thermal comfort. This parameter is expressed as clo, and it ranges from 0 (for a nude body) to 3 or 4 (for a heavy clothing suitable for polar regions). In this regard, 1 clo = 0.155 °C/W.
c An ideal relative humidity between 30% to 70%.d Air velocity has a thermal effect since it can increase heat loss by convection. Moreover,
air movement in a cold thermal zone brings draught. The amount of air fluctuations is also important. The unit is normally m/s.
e The air temperature might be one of the most important ones. This is the temperature of the air surrounding a human body (in Celsius or Fahrenheit).
f The other source of heat perception is radiation. Therefore, mean radiant temperature has a great influence for a human body (i.e. how it loses or gains heat from and to the environment).
Later on, Fanger’s equation became the basis for ISO 7730-1984 and ASHRAE 55-1992. Table 3 and 4 show examples of temperature bandwidths that resulted from climate chamber (steady- state) studies.
Season Clothing insulation (clo)
Activity level (met) Optimum operative temp. (°C)
Operative temp. range (°C)
Winter 1.0 1.2 22 20-24
Summer 0.5 1.2 24.5 23-26
Table 3 Recommended operative temperatures for occupants for sedentary activity based on ISO 7730-1984
i
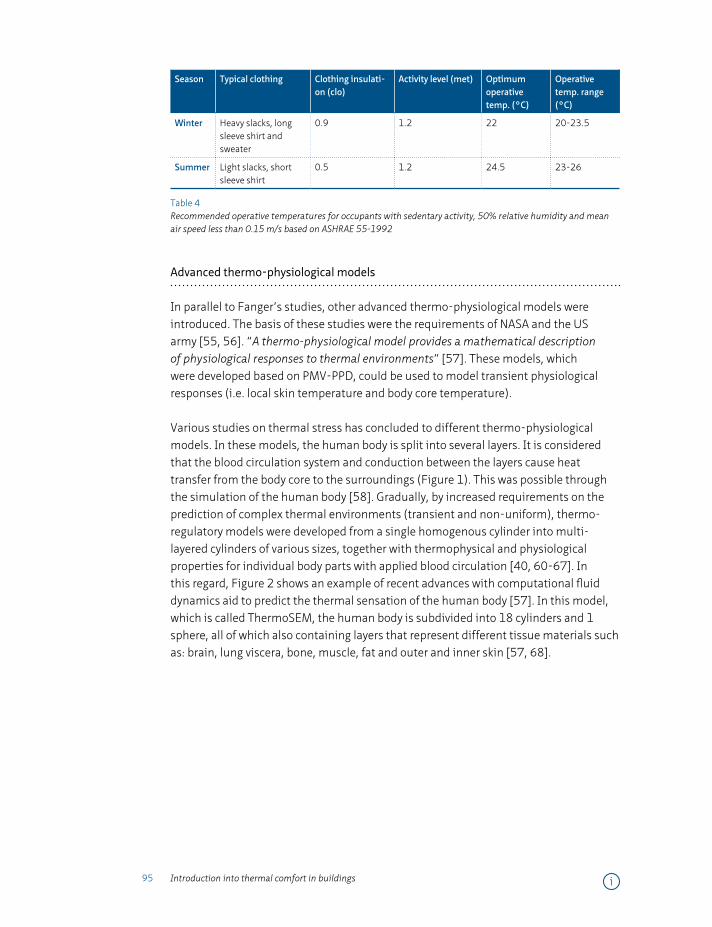
95 Introduction into thermal comfort in buildings
Season Typical clothing Clothing insulati-on (clo)
Activity level (met) Optimum operative temp. (°C)
Operative temp. range (°C)
Winter Heavy slacks, long sleeve shirt and sweater
0.9 1.2 22 20-23.5
Summer Light slacks, short sleeve shirt
0.5 1.2 24.5 23-26
Table 4 Recommended operative temperatures for occupants with sedentary activity, 50% relative humidity and mean air speed less than 0.15 m/s based on ASHRAE 55-1992
Advanced thermo-physiological models
In parallel to Fanger’s studies, other advanced thermo-physiological models were introduced. The basis of these studies were the requirements of NASA and the US army [55, 56]. “A thermo-physiological model provides a mathematical description of physiological responses to thermal environments” [57]. These models, which were developed based on PMV-PPD, could be used to model transient physiological responses (i.e. local skin temperature and body core temperature).
Various studies on thermal stress has concluded to different thermo-physiological models. In these models, the human body is split into several layers. It is considered that the blood circulation system and conduction between the layers cause heat transfer from the body core to the surroundings (Figure 1). This was possible through the simulation of the human body [58]. Gradually, by increased requirements on the prediction of complex thermal environments (transient and non-uniform), thermo-regulatory models were developed from a single homogenous cylinder into multi-layered cylinders of various sizes, together with thermophysical and physiological properties for individual body parts with applied blood circulation [40, 60-67]. In this regard, Figure 2 shows an example of recent advances with computational fluid dynamics aid to predict the thermal sensation of the human body [57]. In this model, which is called ThermoSEM, the human body is subdivided into 18 cylinders and 1 sphere, all of which also containing layers that represent different tissue materials such as: brain, lung viscera, bone, muscle, fat and outer and inner skin [57, 68].
i
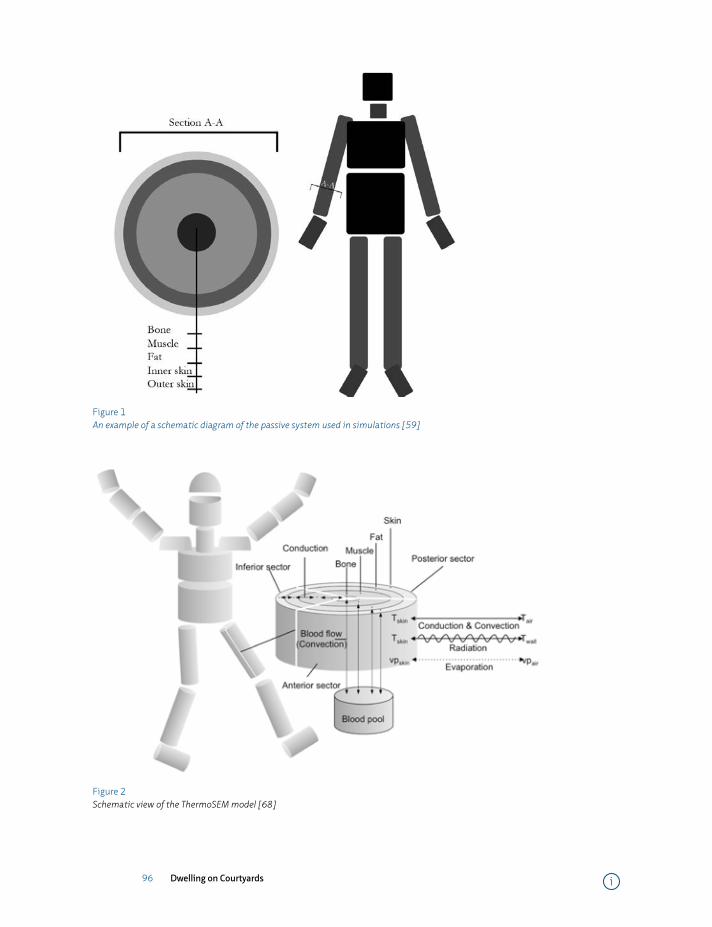
96 Dwelling on Courtyards
Figure 1 An example of a schematic diagram of the passive system used in simulations [59]
Figure 2 Schematic view of the ThermoSEM model [68]
i
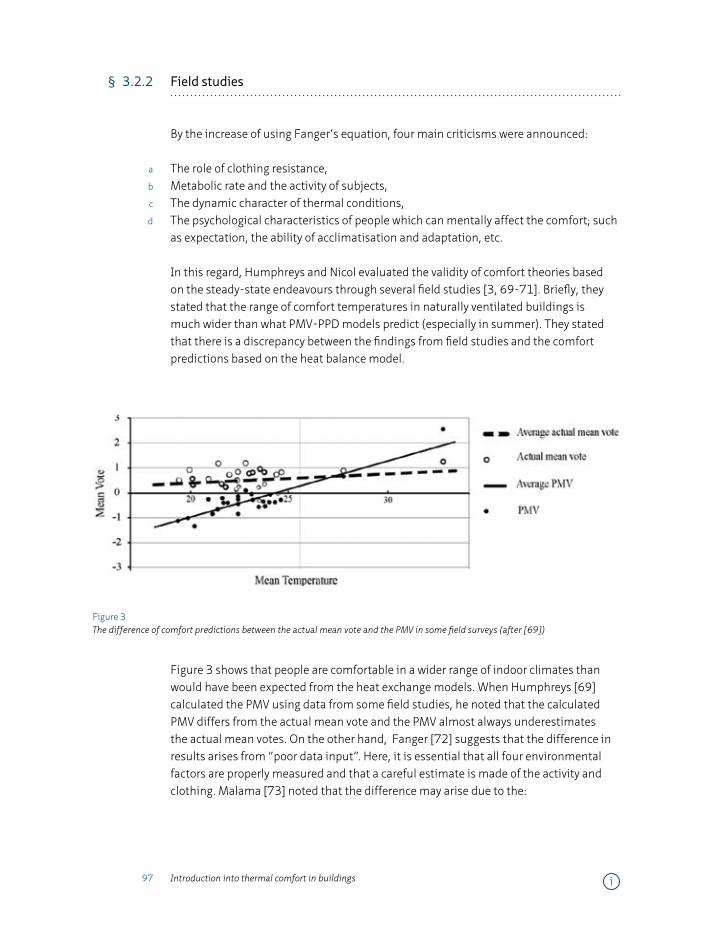
97 Introduction into thermal comfort in buildings
§ 3.2.2 Field studies
By the increase of using Fanger’s equation, four main criticisms were announced:
a The role of clothing resistance,b Metabolic rate and the activity of subjects,c The dynamic character of thermal conditions,d The psychological characteristics of people which can mentally affect the comfort; such
as expectation, the ability of acclimatisation and adaptation, etc.
In this regard, Humphreys and Nicol evaluated the validity of comfort theories based on the steady-state endeavours through several field studies [3, 69-71]. Briefly, they stated that the range of comfort temperatures in naturally ventilated buildings is much wider than what PMV-PPD models predict (especially in summer). They stated that there is a discrepancy between the findings from field studies and the comfort predictions based on the heat balance model.
Figure 3 The difference of comfort predictions between the actual mean vote and the PMV in some field surveys (after [69])
Figure 3 shows that people are comfortable in a wider range of indoor climates than would have been expected from the heat exchange models. When Humphreys [69] calculated the PMV using data from some field studies, he noted that the calculated PMV differs from the actual mean vote and the PMV almost always underestimates the actual mean votes. On the other hand, Fanger [72] suggests that the difference in results arises from “poor data input”. Here, it is essential that all four environmental factors are properly measured and that a careful estimate is made of the activity and clothing. Malama [73] noted that the difference may arise due to the:
i
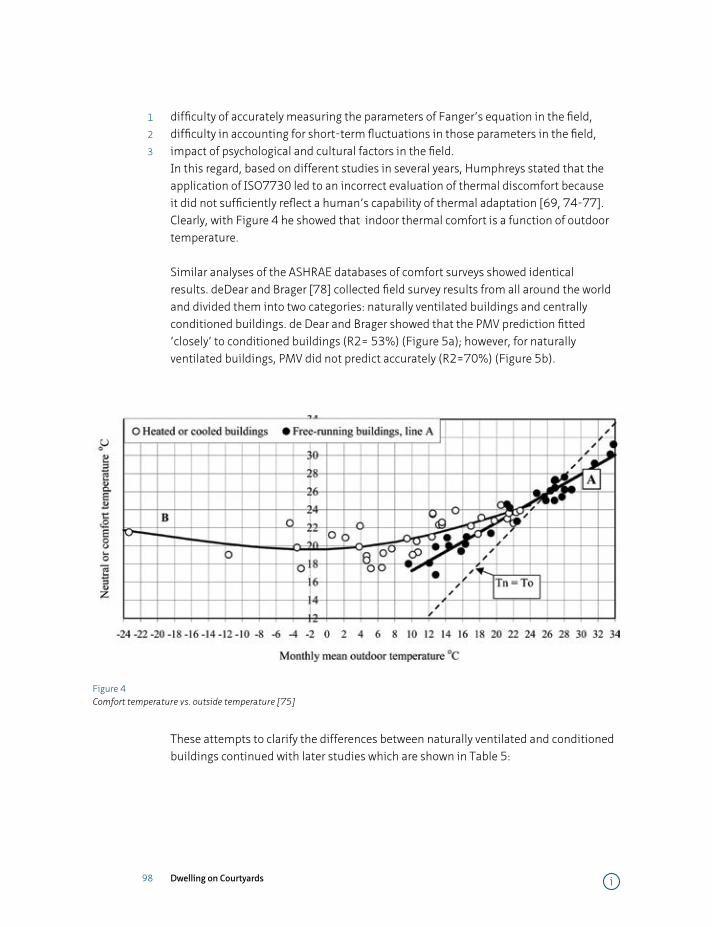
98 Dwelling on Courtyards
1 difficulty of accurately measuring the parameters of Fanger’s equation in the field, 2 difficulty in accounting for short-term fluctuations in those parameters in the field,3 impact of psychological and cultural factors in the field.
In this regard, based on different studies in several years, Humphreys stated that the application of ISO7730 led to an incorrect evaluation of thermal discomfort because it did not sufficiently reflect a human’s capability of thermal adaptation [69, 74-77]. Clearly, with Figure 4 he showed that indoor thermal comfort is a function of outdoor temperature.
Similar analyses of the ASHRAE databases of comfort surveys showed identical results. deDear and Brager [78] collected field survey results from all around the world and divided them into two categories: naturally ventilated buildings and centrally conditioned buildings. de Dear and Brager showed that the PMV prediction fitted ‘closely’ to conditioned buildings (R2= 53%) (Figure 5a); however, for naturally ventilated buildings, PMV did not predict accurately (R2=70%) (Figure 5b).
Figure 4 Comfort temperature vs. outside temperature [75]
These attempts to clarify the differences between naturally ventilated and conditioned buildings continued with later studies which are shown in Table 5:
i
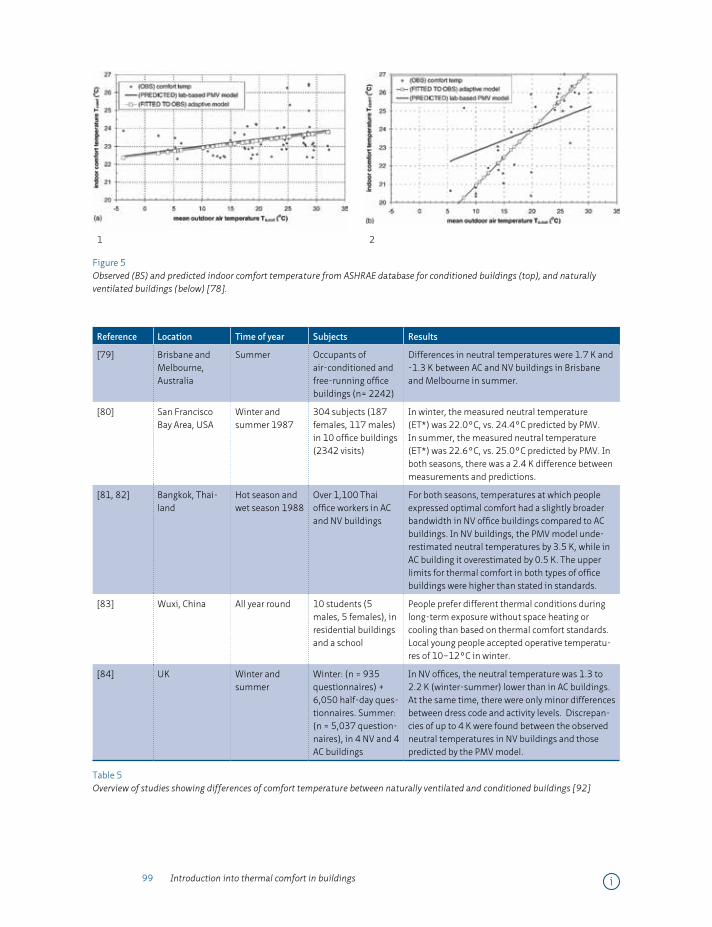
99 Introduction into thermal comfort in buildings
1 2
Figure 5 Observed (BS) and predicted indoor comfort temperature from ASHRAE database for conditioned buildings (top), and naturally ventilated buildings (below) [78].
Reference Location Time of year Subjects Results
[79] Brisbane and Melbourne, Australia
Summer Occupants of air-conditioned and free-running office buildings (n= 2242)
Differences in neutral temperatures were 1.7 K and -1.3 K between AC and NV buildings in Brisbane and Melbourne in summer.
[80] San Francisco Bay Area, USA
Winter and summer 1987
304 subjects (187 females, 117 males) in 10 office buildings (2342 visits)
In winter, the measured neutral temperature (ET*) was 22.0°C, vs. 24.4°C predicted by PMV. In summer, the measured neutral temperature (ET*) was 22.6°C, vs. 25.0°C predicted by PMV. In both seasons, there was a 2.4 K difference between measurements and predictions.
[81, 82] Bangkok, Thai-land
Hot season and wet season 1988
Over 1,100 Thai office workers in AC and NV buildings
For both seasons, temperatures at which people expressed optimal comfort had a slightly broader bandwidth in NV office buildings compared to AC buildings. In NV buildings, the PMV model unde-restimated neutral temperatures by 3.5 K, while in AC building it overestimated by 0.5 K. The upper limits for thermal comfort in both types of office buildings were higher than stated in standards.
[83] Wuxi, China All year round 10 students (5 males, 5 females), in residential buildings and a school
People prefer different thermal conditions during long-term exposure without space heating or cooling than based on thermal comfort standards. Local young people accepted operative temperatu-res of 10–12°C in winter.
[84] UK Winter and summer
Winter: (n = 935 questionnaires) +6,050 half-day ques-tionnaires. Summer: (n = 5,037 question-naires), in 4 NV and 4 AC buildings
In NV offices, the neutral temperature was 1.3 to 2.2 K (winter-summer) lower than in AC buildings. At the same time, there were only minor differences between dress code and activity levels. Discrepan-cies of up to 4 K were found between the observed neutral temperatures in NV buildings and those predicted by the PMV model.
Table 5 Overview of studies showing differences of comfort temperature between naturally ventilated and conditioned buildings [92]
i
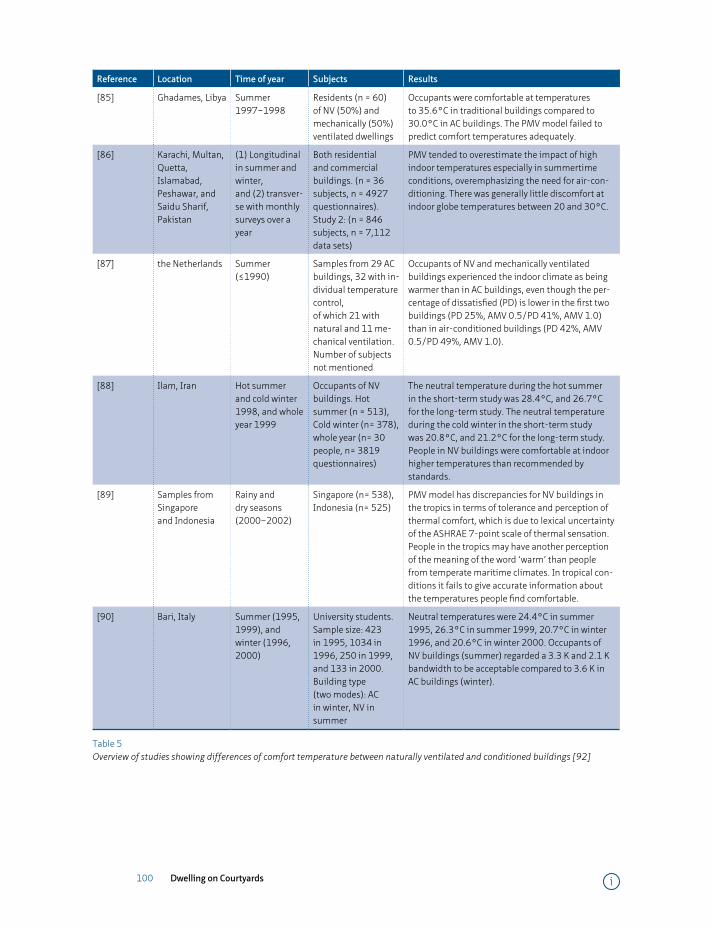
100 Dwelling on Courtyards
Reference Location Time of year Subjects Results
[85] Ghadames, Libya Summer 1997–1998
Residents (n = 60) of NV (50%) and mechanically (50%) ventilated dwellings
Occupants were comfortable at temperatures to 35.6°C in traditional buildings compared to 30.0°C in AC buildings. The PMV model failed to predict comfort temperatures adequately.
[86] Karachi, Multan, Quetta,Islamabad, Peshawar, and Saidu Sharif, Pakistan
(1) Longitudinal in summer and winter,and (2) transver-se with monthly surveys over a year
Both residential and commercial buildings. (n = 36 subjects, n = 4927 questionnaires). Study 2: (n = 846 subjects, n = 7,112 data sets)
PMV tended to overestimate the impact of high indoor temperatures especially in summertime conditions, overemphasizing the need for air-con-ditioning. There was generally little discomfort at indoor globe temperatures between 20 and 30°C.
[87] the Netherlands Summer (≤1990)
Samples from 29 AC buildings, 32 with in-dividual temperature control,of which 21 with natural and 11 me-chanical ventilation. Number of subjects not mentioned
Occupants of NV and mechanically ventilated buildings experienced the indoor climate as being warmer than in AC buildings, even though the per-centage of dissatisfied (PD) is lower in the first two buildings (PD 25%, AMV 0.5/PD 41%, AMV 1.0) than in air-conditioned buildings (PD 42%, AMV 0.5/PD 49%, AMV 1.0).
[88] Ilam, Iran Hot summer and cold winter 1998, and whole year 1999
Occupants of NV buildings. Hot summer (n = 513), Cold winter (n= 378), whole year (n= 30 people, n= 3819 questionnaires)
The neutral temperature during the hot summer in the short-term study was 28.4°C, and 26.7°C for the long-term study. The neutral temperature during the cold winter in the short-term study was 20.8°C, and 21.2°C for the long-term study. People in NV buildings were comfortable at indoor higher temperatures than recommended by standards.
[89] Samples from Singaporeand Indonesia
Rainy and dry seasons (2000–2002)
Singapore (n= 538), Indonesia (n= 525)
PMV model has discrepancies for NV buildings in the tropics in terms of tolerance and perception of thermal comfort, which is due to lexical uncertainty of the ASHRAE 7-point scale of thermal sensation. People in the tropics may have another perception of the meaning of the word ‘warm’ than people from temperate maritime climates. In tropical con-ditions it fails to give accurate information about the temperatures people find comfortable.
[90] Bari, Italy Summer (1995, 1999), and winter (1996, 2000)
University students. Sample size: 423in 1995, 1034 in 1996, 250 in 1999,and 133 in 2000. Building type(two modes): AC in winter, NV in summer
Neutral temperatures were 24.4°C in summer 1995, 26.3°C in summer 1999, 20.7°C in winter 1996, and 20.6°C in winter 2000. Occupants of NV buildings (summer) regarded a 3.3 K and 2.1 K bandwidth to be acceptable compared to 3.6 K in AC buildings (winter).
Table 5 Overview of studies showing differences of comfort temperature between naturally ventilated and conditioned buildings [92]
i
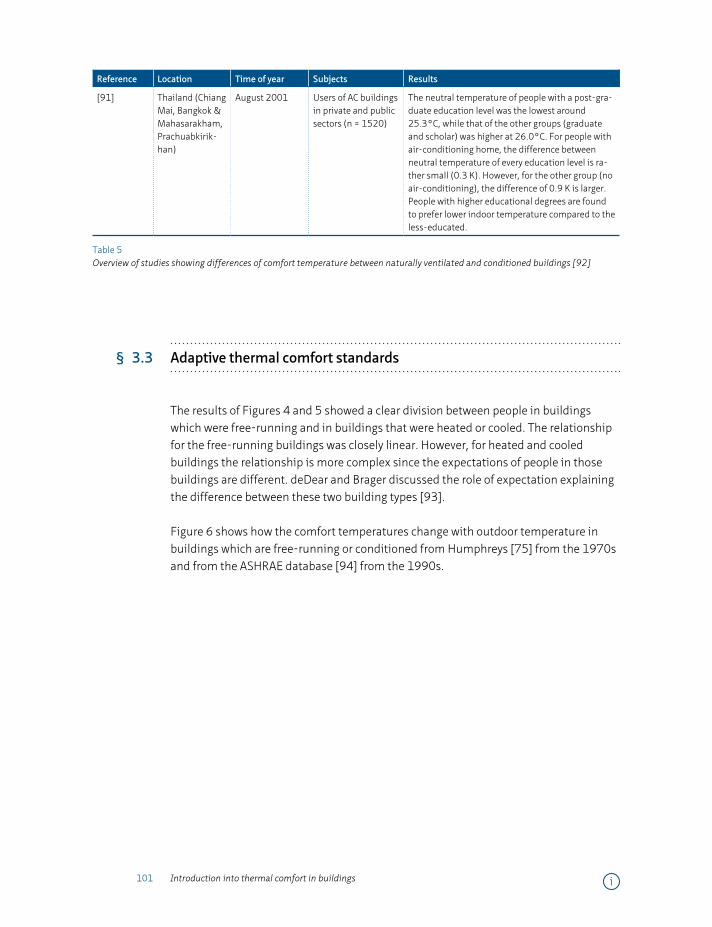
101 Introduction into thermal comfort in buildings
Reference Location Time of year Subjects Results
[91] Thailand (Chiang Mai, Bangkok & Mahasarakham, Prachuabkirik-han)
August 2001 Users of AC buildings in private and public sectors (n = 1520)
The neutral temperature of people with a post-gra-duate education level was the lowest around 25.3°C, while that of the other groups (graduate and scholar) was higher at 26.0°C. For people with air-conditioning home, the difference between neutral temperature of every education level is ra-ther small (0.3 K). However, for the other group (no air-conditioning), the difference of 0.9 K is larger. People with higher educational degrees are found to prefer lower indoor temperature compared to the less-educated.
Table 5 Overview of studies showing differences of comfort temperature between naturally ventilated and conditioned buildings [92]
§ 3.3 Adaptive thermal comfort standards
The results of Figures 4 and 5 showed a clear division between people in buildings which were free-running and in buildings that were heated or cooled. The relationship for the free-running buildings was closely linear. However, for heated and cooled buildings the relationship is more complex since the expectations of people in those buildings are different. deDear and Brager discussed the role of expectation explaining the difference between these two building types [93].
Figure 6 shows how the comfort temperatures change with outdoor temperature in buildings which are free-running or conditioned from Humphreys [75] from the 1970s and from the ASHRAE database [94] from the 1990s.
i
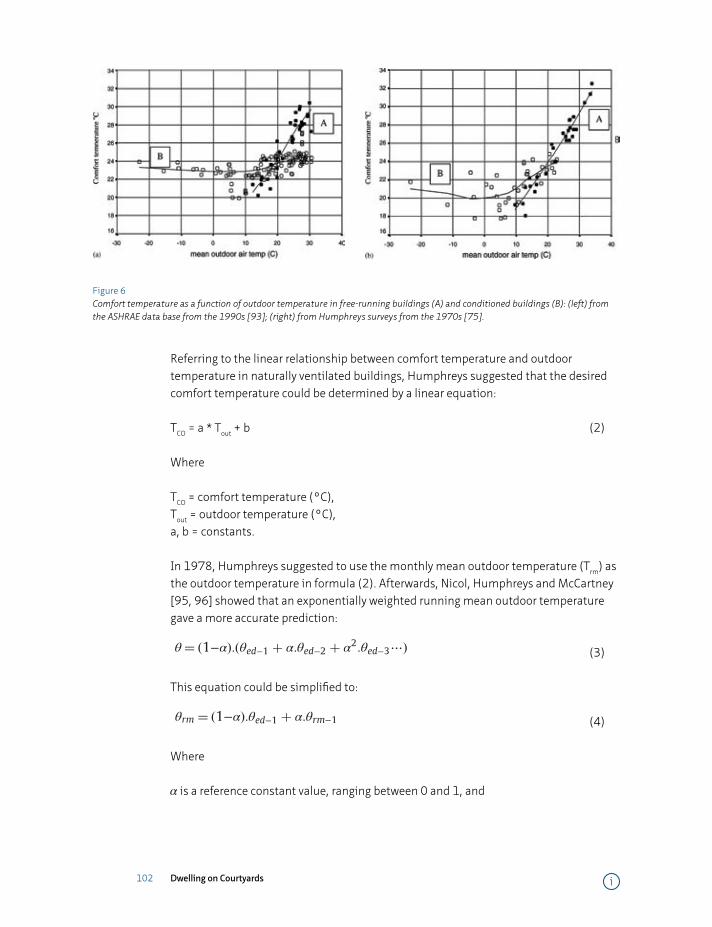
102 Dwelling on Courtyards
Figure 6 Comfort temperature as a function of outdoor temperature in free-running buildings (A) and conditioned buildings (B): (left) from the ASHRAE data base from the 1990s [93]; (right) from Humphreys surveys from the 1970s [75].
Referring to the linear relationship between comfort temperature and outdoor temperature in naturally ventilated buildings, Humphreys suggested that the desired comfort temperature could be determined by a linear equation:
TCO = a * Tout + b (2)
Where
TCO = comfort temperature (°C), Tout = outdoor temperature (°C), a, b = constants.
In 1978, Humphreys suggested to use the monthly mean outdoor temperature (Trm) as the outdoor temperature in formula (2). Afterwards, Nicol, Humphreys and McCartney [95, 96] showed that an exponentially weighted running mean outdoor temperature gave a more accurate prediction:
be determined by a linear equation:
TCO ¼ a:Tout þ b ð2Þ
where
Tco ¼comfort temperature (1C),Tout ¼outdoor temperature (1C),a, b ¼constants.
In 1978, Humphreys suggested to use the monthly meanoutdoor temperature (Trm) as the outdoor temperature in formula(2). Afterwards, Nicol, Humphreys and McCartney [95,96] showedthat an exponentially weighted running mean outdoor tempera-ture gave a more accurate prediction:
θ¼ ð1−αÞ:ðθed−1 þ α:θed−2 þ α2:θed−3⋯Þ ð3Þ
This equation could be simplified to:
θrm ¼ ð1−αÞ:θed−1 þ α:θrm−1 ð4Þ
whereα is a reference constant value, ranging between 0 and 1,
θrm running mean temperature of today,θrm−1 running mean temperature of the previous day,θed−1 the daily mean outdoor temperature of the previous day,θed−2 the daily mean outdoor temperature of the day before
and so on.
In this regard, all these endeavours led to the theory of adaptivecomfort. Briefly, this theory states:
If a change occurs such as to produce discomfort, people react inways which tend to restore their comfort [77]. In the next
Fig. 7. The Graphic Comfort Zone Method: Acceptable range of operative temperature and humidity for 80% of occupants acceptability (10% of dissatisfied based on PMV-PPD index) for 1.1 met and, 0.5 and 1 clo [97]. 0.5 clo normally refers to summer, and 1 to winter.
Fig. 8. The geographic distribution of building studies that formed the basis of the adaptive model and adaptive comfort standard of ASHRAE [78].
M. Taleghani et al. / Renewable and Sustainable Energy Reviews 26 (2013) 201–215208
(3)
This equation could be simplified to:be determined by a linear equation:
TCO ¼ a:Tout þ b ð2Þ
where
Tco ¼comfort temperature (1C),Tout ¼outdoor temperature (1C),a, b ¼constants.
In 1978, Humphreys suggested to use the monthly meanoutdoor temperature (Trm) as the outdoor temperature in formula(2). Afterwards, Nicol, Humphreys and McCartney [95,96] showedthat an exponentially weighted running mean outdoor tempera-ture gave a more accurate prediction:
θ¼ ð1−αÞ:ðθed−1 þ α:θed−2 þ α2:θed−3⋯Þ ð3Þ
This equation could be simplified to:
θrm ¼ ð1−αÞ:θed−1 þ α:θrm−1 ð4Þ
whereα is a reference constant value, ranging between 0 and 1,
θrm running mean temperature of today,θrm−1 running mean temperature of the previous day,θed−1 the daily mean outdoor temperature of the previous day,θed−2 the daily mean outdoor temperature of the day before
and so on.
In this regard, all these endeavours led to the theory of adaptivecomfort. Briefly, this theory states:
If a change occurs such as to produce discomfort, people react inways which tend to restore their comfort [77]. In the next
Fig. 7. The Graphic Comfort Zone Method: Acceptable range of operative temperature and humidity for 80% of occupants acceptability (10% of dissatisfied based on PMV-PPD index) for 1.1 met and, 0.5 and 1 clo [97]. 0.5 clo normally refers to summer, and 1 to winter.
Fig. 8. The geographic distribution of building studies that formed the basis of the adaptive model and adaptive comfort standard of ASHRAE [78].
M. Taleghani et al. / Renewable and Sustainable Energy Reviews 26 (2013) 201–215208
(4)
Wherebe determined by a linear equation:
TCO ¼ a:Tout þ b ð2Þ
where
Tco ¼comfort temperature (1C),Tout ¼outdoor temperature (1C),a, b ¼constants.
In 1978, Humphreys suggested to use the monthly meanoutdoor temperature (Trm) as the outdoor temperature in formula(2). Afterwards, Nicol, Humphreys and McCartney [95,96] showedthat an exponentially weighted running mean outdoor tempera-ture gave a more accurate prediction:
θ¼ ð1−αÞ:ðθed−1 þ α:θed−2 þ α2:θed−3⋯Þ ð3Þ
This equation could be simplified to:
θrm ¼ ð1−αÞ:θed−1 þ α:θrm−1 ð4Þ
whereα is a reference constant value, ranging between 0 and 1,
θrm running mean temperature of today,θrm−1 running mean temperature of the previous day,θed−1 the daily mean outdoor temperature of the previous day,θed−2 the daily mean outdoor temperature of the day before
and so on.
In this regard, all these endeavours led to the theory of adaptivecomfort. Briefly, this theory states:
If a change occurs such as to produce discomfort, people react inways which tend to restore their comfort [77]. In the next
Fig. 7. The Graphic Comfort Zone Method: Acceptable range of operative temperature and humidity for 80% of occupants acceptability (10% of dissatisfied based on PMV-PPD index) for 1.1 met and, 0.5 and 1 clo [97]. 0.5 clo normally refers to summer, and 1 to winter.
Fig. 8. The geographic distribution of building studies that formed the basis of the adaptive model and adaptive comfort standard of ASHRAE [78].
M. Taleghani et al. / Renewable and Sustainable Energy Reviews 26 (2013) 201–215208
is a reference constant value, ranging between 0 and 1, and
i

103 Introduction into thermal comfort in buildings
be determined by a linear equation:
TCO ¼ a:Tout þ b ð2Þ
where
Tco ¼comfort temperature (1C),Tout ¼outdoor temperature (1C),a, b ¼constants.
In 1978, Humphreys suggested to use the monthly meanoutdoor temperature (Trm) as the outdoor temperature in formula(2). Afterwards, Nicol, Humphreys and McCartney [95,96] showedthat an exponentially weighted running mean outdoor tempera-ture gave a more accurate prediction:
θ¼ ð1−αÞ:ðθed−1 þ α:θed−2 þ α2:θed−3⋯Þ ð3Þ
This equation could be simplified to:
θrm ¼ ð1−αÞ:θed−1 þ α:θrm−1 ð4Þ
whereα is a reference constant value, ranging between 0 and 1,
θrm running mean temperature of today,θrm−1 running mean temperature of the previous day,θed−1 the daily mean outdoor temperature of the previous day,θed−2 the daily mean outdoor temperature of the day before
and so on.
In this regard, all these endeavours led to the theory of adaptivecomfort. Briefly, this theory states:
If a change occurs such as to produce discomfort, people react inways which tend to restore their comfort [77]. In the next
Fig. 7. The Graphic Comfort Zone Method: Acceptable range of operative temperature and humidity for 80% of occupants acceptability (10% of dissatisfied based on PMV-PPD index) for 1.1 met and, 0.5 and 1 clo [97]. 0.5 clo normally refers to summer, and 1 to winter.
Fig. 8. The geographic distribution of building studies that formed the basis of the adaptive model and adaptive comfort standard of ASHRAE [78].
M. Taleghani et al. / Renewable and Sustainable Energy Reviews 26 (2013) 201–215208
running mean temperature of today,
be determined by a linear equation:
TCO ¼ a:Tout þ b ð2Þ
where
Tco ¼comfort temperature (1C),Tout ¼outdoor temperature (1C),a, b ¼constants.
In 1978, Humphreys suggested to use the monthly meanoutdoor temperature (Trm) as the outdoor temperature in formula(2). Afterwards, Nicol, Humphreys and McCartney [95,96] showedthat an exponentially weighted running mean outdoor tempera-ture gave a more accurate prediction:
θ¼ ð1−αÞ:ðθed−1 þ α:θed−2 þ α2:θed−3⋯Þ ð3Þ
This equation could be simplified to:
θrm ¼ ð1−αÞ:θed−1 þ α:θrm−1 ð4Þ
whereα is a reference constant value, ranging between 0 and 1,
θrm running mean temperature of today,θrm−1 running mean temperature of the previous day,θed−1 the daily mean outdoor temperature of the previous day,θed−2 the daily mean outdoor temperature of the day before
and so on.
In this regard, all these endeavours led to the theory of adaptivecomfort. Briefly, this theory states:
If a change occurs such as to produce discomfort, people react inways which tend to restore their comfort [77]. In the next
Fig. 7. The Graphic Comfort Zone Method: Acceptable range of operative temperature and humidity for 80% of occupants acceptability (10% of dissatisfied based on PMV-PPD index) for 1.1 met and, 0.5 and 1 clo [97]. 0.5 clo normally refers to summer, and 1 to winter.
Fig. 8. The geographic distribution of building studies that formed the basis of the adaptive model and adaptive comfort standard of ASHRAE [78].
M. Taleghani et al. / Renewable and Sustainable Energy Reviews 26 (2013) 201–215208
running mean temperature of the previous day,
be determined by a linear equation:
TCO ¼ a:Tout þ b ð2Þ
where
Tco ¼comfort temperature (1C),Tout ¼outdoor temperature (1C),a, b ¼constants.
In 1978, Humphreys suggested to use the monthly meanoutdoor temperature (Trm) as the outdoor temperature in formula(2). Afterwards, Nicol, Humphreys and McCartney [95,96] showedthat an exponentially weighted running mean outdoor tempera-ture gave a more accurate prediction:
θ¼ ð1−αÞ:ðθed−1 þ α:θed−2 þ α2:θed−3⋯Þ ð3Þ
This equation could be simplified to:
θrm ¼ ð1−αÞ:θed−1 þ α:θrm−1 ð4Þ
whereα is a reference constant value, ranging between 0 and 1,
θrm running mean temperature of today,θrm−1 running mean temperature of the previous day,θed−1 the daily mean outdoor temperature of the previous day,θed−2 the daily mean outdoor temperature of the day before
and so on.
In this regard, all these endeavours led to the theory of adaptivecomfort. Briefly, this theory states:
If a change occurs such as to produce discomfort, people react inways which tend to restore their comfort [77]. In the next
Fig. 7. The Graphic Comfort Zone Method: Acceptable range of operative temperature and humidity for 80% of occupants acceptability (10% of dissatisfied based on PMV-PPD index) for 1.1 met and, 0.5 and 1 clo [97]. 0.5 clo normally refers to summer, and 1 to winter.
Fig. 8. The geographic distribution of building studies that formed the basis of the adaptive model and adaptive comfort standard of ASHRAE [78].
M. Taleghani et al. / Renewable and Sustainable Energy Reviews 26 (2013) 201–215208
the daily mean outdoor temperature of the previous day,
be determined by a linear equation:
TCO ¼ a:Tout þ b ð2Þ
where
Tco ¼comfort temperature (1C),Tout ¼outdoor temperature (1C),a, b ¼constants.
In 1978, Humphreys suggested to use the monthly meanoutdoor temperature (Trm) as the outdoor temperature in formula(2). Afterwards, Nicol, Humphreys and McCartney [95,96] showedthat an exponentially weighted running mean outdoor tempera-ture gave a more accurate prediction:
θ¼ ð1−αÞ:ðθed−1 þ α:θed−2 þ α2:θed−3⋯Þ ð3Þ
This equation could be simplified to:
θrm ¼ ð1−αÞ:θed−1 þ α:θrm−1 ð4Þ
whereα is a reference constant value, ranging between 0 and 1,
θrm running mean temperature of today,θrm−1 running mean temperature of the previous day,θed−1 the daily mean outdoor temperature of the previous day,θed−2 the daily mean outdoor temperature of the day before
and so on.
In this regard, all these endeavours led to the theory of adaptivecomfort. Briefly, this theory states:
If a change occurs such as to produce discomfort, people react inways which tend to restore their comfort [77]. In the next
Fig. 7. The Graphic Comfort Zone Method: Acceptable range of operative temperature and humidity for 80% of occupants acceptability (10% of dissatisfied based on PMV-PPD index) for 1.1 met and, 0.5 and 1 clo [97]. 0.5 clo normally refers to summer, and 1 to winter.
Fig. 8. The geographic distribution of building studies that formed the basis of the adaptive model and adaptive comfort standard of ASHRAE [78].
M. Taleghani et al. / Renewable and Sustainable Energy Reviews 26 (2013) 201–215208
the daily mean outdoor temperature of the day before and so on.
In this regard, all these endeavours led to the theory of adaptive comfort. Briefly, this theory states:
If a change occurs such as to produce discomfort, people react in ways which tend to restore their comfort [77]. In the next subsections, three basic adaptive thermal comfort standards and guidelines will be described.
§ 3.3.1 ASHRAE 55-2010
The main purpose of the ASHRAE-55 standard is to specify the combinations of indoor thermal environmental parameters (temperature, thermal radiation, humidity, and air speed) and personal parameters (clothing insulation and metabolism rate) that will produce thermal environmental conditions acceptable to a majority of the occupants. This standard was similar to ISO 7730 in the beginning (which was not adaptive).
0.016
0.014
0.012
0.010
0.008
0.006
0.004
0.002
20
15
10
50
-5-10-10
10 13 16 18 21 24 27 29 32 35 38
Summ
er 0.5 clo
Winter 1.0 clo
Operative Temperature [C]
Dew
Point Temperature [C
]
Hum
idity
Rat
io
Figure 7 The Graphic Comfort Zone Method: Acceptable range of operative temperature and humidity for 80% of occupants acceptability (10% of dissatisfied based on PMV-PPD index) for 1.1 met and, 0.5 and 1 clo [97]. 0.5 clo normally refers to summer, and 1 to winter.
i
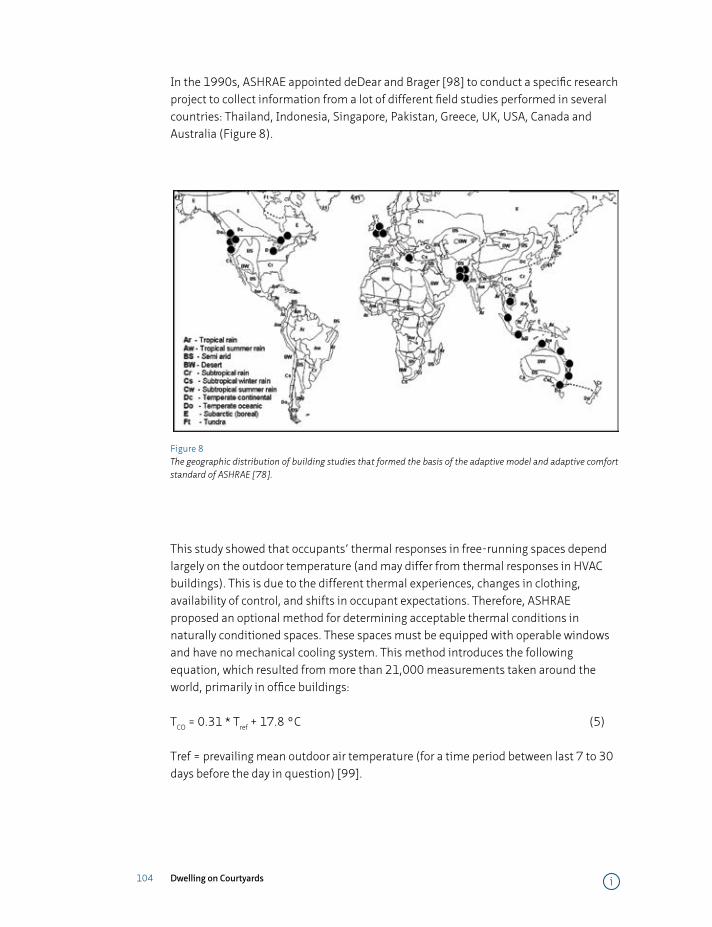
104 Dwelling on Courtyards
In the 1990s, ASHRAE appointed deDear and Brager [98] to conduct a specific research project to collect information from a lot of different field studies performed in several countries: Thailand, Indonesia, Singapore, Pakistan, Greece, UK, USA, Canada and Australia (Figure 8).
Figure 8 The geographic distribution of building studies that formed the basis of the adaptive model and adaptive comfort standard of ASHRAE [78].
This study showed that occupants’ thermal responses in free-running spaces depend largely on the outdoor temperature (and may differ from thermal responses in HVAC buildings). This is due to the different thermal experiences, changes in clothing, availability of control, and shifts in occupant expectations. Therefore, ASHRAE proposed an optional method for determining acceptable thermal conditions in naturally conditioned spaces. These spaces must be equipped with operable windows and have no mechanical cooling system. This method introduces the following equation, which resulted from more than 21,000 measurements taken around the world, primarily in office buildings:
TCO = 0.31 * Tref + 17.8 °C (5)
Tref = prevailing mean outdoor air temperature (for a time period between last 7 to 30 days before the day in question) [99].
i
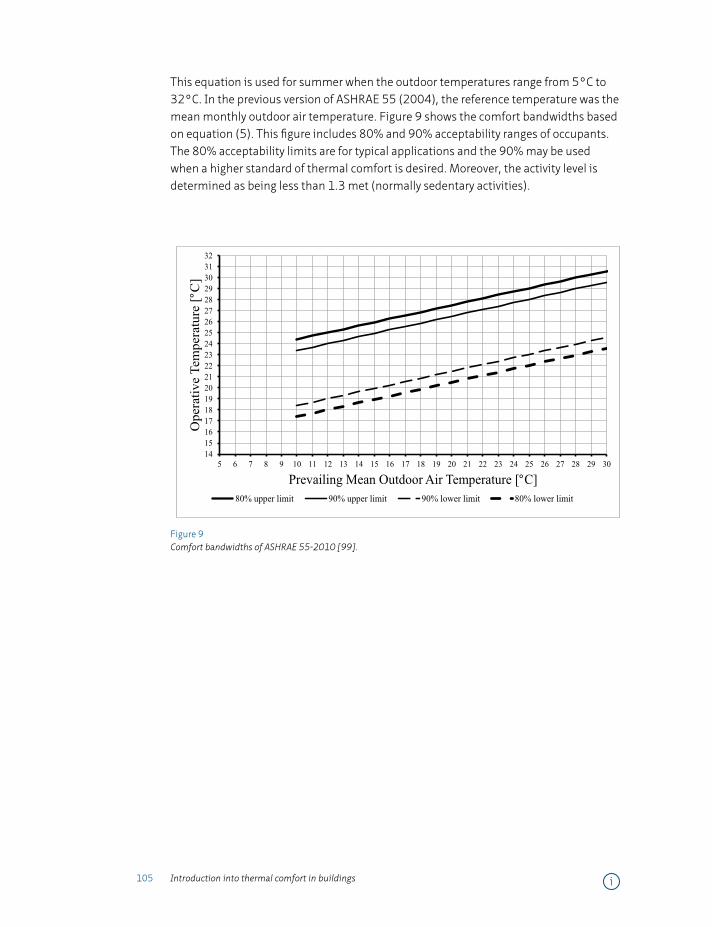
105 Introduction into thermal comfort in buildings
This equation is used for summer when the outdoor temperatures range from 5°C to 32°C. In the previous version of ASHRAE 55 (2004), the reference temperature was the mean monthly outdoor air temperature. Figure 9 shows the comfort bandwidths based on equation (5). This figure includes 80% and 90% acceptability ranges of occupants. The 80% acceptability limits are for typical applications and the 90% may be used when a higher standard of thermal comfort is desired. Moreover, the activity level is determined as being less than 1.3 met (normally sedentary activities).
Figure 9 Comfort bandwidths of ASHRAE 55-2010 [99].
i
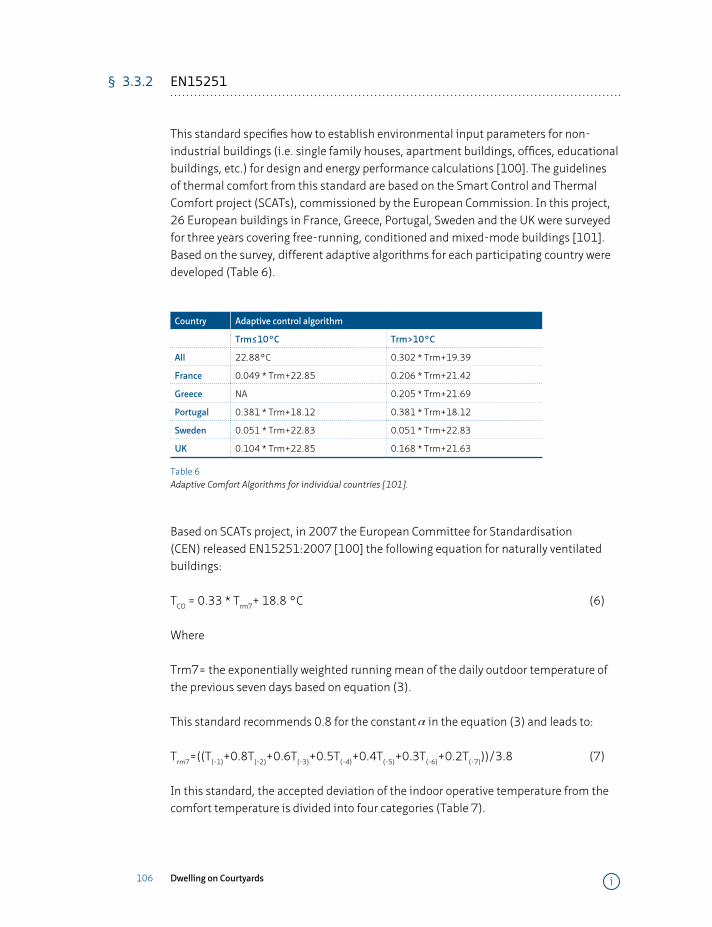
106 Dwelling on Courtyards
§ 3.3.2 EN15251
This standard specifies how to establish environmental input parameters for non-industrial buildings (i.e. single family houses, apartment buildings, offices, educational buildings, etc.) for design and energy performance calculations [100]. The guidelines of thermal comfort from this standard are based on the Smart Control and Thermal Comfort project (SCATs), commissioned by the European Commission. In this project, 26 European buildings in France, Greece, Portugal, Sweden and the UK were surveyed for three years covering free-running, conditioned and mixed-mode buildings [101]. Based on the survey, different adaptive algorithms for each participating country were developed (Table 6).
Country Adaptive control algorithm
Trm≤10°C Trm>10°C
All 22.88°C 0.302 * Trm+19.39
France 0.049 * Trm+22.85 0.206 * Trm+21.42
Greece NA 0.205 * Trm+21.69
Portugal 0.381 * Trm+18.12 0.381 * Trm+18.12
Sweden 0.051 * Trm+22.83 0.051 * Trm+22.83
UK 0.104 * Trm+22.85 0.168 * Trm+21.63
Table 6 Adaptive Comfort Algorithms for individual countries [101].
Based on SCATs project, in 2007 the European Committee for Standardisation (CEN) released EN15251:2007 [100] the following equation for naturally ventilated buildings:
TCO = 0.33 * Trm7+ 18.8 °C (6)
Where
Trm7= the exponentially weighted running mean of the daily outdoor temperature of the previous seven days based on equation (3).
This standard recommends 0.8 for the constant
be determined by a linear equation:
TCO ¼ a:Tout þ b ð2Þ
where
Tco ¼comfort temperature (1C),Tout ¼outdoor temperature (1C),a, b ¼constants.
In 1978, Humphreys suggested to use the monthly meanoutdoor temperature (Trm) as the outdoor temperature in formula(2). Afterwards, Nicol, Humphreys and McCartney [95,96] showedthat an exponentially weighted running mean outdoor tempera-ture gave a more accurate prediction:
θ¼ ð1−αÞ:ðθed−1 þ α:θed−2 þ α2:θed−3⋯Þ ð3Þ
This equation could be simplified to:
θrm ¼ ð1−αÞ:θed−1 þ α:θrm−1 ð4Þ
whereα is a reference constant value, ranging between 0 and 1,
θrm running mean temperature of today,θrm−1 running mean temperature of the previous day,θed−1 the daily mean outdoor temperature of the previous day,θed−2 the daily mean outdoor temperature of the day before
and so on.
In this regard, all these endeavours led to the theory of adaptivecomfort. Briefly, this theory states:
If a change occurs such as to produce discomfort, people react inways which tend to restore their comfort [77]. In the next
Fig. 7. The Graphic Comfort Zone Method: Acceptable range of operative temperature and humidity for 80% of occupants acceptability (10% of dissatisfied based on PMV-PPD index) for 1.1 met and, 0.5 and 1 clo [97]. 0.5 clo normally refers to summer, and 1 to winter.
Fig. 8. The geographic distribution of building studies that formed the basis of the adaptive model and adaptive comfort standard of ASHRAE [78].
M. Taleghani et al. / Renewable and Sustainable Energy Reviews 26 (2013) 201–215208
in the equation (3) and leads to:
Trm7=((T(-1)+0.8T(-2)+0.6T(-3)+0.5T(-4)+0.4T(-5)+0.3T(-6)+0.2T(-7)))/3.8 (7)
In this standard, the accepted deviation of the indoor operative temperature from the comfort temperature is divided into four categories (Table 7).
i

107 Introduction into thermal comfort in buildings
Category Explanation Limit of deviation Range of acceptability
I High level of expectation for very sensitive and fragile users (hospitals, …)
±2°C 90%
II Normal expectation for new buildings ±3°C 80%
III Moderate expectation (existing buildings) ±4°C 65%
IV Values outside the criteria for the above categories (only in a limited period)
±>4°C <65%
Table 7 Suggested applicability for the categories and their associated acceptable temperature ranges (table after [100]).
Figure 10 Comfort bandwidths of EN15251 [100].
Furthermore, based on the comfort algorithm and the range permitted for different percentages of acceptability, Figure 10 presents the comfort bandwidths.
§ 3.3.3 ATG
In 2004, the Dutch new guideline for thermal comfort was introduced prior to the European EN15251:2007. This Adaptive Temperature Limits guideline (ATG) was developed as an alternative to the former guideline (in 1970s), the Weighted Temperature Exceeding Hours method (GTO) which was based on Fanger’s model
i
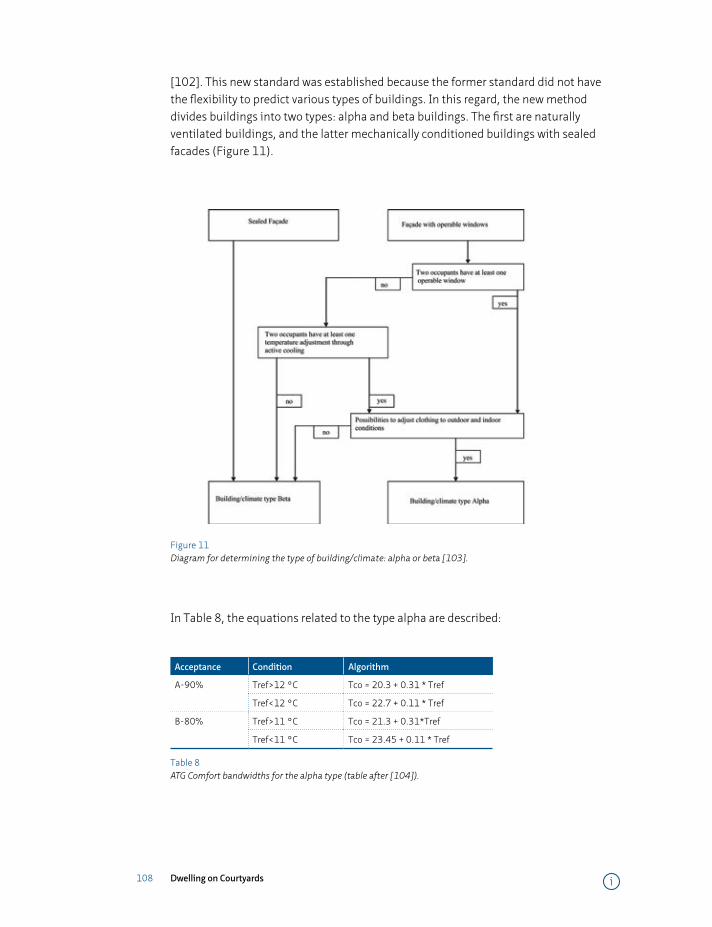
108 Dwelling on Courtyards
[102]. This new standard was established because the former standard did not have the flexibility to predict various types of buildings. In this regard, the new method divides buildings into two types: alpha and beta buildings. The first are naturally ventilated buildings, and the latter mechanically conditioned buildings with sealed facades (Figure 11).
Figure 11 Diagram for determining the type of building/climate: alpha or beta [103].
In Table 8, the equations related to the type alpha are described:
Acceptance Condition Algorithm
A-90% Tref>12 °C Tco = 20.3 + 0.31 * Tref
Tref<12 °C Tco = 22.7 + 0.11 * Tref
B-80% Tref>11 °C Tco = 21.3 + 0.31*Tref
Tref<11 °C Tco = 23.45 + 0.11 * Tref
Table 8 ATG Comfort bandwidths for the alpha type (table after [104]).
i
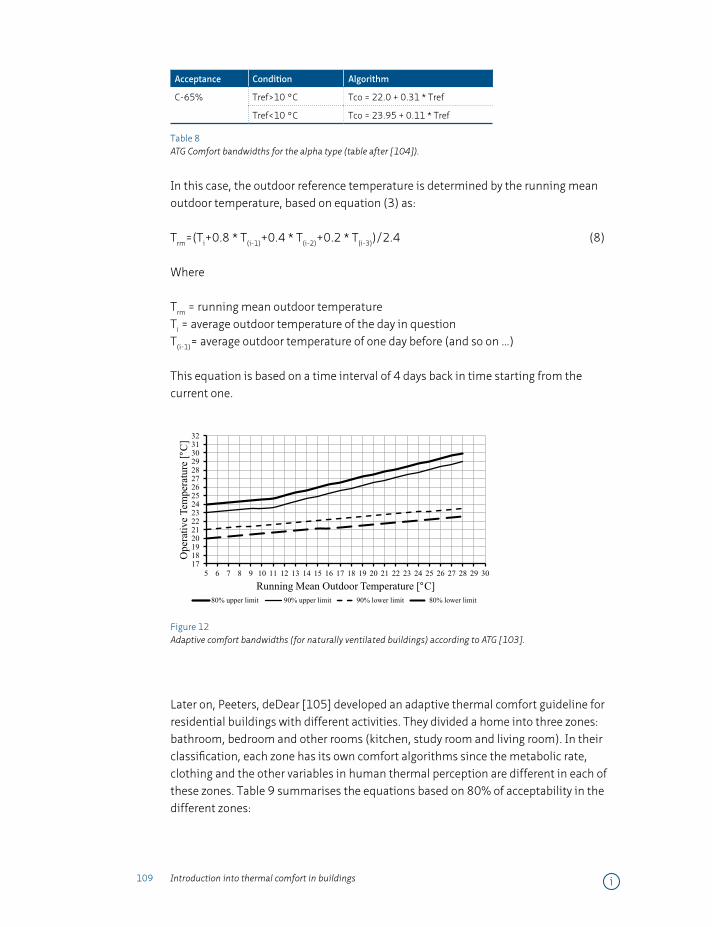
109 Introduction into thermal comfort in buildings
Acceptance Condition Algorithm
C-65% Tref>10 °C Tco = 22.0 + 0.31 * Tref
Tref<10 °C Tco = 23.95 + 0.11 * Tref
Table 8 ATG Comfort bandwidths for the alpha type (table after [104]).
In this case, the outdoor reference temperature is determined by the running mean outdoor temperature, based on equation (3) as:
Trm=(Ti+0.8 * T(i-1)+0.4 * T(i-2)+0.2 * T(i-3))/2.4 (8)
Where
Trm = running mean outdoor temperatureTi = average outdoor temperature of the day in questionT(i-1)= average outdoor temperature of one day before (and so on …)
This equation is based on a time interval of 4 days back in time starting from the current one.
Figure 12 Adaptive comfort bandwidths (for naturally ventilated buildings) according to ATG [103].
Later on, Peeters, deDear [105] developed an adaptive thermal comfort guideline for residential buildings with different activities. They divided a home into three zones: bathroom, bedroom and other rooms (kitchen, study room and living room). In their classification, each zone has its own comfort algorithms since the metabolic rate, clothing and the other variables in human thermal perception are different in each of these zones. Table 9 summarises the equations based on 80% of acceptability in the different zones:
i
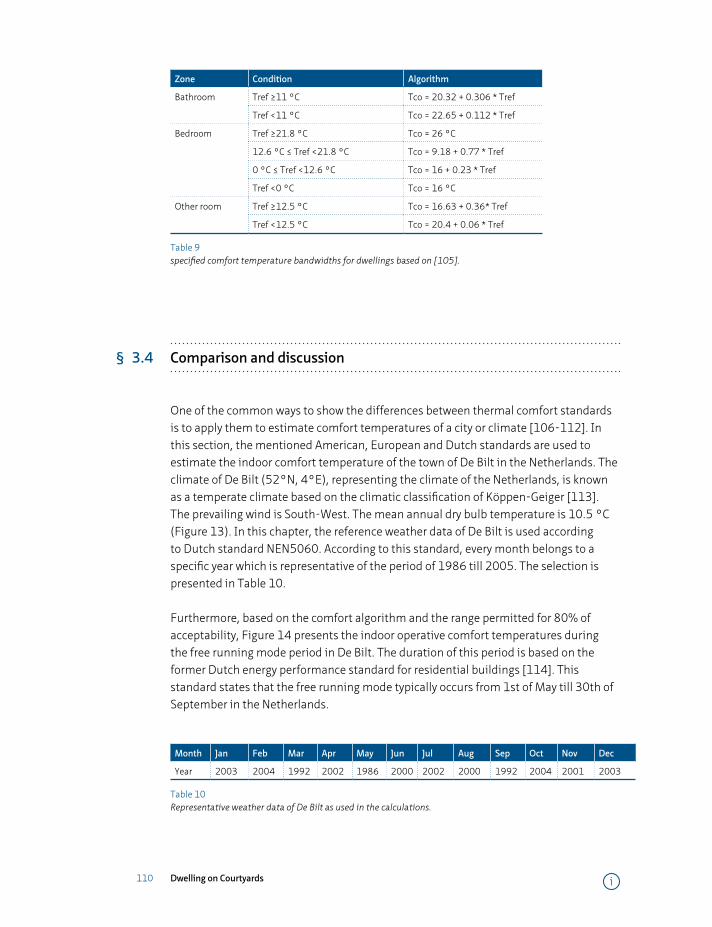
110 Dwelling on Courtyards
Zone Condition Algorithm
Bathroom Tref ≥11 °C Tco = 20.32 + 0.306 * Tref
Tref <11 °C Tco = 22.65 + 0.112 * Tref
Bedroom Tref ≥21.8 °C Tco = 26 °C
12.6 °C ≤ Tref <21.8 °C Tco = 9.18 + 0.77 * Tref
0 °C ≤ Tref <12.6 °C Tco = 16 + 0.23 * Tref
Tref <0 °C Tco = 16 °C
Other room Tref ≥12.5 °C Tco = 16.63 + 0.36* Tref
Tref <12.5 °C Tco = 20.4 + 0.06 * Tref
Table 9 specified comfort temperature bandwidths for dwellings based on [105].
§ 3.4 Comparison and discussion
One of the common ways to show the differences between thermal comfort standards is to apply them to estimate comfort temperatures of a city or climate [106-112]. In this section, the mentioned American, European and Dutch standards are used to estimate the indoor comfort temperature of the town of De Bilt in the Netherlands. The climate of De Bilt (52°N, 4°E), representing the climate of the Netherlands, is known as a temperate climate based on the climatic classification of Köppen-Geiger [113]. The prevailing wind is South-West. The mean annual dry bulb temperature is 10.5 °C (Figure 13). In this chapter, the reference weather data of De Bilt is used according to Dutch standard NEN5060. According to this standard, every month belongs to a specific year which is representative of the period of 1986 till 2005. The selection is presented in Table 10.
Furthermore, based on the comfort algorithm and the range permitted for 80% of acceptability, Figure 14 presents the indoor operative comfort temperatures during the free running mode period in De Bilt. The duration of this period is based on the former Dutch energy performance standard for residential buildings [114]. This standard states that the free running mode typically occurs from 1st of May till 30th of September in the Netherlands.
Month Jan Feb Mar Apr May Jun Jul Aug Sep Oct Nov Dec
Year 2003 2004 1992 2002 1986 2000 2002 2000 1992 2004 2001 2003
Table 10 Representative weather data of De Bilt as used in the calculations.
i
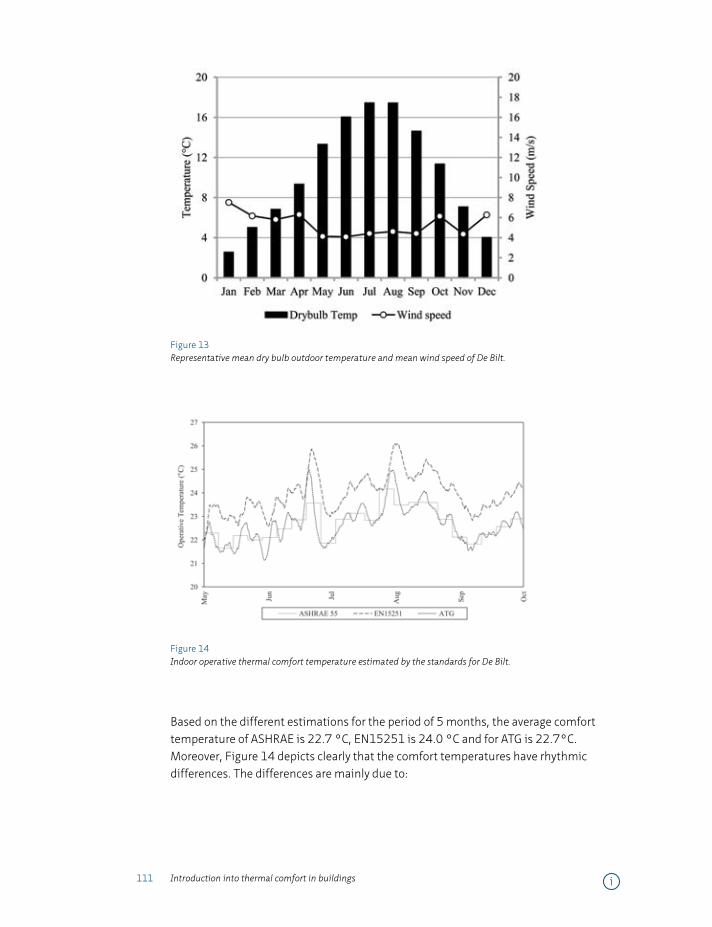
111 Introduction into thermal comfort in buildings
Figure 13 Representative mean dry bulb outdoor temperature and mean wind speed of De Bilt.
Figure 14 Indoor operative thermal comfort temperature estimated by the standards for De Bilt.
Based on the different estimations for the period of 5 months, the average comfort temperature of ASHRAE is 22.7 °C, EN15251 is 24.0 °C and for ATG is 22.7°C. Moreover, Figure 14 depicts clearly that the comfort temperatures have rhythmic differences. The differences are mainly due to:
i
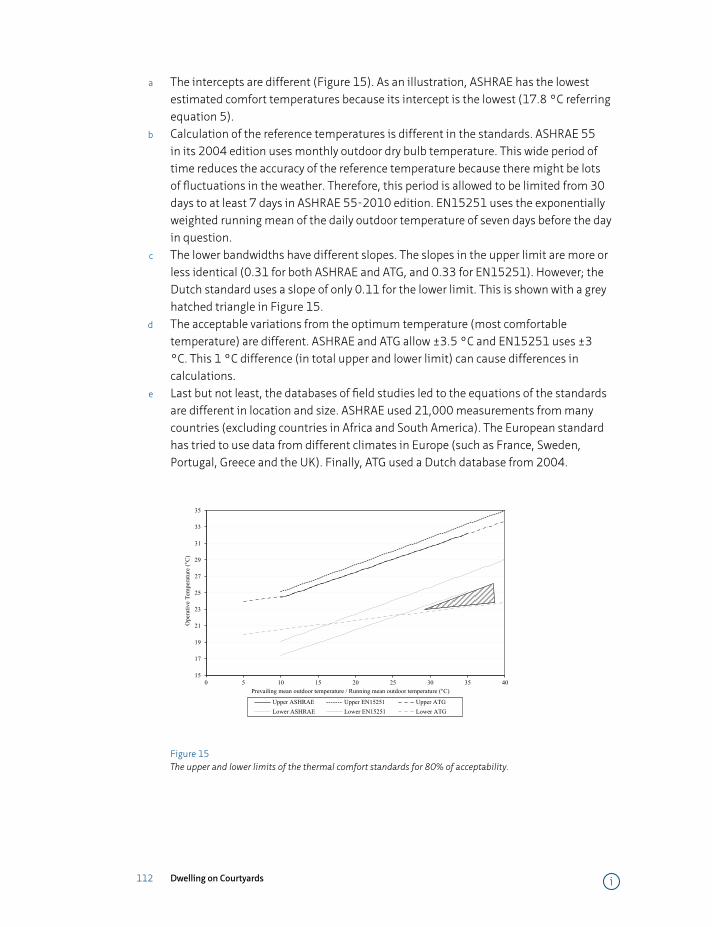
112 Dwelling on Courtyards
a The intercepts are different (Figure 15). As an illustration, ASHRAE has the lowest estimated comfort temperatures because its intercept is the lowest (17.8 °C referring equation 5).
b Calculation of the reference temperatures is different in the standards. ASHRAE 55 in its 2004 edition uses monthly outdoor dry bulb temperature. This wide period of time reduces the accuracy of the reference temperature because there might be lots of fluctuations in the weather. Therefore, this period is allowed to be limited from 30 days to at least 7 days in ASHRAE 55-2010 edition. EN15251 uses the exponentially weighted running mean of the daily outdoor temperature of seven days before the day in question.
c The lower bandwidths have different slopes. The slopes in the upper limit are more or less identical (0.31 for both ASHRAE and ATG, and 0.33 for EN15251). However; the Dutch standard uses a slope of only 0.11 for the lower limit. This is shown with a grey hatched triangle in Figure 15.
d The acceptable variations from the optimum temperature (most comfortable temperature) are different. ASHRAE and ATG allow ±3.5 °C and EN15251 uses ±3 °C. This 1 °C difference (in total upper and lower limit) can cause differences in calculations.
e Last but not least, the databases of field studies led to the equations of the standards are different in location and size. ASHRAE used 21,000 measurements from many countries (excluding countries in Africa and South America). The European standard has tried to use data from different climates in Europe (such as France, Sweden, Portugal, Greece and the UK). Finally, ATG used a Dutch database from 2004.
Figure 15 The upper and lower limits of the thermal comfort standards for 80% of acceptability.
i
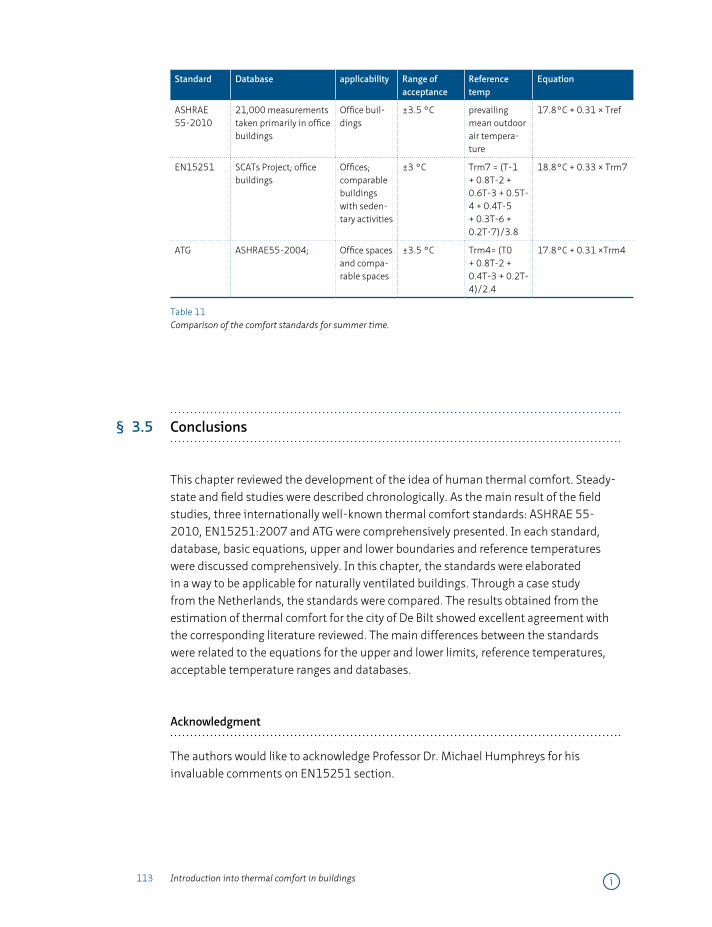
113 Introduction into thermal comfort in buildings
Standard Database applicability Range of acceptance
Reference temp
Equation
ASHRAE 55-2010
21,000 measurements taken primarily in office buildings
Office buil-dings
±3.5 °C prevailing mean outdoor air tempera-ture
17.8°C + 0.31 × Tref
EN15251 SCATs Project; office buildings
Offices; comparable buildings with seden-tary activities
±3 °C Trm7 = (T-1 + 0.8T-2 + 0.6T-3 + 0.5T-4 + 0.4T-5 + 0.3T-6 + 0.2T-7)/3.8
18.8°C + 0.33 × Trm7
ATG ASHRAE55-2004; Office spaces and compa-rable spaces
±3.5 °C Trm4= (T0 + 0.8T-2 + 0.4T-3 + 0.2T-4)/2.4
17.8°C + 0.31 ×Trm4
Table 11 Comparison of the comfort standards for summer time.
§ 3.5 Conclusions
This chapter reviewed the development of the idea of human thermal comfort. Steady-state and field studies were described chronologically. As the main result of the field studies, three internationally well-known thermal comfort standards: ASHRAE 55-2010, EN15251:2007 and ATG were comprehensively presented. In each standard, database, basic equations, upper and lower boundaries and reference temperatures were discussed comprehensively. In this chapter, the standards were elaborated in a way to be applicable for naturally ventilated buildings. Through a case study from the Netherlands, the standards were compared. The results obtained from the estimation of thermal comfort for the city of De Bilt showed excellent agreement with the corresponding literature reviewed. The main differences between the standards were related to the equations for the upper and lower limits, reference temperatures, acceptable temperature ranges and databases.
Acknowledgment
The authors would like to acknowledge Professor Dr. Michael Humphreys for his invaluable comments on EN15251 section.
i
114 Dwelling on Courtyards
References
1 IPCC, Climate Change 2007, in The physical science basis. Contribution of the working group I to the fourth
assessment report of the intergovernmental panel on climate change, S. Solomon, et al., Editors. 2007:
Cambridge.
2 ISO, International Standard 7730. 1984, ISO Geneva, revised 1990.
3 Nicol, J.F., Thermal Comfort- A Handbook for Field Studies toward an Adaptive Model. 1993, London: University of
East London.
4 Sayigh, A. and A.H. Marafia, Chapter 1—Thermal comfort and the development of bioclimatic concept in building
design. Renewable and Sustainable Energy Reviews, 1998. 2(1–2): p. 3-24.
5 Omer, A.M., Renewable building energy systems and passive human comfort solutions. Renewable and
Sustainable Energy Reviews, 2008. 12(6): p. 1562-1587.
6 Raw, G.J. and N.A. Oseland, Why another thermal comfort conference?, in Thermal Comfort: Past, Present and
Future. . 1994, The Building Research Establishment: Garston. p. 1-10.
7 Khodakarami, J. and N. Nasrollahi, Thermal comfort in hospitals – A literature review. Renewable and Sustainable
Energy Reviews, 2012. 16(6): p. 4071-4077.
8 Ormandy, D. and V. Ezratty, Health and thermal comfort: From WHO guidance to housing strategies. Energy Policy,
2012. 49(0): p. 116-121.
9 Chen, A. and V.W.C. Chang, Human health and thermal comfort of office workers in Singapore. Building and
Environment, 2012. 58(0): p. 172-178.
10 Leyten, J.L., S.R. Kurvers, and A.K. Raue, Temperature, thermal sensation and workers’ performance in air-
conditioned and free-running environments. Architectural Science Review, 2012: p. 1-8.
11 Heidari, S., Thermal Comfort in Iranian Courtyard Housing. 2000, PhD Thesis. The University of Sheffield.
12 Blagden, C., Experiments and observations in a heated room. Philosophical Transactions of the Royal Society,
1775. 65: p. 111-123.
13 Gagge, A.P., A new physiological variable associated with sensible and insensible perspiration. American Journal of
Physiology, 1937. 120: p. 277-287.
14 Winslow, C.A., L.P. Herrington, and A.P. Gagge, A new method of partitional calorimetry. american Journal of
Physiology, 1936. 116: p. 641-655.
15 Winslow, C.A., L.P. Herrington, and A.P. Gagge, Physiological reaction of the human body to varying environmental
temperature. American Journal of Physiology 1937. 120: p. 1-22.
16 Gagge, A.P., A.C. Burton, and H.C. Bazett, A practical system of units for the description of the heat exchange of
man with his environment. Science, 1941. 94(2445): p. 428-430.
17 Gagge, A.P., J.A.J. Stolwijk, and Y. Nishi, The prediction of thermal comfort when thermal equilibrium is maintained
by sweating. ASHRAE Transaction, 1969. 75: p. 108-125.
18 18Hill, L., H. Barnard, and J.H. Sequeira, The Effect of Venous Pressure on the Pulse. The Journal of Physiology,
1897. 17(21): p. 147-159.
19 Dufton, A.F., The eupatheostat. Scientific Instruments, 1929. 6: p. 249-251.
20 Yongping, J. and M. Jiuxian, Evolution and evaluation of research on the relation between room airflow and human
thermal comfort. Journal of Heating Ventilating & Air Conditioning, 1999. 29(4): p. 27-30.
21 Ouzi, L., H. Yuli, and L. Xunqian, Study of thermal comfort of occupants and indoor air quality—historical review,
present status and prospects. Building Energy & Environment, 2001. 21(2): p. 26-28.
i
115 Introduction into thermal comfort in buildings
22 Hanqing, W., et al., Dynamic evaluation of thermal comfort environment of air-conditioned buildings. Building and
Environment, 2006. 41(11): p. 1522-1529.
23 Haldane, J.S., The influence of high air temperature. Hygiene, 1905. 5(4): p. 494-513.
24 Hill, L., O.W. Griffith, and M. Flack, The Measurement of the Rate of Heat-Loss at Body Temperature by Convection,
Radiation, and Evaporation. Philosophical Transactions Research Society London B, 1916. 207: p. 183-220.
25 Houghton, F.C. and C.P. Yaglou, Determining equal comfort lines. American Society of Heating Ventilation
Engineers, 1923. 29: p. 165-176.
26 Vernon, H.M. and C.G. Warner, The influence of the humidity of the air on capacity for work at high temperature.
Hygiene, 1932. 32(3): p. 431-463.
27 Robbinson, S., E.S. Turrell, and S.D. Gerking, Physiologically equivalent conditions of air temperature and humidity.
American Journal of Physiology, 1945. 143: p. 21-32.
28 McArdle, B., et al., The prediction of the physiological effects of warm and hot environments, in Medical Research
Council. 1947, London RNP Report 47/391: London.
29 Missenard, A., A thermique des ambiences: équivalences de passage, équivalences de séjours. Chaleur Industry,
1948. 276(159-172 (in French)).
30 Belding, H.S. and T.F. Hatch, Index for evaluating heat stress in terms of resulting physiological strain. Heating,
piping, and air conditioning, 1955. 27: p. 129-136.
31 Yaglou, C.P. and D. Minard, Control of heat casualties at military training centers. AMA Arch.Industr.Health, 1957.
16: p. 302-316.
32 Lind, A.R. and R.F. Hallon, Assessment of physiologic severity of hot climate. Applied Physiology, 1957. 11: p.
35-40.
33 Thom, E.C., The Discomfort Index. Weatherwise, 1959. 12(2): p. 57-61.
34 Lee, D.H.K., Proprioclimates of man and domestic animals, in Climatology, Arid zone research. 1958: UNESCO,
Paris. p. 102-125.
35 Tennenbaum, J., et al., The physiological significance of the cumulative discomfort index (CumDI). Harefuah,
1961. 60: p. 315-319.
36 Givoni, B., The influence of work and environmental conditions on the physiological responses and thermal
equilibrium of man., in f UNESCO Symposium on Environmental Physiology and Psychology in Arid Conditions.
1962: Lucknow. p. 199-204.
37 McKarns, J.S. and R.S. Brief, Nomographs give refined estimate of heat stress index. Heating, piping, and air
conditioning, 1966. 38: p. 113-116.
38 Fuller, F.H. and L. Brouha, New engineering methods for evaluating the job environment. ASHRAE, 1966. 8: p.
39-52.
39 Fanger, P., Thermal Comfort: Analysis and Applications in Environmental Engineering. 1970, Copenhagen Danish
Technical Press.
40 Gagge, A.P., J.A.J. Stolwijk, and Y. Nishi, Effective temperature scale, based on a simple model of human
physiological regulatory response. ASHRAE, 1971. 13(1).
41 Botsford, J.H., A Wet Globe Thermometer for Environmental Heat Measurement. American Industrial Hygiene
Association Journal, 1971. 32(1): p. 1-10.
42 Nishi, Y. and A.P. Gagge, Humid operative temperature. Physiology- Paris, 1971. 63: p. 365-368.
43 Givoni, B. and R.F. Goldman, Predicting rectal temperature response to work, environment and clothing. Applied
Physiology, 1972. 32: p. 812-822.
44 Kerslake, D.M., The stress of hot environment. 1972, Cambridge: Cambridge University Press.
i

116 Dwelling on Courtyards
45 Gonzalez, R.R., Y. Nishi, and A.P. Gagge, Experimental evaluation of standard effective temperature a new
biometeorological index of man’s thermal discomfort. International Journal of Biometeorology, 1974. 18(1): p.
1-15.
46 Givoni, B. and R.F. Goldman, Predicting heart rate response to work, environment, and clothing. Applied
Physiology, 1973. 34: p. 201-204.
47 Gagge, A.P., A.P. Fobelets, and L.G. Berglund, A standard predictive index of human response to the thermal
environment., in ASHRAE Transaction 92. 1986. p. 709-731.
48 Morans, D.S., et al., A modified discomfort index (MDI) as an alternative to the wet bulb globe temperature
(WBGT). in Environmental Ergonomics VIII, Hodgdon JA, Heaney JH, and B. MJ, Editors. 1998: San Diego. p. 77-80.
49 Höppe, P., The physiological equivalent temperature – a universal index for the biometeorological assessment of
the thermal environment. International Journal of Biometeorology, 1999. 43(2): p. 71-75.
50 Moran, D.S., et al., An environmental stress index (ESI) as a substitute for the wet bulb globe temperature (WBGT).
Journal of Thermal Biology, 2001. 26(4–5): p. 427-431.
51 Jendritzky, G., A. Maarouf, and S. Henning, Looking for a Universal Thermal Climate Index UTCI for Outdoor
Applications, in Windsor Conference on Thermal Standards. 2001, Network for Comfort and Energy Use in
Buildings: Windsor, UK.
52 Wallace, R.F., et al., The Effects of Continuous Hot Weather Training on Risk of Exertional Heat Illness. Medicine &
Science in Sports & Exercise, 2005. 37(1): p. 84-90.
53 Epstein, Y. and D.S. Moran, Thermal comfort and the heat stress indices. Industrial Health, 2006. 44: p. 388-398.
54 Nicol, F.J., Thermal Comfort, in Solar Thermal Technologies for Buildings: The State of the Art, M. Santamouris,
Editor. 2003, James & James (Science Publishers) Limited.
55 Stolwijk, J.A.J., A mathematical model of physiological temperature regulation in man. 1971: Washington DC:
National Aeronautics and Space Administration.
56 Parsons, K.C., Human thermal environments: the ffect of hot, moderate, and cold environments on human health,
comfort and performance. 2003: Taylor & Francis.
57 Schellen, L., et al., The use of a thermophysiological model in the built environment to predict thermal sensation:
Coupling with the indoor environment and thermal sensation. Building and Environment, 2012(0).
58 Psikuta, A., et al., Validation of the Fiala multi-node thermophysiological model for UTCI application. International
Journal of Biometeorology, 2012. 56(3): p. 443-460.
59 Fiala, D., K. Lomas, and M. Stohrer, A computer model of human thermoregulation for a wide range of
environmental conditions: the passive system. Journal of Applied Physiology, 1999. 87(5): p. 1957-1972.
60 Wissler, E.H., Mathematical simulation of human thermal behaviour using whole body models, in Heat transfer in
medicine and biology, S. A. and E. R.C., Editors. 1985, Plenum Press: New York. p. 325-373.
61 Huizenga, C., Z. Hui, and E. Arens, A model of human physiology and comfort for assessing complex thermal
environments. Building and Environment, 2001. 36(6): p. 691-699.
62 Fiala, D., et al., UTCI-Fiala multi-node model of human heat transfer and temperature regulation. International
Journal of Biometeorology, 2012. 56(3): p. 429-441.
63 van Marken Lichtenbelt, W.D., et al., Effect of individual characteristics on a mathematical model of human
thermoregulation. Journal of Thermal Biology, 2004. 29(7–8): p. 577-581.
64 van Marken Lichtenbelt, W., et al., Validation of an individualised model of human thermoregulation for predicting
responses to cold air. International Journal of Biometeorology, 2007. 51(3): p. 169-179.
65 Osczevski, R., The basis of wind chill. Arctic, 1995. 48(4): p. 372-382.
i
117 Introduction into thermal comfort in buildings
66 Stolwijk, J.A.J., et al., Development and application of a mathermatical model of human thermoregulation. Archives
des sciences physiologiques, 1973. 27(3): p. A303- A310.
67 Tanabe, S.-i., et al., Evaluation of thermal comfort using combined multi-node thermoregulation (65MN) and
radiation models and computational fluid dynamics (CFD). Energy and Buildings, 2002. 34(6): p. 637-646.
68 Kingma, B., Human thermoregulation- a synergy between physiology and mathematical modelling. 2012,
Maastricht University: Maastricht.
69 Humphreys, M., Thermal Comfort Requirements, Climate and Energy, in the 2nd World Renewable Energy
Congress, A.A.M. Sayigh, Editor. 1992, Pergamon.
70 Humphreys, M.A. and J.F. Nicol, Understanding the adaptive approach to thermal comfort, field studies of thermal
comfort and adaptation. ASHRAE Technical Data Bulletin, 1998. 14(1): p. 1-14.
71 Humphreys, M.A. and F.J. Nicol, The validity of ISO-PMV for predicting comfort votes in every-day thermal
environments. Energy and Buildings, 2002. 34(6): p. 667-684.
72 Fanger, P.O., How to apply models predicting theral sensation and discomfort in practice, in Thermal Comfort: Pas,
Present and Future. 1994, The Building Research Establishment: Garston. p. 11-16.
73 Malama, A., Thermal Comfort and Thermal Performance of Traditional and Contemporary Housing in Zambia.
1997, PhD thesis, University of Sheffield.
74 Humphreys, M.A., Field studies of thermal comfort compared and applied Journal of the Institute of Heating and
Ventilating Engineers, 1976. 44: p. 5-27.
75 Humphreys, M.A., Outdoor temperatures and comfort indoors. Building Research and Practice (Journal of CIB),
1978. 6(2): p. 92-105.
76 Humphreys, M.A., Field studies and climate chamber experiments in thermal comfort research, in Thermal
comfort: past, present, and future, N.A. Oseland and M.A. Humphreys, Editors. 1994, Building Research
Establishment Report: Watford.
77 Humphreys, M.A., An adaptive approach to thermal comfort criteria, in Naturally ventilated buildings: buildings for
the senses, the economy and society, D. Clements-Croome, Editor. 1997, E&FN Spon: London.
78 deDear, R.J. and G.S. Brager, Thermal comfort in naturally ventilated buildings: revisions to ASHRAE Standard 55.
Energy and Buildings, 2002. 34(6): p. 549-561.
79 de Dear, R.J. and A. Auliciems, Validation of the predicted mean vote model of thermal comfort in six Australian
field studies. ASHRAE Transaction, 1985. 91: p. 452-468.
80 Schiller, G.E., A comparison of measured and predicted comfort in office buildings. ASHRAE Transaction, 1990. 96:
p. 609-622.
81 Busch, J.F., Thermal responses to the Thai office environment. ASHRAE Transaction, 1990. 96: p. 859-872.
82 Busch, J.F., A tale of two populations: thermal comfort in air-conditioned and naturally ventilated offices in
Thailand. Energy and Buildings, 1992. 18(3–4): p. 235-249.
83 Fan, Y., S. Lang, and W. Xu, Field study on acceptable thermal conditions for residential buildings in transition zone
of China in Indoor Air 93, J.J.K. Jaakkola, R. Ilmarinen, and O. Seppanen, Editors. 1993: Helsinki. p. 109-114.
84 Oseland, N.A., Thermal comfort in naturally ventilated versus air-conditioned offices, in Indoor Air 96, S.
Yoshizawa, et al., Editors. 1996: Tokyo. p. 215-220.
85 Ealiwa, M.A., et al., Field investigation of thermal comfort in both naturally and mechanically ventilated buildings
in Ghadames, Libya, in Indoor Air 99, G. Raw, C. Aizlewood, and P. Warren, Editors. 1999: Edinburgh. p. 166-171.
86 Nicol, J.F., et al., Climatic variations in comfortable temperatures: the Pakistan projects. Energy and Buildings,
1999. 30(3): p. 261-279.
i
118 Dwelling on Courtyards
87 van der Linden, K., et al., Thermal indoor climate building performance characterized by human comfort response.
Energy and Buildings, 2002. 34(7): p. 737-744.
88 Heidari, S. and S. Sharples, A comparative analysis of short-term and long-term thermal comfort surveys in Iran.
Energy and Buildings, 2002. 34(6): p. 607-614.
89 Feriadi, H. and W.N. Hien, Modelling thermal comfort for tropics using fuzzy logic, in Building Simulation 2003,
J.L.M. Hensen and G. Augenbroe, Editors. 2003: Eindhoven. p. 323-330.
90 Fato, I., F. Martellotta, and C. Chiancarella, Thermal comfort in the climatic conditions of Southern Italy. ASHRAE
Transaction, 2004. 110: p. 578-593.
91 Yamtraipat, N., J. Khedari, and J. Hirunlabh, Thermal comfort standards for air conditioned buildings in hot and
humid Thailand considering additional factors of acclimatization and education level. Solar Energy, 2005. 78(4):
p. 504-517.
92 Van Hoof, J., Forty years of Fanger’s model of thermal comfort: comfort for all? Indoor Air, 2008. 18(3): p. 182-
201.
93 deDear, R. and G. Brager, Developing and adaptive model of thermal comfort and preference. ASHRAE Transaction,
1998. 104(1): p. 145-167.
94 deDear, R., A global database of thermal comfort field experiments. ASHRAE Transaction, 1998. 104(1): p. 1141-
1152.
95 Nicol, J.F. and M.A. Humphreys, Adaptive thermal comfort and sustainable thermal standards for buildings. Energy
and Buildings, 2002. 34(6): p. 563-572.
96 McCartney, K.J. and J. Fergus Nicol, Developing an adaptive control algorithm for Europe. Energy and Buildings,
2002. 34(6): p. 623-635.
97 ASHRAE, ASHRAE Standard 55–2004, in Thermal Environmental Conditions for Human Occupancy. 2004,
ASHRAE Atlanta, GA.
98 deDear, R.J. and G.S. Brager, ASHRAE RP-884 Final Report: developing an adaptive model of thermal comfort and
preference, R.a.A.-C.E. American Society of Heating, Editor. 1997: Atlanta.
99 ASHRAE, ASHRAE Standard 55–2010 in Thermal Environmental Conditions for Human Occupancy. 2010,
ASHRAE Atlanta, GA.
100 CEN, C.E.e.d.N., CEN Standard EN 15251, in Indoor Environmental Input Parameters for Design and Assessment
of Energy Performance of Buildings Addressing Indoor Air Quality, Thermal Environment, Lighting and Acoustics.
2007, CEN: Brussels.
101 McCartney, K.J. and F.J. Nicol, Developing an adaptive control algorithm for Europe. Energy and Buildings, 2002.
34(6): p. 623-635.
102 Kurvers, S., et al., Adaptive Thermal Comfort set to practice: Considerations and experiences with the New Dutch
Guideline, in Healthy Buildings 2006. 2006: Lisbon, Portugal.
103 van der Linden, A.C., et al., Adaptive temperature limits: A new guideline in The Netherlands: A new approach for
the assessment of building performance with respect to thermal indoor climate. Energy and Buildings, 2006.
38(1): p. 8-17.
104 Thermische-Behaaglijkheid, eisen voor de binnentemperatuur in gebouwen, in Publication 74, ISSO. 2004:
Rotterdam.
105 Peeters, L., et al., Thermal comfort in residential buildings: Comfort values and scales for building energy
simulation. Applied Energy, 2009. 86(5): p. 772-780.
106 van Hoof, J. and J.L.M. Hensen, Quantifying the relevance of adaptive thermal comfort models in moderate thermal
climate zones. Building and Environment, 2007. 42(1): p. 156-170.
i
119 Introduction into thermal comfort in buildings
107 Moujalled, B., R. Cantin, and G. Guarracino, Comparison of thermal comfort algorithms in naturally ventilated
office buildings. Energy and Buildings, 2008. 40(12): p. 2215-2223.
108 Sourbron, M. and L. Helsen, Evaluation of adaptive thermal comfort models in moderate climates and their impact
on energy use in office buildings. Energy and Buildings, 2011. 43(2–3): p. 423-432.
109 Borgeson, S. and G. Brager, Comfort standards and variations in exceedance for mixed-mode buildings. Building
Research & Information, 2011. 39(2): p. 118-133.
110 Ferrari, S. and V. Zanotto, Adaptive comfort: Analysis and application of the main indices. Building and
Environment, 2012. 49(0): p. 25-32.
111 Lomas, K.J. and R. Giridharan, Thermal comfort standards, measured internal temperatures and thermal resilience
to climate change of free-running buildings: A case-study of hospital wards. Building and Environment, 2012.
55(0): p. 57-72.
112 Filippín, C. and S. Flores Larsen, Summer thermal behaviour of compact single family housing in a temperate
climate in Argentina. Renewable and Sustainable Energy Reviews, 2012. 16(5): p. 3439-3455.
113 Kottek, M., et al., World Map of the Köppen-Geiger climate classification updated. Meteorologische Zeitschrift,
2006. 15(3).
114 NEN-5128, Energieprestatie van woonfuncties en woongebouwen - Bepalingsmethode. 2004.
i

120 Dwelling on Courtyards i

121 Indoor study
PART 2 Indoor study
i
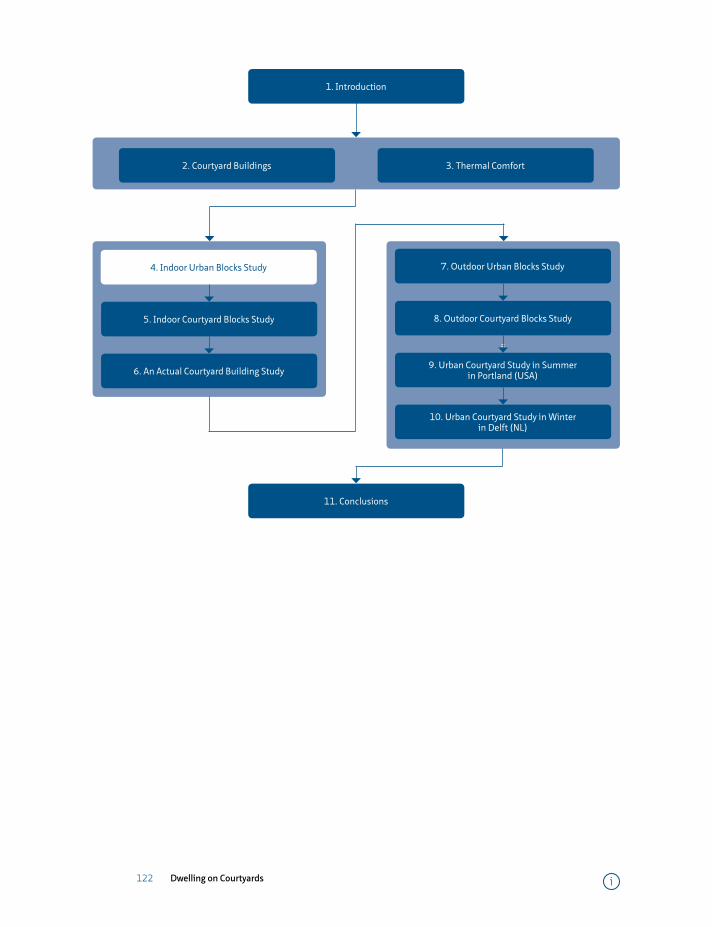
122 Dwelling on Courtyards
=
4. Indoor Urban Blocks Study
5. Indoor Courtyard Blocks Study
6. An Actual Courtyard Building Study
11. Conclusions
=
8. Outdoor Courtyard Blocks Study
9. Urban Courtyard Study in Summer in Portland (USA)
10. Urban Courtyard Study in Winter in Delft (NL)
7. Outdoor Urban Blocks Study
2. Courtyard Buildings 3. Thermal Comfort
1. Introduction
i
123 Indoor thermal comfort in different building blocks
4 Indoor thermal comfort in different building blocks
The previous chapters reviewed the environmental impacts of courtyards and common thermal comfort standards. This chapter begins Part B which discusses indoor thermal comfort in different housing blocks including low-rise residential courtyard buildings.
The main aim is to explore and answer to the question that whether courtyards can provide more indoor comfort and energy efficiency as compared to other building types. The results will determine if this study should go further with courtyard buildings or with other building forms. This chapter discusses a parametric study done by computer simulations for the climate of the Netherlands.
i

124 Dwelling on Courtyards i
125 Indoor thermal comfort in different building blocks
Energy use impact of and thermal comfort in different urban block types in the Netherlands1
Mohammad Taleghani *1, Martin Tenpierik 1, Andy van den Dobbelsteen 1,
Richard deDear 2
1 Delft University of Technology, Delft, the Netherlands2 Faculty of Architecture, Design & Planning, The University of Sydney, Australia
Abstract
This paper discusses the energy and comfort impact of three types of urban block configuration in the Netherlands. The annual heating and lighting energy demand, and summer thermal comfort hours are compared. In total, 102 thermal zones forming single, linear and courtyard building combinations are simulated within the Netherlands’ temperate climate. The results demonstrate the importance of the surface-to-volume ratio in achieving both annual energy ef ficiency and summer thermal comfort. Considering different types with 1-, 2- and 3-storey heights, the courtyard model has the lowest energy demand for heating and the highest number of summer thermal comfort hours.
Keywords
Energy use, thermal comfort, urban block types.
1 Published as: Taleghani M., Tenpierik M., Dobbelsteen A, De Dear R. (2013), “Energy use impact of and thermal comfort in different urban block types in the Netherlands”, Energy and Buildings, 67(2013) 166-175.
i
126 Dwelling on Courtyards
§ 4.1 Introduction
The idea of using the environmentally best building shape was addressed in the 1960s by architects [1] and urban planners [2]. In the beginning, urban designers and planners considered the most favourable land use, whereas architects studied the forces of nature that shape our buildings. Ever since, with increasing environmental concerns and diminishing fossil fuels, more intense attention has been directed to the effect of urban morphology [3-9] and building form [10-12] on energy consumption within the built environment. In this regard, urban designers generally concentrated on the outdoor environment and architects and building physicists on the indoor environment.
On this account, architects’ and urban designers’ responsibilities overlap at the scale of the urban block, potentially causing design conflicts. For instance Olgyay [1], as a building physicist, states “all shapes elongated on the north-south axis work both in winter and summer with less efficiency than the square one. The optimum lies in every case (climate) in a form elongated somewhere along the east-west direction”. However, many studies from urban designers as Yezioro [13] show: “rectangular urban squares elongated along the north–south direction are the best solution (for solar gains)”. Therefore, this chapter tries to investigate the effect of different urban block layouts (urban designers’ decision) on indoor environment (building physicists’ objective).
There is a body of literature dealing with urban block layout effects on the indoor environment. Regarding different layouts, Steemer et al. [7] proposed six archetypal generic urban forms for London (51°N) (Figure 1) and compared incident solar radiation, built potential and day-lighting criteria. They concluded that the courtyard performs best among these six archetypes. Ratti et al. [14] conducted similar analyses for the hot climate city of Marrakech (31°N). Okeil [15] generated a built form named the Residential Solar Block (RSB), which later was compared with a slab and a pavilion court [16]. The RSB was found to lead to an energy efficient neighbourhood layout for a hot and humid climate at a latitude of 25°N. Furthermore, Thapar and Yannas [17] showed the importance of ventilation in urban squares for the hot and humid climate of Dubai. They also indicated the role of vegetation in providing a comfortable microclimate. Yang, Li [18] studied four parameters in Beijing’s climate which influence the urban block thermal environment: block height, thermal mass, material conductivity and surface albedo. They found the geometry (height) of the square is the most important, and the surface albedo the least one. Moreover, Taleghani et al. [19] indicated that a single-family house with no open space is more energy efficient than a courtyard, an atrium and a building with a sunspace in Rotterdam (52°N). The explanation related to the surface-to-volume ratio of dwellings. This chapter continues this work on an urban building scale. In addition, since solar radiation plays an
i
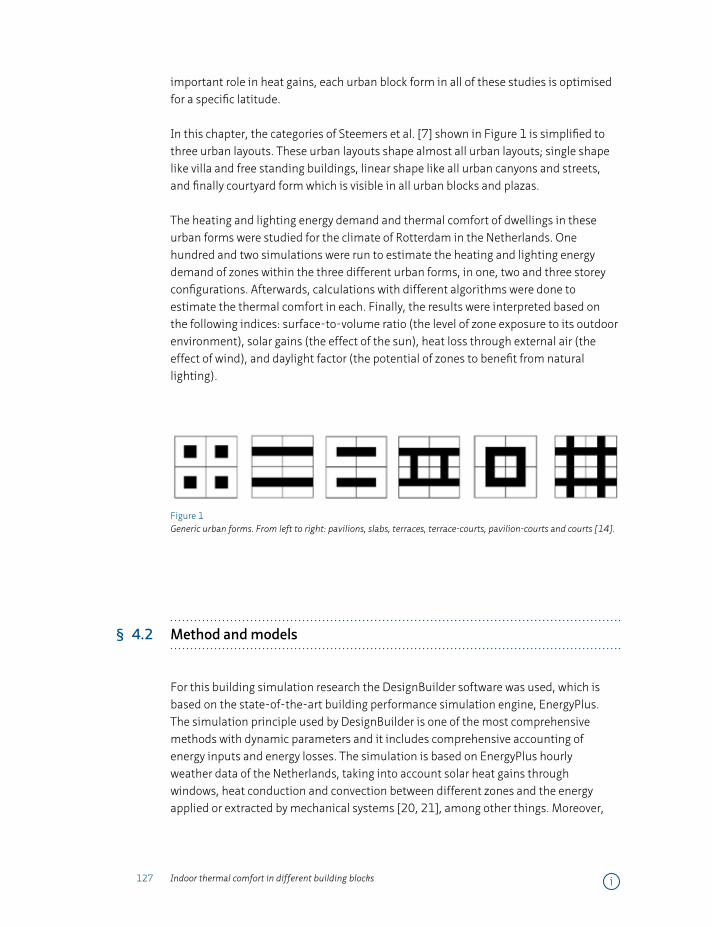
127 Indoor thermal comfort in different building blocks
important role in heat gains, each urban block form in all of these studies is optimised for a specific latitude.
In this chapter, the categories of Steemers et al. [7] shown in Figure 1 is simplified to three urban layouts. These urban layouts shape almost all urban layouts; single shape like villa and free standing buildings, linear shape like all urban canyons and streets, and finally courtyard form which is visible in all urban blocks and plazas.
The heating and lighting energy demand and thermal comfort of dwellings in these urban forms were studied for the climate of Rotterdam in the Netherlands. One hundred and two simulations were run to estimate the heating and lighting energy demand of zones within the three different urban forms, in one, two and three storey configurations. Afterwards, calculations with different algorithms were done to estimate the thermal comfort in each. Finally, the results were interpreted based on the following indices: surface-to-volume ratio (the level of zone exposure to its outdoor environment), solar gains (the effect of the sun), heat loss through external air (the effect of wind), and daylight factor (the potential of zones to benefit from natural lighting).
Figure 1 Generic urban forms. From left to right: pavilions, slabs, terraces, terrace-courts, pavilion-courts and courts [14].
§ 4.2 Method and models
For this building simulation research the DesignBuilder software was used, which is based on the state-of-the-art building performance simulation engine, EnergyPlus. The simulation principle used by DesignBuilder is one of the most comprehensive methods with dynamic parameters and it includes comprehensive accounting of energy inputs and energy losses. The simulation is based on EnergyPlus hourly weather data of the Netherlands, taking into account solar heat gains through windows, heat conduction and convection between different zones and the energy applied or extracted by mechanical systems [20, 21], among other things. Moreover,
i
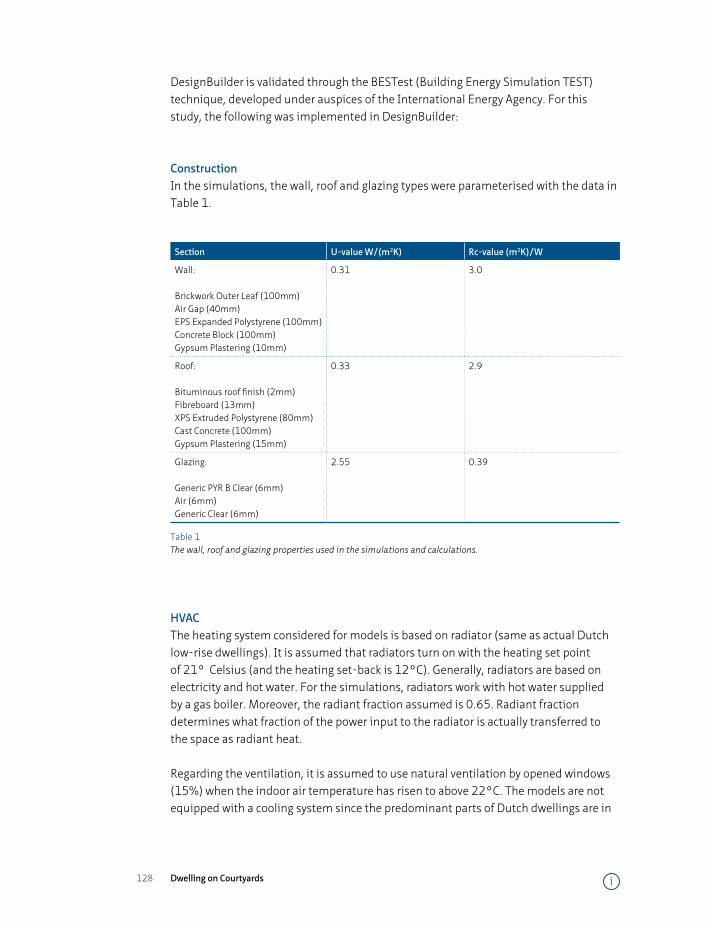
128 Dwelling on Courtyards
DesignBuilder is validated through the BESTest (Building Energy Simulation TEST) technique, developed under auspices of the International Energy Agency. For this study, the following was implemented in DesignBuilder:
ConstructionIn the simulations, the wall, roof and glazing types were parameterised with the data in Table 1.
Section U-value W/(m2K) Rc-value (m2K)/W
Wall:
Brickwork Outer Leaf (100mm)Air Gap (40mm) EPS Expanded Polystyrene (100mm)Concrete Block (100mm)Gypsum Plastering (10mm)
0.31 3.0
Roof:
Bituminous roof finish (2mm)Fibreboard (13mm) XPS Extruded Polystyrene (80mm)Cast Concrete (100mm)Gypsum Plastering (15mm)
0.33 2.9
Glazing:
Generic PYR B Clear (6mm)Air (6mm)Generic Clear (6mm)
2.55 0.39
Table 1 The wall, roof and glazing properties used in the simulations and calculations.
HVACThe heating system considered for models is based on radiator (same as actual Dutch low-rise dwellings). It is assumed that radiators turn on with the heating set point of 21° Celsius (and the heating set-back is 12°C). Generally, radiators are based on electricity and hot water. For the simulations, radiators work with hot water supplied by a gas boiler. Moreover, the radiant fraction assumed is 0.65. Radiant fraction determines what fraction of the power input to the radiator is actually transferred to the space as radiant heat.
Regarding the ventilation, it is assumed to use natural ventilation by opened windows (15%) when the indoor air temperature has risen to above 22°C. The models are not equipped with a cooling system since the predominant parts of Dutch dwellings are in
i
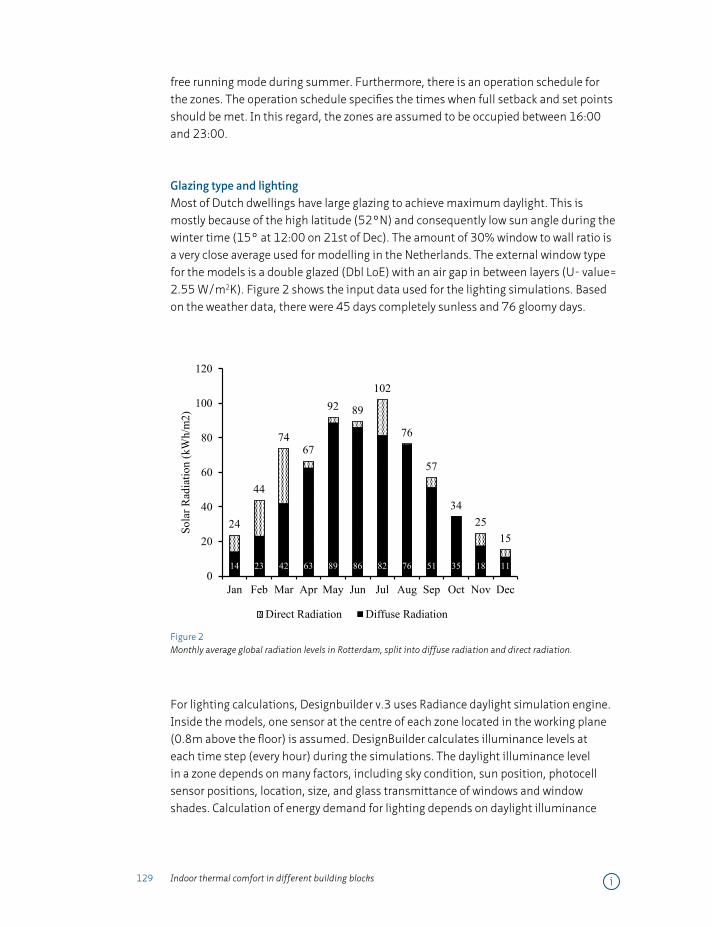
129 Indoor thermal comfort in different building blocks
free running mode during summer. Furthermore, there is an operation schedule for the zones. The operation schedule specifies the times when full setback and set points should be met. In this regard, the zones are assumed to be occupied between 16:00 and 23:00.
Glazing type and lightingMost of Dutch dwellings have large glazing to achieve maximum daylight. This is mostly because of the high latitude (52°N) and consequently low sun angle during the winter time (15° at 12:00 on 21st of Dec). The amount of 30% window to wall ratio is a very close average used for modelling in the Netherlands. The external window type for the models is a double glazed (Dbl LoE) with an air gap in between layers (U- value= 2.55 W/m2K). Figure 2 shows the input data used for the lighting simulations. Based on the weather data, there were 45 days completely sunless and 76 gloomy days.
24
44
74 67
92 89
102
76
57
34 25
15
14 23 42 63 89 86 82 76 51 35 18 11 0
20
40
60
80
100
120
Jan Feb Mar Apr May Jun Jul Aug Sep Oct Nov Dec
Sola
r Rad
iatio
n (k
Wh/
m2)
Direct Radiation Diffuse Radiation
Figure 2 Monthly average global radiation levels in Rotterdam, split into diffuse radiation and direct radiation.
For lighting calculations, Designbuilder v.3 uses Radiance daylight simulation engine. Inside the models, one sensor at the centre of each zone located in the working plane (0.8m above the floor) is assumed. DesignBuilder calculates illuminance levels at each time step (every hour) during the simulations. The daylight illuminance level in a zone depends on many factors, including sky condition, sun position, photocell sensor positions, location, size, and glass transmittance of windows and window shades. Calculation of energy demand for lighting depends on daylight illuminance
i

130 Dwelling on Courtyards
level, illuminance set point, fraction of zone controlled and type of lighting control. In this project, the minimum required illuminance level is 150 lux. Moreover, suspended luminaire type with 0.42 radiation fraction is assumed (this is the fraction of heat from lights that goes into the zone as long wave radiation).
Climatic dataThe climate of Rotterdam (52°N, 4°E) in the Netherlands is known as a temperate climate based on the climatic classification of Köppen-Geiger [22]. The prevailing wind of Rotterdam is South-West. The mean annual dry bulb temperature is 9.9 °C (Figures 3).
0
2
4
6
8
10
12
14
16
18
20
0
4
8
12
16
20
Jan Feb Mar Apr May Jun Jul Aug Sep Oct Nov Dec
Win
d Sp
eed
(m/s
)
Tem
pera
ture
(°C
)
Drybulb Temp Wind speed
Figure 3 Mean dry bulb outdoor temperature and mean wind speed of Rotterdam as used in the calculations.
Zone shape and sizeThe dwellings modelled are based on square zone modules with a net size of 5 * 5 meter. A single zone with the mentioned dimensions is the first model. Two linear models containing 8 zones (2 * 4 zones) are the second model. The elongation of two lines is in east west direction. The distance between two lines is 5 meters. The third main model is a courtyard building involving 8 zones. A courtyard at the centre of a block of houses is also net 5 * 5 meter (Figure 4, above). Furthermore, the window to wall ratio is 30%. This chapter presents results in tabular format corresponding to their physical forms (Figure 4, below). Moreover, the surface to volume ratio of each model is described in Table 2. Below- The layout of the different building types: single zone, linear combination, and courtyard combination of zones.
i
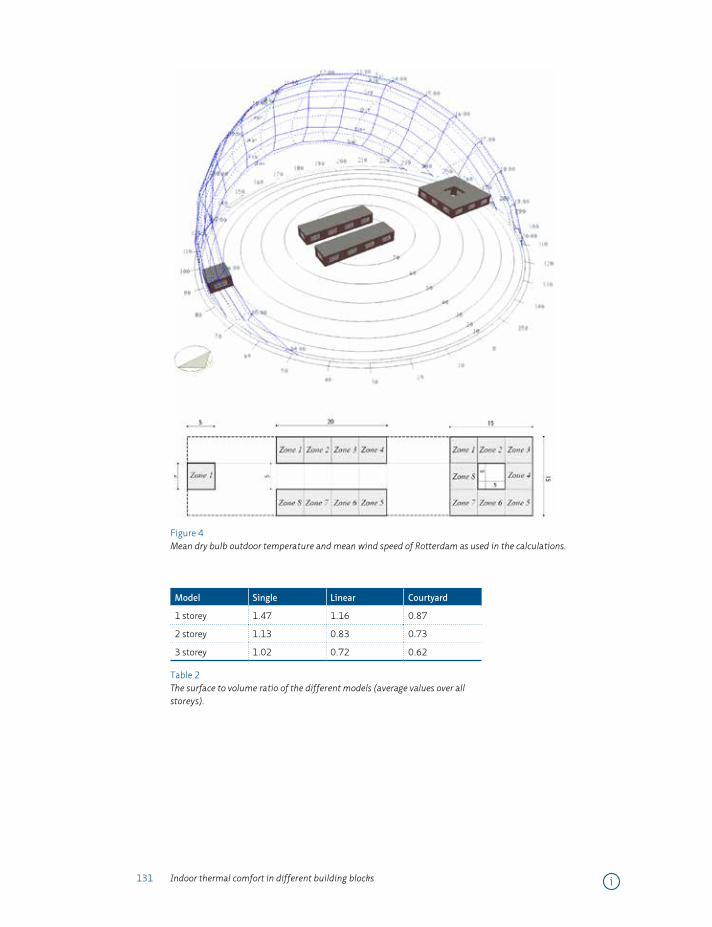
131 Indoor thermal comfort in different building blocks
Figure 4 Mean dry bulb outdoor temperature and mean wind speed of Rotterdam as used in the calculations.
Model Single Linear Courtyard
1 storey 1.47 1.16 0.87
2 storey 1.13 0.83 0.73
3 storey 1.02 0.72 0.62
Table 2 The surface to volume ratio of the different models (average values over all storeys).
i
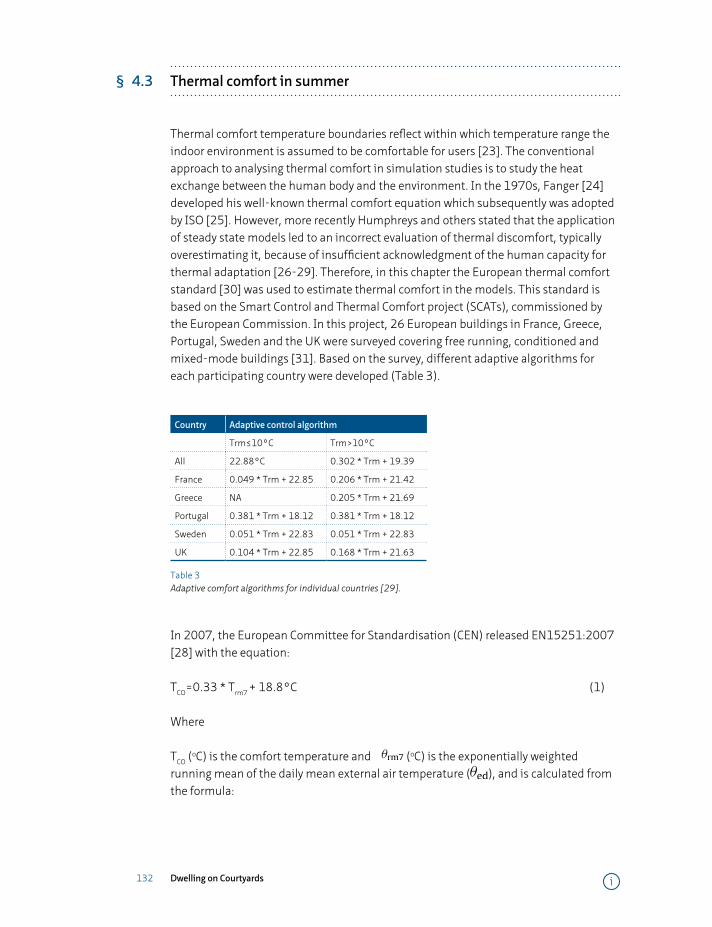
132 Dwelling on Courtyards
§ 4.3 Thermal comfort in summer
Thermal comfort temperature boundaries reflect within which temperature range the indoor environment is assumed to be comfortable for users [23]. The conventional approach to analysing thermal comfort in simulation studies is to study the heat exchange between the human body and the environment. In the 1970s, Fanger [24] developed his well-known thermal comfort equation which subsequently was adopted by ISO [25]. However, more recently Humphreys and others stated that the application of steady state models led to an incorrect evaluation of thermal discomfort, typically overestimating it, because of insufficient acknowledgment of the human capacity for thermal adaptation [26-29]. Therefore, in this chapter the European thermal comfort standard [30] was used to estimate thermal comfort in the models. This standard is based on the Smart Control and Thermal Comfort project (SCATs), commissioned by the European Commission. In this project, 26 European buildings in France, Greece, Portugal, Sweden and the UK were surveyed covering free running, conditioned and mixed-mode buildings [31]. Based on the survey, different adaptive algorithms for each participating country were developed (Table 3).
Country Adaptive control algorithm
Trm≤10°C Trm>10°C
All 22.88°C 0.302 * Trm + 19.39
France 0.049 * Trm + 22.85 0.206 * Trm + 21.42
Greece NA 0.205 * Trm + 21.69
Portugal 0.381 * Trm + 18.12 0.381 * Trm + 18.12
Sweden 0.051 * Trm + 22.83 0.051 * Trm + 22.83
UK 0.104 * Trm + 22.85 0.168 * Trm + 21.63
Table 3 Adaptive comfort algorithms for individual countries [29].
In 2007, the European Committee for Standardisation (CEN) released EN15251:2007 [28] with the equation:
TCO=0.33 * Trm7 + 18.8°C (1)
Where
TCO (oC) is the comfort temperature and
168 M. Taleghani et al. / Energy and Buildings 67 (2013) 166–175
0
2
4
6
8
10
12
14
16
18
20
0
4
8
12
16
20
Jan Feb Mar Apr May Jun Jul Aug Sep Oct Nov Dec
Win
d Sp
eed
(m/s
)
Tem
pera
ture
(°C
)
Drybulb Temp Wind speed
Fig. 3. Mean dry bulb outdoor temperature and mean wind speed of Rotterdam asused in the calculations.
Table 2The surface to volume ratio of the different models (average values over all storeys).
Model Single Linear Courtyard
1 storey 1.47 1.16 0.872 storey 1.13 0.83 0.733 storey 1.02 0.72 0.62
lighting simulations. Based on the weather data, there were 45 dayscompletely sunless and 76 gloomy days.
For lighting calculations, Designbuilder v.3 uses radiance day-light simulation engine. Inside the models, one sensor at the centreof each zone located in the working plane (0.8 m above the floor)is assumed. DesignBuilder calculates illuminance levels at eachtime step (every hour) during the simulations. The daylight illu-minance level in a zone depends on many factors, including skycondition, sun position, photocell sensor positions, location, size,and glass transmittance of windows and window shades. Calcula-tion of energy demand for lighting depends on daylight illuminancelevel, illuminance set point, fraction of zone controlled and typeof lighting control. In this project, the minimum required illumi-nance level is 150 lux. Moreover, suspended luminaire type with0.42 radiation fraction is assumed (this is the fraction of heat fromlights that goes into the zone as long wave radiation).
Climatic data The climate of Rotterdam (52◦N, 4◦E) in theNetherlands is known as a temperate climate based on the climaticclassification of Köppen–Geiger [22]. The prevailing wind of Rot-terdam is South–West. The mean annual dry bulb temperature is9.9 ◦C (Fig. 3).
Zone shape and size The dwellings modelled are based on squarezone modules with a net size of 5 × 5 m. A single zone with the men-tioned dimensions is the first model. Two linear models containing8 zones (2 × 4 zones) are the second model. The elongation of twolines is in east west direction. The distance between two lines is 5 m.
The third main model is a courtyard building involving 8 zones. Acourtyard at the centre of a block of houses is also net 5 × 5 m (Fig. 4,above). Furthermore, the window to wall ratio is 30%. This paperpresents results in tabular format corresponding to their physicalforms (Fig. 4, below). Moreover, the surface to volume ratio of eachmodel is described in Table 2.
Table 3Adaptive Comfort Algorithms for individual countries [31].
Country Adaptive Control Algorithm
Trm ≤ 10 ◦C Trm > 10 ◦C
All 22.88 ◦C 0.302 × Trm + 19.39France 0.049 × Trm + 22.58 0.206 × Trm + 21.42Greece NA 0.205 × Trm + 21.69Portugal 0.381 × Trm + 18.12 0.381 × Trm + 18.12Sweden 0.051 × Trm + 22.83 0.051 × Trm + 22.83UK 0.104 × Trm + 22.58 0.168 × Trm + 21.63
3. Thermal comfort in summer
Thermal comfort temperature boundaries reflect within whichtemperature range the indoor environment is assumed to be com-fortable for users [23]. The conventional approach to analysingthermal comfort in simulation studies is to study the heat exchangebetween the human body and the environment. In the 1970s,Fanger [24] developed his well-known thermal comfort equa-tion, which subsequently was adopted by ISO [25]. However,more recently Humphreys and others stated that the applicationof steady state models led to an incorrect evaluation of ther-mal discomfort, typically overestimating it, because of insufficientacknowledgement of the human capacity for thermal adaptation[26–29]. Therefore, in this paper the European thermal comfortstandard [30] was used to estimate thermal comfort in the models.This standard is based on the Smart Control and Thermal Com-fort project (SCATs), commissioned by the European Commission.In this project, 26 European buildings in France, Greece, Portugal,Sweden and the UK were surveyed covering free running, con-ditioned and mixed-mode buildings [31]. Based on the survey,different adaptive algorithms for each participating country weredeveloped (Table 3).
In 2007, the European Committee for Standardisation (CEN)released EN15251:2007 [30] with the equation:
Tco = 0.33 × �rm7 + 18.8 ◦C (1)
WhereTco [◦C] is the comfort temperature and �rm7 [◦C] is the expo-nentially weighted running mean of the daily mean external airtemperature (�ed), and is calculated from the formula:
�rm = (1 − ˛) × (�ed−1 + ˛.�ed−2 + ˛.�ed−3 + . . .) (2)
This equation can be simplified to:
�rm = (1 − ˛) × (�ed−1 + ˛.�rm−1) (3)
where˛ is a reference constant value, ranging between 0 and 1,
�rm = Running mean temperature for today, �rm−1 = Running meantemperature for previous day, �ed−1 = the daily mean external tem-perature for the previous day, �ed−2 = the daily mean temperaturefor the day before, and so on.
Humphreys proposed 0.8 for ˛ based on the average of fivecountries studied in SCATs project. Therefore, the following approx-imate formula can be used where records of daily mean externaltemperature are not available:
�rm7 = (�ed−1 + 0.8�ed−2 + 0.6�ed−3 + 0.5�ed−4 + 0.4�ed−5 + 0.3�ed−6 + 0.2�ed−7)3.8
(4)
Furthermore, the extent of the deviation of the indoor operativetemperature from the comfort temperature is divided into fourcategories (Table 4). Category II is selected as it matches with thebuilding types studied in this paper.
The second category covers approximately 80% of satisfactionfor building occupants. Furthermore, based on the comfort algo-rithm and the range permitted for the second category, ±3 ◦C, Fig. 5
(oC) is the exponentially weighted running mean of the daily mean external air temperature (
168 M. Taleghani et al. / Energy and Buildings 67 (2013) 166–175
0
2
4
6
8
10
12
14
16
18
20
0
4
8
12
16
20
Jan Feb Mar Apr May Jun Jul Aug Sep Oct Nov Dec
Win
d Sp
eed
(m/s
)
Tem
pera
ture
(°C
)
Drybulb Temp Wind speed
Fig. 3. Mean dry bulb outdoor temperature and mean wind speed of Rotterdam asused in the calculations.
Table 2The surface to volume ratio of the different models (average values over all storeys).
Model Single Linear Courtyard
1 storey 1.47 1.16 0.872 storey 1.13 0.83 0.733 storey 1.02 0.72 0.62
lighting simulations. Based on the weather data, there were 45 dayscompletely sunless and 76 gloomy days.
For lighting calculations, Designbuilder v.3 uses radiance day-light simulation engine. Inside the models, one sensor at the centreof each zone located in the working plane (0.8 m above the floor)is assumed. DesignBuilder calculates illuminance levels at eachtime step (every hour) during the simulations. The daylight illu-minance level in a zone depends on many factors, including skycondition, sun position, photocell sensor positions, location, size,and glass transmittance of windows and window shades. Calcula-tion of energy demand for lighting depends on daylight illuminancelevel, illuminance set point, fraction of zone controlled and typeof lighting control. In this project, the minimum required illumi-nance level is 150 lux. Moreover, suspended luminaire type with0.42 radiation fraction is assumed (this is the fraction of heat fromlights that goes into the zone as long wave radiation).
Climatic data The climate of Rotterdam (52◦N, 4◦E) in theNetherlands is known as a temperate climate based on the climaticclassification of Köppen–Geiger [22]. The prevailing wind of Rot-terdam is South–West. The mean annual dry bulb temperature is9.9 ◦C (Fig. 3).
Zone shape and size The dwellings modelled are based on squarezone modules with a net size of 5 × 5 m. A single zone with the men-tioned dimensions is the first model. Two linear models containing8 zones (2 × 4 zones) are the second model. The elongation of twolines is in east west direction. The distance between two lines is 5 m.
The third main model is a courtyard building involving 8 zones. Acourtyard at the centre of a block of houses is also net 5 × 5 m (Fig. 4,above). Furthermore, the window to wall ratio is 30%. This paperpresents results in tabular format corresponding to their physicalforms (Fig. 4, below). Moreover, the surface to volume ratio of eachmodel is described in Table 2.
Table 3Adaptive Comfort Algorithms for individual countries [31].
Country Adaptive Control Algorithm
Trm ≤ 10 ◦C Trm > 10 ◦C
All 22.88 ◦C 0.302 × Trm + 19.39France 0.049 × Trm + 22.58 0.206 × Trm + 21.42Greece NA 0.205 × Trm + 21.69Portugal 0.381 × Trm + 18.12 0.381 × Trm + 18.12Sweden 0.051 × Trm + 22.83 0.051 × Trm + 22.83UK 0.104 × Trm + 22.58 0.168 × Trm + 21.63
3. Thermal comfort in summer
Thermal comfort temperature boundaries reflect within whichtemperature range the indoor environment is assumed to be com-fortable for users [23]. The conventional approach to analysingthermal comfort in simulation studies is to study the heat exchangebetween the human body and the environment. In the 1970s,Fanger [24] developed his well-known thermal comfort equa-tion, which subsequently was adopted by ISO [25]. However,more recently Humphreys and others stated that the applicationof steady state models led to an incorrect evaluation of ther-mal discomfort, typically overestimating it, because of insufficientacknowledgement of the human capacity for thermal adaptation[26–29]. Therefore, in this paper the European thermal comfortstandard [30] was used to estimate thermal comfort in the models.This standard is based on the Smart Control and Thermal Com-fort project (SCATs), commissioned by the European Commission.In this project, 26 European buildings in France, Greece, Portugal,Sweden and the UK were surveyed covering free running, con-ditioned and mixed-mode buildings [31]. Based on the survey,different adaptive algorithms for each participating country weredeveloped (Table 3).
In 2007, the European Committee for Standardisation (CEN)released EN15251:2007 [30] with the equation:
Tco = 0.33 × �rm7 + 18.8 ◦C (1)
WhereTco [◦C] is the comfort temperature and �rm7 [◦C] is the expo-nentially weighted running mean of the daily mean external airtemperature (�ed), and is calculated from the formula:
�rm = (1 − ˛) × (�ed−1 + ˛.�ed−2 + ˛.�ed−3 + . . .) (2)
This equation can be simplified to:
�rm = (1 − ˛) × (�ed−1 + ˛.�rm−1) (3)
where˛ is a reference constant value, ranging between 0 and 1,
�rm = Running mean temperature for today, �rm−1 = Running meantemperature for previous day, �ed−1 = the daily mean external tem-perature for the previous day, �ed−2 = the daily mean temperaturefor the day before, and so on.
Humphreys proposed 0.8 for ˛ based on the average of fivecountries studied in SCATs project. Therefore, the following approx-imate formula can be used where records of daily mean externaltemperature are not available:
�rm7 = (�ed−1 + 0.8�ed−2 + 0.6�ed−3 + 0.5�ed−4 + 0.4�ed−5 + 0.3�ed−6 + 0.2�ed−7)3.8
(4)
Furthermore, the extent of the deviation of the indoor operativetemperature from the comfort temperature is divided into fourcategories (Table 4). Category II is selected as it matches with thebuilding types studied in this paper.
The second category covers approximately 80% of satisfactionfor building occupants. Furthermore, based on the comfort algo-rithm and the range permitted for the second category, ±3 ◦C, Fig. 5
), and is calculated from the formula:
i
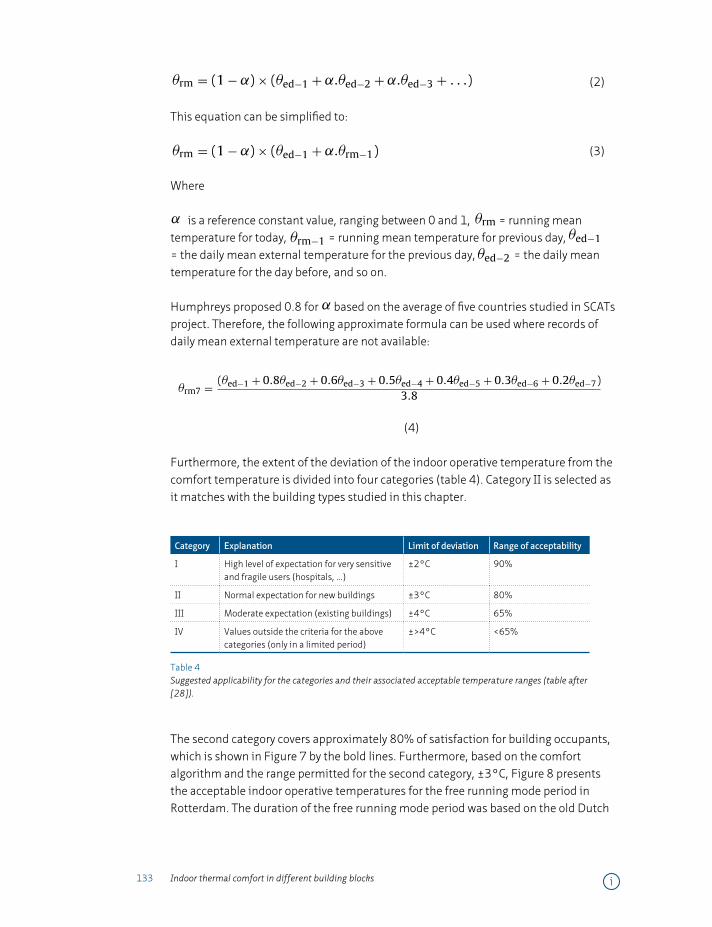
133 Indoor thermal comfort in different building blocks
168 M. Taleghani et al. / Energy and Buildings 67 (2013) 166–175
0
2
4
6
8
10
12
14
16
18
20
0
4
8
12
16
20
Jan Feb Mar Apr May Jun Jul Aug Sep Oct Nov Dec
Win
d Sp
eed
(m/s
)
Tem
pera
ture
(°C
)
Drybulb Temp Wind speed
Fig. 3. Mean dry bulb outdoor temperature and mean wind speed of Rotterdam asused in the calculations.
Table 2The surface to volume ratio of the different models (average values over all storeys).
Model Single Linear Courtyard
1 storey 1.47 1.16 0.872 storey 1.13 0.83 0.733 storey 1.02 0.72 0.62
lighting simulations. Based on the weather data, there were 45 dayscompletely sunless and 76 gloomy days.
For lighting calculations, Designbuilder v.3 uses radiance day-light simulation engine. Inside the models, one sensor at the centreof each zone located in the working plane (0.8 m above the floor)is assumed. DesignBuilder calculates illuminance levels at eachtime step (every hour) during the simulations. The daylight illu-minance level in a zone depends on many factors, including skycondition, sun position, photocell sensor positions, location, size,and glass transmittance of windows and window shades. Calcula-tion of energy demand for lighting depends on daylight illuminancelevel, illuminance set point, fraction of zone controlled and typeof lighting control. In this project, the minimum required illumi-nance level is 150 lux. Moreover, suspended luminaire type with0.42 radiation fraction is assumed (this is the fraction of heat fromlights that goes into the zone as long wave radiation).
Climatic data The climate of Rotterdam (52◦N, 4◦E) in theNetherlands is known as a temperate climate based on the climaticclassification of Köppen–Geiger [22]. The prevailing wind of Rot-terdam is South–West. The mean annual dry bulb temperature is9.9 ◦C (Fig. 3).
Zone shape and size The dwellings modelled are based on squarezone modules with a net size of 5 × 5 m. A single zone with the men-tioned dimensions is the first model. Two linear models containing8 zones (2 × 4 zones) are the second model. The elongation of twolines is in east west direction. The distance between two lines is 5 m.
The third main model is a courtyard building involving 8 zones. Acourtyard at the centre of a block of houses is also net 5 × 5 m (Fig. 4,above). Furthermore, the window to wall ratio is 30%. This paperpresents results in tabular format corresponding to their physicalforms (Fig. 4, below). Moreover, the surface to volume ratio of eachmodel is described in Table 2.
Table 3Adaptive Comfort Algorithms for individual countries [31].
Country Adaptive Control Algorithm
Trm ≤ 10 ◦C Trm > 10 ◦C
All 22.88 ◦C 0.302 × Trm + 19.39France 0.049 × Trm + 22.58 0.206 × Trm + 21.42Greece NA 0.205 × Trm + 21.69Portugal 0.381 × Trm + 18.12 0.381 × Trm + 18.12Sweden 0.051 × Trm + 22.83 0.051 × Trm + 22.83UK 0.104 × Trm + 22.58 0.168 × Trm + 21.63
3. Thermal comfort in summer
Thermal comfort temperature boundaries reflect within whichtemperature range the indoor environment is assumed to be com-fortable for users [23]. The conventional approach to analysingthermal comfort in simulation studies is to study the heat exchangebetween the human body and the environment. In the 1970s,Fanger [24] developed his well-known thermal comfort equa-tion, which subsequently was adopted by ISO [25]. However,more recently Humphreys and others stated that the applicationof steady state models led to an incorrect evaluation of ther-mal discomfort, typically overestimating it, because of insufficientacknowledgement of the human capacity for thermal adaptation[26–29]. Therefore, in this paper the European thermal comfortstandard [30] was used to estimate thermal comfort in the models.This standard is based on the Smart Control and Thermal Com-fort project (SCATs), commissioned by the European Commission.In this project, 26 European buildings in France, Greece, Portugal,Sweden and the UK were surveyed covering free running, con-ditioned and mixed-mode buildings [31]. Based on the survey,different adaptive algorithms for each participating country weredeveloped (Table 3).
In 2007, the European Committee for Standardisation (CEN)released EN15251:2007 [30] with the equation:
Tco = 0.33 × �rm7 + 18.8 ◦C (1)
WhereTco [◦C] is the comfort temperature and �rm7 [◦C] is the expo-nentially weighted running mean of the daily mean external airtemperature (�ed), and is calculated from the formula:
�rm = (1 − ˛) × (�ed−1 + ˛.�ed−2 + ˛.�ed−3 + . . .) (2)
This equation can be simplified to:
�rm = (1 − ˛) × (�ed−1 + ˛.�rm−1) (3)
where˛ is a reference constant value, ranging between 0 and 1,
�rm = Running mean temperature for today, �rm−1 = Running meantemperature for previous day, �ed−1 = the daily mean external tem-perature for the previous day, �ed−2 = the daily mean temperaturefor the day before, and so on.
Humphreys proposed 0.8 for ˛ based on the average of fivecountries studied in SCATs project. Therefore, the following approx-imate formula can be used where records of daily mean externaltemperature are not available:
�rm7 = (�ed−1 + 0.8�ed−2 + 0.6�ed−3 + 0.5�ed−4 + 0.4�ed−5 + 0.3�ed−6 + 0.2�ed−7)3.8
(4)
Furthermore, the extent of the deviation of the indoor operativetemperature from the comfort temperature is divided into fourcategories (Table 4). Category II is selected as it matches with thebuilding types studied in this paper.
The second category covers approximately 80% of satisfactionfor building occupants. Furthermore, based on the comfort algo-rithm and the range permitted for the second category, ±3 ◦C, Fig. 5
(2)
This equation can be simplified to:
168 M. Taleghani et al. / Energy and Buildings 67 (2013) 166–175
0
2
4
6
8
10
12
14
16
18
20
0
4
8
12
16
20
Jan Feb Mar Apr May Jun Jul Aug Sep Oct Nov Dec
Win
d Sp
eed
(m/s
)
Tem
pera
ture
(°C
)
Drybulb Temp Wind speed
Fig. 3. Mean dry bulb outdoor temperature and mean wind speed of Rotterdam asused in the calculations.
Table 2The surface to volume ratio of the different models (average values over all storeys).
Model Single Linear Courtyard
1 storey 1.47 1.16 0.872 storey 1.13 0.83 0.733 storey 1.02 0.72 0.62
lighting simulations. Based on the weather data, there were 45 dayscompletely sunless and 76 gloomy days.
For lighting calculations, Designbuilder v.3 uses radiance day-light simulation engine. Inside the models, one sensor at the centreof each zone located in the working plane (0.8 m above the floor)is assumed. DesignBuilder calculates illuminance levels at eachtime step (every hour) during the simulations. The daylight illu-minance level in a zone depends on many factors, including skycondition, sun position, photocell sensor positions, location, size,and glass transmittance of windows and window shades. Calcula-tion of energy demand for lighting depends on daylight illuminancelevel, illuminance set point, fraction of zone controlled and typeof lighting control. In this project, the minimum required illumi-nance level is 150 lux. Moreover, suspended luminaire type with0.42 radiation fraction is assumed (this is the fraction of heat fromlights that goes into the zone as long wave radiation).
Climatic data The climate of Rotterdam (52◦N, 4◦E) in theNetherlands is known as a temperate climate based on the climaticclassification of Köppen–Geiger [22]. The prevailing wind of Rot-terdam is South–West. The mean annual dry bulb temperature is9.9 ◦C (Fig. 3).
Zone shape and size The dwellings modelled are based on squarezone modules with a net size of 5 × 5 m. A single zone with the men-tioned dimensions is the first model. Two linear models containing8 zones (2 × 4 zones) are the second model. The elongation of twolines is in east west direction. The distance between two lines is 5 m.
The third main model is a courtyard building involving 8 zones. Acourtyard at the centre of a block of houses is also net 5 × 5 m (Fig. 4,above). Furthermore, the window to wall ratio is 30%. This paperpresents results in tabular format corresponding to their physicalforms (Fig. 4, below). Moreover, the surface to volume ratio of eachmodel is described in Table 2.
Table 3Adaptive Comfort Algorithms for individual countries [31].
Country Adaptive Control Algorithm
Trm ≤ 10 ◦C Trm > 10 ◦C
All 22.88 ◦C 0.302 × Trm + 19.39France 0.049 × Trm + 22.58 0.206 × Trm + 21.42Greece NA 0.205 × Trm + 21.69Portugal 0.381 × Trm + 18.12 0.381 × Trm + 18.12Sweden 0.051 × Trm + 22.83 0.051 × Trm + 22.83UK 0.104 × Trm + 22.58 0.168 × Trm + 21.63
3. Thermal comfort in summer
Thermal comfort temperature boundaries reflect within whichtemperature range the indoor environment is assumed to be com-fortable for users [23]. The conventional approach to analysingthermal comfort in simulation studies is to study the heat exchangebetween the human body and the environment. In the 1970s,Fanger [24] developed his well-known thermal comfort equa-tion, which subsequently was adopted by ISO [25]. However,more recently Humphreys and others stated that the applicationof steady state models led to an incorrect evaluation of ther-mal discomfort, typically overestimating it, because of insufficientacknowledgement of the human capacity for thermal adaptation[26–29]. Therefore, in this paper the European thermal comfortstandard [30] was used to estimate thermal comfort in the models.This standard is based on the Smart Control and Thermal Com-fort project (SCATs), commissioned by the European Commission.In this project, 26 European buildings in France, Greece, Portugal,Sweden and the UK were surveyed covering free running, con-ditioned and mixed-mode buildings [31]. Based on the survey,different adaptive algorithms for each participating country weredeveloped (Table 3).
In 2007, the European Committee for Standardisation (CEN)released EN15251:2007 [30] with the equation:
Tco = 0.33 × �rm7 + 18.8 ◦C (1)
WhereTco [◦C] is the comfort temperature and �rm7 [◦C] is the expo-nentially weighted running mean of the daily mean external airtemperature (�ed), and is calculated from the formula:
�rm = (1 − ˛) × (�ed−1 + ˛.�ed−2 + ˛.�ed−3 + . . .) (2)
This equation can be simplified to:
�rm = (1 − ˛) × (�ed−1 + ˛.�rm−1) (3)
where˛ is a reference constant value, ranging between 0 and 1,
�rm = Running mean temperature for today, �rm−1 = Running meantemperature for previous day, �ed−1 = the daily mean external tem-perature for the previous day, �ed−2 = the daily mean temperaturefor the day before, and so on.
Humphreys proposed 0.8 for ˛ based on the average of fivecountries studied in SCATs project. Therefore, the following approx-imate formula can be used where records of daily mean externaltemperature are not available:
�rm7 = (�ed−1 + 0.8�ed−2 + 0.6�ed−3 + 0.5�ed−4 + 0.4�ed−5 + 0.3�ed−6 + 0.2�ed−7)3.8
(4)
Furthermore, the extent of the deviation of the indoor operativetemperature from the comfort temperature is divided into fourcategories (Table 4). Category II is selected as it matches with thebuilding types studied in this paper.
The second category covers approximately 80% of satisfactionfor building occupants. Furthermore, based on the comfort algo-rithm and the range permitted for the second category, ±3 ◦C, Fig. 5
(3)
Where
168 M. Taleghani et al. / Energy and Buildings 67 (2013) 166–175
0
2
4
6
8
10
12
14
16
18
20
0
4
8
12
16
20
Jan Feb Mar Apr May Jun Jul Aug Sep Oct Nov Dec
Win
d Sp
eed
(m/s
)
Tem
pera
ture
(°C
)
Drybulb Temp Wind speed
Fig. 3. Mean dry bulb outdoor temperature and mean wind speed of Rotterdam asused in the calculations.
Table 2The surface to volume ratio of the different models (average values over all storeys).
Model Single Linear Courtyard
1 storey 1.47 1.16 0.872 storey 1.13 0.83 0.733 storey 1.02 0.72 0.62
lighting simulations. Based on the weather data, there were 45 dayscompletely sunless and 76 gloomy days.
For lighting calculations, Designbuilder v.3 uses radiance day-light simulation engine. Inside the models, one sensor at the centreof each zone located in the working plane (0.8 m above the floor)is assumed. DesignBuilder calculates illuminance levels at eachtime step (every hour) during the simulations. The daylight illu-minance level in a zone depends on many factors, including skycondition, sun position, photocell sensor positions, location, size,and glass transmittance of windows and window shades. Calcula-tion of energy demand for lighting depends on daylight illuminancelevel, illuminance set point, fraction of zone controlled and typeof lighting control. In this project, the minimum required illumi-nance level is 150 lux. Moreover, suspended luminaire type with0.42 radiation fraction is assumed (this is the fraction of heat fromlights that goes into the zone as long wave radiation).
Climatic data The climate of Rotterdam (52◦N, 4◦E) in theNetherlands is known as a temperate climate based on the climaticclassification of Köppen–Geiger [22]. The prevailing wind of Rot-terdam is South–West. The mean annual dry bulb temperature is9.9 ◦C (Fig. 3).
Zone shape and size The dwellings modelled are based on squarezone modules with a net size of 5 × 5 m. A single zone with the men-tioned dimensions is the first model. Two linear models containing8 zones (2 × 4 zones) are the second model. The elongation of twolines is in east west direction. The distance between two lines is 5 m.
The third main model is a courtyard building involving 8 zones. Acourtyard at the centre of a block of houses is also net 5 × 5 m (Fig. 4,above). Furthermore, the window to wall ratio is 30%. This paperpresents results in tabular format corresponding to their physicalforms (Fig. 4, below). Moreover, the surface to volume ratio of eachmodel is described in Table 2.
Table 3Adaptive Comfort Algorithms for individual countries [31].
Country Adaptive Control Algorithm
Trm ≤ 10 ◦C Trm > 10 ◦C
All 22.88 ◦C 0.302 × Trm + 19.39France 0.049 × Trm + 22.58 0.206 × Trm + 21.42Greece NA 0.205 × Trm + 21.69Portugal 0.381 × Trm + 18.12 0.381 × Trm + 18.12Sweden 0.051 × Trm + 22.83 0.051 × Trm + 22.83UK 0.104 × Trm + 22.58 0.168 × Trm + 21.63
3. Thermal comfort in summer
Thermal comfort temperature boundaries reflect within whichtemperature range the indoor environment is assumed to be com-fortable for users [23]. The conventional approach to analysingthermal comfort in simulation studies is to study the heat exchangebetween the human body and the environment. In the 1970s,Fanger [24] developed his well-known thermal comfort equa-tion, which subsequently was adopted by ISO [25]. However,more recently Humphreys and others stated that the applicationof steady state models led to an incorrect evaluation of ther-mal discomfort, typically overestimating it, because of insufficientacknowledgement of the human capacity for thermal adaptation[26–29]. Therefore, in this paper the European thermal comfortstandard [30] was used to estimate thermal comfort in the models.This standard is based on the Smart Control and Thermal Com-fort project (SCATs), commissioned by the European Commission.In this project, 26 European buildings in France, Greece, Portugal,Sweden and the UK were surveyed covering free running, con-ditioned and mixed-mode buildings [31]. Based on the survey,different adaptive algorithms for each participating country weredeveloped (Table 3).
In 2007, the European Committee for Standardisation (CEN)released EN15251:2007 [30] with the equation:
Tco = 0.33 × �rm7 + 18.8 ◦C (1)
WhereTco [◦C] is the comfort temperature and �rm7 [◦C] is the expo-nentially weighted running mean of the daily mean external airtemperature (�ed), and is calculated from the formula:
�rm = (1 − ˛) × (�ed−1 + ˛.�ed−2 + ˛.�ed−3 + . . .) (2)
This equation can be simplified to:
�rm = (1 − ˛) × (�ed−1 + ˛.�rm−1) (3)
where˛ is a reference constant value, ranging between 0 and 1,
�rm = Running mean temperature for today, �rm−1 = Running meantemperature for previous day, �ed−1 = the daily mean external tem-perature for the previous day, �ed−2 = the daily mean temperaturefor the day before, and so on.
Humphreys proposed 0.8 for ˛ based on the average of fivecountries studied in SCATs project. Therefore, the following approx-imate formula can be used where records of daily mean externaltemperature are not available:
�rm7 = (�ed−1 + 0.8�ed−2 + 0.6�ed−3 + 0.5�ed−4 + 0.4�ed−5 + 0.3�ed−6 + 0.2�ed−7)3.8
(4)
Furthermore, the extent of the deviation of the indoor operativetemperature from the comfort temperature is divided into fourcategories (Table 4). Category II is selected as it matches with thebuilding types studied in this paper.
The second category covers approximately 80% of satisfactionfor building occupants. Furthermore, based on the comfort algo-rithm and the range permitted for the second category, ±3 ◦C, Fig. 5
is a reference constant value, ranging between 0 and 1,
168 M. Taleghani et al. / Energy and Buildings 67 (2013) 166–175
0
2
4
6
8
10
12
14
16
18
20
0
4
8
12
16
20
Jan Feb Mar Apr May Jun Jul Aug Sep Oct Nov Dec
Win
d Sp
eed
(m/s
)
Tem
pera
ture
(°C
)
Drybulb Temp Wind speed
Fig. 3. Mean dry bulb outdoor temperature and mean wind speed of Rotterdam asused in the calculations.
Table 2The surface to volume ratio of the different models (average values over all storeys).
Model Single Linear Courtyard
1 storey 1.47 1.16 0.872 storey 1.13 0.83 0.733 storey 1.02 0.72 0.62
lighting simulations. Based on the weather data, there were 45 dayscompletely sunless and 76 gloomy days.
For lighting calculations, Designbuilder v.3 uses radiance day-light simulation engine. Inside the models, one sensor at the centreof each zone located in the working plane (0.8 m above the floor)is assumed. DesignBuilder calculates illuminance levels at eachtime step (every hour) during the simulations. The daylight illu-minance level in a zone depends on many factors, including skycondition, sun position, photocell sensor positions, location, size,and glass transmittance of windows and window shades. Calcula-tion of energy demand for lighting depends on daylight illuminancelevel, illuminance set point, fraction of zone controlled and typeof lighting control. In this project, the minimum required illumi-nance level is 150 lux. Moreover, suspended luminaire type with0.42 radiation fraction is assumed (this is the fraction of heat fromlights that goes into the zone as long wave radiation).
Climatic data The climate of Rotterdam (52◦N, 4◦E) in theNetherlands is known as a temperate climate based on the climaticclassification of Köppen–Geiger [22]. The prevailing wind of Rot-terdam is South–West. The mean annual dry bulb temperature is9.9 ◦C (Fig. 3).
Zone shape and size The dwellings modelled are based on squarezone modules with a net size of 5 × 5 m. A single zone with the men-tioned dimensions is the first model. Two linear models containing8 zones (2 × 4 zones) are the second model. The elongation of twolines is in east west direction. The distance between two lines is 5 m.
The third main model is a courtyard building involving 8 zones. Acourtyard at the centre of a block of houses is also net 5 × 5 m (Fig. 4,above). Furthermore, the window to wall ratio is 30%. This paperpresents results in tabular format corresponding to their physicalforms (Fig. 4, below). Moreover, the surface to volume ratio of eachmodel is described in Table 2.
Table 3Adaptive Comfort Algorithms for individual countries [31].
Country Adaptive Control Algorithm
Trm ≤ 10 ◦C Trm > 10 ◦C
All 22.88 ◦C 0.302 × Trm + 19.39France 0.049 × Trm + 22.58 0.206 × Trm + 21.42Greece NA 0.205 × Trm + 21.69Portugal 0.381 × Trm + 18.12 0.381 × Trm + 18.12Sweden 0.051 × Trm + 22.83 0.051 × Trm + 22.83UK 0.104 × Trm + 22.58 0.168 × Trm + 21.63
3. Thermal comfort in summer
Thermal comfort temperature boundaries reflect within whichtemperature range the indoor environment is assumed to be com-fortable for users [23]. The conventional approach to analysingthermal comfort in simulation studies is to study the heat exchangebetween the human body and the environment. In the 1970s,Fanger [24] developed his well-known thermal comfort equa-tion, which subsequently was adopted by ISO [25]. However,more recently Humphreys and others stated that the applicationof steady state models led to an incorrect evaluation of ther-mal discomfort, typically overestimating it, because of insufficientacknowledgement of the human capacity for thermal adaptation[26–29]. Therefore, in this paper the European thermal comfortstandard [30] was used to estimate thermal comfort in the models.This standard is based on the Smart Control and Thermal Com-fort project (SCATs), commissioned by the European Commission.In this project, 26 European buildings in France, Greece, Portugal,Sweden and the UK were surveyed covering free running, con-ditioned and mixed-mode buildings [31]. Based on the survey,different adaptive algorithms for each participating country weredeveloped (Table 3).
In 2007, the European Committee for Standardisation (CEN)released EN15251:2007 [30] with the equation:
Tco = 0.33 × �rm7 + 18.8 ◦C (1)
WhereTco [◦C] is the comfort temperature and �rm7 [◦C] is the expo-nentially weighted running mean of the daily mean external airtemperature (�ed), and is calculated from the formula:
�rm = (1 − ˛) × (�ed−1 + ˛.�ed−2 + ˛.�ed−3 + . . .) (2)
This equation can be simplified to:
�rm = (1 − ˛) × (�ed−1 + ˛.�rm−1) (3)
where˛ is a reference constant value, ranging between 0 and 1,
�rm = Running mean temperature for today, �rm−1 = Running meantemperature for previous day, �ed−1 = the daily mean external tem-perature for the previous day, �ed−2 = the daily mean temperaturefor the day before, and so on.
Humphreys proposed 0.8 for ˛ based on the average of fivecountries studied in SCATs project. Therefore, the following approx-imate formula can be used where records of daily mean externaltemperature are not available:
�rm7 = (�ed−1 + 0.8�ed−2 + 0.6�ed−3 + 0.5�ed−4 + 0.4�ed−5 + 0.3�ed−6 + 0.2�ed−7)3.8
(4)
Furthermore, the extent of the deviation of the indoor operativetemperature from the comfort temperature is divided into fourcategories (Table 4). Category II is selected as it matches with thebuilding types studied in this paper.
The second category covers approximately 80% of satisfactionfor building occupants. Furthermore, based on the comfort algo-rithm and the range permitted for the second category, ±3 ◦C, Fig. 5
= running mean temperature for today,
168 M. Taleghani et al. / Energy and Buildings 67 (2013) 166–175
0
2
4
6
8
10
12
14
16
18
20
0
4
8
12
16
20
Jan Feb Mar Apr May Jun Jul Aug Sep Oct Nov Dec
Win
d Sp
eed
(m/s
)
Tem
pera
ture
(°C
)
Drybulb Temp Wind speed
Fig. 3. Mean dry bulb outdoor temperature and mean wind speed of Rotterdam asused in the calculations.
Table 2The surface to volume ratio of the different models (average values over all storeys).
Model Single Linear Courtyard
1 storey 1.47 1.16 0.872 storey 1.13 0.83 0.733 storey 1.02 0.72 0.62
lighting simulations. Based on the weather data, there were 45 dayscompletely sunless and 76 gloomy days.
For lighting calculations, Designbuilder v.3 uses radiance day-light simulation engine. Inside the models, one sensor at the centreof each zone located in the working plane (0.8 m above the floor)is assumed. DesignBuilder calculates illuminance levels at eachtime step (every hour) during the simulations. The daylight illu-minance level in a zone depends on many factors, including skycondition, sun position, photocell sensor positions, location, size,and glass transmittance of windows and window shades. Calcula-tion of energy demand for lighting depends on daylight illuminancelevel, illuminance set point, fraction of zone controlled and typeof lighting control. In this project, the minimum required illumi-nance level is 150 lux. Moreover, suspended luminaire type with0.42 radiation fraction is assumed (this is the fraction of heat fromlights that goes into the zone as long wave radiation).
Climatic data The climate of Rotterdam (52◦N, 4◦E) in theNetherlands is known as a temperate climate based on the climaticclassification of Köppen–Geiger [22]. The prevailing wind of Rot-terdam is South–West. The mean annual dry bulb temperature is9.9 ◦C (Fig. 3).
Zone shape and size The dwellings modelled are based on squarezone modules with a net size of 5 × 5 m. A single zone with the men-tioned dimensions is the first model. Two linear models containing8 zones (2 × 4 zones) are the second model. The elongation of twolines is in east west direction. The distance between two lines is 5 m.
The third main model is a courtyard building involving 8 zones. Acourtyard at the centre of a block of houses is also net 5 × 5 m (Fig. 4,above). Furthermore, the window to wall ratio is 30%. This paperpresents results in tabular format corresponding to their physicalforms (Fig. 4, below). Moreover, the surface to volume ratio of eachmodel is described in Table 2.
Table 3Adaptive Comfort Algorithms for individual countries [31].
Country Adaptive Control Algorithm
Trm ≤ 10 ◦C Trm > 10 ◦C
All 22.88 ◦C 0.302 × Trm + 19.39France 0.049 × Trm + 22.58 0.206 × Trm + 21.42Greece NA 0.205 × Trm + 21.69Portugal 0.381 × Trm + 18.12 0.381 × Trm + 18.12Sweden 0.051 × Trm + 22.83 0.051 × Trm + 22.83UK 0.104 × Trm + 22.58 0.168 × Trm + 21.63
3. Thermal comfort in summer
Thermal comfort temperature boundaries reflect within whichtemperature range the indoor environment is assumed to be com-fortable for users [23]. The conventional approach to analysingthermal comfort in simulation studies is to study the heat exchangebetween the human body and the environment. In the 1970s,Fanger [24] developed his well-known thermal comfort equa-tion, which subsequently was adopted by ISO [25]. However,more recently Humphreys and others stated that the applicationof steady state models led to an incorrect evaluation of ther-mal discomfort, typically overestimating it, because of insufficientacknowledgement of the human capacity for thermal adaptation[26–29]. Therefore, in this paper the European thermal comfortstandard [30] was used to estimate thermal comfort in the models.This standard is based on the Smart Control and Thermal Com-fort project (SCATs), commissioned by the European Commission.In this project, 26 European buildings in France, Greece, Portugal,Sweden and the UK were surveyed covering free running, con-ditioned and mixed-mode buildings [31]. Based on the survey,different adaptive algorithms for each participating country weredeveloped (Table 3).
In 2007, the European Committee for Standardisation (CEN)released EN15251:2007 [30] with the equation:
Tco = 0.33 × �rm7 + 18.8 ◦C (1)
WhereTco [◦C] is the comfort temperature and �rm7 [◦C] is the expo-nentially weighted running mean of the daily mean external airtemperature (�ed), and is calculated from the formula:
�rm = (1 − ˛) × (�ed−1 + ˛.�ed−2 + ˛.�ed−3 + . . .) (2)
This equation can be simplified to:
�rm = (1 − ˛) × (�ed−1 + ˛.�rm−1) (3)
where˛ is a reference constant value, ranging between 0 and 1,
�rm = Running mean temperature for today, �rm−1 = Running meantemperature for previous day, �ed−1 = the daily mean external tem-perature for the previous day, �ed−2 = the daily mean temperaturefor the day before, and so on.
Humphreys proposed 0.8 for ˛ based on the average of fivecountries studied in SCATs project. Therefore, the following approx-imate formula can be used where records of daily mean externaltemperature are not available:
�rm7 = (�ed−1 + 0.8�ed−2 + 0.6�ed−3 + 0.5�ed−4 + 0.4�ed−5 + 0.3�ed−6 + 0.2�ed−7)3.8
(4)
Furthermore, the extent of the deviation of the indoor operativetemperature from the comfort temperature is divided into fourcategories (Table 4). Category II is selected as it matches with thebuilding types studied in this paper.
The second category covers approximately 80% of satisfactionfor building occupants. Furthermore, based on the comfort algo-rithm and the range permitted for the second category, ±3 ◦C, Fig. 5
= running mean temperature for previous day,
168 M. Taleghani et al. / Energy and Buildings 67 (2013) 166–175
0
2
4
6
8
10
12
14
16
18
20
0
4
8
12
16
20
Jan Feb Mar Apr May Jun Jul Aug Sep Oct Nov Dec
Win
d Sp
eed
(m/s
)
Tem
pera
ture
(°C
)
Drybulb Temp Wind speed
Fig. 3. Mean dry bulb outdoor temperature and mean wind speed of Rotterdam asused in the calculations.
Table 2The surface to volume ratio of the different models (average values over all storeys).
Model Single Linear Courtyard
1 storey 1.47 1.16 0.872 storey 1.13 0.83 0.733 storey 1.02 0.72 0.62
lighting simulations. Based on the weather data, there were 45 dayscompletely sunless and 76 gloomy days.
For lighting calculations, Designbuilder v.3 uses radiance day-light simulation engine. Inside the models, one sensor at the centreof each zone located in the working plane (0.8 m above the floor)is assumed. DesignBuilder calculates illuminance levels at eachtime step (every hour) during the simulations. The daylight illu-minance level in a zone depends on many factors, including skycondition, sun position, photocell sensor positions, location, size,and glass transmittance of windows and window shades. Calcula-tion of energy demand for lighting depends on daylight illuminancelevel, illuminance set point, fraction of zone controlled and typeof lighting control. In this project, the minimum required illumi-nance level is 150 lux. Moreover, suspended luminaire type with0.42 radiation fraction is assumed (this is the fraction of heat fromlights that goes into the zone as long wave radiation).
Climatic data The climate of Rotterdam (52◦N, 4◦E) in theNetherlands is known as a temperate climate based on the climaticclassification of Köppen–Geiger [22]. The prevailing wind of Rot-terdam is South–West. The mean annual dry bulb temperature is9.9 ◦C (Fig. 3).
Zone shape and size The dwellings modelled are based on squarezone modules with a net size of 5 × 5 m. A single zone with the men-tioned dimensions is the first model. Two linear models containing8 zones (2 × 4 zones) are the second model. The elongation of twolines is in east west direction. The distance between two lines is 5 m.
The third main model is a courtyard building involving 8 zones. Acourtyard at the centre of a block of houses is also net 5 × 5 m (Fig. 4,above). Furthermore, the window to wall ratio is 30%. This paperpresents results in tabular format corresponding to their physicalforms (Fig. 4, below). Moreover, the surface to volume ratio of eachmodel is described in Table 2.
Table 3Adaptive Comfort Algorithms for individual countries [31].
Country Adaptive Control Algorithm
Trm ≤ 10 ◦C Trm > 10 ◦C
All 22.88 ◦C 0.302 × Trm + 19.39France 0.049 × Trm + 22.58 0.206 × Trm + 21.42Greece NA 0.205 × Trm + 21.69Portugal 0.381 × Trm + 18.12 0.381 × Trm + 18.12Sweden 0.051 × Trm + 22.83 0.051 × Trm + 22.83UK 0.104 × Trm + 22.58 0.168 × Trm + 21.63
3. Thermal comfort in summer
Thermal comfort temperature boundaries reflect within whichtemperature range the indoor environment is assumed to be com-fortable for users [23]. The conventional approach to analysingthermal comfort in simulation studies is to study the heat exchangebetween the human body and the environment. In the 1970s,Fanger [24] developed his well-known thermal comfort equa-tion, which subsequently was adopted by ISO [25]. However,more recently Humphreys and others stated that the applicationof steady state models led to an incorrect evaluation of ther-mal discomfort, typically overestimating it, because of insufficientacknowledgement of the human capacity for thermal adaptation[26–29]. Therefore, in this paper the European thermal comfortstandard [30] was used to estimate thermal comfort in the models.This standard is based on the Smart Control and Thermal Com-fort project (SCATs), commissioned by the European Commission.In this project, 26 European buildings in France, Greece, Portugal,Sweden and the UK were surveyed covering free running, con-ditioned and mixed-mode buildings [31]. Based on the survey,different adaptive algorithms for each participating country weredeveloped (Table 3).
In 2007, the European Committee for Standardisation (CEN)released EN15251:2007 [30] with the equation:
Tco = 0.33 × �rm7 + 18.8 ◦C (1)
WhereTco [◦C] is the comfort temperature and �rm7 [◦C] is the expo-nentially weighted running mean of the daily mean external airtemperature (�ed), and is calculated from the formula:
�rm = (1 − ˛) × (�ed−1 + ˛.�ed−2 + ˛.�ed−3 + . . .) (2)
This equation can be simplified to:
�rm = (1 − ˛) × (�ed−1 + ˛.�rm−1) (3)
where˛ is a reference constant value, ranging between 0 and 1,
�rm = Running mean temperature for today, �rm−1 = Running meantemperature for previous day, �ed−1 = the daily mean external tem-perature for the previous day, �ed−2 = the daily mean temperaturefor the day before, and so on.
Humphreys proposed 0.8 for ˛ based on the average of fivecountries studied in SCATs project. Therefore, the following approx-imate formula can be used where records of daily mean externaltemperature are not available:
�rm7 = (�ed−1 + 0.8�ed−2 + 0.6�ed−3 + 0.5�ed−4 + 0.4�ed−5 + 0.3�ed−6 + 0.2�ed−7)3.8
(4)
Furthermore, the extent of the deviation of the indoor operativetemperature from the comfort temperature is divided into fourcategories (Table 4). Category II is selected as it matches with thebuilding types studied in this paper.
The second category covers approximately 80% of satisfactionfor building occupants. Furthermore, based on the comfort algo-rithm and the range permitted for the second category, ±3 ◦C, Fig. 5
= the daily mean external temperature for the previous day,
168 M. Taleghani et al. / Energy and Buildings 67 (2013) 166–175
0
2
4
6
8
10
12
14
16
18
20
0
4
8
12
16
20
Jan Feb Mar Apr May Jun Jul Aug Sep Oct Nov Dec
Win
d Sp
eed
(m/s
)
Tem
pera
ture
(°C
)
Drybulb Temp Wind speed
Fig. 3. Mean dry bulb outdoor temperature and mean wind speed of Rotterdam asused in the calculations.
Table 2The surface to volume ratio of the different models (average values over all storeys).
Model Single Linear Courtyard
1 storey 1.47 1.16 0.872 storey 1.13 0.83 0.733 storey 1.02 0.72 0.62
lighting simulations. Based on the weather data, there were 45 dayscompletely sunless and 76 gloomy days.
For lighting calculations, Designbuilder v.3 uses radiance day-light simulation engine. Inside the models, one sensor at the centreof each zone located in the working plane (0.8 m above the floor)is assumed. DesignBuilder calculates illuminance levels at eachtime step (every hour) during the simulations. The daylight illu-minance level in a zone depends on many factors, including skycondition, sun position, photocell sensor positions, location, size,and glass transmittance of windows and window shades. Calcula-tion of energy demand for lighting depends on daylight illuminancelevel, illuminance set point, fraction of zone controlled and typeof lighting control. In this project, the minimum required illumi-nance level is 150 lux. Moreover, suspended luminaire type with0.42 radiation fraction is assumed (this is the fraction of heat fromlights that goes into the zone as long wave radiation).
Climatic data The climate of Rotterdam (52◦N, 4◦E) in theNetherlands is known as a temperate climate based on the climaticclassification of Köppen–Geiger [22]. The prevailing wind of Rot-terdam is South–West. The mean annual dry bulb temperature is9.9 ◦C (Fig. 3).
Zone shape and size The dwellings modelled are based on squarezone modules with a net size of 5 × 5 m. A single zone with the men-tioned dimensions is the first model. Two linear models containing8 zones (2 × 4 zones) are the second model. The elongation of twolines is in east west direction. The distance between two lines is 5 m.
The third main model is a courtyard building involving 8 zones. Acourtyard at the centre of a block of houses is also net 5 × 5 m (Fig. 4,above). Furthermore, the window to wall ratio is 30%. This paperpresents results in tabular format corresponding to their physicalforms (Fig. 4, below). Moreover, the surface to volume ratio of eachmodel is described in Table 2.
Table 3Adaptive Comfort Algorithms for individual countries [31].
Country Adaptive Control Algorithm
Trm ≤ 10 ◦C Trm > 10 ◦C
All 22.88 ◦C 0.302 × Trm + 19.39France 0.049 × Trm + 22.58 0.206 × Trm + 21.42Greece NA 0.205 × Trm + 21.69Portugal 0.381 × Trm + 18.12 0.381 × Trm + 18.12Sweden 0.051 × Trm + 22.83 0.051 × Trm + 22.83UK 0.104 × Trm + 22.58 0.168 × Trm + 21.63
3. Thermal comfort in summer
Thermal comfort temperature boundaries reflect within whichtemperature range the indoor environment is assumed to be com-fortable for users [23]. The conventional approach to analysingthermal comfort in simulation studies is to study the heat exchangebetween the human body and the environment. In the 1970s,Fanger [24] developed his well-known thermal comfort equa-tion, which subsequently was adopted by ISO [25]. However,more recently Humphreys and others stated that the applicationof steady state models led to an incorrect evaluation of ther-mal discomfort, typically overestimating it, because of insufficientacknowledgement of the human capacity for thermal adaptation[26–29]. Therefore, in this paper the European thermal comfortstandard [30] was used to estimate thermal comfort in the models.This standard is based on the Smart Control and Thermal Com-fort project (SCATs), commissioned by the European Commission.In this project, 26 European buildings in France, Greece, Portugal,Sweden and the UK were surveyed covering free running, con-ditioned and mixed-mode buildings [31]. Based on the survey,different adaptive algorithms for each participating country weredeveloped (Table 3).
In 2007, the European Committee for Standardisation (CEN)released EN15251:2007 [30] with the equation:
Tco = 0.33 × �rm7 + 18.8 ◦C (1)
WhereTco [◦C] is the comfort temperature and �rm7 [◦C] is the expo-nentially weighted running mean of the daily mean external airtemperature (�ed), and is calculated from the formula:
�rm = (1 − ˛) × (�ed−1 + ˛.�ed−2 + ˛.�ed−3 + . . .) (2)
This equation can be simplified to:
�rm = (1 − ˛) × (�ed−1 + ˛.�rm−1) (3)
where˛ is a reference constant value, ranging between 0 and 1,
�rm = Running mean temperature for today, �rm−1 = Running meantemperature for previous day, �ed−1 = the daily mean external tem-perature for the previous day, �ed−2 = the daily mean temperaturefor the day before, and so on.
Humphreys proposed 0.8 for ˛ based on the average of fivecountries studied in SCATs project. Therefore, the following approx-imate formula can be used where records of daily mean externaltemperature are not available:
�rm7 = (�ed−1 + 0.8�ed−2 + 0.6�ed−3 + 0.5�ed−4 + 0.4�ed−5 + 0.3�ed−6 + 0.2�ed−7)3.8
(4)
Furthermore, the extent of the deviation of the indoor operativetemperature from the comfort temperature is divided into fourcategories (Table 4). Category II is selected as it matches with thebuilding types studied in this paper.
The second category covers approximately 80% of satisfactionfor building occupants. Furthermore, based on the comfort algo-rithm and the range permitted for the second category, ±3 ◦C, Fig. 5
= the daily mean temperature for the day before, and so on.
Humphreys proposed 0.8 for
168 M. Taleghani et al. / Energy and Buildings 67 (2013) 166–175
0
2
4
6
8
10
12
14
16
18
20
0
4
8
12
16
20
Jan Feb Mar Apr May Jun Jul Aug Sep Oct Nov Dec
Win
d Sp
eed
(m/s
)
Tem
pera
ture
(°C
)Drybulb Temp Wind speed
Fig. 3. Mean dry bulb outdoor temperature and mean wind speed of Rotterdam asused in the calculations.
Table 2The surface to volume ratio of the different models (average values over all storeys).
Model Single Linear Courtyard
1 storey 1.47 1.16 0.872 storey 1.13 0.83 0.733 storey 1.02 0.72 0.62
lighting simulations. Based on the weather data, there were 45 dayscompletely sunless and 76 gloomy days.
For lighting calculations, Designbuilder v.3 uses radiance day-light simulation engine. Inside the models, one sensor at the centreof each zone located in the working plane (0.8 m above the floor)is assumed. DesignBuilder calculates illuminance levels at eachtime step (every hour) during the simulations. The daylight illu-minance level in a zone depends on many factors, including skycondition, sun position, photocell sensor positions, location, size,and glass transmittance of windows and window shades. Calcula-tion of energy demand for lighting depends on daylight illuminancelevel, illuminance set point, fraction of zone controlled and typeof lighting control. In this project, the minimum required illumi-nance level is 150 lux. Moreover, suspended luminaire type with0.42 radiation fraction is assumed (this is the fraction of heat fromlights that goes into the zone as long wave radiation).
Climatic data The climate of Rotterdam (52◦N, 4◦E) in theNetherlands is known as a temperate climate based on the climaticclassification of Köppen–Geiger [22]. The prevailing wind of Rot-terdam is South–West. The mean annual dry bulb temperature is9.9 ◦C (Fig. 3).
Zone shape and size The dwellings modelled are based on squarezone modules with a net size of 5 × 5 m. A single zone with the men-tioned dimensions is the first model. Two linear models containing8 zones (2 × 4 zones) are the second model. The elongation of twolines is in east west direction. The distance between two lines is 5 m.
The third main model is a courtyard building involving 8 zones. Acourtyard at the centre of a block of houses is also net 5 × 5 m (Fig. 4,above). Furthermore, the window to wall ratio is 30%. This paperpresents results in tabular format corresponding to their physicalforms (Fig. 4, below). Moreover, the surface to volume ratio of eachmodel is described in Table 2.
Table 3Adaptive Comfort Algorithms for individual countries [31].
Country Adaptive Control Algorithm
Trm ≤ 10 ◦C Trm > 10 ◦C
All 22.88 ◦C 0.302 × Trm + 19.39France 0.049 × Trm + 22.58 0.206 × Trm + 21.42Greece NA 0.205 × Trm + 21.69Portugal 0.381 × Trm + 18.12 0.381 × Trm + 18.12Sweden 0.051 × Trm + 22.83 0.051 × Trm + 22.83UK 0.104 × Trm + 22.58 0.168 × Trm + 21.63
3. Thermal comfort in summer
Thermal comfort temperature boundaries reflect within whichtemperature range the indoor environment is assumed to be com-fortable for users [23]. The conventional approach to analysingthermal comfort in simulation studies is to study the heat exchangebetween the human body and the environment. In the 1970s,Fanger [24] developed his well-known thermal comfort equa-tion, which subsequently was adopted by ISO [25]. However,more recently Humphreys and others stated that the applicationof steady state models led to an incorrect evaluation of ther-mal discomfort, typically overestimating it, because of insufficientacknowledgement of the human capacity for thermal adaptation[26–29]. Therefore, in this paper the European thermal comfortstandard [30] was used to estimate thermal comfort in the models.This standard is based on the Smart Control and Thermal Com-fort project (SCATs), commissioned by the European Commission.In this project, 26 European buildings in France, Greece, Portugal,Sweden and the UK were surveyed covering free running, con-ditioned and mixed-mode buildings [31]. Based on the survey,different adaptive algorithms for each participating country weredeveloped (Table 3).
In 2007, the European Committee for Standardisation (CEN)released EN15251:2007 [30] with the equation:
Tco = 0.33 × �rm7 + 18.8 ◦C (1)
WhereTco [◦C] is the comfort temperature and �rm7 [◦C] is the expo-nentially weighted running mean of the daily mean external airtemperature (�ed), and is calculated from the formula:
�rm = (1 − ˛) × (�ed−1 + ˛.�ed−2 + ˛.�ed−3 + . . .) (2)
This equation can be simplified to:
�rm = (1 − ˛) × (�ed−1 + ˛.�rm−1) (3)
where˛ is a reference constant value, ranging between 0 and 1,
�rm = Running mean temperature for today, �rm−1 = Running meantemperature for previous day, �ed−1 = the daily mean external tem-perature for the previous day, �ed−2 = the daily mean temperaturefor the day before, and so on.
Humphreys proposed 0.8 for ˛ based on the average of fivecountries studied in SCATs project. Therefore, the following approx-imate formula can be used where records of daily mean externaltemperature are not available:
�rm7 = (�ed−1 + 0.8�ed−2 + 0.6�ed−3 + 0.5�ed−4 + 0.4�ed−5 + 0.3�ed−6 + 0.2�ed−7)3.8
(4)
Furthermore, the extent of the deviation of the indoor operativetemperature from the comfort temperature is divided into fourcategories (Table 4). Category II is selected as it matches with thebuilding types studied in this paper.
The second category covers approximately 80% of satisfactionfor building occupants. Furthermore, based on the comfort algo-rithm and the range permitted for the second category, ±3 ◦C, Fig. 5
based on the average of five countries studied in SCATs project. Therefore, the following approximate formula can be used where records of daily mean external temperature are not available:
168 M. Taleghani et al. / Energy and Buildings 67 (2013) 166–175
0
2
4
6
8
10
12
14
16
18
20
0
4
8
12
16
20
Jan Feb Mar Apr May Jun Jul Aug Sep Oct Nov Dec
Win
d Sp
eed
(m/s
)
Tem
pera
ture
(°C
)
Drybulb Temp Wind speed
Fig. 3. Mean dry bulb outdoor temperature and mean wind speed of Rotterdam asused in the calculations.
Table 2The surface to volume ratio of the different models (average values over all storeys).
Model Single Linear Courtyard
1 storey 1.47 1.16 0.872 storey 1.13 0.83 0.733 storey 1.02 0.72 0.62
lighting simulations. Based on the weather data, there were 45 dayscompletely sunless and 76 gloomy days.
For lighting calculations, Designbuilder v.3 uses radiance day-light simulation engine. Inside the models, one sensor at the centreof each zone located in the working plane (0.8 m above the floor)is assumed. DesignBuilder calculates illuminance levels at eachtime step (every hour) during the simulations. The daylight illu-minance level in a zone depends on many factors, including skycondition, sun position, photocell sensor positions, location, size,and glass transmittance of windows and window shades. Calcula-tion of energy demand for lighting depends on daylight illuminancelevel, illuminance set point, fraction of zone controlled and typeof lighting control. In this project, the minimum required illumi-nance level is 150 lux. Moreover, suspended luminaire type with0.42 radiation fraction is assumed (this is the fraction of heat fromlights that goes into the zone as long wave radiation).
Climatic data The climate of Rotterdam (52◦N, 4◦E) in theNetherlands is known as a temperate climate based on the climaticclassification of Köppen–Geiger [22]. The prevailing wind of Rot-terdam is South–West. The mean annual dry bulb temperature is9.9 ◦C (Fig. 3).
Zone shape and size The dwellings modelled are based on squarezone modules with a net size of 5 × 5 m. A single zone with the men-tioned dimensions is the first model. Two linear models containing8 zones (2 × 4 zones) are the second model. The elongation of twolines is in east west direction. The distance between two lines is 5 m.
The third main model is a courtyard building involving 8 zones. Acourtyard at the centre of a block of houses is also net 5 × 5 m (Fig. 4,above). Furthermore, the window to wall ratio is 30%. This paperpresents results in tabular format corresponding to their physicalforms (Fig. 4, below). Moreover, the surface to volume ratio of eachmodel is described in Table 2.
Table 3Adaptive Comfort Algorithms for individual countries [31].
Country Adaptive Control Algorithm
Trm ≤ 10 ◦C Trm > 10 ◦C
All 22.88 ◦C 0.302 × Trm + 19.39France 0.049 × Trm + 22.58 0.206 × Trm + 21.42Greece NA 0.205 × Trm + 21.69Portugal 0.381 × Trm + 18.12 0.381 × Trm + 18.12Sweden 0.051 × Trm + 22.83 0.051 × Trm + 22.83UK 0.104 × Trm + 22.58 0.168 × Trm + 21.63
3. Thermal comfort in summer
Thermal comfort temperature boundaries reflect within whichtemperature range the indoor environment is assumed to be com-fortable for users [23]. The conventional approach to analysingthermal comfort in simulation studies is to study the heat exchangebetween the human body and the environment. In the 1970s,Fanger [24] developed his well-known thermal comfort equa-tion, which subsequently was adopted by ISO [25]. However,more recently Humphreys and others stated that the applicationof steady state models led to an incorrect evaluation of ther-mal discomfort, typically overestimating it, because of insufficientacknowledgement of the human capacity for thermal adaptation[26–29]. Therefore, in this paper the European thermal comfortstandard [30] was used to estimate thermal comfort in the models.This standard is based on the Smart Control and Thermal Com-fort project (SCATs), commissioned by the European Commission.In this project, 26 European buildings in France, Greece, Portugal,Sweden and the UK were surveyed covering free running, con-ditioned and mixed-mode buildings [31]. Based on the survey,different adaptive algorithms for each participating country weredeveloped (Table 3).
In 2007, the European Committee for Standardisation (CEN)released EN15251:2007 [30] with the equation:
Tco = 0.33 × �rm7 + 18.8 ◦C (1)
WhereTco [◦C] is the comfort temperature and �rm7 [◦C] is the expo-nentially weighted running mean of the daily mean external airtemperature (�ed), and is calculated from the formula:
�rm = (1 − ˛) × (�ed−1 + ˛.�ed−2 + ˛.�ed−3 + . . .) (2)
This equation can be simplified to:
�rm = (1 − ˛) × (�ed−1 + ˛.�rm−1) (3)
where˛ is a reference constant value, ranging between 0 and 1,
�rm = Running mean temperature for today, �rm−1 = Running meantemperature for previous day, �ed−1 = the daily mean external tem-perature for the previous day, �ed−2 = the daily mean temperaturefor the day before, and so on.
Humphreys proposed 0.8 for ˛ based on the average of fivecountries studied in SCATs project. Therefore, the following approx-imate formula can be used where records of daily mean externaltemperature are not available:
�rm7 = (�ed−1 + 0.8�ed−2 + 0.6�ed−3 + 0.5�ed−4 + 0.4�ed−5 + 0.3�ed−6 + 0.2�ed−7)3.8
(4)
Furthermore, the extent of the deviation of the indoor operativetemperature from the comfort temperature is divided into fourcategories (Table 4). Category II is selected as it matches with thebuilding types studied in this paper.
The second category covers approximately 80% of satisfactionfor building occupants. Furthermore, based on the comfort algo-rithm and the range permitted for the second category, ±3 ◦C, Fig. 5
(4)
Furthermore, the extent of the deviation of the indoor operative temperature from the comfort temperature is divided into four categories (table 4). Category II is selected as it matches with the building types studied in this chapter.
Category Explanation Limit of deviation Range of acceptability
I High level of expectation for very sensitive and fragile users (hospitals, …)
±2°C 90%
II Normal expectation for new buildings ±3°C 80%
III Moderate expectation (existing buildings) ±4°C 65%
IV Values outside the criteria for the above categories (only in a limited period)
±>4°C <65%
Table 4 Suggested applicability for the categories and their associated acceptable temperature ranges (table after [28]).
The second category covers approximately 80% of satisfaction for building occupants, which is shown in Figure 7 by the bold lines. Furthermore, based on the comfort algorithm and the range permitted for the second category, ±3°C, Figure 8 presents the acceptable indoor operative temperatures for the free running mode period in Rotterdam. The duration of the free running mode period was based on the old Dutch
i
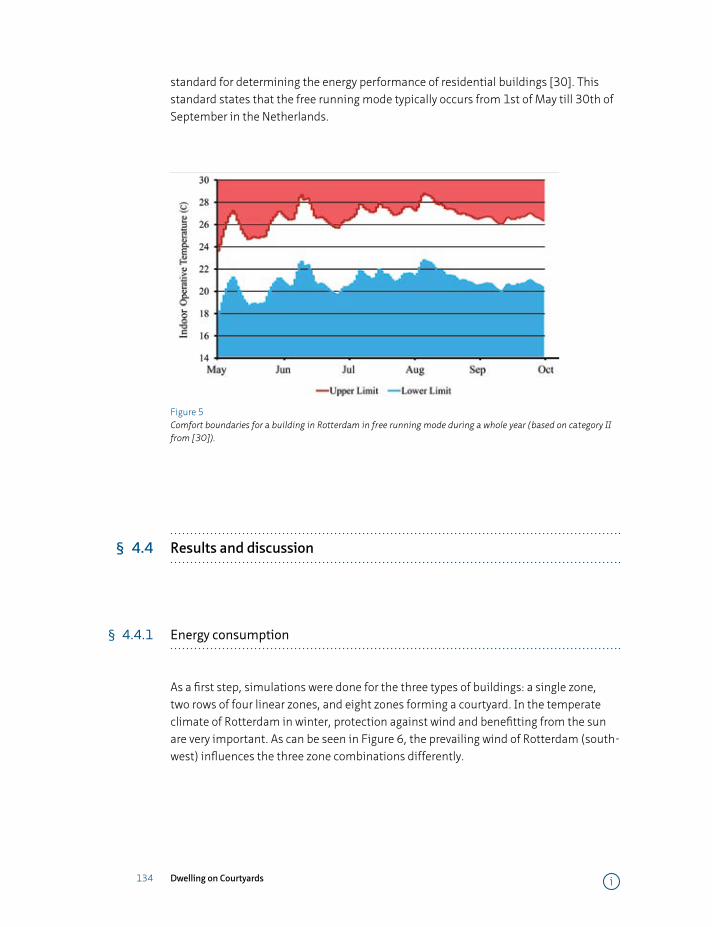
134 Dwelling on Courtyards
standard for determining the energy performance of residential buildings [30]. This standard states that the free running mode typically occurs from 1st of May till 30th of September in the Netherlands.
Figure 5 Comfort boundaries for a building in Rotterdam in free running mode during a whole year (based on category II from [30]).
§ 4.4 Results and discussion
§ 4.4.1 Energy consumption
As a first step, simulations were done for the three types of buildings: a single zone, two rows of four linear zones, and eight zones forming a courtyard. In the temperate climate of Rotterdam in winter, protection against wind and benefitting from the sun are very important. As can be seen in Figure 6, the prevailing wind of Rotterdam (south-west) influences the three zone combinations differently.
i
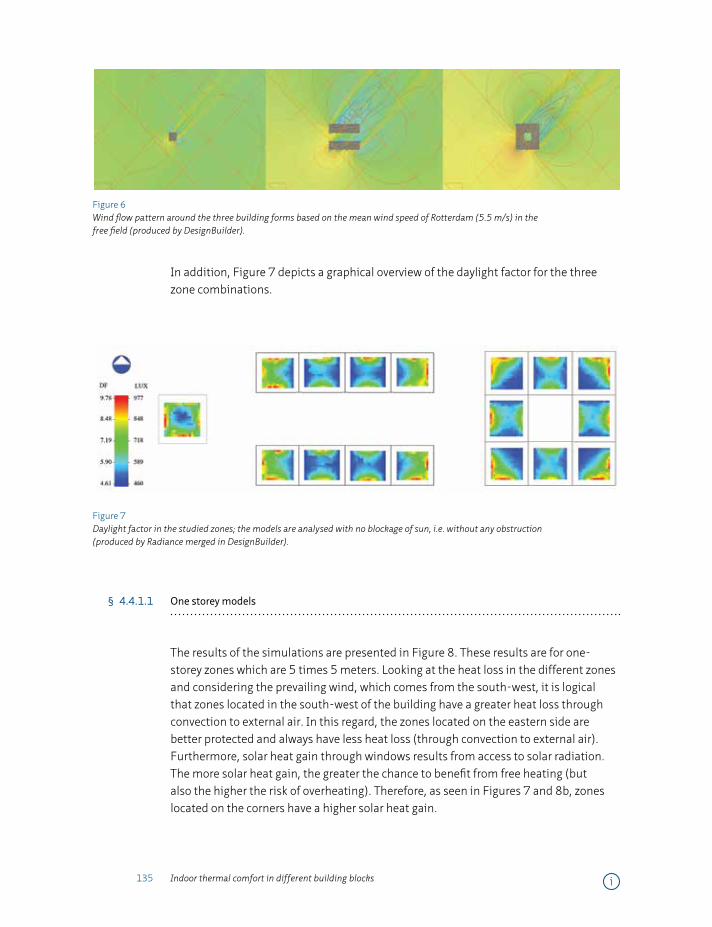
135 Indoor thermal comfort in different building blocks
Figure 6 Wind flow pattern around the three building forms based on the mean wind speed of Rotterdam (5.5 m/s) in the free field (produced by DesignBuilder).
In addition, Figure 7 depicts a graphical overview of the daylight factor for the three zone combinations.
Figure 7 Daylight factor in the studied zones; the models are analysed with no blockage of sun, i.e. without any obstruction (produced by Radiance merged in DesignBuilder).
§ 4.4.1.1 One storey models
The results of the simulations are presented in Figure 8. These results are for one-storey zones which are 5 times 5 meters. Looking at the heat loss in the different zones and considering the prevailing wind, which comes from the south-west, it is logical that zones located in the south-west of the building have a greater heat loss through convection to external air. In this regard, the zones located on the eastern side are better protected and always have less heat loss (through convection to external air). Furthermore, solar heat gain through windows results from access to solar radiation. The more solar heat gain, the greater the chance to benefit from free heating (but also the higher the risk of overheating). Therefore, as seen in Figures 7 and 8b, zones located on the corners have a higher solar heat gain.
i
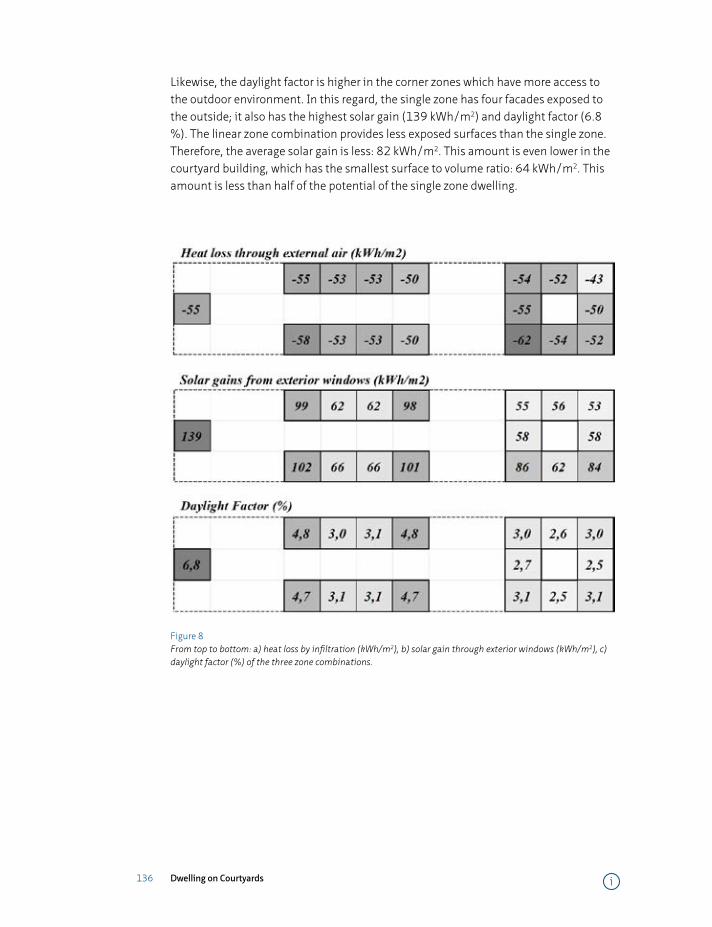
136 Dwelling on Courtyards
Likewise, the daylight factor is higher in the corner zones which have more access to the outdoor environment. In this regard, the single zone has four facades exposed to the outside; it also has the highest solar gain (139 kWh/m2) and daylight factor (6.8 %). The linear zone combination provides less exposed surfaces than the single zone. Therefore, the average solar gain is less: 82 kWh/m2. This amount is even lower in the courtyard building, which has the smallest surface to volume ratio: 64 kWh/m2. This amount is less than half of the potential of the single zone dwelling.
Figure 8 From top to bottom: a) heat loss by infiltration (kWh/m2), b) solar gain through exterior windows (kWh/m2), c) daylight factor (%) of the three zone combinations.
i
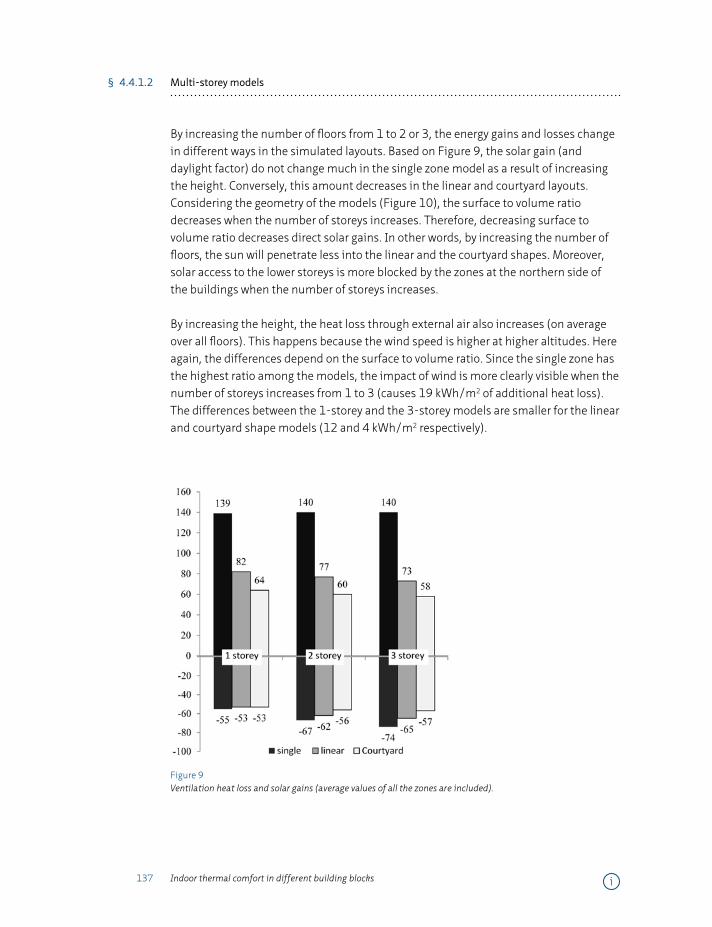
137 Indoor thermal comfort in different building blocks
§ 4.4.1.2 Multi-storey models
By increasing the number of floors from 1 to 2 or 3, the energy gains and losses change in different ways in the simulated layouts. Based on Figure 9, the solar gain (and daylight factor) do not change much in the single zone model as a result of increasing the height. Conversely, this amount decreases in the linear and courtyard layouts. Considering the geometry of the models (Figure 10), the surface to volume ratio decreases when the number of storeys increases. Therefore, decreasing surface to volume ratio decreases direct solar gains. In other words, by increasing the number of floors, the sun will penetrate less into the linear and the courtyard shapes. Moreover, solar access to the lower storeys is more blocked by the zones at the northern side of the buildings when the number of storeys increases.
By increasing the height, the heat loss through external air also increases (on average over all floors). This happens because the wind speed is higher at higher altitudes. Here again, the differences depend on the surface to volume ratio. Since the single zone has the highest ratio among the models, the impact of wind is more clearly visible when the number of storeys increases from 1 to 3 (causes 19 kWh/m2 of additional heat loss). The differences between the 1-storey and the 3-storey models are smaller for the linear and courtyard shape models (12 and 4 kWh/m2 respectively).
Figure 9 Ventilation heat loss and solar gains (average values of all the zones are included).
i
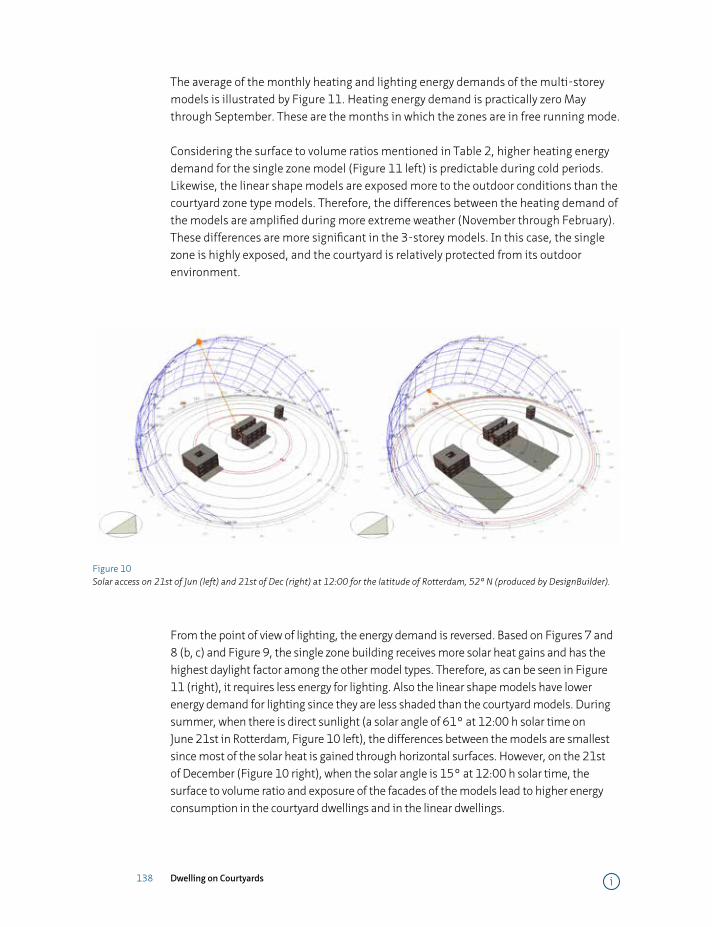
138 Dwelling on Courtyards
The average of the monthly heating and lighting energy demands of the multi-storey models is illustrated by Figure 11. Heating energy demand is practically zero May through September. These are the months in which the zones are in free running mode.
Considering the surface to volume ratios mentioned in Table 2, higher heating energy demand for the single zone model (Figure 11 left) is predictable during cold periods. Likewise, the linear shape models are exposed more to the outdoor conditions than the courtyard zone type models. Therefore, the differences between the heating demand of the models are amplified during more extreme weather (November through February). These differences are more significant in the 3-storey models. In this case, the single zone is highly exposed, and the courtyard is relatively protected from its outdoor environment.
Figure 10 Solar access on 21st of Jun (left) and 21st of Dec (right) at 12:00 for the latitude of Rotterdam, 52° N (produced by DesignBuilder).
From the point of view of lighting, the energy demand is reversed. Based on Figures 7 and 8 (b, c) and Figure 9, the single zone building receives more solar heat gains and has the highest daylight factor among the other model types. Therefore, as can be seen in Figure 11 (right), it requires less energy for lighting. Also the linear shape models have lower energy demand for lighting since they are less shaded than the courtyard models. During summer, when there is direct sunlight (a solar angle of 61° at 12:00 h solar time on June 21st in Rotterdam, Figure 10 left), the differences between the models are smallest since most of the solar heat is gained through horizontal surfaces. However, on the 21st of December (Figure 10 right), when the solar angle is 15° at 12:00 h solar time, the surface to volume ratio and exposure of the facades of the models lead to higher energy consumption in the courtyard dwellings and in the linear dwellings.
i

139 Indoor thermal comfort in different building blocks
Figure 11 Heating demand in 1-storey models (top left); average of heating demand in 2-storey models (middle left); average of heating demand in 3 storey models (down left); Lighting demand in 1 storey model (top right); average of lighting demand in 2 storey models (middle right); average of lighting demand in 3 storey models (down right).
i
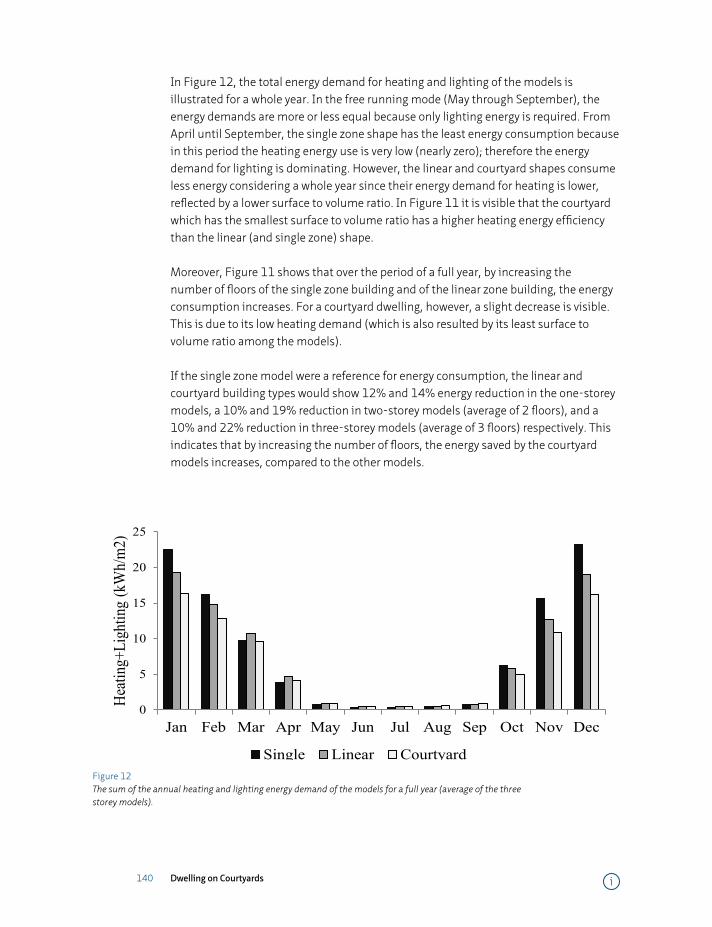
140 Dwelling on Courtyards
In Figure 12, the total energy demand for heating and lighting of the models is illustrated for a whole year. In the free running mode (May through September), the energy demands are more or less equal because only lighting energy is required. From April until September, the single zone shape has the least energy consumption because in this period the heating energy use is very low (nearly zero); therefore the energy demand for lighting is dominating. However, the linear and courtyard shapes consume less energy considering a whole year since their energy demand for heating is lower, reflected by a lower surface to volume ratio. In Figure 11 it is visible that the courtyard which has the smallest surface to volume ratio has a higher heating energy efficiency than the linear (and single zone) shape.
Moreover, Figure 11 shows that over the period of a full year, by increasing the number of floors of the single zone building and of the linear zone building, the energy consumption increases. For a courtyard dwelling, however, a slight decrease is visible. This is due to its low heating demand (which is also resulted by its least surface to volume ratio among the models).
If the single zone model were a reference for energy consumption, the linear and courtyard building types would show 12% and 14% energy reduction in the one-storey models, a 10% and 19% reduction in two-storey models (average of 2 floors), and a 10% and 22% reduction in three-storey models (average of 3 floors) respectively. This indicates that by increasing the number of floors, the energy saved by the courtyard models increases, compared to the other models.
0
5
10
15
20
25
Jan Feb Mar Apr May Jun Jul Aug Sep Oct Nov Dec
Heati
ng+L
ight
ing
(kW
h/m
2)
Single Linear CourtyardFigure 12 The sum of the annual heating and lighting energy demand of the models for a full year (average of the three storey models).
i
141 Indoor thermal comfort in different building blocks
§ 4.4.2 Summer thermal comfort
§ 4.4.2.1 One-storey models
Thermal comfort was examined when the dwellings were in free running mode (May 1st – September 30th). Therefore, the hourly operative temperatures of each zone during this period were applied to the EN15251 adaptive comfort standard. The percentages of discomfort hours are calculated by dividing the total number of discomfort hours by the total number of hours that the zones are occupied in this period (153 days * 7 hours per day = 1071 hours). In Figure 13, the percentages of discomfort hours during the mentioned five months are presented separately according to EN15251.
Comparing the layouts, the single zone building has the highest percentage of discomfort hours compared to the average of the zones of the other buildings. For the linear and courtyard shapes this average is more or less equal. Referring to Table 4, the zones in the linear building on average receive 57 kWh/m2 less solar heat gains from windows compared to the single zone building (1 storey). This difference is 75 kWh/m2 for the courtyard building. Therefore, as discussed in the sections on energy performance, the higher the solar gain, the greater the risk of overheating and consequently the higher the number of discomfort hours.
Discussing the layouts, it is visible that the zones that are more exposed to their outdoor environment (and are less covered) are more prone to increased discomfort. In this regard, the zones located on the corners of the linear and courtyard models have less comfort hours. On this account, the linear model with two separated linear buildings shows the importance of sun exposure. Here the zones located in the southern building have higher sun gains and accordingly a higher number of discomfort hours than the northern building. These differences are repeated for the courtyard zones.
§ 4.4.2.2 Multi-storey models
The differences between the results are also visible in the multi-storey models. By increasing the number of floors, the differences in the percentage of discomfort hours between the single zone building and the other models are more significant.
i

142 Dwelling on Courtyards
Referring to the results and Figure 14, the numbers of discomfort hours rise by increasing the number of floors in the single shape zone. However, for both the linear and the courtyard shapes, the number of discomfort hours decreases with increasing the number of floors. This shows the importance of sun exposure potential in these models.
Figure 13 Percentage of discomfort hours of the models based on EN15251 in the summer period; above, the 1 storey; middle, the average of 2 storey zones; down, the average of 3 storey zones.
§ 4.4.3 Energy versus comfort
Taleghani et al. [19] made a comparison between different building forms regarding the effect of different building typologies on indoor energy and comfort. They showed, all else being equal, that the larger surface to volume ratio of a courtyard building (and its envelopes), the higher heat loss and consequently energy demand for heating
i
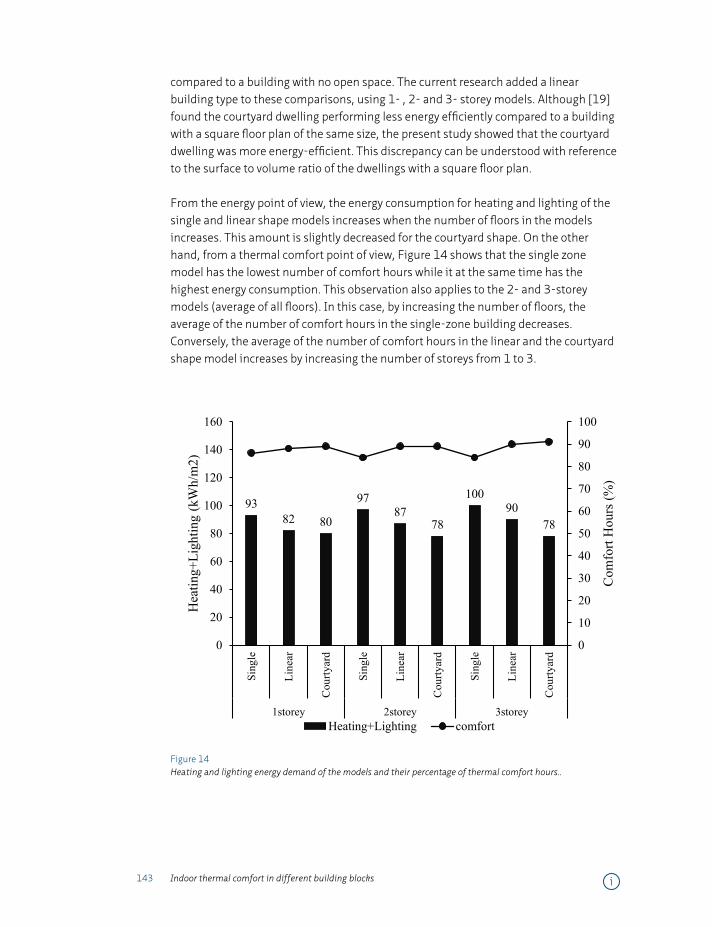
143 Indoor thermal comfort in different building blocks
compared to a building with no open space. The current research added a linear building type to these comparisons, using 1- , 2- and 3- storey models. Although [19] found the courtyard dwelling performing less energy efficiently compared to a building with a square floor plan of the same size, the present study showed that the courtyard dwelling was more energy-efficient. This discrepancy can be understood with reference to the surface to volume ratio of the dwellings with a square floor plan.
From the energy point of view, the energy consumption for heating and lighting of the single and linear shape models increases when the number of floors in the models increases. This amount is slightly decreased for the courtyard shape. On the other hand, from a thermal comfort point of view, Figure 14 shows that the single zone model has the lowest number of comfort hours while it at the same time has the highest energy consumption. This observation also applies to the 2- and 3-storey models (average of all floors). In this case, by increasing the number of floors, the average of the number of comfort hours in the single-zone building decreases. Conversely, the average of the number of comfort hours in the linear and the courtyard shape model increases by increasing the number of storeys from 1 to 3.
93 82 80
97 87
78
100 90
78
0
10
20
30
40
50
60
70
80
90
100
0
20
40
60
80
100
120
140
160
Sing
le
Line
ar
Cou
rtyar
d
Sing
le
Line
ar
Cou
rtyar
d
Sing
le
Line
ar
Cou
rtyar
d
1storey 2storey 3storey
Com
fort
Hou
rs (%
)
Hea
ting+
Ligh
ting
(kW
h/m
2)
Heating+Lighting comfort
Figure 14 Heating and lighting energy demand of the models and their percentage of thermal comfort hours..
i
144 Dwelling on Courtyards
§ 4.5 Conclusion
This chapter analysed the energy and comfort performance of three types of urban blocks in the Netherlands, each with 1, 2 and 3 storey configurations. The main objective of the research was to clarify the effect of building geometry on its annual heating energy demand, daylight factor and annual lighting energy demand, heat loss, solar gains through external windows and discomfort hours during free running time (May 1st – September 30th) for Dutch dwellings based on the European thermal comfort standard (EN15251:2007).
The buildings have different surface to volume ratios owing to different shapes: single, linear and courtyard shape. Actually, the single shape model is more exposed to its outdoor environment and has the highest surface to volume ratio. The linear models are consisted of row zones which leads to a lower exposure, and this amount is the least one for the courtyard models (referring Table 2 and Figure 7). The outdoor environments of geometries analysed with CFD calculations against the prevailing wind (south west in Rotterdam) showed different reactions. This helps to a better understanding of the indoor models behaviour.
In the one storey models, the heat loss energy mostly happens for zones located in the south west corners because of the prevailing wind. Moreover, the single zone has higher surface to volume ratio and this models has the highest solar gains. In total, the average amount of heating energy demand in a year for the single shape is the highest among the models. However, the lighting energy demand for the single shape is the lowest. In this regard, the linear and courtyard models are very close in lighting energy demand. Furthermore, the range of summer thermal comfort acceptable for 80% of people (category II of EN15251:2007 standard) calculated and determined for this climate. It was found that based on the indoor operative temperature of one storey zones, the courtyard model has the least discomfort hours.
The differences between the three different floor-plan layouts in terms of heating energy demand and thermally comfortable hours were most evident in the three storey simulations. The results showed the single house has the greatest amount of daylight, and consequently, the smallest demand for lighting energy. The courtyard shape has the lowest heating energy demand since it is more protected in the temperate climate of the Netherlands. Considering thermal comfort hours in free running mode, the courtyard shape has the least discomfort hours among the models. Reducing the external surface area exposed to the climatic environment leads to higher energy efficiency and improved summer thermal comfort performance.
i
145 Indoor thermal comfort in different building blocks
References
1 Olgyay, V., Design with Climate. 1963, Princeton NJ: Princeton University Press.
2 Martin, L., Architect’s approach to architecture. R.I.B.A. Journal, 1967.
3 Oke, T.R., Boundary Layer Climates. 1987, New York: Routledge.
4 Gupta, V.K., Solar radiation and urban design for hot climates. Environment and Planning B: Planning and Design,
1984. 11(4): p. 435-454.
5 Gupta, V., Thermal efficiency of building clusters: an index for non air-conditioned buildings in hot climates, in
Energy and Urban Built Form, D.H.e. al., Editor. 1987: Butterworths, UK.
6 Blowers, A.E., Planning for a Sustainable Environment, A Report by the Town and Country Planning Association.
1993, London: Earthscan.
7 Steemers, K., et al., City texture and microclimate. Urban Design Studies, 1997. 3: p. 25-50.
8 Martin, L., The grid as generator. Architectural Research Quarterly, 2000. 4(4): p. 309-322.
9 van Esch, M.M.E., R.H.J. Looman, and G.J. de Bruin-Hordijk, The effects of urban and building design parameters on
solar access to the urban canyon and the potential for direct passive solar heating strategies. Energy and Buildings,
2012. 47(0): p. 189-200.
10 Fathy, H., Natural energy and vernacular architecture: principles and examples with reference to hot arid climates.
1986, Chicago: The University of Chicago Press.
11 Givoni, B., Man, climate and architecture. 1976: Applied Science Publishers.
12 Dobbelsteen, A., et al., Ecology of the building geometry- Environmental performance of different building shapes,
in CIB World Building Congress 2007. 2007, CIB/CSIR: Cape Town, South Africa.
13 Yezioro, A., I.G. Capeluto, and E. Shaviv, Design guidelines for appropriate insolation of urban squares. Renewable
Energy, 2006. 31(7): p. 1011-1023.
14 Ratti, C., D. Raydan, and K. Steemers, Building form and environmental performance: archetypes, analysis and an
arid climate. Energy and Buildings, 2003. 35(1): p. 49-59.
15 Okeil, A., In search for Energy efficient urban forms: the residential solar block, in the 5th International Conference
on Indoor Air Quality, Ventilation and Energy Conservation in Buildings Proceedings. 2004: Toronto.
16 Okeil, A., A holistic approach to energy efficient building forms. Energy and Buildings, 2010. 42(9): p. 1437-1444.
17 Thapar, H. and S. Yannas, Microclimate and Urban Form in Dubai, in PLEA 2008 – 25th Conference on Passive and
Low Energy Architecture. 2008: Dublin.
18 Yang, X., Y. Li, and L. Yang, Predicting and understanding temporal 3D exterior surface temperature distribution in
an ideal courtyard. Building and Environment, 2012. 57(0): p. 38-48.
19 Taleghani, M., M. Tenpierik, and A. Dobbelsteen, The Effect of Different Transitional Spaces on Thermal Comfort
and Energy Consumption of Residential Buildings, in 7th Windsor Conference: The changing context of comfort in
an unpredictable world Cumberland Lodge. 2012, Network for Comfort and Energy Use in Buildings: Windsor, UK.
20 DesignBuilder, DesignBuilder software User manual. 2009.
21 Chowdhury, A.A., M.G. Rasul, and M.M.K. Khan, Thermal-comfort analysis and simulation for various low-energy
cooling-technologies applied to an office building in a subtropical climate. Applied Energy, 2008. 85(6): p. 449-
462.
22 Kottek, M., et al., World Map of the Köppen-Geiger climate classification updated. Meteorologische Zeitschrift,
2006. 15(3).
23 Nicol, J.F. and M.A. Humphreys, Adaptive thermal comfort and sustainable thermal standards for buildings. Energy
and Buildings, 2002. 34(6): p. 563-572.
i
146 Dwelling on Courtyards
24 Fanger, P., Thermal Comfort: Analysis and Applications in Environmental Engineering. 1970, Copenhagen Danish
Technical Press.
25 ISO, International Standard 7730. 1984, ISO Geneva, revised 1990.
26 Humphreys, M.A., Field studies of thermal comfort compared and applied Journal of the Institute of Heating and
Ventilating Engineers, 1976. 44: p. 5-27.
27 Humphreys, M.A., Outdoor temperatures and comfort indoors. Building Research and Practice (Journal of CIB),
1978. 6(2): p. 92-105.
28 Humphreys, M., Thermal Comfort Requirements, Climate and Energy, in the 2nd World Renewable Energy
Congress, A.A.M. Sayigh, Editor. 1992, Pergamon.
29 Humphreys, M.A., Field studies and climate chamber experiments in thermal comfort research, in Thermal
comfort: past, present, and future, N.A. Oseland and M.A. Humphreys, Editors. 1994, Building Research
Establishment Report: Watford.
30 CEN, C.E.e.d.N., CEN Standard EN 15251, in Indoor Environmental Input Parameters for Design and Assessment
of Energy Performance of Buildings Addressing Indoor Air Quality, Thermal Environment, Lighting and Acoustics.
2007, CEN: Brussels.
31 McCartney, K.J. and F.J. Nicol, Developing an adaptive control algorithm for Europe. Energy and Buildings, 2002.
34(6): p. 623-635.
32 NEN-5128, Energieprestatie van woonfuncties en woongebouwen - Bepalingsmethode. 2004.
i

147 Indoor thermal comfort in different building blocks i
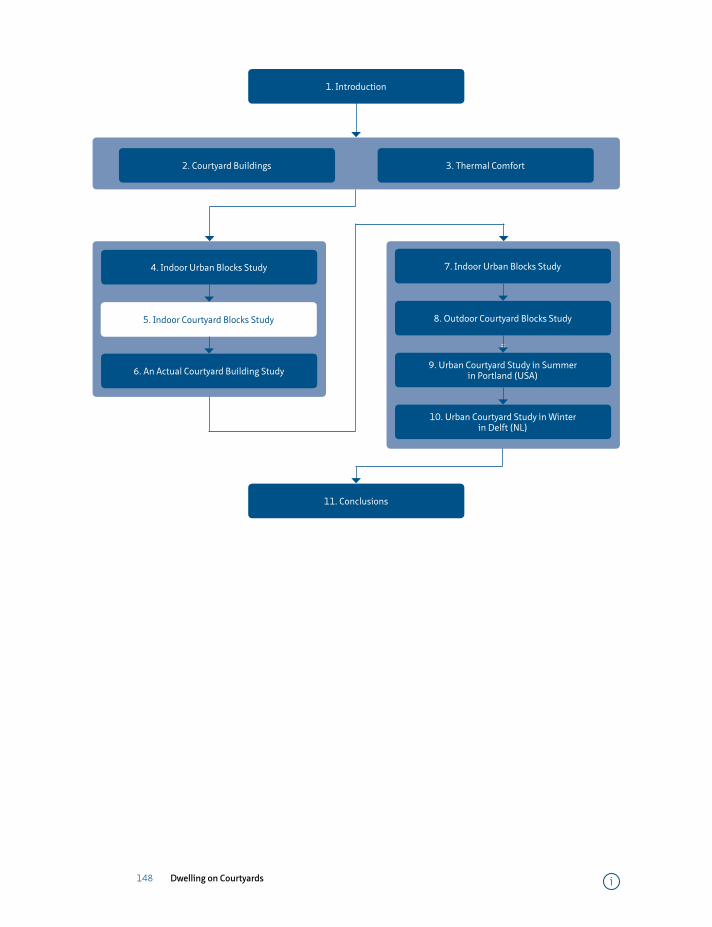
148 Dwelling on Courtyards
=5. Indoor Courtyard Blocks Study
4. Indoor Urban Blocks Study
6. An Actual Courtyard Building Study
11. Conclusions
=
8. Outdoor Courtyard Blocks Study
9. Urban Courtyard Study in Summer in Portland (USA)
10. Urban Courtyard Study in Winter in Delft (NL)
7. Indoor Urban Blocks Study
2. Courtyard Buildings 3. Thermal Comfort
1. Introduction
i

149 Indoor thermal comfort in courtyard buildings
5 Indoor thermal comfort in courtyard buildings
The previous chapter reviewed thermal performance and comfort in different building types including courtyard buildings. The results showed that a residential courtyard building has less annual heating energy demand, and a more comfortable indoor environment as compared to different housing types.
This chapter will focus solely on dwellings alongside urban courtyards. Different courtyard orientations, roof properties and courtyard pavements will be studied through simulation. An experiment on a scale model of a courtyard building with different roofs and pavements will show the effects of wet and dry surfaces. At the end, the simulation software is validated through on the monitoring of an actual house alongside a courtyard in Delft, the Netherlands.
i

150 Dwelling on Courtyards i

151 Indoor thermal comfort in courtyard buildings
Indoor thermal comfort in urban courtyard block dwellings in the Netherlands1
Mohammad Taleghani *1, Martin Tenpierik 1, Andy van den Dobbelsteen 1
1 Faculty of Architecture and the Built Environment, Delft University of Technology, Delft, the Netherlands
Abstract
Global warming and elevated temperatures in the Netherlands will increase the energy demand for cooling. Studying passive strategies to cope with the consequences of climate change is inevitable. This paper investigates the thermal performance of courtyard dwellings in the Netherlands. The effects of different orientations and elongations, cool roofs and pavements on indoor thermal comfort are studied through simulations and field measurements. The results show that North-South and East-West orientations provide the least and most comfortable indoor environments. Regarding materials, the use of green on roofs and as courtyard pavement is the most effective heat mitigation strategy. It was observed that the effects of wet cool roofs are much higher than of dry roofs. Cool roofs did not show a specific negative effect (heat loss) as compared to conventional asphalt roofs in winter. Some simulation results were validated through field measurement with a 0.91°C root mean square deviation.
Keywords
Courtyard buildings, heat mitigation strategies, cool roofs and pavements, indoor thermal comfort.
1 Published as: Taleghani M., Tenpierik M., Dobbelsteen A., “Indoor thermal comfort in urban courtyard block dwellings in the Netherlands”, Building and Environment, 82(2014) 566-579..
i
152 Dwelling on Courtyards
§ 5.1 Introduction
Global warming is affecting human thermal comfort [1], and it is estimated that by 2050, the air temperature in the Netherlands could be up to 2.3°C warmer than in the period from 1981 to 2014 [2]. The built environment can intensify or moderate the environment. One of the most commonly used building archetypes in hot climates is the courtyard form. Courtyards provide shading and consequently a cool microclimate within a building block. It may also ease ventilation through the stack effect. The thermal behaviour of courtyard buildings has extensively been studied in hot and arid climates, but rarely in temperate regions such as West Europe. Courtyards exist in the Netherlands; rarely as single family houses, but mainly as urban blocks. With the warmer future climate estimated for the Netherlands, this study tries to make this archetype climate proof. Therefore, this chapter explores the effect of different courtyard geometries and orientations on the thermal comfort of dwellers in the Netherlands. Heat mitigation strategies such as greenery or high albedo materials on roofs and within courtyards are investigated through simulations. An experiment on a scale model of a courtyard with different roofs and courtyard pavements is done to support the results of the simulations. At the end, a one-month field measurement in an actual courtyard house in Delft is done as a validation of the simulation program used in this chapter.
§ 5.1.1 Thermal behaviour of courtyard buildings
Courtyards have been used mostly in harsh climates in order to provide more shading in hot climates, more ventilation in humid climates and more protection against cold winds in temperate and cold climates. In a comparison between different building forms, Okeil [3] generated Residential Solar Blocks (RSB) based on the courtyard form and showed that it is more energy efficient than slabs and pavilions in the hot and humid climate of UAE. Ratti, et al. [4], based on the six archetypal forms of Martin and March [5], made three “realistic” block layouts for a hot and arid climate. They concluded that the courtyard configuration led to a more favourable micro-climate because of more favourable environmental variables (surface to volume ratio, shadow density, daylight distribution, and sky view factor) as compared to two different pavilion types. In the temperate climate of the Netherlands, Taleghani, et al. [6] compared courtyard buildings with different urban layouts (linear and singular blocks with the same floor area). They showed this typology has the least summer discomfort hours. This was because of the lower surface-to-volume ratio of the courtyard, and it’s shading on the surrounding buildings.
i
153 Indoor thermal comfort in courtyard buildings
§ 5.1.2 Highly reflective materials and cool roofs
Dark surfaces used in urban environments and the lack of vegetation increase the ambient air temperature in cities. This phenomenon is called the urban heat island (UHI) which is more sensible in summer [7, 8]. Akbari, et al. [9] in a study on American metropolises showed that peak urban electric demand rises by 2-4% for each 1°C increase in air temperature. This is an indirect effect of dark materials; but, the direct effect is their higher absorption of solar energy. With a low albedo, dark materials reflect less solar radiation increasing their surface temperature and as a result increasing the energy use for the cooling of buildings, especially during the peak periods of energy demand.
There is a large body of literature on highly reflective materials and vegetated (green) surfaces studied in the hot climates of the USA [10-13] and southern Europe [14-16]; and recently in colder climates such as in Moscow (Russia) [17, 18], Toronto (Canada) [19, 20], and Gothenburg (Sweden) [21]. Vegetation and highly reflective materials are becoming ever more studied and used; however, there are challenges in the use of green roofs. First, the installation and maintenance costs of these roofs are relatively problematic. Second, the behaviour of these roofs (known as cool roofs) is not always beneficial in winter. This could be due to the shading effect of vegetation on the roof but also due to the higher thermal conductivity of water in wet green roofs and the evapotranspiration of vegetation [23]. Liu and Minor [24] showed that with a proper drainage and insulation layer this problem could be solved for a cold climate like Toronto (Canada).
Reviewing the literature, what has been less studied is the effect of cool materials on the microclimate of urban courtyards, and also its effect on the indoor comfort of the dwellers. The other missing (and important) research in the literature is the thermal behaviour of cool materials and green roofs in winter (in dry and wet modes). Therefore, in this chapter the effect of highly reflective materials and vegetation on the roof and on the ground of the courtyard is investigated; in summer and winter, and in dry and wet modes. This will be done through simulations and actual experiments.
§ 5.2 Methodology
This chapter consists of three phases. Phase 1 is done through computer simulation. Phase 2 shows the results of a scale model, and phase 3 is a validation of the simulation model using field measurements in an actual courtyard house.
i
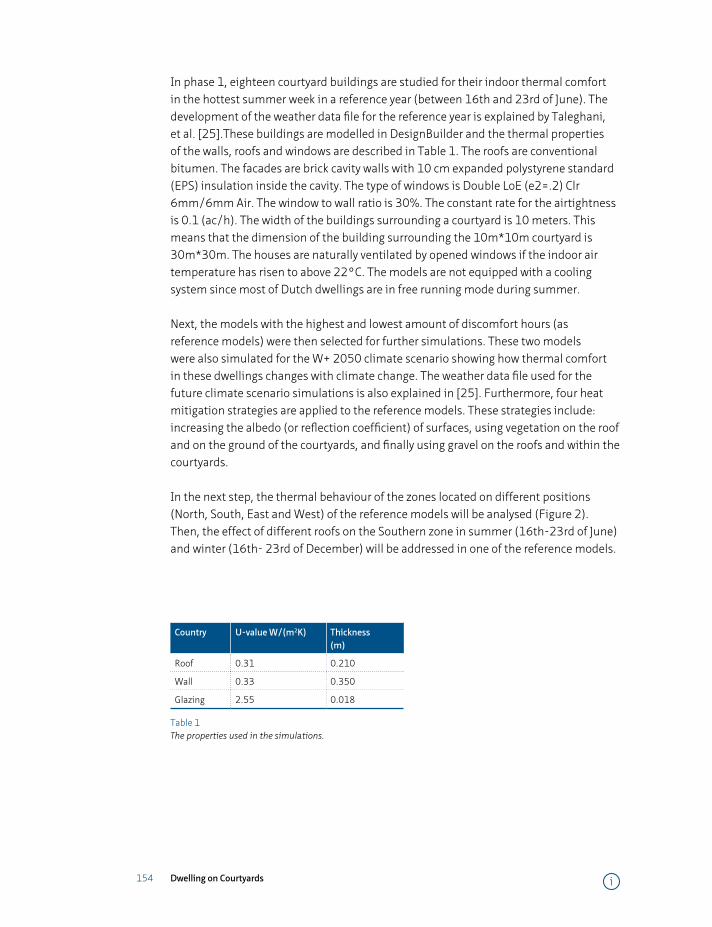
154 Dwelling on Courtyards
In phase 1, eighteen courtyard buildings are studied for their indoor thermal comfort in the hottest summer week in a reference year (between 16th and 23rd of June). The development of the weather data file for the reference year is explained by Taleghani, et al. [25].These buildings are modelled in DesignBuilder and the thermal properties of the walls, roofs and windows are described in Table 1. The roofs are conventional bitumen. The facades are brick cavity walls with 10 cm expanded polystyrene standard (EPS) insulation inside the cavity. The type of windows is Double LoE (e2=.2) Clr 6mm/6mm Air. The window to wall ratio is 30%. The constant rate for the airtightness is 0.1 (ac/h). The width of the buildings surrounding a courtyard is 10 meters. This means that the dimension of the building surrounding the 10m*10m courtyard is 30m*30m. The houses are naturally ventilated by opened windows if the indoor air temperature has risen to above 22°C. The models are not equipped with a cooling system since most of Dutch dwellings are in free running mode during summer.
Next, the models with the highest and lowest amount of discomfort hours (as reference models) were then selected for further simulations. These two models were also simulated for the W+ 2050 climate scenario showing how thermal comfort in these dwellings changes with climate change. The weather data file used for the future climate scenario simulations is also explained in [25]. Furthermore, four heat mitigation strategies are applied to the reference models. These strategies include: increasing the albedo (or reflection coefficient) of surfaces, using vegetation on the roof and on the ground of the courtyards, and finally using gravel on the roofs and within the courtyards.
In the next step, the thermal behaviour of the zones located on different positions (North, South, East and West) of the reference models will be analysed (Figure 2). Then, the effect of different roofs on the Southern zone in summer (16th-23rd of June) and winter (16th- 23rd of December) will be addressed in one of the reference models.
Country U-value W/(m2K) Thickness(m)
Roof 0.31 0.210
Wall 0.33 0.350
Glazing 2.55 0.018
Table 1 The properties used in the simulations.
i
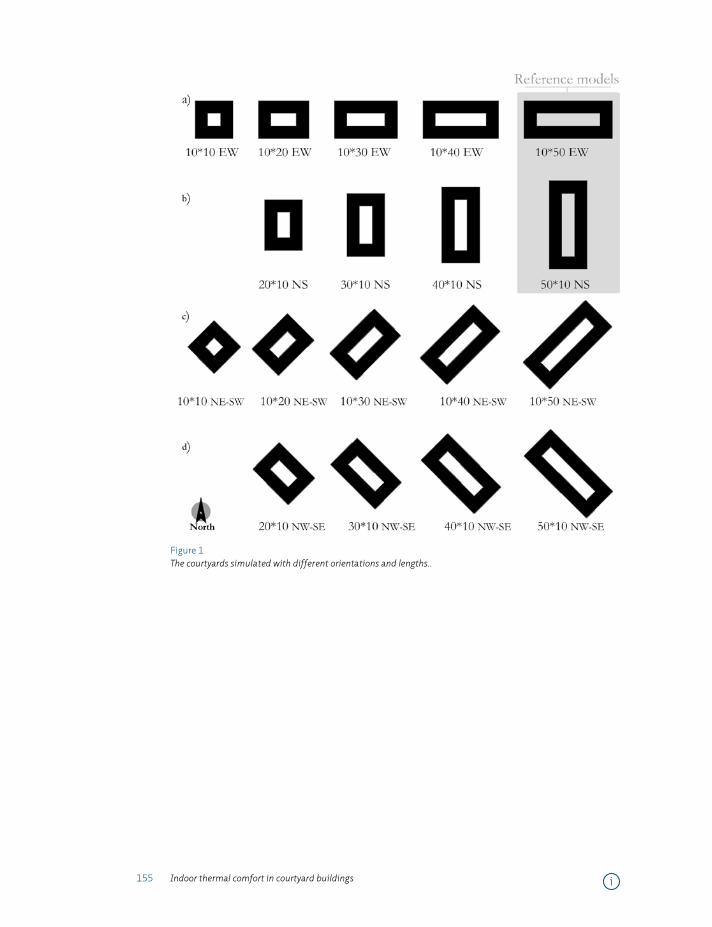
155 Indoor thermal comfort in courtyard buildings
Figure 1 The courtyards simulated with different orientations and lengths..
i
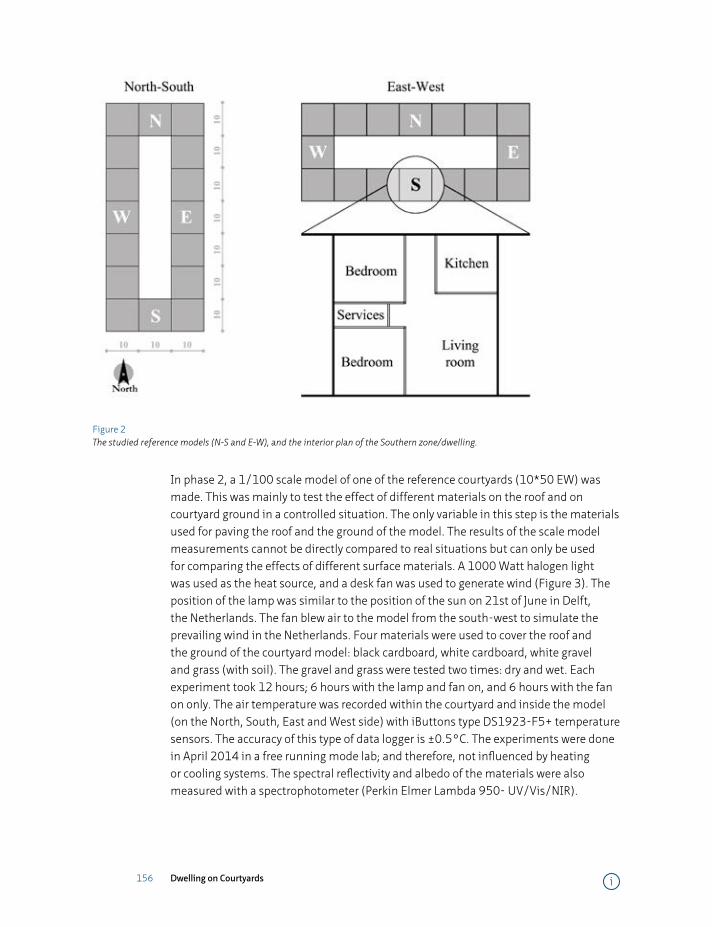
156 Dwelling on Courtyards
Figure 2 The studied reference models (N-S and E-W), and the interior plan of the Southern zone/dwelling.
In phase 2, a 1/100 scale model of one of the reference courtyards (10*50 EW) was made. This was mainly to test the effect of different materials on the roof and on courtyard ground in a controlled situation. The only variable in this step is the materials used for paving the roof and the ground of the model. The results of the scale model measurements cannot be directly compared to real situations but can only be used for comparing the effects of different surface materials. A 1000 Watt halogen light was used as the heat source, and a desk fan was used to generate wind (Figure 3). The position of the lamp was similar to the position of the sun on 21st of June in Delft, the Netherlands. The fan blew air to the model from the south-west to simulate the prevailing wind in the Netherlands. Four materials were used to cover the roof and the ground of the courtyard model: black cardboard, white cardboard, white gravel and grass (with soil). The gravel and grass were tested two times: dry and wet. Each experiment took 12 hours; 6 hours with the lamp and fan on, and 6 hours with the fan on only. The air temperature was recorded within the courtyard and inside the model (on the North, South, East and West side) with iButtons type DS1923-F5+ temperature sensors. The accuracy of this type of data logger is ±0.5°C. The experiments were done in April 2014 in a free running mode lab; and therefore, not influenced by heating or cooling systems. The spectral reflectivity and albedo of the materials were also measured with a spectrophotometer (Perkin Elmer Lambda 950- UV/Vis/NIR).
i

157 Indoor thermal comfort in courtyard buildings
Figure 3 Up left: the scale model experiment with the halogen light and fan. Up right: the sensors placed in the four sides of the model. Down from left to right: black cardboard, gravel, grass and white cardboard.
In phase 3, an actual courtyard house in Delft (the Netherlands) was monitored from April 19th till May 31st. The aim of this monitoring was to validate DesignBuilder as the simulation software used in this chapter (phase 1). The monitoring was done when the courtyard house was in free running mode (with only full mechanical ventilation with heat recovery operating). Thus, no heating or cooling system affected the indoor temperature. The measured house is 11.5m * 7.7m. The air temperature was measured with Plugwise Sense data loggers with a measurement interval of one hour in four rooms (living room, kitchen, master bedroom and small bedroom) and inside the courtyard. The accuracy of these data loggers is ±0.3°C. The measurement results were, then, compared with the simulation results of the house in DesignBuilder.
The U-values of the walls and glass are 0.28 and 1.7 W/m2K, respectively. The window to wall ratio is 63%. Figure 4 shows the location and a view of the courtyard.
i
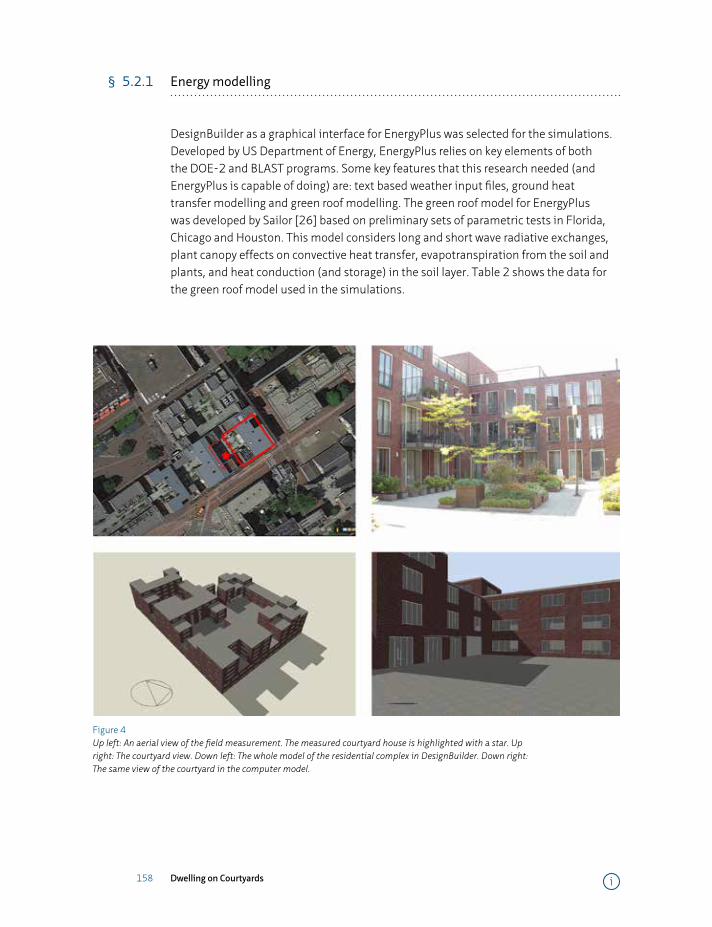
158 Dwelling on Courtyards
§ 5.2.1 Energy modelling
DesignBuilder as a graphical interface for EnergyPlus was selected for the simulations. Developed by US Department of Energy, EnergyPlus relies on key elements of both the DOE-2 and BLAST programs. Some key features that this research needed (and EnergyPlus is capable of doing) are: text based weather input files, ground heat transfer modelling and green roof modelling. The green roof model for EnergyPlus was developed by Sailor [26] based on preliminary sets of parametric tests in Florida, Chicago and Houston. This model considers long and short wave radiative exchanges, plant canopy effects on convective heat transfer, evapotranspiration from the soil and plants, and heat conduction (and storage) in the soil layer. Table 2 shows the data for the green roof model used in the simulations.
Figure 4 Up left: An aerial view of the field measurement. The measured courtyard house is highlighted with a star. Up right: The courtyard view. Down left: The whole model of the residential complex in DesignBuilder. Down right: The same view of the courtyard in the computer model.
i

159 Indoor thermal comfort in courtyard buildings
Height of plants (m) 0.10
Leaf area index (LAI) 5.00
Leaf reflectivity 0.22
Leaf emissivity 0.95
Minimum stomata resistance (s/m) 100
Max volumetric moisture content of the soil layer (saturation) 0.50
Min (residual) volumetric moisture content of the soil layer 0.01
Initial volumetric moisture content of the soil layer 0.15
Table 2 The data used for the simulation of the green roof in this research.
§ 5.2.2 Thermal comfort model
In this chapter, thermal comfort is calculated based on the ASHRAE 55-2010 standard [27]. This standard is based on the largest database with measured results (21,000 measurements) from Australia to Canada. According to this standard, the thermal comfort temperature is calculated as:
TCO=0.31 * Tref+ 17.8
Where TCO [°C] is comfort temperature; and Tref [°C] is the prevailing mean outdoor air temperature (for a time period between the last 7 to 30 days before the day in question). The range of thermal comfort bounds is 3.5°C upper and lower of TCO. The measurements and surveys that were done to create the database that resulted in this standard were done mostly in office buildings. Due to the lack of a standard for dwellings, the mentioned standards were used [28].
§ 5.2.3 Climate of the Netherlands
The climate of the Netherlands is known as a temperate climate based on the climatic classification of Köppen-Geiger [29]. The prevailing wind is South-West, and the mean annual dry bulb temperature is 10.5°C. For the simulations, the hourly weather data of De Bilt (52°N, 4°E) that represents for the Netherlands is used [25].
i
160 Dwelling on Courtyards
The Royal Dutch Meteorological Institute (KNMI) has translated the IPCC climate scenarios for the Netherlands in 2050 [30]. Taleghani, et al. [25] has explained the KNMI ’06 climate scenarios and how from these scenario’s future weather data files can be created. The severest scenario, W+ (warm scenario with an average +2°C temperature increase), was selected in this chapter to study thermal comfort in the future 2.
For phase 3, the simulation of the real courtyard house in Delft, the weather data was taken from a KNMI weather station located at Rotterdam - The Hague Airport about 8 km south-east of the courtyard house.
§ 5.3 Results
§ 5.3.1 Phase 1: Parametric simulations
§ 5.3.1.1 Courtyards with different orientations
In this phase of the study, 18 urban courtyard blocks were simulated for a summer week. The courtyard models vary in length and width from 10 to 50 m with steps of 10m; and have four main orientations N–S, E–W, NW–SE, and NE–SW. In Figure 5, the amount of achieved solar radiation is illustrated for the N-S and E-W models (a) and for NW-SE and NE-SW models (b). The corresponding average indoor ventilation rates (c and d), average indoor operative temperatures (e and f), and numbers of discomfort hours are shown respectively with the same axis scale for the same models (g and h).
2 Recently, in May 2014, KNMI published new climate scenarios for the Netherlands, the so-called KNMI ’14 climate scenarios. Because this study was undertaken before these new scenarios were published, the previous scenarios from 2006 were used.
i
161 Indoor thermal comfort in courtyard buildings
The simulated week contains the longest days in a year. On 21st of June, the sun rises at 5:18h and sets at 22:03h (17:45 hours in total) in De Bilt in the Netherlands. During these long days, the sun rises from the North-East and sets in the North-West. The maximum sun angle is 61° on 21st of June at 12 o’clock solar time (around 13:41 h De Bilt local time). This sun path affects mostly eastern façades (in the morning), roofs and southern façades (at noon) and western façades (in the afternoon and evening). With this principle, buildings with long orientations through N-S have higher solar heat gains, and E-W orientation lower. This phenomenon is visible in Figure 5- a) and b). Among the simulated models, the maximum total solar gain is received by the 50*10 N-S block (289 Wh/m2), and the minimum by the10*50 E-W block (231 Wh/m2).
Figure 5- c) and d) show the average indoor ventilation rate of the models. The prevailing wind in the Netherlands is South-West (from the North Sea). This direction makes the models with NW-SE direction more suitable for natural ventilation. Having a look at the figure, the highest average ventilation rate is achieved by the 10*50 NW-SE model (0.82 ac/h), and the lowest by the 10*50 NE-SW model (0.70 ac/h).
To calculate thermal (dis)comfort, the operative temperature of the models is needed. Figures 5- e) and f) summarise the average operative temperature of the models during the simulated week. The warmest model corresponds to the model that receives the most solar radiation, which is the 50*10 N-S model. In contrast, the coolest model is the 10*50 E-W model corresponding with the least solar radiation entry.
Based on the simulations, the percentage of discomfort hours are calculated for each model. The 50*10 N-S model shows the most discomfort hours (with 90% of the time uncomfortable), and the 10*50 E-W model the least (with 50% of the time uncomfortable). The rotated models 10*50 NW-SE and NE-SW also have a high percentage of discomfort hours (74% and 85%, respectively). This shows that NW-SE orientation is more comfortable among the rotated courtyards.
i

162 Dwelling on Courtyards
Figure 5 a,b) Solar radiation received through the windows; c,d) Indoor ventilation; e,f) Operative temperature; and g,h) Percentage of thermal discomfort during the summer week.
§ 5.3.1.2 Future climate scenario and heat mitigation strategies
Climate change is likely to have a significant effect on the cooling demand of buildings. The severest climate scenario (W+) for the Netherlands in 2050 according to the KNMI ’06 climate scenario’s is used to estimate thermal comfort in dwellings alongside an
i
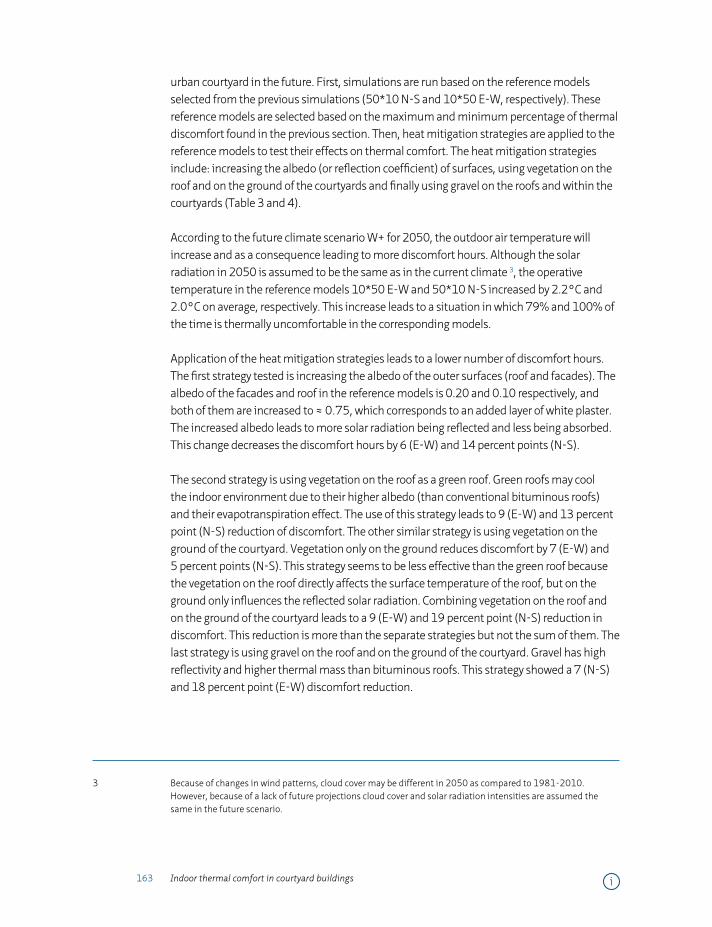
163 Indoor thermal comfort in courtyard buildings
urban courtyard in the future. First, simulations are run based on the reference models selected from the previous simulations (50*10 N-S and 10*50 E-W, respectively). These reference models are selected based on the maximum and minimum percentage of thermal discomfort found in the previous section. Then, heat mitigation strategies are applied to the reference models to test their effects on thermal comfort. The heat mitigation strategies include: increasing the albedo (or reflection coefficient) of surfaces, using vegetation on the roof and on the ground of the courtyards and finally using gravel on the roofs and within the courtyards (Table 3 and 4).
According to the future climate scenario W+ for 2050, the outdoor air temperature will increase and as a consequence leading to more discomfort hours. Although the solar radiation in 2050 is assumed to be the same as in the current climate 3, the operative temperature in the reference models 10*50 E-W and 50*10 N-S increased by 2.2°C and 2.0°C on average, respectively. This increase leads to a situation in which 79% and 100% of the time is thermally uncomfortable in the corresponding models.
Application of the heat mitigation strategies leads to a lower number of discomfort hours. The first strategy tested is increasing the albedo of the outer surfaces (roof and facades). The albedo of the facades and roof in the reference models is 0.20 and 0.10 respectively, and both of them are increased to ≈ 0.75, which corresponds to an added layer of white plaster. The increased albedo leads to more solar radiation being reflected and less being absorbed. This change decreases the discomfort hours by 6 (E-W) and 14 percent points (N-S).
The second strategy is using vegetation on the roof as a green roof. Green roofs may cool the indoor environment due to their higher albedo (than conventional bituminous roofs) and their evapotranspiration effect. The use of this strategy leads to 9 (E-W) and 13 percent point (N-S) reduction of discomfort. The other similar strategy is using vegetation on the ground of the courtyard. Vegetation only on the ground reduces discomfort by 7 (E-W) and 5 percent points (N-S). This strategy seems to be less effective than the green roof because the vegetation on the roof directly affects the surface temperature of the roof, but on the ground only influences the reflected solar radiation. Combining vegetation on the roof and on the ground of the courtyard leads to a 9 (E-W) and 19 percent point (N-S) reduction in discomfort. This reduction is more than the separate strategies but not the sum of them. The last strategy is using gravel on the roof and on the ground of the courtyard. Gravel has high reflectivity and higher thermal mass than bituminous roofs. This strategy showed a 7 (N-S) and 18 percent point (E-W) discomfort reduction.
3 Because of changes in wind patterns, cloud cover may be different in 2050 as compared to 1981-2010. However, because of a lack of future projections cloud cover and solar radiation intensities are assumed the same in the future scenario.
i
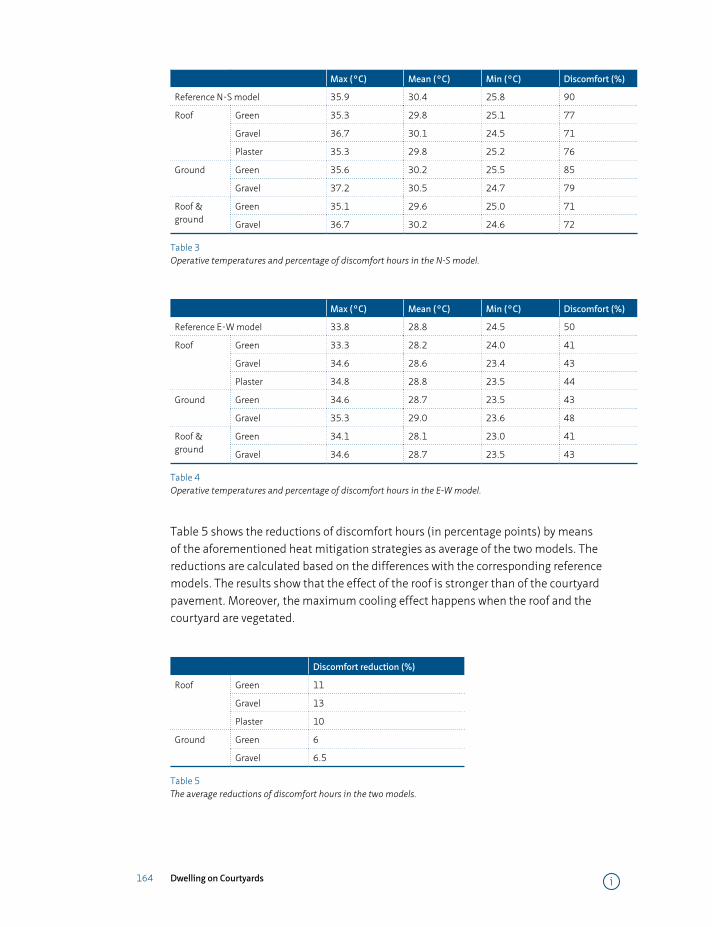
164 Dwelling on Courtyards
Max (°C) Mean (°C) Min (°C) Discomfort (%)
Reference N-S model 35.9 30.4 25.8 90
Roof Green 35.3 29.8 25.1 77
Gravel 36.7 30.1 24.5 71
Plaster 35.3 29.8 25.2 76
Ground Green 35.6 30.2 25.5 85
Gravel 37.2 30.5 24.7 79
Roof & ground
Green 35.1 29.6 25.0 71
Gravel 36.7 30.2 24.6 72
Table 3 Operative temperatures and percentage of discomfort hours in the N-S model.
Max (°C) Mean (°C) Min (°C) Discomfort (%)
Reference E-W model 33.8 28.8 24.5 50
Roof Green 33.3 28.2 24.0 41
Gravel 34.6 28.6 23.4 43
Plaster 34.8 28.8 23.5 44
Ground Green 34.6 28.7 23.5 43
Gravel 35.3 29.0 23.6 48
Roof & ground
Green 34.1 28.1 23.0 41
Gravel 34.6 28.7 23.5 43
Table 4 Operative temperatures and percentage of discomfort hours in the E-W model.
Table 5 shows the reductions of discomfort hours (in percentage points) by means of the aforementioned heat mitigation strategies as average of the two models. The reductions are calculated based on the differences with the corresponding reference models. The results show that the effect of the roof is stronger than of the courtyard pavement. Moreover, the maximum cooling effect happens when the roof and the courtyard are vegetated.
Discomfort reduction (%)
Roof Green 11
Gravel 13
Plaster 10
Ground Green 6
Gravel 6.5
Table 5 The average reductions of discomfort hours in the two models.
i

165 Indoor thermal comfort in courtyard buildings
Discomfort reduction (%)
Roof & ground
Green 14
Gravel 12.5
Table 5 The average reductions of discomfort hours in the two models.
i
166 Dwelling on Courtyards
§ 5.3.1.3 The position effect
In this part of the study, thermal comfort is studied in dwellings with different position/orientation and floor inside the urban courtyard blocks (E-W and N-S). First dwellings in four main orientations, North, South, East and West, are compared, and then the average of all dwellings on each of the three floors (1st, 2nd and 3rd storey).
Figure 6 (a and c) shows how dwellings with different orientation inside the urban courtyard blocks behave differently during the summer week. The dwellings on the Western side of the blocks are the hottest because they are warmed from the early morning (≈5:20), and receive direct sun during the before noon till evening (till ≈22:00 during the simulated summer week). The dwellings on the Eastern side of the blocks also receive a long period of direct sun from the early morning till evening. The dwellings located on the North and South side have the lowest indoor operative temperature because the sun angle is high during this week. Analysis of the results shows that the Northern, Southern, Eastern and Western dwellings in the E-W model have 31%, 31%, 91% and 99% of discomfort hours, respectively. Corresponding amounts for the dwellings in the N-S model are 44%, 51%, 94% and 100%.
The zones located on different levels have different thermal behaviour. Figure 6 (b and d) shows a comparison of dwellings on the Southern side of the urban courtyard blocks on the three different stories of the courtyard models. The ground floors of the models are the coolest and the 2nd floor the warmest. The ground floors of the models are in touch with the ground. The average annual temperature of the ground is around 10°C in the Netherlands. This makes the ground floors of the models cooler than the upper floors. In contrast, the 2nd floors of the models are right below the roof. This roof surface heats the 2nd floors making them warmer than the others. Likewise, the number of discomfort hours during the simulated week is higher on the upper levels. The calculated discomfort hours for the dwellings on the Southern side of the building on the ground, 1st and 2nd floor of the E-W model are 21%, 32% and 42% respectively. These amounts for the N-S model are 35%, 52% and 62%, respectively. This shows that by increasing one level in the model, the number of thermal comfort hours decreases by almost 10 percent points.
i
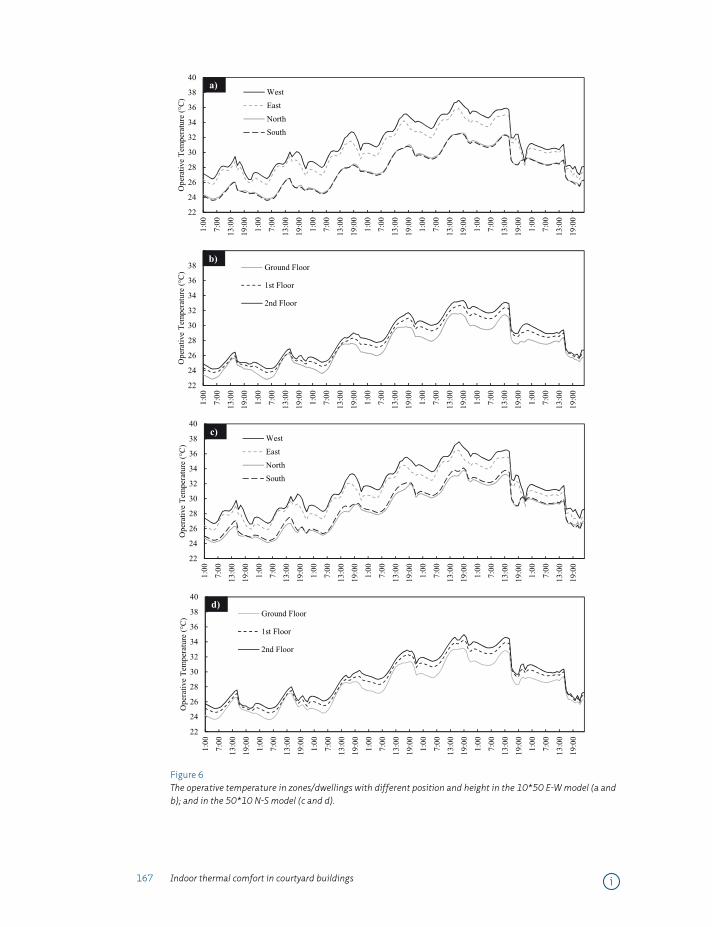
167 Indoor thermal comfort in courtyard buildings
22
24
26
28
30
32
34
36
38
40
1:00
7:00
13:0
0
19:0
0
1:00
7:00
13:0
0
19:0
0
1:00
7:00
13:0
0
19:0
0
1:00
7:00
13:0
0
19:0
0
1:00
7:00
13:0
0
19:0
0
1:00
7:00
13:0
0
19:0
0
1:00
7:00
13:0
0
19:0
0
Ope
rativ
e Te
mpe
ratu
re (°
C)
WestEastNorthSouth
c)
22
24
26
28
30
32
34
36
38
40
1:00
7:00
13:0
0
19:0
0
1:00
7:00
13:0
0
19:0
0
1:00
7:00
13:0
0
19:0
0
1:00
7:00
13:0
0
19:0
0
1:00
7:00
13:0
0
19:0
0
1:00
7:00
13:0
0
19:0
0
1:00
7:00
13:0
0
19:0
0
Ope
rativ
e Te
mpe
ratu
re (°
C) Ground Floor
1st Floor
2nd Floor
d)
22
24
26
28
30
32
34
36
38
40
1:00
7:00
13:0
0
19:0
0
1:00
7:00
13:0
0
19:0
0
1:00
7:00
13:0
0
19:0
0
1:00
7:00
13:0
0
19:0
0
1:00
7:00
13:0
0
19:0
0
1:00
7:00
13:0
0
19:0
0
1:00
7:00
13:0
0
19:0
0
Ope
rativ
e Te
mpe
ratu
re (°
C)
WestEastNorthSouth
a)
40
22
24
26
28
30
32
34
36
38
1:00
7:00
13:0
0
19:0
0
1:00
7:00
13:0
0
19:0
0
1:00
7:00
13:0
0
19:0
0
1:00
7:00
13:0
0
19:0
0
1:00
7:00
13:0
0
19:0
0
1:00
7:00
13:0
0
19:0
0
1:00
7:00
13:0
0
19:0
0
Ope
rativ
e Te
mpe
ratu
re (°
C) Ground Floor
1st Floor
2nd Floor
b)
Figure 6 The operative temperature in zones/dwellings with different position and height in the 10*50 E-W model (a and b); and in the 50*10 N-S model (c and d).
i
168 Dwelling on Courtyards
§ 5.3.1.4 Detailed analysis of a single family house with different roofs
In this part of the study, the effect of different roofs on thermal comfort is studied. To do this, a dwelling on the Southern side of the urban courtyard block located on top floor of the 10*50 E-W model is selected for simulations. The building is simulated with 4 different roofs: a black (conventional), a white, a green (vegetated) and a grey (gravel) roof. The black roof is a typical roof with bituminous top layer. The white roof is finished with white plaster. The green roof is a vegetated roof with grass. The grey roof is covered with gravel. The simulations are run for the summer week (16th till 23rd of June), and also for a winter week (16th till 23rd of December). The winter week is simulated to check the effect of the roof during the winter. Several studies have shown that cool roofs (such as white and green roofs) can lead to additional heat loss and increased heating demand [23, 31, 32]. The simulations are done in a free running mode in winter (same as in summer) to not being influenced by the heating system. The zone as a home, is divided into different sub-zones and activities; two bedrooms, a kitchen, a toilet and bathroom, a living room and corridors.
The results show that the black roof (with the highest solar absorption) causes the highest indoor operative temperature among the models (Figure 7- a)). The white and green roofs have similar behaviour, and the gravel roof provides the lowest operative temperature. This could be due to the high albedo of the gravel and also its higher heat capacity. The average operative temperature of the model with these four roofs during the summer week is 28.4°C, 27.7°C, 27.6°C and 27.3°C for the black, white, green and gravel roofs, respectively. The calculated amount of discomfort hours with these four roofs is 43%, 33%, 29% and 27%, respectively. The operative temperature in the model during the winter week is illustrated in Figure 7- b). In winter, the roofs have very small differences with each other; nevertheless, the black roof leads to the higher operative temperature. The average operative temperature in the models is 12.2°C, 12.1°C, 12.1°C and 12.0°C for the black, the green, the white and the gravel roof, respectively.
To sum up, the gravel roof leads to the minimum indoor operative temperature in summer, whereas the black roof leads to the highest in winter (Table 6).
i
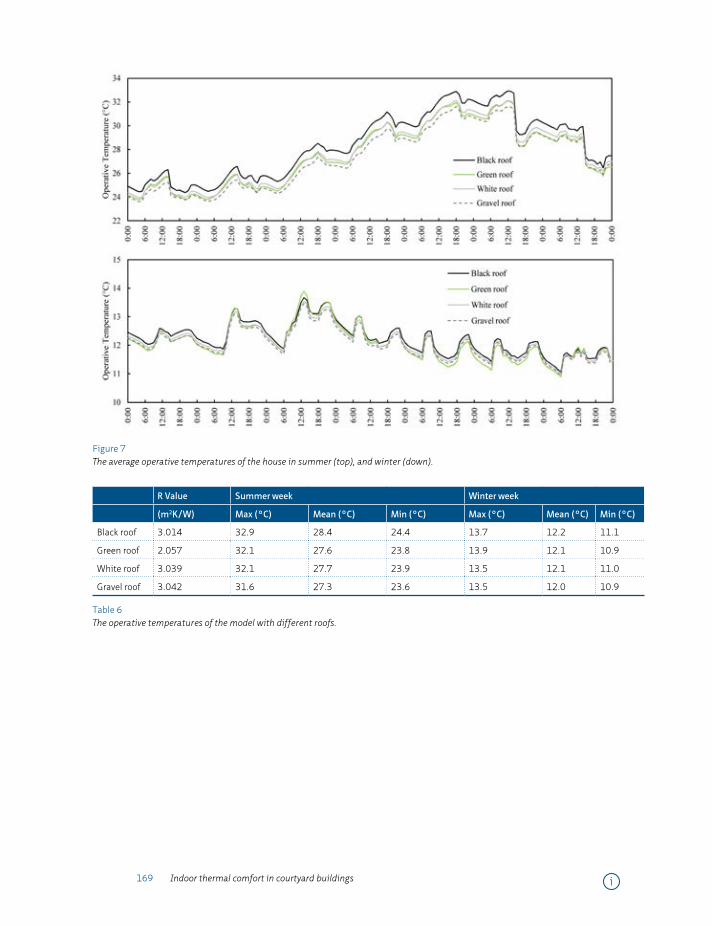
169 Indoor thermal comfort in courtyard buildings
Figure 7 The average operative temperatures of the house in summer (top), and winter (down).
R Value Summer week Winter week
(m2K/W) Max (°C) Mean (°C) Min (°C) Max (°C) Mean (°C) Min (°C)
Black roof 3.014 32.9 28.4 24.4 13.7 12.2 11.1
Green roof 2.057 32.1 27.6 23.8 13.9 12.1 10.9
White roof 3.039 32.1 27.7 23.9 13.5 12.1 11.0
Gravel roof 3.042 31.6 27.3 23.6 13.5 12.0 10.9
Table 6 The operative temperatures of the model with different roofs.
i

170 Dwelling on Courtyards
§ 5.3.2 Phase 2: Scale model experiment
The results of phase 1 were based on the computer simulations. To validate parts of the results, an experiment on a scale model was done. The experiment focused on the effect of the different materials used in the simulations (black, green, white and gravel surfaces). Thus, this complementary phase was added to the research. First, the albedo of the materials used in the scale model experiment was measured. The albedo of the black cardboard is 0.054, of the white cardboard 0.832 and of the grass in dry mode 0.387. The albedo of the (white) gravel could not be measured; but based on Santamouris [33] it should be around 0.72.
Figure 8 shows the normalised air temperature within the courtyard model and inside the model after 6 hours (heating process with a 1000 W lamp and a fan) and after 12 hours (cooling down process with the fan only). To get these normalised values, the ambient air temperature of the lab was subtracted from the measured air temperatures. A value above zero thus means that the air above the surface is warmer than the lab air. The temperatures are plotted after 6 and 12 hours. The lamp (representing the sun) was turned off after 6 hours, and the fan (as the wind source) was turned off after 12 hours, at the end of each experiment.
Considering the indoor environment, the average indoor temperature of the four sides of the scale model (subtracted from the measured lab air temperatures) is illustrated in Figure 8-a. After 6 hours, the indoor environment below the black roof has the highest normalised air temperature (+2.0°C), and the indoor environment below the wet grass roof the lowest (-1.1°C). The wet gravel provides the second coolest indoor environment. This experiment on dry and wet gravel shows that the dry gravel roof has 0.4°C higher temperature than the white roof; however, the wet gravel roof provides a 1.4°C cooler indoor environment than the white roof. This shows that the effect of evaporation is stronger than the effect of albedo. After 12h, the wet grass led to the coolest indoor environment (-2.5°C) while the other models had a more or less similar temperature which was close to or just below the ambient air temperature.
Regarding the courtyard temperatures (Figure 8-b), the dry gravel and the black pavement have the highest normalised air temperature after 6h (+1.9°C and +1.7°C, respectively). Comparing the dry gravel and grass with their wet counterpart, the dry pavements lead to a higher temperature after both 6 and 12 hours. When the gravel pavement is irrigated, the air temperature inside the courtyard decreases with +4.2°C; if the grass is irrigated, this decrease is +2.9°C. After 12 hours, the wet grass pavement results in the lowest courtyard temperature (-3.2°C) among the others. The other cool pavement material was the wet gravel with -2.9°C. The experiment on the microclimate of the courtyard also shows that the gravel and the white cardboard (with highest albedos) do not necessarily provide the coolest environment. The evaporative
i
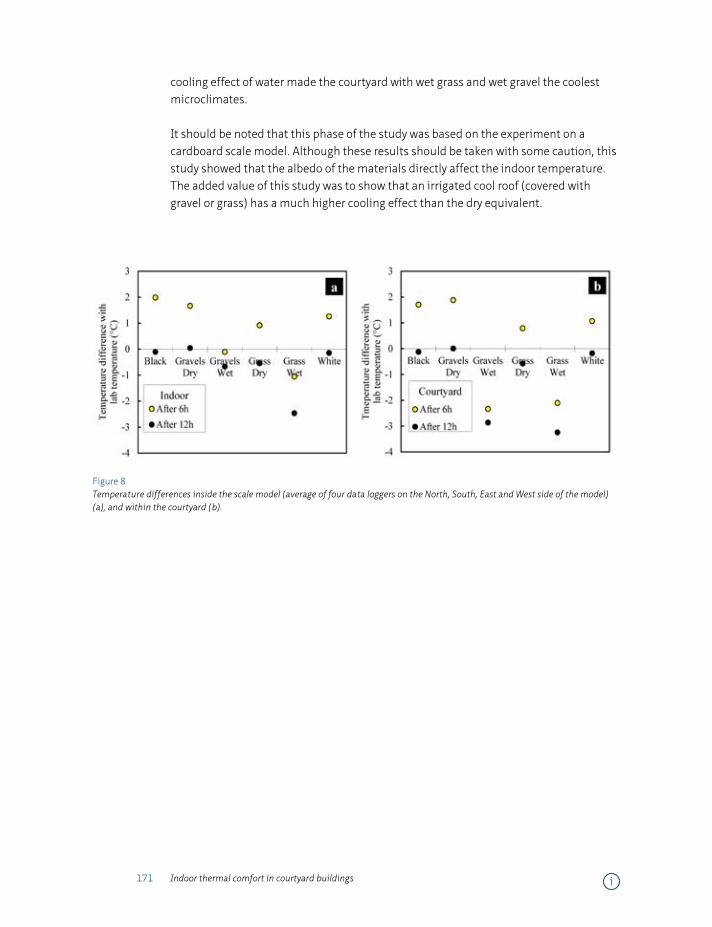
171 Indoor thermal comfort in courtyard buildings
cooling effect of water made the courtyard with wet grass and wet gravel the coolest microclimates.
It should be noted that this phase of the study was based on the experiment on a cardboard scale model. Although these results should be taken with some caution, this study showed that the albedo of the materials directly affect the indoor temperature. The added value of this study was to show that an irrigated cool roof (covered with gravel or grass) has a much higher cooling effect than the dry equivalent.
Figure 8 Temperature differences inside the scale model (average of four data loggers on the North, South, East and West side of the model) (a), and within the courtyard (b).
i
172 Dwelling on Courtyards
§ 5.3.3 Phase 3: An actual courtyard house experiment
In this third phase, the thermal behaviour of an actual courtyard house in Delft (the Netherlands) is studied. Four data loggers recorded the air temperature of the living room, the kitchen, the master bedroom and a small bedroom from 1st till 31st of May. Another data logger measured the air temperature of the courtyard from 19th of April till 31st of May. The courtyard house is also modelled and simulated in DesignBuilder. The measured and simulated results are compared and plotted in Figure 9. The aim of this third phase is to validate the results of DesignBuilder, and see how well it predicts air temperature.
As shown, the simulated indoor temperatures have more fluctuations than the measured data. This is expected to be due to the higher thermal mass in the actual house that keeps the temperature more stable. The root mean square deviations (RMSD) between the measured and simulated temperatures in the living room, kitchen, master bedroom and small bedroom are: 0.80°C, 0.88°C, 0.85°C and 1.12°C, respectively; and 0.91°C on average. Considering that the data loggers had an inaccuracy of ±0.3°C, this small difference is acceptable for the comparative studies done in phase 1 of this study.
The courtyard temperature is also compared to the nearest available KNMI weather station (Rotterdam-The Hague Airport) in Figure 9-e left. The maximum temperature that happened in the Delft courtyard was 26.8°C and at the airport 26.0°C, both at 14:00 h. The minimum temperatures were 6.8°C (at 04:00 h) and 1.5°C (at 03:00 h) in the courtyard and at the airport, respectively. This shows that the courtyard in general has a warmer microclimate than the airport. This could be due to the urban heat island effect because the courtyard is in the city centre, and the airport is located in the suburbs. Moreover, the courtyard has a higher thermal mass and lower openness to the sky than the airport. Figure 9-e right also shows the average (averaged for all 31 days of May) temperature difference for each hour during a 24 hour period between the courtyard and the airport. Based on this graph, the courtyard in general has a higher temperature than the airport except during a few hours around sunrise. The higher thermal mass accumulates the heat during the day and releases it at night. As a result the highest temperature difference occurs in the evening about 2 hours before sunset (19:00 h). To sum up, the average air temperature in the courtyard is 1.5°C higher than at the airport.
i
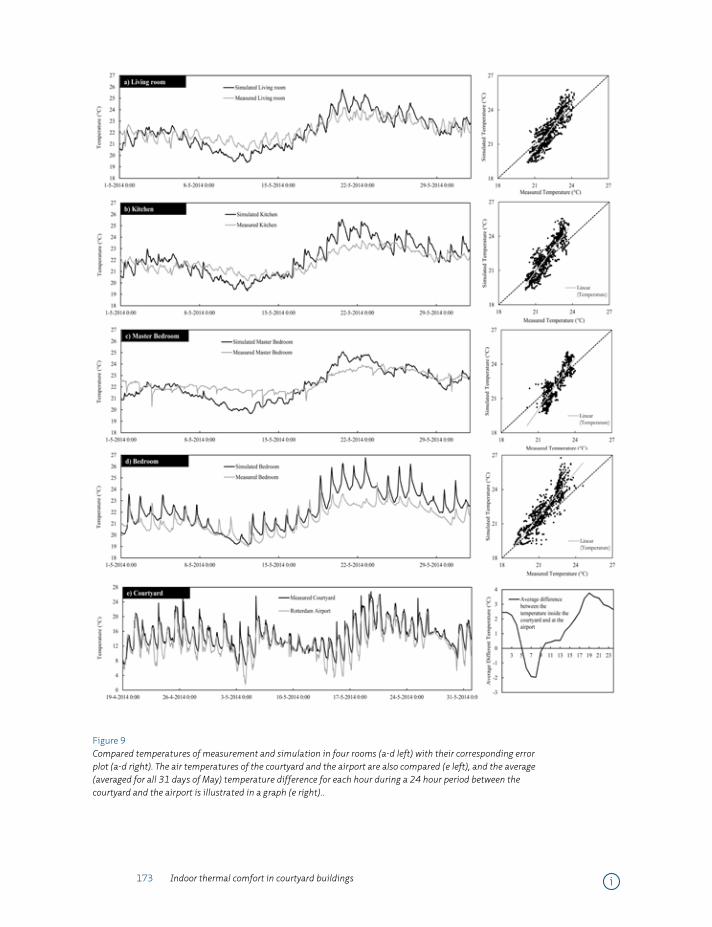
173 Indoor thermal comfort in courtyard buildings
Figure 9 Compared temperatures of measurement and simulation in four rooms (a-d left) with their corresponding error plot (a-d right). The air temperatures of the courtyard and the airport are also compared (e left), and the average (averaged for all 31 days of May) temperature difference for each hour during a 24 hour period between the courtyard and the airport is illustrated in a graph (e right)..
i
174 Dwelling on Courtyards
§ 5.4 Conclusions
This chapter investigated the thermal behaviour of courtyard buildings with different orientations and elongations (sizes) in the Netherlands. The effect of different roofs and courtyard ground pavements were also tested in summer (and in a few cases in winter). The whole study was divided into three main phases:
In phase 1, eighteen courtyard buildings were simulated with DesignBuilder for a summer week. It was found that North-South and East-West orientations provide the least and most comfortable indoor environments, respectively. To optimise the thermal performance of these two models, different cool and highly reflective materials were simulated on the roof and as courtyard pavement. The results showed that the maximum reduction (14%) in the number of discomfort hours happens when the roof and the courtyard ground are vegetated. Regarding the different thermal zones located in a courtyard, this chapter showed that the number of discomfort hours is three times higher in dwellings on the eastern and western sides of an urban courtyard block rather than on the northern and southern sides, mainly because of the high sun angle in summer at 12 o’clock solar time. The number of discomfort hours in dwellings alongside an urban courtyard is higher on the higher floors than on the lower floors; by moving one floor up, the number of discomfort hours increases by 10 percent points. The warmest zones were found to be on the top level because the roof receives more sun in summer (than vertical surfaces). The coolest zones were on the ground floor, where the building is adjacent to the earth. In this phase, the effects of the different cool roofs were also tested in winter (as well as summer). Although the gravel provided an almost 1°C cooler indoor environment in summer, no significant difference with the other roofs was observed in winter.
It should be noted that these results were based on the computer simulations. To validate parts of the results, an experiment on a scale model and a field measurement were done. The experiment focused on the effect of the different materials (used in the simulations), and the field measurement assessed the simulation software results. Thus, two complementary phases were added to the research:
In phase 2, the effects of the mentioned roofs were tested using a 1/100 scale model of an urban courtyard block. The experiment confirmed that cool roofs provide cooler indoor environments. The added value of this study was to show that an irrigated cool roof (covered with gravel or grass) has a much higher cooling effect than the dry equivalent.
In phase 3, the accuracy of DesignBuilder as the simulation program used in this chapter was tested through a one-month (May 2014) field measurement of an actual courtyard house. The simulation and measurement results of four rooms inside this
i
175 Indoor thermal comfort in courtyard buildings
house were compared. The average root mean square deviation of all rooms combined was 0.91°C. The air temperature of the courtyard was also compared to the air temperature at a nearby airport. On average, the courtyard had a +1.5°C higher air temperature than the airport.
Returning back to the aims of this chapter, different parameters for designing a courtyard (such as orientations and roof types) were discussed. The findings help to design courtyard buildings more efficiently for the warmer future of the Netherlands. Results on the effect of the different cool roofs could be used for greening and retrofitting existing buildings and making them climate proof.
References
1 IPCC, Climate Change 2007, in: S. Solomon, D. Qin, M. Manning, Z. Chen, M. Marquis, K.B. Averyt, M. Tignor, M.
H.L. (Eds.) The physical science basis. Contribution of the working group I to the fourth assessment report of the
intergovernmental panel on climate change, Cambridge, 2007.
2 KNMI, KNMI’14 climate scenarios for the Netherlands; A guide for professionals in climate adaptation, in, KNMI,
De Bilt, The Netherlands, 2014.
3 A. Okeil, A holistic approach to energy efficient building forms, Energy and Buildings, 42 (9) (2010) 1437-1444.
4 C. Ratti, D. Raydan, K. Steemers, Building form and environmental performance: archetypes, analysis and an arid
climate, Energy and Buildings, 35 (1) (2003) 49-59.
5 L. Martin, L. March, Urban Space and Structures, Cambridge University Press, UK, 1972.
6 M. Taleghani, M. Tenpierik, A. van den Dobbelsteen, R. de Dear, Energy use impact of and thermal comfort in
different urban block types in the Netherlands, Energy and Buildings, 67 (0) (2013) 166-175.
7 A.H. Rosenfeld, H. Akbari, S. Bretz, B.L. Fishman, D.M. Kurn, D. Sailor, H. Taha, Mitigation of urban heat islands:
materials, utility programs, updates, Energy and Buildings, 22 (3) (1995) 255-265.
8 M. Taleghani, M. Tenpierik, A. Dobbelsteen, D. Sailor, Heat mitigation strategies in winter and summer: field
measurements in temperate climates, Building and Environment, ((accepted)).
9 H. Akbari, U.S.E.P.A.C.C. Division, L.B. Laboratory, U.S.D.o. Energy, Cooling our communities: a guidebook on tree
planting and light-colored surfacing, U.S. Environmental Protection Agency, Office of Policy Analysis, Climate
Change Division, 1992.
10 H. Akbari, H.D. Matthews, Global cooling updates: Reflective roofs and pavements, Energy and Buildings, 55 (0)
(2012) 2-6.
11 H. Taha, Urban climates and heat islands: albedo, evapotranspiration, and anthropogenic heat, Energy and
Buildings, 25 (2) (1997) 99-103.
12 D.J. Sailor, Risks of summertime extreme thermal conditions in buildings as a result of climate change and
exacerbation of urban heat islands, Building and Environment, 78 (0) (2014) 81-88.
13 H. Akbari, M. Pomerantz, H. Taha, Cool surfaces and shade trees to reduce energy use and improve air quality in
urban areas, Solar Energy, 70 (3) (2001) 295-310.
14 M. Santamouris, Cooling the cities – A review of reflective and green roof mitigation technologies to fight heat
island and improve comfort in urban environments, Solar Energy, 103 (0) (2014) 682-703.
i

176 Dwelling on Courtyards
15 J. Kapsomenakis, D. Kolokotsa, T. Nikolaou, M. Santamouris, S.C. Zerefos, Forty years increase of the air ambient
temperature in Greece: The impact on buildings, Energy Conversion and Management, 74 (0) (2013) 353-365.
16 L. Doulos, M. Santamouris, I. Livada, Passive cooling of outdoor urban spaces. The role of materials, Solar Energy,
77 (2) (2004) 231-249.
17 M.A. Lokoshchenko, Urban ‘heat island’ in Moscow, Urban Climate, (0).
18 P.I. Konstantinov, M.I. Varentsov, E.P. Malinina, Modeling of thermal comfort conditions inside the urban
boundary layer during Moscow’s 2010 summer heat wave (case-study), Urban Climate, (0).
19 C. Rinner, M. Hussain, Toronto’s Urban Heat Island—Exploring the Relationship between Land Use and Surface
Temperature, Remote Sensing, 3 (6) (2011) 1251-1265.
20 H. Akbari, S. Konopacki, Energy effects of heat-island reduction strategies in Toronto, Canada, Energy, 29 (2)
(2004) 191-210.
21 S. Thorsson, F. Lindberg, J. Björklund, B. Holmer, D. Rayner, Potential changes in outdoor thermal comfort
conditions in Gothenburg, Sweden due to climate change: the influence of urban geometry, International Journal
of Climatology, 31 (2) (2011) 324-335.
22 J. Sproul, M.P. Wan, B.H. Mandel, A.H. Rosenfeld, Economic comparison of white, green, and black flat roofs in the
United States, Energy and Buildings, 71 (0) (2014) 20-27.
23 M. Zhao, J. Srebric, Assessment of green roof performance for sustainable buildings under winter weather
conditions, J. Cent. South Univ. Technol., 19 (3) (2012) 639-644.
24 K. Liu, J. Minor, Performance evaluation of an extensive green roof, in, National Research Council of Canada, 2005.
25 M. Taleghani, M. Tenpierik, A. van den Dobbelsteen, Energy performance and thermal comfort of courtyard/atrium
dwellings in the Netherlands in the light of climate change, Renewable Energy, 63 (0) (2014) 486-497.
26 D.J. Sailor, A green roof model for building energy simulation programs, Energy and Buildings, 40 (8) (2008) 1466-
1478.
27 ASHRAE, ASHRAE Standard 55–2010 in: Thermal Environmental Conditions for Human Occupancy, ASHRAE
Atlanta, GA, 2010.
28 M. Taleghani, M. Tenpierik, S. Kurvers, A. van den Dobbelsteen, A review into thermal comfort in buildings,
Renewable and Sustainable Energy Reviews, 26 (0) (2013) 201-215.
29 M. Kottek, J. Grieser, C. Beck, B. Rudolf, F. Rubel, World Map of the Köppen-Geiger climate classification updated,
Meteorologische Zeitschrift, 15 (3) (2006).
30 KNMI, in: Climate Change Scenarios 2006 for the Netherlands, KNMI publication: WR-2006-01 2006.
31 R.M. Lazzarin, F. Castellotti, F. Busato, Experimental measurements and numerical modelling of a green roof,
Energy and Buildings, 37 (12) (2005) 1260-1267.
32 E.G. McPherson, L.P. Herrington, G.M. Heisler, Impacts of vegetation on residential heating and cooling, Energy
and Buildings, 12 (1) (1988) 41-51.
33 M. Santamouris, Environmental Design of Urban Buildings: An Integrated Approach, Taylor & Francis, 2012.
i

177 Indoor thermal comfort in courtyard buildings i
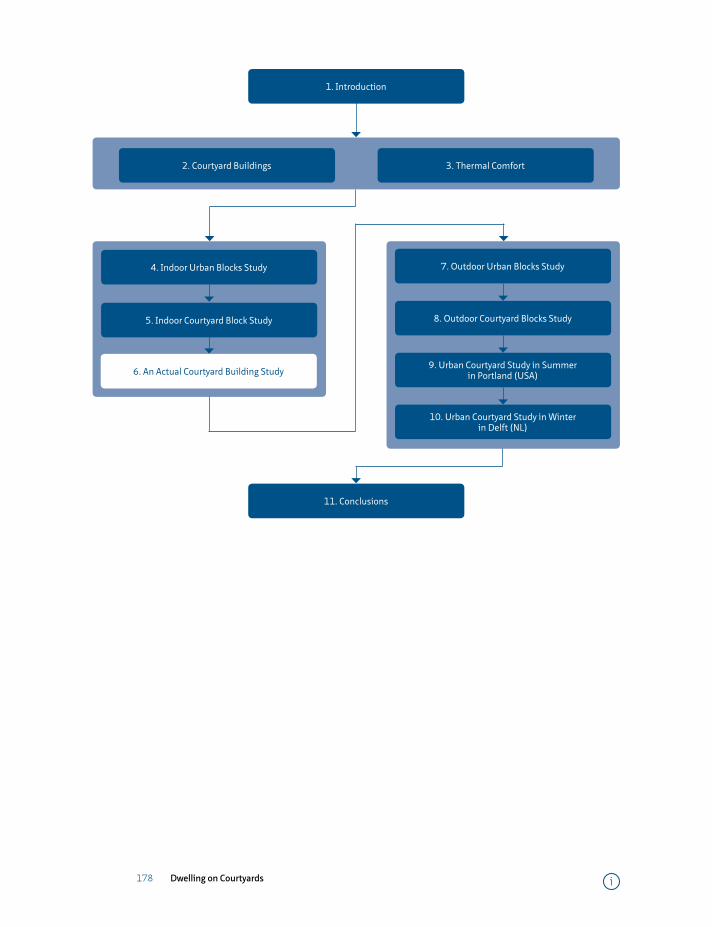
178 Dwelling on Courtyards
=
6. An Actual Courtyard Building Study
4. Indoor Urban Blocks Study
5. Indoor Courtyard Block Study
11. Conclusions
8. Outdoor Courtyard Blocks Study
9. Urban Courtyard Study in Summer in Portland (USA)
10. Urban Courtyard Study in Winter in Delft (NL)
7. Outdoor Urban Blocks Study
2. Courtyard Buildings 3. Thermal Comfort
1. Introduction
i

179 Indoor thermal comfort in a courtyard/atrium dwelling
6 Indoor thermal comfort in a courtyard/atrium dwelling
The previous chapter investigated thermal comfort in different houses alongside urban courtyards in the temperate climate of the Netherlands. To optimise the thermal performance of courtyard buildings, this chapter will examine a covered courtyard with glass. The assumption is that if a courtyard is provided with a glazed roof, heat loss in winter will be reduced. However, summer thermal comfort may be affected by this change as well. Then, modifications are needed to make a balance between an open courtyard and a covered glazed atrium in a year.
In this chapter, the mentioned modifications will be investigated for an actual courtyard house in Amsterdam and a terraced house (one of the Dutch reference dwellings developed by AgenstschapNL). The annual heating energy demand and summer thermal comfort are compared for these two cases. At the end, the optimum durations of having an open or glazed courtyard are explored.
i

180 Dwelling on Courtyards i
181 Indoor thermal comfort in a courtyard/atrium dwelling
Energy performance and thermal comfort of courtyard/atrium dwellings in the Netherlands in the light of climate change1
Mohammad Taleghani*1, Martin Tenpierik1, Andy van den Dobbelsteen1
1 Delft University of Technology, Delft, the Netherlands
Abstract
With increased global concerns on climate change, the need for innovative spaces which can provide thermal comfort and energy ef ficiency is also increasing. This paper analyses the effects of transitional spaces on energy performance and indoor thermal comfort of low-rise dwellings in the Netherlands, at present and projected in 2050. For this analysis the four climate scenarios for 2050 from the Royal Dutch Meteorological Institute (KNMI) were used. Including a courtyard within a Dutch terraced dwelling on the one hand showed an increase in annual heating energy demand but on the other hand a decrease in the number of summer discomfort hours. An atrium integrated into a Dutch terraced dwelling reduced the heating demand but increased the number of discomfort hours in summer. Analysing the monthly energy performance, comfort hours and the climate scenarios indicated that using an open courtyard May through October and an atrium, i.e. a covered courtyard, in the rest of the year establishes an optimum balance between energy use and summer comfort for the severest climate scenario.
Keywords
Courtyard, atrium, climate change, heating demand, thermal comfort.
1 Published as: Taleghani M., Tenpierik M., Dobbelsteen A. (2014), “Energy performance and thermal comfort of courtyard/atrium dwellings in the Netherlands in the light of climate change”, Renewable Energy, 63(2014) 486-497.
i
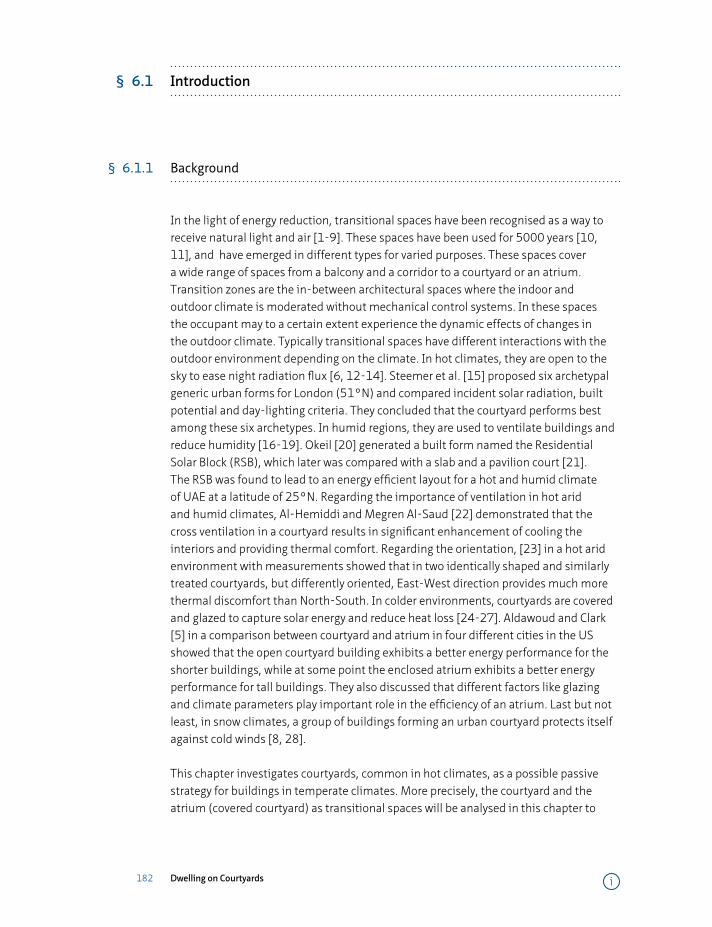
182 Dwelling on Courtyards
§ 6.1 Introduction
§ 6.1.1 Background
In the light of energy reduction, transitional spaces have been recognised as a way to receive natural light and air [1-9]. These spaces have been used for 5000 years [10, 11], and have emerged in different types for varied purposes. These spaces cover a wide range of spaces from a balcony and a corridor to a courtyard or an atrium. Transition zones are the in-between architectural spaces where the indoor and outdoor climate is moderated without mechanical control systems. In these spaces the occupant may to a certain extent experience the dynamic effects of changes in the outdoor climate. Typically transitional spaces have different interactions with the outdoor environment depending on the climate. In hot climates, they are open to the sky to ease night radiation flux [6, 12-14]. Steemer et al. [15] proposed six archetypal generic urban forms for London (51°N) and compared incident solar radiation, built potential and day-lighting criteria. They concluded that the courtyard performs best among these six archetypes. In humid regions, they are used to ventilate buildings and reduce humidity [16-19]. Okeil [20] generated a built form named the Residential Solar Block (RSB), which later was compared with a slab and a pavilion court [21]. The RSB was found to lead to an energy efficient layout for a hot and humid climate of UAE at a latitude of 25°N. Regarding the importance of ventilation in hot arid and humid climates, Al-Hemiddi and Megren Al-Saud [22] demonstrated that the cross ventilation in a courtyard results in significant enhancement of cooling the interiors and providing thermal comfort. Regarding the orientation, [23] in a hot arid environment with measurements showed that in two identically shaped and similarly treated courtyards, but differently oriented, East-West direction provides much more thermal discomfort than North-South. In colder environments, courtyards are covered and glazed to capture solar energy and reduce heat loss [24-27]. Aldawoud and Clark [5] in a comparison between courtyard and atrium in four different cities in the US showed that the open courtyard building exhibits a better energy performance for the shorter buildings, while at some point the enclosed atrium exhibits a better energy performance for tall buildings. They also discussed that different factors like glazing and climate parameters play important role in the efficiency of an atrium. Last but not least, in snow climates, a group of buildings forming an urban courtyard protects itself against cold winds [8, 28].
This chapter investigates courtyards, common in hot climates, as a possible passive strategy for buildings in temperate climates. More precisely, the courtyard and the atrium (covered courtyard) as transitional spaces will be analysed in this chapter to
i
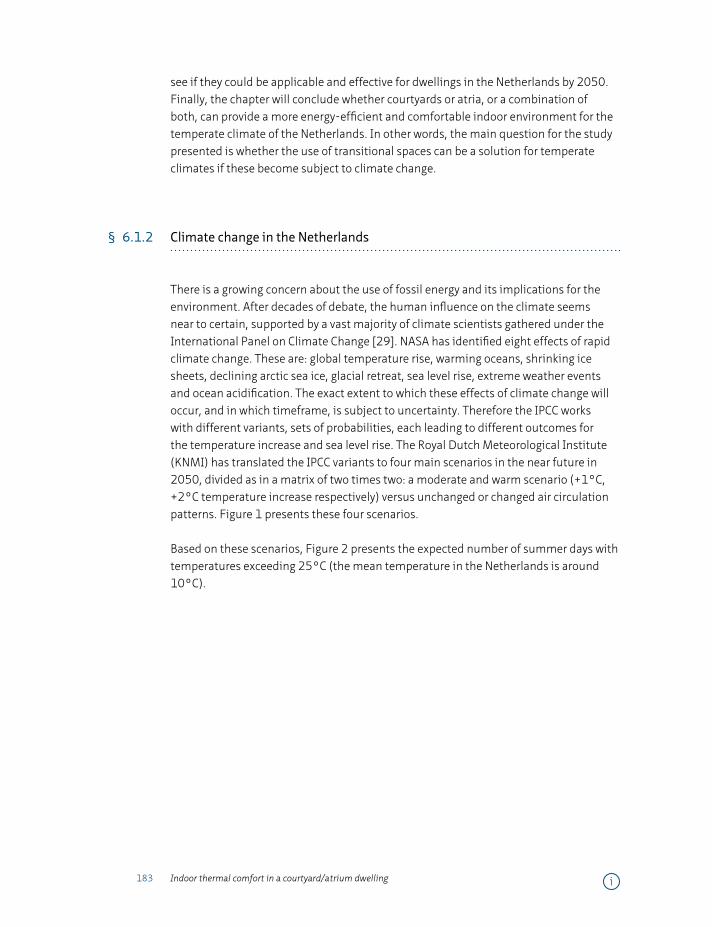
183 Indoor thermal comfort in a courtyard/atrium dwelling
see if they could be applicable and effective for dwellings in the Netherlands by 2050. Finally, the chapter will conclude whether courtyards or atria, or a combination of both, can provide a more energy-efficient and comfortable indoor environment for the temperate climate of the Netherlands. In other words, the main question for the study presented is whether the use of transitional spaces can be a solution for temperate climates if these become subject to climate change.
§ 6.1.2 Climate change in the Netherlands
There is a growing concern about the use of fossil energy and its implications for the environment. After decades of debate, the human influence on the climate seems near to certain, supported by a vast majority of climate scientists gathered under the International Panel on Climate Change [29]. NASA has identified eight effects of rapid climate change. These are: global temperature rise, warming oceans, shrinking ice sheets, declining arctic sea ice, glacial retreat, sea level rise, extreme weather events and ocean acidification. The exact extent to which these effects of climate change will occur, and in which timeframe, is subject to uncertainty. Therefore the IPCC works with different variants, sets of probabilities, each leading to different outcomes for the temperature increase and sea level rise. The Royal Dutch Meteorological Institute (KNMI) has translated the IPCC variants to four main scenarios in the near future in 2050, divided as in a matrix of two times two: a moderate and warm scenario (+1°C, +2°C temperature increase respectively) versus unchanged or changed air circulation patterns. Figure 1 presents these four scenarios.
Based on these scenarios, Figure 2 presents the expected number of summer days with temperatures exceeding 25°C (the mean temperature in the Netherlands is around 10°C).
i
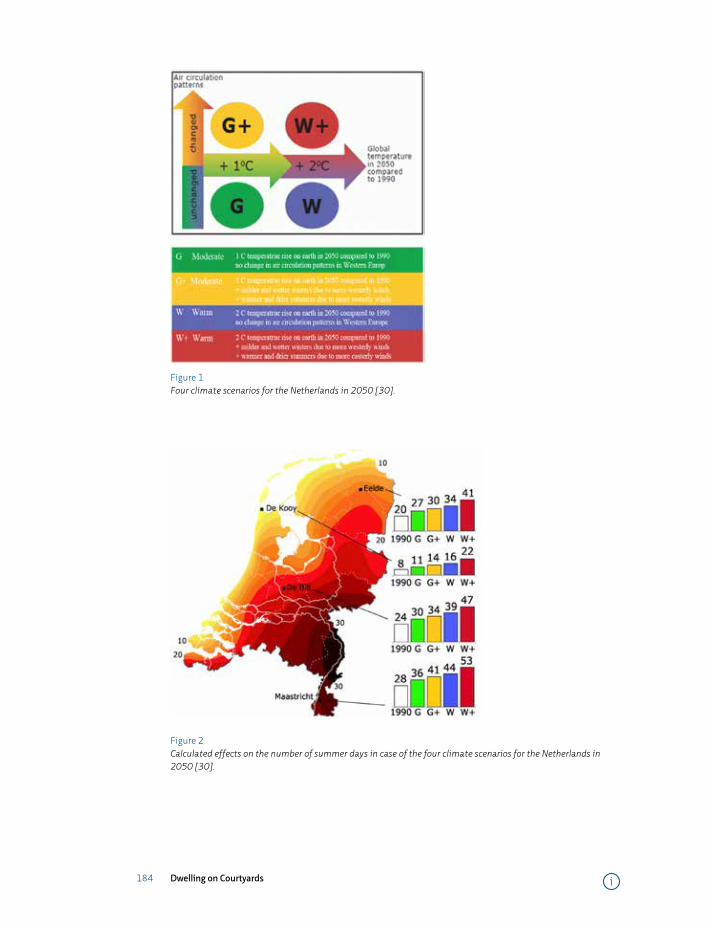
184 Dwelling on Courtyards
Figure 1 Four climate scenarios for the Netherlands in 2050 [30].
Figure 2 Calculated effects on the number of summer days in case of the four climate scenarios for the Netherlands in 2050 [30].
i
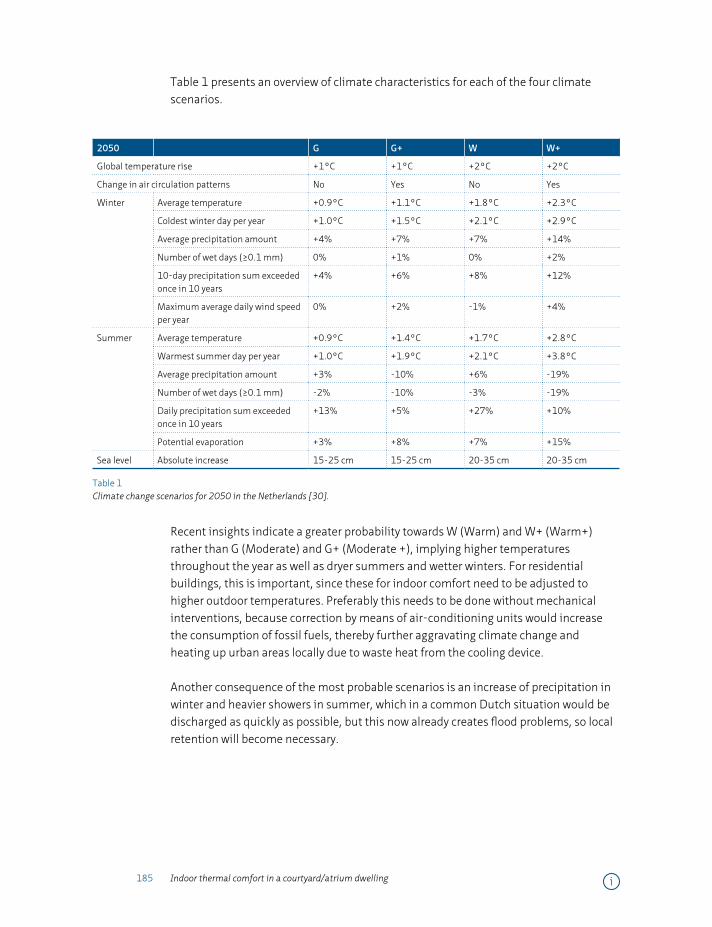
185 Indoor thermal comfort in a courtyard/atrium dwelling
Table 1 presents an overview of climate characteristics for each of the four climate scenarios.
2050 G G+ W W+
Global temperature rise +1°C +1°C +2°C +2°C
Change in air circulation patterns No Yes No Yes
Winter Average temperature +0.9°C +1.1°C +1.8°C +2.3°C
Coldest winter day per year +1.0°C +1.5°C +2.1°C +2.9°C
Average precipitation amount +4% +7% +7% +14%
Number of wet days (≥0.1 mm) 0% +1% 0% +2%
10-day precipitation sum exceeded once in 10 years
+4% +6% +8% +12%
Maximum average daily wind speed per year
0% +2% -1% +4%
Summer Average temperature +0.9°C +1.4°C +1.7°C +2.8°C
Warmest summer day per year +1.0°C +1.9°C +2.1°C +3.8°C
Average precipitation amount +3% -10% +6% -19%
Number of wet days (≥0.1 mm) -2% -10% -3% -19%
Daily precipitation sum exceeded once in 10 years
+13% +5% +27% +10%
Potential evaporation +3% +8% +7% +15%
Sea level Absolute increase 15-25 cm 15-25 cm 20-35 cm 20-35 cm
Table 1 Climate change scenarios for 2050 in the Netherlands [30].
Recent insights indicate a greater probability towards W (Warm) and W+ (Warm+) rather than G (Moderate) and G+ (Moderate +), implying higher temperatures throughout the year as well as dryer summers and wetter winters. For residential buildings, this is important, since these for indoor comfort need to be adjusted to higher outdoor temperatures. Preferably this needs to be done without mechanical interventions, because correction by means of air-conditioning units would increase the consumption of fossil fuels, thereby further aggravating climate change and heating up urban areas locally due to waste heat from the cooling device.
Another consequence of the most probable scenarios is an increase of precipitation in winter and heavier showers in summer, which in a common Dutch situation would be discharged as quickly as possible, but this now already creates flood problems, so local retention will become necessary.
i
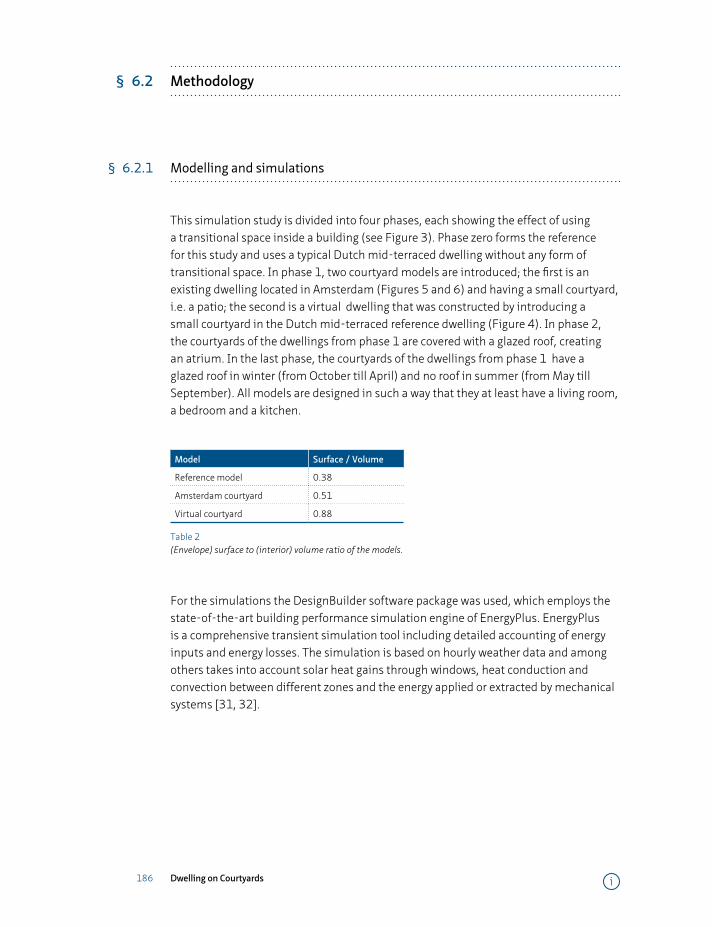
186 Dwelling on Courtyards
§ 6.2 Methodology
§ 6.2.1 Modelling and simulations
This simulation study is divided into four phases, each showing the effect of using a transitional space inside a building (see Figure 3). Phase zero forms the reference for this study and uses a typical Dutch mid-terraced dwelling without any form of transitional space. In phase 1, two courtyard models are introduced; the first is an existing dwelling located in Amsterdam (Figures 5 and 6) and having a small courtyard, i.e. a patio; the second is a virtual dwelling that was constructed by introducing a small courtyard in the Dutch mid-terraced reference dwelling (Figure 4). In phase 2, the courtyards of the dwellings from phase 1 are covered with a glazed roof, creating an atrium. In the last phase, the courtyards of the dwellings from phase 1 have a glazed roof in winter (from October till April) and no roof in summer (from May till September). All models are designed in such a way that they at least have a living room, a bedroom and a kitchen.
Model Surface / Volume
Reference model 0.38
Amsterdam courtyard 0.51
Virtual courtyard 0.88
Table 2 (Envelope) surface to (interior) volume ratio of the models.
For the simulations the DesignBuilder software package was used, which employs the state-of-the-art building performance simulation engine of EnergyPlus. EnergyPlus is a comprehensive transient simulation tool including detailed accounting of energy inputs and energy losses. The simulation is based on hourly weather data and among others takes into account solar heat gains through windows, heat conduction and convection between different zones and the energy applied or extracted by mechanical systems [31, 32].
i
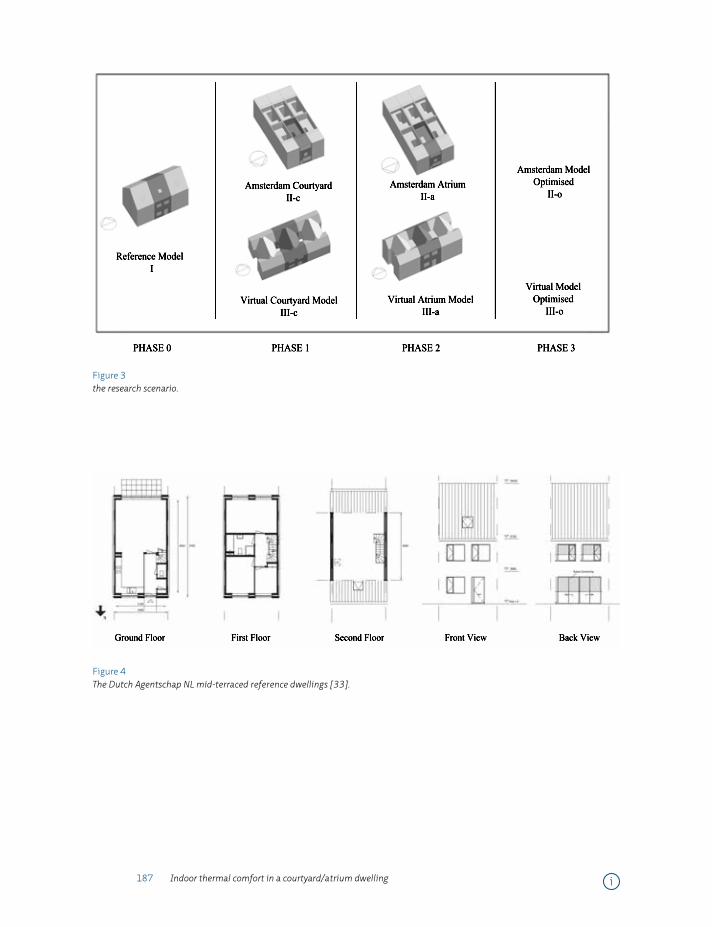
187 Indoor thermal comfort in a courtyard/atrium dwelling
Reference Model I
PHASE 0 PHASE 1 PHASE 2 PHASE 3
Amsterdam Model Optimised
II-o
Virtual Model Optimised
III-o
Amsterdam Courtyard II-c
Virtual Atrium ModelIII-a
Virtual Courtyard ModelIII-c
Amsterdam AtriumII-a
Figure 3 the research scenario.
Ground Floor First Floor Second Floor Front View Back View
Figure 4 The Dutch Agentschap NL mid-terraced reference dwellings [33].
i
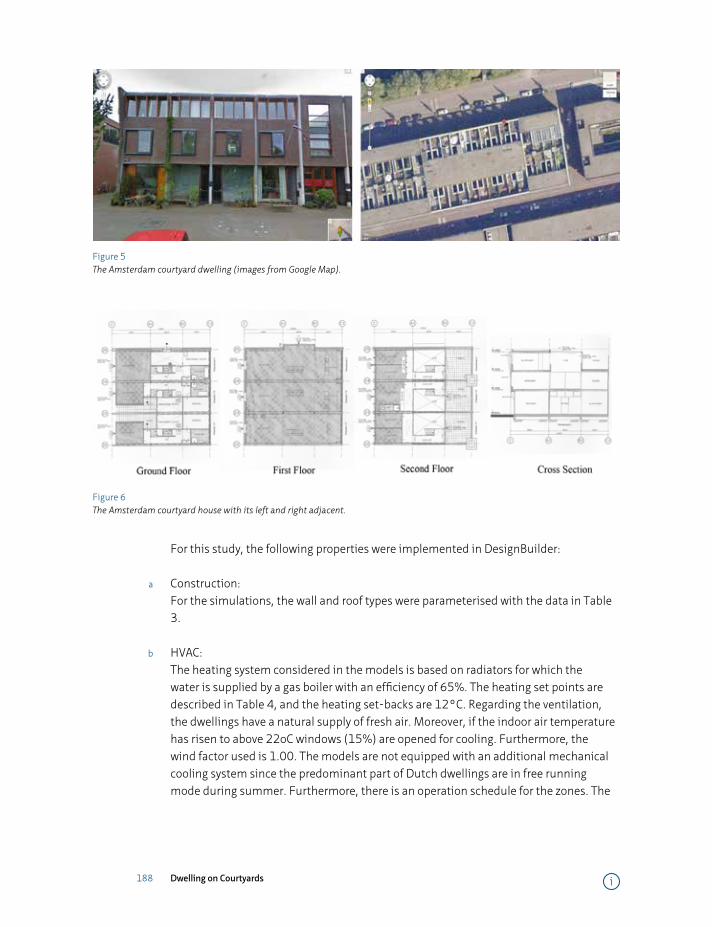
188 Dwelling on Courtyards
Figure 5 The Amsterdam courtyard dwelling (images from Google Map).
Figure 6 The Amsterdam courtyard house with its left and right adjacent.
For this study, the following properties were implemented in DesignBuilder:
a Construction:For the simulations, the wall and roof types were parameterised with the data in Table 3.
b HVAC:The heating system considered in the models is based on radiators for which the water is supplied by a gas boiler with an efficiency of 65%. The heating set points are described in Table 4, and the heating set-backs are 12°C. Regarding the ventilation, the dwellings have a natural supply of fresh air. Moreover, if the indoor air temperature has risen to above 22oC windows (15%) are opened for cooling. Furthermore, the wind factor used is 1.00. The models are not equipped with an additional mechanical cooling system since the predominant part of Dutch dwellings are in free running mode during summer. Furthermore, there is an operation schedule for the zones. The
i
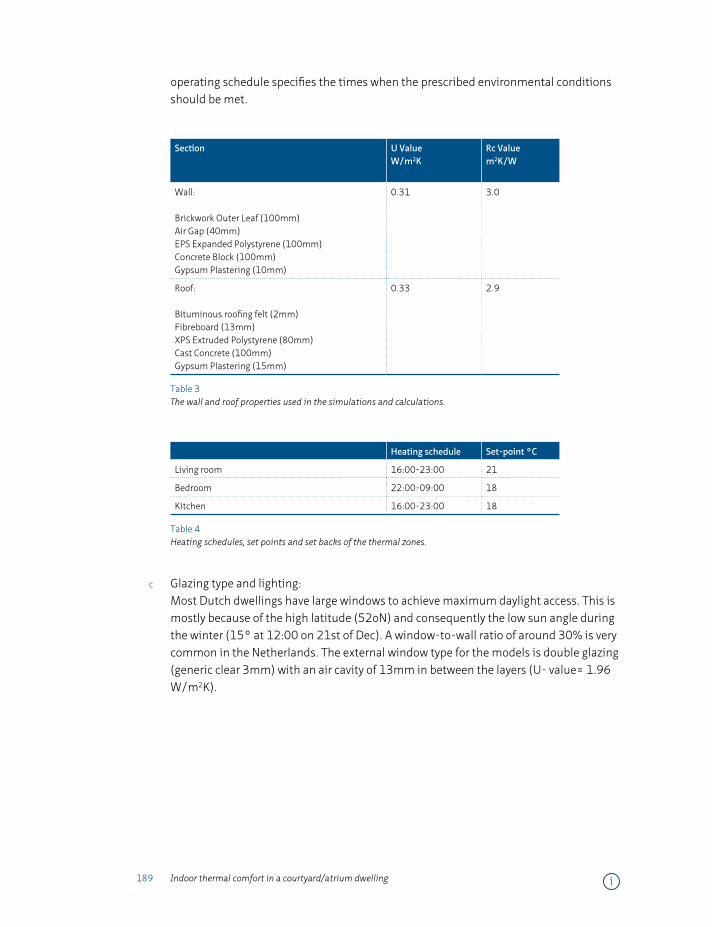
189 Indoor thermal comfort in a courtyard/atrium dwelling
operating schedule specifies the times when the prescribed environmental conditions should be met.
Section U ValueW/m2K
Rc Valuem2K/W
Wall:
Brickwork Outer Leaf (100mm)Air Gap (40mm)EPS Expanded Polystyrene (100mm)Concrete Block (100mm)Gypsum Plastering (10mm)
0.31 3.0
Roof:
Bituminous roofing felt (2mm)Fibreboard (13mm)XPS Extruded Polystyrene (80mm)Cast Concrete (100mm)Gypsum Plastering (15mm)
0.33 2.9
Table 3 The wall and roof properties used in the simulations and calculations.
Heating schedule Set-point °C
Living room 16:00-23:00 21
Bedroom 22:00-09:00 18
Kitchen 16:00-23:00 18
Table 4 Heating schedules, set points and set backs of the thermal zones.
c Glazing type and lighting:Most Dutch dwellings have large windows to achieve maximum daylight access. This is mostly because of the high latitude (52oN) and consequently the low sun angle during the winter (15° at 12:00 on 21st of Dec). A window-to-wall ratio of around 30% is very common in the Netherlands. The external window type for the models is double glazing (generic clear 3mm) with an air cavity of 13mm in between the layers (U- value= 1.96 W/m2K).
i
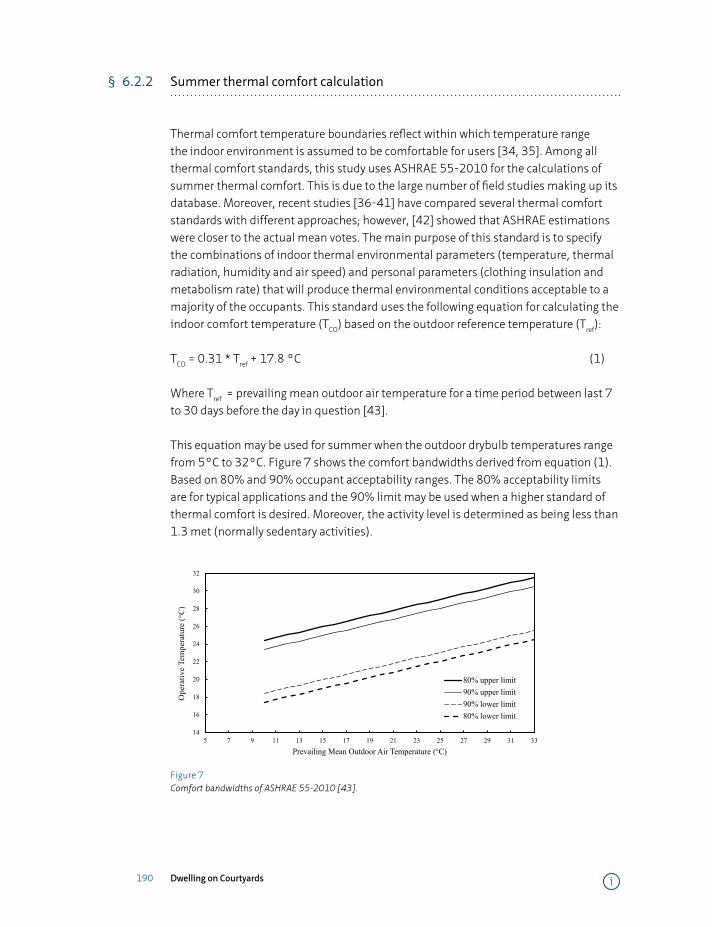
190 Dwelling on Courtyards
§ 6.2.2 Summer thermal comfort calculation
Thermal comfort temperature boundaries reflect within which temperature range the indoor environment is assumed to be comfortable for users [34, 35]. Among all thermal comfort standards, this study uses ASHRAE 55-2010 for the calculations of summer thermal comfort. This is due to the large number of field studies making up its database. Moreover, recent studies [36-41] have compared several thermal comfort standards with different approaches; however, [42] showed that ASHRAE estimations were closer to the actual mean votes. The main purpose of this standard is to specify the combinations of indoor thermal environmental parameters (temperature, thermal radiation, humidity and air speed) and personal parameters (clothing insulation and metabolism rate) that will produce thermal environmental conditions acceptable to a majority of the occupants. This standard uses the following equation for calculating the indoor comfort temperature (TCO) based on the outdoor reference temperature (Tref):
TCO = 0.31 * Tref + 17.8 °C (1)
Where Tref = prevailing mean outdoor air temperature for a time period between last 7 to 30 days before the day in question [43].
This equation may be used for summer when the outdoor drybulb temperatures range from 5°C to 32°C. Figure 7 shows the comfort bandwidths derived from equation (1). Based on 80% and 90% occupant acceptability ranges. The 80% acceptability limits are for typical applications and the 90% limit may be used when a higher standard of thermal comfort is desired. Moreover, the activity level is determined as being less than 1.3 met (normally sedentary activities).
14
16
18
20
22
24
26
28
30
32
5 7 9 11 13 15 17 19 21 23 25 27 29 31 33
Ope
rativ
e Te
mpe
ratu
re (°
C)
Prevailing Mean Outdoor Air Temperature (°C)
80% upper limit90% upper limit90% lower limit80% lower limit
Figure 7 Comfort bandwidths of ASHRAE 55-2010 [43].
i
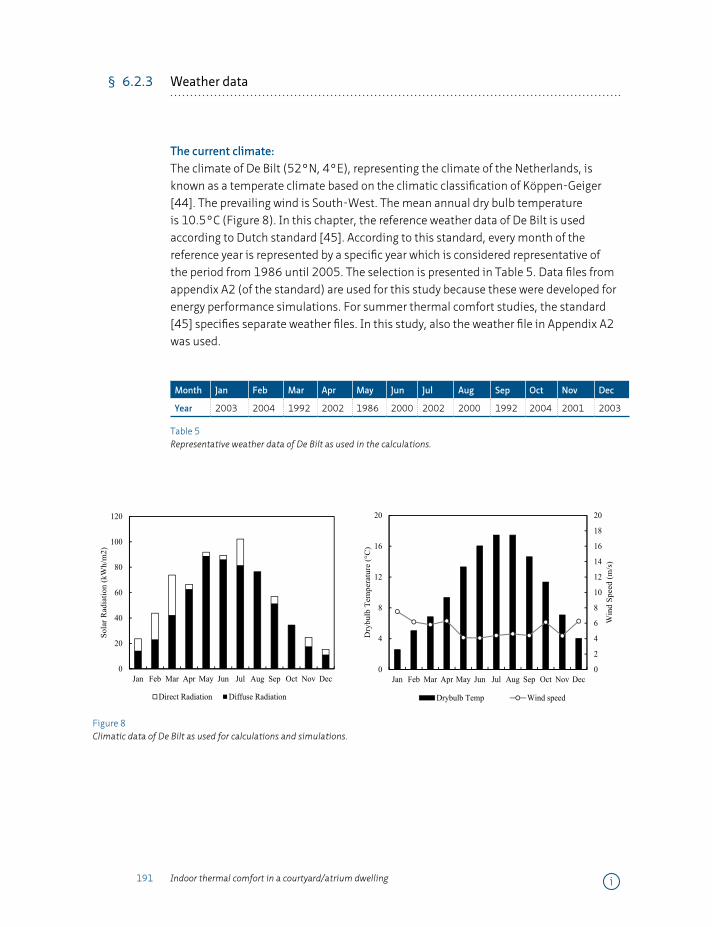
191 Indoor thermal comfort in a courtyard/atrium dwelling
§ 6.2.3 Weather data
The current climate:The climate of De Bilt (52°N, 4°E), representing the climate of the Netherlands, is known as a temperate climate based on the climatic classification of Köppen-Geiger [44]. The prevailing wind is South-West. The mean annual dry bulb temperature is 10.5°C (Figure 8). In this chapter, the reference weather data of De Bilt is used according to Dutch standard [45]. According to this standard, every month of the reference year is represented by a specific year which is considered representative of the period from 1986 until 2005. The selection is presented in Table 5. Data files from appendix A2 (of the standard) are used for this study because these were developed for energy performance simulations. For summer thermal comfort studies, the standard [45] specifies separate weather files. In this study, also the weather file in Appendix A2 was used.
Month Jan Feb Mar Apr May Jun Jul Aug Sep Oct Nov Dec
Year 2003 2004 1992 2002 1986 2000 2002 2000 1992 2004 2001 2003
Table 5 Representative weather data of De Bilt as used in the calculations.
Outside DryDirect Radi Diffuse RadWind Speed General LigGeneral LigGeneral Lighting°C kWh kWh m/s kWh kWh kWh
3 24 14 8 Jan 4.200672 23.639 14.2755 44 23 6 Feb 3.701488 43.812 23.247 74 42 6 Mar 5.319623 73.798 42.2549 67 63 6 Apr 8.448889 66.575 62.788
13 92 89 4 May 12.73481 91.84 88.86116 89 86 4 Jun 15.19764 89.414 86.22417 102 82 4 Jul 16.91196 102.149 81.58617 76 76 5 Aug 17.1414 76.478 76.31915 57 51 4 Sep 14.40625 56.939 51.49311 34 35 6 Oct 10.8504 34.236 34.7137 25 18 4 Nov 6.4925 24.734 17.684 15 11 6 Dec 4.437769 15.302 11.17
0
2
4
6
8
10
12
14
16
18
20
0
4
8
12
16
20
Jan Feb Mar Apr May Jun Jul Aug Sep Oct Nov Dec
Win
d Sp
eed
(m/s
)
Dry
bulb
Tem
pera
ture
(°C
)
Drybulb Temp Wind speed
0
20
40
60
80
100
120
Jan Feb Mar Apr May Jun Jul Aug Sep Oct Nov Dec
Sola
r Rad
iatio
n (k
Wh/
m2)
Direct Radiation Diffuse Radiation
Figure 8 Climatic data of De Bilt as used for calculations and simulations.
i
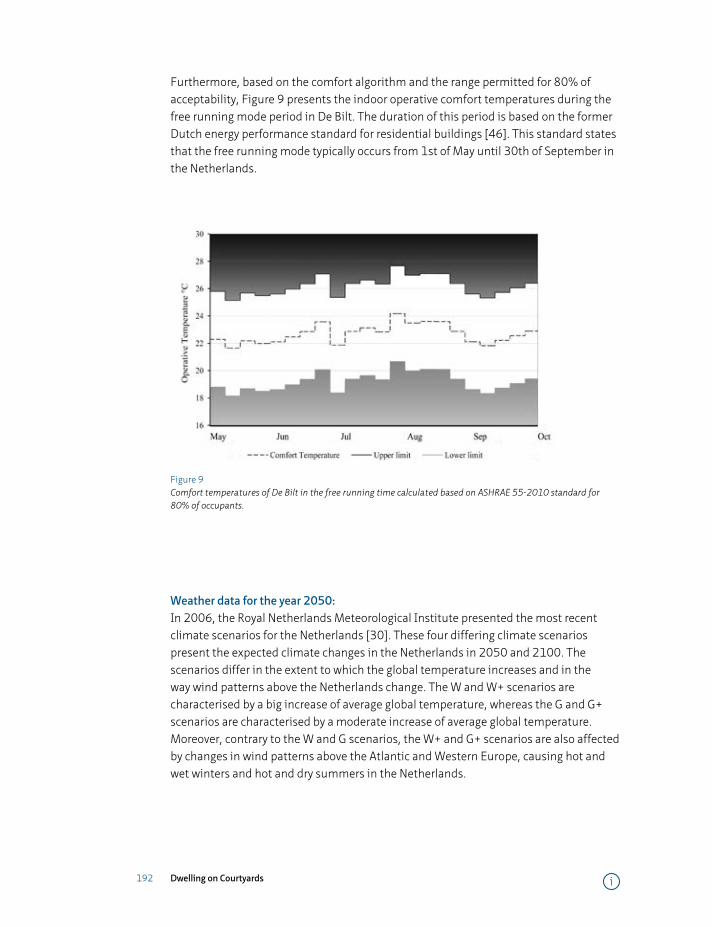
192 Dwelling on Courtyards
Furthermore, based on the comfort algorithm and the range permitted for 80% of acceptability, Figure 9 presents the indoor operative comfort temperatures during the free running mode period in De Bilt. The duration of this period is based on the former Dutch energy performance standard for residential buildings [46]. This standard states that the free running mode typically occurs from 1st of May until 30th of September in the Netherlands.
Figure 9 Comfort temperatures of De Bilt in the free running time calculated based on ASHRAE 55-2010 standard for 80% of occupants.
Weather data for the year 2050:In 2006, the Royal Netherlands Meteorological Institute presented the most recent climate scenarios for the Netherlands [30]. These four differing climate scenarios present the expected climate changes in the Netherlands in 2050 and 2100. The scenarios differ in the extent to which the global temperature increases and in the way wind patterns above the Netherlands change. The W and W+ scenarios are characterised by a big increase of average global temperature, whereas the G and G+ scenarios are characterised by a moderate increase of average global temperature. Moreover, contrary to the W and G scenarios, the W+ and G+ scenarios are also affected by changes in wind patterns above the Atlantic and Western Europe, causing hot and wet winters and hot and dry summers in the Netherlands.
i
193 Indoor thermal comfort in a courtyard/atrium dwelling
As can be seen from Table 1, the four climate scenarios include changes in temperature, wind and precipitation, and consequently sun hours. The first and last are most important for determining the energy performance of buildings, whereas the second and third are less important. For the year 2050 and with reference to the year 1990, the climate scenarios predict an increase in temperature between 0.9°C to 2.3°C in winter and 0.9°C and 2.8°C in summer. The climate scenarios do not present a precise prediction for changes in solar radiation patterns. According to a KNMI climate sketchbook [47], the Netherlands is located at the boundary between Southern Europe, where cloud coverage will decrease, and Northern Europe, where cloud coverage will increase. Only, in the G+ and W+ small changes in the number of rainy days in summer, an consequently sun hours, are expected. In general, though, it is expected that changes in solar radiation patterns will be small. As a result, such changes are not considered in this study.
For the energy performance simulations, hourly weather data including outdoor temperature and solar radiation are needed. As explained previously, the weather file from [45] is used for simulating the current climate. This weather file is also used as a basis for the developing the weather files of 2050 for each of the four climate scenarios; only the outdoor temperature has to be modified. The weather files were developed by [48] using the KNMI online transformation program for time series [49]. This transformation tool transforms historic temperature series on a daily basis to a new series that fits one of the four climate scenarios for a certain time horizon. The procedure is as follows:
• In the transformation program, the weather station of De Bilt was selected with a time horizon of 1990. This produces the daily average temperature in De Bilt between 1976 and 2005.
• With the help of the program the daily temperatures of 1990 are then transformed to the time horizon of 2050 for each of the four climate scenarios. This produces the daily temperature in De Bilt between 2036 and 2065.
• Next, for each day in the period 1976 to 2005, the daily temperature increase over a period of 60 years (from 1976-2005 to 2036-2065) is calculated, again for each climate scenario.
• The hourly weather data in a certain month in the weather file of [45] are measured data coming from a certain representative month between the years 1986 and 2004 (Table 5). For each day in the weather file of [45] the results of the previous step are used to see how big the increase in temperature is according to each of the scenarios.
• Finally, for each day in the [45] weather file, the temperature of each hour is increased by its respective daily increase in order to get the temperature corresponding to a certain climate scenario.
i
194 Dwelling on Courtyards
§ 6.3 Results and discussion
§ 6.3.1 Phase zero: The reference model- Building I
The Netherlands is known as a temperate climate. As can be seen in Figure 8, in winter, the average wind speed is higher than in summer. Wind is important for the heat loss of a building by infiltration. Figure 10 shows the monthly heat loss, solar gains and heating energy demand of Building I for the current representative weather data of De Bilt [45]. The heating demand in January is around 8 kWh/m2 (floor area). When the dwelling is in free-running mode (May-September), heating demand is zero, and during this period, solar gains through windows and internal heat gains make up for the transmission and ventilation/infiltration heat losses. Due to the increase of wind speed, the decrease of the outdoor temperature and the decrease of solar gains, the heating energy demand starts to increase from October.
Based on this model in DesignBuilder, the four climate scenarios G, G+, W and W+ were simulated additionally. These simulations help to understand how climate change affects the dwelling’s indoor environment and energy use. Figure 11 depicts the indoor operative temperature of Building I for the current climate of the Netherlands and for each of the four climate scenarios. As illustrated, the indoor operative temperature is more or less identical in winter for each situation. The main reason is that in winter this temperature is not so much affected by the outdoor conditions but by the heating system. However, during the free-running time, the indoor operative temperature differs for each scenario. In this period, the models are not conditioned and their indoor environment mainly depends on outdoor conditions. The highest indoor operative temperature increase, equal to 2.5°C, can be found in the W+ scenario in the months June, July and August. For that scenario, the monthly average outdoor dry bulb temperature increase approximately equals 3.0oC in the respective months.
i

195 Indoor thermal comfort in a courtyard/atrium dwelling
-12
-10
-8
-6
-4
-2
0
2
4
6
8
10
12
Jan Feb Mar Apr May Jun Jul Aug Sep Oct Nov Dec
kWh/
m2
Heating demand Appliences+Occupancy Solar gainsLighting Infiltration Surfaces transmissions
Figure 10 Monthly energy balance of the reference model representative for the current climate.
Likewise, the heating energy demands based on the five sets of weather data are demonstrated in Figure 12. It is logical that less energy is needed for heating in winter if the outdoor temperature is higher. Consequently, the heating energy demand of Building I based on the representative weather data of [45] is the highest (26 kWh/m2/yr). Also, heating energy demand is the lowest for the severest climate scenario (W+): 19 kWh/m2/yr.
Because of the increase of indoor operative temperature during free-running time, the number of thermally comfortable hours changes. In this regard, the indoor comfort temperature and the range for 80% satisfaction in the climate of De Bilt are important. Calculations using the adaptive thermal comfort model from ASHRAE 55-2010 for the daytime show that by the increase of outdoor drybulb temperature, the number of hours the indoor temperature exceeds the 80% satisfaction range increases from 46 hours (for the current climate) to 331 hours (for the severest scenario; W+), which equals respectively 4% and 31% of the total number of hours.
i
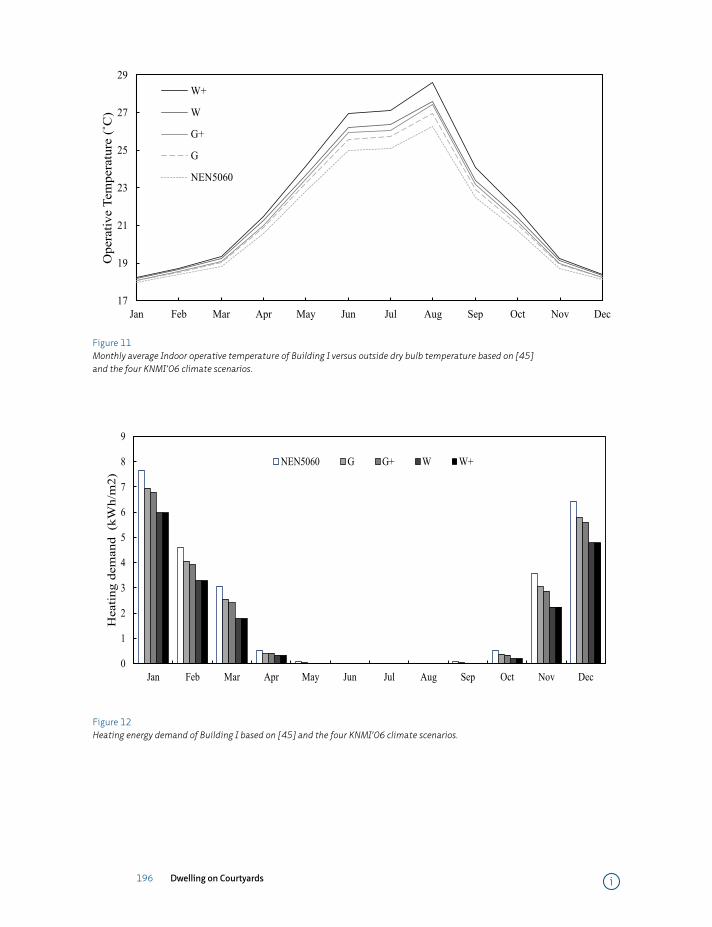
196 Dwelling on Courtyards
17
19
21
23
25
27
29
Jan Feb Mar Apr May Jun Jul Aug Sep Oct Nov Dec
Ope
rativ
e Te
mpe
ratu
re (˚
C)
W+
W
G+
G
NEN5060
Figure 11 Monthly average Indoor operative temperature of Building I versus outside dry bulb temperature based on [45] and the four KNMI’06 climate scenarios.
0
1
2
3
4
5
6
7
8
9
Jan Feb Mar Apr May Jun Jul Aug Sep Oct Nov Dec
Hea
ting
dem
and
(kW
h/m
2)
NEN5060 G G+ W W+
Figure 12 Heating energy demand of Building I based on [45] and the four KNMI’06 climate scenarios.
i
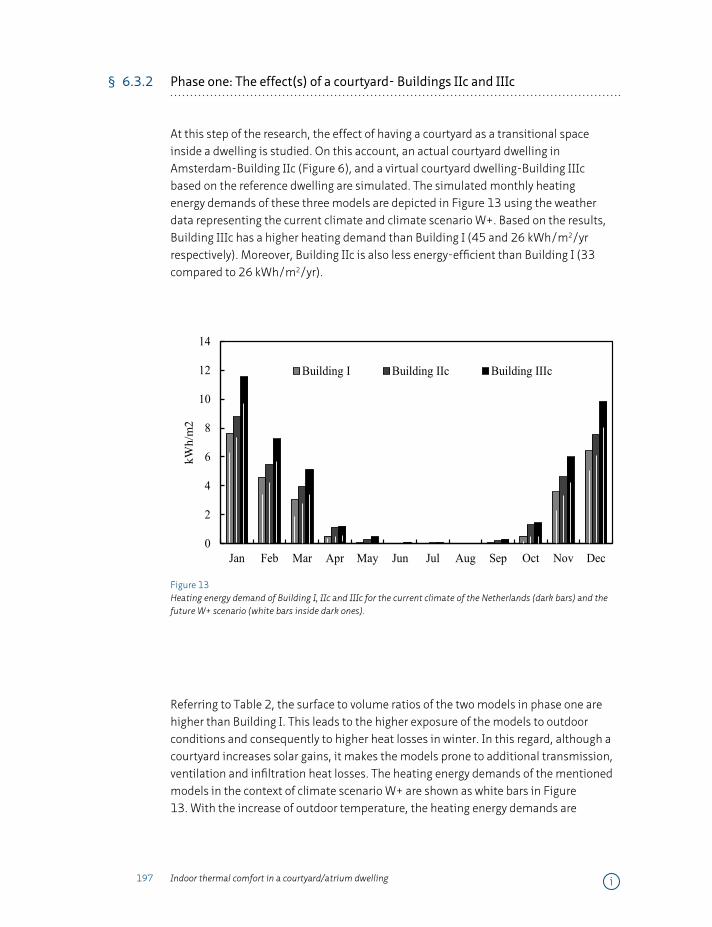
197 Indoor thermal comfort in a courtyard/atrium dwelling
§ 6.3.2 Phase one: The effect(s) of a courtyard- Buildings IIc and IIIc
At this step of the research, the effect of having a courtyard as a transitional space inside a dwelling is studied. On this account, an actual courtyard dwelling in Amsterdam-Building IIc (Figure 6), and a virtual courtyard dwelling-Building IIIc based on the reference dwelling are simulated. The simulated monthly heating energy demands of these three models are depicted in Figure 13 using the weather data representing the current climate and climate scenario W+. Based on the results, Building IIIc has a higher heating demand than Building I (45 and 26 kWh/m2/yr respectively). Moreover, Building IIc is also less energy-efficient than Building I (33 compared to 26 kWh/m2/yr).
0
2
4
6
8
10
12
14
Jan Feb Mar Apr May Jun Jul Aug Sep Oct Nov Dec
kWh/
m2
Building I Building IIc Building IIIc
Figure 13 Heating energy demand of Building I, IIc and IIIc for the current climate of the Netherlands (dark bars) and the future W+ scenario (white bars inside dark ones).
Referring to Table 2, the surface to volume ratios of the two models in phase one are higher than Building I. This leads to the higher exposure of the models to outdoor conditions and consequently to higher heat losses in winter. In this regard, although a courtyard increases solar gains, it makes the models prone to additional transmission, ventilation and infiltration heat losses. The heating energy demands of the mentioned models in the context of climate scenario W+ are shown as white bars in Figure 13. With the increase of outdoor temperature, the heating energy demands are
i
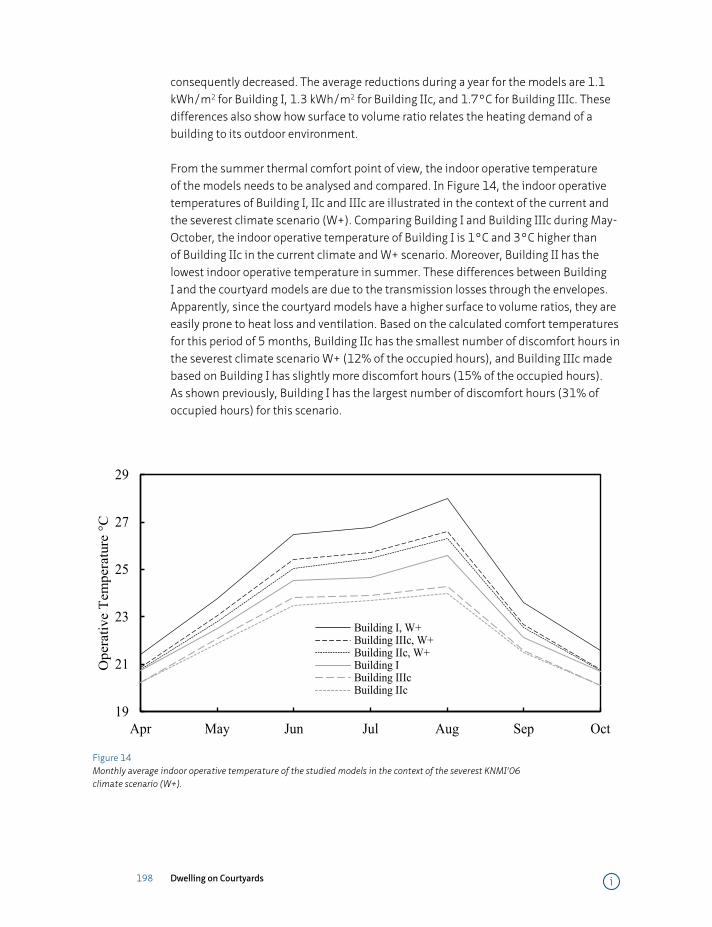
198 Dwelling on Courtyards
consequently decreased. The average reductions during a year for the models are 1.1 kWh/m2 for Building I, 1.3 kWh/m2 for Building IIc, and 1.7°C for Building IIIc. These differences also show how surface to volume ratio relates the heating demand of a building to its outdoor environment.
From the summer thermal comfort point of view, the indoor operative temperature of the models needs to be analysed and compared. In Figure 14, the indoor operative temperatures of Building I, IIc and IIIc are illustrated in the context of the current and the severest climate scenario (W+). Comparing Building I and Building IIIc during May-October, the indoor operative temperature of Building I is 1°C and 3°C higher than of Building IIc in the current climate and W+ scenario. Moreover, Building II has the lowest indoor operative temperature in summer. These differences between Building I and the courtyard models are due to the transmission losses through the envelopes. Apparently, since the courtyard models have a higher surface to volume ratios, they are easily prone to heat loss and ventilation. Based on the calculated comfort temperatures for this period of 5 months, Building IIc has the smallest number of discomfort hours in the severest climate scenario W+ (12% of the occupied hours), and Building IIIc made based on Building I has slightly more discomfort hours (15% of the occupied hours). As shown previously, Building I has the largest number of discomfort hours (31% of occupied hours) for this scenario.
19
21
23
25
27
29
Apr May Jun Jul Aug Sep Oct
Ope
rativ
e T
empe
ratu
re °
C
Building I, W+Building IIIc, W+Building IIc, W+Building IBuilding IIIcBuilding IIc
Figure 14 Monthly average indoor operative temperature of the studied models in the context of the severest KNMI’06 climate scenario (W+).
i

199 Indoor thermal comfort in a courtyard/atrium dwelling
§ 6.3.3 Phase two: The effect(s) of an atrium- Buildings IIa and IIIa
In this phase, the models simulated in phase one with a courtyard are covered with a glass roof (U-value of 2.2 W/m2K). In phase one, the simulated dwellings with a courtyard showed an increase in heating demand in comparison to Building I. In this step, the courtyards are covered to analyse whether this strategy increases the efficiency of the dwellings from an energy use and thermal comfort point of view.
Referring to Figure 15, the heating demands of the courtyard dwellings (IIc and IIIc) are compared with the respective atrium models (IIa and IIIa) in the current climate of the Netherlands. During the cold months, the differences are clearly visible. In this regard, the average winter monthly heating demand of Building IIc is 1.3 kWh/m2 more than of its atrium model (excluding summer months in which the heating demand is zero). The average winter monthly difference for Buildings IIIc and IIIa is 2.3 kWh/m2. This shows that in a temperate climate covering the transitional space, thereby creating an atrium, can reduce the heating demand by 6 and11 kWh/m2 for the whole year for Building IIc and IIIc, respectively. Having the models in the severest KNMI’06 climate scenario (W+), the heating energy demands have been reduced (as visible in Figure 15 with white bars). The average reductions during a year for the models between the current climate and future climate scenario W+ are 1.0 kWh/m2 for Building IIa model, and 1.2 kWh/m2 for Building IIIa. These differences also show how surface to volume ratio relates the heating demand of a building to its outdoor environment.
Also overheating risk should be checked for atria which typically increase the number of summer discomfort hours. Therefore, similarly as in Phase one, the indoor operative temperature of the four models (being the courtyard and atrium dwellings) is compared for both the current Dutch climate and the severest KNMI’06 climate scenario (W+).
i

200 Dwelling on Courtyards
Figure 15 Monthly heating energy demand of the courtyard and atrium dwellings for the current climate of the Netherlands (dark bars) and the future W+ scenario (white bars inside dark ones).
19
21
23
25
27
29
Apr May Jun Jul Aug Sep Oct
Ope
rativ
e Te
mpe
ratu
re °
C
Building IIIa W+ Building IIIaBuilding IIa W+ Building IIaBuilding IIIc W+ Building IIIcBuilding Iic W+ Building IIc
Figure 16 Indoor operative temperature of the studied models in the context of the severest KNMI’06 climate scenario (W+).
i
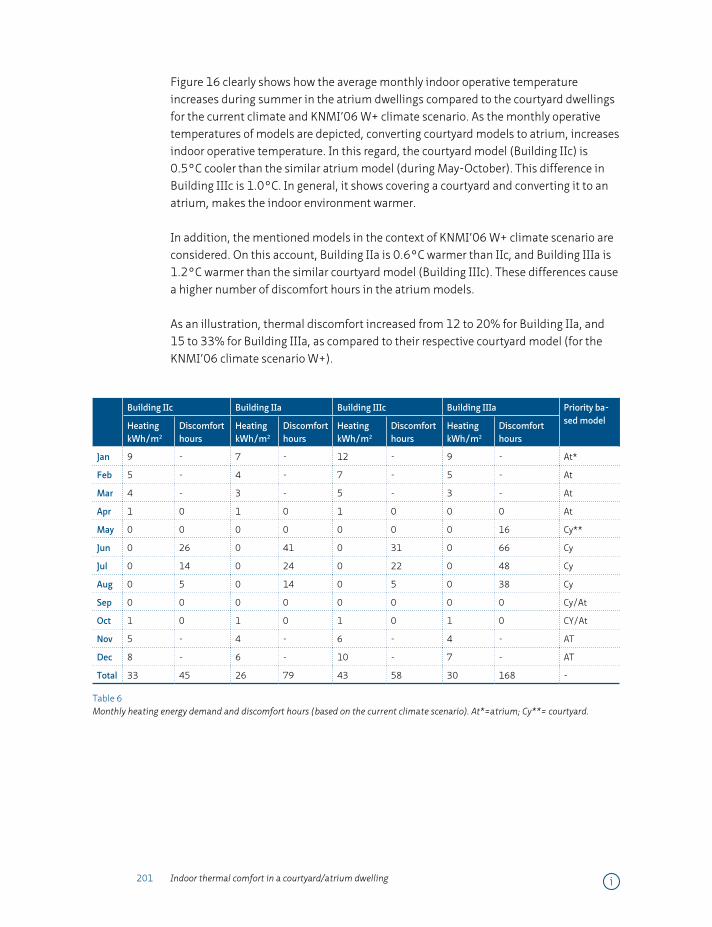
201 Indoor thermal comfort in a courtyard/atrium dwelling
Figure 16 clearly shows how the average monthly indoor operative temperature increases during summer in the atrium dwellings compared to the courtyard dwellings for the current climate and KNMI’06 W+ climate scenario. As the monthly operative temperatures of models are depicted, converting courtyard models to atrium, increases indoor operative temperature. In this regard, the courtyard model (Building IIc) is 0.5°C cooler than the similar atrium model (during May-October). This difference in Building IIIc is 1.0°C. In general, it shows covering a courtyard and converting it to an atrium, makes the indoor environment warmer.
In addition, the mentioned models in the context of KNMI’06 W+ climate scenario are considered. On this account, Building IIa is 0.6°C warmer than IIc, and Building IIIa is 1.2°C warmer than the similar courtyard model (Building IIIc). These differences cause a higher number of discomfort hours in the atrium models.
As an illustration, thermal discomfort increased from 12 to 20% for Building IIa, and 15 to 33% for Building IIIa, as compared to their respective courtyard model (for the KNMI’06 climate scenario W+).
Building IIc Building IIa Building IIIc Building IIIa Priority ba-sed modelHeating
kWh/m2
Discomforthours
HeatingkWh/m2
Discomforthours
HeatingkWh/m2
Discomforthours
HeatingkWh/m2
Discomforthours
Jan 9 - 7 - 12 - 9 - At*
Feb 5 - 4 - 7 - 5 - At
Mar 4 - 3 - 5 - 3 - At
Apr 1 0 1 0 1 0 0 0 At
May 0 0 0 0 0 0 0 16 Cy**
Jun 0 26 0 41 0 31 0 66 Cy
Jul 0 14 0 24 0 22 0 48 Cy
Aug 0 5 0 14 0 5 0 38 Cy
Sep 0 0 0 0 0 0 0 0 Cy/At
Oct 1 0 1 0 1 0 1 0 CY/At
Nov 5 - 4 - 6 - 4 - AT
Dec 8 - 6 - 10 - 7 - AT
Total 33 45 26 79 43 58 30 168 -
Table 6 Monthly heating energy demand and discomfort hours (based on the current climate scenario). At*=atrium; Cy**= courtyard.
i
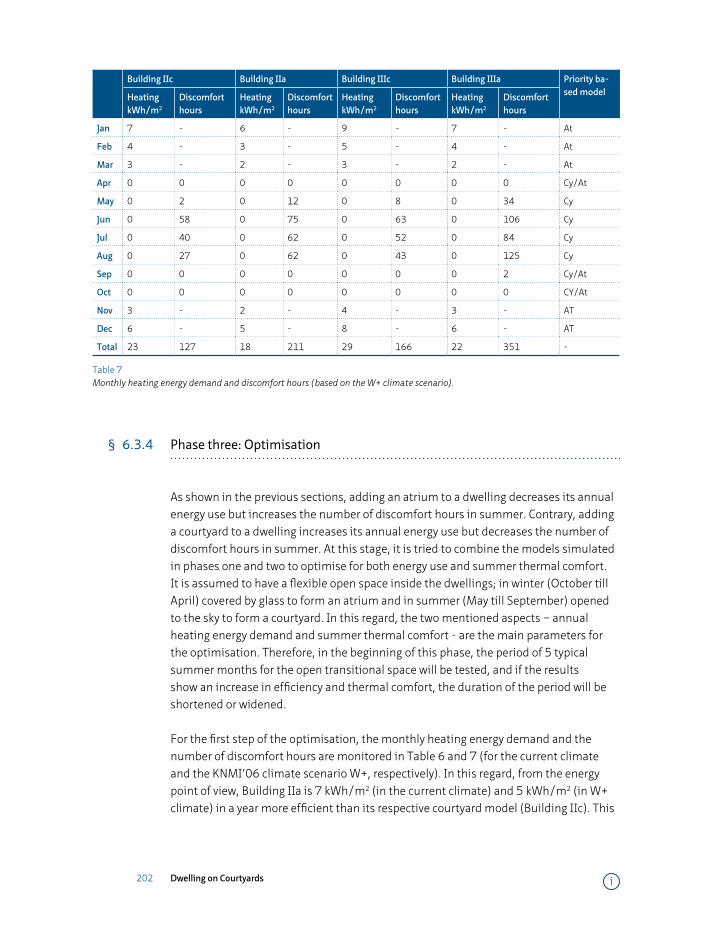
202 Dwelling on Courtyards
Building IIc Building IIa Building IIIc Building IIIa Priority ba-sed modelHeating
kWh/m2
Discomforthours
HeatingkWh/m2
Discomforthours
HeatingkWh/m2
Discomforthours
HeatingkWh/m2
Discomforthours
Jan 7 - 6 - 9 - 7 - At
Feb 4 - 3 - 5 - 4 - At
Mar 3 - 2 - 3 - 2 - At
Apr 0 0 0 0 0 0 0 0 Cy/At
May 0 2 0 12 0 8 0 34 Cy
Jun 0 58 0 75 0 63 0 106 Cy
Jul 0 40 0 62 0 52 0 84 Cy
Aug 0 27 0 62 0 43 0 125 Cy
Sep 0 0 0 0 0 0 0 2 Cy/At
Oct 0 0 0 0 0 0 0 0 CY/At
Nov 3 - 2 - 4 - 3 - AT
Dec 6 - 5 - 8 - 6 - AT
Total 23 127 18 211 29 166 22 351 -
Table 7 Monthly heating energy demand and discomfort hours (based on the W+ climate scenario).
§ 6.3.4 Phase three: Optimisation
As shown in the previous sections, adding an atrium to a dwelling decreases its annual energy use but increases the number of discomfort hours in summer. Contrary, adding a courtyard to a dwelling increases its annual energy use but decreases the number of discomfort hours in summer. At this stage, it is tried to combine the models simulated in phases one and two to optimise for both energy use and summer thermal comfort. It is assumed to have a flexible open space inside the dwellings; in winter (October till April) covered by glass to form an atrium and in summer (May till September) opened to the sky to form a courtyard. In this regard, the two mentioned aspects – annual heating energy demand and summer thermal comfort - are the main parameters for the optimisation. Therefore, in the beginning of this phase, the period of 5 typical summer months for the open transitional space will be tested, and if the results show an increase in efficiency and thermal comfort, the duration of the period will be shortened or widened.
For the first step of the optimisation, the monthly heating energy demand and the number of discomfort hours are monitored in Table 6 and 7 (for the current climate and the KNMI’06 climate scenario W+, respectively). In this regard, from the energy point of view, Building IIa is 7 kWh/m2 (in the current climate) and 5 kWh/m2 (in W+ climate) in a year more efficient than its respective courtyard model (Building IIc). This
i
203 Indoor thermal comfort in a courtyard/atrium dwelling
difference is even bigger for Building IIIa versus IIIc (13 and 7kWh/m2, respectively). Nevertheless, having a look at the summer indoor operative temperature as illustrated in Figure 16, the number of discomfort hours in the courtyard models is less than in their respective atrium models. Therefore, the combination of the two modes (open or closed) should be precisely based on the advantages and disadvantages of monthly performance of the models.
Table 6 and 7 show for each dwelling and for each month a summary of the heating demand and number of discomfort hours based on the current climate and the KNMI’06 climate scenario W+, respectively. The last columns show which of the dwellings, atrium or courtyard situation, has the best performance concerning energy use and/or summer thermal comfort. The courtyard models have a lower number of discomfort hours and higher heating energy demand in comparison with their atrium models. Therefore, for an optimised model the advantages of the atrium should be used for winter (limiting heat losses), whereas the advantages of the courtyard should be used for summer (reducing overheating). According to the simulations, it would be efficient if the transitional space is open for about 4 to 6 months (starting in May; ending in August, September or October) and be covered for the rest of the year. For this optimised model and in the context of the current climate, the heating energy demand of Building IIo will be 26 kWh/m2 in a year, and the discomfort percentage in summer will be 4%. For Building IIIo, it is 30 kWh/m2/yr for heating demand and 5% for discomfort hours. Regarding the future climate scenario (W+), the heating energy demand of the Building IIo will be 18 kWh/m2 in a year, and the discomfort percentage in summer will be 12%. Moreover, for Building IIIo it will be 22 kWh/m2/yr for heating demand and 15% for discomfort hours.
Finally, at the end of the optimisation, it is useful to mention if all the optimisations have led to a more efficient building rather the reference model (Building I). Tables 8 and 9 compare Building I with optimised models in the contexts of current and W+ climate scenarios. Comparing the Buildings IIo and IIIo with Building I, the heating energy demands are equal while the summer discomfort hours are one third and half of Building I, respectively.
i
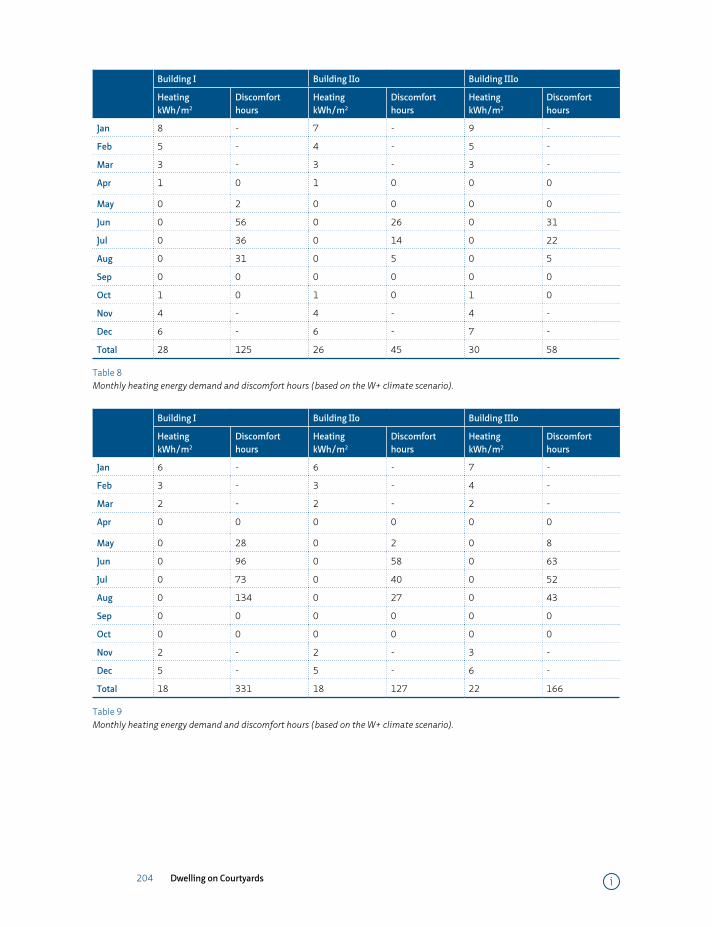
204 Dwelling on Courtyards
Building I Building IIo Building IIIo
HeatingkWh/m2
Discomforthours
HeatingkWh/m2
Discomforthours
HeatingkWh/m2
Discomforthours
Jan 8 - 7 - 9 -
Feb 5 - 4 - 5 -
Mar 3 - 3 - 3 -
Apr 1 0 1 0 0 0
May 0 2 0 0 0 0
Jun 0 56 0 26 0 31
Jul 0 36 0 14 0 22
Aug 0 31 0 5 0 5
Sep 0 0 0 0 0 0
Oct 1 0 1 0 1 0
Nov 4 - 4 - 4 -
Dec 6 - 6 - 7 -
Total 28 125 26 45 30 58
Table 8 Monthly heating energy demand and discomfort hours (based on the W+ climate scenario).
Building I Building IIo Building IIIo
HeatingkWh/m2
Discomforthours
HeatingkWh/m2
Discomforthours
HeatingkWh/m2
Discomforthours
Jan 6 - 6 - 7 -
Feb 3 - 3 - 4 -
Mar 2 - 2 - 2 -
Apr 0 0 0 0 0 0
May 0 28 0 2 0 8
Jun 0 96 0 58 0 63
Jul 0 73 0 40 0 52
Aug 0 134 0 27 0 43
Sep 0 0 0 0 0 0
Oct 0 0 0 0 0 0
Nov 2 - 2 - 3 -
Dec 5 - 5 - 6 -
Total 18 331 18 127 22 166
Table 9 Monthly heating energy demand and discomfort hours (based on the W+ climate scenario).
i
205 Indoor thermal comfort in a courtyard/atrium dwelling
§ 6.4 Conclusions
In this chapter, the effects of transitional spaces on the annual heating energy demand and summer thermal comfort were discussed. A Dutch mid-terraced dwelling was selected as a reference model- Building I (based on AgenstchapNL; Netherlands Ministry of Economic Affairs). As phase zero, this model was simulated in the contexts of five weather conditions in the Netherlands. The first one is representative of the current climate; the other four represent four climate scenarios for the Netherlands in 2050: G (moderate), G+ (moderate, changed air patterns), W (warm), and W+ (warm, changed air patterns). Reasonably, the simulations showed that because of climate change, the heating energy demand of Building I decreases and the number of discomfort hours in summer increases.
Therefore, in the next phase, the effect of a courtyard or patio was tested to see if it can increase the energy efficiency or indoor summer thermal comfort. In this regard, an actual courtyard dwelling in Amsterdam (Building IIc) and a virtual courtyard dwelling (Building IIIc developed from the reference model) were simulated. The results showed that the courtyard reduces the indoor operative temperature in summer, and consequently the number of discomfort hours, but increases the annual heating demand of the dwelling.
Therefore, in the next phase of the study, the courtyards were covered by a glazed roof to reduce the heat losses in winter. Covering the courtyard indeed led to a lower heating energy consumption of the models but also led to more thermal discomfort in summer. Finally, in the last phase, the advantages of the courtyard and atrium models were the subjects for optimisation. This optimisation was based on the monthly behaviour of the models. A combined model was introduced optimising the monthly heating energy demand in winter and thermal discomfort in summer. Simulations showed that the optimal period of having an open courtyard is at least between the four months of May until August. In the period from November until April, the courtyard should be covered with glass. Due to the moderate situation in September and October, both the courtyard or atrium modes perform equally well. Comparing the optimised Amsterdam (Building IIo) and virtual models (Building IIIo) with the reference model (Building I), the heating energy demands are equal while the summer discomfort hours are one third and half of the reference model, respectively.
Consequently, this chapter showed that climate change influences heating energy demand and summer thermal comfort. Open transitional spaces can be a way to reduce overheating. Moreover, the application of these spaces should be in consideration of winter to avoid heat losses. Consequently, the most important finding of this chapter indicates that the best duration for using an open space in a year in the specific climate the Netherlands is between May and August (and can last till October).
i
206 Dwelling on Courtyards
Acknowledgements
The authors would like to acknowledge Mr. Dick de Gunst for providing us with the documents of the Amsterdam courtyard house and Dr. Wim van der Spoel for developing the weather data files for the year 2050 according to the Dutch KNMI’06 climate scenarios.
References
1 Reynolds, J.S., Courtyards: Aesthetic, Social and Thermal Delight. 2002, New York: John Wiley.
2 Chun, C., A. Kwok, and A. Tamura, Thermal comfort in transitional spaces—basic concepts: literature review and
trial measurement. Building and Environment, 2004. 39(10): p. 1187-1192.
3 Pitts, A. and J.B. Saleh, Potential for energy saving in building transition spaces. Energy and Buildings, 2007. 39(7):
p. 815-822.
4 Sharples, S. and D. Lash, Daylight in Atrium Buildings: A Critical Review. Architectural Science Review, 2007. 50(4):
p. 301-312.
5 Aldawoud, A. and R. Clark, Comparative analysis of energy performance between courtyard and atrium in buildings.
Energy and Buildings, 2008. 40(3): p. 209-214.
6 Muhaisen, A.S., Solar Performance Of Courtyard Buildings. 2010: VDM Verlag.
7 Ghaddar, N., K. Ghali, and S. Chehaitly, Assessing thermal comfort of active people in transitional spaces in
presence of air movement. Energy and Buildings, 2011. 43(10): p. 2832-2842.
8 Taleghani, M., M. Tenpierik, and A. Dobbelsteen, Environmental Impact of Courtyards- A Review and Comparison
of Residential Courtyard Buildings in Different Climates. Green Building, 2012. 7(2): p. 113-136.
9 Yang, X., Y. Li, and L. Yang, Predicting and understanding temporal 3D exterior surface temperature distribution in
an ideal courtyard. Building and Environment, 2012. 57(0): p. 38-48.
10 Fathy, H., Natural energy and vernacular architecture: principles and examples with reference to hot arid climates.
1986, Chicago: The University of Chicago Press.
11 Oliver, P., Dwellings: The house across the world. 2003, Oxford: Phaidon Press Ltd.
12 Givoni, B., Climate Considerations in Building and Urban Design. 1998: Wiley.
13 Berkovic, S., A. Yezioro, and A. Bitan, Study of thermal comfort in courtyards in a hot arid climate. Solar Energy,
2012. 86(5): p. 1173-1186.
14 Muhaisen, A.S., Shading simulation of the courtyard form in different climatic regions. Building and Environment,
2006. 41(12): p. 1731-1741.
15 Steemers, K., et al., City texture and microclimate. Urban Design Studies, 1997. 3: p. 25-50.
16 Day, C. and S. Roaf, Ecohouse: A Design Guide. 2012: Taylor & Francis.
17 Rajapaksha, I., H. Nagai, and M. Okumiya, A ventilated courtyard as a passive cooling strategy in the warm humid
tropics. Renewable Energy, 2003. 28(11): p. 1755-1778.
18 Sharples, S. and R. Bensalem, Airflow in courtyard and atrium buildings in the urban environment: a wind tunnel
study. Solar Energy, 2001. 70(3): p. 237-244.
19 Haw, L.C., et al., Empirical study of a wind-induced natural ventilation tower under hot and humid climatic
conditions. Energy and Buildings, 2012. 52(0): p. 28-38.
i
207 Indoor thermal comfort in a courtyard/atrium dwelling
20 Okeil, A., In search for Energy efficient urban forms: the residential solar block, in the 5th International Conference
on Indoor Air Quality, Ventilation and Energy Conservation in Buildings Proceedings. 2004: Toronto.
21 Okeil, A., A holistic approach to energy efficient building forms. Energy and Buildings, 2010. 42(9): p. 1437-1444.
22 Al-Hemiddi, N.A. and K.A. Megren Al-Saud, The effect of a ventilated interior courtyard on the thermal
performance of a house in a hot–arid region. Renewable Energy, 2001. 24(3–4): p. 581-595.
23 Meir, I.A., D. Pearlmutter, and Y. Etzion, On the microclimatic behavior of two semi-enclosed attached courtyards
in a hot dry region. Building and Environment, 1995. 30(4): p. 563-572.
24 Edwards, B., Courtyard Housing: Past, Present, Future. 2006: Taylor & Francis Group.
25 Short, C.A., M.J. Cook, and A. Woods, Low energy ventilation and cooling within an urban heat island. Renewable
Energy, 2009. 34(9): p. 2022-2029.
26 Laouadi, A., M.R. Atif, and A. Galasiu, Methodology towards developing skylight design tools for thermal and energy
performance of atriums in cold climates. Building and Environment, 2003. 38(1): p. 117-127.
27 Ayoob, A.N. and J.L. Izard, Study of comfort in atrium design. Renewable Energy, 1994. 5(5–8): p. 1002-1005.
28 Mänty, J. and N. Pressman, Cities designed for winter. 1988: Building Book Ltd.
29 IPCC, Climate Change 2007, in The physical science basis. Contribution of the working group I to the fourth
assessment report of the intergovernmental panel on climate change, S. Solomon, et al., Editors. 2007:
Cambridge.
30 KNMI, in Climate Change Scenarios 2006 for the Netherlands. 2006, KNMI publication: WR-2006-01
31 DesignBuilder, DesignBuilder software User manual. 2009.
32 Chowdhury, A.A., M.G. Rasul, and M.M.K. Khan, Thermal-comfort analysis and simulation for various low-energy
cooling-technologies applied to an office building in a subtropical climate. Applied Energy, 2008. 85(6): p. 449-
462.
33 Senternovem, Referentiewoningen Nieuwbouw. 2006, Senternovem: Sittard.
34 Nicol, J.F. and M.A. Humphreys, Adaptive thermal comfort and sustainable thermal standards for buildings. Energy
and Buildings, 2002. 34(6): p. 563-572.
35 Taleghani, M., et al., A review into thermal comfort in buildings. Renewable and Sustainable Energy Reviews, 2013.
26(0): p. 201-215.
36 van Hoof, J. and J.L.M. Hensen, Quantifying the relevance of adaptive thermal comfort models in moderate thermal
climate zones. Building and Environment, 2007. 42(1): p. 156-170.
37 Sourbron, M. and L. Helsen, Evaluation of adaptive thermal comfort models in moderate climates and their impact
on energy use in office buildings. Energy and Buildings, 2011. 43(2–3): p. 423-432.
38 Borgeson, S. and G. Brager, Comfort standards and variations in exceedance for mixed-mode buildings. Building
Research & Information, 2011. 39(2): p. 118-133.
39 Ferrari, S. and V. Zanotto, Adaptive comfort: Analysis and application of the main indices. Building and
Environment, 2012. 49(0): p. 25-32.
40 Lomas, K.J. and R. Giridharan, Thermal comfort standards, measured internal temperatures and thermal resilience
to climate change of free-running buildings: A case-study of hospital wards. Building and Environment, 2012.
55(0): p. 57-72.
41 Filippín, C. and S. Flores Larsen, Summer thermal behaviour of compact single family housing in a temperate
climate in Argentina. Renewable and Sustainable Energy Reviews, 2012. 16(5): p. 3439-3455.
42 Moujalled, B., R. Cantin, and G. Guarracino, Comparison of thermal comfort algorithms in naturally ventilated
office buildings. Energy and Buildings, 2008. 40(12): p. 2215-2223.
i

208 Dwelling on Courtyards
43 ASHRAE, ASHRAE Standard 55–2010 in Thermal Environmental Conditions for Human Occupancy. 2010,
ASHRAE Atlanta, GA.
44 Kottek, M., et al., World Map of the Köppen-Geiger climate classification updated. Meteorologische Zeitschrift,
2006. 15(3).
45 NEN-5060, Hygrothermische Eigenschappen van Gebouwen Referentieklimaatgegevens. 2008, Nederlands
Normalisatie-Instituut (NNI).
46 NEN-5128, Energieprestatie van woonfuncties en woongebouwen - Bepalingsmethode. 2004.
47 KNMI, in Klimaatschetsboek Nederland; het huidige en toekomstige klimaat. 2009, KNMI: De Bilt.
48 Spoel, W.H.v.d. and E.v.d. Ham, Pilot effect klimaatverandering op energiegebruik en besparingsconcepten bij
woningen, in report MO11110006 for Agentschap NL, TU Delft. 2012: Delft.
49 KNMI, in KNMI Klimaatscenarios. Transformatie tijdreeksen. 2012, KNMI: De Bilt.
i

209 Outdoor study
PART 3 Outdoor study
i
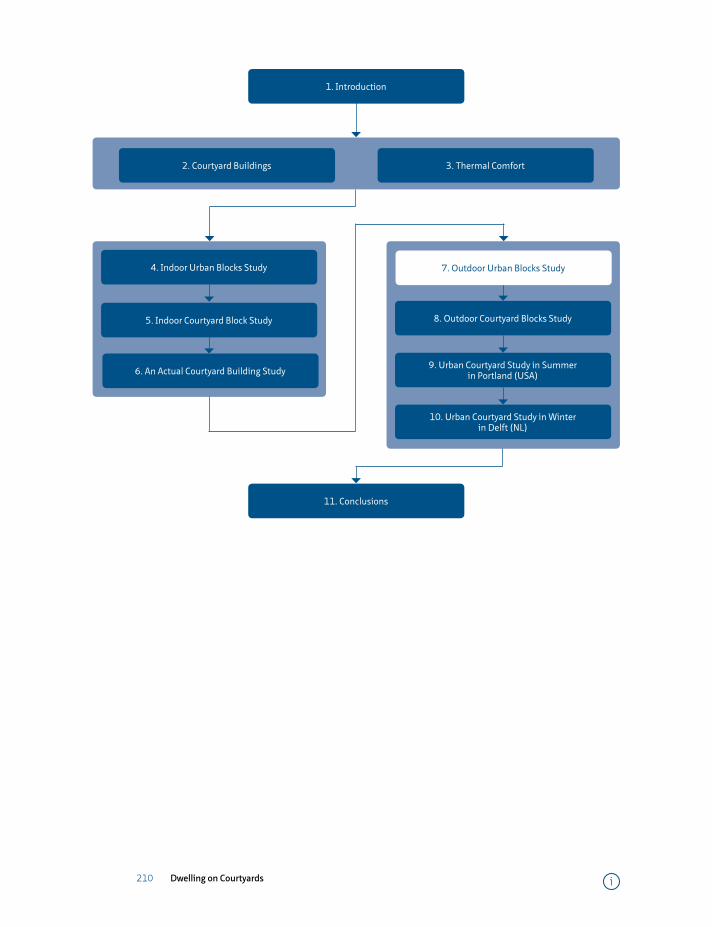
210 Dwelling on Courtyards
=
4. Indoor Urban Blocks Study
5. Indoor Courtyard Block Study
11. Conclusions
8. Outdoor Courtyard Blocks Study
9. Urban Courtyard Study in Summer in Portland (USA)
10. Urban Courtyard Study in Winter in Delft (NL)
7. Outdoor Urban Blocks Study
2. Courtyard Buildings 3. Thermal Comfort
1. Introduction
6. An Actual Courtyard Building Study
i
211 Outdoor thermal comfort within different building blocks
7 Outdoor thermal comfort within different building blocks
Part B studied indoor thermal comfort and energy efficiency of different building blocks. It then, focused on different courtyard buildings and showed the optimum ways of courtyard design from an indoor perspective.
Chapter 7 begins a new part of the dissertation on outdoor thermal comfort. This chapter is parallel to Chapter 4 in which different building block forms were studied. In this chapter, outdoor thermal comfort resulting from different urban forms will be investigated. The aim is to explore whether a courtyard is capable to provide a more comfortable microclimate in comparison with the other forms. The study is based on the simulation of the hottest day in a reference year in the Netherlands. The simulation software is validated through a field measurement inside an actual courtyard on the campus of Delft University of Technology.
i

212 Dwelling on Courtyards i
213 Outdoor thermal comfort within different building blocks
Outdoor thermal comfort within five different urban forms in the Netherlands1
Mohammad Taleghani *1, Laura Kleerekoper 1, Martin Tenpierik 1, Andy van den Dobbelsteen 1
1 Faculty of Architecture and the Built Environment, Delft University of Technology, Delft, the Netherlands
AbstractOutdoor thermal comfort in urban spaces is known as an important contributor to pedestrians’ health. The urban microclimate is also important more generally through its influence on urban air quality and the energy use of buildings. These issues are likely to become more acute as increased urbanisation and climate change exacerbate the urban heat island effect. Careful urban planning, however, may be able to provide for cooler urban environments. Different urban forms provide different microclimates with different comfort situations for pedestrians. In this paper, singular East-West and North-South, linear East-West and North-South, and a courtyard form were analysed for the hottest day so far in the temperate climate of the Netherlands (19th June 2000 with the maximum 33°C air temperature). ENVI-met was used for simulating outdoor air temperature, mean radiant temperature, wind speed and relative humidity whereas RayMan was used for converting these data into Physiological Equivalent Temperature (PET). The models with different compactness provided different thermal environments. The results demonstrate that duration of direct sun and mean radiant temperature, which are influenced by urban form, play the most important role in thermal comfort. This paper also shows that the courtyard provides the most comfortable microclimate in the Netherlands in June compared to the other studied urban forms. The results are validated through a field measurement and calibration.
KeywordsOutdoor thermal comfort, urban forms, PET, ENVI-met, Netherlands.
1 Published as: Taleghani M., Kleerekoper, L, Tenpierik M., Dobbelsteen A., “Outdoor thermal comfort within five different urban forms in the Netherlands”, Building and Environment, Accepted for publication with DOI: http://dx.doi.org/10.1016/j.buildenv.2014.03.014.
i
214 Dwelling on Courtyards
§ 7.1 Introduction
Thermal comfort is defined as ‘that condition of mind which expresses satisfaction with the thermal environment’ [1]. Since the 1980s, studies of thermal comfort in the outdoor environment have grown in number because of increased attention for pedestrians in urban canyons, plazas and squares. This led to a great number of researches addressing microclimate design parameters based on pedestrians’ thermal comfort [2-9]. Thermal comfort in the outdoor environment is mainly related to thermo-physiology, i.e. physiology and the heat balance of the human body [10]. This field of study connects urban and landscape designers to bio-meteorology (more focus on pedestrians) and climatology (more focus on climate). Both bio-meteorologists and climatologists had important roles in developing thermal comfort indices such as the physiological equivalent temperature (PET) [11] and the universal thermal climate index [12]. With regard to different urban forms these indices have been well studied for hot arid and humid climates, but to a lesser extent for cooler environments, probably because in these climates people spend most of their times indoors. But considering climate change and the rise of global temperature makes outdoor thermal comfort more urgent [13, 14].
The Netherlands has a temperate climate. Winters are milder than other climates in similar latitudes (and usually very cloudy) and summers are cool due to cool ocean currents. This country is faced with the effects of rapid climate change such as global temperature rise. Among different efforts, an appropriate urban design can help to mitigate heat stress for pedestrians. In this chapter, five basic microclimates formed by simple urban forms are subject to analyses from a normal pedestrian’s thermal comfort perspective. These analyses were conducted in the context of a representative meteorological city in the Netherlands: De Bilt. The aim of the study is to show which of the urban forms can provide a more comfortable microclimate on the hottest day of a year. Understanding the thermal behaviour of these microclimates allows landscape and urban designers to have clear guidelines for planning and design at their proposal.
§ 7.1.1 Outdoor thermal comfort indices
Howard [15] was the first who suggested to consider the effect of urban form on microclimate. In 1914 Hill, Griffith [16] made a big thermometer that indicated the influence of mean radiant temperature, air temperature and air velocity. Furthermore, Dufton [17] defined the equivalent temperature (Teq) in 1929. This equivalent temperature, however, was only in use for a short period because environmental variables were not accounted for in the algorithms [18, 19]. In addition, ASHRAE
i

215 Outdoor thermal comfort within different building blocks
proposed and used the effective temperature (ET) from 1919 till 1967 [20]. In 1971, Gagge introduced ET* which was more accurate than ET because it simultaneously covered radiation, convection and evaporation. Around the same time, Fanger [21] developed theories of human body heat exchange based on PMV (Predicted Mean Votes) or PPD (Predicted Percentage Dissatisfied). Later on, this theory became the basis for indoor thermal comfort standards such as ISO 7730-1984 and ASHRAE 55-1992. Tahbaz [22] and Cohen, Potchter [7] have divided thermal indices into cold and hot climates:
a Hot climates: Heat Stress Index (HIS) [23], Wet Bulb Globe Temperature (WBGT) [24], Discomfort Index (DI) [25], Index of Thermal Stress (ITS) [26], New Effective Temperature (ET*) [27], Skin Wettedness [28], Heat Index (HI) [29] and Tropical Summer Index (TSI) [30].
b Cold climates: Wind Chill Index (WCI) and Wind Chill Equivalent Temperature (WCET) [31]. As a next step, the need for indices applicable to all climates and seasons led to a number of universal indices such as the Standard Effective Temperature (SET) [32], Perceived Temperature (PT) [33], Outdoor Standard Effective Temperature (OUT_SET) [34], Physiological Equivalent Temperature (PET) [35, 36] and Universal Thermal Climate Index (UTCI) [37-39].
PET, or the physiological equivalent temperature (expressed by °C), tries to simplify the outdoor climate as an index for a lay person. This index is based on the Munich energy balance model for individuals (MEMI) [35, 36, 40] which is a thermo-physiological heat balance model. Such a model takes into account all basic thermoregulatory processes, such as the constriction or dilation of peripheral blood vessels and the physiological sweat rate. In detail, such models are based on the following equation:
S = M ± W ± R ± C ± K - E - RES (1)
Where S is heat storage, M is metabolism, W is external work, R is heat exchange by radiation, C is heat exchange by convection, K is heat exchange by conduction, E is heat loss by evaporation, and RES is heat exchange by respiration (from latent heat and sensible heat).
Actually, PET provides the equivalent temperature of an isothermal reference environment with a 12 hPa water vapour pressure (50% at 20°C) and air velocity of 0.1 m/s, at which the heat balance of a lay person is maintained with core and skin temperature equal to those under the conditions in question. PET uses PMV as assessment scale, making it similar to a comfort index [11, 41]. Finally, Matzarakis and Amelung [42] showed that PET is an accurate index for the assessment of the effects of climate change on human health and well-being. Last but not least, PET has the most important variables for human thermal comfort such as airflow, air temperature,
i
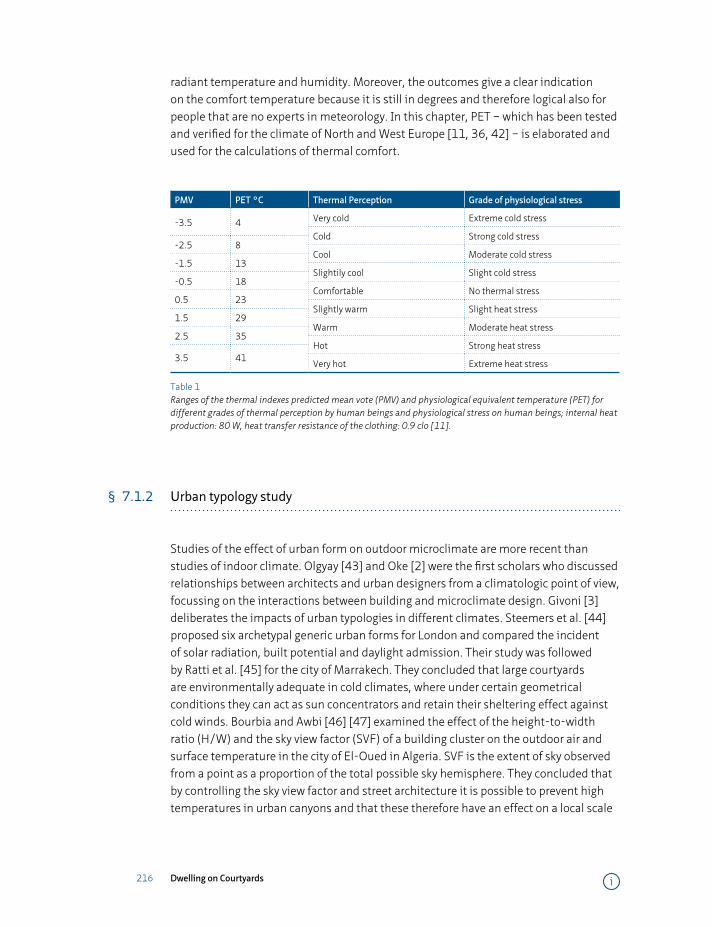
216 Dwelling on Courtyards
radiant temperature and humidity. Moreover, the outcomes give a clear indication on the comfort temperature because it is still in degrees and therefore logical also for people that are no experts in meteorology. In this chapter, PET – which has been tested and verified for the climate of North and West Europe [11, 36, 42] – is elaborated and used for the calculations of thermal comfort.
PMV PET °C Thermal Perception Grade of physiological stress
-3.5 4
-2.5 8
-1.5 13
-0.5 18
0.5 23
1.5 29
2.5 35
3.5 41
Very cold Extreme cold stress
Cold Strong cold stress
Cool Moderate cold stress
Slightily cool Slight cold stress
Comfortable No thermal stress
Slightly warm Slight heat stress
Warm Moderate heat stress
Hot Strong heat stress
Very hot Extreme heat stress
Table 1 Ranges of the thermal indexes predicted mean vote (PMV) and physiological equivalent temperature (PET) for different grades of thermal perception by human beings and physiological stress on human beings; internal heat production: 80 W, heat transfer resistance of the clothing: 0.9 clo [11].
§ 7.1.2 Urban typology study
Studies of the effect of urban form on outdoor microclimate are more recent than studies of indoor climate. Olgyay [43] and Oke [2] were the first scholars who discussed relationships between architects and urban designers from a climatologic point of view, focussing on the interactions between building and microclimate design. Givoni [3] deliberates the impacts of urban typologies in different climates. Steemers et al. [44] proposed six archetypal generic urban forms for London and compared the incident of solar radiation, built potential and daylight admission. Their study was followed by Ratti et al. [45] for the city of Marrakech. They concluded that large courtyards are environmentally adequate in cold climates, where under certain geometrical conditions they can act as sun concentrators and retain their sheltering effect against cold winds. Bourbia and Awbi [46] [47] examined the effect of the height-to-width ratio (H/W) and the sky view factor (SVF) of a building cluster on the outdoor air and surface temperature in the city of El-Oued in Algeria. SVF is the extent of sky observed from a point as a proportion of the total possible sky hemisphere. They concluded that by controlling the sky view factor and street architecture it is possible to prevent high temperatures in urban canyons and that these therefore have an effect on a local scale
i
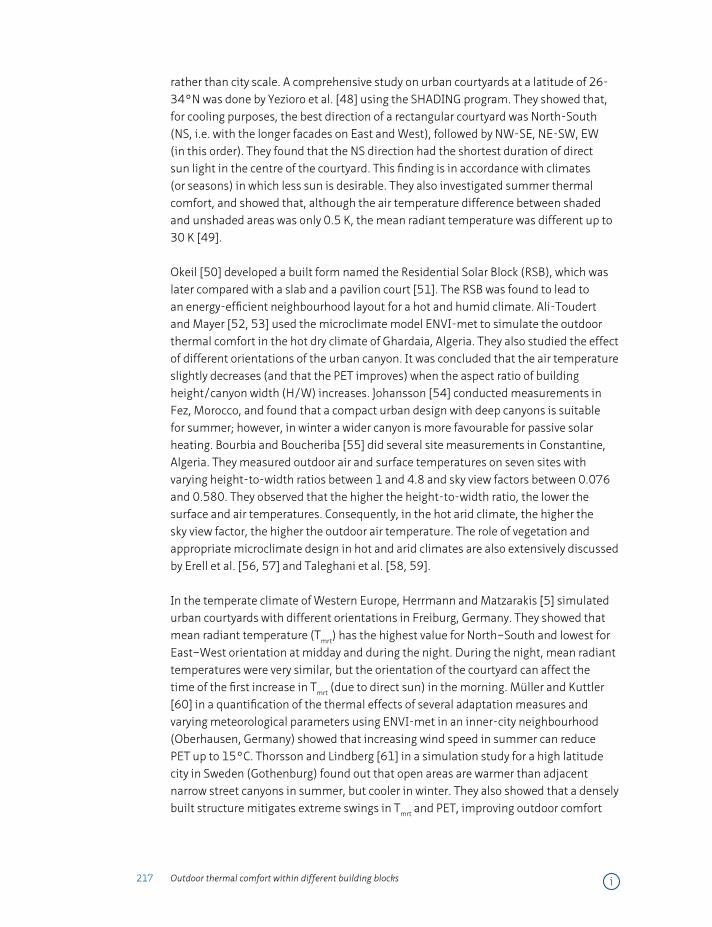
217 Outdoor thermal comfort within different building blocks
rather than city scale. A comprehensive study on urban courtyards at a latitude of 26-34°N was done by Yezioro et al. [48] using the SHADING program. They showed that, for cooling purposes, the best direction of a rectangular courtyard was North-South (NS, i.e. with the longer facades on East and West), followed by NW-SE, NE-SW, EW (in this order). They found that the NS direction had the shortest duration of direct sun light in the centre of the courtyard. This finding is in accordance with climates (or seasons) in which less sun is desirable. They also investigated summer thermal comfort, and showed that, although the air temperature difference between shaded and unshaded areas was only 0.5 K, the mean radiant temperature was different up to 30 K [49].
Okeil [50] developed a built form named the Residential Solar Block (RSB), which was later compared with a slab and a pavilion court [51]. The RSB was found to lead to an energy-efficient neighbourhood layout for a hot and humid climate. Ali-Toudert and Mayer [52, 53] used the microclimate model ENVI-met to simulate the outdoor thermal comfort in the hot dry climate of Ghardaia, Algeria. They also studied the effect of different orientations of the urban canyon. It was concluded that the air temperature slightly decreases (and that the PET improves) when the aspect ratio of building height/canyon width (H/W) increases. Johansson [54] conducted measurements in Fez, Morocco, and found that a compact urban design with deep canyons is suitable for summer; however, in winter a wider canyon is more favourable for passive solar heating. Bourbia and Boucheriba [55] did several site measurements in Constantine, Algeria. They measured outdoor air and surface temperatures on seven sites with varying height-to-width ratios between 1 and 4.8 and sky view factors between 0.076 and 0.580. They observed that the higher the height-to-width ratio, the lower the surface and air temperatures. Consequently, in the hot arid climate, the higher the sky view factor, the higher the outdoor air temperature. The role of vegetation and appropriate microclimate design in hot and arid climates are also extensively discussed by Erell et al. [56, 57] and Taleghani et al. [58, 59].
In the temperate climate of Western Europe, Herrmann and Matzarakis [5] simulated urban courtyards with different orientations in Freiburg, Germany. They showed that mean radiant temperature (Tmrt) has the highest value for North–South and lowest for East–West orientation at midday and during the night. During the night, mean radiant temperatures were very similar, but the orientation of the courtyard can affect the time of the first increase in Tmrt (due to direct sun) in the morning. Müller and Kuttler [60] in a quantification of the thermal effects of several adaptation measures and varying meteorological parameters using ENVI-met in an inner-city neighbourhood (Oberhausen, Germany) showed that increasing wind speed in summer can reduce PET up to 15°C. Thorsson and Lindberg [61] in a simulation study for a high latitude city in Sweden (Gothenburg) found out that open areas are warmer than adjacent narrow street canyons in summer, but cooler in winter. They also showed that a densely built structure mitigates extreme swings in Tmrt and PET, improving outdoor comfort
i
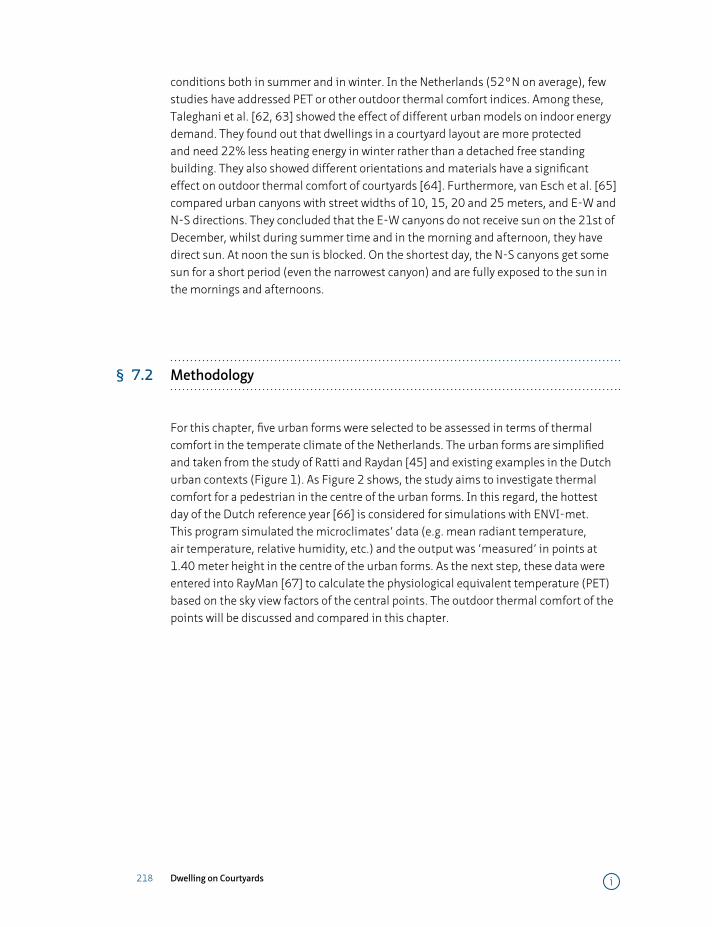
218 Dwelling on Courtyards
conditions both in summer and in winter. In the Netherlands (52°N on average), few studies have addressed PET or other outdoor thermal comfort indices. Among these, Taleghani et al. [62, 63] showed the effect of different urban models on indoor energy demand. They found out that dwellings in a courtyard layout are more protected and need 22% less heating energy in winter rather than a detached free standing building. They also showed different orientations and materials have a significant effect on outdoor thermal comfort of courtyards [64]. Furthermore, van Esch et al. [65] compared urban canyons with street widths of 10, 15, 20 and 25 meters, and E-W and N-S directions. They concluded that the E-W canyons do not receive sun on the 21st of December, whilst during summer time and in the morning and afternoon, they have direct sun. At noon the sun is blocked. On the shortest day, the N-S canyons get some sun for a short period (even the narrowest canyon) and are fully exposed to the sun in the mornings and afternoons.
§ 7.2 Methodology
For this chapter, five urban forms were selected to be assessed in terms of thermal comfort in the temperate climate of the Netherlands. The urban forms are simplified and taken from the study of Ratti and Raydan [45] and existing examples in the Dutch urban contexts (Figure 1). As Figure 2 shows, the study aims to investigate thermal comfort for a pedestrian in the centre of the urban forms. In this regard, the hottest day of the Dutch reference year [66] is considered for simulations with ENVI-met. This program simulated the microclimates’ data (e.g. mean radiant temperature, air temperature, relative humidity, etc.) and the output was ‘measured’ in points at 1.40 meter height in the centre of the urban forms. As the next step, these data were entered into RayMan [67] to calculate the physiological equivalent temperature (PET) based on the sky view factors of the central points. The outdoor thermal comfort of the points will be discussed and compared in this chapter.
i
219 Outdoor thermal comfort within different building blocks
Figure 1 Singular (left) linear (middle) and courtyard (right) urban forms in the Netherlands.
a) Singular blocks E-W
Input data(city climate)
Simulations(microclimates)
Thermal comfort in microclimates
RayMan
ENVI-met
PETSVF
Tmr,Ta,RH,Va,...
Thermal Comfort
e) Courtyard block
d) Linear blocks N-S
b) Singular blocks N-S
c) Linear blocks E-W
Figure 2 The research method. The simulations are done for the hottest day so far in the Netherlands, 19th of June 2000.
§ 7.2.1 Models
The five forms of urban open spaces considered in the study discussed were derived from Martin and March [68], Steemers and Baker [44] and Ratti and Raydan [45] (Figure 3). The open spaces surround 8 blocks, these blocks are 10 x 10 m2 each with a height of 9 m (3 storeys). The receptor (the point considered for thermal comfort) is located in the centre of the canyon or courtyard at a height of 1.40 m. The five urban forms are:
a) Singular blocks E-W; and b) Singular blocks N-S; c) Linear blocks E-W; and d) Linear blocks N-S: these models are the same as form a and b but now the building blocks are connected to each other, forming a set of terraced houses; e) A courtyard block: this block again consists of the same 8 modules forming an internal courtyard of 10 m2.
i

220 Dwelling on Courtyards
The material of walls are assumed brick (U value of 0.31 W/m2k). The pavements are concrete, and the roofs have the albedo of asphalt.
a) Singular blocks E-W
b) Singular blocks N-S
c) Linear blocks E-W
d) Linear blocks N-S
e) Courtyard block
Figure 3 Left: the five models and the positions of the reference points (the numbers are in meter); Right: the Sky View Factor (SVF) of all the forms, a) and b) 0.605, c) and d) 0.404 and e) 0.194) (calculated and produced by RayMan).
i
221 Outdoor thermal comfort within different building blocks
§ 7.2.2 Simulations
For the study presented, 19th of June 2000 as the most extreme hot day was selected to check the potential of the urban forms in providing acceptable outdoor thermal comfort in summer. In this regard, the simulations were done by means of the following software:
A ENVI-met 3.1:
This program is a three-dimensional microclimate model designed to simulate the interaction between surfaces, plants and air in an urban environment with a typical resolution of 0.5 to 10 meters in space and 10 second in time. In this chapter, the time step of 1 hour is used. With this programme, the air temperature (°C), vapour pressure (hPa), relative humidity (%), wind velocity (m/s) and mean radiant temperature (°C) of the receptors in the centre of models can be calculated [69]. A limitation regarding this program is the lack of PET in the outputs. As Figure 3 illustrates, thermal comfort information will be gathered in receptor points. Regarding the wind boundry conditions, ENVI-met makes the height of the boundry 3 times more than the height of the tallest building. Therefore, in the simulation of the five urban forms, the height of the boundry is 36 meter.
The ENVI-met model is chosen because it is the most complete model in terms of the calculation of human comfort. The generated output contains the four main thermal comfort parameters: air temperature, mean radiant temperature (Tmrt), wind speed and relative humidity. Another model that calculates outdoor conditions is the SOLWEIG model developed by Göteborg University [70]. The SOLWEIG model is a radiation model that is very accurate in predicting the Tmrt, but does not provide output of the three other thermal comfort parameters. There are also computational fluid dynamics (CFD) models like, ANSYS Fluent, which are developed to predict air flow and turbulence which are extended with a radiation and heat balance and an evaporation module [71]. Modelling with Fluent is very precise and used to test the aerodynamics of, for example, vehicles or to calculate flow in indoor spaces. Modelling and calculation time take much longer than with ENVI-met, while the obtained accuracy is not relevant at street level. The RayMan model, in contrast with CFD modelling, has a very short running time. The model is a radiation model and generates the Tmrt like the SOLWEIG model, however does not include multiple reflection between buildings. A large advantage of the model is the possibility to generate output in common thermal comfort indexes like the PET and PMV [67].
Other models that are used to simulate thermal comfort conditions are Ecotect, Design Builder and Transit. Ecotect is specialised in analysing daylight conditions, Design
i
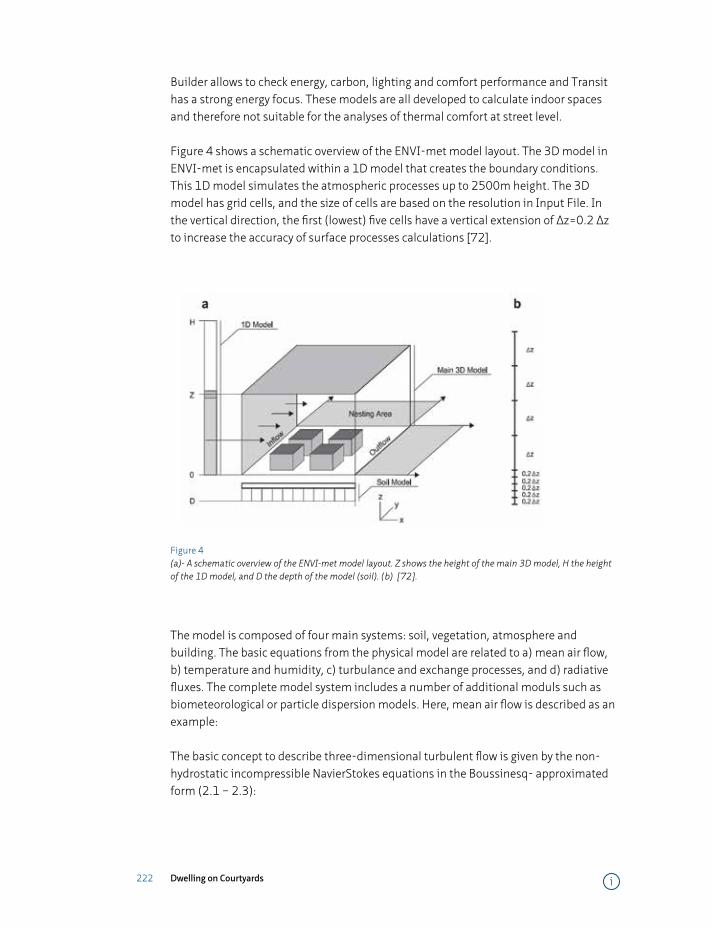
222 Dwelling on Courtyards
Builder allows to check energy, carbon, lighting and comfort performance and Transit has a strong energy focus. These models are all developed to calculate indoor spaces and therefore not suitable for the analyses of thermal comfort at street level.
Figure 4 shows a schematic overview of the ENVI-met model layout. The 3D model in ENVI-met is encapsulated within a 1D model that creates the boundary conditions. This 1D model simulates the atmospheric processes up to 2500m height. The 3D model has grid cells, and the size of cells are based on the resolution in Input File. In the vertical direction, the first (lowest) five cells have a vertical extension of Δz=0.2 Δz to increase the accuracy of surface processes calculations [72].
Figure 4 (a)- A schematic overview of the ENVI-met model layout. Z shows the height of the main 3D model, H the height of the 1D model, and D the depth of the model (soil). (b) [72].
The model is composed of four main systems: soil, vegetation, atmosphere and building. The basic equations from the physical model are related to a) mean air flow, b) temperature and humidity, c) turbulance and exchange processes, and d) radiative fluxes. The complete model system includes a number of additional moduls such as biometeorological or particle dispersion models. Here, mean air flow is described as an example:
The basic concept to describe three-dimensional turbulent flow is given by the non-hydrostatic incompressible NavierStokes equations in the Boussinesq- approximated form (2.1 – 2.3):
i
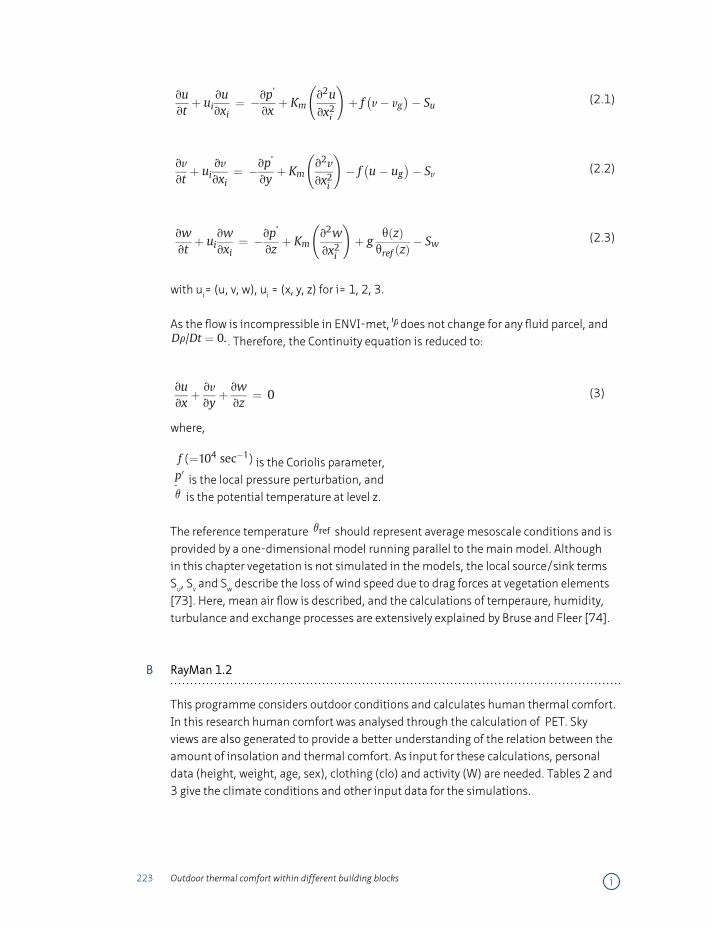
223 Outdoor thermal comfort within different building blocks
c) Linear blocks EeW; and d) Linear blocks NeS: these models arethe same as form a and b but now the building blocks areconnected to each other, forming a set of terraced houses;
e) A courtyard block: this block again consists of the same 8modules forming an internal courtyard of 10 m2.
The material of walls are assumed brick (U value of 0.31 W/m2 K). The pavements are concrete, and the roofs have the albedo ofasphalt.
2.2. Simulations
For the study presented, 19th of June 2000 as the most extremehot day was selected to check the potential of the urban forms inproviding acceptable outdoor thermal comfort in summer. In thisregard, the simulations were done by means of the followingsoftware:
a) ENVI-met 3.1: this program is a three-dimensional microclimatemodel designed to simulate the interaction between surfaces,plants and air in an urban environment with a typical resolutionof 0.5e10m in space and 10 s in time. In this paper, the time stepof 1 h is used. With this programme, the air temperature (�C),vapour pressure (hPa), relative humidity (%), wind velocity (m/s)andmean radiant temperature (�C) of the receptors in the centreof models can be calculated [69]. A limitation regarding thisprogram is the lack of PET in the outputs. As Fig. 3 illustrates,thermal comfort information will be gathered in receptorpoints. Regarding the wind boundary conditions, ENVI-metmakes the height of the boundary 3 times more than theheight of the tallest building. Therefore, in the simulation of thefive urban forms, the height of the boundary is 36 m.
The ENVI-met model is chosen because it is the most completemodel in terms of the calculation of human comfort. The generatedoutput contains the four main thermal comfort parameters: airtemperature, mean radiant temperature (Tmrt), wind speed andrelative humidity. Another model that calculates outdoor condi-tions is the SOLWEIGmodel developed by Göteborg University [70].The SOLWEIG model is a radiation model that is very accurate inpredicting the Tmrt, but does not provide output of the three otherthermal comfort parameters. There are also computational fluiddynamics (CFD) models like, ANSYS Fluent, which are developed topredict air flowand turbulencewhich are extendedwith a radiationand heat balance and an evaporation module [71]. Modelling withFluent is very precise and used to test the aerodynamics of, forexample, vehicles or to calculate flow in indoor spaces. Modellingand calculation time take much longer than with ENVI-met, while
the obtained accuracy is not relevant at street level. The RayManmodel, in contrast with CFD modelling, has a very short runningtime. The model is a radiation model and generates the Tmrt like theSOLWEIG model, however does not include multiple reflectionbetween buildings. A large advantage of the model is the possibilityto generate output in common thermal comfort indexes like thePET and PMV [67].
Other models that are used to simulate thermal comfort con-ditions are Ecotect, Design Builder and Transit. Ecotect is speci-alised in analysing daylight conditions, Design Builder allows tocheck energy, carbon, lighting and comfort performance andTransit has a strong energy focus. Thesemodels are all developed tocalculate indoor spaces and therefore not suitable for the analysesof thermal comfort at street level.
Fig. 4 shows a schematic overview of the ENVI-met modellayout. The 3D model in ENVI-met is encapsulated within a 1Dmodel that creates the boundary conditions. This 1D model simu-lates the atmospheric processes up to 2500m height. The 3Dmodelhas grid cells, and the size of cells are based on the resolution inInput File. In the vertical direction, the first (lowest) five cells have avertical extension of Dz ¼ 0.2 Dz to increase the accuracy of surfaceprocesses calculations [72].
The model is composed of four main systems: soil, vegetation,atmosphere and building. The basic equations from the physicalmodel are related to a) mean air flow, b) temperature and humidity,c) turbulence and exchange processes, and d) radiative fluxes. Thecomplete model system includes a number of additional modelssuch as biometeorological or particle dispersion models. Here,mean air flow is described as an example:
The basic concept to describe three-dimensional turbulent flowis given by the non-hydrostatic incompressible NavierStokesequations in the Boussinesq-approximated form (2.1e2.3):
vuvt
þ uivuvxi
¼ �vp’
vxþ Km
v2uvx2i
!þ f�v� vg
�� Su (2.1)
vv
vtþ ui
vv
vxi¼ �vp’
vyþ Km
v2v
vx2i
!� f�u� ug
�� Sv (2.2)
vwvt
þ uivwvxi
¼ �vp’
vzþ Km
v2wvx2i
!þ g
qðzÞqref ðzÞ
� Sw (2.3)
with ui ¼ (u, v, w), ui ¼ (x, y, z) for i ¼ 1, 2, 3.As the flow is incompressible in ENVI-met, r does not change for
any fluid parcel, and Dr/Dt ¼ 0. Therefore, the Continuity equationis reduced to:
0%
10%
20%
30%
40%
50%
60%
70%
80%
90%
100%
Jan Feb Mar Apr May Jun Jul Aug Sep Oct Nov Dec
PET
Freq
uenc
y
(Very hot)
(Hot)
Warm
Slightly warm
Comfortable
Slightly cool
Cool
Cold
Very cold
desir
able
0
2
4
6
8
10
12
14
16
18
20
0
4
8
12
16
20
Jan Feb Mar Apr May Jun Jul Aug Sep Oct Nov Dec
Win
d Sp
eed
(m/s
)
Dry
bulb
Tem
pera
ture
(°C)
Drybulb Temp
Wind speed
Fig. 5. Left, drybulb outdoor temperature and wind speed of De Bilt. Right, Percentage frequency of PET in the climate of De Bilt (in the open field and outside an urban form). Thecomfort ranges, from slightly cool to slightly warm, are highlighted. The comfort range is between 18 �C and 23 �C, and has occurred in 10 per cents of the year.
M. Taleghani et al. / Building and Environment xxx (2014) 1e14 5
Please cite this article in press as: Taleghani M, et al., Outdoor thermal comfort within five different urban forms in the Netherlands, Buildingand Environment (2014), http://dx.doi.org/10.1016/j.buildenv.2014.03.014
(2.1)
c) Linear blocks EeW; and d) Linear blocks NeS: these models arethe same as form a and b but now the building blocks areconnected to each other, forming a set of terraced houses;
e) A courtyard block: this block again consists of the same 8modules forming an internal courtyard of 10 m2.
The material of walls are assumed brick (U value of 0.31 W/m2 K). The pavements are concrete, and the roofs have the albedo ofasphalt.
2.2. Simulations
For the study presented, 19th of June 2000 as the most extremehot day was selected to check the potential of the urban forms inproviding acceptable outdoor thermal comfort in summer. In thisregard, the simulations were done by means of the followingsoftware:
a) ENVI-met 3.1: this program is a three-dimensional microclimatemodel designed to simulate the interaction between surfaces,plants and air in an urban environment with a typical resolutionof 0.5e10m in space and 10 s in time. In this paper, the time stepof 1 h is used. With this programme, the air temperature (�C),vapour pressure (hPa), relative humidity (%), wind velocity (m/s)andmean radiant temperature (�C) of the receptors in the centreof models can be calculated [69]. A limitation regarding thisprogram is the lack of PET in the outputs. As Fig. 3 illustrates,thermal comfort information will be gathered in receptorpoints. Regarding the wind boundary conditions, ENVI-metmakes the height of the boundary 3 times more than theheight of the tallest building. Therefore, in the simulation of thefive urban forms, the height of the boundary is 36 m.
The ENVI-met model is chosen because it is the most completemodel in terms of the calculation of human comfort. The generatedoutput contains the four main thermal comfort parameters: airtemperature, mean radiant temperature (Tmrt), wind speed andrelative humidity. Another model that calculates outdoor condi-tions is the SOLWEIGmodel developed by Göteborg University [70].The SOLWEIG model is a radiation model that is very accurate inpredicting the Tmrt, but does not provide output of the three otherthermal comfort parameters. There are also computational fluiddynamics (CFD) models like, ANSYS Fluent, which are developed topredict air flowand turbulencewhich are extendedwith a radiationand heat balance and an evaporation module [71]. Modelling withFluent is very precise and used to test the aerodynamics of, forexample, vehicles or to calculate flow in indoor spaces. Modellingand calculation time take much longer than with ENVI-met, while
the obtained accuracy is not relevant at street level. The RayManmodel, in contrast with CFD modelling, has a very short runningtime. The model is a radiation model and generates the Tmrt like theSOLWEIG model, however does not include multiple reflectionbetween buildings. A large advantage of the model is the possibilityto generate output in common thermal comfort indexes like thePET and PMV [67].
Other models that are used to simulate thermal comfort con-ditions are Ecotect, Design Builder and Transit. Ecotect is speci-alised in analysing daylight conditions, Design Builder allows tocheck energy, carbon, lighting and comfort performance andTransit has a strong energy focus. Thesemodels are all developed tocalculate indoor spaces and therefore not suitable for the analysesof thermal comfort at street level.
Fig. 4 shows a schematic overview of the ENVI-met modellayout. The 3D model in ENVI-met is encapsulated within a 1Dmodel that creates the boundary conditions. This 1D model simu-lates the atmospheric processes up to 2500m height. The 3Dmodelhas grid cells, and the size of cells are based on the resolution inInput File. In the vertical direction, the first (lowest) five cells have avertical extension of Dz ¼ 0.2 Dz to increase the accuracy of surfaceprocesses calculations [72].
The model is composed of four main systems: soil, vegetation,atmosphere and building. The basic equations from the physicalmodel are related to a) mean air flow, b) temperature and humidity,c) turbulence and exchange processes, and d) radiative fluxes. Thecomplete model system includes a number of additional modelssuch as biometeorological or particle dispersion models. Here,mean air flow is described as an example:
The basic concept to describe three-dimensional turbulent flowis given by the non-hydrostatic incompressible NavierStokesequations in the Boussinesq-approximated form (2.1e2.3):
vuvt
þ uivuvxi
¼ �vp’
vxþ Km
v2uvx2i
!þ f�v� vg
�� Su (2.1)
vv
vtþ ui
vv
vxi¼ �vp’
vyþ Km
v2v
vx2i
!� f�u� ug
�� Sv (2.2)
vwvt
þ uivwvxi
¼ �vp’
vzþ Km
v2wvx2i
!þ g
qðzÞqref ðzÞ
� Sw (2.3)
with ui ¼ (u, v, w), ui ¼ (x, y, z) for i ¼ 1, 2, 3.As the flow is incompressible in ENVI-met, r does not change for
any fluid parcel, and Dr/Dt ¼ 0. Therefore, the Continuity equationis reduced to:
0%
10%
20%
30%
40%
50%
60%
70%
80%
90%
100%
Jan Feb Mar Apr May Jun Jul Aug Sep Oct Nov Dec
PET
Freq
uenc
y
(Very hot)
(Hot)
Warm
Slightly warm
Comfortable
Slightly cool
Cool
Cold
Very cold
desir
able
0
2
4
6
8
10
12
14
16
18
20
0
4
8
12
16
20
Jan Feb Mar Apr May Jun Jul Aug Sep Oct Nov Dec
Win
d Sp
eed
(m/s
)
Dry
bulb
Tem
pera
ture
(°C)
Drybulb Temp
Wind speed
Fig. 5. Left, drybulb outdoor temperature and wind speed of De Bilt. Right, Percentage frequency of PET in the climate of De Bilt (in the open field and outside an urban form). Thecomfort ranges, from slightly cool to slightly warm, are highlighted. The comfort range is between 18 �C and 23 �C, and has occurred in 10 per cents of the year.
M. Taleghani et al. / Building and Environment xxx (2014) 1e14 5
Please cite this article in press as: Taleghani M, et al., Outdoor thermal comfort within five different urban forms in the Netherlands, Buildingand Environment (2014), http://dx.doi.org/10.1016/j.buildenv.2014.03.014
(2.2)
c) Linear blocks EeW; and d) Linear blocks NeS: these models arethe same as form a and b but now the building blocks areconnected to each other, forming a set of terraced houses;
e) A courtyard block: this block again consists of the same 8modules forming an internal courtyard of 10 m2.
The material of walls are assumed brick (U value of 0.31 W/m2 K). The pavements are concrete, and the roofs have the albedo ofasphalt.
2.2. Simulations
For the study presented, 19th of June 2000 as the most extremehot day was selected to check the potential of the urban forms inproviding acceptable outdoor thermal comfort in summer. In thisregard, the simulations were done by means of the followingsoftware:
a) ENVI-met 3.1: this program is a three-dimensional microclimatemodel designed to simulate the interaction between surfaces,plants and air in an urban environment with a typical resolutionof 0.5e10m in space and 10 s in time. In this paper, the time stepof 1 h is used. With this programme, the air temperature (�C),vapour pressure (hPa), relative humidity (%), wind velocity (m/s)andmean radiant temperature (�C) of the receptors in the centreof models can be calculated [69]. A limitation regarding thisprogram is the lack of PET in the outputs. As Fig. 3 illustrates,thermal comfort information will be gathered in receptorpoints. Regarding the wind boundary conditions, ENVI-metmakes the height of the boundary 3 times more than theheight of the tallest building. Therefore, in the simulation of thefive urban forms, the height of the boundary is 36 m.
The ENVI-met model is chosen because it is the most completemodel in terms of the calculation of human comfort. The generatedoutput contains the four main thermal comfort parameters: airtemperature, mean radiant temperature (Tmrt), wind speed andrelative humidity. Another model that calculates outdoor condi-tions is the SOLWEIGmodel developed by Göteborg University [70].The SOLWEIG model is a radiation model that is very accurate inpredicting the Tmrt, but does not provide output of the three otherthermal comfort parameters. There are also computational fluiddynamics (CFD) models like, ANSYS Fluent, which are developed topredict air flowand turbulencewhich are extendedwith a radiationand heat balance and an evaporation module [71]. Modelling withFluent is very precise and used to test the aerodynamics of, forexample, vehicles or to calculate flow in indoor spaces. Modellingand calculation time take much longer than with ENVI-met, while
the obtained accuracy is not relevant at street level. The RayManmodel, in contrast with CFD modelling, has a very short runningtime. The model is a radiation model and generates the Tmrt like theSOLWEIG model, however does not include multiple reflectionbetween buildings. A large advantage of the model is the possibilityto generate output in common thermal comfort indexes like thePET and PMV [67].
Other models that are used to simulate thermal comfort con-ditions are Ecotect, Design Builder and Transit. Ecotect is speci-alised in analysing daylight conditions, Design Builder allows tocheck energy, carbon, lighting and comfort performance andTransit has a strong energy focus. Thesemodels are all developed tocalculate indoor spaces and therefore not suitable for the analysesof thermal comfort at street level.
Fig. 4 shows a schematic overview of the ENVI-met modellayout. The 3D model in ENVI-met is encapsulated within a 1Dmodel that creates the boundary conditions. This 1D model simu-lates the atmospheric processes up to 2500m height. The 3Dmodelhas grid cells, and the size of cells are based on the resolution inInput File. In the vertical direction, the first (lowest) five cells have avertical extension of Dz ¼ 0.2 Dz to increase the accuracy of surfaceprocesses calculations [72].
The model is composed of four main systems: soil, vegetation,atmosphere and building. The basic equations from the physicalmodel are related to a) mean air flow, b) temperature and humidity,c) turbulence and exchange processes, and d) radiative fluxes. Thecomplete model system includes a number of additional modelssuch as biometeorological or particle dispersion models. Here,mean air flow is described as an example:
The basic concept to describe three-dimensional turbulent flowis given by the non-hydrostatic incompressible NavierStokesequations in the Boussinesq-approximated form (2.1e2.3):
vuvt
þ uivuvxi
¼ �vp’
vxþ Km
v2uvx2i
!þ f�v� vg
�� Su (2.1)
vv
vtþ ui
vv
vxi¼ �vp’
vyþ Km
v2v
vx2i
!� f�u� ug
�� Sv (2.2)
vwvt
þ uivwvxi
¼ �vp’
vzþ Km
v2wvx2i
!þ g
qðzÞqref ðzÞ
� Sw (2.3)
with ui ¼ (u, v, w), ui ¼ (x, y, z) for i ¼ 1, 2, 3.As the flow is incompressible in ENVI-met, r does not change for
any fluid parcel, and Dr/Dt ¼ 0. Therefore, the Continuity equationis reduced to:
0%
10%
20%
30%
40%
50%
60%
70%
80%
90%
100%
Jan Feb Mar Apr May Jun Jul Aug Sep Oct Nov Dec
PET
Freq
uenc
y
(Very hot)
(Hot)
Warm
Slightly warm
Comfortable
Slightly cool
Cool
Cold
Very cold
desir
able
0
2
4
6
8
10
12
14
16
18
20
0
4
8
12
16
20
Jan Feb Mar Apr May Jun Jul Aug Sep Oct Nov Dec
Win
d Sp
eed
(m/s
)
Dry
bulb
Tem
pera
ture
(°C)
Drybulb Temp
Wind speed
Fig. 5. Left, drybulb outdoor temperature and wind speed of De Bilt. Right, Percentage frequency of PET in the climate of De Bilt (in the open field and outside an urban form). Thecomfort ranges, from slightly cool to slightly warm, are highlighted. The comfort range is between 18 �C and 23 �C, and has occurred in 10 per cents of the year.
M. Taleghani et al. / Building and Environment xxx (2014) 1e14 5
Please cite this article in press as: Taleghani M, et al., Outdoor thermal comfort within five different urban forms in the Netherlands, Buildingand Environment (2014), http://dx.doi.org/10.1016/j.buildenv.2014.03.014
(2.3)
with ui= (u, v, w), ui = (x, y, z) for i= 1, 2, 3.
As the flow is incompressible in ENVI-met,
c) Linear blocks EeW; and d) Linear blocks NeS: these models arethe same as form a and b but now the building blocks areconnected to each other, forming a set of terraced houses;
e) A courtyard block: this block again consists of the same 8modules forming an internal courtyard of 10 m2.
The material of walls are assumed brick (U value of 0.31 W/m2 K). The pavements are concrete, and the roofs have the albedo ofasphalt.
2.2. Simulations
For the study presented, 19th of June 2000 as the most extremehot day was selected to check the potential of the urban forms inproviding acceptable outdoor thermal comfort in summer. In thisregard, the simulations were done by means of the followingsoftware:
a) ENVI-met 3.1: this program is a three-dimensional microclimatemodel designed to simulate the interaction between surfaces,plants and air in an urban environment with a typical resolutionof 0.5e10m in space and 10 s in time. In this paper, the time stepof 1 h is used. With this programme, the air temperature (�C),vapour pressure (hPa), relative humidity (%), wind velocity (m/s)andmean radiant temperature (�C) of the receptors in the centreof models can be calculated [69]. A limitation regarding thisprogram is the lack of PET in the outputs. As Fig. 3 illustrates,thermal comfort information will be gathered in receptorpoints. Regarding the wind boundary conditions, ENVI-metmakes the height of the boundary 3 times more than theheight of the tallest building. Therefore, in the simulation of thefive urban forms, the height of the boundary is 36 m.
The ENVI-met model is chosen because it is the most completemodel in terms of the calculation of human comfort. The generatedoutput contains the four main thermal comfort parameters: airtemperature, mean radiant temperature (Tmrt), wind speed andrelative humidity. Another model that calculates outdoor condi-tions is the SOLWEIGmodel developed by Göteborg University [70].The SOLWEIG model is a radiation model that is very accurate inpredicting the Tmrt, but does not provide output of the three otherthermal comfort parameters. There are also computational fluiddynamics (CFD) models like, ANSYS Fluent, which are developed topredict air flowand turbulencewhich are extendedwith a radiationand heat balance and an evaporation module [71]. Modelling withFluent is very precise and used to test the aerodynamics of, forexample, vehicles or to calculate flow in indoor spaces. Modellingand calculation time take much longer than with ENVI-met, while
the obtained accuracy is not relevant at street level. The RayManmodel, in contrast with CFD modelling, has a very short runningtime. The model is a radiation model and generates the Tmrt like theSOLWEIG model, however does not include multiple reflectionbetween buildings. A large advantage of the model is the possibilityto generate output in common thermal comfort indexes like thePET and PMV [67].
Other models that are used to simulate thermal comfort con-ditions are Ecotect, Design Builder and Transit. Ecotect is speci-alised in analysing daylight conditions, Design Builder allows tocheck energy, carbon, lighting and comfort performance andTransit has a strong energy focus. Thesemodels are all developed tocalculate indoor spaces and therefore not suitable for the analysesof thermal comfort at street level.
Fig. 4 shows a schematic overview of the ENVI-met modellayout. The 3D model in ENVI-met is encapsulated within a 1Dmodel that creates the boundary conditions. This 1D model simu-lates the atmospheric processes up to 2500m height. The 3Dmodelhas grid cells, and the size of cells are based on the resolution inInput File. In the vertical direction, the first (lowest) five cells have avertical extension of Dz ¼ 0.2 Dz to increase the accuracy of surfaceprocesses calculations [72].
The model is composed of four main systems: soil, vegetation,atmosphere and building. The basic equations from the physicalmodel are related to a) mean air flow, b) temperature and humidity,c) turbulence and exchange processes, and d) radiative fluxes. Thecomplete model system includes a number of additional modelssuch as biometeorological or particle dispersion models. Here,mean air flow is described as an example:
The basic concept to describe three-dimensional turbulent flowis given by the non-hydrostatic incompressible NavierStokesequations in the Boussinesq-approximated form (2.1e2.3):
vuvt
þ uivuvxi
¼ �vp’
vxþ Km
v2uvx2i
!þ f�v� vg
�� Su (2.1)
vv
vtþ ui
vv
vxi¼ �vp’
vyþ Km
v2v
vx2i
!� f�u� ug
�� Sv (2.2)
vwvt
þ uivwvxi
¼ �vp’
vzþ Km
v2wvx2i
!þ g
qðzÞqref ðzÞ
� Sw (2.3)
with ui ¼ (u, v, w), ui ¼ (x, y, z) for i ¼ 1, 2, 3.As the flow is incompressible in ENVI-met, r does not change for
any fluid parcel, and Dr/Dt ¼ 0. Therefore, the Continuity equationis reduced to:
0%
10%
20%
30%
40%
50%
60%
70%
80%
90%
100%
Jan Feb Mar Apr May Jun Jul Aug Sep Oct Nov Dec
PET
Freq
uenc
y
(Very hot)
(Hot)
Warm
Slightly warm
Comfortable
Slightly cool
Cool
Cold
Very cold
desir
able
0
2
4
6
8
10
12
14
16
18
20
0
4
8
12
16
20
Jan Feb Mar Apr May Jun Jul Aug Sep Oct Nov Dec
Win
d Sp
eed
(m/s
)
Dry
bulb
Tem
pera
ture
(°C)
Drybulb Temp
Wind speed
Fig. 5. Left, drybulb outdoor temperature and wind speed of De Bilt. Right, Percentage frequency of PET in the climate of De Bilt (in the open field and outside an urban form). Thecomfort ranges, from slightly cool to slightly warm, are highlighted. The comfort range is between 18 �C and 23 �C, and has occurred in 10 per cents of the year.
M. Taleghani et al. / Building and Environment xxx (2014) 1e14 5
Please cite this article in press as: Taleghani M, et al., Outdoor thermal comfort within five different urban forms in the Netherlands, Buildingand Environment (2014), http://dx.doi.org/10.1016/j.buildenv.2014.03.014
does not change for any fluid parcel, and
c) Linear blocks EeW; and d) Linear blocks NeS: these models arethe same as form a and b but now the building blocks areconnected to each other, forming a set of terraced houses;
e) A courtyard block: this block again consists of the same 8modules forming an internal courtyard of 10 m2.
The material of walls are assumed brick (U value of 0.31 W/m2 K). The pavements are concrete, and the roofs have the albedo ofasphalt.
2.2. Simulations
For the study presented, 19th of June 2000 as the most extremehot day was selected to check the potential of the urban forms inproviding acceptable outdoor thermal comfort in summer. In thisregard, the simulations were done by means of the followingsoftware:
a) ENVI-met 3.1: this program is a three-dimensional microclimatemodel designed to simulate the interaction between surfaces,plants and air in an urban environment with a typical resolutionof 0.5e10m in space and 10 s in time. In this paper, the time stepof 1 h is used. With this programme, the air temperature (�C),vapour pressure (hPa), relative humidity (%), wind velocity (m/s)andmean radiant temperature (�C) of the receptors in the centreof models can be calculated [69]. A limitation regarding thisprogram is the lack of PET in the outputs. As Fig. 3 illustrates,thermal comfort information will be gathered in receptorpoints. Regarding the wind boundary conditions, ENVI-metmakes the height of the boundary 3 times more than theheight of the tallest building. Therefore, in the simulation of thefive urban forms, the height of the boundary is 36 m.
The ENVI-met model is chosen because it is the most completemodel in terms of the calculation of human comfort. The generatedoutput contains the four main thermal comfort parameters: airtemperature, mean radiant temperature (Tmrt), wind speed andrelative humidity. Another model that calculates outdoor condi-tions is the SOLWEIGmodel developed by Göteborg University [70].The SOLWEIG model is a radiation model that is very accurate inpredicting the Tmrt, but does not provide output of the three otherthermal comfort parameters. There are also computational fluiddynamics (CFD) models like, ANSYS Fluent, which are developed topredict air flowand turbulencewhich are extendedwith a radiationand heat balance and an evaporation module [71]. Modelling withFluent is very precise and used to test the aerodynamics of, forexample, vehicles or to calculate flow in indoor spaces. Modellingand calculation time take much longer than with ENVI-met, while
the obtained accuracy is not relevant at street level. The RayManmodel, in contrast with CFD modelling, has a very short runningtime. The model is a radiation model and generates the Tmrt like theSOLWEIG model, however does not include multiple reflectionbetween buildings. A large advantage of the model is the possibilityto generate output in common thermal comfort indexes like thePET and PMV [67].
Other models that are used to simulate thermal comfort con-ditions are Ecotect, Design Builder and Transit. Ecotect is speci-alised in analysing daylight conditions, Design Builder allows tocheck energy, carbon, lighting and comfort performance andTransit has a strong energy focus. Thesemodels are all developed tocalculate indoor spaces and therefore not suitable for the analysesof thermal comfort at street level.
Fig. 4 shows a schematic overview of the ENVI-met modellayout. The 3D model in ENVI-met is encapsulated within a 1Dmodel that creates the boundary conditions. This 1D model simu-lates the atmospheric processes up to 2500m height. The 3Dmodelhas grid cells, and the size of cells are based on the resolution inInput File. In the vertical direction, the first (lowest) five cells have avertical extension of Dz ¼ 0.2 Dz to increase the accuracy of surfaceprocesses calculations [72].
The model is composed of four main systems: soil, vegetation,atmosphere and building. The basic equations from the physicalmodel are related to a) mean air flow, b) temperature and humidity,c) turbulence and exchange processes, and d) radiative fluxes. Thecomplete model system includes a number of additional modelssuch as biometeorological or particle dispersion models. Here,mean air flow is described as an example:
The basic concept to describe three-dimensional turbulent flowis given by the non-hydrostatic incompressible NavierStokesequations in the Boussinesq-approximated form (2.1e2.3):
vuvt
þ uivuvxi
¼ �vp’
vxþ Km
v2uvx2i
!þ f�v� vg
�� Su (2.1)
vv
vtþ ui
vv
vxi¼ �vp’
vyþ Km
v2v
vx2i
!� f�u� ug
�� Sv (2.2)
vwvt
þ uivwvxi
¼ �vp’
vzþ Km
v2wvx2i
!þ g
qðzÞqref ðzÞ
� Sw (2.3)
with ui ¼ (u, v, w), ui ¼ (x, y, z) for i ¼ 1, 2, 3.As the flow is incompressible in ENVI-met, r does not change for
any fluid parcel, and Dr/Dt ¼ 0. Therefore, the Continuity equationis reduced to:
0%
10%
20%
30%
40%
50%
60%
70%
80%
90%
100%
Jan Feb Mar Apr May Jun Jul Aug Sep Oct Nov Dec
PET
Freq
uenc
y
(Very hot)
(Hot)
Warm
Slightly warm
Comfortable
Slightly cool
Cool
Cold
Very cold
desir
able
0
2
4
6
8
10
12
14
16
18
20
0
4
8
12
16
20
Jan Feb Mar Apr May Jun Jul Aug Sep Oct Nov Dec
Win
d Sp
eed
(m/s
)
Dry
bulb
Tem
pera
ture
(°C)
Drybulb Temp
Wind speed
Fig. 5. Left, drybulb outdoor temperature and wind speed of De Bilt. Right, Percentage frequency of PET in the climate of De Bilt (in the open field and outside an urban form). Thecomfort ranges, from slightly cool to slightly warm, are highlighted. The comfort range is between 18 �C and 23 �C, and has occurred in 10 per cents of the year.
M. Taleghani et al. / Building and Environment xxx (2014) 1e14 5
Please cite this article in press as: Taleghani M, et al., Outdoor thermal comfort within five different urban forms in the Netherlands, Buildingand Environment (2014), http://dx.doi.org/10.1016/j.buildenv.2014.03.014
. Therefore, the Continuity equation is reduced to:
vuvx
þ vv
vyþ vw
vz¼ 0 (3)
where,
f (¼104 sec�1) is the Coriolis parameter,p0 is the local pressure perturbation, andq is the potential temperature at level z.
The reference temperature qref should represent averagemesoscale conditions and is provided by a one-dimensional modelrunning parallel to the main model. Although in this paper vege-tation is not simulated in themodels, the local source/sink terms Su,Sv and Sw describe the loss of wind speed due to drag forces atvegetation elements [73].
Here, mean air flow is described, and the calculations of tem-perature, humidity, turbulence and exchange processes are exten-sively explained by Bruse and Fleer [74].
b) RayMan 1.2: this programme considers outdoor conditions andcalculates human thermal comfort. In this research humancomfort was analysed through the calculation of PET. Sky viewsare also generated to provide a better understanding of therelation between the amount of insolation and thermal comfort.As input for these calculations, personal data (height, weight,age, sex), clothing (clo) and activity (W) are needed. Tables 2 and3 give the climate conditions and other input data for thesimulations.
Finally, the two software programmes discussed above wereemployed for the calculations of thermal comfort. Firstly, ENVI-metwas used to generate Tmrt, air temperature, wind speed, and relativehumidity of the receptor points. Secondly, the parametersmentionedwere used in RayMan, in order to calculate the PETs for anormal pedestrian.
2.3. Weather data
The climate of De Bilt (52 �N, 4 �E), which is representative forthe Netherlands, is known as a temperate climate based on theclassification of Köppen-Geiger [75]. The prevailing wind directionis SoutheWest. The mean annual dry bulb temperature is 10.5 �C.Fig. 5 presents the frequency distribution of different comfortclassifications derived from the physiological equivalent tempera-ture (PET) for the reference Dutch year NEN5060 [66]. According tothis standard, everymonth of the reference year is represented by aspecific year which is considered representative of the period from1986 until 2005. The calculations of PET are done via RayMan for anormal 35-year old male person of 1.75 m high and 75 kg, with ametabolic rate of 80 Watt. An activity level of 80 W arises when anormal person is walking with 1.2 m/s.
2.4. Validation of ENVI-met
2.4.1. Measurement versus simulationIn this step, one ENVI-met model (the courtyard shape as a
sample) was validated through a comparison between field mea-surements and simulation results. The measurements were done
Fig. 6. a) The location of Delft as the place of validation, and De Bilt as the repre-sentative climate for the Netherlands (used in further simulations), b) the weatherstation (Vantage Pro2) used for measurement in situ, c) a view from inside thecourtyard.
M. Taleghani et al. / Building and Environment xxx (2014) 1e146
Please cite this article in press as: Taleghani M, et al., Outdoor thermal comfort within five different urban forms in the Netherlands, Buildingand Environment (2014), http://dx.doi.org/10.1016/j.buildenv.2014.03.014
(3)
where,
vuvx
þ vv
vyþ vw
vz¼ 0 (3)
where,
f (¼104 sec�1) is the Coriolis parameter,p0 is the local pressure perturbation, andq is the potential temperature at level z.
The reference temperature qref should represent averagemesoscale conditions and is provided by a one-dimensional modelrunning parallel to the main model. Although in this paper vege-tation is not simulated in themodels, the local source/sink terms Su,Sv and Sw describe the loss of wind speed due to drag forces atvegetation elements [73].
Here, mean air flow is described, and the calculations of tem-perature, humidity, turbulence and exchange processes are exten-sively explained by Bruse and Fleer [74].
b) RayMan 1.2: this programme considers outdoor conditions andcalculates human thermal comfort. In this research humancomfort was analysed through the calculation of PET. Sky viewsare also generated to provide a better understanding of therelation between the amount of insolation and thermal comfort.As input for these calculations, personal data (height, weight,age, sex), clothing (clo) and activity (W) are needed. Tables 2 and3 give the climate conditions and other input data for thesimulations.
Finally, the two software programmes discussed above wereemployed for the calculations of thermal comfort. Firstly, ENVI-metwas used to generate Tmrt, air temperature, wind speed, and relativehumidity of the receptor points. Secondly, the parametersmentionedwere used in RayMan, in order to calculate the PETs for anormal pedestrian.
2.3. Weather data
The climate of De Bilt (52 �N, 4 �E), which is representative forthe Netherlands, is known as a temperate climate based on theclassification of Köppen-Geiger [75]. The prevailing wind directionis SoutheWest. The mean annual dry bulb temperature is 10.5 �C.Fig. 5 presents the frequency distribution of different comfortclassifications derived from the physiological equivalent tempera-ture (PET) for the reference Dutch year NEN5060 [66]. According tothis standard, everymonth of the reference year is represented by aspecific year which is considered representative of the period from1986 until 2005. The calculations of PET are done via RayMan for anormal 35-year old male person of 1.75 m high and 75 kg, with ametabolic rate of 80 Watt. An activity level of 80 W arises when anormal person is walking with 1.2 m/s.
2.4. Validation of ENVI-met
2.4.1. Measurement versus simulationIn this step, one ENVI-met model (the courtyard shape as a
sample) was validated through a comparison between field mea-surements and simulation results. The measurements were done
Fig. 6. a) The location of Delft as the place of validation, and De Bilt as the repre-sentative climate for the Netherlands (used in further simulations), b) the weatherstation (Vantage Pro2) used for measurement in situ, c) a view from inside thecourtyard.
M. Taleghani et al. / Building and Environment xxx (2014) 1e146
Please cite this article in press as: Taleghani M, et al., Outdoor thermal comfort within five different urban forms in the Netherlands, Buildingand Environment (2014), http://dx.doi.org/10.1016/j.buildenv.2014.03.014
is the Coriolis parameter,
vuvx
þ vv
vyþ vw
vz¼ 0 (3)
where,
f (¼104 sec�1) is the Coriolis parameter,p0 is the local pressure perturbation, andq is the potential temperature at level z.
The reference temperature qref should represent averagemesoscale conditions and is provided by a one-dimensional modelrunning parallel to the main model. Although in this paper vege-tation is not simulated in themodels, the local source/sink terms Su,Sv and Sw describe the loss of wind speed due to drag forces atvegetation elements [73].
Here, mean air flow is described, and the calculations of tem-perature, humidity, turbulence and exchange processes are exten-sively explained by Bruse and Fleer [74].
b) RayMan 1.2: this programme considers outdoor conditions andcalculates human thermal comfort. In this research humancomfort was analysed through the calculation of PET. Sky viewsare also generated to provide a better understanding of therelation between the amount of insolation and thermal comfort.As input for these calculations, personal data (height, weight,age, sex), clothing (clo) and activity (W) are needed. Tables 2 and3 give the climate conditions and other input data for thesimulations.
Finally, the two software programmes discussed above wereemployed for the calculations of thermal comfort. Firstly, ENVI-metwas used to generate Tmrt, air temperature, wind speed, and relativehumidity of the receptor points. Secondly, the parametersmentionedwere used in RayMan, in order to calculate the PETs for anormal pedestrian.
2.3. Weather data
The climate of De Bilt (52 �N, 4 �E), which is representative forthe Netherlands, is known as a temperate climate based on theclassification of Köppen-Geiger [75]. The prevailing wind directionis SoutheWest. The mean annual dry bulb temperature is 10.5 �C.Fig. 5 presents the frequency distribution of different comfortclassifications derived from the physiological equivalent tempera-ture (PET) for the reference Dutch year NEN5060 [66]. According tothis standard, everymonth of the reference year is represented by aspecific year which is considered representative of the period from1986 until 2005. The calculations of PET are done via RayMan for anormal 35-year old male person of 1.75 m high and 75 kg, with ametabolic rate of 80 Watt. An activity level of 80 W arises when anormal person is walking with 1.2 m/s.
2.4. Validation of ENVI-met
2.4.1. Measurement versus simulationIn this step, one ENVI-met model (the courtyard shape as a
sample) was validated through a comparison between field mea-surements and simulation results. The measurements were done
Fig. 6. a) The location of Delft as the place of validation, and De Bilt as the repre-sentative climate for the Netherlands (used in further simulations), b) the weatherstation (Vantage Pro2) used for measurement in situ, c) a view from inside thecourtyard.
M. Taleghani et al. / Building and Environment xxx (2014) 1e146
Please cite this article in press as: Taleghani M, et al., Outdoor thermal comfort within five different urban forms in the Netherlands, Buildingand Environment (2014), http://dx.doi.org/10.1016/j.buildenv.2014.03.014
is the local pressure perturbation, and
vuvx
þ vv
vyþ vw
vz¼ 0 (3)
where,
f (¼104 sec�1) is the Coriolis parameter,p0 is the local pressure perturbation, andq is the potential temperature at level z.
The reference temperature qref should represent averagemesoscale conditions and is provided by a one-dimensional modelrunning parallel to the main model. Although in this paper vege-tation is not simulated in themodels, the local source/sink terms Su,Sv and Sw describe the loss of wind speed due to drag forces atvegetation elements [73].
Here, mean air flow is described, and the calculations of tem-perature, humidity, turbulence and exchange processes are exten-sively explained by Bruse and Fleer [74].
b) RayMan 1.2: this programme considers outdoor conditions andcalculates human thermal comfort. In this research humancomfort was analysed through the calculation of PET. Sky viewsare also generated to provide a better understanding of therelation between the amount of insolation and thermal comfort.As input for these calculations, personal data (height, weight,age, sex), clothing (clo) and activity (W) are needed. Tables 2 and3 give the climate conditions and other input data for thesimulations.
Finally, the two software programmes discussed above wereemployed for the calculations of thermal comfort. Firstly, ENVI-metwas used to generate Tmrt, air temperature, wind speed, and relativehumidity of the receptor points. Secondly, the parametersmentionedwere used in RayMan, in order to calculate the PETs for anormal pedestrian.
2.3. Weather data
The climate of De Bilt (52 �N, 4 �E), which is representative forthe Netherlands, is known as a temperate climate based on theclassification of Köppen-Geiger [75]. The prevailing wind directionis SoutheWest. The mean annual dry bulb temperature is 10.5 �C.Fig. 5 presents the frequency distribution of different comfortclassifications derived from the physiological equivalent tempera-ture (PET) for the reference Dutch year NEN5060 [66]. According tothis standard, everymonth of the reference year is represented by aspecific year which is considered representative of the period from1986 until 2005. The calculations of PET are done via RayMan for anormal 35-year old male person of 1.75 m high and 75 kg, with ametabolic rate of 80 Watt. An activity level of 80 W arises when anormal person is walking with 1.2 m/s.
2.4. Validation of ENVI-met
2.4.1. Measurement versus simulationIn this step, one ENVI-met model (the courtyard shape as a
sample) was validated through a comparison between field mea-surements and simulation results. The measurements were done
Fig. 6. a) The location of Delft as the place of validation, and De Bilt as the repre-sentative climate for the Netherlands (used in further simulations), b) the weatherstation (Vantage Pro2) used for measurement in situ, c) a view from inside thecourtyard.
M. Taleghani et al. / Building and Environment xxx (2014) 1e146
Please cite this article in press as: Taleghani M, et al., Outdoor thermal comfort within five different urban forms in the Netherlands, Buildingand Environment (2014), http://dx.doi.org/10.1016/j.buildenv.2014.03.014
is the potential temperature at level z.
The reference temperature
vuvx
þ vv
vyþ vw
vz¼ 0 (3)
where,
f (¼104 sec�1) is the Coriolis parameter,p0 is the local pressure perturbation, andq is the potential temperature at level z.
The reference temperature qref should represent averagemesoscale conditions and is provided by a one-dimensional modelrunning parallel to the main model. Although in this paper vege-tation is not simulated in themodels, the local source/sink terms Su,Sv and Sw describe the loss of wind speed due to drag forces atvegetation elements [73].
Here, mean air flow is described, and the calculations of tem-perature, humidity, turbulence and exchange processes are exten-sively explained by Bruse and Fleer [74].
b) RayMan 1.2: this programme considers outdoor conditions andcalculates human thermal comfort. In this research humancomfort was analysed through the calculation of PET. Sky viewsare also generated to provide a better understanding of therelation between the amount of insolation and thermal comfort.As input for these calculations, personal data (height, weight,age, sex), clothing (clo) and activity (W) are needed. Tables 2 and3 give the climate conditions and other input data for thesimulations.
Finally, the two software programmes discussed above wereemployed for the calculations of thermal comfort. Firstly, ENVI-metwas used to generate Tmrt, air temperature, wind speed, and relativehumidity of the receptor points. Secondly, the parametersmentionedwere used in RayMan, in order to calculate the PETs for anormal pedestrian.
2.3. Weather data
The climate of De Bilt (52 �N, 4 �E), which is representative forthe Netherlands, is known as a temperate climate based on theclassification of Köppen-Geiger [75]. The prevailing wind directionis SoutheWest. The mean annual dry bulb temperature is 10.5 �C.Fig. 5 presents the frequency distribution of different comfortclassifications derived from the physiological equivalent tempera-ture (PET) for the reference Dutch year NEN5060 [66]. According tothis standard, everymonth of the reference year is represented by aspecific year which is considered representative of the period from1986 until 2005. The calculations of PET are done via RayMan for anormal 35-year old male person of 1.75 m high and 75 kg, with ametabolic rate of 80 Watt. An activity level of 80 W arises when anormal person is walking with 1.2 m/s.
2.4. Validation of ENVI-met
2.4.1. Measurement versus simulationIn this step, one ENVI-met model (the courtyard shape as a
sample) was validated through a comparison between field mea-surements and simulation results. The measurements were done
Fig. 6. a) The location of Delft as the place of validation, and De Bilt as the repre-sentative climate for the Netherlands (used in further simulations), b) the weatherstation (Vantage Pro2) used for measurement in situ, c) a view from inside thecourtyard.
M. Taleghani et al. / Building and Environment xxx (2014) 1e146
Please cite this article in press as: Taleghani M, et al., Outdoor thermal comfort within five different urban forms in the Netherlands, Buildingand Environment (2014), http://dx.doi.org/10.1016/j.buildenv.2014.03.014
should represent average mesoscale conditions and is provided by a one-dimensional model running parallel to the main model. Although in this chapter vegetation is not simulated in the models, the local source/sink terms Su, Sv and Sw describe the loss of wind speed due to drag forces at vegetation elements [73]. Here, mean air flow is described, and the calculations of temperaure, humidity, turbulance and exchange processes are extensively explained by Bruse and Fleer [74].
B RayMan 1.2
This programme considers outdoor conditions and calculates human thermal comfort. In this research human comfort was analysed through the calculation of PET. Sky views are also generated to provide a better understanding of the relation between the amount of insolation and thermal comfort. As input for these calculations, personal data (height, weight, age, sex), clothing (clo) and activity (W) are needed. Tables 2 and 3 give the climate conditions and other input data for the simulations.
i
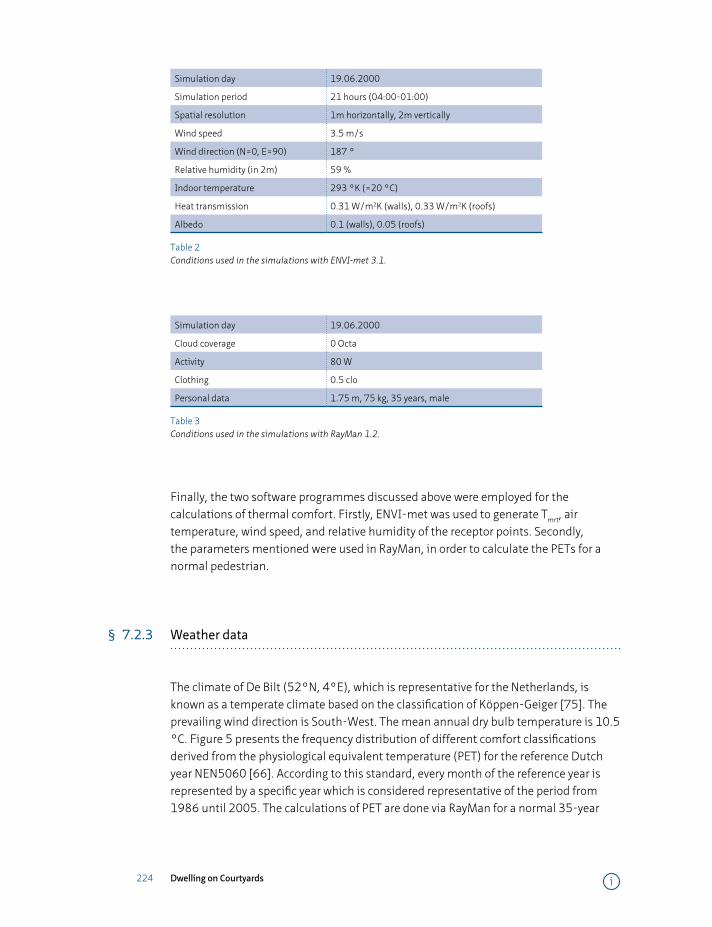
224 Dwelling on Courtyards
Simulation day 19.06.2000
Simulation period 21 hours (04:00-01:00)
Spatial resolution 1m horizontally, 2m vertically
Wind speed 3.5 m/s
Wind direction (N=0, E=90) 187 °
Relative humidity (in 2m) 59 %
Indoor temperature 293 °K (=20 °C)
Heat transmission 0.31 W/m2K (walls), 0.33 W/m2K (roofs)
Albedo 0.1 (walls), 0.05 (roofs)
Table 2 Conditions used in the simulations with ENVI-met 3.1.
Simulation day 19.06.2000
Cloud coverage 0 Octa
Activity 80 W
Clothing 0.5 clo
Personal data 1.75 m, 75 kg, 35 years, male
Table 3 Conditions used in the simulations with RayMan 1.2.
Finally, the two software programmes discussed above were employed for the calculations of thermal comfort. Firstly, ENVI-met was used to generate Tmrt, air temperature, wind speed, and relative humidity of the receptor points. Secondly, the parameters mentioned were used in RayMan, in order to calculate the PETs for a normal pedestrian.
§ 7.2.3 Weather data
The climate of De Bilt (52°N, 4°E), which is representative for the Netherlands, is known as a temperate climate based on the classification of Köppen-Geiger [75]. The prevailing wind direction is South-West. The mean annual dry bulb temperature is 10.5 °C. Figure 5 presents the frequency distribution of different comfort classifications derived from the physiological equivalent temperature (PET) for the reference Dutch year NEN5060 [66]. According to this standard, every month of the reference year is represented by a specific year which is considered representative of the period from 1986 until 2005. The calculations of PET are done via RayMan for a normal 35-year
i
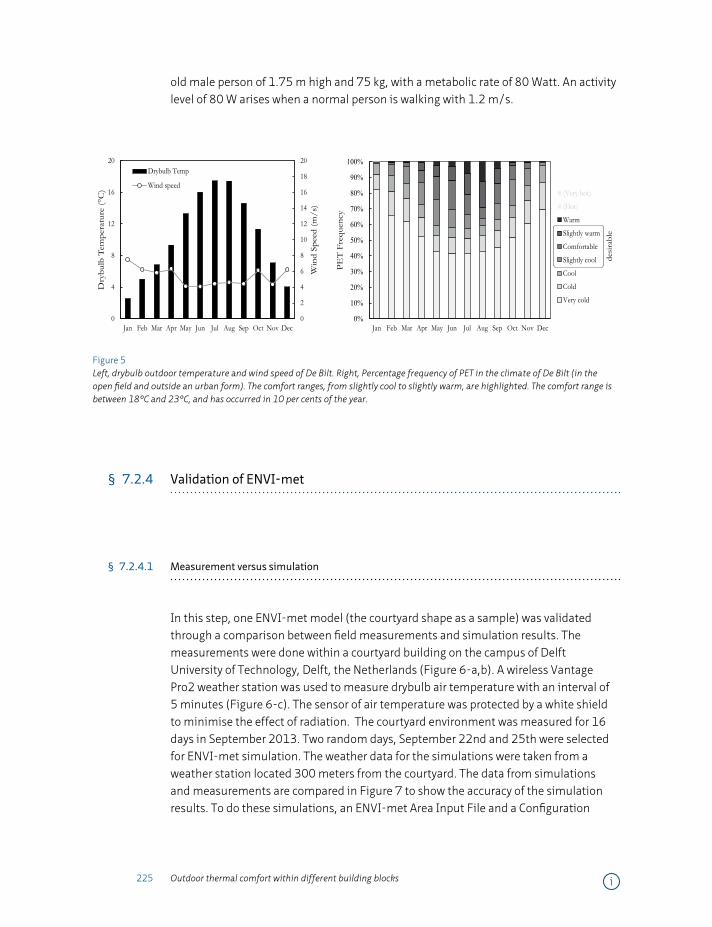
225 Outdoor thermal comfort within different building blocks
old male person of 1.75 m high and 75 kg, with a metabolic rate of 80 Watt. An activity level of 80 W arises when a normal person is walking with 1.2 m/s.
0%
10%
20%
30%
40%
50%
60%
70%
80%
90%
100%
Jan Feb Mar Apr May Jun Jul Aug Sep Oct Nov DecPE
T F
requ
ency
(Very hot)
(Hot)
Warm
Slightly warm
Comfortable
Slightly cool
Cool
Cold
Very cold
desi
rabl
e
0
2
4
6
8
10
12
14
16
18
20
0
4
8
12
16
20
Jan Feb Mar Apr May Jun Jul Aug Sep Oct Nov Dec
Win
d Sp
eed
(m/s
)
Dry
bulb
Tem
pera
ture
(°C
)
Drybulb Temp
Wind speed
Figure 5 Left, drybulb outdoor temperature and wind speed of De Bilt. Right, Percentage frequency of PET in the climate of De Bilt (in the open field and outside an urban form). The comfort ranges, from slightly cool to slightly warm, are highlighted. The comfort range is between 18°C and 23°C, and has occurred in 10 per cents of the year.
§ 7.2.4 Validation of ENVI-met
§ 7.2.4.1 Measurement versus simulation
In this step, one ENVI-met model (the courtyard shape as a sample) was validated through a comparison between field measurements and simulation results. The measurements were done within a courtyard building on the campus of Delft University of Technology, Delft, the Netherlands (Figure 6-a,b). A wireless Vantage Pro2 weather station was used to measure drybulb air temperature with an interval of 5 minutes (Figure 6-c). The sensor of air temperature was protected by a white shield to minimise the effect of radiation. The courtyard environment was measured for 16 days in September 2013. Two random days, September 22nd and 25th were selected for ENVI-met simulation. The weather data for the simulations were taken from a weather station located 300 meters from the courtyard. The data from simulations and measurements are compared in Figure 7 to show the accuracy of the simulation results. To do these simulations, an ENVI-met Area Input File and a Configuration
i
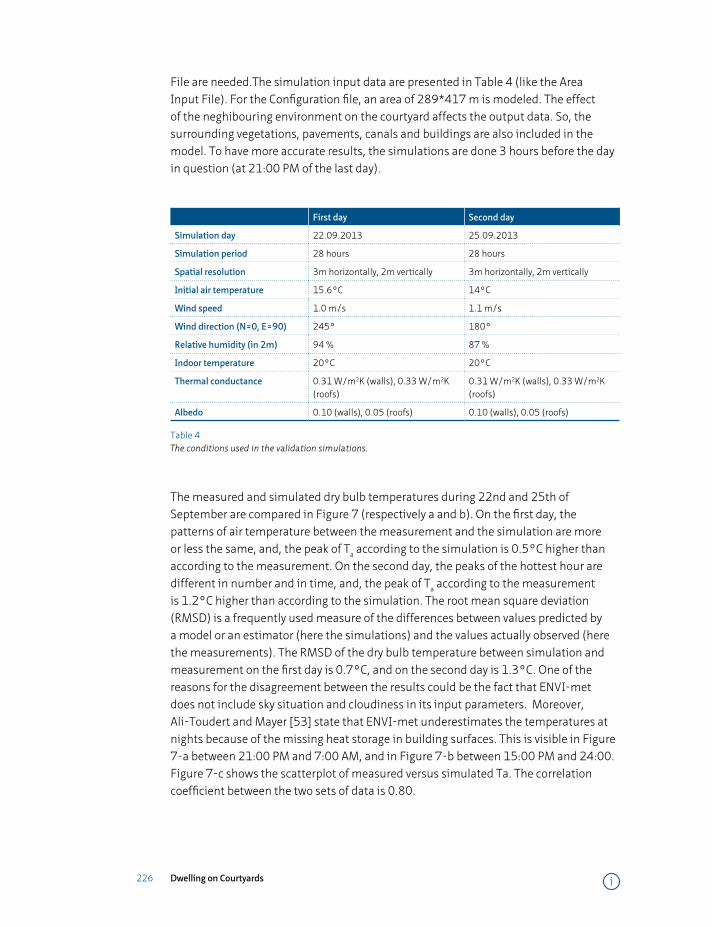
226 Dwelling on Courtyards
File are needed.The simulation input data are presented in Table 4 (like the Area Input File). For the Configuration file, an area of 289*417 m is modeled. The effect of the neghibouring environment on the courtyard affects the output data. So, the surrounding vegetations, pavements, canals and buildings are also included in the model. To have more accurate results, the simulations are done 3 hours before the day in question (at 21:00 PM of the last day).
First day Second day
Simulation day 22.09.2013 25.09.2013
Simulation period 28 hours 28 hours
Spatial resolution 3m horizontally, 2m vertically 3m horizontally, 2m vertically
Initial air temperature 15.6°C 14°C
Wind speed 1.0 m/s 1.1 m/s
Wind direction (N=0, E=90) 245° 180°
Relative humidity (in 2m) 94 % 87 %
Indoor temperature 20°C 20°C
Thermal conductance 0.31 W/m2K (walls), 0.33 W/m2K (roofs)
0.31 W/m2K (walls), 0.33 W/m2K (roofs)
Albedo 0.10 (walls), 0.05 (roofs) 0.10 (walls), 0.05 (roofs)
Table 4 The conditions used in the validation simulations.
The measured and simulated dry bulb temperatures during 22nd and 25th of September are compared in Figure 7 (respectively a and b). On the first day, the patterns of air temperature between the measurement and the simulation are more or less the same, and, the peak of Ta according to the simulation is 0.5°C higher than according to the measurement. On the second day, the peaks of the hottest hour are different in number and in time, and, the peak of Ta according to the measurement is 1.2°C higher than according to the simulation. The root mean square deviation (RMSD) is a frequently used measure of the differences between values predicted by a model or an estimator (here the simulations) and the values actually observed (here the measurements). The RMSD of the dry bulb temperature between simulation and measurement on the first day is 0.7°C, and on the second day is 1.3°C. One of the reasons for the disagreement between the results could be the fact that ENVI-met does not include sky situation and cloudiness in its input parameters. Moreover, Ali-Toudert and Mayer [53] state that ENVI-met underestimates the temperatures at nights because of the missing heat storage in building surfaces. This is visible in Figure 7-a between 21:00 PM and 7:00 AM, and in Figure 7-b between 15:00 PM and 24:00. Figure 7-c shows the scatterplot of measured versus simulated Ta. The correlation coefficient between the two sets of data is 0.80.
i

227 Outdoor thermal comfort within different building blocks
a b c
Figure 6 a) The location of Delft as the place of validation, and De Bilt as the representative climate for the Netherlands (used in further simulations), b) the weather station (Vantage Pro2) used for measurement in situ, c) a view from inside the courtyard.
a) b) c)
Figure 7 Comparison of simulation (ENVI-met) results with measurements on September 22nd (a) and September 25th (b). The mentioned data are compared in a scatterplot (c).
§ 7.2.4.2 Computational domain size sensitivity check
To check the accuracy of the ENVI-met models, the courtyard shape (as a sample of models in Figure 3) is modelled with two different domain sizes (180*180 m2 and 90*90 m2). As it is shown in Figure 8-a, a courtyard model with 8 similar blocks in its surrounding is modelled in the 180*180 m2 domain size. Then, the same model and surface characteristics is simulated also in the 90*90 m2 domain size withought
i

228 Dwelling on Courtyards
neighbouring blocks (Figure 8-b). The height of the boundries are both 52 m (which is four times of the tallest building in the models). If the results of the couryard model in the context of these two different domain sizes are identical, further simulations could be done with 90*90 m2 (the smaller grid size) to reduce the simulation time.
For this comparison, the air temperature within the courtyards are compared. The simulations are done under the conditions mentioned in Table 2 (with the same weather data in Area Input Files). Figures 8-c and 8-d show the air temperature of the courtyards (height of 1.6 m) at 16:00 of the simulation day in 180*180 m2 and 90*90 m2 domain size, respectively. Figure 8-e shows the comparison of the air temperature for the two domain sizes, and Figure 8-f shows both results as function of each other. Since the air temperatures in the two models do not exactly match, the trendline in Figure 8-f is not perfectly 45°. This shows that there is a deviation between the two situations (domain sizes). In fact, the root mean square deviation of the two situations is 0.32°C. The average root mean square deviations for air temperature in the courtyard models are 0.26°C. This shows that further simulations with a 90*90 m2 domain only, thus withought similar urban blocks, introduces a small but acceptable deviation in air temperature.
i
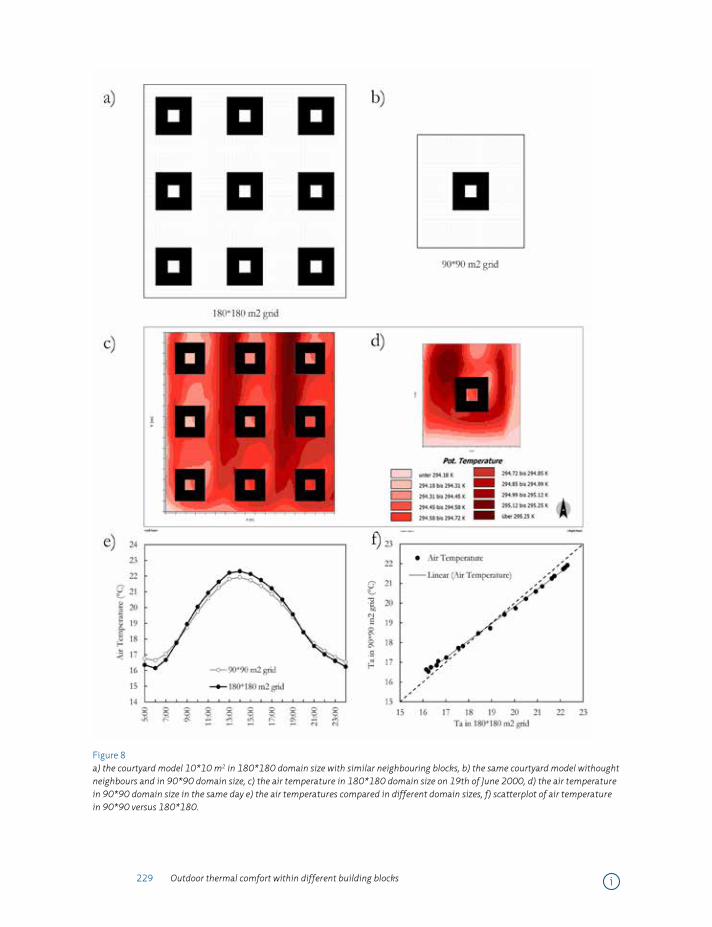
229 Outdoor thermal comfort within different building blocks
Figure 8 a) the courtyard model 10*10 m2 in 180*180 domain size with similar neighbouring blocks, b) the same courtyard model withought neighbours and in 90*90 domain size, c) the air temperature in 180*180 domain size on 19th of June 2000, d) the air temperature in 90*90 domain size in the same day e) the air temperatures compared in different domain sizes, f) scatterplot of air temperature in 90*90 versus 180*180.
i
230 Dwelling on Courtyards
§ 7.2.4.3 Discussion on reliability of ENVI-met
ENVI-met as a CFD program has been previously validated in different climates and countries such as Germany (Freiburg) [74], China (Guangzhou) [76], Singapore (Singapore) [77], Japan (Saga) [78], Morroco (Fez) [54] USA (Phoenix) [79], and UAE (Dubai) [80]. The programmer of ENVI-met states that because the vertical long-wave flux divergence is not taken into account, this could result in a temperature difference of 2 to 4 °C between measurement and simulation [81]. In this research, ENVI-met is also validated for a case in the Netherlands. The maximum deviation of the simulation from the measurements is 2.5°C at 10:00 AM. Moreover, because ENVI-met does not consider cloudiness of sky, simulation of sunny days could be more realistic. In the boundry sensitivity check process, making the reference models when they are standing alone versus in a larger context with neighbouring blocks, showed small differences in air temperature. Therefore, the rest of the simulations in this research are with the mentioned knowledge on reliability about ENVI-met as the research tool.
§ 7.3 Results and discussion
As explained, the five models were simulated for the hottest day in the reference year. The duration of insolation on the reference points are depicted in Figure 9. Insolation stands for incident solar radiation. As shown in Table 5 summarising the duration of insolation, the reference points at the centre of the a), b) and c) models receive solar radiation for the longest period, whilst the linear N-S oriented and the courtyard receive solar radiation during a much shorter period. Moreover, the sky views from the reference points are also illustrated in Figure 9.
Considering the microclimates in these reference points, Figure 10 shows the air temperature and wind speed at the hottest time of the reference year for these models. Comparing air temperature and wind velocity in these models, the singular models (a and b) are simultaneously more exposed to the sun and the wind from the South (187˚). Referring to Figure 11, the centre of the models a) and b) have the highest mean radiant temperature among the models. Likewise, the linear E-W model has a long duration of direct sun. The difference between this model and the singular ones concerning solar radiation occurs between 11:00 h and 14:00 h. During this period, the mean radiant temperature of the linear E-W model decreases since the direct rays of the sun are blocked by the roof edge of the lower linear block reducing solar radiation onto the reference point. Furthermore, when the sun rays appear again from behind the obstacle, the mean radiant temperature rises to the same temperature as at 11:00 h.
i

231 Outdoor thermal comfort within different building blocks
In contrast, the linear N-S model (d) shows different behaviour. Before 11:00 h, the central point is protected by the surrounding buildings and Tmrt increases with a low slope. Between 10:00 h and 14:00 h, it receives direct sun and Tmrt increases very fast.
Similarly, the courtyard model (e) has the same increase in Tmrt; however, its peak is lower than that of the linear N-S model. This is due to the blockage of the sun by the south façade of the courtyard.
Model Insolation start - end Total duration
Singular blocks E-W 06:00 - 18:38 12h:38m
Singular blocks N-S 06:00 - 18:38 12h:38m
Linear blocks E-W 06:24 - 18:14 11h:50m
Linear blocks N-S 10:03 - 14:35 04h:32m
Courtyard block 10:03 - 14:35 04h:32m
Table 5 The duration of insolation of the reference points in the models on the 19th of June.
i
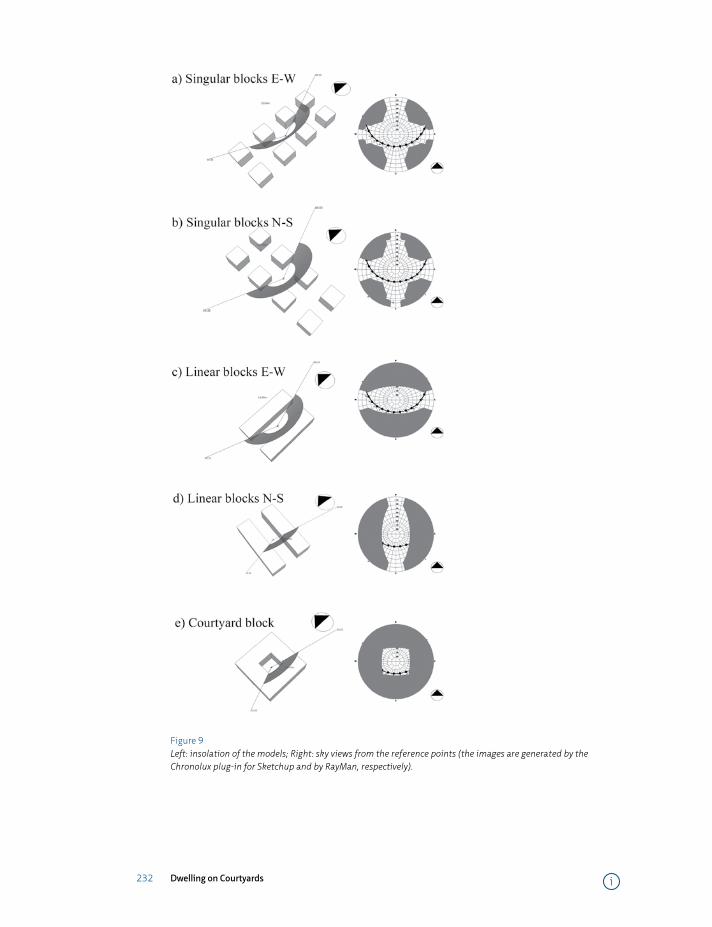
232 Dwelling on Courtyards
Figure 9 Left: insolation of the models; Right: sky views from the reference points (the images are generated by the Chronolux plug-in for Sketchup and by RayMan, respectively).
i
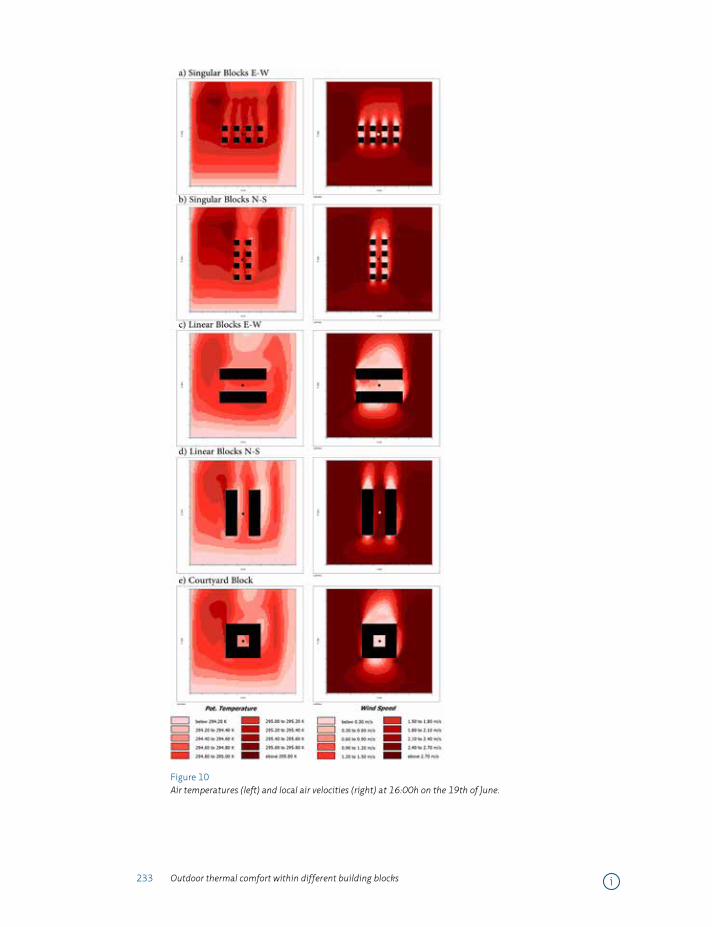
233 Outdoor thermal comfort within different building blocks
Figure 10 Air temperatures (left) and local air velocities (right) at 16:00h on the 19th of June.
i
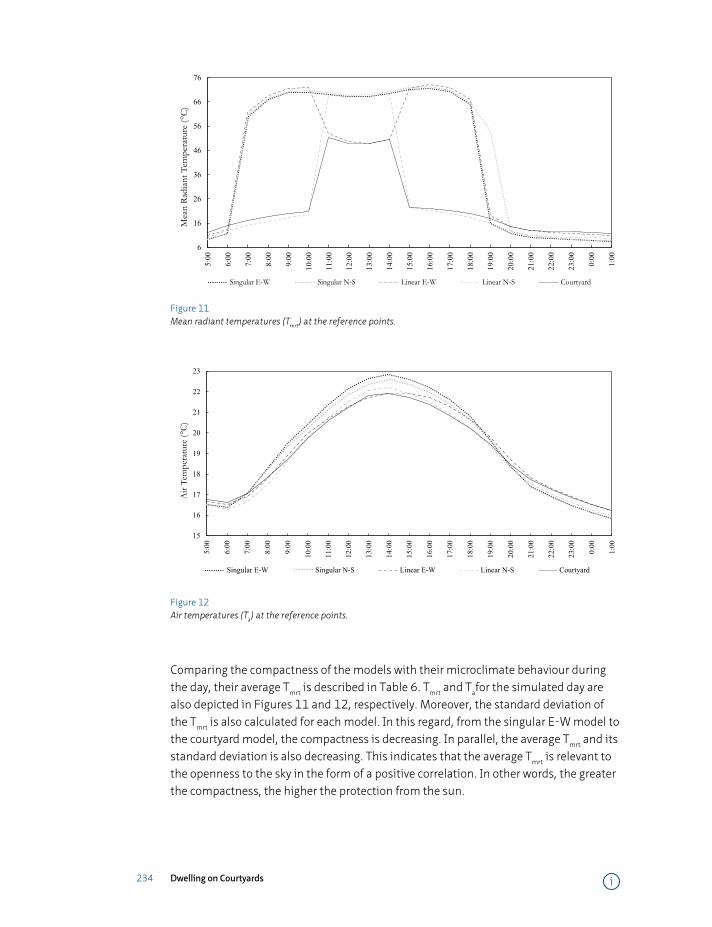
234 Dwelling on Courtyards
6
16
26
36
46
56
66
76
5:00
6:00
7:00
8:00
9:00
10:0
0
11:0
0
12:0
0
13:0
0
14:0
0
15:0
0
16:0
0
17:0
0
18:0
0
19:0
0
20:0
0
21:0
0
22:0
0
23:0
0
0:00
1:00
Mea
n R
adia
nt T
empe
ratu
re (°
C)
Singular E-W Singular N-S Linear E-W Linear N-S Courtyard
Figure 11 Mean radiant temperatures (Tmrt) at the reference points.
15
16
17
18
19
20
21
22
23
5:00
6:00
7:00
8:00
9:00
10:0
0
11:0
0
12:0
0
13:0
0
14:0
0
15:0
0
16:0
0
17:0
0
18:0
0
19:0
0
20:0
0
21:0
0
22:0
0
23:0
0
0:00
1:00
Air
Tem
pera
ture
(°C
)
Singular E-W Singular N-S Linear E-W Linear N-S Courtyard
Figure 12 Air temperatures (Ta) at the reference points.
Comparing the compactness of the models with their microclimate behaviour during the day, their average Tmrt is described in Table 6. Tmrt and Tafor the simulated day are also depicted in Figures 11 and 12, respectively. Moreover, the standard deviation of the Tmrt is also calculated for each model. In this regard, from the singular E-W model to the courtyard model, the compactness is decreasing. In parallel, the average Tmrt and its standard deviation is also decreasing. This indicates that the average Tmrt is relevant to the openness to the sky in the form of a positive correlation. In other words, the greater the compactness, the higher the protection from the sun.
i
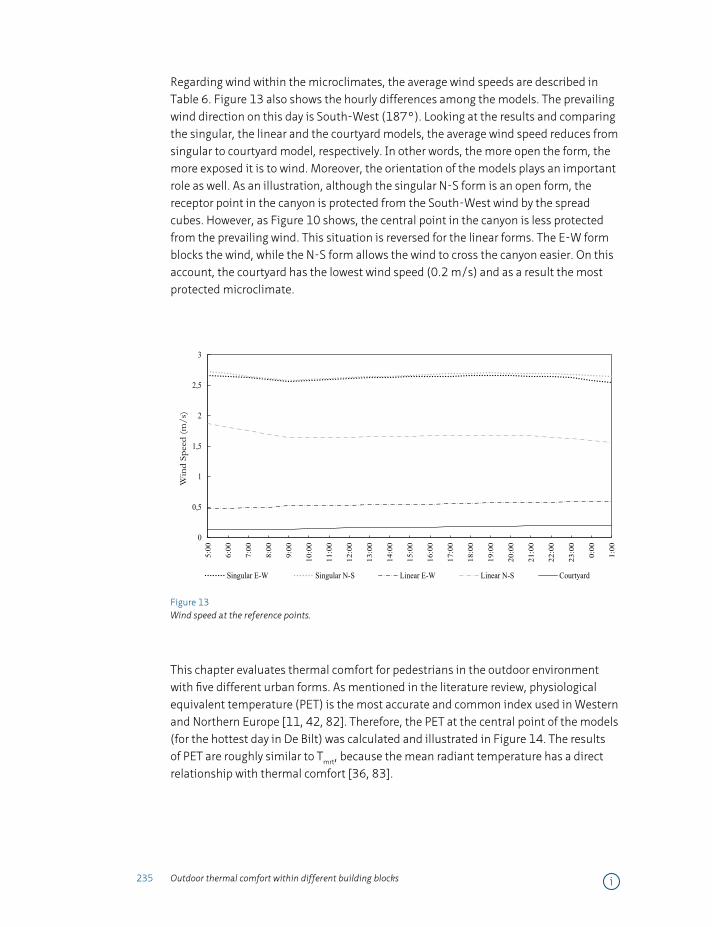
235 Outdoor thermal comfort within different building blocks
Regarding wind within the microclimates, the average wind speeds are described in Table 6. Figure 13 also shows the hourly differences among the models. The prevailing wind direction on this day is South-West (187°). Looking at the results and comparing the singular, the linear and the courtyard models, the average wind speed reduces from singular to courtyard model, respectively. In other words, the more open the form, the more exposed it is to wind. Moreover, the orientation of the models plays an important role as well. As an illustration, although the singular N-S form is an open form, the receptor point in the canyon is protected from the South-West wind by the spread cubes. However, as Figure 10 shows, the central point in the canyon is less protected from the prevailing wind. This situation is reversed for the linear forms. The E-W form blocks the wind, while the N-S form allows the wind to cross the canyon easier. On this account, the courtyard has the lowest wind speed (0.2 m/s) and as a result the most protected microclimate.
0
0,5
1
1,5
2
2,5
3
5:00
6:00
7:00
8:00
9:00
10:0
0
11:0
0
12:0
0
13:0
0
14:0
0
15:0
0
16:0
0
17:0
0
18:0
0
19:0
0
20:0
0
21:0
0
22:0
0
23:0
0
0:00
1:00
Win
d Sp
eed
(m/s
)
Singular E-W Singular N-S Linear E-W Linear N-S Courtyard
Figure 13 Wind speed at the reference points.
This chapter evaluates thermal comfort for pedestrians in the outdoor environment with five different urban forms. As mentioned in the literature review, physiological equivalent temperature (PET) is the most accurate and common index used in Western and Northern Europe [11, 42, 82]. Therefore, the PET at the central point of the models (for the hottest day in De Bilt) was calculated and illustrated in Figure 14. The results of PET are roughly similar to Tmrt, because the mean radiant temperature has a direct relationship with thermal comfort [36, 83].
i

236 Dwelling on Courtyards
Singular E-W Singular N-S Linear E-W Linear N-S Courtyard
SVF 0.605 0.605 0.404 0.404 0.194
Average Ta (°C) 19.3 19.2 19.1 18.9 19.0
Average Tmrt (°C) 43.5 45.8 41.6 25.1 22.9
Standard deviation of Tmrt (°C) 28.8 28.3 26.0 21.4 13.5
Average wind (m/s) 2.6 1.7 0.5 2.7 0.2
PET 23.5 26.4 27.2 17 20.8
Comfortable hours * 3 2 4 8 17
Table 6 Averages of the microclimates properties. *= The sum of slightly cool, comfortable and slightly warm hours.
The results show that during the reference day, the central points inside the linear N-S and courtyard models have the lowest average PET among the models. The courtyard has also the smallest standard deviation of Tmrt. In Figure 14, the comfort bandwidths are highlighted with a grey rectangle covering 13°C to 29°C of PET (from slightly cool to slightly warm). As shown here, the courtyard block provides 17 thermally comfortable hours. The second most comfortable model is the linear N-S with only 4.5 hours of direct sun. The elongation of this model is in accordance with the prevailing wind and this provides an average wind speed of 2.7 m/s in the reference point which helps to reduce heat stress. The singular models provide 2 or 3 hours of thermal comfort. Looking at Figure 11, their mean radiant temperatures increase at 06:00 h, remain at the hottest temperature because of the direct sun, and drop down around 19:00 h.
Considering Figures 15 (PET in microclimates) and 5 (PET in the city) allows comparing PET inside microclimates and city climate (open field). Based on these two graphs very cold and cold situations do not occur inside the microclimates, and very hot and hot situations do not occur in the city climate. Apparently in the open field (city climate), the parameters affecting thermal comfort (such as wind) are leading to a cooler environment. To be more precise, a very hot situation only occurs in the linear E-W model.
i
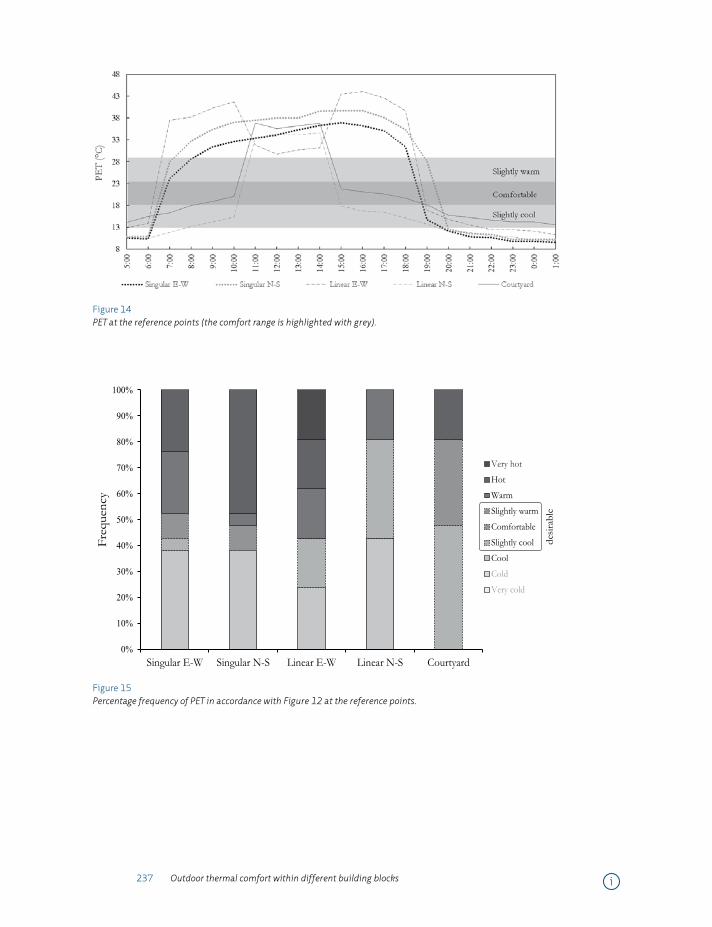
237 Outdoor thermal comfort within different building blocks
Figure 14 PET at the reference points (the comfort range is highlighted with grey).
0%
10%
20%
30%
40%
50%
60%
70%
80%
90%
100%
Singular E-W Singular N-S Linear E-W Linear N-S Courtyard
Freq
uenc
y
Very hot
Hot
Warm
Slightly warm
Comfortable
Slightly cool
Cool
Cold
Very cold
desir
able
Figure 15 Percentage frequency of PET in accordance with Figure 12 at the reference points.
i
238 Dwelling on Courtyards
§ 7.4 Conclusions
A comparison between the models and their outdoor thermal comfort situations can generate clear guidelines for landscape and urban designers who want to create thermally comfortable outdoor climates. The three main urban forms studied (singular, linear and courtyard), each with a different compactness, provide different situations in their microclimate. Among different parameters that affect outdoor thermal comfort, mean radiant temperature and wind velocity are influenced more by urban geometry.
The results of this chapter showed that in the temperate climate of the Netherlands, the singular shapes provide a long duration of solar radiation for the outdoor environment. This causes the worst comfort situation among the models at the centre of the canyon. In contrast, the courtyard provides a more protected microclimate which has less solar radiation in summer. Considering the physiological equivalent temperature (PET), the courtyard has the most comfortable hours on a summer day. Since courtyards are not yet very common in temperate climates, the changing global climate, with an expected increase of temperature levels in Western Europe, advocates the usage of courtyards in (new or redeveloped) urban settings.
Regarding the different orientations of the models and their effect on outdoor thermal comfort, it is difficult to specify the differences between the singular E-W and N-S forms because they receive equal amounts of insolation and are equally exposed to wind. Nevertheless, the linear E-W and N-S forms are different in their thermal behaviour. The centre point at the linear E-W form receives sun for about 12 hours a day. In contrast, this point at the linear N-S form receives 4 hours of direct sunlight per day. Therefore, in comparison with the E-W orientation this N-S orientation provides a cooler microclimate.
Finally, our recommendation for further research on the courtyard as an optimal urban form is to study the effects of different orientations on insolation and different aspect ratios (length to width and height to width) on the microclimate. Another parameter that plays an important role in the urban microclimate is vegetation. Trees and deciduous trees in particular can protect spaces from direct sun in summer and allow solar radiation in winter. Vegetation also has a low heat capacity. Referring back to the PET which illustrates thermal comfort, it increases in the afternoon. This is because the heat stored during the day is released to the air during the afternoon and evening. More investigations are needed to show whether green areas with a lower heat capacity (over construction materials) can minimise the canyon temperature.
i
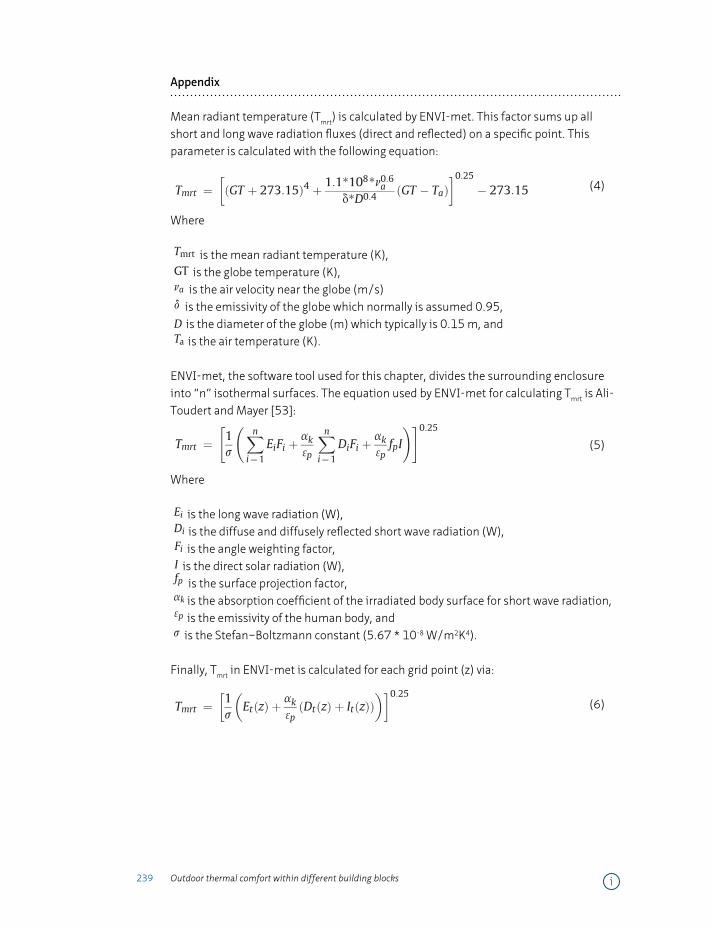
239 Outdoor thermal comfort within different building blocks
Appendix
Mean radiant temperature (Tmrt) is calculated by ENVI-met. This factor sums up all short and long wave radiation fluxes (direct and reflected) on a specific point. This parameter is calculated with the following equation:
vegetation. Trees and deciduous trees in particular can protectspaces from direct sun in summer and allow solar radiation inwinter. Vegetation also has a low heat capacity. Referring back tothe PET which illustrates thermal comfort, it increases in the af-ternoon. This is because the heat stored during the day is releasedto the air during the afternoon and evening.More investigations areneeded to show whether green areas with a lower heat capacity(over construction materials) can minimise the canyontemperature.
Appendix
Mean radiant temperature is calculated by ENVI-met. This factorsums up all short and long wave radiation fluxes (direct and
reflected) on a specific point. This parameter is calculated with thefollowing equation:
Tmrt ¼�ðGT þ 273:15Þ4 þ 1:1*108*n0:6a
d*D0:4 ðGT � TaÞ�0:25
� 273:15
(4)
where
Tmrt is the mean radiant temperature (K),GT is the globe temperature (K),na is the air velocity near the globe (m/s),d is the emissivity of the globe which normally is assumed 0.95,D is the diameter of the globe (m) which typically is 0.15 m, andTa is the air temperature (K).
ENVI-met, the software tool used for this paper, divides thesurrounding enclosure into “n” isothermal surfaces. The equationused by ENVI-met for calculating Tmrt is Ali-Toudert and Mayer[53]:
Tmrt ¼"1s
Xn
i¼1
EiFi þak3p
Xn
i¼1
DiFi þak3pfpI
!#0:25(5)
where
Ei is the long wave radiation (W),Di is the diffuse and diffusely reflected short wave radiation (W),
Fig. 11. Mean radiant temperatures (Tmrt) at the reference points.
Table 6Averages of the microclimates properties.* ¼ The sum of slightly cool, comfortableand slightly warm hours.
SingularEeW
SingularNeS
LinearEeW
Linear NeS Courtyard
SVF 0.605 0.605 0.404 0.404 0.194Average Ta (�C) 19.3 19.2 19.1 18.9 19.0Average Tmrt (�C) 43.5 45.8 41.6 25.1 22.9Standard deviation
of Tmrt (�C)28.8 28.3 26.0 21.4 13.5
Average wind (m/s) 2.6 1.7 0.5 2.7 0.2PET 23.5 26.4 27.2 17 20.8Comfortable hours* 3 2 4 8 17
15
16
17
18
19
20
21
22
23
5:00
6:00
7:00
8:00
9:00
10:0
0
11:0
0
12:0
0
13:0
0
14:0
0
15:0
0
16:0
0
17:0
0
18:0
0
19:0
0
20:0
0
21:0
0
22:0
0
23:0
0
0:00
1:00
Air
Tem
pera
ture
(°C)
Singular E-W Singular N-S Linear E-W Linear N-S Courtyard
Fig. 12. Air temperatures (Ta) at the reference points.
M. Taleghani et al. / Building and Environment xxx (2014) 1e14 11
Please cite this article in press as: Taleghani M, et al., Outdoor thermal comfort within five different urban forms in the Netherlands, Buildingand Environment (2014), http://dx.doi.org/10.1016/j.buildenv.2014.03.014
(4)
Where
vegetation. Trees and deciduous trees in particular can protectspaces from direct sun in summer and allow solar radiation inwinter. Vegetation also has a low heat capacity. Referring back tothe PET which illustrates thermal comfort, it increases in the af-ternoon. This is because the heat stored during the day is releasedto the air during the afternoon and evening.More investigations areneeded to show whether green areas with a lower heat capacity(over construction materials) can minimise the canyontemperature.
Appendix
Mean radiant temperature is calculated by ENVI-met. This factorsums up all short and long wave radiation fluxes (direct and
reflected) on a specific point. This parameter is calculated with thefollowing equation:
Tmrt ¼�ðGT þ 273:15Þ4 þ 1:1*108*n0:6a
d*D0:4 ðGT � TaÞ�0:25
� 273:15
(4)
where
Tmrt is the mean radiant temperature (K),GT is the globe temperature (K),na is the air velocity near the globe (m/s),d is the emissivity of the globe which normally is assumed 0.95,D is the diameter of the globe (m) which typically is 0.15 m, andTa is the air temperature (K).
ENVI-met, the software tool used for this paper, divides thesurrounding enclosure into “n” isothermal surfaces. The equationused by ENVI-met for calculating Tmrt is Ali-Toudert and Mayer[53]:
Tmrt ¼"1s
Xn
i¼1
EiFi þak3p
Xn
i¼1
DiFi þak3pfpI
!#0:25(5)
where
Ei is the long wave radiation (W),Di is the diffuse and diffusely reflected short wave radiation (W),
Fig. 11. Mean radiant temperatures (Tmrt) at the reference points.
Table 6Averages of the microclimates properties.* ¼ The sum of slightly cool, comfortableand slightly warm hours.
SingularEeW
SingularNeS
LinearEeW
Linear NeS Courtyard
SVF 0.605 0.605 0.404 0.404 0.194Average Ta (�C) 19.3 19.2 19.1 18.9 19.0Average Tmrt (�C) 43.5 45.8 41.6 25.1 22.9Standard deviation
of Tmrt (�C)28.8 28.3 26.0 21.4 13.5
Average wind (m/s) 2.6 1.7 0.5 2.7 0.2PET 23.5 26.4 27.2 17 20.8Comfortable hours* 3 2 4 8 17
15
16
17
18
19
20
21
22
23
5:00
6:00
7:00
8:00
9:00
10:0
0
11:0
0
12:0
0
13:0
0
14:0
0
15:0
0
16:0
0
17:0
0
18:0
0
19:0
0
20:0
0
21:0
0
22:0
0
23:0
0
0:00
1:00
Air
Tem
pera
ture
(°C)
Singular E-W Singular N-S Linear E-W Linear N-S Courtyard
Fig. 12. Air temperatures (Ta) at the reference points.
M. Taleghani et al. / Building and Environment xxx (2014) 1e14 11
Please cite this article in press as: Taleghani M, et al., Outdoor thermal comfort within five different urban forms in the Netherlands, Buildingand Environment (2014), http://dx.doi.org/10.1016/j.buildenv.2014.03.014
is the mean radiant temperature (K),
vegetation. Trees and deciduous trees in particular can protectspaces from direct sun in summer and allow solar radiation inwinter. Vegetation also has a low heat capacity. Referring back tothe PET which illustrates thermal comfort, it increases in the af-ternoon. This is because the heat stored during the day is releasedto the air during the afternoon and evening.More investigations areneeded to show whether green areas with a lower heat capacity(over construction materials) can minimise the canyontemperature.
Appendix
Mean radiant temperature is calculated by ENVI-met. This factorsums up all short and long wave radiation fluxes (direct and
reflected) on a specific point. This parameter is calculated with thefollowing equation:
Tmrt ¼�ðGT þ 273:15Þ4 þ 1:1*108*n0:6a
d*D0:4 ðGT � TaÞ�0:25
� 273:15
(4)
where
Tmrt is the mean radiant temperature (K),GT is the globe temperature (K),na is the air velocity near the globe (m/s),d is the emissivity of the globe which normally is assumed 0.95,D is the diameter of the globe (m) which typically is 0.15 m, andTa is the air temperature (K).
ENVI-met, the software tool used for this paper, divides thesurrounding enclosure into “n” isothermal surfaces. The equationused by ENVI-met for calculating Tmrt is Ali-Toudert and Mayer[53]:
Tmrt ¼"1s
Xn
i¼1
EiFi þak3p
Xn
i¼1
DiFi þak3pfpI
!#0:25(5)
where
Ei is the long wave radiation (W),Di is the diffuse and diffusely reflected short wave radiation (W),
Fig. 11. Mean radiant temperatures (Tmrt) at the reference points.
Table 6Averages of the microclimates properties.* ¼ The sum of slightly cool, comfortableand slightly warm hours.
SingularEeW
SingularNeS
LinearEeW
Linear NeS Courtyard
SVF 0.605 0.605 0.404 0.404 0.194Average Ta (�C) 19.3 19.2 19.1 18.9 19.0Average Tmrt (�C) 43.5 45.8 41.6 25.1 22.9Standard deviation
of Tmrt (�C)28.8 28.3 26.0 21.4 13.5
Average wind (m/s) 2.6 1.7 0.5 2.7 0.2PET 23.5 26.4 27.2 17 20.8Comfortable hours* 3 2 4 8 17
15
16
17
18
19
20
21
22
23
5:00
6:00
7:00
8:00
9:00
10:0
0
11:0
0
12:0
0
13:0
0
14:0
0
15:0
0
16:0
0
17:0
0
18:0
0
19:0
0
20:0
0
21:0
0
22:0
0
23:0
0
0:00
1:00
Air
Tem
pera
ture
(°C)
Singular E-W Singular N-S Linear E-W Linear N-S Courtyard
Fig. 12. Air temperatures (Ta) at the reference points.
M. Taleghani et al. / Building and Environment xxx (2014) 1e14 11
Please cite this article in press as: Taleghani M, et al., Outdoor thermal comfort within five different urban forms in the Netherlands, Buildingand Environment (2014), http://dx.doi.org/10.1016/j.buildenv.2014.03.014
is the globe temperature (K),
vegetation. Trees and deciduous trees in particular can protectspaces from direct sun in summer and allow solar radiation inwinter. Vegetation also has a low heat capacity. Referring back tothe PET which illustrates thermal comfort, it increases in the af-ternoon. This is because the heat stored during the day is releasedto the air during the afternoon and evening.More investigations areneeded to show whether green areas with a lower heat capacity(over construction materials) can minimise the canyontemperature.
Appendix
Mean radiant temperature is calculated by ENVI-met. This factorsums up all short and long wave radiation fluxes (direct and
reflected) on a specific point. This parameter is calculated with thefollowing equation:
Tmrt ¼�ðGT þ 273:15Þ4 þ 1:1*108*n0:6a
d*D0:4 ðGT � TaÞ�0:25
� 273:15
(4)
where
Tmrt is the mean radiant temperature (K),GT is the globe temperature (K),na is the air velocity near the globe (m/s),d is the emissivity of the globe which normally is assumed 0.95,D is the diameter of the globe (m) which typically is 0.15 m, andTa is the air temperature (K).
ENVI-met, the software tool used for this paper, divides thesurrounding enclosure into “n” isothermal surfaces. The equationused by ENVI-met for calculating Tmrt is Ali-Toudert and Mayer[53]:
Tmrt ¼"1s
Xn
i¼1
EiFi þak3p
Xn
i¼1
DiFi þak3pfpI
!#0:25(5)
where
Ei is the long wave radiation (W),Di is the diffuse and diffusely reflected short wave radiation (W),
Fig. 11. Mean radiant temperatures (Tmrt) at the reference points.
Table 6Averages of the microclimates properties.* ¼ The sum of slightly cool, comfortableand slightly warm hours.
SingularEeW
SingularNeS
LinearEeW
Linear NeS Courtyard
SVF 0.605 0.605 0.404 0.404 0.194Average Ta (�C) 19.3 19.2 19.1 18.9 19.0Average Tmrt (�C) 43.5 45.8 41.6 25.1 22.9Standard deviation
of Tmrt (�C)28.8 28.3 26.0 21.4 13.5
Average wind (m/s) 2.6 1.7 0.5 2.7 0.2PET 23.5 26.4 27.2 17 20.8Comfortable hours* 3 2 4 8 17
15
16
17
18
19
20
21
22
23
5:00
6:00
7:00
8:00
9:00
10:0
0
11:0
0
12:0
0
13:0
0
14:0
0
15:0
0
16:0
0
17:0
0
18:0
0
19:0
0
20:0
0
21:0
0
22:0
0
23:0
0
0:00
1:00
Air
Tem
pera
ture
(°C)
Singular E-W Singular N-S Linear E-W Linear N-S Courtyard
Fig. 12. Air temperatures (Ta) at the reference points.
M. Taleghani et al. / Building and Environment xxx (2014) 1e14 11
Please cite this article in press as: Taleghani M, et al., Outdoor thermal comfort within five different urban forms in the Netherlands, Buildingand Environment (2014), http://dx.doi.org/10.1016/j.buildenv.2014.03.014
is the air velocity near the globe (m/s)
vegetation. Trees and deciduous trees in particular can protectspaces from direct sun in summer and allow solar radiation inwinter. Vegetation also has a low heat capacity. Referring back tothe PET which illustrates thermal comfort, it increases in the af-ternoon. This is because the heat stored during the day is releasedto the air during the afternoon and evening.More investigations areneeded to show whether green areas with a lower heat capacity(over construction materials) can minimise the canyontemperature.
Appendix
Mean radiant temperature is calculated by ENVI-met. This factorsums up all short and long wave radiation fluxes (direct and
reflected) on a specific point. This parameter is calculated with thefollowing equation:
Tmrt ¼�ðGT þ 273:15Þ4 þ 1:1*108*n0:6a
d*D0:4 ðGT � TaÞ�0:25
� 273:15
(4)
where
Tmrt is the mean radiant temperature (K),GT is the globe temperature (K),na is the air velocity near the globe (m/s),d is the emissivity of the globe which normally is assumed 0.95,D is the diameter of the globe (m) which typically is 0.15 m, andTa is the air temperature (K).
ENVI-met, the software tool used for this paper, divides thesurrounding enclosure into “n” isothermal surfaces. The equationused by ENVI-met for calculating Tmrt is Ali-Toudert and Mayer[53]:
Tmrt ¼"1s
Xn
i¼1
EiFi þak3p
Xn
i¼1
DiFi þak3pfpI
!#0:25(5)
where
Ei is the long wave radiation (W),Di is the diffuse and diffusely reflected short wave radiation (W),
Fig. 11. Mean radiant temperatures (Tmrt) at the reference points.
Table 6Averages of the microclimates properties.* ¼ The sum of slightly cool, comfortableand slightly warm hours.
SingularEeW
SingularNeS
LinearEeW
Linear NeS Courtyard
SVF 0.605 0.605 0.404 0.404 0.194Average Ta (�C) 19.3 19.2 19.1 18.9 19.0Average Tmrt (�C) 43.5 45.8 41.6 25.1 22.9Standard deviation
of Tmrt (�C)28.8 28.3 26.0 21.4 13.5
Average wind (m/s) 2.6 1.7 0.5 2.7 0.2PET 23.5 26.4 27.2 17 20.8Comfortable hours* 3 2 4 8 17
15
16
17
18
19
20
21
22
23
5:00
6:00
7:00
8:00
9:00
10:0
0
11:0
0
12:0
0
13:0
0
14:0
0
15:0
0
16:0
0
17:0
0
18:0
0
19:0
0
20:0
0
21:0
0
22:0
0
23:0
0
0:00
1:00
Air
Tem
pera
ture
(°C)
Singular E-W Singular N-S Linear E-W Linear N-S Courtyard
Fig. 12. Air temperatures (Ta) at the reference points.
M. Taleghani et al. / Building and Environment xxx (2014) 1e14 11
Please cite this article in press as: Taleghani M, et al., Outdoor thermal comfort within five different urban forms in the Netherlands, Buildingand Environment (2014), http://dx.doi.org/10.1016/j.buildenv.2014.03.014
is the emissivity of the globe which normally is assumed 0.95,
vegetation. Trees and deciduous trees in particular can protectspaces from direct sun in summer and allow solar radiation inwinter. Vegetation also has a low heat capacity. Referring back tothe PET which illustrates thermal comfort, it increases in the af-ternoon. This is because the heat stored during the day is releasedto the air during the afternoon and evening.More investigations areneeded to show whether green areas with a lower heat capacity(over construction materials) can minimise the canyontemperature.
Appendix
Mean radiant temperature is calculated by ENVI-met. This factorsums up all short and long wave radiation fluxes (direct and
reflected) on a specific point. This parameter is calculated with thefollowing equation:
Tmrt ¼�ðGT þ 273:15Þ4 þ 1:1*108*n0:6a
d*D0:4 ðGT � TaÞ�0:25
� 273:15
(4)
where
Tmrt is the mean radiant temperature (K),GT is the globe temperature (K),na is the air velocity near the globe (m/s),d is the emissivity of the globe which normally is assumed 0.95,D is the diameter of the globe (m) which typically is 0.15 m, andTa is the air temperature (K).
ENVI-met, the software tool used for this paper, divides thesurrounding enclosure into “n” isothermal surfaces. The equationused by ENVI-met for calculating Tmrt is Ali-Toudert and Mayer[53]:
Tmrt ¼"1s
Xn
i¼1
EiFi þak3p
Xn
i¼1
DiFi þak3pfpI
!#0:25(5)
where
Ei is the long wave radiation (W),Di is the diffuse and diffusely reflected short wave radiation (W),
Fig. 11. Mean radiant temperatures (Tmrt) at the reference points.
Table 6Averages of the microclimates properties.* ¼ The sum of slightly cool, comfortableand slightly warm hours.
SingularEeW
SingularNeS
LinearEeW
Linear NeS Courtyard
SVF 0.605 0.605 0.404 0.404 0.194Average Ta (�C) 19.3 19.2 19.1 18.9 19.0Average Tmrt (�C) 43.5 45.8 41.6 25.1 22.9Standard deviation
of Tmrt (�C)28.8 28.3 26.0 21.4 13.5
Average wind (m/s) 2.6 1.7 0.5 2.7 0.2PET 23.5 26.4 27.2 17 20.8Comfortable hours* 3 2 4 8 17
15
16
17
18
19
20
21
22
23
5:00
6:00
7:00
8:00
9:00
10:0
0
11:0
0
12:0
0
13:0
0
14:0
0
15:0
0
16:0
0
17:0
0
18:0
0
19:0
0
20:0
0
21:0
0
22:0
0
23:0
0
0:00
1:00
Air
Tem
pera
ture
(°C)
Singular E-W Singular N-S Linear E-W Linear N-S Courtyard
Fig. 12. Air temperatures (Ta) at the reference points.
M. Taleghani et al. / Building and Environment xxx (2014) 1e14 11
Please cite this article in press as: Taleghani M, et al., Outdoor thermal comfort within five different urban forms in the Netherlands, Buildingand Environment (2014), http://dx.doi.org/10.1016/j.buildenv.2014.03.014
is the diameter of the globe (m) which typically is 0.15 m, andvegetation. Trees and deciduous trees in particular can protectspaces from direct sun in summer and allow solar radiation inwinter. Vegetation also has a low heat capacity. Referring back tothe PET which illustrates thermal comfort, it increases in the af-ternoon. This is because the heat stored during the day is releasedto the air during the afternoon and evening.More investigations areneeded to show whether green areas with a lower heat capacity(over construction materials) can minimise the canyontemperature.
Appendix
Mean radiant temperature is calculated by ENVI-met. This factorsums up all short and long wave radiation fluxes (direct and
reflected) on a specific point. This parameter is calculated with thefollowing equation:
Tmrt ¼�ðGT þ 273:15Þ4 þ 1:1*108*n0:6a
d*D0:4 ðGT � TaÞ�0:25
� 273:15
(4)
where
Tmrt is the mean radiant temperature (K),GT is the globe temperature (K),na is the air velocity near the globe (m/s),d is the emissivity of the globe which normally is assumed 0.95,D is the diameter of the globe (m) which typically is 0.15 m, andTa is the air temperature (K).
ENVI-met, the software tool used for this paper, divides thesurrounding enclosure into “n” isothermal surfaces. The equationused by ENVI-met for calculating Tmrt is Ali-Toudert and Mayer[53]:
Tmrt ¼"1s
Xn
i¼1
EiFi þak3p
Xn
i¼1
DiFi þak3pfpI
!#0:25(5)
where
Ei is the long wave radiation (W),Di is the diffuse and diffusely reflected short wave radiation (W),
Fig. 11. Mean radiant temperatures (Tmrt) at the reference points.
Table 6Averages of the microclimates properties.* ¼ The sum of slightly cool, comfortableand slightly warm hours.
SingularEeW
SingularNeS
LinearEeW
Linear NeS Courtyard
SVF 0.605 0.605 0.404 0.404 0.194Average Ta (�C) 19.3 19.2 19.1 18.9 19.0Average Tmrt (�C) 43.5 45.8 41.6 25.1 22.9Standard deviation
of Tmrt (�C)28.8 28.3 26.0 21.4 13.5
Average wind (m/s) 2.6 1.7 0.5 2.7 0.2PET 23.5 26.4 27.2 17 20.8Comfortable hours* 3 2 4 8 17
15
16
17
18
19
20
21
22
23
5:00
6:00
7:00
8:00
9:00
10:0
0
11:0
0
12:0
0
13:0
0
14:0
0
15:0
0
16:0
0
17:0
0
18:0
0
19:0
0
20:0
0
21:0
0
22:0
0
23:0
0
0:00
1:00
Air
Tem
pera
ture
(°C)
Singular E-W Singular N-S Linear E-W Linear N-S Courtyard
Fig. 12. Air temperatures (Ta) at the reference points.
M. Taleghani et al. / Building and Environment xxx (2014) 1e14 11
Please cite this article in press as: Taleghani M, et al., Outdoor thermal comfort within five different urban forms in the Netherlands, Buildingand Environment (2014), http://dx.doi.org/10.1016/j.buildenv.2014.03.014
is the air temperature (K).
ENVI-met, the software tool used for this chapter, divides the surrounding enclosure into “n” isothermal surfaces. The equation used by ENVI-met for calculating Tmrt is Ali-Toudert and Mayer [53]:
vegetation. Trees and deciduous trees in particular can protectspaces from direct sun in summer and allow solar radiation inwinter. Vegetation also has a low heat capacity. Referring back tothe PET which illustrates thermal comfort, it increases in the af-ternoon. This is because the heat stored during the day is releasedto the air during the afternoon and evening.More investigations areneeded to show whether green areas with a lower heat capacity(over construction materials) can minimise the canyontemperature.
Appendix
Mean radiant temperature is calculated by ENVI-met. This factorsums up all short and long wave radiation fluxes (direct and
reflected) on a specific point. This parameter is calculated with thefollowing equation:
Tmrt ¼�ðGT þ 273:15Þ4 þ 1:1*108*n0:6a
d*D0:4 ðGT � TaÞ�0:25
� 273:15
(4)
where
Tmrt is the mean radiant temperature (K),GT is the globe temperature (K),na is the air velocity near the globe (m/s),d is the emissivity of the globe which normally is assumed 0.95,D is the diameter of the globe (m) which typically is 0.15 m, andTa is the air temperature (K).
ENVI-met, the software tool used for this paper, divides thesurrounding enclosure into “n” isothermal surfaces. The equationused by ENVI-met for calculating Tmrt is Ali-Toudert and Mayer[53]:
Tmrt ¼"1s
Xn
i¼1
EiFi þak3p
Xn
i¼1
DiFi þak3pfpI
!#0:25(5)
where
Ei is the long wave radiation (W),Di is the diffuse and diffusely reflected short wave radiation (W),
Fig. 11. Mean radiant temperatures (Tmrt) at the reference points.
Table 6Averages of the microclimates properties.* ¼ The sum of slightly cool, comfortableand slightly warm hours.
SingularEeW
SingularNeS
LinearEeW
Linear NeS Courtyard
SVF 0.605 0.605 0.404 0.404 0.194Average Ta (�C) 19.3 19.2 19.1 18.9 19.0Average Tmrt (�C) 43.5 45.8 41.6 25.1 22.9Standard deviation
of Tmrt (�C)28.8 28.3 26.0 21.4 13.5
Average wind (m/s) 2.6 1.7 0.5 2.7 0.2PET 23.5 26.4 27.2 17 20.8Comfortable hours* 3 2 4 8 17
15
16
17
18
19
20
21
22
23
5:00
6:00
7:00
8:00
9:00
10:0
0
11:0
0
12:0
0
13:0
0
14:0
0
15:0
0
16:0
0
17:0
0
18:0
0
19:0
0
20:0
0
21:0
0
22:0
0
23:0
0
0:00
1:00
Air
Tem
pera
ture
(°C)
Singular E-W Singular N-S Linear E-W Linear N-S Courtyard
Fig. 12. Air temperatures (Ta) at the reference points.
M. Taleghani et al. / Building and Environment xxx (2014) 1e14 11
Please cite this article in press as: Taleghani M, et al., Outdoor thermal comfort within five different urban forms in the Netherlands, Buildingand Environment (2014), http://dx.doi.org/10.1016/j.buildenv.2014.03.014
(5)
Where
vegetation. Trees and deciduous trees in particular can protectspaces from direct sun in summer and allow solar radiation inwinter. Vegetation also has a low heat capacity. Referring back tothe PET which illustrates thermal comfort, it increases in the af-ternoon. This is because the heat stored during the day is releasedto the air during the afternoon and evening.More investigations areneeded to show whether green areas with a lower heat capacity(over construction materials) can minimise the canyontemperature.
Appendix
Mean radiant temperature is calculated by ENVI-met. This factorsums up all short and long wave radiation fluxes (direct and
reflected) on a specific point. This parameter is calculated with thefollowing equation:
Tmrt ¼�ðGT þ 273:15Þ4 þ 1:1*108*n0:6a
d*D0:4 ðGT � TaÞ�0:25
� 273:15
(4)
where
Tmrt is the mean radiant temperature (K),GT is the globe temperature (K),na is the air velocity near the globe (m/s),d is the emissivity of the globe which normally is assumed 0.95,D is the diameter of the globe (m) which typically is 0.15 m, andTa is the air temperature (K).
ENVI-met, the software tool used for this paper, divides thesurrounding enclosure into “n” isothermal surfaces. The equationused by ENVI-met for calculating Tmrt is Ali-Toudert and Mayer[53]:
Tmrt ¼"1s
Xn
i¼1
EiFi þak3p
Xn
i¼1
DiFi þak3pfpI
!#0:25(5)
where
Ei is the long wave radiation (W),Di is the diffuse and diffusely reflected short wave radiation (W),
Fig. 11. Mean radiant temperatures (Tmrt) at the reference points.
Table 6Averages of the microclimates properties.* ¼ The sum of slightly cool, comfortableand slightly warm hours.
SingularEeW
SingularNeS
LinearEeW
Linear NeS Courtyard
SVF 0.605 0.605 0.404 0.404 0.194Average Ta (�C) 19.3 19.2 19.1 18.9 19.0Average Tmrt (�C) 43.5 45.8 41.6 25.1 22.9Standard deviation
of Tmrt (�C)28.8 28.3 26.0 21.4 13.5
Average wind (m/s) 2.6 1.7 0.5 2.7 0.2PET 23.5 26.4 27.2 17 20.8Comfortable hours* 3 2 4 8 17
15
16
17
18
19
20
21
22
23
5:00
6:00
7:00
8:00
9:00
10:0
0
11:0
0
12:0
0
13:0
0
14:0
0
15:0
0
16:0
0
17:0
0
18:0
0
19:0
0
20:0
0
21:0
0
22:0
0
23:0
0
0:00
1:00
Air
Tem
pera
ture
(°C)
Singular E-W Singular N-S Linear E-W Linear N-S Courtyard
Fig. 12. Air temperatures (Ta) at the reference points.
M. Taleghani et al. / Building and Environment xxx (2014) 1e14 11
Please cite this article in press as: Taleghani M, et al., Outdoor thermal comfort within five different urban forms in the Netherlands, Buildingand Environment (2014), http://dx.doi.org/10.1016/j.buildenv.2014.03.014
is the long wave radiation (W),
vegetation. Trees and deciduous trees in particular can protectspaces from direct sun in summer and allow solar radiation inwinter. Vegetation also has a low heat capacity. Referring back tothe PET which illustrates thermal comfort, it increases in the af-ternoon. This is because the heat stored during the day is releasedto the air during the afternoon and evening.More investigations areneeded to show whether green areas with a lower heat capacity(over construction materials) can minimise the canyontemperature.
Appendix
Mean radiant temperature is calculated by ENVI-met. This factorsums up all short and long wave radiation fluxes (direct and
reflected) on a specific point. This parameter is calculated with thefollowing equation:
Tmrt ¼�ðGT þ 273:15Þ4 þ 1:1*108*n0:6a
d*D0:4 ðGT � TaÞ�0:25
� 273:15
(4)
where
Tmrt is the mean radiant temperature (K),GT is the globe temperature (K),na is the air velocity near the globe (m/s),d is the emissivity of the globe which normally is assumed 0.95,D is the diameter of the globe (m) which typically is 0.15 m, andTa is the air temperature (K).
ENVI-met, the software tool used for this paper, divides thesurrounding enclosure into “n” isothermal surfaces. The equationused by ENVI-met for calculating Tmrt is Ali-Toudert and Mayer[53]:
Tmrt ¼"1s
Xn
i¼1
EiFi þak3p
Xn
i¼1
DiFi þak3pfpI
!#0:25(5)
where
Ei is the long wave radiation (W),Di is the diffuse and diffusely reflected short wave radiation (W),
Fig. 11. Mean radiant temperatures (Tmrt) at the reference points.
Table 6Averages of the microclimates properties.* ¼ The sum of slightly cool, comfortableand slightly warm hours.
SingularEeW
SingularNeS
LinearEeW
Linear NeS Courtyard
SVF 0.605 0.605 0.404 0.404 0.194Average Ta (�C) 19.3 19.2 19.1 18.9 19.0Average Tmrt (�C) 43.5 45.8 41.6 25.1 22.9Standard deviation
of Tmrt (�C)28.8 28.3 26.0 21.4 13.5
Average wind (m/s) 2.6 1.7 0.5 2.7 0.2PET 23.5 26.4 27.2 17 20.8Comfortable hours* 3 2 4 8 17
15
16
17
18
19
20
21
22
23
5:00
6:00
7:00
8:00
9:00
10:0
0
11:0
0
12:0
0
13:0
0
14:0
0
15:0
0
16:0
0
17:0
0
18:0
0
19:0
0
20:0
0
21:0
0
22:0
0
23:0
0
0:00
1:00
Air
Tem
pera
ture
(°C)
Singular E-W Singular N-S Linear E-W Linear N-S Courtyard
Fig. 12. Air temperatures (Ta) at the reference points.
M. Taleghani et al. / Building and Environment xxx (2014) 1e14 11
Please cite this article in press as: Taleghani M, et al., Outdoor thermal comfort within five different urban forms in the Netherlands, Buildingand Environment (2014), http://dx.doi.org/10.1016/j.buildenv.2014.03.014
is the diffuse and diffusely reflected short wave radiation (W),Fi is the angle weighting factor,I is the direct solar radiation (W),fp is the surface projection factor,ak is the absorption coefficient of the irradiated body surface forshort wave radiation,3p is the emissivity of the human body, ands is the StefaneBoltzmann constant (5.67$10�8 W/m2 K4).
Finally, Tmrt in ENVI-met is calculated for each grid point (z) via:
Tmrt ¼�1s
�EtðzÞ þ ak
3pðDtðzÞ þ ItðzÞÞ
��0:25(6)
References
[1] ISO. International Standard 7730. ISO Geneva, revised 1990; 1984.[2] Oke TR. Boundary layer climates. New York: Routledge; 1987.[3] Givoni B. Climate considerations in building and urban design. Wiley; 1998.[4] Tseliou A, Tsiros IX, Lykoudis S, Nikolopoulou M. An evaluation of three
biometeorological indices for human thermal comfort in urban outdoor areasunder real climatic conditions. Build Environ 2010;45:1346e52.
[5] Herrmann J, Matzarakis A. Mean radiant temperature in idealised urbancanyonsdexamples from Freiburg, Germany. Int J Biometeorol 2012;56:199e203.
[6] Chen L, Ng E. Outdoor thermal comfort and outdoor activities: a review ofresearch in the past decade. Cities 2012;29:118e25.
[7] Cohen P, Potchter O, Matzarakis A. Human thermal perception of CoastalMediterranean outdoor urban environments. Appl Geogr 2013;37:1e10.
[8] Andreou E. Thermal comfort in outdoor spaces and urban canyon microcli-mate. Renew Energy 2013;55:182e8.
[9] Taleghani M, Tenpierik M, Kurvers S, van den Dobbelsteen A. A review intothermal comfort in buildings. Renew Sustain Energy Rev 2013;26:201e15.
[10] Höppe P. Different aspects of assessing indoor and outdoor thermal comfort.Energy Build 2002;34:661e5.
[11] Matzarakis A, Mayer H, Iziomon MG. Applications of a universal thermal in-dex: physiological equivalent temperature. Int J Biometeorol 1999;43:76e84.
0
0,5
1
1,5
2
2,5
3
5:00
6:00
7:00
8:00
9:00
10:0
0
11:0
0
12:0
0
13:0
0
14:0
0
15:0
0
16:0
0
17:0
0
18:0
0
19:0
0
20:0
0
21:0
0
22:0
0
23:0
0
0:00
1:00
Win
d Sp
eed
(m/s
)
Singular E-W Singular N-S Linear E-W Linear N-S Courtyard
Fig. 13. Wind speed at the reference points.
Fig. 14. PET at the reference points (the comfort range is highlighted with grey).
0%
10%
20%
30%
40%
50%
60%
70%
80%
90%
100%
Singular E-W Singular N-S Linear E-W Linear N-S Courtyard
Freq
uenc
y
Very hot
Hot
Warm
Slightly warm
Comfortable
Slightly cool
Cool
Cold
Very cold
desir
able
Fig. 15. Percentage frequency of PET in accordance with Fig. 12 at the reference points.
M. Taleghani et al. / Building and Environment xxx (2014) 1e1412
Please cite this article in press as: Taleghani M, et al., Outdoor thermal comfort within five different urban forms in the Netherlands, Buildingand Environment (2014), http://dx.doi.org/10.1016/j.buildenv.2014.03.014
is the angle weighting factor,Fi is the angle weighting factor,I is the direct solar radiation (W),fp is the surface projection factor,ak is the absorption coefficient of the irradiated body surface forshort wave radiation,3p is the emissivity of the human body, ands is the StefaneBoltzmann constant (5.67$10�8 W/m2 K4).
Finally, Tmrt in ENVI-met is calculated for each grid point (z) via:
Tmrt ¼�1s
�EtðzÞ þ ak
3pðDtðzÞ þ ItðzÞÞ
��0:25(6)
References
[1] ISO. International Standard 7730. ISO Geneva, revised 1990; 1984.[2] Oke TR. Boundary layer climates. New York: Routledge; 1987.[3] Givoni B. Climate considerations in building and urban design. Wiley; 1998.[4] Tseliou A, Tsiros IX, Lykoudis S, Nikolopoulou M. An evaluation of three
biometeorological indices for human thermal comfort in urban outdoor areasunder real climatic conditions. Build Environ 2010;45:1346e52.
[5] Herrmann J, Matzarakis A. Mean radiant temperature in idealised urbancanyonsdexamples from Freiburg, Germany. Int J Biometeorol 2012;56:199e203.
[6] Chen L, Ng E. Outdoor thermal comfort and outdoor activities: a review ofresearch in the past decade. Cities 2012;29:118e25.
[7] Cohen P, Potchter O, Matzarakis A. Human thermal perception of CoastalMediterranean outdoor urban environments. Appl Geogr 2013;37:1e10.
[8] Andreou E. Thermal comfort in outdoor spaces and urban canyon microcli-mate. Renew Energy 2013;55:182e8.
[9] Taleghani M, Tenpierik M, Kurvers S, van den Dobbelsteen A. A review intothermal comfort in buildings. Renew Sustain Energy Rev 2013;26:201e15.
[10] Höppe P. Different aspects of assessing indoor and outdoor thermal comfort.Energy Build 2002;34:661e5.
[11] Matzarakis A, Mayer H, Iziomon MG. Applications of a universal thermal in-dex: physiological equivalent temperature. Int J Biometeorol 1999;43:76e84.
0
0,5
1
1,5
2
2,5
3
5:00
6:00
7:00
8:00
9:00
10:0
0
11:0
0
12:0
0
13:0
0
14:0
0
15:0
0
16:0
0
17:0
0
18:0
0
19:0
0
20:0
0
21:0
0
22:0
0
23:0
0
0:00
1:00
Win
d Sp
eed
(m/s
)
Singular E-W Singular N-S Linear E-W Linear N-S Courtyard
Fig. 13. Wind speed at the reference points.
Fig. 14. PET at the reference points (the comfort range is highlighted with grey).
0%
10%
20%
30%
40%
50%
60%
70%
80%
90%
100%
Singular E-W Singular N-S Linear E-W Linear N-S Courtyard
Freq
uenc
y
Very hot
Hot
Warm
Slightly warm
Comfortable
Slightly cool
Cool
Cold
Very cold
desir
able
Fig. 15. Percentage frequency of PET in accordance with Fig. 12 at the reference points.
M. Taleghani et al. / Building and Environment xxx (2014) 1e1412
Please cite this article in press as: Taleghani M, et al., Outdoor thermal comfort within five different urban forms in the Netherlands, Buildingand Environment (2014), http://dx.doi.org/10.1016/j.buildenv.2014.03.014
is the direct solar radiation (W),Fi is the angle weighting factor,I is the direct solar radiation (W),fp is the surface projection factor,ak is the absorption coefficient of the irradiated body surface forshort wave radiation,3p is the emissivity of the human body, ands is the StefaneBoltzmann constant (5.67$10�8 W/m2 K4).
Finally, Tmrt in ENVI-met is calculated for each grid point (z) via:
Tmrt ¼�1s
�EtðzÞ þ ak
3pðDtðzÞ þ ItðzÞÞ
��0:25(6)
References
[1] ISO. International Standard 7730. ISO Geneva, revised 1990; 1984.[2] Oke TR. Boundary layer climates. New York: Routledge; 1987.[3] Givoni B. Climate considerations in building and urban design. Wiley; 1998.[4] Tseliou A, Tsiros IX, Lykoudis S, Nikolopoulou M. An evaluation of three
biometeorological indices for human thermal comfort in urban outdoor areasunder real climatic conditions. Build Environ 2010;45:1346e52.
[5] Herrmann J, Matzarakis A. Mean radiant temperature in idealised urbancanyonsdexamples from Freiburg, Germany. Int J Biometeorol 2012;56:199e203.
[6] Chen L, Ng E. Outdoor thermal comfort and outdoor activities: a review ofresearch in the past decade. Cities 2012;29:118e25.
[7] Cohen P, Potchter O, Matzarakis A. Human thermal perception of CoastalMediterranean outdoor urban environments. Appl Geogr 2013;37:1e10.
[8] Andreou E. Thermal comfort in outdoor spaces and urban canyon microcli-mate. Renew Energy 2013;55:182e8.
[9] Taleghani M, Tenpierik M, Kurvers S, van den Dobbelsteen A. A review intothermal comfort in buildings. Renew Sustain Energy Rev 2013;26:201e15.
[10] Höppe P. Different aspects of assessing indoor and outdoor thermal comfort.Energy Build 2002;34:661e5.
[11] Matzarakis A, Mayer H, Iziomon MG. Applications of a universal thermal in-dex: physiological equivalent temperature. Int J Biometeorol 1999;43:76e84.
0
0,5
1
1,5
2
2,5
3
5:00
6:00
7:00
8:00
9:00
10:0
0
11:0
0
12:0
0
13:0
0
14:0
0
15:0
0
16:0
0
17:0
0
18:0
0
19:0
0
20:0
0
21:0
0
22:0
0
23:0
0
0:00
1:00
Win
d Sp
eed
(m/s
)
Singular E-W Singular N-S Linear E-W Linear N-S Courtyard
Fig. 13. Wind speed at the reference points.
Fig. 14. PET at the reference points (the comfort range is highlighted with grey).
0%
10%
20%
30%
40%
50%
60%
70%
80%
90%
100%
Singular E-W Singular N-S Linear E-W Linear N-S Courtyard
Freq
uenc
y
Very hot
Hot
Warm
Slightly warm
Comfortable
Slightly cool
Cool
Cold
Very cold
desir
able
Fig. 15. Percentage frequency of PET in accordance with Fig. 12 at the reference points.
M. Taleghani et al. / Building and Environment xxx (2014) 1e1412
Please cite this article in press as: Taleghani M, et al., Outdoor thermal comfort within five different urban forms in the Netherlands, Buildingand Environment (2014), http://dx.doi.org/10.1016/j.buildenv.2014.03.014
is the surface projection factor,
Fi is the angle weighting factor,I is the direct solar radiation (W),fp is the surface projection factor,ak is the absorption coefficient of the irradiated body surface forshort wave radiation,3p is the emissivity of the human body, ands is the StefaneBoltzmann constant (5.67$10�8 W/m2 K4).
Finally, Tmrt in ENVI-met is calculated for each grid point (z) via:
Tmrt ¼�1s
�EtðzÞ þ ak
3pðDtðzÞ þ ItðzÞÞ
��0:25(6)
References
[1] ISO. International Standard 7730. ISO Geneva, revised 1990; 1984.[2] Oke TR. Boundary layer climates. New York: Routledge; 1987.[3] Givoni B. Climate considerations in building and urban design. Wiley; 1998.[4] Tseliou A, Tsiros IX, Lykoudis S, Nikolopoulou M. An evaluation of three
biometeorological indices for human thermal comfort in urban outdoor areasunder real climatic conditions. Build Environ 2010;45:1346e52.
[5] Herrmann J, Matzarakis A. Mean radiant temperature in idealised urbancanyonsdexamples from Freiburg, Germany. Int J Biometeorol 2012;56:199e203.
[6] Chen L, Ng E. Outdoor thermal comfort and outdoor activities: a review ofresearch in the past decade. Cities 2012;29:118e25.
[7] Cohen P, Potchter O, Matzarakis A. Human thermal perception of CoastalMediterranean outdoor urban environments. Appl Geogr 2013;37:1e10.
[8] Andreou E. Thermal comfort in outdoor spaces and urban canyon microcli-mate. Renew Energy 2013;55:182e8.
[9] Taleghani M, Tenpierik M, Kurvers S, van den Dobbelsteen A. A review intothermal comfort in buildings. Renew Sustain Energy Rev 2013;26:201e15.
[10] Höppe P. Different aspects of assessing indoor and outdoor thermal comfort.Energy Build 2002;34:661e5.
[11] Matzarakis A, Mayer H, Iziomon MG. Applications of a universal thermal in-dex: physiological equivalent temperature. Int J Biometeorol 1999;43:76e84.
0
0,5
1
1,5
2
2,5
3
5:00
6:00
7:00
8:00
9:00
10:0
0
11:0
0
12:0
0
13:0
0
14:0
0
15:0
0
16:0
0
17:0
0
18:0
0
19:0
0
20:0
0
21:0
0
22:0
0
23:0
0
0:00
1:00
Win
d Sp
eed
(m/s
)
Singular E-W Singular N-S Linear E-W Linear N-S Courtyard
Fig. 13. Wind speed at the reference points.
Fig. 14. PET at the reference points (the comfort range is highlighted with grey).
0%
10%
20%
30%
40%
50%
60%
70%
80%
90%
100%
Singular E-W Singular N-S Linear E-W Linear N-S Courtyard
Freq
uenc
y
Very hot
Hot
Warm
Slightly warm
Comfortable
Slightly cool
Cool
Cold
Very cold
desir
able
Fig. 15. Percentage frequency of PET in accordance with Fig. 12 at the reference points.
M. Taleghani et al. / Building and Environment xxx (2014) 1e1412
Please cite this article in press as: Taleghani M, et al., Outdoor thermal comfort within five different urban forms in the Netherlands, Buildingand Environment (2014), http://dx.doi.org/10.1016/j.buildenv.2014.03.014
is the absorption coefficient of the irradiated body surface for short wave radiation,
Fi is the angle weighting factor,I is the direct solar radiation (W),fp is the surface projection factor,ak is the absorption coefficient of the irradiated body surface forshort wave radiation,3p is the emissivity of the human body, ands is the StefaneBoltzmann constant (5.67$10�8 W/m2 K4).
Finally, Tmrt in ENVI-met is calculated for each grid point (z) via:
Tmrt ¼�1s
�EtðzÞ þ ak
3pðDtðzÞ þ ItðzÞÞ
��0:25(6)
References
[1] ISO. International Standard 7730. ISO Geneva, revised 1990; 1984.[2] Oke TR. Boundary layer climates. New York: Routledge; 1987.[3] Givoni B. Climate considerations in building and urban design. Wiley; 1998.[4] Tseliou A, Tsiros IX, Lykoudis S, Nikolopoulou M. An evaluation of three
biometeorological indices for human thermal comfort in urban outdoor areasunder real climatic conditions. Build Environ 2010;45:1346e52.
[5] Herrmann J, Matzarakis A. Mean radiant temperature in idealised urbancanyonsdexamples from Freiburg, Germany. Int J Biometeorol 2012;56:199e203.
[6] Chen L, Ng E. Outdoor thermal comfort and outdoor activities: a review ofresearch in the past decade. Cities 2012;29:118e25.
[7] Cohen P, Potchter O, Matzarakis A. Human thermal perception of CoastalMediterranean outdoor urban environments. Appl Geogr 2013;37:1e10.
[8] Andreou E. Thermal comfort in outdoor spaces and urban canyon microcli-mate. Renew Energy 2013;55:182e8.
[9] Taleghani M, Tenpierik M, Kurvers S, van den Dobbelsteen A. A review intothermal comfort in buildings. Renew Sustain Energy Rev 2013;26:201e15.
[10] Höppe P. Different aspects of assessing indoor and outdoor thermal comfort.Energy Build 2002;34:661e5.
[11] Matzarakis A, Mayer H, Iziomon MG. Applications of a universal thermal in-dex: physiological equivalent temperature. Int J Biometeorol 1999;43:76e84.
0
0,5
1
1,5
2
2,5
3
5:00
6:00
7:00
8:00
9:00
10:0
0
11:0
0
12:0
0
13:0
0
14:0
0
15:0
0
16:0
0
17:0
0
18:0
0
19:0
0
20:0
0
21:0
0
22:0
0
23:0
0
0:00
1:00
Win
d Sp
eed
(m/s
)
Singular E-W Singular N-S Linear E-W Linear N-S Courtyard
Fig. 13. Wind speed at the reference points.
Fig. 14. PET at the reference points (the comfort range is highlighted with grey).
0%
10%
20%
30%
40%
50%
60%
70%
80%
90%
100%
Singular E-W Singular N-S Linear E-W Linear N-S Courtyard
Freq
uenc
y
Very hot
Hot
Warm
Slightly warm
Comfortable
Slightly cool
Cool
Cold
Very cold
desir
able
Fig. 15. Percentage frequency of PET in accordance with Fig. 12 at the reference points.
M. Taleghani et al. / Building and Environment xxx (2014) 1e1412
Please cite this article in press as: Taleghani M, et al., Outdoor thermal comfort within five different urban forms in the Netherlands, Buildingand Environment (2014), http://dx.doi.org/10.1016/j.buildenv.2014.03.014
is the emissivity of the human body, and
Fi is the angle weighting factor,I is the direct solar radiation (W),fp is the surface projection factor,ak is the absorption coefficient of the irradiated body surface forshort wave radiation,3p is the emissivity of the human body, ands is the StefaneBoltzmann constant (5.67$10�8 W/m2 K4).
Finally, Tmrt in ENVI-met is calculated for each grid point (z) via:
Tmrt ¼�1s
�EtðzÞ þ ak
3pðDtðzÞ þ ItðzÞÞ
��0:25(6)
References
[1] ISO. International Standard 7730. ISO Geneva, revised 1990; 1984.[2] Oke TR. Boundary layer climates. New York: Routledge; 1987.[3] Givoni B. Climate considerations in building and urban design. Wiley; 1998.[4] Tseliou A, Tsiros IX, Lykoudis S, Nikolopoulou M. An evaluation of three
biometeorological indices for human thermal comfort in urban outdoor areasunder real climatic conditions. Build Environ 2010;45:1346e52.
[5] Herrmann J, Matzarakis A. Mean radiant temperature in idealised urbancanyonsdexamples from Freiburg, Germany. Int J Biometeorol 2012;56:199e203.
[6] Chen L, Ng E. Outdoor thermal comfort and outdoor activities: a review ofresearch in the past decade. Cities 2012;29:118e25.
[7] Cohen P, Potchter O, Matzarakis A. Human thermal perception of CoastalMediterranean outdoor urban environments. Appl Geogr 2013;37:1e10.
[8] Andreou E. Thermal comfort in outdoor spaces and urban canyon microcli-mate. Renew Energy 2013;55:182e8.
[9] Taleghani M, Tenpierik M, Kurvers S, van den Dobbelsteen A. A review intothermal comfort in buildings. Renew Sustain Energy Rev 2013;26:201e15.
[10] Höppe P. Different aspects of assessing indoor and outdoor thermal comfort.Energy Build 2002;34:661e5.
[11] Matzarakis A, Mayer H, Iziomon MG. Applications of a universal thermal in-dex: physiological equivalent temperature. Int J Biometeorol 1999;43:76e84.
0
0,5
1
1,5
2
2,5
3
5:00
6:00
7:00
8:00
9:00
10:0
0
11:0
0
12:0
0
13:0
0
14:0
0
15:0
0
16:0
0
17:0
0
18:0
0
19:0
0
20:0
0
21:0
0
22:0
0
23:0
0
0:00
1:00
Win
d Sp
eed
(m/s
)
Singular E-W Singular N-S Linear E-W Linear N-S Courtyard
Fig. 13. Wind speed at the reference points.
Fig. 14. PET at the reference points (the comfort range is highlighted with grey).
0%
10%
20%
30%
40%
50%
60%
70%
80%
90%
100%
Singular E-W Singular N-S Linear E-W Linear N-S Courtyard
Freq
uenc
y
Very hot
Hot
Warm
Slightly warm
Comfortable
Slightly cool
Cool
Cold
Very cold
desir
able
Fig. 15. Percentage frequency of PET in accordance with Fig. 12 at the reference points.
M. Taleghani et al. / Building and Environment xxx (2014) 1e1412
Please cite this article in press as: Taleghani M, et al., Outdoor thermal comfort within five different urban forms in the Netherlands, Buildingand Environment (2014), http://dx.doi.org/10.1016/j.buildenv.2014.03.014
is the Stefan–Boltzmann constant (5.67 * 10-8 W/m2K4).
Finally, Tmrt in ENVI-met is calculated for each grid point (z) via:Fi is the angle weighting factor,I is the direct solar radiation (W),fp is the surface projection factor,ak is the absorption coefficient of the irradiated body surface forshort wave radiation,3p is the emissivity of the human body, ands is the StefaneBoltzmann constant (5.67$10�8 W/m2 K4).
Finally, Tmrt in ENVI-met is calculated for each grid point (z) via:
Tmrt ¼�1s
�EtðzÞ þ ak
3pðDtðzÞ þ ItðzÞÞ
��0:25(6)
References
[1] ISO. International Standard 7730. ISO Geneva, revised 1990; 1984.[2] Oke TR. Boundary layer climates. New York: Routledge; 1987.[3] Givoni B. Climate considerations in building and urban design. Wiley; 1998.[4] Tseliou A, Tsiros IX, Lykoudis S, Nikolopoulou M. An evaluation of three
biometeorological indices for human thermal comfort in urban outdoor areasunder real climatic conditions. Build Environ 2010;45:1346e52.
[5] Herrmann J, Matzarakis A. Mean radiant temperature in idealised urbancanyonsdexamples from Freiburg, Germany. Int J Biometeorol 2012;56:199e203.
[6] Chen L, Ng E. Outdoor thermal comfort and outdoor activities: a review ofresearch in the past decade. Cities 2012;29:118e25.
[7] Cohen P, Potchter O, Matzarakis A. Human thermal perception of CoastalMediterranean outdoor urban environments. Appl Geogr 2013;37:1e10.
[8] Andreou E. Thermal comfort in outdoor spaces and urban canyon microcli-mate. Renew Energy 2013;55:182e8.
[9] Taleghani M, Tenpierik M, Kurvers S, van den Dobbelsteen A. A review intothermal comfort in buildings. Renew Sustain Energy Rev 2013;26:201e15.
[10] Höppe P. Different aspects of assessing indoor and outdoor thermal comfort.Energy Build 2002;34:661e5.
[11] Matzarakis A, Mayer H, Iziomon MG. Applications of a universal thermal in-dex: physiological equivalent temperature. Int J Biometeorol 1999;43:76e84.
0
0,5
1
1,5
2
2,5
3
5:00
6:00
7:00
8:00
9:00
10:0
0
11:0
0
12:0
0
13:0
0
14:0
0
15:0
0
16:0
0
17:0
0
18:0
0
19:0
0
20:0
0
21:0
0
22:0
0
23:0
0
0:00
1:00
Win
d Sp
eed
(m/s
)
Singular E-W Singular N-S Linear E-W Linear N-S Courtyard
Fig. 13. Wind speed at the reference points.
Fig. 14. PET at the reference points (the comfort range is highlighted with grey).
0%
10%
20%
30%
40%
50%
60%
70%
80%
90%
100%
Singular E-W Singular N-S Linear E-W Linear N-S Courtyard
Freq
uenc
y
Very hot
Hot
Warm
Slightly warm
Comfortable
Slightly cool
Cool
Cold
Very cold
desir
able
Fig. 15. Percentage frequency of PET in accordance with Fig. 12 at the reference points.
M. Taleghani et al. / Building and Environment xxx (2014) 1e1412
Please cite this article in press as: Taleghani M, et al., Outdoor thermal comfort within five different urban forms in the Netherlands, Buildingand Environment (2014), http://dx.doi.org/10.1016/j.buildenv.2014.03.014
(6)
i
240 Dwelling on Courtyards
References
1 ISO. International Standard 7730. ISO Geneva, revised 1990; 1984.
2 Oke TR. Boundary Layer Climates. New York: Routledge; 1987.
3 Givoni B. Climate Considerations in Building and Urban Design: Wiley; 1998.
4 Tseliou A, Tsiros IX, Lykoudis S, Nikolopoulou M. An evaluation of three biometeorological indices for human
thermal comfort in urban outdoor areas under real climatic conditions. Building and Environment. 2010;45:1346-
52.
5 Herrmann J, Matzarakis A. Mean radiant temperature in idealised urban canyons—examples from Freiburg,
Germany. Int J Biometeorol. 2012;56:199-203.
6 Chen L, Ng E. Outdoor thermal comfort and outdoor activities: A review of research in the past decade. Cities.
2012;29:118-25.
7 Cohen P, Potchter O, Matzarakis A. Human thermal perception of Coastal Mediterranean outdoor urban
environments. Applied Geography. 2013;37:1-10.
8 Andreou E. Thermal comfort in outdoor spaces and urban canyon microclimate. Renewable Energy. 2013;55:182-
8.
9 Taleghani M, Tenpierik M, Kurvers S, van den Dobbelsteen A. A review into thermal comfort in buildings. Renewable
and Sustainable Energy Reviews. 2013;26:201-15.
10 Höppe P. Different aspects of assessing indoor and outdoor thermal comfort. Energy and Buildings. 2002;34:661-5.
11 Matzarakis A, Mayer H, Iziomon MG. Applications of a universal thermal index: physiological equivalent
temperature. Int J Biometeorol. 1999;43:76-84.
12 Blazejczyk K, Broede P, Fiala D, Havenith G, Holmer I, Jendritzky G, et al. Priciples of the new universal thermal
cliamte index (UTCI) and its application to bioclimatic research in European scale. Miscellanea Geographica.
2010;14:91-102.
13 Change IPoC. Climate Change 2007 - The Physical Science Basis: Contribution of Working Group I to the Fourth
Assessment Report of the IPCC. Cambridge2007.
14 Johansson E, Thorsson S, Emmanuel R, Krüger E. Instruments and methods in outdoor thermal comfort studies –
The need for standardization. Urban Climate.
15 Howard L. The climate of London, deduced from meteorological observations made in the metropolis and various
places around it. London: Harvey and Darton; 1833.
16 Hill L, Griffith OW, Flack M. The Measurement of the Rate of Heat-Loss at Body Temperature by Convection,
Radiation, and Evaporation. Philosophical Transactions Research Society London B. 1916;207:183-220.
17 Dufton AF. The eupatheostat. Scientific Instruments. 1929;6:249-51.
18 Yongping J, Jiuxian M. Evolution and evaluation of research on the relation between room airflow and human
thermal comfort. Journal of Heating Ventilating & Air Conditioning. 1999;29:27-30.
19 Ouzi L, Yuli H, Xunqian L. Study of thermal comfort of occupants and indoor air quality—historical review, present
status and prospects. Building Energy & Environment. 2001;21:26-8.
20 Hanqing W, Chunhua H, Zhiqiang L, Guangfa T, Yingyun L, Zhiyong W. Dynamic evaluation of thermal comfort
environment of air-conditioned buildings. Building and Environment. 2006;41:1522-9.
21 Fanger P. Thermal Comfort: Analysis and Applications in Environmental Engineering. Copenhagen Danish Technical
Press; 1970.
22 Tahbaz M. Psychrometric chart as a basis for outdoor thermal analysis. International Journal of Architectural
Engineering & Urban Planning. 2011;21:95-109.
i

241 Outdoor thermal comfort within different building blocks
23 Belding HS, Hatch TF. Index for evaluating heat stress in terms of resulting physiological strain. Heating, piping, and
air conditioning. 1955;27:129-36.
24 Yaglou CP, Minard D. Control of heat casualties at military training centers. AMA ArchIndustrHealth. 1957;16:302-
16.
25 Thom EC. The Discomfort Index. Weatherwise. 1959;12:57-61.
26 Givoni B. The influence of work and environmental conditions on the physiological responses and thermal
equilibrium of man. f UNESCO Symposium on Environmental Physiology and Psychology in Arid Conditions.
Lucknow1962. p. 199-204.
27 Gagge AP, Stolwijk JAJ, Nishi Y. Effective temperature scale, based on a simple model of human physiological
regulatory response. ASHRAE. 1971;13.
28 Kerslake DM. The stress of hot environment. Cambridge: Cambridge University Press; 1972.
29 Steadman RG. The Assessment of Sultriness. Part I: A Temperature-Humidity Index Based on Human Physiology
and Clothing Science. Journal of Applied Meteorology and Climatology. 1979;18:861-73.
30 Sharma MR, Ali S. Tropical summer index—a study of thermal comfort of Indian subjects. Building and
Environment. 1986;21:11-24.
31 ISO/TR11079. Evaluation of cold environments – Determination of required clothing insulation (IREQ). Geneva:
International Organization for Standardisation; 1993.
32 Gagge AP, Fobelets AP, Berglund LG. A standard predictive index of human response to the thermal environment.
ASHRAE Transaction 921986. p. 709-31.
33 Staiger H, Bucher K, Jendritzky G. Gefühlte Temperatur. Die physiologisch gerechte Bewertung von Wärmebelastung
und Kältestress beim Aufenthalt im Freien in der Maßzahl Grad Celsius. Annalen der Meteorologie. 1997;33:100-7.
34 Pickup J, de Dear RJ. An outdoor thermal comfort index (OUT_SET*) – part I – the model and its assumptions. In: R.
J. de Dear, J. D. Kalma, T. R. Oke, Auliciems A., editors. Selected papers from the ICB-ICUC’99 conference, Sydney.
Geneva: World Meteorological Organization; 2000.
35 Mayer H, Höppe P. Die Bedeutung des Waldes für die Erholung aus der Sicht der Humanbioklimatologie.
Forstwissenschaftliches Centralblatt. 1984;103:125-31.
36 Höppe P. The physiological equivalent temperature - A universal index for the biometeorological assessment of the
thermal environment. Int J Biometeorol. 1999;43:71-5.
37 Jendritzky G, Maarouf A, Henning S. Looking for a Universal Thermal Climate Index UTCI for Outdoor Applications.
Windsor Conference on Thermal Standards. Windsor, UK: Network for Comfort and Energy Use in Buildings; 2001.
38 Fiala D, Havenith G, Bröde P, Kampmann B, Jendritzky G. UTCI-Fiala multi-node model of human heat transfer and
temperature regulation. Int J Biometeorol. 2012;56:429-41.
39 Bröde P, Fiala D, Błażejczyk K, Holmér I, Jendritzky G, Kampmann B, et al. Deriving the operational procedure for the
Universal Thermal Climate Index (UTCI). Int J Biometeorol. 2012;56:481-94.
40 Höppe P. Heat balance modelling. Experientia. 1993;49:741-6.
41 Blazejczyk K, Epstein Y, Jendritzky G, Staiger H, Tinz B. Comparison of UTCI to selected thermal indices. Int J
Biometeorol. 2012;56:515-35.
42 Matzarakis A, Amelung B. Physiological Equivalent Temperature as Indicator for Impacts of Climate Change on
Thermal Comfort of Humans. In: Thomson M.C., García Herrera R., Beniston M., editors. Seasonal Forecasts,
Climatic Change and Human Health: Springer; 2008.
43 Olgyay V. Design with Climate. Princeton NJ: Princeton University Press; 1963.
44 Steemers K, Baker N, Crowther D, Dubiel J, Nikolopoulou MH, Ratti C. City texture and microclimate. Urban Design
Studies. 1997;3:25-50.
i
242 Dwelling on Courtyards
45 Ratti C, Raydan D, Steemers K. Building form and environmental performance: archetypes, analysis and an arid
climate. Energy and Buildings. 2003;35:49-59.
46 Bourbia F, Awbi HB. Building cluster and shading in urban canyon for hot dry climate: Part 1: Air and surface
temperature measurements. Renewable Energy. 2004;29:249-62.
47 Bourbia F, Awbi HB. Building cluster and shading in urban canyon for hot dry climate: Part 2: Shading simulations.
Renewable Energy. 2004;29:291-301.
48 Yezioro A, Capeluto IG, Shaviv E. Design guidelines for appropriate insolation of urban squares. Renewable Energy.
2006;31:1011-23.
49 Berkovic S, Yezioro A, Bitan A. Study of thermal comfort in courtyards in a hot arid climate. Solar Energy.
2012;86:1173-86.
50 Okeil A. In search for Energy efficient urban forms: the residential solar block. the 5th International Conference on
Indoor Air Quality, Ventilation and Energy Conservation in Buildings Proceedings. Toronto2004.
51 Okeil A. A holistic approach to energy efficient building forms. Energy and Buildings. 2010;42:1437-44.
52 Ali-Toudert F, Mayer H. Effects of asymmetry, galleries, overhanging façades and vegetation on thermal comfort in
urban street canyons. Solar Energy. 2007;81:742-54.
53 Ali-Toudert F, Mayer H. Numerical study on the effects of aspect ratio and orientation of an urban street canyon on
outdoor thermal comfort in hot and dry climate. Building and Environment. 2006;41:94-108.
54 Johansson E. Influence of urban geometry on outdoor thermal comfort in a hot dry climate: A study in Fez, Morocco.
Building and Environment. 2006;41:1326-38.
55 Bourbia F, Boucheriba F. Impact of street design on urban microclimate for semi arid climate (Constantine).
Renewable Energy. 2010;35:343-7.
56 Erell E, Pearlmutter D, Williamson TJ. Urban Microclimate: Designing the Spaces Between Buildings: Earthscan;
2012.
57 Shashua-Bar L, Pearlmutter D, Erell E. The cooling efficiency of urban landscape strategies in a hot dry climate.
Landscape and Urban Planning. 2009;92:179-86.
58 Taleghani M, Sailor DJ, Tenpierik M, van den Dobbelsteen A. Thermal assessment of heat mitigation strategies: The
case of Portland State University, Oregon, USA. Building and Environment. 2014;73:138-50.
59 Taleghani M, Tenpierik M, Dobbelsteen A. Environmental Impact of Courtyards- A Review and Comparison of
Residential Courtyard Buildings in Different Climates. Green Building. 2012;7:113-36.
60 Müller N, Kuttler W, Barlag A-B. Counteracting urban climate change: adaptation measures and their effect on
thermal comfort. Theor Appl Climatol. 2013:1-15.
61 Thorsson S, Lindberg F, Björklund J, Holmer B, Rayner D. Potential changes in outdoor thermal comfort conditions in
Gothenburg, Sweden due to climate change: the influence of urban geometry. International Journal of Climatology.
2011;31:324-35.
62 Taleghani M, Tenpierik M, van den Dobbelsteen A, de Dear R. Energy use impact of and thermal comfort in different
urban block types in the Netherlands. Energy and Buildings. 2013;67:166-75.
63 Taleghani M, Tenpierik M, van den Dobbelsteen A. Energy performance and thermal comfort of courtyard/atrium
dwellings in the Netherlands in the light of climate change. Renewable Energy. 2014;63:486-97.
64 Taleghani M, Tenpierik M, van den Dobbelsteen A, Sailor DJ. Heat in courtyards: A validated and calibrated
parametric study of heat mitigation strategies for urban courtyards in the Netherlands. Solar Energy.
2014;103:108-24.
i
243 Outdoor thermal comfort within different building blocks
65 van Esch MME, Looman RHJ, de Bruin-Hordijk GJ. The effects of urban and building design parameters on solar
access to the urban canyon and the potential for direct passive solar heating strategies. Energy and Buildings.
2012;47:189-200.
66 NEN-5060. Hygrothermische Eigenschappen van Gebouwen Referentieklimaatgegevens. Nederlands Normalisatie-
Instituut (NNI); 2008.
67 Matzarakis A, Rutz F, Mayer H. Modelling radiation fluxes in simple and complex environments—application of the
RayMan model. Int J Biometeorol. 2007;51:323-34.
68 Martin L, March L. Urban Space and Structures. UK: Cambridge University Press; 1972.
69 Bruse M. Die Auswirkungen kleinskaliger Umweltgestaltung auf das Mikroklima, Entwicklung des prognostischen
numerischen Modells ENVI-met zur Simulation der Wind-, Temperatur-, und Feuchtverteilung in sta¨dtischen
Strukturen: University of Bochum, Germany; 1999.
70 Lindberg F, Holmer B, Thorsson S. SOLWEIG 1.0 – Modelling spatial variations of 3D radiant fluxes and mean
radiant temperature in complex urban settings. Int J Biometeorol. 2008;52:697-713.
71 Defraeye T, Blocken B, Carmeliet J. CFD simulation of heat transfer at surfaces of bluff bodies in turbulent boundary
layers: Evaluation of a forced-convective temperature wall function for mixed convection. Journal of Wind
Engineering and Industrial Aerodynamics. 2012;104–106:439-46.
72 Wania A, Bruse M, Blond N, Weber C. Analysing the influence of different street vegetation on traffic-induced
particle dispersion using microscale simulations. Journal of Environmental Management. 2012;94:91-101.
73 Bruse M. Simulating microscale climate interactions in complex terrain with a high-resolution numerical model: A
case study for the Sydney CBD Area. Biometeorology and Urban Climatology at the Turn of the Millennium, WMO/
TD No 1026. World Meteorological Organisation, Geneva, CH2000.
74 Bruse M, Fleer H. Simulating surface–plant–air interactions inside urban environments with a three dimensional
numerical model. Environmental Modelling & Software. 1998;13:373-84.
75 Kottek M, Grieser J, Beck C, Rudolf B, Rubel F. World Map of the Köppen-Geiger climate classification updated.
Meteorologische Zeitschrift. 2006;15.
76 Yang X, Zhao L, Bruse M, Meng Q. Evaluation of a microclimate model for predicting the thermal behavior of
different ground surfaces. Building and Environment. 2013;60:93-104.
77 Wong NH, Kardinal Jusuf S, Aung La Win A, Kyaw Thu H, Syatia Negara T, Xuchao W. Environmental study of the
impact of greenery in an institutional campus in the tropics. Building and Environment. 2007;42:2949-70.
78 Srivanit M, Hokao K. Evaluating the cooling effects of greening for improving the outdoor thermal environment at an
institutional campus in the summer. Building and Environment. 2013;66:158-72.
79 Hedquist BC, Brazel AJ. Seasonal variability of temperatures and outdoor human comfort in Phoenix, Arizona, U.S.A.
Building and Environment.
80 Taleb D, Abu-Hijleh B. Urban heat islands: Potential effect of organic and structured urban configurations on
temperature variations in Dubai, UAE. Renewable Energy. 2013;50:747-62.
81 Bruse M, BÜRGER M, Bohnstedt A, Ihde A, Jesionek K, Lahme E. Measurements and model simulations in WP
MICRO. Ruhr-University Bochum, Institute of Geography, Research Group Climatology2002.
82 Hwang RL, Lin TP, Matzarakis A. Seasonal effects of urban street shading on long-term outdoor thermal comfort.
Building and Environment. 2011;46:863-70.
83 Thorsson S, Lindberg F, Eliasson I, Holmer B. Different methods for estimating the mean radiant temperature in an
outdoor urban setting. International Journal of Climatology. 2007;27:1983-93.
i
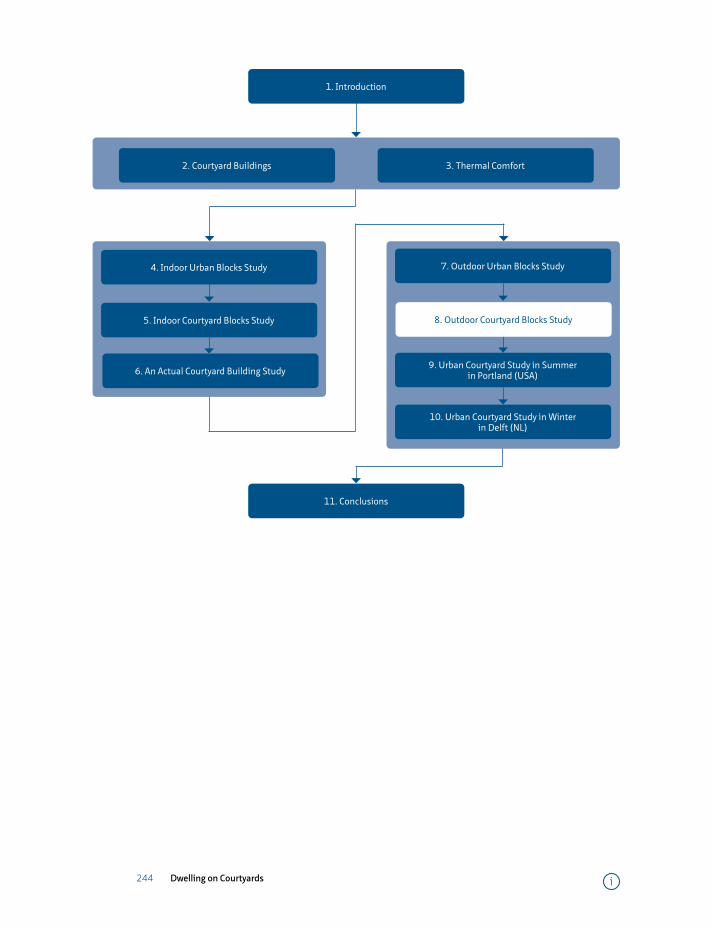
244 Dwelling on Courtyards
=
4. Indoor Urban Blocks Study
5. Indoor Courtyard Blocks Study
11. Conclusions
7. Outdoor Urban Blocks Study
9. Urban Courtyard Study in Summer in Portland (USA)
10. Urban Courtyard Study in Winter in Delft (NL)
8. Outdoor Courtyard Blocks Study
2. Courtyard Buildings 3. Thermal Comfort
1. Introduction
6. An Actual Courtyard Building Study
i

245 Outdoor thermal comfort within different courtyard buildings
8 Outdoor thermal comfort within different courtyard buildings
The previous chapter showed that courtyards may provide a lower PET (and thus a more comfortable microclimate) during a longer period than the other urban forms investigated during the hottest day of the Netherlands. This chapter is parallel to Chapter 5, where the effect(s) of different courtyard orientations on pedestrians’ thermal comfort will be explored. Then, the most and least comfortable courtyards will be taken as reference models for further modifications. The modifications include using vegetation, water and a high albedo material on the roof and the pavement of the courtyards. The study is based on simulations again for the hottest day in a reference year in the Netherlands.
i

246 Dwelling on Courtyards i

247 Outdoor thermal comfort within different courtyard buildings
Heat in courtyards: A validated and calibrated parametric study of heat mitigation strategies for urban courtyards in the Netherlands1
Mohammad Taleghani *1 , Martin Tenpierik 1, Andy. van den Dobbelsteen 1, David J. Sailor 2
1 Faculty of Architecture and the Built Environment, Delft University of Technology, Delft, the Netherlands
2 Department of Mechanical and Materials Engineering, Portland State University, Portland, OR, USA
AbstractOutdoor thermal comfort in urban spaces is an important contributor to pedestrians’ health. A parametric study into different geometries and orientations of urban courtyard blocks in the Netherlands was therefore conducted for the hottest day in the Dutch reference year (19th June 2000 with the maximum 33°C air temperature). The study also considered the most severe climate scenario for the Netherlands for the year 2050. Three urban heat mitigation strategies that moderate the microclimate of the courtyards were investigated: changing the albedo of the facades of the urban blocks, including water ponds and including urban vegetation. The results showed that a north-south canyon orientation provides the shortest and the east-west direction the longest duration of direct sun at the centre of the courtyards. Moreover, increasing the albedo of the facades actually increased the mean radiant temperature in a closed urban layout such as a courtyard. In contrast, using a water pool and urban vegetation cooled the microclimates; providing further evidence of their promise as strategies for cooling cities. The results are validated through a field measurement and calibration.
Key wordsUrban courtyard blocks, climate change, urban microclimate, heat island mitigation strategies.
1 Published as: Taleghani M., Tenpierik M., Dobbelsteen A., Sailor, D., “Heat in Courtyards: A validated and calibrated parametric study of heat mitigation strategies for urban courtyards in the Netherlands”, Solar Energy, 103(2014) 108-124.
i
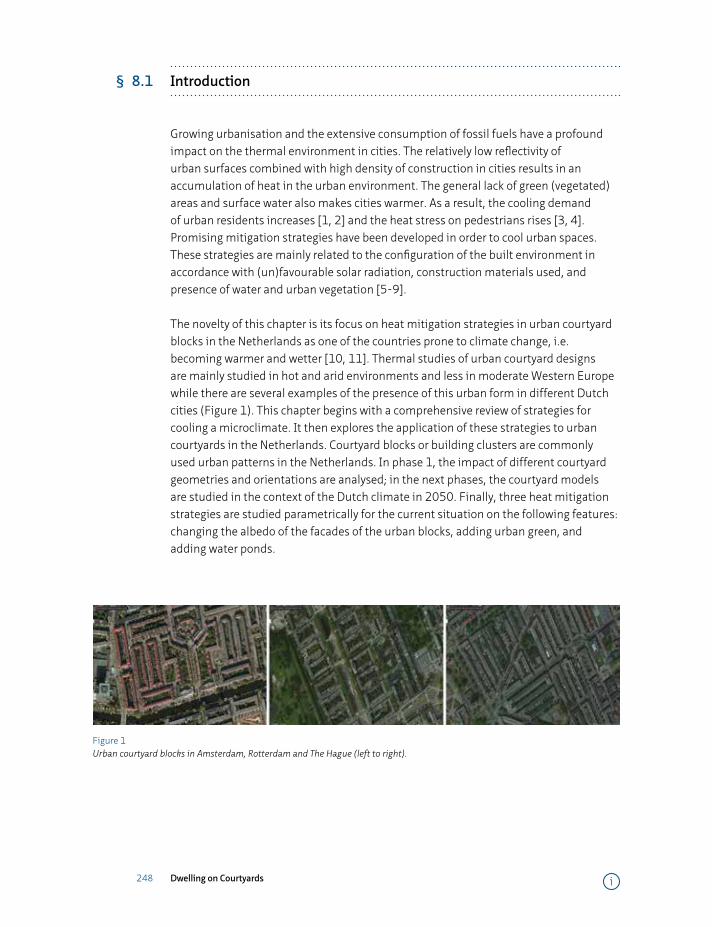
248 Dwelling on Courtyards
§ 8.1 Introduction
Growing urbanisation and the extensive consumption of fossil fuels have a profound impact on the thermal environment in cities. The relatively low reflectivity of urban surfaces combined with high density of construction in cities results in an accumulation of heat in the urban environment. The general lack of green (vegetated) areas and surface water also makes cities warmer. As a result, the cooling demand of urban residents increases [1, 2] and the heat stress on pedestrians rises [3, 4]. Promising mitigation strategies have been developed in order to cool urban spaces. These strategies are mainly related to the configuration of the built environment in accordance with (un)favourable solar radiation, construction materials used, and presence of water and urban vegetation [5-9].
The novelty of this chapter is its focus on heat mitigation strategies in urban courtyard blocks in the Netherlands as one of the countries prone to climate change, i.e. becoming warmer and wetter [10, 11]. Thermal studies of urban courtyard designs are mainly studied in hot and arid environments and less in moderate Western Europe while there are several examples of the presence of this urban form in different Dutch cities (Figure 1). This chapter begins with a comprehensive review of strategies for cooling a microclimate. It then explores the application of these strategies to urban courtyards in the Netherlands. Courtyard blocks or building clusters are commonly used urban patterns in the Netherlands. In phase 1, the impact of different courtyard geometries and orientations are analysed; in the next phases, the courtyard models are studied in the context of the Dutch climate in 2050. Finally, three heat mitigation strategies are studied parametrically for the current situation on the following features: changing the albedo of the facades of the urban blocks, adding urban green, and adding water ponds.
Figure 1 Urban courtyard blocks in Amsterdam, Rotterdam and The Hague (left to right).
i
249 Outdoor thermal comfort within different courtyard buildings
§ 8.2 Background
The following brief literature review considers studies of a) urban geometry and courtyards, b) microclimate design to cope with climate change, c) the effects of albedo on a microclimate, d) the effects of water on a microclimate, and e) the effects of vegetation on a microclimate.
A Urban geometry and courtyards
The interactions between urban geometry and surface properties under a specific climate generate microclimates. These interactions were first discussed by Olgyay [12] and Oke [3]. Givoni [13] discussed the thermal impact of urban typologies in different climates and arrived at general design guidelines. He writes that architectural forms, surface materials and urban morphology (compactness, elongations, etc.) can affect the microclimate environment. On this topic, courtyard blocks were studied in several climates addressing different benefits. A comprehensive study on urban courtyards at a latitude of 26-34°N was done by Yezioro, Capeluto and Shaviv [14] using the SHADING program. They showed that, for cooling purposes, the best direction of a rectangular courtyard was North-South (NS, i.e. with the longer facades on East and West), followed by NW-SE, NE-SW, EW (in this order). They found that the NS direction had the shortest duration of direct sun light in the centre of the courtyard. This finding is in accordance with climates (or seasons) in which less sun is desirable. They also investigated summer thermal comfort, and showed that, although the air temperature difference between shaded and unshaded areas was only 0.5 K, the mean radiant temperature was different up to 30 C [15]. Steemers, Baker, Crowther, Dubiel, Nikolopoulou and Ratti [16] proposed six archetypical generic urban forms for London and compared the incident solar radiation, built potential and daylight admission. They concluded that large courtyards are environmentally adequate in cold climates, where under certain geometrical conditions they can act as sun concentrators and retain their sheltering effect against cold winds. Herrmann and Matzarakis [17] simulated urban courtyards with different orientations in Freiburg, Germany. They showed that the mean radiant temperature (Tmrt) was highest for NS and lowest for the EW orientation at midday and at night. During the night, the mean radiant temperatures were very similar, but the orientation of the courtyard affects the time of the first increase of Tmrt in the morning, due to direct sun. In the Netherlands (on average at 52°N), few studies have addressed the Physiological Equivalent Temperature (PET) or other outdoor thermal comfort indices. Among these, van Esch, Looman and de Bruin-Hordijk [18] compared urban canyons with street widths of 10, 15, 20 and 25 meters, and EW and NS directions. They concluded that the EW canyons did not receive sun on the 21st of December, while during summer and in the morning and afternoon, canyons had direct sun; at noon the sun was blocked. On the shortest day, the NS canyons got some sun
i

250 Dwelling on Courtyards
for a short period (even the narrowest canyon) and were fully exposed to the sun in the mornings and afternoons.
B Microclimate design to cope with climate change
Global warming is likely to have a significant effect on cooling and heating loads in buildings. IPCC [19] provides (and updates) estimations for future climates through different climate scenarios. Accordingly, building and urban designers try to reduce cooling loads of buildings to cope with climate change in the future. The strategies that they use are mainly through:
• reducing solar heat loads, for instance with appropriate design, sun shading and reflecting materials [20-22];
• using natural cooling (provided by greenery, water and natural ventilation at night) [23, 24]; and
• using thermal mass in order to stabilise indoor temperatures [25, 26].
Vegetation can simultaneously block and reflect the sun and cool the environment through evapotranspiration. However, there are few studies addressing the effects of greenery in the context of future climate scenarios in the Netherlands. Outdoor thermal comfort needs to be studied to clarify how increasing urban greenery can provide a more comfortable environment in a warmer future.
C The effects of albedo on the microclimate
The albedo of a surface or material is defined as the fraction of incident solar radiation that is reflected [27]. High albedo materials therefore lead to lower surface temperatures, and a cooler ambient temperature through the mechanism of convection [28]. However, conventional materials used in urban environments such as asphalt, brick and stone pavements generally have low albedos (0.05, 0.2 and 0.4 respectively) [29, 30]. The use of these materials intensifies the urban heat island phenomenon. Several studies have reported that use of materials with low albedo and high specific heat capacity usually causes a larger temperature difference between the city and the countryside at night than during the day [31, 32].
In this regard, Doulos, Santamouris and Livada [33] compared 93 commonly used materials for outdoor pavements. They found that albedo depends on the visible colour, surface texture (roughness) and the type of material of a pavement. They concluded that smooth, flat and light tiles made of marble, mosaic and stone had higher albedo than concrete and granite. Conversely, although a higher albedo results in a lower surface temperature and consequently cooler indoor environment, it could
i
251 Outdoor thermal comfort within different courtyard buildings
have negative consequences on the physical and mental health of pedestrians [34-36]. In the subtropical climate of Shanghai Yang et al. [37] showed that by increasing the ground surface albedo by 0.4, overall outdoor thermal comfort decreased as reflected by an increase in physiological equivalent temperature (PET) by 5–7°C. In this way, in a dense urban area with a hot climate, the albedo of vertical surfaces such as facades will play an important role for the pedestrian’s thermal (and visual) comfort. In an extreme situation in Tokyo, the use of high albedo materials on the exterior opposite walls led to a higher indoor cooling demand because of the increased solar radiation reflected indoors through the windows [38]. Taleghani et al. [39] showed in the temperate climate of Portland (OR, USA) in a measurement showed a white material (with albedo 0.91) increased the globe and mean radiant temperature (0.9°C and 2.9°C respectively) while producing a cooler local air temperature (1.3°C) in comparison with a black pavement (with albedo 0.37). To sum up, the effect of albedo on both the indoor and the outdoor thermal environment can only be determined when studied in more detail for each urban situation.
D The effects of water on the microclimate
The cooling effect of ponds and canals on microclimates has been demonstrated in multiple studies [40, 41]. In the hot and dry climate of Bornos (Spain), for example, Reynolds and Carrasco [42] found summer temperature variations inside a courtyard with an enclosed pond from 26 to 29.5°C while the ambient temperature outside the courtyard varied between 22 and 44°C. Nakayama and Fujita [43] developed a water-holding pavement (consisting of porous asphalt and a water-holding filler) to increase water presence in urban spaces of Japan. They reported that the air temperature (Ta) above the water-holding pavement (when saturated) was 1-2°C lower than above the lawn and 3-5°C lower than above conventional pavements. In the hot and arid climate of Bahrain Radhi, Fikry and Sharples [44] showed that lack of water in an urban space could cause a 2-3°C temperature increase in the city and a 3-5°C temperature increase on artificial islands. In addition, through an optimisation study for the thermal comfort of an urban square in France, Robitu et al. [45] reported that the presence of trees and water ponds reduced the mean radiant temperature by 35-40°C at 1.5 m above the ground.
E The effects of vegetation on the microclimate
Vegetation has been studied in urban climates [46], mostly in regard to the urban heat island effect (first studied by Luke Howard in the early 19th century [47]). In contrast to the urban heat island, the park cool island can reduce the air temperature up to 3-4°C in summer [46, 48-50]. Vegetation cools the environment through two mechanisms [51]:
i
252 Dwelling on Courtyards
1 With a higher albedo compared to common pavements as asphalt and brick. Vegetation reflects more solar radiation [52]; moreover, with a lower specific heat capacity, green areas accumulate less heat [49, 53].
2 By evapotranspiration, which is the sum of evaporation (from the earth’s surface) and transpiration (from vegetation). The ambient air is cooled by this phenomenon [3, 54, 55].
The evapotranspiration process requires a significant amount of energy from the microclimate. As noted by Montgomery [56] the latent heat of vaporisation of water is 2324 kJ/kg. Moffat and Schiller [57] found that latent heat transfer from wet grass can result in an air temperature 6–8°C cooler compared to a similar area with exposed soil. They also found that 1 m2 of grass absorbs 12 MJ of heat on a sunny day.
The other advantage of green areas is their effect on the energy use for maintaining comfortable indoor environments. According to Akbari et al. [58], Wong et al.[59] and Carter and Keeler [60] trees and shrubs planted next to a building can reduce air conditioning costs by 15-35 % (and by 10 % of annual cooling demand). Likewise, the exposed surface of a black roof with a very low albedo can be as much as 50°C hotter than the roof surface under a vegetated green roof in summer [61].
While trees have the advantage to block the sun reaching the ground surface cooling the entire air space under their canopy, grass reduces the temperature mainly near ground level [62, 63]. Air temperature reductions due to vegetation are reported as: Miami 16°C, Tokyo 20°C, Singapore 5°C and Athens 8°C [64-67]. The potential cooling benefits of vegetation are increasingly being exploited in rooftop applications. Vegetated or “green” roofs have multiple benefits for the urban environment, including a reduction in storm water runoff, cooling of the urban climate system, and reduction in summer time heat transfer into buildings [6, 68, 69].
§ 8.3 Methodology
The study presented in this chapter consisted of five phases. In the first phase, 18 courtyard models were simulated using the ENVI-met software package for 19th June 2000, the hottest reference day in the Netherlands. These courtyards are given four directions: E-W, N-S, NE-SW and, NW-SE (see Figure 2, respectively row a, b, c and d). The dimensions of the courtyards inside the urban blocks vary between 10*10 m2 and 10*50 m2 with steps of 10 m.
i
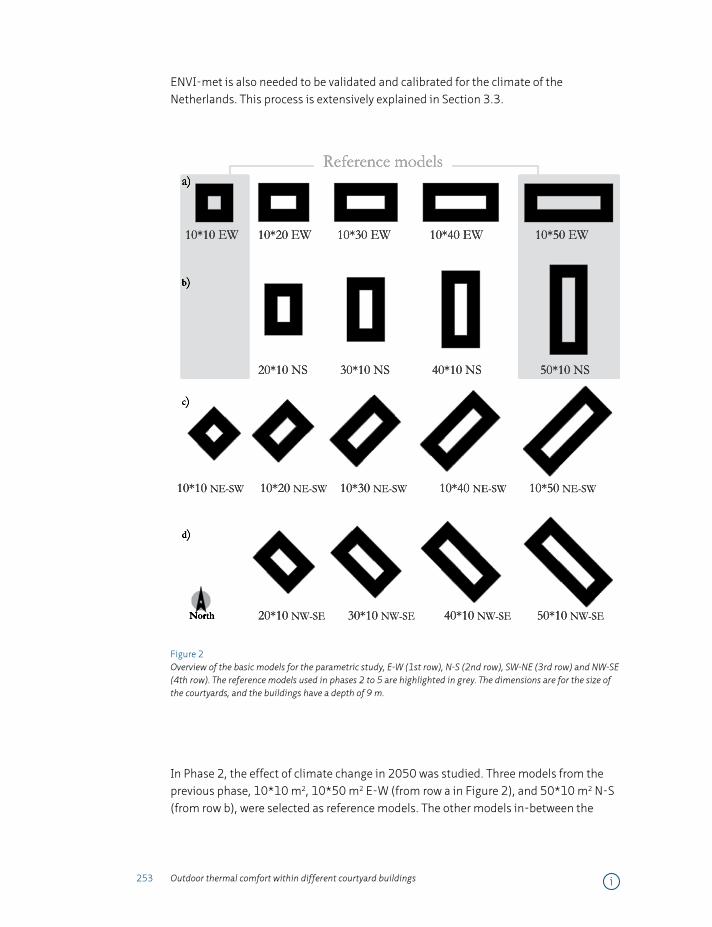
253 Outdoor thermal comfort within different courtyard buildings
ENVI-met is also needed to be validated and calibrated for the climate of the Netherlands. This process is extensively explained in Section 3.3.
North
Reference models
10*10 EW 10*20 EW 10*30 EW 10*40 EW 10*50 EW
10*10 NE-SW 10*20 NE-SW 10*30 NE-SW 10*40 NE-SW 10*50 NE-SW
a)
b)
c)
d)
20*10 NS 30*10 NS 40*10 NS 50*10 NS
20*10 NW-SE 30*10 NW-SE 40*10 NW-SE 50*10 NW-SE
Figure 2 Overview of the basic models for the parametric study, E-W (1st row), N-S (2nd row), SW-NE (3rd row) and NW-SE (4th row). The reference models used in phases 2 to 5 are highlighted in grey. The dimensions are for the size of the courtyards, and the buildings have a depth of 9 m.
In Phase 2, the effect of climate change in 2050 was studied. Three models from the previous phase, 10*10 m2, 10*50 m2 E-W (from row a in Figure 2), and 50*10 m2 N-S (from row b), were selected as reference models. The other models in-between the
i
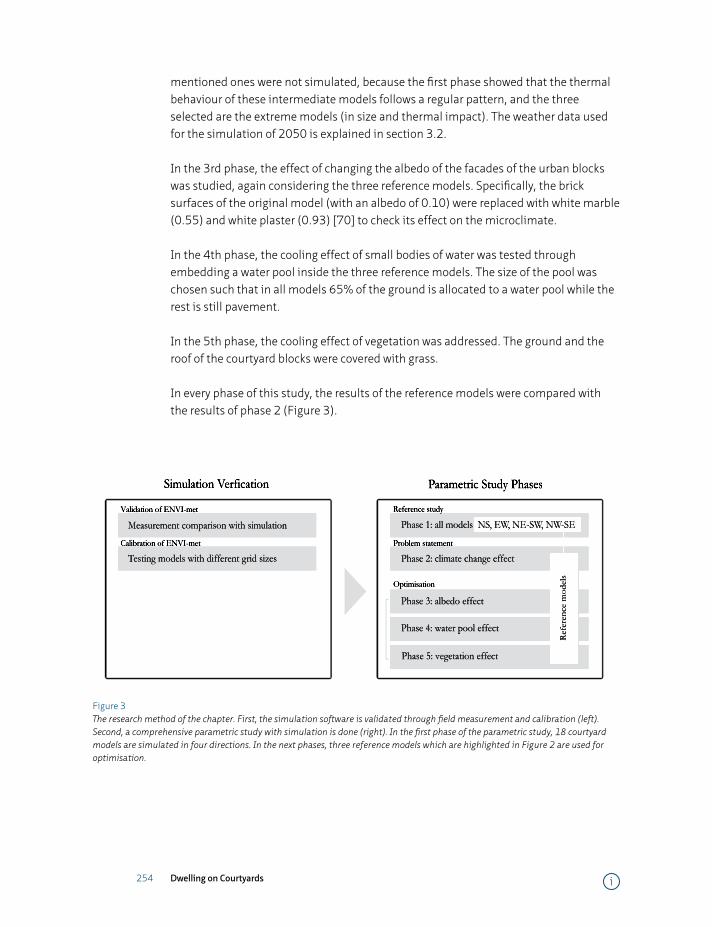
254 Dwelling on Courtyards
mentioned ones were not simulated, because the first phase showed that the thermal behaviour of these intermediate models follows a regular pattern, and the three selected are the extreme models (in size and thermal impact). The weather data used for the simulation of 2050 is explained in section 3.2.
In the 3rd phase, the effect of changing the albedo of the facades of the urban blocks was studied, again considering the three reference models. Specifically, the brick surfaces of the original model (with an albedo of 0.10) were replaced with white marble (0.55) and white plaster (0.93) [70] to check its effect on the microclimate.
In the 4th phase, the cooling effect of small bodies of water was tested through embedding a water pool inside the three reference models. The size of the pool was chosen such that in all models 65% of the ground is allocated to a water pool while the rest is still pavement.
In the 5th phase, the cooling effect of vegetation was addressed. The ground and the roof of the courtyard blocks were covered with grass.
In every phase of this study, the results of the reference models were compared with the results of phase 2 (Figure 3).
Simulation Verfication Parametric Study Phases
Phase 1: all models NS, EW, NE-SW, NW-SEMeasurement comparison with simulation
Phase 3: albedo effect
Phase 2: climate change effectTesting models with different grid sizes
Phase 4: water pool effect
Phase 5: vegetation effect
Optimisation
Problem statementCalibration of ENVI-met
Reference studyValidation of ENVI-met
Ref
eren
ce m
odel
s
Figure 3 The research method of the chapter. First, the simulation software is validated through field measurement and calibration (left). Second, a comprehensive parametric study with simulation is done (right). In the first phase of the parametric study, 18 courtyard models are simulated in four directions. In the next phases, three reference models which are highlighted in Figure 2 are used for optimisation.
i
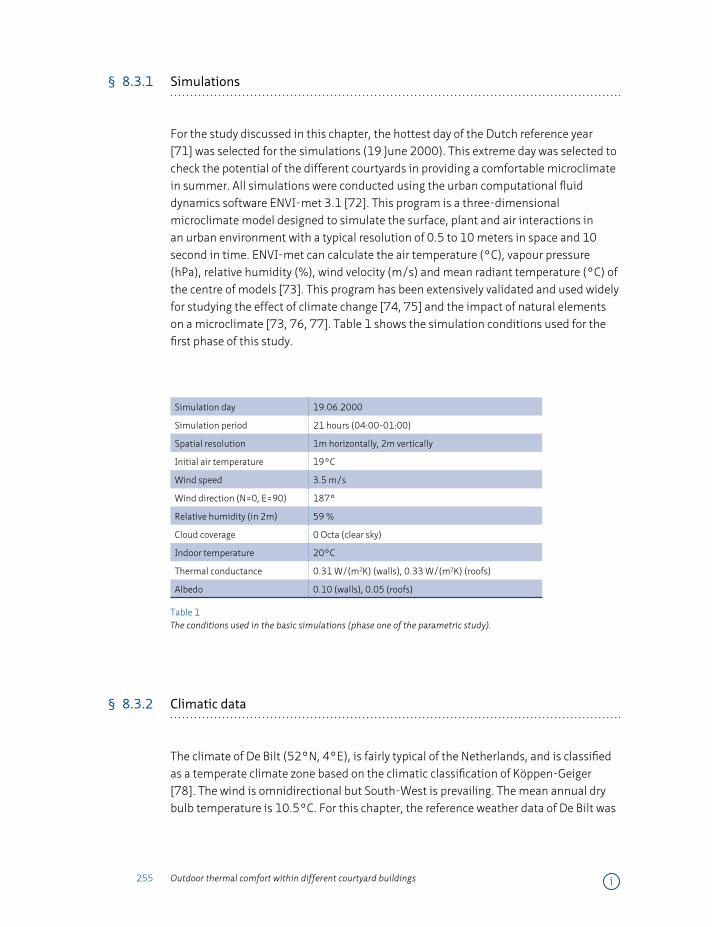
255 Outdoor thermal comfort within different courtyard buildings
§ 8.3.1 Simulations
For the study discussed in this chapter, the hottest day of the Dutch reference year [71] was selected for the simulations (19 June 2000). This extreme day was selected to check the potential of the different courtyards in providing a comfortable microclimate in summer. All simulations were conducted using the urban computational fluid dynamics software ENVI-met 3.1 [72]. This program is a three-dimensional microclimate model designed to simulate the surface, plant and air interactions in an urban environment with a typical resolution of 0.5 to 10 meters in space and 10 second in time. ENVI-met can calculate the air temperature (°C), vapour pressure (hPa), relative humidity (%), wind velocity (m/s) and mean radiant temperature (°C) of the centre of models [73]. This program has been extensively validated and used widely for studying the effect of climate change [74, 75] and the impact of natural elements on a microclimate [73, 76, 77]. Table 1 shows the simulation conditions used for the first phase of this study.
Simulation day 19.06.2000
Simulation period 21 hours (04:00-01:00)
Spatial resolution 1m horizontally, 2m vertically
Initial air temperature 19°C
Wind speed 3.5 m/s
Wind direction (N=0, E=90) 187°
Relative humidity (in 2m) 59 %
Cloud coverage 0 Octa (clear sky)
Indoor temperature 20°C
Thermal conductance 0.31 W/(m2K) (walls), 0.33 W/(m2K) (roofs)
Albedo 0.10 (walls), 0.05 (roofs)
Table 1 The conditions used in the basic simulations (phase one of the parametric study).
§ 8.3.2 Climatic data
The climate of De Bilt (52°N, 4°E), is fairly typical of the Netherlands, and is classified as a temperate climate zone based on the climatic classification of Köppen-Geiger [78]. The wind is omnidirectional but South-West is prevailing. The mean annual dry bulb temperature is 10.5°C. For this chapter, the reference weather data of De Bilt was
i
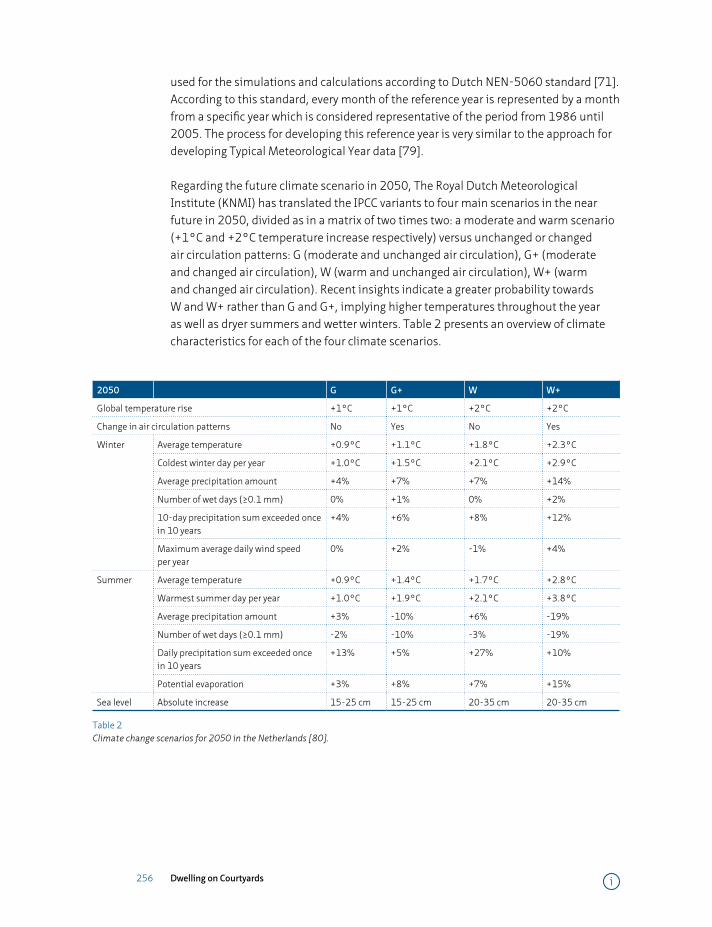
256 Dwelling on Courtyards
used for the simulations and calculations according to Dutch NEN-5060 standard [71]. According to this standard, every month of the reference year is represented by a month from a specific year which is considered representative of the period from 1986 until 2005. The process for developing this reference year is very similar to the approach for developing Typical Meteorological Year data [79].
Regarding the future climate scenario in 2050, The Royal Dutch Meteorological Institute (KNMI) has translated the IPCC variants to four main scenarios in the near future in 2050, divided as in a matrix of two times two: a moderate and warm scenario (+1°C and +2°C temperature increase respectively) versus unchanged or changed air circulation patterns: G (moderate and unchanged air circulation), G+ (moderate and changed air circulation), W (warm and unchanged air circulation), W+ (warm and changed air circulation). Recent insights indicate a greater probability towards W and W+ rather than G and G+, implying higher temperatures throughout the year as well as dryer summers and wetter winters. Table 2 presents an overview of climate characteristics for each of the four climate scenarios.
2050 G G+ W W+
Global temperature rise +1°C +1°C +2°C +2°C
Change in air circulation patterns No Yes No Yes
Winter Average temperature +0.9°C +1.1°C +1.8°C +2.3°C
Coldest winter day per year +1.0°C +1.5°C +2.1°C +2.9°C
Average precipitation amount +4% +7% +7% +14%
Number of wet days (≥0.1 mm) 0% +1% 0% +2%
10-day precipitation sum exceeded once in 10 years
+4% +6% +8% +12%
Maximum average daily wind speed per year
0% +2% -1% +4%
Summer Average temperature +0.9°C +1.4°C +1.7°C +2.8°C
Warmest summer day per year +1.0°C +1.9°C +2.1°C +3.8°C
Average precipitation amount +3% -10% +6% -19%
Number of wet days (≥0.1 mm) -2% -10% -3% -19%
Daily precipitation sum exceeded once in 10 years
+13% +5% +27% +10%
Potential evaporation +3% +8% +7% +15%
Sea level Absolute increase 15-25 cm 15-25 cm 20-35 cm 20-35 cm
Table 2 Climate change scenarios for 2050 in the Netherlands [80].
i
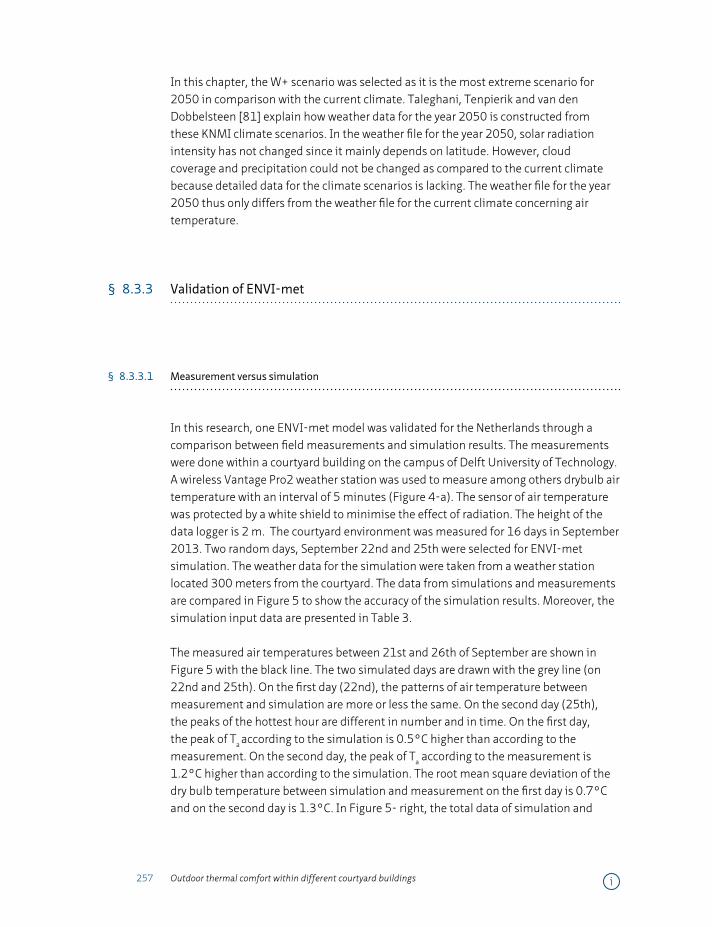
257 Outdoor thermal comfort within different courtyard buildings
In this chapter, the W+ scenario was selected as it is the most extreme scenario for 2050 in comparison with the current climate. Taleghani, Tenpierik and van den Dobbelsteen [81] explain how weather data for the year 2050 is constructed from these KNMI climate scenarios. In the weather file for the year 2050, solar radiation intensity has not changed since it mainly depends on latitude. However, cloud coverage and precipitation could not be changed as compared to the current climate because detailed data for the climate scenarios is lacking. The weather file for the year 2050 thus only differs from the weather file for the current climate concerning air temperature.
§ 8.3.3 Validation of ENVI-met
§ 8.3.3.1 Measurement versus simulation
In this research, one ENVI-met model was validated for the Netherlands through a comparison between field measurements and simulation results. The measurements were done within a courtyard building on the campus of Delft University of Technology. A wireless Vantage Pro2 weather station was used to measure among others drybulb air temperature with an interval of 5 minutes (Figure 4-a). The sensor of air temperature was protected by a white shield to minimise the effect of radiation. The height of the data logger is 2 m. The courtyard environment was measured for 16 days in September 2013. Two random days, September 22nd and 25th were selected for ENVI-met simulation. The weather data for the simulation were taken from a weather station located 300 meters from the courtyard. The data from simulations and measurements are compared in Figure 5 to show the accuracy of the simulation results. Moreover, the simulation input data are presented in Table 3.
The measured air temperatures between 21st and 26th of September are shown in Figure 5 with the black line. The two simulated days are drawn with the grey line (on 22nd and 25th). On the first day (22nd), the patterns of air temperature between measurement and simulation are more or less the same. On the second day (25th), the peaks of the hottest hour are different in number and in time. On the first day, the peak of Ta according to the simulation is 0.5°C higher than according to the measurement. On the second day, the peak of Ta according to the measurement is 1.2°C higher than according to the simulation. The root mean square deviation of the dry bulb temperature between simulation and measurement on the first day is 0.7°C and on the second day is 1.3°C. In Figure 5- right, the total data of simulation and
i
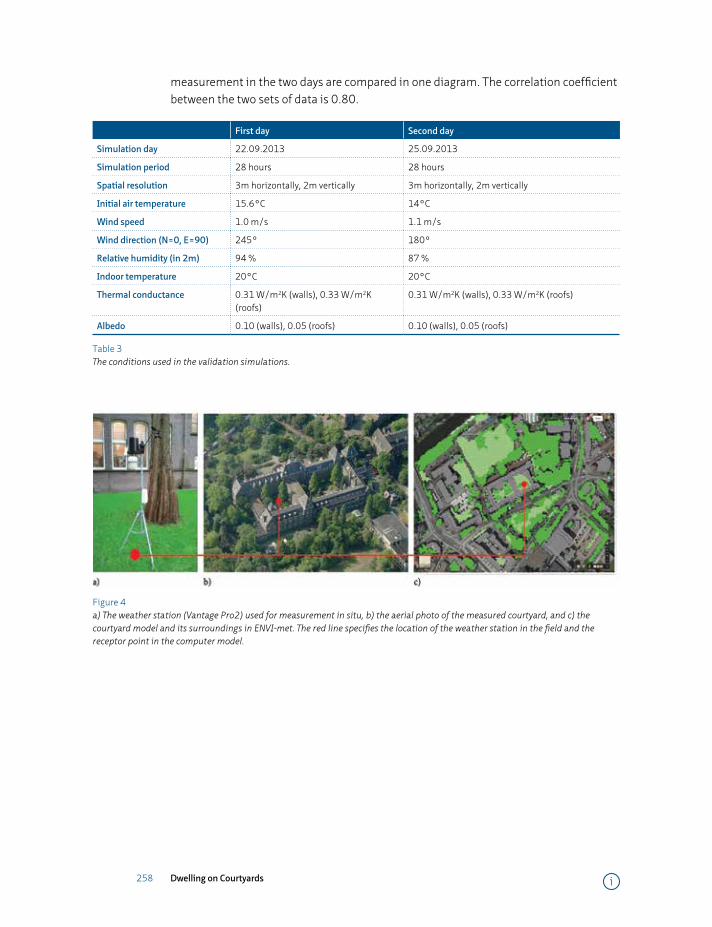
258 Dwelling on Courtyards
measurement in the two days are compared in one diagram. The correlation coefficient between the two sets of data is 0.80.
First day Second day
Simulation day 22.09.2013 25.09.2013
Simulation period 28 hours 28 hours
Spatial resolution 3m horizontally, 2m vertically 3m horizontally, 2m vertically
Initial air temperature 15.6°C 14°C
Wind speed 1.0 m/s 1.1 m/s
Wind direction (N=0, E=90) 245° 180°
Relative humidity (in 2m) 94 % 87 %
Indoor temperature 20°C 20°C
Thermal conductance 0.31 W/m2K (walls), 0.33 W/m2K (roofs)
0.31 W/m2K (walls), 0.33 W/m2K (roofs)
Albedo 0.10 (walls), 0.05 (roofs) 0.10 (walls), 0.05 (roofs)
Table 3 The conditions used in the validation simulations.
Figure 4 a) The weather station (Vantage Pro2) used for measurement in situ, b) the aerial photo of the measured courtyard, and c) the courtyard model and its surroundings in ENVI-met. The red line specifies the location of the weather station in the field and the receptor point in the computer model.
i
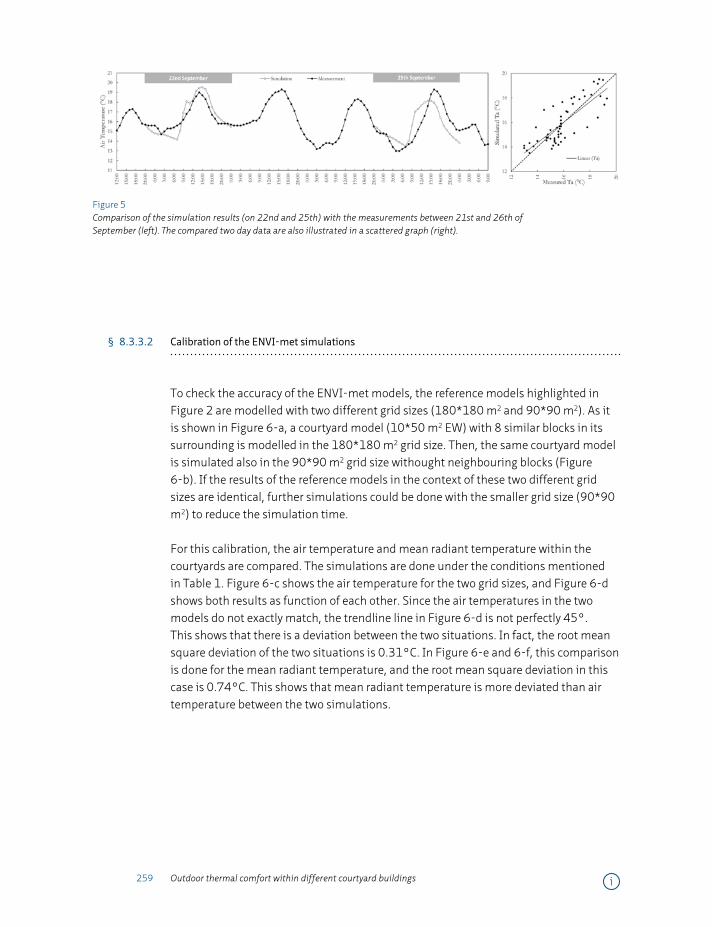
259 Outdoor thermal comfort within different courtyard buildings
Figure 5 Comparison of the simulation results (on 22nd and 25th) with the measurements between 21st and 26th of September (left). The compared two day data are also illustrated in a scattered graph (right).
§ 8.3.3.2 Calibration of the ENVI-met simulations
To check the accuracy of the ENVI-met models, the reference models highlighted in Figure 2 are modelled with two different grid sizes (180*180 m2 and 90*90 m2). As it is shown in Figure 6-a, a courtyard model (10*50 m2 EW) with 8 similar blocks in its surrounding is modelled in the 180*180 m2 grid size. Then, the same courtyard model is simulated also in the 90*90 m2 grid size withought neighbouring blocks (Figure 6-b). If the results of the reference models in the context of these two different grid sizes are identical, further simulations could be done with the smaller grid size (90*90 m2) to reduce the simulation time.
For this calibration, the air temperature and mean radiant temperature within the courtyards are compared. The simulations are done under the conditions mentioned in Table 1. Figure 6-c shows the air temperature for the two grid sizes, and Figure 6-d shows both results as function of each other. Since the air temperatures in the two models do not exactly match, the trendline line in Figure 6-d is not perfectly 45°. This shows that there is a deviation between the two situations. In fact, the root mean square deviation of the two situations is 0.31°C. In Figure 6-e and 6-f, this comparison is done for the mean radiant temperature, and the root mean square deviation in this case is 0.74°C. This shows that mean radiant temperature is more deviated than air temperature between the two simulations.
i
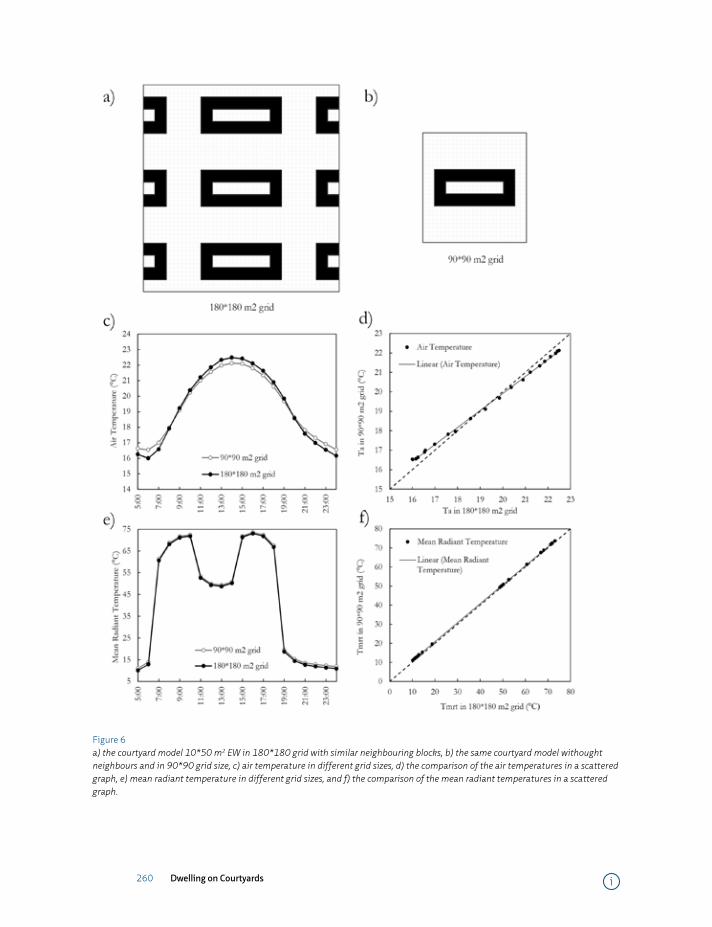
260 Dwelling on Courtyards
Figure 6 a) the courtyard model 10*50 m2 EW in 180*180 grid with similar neighbouring blocks, b) the same courtyard model withought neighbours and in 90*90 grid size, c) air temperature in different grid sizes, d) the comparison of the air temperatures in a scattered graph, e) mean radiant temperature in different grid sizes, and f) the comparison of the mean radiant temperatures in a scattered graph.
i
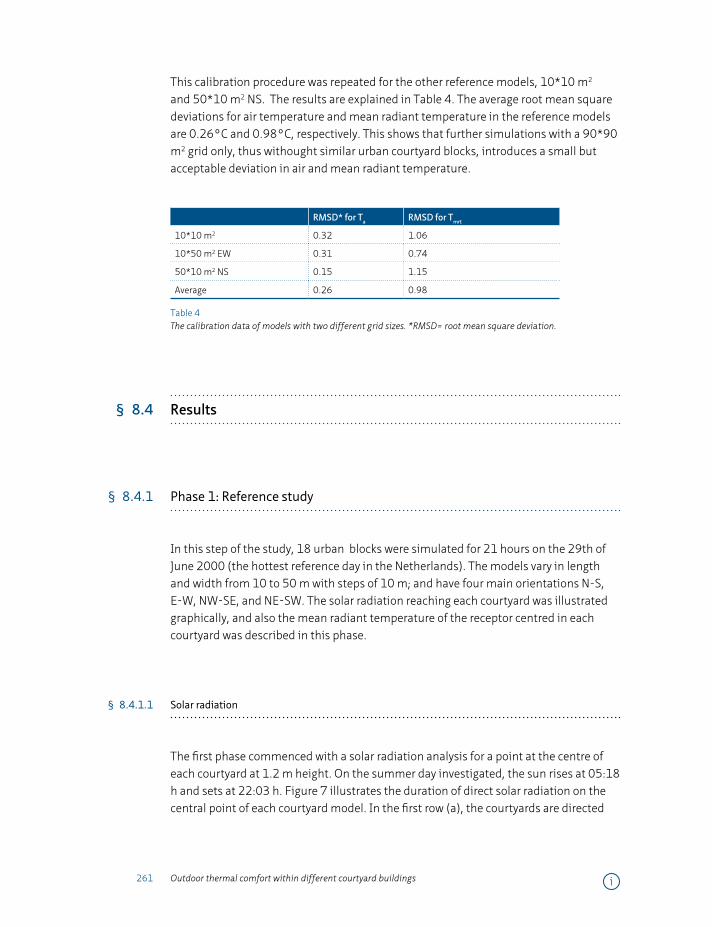
261 Outdoor thermal comfort within different courtyard buildings
This calibration procedure was repeated for the other reference models, 10*10 m2 and 50*10 m2 NS. The results are explained in Table 4. The average root mean square deviations for air temperature and mean radiant temperature in the reference models are 0.26°C and 0.98°C, respectively. This shows that further simulations with a 90*90 m2 grid only, thus withought similar urban courtyard blocks, introduces a small but acceptable deviation in air and mean radiant temperature.
RMSD* for Ta RMSD for Tmrt
10*10 m2 0.32 1.06
10*50 m2 EW 0.31 0.74
50*10 m2 NS 0.15 1.15
Average 0.26 0.98
Table 4 The calibration data of models with two different grid sizes. *RMSD= root mean square deviation.
§ 8.4 Results
§ 8.4.1 Phase 1: Reference study
In this step of the study, 18 urban blocks were simulated for 21 hours on the 29th of June 2000 (the hottest reference day in the Netherlands). The models vary in length and width from 10 to 50 m with steps of 10 m; and have four main orientations N-S, E-W, NW-SE, and NE-SW. The solar radiation reaching each courtyard was illustrated graphically, and also the mean radiant temperature of the receptor centred in each courtyard was described in this phase.
§ 8.4.1.1 Solar radiation
The first phase commenced with a solar radiation analysis for a point at the centre of each courtyard at 1.2 m height. On the summer day investigated, the sun rises at 05:18 h and sets at 22:03 h. Figure 7 illustrates the duration of direct solar radiation on the central point of each courtyard model. In the first row (a), the courtyards are directed
i

262 Dwelling on Courtyards
E-W. For this orientation, the duration of direct solar radiation increases from 4 hours and 32 minutes for the 10*10 m2 courtyard to 11 hours and 44 minutes for the 10*50 m2 E-W courtyard. Moreover, the first courtyard receives direct sun from 10:03 h till 14:35 h; the widest courtyard from 06:27 h till 18:11 h.
Regarding the second row (b), the courtyards are extended in N-S direction. In contrast to the previous urban blocks, the duration of direct solar radiation does not change if the size of the courtyard increases from 10*10 m2 to 10*50 m2; it is always 4 hours and 32 minutes. This shows that the east and west parts of the urban block are the main barriers against solar radiation.
In the third row (c), the urban blocks are rotated 45˚ towards NE-SW direction. Here, the courtyards are also extended from 10*10 m2 to 10*50 m2. The first rotated courtyard (10*10 m2) receives direct sun at midday for 3 hours and 2 minutes. For the remainder of the models, this duration is 5 hours and 13 minutes starting at 10:48 h and ending at 16:01 h (mainly in the afternoon rather than in the morning).
In contrast, the last row (d) with NW-SE orientation has the same duration of direct solar radiation but between 08:37 h and 13:50 h. Insolation for this orientation happens mainly in the morning rather than in the afternoon. The duration of direct sun is described in Table 6 (Appendix).
i
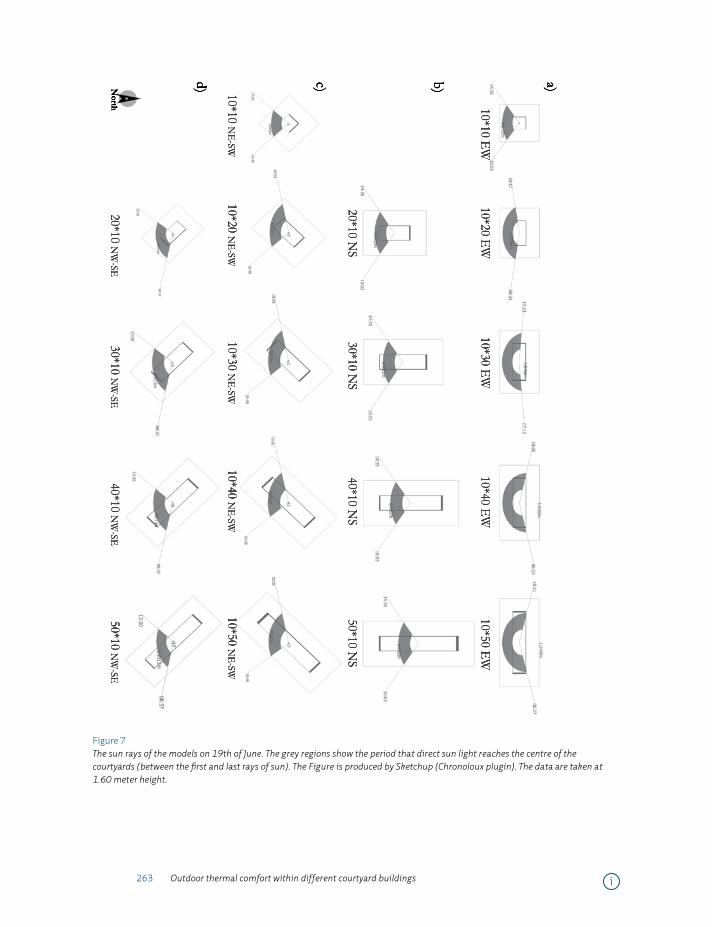
263 Outdoor thermal comfort within different courtyard buildings
a)b)c)d)North
10*10 NE-SW
10*20 NE-SW
10*30 NE-SW
10*40 NE-SW
10*50 NE-SW
20*10 NW
-SE 30*10 NW
-SE 40*10 NW
-SE 50*10 NW
-SE
20*10 NS 30*10 N
S 40*10 NS 50*10 N
S
10*10 EW 10*20 EW
10*30 EW 10*40 EW
10*50 EW
Figure 7 The sun rays of the models on 19th of June. The grey regions show the period that direct sun light reaches the centre of the courtyards (between the first and last rays of sun). The Figure is produced by Sketchup (Chronoloux plugin). The data are taken at 1.60 meter height.
i

264 Dwelling on Courtyards
Figure 8 Air temperature distribution of the urban block models at 16:00 h (time of peak temperature), on the 19th of June. The data are taken at 1.60 meter height.
i
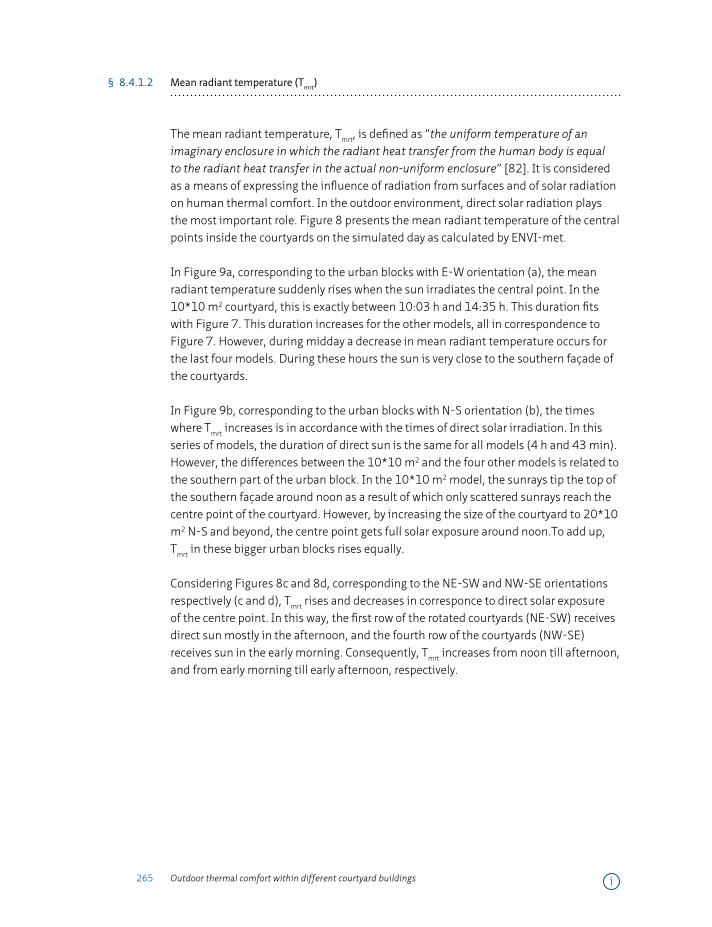
265 Outdoor thermal comfort within different courtyard buildings
§ 8.4.1.2 Mean radiant temperature (Tmrt)
The mean radiant temperature, Tmrt, is defined as “the uniform temperature of an imaginary enclosure in which the radiant heat transfer from the human body is equal to the radiant heat transfer in the actual non-uniform enclosure” [82]. It is considered as a means of expressing the influence of radiation from surfaces and of solar radiation on human thermal comfort. In the outdoor environment, direct solar radiation plays the most important role. Figure 8 presents the mean radiant temperature of the central points inside the courtyards on the simulated day as calculated by ENVI-met.
In Figure 9a, corresponding to the urban blocks with E-W orientation (a), the mean radiant temperature suddenly rises when the sun irradiates the central point. In the 10*10 m2 courtyard, this is exactly between 10:03 h and 14:35 h. This duration fits with Figure 7. This duration increases for the other models, all in correspondence to Figure 7. However, during midday a decrease in mean radiant temperature occurs for the last four models. During these hours the sun is very close to the southern façade of the courtyards.
In Figure 9b, corresponding to the urban blocks with N-S orientation (b), the times where Tmrt increases is in accordance with the times of direct solar irradiation. In this series of models, the duration of direct sun is the same for all models (4 h and 43 min). However, the differences between the 10*10 m2 and the four other models is related to the southern part of the urban block. In the 10*10 m2 model, the sunrays tip the top of the southern façade around noon as a result of which only scattered sunrays reach the centre point of the courtyard. However, by increasing the size of the courtyard to 20*10 m2 N-S and beyond, the centre point gets full solar exposure around noon.To add up, Tmrt in these bigger urban blocks rises equally.
Considering Figures 8c and 8d, corresponding to the NE-SW and NW-SE orientations respectively (c and d), Tmrt rises and decreases in corresponce to direct solar exposure of the centre point. In this way, the first row of the rotated courtyards (NE-SW) receives direct sun mostly in the afternoon, and the fourth row of the courtyards (NW-SE) receives sun in the early morning. Consequently, Tmrt increases from noon till afternoon, and from early morning till early afternoon, respectively.
i
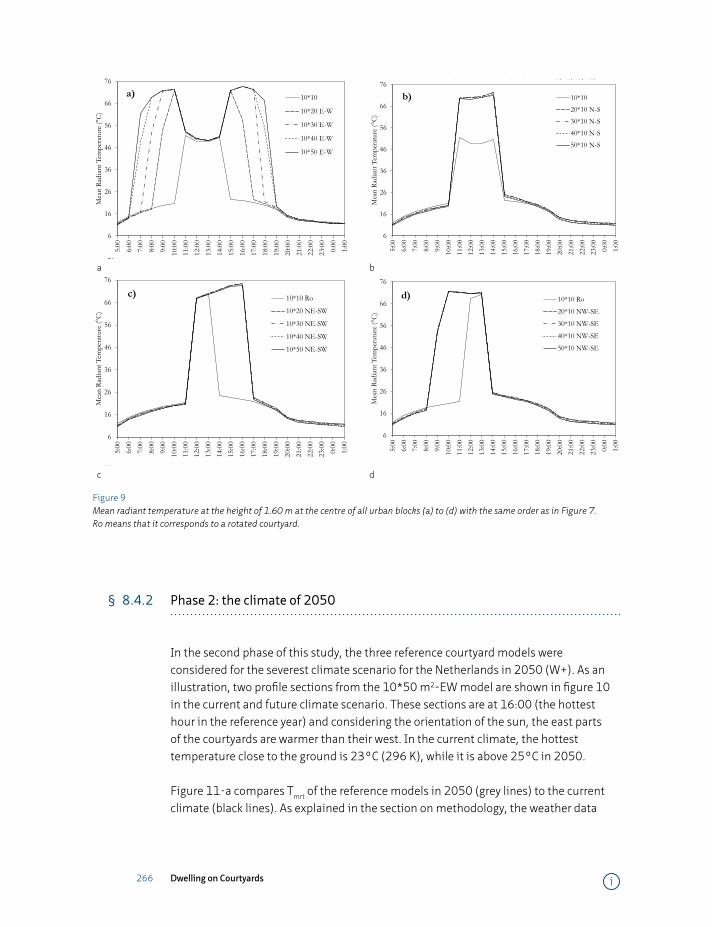
266 Dwelling on Courtyards
Time 10*10 10*20 E-W 10*30 E-W 10*40 E-W 10*50 E-W 20*10 N-S 30*10 N-S 40*10 N-S 50*10 N-S5:00 12 12 11 11 11.1 11.4 11.2 11.0 10.86:00 15 14 14 14 13.9 14.2 14.1 13.9 13.57:00 17 17 16 49 61.3 16.4 16.2 16.0 15.68:00 19 18 53 69 68.8 17.9 17.8 17.7 17.39:00 20 54 71 72 71.8 19.2 19.0 19.0 18.6
10:00 21 72 72 72 72.4 20.2 20.1 20.1 19.711:00 51 53 53 53 53.3 69.8 69.7 69.8 69.412:00 49 50 50 50 50.0 69.9 69.9 70.0 69.313:00 49 49 49 49 49.3 70.5 70.5 69.9 69.814:00 50 51 51 51 50.8 72.1 72.1 70.8 71.415:00 22 72 72 72 71.9 25.3 25.3 24.6 24.416:00 22 59 74 74 73.6 23.5 23.5 23.1 22.717:00 21 23 73 73 72.5 22.1 22.0 21.8 21.318:00 20 21 22 55 67.6 20.4 20.3 20.2 19.619:00 18 18 19 19 19.5 18.2 18.0 17.9 17.320:00 14 15 15 15 15.3 14.6 14.4 13.9 13.721:00 13 13 13 13 13.5 13.1 12.9 12.3 12.222:00 13 13 13 13 12.8 12.5 12.4 11.8 11.723:00 12 12 12 12 12.3 12.1 11.9 11.6 11.3
0:00 12 12 12 12 11.9 11.8 11.6 11.4 11.01:00 12 12 12 12 11.5 11.5 11.3 11.1 10.7
Tmr (_C)10*10 Ro 10*20 NE-SW10*30 NE-SW10*40 NE-SW10*50 NE-SW20*10 NW-SE30*10 NW-SE40*10 NW-SE50*10 NW-SE
12 11 11 11 10.8 11.4 11.2 11.0 10.915 14 14 14 13.6 14.3 14.0 13.8 13.717 16 16 16 15.8 16.5 16.2 15.9 15.918 18 18 18 17.4 18.0 17.8 17.6 17.520 19 19 19 18.8 53.8 53.6 53.5 53.521 20 20 20 19.8 71.3 71.6 71.5 71.521 21 21 21 20.7 71.2 71.3 71.2 71.168 68 68 68 67.7 70.7 70.8 70.6 70.570 70 70 70 69.4 71.1 71.1 70.9 70.825 72 72 72 71.3 25.4 25.4 25.1 24.924 74 74 73 73.1 24.1 24.0 23.8 23.623 74 74 74 73.8 23.1 23.0 22.7 22.522 24 24 23 22.8 21.9 21.7 21.5 21.320 21 21 21 20.5 20.3 20.2 19.8 19.718 19 19 18 17.9 18.1 17.9 17.6 17.415 15 15 14 14.1 14.5 14.3 14.0 13.813 13 13 13 12.6 13.0 12.8 12.5 12.313 13 13 12 12.0 12.5 12.3 12.0 11.812 12 12 12 11.5 12.1 11.9 11.6 11.412 12 12 11 11.2 11.8 11.6 11.2 11.112 12 11 11 10.8 11.5 11.3 11.0 10.8
6
16
26
36
46
56
66
76
5:00
6:00
7:00
8:00
9:00
10:0
011
:00
12:0
013
:00
14:0
015
:00
16:0
017
:00
18:0
019
:00
20:0
021
:00
22:0
023
:00
0:00
1:00
Mea
n Ra
dian
t Tem
pera
ture
(°C)
10*10
10*20 E-W
10*30 E-W
10*40 E-W
10*50 E-W
a)
6
16
26
36
46
56
66
76
5:00
6:00
7:00
8:00
9:00
10:0
011
:00
12:0
013
:00
14:0
015
:00
16:0
017
:00
18:0
019
:00
20:0
021
:00
22:0
023
:00
0:00
1:00
Mea
n Ra
dian
t Tem
pera
ture
(°C)
10*10
20*10 N-S
30*10 N-S
40*10 N-S
50*10 N-S
b)
6
16
26
36
46
56
66
76
5:00
6:00
7:00
8:00
9:00
10:0
011
:00
12:0
013
:00
14:0
015
:00
16:0
017
:00
18:0
019
:00
20:0
021
:00
22:0
023
:00
0:00
1:00
Mea
n Ra
dian
t Tem
pera
ture
(°C)
10*10 Ro
10*20 NE-SW
10*30 NE-SW
10*40 NE-SW
10*50 NE-SW
c)
6
16
26
36
46
56
66
76
5:00
6:00
7:00
8:00
9:00
10:0
011
:00
12:0
013
:00
14:0
015
:00
16:0
017
:00
18:0
019
:00
20:0
021
:00
22:0
023
:00
0:00
1:00
Mea
n Ra
dian
t Tem
pera
ture
(°C)
10*10 Ro
20*10 NW-SE
30*10 NW-SE
40*10 NW-SE
50*10 NW-SE
d)
a b
Time 10*10 10*20 E-W 10*30 E-W 10*40 E-W 10*50 E-W 20*10 N-S 30*10 N-S 40*10 N-S 50*10 N-S5:00 12 12 11 11 11.1 11.4 11.2 11.0 10.86:00 15 14 14 14 13.9 14.2 14.1 13.9 13.57:00 17 17 16 49 61.3 16.4 16.2 16.0 15.68:00 19 18 53 69 68.8 17.9 17.8 17.7 17.39:00 20 54 71 72 71.8 19.2 19.0 19.0 18.6
10:00 21 72 72 72 72.4 20.2 20.1 20.1 19.711:00 51 53 53 53 53.3 69.8 69.7 69.8 69.412:00 49 50 50 50 50.0 69.9 69.9 70.0 69.313:00 49 49 49 49 49.3 70.5 70.5 69.9 69.814:00 50 51 51 51 50.8 72.1 72.1 70.8 71.415:00 22 72 72 72 71.9 25.3 25.3 24.6 24.416:00 22 59 74 74 73.6 23.5 23.5 23.1 22.717:00 21 23 73 73 72.5 22.1 22.0 21.8 21.318:00 20 21 22 55 67.6 20.4 20.3 20.2 19.619:00 18 18 19 19 19.5 18.2 18.0 17.9 17.320:00 14 15 15 15 15.3 14.6 14.4 13.9 13.721:00 13 13 13 13 13.5 13.1 12.9 12.3 12.222:00 13 13 13 13 12.8 12.5 12.4 11.8 11.723:00 12 12 12 12 12.3 12.1 11.9 11.6 11.3
0:00 12 12 12 12 11.9 11.8 11.6 11.4 11.01:00 12 12 12 12 11.5 11.5 11.3 11.1 10.7
Tmr (_C)10*10 Ro 10*20 NE-SW10*30 NE-SW10*40 NE-SW10*50 NE-SW20*10 NW-SE30*10 NW-SE40*10 NW-SE50*10 NW-SE
12 11 11 11 10.8 11.4 11.2 11.0 10.915 14 14 14 13.6 14.3 14.0 13.8 13.717 16 16 16 15.8 16.5 16.2 15.9 15.918 18 18 18 17.4 18.0 17.8 17.6 17.520 19 19 19 18.8 53.8 53.6 53.5 53.521 20 20 20 19.8 71.3 71.6 71.5 71.521 21 21 21 20.7 71.2 71.3 71.2 71.168 68 68 68 67.7 70.7 70.8 70.6 70.570 70 70 70 69.4 71.1 71.1 70.9 70.825 72 72 72 71.3 25.4 25.4 25.1 24.924 74 74 73 73.1 24.1 24.0 23.8 23.623 74 74 74 73.8 23.1 23.0 22.7 22.522 24 24 23 22.8 21.9 21.7 21.5 21.320 21 21 21 20.5 20.3 20.2 19.8 19.718 19 19 18 17.9 18.1 17.9 17.6 17.415 15 15 14 14.1 14.5 14.3 14.0 13.813 13 13 13 12.6 13.0 12.8 12.5 12.313 13 13 12 12.0 12.5 12.3 12.0 11.812 12 12 12 11.5 12.1 11.9 11.6 11.412 12 12 11 11.2 11.8 11.6 11.2 11.112 12 11 11 10.8 11.5 11.3 11.0 10.8
6
16
26
36
46
56
66
76
5:00
6:00
7:00
8:00
9:00
10:0
011
:00
12:0
013
:00
14:0
015
:00
16:0
017
:00
18:0
019
:00
20:0
021
:00
22:0
023
:00
0:00
1:00
Mea
n Ra
dian
t Tem
pera
ture
(°C
)
10*10
10*20 E-W
10*30 E-W
10*40 E-W
10*50 E-W
a)
6
16
26
36
46
56
66
76
5:00
6:00
7:00
8:00
9:00
10:0
011
:00
12:0
013
:00
14:0
015
:00
16:0
017
:00
18:0
019
:00
20:0
021
:00
22:0
023
:00
0:00
1:00
Mea
n Ra
dian
t Tem
pera
ture
(°C
) 10*10
20*10 N-S
30*10 N-S
40*10 N-S
50*10 N-S
b)
6
16
26
36
46
56
66
76
5:00
6:00
7:00
8:00
9:00
10:0
011
:00
12:0
013
:00
14:0
015
:00
16:0
017
:00
18:0
019
:00
20:0
021
:00
22:0
023
:00
0:00
1:00
Mea
n Ra
dian
t Tem
pera
ture
(°C
)
10*10 Ro
10*20 NE-SW
10*30 NE-SW
10*40 NE-SW
10*50 NE-SW
c)
6
16
26
36
46
56
66
76
5:00
6:00
7:00
8:00
9:00
10:0
011
:00
12:0
013
:00
14:0
015
:00
16:0
017
:00
18:0
019
:00
20:0
021
:00
22:0
023
:00
0:00
1:00
Mea
n Ra
dian
t Tem
pera
ture
(°C
)
10*10 Ro
20*10 NW-SE
30*10 NW-SE
40*10 NW-SE
50*10 NW-SE
d)
Time 10*10 10*20 E-W 10*30 E-W 10*40 E-W 10*50 E-W 20*10 N-S 30*10 N-S 40*10 N-S 50*10 N-S5:00 12 12 11 11 11.1 11.4 11.2 11.0 10.86:00 15 14 14 14 13.9 14.2 14.1 13.9 13.57:00 17 17 16 49 61.3 16.4 16.2 16.0 15.68:00 19 18 53 69 68.8 17.9 17.8 17.7 17.39:00 20 54 71 72 71.8 19.2 19.0 19.0 18.6
10:00 21 72 72 72 72.4 20.2 20.1 20.1 19.711:00 51 53 53 53 53.3 69.8 69.7 69.8 69.412:00 49 50 50 50 50.0 69.9 69.9 70.0 69.313:00 49 49 49 49 49.3 70.5 70.5 69.9 69.814:00 50 51 51 51 50.8 72.1 72.1 70.8 71.415:00 22 72 72 72 71.9 25.3 25.3 24.6 24.416:00 22 59 74 74 73.6 23.5 23.5 23.1 22.717:00 21 23 73 73 72.5 22.1 22.0 21.8 21.318:00 20 21 22 55 67.6 20.4 20.3 20.2 19.619:00 18 18 19 19 19.5 18.2 18.0 17.9 17.320:00 14 15 15 15 15.3 14.6 14.4 13.9 13.721:00 13 13 13 13 13.5 13.1 12.9 12.3 12.222:00 13 13 13 13 12.8 12.5 12.4 11.8 11.723:00 12 12 12 12 12.3 12.1 11.9 11.6 11.3
0:00 12 12 12 12 11.9 11.8 11.6 11.4 11.01:00 12 12 12 12 11.5 11.5 11.3 11.1 10.7
Tmr (_C)10*10 Ro 10*20 NE-SW10*30 NE-SW10*40 NE-SW10*50 NE-SW20*10 NW-SE30*10 NW-SE40*10 NW-SE50*10 NW-SE
12 11 11 11 10.8 11.4 11.2 11.0 10.915 14 14 14 13.6 14.3 14.0 13.8 13.717 16 16 16 15.8 16.5 16.2 15.9 15.918 18 18 18 17.4 18.0 17.8 17.6 17.520 19 19 19 18.8 53.8 53.6 53.5 53.521 20 20 20 19.8 71.3 71.6 71.5 71.521 21 21 21 20.7 71.2 71.3 71.2 71.168 68 68 68 67.7 70.7 70.8 70.6 70.570 70 70 70 69.4 71.1 71.1 70.9 70.825 72 72 72 71.3 25.4 25.4 25.1 24.924 74 74 73 73.1 24.1 24.0 23.8 23.623 74 74 74 73.8 23.1 23.0 22.7 22.522 24 24 23 22.8 21.9 21.7 21.5 21.320 21 21 21 20.5 20.3 20.2 19.8 19.718 19 19 18 17.9 18.1 17.9 17.6 17.415 15 15 14 14.1 14.5 14.3 14.0 13.813 13 13 13 12.6 13.0 12.8 12.5 12.313 13 13 12 12.0 12.5 12.3 12.0 11.812 12 12 12 11.5 12.1 11.9 11.6 11.412 12 12 11 11.2 11.8 11.6 11.2 11.112 12 11 11 10.8 11.5 11.3 11.0 10.8
6
16
26
36
46
56
66
76
5:00
6:00
7:00
8:00
9:00
10:0
011
:00
12:0
013
:00
14:0
015
:00
16:0
017
:00
18:0
019
:00
20:0
021
:00
22:0
023
:00
0:00
1:00
Mea
n Ra
dian
t Tem
pera
ture
(°C)
10*10
10*20 E-W
10*30 E-W
10*40 E-W
10*50 E-W
a)
6
16
26
36
46
56
66
76
5:00
6:00
7:00
8:00
9:00
10:0
011
:00
12:0
013
:00
14:0
015
:00
16:0
017
:00
18:0
019
:00
20:0
021
:00
22:0
023
:00
0:00
1:00
Mea
n Ra
dian
t Tem
pera
ture
(°C)
10*10
20*10 N-S
30*10 N-S
40*10 N-S
50*10 N-S
b)
6
16
26
36
46
56
66
76
5:00
6:00
7:00
8:00
9:00
10:0
011
:00
12:0
013
:00
14:0
015
:00
16:0
017
:00
18:0
019
:00
20:0
021
:00
22:0
023
:00
0:00
1:00
Mea
n Ra
dian
t Tem
pera
ture
(°C)
10*10 Ro
10*20 NE-SW
10*30 NE-SW
10*40 NE-SW
10*50 NE-SW
c)
6
16
26
36
46
56
66
76
5:00
6:00
7:00
8:00
9:00
10:0
011
:00
12:0
013
:00
14:0
015
:00
16:0
017
:00
18:0
019
:00
20:0
021
:00
22:0
023
:00
0:00
1:00
Mea
n Ra
dian
t Tem
pera
ture
(°C)
10*10 Ro
20*10 NW-SE
30*10 NW-SE
40*10 NW-SE
50*10 NW-SE
d)
c d
Figure 9 Mean radiant temperature at the height of 1.60 m at the centre of all urban blocks (a) to (d) with the same order as in Figure 7. Ro means that it corresponds to a rotated courtyard.
§ 8.4.2 Phase 2: the climate of 2050
In the second phase of this study, the three reference courtyard models were considered for the severest climate scenario for the Netherlands in 2050 (W+). As an illustration, two profile sections from the 10*50 m2-EW model are shown in figure 10 in the current and future climate scenario. These sections are at 16:00 (the hottest hour in the reference year) and considering the orientation of the sun, the east parts of the courtyards are warmer than their west. In the current climate, the hottest temperature close to the ground is 23°C (296 K), while it is above 25°C in 2050.
Figure 11-a compares Tmrt of the reference models in 2050 (grey lines) to the current climate (black lines). As explained in the section on methodology, the weather data
i
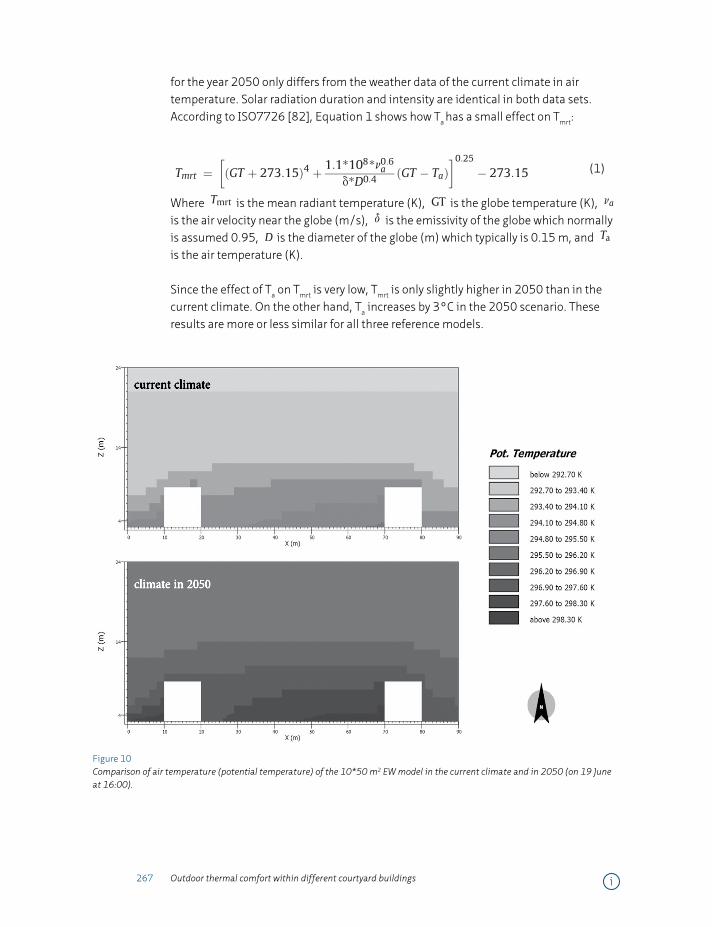
267 Outdoor thermal comfort within different courtyard buildings
for the year 2050 only differs from the weather data of the current climate in air temperature. Solar radiation duration and intensity are identical in both data sets. According to ISO7726 [82], Equation 1 shows how Ta has a small effect on Tmrt:
vegetation. Trees and deciduous trees in particular can protectspaces from direct sun in summer and allow solar radiation inwinter. Vegetation also has a low heat capacity. Referring back tothe PET which illustrates thermal comfort, it increases in the af-ternoon. This is because the heat stored during the day is releasedto the air during the afternoon and evening.More investigations areneeded to show whether green areas with a lower heat capacity(over construction materials) can minimise the canyontemperature.
Appendix
Mean radiant temperature is calculated by ENVI-met. This factorsums up all short and long wave radiation fluxes (direct and
reflected) on a specific point. This parameter is calculated with thefollowing equation:
Tmrt ¼�ðGT þ 273:15Þ4 þ 1:1*108*n0:6a
d*D0:4 ðGT � TaÞ�0:25
� 273:15
(4)
where
Tmrt is the mean radiant temperature (K),GT is the globe temperature (K),na is the air velocity near the globe (m/s),d is the emissivity of the globe which normally is assumed 0.95,D is the diameter of the globe (m) which typically is 0.15 m, andTa is the air temperature (K).
ENVI-met, the software tool used for this paper, divides thesurrounding enclosure into “n” isothermal surfaces. The equationused by ENVI-met for calculating Tmrt is Ali-Toudert and Mayer[53]:
Tmrt ¼"1s
Xn
i¼1
EiFi þak3p
Xn
i¼1
DiFi þak3pfpI
!#0:25(5)
where
Ei is the long wave radiation (W),Di is the diffuse and diffusely reflected short wave radiation (W),
Fig. 11. Mean radiant temperatures (Tmrt) at the reference points.
Table 6Averages of the microclimates properties.* ¼ The sum of slightly cool, comfortableand slightly warm hours.
SingularEeW
SingularNeS
LinearEeW
Linear NeS Courtyard
SVF 0.605 0.605 0.404 0.404 0.194Average Ta (�C) 19.3 19.2 19.1 18.9 19.0Average Tmrt (�C) 43.5 45.8 41.6 25.1 22.9Standard deviation
of Tmrt (�C)28.8 28.3 26.0 21.4 13.5
Average wind (m/s) 2.6 1.7 0.5 2.7 0.2PET 23.5 26.4 27.2 17 20.8Comfortable hours* 3 2 4 8 17
15
16
17
18
19
20
21
22
23
5:00
6:00
7:00
8:00
9:00
10:0
0
11:0
0
12:0
0
13:0
0
14:0
0
15:0
0
16:0
0
17:0
0
18:0
0
19:0
0
20:0
0
21:0
0
22:0
0
23:0
0
0:00
1:00
Air
Tem
pera
ture
(°C)
Singular E-W Singular N-S Linear E-W Linear N-S Courtyard
Fig. 12. Air temperatures (Ta) at the reference points.
M. Taleghani et al. / Building and Environment xxx (2014) 1e14 11
Please cite this article in press as: Taleghani M, et al., Outdoor thermal comfort within five different urban forms in the Netherlands, Buildingand Environment (2014), http://dx.doi.org/10.1016/j.buildenv.2014.03.014
(1)
Where
vegetation. Trees and deciduous trees in particular can protectspaces from direct sun in summer and allow solar radiation inwinter. Vegetation also has a low heat capacity. Referring back tothe PET which illustrates thermal comfort, it increases in the af-ternoon. This is because the heat stored during the day is releasedto the air during the afternoon and evening.More investigations areneeded to show whether green areas with a lower heat capacity(over construction materials) can minimise the canyontemperature.
Appendix
Mean radiant temperature is calculated by ENVI-met. This factorsums up all short and long wave radiation fluxes (direct and
reflected) on a specific point. This parameter is calculated with thefollowing equation:
Tmrt ¼�ðGT þ 273:15Þ4 þ 1:1*108*n0:6a
d*D0:4 ðGT � TaÞ�0:25
� 273:15
(4)
where
Tmrt is the mean radiant temperature (K),GT is the globe temperature (K),na is the air velocity near the globe (m/s),d is the emissivity of the globe which normally is assumed 0.95,D is the diameter of the globe (m) which typically is 0.15 m, andTa is the air temperature (K).
ENVI-met, the software tool used for this paper, divides thesurrounding enclosure into “n” isothermal surfaces. The equationused by ENVI-met for calculating Tmrt is Ali-Toudert and Mayer[53]:
Tmrt ¼"1s
Xn
i¼1
EiFi þak3p
Xn
i¼1
DiFi þak3pfpI
!#0:25(5)
where
Ei is the long wave radiation (W),Di is the diffuse and diffusely reflected short wave radiation (W),
Fig. 11. Mean radiant temperatures (Tmrt) at the reference points.
Table 6Averages of the microclimates properties.* ¼ The sum of slightly cool, comfortableand slightly warm hours.
SingularEeW
SingularNeS
LinearEeW
Linear NeS Courtyard
SVF 0.605 0.605 0.404 0.404 0.194Average Ta (�C) 19.3 19.2 19.1 18.9 19.0Average Tmrt (�C) 43.5 45.8 41.6 25.1 22.9Standard deviation
of Tmrt (�C)28.8 28.3 26.0 21.4 13.5
Average wind (m/s) 2.6 1.7 0.5 2.7 0.2PET 23.5 26.4 27.2 17 20.8Comfortable hours* 3 2 4 8 17
15
16
17
18
19
20
21
22
23
5:00
6:00
7:00
8:00
9:00
10:0
0
11:0
0
12:0
0
13:0
0
14:0
0
15:0
0
16:0
0
17:0
0
18:0
0
19:0
0
20:0
0
21:0
0
22:0
0
23:0
0
0:00
1:00
Air
Tem
pera
ture
(°C)
Singular E-W Singular N-S Linear E-W Linear N-S Courtyard
Fig. 12. Air temperatures (Ta) at the reference points.
M. Taleghani et al. / Building and Environment xxx (2014) 1e14 11
Please cite this article in press as: Taleghani M, et al., Outdoor thermal comfort within five different urban forms in the Netherlands, Buildingand Environment (2014), http://dx.doi.org/10.1016/j.buildenv.2014.03.014
is the mean radiant temperature (K),
vegetation. Trees and deciduous trees in particular can protectspaces from direct sun in summer and allow solar radiation inwinter. Vegetation also has a low heat capacity. Referring back tothe PET which illustrates thermal comfort, it increases in the af-ternoon. This is because the heat stored during the day is releasedto the air during the afternoon and evening.More investigations areneeded to show whether green areas with a lower heat capacity(over construction materials) can minimise the canyontemperature.
Appendix
Mean radiant temperature is calculated by ENVI-met. This factorsums up all short and long wave radiation fluxes (direct and
reflected) on a specific point. This parameter is calculated with thefollowing equation:
Tmrt ¼�ðGT þ 273:15Þ4 þ 1:1*108*n0:6a
d*D0:4 ðGT � TaÞ�0:25
� 273:15
(4)
where
Tmrt is the mean radiant temperature (K),GT is the globe temperature (K),na is the air velocity near the globe (m/s),d is the emissivity of the globe which normally is assumed 0.95,D is the diameter of the globe (m) which typically is 0.15 m, andTa is the air temperature (K).
ENVI-met, the software tool used for this paper, divides thesurrounding enclosure into “n” isothermal surfaces. The equationused by ENVI-met for calculating Tmrt is Ali-Toudert and Mayer[53]:
Tmrt ¼"1s
Xn
i¼1
EiFi þak3p
Xn
i¼1
DiFi þak3pfpI
!#0:25(5)
where
Ei is the long wave radiation (W),Di is the diffuse and diffusely reflected short wave radiation (W),
Fig. 11. Mean radiant temperatures (Tmrt) at the reference points.
Table 6Averages of the microclimates properties.* ¼ The sum of slightly cool, comfortableand slightly warm hours.
SingularEeW
SingularNeS
LinearEeW
Linear NeS Courtyard
SVF 0.605 0.605 0.404 0.404 0.194Average Ta (�C) 19.3 19.2 19.1 18.9 19.0Average Tmrt (�C) 43.5 45.8 41.6 25.1 22.9Standard deviation
of Tmrt (�C)28.8 28.3 26.0 21.4 13.5
Average wind (m/s) 2.6 1.7 0.5 2.7 0.2PET 23.5 26.4 27.2 17 20.8Comfortable hours* 3 2 4 8 17
15
16
17
18
19
20
21
22
23
5:00
6:00
7:00
8:00
9:00
10:0
0
11:0
0
12:0
0
13:0
0
14:0
0
15:0
0
16:0
0
17:0
0
18:0
0
19:0
0
20:0
0
21:0
0
22:0
0
23:0
0
0:00
1:00
Air
Tem
pera
ture
(°C)
Singular E-W Singular N-S Linear E-W Linear N-S Courtyard
Fig. 12. Air temperatures (Ta) at the reference points.
M. Taleghani et al. / Building and Environment xxx (2014) 1e14 11
Please cite this article in press as: Taleghani M, et al., Outdoor thermal comfort within five different urban forms in the Netherlands, Buildingand Environment (2014), http://dx.doi.org/10.1016/j.buildenv.2014.03.014
is the globe temperature (K),
vegetation. Trees and deciduous trees in particular can protectspaces from direct sun in summer and allow solar radiation inwinter. Vegetation also has a low heat capacity. Referring back tothe PET which illustrates thermal comfort, it increases in the af-ternoon. This is because the heat stored during the day is releasedto the air during the afternoon and evening.More investigations areneeded to show whether green areas with a lower heat capacity(over construction materials) can minimise the canyontemperature.
Appendix
Mean radiant temperature is calculated by ENVI-met. This factorsums up all short and long wave radiation fluxes (direct and
reflected) on a specific point. This parameter is calculated with thefollowing equation:
Tmrt ¼�ðGT þ 273:15Þ4 þ 1:1*108*n0:6a
d*D0:4 ðGT � TaÞ�0:25
� 273:15
(4)
where
Tmrt is the mean radiant temperature (K),GT is the globe temperature (K),na is the air velocity near the globe (m/s),d is the emissivity of the globe which normally is assumed 0.95,D is the diameter of the globe (m) which typically is 0.15 m, andTa is the air temperature (K).
ENVI-met, the software tool used for this paper, divides thesurrounding enclosure into “n” isothermal surfaces. The equationused by ENVI-met for calculating Tmrt is Ali-Toudert and Mayer[53]:
Tmrt ¼"1s
Xn
i¼1
EiFi þak3p
Xn
i¼1
DiFi þak3pfpI
!#0:25(5)
where
Ei is the long wave radiation (W),Di is the diffuse and diffusely reflected short wave radiation (W),
Fig. 11. Mean radiant temperatures (Tmrt) at the reference points.
Table 6Averages of the microclimates properties.* ¼ The sum of slightly cool, comfortableand slightly warm hours.
SingularEeW
SingularNeS
LinearEeW
Linear NeS Courtyard
SVF 0.605 0.605 0.404 0.404 0.194Average Ta (�C) 19.3 19.2 19.1 18.9 19.0Average Tmrt (�C) 43.5 45.8 41.6 25.1 22.9Standard deviation
of Tmrt (�C)28.8 28.3 26.0 21.4 13.5
Average wind (m/s) 2.6 1.7 0.5 2.7 0.2PET 23.5 26.4 27.2 17 20.8Comfortable hours* 3 2 4 8 17
15
16
17
18
19
20
21
22
23
5:00
6:00
7:00
8:00
9:00
10:0
0
11:0
0
12:0
0
13:0
0
14:0
0
15:0
0
16:0
0
17:0
0
18:0
0
19:0
0
20:0
0
21:0
0
22:0
0
23:0
0
0:00
1:00
Air
Tem
pera
ture
(°C)
Singular E-W Singular N-S Linear E-W Linear N-S Courtyard
Fig. 12. Air temperatures (Ta) at the reference points.
M. Taleghani et al. / Building and Environment xxx (2014) 1e14 11
Please cite this article in press as: Taleghani M, et al., Outdoor thermal comfort within five different urban forms in the Netherlands, Buildingand Environment (2014), http://dx.doi.org/10.1016/j.buildenv.2014.03.014
is the air velocity near the globe (m/s),
vegetation. Trees and deciduous trees in particular can protectspaces from direct sun in summer and allow solar radiation inwinter. Vegetation also has a low heat capacity. Referring back tothe PET which illustrates thermal comfort, it increases in the af-ternoon. This is because the heat stored during the day is releasedto the air during the afternoon and evening.More investigations areneeded to show whether green areas with a lower heat capacity(over construction materials) can minimise the canyontemperature.
Appendix
Mean radiant temperature is calculated by ENVI-met. This factorsums up all short and long wave radiation fluxes (direct and
reflected) on a specific point. This parameter is calculated with thefollowing equation:
Tmrt ¼�ðGT þ 273:15Þ4 þ 1:1*108*n0:6a
d*D0:4 ðGT � TaÞ�0:25
� 273:15
(4)
where
Tmrt is the mean radiant temperature (K),GT is the globe temperature (K),na is the air velocity near the globe (m/s),d is the emissivity of the globe which normally is assumed 0.95,D is the diameter of the globe (m) which typically is 0.15 m, andTa is the air temperature (K).
ENVI-met, the software tool used for this paper, divides thesurrounding enclosure into “n” isothermal surfaces. The equationused by ENVI-met for calculating Tmrt is Ali-Toudert and Mayer[53]:
Tmrt ¼"1s
Xn
i¼1
EiFi þak3p
Xn
i¼1
DiFi þak3pfpI
!#0:25(5)
where
Ei is the long wave radiation (W),Di is the diffuse and diffusely reflected short wave radiation (W),
Fig. 11. Mean radiant temperatures (Tmrt) at the reference points.
Table 6Averages of the microclimates properties.* ¼ The sum of slightly cool, comfortableand slightly warm hours.
SingularEeW
SingularNeS
LinearEeW
Linear NeS Courtyard
SVF 0.605 0.605 0.404 0.404 0.194Average Ta (�C) 19.3 19.2 19.1 18.9 19.0Average Tmrt (�C) 43.5 45.8 41.6 25.1 22.9Standard deviation
of Tmrt (�C)28.8 28.3 26.0 21.4 13.5
Average wind (m/s) 2.6 1.7 0.5 2.7 0.2PET 23.5 26.4 27.2 17 20.8Comfortable hours* 3 2 4 8 17
15
16
17
18
19
20
21
22
23
5:00
6:00
7:00
8:00
9:00
10:0
0
11:0
0
12:0
0
13:0
0
14:0
0
15:0
0
16:0
0
17:0
0
18:0
0
19:0
0
20:0
0
21:0
0
22:0
0
23:0
0
0:00
1:00
Air
Tem
pera
ture
(°C)
Singular E-W Singular N-S Linear E-W Linear N-S Courtyard
Fig. 12. Air temperatures (Ta) at the reference points.
M. Taleghani et al. / Building and Environment xxx (2014) 1e14 11
Please cite this article in press as: Taleghani M, et al., Outdoor thermal comfort within five different urban forms in the Netherlands, Buildingand Environment (2014), http://dx.doi.org/10.1016/j.buildenv.2014.03.014
is the emissivity of the globe which normally is assumed 0.95,
vegetation. Trees and deciduous trees in particular can protectspaces from direct sun in summer and allow solar radiation inwinter. Vegetation also has a low heat capacity. Referring back tothe PET which illustrates thermal comfort, it increases in the af-ternoon. This is because the heat stored during the day is releasedto the air during the afternoon and evening.More investigations areneeded to show whether green areas with a lower heat capacity(over construction materials) can minimise the canyontemperature.
Appendix
Mean radiant temperature is calculated by ENVI-met. This factorsums up all short and long wave radiation fluxes (direct and
reflected) on a specific point. This parameter is calculated with thefollowing equation:
Tmrt ¼�ðGT þ 273:15Þ4 þ 1:1*108*n0:6a
d*D0:4 ðGT � TaÞ�0:25
� 273:15
(4)
where
Tmrt is the mean radiant temperature (K),GT is the globe temperature (K),na is the air velocity near the globe (m/s),d is the emissivity of the globe which normally is assumed 0.95,D is the diameter of the globe (m) which typically is 0.15 m, andTa is the air temperature (K).
ENVI-met, the software tool used for this paper, divides thesurrounding enclosure into “n” isothermal surfaces. The equationused by ENVI-met for calculating Tmrt is Ali-Toudert and Mayer[53]:
Tmrt ¼"1s
Xn
i¼1
EiFi þak3p
Xn
i¼1
DiFi þak3pfpI
!#0:25(5)
where
Ei is the long wave radiation (W),Di is the diffuse and diffusely reflected short wave radiation (W),
Fig. 11. Mean radiant temperatures (Tmrt) at the reference points.
Table 6Averages of the microclimates properties.* ¼ The sum of slightly cool, comfortableand slightly warm hours.
SingularEeW
SingularNeS
LinearEeW
Linear NeS Courtyard
SVF 0.605 0.605 0.404 0.404 0.194Average Ta (�C) 19.3 19.2 19.1 18.9 19.0Average Tmrt (�C) 43.5 45.8 41.6 25.1 22.9Standard deviation
of Tmrt (�C)28.8 28.3 26.0 21.4 13.5
Average wind (m/s) 2.6 1.7 0.5 2.7 0.2PET 23.5 26.4 27.2 17 20.8Comfortable hours* 3 2 4 8 17
15
16
17
18
19
20
21
22
23
5:00
6:00
7:00
8:00
9:00
10:0
0
11:0
0
12:0
0
13:0
0
14:0
0
15:0
0
16:0
0
17:0
0
18:0
0
19:0
0
20:0
0
21:0
0
22:0
0
23:0
0
0:00
1:00
Air
Tem
pera
ture
(°C)
Singular E-W Singular N-S Linear E-W Linear N-S Courtyard
Fig. 12. Air temperatures (Ta) at the reference points.
M. Taleghani et al. / Building and Environment xxx (2014) 1e14 11
Please cite this article in press as: Taleghani M, et al., Outdoor thermal comfort within five different urban forms in the Netherlands, Buildingand Environment (2014), http://dx.doi.org/10.1016/j.buildenv.2014.03.014
is the diameter of the globe (m) which typically is 0.15 m, and vegetation. Trees and deciduous trees in particular can protectspaces from direct sun in summer and allow solar radiation inwinter. Vegetation also has a low heat capacity. Referring back tothe PET which illustrates thermal comfort, it increases in the af-ternoon. This is because the heat stored during the day is releasedto the air during the afternoon and evening.More investigations areneeded to show whether green areas with a lower heat capacity(over construction materials) can minimise the canyontemperature.
Appendix
Mean radiant temperature is calculated by ENVI-met. This factorsums up all short and long wave radiation fluxes (direct and
reflected) on a specific point. This parameter is calculated with thefollowing equation:
Tmrt ¼�ðGT þ 273:15Þ4 þ 1:1*108*n0:6a
d*D0:4 ðGT � TaÞ�0:25
� 273:15
(4)
where
Tmrt is the mean radiant temperature (K),GT is the globe temperature (K),na is the air velocity near the globe (m/s),d is the emissivity of the globe which normally is assumed 0.95,D is the diameter of the globe (m) which typically is 0.15 m, andTa is the air temperature (K).
ENVI-met, the software tool used for this paper, divides thesurrounding enclosure into “n” isothermal surfaces. The equationused by ENVI-met for calculating Tmrt is Ali-Toudert and Mayer[53]:
Tmrt ¼"1s
Xn
i¼1
EiFi þak3p
Xn
i¼1
DiFi þak3pfpI
!#0:25(5)
where
Ei is the long wave radiation (W),Di is the diffuse and diffusely reflected short wave radiation (W),
Fig. 11. Mean radiant temperatures (Tmrt) at the reference points.
Table 6Averages of the microclimates properties.* ¼ The sum of slightly cool, comfortableand slightly warm hours.
SingularEeW
SingularNeS
LinearEeW
Linear NeS Courtyard
SVF 0.605 0.605 0.404 0.404 0.194Average Ta (�C) 19.3 19.2 19.1 18.9 19.0Average Tmrt (�C) 43.5 45.8 41.6 25.1 22.9Standard deviation
of Tmrt (�C)28.8 28.3 26.0 21.4 13.5
Average wind (m/s) 2.6 1.7 0.5 2.7 0.2PET 23.5 26.4 27.2 17 20.8Comfortable hours* 3 2 4 8 17
15
16
17
18
19
20
21
22
23
5:00
6:00
7:00
8:00
9:00
10:0
0
11:0
0
12:0
0
13:0
0
14:0
0
15:0
0
16:0
0
17:0
0
18:0
0
19:0
0
20:0
0
21:0
0
22:0
0
23:0
0
0:00
1:00
Air
Tem
pera
ture
(°C)
Singular E-W Singular N-S Linear E-W Linear N-S Courtyard
Fig. 12. Air temperatures (Ta) at the reference points.
M. Taleghani et al. / Building and Environment xxx (2014) 1e14 11
Please cite this article in press as: Taleghani M, et al., Outdoor thermal comfort within five different urban forms in the Netherlands, Buildingand Environment (2014), http://dx.doi.org/10.1016/j.buildenv.2014.03.014
is the air temperature (K).
Since the effect of Ta on Tmrt is very low, Tmrt is only slightly higher in 2050 than in the current climate. On the other hand, Ta increases by 3°C in the 2050 scenario. These results are more or less similar for all three reference models.
current climate
climate in 2050
Figure 10 Comparison of air temperature (potential temperature) of the 10*50 m2 EW model in the current climate and in 2050 (on 19 June at 16:00).
i

268 Dwelling on Courtyards
Figure 11 Mean radiant temperature of reference models in comparison with: a) the 2050 W+ climate scenario; b) higher albedo of plaster; c) courtyards with a water pool; d) courtyards with a green area.
Based on these differences between the current and the future climate in the Netherlands, the next three phases in the analysis investigated possible heat mitigation strategies.
§ 8.4.3 Phase 3: The albedo effect
In the third phase of this study, the albedo of the models’ facades was increased. This change allowed us to understand whether higher albedo materials can help cool the microclimate of the courtyards or not. In the phase 1 and 2 simulations, the albedo of the facades was 0.10, representing dark brick. In the new simulations, the albedo was changed to 0.55 and 0.93, representing white marble and highly reflective plaster [70]. Light-coloured plaster, materials and paint are used in the countries close to the equator with a high solar radiation intensity. As a result, the increased albedo helps to reduce absorption of solar radiation. This phase of the study investigated the potential of this strategy for cooler climates.
i
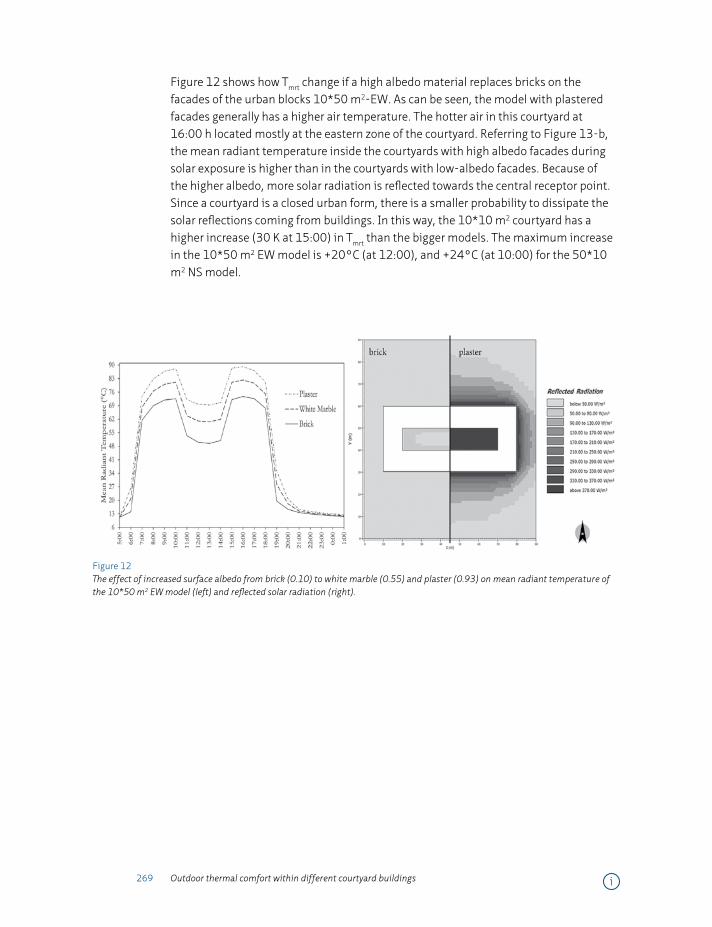
269 Outdoor thermal comfort within different courtyard buildings
Figure 12 shows how Tmrt change if a high albedo material replaces bricks on the facades of the urban blocks 10*50 m2-EW. As can be seen, the model with plastered facades generally has a higher air temperature. The hotter air in this courtyard at 16:00 h located mostly at the eastern zone of the courtyard. Referring to Figure 13-b, the mean radiant temperature inside the courtyards with high albedo facades during solar exposure is higher than in the courtyards with low-albedo facades. Because of the higher albedo, more solar radiation is reflected towards the central receptor point. Since a courtyard is a closed urban form, there is a smaller probability to dissipate the solar reflections coming from buildings. In this way, the 10*10 m2 courtyard has a higher increase (30 K at 15:00) in Tmrt than the bigger models. The maximum increase in the 10*50 m2 EW model is +20°C (at 12:00), and +24°C (at 10:00) for the 50*10 m2 NS model.
Figure 12 The effect of increased surface albedo from brick (0.10) to white marble (0.55) and plaster (0.93) on mean radiant temperature of the 10*50 m2 EW model (left) and reflected solar radiation (right).
i
270 Dwelling on Courtyards
§ 8.4.4 Phase 4: The effect of water
Water installations such as fountains, canals, pools and ponds serve as heat buffers (with its high specific heat capacity as a thermal mass) at urban, neighbourhood and building scales. In the fourth phase of this study, the cooling effect of water (evaporation, heat buffering and thermal mass) was considered for the three reference models. A water pool was embedded on the ground inside the courtyard covering 65% of the area (the rest is left for walking (pavement)). Figure 13-c presents Tmrt of the models with water (grey lines) and compares this with the models without water from phase 1 (black lines).
The mean radiant temperature of the models with water is lower than of the models without water. For the 10*50 m2-EW model, the maximum decrease is 18°C; and for the 50*10 m2-NS model the maximum decrease is 21°C. Here it is worth mentioning that high-albedo materials (e.g. the plaster used in phase 3) and water are both highly reflective substances. The first showed a higher Tmrt in comparison with the phase 1 models while the latter showed lower Tmrt. In case of a water pond, water on the ground reflects the high-altitude summer sun back towards the sky and towards the receptor point. In contrast, the vertical high-albedo materials (plasters on the facades) reflect the sun towards the ground of the courtyard and also to the receptor point. Water has a high heat capacity as a result of which it does not heat up as quickly as the concrete pavement does. Additionally, the evaporation of water from the pond cools its surface and since the pond is close to the receptor point in the centre of the courtyard, it has a strong effect on Tmrt.
§ 8.4.5 Phase 5: The effect of vegetation
It was acknowledged in section 2 of this chapter that the greening of urban spaces and the installation of green roofs and porous pavements improves the air quality, reduces the ambient air temperature and consequently lowers indoor air conditioning energy demands. In the fifth phase of this study the ground of the courtyards and the roofs of the urban blocks were covered with grass.
The first benefit of the grass is that it blocks the sun to the ground level of the courtyards. Therefore, the soil absorbs less solar energy. Furthermore, the grass and soil cool the ground surface and air layer above by evapotranspiration, an effect similar to the evaporative cooling effect of the water ponds. In Figure 13-d, the differences between the green and reference microclimates are shown (respectively grey and black lines). The largest difference in mean radiant temperature is exhibited by the 50*10 m2 NS courtyard with a 17°C cooler environment at 14:00 h due to the presence of grass.
i
271 Outdoor thermal comfort within different courtyard buildings
§ 8.5 Discussion
Alteration of a building’s geometry to receive or block sun is a common strategy in the early stages of climate-sensitive design. This strategy was explored in the first phase of this study. Different proportions of length to width in combination with four main orientations led to varied microclimates. The N-S courtyard direction has the shortest duration of solar radiation to penetrate into the courtyard, while the E-W orientation has the longest. The NW-SE orientation receives sun in the early morning while the NE-SW orientation mainly in the afternoon. Furthermore, by increasing the length of the courtyards only in the E-W direction, the duration of solar radiation can be increased. In this way, among the models the 10*50 m2 EW courtyard model has the longest exposure to direct sun.
These results show that courtyards with N-S orientation are recommended for hot climates, and E-W oriented courtyards are more favourable for colder regions. In addition, the NW-SE direction is suitable when nights are cold and early morning sun is desired. In contrast, urban spaces in cold climates that are used for afternoon activities (like recreational squares) are more in accordance with NE-SW sun access.
Subsequently, the courtyard model with the longest duration of sun radiation (10*50 m2 EW) was analysed and discussed to clarify the effects of different heat mitigation strategies: a) use of a higher albedo material, b) use of a water pool, and c) use of vegetation. These three strategies were analysed via their mean radiant temperature and air temperature.
As illustrated in Figure 12 (and Table 5), a high albedo of the facades leads to a higher mean radiant temperature (maximum +20°C increase at 12:00 h); a water pool inside the courtyard strongly reduces the mean radiant temperature (maximum -18°C at 15:00 h); vegetation also strongly reduces the mean radiant temperature (maximum -17°C at 15:00 h). Considering that the water pool covered 65% of the ground and the grass 100%, the cooling effect of water seems to be more effective. Here it is worthy mentioning that several studies have shown that increasing the albedo of facades leads to a cooler indoor environment; however; this chapter shows that outdoor environment performs different with higher albedos.
Figure 14 shows the air temperature of 10*50 m2 EW courtyard model at 16:00 h, which was the hottest hour on the hottest reference day in the Netherlands. At this time, the sun irradiates the model from the south-west, and thus the north-east side inside of the courtyard is warmer, while the south-west side is cooler (Figure 14a). By increasing the albedo, the air temperature in the courtyard increases mainly in the eastern part (which is more irradiated than the western part at 16:00 h). Considering the outdoor space of the courtyard model (surrounding the building), the
i
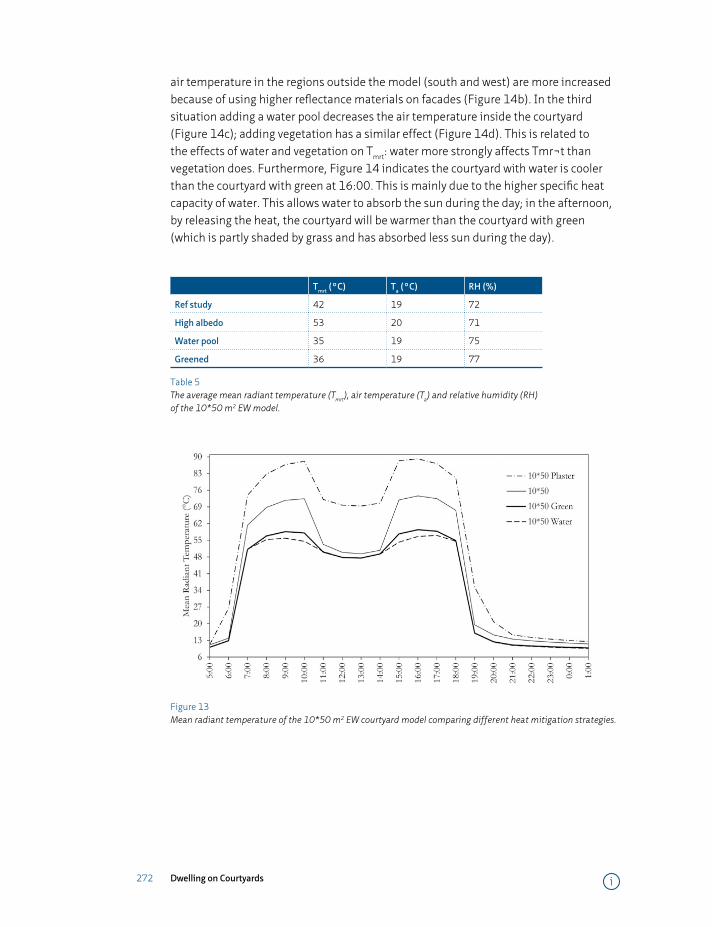
272 Dwelling on Courtyards
air temperature in the regions outside the model (south and west) are more increased because of using higher reflectance materials on facades (Figure 14b). In the third situation adding a water pool decreases the air temperature inside the courtyard (Figure 14c); adding vegetation has a similar effect (Figure 14d). This is related to the effects of water and vegetation on Tmrt: water more strongly affects Tmr¬t than vegetation does. Furthermore, Figure 14 indicates the courtyard with water is cooler than the courtyard with green at 16:00. This is mainly due to the higher specific heat capacity of water. This allows water to absorb the sun during the day; in the afternoon, by releasing the heat, the courtyard will be warmer than the courtyard with green (which is partly shaded by grass and has absorbed less sun during the day).
Tmrt (°C) Ta (°C) RH (%)
Ref study 42 19 72
High albedo 53 20 71
Water pool 35 19 75
Greened 36 19 77
Table 5 The average mean radiant temperature (Tmrt), air temperature (Ta) and relative humidity (RH) of the 10*50 m2 EW model.
Figure 13 Mean radiant temperature of the 10*50 m2 EW courtyard model comparing different heat mitigation strategies.
i

273 Outdoor thermal comfort within different courtyard buildings
Figure 14 Air temperature of the 10*50 m2 EW courtyard model in different phases of the study: a) basic study, b) using high albedo facades, c) using water pool, and d) using grass.
§ 8.6 Conclusions
The urban heat island phenomenon and climate change have led and will further lead to a temperature rise in urban spaces and cities. Therefore, there is a need for solutions to alter microclimates and provide a more desirable environment for pedestrians. This chapter investigated the outdoor microclimate of different urban blocks during the hottest reference day in the Netherlands. The courtyards were oriented in four main directions E-W, N-S, NE-SW and NW-SE. Subsequently, they were widened from a symmetrical 10*10 m2 to 10*50 m2 in E-W and other directions.
i
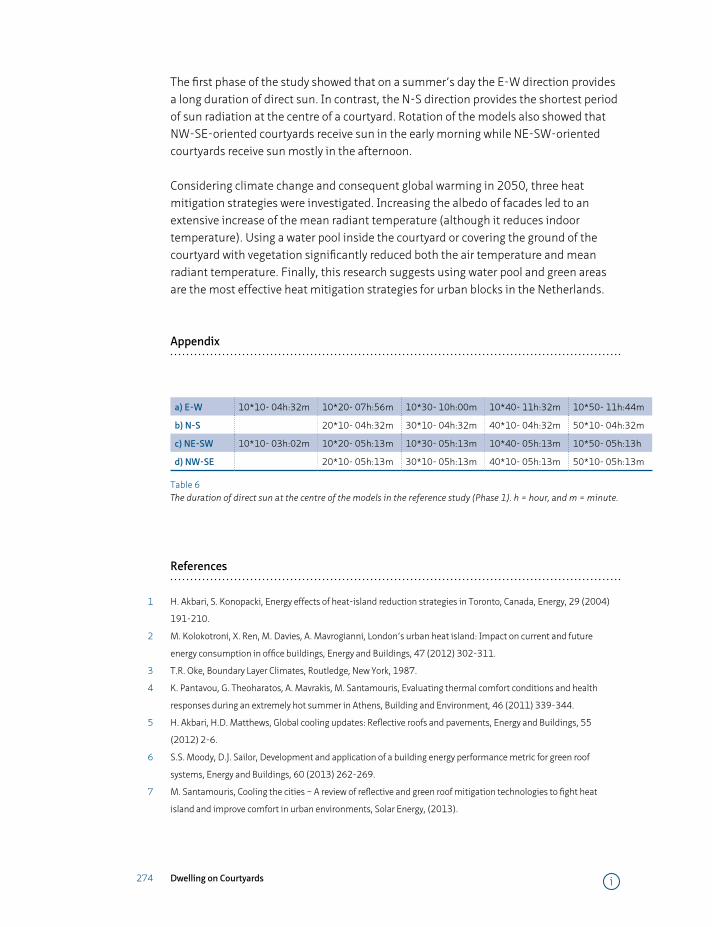
274 Dwelling on Courtyards
The first phase of the study showed that on a summer’s day the E-W direction provides a long duration of direct sun. In contrast, the N-S direction provides the shortest period of sun radiation at the centre of a courtyard. Rotation of the models also showed that NW-SE-oriented courtyards receive sun in the early morning while NE-SW-oriented courtyards receive sun mostly in the afternoon.
Considering climate change and consequent global warming in 2050, three heat mitigation strategies were investigated. Increasing the albedo of facades led to an extensive increase of the mean radiant temperature (although it reduces indoor temperature). Using a water pool inside the courtyard or covering the ground of the courtyard with vegetation significantly reduced both the air temperature and mean radiant temperature. Finally, this research suggests using water pool and green areas are the most effective heat mitigation strategies for urban blocks in the Netherlands.
Appendix
a) E-W 10*10- 04h:32m 10*20- 07h:56m 10*30- 10h:00m 10*40- 11h:32m 10*50- 11h:44m
b) N-S 20*10- 04h:32m 30*10- 04h:32m 40*10- 04h:32m 50*10- 04h:32m
c) NE-SW 10*10- 03h:02m 10*20- 05h:13m 10*30- 05h:13m 10*40- 05h:13m 10*50- 05h:13h
d) NW-SE 20*10- 05h:13m 30*10- 05h:13m 40*10- 05h:13m 50*10- 05h:13m
Table 6 The duration of direct sun at the centre of the models in the reference study (Phase 1). h = hour, and m = minute.
References
1 H. Akbari, S. Konopacki, Energy effects of heat-island reduction strategies in Toronto, Canada, Energy, 29 (2004)
191-210.
2 M. Kolokotroni, X. Ren, M. Davies, A. Mavrogianni, London’s urban heat island: Impact on current and future
energy consumption in office buildings, Energy and Buildings, 47 (2012) 302-311.
3 T.R. Oke, Boundary Layer Climates, Routledge, New York, 1987.
4 K. Pantavou, G. Theoharatos, A. Mavrakis, M. Santamouris, Evaluating thermal comfort conditions and health
responses during an extremely hot summer in Athens, Building and Environment, 46 (2011) 339-344.
5 H. Akbari, H.D. Matthews, Global cooling updates: Reflective roofs and pavements, Energy and Buildings, 55
(2012) 2-6.
6 S.S. Moody, D.J. Sailor, Development and application of a building energy performance metric for green roof
systems, Energy and Buildings, 60 (2013) 262-269.
7 M. Santamouris, Cooling the cities – A review of reflective and green roof mitigation technologies to fight heat
island and improve comfort in urban environments, Solar Energy, (2013).
i

275 Outdoor thermal comfort within different courtyard buildings
8 M. Taleghani, M. Tenpierik, S. Kurvers, A. van den Dobbelsteen, A review into thermal comfort in buildings,
Renewable and Sustainable Energy Reviews, 26 (2013) 201-215.
9 M. Taleghani, M. Tenpierik, A. van den Dobbelsteen, R. de Dear, Energy use impact of and thermal comfort in
different urban block types in the Netherlands, Energy and Buildings, 67 (2013) 166-175.
10 IPCC, Climate Change 2007, in: S. Solomon, D. Qin, M. Manning, Z. Chen, M. Marquis, K.B. Averyt, M. Tignor, M.
H.L. (Eds.) The physical science basis. Contribution of the working group I to the fourth assessment report of the
intergovernmental panel on climate change, Cambridge, 2007.
11 KNMI, in: KNMI Klimaatscenarios. Transformatie tijdreeksen, KNMI, De Bilt, 2012.
12 V. Olgyay, Design with Climate, Princeton University Press, Princeton NJ, 1963.
13 B. Givoni, Climate Considerations in Building and Urban Design, Wiley, 1998.
14 A. Yezioro, I.G. Capeluto, E. Shaviv, Design guidelines for appropriate insolation of urban squares, Renewable
Energy, 31 (2006) 1011-1023.
15 S. Berkovic, A. Yezioro, A. Bitan, Study of thermal comfort in courtyards in a hot arid climate, Solar Energy, 86
(2012) 1173-1186.
16 K. Steemers, N. Baker, D. Crowther, J. Dubiel, M.H. Nikolopoulou, C. Ratti, City texture and microclimate, Urban
Design Studies, 3 (1997) 25-50.
17 J. Herrmann, A. Matzarakis, Mean radiant temperature in idealised urban canyons—examples from Freiburg,
Germany, International Journal of Biometeorology, 56 (2012) 199-203.
18 M.M.E. van Esch, R.H.J. Looman, G.J. de Bruin-Hordijk, The effects of urban and building design parameters on
solar access to the urban canyon and the potential for direct passive solar heating strategies, Energy and Buildings,
47 (2012) 189-200.
19 I.P.o.C. Change, Climate Change 2007 - The Physical Science Basis: Contribution of Working Group I to the Fourth
Assessment Report of the IPCC, in, Cambridge, 2007.
20 M.J. Holmes, J.N. Hacker, Climate change, thermal comfort and energy: Meeting the design challenges of the 21st
century, Energy and Buildings, 39 (2007) 802-814.
21 A. Matzarakis, C. Endler, Climate change and thermal bioclimate in cities: impacts and options for adaptation in
Freiburg, Germany, International Journal of Biometeorology, 54 (2010) 479-483.
22 R.L. Hwang, T.P. Lin, A. Matzarakis, Seasonal effects of urban street shading on long-term outdoor thermal
comfort, Building and Environment, 46 (2011) 863-870.
23 A.M. Coutts, N.J. Tapper, J. Beringer, M. Loughnan, M. Demuzere, Watering our cities: The capacity for Water
Sensitive Urban Design to support urban cooling and improve human thermal comfort in the Australian context,
Progress in Physical Geography, 37 (2013) 2-28.
24 M.L. Lambert-Habib, J. Hidalgo, C. Fedele, A. Lemonsu, C. Bernard, How is climatic adaptation taken into account
by legal tools? Introduction of water and vegetation by French town planning documents, Urban Climate, (2013).
25 A.R. Gentle, J.L.C. Aguilar, G.B. Smith, Optimized cool roofs: Integrating albedo and thermal emittance with
R-value, Solar Energy Materials and Solar Cells, 95 (2011) 3207-3215.
26 J. Karlsson, L. Wadsö, M. Öberg, A conceptual model that simulates the influence of thermal inertia in building
structures, Energy and Buildings, 60 (2013) 146-151.
27 H. Taha, D. Sailor, R. Ritschard, B. Huang, Database on albedo, surface moisture, and roughness length for
meteorological simulations of the South Coast Air Basin, in: Lawrence Berkeley Laboratory Report No. 33051,
1992.
28 M. Santamouris, Environmental Design of Urban Buildings: An Integrated Approach, Taylor & Francis, 2012.
29 M.C. Baker, N.R.C.o. Canada, Roofs: design, application, and maintenance, Multiscience Publications, 1980.
i

276 Dwelling on Courtyards
30 S. Bretz, H. Akbari, A.H. Rosenfeld, H. Taha, Implementation of Solar Reflective Surfaces: Materials and Utility
Programs, in: LBL Report 32467, University of California, Berkeley, 1992.
31 M. Roth, T.R. Oke, W.J. Emery, Satellite-derived urban heat islands from three coastal cities and the utilization of
such data in urban climatology, International Journal of Remote Sensing, 10 (1989) 1699-1720.
32 J. Nichol, Remote sensing of urban heatislands by day and night, Photogrammetric Engineering and Remote
Sensing, 71 (2005) 613-621.
33 L. Doulos, M. Santamouris, I. Livada, Passive cooling of outdoor urban spaces. The role of materials, Solar Energy,
77 (2004) 231-249.
34 B.-L. Wang, T. Takigawa, Y. Yamasaki, N. Sakano, D.-H. Wang, K. Ogino, Symptom definitions for SBS (sick building
syndrome) in residential dwellings, International Journal of Hygiene and Environmental Health, 211 (2008) 114-
120.
35 S.S.Y. Lau, F. Yang, Introducing Healing Gardens into a Compact University Campus: Design Natural Space to
Create Healthy and Sustainable Campuses, Landscape Research, 34 (2009) 55-81.
36 T.-P. Lin, A. Matzarakis, R.-L. Hwang, Shading effect on long-term outdoor thermal comfort, Building and
Environment, 45 (2010) 213-221.
37 F. Yang, S.S.Y. Lau, F. Qian, Thermal comfort effects of urban design strategies in high-rise urban environments in
a sub-tropical climate, Architectural Science Review, 54 (2011) 285-304.
38 Y. Kikegawa, Y. Genchi, H. Kondo, K. Hanaki, Impacts of city-block-scale countermeasures against urban heat-
island phenomena upon a building’s energy-consumption for air-conditioning, Applied Energy, 83 (2006) 649-
668.
39 M. Taleghani, D.J. Sailor, M. Tenpierik, A. van den Dobbelsteen, Thermal assessment of heat mitigation strategies:
The case of Portland State University, Oregon, USA, Building and Environment, 73 (2014) 138-150.
40 R.A. Spronken-Smith, T.R. Oke, Scale Modelling of Nocturnal Cooling in Urban Parks, Boundary-Layer Meteorology,
93 (1999) 287-312.
41 C.R. Chang, M.H. Li, S.D. Chang, A preliminary study on the local cool-island intensity of Taipei city parks,
Landscape and Urban Planning, 80 (2007) 386-395.
42 J.S. Reynolds, V. Carrasco, Shade water and mass: Passive cooling in Andalucia, in: National Passive Solar
Conference, American Solar Energy Society, Boulder, CO, 1996.
43 T. Nakayama, T. Fujita, Cooling effect of water-holding pavements made of new materials on water and heat
budgets in urban areas, Landscape and Urban Planning, 96 (2010) 57-67.
44 H. Radhi, F. Fikry, S. Sharples, Impacts of urbanisation on the thermal behaviour of new built up environments: A
scoping study of the urban heat island in Bahrain, Landscape and Urban Planning, 113 (2013) 47-61.
45 M. Robitu, M. Musy, C. Inard, D. Groleau, Modeling the influence of vegetation and water pond on urban
microclimate, Solar Energy, 80 (2006) 435-447.
46 T.R. Oke, J.M. Crowther, K.G. McNaughton, J.L. Monteith, B. Gardiner, The Micrometeorology of the Urban Forest
[and Discussion], Philosophical Transactions of the Royal Society of London. B, Biological Sciences, 324 (1989)
335-349.
47 L. Howard, The climate of London, deduced from meteorological observations made in the metropolis and various
places around it, Harvey and Darton, London, 1833.
48 A.H. Rosenfeld, H. Akbari, S. Bretz, B.L. Fishman, D.M. Kurn, D. Sailor, H. Taha, Mitigation of urban heat islands:
materials, utility programs, updates, Energy and Buildings, 22 (1995) 255-265.
49 A. Dimoudi, M. Nikolopoulou, Vegetation in the urban environment: microclimatic analysis and benefits, Energy
and Buildings, 35 (2003) 69-76.
i
277 Outdoor thermal comfort within different courtyard buildings
50 C.S.B. Grimmond, M. Roth, T.R. Oke, Y.C. Au, M. Best, R. Betts, G. Carmichael, H. Cleugh, W. Dabberdt, R.
Emmanuel, E. Freitas, K. Fortuniak, S. Hanna, P. Klein, L.S. Kalkstein, C.H. Liu, A. Nickson, D. Pearlmutter, D. Sailor,
J. Voogt, Climate and More Sustainable Cities: Climate Information for Improved Planning and Management of
Cities (Producers/Capabilities Perspective), Procedia Environmental Sciences, 1 (2010) 247-274.
51 E.G. McPherson, A.R. Rowntree, J.A. Wagar, Energy-efficient landscapes, in: G. Bradley (Ed.) Urban Forest
Landscapes- Integrating Multidisciplinary Perspectives, University of Washington Press, Seattle/London, 1994.
52 T.R. Oke, The energetic basis of the urban heat island, Quarterly Journal of the Royal Meteorological Society, 108
(1982) 1-24.
53 H. Taha, S. Douglas, J. Haney, Mesoscale meteorological and air quality impacts of increased urban albedo and
vegetation, Energy and Buildings, 25 (1997) 169-177.
54 L. Pereira, A. Perrier, R. Allen, I. Alves, Evapotranspiration: Concepts and Future Trends, Journal of Irrigation and
Drainage Engineering, 125 (1999) 45-51.
55 D.J. Sailor, A review of methods for estimating anthropogenic heat and moisture emissions in the urban
environment, International Journal of Climatology, 31 (2011) 189-199.
56 D.A. Montgomery, Landscaping as a passive solar strategy, Passive Solar Journal, 4 (1987) 79-108.
57 A. Moffat, M. Schiller, Landscape Design that Saves Energy, William Morrow and Company, New York, 1981.
58 H. Akbari, U.S.E.P.A.C.C. Division, L.B. Laboratory, U.S.D.o. Energy, Cooling our communities: a guidebook on tree
planting and light-colored surfacing, U.S. Environmental Protection Agency, Office of Policy Analysis, Climate
Change Division, 1992.
59 N.H. Wong, S.F. Tay, R. Wong, C.L. Ong, A. Sia, Life cycle cost analysis of rooftop gardens in Singapore, Building and
Environment, 38 (2003) 499-509.
60 T. Carter, A. Keeler, Life-cycle cost–benefit analysis of extensive vegetated roof systems, Journal of Environmental
Management, 87 (2008) 350-363.
61 FiBRE, Can greenery make commercial buildings more green? , in: Findings in Built and Rural Environments,
Cambridge University, 2007.
62 G.B. Bonan, The microclimates of a suburban Colorado (USA) landscape and implications for planning and design,
Landscape and Urban Planning, 49 (2000) 97-114.
63 L. Shashua-Bar, D. Pearlmutter, E. Erell, The cooling efficiency of urban landscape strategies in a hot dry climate,
Landscape and Urban Planning, 92 (2009) 179-186.
64 J.H. Parker, Use of Landscaping for Energy Conversion, Department of Physical Sciences, Florida Internatioal
University, Miami, FL, 1981.
65 A. Hoyano, Climatological uses of plants for solar control and the effects on the thermal environment of a building,
Energy and Buildings, 11 (1988) 181-199.
66 O.B. Lay, L.G. Tiong, C. Yu, A survey of the thermal effect of plants on the vertical sides of tall buildings in Singapore,
in: PLEA 2000, Cambridge, UK, 2000, pp. 495-500.
67 A.M. Papadopoulos, The influence of street canyons on the cooling loads of buildings and the performance of air
conditioning systems, Energy and Buildings, 33 (2001) 601-607.
68 H.F. Castleton, V. Stovin, S.B.M. Beck, J.B. Davison, Green roofs; building energy savings and the potential for
retrofit, Energy and Buildings, 42 (2010) 1582-1591.
69 I. Jaffal, S.-E. Ouldboukhitine, R. Belarbi, A comprehensive study of the impact of green roofs on building energy
performance, Renewable Energy, 43 (2012) 157-164.
70 M. Santamouris, Environmental Design of Urban Buildings: An Integrated Approach, Taylor & Francis, 2013.
i
278 Dwelling on Courtyards
71 NEN-5060, Hygrothermische Eigenschappen van Gebouwen Referentieklimaatgegevens, in, Nederlands
Normalisatie-Instituut (NNI), 2008.
72 M. Bruse, ENVI-met website, in, 2013.
73 M. Bruse, H. Fleer, Simulating surface–plant–air interactions inside urban environments with a three dimensional
numerical model, Environmental Modelling & Software, 13 (1998) 373-384.
74 S. Huttner, M. Bruse, P. Dostal, Using ENVI-met to simulate the impact of global warming on the microclimate in
central European cities in: H. Mayer, A. Matzarakis (Eds.) 5th Japanese-German Meeting on Urban Climatology,
Meteorologischen Instituts der Albert-Ludwigs-Universität Freiburg, 2008, pp. 307-312.
75 M. Mahammadzadeh, Klimaschutz und Anpassung an die Klimafolgen: Strategien, Maßnahmen und
Anwendungsbeispiele, IW-Medien, 2009.
76 N.H. Wong, S. Kardinal Jusuf, A. Aung La Win, H. Kyaw Thu, T. Syatia Negara, W. Xuchao, Environmental study of
the impact of greenery in an institutional campus in the tropics, Building and Environment, 42 (2007) 2949-
2970.
77 D. Taleb, B. Abu-Hijleh, Urban heat islands: Potential effect of organic and structured urban configurations on
temperature variations in Dubai, UAE, Renewable Energy, 50 (2013) 747-762.
78 M. Kottek, J. Grieser, C. Beck, B. Rudolf, F. Rubel, World Map of the Köppen-Geiger climate classification updated,
Meteorologische Zeitschrift, 15 (2006).
79 S. Wilcox, W. Marion, User’s Manual for TMY3 Data Sets, NREL/TP-581-43156, in, Golden, Colorado: National
Renewable Energy Laboratory, 2008.
80 KNMI, in: Climate Change Scenarios 2006 for the Netherlands, KNMI publication: WR-2006-01 2006.
81 M. Taleghani, M. Tenpierik, A. van den Dobbelsteen, Energy performance and thermal comfort of courtyard/atrium
dwellings in the Netherlands in the light of climate change, Renewable Energy, 63 (2014) 486-497.
82 ISO7726, International Standard 7726, in: Ergonomics of the thermal environment - Instrument for measuring
physical quantities, ISO Geneva, 1998.
i

279 Outdoor thermal comfort within different courtyard buildings i
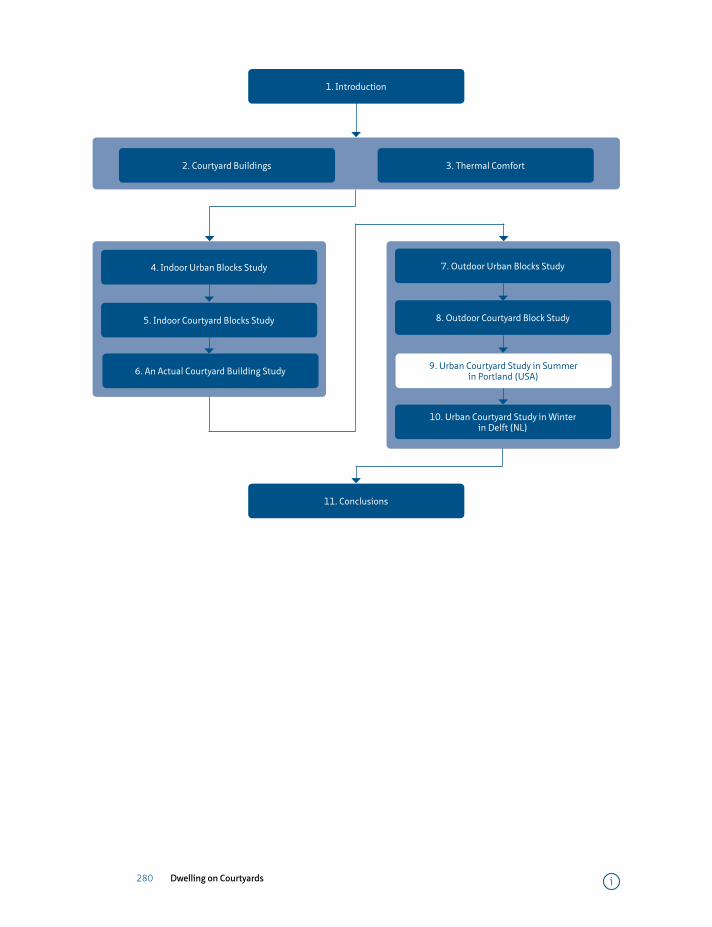
280 Dwelling on Courtyards
=
4. Indoor Urban Blocks Study
5. Indoor Courtyard Blocks Study
11. Conclusions
7. Outdoor Urban Blocks Study
8. Outdoor Courtyard Block Study
10. Urban Courtyard Study in Winter in Delft (NL)
9. Urban Courtyard Study in Summer in Portland (USA)
2. Courtyard Buildings 3. Thermal Comfort
1. Introduction
6. An Actual Courtyard Building Study
i
281 Heat mitigation strategies on courtyard buildings in summer
9 Heat mitigation strategies on courtyard buildings in summer
The previous chapter showed parametric studies on different orientations and heat mitigation strategies for courtyards. The study was based on computer simulations. This chapter studies heat mitigation strategies using field measurements inside actual courtyards. This study was done during a summer period in the temperate climate of Portland, Oregon, USA. The study first looks at the effect of vegetation in a university campus. Then, three different courtyards are compared: a bare courtyard a green (vegetated) courtyard and a courtyard with a water pond. At the end, the effects of white and black pavements on the thermal behaviour of the bare courtyard are studied.
i

282 Dwelling on Courtyards i
283 Heat mitigation strategies on courtyard buildings in summer
Thermal assessment of heat mitigation strategies: the case of Portland State University, Oregon, USA1
Mohammad Taleghani *1,2, David Sailor 2, Martin Tenpierik 1, Andy van den Dobbelsteen1
1 Faculty of Architecture and the Built Environment, Delft University of Technology, Delft, the Netherlands.2 Department of Mechanical and Materials Engineering, Portland State University, Portland, OR, USA.
Abstract
Courtyard vegetation, high albedo surfaces, and courtyard ponds were investigated as potential heat mitigation strategies using field measurements and simulations in a university campus environment. The investigation was performed during a summer period in the temperate climate of Portland, Oregon, USA. In a comparison of seven locations on the campus, the maximum park cooling island effect recorded was 5.8°C between the heavily treed campus park and a nearby parking lot with asphalt pavement. Simulations of courtyards with vegetation and a water pond showed 1.6°C and 1.1°C air temperature reduction, respectively. Changing the albedo of the pavement in a bare courtyard from 0.37 (black) to 0.91 (white) led to 2.9°C increase of mean radiant temperature and 1.3°C decrease of air temperature.
Keywords
Heat mitigation, thermal comfort, courtyard, field measurement, ENVI-met simulation.
1 Published as: Taleghani M., Sailor, D., Tenpierik M., Dobbelsteen A., “Thermal assessment of heat mitigation strategies: Case of Portland State University, Oregon, USA”, Building and Environment, 73(2014) 138-150.
i
284 Dwelling on Courtyards
§ 9.1 Introduction
The urban heat island (UHI) phenomenon results in higher air temperature in dense urban areas compared with their suburbs and rural surroundings. It varies among different cities based on morphology, location and climatic zone [1-3]. This phenomenon affects human health through thermal discomfort and air pollution [4-14] and the heating and cooling energy demands of buildings in cities [15-17]. Moreover, Hart and Sailor [18] explain that the intensity of UHI in a city depends on a) the geometry of the built environment (mainly buildings) [19, 20], b) the characteristics and the materials of the surfaces [21-23], and c) the anthropogenic activities [24].
The geometry effect relates to building densities, sky view factor (SVF) in urban spaces, height to width ratio of buildings (their shading effect), and canyon orientations with sun and prevailing winds. The surface characteristics factor is related to the relative availability of surface moisture and the thermal mass and reflectivity of various construction materials. Finally, waste emissions from energy use in cities can introduce a significant source of both heat and moisture.
Urban university campuses often have extensive areas of vegetation and green, and thus offer a unique opportunity to investigate possible mitigation strategies to cope with the negative impacts of the UHI [25, 26]. This chapter considers the campus of Portland State University in Portland, Oregon, USA. To date, UHI has not been studied continuously during day and night in Portland. Portland has a temperate climate with warm dry summers and cool wet winters (Köppen-Geiger classification Csb). To fill this knowledge gap, this chapter reports on field measurements and simulations of the campus in the downtown of Portland metropolitan.
§ 9.2 2. Literature review on heat mitigation strategies
Vegetation has been studied in urban climates [27], mostly in regard to the urban heat island effect (first studied by Luke Howard in the early 19th century [28]). In contrast to the urban heat island (UHI), the park cool island (PCI) can reduce the air temperature up to 3-4°C in summer [2, 3, 27, 29, 30]. Vegetation cools the environment through two mechanisms [31]:
i
285 Heat mitigation strategies on courtyard buildings in summer
1 With a higher albedo (typically 0.18-0.22) compared to common pavements such as asphalt (typically 0.05-0.15), vegetation reflects more solar radiation [32]; moreover, with a lower specific heat capacity, green areas accumulate less heat [29, 33].
2 By evapotranspiration, which is the sum of evaporation (from the earth’s surface) and transpiration (from vegetation), the ambient air is cooled [1, 24, 34].
Several studies in various climates have addressed different heat mitigation strategies in urban spaces. Some of these investigations representing different climates are discussed here. A recent study using measurement and simulation was conducted by Srivanit and Hokao [26] in an institutional campus in the subtropical-humid climate of Saga, Japan. These researchers reported that the average daily maximum temperature would decrease by 2.7°C when the quantity of the trees was increased by 20% in the campus area. A key limitation of this study was the sole focus on air temperature, Ta; however, several other studies have shown the importance of mean radiant temperature, Tmrt, on outdoor thermal comfort [35-37]. As an example of a field measurement, in the subtropical-Mediterranean climate of Lisbon Oliveira, Andrade and Vaz [38] studied the thermal performance (Ta and Tmrt) of a small green space (0.24 ha). They found that the green area of interest was cooler than the surrounding areas, either in the sun or in the shade. Their measurement showed the highest difference was 6.9°C for Ta and 39.2°C for Tmrt.
Moreover, SVF and its effect on the amount of radiation is another important factor affecting thermal comfort in urban areas [39, 40]. In the tropical climate of Taiwan, Lin et al. [41] considered the outdoor thermal comfort index PET (Physiological Equivalent Temperature) for a field measurement at the National Formosa University campus. They indicated that a high SVF (barely shaded) causes discomfort in summer and in contrast, a low SVF (highly shaded) causes discomfort in winter.
Studies related to PCI and UHI are not limited to tropical and Mediterranean climates. Considering a colder climate, the influence of three urban parks on air temperature in a high latitude city (Göteborg, Sweden) was studied by Upmanis et al. [42] over one and half year period. The maximum temperature reduction occurred during the summer and was equal to 5.9°C. Moreover, the extension of the cooling effect of the parks into the city (built up areas) was 1100 m.
Furthermore, in the semi-arid climate of Ouagadougou (Burkina Faso), Lindén [43] reported that while the evening UHI effect reached only 1.9°C (warmer), the cool island effect in a dense and irrigated park was 5.0°C (cooler) compared to the dry rural reference. Regarding hot and arid areas, Spronken-Smith and Oke [44] showed that the type of vegetation also greatly influences the cooling effects, as irrigated parks in daytime stay significantly cooler than their surroundings, while areas with dry dead grass or bare soil can be hotter than their environments. They also showed that the PCI effect is different in various climates. They reported that parks in Vancouver, BC,
i
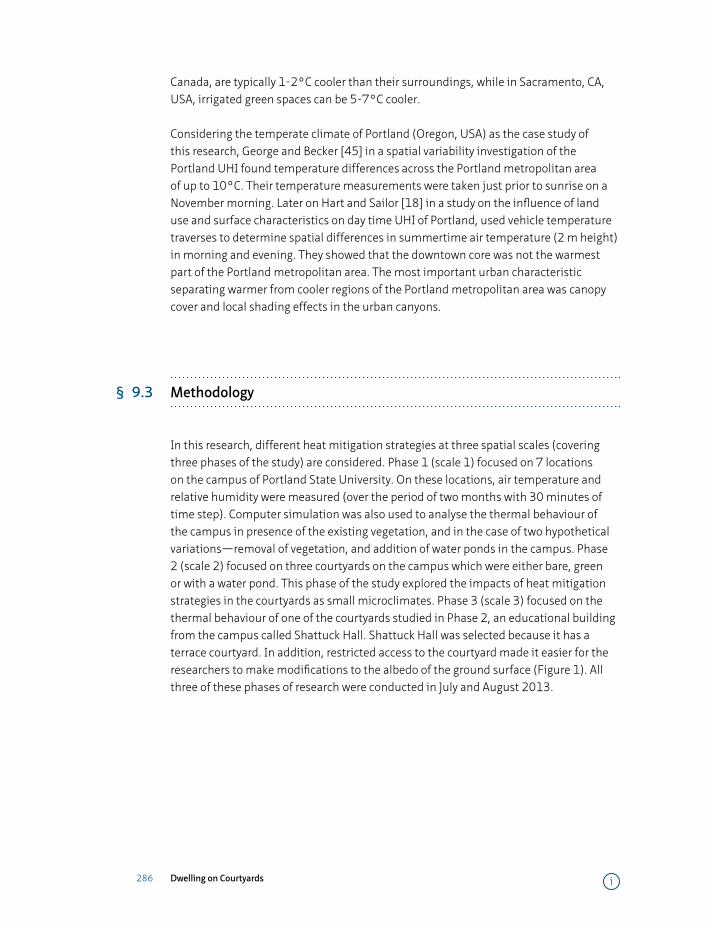
286 Dwelling on Courtyards
Canada, are typically 1-2°C cooler than their surroundings, while in Sacramento, CA, USA, irrigated green spaces can be 5-7°C cooler.
Considering the temperate climate of Portland (Oregon, USA) as the case study of this research, George and Becker [45] in a spatial variability investigation of the Portland UHI found temperature differences across the Portland metropolitan area of up to 10°C. Their temperature measurements were taken just prior to sunrise on a November morning. Later on Hart and Sailor [18] in a study on the influence of land use and surface characteristics on day time UHI of Portland, used vehicle temperature traverses to determine spatial differences in summertime air temperature (2 m height) in morning and evening. They showed that the downtown core was not the warmest part of the Portland metropolitan area. The most important urban characteristic separating warmer from cooler regions of the Portland metropolitan area was canopy cover and local shading effects in the urban canyons.
§ 9.3 Methodology
In this research, different heat mitigation strategies at three spatial scales (covering three phases of the study) are considered. Phase 1 (scale 1) focused on 7 locations on the campus of Portland State University. On these locations, air temperature and relative humidity were measured (over the period of two months with 30 minutes of time step). Computer simulation was also used to analyse the thermal behaviour of the campus in presence of the existing vegetation, and in the case of two hypothetical variations—removal of vegetation, and addition of water ponds in the campus. Phase 2 (scale 2) focused on three courtyards on the campus which were either bare, green or with a water pond. This phase of the study explored the impacts of heat mitigation strategies in the courtyards as small microclimates. Phase 3 (scale 3) focused on the thermal behaviour of one of the courtyards studied in Phase 2, an educational building from the campus called Shattuck Hall. Shattuck Hall was selected because it has a terrace courtyard. In addition, restricted access to the courtyard made it easier for the researchers to make modifications to the albedo of the ground surface (Figure 1). All three of these phases of research were conducted in July and August 2013.
i
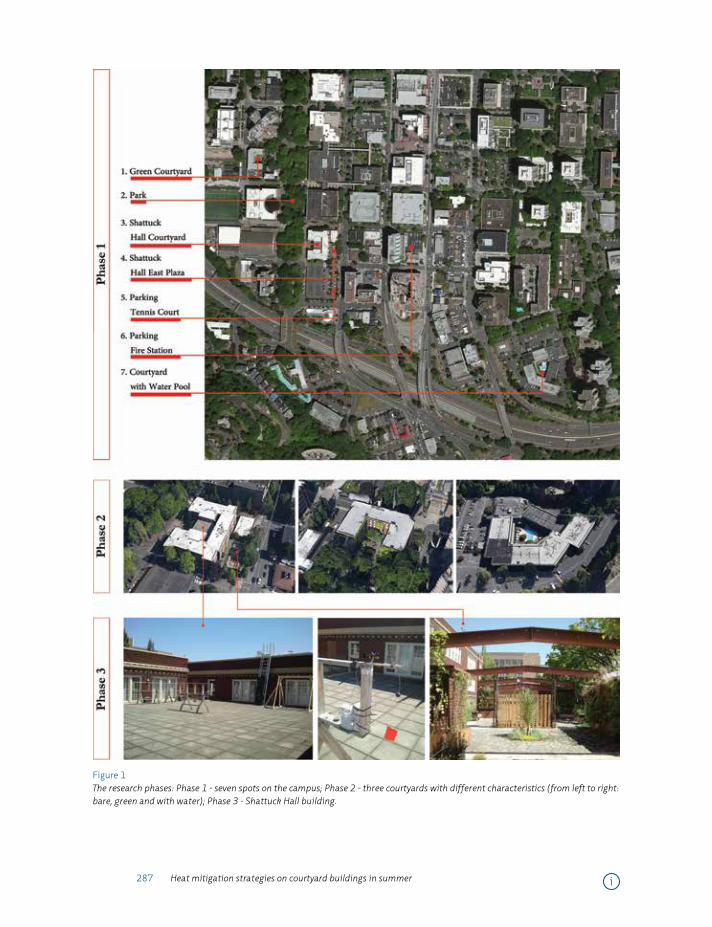
287 Heat mitigation strategies on courtyard buildings in summer
Figure 1 The research phases: Phase 1 - seven spots on the campus; Phase 2 - three courtyards with different characteristics (from left to right: bare, green and with water); Phase 3 - Shattuck Hall building.
i
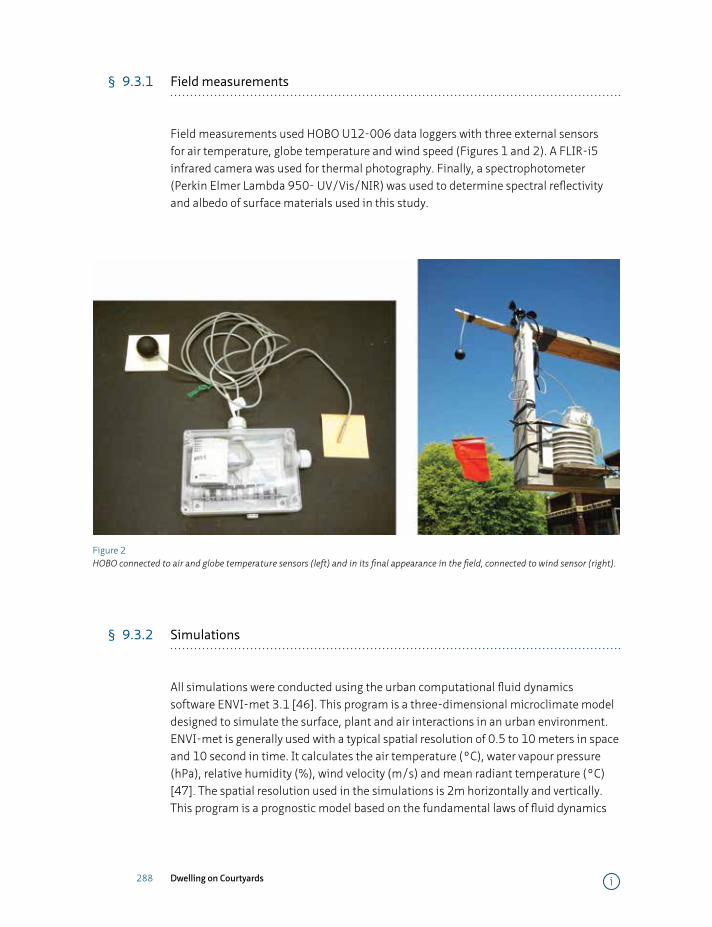
288 Dwelling on Courtyards
§ 9.3.1 Field measurements
Field measurements used HOBO U12-006 data loggers with three external sensors for air temperature, globe temperature and wind speed (Figures 1 and 2). A FLIR-i5 infrared camera was used for thermal photography. Finally, a spectrophotometer (Perkin Elmer Lambda 950- UV/Vis/NIR) was used to determine spectral reflectivity and albedo of surface materials used in this study.
Figure 2 HOBO connected to air and globe temperature sensors (left) and in its final appearance in the field, connected to wind sensor (right).
§ 9.3.2 Simulations
All simulations were conducted using the urban computational fluid dynamics software ENVI-met 3.1 [46]. This program is a three-dimensional microclimate model designed to simulate the surface, plant and air interactions in an urban environment. ENVI-met is generally used with a typical spatial resolution of 0.5 to 10 meters in space and 10 second in time. It calculates the air temperature (°C), water vapour pressure (hPa), relative humidity (%), wind velocity (m/s) and mean radiant temperature (°C) [47]. The spatial resolution used in the simulations is 2m horizontally and vertically. This program is a prognostic model based on the fundamental laws of fluid dynamics
i

289 Heat mitigation strategies on courtyard buildings in summer
and thermodynamics that can simulate exchange processes of heat and vapour at the ground surface and at walls, flows around and between buildings. This program has been extensively validated and widely used for studying the effect of climate change [48, 49] and the impact of natural elements on a microclimate [47, 50, 51].
§ 9.3.3 Climate of Portland
Portland (45°N, 122°W) experiences a temperate oceanic climate typified by warm, dry summers and mild, damp winters [52]. Its climate is classified as a dry-summer subtropical or Mediterranean climate zone (Csb) based on the climatic classification of Köppen-Geiger [53]. The prevailing wind is North-West. The mean annual dry bulb temperature is 12.4°C (Figure 3).
Portland, OR
study area
Figure 3 The position and climatic conditions of Portland, OR.
i

290 Dwelling on Courtyards
§ 9.4 Results and discussion
§ 9.4.1 Scale 1: the campus microclimate
In this phase of the study, seven locations on the campus with different microclimate characteristics were measured in July 2013. These microclimates range from very bare (Shattuck Hall courtyard) to very green (the campus park). The main aim was to understand how vegetation can affect the local thermal environment. These measurements with HOBO devices are described in Table 1 with maximum and minimum temperatures present on the seven locations. It was observed that the park had the coolest temperature; therefore, the maximum temperature differences between the park and the six other spots are calculated and demonstrated in Table 1.
Figure 4 Thermography of the campus park and the surroundings from a prior study (August 23rd, 2011).
i
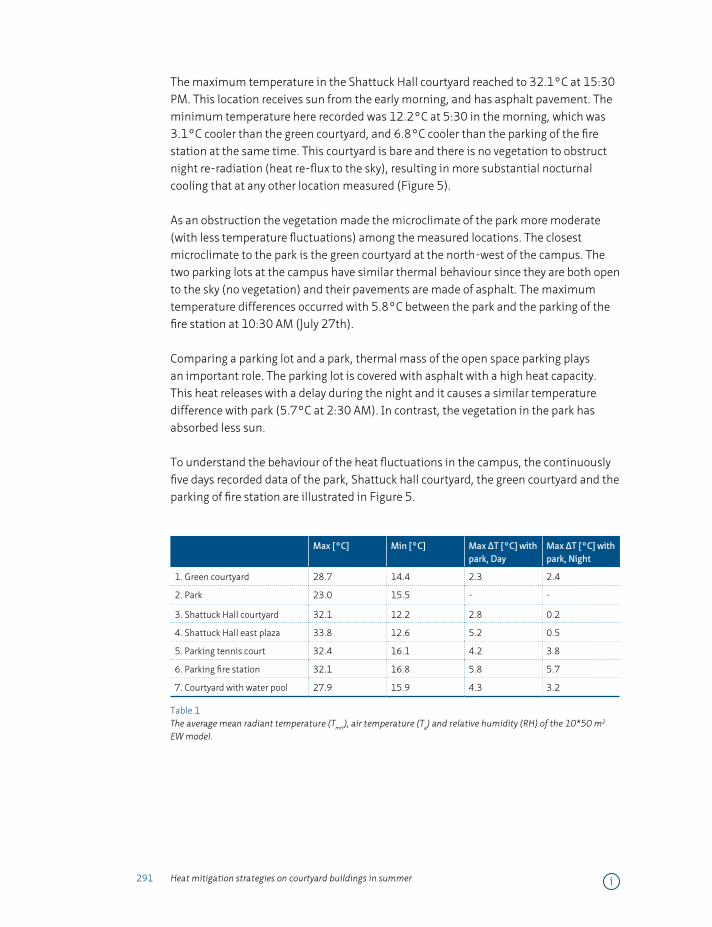
291 Heat mitigation strategies on courtyard buildings in summer
The maximum temperature in the Shattuck Hall courtyard reached to 32.1°C at 15:30 PM. This location receives sun from the early morning, and has asphalt pavement. The minimum temperature here recorded was 12.2°C at 5:30 in the morning, which was 3.1°C cooler than the green courtyard, and 6.8°C cooler than the parking of the fire station at the same time. This courtyard is bare and there is no vegetation to obstruct night re-radiation (heat re-flux to the sky), resulting in more substantial nocturnal cooling that at any other location measured (Figure 5).
As an obstruction the vegetation made the microclimate of the park more moderate (with less temperature fluctuations) among the measured locations. The closest microclimate to the park is the green courtyard at the north-west of the campus. The two parking lots at the campus have similar thermal behaviour since they are both open to the sky (no vegetation) and their pavements are made of asphalt. The maximum temperature differences occurred with 5.8°C between the park and the parking of the fire station at 10:30 AM (July 27th).
Comparing a parking lot and a park, thermal mass of the open space parking plays an important role. The parking lot is covered with asphalt with a high heat capacity. This heat releases with a delay during the night and it causes a similar temperature difference with park (5.7°C at 2:30 AM). In contrast, the vegetation in the park has absorbed less sun.
To understand the behaviour of the heat fluctuations in the campus, the continuously five days recorded data of the park, Shattuck hall courtyard, the green courtyard and the parking of fire station are illustrated in Figure 5.
Max [°C] Min [°C] Max ΔT [°C] with park, Day
Max ΔT [°C] with park, Night
1. Green courtyard 28.7 14.4 2.3 2.4
2. Park 23.0 15.5 - -
3. Shattuck Hall courtyard 32.1 12.2 2.8 0.2
4. Shattuck Hall east plaza 33.8 12.6 5.2 0.5
5. Parking tennis court 32.4 16.1 4.2 3.8
6. Parking fire station 32.1 16.8 5.8 5.7
7. Courtyard with water pool 27.9 15.9 4.3 3.2
Table 1 The average mean radiant temperature (Tmrt), air temperature (Ta) and relative humidity (RH) of the 10*50 m2 EW model.
i
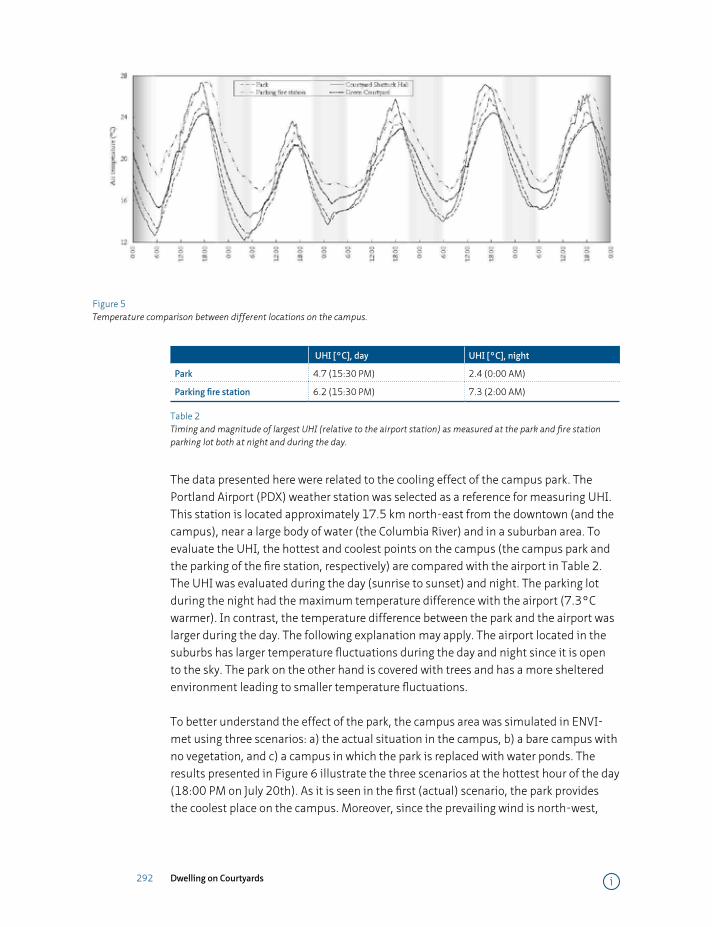
292 Dwelling on Courtyards
Figure 5 Temperature comparison between different locations on the campus.
UHI [°C], day UHI [°C], night
Park 4.7 (15:30 PM) 2.4 (0:00 AM)
Parking fire station 6.2 (15:30 PM) 7.3 (2:00 AM)
Table 2 Timing and magnitude of largest UHI (relative to the airport station) as measured at the park and fire station parking lot both at night and during the day.
The data presented here were related to the cooling effect of the campus park. The Portland Airport (PDX) weather station was selected as a reference for measuring UHI. This station is located approximately 17.5 km north-east from the downtown (and the campus), near a large body of water (the Columbia River) and in a suburban area. To evaluate the UHI, the hottest and coolest points on the campus (the campus park and the parking of the fire station, respectively) are compared with the airport in Table 2. The UHI was evaluated during the day (sunrise to sunset) and night. The parking lot during the night had the maximum temperature difference with the airport (7.3°C warmer). In contrast, the temperature difference between the park and the airport was larger during the day. The following explanation may apply. The airport located in the suburbs has larger temperature fluctuations during the day and night since it is open to the sky. The park on the other hand is covered with trees and has a more sheltered environment leading to smaller temperature fluctuations.
To better understand the effect of the park, the campus area was simulated in ENVI-met using three scenarios: a) the actual situation in the campus, b) a bare campus with no vegetation, and c) a campus in which the park is replaced with water ponds. The results presented in Figure 6 illustrate the three scenarios at the hottest hour of the day (18:00 PM on July 20th). As it is seen in the first (actual) scenario, the park provides the coolest place on the campus. Moreover, since the prevailing wind is north-west,
i
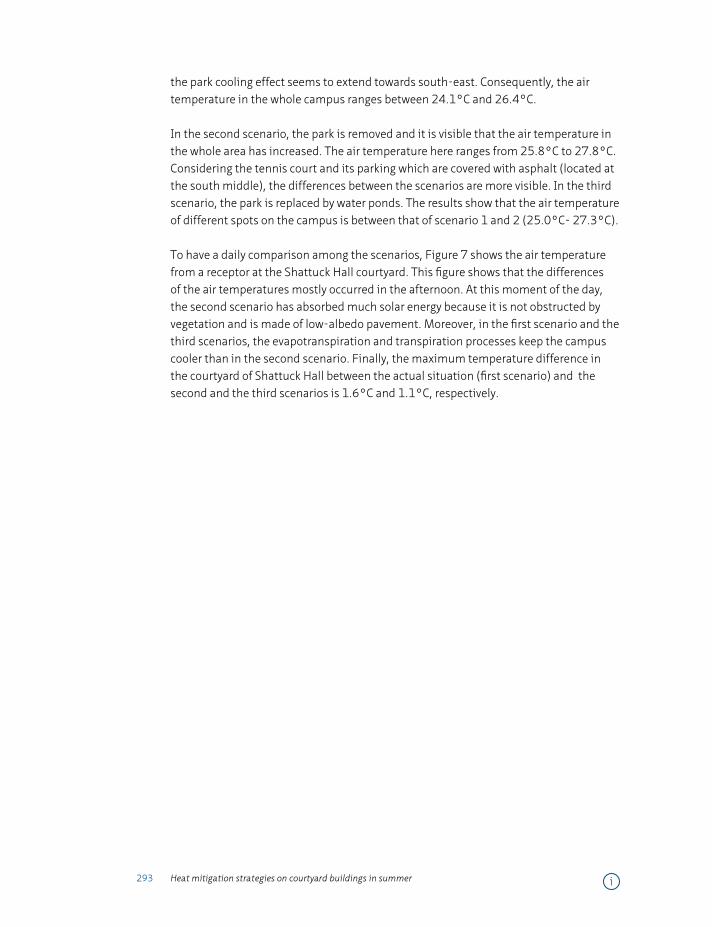
293 Heat mitigation strategies on courtyard buildings in summer
the park cooling effect seems to extend towards south-east. Consequently, the air temperature in the whole campus ranges between 24.1°C and 26.4°C.
In the second scenario, the park is removed and it is visible that the air temperature in the whole area has increased. The air temperature here ranges from 25.8°C to 27.8°C. Considering the tennis court and its parking which are covered with asphalt (located at the south middle), the differences between the scenarios are more visible. In the third scenario, the park is replaced by water ponds. The results show that the air temperature of different spots on the campus is between that of scenario 1 and 2 (25.0°C- 27.3°C).
To have a daily comparison among the scenarios, Figure 7 shows the air temperature from a receptor at the Shattuck Hall courtyard. This figure shows that the differences of the air temperatures mostly occurred in the afternoon. At this moment of the day, the second scenario has absorbed much solar energy because it is not obstructed by vegetation and is made of low-albedo pavement. Moreover, in the first scenario and the third scenarios, the evapotranspiration and transpiration processes keep the campus cooler than in the second scenario. Finally, the maximum temperature difference in the courtyard of Shattuck Hall between the actual situation (first scenario) and the second and the third scenarios is 1.6°C and 1.1°C, respectively.
i
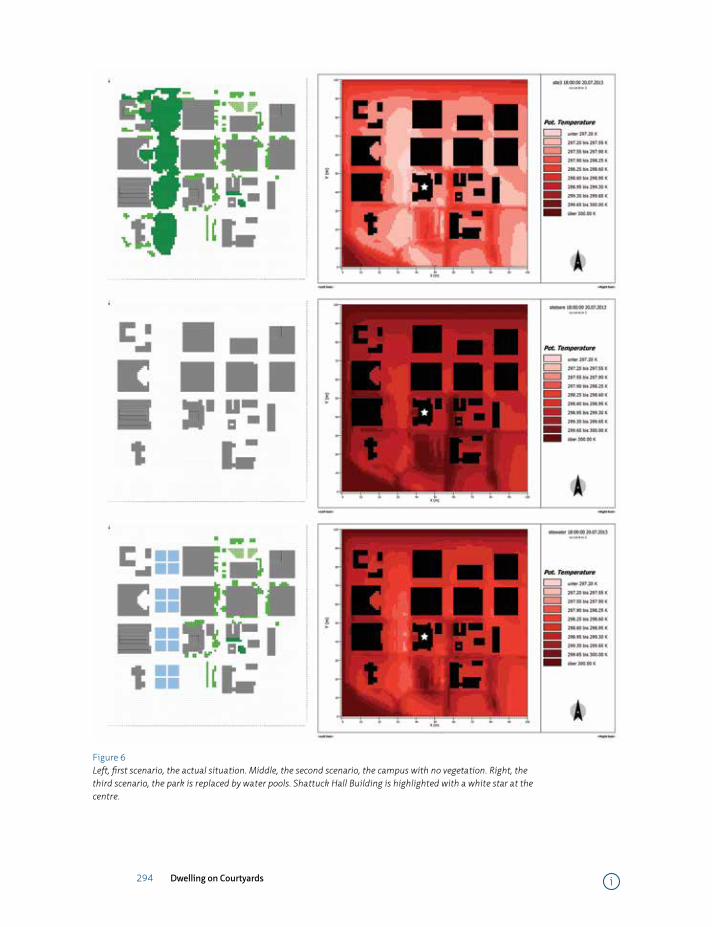
294 Dwelling on Courtyards
Figure 6 Left, first scenario, the actual situation. Middle, the second scenario, the campus with no vegetation. Right, the third scenario, the park is replaced by water pools. Shattuck Hall Building is highlighted with a white star at the centre.
i
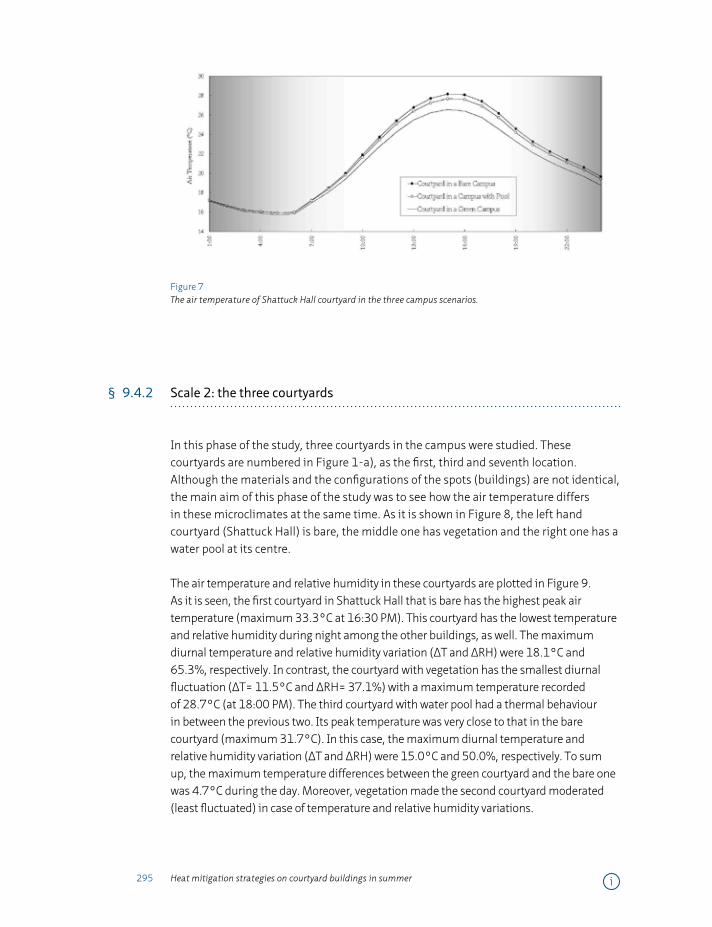
295 Heat mitigation strategies on courtyard buildings in summer
Figure 7 The air temperature of Shattuck Hall courtyard in the three campus scenarios.
§ 9.4.2 Scale 2: the three courtyards
In this phase of the study, three courtyards in the campus were studied. These courtyards are numbered in Figure 1-a), as the first, third and seventh location. Although the materials and the configurations of the spots (buildings) are not identical, the main aim of this phase of the study was to see how the air temperature differs in these microclimates at the same time. As it is shown in Figure 8, the left hand courtyard (Shattuck Hall) is bare, the middle one has vegetation and the right one has a water pool at its centre.
The air temperature and relative humidity in these courtyards are plotted in Figure 9. As it is seen, the first courtyard in Shattuck Hall that is bare has the highest peak air temperature (maximum 33.3°C at 16:30 PM). This courtyard has the lowest temperature and relative humidity during night among the other buildings, as well. The maximum diurnal temperature and relative humidity variation (ΔT and ΔRH) were 18.1°C and 65.3%, respectively. In contrast, the courtyard with vegetation has the smallest diurnal fluctuation (ΔT= 11.5°C and ΔRH= 37.1%) with a maximum temperature recorded of 28.7°C (at 18:00 PM). The third courtyard with water pool had a thermal behaviour in between the previous two. Its peak temperature was very close to that in the bare courtyard (maximum 31.7°C). In this case, the maximum diurnal temperature and relative humidity variation (ΔT and ΔRH) were 15.0°C and 50.0%, respectively. To sum up, the maximum temperature differences between the green courtyard and the bare one was 4.7°C during the day. Moreover, vegetation made the second courtyard moderated (least fluctuated) in case of temperature and relative humidity variations.
i
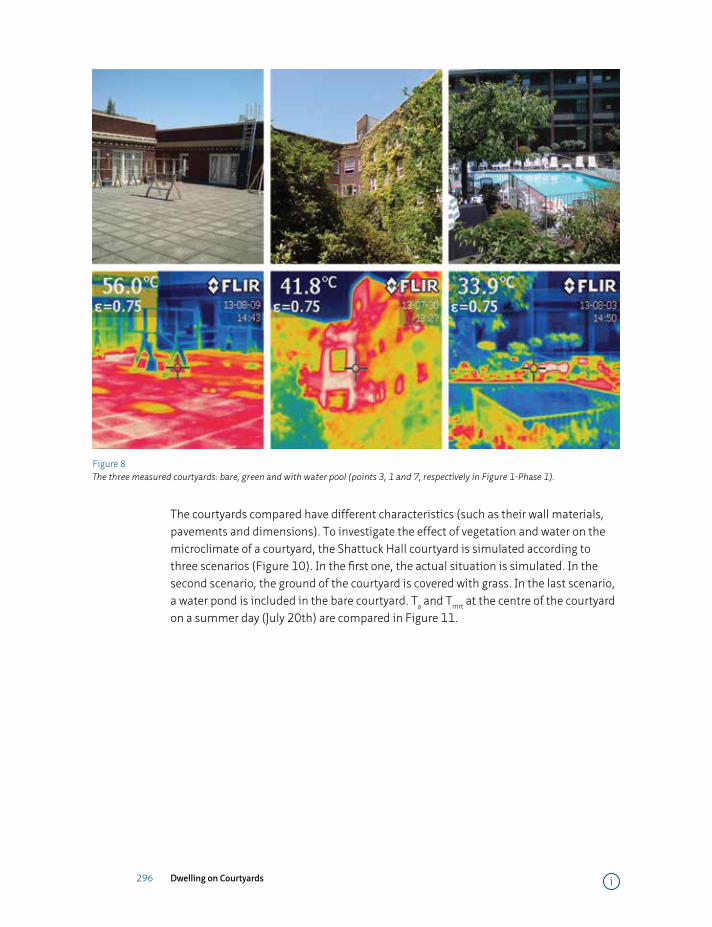
296 Dwelling on Courtyards
Figure 8 The three measured courtyards: bare, green and with water pool (points 3, 1 and 7, respectively in Figure 1-Phase 1).
The courtyards compared have different characteristics (such as their wall materials, pavements and dimensions). To investigate the effect of vegetation and water on the microclimate of a courtyard, the Shattuck Hall courtyard is simulated according to three scenarios (Figure 10). In the first one, the actual situation is simulated. In the second scenario, the ground of the courtyard is covered with grass. In the last scenario, a water pond is included in the bare courtyard. Ta and Tmrt at the centre of the courtyard on a summer day (July 20th) are compared in Figure 11.
i
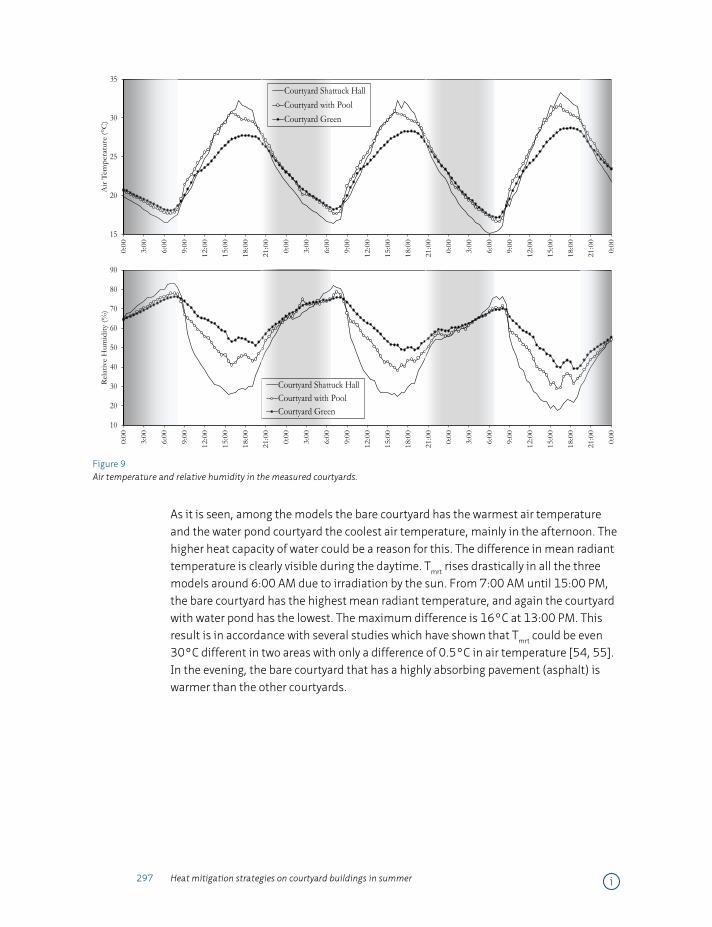
297 Heat mitigation strategies on courtyard buildings in summer
15
20
25
30
35
0:00
3:00
6:00
9:00
12:0
0
15:0
0
18:0
0
21:0
0
0:00
3:00
6:00
9:00
12:0
0
15:0
0
18:0
0
21:0
0
0:00
3:00
6:00
9:00
12:0
0
15:0
0
18:0
0
21:0
0
0:00
Air
Tem
pera
ture
(°C
)
Courtyard Shattuck HallCourtyard with PoolCourtyard Green
10
20
30
40
50
60
70
80
90
0:00
3:00
6:00
9:00
12:0
0
15:0
0
18:0
0
21:0
0
0:00
3:00
6:00
9:00
12:0
0
15:0
0
18:0
0
21:0
0
0:00
3:00
6:00
9:00
12:0
0
15:0
0
18:0
0
21:0
0
0:00
Rel
ativ
e H
umid
ity (%
)
Courtyard Shattuck HallCourtyard with PoolCourtyard Green
Figure 9 Air temperature and relative humidity in the measured courtyards.
As it is seen, among the models the bare courtyard has the warmest air temperature and the water pond courtyard the coolest air temperature, mainly in the afternoon. The higher heat capacity of water could be a reason for this. The difference in mean radiant temperature is clearly visible during the daytime. Tmrt rises drastically in all the three models around 6:00 AM due to irradiation by the sun. From 7:00 AM until 15:00 PM, the bare courtyard has the highest mean radiant temperature, and again the courtyard with water pond has the lowest. The maximum difference is 16°C at 13:00 PM. This result is in accordance with several studies which have shown that Tmrt could be even 30°C different in two areas with only a difference of 0.5°C in air temperature [54, 55]. In the evening, the bare courtyard that has a highly absorbing pavement (asphalt) is warmer than the other courtyards.
i
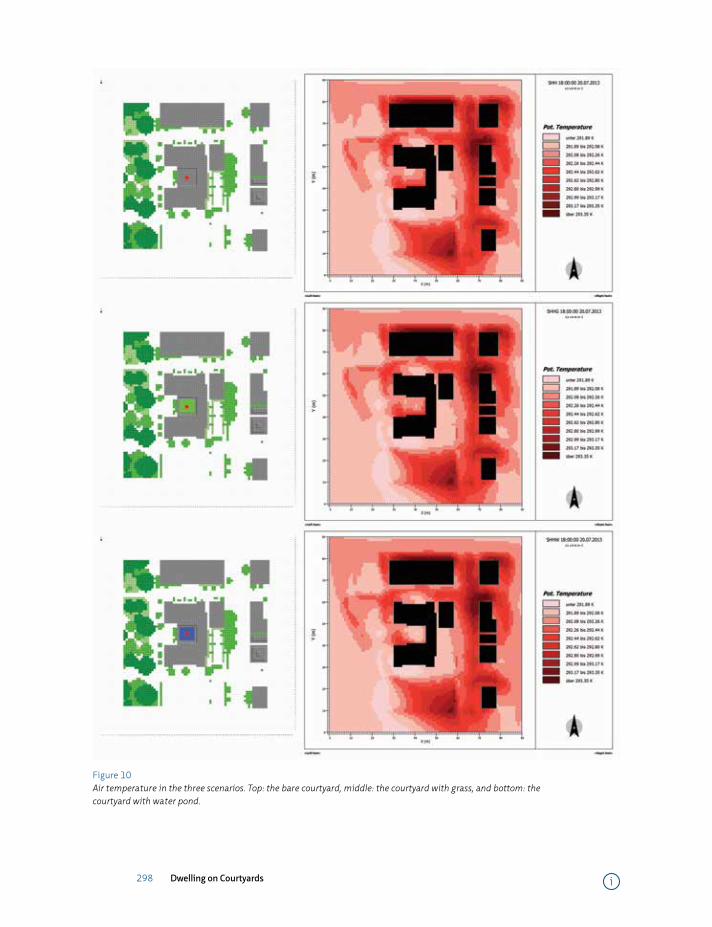
298 Dwelling on Courtyards
Figure 10 Air temperature in the three scenarios. Top: the bare courtyard, middle: the courtyard with grass, and bottom: the courtyard with water pond.
i

299 Heat mitigation strategies on courtyard buildings in summer
Figure 11 Air temperature (top) and mean radiant temperature (bottom) at the centre of the Shattuck hall courtyard according to the three scenarios: bare, green and with water pond.
§ 9.4.3 Scale 3: Shattuck Hall
During the third phase, the effect of albedo was studied by changing the pavement surface on the Shattuck Hall courtyard. 5 * 5 m2 of the existing pavement was covered with white and black cardboard (Figure 12). Infrared photography allowed observing the surface temperature differences at various moments (14:00 PM, 18:00 PM and 22:00 PM). Based on the spectrometer test, the albedos of the white and black
i
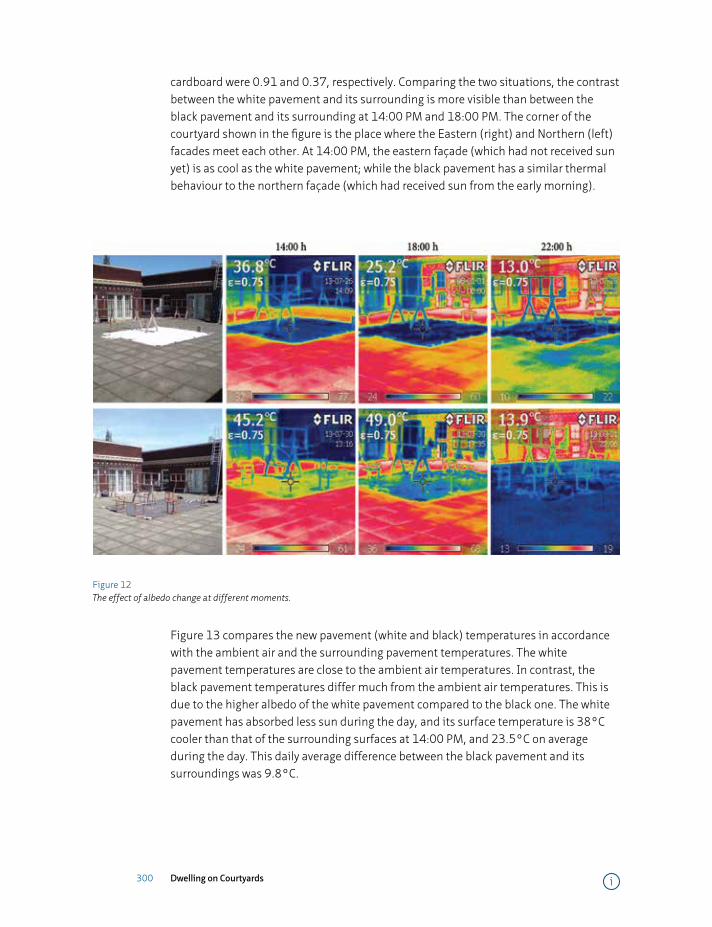
300 Dwelling on Courtyards
cardboard were 0.91 and 0.37, respectively. Comparing the two situations, the contrast between the white pavement and its surrounding is more visible than between the black pavement and its surrounding at 14:00 PM and 18:00 PM. The corner of the courtyard shown in the figure is the place where the Eastern (right) and Northern (left) facades meet each other. At 14:00 PM, the eastern façade (which had not received sun yet) is as cool as the white pavement; while the black pavement has a similar thermal behaviour to the northern façade (which had received sun from the early morning).
Figure 12 The effect of albedo change at different moments.
Figure 13 compares the new pavement (white and black) temperatures in accordance with the ambient air and the surrounding pavement temperatures. The white pavement temperatures are close to the ambient air temperatures. In contrast, the black pavement temperatures differ much from the ambient air temperatures. This is due to the higher albedo of the white pavement compared to the black one. The white pavement has absorbed less sun during the day, and its surface temperature is 38°C cooler than that of the surrounding surfaces at 14:00 PM, and 23.5°C on average during the day. This daily average difference between the black pavement and its surroundings was 9.8°C.
i
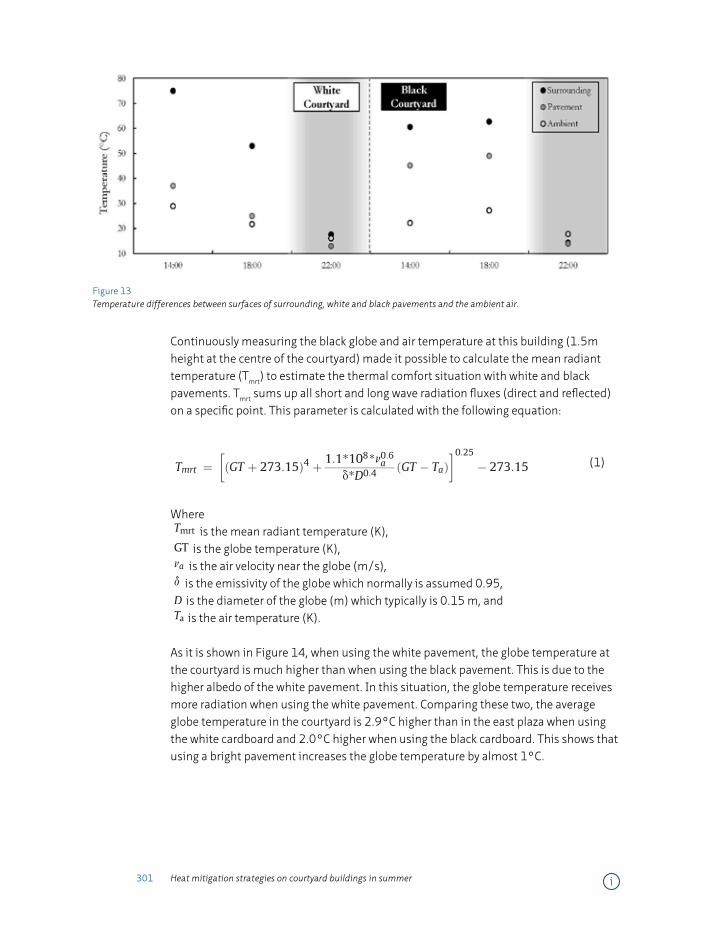
301 Heat mitigation strategies on courtyard buildings in summer
Figure 13 Temperature differences between surfaces of surrounding, white and black pavements and the ambient air.
Continuously measuring the black globe and air temperature at this building (1.5m height at the centre of the courtyard) made it possible to calculate the mean radiant temperature (Tmrt) to estimate the thermal comfort situation with white and black pavements. Tmrt sums up all short and long wave radiation fluxes (direct and reflected) on a specific point. This parameter is calculated with the following equation:
vegetation. Trees and deciduous trees in particular can protectspaces from direct sun in summer and allow solar radiation inwinter. Vegetation also has a low heat capacity. Referring back tothe PET which illustrates thermal comfort, it increases in the af-ternoon. This is because the heat stored during the day is releasedto the air during the afternoon and evening.More investigations areneeded to show whether green areas with a lower heat capacity(over construction materials) can minimise the canyontemperature.
Appendix
Mean radiant temperature is calculated by ENVI-met. This factorsums up all short and long wave radiation fluxes (direct and
reflected) on a specific point. This parameter is calculated with thefollowing equation:
Tmrt ¼�ðGT þ 273:15Þ4 þ 1:1*108*n0:6a
d*D0:4 ðGT � TaÞ�0:25
� 273:15
(4)
where
Tmrt is the mean radiant temperature (K),GT is the globe temperature (K),na is the air velocity near the globe (m/s),d is the emissivity of the globe which normally is assumed 0.95,D is the diameter of the globe (m) which typically is 0.15 m, andTa is the air temperature (K).
ENVI-met, the software tool used for this paper, divides thesurrounding enclosure into “n” isothermal surfaces. The equationused by ENVI-met for calculating Tmrt is Ali-Toudert and Mayer[53]:
Tmrt ¼"1s
Xn
i¼1
EiFi þak3p
Xn
i¼1
DiFi þak3pfpI
!#0:25(5)
where
Ei is the long wave radiation (W),Di is the diffuse and diffusely reflected short wave radiation (W),
Fig. 11. Mean radiant temperatures (Tmrt) at the reference points.
Table 6Averages of the microclimates properties.* ¼ The sum of slightly cool, comfortableand slightly warm hours.
SingularEeW
SingularNeS
LinearEeW
Linear NeS Courtyard
SVF 0.605 0.605 0.404 0.404 0.194Average Ta (�C) 19.3 19.2 19.1 18.9 19.0Average Tmrt (�C) 43.5 45.8 41.6 25.1 22.9Standard deviation
of Tmrt (�C)28.8 28.3 26.0 21.4 13.5
Average wind (m/s) 2.6 1.7 0.5 2.7 0.2PET 23.5 26.4 27.2 17 20.8Comfortable hours* 3 2 4 8 17
15
16
17
18
19
20
21
22
23
5:00
6:00
7:00
8:00
9:00
10:0
0
11:0
0
12:0
0
13:0
0
14:0
0
15:0
0
16:0
0
17:0
0
18:0
0
19:0
0
20:0
0
21:0
0
22:0
0
23:0
0
0:00
1:00
Air
Tem
pera
ture
(°C)
Singular E-W Singular N-S Linear E-W Linear N-S Courtyard
Fig. 12. Air temperatures (Ta) at the reference points.
M. Taleghani et al. / Building and Environment xxx (2014) 1e14 11
Please cite this article in press as: Taleghani M, et al., Outdoor thermal comfort within five different urban forms in the Netherlands, Buildingand Environment (2014), http://dx.doi.org/10.1016/j.buildenv.2014.03.014
(1)
Where
vegetation. Trees and deciduous trees in particular can protectspaces from direct sun in summer and allow solar radiation inwinter. Vegetation also has a low heat capacity. Referring back tothe PET which illustrates thermal comfort, it increases in the af-ternoon. This is because the heat stored during the day is releasedto the air during the afternoon and evening.More investigations areneeded to show whether green areas with a lower heat capacity(over construction materials) can minimise the canyontemperature.
Appendix
Mean radiant temperature is calculated by ENVI-met. This factorsums up all short and long wave radiation fluxes (direct and
reflected) on a specific point. This parameter is calculated with thefollowing equation:
Tmrt ¼�ðGT þ 273:15Þ4 þ 1:1*108*n0:6a
d*D0:4 ðGT � TaÞ�0:25
� 273:15
(4)
where
Tmrt is the mean radiant temperature (K),GT is the globe temperature (K),na is the air velocity near the globe (m/s),d is the emissivity of the globe which normally is assumed 0.95,D is the diameter of the globe (m) which typically is 0.15 m, andTa is the air temperature (K).
ENVI-met, the software tool used for this paper, divides thesurrounding enclosure into “n” isothermal surfaces. The equationused by ENVI-met for calculating Tmrt is Ali-Toudert and Mayer[53]:
Tmrt ¼"1s
Xn
i¼1
EiFi þak3p
Xn
i¼1
DiFi þak3pfpI
!#0:25(5)
where
Ei is the long wave radiation (W),Di is the diffuse and diffusely reflected short wave radiation (W),
Fig. 11. Mean radiant temperatures (Tmrt) at the reference points.
Table 6Averages of the microclimates properties.* ¼ The sum of slightly cool, comfortableand slightly warm hours.
SingularEeW
SingularNeS
LinearEeW
Linear NeS Courtyard
SVF 0.605 0.605 0.404 0.404 0.194Average Ta (�C) 19.3 19.2 19.1 18.9 19.0Average Tmrt (�C) 43.5 45.8 41.6 25.1 22.9Standard deviation
of Tmrt (�C)28.8 28.3 26.0 21.4 13.5
Average wind (m/s) 2.6 1.7 0.5 2.7 0.2PET 23.5 26.4 27.2 17 20.8Comfortable hours* 3 2 4 8 17
15
16
17
18
19
20
21
22
23
5:00
6:00
7:00
8:00
9:00
10:0
0
11:0
0
12:0
0
13:0
0
14:0
0
15:0
0
16:0
0
17:0
0
18:0
0
19:0
0
20:0
0
21:0
0
22:0
0
23:0
0
0:00
1:00
Air
Tem
pera
ture
(°C)
Singular E-W Singular N-S Linear E-W Linear N-S Courtyard
Fig. 12. Air temperatures (Ta) at the reference points.
M. Taleghani et al. / Building and Environment xxx (2014) 1e14 11
Please cite this article in press as: Taleghani M, et al., Outdoor thermal comfort within five different urban forms in the Netherlands, Buildingand Environment (2014), http://dx.doi.org/10.1016/j.buildenv.2014.03.014
is the mean radiant temperature (K),
vegetation. Trees and deciduous trees in particular can protectspaces from direct sun in summer and allow solar radiation inwinter. Vegetation also has a low heat capacity. Referring back tothe PET which illustrates thermal comfort, it increases in the af-ternoon. This is because the heat stored during the day is releasedto the air during the afternoon and evening.More investigations areneeded to show whether green areas with a lower heat capacity(over construction materials) can minimise the canyontemperature.
Appendix
Mean radiant temperature is calculated by ENVI-met. This factorsums up all short and long wave radiation fluxes (direct and
reflected) on a specific point. This parameter is calculated with thefollowing equation:
Tmrt ¼�ðGT þ 273:15Þ4 þ 1:1*108*n0:6a
d*D0:4 ðGT � TaÞ�0:25
� 273:15
(4)
where
Tmrt is the mean radiant temperature (K),GT is the globe temperature (K),na is the air velocity near the globe (m/s),d is the emissivity of the globe which normally is assumed 0.95,D is the diameter of the globe (m) which typically is 0.15 m, andTa is the air temperature (K).
ENVI-met, the software tool used for this paper, divides thesurrounding enclosure into “n” isothermal surfaces. The equationused by ENVI-met for calculating Tmrt is Ali-Toudert and Mayer[53]:
Tmrt ¼"1s
Xn
i¼1
EiFi þak3p
Xn
i¼1
DiFi þak3pfpI
!#0:25(5)
where
Ei is the long wave radiation (W),Di is the diffuse and diffusely reflected short wave radiation (W),
Fig. 11. Mean radiant temperatures (Tmrt) at the reference points.
Table 6Averages of the microclimates properties.* ¼ The sum of slightly cool, comfortableand slightly warm hours.
SingularEeW
SingularNeS
LinearEeW
Linear NeS Courtyard
SVF 0.605 0.605 0.404 0.404 0.194Average Ta (�C) 19.3 19.2 19.1 18.9 19.0Average Tmrt (�C) 43.5 45.8 41.6 25.1 22.9Standard deviation
of Tmrt (�C)28.8 28.3 26.0 21.4 13.5
Average wind (m/s) 2.6 1.7 0.5 2.7 0.2PET 23.5 26.4 27.2 17 20.8Comfortable hours* 3 2 4 8 17
15
16
17
18
19
20
21
22
23
5:00
6:00
7:00
8:00
9:00
10:0
0
11:0
0
12:0
0
13:0
0
14:0
0
15:0
0
16:0
0
17:0
0
18:0
0
19:0
0
20:0
0
21:0
0
22:0
0
23:0
0
0:00
1:00
Air
Tem
pera
ture
(°C)
Singular E-W Singular N-S Linear E-W Linear N-S Courtyard
Fig. 12. Air temperatures (Ta) at the reference points.
M. Taleghani et al. / Building and Environment xxx (2014) 1e14 11
Please cite this article in press as: Taleghani M, et al., Outdoor thermal comfort within five different urban forms in the Netherlands, Buildingand Environment (2014), http://dx.doi.org/10.1016/j.buildenv.2014.03.014
is the globe temperature (K),
vegetation. Trees and deciduous trees in particular can protectspaces from direct sun in summer and allow solar radiation inwinter. Vegetation also has a low heat capacity. Referring back tothe PET which illustrates thermal comfort, it increases in the af-ternoon. This is because the heat stored during the day is releasedto the air during the afternoon and evening.More investigations areneeded to show whether green areas with a lower heat capacity(over construction materials) can minimise the canyontemperature.
Appendix
Mean radiant temperature is calculated by ENVI-met. This factorsums up all short and long wave radiation fluxes (direct and
reflected) on a specific point. This parameter is calculated with thefollowing equation:
Tmrt ¼�ðGT þ 273:15Þ4 þ 1:1*108*n0:6a
d*D0:4 ðGT � TaÞ�0:25
� 273:15
(4)
where
Tmrt is the mean radiant temperature (K),GT is the globe temperature (K),na is the air velocity near the globe (m/s),d is the emissivity of the globe which normally is assumed 0.95,D is the diameter of the globe (m) which typically is 0.15 m, andTa is the air temperature (K).
ENVI-met, the software tool used for this paper, divides thesurrounding enclosure into “n” isothermal surfaces. The equationused by ENVI-met for calculating Tmrt is Ali-Toudert and Mayer[53]:
Tmrt ¼"1s
Xn
i¼1
EiFi þak3p
Xn
i¼1
DiFi þak3pfpI
!#0:25(5)
where
Ei is the long wave radiation (W),Di is the diffuse and diffusely reflected short wave radiation (W),
Fig. 11. Mean radiant temperatures (Tmrt) at the reference points.
Table 6Averages of the microclimates properties.* ¼ The sum of slightly cool, comfortableand slightly warm hours.
SingularEeW
SingularNeS
LinearEeW
Linear NeS Courtyard
SVF 0.605 0.605 0.404 0.404 0.194Average Ta (�C) 19.3 19.2 19.1 18.9 19.0Average Tmrt (�C) 43.5 45.8 41.6 25.1 22.9Standard deviation
of Tmrt (�C)28.8 28.3 26.0 21.4 13.5
Average wind (m/s) 2.6 1.7 0.5 2.7 0.2PET 23.5 26.4 27.2 17 20.8Comfortable hours* 3 2 4 8 17
15
16
17
18
19
20
21
22
23
5:00
6:00
7:00
8:00
9:00
10:0
0
11:0
0
12:0
0
13:0
0
14:0
0
15:0
0
16:0
0
17:0
0
18:0
0
19:0
0
20:0
0
21:0
0
22:0
0
23:0
0
0:00
1:00
Air
Tem
pera
ture
(°C)
Singular E-W Singular N-S Linear E-W Linear N-S Courtyard
Fig. 12. Air temperatures (Ta) at the reference points.
M. Taleghani et al. / Building and Environment xxx (2014) 1e14 11
Please cite this article in press as: Taleghani M, et al., Outdoor thermal comfort within five different urban forms in the Netherlands, Buildingand Environment (2014), http://dx.doi.org/10.1016/j.buildenv.2014.03.014
is the air velocity near the globe (m/s),
vegetation. Trees and deciduous trees in particular can protectspaces from direct sun in summer and allow solar radiation inwinter. Vegetation also has a low heat capacity. Referring back tothe PET which illustrates thermal comfort, it increases in the af-ternoon. This is because the heat stored during the day is releasedto the air during the afternoon and evening.More investigations areneeded to show whether green areas with a lower heat capacity(over construction materials) can minimise the canyontemperature.
Appendix
Mean radiant temperature is calculated by ENVI-met. This factorsums up all short and long wave radiation fluxes (direct and
reflected) on a specific point. This parameter is calculated with thefollowing equation:
Tmrt ¼�ðGT þ 273:15Þ4 þ 1:1*108*n0:6a
d*D0:4 ðGT � TaÞ�0:25
� 273:15
(4)
where
Tmrt is the mean radiant temperature (K),GT is the globe temperature (K),na is the air velocity near the globe (m/s),d is the emissivity of the globe which normally is assumed 0.95,D is the diameter of the globe (m) which typically is 0.15 m, andTa is the air temperature (K).
ENVI-met, the software tool used for this paper, divides thesurrounding enclosure into “n” isothermal surfaces. The equationused by ENVI-met for calculating Tmrt is Ali-Toudert and Mayer[53]:
Tmrt ¼"1s
Xn
i¼1
EiFi þak3p
Xn
i¼1
DiFi þak3pfpI
!#0:25(5)
where
Ei is the long wave radiation (W),Di is the diffuse and diffusely reflected short wave radiation (W),
Fig. 11. Mean radiant temperatures (Tmrt) at the reference points.
Table 6Averages of the microclimates properties.* ¼ The sum of slightly cool, comfortableand slightly warm hours.
SingularEeW
SingularNeS
LinearEeW
Linear NeS Courtyard
SVF 0.605 0.605 0.404 0.404 0.194Average Ta (�C) 19.3 19.2 19.1 18.9 19.0Average Tmrt (�C) 43.5 45.8 41.6 25.1 22.9Standard deviation
of Tmrt (�C)28.8 28.3 26.0 21.4 13.5
Average wind (m/s) 2.6 1.7 0.5 2.7 0.2PET 23.5 26.4 27.2 17 20.8Comfortable hours* 3 2 4 8 17
15
16
17
18
19
20
21
22
23
5:00
6:00
7:00
8:00
9:00
10:0
0
11:0
0
12:0
0
13:0
0
14:0
0
15:0
0
16:0
0
17:0
0
18:0
0
19:0
0
20:0
0
21:0
0
22:0
0
23:0
0
0:00
1:00
Air
Tem
pera
ture
(°C)
Singular E-W Singular N-S Linear E-W Linear N-S Courtyard
Fig. 12. Air temperatures (Ta) at the reference points.
M. Taleghani et al. / Building and Environment xxx (2014) 1e14 11
Please cite this article in press as: Taleghani M, et al., Outdoor thermal comfort within five different urban forms in the Netherlands, Buildingand Environment (2014), http://dx.doi.org/10.1016/j.buildenv.2014.03.014
is the emissivity of the globe which normally is assumed 0.95,
vegetation. Trees and deciduous trees in particular can protectspaces from direct sun in summer and allow solar radiation inwinter. Vegetation also has a low heat capacity. Referring back tothe PET which illustrates thermal comfort, it increases in the af-ternoon. This is because the heat stored during the day is releasedto the air during the afternoon and evening.More investigations areneeded to show whether green areas with a lower heat capacity(over construction materials) can minimise the canyontemperature.
Appendix
Mean radiant temperature is calculated by ENVI-met. This factorsums up all short and long wave radiation fluxes (direct and
reflected) on a specific point. This parameter is calculated with thefollowing equation:
Tmrt ¼�ðGT þ 273:15Þ4 þ 1:1*108*n0:6a
d*D0:4 ðGT � TaÞ�0:25
� 273:15
(4)
where
Tmrt is the mean radiant temperature (K),GT is the globe temperature (K),na is the air velocity near the globe (m/s),d is the emissivity of the globe which normally is assumed 0.95,D is the diameter of the globe (m) which typically is 0.15 m, andTa is the air temperature (K).
ENVI-met, the software tool used for this paper, divides thesurrounding enclosure into “n” isothermal surfaces. The equationused by ENVI-met for calculating Tmrt is Ali-Toudert and Mayer[53]:
Tmrt ¼"1s
Xn
i¼1
EiFi þak3p
Xn
i¼1
DiFi þak3pfpI
!#0:25(5)
where
Ei is the long wave radiation (W),Di is the diffuse and diffusely reflected short wave radiation (W),
Fig. 11. Mean radiant temperatures (Tmrt) at the reference points.
Table 6Averages of the microclimates properties.* ¼ The sum of slightly cool, comfortableand slightly warm hours.
SingularEeW
SingularNeS
LinearEeW
Linear NeS Courtyard
SVF 0.605 0.605 0.404 0.404 0.194Average Ta (�C) 19.3 19.2 19.1 18.9 19.0Average Tmrt (�C) 43.5 45.8 41.6 25.1 22.9Standard deviation
of Tmrt (�C)28.8 28.3 26.0 21.4 13.5
Average wind (m/s) 2.6 1.7 0.5 2.7 0.2PET 23.5 26.4 27.2 17 20.8Comfortable hours* 3 2 4 8 17
15
16
17
18
19
20
21
22
23
5:00
6:00
7:00
8:00
9:00
10:0
0
11:0
0
12:0
0
13:0
0
14:0
0
15:0
0
16:0
0
17:0
0
18:0
0
19:0
0
20:0
0
21:0
0
22:0
0
23:0
0
0:00
1:00
Air
Tem
pera
ture
(°C)
Singular E-W Singular N-S Linear E-W Linear N-S Courtyard
Fig. 12. Air temperatures (Ta) at the reference points.
M. Taleghani et al. / Building and Environment xxx (2014) 1e14 11
Please cite this article in press as: Taleghani M, et al., Outdoor thermal comfort within five different urban forms in the Netherlands, Buildingand Environment (2014), http://dx.doi.org/10.1016/j.buildenv.2014.03.014
is the diameter of the globe (m) which typically is 0.15 m, andvegetation. Trees and deciduous trees in particular can protectspaces from direct sun in summer and allow solar radiation inwinter. Vegetation also has a low heat capacity. Referring back tothe PET which illustrates thermal comfort, it increases in the af-ternoon. This is because the heat stored during the day is releasedto the air during the afternoon and evening.More investigations areneeded to show whether green areas with a lower heat capacity(over construction materials) can minimise the canyontemperature.
Appendix
Mean radiant temperature is calculated by ENVI-met. This factorsums up all short and long wave radiation fluxes (direct and
reflected) on a specific point. This parameter is calculated with thefollowing equation:
Tmrt ¼�ðGT þ 273:15Þ4 þ 1:1*108*n0:6a
d*D0:4 ðGT � TaÞ�0:25
� 273:15
(4)
where
Tmrt is the mean radiant temperature (K),GT is the globe temperature (K),na is the air velocity near the globe (m/s),d is the emissivity of the globe which normally is assumed 0.95,D is the diameter of the globe (m) which typically is 0.15 m, andTa is the air temperature (K).
ENVI-met, the software tool used for this paper, divides thesurrounding enclosure into “n” isothermal surfaces. The equationused by ENVI-met for calculating Tmrt is Ali-Toudert and Mayer[53]:
Tmrt ¼"1s
Xn
i¼1
EiFi þak3p
Xn
i¼1
DiFi þak3pfpI
!#0:25(5)
where
Ei is the long wave radiation (W),Di is the diffuse and diffusely reflected short wave radiation (W),
Fig. 11. Mean radiant temperatures (Tmrt) at the reference points.
Table 6Averages of the microclimates properties.* ¼ The sum of slightly cool, comfortableand slightly warm hours.
SingularEeW
SingularNeS
LinearEeW
Linear NeS Courtyard
SVF 0.605 0.605 0.404 0.404 0.194Average Ta (�C) 19.3 19.2 19.1 18.9 19.0Average Tmrt (�C) 43.5 45.8 41.6 25.1 22.9Standard deviation
of Tmrt (�C)28.8 28.3 26.0 21.4 13.5
Average wind (m/s) 2.6 1.7 0.5 2.7 0.2PET 23.5 26.4 27.2 17 20.8Comfortable hours* 3 2 4 8 17
15
16
17
18
19
20
21
22
23
5:00
6:00
7:00
8:00
9:00
10:0
0
11:0
0
12:0
0
13:0
0
14:0
0
15:0
0
16:0
0
17:0
0
18:0
0
19:0
0
20:0
0
21:0
0
22:0
0
23:0
0
0:00
1:00
Air
Tem
pera
ture
(°C)
Singular E-W Singular N-S Linear E-W Linear N-S Courtyard
Fig. 12. Air temperatures (Ta) at the reference points.
M. Taleghani et al. / Building and Environment xxx (2014) 1e14 11
Please cite this article in press as: Taleghani M, et al., Outdoor thermal comfort within five different urban forms in the Netherlands, Buildingand Environment (2014), http://dx.doi.org/10.1016/j.buildenv.2014.03.014
is the air temperature (K).
As it is shown in Figure 14, when using the white pavement, the globe temperature at the courtyard is much higher than when using the black pavement. This is due to the higher albedo of the white pavement. In this situation, the globe temperature receives more radiation when using the white pavement. Comparing these two, the average globe temperature in the courtyard is 2.9°C higher than in the east plaza when using the white cardboard and 2.0°C higher when using the black cardboard. This shows that using a bright pavement increases the globe temperature by almost 1°C.
i

302 Dwelling on Courtyards
Considering the air temperature on the two spots, the east plaza is warmer than the courtyard with white pavement with a maximum temperature difference of 1.9°C. Contrary, the east plaza has only slightly higher air temperature than the courtyard with black pavement with a maximum difference of 0.6°C. This shows how pavement with low albedo can increase the ambient air temperature in a microclimate.
Discussing mean radiant temperature (Tmrt) which is the most important factor to determine thermal comfort, Figure 12 shows how it differs when using white and black pavements. In general, the courtyard has a continuously higher Tmrt than the east plaza. In case of a white pavement, the differences are much higher than in case of a black pavement. Clearly, the average Tmrt of the courtyard with white pavement is 12.4°C higher than the east plaza. This difference reduced to 2.9°C with the black pavement.
From thermal comfort point of view, having the lower mean radiant temperature with the black pavement leads to higher thermal comfort for a pedestrian because lower reflected sun is reflected from the ground. In contrast, the black pavement that reflects less sun and gets warmer than the white pavement. Therefore, this roof can conduct and radiate its heat to the indoor environment of the building, and consequently can increase the cooling demand of the building. This effect of outdoor heat mitigation on indoor energy demand could be useful for designers to consider the consequence of outdoor heat mitigation strategies.
i

303 Heat mitigation strategies on courtyard buildings in summer
Figure 14 The globe, air and mean radiant temperature when using white and black pavements.
i
304 Dwelling on Courtyards
§ 9.5 Conclusion
This research investigated different heat mitigation strategies through measurements and simulations in a university campus area in Portland, Oregon, USA. The study analysed local urban climate conditions in July and August of 2013 at three scales: the university campus, three courtyard buildings with different characteristics, and finally, one of the university buildings.
In the first phase, seven locations on the campus were measured. The maximum park cooling effect reported (i.e. temperature difference between a cool park and another location) was 5.8°C between the campus park and a parking lot with asphalt pavement (located 250 m apart). Moreover, the vegetation of the park as an obstruction, made the microclimate of the park more moderate (with less temperature fluctuations) as compared to the other measured locations. Furthermore, the campus was simulated for three different scenarios: the actual campus, a campus with water pools instead of a campus park, and the campus without any vegetation. It was found that the peak air temperature in the Shattuck Hall courtyard was 0.5°C and 1.6°C cooler in case of the park replaced by water bodies and in case of the existing park, respectively, compared to the bare campus. Since public transportation and asphalt pavements are inevitable in educational campuses, these findings could be useful for planners and designers to consider the cooling effect of vegetation and water within the public areas of university campuses. Moreover, there is a body of literature that confirms the environmental and psychological effects of natural elements in educational spaces.
In the second phase, three courtyard buildings on the campus with different characteristics were compared (one with vegetation, one with water bodies and a bare one- Shattuck Building courtyard). The air temperature in the bare courtyard was recorded as the highest and in the green courtyard as the lowest. The maximum temperature difference recorded was 4.7°C (at 16:30 PM). To have a clear understanding of the role of vegetation and water, simulations were performed for the bare courtyard. The courtyard was modelled in its current configuration and using test cases where the courtyard was first greened with vegetation or filled with a water body. The case with a water pond reduced the mean radiant temperature by 15.8°C compared to the bare situation.
In the last phase, the courtyard of the Shattuck Building was used to study the effect of albedo change. The existing pavement was partially covered with black and white cardboard with albedo of 0.37 and 0.91, respectively. It was observed that the black treatment reduced the globe temperature and consequently mean radiant temperature, but increased the local air temperature. In contrast, the white treatment significantly increased the globe and mean radiant temperature (0.9°C and 2.9°C respectively) while producing a cooler local air temperature (1.3°C). This phase showed how surface colours could affect indoor and outdoor thermal comfort in public and urban spaces.
i
305 Heat mitigation strategies on courtyard buildings in summer
This research suggests that in the temperate climate of Portland, vegetation and water bodies can reduce air temperature and significantly mean radiant temperature in canyons. This is in accordance with several studies that have shown the importance of using natural elements in urban areas. Finally, this chapter mainly addressed air temperature and mean radiant temperature as key factors affecting outdoor thermal comfort; while, future studies can make this study more advanced with showing the role of moisture and other indices on outdoor thermal comfort in urban canyons. Considering the fact that most of metropolitan cities like Portland have university and educational campuses, planners and designers can use the benefit of greening these spaces as a strategy to mitigate urban heat island.
Acknowledgment
This research was partially supported by the Department of Energy under Award Number #DE-EE0003870.
References
1 T.R. Oke, Boundary Layer Climates, Routledge, New York, 1987.
2 A.H. Rosenfeld, H. Akbari, S. Bretz, B.L. Fishman, D.M. Kurn, D. Sailor, H. Taha, Mitigation of urban heat islands:
materials, utility programs, updates, Energy and Buildings, 22 (3) (1995) 255-265.
3 C.S.B. Grimmond, M. Roth, T.R. Oke, Y.C. Au, M. Best, R. Betts, G. Carmichael, H. Cleugh, W. Dabberdt, R.
Emmanuel, E. Freitas, K. Fortuniak, S. Hanna, P. Klein, L.S. Kalkstein, C.H. Liu, A. Nickson, D. Pearlmutter,
D. Sailor, J. Voogt, Climate and More Sustainable Cities: Climate Information for Improved Planning and
Management of Cities (Producers/Capabilities Perspective), Procedia Environmental Sciences, 1 (0) (2010)
247-274.
4 J.A. Voogt, T.R. Oke, Thermal remote sensing of urban climates, Remote Sensing of Environment, 86 (3) (2003)
370-384.
5 H. Taha, Meso-urban meteorological and photochemical modeling of heat island mitigation, Atmospheric
Environment, 42 (38) (2008) 8795-8809.
6 M. Santamouris, Cooling the cities – A review of reflective and green roof mitigation technologies to fight heat
island and improve comfort in urban environments, Solar Energy, (0) (2013).
7 L.Y. Xu, X.D. Xie, S. Li, Correlation analysis of the urban heat island effect and the spatial and temporal
distribution of atmospheric particulates using TM images in Beijing, Environmental Pollution, 178 (0) (2013)
102-114.
8 J. Kapsomenakis, D. Kolokotsa, T. Nikolaou, M. Santamouris, S.C. Zerefos, Forty years increase of the air ambient
temperature in Greece: The impact on buildings, Energy Conversion and Management, 74 (0) (2013) 353-365.
9 E. Carnielo, M. Zinzi, Optical and thermal characterisation of cool asphalts to mitigate urban temperatures and
building cooling demand, Building and Environment, 60 (0) (2013) 56-65.
10 U. Mazzali, F. Peron, P. Romagnoni, R.M. Pulselli, S. Bastianoni, Experimental investigation on the energy
performance of Living Walls in a temperate climate, Building and Environment, 64 (0) (2013) 57-66.
i
306 Dwelling on Courtyards
11 B.C. Hedquist, A.J. Brazel, Seasonal variability of temperatures and outdoor human comfort in Phoenix, Arizona,
U.S.A, Building and Environment, (0).
12 A.M. Coutts, E. Daly, J. Beringer, N.J. Tapper, Assessing practical measures to reduce urban heat: Green and cool
roofs, Building and Environment, 70 (0) (2013) 266-276.
13 M. Taleghani, M. Tenpierik, A. van den Dobbelsteen, R. de Dear, Energy use impact of and thermal comfort in
different urban block types in the Netherlands, Energy and Buildings, 67 (0) (2013) 166-175.
14 M. Taleghani, M. Tenpierik, S. Kurvers, A. van den Dobbelsteen, A review into thermal comfort in buildings,
Renewable and Sustainable Energy Reviews, 26 (0) (2013) 201-215.
15 H. Akbari, S. Konopacki, Energy effects of heat-island reduction strategies in Toronto, Canada, Energy, 29 (2)
(2004) 191-210.
16 Y. Hirano, T. Fujita, Evaluation of the impact of the urban heat island on residential and commercial energy
consumption in Tokyo, Energy, 37 (1) (2012) 371-383.
17 H. Radhi, S. Sharples, Quantifying the domestic electricity consumption for air-conditioning due to urban heat
islands in hot arid regions, Applied Energy, 112 (0) (2013) 371-380.
18 M. Hart, D. Sailor, Quantifying the influence of land-use and surface characteristics on spatial variability in the
urban heat island, Theor Appl Climatol, 95 (3-4) (2009) 397-406.
19 T.R. Oke, Canyon geometry and the nocturnal urban heat island: Comparison of scale model and field
observations, Journal of Climatology, 1 (3) (1981) 237-254.
20 A. Dimoudi, A. Kantzioura, S. Zoras, C. Pallas, P. Kosmopoulos, Investigation of urban microclimate parameters
in an urban center, Energy and Buildings, 64 (0) (2013) 1-9.
21 H. Taha, Urban climates and heat islands: albedo, evapotranspiration, and anthropogenic heat, Energy and
Buildings, 25 (2) (1997) 99-103.
22 H. Akbari, H.D. Matthews, Global cooling updates: Reflective roofs and pavements, Energy and Buildings, 55 (0)
(2012) 2-6.
23 M. Taleghani, M. Tenpierik, A. van den Dobbelsteen, Energy performance and thermal comfort of courtyard/
atrium dwellings in the Netherlands in the light of climate change, Renewable Energy, 63 (0) (2014) 486-497.
24 D.J. Sailor, A review of methods for estimating anthropogenic heat and moisture emissions in the urban
environment, International Journal of Climatology, 31 (2) (2011) 189-199.
25 W.L. Chow, R. Pope, C. Martin, A. Brazel, Observing and modeling the nocturnal park cool island of an arid city:
horizontal and vertical impacts, Theor Appl Climatol, 103 (1-2) (2011) 197-211.
26 M. Srivanit, K. Hokao, Evaluating the cooling effects of greening for improving the outdoor thermal environment
at an institutional campus in the summer, Building and Environment, 66 (0) (2013) 158-172.
27 T.R. Oke, J.M. Crowther, K.G. McNaughton, J.L. Monteith, B. Gardiner, The Micrometeorology of the Urban Forest
[and Discussion], Philosophical Transactions of the Royal Society of London. B, Biological Sciences, 324 (1223)
(1989) 335-349.
28 L. Howard, The climate of London, deduced from meteorological observations made in the metropolis and
various places around it, Harvey and Darton, London, 1833.
29 A. Dimoudi, M. Nikolopoulou, Vegetation in the urban environment: microclimatic analysis and benefits, Energy
and Buildings, 35 (1) (2003) 69-76.
30 L. Kleerekoper, M. van Esch, T.B. Salcedo, How to make a city climate-proof, addressing the urban heat island
effect, Resources, Conservation and Recycling, 64 (0) (2012) 30-38.
31 E.G. McPherson, A.R. Rowntree, J.A. Wagar, Energy-efficient landscapes, in: G. Bradley (Ed.) Urban Forest
Landscapes- Integrating Multidisciplinary Perspectives, University of Washington Press, Seattle/London, 1994.
i
307 Heat mitigation strategies on courtyard buildings in summer
32 T.R. Oke, The energetic basis of the urban heat island, Quarterly Journal of the Royal Meteorological Society, 108
(455) (1982) 1-24.
33 H. Taha, S. Douglas, J. Haney, Mesoscale meteorological and air quality impacts of increased urban albedo and
vegetation, Energy and Buildings, 25 (2) (1997) 169-177.
34 L. Pereira, A. Perrier, R. Allen, I. Alves, Evapotranspiration: Concepts and Future Trends, Journal of Irrigation and
Drainage Engineering, 125 (2) (1999) 45-51.
35 M. Nikolopoulou, N. Baker, K. Steemers, Thermal comfort in outdoor urban spaces: understanding the human
parameter, Solar Energy, 70 (3) (2001) 227-235.
36 P. Höppe, Different aspects of assessing indoor and outdoor thermal comfort, Energy and Buildings, 34 (6)
(2002) 661-665.
37 D. Fiala, G. Havenith, P. Bröde, B. Kampmann, G. Jendritzky, UTCI-Fiala multi-node model of human heat
transfer and temperature regulation, International Journal of Biometeorology, 56 (3) (2012) 429-441.
38 S. Oliveira, H. Andrade, T. Vaz, The cooling effect of green spaces as a contribution to the mitigation of urban
heat: A case study in Lisbon, Building and Environment, 46 (11) (2011) 2186-2194.
39 F. Ali-Toudert, H. Mayer, Numerical study on the effects of aspect ratio and orientation of an urban street canyon
on outdoor thermal comfort in hot and dry climate, Building and Environment, 41 (2) (2006) 94-108.
40 F. Bourbia, F. Boucheriba, Impact of street design on urban microclimate for semi arid climate (Constantine),
Renewable Energy, 35 (2) (2010) 343-347.
41 T.-P. Lin, A. Matzarakis, R.-L. Hwang, Shading effect on long-term outdoor thermal comfort, Building and
Environment, 45 (1) (2010) 213-221.
42 H. Upmanis, I. Eliasson, S. Lindqvist, The influence of green areas on nocturnal temperatures in a high latitude
city (Göteborg, Sweden), International Journal of Climatology, 18 (6) (1998) 681-700.
43 J. Lindén, Nocturnal Cool Island in the Sahelian city of Ouagadougou, Burkina Faso, International Journal of
Climatology, 31 (4) (2011) 605-620.
44 R.A. Spronken-Smith, T.R. Oke, The thermal regime of urban parks in two cities with different summer climates,
International Journal of Remote Sensing, 19 (11) (1998) 2085-2104.
45 L.A. George, W. Becker, Investigating the urban heat island effect with a collaborative inquiry project, Geoscience
Education, 51 (2) (2003) 237-243.
46 M. Bruse, ENVI-met website, in, 2013.
47 M. Bruse, H. Fleer, Simulating surface–plant–air interactions inside urban environments with a three
dimensional numerical model, Environmental Modelling & Software, 13 (3–4) (1998) 373-384.
48 S. Huttner, M. Bruse, P. Dostal, Using ENVI-met to simulate the impact of global warming on the microclimate
in central European cities in: H. Mayer, A. Matzarakis (Eds.) 5th Japanese-German Meeting on Urban
Climatology, Meteorologischen Instituts der Albert-Ludwigs-Universität Freiburg, 2008, pp. 307-312.
49 M. Mahammadzadeh, Klimaschutz und Anpassung an die Klimafolgen: Strategien, Maßnahmen und
Anwendungsbeispiele, IW-Medien, 2009.
50 N.H. Wong, S. Kardinal Jusuf, A. Aung La Win, H. Kyaw Thu, T. Syatia Negara, W. Xuchao, Environmental study
of the impact of greenery in an institutional campus in the tropics, Building and Environment, 42 (8) (2007)
2949-2970.
51 D. Taleb, B. Abu-Hijleh, Urban heat islands: Potential effect of organic and structured urban configurations on
temperature variations in Dubai, UAE, Renewable Energy, 50 (0) (2013) 747-762.
52 FAO, Global Ecological Zoning for the Global Forest Resources Assessment 2000, in, Forestry Department of the
Food and Agriculture Organization, 2001.
i

308 Dwelling on Courtyards
53 M. Kottek, J. Grieser, C. Beck, B. Rudolf, F. Rubel, World Map of the Köppen-Geiger climate classification
updated, Meteorologische Zeitschrift, 15 (3) (2006).
54 S. Berkovic, A. Yezioro, A. Bitan, Study of thermal comfort in courtyards in a hot arid climate, Solar Energy, 86 (5)
(2012) 1173-1186.
55 J. Herrmann, A. Matzarakis, Mean radiant temperature in idealised urban canyons—examples from Freiburg,
Germany, International Journal of Biometeorology, 56 (1) (2012) 199-203.
i

309 Heat mitigation strategies on courtyard buildings in summer i
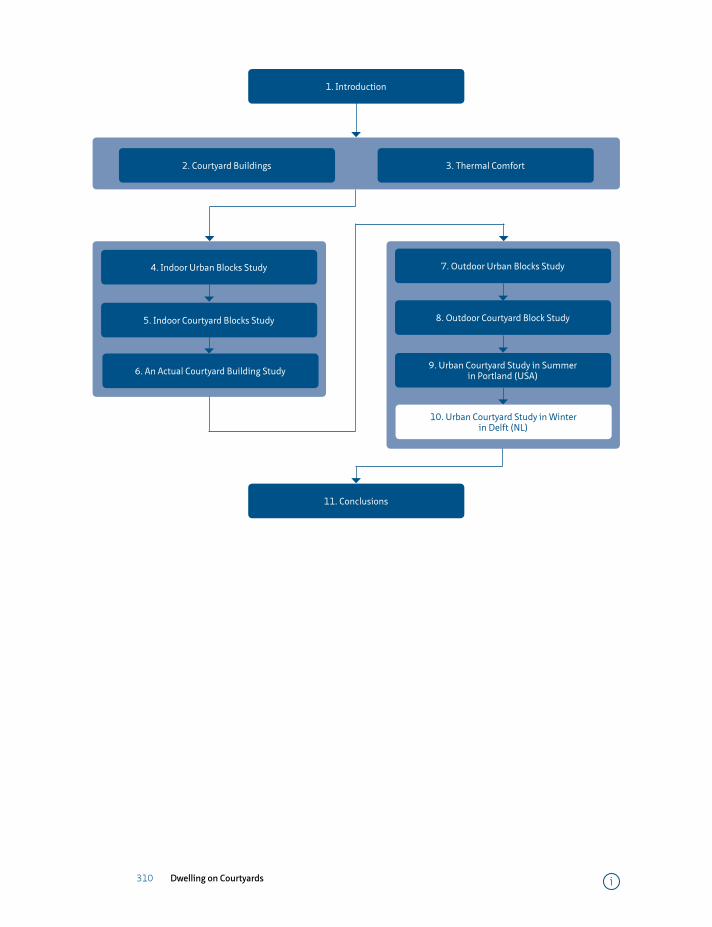
310 Dwelling on Courtyards
=
4. Indoor Urban Blocks Study
5. Indoor Courtyard Blocks Study
11. Conclusions
7. Outdoor Urban Blocks Study
8. Outdoor Courtyard Block Study
9. Urban Courtyard Study in Summer in Portland (USA)
10. Urban Courtyard Study in Winter in Delft (NL)
2. Courtyard Buildings 3. Thermal Comfort
1. Introduction
6. An Actual Courtyard Building Study
i
311 Heat mitigation strategies on courtyard buildings in winter
10 Heat mitigation strategies on courtyard buildings in winter
The previous chapter showed measurements inside actual courtyards in summer. The study from this chapter uses similar measurements in winter. The measurements were done within three different courtyards; a bare courtyard, a green courtyard and a courtyard with a water pond. Three different roofs (black, green and covered with gravel) were also measured. At the end, a scale model experiment helped to better explore the thermal differences between dry and wet surfaces. Moreover, temperature differences between a city park and the suburbs (known as park cooling effect) are described.
i

312 Dwelling on Courtyards i
313 Heat mitigation strategies on courtyard buildings in winter
Heat mitigation strategies in winter and summer: field measurements in temperate climates 1,2
Mohammad Taleghani*1, Martin Tenpierik1, Andy van den Dobbelsteen1, David J. Sailor2
1 Faculty of Architecture and the Built Environment, Delft University of Technology, Delft, the Netherlands2 Department of Mechanical and Materials Engineering, Portland State University, Portland, OR, USA
AbstractNatural elements such as vegetation and water bodies may help reduce heat in urban spaces in summer or in hot climates. This effect, however, has rarely been studied during cold seasons. This paper briefly studies the effect of vegetation and water in summer and more comprehensively in winter. Both studies are done in courtyards on two university campuses in temperate climates. A scale model experiment with similar materials supports the previous studies. The summer study is done in Portland (OR), USA, and the winter study (along with the scale model) in Delft, the Netherlands. The summer study shows that a green courtyard at most has a 4.7°C lower air temperature in the afternoon in comparison with a bare one. The winter study indicates that the air temperature above a green roof is higher than above a white gravel roof. It also shows that, although a ‘black’ courtyard has higher air temperatures for a few hours on sunny winter days, a courtyard with a water pond and with high amounts of thermal mass on the ground has a warmer and more constant air temperature in general. Both the summer and winter studies show that parks in cities have a lower and more constant air temperature compared to suburbs, both in summer and winter. The scale model also demonstrates that although grass has a lower albedo than the used gravel, it can provide a cooler environment in comparison with gravels and black roof.
KeywordsVegetation, water body, summer and winter, courtyard, temperate climates, urban heat island effect, park cool effect.
1 Published as: Taleghani M., Tenpierik M., Dobbelsteen A., Sailor, D., “Heat mitigation strategies in winter and summer: Field measurements in temperate climates”, Building and Environment, 81(2014) 309-319.
2 This is a follow up study based on the key findings published by the authors in Building and Environment, 73(2014) 138-150.
i
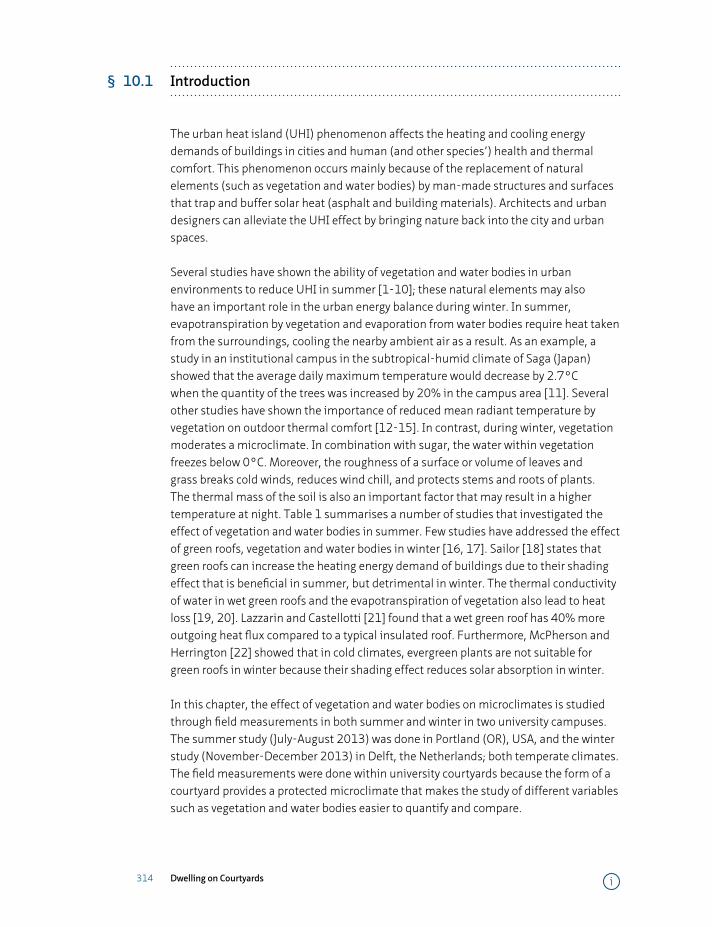
314 Dwelling on Courtyards
§ 10.1 Introduction
The urban heat island (UHI) phenomenon affects the heating and cooling energy demands of buildings in cities and human (and other species’) health and thermal comfort. This phenomenon occurs mainly because of the replacement of natural elements (such as vegetation and water bodies) by man-made structures and surfaces that trap and buffer solar heat (asphalt and building materials). Architects and urban designers can alleviate the UHI effect by bringing nature back into the city and urban spaces.
Several studies have shown the ability of vegetation and water bodies in urban environments to reduce UHI in summer [1-10]; these natural elements may also have an important role in the urban energy balance during winter. In summer, evapotranspiration by vegetation and evaporation from water bodies require heat taken from the surroundings, cooling the nearby ambient air as a result. As an example, a study in an institutional campus in the subtropical-humid climate of Saga (Japan) showed that the average daily maximum temperature would decrease by 2.7°C when the quantity of the trees was increased by 20% in the campus area [11]. Several other studies have shown the importance of reduced mean radiant temperature by vegetation on outdoor thermal comfort [12-15]. In contrast, during winter, vegetation moderates a microclimate. In combination with sugar, the water within vegetation freezes below 0°C. Moreover, the roughness of a surface or volume of leaves and grass breaks cold winds, reduces wind chill, and protects stems and roots of plants. The thermal mass of the soil is also an important factor that may result in a higher temperature at night. Table 1 summarises a number of studies that investigated the effect of vegetation and water bodies in summer. Few studies have addressed the effect of green roofs, vegetation and water bodies in winter [16, 17]. Sailor [18] states that green roofs can increase the heating energy demand of buildings due to their shading effect that is beneficial in summer, but detrimental in winter. The thermal conductivity of water in wet green roofs and the evapotranspiration of vegetation also lead to heat loss [19, 20]. Lazzarin and Castellotti [21] found that a wet green roof has 40% more outgoing heat flux compared to a typical insulated roof. Furthermore, McPherson and Herrington [22] showed that in cold climates, evergreen plants are not suitable for green roofs in winter because their shading effect reduces solar absorption in winter.
In this chapter, the effect of vegetation and water bodies on microclimates is studied through field measurements in both summer and winter in two university campuses. The summer study (July-August 2013) was done in Portland (OR), USA, and the winter study (November-December 2013) in Delft, the Netherlands; both temperate climates. The field measurements were done within university courtyards because the form of a courtyard provides a protected microclimate that makes the study of different variables such as vegetation and water bodies easier to quantify and compare.
i
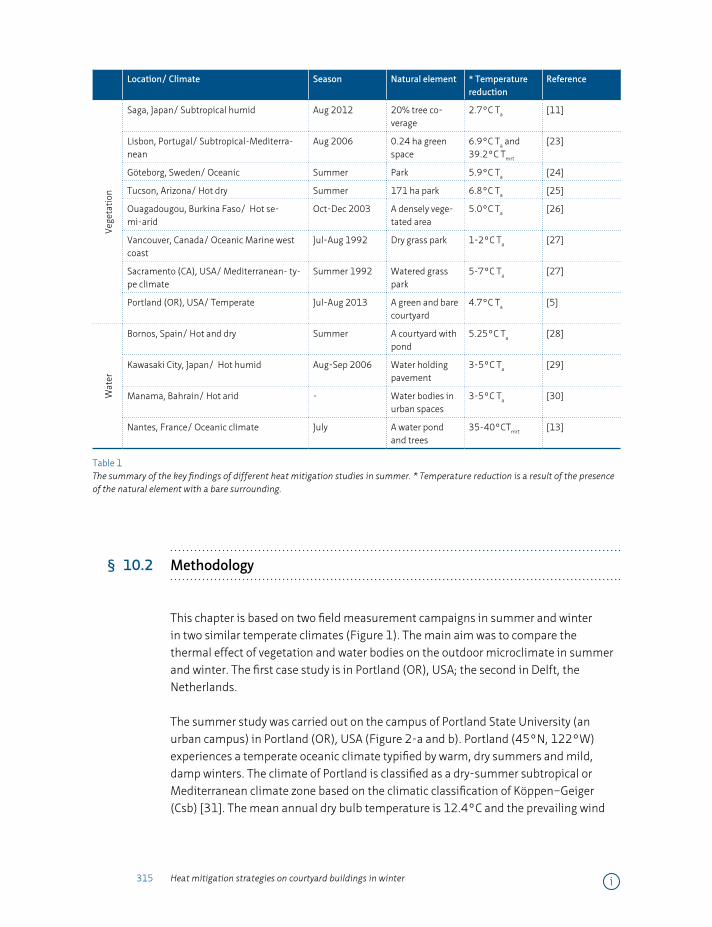
315 Heat mitigation strategies on courtyard buildings in winter
Location/ Climate Season Natural element * Temperature reduction
Reference
Vege
tati
onSaga, Japan/ Subtropical humid Aug 2012 20% tree co-
verage2.7°C Ta [11]
Lisbon, Portugal/ Subtropical-Mediterra-nean
Aug 2006 0.24 ha green space
6.9°C Ta and 39.2°C Tmrt
[23]
Göteborg, Sweden/ Oceanic Summer Park 5.9°C Ta [24]
Tucson, Arizona/ Hot dry Summer 171 ha park 6.8°C Ta [25]
Ouagadougou, Burkina Faso/ Hot se-mi-arid
Oct-Dec 2003 A densely vege-tated area
5.0°C Ta [26]
Vancouver, Canada/ Oceanic Marine west coast
Jul-Aug 1992 Dry grass park 1-2°C Ta [27]
Sacramento (CA), USA/ Mediterranean- ty-pe climate
Summer 1992 Watered grass park
5-7°C Ta [27]
Portland (OR), USA/ Temperate Jul-Aug 2013 A green and bare courtyard
4.7°C Ta [5]
Wat
er
Bornos, Spain/ Hot and dry Summer A courtyard with pond
5.25°C Ta [28]
Kawasaki City, Japan/ Hot humid Aug-Sep 2006 Water holding pavement
3-5°C Ta [29]
Manama, Bahrain/ Hot arid - Water bodies in urban spaces
3-5°C Ta [30]
Nantes, France/ Oceanic climate July A water pond and trees
35-40°CTmrt [13]
Table 1 The summary of the key findings of different heat mitigation studies in summer. * Temperature reduction is a result of the presence of the natural element with a bare surrounding.
§ 10.2 Methodology
This chapter is based on two field measurement campaigns in summer and winter in two similar temperate climates (Figure 1). The main aim was to compare the thermal effect of vegetation and water bodies on the outdoor microclimate in summer and winter. The first case study is in Portland (OR), USA; the second in Delft, the Netherlands.
The summer study was carried out on the campus of Portland State University (an urban campus) in Portland (OR), USA (Figure 2-a and b). Portland (45°N, 122°W) experiences a temperate oceanic climate typified by warm, dry summers and mild, damp winters. The climate of Portland is classified as a dry-summer subtropical or Mediterranean climate zone based on the climatic classification of Köppen–Geiger (Csb) [31]. The mean annual dry bulb temperature is 12.4°C and the prevailing wind
i
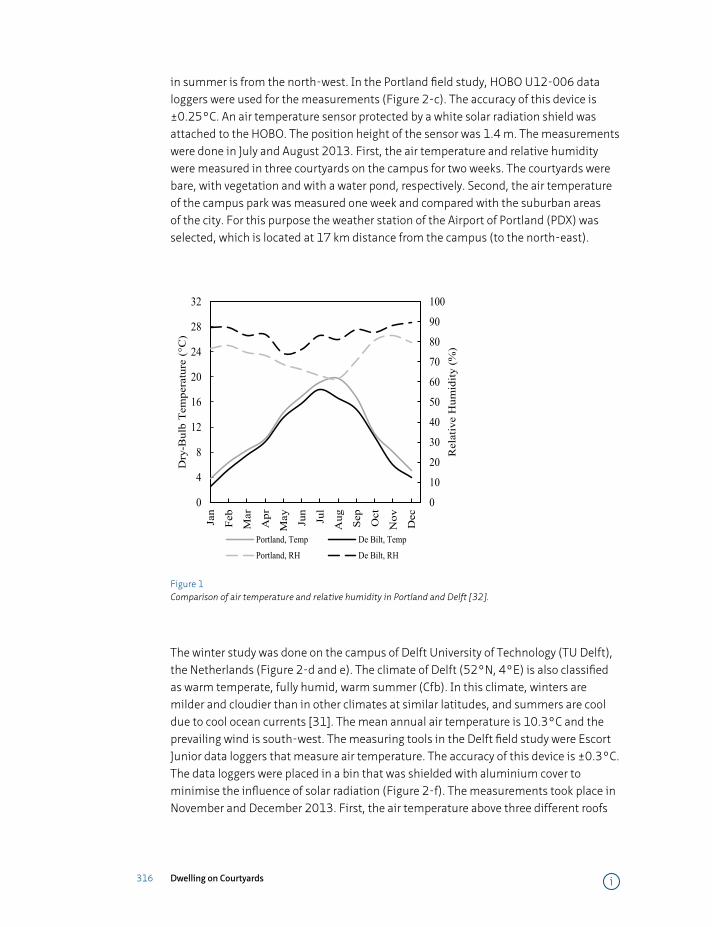
316 Dwelling on Courtyards
in summer is from the north-west. In the Portland field study, HOBO U12-006 data loggers were used for the measurements (Figure 2-c). The accuracy of this device is ±0.25°C. An air temperature sensor protected by a white solar radiation shield was attached to the HOBO. The position height of the sensor was 1.4 m. The measurements were done in July and August 2013. First, the air temperature and relative humidity were measured in three courtyards on the campus for two weeks. The courtyards were bare, with vegetation and with a water pond, respectively. Second, the air temperature of the campus park was measured one week and compared with the suburban areas of the city. For this purpose the weather station of the Airport of Portland (PDX) was selected, which is located at 17 km distance from the campus (to the north-east).
0
10
20
30
40
50
60
70
80
90
100
0
4
8
12
16
20
24
28
32
Jan
Feb
Mar
Apr
May Jun
Jul
Aug Se
p
Oct
Nov
Dec
Rel
ativ
e H
umid
ity (
%)
Dry
-Bul
b T
empe
ratu
re (
°C)
Portland, Temp De Bilt, Temp
Portland, RH De Bilt, RH
Figure 1 Comparison of air temperature and relative humidity in Portland and Delft [32].
The winter study was done on the campus of Delft University of Technology (TU Delft), the Netherlands (Figure 2-d and e). The climate of Delft (52°N, 4°E) is also classified as warm temperate, fully humid, warm summer (Cfb). In this climate, winters are milder and cloudier than in other climates at similar latitudes, and summers are cool due to cool ocean currents [31]. The mean annual air temperature is 10.3°C and the prevailing wind is south-west. The measuring tools in the Delft field study were Escort Junior data loggers that measure air temperature. The accuracy of this device is ±0.3°C. The data loggers were placed in a bin that was shielded with aluminium cover to minimise the influence of solar radiation (Figure 2-f). The measurements took place in November and December 2013. First, the air temperature above three different roofs
i
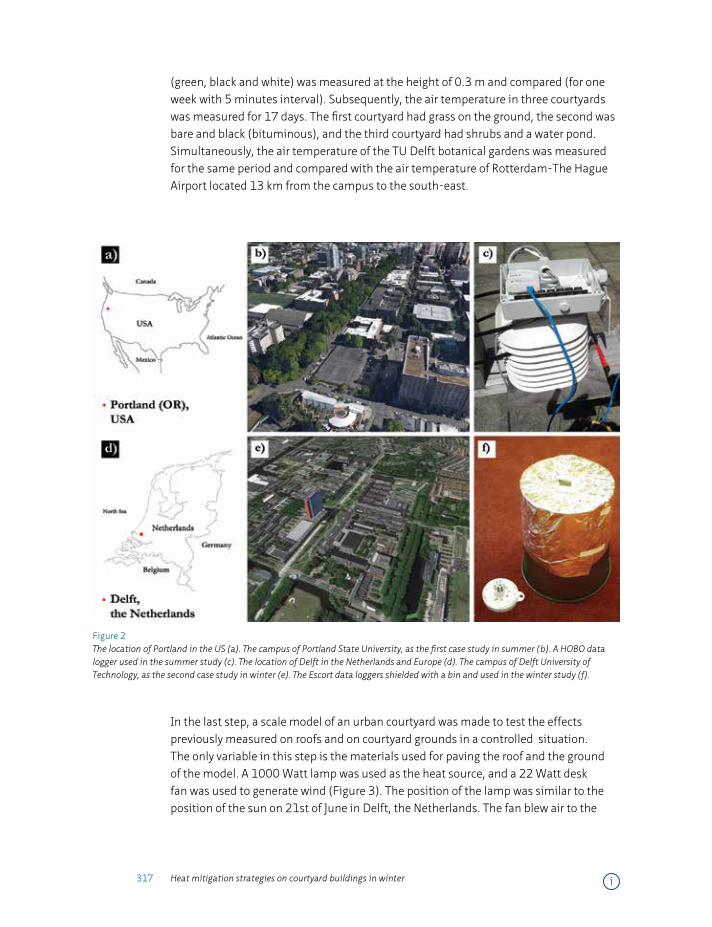
317 Heat mitigation strategies on courtyard buildings in winter
(green, black and white) was measured at the height of 0.3 m and compared (for one week with 5 minutes interval). Subsequently, the air temperature in three courtyards was measured for 17 days. The first courtyard had grass on the ground, the second was bare and black (bituminous), and the third courtyard had shrubs and a water pond. Simultaneously, the air temperature of the TU Delft botanical gardens was measured for the same period and compared with the air temperature of Rotterdam-The Hague Airport located 13 km from the campus to the south-east.
Figure 2 The location of Portland in the US (a). The campus of Portland State University, as the first case study in summer (b). A HOBO data logger used in the summer study (c). The location of Delft in the Netherlands and Europe (d). The campus of Delft University of Technology, as the second case study in winter (e). The Escort data loggers shielded with a bin and used in the winter study (f).
In the last step, a scale model of an urban courtyard was made to test the effects previously measured on roofs and on courtyard grounds in a controlled situation. The only variable in this step is the materials used for paving the roof and the ground of the model. A 1000 Watt lamp was used as the heat source, and a 22 Watt desk fan was used to generate wind (Figure 3). The position of the lamp was similar to the position of the sun on 21st of June in Delft, the Netherlands. The fan blew air to the
i
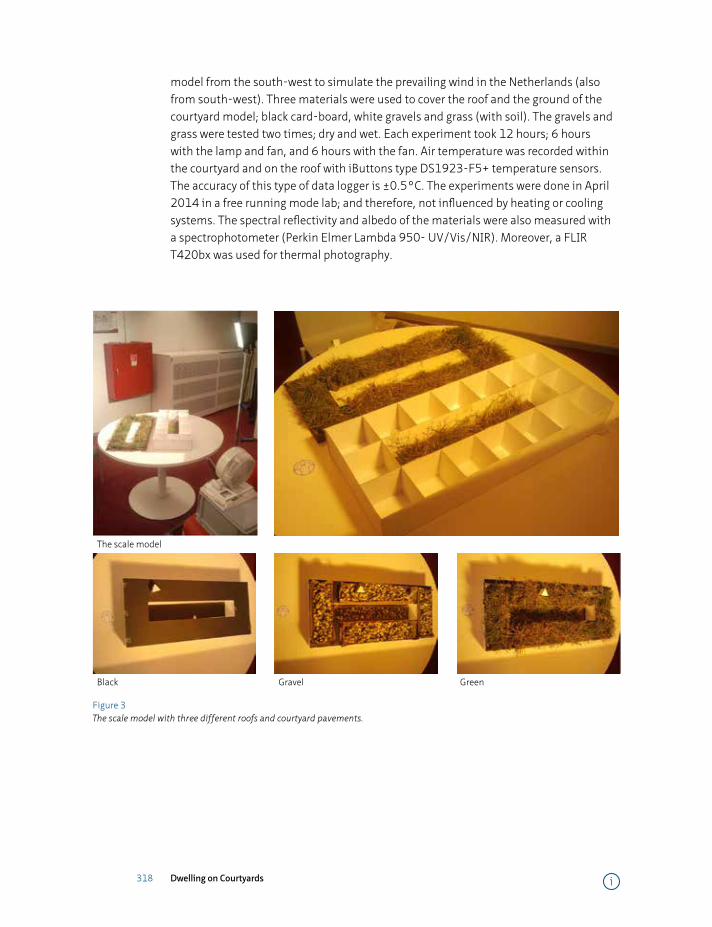
318 Dwelling on Courtyards
model from the south-west to simulate the prevailing wind in the Netherlands (also from south-west). Three materials were used to cover the roof and the ground of the courtyard model; black card-board, white gravels and grass (with soil). The gravels and grass were tested two times; dry and wet. Each experiment took 12 hours; 6 hours with the lamp and fan, and 6 hours with the fan. Air temperature was recorded within the courtyard and on the roof with iButtons type DS1923-F5+ temperature sensors. The accuracy of this type of data logger is ±0.5°C. The experiments were done in April 2014 in a free running mode lab; and therefore, not influenced by heating or cooling systems. The spectral reflectivity and albedo of the materials were also measured with a spectrophotometer (Perkin Elmer Lambda 950- UV/Vis/NIR). Moreover, a FLIR T420bx was used for thermal photography.
The scale model
Black Gravel Green
Figure 3 The scale model with three different roofs and courtyard pavements.
i
319 Heat mitigation strategies on courtyard buildings in winter
§ 10.3 Results and discussion
§ 10.3.1 Summer study, the case of Portland (OR), USA
§ 10.3.1.1 The three different courtyards
The summer study was carried out in three different courtyards on the campus of Portland State University (OR), USA. The courtyards are green, bare and with a water pond (respectively shown a to c in Figure 4). The green courtyard (5-stories) has shrubs and small trees within the courtard, and the brick walls are covered mostly with climbing plants (ivy). The bare courtyard (1-storey) has brick walls and a concrete pavement. The courtyard with a water pond (3-stories) is also paved with concrete and walls are partly brick partly concrete. The courtyards were measured simultaneously to detect differences in air temperature .
The air temperature recorded during three days in these courtyards is shown in Figure 5. The bare courtyard has the highest maximum and lowest minimum temperatures. The hottest temperature recorded in this courtyard was 33.3°C at 16:30 PM, and the coolest was 15.1°C at 6:00 AM. This courtyard therefore has the largest temperature variation in a day (18.1°C). In contrast, the green courtyard showed the smallest diurnal fluctuation (ΔT = 11.5°C) with a recorded maximum temperature of 28.7°C at 18:00 PM. The maximum temperature difference was found between the bare and green courtyard at 16:30 PM with 4.7°C (on August 6th, the sunset was at 19:57 PM).
With reference to the bare courtyard the higher albedo of vegetation of the green courtyard and their evapotranspiration effect causes the lower air temperature. The temperature measured in the courtyard with a water pond turned out to be in between. This courtyard has a combination of the other courtyards’ characteristics: high thermal mass and the evaporation of the water pond. During the nights, both the courtyard with a water pond and the green courtyard, which have more thermal mass, release their heat slowly to the microclimate, making their environment warmer than inside the bare courtyard. Moreover, trees and shrubs reduce the re-radiation of heat from the ground to the sky.
i

320 Dwelling on Courtyards
Figure 4 The campus of Portland State University, with indication of the green courtyard (a), the bare courtyard (b), and the courtyard with a water pond (c).
Figure 5 The air temperature compared in the three Portland courtyards.
i
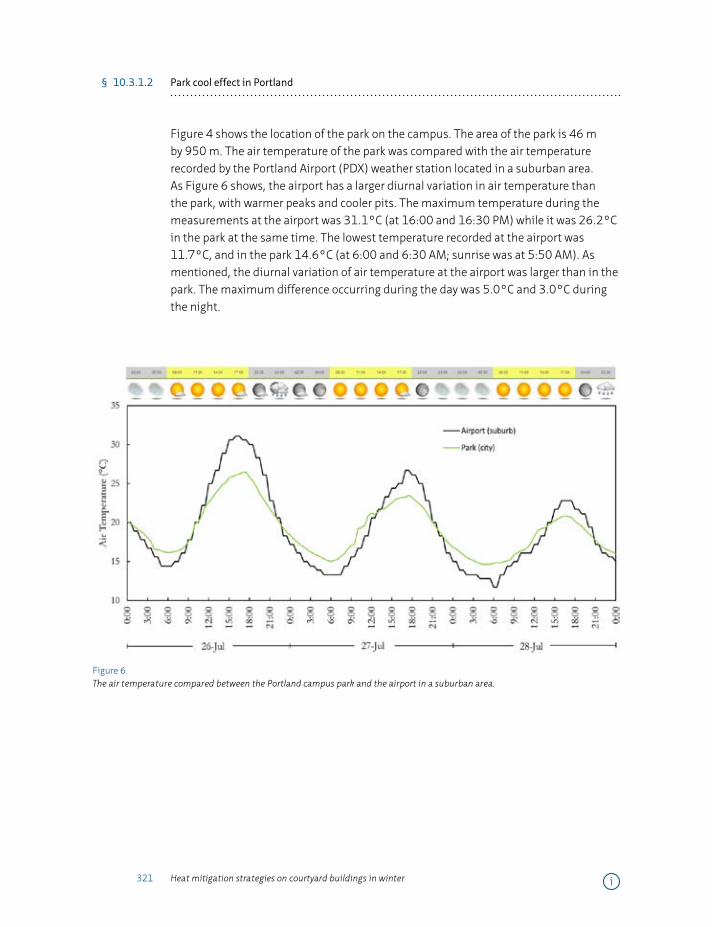
321 Heat mitigation strategies on courtyard buildings in winter
§ 10.3.1.2 Park cool effect in Portland
Figure 4 shows the location of the park on the campus. The area of the park is 46 m by 950 m. The air temperature of the park was compared with the air temperature recorded by the Portland Airport (PDX) weather station located in a suburban area. As Figure 6 shows, the airport has a larger diurnal variation in air temperature than the park, with warmer peaks and cooler pits. The maximum temperature during the measurements at the airport was 31.1°C (at 16:00 and 16:30 PM) while it was 26.2°C in the park at the same time. The lowest temperature recorded at the airport was 11.7°C, and in the park 14.6°C (at 6:00 and 6:30 AM; sunrise was at 5:50 AM). As mentioned, the diurnal variation of air temperature at the airport was larger than in the park. The maximum difference occurring during the day was 5.0°C and 3.0°C during the night.
Figure 6 The air temperature compared between the Portland campus park and the airport in a suburban area.
i
322 Dwelling on Courtyards
§ 10.3.2 Winter study, the case of Delft, the Netherlands
§ 10.3.2.1 The three different courtyards
As a next step, three different courtyards were measured between the 15th of November and 30th of December 2013 on the campus of TU Delft (Figure 7). The first courtyard (30*31 m2) is covered with grass and has two trees (a). The second one (b) has black bitumen (30*58 m2), and the third one (c) has a water pond and shrubs (15*19 m2). The orientation of these three courtyards is from North-East to South-West. The air temperature was recorded at a height of 1 m above the ground every 30 minutes. Figure 8 shows the air temperature in the courtyards during four representative days.
During the first two days, which were sunny, the black courtyard had a higher air temperature. This is due to the black colour and consequently lower albedo of the surfaces. Moreover, the very low thermal mass of the surface causes the large diurnal fluctuations. During the next two rainy days, this courtyard did not show the highest temperature among the courtyards. Instead, the courtyard with water pond and shrubs had the highest air temperature. This courtyard is paved with concrete mosaic and is the smallest of the three (making it more protected against the wind). The heat capacity of the ground in addition to the radiated heat from the surrounding building and the lower wind speeds keeps the courtyard warmer than the others. The green courtyard covered with grass has the lowest temperature in general; however, the minimum recorded temperature occurred in the black courtyard (1.4°C). Considering Figure 7, the green courtyard is close to the botanical garden, and this adjacency can lower the ambient air temperature around the courtyard.
It should be mentioned that the geometry of the courtyard is also a key factor in the thermal behaviour of these microclimates. The green courtyard is 3 stories high (the deepest among the others) and its solar gain is lower than of the others. The black courtyard (with 1 storey building) is open from one side (South-East), which means it can receive early morning sun and is prone to more ventilation. The black courtyard has 1 story and the courtyard with water pond has a 2-story building around it.
i

323 Heat mitigation strategies on courtyard buildings in winter
Figure 7 The three courtyards measured in Delft (numbered a to c) and the botanical garden highlighted with a star.
Figure 8 The air temperature measured in the Delft courtyards.
i

324 Dwelling on Courtyards
§ 10.3.2.2 Park cool effect in Delft
It is normally expected that city centres have a higher nocturnal air temperature than their suburbs because of the urban heat island phenomenon [33, 34]. Most of the time differences between the two areas are compared during summer because of the effect on heat stress and the buildings’ energy consumption. Instead of a city centre, this research investigates the thermal situation in a park located in a city centre in comparison with the suburbs. The air temperature in the botanical gardens of the university campus was compared with the rural area of Delft in winter. An appropriate weather station is Rotterdam-The Hague Airport at 13 km distance from the botanical gardens to the South-East. The measurements were taken between the 13th of November and 30th of December 2013.
The data is compared in Figure 9, showing that the airport located outside of the city always has a slightly higher air temperature in general. The trend of daily peaks in the botanical gardens is the same as at the airport, however with a short delay. This delay might be due to the thermal mass of the city. It means that the airport is in an open area that receives solar radiation freely and therefore gets warm faster than an area with higher thermal mass with different urban geometries and shading. The maximum air temperature recorded at the airport was 10°C, and 1°C less in the gardens with a time delay of 2 or 3 hours. It should also be mentioned that weather stations record the air temperature at 1.5 m above the ground. In the botanical gardens, the air temperature was measured at a height of 1 m. The openness to the sky of the airport and the limited thermal mass causes faster loss of heat at night. Therefore, the slopes towards the highest and lowest temperatures are steeper at the airport. The minimum air temperature recorded at the airport was 4.1°C at 7:00 AM (before the sun rises at 8:48 AM). At that moment, the botanical gardens had an air temperature of 4.8°C.
The botanical gardens and the airport also have different range in diurnal temperature variation. A small range indicates that the recorded diurnal temperature fluctuations are small. In these two areas, the difference between the maximum and minimum values of the air temperature of the gardens is 4.5°C, and 5.9°C at the airport. This indicates that the botanical gardens have a slightly more stable microclimate than the airport.
i
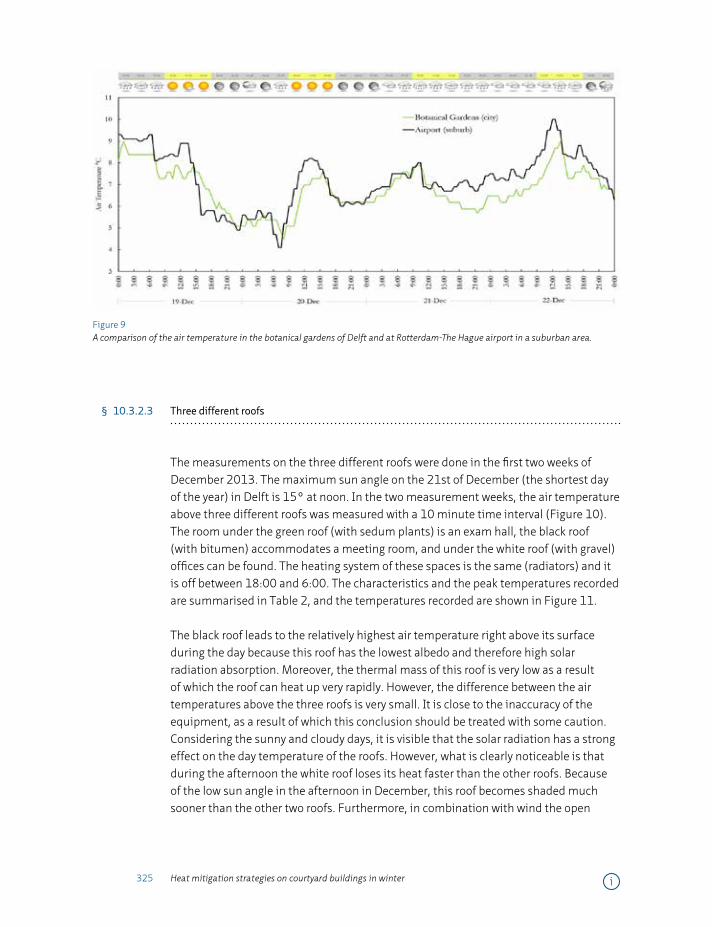
325 Heat mitigation strategies on courtyard buildings in winter
Figure 9 A comparison of the air temperature in the botanical gardens of Delft and at Rotterdam-The Hague airport in a suburban area.
§ 10.3.2.3 Three different roofs
The measurements on the three different roofs were done in the first two weeks of December 2013. The maximum sun angle on the 21st of December (the shortest day of the year) in Delft is 15° at noon. In the two measurement weeks, the air temperature above three different roofs was measured with a 10 minute time interval (Figure 10). The room under the green roof (with sedum plants) is an exam hall, the black roof (with bitumen) accommodates a meeting room, and under the white roof (with gravel) offices can be found. The heating system of these spaces is the same (radiators) and it is off between 18:00 and 6:00. The characteristics and the peak temperatures recorded are summarised in Table 2, and the temperatures recorded are shown in Figure 11.
The black roof leads to the relatively highest air temperature right above its surface during the day because this roof has the lowest albedo and therefore high solar radiation absorption. Moreover, the thermal mass of this roof is very low as a result of which the roof can heat up very rapidly. However, the difference between the air temperatures above the three roofs is very small. It is close to the inaccuracy of the equipment, as a result of which this conclusion should be treated with some caution. Considering the sunny and cloudy days, it is visible that the solar radiation has a strong effect on the day temperature of the roofs. However, what is clearly noticeable is that during the afternoon the white roof loses its heat faster than the other roofs. Because of the low sun angle in the afternoon in December, this roof becomes shaded much sooner than the other two roofs. Furthermore, in combination with wind the open
i
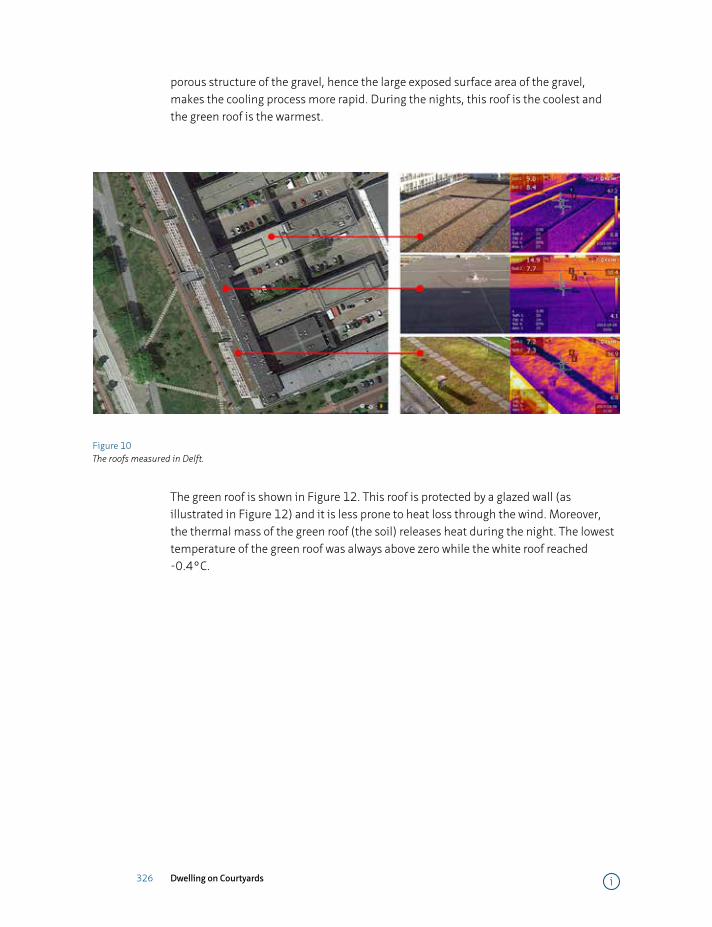
326 Dwelling on Courtyards
porous structure of the gravel, hence the large exposed surface area of the gravel, makes the cooling process more rapid. During the nights, this roof is the coolest and the green roof is the warmest.
Figure 10 The roofs measured in Delft.
The green roof is shown in Figure 12. This roof is protected by a glazed wall (as illustrated in Figure 12) and it is less prone to heat loss through the wind. Moreover, the thermal mass of the green roof (the soil) releases heat during the night. The lowest temperature of the green roof was always above zero while the white roof reached -0.4°C.
i
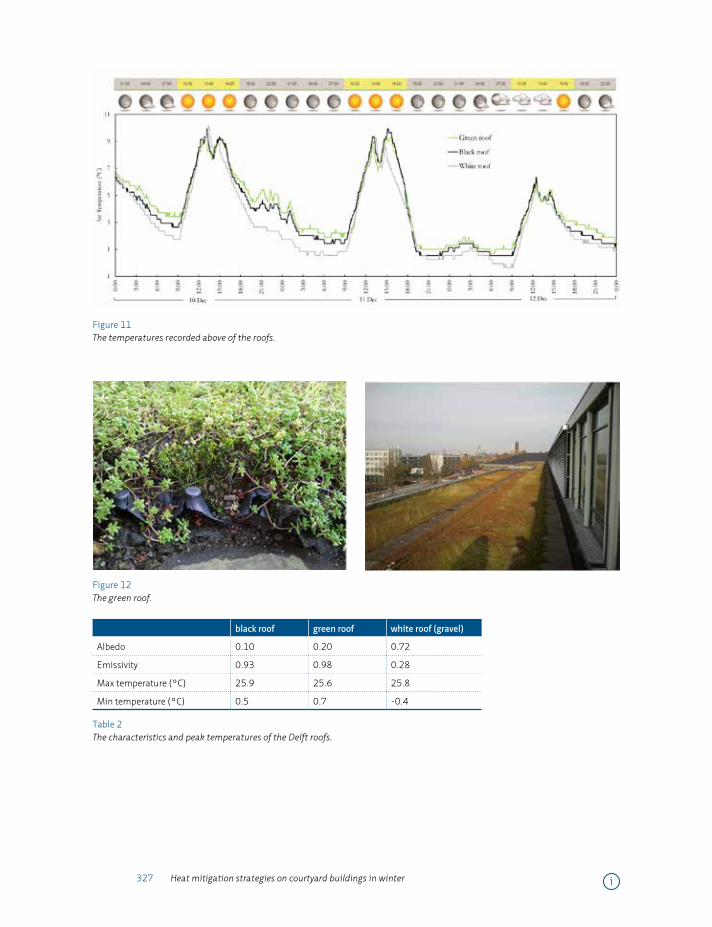
327 Heat mitigation strategies on courtyard buildings in winter
Figure 11 The temperatures recorded above of the roofs.
Figure 12 The green roof.
black roof green roof white roof (gravel)
Albedo 0.10 0.20 0.72
Emissivity 0.93 0.98 0.28
Max temperature (°C) 25.9 25.6 25.8
Min temperature (°C) 0.5 0.7 -0.4
Table 2 The characteristics and peak temperatures of the Delft roofs.
i
328 Dwelling on Courtyards
§ 10.3.3 Scale model experiment
Although the previous studies were done on real cases, they may have been influenced by other unsought factors (such as different user activities and different adjacency to parks). In this lab experiment, the only variable was the material used to cover the roof and the ground of the courtyard model. The materials used were black cardboard, whitish gravels and grass. Gravels and grass were measured dry and wet (five experiments in total). The albedo of the black cardboard is 0.054, and the grass in dry mode is 0.387 (both measured). The albedo of the gravels based on Santamouris [35] is 0.72.
Figure 13 shows the normalised air temperature within the courtyard model and above the roof. To get these normalised values, the ambient air temperature of the lab was subtracted from the measured air temperatures right above the roofs and courtyard grounds (5 mm above the surface). A value above zero thus means that the air above the surface is warmer than the lab air temperature, vice versa. The temperatures are plotted after 6 and 12 hours. The lamp (representing the sun) was turned off after 6 hours, and the fan (as the wind source) was turned off after 12 hours, at the end of each experiment.
Concerning the roof of the model, the black pavement (with the lowest albedo and mass) has provided the highest temperature difference (+2.7°C) after 6 hours of heating with the lamp. The dry gravel roof has the second highest temperature; however, when this roof was irrigated, its temperature dropped down and became cooler than the ambient air temperature (-0.7°C). The dry and wet grass roofs were also cooler than the ambient air temperature. This study did not find a significant difference between the dry and irrigated grass roof. This may have been caused by water still present in the soil of the dry grass. Nevertheless, it is found that grass in wet and dry mode is cooler than the ambient; however, gravels need to be watered to provide a cooler temperature.
Regarding the courtyard temperatures, the dry gravels and the black pavements have the highest temperature difference after 6 hours (+1.9°C and +1.7°C, respectively). Comparing the dry gravels and grass with their wet situation, the dry pavements have higher temperature in both materials, after 6 and 12 hours. When the gravel pavement is irrigated, its temperature difference with the dry mode (4.2°C) is much higher than the difference between the dry and wet grass (2.9°C). After 12 hours of monitoring, the wet grass pavement has the lowest temperature (-3.2°C) among the others. The other cool pavement material was the wet gravels with -2.9°C, and there was no significant temperature difference between the dry gravels and the black pavement.
i
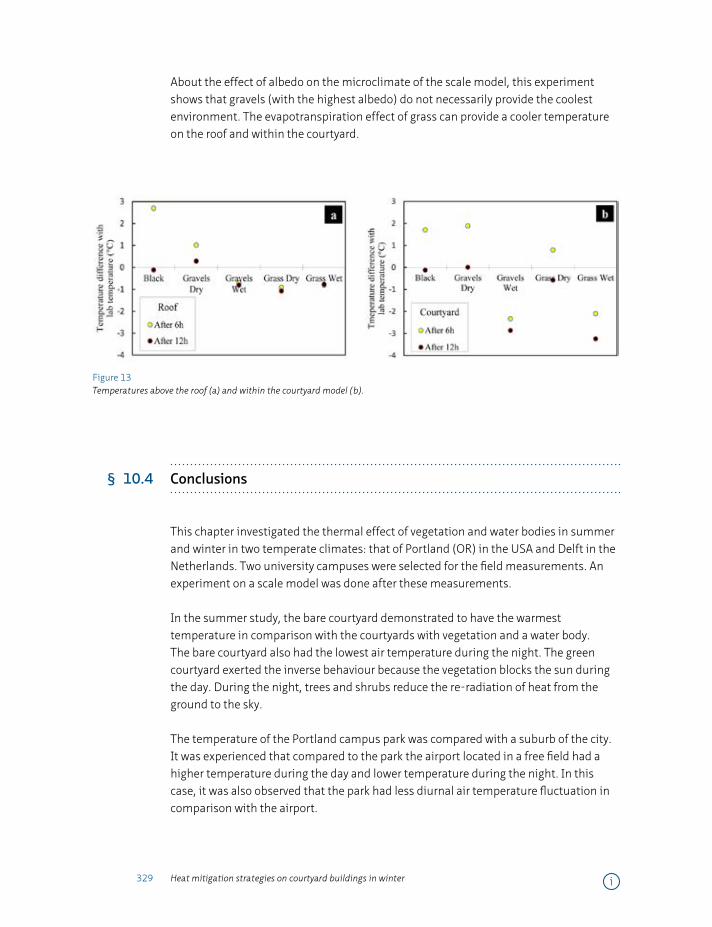
329 Heat mitigation strategies on courtyard buildings in winter
About the effect of albedo on the microclimate of the scale model, this experiment shows that gravels (with the highest albedo) do not necessarily provide the coolest environment. The evapotranspiration effect of grass can provide a cooler temperature on the roof and within the courtyard.
Figure 13 Temperatures above the roof (a) and within the courtyard model (b).
§ 10.4 Conclusions
This chapter investigated the thermal effect of vegetation and water bodies in summer and winter in two temperate climates: that of Portland (OR) in the USA and Delft in the Netherlands. Two university campuses were selected for the field measurements. An experiment on a scale model was done after these measurements.
In the summer study, the bare courtyard demonstrated to have the warmest temperature in comparison with the courtyards with vegetation and a water body. The bare courtyard also had the lowest air temperature during the night. The green courtyard exerted the inverse behaviour because the vegetation blocks the sun during the day. During the night, trees and shrubs reduce the re-radiation of heat from the ground to the sky.
The temperature of the Portland campus park was compared with a suburb of the city. It was experienced that compared to the park the airport located in a free field had a higher temperature during the day and lower temperature during the night. In this case, it was also observed that the park had less diurnal air temperature fluctuation in comparison with the airport.
i
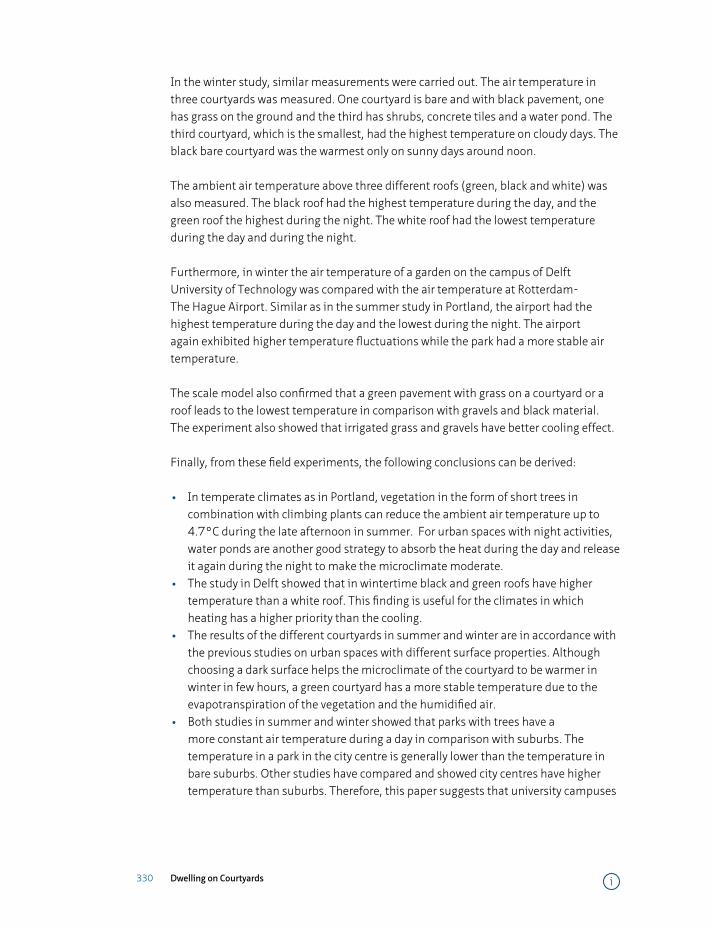
330 Dwelling on Courtyards
In the winter study, similar measurements were carried out. The air temperature in three courtyards was measured. One courtyard is bare and with black pavement, one has grass on the ground and the third has shrubs, concrete tiles and a water pond. The third courtyard, which is the smallest, had the highest temperature on cloudy days. The black bare courtyard was the warmest only on sunny days around noon.
The ambient air temperature above three different roofs (green, black and white) was also measured. The black roof had the highest temperature during the day, and the green roof the highest during the night. The white roof had the lowest temperature during the day and during the night.
Furthermore, in winter the air temperature of a garden on the campus of Delft University of Technology was compared with the air temperature at Rotterdam-The Hague Airport. Similar as in the summer study in Portland, the airport had the highest temperature during the day and the lowest during the night. The airport again exhibited higher temperature fluctuations while the park had a more stable air temperature.
The scale model also confirmed that a green pavement with grass on a courtyard or a roof leads to the lowest temperature in comparison with gravels and black material. The experiment also showed that irrigated grass and gravels have better cooling effect.
Finally, from these field experiments, the following conclusions can be derived:
• In temperate climates as in Portland, vegetation in the form of short trees in combination with climbing plants can reduce the ambient air temperature up to 4.7°C during the late afternoon in summer. For urban spaces with night activities, water ponds are another good strategy to absorb the heat during the day and release it again during the night to make the microclimate moderate.
• The study in Delft showed that in wintertime black and green roofs have higher temperature than a white roof. This finding is useful for the climates in which heating has a higher priority than the cooling.
• The results of the different courtyards in summer and winter are in accordance with the previous studies on urban spaces with different surface properties. Although choosing a dark surface helps the microclimate of the courtyard to be warmer in winter in few hours, a green courtyard has a more stable temperature due to the evapotranspiration of the vegetation and the humidified air.
• Both studies in summer and winter showed that parks with trees have a more constant air temperature during a day in comparison with suburbs. The temperature in a park in the city centre is generally lower than the temperature in bare suburbs. Other studies have compared and showed city centres have higher temperature than suburbs. Therefore, this paper suggests that university campuses
i
331 Heat mitigation strategies on courtyard buildings in winter
located in city centres with their open spaces have the potential to mitigate urban heat island by adding more vegetation and water bodies.
• The experiment on the scale model showed that vegetation with lower albedo has a stronger cooling effect than gravels.
One important finding from this study is that in terms of their temperature effect roofs and courtyards do not behave significantly differently in winter than in summer. Prior research has focused mainly on the effect in summer. This research demonstrates that similar effects can be observed in wintertime.
Appendix
Figure 14 shows the surface temperature of the materials used in the scale model after 7 hours of radiation with the lamp (and wind with the fan). The surface temperature of the black, dry grass, wet grass, wet gravels and dry gravels are 28.1°C, 27.8°C, 20.9°C, 24.5°C and 28.1°C, respectively. This figure illustrates that irrigated grass and gravels have a cooler surface than their dry mode. The dry gravels have the same temperature as the black surface.
Figure 14 Comparison of the materials used in the scale model experiment.
i
332 Dwelling on Courtyards
Acknowledgement
The authors appreciate cooperation and consultation of Dr. Bob Ursem from the Botanic Garden of Delft University of Technology.
References
1 Oke, T.R., Boundary Layer Climates. 2002: Taylor & Francis.
2 Rosenfeld, A.H., et al., Mitigation of urban heat islands: materials, utility programs, updates. Energy and Buildings,
1995. 22(3): p. 255-265.
3 Scherba, A., et al., Modeling impacts of roof reflectivity, integrated photovoltaic panels and green roof systems on
sensible heat flux into the urban environment. Building and Environment, 2011. 46(12): p. 2542-2551.
4 Lin, T.-P., A. Matzarakis, and R.-L. Hwang, Shading effect on long-term outdoor thermal comfort. Building and
Environment, 2010. 45(1): p. 213-221.
5 Taleghani, M., et al., Thermal assessment of heat mitigation strategies: The case of Portland State University,
Oregon, USA. Building and Environment, 2014. 73: p. 138-150.
6 Montazeri, H., B. Blocken, and J.L.M. Hensen, Evaporative cooling by water spray systems: CFD simulation,
experimental validation and sensitivity analysis. Building and Environment. 78.
7 Erell, E., D. Pearlmutter, and T.J. Williamson, Urban Microclimate: Designing the Spaces Between Buildings. 2012:
Earthscan.
8 Taleghani, M., et al., Outdoor thermal comfort within five different urban forms in the Netherlands. Building and
Environment. In Press.
9 Santamouris, M., et al., Using cool paving materials to improve microclimate of urban areas – Design realization
and results of the flisvos project. Building and Environment, 2012. 53(0): p. 128-136.
10 Taha, H., et al., Residential cooling loads and the urban heat island—the effects of albedo. Building and
Environment, 1988. 23(4): p. 271-283.
11 Srivanit, M. and K. Hokao, Evaluating the cooling effects of greening for improving the outdoor thermal
environment at an institutional campus in the summer. Building and Environment, 2013. 66(0): p. 158-172.
12 Shahidan, M.F., et al., An evaluation of outdoor and building environment cooling achieved through combination
modification of trees with ground materials. Building and Environment, 2012. 58(0): p. 245-257.
13 Robitu, M., et al., Modeling the influence of vegetation and water pond on urban microclimate. Solar Energy, 2006.
80(4): p. 435-447.
14 Ng, E., et al., A study on the cooling effects of greening in a high-density city: An experience from Hong Kong.
Building and Environment, 2012. 47(0): p. 256-271.
15 Coutts, A.M., et al., Assessing practical measures to reduce urban heat: Green and cool roofs. Building and
Environment, 2013. 70(0): p. 266-276.
16 Jim, C.Y., Passive warming of indoor space induced by tropical green roof in winter. Energy, 2014. 68(0): p. 272-
282.
17 Lin, B.-S., et al., Impact of climatic conditions on the thermal effectiveness of an extensive green roof. Building and
Environment, 2013. 67(0): p. 26-33.
18 Sailor, D.J., A green roof model for building energy simulation programs. Energy and Buildings, 2008. 40(8): p.
1466-1478.
i
333 Heat mitigation strategies on courtyard buildings in winter
19 Zhao, M. and J. Srebric, Assessment of green roof performance for sustainable buildings under winter weather
conditions. Journal of Central South University, 2012. 19(3): p. 639-644.
20 Taleghani, M., et al., Heat in courtyards: A validated and calibrated parametric study of heat mitigation strategies
for urban courtyards in the Netherlands. Solar Energy, 2014. 103: p. 108-124.
21 Lazzarin, R.M., F. Castellotti, and F. Busato, Experimental measurements and numerical modelling of a green roof.
Energy and Buildings, 2005. 37(12): p. 1260-1267.
22 McPherson, E.G., L.P. Herrington, and G.M. Heisler, Impacts of vegetation on residential heating and cooling.
Energy and Buildings, 1988. 12(1): p. 41-51.
23 Oliveira, S., H. Andrade, and T. Vaz, The cooling effect of green spaces as a contribution to the mitigation of urban
heat: A case study in Lisbon. Building and Environment, 2011. 46(11): p. 2186-2194.
24 Upmanis, H., I. Eliasson, and S. Lindqvist, The influence of green areas on nocturnal temperatures in a high latitude
city (Göteborg, Sweden). International Journal of Climatology, 1998. 18(6): p. 681-700.
25 Spronken-Smith, R.A., Energetics and cooling in urban parks. 1994, The University of British Columbia, Vancouver.
p. 204 pp.
26 Lindén, J., Nocturnal Cool Island in the Sahelian city of Ouagadougou, Burkina Faso. International Journal of
Climatology, 2011. 31(4): p. 605-620.
27 Spronken-Smith, R.A. and T.R. Oke, The thermal regime of urban parks in two cities with different summer
climates. International Journal of Remote Sensing, 1998. 19(11): p. 2085-2104.
28 Reynolds, J.S. and V. Carrasco, Shade water and mass: Passive cooling in Andalucia, in National Passive Solar
Conference. 1996, American Solar Energy Society: Boulder, CO.
29 Nakayama, T. and T. Fujita, Cooling effect of water-holding pavements made of new materials on water and heat
budgets in urban areas. Landscape and Urban Planning, 2010. 96(2): p. 57-67.
30 Radhi, H., F. Fikry, and S. Sharples, Impacts of urbanisation on the thermal behaviour of new built up
environments: A scoping study of the urban heat island in Bahrain. Landscape and Urban Planning, 2013. 113(0):
p. 47-61.
31 Kottek, M., et al., World Map of the Köppen-Geiger climate classification updated. Meteorologische Zeitschrift,
2006. 15(3).
32 Weather Data. 2012 16.07.2012]; Weather Data]. Available from: http://apps1.eere.energy.gov/buildings/
energyplus/cfm/weather_data3.cfm/region=6_europe_wmo_region_6/country=NLD/cname=Netherlands.
33 Santamouris, M., et al., On the impact of urban climate on the energy consumption of buildings. Solar Energy,
2001. 70(3): p. 201-216.
34 Taha, H., Meso-urban meteorological and photochemical modeling of heat island mitigation. Atmospheric
Environment, 2008. 42(38): p. 8795-8809.
35 Santamouris, M., Environmental Design of Urban Buildings: An Integrated Approach. 2012: Taylor & Francis.
i
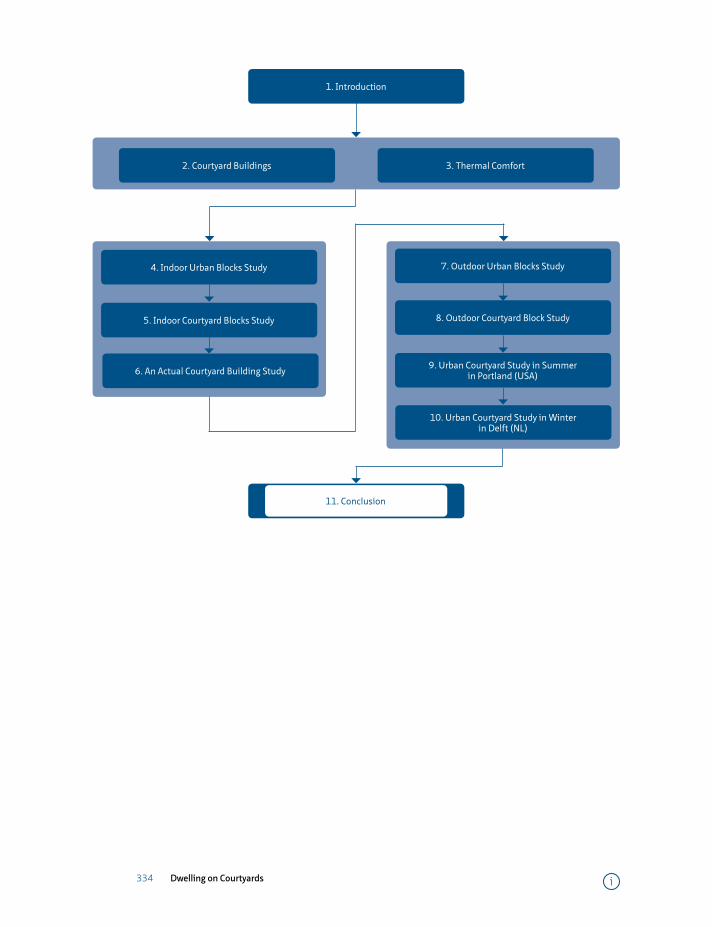
334 Dwelling on Courtyards
=
4. Indoor Urban Blocks Study
5. Indoor Courtyard Blocks Study
11. Conclusions
7. Outdoor Urban Blocks Study
8. Outdoor Courtyard Block Study
9. Urban Courtyard Study in Summer in Portland (USA)
2. Courtyard Buildings 3. Thermal Comfort
1. Introduction
6. An Actual Courtyard Building Study
11. Conclusion
10. Urban Courtyard Study in Winter in Delft (NL)
i
335 Conclusions
11 Conclusions
§ 11.1 Introduction
The literature review of this dissertation showed that courtyard buildings have been used for thousands of years in different climates. There is a substantial body of literature dealing with the thermal benefits of courtyards. In hot climates they provide shading, in humid climates they cause a stack effect helping ventilation, in cold climates they break cold winds and protect their microclimate. In temperate climates (such as the Netherlands), the thermal behaviour of courtyards has been studied less. In this study low-rise residential courtyard buildings were therefore studied among (and along) different urban block types in a temperate climate.
As the first step, computer simulations were done as a parametric study for indoor and outdoor comfort. Field measurements in actual urban courtyards and in dwellings alongside urban courtyards in the Netherlands (and in a similar temperate climate in the US) and a scale model experiment followed the simulations. Some of these field measurements were used to validate the simulation models.
The results of this dissertation can help designers in choosing the form, orientation and the roof and ground pavement of courtyards.
§ 11.2 Answers to the research questions
This section gives detailed answers first to the sub research questions and then, to the two main questions posed in chapter 1.
i
336 Dwelling on Courtyards
§ 11.2.1 Answers to the sub-research questions
Question 1.1 (mainly chapter 4):
To what extent is a dwelling alongside an urban courtyard more efficient and thermally comfortable than other dwellings?
To answer this question, the energy performance of and thermal comfort inside dwellings in three types of urban blocks in the Netherlands (each with 1, 2 and 3 stories) were analysed (with an identical floor area). The main objective of the research was to clarify the effect of building geometry on its annual heating energy demand, heat loss, solar gains through external windows and discomfort hours when the dwellings were in free-running mode (May 1st –September 30th). The buildings have different surface to volume ratios owing to different shapes: single, linear and courtyard shape. The single shape model is more exposed to its outdoor environment and has the highest surface to volume ratio. The linear models consist of a row of dwellings, which leads to a smaller area exposed to the outdoor environment, and this amount is the lowest for the courtyard models. The single dwelling has a higher surface to volume ratio and this model has the highest solar gains. The average amount of energy demand for heating in a year for the single shape is the highest among the models. However, the lighting energy demand for the single shape is the lowest. The linear and courtyard models are very similar in lighting energy demand. The courtyard shape has the lowest energy demand for heating since it is more protected. Considering thermal comfort hours in free running mode, the courtyard shape has the lowest number of discomfort hours among the models. Reducing the external surface area exposed to the climatic environment leads to higher energy efficiency and improved summer thermal comfort performance. Therefore, this analysis showed that the courtyard shape proves to be more energy efficient and thermally comfortable than other dwellings.
Question 1.2 (mainly chapter 7)
To what extent do people have a more comfortable microclimate within an urban courtyard block on a hot summer day than within other urban fabric forms?
The urban forms previously studied (singular, linear and courtyard), provide different situations for their microclimate. These models were simulated, each with two different orientations (E-W and N-S, except for the courtyard). To explore their microclimates the simulations were done in ENVI-met for the hottest day in the Netherlands (19th June 2000) according to the temperature data set provided in NEN5060. The results showed that the singular forms provide a long duration of solar radiation for the outdoor environment. This causes the worst comfort situation among the models
i
337 Conclusions
at the centre of the canyon. In contrast, the courtyard provides a more protected microclimate which has less solar radiation in summer. Considering the physiological equivalent temperature (PET), the courtyard has the highest number of comfortable hours on a summer day. Regarding the different orientations of the models and their effect on outdoor thermal comfort, it is difficult to specify the differences between the singular E-W and N-S forms because they receive equal amounts of insolation and are equally exposed to wind. Nevertheless, the linear E-W and N-S forms are different in their thermal behaviour. The centre point at the linear E-W form receives sun for about 12 h. In contrast, this point at the linear N-S form receives 4 h of direct sunlight per day. Therefore, in comparison with the E-W orientation this N-S orientation provides a cooler microclimate.
Question 2.1 (mainly chapter 5)
What is the best orientation, roof type and pavement material for a low-rise residential courtyard building in the Netherlands in order to maximise indoor thermal comfort?
To answer this question, eighteen courtyard buildings were simulated with DesignBuilder for a summer week (19th- 23rd June 2000). It was found that North-South and East-West orientations provide the least and most comfortable indoor environments, respectively. To optimise the thermal performance of these two models, different cool and highly reflective materials were simulated on the roof and as courtyard pavement. The results showed that the maximum reduction (14%) in the number of discomfort hours happens when the roof and the courtyard ground are vegetated. Regarding the different thermal zones located in a courtyard, it was found that the number of discomfort hours is three times higher in dwellings on the eastern and western sides of an urban courtyard block rather than on the northern and southern sides, mainly because of the high sun angle in summer at 12 O’clock solar time. In this phase, the effects of the different cool roofs were also tested in winter (as well as summer). Although gravel provided an almost 1°C cooler indoor environment in summer, no significant difference with the other roofs was observed in winter. The effects of the roofs mentioned were also tested using a 1/100 scale model of an urban courtyard block. The experiment confirmed that cool roofs provide cooler indoor environments under summer conditions. The added value of this study was to show that an irrigated cool roof (covered with gravel or grass) has a much greater cooling effect than its dry equivalent.
Question 2.2 (mainly chapter 6)
To what extent can a permanent or temporary glass cover above a courtyard as part of a low-rise residential building in a temperate climate (as an atrium) make this building more energy efficient and comfortable?
i
338 Dwelling on Courtyards
To answer this question, an actual courtyard dwelling in Amsterdam and a typical Dutch mid-terraced reference dwelling (based on AgentschapNL; Netherlands Ministry of Economic Affairs) was simulated for one year. The heating energy demand and the number of thermal comfort hours were compared with the same models with a glazed roof. The results showed that the open courtyard reduces the indoor operative temperature in summer, and consequently the number of discomfort hours, but increases the annual heating demand of the dwelling.
Covering the courtyard indeed led to a lower heating energy consumption of the models but also led to more thermal discomfort in summer. Thus, the advantages of the courtyard and atrium models were the subjects for optimisation. This optimisation was based on the monthly behaviour of the models. A combined model (of courtyard and atrium) was introduced optimising the monthly heating energy demand in winter and thermal comfort in summer. Simulations showed that the optimal period of having an open courtyard is at least between the four months of May until August. In the period from November until April, the courtyard should be covered with glass. Due to the moderate situation in September and October, both the courtyard or atrium modes perform equally well.
Question 2.3 (mainly chapter 8)
What is the best orientation and what are the best surface properties of the roof, walls and pavements in order to achieve a high level of summer thermal comfort for people within an urban courtyard block?
Alteration of a building’s geometry to receive or block sun is a common strategy in the early stages of climate-sensitive design. This strategy was explored in the first phase of the study in chapter 8. Different proportions of length to width in combination with four main orientations led to varied microclimates. The N-S courtyard direction has the shortest duration of solar radiation to penetrate into the courtyard, while the E-W orientation has the longest. The NW-SE orientation receives sun in the early morning while the NE-SW orientation mainly in the afternoon. Furthermore, by increasing the length of the courtyards only in the E-W direction, the duration of solar radiation can be increased. In this way, among the models the 10*50 m2 E-W courtyard model has the longest exposure to direct sun.
Subsequently, the courtyard model with the longest duration of solar radiation (10*50 m2 E-W) was analysed and discussed to clarify the effects of different heat mitigation strategies: (a) use of a higher albedo material, (b) use of a water pool, and (c) use of vegetation. These three strategies were analysed via their mean radiant temperature and air temperature. The results showed a high albedo material on the facades leads to a higher mean radiant temperature (maximum +20°C increase at 12:00 h); a water pool inside the courtyard strongly reduces the mean radiant temperature (maximum
i
339 Conclusions
−18°C at 15:00 h); vegetation also strongly reduces the mean radiant temperature (maximum −17°C at 15:00 h). Considering that the water pool covered 65% of the ground and the grass 100%, the cooling effect of water seems to be more effective.
Question 2.4 (mainly chapter 9)
How and to what extent do heat mitigation strategies improve the microclimate of a courtyard in the Netherlands in summer?
This dissertation investigated different heat mitigation strategies through measurements and simulations in a university campus area in Portland, Oregon, USA. The study analysed local urban climate conditions in July and August of 2013 at two scales: three courtyard buildings with different characteristics, and one of the university buildings with two different pavements.
In the first phase, three courtyard buildings on the campus with different characteristics were compared (one with vegetation, one with water bodies and a bare one). The air temperature in the bare courtyard was recorded as the highest and in the green courtyard as the lowest. The maximum temperature difference recorded was 4.7°C (at 16:30 PM). To have a clear understanding of the role of vegetation and water, simulations with ENVI-met were performed for the bare courtyard. The courtyard was modelled in its current configuration, in a configuration with vegetation and in a configuration with a water body. The case with a water pond reduced the mean radiant temperature by 15.8°C compared to the bare situation.
In the second phase, the bare courtyard was used to study the effect of albedo change. The existing pavement was partially covered with black and white cardboard with an albedo of 0.37 and 0.91, respectively. It was observed that the black treatment reduced the globe temperature and consequently mean radiant temperature, but increased the local air temperature. In contrast, the white treatment significantly increased the globe and mean radiant temperature (0.9°C and 2.9°C, respectively) while producing a cooler local air temperature (-1.3°C). This phase showed how surface colours could affect outdoor thermal comfort in public and urban spaces.
Question 2.5 (mainly chapter 10)
How and to what extent do the aforementioned heat mitigation strategies affect the microclimate of a courtyard in the Netherlands in winter?
To find out how heat mitigation strategies perform in winter, experiments were done on the campus of Delft University of Technology (Delft, the Netherlands). Similar measurements as the summer measurements in Portland mentioned before were carried out. The air temperature in three courtyards was measured. One courtyard was
i
340 Dwelling on Courtyards
bare and with black pavement, one had grass on the ground and the third had shrubs, concrete tiles and a water pond. The third courtyard, which was the smallest, had the highest temperature on cloudy days. The black bare courtyard was the warmest only on sunny days around noon; however, the courtyard with water pond and high thermal mass had the highest temperature in general. In other words, although choosing a dark surface helps the microclimate of a courtyard to be warmer in winter during a few hours, a green courtyard has a more stable temperature due to the evapotranspiration of the vegetation and the humidified air. It must be said here also that the bare black courtyard had limited thermal mass.
The ambient air temperature above three different roofs (green, black and white) was also measured. The black roof had the highest temperature during the day, and the green roof the highest during the night. The white roof had the lowest temperature during the day and during the night.
§ 11.2.2 Answers to the main research questions
The main two research questions were:
1. To what extent can a courtyard (as part of a passive strategy) provide thermally comfortable and energy efficient indoor environments in low-rise residential buildings in the Netherlands, and simultaneously, thermally comfortable outdoor environments for pedestrians within the courtyard?
2. What features (orientation, materials, vegetation, etc.) would make this building/block form efficient in terms of thermal comfort and energy use for use in low-rise residential buildings in the Netherlands?
As chapter 4 showed, the courtyard form with the lowest surface to volume ratio has the smallest heat exchange with its outdoor environment. In summer it receives less heat, and in winter its heat loss is low. It was found that a 3-storey courtyard consumes 22% less heating energy than a singular form while its comfort hours are 9% more in summer. Furthermore, it was shown that covering the roof of a courtyard makes it more energy efficient in winter because it reduces the heat loss through the facades alongside the courtyard. However, it should be kept open in summer to allow more natural ventilation and ease the stack effect.
Considering the courtyard as a form of urban block, it was found that this form provides more shading than the other studied forms in summer. In other words, a person receives 4 hours of direct sun in the centre of a 10m*10m (3-storey) courtyard, and 12:40 of hours in the centre of the street between a row of singular buildings with
i
341 Conclusions
the distance of 10 m. Thus, the courtyard provides a more protected and comfortable microclimate in summer.
Regarding the optimisations of courtyards for the Netherlands, the effect of orientation, elongation and materials was studied through simulations, measurements and a lab experiment. These studies were carried out both for the indoor and outdoor environment of the courtyards.
For the indoor environment, the results showed that North-South and East-West orientations provide the least and most comfortable indoor environments (90% and 50% of discomfort hours in a summer week). Regarding the materials, the use of green on roofs and as courtyard pavement is the most effective strategy for heat mitigation. It was observed that the effects of wet cool roofs are much higher than of dry roofs. Cool roofs did not show a significant negative effect (heat loss) as compared to conventional asphalt roofs in winter.
Focusing on the outdoor environment, the results showed that a North-South canyon orientation provides the shortest and the East-West direction the longest duration of direct sun at the centre of the courtyards. Moreover, increasing the albedo of the facades actually increased the mean radiant temperature in a closed urban layout such as a courtyard. This finding was followed by an experiment with two different materials on the pavement of a courtyard, black and white (with an albedo of 0.37 and 0.91, respectively). The black material showed a higher air temperature than the white one, while its radiant temperature was much lower than the white pavement. In contrast, using a water pool and vegetation cools the microclimate of a courtyard. These results were validated through a field measurement in the summer of 2013 in Portland (OR). Three different courtyards (a bare courtyard, a courtyard with vegetation and a courtyard with a water pond) were measured. It was observed that the green courtyard had a 4.7°C cooler ambient air temperature than the bare courtyard at 16:30 h. A lab experiment on a 1/100 scale model was also done to investigate the effect of these materials. The experiment showed that by comparison between black cardboard, white cardboard, grass and gravel, wet vegetation turned out to have a stronger cooling effect than the other materials.
i
342 Dwelling on Courtyards
§ 11.3 Limitations of this research
Climate of the NetherlandsThe focus of this research was on the temperate climate of the Netherlands, located at 52°N- 5°E (De Bilt as the representative city). The length of the longest and shortest days in the Netherlands are 16:45hours (around 21 June) and 07:43hours (around 21 December), respectively. In generalising the results of this dissertation to similar temperate climates, it should be noted that the results can vary in different latitudes with different sun angle and wind patterns. Another limitation is about the weather files used by the simulations. In the simulations, the weather data of De Bilt is used as the representative city/climate in the Netherlands. Moreover, it should be noted that in order to generate the weather data for the future climate scenarios, only one parameter (air temperature) was projected into the future. Because of a lack of detailed data on how changed wind patterns affect cloud cover, wind speed and direction, solar radiation intensity and precipitation, these parameters were not changed.
Simulation toolsDuring this study, DesignBuilder was used for the simulation of the indoor environment of courtyard buildings. This program is also validated in chapter 5. The root mean deviation (RMSD) found for this program was 0.91°C. The root-mean-square deviation is a frequently used measure of the differences between values predicted (in the case of this dissertation simulated) and the values actually observed. The main limitation of this program was its inability to simulate outdoor environments. Therefore, the microclimates of the courtyards could not be simulated with this software. Moreover, DesignBuilder cannot simulate the evaporation of water bodies. Thus, the effect of water bodies inside the courtyards was not included in the parametric study.
The limitation of DesignBuilder for simulating outdoor environments led to the use of ENVI-met v3.1 to simulate the outdoor environment. ENVI-met was validated in this dissertation for summer days with RMSD of 1.0°C between the simulation and measurement. The validation procedure is explained in chapters 7 and 8. However, the results for winter days were not reliable and the program overestimated the temperature, and did not follow the initial temperatures of cold days.
Comfort standardsRegarding the calculation of indoor thermal comfort, this research used ASHRAE 55-2010 and EN-15251:2007 for dwellings. The measurements and surveys that were done to create the database that resulted in these standards were done mostly in office
i
343 Conclusions
buildings. Because the clothing type and activities are different in offices and dwellings, the application of these standards for dwellings might have effects on the results. But, due to the lack of a standard for dwellings, the mentioned standards were used.
Inaccuracy in measurementData loggers normally have an inaccuracy in data collection. The inaccuracies of the data loggers used for the field measurements are mentioned in chapter 1, Section 5.2.2. Moreover, different data loggers of the same type may lead to different results. This problem was solved by mutual calibration of the data loggers after each measurement.
§ 11.4 Conclusions of findings
Indoor and outdoor thermal comfort were studied for low-rise residential courtyard buildings in the Netherlands. This study was also conducted on different building/block forms. The effect of different roof and pavement types were also studied from indoor and outdoor perspectives. These results are discussed here separately, and recommended design strategies at the end associate the findings of the two viewpoints.
§ 11.4.1 Indoor thermal comfort and energy use
Comparing buildings with different urban layouts (such as linear and singular blocks), the courtyard typology has the smallest number of summer discomfort hours. This is because of the shading effect of the courtyard for the surrounding building. Moreover, the annual heating energy demand of a courtyard is less than of a linear and a single block. This is due to the lower surface to volume ratio of a courtyard (with the same floor area). It should be noted that providing a courtyard within a solid building inevitably increases the surfaces and leads to more heat exchange between the building and its environment. In this way, a set of dwellings alongside an urban courtyard are more efficient than a single house with a courtyard.
Looking at the annual thermal behaviour of a single-family courtyard dwelling in the Netherlands, covering the courtyard with glass between November till May will reduce the heat loss through the envelopes of the courtyard (increase the efficiency of the
i
344 Dwelling on Courtyards
building). Hence, the optimum period of having an open courtyard in the Netherlands is recommended from May through October. This shows that a courtyard dwelling is not the most efficient form for the whole year.
The orientation and materials used inside the courtyard (and on the roof of the building) were also investigated through simulation and measurement. The E-W and N-S orientations were the most and least comfortable orientations for the occupants of a courtyard dwelling.
§ 11.4.2 Outdoor thermal comfort
The outdoor thermal comfort of different urban layouts (singular, linear and courtyard) was also investigated in summer. The study showed that a pedestrian within the courtyard model receives a short period of direct solar radiation (4 hours); and in a singular layout a long duration (11 hours). This leads to a lower mean radiant temperature (and consequently a lower physiological equivalent temperature) inside a courtyard layout in comparison with the other layouts.
The comparison of different orientations for an urban courtyard showed that the N-S orientation leads to the longest duration of direct sun, and the E-W orientation to the shortest. This is in contrast with the previous findings on the indoor perspective on courtyard buildings that showed E-W orientation provides the most and N-S the least comfortable indoor environment. The cooling effect of vegetation and water ponds within a courtyard were studied through simulation. The simulations showed that water and vegetation within a 10m*50m courtyard reduce the average mean radiant temperature by 7°C and 6°C respectively (on 19 June 2000 as a hot summer day in the Netherlands). This study also revealed that using a highly reflective material (like plaster) on the surfaces of the courtyard to keep the indoor environment cool, leads to an 11°C higher mean radiant temperature within the courtyard.
The field measurements on actual courtyards with different characteristics in a similar temperature climate in the USA, Portland (OR), showed that a green courtyard at most has a 4.7°C lower air temperature in the afternoon in comparison with a bare one. Moreover, changing the albedo of the pavement in a bare courtyard from 0.37 (black) to 0.91 (white) led to a 2.9°C increase of the mean radiant temperature and a 1.3°C decrease of the air temperature. Similar field measurements in winter in Delft, the Netherlands, showed that although a black courtyard results in a higher air temperature on sunny days (only during the day); a courtyard with vegetation and water has a higher air temperature on cloudy days, and during the nights of sunny days (nights with clear skies).
i
345 Conclusions
§ 11.4.3 Design recommendations based on the results
Apart from the academic world, the intended audience of this dissertation are architects, landscape and urban designers and urban managers and planners.
The knowledge from different disciplines such as building physics and urban physics, biometeorology, climatology, horticulture, fluid dynamics and material science supported the background information needed for this research. These multidisciplinary approaches led to design strategies that are not always in harmony with each other. Three contradicting results regarding a) the form, b) the orientation, and c) the roof type of a courtyard are explained here with their possible solutions:
a Dealing with solar absorption and ventilation in a courtyard is problematic. The dimensions of a courtyard can influence the quantity of sun and wind allowed or blocked. In summer, less absorption and more ventilation is favourable. Conversely, more sun and less wind are preferable in winter. In summer, the sun angle is high and a compact form provides more shading while a less compact form allows more sun to penetrate in winter. Likewise, a compact form breaks cold winds in winter but is less ventilated in summer. An efficient design strategy could be based on the weight of the heating or cooling energy consumption. Hence, this shows that the design of a courtyard depends on the policies of energy consumption on a national or regional level.
b On the one hand, the North-South orientation provides the coolest microclimate within a courtyard block for a pedestrian. This orientation keeps a courtyard shaded from the early morning till 2 hours before noon, and again 2 hours after noon till sunset. On the other hand, the indoor environment of the building absorbs the sun while it has provided shading for the courtyard. This makes the North-South orientation the least comfortable model and East-West the most comfortable in summer from the perspective of the indoor environment. A square plan (like the 10m*10m courtyard investigated in chapters 4 and 7) could be a balance that satisfies both a person within the courtyard and a dweller inside the building.
c The measurements and simulations showed that green and gravel roofs (known as cool roofs) keep the indoor environment cool during summer. Considering the outdoor environment and the urban heat island phenomenon, these roofs are beneficial for the environment. The green roof absorbs rain and delays the run off (especially in metropolitan areas). This absorption (along with the evaporation of the soil moisture) causes additional heat loss in winter for the building underneath the roof. A courtyard building with a gravel roof and green pavement within the courtyard can solve this problem. When the gravel roof is watered, its water could be led to the green ground within the courtyard. The water will irrigate the soil of the green. Therefore this complex will have a dry roof and still avoids run off to the sewer system.
i
346 Dwelling on Courtyards
§ 11.5 Recommendations
§ 11.5.1 Recommendations for future research
This dissertation suggests two topics for further research projects:
a In the research presented outdoor thermal comfort of people within courtyard buildings among different block forms was compared and studied for a summer situation. This comparison could be very interesting in winter because the courtyard form blocks the sun on the one hand; but breaks the cold wind, and keeps the microclimate more stable while receiving heat from the surrounding buildings on the other hand. The other studied urban block forms allow a longer duration of direct sun but they are more prone to wind chill. So, the balance between having less sun and less wind and their impact on PET would be valuable areas of research for winter outdoor comfort.
b Green roofs may cause enlarged heat losses during winter, especially when they are irrigated. This thesis showed that gravel roofs exhibit similar behaviour. Although gravel roofs do not have the additional environmental benefits green roofs have, they could be an alternative. The field experiments showed that the problem with gravel roofs is the water between the gravel. Further research can work on this problem and see if a drainage layer (like that in green roofs) can help to get rid of the water in winter.
§ 11.5.2 Recommendations for the market
Reduction of the dependency on fossil fuels and coping with climate change were two parallel larger aims of this dissertation. Some design strategies help to reduce energy consumption of buildings. Some others are helpful for the warm future of cities. This study showed that courtyard buildings as a passive design strategy (originally from hot and arid climates) can do both. This building archetype can reduce energy demands for cooling, as a result being a good alternative form for the expected warmer future of the Netherlands. The most efficient way of using courtyards in this temperate climate is to design urban courtyards. Designing small scale courtyards (single-family house) needs attention in winter. Courtyards provide more indoor and outdoor comfort in comparison with linear and singular forms. With this knowledge, it could be said that design strategies taken from one climate may be applicable in other climates but with attentions and modifications. Different disciplines and sciences can perform valuable roles to make this transition beneficial for the fragile ecosystem and people.
i
347 Conclusions
§ 11.6 Value of this dissertation
This dissertation has provided a set of unique and original results regarding human thermal comfort inside dwellings alongside courtyards (indoors) and inside courtyards (outdoors) in the Netherlands. The results were derived from computer simulations, field measurements and scale model experiments. Supporting field measurements were done in a similar temperate climate, in Portland (OR), USA.
The idea of implementing the courtyard form for a warmer future of the Netherlands was taken from hot climates. This dissertation is unique in that it for the first time combines both indoor and outdoor thermal comfort studies. Courtyard buildings with their semi indoor-outdoor spaces made it possible for this research.
The other factor that distinguishes this dissertation is its multidisciplinary perspective on design and comfort. There is a growing concern about indoor and outdoor thermal comfort. Architects and building designers mostly address the indoor environment, while landscape and urban designers address outdoor thermal comfort. This dissertation looked at both areas.
At the end, this dissertation serves society because it helps improving the built environment with its knowledge on dwellings capable to resist a warmer future.
i

348 Dwelling on Courtyards i

349 Acknowledgements
Acknowledgements
First and foremost, I would like to express my gratitude to my promoter, Professor Dr. Andy van den Dobbelsteen for his invaluable guidance and supervision on this research. His kindness and friendship made it easier for me as a foreign student to reach my goals. I’m also grateful to my co-promoter, Dr. Martin Tenpierik. I was very lucky to have him as a supervisor who showed great interest in my work, and who responded to my inquiries so promptly. I would like to extend my gratitude to Prof. Dr. David J. Sailor for providing me the opportunity to work in his Green Building Research Lab in Portland State University and co-operation in three journal papers out of my dissertation. I do also acknowledge the efforts of my other co-authors in the journal papers: Prof. Dr. Richard de Dear (the University of Sydney), Stanley Kurvers and Laura Kleerekoper.
Besides my advisors and co-authors, I particularly acknowledge the rest of my defence committee: Prof. Dr. Koen Steemers, Prof. Dr. Lara Schrijver, Prof. Dr. Bert Blocken, Prof. Dr. Philomena Bluyssen and Prof. Peter Luscuere for their encouragement, constructive comments and insightful questions.
I would like to thank the great scholars who helped me through this research; Dr. Marc Ottelé, Prof. Michael Humphreys, Prof. Dr. Andreas Matzarakis, Dr. Shahin Heidari and Dr. Somaye Fadaei Nejad. Im also thankful to Dr. Frank van der Hoeven for his support, and Véro Crickx for helping me through the final layout and publication of this work.
I really enjoyed working with warm and intimate colleagues and friends from the first year of my work; Noortje, Sabine, Suzanne, Marjolein, Remco, Hester, Zhiming, Yayi, Nico, Jurek, Celine and Wiebke. I had also great times with my friends in other chairs of BK; Mauricio, Ahmed, Thaleia, Alejandro, Luz Maria, Sinem and Irem. My special thanks to Shohreh and her family. There is no word that can describe my gratitude to Babak, Farzaneh, Mohammad Bashir, Alireza, Azadeh and Hamed who were and are more than friends. Their presence made Delft sunny for me. Many thanks to Bo, Shaida, Françoise and Barbara. I will never forget the warm atmosphere of Climate Design because of Bob, Siebe, Michiel, Craig and Leo.
I’m also thankful to Dr. George Ban-Weiss and my new friends in University of Southern California, and of course my friends in Green Building Research Lab at Portland State University.
Lastly, I would like to thank my family for all their love and encouragement. For my parents who raised me with a love of science and brothers who supported me in all my pursuits. Their love warms me thousands of kilometres away from home.
i

350 Dwelling on Courtyards
i

351 Curriculum vitae
Curriculum vitae
Mohammad Taleghani was born on 24 August 1985 in Shahrood, Iran. He obtained his MSc in Architecture Engineering in the University of Tehran, Iran, and started his PhD in Delft University of Technology in 2010.
Through his PhD, Mohammad published several journal papers which were partly done with international co-authors in Portland State University (Prof. Dr. David J. Sailor) and University of Sydney (Prof. Dr. Richard de Dear). He spent summer 2013 as a visiting scholar in Portland State University (OR, USA) as a visiting scholar. This opportunity made it possible for him to learn from several field measurements and to increase his knowledge in an international research lab in the US. This encouraged Mohammad to start his career in the University of Southern California (USC) in Los Angeles as a researcher before his PhD defence.
i

352 Dwelling on Courtyards i
353 List of publications
List of publications
Journal papers
1 Taleghani M., Tenpierik M., and Dobbelsteen A., (2012), Environmental Impact of Courtyards- A Review and Comparison of Residential Courtyard Buildings in Different Climates, Int. Journal of Green Building, Volume 7, Issue 2, 113-136.
2 Taleghani M., Tenpierik M., Kurvers S., Dobbelsteen A., (2013), “A review into thermal comfort in buildings”, Renewable & Sustainable Energy Reviews, 26(2013) 201-215.
3 Taleghani M., Tenpierik M., Dobbelsteen A., de Dear R., (2013), “Energy use impact of and thermal comfort in different urban block types in the Netherlands”, Energy and Buildings, 67(2013) 166-175.
4 Taleghani M., Tenpierik M., Dobbelsteen A., (2014), “Energy performance and thermal comfort of courtyard/atrium dwellings in the Netherlands in the light of climate change”, Renewable Energy, 63(2014) 486-497.
5 Taleghani M., Tenpierik M., Dobbelsteen A., Sailor D., “Heat in Courtyards: A validated and calibrated parametric study of heat mitigation strategies for urban courtyards in the Netherlands”, Solar Energy, 103(2014) 108-124.
6 Taleghani M., Sailor D., Tenpierik M., Dobbelsteen A., “Thermal assessment of heat mitigation strategies: Case of Portland State University, Oregon, USA”, Building and Environment, 73(2014) 138-150.
7 Taleghani M., Tenpierik M., Dobbelsteen A., Sailor D., “Heat mitigation strategies in winter and summer: Field measurements in temperate climates”, Building and Environment, 81(2014) 309-309.
8 Taleghani M., Tenpierik M., Dobbelsteen A., “Indoor thermal comfort in urban courtyard block dwellings in the Netherlands”, Building and Environment, 82(2014), 566-579.
9 Taleghani M., Kleerekoper, L, Tenpierik M., Dobbelsteen A., “Outdoor thermal comfort within five different urban forms in the Netherlands”, Building and Environment, Accepted for publication with DOI: http://dx.doi.org/10.1016/j.buildenv.2014.03.014.
10 Kleerekoper L., Taleghani M., Dobbelsteen A., Hordijk G.J., “Urban measures for hot weather conditions in the Netherlands: an extensive theoretical comparative study”, Journal of Urban Technology, Submitted.
i
354 Dwelling on Courtyards
Conference papers
11 Taleghani M., Tenpierik M., Dobbelsteen A. (2013), “Optimisation of Heating Energy Demand and Thermal Comfort of a Courtyard-Atrium Dwelling”, PLEA2013 - 29th Conference, Sustainable Architecture for a Renewable Future, Munich, Germany 10-12 September 2013.
12 Taleghani, M; Tenpierik, M; Dobbelsteen, A (2012), “The Effect of Different Transitional Spaces on Thermal Comfort and Energy Consumption of Residential Buildings”, 7th Windsor Conference: The changing context of comfort in an unpredictable world Cumberland Lodge, Windsor, UK, 12-15 April 2012. London: Network for Comfort and Energy Use in Buildings, http://nceub.org.uk
i