euab254.pdf - tu delft research portal
TRANSCRIPT
Delft University of Technology
Critical appraisal of technologies to assess electrical activity during atrial fibrillationa position paper from the European Heart Rhythm Association and European Society ofCardiology Working Group on eCardiology in collaboration with the Heart Rhythm Society,Asia Pacific Heart Rhythm Society, Latin American Heart Rhythm Society and Computingin Cardiologyde Groot, Natasja M.S.; Shah, Dipen; Boyle, Patrick M.; Anter, Elad; Clifford, Gari D.; Deisenhofer, Isabel;van Dessel, Pascal; Dilaveris, Polychronis; van der Veen, Alle Jan; More AuthorsDOI10.1093/europace/euab254Publication date2022Document VersionFinal published versionPublished inEuropace : European pacing, arrhythmias, and cardiac electrophysiology : journal of the working groups oncardiac pacing, arrhythmias, and cardiac cellular electrophysiology of the European Society of Cardiology
Citation (APA)de Groot, N. M. S., Shah, D., Boyle, P. M., Anter, E., Clifford, G. D., Deisenhofer, I., van Dessel, P.,Dilaveris, P., van der Veen, A. J., & More Authors (2022). Critical appraisal of technologies to assesselectrical activity during atrial fibrillation: a position paper from the European Heart Rhythm Association andEuropean Society of Cardiology Working Group on eCardiology in collaboration with the Heart RhythmSociety, Asia Pacific Heart Rhythm Society, Latin American Heart Rhythm Society and Computing inCardiology. Europace : European pacing, arrhythmias, and cardiac electrophysiology : journal of theworking groups on cardiac pacing, arrhythmias, and cardiac cellular electrophysiology of the EuropeanSociety of Cardiology, 24(2), 313-330. https://doi.org/10.1093/europace/euab254Important noteTo cite this publication, please use the final published version (if applicable).Please check the document version above.
CopyrightOther than for strictly personal use, it is not permitted to download, forward or distribute the text or part of it, without the consentof the author(s) and/or copyright holder(s), unless the work is under an open content license such as Creative Commons.

Critical appraisal of technologies to assess
electrical activity during atrial fibrillation: a
position paper from the European Heart
Rhythm Association and European Society of
Cardiology Working Group on eCardiology in
collaboration with the Heart Rhythm Society,
Asia Pacific Heart Rhythm Society, Latin
American Heart Rhythm Society and
Computing in Cardiology
Natasja M.S. de Groot1*, Dipen Shah2, Patrick M. Boyle3, Elad Anter4,
Gari D. Clifford5, Isabel Deisenhofer6, Thomas Deneke7, Pascal van Dessel8,
Olaf Doessel9, Polychronis Dilaveris10, Frank R. Heinzel11, Suraj Kapa12,
Pier D. Lambiase13, Joost Lumens14, Pyotr G. Platonov15, Tachapong Ngarmukos16,
Juan Pablo Martinez17, Alejandro Olaya Sanchez18, Yoshihide Takahashi19,
Bruno P. Valdigem20, Alle-Jan van der Veen21, Kevin Vernooy22,
Ruben Casado-Arroyo (co-chair)23
ESC Scientific Document Group: Tom De Potter24, Borislav Dinov25,
Jedrzej Kosiuk26, Dominik Linz27, Lis Neubeck28, Emma Svennberg29,30,
Young-Hoon Kim31, Elaine Wan32, Nestor Lopez-Cabanillas33,34,
Emanuela T. Locati35, and Peter Macfarlane36
1Department of Cardiology, Erasmus University Medical Centre, Rotterdam, Delft University of Technology, Delft the Netherlands; 2Cardiology Service, University HospitalsGeneva, Geneva, Switzerland; 3Department of Bioengineering, University of Washington, Seattle, Washington, USA; 4Cardiac Electrophysiology Section, Department ofCardiovascular Medicine, Cleveland Clinic, Cleveland, Ohio, USA; 5Department of Biomedical Informatics, Emory University, Department of Biomedical Engineering, GeorgiaInstitute of Technology and Emory University, Atlanta, USA; 6Department of Electrophysiology, German Heart Center Munich and Technical University of Munich, Munich,Germany; 7Department of Cardiology, Rhon-klinikum Campus Bad Neustadt, Germany; 8Department of Cardiology, Medisch Spectrum Twente, Twente, the Netherlands;9Karlsruher Institut fur Technologie (KIT), Karlsruhe, Germany; 101st University Department of Cardiology, National & Kapodistrian University of Athens School of Medicine,Hippokration Hospital, Athens, Greece; 11Department of Internal Medicine and Cardiology, Charite-Universitatsmedizin Berlin, Campus Virchow-Klinikum and DZHK (GermanCentre for Cardiovascular Research), Berlin, Germany; 12Department of Cardiology, Mayo Clinic, Rochester, USA; 13Barts Heart Centre and University College, London, UK;14Cardiovascular Research Institute Maastricht (CARIM) Maastricht University, Maastricht, the Netherlands; 15Department of Cardiology, Clinical Sciences, Lund University, Lund,Sweden; 16Faculty of Medicine Ramathibodi Hospital, Mahidol University, Bangkok, Thailand; 17Aragon Institute of Engineering Research/IIS-Aragon and University of Zaragoza,Zaragoza, Spain, CIBER Bioengineering, Biomaterials and Nanomedicine (CIBER-BBN), Zaragoza, Spain; 18Department of Cardiology, Hospital San Jose, Fundacion Universitaia deCiencas de la Salud, Bogota, Colombia; 19Department of Cardiovascular Medicine, Tokyo Medical and Dental University, Tokyo, Japan; 20Department of Cardiology, HospitalRede D’or S~ao Luiz, hospital Albert einstein and Dante pazzanese heart institute, S~ao Paulo, Brasil; 21Department Circuits and Systems, Delft University of Technology, Delft, theNetherlands; 22Department of Cardiology, Cardiovascular Research Institute Maastricht (CARIM), Maastricht University Medical Centre, Maastricht, the Netherlands;23Department of Cardiology, Erasme University Hospital, Universite Libre de Bruxelles, Brussels, Belgium; 24Cardiology Department, Olv Aalst, Aalst, Belgium; 25RhythmologyUnit, Herzzentrum Leipzig, Leipzig, Germany; 26Department of Electrophysiology, Helios Clinic Koethen, Koethen, Germany; 27MUMC, Maastricht Hart en Vaat Centrum,
* Corresponding author. Tel: 010 703 39 38. E-mail address: [email protected] on behalf of the European Society of Cardiology. All rights reserved. VC The Author(s) 2021. For permissions, please email: [email protected].
Europace (2022) 24, 313–330 POSITION PAPERdoi:10.1093/europace/euab254
Dow
nloaded from https://academ
ic.oup.com/europace/article/24/2/313/6456176 by D
elft University of Technology user on 22 February 2022

Maastricht, The Netherlands; 28Edinburgh Napier University, Edinburgh, UK; 29Cardiology Department, Karolinska University Hospital, Sweden; 30Department of ClinicalSciences, Danderyd’s Hospital, Danderyd, Sweden; 31Cardiology Department, Korea University Medical Center, Seoul, Republic of Korea; 32Columbia University, New York,USA; 33Adventist Cardiovascular Institute of Buenos Aires, Argentina; 34Medical School, 8 College Road, Singapore; 35Department of Arrhythmology and Electrophysiology,IRCCS Policlinico San Donato, San Donato Milanese, Milan, Italy; and 36Electrocardiology Group, Institute of Health and Wellbeing, University of Glasgow, Level 1, New ListerBuilding, Royal Infirmary, Glasgow, UK
Received 23 August 2021; editorial decision 15 September 2021; accepted 21 September 2021; online publish-ahead-of-print 8 December 2021
Abstract We aim to provide a critical appraisal of basic concepts underlying signal recording and processing technologiesapplied for (i) atrial fibrillation (AF) mapping to unravel AF mechanisms and/or identifying target sites for AF ther-apy and (ii) AF detection, to optimize usage of technologies, stimulate research aimed at closing knowledge gaps,and developing ideal AF recording and processing technologies. Recording and processing techniques for assess-ment of electrical activity during AF essential for diagnosis and guiding ablative therapy including body surface elec-trocardiograms (ECG) and endo- or epicardial electrograms (EGM) are evaluated. Discussion of (i) differences inuni-, bi-, and multi-polar (omnipolar/Laplacian) recording modes, (ii) impact of recording technologies on EGMmorphology, (iii) global or local mapping using various types of EGM involving signal processing techniques includingisochronal-, voltage- fractionation-, dipole density-, and rotor mapping, enabling derivation of parameters like atrialrate, entropy, conduction velocity/direction, (iv) value of epicardial and optical mapping, (v) AF detection by cardiacimplantable electronic devices containing various detection algorithms applicable to stored EGMs, (vi) contributionof machine learning (ML) to further improvement of signals processing technologies. Recording and processing ofEGM (or ECG) are the cornerstones of (body surface) mapping of AF. Currently available AF recording and proc-essing technologies are mainly restricted to specific applications or have technological limitations. Improvements inAF mapping by obtaining highest fidelity source signals (e.g. catheter–electrode combinations) for signal processing(e.g. filtering, digitization, and noise elimination) is of utmost importance. Novel acquisition instruments (multi-polarcatheters combined with improved physical modelling and ML techniques) will enable enhanced and automated in-terpretation of EGM recordings in the near future.
� � � � � � � � � � � � � � � � � � � � � � � � � � � � � � � � � � � � � � � � � � � � � � � � � � � � � � � � � � � � � � � � � � � � � � � � � � � � � � � � � � � � � � � � � � � � � � � � � � � � � � � � � � � � � � � � � � � � � � � � � � � � � � � � � � � � � � � � � � � � � � � � � � � � � � � � � � � � � � � � � � � � � � � � � � � � � � � � � � � � � � � � � � � � � � � � � � � � � � � � � � � � � � � � � � � �
Keywords Atrial fibrillation • Signal recording • Signal processing • Mapping • Machine learning • Cardiac implantableelectronic devices • EHRA position paper
Introduction
Recording, processing, and subsequently interpretation of electricalactivity of the atria is essential for diagnosis and guiding (ablation)therapy of atrial fibrillation (AF). Atrial electrical activity in clinicalpractice can be measured using body surface electrocardiograms(ECG) or endo- and epicardial electrograms (EGM); optical actionpotentials are also used in research settings. The ECGs recorded byimplantable loop recorders or EGMs by pacemaker and implantablecardioverter-defibrillators (ICDs) can be used for AF detection.
In the electrophysiology laboratory, analysis of EGMs recorded bycatheters plays an important role in adjunctive ablation strategies per-formed in addition to pulmonary vein isolation, particularly in patientswith (longstanding) persistent AF. However, electrical activity duringAF is highly complex requiring advanced mapping systems equippedwith sophisticated processing technologies for identification of suit-able target sites for ablation. As standard approaches for recordingand processing electrical activity during AF do not exist a lot of efforthas been put in clinically evaluating a variety of mapping systems yetwith mixed outcomes. Many of the currently available recording andprocessing technologies are also restricted to specific applications orhave technological limitations hampering wide-spread applicability.Importantly, guidelines or recommendations in this area currently donot exist.
Aims and scopeThe objectives of this document are to (i) provide a critical appraisal ofbasic concepts underlying signal recording and processing technologiesapplied for AF mapping to unravel AF mechanisms and/or identifyingtarget sites for AF therapy and AF detection, (ii) discuss clinical valuesand limitations based on unique features of these technologies, (iii) ad-vise on their applications, and (iv) to identify unmet needs in context ofsignal recording and processing. This position paper provides up-to-date knowledge for clinicians, engineers, and researchers to optimizeusage of signal recording and processing methodologies, stimulate re-search aimed at closing knowledge gaps and developing ideal AF record-ing and processing technologies. As novel signal recording andprocessing technologies are continuously being developed, we do notaim to review all features offered by currently existing mapping systems.
Electrograms
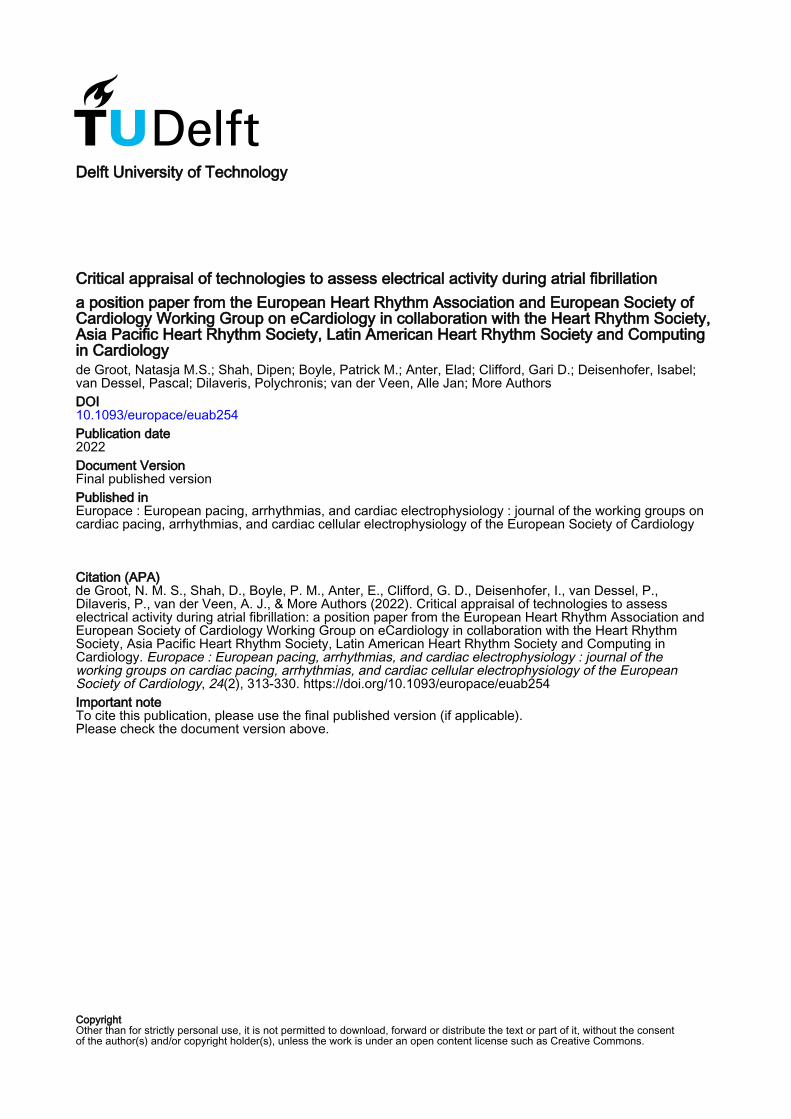
Unipolar and bipolar electrogramsAn EGM is the extracellular potential difference between two adja-cent electrodes [bipolar (Bi-EGM)] or the potential difference be-tween one single electrode in tissue contact relative to an indifferentelectrode at zero potential or Wilson Central Terminal [unipolar (U-EGM)]. Figure 1 shows examples of U-EGM and corresponding Bi-
314 N.M.S. deGroot et al.D
ownloaded from
https://academic.oup.com
/europace/article/24/2/313/6456176 by Delft U
niversity of Technology user on 22 February 2022
EGM recorded during AF.1,2 Although AF mapping is most frequentlyperformed with Bi-EGM, U-EGM are nowadays also increasingly be-ing used. So far, differences between U-EGM and Bi-EGM for AFmapping have only been examined for identification of low-voltageareas in single centre clinical studies and experimental studies(Voltage mapping section) and of endo-epicardial asynchronously ac-tivated areas in experimental studies (Epicardial mapping of AF sec-tion). The advantage of U-EGMs is that determination of localactivation time (LAT) is straightforward (LAT mapping section).The main disadvantage of U-EGMs is that local fibrillation potentialsmay be masked by far-field potentials or distant atrial activitycaused by the ventricles and multiple fibrillation waves, as U-EGMsare sensitive to remote electrical activity. So far, in only one report,U-EGM features (dV/dTmax< 0.05 V/s, amplitudes < 0.2 mV, anddurations > 35ms) used to discriminate local from far-field fibrilla-tion potentials have been described.3 The major advantage of Bi-EGM is its relative insensitivity to remote electrical activity andelectrical noise (due to common mode rejection) and it is thereforeoften the preferred recording mode used for AF mapping.1,2
However, a disadvantage of Bi-EGM is that its amplitude dependson wavefront direction; when a fibrillation wave passes both elec-trodes at the same time, subtraction of virtually equal U-EGMsresults in no residual Bi-EGM. Annotation of LAT is also more am-biguous (LAT mapping section). In addition, Bi-EGM morphologynot only depends on inter-electrode spacings,4 but also on conduc-tion velocity (CV) and direction of the fibrillation waves which bothvary from beat-to-beat during AF.
Thus, Bi- and U-EGM have their own (dis) advantages (Table 1) forAF mapping and their morphology is affected by various variables
(see Supplementary material online, Table S1). At present, there areno clinical studies demonstrating that either U- or Bi-EGM are moresuitable for AF mapping. As they provide complimentary information,combined usage for AF mapping could be beneficial.
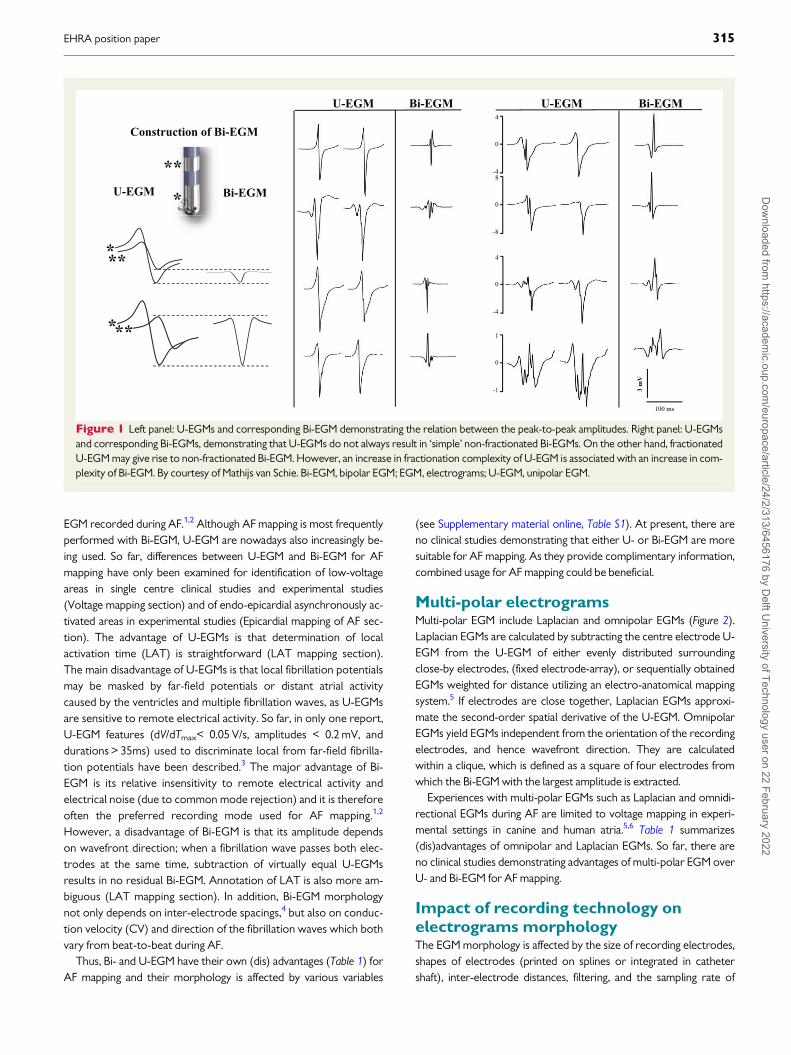
Multi-polar electrogramsMulti-polar EGM include Laplacian and omnipolar EGMs (Figure 2).Laplacian EGMs are calculated by subtracting the centre electrode U-EGM from the U-EGM of either evenly distributed surroundingclose-by electrodes, (fixed electrode-array), or sequentially obtainedEGMs weighted for distance utilizing an electro-anatomical mappingsystem.5 If electrodes are close together, Laplacian EGMs approxi-mate the second-order spatial derivative of the U-EGM. OmnipolarEGMs yield EGMs independent from the orientation of the recordingelectrodes, and hence wavefront direction. They are calculatedwithin a clique, which is defined as a square of four electrodes fromwhich the Bi-EGM with the largest amplitude is extracted.
Experiences with multi-polar EGMs such as Laplacian and omnidi-rectional EGMs during AF are limited to voltage mapping in experi-mental settings in canine and human atria.5,6 Table 1 summarizes(dis)advantages of omnipolar and Laplacian EGMs. So far, there areno clinical studies demonstrating advantages of multi-polar EGM overU- and Bi-EGM for AF mapping.
Impact of recording technology onelectrograms morphologyThe EGM morphology is affected by the size of recording electrodes,shapes of electrodes (printed on splines or integrated in cathetershaft), inter-electrode distances, filtering, and the sampling rate of
Figure 1 Left panel: U-EGMs and corresponding Bi-EGM demonstrating the relation between the peak-to-peak amplitudes. Right panel: U-EGMsand corresponding Bi-EGMs, demonstrating that U-EGMs do not always result in ‘simple’ non-fractionated Bi-EGMs. On the other hand, fractionatedU-EGM may give rise to non-fractionated Bi-EGM. However, an increase in fractionation complexity of U-EGM is associated with an increase in com-plexity of Bi-EGM. By courtesy of Mathijs van Schie. Bi-EGM, bipolar EGM; EGM, electrograms; U-EGM, unipolar EGM.
EHRA position paper 315D
ownloaded from
https://academic.oup.com
/europace/article/24/2/313/6456176 by Delft U
niversity of Technology user on 22 February 2022
digitization (see Supplementary material online, Table S1). Smaller di-ameter electrodes result in higher frequency and amplitude poten-tials of both U- and Bi-EGM7 but also higher noise levels caused byhigher input impedances.8,9 A decrease in inter-electrode distances is
associated with a decrease in voltages and fractionation.10,11 Filteringand the sampling frequency also influence EGM characteristics.12
According to the Nyquist principle, the sampling rate should be atleast twice the highest intended frequency content to be measured.
....................................................................................................................................................................................................................
Table 1 Advantages and disadvantages of uni-, bi-, and multi-polar EGMs
EGM Advantages Disadvantages
Unipolar • LAT: inambiguous, wavefront direction independent• Morphology: information on wavefront characteristics
• Sensitive to remote electrical activity
Bipolar • Insensitive to remote electrical activity • LAT: ambiguous• Morphology: depends on inter-electrode distances, CV,
wavefront direction
Multi-polar • Insensitive to remote electrical activity• LAT: less ambiguous, less wavefront direction dependent
than bi-EGM• Amplitude: less wavefront direction dependency than bi-
EGM
• Loss of spatial resolution• Additional computational efforts• Electrode distance should be <_1 mm (Laplacian only)• Specialized dedicated electrode array, electro-anatomical
mapping systems.
CV, conduction velocity; LAT, local activation time.
A
D
C D
Figure 2 (A) Cliques enclosed by four electrodes are used to record three U-EGM (filter: 5–400 Hz) visualized in the top of (C). The U-EGMs ofthree adjacent electrodes (1,2, and 3) are used to derive Bi-EGM by subtracting one U-EGM from the other U-EGM such that two pairs of Bi-EGMs(1–2 and 2–3) are constructed along the horizontal (red) and vertical (green) directions. Bi-EGMs are filtered (30–400 Hz) and visualized in the centreof (C). Both Bi-EGMs are used to describe a depolarization wavefront as an electrical field which is electrode orientation-independent. (B) Illustratesthe projections along the time-axis of the electrical field derived from both Bi-EGMs. This enables to mathematically obtain Bi-EGMs in any directionwithout physically rotating a sensing electrode. The E-field is subsequently scaled to analogous 2D voltage signals from which the maximal extentover the interval (T) is calculated and corresponds to the peak-to-peak amplitude of a Bi-EGM obtained along a unit vector direction. (C) Resultingomnipolar EGM, (D) corresponding Laplacian EGM. By courtesy of Mathijs van Schie. Bi-EGM, bipolar EGM; EGM, electrograms; U-EGM, unipolarEGM.
316 N.M.S. deGroot et al.D
ownloaded from
https://academic.oup.com
/europace/article/24/2/313/6456176 by Delft U
niversity of Technology user on 22 February 2022

Filtering may attenuate respiration or movement artefacts, interfer-ence and far-field components, but it also affects EGM morphol-ogy.1,2,9 Especially high-order filters that attenuate certainfrequencies more steeply, may disturb EGM morphology signifi-cantly.9,12 Such filters are prone to ringing and may generate artificialdeflections. Low- and high-pass filtering may, respectively, increaseand decrease amplitudes of U-EGM; both low- and high-pass filteringdecreases fractionation of U-EGM recorded during AF.1,9 Notch fil-tering increases fractionation of U-EGM during AF and reducesamplitudes.9 Hence, filtering significantly affects the already complexmorphology of EGM recorded during AF and should therefore beavoided as much as possible.
Invasive mapping of atrialfibrillation
Local vs. global mapping modesCardiac mapping is defined as a methodology by which electricalpotentials recorded from the heart are spatially depicted in an inte-grated manner, usually as a function of time.13 Identification of under-lying mechanism(s) and arrhythmogenic substrates by mapping of AFis slowly progressing. In contrast to mapping uniform arrhythmiaswith a stable and defined focal or re-entrant mechanism, AF mappingis challenging, as AF is neither purely focal nor stable re-entry in na-ture.14,15 Thus, conventional mapping catheters and algorithms as-suming spatiotemporal EGM stability are not applicable to AFmapping. There is no consensus on how long AF episodes should berecorded to obtain a representative value of a specific parameter andhow to determine the electropathological variable which most accu-rately represents arrhythmogenic tissue (e.g. mean, median, orranges). Two concepts for recording of electrical activity during AFare ‘global’ and ‘local mapping’.
Global atrial fibrillation mappingGlobal mapping (‘panoramic view’) refers to simultaneous recordingof EGMs of the entire atria using large intra-cardiac basket catheter(s)(see Supplementary material online, Figure S1) or body surface elec-trodes (Non-invasive mapping of AF section). Endocardial, multi-electrode basket catheters record up to 128 U-EGMs simultaneouslyfrom multiple locations and can be used for e.g. activation or phasemapping. Bi-atrial activity is recorded during a single interval whichavoids interpolation associated with combining sequential data frommultiple intervals.
Non-randomized clinical studies demonstrated that ablation tar-geted at stable rotational activity and focal sources could eliminateAF.16,17Algorithms using data recorded by these basket catheters areoften biased towards detection of rotational activities evenwhen these do not exist; focal activation might be displayed as rota-tional activity if the wavefront reaches surrounding electrodes se-quentially.18,19 Advantages of these catheters are that they measurecontact EGMs and allow real-time evaluation of propagation for guid-ing ablation. However, they also have significant limitations: (i) subop-timal electrode–tissue contact at many poles; (ii) splines are notequidistantly separated, (iii) low spatial resolution, (iv) lack of repro-ducible positioning, (v) recordings contain spline touch artefact’s, (vi)
higher pro-coagulative tendency, (vii) septum and coronary sinus arenot included. Additionally, the amount of extrapolation used for con-struction of e.g. activation time maps is difficult to determine.Although initial, non-randomized studies in patients with AF werepromising, a randomized, controlled, multi-centre clinical trial failedto demonstrated successful outcomes of ablative therapy guided byglobal mapping.20
Local atrial fibrillation mappingLocal mapping refers to high-density mapping of smaller regions usingcontact multi-polar catheters; the catheter moves consecutivelythrough the atria to obtain local electrical activity.
During local mapping, contact catheters directly record, ratherthan estimate, EGMs. This can be achieved epicardially with high-density electrode grids placed during surgery21 or endocardially withmulti-electrode mapping catheters introduced percutaneously (seeSupplementary material online, Figure S1).22 The resulting maps havea high local resolution but however, limited global resolution. Mapscreated with roving catheters often utilize Bi-EGM rather than U-EGM. A benefit of multi-electrode mapping catheters over linear ab-lation catheters is the higher likelihood that electrodes are in contactwith tissue, reducing the effect of catheter angle on EGM morphol-ogy.23–25 Also, multi-electrode grids allow fixed uniform and repro-ducible interpolation unlike spline or basket multi-electrodecatheters.
Multi-electrode mapping catheters with smaller electrodes andcloser inter-electrode spacing increase the mapping resolution.22,26
However, the optimal mapping resolution during AF is yet to be de-fined. Also, the larger number of data points recorded by multi-elec-trode mapping catheters precludes real-time manual annotation ofindividual signals, thus, creating dependency on automated algorithmsand their accuracy. Simultaneous construction of endocardial andepicardial contact maps accounting for transmural activation sequen-ces may be warranted in AF but has not yet been clinicallyimplemented.3
Signal processing technologies
Signal processing refers to analysis, usually automated, of EGMs.Analysis is focused on identifying specific parameters defining individ-ual EGM characteristics with the principal aim of rapidly interrogatingthe arrhythmogenic substrate and targeting sites critical to AF main-tenance. Various signal processing techniques applicable for AF map-ping discussed below are summarized in Table 2.
Local activation time mappingA LAT map depicts the activation time at every recording site relativeto a reference point.27,28 The LAT mapping is used to visualize pat-terns of activation to e.g. discriminate between re-entry and focal ac-tivity or to identify slow, crucial zones of slow conduction bysuperimposing isochrones. Figure 3 illustrates examples of difficultiesencountered in annotation LAT of U- and Bi-EGM. The LAT maps us-ing U-EGM are based on the principle that the timing of �dV/dTmax
coincides with the time of maximum rate of rise of the transmem-brane potential (time differences less than 50ms29) corresponding tothe maximum increase in sodium current and its conductance. The
EHRA position paper 317D
ownloaded from
https://academic.oup.com
/europace/article/24/2/313/6456176 by Delft U
niversity of Technology user on 22 February 2022

....
....
....
....
....
....
....
....
....
....
....
....
....
....
....
....
....
....
....
....
....
....
....
....
....
....
....
....
....
....
....
....
....
....
....
....
....
....
....
....
....
....
....
....
....
....
....
....
....
....
....
....
....
....
....
....
....
....
....
....
....
....
....
....
....
....
....
....
....
....
....
....
.
Tab
le2
Su
mm
ary
ofsi
gn
alp
rocess
ing
tech
no
logie
s
An
aly
tic
tech
niq
ue
Rati
on
ale
Ass
um
pti
on
Pri
ncip
alis
sue
(s)
Pro
cess
ing
req
uir
em
en
ts
Real-
tim
eu
seE
vid
en
ce
Clin
icalst
atu
s
LAT
map
sT
empo
ro-s
patia
l
sequ
enci
ng
EGM
refle
cts
uniq
ue
disc
rete
myo
card
ial
depo
lari
zatio
n
Sequ
enci
ng6¼
mec
ha-
nism
;3D
sim
plifi
ed
to2D
AD
conv
ersi
on,d
ata
stor
age,
Lim
ited
al-
gori
thm
ic
proc
essi
ng
Nea
rly
real
-tim
eEx
tens
ion
ofor
ga-
nize
dta
chya
rrhy
th-
mia
s;an
imal
AF
mod
els
Dat
asu
ppor
ting
clin
i-
calf
easi
bilit
ybu
t
not
abla
tion
Vol
tage
map
sD
elin
eatio
nof
elec
tri-
cally
inac
tive/
less
activ
ear
eas
base
d
onEG
Mvo
ltage
Red
uced
EGM
vol-
tage
sre
flect
de-
sync
hron
izat
ion
and
fibro
ustis
sue
Mul
tiple
poss
ible
con-
foun
ders
ofEG
M
volta
ge
Min
imal
Yes
Fibr
osis
,sca
rrin
gin
anim
alve
ntri
cula
r
infa
rct
mod
els
Easi
lyav
aila
ble,
but
not
‘wel
l
esta
blis
hed’
CFA
Em
aps
Shor
tin
terv
alm
ulti-
defle
ctio
nor
con-
tinuo
usEG
Mre
pre-
sent
ing
driv
er
sour
ces,
re-e
ntry
CFA
Esre
pres
ent
mul
ti-w
avel
et
driv
erso
urce
sno
t
pass
ive
fibri
llato
ry
cond
uctio
n
Mul
tiple
defin
ition
sof
CFA
E;la
ckof
con-
vinc
ing
evid
ence
of
driv
erro
le
Min
imal
Yes
Hum
anA
Fep
icar
dial
map
ping
,som
eou
t-
com
esof
CFA
E-
base
dab
latio
n
Easi
lyav
aila
ble
but
nost
anda
rdiz
ed
defin
ition
;als
ono
t
‘wel
lest
ablis
hed’
Den
sity
char
gem
aps
Impr
oved
reso
lved
lo-
cala
ctiv
atio
nco
m-
pare
dw
ithEG
M
volta
ge
Mat
hem
atic
alde
riva
-
tion
ofen
doca
rdia
l
surf
ace
proj
ecte
d
EGM
from
non-
cont
act
U-E
GM
and
corr
ecte
dfo
r
‘cha
rge
dens
ity’
prom
isin
gle
sser
far-
field
effe
cts
Mat
hem
atic
alas
sum
p-
tions
invo
lvin
g
reco
nstr
ucte
dEG
M
prom
inen
tef
fect
s
ofdi
stan
ce—
accu
-
racy
and
valid
atio
n
conc
erns
—re
min
is-
cent
ofa
lega
cy
non-
cont
act
map
-
ping
tech
nolo
gy
Subs
tant
iala
nd
prop
riet
ary
Suffi
cien
tlyra
pid
tobe
usab
lein
the
EPla
b
Lim
ited
corr
elat
ions
with
cont
act
map
-
ping
inA
Fan
dSR
Sing
lebe
at‘p
ano-
ram
ic’c
ham
ber
map
ping
abili
tyat
-
trac
tive
but
furt
her
valid
atio
nof
com
-
plex
activ
atio
n
need
ed
Rot
orm
aps
Phas
e‘r
econ
stru
ctio
n’
with
out
LAT
dete
r-
min
atio
nal
low
sde
-
tect
ion
of
func
tiona
lre-
entr
y
with
out
cent
rali
n-
exci
tabl
eob
stac
le
aspr
efer
entia
l
driv
ers
Rot
ors—
aty
peof
func
tiona
lre-
en-
try—
the
mai
n
driv
erso
urce
(s)
whi
char
eno
tde
-
tect
able
with
out
phas
e
reco
nstr
uctio
n
Phas
em
appi
nga
form
oflo
wpa
ss
smoo
thin
gof
low
reso
lutio
nU
-EG
Ms
unde
rlyi
ngal
go-
rith
mfa
vour
sre
ndi-
tion
ofro
tatio
nal
activ
atio
n
Prop
riet
ary
algo
rith
m,
opaq
uepr
oces
sing
Suffi
cien
tlyra
pid
tobe
usab
lein
the
EPla
b
but
with
offs
ite
proc
essi
ng
Expe
rim
enta
lstu
dies
,
typi
cally
with
actio
n
pote
ntia
l-bas
edop
-
tical
map
ping
Con
trov
ersi
alou
t-
com
esof
abla
tion;
non-
stan
dard
ized
inte
rpre
tatio
nof
phas
em
aps Co
ntin
ued
318 N.M.S. deGroot et al.D
ownloaded from
https://academic.oup.com
/europace/article/24/2/313/6456176 by Delft U
niversity of Technology user on 22 February 2022
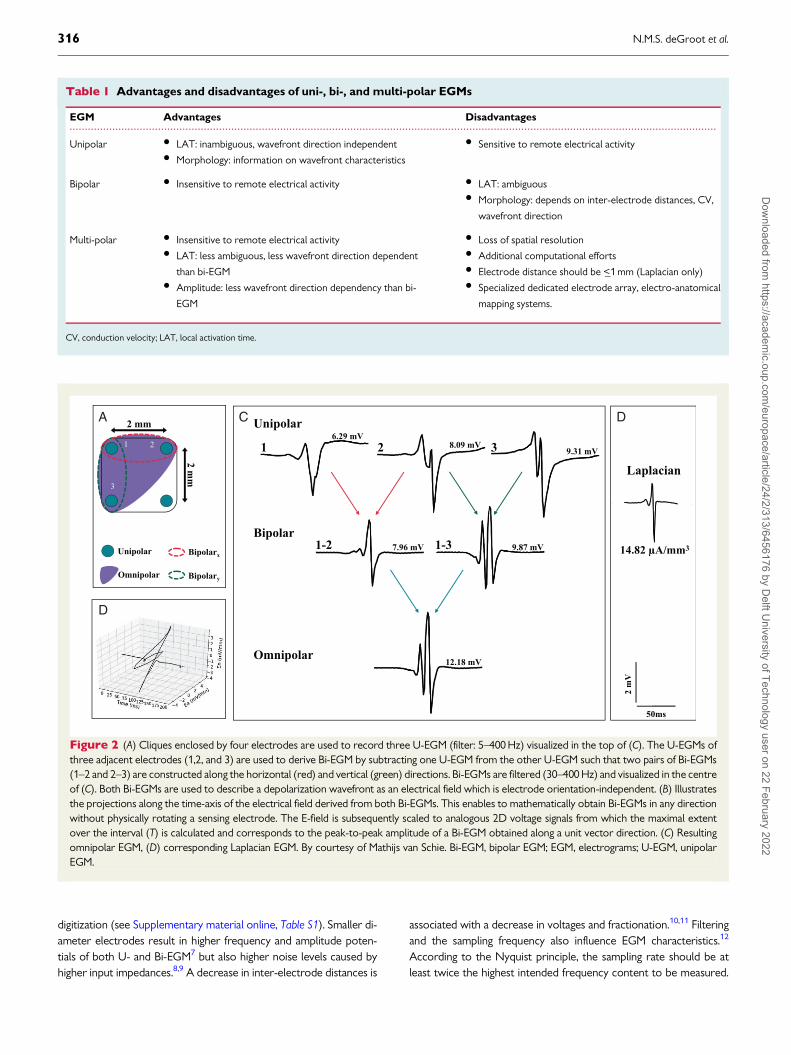
LAT determination using Bi-EGM is more complex; bipolar LATmaps are constructed by annotating the onset, peak or�dV/dTmax ofBi-EGM. An accurate algorithm for LAT annotation utilizes the �dV/dTmax of the first-order spatial derivative of the underlying U-EGM.This assumes that shape and velocity of the propagating wavefrontremains constant, which is usually not the case during AF. Activationtime mapping is an effective approach if EGMs consist of a single nega-tive deflection but is challenging if EGMs are fractionated or containcontinuous electrical activities. Several advanced signal processingtechnologies have been proposed to improve automated analysisof complex EGMs, including investigation of signal morphology,wavelet decomposition, deconvolution, and wavefront tracking, yetclinical benefits of these technologies have not yet been demon-strated.28,30–33
Voltage mappingA voltage (V) map depicts the peak-to-peak amplitudes of EGMs atmultiple sites (see Supplementary material online, Figure S1).However, both unipolar (UV) and bi-polar voltage (Bi-V) are influ-enced by numerous variables (see Supplementary material online,Table S1). The UVs are larger than Bi-V; only when the maximum V atone electrode nearly coincides with the minimum V at the other elec-trode, then the V of the negative deflection of Bi-EGM equals thepeak-to-peak V of U-EGM (left panel, Figure 1). Another determinantof EGM-V is rate and hence cardiac rhythm.34 There is a modest cor-relation between Bi-V measured during AF and sinus rhythm, whichbecomes weaker in patients with more persistent types of AF.35 TheBi-V are higher during sinus rhythm compared with AF. During atrialextra stimuli with decreasing coupling intervals, Bi-V were more at-tenuated than UV.34 Despite numerous variables affecting EGM-V,low endocardial Bi-V are regarded as surrogate markers of fibrotictissue and low-voltage areas have therefore become targets for abla-tive therapy in patients with AF.36 It is important, however, to empha-size that there is limited data correlating low-voltage areas tomechanisms initiating or perpetuating AF.36 Several definitions ofvoltage thresholds related to ‘scar tissue’ have been introduced e.g.0.5 mV (most often used, 5th percentile obtained during supraven-tricular tachycardia), 0.05 mV (noise level electro-anatomical map-ping system), 0.2 mV for the posterior left atrial wall (5th percentileof V histograms of patients with paroxysmal AF) or <0.1 mV (‘densescar’, patients with persistent AF).37–39 However, none of thesethresholds have been validated pathologically and outcomes of abla-tion targeting bipolar low-voltage areas—either during sinus rhythmor AF—show conflicting results.40 Possible explanations for thesediscrepancies include mapping and/or ablation strategies and patientselection. Also, since voltage depends on size and distances of elec-trodes, voltage maps acquired with different catheters should not becompared.
Complex fractionated atrialelectrograms mappingComplex fractionated atrial electrograms (CFAE) maps depict the lo-cation of CFAEs (see Supplementary material online, Figure S1). TheCFAE are most often defined as potentials with three or more nega-tive deflections. However, in literature, at least 27 different definitionsand/or methodologies for identification of CFAE have been
....
....
....
....
....
....
....
....
....
....
....
....
....
....
....
....
....
....
....
....
....
....
....
....
....
....
....
....
....
....
....
....
....
....
....
....
....
....
....
....
....
....
....
....
....
....
....
....
....
....
....
....
....
....
....
....
....
....
....
....
....
....
....
....
....
....
....
....
....
....
....
....
.
Tab
le2
Conti
nued
An
aly
tic
tech
niq
ue
Rati
on
ale
Ass
um
pti
on
Pri
ncip
alis
sue
(s)
Pro
cess
ing
req
uir
em
en
ts
Real-
tim
eu
seE
vid
en
ce
Clin
icalst
atu
s
Body
surf
ace
map
sEC
Gin
vers
ion
allo
ws
non-
inva
sive
EGM
reco
nstr
uctio
n
Mat
hem
atic
alm
odel
ofth
eth
orax
con-
duct
ivity
;ana
tom
y
obta
ined
from
MR
I
orC
T
Num
eric
alin
stab
ility
,
poor
reso
lutio
n/
time
dom
ain
fidel
-
ity,m
otio
nar
tefa
cts
Larg
ean
dm
ostly
prop
riet
ary
Suffi
cien
tlyra
pid
tobe
usab
lein
the
EPla
b
but
with
offs
ite
proc
essi
ng
Expe
rim
enta
land
clin
-
ical
evid
ence
Sing
lebe
atEG
Mre
-
cons
truc
tion
of
the
entir
ehe
art
at
rela
tivel
ylo
wre
s-
olut
ion;
furt
her
valid
atio
nne
eded
Mac
hine
lear
ning
/AI
EGM
-bas
edtr
aini
ng
(big
)da
taus
edby
mac
hine
sw
itha
lear
ning
algo
rith
m
toid
entif
ydr
iver
s
Inpu
tda
tase
tsco
ntai
n
(a)
valid
envi
sage
d
solu
tions
Opt
imal
gold
stan
dard
for
trai
ning
yet
to
beid
entifi
ed;d
eci-
sion
mak
ing
tree
opaq
ue
Larg
eIn
tend
edfo
rus
ein
the
lab
with
offs
ite
proc
essi
ng
Iden
tifyi
ngdr
iver
sin
AF
com
puta
tiona
l
mod
els
Und
eter
min
ed
AD
,act
ivat
ion
dire
ctio
n;A
F,at
rial
fibri
llatio
n;A
I,ar
tifici
alin
telli
genc
e;Bi
-EG
M,b
ipol
arEG
M;C
FAE,
com
plex
frac
tiona
ted
atri
alel
ectr
ogra
ms;
EGM
,ele
ctro
gram
s;LA
T,l
ocal
activ
atio
ntim
e;U
-EG
M,u
nipo
lar
EGM
.
EHRA position paper 319D
ownloaded from
https://academic.oup.com
/europace/article/24/2/313/6456176 by Delft U
niversity of Technology user on 22 February 2022
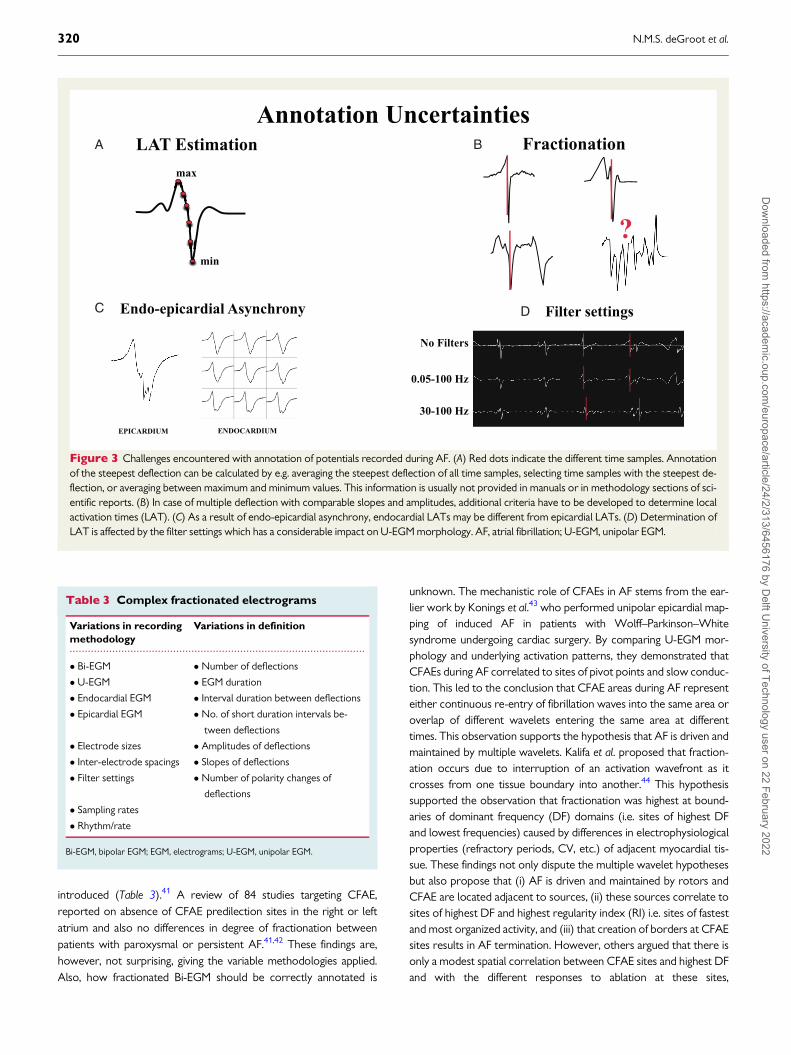
introduced (Table 3).41 A review of 84 studies targeting CFAE,reported on absence of CFAE predilection sites in the right or leftatrium and also no differences in degree of fractionation betweenpatients with paroxysmal or persistent AF.41,42 These findings are,however, not surprising, giving the variable methodologies applied.Also, how fractionated Bi-EGM should be correctly annotated is
unknown. The mechanistic role of CFAEs in AF stems from the ear-lier work by Konings et al.43 who performed unipolar epicardial map-ping of induced AF in patients with Wolff–Parkinson–Whitesyndrome undergoing cardiac surgery. By comparing U-EGM mor-phology and underlying activation patterns, they demonstrated thatCFAEs during AF correlated to sites of pivot points and slow conduc-tion. This led to the conclusion that CFAE areas during AF representeither continuous re-entry of fibrillation waves into the same area oroverlap of different wavelets entering the same area at differenttimes. This observation supports the hypothesis that AF is driven andmaintained by multiple wavelets. Kalifa et al. proposed that fraction-ation occurs due to interruption of an activation wavefront as itcrosses from one tissue boundary into another.44 This hypothesissupported the observation that fractionation was highest at bound-aries of dominant frequency (DF) domains (i.e. sites of highest DFand lowest frequencies) caused by differences in electrophysiologicalproperties (refractory periods, CV, etc.) of adjacent myocardial tis-sue. These findings not only dispute the multiple wavelet hypothesesbut also propose that (i) AF is driven and maintained by rotors andCFAE are located adjacent to sources, (ii) these sources correlate tosites of highest DF and highest regularity index (RI) i.e. sites of fastestand most organized activity, and (iii) that creation of borders at CFAEsites results in AF termination. However, others argued that there isonly a modest spatial correlation between CFAE sites and highest DFand with the different responses to ablation at these sites,
.................................................................................................
Table 3 Complex fractionated electrograms
Variations in recording
methodology
Variations in definition
� Bi-EGM � Number of deflections
� U-EGM � EGM duration
� Endocardial EGM � Interval duration between deflections
� Epicardial EGM � No. of short duration intervals be-
tween deflections
� Electrode sizes � Amplitudes of deflections
� Inter-electrode spacings � Slopes of deflections
� Filter settings � Number of polarity changes of
deflections
� Sampling rates
� Rhythm/rate
Bi-EGM, bipolar EGM; EGM, electrograms; U-EGM, unipolar EGM.
A
C D
B
Figure 3 Challenges encountered with annotation of potentials recorded during AF. (A) Red dots indicate the different time samples. Annotationof the steepest deflection can be calculated by e.g. averaging the steepest deflection of all time samples, selecting time samples with the steepest de-flection, or averaging between maximum and minimum values. This information is usually not provided in manuals or in methodology sections of sci-entific reports. (B) In case of multiple deflection with comparable slopes and amplitudes, additional criteria have to be developed to determine localactivation times (LAT). (C) As a result of endo-epicardial asynchrony, endocardial LATs may be different from epicardial LATs. (D) Determination ofLAT is affected by the filter settings which has a considerable impact on U-EGM morphology. AF, atrial fibrillation; U-EGM, unipolar EGM.
320 N.M.S. deGroot et al.D
ownloaded from
https://academic.oup.com
/europace/article/24/2/313/6456176 by Delft U
niversity of Technology user on 22 February 2022
respectively, this may indicate that CFAE and DF domains are sepa-rate entities.45 A multi-centre, randomized trial indeed demonstratedthat CFAE ablation did not reduce AF recurrences on the long-term.46,47
Dipole density mappingDipole density mapping refers to utilization of dipole density—de-fined as ‘cellular charge sources’—to resolve local electrical activa-tion.48,49 Data from an ultrasound array are used for reconstructionof the anatomy.49 Non-contact electrodes sense intra-cavitary U-EGMs from which dipole densities are derived based on the preciseultrasound measured distance and reconstructed endocardial surfacearea. From these dipole densities, forward-calculated EGMs arereconstructed. A prediction model instead of data interpolation isused between the measuring points. Fundamental differences be-tween voltage and dipole density lie in the averaging effect of ‘spatialsummation’ and in the volume of space occupied by each.Theoretically, dipole density-based mapping provides a more local-ized portrayal of activation patterns than voltage-based mappingdoes, and with less far-field interference.
The accuracy of non-contact dipole density map was comparedwith contact voltage mapping during sinus rhythm and AF and corre-lated well when the recorded sites were <_40 mm from the endocar-dial surface, comparable with previously published for non-contactmapping systems.50 The theoretical benefits of dipole density map-ping and initial clinical outcomes from single centre studies requirefurther validation in randomized controlled trials.50,51
Rotational activity mappingRotational activity is caused by functional re-entry circuits (seeSupplementary material online, movie 1) with an excitable but non-excited core and a curved wavefront subject to source-sink mis-match driving spiral waves.52 Phase analysis is used to identifyrotors based on identification of the phase singularity point andthereby the core of rotational activity driving AF. In phase mapping,the converted EGM is mathematically transformed to capturewavefront dynamics through the activation-recovery cycle of theunderlying tissue, effectively functioning as a low-pass filter imple-mented on fractionated EGMs.53 Phase analysis is particularly suitedto optical mapping of action potentials with their characteristic de-polarization upstroke, intervening plateau, and repolarization down-slope and has been used effectively for AF analysis in experimentalmodels.54 However, as the type of signals recorded, and the tech-nique employed influences phase analysis it remains unclearwhether rotational activity seen during mapping of AF in humans isrepresentative of the same re-entry mechanism demonstrated withoptical mapping.55 In computational and experimental models, rota-tional activities maintain AF and therefore have been consideredablation targets. Limitations of mapping in humans that may influ-ence the phase analysis and thereby interpretation of phase mapsincludes: (i) artefact due to noise, (ii) far-field ventricular signals,and (iii) limited resolution with mapping catheters particularly bas-ket catheters resulting in data interpolation. Interpolation of phasesmay result in representation of non-existent rotors as the interpo-lation algorithm is devised to detect rotational activity.18,19,56
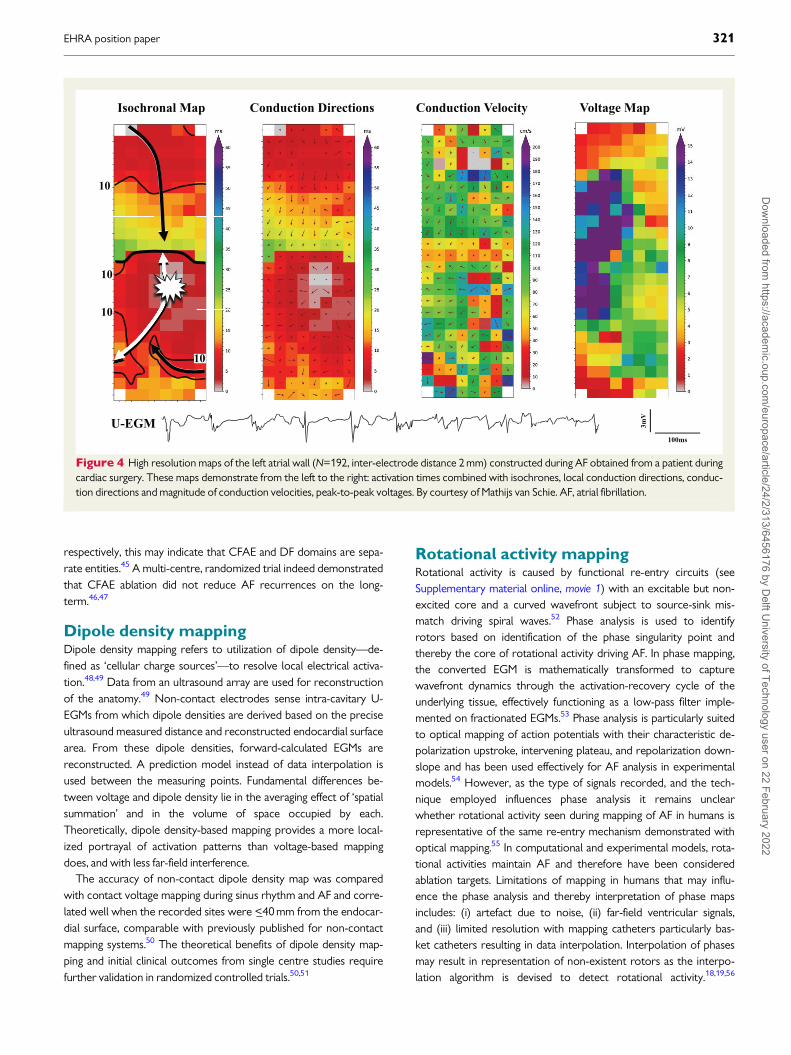
Figure 4 High resolution maps of the left atrial wall (N=192, inter-electrode distance 2 mm) constructed during AF obtained from a patient duringcardiac surgery. These maps demonstrate from the left to the right: activation times combined with isochrones, local conduction directions, conduc-tion directions and magnitude of conduction velocities, peak-to-peak voltages. By courtesy of Mathijs van Schie. AF, atrial fibrillation.
EHRA position paper 321D
ownloaded from
https://academic.oup.com
/europace/article/24/2/313/6456176 by Delft U
niversity of Technology user on 22 February 2022
Therefore, it remains unclear whether the current mapping modali-ties available in humans are able to effectively identify source mech-anisms that have so elegantly been demonstrated in animal modelswith optical mapping. Furthermore, characteristics of these local-ized sources remain unclear. Spatiotemporal stability of rotationalactivities has been demonstrated in optical mapping studies in ani-mal models, however, mapping of rotational activity in humans hasshown inconsistent results.16,17,57,58 While some studies concludethat these drivers are spatiotemporally stable16 others have shownthat even though spatially stable the drivers elicit temporal period-icity.57 It remains unclear which of these characteristics are the cor-rect description of these drivers and if both are, does the temporalstability have an impact on the mechanistic importance of thesedrivers? These questions remain to be answered.
Atrial rate analysisThe activation rate of a recording site can be estimated in the timedomain in terms of average cycle length, while several indices relatedto activation organization can be obtained from the dispersion of thecycle length histogram. However, this approach requires the use ofautomatic algorithms to estimate LATs or cycle lengths, which can bechallenging in case of CFAE.59 Atrial rate can also be computed in thefrequency domain, avoiding the need of LAT detection. In order toensure that the maximum spectral amplitude corresponds to theatrial rate and not to one of its harmonics, Botteron’s pre-process-ing60,61 is applied to the raw signal before computing the spectrum.This pre-processing (see Supplementary material online, Figure S2)consists of three steps: band-pass filtering, rectification, and low-passfilter removing details of the individual activations and converting theraw signal in a train of smooth pulses. The DF is defined as the highestspectral peak of this pre-processed signal. The organization index hasbeen defined as the ratio of the spectral power around the DF and itsharmonics to the total spectral power.62 This index measures the pe-riodicity of the pre-processed signal, which is a sign of periodic andorganized activations. Spatial distribution of activation rate and activa-tion organization has been studied to find AF critical sources, andtherefore, candidate sites for ablation, based on the hypothesis thathigh activation rates and organization allows identification of sourcesdriving AF.63 While reduction of DF has been shown to be a markerof good ablation outcome,64 direct ablation of sites with maximumDF have shown mixed results.65–67
Conduction velocity and activationdirection analysisConduction velocity (CV) along a given activation direction (AD) canbe measured from differences of LATs at electrodes with knowntwo-dimensional inter-electrode distances (Figure 4).28,68,69
However, CV can only be estimated as the true three-dimenionalpathway is unknown. The CV can be semi quantitively visualized byconstruction of isochronal maps. Model-based approaches havebeen used to estimate both CV and AD, using LAT from EGMsrecorded by circular catheters or multi-electrode arrays.68 In general,CV and AD maps can be obtained by post-processing activationmaps if they have enough spatial resolution,70 but they may be verysensitive to errors and inconsistencies in LAT estimates. To copewith this problem, Anter et al.69 proposed a method which estimates
a consistent global pattern of activation in the whole chamber, takinginto account all candidate LATs in a single EGM, and then locally esti-mated CV and AD. Uncertainties in LAT estimation have been quan-tified and used for LAT interpolation.71 Recently, van Schie et al.72
introduced a novel, modified discrete velocity vectors methodologyto calculate CV. The CV during AF is calculated to identify areas withlow CV associated with structural remodelling. However, as thetrue pathlength is unknown, particularly in complex patterns of acti-vations during AF, the calculated ‘effective’ CV may only be roughlyestimated.
EntropyEntropy is a dimensionless parameter of randomness, used in infor-mation theory to measure information content, estimate signal vari-ability, or randomness in time series data and can therefore be usedto evaluate EGM complexity objectively.73 When applied to EGMs,low values indicate high regularity and predictability whereas high val-ues increase progressively with irregularity and are highest for ran-dom noise. The amplitude histogram-based Shannon entropymeasure was only moderately inversely correlated with CFAE.73 Arecent single centre study demonstrated that sample entropy, whichuses EGM segment vector comparisons, is correlated with outcomesof ablation therapy in persistent AF patients undergoing CFAEablation.
Non-invasive mapping of atrialfibrillation
The ECG Imaging (ECGI) is a non-invasive, body surface mappingtechnique (Figure 5) for reconstruction of cardiac excitation patternsusing 80–250 electrodes applied to the upper torso.74–76 Prior tothis, the cardiac anatomy and electrode positions are determined ei-ther via medical imaging (CT or MRI scans) or with 3D localizationtechnology.74,77 Numerical inversion provides real-time estimates ofepi- and endocardial U-EGMs, excitation wavefronts, or transmem-brane voltages. From these, atrial maps of various quantities (e.g. acti-vation time, voltage, phase, CV, and DF) can be derived and specificphenomena can be localized (e.g. ectopic foci, phase singularities, androtors/rotor densities). Because of severe numerical problems, onlya few investigators attempted to estimate transmural potentials.Inversion requires an accurate forward model including a source andan observation model. The observation model is a volume conductormodel of the torso relating cardiac sources to body surface poten-tials. Relatively large distances between sources and electrodes trans-late into spatial blurring which the inversion tries to correct, but thisis complicated as there are far fewer electrodes than source loca-tions. The source model describes generation and spatiotemporalpropagation of excitation, and depends on many hidden parame-ters—this serves as a prior to the solution. In practice, this is replacedby patient-independent assumptions and constraints on spatiotem-poral smoothness. Priors are needed for regularization, because in-version is inherently an ill-posed problem with ambiguous solutions.Current systems reach resolutions of 10–20 mm, with wide standarddeviations.78 Temporal fidelity is often limited; estimated activationtimes have errors of 10–20 ms. Also, artefacts like spurious lines of
322 N.M.S. deGroot et al.D
ownloaded from
https://academic.oup.com
/europace/article/24/2/313/6456176 by Delft U
niversity of Technology user on 22 February 2022

block are reported.79 Due to their lower amplitude, atrial signals areharder to reconstruct than ventricular signals.
The promise of ECGI is that it will provide clinicians with non-invasive panoramic maps before the patient moves into the EP-lab,allowing anatomic characterization and localization of AF drivers, andtherefore targets for ablation prior to procedures.57 The ECGI couldalso help verify permanent post-ablation conduction block or identifygaps in ablation lines before re-do procedures.80 As a research tool,ECGI provides a means of studying AF and poorly understood mech-anisms like re-entry circuits, rotors, and rotor densities, areas of slowconduction, focal sources, CFAEs, and DF heterogeneities.81
Combined with LGE-MRI, it can identify locations where rotors an-chor to fibrotic substrates—potential ablation targets.82
However, validation of ECGI remains a significant challenge.Comparison of ECGI with EGMs using an intra-cardiac catheter map-ping showed general agreement with several important limita-tions,53,83,84 primarily related to numerical challenges in the inversion.The technique is sensitive to ECG noise and motion (cardiac cycle,breathing), sometimes resulting in artefacts or outliers.Regularization techniques make generic assumptions on sourceparameters and it is unclear how that impacts accuracy. Detection ofsmall amplitude EGMs or drivers with short cycle lengths using ECGImay not be reliable, in particular the assessment of drivers in the sep-tal area is challenging. Moreover, the clinical workflow is complex, re-quiring application of an electrode vest, its anatomical registrationand subsequent image processing that has not yet been fully
automated and may be hampered by patient-specific factors. This haslimited its clinical adoption. Hence, translation of ECGI maps into reli-able disease markers requires additional studies.85
Research tools for atrialfibrillation mapping
Optical mapping of atrial fibrillationOptical mapping involves use of voltage-sensitive dyes to examinespatiotemporal excitation patterns in cardiac tissue (Figure 6).86 Thistechnique has been used in animal models to elucidate tissue-scale ororgan-scale atrial electrophysiology, including characterization ofanti-arrhythmic drug effects, understanding cellular and molecular AFmechanisms, and exploring the prospect of light-based optogeneticcardioversion.86–88 In contrast to isolated cell models, optical map-ping enables analysis of non-disrupted myocardium in its native elec-trophysiological milieu. Recent advances have evaluated interplaysbetween three-dimensional tissue fibrosis and AF mechanisms.89
These data have been used to calibrate computational models thatrealistically reproduced re-entrant arrhythmia drivers seen in vitro.Insights obtained from such studies may be useful to improve calibra-tion of image-based computational models in contemporary stud-ies.90,91 Disadvantages of optical mapping include applicability to onlyex vivo cardiac tissue construction of solely two-dimensional images.As a research tool, modern mapping technologies may integrate es-sential findings from optical mapping data specifically on large-scaletissue activation. Progress in this area will likely be hastened by the re-cent publication of open experimental protocols for relatively inex-pensive construction of panoramic optical mapping systems.92,93
Notably, interpretation of data from optical mapping could accountfor limitations of experimental systems, such as the absence ofextracardiac sympathetic or parasympathetic regulation ofLangendorff-perfused hearts. Moreover, recent findings show that us-age of Blebbistatin to reduce motion artefacts in optically mappedhearts via blocking excitation–contraction leads to non-physiologicalaction potential duration prolongation.94
Epicardial mapping of atrial fibrillationCardiac surgery offers the opportunity to perform mapping (Figure 4)of the atrial epicardium. Epicardial mapping can be performed witharrays containing a high number of electrodes (>100) with smalldiameters (0.4–0.6 mm) and inter-electrode distances (2–2.5 mm).21,95 As these arrays are manually positioned on the epicar-dium, stable contact between electrodes and atrial tissue is ensured.Also, exact locations of the electrode array in relation to anatomicalstructures are visualized. Another advantage of this mapping ap-proach is access to regions which cannot be reached from the endo-cardium such as Bachmann’s Bundle.96 Electrode arrays used duringcardiac surgery records EGM at multiple sites simultaneously, whichis essential for understanding AF mechanisms. Simultaneous mappingof the endo-epicardium during surgery has indeed unravelled endo-epicardial electrical asynchrony as potential novel mechanism under-lying AF persistence.3 A disadvantage is the sequential mapping ap-proach and the electrode arrays are custom-made and therefore notclinical available. At present, there are no clinical studies
Figure 5 Upper panel: simulation of excitation of the right andleft atrium. Lower panel: body surface maps of the right and leftatrium based on simulated—and measured activation times con-structed during sinus rhythm with an 80-channel active electrodesystem (ActiveTwo, BioSemi, Amsterdam, The Netherlands).
EHRA position paper 323D
ownloaded from
https://academic.oup.com
/europace/article/24/2/313/6456176 by Delft U
niversity of Technology user on 22 February 2022

demonstrating the value of epicardial mapping guiding (surgical) abla-tion procedures.
Detection of atrial fibrillation
Implantable cardioverter-defibrillator/pacemakersIn recent years, an increasing number of cardiac implantable elec-tronic devices (CIEDs) have been implanted in patients with cardio-vascular diseases. The CIEDs enable AF detection with storage ofintra-cardiac EGM for evaluation at any time. As a result of continu-ous monitoring of a growing number of patients, AF detection has in-creased dramatically, potentially impacting therapeutic strategies.97
Atrial high rate EGM (AHREs) are commonly used to detect AF. TheAF detection algorithms vary between different CIEDs. Generally, inall CIEDs, the PP intervals are continuously monitored. Differentmodels of associating the detected PP intervals to the programmedPP values are used to identify AF (Table 4). Moreover, it should be
noted that AF detection by CIEDs is not always correct, particularlywhen repetitive non-re-entrant ventriculo-atrial synchrony ensues.98
Implantable loop recordersImplantable loop recorders (ILRs) with dedicated AF algorithms areused for diagnosis and monitoring of AF after surgical or catheter AFablation, and cryptogenic stroke.99–104 The ILRs have high accuracy indetecting AF burdens using incoherence of R–R intervals over a pe-riod of time.105–108 Lorenz plots have extensively been used to dem-onstrate RR interval irregularity during AF and to discriminatebetween AF and sinus rhythm. Different ILR models equipped withalgorithms for AF detection can accurately quantify AF burden(98.5%) and are very sensitive (96.4%) to identify asymptomaticpatients with AF.106,107 In order to reduce the rate of false positiveAF episodes, an ILR with a long sensing vector has been utilized.109
Moreover, ILR algorithms were improved to detect visible P waves inthe absence of noisy baseline or flutter waves and were enhancedwith artificial intelligence (AI) tools that learn if a patient has P-wavesduring periods of RR irregularity. Performance of AF detection
A B C
D E F
Figure 6 Schematic illustration of the use of an open source imaging toolkit for panoramic optical mapping, as described by Gloschat et al. (A)Experimental optical mapping setup, including Langendorff-perfused heart. (B) Heart image with superimposed silhouette (yellow) derived via an au-tomated thresholding process. (C) Data projection points for reconstruction of panoramic maps of optically mapped data. (D) Examples of opticallymapped action potentials recorded from the epicardial surface of a rat heart, including annotations for activation and 80% repolarization times. (Eand F) Spatial reconstructions of activation time (E) and 80% action potential duration (F) from representative rat panoramic optical data. Imagesreproduced from Figure 1 (A–C) and Figure 7 (D–F) of Gloschat et al. under the terms of the Creative Commons Attribution 4.0 International License.To view a copy of this license, visit http://creativecommons.org/licenses/by/4.0/. 93
324 N.M.S. deGroot et al.D
ownloaded from
https://academic.oup.com
/europace/article/24/2/313/6456176 by Delft U
niversity of Technology user on 22 February 2022
algorithms in ILRs depends significantly on the patient population, in-cidence rate of AF, duration of monitoring, and type of AF. For exam-ple, diagnostic sensitivity will get closer to 100% for longermonitoring duration or in patients with persistent AF.108,110,111
Therefore, prolonged monitoring periods (> 3 years) are a prerequi-site for the improvement of the ILR’s diagnostic yield.
Post-processing of electricalsignals
Advances in the field of Artificial Intelligence and in particularMachine Learning (ML), offer new opportunities to improve analysis
of electrical signals.112,113 Rapid progression in computational power,data storage, and remote data acquisition have enabled the applica-tion of ML to ECGs and EGMs.112 Table 5 provides a non-exhaustivelist of potential applications of ML in AF.113,114 For the discussion ofthe application of AI for detection of AF we refer to recent scientificdocuments.115,116
The ML has several limitations and challenges. First, external valid-ity and generalizability remain to be determined. The real value ofthis new approach in addition to clinical risk factors and risk scoresrequires further investigation and validation. Second, while largeamounts of data can increase effectiveness of ML models, it is moredifficult to critically assess their quality. Third, black box ML method-ologies inhibit interpretation and make it impossible to involve
....................................................................................................................................................................................................................
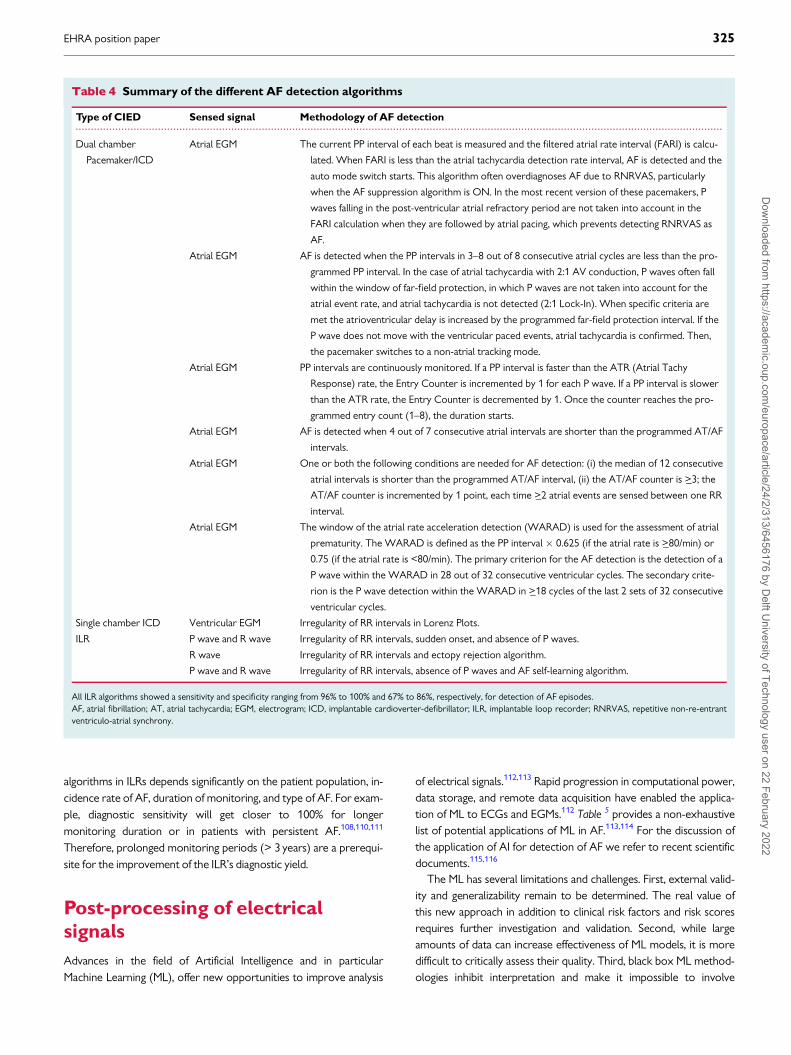
Table 4 Summary of the different AF detection algorithms
Type of CIED Sensed signal Methodology of AF detection
Dual chamber
Pacemaker/ICD
Atrial EGM The current PP interval of each beat is measured and the filtered atrial rate interval (FARI) is calcu-
lated. When FARI is less than the atrial tachycardia detection rate interval, AF is detected and the
auto mode switch starts. This algorithm often overdiagnoses AF due to RNRVAS, particularly
when the AF suppression algorithm is ON. In the most recent version of these pacemakers, P
waves falling in the post-ventricular atrial refractory period are not taken into account in the
FARI calculation when they are followed by atrial pacing, which prevents detecting RNRVAS as
AF.
Atrial EGM AF is detected when the PP intervals in 3–8 out of 8 consecutive atrial cycles are less than the pro-
grammed PP interval. In the case of atrial tachycardia with 2:1 AV conduction, P waves often fall
within the window of far-field protection, in which P waves are not taken into account for the
atrial event rate, and atrial tachycardia is not detected (2:1 Lock-In). When specific criteria are
met the atrioventricular delay is increased by the programmed far-field protection interval. If the
P wave does not move with the ventricular paced events, atrial tachycardia is confirmed. Then,
the pacemaker switches to a non-atrial tracking mode.
Atrial EGM PP intervals are continuously monitored. If a PP interval is faster than the ATR (Atrial Tachy
Response) rate, the Entry Counter is incremented by 1 for each P wave. If a PP interval is slower
than the ATR rate, the Entry Counter is decremented by 1. Once the counter reaches the pro-
grammed entry count (1–8), the duration starts.
Atrial EGM AF is detected when 4 out of 7 consecutive atrial intervals are shorter than the programmed AT/AF
intervals.
Atrial EGM One or both the following conditions are needed for AF detection: (i) the median of 12 consecutive
atrial intervals is shorter than the programmed AT/AF interval, (ii) the AT/AF counter is >_3; the
AT/AF counter is incremented by 1 point, each time >_2 atrial events are sensed between one RR
interval.
Atrial EGM The window of the atrial rate acceleration detection (WARAD) is used for the assessment of atrial
prematurity. The WARAD is defined as the PP interval � 0.625 (if the atrial rate is >_80/min) or
0.75 (if the atrial rate is <80/min). The primary criterion for the AF detection is the detection of a
P wave within the WARAD in 28 out of 32 consecutive ventricular cycles. The secondary crite-
rion is the P wave detection within the WARAD in >_18 cycles of the last 2 sets of 32 consecutive
ventricular cycles.
Single chamber ICD Ventricular EGM Irregularity of RR intervals in Lorenz Plots.
ILR P wave and R wave Irregularity of RR intervals, sudden onset, and absence of P waves.
R wave Irregularity of RR intervals and ectopy rejection algorithm.
P wave and R wave Irregularity of RR intervals, absence of P waves and AF self-learning algorithm.
All ILR algorithms showed a sensitivity and specificity ranging from 96% to 100% and 67% to 86%, respectively, for detection of AF episodes.AF, atrial fibrillation; AT, atrial tachycardia; EGM, electrogram; ICD, implantable cardioverter-defibrillator; ILR, implantable loop recorder; RNRVAS, repetitive non-re-entrantventriculo-atrial synchrony.
EHRA position paper 325D
ownloaded from
https://academic.oup.com
/europace/article/24/2/313/6456176 by Delft U
niversity of Technology user on 22 February 2022
stakeholders in meaningful shared decisions. Fourth, as we moveaway from intuition and physiologically reasoned model-basedapproaches towards large (and deep) multi-variate ML models, welose interpretability and potentially increase the likelihood of cata-strophic outputs, resulting in non-causal associations.
Conclusion
Recording and processing of EGMs are the cornerstones of mappingof AF. Yet, at present, it is unknown what the most ideal EGM re-cording type (e.g. uni-, bi-, or omnipolar) is and thus which technol-ogy should be used for recording and processing. The combination ofa lack of golden standard of EGM recording and processing
technology during AF and of a comprehensive understanding ofmechanism(s) underlying AF, does not give significant confidence incomparative evaluation of current technologies. The AI has opened anew era for signal processing, yet the clinical value still has to be fur-ther explored. The CIEDS are increasingly used to detect AF epi-sodes, yet diagnostic yields need further improvement.
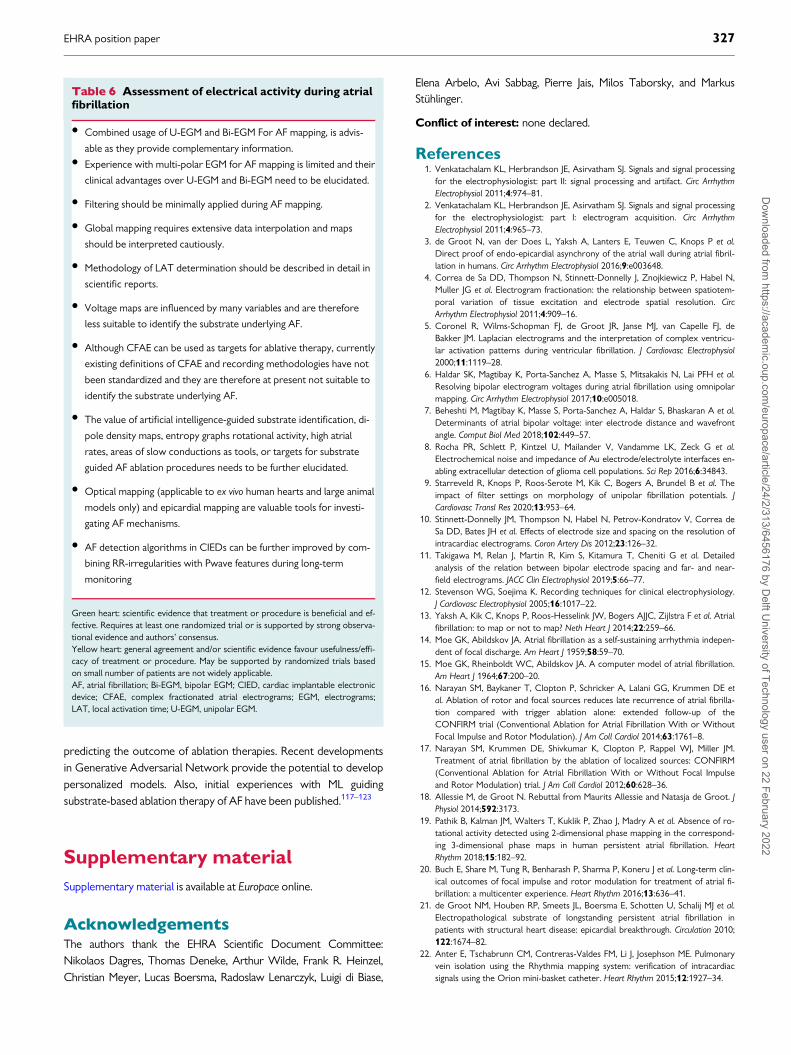
Suggestions according to the EHRA consensus documents classifi-cations are summarized in Table 6.
Future perspectives
Improvements in AF mapping by obtaining highest fidelity source sig-nals—including catheter–electrode combinations, to signal process-ing including filtering, digitization, and noise elimination is of utmostimportance. The cleanest source signal, with minimal and/or clearlyunderstood processing and a well-defined protocol facilitates evalua-tion and clinical application. A critical evaluation of signal recordingand processing techniques takes into account all assumptions andmathematical transformations. Rigorous evaluation and validation ofnovel technologies involves e.g. large animal arrhythmia models andorganized tachyarrhythmias before extending application to AF.Algorithms integrated in signal processing software should be pro-vided in manuals and provided as supplements in scientific publica-tions. Simultaneous multi-electrode activation time mapping,optimized for signal quality, electrode size, density, spacing, and cov-erage resolved to continuous high-fidelity propagation sequenceswith extraction of the arrhythmogenic substrate by automated soft-ware in near real-time enables minimally manipulated extraction ofelectrophysiological mechanisms underlying AF.
The ideal mapping system for AF should be able to automatically(i) detect noise sources and have an optimized noise removal therebyimproving the signal-to-noise ratio, (ii) remove far-field QRS signalfrom the atrial EGM, (iii) annotate fibrillation potentials, and (iv) iden-tify specific EGM features related to arrhythmia development ormaintenance. The arrhythmogenic substrate underlying AF can bedetected by AI and there is an integration of multi-parametric gener-ated maps and images (e.g. MRI) with algorithms identifying sites ofdriver activity or specific substrate parameters related to AF and avalidated support for identification of ablation targets. Finally, there isa real-time EGM monitoring to detect variations in AF maintainingmechanisms and display of multi-parametric maps.
The AF diagnostic yield of pacemaker/ICDs may be improved byenhancement of existing algorithms by use of RR interval irregularitydetection algorithms. Furthermore, adequate atrial lead selection andpositioning and optimal programming of atrial sensitivity may elimi-nate the effects of near-field P-wave or far-field R-wave oversensingby the atrial lead, runs of pre-mature atrial complexes, electrical in-terference, myopotentials, or repetitive non-re-entrant ventriculo-atrial synchrony on accurate AF detection.
For ILRs, further improvement in the AF detection algorithmshould integrate rejection of ventricular extrasystoles in order to en-hance the accuracy of AF diagnosis in patients presenting significantRR interval irregularities. Developments in multi-modal ML could beused for prediction and prognosis from multi-modal data (e.g. ECG,EGM, and LGE-MRI), improving understanding of the AF substrate,differentiating between paroxysmal AF and persistent AF, and
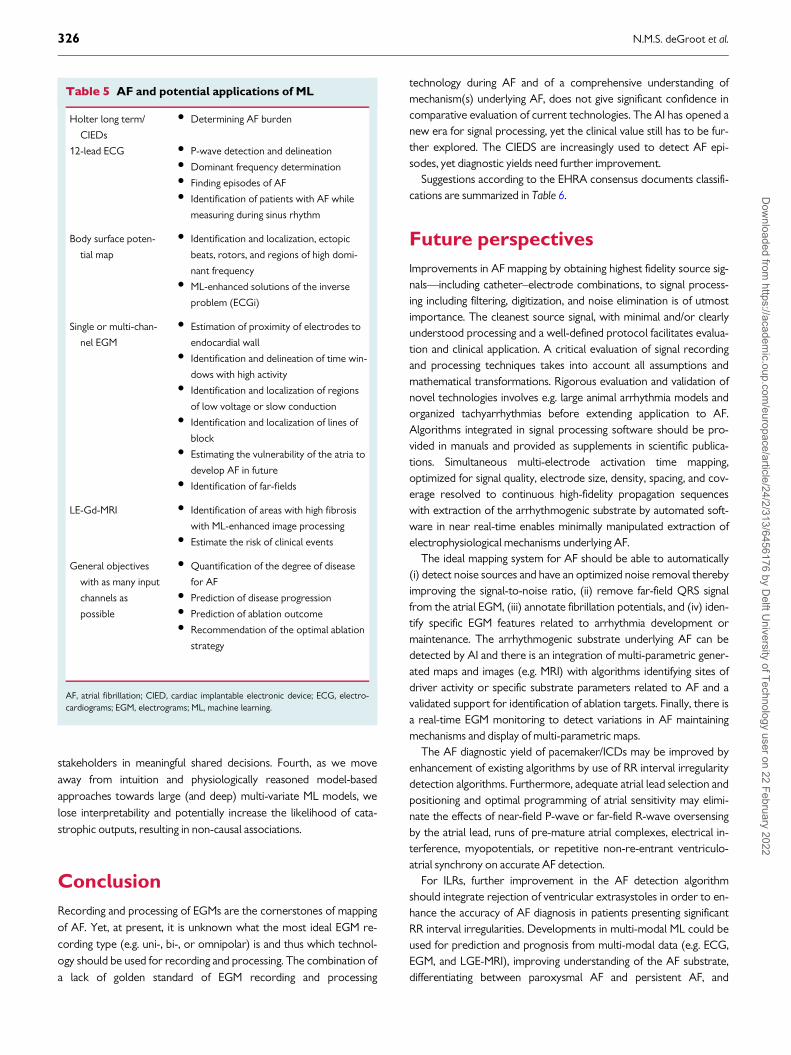
Table 5 AF and potential applications of ML
Holter long term/
CIEDs
• Determining AF burden
12-lead ECG • P-wave detection and delineation• Dominant frequency determination• Finding episodes of AF• Identification of patients with AF while
measuring during sinus rhythm
Body surface poten-
tial map
• Identification and localization, ectopic
beats, rotors, and regions of high domi-
nant frequency• ML-enhanced solutions of the inverse
problem (ECGi)
Single or multi-chan-
nel EGM
• Estimation of proximity of electrodes to
endocardial wall• Identification and delineation of time win-
dows with high activity• Identification and localization of regions
of low voltage or slow conduction• Identification and localization of lines of
block• Estimating the vulnerability of the atria to
develop AF in future• Identification of far-fields
LE-Gd-MRI • Identification of areas with high fibrosis
with ML-enhanced image processing• Estimate the risk of clinical events
General objectives
with as many input
channels as
possible
• Quantification of the degree of disease
for AF• Prediction of disease progression• Prediction of ablation outcome• Recommendation of the optimal ablation
strategy
AF, atrial fibrillation; CIED, cardiac implantable electronic device; ECG, electro-cardiograms; EGM, electrograms; ML, machine learning.
326 N.M.S. deGroot et al.D
ownloaded from
https://academic.oup.com
/europace/article/24/2/313/6456176 by Delft U
niversity of Technology user on 22 February 2022
predicting the outcome of ablation therapies. Recent developmentsin Generative Adversarial Network provide the potential to developpersonalized models. Also, initial experiences with ML guidingsubstrate-based ablation therapy of AF have been published.117–123
Supplementary material
Supplementary material is available at Europace online.
AcknowledgementsThe authors thank the EHRA Scientific Document Committee:Nikolaos Dagres, Thomas Deneke, Arthur Wilde, Frank R. Heinzel,Christian Meyer, Lucas Boersma, Radoslaw Lenarczyk, Luigi di Biase,
Elena Arbelo, Avi Sabbag, Pierre Jais, Milos Taborsky, and MarkusStuhlinger.
Conflict of interest: none declared.
References1. Venkatachalam KL, Herbrandson JE, Asirvatham SJ. Signals and signal processing
for the electrophysiologist: part II: signal processing and artifact. Circ ArrhythmElectrophysiol 2011;4:974–81.
2. Venkatachalam KL, Herbrandson JE, Asirvatham SJ. Signals and signal processingfor the electrophysiologist: part I: electrogram acquisition. Circ ArrhythmElectrophysiol 2011;4:965–73.
3. de Groot N, van der Does L, Yaksh A, Lanters E, Teuwen C, Knops P et al.Direct proof of endo-epicardial asynchrony of the atrial wall during atrial fibril-lation in humans. Circ Arrhythm Electrophysiol 2016;9:e003648.
4. Correa de Sa DD, Thompson N, Stinnett-Donnelly J, Znojkiewicz P, Habel N,Muller JG et al. Electrogram fractionation: the relationship between spatiotem-poral variation of tissue excitation and electrode spatial resolution. CircArrhythm Electrophysiol 2011;4:909–16.
5. Coronel R, Wilms-Schopman FJ, de Groot JR, Janse MJ, van Capelle FJ, deBakker JM. Laplacian electrograms and the interpretation of complex ventricu-lar activation patterns during ventricular fibrillation. J Cardiovasc Electrophysiol2000;11:1119–28.
6. Haldar SK, Magtibay K, Porta-Sanchez A, Masse S, Mitsakakis N, Lai PFH et al.Resolving bipolar electrogram voltages during atrial fibrillation using omnipolarmapping. Circ Arrhythm Electrophysiol 2017;10:e005018.
7. Beheshti M, Magtibay K, Masse S, Porta-Sanchez A, Haldar S, Bhaskaran A et al.Determinants of atrial bipolar voltage: inter electrode distance and wavefrontangle. Comput Biol Med 2018;102:449–57.
8. Rocha PR, Schlett P, Kintzel U, Mailander V, Vandamme LK, Zeck G et al.Electrochemical noise and impedance of Au electrode/electrolyte interfaces en-abling extracellular detection of glioma cell populations. Sci Rep 2016;6:34843.
9. Starreveld R, Knops P, Roos-Serote M, Kik C, Bogers A, Brundel B et al. Theimpact of filter settings on morphology of unipolar fibrillation potentials. JCardiovasc Transl Res 2020;13:953–64.
10. Stinnett-Donnelly JM, Thompson N, Habel N, Petrov-Kondratov V, Correa deSa DD, Bates JH et al. Effects of electrode size and spacing on the resolution ofintracardiac electrograms. Coron Artery Dis 2012;23:126–32.
11. Takigawa M, Relan J, Martin R, Kim S, Kitamura T, Cheniti G et al. Detailedanalysis of the relation between bipolar electrode spacing and far- and near-field electrograms. JACC Clin Electrophysiol 2019;5:66–77.
12. Stevenson WG, Soejima K. Recording techniques for clinical electrophysiology.J Cardiovasc Electrophysiol 2005;16:1017–22.
13. Yaksh A, Kik C, Knops P, Roos-Hesselink JW, Bogers AJJC, Zijlstra F et al. Atrialfibrillation: to map or not to map? Neth Heart J 2014;22:259–66.
14. Moe GK, Abildskov JA. Atrial fibrillation as a self-sustaining arrhythmia indepen-dent of focal discharge. Am Heart J 1959;58:59–70.
15. Moe GK, Rheinboldt WC, Abildskov JA. A computer model of atrial fibrillation.Am Heart J 1964;67:200–20.
16. Narayan SM, Baykaner T, Clopton P, Schricker A, Lalani GG, Krummen DE etal. Ablation of rotor and focal sources reduces late recurrence of atrial fibrilla-tion compared with trigger ablation alone: extended follow-up of theCONFIRM trial (Conventional Ablation for Atrial Fibrillation With or WithoutFocal Impulse and Rotor Modulation). J Am Coll Cardiol 2014;63:1761–8.
17. Narayan SM, Krummen DE, Shivkumar K, Clopton P, Rappel WJ, Miller JM.Treatment of atrial fibrillation by the ablation of localized sources: CONFIRM(Conventional Ablation for Atrial Fibrillation With or Without Focal Impulseand Rotor Modulation) trial. J Am Coll Cardiol 2012;60:628–36.
18. Allessie M, de Groot N. Rebuttal from Maurits Allessie and Natasja de Groot. JPhysiol 2014;592:3173.
19. Pathik B, Kalman JM, Walters T, Kuklik P, Zhao J, Madry A et al. Absence of ro-tational activity detected using 2-dimensional phase mapping in the correspond-ing 3-dimensional phase maps in human persistent atrial fibrillation. HeartRhythm 2018;15:182–92.
20. Buch E, Share M, Tung R, Benharash P, Sharma P, Koneru J et al. Long-term clin-ical outcomes of focal impulse and rotor modulation for treatment of atrial fi-brillation: a multicenter experience. Heart Rhythm 2016;13:636–41.
21. de Groot NM, Houben RP, Smeets JL, Boersma E, Schotten U, Schalij MJ et al.Electropathological substrate of longstanding persistent atrial fibrillation inpatients with structural heart disease: epicardial breakthrough. Circulation 2010;122:1674–82.
22. Anter E, Tschabrunn CM, Contreras-Valdes FM, Li J, Josephson ME. Pulmonaryvein isolation using the Rhythmia mapping system: verification of intracardiacsignals using the Orion mini-basket catheter. Heart Rhythm 2015;12:1927–34.
Table 6 Assessment of electrical activity during atrialfibrillation
• Combined usage of U-EGM and Bi-EGM For AF mapping, is advis-
able as they provide complementary information.• Experience with multi-polar EGM for AF mapping is limited and their
clinical advantages over U-EGM and Bi-EGM need to be elucidated.
• Filtering should be minimally applied during AF mapping.
• Global mapping requires extensive data interpolation and maps
should be interpreted cautiously.
• Methodology of LAT determination should be described in detail in
scientific reports.
• Voltage maps are influenced by many variables and are therefore
less suitable to identify the substrate underlying AF.
• Although CFAE can be used as targets for ablative therapy, currently
existing definitions of CFAE and recording methodologies have not
been standardized and they are therefore at present not suitable to
identify the substrate underlying AF.
• The value of artificial intelligence-guided substrate identification, di-
pole density maps, entropy graphs rotational activity, high atrial
rates, areas of slow conductions as tools, or targets for substrate
guided AF ablation procedures needs to be further elucidated.
• Optical mapping (applicable to ex vivo human hearts and large animal
models only) and epicardial mapping are valuable tools for investi-
gating AF mechanisms.
• AF detection algorithms in CIEDs can be further improved by com-
bining RR-irregularities with Pwave features during long-term
monitoring
Green heart: scientific evidence that treatment or procedure is beneficial and ef-fective. Requires at least one randomized trial or is supported by strong observa-tional evidence and authors’ consensus.Yellow heart: general agreement and/or scientific evidence favour usefulness/effi-cacy of treatment or procedure. May be supported by randomized trials basedon small number of patients are not widely applicable.AF, atrial fibrillation; Bi-EGM, bipolar EGM; CIED, cardiac implantable electronicdevice; CFAE, complex fractionated atrial electrograms; EGM, electrograms;LAT, local activation time; U-EGM, unipolar EGM.
EHRA position paper 327D
ownloaded from
https://academic.oup.com
/europace/article/24/2/313/6456176 by Delft U
niversity of Technology user on 22 February 2022
23. Sroubek J, Rottmann M, Barkagan M, Leshem E, Shapira-Daniels A, Brem E et al.A novel octaray multielectrode catheter for high-resolution atrial mapping:electrogram characterization and utility for mapping ablation gaps. J CardiovascElectrophysiol 2019;30:749–57.
24. Huemer M, Qaiyumi D, Attanasio P, Parwani A, Pieske B, Blaschke F et al. Doesthe extent of left atrial arrhythmogenic substrate depend on the electroana-tomical mapping technique: impact of pulmonary vein mapping catheter vs. abla-tion catheter. Europace 2017;19:1293–301.
25. Takigawa M, Relan J, Martin R, Kim S, Kitamura T, Frontera A et al. Effect of bi-polar electrode orientation on local electrogram properties. Heart Rhythm2018;15:1853–61.
26. Anter E, Tschabrunn CM, Josephson ME. High-resolution mapping of scar-related atrial arrhythmias using smaller electrodes with closer interelectrodespacing. Circ Arrhythm Electrophysiol 2015;8:537–45.
27. Ellis WS, Eisenberg SJ, Auslander DM, Dae MW, Zakhor A, Lesh MD.Deconvolution: a novel signal processing approach for determining activationtime from fractionated electrograms and detecting infarcted tissue. Circulation1996;94:2633–40.
28. Cantwell CD, Roney CH, Ng FS, Siggers JH, Sherwin SJ, Peters NS. Techniquesfor automated local activation time annotation and conduction velocity estima-tion in cardiac mapping. Comput Biol Med 2015;65:229–42.
29. Spach MS, Dolber PC. Relating extracellular potentials and their derivatives toanisotropic propagation at a microscopic level in human cardiac muscle.Evidence for electrical uncoupling of side-to-side fiber connections with in-creasing age. Circ Res 1986;58:356–71.
30. Bollacker KD, Simpson EV, Hillsley RE, Blanchard SM, Gerstle RJ, Walcott GPet al. An automated technique for identification and analysis of activation frontsin a two-dimensional electrogram array. Comput Biomed Res 1994;27:229–44.
31. Alcaine A, Soto-Iglesias D, Calvo M, Guiu E, Andreu D, Fernandez-Armenta J etal. A wavelet-based electrogram onset delineator for automatic ventricular acti-vation mapping. IEEE Trans Biomed Eng 2014;61:2830–9.
32. Vidmar D, Alhusseini MI, Narayan SM, Rappel WJ. Characterizing electrogramsignal fidelity and the effects of signal contamination on mapping human persis-tent atrial fibrillation. Front Physiol 2018;9:1232.
33. Ye Z, van Schie MS, de Groot NMS. Signal fingerprinting as a novel diagnostictool to identify conduction inhomogeneity. Front Physiol 2021;12:652128.
34. Williams SE, Linton N, O’Neill L, Harrison J, Whitaker J, Mukherjee R et al. Theeffect of activation rate on left atrial bipolar voltage in patients with paroxysmalatrial fibrillation. J Cardiovasc Electrophysiol 2017;28:1028–36.
35. Ndrepepa G, Schneider MA, Karch MR, Weber S, Schreieck J, Zrenner B et al.Impact of atrial fibrillation on the voltage of bipolar signals acquired from theleft and right atria. Pacing Clin Electrophysiol 2003;26:862–9.
36. Anter E, Josephson ME. Bipolar voltage amplitude: what does it really mean?Heart Rhythm 2016;13:326–7.
37. Sim I, Bishop M, O’Neill M, Williams SE. Left atrial voltage mapping: definingand targeting the atrial fibrillation substrate. J Interv Card Electrophysiol 2019;56:213–27.
38. Masuda M, Fujita M, Iida O, Okamoto S, Ishihara T, Nanto K et al. Left atriallow-voltage areas predict atrial fibrillation recurrence after catheter ablation inpatients with paroxysmal atrial fibrillation. Int J Cardiol 2018;257:97–101.
39. Rodriguez-Manero M, Valderrabano M, Baluja A, Kreidieh O, Martinez-Sande JL,Garcia-Seara J et al. Validating left atrial low voltage areas during atrial fibrilla-tion and atrial flutter using multielectrode automated electroanatomic mapping.JACC Clin Electrophysiol 2018;4:1541–52.
40. Spragg DD, Zghaib T. Veracity of voltage mapping during atrial fibrillation andflutter: how good is good enough? JACC Clin Electrophysiol 2018;4:1553–5.
41. van der Does LJ, de Groot NM. Inhomogeneity and complexity in defining frac-tionated electrograms. Heart Rhythm 2017;14:616–24.
42. Starreveld R, van der Does L, de Groot NMS. Anatomical hotspots of fraction-ated electrograms in the left and right atrium: do they exist? Europace 2019;21:60–72.
43. Konings KT, Kirchhof CJ, Smeets JR, Wellens HJ, Penn OC, Allessie MA. High-density mapping of electrically induced atrial fibrillation in humans. Circulation1994;89:1665–80.
44. Kalifa J, Tanaka K, Zaitsev AV, Warren M, Vaidyanathan R, Auerbach D et al.Mechanisms of wave fractionation at boundaries of high-frequency excitation inthe posterior left atrium of the isolated sheep heart during atrial fibrillation.Circulation 2006;113:626–33.
45. Kumagai K, Sakamoto T, Nakamura K, Nishiuchi S, Hayano M, Hayashi T et al.Combined dominant frequency and complex fractionated atrial electrogram ab-lation after circumferential pulmonary vein isolation of atrial fibrillation. JCardiovasc Electrophysiol 2013;24:975–83.
46. Vogler J, Willems S, Sultan A, Schreiber D, Luker J, Servatius H et al. Pulmonaryvein isolation versus defragmentation: the CHASE-AF clinical trial. J Am CollCardiol 2015;66:2743–52.
47. Calkins H, Hindricks G, Cappato R, Kim YH, Saad EB, Aguinaga L et al. 2017HRS/EHRA/ECAS/APHRS/SOLAECE expert consensus statement on catheterand surgical ablation of atrial fibrillation. Europace 2018;20:e1–e160.
48. Grace A, Verma A, Willems S. Dipole density mapping of atrial fibrillation. EurHeart J 2017;38:5–9.
49. Grace A, Willems S, Meyer C, Verma A, Heck P, Zhu M et al. High-resolutionnoncontact charge-density mapping of endocardial activation. JCI Insight 2019;4:e126422.
50. Shi R, Parikh P, Chen Z, Angel N, Norman M, Hussain W et al. Validation of di-pole density mapping during atrial fibrillation and sinus rhythm in human leftatrium. JACC Clin Electrophysiol 2020;6:171–81.
51. Earley MJ, Abrams DJ, Sporton SC, Schilling RJ. Validation of the noncontactmapping system in the left atrium during permanent atrial fibrillation and sinusrhythm. J Am Coll Cardiol 2006;48:485–91.
52. Allessie MA, Bonke FI, Schopman FJ. Circus movement in rabbit atrial muscle asa mechanism of tachycardia. III. The "leading circle" concept: a new model ofcircus movement in cardiac tissue without the involvement of an anatomicalobstacle. Circ Res 1977;41:9–18.
53. Kuklik P, Zeemering S, Maesen B, Maessen J, Crijns HJ, Verheule S et al.Reconstruction of instantaneous phase of unipolar atrial contact electrogramusing a concept of sinusoidal recomposition and Hilbert transform. IEEE TransBiomed Eng 2015;62:296–302.
54. Jalife J, Berenfeld O, Mansour M. Mother rotors and fibrillatory conduction: amechanism of atrial fibrillation. Cardiovasc Res 2002;54:204–16.
55. Roney CH, Cantwell CD, Qureshi NA, Chowdhury RA, Dupont E, Lim PB etal. Rotor tracking using phase of electrograms recorded during atrial fibrillation.Ann Biomed Eng 2017;45:910–23.
56. Berenfeld O, Oral H. The quest for rotors in atrial fibrillation: different netscatch different fishes. Heart Rhythm 2012;9:1440–1.
57. Haissaguerre M, Hocini M, Denis A, Shah AJ, Komatsu Y, Yamashita S et al.Driver domains in persistent atrial fibrillation. Circulation 2014;130:530–8.
58. Swarup V, Baykaner T, Rostamian A, Daubert JP, Hummel J, Krummen DE et al.Stability of rotors and focal sources for human atrial fibrillation: focal impulseand rotor mapping (FIRM) of AF sources and fibrillatory conduction. JCardiovasc Electrophysiol 2014;25:1284–92.
59. Ravelli F, Mase M. Computational mapping in atrial fibrillation: how the integra-tion of signal-derived maps may guide the localization of critical sources.Europace 2014;16:714–23.
60. Botteron GW, Smith JM. A technique for measurement of the extent of spatialorganization of atrial activation during atrial fibrillation in the intact humanheart. IEEE Trans Biomed Eng 1995;42:579–86.
61. Castells F, Cervigon R, Millet J. On the preprocessing of atrial electrograms inatrial fibrillation: understanding Botteron’s approach. Pacing Clin Electrophysiol2014;37:133–43.
62. Everett THt, Kok LC, Vaughn RH, Moorman JR, Haines DE. Frequency domainalgorithm for quantifying atrial fibrillation organization to increase defibrillationefficacy. IEEE Trans Biomed Eng 2001;48:969–78.
63. Lin YJ, Tsao HM, Chang SL, Lo LW, Hu YF, Chang CJ et al. Role of high domi-nant frequency sites in nonparoxysmal atrial fibrillation patients: insights fromhigh-density frequency and fractionation mapping. Heart Rhythm 2010;7:1255–62.
64. Gadenz L, Hashemi J, Shariat MH, Gula L, Redfearn DP. Clinical role of domi-nant frequency measurements in atrial fibrillation ablation—a systematic review.J Atr Fibrillation 2017;9:1548.
65. Verma A, Lakkireddy D, Wulffhart Z, Pillarisetti J, Farina D, Beardsall M et al.Relationship between complex fractionated electrograms (CFE) and dominantfrequency (DF) sites and prospective assessment of adding DF-guided ablationto pulmonary vein isolation in persistent atrial fibrillation (AF). J CardiovascElectrophysiol 2011;22:1309–16.
66. Atienza F, Almendral J, Jalife J, Zlochiver S, Ploutz-Snyder R, Torrecilla EG et al.Real-time dominant frequency mapping and ablation of dominant frequencysites in atrial fibrillation with left-to-right frequency gradients predicts long-termmaintenance of sinus rhythm. Heart Rhythm 2009;6:33–40.
67. Atienza F, Almendral J, Ormaetxe JM, Moya A, Martinez-Alday JD, Hernandez-Madrid A et al.; RADAR-AF Investigators. Comparison of radiofrequency cathe-ter ablation of drivers and circumferential pulmonary vein isolation in atrial fi-brillation: a noninferiority randomized multicenter RADAR-AF trial. J Am CollCardiol 2014;64:2455–67.
68. Weber FM, Schilling C, Seemann G, Luik A, Schmitt C, Lorenz C et al. Wave-di-rection and conduction-velocity analysis from intracardiac electrograms–asingle-shot technique. IEEE Trans Biomed Eng 2010;57:2394–401.
69. Anter E, Duytschaever M, Shen CY, Strisciuglio T, Leshem E, Contreras-ValdesFM et al. Activation mapping with integration of vector and velocity informationimproves the ability to identify the mechanism and location of complex scar-related atrial tachycardias. Circ Arrhythmia Electrophysiol 2018;11.
328 N.M.S. deGroot et al.D
ownloaded from
https://academic.oup.com
/europace/article/24/2/313/6456176 by Delft U
niversity of Technology user on 22 February 2022

70. Dallet C, Roney C, Martin R, Kitamura T, Puyo S, Duchateau J et al. Cardiacpropagation pattern mapping with vector field for helping tachyarrhythmias di-agnosis with clinical tridimensional electro-anatomical mapping tools. IEEE TransBiomed Eng 2019;66:373–82.
71. Coveney S, Corrado C, Roney CH, Wilkinson RD, Oakley JE, Lindgren F et al.Probabilistic interpolation of uncertain local activation times on human atrialmanifolds. IEEE Trans Biomed Eng 2020;67:99–109.
72. van Schie MS, Starreveld R, Bogers A, de Groot NMS. Sinus rhythm voltage fin-gerprinting in patients with mitral valve disease using a high-density epicardialmapping approach. Europace 2021;23:469–78.
73. Ganesan AN, Kuklik P, Lau DH, Brooks AG, Baumert M, Lim WW et al. Bipolarelectrogram shannon entropy at sites of rotational activation implications forablation of atrial fibrillation. Circ Arrhythm Electrophysiol 2013;6:48–57.
74. Cuculich PS, Wang Y, Lindsay BD, Faddis MN, Schuessler RB, Damiano RJ Jr. etal. Noninvasive characterization of epicardial activation in humans with diverseatrial fibrillation patterns. Circulation 2010;122:1364–72.
75. Shah AJ, Hocini M, Xhaet O, Pascale P, Roten L, Wilton SB et al. Validation ofnovel 3-dimensional electrocardiographic mapping of atrial tachycardias by inva-sive mapping and ablation: a multicenter study. J Am Coll Cardiol 2013;62:889–97.
76. Salinet J, Molero R, Schlindwein FS, Karel J, Rodrigo M, Rojo-Alvarez JL et al.Electrocardiographic imaging for atrial fibrillation: a perspective from computermodels and animal experiments to clinical value. Front Physiol 2021;12:653013.
77. Ramanathan C, Ghanem RN, Jia P, Ryu K, Rudy Y. Noninvasive electrocardio-graphic imaging for cardiac electrophysiology and arrhythmia. Nat Med 2004;10:422–8.
78. Bear LR, LeGrice IJ, Sands GB, Lever NA, Loiselle DS, Paterson DJ et al. Howaccurate is inverse electrocardiographic mapping? a systematic in vivo evalua-tion. Circ Arrhythm Electrophysiol 2018;11:e006108.
79. Duchateau J, Sacher F, Pambrun T, Derval N, Chamorro-Servent J, Denis A etal. Performance and limitations of noninvasive cardiac activation mapping. HeartRhythm 2019;16:435–42.
80. Dubois R, Shah AJ, Hocini M, Denis A, Derval N, Cochet H et al. Non-invasivecardiac mapping in clinical practice: application to the ablation of cardiacarrhythmias. J Electrocardiol 2015;48:966–74.
81. Schuler S, Potyagaylo D, Dossel O. ECG imaging of simulated atrial fibrillation:imposing epi-endocardial similarity facilitates the reconstruction of transmem-brane voltages. Comput Cardiol 2017;44: 245–303.
82. Boyle PM, Hakim JB, Zahid S, Franceschi WH, Murphy MJ, Vigmond EJ et al.Comparing reentrant drivers predicted by image-based computational modelingand mapped by electrocardiographic imaging in persistent atrial fibrillation. FrontPhysiol 2018;9:414.
83. Haissaguerre M, Hocini M, Shah AJ, Derval N, Sacher F, Jais P et al. Noninvasivepanoramic mapping of human atrial fibrillation mechanisms: a feasibility report. JCardiovasc Electrophysiol 2013;24:711–7.
84. Vijayakumar R, Vasireddi SK, Cuculich PS, Faddis MN, Rudy Y. Methodologyconsiderations in phase mapping of human cardiac arrhythmias. Circ ArrhythmElectrophysiol 2016;9:e004409.
85. Coll-Font J, Dhamala J, Potyagaylo D, Schulze WH, Tate JD, Guillem MS et al.The consortium for electrocardiographic imaging. Comput Cardiol 2016;43:325–8.
86. Sirish P, Li N, Timofeyev V, Zhang XD, Wang L, Yang J et al. Molecular mecha-nisms and new treatment paradigm for atrial fibrillation. Circ ArrhythmElectrophysiol 2016;9:e003721.
87. Nyns ECA, Poelma RH, Volkers L, Plomp JJ, Bart CI, Kip AM et al. An auto-mated hybrid bioelectronic system for autogenous restoration of sinus rhythmin atrial fibrillation. Sci Transl Med 2019;11:eaau6447.
88. Polina I, Jansen HJ, Li T, Moghtadaei M, Bohne LJ, Liu Y et al. Loss of insulin sig-naling may contribute to atrial fibrillation and atrial electrical remodeling in type1 diabetes. Proc Natl Acad Sci USA 2020;117:7990–8000.
89. Hansen BJ, Zhao J, Li N, Zolotarev A, Zakharkin S, Wang Y et al. Human atrialfibrillation drivers resolved with integrated functional and structural imaging tobenefit clinical mapping. JACC Clin Electrophysiol 2018;4:1501–15.
90. Boyle PM, Zghaib T, Zahid S, Ali RL, Deng D, Franceschi WH et al.Computationally guided personalized targeted ablation of persistent atrial fibril-lation. Nat Biomed Eng 2019;3:870–9.
91. Zhao J, Hansen BJ, Wang Y, Csepe TA, Sul LV, Tang A et al. Three-dimensionalIntegrated functional, structural, and computational mapping to define thestructural "Fingerprints" of heart-specific atrial fibrillation drivers in human heartex vivo. J Am Heart Assoc 2017;6:e003721.
92. Lee P, Calvo CJ, Alfonso-Almazan JM, Quintanilla JG, Chorro FJ, Yan P et al.Low-cost optical mapping systems for panoramic imaging of complex arrhyth-mias and drug-action in translational heart models. Sci Rep 2017;7:43217.
93. Gloschat C, Aras K, Gupta S, Faye NR, Zhang H, Syunyaev RA et al. RHYTHM:an open source imaging toolkit for cardiac panoramic optical mapping. Sci Rep2018;8:2921.
94. Kappadan V, Telele S, Uzelac I, Fenton F, Parlitz U, Luther S et al. High-resolu-tion optical measurement of cardiac restitution, contraction, and fibrillation dy-namics in beating vs. blebbistatin-uncoupled isolated rabbit hearts. Front Physiol2020;11:464.
95. Lee S, Sahadevan J, Khrestian CM, Markowitz A, Waldo AL. Characterization offoci and breakthrough sites during persistent and long-standing persistent atrialfibrillation in patients: studies using high-density (510-512 Electrodes) biatrialepicardial mapping. J Am Heart Assoc 2017;6:e005274.
96. Teuwen CP, Yaksh A, Lanters EA, Kik C, van der Does LJ, Knops P et al.Relevance of conduction disorders in Bachmann’s bundle during sinus rhythmin humans. Circ Arrhythm Electrophysiol 2016;9:e003972.
97. Hindricks G, Taborsky M, Glikson M, Heinrich U, Schumacher B, Katz A et al.;IN-TIME study group. Implant-based multiparameter telemonitoring of patientswith heart failure (IN-TIME): a randomised controlled trial. Lancet 2014;384:583–90.
98. Kohno R, Abe H, Oginosawa Y, Tamura M, Takeuchi M, Nagatomo T et al.Reliability and characteristics of atrial tachyarrhythmias detection in dual cham-ber pacemakers. Circ J 2011;75:1090–7.
99. Sanna T, Diener HC, Passman RS, Di Lazzaro V, Bernstein RA, Morillo CA et al.Cryptogenic stroke and underlying atrial fibrillation. N Engl J Med 2014;370:2478–86.
100. Hanke T, Charitos EI, Stierle U, Karluss A, Kraatz E, Graf B et al. Twenty-four-hour holter monitor follow-up does not provide accurate heart rhythm statusafter surgical atrial fibrillation ablation therapy: up to 12 months experiencewith a novel permanently implantable heart rhythm monitor device. Circulation2009;120:S177–184.
101. Verma A, Champagne J, Sapp J, Essebag V, Novak P, Skanes A et al. Discerningthe incidence of symptomatic and asymptomatic episodes of atrial fibrillationbefore and after catheter ablation (DISCERN AF): a prospective, multicenterstudy. JAMA Intern Med 2013;173:149–56.
102. Kapa S, Epstein AE, Callans DJ, Garcia FC, Lin D, Bala R et al. Assessing arrhyth-mia burden after catheter ablation of atrial fibrillation using an implantable looprecorder: the ABACUS study. J Cardiovasc Electrophysiol 2013;24:875–81.
103. Pokushalov E, Romanov A, Corbucci G, Artyomenko S, Turov A, Shirokova Net al. Use of an implantable monitor to detect arrhythmia recurrences and se-lect patients for early repeat catheter ablation for atrial fibrillation: a pilot study.Circ Arrhythm Electrophysiol 2011;4:823–31.
104. Platonov PG, Stridh M, de Melis M, Urban L, Carlson J, Corbucci G et al.Analysis of atrial fibrillatory rate during spontaneous episodes of atrial fibrilla-tion in humans using implantable loop recorder electrocardiogram. JElectrocardiol 2012;45:723–6.
105. Hindricks G, Pokushalov E, Urban L, Taborsky M, Kuck KH, Lebedev D et al.;XPECT Trial Investigators. Performance of a new leadless implantable cardiacmonitor in detecting and quantifying atrial fibrillation: results of the XPECT trial.Circ Arrhythm Electrophysiol 2010;3:141–7.
106. Nolker G, Mayer J, Boldt L-H, Seidl K, VAN Driel V, Massa T et al. Performanceof an Implantable cardiac monitor to detect atrial fibrillation: results of theDETECT AF study. J Cardiovasc Electrophysiol 2016;27:1403–10.
107. Purerfellner H, Pokushalov E, Sarkar S, Koehler J, Zhou R, Urban L et al. P-waveevidence as a method for improving algorithm to detect atrial fibrillation ininsertable cardiac monitors. Heart Rhythm 2014;11:1575–83.
108. Sanders P, Purerfellner H, Pokushalov E, Sarkar S, Di Bacco M, Maus B et al.;Reveal LINQ Usability Investigators. Performance of a new atrial fibrillation de-tection algorithm in a miniaturized insertable cardiac monitor: results from thereveal LINQ usability study. Heart Rhythm 2016;13:1425–30.
109. Mariani JA, Weerasooriya R, van den Brink O, Mohamed U, Gould PA, PathakRK et al. Miniaturized implantable cardiac monitor with a long sensing vector(BIOMONITOR III): insertion procedure assessment, sensing performance, andhome monitoring transmission success. J Electrocardiol 2020;60:118–25.
110. Purerfellner H, Sanders P, Sarkar S, Reisfeld E, Reiland J, Koehler J et al.Adapting detection sensitivity based on evidence of irregular sinus arrhythmiato improve atrial fibrillation detection in insertable cardiac monitors. Europace2018;20:f321–f328.
111. Ciconte G, Saviano M, Giannelli L, Calovic Z, Baldi M, Ciaccio C et al. Atrial fi-brillation detection using a novel three-vector cardiac implantable monitor: theatrial fibrillation detect study. Europace 2017;19:1101–8.
112. Schilling C, Keller M, Scherr D, Oesterlein T, Haissaguerre M, Schmitt C et al.Fuzzy decision tree to classify complex fractionated atrial electrograms. BiomedTech 2015;60:245–55.
113. Reich C, Oesterlein T, Rottmann M, Seemann G, Dossel O. Classification ofcardiac excitation patterns during atrial fibrillation. Curr Dir Biomed Eng 2016;2:161–166.
114. Attia ZI, Noseworthy PA, Lopez-Jimenez F, Asirvatham SJ, Deshmukh AJ, GershBJ et al. An artificial intelligence-enabled ECG algorithm for the identification ofpatients with atrial fibrillation during sinus rhythm: a retrospective analysis ofoutcome prediction. Lancet 2019;394:861–7.
EHRA position paper 329D
ownloaded from
https://academic.oup.com
/europace/article/24/2/313/6456176 by Delft U
niversity of Technology user on 22 February 2022
115. Mairesse GH, Moran P, Van Gelder IC, Elsner C, Rosenqvist M, Mant J et al.;ESC Scientific Document Group. Screening for atrial fibrillation: a EuropeanHeart Rhythm Association (EHRA) consensus document endorsed by theHeart Rhythm Society (HRS), Asia Pacific Heart Rhythm Society (APHRS), andSociedad Latinoamericana de Estimulacion Cardiaca y Electrofisiologia(SOLAECE). Europace 2017;19:1589–623.
116. Varma N, Cygankiewicz I, Turakhia MP, Heidbuchel H, Hu YF, Chen LY et al.2021 ISHNE/HRS/EHRA/APHRS expert collaborative statement on mhealth inarrhythmia management: digital medical tools for heart rhythm professionals:from the International Society for Holter and Noninvasive Electrocardiology/Heart Rhythm Society/European Heart Rhythm Association/Asia-Pacific HeartRhythm Society. Circ Arrhythm Electrophysiol 2021;14:e009204.
117. Budzianowski J, Hiczkiewicz J, Burchardt P, Pieszko K, Rze�zniczak J,Budzianowski P et al. Predictors of atrial fibrillation early recurrence followingcryoballoon ablation of pulmonary veins using statistical assessment and ma-chine learning algorithms. Heart Vessels 2019;34:352–9.
118. Furui K, Morishima I, Morita Y, Kanzaki Y, Takagi K, Yoshida R et al. Predictinglong-term freedom from atrial fibrillation after catheter ablation by a machinelearning algorithm: validation of the CAAP-AF score. J Arrhythm 2020;36:297–303.
119. Hung M, Hon ES, Lauren E, Xu J, Judd G, Su W. Machine learning approach topredict risk of 90-day hospital readmissions in patients with atrial fibrillation:implications for quality improvement in healthcare. Health Serv Res ManagEpidemiol 2020;7:2333392820961887.
120. Hung M, Lauren E, Hon E, Xu J, Ruiz-Negron B, Rosales M et al. Using machinelearning to predict 30-day hospital readmissions in patients with atrial fibrillationundergoing catheter ablation. J Pers Med 2020;10:jpm10030082.
121. Li W, Lipsky MS, Hon ES, Su W, Su S, He Y et al. Predicting all-cause 90-dayhospital readmission for dental patients using machine learning methods. BDJOpen 2021;7:1.
122. Alhusseini MI, Abuzaid F, Rogers AJ, Zaman JAB, Baykaner T, Clopton P et al.Machine learning to classify intracardiac electrical patterns during atrial fibrilla-tion: machine learning of atrial fibrillation. Circ Arrhythm Electrophysiol 2020;13:e008160.
123. Shade JK, Ali RL, Basile D, Popescu D, Akhtar T, Marine JE et al. Preprocedureapplication of machine learning and mechanistic simulations predicts likelihoodof paroxysmal atrial fibrillation recurrence following pulmonary vein isolation.Circ Arrhythm Electrophysiol 2020;13:e008213.
330 N.M.S. deGroot et al.D
ownloaded from
https://academic.oup.com
/europace/article/24/2/313/6456176 by Delft U
niversity of Technology user on 22 February 2022