dwarfism of blue mussels in the low saline baltic sea—growth to the lower salinity limit
TRANSCRIPT
MARINE ECOLOGY PROGRESS SERIESMar Ecol Prog Ser
Vol. 517: 181–192, 2014doi: 10.3354/meps11011
Published December 15
INTRODUCTION
The Baltic Mytilus hybrid zone is characterized bymultilocus clines between the Atlantic blue musselMytilus edulis and the Baltic M. trossulus (Theisen
1978, Bulnheim & Gosling 1988, Johannesson et al.1990, Riginos & Cunningham 2005, Zbawicka et al.2007, Stuckas et al. 2009, Väinölä & Strelkov 2011).Hybridization takes place wherever M. trossulusand M. edulis meet, but the extent of hybridization
© Inter-Research 2014 · www.int-res.com*Corresponding author: [email protected]
Dwarfism of blue mussels in the low saline Baltic Sea — growth to the lower salinity limit
Hans Ulrik Riisgård1,*, Poul S. Larsen2, Raisa Turja3, Kim Lundgreen1
1Marine Biological Research Centre (University of Southern Denmark), Hindsholmvej 11, 5300 Kerteminde, Denmark2DTU Mechanical Engineering, Fluid Mechanics, Technical University of Denmark, Building 403, 2800 Kgs. Lyngby,
Denmark3Finnish Environmental Institute, Marine Research Centre, PO Box 140, 00251 Helsinki, Finland
ABSTRACT: Mussels within the Baltic Mytilus edulis × M. trossulus hybrid zone have adapted tothe low salinities in the Baltic Sea which, however, results in slow-growing dwarfed mussels. Toget a better understanding of the nature of dwarfism, we studied the ability of M. trossulus to feedand grow at low salinity (7 psu) compared with its performance at relatively high-salinity (20 psu)in controlled laboratory experiments, supplemented with field (Great Belt) growth experimentswith M. trossulus and M. edulis in net-bags. Subsequently, the growth of M. trossulus trans-planted in cages to various localities in the northern Baltic Sea was used to evaluate the effect ofvery low salinities, down to 3.4 psu. The laboratory feeding experiments with M. trossulus at 7 psushowed that the growth in shell length was negligible, whereas the body dry weight nearly dou-bled during the 15 d experiment, with a weight-specific growth rate of 3.7% d−1. The same para -meters measured at 20 psu showed a pronounced growth in both shell length and body dryweight, with a weight-specific growth rate of 2.2% d−1. The growth rates of M. trossulus and M.edulis in suspended net-bags in the Great Belt (22 psu) were similar: 5.6 and 6.8% d−1, respec-tively. M. trossulus in cage experiments had positive growth rates at locations with salinities above4.5 psu, up to 2.60% d−1, but negligible increase in the shell length, and at sites with salinitiesbelow about 4.5 psu, the somatic growth was negative, around −0.3% d−1, which indicates valveclosure and respiratory weight loss. A trend line in a plot of all available growth data for both mus-sel species as a function of salinity indicates that the growth of mussels is steadily hampered byreduced salinities from 30 psu down to about 10 psu, below which the growth is rapidly reducedto become negative below 4.5 psu. We suggest that reduced ability to produce shell material atextremely low salinity may explain dwarfism of mussels in the Baltic Sea. Reduced bio-calcifica-tion at low salinity, however, may impede shell growth, but not somatic growth, and this may atfirst result in an increased condition index, as seen in the benthic Baltic Sea mussels transferred tocages suspended in the water column.
KEY WORDS: Mytilus edulis · Mytilus trossulus · Filtration rate · Specific growth rate · Adaptation ·Effect of salinity · Condition index · Bio Energetic Growth (BEG) model
Resale or republication not permitted without written consent of the publisher
This authors' personal copy may not be publicly or systematically copied or distributed, or posted on the Open Web, except with written permission of the copyright holder(s). It may be distributed to interested individuals on request.
Mar Ecol Prog Ser 517: 181–192, 2014182
varies within the hybrid zone (e.g. Väinölä & Strel -kov 2011). The Great Belt (Storebœlt) is in the steeptransition zone between North Sea M. edulis andBaltic Sea M. trossulus, and therefore, it seems rea-sonable to discriminate between ‘Great Belt M.edulis’ and ‘Baltic Sea M. trossulus’. Recent obser-vations of the different abilities of the 2 mussels toacclimatize their filtration rates to low salinities(Riisgård et al. 2013) may be explained by differentgenotypes. The mussels within the M. edulis × M.trossulus hybrid zone have adapted to the low salin-ities in the Baltic Sea, although the low salinitieshave a detrimental effect on the growth, resulting invery slow-growing dwarfed mussels forming densepopulations that dominate the hard bottoms in theCentral Baltic Sea, where the salinity is about 6 to7 psu (Remane & Schlieper 1971, Kautsky 1982,Teden gren & Kautsky 1986, Vuorinen et al. 2002,Kossak 2006). Hiebenthal et al. (2012) studied theeffects of temperature and salinity on shell growth,physiological stress and mortality of young M. edu -lis in the Baltic Sea, but only for a limited salinityrange (15 to 35 psu). Due to the absence of preda-tors and competitors in the Baltic Sea, intraspecificcompetition is an important factor controlling themussel population, and strong competition for food(phytoplankton) may partly explain the observedvery slow growth rates (Kautsky 1982, Westerbomet al. 2002, Larsen et al. 2014, Fig. 9 therein). How-ever, when exposed to 20 psu, the filtration rates ofdwarfed mussels from the Central Baltic Sea (natu-rally adapted to 6.5 psu) are comparable to filtrationrates of Great Belt (Denmark) mussels of similar size(adapted to salinities >10 psu), and further, CentralBaltic Sea mussels easily adjust back and forthbetween 6.5 and 20 psu in contrast to Great Beltmussels (Riisgård et al. 2013, 2014a).
To get a better understanding of the nature ofdwarfism of mussels in the Baltic Sea, we studiedability of Baltic Sea mussels to feed and grow at lowsalinity (7 psu) and to compare with their perform-ance at relatively high (20 psu) salinity in controlledlaboratory experiments. Further, to study the possi-ble effect of preceding exposure of dwar fed musselsto low salinity in the Central Baltic Sea, the growth ofM. tros sulus and M. edulis of same size collected inthe Central Baltic Sea and in the Great Belt, respec-tively, was simultaneously measured after placingthe mussels in suspended net-bags in the Great Belt(mean salinity 17 psu). Finally, the somatic growth ofBaltic mussels transplanted to various localities innorthern Baltic Sea was used to evaluate the effect ofsalinities down to 3.5 psu.
MATERIALS AND METHODS
Laboratory feeding and growth experiments
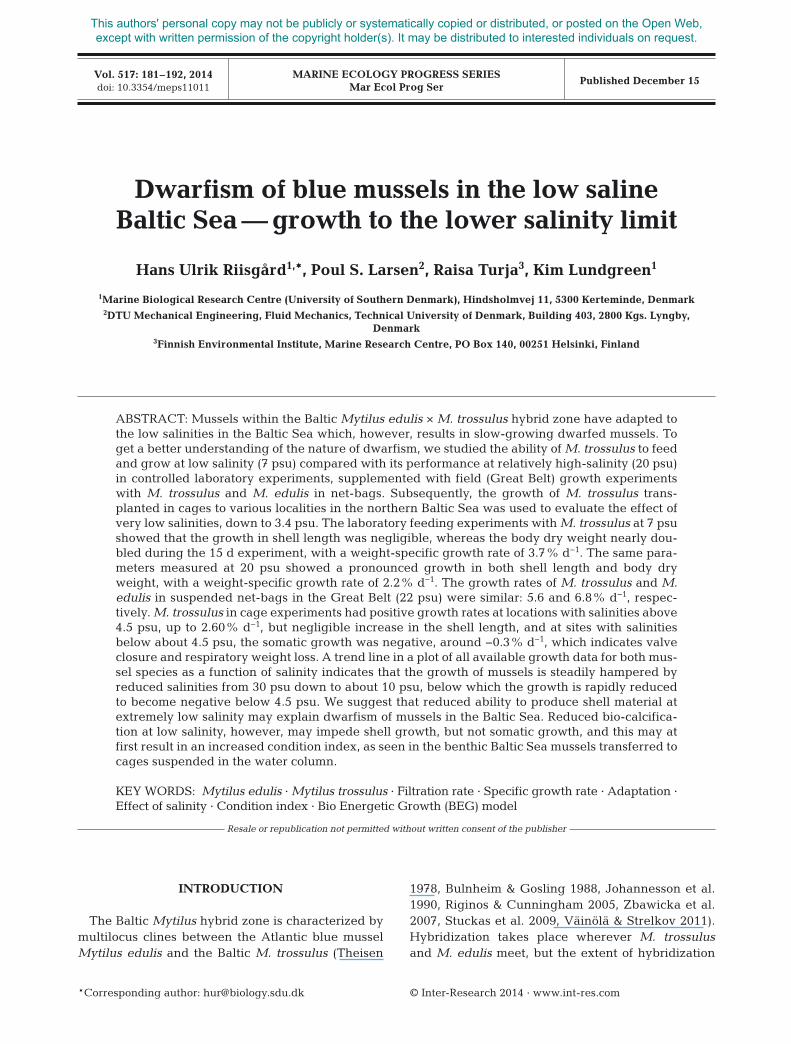
Collection of mussels. Blue mussels Mytilus tros -sulus (denoted dwarfed or Åland mussels) were col-lected in coastal waters (6 to 7 psu) near the island ofKumlinge (Åland, Finland; Fig. 1A) on 4 December2012 and 23 May 2013 and transported in a boxcooled with ice to the Marine Biological ResearchCentre, Denmark.
Low salinity (7 psu) growth experiments. From alarger group of mussels collected on 4 December2012, 42 mussels of similar size (between 15 and16 mm) were selected and stored in an aquariumwith artificially prepared 6.5 psu seawater for 2 dbefore the start of the experiment. During the exper-imental growth period, subsamples of mussels (n =10) were collected on Day 0, 6, 11 and 15 for determi-nation of shell length, dry weight of soft parts, dryweight of shells and condition indexes (CI). Becausethe algal suspension dosed by a pump to the musselswas 20 psu, the salinity in the experimental aquariumwas adjusted early in the morning and late in theafternoon to remain near constant (7.2 ± 1.3 psu) bymanually turning on and off a pump supplying theaquarium with distilled water. Every 2 d, the experi-mental aquarium was cleaned and the water re -placed. The mean algal concentration during thegrowth period was 3018 Rhodomonas salina cellsml−1 (3.8 µg chl a l−1).
High salinity (20 psu) growth experiment. From alarger group of mussels that had been transferred toa tank with through-flowing Great Belt seawater(~20 psu) after arrival at the laboratory, 72 mussels ofsimilar size (between 15 and 16 mm) were selectedand transferred to a well-mixed aquarium (10 l), 2 dbefore the start of the growth experiment. Subsam-ples of mussels (n = 10) were collected during theexperimental growth periods on Day 0, 7, 14, 21, 28and 35 to determine growth parameters for determi-nation of shell length, dry weight of soft parts, dryweight of shells and CI. The mean algal concentra-tion in the experiment was 2925 Rhodomonas salinacells ml−1 (3.7 µg chl a l−1).
Fluorometer-controlled apparatus. The growthexperiments were performed using the fluorometer-controlled apparatus (FCA) described by Pleissner etal. (2013). On a few occasions, one of the mussels col-lected during the experimental growth period provedto be empty closed shells, but the total mortalityamong the original 42 mussels used at low salinity(7 psu), for example, did not exceed 2 individuals.
Aut
hor c
opy
Riisgård et al.: Mussel dwarfism in low salinity 183
The FCA method ensures a certain narrow range ofalgal concentrations (Ca) in an aquarium with well-mixed water and filtering mussels. To this aquariumis added algal suspension from a culture with a cer-tain high concentration (Cc) at a known rate (P) by
means of a dosing pump. An overflowen sured a constant volume in theaqua rium, and therefore, the mean in -dividual filtration rate (F) can be calcu-lated as follows (Pleissner et al. 2013):
F = P × (Cc − Ca)/(n × Ca) (1)
where n = number of filtering mussels.During the experimental period, whenthe mussels may grow and increasetheir filtration rate, Ca is kept constantby the automatic fluorometer-control ofthe algal dosing rate (P).
As a supplementary check, the filtra-tion rate of the mussels was also meas-ured daily by the clearance methodwhere the filtration rate is determinedas the volume of water cleared of sus-pended particles per unit of time. Bystopping the dosing pump and through-flow, the reduction in the number of al-gal cells as a function of time was fol-lowed by taking water samples at fixedtime intervals from the aquarium withmussels and well-mixed seawater andmeasuring the algal cell concentrationwith an electronic particle counter (El-zone 180). The filtration rate (F) is de-termined by means of the ‘clearancemethod’ from the exponential decreasein algal concentration (verified as astraight line in a semi-log plot) as afunction of time using the following for-mula (Riisgård et al. 2011a,b):
F = (V × b)/n (2)
where V is the volume of water inaquarium, n is the number of mussels,and b is the slope of regression line in asemi-ln plot for the reduction in algalconcentration with time.
Equations for data analysis. Thecon dition index (CI) and shell conditionindex (CIshell) were calculated from thedry weight of soft parts (W, mg), dryweight of shell (Wshell, mg) and the shelllength (L, cm):
CI = W/L3, CIshell = Wshell/L3 (3)
For experimental data, the actual weight-specificgrowth rates of mussels (μact = W −1dW/dt, % d−1) wascalculated as follows:
Fig. 1. (A) Salinity of surface water in the Baltic Sea (based on HELCOM datafrom http://balance-eu.org/publications/index.html), and the location of theGreat Belt (rectangle) and Kerteminde Fjord (point). (B) Mussel collection sites,and locations for experimental growth studies with mussels in cages (see ‘Mate-
rials and methods’ and Table 5)
Aut
hor c
opy
Mar Ecol Prog Ser 517: 181–192, 2014
μact = ln(W2/W1)/(t2 − t1) × 100 (4)
(or equivalently from the slope of the trend line in aplot of ln(W) versus time), where t1 and t2 refer to thestart and end of a growth period, respectively, andW1 and W2 are the corresponding values of dryweight. The average value of μact obtained this way istaken to be valid at the average dry weight of softparts defined as follows:
Wavg = (W1 × W2)1/2 (5)The estimated weight-specific growth rate based
on the BioEnergetic Growth (BEG) model (Riisgårdet al. 2012a, Eq.18 therein) was calculated as follows:
μBEG ≡ μW = aWb, (a = 0.871 × C − 0.986; b = −0.34) (6)
where the units are μBEG in % d−1, W in g dry weightof soft tissue and C in µg chl a l−1. The notation μW
implies μ to be based on an empirical filtration rate interms of W (in the form FW(l h−1) = 7.45W (g)0.66).
Because the relationship between gill area andshell length remains essentially constant, it may beexpected that a filtration rate based on shell length(FL) would be more accurate than one based on thedry weight of soft tissue (FW) as the CI varies duringgrowth. The influence of CI was recently examinedby Riisgård et al. (2014b) using available and newexperimental data on maximum filtration rates ofM. edulis covering the CI range of 2.31 to 8.68 mgcm−3, for which the following ‘model’ equations werefound:
FW(l h−1) = 6.521W (g)2/3 (7)
FL(l h−1) = 0.00183L (mm)2 (8)
FL/FW = (0.3562CI (mg cm−3)2/3)−1 (9)
Since the filtration rate based on dry weight of softtissue enters into the first term of a in Eq. (6), wearrive at the modified BEG model based on FL byintroducing the correction factor Eq. (9):
μBEG-corr = aWb,
(a = 0.871 × C × FL/FW − 0.986; b = −0.34)(10)
orμBEG-corr ≡ μL = aWb,
(a = 2.445 × C × CI −2/3 − 0.986; b = −0.34) (11)
The notation μL implies μ to be based on empiricalfiltration rate in terms of L (Eq. 8). The correction fac-tor Eq. (9) is unity for CI = 4.70 mg cm−3 for which Eq.(11) reduces to Eq. (6), and it implies that FW tends tounderestimate the actual filtration rate (FL) when CI <4.70, and to overestimate it when CI > 4.70 mg cm−3.
Statistical analysis. Since no experiment was repli-cated, we rely on correlation coefficients (R2) to char-
acterize goodness of regression equation fit in thefigures, while 2-factor ANOVA without replication isused to measure significance of weight-specificgrowth rates (μ) from models relative to experimentalvalues, with p > 0.05 implying statistical significancefor agreement.
Field growth experiments
Great Belt. A growth experiment was conductednear the Great Belt (Denmark; Fig. 1A) in the inletto Ker teminde Fjord by suspending net bags con-taining 9 to 11 individuals of either small musselsfrom the Central Baltic Sea (near the island ofAskö, 70 km south of Stockholm, Sweden; Fig. 1B)or Great Belt at a depth of ~1 m. Prior to thegrowth experiment, a total of 38 and 41 mussels ofthe same size (~15 ± 0.5 mm) from Askö and GreatBelt, respectively, were randomly selected andput in net bags. Each net bag was kept separatelyin a small tank for 7 d to allow the mussels to pro-duce byssi and attach firmly to the net-bag ma -terial before the bags were suspended in the waterat the growth site (the ‘triangle’ close to theMarine Biological Research Centre [SDU], Kerte-minde). Subsamples (n = 5 to 11) were collected atDay 0, 7, 15 and 21 for determination of shelllength and dry weight of soft parts, giving rise toperiods I (Days 0–7), II (Days 7–15), III (Days 15–21), and IV (Days 0–21). Measurements of chl a,temperature and salinity were made daily (YellowSprings Instruments, YSI 650) during the growthperiod.
Baltic Sea. The growth of dwarfed mussels fromHanko, southwest of Finland (5.9 to 6.0 psu), wasinvestigated by caging the mussels at various loca-tions along the salinity gradient in the Gulf of Fin-land (stations Helsinki, Porvoo, Kotka) and Gulf ofBothnia (stations Turku, Pori, Gävle, Sundsvall) inthe northern Baltic Sea (Fig. 1B). Adult mussels(shell length 25 to 30 mm) were collected bySCUBA divers at Hanko, placed in aerated waterfrom the collection site, transported to the RV‘Aranda’ and kept at same ambient temperatureuntil arrival at the caging locations. Mussels (n ≈400) were deployed in stainless steel cages (80 ×40 cm) at depths of 7 to 8 m. Cages were held in sta-ble vertical position by submerged buoys andanchored to the bottom with a 350 kg weight. Chl a,temperature and salinity at the caging locationswere either measured at the time of sampling orobtained from the regional monitoring data bank
184A
utho
r cop
y
Riisgård et al.: Mussel dwarfism in low salinity
(Baltic Sea Portal, Finnish Environ-ment Institute, www.itameripor-taali.fi/ en/tietoa/ algaline _ seuranta/en_GB/ algaline _ seuranta/) and in 2cases (Gävle, S undsvall) from dataloggers (Star-oddi DST-CTD) at -tached to the cages. Growth ofdwarfed mussels was estimatedfrom measured mean shell lengthand body dry weight of samples col-lected on first and last day of thegrowth period.
RESULTS
Laboratory feeding and growthexperiments with Åland mussels
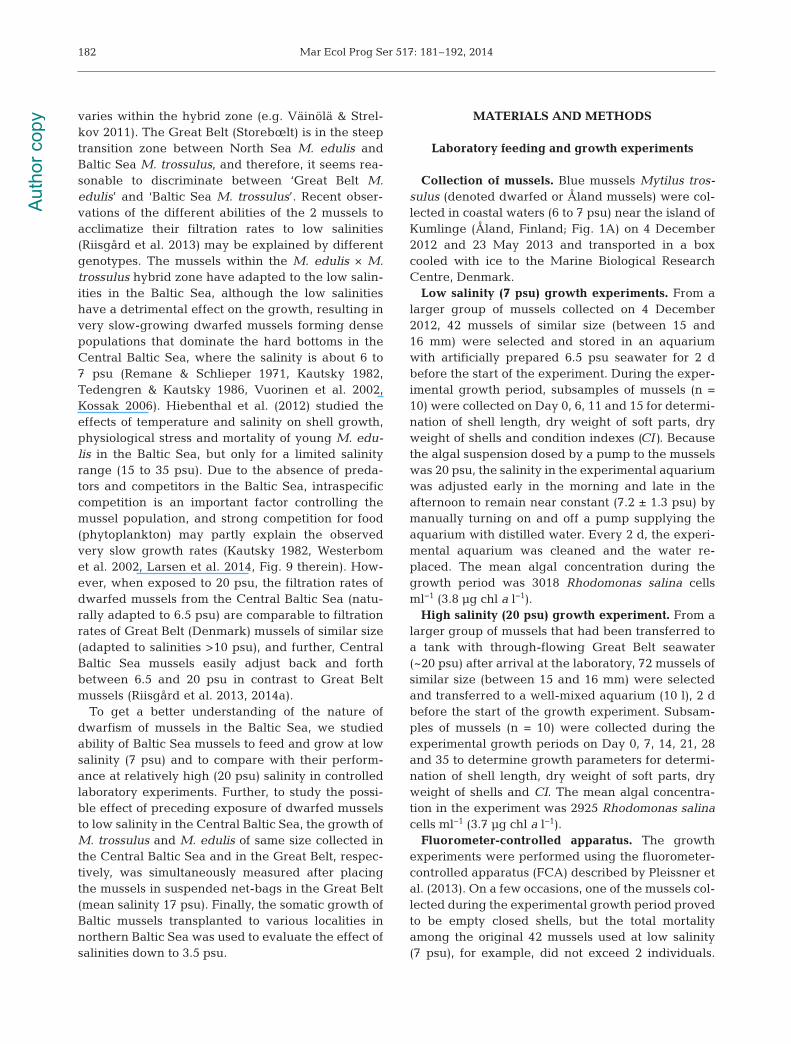
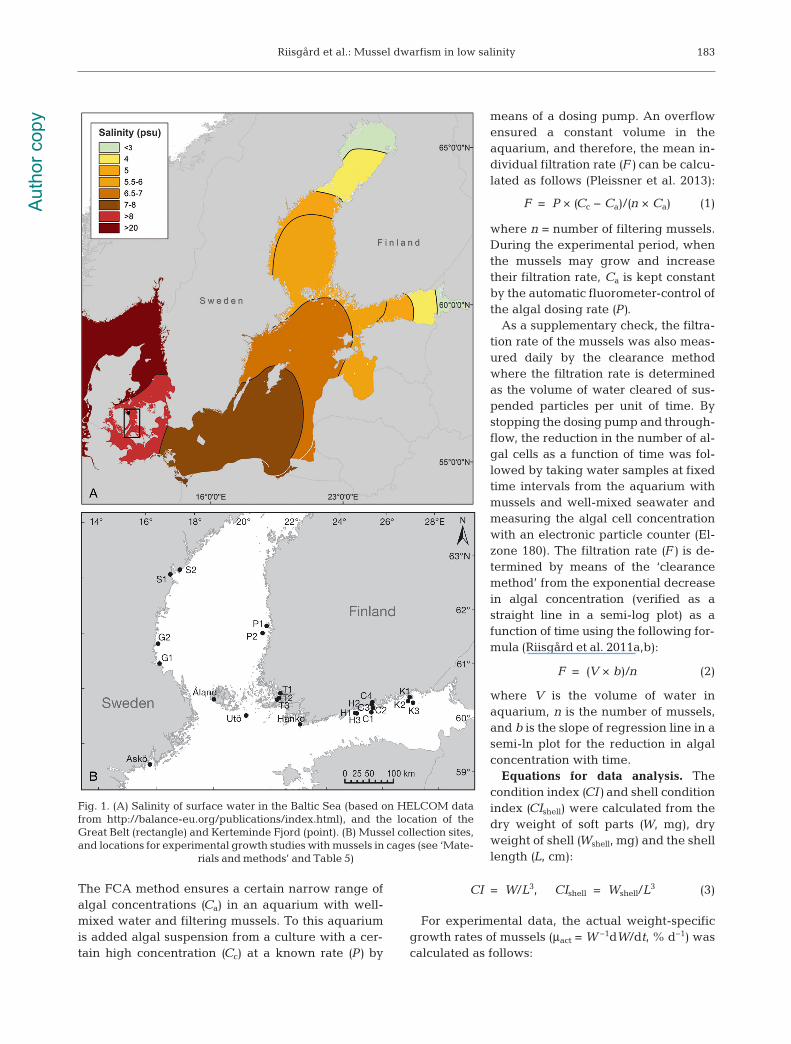
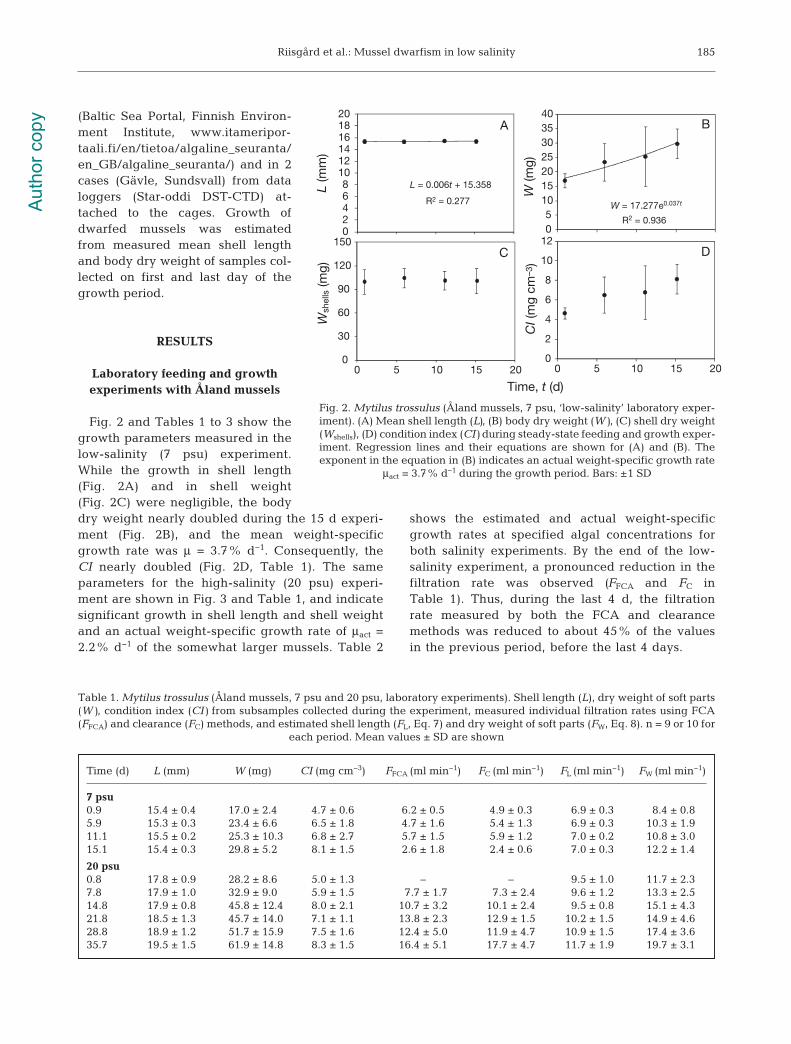
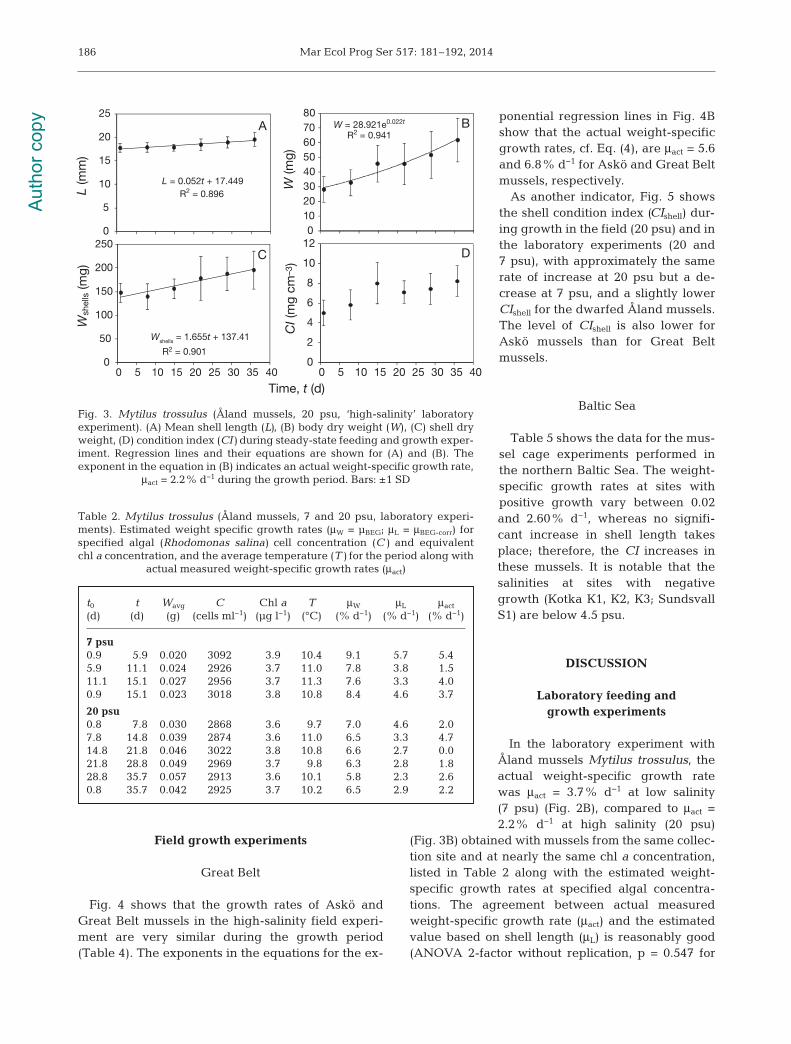
Fig. 2 and Tables 1 to 3 show thegrowth parameters measured in thelow-salinity (7 psu) experiment.While the growth in shell length(Fig. 2A) and in shell weight(Fig. 2C) were negligible, the bodydry weight nearly doubled during the 15 d experi-ment (Fig. 2B), and the mean weight-specificgrowth rate was μ = 3.7% d−1. Consequently, theCI nearly doubled (Fig. 2D, Table 1). The sameparameters for the high-salinity (20 psu) experi-ment are shown in Fig. 3 and Table 1, and indicatesignificant growth in shell length and shell weightand an actual weight-specific growth rate of μact =2.2% d−1 of the somewhat larger mussels. Table 2
shows the estimated and actual weight-specificgrowth rates at specified algal concentrations forboth salinity experiments. By the end of the low-salinity experiment, a pronoun ced reduction in thefiltration rate was observed (FFCA and FC inTable 1). Thus, during the last 4 d, the filtrationrate measured by both the FCA and clearancemethods was reduced to about 45% of the valuesin the previous period, before the last 4 days.
185
L = 0.006t + 15.358
R2 = 0.277
02468
101214161820
L (m
m)
A
W = 17.277e0.037t
R2 = 0.93605
10152025303540
W (m
g)
B
0
30
60
90
120
150
0 5 10 15 20
Wsh
ells (m
g)
C
0
2
4
6
8
10
12
0 5 10 15 20
CI (
mg
cm–3
)
Time, t (d)
D
Fig. 2. Mytilus trossulus (Åland mussels, 7 psu, ‘low-salinity’ laboratory exper-iment). (A) Mean shell length (L), (B) body dry weight (W), (C) shell dry weight(Wshells), (D) condition index (CI) during steady-state feeding and growth exper-iment. Regression lines and their equations are shown for (A) and (B). Theexponent in the equation in (B) indicates an actual weight-specific growth rate
μact = 3.7% d−1 during the growth period. Bars: ±1 SD
Time (d) L (mm) W (mg) CI (mg cm−3) FFCA (ml min−1) FC (ml min−1) FL (ml min−1) FW (ml min−1)
7 psu0.9 15.4 ± 0.4 17.0 ± 2.4 4.7 ± 0.6 6.2 ± 0.5 4.9 ± 0.3 6.9 ± 0.3 8.4 ± 0.85.9 15.3 ± 0.3 23.4 ± 6.6 6.5 ± 1.8 4.7 ± 1.6 5.4 ± 1.3 6.9 ± 0.3 10.3 ± 1.911.1 15.5 ± 0.2 25.3 ± 10.3 6.8 ± 2.7 5.7 ± 1.5 5.9 ± 1.2 7.0 ± 0.2 10.8 ± 3.015.1 15.4 ± 0.3 29.8 ± 5.2 8.1 ± 1.5 2.6 ± 1.8 2.4 ± 0.6 7.0 ± 0.3 12.2 ± 1.4
20 psu0.8 17.8 ± 0.9 28.2 ± 8.6 5.0 ± 1.3 − − 9.5 ± 1.0 11.7 ± 2.37.8 17.9 ± 1.0 32.9 ± 9.0 5.9 ± 1.5 7.7 ± 1.7 7.3 ± 2.4 9.6 ± 1.2 13.3 ± 2.514.8 17.9 ± 0.8 45.8 ± 12.4 8.0 ± 2.1 10.7 ± 3.2 10.1 ± 2.4 9.5 ± 0.8 15.1 ± 4.321.8 18.5 ± 1.3 45.7 ± 14.0 7.1 ± 1.1 13.8 ± 2.3 12.9 ± 1.5 10.2 ± 1.5 14.9 ± 4.628.8 18.9 ± 1.2 51.7 ± 15.9 7.5 ± 1.6 12.4 ± 5.0 11.9 ± 4.7 10.9 ± 1.5 17.4 ± 3.635.7 19.5 ± 1.5 61.9 ± 14.8 8.3 ± 1.5 16.4 ± 5.1 17.7 ± 4.7 11.7 ± 1.9 19.7 ± 3.1
Table 1. Mytilus trossulus (Åland mussels, 7 psu and 20 psu, laboratory experiments). Shell length (L), dry weight of soft parts(W), condition index (CI) from subsamples collected during the experiment, measured individual filtration rates using FCA(FFCA) and clearance (FC) methods, and estimated shell length (FL, Eq. 7) and dry weight of soft parts (FW, Eq. 8). n = 9 or 10 for
each period. Mean values ± SD are shown
Aut
hor c
opy
Mar Ecol Prog Ser 517: 181–192, 2014
Field growth experiments
Great Belt
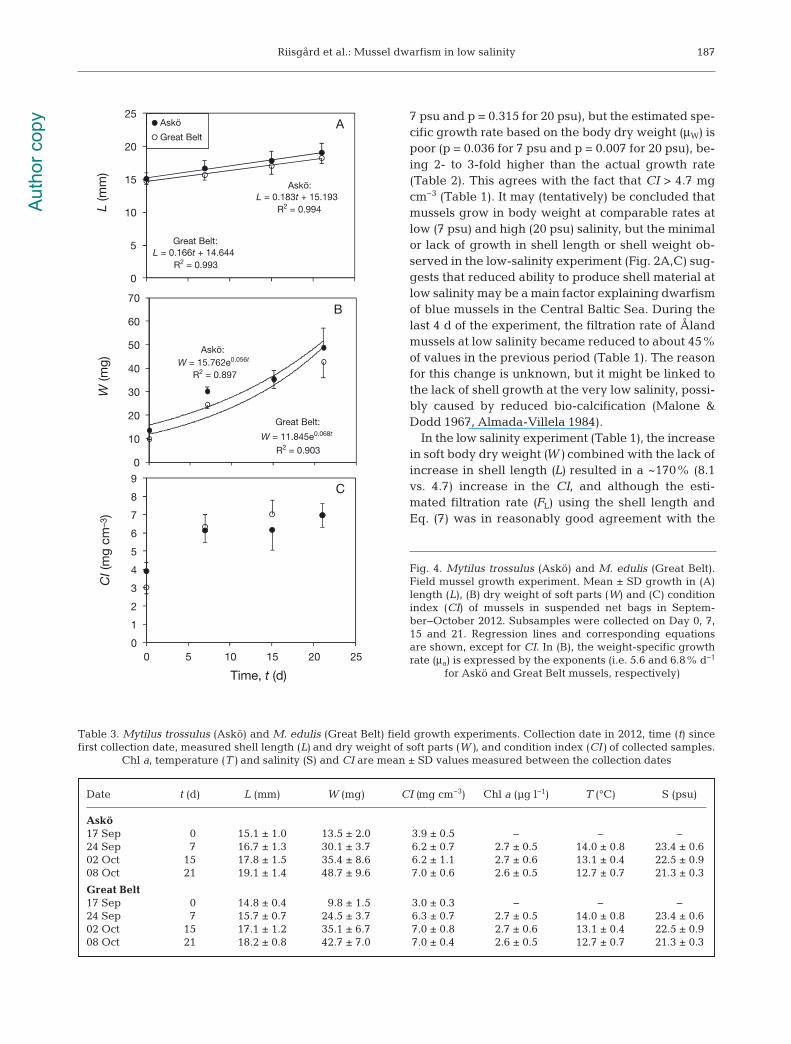
Fig. 4 shows that the growth rates of Askö andGreat Belt mussels in the high-salinity field experi-ment are very similar during the growth period(Table 4). The exponents in the equations for the ex -
ponential regression lines in Fig. 4Bshow that the ac tual weight-specificgrowth rates, cf. Eq. (4), are μact = 5.6and 6.8% d−1 for Askö and Great Beltmussels, respectively.
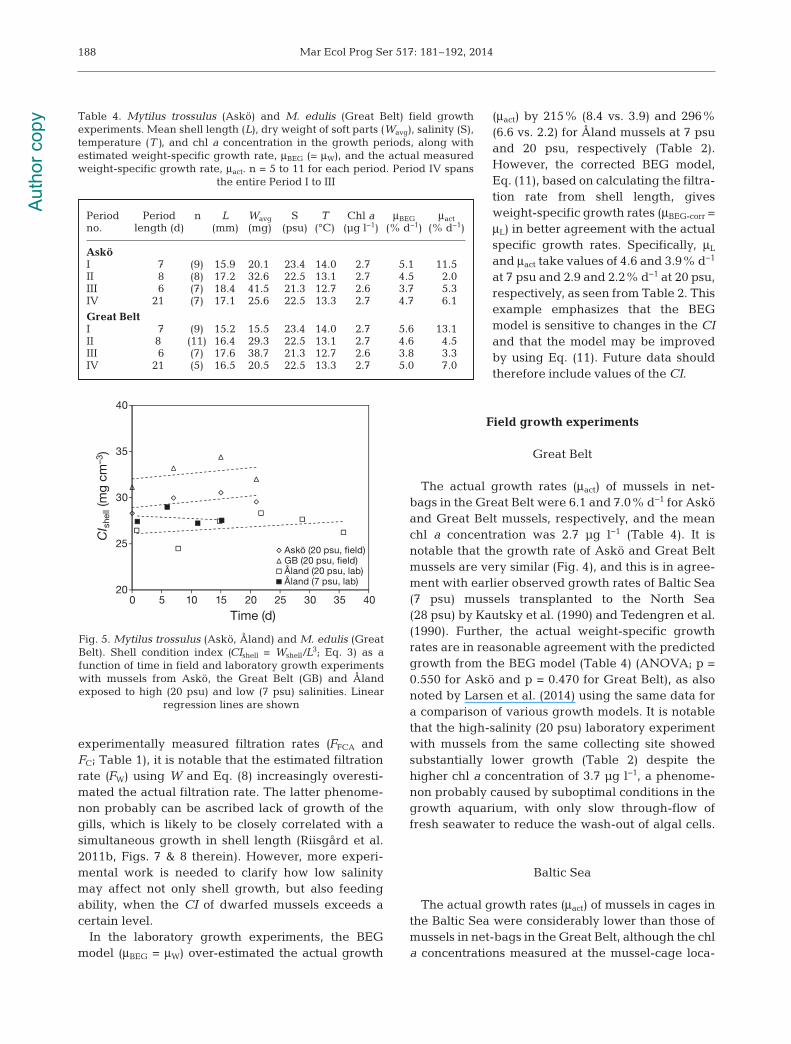
As another indicator, Fig. 5 showsthe shell condition index (CIshell) dur-ing growth in the field (20 psu) and inthe laboratory experiments (20 and7 psu), with approximately the samerate of increase at 20 psu but a de -crease at 7 psu, and a slightly lowerCIshell for the dwarfed Åland mussels.The level of CIshell is also lower forAskö mussels than for Great Beltmussels.
Baltic Sea
Table 5 shows the data for the mus-sel cage experiments performed inthe northern Baltic Sea. The weight- specific growth rates at sites withpositive growth vary between 0.02and 2.60% d−1, whereas no signifi-cant increase in shell length takesplace; therefore, the CI increases inthese mussels. It is notable that thesalinities at sites with negativegrowth (Kotka K1, K2, K3; SundsvallS1) are below 4.5 psu.
DISCUSSION
Laboratory feeding and growth experiments
In the laboratory experiment withÅland mussels Mytilus trossulus, theactual weight-specific growth ratewas μact = 3.7% d−1 at low salinity(7 psu) (Fig. 2B), compared to μact =2.2% d−1 at high salinity (20 psu)
(Fig. 3B) obtained with mussels from the same collec-tion site and at nearly the same chl a concentration,listed in Table 2 along with the estima ted weight-specific growth rates at specified algal concentra -tions. The agreement between actual measuredweight-specific growth rate (μact) and the estimatedvalue based on shell length (μL) is reasonably good(ANOVA 2-factor without replication, p = 0.547 for
186
0
2
4
6
8
10
12
0 5 10 15 20 25 30 35 40
L = 0.052t + 17.449R2 = 0.896
0
5
10
15
20
25A W = 28.921e0.022t
R2 = 0.941
01020304050607080
B
0
50
100
150
200
250
0 5 10 15 20 25 30 35 40
C D
L (m
m)
W (m
g)
Wsh
ells (m
g)
CI (
mg
cm–3
)
Time, t (d)
Wshells = 1.655t + 137.41
R2 = 0.901
Fig. 3. Mytilus trossulus (Åland mussels, 20 psu, ‘high-salinity’ laboratoryexperiment). (A) Mean shell length (L), (B) body dry weight (W), (C) shell dryweight, (D) condition index (CI) during steady-state feeding and growth exper-iment. Regression lines and their equations are shown for (A) and (B). Theexponent in the equation in (B) indicates an actual weight-specific growth rate,
μact = 2.2% d−1 during the growth period. Bars: ±1 SD
t0 t Wavg C Chl a T μW μL μact
(d) (d) (g) (cells ml−1) (µg l−1) (°C) (% d−1) (% d−1) (% d−1)
7 psu0.9 5.9 0.020 3092 3.9 10.4 9.1 5.7 5.45.9 11.1 0.024 2926 3.7 11.0 7.8 3.8 1.511.1 15.1 0.027 2956 3.7 11.3 7.6 3.3 4.00.9 15.1 0.023 3018 3.8 10.8 8.4 4.6 3.7
20 psu0.8 7.8 0.030 2868 3.6 9.7 7.0 4.6 2.07.8 14.8 0.039 2874 3.6 11.0 6.5 3.3 4.714.8 21.8 0.046 3022 3.8 10.8 6.6 2.7 0.021.8 28.8 0.049 2969 3.7 9.8 6.3 2.8 1.828.8 35.7 0.057 2913 3.6 10.1 5.8 2.3 2.60.8 35.7 0.042 2925 3.7 10.2 6.5 2.9 2.2
Table 2. Mytilus trossulus (Åland mussels, 7 and 20 psu, laboratory experi-ments). Estimated weight specific growth rates (μW = µBEG; μL = μBEG-corr) forspecified algal (Rhodomonas salina) cell concentration (C) and equivalentchl a concentration, and the average temperature (T) for the period along with
actual measured weight-specific growth rates (μact)
Aut
hor c
opy
Riisgård et al.: Mussel dwarfism in low salinity
7 psu and p = 0.315 for 20 psu), but the estimated spe-cific growth rate based on the body dry weight (μW) ispoor (p = 0.036 for 7 psu and p = 0.007 for 20 psu), be-ing 2- to 3-fold higher than the actual growth rate(Table 2). This agrees with the fact that CI > 4.7 mgcm−3 (Table 1). It may (tentatively) be concluded thatmussels grow in body weight at comparable rates atlow (7 psu) and high (20 psu) salinity, but the minimalor lack of growth in shell length or shell weight ob-served in the low-salinity experiment (Fig. 2A,C) sug-gests that reduced ability to produce shell material atlow salinity may be a main factor explaining dwarfismof blue mussels in the Central Baltic Sea. During thelast 4 d of the experiment, the filtration rate of Ålandmussels at low salinity became reduced to about 45%of values in the previous period (Table 1). The reasonfor this change is unknown, but it might be linked tothe lack of shell growth at the very low salinity, possi-bly caused by reduced bio- calcification (Malone &Dodd 1967, Almada-Villela 1984).
In the low salinity experiment (Table 1), the increasein soft body dry weight (W) combined with the lack ofincrease in shell length (L) resulted in a ~170% (8.1vs. 4.7) increase in the CI, and although the esti-mated filtration rate (FL) using the shell length andEq. (7) was in reasonably good agreement with the
187
Askö:L = 0.183t + 15.193
R2 = 0.994
Great Belt:L = 0.166t + 14.644
R2 = 0.993
0
5
10
15
20
25Askö
Great BeltA
Askö:W = 15.762e0.056t
R2 = 0.897
Great Belt:
W = 11.845e0.068t
R2 = 0.9030
10
20
30
40
50
60
70B
0
1
2
3
4
5
6
7
8
9
0 5 10 15 20 25
Time, t (d)
C
L (m
m)
W (m
g)C
I (m
g cm
–3)
Fig. 4. Mytilus trossulus (Askö) and M. edulis (Great Belt).Field mussel growth experiment. Mean ± SD growth in (A)length (L), (B) dry weight of soft parts (W) and (C) conditionindex (CI) of mussels in suspended net bags in Septem-ber−October 2012. Subsamples were collected on Day 0, 7,15 and 21. Regression lines and corresponding equationsare shown, except for CI. In (B), the weight-specific growthrate (μa) is expressed by the exponents (i.e. 5.6 and 6.8% d−1
for Askö and Great Belt mussels, respectively)
Date t (d) L (mm) W (mg) CI (mg cm−3) Chl a (µg l−1) T (°C) S (psu)
Askö17 Sep 0 15.1 ± 1.0 13.5 ± 2.0 3.9 ± 0.5 – – –24 Sep 7 16.7 ± 1.3 30.1 ± 3.7 6.2 ± 0.7 2.7 ± 0.5 14.0 ± 0.8 23.4 ± 0.602 Oct 15 17.8 ± 1.5 35.4 ± 8.6 6.2 ± 1.1 2.7 ± 0.6 13.1 ± 0.4 22.5 ± 0.908 Oct 21 19.1 ± 1.4 48.7 ± 9.6 7.0 ± 0.6 2.6 ± 0.5 12.7 ± 0.7 21.3 ± 0.3
Great Belt17 Sep 0 14.8 ± 0.4 9.8 ± 1.5 3.0 ± 0.3 − − −24 Sep 7 15.7 ± 0.7 24.5 ± 3.7 6.3 ± 0.7 2.7 ± 0.5 14.0 ± 0.8 23.4 ± 0.602 Oct 15 17.1 ± 1.2 35.1 ± 6.7 7.0 ± 0.8 2.7 ± 0.6 13.1 ± 0.4 22.5 ± 0.908 Oct 21 18.2 ± 0.8 42.7 ± 7.0 7.0 ± 0.4 2.6 ± 0.5 12.7 ± 0.7 21.3 ± 0.3
Table 3. Mytilus trossulus (Askö) and M. edulis (Great Belt) field growth experiments. Collection date in 2012, time (t) sincefirst collection date, measured shell length (L) and dry weight of soft parts (W), and condition index (CI) of collected samples.
Chl a, temperature (T) and salinity (S) and CI are mean ± SD values measured between the collection dates
Aut
hor c
opy
Mar Ecol Prog Ser 517: 181–192, 2014
experimentally measured filtration rates (FFCA andFC; Table 1), it is notable that the estimated filtrationrate (FW) using W and Eq. (8) increasingly overesti-mated the actual filtration rate. The latter phenome-non probably can be ascribed lack of growth of thegills, which is likely to be closely correlated with asimultaneous growth in shell length (Riisgård et al.2011b, Figs. 7 & 8 therein). However, more experi-mental work is needed to clarify how low salinitymay affect not only shell growth, but also feedingability, when the CI of dwarfed mussels exceeds acertain level.
In the laboratory growth experiments, the BEGmodel (μBEG = μW) over-estimated the actual growth
(μact) by 215% (8.4 vs. 3.9) and 296%(6.6 vs. 2.2) for Åland mussels at 7 psuand 20 psu, respectively (Table 2).However, the corrected BEG model,Eq. (11), based on calculating the filtra-tion rate from shell length, givesweight-specific growth rates (μBEG-corr =μL) in better agreement with the actualspecific growth rates. Specifically, μL
and μact take values of 4.6 and 3.9% d−1
at 7 psu and 2.9 and 2.2% d−1 at 20 psu,respectively, as seen from Table 2. Thisexample emphasizes that the BEGmodel is sensitive to changes in the CIand that the model may be improvedby using Eq. (11). Future data shouldtherefore include values of the CI.
Field growth experiments
Great Belt
The actual growth rates (μact) of mussels in net-bags in the Great Belt were 6.1 and 7.0% d−1 for Asköand Great Belt mussels, respectively, and the meanchl a concentration was 2.7 µg l−1 (Table 4). It isnotable that the growth rate of Askö and Great Beltmussels are very similar (Fig. 4), and this is in agree-ment with earlier observed growth rates of Baltic Sea(7 psu) mussels transplanted to the North Sea(28 psu) by Kautsky et al. (1990) and Tedengren et al.(1990). Further, the actual weight-specific growthrates are in reasonable agreement with the predictedgrowth from the BEG model (Table 4) (ANOVA; p =0.550 for Askö and p = 0.470 for Great Belt), as alsonoted by Larsen et al. (2014) using the same data fora comparison of various growth models. It is notablethat the high-salinity (20 psu) laboratory experimentwith mussels from the same collecting site showedsubstantially lower growth (Table 2) despite thehigher chl a concentration of 3.7 µg l−1, a phenome-non probably caused by suboptimal conditions in thegrowth aquarium, with only slow through-flow offresh seawater to reduce the wash-out of algal cells.
Baltic Sea
The actual growth rates (μact) of mussels in cages inthe Baltic Sea were considerably lower than those ofmussels in net-bags in the Great Belt, although the chla concentrations measured at the mussel-cage loca-
188
20
25
30
35
40
0 5 10 15 20 25 30 35 40
Time (d)
Askö (20 psu, field)GB (20 psu, field)Åland (20 psu, lab)Åland (7 psu, lab)
CI s
hell
(mg
cm–3
)
Fig. 5. Mytilus trossulus (Askö, Åland) and M. edulis (GreatBelt). Shell condition index (CIshell = Wshell/L3; Eq. 3) as afunction of time in field and laboratory growth experimentswith mussels from Askö, the Great Belt (GB) and Ålandexposed to high (20 psu) and low (7 psu) salinities. Linear
regression lines are shown
Period Period n L Wavg S T Chl a μBEG μact no. length (d) (mm) (mg) (psu) (°C) (µg l−1) (% d−1) (% d−1)
AsköI 7 (9) 15.9 20.1 23.4 14.0 2.7 5.1 11.5II 8 (8) 17.2 32.6 22.5 13.1 2.7 4.5 2.0III 6 (7) 18.4 41.5 21.3 12.7 2.6 3.7 5.3IV 21 (7) 17.1 25.6 22.5 13.3 2.7 4.7 6.1
Great BeltI 7 (9) 15.2 15.5 23.4 14.0 2.7 5.6 13.1II 8 (11) 16.4 29.3 22.5 13.1 2.7 4.6 4.5III 6 (7) 17.6 38.7 21.3 12.7 2.6 3.8 3.3IV 21 (5) 16.5 20.5 22.5 13.3 2.7 5.0 7.0
Table 4. Mytilus trossulus (Askö) and M. edulis (Great Belt) field growthexperiments. Mean shell length (L), dry weight of soft parts (Wavg), salinity (S),temperature (T), and chl a concentration in the growth periods, along withestimated weight-specific growth rate, μBEG (= μW), and the actual measuredweight-specific growth rate, μact. n = 5 to 11 for each period. Period IV spans
the entire Period I to III
Aut
hor c
opy
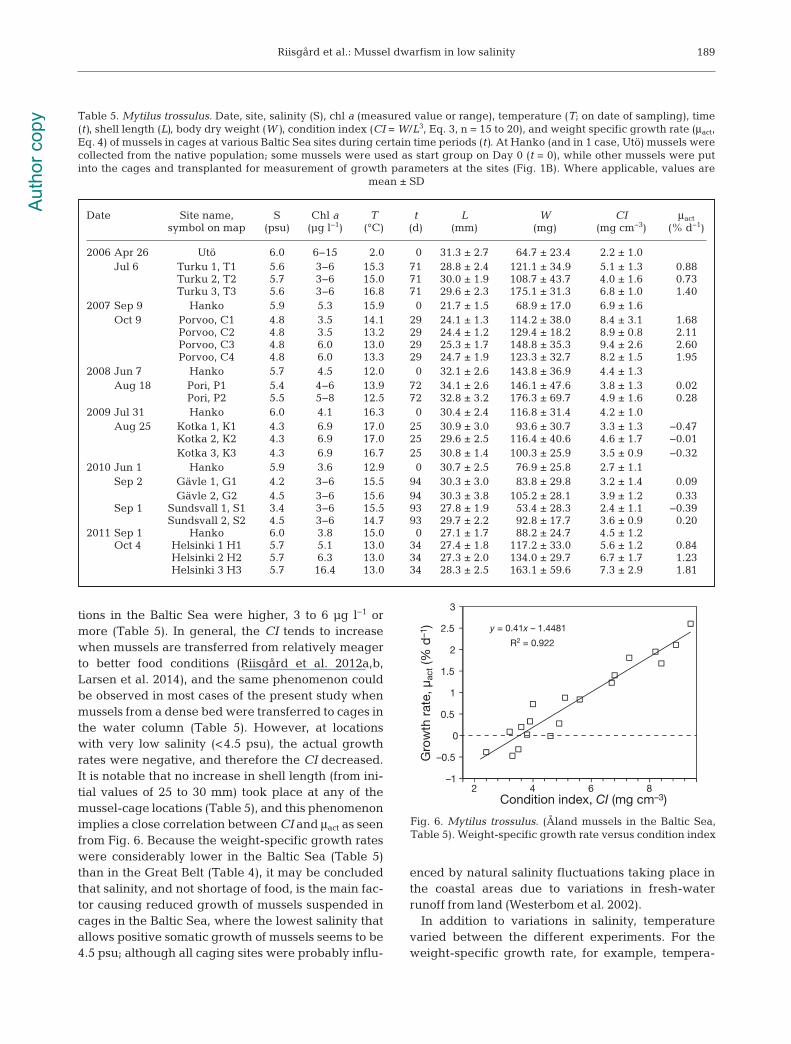
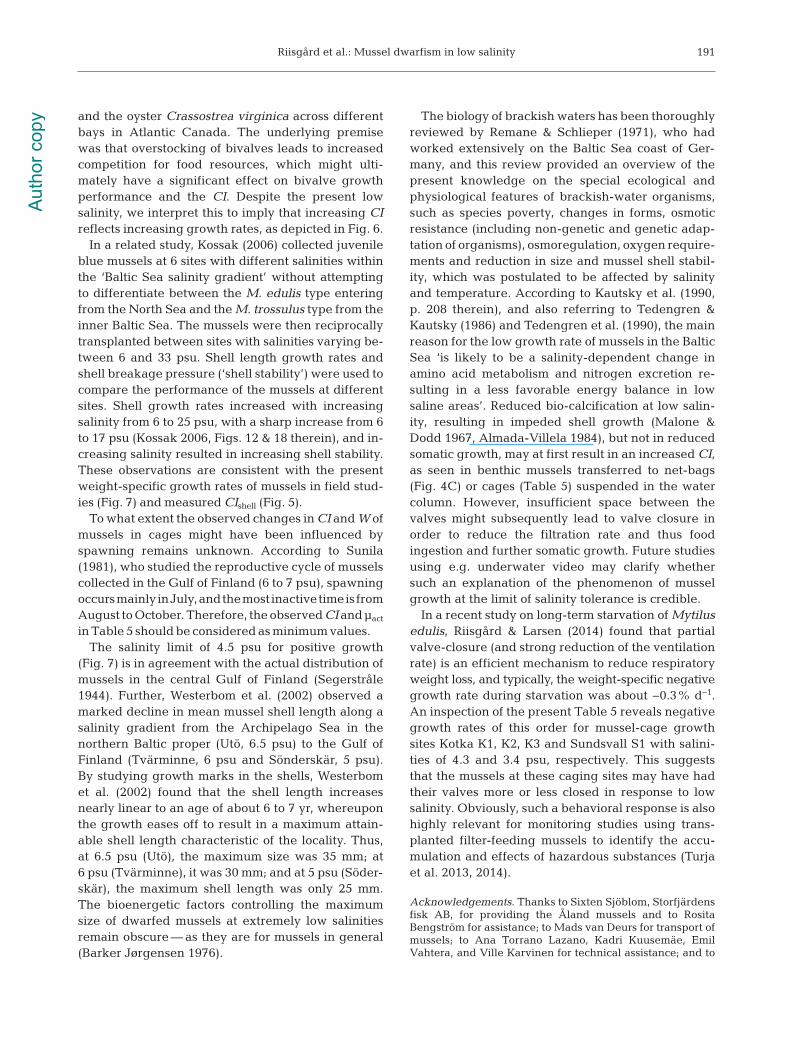
tions in the Baltic Sea were higher, 3 to 6 µg l−1 ormore (Table 5). In general, the CI tends to increasewhen mussels are transferred from relatively meagerto better food conditions (Riisgård et al. 2012a,b,Larsen et al. 2014), and the same phenomenon couldbe observed in most cases of the present study whenmussels from a dense bed were transferred to cages inthe water column (Table 5). However, at locationswith very low salinity (<4.5 psu), the actual growthrates were negative, and therefore the CI decreased.It is notable that no increase in shell length (from ini-tial values of 25 to 30 mm) took place at any of themussel-cage locations (Table 5), and this phenomenonimplies a close correlation between CI and μact as seenfrom Fig. 6. Because the weight-specific growth rateswere considerably lower in the Baltic Sea (Table 5)than in the Great Belt (Table 4), it may be concludedthat salinity, and not shortage of food, is the main fac-tor causing reduced growth of mussels suspended incages in the Baltic Sea, where the lowest salinity thatallows positive somatic growth of mussels seems to be4.5 psu; although all caging sites were probably influ-
enced by natural salinity fluctuations taking place inthe coastal areas due to variations in fresh-waterrunoff from land (Westerbom et al. 2002).
In addition to variations in salinity, temperaturevaried between the different experiments. For theweight-specific growth rate, for example, tempera-
Riisgård et al.: Mussel dwarfism in low salinity 189
–1
–0.5
0
0.5
1
1.5
2
2.5
3
2 4 6 8
y = 0.41x – 1.4481
R2 = 0.922
Gro
wth
rat
e, µ
act (
% d
–1)
Condition index, CI (mg cm–3)
Fig. 6. Mytilus trossulus. (Åland mussels in the Baltic Sea,Table 5). Weight-specific growth rate versus condition index
Date Site name, S Chl a T t L W CI μact symbol on map (psu) (µg l−1) (°C) (d) (mm) (mg) (mg cm−3) (% d−1)
2006 Apr 26 Utö 6.0 6−15 2.0 0 31.3 ± 2.7 64.7 ± 23.4 2.2 ± 1.0Jul 6 Turku 1, T1 5.6 3−6 15.3 71 28.8 ± 2.4 121.1 ± 34.9 5.1 ± 1.3 0.88
Turku 2, T2 5.7 3−6 15.0 71 30.0 ± 1.9 108.7 ± 43.7 4.0 ± 1.6 0.73Turku 3, T3 5.6 3−6 16.8 71 29.6 ± 2.3 175.1 ± 31.3 6.8 ± 1.0 1.40
2007 Sep 9 Hanko 5.9 5.3 15.9 0 21.7 ± 1.5 68.9 ± 17.0 6.9 ± 1.6Oct 9 Porvoo, C1 4.8 3.5 14.1 29 24.1 ± 1.3 114.2 ± 38.0 8.4 ± 3.1 1.68
Porvoo, C2 4.8 3.5 13.2 29 24.4 ± 1.2 129.4 ± 18.2 8.9 ± 0.8 2.11Porvoo, C3 4.8 6.0 13.0 29 25.3 ± 1.7 148.8 ± 35.3 9.4 ± 2.6 2.60Porvoo, C4 4.8 6.0 13.3 29 24.7 ± 1.9 123.3 ± 32.7 8.2 ± 1.5 1.95
2008 Jun 7 Hanko 5.7 4.5 12.0 0 32.1 ± 2.6 143.8 ± 36.9 4.4 ± 1.3Aug 18 Pori, P1 5.4 4−6 13.9 72 34.1 ± 2.6 146.1 ± 47.6 3.8 ± 1.3 0.02
Pori, P2 5.5 5−8 12.5 72 32.8 ± 3.2 176.3 ± 69.7 4.9 ± 1.6 0.282009 Jul 31 Hanko 6.0 4.1 16.3 0 30.4 ± 2.4 116.8 ± 31.4 4.2 ± 1.0
Aug 25 Kotka 1, K1 4.3 6.9 17.0 25 30.9 ± 3.0 93.6 ± 30.7 3.3 ± 1.3 −0.47Kotka 2, K2 4.3 6.9 17.0 25 29.6 ± 2.5 116.4 ± 40.6 4.6 ± 1.7 −0.01Kotka 3, K3 4.3 6.9 16.7 25 30.8 ± 1.4 100.3 ± 25.9 3.5 ± 0.9 −0.32
2010 Jun 1 Hanko 5.9 3.6 12.9 0 30.7 ± 2.5 76.9 ± 25.8 2.7 ± 1.1Sep 2 Gävle 1, G1 4.2 3−6 15.5 94 30.3 ± 3.0 83.8 ± 29.8 3.2 ± 1.4 0.09
Gävle 2, G2 4.5 3−6 15.6 94 30.3 ± 3.8 105.2 ± 28.1 3.9 ± 1.2 0.33Sep 1 Sundsvall 1, S1 3.4 3−6 15.5 93 27.8 ± 1.9 53.4 ± 28.3 2.4 ± 1.1 −0.39
Sundsvall 2, S2 4.5 3−6 14.7 93 29.7 ± 2.2 92.8 ± 17.7 3.6 ± 0.9 0.202011 Sep 1 Hanko 6.0 3.8 15.0 0 27.1 ± 1.7 88.2 ± 24.7 4.5 ± 1.2
Oct 4 Helsinki 1 H1 5.7 5.1 13.0 34 27.4 ± 1.8 117.2 ± 33.0 5.6 ± 1.2 0.84Helsinki 2 H2 5.7 6.3 13.0 34 27.3 ± 2.0 134.0 ± 29.7 6.7 ± 1.7 1.23Helsinki 3 H3 5.7 16.4 13.0 34 28.3 ± 2.5 163.1 ± 59.6 7.3 ± 2.9 1.81
Table 5. Mytilus trossulus. Date, site, salinity (S), chl a (measured value or range), temperature (T; on date of sampling), time(t), shell length (L), body dry weight (W), condition index (CI = W/L3, Eq. 3, n = 15 to 20), and weight specific growth rate (μact,Eq. 4) of mussels in cages at various Baltic Sea sites during certain time periods (t). At Hanko (and in 1 case, Utö) mussels werecollected from the native population; some mussels were used as start group on Day 0 (t = 0), while other mussels were putinto the cages and transplanted for measurement of growth parameters at the sites (Fig. 1B). Where applicable, values are
mean ± SD
Aut
hor c
opy
Mar Ecol Prog Ser 517: 181–192, 2014190
tures ranged from 12.7 to 14°C (Table 4). To estimatethe resulting variation of weight-specific growth rate,we consider the temperature corrections to filtrationrate and respiration introduced by Larsen et al.(2014, Eq. 5 therein) to their BEG model. Relative tothe value of μBEG at the mean temperature of 13.35°C,μBEG varied from −0.8% to +0.7% in the temperaturerange of 12.7 to 14°C at the chl a concentration of2.7 µg l−1, which is negligible compared to the varia-tions seen in Table 4.
For the data of Table 5, temperature varies from alow of 12°C (ignoring the 2.0°C of Utö) to a high of16.8°C, but also the chl a concentration varies be -tween sites. For an estimate of the temperatureeffect, we assume the same reference temperature of13.35°C as for Table 4 and a chl a concentration of4.5 µg l−1, which gives a variation of μBEG of −2.5% to+5.9% for the temperature range.
For the data of Fig. 5 (CIshell versus time), there is adecreasing temperature pattern for Askö and theGreat Belt (from about 14 to 12.7°C), but data on tem-perature changes for Åland (20 psu and 7 psu) arenot available. Hiebenthal et al. (2012) found themass-based CI (ratio of soft tissue weight to shellweight) to decrease with increasing temperature (5to 25°C) but not to be significantly affected by salinity(15 to 35 psu), which is contrary to the present results(Fig. 5), although covering a rather narrow tempera-ture range (9.7 to 14°C).
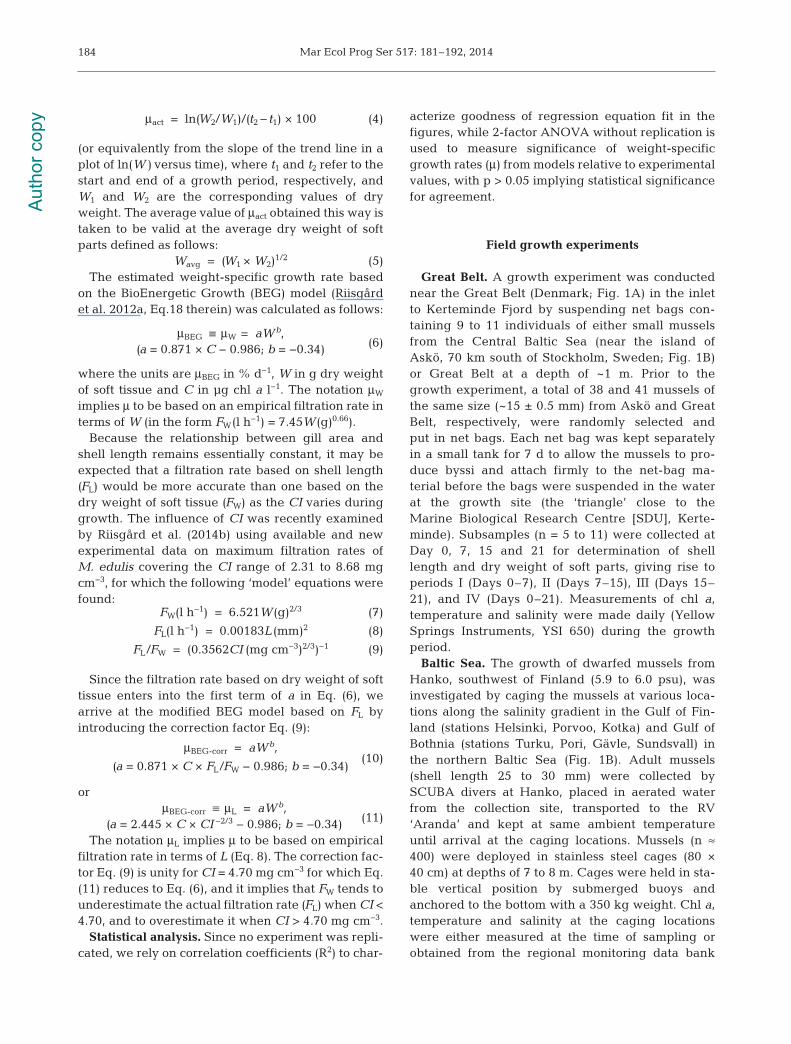
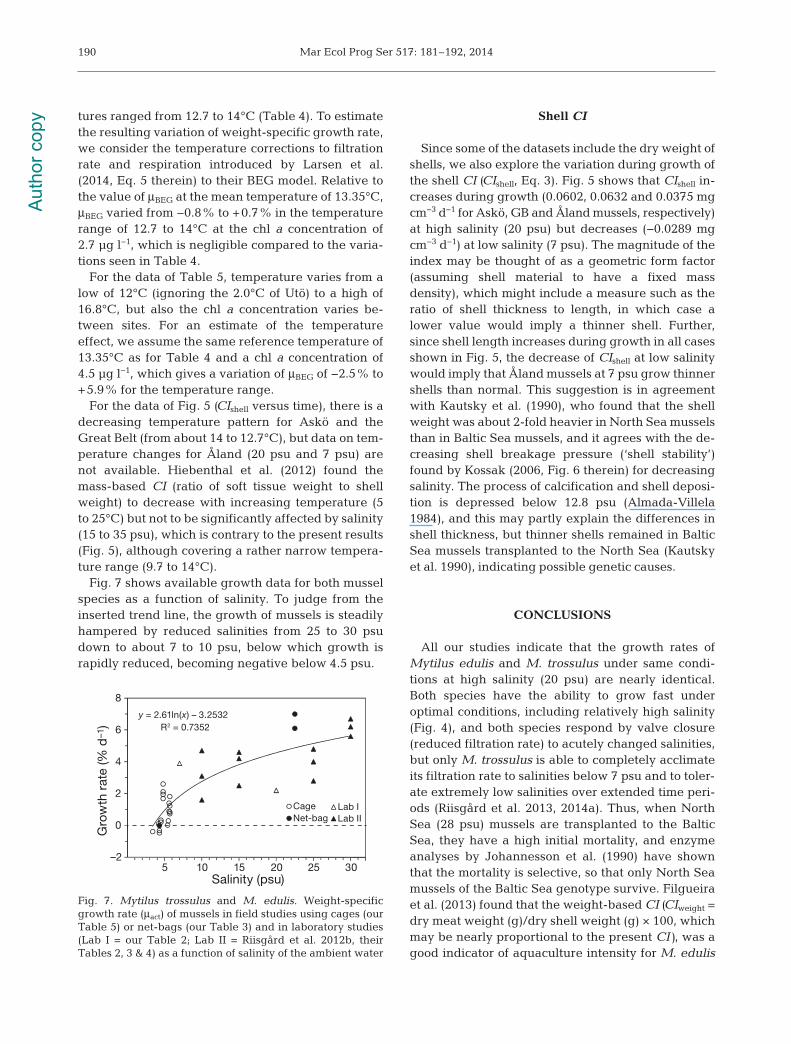
Fig. 7 shows available growth data for both musselspecies as a function of salinity. To judge from theinserted trend line, the growth of mussels is steadilyhampered by reduced salinities from 25 to 30 psudown to about 7 to 10 psu, below which growth israpidly reduced, becoming negative below 4.5 psu.
Shell CI
Since some of the datasets include the dry weight ofshells, we also explore the variation during growth ofthe shell CI (CIshell, Eq. 3). Fig. 5 shows that CIshell in-creases during growth (0.0602, 0.0632 and 0.0375 mgcm−3 d−1 for Askö, GB and Åland mussels, respectively)at high salinity (20 psu) but decreases (−0.0289 mgcm−3 d−1) at low salinity (7 psu). The magnitude of theindex may be thought of as a geometric form factor(assuming shell material to have a fixed massdensity), which might include a measure such as theratio of shell thickness to length, in which case alower value would imply a thinner shell. Further,since shell length increases during growth in all casesshown in Fig. 5, the de crease of CIshell at low salinitywould imply that Åland mussels at 7 psu grow thinnershells than normal. This suggestion is in agreementwith Kautsky et al. (1990), who found that the shellweight was about 2-fold heavier in North Sea musselsthan in Baltic Sea mussels, and it agrees with the de-creasing shell breakage pressure (‘shell stability’)found by Kossak (2006, Fig. 6 therein) for decreasingsalinity. The process of calcification and shell deposi-tion is depressed below 12.8 psu (Almada-Villela1984), and this may partly explain the differences inshell thickness, but thinner shells remained in BalticSea mussels transplanted to the North Sea (Kautskyet al. 1990), indicating possible genetic causes.
CONCLUSIONS
All our studies indicate that the growth rates ofMytilus edulis and M. trossulus under same condi-tions at high salinity (20 psu) are nearly identical.Both species have the ability to grow fast under optimal conditions, including relatively high salinity(Fig. 4), and both species respond by valve closure(reduced filtration rate) to acutely changed salinities,but only M. trossulus is able to completely acclimateits filtration rate to salinities below 7 psu and to toler-ate extremely low salinities over ex tended time peri-ods (Riisgård et al. 2013, 2014a). Thus, when NorthSea (28 psu) mussels are transplanted to the BalticSea, they have a high initial mortality, and enzymeanalyses by Johannesson et al. (1990) have shownthat the mortality is selective, so that only North Seamussels of the Baltic Sea genotype survive. Filgueiraet al. (2013) found that the weight-based CI (CIweight =dry meat weight (g)/dry shell weight (g) × 100, whichmay be nearly proportional to the present CI), was agood indicator of aquaculture intensity for M. edulis
y = 2.61ln(x) – 3.2532 R2 = 0.7352
–2
0
2
4
6
8
5 10 15 20 25 30
Gro
wth
rat
e (%
d–1
)
Salinity (psu)
CageNet-bag
Lab ILab II
Fig. 7. Mytilus trossulus and M. edulis. Weight-specificgrowth rate (μact) of mussels in field studies using cages (ourTable 5) or net-bags (our Table 3) and in laboratory studies(Lab I = our Table 2; Lab II = Riisgård et al. 2012b, theirTables 2, 3 & 4) as a function of salinity of the ambient water
Aut
hor c
opy
Riisgård et al.: Mussel dwarfism in low salinity
and the oyster Crassostrea virginica across differentbays in Atlantic Canada. The underlying premisewas that overstocking of bivalves leads to increasedcompetition for food resources, which might ulti-mately have a significant effect on bivalve growthperformance and the CI. Despite the present lowsalinity, we interpret this to imply that increasing CIreflects increasing growth rates, as depicted in Fig. 6.
In a related study, Kossak (2006) collected juvenileblue mussels at 6 sites with different salinities withinthe ‘Baltic Sea salinity gradient’ without attemptingto differentiate between the M. edulis type enteringfrom the North Sea and the M. trossulus type from theinner Baltic Sea. The mussels were then reciprocallytransplanted between sites with salinities varying be-tween 6 and 33 psu. Shell length growth rates andshell breakage pressure (‘shell stability’) were used tocompare the performance of the mussels at differentsites. Shell growth rates increased with increasingsalinity from 6 to 25 psu, with a sharp increase from 6to 17 psu (Kossak 2006, Figs. 12 & 18 therein), and in-creasing salinity resulted in in creasing shell stability.These observations are consistent with the presentweight-specific growth rates of mussels in field stud-ies (Fig. 7) and measured CIshell (Fig. 5).
To what extent the observed changes in CI and W ofmussels in cages might have been influenced byspawning remains unknown. According to Sunila(1981), who studied the reproductive cycle of musselscollected in the Gulf of Finland (6 to 7 psu), spawningoccursmainly inJuly,andthemost inactivetimeis fromAugust to October. Therefore, the observed CI and µact
in Table 5 should be considered as minimum values.The salinity limit of 4.5 psu for positive growth
(Fig. 7) is in agreement with the actual distribution ofmussels in the central Gulf of Finland (Segerstråle1944). Further, Westerbom et al. (2002) observed amarked decline in mean mussel shell length along asalinity gradient from the Archipelago Sea in thenorthern Baltic proper (Utö, 6.5 psu) to the Gulf ofFinland (Tvärminne, 6 psu and Sönderskär, 5 psu).By studying growth marks in the shells, Westerbomet al. (2002) found that the shell length increasesnearly linear to an age of about 6 to 7 yr, whereuponthe growth eases off to result in a maximum attain-able shell length characteristic of the locality. Thus,at 6.5 psu (Utö), the maximum size was 35 mm; at6 psu (Tvärminne), it was 30 mm; and at 5 psu (Söder-skär), the maximum shell length was only 25 mm.The bioenergetic factors controlling the maximumsize of dwarfed mussels at extremely low salinitiesremain obscure — as they are for mussels in general(Barker Jørgensen 1976).
The biology of brackish waters has been thoroughlyreviewed by Remane & Schlieper (1971), who hadworked extensively on the Baltic Sea coast of Ger-many, and this review provided an overview of thepresent knowledge on the special ecological andphysiological features of brackish-water organisms,such as species poverty, changes in forms, osmoticresistance (including non-genetic and genetic adap-tation of organisms), osmoregulation, oxygen require -ments and reduction in size and mussel shell stabil-ity, which was postulated to be affected by salinityand temperature. According to Kautsky et al. (1990,p. 208 therein), and also referring to Tedengren &Kautsky (1986) and Tedengren et al. (1990), the mainreason for the low growth rate of mussels in the BalticSea ‘is likely to be a salinity-dependent change inamino acid metabolism and nitrogen excretion re -sulting in a less favorable energy balance in lowsaline areas’. Reduced bio- calcification at low salin-ity, resulting in impeded shell growth (Malone &Dodd 1967, Almada-Villela 1984), but not in reducedsomatic growth, may at first result in an increased CI,as seen in benthic mussels transferred to net-bags(Fig. 4C) or cages (Table 5) suspended in the watercolumn. However, insufficient space between thevalves might subsequently lead to valve closure inorder to reduce the filtration rate and thus foodingestion and further somatic growth. Future studiesusing e.g. underwater video may clarify whethersuch an explanation of the phenomenon of musselgrowth at the limit of salinity tolerance is credible.
In a recent study on long-term starvation of Mytilusedulis, Riisgård & Larsen (2014) found that partialvalve-closure (and strong reduction of the ventilationrate) is an efficient mechanism to reduce respiratoryweight loss, and typically, the weight-specific negativegrowth rate during starvation was about −0.3% d−1.An inspection of the present Table 5 re veals negativegrowth rates of this order for mussel-cage growthsites Kotka K1, K2, K3 and Sundsvall S1 with salini-ties of 4.3 and 3.4 psu, respectively. This suggeststhat the mussels at these caging sites may have hadtheir valves more or less closed in response to lowsalinity. Obviously, such a behavioral response is alsohighly relevant for monitoring studies using trans-planted filter-feeding mussels to identify the accu-mulation and effects of hazardous substances (Turjaet al. 2013, 2014).
Acknowledgements. Thanks to Sixten Sjöblom, Storfjärdensfisk AB, for providing the Åland mussels and to RositaBengström for assistance; to Mads van Deurs for transport ofmussels; to Ana Torrano Lazano, Kadri Kuusemäe, EmilVahtera, and Ville Karvinen for technical assistance; and to
191A
utho
r cop
y
Mar Ecol Prog Ser 517: 181–192, 2014
Juhani Rapo and crew on board the RV ‘Aranda’ for helpwith conducting the caging experiments. Constructive com-ments made by 3 anonymous reviewers helped to improvethe submitted manuscript.
LITERATURE CITED
Almada-Villela PC (1984) The effects of reduced salinity onthe shell growth of small Mytilus edulis. J Mar Biol AssocUK 64: 171−182
Bulnheim HP, Gosling E (1988) Population genetic structureof mussels from the Baltic Sea. Helgol Meersunters 42: 113−129
Filgueira R, Comeau LA, Landry T, Grant J, Guyondet T,Mallet A (2013) Bivalve condition index as an indicator ofaquaculture intensity: a meta-analysis. Ecol Indic 25: 215−229
Hiebenthal C, Philipp EER, Eisenhauer A, Wahl M (2012)Interactive effects of temperature and salinity on shellformation and general condition in Baltic Sea Mytilusedulis and Arctica islandica. Aquat Biol 14: 289−298
Johannesson K, Kautsky N, Tedengren M (1990) Genotypicand phenotypic differences between Baltic and NorthSea populations of Mytilus edulis evaluated throughreciprocal transplantations. II. Genetic variation. MarEcol Prog Ser 59: 211–219
Jørgensen CB (1976) Growth efficiencies and factors control-ling size in some mytilid bivalves, especially My ti lus edulisL.: review and interpretation. Ophelia 15: 175−192
Kautsky N (1982) Growth and size structure in a BalticMytilus edulis population. Mar Biol 68: 117−133
Kautsky N, Johannesson K, Tedengren M (1990) Genotypicand phenotypic differences between Baltic and NorthSea populations of Mytilus edulis evaluated through re ciprocal transplantations. I. Growth and morphology.Mar Ecol Prog Ser 59: 203−210
Kossak U (2006) How climate change translates into eco -logical change: impacts of warming and desalination onprey properties and predator-prey interactions in theBaltic Sea. PhD dissertation, Christian-Albrechts- Universität, Kiel
Larsen PS, Filgueira R, Riisgård HU (2014) Somatic growthof mussels Mytilus edulis in field studies compared topredictions using BEG, DEB, and SFG models. J Sea Res88: 100−108
Malone PG, Dodd J (1967) Temperature and salinity effectson calcification rate in Mytilus edulis and its paleoeco-logical implications. Limnol Oceanogr 12: 432−436
Pleissner D, Lundgreen K, Lüskow F, Riisgård HU (2013)Fluorometer controlled apparatus designed for long-term algal-feeding experiments and environmentaleffect studies with mussels. J Mar Biol 2013: 401961
Remane A, Schlieper C (1971) Biology of brackish waters.Die Binnengewässer, 2nd edn. Wiley, New York, NY
Riginos C, Cunningham CW (2005) Local adaptation andspecies segregation in two mussel (Mytilus edulis ×Mytilus trossulus) hybrid zones. Mol Ecol 14: 381−400
Riisgård HU, Larsen PS (2014) Physiologically regulatedvalve-closure makes mussels long-term starvation sur-vivors: test of hypothesis. J Mollusc Stud (in press)
Riisgård HU, Egede PP, Saavedra IB (2011a) Feeding behav-iour of the mussel, Mytilus edulis: new observations, witha mini-review of current knowledge. J Mar Biol 2011: 312459
Riisgård HU, Jørgensen BH, Lundgreen K, Storti F, WaltherJH, Meyer KE, Larsen PS (2011b) The exhalant jet of
mussels Mytilus edulis. Mar Ecol Prog Ser 437: 147−164Riisgård HU, Lundgreen K, Larsen PS (2012a) Field data and
growth model for mussels Mytilus edulis in Danishwaters. Mar Biol Res 8: 683−700
Riisgård HU, Bøttiger L, Pleissner D (2012b) Effect of salinityon growth of mussels, Mytilus edulis, with special refer-ence to Great Belt (Denmark). Open J Mar Sci 2: 167−176
Riisgård HU, Lüskow F, Pleissner D, Lundgreen K, LópezMAP (2013) Effect of salinity on filtration rates of musselsMytilus edulis with special emphasis on dwarfed musselsfrom the low saline Central Baltic Sea. Helgol Mar Res67: 591−598
Riisgård HU, Mulot M, Merino L, Pleissner D (2014a) Effectof salinity-changing rates on filtration activity of musselsfrom two sites within the Baltic Mytilus hybrid zone: thebrackish Great Belt (Denmark) and the low saline Cen-tral Baltic Sea. Open J Mar Sci 4: 101−109
Riisgård HU, Larsen PS, Pleissner D (2014b) Allometricequations for maximum filtration rate in blue musselsMytilus edulis and importance of condition index. HelgolMar Res 68: 193−198
Segerstråle S (1944) Ein Beitrag zur Kenntnis der östlichenVerbreitung de Miesmuschel (Mytilus edulis L.) an derSüdküste Finnlands. Mem Soc Fauna Flora Fenn 19: 5−7
Stuckas H, Stoof K, Quesada H, Tiedemann R (2009) Evolu-tionary implications of discordant clines across the BalticMytilus hybrid zone (Mytilus edulis and Mytilus trossu-lus). Heredity 103: 146−156
Sunila I (1981) Reproduction of Mytilus edulis L. (Bivalvia) ina brackish water area, the Gulf of Finland. Ann ZoolFenn 18: 121−128
Tedengren M, Kautsky N (1986) Comparative study of thephysiology and its probable effect on size in blue mussels(Mytilus edulis L.) from the North Sea and the northernBaltic proper. Ophelia 25: 147−155
Tedengren M, André C, Johannesson K, Kautsky N (1990)Genotypic and phenotypic differences between Balticand North Sea populations of Mytilus edulis evaluatedthrough reciprocal transplantations. III. Physiology. MarEcol Prog Ser 59: 221−227
Theisen BF (1978) Allozyme clines and evidence of strongselection in three loci in Mytilus edulis L. (Bivalva) fromDanish waters. Ophelia 17: 135−142
Turja R, Soirinsuo A, Budzinski H, Devier MH, Lehtonen KK(2013) Biomarker responses and accumulation of haz-ardous substances in mussels (Mytilus trossulus) trans-planted along a pollution gradient close to an oil terminalin the Gulf of Finland (Baltic Sea). Comp Biochem Physiol C 157: 80−92
Turja R, Höher N, Snoeijs P, Barsiene J, Kuznetsova T,Kholodkevich SV (2014) A multibiomarker approach tothe assessment of pollution impacts in two Baltic Seacoastal areas in Sweden using caged mussels (Mytilustrossulus). Sci Total Environ 473-474: 398−409
Väinölä R, Strelkov P (2011) Mytilus trossulus in NorthernEurope. Mar Biol 158: 817−833
Vuorinen I, Antsulevich AE, Maximovich NV (2002) Spatialdistribution and growth of the common mussel Mytilusedulis L. in the archipelago of SW-Finland, NorthernBaltic Sea. Boreal Environ Res 7: 41−52
Westerbom M, Kilpi M, Mustonen O (2002) Blue mussels,Mytilus edulis, at the edge of the range: population struc-ture, growth and biomass along a salinity gradient in thenorth-eastern Baltic Sea. Mar Biol 140: 991−999
Zbawicka M, Burzynski A, Wenne R (2007) Completesequences of mitochondrial genomes from the Balticmussel Mytilus trossulus. Gene 406: 191−198
192
Editorial responsibility: Roger Hughes, Bangor, UK
Submitted: May 26, 2014; Accepted: August 20, 2014Proofs received from author(s): November 17, 2014
Aut
hor c
opy