assessing the effect of physicochemical properties of saline
TRANSCRIPT
Citation: Gao, J.; Zhao, Q.; Chang, D.;
Ndayisenga, F.; Yu, Z. Assessing the
Effect of Physicochemical Properties
of Saline and Sodic Soil on Soil
Microbial Communities. Agriculture
2022, 12, 782. https://doi.org/
10.3390/agriculture12060782
Academic Editors: Sandipan Samaddar
and Poulami Chatterjee
Received: 27 March 2022
Accepted: 27 May 2022
Published: 29 May 2022
Publisher’s Note: MDPI stays neutral
with regard to jurisdictional claims in
published maps and institutional affil-
iations.
Copyright: © 2022 by the authors.
Licensee MDPI, Basel, Switzerland.
This article is an open access article
distributed under the terms and
conditions of the Creative Commons
Attribution (CC BY) license (https://
creativecommons.org/licenses/by/
4.0/).
agriculture
Article
Assessing the Effect of Physicochemical Properties of Salineand Sodic Soil on Soil Microbial CommunitiesJunzhi Gao †, Qingzhou Zhao †, Dongdong Chang, Fabrice Ndayisenga and Zhisheng Yu *
College of Resources and Environment, University of Chinese Academy of Sciences, Beijing 100049, China;[email protected] (J.G.); [email protected] (Q.Z.); [email protected] (D.C.);[email protected] (F.N.)* Correspondence: [email protected]; Tel.: +86-10-88256057† These authors contributed equally to this work.
Abstract: Soil physicochemical properties are the main driving factors affecting the stability anddiversity of the soil microbial community. The impacts of the saline–alkali situation and associated soildegradation need to be understood and reversed as soil diversity and communities are increasinglyaffected by saline–alkaline soil. However, the differences between salinization and alkalization soiland their impact on microbiota have been overlooked. The object of this study is to demonstratethe differences in salinization and alkalization soil and the driving factors affecting microbiota. Inthis study, 12 soil samples collected from saline–alkaline spots were used to detect the differences insoil physicochemical properties. The soil microbial community was sequenced by high-throughputsequencing. The results of ESP and EC in the soil samples indicated that the soil samples werecategorized as saline soil and sodic soil. Venn diagrams indicated that unique OTUs in salinesoil showed higher adaptation and environmental tolerance. Partial Mantel tests showed that thedifferences in pH, exchangeable sodium percentage (ESP), C/N, Na, and K between saline andsodic soil were the primary determinants affecting the relative abundance of bacterial and fungalcommunities, besides electrical conductivity (EC). In the KEGG analysis, ESP mainly affected thecellular processes in the archaea. Metabolism in the bacterial function was positively correlated withK only in sodic soil. These results indicated that the proportions in sodic soil were more stronglyaffecting soil microbiota.
Keywords: saline–alkaline soil; soil physicochemical properties; saline soil; sodic soil; microbialcommunity; correlation analysis; functional prediction
1. Introduction
The saline–alkali situation has been perceived as one of the most significant factorscausing soil degradation throughout the world [1]. Saline–alkaline soil reduces soil micro-bial diversity, activity, and soil quality [2]. Saline-alkaline soil is distributed in more than100 countries and affects various soil ecosystems, such as agriculture, grassland, and wetmeadows [1,3,4]. The area in Inner Mongolia accounts for 12.3% of the area of China,while saline–alkaline soil covers nearly a quarter of the saline–alkaline soil of China [5].High evaporation associated with a short rainy period in arid and semi-arid areas furtheraggravates the shaping of saline–alkaline soil [6]. Inner Mongolia is the dominant grazedarea in the north of China, where saline–alkaline soil on the pastures has been rapidlyshaped and adversely affected the grass growth [7]. According to the soil classification,saline–alkaline soil is the general term for salinization and alkalization soil (based onthe physicochemical properties of soil, such as electrical conductivity, EC, dS/m, andexchangeable sodium percentage, ESP, %, saline–alkaline soil can be classified as saline soil,EC < 4 dS/m, ESP < 15%, and sodic soil, EC < 4 dS/m, ESP > 15%) [8,9]. The soil is home tolarge and diverse microbes [10]. Soil microbiota has a key role in regulating and supportingsoil ecosystems, including restoring degradation and nutrient cycling [11,12]. They are not
Agriculture 2022, 12, 782. https://doi.org/10.3390/agriculture12060782 https://www.mdpi.com/journal/agriculture

Agriculture 2022, 12, 782 2 of 17
only a participant in soil activity but also a responder to changes in soil characteristics [13].The soil microbiota is sensitive to soil environmental factors, affecting their diversity andcomposition [14]. Microbial communities mainly consist of archaea, bacteria, and fungi [15].
High salinity in the soil is considered a harsh habitat for microorganisms, includingsalt lakes, the sediment of salt lakes, and desert soil, but many microbial communities stillsurvive [16,17]. Many studies pay attention to the effect of saline soil on soil and ecologicalenvironments. In a global survey of microbial communities from both terrestrial andaquatic ecosystems, it was found that salinity was the dominant factor in shaping bacterialcommunity composition [18]. A study by Zhang et al. (2019) [19] found that bacterialalpha diversity in desert soil was strongly negatively correlated with saline gradients,using EC as an indicator of soil salinity. Banda et al. (2021) [20] demonstrated that therelative abundance of Euryarchaeota (archaeal phylum) in saline lakes increased with risingsalinity. The abundant change of Nectriaceae and Cladosporiaceae can be used as a marker todistinguish the extent of low and high saline soil in the Yellow River Delta [21]. Therefore,the change in microbial diversity and composition in the soil can reflect the extent of thesalinity of the soil [22].
Apart from the effect of salinity, microorganisms also face different abiotic factors inhabitats, including pH, moisture, and other physicochemical properties. In aquatic ecosys-tems, oxygen, carbon substrates, and pH are also the key factors shaping the microbialcommunity of the sediment in the salt lakes. Zhao et al. (2018) [23] demonstrated that pHwas equally a determinant of bacterial communities in soil across a salt lake shoreline. Itwas demonstrated that the pH in the soil could increase due to saline ion exchange [24].Therefore, saline and sodic soil are closely related and occur concurrently [1]. A changein saline and sodic soil was associated with high Na, pH, and ESP [25]. Moreover, as animportant indicator, a change in EC can severely affect the soil microbiota [26]. However,the differences between saline and sodic soil and the relative importance of saline and sodicsoil in shaping the microbial community of soil are still poorly understood, although theproperties and classification of soil have been widely studied. Considering the relationshipbetween microbial communities and various soil factors, it is important to identify whichdifferences in factors in saline and sodic soil have a greater influence on the compositionand distribution of soil microbial communities.
The feces of livestock can also result in soil with different levels of salinization andalkalization, and further lead to different sizes of spots on the grassland [27]. In this study,we analyzed the effect of physicochemical differences between saline and sodic soil on soilmicrobiota using high-throughput sequencing in the Maodeng pasture in Xilingol, in InnerMongolia, China. In this study, we aimed to evaluate (1) the differences in physicochemicalproperties in saline and sodic soil; (2) the effect of the physicochemical property differencesbetween saline and sodic soil on soil microbiota; (3) the potential function of changes insaline and sodic soil. The purpose of this study was to understand the differences betweensalinization and alkalinization and provide a direction for improving soil quality.
2. Materials and Methods2.1. Sampling Sites and Collection
The climate of Inner Mongolia is that of an arid and semi-arid monsoon [28]. As partof the great Euro-Asian grassland, the main management of the Inner Mongolia steppeis agricultural and animal husbandry [29]. Climate change and overgrazing aggravatedrought and plant degradation [30]. The experiment was carried out at the field stationlocated in the Maodeng pasture (Research Station of Animal Ecology, Institute of Zoology,CAS, 44◦11′ N, 116◦27′ E), located in the Xilingol League of Inner Mongolia. The meanannual temperature of the Xilingol League is 2.76 °C, and the mean annual precipitation is253.86 mm [31].
All the saline–alkaline spots’ soil samples were collected randomly at 12 sites usinguniform sampling. Each site used a 1 m × 1 m quadrilateral frame (five subsamples persite) and each subsample was driven into the soil at 20 cm with a drill. Stones and residue

Agriculture 2022, 12, 782 3 of 17
were removed from five subsamples before they were mixed as a site soil sample. Eachfresh soil sample was divided into two parts, one of which was sifted using a 2 mm meshscreen and air-dried for physicochemical property measurement. The other part was siftedusing a 0.15 mm mesh screen and stored at −80 ◦C for DNA extraction.
2.2. Analysis of Soil Physicochemical Properties
Electrical conductivity (EC) was used as the indicator of soil salinity in this study. Thebasic soil physicochemical properties (including pH, EC, C/N ratio, exchangeable sodium,and cation exchange capacity (CEC)) and soil ions (including K, Ca, Na, Mg, Fe, Al, Sr,and Si) were measured and analyzed. Briefly, elements in soil and exchangeable sodiumwere analyzed using ICP-OES (Prodigy, Leeman, WI, USA). CEC was analyzed using theammonium acetate method [32]. Exchangeable sodium percentage (ESP, %) was calculatedby the date of exchangeable sodium and CEC (Table S1) [33]. pH and EC were measuredusing water extracts (pH, 1:5 w/v; EC, 1:2.5 w/v) after suspension for 30 min (ORION-STARA215, Thermo Fisher Scientific, Waltham, MA, USA). The C/N ratio was analyzed usingElemental Analyzer (Vario Macro Cube, Elemental, Germany).
2.3. DNA Extraction
Genomic DNA from the soil sample was extracted using a MoBio PowerSoil kit(MoBio Laboratories, Carlsbad, CA, USA) according to the manufacturer’s instructions.The DNA concentration was detected using a NanoDrop ND-2000 spectrophotometer(NaonoDrop Technologie, Wilmington, DE, USA). The DNA quality was detected using1% (w/v) agarose gel electrophoresis. Each final DNA sample was mixed with the samevolume from triplicate samples, avoiding bias in sampling and extraction. All the DNAwas stored at −20 ◦C until further PCR amplification.
2.4. PCR Amplification
PCR amplifications targeting the V3–V4 region of archaeal 16S rRNA genes wereperformed in all samples using primers 524-10-ext (5′-TGYCAGCCGCCGCGGTAA-3′) andarch958RmodR (5′-YCCGGCGTTGAVTCCAATT-3′) [34]. PCR amplifications targetingthe V3–V4 region of bacterial 16S rRNA genes were performed for all samples using primers338F (5′-ACTCCTACGGGAGGCAGCAG-3′) and 806R (5′-GGACTACHVGGGTWTCTAAT-3′) [35]. PCR amplifications targeting the ITS region of fungal genes were performedfor all samples using primers ITS3F (5′-CTTGGTCATTTAGAGGAAGTAA-3′) and ITS3R(5′-GCTGCGTTCTTCATCG ATGC-3′) [36].
PCR was performed in a 20 µL mixture volume containing 10× Buffer 2.0 µL (TAKARA,Tokyo, Japan), 2.5×mM dNTPs 2.0 µL (TAKARA, Tokyo, Japan), 10× each primer (5 µM)0.8 µL, 10× rTaq Polymerase 0.2 µL (TAKARA, Tokyo, Japan), BSA 0.2 µL and DNA tem-plate 10 ng, and 14.8 µL ddH2O. PCR was performed with the following program: 95 ◦Cfor 3 min, 35 cycles of 95 ◦C for 30 s, 55 ◦C for 30 s, and 72 ◦C for 45 s, followed by 72 ◦Cfor 10 min. PCR of each sample was performed in triplicate and the PCR products weremixed to minimize the impact of potential early-round PCR errors [37]. All PCR productswere detected using 1% (w/v) agarose gels. Then, PCR products were purified using theAxyPrep DNA Gel Extraction Kit (Axygen Biosciences, Union City, CA, USA), according tothe manufacturer’s protocol. The PCR products were quantified using a QuantiFluorTM-ST(Promega, Madison, WI, USA). Purified PCR productions were sent to Shanghai MajorbioBio-Pharm Biotechnology Co. Ltd. (Shanghai, China) for sequencing.
2.5. Sequencing Analysis
The obtained raw sequence reads from each sample were processed and analyzedusing the Quantitative Insights Into Microbial Ecology (QIIME) Pipeline (http://qiime.org/index.html (accessed on 26 March 2022)) [38]. Briefly, low-quality reads with a quality scorebelow 20 and containing an ambiguous base (“N”) were filtered using Trimmomatic [39].Chimeric reads were checked and discarded using UCHIME [40]. Obtained high-quality

Agriculture 2022, 12, 782 4 of 17
paired-end reads were merged into sequences using Fast Length Adjustment of Short reads(FLASH) (Version 1.2.11) [41]. Sequences were clustered into operational taxonomic units(OTUs) based on a 97% identity threshold using USEARCH (Version 7.0) [42]. Bacterialand archaeal sequences from OTUs were selected to compare to SILVA sequence databasereference alignment for taxonomic assignment (Version 132). Fungal sequences from OTUswere classified against the UNITE sequence database (Version 8.0).
2.6. Statistical Analyses
After the raw sequences were quality-filtered and merged, alpha diversity indices ofobserved OTUs, Shannon index, Chao 1 estimator, and the Good’s coverage were estimatedby the calculation of Mothur (v 1.30.1) [43]. The normal distribution of the soil physico-chemical properties and the alpha diversity of the microbial community were tested byqq plot and Shapiro–Wilk normality test using the “shapiro. test()” function in package“car” by R (Version 3.3.1). A T-test was used to determine the significance of different soilsamples. A Venn diagram was used to evaluate the differences and overlap in the microbialcommunities of soil samples. Redundancy analysis (RDA) was conducted to explore theassociation between the physicochemical properties and microbial communities of soilusing the package “vegan” in R. Linear discriminant analysis (LDA) was used to identifythe abundance difference at the genera level using the online LEfSe program [44]. Based onthe Bray–Curtis distance matrix, principal coordinates analysis (PCoA) was used to assessthe beta diversity of microbial community structures among the different soil samples, andpermutational multivariate analysis of variance (PERMANOVA) was used to determine thesignificant differences in the groups using the “vegan” package in R. Pairwise comparisonsof soil physicochemical properties were performed using Spearman’s correlation coeffi-cients. The Mantel test was used to confirm the influence of the physicochemical propertiesof soil on microbial community structures using the “vegan” package. The Mantel testwas also used to calculate the correlation between environmental factors of soil and therelative abundance of microbial communities with the package “linkET”. Rare communi-ties were considered as the microbial communities with relative abundance less than 0.1%(<0.1%). Phylogenetic Investigation of Communities by Reconstruction of UnobservedStates (PICRUSt) was conducted to predict the metabolic functions of archaeal and bacterialcommunities based on the 16S rRNA gene, and FUNGuild was used to annotate fungalmetabolic functions [45,46]. Correlations between the soil physicochemical properties andmicrobial community were analyzed using Pearson’s correlation in packages “psych” and“rewshape2” in R.
3. Results3.1. Differences in Soil Physicochemical Properties
According to the value of ESP and EC, the soil samples were divided into two cat-egories: saline soil (ESP < 15%, EC < 4 dS/m) and sodic soil (ESP > 15%, EC < 4 dS/m)(Figure 1A). The physicochemical properties of the two soil categories were significantlydifferent (Figure 1). The basic physicochemical properties of sodic soil samples, includ-ing ESP, EC, pH, and C/N were significantly higher than those in saline soil samples(p < 0.05), especially ESP. The average values of ESP in saline and sodic soil were 3.61% and23.03% (Figure 1A). K content in saline soil showed no significant difference from sodicsoil (Figure 1C). The content of each element in the saline and sodic soil samples showed asignificant change (Figure 1B). Na content was significantly higher in sodic soil samples(average content, 195.23 mg/kg) (Figure 1B). The Ca, Mg, Fe, Al, Sr, and Si content in salinesoil were lower than in sodic soil samples (Figure 1C).
3.2. Sequencing Data and Alpha Diversity of Saline and Sodic Soil
In total, we obtained 571,307 high-quality archaeal 16S rDNA gene sequences,558,900 bacterial 16S rDNA gene sequences, and 695,347 fungal ITS region sequences(Table S2). After normalization, 29,897 archaeal 16S rDNA gene sequences were clustered

Agriculture 2022, 12, 782 5 of 17
into 190 OTUs based on a 97% identity threshold, 22,466 bacterial 16S rDNA gene sequenceswere clustered into 3295 OTUs, and 37,523 fungal ITS region sequences were clustered into1659 OTUs. The Good’s coverage ranged from 0.9759 to 0.9999, which indicated that thesequencing depth was sufficient to describe the microbial composition accurately (Table S3).The alpha diversity of the bacterial community was higher than that of archaea and fungi,and all the bacterial diversity indexes in saline soil were higher than in sodic soil (Table 1).The observed OTUs of the archaeal community in sodic soil samples were significantlyhigher than those in saline soil samples (t-test, p < 0.05). Chao 1 estimator values of thearchaeal and fungal communities in sodic soil samples were significantly higher than thosein saline soil samples (t-test, p < 0.05), but the Shannon index of the bacterial community insodic soil samples was significantly lower than that in saline soil samples (t-test, p < 0.05).
Agriculture 2022, 12, x FOR PEER REVIEW 5 of 18
(average content, 195.23 mg/kg) (Figure 1B). The Ca, Mg, Fe, Al, Sr, and Si content in saline soil were lower than in sodic soil samples (Figure 1C).
3.2. Sequencing Data and Alpha Diversity of Saline and Sodic Soil In total, we obtained 571,307 high-quality archaeal 16S rDNA gene sequences,
558,900 bacterial 16S rDNA gene sequences, and 695,347 fungal ITS region sequences (Table S2). After normalization, 29,897 archaeal 16S rDNA gene sequences were clustered into 190 OTUs based on a 97% identity threshold, 22,466 bacterial 16S rDNA gene se-quences were clustered into 3295 OTUs, and 37,523 fungal ITS region sequences were clustered into 1659 OTUs. The Good’s coverage ranged from 0.9759 to 0.9999, which indi-cated that the sequencing depth was sufficient to describe the microbial composition ac-curately (Table S3). The alpha diversity of the bacterial community was higher than that of archaea and fungi, and all the bacterial diversity indexes in saline soil were higher than in sodic soil (Table 1). The observed OTUs of the archaeal community in sodic soil samples were significantly higher than those in saline soil samples (t-test, p < 0.05). Chao 1 estima-tor values of the archaeal and fungal communities in sodic soil samples were significantly higher than those in saline soil samples (t-test, p < 0.05), but the Shannon index of the bacterial community in sodic soil samples was significantly lower than that in saline soil samples (t-test, p < 0.05).
Figure 1. (A) Basic physicochemical properties of soil samples (t-test, p < 0.05). (B) Soil content of metal elements. (C) differences in saline and sodic soil (t-test, p < 0.05).
3.3. Beta Diversity of Saline and Sodic Soil Venn diagrams revealed that the bacterial microbial community possessed the high-
est number of shared and unique OTUs (Figure 2A). The numbers of unique OTUs in the archaeal and bacterial communities of saline soil were higher than in sodic soil, while the numbers of unique OTUs of the fungal community in saline soil were lower than in sodic soil samples. Further analysis revealed that the unique OTUs in the archaeal communities
Figure 1. (A) Basic physicochemical properties of soil samples (t-test, p < 0.05). (B) Soil content ofmetal elements. (C) differences in saline and sodic soil (t-test, p < 0.05).
Table 1. Comparison of alpha diversity between saline soil and sodic soil samples.
Sample Classifications Observed OTUs Chao 1 Estimator Shannon Index
ArchaeaSaline soil 52 ± 14 a 64 ± 24 a 2.16 ± 0.14 aSodic soil 74 ± 11 b 90 ± 20 b 2.04 ± 0.12 a
BacteriaSaline soil 1780 ± 104 a 2227 ± 142 a 6.18 ± 0.09 aSodic soil 1634 ± 204 a 2073 ± 252 a 5.91 ± 0.29 b
FungiSaline soil 585 ± 76 a 118 ± 48 a 3.74 ± 0.83 aSodic soil 444 ± 16 a 193 ± 30 b 3.82 ± 0.57 a
Values in this table indicate the means ± SD of each index. Different letters within the same column representsignificant differences across seasonal groups (t-test, p < 0.05).
Agriculture 2022, 12, 782 6 of 17
3.3. Beta Diversity of Saline and Sodic Soil
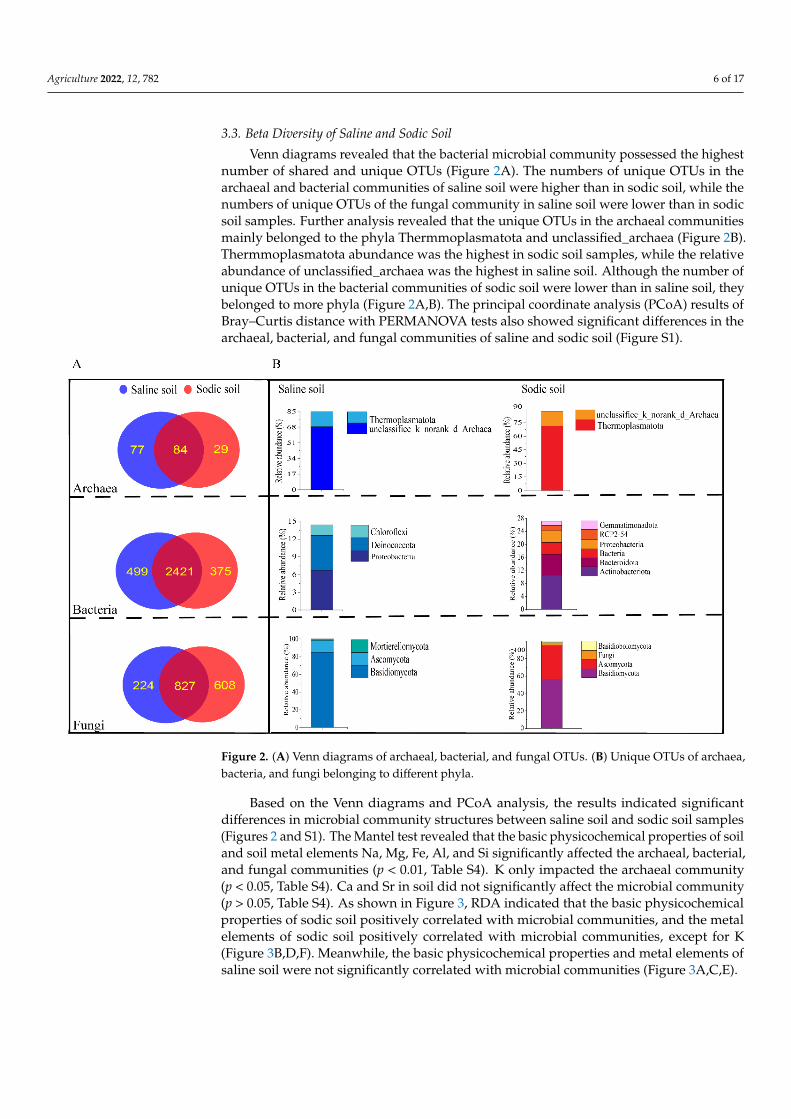
Venn diagrams revealed that the bacterial microbial community possessed the highestnumber of shared and unique OTUs (Figure 2A). The numbers of unique OTUs in thearchaeal and bacterial communities of saline soil were higher than in sodic soil, while thenumbers of unique OTUs of the fungal community in saline soil were lower than in sodicsoil samples. Further analysis revealed that the unique OTUs in the archaeal communitiesmainly belonged to the phyla Thermmoplasmatota and unclassified_archaea (Figure 2B).Thermmoplasmatota abundance was the highest in sodic soil samples, while the relativeabundance of unclassified_archaea was the highest in saline soil. Although the number ofunique OTUs in the bacterial communities of sodic soil were lower than in saline soil, theybelonged to more phyla (Figure 2A,B). The principal coordinate analysis (PCoA) results ofBray–Curtis distance with PERMANOVA tests also showed significant differences in thearchaeal, bacterial, and fungal communities of saline and sodic soil (Figure S1).
Agriculture 2022, 12, x FOR PEER REVIEW 7 of 18
Figure 2. (A) Venn diagrams of archaeal, bacterial, and fungal OTUs. (B) Unique OTUs of archaea, bacteria, and fungi belonging to different phyla.
Figure 2. (A) Venn diagrams of archaeal, bacterial, and fungal OTUs. (B) Unique OTUs of archaea,bacteria, and fungi belonging to different phyla.
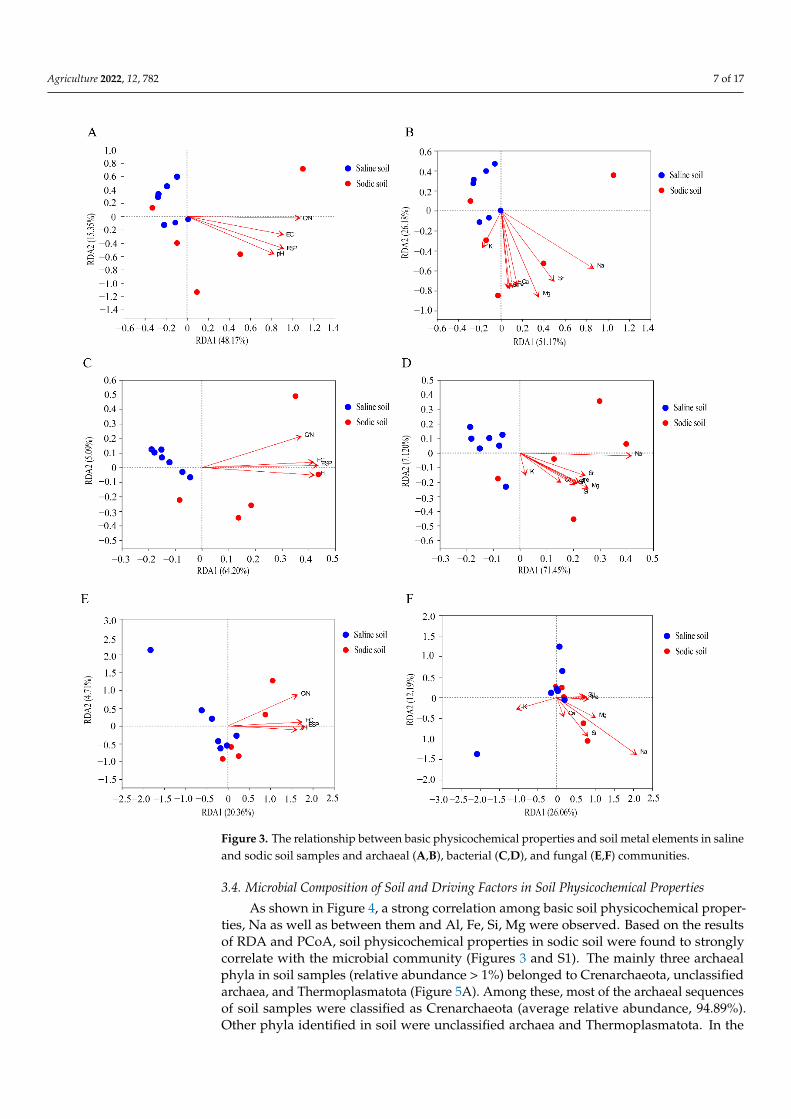
Based on the Venn diagrams and PCoA analysis, the results indicated significantdifferences in microbial community structures between saline soil and sodic soil samples(Figures 2 and S1). The Mantel test revealed that the basic physicochemical properties of soiland soil metal elements Na, Mg, Fe, Al, and Si significantly affected the archaeal, bacterial,and fungal communities (p < 0.01, Table S4). K only impacted the archaeal community(p < 0.05, Table S4). Ca and Sr in soil did not significantly affect the microbial community(p > 0.05, Table S4). As shown in Figure 3, RDA indicated that the basic physicochemicalproperties of sodic soil positively correlated with microbial communities, and the metalelements of sodic soil positively correlated with microbial communities, except for K(Figure 3B,D,F). Meanwhile, the basic physicochemical properties and metal elements ofsaline soil were not significantly correlated with microbial communities (Figure 3A,C,E).
Agriculture 2022, 12, 782 7 of 17Agriculture 2022, 12, x FOR PEER REVIEW 8 of 18
Figure 3. The relationship between basic physicochemical properties and soil metal elements in sa-line and sodic soil samples and archaeal (A and B), bacterial (C and D), and fungal (E and F) com-munities.
3.4. Microbial Composition of Soil and Driving Factors in Soil Physicochemical Properties As shown in Figure 4, a strong correlation among basic soil physicochemical proper-
ties, Na as well as between them and Al, Fe, Si, Mg were observed. Based on the results of RDA and PCoA, soil physicochemical properties in sodic soil were found to strongly cor-relate with the microbial community (Figures 3 and Figures S1). The mainly three archaeal phyla in soil samples (relative abundance > 1%) belonged to Crenarchaeota, unclassified archaea, and Thermoplasmatota (Figure 5A). Among these, most of the archaeal se-quences of soil samples were classified as Crenarchaeota (average relative abundance,
Figure 3. The relationship between basic physicochemical properties and soil metal elements in salineand sodic soil samples and archaeal (A,B), bacterial (C,D), and fungal (E,F) communities.
3.4. Microbial Composition of Soil and Driving Factors in Soil Physicochemical Properties
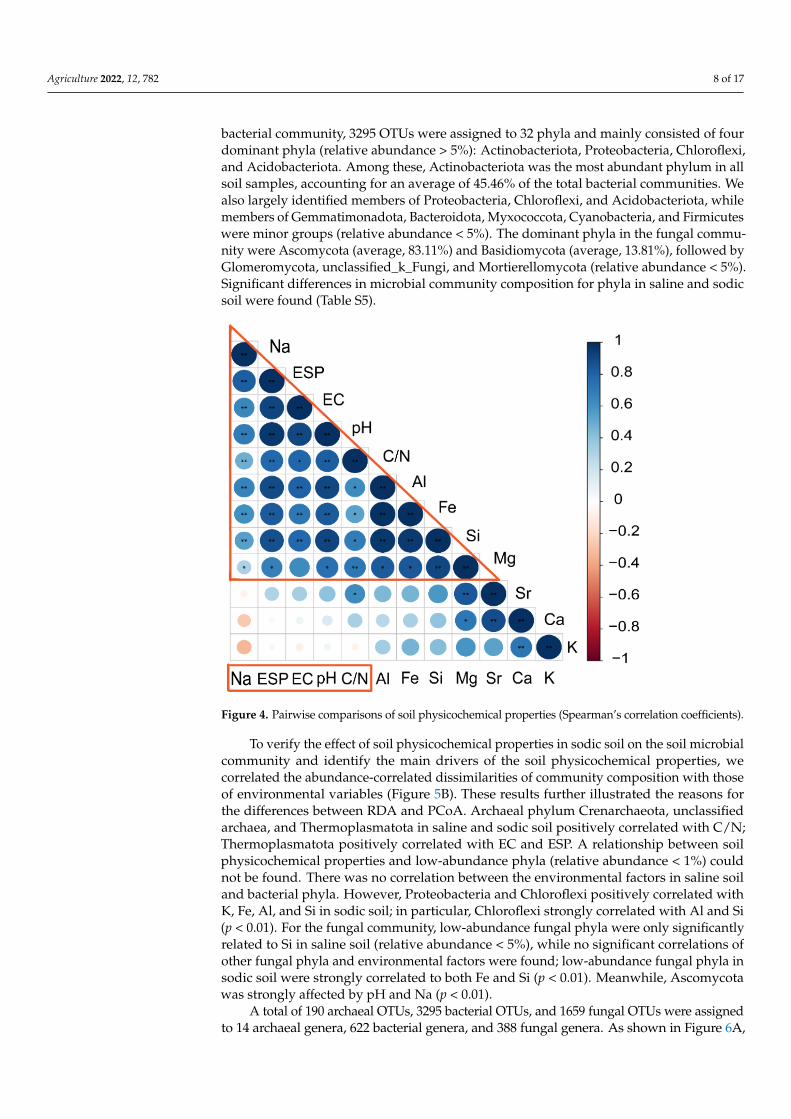
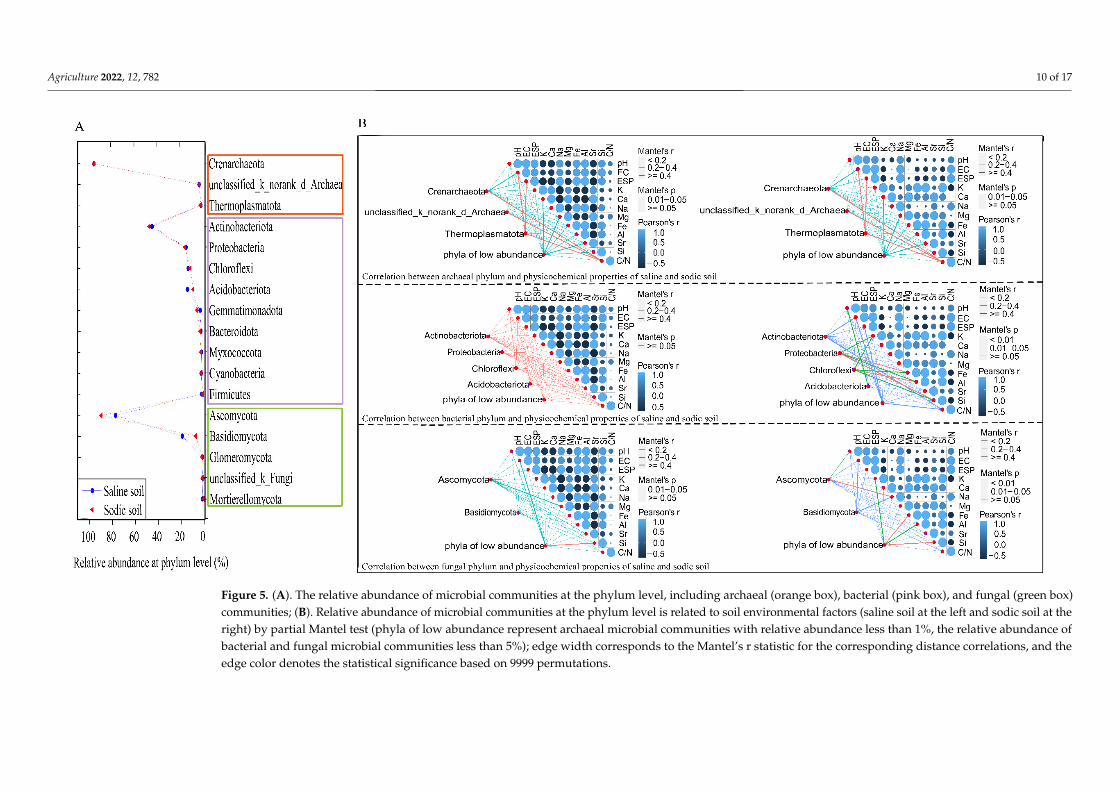
As shown in Figure 4, a strong correlation among basic soil physicochemical proper-ties, Na as well as between them and Al, Fe, Si, Mg were observed. Based on the resultsof RDA and PCoA, soil physicochemical properties in sodic soil were found to stronglycorrelate with the microbial community (Figures 3 and S1). The mainly three archaealphyla in soil samples (relative abundance > 1%) belonged to Crenarchaeota, unclassifiedarchaea, and Thermoplasmatota (Figure 5A). Among these, most of the archaeal sequencesof soil samples were classified as Crenarchaeota (average relative abundance, 94.89%).Other phyla identified in soil were unclassified archaea and Thermoplasmatota. In the
Agriculture 2022, 12, 782 8 of 17
bacterial community, 3295 OTUs were assigned to 32 phyla and mainly consisted of fourdominant phyla (relative abundance > 5%): Actinobacteriota, Proteobacteria, Chloroflexi,and Acidobacteriota. Among these, Actinobacteriota was the most abundant phylum in allsoil samples, accounting for an average of 45.46% of the total bacterial communities. Wealso largely identified members of Proteobacteria, Chloroflexi, and Acidobacteriota, whilemembers of Gemmatimonadota, Bacteroidota, Myxococcota, Cyanobacteria, and Firmicuteswere minor groups (relative abundance < 5%). The dominant phyla in the fungal commu-nity were Ascomycota (average, 83.11%) and Basidiomycota (average, 13.81%), followed byGlomeromycota, unclassified_k_Fungi, and Mortierellomycota (relative abundance < 5%).Significant differences in microbial community composition for phyla in saline and sodicsoil were found (Table S5).
Agriculture 2022, 12, x FOR PEER REVIEW 9 of 18
94.89%). Other phyla identified in soil were unclassified archaea and Thermoplasmatota. In the bacterial community, 3295 OTUs were assigned to 32 phyla and mainly consisted of four dominant phyla (relative abundance > 5%): Actinobacteriota, Proteobacteria, Chloroflexi, and Acidobacteriota. Among these, Actinobacteriota was the most abundant phylum in all soil samples, accounting for an average of 45.46% of the total bacterial com-munities. We also largely identified members of Proteobacteria, Chloroflexi, and Acido-bacteriota, while members of Gemmatimonadota, Bacteroidota, Myxococcota, Cyanobac-teria, and Firmicutes were minor groups (relative abundance < 5%). The dominant phyla in the fungal community were Ascomycota (average, 83.11%) and Basidiomycota (aver-age, 13.81%), followed by Glomeromycota, unclassified_k_Fungi, and Mortierellomycota (relative abundance < 5%). Significant differences in microbial community composition for phyla in saline and sodic soil were found (Table S5).
Figure 4. Pairwise comparisons of soil physicochemical properties (Spearman’s correlation coeffi-cients).
To verify the effect of soil physicochemical properties in sodic soil on the soil micro-bial community and identify the main drivers of the soil physicochemical properties, we correlated the abundance-correlated dissimilarities of community composition with those of environmental variables (Figure 5B). These results further illustrated the reasons for the differences between RDA and PCoA. Archaeal phylum Crenarchaeota, unclassified ar-chaea, and Thermoplasmatota in saline and sodic soil positively correlated with C/N; Thermoplasmatota positively correlated with EC and ESP. A relationship between soil physicochemical properties and low-abundance phyla (relative abundance < 1%) could not be found. There was no correlation between the environmental factors in saline soil and bacterial phyla. However, Proteobacteria and Chloroflexi positively correlated with K, Fe, Al, and Si in sodic soil; in particular, Chloroflexi strongly correlated with Al and Si (p < 0.01). For the fungal community, low-abundance fungal phyla were only significantly related to Si in saline soil (relative abundance < 5%), while no significant correlations of other fungal phyla and environmental factors were found; low-abundance fungal phyla in sodic soil were strongly correlated to both Fe and Si (p < 0.01). Meanwhile, Ascomycota was strongly affected by pH and Na (p < 0.01).
A total of 190 archaeal OTUs, 3295 bacterial OTUs, and 1659 fungal OTUs were as-signed to 14 archaeal genera, 622 bacterial genera, and 388 fungal genera. As shown in Figure 6A, the LefSe analysis revealed the representative microbiota at the genus level in saline soil and sodic soil, including three archaeal genera, 16 bacterial genera, and eight
Figure 4. Pairwise comparisons of soil physicochemical properties (Spearman’s correlation coefficients).
To verify the effect of soil physicochemical properties in sodic soil on the soil microbialcommunity and identify the main drivers of the soil physicochemical properties, wecorrelated the abundance-correlated dissimilarities of community composition with thoseof environmental variables (Figure 5B). These results further illustrated the reasons forthe differences between RDA and PCoA. Archaeal phylum Crenarchaeota, unclassifiedarchaea, and Thermoplasmatota in saline and sodic soil positively correlated with C/N;Thermoplasmatota positively correlated with EC and ESP. A relationship between soilphysicochemical properties and low-abundance phyla (relative abundance < 1%) couldnot be found. There was no correlation between the environmental factors in saline soiland bacterial phyla. However, Proteobacteria and Chloroflexi positively correlated withK, Fe, Al, and Si in sodic soil; in particular, Chloroflexi strongly correlated with Al and Si(p < 0.01). For the fungal community, low-abundance fungal phyla were only significantlyrelated to Si in saline soil (relative abundance < 5%), while no significant correlations ofother fungal phyla and environmental factors were found; low-abundance fungal phyla insodic soil were strongly correlated to both Fe and Si (p < 0.01). Meanwhile, Ascomycotawas strongly affected by pH and Na (p < 0.01).
A total of 190 archaeal OTUs, 3295 bacterial OTUs, and 1659 fungal OTUs were assignedto 14 archaeal genera, 622 bacterial genera, and 388 fungal genera. As shown in Figure 6A,

Agriculture 2022, 12, 782 9 of 17
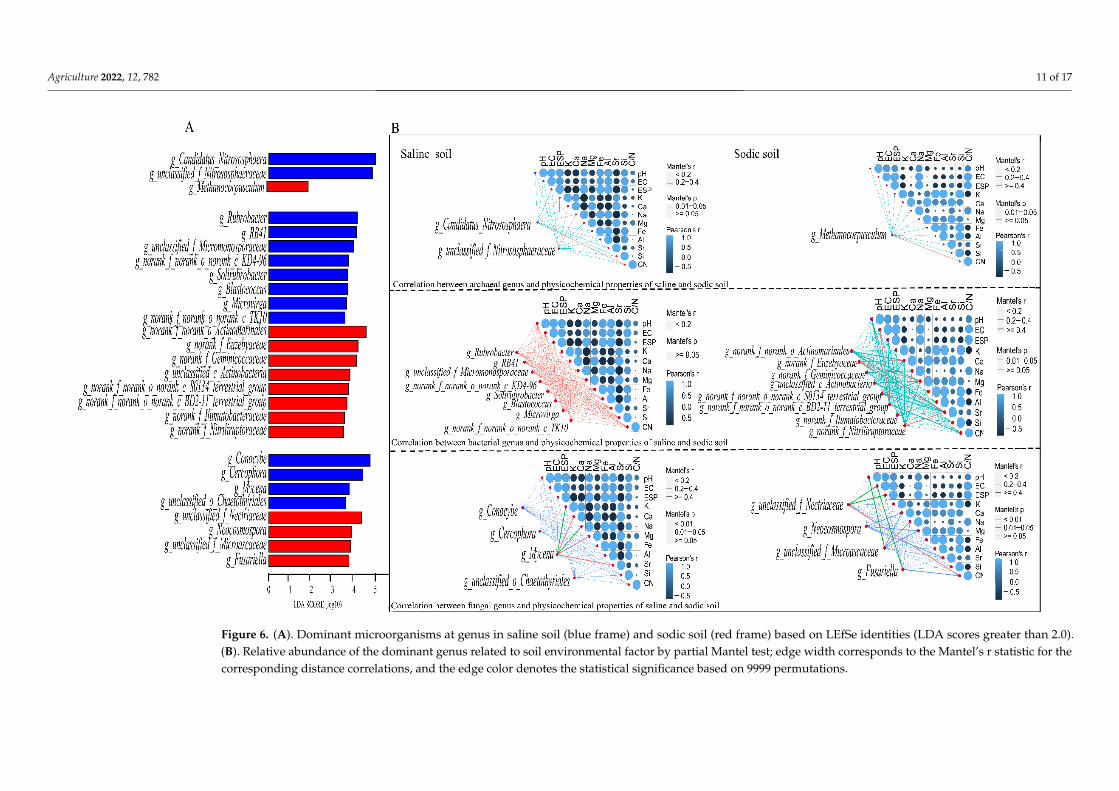
the LefSe analysis revealed the representative microbiota at the genus level in saline soil andsodic soil, including three archaeal genera, 16 bacterial genera, and eight fungal genera. Inthe archaeal genera, both g_Candidatus_Nitrocosmicus in saline soil and g_Methanocorpusculumin sodic soil significantly correlated with C/N (Figure 6B). A correlation between all theenvironmental factors of saline soil and bacterial communities at the genus level was notfound. Bacterial genus g_norank_f_norank_o_norank_c_S0134_terrestrial_group was stronglycorrelated with pH and EC in sodic soil, while g_norank_f_Euzebyaceae was strongly correlatedwith Ca, Mg, and Sr. Meanwhile, fungal genus g_Mycena was significantly correlated with Ca,Mg, and Sr in saline soil. In sodic soil, the fungal genus g_unclassified_f_Nectriaceae significantlycorrelated with EC, ESP, and C/N. g_unclassified_f_Microascaceae significantly correlated withpH (p < 0.01), and g_Fusarium was significantly correlated with EC (p < 0.01).
3.5. The Effect of Soil Physicochemical Properties on Functional Prediction of Microbiota
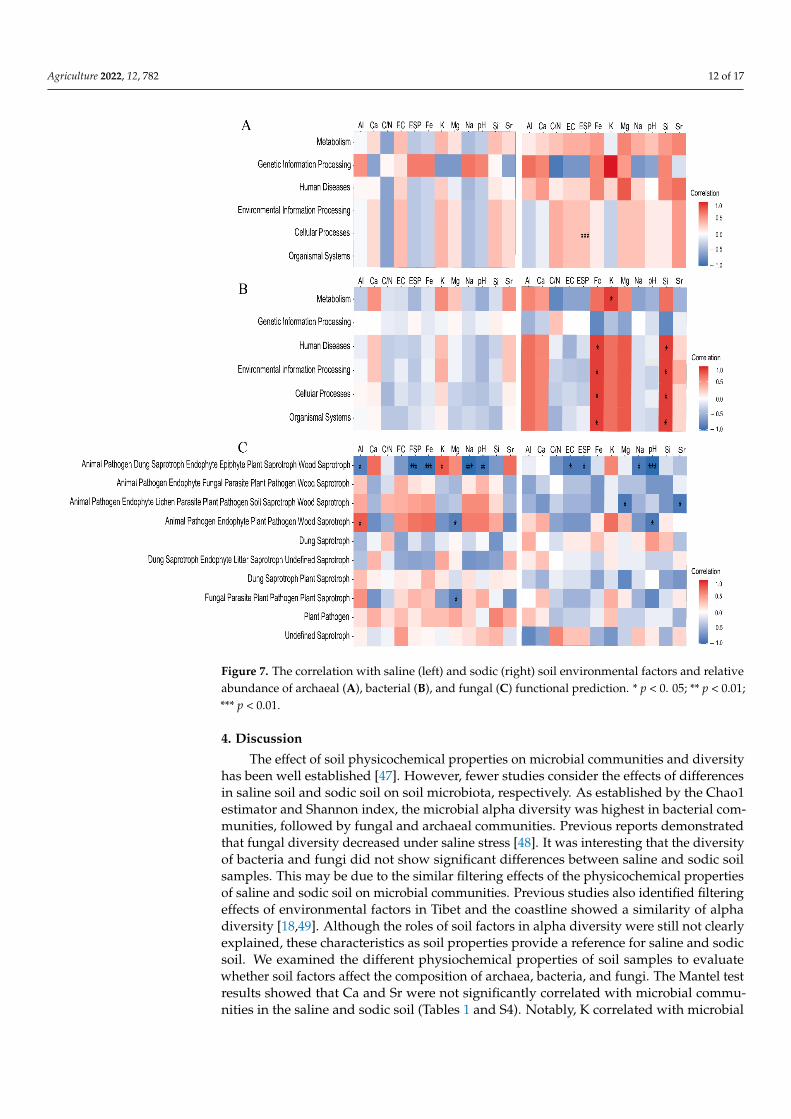
To gain further insight into the ecological role of soil environmental factors in microbialfunctions in soil, PICRUSt and FUNGulid were used to assess the relationships betweensoil physicochemical properties and bacterial and fungal metabolic pathways. In Figure 7,the left and the right of the three figures show the functional correlations with salinesoil and sodic soil environmental factors and the relative abundance of soil microbiota,respectively. For the archaeal functional pathways, cellular processes positively correlatedwith ESP in sodic soil samples (Figure 7A). Bacterial metabolic pathways strongly positivelycorrelated with Fe and Si in sodic soil samples, except for genetic information processing,whereas bacterial metabolism only positively correlated with K (Figure 7B). There were nosignificant correlations between the physicochemical properties of saline soil and archaealand bacterial metabolic pathways (Figure 7). For the fungal functional metabolic pathways,“Fungal Parasite Plant Pathogen Saprotroph” negatively correlated with Mg in saline soil(Figure 7C). “Animal Pathogen Endophyte Plant Pathogen Wood Saprotroph” in salinesoil negatively correlated with Mg, but it negatively correlated with pH in sodic soil.Only “Animal Pathogen Endophyte Plant Pathogen Wood Saprotroph” was positivelycorrelated with Al in saline soil. “Animal Pathogen Endophyte Lichen Parasite PlantPathogen Soil Saprotroph-Wood Saprotroph” negatively correlated with Mg and Sr insodic soil. “Animal Pathogen-Dung Saprotroph-Endophyte-Epiphyte-Plant Saprotroph-Wood Saprotroph” negatively correlated with ESP, Na, and pH in saline and sodic soil(Figure 7C). “Animal Pathogen-Dung Saprotroph-Endophyte-Epiphyte-Plant Saprotroph-Wood Saprotroph” negatively correlated with Al and Fe in saline soil, but positivelycorrelated with K. In total, the differences in correlation with fungal functions and differentsoil properties showed that both saline and sodic soil affected fungal functions. “AnimalPathogen-Dung Saprotroph-Endophyte-Epiphyte-Plant Saprotroph-Wood Saprotroph” inthe fungal function was more negatively correlated with soil physicochemical properties.
Agriculture 2022, 12, 782 10 of 17
Agriculture 2022, 12, x FOR PEER REVIEW 11 of 18
1 Figure 5. (A). The relative abundance of microbial communities at the phylum level, including archaeal (orange box), bacterial (pink box), and fungal (green box) 2 communities; (B). Relative abundance of microbial communities at the phylum level is related to soil environmental factors (saline soil at the left and sodic soil at 3 the right) by partial Mantel test (phyla of low abundance represent archaeal microbial communities with relative abundance less than 1%, the relative abundance 4 of bacterial and fungal microbial communities less than 5%); edge width corresponds to the Mantel’s r statistic for the corresponding distance correlations, and 5 the edge color denotes the statistical significance based on 9999 permutations. 6
Figure 5. (A). The relative abundance of microbial communities at the phylum level, including archaeal (orange box), bacterial (pink box), and fungal (green box)communities; (B). Relative abundance of microbial communities at the phylum level is related to soil environmental factors (saline soil at the left and sodic soil at theright) by partial Mantel test (phyla of low abundance represent archaeal microbial communities with relative abundance less than 1%, the relative abundance ofbacterial and fungal microbial communities less than 5%); edge width corresponds to the Mantel’s r statistic for the corresponding distance correlations, and theedge color denotes the statistical significance based on 9999 permutations.
Agriculture 2022, 12, 782 11 of 17Agriculture 2022, 12, x FOR PEER REVIEW 12 of 18
7 Figure 6. (A). Dominant microorganisms at genus in saline soil (blue frame) and sodic soil (red frame) based on LEfSe identities (LDA scores greater than 2.0). 8 (B). Relative abundance of the dominant genus related to soil environmental factor by partial Mantel test; edge width corresponds to the Mantel’s r statistic for 9 the corresponding distance correlations, and the edge color denotes the statistical significance based on 9999 permutations. 10
Figure 6. (A). Dominant microorganisms at genus in saline soil (blue frame) and sodic soil (red frame) based on LEfSe identities (LDA scores greater than 2.0).(B). Relative abundance of the dominant genus related to soil environmental factor by partial Mantel test; edge width corresponds to the Mantel’s r statistic for thecorresponding distance correlations, and the edge color denotes the statistical significance based on 9999 permutations.
Agriculture 2022, 12, 782 12 of 17
Agriculture 2022, 12, x FOR PEER REVIEW 13 of 18
Figure 7. The correlation with saline (left) and sodic (right) soil environmental factors and relative abundance of archaeal (A), bacterial (B), and fungal (C) functional prediction. * p < 0. 05; ** p < 0.01; *** p < 0.01.
4. Discussion The effect of soil physicochemical properties on microbial communities and diversity
has been well established [47]. However, fewer studies consider the effects of differences in saline soil and sodic soil on soil microbiota, respectively. As established by the Chao1 estimator and Shannon index, the microbial alpha diversity was highest in bacterial com-munities, followed by fungal and archaeal communities. Previous reports demonstrated that fungal diversity decreased under saline stress [48]. It was interesting that the diversity of bacteria and fungi did not show significant differences between saline and sodic soil samples. This may be due to the similar filtering effects of the physicochemical properties of saline and sodic soil on microbial communities. Previous studies also identified filtering effects of environmental factors in Tibet and the coastline showed a similarity of alpha diversity [18,49]. Although the roles of soil factors in alpha diversity were still not clearly explained, these characteristics as soil properties provide a reference for saline and sodic soil. We examined the different physiochemical properties of soil samples to evaluate whether soil factors affect the composition of archaea, bacteria, and fungi. The Mantel test
Figure 7. The correlation with saline (left) and sodic (right) soil environmental factors and relativeabundance of archaeal (A), bacterial (B), and fungal (C) functional prediction. * p < 0. 05; ** p < 0.01;*** p < 0.01.
4. Discussion
The effect of soil physicochemical properties on microbial communities and diversityhas been well established [47]. However, fewer studies consider the effects of differencesin saline soil and sodic soil on soil microbiota, respectively. As established by the Chao1estimator and Shannon index, the microbial alpha diversity was highest in bacterial com-munities, followed by fungal and archaeal communities. Previous reports demonstratedthat fungal diversity decreased under saline stress [48]. It was interesting that the diversityof bacteria and fungi did not show significant differences between saline and sodic soilsamples. This may be due to the similar filtering effects of the physicochemical propertiesof saline and sodic soil on microbial communities. Previous studies also identified filteringeffects of environmental factors in Tibet and the coastline showed a similarity of alphadiversity [18,49]. Although the roles of soil factors in alpha diversity were still not clearlyexplained, these characteristics as soil properties provide a reference for saline and sodicsoil. We examined the different physiochemical properties of soil samples to evaluatewhether soil factors affect the composition of archaea, bacteria, and fungi. The Mantel testresults showed that Ca and Sr were not significantly correlated with microbial commu-nities in the saline and sodic soil (Tables 1 and S4). Notably, K correlated with microbial

Agriculture 2022, 12, 782 13 of 17
communities in the archaeal communities of saline and sodic soil but not in bacterial andfungal communities, suggesting a strong influence of K for the archaeal community.
Accumulating studies have revealed the tight correlations of soil physicochemicalproperties that can affect the microbial community [49–51], and our results indicated thatthe differences in saline soil and sodic soil might explain the distribution of microbialcommunity structures. Many studies have reported the effects of different salinities on thesoil microbial community [50,52]. It directly or indirectly affects the microbial communitystructure by filtering out those microbiota that are not adapted to a particular salineenvironment [53]. In this study, we found that the basic physicochemical properties in salinesoil were significantly lower than in sodic soil samples. This might result in a high numberof archaeal and bacterial unique OTUs in saline soil samples, which also indicates thatarchaea and bacteria have more stability and can adapt to a saline environment. However,unique OTUs were affected by differences in saline and sodic soil, e.g., Thermmoplasmatotashowed higher abundance in sodic soil, Basidiomycota was higher in saline soil, and ahigher abundance of Actinobacteria was observed in sodic soil (Figure 2B). Differencesin basic physicochemical properties also changed the microbial community structuresand distribution in soil. Clustering reflected a significant relationship between microbialcommunity structures and soil environmental factors. The results of PCoA, RDA, and LEfSedirectly showed and explained that the differences between saline and sodic soil shaped themicrobial community structures (Figure 3). It was noteworthy that the microbial communitystructures in sodic soil were significantly related to C/N and Na; this indicated that themicrobial communities in sodic soil were more sensitive than in saline soil environments.
According to the ESP and EC, saline–alkaline soil was classified as saline and sodicsoil [9]. The physicochemical property differences in saline and sodic soil exerted a sig-nificant influence on microbial community compositions. Crenarchaeota was the mostabundant archaeal phylum in all soil samples and was also prevalent in saline soil in thelake, mineral soil, and other saline soil [54,55]. Analysis of bacterial communities in differ-ent soil samples revealed that the most abundant phylum was Actinobacteria, followedby Proteobacteria and Chloroflexi (Figure 5A, Table S5). pH is generally considered anessential driving factor in microbial diversity and community composition, and previousstudies also indicated consistent results [23]. However, this study showed that pH wasnot a dominant limiting factor; the differences in physicochemical properties in saline andsodic soil played critical roles in driving archaeal, bacterial, and fungal communities. Wefound that the archaeal communities at the phylum and genus levels have a significantlypositive correlation with EC, ESP, and C/N. Thermoplasmatota positively correlated withEC and ESP. On the other hand, EC, ESP, and C/N might act as predictors as they playedan essential role in influencing archaeal community abundance and regulating adaptation.Compared with the archaeal community, bacterial and fungal communities have a moreevident correlation with soil physicochemical properties. Previous studies detected halo-tolerant bacteria affiliated with Proteobacteria, Bacteroidetes, and Actinobacteria [56,57].The relative abundance of Actinobacteria, Proteobacteria, and Bacteroidetes correlatedwith physicochemical properties in sodic soil. These bacterial phyla may act as potentialniche markers for microbial communities in sodic soil. There was no significant correlationbetween the bacterial community at the phylum and genus levels and the physicochemicalproperties of saline soil. This indicates that bacterial communities have a strong abilityto regulate and relieve the stress of saline soil. Fewer studies have focused on the effectsof pH on the fungal community, especially in sodic soil [58]. Importantly, Ascomycotaand Basidiomycota are the dominant fungal phyla in soil and are involved in degradingplant lignocellulose and maintaining soil aggregate stability [59]. In the present study, wefound a high abundance of Ascomycota in sodic soil that was strongly affected by pH andNa, which has not been found previously. Overall, our results support the findings ofother studies wherein the critical factors of differences in microbial composition were soilenvironmental factors [60]. Moreover, the results showed that, compared with Na and basicphysicochemical properties, the interaction contributions of other environmental factors
Agriculture 2022, 12, 782 14 of 17
were weaker, especially K (Figure 4). K is predominantly involved in balancing the osmosisof microbial cytoplasm in saline soil [61]. Accumulating Na content in saline–alkaline soilmay reduce the effectivity of other metal elements, such as K [62]. The high content of Nain the soil also affected the mobilities of other base cations [63]. Therefore, the findingsin this study further identified that K content had no significant difference in saline andsodic soil. Although salinity is an important determining factor in shaping the microbialcommunity in different environments, the physicochemical differences in saline and sodicsoil determined soil types and affected the microbial community and distribution. Thisfinding expands our understanding of the influence of differences in saline and sodic soilon microbial communities and might lead to innovations in soil improvement strategies inthe future.
In this study, the environmental stress of sodic soil significantly affected the cellularprocesses of archaeal function. Feng et al. evaluated the C/N cycle in the fungal communitythrough FUNGuild [25]. Notably, we found that Fe and Si in sodic soil were significantlycorrelated with most bacterial functions, which indicated that bacterial functions couldbe regulated by changes in soil environments. ESP, Na, and pH in saline and sodic soilwere negatively correlated with only a fungal pathway. Compared with bacterial functions,fungal functions at the phylum level showed higher tolerance and stability, indicating morepotential benefits in improving saline and sodic soil.
5. Conclusions
Our results demonstrated the differences in the microbial community in saline andsodic soil and revealed the main influencing factors. Based on the ESP and EC, soil sampleswere classified as saline and sodic soil. Environmental factors in sodic soil, including pH,ESP, EC, and C/N, were higher than in saline soil. The RDA and partial Mantel tests furthersuggested that the microbial community structures were significantly related to pH, EC,ESP, C/N, Na, and K in sodic soil, which were also the primary determinants affectingthe abundance of microbial communities. ESP mainly affected the cellular processes ofthe archaea in sodic soil. Metabolism in the bacterial metabolic pathway in sodic soilwas only positively correlated with K. Based on this, sodic soil more strongly altered themicrobial community structure. Our results shed light on the main factors in saline andsodic soil affecting microbial assemblages and the potential influence on the functions of themicrobial community, and more attention should be paid to the response of the microbialcommunity to increasingly saline and sodic soil environments in future studies, especiallyin grasslands.
Supplementary Materials: The following supporting information can be downloaded at: https://www.mdpi.com/article/10.3390/agriculture12060782/s1, Figure S1: PCoA analysis of archaeal(A), bacterial (B), and fungal (C) communities based on Bray–Curtis distance matrix; Table S1: Thedata of exchangeable sodium and cation exchange capacity; Table S2: Valid sequences of eachsample; Table S3: Comparison coverage and diversity estimators of the archaeal, bacterial, and fungalsequences after normalization; Table S4: Significance tests of the correlation between physicochemicalproperties and microbial community composition as shown by the Mantel tests; Table S5: Relativeabundance at phylum level in saline and sodic soil samples.
Author Contributions: Data curation, J.G.; formal analysis, J.G.; investigation, J.G.; validation, J.G.;visualization, J.G.; writing—original draft, J.G.; funding acquisition, Z.Y; project administration, Z.Y.;supervision, Z.Y.; resources, Z.Y.; writing—review and editing, Q.Z., D.C., F.N. and Z.Y. All authorshave read and agreed to the published version of the manuscript.
Funding: This work was supported by National Key Research and Development Program of China(No. 2018YFD0800403) and the National Natural Science Foundation of China (No. 21978287).
Institutional Review Board Statement: Not applicable.
Informed Consent Statement: Not applicable.
Agriculture 2022, 12, 782 15 of 17
Data Availability Statement: Sequence data obtained in this study are deposited in the NCBISequence Read Archive and are accessible under bioproject accession number PRJNA751210, withbiosample number SUB10121718 for archaea, and bioproject accession number PRJNA751157, withbiosample number SUB10121716 for bacteria, and bioproject accession number PRJNA751152, withbiosample number SUB10120359.
Acknowledgments: The authors also wish to thank the following people: Guoliang Li, for hisexcellent cooperation and agreement in allowing us to use the experimental field for the present study;Jianjun Chen and his group members, for their help during the experimental material collection.
Conflicts of Interest: The authors declare no conflict of interest.
References1. Zhang, Z.C.; Feng, S.C.; Luo, J.Q.; Hao, B.H.; Diao, F.W.; Li, X.; Jia, B.B.; Wang, L.X.; Bao, Z.H.; Guo, W. Evaluation of microbial
assemblages in various saline-alkaline soils driven by soluble salt ion components. J. Agric. Food Chem. 2021, 69, 3390–3400.[CrossRef] [PubMed]
2. Tripathi, S.; Kumari, S.; Chakraborty, A.; Gupta, A.; Chakrabarti, K.; Bandyapadhyay, B.K. Microbial biomass and its activities insalt-affected coastal soils. Biol. Fertil. Soils 2005, 42, 273–277. [CrossRef]
3. Shahid, S.A.; Zaman, M.; Heng, L. Soil salinity: Historical perspectives and a world overview of the problem. In Guideline forSalinity Assessment, Mitigation and Adaptation Using Nuclear and Related Techniques; Springer: New York, NY, USA, 2018; pp. 43–53.
4. Wicke, B.; Smeets, E.; Dornburg, V.; Vashev, B.; Gaiser, T.; Turkenburg, W.; Faaij, A. The global technical and economic potential ofbioenergy from salt-affected soils. Energy Environ. Sci. 2011, 4, 2669–2681. [CrossRef]
5. Bai, W. Sustainable Development of Animal Husbandry in Inner Mongolia. Master’s Thesis, Minzu University of China, Beijing,China, 2007.
6. Egamberdieva, D.; Kamilova, F.; Validov, S.; Gafurova, L.; Kucharova, Z.; Lugtenberg, B. High incidence of plant growth-stimulating bacteria associated with the rhizosphere of wheat grown on salinated soil in Uzbekistan. Environ. Microbiol. 2008, 10,1–9. [CrossRef] [PubMed]
7. Wang, J.Y.; Abdullah, I.; Xu, T.T.; Zhu, W.Y.; Gao, Y.; Wang, L. Effects of mowing disturbance and competition on spatial expansionof the clonal plant Leymus chinensis into saline-alkali soil patches. Environ. Exp. Bot. 2019, 168, 103890. [CrossRef]
8. Cheng, B.; Zhang, H.H. Information extraction of saline-alkali soil in the west of jilin province based on fully polarimetricsar-a case study in qian an county. In Proceedings of the 2nd International Conference on Computer Science and ApplicationEngineering of the Conference, Hohhot, China, 22–24 October 2018.
9. Allison, L.; Richards, L.A. Diagnosis and Improvement of Saline and Alkali Soils; Soil and Water Conservative Research Branch,Agricultural Research Service: Washington, DC, USA, 1954.
10. Chandra, N.; Kumar, S. Antibiotics producing soil microorganisms. In Antibiotics and Antibiotics Resistance Genes in Soils; Springer:New York, NY, USA, 2017; pp. 1–18.
11. Mataix-Solera, J.; Guerrero, C.; García-Orenes, F.; Bárcenas, G.M.; Torres, M.P. Forest fire effects on soil microbiology. In Fire Effectson Soils and Restoration Strategies; CRC Press: Boca Raton, FL, USA, 2009; pp. 149–192.
12. Rashid, M.I.; Mujawar, L.H.; Shahzad, T.; Almeelbi, T.; Ismail, I.M.I.; Oves, M. Bacteria and fungi can contribute to nutrientsbioavailability and aggregate formation in degraded soils. Microbiol. Res. 2016, 183, 26–41. [CrossRef]
13. Muñoz-Rojas, M.; Erickson, T.E.; Dixon, K.W.; Merritt, D.J. Soil quality indicators to assess functionality of restored soils indegraded semiarid ecosystems. Restor. Ecol. 2016, 24, S43–S52. [CrossRef]
14. Mendes, L.W.; Tsai, S.M.; Navarrete, A.A.; De Hollander, M.; Van Veen, J.A.; Kuramae, E.E. Soil-Borne Microbiome: LinkingDiversity to Function. Microb. Ecol. 2015, 70, 255–265. [CrossRef]
15. Wagg, C.; Bender, S.F.; Widmer, F.; van der Heijden, M.G.A. Soil biodiversity and soil community composition determineecosystem multifunctionality. Proc. Natl. Acad. Sci. USA 2014, 111, 5266–5270. [CrossRef]
16. Caton, T.M.; Witte, L.R.; Ngyuen, H.D.; Buchheim, J.A.; Schneegurt, M.A. Halotolerant Aerobic Heterotrophic Bacteria from theGreat Salt Plains of Oklahoma. Microb. Ecol. 2004, 48, 449–462. [CrossRef]
17. Hollister, E.B.; Engledow, A.S.; Hammett, A.J.M.; Provin, T.L.; Wilkinson, H.H.; Gentry, T.J. Shifts in microbial communitystructure along an ecological gradient of hypersaline soils and sediments. ISME J. 2010, 4, 829–838. [CrossRef] [PubMed]
18. Lozupone, C.A.; Knight, R. Global patterns in bacterial diversity. Proc. Natl. Acad. Sci. USA 2007, 104, 11436–11440. [CrossRef][PubMed]
19. Zhang, K.P.; Shi, Y.; Cui, X.Q.; Yue, P.; Li, K.H.; Liu, X.J.; Tripathi, B.M.; Chu, H.Y. Salinity Is a Key Determinant for Soil MicrobialCommunities in a Desert Ecosystem. mSystems 2019, 4, e00225-18. [CrossRef] [PubMed]
20. Banda, J.F.; Zhang, Q.; Ma, L.Q.; Pei, L.X.; Du, Z.R.; Hao, C.B.; Dong, H.L. Both pH and salinity shape the microbial communitiesof the lakes in Badain Jaran Desert, NW China. Sci. Total Environ. 2021, 791, 148108. [CrossRef] [PubMed]
21. Yang, C.; Sun, J. Soil Salinity Drives the Distribution Patterns and Ecological Functions of Fungi in Saline-Alkali Land in theYellow River Delta, China. Front. Microbiol. 2020, 11, 594284. [CrossRef] [PubMed]

Agriculture 2022, 12, 782 16 of 17
22. Andronov, E.E.; Petrova, S.N.; Pinaev, A.G.; Pershina, E.V.; Rakhimgaliyeva, S.Z.; Akhmedenov, K.M.; Gorobets, A.V.;Sergaliev, N.K. Analysis of the structure of microbial community in soils with different degrees of salinization using T-RFLP andreal-time PCR techniques. Eurasian Soil Sci. 2012, 45, 147–156. [CrossRef]
23. Zhao, S.; Liu, J.J.; Banerjee, S.; Zhou, N.; Zhao, Z.Y.; Zhang, K.; Tian, C.Y. Soil pH is equally important as salinity in shapingbacterial communities in saline soils under halophytic vegetation. Sci. Rep. 2018, 8, 4550. [CrossRef]
24. Dakouré, M.Y.S.; Mermoud, A.; Yacouba, H.; Boivin, P. Impacts of irrigation with industrial treated wastewater on soil properties.Geoderma 2013, 200–201, 31–39. [CrossRef]
25. Feng, H.J.; Wang, S.Y.; Gao, Z.D.; Wang, Z.K.; Ren, X.Q.; Hu, S.W.; Pan, H. Effect of land use on the composition of bacterial andfungal communities in saline-sodic soils. Land Degrad Dev. 2019, 30, 1851–1860. [CrossRef]
26. Rietz, D.N.; Haynes, R.J. Effects of irrigation-induced salinity and sodicity on soil microbial activity. Soil Biol. Biochem. 2003, 35,845–854. [CrossRef]
27. Yang, X.; Shen, Y.; Badgery, W.B.; Guo, Y.P.; Zhang, Y.J. Arbuscular mycorrhizal fungi alter plant community composition along agrazing gradient in Inner Mongolia Steppe. Basic Appl. Ecol. 2018, 32, 53–65. [CrossRef]
28. Yin, Y.; Liu, H.Y.; He, S.Y.; Zhao, F.J.; Zhu, J.L.; Wang, H.Y.; Liu, G.; Wu, X.C. Patterns of local and regional grain size distributionand their application to Holocene climate reconstruction in semi-arid Inner Mongolia, China. Palaeogeogr. Palaeoclim. Palaeoecol.2011, 307, 168–176. [CrossRef]
29. Miao, L.J.; Jiang, C.; Xue, B.L.; Liu, Q.; He, B.; Nath, R.; Cui, X.F. Vegetation dynamics and factor analysis in arid and semi-aridInner Mongolia. Environ. Earth Sci. 2014, 73, 2343–2352. [CrossRef]
30. Sun, G.N.; Wang, M.H. Study on relation and distribution between vegetative coverage and land degradation in Inner Mongolia.Arid Land Resour. Environ. 2008, 22, 140–144.
31. Cao, Y.P.; Pang, Y.J.; Pang, X.J. The characteristics of climate change in Xilingol league from 1956 to 2017. Agric. Res. Arid. Areas2019, 37, 284–290.
32. Luo, X.X.; Liu, G.C.; Xia, Y.; Chen, L.; Jiang, Z.X.; Zheng, H.; Wang, Z.Y. Use of biochar-compost to improve properties andproductivity of the degraded coastal soil in the Yellow River Delta, China. J. Soils Sediments 2016, 17, 780–789. [CrossRef]
33. Irvine, S.A.; Reid, D.J. Field prediction of sodicity in dryland agriculture in Central Queensland, Australia. Soil Res. 2001, 39,1349–1357. [CrossRef]
34. Liu, C.; Li, H.; Zhang, Y.Y.; Si, D.D.; Chen, Q.W. Evolution of microbial community along with increasing solid concentrationduring high-solids anaerobic digestion of sewage sludge. Bioresour. Technol. 2016, 216, 87–94. [CrossRef]
35. Xu, N.; Tan, G.C.; Wang, H.Y.; Gai, X.P. Effect of biochar additions to soil on nitrogen leaching, microbial biomass and bacterialcommunity structure. Eur. J. Soil Biol. 2016, 74, 1–8. [CrossRef]
36. Adams, R.I.; Miletto, M.; Taylor, J.W.; Bruns, T.D. Dispersal in microbes: Fungi in indoor air are dominated by outdoor air andshow dispersal limitation at short distances. ISME J. 2013, 7, 1262–1273. [CrossRef]
37. Eren, A.M.; Sogin, M.L.; Morrison, H.G.; Vineis, J.H.; Fisher, J.C.; Newton, R.J.; McLellan, S.L. A single genus in the gutmicrobiome reflects host preference and specificity. ISME J. 2015, 9, 90–100. [CrossRef] [PubMed]
38. Caporaso, J.G.; Kuczynski, J.; Stombaugh, J.; Bittinger, K.; Bushman, F.D.; Costello, E.K.; Fierer, N.; Pena, A.G.; Goodrich, J.K.;Gordon, J.I.; et al. QIIME allows analysis of high-throughput community sequencing data. Nat. Methods 2010, 7, 335–336.[CrossRef] [PubMed]
39. Bolger, A.M.; Lohse, M.; Usadel, B. Trimmomatic: A flexible trimmer for Illumina sequence data. Bioinformatics 2014, 30, 2114–2120.[CrossRef] [PubMed]
40. Edgar, R.C.; Haas, B.J.; Clemente, J.C.; Quince, C.; Knight, R. UCHIME improves sensitivity and speed of chimera detection.Bioinformatics 2011, 27, 2194–2200. [CrossRef]
41. Magoc, T.; Salzberg, S.L. FLASH: Fast length adjustment of short reads to improve genome assemblies. Bioinformatics 2011, 27,2957–2963. [CrossRef]
42. Edgar, R.C. Search and clustering orders of magnitude faster than BLAST. Bioinformatics 2010, 26, 2460–2461. [CrossRef]43. Schloss, P.D.; Westcott, S.L.; Ryabin, T.; Hall, J.R.; Hartmann, M.; Hollister, E.B.; Lesniewski, R.A.; Oakley, B.B.; Parks, D.H.;
Robinson, C.J.; et al. Introducing mothur: Open-Source, Platform-Independent, Community-Supported Software for Describingand Comparing Microbial Communities. Appl. Environ. Microbiol. 2009, 75, 7537–7541. [CrossRef]
44. Segata, N.; Izard, J.; Waldron, L.; Gevers, D.; Miropolsky, L.; Garrett, W.S.; Huttenhower, C. Metagenomic biomarker discoveryand explanation. Genome Biol. 2011, 12, R60. [CrossRef]
45. Langille, M.G.I.; Zaneveld, J.; Caporaso, J.G.; McDonald, D.; Knights, D.; Reyes, J.A.; Clemente, J.C.; Burkepile, D.E.;Thurber, R.L.V.; Knight, R.; et al. Predictive functional profiling of microbial communities using 16S rRNA marker gene sequences.Nat. Biotechnol. 2013, 31, 814–821. [CrossRef]
46. Nguyen, N.H.; Song, Z.W.; Bates, S.T.; Branco, S.; Tedersoo, L.; Menke, J.; Schilling, J.S.; Kennedy, P.G. FUNGuild: An openannotation tool for parsing fungal community datasets by ecological guild. Fungal Ecol. 2016, 20, 241–248. [CrossRef]
47. Lombard, N.; Prestat, E.; Van Elsas, J.D.; Simonet, P. Soil-specific limitations for access and analysis of soil microbial communitiesby metagenomics. FEMS Microbiol. Ecol. 2011, 78, 31–49. [CrossRef] [PubMed]
48. Chowdhury, N.; Marschner, P.; Burns, R.G. Soil microbial activity and community composition: Impact of changes in matric andosmotic potential. Soil Biol. Biochem. 2011, 43, 1229–1236. [CrossRef]

Agriculture 2022, 12, 782 17 of 17
49. Wang, J.J.; Yang, D.M.; Zhang, Y.; Shen, J.; van der Gast, C.; Hahn, M.W.; Wu, Q.L. Do Patterns of Bacterial Diversity along SalinityGradients Differ from Those Observed for Macroorganisms? PLoS ONE 2011, 6, e27597. [CrossRef] [PubMed]
50. Bissett, A.; Richardson, A.E.; Baker, G.; Thrall, P.H. Long-term land use effects on soil microbial community structure and function.Appl. Soil Ecol. 2011, 51, 66–78. [CrossRef]
51. Ushio, M.; Kitayama, K.; Balser, T.C. Tree species-mediated spatial patchiness of the composition of microbial community andphysicochemical properties in the topsoils of a tropical montane forest. Soil Biol. Biochem. 2010, 42, 1588–1595. [CrossRef]
52. Lin, W.; Wang, Y.Z.; Gorby, Y.; Nealson, K.; Pan, Y.X. Integrating niche-based process and spatial process in biogeography ofmagnetotactic bacteria. Sci. Rep. 2013, 3, 1643. [CrossRef]
53. Logares, R.; Bråte, J.; Bertilsson, S.; Clasen, J.L.; Shalchian-Tabrizi, K.; Rengefors, K. Infrequent marine–freshwater transitions inthe microbial world. Trends Microbiol. 2009, 17, 414–422. [CrossRef]
54. de Vries, F.T.; Liiri, M.E.; Bjørnlund, L.; Bowker, M.A.; Christensen, S.; Setälä, H.M.; Bardgett, R.D. Land use alters the resistanceand resilience of soil food webs to drought. Nat. Clim. Change 2012, 2, 276–280. [CrossRef]
55. Ayton, J.; Aislabie, J.; Barker, G.M.; Saul, D.; Turner, S. Crenarchaeota affiliated with group 1.1 b are prevalent in coastal mineralsoils of the Ross Sea region of Antarctica. Environ. Microbiol. 2010, 12, 689–703. [CrossRef]
56. Canfora, L.; Bacci, G.; Pinzari, F.; Lo Papa, G.; Dazzi, C.; Benedetti, A. Salinity and Bacterial Diversity: To What Extent Does theConcentration of Salt Affect the Bacterial Community in a Saline Soil? PLoS ONE 2014, 9, e106662. [CrossRef]
57. Ahmed, V.; Verma, M.K.; Gupta, S.; Mandhan, V.; Chauhan, N.S. Metagenomic Profiling of Soil Microbes to Mine Salt StressTolerance Genes. Front. Microbiol. 2018, 9, 159. [CrossRef] [PubMed]
58. Rousk, J.; Bååth, E.; Brookes, P.C.; Lauber, C.L.; Lozupone, C.; Caporaso, J.G.; Knight, R.; Fierer, N. Soil bacterial and fungalcommunities across a pH gradient in an arable soil. ISME J. 2010, 4, 1340–1351. [CrossRef] [PubMed]
59. Osono, T.; Takeda, H. Fungal decomposition of Abiesneedle and Betulaleaf litter. Mycologia 2006, 98, 172–179. [CrossRef]60. Drenovsky, R.E.; Steenwerth, K.L.; Jackson, L.E.; Scow, K.M. Land use and climatic factors structure regional patterns in soil
microbial communities. Glob. Ecol. Biogeogr. 2009, 19, 27–39. [CrossRef] [PubMed]61. Oren, A. Thermodynamic limits to microbial life at high salt concentrations. Environ. Microbiol. 2010, 13, 1908–1923. [CrossRef]62. Coban, O.; De Deyn, G.B.; van der Ploeg, M. Soil microbiota as game-changers in restoration of degraded lands. Science 2022,
375, abe0725. [CrossRef]63. Wang, M.; Chen, S.B.; Chen, L.; Wang, D. Responses of soil microbial communities and their network interactions to saline-alkaline
stress in Cd-contaminated soils. Environ. Pollut. 2019, 252, 1609–1621. [CrossRef]