physicochemical properties of cellulose ethers - mdpi
TRANSCRIPT
Citation: McMullen, R.L.; Ozkan, S.;
Gillece, T. Physicochemical Properties
of Cellulose Ethers. Cosmetics 2022, 9,
52. https://doi.org/10.3390/
cosmetics9030052
Academic Editor: Enzo Berardesca
Received: 27 April 2022
Accepted: 11 May 2022
Published: 17 May 2022
Publisher’s Note: MDPI stays neutral
with regard to jurisdictional claims in
published maps and institutional affil-
iations.
Copyright: © 2022 by the authors.
Licensee MDPI, Basel, Switzerland.
This article is an open access article
distributed under the terms and
conditions of the Creative Commons
Attribution (CC BY) license (https://
creativecommons.org/licenses/by/
4.0/).
cosmetics
Article
Physicochemical Properties of Cellulose EthersRoger L. McMullen *, Seher Ozkan and Timothy Gillece
Ashland LLC, 1005 US HWY 202/206, Bridgewater, NJ 08807, USA; [email protected] (S.O.);[email protected] (T.G.)* Correspondence: [email protected]
Abstract: Cellulose ethers are naturally derived ingredients that are commonly used in personalcare products as rheology modifiers, film formers, stabilizers, and sensorial agents. In this work,we investigated the physicochemical properties of various grades of hydroxyethylcellulose (HEC),hydroxypropylcellulose (HPC), hydroxypropylmethylcellulose (HPMC), methylcellulose (MC), andsodium carboxymethylcellulose (CMC). In addition, we also studied the influence of hydrophobicmodification on the structure of HEC by carrying out experiments with cetyl hydroxyethylcellulose(HMHEC). Rheological, friction coefficient, dynamic vapor sorption (DVS), surface tension analysis,differential scanning calorimetry (DSC), and thermogravimetric analysis (TGA) data were generatedfor the cellulose ethers in order to obtain information about their viscosity, lubricity, moistureabsorption, solubility in the bulk solution phase, physical properties, and thermal degradationprofile, respectively.
Keywords: cellulose; cellulose ethers; HEC; HMHEC; HPC; MC; HPMC; CMC; Tg; friction coefficient;surface tension; salt tolerance; surfactant tolerance
1. Introduction
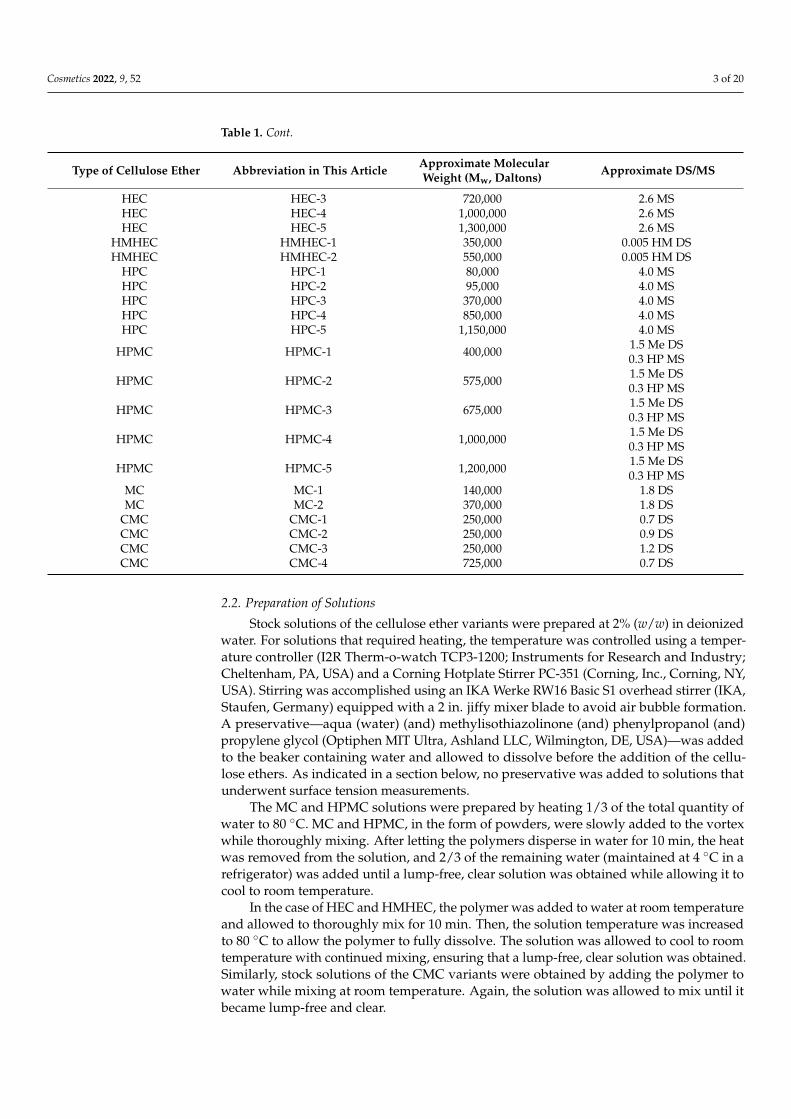
Cellulose is the most abundant polysaccharide on Earth and is the principal structuralcomponent of trees and plants [1]. It consists of repeating D-anhydroglucose units joinedtogether by β-1-4-glycosidic bonds [2]. Figure 1 contains the structure of cellulose (whenR=OH). Each anhydroglucose unit contains a hydroxyl group at the 2, 3, and 5 positionson the ring. In addition, cellulose is characterized by the reducing and non-reducing ends,which contain one and two hydroxyl groups, respectively [3].
Cosmetics 2022, 9, x FOR PEER REVIEW 2 of 20
hydroxypropyl substituents, respectively, while HPMC is a mixed cellulose ether contain-ing methoxy and hydroxypropyl groups. MC contains methyl substitution, while CMC possesses sodium carboxylate moieties. Finally, HMHEC is a hydrophobically modified analogue of HEC and contains a C16 chain extending from a small fraction of the available reactive sites on the anhydroglucose ring.
In addition to molecular weight, another important classification of cellulose ethers is the degree of substitution (DS) or molar substitution (MS). DS describes the number of hydroxyl group sites occupied by etherified substituent groups per anhydroglucose ring. For example, if there are a total of four substituent groups in place of the hydroxyl groups on both rings in Figure 1, the DS would be 4/2 = 2.
Figure 1. Molecular structure of the cellulose backbone for various cellulose ethers: cellulose, R=OH; MC, R=OH or CH3; HEC, R=OH or CH2CH2OH; CMC, R=OH or CH2COONa; HPC, R=OH or CH2CH(OH)CH3; HPMC, R=OH or CH3 or CH2CH(OH)CH3.
In the case of some cellulose ethers, there can be multiple groups linked together (chain extension) at the reactive hydroxyl sites. The MS parameter captures how many moles of each substituent are present per anhydroglucose ring. For example, if four of the available six sites on the two rings contain six groups, the MS would be 6/2 = 3. In contrast, the DS would be 4/2 = 2. In the case of HEC, HPC, and HPMC, longer chain lengths can be achieved since the substituent groups all contain a hydroxyl moiety, which can un-dergo further reactions with substituents. On the other hand, MC and CMC contain non-reactive groups, such as -CH3 and -COO−Na+, respectively, which prevent chain extension.
MS and DS are important from the standpoint of understanding the solution proper-ties of cellulose ethers. Most commercially available water-soluble cellulose ethers have DS values in the range of 0.4 to 2.0, while water-insoluble derivatives generally range from 2.3 to 2.8. In contrast, MS values can range from 1.5 to 4.0 for hydroxyalkyl cellulose ethers [9].
Cellulose ethers have a long history of use in cosmetic products and have a good toxicological profile [10]. There have been a number of studies that have investigated the rheological, mechanical, degradation, and physical properties of the cellulose ethers [11–16]. In this text, we provide additional technical data from steady torsional measurements, LAOS measurements, sliding friction, surface tension, moisture sorption, and thermal studies offering insight into the use of these products in various personal care applica-tions.
2. Materials and Methods 2.1. Tested Ingredients
A number of different cellulose ether ingredients were tested in this study, including molecular weight and DS/MS variants of HEC, HMHEC, HPC, HPMC, MC, and CMC. Table 1 contains a list of all the cellulose ethers investigated in this report along with their molecular weight and DS/MS.
Figure 1. Molecular structure of the cellulose backbone for various cellulose ethers: cellulose, R=OH;MC, R=OH or CH3; HEC, R=OH or CH2CH2OH; CMC, R=OH or CH2COONa; HPC, R=OH orCH2CH(OH)CH3; HPMC, R=OH or CH3 or CH2CH(OH)CH3.
Due to the shape of its backbone and structural stabilization by hydrogen bonding,cellulose contains elongated chains that form crystalline microfibrils [4]. The degree ofpolymerization of cellulose depends on its source and, of course, any subsequent treatmentsfor its isolation. Due to its structural integrity, cellulose is insoluble in water. In addition,it is not metabolized in the human gastrointestinal tract due to the lack of the necessaryenzymatic machinery to cleave the glycosidic β-1-4 bonds [5]. It is, however, an importantcomponent of dietary fiber.
Cellulose ethers are derivatives of cellulose that are used universally in many differentindustrial areas, including pharmaceutical, personal care, food and beverage, paints and
Cosmetics 2022, 9, 52. https://doi.org/10.3390/cosmetics9030052 https://www.mdpi.com/journal/cosmetics
Cosmetics 2022, 9, 52 2 of 20
coatings, paper, and oilfield applications [5–8]. The hydroxyl groups in cellulose at the 2-,3-, and 5-position can be derivatized by etherification, which allows for the tailored designof molecules with specifically engineered properties, such as solubility, viscosity, etc. [4]. Itis generally accepted that the reactivity of the hydroxyl groups at the 2 and 5 positions aregreater than that found in the hydroxyl group at the 3-position due to steric effects.
Figure 1 contains the structural backbone of the cellulose molecule along with thederivatizations to the pendant hydroxyl groups that yield the various cellulose ethervariants. HEC and HPC are characterized by substitution with hydroxyethyl and hy-droxypropyl substituents, respectively, while HPMC is a mixed cellulose ether contain-ing methoxy and hydroxypropyl groups. MC contains methyl substitution, while CMCpossesses sodium carboxylate moieties. Finally, HMHEC is a hydrophobically modifiedanalogue of HEC and contains a C16 chain extending from a small fraction of the availablereactive sites on the anhydroglucose ring.
In addition to molecular weight, another important classification of cellulose ethersis the degree of substitution (DS) or molar substitution (MS). DS describes the number ofhydroxyl group sites occupied by etherified substituent groups per anhydroglucose ring.For example, if there are a total of four substituent groups in place of the hydroxyl groupson both rings in Figure 1, the DS would be 4/2 = 2.
In the case of some cellulose ethers, there can be multiple groups linked together(chain extension) at the reactive hydroxyl sites. The MS parameter captures how manymoles of each substituent are present per anhydroglucose ring. For example, if four of theavailable six sites on the two rings contain six groups, the MS would be 6/2 = 3. In contrast,the DS would be 4/2 = 2. In the case of HEC, HPC, and HPMC, longer chain lengths can beachieved since the substituent groups all contain a hydroxyl moiety, which can undergofurther reactions with substituents. On the other hand, MC and CMC contain non-reactivegroups, such as -CH3 and -COO−Na+, respectively, which prevent chain extension.
MS and DS are important from the standpoint of understanding the solution propertiesof cellulose ethers. Most commercially available water-soluble cellulose ethers have DSvalues in the range of 0.4 to 2.0, while water-insoluble derivatives generally range from 2.3to 2.8. In contrast, MS values can range from 1.5 to 4.0 for hydroxyalkyl cellulose ethers [9].
Cellulose ethers have a long history of use in cosmetic products and have a goodtoxicological profile [10]. There have been a number of studies that have investigated therheological, mechanical, degradation, and physical properties of the cellulose ethers [11–16].In this text, we provide additional technical data from steady torsional measurements,LAOS measurements, sliding friction, surface tension, moisture sorption, and thermalstudies offering insight into the use of these products in various personal care applications.
2. Materials and Methods2.1. Tested Ingredients
A number of different cellulose ether ingredients were tested in this study, includingmolecular weight and DS/MS variants of HEC, HMHEC, HPC, HPMC, MC, and CMC.Table 1 contains a list of all the cellulose ethers investigated in this report along with theirmolecular weight and DS/MS.
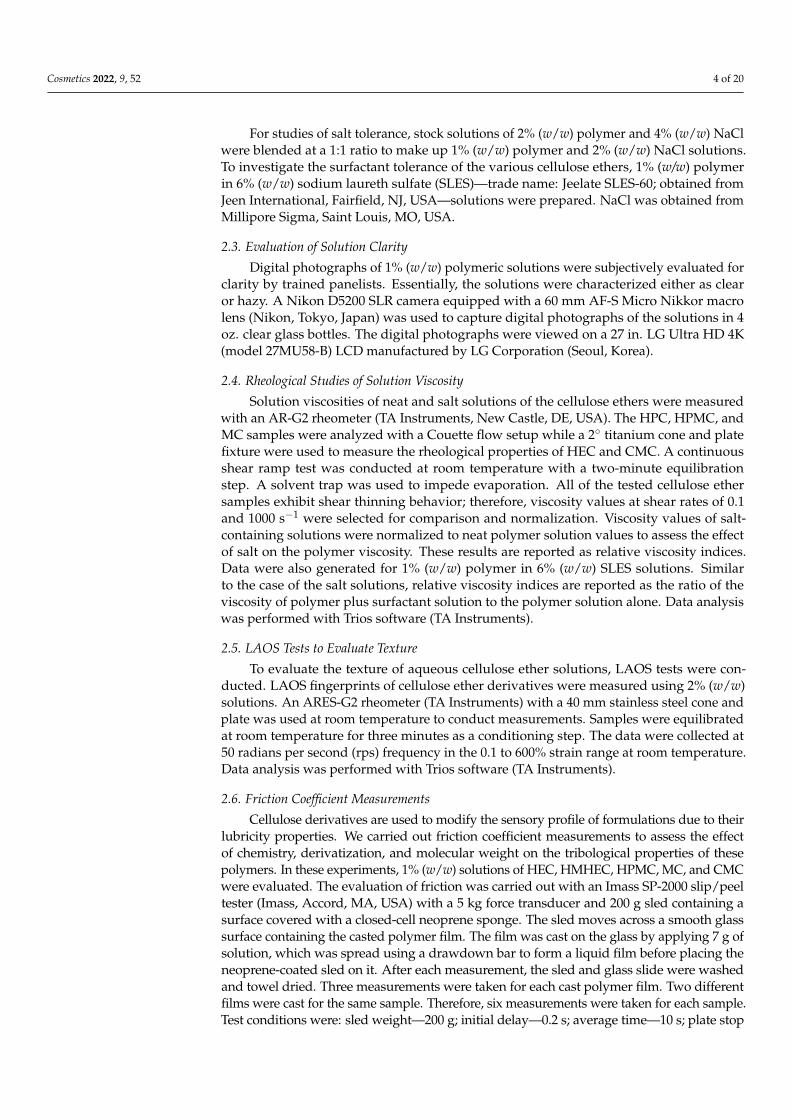
Table 1. Various commercial grades of cellulose ethers were investigated in this study. The polymerswere obtained from Ashland LLC, Wilmington, DE, USA. Data were compiled from internal reportsproduced by the Measurement Science department at Ashland LLC. In addition to the abbreviationsalready introduced in the body of the text, the following apply in the table: HM = hydrophobicallymodified; Me = methyl; HP = hydroxypropyl.
Type of Cellulose Ether Abbreviation in This Article Approximate MolecularWeight (Mw, Daltons) Approximate DS/MS
HEC HEC-1 90,000 2.6 MSHEC HEC-2 300,000 2.6 MS
Cosmetics 2022, 9, 52 3 of 20
Table 1. Cont.
Type of Cellulose Ether Abbreviation in This Article Approximate MolecularWeight (Mw, Daltons) Approximate DS/MS
HEC HEC-3 720,000 2.6 MSHEC HEC-4 1,000,000 2.6 MSHEC HEC-5 1,300,000 2.6 MS
HMHEC HMHEC-1 350,000 0.005 HM DSHMHEC HMHEC-2 550,000 0.005 HM DS
HPC HPC-1 80,000 4.0 MSHPC HPC-2 95,000 4.0 MSHPC HPC-3 370,000 4.0 MSHPC HPC-4 850,000 4.0 MSHPC HPC-5 1,150,000 4.0 MS
HPMC HPMC-1 400,000 1.5 Me DS0.3 HP MS
HPMC HPMC-2 575,000 1.5 Me DS0.3 HP MS
HPMC HPMC-3 675,000 1.5 Me DS0.3 HP MS
HPMC HPMC-4 1,000,000 1.5 Me DS0.3 HP MS
HPMC HPMC-5 1,200,000 1.5 Me DS0.3 HP MS
MC MC-1 140,000 1.8 DSMC MC-2 370,000 1.8 DS
CMC CMC-1 250,000 0.7 DSCMC CMC-2 250,000 0.9 DSCMC CMC-3 250,000 1.2 DSCMC CMC-4 725,000 0.7 DS
2.2. Preparation of Solutions
Stock solutions of the cellulose ether variants were prepared at 2% (w/w) in deionizedwater. For solutions that required heating, the temperature was controlled using a temper-ature controller (I2R Therm-o-watch TCP3-1200; Instruments for Research and Industry;Cheltenham, PA, USA) and a Corning Hotplate Stirrer PC-351 (Corning, Inc., Corning, NY,USA). Stirring was accomplished using an IKA Werke RW16 Basic S1 overhead stirrer (IKA,Staufen, Germany) equipped with a 2 in. jiffy mixer blade to avoid air bubble formation.A preservative—aqua (water) (and) methylisothiazolinone (and) phenylpropanol (and)propylene glycol (Optiphen MIT Ultra, Ashland LLC, Wilmington, DE, USA)—was addedto the beaker containing water and allowed to dissolve before the addition of the cellu-lose ethers. As indicated in a section below, no preservative was added to solutions thatunderwent surface tension measurements.
The MC and HPMC solutions were prepared by heating 1/3 of the total quantity ofwater to 80 ◦C. MC and HPMC, in the form of powders, were slowly added to the vortexwhile thoroughly mixing. After letting the polymers disperse in water for 10 min, the heatwas removed from the solution, and 2/3 of the remaining water (maintained at 4 ◦C in arefrigerator) was added until a lump-free, clear solution was obtained while allowing it tocool to room temperature.
In the case of HEC and HMHEC, the polymer was added to water at room temperatureand allowed to thoroughly mix for 10 min. Then, the solution temperature was increasedto 80 ◦C to allow the polymer to fully dissolve. The solution was allowed to cool to roomtemperature with continued mixing, ensuring that a lump-free, clear solution was obtained.Similarly, stock solutions of the CMC variants were obtained by adding the polymer towater while mixing at room temperature. Again, the solution was allowed to mix until itbecame lump-free and clear.
Cosmetics 2022, 9, 52 4 of 20
For studies of salt tolerance, stock solutions of 2% (w/w) polymer and 4% (w/w) NaClwere blended at a 1:1 ratio to make up 1% (w/w) polymer and 2% (w/w) NaCl solutions.To investigate the surfactant tolerance of the various cellulose ethers, 1% (w/w) polymerin 6% (w/w) sodium laureth sulfate (SLES)—trade name: Jeelate SLES-60; obtained fromJeen International, Fairfield, NJ, USA—solutions were prepared. NaCl was obtained fromMillipore Sigma, Saint Louis, MO, USA.
2.3. Evaluation of Solution Clarity
Digital photographs of 1% (w/w) polymeric solutions were subjectively evaluated forclarity by trained panelists. Essentially, the solutions were characterized either as clearor hazy. A Nikon D5200 SLR camera equipped with a 60 mm AF-S Micro Nikkor macrolens (Nikon, Tokyo, Japan) was used to capture digital photographs of the solutions in 4oz. clear glass bottles. The digital photographs were viewed on a 27 in. LG Ultra HD 4K(model 27MU58-B) LCD manufactured by LG Corporation (Seoul, Korea).
2.4. Rheological Studies of Solution Viscosity
Solution viscosities of neat and salt solutions of the cellulose ethers were measuredwith an AR-G2 rheometer (TA Instruments, New Castle, DE, USA). The HPC, HPMC, andMC samples were analyzed with a Couette flow setup while a 2◦ titanium cone and platefixture were used to measure the rheological properties of HEC and CMC. A continuousshear ramp test was conducted at room temperature with a two-minute equilibrationstep. A solvent trap was used to impede evaporation. All of the tested cellulose ethersamples exhibit shear thinning behavior; therefore, viscosity values at shear rates of 0.1and 1000 s−1 were selected for comparison and normalization. Viscosity values of salt-containing solutions were normalized to neat polymer solution values to assess the effectof salt on the polymer viscosity. These results are reported as relative viscosity indices.Data were also generated for 1% (w/w) polymer in 6% (w/w) SLES solutions. Similarto the case of the salt solutions, relative viscosity indices are reported as the ratio of theviscosity of polymer plus surfactant solution to the polymer solution alone. Data analysiswas performed with Trios software (TA Instruments).
2.5. LAOS Tests to Evaluate Texture
To evaluate the texture of aqueous cellulose ether solutions, LAOS tests were con-ducted. LAOS fingerprints of cellulose ether derivatives were measured using 2% (w/w)solutions. An ARES-G2 rheometer (TA Instruments) with a 40 mm stainless steel cone andplate was used at room temperature to conduct measurements. Samples were equilibratedat room temperature for three minutes as a conditioning step. The data were collected at50 radians per second (rps) frequency in the 0.1 to 600% strain range at room temperature.Data analysis was performed with Trios software (TA Instruments).
2.6. Friction Coefficient Measurements
Cellulose derivatives are used to modify the sensory profile of formulations due to theirlubricity properties. We carried out friction coefficient measurements to assess the effectof chemistry, derivatization, and molecular weight on the tribological properties of thesepolymers. In these experiments, 1% (w/w) solutions of HEC, HMHEC, HPMC, MC, and CMCwere evaluated. The evaluation of friction was carried out with an Imass SP-2000 slip/peeltester (Imass, Accord, MA, USA) with a 5 kg force transducer and 200 g sled containing asurface covered with a closed-cell neoprene sponge. The sled moves across a smooth glasssurface containing the casted polymer film. The film was cast on the glass by applying 7 g ofsolution, which was spread using a drawdown bar to form a liquid film before placing theneoprene-coated sled on it. After each measurement, the sled and glass slide were washedand towel dried. Three measurements were taken for each cast polymer film. Two differentfilms were cast for the same sample. Therefore, six measurements were taken for each sample.Test conditions were: sled weight—200 g; initial delay—0.2 s; average time—10 s; plate stop
Cosmetics 2022, 9, 52 5 of 20
mode—test time; speed units—mm/s; testing speed—5 mm/s; slack removal force—0.05 g.Data were collected from the instrument with ComLink software.
2.7. DVS Measurements
Vapor sorption studies were carried out with a Q5000 SA DVS (TA Instruments). Thecellulose ether samples, in the form of powder, were placed into pre-flamed 100 µL platinumTGA pans (TA Instruments). The instrument was operated with Universal Analysis 2000 soft-ware (TA Instruments). Each sample underwent a pre-conditioning step, where the samplewas dried for 3 h at 60 ◦C and 0% RH. The actual vapor sorption test consisted of equilibratingthe sample for 6 h at 25 ◦C and 90% RH. The % weight gain was recorded for each sample.
2.8. Determination of Surface Tension
Surface tension measurements were performed with an Attension Sigma 700 forcetensiometer (Biolin Scientific, Gothenburg, Sweden) equipped with a standard platinumWilhelmy plate. Measurements were performed at 22.0 ◦C with three replicates for eachsample. The plate was washed and flamed between each sample run. Equilibrium surfacetension measurements were carried out using the continuous Wilhelmy plate methodwith the following instrumental settings: probe—Wilhelmy plate (WL = 39.2800 mm);vessel—small vessel; light phase—air; heavy phase—water; speed up—20 mm/min; speeddown—20 mm/min; wetting depth—6 mm; measurement depth—3 mm; measurementtime—15 min; sample interval—1 s; stabilize—4 s; integrate—4 s; detect range—2 mN/m;start position—5 mm; reset speed—40 mm/min; zero when wet.
Sample results were compared to deionized water (measured at 72.6 mN/m). Mea-surements of the deionized water were conducted before and after the measurements ofthe cellulose ethers. Sample concentrations were 0.1% (w/w). Studies were completed onsolutions of HEC, HMHEC, HPMC, MC, and CMC. The instrument was operated and datawere collected with OneAttension software (Biolin Scientific).
2.9. Thermal Analysis
DSC measurements were carried out to determine the Tg and Tm of the variouscellulose ethers using a TA Q2000 DSC manufactured by TA Instruments. Samples (powderform) were placed into Tzero aluminum pans with perforated Tzero aluminum lids (TAInstruments). The following experimental procedure was employed: ramp 10 ◦C/min to105–120 ◦C; isothermal for 15–30 min; ramp 10 ◦C/min to −70 ◦C; isothermal for 15 min;ramp 10 ◦C/min to 200–250 ◦C. Dry nitrogen was used as the sample purge gas in allexperiments at a flow rate of 50 mL/min. Note that the experimental method was tailoredfor each cellulose ether.
TGA measurements were performed to characterize the thermal decomposition of thecellulose ethers. A key parameter reported in this work is the pyrolysis onset temperature(Tp), which represents the onset in change of the weight-loss curve. The cellulose ethersamples were placed directly (powder form) into 100 µL platinum HT TGA pans (TA Instru-ments). The following experimental protocol was employed for the TGA measurements:equilibrate at 40 ◦C; isothermal for 5 min; ramp 10 ◦C/min to 600 ◦C; sample purge flowwith dry nitrogen at a flow rate of 25 mL/min. In both the DSC and TGA experiments,the average value represents three measurements for each tested cellulose ether derivative.Both instruments were operated and analyzed with Universal Analysis v4.5A softwaresupplied by TA Instruments.
3. Results and Discussion
The physicochemical properties of HEC, HMHEC, HPC, HPMC, MC, and CMC weredetermined using a variety of techniques. The rheological properties (in the presence andabsence of NaCl and SLES) were examined by conventional rheological techniques as wellas LAOS to better understand their high shear behavior, which is commonly experiencedduring the application of personal care products to the skin and hair. Static and kinetic
Cosmetics 2022, 9, 52 6 of 20
coefficient of friction data allowed us to make conclusions regarding the contribution of thechemistry and physical properties (i.e., molecular weight) of a cellulose ether variant to thesensorial properties of an ingredient. Further, other important data obtained from surfacetension, vapor sorption, and thermal analysis studies were also generated.
3.1. Solution Clarity, Viscosity, Salt Tolerance, and Surfactant Compatibility
The 1% (w/w) solutions were first evaluated for clarity by taking digital photographsfollowed by evaluation by a trained panelist to determine whether clear or hazy solutionswere formed. Essentially, all of the cellulose ether derivatives formed clear aqueoussolutions except for the hydrophobically modified analogues of HEC—HMHEC-1 andHMHEC-2—which produced slightly hazy solutions. There were no changes in the solutionclarity when 2% (w/w) NaCl was incorporated into the solutions.
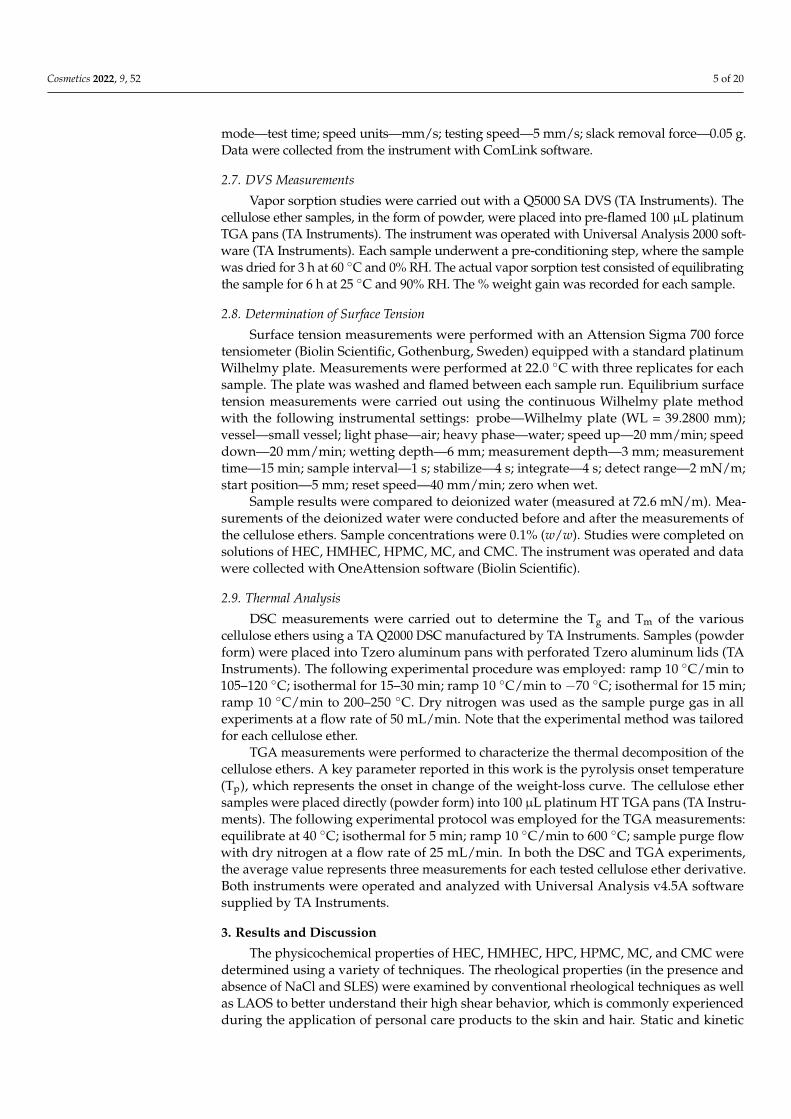
Rheological data were generated for the various grades of HEC, HMHEC, HPC, HPMC,MC, and CMC by conducting continuous shear ramp tests for each 1% (w/w) solution.Figures 2–5 contain typical flow curves for the tested cellulose ethers. The viscosity of thevariants depends on molecular weight and hydrophobic modification. For example, in allfigures, it is clear that the higher molecular weight variants produce higher viscosity. InFigure 2, all of the HEC derivatives follow suit, where the viscosity of HEC-1 < HEC-2 <HEC-3 < HEC-4 < HEC-5.
Cosmetics 2022, 9, x FOR PEER REVIEW 6 of 20
purge flow with dry nitrogen at a flow rate of 25 mL/min. In both the DSC and TGA ex-periments, the average value represents three measurements for each tested cellulose ether derivative. Both instruments were operated and analyzed with Universal Analysis v4.5A software supplied by TA Instruments.
3. Results and Discussion The physicochemical properties of HEC, HMHEC, HPC, HPMC, MC, and CMC were
determined using a variety of techniques. The rheological properties (in the presence and absence of NaCl and SLES) were examined by conventional rheological techniques as well as LAOS to better understand their high shear behavior, which is commonly experienced during the application of personal care products to the skin and hair. Static and kinetic coefficient of friction data allowed us to make conclusions regarding the contribution of the chemistry and physical properties (i.e., molecular weight) of a cellulose ether variant to the sensorial properties of an ingredient. Further, other important data obtained from surface tension, vapor sorption, and thermal analysis studies were also generated.
3.1. Solution Clarity, Viscosity, Salt Tolerance, and Surfactant Compatibility The 1% (w/w) solutions were first evaluated for clarity by taking digital photographs
followed by evaluation by a trained panelist to determine whether clear or hazy solutions were formed. Essentially, all of the cellulose ether derivatives formed clear aqueous solu-tions except for the hydrophobically modified analogues of HEC—HMHEC-1 and HMHEC-2—which produced slightly hazy solutions. There were no changes in the solu-tion clarity when 2% (w/w) NaCl was incorporated into the solutions.
Rheological data were generated for the various grades of HEC, HMHEC, HPC, HPMC, MC, and CMC by conducting continuous shear ramp tests for each 1% (w/w) so-lution. Figures 2–5 contain typical flow curves for the tested cellulose ethers. The viscosity of the variants depends on molecular weight and hydrophobic modification. For example, in all figures, it is clear that the higher molecular weight variants produce higher viscosity. In Figure 2, all of the HEC derivatives follow suit, where the viscosity of HEC-1 < HEC-2 < HEC-3 < HEC-4 < HEC-5.
Figure 2. Shear viscosity plotted as a function of shear rate for variants of HEC and HMHEC.
Not surprisingly, hydrophobically modified HEC variants (HMHEC-1 and HMHEC-2) have higher viscosity than corresponding HEC analogues with similar molecular weight. For example, a good comparison would be HEC-1 (Mw = 90,000 kDa) and HEC-2 (Mw = 300,000 kDa) with HMHEC-1 (Mw = 350,000 kDa). Likewise, HMHEC-2 (Mw =
Shea
rvisc
osity
, η(P
a⋅s)
100.0
10.0
1.000
0.100
0.01000
0.0010000.1000 1.000 10.00 100.0 1000
Shear rate, γ (1/s)
HMHEC-2
HEC-5
HEC-4 HMHEC-1
HEC-3
HEC-2
HEC-1
⋅Figure 2. Shear viscosity plotted as a function of shear rate for variants of HEC and HMHEC.
Cosmetics 2022, 9, x FOR PEER REVIEW 7 of 20
550,000 kDa) could be compared with HEC-4 and HEC-5, which have molecular weights of 1,000,000 and 1,300,000 kDa, respectively.
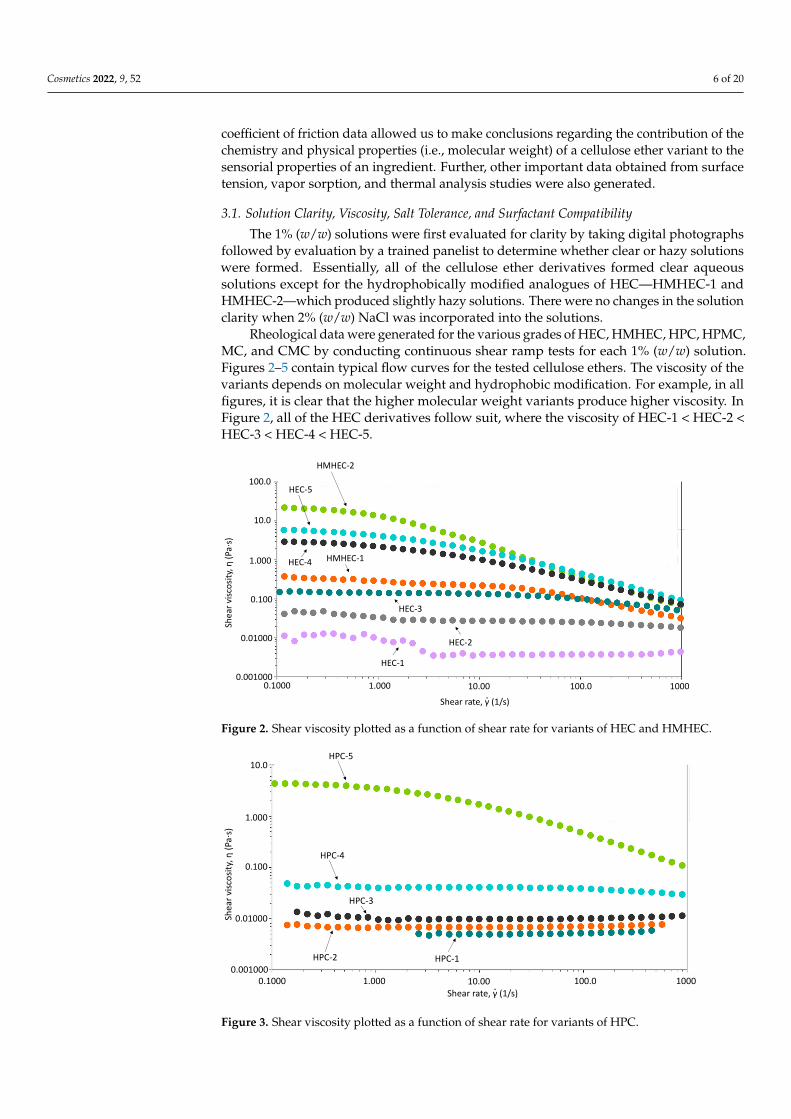
Flow curves for the HPC variants are provided in Figure 3. The shear viscosity of these variants is similar in magnitude to that obtained for the HEC analogues. The molec-ular weight range is similar for the tested HEC and HPC variants, which is the largest contributing factor to viscosity magnitude.
Figure 3. Shear viscosity plotted as a function of shear rate for variants of HPC.
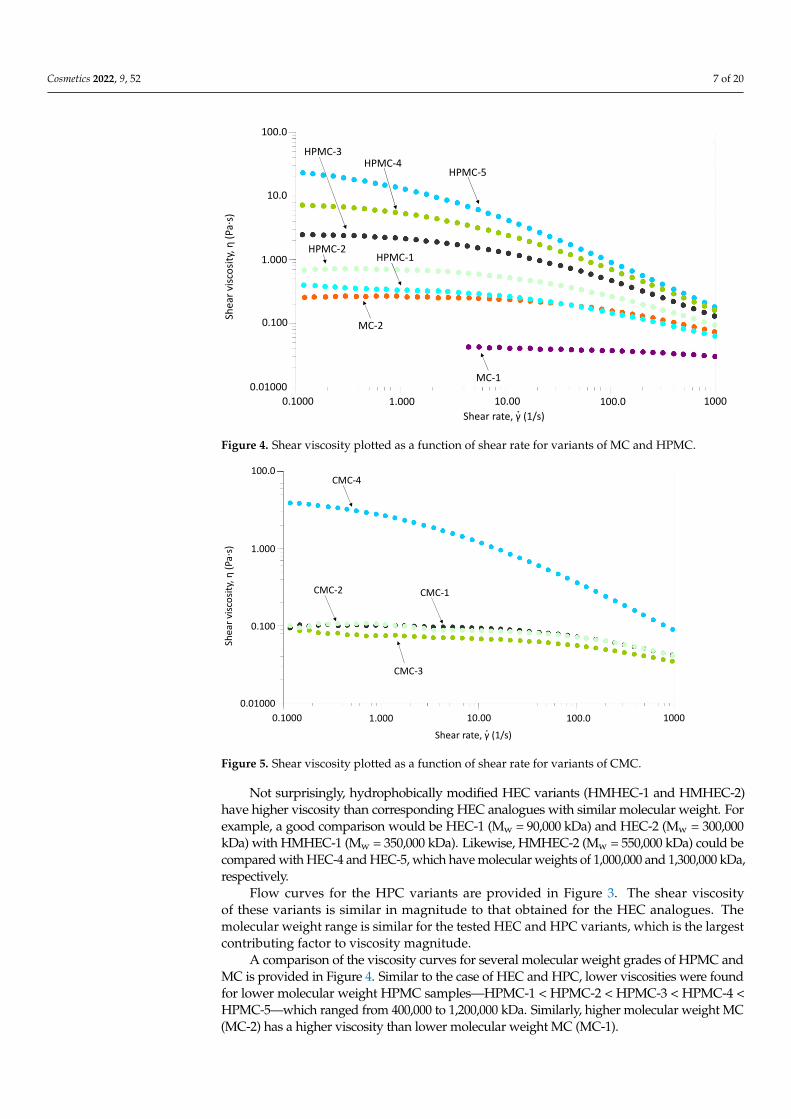
A comparison of the viscosity curves for several molecular weight grades of HPMC and MC is provided in Figure 4. Similar to the case of HEC and HPC, lower viscosities were found for lower molecular weight HPMC samples—HPMC-1 < HPMC-2 < HPMC-3 < HPMC-4 < HPMC-5—which ranged from 400,000 to 1,200,000 kDa. Similarly, higher molecular weight MC (MC-2) has a higher viscosity than lower molecular weight MC (MC-1).
Figure 4. Shear viscosity plotted as a function of shear rate for variants of MC and HPMC.
Shea
rvisc
osity
, η(P
a⋅s)
10.0
1.000
0.100
0.01000
0.0010000.1000 1.000 10.00 100.0 1000
HPC-5
HPC-4
HPC-3
HPC-2 HPC-1
Shear rate, γ (1/s)⋅
Shea
rvisc
osity
, η(P
a⋅s)
100.0
10.0
1.000
0.100
0.010000.1000 1.000 10.00 100.0 1000
HPMC-5
HPMC-3HPMC-4
HPMC-2HPMC-1
MC-2
MC-1
Shear rate, γ (1/s)⋅
Figure 3. Shear viscosity plotted as a function of shear rate for variants of HPC.
Cosmetics 2022, 9, 52 7 of 20
Cosmetics 2022, 9, x FOR PEER REVIEW 7 of 20
550,000 kDa) could be compared with HEC-4 and HEC-5, which have molecular weights of 1,000,000 and 1,300,000 kDa, respectively.
Flow curves for the HPC variants are provided in Figure 3. The shear viscosity of these variants is similar in magnitude to that obtained for the HEC analogues. The molec-ular weight range is similar for the tested HEC and HPC variants, which is the largest contributing factor to viscosity magnitude.
Figure 3. Shear viscosity plotted as a function of shear rate for variants of HPC.
A comparison of the viscosity curves for several molecular weight grades of HPMC and MC is provided in Figure 4. Similar to the case of HEC and HPC, lower viscosities were found for lower molecular weight HPMC samples—HPMC-1 < HPMC-2 < HPMC-3 < HPMC-4 < HPMC-5—which ranged from 400,000 to 1,200,000 kDa. Similarly, higher molecular weight MC (MC-2) has a higher viscosity than lower molecular weight MC (MC-1).
Figure 4. Shear viscosity plotted as a function of shear rate for variants of MC and HPMC.
Shea
rvisc
osity
, η(P
a⋅s)
10.0
1.000
0.100
0.01000
0.0010000.1000 1.000 10.00 100.0 1000
HPC-5
HPC-4
HPC-3
HPC-2 HPC-1
Shear rate, γ (1/s)⋅
Shea
rvisc
osity
, η(P
a⋅s)
100.0
10.0
1.000
0.100
0.010000.1000 1.000 10.00 100.0 1000
HPMC-5
HPMC-3HPMC-4
HPMC-2HPMC-1
MC-2
MC-1
Shear rate, γ (1/s)⋅Figure 4. Shear viscosity plotted as a function of shear rate for variants of MC and HPMC.
Cosmetics 2022, 9, x FOR PEER REVIEW 8 of 20
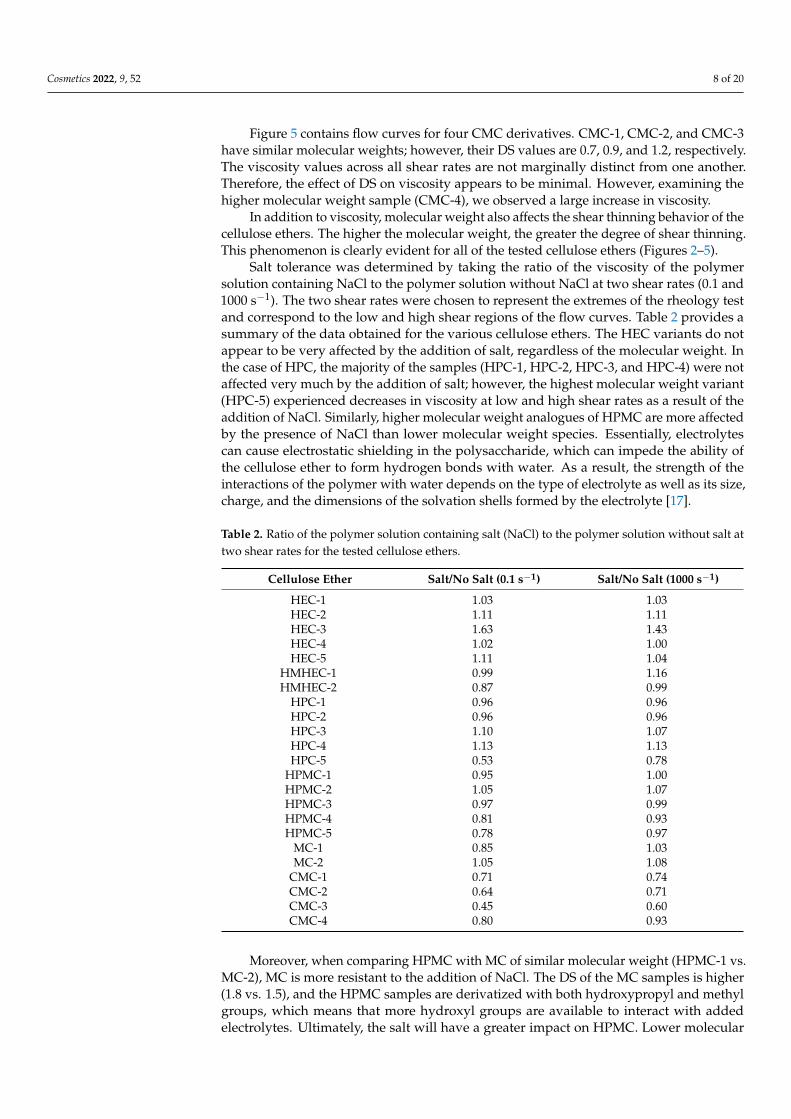
Figure 5 contains flow curves for four CMC derivatives. CMC-1, CMC-2, and CMC-3 have similar molecular weights; however, their DS values are 0.7, 0.9, and 1.2, respec-tively. The viscosity values across all shear rates are not marginally distinct from one an-other. Therefore, the effect of DS on viscosity appears to be minimal. However, examining the higher molecular weight sample (CMC-4), we observed a large increase in viscosity.
Figure 5. Shear viscosity plotted as a function of shear rate for variants of CMC.
In addition to viscosity, molecular weight also affects the shear thinning behavior of the cellulose ethers. The higher the molecular weight, the greater the degree of shear thin-ning. This phenomenon is clearly evident for all of the tested cellulose ethers (Figures 2–5).
Salt tolerance was determined by taking the ratio of the viscosity of the polymer so-lution containing NaCl to the polymer solution without NaCl at two shear rates (0.1 and 1000 s−1). The two shear rates were chosen to represent the extremes of the rheology test and correspond to the low and high shear regions of the flow curves. Table 2 provides a summary of the data obtained for the various cellulose ethers. The HEC variants do not appear to be very affected by the addition of salt, regardless of the molecular weight. In the case of HPC, the majority of the samples (HPC-1, HPC-2, HPC-3, and HPC-4) were not affected very much by the addition of salt; however, the highest molecular weight variant (HPC-5) experienced decreases in viscosity at low and high shear rates as a result of the addition of NaCl. Similarly, higher molecular weight analogues of HPMC are more affected by the presence of NaCl than lower molecular weight species. Essentially, elec-trolytes can cause electrostatic shielding in the polysaccharide, which can impede the abil-ity of the cellulose ether to form hydrogen bonds with water. As a result, the strength of the interactions of the polymer with water depends on the type of electrolyte as well as its size, charge, and the dimensions of the solvation shells formed by the electrolyte [17].
Moreover, when comparing HPMC with MC of similar molecular weight (HPMC-1 vs. MC-2), MC is more resistant to the addition of NaCl. The DS of the MC samples is higher (1.8 vs. 1.5), and the HPMC samples are derivatized with both hydroxypropyl and methyl groups, which means that more hydroxyl groups are available to interact with added electrolytes. Ultimately, the salt will have a greater impact on HPMC. Lower mo-lecular weight variants of CMC—CMC-1, CMC-2, and CMC-3—are less salt-tolerant than higher molecular weight CMC (CMC-4). The DS also influences the salt tolerance of CMC, with high DS variants being more susceptible to viscosity losses.
Shea
rvisc
osity
, η(P
a⋅s)
100.0
1.000
0.100
0.010000.1000 1.000 10.00 100.0 1000
CMC-4
CMC-1CMC-2
CMC-3
Shear rate, γ (1/s)⋅Figure 5. Shear viscosity plotted as a function of shear rate for variants of CMC.
Not surprisingly, hydrophobically modified HEC variants (HMHEC-1 and HMHEC-2)have higher viscosity than corresponding HEC analogues with similar molecular weight. Forexample, a good comparison would be HEC-1 (Mw = 90,000 kDa) and HEC-2 (Mw = 300,000kDa) with HMHEC-1 (Mw = 350,000 kDa). Likewise, HMHEC-2 (Mw = 550,000 kDa) could becompared with HEC-4 and HEC-5, which have molecular weights of 1,000,000 and 1,300,000 kDa,respectively.
Flow curves for the HPC variants are provided in Figure 3. The shear viscosityof these variants is similar in magnitude to that obtained for the HEC analogues. Themolecular weight range is similar for the tested HEC and HPC variants, which is the largestcontributing factor to viscosity magnitude.
A comparison of the viscosity curves for several molecular weight grades of HPMC andMC is provided in Figure 4. Similar to the case of HEC and HPC, lower viscosities were foundfor lower molecular weight HPMC samples—HPMC-1 < HPMC-2 < HPMC-3 < HPMC-4 <HPMC-5—which ranged from 400,000 to 1,200,000 kDa. Similarly, higher molecular weight MC(MC-2) has a higher viscosity than lower molecular weight MC (MC-1).
Cosmetics 2022, 9, 52 8 of 20
Figure 5 contains flow curves for four CMC derivatives. CMC-1, CMC-2, and CMC-3have similar molecular weights; however, their DS values are 0.7, 0.9, and 1.2, respectively.The viscosity values across all shear rates are not marginally distinct from one another.Therefore, the effect of DS on viscosity appears to be minimal. However, examining thehigher molecular weight sample (CMC-4), we observed a large increase in viscosity.
In addition to viscosity, molecular weight also affects the shear thinning behavior of thecellulose ethers. The higher the molecular weight, the greater the degree of shear thinning.This phenomenon is clearly evident for all of the tested cellulose ethers (Figures 2–5).
Salt tolerance was determined by taking the ratio of the viscosity of the polymersolution containing NaCl to the polymer solution without NaCl at two shear rates (0.1 and1000 s−1). The two shear rates were chosen to represent the extremes of the rheology testand correspond to the low and high shear regions of the flow curves. Table 2 provides asummary of the data obtained for the various cellulose ethers. The HEC variants do notappear to be very affected by the addition of salt, regardless of the molecular weight. Inthe case of HPC, the majority of the samples (HPC-1, HPC-2, HPC-3, and HPC-4) were notaffected very much by the addition of salt; however, the highest molecular weight variant(HPC-5) experienced decreases in viscosity at low and high shear rates as a result of theaddition of NaCl. Similarly, higher molecular weight analogues of HPMC are more affectedby the presence of NaCl than lower molecular weight species. Essentially, electrolytescan cause electrostatic shielding in the polysaccharide, which can impede the ability ofthe cellulose ether to form hydrogen bonds with water. As a result, the strength of theinteractions of the polymer with water depends on the type of electrolyte as well as its size,charge, and the dimensions of the solvation shells formed by the electrolyte [17].
Table 2. Ratio of the polymer solution containing salt (NaCl) to the polymer solution without salt attwo shear rates for the tested cellulose ethers.
Cellulose Ether Salt/No Salt (0.1 s−1) Salt/No Salt (1000 s−1)
HEC-1 1.03 1.03HEC-2 1.11 1.11HEC-3 1.63 1.43HEC-4 1.02 1.00HEC-5 1.11 1.04
HMHEC-1 0.99 1.16HMHEC-2 0.87 0.99
HPC-1 0.96 0.96HPC-2 0.96 0.96HPC-3 1.10 1.07HPC-4 1.13 1.13HPC-5 0.53 0.78
HPMC-1 0.95 1.00HPMC-2 1.05 1.07HPMC-3 0.97 0.99HPMC-4 0.81 0.93HPMC-5 0.78 0.97
MC-1 0.85 1.03MC-2 1.05 1.08
CMC-1 0.71 0.74CMC-2 0.64 0.71CMC-3 0.45 0.60CMC-4 0.80 0.93
Moreover, when comparing HPMC with MC of similar molecular weight (HPMC-1 vs.MC-2), MC is more resistant to the addition of NaCl. The DS of the MC samples is higher(1.8 vs. 1.5), and the HPMC samples are derivatized with both hydroxypropyl and methylgroups, which means that more hydroxyl groups are available to interact with addedelectrolytes. Ultimately, the salt will have a greater impact on HPMC. Lower molecular
Cosmetics 2022, 9, 52 9 of 20
weight variants of CMC—CMC-1, CMC-2, and CMC-3—are less salt-tolerant than highermolecular weight CMC (CMC-4). The DS also influences the salt tolerance of CMC, withhigh DS variants being more susceptible to viscosity losses.
Shampoo and body wash products typically contain a mixture of SLES and cocami-dopropyl betaine (CAPB). The primary thickening mechanism of these ingredients is theformation of long tubular micelles due to the high surfactant concentration and the pres-ence of salt. These long tubular micelles (also referred to as worms) act like giant polymerchains and form entanglements, leading to a significant viscosity increase in the system.Hydrophilic polymers may increase the entanglement density of the micellar system dueto the space occupied by the polymer chains. In addition, the length of the tubules could beincreased, allowing tubules to connect with each other and providing enhanced stabilityto the system. Overall, increased entanglement density results in increased viscosity andrelaxation time. The addition of a polymer can also cause disorder to the tubules, especiallyat higher concentrations, which results in a breakdown of the surfactant network due tohigh molecular weight or pendant hydrophobic moieties [18].
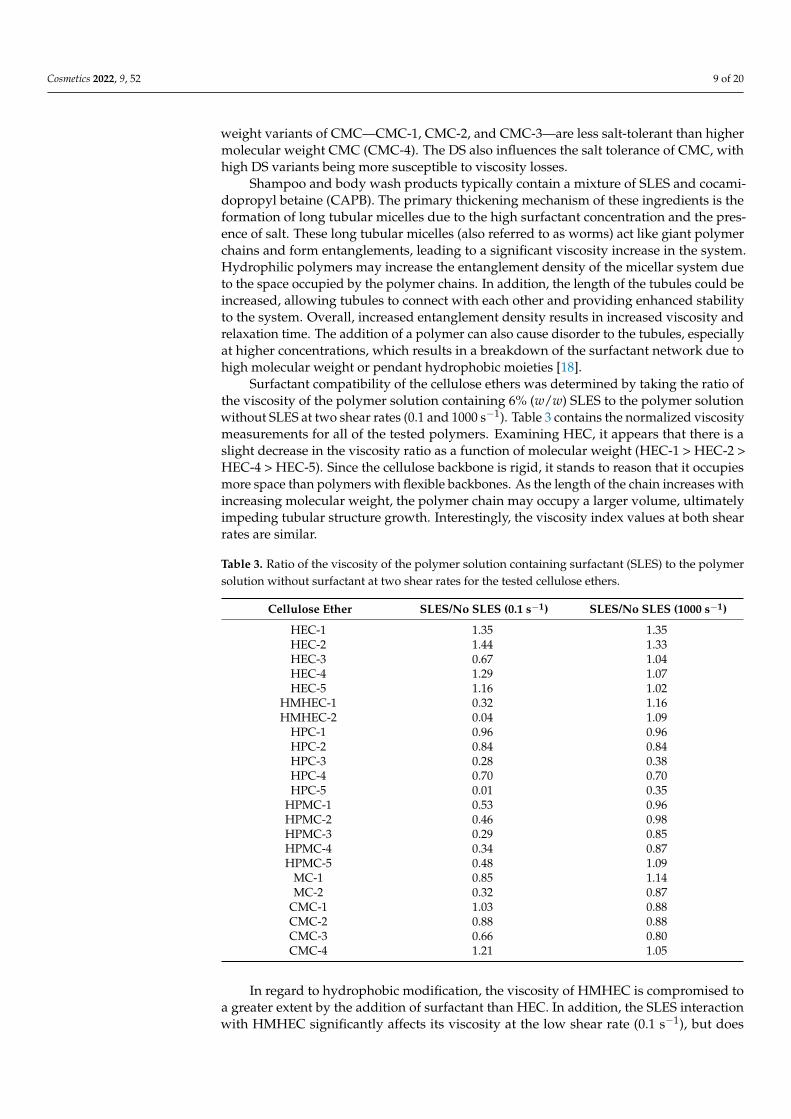
Surfactant compatibility of the cellulose ethers was determined by taking the ratio ofthe viscosity of the polymer solution containing 6% (w/w) SLES to the polymer solutionwithout SLES at two shear rates (0.1 and 1000 s−1). Table 3 contains the normalized viscositymeasurements for all of the tested polymers. Examining HEC, it appears that there is aslight decrease in the viscosity ratio as a function of molecular weight (HEC-1 > HEC-2 >HEC-4 > HEC-5). Since the cellulose backbone is rigid, it stands to reason that it occupiesmore space than polymers with flexible backbones. As the length of the chain increases withincreasing molecular weight, the polymer chain may occupy a larger volume, ultimatelyimpeding tubular structure growth. Interestingly, the viscosity index values at both shearrates are similar.
Table 3. Ratio of the viscosity of the polymer solution containing surfactant (SLES) to the polymersolution without surfactant at two shear rates for the tested cellulose ethers.
Cellulose Ether SLES/No SLES (0.1 s−1) SLES/No SLES (1000 s−1)
HEC-1 1.35 1.35HEC-2 1.44 1.33HEC-3 0.67 1.04HEC-4 1.29 1.07HEC-5 1.16 1.02
HMHEC-1 0.32 1.16HMHEC-2 0.04 1.09
HPC-1 0.96 0.96HPC-2 0.84 0.84HPC-3 0.28 0.38HPC-4 0.70 0.70HPC-5 0.01 0.35
HPMC-1 0.53 0.96HPMC-2 0.46 0.98HPMC-3 0.29 0.85HPMC-4 0.34 0.87HPMC-5 0.48 1.09
MC-1 0.85 1.14MC-2 0.32 0.87
CMC-1 1.03 0.88CMC-2 0.88 0.88CMC-3 0.66 0.80CMC-4 1.21 1.05
In regard to hydrophobic modification, the viscosity of HMHEC is compromised toa greater extent by the addition of surfactant than HEC. In addition, the SLES interactionwith HMHEC significantly affects its viscosity at the low shear rate (0.1 s−1), but does
Cosmetics 2022, 9, 52 10 of 20
not appear to change it very much at the high shear rate (1000 s−1). Most likely, thependant hydrophobic chains of HMHEC insert inside the surfactant assembly (tubularstructure), which could disrupt the thermodynamic equilibrium of the tubules. As aconsequence, the tubular structure would be markedly shortened or branched, resultingin a significant decrease in viscosity. Typically, at low shear, longer tubules yield higherviscosity. Increasing shear disrupts the tubules and transforms the surfactant assembly intoshorter chains or spheres, and sometimes lamellar structures, which causes a reductionin viscosity.
In the case of HPC, the addition of SLES had a greater effect on the higher molecularweight samples. As observed in the case of HEC, there was not an appreciable differencebetween the effect of SLES on the low and high shear rates. Similar to HMHEC, the viscosityindex values of HPMC are lower at the low shear rate as compared to the high shear rate.There is no clear trend on the effect of SLES for the various molecular weight grades ofHPMC. At roughly the same molecular weight, MC is slightly more sensitive to the additionof SLES as compared to HPMC (MC-2 vs. HPMC-1). As already mentioned, some highermolecular weight cellulose ethers are more affected by the presence of SLES than theirlower molecular weight counterparts (e.g., compare MC-1 vs. MC-2).
We also investigated the effects of SLES on CMC solution viscosity. Increasing the DSresults in a decrease in the viscosity index, although this effect is more pronounced at thelow shear rate (0.1 s−1) as compared to the high shear rate (1000 s−1). Such a result suggeststhat the -COO−Na+ functionality (as compared to -OH) does not interact favorably withsurfactant micelles. Possibly, the carboxylate moieties interact electrostatically with thesurfactant headgroup, causing destabilization of the tubular structures. Similar to thecase of HMHEC and MC, the viscosity index of the CMC–SLES solution is lower at highermolecular weight (CMC-1 vs. CMC-4). Again, this could be due to increased destabilizationof the tubular structures since the occupied volume of the cellulose derivative increaseswith increasing molecular weight.
3.2. Textural Properties of the Cellulose Ether Solutions
In previous studies, we utilized a non-linear rheological technique termed LAOS tocapture the textural expression perceived by consumers under large and fast deforma-tions [19–21]. The LAOS test is a sinusoidal oscillatory flow experiment in which theamplitude of the strain input is selected to be large enough to deform the material beyondthe linear viscoelastic limit. The large strain amplitude deforms and changes the formula-tion or solution architecture of the complex fluid. In practice, the sample is loaded betweentwo parallel discs that are separated by a known gap. Lissajous–Bowditch curves aregenerated by starting the LAOS experiments with small deformations, which progressivelyincrease with each twist of the parallel plates. In this work, LAOS studies were carried outon 2% (w/w) solutions of the various grades of cellulose ethers.
A linear σ vs..γ Lissajous–Bowditch plot indicates viscous behavior, while a circular
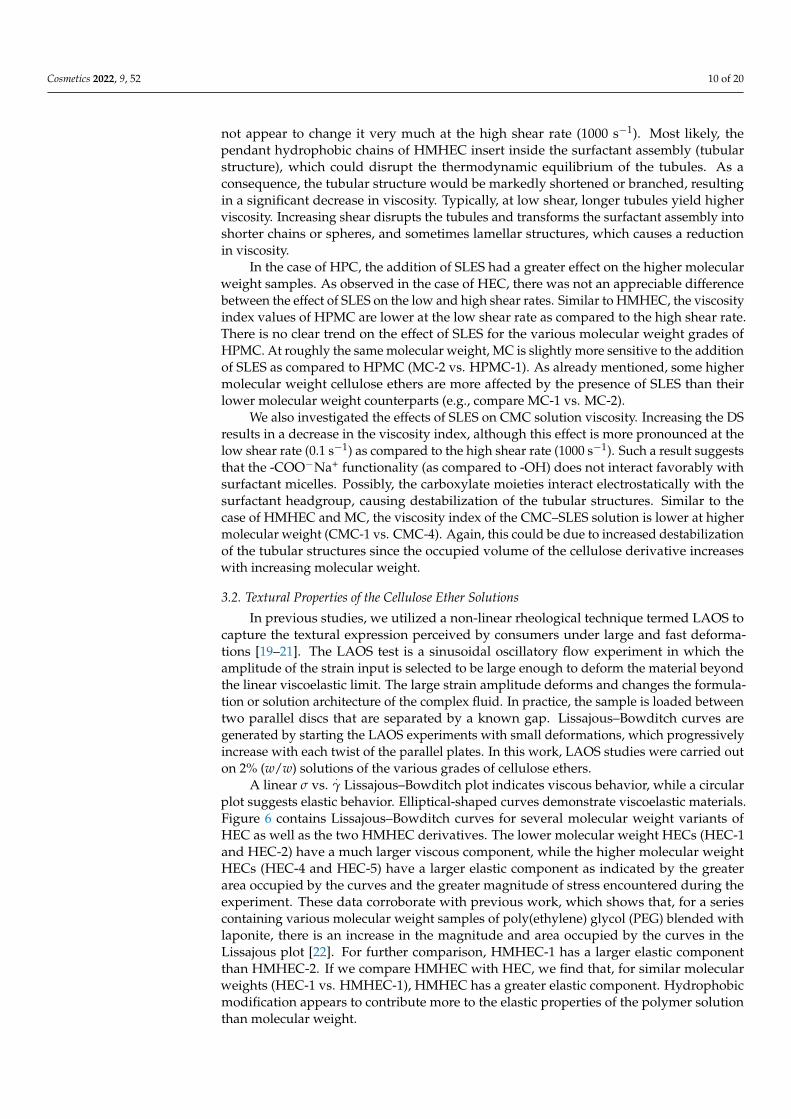
plot suggests elastic behavior. Elliptical-shaped curves demonstrate viscoelastic materials.Figure 6 contains Lissajous–Bowditch curves for several molecular weight variants ofHEC as well as the two HMHEC derivatives. The lower molecular weight HECs (HEC-1and HEC-2) have a much larger viscous component, while the higher molecular weightHECs (HEC-4 and HEC-5) have a larger elastic component as indicated by the greaterarea occupied by the curves and the greater magnitude of stress encountered during theexperiment. These data corroborate with previous work, which shows that, for a seriescontaining various molecular weight samples of poly(ethylene) glycol (PEG) blended withlaponite, there is an increase in the magnitude and area occupied by the curves in theLissajous plot [22]. For further comparison, HMHEC-1 has a larger elastic componentthan HMHEC-2. If we compare HMHEC with HEC, we find that, for similar molecularweights (HEC-1 vs. HMHEC-1), HMHEC has a greater elastic component. Hydrophobicmodification appears to contribute more to the elastic properties of the polymer solutionthan molecular weight.
Cosmetics 2022, 9, 52 11 of 20
Cosmetics 2022, 9, x FOR PEER REVIEW 11 of 20
3.2. Textural Properties of the Cellulose Ether Solutions In previous studies, we utilized a non-linear rheological technique termed LAOS to
capture the textural expression perceived by consumers under large and fast deformations [19–21]. The LAOS test is a sinusoidal oscillatory flow experiment in which the amplitude of the strain input is selected to be large enough to deform the material beyond the linear viscoelastic limit. The large strain amplitude deforms and changes the formulation or so-lution architecture of the complex fluid. In practice, the sample is loaded between two parallel discs that are separated by a known gap. Lissajous–Bowditch curves are gener-ated by starting the LAOS experiments with small deformations, which progressively in-crease with each twist of the parallel plates. In this work, LAOS studies were carried out on 2% (w/w) solutions of the various grades of cellulose ethers.
A linear 𝜎 vs. 𝛾 Lissajous–Bowditch plot indicates viscous behavior, while a circu-lar plot suggests elastic behavior. Elliptical-shaped curves demonstrate viscoelastic mate-rials. Figure 6 contains Lissajous–Bowditch curves for several molecular weight variants of HEC as well as the two HMHEC derivatives. The lower molecular weight HECs (HEC-1 and HEC-2) have a much larger viscous component, while the higher molecular weight HECs (HEC-4 and HEC-5) have a larger elastic component as indicated by the greater area occupied by the curves and the greater magnitude of stress encountered during the ex-periment. These data corroborate with previous work, which shows that, for a series con-taining various molecular weight samples of poly(ethylene) glycol (PEG) blended with laponite, there is an increase in the magnitude and area occupied by the curves in the Lissajous plot [22]. For further comparison, HMHEC-1 has a larger elastic component than HMHEC-2. If we compare HMHEC with HEC, we find that, for similar molecular weights (HEC-1 vs. HMHEC-1), HMHEC has a greater elastic component. Hydrophobic modifi-cation appears to contribute more to the elastic properties of the polymer solution than molecular weight.
Figure 6. Lissajous–Bowditch curves for HEC-1, HEC-2, HEC-3, HEC-4, HEC-5, HMHEC-1, and HMHEC-2.
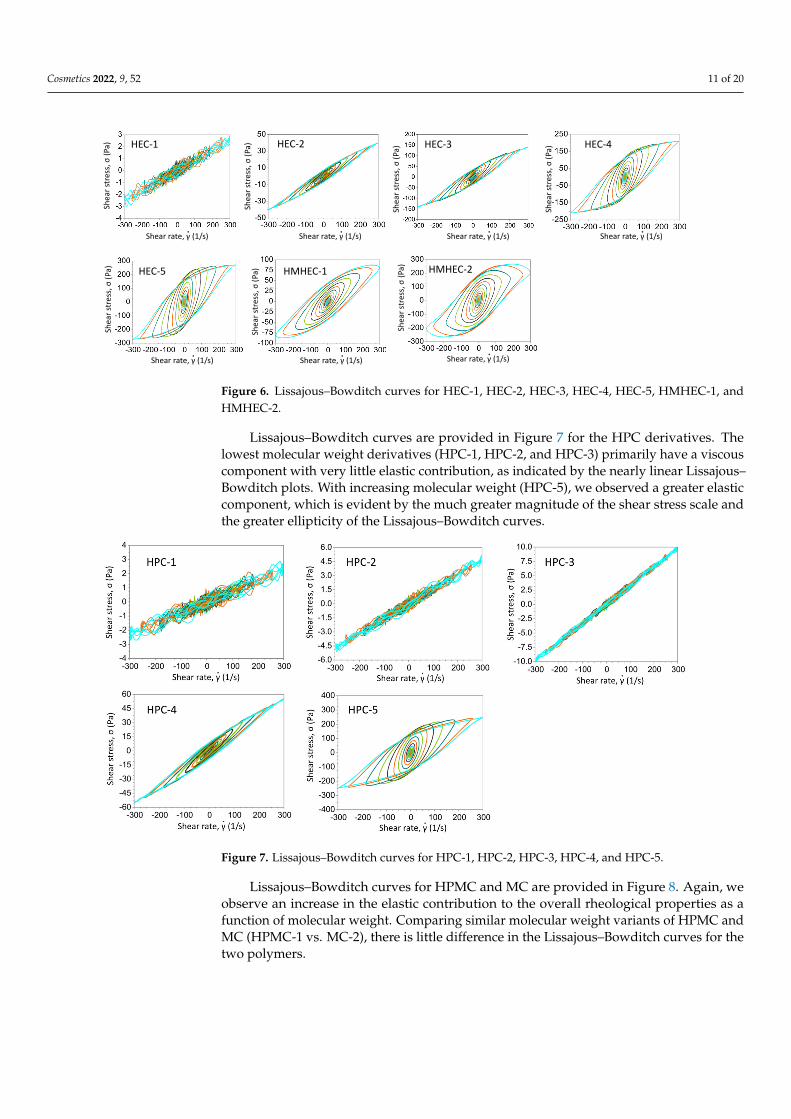
Lissajous–Bowditch curves are provided in Figure 7 for the HPC derivatives. The lowest molecular weight derivatives (HPC-1, HPC-2, and HPC-3) primarily have a vis-cous component with very little elastic contribution, as indicated by the nearly linear Lis-sajous–Bowditch plots. With increasing molecular weight (HPC-5), we observed a greater elastic component, which is evident by the much greater magnitude of the shear stress scale and the greater ellipticity of the Lissajous–Bowditch curves.
Shea
rstr
ess,
σ(P
a)
Shea
rstr
ess,
σ(P
a)
Shea
rstre
ss, σ
(Pa)
Shea
rstre
ss, σ
(Pa)
Shea
rstr
ess,
σ(P
a)
Shea
rstr
ess,
σ(P
a)
Shea
rstr
ess,
σ(P
a) HMHEC-2HEC-5
HEC-4
HMHEC-1
HEC-2HEC-1 HEC-3
Shear rate, γ (1/s)⋅ Shear rate, γ (1/s)⋅ Shear rate, γ (1/s)⋅ Shear rate, γ (1/s)⋅
Shear rate, γ (1/s)⋅ Shear rate, γ (1/s)⋅ Shear rate, γ (1/s)⋅Figure 6. Lissajous–Bowditch curves for HEC-1, HEC-2, HEC-3, HEC-4, HEC-5, HMHEC-1, andHMHEC-2.
Lissajous–Bowditch curves are provided in Figure 7 for the HPC derivatives. Thelowest molecular weight derivatives (HPC-1, HPC-2, and HPC-3) primarily have a viscouscomponent with very little elastic contribution, as indicated by the nearly linear Lissajous–Bowditch plots. With increasing molecular weight (HPC-5), we observed a greater elasticcomponent, which is evident by the much greater magnitude of the shear stress scale andthe greater ellipticity of the Lissajous–Bowditch curves.
Cosmetics 2022, 9, x FOR PEER REVIEW 12 of 20
Figure 7. Lissajous–Bowditch curves for HPC-1, HPC-2, HPC-3, HPC-4, and HPC-5.
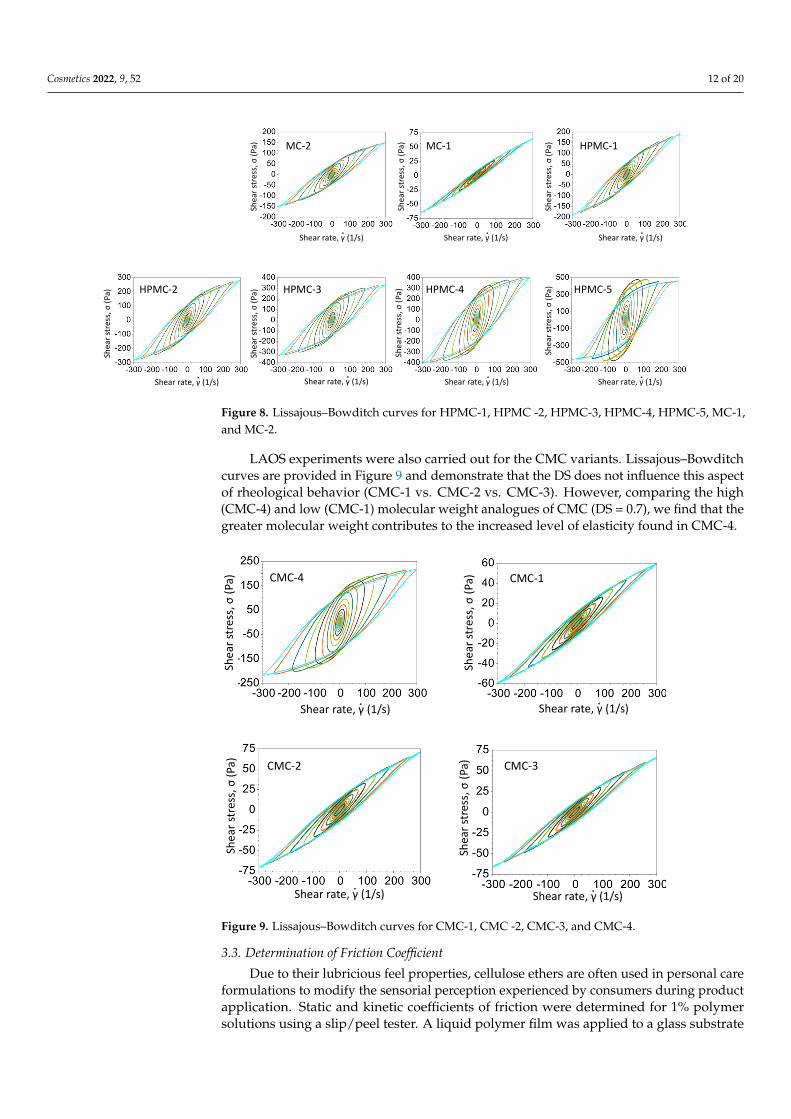
Lissajous–Bowditch curves for HPMC and MC are provided in Figure 8. Again, we observe an increase in the elastic contribution to the overall rheological properties as a function of molecular weight. Comparing similar molecular weight variants of HPMC and MC (HPMC-1 vs. MC-2), there is little difference in the Lissajous–Bowditch curves for the two polymers.
Figure 8. Lissajous–Bowditch curves for HPMC-1, HPMC -2, HPMC-3, HPMC-4, HPMC-5, MC-1, and MC-2.
LAOS experiments were also carried out for the CMC variants. Lissajous–Bowditch curves are provided in Figure 9 and demonstrate that the DS does not influence this aspect of rheological behavior (CMC-1 vs. CMC-2 vs. CMC-3). However, comparing the high (CMC-4) and low (CMC-1) molecular weight analogues of CMC (DS = 0.7), we find that the greater molecular weight contributes to the increased level of elasticity found in CMC-4.
Shea
rstr
ess,
σ(P
a)
Shea
rstr
ess,
σ(P
a)
Shea
rstr
ess,
σ(P
a)
Shea
rstr
ess,
σ(P
a)
Shea
rstr
ess,
σ(P
a)
Shea
rstr
ess,
σ(P
a)
Shea
rstr
ess,
σ(P
a) HPMC-5HPMC-3 HPMC-4HPMC-2
HPMC-1MC-2 MC-1
Shear rate, γ (1/s)⋅ Shear rate, γ (1/s)⋅ Shear rate, γ (1/s)⋅
Shear rate, γ (1/s)⋅ Shear rate, γ (1/s)⋅ Shear rate, γ (1/s)⋅ Shear rate, γ (1/s)⋅
Figure 7. Lissajous–Bowditch curves for HPC-1, HPC-2, HPC-3, HPC-4, and HPC-5.
Lissajous–Bowditch curves for HPMC and MC are provided in Figure 8. Again, weobserve an increase in the elastic contribution to the overall rheological properties as afunction of molecular weight. Comparing similar molecular weight variants of HPMC andMC (HPMC-1 vs. MC-2), there is little difference in the Lissajous–Bowditch curves for thetwo polymers.
Cosmetics 2022, 9, 52 12 of 20
Cosmetics 2022, 9, x FOR PEER REVIEW 12 of 20
Figure 7. Lissajous–Bowditch curves for HPC-1, HPC-2, HPC-3, HPC-4, and HPC-5.
Lissajous–Bowditch curves for HPMC and MC are provided in Figure 8. Again, we observe an increase in the elastic contribution to the overall rheological properties as a function of molecular weight. Comparing similar molecular weight variants of HPMC and MC (HPMC-1 vs. MC-2), there is little difference in the Lissajous–Bowditch curves for the two polymers.
Figure 8. Lissajous–Bowditch curves for HPMC-1, HPMC -2, HPMC-3, HPMC-4, HPMC-5, MC-1, and MC-2.
LAOS experiments were also carried out for the CMC variants. Lissajous–Bowditch curves are provided in Figure 9 and demonstrate that the DS does not influence this aspect of rheological behavior (CMC-1 vs. CMC-2 vs. CMC-3). However, comparing the high (CMC-4) and low (CMC-1) molecular weight analogues of CMC (DS = 0.7), we find that the greater molecular weight contributes to the increased level of elasticity found in CMC-4.
Shea
rstr
ess,
σ(P
a)
Shea
rstr
ess,
σ(P
a)
Shea
rstr
ess,
σ(P
a)
Shea
rstr
ess,
σ(P
a)
Shea
rstr
ess,
σ(P
a)
Shea
rstr
ess,
σ(P
a)
Shea
rstr
ess,
σ(P
a) HPMC-5HPMC-3 HPMC-4HPMC-2
HPMC-1MC-2 MC-1
Shear rate, γ (1/s)⋅ Shear rate, γ (1/s)⋅ Shear rate, γ (1/s)⋅
Shear rate, γ (1/s)⋅ Shear rate, γ (1/s)⋅ Shear rate, γ (1/s)⋅ Shear rate, γ (1/s)⋅Figure 8. Lissajous–Bowditch curves for HPMC-1, HPMC -2, HPMC-3, HPMC-4, HPMC-5, MC-1,and MC-2.
LAOS experiments were also carried out for the CMC variants. Lissajous–Bowditchcurves are provided in Figure 9 and demonstrate that the DS does not influence this aspectof rheological behavior (CMC-1 vs. CMC-2 vs. CMC-3). However, comparing the high(CMC-4) and low (CMC-1) molecular weight analogues of CMC (DS = 0.7), we find that thegreater molecular weight contributes to the increased level of elasticity found in CMC-4.
Cosmetics 2022, 9, x FOR PEER REVIEW 13 of 20
Figure 9. Lissajous–Bowditch curves for CMC-1, CMC -2, CMC-3, and CMC-4.
3.3. Determination of Friction Coefficient Due to their lubricious feel properties, cellulose ethers are often used in personal care
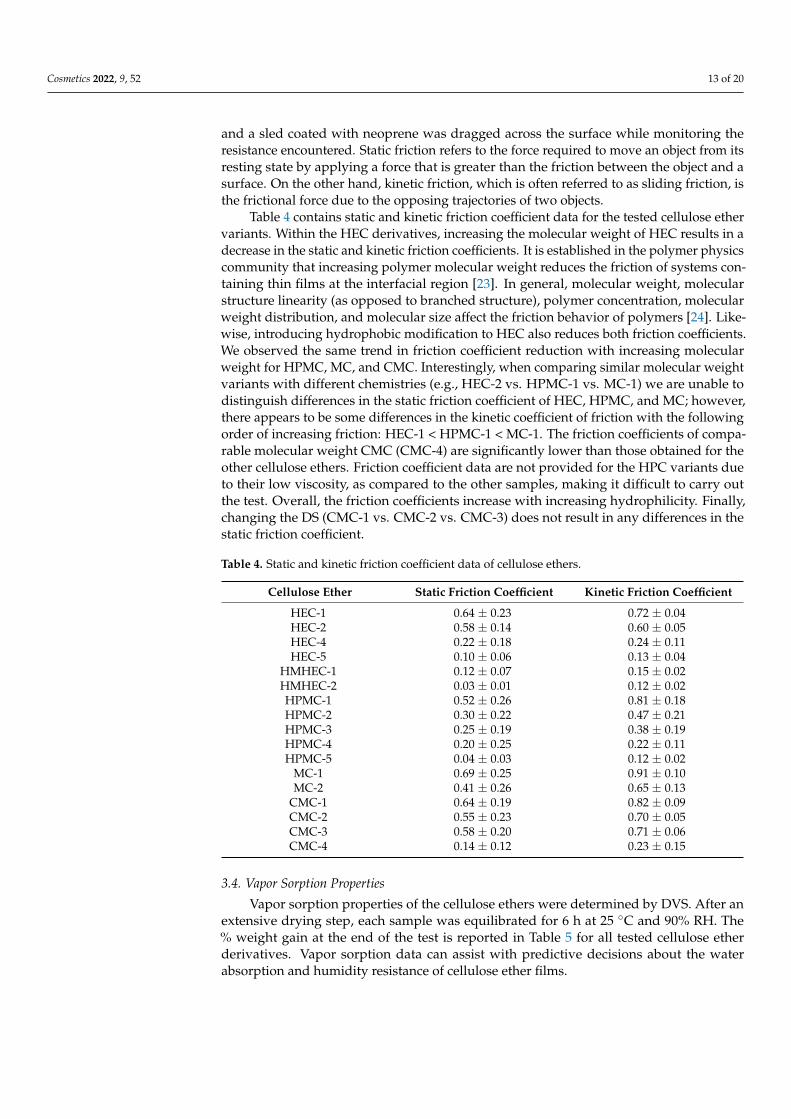
formulations to modify the sensorial perception experienced by consumers during prod-uct application. Static and kinetic coefficients of friction were determined for 1% polymer solutions using a slip/peel tester. A liquid polymer film was applied to a glass substrate and a sled coated with neoprene was dragged across the surface while monitoring the resistance encountered. Static friction refers to the force required to move an object from its resting state by applying a force that is greater than the friction between the object and a surface. On the other hand, kinetic friction, which is often referred to as sliding friction, is the frictional force due to the opposing trajectories of two objects.
Table 4 contains static and kinetic friction coefficient data for the tested cellulose ether variants. Within the HEC derivatives, increasing the molecular weight of HEC results in a decrease in the static and kinetic friction coefficients. It is established in the polymer physics community that increasing polymer molecular weight reduces the friction of sys-tems containing thin films at the interfacial region [23]. In general, molecular weight, mo-lecular structure linearity (as opposed to branched structure), polymer concentration, mo-lecular weight distribution, and molecular size affect the friction behavior of polymers [24]. Likewise, introducing hydrophobic modification to HEC also reduces both friction coefficients. We observed the same trend in friction coefficient reduction with increasing molecular weight for HPMC, MC, and CMC. Interestingly, when comparing similar mo-lecular weight variants with different chemistries (e.g., HEC-2 vs. HPMC-1 vs. MC-1) we are unable to distinguish differences in the static friction coefficient of HEC, HPMC, and MC; however, there appears to be some differences in the kinetic coefficient of friction with the following order of increasing friction: HEC-1 < HPMC-1 < MC-1. The friction coefficients of comparable molecular weight CMC (CMC-4) are significantly lower than those obtained for the other cellulose ethers. Friction coefficient data are not provided for the HPC variants due to their low viscosity, as compared to the other samples, making it difficult to carry out the test. Overall, the friction coefficients increase with increasing hy-drophilicity. Finally, changing the DS (CMC-1 vs. CMC-2 vs. CMC-3) does not result in any differences in the static friction coefficient.
Shea
rstr
ess,
σ(P
a)
Shea
rstr
ess,
σ(P
a)
Shea
rstr
ess,
σ(P
a)
Shea
rstre
ss, σ
(Pa)
CMC-4 CMC-1
CMC-2 CMC-3
Shear rate, γ (1/s)⋅ Shear rate, γ (1/s)⋅
Shear rate, γ (1/s)⋅ Shear rate, γ (1/s)⋅Figure 9. Lissajous–Bowditch curves for CMC-1, CMC -2, CMC-3, and CMC-4.
3.3. Determination of Friction Coefficient
Due to their lubricious feel properties, cellulose ethers are often used in personal careformulations to modify the sensorial perception experienced by consumers during productapplication. Static and kinetic coefficients of friction were determined for 1% polymersolutions using a slip/peel tester. A liquid polymer film was applied to a glass substrate
Cosmetics 2022, 9, 52 13 of 20
and a sled coated with neoprene was dragged across the surface while monitoring theresistance encountered. Static friction refers to the force required to move an object from itsresting state by applying a force that is greater than the friction between the object and asurface. On the other hand, kinetic friction, which is often referred to as sliding friction, isthe frictional force due to the opposing trajectories of two objects.
Table 4 contains static and kinetic friction coefficient data for the tested cellulose ethervariants. Within the HEC derivatives, increasing the molecular weight of HEC results in adecrease in the static and kinetic friction coefficients. It is established in the polymer physicscommunity that increasing polymer molecular weight reduces the friction of systems con-taining thin films at the interfacial region [23]. In general, molecular weight, molecularstructure linearity (as opposed to branched structure), polymer concentration, molecularweight distribution, and molecular size affect the friction behavior of polymers [24]. Like-wise, introducing hydrophobic modification to HEC also reduces both friction coefficients.We observed the same trend in friction coefficient reduction with increasing molecularweight for HPMC, MC, and CMC. Interestingly, when comparing similar molecular weightvariants with different chemistries (e.g., HEC-2 vs. HPMC-1 vs. MC-1) we are unable todistinguish differences in the static friction coefficient of HEC, HPMC, and MC; however,there appears to be some differences in the kinetic coefficient of friction with the followingorder of increasing friction: HEC-1 < HPMC-1 < MC-1. The friction coefficients of compa-rable molecular weight CMC (CMC-4) are significantly lower than those obtained for theother cellulose ethers. Friction coefficient data are not provided for the HPC variants dueto their low viscosity, as compared to the other samples, making it difficult to carry outthe test. Overall, the friction coefficients increase with increasing hydrophilicity. Finally,changing the DS (CMC-1 vs. CMC-2 vs. CMC-3) does not result in any differences in thestatic friction coefficient.
Table 4. Static and kinetic friction coefficient data of cellulose ethers.
Cellulose Ether Static Friction Coefficient Kinetic Friction Coefficient
HEC-1 0.64 ± 0.23 0.72 ± 0.04HEC-2 0.58 ± 0.14 0.60 ± 0.05HEC-4 0.22 ± 0.18 0.24 ± 0.11HEC-5 0.10 ± 0.06 0.13 ± 0.04
HMHEC-1 0.12 ± 0.07 0.15 ± 0.02HMHEC-2 0.03 ± 0.01 0.12 ± 0.02HPMC-1 0.52 ± 0.26 0.81 ± 0.18HPMC-2 0.30 ± 0.22 0.47 ± 0.21HPMC-3 0.25 ± 0.19 0.38 ± 0.19HPMC-4 0.20 ± 0.25 0.22 ± 0.11HPMC-5 0.04 ± 0.03 0.12 ± 0.02
MC-1 0.69 ± 0.25 0.91 ± 0.10MC-2 0.41 ± 0.26 0.65 ± 0.13
CMC-1 0.64 ± 0.19 0.82 ± 0.09CMC-2 0.55 ± 0.23 0.70 ± 0.05CMC-3 0.58 ± 0.20 0.71 ± 0.06CMC-4 0.14 ± 0.12 0.23 ± 0.15
3.4. Vapor Sorption Properties
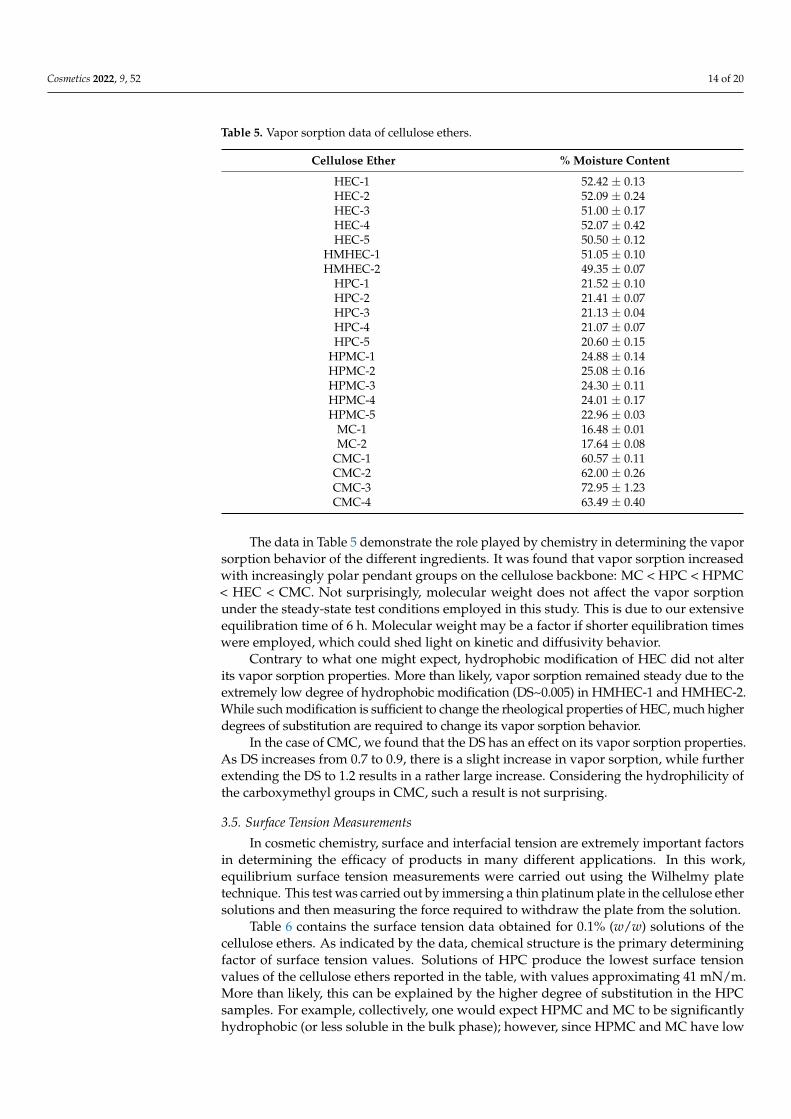
Vapor sorption properties of the cellulose ethers were determined by DVS. After anextensive drying step, each sample was equilibrated for 6 h at 25 ◦C and 90% RH. The% weight gain at the end of the test is reported in Table 5 for all tested cellulose etherderivatives. Vapor sorption data can assist with predictive decisions about the waterabsorption and humidity resistance of cellulose ether films.
Cosmetics 2022, 9, 52 14 of 20
Table 5. Vapor sorption data of cellulose ethers.
Cellulose Ether % Moisture Content
HEC-1 52.42 ± 0.13HEC-2 52.09 ± 0.24HEC-3 51.00 ± 0.17HEC-4 52.07 ± 0.42HEC-5 50.50 ± 0.12
HMHEC-1 51.05 ± 0.10HMHEC-2 49.35 ± 0.07
HPC-1 21.52 ± 0.10HPC-2 21.41 ± 0.07HPC-3 21.13 ± 0.04HPC-4 21.07 ± 0.07HPC-5 20.60 ± 0.15
HPMC-1 24.88 ± 0.14HPMC-2 25.08 ± 0.16HPMC-3 24.30 ± 0.11HPMC-4 24.01 ± 0.17HPMC-5 22.96 ± 0.03
MC-1 16.48 ± 0.01MC-2 17.64 ± 0.08
CMC-1 60.57 ± 0.11CMC-2 62.00 ± 0.26CMC-3 72.95 ± 1.23CMC-4 63.49 ± 0.40
The data in Table 5 demonstrate the role played by chemistry in determining the vaporsorption behavior of the different ingredients. It was found that vapor sorption increasedwith increasingly polar pendant groups on the cellulose backbone: MC < HPC < HPMC< HEC < CMC. Not surprisingly, molecular weight does not affect the vapor sorptionunder the steady-state test conditions employed in this study. This is due to our extensiveequilibration time of 6 h. Molecular weight may be a factor if shorter equilibration timeswere employed, which could shed light on kinetic and diffusivity behavior.
Contrary to what one might expect, hydrophobic modification of HEC did not alterits vapor sorption properties. More than likely, vapor sorption remained steady due to theextremely low degree of hydrophobic modification (DS~0.005) in HMHEC-1 and HMHEC-2.While such modification is sufficient to change the rheological properties of HEC, much higherdegrees of substitution are required to change its vapor sorption behavior.
In the case of CMC, we found that the DS has an effect on its vapor sorption properties.As DS increases from 0.7 to 0.9, there is a slight increase in vapor sorption, while furtherextending the DS to 1.2 results in a rather large increase. Considering the hydrophilicity ofthe carboxymethyl groups in CMC, such a result is not surprising.
3.5. Surface Tension Measurements
In cosmetic chemistry, surface and interfacial tension are extremely important factorsin determining the efficacy of products in many different applications. In this work,equilibrium surface tension measurements were carried out using the Wilhelmy platetechnique. This test was carried out by immersing a thin platinum plate in the cellulose ethersolutions and then measuring the force required to withdraw the plate from the solution.
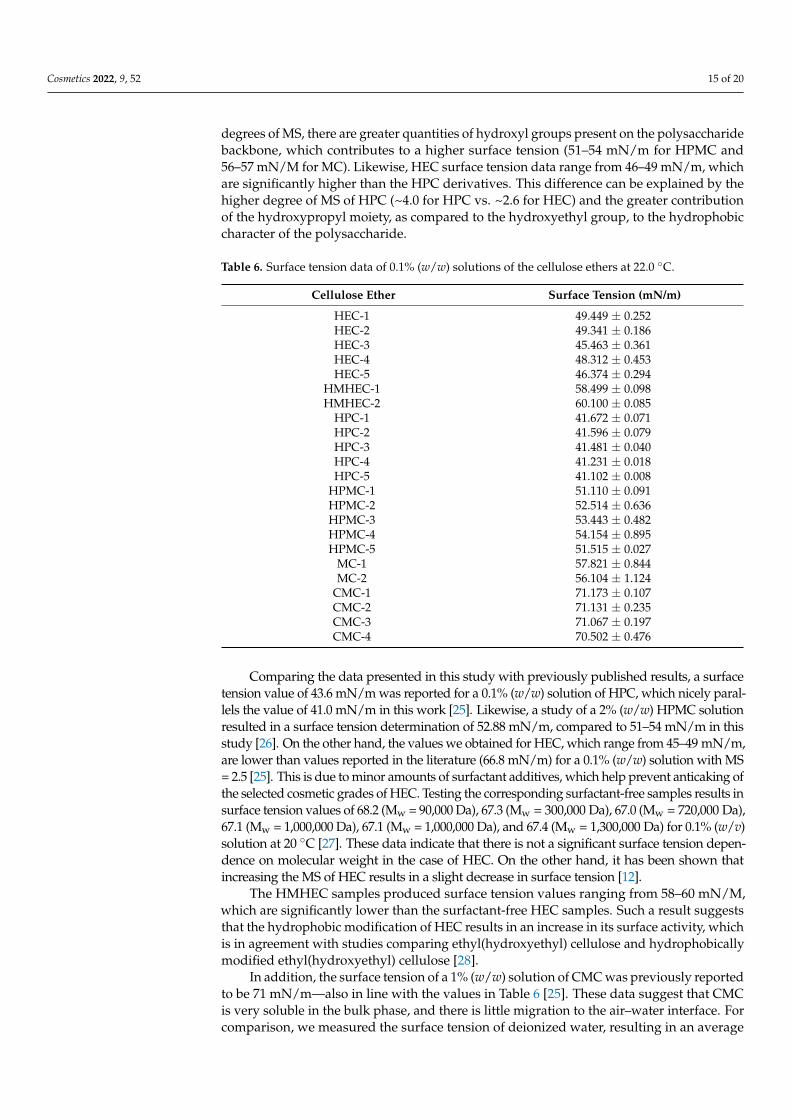
Table 6 contains the surface tension data obtained for 0.1% (w/w) solutions of thecellulose ethers. As indicated by the data, chemical structure is the primary determiningfactor of surface tension values. Solutions of HPC produce the lowest surface tensionvalues of the cellulose ethers reported in the table, with values approximating 41 mN/m.More than likely, this can be explained by the higher degree of substitution in the HPCsamples. For example, collectively, one would expect HPMC and MC to be significantlyhydrophobic (or less soluble in the bulk phase); however, since HPMC and MC have low
Cosmetics 2022, 9, 52 15 of 20
degrees of MS, there are greater quantities of hydroxyl groups present on the polysaccharidebackbone, which contributes to a higher surface tension (51–54 mN/m for HPMC and56–57 mN/M for MC). Likewise, HEC surface tension data range from 46–49 mN/m, whichare significantly higher than the HPC derivatives. This difference can be explained by thehigher degree of MS of HPC (~4.0 for HPC vs. ~2.6 for HEC) and the greater contributionof the hydroxypropyl moiety, as compared to the hydroxyethyl group, to the hydrophobiccharacter of the polysaccharide.
Table 6. Surface tension data of 0.1% (w/w) solutions of the cellulose ethers at 22.0 ◦C.
Cellulose Ether Surface Tension (mN/m)
HEC-1 49.449 ± 0.252HEC-2 49.341 ± 0.186HEC-3 45.463 ± 0.361HEC-4 48.312 ± 0.453HEC-5 46.374 ± 0.294
HMHEC-1 58.499 ± 0.098HMHEC-2 60.100 ± 0.085
HPC-1 41.672 ± 0.071HPC-2 41.596 ± 0.079HPC-3 41.481 ± 0.040HPC-4 41.231 ± 0.018HPC-5 41.102 ± 0.008
HPMC-1 51.110 ± 0.091HPMC-2 52.514 ± 0.636HPMC-3 53.443 ± 0.482HPMC-4 54.154 ± 0.895HPMC-5 51.515 ± 0.027
MC-1 57.821 ± 0.844MC-2 56.104 ± 1.124
CMC-1 71.173 ± 0.107CMC-2 71.131 ± 0.235CMC-3 71.067 ± 0.197CMC-4 70.502 ± 0.476
Comparing the data presented in this study with previously published results, a surfacetension value of 43.6 mN/m was reported for a 0.1% (w/w) solution of HPC, which nicely paral-lels the value of 41.0 mN/m in this work [25]. Likewise, a study of a 2% (w/w) HPMC solutionresulted in a surface tension determination of 52.88 mN/m, compared to 51–54 mN/m in thisstudy [26]. On the other hand, the values we obtained for HEC, which range from 45–49 mN/m,are lower than values reported in the literature (66.8 mN/m) for a 0.1% (w/w) solution with MS= 2.5 [25]. This is due to minor amounts of surfactant additives, which help prevent anticaking ofthe selected cosmetic grades of HEC. Testing the corresponding surfactant-free samples results insurface tension values of 68.2 (Mw = 90,000 Da), 67.3 (Mw = 300,000 Da), 67.0 (Mw = 720,000 Da),67.1 (Mw = 1,000,000 Da), 67.1 (Mw = 1,000,000 Da), and 67.4 (Mw = 1,300,000 Da) for 0.1% (w/v)solution at 20 ◦C [27]. These data indicate that there is not a significant surface tension depen-dence on molecular weight in the case of HEC. On the other hand, it has been shown thatincreasing the MS of HEC results in a slight decrease in surface tension [12].
The HMHEC samples produced surface tension values ranging from 58–60 mN/M,which are significantly lower than the surfactant-free HEC samples. Such a result suggeststhat the hydrophobic modification of HEC results in an increase in its surface activity, whichis in agreement with studies comparing ethyl(hydroxyethyl) cellulose and hydrophobicallymodified ethyl(hydroxyethyl) cellulose [28].
In addition, the surface tension of a 1% (w/w) solution of CMC was previously reportedto be 71 mN/m—also in line with the values in Table 6 [25]. These data suggest that CMCis very soluble in the bulk phase, and there is little migration to the air–water interface. Forcomparison, we measured the surface tension of deionized water, resulting in an average
Cosmetics 2022, 9, 52 16 of 20
value of 71.479 ± 0.119 mN/m, which is consistent with the generally accepted valuesobtained for water.
The surface tension data presented thus far represent a single concentration point. Bymeasuring surface tension at various concentrations, a plot can be constructed, allowingthe critical aggregation concentration (CAC) to be determined. CAC is analogous to criticalmicelle concentration (CMC), which describes the bulk-phase concentration of a surfactantsolution at which any additionally added surfactant will form micelles. Prior to reachingthe CMC, the surface tension undergoes a sharp drop; however, once the CMC is reached,the surface tension remains steady with the added surfactant. While CMC is specific formicelle formation, CAC refers to the formation of any type of aggregate, regardless of itsshape, and is commonly used to describe the behavior of polymer solutions. We measuredthe surface tension for two molecular weight grades of HEC (HEC-1 and HEC-3) at variousconcentrations and found the CAC to be 0.001% (w/w). A surface tension study of MCrevealed a CAC of 0.001% (w/w), similar to our value obtained for HEC [29]. In agreementwith our observations, the same researchers found that molecular weight does not affectthe equilibrium surface tension or CAC of MC.
3.6. Thermal Analysis
DSC and TGA were carried out to characterize the influence of temperature on thephysical and chemical structure of the cellulose ethers. In a DSC experiment, the heat flowof a sample is monitored as a function of temperature in a controlled environment. Thermaltransitions that occur during the heating ramp can be endothermic or exothermic events.Amorphous (non-crystalline or semi-crystalline) materials have a characteristic Tg, whichcan be determined with DSC, whereas Tm represents the onset of melting for crystallinedomains in the polymer. The Tg represents the inflection in the DSC heat flow curve, whichindicates that sufficient energy has been provided to enable neighboring segments in thepolymer to synchronously wiggle and vibrate. At the Tg, the volume and heat capacity ofthe glassy material increase, and the substance undergoes a physical transition to a rubberystate. The determination of Tg is important for pharmaceutical applications, such as spraydrying and hot-melt extrusion, where polymers are used to enhance the solubility of activepharmaceutical ingredients [30]. It is also a key parameter that is used to characterizehair-styling ingredients, providing insight into the dissipative mechanical properties offilm-forming polymers [31]. During a Tm transition, which involves a change in physicalstate, thermal energy scrambles the ordered chain segments. The increase in entropydissolves the crystal lattice and abruptly increases sample volume while exchanging heatwith its surroundings. After melting, film pliability and tack properties increase, and withadditional heating, the polymer chains undergo translational flow.
Measuring the dry Tg of cellulose derivatives is not a trivial task. The inherentstructural backbone of cellulose is rigid, meaning that the free rotation of chemical bondsaround the chain axis is limited. Hence, at the glass transition, the change in heat capacity isminimal, making it difficult to observe a marked heat flow inflection. One simple solutionto enhance the thermal transition sensitivity for cellulosic polymers is to increase theheating rate (e.g., from 10 to 20 ◦C/min); however, increasing the heating rate decreasesthermogram resolution.
A second tactic involves using hermetically sealed DSC pans to retain physisorbedatmospheric moisture during heating. The added water increases the free volume sur-rounding the cellulose chains to provide a sharp but plasticized Tg, which emerges in thethermogram for most cellulose ethers in the first heat, between 40 and 70 ◦C. Note thatusing hermetically sealed pans and trapped ambient water vapor likely provides the bestTg value for predicting the mechanics of ambient film applications.
A third approach (used in this work) is to closely approximate the dry glass transitionby using a controlled drying step (prior to the first heat) to leave residual bound moisture onthe cellulose backbone, whereby the increase in free volume is sufficient to clearly resolve aheat flow inflection. Finally, to further complicate the success of a dry Tg measurement, bear
Cosmetics 2022, 9, 52 17 of 20
in mind that MS, substituent blockiness, and consequential structural microheterogeneitytend to broaden otherwise sharp heat flow inflections, thereby rendering the assignment ofprecise dry glass transitions non-trivial.
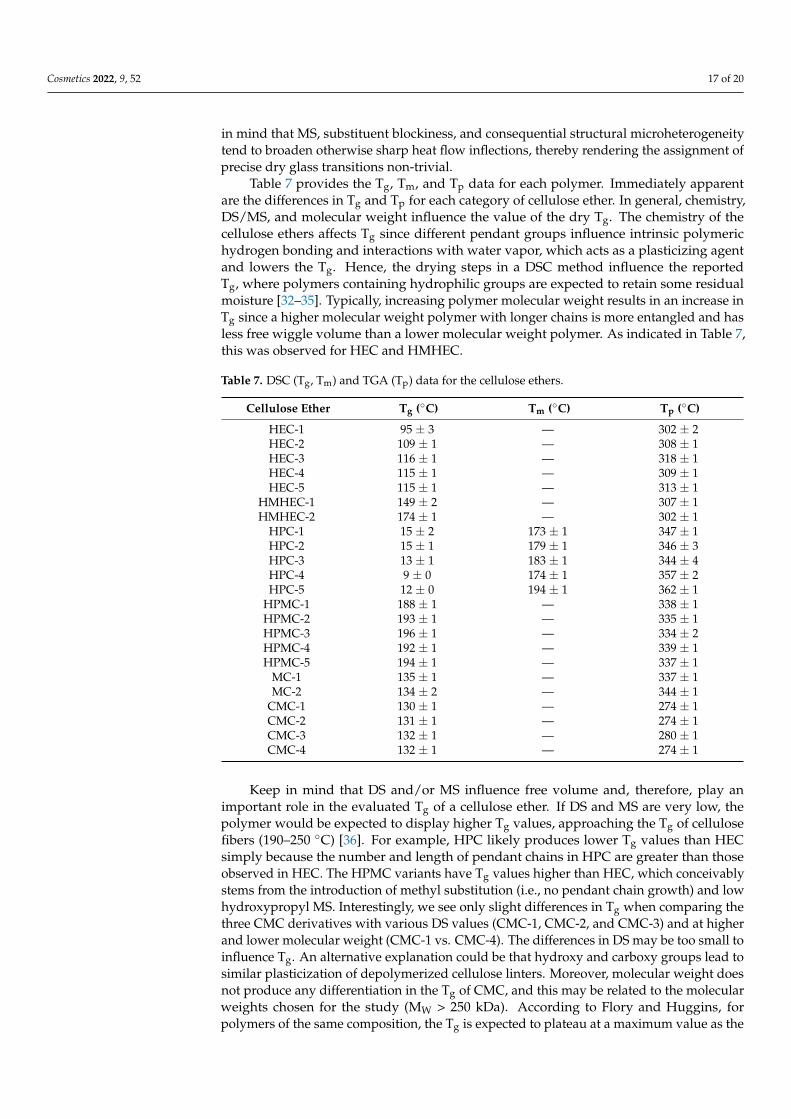
Table 7 provides the Tg, Tm, and Tp data for each polymer. Immediately apparentare the differences in Tg and Tp for each category of cellulose ether. In general, chemistry,DS/MS, and molecular weight influence the value of the dry Tg. The chemistry of thecellulose ethers affects Tg since different pendant groups influence intrinsic polymerichydrogen bonding and interactions with water vapor, which acts as a plasticizing agentand lowers the Tg. Hence, the drying steps in a DSC method influence the reportedTg, where polymers containing hydrophilic groups are expected to retain some residualmoisture [32–35]. Typically, increasing polymer molecular weight results in an increase inTg since a higher molecular weight polymer with longer chains is more entangled and hasless free wiggle volume than a lower molecular weight polymer. As indicated in Table 7,this was observed for HEC and HMHEC.
Table 7. DSC (Tg, Tm) and TGA (Tp) data for the cellulose ethers.
Cellulose Ether Tg (◦C) Tm (◦C) Tp (◦C)
HEC-1 95 ± 3 — 302 ± 2HEC-2 109 ± 1 — 308 ± 1HEC-3 116 ± 1 — 318 ± 1HEC-4 115 ± 1 — 309 ± 1HEC-5 115 ± 1 — 313 ± 1
HMHEC-1 149 ± 2 — 307 ± 1HMHEC-2 174 ± 1 — 302 ± 1
HPC-1 15 ± 2 173 ± 1 347 ± 1HPC-2 15 ± 1 179 ± 1 346 ± 3HPC-3 13 ± 1 183 ± 1 344 ± 4HPC-4 9 ± 0 174 ± 1 357 ± 2HPC-5 12 ± 0 194 ± 1 362 ± 1
HPMC-1 188 ± 1 — 338 ± 1HPMC-2 193 ± 1 — 335 ± 1HPMC-3 196 ± 1 — 334 ± 2HPMC-4 192 ± 1 — 339 ± 1HPMC-5 194 ± 1 — 337 ± 1
MC-1 135 ± 1 — 337 ± 1MC-2 134 ± 2 — 344 ± 1
CMC-1 130 ± 1 — 274 ± 1CMC-2 131 ± 1 — 274 ± 1CMC-3 132 ± 1 — 280 ± 1CMC-4 132 ± 1 — 274 ± 1
Keep in mind that DS and/or MS influence free volume and, therefore, play animportant role in the evaluated Tg of a cellulose ether. If DS and MS are very low, thepolymer would be expected to display higher Tg values, approaching the Tg of cellulosefibers (190–250 ◦C) [36]. For example, HPC likely produces lower Tg values than HECsimply because the number and length of pendant chains in HPC are greater than thoseobserved in HEC. The HPMC variants have Tg values higher than HEC, which conceivablystems from the introduction of methyl substitution (i.e., no pendant chain growth) and lowhydroxypropyl MS. Interestingly, we see only slight differences in Tg when comparing thethree CMC derivatives with various DS values (CMC-1, CMC-2, and CMC-3) and at higherand lower molecular weight (CMC-1 vs. CMC-4). The differences in DS may be too small toinfluence Tg. An alternative explanation could be that hydroxy and carboxy groups lead tosimilar plasticization of depolymerized cellulose linters. Moreover, molecular weight doesnot produce any differentiation in the Tg of CMC, and this may be related to the molecularweights chosen for the study (MW > 250 kDa). According to Flory and Huggins, forpolymers of the same composition, the Tg is expected to plateau at a maximum value as the
Cosmetics 2022, 9, 52 18 of 20
number average molecular weight (Mn) of the polymer increases (e.g., Mn > 50–100 kDa).Hence, thermal measurements provided poor differentiation for the various molecularweight grades of CMC.
The HPMC variants yielded the highest Tg values followed by HMHEC, MC, CMC,HEC, and HPC. Note that HPC is the only derivative with a measurable melting transition(173–179 ◦C; ∆Hfus = 3–5 J/g), suggesting that HPC is approximately 15% crystalline [36].Further, although not provided in Table 7, HPC also shows a secondary thermal transitionthat more closely parallels the characteristic cellulose ether transitions displayed in Table 7.As with other cellulose ether grades, the location of the transient 100–135 ◦C inflectionis influenced by residual water and thermal history and is likely related to segmentalvibrations of the plasticized cellulose backbone.
In TGA, the sample is heated above the pyrolysis temperature (Tp) of the material inan oxygen-free environment, and changes in the sample weight are continuously monitoredas a function of increasing temperature. Tp is defined as the extrapolated onset of a massloss event in the weight vs. temperature thermogram [37]. For cellulose derivatives, factorssuch as reactivity, porosity, and the type of atmosphere (i.e., air vs. nitrogen gas) affect themagnitude of Tp. The Tp for cellulose ethers is governed by chemical composition and islowest for the CMC variants followed by (in increasing order): HEC, HMHEC, HPMC, MC,and HPC. Likely, the specific substituent and DS and/or MS influence the bond dissociationenergy and stability of the physical polymer–polymer chain interactions. Based on the data,it is likely that Tp is not influenced by polymer molecular weight.
4. Conclusions
In this work, we monitored a number of important physicochemical properties ofcellulose ethers commonly used in personal care products. The rheological behaviorof these ingredients is predominantly controlled by molecular weight and hydrophobicmodification. In addition to conventional flow curves, Lissajous–Bowditch curves wereobtained from LAOS experiments to provide insight into the influence of molecular weightand chemistry to the sensorial/textural properties of these ingredients. Further, we foundthat surface tension is greatly influenced by DS/MS, which provides an overall indicatorof chemistry for each cellulose ether analogue. The vapor sorption characteristics of thecellulose ethers closely parallel the results one would expect based on a molecule’s chemicalcomposition, where cellulose ethers with more hydrophobic characteristics absorb lesswater. Finally, thermal analysis was carried out to determine key parameters, such as Tg, ofthe cellulose ether variants. In general, increasing the molecular weight leads to an increasein Tg. The chemistry of pendant groups on the anhydroglucose ring also influences themeasured values of Tg with greater hydrophobicity correlating with a higher Tg.
Author Contributions: Conceptualization, R.L.M., S.O. and T.G.; methodology, R.L.M., S.O. and T.G.;software, R.L.M., S.O. and T.G.; validation, R.L.M., S.O. and T.G.; formal analysis, R.L.M., S.O. andT.G.; investigation, R.L.M., S.O. and T.G.; resources, R.L.M.; data curation, R.L.M., S.O. and T.G.;writing—original draft preparation, R.L.M., S.O. and T.G.; writing—review and editing, R.L.M., S.O.and T.G.; visualization, R.L.M., S.O. and T.G.; supervision, R.L.M.; project administration, R.L.M. Allauthors have read and agreed to the published version of the manuscript.
Funding: This research received no external funding.
Acknowledgments: The authors would like to express their gratitude to the Ashland LLC R&Dmanagement team for their support of this project. We would like to especially acknowledge BertKroon for his input and advice about the manuscript.
Conflicts of Interest: The authors declare no conflict of interest.
Cosmetics 2022, 9, 52 19 of 20
References1. Wertz, J.; Bédué, O.; Mercier, J. Cellulose Science and Technology; EPFL Press: Lausanne, Switzerland, 2010.2. Kamide, K. Cellulose and Cellulose Derivatives: Molecular Characterization and its Applications; Elsevier: Amsterdam, The Netherlands, 2005.3. Kongruang, S.; Han, M.; Breton, C.G.; Penner, M. Quantitative analysis of cellulose-reducing ends. Appl. Biochem. Biotechnol. 2004,
113, 213–231. [CrossRef]4. Wüstenberg, T. Cellulose. In Cellulose and Cellulose Derivatives in the Food Industry: Fundamentals and Applications; Wiley-VCH:
Weinheim, Germany, 2015; pp. 91–141.5. Coffey, D.; Bell, D. Cellulose and Cellulose Derivatives. In Food Polysaccharides and Their Applications; Stephen, A., Ed.; Marcel
Dekker: New York, NY, USA, 1995; pp. 123–153.6. Arca, H.; Mosquera-Giraldo, L.; Bi, V.; Xu, D.; Taylor, L.; Edgar, K. Pharmaceutical applications of cellulose ethers and cellulose
ether esters. Biomacromolecules 2018, 19, 2351–2376. [CrossRef] [PubMed]7. Croll, S.; Kleinlein, R. Influence of Cellulose Ethers on Coating Performance. In Water-Soluble Polymers; Glass, J., Ed.; American
Chemical Society: Washington, DC, USA, 1986; pp. 333–350.8. Liu, K.; Du, H.; Zheng, T.; Liu, H.; Zhang, M.; Zhang, R.; Li, H.; Xie, H.; Zhang, X.; Ma, M.; et al. Recent advances in cellulose and
its derivatives for oilfield applications. Carbohydr. Polym. 2021, 259, 117740. [CrossRef] [PubMed]9. Brady, J.; Dürig, T.; Lee, P.; Li, J. Polymer properties and characterization. In Developing Solid Oral Dosage Forms; Qiu, Y., Ed.;
Academic Press: London, UK, 2016; pp. 181–223.10. Final report on the safety assessment of hydroxyethylcellulose, hydroxypropylcellulose, methylcellulose, hydroxypropylmethyl-
cellulose, and cellulose gum. J. Am. Coll. Toxicol. 1986, 5, 1–59. [CrossRef]11. Desmarais, A.; Wint, R. Hydroxyalkyl and ethyl ethers of cellulose. In Industrial Gums: Polysaccharides and Their Derivatives;
Whistler, R., BeMiller, J., Eds.; Academic Press: San Diego, CA, USA, 1993; pp. 505–535.12. Klug, E. Some properties of water-soluble hydroxyalkyl celluloses and their derivatives. J. Poly. Sci. Part C 1971, 36, 491–508.
[CrossRef]13. Lopez, C.; Colby, R.; Graham, P.; Cabral, J. Viscosity and scaling of semiflexible polyelectrolyte NaCMC in aqueous salt solutions.
Macromolecules 2016, 50, 332–338. [CrossRef]14. DeButts, E.; Hudy, J.; Elliot, J. Rheology of sodium carboxymethylcellulose solutions. Ind. Eng. Chem. 1957, 49, 94–98. [CrossRef]15. Benyounes, K.; Remli, S.; Benmounah, A. Rheological behavior of hydroxyethylcellulose (HEC) solutions. J. Phys. Conf. Ser. 2018,
1045, 012008. [CrossRef]16. Prodduturi, S.; Manek, R.; Kolling, W.; Stodghill, S.; Repka, M. Water vapor sorption of hot-melt extruded hydroxypropyl
cellulose films: Effect on physico-mechanical properties, release characteristics, and stability. J. Pharm. Sci. 2004, 93, 3047–3056.[CrossRef]
17. Blažková, A.; Hrivíková, J.; Lapcík, L. Viscosity properties of aqueous solutions of hydroxethylcellulose. Chem. Papers 1990, 44,289–301.
18. Kwiatkowski, A.; Sharma, H.; Molchanov, V.; Orekhov, A.; Vasiliev, A.; Dormidontova, E.; Philippova, O. Wormlike surfactantmicelles with embedded polymer chains. Macromolecules 2017, 50, 7299–7308. [CrossRef]
19. Ozkan, S.; Alonso, C.; McMullen, R. Rheological fingerprinting as an effective tool to guide development of personal careformulations. Int. J. Cosmet. Sci. 2020, 42, 536–547. [CrossRef] [PubMed]
20. Ozkan, S.; Gillece, T.; Senak, L.; Moore, D. Characterization of yield stress and slip behaviour of skin/hair care gels using steadyflow and LAOS measurements and their correlation with sensorial attributes. Int. J. Cosmet. Sci. 2012, 34, 193–201. [CrossRef][PubMed]
21. Gillece, T.; McMullen, R.; Fares, H.; Senak, L.; Ozkan, S.; Foltis, L. Probing the textures of composite skin care formulations usinglarge amplitude oscillatory shear. J. Cosmet. Sci. 2016, 67, 121–159. [PubMed]
22. Sun, W.; Yang, Y.; Wang, T.; Liu, X.; Wang, C.; Tong, Z. Large amplitude oscillatory shear rheology for nonlinear viscoelasticity inhectorite suspensions containing poly(ethylene glycol). Polymer 2011, 52, 1402–1409. [CrossRef]
23. Yu, K.; Hodges, C.; Biggs, S.; Cayre, O.; Harbottle, D. Polymer molecular weight dependence on lubricating particle-particleinteractions. Ind. Eng. Chem. Res. 2018, 57, 2131–2138. [CrossRef]
24. Matjukhov, A.; Mironov, B.; Anisimov, I. The influence of molecular mass distribution, size, and elasticity of macromolecules onfriction reduction effect. In The Influence of Polymer Additives on Velocity and Temperature Fields; Gampert, B., Ed.; Springer: Essen,Germany, 1985; pp. 107–118.
25. Majewicz, T.; Erazo-Majewicz, P.; Podlas, T. Cellulose ethers. In Encyclopedia of Polymer Science and Technology; Mark, H., Ed.; JohnWiley & Sons: Hoboken, NJ, USA, 2002; pp. 507–532.
26. Riedl, Z.; Szklenárik, G.; Zelkó, R.; Marton, S.; Rácz, I. The effect of temperature and polymer concentration on dynamic surfacetension and wetting ability of hydroxypropylmethylcellulose solutions. Drug. Dev. Ind. Pharm. 2000, 26, 1321–1323. [CrossRef][PubMed]
27. Formulating Elegant Liquid and Semisolid Drug Products: Natrosol 250 Hydroxyethylcellulose (HEC); PHA18-101; Ashland LLC:Wilmington, DE, USA, 2018.
28. Um, S.; Poptoshev, E.; Pugh, R. Aqueous solutions of ethyl (hydroxyethyl) cellulose and hydrophobic modified ethyl (hydroxethyl)cellulose polymer: Dynamic surface tension measurements. J. Colloid Interface Sci. 1997, 193, 41–49. [CrossRef]
Cosmetics 2022, 9, 52 20 of 20
29. Nasatto, P.; Pignon, F.; Silveira, J.; Duarte, M.; Noseda, M.; Rinaudo, M. Interfacial properties of methylcelluloses: The influenceof molar mass. Polymers 2014, 6, 2961–2973. [CrossRef]
30. Newman, A.; Zografi, G. Commentary: Considerations in the measurement of glass transition temperatures of pharmaceuticalamorphous solids. AAPS PharmSciTech 2020, 21, 26. [CrossRef]
31. Rafferty, D.; Zellia, J.; Hasman, D.; Mullay, J. Polymer composite principles applied to hair styling gels. J. Cosmet. Sci. 2008, 59,497–508. [CrossRef]
32. Kubát, J.; Pattyranie, C. Transitions in cellulose in the vicinity of −30 ◦C. Nature 1967, 215, 390–391. [CrossRef]33. Salmén, N.; Back, E. The influence of water on the glass phase transition temperature of cellulose. Tappi 1977, 60, 137–140.34. Szczesniak, L.; Rachocki, A.; Tritt-Goc, J. Glass transition temperature and thermal decomposition of cellulose powder. Cellulose
2008, 15, 445–451. [CrossRef]35. Hancock, B.; Zografi, G. The relationship between the glass transition temperature and the water content of amorphous
pharmaceutical solids. Pharm. Res. 1994, 11, 451. [CrossRef]36. ASTM E2550-21; Standard Test Method for Thermal Stability by Thermogravimetry. ASTM International: West Conshohocken,
PA, USA, 2021.37. Rials, T.; Glasser, W. Thermal and dynamic mechanical properties of hydroxypropyl cellulose films. J. Appl. Polym. Sci. 1988, 36,
749–758. [CrossRef]