dtap3000 dtsx3000 control visualization software guide
TRANSCRIPT

User’s Manual
IM 39J02B40-01E
DTAP3000 DTSX3000 Control Visualization Software Guide
IM 39J02B40-01E 1st Edition

Blank Page

< Introduction > i
Introduction
About this Manual Thank you for purchasing the DTSX3000 Control Visualization Software DTAP3000. This document describes the functions, operation and usage precautions of the DTAP3000. Read it carefully before using the software to ensure proper use. After reading, save this document in an accessible location for easy reference during software use. Besides this manual, the table below lists five other manuals related to the DTSX3000 Distribution Temperature Sensor. Read these manuals as well. The term “DTSX Series” in this document shall refer collectively to the DTSX200 and DTSX3000.
Manual name Document No. Description DTSXL Distributed Temperature Sensor Long Range System Guide
IM39J06B40-01E This document describes the functions, operation and usage precautions of the DTSXL Distributed Temperature Sensor.
DTSX3000 Communications (Modbus) Guide
IM39J06B40-02E This manual describes commands for controlling the DTSX3000 Distributed Temperature Sensor.
DTAP3000 DTSX3000 Control Visualization Software LAS 2.0 Data Conversion Guide
IM39J02B40-02E
This document describes the functions, operation and usage precautions of the software for converting and transmitting measurement data of the DTSX3000 Distributed Temperature Sensor in LAS format.
DTAP3000D DTSX3000 Data Conversion Software WITSML1.3.1.1 Guide
IM39J02B40-03E This document describes the functions, operation and usage precautions of the software for converting and transmitting measurement data of the DTSX3000 Distributed Temperature Sensor in WISTML format.
DTAP3000 DTSX3000 Control Visualization Software Calibration Guide
IM39J02B40-04E
This document describes the functions, operation and usage precautions of the software for calibrating the measurement of the DTSX3000 Distributed Temperature Sensor, and thereafter setting the calibration values in the DTSX3000.
Caution • This document describes the DTSX3000 Control Visualization Software R1.01.01.
You can check your software version by selecting [Help] from the software menu bar.
• YOKOGAWA reserves the right to make improvements in the manuals and product at any time, without notice or obligation. Moreover, actual screen display in the software may differ somewhat from the screen display contained in this document.
• If you have any questions, or you find mistakes or omissions in the manuals, please contact our sales representative or your local distributor.
• The use and operation of Windows is not described in this document. • No part of the manual may be transferred or reproduced without prior written
consent from YOKOGAWA.

< Introduction > ii
Trademarks and licensed software The following names are trademarks or registered trademarks of their respective holders. • DTSX is a trademark of Yokogawa Electric Corporation. • Microsoft and Windows are registered trademarks or trademarks of Microsoft
Corporation in the United States and other countries. • Adobe and Acrobat are trademarks of Adobe systems Incorporated registered in
certain regions. • Ethernet is a registered trademark of Xerox Corporation.• IBM and IBM-PC/AT are registered trademarks of IBM Corporation. • Other company and product names appearing in this document are trademarks or
registered trademarks of their respective holders. • Registered trademarks and trademarks in this document are not displayed with TM
or the ® mark. • The following third-party software are used in this software:
NetAdvantage Icons © 2011 – Infragistics Products
TeeChart Pro .NET v2010 Copyright © 2010 by Steema Software SL

< CONTENTS > iii
CONTENTS Introduction ................................................................................................ i CONTENTS ............................................................................................... iii 1. Before Using the Software .............................................................. 1
1.1 Functional Description of the DTSX3000 Control Visualization Software ....................................................................................................... 1
1.2 System Requirements ................................................................................. 4 1.3 Installation Procedure ................................................................................. 5 1.4 Network Setup ............................................................................................. 5
2. Using the Software ........................................................................... 7 2.1 Operation Flowchart ................................................................................... 7
3. Running and Terminating the Software .......................................... 9 3.1 Startup Sequence ........................................................................................ 9 3.2 Running the Software ............................................................................... 10 3.3 Selecting DTS Model and Operation Mode ............................................. 10 3.4 Connecting to DTSX series ...................................................................... 12 3.5 Online and Offline States .......................................................................... 17 3.6 Terminating the Software .......................................................................... 21
4. Basic Software Operations ............................................................ 23 4.1 Window Components and Functions ...................................................... 23
4.1.1 List of Windows and Dialogs .......................................................... 24 4.1.2 Main Window .................................................................................. 25 4.1.3 Solution Tree Window .................................................................... 31
4.2 Loading and Saving Settings ................................................................... 38 4.2.1 Loading and Saving Settings from the Start Menu ......................... 38 4.2.2 Loading and Saving Settings from Context Menu .......................... 42
4.3 Copying, Pasting and Defaulting Settings .............................................. 46 4.3.1 Copying, Pasting and Defaulting Settings from the Main
Window Menu ................................................................................ 46 4.3.2 Copying, Pasting and Defaulting Settings from Context Menu ...... 50
4.4 Displaying Windows and Dialogs ............................................................ 53 4.4.1 Menu Items for Displaying Windows (in main window) .................. 53 4.4.2 Nodes for Displaying Windows (in Solution Tree Window) ............ 54 4.4.3 Window Operations ........................................................................ 55
DTAP3000 DTSX3000 Control Visualization Software Guide IM 39J02B40-01E 1st Edition

< CONTENTS > iv
4.4.4 Menu Items for Displaying Dialogs (in main window) ..................... 78 4.4.5 Nodes for Displaying Dialogs (in Solution Tree Window) ............... 80 4.4.6 Dialog Operations .......................................................................... 82
4.5 Starting and Stopping Measurement ....................................................... 84 4.5.1 Starting Measurement from Menu (in main window) ...................... 84 4.5.2 Starting Measurement from Context Menu (in Solution Tree
window) .......................................................................................... 85 4.6 Status Display ............................................................................................ 86
4.6.1 DTSX series Error Status ............................................................... 86 4.6.2 DTSX series Connection Status ..................................................... 86 4.6.3 DTSX series Measurement Status ................................................. 87 4.6.4 DTSX series Measurement Progress Status ................................. 87
4.7 Chart Display ............................................................................................. 88 4.7.1 Displaying a Chart .......................................................................... 88 4.7.2 Displaying a Chart Configuration Window ...................................... 90 4.7.3 Configuring Chart Display .............................................................. 92 4.7.4 Specifying Chart Colors .................................................................. 97 4.7.5 Specifying the Data Display Range (available only in Trace
mode) ............................................................................................. 98 4.7.6 Performing Data Auto Play (available only in Trace Folder
mode) ............................................................................................. 99 4.7.7 Displaying Trace Data by Drag-and-drop (available only in
Trace File mode) ............................................................................ 99 4.7.8 Chart Display Functions ............................................................... 100
4.8 Messages ................................................................................................. 101 4.9 Alarms ....................................................................................................... 102 4.10 Help ........................................................................................................... 103
5. Control Mode ................................................................................ 104 5.1 Control Mode Functions ......................................................................... 104 5.2 Preparing for Measurement .................................................................... 107 5.3 Single-ended Measurement .................................................................... 115 5.4 Double-ended Measurement .................................................................. 123 5.5 Single and Continuous Sequence Measurement ................................. 128 5.6 Temperature Alarm Display .................................................................... 130 5.7 Data Compression Using Sectional Setting.......................................... 134 5.8 Self-Test .................................................................................................... 136
6. Monitoring Mode .......................................................................... 137 6.1 Monitoring Mode Functions ................................................................... 137
7. Trace Mode ................................................................................... 139 7.1 Trace Mode Functions ............................................................................ 139 7.2 Loading Trace Folder or Trace File ........................................................ 141
7.2.1 Specifying a Folder ....................................................................... 141 7.2.2 Specifying Files ............................................................................ 142

< CONTENTS > v
7.2.3 Folder/File structure ......................................................................... 148 7.3 Saving to CSV File ................................................................................... 149
Appendix A. Messages ................................................................. 151 Appendix A.1 List of Messages ..................................................................... 152
Appendix B. Version Compatibility .............................................. 161 Appendix B.1 Version Compatibility Tables ................................................... 161
Revision Information ................................................................................. i

Blank Page

< 1. Before Using the Software > 1
IM 39J02B40-01E
1. Before Using the Software
1.1 Functional Description of the DTSX3000 Control Visualization Software
DTAP3000 includes three software applications, namely, the DTSX3000 Control Visualization Software, the DTSX3000 Control Visualization Software LAS 2.0 Data Conversion and the DTSX3000 Control Visualization Software Calibration. Read this document for information on how to use the DTSX3000 Control Visualization Software.
SEE ALSO - For information on how to use DTSX3000 Control Visualization Software LAS 2.0 Data Conversion,
see the DTAP3000 DTSX3000 Control Visualization Software LAS 2.0 Guide (IM39J02B40-02E).
- For information on how to use DTSX3000 Control Visualization Software Calibration, see the DTAP3000 DTSX3000 Control Visualization Software Calibration Guide (IM39J02B40-04E).
HMI software Monitoring
Host data server
Data
HMI softwareMonitoring
HMI softwareControl and LAS data conversion
DCS
Protocols:- SSH- SCP(SFTP) Ethenet
HTTP protocol
Trace data
LAS data
The DTSX3000 Control Visualization Software runs on a PC connected to the DTSX series via Ethernet. It has three main functions, which are described below.
(1) Control mode In control mode, you can control temperature measurement by the DTSX series, acquire temperature data files created by the DTSX series and display the data in charts. Acquired temperature data files are saved to a storage device connected to a PC. Errors and temperature alarm status of the DTSX series can also be displayed.
SEE ALSO For details, see Chapter 5, “Control Mode.”
This software application

< 1. Before Using the Software > 2
IM 39J02B40-01E
(2) Monitoring mode Monitoring mode is essentially control mode less DTSX series control functions. In monitoring mode, you can get temperature data files of the DTSX series controlled by another DTSX3000 Control Visualization Software and display the data in charts. As in control mode, acquired temperature data files are saved to a storage device connected to a PC. Errors and temperature alarm status of the DTSX series can also be displayed.
SEE ALSO For details, see Chapter 6, “Monitoring Mode.”
(3) Trace mode In trace mode, you can load temperature data files, which are saved on a storage device connected to the PC and display the temperature data in a chart in offline state.
SEE ALSO For more details, see Chapter 7, “Trace Mode.”
IMPORTANT
- Up to eight instances of the DTAP3000 (this software), DTAP3000D, DTAP3000 LAS2.0 and DTAP3000 Calibration software combined can be run concurrently on a PC.
- However, running multiple instances of the applications on a PC may slow down response time significantly due to heavy processing load so the use of a powerful PC is recommended.
- Up to four users of the DTAP3000 (this software), DTAP3000D, DTAP3000 LAS2.0, DTAP3000 Calibration, DTAP200, DTAP200D and DTAP200 LAS 2.0 software applications combined can be connected to the DTSX200 concurrently.
- Up to four users of the DTAP3000 (this software), DTAP3000D, DTAP3000 LAS2.0 and DTAP3000 Calibration software combined can be connected to the DTSX3000 concurrently.

< 1. Before Using the Software > 3
IM 39J02B40-01E
- List of functions in each mode
Function Control Mode Monitoring Mode Trace Mode
Online Offline Online Offline Offline Setting measurement parameters
Ο Δ Δ Δ X
Measurement control Ο X X X X
Saving measurement result
Ο X Ο X X
Measurement result display Ο Ο Ο Ο Ο
Status display Ο Ο Ο Ο Ο Self-test execution Ο X X X X
Ο: Enabled; Δ: Configurable but edited settings are not updated to DTSX3000 (or DTSX200); X: Disabled

< 1. Before Using the Software > 4
IM 39J02B40-01E
1.2 System Requirements ● Operating system (OS)
The software runs on the following operating systems: - Windows 7 Home Premium SP1 English / Japanese (x86 / x64) - Windows 7 Ultimate SP1 English / Japanese (x86 / x64) - Windows 7 Professional SP1 English / Japanese (x86 / x64) - Windows 7 Enterprise SP1 English / Japanese (x86 / x64) (.NET Framework 4.0 is required) - Windows 8.1 English / Japanese (x86 / x64) - Windows 8.1 Pro English / Japanese (x86 / x64) - Windows 8.1 Enterprise English / Japanese (x86 / x64) The software is not guaranteed to run properly on other operating systems not listed above.
● Personal computer (PC) The PC must be installed with any of the above operating systems, as well as a CPU and memory meeting the following requirements: Dual-core 32-bit processor 2 GHz or better 2 GB or more memory
● Hard disk 2 GB or more free space
● Optical disk drive An optical disk drive compatible with the operating system and capable of reading CD-ROMs is required for software installation.
● Mouse, keyboard and other input devices Input devices supported by the operating system
● Display A video card recommended for use with the operating system and display device supporting 1024X768 dpi resolution or higher and 65536 colors or more, and supported by the operating system
● Printer Printer and printer driver compatible with the operating system

< 1. Before Using the Software > 5
IM 39J02B40-01E
● Ethernet adaptor Ethernet adaptor (100BASE-TX or 10BASE-T) supported by the operating system
● Baud rate (throughput) Baud rate between PC and DTSX3000: 500 kbps or higher Module operation may be unstable if baud rate (throughput) is below 500 kbps.
TIP - To install the software in Windows7/8.1, you must log in as a user with Administrator authority.
● PDF Reader Adobe Reader X is required for reading this guide.
1.3 Installation Procedure SEE ALSO Read the DTAP3000 installation manual (IM39J02B40-05E) bundled with the software.
1.4 Network Setup
Set the IP address of the PC to a fixed IP address on the same segment as the IP address of the DTSX series. As shown in the figure above, select the Use the following IP address option, and enter the IP address and subnet mask. For details on the network settings, consult your system administrator.

IM 39J02B40-01E
Blank Page

<2. Using the Software > 7
IM 39J02B40-01E
2. Using the Software
2.1 Operation Flowchart The operation flowchart below shows the overall operation flow when using the software for the first time. For details on individual items, see the respective chapters or sections indicated in the flowchart.
Install software
Installation Procedure (Section 1.3)Install the software on the PC.
Run software
Startup Sequence (Section 3.1)Running the Software (Section 3.2)Selecting Operation Mode (Section 3.3)
Run the software.
Connect to DTSX series
Network Setup (Section 1.4)Connecting to DTSX series (Section 3.4)
Connect the software to DTSX series.
Parameter Setup
Single-ended Measurement (Section 5.3)Double-ended Measurement (Section 5.4)Single & Continuous Sequence Measurement (Section 5.5)Temperature Alarm Display (Section 5.6)
Set DTSX series measurement parameters.
Configure storage of DTSX series measurement data to PC.
Preparing for Measurement (Section 5.2)
Measurement
Starting and Stopping Measurement (Section 4.5)Start and stop measurement.
Check measurement progress.
Status Display (Section 4.6)Check measurement results.
Chart Display (Section 4.7)Check for temperature alarms or DTSX series failure alarms.
Alarms (Section 4.9)
Terminate software execution
Terminating the Software (Section 3.6)Terminate software execution.
Check result
Trace Mode (Chapter 7)Chart Display (Section 4.7)
Check previously saved measurement result in trace mode.

8
IM 39J02B40-01E
Blank Page

<3. Running and Terminating the Software > 9
IM 39J02B40-01E
3. Running and Terminating the Software
3.1 Startup Sequence The flowchart below gives an overview of the startup sequence for the DTSX3000 Control Visualization Software. For details on individual items, see the respective sections.
Begin startup sequence
End of startup sequence
Double-click executable (.exe) file.
Select DTS Model & Operation Mode dialog is displayed.
Mode selection
Connect dialogis displayed.
Open Trace dialogis displayed.
Specify folder or file.
Trace mode selected
Control or Monitor mode selected
Execution is terminated.[Cancel]
Software is started in offline state.
- Select row No. - Enter IP Address or Port.
[Select] or [Cancel]?
Select Switch dialogis displayed.
Select number of channels from Ch1, Ch2, Ch4 or Ch16
[Cancel]
User ID / Password dialogis displayed.
[Select]
Enter user ID and password.
[Connect] or [Cancel]?[Cancel]
[Connect]
Software is started in online state.

<3. Running and Terminating the Software > 10
IM 39J02B40-01E
3.2 Running the Software This section describes how to run the DTSX3000 Control Visualization Software.
● Running the software from the Start menu In Microsoft Windows running on a PC, select Start>All Programs> YOKOGAWA DTSX3000>DTSX3000 Control Visualization Software.
● Running the software from its desktop icon You can also run the software by double-clicking the “DTSX3000 Control Visualization Software.exe” icon on the desktop.
3.3 Selecting DTS Model and Operation Mode On initial execution, the DTSX3000 Control Visualization Software displays the “Select DTS Model & Operation Mode” dialog for selecting the DTS model and operation mode.
● Selecting DTS model Select either DTSX200 or DTSX3000 as the DTS Model.
● Selecting operation mode Select Control, Monitor or Trace as the operation mode, and click [OK]. This confirms the DTS model and operation mode selections. If you have selected Control or Monitor mode, proceed to connect with the DTSX series (see Section 3.4). If you have selected Trace mode, proceed to specify a trace folder (or trace files) (see Chapter 7).
SEE ALSO For details on individual operation modes, see Chapters 5 to 7.
● Cancel Clicking [Cancel] aborts the execution of the DTSX3000 Control Visualization Software.

<3. Running and Terminating the Software > 11
IM 39J02B40-01E
Confirm mode selection. Abort execution.

<3. Running and Terminating the Software > 12
IM 39J02B40-01E
3.4 Connecting to DTSX series If you have selected the control or monitor operation mode, the DTSX3000 Control Visualization Software starts up in the selected operation mode and displays the Connect dialog. At this point, operations of the DTSX3000 Control Visualization Software are still disabled. First, you need to define settings for connection to the DTSX series.
IMPORTANT
- Only users with read and write authority are allowed to connect to the DTSX series. - We recommend using the latest version for the DTAP3000 software, as well as the
firmware on the DTSX series to be connected, as there may be functional limitations otherwise.
- Connection can only be made to DTSX series of the same DTS model selected on the “Select DTS Model & Operation Mode” dialog but not to a different model.

<3. Running and Terminating the Software > 13
IM 39J02B40-01E
● Define settings for connection to DTSX series 1. On the Connect dialog, select the row with network setting (IP address) and CV Soft
setting (port number) matching the DTSX series to be connected by clicking on its row header. An arrow (►) mark is displayed before the selected row.
Example: DTSX3000 system configuration
Selected row
Row header
Select the DTSX series to be connected.

<3. Running and Terminating the Software > 14
IM 39J02B40-01E
2. If none of the displayed rows matches the IP address and the port number of the
destination DTSX series, edit a cell value to the required value by first clicking on the cell to enable it.
TIP - Cell numbers displayed in the [No.] column cannot be edited. Only values in the IP Address and
Port columns can be edited.
- The software performs input validation when you move the focus to another cell or another control after editing a cell value. If an invalid edited value is detected, the edited value reverts to its unedited value and an error provider control is displayed in the row header area. To see the error message, move the mouse cursor over the error provider.
Editing a cell
Displaying an error
- IP address must be entered in IP address (IPv4) format.
- Port number must be an integer from 0 to 65535.
Cell being edited
Invalid input
Setting reverts to its unedited value.
Error message
Error provider

<3. Running and Terminating the Software > 15
IM 39J02B40-01E
3. Click [Select]. The UserID/Password dialog is displayed. 4. Enter the user ID and password of a user having read and write authority.
Example: DTSX3000 system configuration
TIP - The [Connect] button is enabled when a user ID is entered.
- Enter the user ID and password of a user account registered in the DTSX series.
Returns to Connect dialog.
Begins connection
List of registered user accounts

<3. Running and Terminating the Software > 16
IM 39J02B40-01E
SEE ALSO For details on how to register a user account, see the DTSXL Distributed Temperature Sensor Long Range System Guide (IM39J06B40-01E).
5. Clicking [Connect] initiates connection to DTSX series. Clicking [Cancel] returns to
the Connect dialog.
TIP - When you click [Connect] on the UserID/Password dialog, edited settings on the Connect dialog
are saved and will be displayed in the Connect dialog when the software is next executed. Up to five IP address and port number pairs can be saved. Entered values are not saved if you click [Cancel].
- Values entered in the UserID/Password dialog are not saved and must be re-entered each time.
● Canceling connection to DTSX series You can abort a connection by clicking the [Cancel] button in the Connect dialog or the [X] button at the top right corner of the Connect dialog. Doing so runs the software in offline state.
Five IP address and port number pairs
Aborts connection

<3. Running and Terminating the Software > 17
IM 39J02B40-01E
3.5 Online and Offline States In online state whereby the software is connected to the DTSX series, you can monitor and control measurement by the DTSX series, etc. On the other hand, in offline state where the software is not connected to the DTSX series, you can redisplay previously acquired measurement data and recalculate temperature data (in trace mode), as well as edit and save settings.
● Online state To control and monitor measurement by the DTSX series, run the software in online state. To do so, click [Connect] in the UserID/Password dialog. Connection to the DTSX series begins and the DTSX3000 Control Visualization Software is activated. The status display changes from “Idle” to “Connecting…” and when connection is successful, to “Connect (IP address of DTSX series).”
Status display

<3. Running and Terminating the Software > 18
IM 39J02B40-01E
TIP - If connection is unsuccessful, the following error message dialog is displayed and the status
display changes to “Idle.”
The [Connect] button of the main window is enabled at this time. Click [OK] on the error message
dialog, and then click the [Connect] button to redisplay the Connect dialog. Re-enter a valid user ID and a password to connect to the DTSX series.
- If connection is successful, the number of channels displayed under Channel Setting automatically
changes to match the number of channels of the optical switch.
- If connection is successful, the current setting values of the DTSX3000 are retrieved and displayed under Sequence Setting and Channel Setting.
- If a connected DTSX Series becomes disconnected due to, say, removal of the Ethernet cable, the status display changes to “Retry connection” and the software retries to connect until connection is successful.

<3. Running and Terminating the Software > 19
IM 39J02B40-01E
● Offline state Selecting Control or Monitor operation mode but not connecting to DTSX series runs the software in offline state where only editing of setting values is allowed. To run in offline state, click [Cancel] in the Connect dialog. Without connecting to the DTSX series, the number of channels for the optical switch cannot be determined automatically and thus must be specified manually. When Select Switch dialog is displayed, select either 1 channel, 2 channels, 4 channels or 16 channels for the Switch Type.
Click [OK] on the Select Switch dialog window. The switch type (number of channels) is confirmed and the DTSX3000 Control Visualization Software is activated. The status display, however, remains as “Idle.”
Confirm the number of channels.

<3. Running and Terminating the Software > 20
IM 39J02B40-01E
TIP - The number of channels displayed on Channel Setting changes automatically to match the number
of channels selected for optical switch on the Select Switch dialog.
- Sequence Setting and Channel Setting display the last confirmed edited settings.
- If Trace operation mode is selected, the software always runs in offline state. The software startup sequence in Trace mode differs from the other operation modes. For details on Trace mode, see Chapter 7, “Trace Mode.”

<3. Running and Terminating the Software > 21
IM 39J02B40-01E
3.6 Terminating the Software This section describes how to terminate the execution of the DTSX3000 Control Visualization Software.
● Terminating the software from the main window menu 1. Click the icon at the top left of the main window. A menu is displayed. 2. Select [Exit] from the menu.
● Terminating the software using the [X] button of the main window You can also terminate software execution by clicking the [X] button at the top right corner of the main window.

22
IM 39J02B40-01E
Blank Page

<4. Basic Software Operations > 23
IM 39J02B40-01E
4. Basic Software Operations This chapter describes the windows, dialogs and basic operations of the software. This document distinguishes between “windows”, which can be docked to the main window or Chart window, and “dialogs”, which are displayed as pop-ups of windows.
4.1 Window Components and Functions When the software is first executed, the main window, Solution Tree window, Chart window, Viewer_1 Chart window, Alarm window and Message window are displayed. For subsequent executions, windows that were previously displayed when software execution was last terminated are restored. Previously displayed Viewer_1-4 Chart windows, however, are not restored. Only the Viewer_1 Chart window is always displayed at software startup.
TIP - Viewer_1-4 Chart windows are chart display windows displayed in the Chart window.
Main window Solution Tree window
Chart window
Viewer_1 Chart window
Alarm window Message window

<4. Basic Software Operations > 24
IM 39J02B40-01E
4.1.1 List of Windows and Dialogs The tables below list the windows and dialog windows of the software. Dialogs for loading and saving are, however, omitted.
Window Name Description For Details, See:
Main Base window Subsection 4.1.2, Main Window
Solution Tree Displays solution tree Subsection 4.1.3, Solution Tree window
Chart Base window for displaying Viewer_1-4 Chart windows Section 4.7, Chart Display
Message Displays software messages Section 4.8, Messages
Alarm Reports DTSX series errors and warnings Section 4.9, Alarms
Viewer_1-4 Chart Displays measurement data in a chart Section 4.7, Chart Display
Dialog name Description For details, see:
Sequence setting Measurement sequence settings
Chapter 5, Control Mode Channel_1-16 Channel settings
Trace Storage Config Settings for trace data storage
Viewer_1-4 Config Configures display of Viewer_1-4 Chart windows Section 4.7, Chart Display
CSV Save Config Conversion to CSV file Section 7.3, Saving to CSV File
Self Test DTSX series self test execution Section 5.8, Self-test

<4. Basic Software Operations > 25
IM 39J02B40-01E
4.1.2 Main Window The main window is the base window for all other windows, which can be dragged and dropped onto the main window. Viewer_1 to 4 Config windows, however, are based on the Chart window and thus cannot be dragged and dropped directly onto the main window.
● Start Menu button The Start Menu button is displayed at the top left corner of the main window. Clicking the Start Menu button displays the Start menu for selection of the Open, Save and Exit operations.
● Title bar The title bar is displayed at the top of the main window. The title bar displays the application name as “DTSX3000 Control Visualization Software_n” where the suffix n is the application launch ID, which is assigned serially from 1 to 8 each time a DTSX3000 software application is run. Up to eight DTSX3000 applications can run concurrently on one PC.
TIP - Besides this software, other DTSX3000 applications include the “DTSX3000 Data Control
Visualization Software LAS 2.0 Data Conversion”, “DTSX3000 Data Conversion Software WITSML 1.3.1.1” and the “DTSX3000 Data Control Visualization Software Calibration”.
● Menu A menu is displayed at the top of the main window. The menu displays a list of buttons for operating the application. You can switch between menus by clicking one of the three tabs displayed above the menu.
Menu (Tab) Description
Home Lists buttons for the main functions of the current mode, DTSX series control functions and settings edit functions.
View Lists buttons for displaying windows and dialogs.
Tool Displays a button for displaying the Self Test dialog for DTSX series self-test execution.

<4. Basic Software Operations > 26
IM 39J02B40-01E
Home tab
View tab
Tool tab

<4. Basic Software Operations > 27
IM 39J02B40-01E
The table below lists the group boxes and buttons for each tab. Menu item
(Tab, group box or button)
Description
Home Tab for main functions of each mode, DTSX Series control functions and settings edit functions
DTS Control Group box for DTSX Series control functions
Connect Button for displaying the Connect dialog Start Button for starting measurement Stop Button for stopping measurement
Trace Group box for main functions of trace mode
Scaling Of Trace Database (*1) Group box for trace data selection functions
Edit Group box for settings edit functions
Copy (*2) Drop-down button that displays a menu for copying various settings Paste (*2) Drop-down button that displays a menu for pasting various settings Default (*2) Drop-down button that displays a menu for defaulting various settings
View Tab for window and dialog display functions
Setting Group box for DTSX Series settings
Sequence setting Button for displaying Sequence Setting dialog Channel Setting (*3) Drop-down button that displays a menu for displaying Channel_1-16 dialogs
Configuration Group box for application configuration
CSV Save Config Button for displaying the CSV Save Config dialog Trace Storage Config Button for displaying the Trace Storage Config dialog
Viewer Config (*4) Drop-down button that displays a menu for displaying Viewer_1-4 Config dialogs
Windows Group box for window display and manipulation
Solution Tree Button for displaying and giving focus to the Solution Tree window
Viewer Chart (*5) Drop-down button that displays a menu for displaying and giving focus to the Chart window and each Viewer_1-4 Chart window
Message Button for displaying and giving focus to the Message window Alarm Button for displaying and giving focus to the Alarm window Default Layout Button for initializing the display positions of windows
Tool Tab for temperature measurement test functions
Self Test Group box for DTSX Series self-test function Self Test Button for displaying the Self Test dialog
*1: Scaling Of Trace Database group box contains buttons and scroll bars for selecting trace data. For details, see Chapter 7, "Trace Mode."
*2: Clicking the Copy, Paste or Default drop-down button displays a menu of settings for selection. For details, see Section 4.3, "Copying, Pasting and Defaulting Settings."
*3: Clicking the Channel Setting drop-down button displays a menu for displaying each Channel dialog. For details, see Chapter 5, "Control Mode."
*4: Clicking the Viewer Config drop-down button displays a menu for displaying each Viewer Config window. For details, see Section 4.7, "Chart Display."
*5: Clicking the Viewer Chart drop-down button displays a menu for displaying and giving focus to the Chart window and each Viewer Chart widow. For details, see Section 4.7, "Chart Display."

<4. Basic Software Operations > 28
IM 39J02B40-01E
The display of the tabs, group boxes and buttons varies with the operation mode (control, monitor or trace) and the online/offline state. The table below shows the display in each operation mode in online state and offline state.
Tab, group box or button
Online Offline
Control Monitor Control Monitor Trace (Folder)
Trace (File)
Home Ο Ο Ο Ο Ο Ο
DTS Control
Ο Ο
X X X X
Connect Start
X Stop
Trace X X X X Ο Ο(*1)
Scaling Of Trace Database
Edit
Ο Ο Ο Ο Ο Ο(*2)
Copy Paste Default
View Ο Ο Ο Ο Ο Ο
Setting
Ο Ο Ο Ο Ο Δ
Sequence setting Channel Setting
Configuration Ο Ο Ο Ο Ο Ο
CSV Save Config X X X X Ο Ο
Trace Storage Config Ο Ο Ο Ο Ο Ο Viewer Config
Windows
Ο Ο Ο Ο Ο Ο
Solution Tree Viewer Chart Message Alarm Default Layout
Tool Ο X X X X X Ο Displayed Δ Displayed but not selectable X Not displayed *1) The AutoPlay function is not available when File mode is selected. *2) When File mode is selected, editing (copy, paste or default) of Channel Setting is not allowed but editing of Trace
Storage Config is allowed.

<4. Basic Software Operations > 29
IM 39J02B40-01E
Home tab in online control mode
Home tab in online monitoring mode
Home tab in offline control or monitoring mode
Home tab in offline trace mode
View tab in offline (or online) control or monitor mode
View tab in offline trace mode
Tool tab in online control mode

<4. Basic Software Operations > 30
IM 39J02B40-01E
● Help button The Help button is displayed near the top right corner of the main window. Clicking the Help button displays the Information dialog window.
SEE ALSO For details, see Section 4.10, “Help.”
● Status bar The Status bar is displayed at the bottom of the main window. It displays the DTSX series connection status and measurement status.
SEE ALSO For details, see Section 4.6, “Status Display.”
● Other buttons The Minimize button, Maximize/Reduce button and the Close button are displayed at the top right corner of the main window.
Help button
Maximize button
Close button
Minimize button
Status bar

<4. Basic Software Operations > 31
IM 39J02B40-01E
4.1.3 Solution Tree Window Selecting View>Windows>Solution Tree displays (or if already displayed, gives focus to) the Solution Tree window. The table below lists the functions of the Solution Tree window. The Solution Tree window can be used to display other windows and dialogs, to copy settings and perform other operations.
Click
Displayed and given focus

<4. Basic Software Operations > 32
IM 39J02B40-01E
● Solution Tree window layout The Solution Tree window displays nodes structured in the form of a tree. The current operation mode (Control, Monitor or Trace) is displayed at the top as the root node and the tree of nodes is up to five levels deep. Nodes displayed at the bottom level are called leaf nodes. Leaf nodes are bolded in the table below. Double-clicking on a leaf node displays its associated window or dialog. Right-clicking on some nodes displays a context menu of functions for loading settings, copying, etc. Details on window display, dialog display and context menu operations of the Solution Tree window are described later in this chapter. The table below shows the tree structure of the nodes.
TIP - In online state, individual nodes for displaying dialogs may be enabled or disabled depending on
the state of the DTSX3000. Double-clicking on a disabled node will not display its associated dialog.
Node Name Description
Control, Monitor or Trace Root node displaying the operation mode
CSV Save Config Node for displaying the CSV Save Config dialog Setting Group node for settings-related nodes
User Setting Node for grouping and operating user settings related nodes.
Sequence Setting Node for displaying and operating the Sequence Setting dialog Channel Setting Group node for channel related nodes Channel_1-16 (*1) Nodes for displaying and operating Channel_1-16 dialogs
Trace Storage Config Node for displaying and operating the Trace Storage Config dialog
Trace Group node for nodes related to measurement data chart display and configuration.
Viewer_1- 4 Group node for chart display and chart configuration for Viewer_1 to Viewer_4 windows.
Chart
Node for displaying and giving focus to Viewer_n Chart window (n matches the number of the parent node) along with Chart window.
Config Node for displaying and operating Viewer_n Config dialog (n matches the number of the parent node.)
Window Group node for window display related nodes
Message Node for displaying and giving focus to the Message window Alarm Node for displaying and giving focus to the Alarm window
Self Test Node for displaying the Self Test dialog File List (*2) Group node for loaded trace files. t20140101000000c01.ddtl(*3) File name of loaded trace file. … (*3) File name of loaded trace file. … (*3) File name of loaded trace file.
*1: In online state, nodes are displayed for the number of channels installed in the DTSX series. In offline state except in Trace mode, nodes are displayed for the number of channels selected in the Select Switch
dialog; and in Trace mode, nodes are displayed for all channels in the tree, but they are disabled in Trace File mode, and enabled only for the number of loaded channels in Trace Folder mode.
*2: This node is displayed in Trace File mode. *3: The filenames of loaded trace files are displayed in Trace File mode. Up to 64 filenames can be displayed. When a
new file is added with 64 files already loaded, the first loaded file is removed.

<4. Basic Software Operations > 33
IM 39J02B40-01E
The display of the nodes varies with the operation mode (Control, Monitor or Trace) and the online/offline state. The table below shows the display in each operation mode in online state and offline state.
Node Name Online Offline
Control Monitor Control Monitor Trace (Folder)
Trace (File)
Control, Monitor or Trace Control Monitor Control Monitor Trace Trace
CSV Save Config X X X X X Ο Setting
Ο Ο Ο Ο Ο Δ
User Setting
Sequence Setting Channel Setting Channel_1-16 Ο(*1) Ο(*1) Ο(*2) Ο(*2) Ο(*3)
Trace Storage Config Ο Ο Ο Ο Ο Ο Trace
Ο Ο Ο Ο
Ο
Ο Viewer_1 to 4
Ο(*3) Chart Config
Window Ο Ο Ο Ο Ο Ο Message
Alarm Self Test Ο X X X X X File List X X X X X Ο
t20140101000000c01.ddtl X X X X X Ο
… X X X X X Ο … X X X X X Ο
Ο Displayed Δ Displayed but not selectable X Not displayed *1: Nodes are displayed for the number of channels installed in the DTSX series. *2: Nodes are displayed for the number of channels selected in the Select Switch dialog. *3: Nodes are displayed for all channels, but enabled only the number of loaded channels. 1) Control mode 2) Monitor mode
3) Trace mode (Folder) 4) Trace mode (File)
Not displayed in offline state

<4. Basic Software Operations > 34
IM 39J02B40-01E
Number of channels=1 Number of channels=2 Number of channels=4 Number of channels=16

<4. Basic Software Operations > 35
IM 39J02B40-01E
● Context menus In the Solution Tree window, right-clicking on a node bolded in the table below displays its associated context menu. The table below shows the mapping between context menus and nodes.
Node Name Control Monitor Trace (Folder)
Trace (File)
Control, Monitor or Trace I(*1) II(*1) X X CSV Save Config X X Setting X X X X
User Setting III IV IV IV
Sequence Setting III IV IV IV
Channel Setting X X X X Channel_1-16 (*3) V IV VI VI Trace Storage Config III III IV IV Trace X X X X
Viewer_1 to 4 X X X X
Chart X X X X Config V V V V Window X X X X
Message X X X X
Alarm X X X X Self Test X (*2) File List (*4) VII t20140101000000c01.ddtl (*4) VIII … (*4) VIII … (*4) VIII
*1: Context menu is displayed only in online state. *2: Node is displayed only in online state. *3: In online state, nodes are displayed for the number of channels installed in the DTSX series. In offline state except in Trace mode, nodes are displayed for the number of channels selected in the Select Switch
dialog; and in Trace mode, nodes are displayed for all channels in the tree, but they are disabled in Trace File mode, and enabled only for the number of loaded channels in Trace Folder mode.
*4: These nodes are displayed only in Trace File mode. / Node is not displayed. X Node has no context menu. I to VIII: context menu (see text on the right for details) I Connect/Start/Stop II Connect III Open/Save/Default IV Save V Open/Save/Copy/Paste/Default VI Save/Copy/Paste VII Update VIII Delete/Display>Viewer_1 Chart ~ Viewer_4 Chart

<4. Basic Software Operations > 36
IM 39J02B40-01E
Operation Type Item Description
DTSX series operations
Connect Displays dialog for connection to DTSX series.
Start Starts measurement.
Stop Stops measurement.
Settings operations
Open Loads settings file for the node.
Save Saves settings file for the node.
Copy Copies settings for the node.
Paste Pastes settings for the node.
Default Initializes settings for the node.
File operations (*1)
Update Adds or deletes trace files.
Clear Chart Clears the display of the specified chart.
Viewer_1 Chart Clears the display of Viewer_1 Chart.
Viewer_2 Chart Clears the display of Viewer_2 Chart.
Viewer_3 Chart Clears the display of Viewer_3 Chart.
Viewer_4 Chart Clears the display of Viewer_4 Chart.
Delete Deletes trace files.
Display Hides/shows chart display of trace file.
Viewer_1 Chart Hides/shows trace file for Viewer_1 Chart
Viewer_2 Chart Hides/shows trace file for Viewer_2 Chart
Viewer_3 Chart Hides/shows trace file for Viewer_3 Chart
Viewer_4 Chart Hides/shows trace file for Viewer_4 Chart
*1) File operations are enabled only when the software is run in Trace mode, and files are specified for loading (Trace File mode).
Context menu for DTSX series control Context menu for settings manipulation
Context menu for File control

<4. Basic Software Operations > 37
IM 39J02B40-01E
TIP - In online state, individual nodes with context menus may be enabled or disabled depending on the
state of the DTSX series. Right-clicking on a disabled node will not display its associated context menu.
- In online state, individual menu items on a displayed context menu may be enabled or disabled depending on the state of the DTSX series. A disabled context menu item cannot be selected.
- Operations on the context menu of the User Setting node apply to the combined settings of the Sequence Setting and Channel Setting nodes just below it.
- File operations are available only when the software is run in Trace mode, and files are specified for loading (Trace File mode) so file operations are described in Chapter 7, “Trace Mode.”

<4. Basic Software Operations > 38
IM 39J02B40-01E
4.2 Loading and Saving Settings Settings specified using the software can be saved to or loaded from a settings file either from the Start menu of the main window or from a context menu in the Solution Tree window.
4.2.1 Loading and Saving Settings from the Start Menu This subsection describes how to load and save settings from the Start menu of the main window by selecting Start menu>Open and Start menu>Save respectively.
Clicking Open or Save on the Start menu displays a cascade menu of settings type. Selecting a settings type to be loaded or saved from the displayed menu displays a corresponding open/save dialog. The table below lists each Open or Save menu option along with the open/save dialog displayed and the settings file loaded or saved when the option is selected from the menu.
Open menu or Save menu
Open/Save Dialog Displayed, Settings File Type
File Extension
(*4)
User Setting "Open/Save a user setting file" dialog Settings file combining Sequence Setting and settings for Channel_1 to 16
*.dua *.dual
Sequence Setting "Open/Save a sequence setting file" dialog Sequence settings file
*.dus *.dusl
Channel Setting (*1)
Channel_1 to 16 (*2) "Open/Save a channel setting file" dialog Channel settings file (separate operation for Channel_1 to 16)
*.duc *.ducl
Viewer Config (*3)
Viewer_1 to 4 "Open/Save a viewer configuration file" dialog Setting files for charts 1 to 4 (separate operation for Viewer_1 to 4)
*.dug *.dugl
Trace Storage Config "Open/Save a trace storage configuration file" dialog Trace storage configuration file
*.dur *.durl
*1: Displays menu options for Channel_1 to 16. *2: In online state, nodes are displayed for the number of channels installed in the DTSX series. In offline state except in Trace mode, nodes are displayed for the number of channels selected in the Select Switch
dialog; and in Trace mode, nodes are displayed for all channels in the tree, but they are disabled in Trace File mode, and enabled only for the number of loaded channels in Trace Folder mode.
*3: Displays menu options for Viewer_1 to 4. *4: File extensions of DTSX200 settings files and DTSX3000 settings files differ; the latter have an extra letter “l” at the
end.
TIP - The User Setting menu option combines Sequence Setting and Channel Setting (settings for
Channel_1 to Channel_16). It can be used for loading or saving sequence settings and all channel settings for a DTSX series in one go. If the DTSX series is installed with less than the maximum of 16 channels, settings for uninstalled channels are disabled.

<4. Basic Software Operations > 39
IM 39J02B40-01E
The menu displayed when Start>Open is selected varies with the operation mode. Moreover, some menu items are disabled during measurement and disconnection in online state. The table below shows these dependencies.
Open menu Control Monitor Trace User Setting Ο(*1) X X Sequence Setting Ο(*1) X X Channel Setting Ο(*1) X X Channel_1-16 (*2) Viewer Config Ο Ο Ο Viewer_1-4 (*3) Trace Storage Config Ο(*1) Ο(*1) X
Ο Displayed. X Not displayed. *1: Disabled during measurement or disconnection in online state. *2: In online state, nodes are displayed for the number of channels installed in the DTSX series. In offline state except in Trace mode, nodes are displayed for the number of channels selected in the Select Switch
dialog; and in Trace mode, nodes are displayed for all channels in the tree, but they are disabled in Trace File mode, and enabled only for the number of loaded channels in Trace Folder mode.
Open menu in control mode Open menu in monitoring mode
Open menu in trace mode
● Procedure for loading settings (in main window) We describe the procedure below using an example for loading channel settings of Channel 1. 1. Select Start menu>Open>Channel Setting>Channel_1. (The “Open a channel
setting file” dialog is displayed.)
2. Specify the folder containing the channel settings file to be loaded. 3. Select the channel settings file to be loaded and click [Open]. (The “Open a channel
setting file” dialog closes.)

<4. Basic Software Operations > 40
IM 39J02B40-01E
After loading is completed, you can check the loaded channel settings by selecting View> Setting>Channel Setting>Channel_1 to display the Channel_1 dialog window.
TIP - In Windows 7, the following folder is specified by default in each Open dialog:
C:\Users\ <user name>\Documents\DTSX3000 Control Visualization Software\SETUP
1. Specify a folder.
2. Select a file.
3. Open the file.

<4. Basic Software Operations > 41
IM 39J02B40-01E
● Procedure for saving settings (in main window) We describe the procedure below using an example for saving channel settings of Channel 1. 1. Select Start menu>Save>Channel Setting>Channel_1. (The “Save a channel
setting file” dialog is displayed.)
2. Specify the destination folder for saving the channel settings file. 3. Specify a file name for saving the channel settings and click [Save]. (The “Save a
channel setting file” dialog closes.)
TIP - In Windows 7, the following destination folder is specified by default in each Save dialog window:
C:\Users\<user name>\Documents\DTSX3000 Control Visualization Software\SETUP
1. Specify a folder.
2. Specify a file name.
3. Save the file.

<4. Basic Software Operations > 42
IM 39J02B40-01E
4.2.2 Loading and Saving Settings from Context Menu This subsection describes how to load and save settings from a context menu in the Solution Tree window by right-clicking on a node and selecting Open and Save respectively from the displayed context menu. Whether both Open and Save or only Save is displayed in the context menu of a node depends on the operation mode. Moreover, Open is disabled during measurement and disconnection in online state for some nodes. The table below shows these dependencies.
Node Display of Open and Save in Context Menus in Each
Mode
Control Monitor Trace
User Setting Open (*1)/Save Save Save(*3)
Sequence Setting Open (*1)/Save Save Save(*3) Channel Setting Channel_1-16 (*2) Open (*1)/Save Save Save(*3)
Trace Storage Config Open (*1)/Save Open (*1)/Save Save Viewer_1 to 4 Config Open/Save Open/Save Open/Save
*1: Disabled during measurement or disconnection in online state. *2: In online state, nodes are displayed for the number of channels installed in the DTSX series. In offline state except in Trace mode, nodes are displayed for the number of channels selected in the Select Switch
dialog; and in Trace mode, nodes are displayed for all channels in the tree, but they are disabled in Trace File mode, and enabled only for the number of loaded channels in Trace Folder mode.
*3: This item is displayed only when a folder is specified for loading.
(in control mode) (in monitor or trace mode)
TIP - The context menu of the User Setting node combines Sequence Setting and Channel Setting
(settings for Channel_1 to Channel_16). It can be used for loading or saving sequence settings and all channel settings for a DTSX series in one go. If the DTSX series is installed with less than the maximum of 16 channels, settings for uninstalled channels are disabled.
Context menu for User Setting

<4. Basic Software Operations > 43
IM 39J02B40-01E
The table below shows the open or save dialog displayed and the settings file loaded or saved when Open or Save is selected from the context menu of each node.
Node Open/Save Dialog Displayed, Settings File Type
File Extension (*2)
User Setting "Open/Save a user setting file" dialog Settings file combining Sequence Setting and settings for Channel_1 to 16
*.dua *.dual
Sequence Setting "Open/Save a sequence setting file" dialog Sequence settings file
*.dus *.dusl
Channel Setting
Channel_1-16 (*1) "Open/Save a channel setting file" dialog Channel settings file (separate operation for Channel_1 to 16)
*.duc *.ducl
Trace Storage Config "Open/Save a trace storage configuration file" dialog Trace storage configuration file
*.dur *.durl
Viewer_1- 4 (*2)
Config "Open/Save a viewer configuration file" dialog window Setting files for charts 1 to 4 (separate operation for Viewer_1 to 4)
*.dug *.dugl
*1: In online state, nodes are displayed for the number of channels installed in the DTSX series. In offline state except in Trace mode, nodes are displayed for the number of channels selected in the Select Switch
dialog; and in Trace mode, nodes are displayed for all channels in the tree, but they are disabled in Trace File mode, and enabled only for the number of loaded channels in Trace Folder mode.
*2: File extensions of DTSX200 settings files and DTSX3000 settings files differ; the latter have an extra letter “l” at the end.
● Procedure for loading settings (in Solution Tree window) We describe the procedure below using an example for loading channel settings of Channel 1. 1. Right-click the Channel_1 node. 2. Select Open from the context menu. (The “Open a channel setting file” dialog is
displayed.)
3. Specify the folder containing the channel settings file to be loaded. 4. Select the channel settings file to be loaded and click [Open]. (The “Open a
channel setting file” dialog closes.)

<4. Basic Software Operations > 44
IM 39J02B40-01E
After loading is completed, you can check the loaded settings by double-clicking the Channel_1 node to display the Channel_1 dialog window.
TIP - In Windows 7, the following folder is specified by default in each Open dialog:
C:\Users\<user name>\Documents\DTSX3000 Control Visualization Software\SETUP
1. Specify a folder.
2. Select a file.
3. Open the file.

<4. Basic Software Operations > 45
IM 39J02B40-01E
● Procedure for saving settings (in Solution Tree window) We describe the procedure below using an example for saving channel settings of Channel 1. 1. Right-click on the Channel_1 node.
2. Select Save from the context menu. (The “Save a channel setting file” dialog is
displayed.) 3. Specify the destination folder for saving the channel settings file. 4. Specify a file name for saving the channel settings and click [Save]. (The “Save a
channel setting file” dialog closes.)
1. Specify a folder.
2. Specify a file name.
3. Save the file.

<4. Basic Software Operations > 46
IM 39J02B40-01E
4.3 Copying, Pasting and Defaulting Settings You can copy, paste and initialize (set to default values) settings either from the menu of the main window or from a context menu in the Solution Tree window.
TIP - You must perform a copy operation before a paste operation.
- A copy operation overwrites previously copied values.
- Settings for one channel or settings for one chart are copied for each copy operation. A copy operation overwrites previously copied values.
4.3.1 Copying, Pasting and Defaulting Settings from the Main Window Menu This subsection describes how to copy, paste and initialize (default) settings using the main window menu by selecting Home>Edit>Copy, Home>Edit>Paste and Home>Edit>Default respectively.
Clicking Copy, Paste or Default on the menu displays a cascade menu for selecting the type of settings to be copied, pasted or defaulted. The table below shows the menu displayed when Copy or Paste is clicked on the main window menu.
Copy Menu or Paste Menu Settings Type Channel Setting (*1) Channel_1-16 (*2) Channel settings Trace Config (*3) Viewer_1- 4 Chart settings
*1: Displays menu options for Channel_1 to 16. *2: In online state, nodes are displayed for the number of channels installed in the DTSX series. In offline state except in Trace mode, nodes are displayed for the number of channels selected in the Select Switch
dialog; and in Trace mode, nodes are displayed for all channels in the tree, but they are disabled in Trace File mode, and enabled only for the number of loaded channels in Trace Folder mode.
*3: Displays menu options for Viewer_1 to 4. The menu displayed when Copy and Paste is clicked on the main window menu varies with the operation mode. Moreover, some menu items are disabled during measurement and disconnection in online state. The table below shows these dependencies.
Copy Menu or Paste Menu Control Monitor Trace (Folder)
Trace (File)
Channel Setting Ο(*1) X Ο X Channel_1-16 (*2) Trace Config Ο Ο Ο Ο Viewer_1- 4 Ο Displayed. X Not displayed or not enabled *1: Disabled during measurement or disconnection in online state. *2: In online state, nodes are displayed for the number of channels installed in the DTSX series. In offline state except in Trace mode, nodes are displayed for the number of channels selected in the Select Switch
dialog; and in Trace mode, nodes are displayed for all channels in the tree, but they are disabled in Trace File mode, and enabled only for the number of loaded channels in Trace Folder mode.

<4. Basic Software Operations > 47
IM 39J02B40-01E
Copy menu in control or trace mode (folder mode)
Copy menu in monitor mode
The table below shows the menu displayed when Default is clicked on the main window menu.
Default Menu Settings Type User Setting Combination of Sequence Setting and settings for Channel_1 to 16 Sequence Setting Sequence settings Channel Setting (*1) Channel_1-16 (*2) Channel settings Trace Config (*3) Viewer_1-4 Settings for charts 1 to 4 Trace Storage Config Trace storage configuration
*1: Displays menu options for Channel_1 to 16. *2: In online state, nodes are displayed for the number of channels installed in the DTSX series. In offline state except in Trace mode, nodes are displayed for the number of channels selected in the Select Switch
dialog; and in Trace mode, nodes are displayed for all channels in the tree, but they are disabled in Trace File mode, and enabled only for the number of loaded channels in Trace Folder mode.
*3: Displays menu options for Viewer_1 to 4.
TIP - The User Setting menu option combines Sequence Setting and Channel Setting (settings for
Channel_1 to Channel_16). It can be used for defaulting (initializing) settings and all channel settings for a DTSX series in one go.
The menu displayed when Default is selected from the main window menu varies with the operation mode. Moreover, some menu items are disabled during measurement and disconnection in online state. The table below shows these dependencies.
Default Menu Control Monitor Trace User Setting Ο(*1) X X Sequence Setting Ο(*1) X X Channel Setting Ο(*1) X X Channel_1-16 (*2) Trace Config Ο Ο Ο Viewer_1-4 Trace Storage Config Ο(*1) Ο(*1) X
Ο Displayed. X Not displayed. *1: Disabled during measurement or disconnection in online state. *2: In online state, nodes are displayed for the number of channels installed in the DTSX series. In offline state except in Trace mode, nodes are displayed for the number of channels selected in the Select Switch
dialog; and in Trace mode, nodes are displayed for all channels in the tree, but they are disabled in Trace File mode, and enabled only for the number of loaded channels in Trace Folder mode.

<4. Basic Software Operations > 48
IM 39J02B40-01E
Default menu in Control mode Default menu in Monitoring mode
Default menu in Trace mode
● Procedure for copying settings (in main window) We describe the procedure below using an example for copying channel settings of Channel 1. 1. Select Home>Copy>Channel Setting>Channel_1.

<4. Basic Software Operations > 49
IM 39J02B40-01E
● Procedure for pasting settings (in main window) We describe the procedure below using an example for pasting to channel settings of Channel 2. 1. Select Home>Paste>Channel Setting>Channel_2.
After pasting is completed, you can check the pasted channel settings by selecting View> Setting>Channel Setting>Channel_2 to display the Channel_1 dialog window.
● Procedure for defaulting settings (in main window) We describe the procedure below using an example for defaulting channel settings of Channel 1. 1. Select Home>Default>Channel Setting>Channel_1.
After defaulting is completed, you can check the initialized channel settings by selecting View> Setting>Channel Setting>Channel_1 to display the Channel_1 dialog window.

<4. Basic Software Operations > 50
IM 39J02B40-01E
4.3.2 Copying, Pasting and Defaulting Settings from Context Menu This subsection describes how to copy, paste and default settings from a context menu in the Solution Tree window by right-clicking on a node and selecting Copy, Paste and Default respectively from the displayed context menu. Whether Copy, Paste and/or Default are displayed in the context menu of a node depends on the operation mode. Moreover, Paste and Default are disabled during measurement and disconnection in online state for some nodes. The table below shows these dependencies.
Node Display of Copy, Paste and Default in Context Menus in Each Mode
Control Monitor Trace (Folder)
Trace (File)
User Setting Default (*1) X X X
Sequence Setting Default (*1) X X X
Channel Setting
Channel_1-16 (*3) Copy/Paste (*1)/ Default (*1) X Copy/Paste (*2) X
Trace Storage Config Default (*1) Default (*1) X X
Viewer_1- 4
Config Copy/Paste/ Default
Copy/Paste/ Default
Copy/Paste/ Default
Copy/Paste/ Default
X Not displayed. *1: Disabled during measurement or disconnection in online state. *2: Only calculation parameters will be pasted. For details, see Chapter 5, "Control Mode." *3: In online state, nodes are displayed for the number of channels installed in the DTSX series. In offline state except in Trace mode, nodes are displayed for the number of channels selected in the Select Switch
dialog; and in Trace mode, nodes are displayed for all channels in the tree, but they are disabled in Trace File mode, and enabled only for the number of loaded channels in Trace Folder mode.
TIP - The context menu of User Setting combines Sequence Setting and Channel Setting (settings for
Channel_1 to Channel_16). It can be used for defaulting sequence settings and all channel settings for a DTSX series in one go.

<4. Basic Software Operations > 51
IM 39J02B40-01E
● Procedure for copying settings (in Solution Tree window) We describe the procedure below using an example for copying channel settings of Channel 1. 1. Right-click the Channel_1 node. 2. Select Copy from the context menu.
● Procedure for pasting settings (in Solution Tree window) We describe the procedure below using an example for pasting to channel settings of Channel 2. 1. Right-click on the Channel_2 node. 2. Select Paste from the context menu.
After pasting is completed, you can check the pasted channel settings by double-clicking on the Channel_2 node to display the Channel_2 dialog window.

<4. Basic Software Operations > 52
IM 39J02B40-01E
● Procedure for defaulting settings (in Solution Tree window) We describe the procedure below using an example for defaulting channel settings of Channel 1. 1. Right-click on the Channel_1 node. 2. Select Default from the context menu.
After defaulting is completed, you can check the initialized channel settings by double-clicking on the Channel_1 node to display the Channel_1 dialog window.

<4. Basic Software Operations > 53
IM 39J02B40-01E
4.4 Displaying Windows and Dialogs This section describes how to display windows and dialogs, as well as basic window operations. Windows and dialogs can be displayed from the menu of the main window or from a node in the Solution Tree window. A window or dialog can be displayed by clicking on its associated menu button in the main window. If the window is already displayed, it is given focus. A window or dialog can also be displayed by double-clicking on its associated node in the Solution Tree window. If the window is already displayed, it is given focus.
4.4.1 Menu Items for Displaying Windows (in main window) This subsection describes the displaying of windows from the main window menu. The table below lists the menu items (tabs, group boxes, buttons and menus) for displaying windows.
Menu Element (Tab, group box, button or menu) Description
View (tab)
Windows (group box)
Solution Tree (button) Displays and moves focus to Solution Tree window
Viewer Chart (Drop-down button)
Viewer_1-4 Chart (menu) Displays and moves focus to Viewer_1-4 Chart window and Chart window.
Message (button) Displays and moves focus to Message window
Alarm (button) Displays and moves focus to Alarm window

<4. Basic Software Operations > 54
IM 39J02B40-01E
4.4.2 Nodes for Displaying Windows (in Solution Tree Window) This subsection describes the displaying of windows from a node in the Solution Tree window. The table below lists the nodes for displaying windows.
Node for Displaying Windows Description
Control, Monitor or Trace
Trace
Viewer_1-4
Chart Displays and moves focus to Viewer_n Chart window along with Chart window (n matches the parent node).
Window
Message Displays and moves focus to Message window Alarm Displays and moves focus to Alarm window

<4. Basic Software Operations > 55
IM 39J02B40-01E
4.4.3 Window Operations This subsection describes basic window operations.
● Displaying and giving focus to a window A window can be displayed by clicking on its associated menu item in the main window or double-clicking on its associated node in the Solution Tree window. If the window is already displayed, it is given focus.
TIP - Displaying a Viewer_1-4 Chart window automatically displays the Chart window. This applies
similarly when giving focus to the window.
Click
Double-click
Displayed and given given focus

<4. Basic Software Operations > 56
IM 39J02B40-01E
● Closing a window Clicking on the [x] button at the top right corner of a window closes it.
TIP - Closing a Chart window automatically closes displayed Viewer_1-4 Chart windows.
- Redisplaying a Viewer_1-4 Chart window after closing a Chart window automatically displays previously displayed Viewer_1-4 Chart windows.
Click
Both Chart window and Viewer_1 Chart window are closed

<4. Basic Software Operations > 57
IM 39J02B40-01E
● Auto-hiding a window Clicking on the [ ] button at the top right corner of a window auto-hides it. An auto-hiding window appears as a tab along one of the four edges of the main window. An auto-hiding Viewer_1-4 Chart window, however, appears as a tab along one of the four edges of the Chart window.
Click
Window auto-hides as a tab.

<4. Basic Software Operations > 58
IM 39J02B40-01E
● Displaying an auto-hiding window temporarily Hovering the mouse pointer over the tab of an auto-hiding window displays the window temporarily. Moving the mouse pointer outside the temporarily displayed window auto-hides it again. Clicking on a temporarily displayed window gives it focus. The window remains displayed until the focus is moved elsewhere.
TIP - Hovering the mouse pointer over the tab of an auto-hiding window when the application itself is not
in focus will not display the window temporarily.
● Turning off auto-hiding of a window There are three ways to turn off auto-hiding of a window: Method 1: Clicking on [ ] when the auto-hiding window is temporarily displayed. Method 2: Clicking on its associated menu button in the main window. Method 3: Double-clicking on its associated node in the Solution Tree window.
TIP - Auto-hiding of a Chart window can only be cancelled using method 1. Applying method 2 or 3 on a
Viewer_1-4 Chart window temporarily displays and gives focus to the Chart window. (The Chart window remains displayed until the focus is moved elsewhere.)
Hover mouse pointer over tab
Auto-hiding window is displayed temporarily.

<4. Basic Software Operations > 59
IM 39J02B40-01E
Double-click (method 3)
Click (method 2)
Click (method 1)

<4. Basic Software Operations > 60
IM 39J02B40-01E
Displayed permanently

<4. Basic Software Operations > 61
IM 39J02B40-01E
● Floating a window There are two ways to float a window as described below: Method 1: Double-click on the title bar of a window to be floated. Method 2: Drag and drop the title bar of a window to be floated (see procedure below): 1. Drag the title bar of a window to be floated. (Docking icons appear when the title
bar is dragged over the display area of another window.) 2. Drop the title bar where the mouse pointer is not over a docking icon.
Drag
D
ouble-click
Double-click (method 1)
Drag (method 2)
Drop where the mouse pointer is not over a docking icon

<4. Basic Software Operations > 62
IM 39J02B40-01E
Window is floated

<4. Basic Software Operations > 63
IM 39J02B40-01E
● Returning a floating window to its previously docked position To return a floating window to its previously docked position, double-click its title bar.
Double-click
Window returns to previously docked position

<4. Basic Software Operations > 64
IM 39J02B40-01E
● Docking a window to any edge of the main window A window can be docked to any one of the four edges of a window other than the main window using the following procedure: 1. Drag the title bar of the window to be docked. (Docking icons appear when the title
bar is dragged over the display area of another window.) 2. Drag, move the mouse pointer over the desired docking icon displayed on an outer
edge, and drop. (An outline of the window (docking image) appears when the mouse pointer is over a docking icon.)
TIP - A Viewer_1-4 Chart window can be docked within a Chart window.
- If a window to be docked is the only displayed window, dropping it over any docking icon (except the cross center of the inner docking icons) will dock the window fully within the main window.
Docking image
Drag the mouse pointer over docking icon and drop.

<4. Basic Software Operations > 65
IM 39J02B40-01E
● Docking a window to any edge of a window other than the main window A window can be docked to any one of the four edges of a window other than the main window using the following procedure: 1. Drag the title bar of the window to be docked. (Docking icons appear when the title
bar is dragged over another window.) 2. Drag the title bar over the display area of the window where you want to dock it.
Move the mouse pointer over the desired docking icon (except the cross center) displayed on an inner edge, and drop the title bar. (An outline of the window (docking image) appears when the mouse pointer is over a docking icon.)
TIP - A Viewer_1-4 Chart window can be docked to another Viewer_1-4 Chart window.
- A window can also be docked to a floating window. When a window to be docked is dragged over the display area of a floating window, only the docking icons arranged as a cross appear.
Window is docked to desired position.

<4. Basic Software Operations > 66
IM 39J02B40-01E
Window is docked to desired position
Docking image
Drag the mouse pointer over docking icon and drop.

<4. Basic Software Operations > 67
IM 39J02B40-01E
● Tab-docking a window (creating a set of tabbed windows) A window can be tab-docked to another window, other than the main window. There are two ways to do this. Method 1: Using the docking icon (See detailed procedure below.) 1. Drag the title bar of the window to be tab-docked. (Docking icons appear when the
title bar is dragged over the display area of another window.) 2. Drag the title bar over the display area of the window where you want to dock it.
Move the mouse pointer over the cross center of the inner docking icons, and release the mouse button. (An outline of the window (docking image) appears when the mouse pointer is over a docking icon.)
Method 2: Drag and drop window title bar onto the title bar of the destination window (See detailed procedure below.) 1. Drag the window title of the window to be tab-docked. 2. Move the mouse pointer over the title bar of another window and release the mouse
button. (An outline of the window (docking image) appears when the mouse pointer is over the title bar.)
TIP - A Viewer_1-4 Chart window can be tab-docked to another Viewer_1-4 Chart window.
- If no other window is displayed, moving the mouse pointer over the cross center of the inner docking icons floats the window.
Drag the title bar over docking icon and drop it.
Docking image (of tabbed window)

<4. Basic Software Operations > 68
IM 39J02B40-01E
● Switching display between tabbed windows Clicking a tab at the bottom of a tabbed group switches the window display to the selected tabbed window.
● Separating a tabbed window A superimposed window can be separated using any of the following two methods: Method 1: Double-click the tab of the window to be separated. (The separated window
becomes a floating window.) Method 2: Drag and drop the tab of the window to be separated. (Dragging a tab has
the same effect of dragging the title bar of that window.)
Window tab-docked at desired position
Click on a tab to switch between tabbed windows

<4. Basic Software Operations > 69
IM 39J02B40-01E
TIP - In method 2, the dragged window can be floated or docked in any preferred way as follows:
Float the window (method 2)
Drag the tab to any one of the four edges of the main window
Drag the tab to any one of the four edges of another window
Drag
D
ouble-click
Double-click (method 1)
Drag (method 2)
Title bar is dragged.

<4. Basic Software Operations > 70
IM 39J02B40-01E
● Closing a tabbed window Clicking the [X] button at the top right corner of a tabbed window closes superimposed windows.
TIP - If the tabbed window is docked in a main window, only the displayed window is closed.
- If the tabbed window is floating, all windows of the tabbed group are closed.
SEE ALSO For details on the window operation, see the description entitled “Closing a window.”
● Auto-hiding tabbed windows Clicking on the [ ] button at the top right corner of the displayed window auto-hides its tabbed windows. Auto-hiding tabbed windows appear as a tab along one of the four edges of the main window. Viewer_1-4 Chart windows, however, are displayed as a tab along one of the four edges of the Chart window. Auto-hiding tabbed windows are grouped into a single tab, which displays their window titles jointly. The title of the tabbed window that is displayed before auto-hiding appears in full form in the tab while the titles of the other tabbed windows appear abbreviated in the tab.
Floating window

<4. Basic Software Operations > 71
IM 39J02B40-01E
● Displaying an auto-hiding tabbed window temporarily Hovering the mouse pointer over any window title in a tag displays the auto-hiding window temporarily. Moving the mouse pointer outside the temporarily displayed window auto-hides it again. When any auto-hiding window is displayed temporarily, its window title appears in full form in the tab while the titles of the other windows appear truncated. No tab is displayed at the bottom of the temporarily displayed window. (Switching display between windows is not allowed.) Clicking on a temporarily displayed window gives it focus. The window remains displayed until the focus is moved elsewhere.
Click
Auto-hiding tabbed windows are grouped into one tab.

<4. Basic Software Operations > 72
IM 39J02B40-01E
TIP - Hovering the mouse pointer over a window title in a tab when the application itself is not in focus
will not display the auto-hiding window temporarily.
Hover the mouse pointer over the title of the window to be displayed.
Window is displayed temporarily.

<4. Basic Software Operations > 73
IM 39J02B40-01E
● Turning off auto-hiding of a tabbed window The method is similar to that for a normal non-tabbed window. For details, see the description entitled “● Turning off auto-hiding of a window.”
● Floating a tabbed window The method is similar to that for a normal non-tabbed window. For details, see the description entitled “● Floating a window.”
● Returning a floating tabbed window to its previously docked position The method is similar to that for a normal non-tabbed window. For details, see the description entitled “● Returning a floating window to its previously docked position.”
● Docking a tabbed window to any edge of the main window The method is similar to that for a normal non-tabbed window. For details, see the description entitled “● Docking a window to any edge of the main window.”
● Docking a tabbed window to any edge of a window other than the main window The method is similar to that for a normal non-tabbed window. For details, see the description entitled “● Docking a window to any edge of a window other than the main window.”

<4. Basic Software Operations > 74
IM 39J02B40-01E
● Resizing a window When multiple windows are displayed, the windows can be resized by dragging and dropping the boundary between the windows. A vertical boundary can be dragged left and right while a horizontal boundary can be dragged up and down.
Drag a vertical boundary left or right.
Windows are resized.

<4. Basic Software Operations > 75
IM 39J02B40-01E
Drag a horizontal boundary up or down.
Windows are resized.

<4. Basic Software Operations > 76
IM 39J02B40-01E
● Resizing a floating window A floating window can be resized by dragging and dropping one of its edges. The left and right edges of a floating window can be dragged left and right while the top and bottom edges of a floating window can be dragged up and down. The corners of a floating window can be dragged diagonally.
● Initializing window layout Selecting View>Windows>Default Layout in the main window initializes the window layout.
Drag a window edge to resize the window.
Window is resized.

<4. Basic Software Operations > 77
IM 39J02B40-01E
TIP - The initial window layout refers to the window layout when the application is first started after
installation.
- The size of the main window is not initialized.
- The window layout of Viewer_1-4 Chart windows is not initialized.
Click
Layout of all windows other than the Viewer_1-4 Chart windows is initialized.

<4. Basic Software Operations > 78
IM 39J02B40-01E
4.4.4 Menu Items for Displaying Dialogs (in main window) This subsection describes the displaying of dialogs from the main window menu. The table below lists the menu items (tabs, group boxes, buttons and menus) for displaying dialogs.
Menu Element (Tab, group box, button or menu) Description
Home (tab)
DTS Control (group box) Connect (*1) (button) Displays Connect dialog
View (tab)
Setting (group box)
Sequence setting (button) Displays Sequence Setting dialog Channel Setting (Drop-down button)
Channel_1-16 (*2) (menu) Displays Channel_1-16 dialog Configuration (group box)
CSV Save Config (button) Displays CSV Save Config dialog Trace Storage Config (button) Displays Trace Storage Config dialog Trace Config (Drop-down button)
Viewer_1-4 Config (menu) Displays Viewer_1-4 Config dialog Tool (tab)
Self Test (group box) Self Test (button) Displays Self Test dialog
*1: Displayed if connection to the DTSX series was unsuccessful. *2: In online state, nodes are displayed for the number of channels installed in the DTSX series. In offline state except in Trace mode, nodes are displayed for the number of channels selected in the Select Switch
dialog; and in Trace mode, nodes are displayed for all channels in the tree, but they are disabled in Trace File mode, and enabled only for the number of loaded channels in Trace Folder mode.

<4. Basic Software Operations > 79
IM 39J02B40-01E
The display of the menu varies with the operation mode (Control, Monitor or Trace) and the online/offline state as shown in the table below.
Menu Element for Displaying Dialogs (tab, group box, button or menu)
Online Offline
Control Monitor Control Monitor Trace (Folder)
Trace (File)
Home (tab) Ο Ο Ο Ο Ο Ο
DTS Control (group box)
Ο Ο X X X X Connect (button)
View (tab) Ο Ο Ο Ο Ο Ο
Setting (group box)
Ο Ο Ο Ο Ο Δ
Sequence setting (button)
Channel Setting (Drop-down button)
Channel_1-16 (*1) (button) Ο Ο Ο Ο Ο X
Configuration (group box) Ο Ο Ο Ο Ο Ο
CSV Save Config (button) X X X X Ο Ο Trace Storage Config (button) Ο Ο Ο Ο Ο Ο
Trace Config (Drop-down button) Ο Ο Ο Ο Ο Ο
Viewer_1-4 Config (menu)
Tool (tab) Ο X X X X X
Self Test (group box)
Ο X X X X X Self Test (button)
Ο Displayed Δ Displayed but not selectable X Not displayed *1: In online state, nodes are displayed for the number of channels installed in the DTSX series. In offline state except in Trace mode, nodes are displayed for the number of channels selected in the Select Switch
dialog; and in Trace mode, nodes are displayed for all channels in the tree, but they are disabled in Trace File mode, and enabled only for the number of loaded channels in Trace Folder mode.

<4. Basic Software Operations > 80
IM 39J02B40-01E
4.4.5 Nodes for Displaying Dialogs (in Solution Tree Window) This subsection describes the displaying of dialogs from a node in the Solution Tree window. The table below lists the nodes for displaying dialogs.
Nodes for Displaying Dialogs Description Control, Monitor or Trace
CSV Save Config Displays CSV Save Config dialog. Setting
User Setting
Sequence Setting Display and operation of Sequence Setting dialog. Channel Setting Channel_1-16 (*1) Display and operation of Channel_1-16 dialog.
Trace Storage Config Display and operation of Trace Storage Config dialog. Trace
Viewer_1-4
Config Display and operation of Viewer_n Config dialog (n matches the parent node).
Self Test Displays Self Test dialog. *1: In online state, nodes are displayed for the number of channels installed in the DTSX series. In offline state except in Trace mode, nodes are displayed for the number of channels selected in the Select Switch
dialog; and in Trace mode, nodes are displayed for all channels in the tree, but they are disabled in Trace File mode, and enabled only for the number of loaded channels in Trace Folder mode.

<4. Basic Software Operations > 81
IM 39J02B40-01E
The display of the nodes varies with the operation mode (Control, Monitor or Trace) and the online/offline state as shown in the table below.
Nodes for Displaying Dialogs
Online Offline Control Monitor Control Monitor Trace
Control, Monitor or Trace Control Monitor Control Monitor Trace
CSV Save Config X X X X Ο Setting
Ο Ο Ο Ο Ο
User Setting
Sequence Setting Channel Setting
Channel_1-16 Ο(*1) Ο(*1) Ο(*2) Ο(*2) Ο(*3)
Trace Storage Config Ο Ο Ο Ο Ο
Trace Ο Ο Ο Ο Ο Viewer_1-4
Config Self Test Ο X X X X
Ο Displayed Δ Displayed but not selectable X Not displayed *1: Nodes are displayed for the number of channels installed in the DTSX series. *2: Nodes are displayed for the no. of channels selected in the Select Switch dialog. *3: In Trace mode, nodes are displayed for all channels in the tree, but they are disabled in Trace File mode, and
enabled only for the number of loaded channels in Trace Folder mode.

<4. Basic Software Operations > 82
IM 39J02B40-01E
4.4.6 Dialog Operations This subsection describes basic dialog operations. A dialog is displayed as a pop-up window. While a dialog is displayed, displaying another window or dialog and working on another displayed window are not allowed. Dialogs cannot be resized and do not allow complex operations available with normal windows.
● Displaying a dialog A dialog can be displayed by clicking on its associated button in the main window or double-clicking on its associated node in the Solution Tree window.
Dialog is displayed.
Click
Double-click

<4. Basic Software Operations > 83
IM 39J02B40-01E
● Closing a dialog Clicking a button at the bottom of a dialog or the [x] button at the top right corner of a dialog closes the dialog.
TIP - The buttons displayed at the bottom of a dialog vary with the dialog and may include [OK],
[Cancel], [Close] and other buttons. For details, see the description of each dialog.
Closes the dialog.

<4. Basic Software Operations > 84
IM 39J02B40-01E
4.5 Starting and Stopping Measurement You can start, as well as stop measurement by the DTSX series from the menu of the main window or a context menu in the Solution Tree window. Measurement can be started or stopped only in Control mode and when the DTSX series is connected online. Moreover, measurement can be started only when it is not in progress and conversely can be stopped only when it is in progress.
Menu or Context Menu Item
Online State Offline State
Control Monitor Trace
Start Ο(*1) X X X
Stop Ο(*2) X X X Ο Displayed X Not displayed *1: Executable when connected to DTSX series and measurement is not in progress *2: Executable when connected to DTSX series and measurement is in progress
4.5.1 Starting Measurement from Menu (in main window) This subsection describes how to start and stop measurement by the DTSX3000 from the menu in the main window. To start measurement, select Home>DTS Control>Start. To stop measurement, select Home>DTS Control>Stop.

<4. Basic Software Operations > 85
IM 39J02B40-01E
4.5.2 Starting Measurement from Context Menu (in Solution Tree window) This subsection describes how to start and stop measurement by the DTSX3000 from a context menu in the Solution Tree window.
● Procedure for starting measurement To start measurement in Control mode when the DTSX series is connected online: 1. Right-click on the Control node. 2. Select Start from the displayed context menu.
● Procedure for stopping measurement To stop measurement in Control mode when the DTSX series is connected online: 1. Right-click on the Control node. 2. Select Stop from the displayed context menu.

<4. Basic Software Operations > 86
IM 39J02B40-01E
4.6 Status Display The status bar is displayed at the bottom of the main window. It displays the following status information. - DTSX series error status - DTSX series connection status - DTSX series measurement status - DTSX series measurement progress status
4.6.1 DTSX series Error Status A lamp is displayed at the leftmost end of the status bar. This lamp is lit in red if an error is detected on the DTSX series. Detailed error information can be checked on the maintenance screen of the DTSX series. The table below lists each color of the lamp along with its description.
Lamp color Status
Grey DTSX series is not connected.
Green No DTSX series connection error
Red DTSX series connection error
4.6.2 DTSX series Connection Status The status of the connection to the DTSX series is displayed to the immediate right of the DTSX series error status lamp in the status bar. The table below lists each connection status display value with its description.
Displayed connection status Status description
Connect (IP address) Connected to DTSX series at the displayed IP address
Connecting ... Requesting for connection
Retry connection Retrying to connect
Idle Not connected

<4. Basic Software Operations > 87
IM 39J02B40-01E
4.6.3 DTSX series Measurement Status The DTSX series measurement status is displayed to the immediate right of the DTSX series connection status in the status bar. The table below lists each measurement status display value with its description.
Measurement status display Status description
Run Measurement is in progress
Run preparation Preparing for measurement
Stop Measurement is not in progress
Stop preparation Preparing to stop measurement
Unknown Unknown state
4.6.4 DTSX series Measurement Progress Status The DTSX series measurement status is displayed at the rightmost end of the status bar as two substatuses: - Channel measurement progress status - Sequence measurement progress status
● Channel measurement progress status The channel measurement progress status is displayed graphically as a progress bar, which grows as measurement progresses to completion. The channel number is displayed to the left of the progress bar.
● Sequence measurement progress status The sequence measurement progress status is displayed graphically as a progress bar. In an example where a measurement sequence specifies measurement of channel 1 followed by channel 2, the progress bar indicates 50% completion at the end of channel 1 measurement and 100% completion at the end of channel 2 measurement. For details on measurement sequence, see Chapter 5, “Control Mode.”

<4. Basic Software Operations > 88
IM 39J02B40-01E
4.7 Chart Display
4.7.1 Displaying a Chart Temperature measurement data of the DTSX series can be displayed in a chart. No chart is displayed when the software application is started.
Double-clicking on Solution Tree>Trace>Trace>Viewer_1>Chart displays the Viewer_1 Chart window shown in the figure below. Up to four chart viewer windows, named Vewer_1 to Viewer_4, can be displayed.
Double-clicking on any of these nodes displays a chart window.

<4. Basic Software Operations > 89
IM 39J02B40-01E
The same chart viewer window can also be displayed by selecting View>Viewer Chart>Viewer_1 Chart from the menu bar.

<4. Basic Software Operations > 90
IM 39J02B40-01E
4.7.2 Displaying a Chart Configuration Window The Chart Configuration Window is used to configure a chart viewer.
Double-clicking on Solution Tree>Trace>Trace>Viewer_1>Config displays the Viewer_1 Config window shown in the figure below. The four chart configuration windows, namely, Vewer_1 Chart to Viewer_4 Chart, correspond one-to-one to the four chart viewer windows (Viewer_1 Chart to Viewer_4 Chart).
Double-clicking on any of these nodes displays a chart configuration window.

<4. Basic Software Operations > 91
IM 39J02B40-01E
The same chart configuration window can also be displayed by selecting View>Viewer Config>Viewer_1 Config from the menu bar.

<4. Basic Software Operations > 92
IM 39J02B40-01E
4.7.3 Configuring Chart Display
You can configure a chart display by selecting the Chart Setup tab in a chart configuration window.
(1) Data Type Select the type of data to be displayed. Temperature: displays temperature data Signal Level: displays signal levels ST: displays Stokes signal levels. AS: displays anti-Stokes signal levels. CFL: displays loss (Calculated Fiber Loss) values.
TIP The DTSX3000 calculates temperature data from measured signal levels.
The CFL waveform is obtained by eliminating the effect of temperature from Stokes signal levels. As the correction value for the fiber loss for Stokes light is fixed (at 1.2 dB/km@DTSX200, 0.25dB/km@DTSX3000), the CFL slopes downwards when fiber loss is significantly large, indicating a deteriorated optical fiber. However, the CFL result is only meaningful in single-ended measurement and does not indicate fiber loss in double-ended measurement where the measurement results of the forward and reverse directions are combined. Moreover, beware that the CFL is useful only as reference data but not for quantitative assessment of fiber loss.

<4. Basic Software Operations > 93
IM 39J02B40-01E
(2) Channel Select the channel for chart display. You can select a channel being measured.
(3) Temperature Unit Select the unit for temperature data. Available options are Celsius [degC], Fahrenheit [degF] and Kelvin [K].
(4) Depth / Distance Select the distance type. Depth: Depth, which starts from the well inlet position as 0 m and takes into
consideration winding coefficient, is used as distance. Distance: Distance starting from the DTSX3000 exit position as 0 m is used.
(5) Depth / Distance Unit Select the unit for depth or distance. Available options are Meter [m], Yard [yd], Feet [ft] and Mile [mi].

<4. Basic Software Operations > 94
IM 39J02B40-01E
(6) 3D Surface: Displays a 3D chart as a surface chart. Line: Displays a 3D chart as a line chart.
TIP - Difference between Surface and Line Charts
In a surface chart, adjacent data points along the X-axis and Z-axis are joined by planes. In a line chart, adjacent data points along the X-axis are joined by a line. The figure below shows the surface chart and line chart for the same sample data.
Surface chart
Line chart

<4. Basic Software Operations > 95
IM 39J02B40-01E
(7) Chart Type Select the chart type.
- 2D Type Horizontal Axis (X) Vertical Axis (Y)
X:Time – Y:Data (Grid=OFF)
Time Data (temperature or signal level or CFL)
X:Depth (Distance) – Y:Data
Distance Data (temperature or signal level or CFL)
X:Data – Y:Time (Grid=OFF)
Data (temperature or signal level or CFL)
Time
X:Data – Y:Depth (Distance)
Data (temperature or signal level or CFL)
Distance
Color Grid Display When in Trace Folder mode, a Grid checkbox is displayed to the right of the X:Time – Y:Data and X:Data – Y:Time settings. You can select the checkbox to display multiple measurement data with temperature range represented by different colors (see TIP below). If the Grid checkbox is not displayed, Grid=OFF.
X:Time - Y:Data (Grid=ON)
Time Distance
X:Data - Y:Time (Grid=ON)
Distance Time
TIP In color grid display, temperature distribution of measurement data is represented by color, and continuous data is displayed as bands along the X axis or Y axis. In addition, a distance-temperature chart for the time designated by the mouse pointer position and a time-temperature chart for the distance designated by the mouse pointer position are displayed currently. A sample display is shown below.

<4. Basic Software Operations > 96
IM 39J02B40-01E
- 3D Type Horizontal axis (X) Vertical axis (Y) Depth axis (Z)
X:Time – Y:Data – Z:Depth (Distance)
Time Data (temperature or signal level or CFL)
Distance
X:Depth(Distance) – Y:Data – Z:Time
Distance Data (temperature or signal level or CFL)
Time
X:Data – Y:Time – Z:Depth(Distance)
Data (temperature or signal level or CFL)
Time Distance
X:Data – Y:Depth(Distance) – Z:Time
Data (temperature or signal level or CFL)
Distance Time
Note X:Time - Y:Data, X:Data - Y:Time, X;Time - Y:Data - Z:Depth and X:Data - Y:Time - Z:Depth cannot be selected if
the Data Type is Temperature and the selected channel has not been configured by selecting Trace Storage Config>Time Series Storage Config. For details, see Section 5.6, ” Time Series Measurement.”
(8) Display Number (available only in Trace mode) Specify the number of charts to be displayed from 1 to 32. If there are fewer loaded temperature data files than the specified display number, this setting is ignored and charts are displayed for the number of loaded temperature data files.
TIP If a display number increases, the processing speed of application will become slow.
(9) Legend
Specify how a legend (chart colors and data acquisition time) is to be displayed. Right: Displayed to the right of the chart. Bottom: Displayed below the chart. Off: Not displayed.
Legend

<4. Basic Software Operations > 97
IM 39J02B40-01E
(10) Temperature Scale Select the temperature scale as Auto or Manual. If you have selected Manual, specify the minimum and maximum values of the scale. The valid data range depends on the temperature unit setting as shown in the table below.
Temperature Unit Maximum value Minimum value Setting resolution Celsius[degC] 1,000 -1,000 1 Fahrenheit[degF] 2,000 -2,000 1 Kelvin[K] 1,300 -1,300 1
(11) Depth(Distance) Scale Select the depth (distance) scale as Auto or Manual. If you have selected Manual, specify the minimum and maximum values of the scale. The valid data range depends on the Depth / Distance Unit setting as shown in the table below.
Depth/Distance Unit Maximum value Minimum value Setting resolution Meter[m] 60,000 -60,000 1 Yard[yd] 65,000 -65,000 1 Feet[ft] 192,000 -192,000 1 Mile[mi] 37.000 -37.000 0.001
4.7.4 Specifying Chart Colors
You can specify colors for chart lines by selecting the Color tab in the Chart Configuration window. Clicking on the colored rectangle to the right of any of the 32 chart lines (Line1-32) displays a Color dialog for color selection.

<4. Basic Software Operations > 98
IM 39J02B40-01E
4.7.5 Specifying the Data Display Range (available only in Trace mode)
You can specify the starting data number for chart display by selecting View>Scaling of trace database from the menu. Data number begins with 1 denoting the most recent data and increments by 1 for successively older data. You may specify a starting data number either by entering a value in the Data Number field or by moving the slider. When you press the [Set] button, the chart display is updated to display data starting from the specified data number.
TIP The total number of data sets is the number of available measurement data sets for the channel specified on the Chart Setup tab (see Subsection 4.7.3).
[Set] button Data Number field
Total number of data sets
Slider

<4. Basic Software Operations > 99
IM 39J02B40-01E
4.7.6 Performing Data Auto Play (available only in Trace Folder mode)
In Trace Folder mode, you can perform data Auto Play (slide show) by selecting Home>Auto Play from the menu. When you click the Auto Play Start button, trace data is automatically displayed as a slideshow, which begins with the data designated by the data number of Scaling Of Trace Database, is updated at time intervals specified by Interval and ends with the latest data. Auto Play ends after displaying the last data. During Auto Play, the Start Auto Play button changes into the End Auto Play button. Auto Play can be aborted by clicking the End Auto Play button.
Start Auto Play button End Auto Play button
4.7.7 Displaying Trace Data by Drag-and-drop (available only in Trace File mode) In Trace File mode, you can drag and drop a trace file onto a chart display window (Viewer_1 Chart to Viewer_4 Chart) to display the file. If dragging and dropping a trace file causes the number of displayed waveforms to exceed the Display Number specified in the Chart Setup window, the oldest registered data is removed from the display and the trace data is displayed.
Auto play interval (s) Start/End Auto Play button

<4. Basic Software Operations > 100
IM 39J02B40-01E
4.7.8 Chart Display Functions You can execute various display functions in a Chart Viewer window either directly using mouse operations or by right-clicking the mouse button in the window and selecting a function from the displayed context menu. The executable functions differ in 2D and 3D display. The tables below list and describe these functions.
(1) Mouse operations Function 2D 3D Description
Zoom Ο X You can enlarge or reduce the display by dragging the mouse. Drag the mouse from the upper left to the lower right to zoom in and drag the mouse from the lower left to the upper right to zoom out. You can also zoom out by selecting Zoom Out from the context menu.
Pan Ο X Clicking on an arrow displayed at the end of a scale in a Chart Viewer window moves the scale and the display in the direction of the arrow.
(2) Context menu operations Function 2D 3D Description
Copy Ο Ο Copies the chart display to the clipboard. Save Ο Ο Saves the chart display to a file in BMP, JPG, WMF, EMF, GIF, PNG or
TIFF format. Print Ο Ο Prints the chart display in fixed A4 size and landscape orientation. Print Preview Ο Ο Prints a preview of the chart display. You can modify the print size, color
and other properties before printing. Transparency Ο Ο Sets the transparency of waveform display to 50% (The default is 0%). Guide Line Ο X Displays guidelines (a horizontal line and a vertical line), which track the
mouse pointer. Display Value Ο X Displays mouse pointer position values. Zoom Out Ο X Undoes the last zoom operation. Default Scale Ο X Restores default scale, undoing all zooming. Scale X Ο Select the scale factor for the entire chart from 10% to 100% in
increments of 10%. Rotate X Ο When rotation is enabled, you can change the view point of a chart
display by dragging the Chart window. Z Scale X Δ Shows the scale of the Z-axis (applicable only to surface chart).

<4. Basic Software Operations > 101
IM 39J02B40-01E
4.8 Messages Selecting View>Windows>Message in the main window displays (or if already displayed, gives focus to) the Message window. The Message window can also be displayed by double-clicking on the Message node in the Solution Tree window. The Message window displays various information and errors. The displayed information includes the time of occurrence, message type, message number and message text.
The following types of messages may be displayed. Type Description
Normal Normal information Error An error has been detected (but the application can continue execution.) FatalError An error has been detected (and the application cannot continue execution.) Warning A warning has been detected (but the application can continue execution.) Terminated The application is terminated.
IMPORTANT
- If an Error type message is displayed, the application can continue execution but there may be some limitations on its operation thereafter.
- If a FatalError type message is displayed, it will be followed by a “Terminated” type message and the application will be aborted.

<4. Basic Software Operations > 102
IM 39J02B40-01E
4.9 Alarms Selecting View>Windows>Alarm in the main window displays (or if already displayed, gives focus to) the Alarm window. The Alarm window can also be displayed by double-clicking on the Alarm node in the Solution Tree window. The Alarm window displays DTSX series failure information and temperature alarm information.
● DTS Failure buttons The DTS failure button indicators indicate whether a DTSX series failure has been detected. If an error or warning has been detected, the corresponding error or warning button turns red. The button reverts to its original color when the error or warning condition is no longer present.
SEE ALSO Details on a detected error or warning can be checked from maintenance window of the DTSX series.
● Alarm buttons The Alarm button indicator for each channel indicates whether a temperature alarm has been detected for the channel. If a temperature alarm has been detected for the most recent data, the corresponding channel button turns red. If a temperature alarm has been detected for earlier data, the corresponding channel button appears yellow. Clicking a red or yellow alarm button displays details of the alarm as shown in the figure below.
SEE ALSO For details on how to define temperature alarms, see Chapter 5.6 , “Displaying Temperature Alarms.”
● [CLR] button for clearing temperature alarms (This button is not displayed in Trace mode) Clicking the [CLR] button clears all temperature alarm information and restores all alarm buttons to default color.

<4. Basic Software Operations > 103
IM 39J02B40-01E
4.10 Help Clicking on the [?] button located at the upper right corner of the main window displays the Information dialog window. The window displays version information about the software in offline state and additional information about the DTSX3000 in online state.
The following types of information are displayed in the Information window. Displayed Item Description
Software Version Version of the software Firmware Version Version of the firmware of the connected DTSX series LAS 2.0 Data Conversion “Active” or “Inactive” is displayed if the LAS 2.0 conversion
function installed in the connected DTSX series is enabled or disabled respectively.
WITSML 1.3.1.1 Data Conversion
“Active” or “Inactive” is displayed if the license for the WITSML 1.3.1.1 conversion function of the connected DTSX series is enabled or disabled respectively.
FPGA Version FPGA version of the connected DTSX series Board Version Board version of the connected DTSX series Model and Suffix Codes Model name and suffix codes of the connected DTSX series Serial No. Serial number of the connected DTSX series MAC Address MAC address of the connected DTSX series Switch Model and Suffix Codes
Model number and suffix codes of the optical switch of the connected DTSX series (if an optical switch is installed)
Switch Serial No, Serial number of the optical switch of the connected DTSX series (if an optical switch is installed)
Number of Switch Channels Number of channels of the optical switch of the connected DTSX series (if an optical switch is installed)
Clicking the [Manual] button displays the user manual, which is in PDF format. Software capable of displaying PDF files must be pre-installed on the PC to view the user manual.

< 5. Control Mode> 104
IM 39J02B40-01E
5. Control Mode
5.1 Control Mode Functions The Control mode is used for setting various measurement parameters of the DTSX series, as well as starting and stopping measurement by the DTSX series.
(1) Setting Measurement Parameters Measurement parameters include measurement-related settings and calculation-related settings. The former is used for configuring measurement of Raman scatter signal levels while the latter is used for configuring temperature data calculation using measured signal level data. The software supports recalculation of temperature data so any modification to calculation-related settings during measurement or after measurement completion is reflected in measurement result display.
TIP - Any modification to calculation-related settings during measurement or after measurement
completion is reflected only in measurement result display but not in saved measurement result data.
(2) Starting and Stopping Measurement You can start and stop measurement by the DTSX series by clicking the [Start] button and [Stop] button respectively.
(3) Saving Measurement Result Data The software allows trace data (measurement result data) of the DTSX series to be saved on a PC. Moreover, time series data can be saved for use in time series chart display (with time on the X-axis). Data saved to a PC can be retrieved in Trace mode after measurement completion.
TIP - Measurement result data and time series data can be saved only when this software is connected
to the DTSX series. Measurement result data and time series data cannot be saved when this software is closed or when this software is disconnected from the DTSX series due to communication error or some other reason.
- Measurement result data is known as trace data, files containing trace data are known as trace files and folders containing trace files are known as trace folders.
(4) Measurement Result Display Measurement result data of the DTSX series can be displayed as charts.

< 5. Control Mode> 105
IM 39J02B40-01E
(5) Status Display Status display functions include DTSX series status display and software status display. • DTSX series status display - Alarm window:
Displays status information on temperature alarms detected by the DTSX series, as well as failure/error status of the DTSX series.
- Status bar (measurement status display): Displays measurement status information (whether measurement is in
progress or not) and measurement progress status information (percentage completion).
• Software status display - Message window:
Displays various errors and warnings detected by the software. - Status bar (connection status display):
Displays the status of the communication connection between the software and the DTSX series.
(6) Self-test Execution Self test of the DTSX series can be executed and the test result displayed from the Self Test dialog.

< 5. Control Mode> 106
IM 39J02B40-01E
(7) Enabled and Disabled Functions Individual functions of Control mode may be enabled or disabled depending on the system status as shown in the table below.
Function Window, Dialog or Button
System Status
Offline state
Online state Connected to DTSX series Disconnecte
d from DTSX series
Measurement in progress
Measurement not in
progress
Setting measurement parameters
Sequence Setting dialog Ο Δ(*1) Ο Δ(*1) Channel Setting dialog (excluding Fiber Setting tab) Ο Δ(*1) Ο Δ(*1)
Channel Setting dialog (Fiber Setting tab) Ο Δ(*1) Ο(*2) Δ(*1)
Starting and stopping measurement
Start button X X Ο X
Stop button X Ο X X
Saving measurement result
Trace Storage Config dialog Ο Δ(*1) Ο Δ(*1)
Measurement result display
Viewer Chart window X Ο X (*3) X (*3) Viewer Config dialog Ο Ο Ο Ο
Status display
Alarm window X Ο Ο X (*3) Message window Ο Ο Ο Ο Status bar (Measurement status display) X Ο Ο X
Status bar (Connection status display) Ο Ο Ο Ο
Self-test execution Self Test dialog X X Ο X
*1: Display only. No modification is allowed. *2: Any modification to settings is reflected in measurement result display but not in saved measurement result data. *3: Displays the status at the time of the last measurement. Ο: Enabled Δ: Enabled but with restrictions X: Disabled A disabled dialog cannot be displayed. A disabled window is displayed but not updated. A disabled button cannot be pressed.

< 5. Control Mode> 107
IM 39J02B40-01E
5.2 Preparing for Measurement Before starting measurement, you need to specify measurement parameters and configure the saving of measurement results.
SEE ALSO For details on how to set measurement parameters, see sections of Chapter 5, starting from Section 5.3.
Saving measurement results The software allows measurement result data of the DTSX series to be saved to files on a PC. Files containing saved measurement result data can be used for chart display.
TIP The following terms will be used hereafter.
- Trace data refers to measurement result data.
- Trace file refers to a file containing trace data.
- Trace folder refers to a folder storing trace files.
Two types of measurement result data can be saved to a trace folder. 1. Trace data (measurement result data) Trace data refers to measurement result data of the DTSX series. By saving trace data, measurement result can be displayed in a chart with distance on the X-axis.

< 5. Control Mode> 108
IM 39J02B40-01E
2. Time series data Time series data records temperature changes over time at a specified depth. By saving time series data, measurement result can be displayed in a chart with time on the X-axis.
● Trace Storage Config dialog The Trace Storage Configuration dialog can be displayed by double-clicking on the Trace Storage Config node in the Solution Tree window as shown in the figure below.
TIP - Trace data and time series data can be saved only when the software is connected to the DTSX
series.
- Trace file refers to a file containing trace data. Trace data and time series data cannot be saved when the software is not running or when the software is disconnected from the DTSX series due to communication error or some other reason.
Trace storage configuration

< 5. Control Mode> 109
IM 39J02B40-01E
● Trace File Storage Config tab
Selecting the Trace File Storage Config tab displays a tab window for configuring the storage of trace data (measurement result data). You can specify the trace storage folder, as well as whether trace data storage is to be limited by the amount of free space left. If a free space limit is specified, trace data storage and measurement result display stop when free space falls below the specified limit. To configure storage of trace data: 1. Under Storage Management, select whether trace data storage is to be Limited by
free space or Unlimited. 2. If you have selected for storage to be limited by free space, specify a free space
limit from 1.0 [Gbyte] to 100000.0 [Gbyte]. 3. In the Save Folder field, specify a trace folder for storing trace files. If the specified
folder does not exist, an error will be reported when you press the [OK] button.
TIP - Trace data storage cannot be turned off. Therefore, we recommend to delete unwanted trace
folders and trace files regularly.
- Even if you have selected Unlimited for storage management, if the specified trace folder is on a system drive (C:), trace data storage stops automatically when free space on the drive is about 1 gigabyte or less.
- The specified free space limit is observed by the software but not strictly.
- We recommend specifying a trace folder on an internal hard disk of the PC. If a network drive is specified, communication error may cause trace data storage or time series data storage to fail.
Trace data storage configuration

< 5. Control Mode> 110
IM 39J02B40-01E
● Time Series Storage Config tab
Selecting the Time Series Storage Config tab displays a tab window for configuring the storage of time series data. You can specify whether to enable or disable storage of time series data, as well as specify a list of depths for saving temporal temperature data for each optical switch channel using the following procedure. 1. Select the Use checkbox to enable time series data storage; deselect the checkbox
to disable time series data storage. 2. If the Use checkbox is selected, the Depth list for time series storage column
displays a list of depths for storing temporal temperature data for each individual optical switch channel.
3. To specify the depth list for time series data storage for a channel, display the Time Series Storage Config dialog. To do so: Double-click on the required channel in the Ch list; or With the required channel selected, click the [Property] button.
4. You can copy the depth list of one channel to another channel. To do so, select the source channel from the Ch list and click the [Copy] button. Next, select the destination channel and click the [Paste] button.
TIP - If a specified depth is outside the measurement range, 0°C is stored.
- Up to 3000 time series data points can be stored. If more than 3000 data points are measured, the most recent 3000 time series data measurements are stored.
- If continuous measurement is interrupted by communication problem, DTSX series reboot or some other reason, time series data will be stored up to measurement interruption.
Time series data storage configuration

< 5. Control Mode> 111
IM 39J02B40-01E
The Time Series Storage Config_nn dialog is used to specify a depth list for time series data storage for a channel. You can specify whether to enable or disable time series data storage for the channel, as well as specify a list of depths for storing temporal temperature data. 1. Select the Use checkbox to enable time series data storage for the channel;
deselect the checkbox to disable time series data storage. 2. To add a depth for temporal temperature data storage to the depth list, enter a value
from 0.0 to 30000.0 [m] in the Depth field shown in the figure above, and click the [Add] button. The entered depth is added to the depth list.
3. Up to 32 depths can be specified for temporal temperature data storage. 4. To delete all depths in the list, click the [Clear] button. 5. To delete a depth from the list, select the depth to be deleted and click the [Delete]
button.
Depth field

< 5. Control Mode> 112
IM 39J02B40-01E
● Trace file structure
Consider an example where the destination for storing a trace folder is specified in Save Folder as “C:\Trace” as shown in the figure above. The resultant trace folder and file structure is shown in the figure below.
A trace folder is created below the “C:\Trace” folder by the DTSX series at the beginning of each measurement. The first digit of the trace folder name indicates the application launch ID and the next 14 digits indicate the measurement start time (YYYYMMDDhhmmss).
TIP - Do not change the structure or names of subfolders and files below a trace folder. Otherwise, data
loading by the software may fail or an error may occur after loading.
- Always specify a trace folder when copying or deleting trace data. Loading by the software will fail if only subfolders or files under a trace folder are copied.
- The measurement start time is acquired from the DTSX series.
Trace folders

< 5. Control Mode> 113
IM 39J02B40-01E
Trace file folders, configuration files and time series data files are created below a trace folder. 1. A new trace file folder is created each time 100 trace files have been created. Trace
file folders are assigned names serially starting from 00000000. 2. Configuration files store settings prevailing at the time of measurement. 3. A time series data file is created for each optical switch channel.
Trace files are created below a trace file folder. The trace file name begins with the letter t followed by 14 digits indicating the end time of each measurement (YYYYMMDDhhmmss), the letter c and 2 digits indicating the optical switch channel number.
Configuration files Time series data files
Trace file folder
Trace files
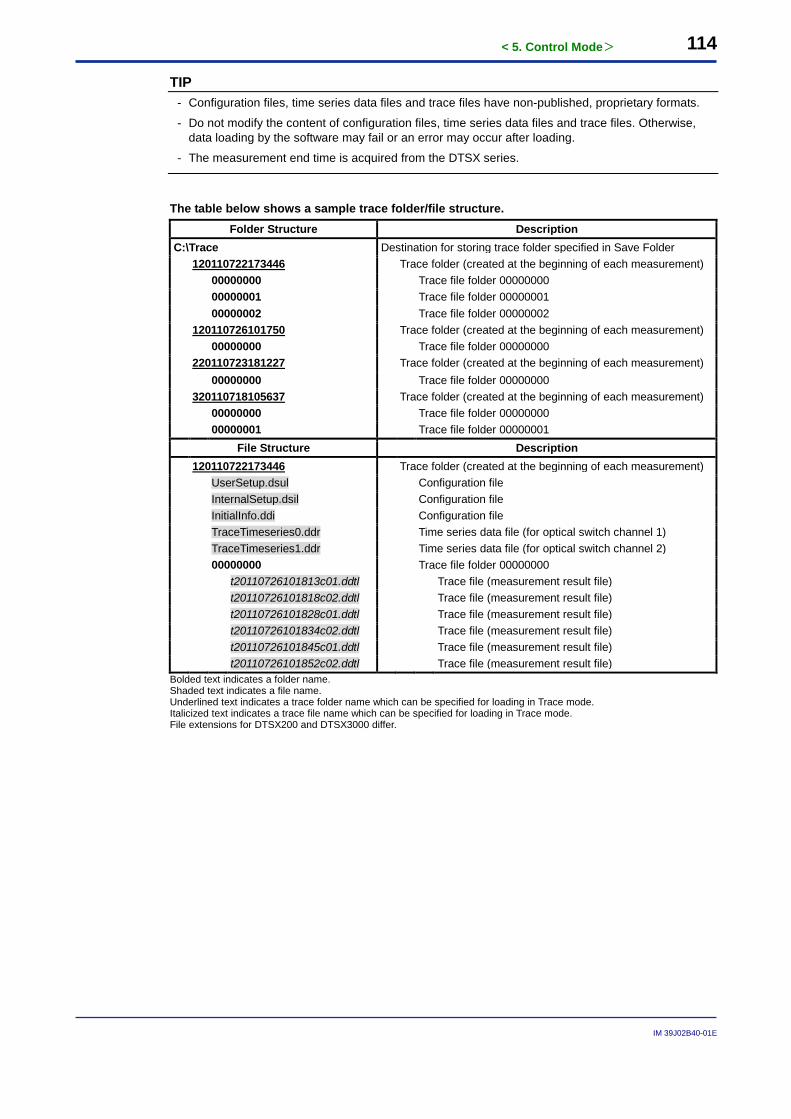
< 5. Control Mode> 114
IM 39J02B40-01E
TIP - Configuration files, time series data files and trace files have non-published, proprietary formats.
- Do not modify the content of configuration files, time series data files and trace files. Otherwise, data loading by the software may fail or an error may occur after loading.
- The measurement end time is acquired from the DTSX series.
The table below shows a sample trace folder/file structure. Folder Structure Description
C:\Trace Destination for storing trace folder specified in Save Folder 120110722173446 Trace folder (created at the beginning of each measurement) 00000000 Trace file folder 00000000 00000001 Trace file folder 00000001 00000002 Trace file folder 00000002 120110726101750 Trace folder (created at the beginning of each measurement) 00000000 Trace file folder 00000000 220110723181227 Trace folder (created at the beginning of each measurement) 00000000 Trace file folder 00000000 320110718105637 Trace folder (created at the beginning of each measurement) 00000000 Trace file folder 00000000 00000001 Trace file folder 00000001
File Structure Description 120110722173446 Trace folder (created at the beginning of each measurement) UserSetup.dsul Configuration file InternalSetup.dsil Configuration file InitialInfo.ddi Configuration file TraceTimeseries0.ddr Time series data file (for optical switch channel 1) TraceTimeseries1.ddr Time series data file (for optical switch channel 2) 00000000 Trace file folder 00000000 t20110726101813c01.ddtl Trace file (measurement result file) t20110726101818c02.ddtl Trace file (measurement result file) t20110726101828c01.ddtl Trace file (measurement result file) t20110726101834c02.ddtl Trace file (measurement result file) t20110726101845c01.ddtl Trace file (measurement result file) t20110726101852c02.ddtl Trace file (measurement result file)
Bolded text indicates a folder name. Shaded text indicates a file name. Underlined text indicates a trace folder name which can be specified for loading in Trace mode. Italicized text indicates a trace file name which can be specified for loading in Trace mode. File extensions for DTSX200 and DTSX3000 differ.

< 5. Control Mode> 115
IM 39J02B40-01E
5.3 Single-ended Measurement The DTSX series supports both single-ended and double-ended temperature measurement. In single-ended measurement, a light pulse is launched from one end of the optical fiber and the returned Raman scatter is measured to determine temperature distribution. In double-ended temperature measurement, a light pulse is launched from each of the two ends of the optical fiber and the returned Raman scatter is measured separately to determine temperature distribution. This Section describes how to perform single-ended measurement.
SEE ALSO For details on single-ended measurement, see “Single-ended Measurement and Double-ended Measurement” of the DTSXL Distributed Temperature Sensor Long Range System Guide (IM39J06B40-01E).
1. First, display the Sequence Setting dialog to configure a measurement sequence. 2. On the Sequence Control tab window, select the Sequence Mode as Single or
Continuous.
SEE ALSO For details on the single and continuous sequence modes, see Section 5.5, “Single and Continuous Sequence Measurement.”
3. Define a sequence table on the Sequence Table tab window. - Temperature measurement proceeds in ascending order of No. for channels whose
Use checkbox is selected. - Select SingleEnd from the pull-down menu of Principle for single-ended
measurement. - Select the channel to be measured from the pull-down menu of Channel(Near). - Specify a sequence interval in Interval[sec]. 4. After editing is completed, click [OK]. The settings are saved and the dialog closes.
Clicking [Cancel] closes the dialog without saving edited settings.

< 5. Control Mode> 116
IM 39J02B40-01E
The table below describes the parameters of the Sequence Table. Item Description Type
No. Indicates the order in the measurement sequence. - Use Enables or disables measurement for a channel. M
Principle Select either SingleEnd or DoubleEnd for single-ended or double-ended measurement respectively.
M
Channel (Near) Select the near-end measurement channel. M Channel (Far) Select the far-end measurement channel. M Interval [sec] Specify a sequence interval. M
* Type M indicates a measurement-related setting.
TIP - The Channel(Far) setting is disabled if single-ended measurement is selected.
- If the specified sequence interval is shorter than the measurement time, the next measurement starts immediately after measurement stops.
- If an entered sequence interval is invalid, it is reverted to its original value and an error provider is displayed at the row header .
- Clicking [OK] with no Use checkbox selected or a duplicate channel number specified causes an error message to be displayed.
5. Next, display each Channel_n dialog (where n denotes a channel number) to
configure each channel in turn.

< 5. Control Mode> 117
IM 39J02B40-01E
6. Specify each parameter on the Measurement Control tab. The following table describes each parameter.
Item Description Type
Repetition Rate This parameter determines the rate for pulse repetition. Select Standard Rate if the far-end of the fiber does not have anti-reflection termination to avoid measurement error due to reflection. Fast Rate may be selected if adequate termination has been done.
M
Distance Range The specified distance range must be longer than the fiber length. The available distance range varies with the DTSX series model. M
Sampling Resolution
This parameter determines the sampling resolution for A/D conversion. Available options for DTSX3000 are 50cm, 1 m and 2 m. Available options for DTSX200 are 10 cm, 20 cm, 50 cm and 1 m. However, the above options may be limited by the specified Distance Range.
M
Averaging
This parameter specifies the number of times measurement is to be repeated for averaging purpose. Averaging can be used to improve the signal-noise ratio when the Raman scatter signal level is very weak, If Measurement Time is selected, the specified measurement time is used to determine the number of measurements to be used for averaging.
M
Fiber Failure Detection
Select the ON checkbox to enable fiber failure detection. If enabled, specify a threshold level for fiber failure detection. When enabled, fiber failure detection outputs a warning if the loss for a certain distance exceeds the Threshold Level and the signal level falls below a certain level. However, no fiber failure will be reported near and beyond the specified Fiber-End even if the loss is large. Fiber failure is detectable from 0 [m] to [Fiber End] - X [m], where X varies with [Fiber End] (length). <Reference> 0~10 km : X=10[m], 10~20km : X=20[m], 20~30km : X=30[m], 30~40km : X=40[m], 40~50km : X=50[m]
M
Increased Loss Detection
This parameter relates to increased loss detection. Select the ON checkbox to enable increased loss detection. When enabled, increased loss detection outputs a warning if the CFL level near the fiber far-end (Fiber End - X[m]) falls below the Threshold Level, , where X varies with [Fiber End] (length). <Reference> 0~10 km : X=10[m], 10~20km : X=20[m], 20~30km : X=30[m], 30~40km : X=40[m], 40~50km : X=50[m]
M
* Type M indicates a measurement-related setting.
IMPORTANT
- Actual measurement time might differ from the measurement time setting, and might fluctuate. The difference between actual measurement time and the measurement time setting increases when DTAP3000 connection, alarm detection, sectional data generation, data conversion, data transfer and other functions are used.
- The Measurement Time setting allows any value from 1 (second) to be specified but a value from 10 (seconds) onwards should be specified as the shortest practical measurement time is around 10 seconds.
- To ensure accurate measurement results, select a distance range that is definitely longer than the fiber to be measured.
- The fiber failure location reported by fiber failure detection might be inaccurate depending on the specified measurement condition (Measurement Time, Averaging Times). To ensure accurate detection, we recommended specifying a sufficiently long measurement time (or sufficiently large value for Averaging Times).
- Similarly to fiber failure detection, to ensure accurate increased loss detection, we recommended specifying a sufficiently long measurement time (or sufficiently large value for Averaging Times).

< 5. Control Mode> 118
IM 39J02B40-01E
7. Next, specify each parameter on the Fiber Setting tab window.
Fiber Setting_nn dialog is displayed.
Calculation dialog is displayed.
Click
Double-click

< 5. Control Mode> 119
IM 39J02B40-01E
The following table describes each item on the Fiber Setting tab window. Item Description Type
Optical Switch Exit Position This parameter defines the exit position of the optical switch. C
Well Inlet Position This parameter determines the well inlet position. If Depth is specified for an axis in chart display, the well inlet position is displayed as 0 m. C
Fiber Setting list
The Fiber Setting section lists the settings for each fiber section. The maximum number of fiber sections differs between DTSX200 and DTSX3000. DTSX200 allows for splitting up to 10 sections, while DTSX3000 allows up to 20 sections.
-
Total Length This field displays the sum of the lengths of all fiber sections. -
Fiber End This parameter defines the fiber end. No fiber failure will be reported near and beyond the specified Fiber End even if the loss is large. M
[Add] button Clicking the [Add] button enables the row following the row currently enabled in the list. -
[Insert] button Clicking [Insert] with any row in the list selected inserts a new enabled row and deletes the last row. -
[Delete] button Clicking [Delete] deletes the selected row and adds a disabled row at the end of the list. -
[Property] button Clicking [Property] with any row selected displays the Fiber Setting_* dialog (where * denotes the fiber section number). Double-clicking any row produces the same result.
-
Calculation Range
Select the [Total Length] option to output data up to the total fiber length if data display beyond that is not required. Select the [All Data] option to output data used in temperature calculation. DTSX3000 has an additional Range Setting option that allows the Start and End of the output range to be specified. * DTSX200 does not have the output range setting feature.
C
[Calculate Wavenumber] button
Clicking [Calculate Wavenumber] displays the Calculation dialog. -
* Type M indicates a measurement-related setting while type C indicates a calculated-related setting.
TIP - DTSX200 and DTSX3000 allow up to 10 and 20 fiber sections to be configured, respectively.
- The setting range for distance-related parameters (Optical Switch Exit Position, Well Inlet Position and Fiber End) differs between DTSX200 and DTSX3000.
Specify the calculation-related parameters for each fiber section using the Fiber Setting_nn dialog where nn denotes a fiber section number. The table below describes the calculated-related parameters.

< 5. Control Mode> 120
IM 39J02B40-01E
Item Description Type
Basic Parameters The section defines the basic fiber parameters. -
Length Specify the fiber length of a fiber section. C
Group Index Specify the group index of a fiber section. This parameter applies to a distance axis. C
Loss The Stokes and anti-Stokes signals of the Raman scatter suffer different fiber loss because of their different wavelengths. Specify the differential loss for a fiber section to correct for this temperature error.
C
Winding Coeff. Specify the winding coefficient of a fiber section. This parameter relates to depth. C
Correction This section defines the temperature correction for a fiber section. -
Use Select this checkbox to enable temperature correction. C Linearity This parameter relates to the temperature scale. C
Slope This parameter relates to the temperature slope. (* It represents the temperature change [degC] per 100 meters.) C
Offset This parameter relates to the temperature offset. C
Noise Filter This section configures a noise filter installed at ±5 m of an optical fiber connection point (at the boundary with a previous fiber section). -
Use Select this checkbox to install a noise filter. C 3 Points Select this option to reduce noise near the fiber connection point. C
5 Points Select this option to reduce noise near the fiber connection point. More noise reduction can be achieved compared to the 3 Points option. C
Calibration This section defines temperature calibration for a fiber section. -
Use Select this checkbox to enable temperature calibration. C
Calibration Type Select the type of temperature calibration to be performed. -
Manual Input Select this option to enable the Manual Input group box and use its settings for calibration. C
Remote Input
Select this option to enable the Remote Input group box and use its settings for calibration. * This option is valid only when a reference thermometer is available at a specified position and communication with the DTSX series is open so that the thermometer temperature readings can be transmitted to the DTSX series. With this option, the DTSX series temperature measurement is calibrated using the transmitted thermometer readings and the DTSX series measurement values at the same position.
C
Optical Switch
Select this option to use settings stored in the optical switch memory for calibration. * This option can only be selected for the first fiber section. * If this option is selected but no optical switch is installed, temperature calibration is not performed.
C
Wavenumber This group box selects and defines the wavenumber to be used for temperature calculation. -
Default Or Other Section
Select this option to use the default wavenumber value or the wavenumber value specified for other fiber sections. * If wavenumber is specified for multiple fiber sections, their average value is used.
C
Setting Select this option to use the specified wavenumber value. C
Remote Input Select this option to calibrate DTSX series temperature measurement using data at a specified position. -
Position Specify the position for temperature calibration.
* The setting range differs between DTSX200 and DTSX3000. C
Averaging Distance
Specify the distance in meters centered on the specified position to be used for averaging. C
Manual Input Select this option to calibrate DTSX series temperature measurement using an actual thermometer temperature reading. -
Thermometer reading Specify the thermometer temperature reading (actual value). C
DTS reading Specify the DTSX series temperature measurement reading. C * Type C indicates a calculated-related setting.

< 5. Control Mode> 121
IM 39J02B40-01E
TIP - The setting range and default value of some of the above parameters differ between DTSX200 and
DTSX3000.
- For DTSX200, the Noise Filter settings may or may not be displayed, depending on the option.
The well inlet position and winding coefficient parameters are used for converting distance to depth as shown in the example below.
S W C01 E
Assuming that:Well Inlet Position = 400mFor Internal Section & Section 1, Winding Coeff. = 1, For Section 2, Winding Coeff. = 2
When position is represented as distance:
0m 100m 400m 800m
Section 1 Section 2
When position is represented as depth:
W C01
-300m 0m
Section 1 Section 2S
-400m 200m
InternalSection
S : Start PositionW : Switch Exit PositionC01 : Connection PositionE : End Position
EInternalSection
The Calculation dialog can be used for calculating the wavenumber. The table below describes the settings in this dialog.
Item Description Normal Temperature Specify settings for normal (low) temperatures.
Thermometer Reading Specify a thermometer temperature reading.
DTS Reading Specify the DTSX series measured temperature before temperature calibration.
Heated Temperature Specify settings for high temperatures.

< 5. Control Mode> 122
IM 39J02B40-01E
Thermometer Reading Specify a thermometer temperature reading.
DTS Reading Specify the DTSX series measured temperature before temperature calibration. [Calculate] button Clicking [Calculate] begins wavenumber calculation. Wavenumber The calculated wavenumber is displayed in this field.
[Copy] button Clicking [Copy] updates the specified fiber section with the calculated wavenumber. (The value is updated to the specified fiber section in the Fiber Setting list.)
To Fiber Section Select the fiber section to be updated with the calculated wavenumber. [Close] button Clicking [Close] closes the Calculation dialog.
TIP - The Double End Setting tab is not displayed in the Channel dialog for a channel specified for
single-ended measurement.
- Except for the Fiber End parameter, all parameters on the Fiber Setting tab window are calculation-related settings. Modification to any of these parameters even after measurement completion can be reflected on displayed charts.
8. After specifying all the required settings, check that the sensing fiber is properly
connected to the DTSX series and then click the [Start] button on the main window to start measurement.
9. When measurement completes, the chart display is updated. Thereafter, the next measurement is started according to the specified Interval on the Sequence Table tab of the Sequence Setting dialog. When measurement completes, the chart display is again updated. This process is repeated until the [Stop] button is clicked or the sequence ends.

< 5. Control Mode> 123
IM 39J02B40-01E
5.4 Double-ended Measurement This section describes the procedure for performing double-ended measurement with light pulses launched from both ends of an optical fiber.
SEE ALSO For details on the measurement method, see “Single-ended Measurement and Double-ended Measurement” of the DTSXL Distributed Temperature Sensor Long Range System Guide (IM39J06B40-01E).
1. Similarly to single-ended measurement, display the Sequence Setting dialog and
specify the sequence settings. To specify double-ended measurement for a channel, select DoubleEnd from the pull-down menu of Principle on the Sequence Table tab window. When DoubleEnd is selected, Channel(Far) is enabled. Select the far-end channel from the pull-down menu of Channel (Far).
2. Next, display the Channel_n dialog for each channel (where n denotes the channel
number) in turn and specify the channel settings. - Similarly to single-ended measurement, specify the measurement parameters on
the Measurement Control tab window.
TIP - In double-ended measurement, only the channel settings of the specified near-end channel
(Channel(Near)) are used in measurement and calculation. Channel settings of the far-end channel (Channel(Far)) are disabled. The channel settings of the near-end channel are used for both forward direction measurement and reverse direction measurement.
- Measurement is repeated for the number of times specified for averaging (Averaging Times) separately in the forward direction and reverse direction.
- If Fiber Failure Detection is not turned on, a fiber failure, if it occurs, will not be detected so measurements from both directions will be combined, leading to incorrect measurement results.
- Similarly to single-ended measurement, specify the various calculation parameters
on the Fiber Setting tab window.
Settings for double-ended measurement

< 5. Control Mode> 124
IM 39J02B40-01E
TIP - For double-ended measurement, the Loss setting need not be specified because measurement
results of the forward and reverse directions are combined. Even if specified, it will not affect the temperature calculation result.
- The Double End Setting tab is displayed for a channel configured for double-ended
measurement. As measurement results of the forward and reverse directions are combined in double-ended measurement, loss correction is not required but measurement accuracy might be improved with appropriate settings as described below.
Item Description Type
Setting Select this option and enter a value manually for the total differential loss between the Stokes and anti-Stokes signals over the full fiber length to perform temperature correction using this value.
C
Measurement
Select this option to have the system automatically determine by measurement the total differential loss between the Stokes and anti-Stokes signals over the full fiber length and use it for temperature correction. Specify near-end and far-end positions for differential loss measurement as described below.
C
Near End Group box for specifying a near-end position for differential loss measurement. -
Distance Of W To P1
Specify position P1 of constant temperature by its distance from the switch exit position. C
Averaging Distance Specify the distance in meters centered on P1 to be used for correction. C
Far End Group box for specifying a far-end position for differential loss measurement. -
Distance Of W To P2
Specify position P2 of constant temperature by its distance from the switch exit position. C
Distance Of E To P2 Specify position P2 of constant temperature by its distance from the fiber end. C
Averaging Distance Specify the distance in meters centered on P2 to be used for correction. C
Switch Exit Position This field displays the switch exit position. -
End Position This field displays the total fiber length. * It displays the Total Length value on the Fiber Setting tab. -
* Type C indicates a calculation-related setting.

< 5. Control Mode> 125
IM 39J02B40-01E
TIP - For double-ended measurement, we recommend selecting correction by Measurement. Select
correction by Setting only if a constant temperature section is unavailable.
- If you have selected Setting, we recommend using the default value for Differential Loss. Enter 0.000 [dB/km] to perform no correction. Do not modify the Differential Loss value after performing temperature calibration.
- If you have selected Measurement, beware that the temperatures of the specified near-end and far-end positions must be the same.
- With the Measurement option, if continuous sequence mode is selected, differential loss is averaged over the repeated measurements. This improves the accuracy especially for the far-end where signal-to-raise ratio is poor.
- Beware that the Distance Of W To P1 and Distance Of W To P2 settings refer to distances from the switch exit position but not distances from the DTSX3000 exit position.
- The setting range and default value of some of the parameters differ between DTSX200 and DTSX3000.
3. After specifying all the required settings, check that the sensing fiber is correctly
connected to the DTSX series and click the Start button on the main window to start measurement.
4. When measurement completes, the chart display is updated. Thereafter, the next
measurement is started according to the specified Interval on the Sequence Table tab of the Sequence Setting dialog. When measurement completes, the chart display is again updated. This process is repeated until the [Stop] button is clicked or the sequence ends.

< 5. Control Mode> 126
IM 39J02B40-01E
● When fiber failure is not detected Example: Signal Level
Example: Temperature
Measurement results of the forward and reverse directions are combined.

< 5. Control Mode> 127
IM 39J02B40-01E
● When fiber failure is detected Example: Signal Level
Example: Temperature
Forward measurement Reverse measurement
Fiber failure position

< 5. Control Mode> 128
IM 39J02B40-01E
5.5 Single and Continuous Sequence Measurement You can select to execute a measurement sequence repeatedly or only once by selecting Continuous or Single respectively for Sequence Mode in the Sequence Setting dialog.
If you have selected continuous sequence execution, you can specify a fixed sequence interval or specify a table of start times for repeating the sequence execution by selecting Sequence Interval or Sequence Start Time respectively for Repetition Mode. Finally, you can select to apply the entered list of start times every day or once only by selecting Every Day or 1 Cycle for Start Time Setting. The flowchart below illustrates the various setting options available.
Single
Continuous Sequence Interval
Sequence Start Time Every Day
1 Cycle
Sequence Mode
Repetition Mode
Start Time Setting
Specify up to 6 values in Start Time Table.
Specify Interval value.

< 5. Control Mode> 129
IM 39J02B40-01E
The table below lists and describes each parameter in the Sequence Setting dialog. Item Description Type
Power Save Mode Select this checkbox to enable power saving mode. M
Sequence Mode Select whether to execute the measurement sequence defined on the Sequence Table tab window only once or repeatedly. M
Continuous Select this checkbox to execute the sequence repeatedly according to the specified Repetition Mode. M
Sequence Interval
Select this checkbox to specify a fixed interval for repeating sequence execution. Sequence execution begins when measurement is started and when the sequence is completed, it is repeated after waiting according to the specified Interval. The specified interval defines the interval between the starting times of two successive sequence executions. If the specified interval is shorter than the time for one sequence execution, the next sequence execution begins immediately after the current sequence execution ends.
M
Sequence Start Time
Select this option to specify up to 6 start times in the Start Time Table for repeating sequence execution. If the next specified start time is exceeded when a sequence execution ends, the next sequence execution begins immediately.
M
Every Day Select this option to begin sequence execution at each start time specified in the Start Time table every day. M
1 Cycle Select this option to perform one cycle of sequence executions according to the start times specified in the Start Time table. M
Start Time Table
You can specify up to six start times. Sequence execution is carried out in ascending order of No. No. : Displays a read-only running number. Use: Select this checkbox to enable a start time setting. Hour: Specify the hour for the start time as an integer from 01 to 23. Minute : Specify the minute for the start time as an integer from 0 to 59.
M
Single Select this option to execute the measurement sequence only once. M * Type M indicates a measurement-related setting.
TIP - Power Save Mode is not displayed for the DTSX3000. Power save settings can be modified using
a Web browser. For details, see the DTSXL Distributed Temperature Sensor Long Range System Guide (IM39J06B40-01E).
- If an entered Hour or Minute value in the Start Time Table is invalid, an error provider is displayed at the beginning of the input row.
- When the focus is moved out of the Start Time Table, the start time values entered in the table are automatically sorted in ascending order.
- If a start time is repeated in the Start Time Table, the measurement sequence is executed only once at the start time.

< 5. Control Mode> 130
IM 39J02B40-01E
5.6 Temperature Alarm Display ● Defining Alarms on Alarm Setting tab
The upper limit for the number of alarm sections differs between DTSX200 and DTSX3000. The DTSX200 and DTSX3000 allow up to 10 and 50 alarm sections to be configured, respectively. Moreover, the limit on the number of alarm sections for the DTSX3000 can be toggled between 50 and 10 sections by setting the More Sections flag (More Sections checkbox) to ON and OFF, respectively. Moreover, each alarm section can be enabled or disabled individually using a Use flag. - Specify the Start Depth and Depth (distance from the Start Depth) for each alarm
section. - The End Depth is calculated automatically and thus need not be specified. - When specifying contiguous alarm sections where the Start Depth of a section
coincides with the End Depth of the previous section, you can save typing by deselecting the STR checkbox.
- If an entered Start Depth is before the End Depth of the preceding section, an error is reported is the entered value is rejected.
Clicking the [Setting] button in an alarm section row on the Alarm Setting tab window displays the following pop-up dialog window for detailed configuration of the alarm section.
Section 1
Depth
Section 2 Depth[m]
Start Depth End
Depth
Depth Start Depth
Section 3
End Depth Start Depth
End Depth
250 200 100 350 450

< 5. Control Mode> 131
IM 39J02B40-01E
Each of the 9 available alarm types can be enabled or disabled individually for each individual alarm section. The table below lists each alarm type along with the condition for alarm detection and the valid data range for specifying the alarm limit. All alarm limit values can be specified with resolution of 0.01 [degC].
Alarm Type Alarm Condition Setting Range Temperature High Limit Measured value > Limit -273.15 ≤ Limit ≤ 999.99 Temperature Low Limit Measured value < Limit -273.15 ≤ Limit ≤ 999.99
Temperature Rise Limit (Measured value - nth preceding measured value) > Limit where n is specified by Previous
0 ≤ Limit ≤ 1273.14 0 ≤ Previous ≤ 10
Temperature Fall Limit (nth preceding measured value - measured value) > Limit where n is specified by Previous
0 ≤ Limit ≤ 1273.14 0 ≤ Previous ≤ 10
Temperature Difference Limit
Difference between maximum and minimum measured values within section > Limit -273.15 ≤ Limit ≤ 999.99
Delayed Temperature High Limit
Measured value > Limit for n successive measurements where n is specified by Count
-273.15 ≤ Limit ≤ 999.99 0 ≤ Count ≤ 10
Delayed Temperature Low Limit
Measured value < Limit for n successive measurements where n is specified by Count
-273.15 ≤ Limit ≤ 999.99 0 ≤ Count ≤ 10
Temperature Difference High Limit
|average value within a section – measured value|> threshold (Limit) 0 ≤ Limit ≤ 1273.14
Temperature Difference Low Limit
|average value within a section – measured value|< threshold (Limit) 0 ≤ Limit ≤ 1273.14

< 5. Control Mode> 132
IM 39J02B40-01E
For alarm types other than Temperature Difference Limit, Temperature Difference High Limit and Temperature Difference Low Limit: - Select Point to report an alarm when any measured value within the section meets
the alarm condition. - Select Average to report an alarm when the average measured value of a section
meets the alarm condition. You can click the [Copy] button on the Alarm Setting dialog to copy the detailed alarm settings for any alarm No. to another alarm No.
TIP - There are altogether 9 alarm types but take note that the Temperature Difference High Limit and
Temperature Difference Low Limit alarm types are not displayed and cannot be configured for the DTSX200.
- When More Sections (50 sections) is enabled for DTSX3000, there are some restrictions on alarm configuration. In particular, the Previous setting for Temperature Rise Limit and Temperature Fall Limit alarms is common to all sections. Therefore, any modification to the Previous setting of any section is applied to all sections.

< 5. Control Mode> 133
IM 39J02B40-01E
● Temperature Alarm Display
When any alarm condition is true, the corresponding alarm button for the channel in the Alarm window turns red. Clicking a red Alarm button opens a child window displaying information on the alarm section, alarm type and alarm position (Depth) for the detected alarm. The table below shows the relationship between alarm mode and displayed alarm position (Depth).
Alarm Mode Depth An average-type alarm has been detected. The Start Depth of the alarm section is displayed.
Both an average-type and a point-type alarm have been detected.
Point-type alarms have precedence over average-type alarms. The position nearest to the Start Depth of the alarm section is displayed.
A point-type alarm has been detected.
The position nearest to the Start Depth of the alarm section is displayed.

< 5. Control Mode> 134
IM 39J02B40-01E
5.7 Data Compression Using Sectional Setting ● Defining Sectional Data Conditions
The limit on the number of sections for sectional data generation differs between DTSX200 and DTSX3000. DTSX200 and DTSX3000 allows up to 4 and 10 sections, respectively. - Specify the Start Depth and Depth (distance from the Start Depth) for each section. - The End Depth is calculated automatically - When specifying contiguous sections where the Start Depth of a section coincides
with the End Depth of the previous section, you can omit the Start Depth. Each section can be further split into smaller units by specifying a value for Unit, provided that the total number of units for all sections does not exceed 100 and 200 for DTSX200 and DTSX3000, respectively. - Configuration is on section basis. The same data type is processed within one
section. - Processing result is generated and retrievable on unit basis. - If the Depth of a section is not divisible by the specified Unit, the last sub section
will be shorter than a unit. (For example, if Depth=100 [m] and Unit=30 [m], then the section will be split into 3 subsections of 30 [m] each and one last subsection of 10 [m].)
No1
Depth
No2
Depth[m]
Start Depth End
Depth
Depth Start Depth
No3
End Depth Start Depth
End Depth
250 200 100 350 450
Unit×20 Unit×20 Unit×20

< 5. Control Mode> 135
IM 39J02B40-01E
Any of the following five data types can be selected from the pull-down menu.
Sectional Data Type
Unit Processing Average degC The average value of all measured values within a unit is determined. Maximum degC The maximum value of all measured values within a unit is determined. Minimum degC The minimum value of all measured values within a unit is determined.
Difference degC The difference between the maximum and minimum measured values within a unit is determined.
Slope degC/m The slope of the approximate line within a unit is determined using least square method.
Compressed sectional data can be read via Modbus. (Compressed sectional data cannot be read using this software.)
SEE ALSO For details, see description on Modbus/RTU and Modbus/TCP in Chapter B5, “Communication Functions” of the DTSXL Distributed Temperature Sensor Long Range System Guide (IM39J06B40-01E), along with the DTSX3000 Communications (Modbus) Guide (IM39J06B40-02E).

< 5. Control Mode> 136
IM 39J02B40-01E
5.8 Self-Test The DTSX series provides a self-test function. The Self Test dialog can be displayed by selecting Tool>Self Test in the main window.
TIP - The Self Test dialog can also be displayed by double-clicking the Self Test node in the Solution
Tree window.
- Self-test cannot be executed during measurement.
(1) Start button Click [Start] to start self test. (2) Stop button Click [Stop] to abort self test. (3) Close button Click [Close] to close the Self Test dialog window. (4) Result display The self-test result display lists each test item along with its completion status (Completed or Not yet) and result (OK or NG). (5) Status display The status display shows the status of self-test execution.
Displayed Status Description Stop Self-test not in progress. Run Self-test in progress. Stop Preparation Preparing to abort self-test. Run Preparation Preparing to execute self-test.
Status display
Result display

<6. Monitoring Mode > 137
IM 39J02B40-01E
6. Monitoring Mode
6.1 Monitoring Mode Functions The Monitoring mode is used for checking the measurement status of the DTSX series and measurement results. Monitoring mode does not allow modification of measurement parameters of the DTSX series, measurement initiation and measurement termination, and thus protects against inadvertent modification during browsing and monitoring.
(1) Setting Measurement Parameters Measurement parameters include measurement-related settings and calculation-related settings. The former is used for configuring measurement of Raman scatter signal levels while the latter is used for configuring temperature data calculation using measured signal level data. The software supports recalculation of temperature data so any modification to calculation-related settings during measurement or after measurement completion is reflected in measurement result display.
TIP - Any modification to calculation-related settings during measurement or after measurement
completion is reflected only in measurement result display but not in saved measurement result data.
- Measurement-related settings are for display only and cannot be modified in Monitoring mode.
(2) Saving Measurement Result Data
SEE ALSO This function is the same as in Control mode. For details, see Section 5.1.
(3) Measurement Result Display
SEE ALSO This function is the same as in Control mode. For details, see Section 5.1.
(4) Status Display
SEE ALSO This function is the same as in Control mode. For details, see Section 5.1.

<6. Monitoring Mode > 138
IM 39J02B40-01E
(5) Enabled and Disabled Functions Individual functions of Monitoring mode may be enabled or disabled depending on the system status as shown in the table below.
Function Window, Dialog or Button
System Status
Offline
state
Online state Connected to DTSX series Discon
nected from DTSX series
Measurement in progress
Measurement not in
progress
Setting measurement parameters
Sequence Setting dialog Ο Δ(*1) Δ(*1) Δ(*1) Channel Setting dialog (excluding Fiber Setting tab) Ο Δ(*1) Δ(*1) Δ(*1) Channel Setting dialog (Fiber Setting tab) Ο Δ(*1) Δ(*1) Δ(*1)
Saving measurement result
Trace Storage Config dialog Ο Δ(*1) Ο Δ(*1)
Measurement result display
Viewer Chart window X Ο X (*3) X (*3) Viewer Config dialog Ο Ο Ο Ο
Status display
Alarm window X Ο Ο X (*3) Message window Ο Ο Ο Ο Status bar (Measurement status display) X Ο Ο X Status bar (Connection status display) Ο Ο Ο Ο
Self-test execution Self Test dialog X X X X
*1: Display only. No modification is allowed. *2: Any modification to settings is reflected in measurement result display but not in saved measurement result data. *3: Displays the status at the time of the last measurement. Ο: Enabled Δ: Enabled but with restrictions X: Disabled A disabled dialog cannot be displayed. A disabled window is displayed but not updated. A disabled button cannot be pressed.

<7. Trace Mode > 139
IM 39J02B40-01E
7. Trace Mode
7.1 Trace Mode Functions The Trace mode is used for checking measurement results after measurement completion.
TIP The following terms will be used hereafter:
- Trace data refers to measurement result data.
- Trace file refers to a file containing trace data.
- Trace folder refers to a folder storing trace files.
- For information on the trace file and folder structure, see Section 5.2.
(1) Loading Measurement Results You can specify either a trace folder or a trace file to be loaded when the software is started, which puts the software in Folder mode or File mode respectively. - Folder mode
If the trace folder specified when the software is started contains multiple trace files, the files are all loaded, and you can specify the location of the trace file to be displayed when displaying measurement results.
If a time series data file is present, time series data is also loaded so time series chart display can be selected for measurement result display.
- File mode Up to 64 trace files can be loaded. Multiple trace files can be specified and loaded when the software is started,
and loaded trace files can be added or deleted at any time. Any of the loaded trace files can be selected in measurement result display. Time series chart display cannot be selected in measurement result display.
(2) Setting Measurement Parameters Measurement parameters include measurement-related settings and calculation-related settings. The former is used for configuring measurement of Raman scatter signal levels while the latter is used for configuring temperature data calculation using measured signal level data. The software supports recalculation of temperature data so any modification to calculation-related settings is reflected in measurement result display.
TIP - Any modification to calculation-related settings is reflected only in measurement result display but
not in trace folders or trace files.
- Measurement-related settings are only displayed and cannot be modified in folder mode.
- Measurement-related settings, as well as calculation-related settings, are not displayed and cannot be modified in file mode.

<7. Trace Mode > 140
IM 39J02B40-01E
(3) Measurement Result Display Loaded trace data can be displayed as charts.
(4) Status Display Status display functions include DTSX series status display and software status display. • DTSX series status display - Alarm window:
Displays status information on temperature alarms detected by the DTSX series for the displayed trace data. (If multiple data sets are displayed in the measurement result display, the alarm status of the oldest data set is displayed in folder mode while the alarm status of the most recently loaded file is displayed in file mode.)
• Software status display - Message window:
Displays various errors and warnings detected by the software.
(5) Saving Measurement Result to CSV Format File Loaded trace data can be converted and saved to a CSV formatted file. The created CSV file, however, cannot be reloaded by the software.
(6) Enabled and Disabled Functions The table below shows enabled and disabled functions in trace mode.
Function Window, Dialog or Button Status
Offline state Folder Mode File Mode
Setting measurement parameters
Sequence Setting dialog Δ(*1) X Channel Setting dialog (excluding Fiber Setting tab) Δ(*1) X
Channel Setting dialog (Fiber Setting tab) Ο (*2) X Saving measurement result Trace Storage Config dialog Δ(*1) Δ(*1)
Measurement result display
Viewer Chart window Ο Ο Viewer Config dialog Ο Ο
Status display Alarm window Ο(*3) Ο(*3) Message window Ο Ο
*1: Display only. No modification is allowed. *2: Any modification to settings is reflected in measurement result display but not in measurement result file. *3: Displays the status for the displayed measurement result data. Ο: Enabled Δ: Enabled but with restrictions X: Disabled A disabled dialog cannot be displayed. A disabled window is displayed but not updated. A disabled button cannot be pressed.

<7. Trace Mode > 141
IM 39J02B40-01E
7.2 Loading Trace Folder or Trace File Run the software and select Trace for Action Mode on the “Select DTS Model and Operation Mode” dialog. The Open Trace dialog is displayed. You can specify either a trace folder or a trace file in this dialog, which puts the software in Folder mode or File mode respectively.
7.2.1 Specifying a Folder In Folder mode, all files under a specified folder are loaded. Follow the procedure below to specify a folder. 1. In the [Open Folder Or File] group box, select Folder (trace folder). 2. If you have selected Folder, specify the folder to be loaded by any of the following
ways: - Entering a folder name in the text box directly; - Clicking the [Browse] button and selecting a folder in the displayed Browse For
Folder dialog; or
- Dragging and dropping the folder to be loaded onto the text box. 3. Click [OK].

<7. Trace Mode > 142
IM 39J02B40-01E
7.2.2 Specifying Files In File mode, you can specify one or up to 64 files to be loaded. 1. In the [Open Folder Or File] group box, select File (trace file). 2. If you have selected File, specify the file(s) to be loaded by any of the following
ways: - Clicking the [Browse] button and selecting one or more files in the displayed “Open
a trace file” dialog; or
- Dragging and dropping one or more files to be loaded onto the list box within the
[Trace Files] group box.

<7. Trace Mode > 143
IM 39J02B40-01E
3. Trace files to be loaded are listed in the list box within the [Trace Files] group box. The content of the trace file list can be modified as described below.
● Adding trace files to the list
Add trace files to the list box using the method described in step 2 above. ● Clearing all trace files from the list
Click the [Clear] button to clear the trace file list. ● Deleting trace files from the list
Select one or more files from the list and click [Delete] to delete the selected files from the list.
● Reordering files in the list The list of trace files are loaded according to the displayed order. Therefore, the first loaded file is normally the oldest file. Using the [Up] and [Down] buttons, you can change the position of a file in the list.
● Sorting by filename You can sort the trace file list by filename as required. Select the [Sort] checkbox to enable sorting by filename. When sorting is enabled, the [Up] and [Down] buttons are disabled.
4. Click [OK].

<7. Trace Mode > 144
IM 39J02B40-01E
If you have specified file(s) to be loaded, you can use the file operation functions of the Solution Tree window to update (add files, delete files, etc.) the trace file list after loading.
● Updating Loaded Files (from Context Menu) Right-click the File List node in the Solution Tree window. Select [Update] from the displayed context menu to open the Update Trace File dialog. A list of loaded trace files is displayed. Trace files can be added, deleted, cleared and reordered using the same operations described earlier for the Open Trace dialog.
You can also delete a specific file. To do so, select and right-click the name of the file to be deleted in the Solution Tree window. Then, select Delete from the displayed context menu.

<7. Trace Mode > 145
IM 39J02B40-01E
● Updating Loaded Files (using Drag and Drop) You can load trace files by dragging and dropping trace files to be added onto the Solution Tree window or a Viewer_n Chart window.
TIP - If adding files causes more than 64 files to be loaded, previously loaded files are removed, starting
from the oldest file (the first file to be loaded).
- If many trace files are added, redisplay of the Solution Tree and View_n Chart window may take some time.
- When trace files are added, only the chart in focus (Viewer_n Chart) become active (displayed). However, the maximum number of files that can be displayed is limited by the Display Number as set in the Viewer_n_Config dialog for that chart window. Modify this setting as required.
- Deleting a file using the file operation described above does not physically delete the file but only removes it from the Viewer_n Chart window and Solution Tree window.
Drag and drop onto Solution Tree window.
Drag and drop onto Viewer_1 Chart window.

<7. Trace Mode > 146
IM 39J02B40-01E
● Updating Chart (from Context Menu) In the Solution Tree window, you can check whether a loaded trace file is active (can be displayed) or inactive (cannot be displayed) with respect to each of the four charts (Viewer_1 Chart to Viewer_4 Chart). (When trace files are active, the maximum number of the files displayed for a particular chart (Viewer_n Chart) is limited by the Display Number as set in the Viewer_n Config dialog for that chart.) To do so, right-click on the node of the required filename in the Solution Tree window. In the displayed context menu, right-click on [Display]. This displays a menu to the right showing Viewer_1 Chart to Viewer_4 Chart as either active (in black color) or inactive (in gray color). You can toggle the active/inactive state of a chart (Viewer_n Chart) by clicking on it.
You can also clear the display of a specific chart (Viewer_n Chart) in the Solution Tree window. To do so, right-click on the File List node and from the displayed context menu, select [Clear Chart]. Next, from the displayed menu listing Viewer_1 Chart to Viewer_4 Chart, select the chart (Viewer_n Chart) to be cleared.
Active
Inactive

<7. Trace Mode > 147
IM 39J02B40-01E
● Updating Chart (by double-clicking) Double-click any filename in the Solution Tree window. The chart (Viewer_n Chart) currently in focus becomes active.

<7. Trace Mode > 148
IM 39J02B40-01E
7.2.3 Folder/File structure
The table below shows a sample trace folder/file structure. Folder Structure Description
C:\Trace Destination for storing trace folder specified in Save Folder 120110722173446 Trace folder (created at the beginning of each measurement) 00000000 Trace file folder 00000000 00000001 Trace file folder 00000001 00000002 Trace file folder 00000002 120110726101750 Trace folder (created at the beginning of each measurement) 00000000 Trace file folder 00000000 220110723181227 Trace folder (created at the beginning of each measurement) 00000000 Trace file folder 00000000 320110718105637 Trace folder (created at the beginning of each measurement) 00000000 Trace file folder 00000000 00000001 Trace file folder 00000001
File Structure Description 120110722173446 Trace folder (created at the beginning of each measurement) UserSetup.dsul Configuration file InternalSetup.dsil Configuration file InitialInfo.ddi Configuration file TraceTimeseries0.ddr Time series data file (for optical switch channel 1) TraceTimeseries1.ddr Time series data file (for optical switch channel 2) 0 Trace file folder 00000000 t20110726101813c01.ddtl Trace file (measurement result file) t20110726101818c02.ddtl Trace file (measurement result file) t20110726101828c01.ddtl Trace file (measurement result file) t20110726101834c02.ddtl Trace file (measurement result file) t20110726101845c01.ddtl Trace file (measurement result file) t20110726101852c02.ddtl Trace file (measurement result file)
Bolded text indicates a folder name. Shaded text indicates a file name. Underlined text indicates a trace folder name which can be specified for loading in Trace mode. Italicized text indicates a trace file name which can be specified for loading in Trace mode. Some file extensions differ between DTSX200 and DTSX3000.
IMPORTANT
- When specifying a trace folder or trace file to be loaded, you must select one of the loadable locations shown in the above table. Otherwise, loading may fail or an error may occur after loading.
- Do not change the structure or names of subfolders and files below a trace folder. Otherwise, data loading by the software may fail or an error may occur after loading.
- Always specify a trace folder when copying or deleting trace data. Loading by the software will fail if only subfolders or files under a trace folder are copied.
- Do not modify the content of configuration files, time series data files and trace files. Otherwise, data loading by the software may fail or an error may occur after loading.

<7. Trace Mode > 149
IM 39J02B40-01E
7.3 Saving to CSV File Trace data can be converted to CSV format and saved in a file using the CSV Save Config dialog.
On the CSV Save Config dialog, specify a destination folder for saving CSV files, the data types to be converted, the temperature unit, the distance unit, the trace files to be converted and whether to overwrite an existing file having the same name during saving. Click the [RUN] button to begin CSV file conversion. 1. For [Save Folder (CSV File)], specify a folder for storing converted CSV files. An
error will be reported if the specified folder does not exist. 2. For [Index], select either Depth or Distance as the distance parameter to be
converted. 3. For [Output Format], select either 1 Data or Multi-Data as the number of data items
to output in one CSV file. 4. If you have selected Multi-Data, specify the number of output columns for [Number
of Columns]. The actual number of output columns is Number Of Columns+1 (including the Index column).
5. For [Data Type], specify the data to be converted as follows:

<7. Trace Mode > 150
IM 39J02B40-01E
- Select the data types to be output from the four data types: Temperature, Signal level (ST), Signal level (AS) and CFL. Conversion is not allowed if none of these four checkboxes are selected. If [Output Format] is specified as 1 Data, one or more data types can be selected here. If [Output Format] is specified as Multi-Data, only one data type can be selected here.
6. For [Temperature Unit], specify the temperature unit for output data by selecting Celsius(decC, Fahrenheit(degF) or Kelvin(K). This setting applies to the Temperature data type.
7. For [Depth/Distance Unit], specify the depth/distance unit for output data by selecting Meter[m], Yard[yd], Feet[ft] or Mile[mi]. This setting applies to the Depth and Distance data types.
8. Under [File Control], specify the trace files to be converted as follows: - From the Trace Files list displayed on the left, select a file to be converted and click
the [->] button. The selected file is added to the CSV Files list on the right. - To remove a file from the CSV Files list of files to be converted, select the file and
click the [<-] button. - By selecting or deselecting the [Overwrite An Existing File] checkbox, specify
whether to overwrite an existing file in the specified [Save Folder (CSV File)] destination folder having the same file name as a CSV file to be saved, if found.
9. Click the [RUN] button to initiate CSV file conversion. The following Convert CSV Files dialog is displayed to show the execution progress.
10. When CSV file conversion is completed, the Convert CSV Files dialog closes
automatically. 11. Clicking the [Cancel] button during conversion aborts the conversion and closes the
dialog.
TIP - A converted CSV file has the same name as the original trace file but with file extension “.csv”.
Example:
Trace file name: t20110126032134c01.ddtl
Display in Trace Files list: Ch:01/Time:2011/01/26 03:21:34
CSV file name: t20110126032134c01.csv
- Converted CSV files cannot be loaded using this software.
- If CSV file conversion is aborted, CSV files created before the abort will remain undeleted in the destination folder.
<Appendix A. Messages > 151
IM 39J02B40-01E
Appendix A. Messages A specific message may be displayed only in the Message window (see Section 4.8), only in dialogs or both. In addition, messages can be broadly classified into the following types.
Type Description Normal Normal information Error An error has been detected (but the application can continue execution.) FatalError An error has been detected (and the application cannot continue execution.) Warning A warning has been detected (but the application can continue execution.) Terminated The application is terminated.
IMPORTANT
- If an Error type message is displayed, the application can continue execution but there may be some limitations on its operation thereafter.
- If a FatalError type message is displayed, it will be followed by a “Terminated” type message and the application will be aborted.

<Appendix A. Messages > 152
IM 39J02B40-01E
Appendix A.1 List of Messages ● Normal messages
List of Normal Messages No. Type Message Description Remedial Measures
0651 Normal Cannot change setting, now! Please save.
A setting could not be changed. Settings cannot be changed during measurement in online state when in disconnected state.
- To keep current settings, save and then load the settings.
0652 Normal Please define a "Sequence Table".
Measurement could not be started because sequence settings have not been defined.
- Define sequence settings. - See Section 5.3, “Single-
ended Measurement” or Section 5.4, “Double-ended Measurement” for details.
0653 Normal Setting isn't transmitted to DTS. Please save.
Measurement is not started after settings are modified so current settings are not updated to the DTSX series and may be overwritten by old settings on the DTSX series on subsequent connection to the DTSX series. Save the modified settings if necessary.
- To keep current settings, save the settings.
0713 Normal Start Connect, Reconnection was initiated because an error was detected during communication with the DTSX series.
- Check the error reported in the preceding message for the cause of reconnection.
0714 Normal Cancel Connect Connection with the DTSX series was cancelled by a user.
-
0717 Normal DTS was rebooted. It is reconnected.
Reconnection is made to the DTSX series because the DTSX series was rebooted.
- Check the DTSX series message log for the cause of reboot.
0719 Normal Connect to DTS. Connection was made to DTSX series.
0729 Normal Connection with DTS went wrong. Click the Connect button and connect again.
Connection to DTSX series has failed. Click the [Connect] button to connect again.
- Click the [Connect] button to connect again.

<Appendix A. Messages > 153
IM 39J02B40-01E
● Warning messages
List of Warning Messages No. Type Message Description Remedial Measures
0102 Warning The specified folder is not found.
The folder specified for Save Folder in the CSV Save Config dialog was not found.
- Check that the specified folder exists.
The folder specified for Save Folder in the Trace Storage Config dialog was not found.
- Check that the specified folder exists.
The folder specified for Open Folder Or File in the Open Trace dialog was not found.
- Check that the specified folder exists.
0103 Warning There is no item in the conversion list.
No item for conversion has been added to CSV Files in the CSV Save Config dialog.
- Add at least one item to CSV Files and re-execute CSV conversion.
0104 Warning The selection channel overlaps.
A channel is selected more than once in the Sequence Table of the Sequence Setting dialog.
- Modify the Sequence Table settings to remove the duplicate channel selection.
0105 Warning No measurement channel is specified.
No channel for measurement is specified in the Sequence Table of the Sequence Setting dialog.
- Specify at least one channel for measurement in the Sequence Table.
0106 Warning No data type is selected. No data type for conversion is selected for Data Type in the CSV Save Config dialog.
- Select at least one data type for conversion in Data Type and then execute CSV conversion again.
0107 Warning File Error (Failed to add some files or all files.)
File(s) could not be added to the trace file list in the Open Trace dialog.
- Check that no file is already added previously.
- Check that the limit on the number of files is not exceeded.
- Check that the file extension is correct.
0205 Warning Trace Warning (Time series data file does not exist.)
In trace mode, time series data was not found in the specified trace folder. Chart display with time on the X axis is not allowed.
- This message is displayed if time series data was not saved at the time of measurement.
0208 Warning Trace Warning (Failed to save file because a file of the same name exists.)
In trace mode, a converted CSV file could not be saved because a file of the same name was found.
- This message is displayed only if the option to overwrite an existing file is not selected.
0727 Warning Some functions are unavailable for the connected DTS.
Some functions are unavailable as either the DTSX series firmware or the DTAP3000 software is not of the latest version.
- Upgrade the firmware of the DTSX series, as well as the DTAP3000 software, to the latest version.

<Appendix A. Messages > 154
IM 39J02B40-01E
● Error messages
List of Error Messages No. Type Message Description Remedial Measures
0201 Error Trace Error (Failed to load setting file.)
When in control, monitor mode, a settings file downloaded by DTSX series could not be loaded.
- Check that no modification has been made to the file structure, folder structure or files in the trace folder.
- Reboot the PC and re-execute measurement.
- Reboot the DTSX series and re-execute measurement.
- Change the trace folder and re-execute measurement.
When in trace mode, either the file structure of the specified trace folder is invalid or the content of a settings file is invalid.
- Check that no modification has been made to the file structure, folder structure or files in the trace folder.
- Re-execute measurement and then load the acquired trace folder or file.
0202 Error Trace Error (Failed to save csv file.)
In trace mode, a converted CSV file could not be saved.
- Check that no modification has been made to the file structure, folder structure or files in the trace folder.
- Check that the destination folder for CSV files has sufficient free space.
- Check that the destination folder for CSV files exists.
- Change the destination folder for saving CSV files.
0203 Error Trace Error (Failed to load data file.)
When in control, monitor mode, a trace file downloaded by DTSX series could not be loaded.
- Check that no modification has been made to the file structure, folder structure or files in the trace folder.
- Reboot the PC and re-execute measurement.
- Reboot the DTSX series and re-execute measurement.
- Change the trace folder and re-execute measurement.
When in trace mode, either the file structure of the specified trace folder is invalid or the content of a trace file is invalid.
- Check that no modification has been made to the file structure, folder structure or files in the trace folder.
- Re-execute measurement and then load the acquired trace folder or file.
0204 Error Trace Error (File or folder does not exist.)
When in trace mode, the specified trace folder or trace file was not found.
- Check that no modification has been made to the file structure, folder structure or files in the trace folder.
- Check that the specified file or folder exists.
0206 Error Trace Error (Failed to save timeseries file.)
When in control or monitoring mode, time series data files could not be saved at the end of measurement.
- Check that no modification has been made to the file structure, folder structure or files in the trace folder.

<Appendix A. Messages > 155
IM 39J02B40-01E
No. Type Message Description Remedial Measures If time series data is discontinuous because measurement by the DTSX series is momentarily interrupted or trace file retrieval is discontinuous because the communication between this software and the DTSX series is disconnected, only time series data preceding the discontinuity is stored.
- Reboot the PC and re-execute measurement.
- Change the trace folder and re-execute measurement.
0207 Error Trace Error (Failed to open measurement database.)
When in control, monitor mode, the specified trace folder was not found.
- Check that no modification has been made to the file structure, folder structure or files in the trace folder.
- Reboot the PC and re-execute measurement.
- Change the trace folder and re-execute measurement.
When in trace mode, the specified trace folder or trace file was not found.
- Check that no modification has been made to the file structure, folder structure or files in the trace folder.
- Check that the specified file or folder exists.
0209 Error Trace Error (Failed to save setting file.)
When in control, monitor mode, settings files could not be saved at the beginning of measurement.
- Check that no modification has been made to the file structure, folder structure or files in the trace folder.
- Reboot the PC and re-execute measurement.
- Change the trace folder and re-execute measurement.
0210 Error Trace Error (trace display overrun)
Update processing of chart display failed to keep up.
- Try terminating other applications running on the PC.
- The processing power of the PC may be inadequate. Try switching to a more powerful PC.
0501 Error Setup Error (Failed to load a setting.)
The specified settings file could not be loaded.
- Check that the file exists. - Check that software startup
or exit is not in progress. - Check that measurement
by DTSX series is not in progress.
- Save settings and check if the file can be loaded.
0502 Error Setup Error (Failed to save a setting.)
The specified settings file could not be saved.
- Check that the file exists. - Check that software startup
or exit is not in progress.
0503 Error Setup Error (Failed to default a setting.)
The specified setting could not be initialized.
- Check that software startup or exit is not in progress.
- Check that measurement by DTSX series is not in progress.
0504 Error Setup Error (Failed to copy a setting.)
The specified setting could not be copied.
- Check that software startup or exit is not in progress.
0505 Error Setup Error (Failed to paste a setting)
The specified setting could not be pasted.
- Check that software startup or exit is not in progress.
- Check that measurement by DTSX series is not in progress.
- Copy setting and check if the setting can be pasted.
0506 Error Setup Error (Failed to change a setting.)
The specified setting could not be changed.
- Check that software startup or exit is not in progress.
- Check that measurement by DTSX series is not in progress.

<Appendix A. Messages > 156
IM 39J02B40-01E
No. Type Message Description Remedial Measures
0509 Error Startup Error (Failed to get data from form.)
Setting(s) could not be retrieved from a displayed configuration dialog.
- Try re-running the software. - Try rebooting the PC. - Try reinstalling the
software.
0511 Error Form Error (Failed to open a form.)
A window or dialog could not be displayed.
- Try re-running the software. - Try rebooting the PC. - Try reinstalling the
software.
0514 Error Form Error (Failed to close a form.)
An error was detected during termination of a dialog.
- Try re-running the software. - Try rebooting the PC. - Try reinstalling the
software.
0515 Error Form Error (Failed to make a dialog) A dialog could not be created.
- Try re-running the software. - Try rebooting the PC. - Try reinstalling the
software.
0523 Error Processing Error (Cannot connect to DTS.)
Connection to DTSX series was aborted.
- Check that the DTSX series is not connected.
- The status display may be delayed.
0524 Error Processing Error (Cannot start measurement.)
Measurement could not be started.
- Check that measurement is not already started.
- Check that self test is not in progress.
- Check that the DTSX series is not disconnected.
- The status display may be delayed.
0525 Error Processing Error (Cannot stop measurement.)
Measurement could not be stopped.
- Check that measurement is not already stopped.
- Check that self test is not in progress.
- Check that the DTSX series is not disconnected.
- The status display may be delayed.
0531 Error File Error (Failed to find a file.)
A file (manual, etc.) does not exist.
- Try reinstalling the software.
0532 Error File Error (Failed to open a file.)
A file (manual, etc.) could not be opened.
- Install Acrobat Reader or some other PDF file browser software.
0543 Error Calibration Error (Cannot calibrate)
Calibration could not be executed.
- Check that DTSX series has stopped measurement.
- Check that self test is not in progress.
- Check that the DTSX series is not disconnected.
- The status display may be delayed.
0554 Error Setup Error (Value is empty.) No value is specified.
- Specify a value. - See parameter description
in this manual for details.
0555 Error Setup Error (Over max length.)
The specified character string is too long.
- Specify a string value not longer than the length limit.
- See parameter description in this manual for details.
0557 Error Setup Error (Over max value.)
The specified value is too large.
- Specify a value equal or smaller than the high limit.
- See parameter description in this manual for details.
0558 Error Setup Error (Under min value.)
The specified value is too small.
- Specify a value equal or larger than the low limit.
- See parameter description in the manual for details.
0559 Error Setup Error (Illegal preceding or trailing space characters.)
Space character(s) are present at the beginning and/or end of the specified value.
- Remove preceding and trailing space character(s) from the specified value.
- See parameter description in this manual for details.
0560 Error Setup Error (Invalid Value)
The specified value is invalid. (E.g. A letter was wrongly
- Specify a valid value. - See parameter description

<Appendix A. Messages > 157
IM 39J02B40-01E
No. Type Message Description Remedial Measures entered for a numeric parameter.)
in this manual for details.
0701 Error Comm Error
This is a general communication error. The application will automatically retry to communicate with the DTSX series. If the failure persists, adopt the remedial measures.
- Try rebooting the PC. - Try rebooting the DTSX
series. - Check the transmission
path between the PC and DTSX series.
0702 Error SFTP Connect Error SFTP connection has failed.
- Try rebooting the PC. - Try rebooting the DTSX
series. - Check the transmission
path between the PC and DTSX series.
0703 Error SFTP Login Error SFTP login has failed.
- Try rebooting the PC. - Try rebooting the DTSX
series. - Check the transmission
path between the PC and DTSX series.
0704 Error SCP Connect Error SCP connection has failed.
- Try rebooting the PC. - Try rebooting the DTSX
series. - Check the transmission
path between the PC and DTSX series.
0705 Error SCP Login Error SCP login has failed.
- Try rebooting the PC. - Try rebooting the DTSX
series. - Check the transmission
path between the PC and DTSX series.
0706 Error DTS Connect Error (IP Address Error.)
DTSX series was not found at the specified IP address.
- Check the IP address of the DTSX series.
- Check that DTSX series is powered on.
- Check the transmission path to the DTSX series.
- Try rebooting the PC. - Try rebooting the DTSX
series.
0707 Error SSH Connect Error SSH connection has failed.
- Try rebooting the PC. - Try rebooting the DTSX
series. - Check the transmission
path between the PC and DTSX series.
0708 Error SSH Login Error SSH login has failed.
- Check the user ID and password.
- Try rebooting the PC. - Try rebooting the DTSX
series. - Check the transmission
path between the PC and DTSX series.
0709 Error Measurement Error An error was detected during measurement preparation or during measurement.
- Check that the DTSX series is not performing self-test.
- Try rebooting the PC. - Try rebooting the DTSX
series. - Check the transmission
path between the PC and DTSX series.
0710 Error Selftest Error An error was detected during self-test preparation or during self-test execution.
- Check that the DTSX series is not performing measurement.
- Try rebooting the PC. - Try rebooting the DTSX
series. - Check the transmission
path between the PC and

<Appendix A. Messages > 158
IM 39J02B40-01E
No. Type Message Description Remedial Measures DTSX series.
0715 Error
DTS Connect Error (The number of DTS connections exceeded limit or port numbers are different.)
The number of DTSX series connections exceeded the maximum limit or port numbers are different.
- Check the DTSX series port number.
- Reduce the number of connections to the DTSX series from this software or from data conversion software.
- Check the transmission path to the DTSX series.
- Try rebooting the PC. - Try rebooting the DTSX
series.
0716 Error Disk Full. The free space on the specified storage device is below the stipulated value.
- Change to a storage device with sufficient free space for saving trace files.
- Try rebooting the PC.
0718 Error DTS Status Error DTSX series initialization is taking too long.
- Try rebooting the DTSX series.
- Check the transmission path between the PC and DTSX series.
0725 Error DTS Connect Error (The port number is different.)
Connection to DTSX series has failed because port numbers are different.
- Check the port number of the DTSX series.
- Check the transmission path to the DTSX series.
- Try rebooting the PC. - Try rebooting the DTSX
series.
0726 Error Connection to this DTS is not allowed.
This application version does not allow connection to the DTSX series.
- Try upgrading this software and the DTSX series to the latest version.
- Try rebooting the PC. - Try rebooting the DTSX
series.
0728 Error DTS Connect Error (IP Address Error.)
DTSX series was not found at the specified IP address.
- Check the IP address of the DTSX series
- Check that the DTSX series is powered on.
- Check the transmission path to the DTSX series.
- Try rebooting the PC. - Try rebooting the DTSX
series.
0730 Error User ID authority is not RW User. Please re-connect with a different user name.
The login user ID does not have RW authority.
- Check the authority of the login user name.
- Try rebooting the DTSX series.
0731 Error Please perform installation from a disk.
You should re-install the application from the installation disk.
- Reinstall the application.
0732 Error DTS Connect Error (Connection is not allowed.)
The system configuration of the DTSX series disallows connection to this software.
- Modify the system configuration of the DTSX series.
- For details on the system configuration, see the DTSXL Distributed Temperature Sensor Long Range System Guide.

<Appendix A. Messages > 159
IM 39J02B40-01E
● Fatal Error messages
List of Fatal Error Messages No. Type Message Description Remedial Measures
0001 FatalError Startup Error (Failed to copy folder(s).)
The startup process has failed to copy a work folder.
- Try rebooting the PC. - Try reinstalling the
software. - Try replacing the PC.
0002 FatalError Startup Error (Failed to read a configuration File.)
The startup process has failed to load the default configuration file.
- Try rebooting the PC. - Try reinstalling the
software. - Try replacing the PC.
0003 FatalError Exit Error (Failed to copy or delete folder(s).)
A work folder could not be copied or deleted at software termination.
- Try rebooting the PC. - Try reinstalling the
software. - Try replacing the PC.
0004 FatalError Startup Error (Failed to get an application folder.)
The startup process has failed to get the folder name containing this software.
- Try rebooting the PC. - Try reinstalling the
software. - Try replacing the PC.
0005 FatalError Startup Error (Failed to get an application launch ID.)
The startup process has failed to get an application launch ID.
- Try rebooting the PC. - Try reinstalling the
software. - Try replacing the PC.
0006 FatalError Startup Error (Failed to make folder(s).)
The startup process has failed to create one or more work folders.
- Try rebooting the PC. - Try reinstalling the
software. - Try replacing the PC.
0007 FatalError Startup Error (Failed to get a MyDocuments folder.)
The startup process has failed to get a MyDocuments folder.
- Try rebooting the PC. - Try reinstalling the
software. - Try replacing the PC.
0008 FatalError Startup Error (Failed to get an application work folder.)
The startup process has failed to get an application folder.
- Try rebooting the PC. - Try reinstalling the
software. - Try replacing the PC.
0009 FatalError Startup Error (Failed to start a application. You can use 8 applications at the same time.)
The application could not be started because the limit on the number of DTSX3000-related applications (DTAP3000, DTAP3000D, DTAP3000 Calibration and DTAP3000 LAS2.0) running concurrently was exceeded.
- Check that no more than 7 instances of the DTSX3000-related applications are running concurrently.
- Try rebooting the PC.
0010 FatalError Startup Error (Failed to get a trace folder.)
The specified trace folder or default trace folder was not found.
- Try rebooting the PC. - Try reinstalling the
software. - Try replacing the PC.
0101 FatalError Temperature Calculation Error
Temperature calculation has failed.
- Try rebooting the PC. - Try rebooting the DTSX
series.
0591 FatalError Fatal Error A non-recoverable software error has been detected.
- Try re-running the software. - Try rebooting the PC. - Try reinstalling the
software. - Try replacing the PC.
● Termination messages
List of Termination Messages No. Type Message Description Remedial Measures
0592 Terminated Fatal Error (This application will be terminated.)
The software will be aborted because a fatal error has been detected.
- Refer to the remedial measures for the error message displayed before this message.

160
IM 39J02B40-01E
Blank Page

<Appendix B. Version Compatibility> 161
IM 39J02B40-01E
Appendix B. Version Compatibility We recommend using the latest version for the DTAP3000 software, as well as the firmware on the connected DTSX series, as there may be functional limitations otherwise. Beware also of possible functional limitations when loading a setting file that is saved using a different software version.
Appendix B.1 Version Compatibility Tables ● Version compatibility between DTAP3000 software and DTSX3000
firmware The DTAP3000 software compares its own version against the version of the firmware installed on a connected DTSX3000 and performs version compatibility processing accordingly.
DTAP3000 software version
DTSX3000 firmware version Limitations
● Version compatibility between DTAP3000 software and DTSX200 firmware The DTAP3000 software compares its own version against the version of the firmware installed on a connected DTSX200 and performs version compatibility processing accordingly.
DTAP3000 software version
DTSX200 firmware version Limitations
R1.01.01 R1.05.01 This combination is recommended.
R1.01.01 R1.01.01 Functional limitations exist on the DTSX200 firmware side. The Calculation Range setting on the Fiber Setting tab of channel settings is not displayed in the DTAP3000 software, and measurement result is output using all data.

<Appendix B. Version Compatibility> 162
IM 39J02B40-01E
● Limitations when loading a setting file saved using a different software version
Version of DTAP3000 used to
load settings
Version of DTAP3000 used to
save settings Limitations

IM 39J02B40-01E
Blank Page

i
IM 39J02B40-01E
Revision Information Title : DTAP3000 DTSX3000 Control Visualization Software Guide Manual No. : IM 39J02B40-01E Oct. 2014/1st Edition/R1.01.01 or later - First published
* : Denotes the release number of the software corresponding to the contents of this instruction manual. The revised contents are valid until the next edition is issued.
Written by Fiber Sensing Department New Field Development Center Industrial Automation Platform Business Headquarters
Yokogawa Electric Corporation Published by Yokogawa Electric Corporation 2-9-32 Nakacho, Musashino-shi, Tokyo 180-8750, Japan Printed by Kohoku Publishing & Printing Inc.