download - alagappa university - karaikudi, india
TRANSCRIPT


ALAGAPPA UNIVERSITY [Accredited with ‘A+’ Grade by NAAC (CGPA:3.64) in the Third Cycle
and Graded as Category–I University by MHRD-UGC] (A State University Established by the Government of Tamil Nadu)
KARAIKUDI – 630 003
Directorate of Distance Education
Diploma in Computer Applications
SEMESTER I
OFFICE AUTOMATION
51713
Course Material Edited by: Dr P.Prabhu Assistant Professor in Information Technology Directorate of Distance Education Alagappa University, Karaikudi.
SYLLABI-BOOK MAPPING TABLE Syllabi Mapping in Book
Unit I :
MS-Word: Working with Files – Working with Text – Formatting,
Moving, copying and pasting text Styles – Lists – Bulleted and
numbered lists, Nested lists, Formatting lists. Table Manipulations.
Graphics – Adding clip Art, add an image from a file, editing
graphics, Spelling and Grammar, AutoCorrect - Page formatting,
Header and footers, page numbers, Mail Merge, Macros - Creating &
Saving web pages, Hyperlinks.
Working with Files
(Pages 1-14); Styles
(Pages 15-29); Table Manipulations
(Pages 30-39); Page Formatting
(Pages 40-58)
Unit II:
MS-Excel- Modifying a Worksheet – Moving through cells, Adding
worksheets, rows and columns Resizing rows and columns, Selecting
cells, Moving and copying cells, Freezing panes - Macros – recording
and running. Formatting cells – Formatting toolbar, Dates and times,
Auto formatting. Formula and Functions. Linking worksheets.
Modifying a Worksheet
(Pages 59-72);
Formatting Cells
(Pages 73-85);
Unit III:
MS-Excel : Sorting and Filling, Alternating text and numbers with
Auto fill, Auto filling functions. Graphics – Adding clip art, add an
image from a file, Charts – Using chart Wizard, Copy a chart to
Microsoft Word.
Sorting and Filling
(Pages 86-92); Graphics
(Pages 93-102)
Unit IV:
MS-Power Point -Create a Presentation from a template- Working
with Slides – Insert a new slide, Applying a design template,
Changing slide layouts -Slides: Reordering slides, Hide slides, Create
a Custom slide show. Adding Content – Resizing a text box, Text box
properties, Delete a text box. Video and Audio effects, Color
Schemes & Backgrounds Adding clip art, Adding an image from a
file, Save as a web page.
Create a Presentation
from a Template
(Pages 103-113);
Slides
(Pages 114-138);
Video and Audio Effects
(Pages 139-152)
UNIT V
MS-Access - Using Access database wizard, pages and projects.
Creating Tables – Create a Table in design view. Datasheet Records
– Adding, Editing, deleting records, Adding and deleting columns
Resizing rows and columns, finding data in a table & replacing, Print
a datasheet. Queries.
Using Access Database Wizard, Pages and
Projects
(Pages 153-171);
Datasheet Records
(Pages 172-189)
UNIT VI
MS-Access Forms - Forms – Create a form using the wizard, Create
a form in Design View. Form Controls. Sub forms-Create a form and
sub form at once, Sub form wizard, Drag and drop method. Reports
– Using the wizard, Create in Design View, Printing reports.
Importing, Exporting, Linking.
Forms
(Pages 190-210)
Working with Files
NOTES
Self-InstructionalMaterial 1
BLOCK - IMS-WORD
UNIT 1 WORKING WITH FILES
Structure1.0 Introduction1.1 Objectives1.2 Features in Microsoft Word 2010
1.2.1 The Ribbon Interface1.2.2 Backstage View
1.3 Requisite Word: Essential Features1.3.1 File Management1.3.2 Shortcuts and Tips
1.4 Answers to Check Your Progress Questions1.5 Summary1.6 Key Words1.7 Self Assessment Questions and Exercises1.8 Further Readings
1.0 INTRODUCTION
Microsoft Word (MS Word or Word) is a program which is used for creatingdocuments. It is used by the organization or standalone user to create documents,reports and notes. Word provides the facilities of creating reports and picturesand thus, manifests your idea on the paper. If you have worked in MS Wordearlier, you will notice that a lot of new features are added in MS Word 2010. Ifyou are a beginner, there is no need to worry about learning MS Word. This unitfocuses on every aspect of this software from beginning to the expert level. Youwill learn about the essential features of MS Word, which are needed to enhancethe documents.
1.1 OBJECTIVES
After going through this unit, you will be able to: Explain the ribbon interface Discuss the essential features of MS Word 2010 Explain the file menu that helps in managing the files Discuss the shortcut keys for a particular action
Working with Files
NOTES
Self-Instructional2 Material
1.2 FEATURES IN MICROSOFT WORD 2010
In Microsoft Word 2010 various new features have been included which help increating an effective and attractive document. MS Word 2010 includes all thefeatures of the previous version of MS Word, plus some additional ones.There are various new features of Microsoft Office 2010 given as follows:
• Ribbon Interface: It is a set of tabs and commands, required to performvarious sets of functions and operations on documents. Ribbon interfacehas replaced the earlier interface which relied on traditional icons. Whenyou install Microsoft Office 2010 you will find that the biggest change is theintroduction of the File button in place of the round Office Button. Whenyou click on the File tab, the full screen will open which will show variousoptions related to File, methods to protect documents and many more.There are some changes in the UI interface as well. In the previous version,the background color of Microsoft Office was blue. In the recent version,the background color of Microsoft Office is grey.
Backstage View: Backstage View is the center of document management. Thereare various groups of commands that help in creating new documents, saving,opening or printing the document. Backstage view appears on clicking onthe File tab. Backstage view hides the opened document and performs operationsassociated with the document.
• Artistic Effect: In Microsoft Word 2010, various new artistic effects havebeen added. With the help of Artistic Effect, the user can draw sketchesusing Pencil, Chalk and Glowy Edges.
• Screenshot option: Microsoft Word 2010 includes the option ofScreenshot which is present inside the Insert tab in section Illustrations.With the help of Screenshot option, user can directly add screenshot tothe document. There is no need to use the Snipping tool or Paint to pastepictures in the word document. When you l click on the Screenshot option,the windows which are open will be displayed. Click on any of the AvailableWindows to apply screenshot to your document. This even helps to removethe background color or a portion of a picture.
• Collaboration functions: Collaboration functions helps to inspect thedocument before sharing it with others. This helps to hide the informationwhich you do not want to share with the other people.
• Silverlight: Microsoft Office 2010 offers the facility of Web basedapplications. This helps users to upload reports in Windows Live accountsuch as hotmail.com. With the help of Web based applications, users canaccess the documents from anywhere. However, to access the documentusing Silverlight the user should have an internet connection.
Working with Files
NOTES
Self-InstructionalMaterial 3
• PDF support: Microsoft Office 2010 provides the facility of saving theWord file in PDF format. This helps to directly convert your word files toPDF files without using any software.
1.2.1 The Ribbon Interface
Ribbon View is a substitute that provides the facilities of accessing the commandsfor applications. It is organized using a horizontal bar. It provides an easy way toaccess the commands, as all the commands are organized using tabs and groups.With the help of Ribbon, performing various actions to the Office application iseasy. Ribbon is dynamic in nature, which implies that behavior changes as the sizeof Microsoft Office changes.
‘Ribbon’ is a set of toolbars which displays the commands and tools forperforming various tasks. In Microsoft Office 2003, user worked with the classicdrop down menu and toolbar and users were able to work with them easily andquickly. With the release of Microsoft Office 2007, the new term ‘Ribbon’ wasproposed that refers its own implementation of tabbed toolbars bearingheterogeneous controls, known as ‘The Fluent User Interface’, which swappedthe menus and toolbars with a single ‘Office Menu’. MS Word, PowerPoint,Access and Excel implemented ‘Ribbon’ in MS office 2007.
With the release of MS Office 2010, however, ‘ribbon’ was implemented inthe rest of the MS Office applications and added end user customization supportfor its end user. MS Office 2010 ribbon is great, flexible and easy to use.
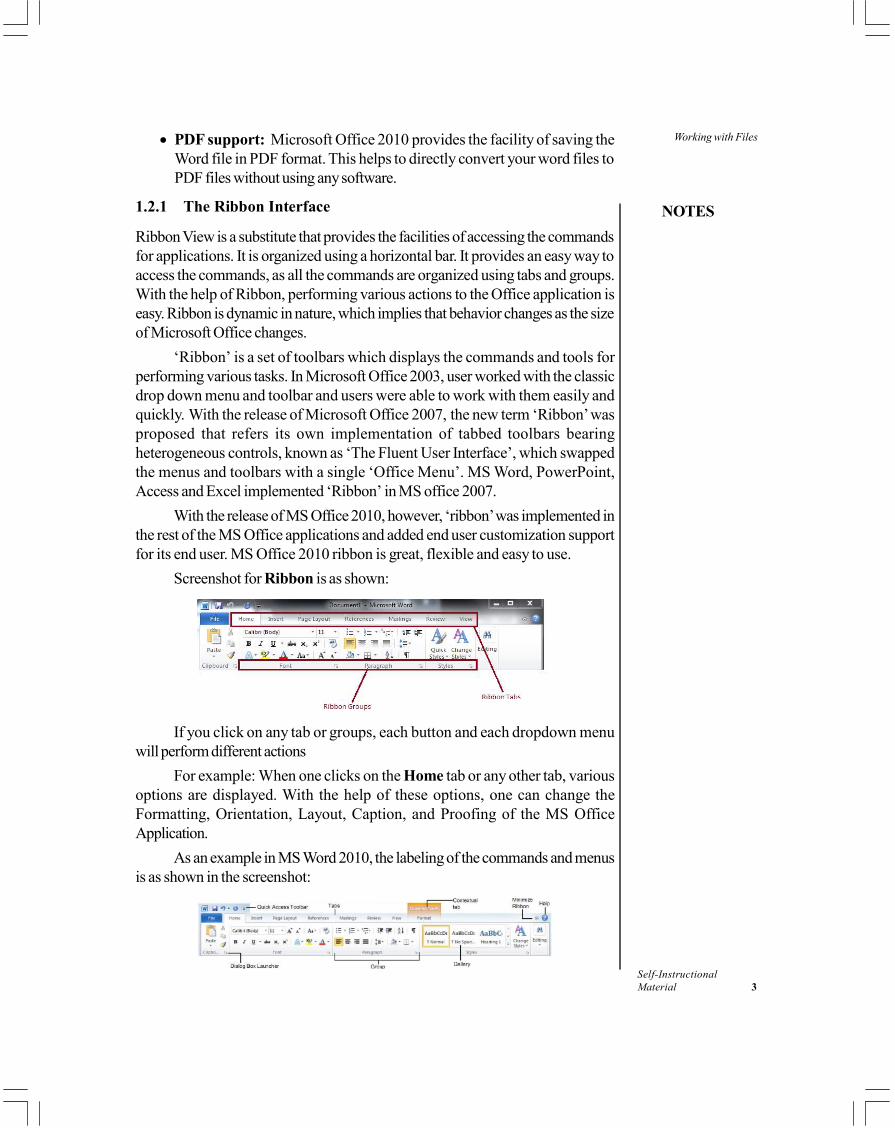
Screenshot for Ribbon is as shown:
If you click on any tab or groups, each button and each dropdown menuwill perform different actions
For example: When one clicks on the Home tab or any other tab, variousoptions are displayed. With the help of these options, one can change theFormatting, Orientation, Layout, Caption, and Proofing of the MS OfficeApplication.
As an example in MS Word 2010, the labeling of the commands and menusis as shown in the screenshot:
Working with Files
NOTES
Self-Instructional4 Material
• Tab: It shows different types of commands for creating MS Officesapplications. You can see the commands by clicking on the particulartab.
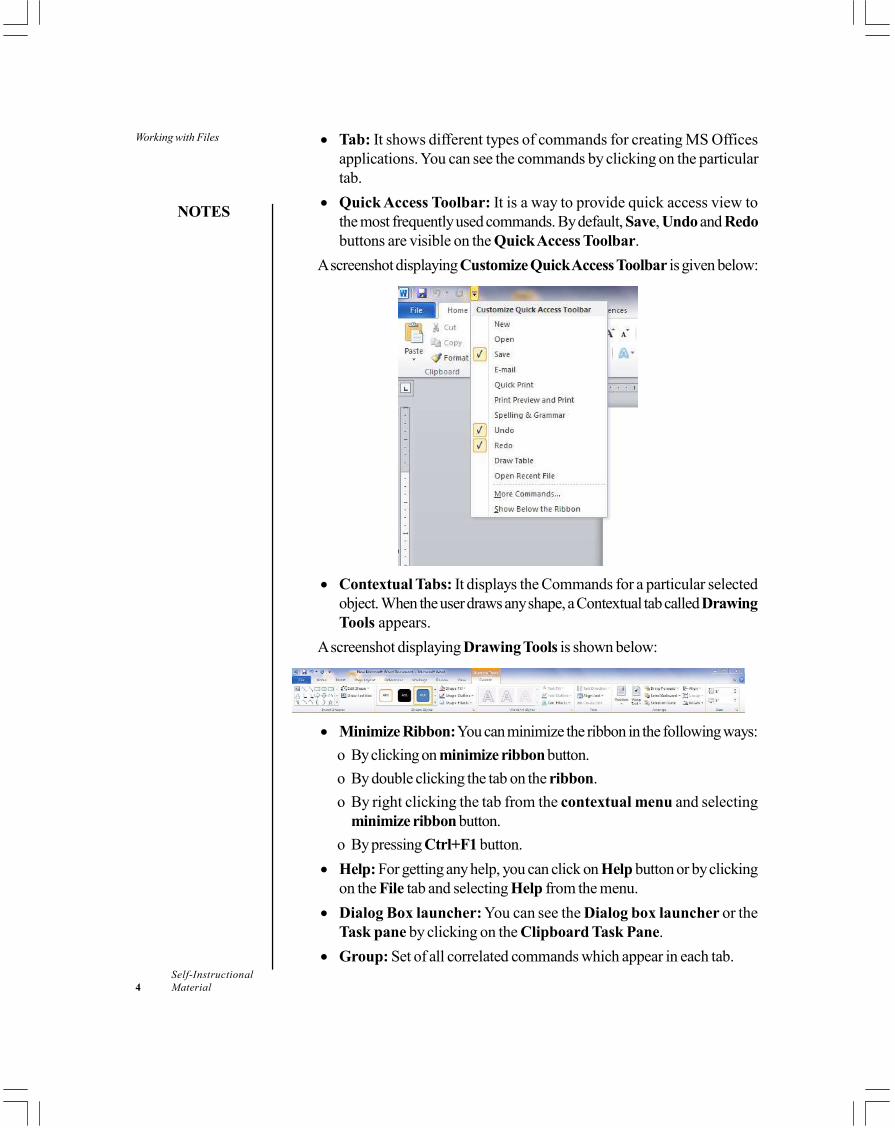
• Quick Access Toolbar: It is a way to provide quick access view tothe most frequently used commands. By default, Save, Undo and Redobuttons are visible on the Quick Access Toolbar.
A screenshot displaying Customize Quick Access Toolbar is given below:
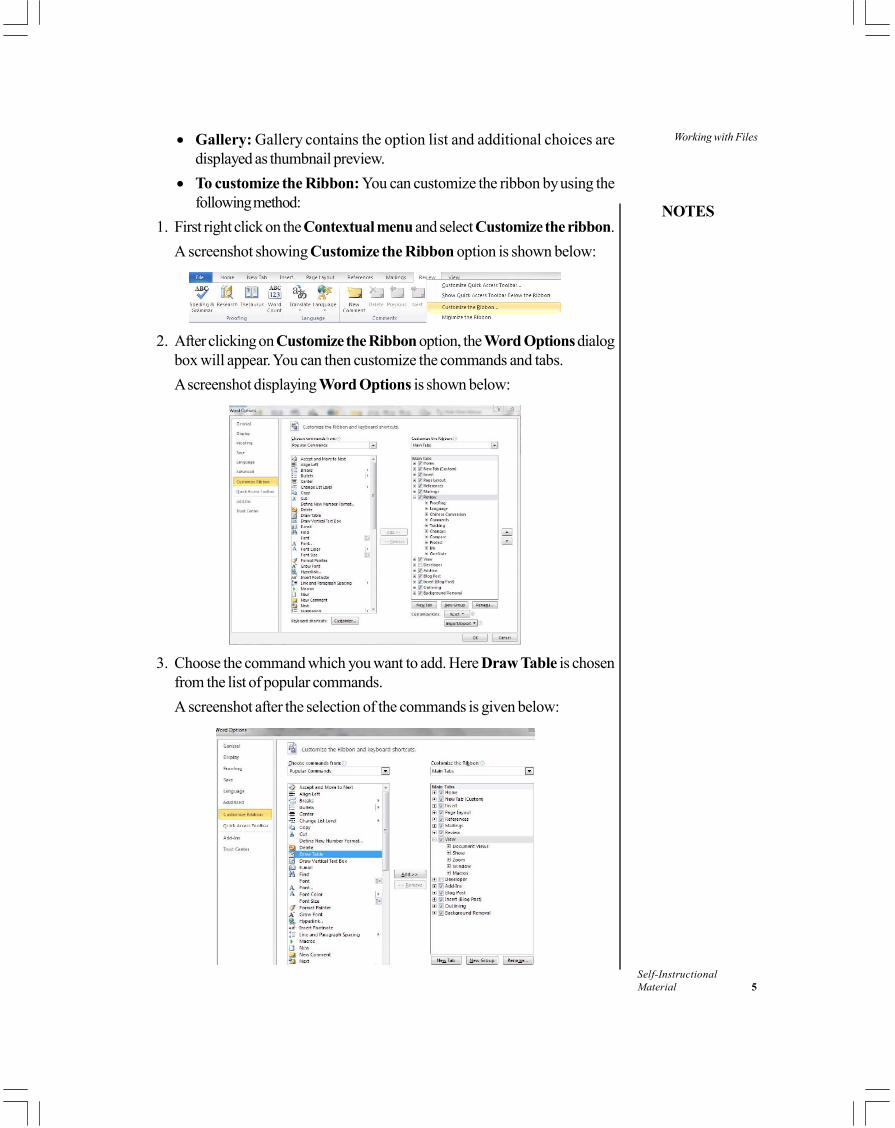
• Contextual Tabs: It displays the Commands for a particular selectedobject. When the user draws any shape, a Contextual tab called DrawingTools appears.
A screenshot displaying Drawing Tools is shown below:
• Minimize Ribbon: You can minimize the ribbon in the following ways:o By clicking on minimize ribbon button.o By double clicking the tab on the ribbon.o By right clicking the tab from the contextual menu and selecting
minimize ribbon button.o By pressing Ctrl+F1 button.
• Help: For getting any help, you can click on Help button or by clickingon the File tab and selecting Help from the menu.
• Dialog Box launcher: You can see the Dialog box launcher or theTask pane by clicking on the Clipboard Task Pane.
• Group: Set of all correlated commands which appear in each tab.
Working with Files
NOTES
Self-InstructionalMaterial 5
• Gallery: Gallery contains the option list and additional choices aredisplayed as thumbnail preview.
• To customize the Ribbon: You can customize the ribbon by using thefollowing method:
1. First right click on the Contextual menu and select Customize the ribbon.A screenshot showing Customize the Ribbon option is shown below:
2. After clicking on Customize the Ribbon option, the Word Options dialogbox will appear. You can then customize the commands and tabs.A screenshot displaying Word Options is shown below:
3. Choose the command which you want to add. Here Draw Table is chosenfrom the list of popular commands.A screenshot after the selection of the commands is given below:
Working with Files
NOTES
Self-Instructional6 Material
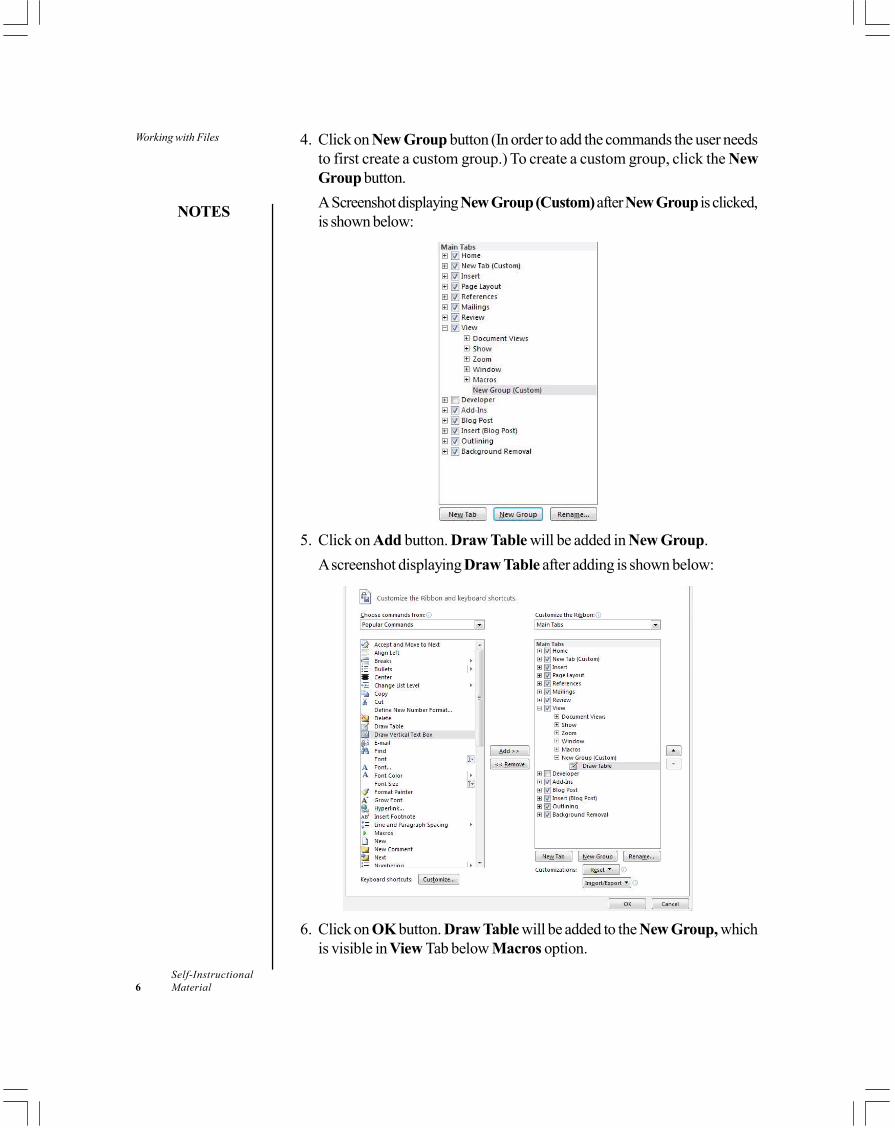
4. Click on New Group button (In order to add the commands the user needsto first create a custom group.) To create a custom group, click the NewGroup button.A Screenshot displaying New Group (Custom) after New Group is clicked,is shown below:
5. Click on Add button. Draw Table will be added in New Group.A screenshot displaying Draw Table after adding is shown below:
6. Click on OK button. Draw Table will be added to the New Group, whichis visible in View Tab below Macros option.
Working with Files
NOTES
Self-InstructionalMaterial 7
A Screenshot displaying New Group is given below:
1.2.2 Backstage View
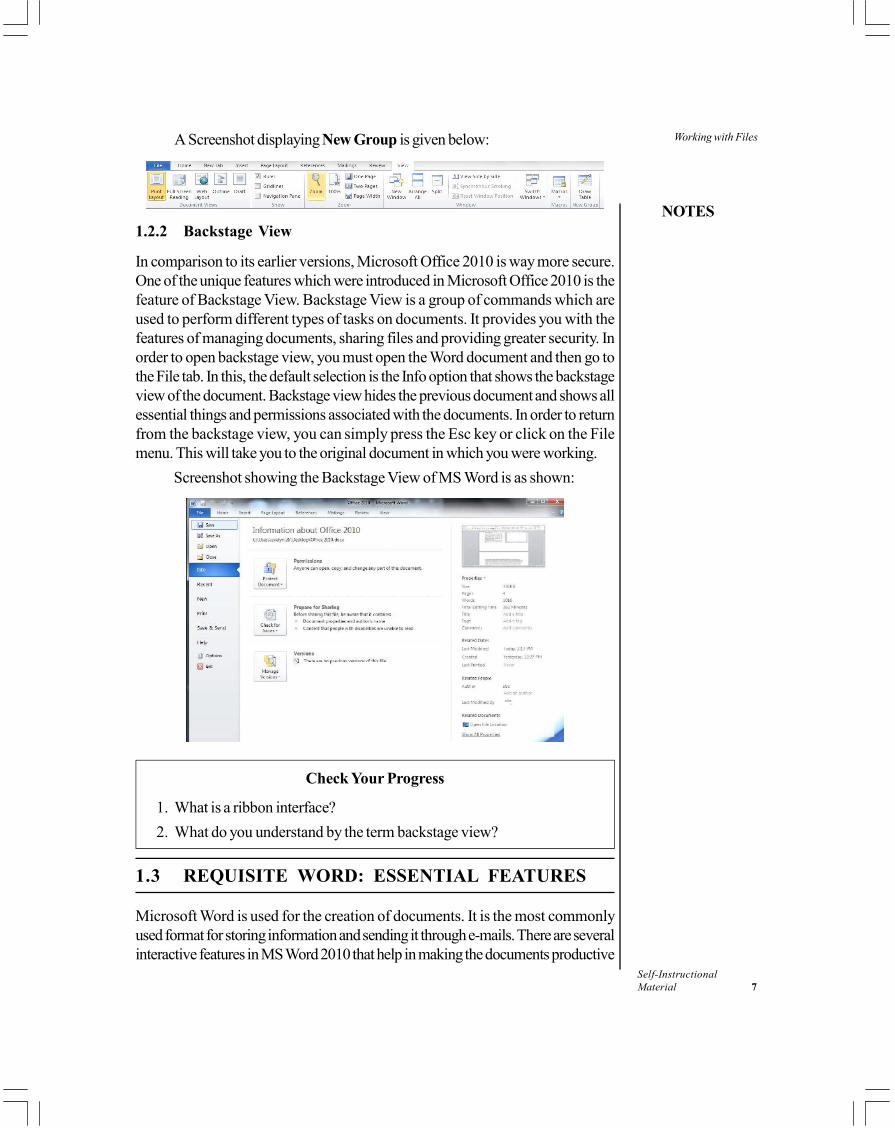
In comparison to its earlier versions, Microsoft Office 2010 is way more secure.One of the unique features which were introduced in Microsoft Office 2010 is thefeature of Backstage View. Backstage View is a group of commands which areused to perform different types of tasks on documents. It provides you with thefeatures of managing documents, sharing files and providing greater security. Inorder to open backstage view, you must open the Word document and then go tothe File tab. In this, the default selection is the Info option that shows the backstageview of the document. Backstage view hides the previous document and shows allessential things and permissions associated with the documents. In order to returnfrom the backstage view, you can simply press the Esc key or click on the Filemenu. This will take you to the original document in which you were working.
Screenshot showing the Backstage View of MS Word is as shown:
Check Your Progress
1. What is a ribbon interface?2. What do you understand by the term backstage view?
1.3 REQUISITE WORD: ESSENTIAL FEATURES
Microsoft Word is used for the creation of documents. It is the most commonlyused format for storing information and sending it through e-mails. There are severalinteractive features in MS Word 2010 that help in making the documents productive
Working with Files
NOTES
Self-Instructional8 Material
and innovative. In this unit, we will explore some features such as the managementof various files in the word documents, management of the information in a securedway and various shortcuts and tips to access different commands.
1.3.1 File Management
File Management provides the facility to organize the files by saving them in thecomputer and drives such as disk drive, USB drive, etc. The saved file can thenbe searched and opened later on. Also, the files can be moved from one locationto another as the need be. To better understand the features and functions includedin file management, it is essential for you to know about the File menu of MSWord 2010.
To make you comfortable with the various aspects of file management, adetailed description of the File menu is given below:
File Menu
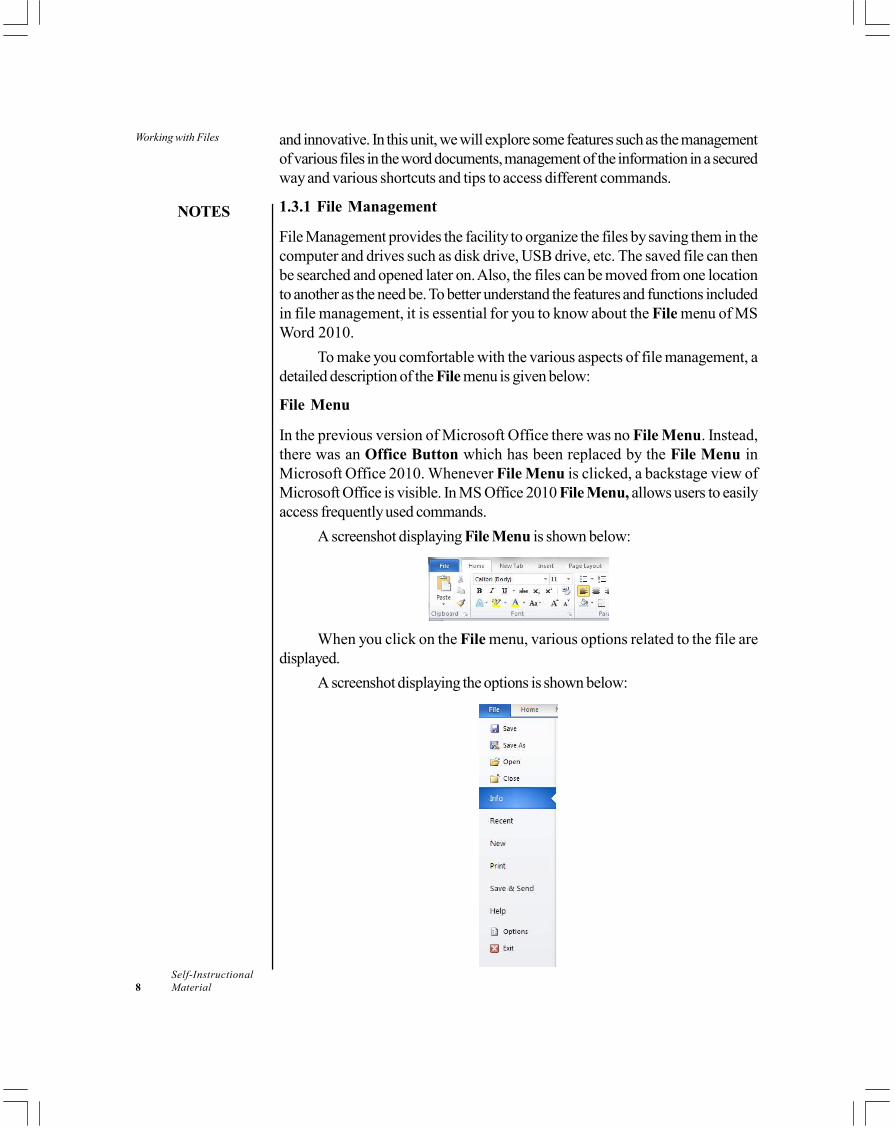
In the previous version of Microsoft Office there was no File Menu. Instead,there was an Office Button which has been replaced by the File Menu inMicrosoft Office 2010. Whenever File Menu is clicked, a backstage view ofMicrosoft Office is visible. In MS Office 2010 File Menu, allows users to easilyaccess frequently used commands.
A screenshot displaying File Menu is shown below:
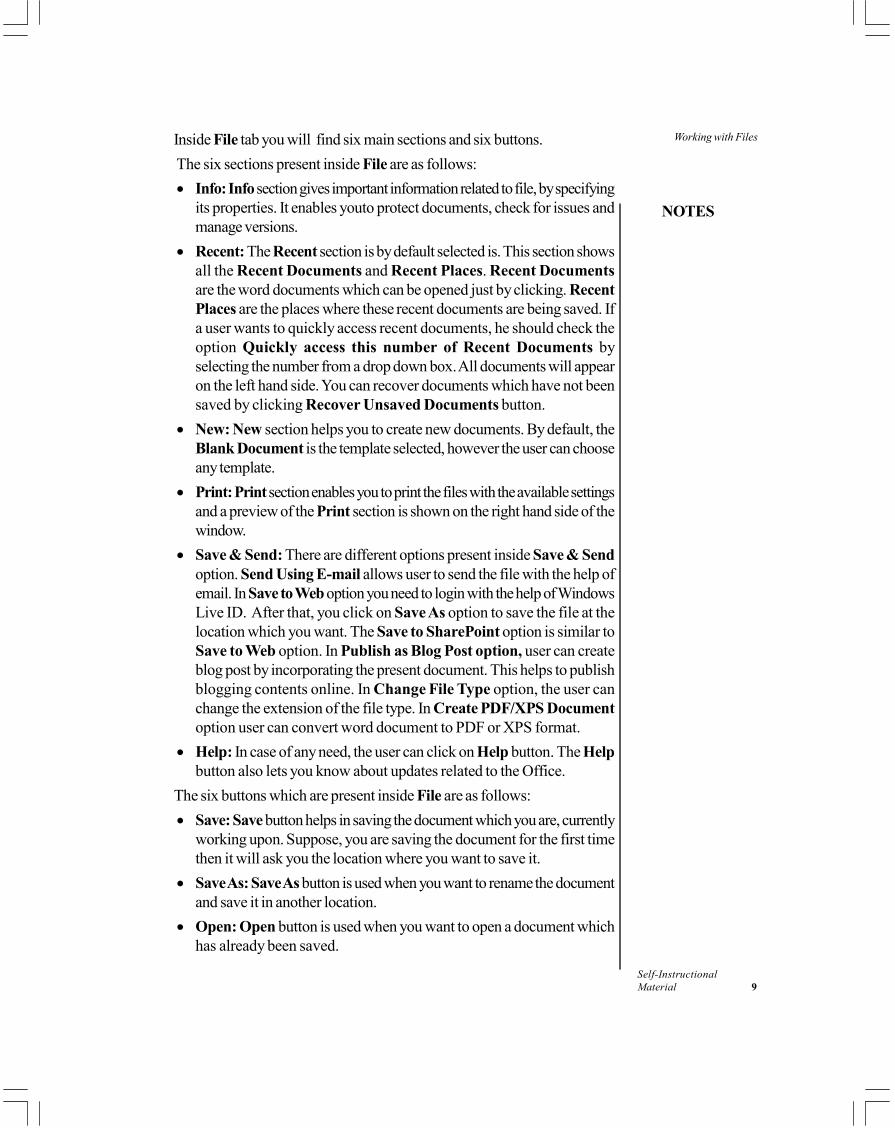
When you click on the File menu, various options related to the file aredisplayed.
A screenshot displaying the options is shown below:
Working with Files
NOTES
Self-InstructionalMaterial 9
Inside File tab you will find six main sections and six buttons. The six sections present inside File are as follows:• Info: Info section gives important information related to file, by specifying
its properties. It enables youto protect documents, check for issues andmanage versions.
• Recent: The Recent section is by default selected is. This section showsall the Recent Documents and Recent Places. Recent Documentsare the word documents which can be opened just by clicking. RecentPlaces are the places where these recent documents are being saved. Ifa user wants to quickly access recent documents, he should check theoption Quickly access this number of Recent Documents byselecting the number from a drop down box. All documents will appearon the left hand side. You can recover documents which have not beensaved by clicking Recover Unsaved Documents button.
• New: New section helps you to create new documents. By default, theBlank Document is the template selected, however the user can chooseany template.
• Print: Print section enables you to print the files with the available settingsand a preview of the Print section is shown on the right hand side of thewindow.
• Save & Send: There are different options present inside Save & Sendoption. Send Using E-mail allows user to send the file with the help ofemail. In Save to Web option you need to login with the help of WindowsLive ID. After that, you click on Save As option to save the file at thelocation which you want. The Save to SharePoint option is similar toSave to Web option. In Publish as Blog Post option, user can createblog post by incorporating the present document. This helps to publishblogging contents online. In Change File Type option, the user canchange the extension of the file type. In Create PDF/XPS Documentoption user can convert word document to PDF or XPS format.
• Help: In case of any need, the user can click on Help button. The Helpbutton also lets you know about updates related to the Office.
The six buttons which are present inside File are as follows:• Save: Save button helps in saving the document which you are, currently
working upon. Suppose, you are saving the document for the first timethen it will ask you the location where you want to save it.
• Save As: Save As button is used when you want to rename the documentand save it in another location.
• Open: Open button is used when you want to open a document whichhas already been saved.
Working with Files
NOTES
Self-Instructional10 Material
• Close: Close button is used when you want to close the documentswhich you are currently working upon.
• Options: Options button is used when the user wants to apply variousWord options related to the file.
• Exit: Exit button is used to exit documents. Before you exit, you areasked whether you want to save the document or not.
Saving a document
In MS Word 2010, files are saved in the default format, which is .docx. This isbecause .docx format is more secured and damages can be easily recovered.Some other formats of saving the files in Microsoft Word are .docm, .dotx and.dotm, which are explained as follows:
.docm file format is used when the document is to be saved in macro-enabled documents.
.dotx file format is used when the document is to be saved in documenttemplate.
.dotm file format is used when the document is to be saved in macro-enabled template.
There are many ways of saving the files but these are optimized for thespecific uses.
Steps to save the documents are as follows:1. Click the File tab which is present on the left hand side of the ribbon.2. Click the Save As option.3. Select the drive and folder where you want to save the file.4. Go to the File name textbox to write the name of the file.5. Select the format in which you want to save the File. By default, the file
format in which the file is saved is .docx.6. Click on Save button to save the file.This can also be done by clicking the Save icon present on the Quick
Access Toolbar. The keyboard shortcut for saving a word document is Ctrl+S.
Saving a document in PDF or XPS format
There are two methods for saving a document in PDF or XPS format, both aregiven below:
1. One method of saving the file in Pdf or Xps format is with the help of SaveAs button.
2. Another method of saving the file in Pdf or Xps format is with the help ofSave & Send section.
Working with Files
NOTES
Self-InstructionalMaterial 11
Here are the steps for saving a document in PDF or XPS format using Save Asoption:
1. Go to the File tab which is present in the ribbon.2. Inside File tab, click on the button Save As. The Save As dialog box
appears.3. Choose PDF extension from Save as type which will save the word file in
PDF format. In order to save the file as an XPS Document, choose XPSDocument extension.
To save a document in PDF or XPS format using Save & Send option, follow thefollowing steps:
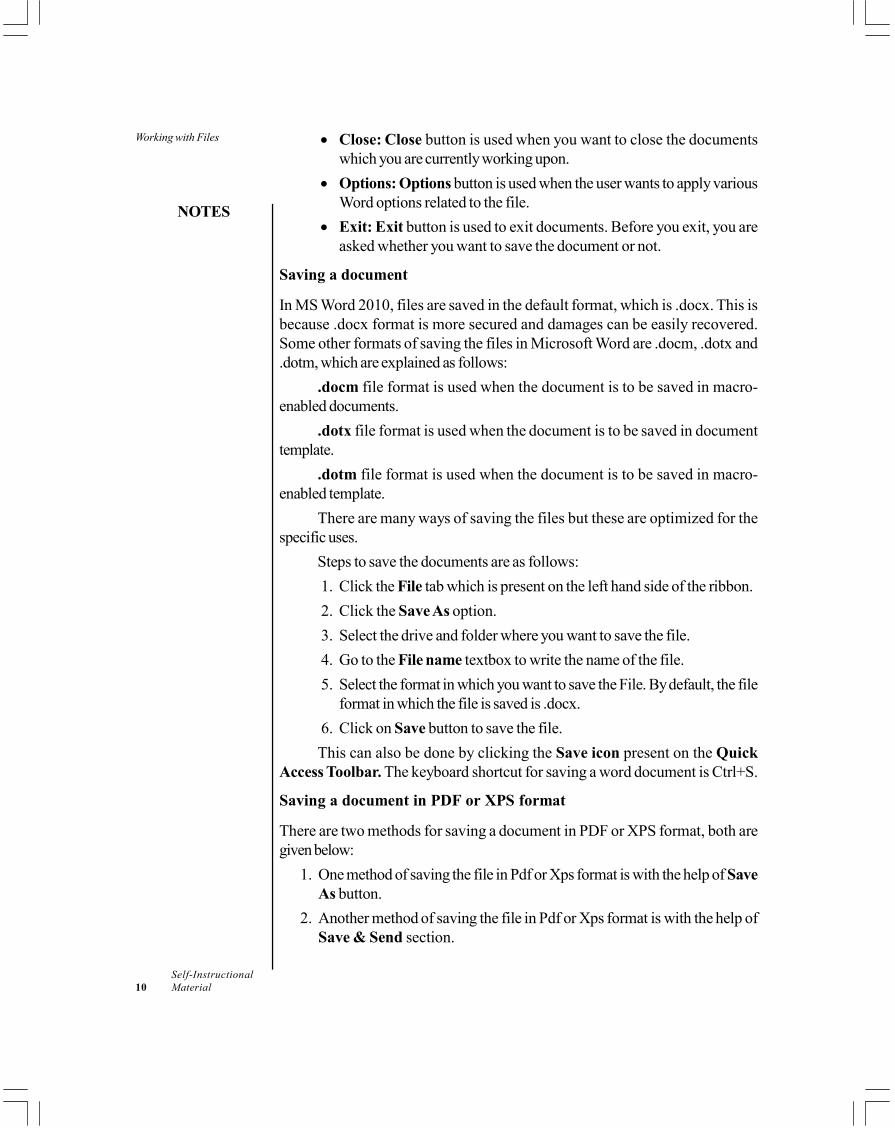
1. Go to the File tab which is present in the ribbon.2. Inside File tab click on the section Send & Save.3. Click on the button Create PDF/XPS Document.
The screenshot after clicking on Create PDF/XPS Document is given below:
4. Click on Create PDF/XPS button, present on the right hand side of thedialog box. After clicking on Create PDF/XPS button, the Publish asPDF or XPS dialog box appears.
5. After that Click on Publish button to publish the document in PDF format.If the user wants to publish the document in XPS format then user shouldchoose XPS Document from the Save as type drop box.
1.3.2 Shortcuts and Tips
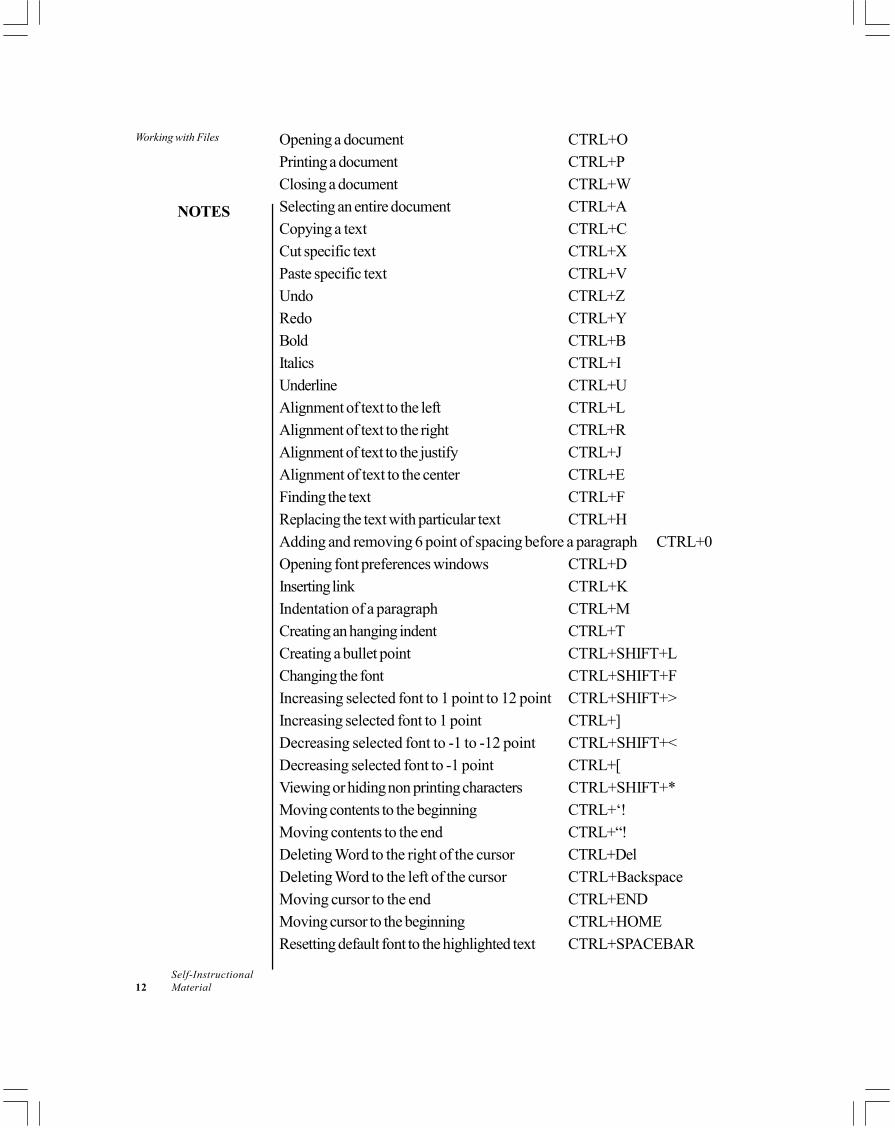
Shortcuts and Tips for MS Word are tabulated as follows:Using Keyboard Shortcut
Action KeystrokesCreation of new document CTRL+NSaving a document CTRL+S
Working with Files
NOTES
Self-Instructional12 Material
Opening a document CTRL+OPrinting a document CTRL+PClosing a document CTRL+WSelecting an entire document CTRL+ACopying a text CTRL+CCut specific text CTRL+XPaste specific text CTRL+VUndo CTRL+ZRedo CTRL+YBold CTRL+BItalics CTRL+IUnderline CTRL+UAlignment of text to the left CTRL+LAlignment of text to the right CTRL+RAlignment of text to the justify CTRL+JAlignment of text to the center CTRL+EFinding the text CTRL+FReplacing the text with particular text CTRL+HAdding and removing 6 point of spacing before a paragraph CTRL+0Opening font preferences windows CTRL+DInserting link CTRL+KIndentation of a paragraph CTRL+MCreating an hanging indent CTRL+TCreating a bullet point CTRL+SHIFT+LChanging the font CTRL+SHIFT+FIncreasing selected font to 1 point to 12 point CTRL+SHIFT+>Increasing selected font to 1 point CTRL+]Decreasing selected font to -1 to -12 point CTRL+SHIFT+<Decreasing selected font to -1 point CTRL+[Viewing or hiding non printing characters CTRL+SHIFT+*Moving contents to the beginning CTRL+‘!Moving contents to the end CTRL+“!Deleting Word to the right of the cursor CTRL+DelDeleting Word to the left of the cursor CTRL+BackspaceMoving cursor to the end CTRL+ENDMoving cursor to the beginning CTRL+HOMEResetting default font to the highlighted text CTRL+SPACEBAR
Working with Files
NOTES
Self-InstructionalMaterial 13
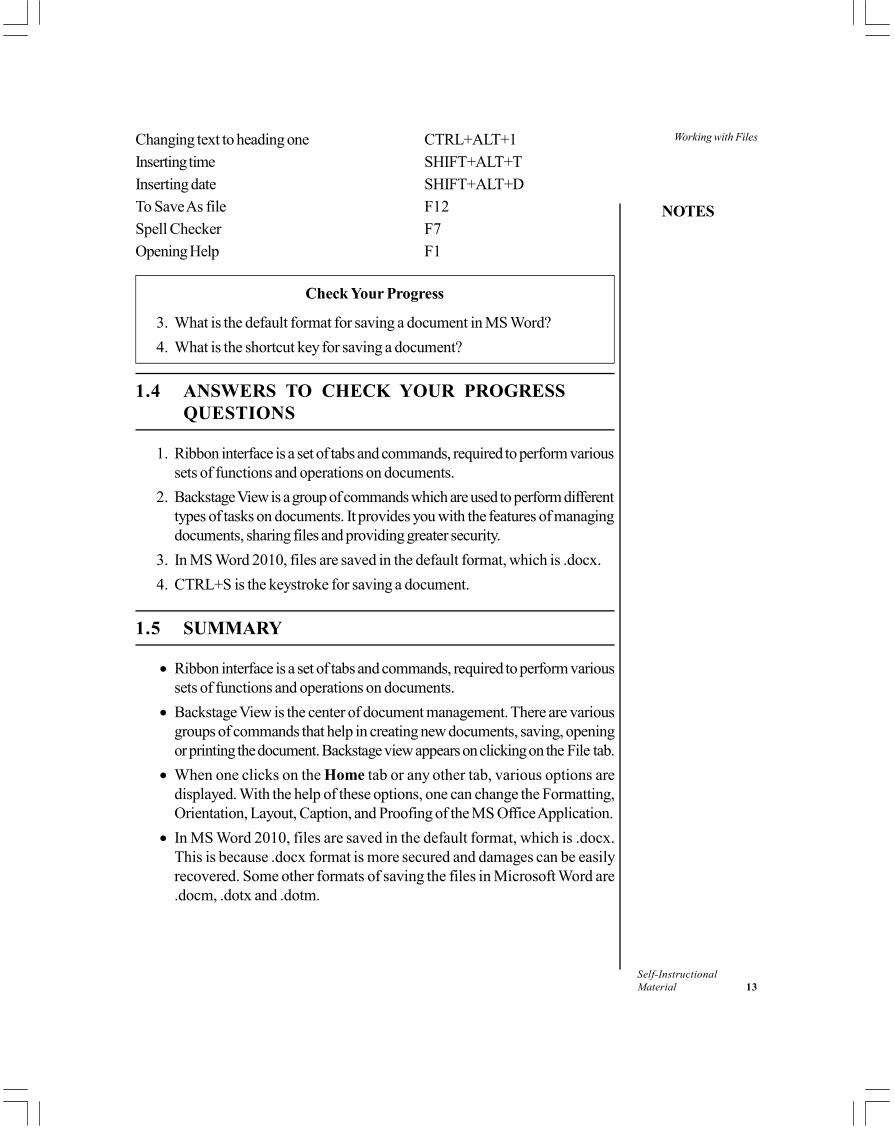
Changing text to heading one CTRL+ALT+1Inserting time SHIFT+ALT+TInserting date SHIFT+ALT+DTo Save As file F12Spell Checker F7Opening Help F1
Check Your Progress
3. What is the default format for saving a document in MS Word?4. What is the shortcut key for saving a document?
1.4 ANSWERS TO CHECK YOUR PROGRESSQUESTIONS
1. Ribbon interface is a set of tabs and commands, required to perform varioussets of functions and operations on documents.
2. Backstage View is a group of commands which are used to perform differenttypes of tasks on documents. It provides you with the features of managingdocuments, sharing files and providing greater security.
3. In MS Word 2010, files are saved in the default format, which is .docx.4. CTRL+S is the keystroke for saving a document.
1.5 SUMMARY
• Ribbon interface is a set of tabs and commands, required to perform varioussets of functions and operations on documents.
• Backstage View is the center of document management. There are variousgroups of commands that help in creating new documents, saving, openingor printing the document. Backstage view appears on clicking on the File tab.
• When one clicks on the Home tab or any other tab, various options aredisplayed. With the help of these options, one can change the Formatting,Orientation, Layout, Caption, and Proofing of the MS Office Application.
• In MS Word 2010, files are saved in the default format, which is .docx.This is because .docx format is more secured and damages can be easilyrecovered. Some other formats of saving the files in Microsoft Word are.docm, .dotx and .dotm.
Working with Files
NOTES
Self-Instructional14 Material
1.6 KEY WORDS
• Ribbon: It is a set of tabs and commands to perform various sets of functionsand operations on documents.
• Quick Access Toolbar: It is a type of toolbar that can be customized toinclude the set of commands for the quick access and independent of thetabs on the menu bar.
• Templates: Design pattern or style which can be applied to the document.
1.7 SELF ASSESSMENT QUESTIONSAND EXERCISES
1. Perform the following operations on MS Word.(i) Open a blank document.(ii) Customize the ribbon, for example, add an insert table command.(iii) Write about yourself on the document and save using file menu or
shortcut key.(iv) Save the document in PDF or XPS format.(v) Print the document.
2. Open the file that you have created and use shortcut keys for selecting, cut,paste, print and closing the document.
1.8 FURTHER READINGS
Srivastava, S.S. 2008. MS Office. New Delhi: Firewall Media.Saxena, Sanjay. 2011. MS Office 2007 in a Nutshell. Noida: Vikas Publishing
house.Courter, Gini and Annette Marquis. 1999. Mastering Microsoft Office 2000.
New Delhi: BPB Publications.Blattner, Patrick, Ken Cook, Laurie Ulrich and Timothy Dyck. 1999. Special
Edition Using Microsoft Excel 2000. New Delhi: Prentice-Hall of India.
Styles
NOTES
Self-InstructionalMaterial 15
UNIT 2 STYLES
Structure2.0 Introduction2.1 Objectives2.2 Formatting with Styles
2.2.1 Illustrations2.3 Bullets and Numbering2.4 Answers to Check Your Progress Questions2.5 Summary2.6 Key Words2.7 Self Assessment Questions and Exercises2.8 Further Readings
2.0 INTRODUCTION
In this unit, you will learn about the styles. Style option is found in the paragraphgroup on the Home tab. Style sets are the combination of title, heading, andparagraph styles, which can be formatted all at once. You will also learn how tomodify the style and add Smart. SmartArt helps to represent valuable contentsmore effectively using diagrammatical representation. Visual Elements help to depictideas pictorially.
2.1 OBJECTIVES
After going through this unit, you will be able to:• Apply the styles to the word document• Modify the style• Work with SmartArt
2.2 FORMATTING WITH STYLES
Formatting plays an important role when you create any document. Style is aused to apply various sets of formatting by selecting the text. Formatting is appliedto the word by choosing the type of style. Style option is found in the paragraphgroup on the Home tab. Style helps in the enhancement of the document in theeasiest and quickest ways. It provides sophisticated look to the document. On theother side, themes are used to change the tone of the entire document. The defaultStyle chosen in the word is Normal. Style formatting is consistent throughout thedocuments.
Styles
NOTES
Self-Instructional16 Material
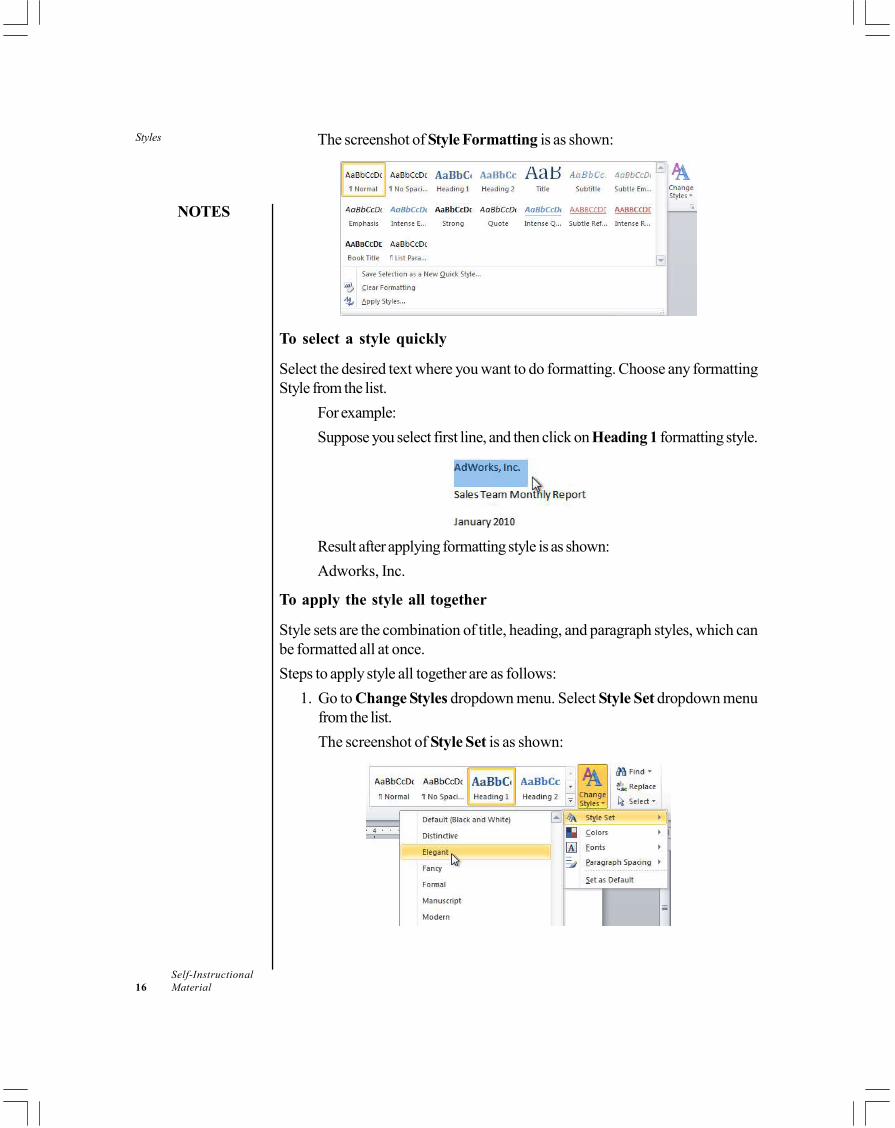
The screenshot of Style Formatting is as shown:
To select a style quickly
Select the desired text where you want to do formatting. Choose any formattingStyle from the list.
For example:Suppose you select first line, and then click on Heading 1 formatting style.
Result after applying formatting style is as shown:Adworks, Inc.
To apply the style all together
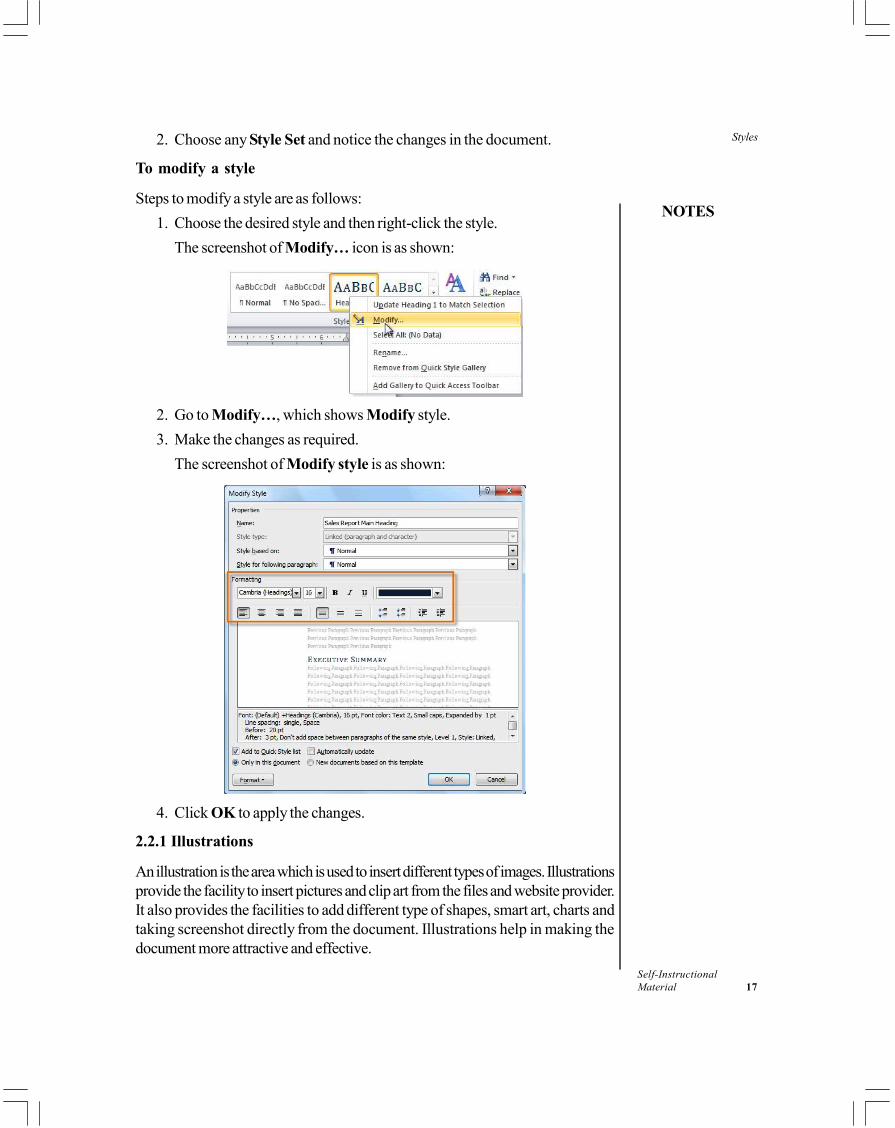
Style sets are the combination of title, heading, and paragraph styles, which canbe formatted all at once.Steps to apply style all together are as follows:
1. Go to Change Styles dropdown menu. Select Style Set dropdown menufrom the list.The screenshot of Style Set is as shown:
Styles
NOTES
Self-InstructionalMaterial 17
2. Choose any Style Set and notice the changes in the document.
To modify a style
Steps to modify a style are as follows:1. Choose the desired style and then right-click the style.
The screenshot of Modify… icon is as shown:
2. Go to Modify…, which shows Modify style.3. Make the changes as required.
The screenshot of Modify style is as shown:
4. Click OK to apply the changes.
2.2.1 Illustrations
An illustration is the area which is used to insert different types of images. Illustrationsprovide the facility to insert pictures and clip art from the files and website provider.It also provides the facilities to add different type of shapes, smart art, charts andtaking screenshot directly from the document. Illustrations help in making thedocument more attractive and effective.
Styles
NOTES
Self-Instructional18 Material
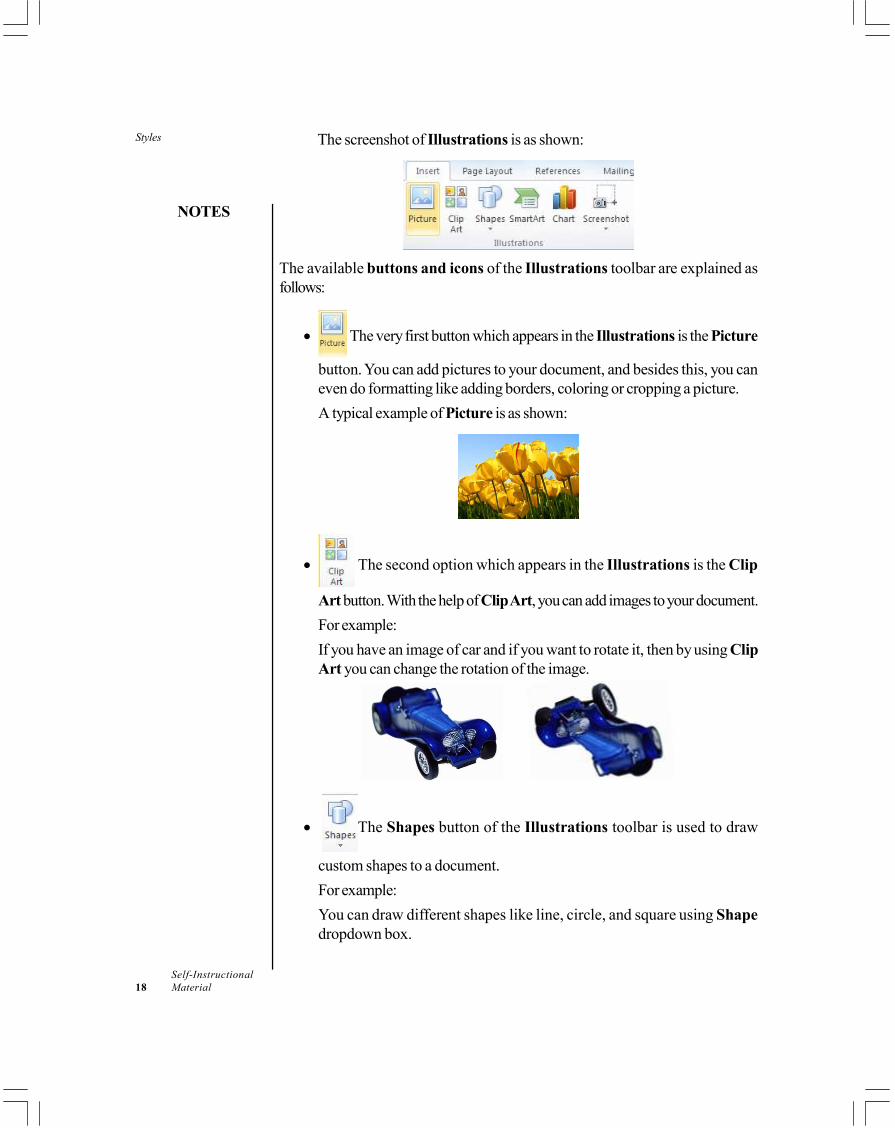
The screenshot of Illustrations is as shown:
The available buttons and icons of the Illustrations toolbar are explained asfollows:
• The very first button which appears in the Illustrations is the Picture
button. You can add pictures to your document, and besides this, you caneven do formatting like adding borders, coloring or cropping a picture.A typical example of Picture is as shown:
• The second option which appears in the Illustrations is the Clip
Art button. With the help of Clip Art, you can add images to your document.For example:If you have an image of car and if you want to rotate it, then by using ClipArt you can change the rotation of the image.
• The Shapes button of the Illustrations toolbar is used to draw
custom shapes to a document.For example:You can draw different shapes like line, circle, and square using Shapedropdown box.
Styles
NOTES
Self-InstructionalMaterial 19
A typical example of some shapes is as shown:
• The SmartArt button of the Illustrations toolbar is used to add
different types of graphics such as basic block, hexagon, matrix, relationshiphierarchy, and circle.A typical example of circular arrangement is as shown:
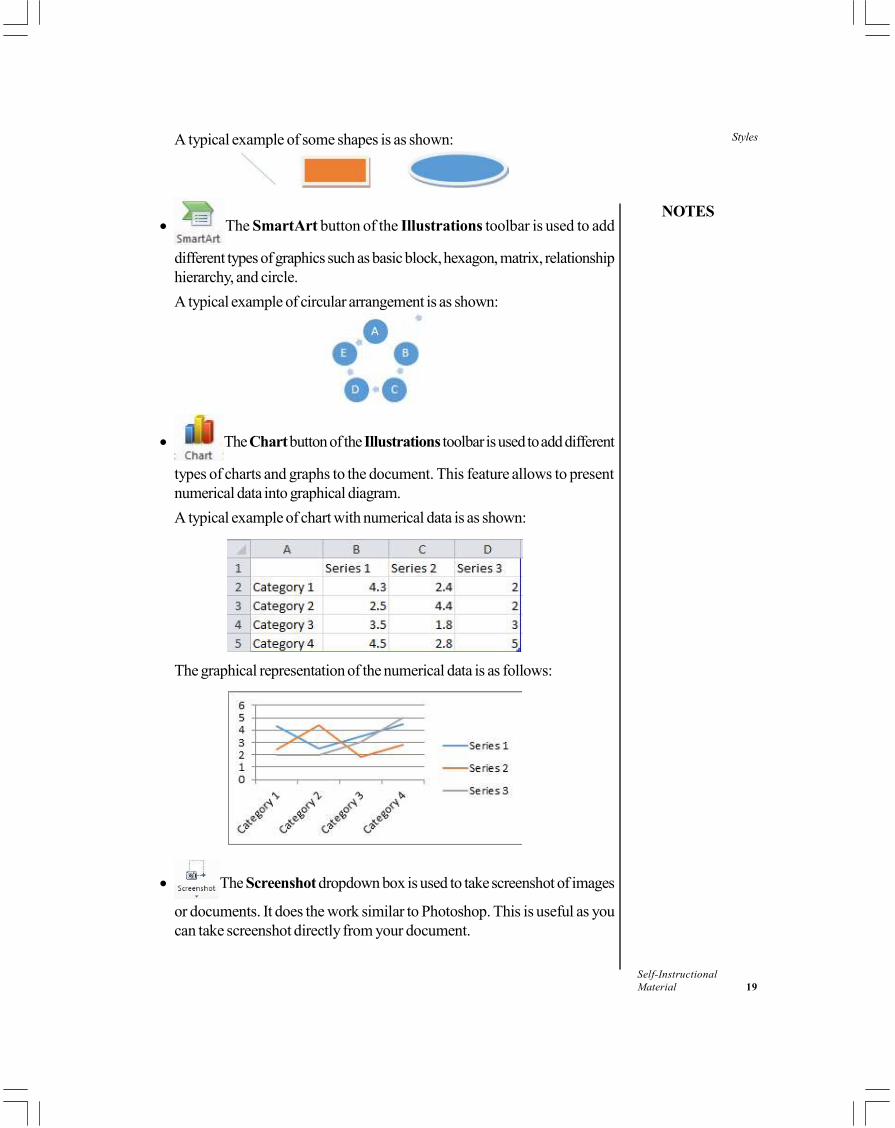
• The Chart button of the Illustrations toolbar is used to add different
types of charts and graphs to the document. This feature allows to presentnumerical data into graphical diagram.A typical example of chart with numerical data is as shown:
The graphical representation of the numerical data is as follows:
• The Screenshot dropdown box is used to take screenshot of images
or documents. It does the work similar to Photoshop. This is useful as youcan take screenshot directly from your document.
Styles
NOTES
Self-Instructional20 Material
A typical example of Screenshot is as shown:
Add an Extra shape to SmartArt in MS Word 2010
SmartArt graphics is used to illustrate and organize various kinds of ideas inMicrosoft Word. It helps to represent valuable contents more effectively usingdiagrammatical representation. To insert the default diagram from SmartArt graphicslibrary is quite easy, but sometimes, the default images part of SmartArt graphicsare not enough. Therefore, you will need to add an extra shape or diagram in yourdocument. Microsoft Word 2010 provides full support for SmartArt graphics,which means you can insert an extra shape into SmartArt for improved presentationof the content.
To add or insert an extra shape to the MS word document, complete thefollowing process:
• First of all, to add or insert an extra shape into SmartArt graphics, makesure that SmartArt graphics image is selected.
• If not selected, then click on it to select it. When you select the SmartArtgraphics image, you can see the SmartArt Tools tab in the Ribbon.The screenshot showing the open SmartArt Tools is given below:
• Now, you need to select the place in your document where you want toinsert or add the extra shape.
• Select an existing shape of SmartArt graphics and click on Design underthe SmartArt Tools as shown in the screenshot above.
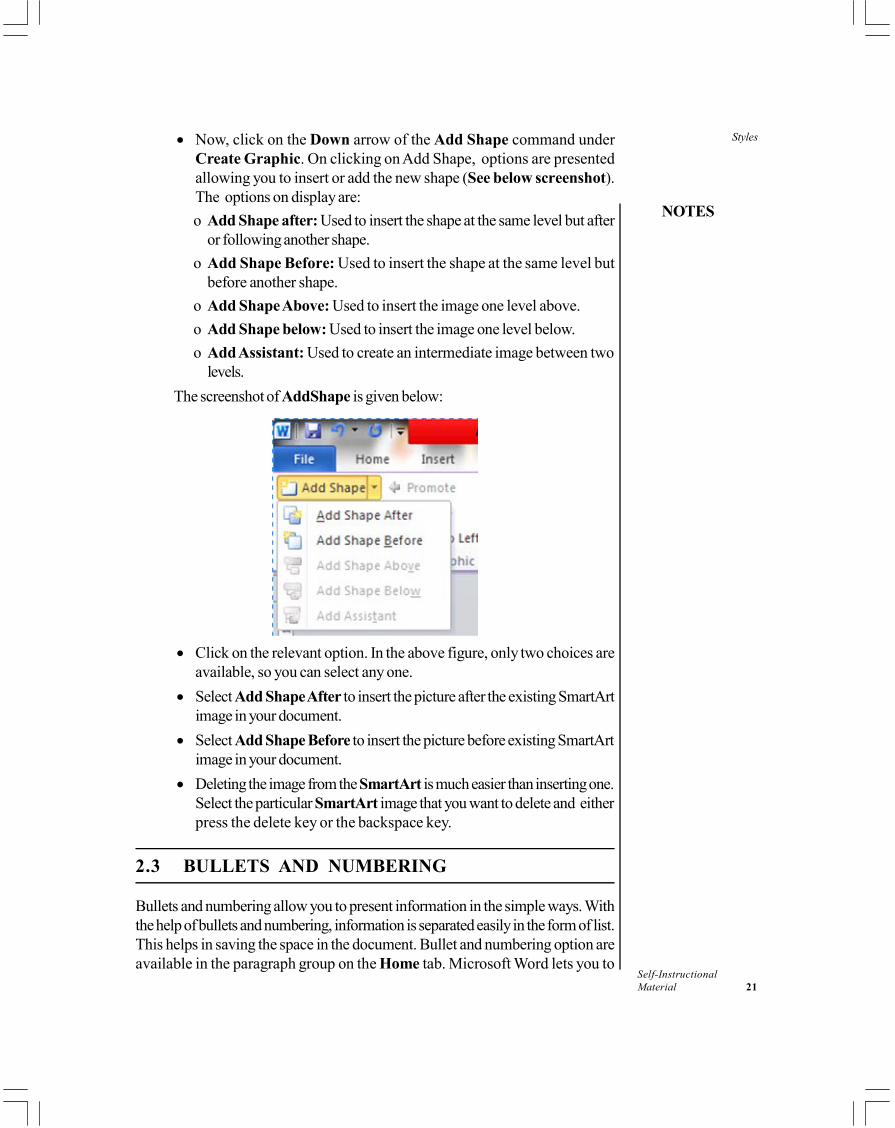
• Go to Add Shape placed inside Create Graphic group under theSmartArt Tools (See following Screenshot).
Styles
NOTES
Self-InstructionalMaterial 21
• Now, click on the Down arrow of the Add Shape command underCreate Graphic. On clicking on Add Shape, options are presentedallowing you to insert or add the new shape (See below screenshot).The options on display are:o Add Shape after: Used to insert the shape at the same level but after
or following another shape.o Add Shape Before: Used to insert the shape at the same level but
before another shape.o Add Shape Above: Used to insert the image one level above.o Add Shape below: Used to insert the image one level below.o Add Assistant: Used to create an intermediate image between two
levels.The screenshot of AddShape is given below:
• Click on the relevant option. In the above figure, only two choices areavailable, so you can select any one.
• Select Add Shape After to insert the picture after the existing SmartArtimage in your document.
• Select Add Shape Before to insert the picture before existing SmartArtimage in your document.
• Deleting the image from the SmartArt is much easier than inserting one.Select the particular SmartArt image that you want to delete and eitherpress the delete key or the backspace key.
2.3 BULLETS AND NUMBERING
Bullets and numbering allow you to present information in the simple ways. Withthe help of bullets and numbering, information is separated easily in the form of list.This helps in saving the space in the document. Bullet and numbering option areavailable in the paragraph group on the Home tab. Microsoft Word lets you to
Styles
NOTES
Self-Instructional22 Material
create bulleted and numbered lists, to specify different lines or topics. Once youcreate bulleted and numbered list, each time you press enter, same bullets areadded to your list. If you want to add another bullet, then you can choose differentbullets and numbering from the Home tab. If you hit enter twice, then you willreturn to the earlier level. If you hit enter twice at the end of the list, then the list willbe terminated.
The screenshot of bullet and numbering list is as shown:
Bulleted list
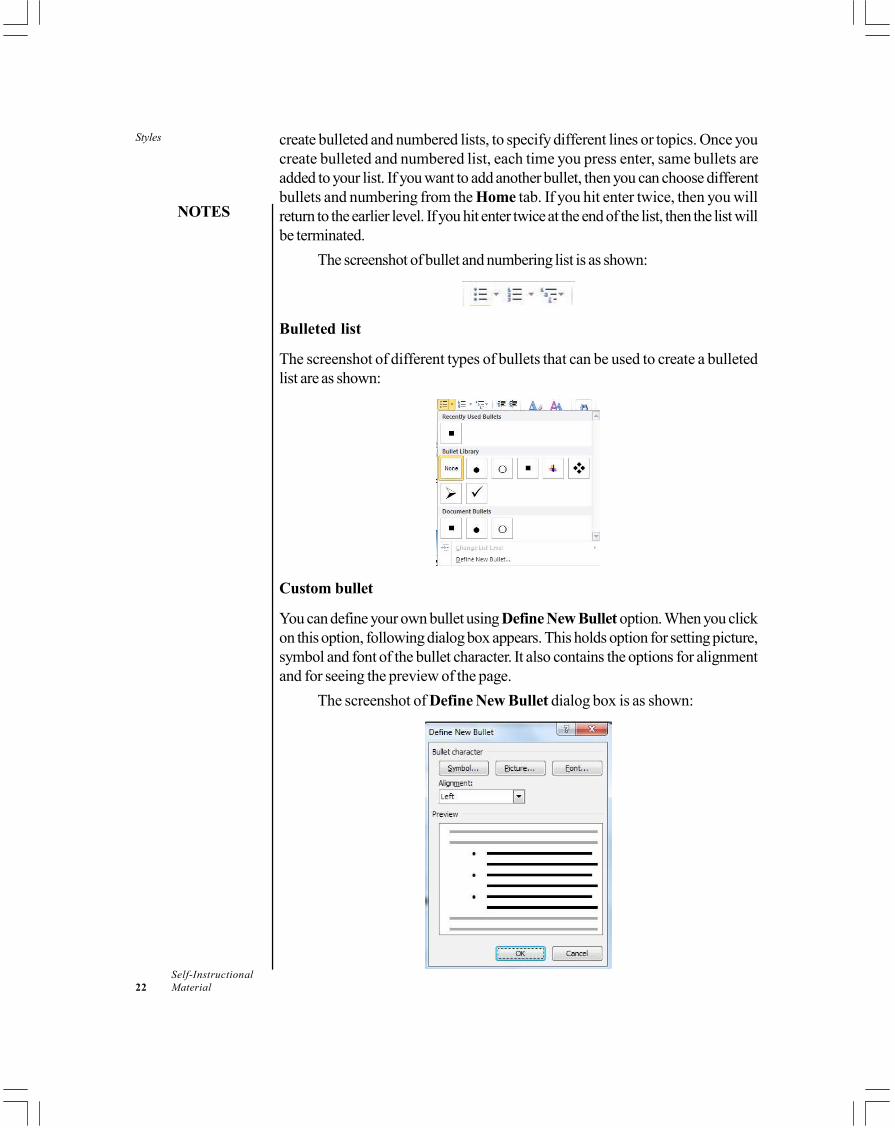
The screenshot of different types of bullets that can be used to create a bulletedlist are as shown:
Custom bullet
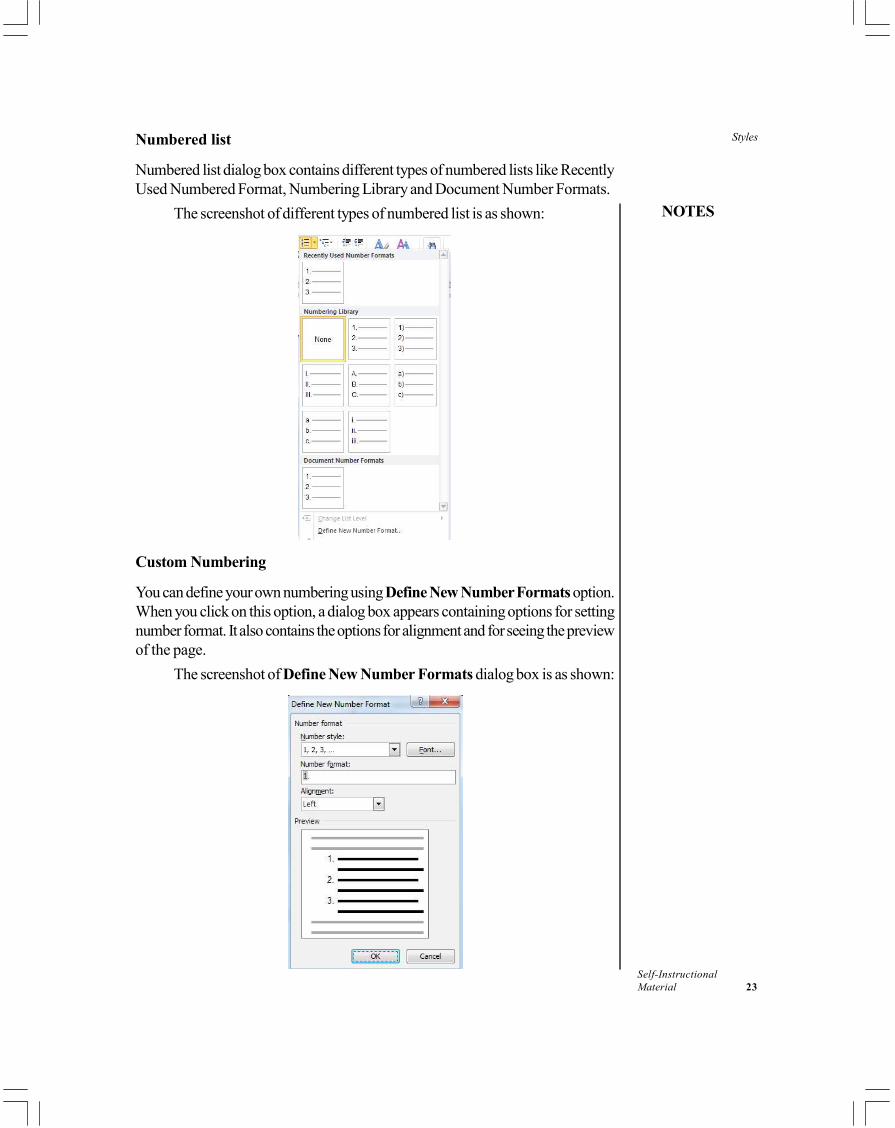
You can define your own bullet using Define New Bullet option. When you clickon this option, following dialog box appears. This holds option for setting picture,symbol and font of the bullet character. It also contains the options for alignmentand for seeing the preview of the page.
The screenshot of Define New Bullet dialog box is as shown:
Styles
NOTES
Self-InstructionalMaterial 23
Numbered list
Numbered list dialog box contains different types of numbered lists like RecentlyUsed Numbered Format, Numbering Library and Document Number Formats.
The screenshot of different types of numbered list is as shown:
Custom Numbering
You can define your own numbering using Define New Number Formats option.When you click on this option, a dialog box appears containing options for settingnumber format. It also contains the options for alignment and for seeing the previewof the page.
The screenshot of Define New Number Formats dialog box is as shown:
Styles
NOTES
Self-Instructional24 Material
Creating own bullet in Microsoft Word 2010
Microsoft Word 2010 enables you to use different types of existing bullets fromthe bullets library. It also helps you to create and use your own bullets. While thereare lots of bullets present in the Microsoft Word library, if you want to create yourown bullets in the form of symbols or pictures, you have to follow these steps:
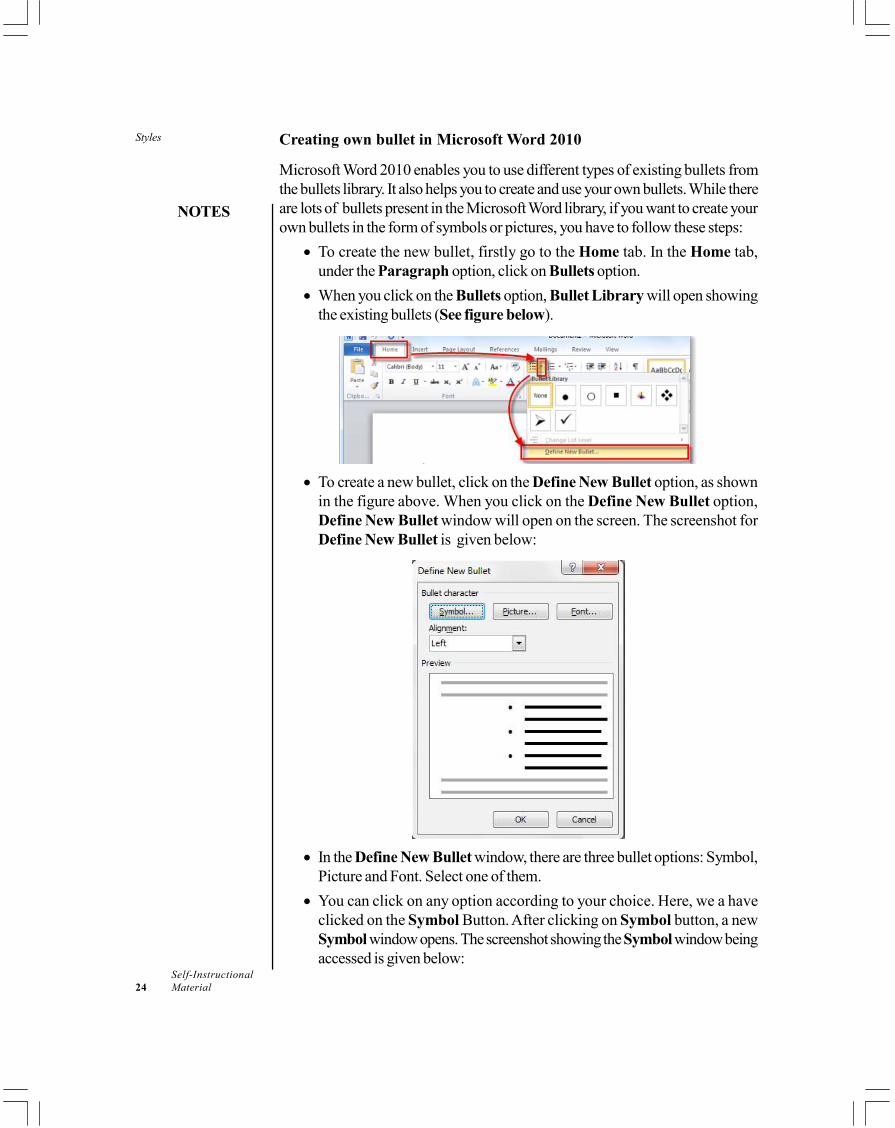
• To create the new bullet, firstly go to the Home tab. In the Home tab,under the Paragraph option, click on Bullets option.
• When you click on the Bullets option, Bullet Library will open showingthe existing bullets (See figure below).
• To create a new bullet, click on the Define New Bullet option, as shownin the figure above. When you click on the Define New Bullet option,Define New Bullet window will open on the screen. The screenshot forDefine New Bullet is given below:
• In the Define New Bullet window, there are three bullet options: Symbol,Picture and Font. Select one of them.
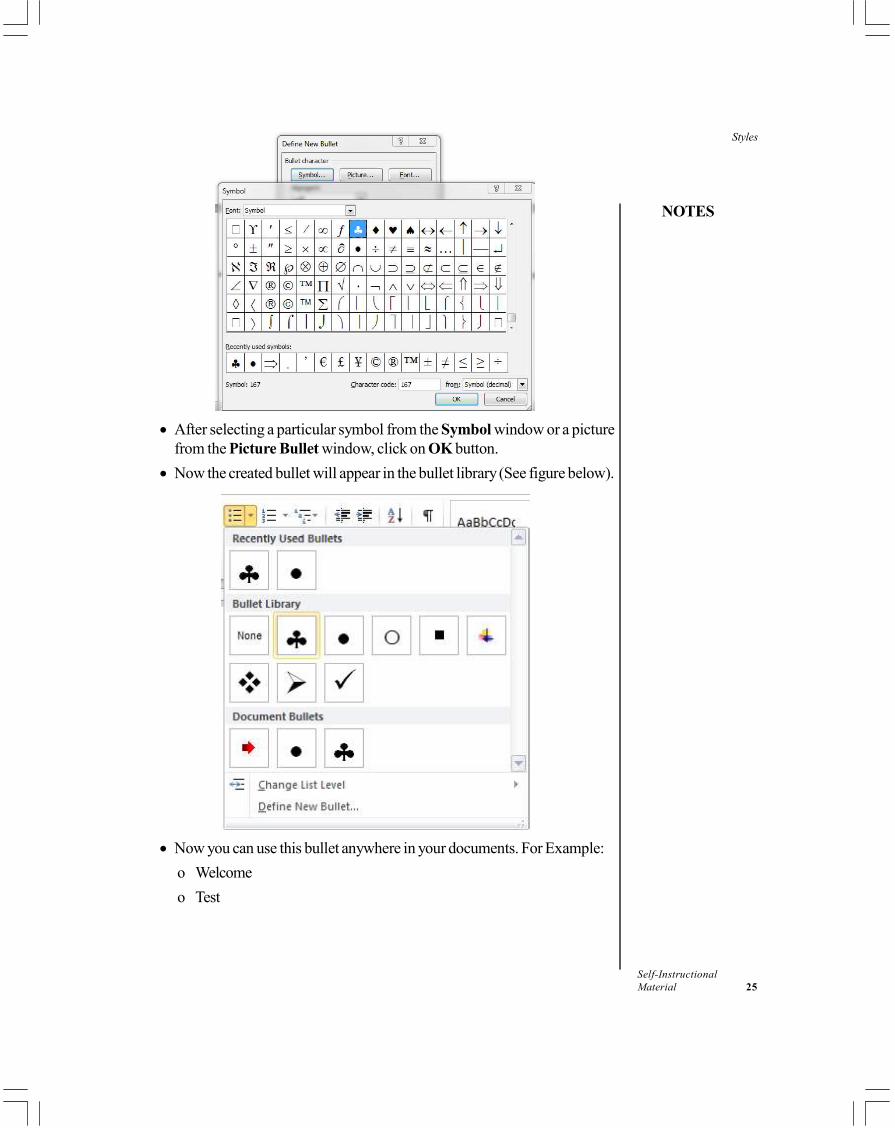
• You can click on any option according to your choice. Here, we a haveclicked on the Symbol Button. After clicking on Symbol button, a newSymbol window opens. The screenshot showing the Symbol window beingaccessed is given below:
Styles
NOTES
Self-InstructionalMaterial 25
• After selecting a particular symbol from the Symbol window or a picturefrom the Picture Bullet window, click on OK button.
• Now the created bullet will appear in the bullet library (See figure below).
• Now you can use this bullet anywhere in your documents. For Example:o Welcomeo Test
Styles
NOTES
Self-Instructional26 Material
Multilevel Bullet list
The Multilevel Bullet list shows bullets at different levels, rather than those indentedat one level. Multi-level bullet or number list is similar to the outlined number list.Sometimes, one level of bullets is not enough; therefore you have to use or createa multilevel bullet list. Microsoft Word 2010 allows you to customize the bullets atnine different levels. Customizing your bullet list allows you to be more creative.The following procedure helps to change the available bullet, or to add bullets tocreate different levels in the bullet list:
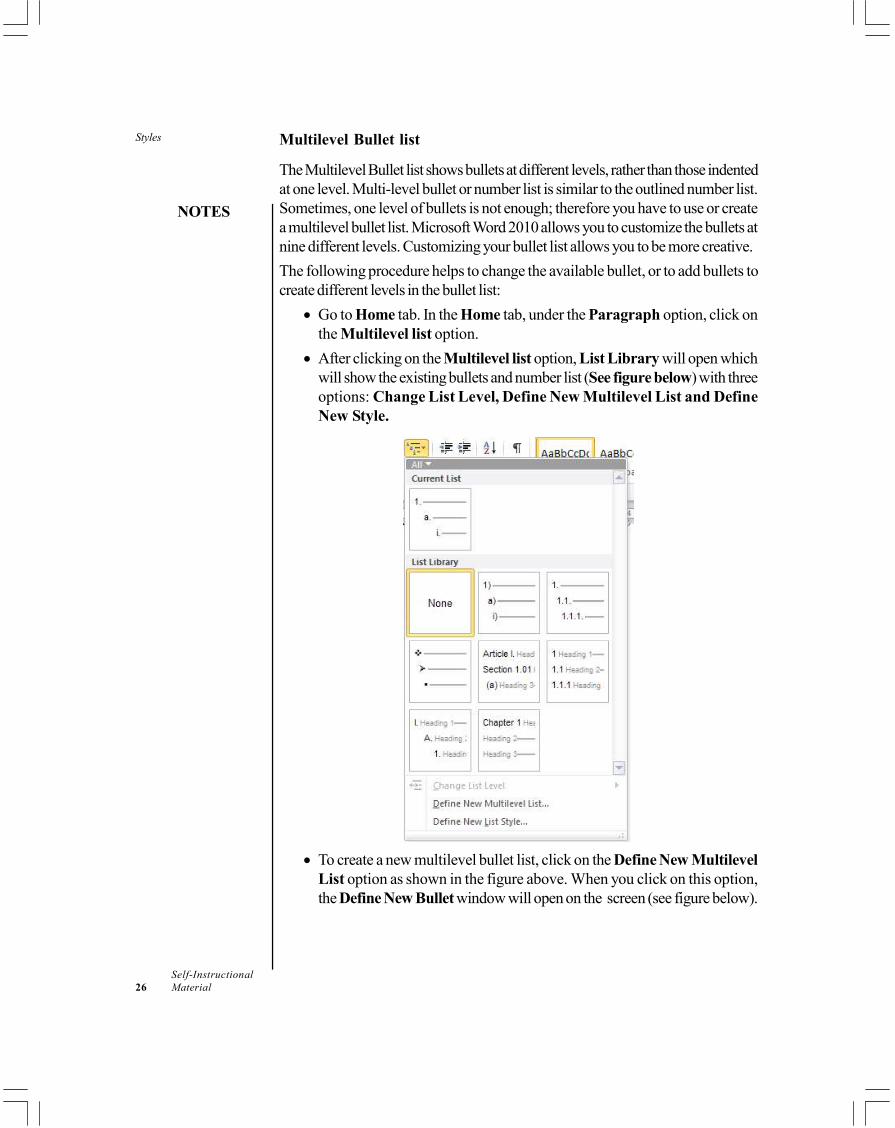
• Go to Home tab. In the Home tab, under the Paragraph option, click onthe Multilevel list option.
• After clicking on the Multilevel list option, List Library will open whichwill show the existing bullets and number list (See figure below) with threeoptions: Change List Level, Define New Multilevel List and DefineNew Style.
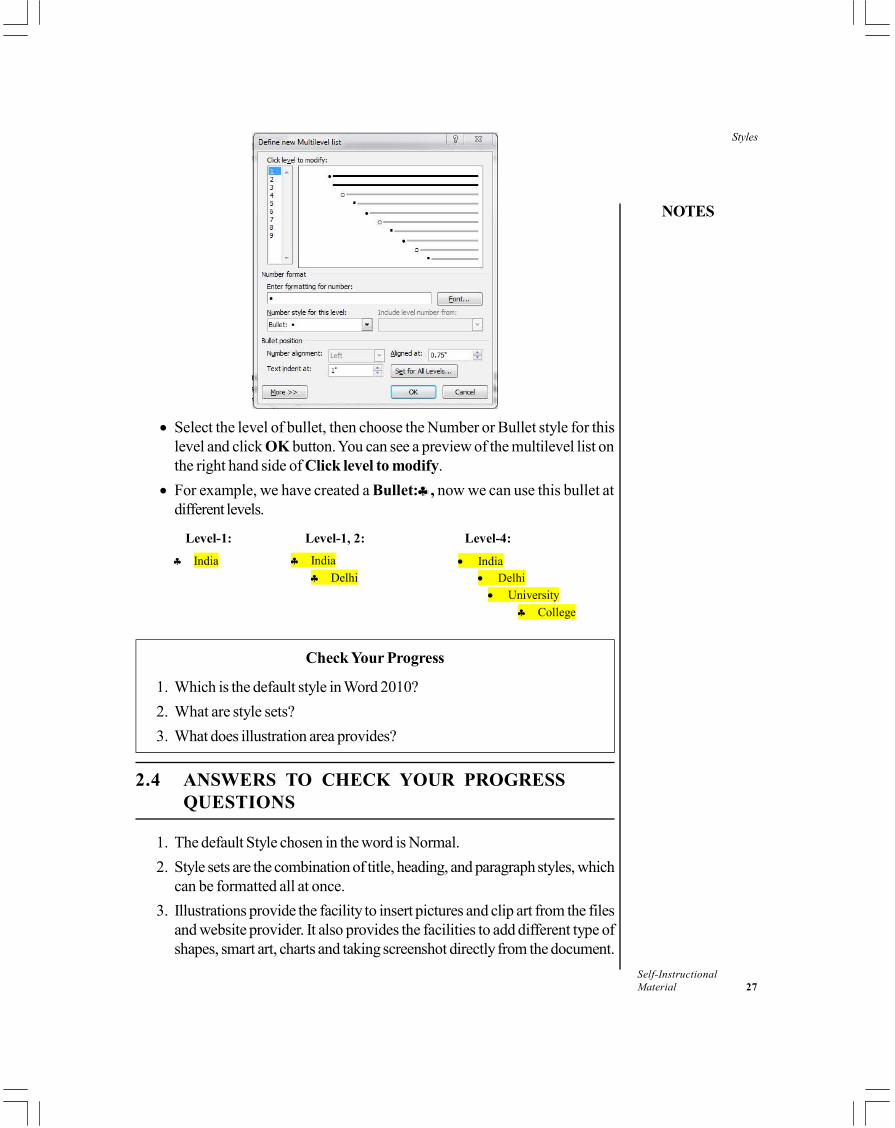
• To create a new multilevel bullet list, click on the Define New MultilevelList option as shown in the figure above. When you click on this option,the Define New Bullet window will open on the screen (see figure below).
Styles
NOTES
Self-InstructionalMaterial 27
• Select the level of bullet, then choose the Number or Bullet style for thislevel and click OK button. You can see a preview of the multilevel list onthe right hand side of Click level to modify.
• For example, we have created a Bullet:♣ , now we can use this bullet atdifferent levels.
Level-1: Level-1, 2: Level-4: ♣ India ♣ India
♣ Delhi • India
• Delhi • University
♣ College
Check Your Progress
1. Which is the default style in Word 2010?2. What are style sets?3. What does illustration area provides?
2.4 ANSWERS TO CHECK YOUR PROGRESSQUESTIONS
1. The default Style chosen in the word is Normal.2. Style sets are the combination of title, heading, and paragraph styles, which
can be formatted all at once.3. Illustrations provide the facility to insert pictures and clip art from the files
and website provider. It also provides the facilities to add different type ofshapes, smart art, charts and taking screenshot directly from the document.
Styles
NOTES
Self-Instructional28 Material
2.5 SUMMARY
• Style helps in the enhancement of the document in the easiest and quickestways. It provides sophisticated look to the document. The default Stylechosen in the word is Normal.
• Style sets are the combination of title, heading, and paragraph styles, whichcan be formatted all at once.
• An illustration is the area which is used to insert different types of images.Illustrations provide the facility to insert pictures and clip art from the filesand website provider. It also provides the facilities to add different type ofshapes, smart art, charts and taking screenshot directly from the document.
• SmartArt graphics is used to illustrate and organize various kinds of ideas inMicrosoft Word. It helps to represent valuable contents more effectivelyusing diagrammatical representation.
• Bullets and numbering allow you to present information in the simple ways.With the help of bullets and numbering, information is separated easily inthe form of list.
• You can define your own bullet using Define New Bullet option.• The Multilevel Bullet list shows bullets at different levels, rather than those
indented at one level.
2.6 KEY WORDS
• Illustrations: It is the area which is used to insert different types of images.• Clip Art: It contains the random images or the images representing a specific
group.
2.7 SELF ASSESSMENT QUESTIONSAND EXERCISES
1. Perform the following operations on any word document.(i) Select the desired text and apply a style. Style is found in the style
group of the Home tab.(ii) Modify the style.(iii) Insert pictures from your computer, web, shapes, SmartArt and charts
using illustration group in the Insert tab.2. Open a new document and write the various applications of MS Word.
Also, use bullets or number to enhance its appearance.

Styles
NOTES
Self-InstructionalMaterial 29
2.8 FURTHER READINGS
Srivastava, S.S. 2008. MS Office. New Delhi: Firewall Media.Saxena, Sanjay. 2011. MS Office 2007 in a Nutshell. Noida: Vikas Publishing
house.Courter, Gini and Annette Marquis. 1999. Mastering Microsoft Office 2000.
New Delhi: BPB Publications.Blattner, Patrick, Ken Cook, Laurie Ulrich and Timothy Dyck. 1999. Special
Edition Using Microsoft Excel 2000. New Delhi: Prentice-Hall of India.
Table Manipulations
NOTES
Self-Instructional30 Material
UNIT 3 TABLE MANIPULATIONS
Structure3.0 Introduction3.1 Objectives3.2 Enhancing the Documents
3.2.1 Working with Tables, Columns and Sections3.2.2 Borders and Shading3.2.3 Spelling, Grammar Checking and Thesaurus
3.3 Answers to Check Your Progress Questions3.4 Summary3.5 Key Words3.6 Self Assessment Questions and Exercises3.7 Further Readings
3.0 INTRODUCTION
In this unit, you will learn how to enhance the documents using tables, columns, anborders and shading. Table consists of the rows and columns. Rows are horizontaland columns are vertical. At the intersection of the rows and column there is a cellwhich contains the text.
3.1 OBJECTIVES
After going through this unit, you will be able to:• Explain the working with tables• Apply borders and shading to enhance the appearance of the document
3.2 ENHANCING THE DOCUMENTS
There are various features provided by MS word to enhance the documents. Webegin with the working of tables, columns and sections. Use of borders, shading,header and footers will be discussed next in this section.
3.2.1 Working with Tables, Columns and Sections
Table
Table consists of the rows and columns. Rows are horizontal and columns arevertical. At the intersection of the rows and column there is a cell which containsthe text. We can format the tables according to our requirements.
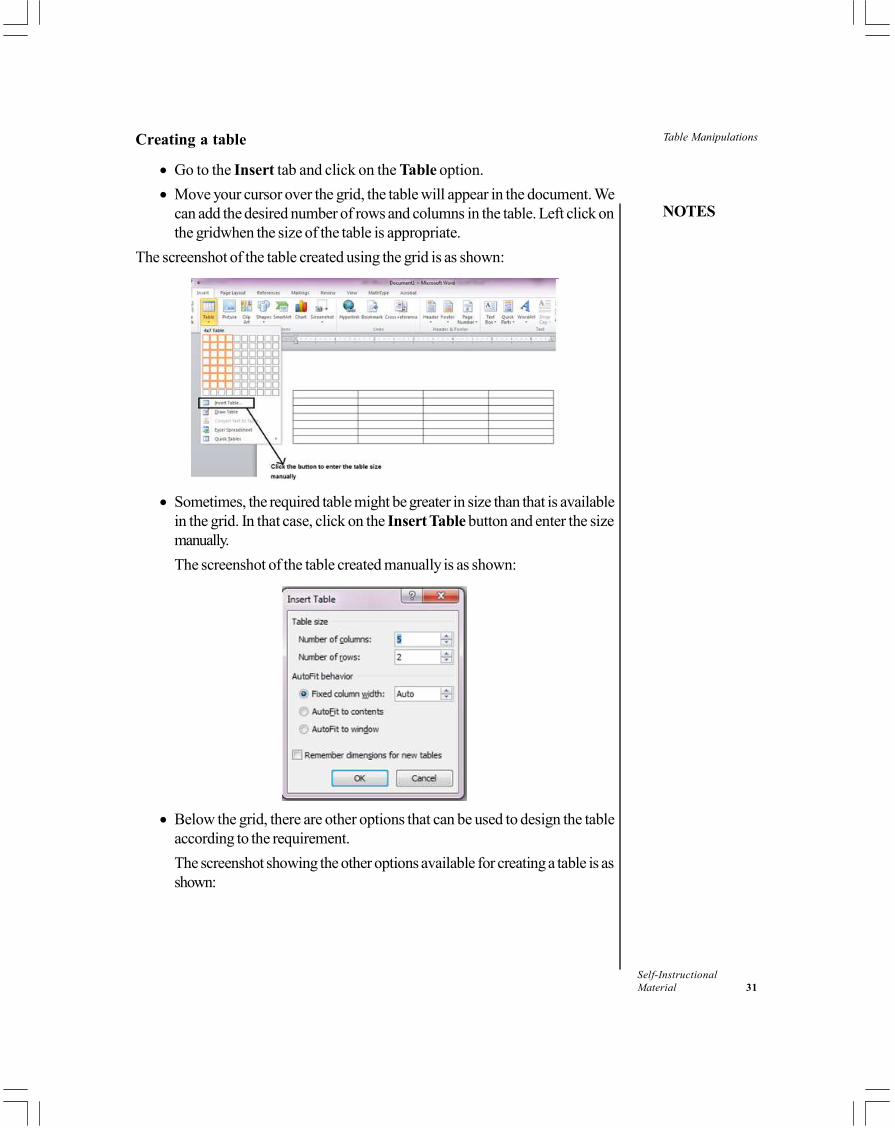
Table Manipulations
NOTES
Self-InstructionalMaterial 31
Creating a table
• Go to the Insert tab and click on the Table option.• Move your cursor over the grid, the table will appear in the document. We
can add the desired number of rows and columns in the table. Left click onthe gridwhen the size of the table is appropriate.
The screenshot of the table created using the grid is as shown:
• Sometimes, the required table might be greater in size than that is availablein the grid. In that case, click on the Insert Table button and enter the sizemanually.The screenshot of the table created manually is as shown:
• Below the grid, there are other options that can be used to design the tableaccording to the requirement.The screenshot showing the other options available for creating a table is asshown:
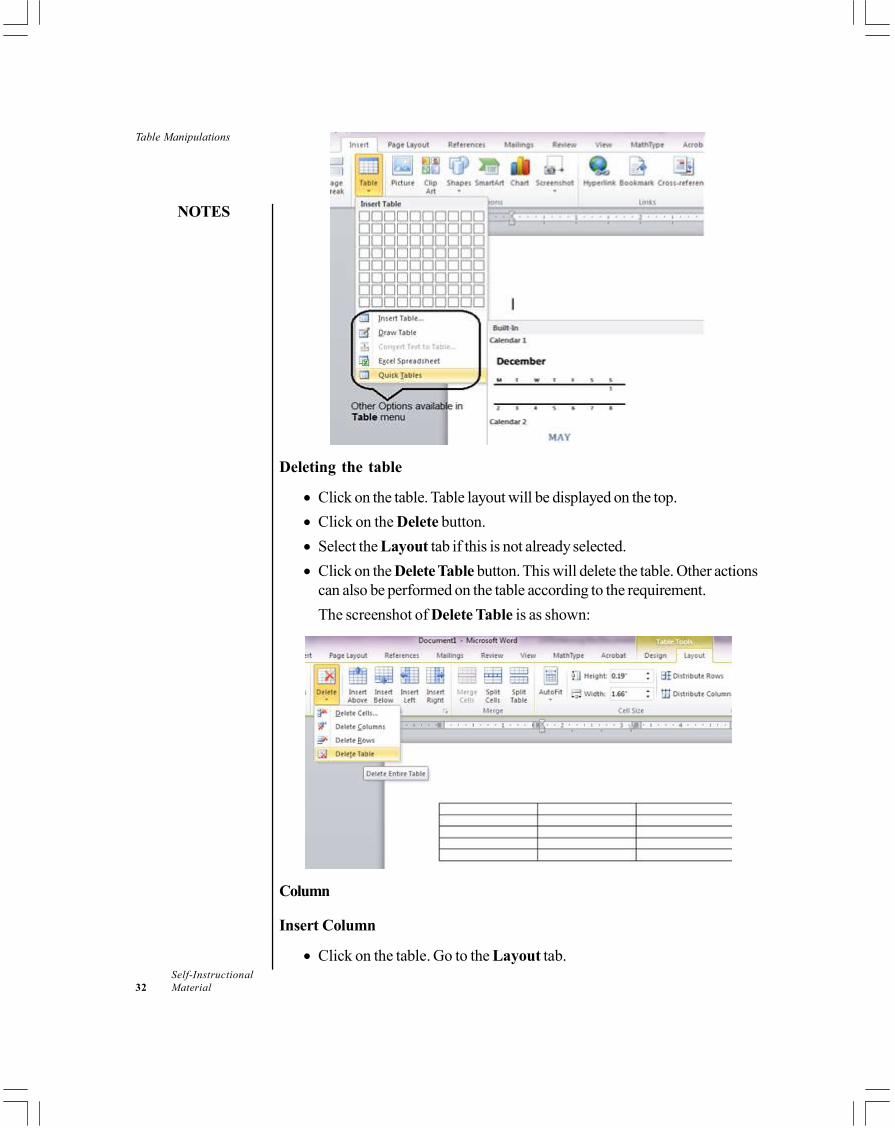
Table Manipulations
NOTES
Self-Instructional32 Material
Deleting the table
• Click on the table. Table layout will be displayed on the top.• Click on the Delete button.• Select the Layout tab if this is not already selected.• Click on the Delete Table button. This will delete the table. Other actions
can also be performed on the table according to the requirement.The screenshot of Delete Table is as shown:
Column
Insert Column
• Click on the table. Go to the Layout tab.
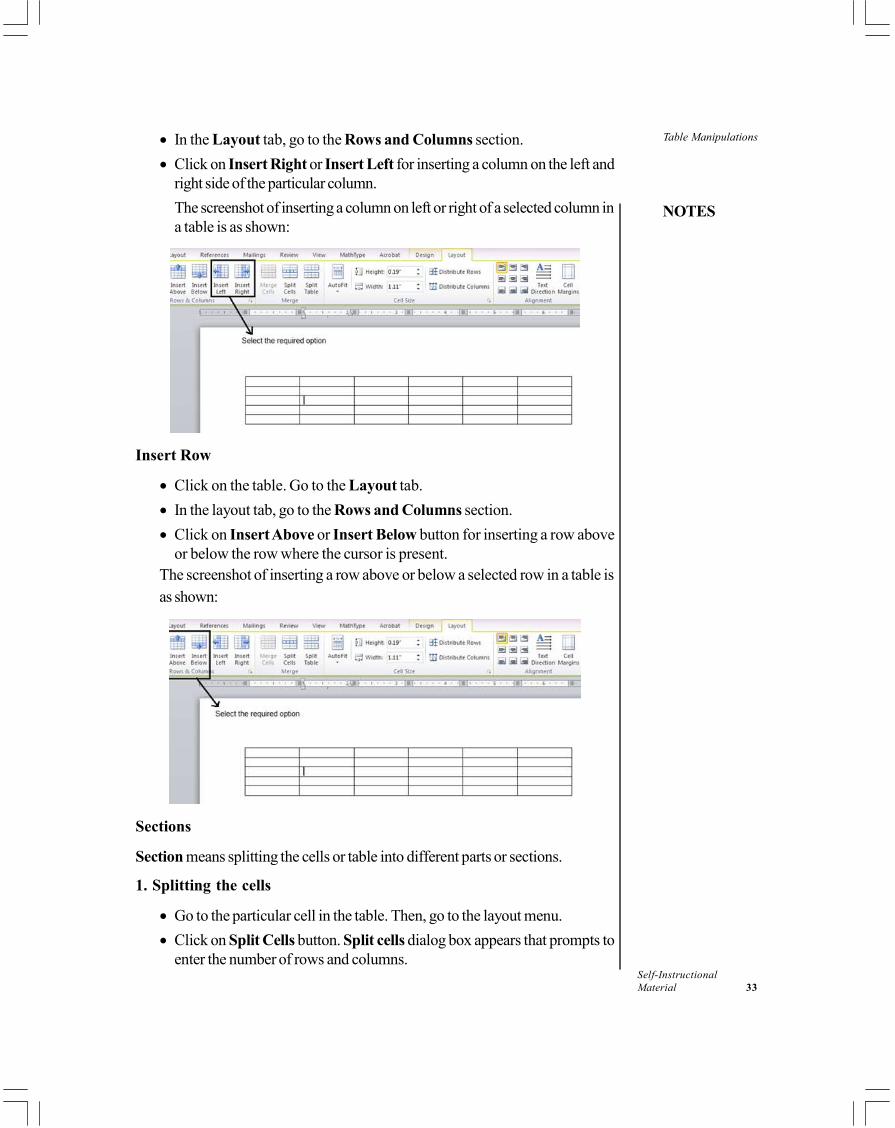
Table Manipulations
NOTES
Self-InstructionalMaterial 33
• In the Layout tab, go to the Rows and Columns section.• Click on Insert Right or Insert Left for inserting a column on the left and
right side of the particular column.The screenshot of inserting a column on left or right of a selected column ina table is as shown:
Insert Row
• Click on the table. Go to the Layout tab.• In the layout tab, go to the Rows and Columns section.• Click on Insert Above or Insert Below button for inserting a row above
or below the row where the cursor is present.The screenshot of inserting a row above or below a selected row in a table isas shown:
Sections
Section means splitting the cells or table into different parts or sections.
1. Splitting the cells
• Go to the particular cell in the table. Then, go to the layout menu.• Click on Split Cells button. Split cells dialog box appears that prompts to
enter the number of rows and columns.
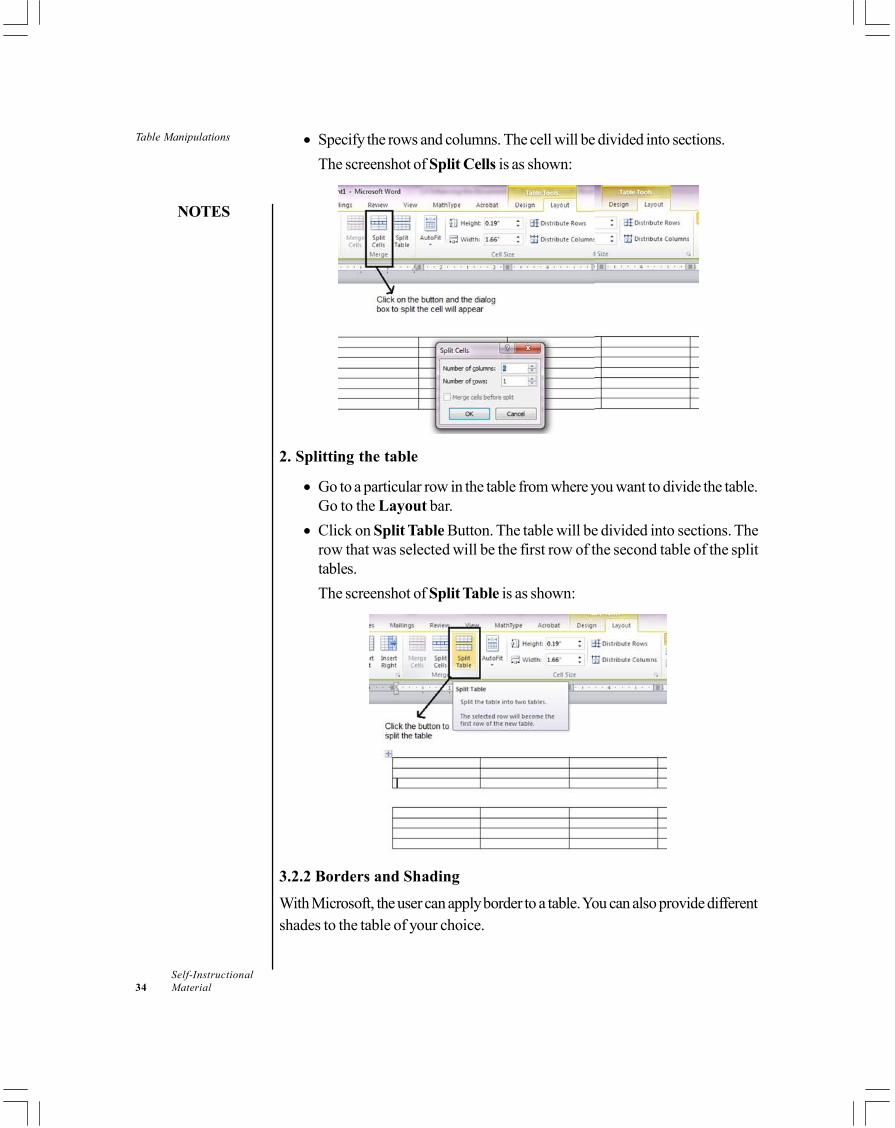
Table Manipulations
NOTES
Self-Instructional34 Material
• Specify the rows and columns. The cell will be divided into sections.The screenshot of Split Cells is as shown:
2. Splitting the table
• Go to a particular row in the table from where you want to divide the table.Go to the Layout bar.
• Click on Split Table Button. The table will be divided into sections. Therow that was selected will be the first row of the second table of the splittables.The screenshot of Split Table is as shown:
3.2.2 Borders and Shading
With Microsoft, the user can apply border to a table. You can also provide differentshades to the table of your choice.
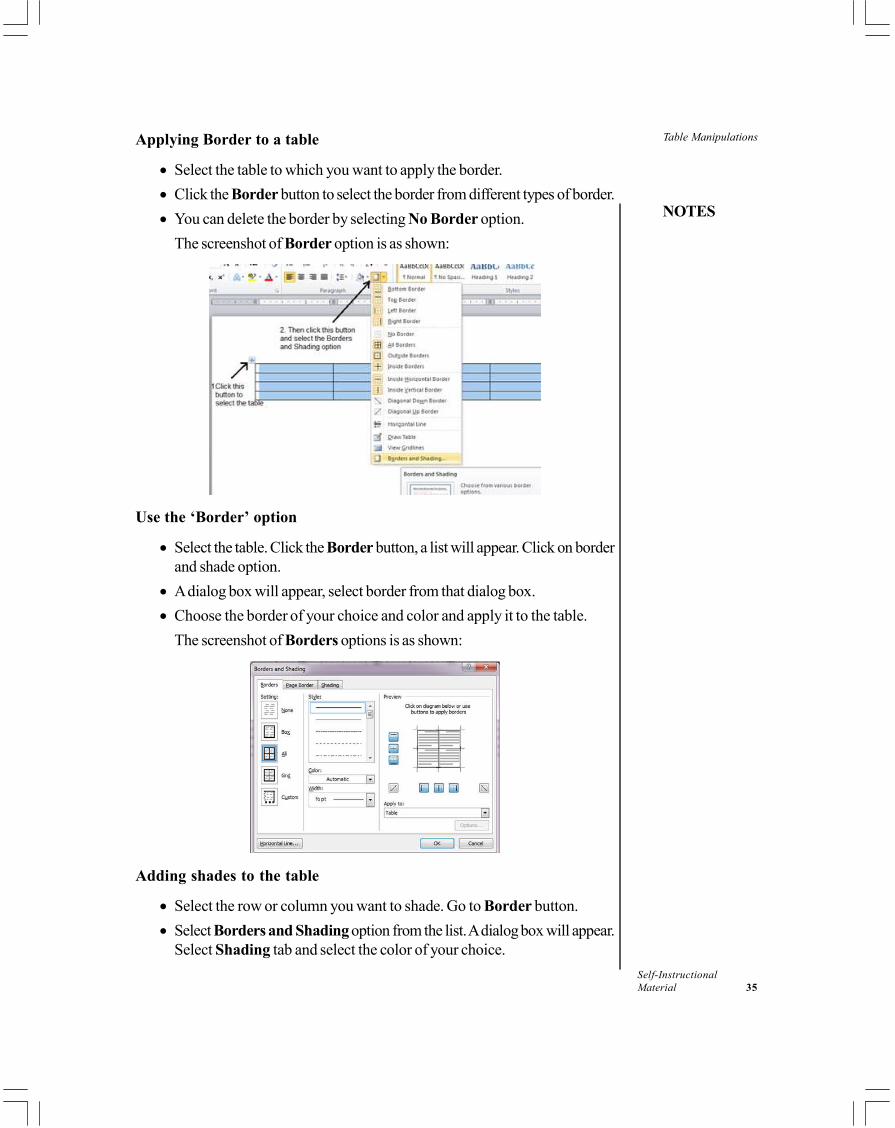
Table Manipulations
NOTES
Self-InstructionalMaterial 35
Applying Border to a table
• Select the table to which you want to apply the border.• Click the Border button to select the border from different types of border.• You can delete the border by selecting No Border option.
The screenshot of Border option is as shown:
Use the ‘Border’ option
• Select the table. Click the Border button, a list will appear. Click on borderand shade option.
• A dialog box will appear, select border from that dialog box.• Choose the border of your choice and color and apply it to the table.
The screenshot of Borders options is as shown:
Adding shades to the table
• Select the row or column you want to shade. Go to Border button.• Select Borders and Shading option from the list. A dialog box will appear.
Select Shading tab and select the color of your choice.
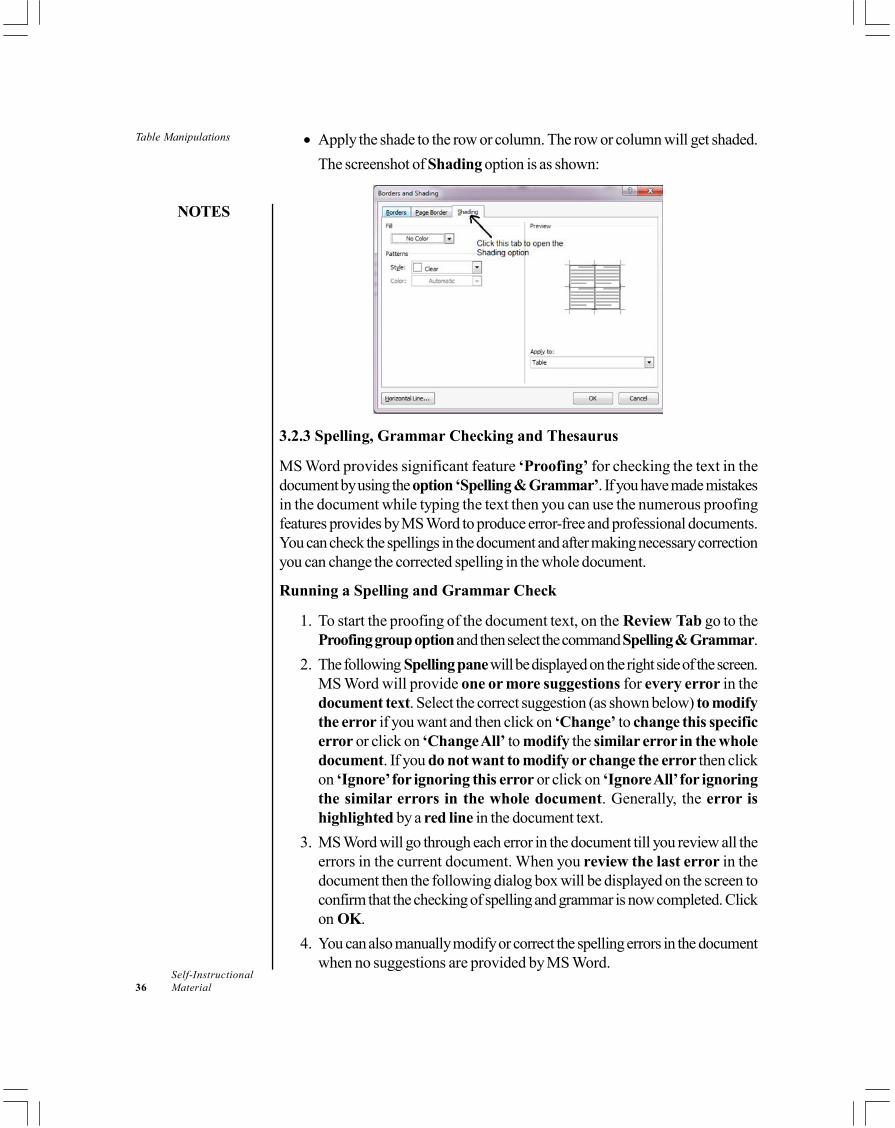
Table Manipulations
NOTES
Self-Instructional36 Material
• Apply the shade to the row or column. The row or column will get shaded.The screenshot of Shading option is as shown:
3.2.3 Spelling, Grammar Checking and Thesaurus
MS Word provides significant feature ‘Proofing’ for checking the text in thedocument by using the option ‘Spelling & Grammar’. If you have made mistakesin the document while typing the text then you can use the numerous proofingfeatures provides by MS Word to produce error-free and professional documents.You can check the spellings in the document and after making necessary correctionyou can change the corrected spelling in the whole document.
Running a Spelling and Grammar Check
1. To start the proofing of the document text, on the Review Tab go to theProofing group option and then select the command Spelling & Grammar.
2. The following Spelling pane will be displayed on the right side of the screen.MS Word will provide one or more suggestions for every error in thedocument text. Select the correct suggestion (as shown below) to modifythe error if you want and then click on ‘Change’ to change this specificerror or click on ‘Change All’ to modify the similar error in the wholedocument. If you do not want to modify or change the error then clickon ‘Ignore’ for ignoring this error or click on ‘Ignore All’ for ignoringthe similar errors in the whole document. Generally, the error ishighlighted by a red line in the document text.
3. MS Word will go through each error in the document till you review all theerrors in the current document. When you review the last error in thedocument then the following dialog box will be displayed on the screen toconfirm that the checking of spelling and grammar is now completed. Clickon OK.
4. You can also manually modify or correct the spelling errors in the documentwhen no suggestions are provided by MS Word.
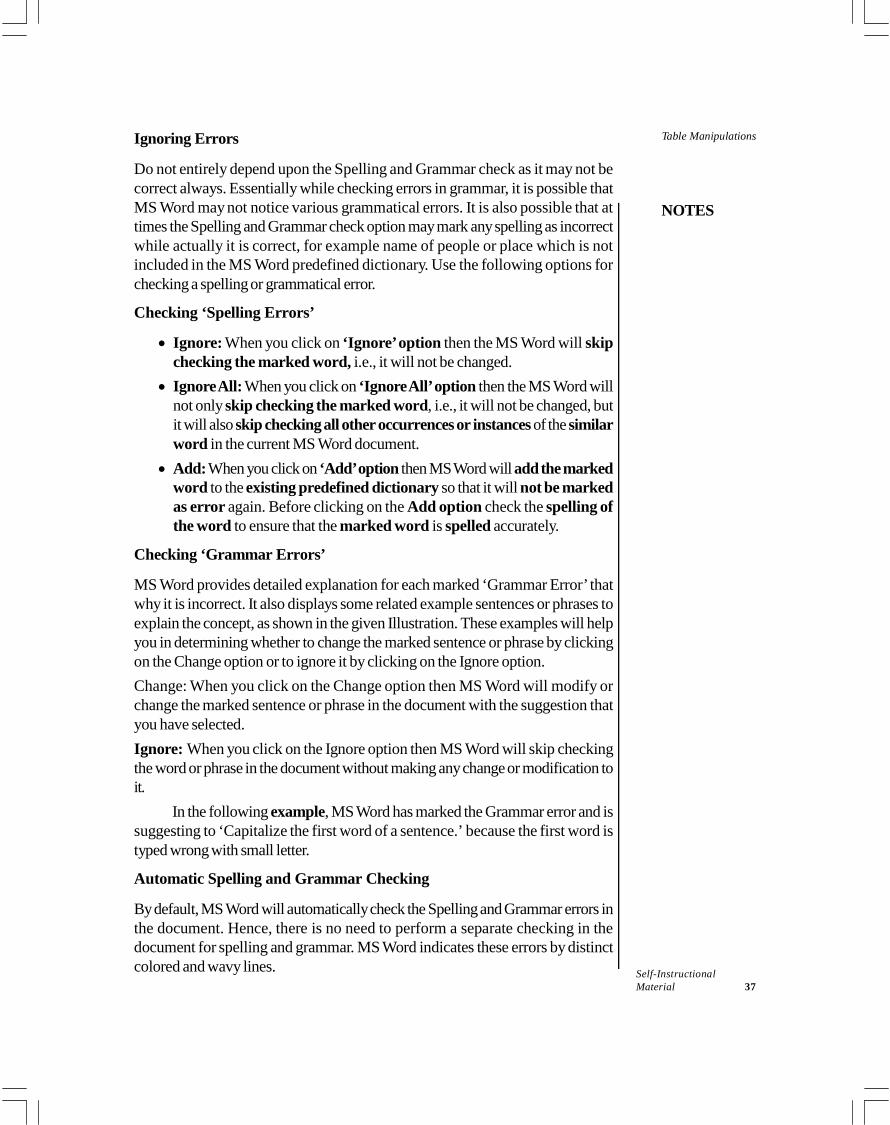
Table Manipulations
NOTES
Self-InstructionalMaterial 37
Ignoring Errors
Do not entirely depend upon the Spelling and Grammar check as it may not becorrect always. Essentially while checking errors in grammar, it is possible thatMS Word may not notice various grammatical errors. It is also possible that attimes the Spelling and Grammar check option may mark any spelling as incorrectwhile actually it is correct, for example name of people or place which is notincluded in the MS Word predefined dictionary. Use the following options forchecking a spelling or grammatical error.
Checking ‘Spelling Errors’
Ignore: When you click on ‘Ignore’ option then the MS Word will skipchecking the marked word, i.e., it will not be changed. Ignore All: When you click on ‘Ignore All’ option then the MS Word will
not only skip checking the marked word, i.e., it will not be changed, butit will also skip checking all other occurrences or instances of the similarword in the current MS Word document. Add: When you click on ‘Add’ option then MS Word will add the marked
word to the existing predefined dictionary so that it will not be markedas error again. Before clicking on the Add option check the spelling ofthe word to ensure that the marked word is spelled accurately.
Checking ‘Grammar Errors’
MS Word provides detailed explanation for each marked ‘Grammar Error’ thatwhy it is incorrect. It also displays some related example sentences or phrases toexplain the concept, as shown in the given Illustration. These examples will helpyou in determining whether to change the marked sentence or phrase by clickingon the Change option or to ignore it by clicking on the Ignore option.Change: When you click on the Change option then MS Word will modify orchange the marked sentence or phrase in the document with the suggestion thatyou have selected.Ignore: When you click on the Ignore option then MS Word will skip checkingthe word or phrase in the document without making any change or modification toit.
In the following example, MS Word has marked the Grammar error and issuggesting to ‘Capitalize the first word of a sentence.’ because the first word istyped wrong with small letter.
Automatic Spelling and Grammar Checking
By default, MS Word will automatically check the Spelling and Grammar errors inthe document. Hence, there is no need to perform a separate checking in thedocument for spelling and grammar. MS Word indicates these errors by distinctcolored and wavy lines.
Table Manipulations
NOTES
Self-Instructional38 Material
• If the word is marked with the red wavy line then it indicates that it is amisspelled word, i.e., the spelling of the marked word is incorrect.
• If the word or sentence is marked with the blue wavy line then it indicatesthat it is a grammatical error, i.e., either the usage of word is grammaticallyincorrect or the sentence includes misused words.
Check Your Progress
1. Write the steps to insert a row in a table.2. Write the steps for applying border to a table.
3.3 ANSWERS TO CHECK YOUR PROGRESSQUESTIONS
1. Following are the steps to insert a row in a table.• Click on the table. Go to the Layout tab.• In the layout tab, go to the Rows and Columns section.• Click on Insert Above or Insert Below button for inserting a row
above or below the row where the cursor is present.2. Steps for applying border to a table are:
• Select the table to which you want to apply the border.• Click the Border button to select the border from different types of
border.
3.4 SUMMARY
• Table consists of the rows and columns. Rows are horizontal and columnsare vertical. At the intersection of the rows and column there is a cell whichcontains the text.
• Section means splitting the cells or table into different parts or sections.• MS Word provides significant feature ‘Proofing’ for checking the text in
the document by using the option ‘Spelling & Grammar’. If you havemade mistakes in the document while typing the text then you can use thenumerous proofing features provides by MS Word to produce error-freeand professional documents.
3.5 KEY WORDS
• Border: Border is used to add the border around the document that is onleft, right, top and bottom side.
Table Manipulations
NOTES
Self-InstructionalMaterial 39
Shades: Shades are used to design or provide different shades to rowsand columns of a table.
3.6 SELF ASSESSMENT QUESTIONS ANDEXERCISES
1. Apply the following on a word file.(i) Insert a table of 4 rows and 4 columns(ii) Add a row/ column to this table(iii) Split cell(iv) Split the table(v) Delete the table
2. Create a table with the following fields.(i) Employee id(ii) Employee name(iii) Designation(iv) Permanent address(v) Phone number
Also, enhance its appearance using border and shading3. Apply spelling and grammar check on a document.
3.7 FURTHER READINGS
Srivastava, S.S. 2008. MS Office. New Delhi: Firewall Media.Saxena, Sanjay. 2011. MS Office 2007 in a Nutshell. Noida: Vikas Publishing
house.Courter, Gini and Annette Marquis. 1999. Mastering Microsoft Office 2000.
New Delhi: BPB Publications.Blattner, Patrick, Ken Cook, Laurie Ulrich and Timothy Dyck. 1999. Special
Edition Using Microsoft Excel 2000. New Delhi: Prentice-Hall of India.
Page Formatting
NOTES
Self-Instructional40 Material
UNIT 4 PAGE FORMATTING
Structure4.0 Introduction4.1 Objectives4.2 Formatting Word Documents
4.2.1 Font and Paragraph Formatting4.2.2 Embed Font in Microsoft Word 2010
4.3 Page Setup and Break4.4 Header or Footer4.5 Mail Merge4.6 Macros: Recording, Editing and Using4.7 Working with Hyperlinks4.8 Answers to Check Your Progress Questions4.9 Summary
4.10 Key Words4.11 Self Assessment Questions and Exercises4.12 Further Readings
4.0 INTRODUCTION
In this unit, you will learn about the formatting word documents. It is necessary inorder to create an effective document. There are various types of that can be usedto format documents. You can apply font and paragraph formatting to keep thedocuments simple and appealing.
4.1 OBJECTIVES
After going through this unit, you will be able to:• Discuss how to apply buttons and icons of font toolbar• Explain how to apply paragraph formatting• Insert page break, margin and header and footer• Explain the use of mail merge• Record, edit and use macros• Add hyperlinks in the document
4.2 FORMATTING WORD DOCUMENTS
Formatting word document is necessary in order to create an effective document.In case of formatting, you format a text, letters, words, pictures, paragraphs, and
Page Formatting
NOTES
Self-InstructionalMaterial 41
so on. It can be applied to any portions of word documents. There are four typesin which formatting are classified, which are character, document, section andparagraph. There are various tools which let you format the word documents. Youcan apply font and paragraph formatting; create bullet and numbering to show theinformation in point. You can also apply various styles to enhance the text. In thissection, you will learn to format a word document by applying different formattingeffects.
4.2.1 Font and Paragraph Formatting
Font and paragraph formatting is one of the most important styles of formatting. Ifyou doesn’t apply any style, then font and paragraph formatting are applied bydefault. It is applied to keep the documents simple and appealing.
Font Formatting
Font formatting is used to change the appearance of words or a single character.It is present in the Home tab of ribbon view. You can apply the Font formatting byhighlighting the text.
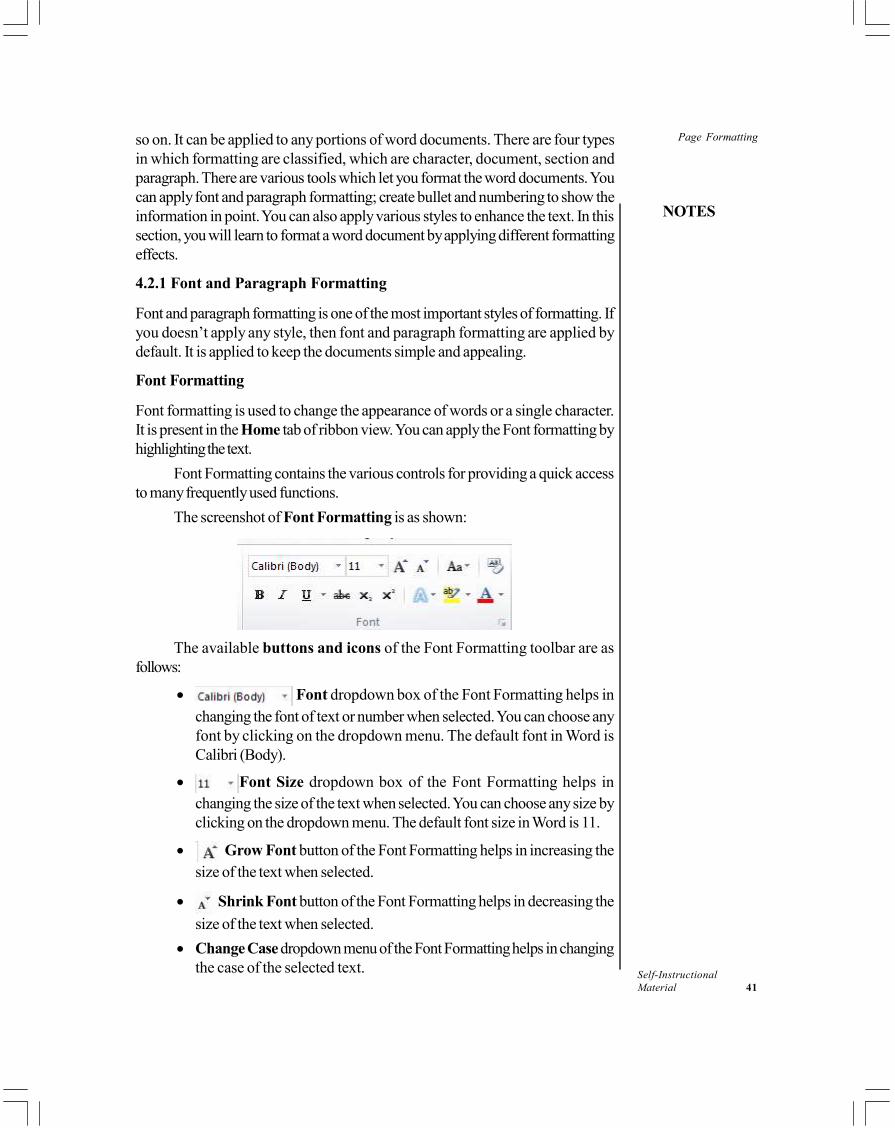
Font Formatting contains the various controls for providing a quick accessto many frequently used functions.
The screenshot of Font Formatting is as shown:
The available buttons and icons of the Font Formatting toolbar are asfollows:
• Font dropdown box of the Font Formatting helps inchanging the font of text or number when selected. You can choose anyfont by clicking on the dropdown menu. The default font in Word isCalibri (Body).
• Font Size dropdown box of the Font Formatting helps inchanging the size of the text when selected. You can choose any size byclicking on the dropdown menu. The default font size in Word is 11.
• Grow Font button of the Font Formatting helps in increasing thesize of the text when selected.
• Shrink Font button of the Font Formatting helps in decreasing thesize of the text when selected.
• Change Case dropdown menu of the Font Formatting helps in changingthe case of the selected text.
Page Formatting
NOTES
Self-Instructional42 Material
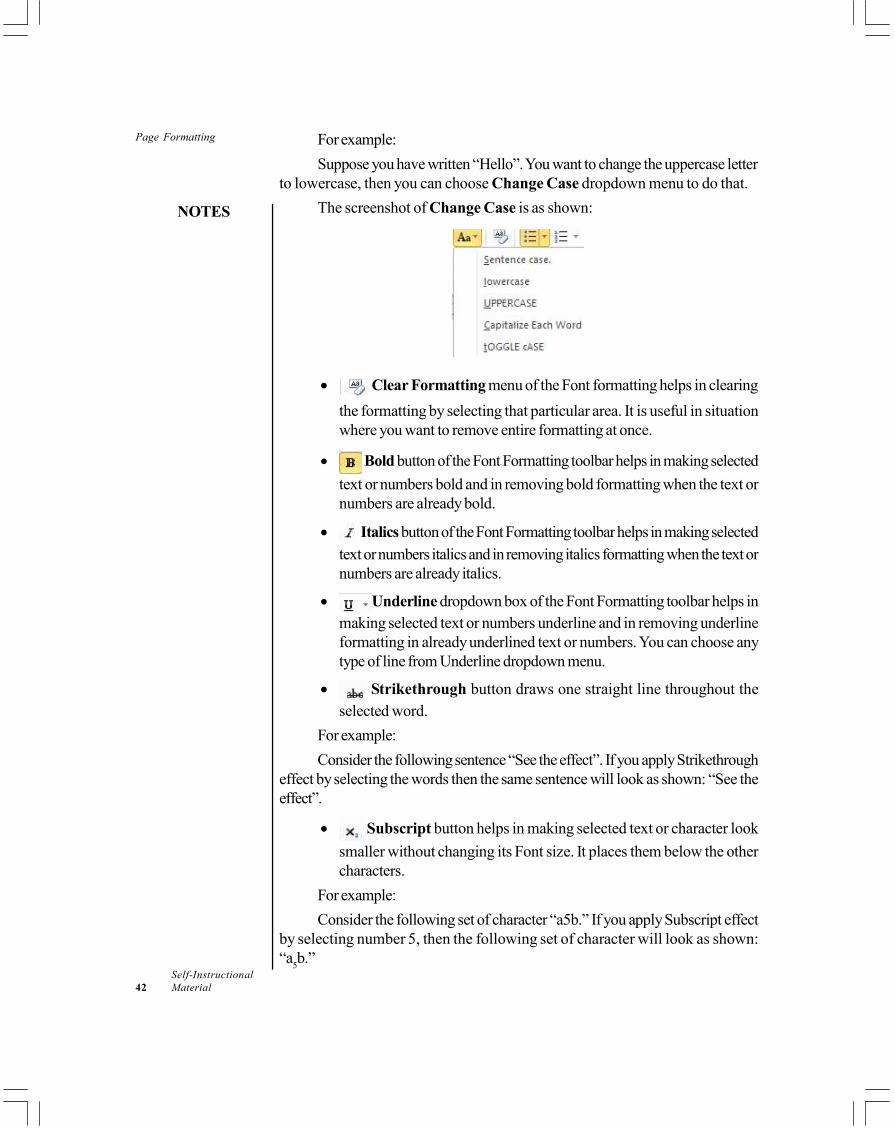
For example:Suppose you have written “Hello”. You want to change the uppercase letter
to lowercase, then you can choose Change Case dropdown menu to do that.The screenshot of Change Case is as shown:
• Clear Formatting menu of the Font formatting helps in clearingthe formatting by selecting that particular area. It is useful in situationwhere you want to remove entire formatting at once.
• Bold button of the Font Formatting toolbar helps in making selectedtext or numbers bold and in removing bold formatting when the text ornumbers are already bold.
• Italics button of the Font Formatting toolbar helps in making selectedtext or numbers italics and in removing italics formatting when the text ornumbers are already italics.
• Underline dropdown box of the Font Formatting toolbar helps inmaking selected text or numbers underline and in removing underlineformatting in already underlined text or numbers. You can choose anytype of line from Underline dropdown menu.
• Strikethrough button draws one straight line throughout theselected word.
For example:Consider the following sentence “See the effect”. If you apply Strikethrough
effect by selecting the words then the same sentence will look as shown: “See theeffect”.
• Subscript button helps in making selected text or character looksmaller without changing its Font size. It places them below the othercharacters.
For example:Consider the following set of character “a5b.” If you apply Subscript effect
by selecting number 5, then the following set of character will look as shown:“a5b.”
Page Formatting
NOTES
Self-InstructionalMaterial 43
• Superscript button helps in making selected text or character looksmaller without changing its Font size. It places them above the othercharacters.
For example:Consider the following set of character “a5b.” If you apply Superscript
effect by selecting number 5, then the following set of characters will look asshown: “a5b.”
• Text Effects dropdown menu of the Font Formatting toolbarhelps in drawing colored line around the text. You can choose any colorfrom dropdown menu.
For example:Consider the following sentence “See the effect”. If you apply Text Effect
by selecting the text then the same sentence will look as shown: “See the effect”
• Highlight button of the Font Formatting toolbar highlights thetext or number with the specified color. By default, “Yellow” color isselected. You can choose any color from the drop down menu. You canadd and remove the color by clicking the specific color.
• Font Color button of the formatting toolbar helps in changing thecolor of the text. By default, “Red” color is selected. You can chooseany color from the drop down menu.
Paragraph Formatting
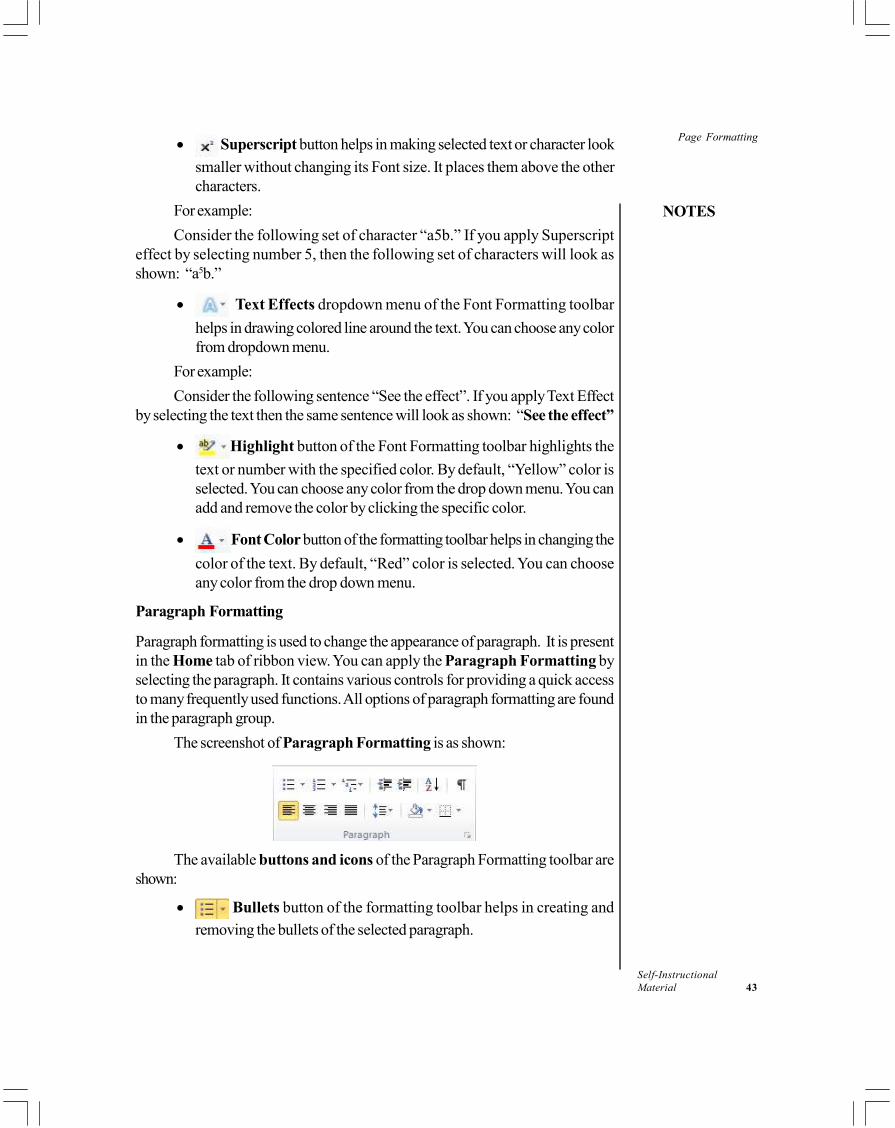
Paragraph formatting is used to change the appearance of paragraph. It is presentin the Home tab of ribbon view. You can apply the Paragraph Formatting byselecting the paragraph. It contains various controls for providing a quick accessto many frequently used functions. All options of paragraph formatting are foundin the paragraph group.
The screenshot of Paragraph Formatting is as shown:
The available buttons and icons of the Paragraph Formatting toolbar areshown:
• Bullets button of the formatting toolbar helps in creating andremoving the bullets of the selected paragraph.
Page Formatting
NOTES
Self-Instructional44 Material
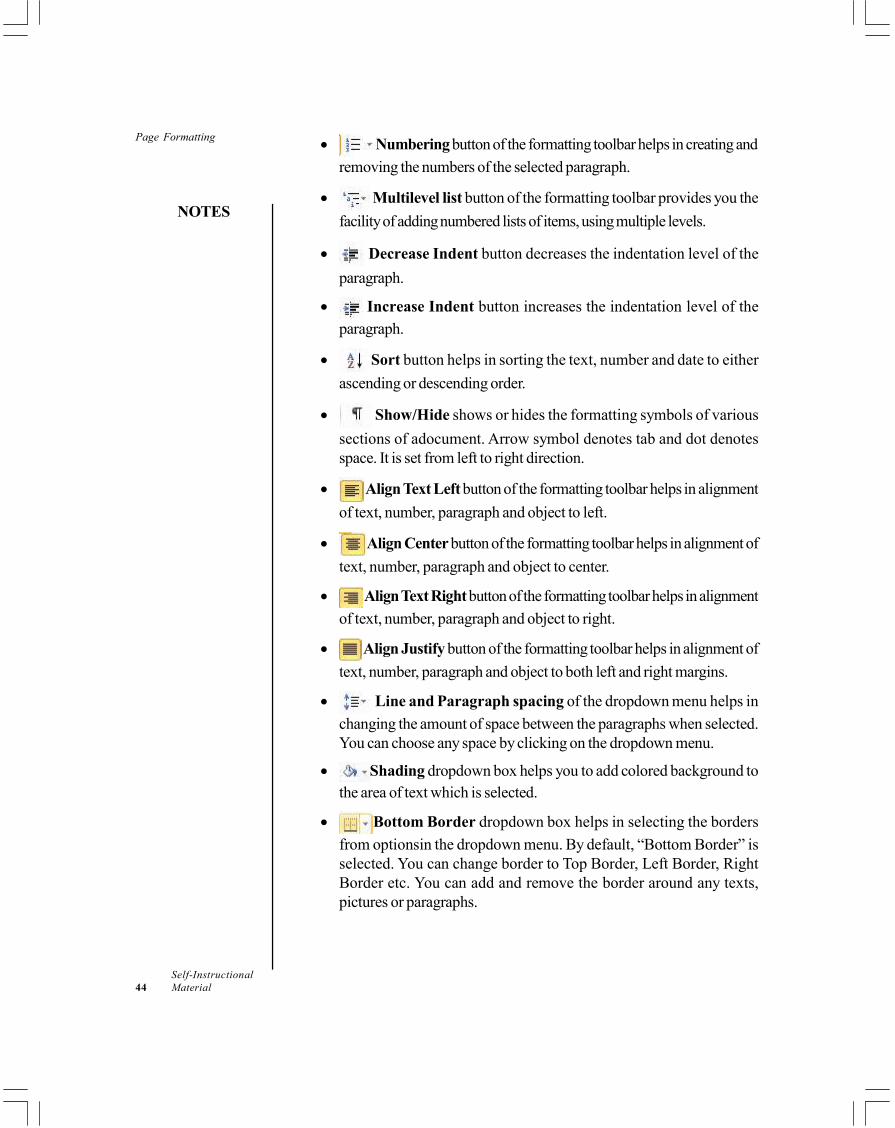
• Numbering button of the formatting toolbar helps in creating andremoving the numbers of the selected paragraph.
• Multilevel list button of the formatting toolbar provides you thefacility of adding numbered lists of items, using multiple levels.
• Decrease Indent button decreases the indentation level of theparagraph.
• Increase Indent button increases the indentation level of theparagraph.
• Sort button helps in sorting the text, number and date to eitherascending or descending order.
• Show/Hide shows or hides the formatting symbols of varioussections of adocument. Arrow symbol denotes tab and dot denotesspace. It is set from left to right direction.
• Align Text Left button of the formatting toolbar helps in alignmentof text, number, paragraph and object to left.
• Align Center button of the formatting toolbar helps in alignment oftext, number, paragraph and object to center.
• Align Text Right button of the formatting toolbar helps in alignmentof text, number, paragraph and object to right.
• Align Justify button of the formatting toolbar helps in alignment oftext, number, paragraph and object to both left and right margins.
• Line and Paragraph spacing of the dropdown menu helps inchanging the amount of space between the paragraphs when selected.You can choose any space by clicking on the dropdown menu.
• Shading dropdown box helps you to add colored background tothe area of text which is selected.
• Bottom Border dropdown box helps in selecting the bordersfrom optionsin the dropdown menu. By default, “Bottom Border” isselected. You can change border to Top Border, Left Border, RightBorder etc. You can add and remove the border around any texts,pictures or paragraphs.
Page Formatting
NOTES
Self-InstructionalMaterial 45
4.2.2 Embed Font in Microsoft Word 2010
In any Microsoft Word document, the Font option determines the document’sappearance at the time of view or print. If the first user shares a document with asecond user and the second user does not have the same font installed, thenMicrosoft Word will change the font automatically in the second user’s document.Microsoft Word 2010 helps to embed fonts in documents.The following steps explain how to embed fonts:
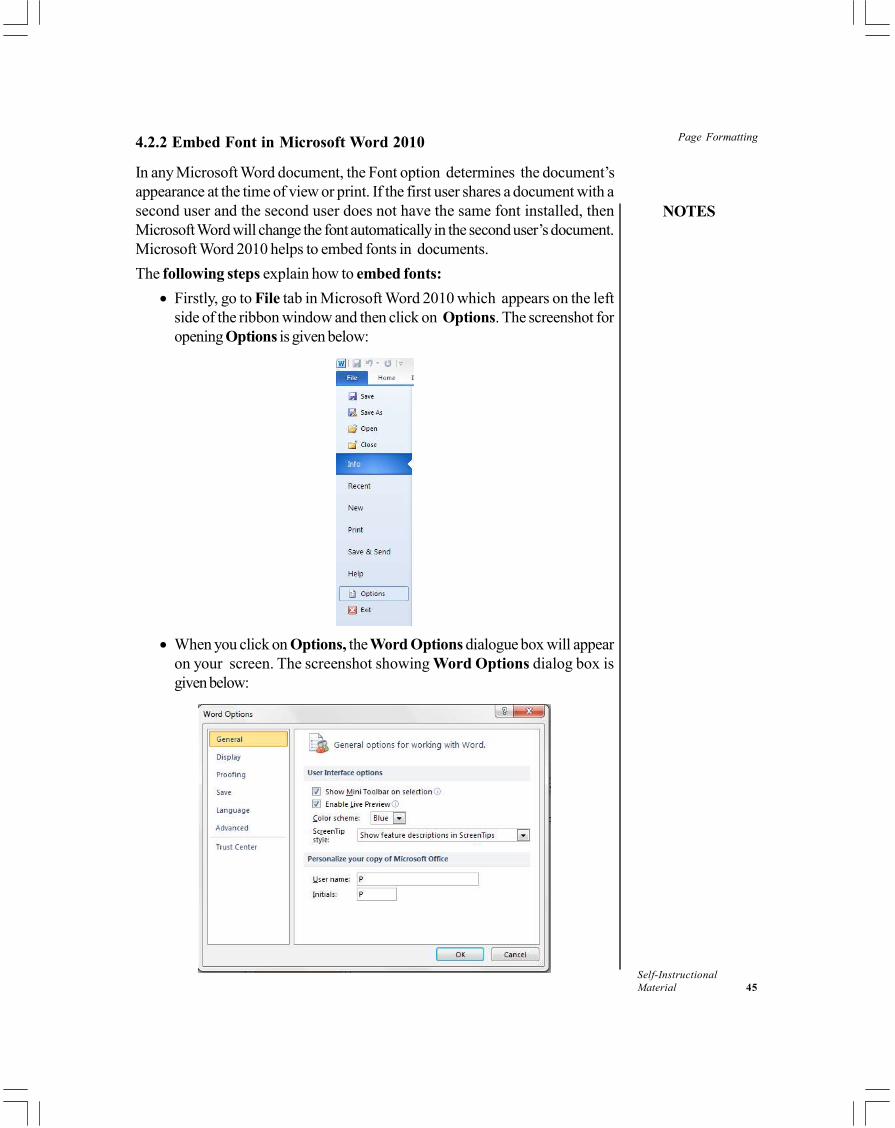
• Firstly, go to File tab in Microsoft Word 2010 which appears on the leftside of the ribbon window and then click on Options. The screenshot foropening Options is given below:
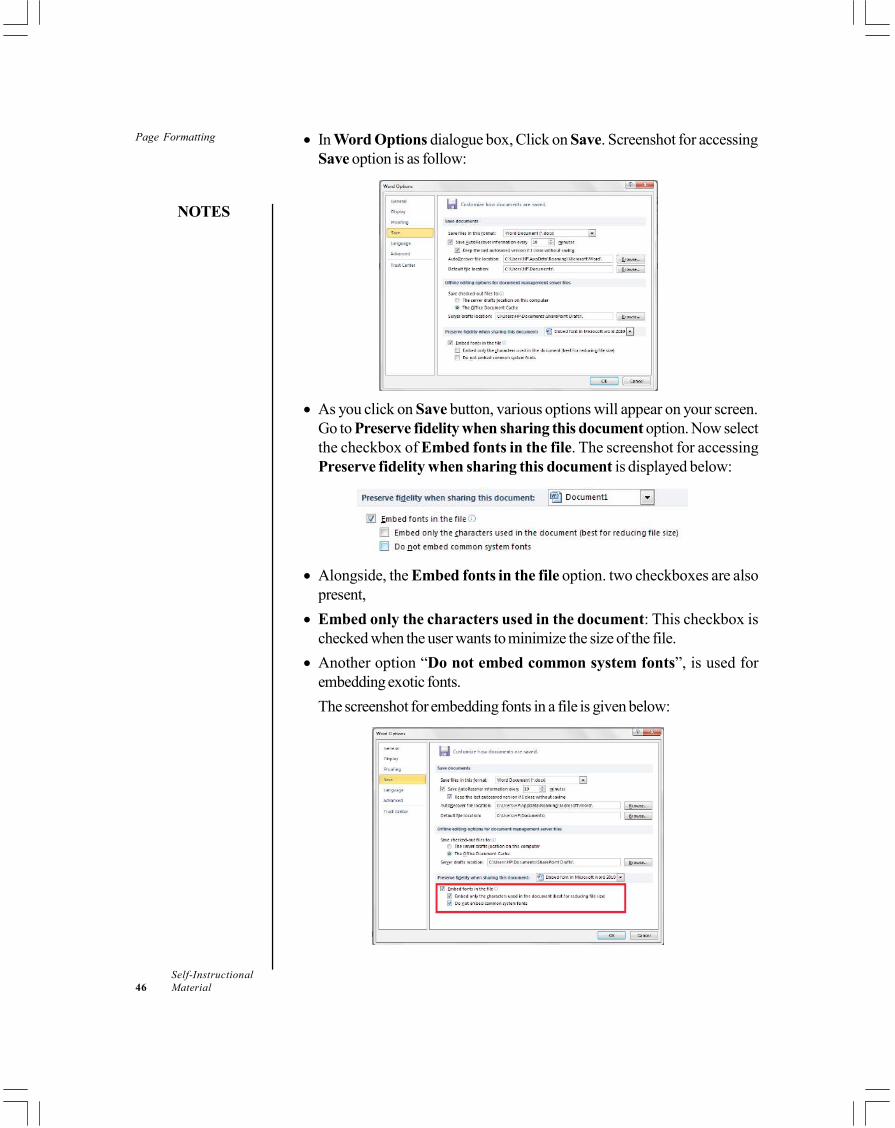
• When you click on Options, the Word Options dialogue box will appearon your screen. The screenshot showing Word Options dialog box isgiven below:
Page Formatting
NOTES
Self-Instructional46 Material
• In Word Options dialogue box, Click on Save. Screenshot for accessingSave option is as follow:
• As you click on Save button, various options will appear on your screen.Go to Preserve fidelity when sharing this document option. Now selectthe checkbox of Embed fonts in the file. The screenshot for accessingPreserve fidelity when sharing this document is displayed below:
• Alongside, the Embed fonts in the file option. two checkboxes are alsopresent,
• Embed only the characters used in the document: This checkbox ischecked when the user wants to minimize the size of the file.
• Another option “Do not embed common system fonts”, is used forembedding exotic fonts.The screenshot for embedding fonts in a file is given below:
Page Formatting
NOTES
Self-InstructionalMaterial 47
• Finally click on OK button to complete the process.
Check Your Progress
1. What is the default font type in Word?2. What is the default font size in Word?3. What is the use of justify button?
4.3 PAGE SETUP AND BREAK
Break: In word, a new page begins after the previous page is completely filledbut with the help of break, the user can force the text to start from the new page.
Insert page break
• Open the document. Go to the location from where you want to start a newpage.
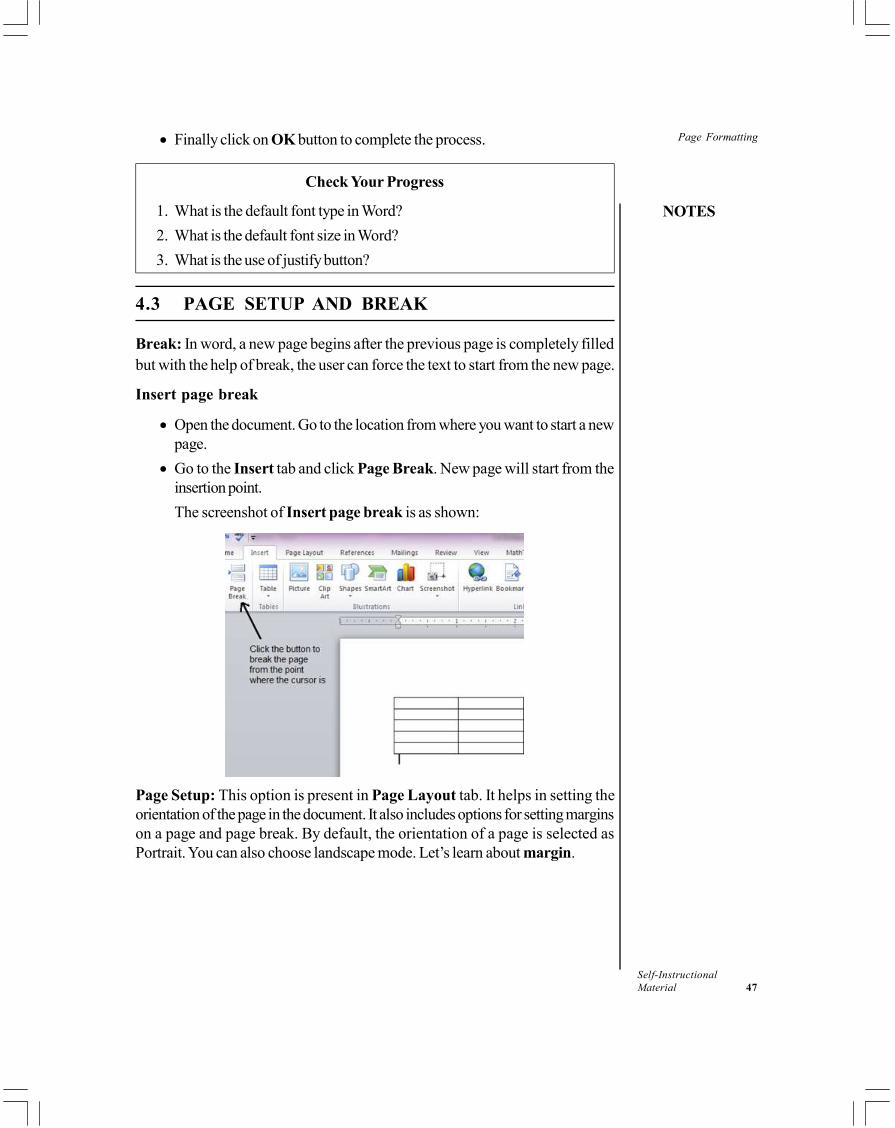
• Go to the Insert tab and click Page Break. New page will start from theinsertion point.The screenshot of Insert page break is as shown:
Page Setup: This option is present in Page Layout tab. It helps in setting theorientation of the page in the document. It also includes options for setting marginson a page and page break. By default, the orientation of a page is selected asPortrait. You can also choose landscape mode. Let’s learn about margin.
Page Formatting
NOTES
Self-Instructional48 Material
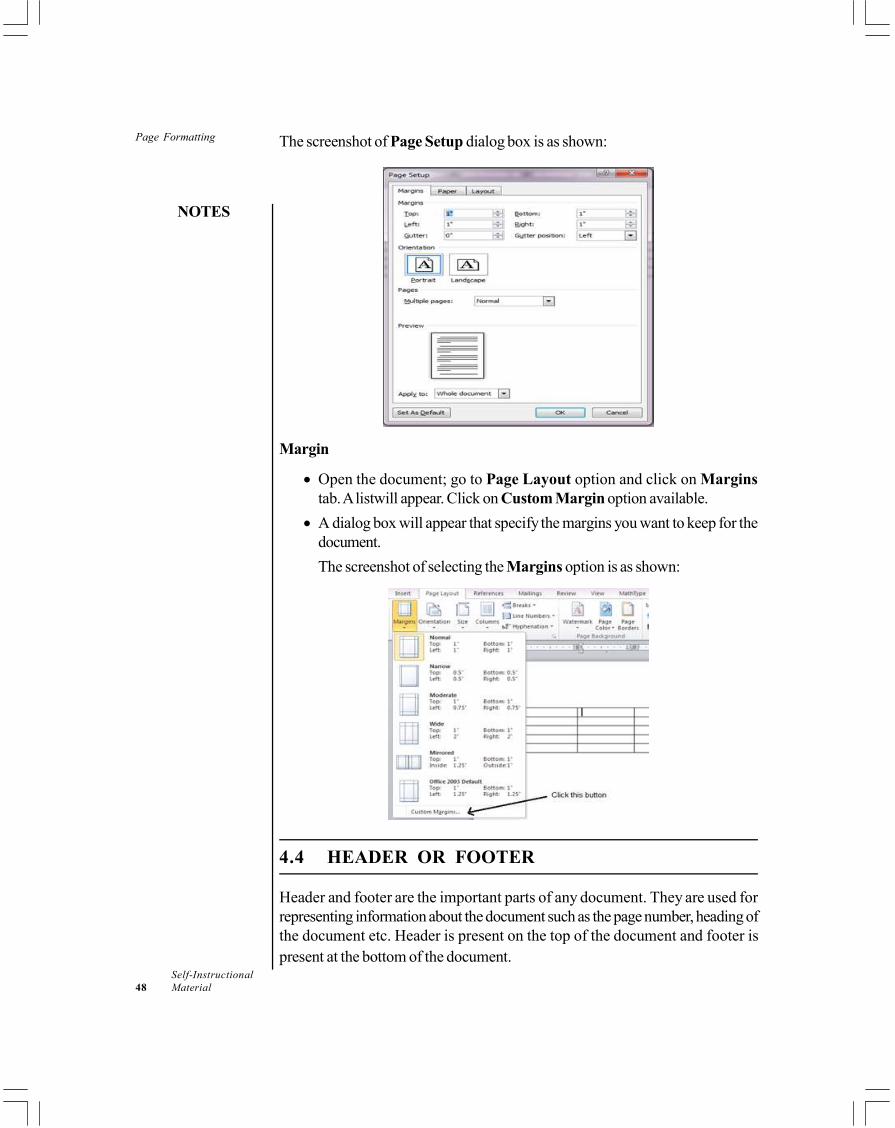
The screenshot of Page Setup dialog box is as shown:
Margin
• Open the document; go to Page Layout option and click on Marginstab. A listwill appear. Click on Custom Margin option available.
• A dialog box will appear that specify the margins you want to keep for thedocument.The screenshot of selecting the Margins option is as shown:
4.4 HEADER OR FOOTER
Header and footer are the important parts of any document. They are used forrepresenting information about the document such as the page number, heading ofthe document etc. Header is present on the top of the document and footer ispresent at the bottom of the document.
Page Formatting
NOTES
Self-InstructionalMaterial 49
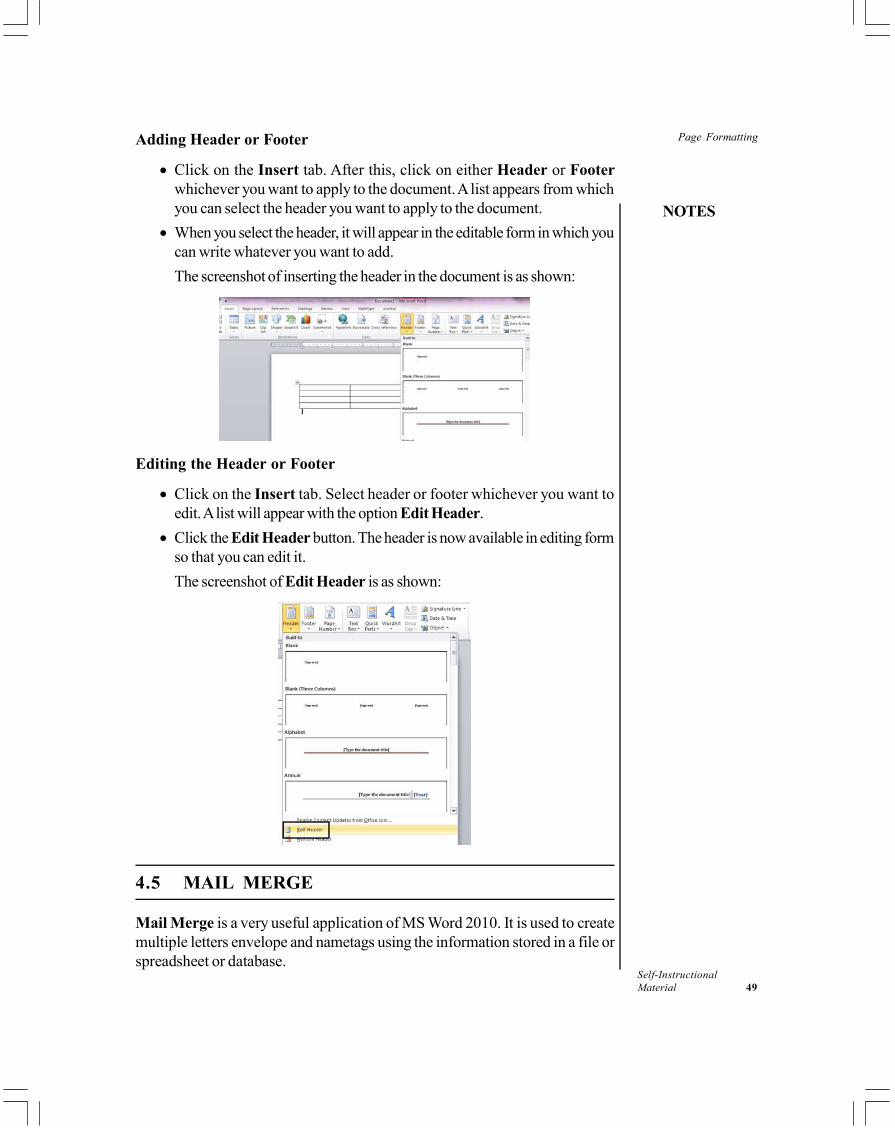
Adding Header or Footer
• Click on the Insert tab. After this, click on either Header or Footerwhichever you want to apply to the document. A list appears from whichyou can select the header you want to apply to the document.
• When you select the header, it will appear in the editable form in which youcan write whatever you want to add.The screenshot of inserting the header in the document is as shown:
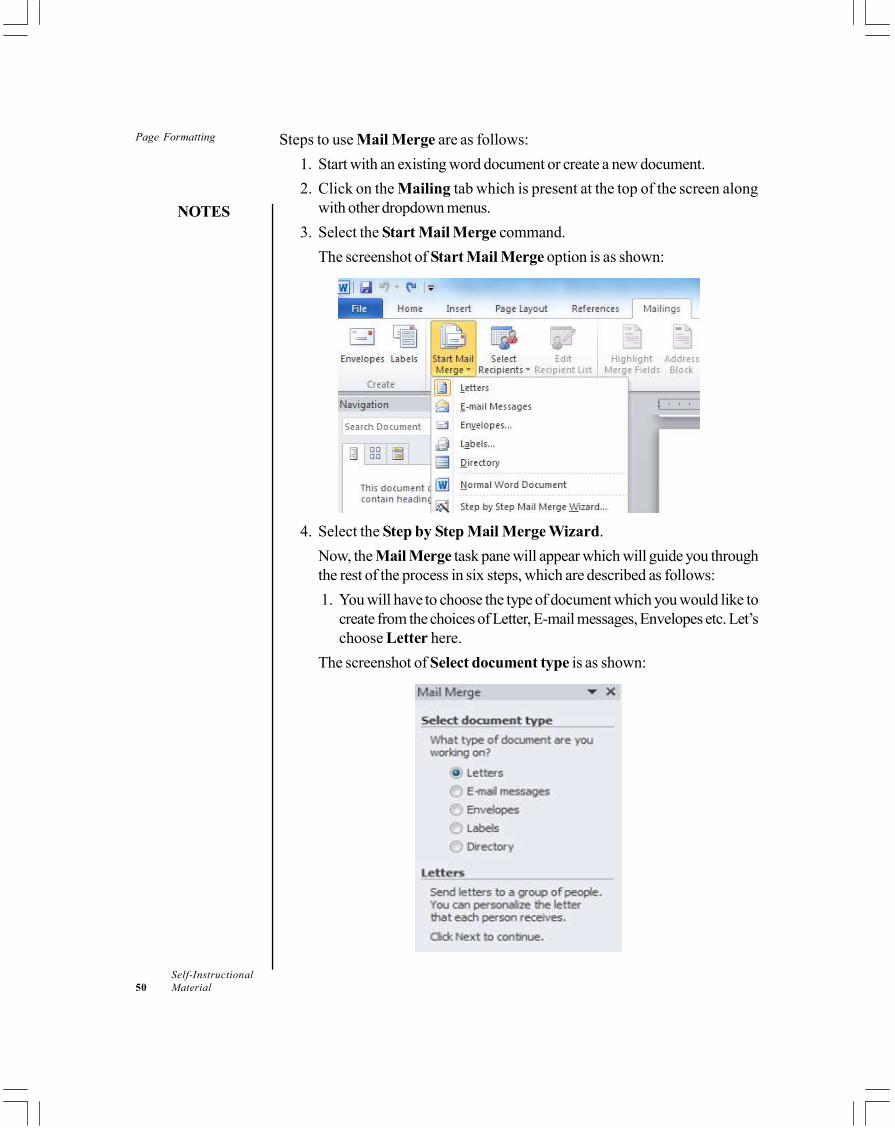
Editing the Header or Footer
• Click on the Insert tab. Select header or footer whichever you want toedit. A list will appear with the option Edit Header.
• Click the Edit Header button. The header is now available in editing formso that you can edit it.The screenshot of Edit Header is as shown:
4.5 MAIL MERGE
Mail Merge is a very useful application of MS Word 2010. It is used to createmultiple letters envelope and nametags using the information stored in a file orspreadsheet or database.
Page Formatting
NOTES
Self-Instructional50 Material
Steps to use Mail Merge are as follows:1. Start with an existing word document or create a new document.2. Click on the Mailing tab which is present at the top of the screen along
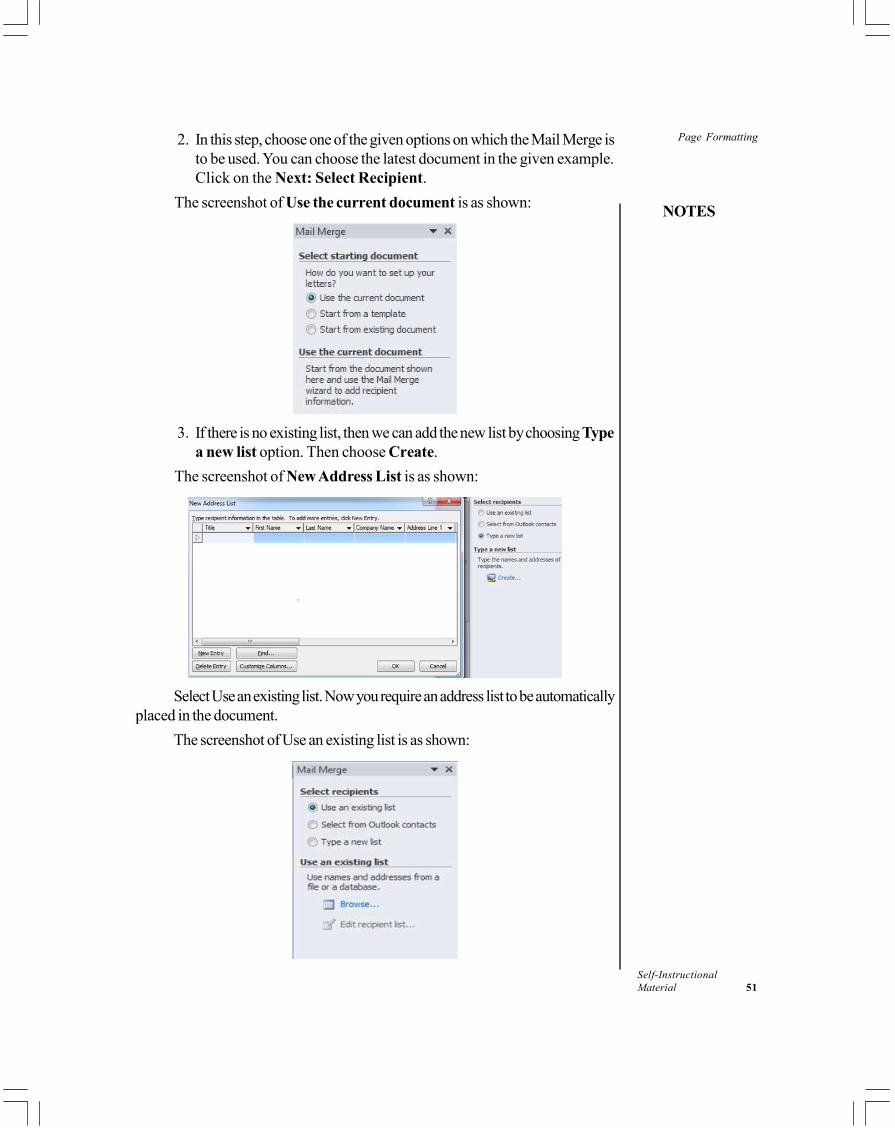
with other dropdown menus.3. Select the Start Mail Merge command.
The screenshot of Start Mail Merge option is as shown:
4. Select the Step by Step Mail Merge Wizard.Now, the Mail Merge task pane will appear which will guide you throughthe rest of the process in six steps, which are described as follows:1. You will have to choose the type of document which you would like to
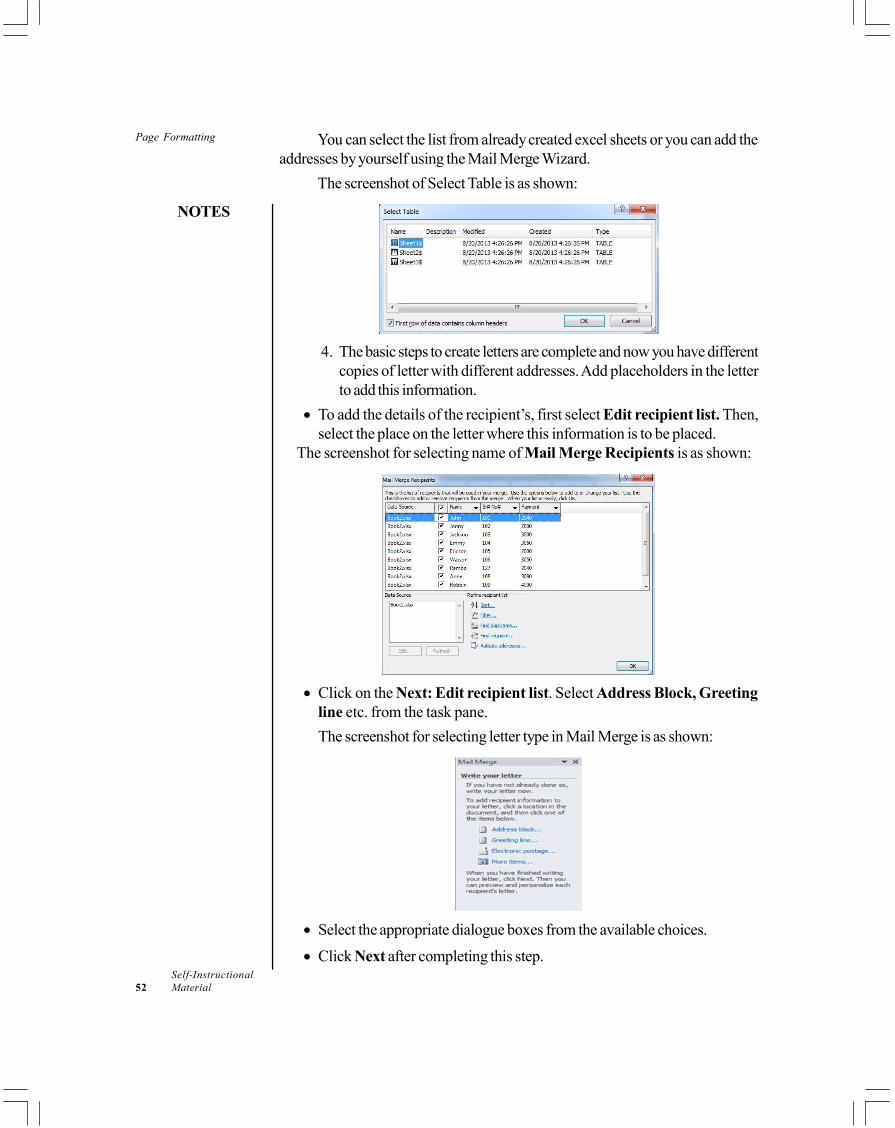
create from the choices of Letter, E-mail messages, Envelopes etc. Let’schoose Letter here.
The screenshot of Select document type is as shown:
Page Formatting
NOTES
Self-InstructionalMaterial 51
2. In this step, choose one of the given options on which the Mail Merge isto be used. You can choose the latest document in the given example.Click on the Next: Select Recipient.
The screenshot of Use the current document is as shown:
3. If there is no existing list, then we can add the new list by choosing Typea new list option. Then choose Create.
The screenshot of New Address List is as shown:
Select Use an existing list. Now you require an address list to be automaticallyplaced in the document.
The screenshot of Use an existing list is as shown:
Page Formatting
NOTES
Self-Instructional52 Material
You can select the list from already created excel sheets or you can add theaddresses by yourself using the Mail Merge Wizard.
The screenshot of Select Table is as shown:
4. The basic steps to create letters are complete and now you have differentcopies of letter with different addresses. Add placeholders in the letterto add this information.
• To add the details of the recipient’s, first select Edit recipient list. Then,select the place on the letter where this information is to be placed.
The screenshot for selecting name of Mail Merge Recipients is as shown:
• Click on the Next: Edit recipient list. Select Address Block, Greetingline etc. from the task pane.The screenshot for selecting letter type in Mail Merge is as shown:
• Select the appropriate dialogue boxes from the available choices.
• Click Next after completing this step.
Page Formatting
NOTES
Self-InstructionalMaterial 53
5. Before finalizing, you can preview the letter for each recipient and checkwhether the names and addresses match. After completing, go to nextstep.
6. Click on the print option to print the letters. The merge and print dialoguebox appears. Select all or few selected letters according to your choiceto be printed. Select OK. A print dialogue box will appear. Adjust theprint settings and then print the letters. Enjoy mailing.
4.6 MACROS: RECORDING, EDITING AND USING
Macros are used to automate a task which is performed repeatedly. Using macros,a task becomes easy and the chances of mistakes are reduced, as the data isconverted into pre-recorded the commands . To work on macros, the first thingyou should look at is the Developer tab or the View tab inside the Ribbon. Alloptions related to macros and macro security are given on these tabs.The following steps explain how you can add the Developer tab to the ribbon ifit is not available:
1. Click on the File tab inside the ribbon.2. Select Options from the navigation bar. The Word Options dialog box
opens.3. Click on the Customize Ribbon option, given on the left pane of the
dialog box .4. On the right pane, check the Developer tab from the Main Tabs and
press the OK button.5. Developer tab will appear on the ribbon for macro recording and editing.
This tab is found in the Code section..The steps enabling you to view the macros from the View tab, are given below:
1. Click on the View tab inside the ribbon.2. Go to the Macros section and click on the Macros dropdown box. This
will help you record, view and edit the macros.
Recording the Macro
Macros can be recorded in two ways— either by using the Developer tab orwith the help of View tab, present inside the ribbon.The following steps tell you how to record the macros:
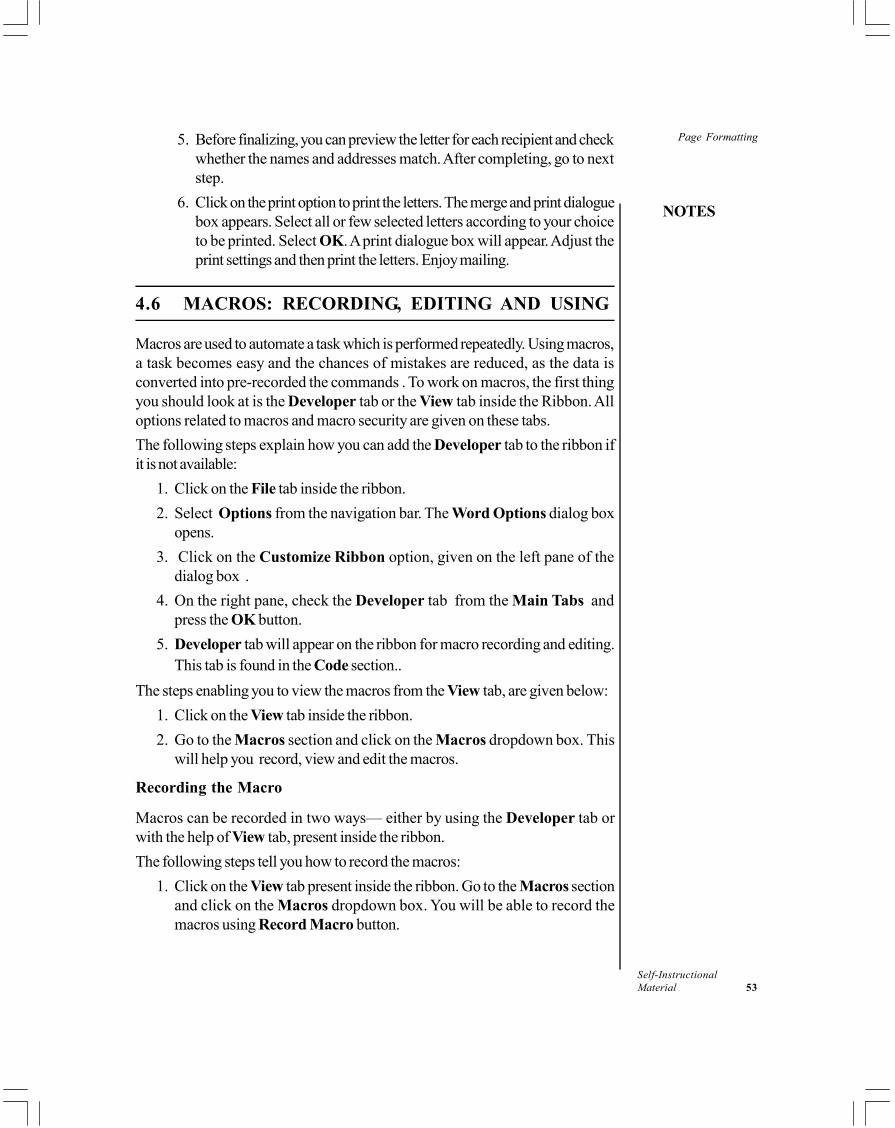
1. Click on the View tab present inside the ribbon. Go to the Macros sectionand click on the Macros dropdown box. You will be able to record themacros using Record Macro button.
Page Formatting
NOTES
Self-Instructional54 Material
A screenshot displaying the Record Macro option isgiven below:
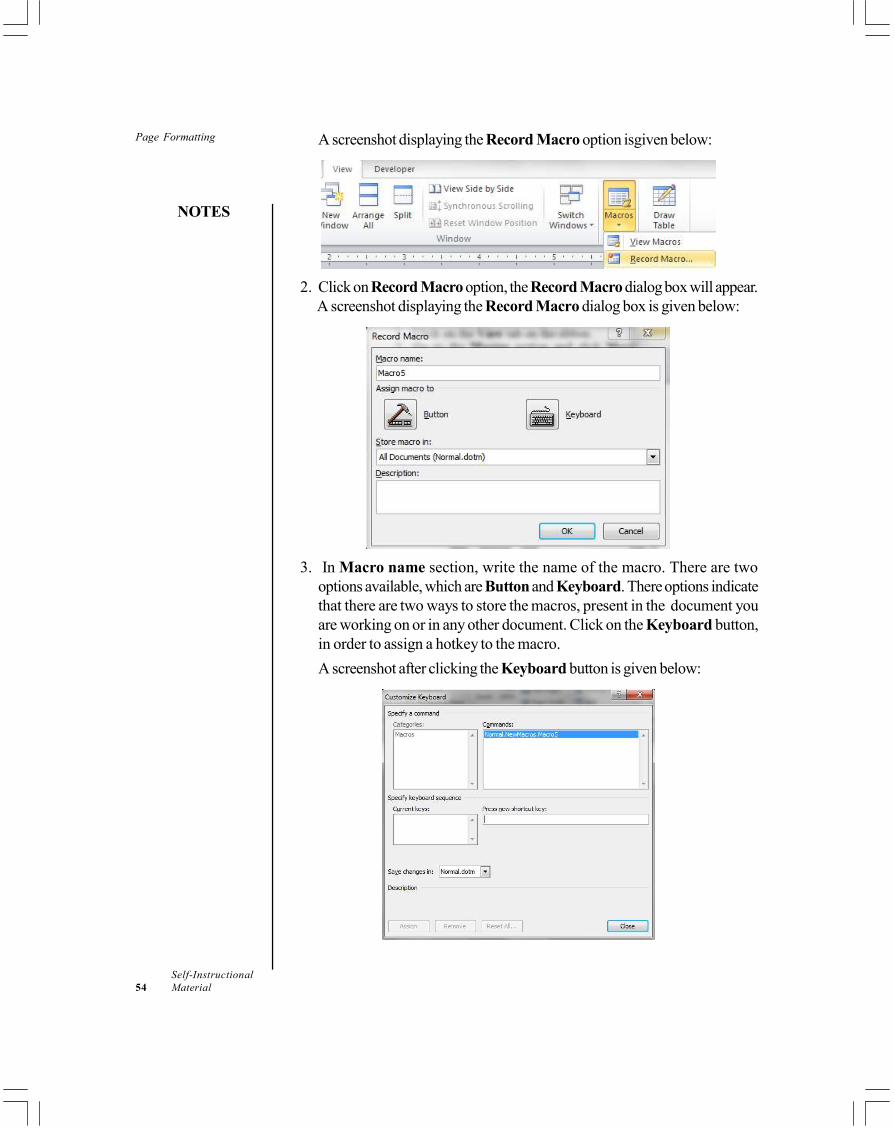
2. Click on Record Macro option, the Record Macro dialog box will appear.A screenshot displaying the Record Macro dialog box is given below:
3. In Macro name section, write the name of the macro. There are twooptions available, which are Button and Keyboard. There options indicatethat there are two ways to store the macros, present in the document youare working on or in any other document. Click on the Keyboard button,in order to assign a hotkey to the macro.A screenshot after clicking the Keyboard button is given below:
Page Formatting
NOTES
Self-InstructionalMaterial 55
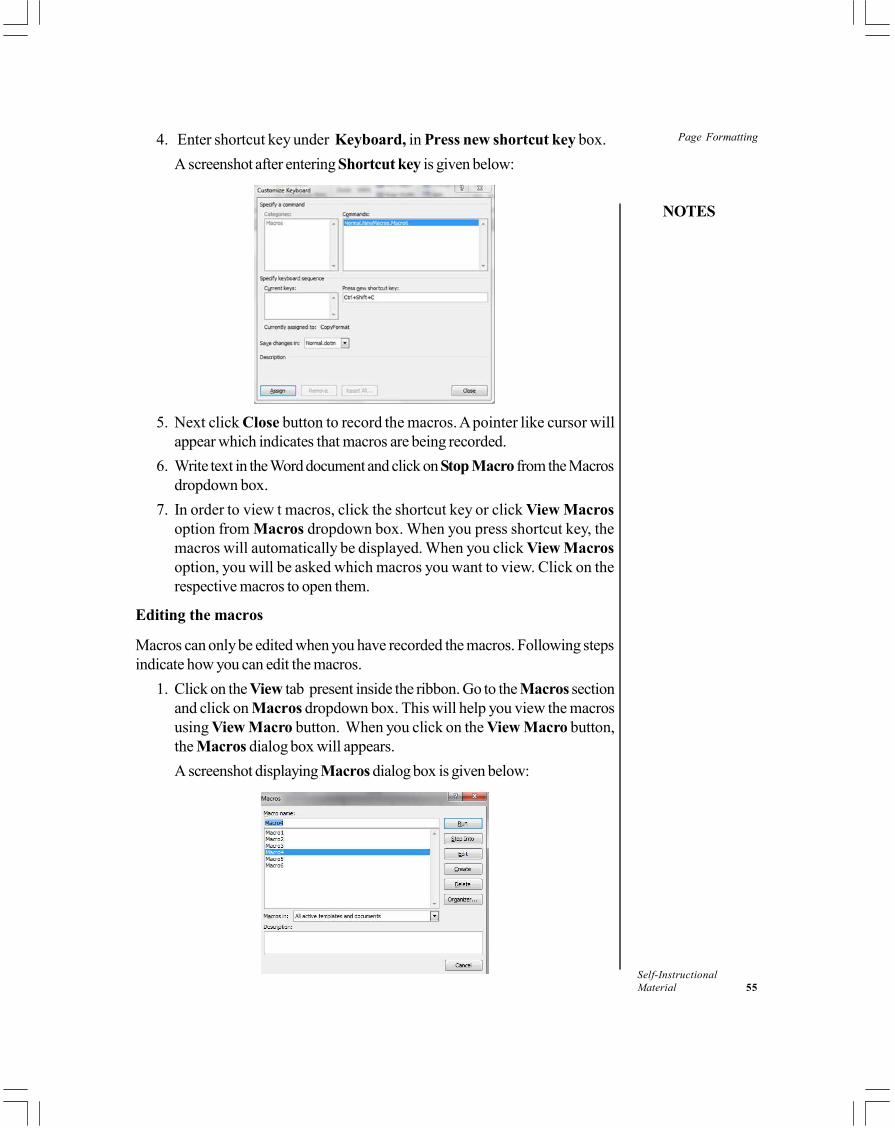
4. Enter shortcut key under Keyboard, in Press new shortcut key box.A screenshot after entering Shortcut key is given below:
5. Next click Close button to record the macros. A pointer like cursor willappear which indicates that macros are being recorded.
6. Write text in the Word document and click on Stop Macro from the Macrosdropdown box.
7. In order to view t macros, click the shortcut key or click View Macrosoption from Macros dropdown box. When you press shortcut key, themacros will automatically be displayed. When you click View Macrosoption, you will be asked which macros you want to view. Click on therespective macros to open them.
Editing the macros
Macros can only be edited when you have recorded the macros. Following stepsindicate how you can edit the macros.
1. Click on the View tab present inside the ribbon. Go to the Macros sectionand click on Macros dropdown box. This will help you view the macrosusing View Macro button. When you click on the View Macro button,the Macros dialog box will appears.A screenshot displaying Macros dialog box is given below:
Page Formatting
NOTES
Self-Instructional56 Material
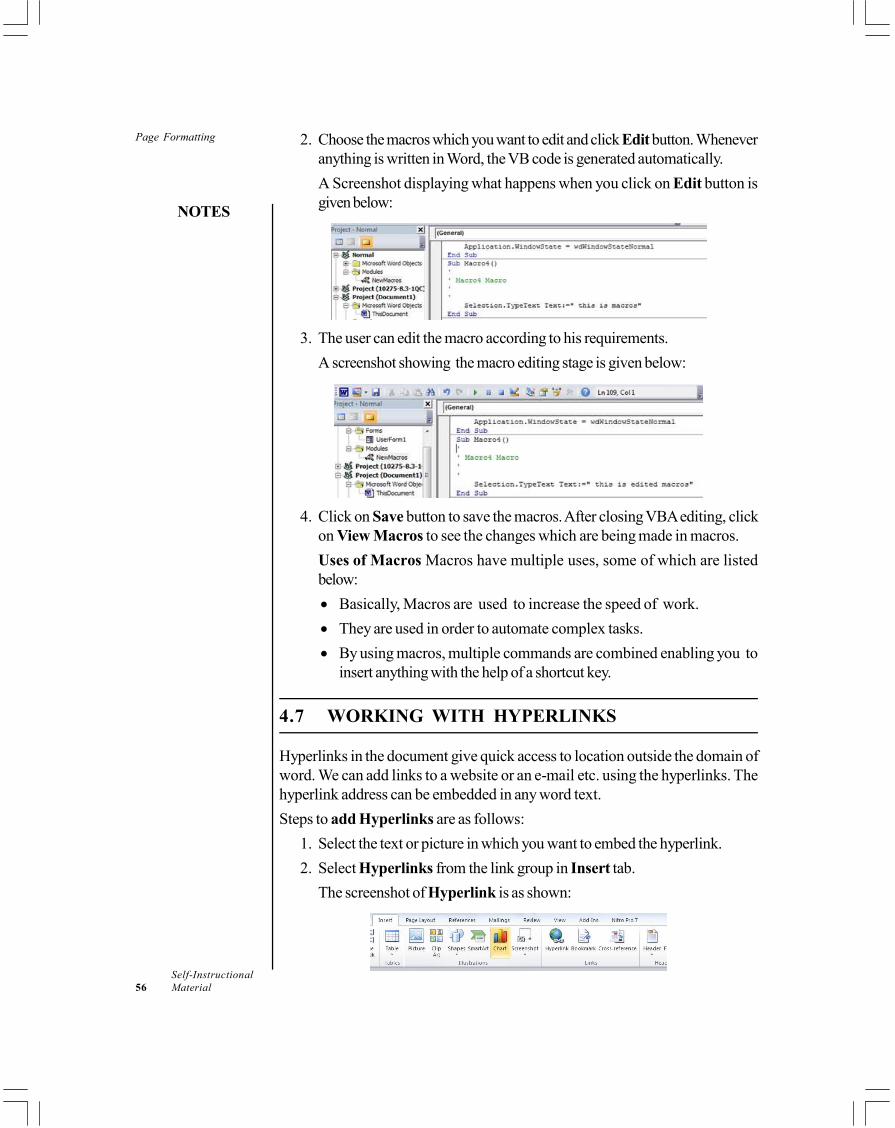
2. Choose the macros which you want to edit and click Edit button. Wheneveranything is written in Word, the VB code is generated automatically.A Screenshot displaying what happens when you click on Edit button isgiven below:
3. The user can edit the macro according to his requirements.A screenshot showing the macro editing stage is given below:
4. Click on Save button to save the macros. After closing VBA editing, clickon View Macros to see the changes which are being made in macros.Uses of Macros Macros have multiple uses, some of which are listedbelow:• Basically, Macros are used to increase the speed of work.• They are used in order to automate complex tasks.• By using macros, multiple commands are combined enabling you to
insert anything with the help of a shortcut key.
4.7 WORKING WITH HYPERLINKS
Hyperlinks in the document give quick access to location outside the domain ofword. We can add links to a website or an e-mail etc. using the hyperlinks. Thehyperlink address can be embedded in any word text.Steps to add Hyperlinks are as follows:
1. Select the text or picture in which you want to embed the hyperlink.2. Select Hyperlinks from the link group in Insert tab.
The screenshot of Hyperlink is as shown:
Page Formatting
NOTES
Self-InstructionalMaterial 57
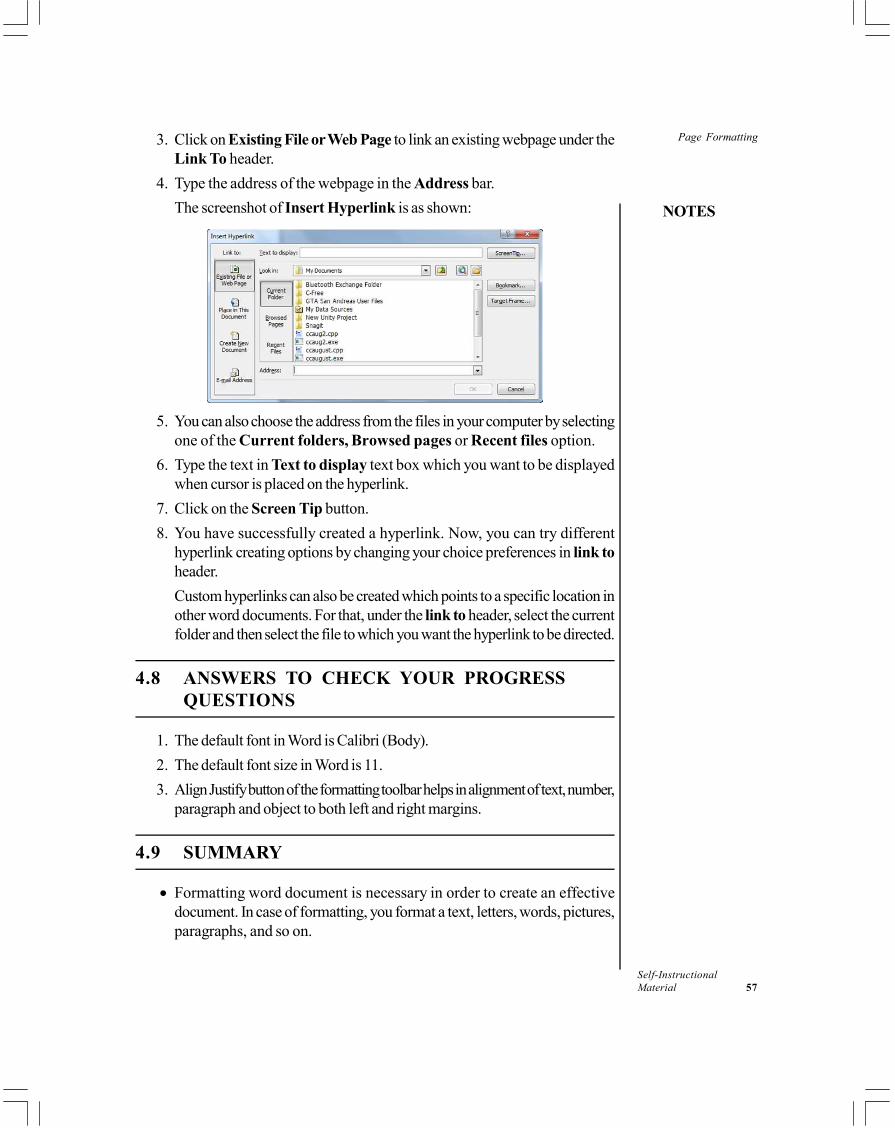
3. Click on Existing File or Web Page to link an existing webpage under theLink To header.
4. Type the address of the webpage in the Address bar.The screenshot of Insert Hyperlink is as shown:
5. You can also choose the address from the files in your computer by selectingone of the Current folders, Browsed pages or Recent files option.
6. Type the text in Text to display text box which you want to be displayedwhen cursor is placed on the hyperlink.
7. Click on the Screen Tip button.8. You have successfully created a hyperlink. Now, you can try different
hyperlink creating options by changing your choice preferences in link toheader.Custom hyperlinks can also be created which points to a specific location inother word documents. For that, under the link to header, select the currentfolder and then select the file to which you want the hyperlink to be directed.
4.8 ANSWERS TO CHECK YOUR PROGRESSQUESTIONS
1. The default font in Word is Calibri (Body).2. The default font size in Word is 11.3. Align Justify button of the formatting toolbar helps in alignment of text, number,
paragraph and object to both left and right margins.
4.9 SUMMARY
• Formatting word document is necessary in order to create an effectivedocument. In case of formatting, you format a text, letters, words, pictures,paragraphs, and so on.
Page Formatting
NOTES
Self-Instructional58 Material
• Font and paragraph formatting is one of the most important styles offormatting. If you doesn’t apply any style, then font and paragraph formattingare applied by default.
• Font formatting is used to change the appearance of words or a singlecharacter. It is present in the Home tab of ribbon view.
• Paragraph formatting is used to change the appearance of paragraph. It ispresent in the Home tab of ribbon view. You can apply the ParagraphFormatting by selecting the paragraph. It contains various controls forproviding a quick access to many frequently used functions.
4.10 KEY WORDS
• Decrease Indent: This button decreases the indentation level of theparagraph.
• Align Center: This button of the formatting toolbar helps in alignment oftext, number, paragraph and object to center.
• Subscript: This button helps in making selected text or character looksmaller without changing its Font size.
4.11 SELF ASSESSMENT QUESTIONS ANDEXERCISES
1. Prepare a document while applying the following formatting styles.(i) Font formatting functions(ii) Use all options of paragraph formatting(iii) Apply header and footer
2. What is the significance of Mail merge? Explain with the help of its applicationon a document.
3. Add a hyperlink in the existing word document.
4.12 FURTHER READINGS
Srivastava, S.S. 2008. MS Office. New Delhi: Firewall Media.Saxena, Sanjay. 2011. MS Office 2007 in a Nutshell. Noida: Vikas Publishing
house.Courter, Gini and Annette Marquis. 1999. Mastering Microsoft Office 2000.
New Delhi: BPB Publications.Blattner, Patrick, Ken Cook, Laurie Ulrich and Timothy Dyck. 1999. Special
Edition Using Microsoft Excel 2000. New Delhi: Prentice-Hall of India.
Modifying a Worksheet
NOTES
Self-InstructionalMaterial 59
UNIT 5 MODIFYING AWORKSHEET
Structure5.0 Introduction5.1 Objectives5.2 Requisite Excel: Essential Features
5.2.1 Shortcuts and Tips5.3 Advanced Spreadsheet Modifications
5.3.1 Hide or Unhide Rows and Columns5.3.2 Freezing/Splitting Rows and Columns
5.4 Macros5.5 Answers to Check Your Progress Questions5.6 Summary5.7 Key Words5.8 Self Assessment Questions and Exercises5.9 Further Readings
5.0 INTRODUCTION
Microsoft Excel (MS Excel or Excel) is the program that is used for creating theExcel sheets or worksheets. It is used by businessmen and individuals for storingdata and its interpretation. It is a part of MS Office, which provides the facilities ofstoring data in the form of table that contains rows and columns. This programhelps in doing the tasks at the faster speed as all the calculations are performedusing formulas and functions. If you have used MS Excel 2010 earlier, you willnotice that more complicated features have been added. It includes features suchas calculation, pivot table, slicers, sparklines and many more. The programminglanguage used by the Excel for applications is Visual Basic.
5.1 OBJECTIVES
After going through this unit, you will be able to:• Understand how to save and open a worksheet• Hide and unhide rows and columns• Create and run macros
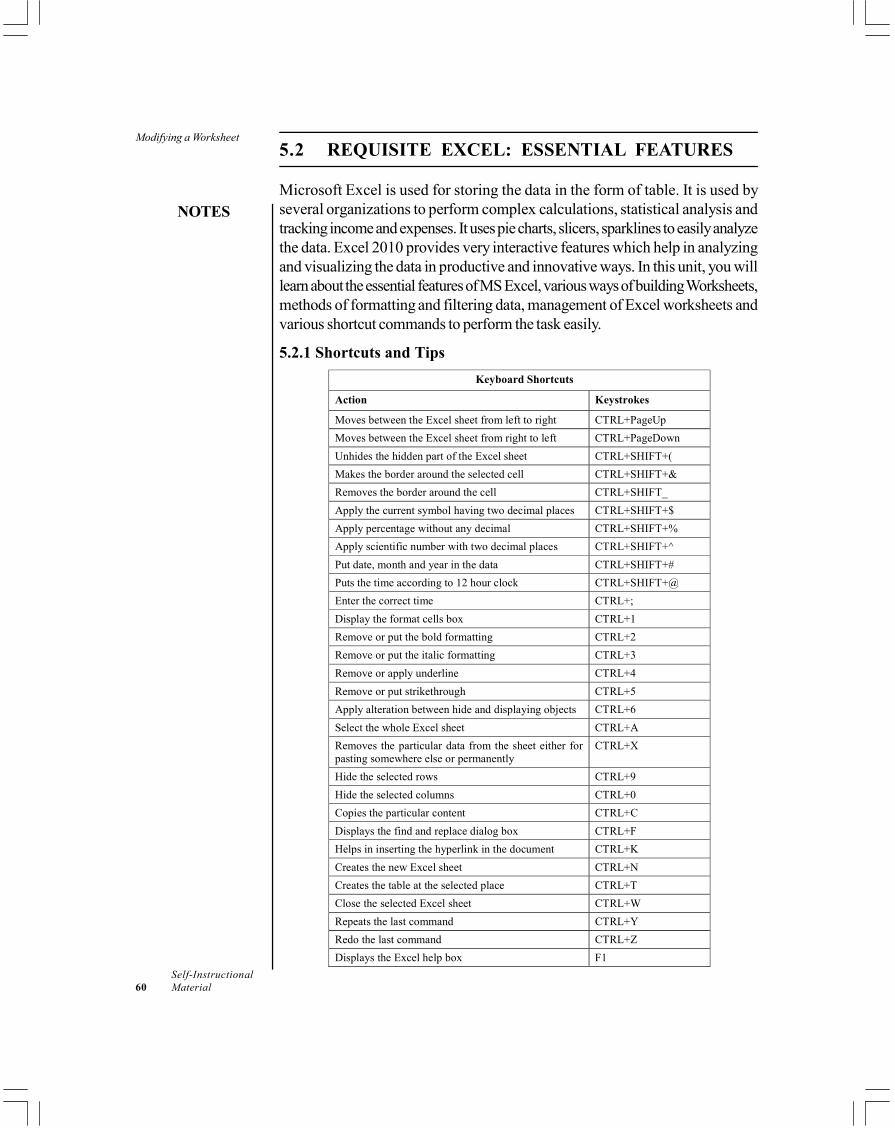
Modifying a Worksheet
NOTES
Self-Instructional60 Material
5.2 REQUISITE EXCEL: ESSENTIAL FEATURES
Microsoft Excel is used for storing the data in the form of table. It is used byseveral organizations to perform complex calculations, statistical analysis andtracking income and expenses. It uses pie charts, slicers, sparklines to easily analyzethe data. Excel 2010 provides very interactive features which help in analyzingand visualizing the data in productive and innovative ways. In this unit, you willlearn about the essential features of MS Excel, various ways of building Worksheets,methods of formatting and filtering data, management of Excel worksheets andvarious shortcut commands to perform the task easily.
5.2.1 Shortcuts and TipsKeyboard Shortcuts
Action Keystrokes
Moves between the Excel sheet from left to right CTRL+PageUp Moves between the Excel sheet from right to left CTRL+PageDown Unhides the hidden part of the Excel sheet CTRL+SHIFT+( Makes the border around the selected cell CTRL+SHIFT+& Removes the border around the cell CTRL+SHIFT_ Apply the current symbol having two decimal places CTRL+SHIFT+$ Apply percentage without any decimal CTRL+SHIFT+% Apply scientific number with two decimal places CTRL+SHIFT+^ Put date, month and year in the data CTRL+SHIFT+# Puts the time according to 12 hour clock CTRL+SHIFT+@ Enter the correct time CTRL+; Display the format cells box CTRL+1 Remove or put the bold formatting CTRL+2 Remove or put the italic formatting CTRL+3 Remove or apply underline CTRL+4 Remove or put strikethrough CTRL+5 Apply alteration between hide and displaying objects CTRL+6 Select the whole Excel sheet CTRL+A Removes the particular data from the sheet either for pasting somewhere else or permanently
CTRL+X
Hide the selected rows CTRL+9 Hide the selected columns CTRL+0 Copies the particular content CTRL+C Displays the find and replace dialog box CTRL+F Helps in inserting the hyperlink in the document CTRL+K Creates the new Excel sheet CTRL+N Creates the table at the selected place CTRL+T Close the selected Excel sheet CTRL+W Repeats the last command CTRL+Y Redo the last command CTRL+Z Displays the Excel help box F1
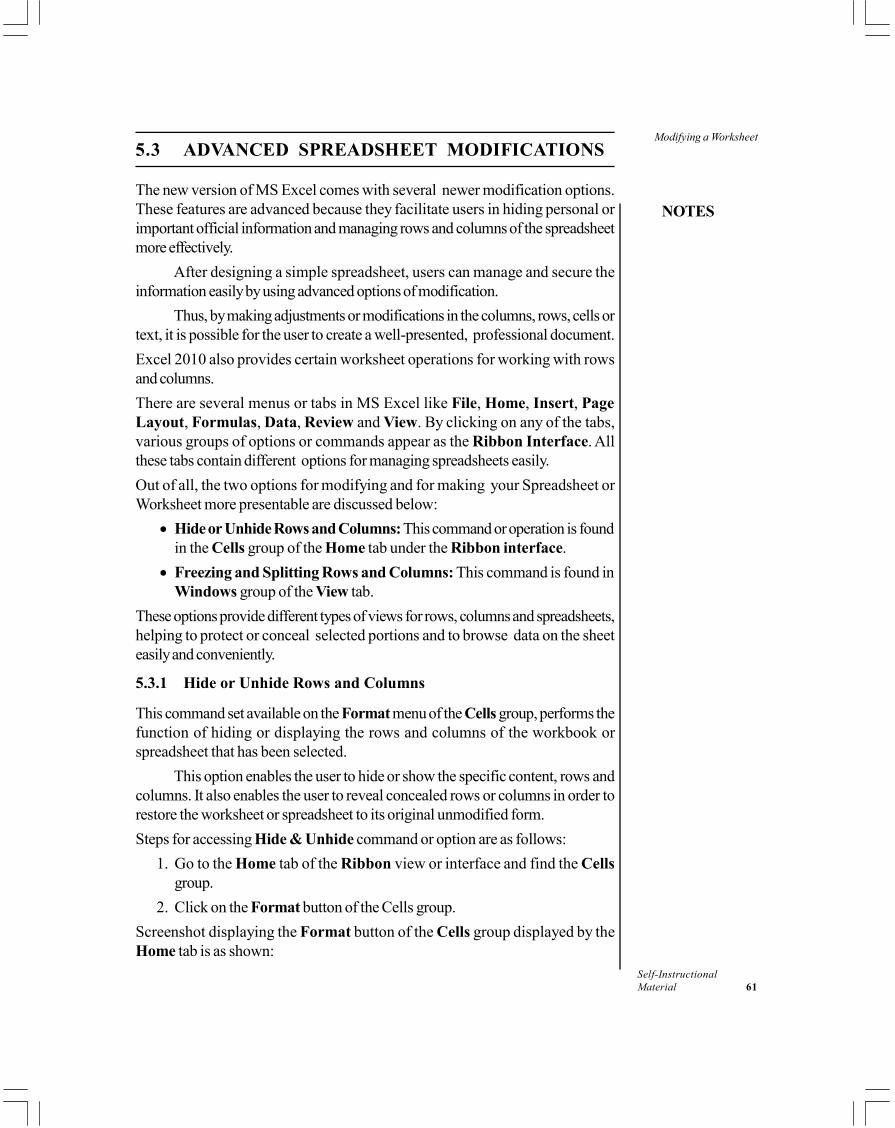
Modifying a Worksheet
NOTES
Self-InstructionalMaterial 61
5.3 ADVANCED SPREADSHEET MODIFICATIONS
The new version of MS Excel comes with several newer modification options.These features are advanced because they facilitate users in hiding personal orimportant official information and managing rows and columns of the spreadsheetmore effectively.
After designing a simple spreadsheet, users can manage and secure theinformation easily by using advanced options of modification.
Thus, by making adjustments or modifications in the columns, rows, cells ortext, it is possible for the user to create a well-presented, professional document.Excel 2010 also provides certain worksheet operations for working with rowsand columns.There are several menus or tabs in MS Excel like File, Home, Insert, PageLayout, Formulas, Data, Review and View. By clicking on any of the tabs,various groups of options or commands appear as the Ribbon Interface. Allthese tabs contain different options for managing spreadsheets easily.Out of all, the two options for modifying and for making your Spreadsheet orWorksheet more presentable are discussed below:
• Hide or Unhide Rows and Columns: This command or operation is foundin the Cells group of the Home tab under the Ribbon interface.
• Freezing and Splitting Rows and Columns: This command is found inWindows group of the View tab.
These options provide different types of views for rows, columns and spreadsheets,helping to protect or conceal selected portions and to browse data on the sheeteasily and conveniently.
5.3.1 Hide or Unhide Rows and Columns
This command set available on the Format menu of the Cells group, performs thefunction of hiding or displaying the rows and columns of the workbook orspreadsheet that has been selected.
This option enables the user to hide or show the specific content, rows andcolumns. It also enables the user to reveal concealed rows or columns in order torestore the worksheet or spreadsheet to its original unmodified form.Steps for accessing Hide & Unhide command or option are as follows:
1. Go to the Home tab of the Ribbon view or interface and find the Cellsgroup.
2. Click on the Format button of the Cells group.Screenshot displaying the Format button of the Cells group displayed by theHome tab is as shown:
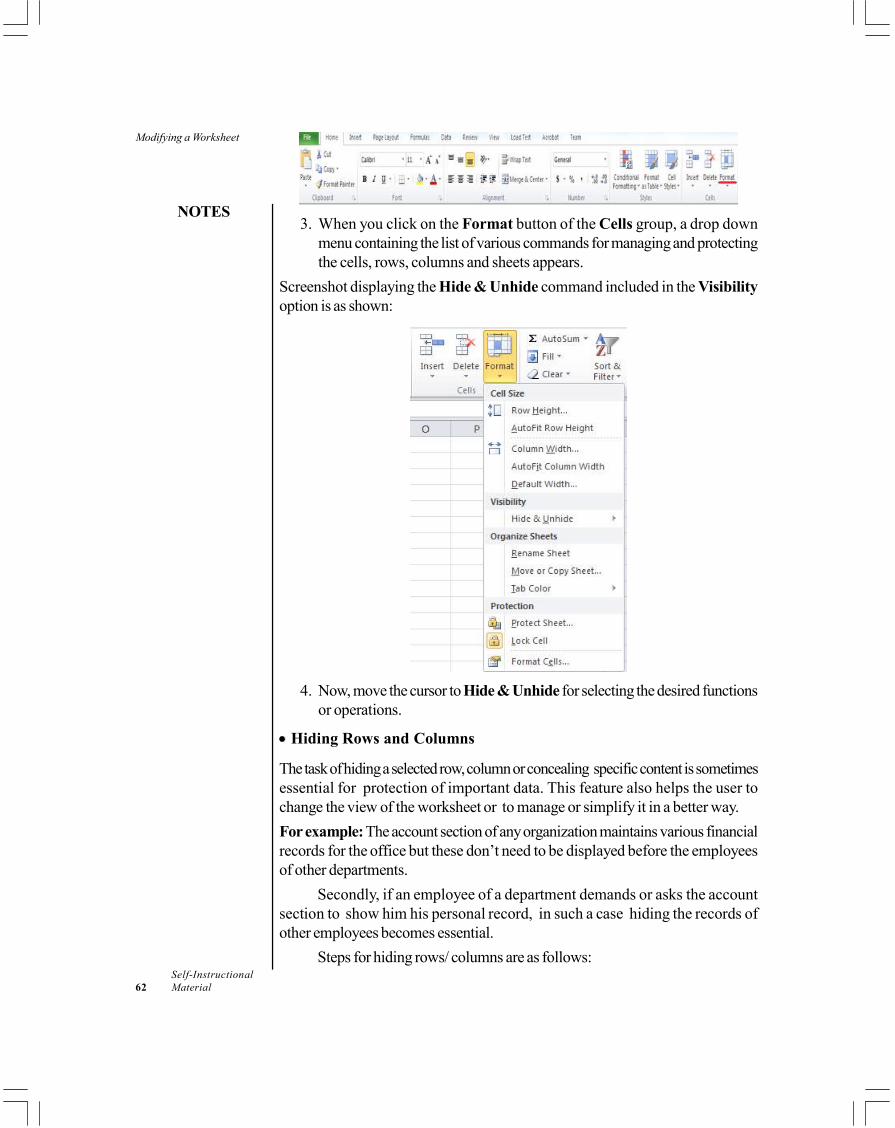
Modifying a Worksheet
NOTES
Self-Instructional62 Material
3. When you click on the Format button of the Cells group, a drop downmenu containing the list of various commands for managing and protectingthe cells, rows, columns and sheets appears.
Screenshot displaying the Hide & Unhide command included in the Visibilityoption is as shown:
4. Now, move the cursor to Hide & Unhide for selecting the desired functionsor operations.
• Hiding Rows and Columns
The task of hiding a selected row, column or concealing specific content is sometimesessential for protection of important data. This feature also helps the user tochange the view of the worksheet or to manage or simplify it in a better way.For example: The account section of any organization maintains various financialrecords for the office but these don’t need to be displayed before the employeesof other departments.
Secondly, if an employee of a department demands or asks the accountsection to show him his personal record, in such a case hiding the records ofother employees becomes essential.
Steps for hiding rows/ columns are as follows:
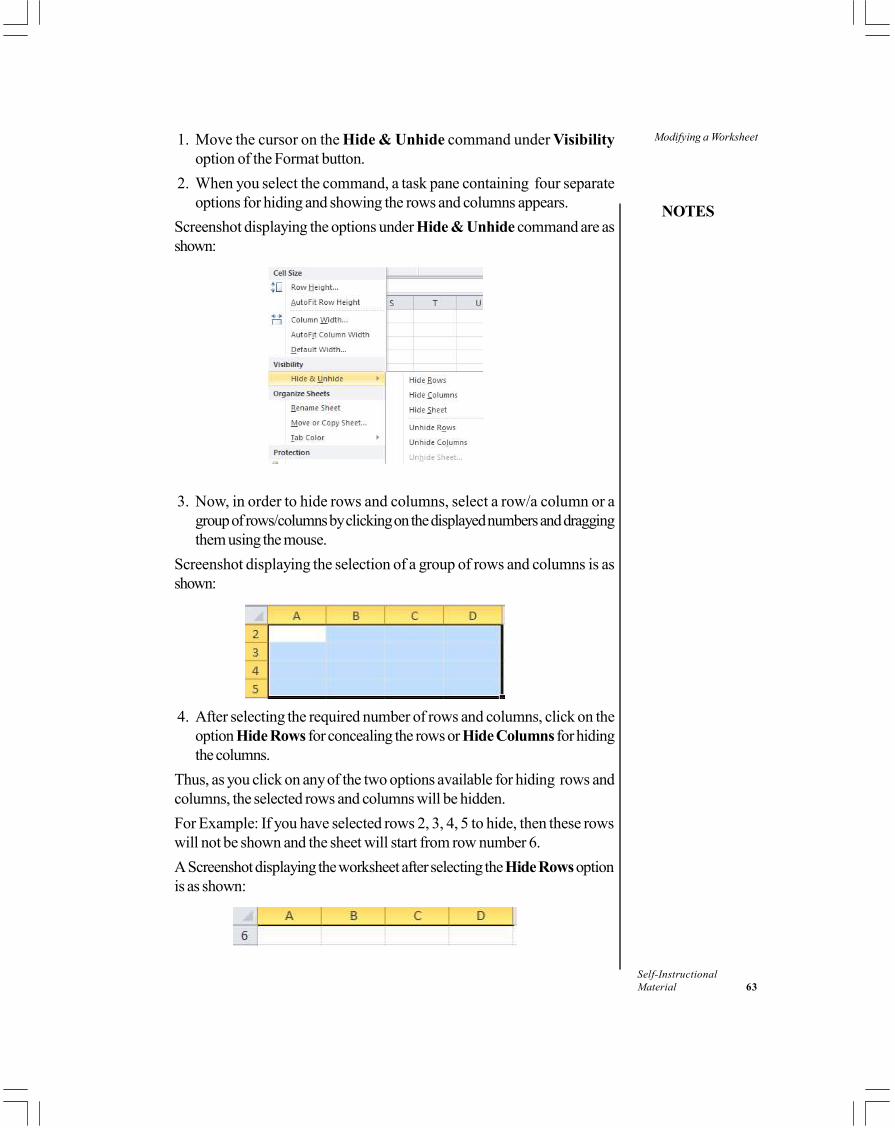
Modifying a Worksheet
NOTES
Self-InstructionalMaterial 63
1. Move the cursor on the Hide & Unhide command under Visibilityoption of the Format button.
2. When you select the command, a task pane containing four separateoptions for hiding and showing the rows and columns appears.
Screenshot displaying the options under Hide & Unhide command are asshown:
3. Now, in order to hide rows and columns, select a row/a column or agroup of rows/columns by clicking on the displayed numbers and draggingthem using the mouse.
Screenshot displaying the selection of a group of rows and columns is asshown:
4. After selecting the required number of rows and columns, click on theoption Hide Rows for concealing the rows or Hide Columns for hidingthe columns.
Thus, as you click on any of the two options available for hiding rows andcolumns, the selected rows and columns will be hidden.For Example: If you have selected rows 2, 3, 4, 5 to hide, then these rowswill not be shown and the sheet will start from row number 6.A Screenshot displaying the worksheet after selecting the Hide Rows optionis as shown:
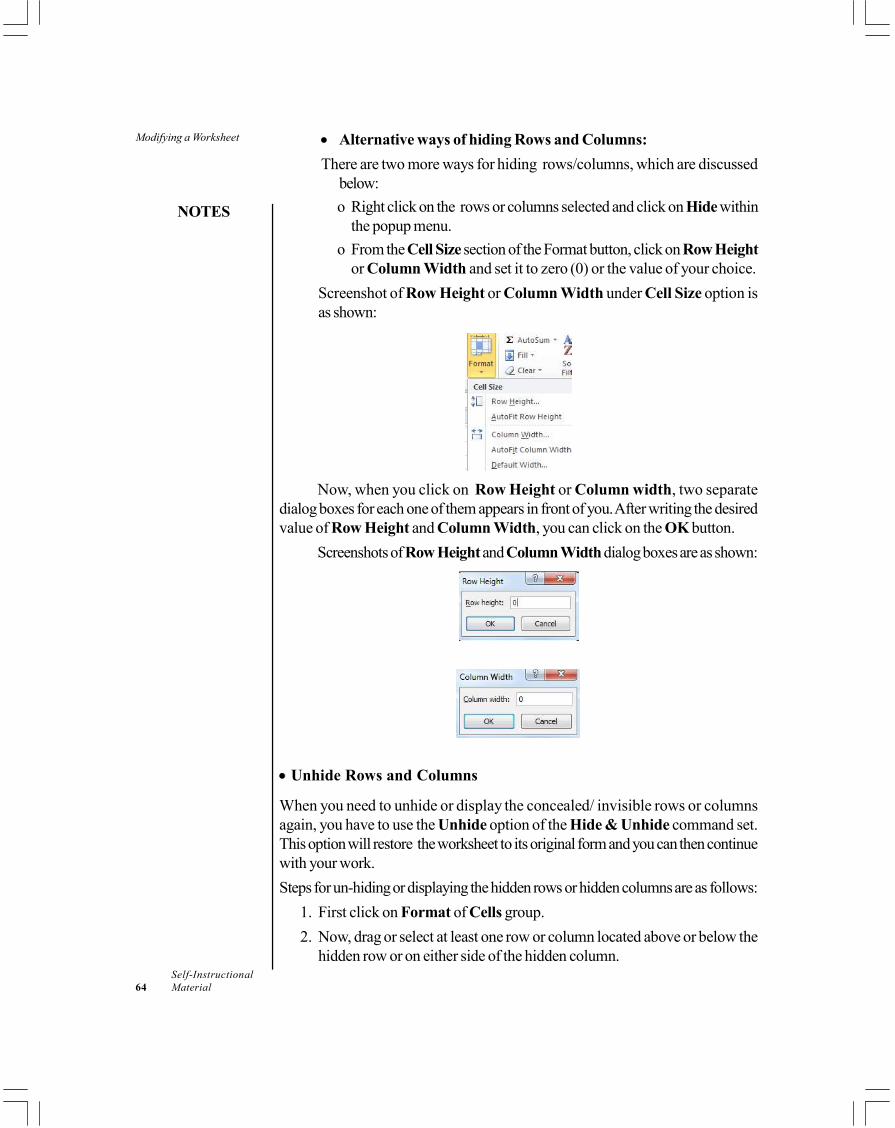
Modifying a Worksheet
NOTES
Self-Instructional64 Material
• Alternative ways of hiding Rows and Columns:There are two more ways for hiding rows/columns, which are discussed
below:o Right click on the rows or columns selected and click on Hide within
the popup menu.o From the Cell Size section of the Format button, click on Row Height
or Column Width and set it to zero (0) or the value of your choice.Screenshot of Row Height or Column Width under Cell Size option isas shown:
Now, when you click on Row Height or Column width, two separatedialog boxes for each one of them appears in front of you. After writing the desiredvalue of Row Height and Column Width, you can click on the OK button.
Screenshots of Row Height and Column Width dialog boxes are as shown:
• Unhide Rows and Columns
When you need to unhide or display the concealed/ invisible rows or columnsagain, you have to use the Unhide option of the Hide & Unhide command set.This option will restore the worksheet to its original form and you can then continuewith your work.Steps for un-hiding or displaying the hidden rows or hidden columns are as follows:
1. First click on Format of Cells group.2. Now, drag or select at least one row or column located above or below the
hidden row or on either side of the hidden column.
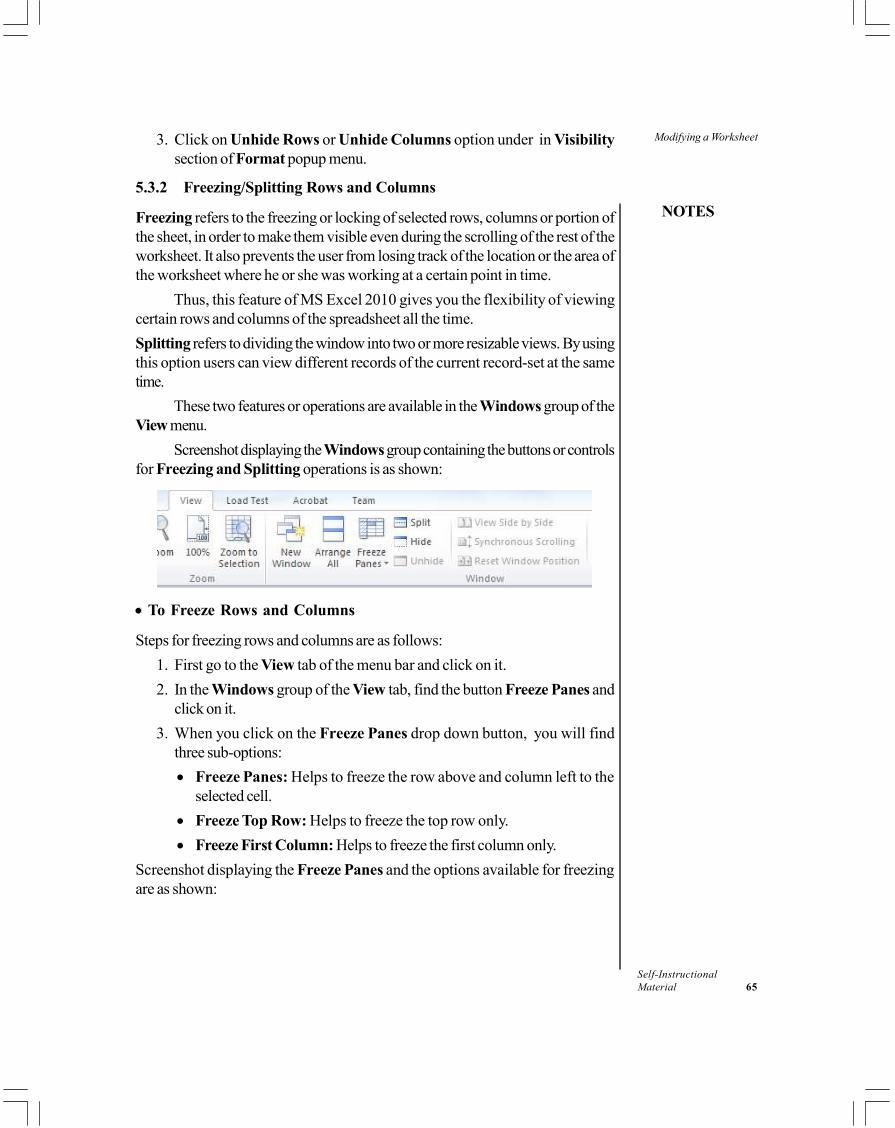
Modifying a Worksheet
NOTES
Self-InstructionalMaterial 65
3. Click on Unhide Rows or Unhide Columns option under in Visibilitysection of Format popup menu.
5.3.2 Freezing/Splitting Rows and Columns
Freezing refers to the freezing or locking of selected rows, columns or portion ofthe sheet, in order to make them visible even during the scrolling of the rest of theworksheet. It also prevents the user from losing track of the location or the area ofthe worksheet where he or she was working at a certain point in time.
Thus, this feature of MS Excel 2010 gives you the flexibility of viewingcertain rows and columns of the spreadsheet all the time.Splitting refers to dividing the window into two or more resizable views. By usingthis option users can view different records of the current record-set at the sametime.
These two features or operations are available in the Windows group of theView menu.
Screenshot displaying the Windows group containing the buttons or controlsfor Freezing and Splitting operations is as shown:
• To Freeze Rows and Columns
Steps for freezing rows and columns are as follows:1. First go to the View tab of the menu bar and click on it.2. In the Windows group of the View tab, find the button Freeze Panes and
click on it.3. When you click on the Freeze Panes drop down button, you will find
three sub-options:• Freeze Panes: Helps to freeze the row above and column left to the
selected cell.• Freeze Top Row: Helps to freeze the top row only.• Freeze First Column: Helps to freeze the first column only.
Screenshot displaying the Freeze Panes and the options available for freezingare as shown:
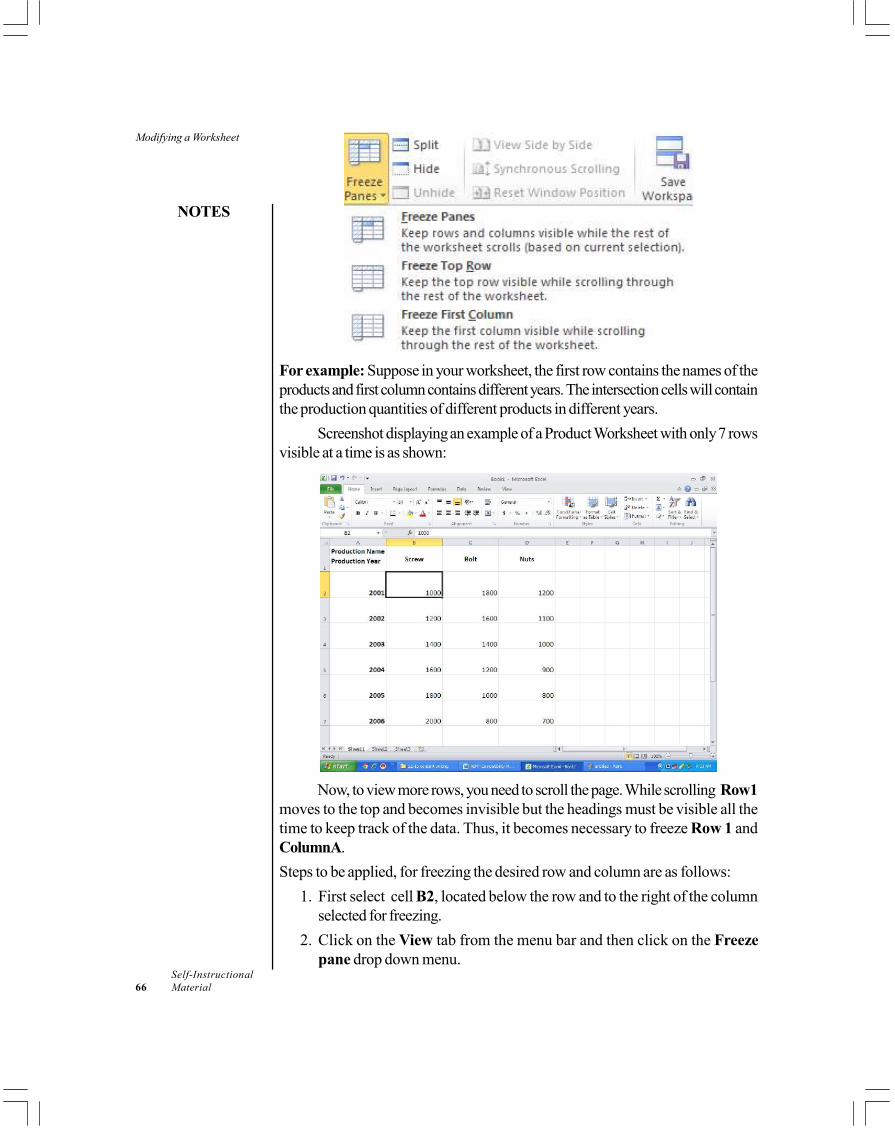
Modifying a Worksheet
NOTES
Self-Instructional66 Material
For example: Suppose in your worksheet, the first row contains the names of theproducts and first column contains different years. The intersection cells will containthe production quantities of different products in different years.
Screenshot displaying an example of a Product Worksheet with only 7 rowsvisible at a time is as shown:
Now, to view more rows, you need to scroll the page. While scrolling Row1moves to the top and becomes invisible but the headings must be visible all thetime to keep track of the data. Thus, it becomes necessary to freeze Row 1 andColumnA.Steps to be applied, for freezing the desired row and column are as follows:
1. First select cell B2, located below the row and to the right of the columnselected for freezing.
2. Click on the View tab from the menu bar and then click on the Freezepane drop down menu.
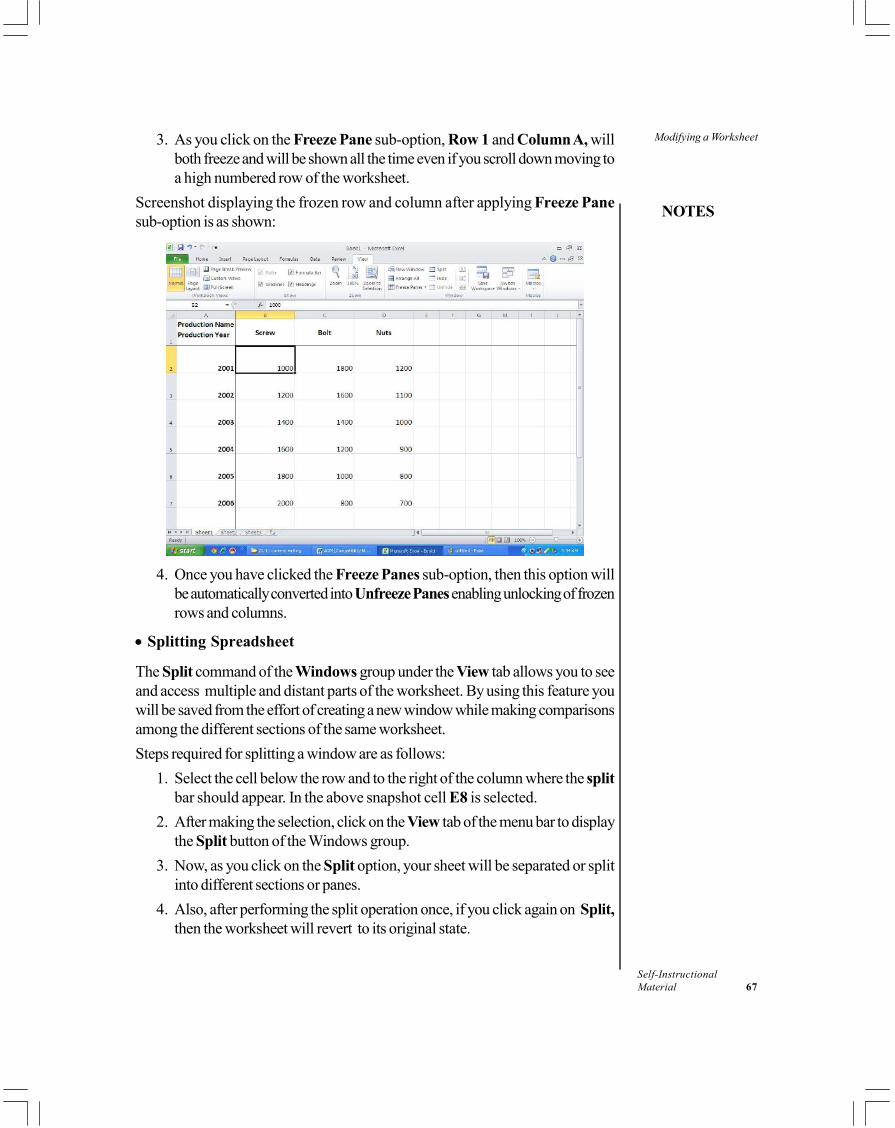
Modifying a Worksheet
NOTES
Self-InstructionalMaterial 67
3. As you click on the Freeze Pane sub-option, Row 1 and Column A, willboth freeze and will be shown all the time even if you scroll down moving toa high numbered row of the worksheet.
Screenshot displaying the frozen row and column after applying Freeze Panesub-option is as shown:
4. Once you have clicked the Freeze Panes sub-option, then this option willbe automatically converted into Unfreeze Panes enabling unlocking of frozenrows and columns.
• Splitting Spreadsheet
The Split command of the Windows group under the View tab allows you to seeand access multiple and distant parts of the worksheet. By using this feature youwill be saved from the effort of creating a new window while making comparisonsamong the different sections of the same worksheet.Steps required for splitting a window are as follows:
1. Select the cell below the row and to the right of the column where the splitbar should appear. In the above snapshot cell E8 is selected.
2. After making the selection, click on the View tab of the menu bar to displaythe Split button of the Windows group.
3. Now, as you click on the Split option, your sheet will be separated or splitinto different sections or panes.
4. Also, after performing the split operation once, if you click again on Split,then the worksheet will revert to its original state.
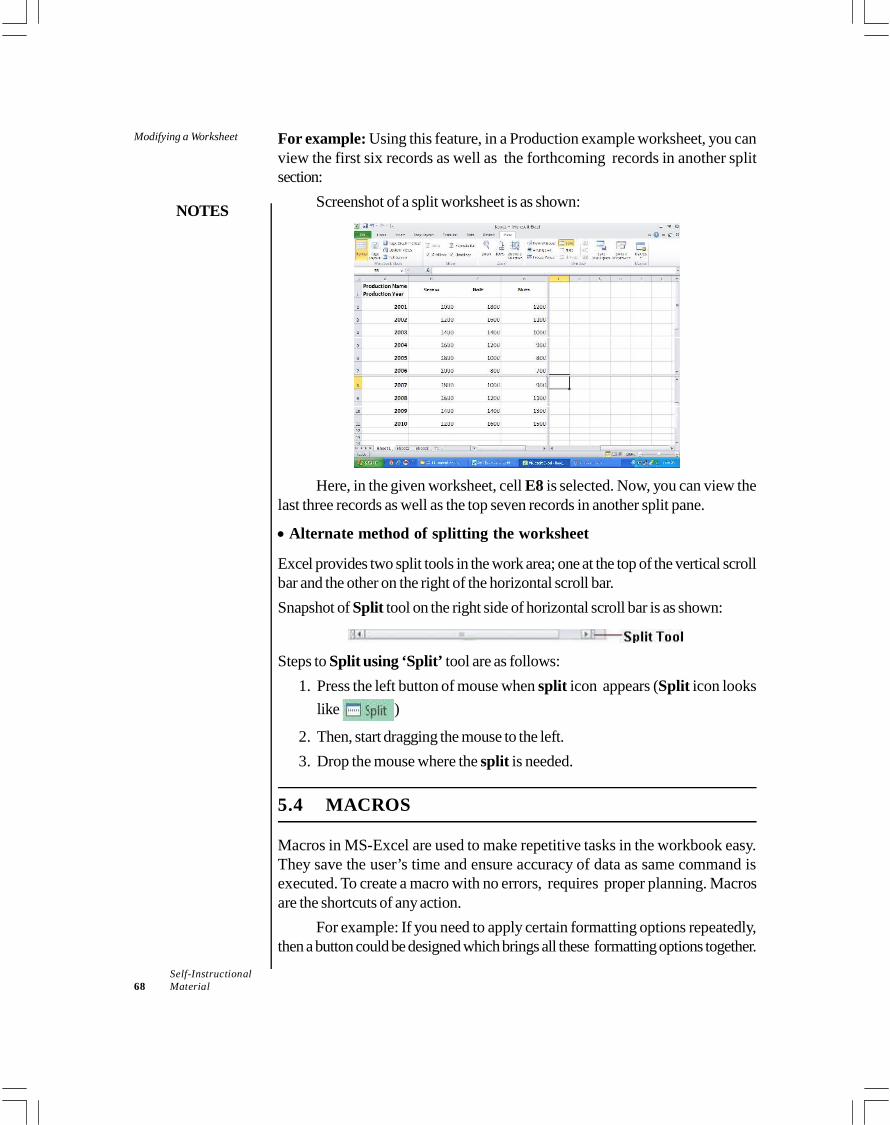
Modifying a Worksheet
NOTES
Self-Instructional68 Material
For example: Using this feature, in a Production example worksheet, you canview the first six records as well as the forthcoming records in another splitsection:
Screenshot of a split worksheet is as shown:
Here, in the given worksheet, cell E8 is selected. Now, you can view thelast three records as well as the top seven records in another split pane.
Alternate method of splitting the worksheet
Excel provides two split tools in the work area; one at the top of the vertical scrollbar and the other on the right of the horizontal scroll bar.Snapshot of Split tool on the right side of horizontal scroll bar is as shown:
Steps to Split using ‘Split’ tool are as follows:1. Press the left button of mouse when split icon appears (Split icon looks
like )
2. Then, start dragging the mouse to the left.3. Drop the mouse where the split is needed.
5.4 MACROS
Macros in MS-Excel are used to make repetitive tasks in the workbook easy.They save the user’s time and ensure accuracy of data as same command isexecuted. To create a macro with no errors, requires proper planning. Macrosare the shortcuts of any action.
For example: If you need to apply certain formatting options repeatedly,then a button could be designed which brings all these formatting options together.
Modifying a Worksheet
NOTES
Self-InstructionalMaterial 69
When this button is clicked, all the options will be applied. This shortcut is calledMacro. You can also assign a shortcut key for running macro.There are two ways of creating a macro in Excel, which are as follows: Macro can be created by using Record Macro option, which records
keystrokes and mouse actions.Method of creating Macro, with the help of Record Macro option is asshown:1. With the help of Record Macro, simple macros can be created. First
click on the Developer tab present on the ribbon.2. After that select Record Macro from Code section. Record Macro
dialog box will appear.3. Write the name of the macros, the user can even specify shortcut key
for the macros, as well as description and place where to store themacros.
4. Click OK button. After that type text in excel specifying which actionuser wants to perform.
5. Finally, Click on Record Macro option once again to stop recordingand to save the macro.
Macros can also be created by using Visual Basic Applicationprogramming language for a set of commands.Method for creating Macro with the help of Visual Basic Application isas follows:1. More complicated macros or tasks can be created by taking up coding
in VBA editor. Click Visual Basic option present inside the Codesection.
2. After clicking, Visual Basis Application for excel sheet will open. Clickon any sheet of Microsoft Excel Objects. The general declaration sectionof Excel will open.
3. Write the macro code in the general declaration section. Provide a propername for the macro. Previous created macros are also edited in VBAeditor. The macro will be created in MS Excel.
Methods to run a Macro
Macros can be tested by running them on the workbook. Macros run in the sameorder as they are created in the worksheet.There are two methods to run a macro which are as follows: Macro Dialog Box: Methods of running a macro with the help of a Macro
Dialog Box is as shown:1. Go to the Developer tab which is present on the ribbon.2. Go to the Code group and click on the Macros option.
Modifying a Worksheet
NOTES
Self-Instructional70 Material
3. A Macro dialog box will appear, with the list of all macros stored orcreated. Select the name of the macro you wish to run and click on Runbutton.
• Record Macro dialog box: The user can also choose to press the shortcutkey to run the macro, but only if the key has been provided during therecording of the macro. This is the fastest way to run the macro. Methodsfor running a macro with the help of Record Macro dialog box is as shown:1. Click on Record Macro option present in the Code section.2. In Code section, provide a shortcut key to run to macro. In order to run
the macro, a shortcut key button is pressed, with the help of a keyword.
Editing a Macro
Macros are basically a programmed sub-module scripted in VBA (Visual Basicfor Application) and are editable inside the VB editor present in MS-Excel. Theuser can create macros either by recording them or coding them in VBA editor.Also, macros can be edited, whenever required by the user. However, the usershould be careful while editing a macro as a small mistake or error in theprogramming of macro, can change into a run-time error thus affecting the workingof the macro.
Steps which are required for editing a macro are as follows:1. In the Code group of Developer tab, click on Macros option. A list of
all Macros will appear in the macro dialog box.2. Select the macro which needs to be edited.3. Click on the Edit button on the right hand side. The VBA editor will
open. The user can edit the macro here.
Saving a Macro in Workbook
When a macro is saved in the normal Excel workbook format, a dialog box appearsgiving you Yes and No options. If you want to save a file or workbook withoutthe macros, click on the Yes button.
Screenshot displaying the dialog box wherein macro is saved in a normalExcel workbook is as shown:
Modifying a Worksheet
NOTES
Self-InstructionalMaterial 71
The method to save a macro in the workbook is as follows:1. To save the workbook with the macros, click on the No button.2. When the No button is clicked, the Save As dialog box appears asking the
user about the location and format of the file. Basically, macros are notsaved in the general Excel workbook format i.e. the .xlsx extension. Instead,they are stored in macro enabled workbook format i.e. in.xlsm extension.
From the Save As Type drop down, select Excel Macro-Enabled Workbook.Then, click on Save button. Now, the excel workbook is saved with macros.
Check Your Progress
1. What is the file format extension of worksheet?2. What are the steps required to edit a macro?
5.5 ANSWERS TO CHECK YOUR PROGRESSQUESTIONS
1. In Microsoft Excel 2010, files are saved in .xlsx format.2. Steps which are required for editing a macro are as follows:
(i) In the Code group of Developer tab, click on Macros option. A listof all Macros will appear in the macro dialog box.
(ii) Select the macro which needs to be edited.(iii) Click on the Edit button on the right hand side. The VBA editor will
open. The user can edit the macro here.
5.6 SUMMARY
• Microsoft Excel is used for storing the data in the form of table. It is used byseveral organizations to perform complex calculations, statistical analysisand tracking income and expenses.
• Hide or Unhide Rows and Columns command or operation is found in theCells group of the Home tab under the Ribbon interface.
• Freezing and Splitting Rows and Columns command is found in Windowsgroup of the View tab.
• Freezing refers to the freezing or locking of selected rows, columns or portionof the sheet, in order to make them visible even during the scrolling of therest of the worksheet. It also prevents the user from losing track of thelocation or the area of the worksheet where he or she was working at acertain point in time.
Modifying a Worksheet
NOTES
Self-Instructional72 Material
• Macros in MS-Excel are used to make repetitive tasks in the workbookeasy. They save the user’s time and ensure accuracy of data as samecommand is executed.
5.7 KEY WORDS
• Cell: It is the interaction of row and column.• Worksheet: It is the Excel sheet in workbook.• Workbook: It is Excel document that contains Excel sheets.
5.8 SELF ASSESSMENT QUESTIONS ANDEXERCISES
1. Apply the various shortcut keys on a worksheet.2. Use hide or unhide and freeze or split options on rows and columns of a
worksheet.3. Create and run a macro in MS Excel 2010.
5.9 FURTHER READINGS
Srivastava, S.S. 2008. MS Office. New Delhi: Firewall Media.Saxena, Sanjay. 2011. MS Office 2007 in a Nutshell. Noida: Vikas Publishing
house.Courter, Gini and Annette Marquis. 1999. Mastering Microsoft Office 2000.
New Delhi: BPB Publications.Blattner, Patrick, Ken Cook, Laurie Ulrich and Timothy Dyck. 1999. Special
Edition Using Microsoft Excel 2000. New Delhi: Prentice-Hall of India.
Formatting Cells
NOTES
Self-InstructionalMaterial 73
UNIT 6 FORMATTING CELLS
Structure6.0 Introduction6.1 Objectives6.2 Hyperlinks in MS Excel
6.2.1 Find, Replace and Go to6.3 All Formulas and Functions
6.3.1 Working with Arithmetic Operators6.3.2 Text Functions6.3.3 Date and Time Functions6.3.4 Math Functions6.3.5 Statistical Functions6.3.6 Cell Referencing in Excel 2010
6.4 Answers to Check Your Progress Questions6.5 Summary6.6 Key Words6.7 Self Assessment Questions and Exercises6.8 Further Readings
6.0 INTRODUCTION
In this unit, you will learn about the hyperlinks, formulae and functions. Excel file isa workbook that contains one or more worksheets. Hyperlinks in excel files helpsin navigating between worksheets. By default, each Excel file has three worksheets.You will also learn to insert formulae and functions that makes working simplerand easier.
6.1 OBJECTIVES
After going through this unit, you will be able to:• Create hyperlinks in MS Excel• Insert formulae and functions• Explain types of cell referencing
6.2 HYPERLINKS IN MS EXCEL
Hyperlink provides a connection enabling the user to open another worksheet orworkbook or any website. Text written in any cell may be defined as hyperlink.Text or picture in a cell when clicked, works as a link helping to open target file.Hyperlinks are generally used for navigating between worksheets, different filesor different web pages.
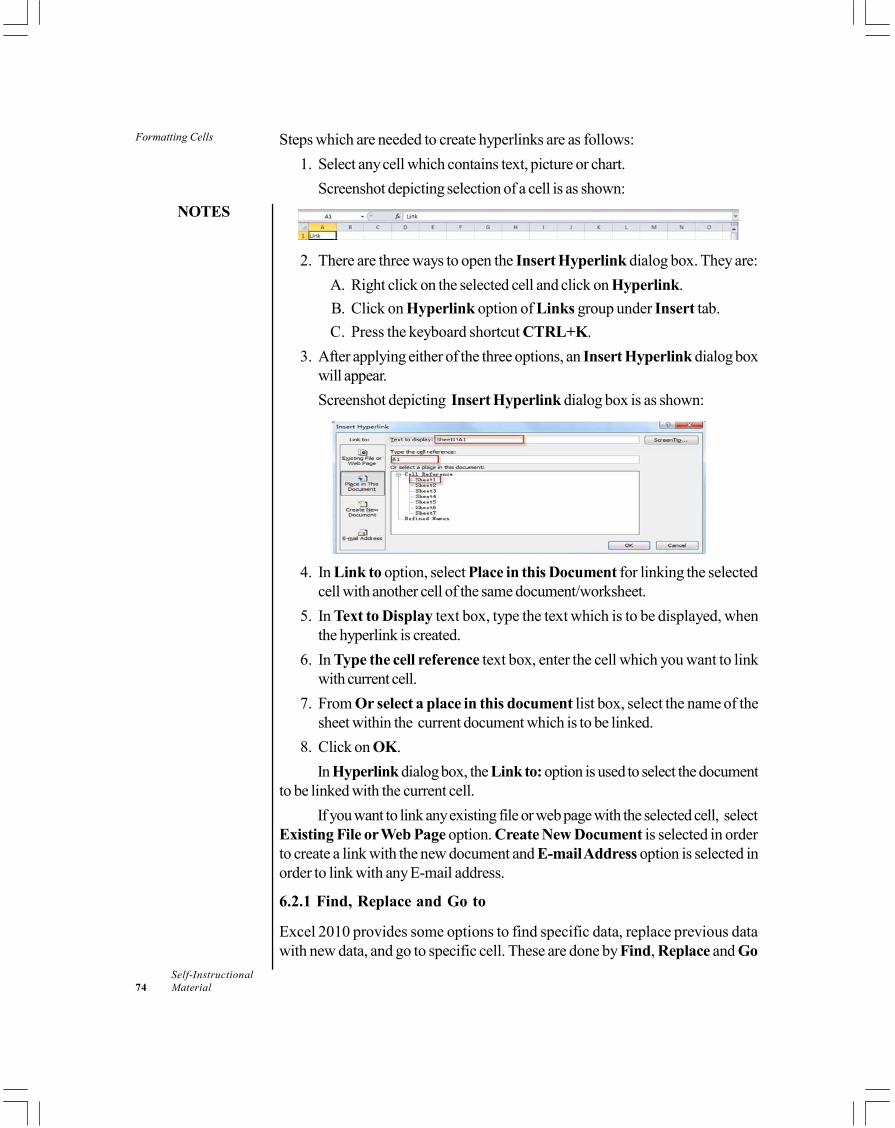
Formatting Cells
NOTES
Self-Instructional74 Material
Steps which are needed to create hyperlinks are as follows:1. Select any cell which contains text, picture or chart.
Screenshot depicting selection of a cell is as shown:
2. There are three ways to open the Insert Hyperlink dialog box. They are:A. Right click on the selected cell and click on Hyperlink.B. Click on Hyperlink option of Links group under Insert tab.C. Press the keyboard shortcut CTRL+K.
3. After applying either of the three options, an Insert Hyperlink dialog boxwill appear.Screenshot depicting Insert Hyperlink dialog box is as shown:
4. In Link to option, select Place in this Document for linking the selectedcell with another cell of the same document/worksheet.
5. In Text to Display text box, type the text which is to be displayed, whenthe hyperlink is created.
6. In Type the cell reference text box, enter the cell which you want to linkwith current cell.
7. From Or select a place in this document list box, select the name of thesheet within the current document which is to be linked.
8. Click on OK.In Hyperlink dialog box, the Link to: option is used to select the document
to be linked with the current cell.If you want to link any existing file or web page with the selected cell, select
Existing File or Web Page option. Create New Document is selected in orderto create a link with the new document and E-mail Address option is selected inorder to link with any E-mail address.
6.2.1 Find, Replace and Go to
Excel 2010 provides some options to find specific data, replace previous datawith new data, and go to specific cell. These are done by Find, Replace and Go
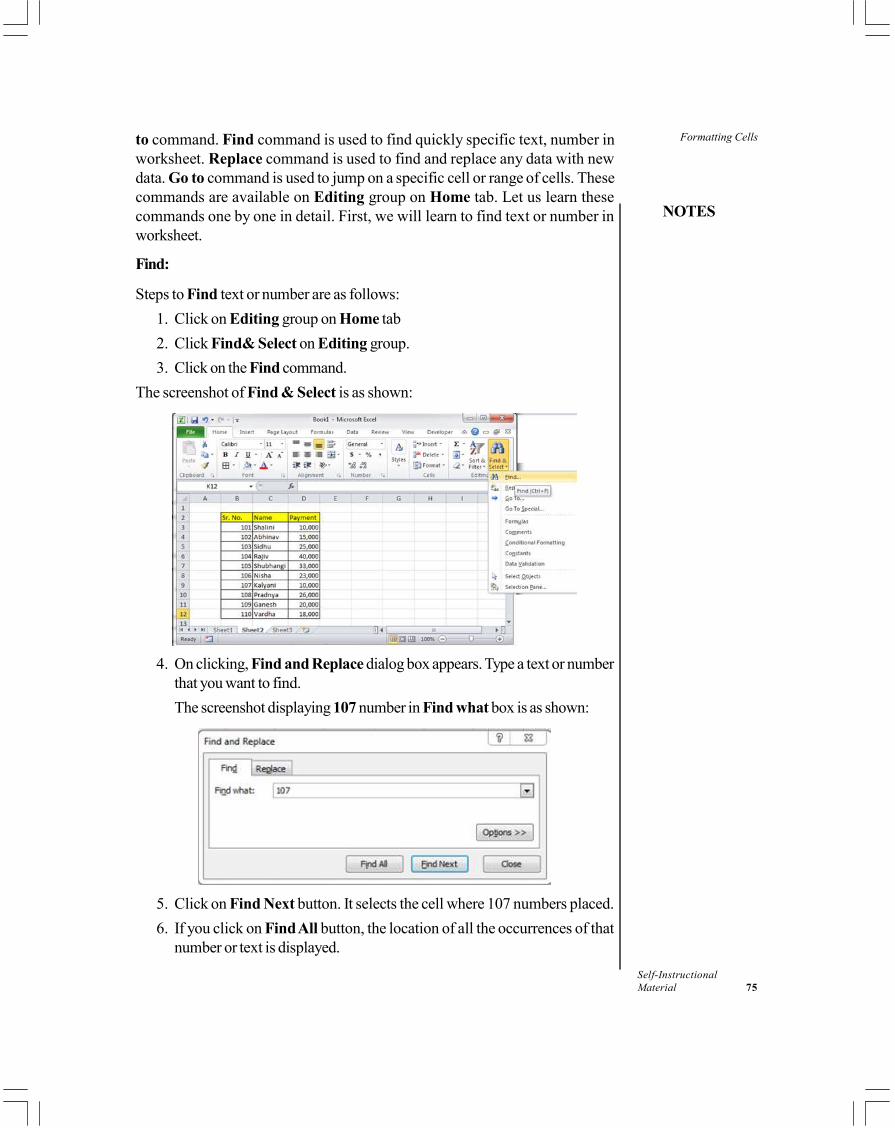
Formatting Cells
NOTES
Self-InstructionalMaterial 75
to command. Find command is used to find quickly specific text, number inworksheet. Replace command is used to find and replace any data with newdata. Go to command is used to jump on a specific cell or range of cells. Thesecommands are available on Editing group on Home tab. Let us learn thesecommands one by one in detail. First, we will learn to find text or number inworksheet.
Find:
Steps to Find text or number are as follows:1. Click on Editing group on Home tab2. Click Find& Select on Editing group.3. Click on the Find command.
The screenshot of Find & Select is as shown:
4. On clicking, Find and Replace dialog box appears. Type a text or numberthat you want to find.The screenshot displaying 107 number in Find what box is as shown:
5. Click on Find Next button. It selects the cell where 107 numbers placed.6. If you click on Find All button, the location of all the occurrences of that
number or text is displayed.
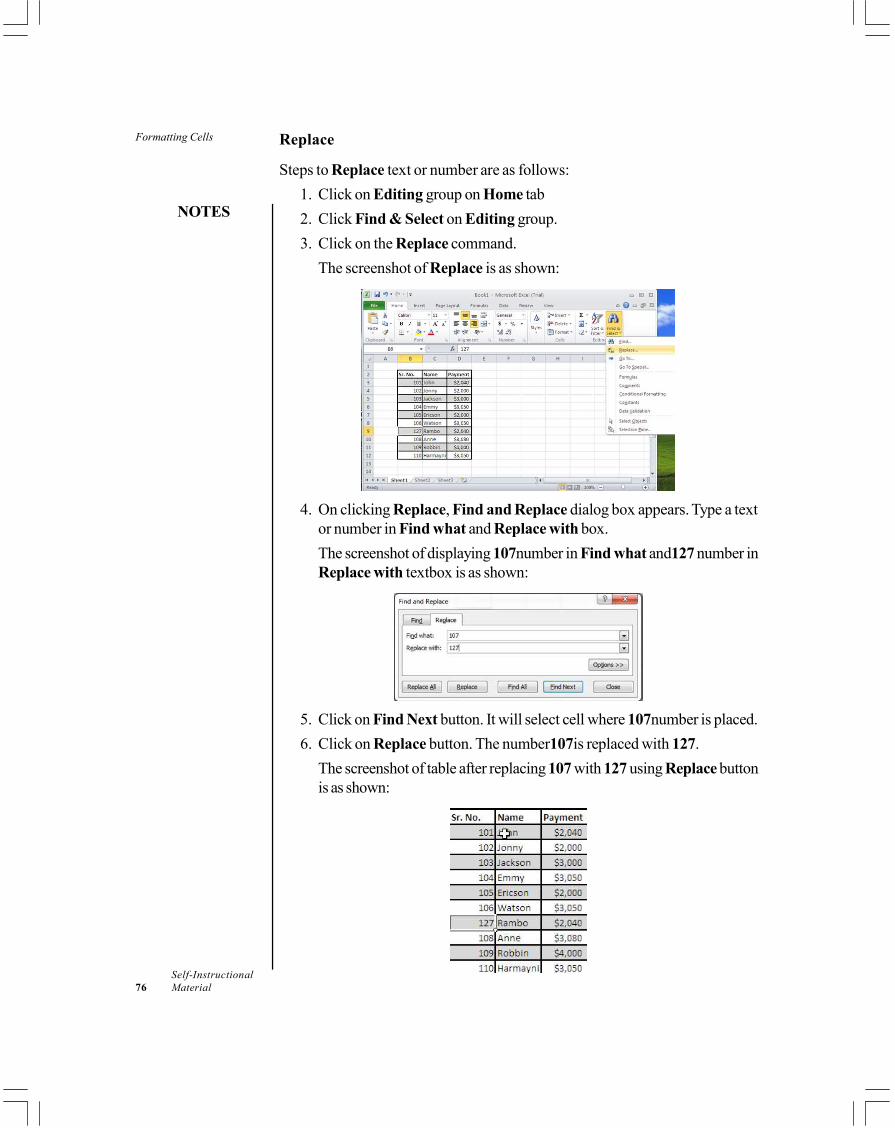
Formatting Cells
NOTES
Self-Instructional76 Material
Replace
Steps to Replace text or number are as follows:1. Click on Editing group on Home tab2. Click Find & Select on Editing group.3. Click on the Replace command.
The screenshot of Replace is as shown:
4. On clicking Replace, Find and Replace dialog box appears. Type a textor number in Find what and Replace with box.The screenshot of displaying 107number in Find what and127 number inReplace with textbox is as shown:
5. Click on Find Next button. It will select cell where 107number is placed.6. Click on Replace button. The number107is replaced with 127.
The screenshot of table after replacing 107 with 127 using Replace buttonis as shown:
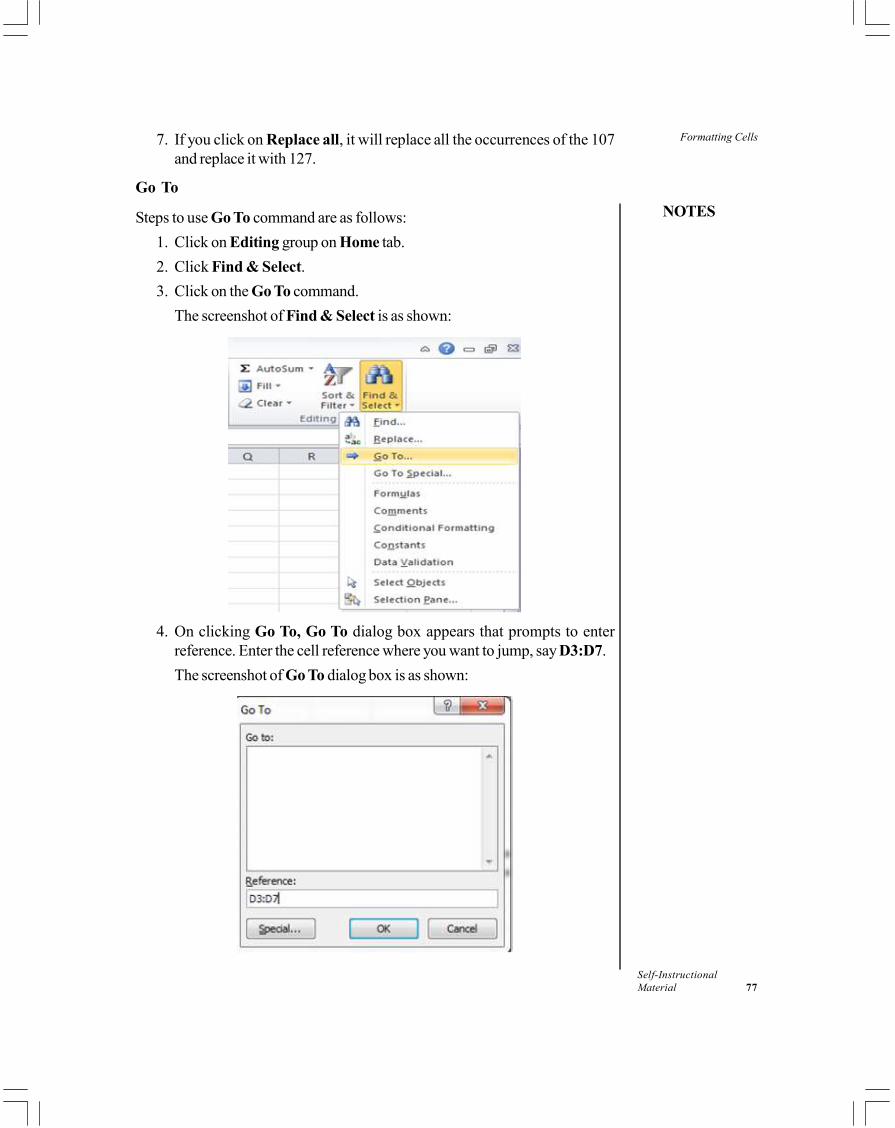
Formatting Cells
NOTES
Self-InstructionalMaterial 77
7. If you click on Replace all, it will replace all the occurrences of the 107and replace it with 127.
Go To
Steps to use Go To command are as follows:1. Click on Editing group on Home tab.2. Click Find & Select.3. Click on the Go To command.
The screenshot of Find & Select is as shown:
4. On clicking Go To, Go To dialog box appears that prompts to enterreference. Enter the cell reference where you want to jump, say D3:D7.The screenshot of Go To dialog box is as shown:
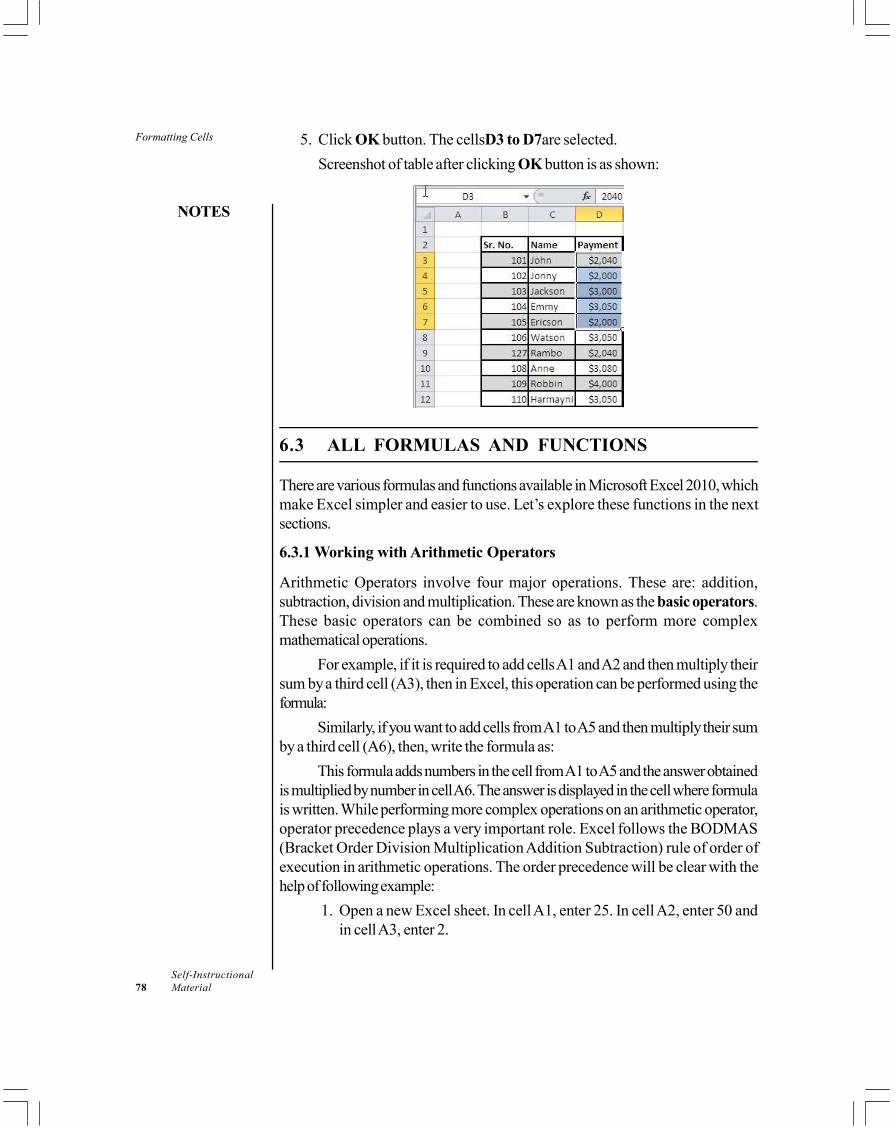
Formatting Cells
NOTES
Self-Instructional78 Material
5. Click OK button. The cellsD3 to D7are selected.Screenshot of table after clicking OK button is as shown:
6.3 ALL FORMULAS AND FUNCTIONS
There are various formulas and functions available in Microsoft Excel 2010, whichmake Excel simpler and easier to use. Let’s explore these functions in the nextsections.
6.3.1 Working with Arithmetic Operators
Arithmetic Operators involve four major operations. These are: addition,subtraction, division and multiplication. These are known as the basic operators.These basic operators can be combined so as to perform more complexmathematical operations.
For example, if it is required to add cells A1 and A2 and then multiply theirsum by a third cell (A3), then in Excel, this operation can be performed using theformula:
Similarly, if you want to add cells from A1 to A5 and then multiply their sumby a third cell (A6), then, write the formula as:
This formula adds numbers in the cell from A1 to A5 and the answer obtainedis multiplied by number in cell A6. The answer is displayed in the cell where formulais written. While performing more complex operations on an arithmetic operator,operator precedence plays a very important role. Excel follows the BODMAS(Bracket Order Division Multiplication Addition Subtraction) rule of order ofexecution in arithmetic operations. The order precedence will be clear with thehelp of following example:
1. Open a new Excel sheet. In cell A1, enter 25. In cell A2, enter 50 andin cell A3, enter 2.
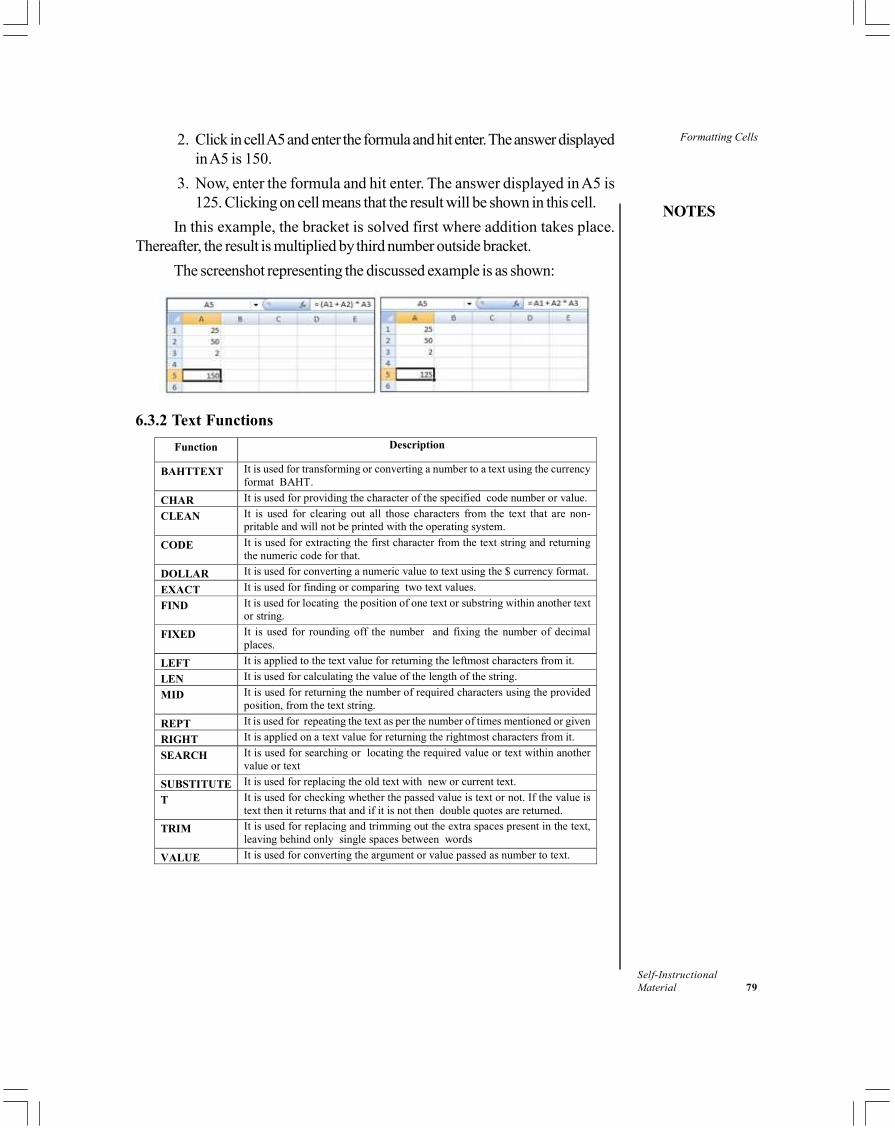
Formatting Cells
NOTES
Self-InstructionalMaterial 79
2. Click in cell A5 and enter the formula and hit enter. The answer displayedin A5 is 150.
3. Now, enter the formula and hit enter. The answer displayed in A5 is125. Clicking on cell means that the result will be shown in this cell.
In this example, the bracket is solved first where addition takes place.Thereafter, the result is multiplied by third number outside bracket.
The screenshot representing the discussed example is as shown:
6.3.2 Text FunctionsFunction Description
BAHTTEXT It is used for transforming or converting a number to a text using the currency format BAHT.
CHAR It is used for providing the character of the specified code number or value. CLEAN It is used for clearing out all those characters from the text that are non-
pritable and will not be printed with the operating system.
CODE It is used for extracting the first character from the text string and returning the numeric code for that.
DOLLAR It is used for converting a numeric value to text using the $ currency format.
EXACT It is used for finding or comparing two text values. FIND It is used for locating the position of one text or substring within another text
or string. FIXED It is used for rounding off the number and fixing the number of decimal
places. LEFT It is applied to the text value for returning the leftmost characters from it. LEN It is used for calculating the value of the length of the string. MID It is used for returning the number of required characters using the provided
position, from the text string. REPT It is used for repeating the text as per the number of times mentioned or given RIGHT It is applied on a text value for returning the rightmost characters from it.
SEARCH It is used for searching or locating the required value or text within another value or text
SUBSTITUTE It is used for replacing the old text with new or current text. T It is used for checking whether the passed value is text or not. If the value is
text then it returns that and if it is not then double quotes are returned. TRIM It is used for replacing and trimming out the extra spaces present in the text,
leaving behind only single spaces between words
VALUE It is used for converting the argument or value passed as number to text.
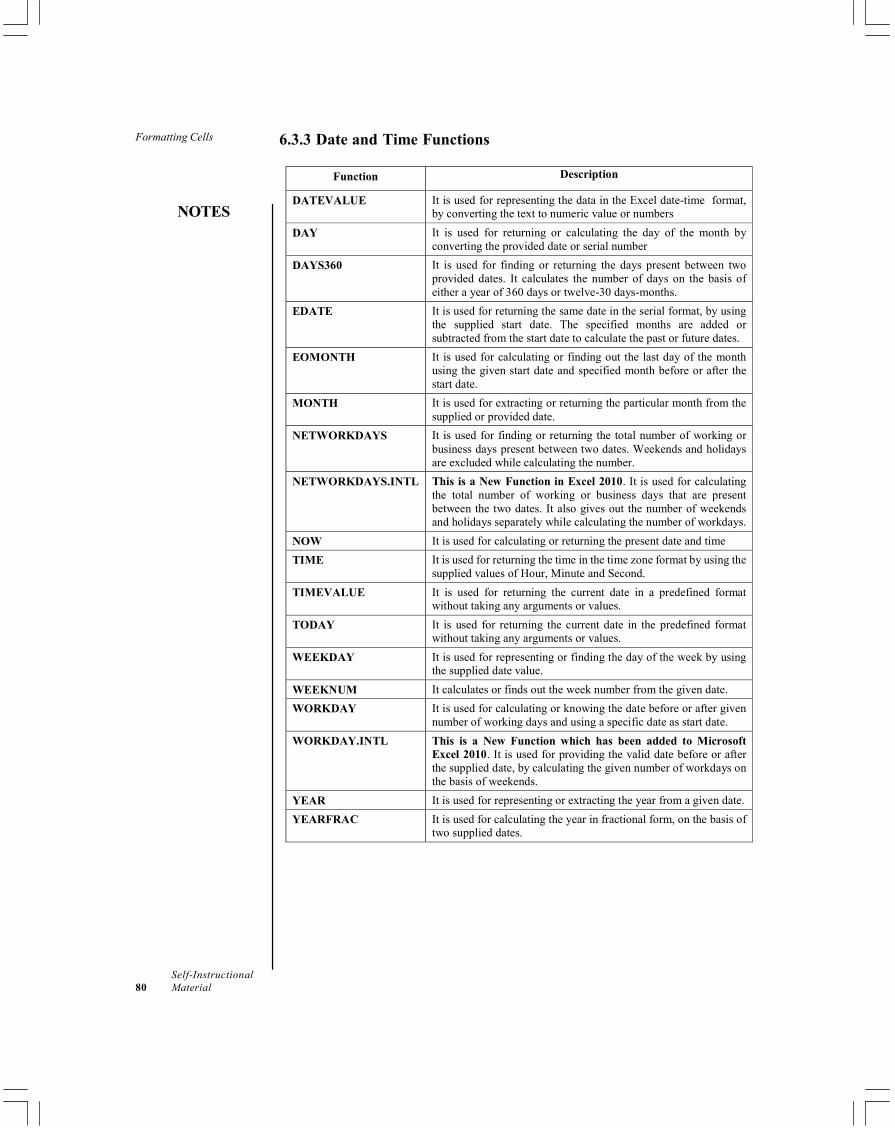
Formatting Cells
NOTES
Self-Instructional80 Material
6.3.3 Date and Time Functions
Function Description
DATEVALUE It is used for representing the data in the Excel date-time format, by converting the text to numeric value or numbers
DAY It is used for returning or calculating the day of the month by converting the provided date or serial number
DAYS360 It is used for finding or returning the days present between two provided dates. It calculates the number of days on the basis of either a year of 360 days or twelve-30 days-months.
EDATE It is used for returning the same date in the serial format, by using the supplied start date. The specified months are added or subtracted from the start date to calculate the past or future dates.
EOMONTH It is used for calculating or finding out the last day of the month using the given start date and specified month before or after the start date.
MONTH It is used for extracting or returning the particular month from the supplied or provided date.
NETWORKDAYS It is used for finding or returning the total number of working or business days present between two dates. Weekends and holidays are excluded while calculating the number.
NETWORKDAYS.INTL This is a New Function in Excel 2010. It is used for calculating the total number of working or business days that are present between the two dates. It also gives out the number of weekends and holidays separately while calculating the number of workdays.
NOW It is used for calculating or returning the present date and time TIME It is used for returning the time in the time zone format by using the
supplied values of Hour, Minute and Second. TIMEVALUE It is used for returning the current date in a predefined format
without taking any arguments or values. TODAY It is used for returning the current date in the predefined format
without taking any arguments or values. WEEKDAY It is used for representing or finding the day of the week by using
the supplied date value.
WEEKNUM It calculates or finds out the week number from the given date. WORKDAY It is used for calculating or knowing the date before or after given
number of working days and using a specific date as start date. WORKDAY.INTL This is a New Function which has been added to Microsoft
Excel 2010. It is used for providing the valid date before or after the supplied date, by calculating the given number of workdays on the basis of weekends.
YEAR It is used for representing or extracting the year from a given date. YEARFRAC It is used for calculating the year in fractional form, on the basis of
two supplied dates.
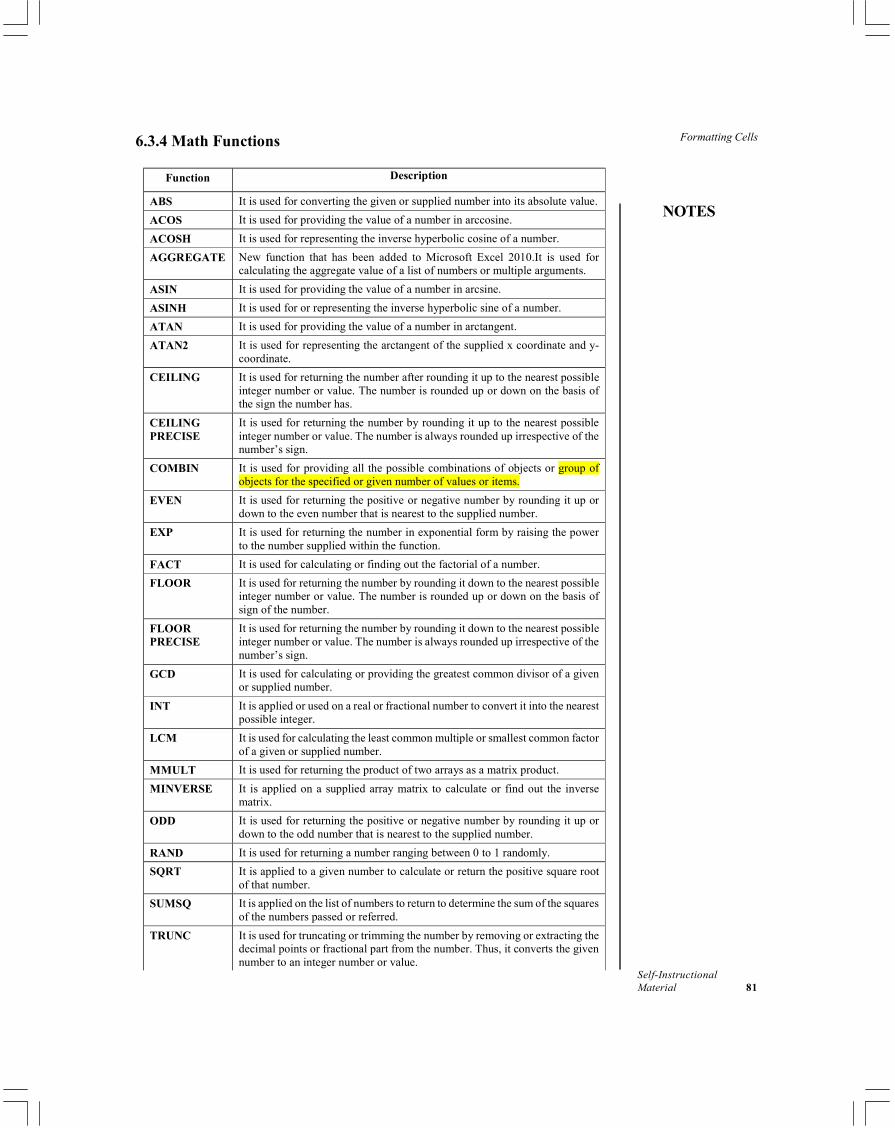
Formatting Cells
NOTES
Self-InstructionalMaterial 81
6.3.4 Math Functions
Function Description
ABS It is used for converting the given or supplied number into its absolute value. ACOS It is used for providing the value of a number in arccosine. ACOSH It is used for representing the inverse hyperbolic cosine of a number. AGGREGATE New function that has been added to Microsoft Excel 2010.It is used for
calculating the aggregate value of a list of numbers or multiple arguments. ASIN It is used for providing the value of a number in arcsine. ASINH It is used for or representing the inverse hyperbolic sine of a number. ATAN It is used for providing the value of a number in arctangent. ATAN2 It is used for representing the arctangent of the supplied x coordinate and y-
coordinate. CEILING It is used for returning the number after rounding it up to the nearest possible
integer number or value. The number is rounded up or down on the basis of the sign the number has.
CEILING PRECISE
It is used for returning the number by rounding it up to the nearest possible integer number or value. The number is always rounded up irrespective of the number’s sign.
COMBIN It is used for providing all the possible combinations of objects or group of objects for the specified or given number of values or items.
EVEN It is used for returning the positive or negative number by rounding it up or down to the even number that is nearest to the supplied number.
EXP It is used for returning the number in exponential form by raising the power to the number supplied within the function.
FACT It is used for calculating or finding out the factorial of a number. FLOOR It is used for returning the number by rounding it down to the nearest possible
integer number or value. The number is rounded up or down on the basis of sign of the number.
FLOOR PRECISE
It is used for returning the number by rounding it down to the nearest possible integer number or value. The number is always rounded up irrespective of the number’s sign.
GCD It is used for calculating or providing the greatest common divisor of a given or supplied number.
INT It is applied or used on a real or fractional number to convert it into the nearest possible integer.
LCM It is used for calculating the least common multiple or smallest common factor of a given or supplied number.
MMULT It is used for returning the product of two arrays as a matrix product. MINVERSE It is applied on a supplied array matrix to calculate or find out the inverse
matrix. ODD It is used for returning the positive or negative number by rounding it up or
down to the odd number that is nearest to the supplied number. RAND It is used for returning a number ranging between 0 to 1 randomly. SQRT It is applied to a given number to calculate or return the positive square root
of that number. SUMSQ It is applied on the list of numbers to return to determine the sum of the squares
of the numbers passed or referred. TRUNC It is used for truncating or trimming the number by removing or extracting the
decimal points or fractional part from the number. Thus, it converts the given number to an integer number or value.
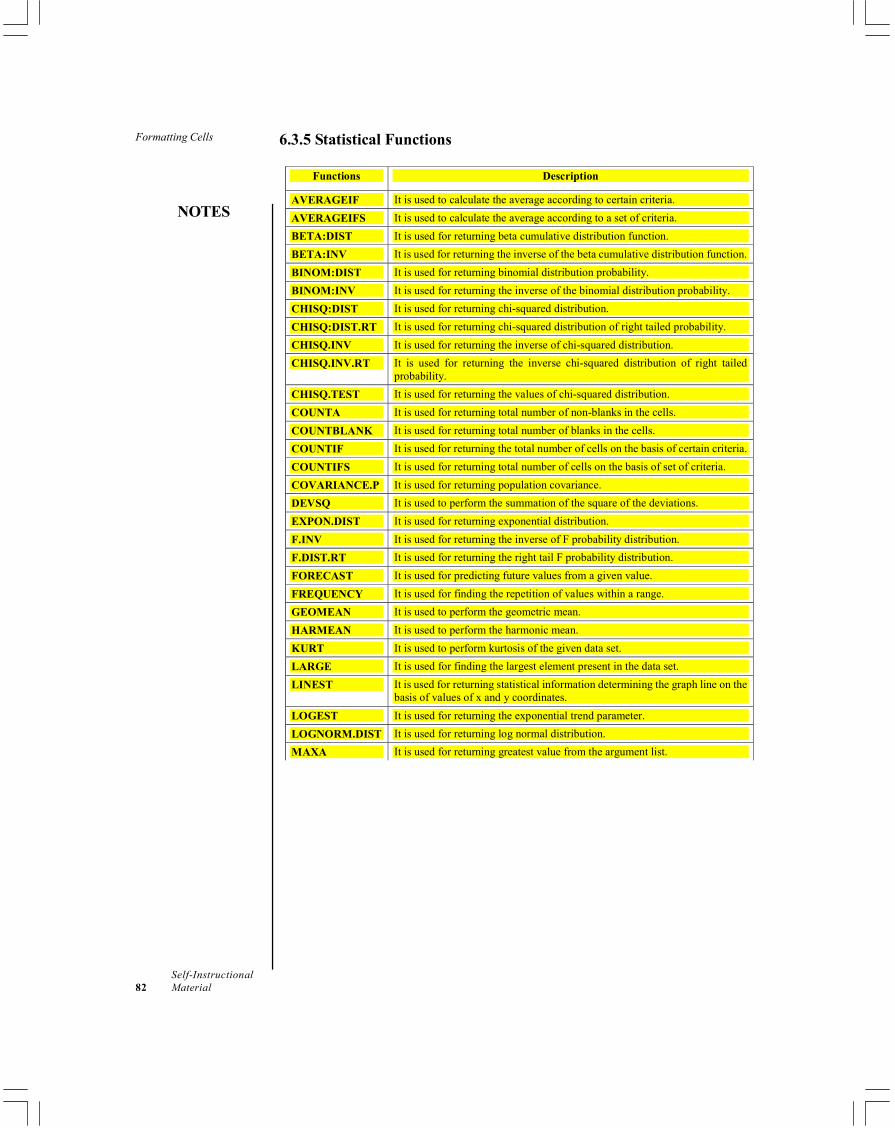
Formatting Cells
NOTES
Self-Instructional82 Material
6.3.5 Statistical Functions
Functions Description
AVERAGEIF It is used to calculate the average according to certain criteria. AVERAGEIFS It is used to calculate the average according to a set of criteria. BETA:DIST It is used for returning beta cumulative distribution function. BETA:INV It is used for returning the inverse of the beta cumulative distribution function. BINOM:DIST It is used for returning binomial distribution probability. BINOM:INV It is used for returning the inverse of the binomial distribution probability. CHISQ:DIST It is used for returning chi-squared distribution. CHISQ:DIST.RT It is used for returning chi-squared distribution of right tailed probability. CHISQ.INV It is used for returning the inverse of chi-squared distribution. CHISQ.INV.RT It is used for returning the inverse chi-squared distribution of right tailed
probability. CHISQ.TEST It is used for returning the values of chi-squared distribution. COUNTA It is used for returning total number of non-blanks in the cells. COUNTBLANK It is used for returning total number of blanks in the cells. COUNTIF It is used for returning the total number of cells on the basis of certain criteria. COUNTIFS It is used for returning total number of cells on the basis of set of criteria. COVARIANCE.P It is used for returning population covariance. DEVSQ It is used to perform the summation of the square of the deviations. EXPON.DIST It is used for returning exponential distribution. F.INV It is used for returning the inverse of F probability distribution. F.DIST.RT It is used for returning the right tail F probability distribution. FORECAST It is used for predicting future values from a given value. FREQUENCY It is used for finding the repetition of values within a range. GEOMEAN It is used to perform the geometric mean. HARMEAN It is used to perform the harmonic mean. KURT It is used to perform kurtosis of the given data set. LARGE It is used for finding the largest element present in the data set. LINEST It is used for returning statistical information determining the graph line on the
basis of values of x and y coordinates. LOGEST It is used for returning the exponential trend parameter. LOGNORM.DIST It is used for returning log normal distribution. MAXA It is used for returning greatest value from the argument list.
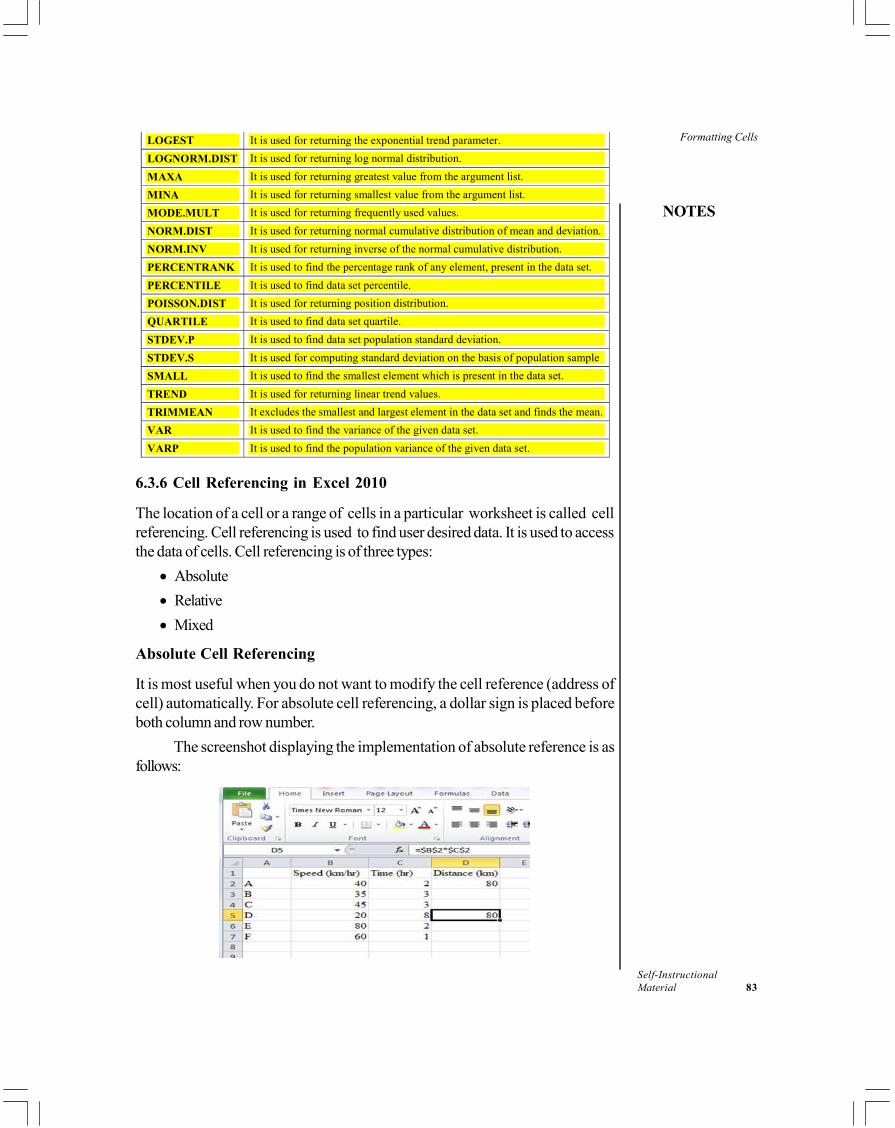
Formatting Cells
NOTES
Self-InstructionalMaterial 83
LOGEST It is used for returning the exponential trend parameter. LOGNORM.DIST It is used for returning log normal distribution. MAXA It is used for returning greatest value from the argument list. MINA It is used for returning smallest value from the argument list. MODE.MULT It is used for returning frequently used values. NORM.DIST It is used for returning normal cumulative distribution of mean and deviation. NORM.INV It is used for returning inverse of the normal cumulative distribution. PERCENTRANK It is used to find the percentage rank of any element, present in the data set. PERCENTILE It is used to find data set percentile. POISSON.DIST It is used for returning position distribution. QUARTILE It is used to find data set quartile. STDEV.P It is used to find data set population standard deviation. STDEV.S It is used for computing standard deviation on the basis of population sample SMALL It is used to find the smallest element which is present in the data set. TREND It is used for returning linear trend values. TRIMMEAN It excludes the smallest and largest element in the data set and finds the mean. VAR It is used to find the variance of the given data set. VARP It is used to find the population variance of the given data set.
6.3.6 Cell Referencing in Excel 2010
The location of a cell or a range of cells in a particular worksheet is called cellreferencing. Cell referencing is used to find user desired data. It is used to accessthe data of cells. Cell referencing is of three types:
• Absolute• Relative• Mixed
Absolute Cell Referencing
It is most useful when you do not want to modify the cell reference (address ofcell) automatically. For absolute cell referencing, a dollar sign is placed beforeboth column and row number.
The screenshot displaying the implementation of absolute reference is asfollows:
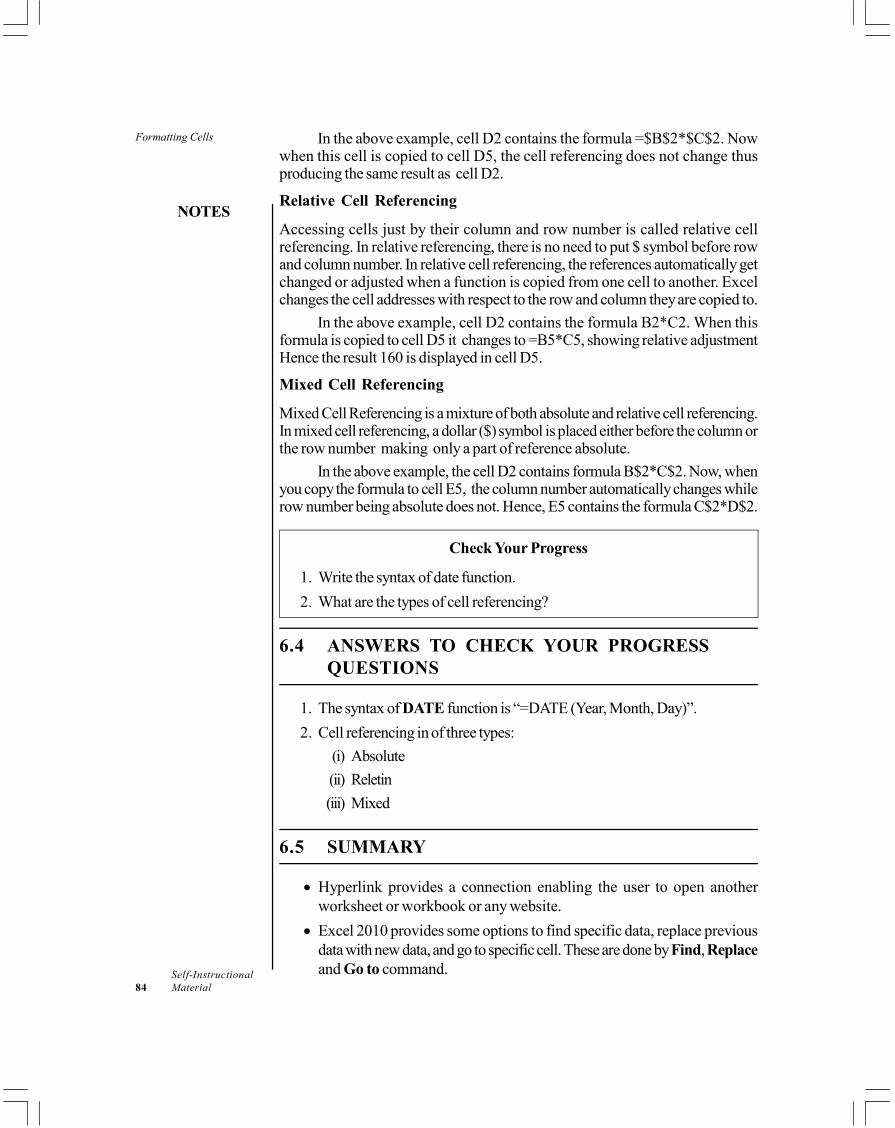
Formatting Cells
NOTES
Self-Instructional84 Material
In the above example, cell D2 contains the formula =$B$2*$C$2. Nowwhen this cell is copied to cell D5, the cell referencing does not change thusproducing the same result as cell D2.
Relative Cell Referencing
Accessing cells just by their column and row number is called relative cellreferencing. In relative referencing, there is no need to put $ symbol before rowand column number. In relative cell referencing, the references automatically getchanged or adjusted when a function is copied from one cell to another. Excelchanges the cell addresses with respect to the row and column they are copied to.
In the above example, cell D2 contains the formula B2*C2. When thisformula is copied to cell D5 it changes to =B5*C5, showing relative adjustmentHence the result 160 is displayed in cell D5.
Mixed Cell Referencing
Mixed Cell Referencing is a mixture of both absolute and relative cell referencing.In mixed cell referencing, a dollar ($) symbol is placed either before the column orthe row number making only a part of reference absolute.
In the above example, the cell D2 contains formula B$2*C$2. Now, whenyou copy the formula to cell E5, the column number automatically changes whilerow number being absolute does not. Hence, E5 contains the formula C$2*D$2.
Check Your Progress
1. Write the syntax of date function.2. What are the types of cell referencing?
6.4 ANSWERS TO CHECK YOUR PROGRESSQUESTIONS
1. The syntax of DATE function is “=DATE (Year, Month, Day)”.2. Cell referencing in of three types:
(i) Absolute(ii) Reletin(iii) Mixed
6.5 SUMMARY
• Hyperlink provides a connection enabling the user to open anotherworksheet or workbook or any website.
• Excel 2010 provides some options to find specific data, replace previousdata with new data, and go to specific cell. These are done by Find, Replaceand Go to command.
Formatting Cells
NOTES
Self-InstructionalMaterial 85
• Arithmetic Operators involve four major operations. These are: addition,subtraction, division and multiplication. These are known as the basicoperators.
• Date & Time functions are used for making the modifications in date andtime and also, to know the current date and time.
6.6 KEY WORDS
• Formatting: It means changing the property or the style of cell accordingto the need of the user.
• Operator precedence: The execution of operators in standard order in amathematical operation is known as operator precedence.
• Concatenate: It is used to combine data from separate cells in one cell.• Replace: It is used to replace data in a cell with another data.• Product: It is used to multiply numbers in Excel.• Median: It gives the middle value of all the numbers.• Average: This function helps to find the average value of all the given
numbers.
6.7 SELF ASSESSMENT QUESTIONS ANDEXERCISES
1. Create a hyperlink in an Excel sheet and use it to navigate in another sheet.2. Apply find command to search for a text in a sheet.3. How will you replace a text using replace command?4. Create a record of employee having the following fields: Employee id, Name,
Salary, phone number. Perform the following operations.(i) Find out the total number of employees.(ii) Calculate average and total salary of the employees.(iii) Increase the salary of every employee by 5%.(iv) Insert date and time in this worksheet.
6.8 FURTHER READINGS
Srivastava, S.S. 2008. MS Office. New Delhi: Firewall Media.Saxena, Sanjay. 2011. MS Office 2007 in a Nutshell. Noida: Vikas Publishing
house.Courter, Gini and Annette Marquis. 1999. Mastering Microsoft Office 2000.
New Delhi: BPB Publications.Blattner, Patrick, Ken Cook, Laurie Ulrich and Timothy Dyck. 1999. Special
Edition Using Microsoft Excel 2000. New Delhi: Prentice-Hall of India.
Sorting and Filtering
NOTES
Self-Instructional86 Material
UNIT 7 SORTING AND FILTERING
Structure7.0 Introduction7.1 Objectives7.2 Sorting and Filtering Information7.3 Answers to Check Your Progress Questions7.4 Summary7.5 Key Words7.6 Self Assessment Questions and Exercises7.7 Further Readings
7.0 INTRODUCTION
In this unit, you will learn about the sorting and filtering of data. Excel is anamazing tool for analysing data and Sort and Filter are some of the mostcommonly used features that helps to achieve it. Sorting is required to changethe order of the data but to focus on a specific set of your data, you can filter arange of cells or a table.
7.1 OBJECTIVES
After going through this unit, you will be able to:• Understand how to sort data in single column• Sort and filter the multiple data
7.2 SORTING AND FILTERING INFORMATION
In MS Excel, you can store enormous data. If you want to arrange the data, youcan use Sort command. Filter command is used to find any specific informationfrom specific column. In Excel 2010, Sort and filter command are availabletogether in Editing group on Home tab. Both the commands are described infurther subsections.Sort: Sort is most commonly used command to arrange the list of data inalphabetical order. In Excel, there are two basic sorting methods such as A to Zand Z to A. For example, if you want to arrange employee name in ascendingorder, click on A to Z in Sort & Filter option. Sort command is used to visualizethe data such that it increases understanding and makes data easily searchable.
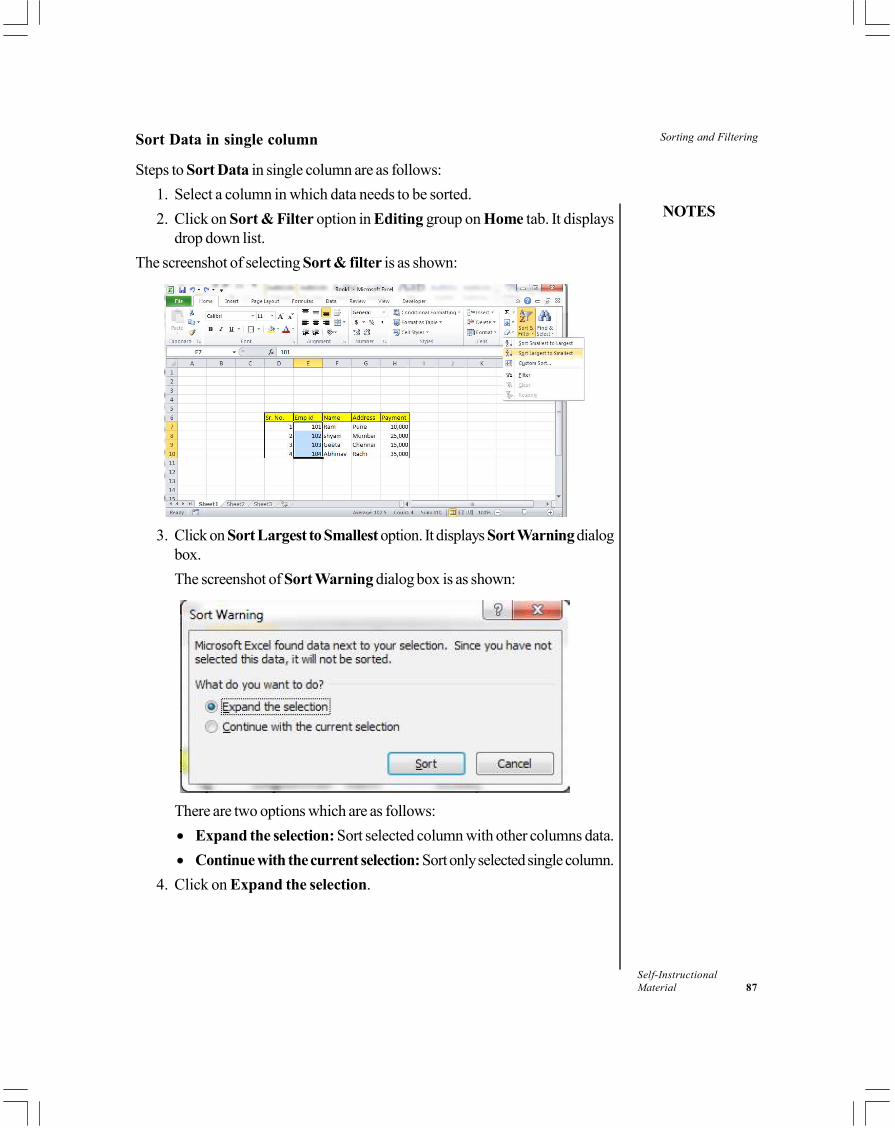
Sorting and Filtering
NOTES
Self-InstructionalMaterial 87
Sort Data in single column
Steps to Sort Data in single column are as follows:1. Select a column in which data needs to be sorted.2. Click on Sort & Filter option in Editing group on Home tab. It displays
drop down list.The screenshot of selecting Sort & filter is as shown:
3. Click on Sort Largest to Smallest option. It displays Sort Warning dialogbox.The screenshot of Sort Warning dialog box is as shown:
There are two options which are as follows:• Expand the selection: Sort selected column with other columns data.• Continue with the current selection: Sort only selected single column.
4. Click on Expand the selection.
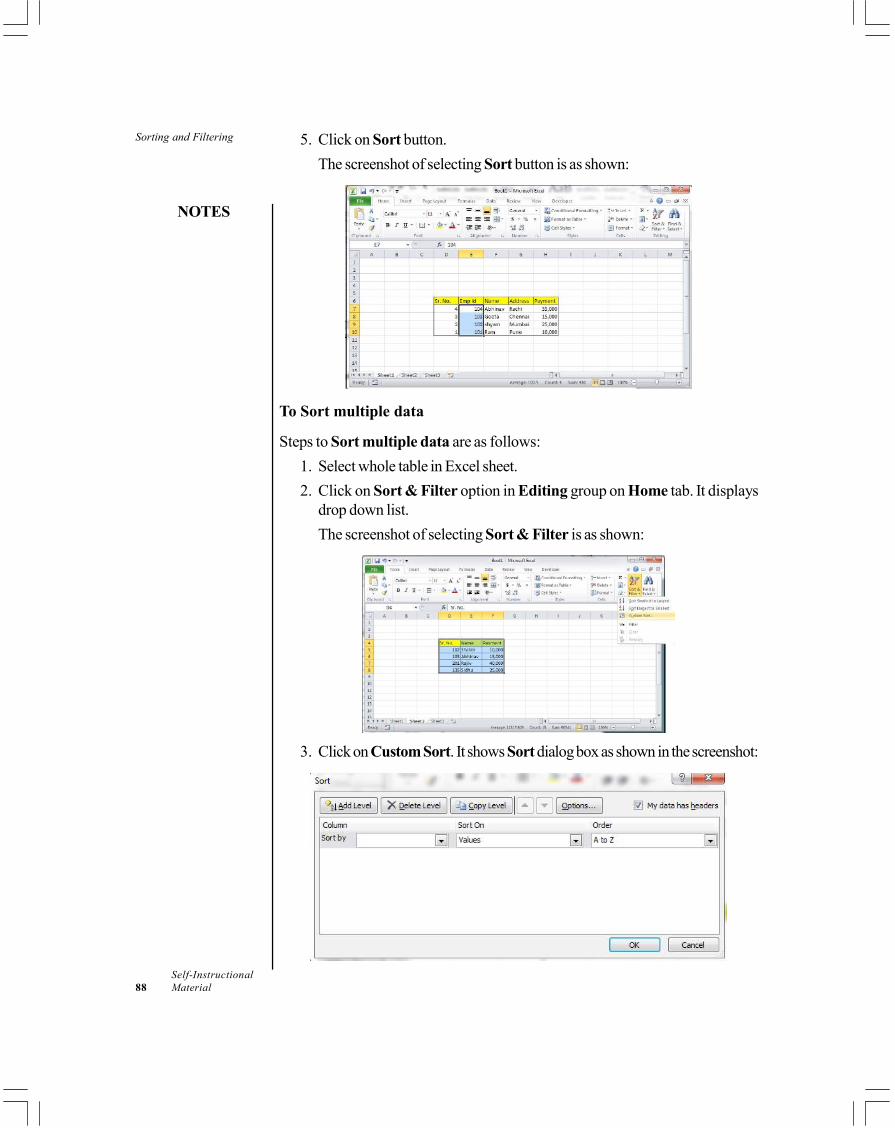
Sorting and Filtering
NOTES
Self-Instructional88 Material
5. Click on Sort button.The screenshot of selecting Sort button is as shown:
To Sort multiple data
Steps to Sort multiple data are as follows:1. Select whole table in Excel sheet.2. Click on Sort & Filter option in Editing group on Home tab. It displays
drop down list.The screenshot of selecting Sort & Filter is as shown:
3. Click on Custom Sort. It shows Sort dialog box as shown in the screenshot:
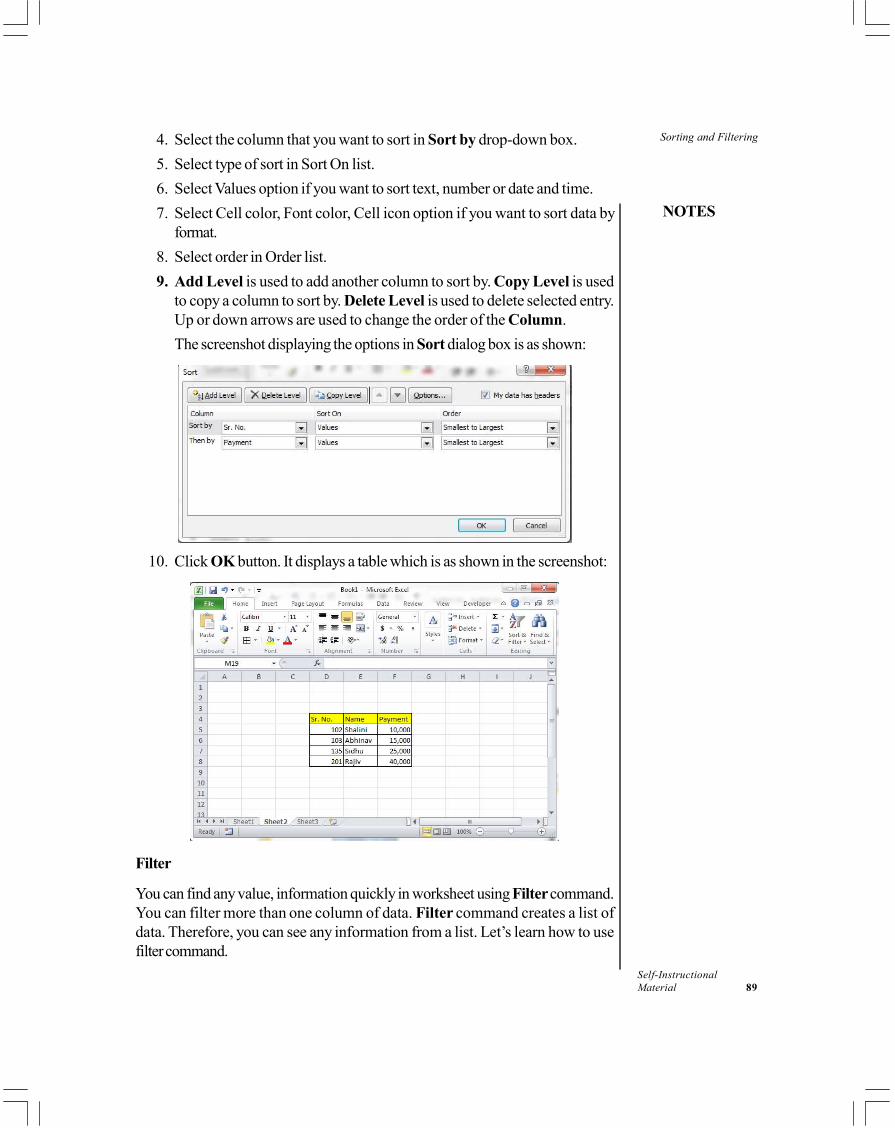
Sorting and Filtering
NOTES
Self-InstructionalMaterial 89
4. Select the column that you want to sort in Sort by drop-down box.5. Select type of sort in Sort On list.6. Select Values option if you want to sort text, number or date and time.7. Select Cell color, Font color, Cell icon option if you want to sort data by
format.8. Select order in Order list.9. Add Level is used to add another column to sort by. Copy Level is used
to copy a column to sort by. Delete Level is used to delete selected entry.Up or down arrows are used to change the order of the Column.The screenshot displaying the options in Sort dialog box is as shown:
10. Click OK button. It displays a table which is as shown in the screenshot:
Filter
You can find any value, information quickly in worksheet using Filter command.You can filter more than one column of data. Filter command creates a list ofdata. Therefore, you can see any information from a list. Let’s learn how to usefilter command.
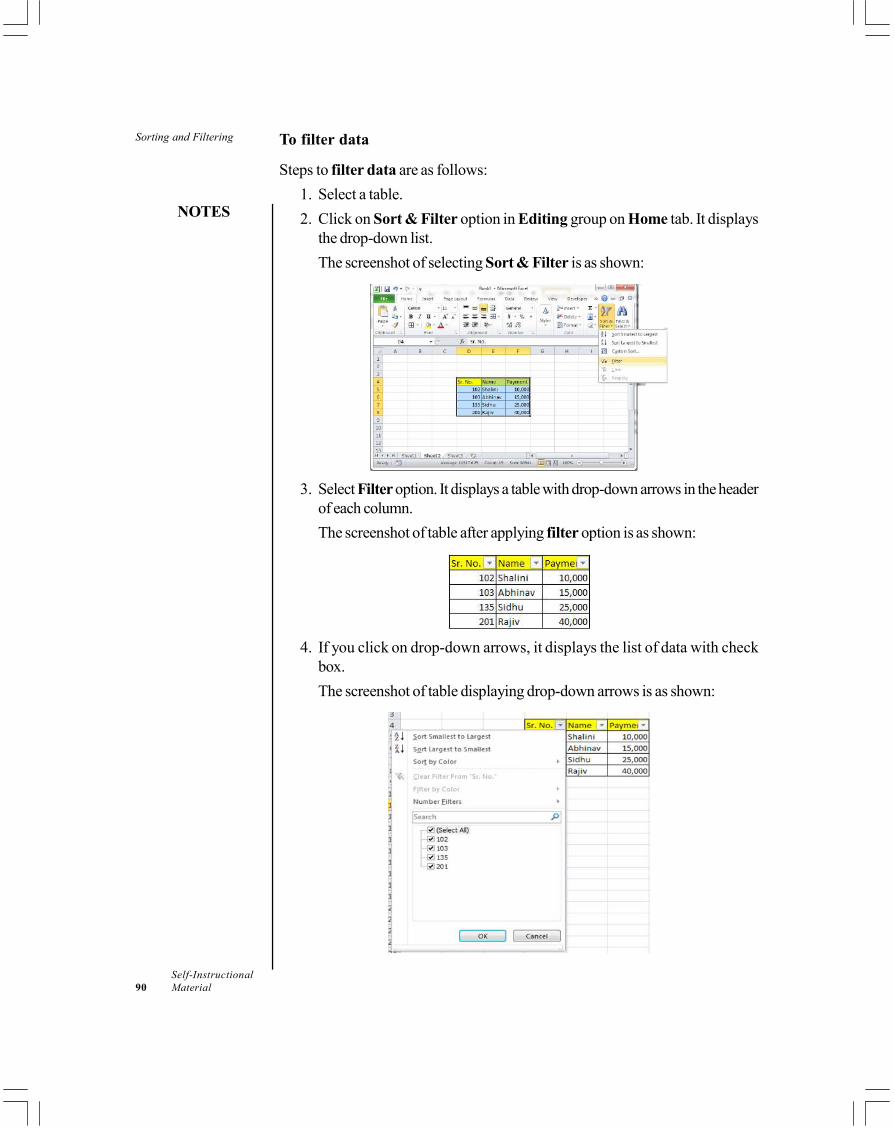
Sorting and Filtering
NOTES
Self-Instructional90 Material
To filter data
Steps to filter data are as follows:1. Select a table.2. Click on Sort & Filter option in Editing group on Home tab. It displays
the drop-down list.The screenshot of selecting Sort & Filter is as shown:
3. Select Filter option. It displays a table with drop-down arrows in the headerof each column.The screenshot of table after applying filter option is as shown:
4. If you click on drop-down arrows, it displays the list of data with checkbox.The screenshot of table displaying drop-down arrows is as shown:
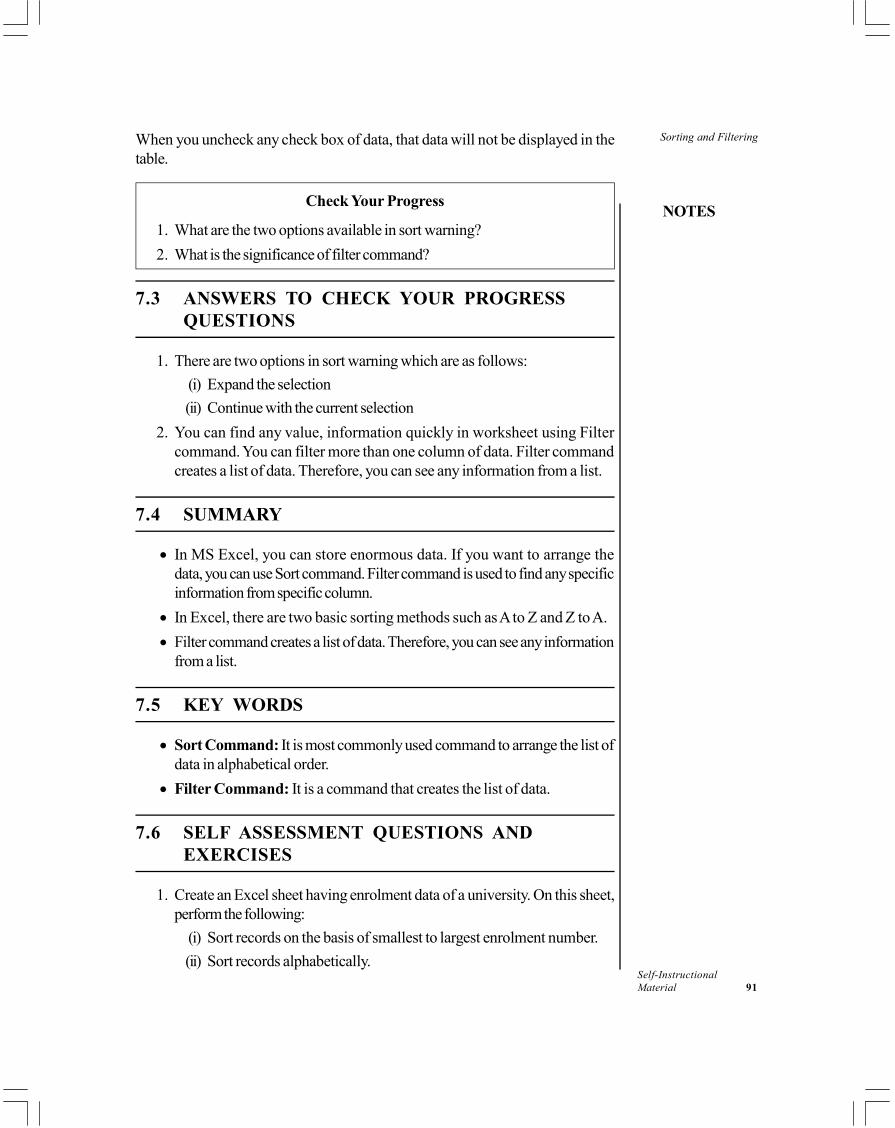
Sorting and Filtering
NOTES
Self-InstructionalMaterial 91
When you uncheck any check box of data, that data will not be displayed in thetable.
Check Your Progress
1. What are the two options available in sort warning?2. What is the significance of filter command?
7.3 ANSWERS TO CHECK YOUR PROGRESSQUESTIONS
1. There are two options in sort warning which are as follows:(i) Expand the selection(ii) Continue with the current selection
2. You can find any value, information quickly in worksheet using Filtercommand. You can filter more than one column of data. Filter commandcreates a list of data. Therefore, you can see any information from a list.
7.4 SUMMARY
• In MS Excel, you can store enormous data. If you want to arrange thedata, you can use Sort command. Filter command is used to find any specificinformation from specific column.
• In Excel, there are two basic sorting methods such as A to Z and Z to A.• Filter command creates a list of data. Therefore, you can see any information
from a list.
7.5 KEY WORDS
• Sort Command: It is most commonly used command to arrange the list ofdata in alphabetical order.
• Filter Command: It is a command that creates the list of data.
7.6 SELF ASSESSMENT QUESTIONS ANDEXERCISES
1. Create an Excel sheet having enrolment data of a university. On this sheet,perform the following:
(i) Sort records on the basis of smallest to largest enrolment number.(ii) Sort records alphabetically.
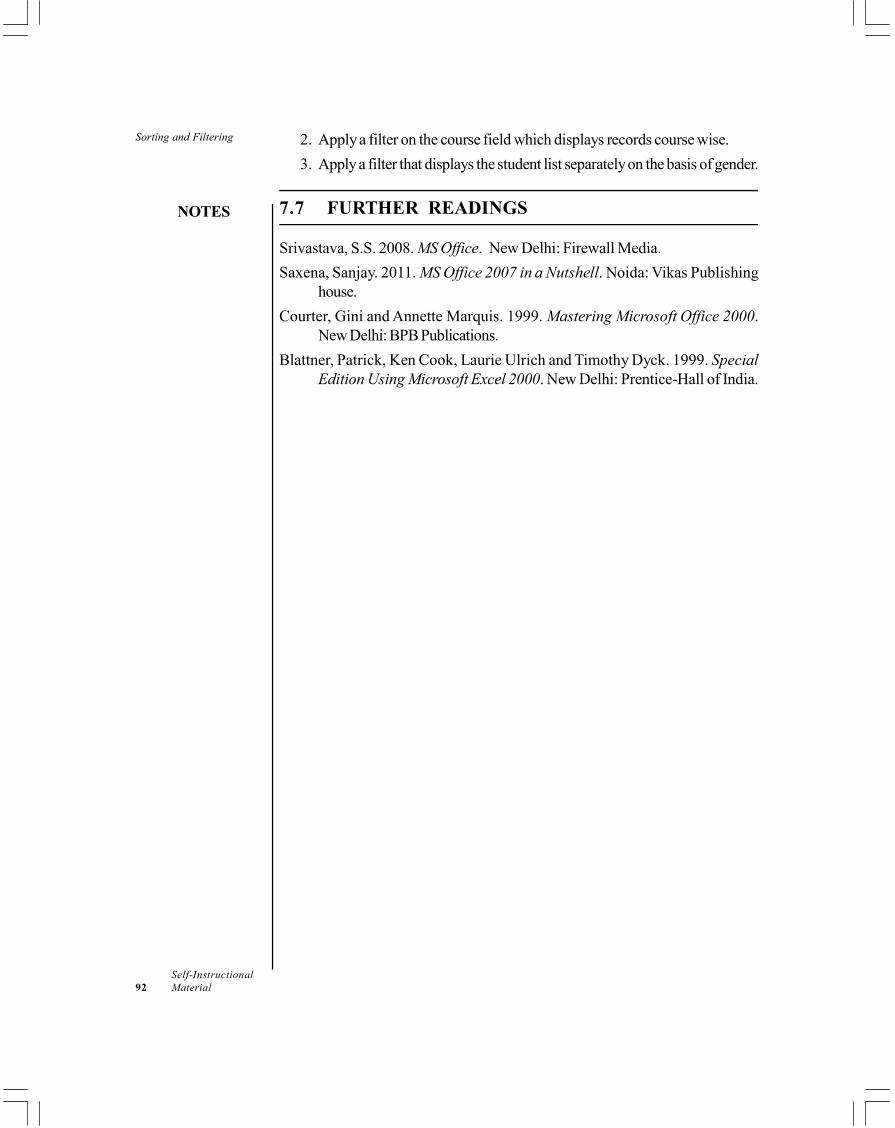
Sorting and Filtering
NOTES
Self-Instructional92 Material
2. Apply a filter on the course field which displays records course wise.3. Apply a filter that displays the student list separately on the basis of gender.
7.7 FURTHER READINGS
Srivastava, S.S. 2008. MS Office. New Delhi: Firewall Media.Saxena, Sanjay. 2011. MS Office 2007 in a Nutshell. Noida: Vikas Publishing
house.Courter, Gini and Annette Marquis. 1999. Mastering Microsoft Office 2000.
New Delhi: BPB Publications.Blattner, Patrick, Ken Cook, Laurie Ulrich and Timothy Dyck. 1999. Special
Edition Using Microsoft Excel 2000. New Delhi: Prentice-Hall of India.
Graphics
NOTES
Self-InstructionalMaterial 93
UNIT 8 GRAPHICS
Structure8.0 Introduction8.1 Objectives8.2 Working with Charts
8.2.1 Legends8.2.2 Formatting Axes and Gridlines within Charts and Graphs
8.3 Answers to Check Your Progress Questions8.4 Summary8.5 Key Words8.6 Self Assessment Questions and Exercises8.7 Further Readings
8.0 INTRODUCTION
In this unit, you will learn about the working with charts. A chart in Excel refers tothe tool that helps in representing data in the graphical form. It makes it easier forthe audience or a user to understand the task in simple language. It helps inrepresenting the comparison between the same types of data.
8.1 OBJECTIVES
After going through this unit, you will be able to:• Create and identify chart tools.• Create and set legends.• Format and customize grid lines.
8.2 WORKING WITH CHARTS
A chart in Excel refers to the tool that helps in representing data in the graphicalform. It makes it easier for the audience or a user to understand the task in simplelanguage. It helps in representing the comparison between the same types of data.There are many functions that can be performed with charts. Let’s learn to createa chart.Steps for creating a chart are as follows:
1. Select the cells (rows and columns) containing data for which the chart isto be created.
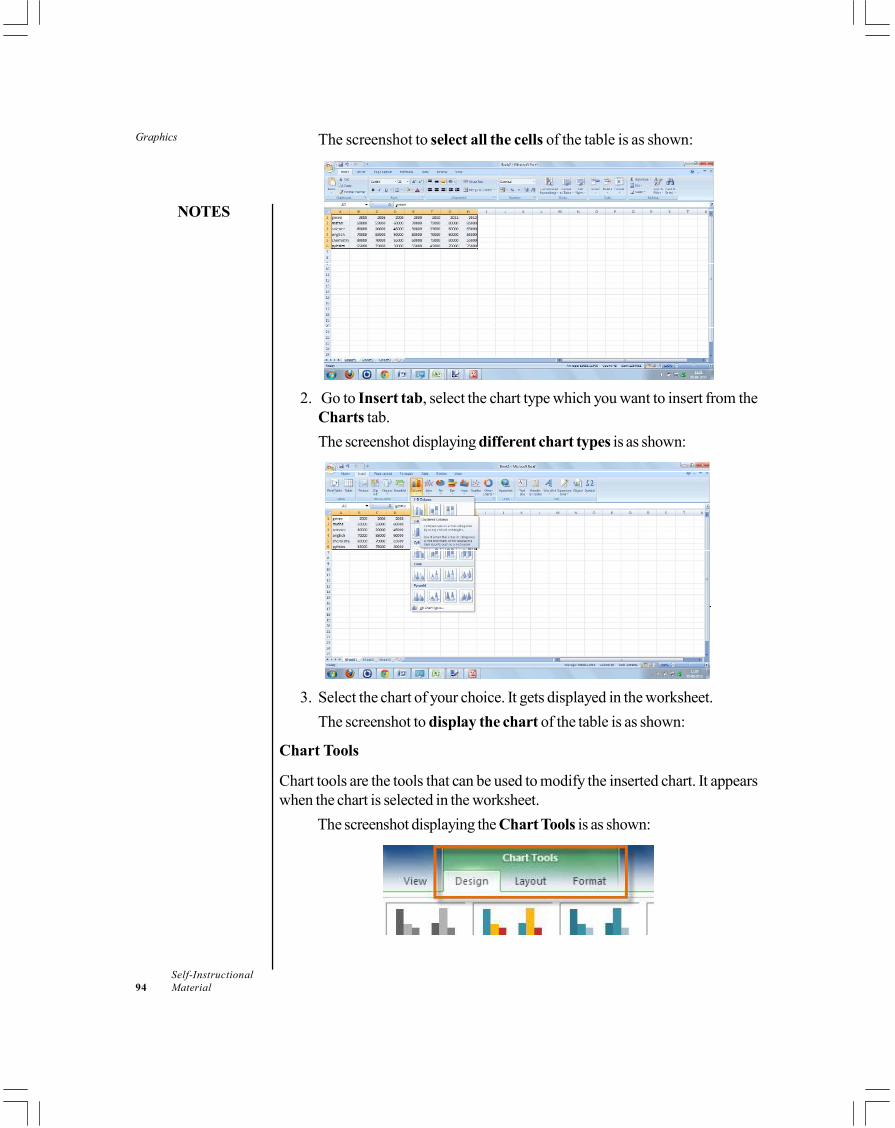
Graphics
NOTES
Self-Instructional94 Material
The screenshot to select all the cells of the table is as shown:
2. Go to Insert tab, select the chart type which you want to insert from theCharts tab.The screenshot displaying different chart types is as shown:
.
3. Select the chart of your choice. It gets displayed in the worksheet.The screenshot to display the chart of the table is as shown:
Chart Tools
Chart tools are the tools that can be used to modify the inserted chart. It appearswhen the chart is selected in the worksheet.
The screenshot displaying the Chart Tools is as shown:
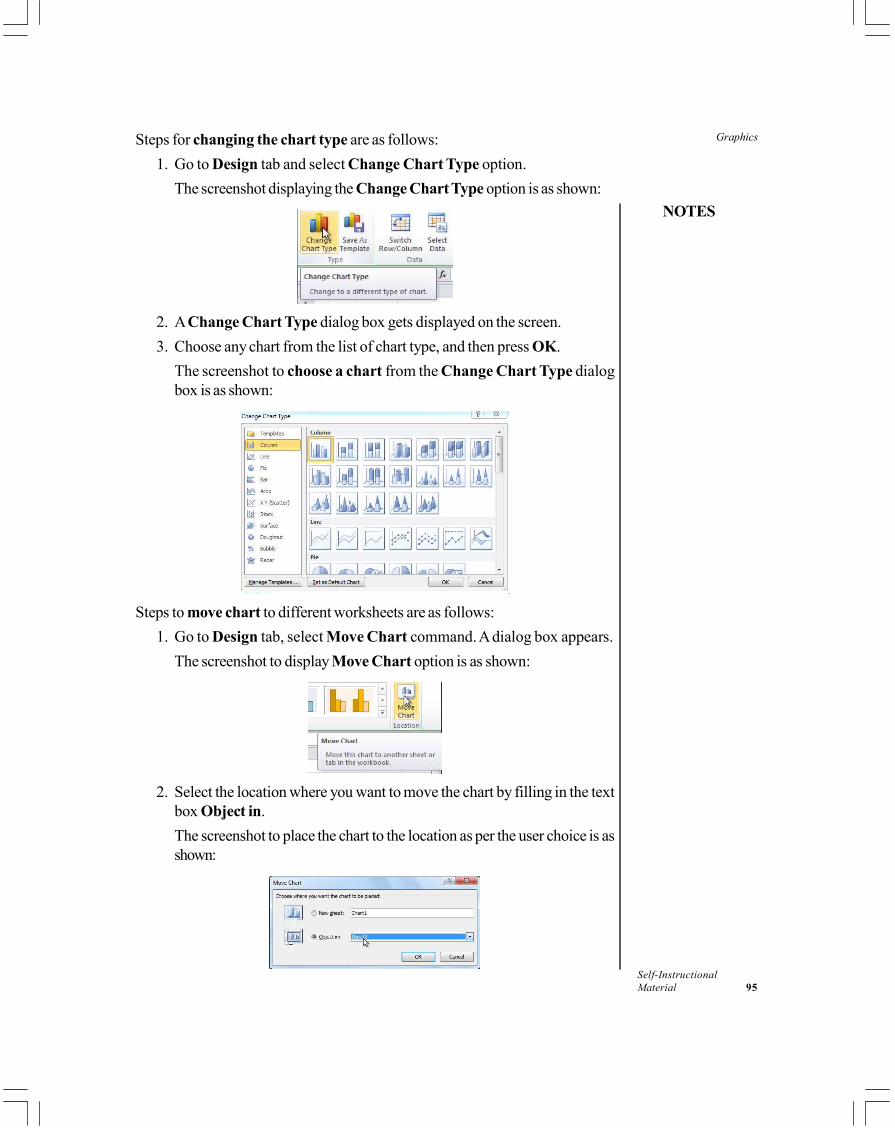
Graphics
NOTES
Self-InstructionalMaterial 95
Steps for changing the chart type are as follows:1. Go to Design tab and select Change Chart Type option.
The screenshot displaying the Change Chart Type option is as shown:
2. A Change Chart Type dialog box gets displayed on the screen.3. Choose any chart from the list of chart type, and then press OK.
The screenshot to choose a chart from the Change Chart Type dialogbox is as shown:
Steps to move chart to different worksheets are as follows:1. Go to Design tab, select Move Chart command. A dialog box appears.
The screenshot to display Move Chart option is as shown:
2. Select the location where you want to move the chart by filling in the textbox Object in.The screenshot to place the chart to the location as per the user choice is asshown:
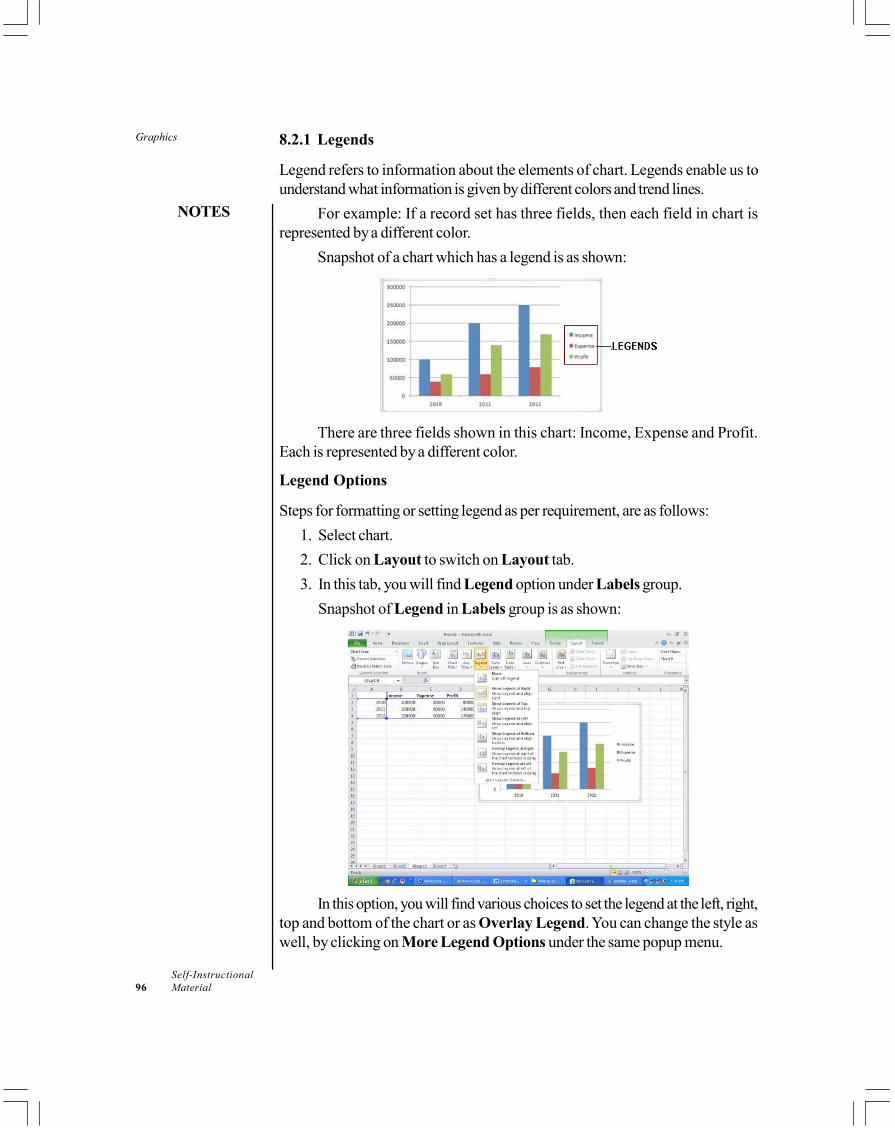
Graphics
NOTES
Self-Instructional96 Material
8.2.1 Legends
Legend refers to information about the elements of chart. Legends enable us tounderstand what information is given by different colors and trend lines.
For example: If a record set has three fields, then each field in chart isrepresented by a different color.
Snapshot of a chart which has a legend is as shown:
There are three fields shown in this chart: Income, Expense and Profit.Each is represented by a different color.
Legend Options
Steps for formatting or setting legend as per requirement, are as follows:1. Select chart.2. Click on Layout to switch on Layout tab.3. In this tab, you will find Legend option under Labels group.
Snapshot of Legend in Labels group is as shown:
In this option, you will find various choices to set the legend at the left, right,top and bottom of the chart or as Overlay Legend. You can change the style aswell, by clicking on More Legend Options under the same popup menu.
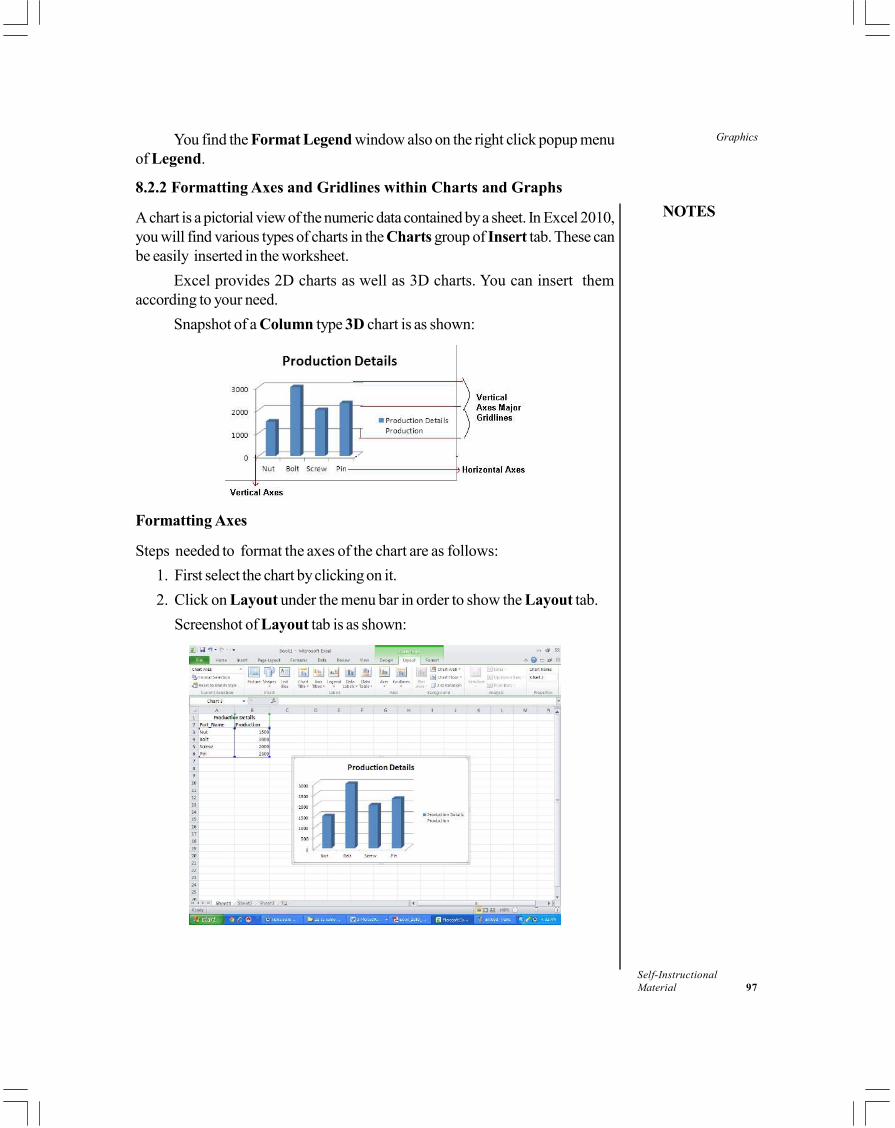
Graphics
NOTES
Self-InstructionalMaterial 97
You find the Format Legend window also on the right click popup menuof Legend.
8.2.2 Formatting Axes and Gridlines within Charts and Graphs
A chart is a pictorial view of the numeric data contained by a sheet. In Excel 2010,you will find various types of charts in the Charts group of Insert tab. These canbe easily inserted in the worksheet.
Excel provides 2D charts as well as 3D charts. You can insert themaccording to your need.
Snapshot of a Column type 3D chart is as shown:
Formatting Axes
Steps needed to format the axes of the chart are as follows:1. First select the chart by clicking on it.2. Click on Layout under the menu bar in order to show the Layout tab.
Screenshot of Layout tab is as shown:
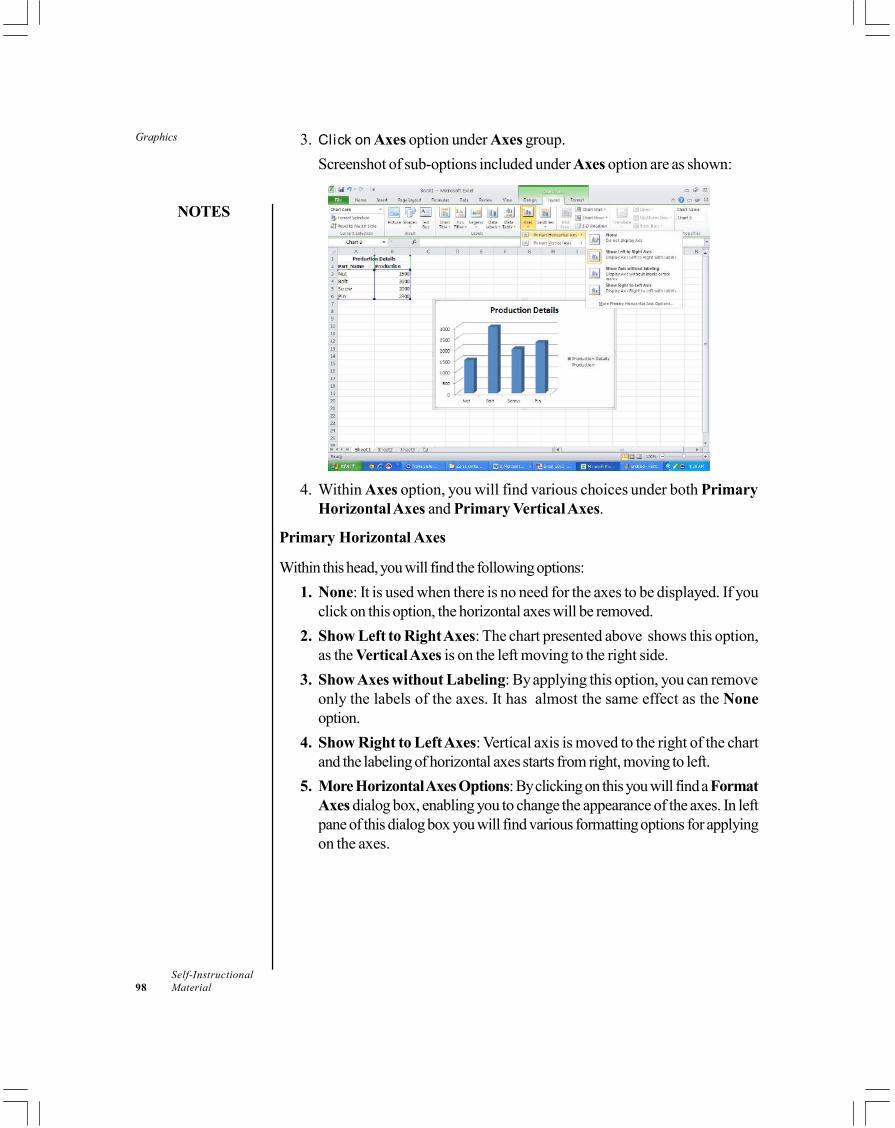
Graphics
NOTES
Self-Instructional98 Material
3. Click on Axes option under Axes group.Screenshot of sub-options included under Axes option are as shown:
4. Within Axes option, you will find various choices under both PrimaryHorizontal Axes and Primary Vertical Axes.
Primary Horizontal Axes
Within this head, you will find the following options:1. None: It is used when there is no need for the axes to be displayed. If you
click on this option, the horizontal axes will be removed.2. Show Left to Right Axes: The chart presented above shows this option,
as the Vertical Axes is on the left moving to the right side.3. Show Axes without Labeling: By applying this option, you can remove
only the labels of the axes. It has almost the same effect as the Noneoption.
4. Show Right to Left Axes: Vertical axis is moved to the right of the chartand the labeling of horizontal axes starts from right, moving to left.
5. More Horizontal Axes Options: By clicking on this you will find a FormatAxes dialog box, enabling you to change the appearance of the axes. In leftpane of this dialog box you will find various formatting options for applyingon the axes.
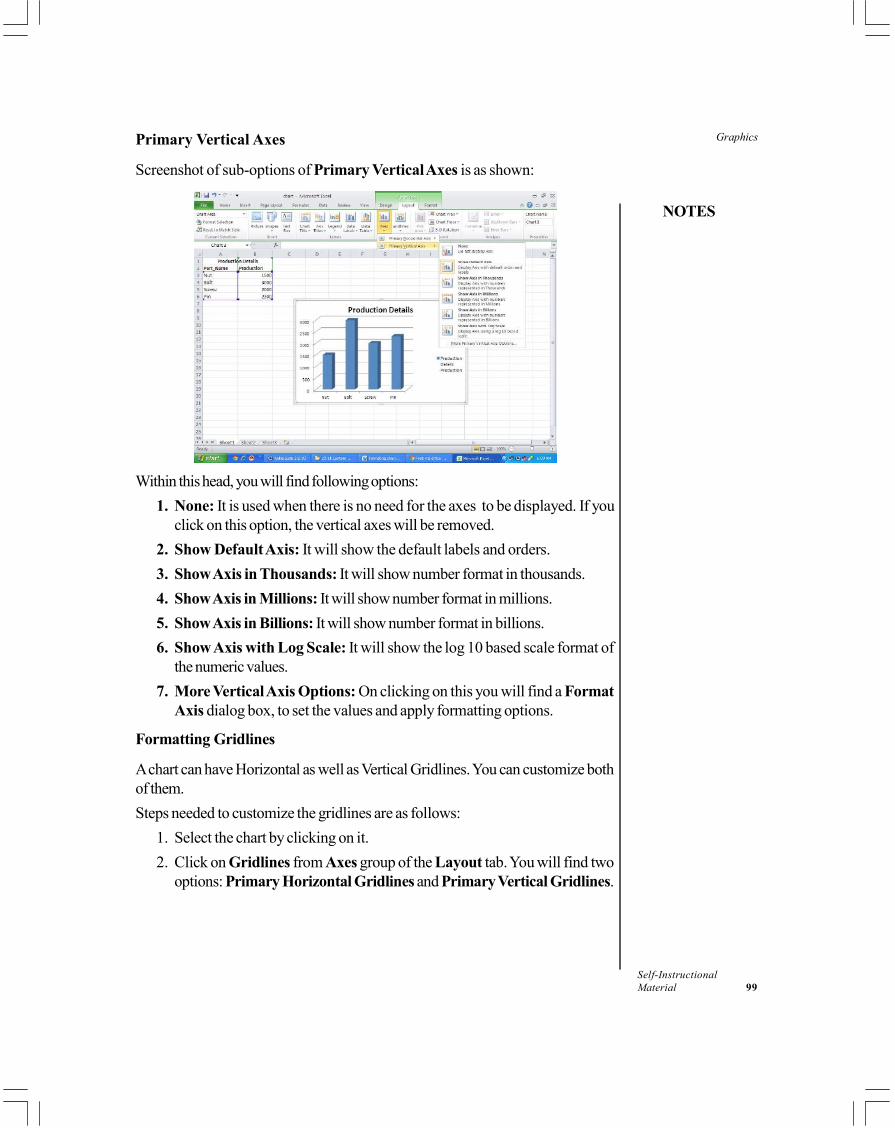
Graphics
NOTES
Self-InstructionalMaterial 99
Primary Vertical Axes
Screenshot of sub-options of Primary Vertical Axes is as shown:
Within this head, you will find following options:1. None: It is used when there is no need for the axes to be displayed. If you
click on this option, the vertical axes will be removed.2. Show Default Axis: It will show the default labels and orders.3. Show Axis in Thousands: It will show number format in thousands.4. Show Axis in Millions: It will show number format in millions.5. Show Axis in Billions: It will show number format in billions.6. Show Axis with Log Scale: It will show the log 10 based scale format of
the numeric values.7. More Vertical Axis Options: On clicking on this you will find a Format
Axis dialog box, to set the values and apply formatting options.
Formatting Gridlines
A chart can have Horizontal as well as Vertical Gridlines. You can customize bothof them.Steps needed to customize the gridlines are as follows:
1. Select the chart by clicking on it.2. Click on Gridlines from Axes group of the Layout tab. You will find two
options: Primary Horizontal Gridlines and Primary Vertical Gridlines.
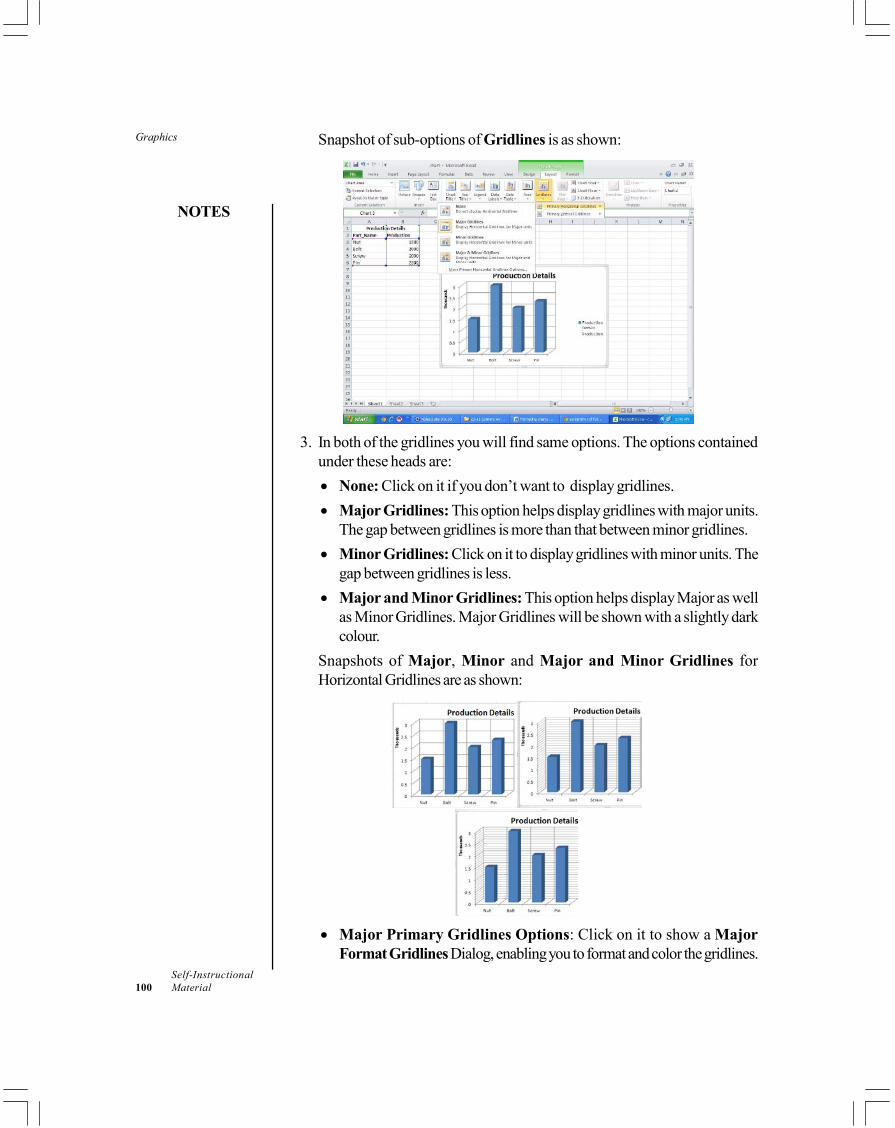
Graphics
NOTES
Self-Instructional100 Material
Snapshot of sub-options of Gridlines is as shown:
3. In both of the gridlines you will find same options. The options containedunder these heads are:• None: Click on it if you don’t want to display gridlines.• Major Gridlines: This option helps display gridlines with major units.
The gap between gridlines is more than that between minor gridlines.• Minor Gridlines: Click on it to display gridlines with minor units. The
gap between gridlines is less.• Major and Minor Gridlines: This option helps display Major as well
as Minor Gridlines. Major Gridlines will be shown with a slightly darkcolour.
Snapshots of Major, Minor and Major and Minor Gridlines forHorizontal Gridlines are as shown:
• Major Primary Gridlines Options: Click on it to show a MajorFormat Gridlines Dialog, enabling you to format and color the gridlines.
Graphics
NOTES
Self-InstructionalMaterial 101
Check Your Progress
1. Define chart in excel.2. What is legend in excel?
8.3 ANSWERS TO CHECK YOUR PROGRESSQUESTIONS
1. A chart in Excel refers to the tool that helps in representing data in thegraphical form. It makes it easier for the audience or a user to understandthe task in simple language.
2. Legend refers to information about the elements of chart. Legends enableus to understand what information is given by different colors and trendlines.
8.4 SUMMARY
• A chart in Excel refers to the tool that helps in representing data in thegraphical form. It makes it easier for the audience or a user to understandthe task in simple language. It helps in representing the comparison betweenthe same types of data.
• Chart tools are the tools that can be used to modify the inserted chart. Itappears when the chart is selected in the worksheet.
• Legend refers to information about the elements of chart. Legends enableus to understand what information is given by different colors and trendlines.
8.5 KEY WORDS
• Chart: A chart in Excel refer to the tool that helps in representing data in thegraphical form. It increases the understanding of the audience or a user.
• Chart Tools: These tools are used to modify the inserted chart. It willappear when the chart is selected in the worksheet.
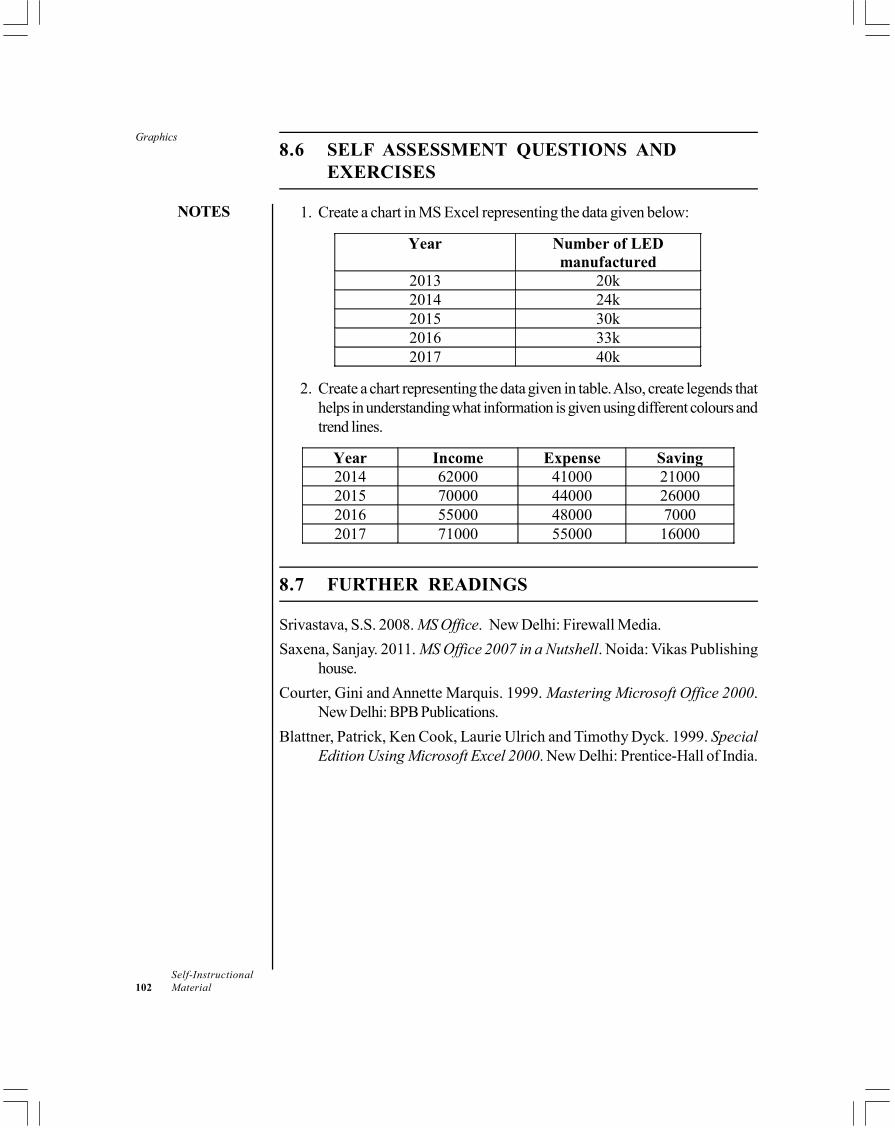
Graphics
NOTES
Self-Instructional102 Material
8.6 SELF ASSESSMENT QUESTIONS ANDEXERCISES
1. Create a chart in MS Excel representing the data given below:
Year Number of LED manufactured
2013 20k 2014 24k 2015 30k 2016 33k 2017 40k
2. Create a chart representing the data given in table. Also, create legends thathelps in understanding what information is given using different colours andtrend lines.
Year Income Expense Saving 2014 62000 41000 21000 2015 70000 44000 26000 2016 55000 48000 7000 2017 71000 55000 16000
8.7 FURTHER READINGS
Srivastava, S.S. 2008. MS Office. New Delhi: Firewall Media.Saxena, Sanjay. 2011. MS Office 2007 in a Nutshell. Noida: Vikas Publishing
house.Courter, Gini and Annette Marquis. 1999. Mastering Microsoft Office 2000.
New Delhi: BPB Publications.Blattner, Patrick, Ken Cook, Laurie Ulrich and Timothy Dyck. 1999. Special
Edition Using Microsoft Excel 2000. New Delhi: Prentice-Hall of India.
Creating a Presentation
NOTES
Self-InstructionalMaterial 103
UNIT 9 CREATING APRESENTATION
Structure9.0 Introduction9.1 Objectives9.2 Requisite Powerpoint: Essential Features
9.2.1 File Management; 9.2.2 Shortcuts and Tips9.3 Formatting Presentations
9.3.1 Working with Layouts/Templates; 9.3.2 Working with Masters9.3.3 Applying Design Templates and Themes
9.4 Answers to Check Your Progress Questions9.5 Summary9.6 Key Words9.7 Self Assessment Questions and Exercises9.8 Further Readings
9.0 INTRODUCTION
Microsoft PowerPoint (MS PowerPoint or PowerPoint) is a program which isused for creating presentations. It is used by the working professionals, studentsand politicians for creating attractive presentations. It consists of information in theform of text and various visual aids such as graphics, pictures and video, whichkeeps the audience interested. This way of presenting information and sharing ofideas increases visual literacy among users. This unit emphasizes on each andevery aspect of creating and designing presentations.
9.1 OBJECTIVES
After going through this unit, you will be able to:• Create, save and open the presentation• Working with layouts and master slides• Apply themes and design templates
9.2 REQUISITE POWERPOINT: ESSENTIALFEATURES
Microsoft PowerPoint is used for creating the presentations. The presentationconsists of series of Slides on which information in the form of text, pictures,graphics, audio, etc. Each slide can be viewed one after other, just like flipping
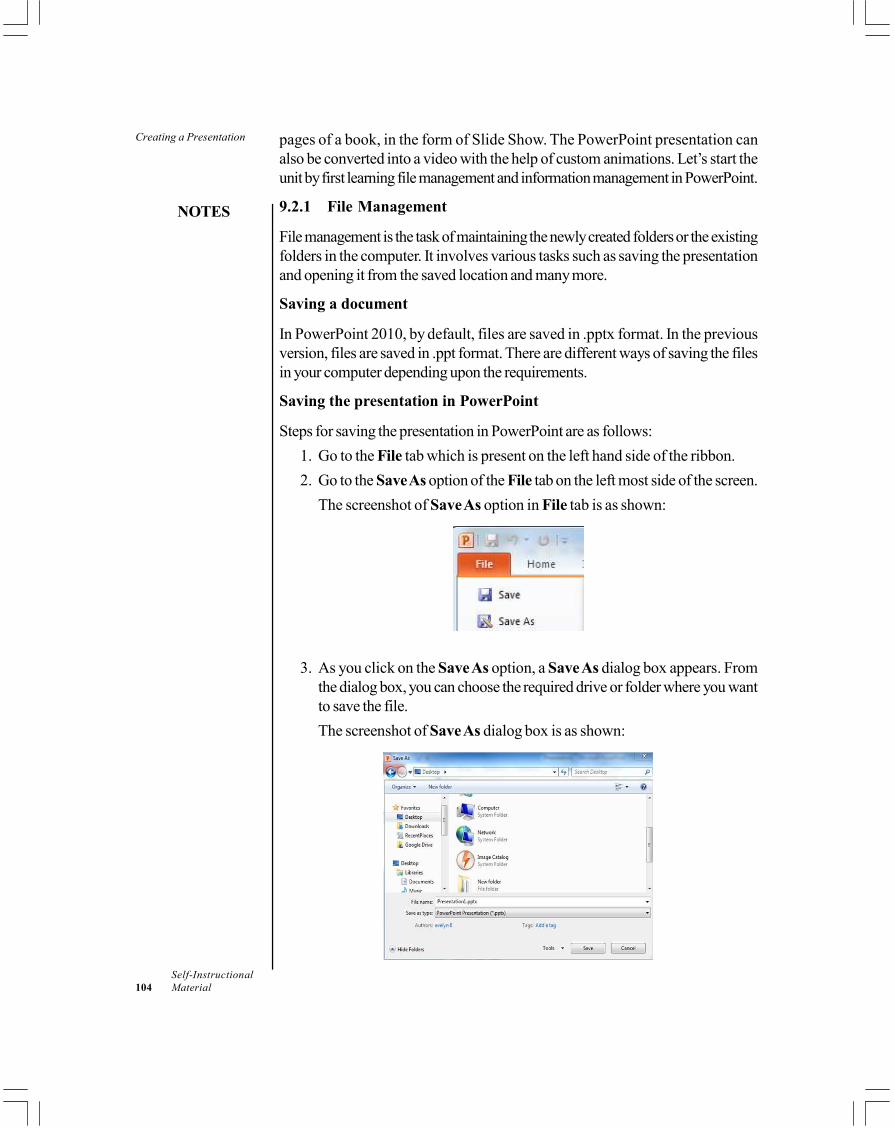
Creating a Presentation
NOTES
Self-Instructional104 Material
pages of a book, in the form of Slide Show. The PowerPoint presentation canalso be converted into a video with the help of custom animations. Let’s start theunit by first learning file management and information management in PowerPoint.
9.2.1 File Management
File management is the task of maintaining the newly created folders or the existingfolders in the computer. It involves various tasks such as saving the presentationand opening it from the saved location and many more.
Saving a document
In PowerPoint 2010, by default, files are saved in .pptx format. In the previousversion, files are saved in .ppt format. There are different ways of saving the filesin your computer depending upon the requirements.
Saving the presentation in PowerPoint
Steps for saving the presentation in PowerPoint are as follows:1. Go to the File tab which is present on the left hand side of the ribbon.2. Go to the Save As option of the File tab on the left most side of the screen.
The screenshot of Save As option in File tab is as shown:
3. As you click on the Save As option, a Save As dialog box appears. Fromthe dialog box, you can choose the required drive or folder where you wantto save the file.The screenshot of Save As dialog box is as shown:
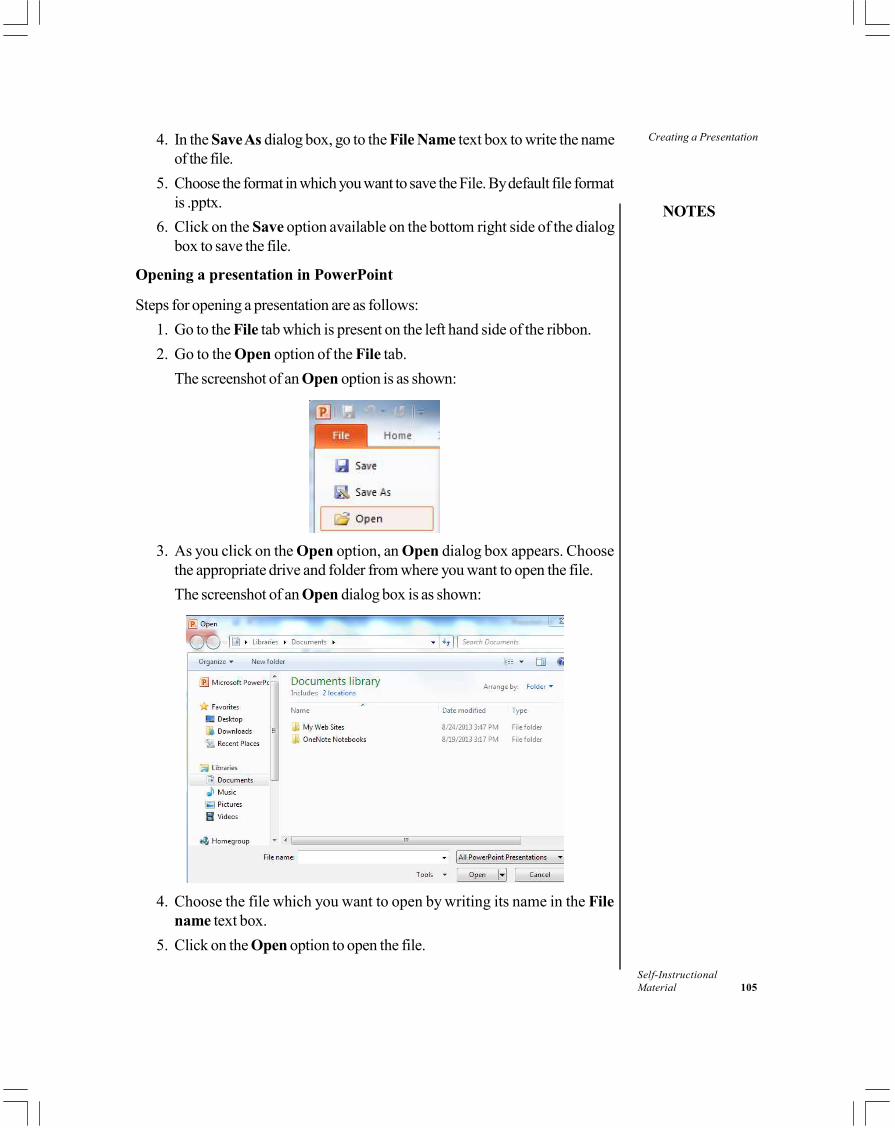
Creating a Presentation
NOTES
Self-InstructionalMaterial 105
4. In the Save As dialog box, go to the File Name text box to write the nameof the file.
5. Choose the format in which you want to save the File. By default file formatis .pptx.
6. Click on the Save option available on the bottom right side of the dialogbox to save the file.
Opening a presentation in PowerPoint
Steps for opening a presentation are as follows:1. Go to the File tab which is present on the left hand side of the ribbon.2. Go to the Open option of the File tab.
The screenshot of an Open option is as shown:
3. As you click on the Open option, an Open dialog box appears. Choosethe appropriate drive and folder from where you want to open the file.The screenshot of an Open dialog box is as shown:
4. Choose the file which you want to open by writing its name in the Filename text box.
5. Click on the Open option to open the file.
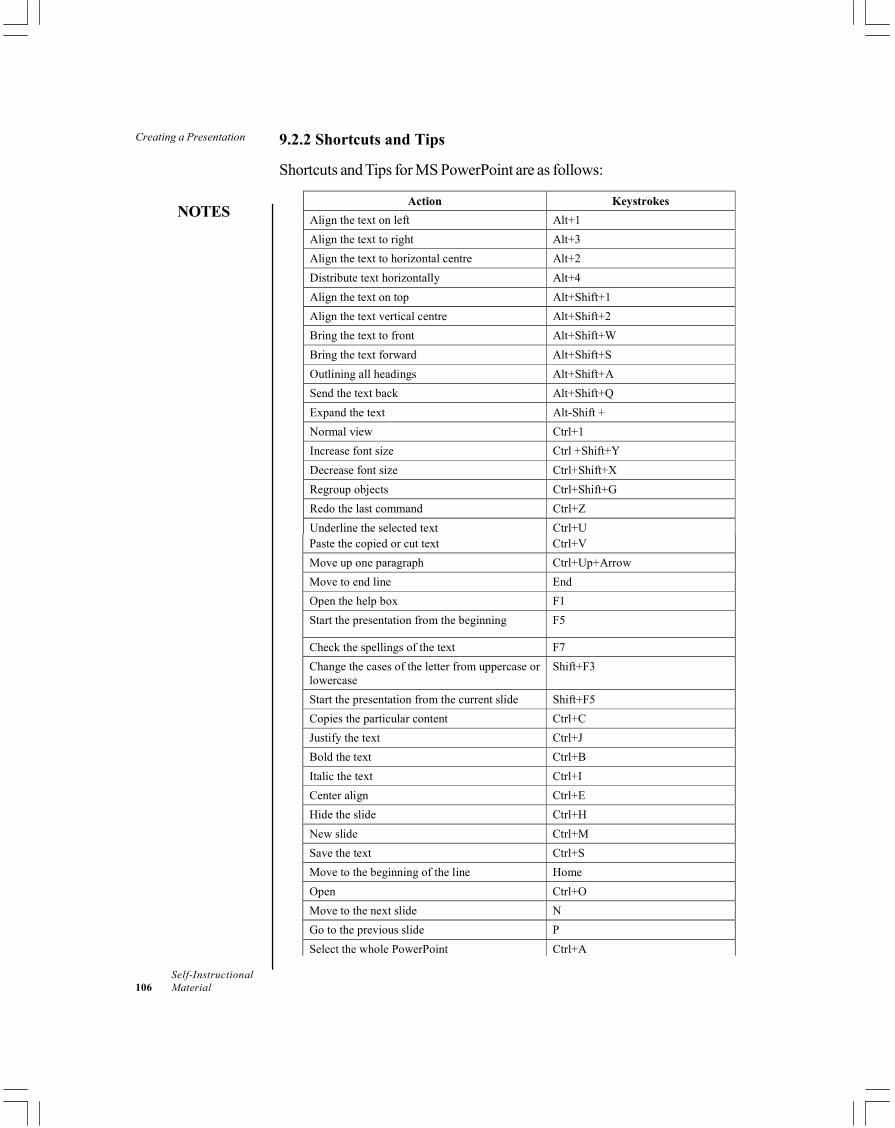
Creating a Presentation
NOTES
Self-Instructional106 Material
9.2.2 Shortcuts and Tips
Shortcuts and Tips for MS PowerPoint are as follows:
Action Keystrokes Align the text on left Alt+1 Align the text to right Alt+3 Align the text to horizontal centre Alt+2 Distribute text horizontally Alt+4 Align the text on top Alt+Shift+1 Align the text vertical centre Alt+Shift+2 Bring the text to front Alt+Shift+W Bring the text forward Alt+Shift+S Outlining all headings Alt+Shift+A Send the text back Alt+Shift+Q Expand the text Alt-Shift + Normal view Ctrl+1 Increase font size Ctrl +Shift+Y Decrease font size Ctrl+Shift+X Regroup objects Ctrl+Shift+G Redo the last command Ctrl+Z Underline the selected text Ctrl+U Paste the copied or cut text Ctrl+V Move up one paragraph Ctrl+Up+Arrow Move to end line End Open the help box F1 Start the presentation from the beginning F5
Check the spellings of the text F7 Change the cases of the letter from uppercase or lowercase
Shift+F3
Start the presentation from the current slide Shift+F5 Copies the particular content Ctrl+C Justify the text Ctrl+J Bold the text Ctrl+B Italic the text Ctrl+I Center align Ctrl+E Hide the slide Ctrl+H New slide Ctrl+M Save the text Ctrl+S Move to the beginning of the line Home Open Ctrl+O Move to the next slide N Go to the previous slide P Select the whole PowerPoint Ctrl+A
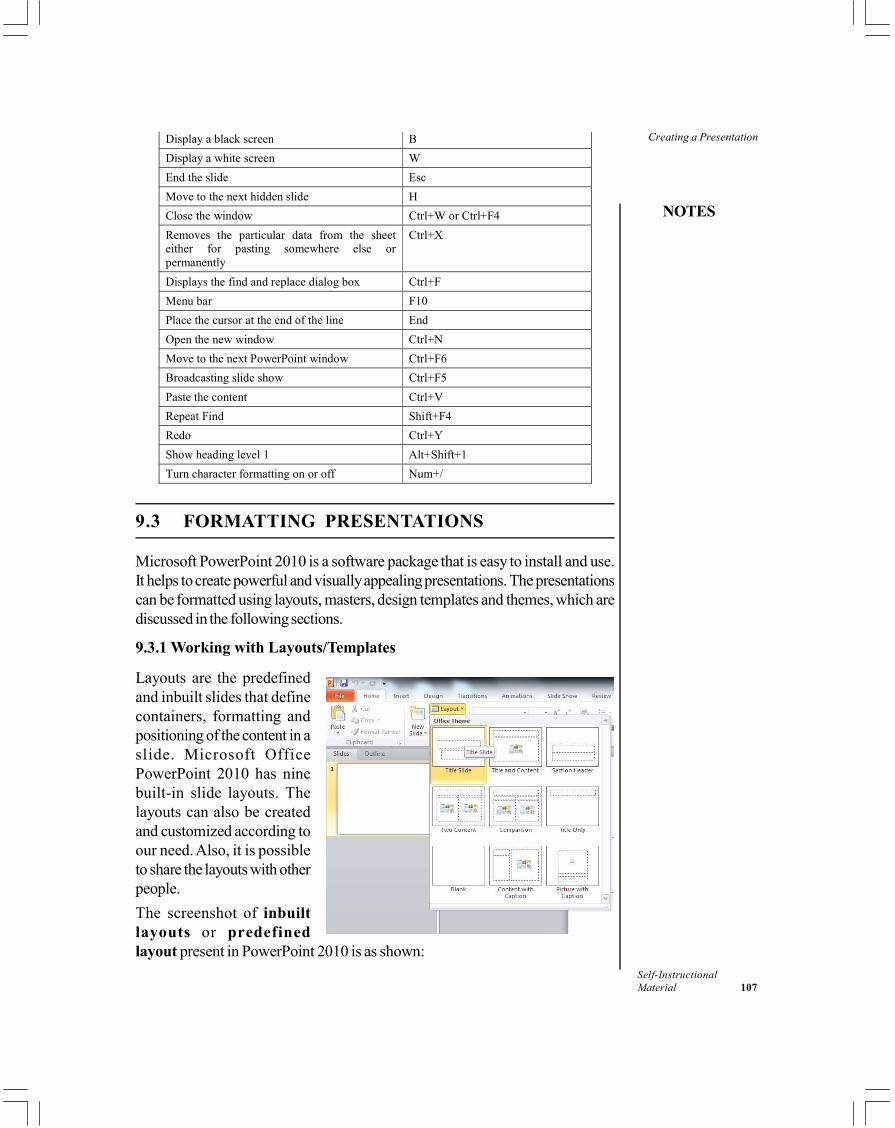
Creating a Presentation
NOTES
Self-InstructionalMaterial 107
Display a black screen B Display a white screen W End the slide Esc Move to the next hidden slide H Close the window Ctrl+W or Ctrl+F4 Removes the particular data from the sheet either for pasting somewhere else or permanently
Ctrl+X
Displays the find and replace dialog box Ctrl+F Menu bar F10 Place the cursor at the end of the line End Open the new window Ctrl+N Move to the next PowerPoint window Ctrl+F6 Broadcasting slide show Ctrl+F5 Paste the content Ctrl+V Repeat Find Shift+F4 Redo Ctrl+Y Show heading level 1 Alt+Shift+1 Turn character formatting on or off Num+/
9.3 FORMATTING PRESENTATIONS
Microsoft PowerPoint 2010 is a software package that is easy to install and use.It helps to create powerful and visually appealing presentations. The presentationscan be formatted using layouts, masters, design templates and themes, which arediscussed in the following sections.
9.3.1 Working with Layouts/Templates
Layouts are the predefinedand inbuilt slides that definecontainers, formatting andpositioning of the content in aslide. Microsoft OfficePowerPoint 2010 has ninebuilt-in slide layouts. Thelayouts can also be createdand customized according toour need. Also, it is possibleto share the layouts with otherpeople.The screenshot of inbuiltlayouts or predefinedlayout present in PowerPoint 2010 is as shown:
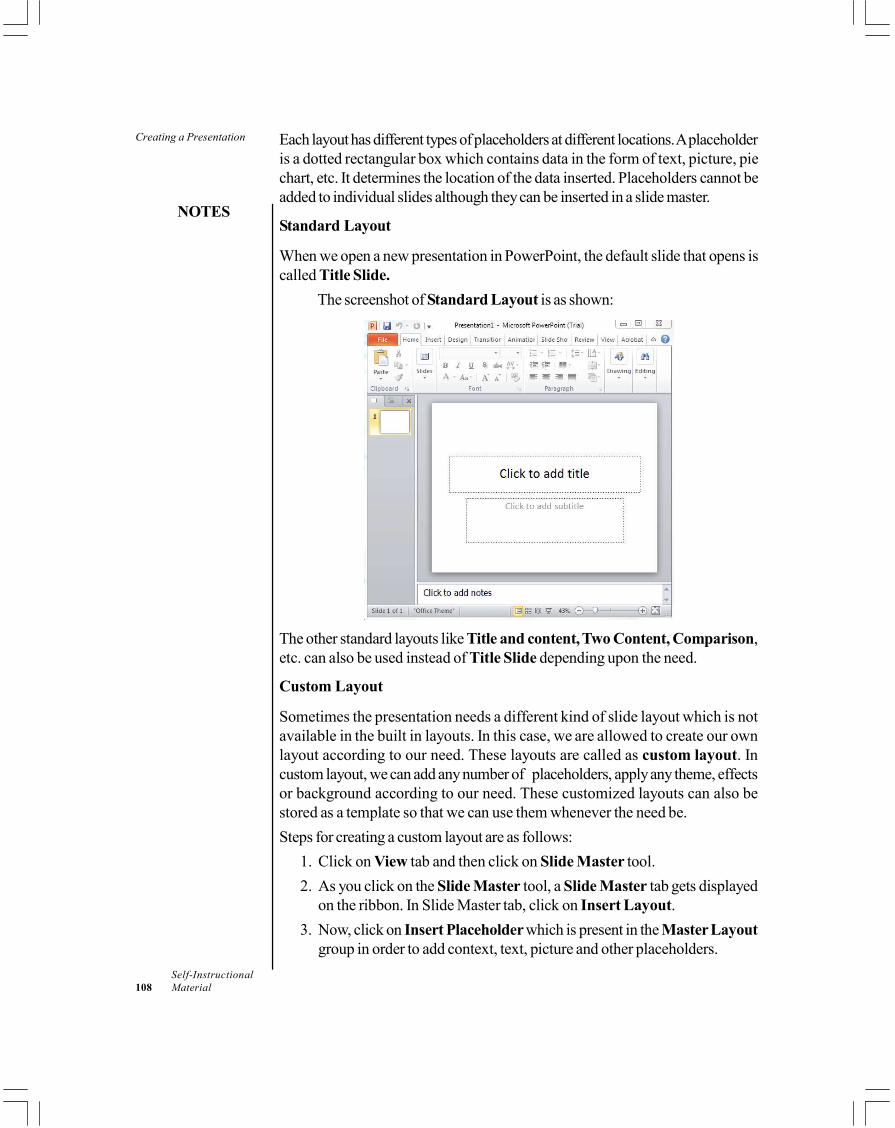
Creating a Presentation
NOTES
Self-Instructional108 Material
Each layout has different types of placeholders at different locations. A placeholderis a dotted rectangular box which contains data in the form of text, picture, piechart, etc. It determines the location of the data inserted. Placeholders cannot beadded to individual slides although they can be inserted in a slide master.
Standard Layout
When we open a new presentation in PowerPoint, the default slide that opens iscalled Title Slide.
The screenshot of Standard Layout is as shown:
The other standard layouts like Title and content, Two Content, Comparison,etc. can also be used instead of Title Slide depending upon the need.
Custom Layout
Sometimes the presentation needs a different kind of slide layout which is notavailable in the built in layouts. In this case, we are allowed to create our ownlayout according to our need. These layouts are called as custom layout. Incustom layout, we can add any number of placeholders, apply any theme, effectsor background according to our need. These customized layouts can also bestored as a template so that we can use them whenever the need be.Steps for creating a custom layout are as follows:
1. Click on View tab and then click on Slide Master tool.2. As you click on the Slide Master tool, a Slide Master tab gets displayed
on the ribbon. In Slide Master tab, click on Insert Layout.3. Now, click on Insert Placeholder which is present in the Master Layout
group in order to add context, text, picture and other placeholders.
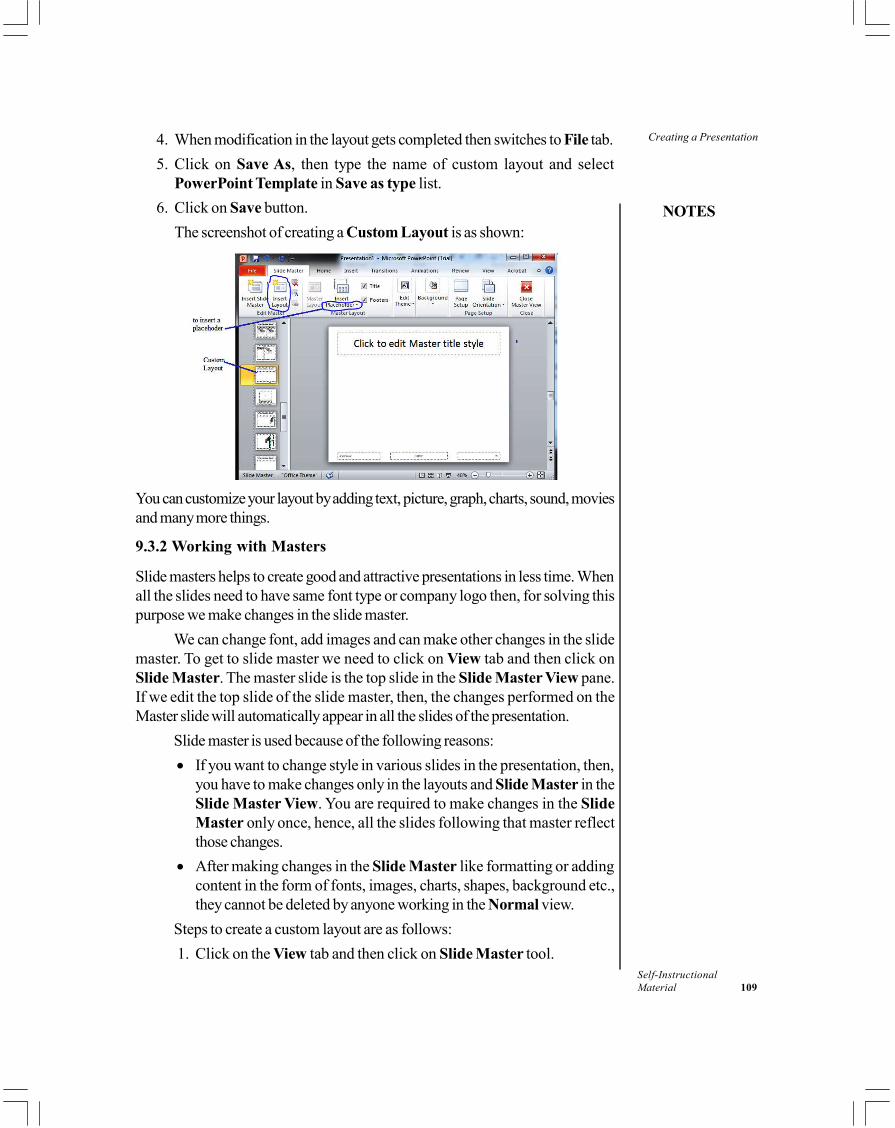
Creating a Presentation
NOTES
Self-InstructionalMaterial 109
4. When modification in the layout gets completed then switches to File tab.5. Click on Save As, then type the name of custom layout and select
PowerPoint Template in Save as type list.6. Click on Save button.
The screenshot of creating a Custom Layout is as shown:
You can customize your layout by adding text, picture, graph, charts, sound, moviesand many more things.
9.3.2 Working with Masters
Slide masters helps to create good and attractive presentations in less time. Whenall the slides need to have same font type or company logo then, for solving thispurpose we make changes in the slide master.
We can change font, add images and can make other changes in the slidemaster. To get to slide master we need to click on View tab and then click onSlide Master. The master slide is the top slide in the Slide Master View pane.If we edit the top slide of the slide master, then, the changes performed on theMaster slide will automatically appear in all the slides of the presentation.
Slide master is used because of the following reasons:• If you want to change style in various slides in the presentation, then,
you have to make changes only in the layouts and Slide Master in theSlide Master View. You are required to make changes in the SlideMaster only once, hence, all the slides following that master reflectthose changes.
• After making changes in the Slide Master like formatting or addingcontent in the form of fonts, images, charts, shapes, background etc.,they cannot be deleted by anyone working in the Normal view.
Steps to create a custom layout are as follows:1. Click on the View tab and then click on Slide Master tool.
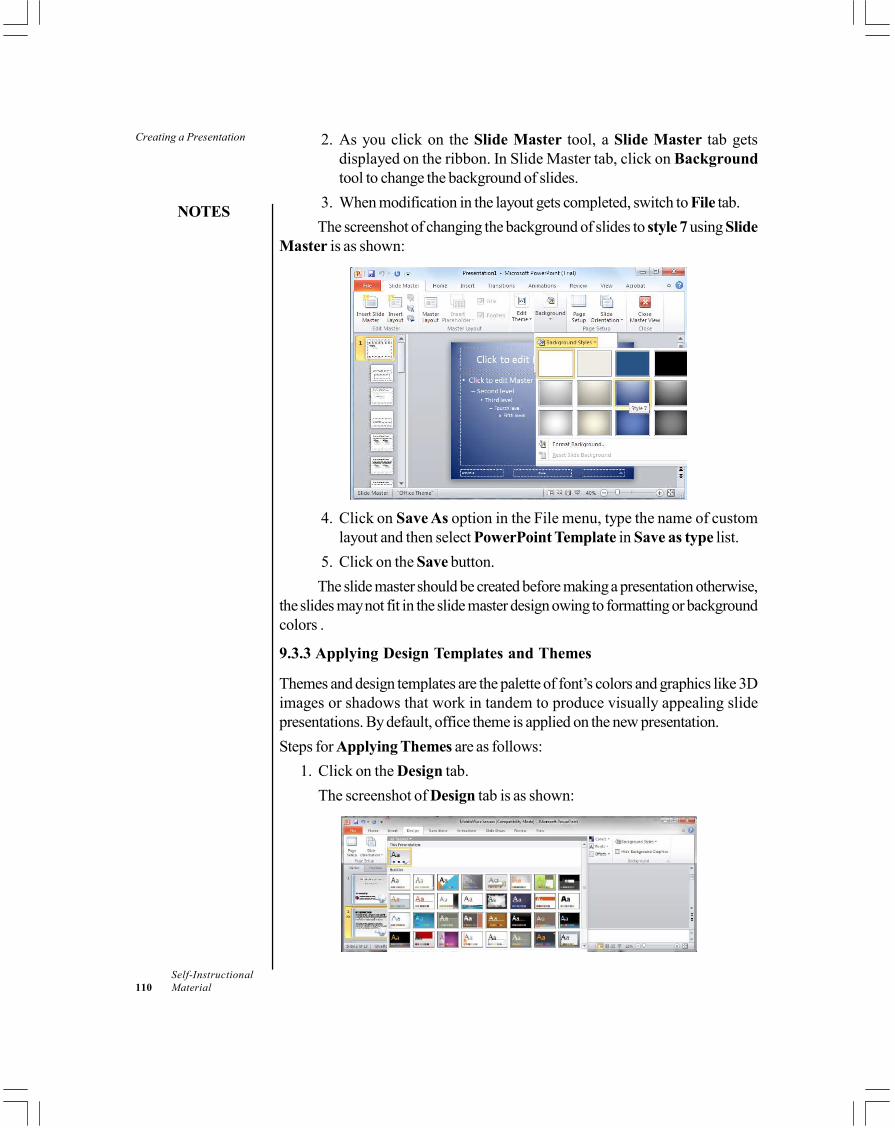
Creating a Presentation
NOTES
Self-Instructional110 Material
2. As you click on the Slide Master tool, a Slide Master tab getsdisplayed on the ribbon. In Slide Master tab, click on Backgroundtool to change the background of slides.
3. When modification in the layout gets completed, switch to File tab.The screenshot of changing the background of slides to style 7 using Slide
Master is as shown:
4. Click on Save As option in the File menu, type the name of customlayout and then select PowerPoint Template in Save as type list.
5. Click on the Save button.The slide master should be created before making a presentation otherwise,
the slides may not fit in the slide master design owing to formatting or backgroundcolors .
9.3.3 Applying Design Templates and Themes
Themes and design templates are the palette of font’s colors and graphics like 3Dimages or shadows that work in tandem to produce visually appealing slidepresentations. By default, office theme is applied on the new presentation.Steps for Applying Themes are as follows:
1. Click on the Design tab.The screenshot of Design tab is as shown:
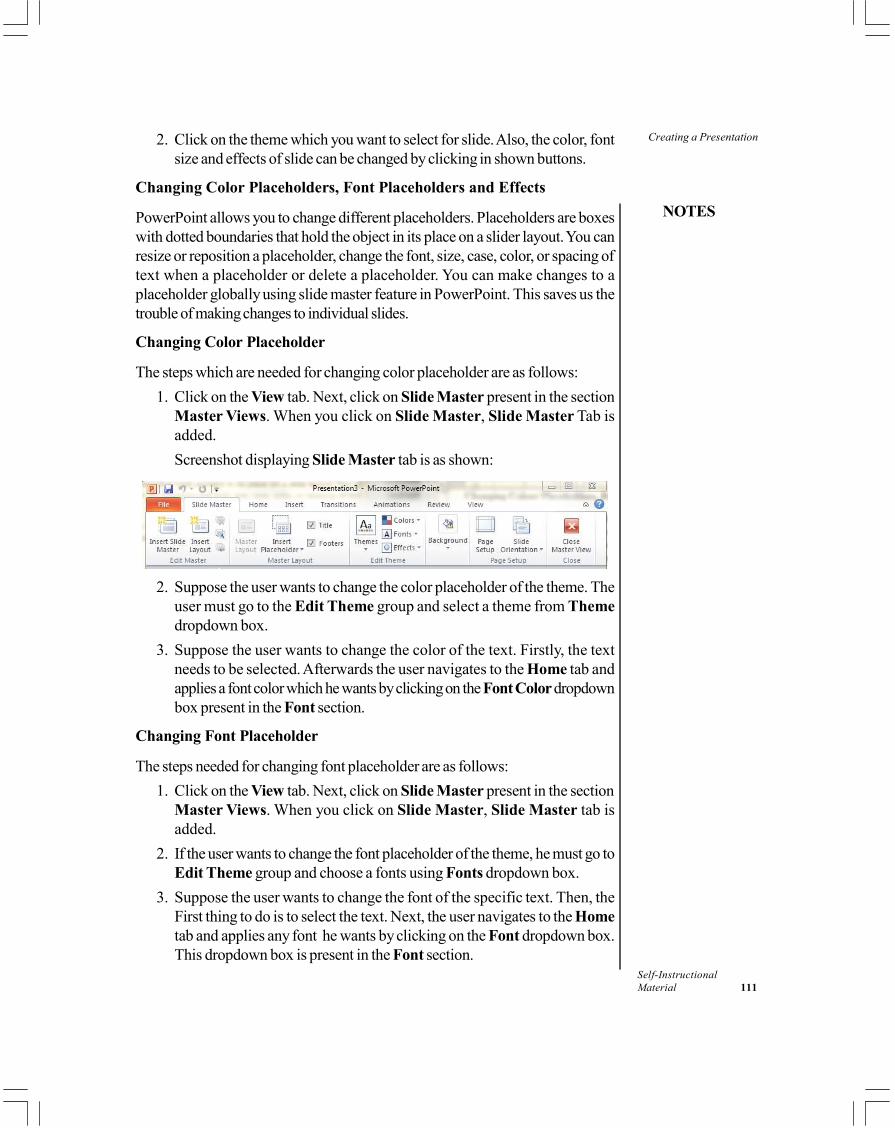
Creating a Presentation
NOTES
Self-InstructionalMaterial 111
2. Click on the theme which you want to select for slide. Also, the color, fontsize and effects of slide can be changed by clicking in shown buttons.
Changing Color Placeholders, Font Placeholders and Effects
PowerPoint allows you to change different placeholders. Placeholders are boxeswith dotted boundaries that hold the object in its place on a slider layout. You canresize or reposition a placeholder, change the font, size, case, color, or spacing oftext when a placeholder or delete a placeholder. You can make changes to aplaceholder globally using slide master feature in PowerPoint. This saves us thetrouble of making changes to individual slides.
Changing Color Placeholder
The steps which are needed for changing color placeholder are as follows:1. Click on the View tab. Next, click on Slide Master present in the section
Master Views. When you click on Slide Master, Slide Master Tab isadded.Screenshot displaying Slide Master tab is as shown:
2. Suppose the user wants to change the color placeholder of the theme. Theuser must go to the Edit Theme group and select a theme from Themedropdown box.
3. Suppose the user wants to change the color of the text. Firstly, the textneeds to be selected. Afterwards the user navigates to the Home tab andapplies a font color which he wants by clicking on the Font Color dropdownbox present in the Font section.
Changing Font Placeholder
The steps needed for changing font placeholder are as follows:1. Click on the View tab. Next, click on Slide Master present in the section
Master Views. When you click on Slide Master, Slide Master tab isadded.
2. If the user wants to change the font placeholder of the theme, he must go toEdit Theme group and choose a fonts using Fonts dropdown box.
3. Suppose the user wants to change the font of the specific text. Then, theFirst thing to do is to select the text. Next, the user navigates to the Hometab and applies any font he wants by clicking on the Font dropdown box.This dropdown box is present in the Font section.
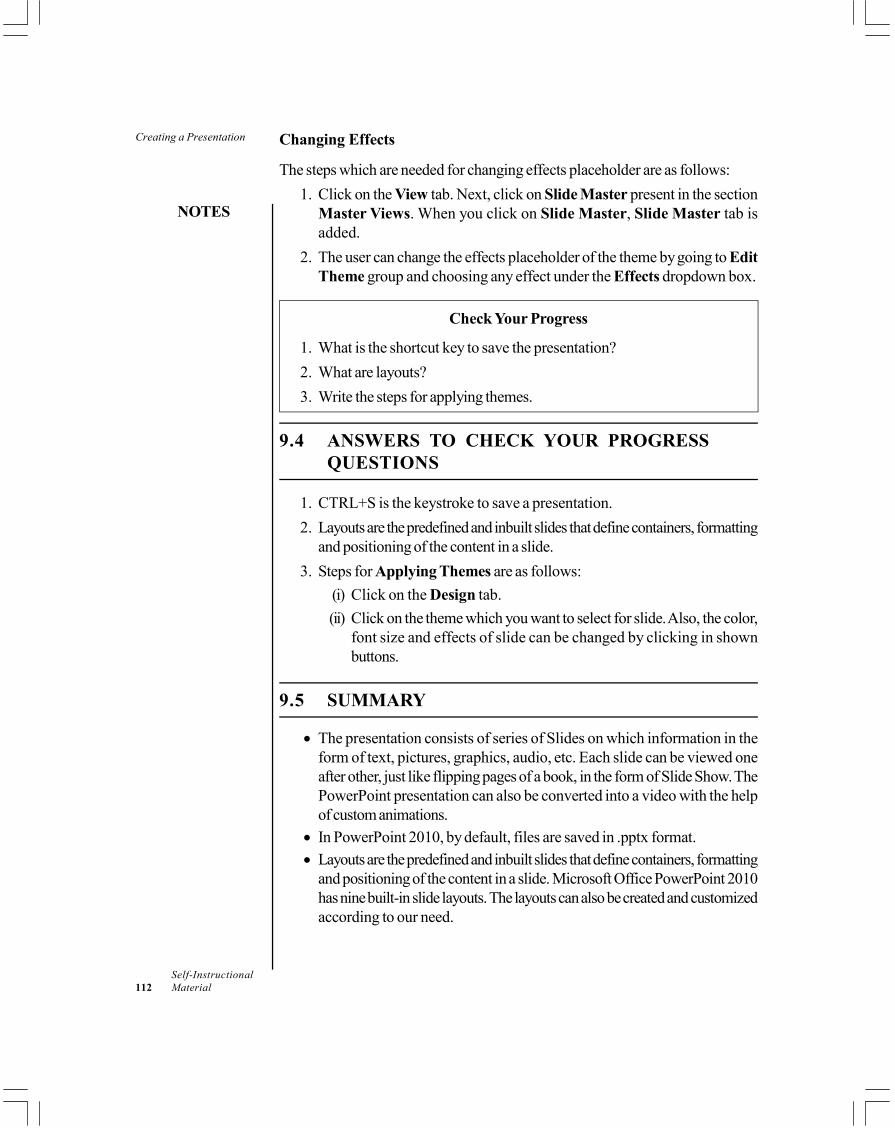
Creating a Presentation
NOTES
Self-Instructional112 Material
Changing Effects
The steps which are needed for changing effects placeholder are as follows:1. Click on the View tab. Next, click on Slide Master present in the section
Master Views. When you click on Slide Master, Slide Master tab isadded.
2. The user can change the effects placeholder of the theme by going to EditTheme group and choosing any effect under the Effects dropdown box.
Check Your Progress
1. What is the shortcut key to save the presentation?2. What are layouts?3. Write the steps for applying themes.
9.4 ANSWERS TO CHECK YOUR PROGRESSQUESTIONS
1. CTRL+S is the keystroke to save a presentation.2. Layouts are the predefined and inbuilt slides that define containers, formatting
and positioning of the content in a slide.3. Steps for Applying Themes are as follows:
(i) Click on the Design tab.(ii) Click on the theme which you want to select for slide. Also, the color,
font size and effects of slide can be changed by clicking in shownbuttons.
9.5 SUMMARY
• The presentation consists of series of Slides on which information in theform of text, pictures, graphics, audio, etc. Each slide can be viewed oneafter other, just like flipping pages of a book, in the form of Slide Show. ThePowerPoint presentation can also be converted into a video with the helpof custom animations.
• In PowerPoint 2010, by default, files are saved in .pptx format.• Layouts are the predefined and inbuilt slides that define containers, formatting
and positioning of the content in a slide. Microsoft Office PowerPoint 2010has nine built-in slide layouts. The layouts can also be created and customizedaccording to our need.
Creating a Presentation
NOTES
Self-InstructionalMaterial 113
• In custom layout, we can add any number of placeholders, apply anytheme, effects or background according to our need. These customizedlayouts can also be stored as a template so that we can use them wheneverthe need be.
• The master slide is the top slide in the Slide Master View pane. If we editthe top slide of the slide master, then, the changes performed on the Masterslide will automatically appear in all the slides of the presentation.
9.6 KEY WORDS
• Layouts: Layouts are predefined and prebuilt slides that define containers,formatting and positioning of the content in a slide.
• Themes: They are palette of font’s colors and graphics like 3D images orshadows that work in tandem to produce visually appealing slidepresentations. Themes can be applied to the current slides.
• Slide Masters: These are slides that are based on a theme and have a setof layouts. This option is available in View tab.
9.7 SELF ASSESSMENT QUESTIONS ANDEXERCISES
1. Create a presentation using templates on the topic of different types ofcommunication.
2. Select and apply one of the themes to the slides of the presentation.3. Create a presentation explaining different types of peripheral devices of a
computer system.
9.8 FURTHER READINGS
Srivastava, S.S. 2008. MS Office. New Delhi: Firewall Media.Saxena, Sanjay. 2011. MS Office 2007 in a Nutshell. Noida: Vikas Publishing
house.Courter, Gini and Annette Marquis. 1999. Mastering Microsoft Office 2000.
New Delhi: BPB Publications.Blattner, Patrick, Ken Cook, Laurie Ulrich and Timothy Dyck. 1999. Special
Edition Using Microsoft Excel 2000. New Delhi: Prentice-Hall of India.
Slides
NOTES
Self-Instructional114 Material
UNIT 10 SLIDES
Structure10.0 Introduction10.1 Objectives10.2 Enhancing Presentation
10.2.1 Applying Animation10.2.2 Transition Effects10.2.3 Including Header and Footer10.2.4 Working with Tables, Images and Illustrations
10.3 Delivering a Presentation10.3.1 Setting for Slide Show
10.4 Answers to Check Your Progress Questions10.5 Summary10.6 Key Words10.7 Self Assessment Questions and Exercises10.8 Further Readings
10.0 INTRODUCTION
In this unit, you will learn about the application of animation, transition effects andheader and footer. Animation is one of the most common features of MSPowerPoint. It is used to make an attractive presentation and for creating theinterest in audience. Slide Transition is also an animation effect which is to defineeffects while proceeding from one slide to next slide during the slide show. It alsoincludes adding sound effects. You can apply the different kinds of transition effectsin slides of a presentation. You will also learn how to deliver a presentation.
10.1 OBJECTIVES
After going through this unit, you will be able to:• Enhance presentation with the help of animation, transition effects and header
and footer• Work with table, image and illustrations• Set up the slide show.
10.2 ENHANCING PRESENTATION
MS Office 2010 plays an important role in business, seminars and for personaluse. It allows the user to demonstrate information in office conferences, class
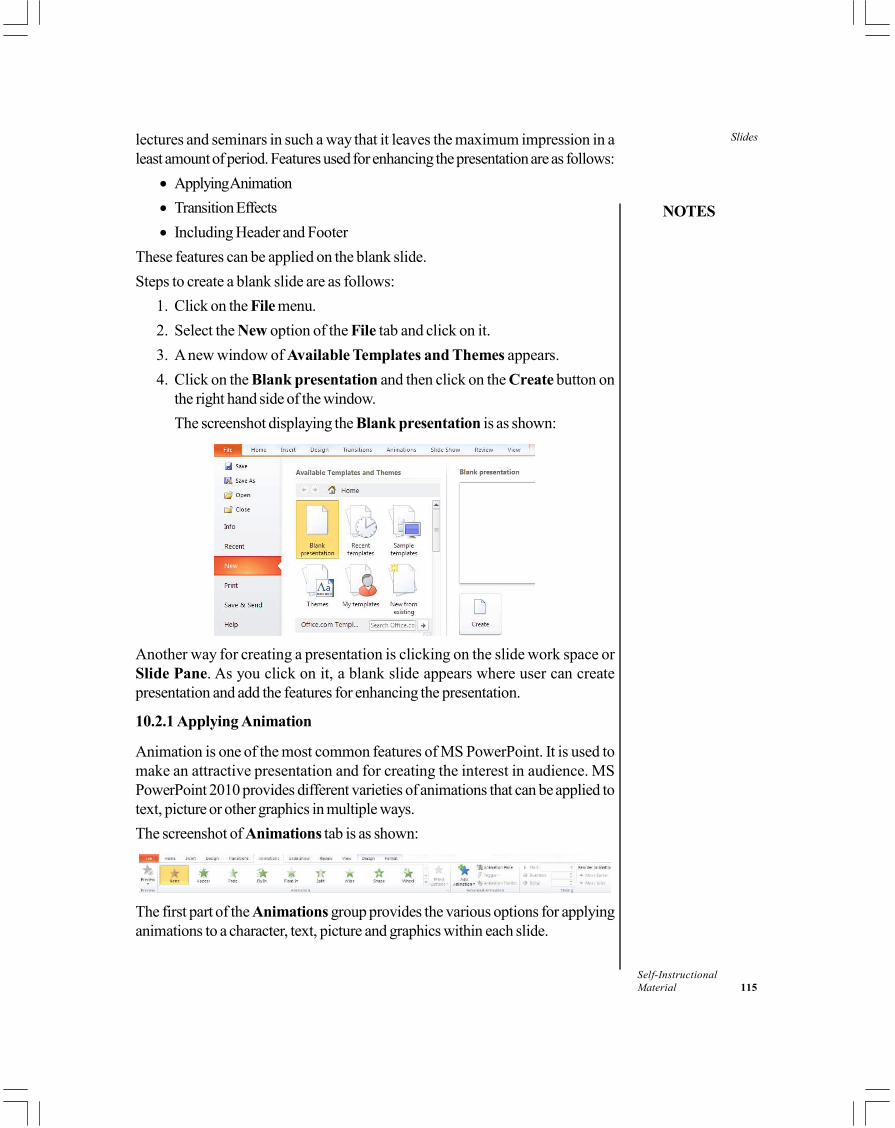
Slides
NOTES
Self-InstructionalMaterial 115
lectures and seminars in such a way that it leaves the maximum impression in aleast amount of period. Features used for enhancing the presentation are as follows:
• Applying Animation• Transition Effects• Including Header and Footer
These features can be applied on the blank slide.Steps to create a blank slide are as follows:
1. Click on the File menu.2. Select the New option of the File tab and click on it.3. A new window of Available Templates and Themes appears.4. Click on the Blank presentation and then click on the Create button on
the right hand side of the window.The screenshot displaying the Blank presentation is as shown:
Another way for creating a presentation is clicking on the slide work space orSlide Pane. As you click on it, a blank slide appears where user can createpresentation and add the features for enhancing the presentation.
10.2.1 Applying Animation
Animation is one of the most common features of MS PowerPoint. It is used tomake an attractive presentation and for creating the interest in audience. MSPowerPoint 2010 provides different varieties of animations that can be applied totext, picture or other graphics in multiple ways.The screenshot of Animations tab is as shown:
The first part of the Animations group provides the various options for applyinganimations to a character, text, picture and graphics within each slide.
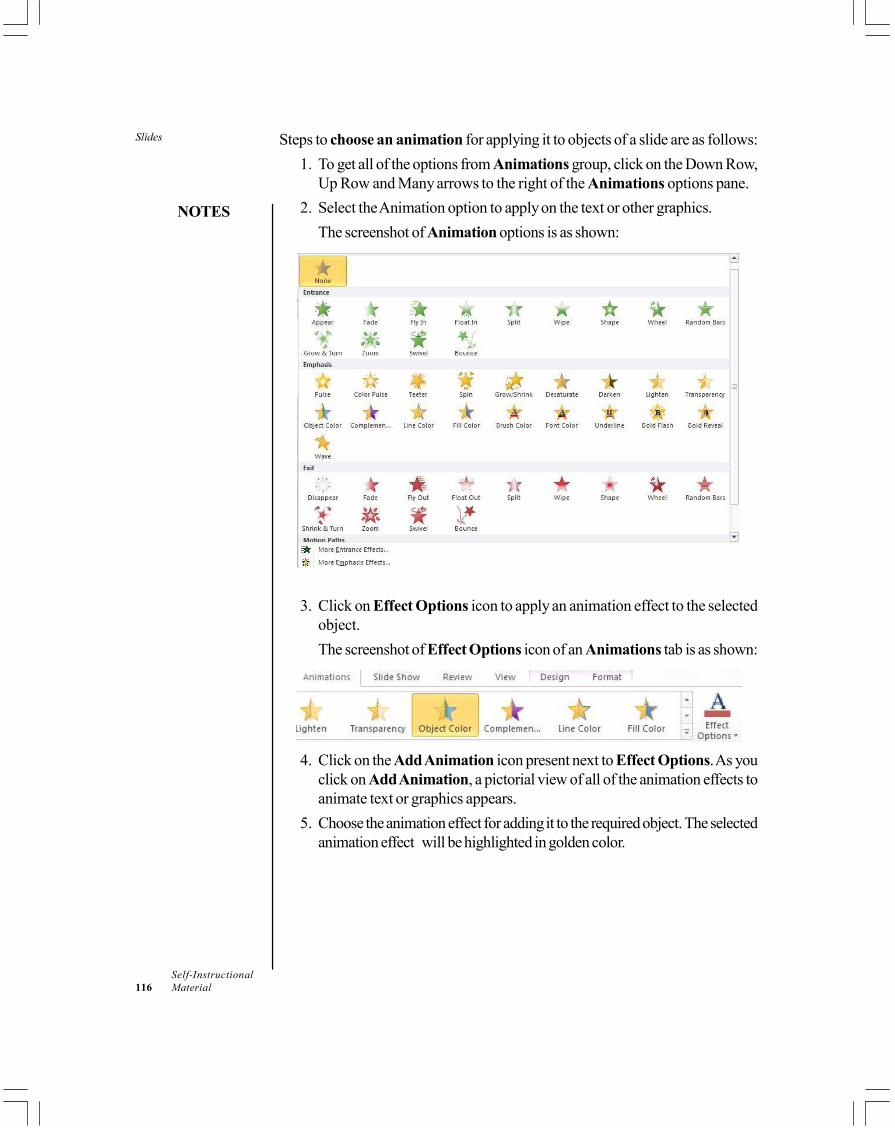
Slides
NOTES
Self-Instructional116 Material
Steps to choose an animation for applying it to objects of a slide are as follows:1. To get all of the options from Animations group, click on the Down Row,
Up Row and Many arrows to the right of the Animations options pane.2. Select the Animation option to apply on the text or other graphics.
The screenshot of Animation options is as shown:
3. Click on Effect Options icon to apply an animation effect to the selectedobject.The screenshot of Effect Options icon of an Animations tab is as shown:
4. Click on the Add Animation icon present next to Effect Options. As youclick on Add Animation, a pictorial view of all of the animation effects toanimate text or graphics appears.
5. Choose the animation effect for adding it to the required object. The selectedanimation effect will be highlighted in golden color.
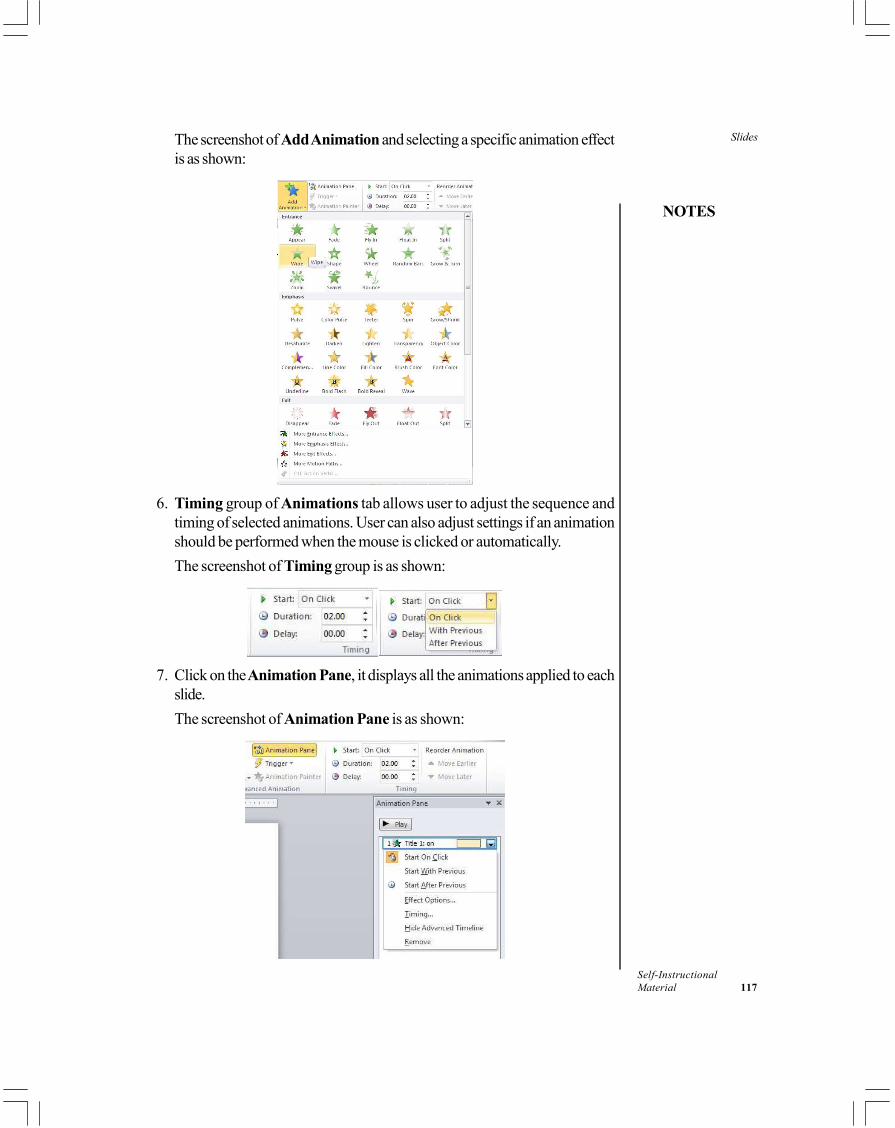
Slides
NOTES
Self-InstructionalMaterial 117
The screenshot of Add Animation and selecting a specific animation effectis as shown:
6. Timing group of Animations tab allows user to adjust the sequence andtiming of selected animations. User can also adjust settings if an animationshould be performed when the mouse is clicked or automatically.The screenshot of Timing group is as shown:
7. Click on the Animation Pane, it displays all the animations applied to eachslide.The screenshot of Animation Pane is as shown:
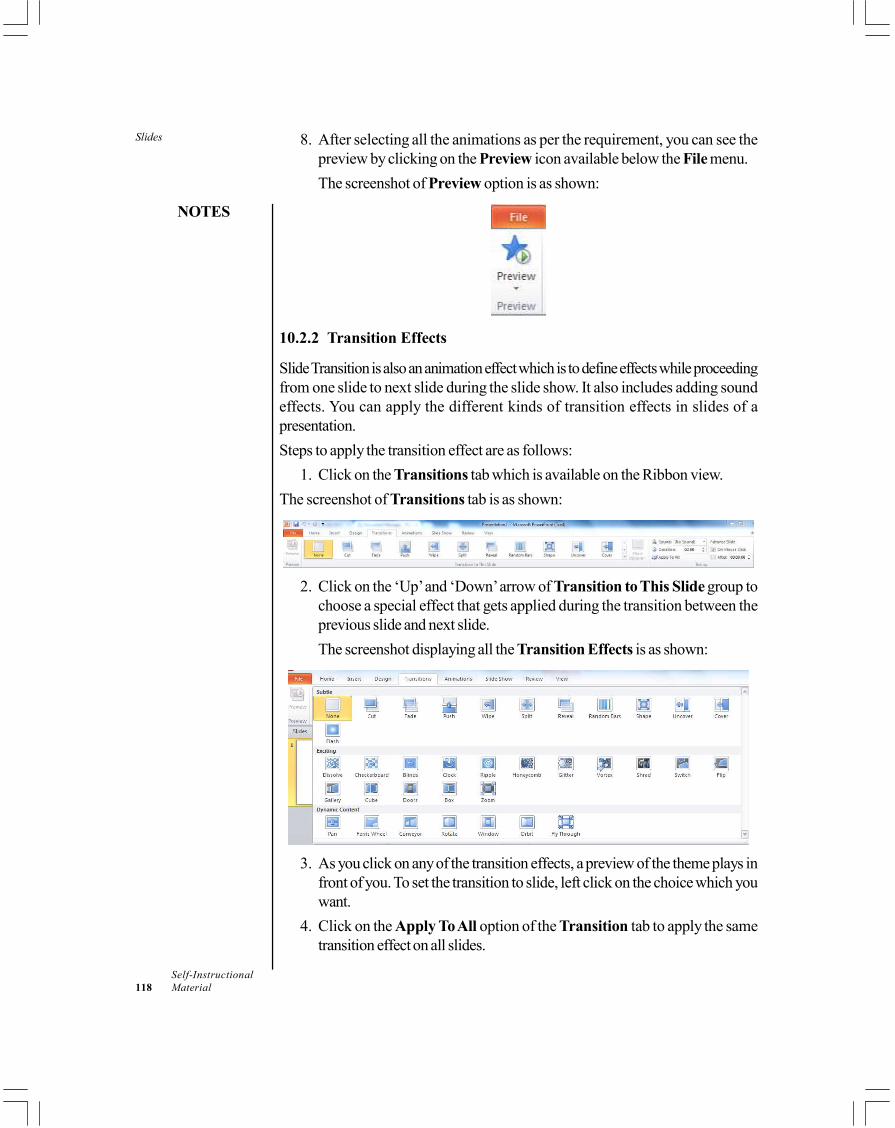
Slides
NOTES
Self-Instructional118 Material
8. After selecting all the animations as per the requirement, you can see thepreview by clicking on the Preview icon available below the File menu.The screenshot of Preview option is as shown:
10.2.2 Transition Effects
Slide Transition is also an animation effect which is to define effects while proceedingfrom one slide to next slide during the slide show. It also includes adding soundeffects. You can apply the different kinds of transition effects in slides of apresentation.Steps to apply the transition effect are as follows:
1. Click on the Transitions tab which is available on the Ribbon view.The screenshot of Transitions tab is as shown:
2. Click on the ‘Up’ and ‘Down’ arrow of Transition to This Slide group tochoose a special effect that gets applied during the transition between theprevious slide and next slide.The screenshot displaying all the Transition Effects is as shown:
3. As you click on any of the transition effects, a preview of the theme plays infront of you. To set the transition to slide, left click on the choice which youwant.
4. Click on the Apply To All option of the Transition tab to apply the sametransition effect on all slides.
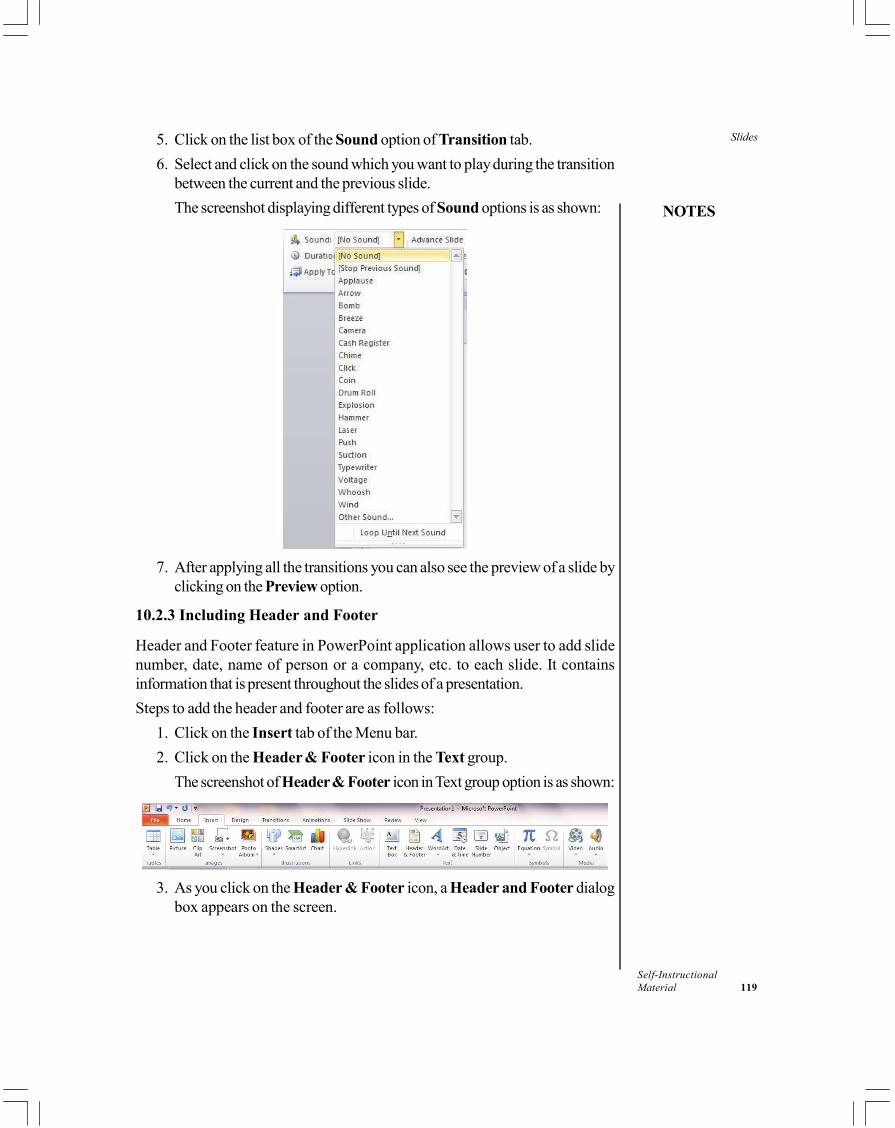
Slides
NOTES
Self-InstructionalMaterial 119
5. Click on the list box of the Sound option of Transition tab.6. Select and click on the sound which you want to play during the transition
between the current and the previous slide.The screenshot displaying different types of Sound options is as shown:
7. After applying all the transitions you can also see the preview of a slide byclicking on the Preview option.
10.2.3 Including Header and Footer
Header and Footer feature in PowerPoint application allows user to add slidenumber, date, name of person or a company, etc. to each slide. It containsinformation that is present throughout the slides of a presentation.Steps to add the header and footer are as follows:
1. Click on the Insert tab of the Menu bar.2. Click on the Header & Footer icon in the Text group.
The screenshot of Header & Footer icon in Text group option is as shown:
3. As you click on the Header & Footer icon, a Header and Footer dialogbox appears on the screen.
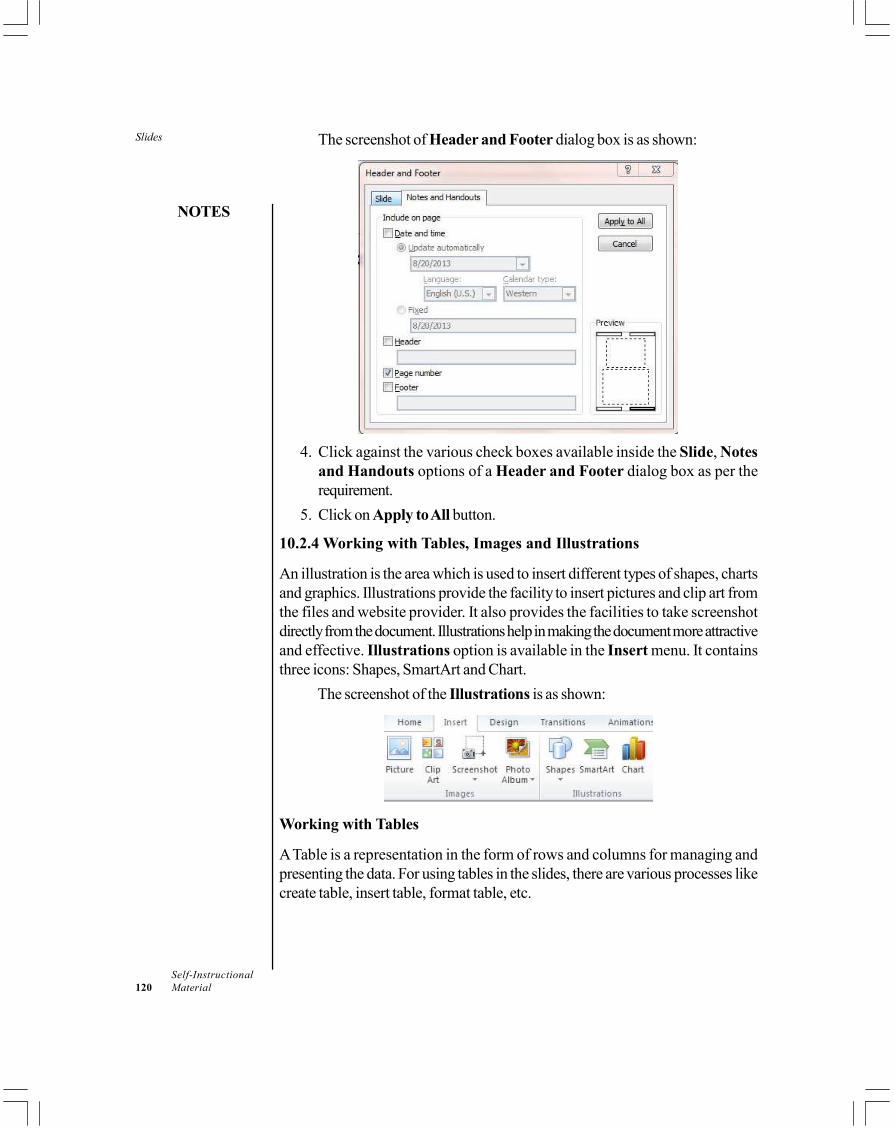
Slides
NOTES
Self-Instructional120 Material
The screenshot of Header and Footer dialog box is as shown:
4. Click against the various check boxes available inside the Slide, Notesand Handouts options of a Header and Footer dialog box as per therequirement.
5. Click on Apply to All button.
10.2.4 Working with Tables, Images and Illustrations
An illustration is the area which is used to insert different types of shapes, chartsand graphics. Illustrations provide the facility to insert pictures and clip art fromthe files and website provider. It also provides the facilities to take screenshotdirectly from the document. Illustrations help in making the document more attractiveand effective. Illustrations option is available in the Insert menu. It containsthree icons: Shapes, SmartArt and Chart.
The screenshot of the Illustrations is as shown:
Working with Tables
A Table is a representation in the form of rows and columns for managing andpresenting the data. For using tables in the slides, there are various processes likecreate table, insert table, format table, etc.
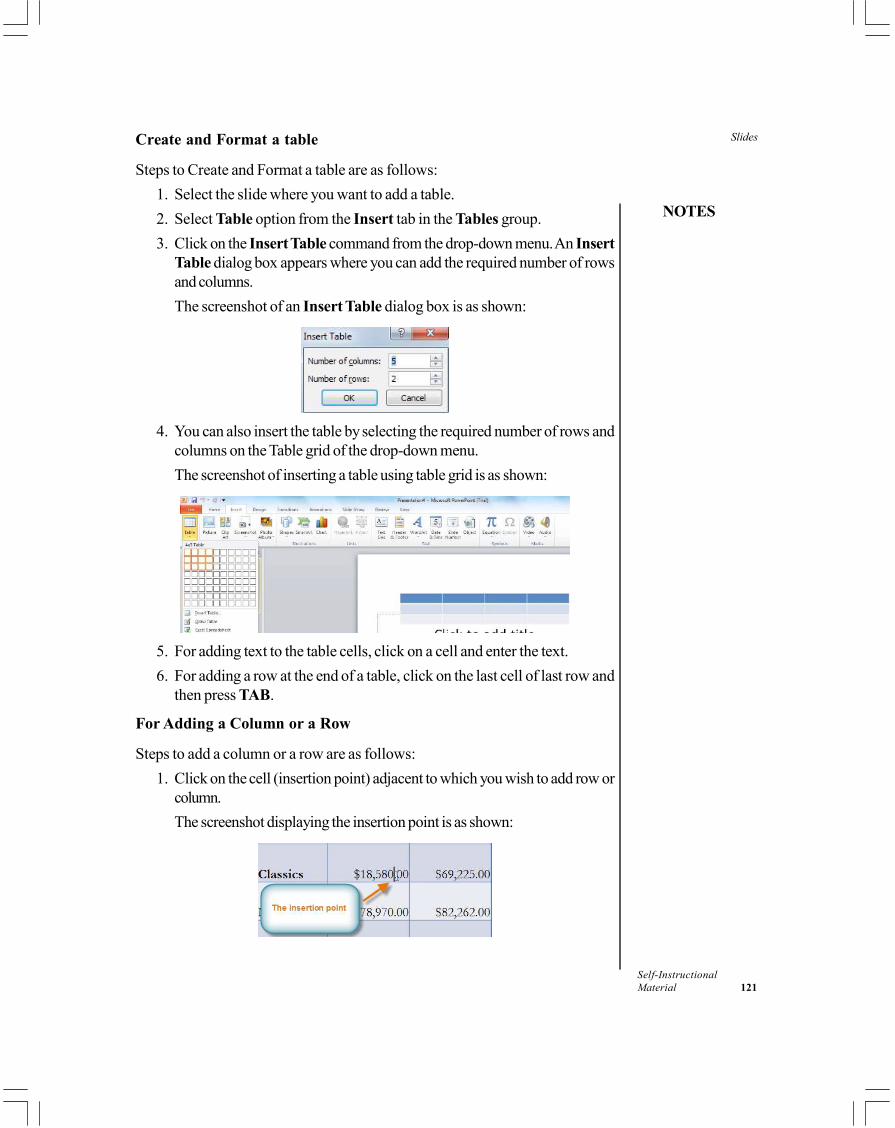
Slides
NOTES
Self-InstructionalMaterial 121
Create and Format a table
Steps to Create and Format a table are as follows:1. Select the slide where you want to add a table.2. Select Table option from the Insert tab in the Tables group.3. Click on the Insert Table command from the drop-down menu. An Insert
Table dialog box appears where you can add the required number of rowsand columns.The screenshot of an Insert Table dialog box is as shown:
4. You can also insert the table by selecting the required number of rows andcolumns on the Table grid of the drop-down menu.The screenshot of inserting a table using table grid is as shown:
5. For adding text to the table cells, click on a cell and enter the text.6. For adding a row at the end of a table, click on the last cell of last row and
then press TAB.
For Adding a Column or a Row
Steps to add a column or a row are as follows:1. Click on the cell (insertion point) adjacent to which you wish to add row or
column.The screenshot displaying the insertion point is as shown:
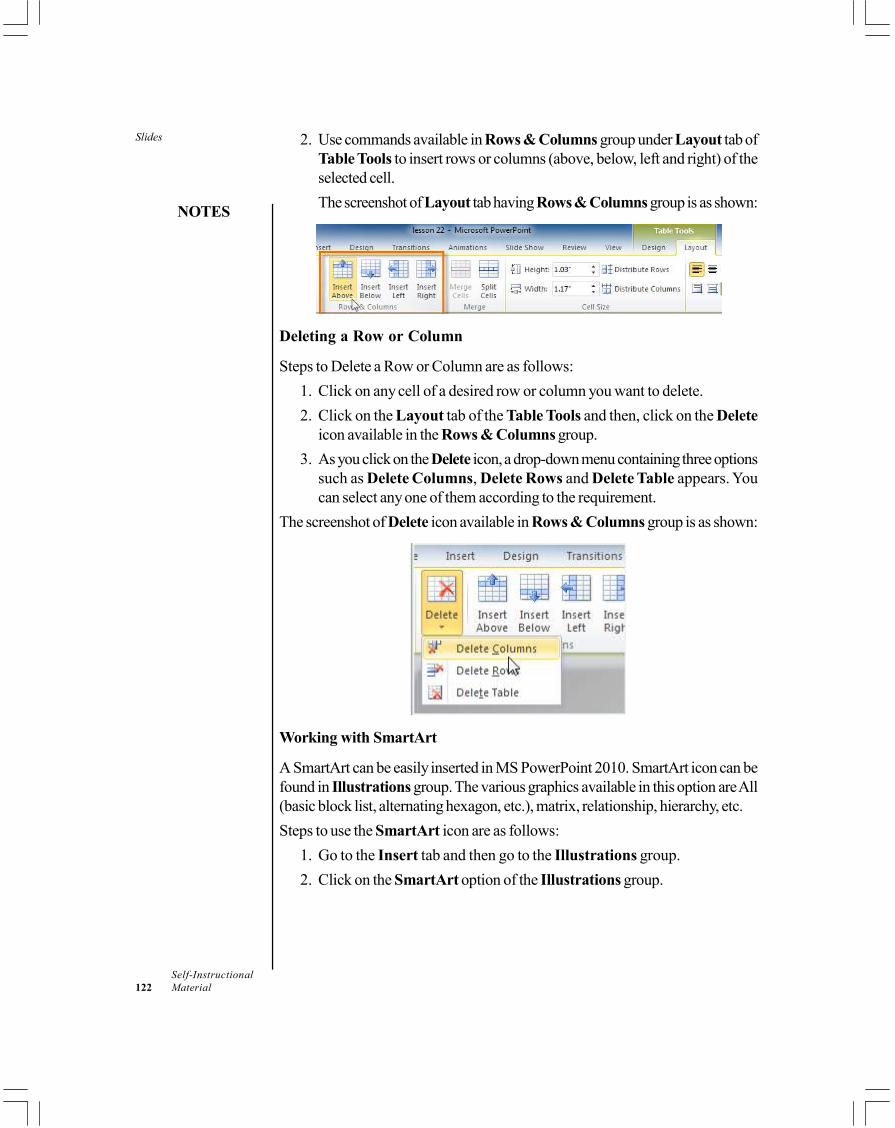
Slides
NOTES
Self-Instructional122 Material
2. Use commands available in Rows & Columns group under Layout tab ofTable Tools to insert rows or columns (above, below, left and right) of theselected cell.The screenshot of Layout tab having Rows & Columns group is as shown:
Deleting a Row or Column
Steps to Delete a Row or Column are as follows:1. Click on any cell of a desired row or column you want to delete.2. Click on the Layout tab of the Table Tools and then, click on the Delete
icon available in the Rows & Columns group.3. As you click on the Delete icon, a drop-down menu containing three options
such as Delete Columns, Delete Rows and Delete Table appears. Youcan select any one of them according to the requirement.
The screenshot of Delete icon available in Rows & Columns group is as shown:
Working with SmartArt
A SmartArt can be easily inserted in MS PowerPoint 2010. SmartArt icon can befound in Illustrations group. The various graphics available in this option are All(basic block list, alternating hexagon, etc.), matrix, relationship, hierarchy, etc.Steps to use the SmartArt icon are as follows:
1. Go to the Insert tab and then go to the Illustrations group.2. Click on the SmartArt option of the Illustrations group.
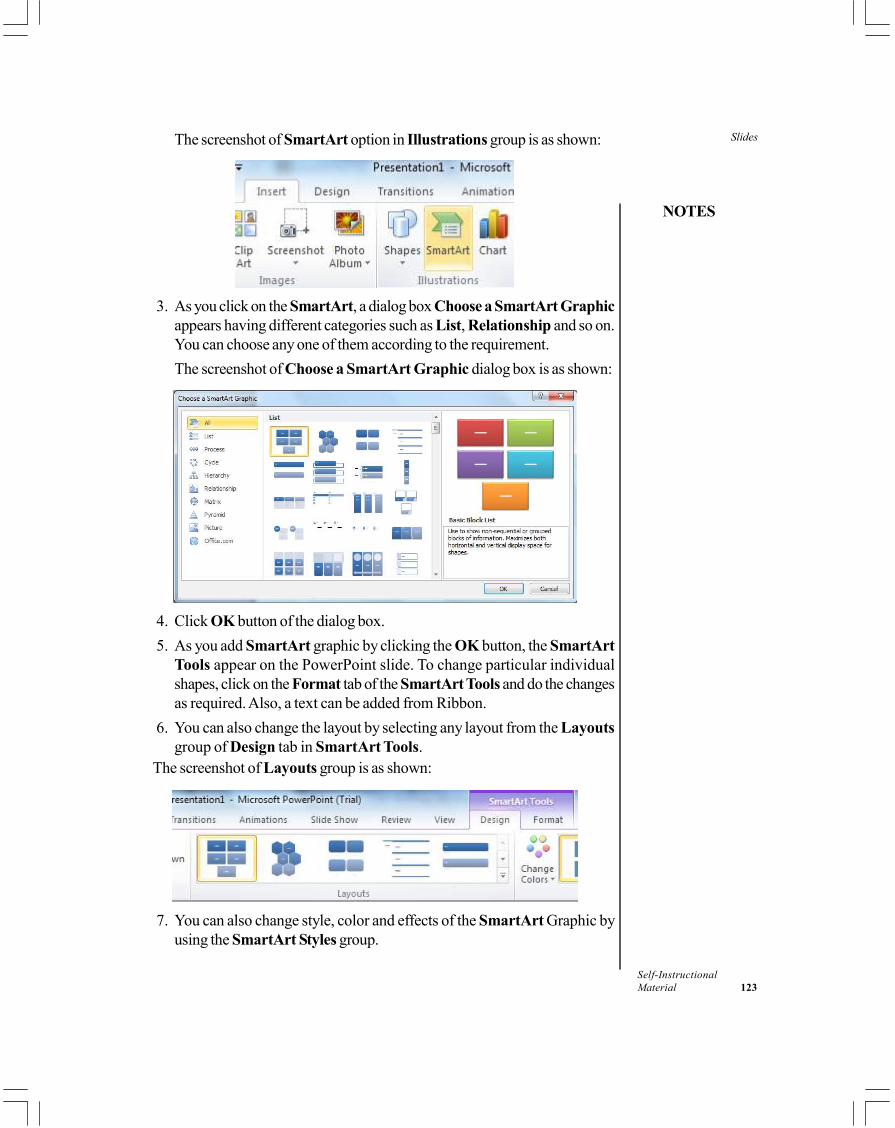
Slides
NOTES
Self-InstructionalMaterial 123
The screenshot of SmartArt option in Illustrations group is as shown:
3. As you click on the SmartArt, a dialog box Choose a SmartArt Graphicappears having different categories such as List, Relationship and so on.You can choose any one of them according to the requirement.The screenshot of Choose a SmartArt Graphic dialog box is as shown:
4. Click OK button of the dialog box.5. As you add SmartArt graphic by clicking the OK button, the SmartArt
Tools appear on the PowerPoint slide. To change particular individualshapes, click on the Format tab of the SmartArt Tools and do the changesas required. Also, a text can be added from Ribbon.
6. You can also change the layout by selecting any layout from the Layoutsgroup of Design tab in SmartArt Tools.
The screenshot of Layouts group is as shown:
7. You can also change style, color and effects of the SmartArt Graphic byusing the SmartArt Styles group.
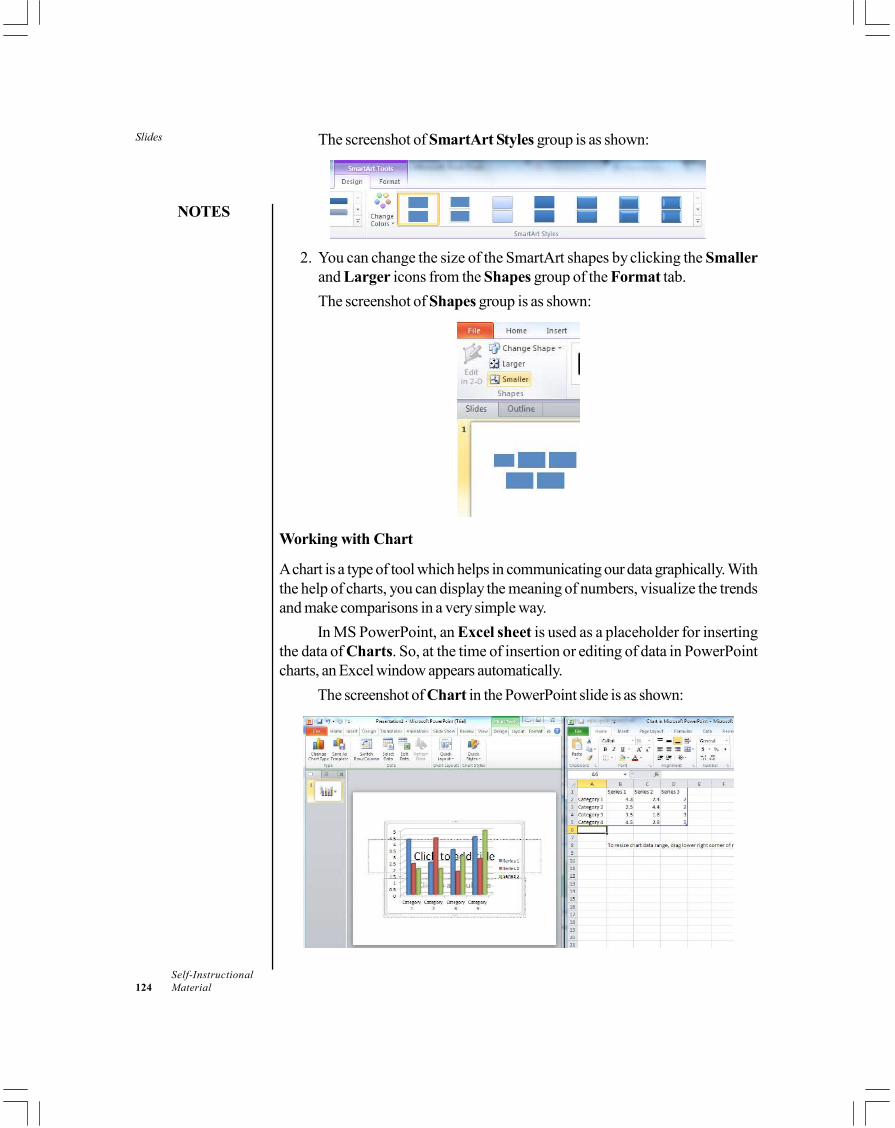
Slides
NOTES
Self-Instructional124 Material
The screenshot of SmartArt Styles group is as shown:
2. You can change the size of the SmartArt shapes by clicking the Smallerand Larger icons from the Shapes group of the Format tab.The screenshot of Shapes group is as shown:
Working with Chart
A chart is a type of tool which helps in communicating our data graphically. Withthe help of charts, you can display the meaning of numbers, visualize the trendsand make comparisons in a very simple way.
In MS PowerPoint, an Excel sheet is used as a placeholder for insertingthe data of Charts. So, at the time of insertion or editing of data in PowerPointcharts, an Excel window appears automatically.
The screenshot of Chart in the PowerPoint slide is as shown:
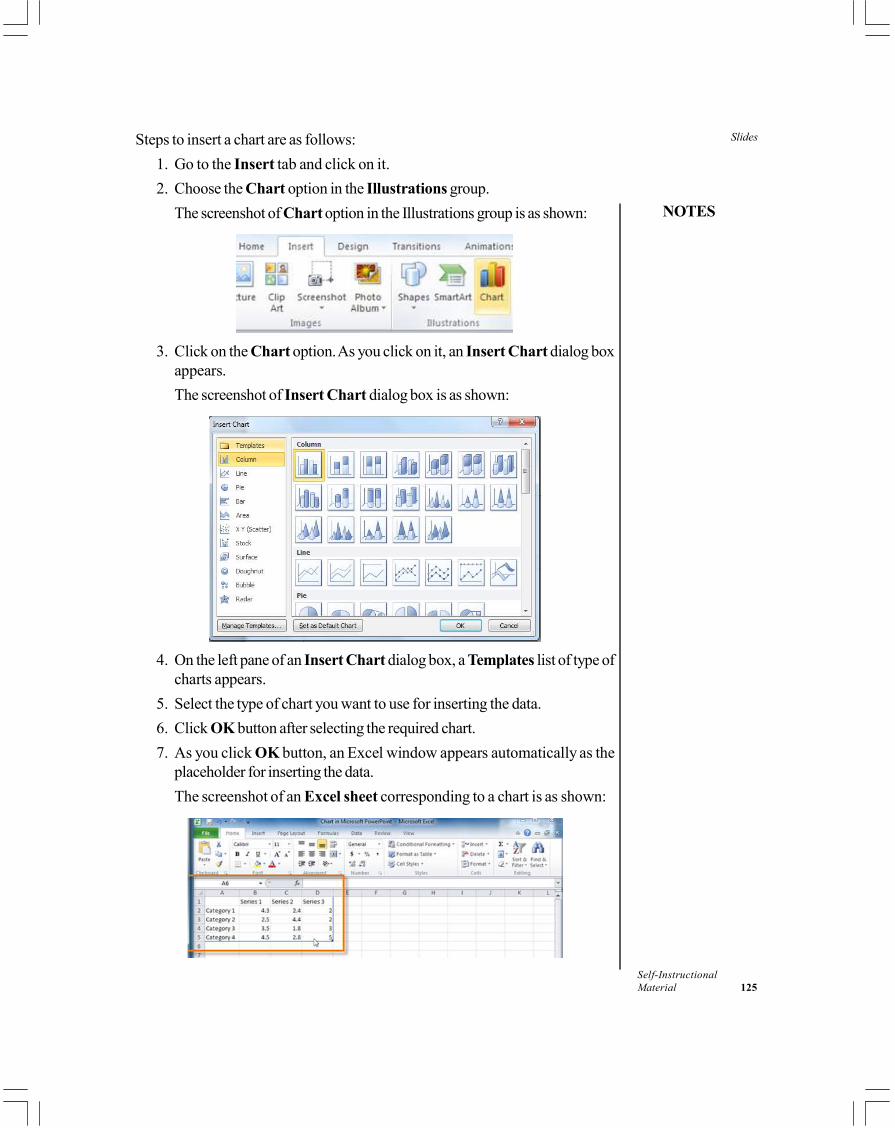
Slides
NOTES
Self-InstructionalMaterial 125
Steps to insert a chart are as follows:1. Go to the Insert tab and click on it.2. Choose the Chart option in the Illustrations group.
The screenshot of Chart option in the Illustrations group is as shown:
3. Click on the Chart option. As you click on it, an Insert Chart dialog boxappears.The screenshot of Insert Chart dialog box is as shown:
4. On the left pane of an Insert Chart dialog box, a Templates list of type ofcharts appears.
5. Select the type of chart you want to use for inserting the data.6. Click OK button after selecting the required chart.7. As you click OK button, an Excel window appears automatically as the
placeholder for inserting the data.The screenshot of an Excel sheet corresponding to a chart is as shown:
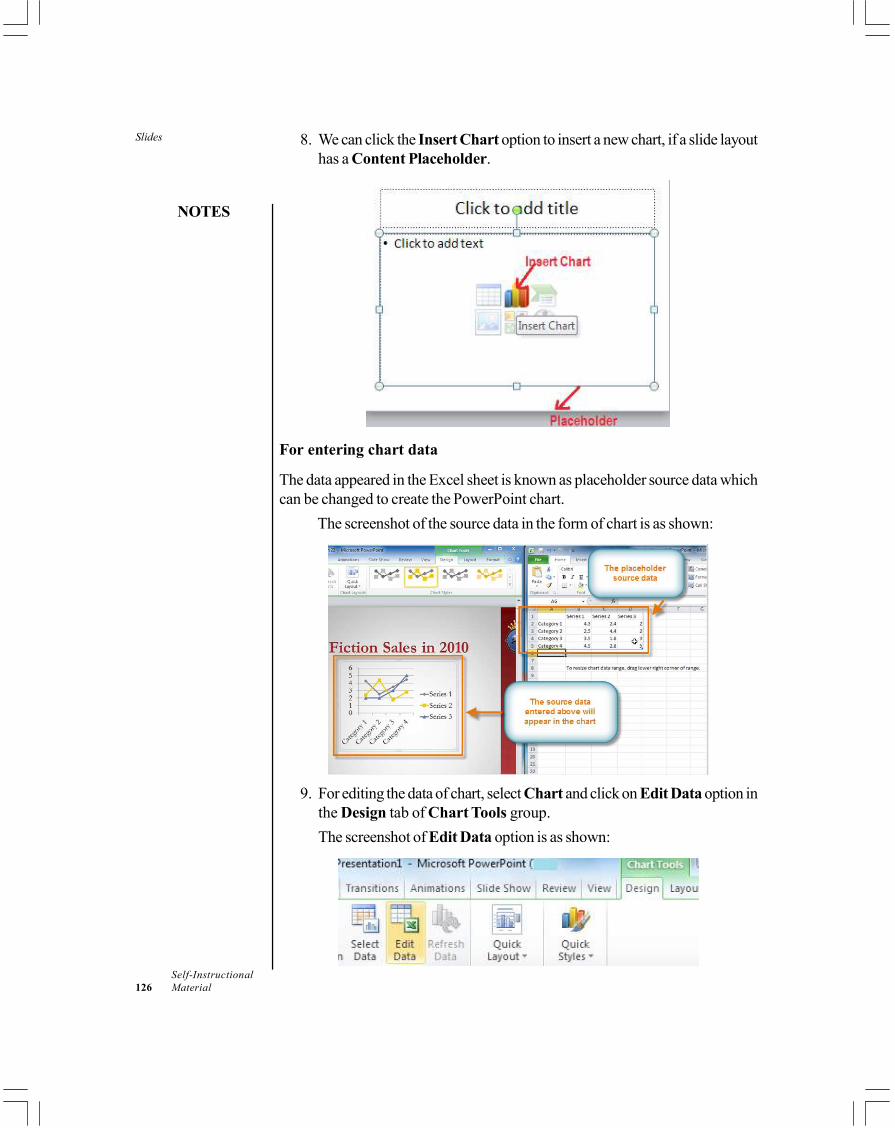
Slides
NOTES
Self-Instructional126 Material
8. We can click the Insert Chart option to insert a new chart, if a slide layouthas a Content Placeholder.
For entering chart data
The data appeared in the Excel sheet is known as placeholder source data whichcan be changed to create the PowerPoint chart.
The screenshot of the source data in the form of chart is as shown:
9. For editing the data of chart, select Chart and click on Edit Data option inthe Design tab of Chart Tools group.The screenshot of Edit Data option is as shown:
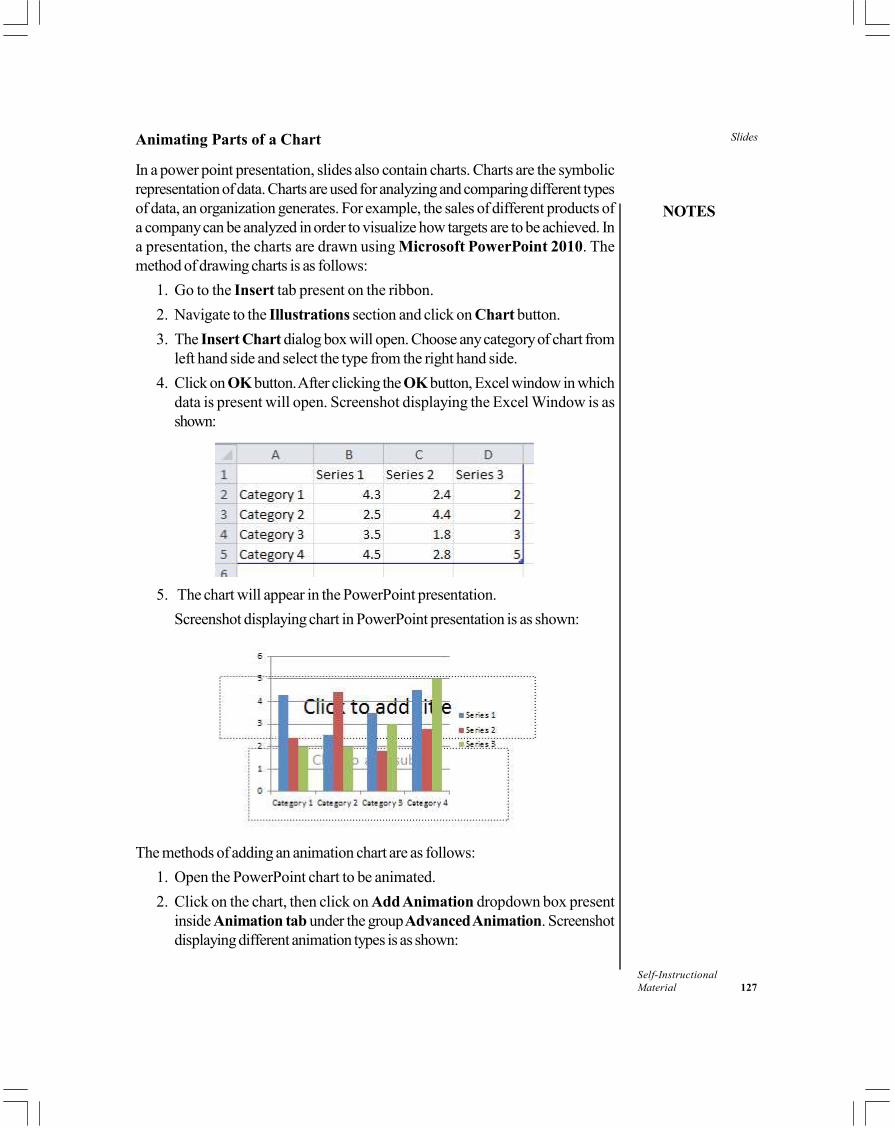
Slides
NOTES
Self-InstructionalMaterial 127
Animating Parts of a Chart
In a power point presentation, slides also contain charts. Charts are the symbolicrepresentation of data. Charts are used for analyzing and comparing different typesof data, an organization generates. For example, the sales of different products ofa company can be analyzed in order to visualize how targets are to be achieved. Ina presentation, the charts are drawn using Microsoft PowerPoint 2010. Themethod of drawing charts is as follows:
1. Go to the Insert tab present on the ribbon.2. Navigate to the Illustrations section and click on Chart button.3. The Insert Chart dialog box will open. Choose any category of chart from
left hand side and select the type from the right hand side.4. Click on OK button. After clicking the OK button, Excel window in which
data is present will open. Screenshot displaying the Excel Window is asshown:
5. The chart will appear in the PowerPoint presentation.Screenshot displaying chart in PowerPoint presentation is as shown:
The methods of adding an animation chart are as follows:1. Open the PowerPoint chart to be animated.2. Click on the chart, then click on Add Animation dropdown box present
inside Animation tab under the group Advanced Animation. Screenshotdisplaying different animation types is as shown:
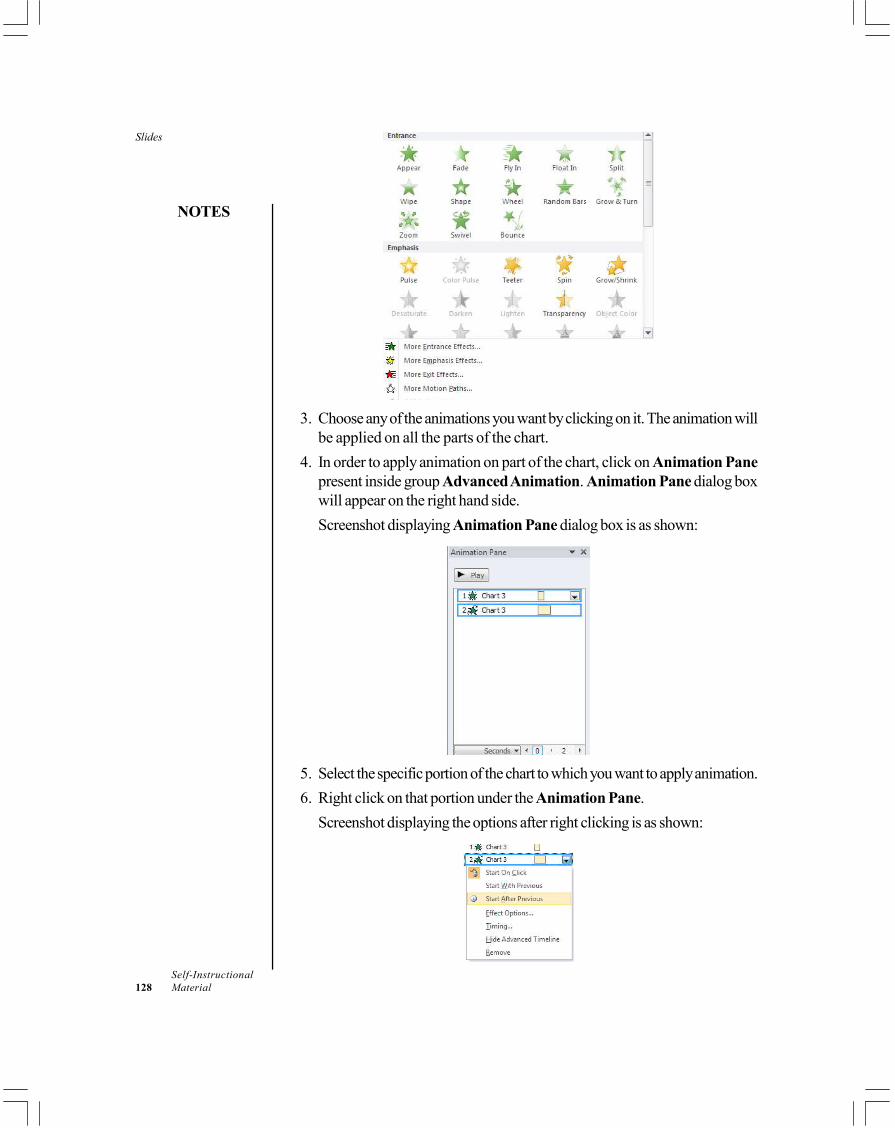
Slides
NOTES
Self-Instructional128 Material
3. Choose any of the animations you want by clicking on it. The animation willbe applied on all the parts of the chart.
4. In order to apply animation on part of the chart, click on Animation Panepresent inside group Advanced Animation. Animation Pane dialog boxwill appear on the right hand side.Screenshot displaying Animation Pane dialog box is as shown:
5. Select the specific portion of the chart to which you want to apply animation.6. Right click on that portion under the Animation Pane.
Screenshot displaying the options after right clicking is as shown:
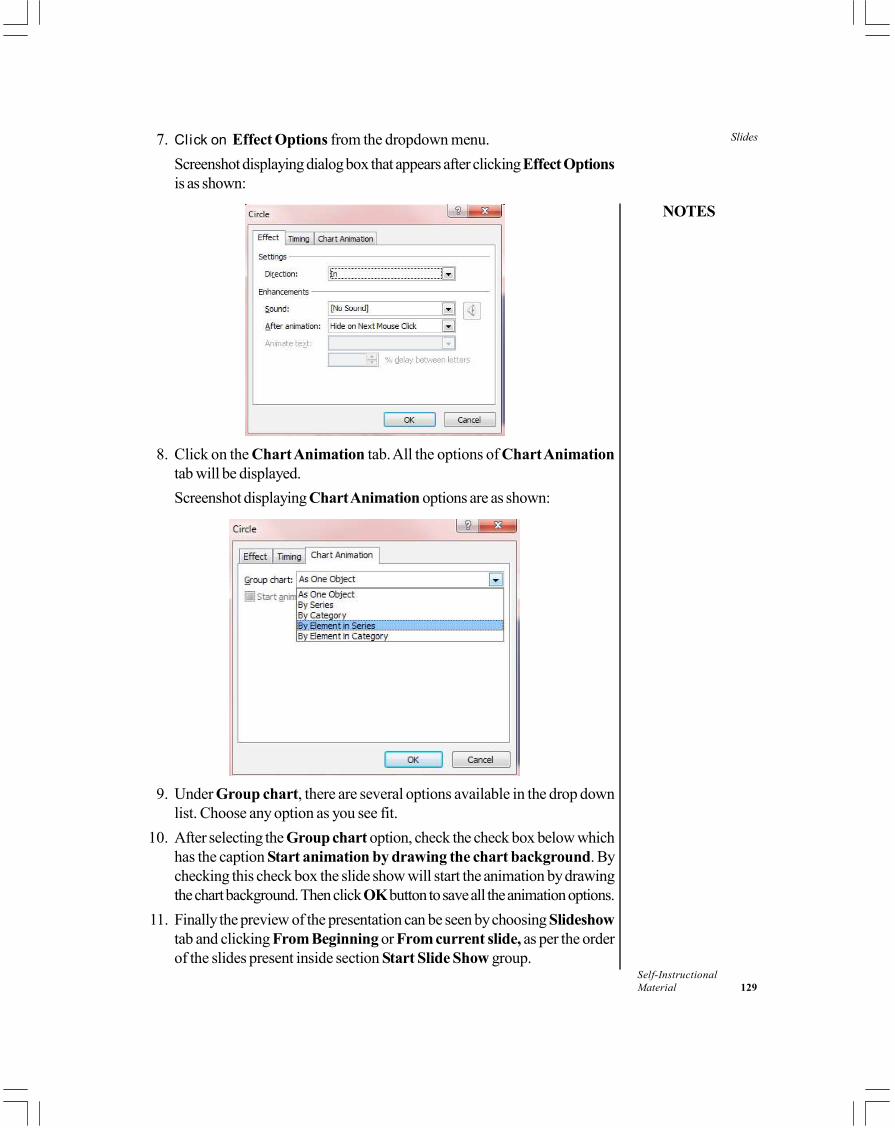
Slides
NOTES
Self-InstructionalMaterial 129
7. Click on Effect Options from the dropdown menu.Screenshot displaying dialog box that appears after clicking Effect Optionsis as shown:
8. Click on the Chart Animation tab. All the options of Chart Animationtab will be displayed.Screenshot displaying Chart Animation options are as shown:
9. Under Group chart, there are several options available in the drop downlist. Choose any option as you see fit.
10. After selecting the Group chart option, check the check box below whichhas the caption Start animation by drawing the chart background. Bychecking this check box the slide show will start the animation by drawingthe chart background. Then click OK button to save all the animation options.
11. Finally the preview of the presentation can be seen by choosing Slideshowtab and clicking From Beginning or From current slide, as per the orderof the slides present inside section Start Slide Show group.
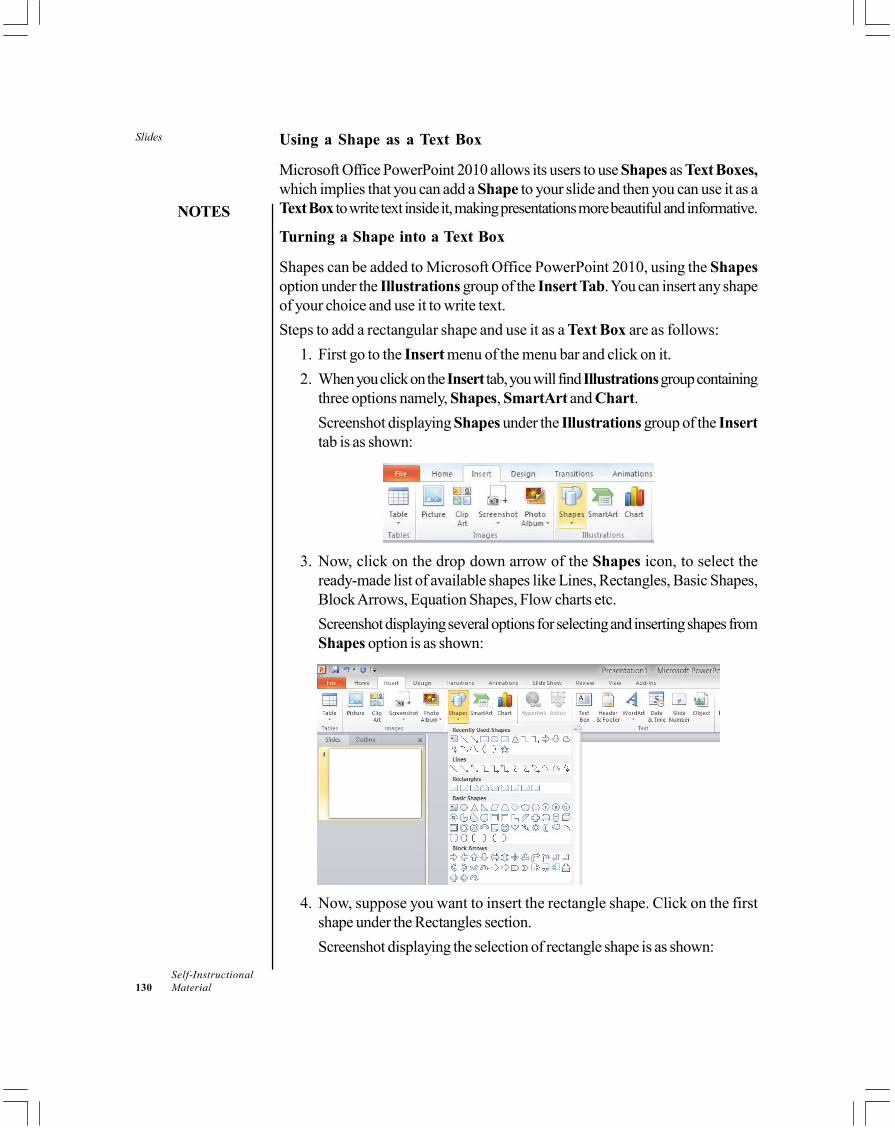
Slides
NOTES
Self-Instructional130 Material
Using a Shape as a Text Box
Microsoft Office PowerPoint 2010 allows its users to use Shapes as Text Boxes,which implies that you can add a Shape to your slide and then you can use it as aText Box to write text inside it, making presentations more beautiful and informative.
Turning a Shape into a Text Box
Shapes can be added to Microsoft Office PowerPoint 2010, using the Shapesoption under the Illustrations group of the Insert Tab. You can insert any shapeof your choice and use it to write text.Steps to add a rectangular shape and use it as a Text Box are as follows:
1. First go to the Insert menu of the menu bar and click on it.2. When you click on the Insert tab, you will find Illustrations group containing
three options namely, Shapes, SmartArt and Chart.Screenshot displaying Shapes under the Illustrations group of the Inserttab is as shown:
3. Now, click on the drop down arrow of the Shapes icon, to select theready-made list of available shapes like Lines, Rectangles, Basic Shapes,Block Arrows, Equation Shapes, Flow charts etc.Screenshot displaying several options for selecting and inserting shapes fromShapes option is as shown:
4. Now, suppose you want to insert the rectangle shape. Click on the firstshape under the Rectangles section.Screenshot displaying the selection of rectangle shape is as shown:
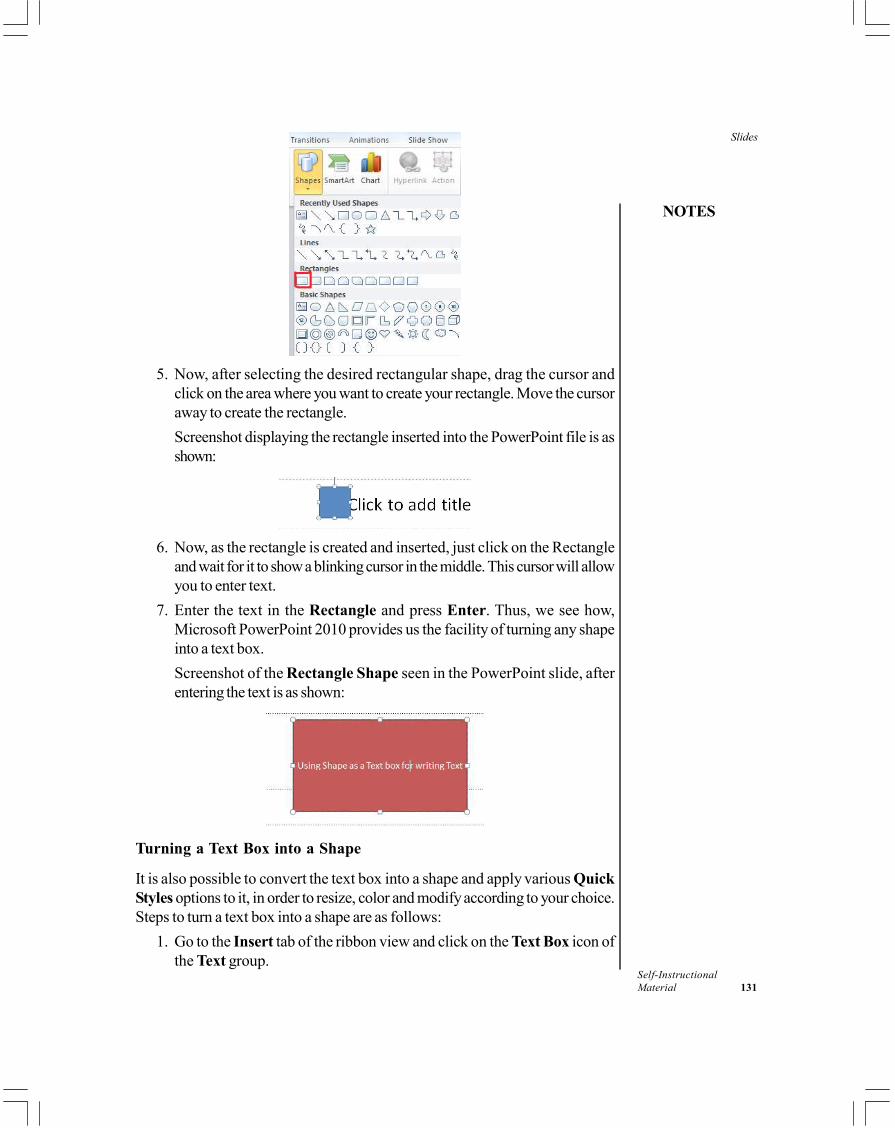
Slides
NOTES
Self-InstructionalMaterial 131
5. Now, after selecting the desired rectangular shape, drag the cursor andclick on the area where you want to create your rectangle. Move the cursoraway to create the rectangle.Screenshot displaying the rectangle inserted into the PowerPoint file is asshown:
6. Now, as the rectangle is created and inserted, just click on the Rectangleand wait for it to show a blinking cursor in the middle. This cursor will allowyou to enter text.
7. Enter the text in the Rectangle and press Enter. Thus, we see how,Microsoft PowerPoint 2010 provides us the facility of turning any shapeinto a text box.Screenshot of the Rectangle Shape seen in the PowerPoint slide, afterentering the text is as shown:
Turning a Text Box into a Shape
It is also possible to convert the text box into a shape and apply various QuickStyles options to it, in order to resize, color and modify according to your choice.Steps to turn a text box into a shape are as follows:
1. Go to the Insert tab of the ribbon view and click on the Text Box icon ofthe Text group.
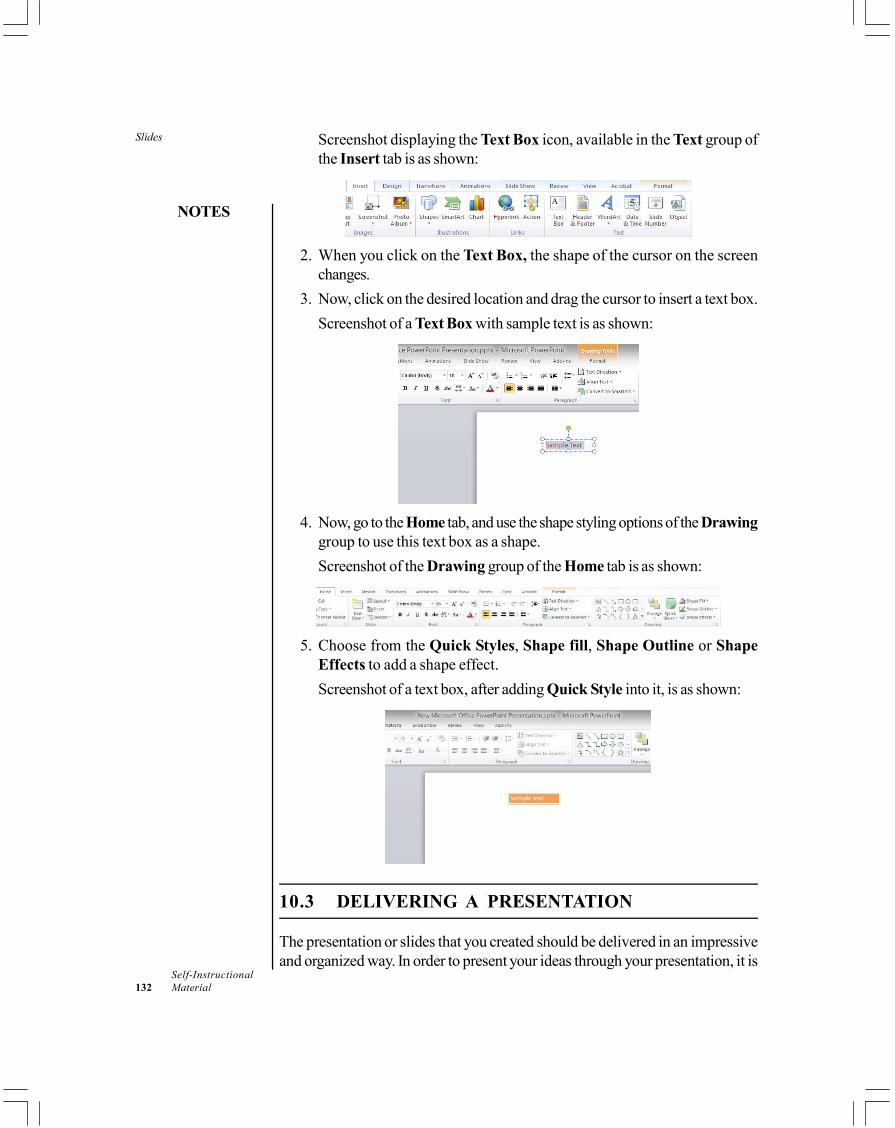
Slides
NOTES
Self-Instructional132 Material
Screenshot displaying the Text Box icon, available in the Text group ofthe Insert tab is as shown:
2. When you click on the Text Box, the shape of the cursor on the screenchanges.
3. Now, click on the desired location and drag the cursor to insert a text box.Screenshot of a Text Box with sample text is as shown:
4. Now, go to the Home tab, and use the shape styling options of the Drawinggroup to use this text box as a shape.Screenshot of the Drawing group of the Home tab is as shown:
5. Choose from the Quick Styles, Shape fill, Shape Outline or ShapeEffects to add a shape effect.Screenshot of a text box, after adding Quick Style into it, is as shown:
10.3 DELIVERING A PRESENTATION
The presentation or slides that you created should be delivered in an impressiveand organized way. In order to present your ideas through your presentation, it is
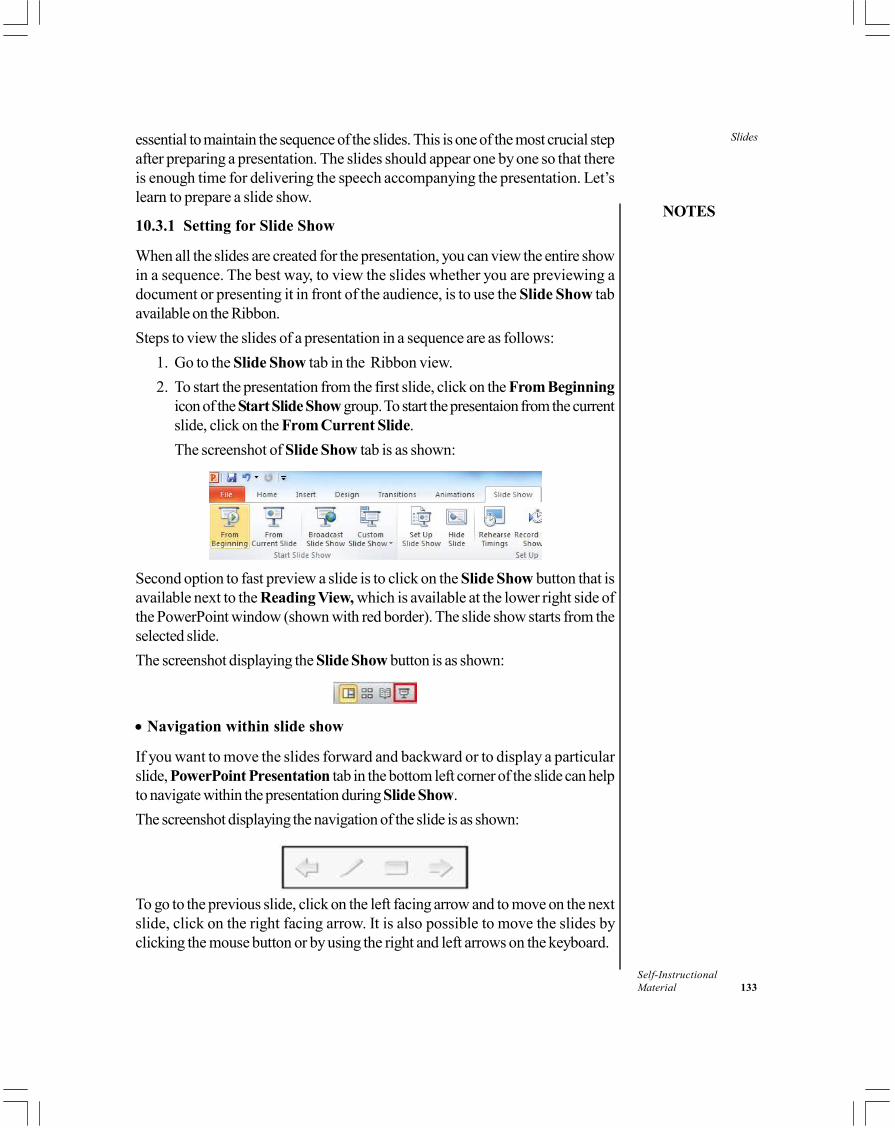
Slides
NOTES
Self-InstructionalMaterial 133
essential to maintain the sequence of the slides. This is one of the most crucial stepafter preparing a presentation. The slides should appear one by one so that thereis enough time for delivering the speech accompanying the presentation. Let’slearn to prepare a slide show.
10.3.1 Setting for Slide Show
When all the slides are created for the presentation, you can view the entire showin a sequence. The best way, to view the slides whether you are previewing adocument or presenting it in front of the audience, is to use the Slide Show tabavailable on the Ribbon.Steps to view the slides of a presentation in a sequence are as follows:
1. Go to the Slide Show tab in the Ribbon view.2. To start the presentation from the first slide, click on the From Beginning
icon of the Start Slide Show group. To start the presentaion from the currentslide, click on the From Current Slide.The screenshot of Slide Show tab is as shown:
Second option to fast preview a slide is to click on the Slide Show button that isavailable next to the Reading View, which is available at the lower right side ofthe PowerPoint window (shown with red border). The slide show starts from theselected slide.The screenshot displaying the Slide Show button is as shown:
• Navigation within slide show
If you want to move the slides forward and backward or to display a particularslide, PowerPoint Presentation tab in the bottom left corner of the slide can helpto navigate within the presentation during Slide Show.The screenshot displaying the navigation of the slide is as shown:
To go to the previous slide, click on the left facing arrow and to move on the nextslide, click on the right facing arrow. It is also possible to move the slides byclicking the mouse button or by using the right and left arrows on the keyboard.
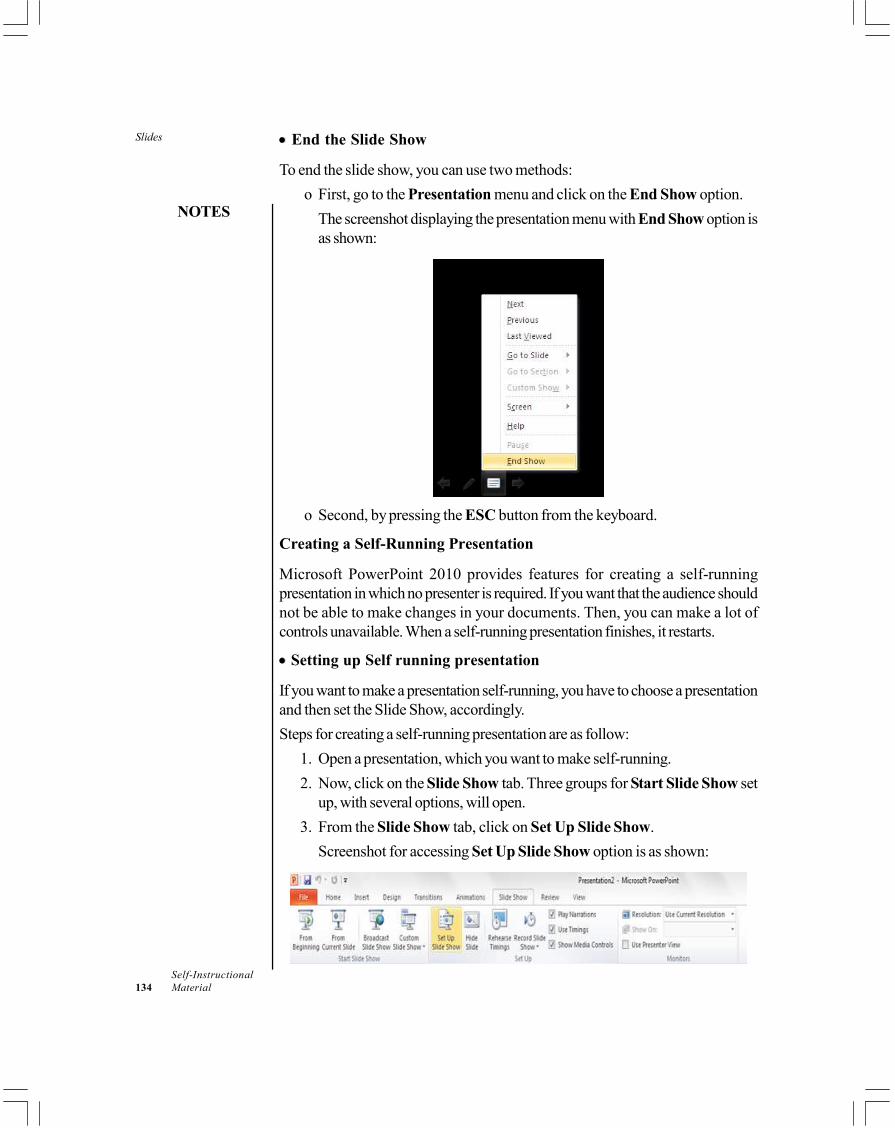
Slides
NOTES
Self-Instructional134 Material
• End the Slide Show
To end the slide show, you can use two methods:o First, go to the Presentation menu and click on the End Show option.
The screenshot displaying the presentation menu with End Show option isas shown:
o Second, by pressing the ESC button from the keyboard.
Creating a Self-Running Presentation
Microsoft PowerPoint 2010 provides features for creating a self-runningpresentation in which no presenter is required. If you want that the audience shouldnot be able to make changes in your documents. Then, you can make a lot ofcontrols unavailable. When a self-running presentation finishes, it restarts.
• Setting up Self running presentation
If you want to make a presentation self-running, you have to choose a presentationand then set the Slide Show, accordingly.Steps for creating a self-running presentation are as follow:
1. Open a presentation, which you want to make self-running.2. Now, click on the Slide Show tab. Three groups for Start Slide Show set
up, with several options, will open.3. From the Slide Show tab, click on Set Up Slide Show.
Screenshot for accessing Set Up Slide Show option is as shown:
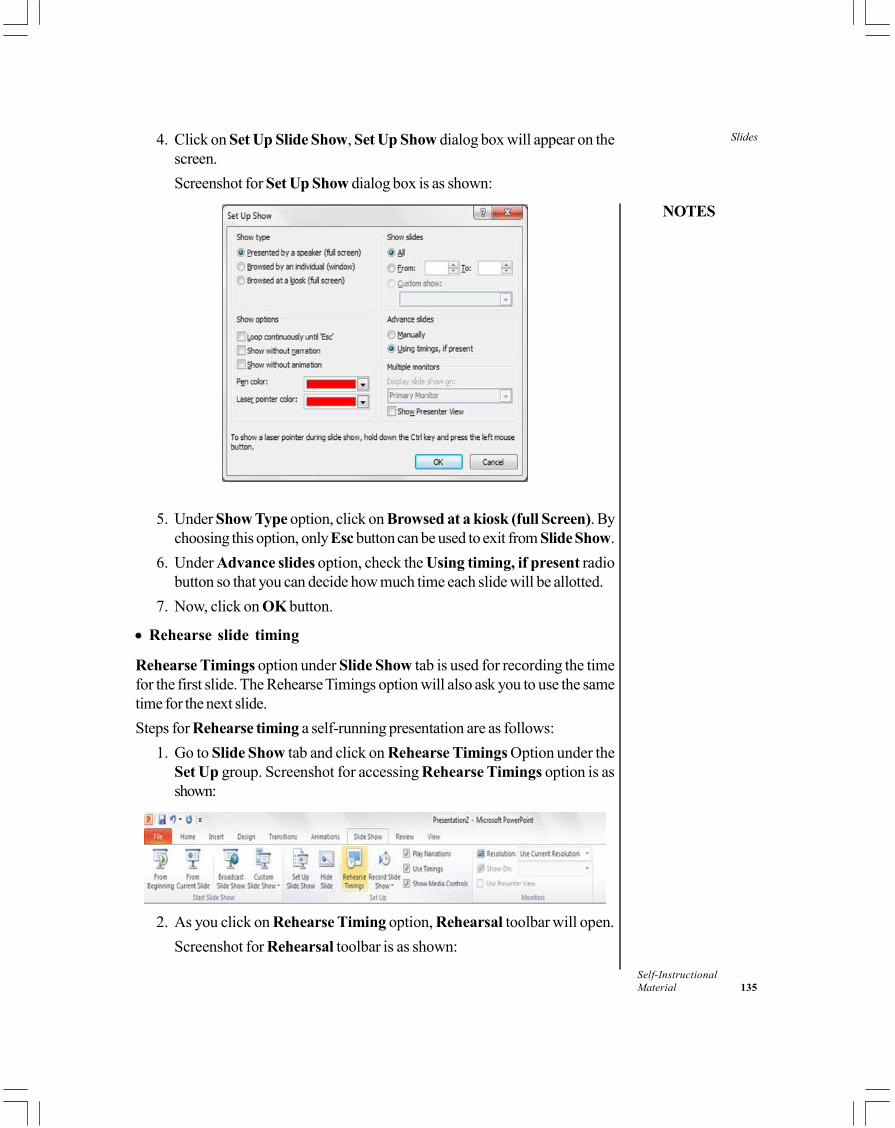
Slides
NOTES
Self-InstructionalMaterial 135
4. Click on Set Up Slide Show, Set Up Show dialog box will appear on thescreen.Screenshot for Set Up Show dialog box is as shown:
5. Under Show Type option, click on Browsed at a kiosk (full Screen). Bychoosing this option, only Esc button can be used to exit from Slide Show.
6. Under Advance slides option, check the Using timing, if present radiobutton so that you can decide how much time each slide will be allotted.
7. Now, click on OK button.
• Rehearse slide timing
Rehearse Timings option under Slide Show tab is used for recording the timefor the first slide. The Rehearse Timings option will also ask you to use the sametime for the next slide.Steps for Rehearse timing a self-running presentation are as follows:
1. Go to Slide Show tab and click on Rehearse Timings Option under theSet Up group. Screenshot for accessing Rehearse Timings option is asshown:
2. As you click on Rehearse Timing option, Rehearsal toolbar will open.Screenshot for Rehearsal toolbar is as shown:
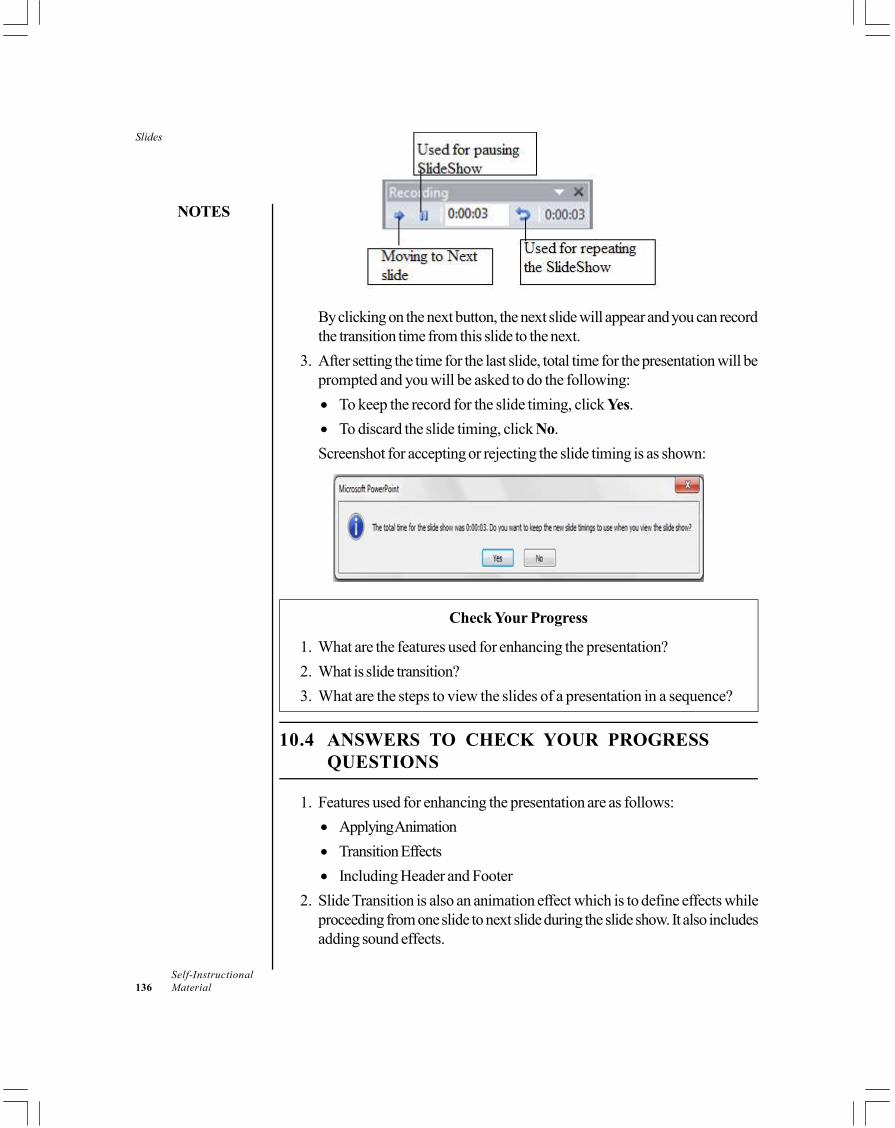
Slides
NOTES
Self-Instructional136 Material
By clicking on the next button, the next slide will appear and you can recordthe transition time from this slide to the next.
3. After setting the time for the last slide, total time for the presentation will beprompted and you will be asked to do the following:• To keep the record for the slide timing, click Yes.• To discard the slide timing, click No.Screenshot for accepting or rejecting the slide timing is as shown:
Check Your Progress
1. What are the features used for enhancing the presentation?2. What is slide transition?3. What are the steps to view the slides of a presentation in a sequence?
10.4 ANSWERS TO CHECK YOUR PROGRESSQUESTIONS
1. Features used for enhancing the presentation are as follows:• Applying Animation• Transition Effects• Including Header and Footer
2. Slide Transition is also an animation effect which is to define effects whileproceeding from one slide to next slide during the slide show. It also includesadding sound effects.
Slides
NOTES
Self-InstructionalMaterial 137
3. Steps to view the slides of a presentation in a sequence are as follows:(i) Go to the Slide Show tab in the Ribbon view.(ii) To start the presentation from the first slide, click on the From Beginning
icon of the Start Slide Show group. To start the presentaion from thecurrent slide, click on the From Current Slide.
10.5 SUMMARY
• Animation is one of the most common features of MS PowerPoint. It isused to make an attractive presentation and for creating the interest inaudience.
• The first part of the Animations group provides the various options forapplying animations to a character, text, picture and graphics within eachslide.
• Header and Footer feature in PowerPoint application allows user to addslide number, date, name of person or a company, etc. to each slide. Itcontains information that is present throughout the slides of a presentation.
• The best way, to view the slides whether you are previewing a document orpresenting it in front of the audience, is to use the Slide Show tab availableon the Ribbon.
• If you want to move the slides forward and backward or to display aparticular slide, PowerPoint Presentation tab in the bottom left corner ofthe slide can help to navigate within the presentation during Slide Show.
• Rehearse Timings option under Slide Show tab is used for recording thetime for the first slide. The Rehearse Timings option will also ask you to usethe same time for the next slide.
10.6 KEY WORDS
• Animation: It refers to moving pictures or texts. It is used to draw attentionof the audience and hence enhance the presentation.
• Slide transitions: Slide transitions display slides in such a way that oneslide disappears and the next one appears in an elegant way.
• Template: Template is a presentation that contains themes, text, andgraphics predesigned for presentation.
• Header and footer: To display the information such as page no., date,name, etc. in all slides of a presentation.
Slides
NOTES
Self-Instructional138 Material
10.7 SELF ASSESSMENT QUESTIONS ANDEXERCISES
1. Create and deliver a presentation on the different types of information systemsincluding the following features.
(i) Animation effects(ii) Transition effects(iii) Includes header and footer(iv) Includes table that shows the features of different categories of info.
System.2. How you will add charts in presentation? Show this using an existing
PowerPoint presentation.
10.8 FURTHER READINGS
Srivastava, S.S. 2008. MS Office. New Delhi: Firewall Media.Saxena, Sanjay. 2011. MS Office 2007 in a Nutshell. Noida: Vikas Publishing
house.Courter, Gini and Annette Marquis. 1999. Mastering Microsoft Office 2000.
New Delhi: BPB Publications.Blattner, Patrick, Ken Cook, Laurie Ulrich and Timothy Dyck. 1999. Special
Edition Using Microsoft Excel 2000. New Delhi: Prentice-Hall of India.
Video and Audio Effects
NOTES
Self-InstructionalMaterial 139
UNIT 11 VIDEO AND AUDIOEFFECTS
Structure11.0 Introduction11.1 Objectives11.2 Preparing and Delivering a Live Presentation
11.2.1 Working with Audiovisual Equipment11.2.2 Importing Image Files into PowerPoint
11.3 Answers to Check Your Progress Questions11.4 Summary11.5 Key Words11.6 Self Assessment Questions and Exercises11.7 Further Readings
11.0 INTRODUCTION
In this unit, you will learn about the creating and delivering the live presentationthat includes audio and video files. This can done by adding animation, themes,bullets and numbering. In a presentation, short sentences are used generally andexplanations are provided by the person who is delivering the presentation. Audioand video files can be added using media clips option in the insert tab. You willalso learn how to import image files in PowerPoint.
11.1 OBJECTIVES
After going through this unit, you will be able to:• Create and deliver a live presentation• Insert audio and video files in Presentation• Import image files into PowerPoint
11.2 PREPARING AND DELIVERING A LIVEPRESENTATION
The presentation should be prepared in such a manner that it is visible from adistance and the text and images are appealing to the user. This is done by addinganimation, themes, bullets and numbering. In a presentation, short sentences areused generally and explanations are provided by the person who is delivering thepresentation. It is basically designed for an organization, for educational learningprograms and even for personal use.
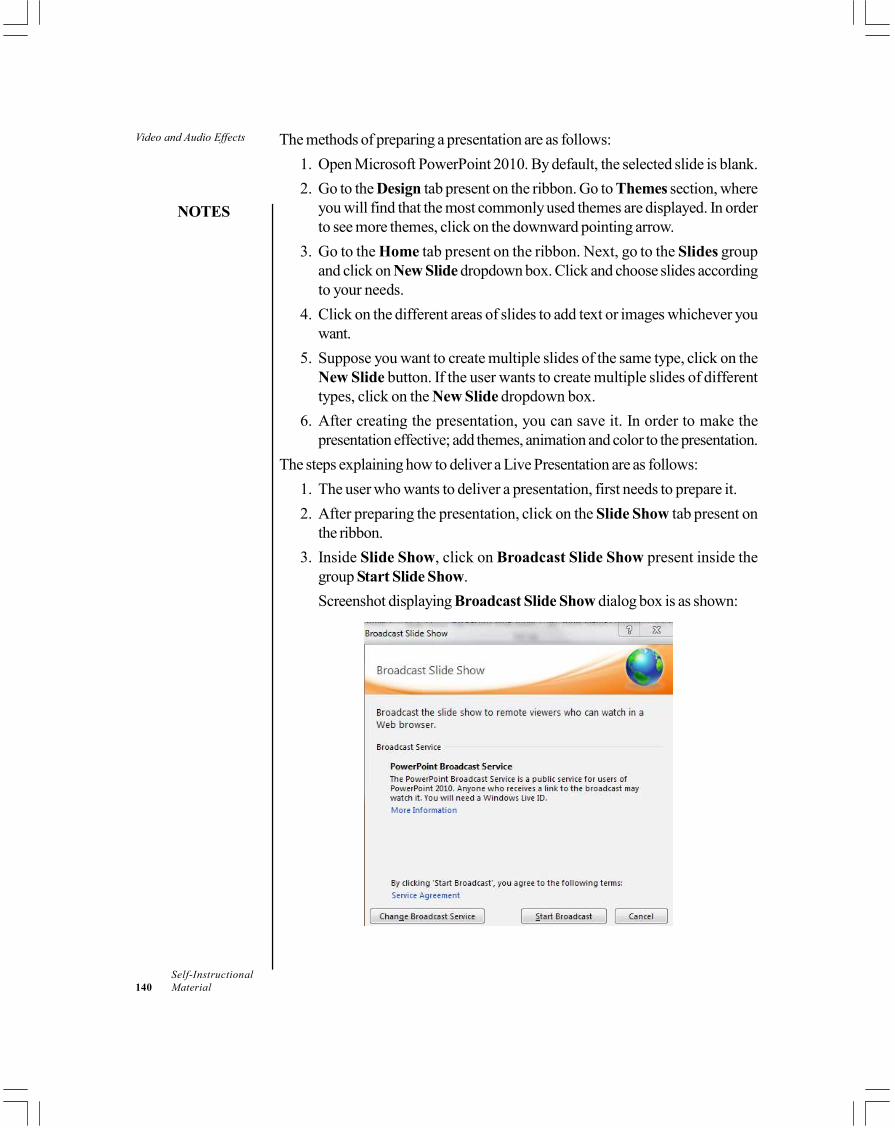
Video and Audio Effects
NOTES
Self-Instructional140 Material
The methods of preparing a presentation are as follows:1. Open Microsoft PowerPoint 2010. By default, the selected slide is blank.2. Go to the Design tab present on the ribbon. Go to Themes section, where
you will find that the most commonly used themes are displayed. In orderto see more themes, click on the downward pointing arrow.
3. Go to the Home tab present on the ribbon. Next, go to the Slides groupand click on New Slide dropdown box. Click and choose slides accordingto your needs.
4. Click on the different areas of slides to add text or images whichever youwant.
5. Suppose you want to create multiple slides of the same type, click on theNew Slide button. If the user wants to create multiple slides of differenttypes, click on the New Slide dropdown box.
6. After creating the presentation, you can save it. In order to make thepresentation effective; add themes, animation and color to the presentation.
The steps explaining how to deliver a Live Presentation are as follows:1. The user who wants to deliver a presentation, first needs to prepare it.2. After preparing the presentation, click on the Slide Show tab present on
the ribbon.3. Inside Slide Show, click on Broadcast Slide Show present inside the
group Start Slide Show.Screenshot displaying Broadcast Slide Show dialog box is as shown:
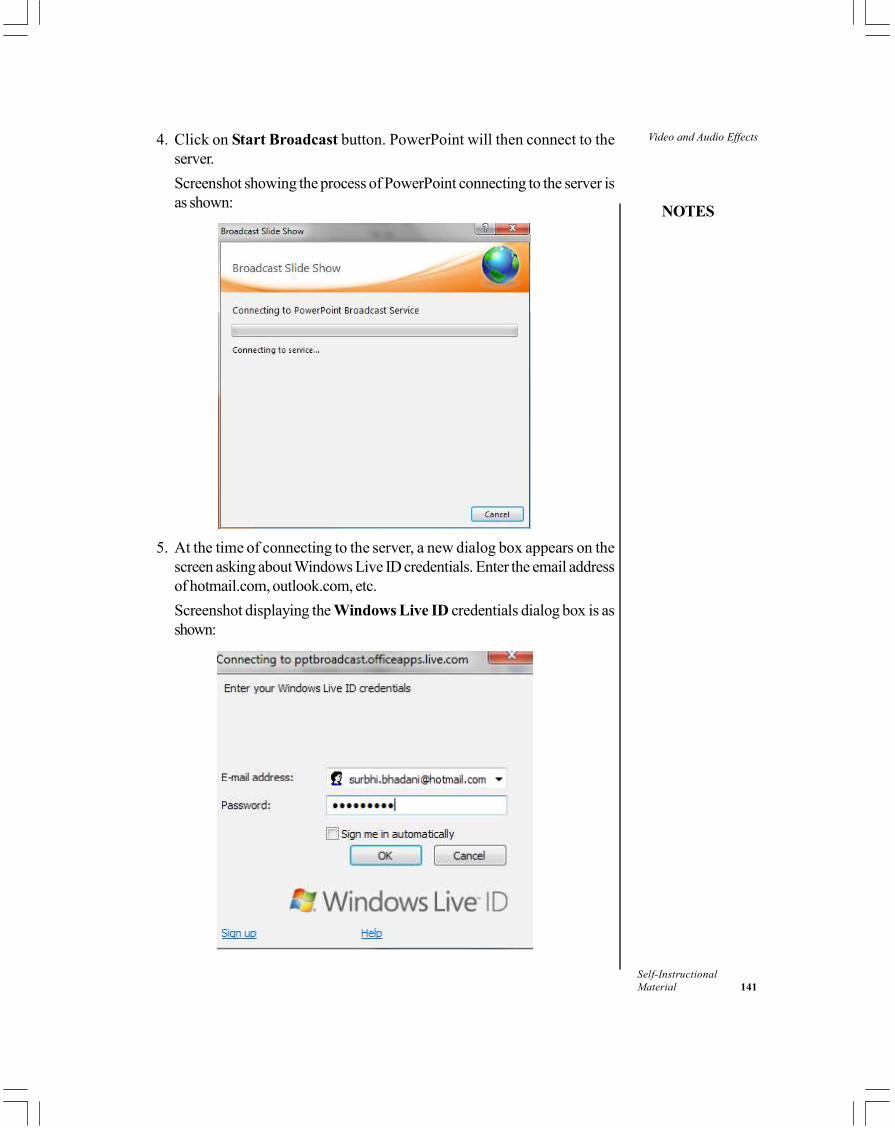
Video and Audio Effects
NOTES
Self-InstructionalMaterial 141
4. Click on Start Broadcast button. PowerPoint will then connect to theserver.Screenshot showing the process of PowerPoint connecting to the server isas shown:
5. At the time of connecting to the server, a new dialog box appears on thescreen asking about Windows Live ID credentials. Enter the email addressof hotmail.com, outlook.com, etc.Screenshot displaying the Windows Live ID credentials dialog box is asshown:
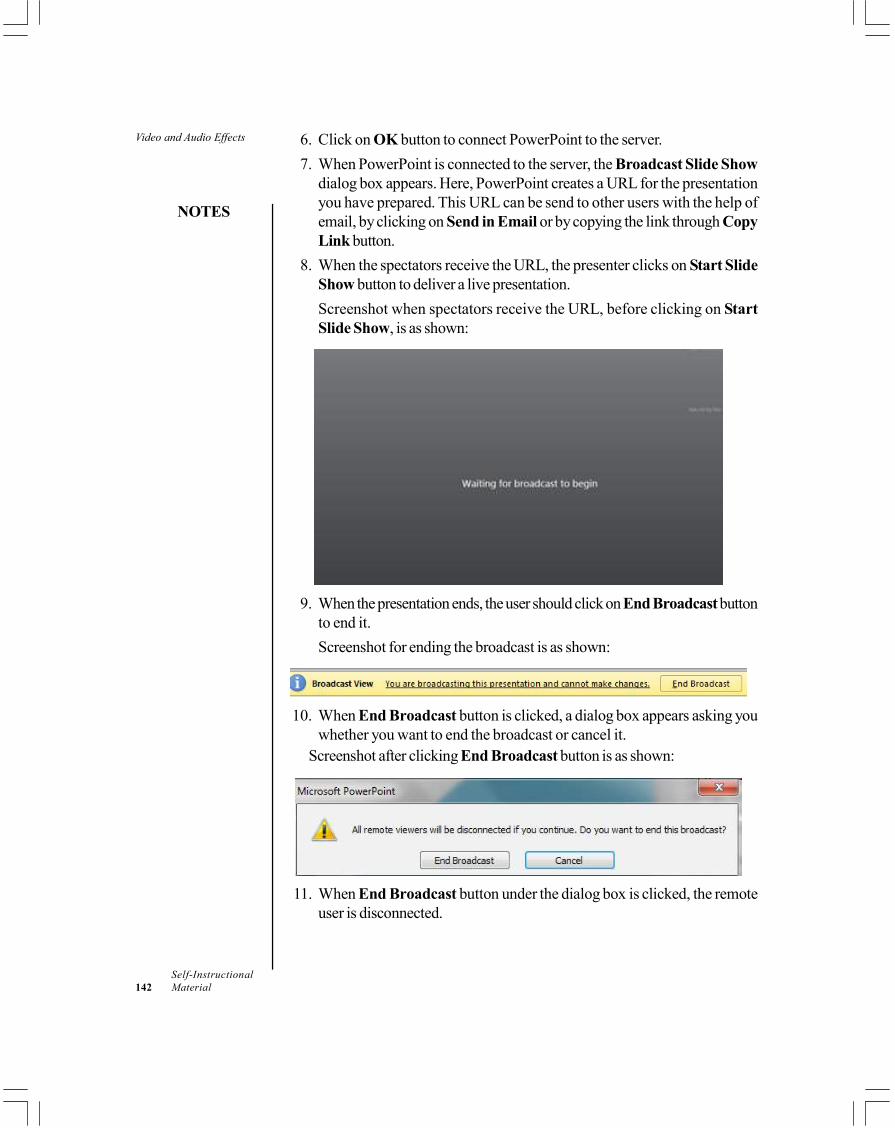
Video and Audio Effects
NOTES
Self-Instructional142 Material
6. Click on OK button to connect PowerPoint to the server.7. When PowerPoint is connected to the server, the Broadcast Slide Show
dialog box appears. Here, PowerPoint creates a URL for the presentationyou have prepared. This URL can be send to other users with the help ofemail, by clicking on Send in Email or by copying the link through CopyLink button.
8. When the spectators receive the URL, the presenter clicks on Start SlideShow button to deliver a live presentation.Screenshot when spectators receive the URL, before clicking on StartSlide Show, is as shown:
9. When the presentation ends, the user should click on End Broadcast buttonto end it.Screenshot for ending the broadcast is as shown:
10. When End Broadcast button is clicked, a dialog box appears asking youwhether you want to end the broadcast or cancel it.
Screenshot after clicking End Broadcast button is as shown:
11. When End Broadcast button under the dialog box is clicked, the remoteuser is disconnected.
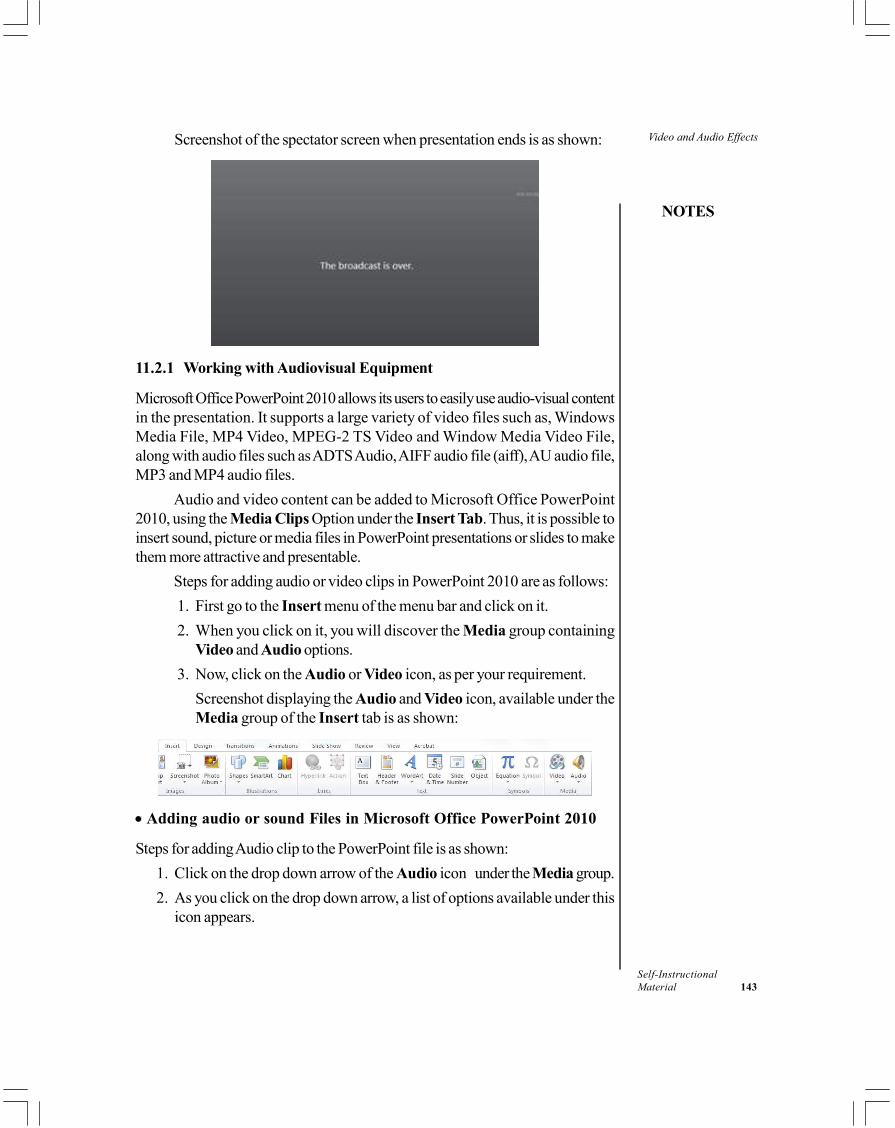
Video and Audio Effects
NOTES
Self-InstructionalMaterial 143
Screenshot of the spectator screen when presentation ends is as shown:
11.2.1 Working with Audiovisual Equipment
Microsoft Office PowerPoint 2010 allows its users to easily use audio-visual contentin the presentation. It supports a large variety of video files such as, WindowsMedia File, MP4 Video, MPEG-2 TS Video and Window Media Video File,along with audio files such as ADTS Audio, AIFF audio file (aiff), AU audio file,MP3 and MP4 audio files.
Audio and video content can be added to Microsoft Office PowerPoint2010, using the Media Clips Option under the Insert Tab. Thus, it is possible toinsert sound, picture or media files in PowerPoint presentations or slides to makethem more attractive and presentable.
Steps for adding audio or video clips in PowerPoint 2010 are as follows:1. First go to the Insert menu of the menu bar and click on it.2. When you click on it, you will discover the Media group containing
Video and Audio options.3. Now, click on the Audio or Video icon, as per your requirement.
Screenshot displaying the Audio and Video icon, available under theMedia group of the Insert tab is as shown:
• Adding audio or sound Files in Microsoft Office PowerPoint 2010
Steps for adding Audio clip to the PowerPoint file is as shown:1. Click on the drop down arrow of the Audio icon under the Media group.2. As you click on the drop down arrow, a list of options available under this
icon appears.
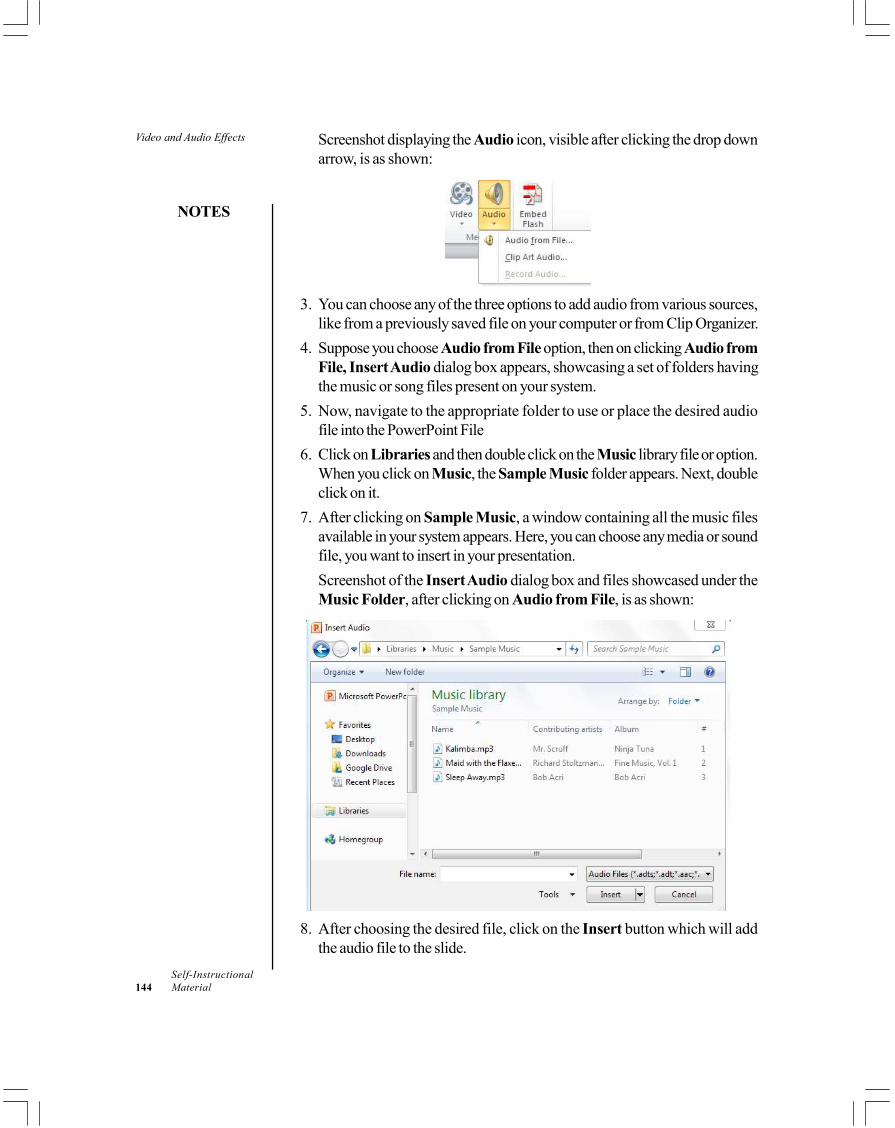
Video and Audio Effects
NOTES
Self-Instructional144 Material
Screenshot displaying the Audio icon, visible after clicking the drop downarrow, is as shown:
3. You can choose any of the three options to add audio from various sources,like from a previously saved file on your computer or from Clip Organizer.
4. Suppose you choose Audio from File option, then on clicking Audio fromFile, Insert Audio dialog box appears, showcasing a set of folders havingthe music or song files present on your system.
5. Now, navigate to the appropriate folder to use or place the desired audiofile into the PowerPoint File
6. Click on Libraries and then double click on the Music library file or option.When you click on Music, the Sample Music folder appears. Next, doubleclick on it.
7. After clicking on Sample Music, a window containing all the music filesavailable in your system appears. Here, you can choose any media or soundfile, you want to insert in your presentation.Screenshot of the Insert Audio dialog box and files showcased under theMusic Folder, after clicking on Audio from File, is as shown:
8. After choosing the desired file, click on the Insert button which will addthe audio file to the slide.
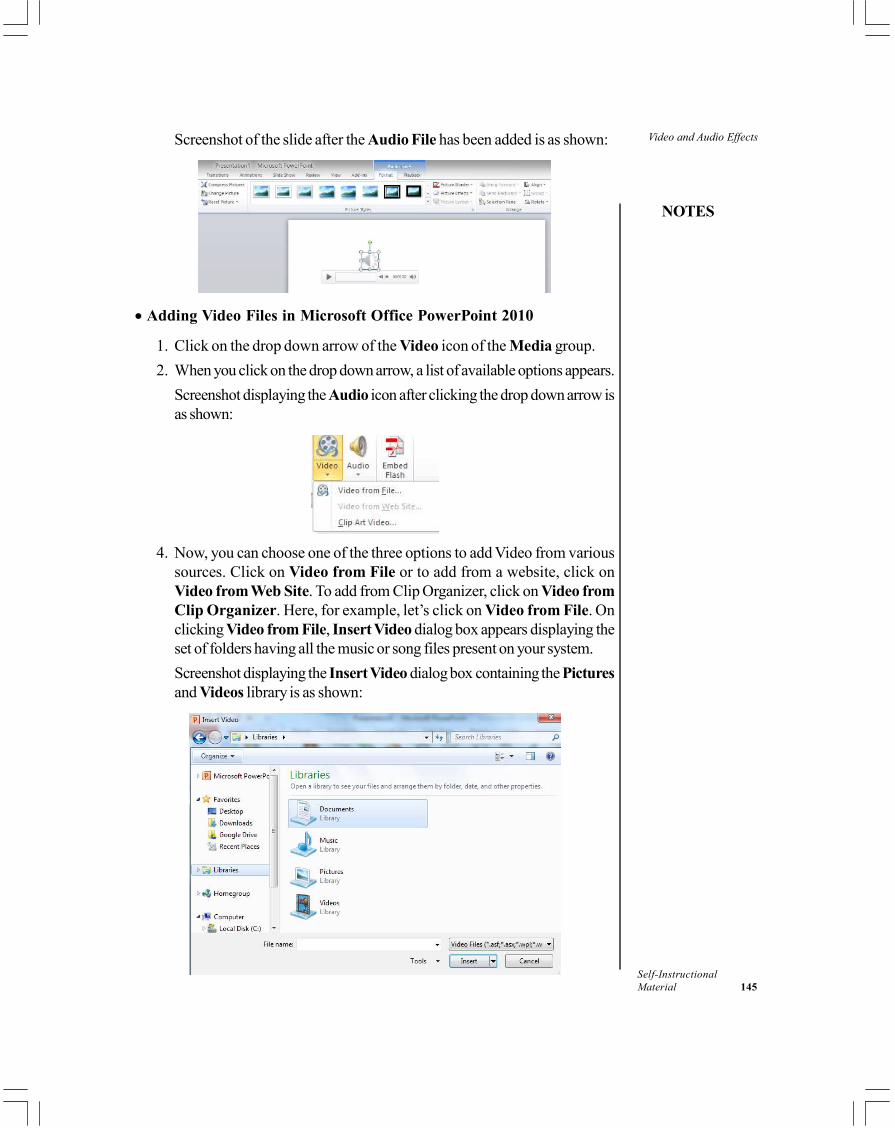
Video and Audio Effects
NOTES
Self-InstructionalMaterial 145
Screenshot of the slide after the Audio File has been added is as shown:
• Adding Video Files in Microsoft Office PowerPoint 2010
1. Click on the drop down arrow of the Video icon of the Media group.2. When you click on the drop down arrow, a list of available options appears.
Screenshot displaying the Audio icon after clicking the drop down arrow isas shown:
4. Now, you can choose one of the three options to add Video from varioussources. Click on Video from File or to add from a website, click onVideo from Web Site. To add from Clip Organizer, click on Video fromClip Organizer. Here, for example, let’s click on Video from File. Onclicking Video from File, Insert Video dialog box appears displaying theset of folders having all the music or song files present on your system.Screenshot displaying the Insert Video dialog box containing the Picturesand Videos library is as shown:
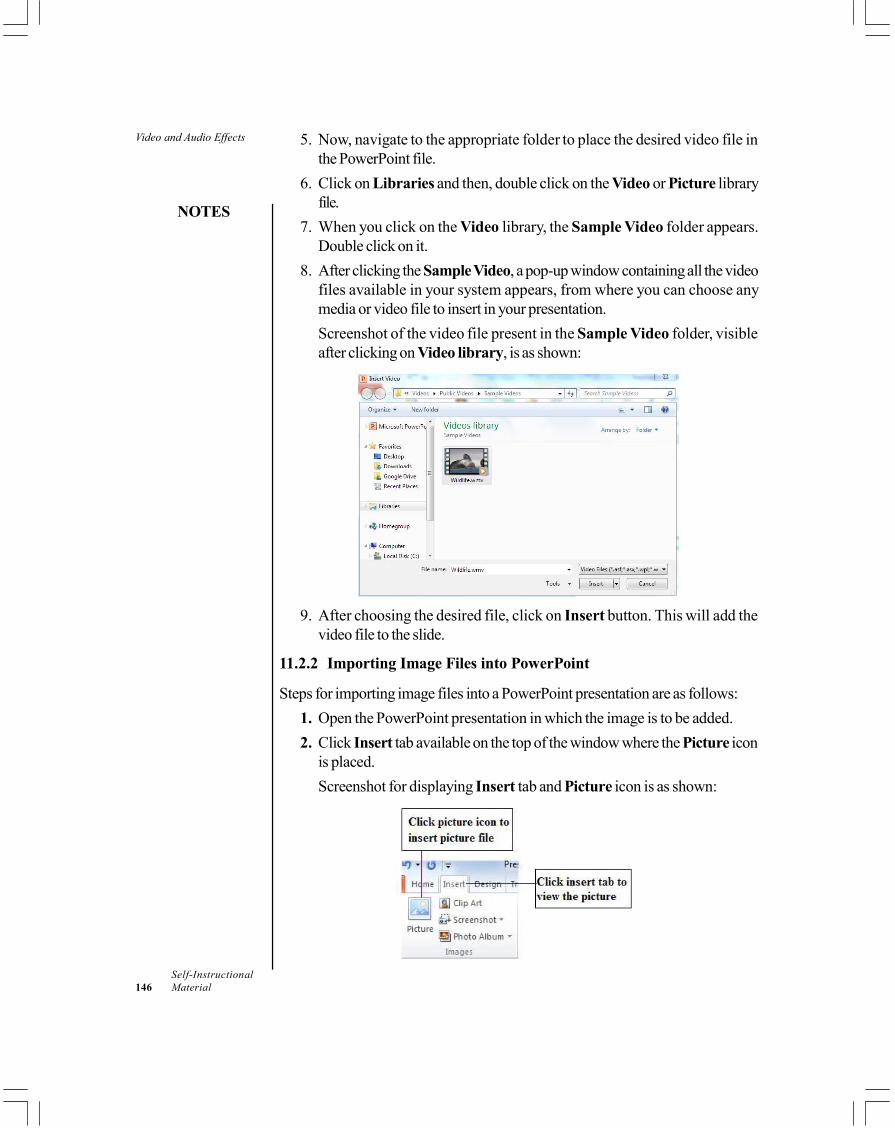
Video and Audio Effects
NOTES
Self-Instructional146 Material
5. Now, navigate to the appropriate folder to place the desired video file inthe PowerPoint file.
6. Click on Libraries and then, double click on the Video or Picture libraryfile.
7. When you click on the Video library, the Sample Video folder appears.Double click on it.
8. After clicking the Sample Video, a pop-up window containing all the videofiles available in your system appears, from where you can choose anymedia or video file to insert in your presentation.Screenshot of the video file present in the Sample Video folder, visibleafter clicking on Video library, is as shown:
9. After choosing the desired file, click on Insert button. This will add thevideo file to the slide.
11.2.2 Importing Image Files into PowerPoint
Steps for importing image files into a PowerPoint presentation are as follows:1. Open the PowerPoint presentation in which the image is to be added.2. Click Insert tab available on the top of the window where the Picture icon
is placed.Screenshot for displaying Insert tab and Picture icon is as shown:
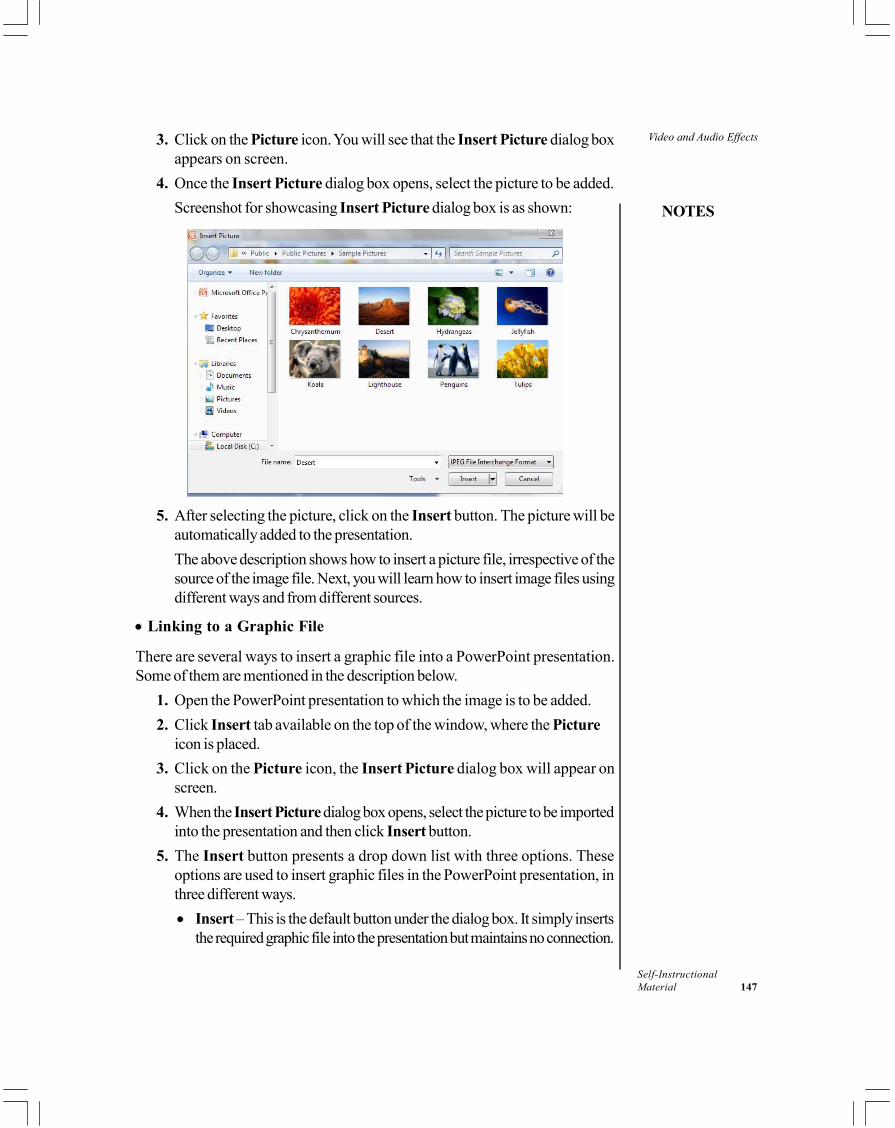
Video and Audio Effects
NOTES
Self-InstructionalMaterial 147
3. Click on the Picture icon. You will see that the Insert Picture dialog boxappears on screen.
4. Once the Insert Picture dialog box opens, select the picture to be added.Screenshot for showcasing Insert Picture dialog box is as shown:
5. After selecting the picture, click on the Insert button. The picture will beautomatically added to the presentation.The above description shows how to insert a picture file, irrespective of thesource of the image file. Next, you will learn how to insert image files usingdifferent ways and from different sources.
• Linking to a Graphic File
There are several ways to insert a graphic file into a PowerPoint presentation.Some of them are mentioned in the description below.
1. Open the PowerPoint presentation to which the image is to be added.2. Click Insert tab available on the top of the window, where the Picture
icon is placed.3. Click on the Picture icon, the Insert Picture dialog box will appear on
screen.4. When the Insert Picture dialog box opens, select the picture to be imported
into the presentation and then click Insert button.5. The Insert button presents a drop down list with three options. These
options are used to insert graphic files in the PowerPoint presentation, inthree different ways.• Insert – This is the default button under the dialog box. It simply inserts
the required graphic file into the presentation but maintains no connection.
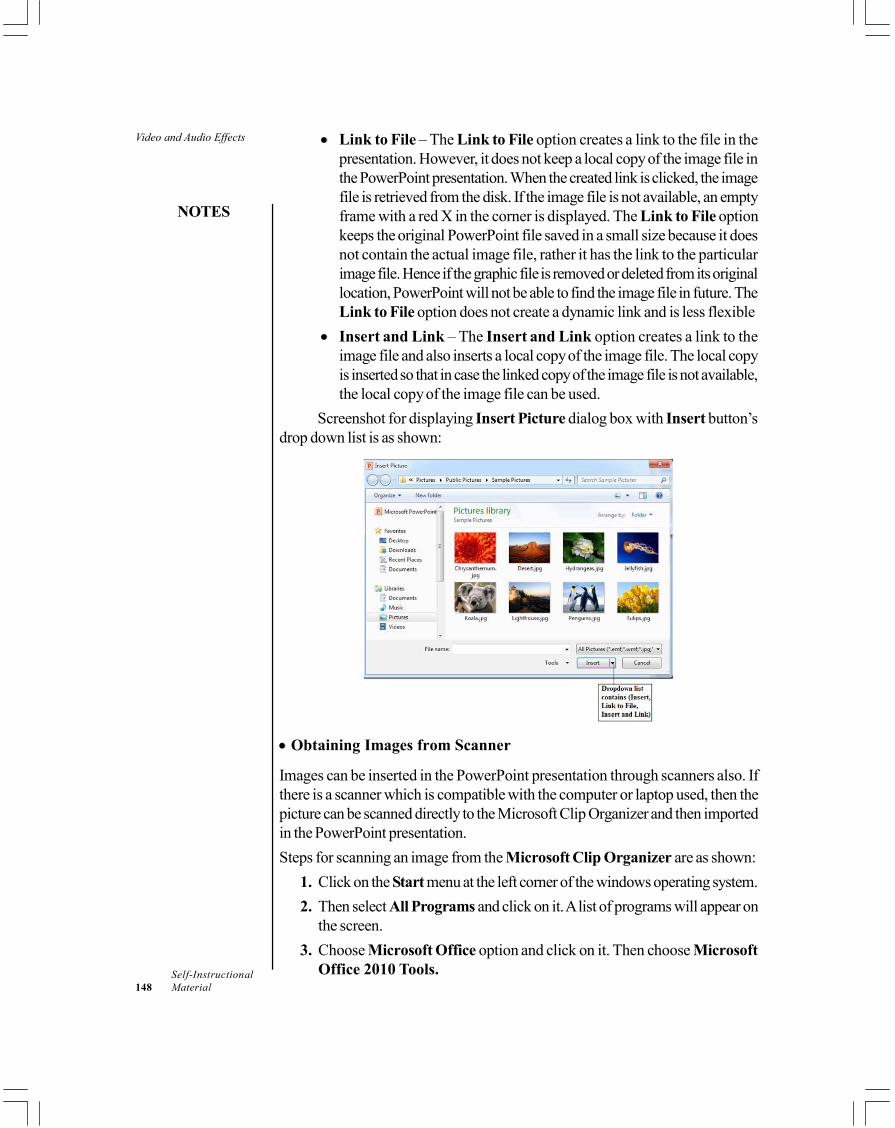
Video and Audio Effects
NOTES
Self-Instructional148 Material
• Link to File – The Link to File option creates a link to the file in thepresentation. However, it does not keep a local copy of the image file inthe PowerPoint presentation. When the created link is clicked, the imagefile is retrieved from the disk. If the image file is not available, an emptyframe with a red X in the corner is displayed. The Link to File optionkeeps the original PowerPoint file saved in a small size because it doesnot contain the actual image file, rather it has the link to the particularimage file. Hence if the graphic file is removed or deleted from its originallocation, PowerPoint will not be able to find the image file in future. TheLink to File option does not create a dynamic link and is less flexible
• Insert and Link – The Insert and Link option creates a link to theimage file and also inserts a local copy of the image file. The local copyis inserted so that in case the linked copy of the image file is not available,the local copy of the image file can be used.
Screenshot for displaying Insert Picture dialog box with Insert button’sdrop down list is as shown:
• Obtaining Images from Scanner
Images can be inserted in the PowerPoint presentation through scanners also. Ifthere is a scanner which is compatible with the computer or laptop used, then thepicture can be scanned directly to the Microsoft Clip Organizer and then importedin the PowerPoint presentation.Steps for scanning an image from the Microsoft Clip Organizer are as shown:
1. Click on the Start menu at the left corner of the windows operating system.2. Then select All Programs and click on it. A list of programs will appear on
the screen.3. Choose Microsoft Office option and click on it. Then choose Microsoft
Office 2010 Tools.
Video and Audio Effects
NOTES
Self-InstructionalMaterial 149
4. Next, select Microsoft Clip Organizer and click on it. The MicrosoftClick Organizer utility opens.
5. Under the Microsoft Click Organizer utility, choose File option. Next,click on Add Clips to Organizer and choose the From Scanner orCamera option. The Insert Picture From Scanner or Camera dialogbox opens.
6. Now, choose the Scanner from the Device List.7. Next, select a Resolution. It can be low resolution (web) or high resolution
(Printing). Low resolution means the file will be smaller in size and havefewer pixels which will compromise the quality of the image. Low resolutionimage is mostly used in onscreen presentations.
8. After choosing the resolution, you will find that there are two options forscanning the picture. These options are discussed as below:(i) Insert button - Default settings are used, to insert the picture to be
scanned.(ii) Custom Insert button – After clicking this button, the Custom Insert
dialog box appears showing all the controls for the scanner. The controlsvary depending upon the model of the scanner. In the Custom Insertdialog box, the following options are available:
a. Choosing a scanning mode: Under this option, the color depthof the image can be chosen. There are four options such as colorpicture (24 bit color), gray scale (8-bit, single color), black andwhite (single bit picture or text.)
b. Previewing the scan: The Preview button is clicked to performa test scan. Then, the squares, which appear black in the previewarea, are dragged to adjust the portion of image saved duringthe actual scan.
c. Choosing the paper source: Sometimes, the scanners mighthave a document feeder used to choose the paper source.
d. Adjust the quality of the scanned picture: A hyperlink isavailable in the Custom Insert dialog box, which helps inadjusting the quality of the scanned picture. When the hyperlinkis clicked, the Advanced Properties dialog box appears. Inthis dialog box, drag the brightness and contrast sliders to choosea resolution for the picture.
• Acquiring Images from Digital Camera
There are several ways to upload images from digital camera to the computer orlaptop. The most common way is to connect the digital camera to the computer orlaptop, through an USB port and copy the photos into a folder on the hard disk.
Video and Audio Effects
NOTES
Self-Instructional150 Material
The pictures can also be inserted directly from the camera to the Clip Organizer,as done for the scanners.
• Capturing and Inserting Screen Shots
A screenshot is an image or picture taken from the computer screen, using theutility available in the Windows Operating System itself. These pictures or imagescan be inserted in the PowerPoint presentation.The Windows Operating System has always had a screenshot feature called PrintScreen key, which is built into it. This Print Screen key can be pressed totransfer images on the screen to the clipboard. Then, you can copy and paste it inthe PowerPoint presentation slide directly. Also, you can copy and save the file inan image editing program such as Paint which is mostly available in all the versionsof Windows Operating System. In Windows 7, there is an option called SnippingTool used for taking screenshots.In PowerPoint 2010, you can capture screenshots directly and insert them intothe PowerPoint presentation. You can also use the screenshot command to captureindividual windows instead of capturing the entire screen.
Steps for taking the screenshot of an open window are as shown
1. Open the slide of the PowerPoint presentation in which the screenshot is tobe placed.
2. Choose Insert tab. Then, click on the Screenshot option. After choosingthe Screenshot option, a menu appears showing the available windows inthe form of thumbnails.
3. Click the thumbnail image of the window to be captured as a screenshot.The image is immediately inserted into the slide of the PowerPointpresentation.
Using Screen clipping command to insert the image
There are certain times, when the required window is not available in the thumbnailslist or the size of the image needs to be changed. You can use the screen clippingcommand to crop the size of the image and use it in the presentation.
Steps for taking screenshot using screen clipping command are asshown
1. Open the window or an application to be captured as a screenshot.2. Use the taskbar to switch to the PowerPoint presentation slide, where the
image is to be inserted.3. Choose Insert tab. Then, click Screenshot option and choose the Screen
Clipping option. Afterwards, minimize the PowerPoint window. You willfind the window to be captured beneath.
Video and Audio Effects
NOTES
Self-InstructionalMaterial 151
4. Now, select the area to be cropped by dragging the mouse pointer. Oncethe mouse button is released, the defined area appears in the slide of thePowerPoint presentation.
Check Your Progress
1. What are the file format supported by the PowerPoint 2010?2. What is the shortcut key for saving a presentation?
11.3 ANSWERS TO CHECK YOUR PROGRESSQUESTIONS
1. PowerPoint supports a large variety of video files such as, Windows MediaFile, MP4 Video, MPEG-2 TS Video and Window Media Video File,along with audio files such as ADTS Audio, AIFF audio file (aiff), AU audiofile, MP3 and MP4 audio files.
2. CTRL+S is the key for saving a presentation.
11.4 SUMMARY
• The presentation should be prepared in such a manner that it is visible froma distance and the text and images are appealing to the user. This is done byadding animation, themes, bullets and numbering. In a presentation, shortsentences are used generally and explanations are provided by the personwho is delivering the presentation.
• Audio and video content can be added to Microsoft Office PowerPoint2010, using the Media Clips Option under the Insert Tab.
• Image files can be inserted into PowerPoint presentation. The option toinsert image is available in image group of insert tab.
11.5 KEY WORDS
• Presenter: A presenter is the person who presents the power pointpresentation to the viewers.
• Viewer: A viewer is the person who listens to the presenter.
Video and Audio Effects
NOTES
Self-Instructional152 Material
11.6 SELF ASSESSMENT QUESTIONS ANDEXERCISES
1. Add audio and video files available on your system in a PowerPointpresentation.
2. Insert/import an image file to a PowerPoint presentation.
11.7 FURTHER READINGS
Srivastava, S.S. 2008. MS Office. New Delhi: Firewall Media.Saxena, Sanjay. 2011. MS Office 2007 in a Nutshell. Noida: Vikas Publishing
house.Courter, Gini and Annette Marquis. 1999. Mastering Microsoft Office 2000.
New Delhi: BPB Publications.Blattner, Patrick, Ken Cook, Laurie Ulrich and Timothy Dyck. 1999. Special
Edition Using Microsoft Excel 2000. New Delhi: Prentice-Hall of India.
Access Database Wizard,Pages and Projects
NOTES
Self-InstructionalMaterial 153
UNIT 12 ACCESS DATABASEWIZARD, PAGES ANDPROJECTS
Structure12.0 Introduction12.1 Objectives12.2 Working with Access Environment
12.2.1 Description of MS12.3 Database Design in MS Access
12.3.1 Designing Your Own Database12.3.2 Creating a Database from a Template
12.4 Working with Tables12.4.1 Understanding Tables12.4.2 Navigating within Tables
12.5 Answers to Check Your Progress Questions12.6 Summary12.7 Key Words12.8 Self Assessment Questions and Exercises12.9 Further Readings
12.0 INTRODUCTION
Microsoft Office Access or MS Access 2010 is a most popular databasemanagement system tool for windows. It combines the object-oriented relationaldatabase management system engine with graphical user interface and software-development tools from Microsoft. Microsoft Access 2010 has some designmodifications over MS Access 2007. It is a relational database application meantfor allowing users or programmers to manage, sort and filter large amounts ofdata. It is a powerful tool for creating and running database solutions and producingmeaningful reports.
It is designed to help the organizations such as a company, school, institutionsto collect, organize, manage, and access useful data in such a way that it can beeasily retrieved and made available to users in a convenient way.
12.1 OBJECTIVES
After going through this unit, you will be able to:• Describe the function of all tabs• Create table and access records• Design your own database and import data from different sources
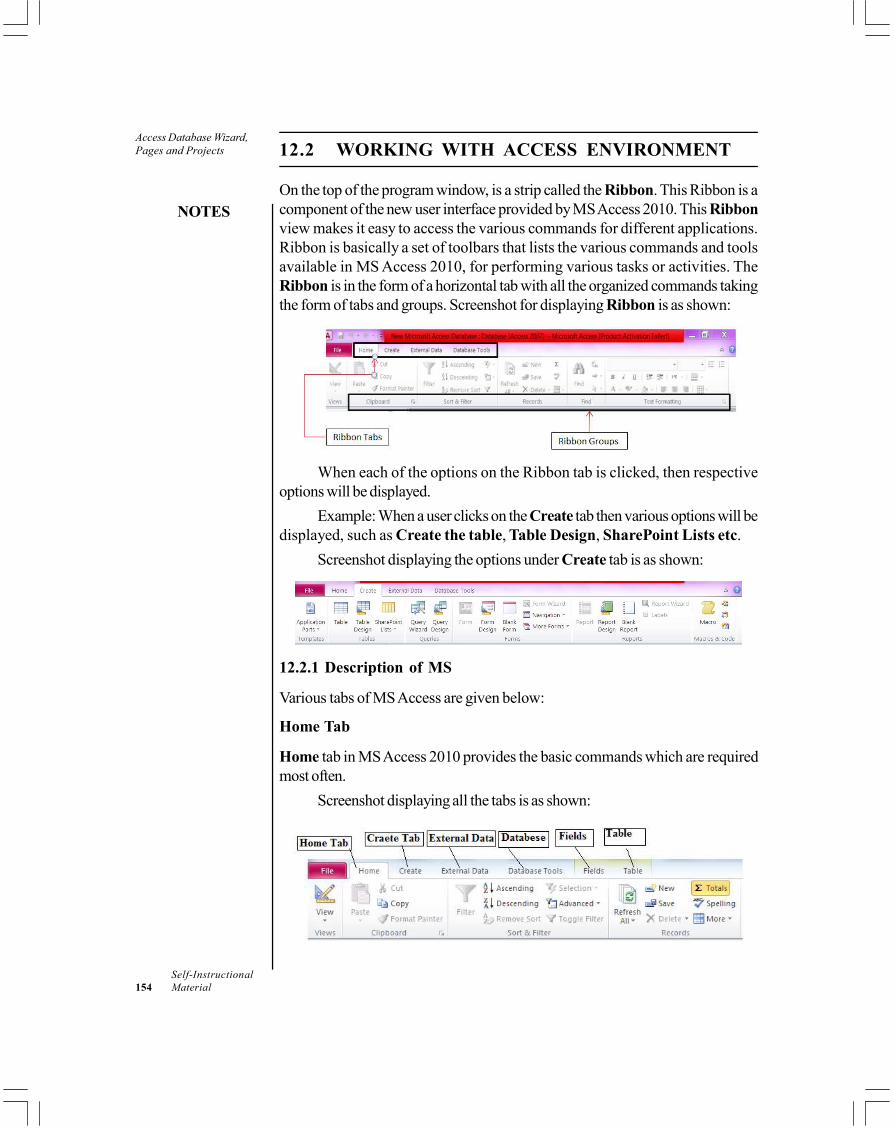
Access Database Wizard,Pages and Projects
NOTES
Self-Instructional154 Material
12.2 WORKING WITH ACCESS ENVIRONMENT
On the top of the program window, is a strip called the Ribbon. This Ribbon is acomponent of the new user interface provided by MS Access 2010. This Ribbonview makes it easy to access the various commands for different applications.Ribbon is basically a set of toolbars that lists the various commands and toolsavailable in MS Access 2010, for performing various tasks or activities. TheRibbon is in the form of a horizontal tab with all the organized commands takingthe form of tabs and groups. Screenshot for displaying Ribbon is as shown:
When each of the options on the Ribbon tab is clicked, then respectiveoptions will be displayed.
Example: When a user clicks on the Create tab then various options will bedisplayed, such as Create the table, Table Design, SharePoint Lists etc.
Screenshot displaying the options under Create tab is as shown:
12.2.1 Description of MS
Various tabs of MS Access are given below:
Home Tab
Home tab in MS Access 2010 provides the basic commands which are requiredmost often.
Screenshot displaying all the tabs is as shown:
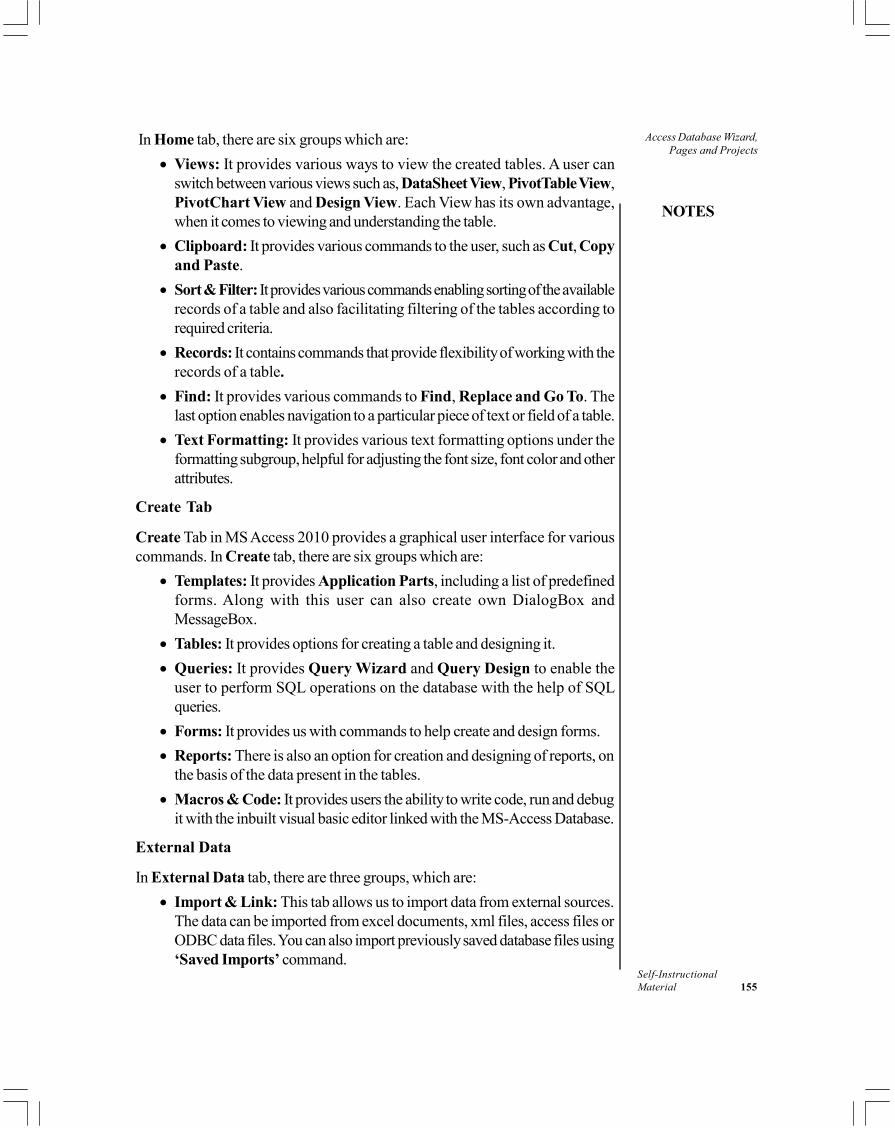
Access Database Wizard,Pages and Projects
NOTES
Self-InstructionalMaterial 155
In Home tab, there are six groups which are:• Views: It provides various ways to view the created tables. A user can
switch between various views such as, DataSheet View, PivotTable View,PivotChart View and Design View. Each View has its own advantage,when it comes to viewing and understanding the table.
• Clipboard: It provides various commands to the user, such as Cut, Copyand Paste.
• Sort & Filter: It provides various commands enabling sorting of the availablerecords of a table and also facilitating filtering of the tables according torequired criteria.
• Records: It contains commands that provide flexibility of working with therecords of a table.
• Find: It provides various commands to Find, Replace and Go To. Thelast option enables navigation to a particular piece of text or field of a table.
• Text Formatting: It provides various text formatting options under theformatting subgroup, helpful for adjusting the font size, font color and otherattributes.
Create Tab
Create Tab in MS Access 2010 provides a graphical user interface for variouscommands. In Create tab, there are six groups which are:
• Templates: It provides Application Parts, including a list of predefinedforms. Along with this user can also create own DialogBox andMessageBox.
• Tables: It provides options for creating a table and designing it.• Queries: It provides Query Wizard and Query Design to enable the
user to perform SQL operations on the database with the help of SQLqueries.
• Forms: It provides us with commands to help create and design forms.• Reports: There is also an option for creation and designing of reports, on
the basis of the data present in the tables.• Macros & Code: It provides users the ability to write code, run and debug
it with the inbuilt visual basic editor linked with the MS-Access Database.
External Data
In External Data tab, there are three groups, which are:• Import & Link: This tab allows us to import data from external sources.
The data can be imported from excel documents, xml files, access files orODBC data files. You can also import previously saved database files using‘Saved Imports’ command.
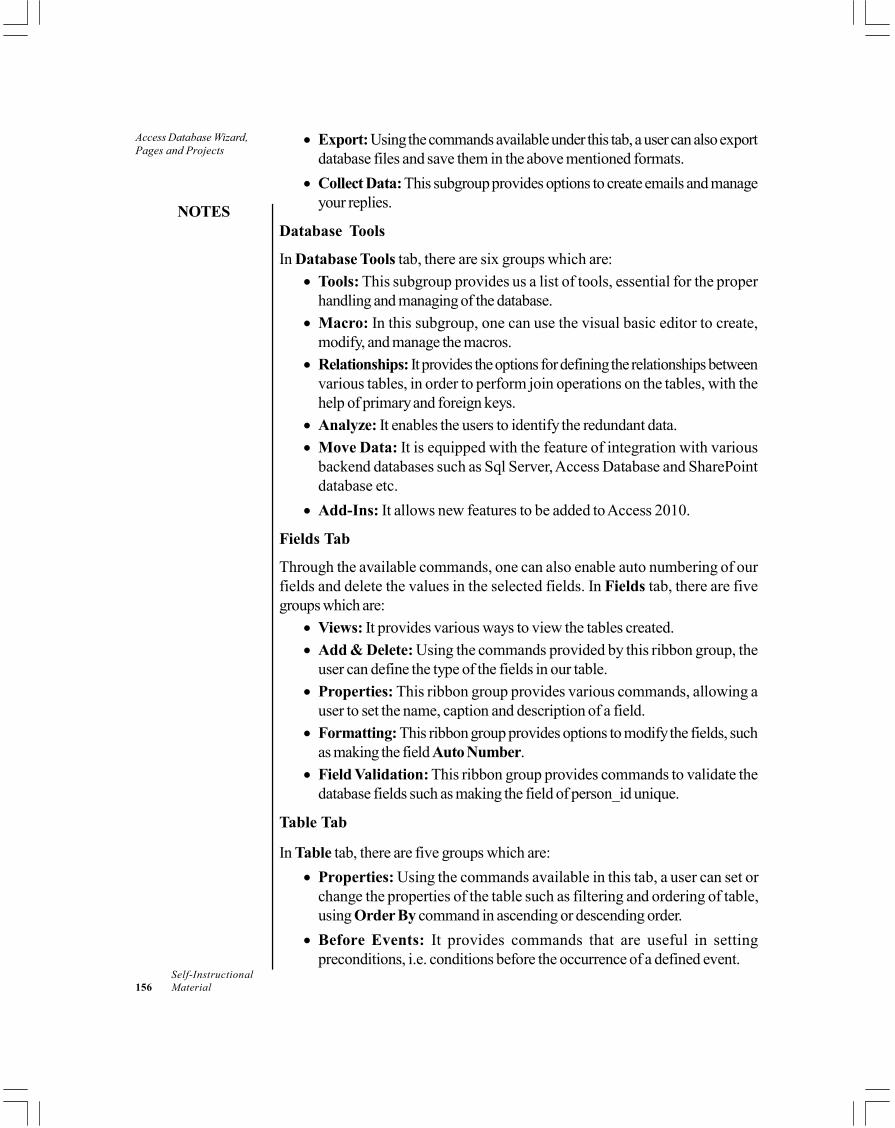
Access Database Wizard,Pages and Projects
NOTES
Self-Instructional156 Material
• Export: Using the commands available under this tab, a user can also exportdatabase files and save them in the above mentioned formats.
• Collect Data: This subgroup provides options to create emails and manageyour replies.
Database Tools
In Database Tools tab, there are six groups which are:• Tools: This subgroup provides us a list of tools, essential for the proper
handling and managing of the database.• Macro: In this subgroup, one can use the visual basic editor to create,
modify, and manage the macros.• Relationships: It provides the options for defining the relationships between
various tables, in order to perform join operations on the tables, with thehelp of primary and foreign keys.
• Analyze: It enables the users to identify the redundant data.• Move Data: It is equipped with the feature of integration with various
backend databases such as Sql Server, Access Database and SharePointdatabase etc.
• Add-Ins: It allows new features to be added to Access 2010.
Fields Tab
Through the available commands, one can also enable auto numbering of ourfields and delete the values in the selected fields. In Fields tab, there are fivegroups which are:
• Views: It provides various ways to view the tables created.• Add & Delete: Using the commands provided by this ribbon group, the
user can define the type of the fields in our table.• Properties: This ribbon group provides various commands, allowing a
user to set the name, caption and description of a field.• Formatting: This ribbon group provides options to modify the fields, such
as making the field Auto Number.• Field Validation: This ribbon group provides commands to validate the
database fields such as making the field of person_id unique.
Table Tab
In Table tab, there are five groups which are:• Properties: Using the commands available in this tab, a user can set or
change the properties of the table such as filtering and ordering of table,using Order By command in ascending or descending order.
• Before Events: It provides commands that are useful in settingpreconditions, i.e. conditions before the occurrence of a defined event.
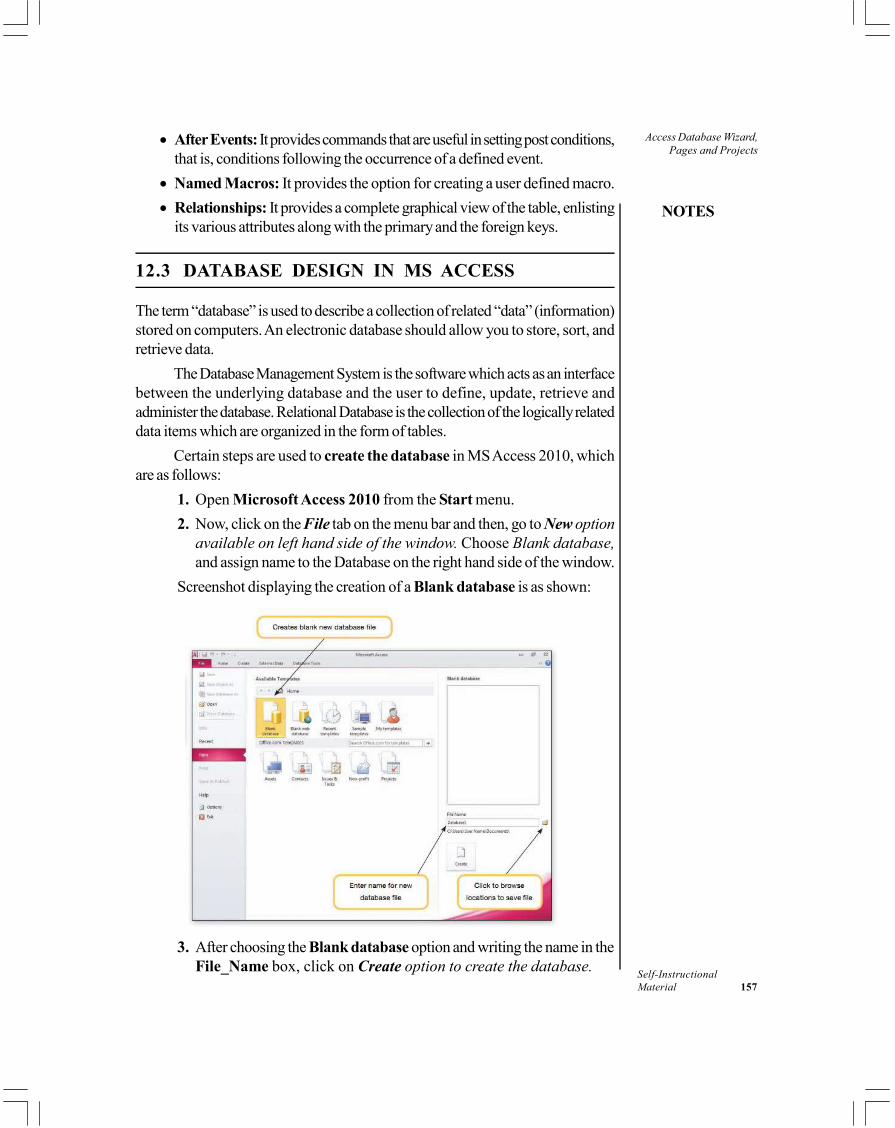
Access Database Wizard,Pages and Projects
NOTES
Self-InstructionalMaterial 157
• After Events: It provides commands that are useful in setting post conditions,that is, conditions following the occurrence of a defined event.
• Named Macros: It provides the option for creating a user defined macro.• Relationships: It provides a complete graphical view of the table, enlisting
its various attributes along with the primary and the foreign keys.
12.3 DATABASE DESIGN IN MS ACCESS
The term “database” is used to describe a collection of related “data” (information)stored on computers. An electronic database should allow you to store, sort, andretrieve data.
The Database Management System is the software which acts as an interfacebetween the underlying database and the user to define, update, retrieve andadminister the database. Relational Database is the collection of the logically relateddata items which are organized in the form of tables.
Certain steps are used to create the database in MS Access 2010, whichare as follows:
1. Open Microsoft Access 2010 from the Start menu.2. Now, click on the File tab on the menu bar and then, go to New option
available on left hand side of the window. Choose Blank database,and assign name to the Database on the right hand side of the window.
Screenshot displaying the creation of a Blank database is as shown:
3. After choosing the Blank database option and writing the name in theFile_Name box, click on Create option to create the database.
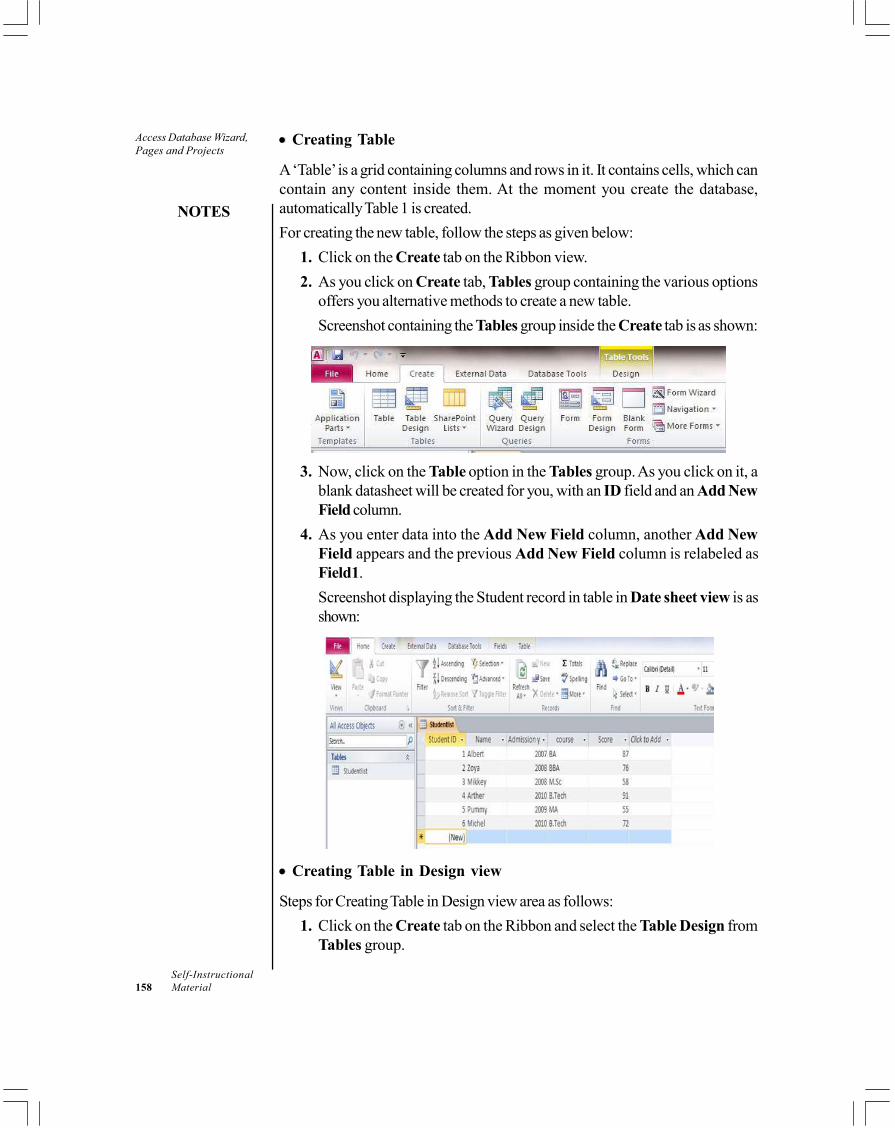
Access Database Wizard,Pages and Projects
NOTES
Self-Instructional158 Material
• Creating Table
A ‘Table’ is a grid containing columns and rows in it. It contains cells, which cancontain any content inside them. At the moment you create the database,automatically Table 1 is created.For creating the new table, follow the steps as given below:
1. Click on the Create tab on the Ribbon view.2. As you click on Create tab, Tables group containing the various options
offers you alternative methods to create a new table.Screenshot containing the Tables group inside the Create tab is as shown:
3. Now, click on the Table option in the Tables group. As you click on it, ablank datasheet will be created for you, with an ID field and an Add NewField column.
4. As you enter data into the Add New Field column, another Add NewField appears and the previous Add New Field column is relabeled asField1.Screenshot displaying the Student record in table in Date sheet view is asshown:
• Creating Table in Design view
Steps for Creating Table in Design view area as follows:1. Click on the Create tab on the Ribbon and select the Table Design from
Tables group.
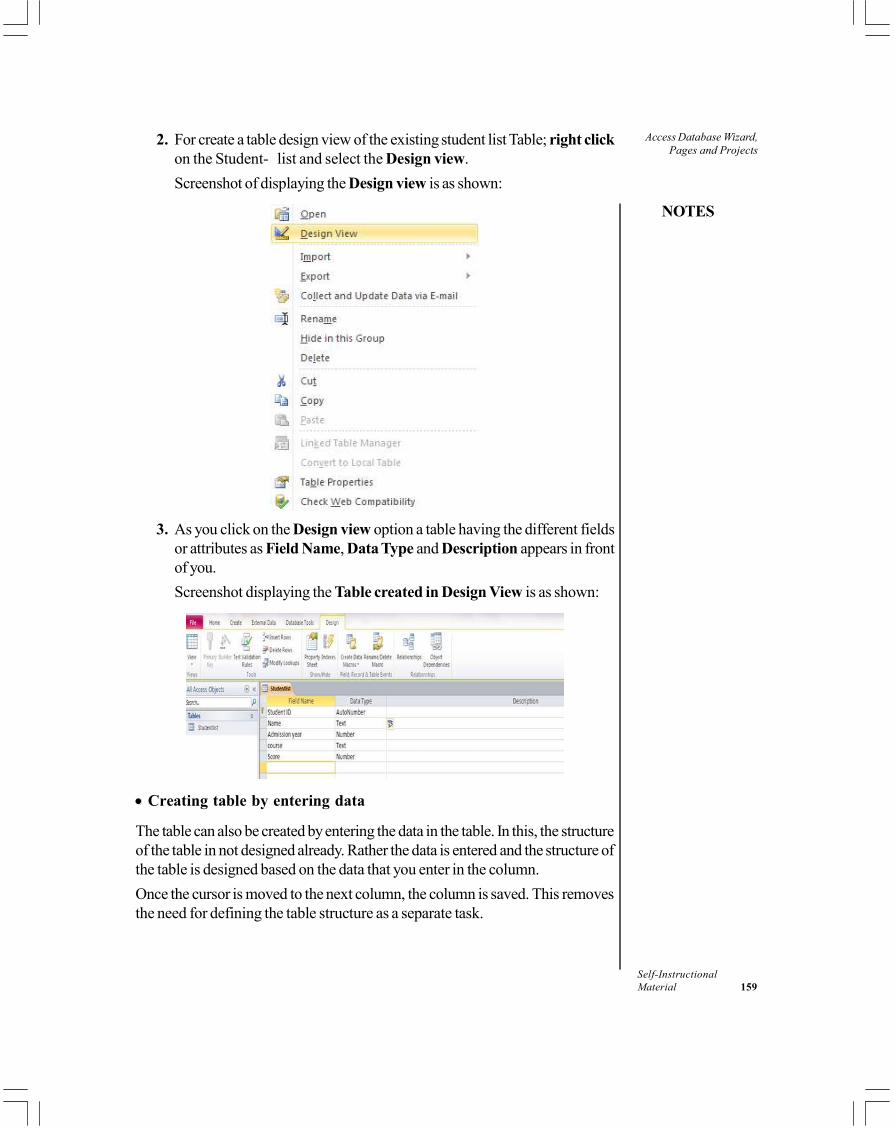
Access Database Wizard,Pages and Projects
NOTES
Self-InstructionalMaterial 159
2. For create a table design view of the existing student list Table; right clickon the Student- list and select the Design view.Screenshot of displaying the Design view is as shown:
3. As you click on the Design view option a table having the different fieldsor attributes as Field Name, Data Type and Description appears in frontof you.Screenshot displaying the Table created in Design View is as shown:
• Creating table by entering data
The table can also be created by entering the data in the table. In this, the structureof the table in not designed already. Rather the data is entered and the structure ofthe table is designed based on the data that you enter in the column.Once the cursor is moved to the next column, the column is saved. This removesthe need for defining the table structure as a separate task.
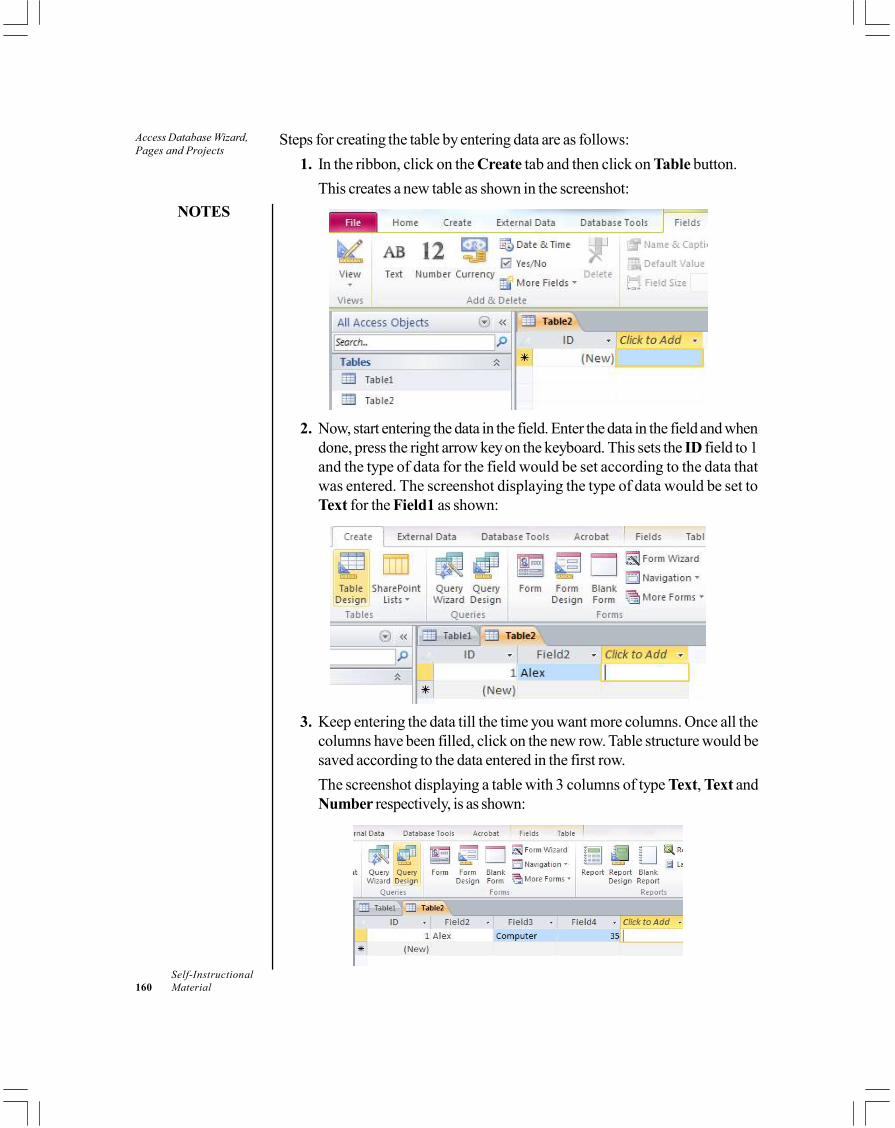
Access Database Wizard,Pages and Projects
NOTES
Self-Instructional160 Material
Steps for creating the table by entering data are as follows:1. In the ribbon, click on the Create tab and then click on Table button.
This creates a new table as shown in the screenshot:
2. Now, start entering the data in the field. Enter the data in the field and whendone, press the right arrow key on the keyboard. This sets the ID field to 1and the type of data for the field would be set according to the data thatwas entered. The screenshot displaying the type of data would be set toText for the Field1 as shown:
3. Keep entering the data till the time you want more columns. Once all thecolumns have been filled, click on the new row. Table structure would besaved according to the data entered in the first row.The screenshot displaying a table with 3 columns of type Text, Text andNumber respectively, is as shown:
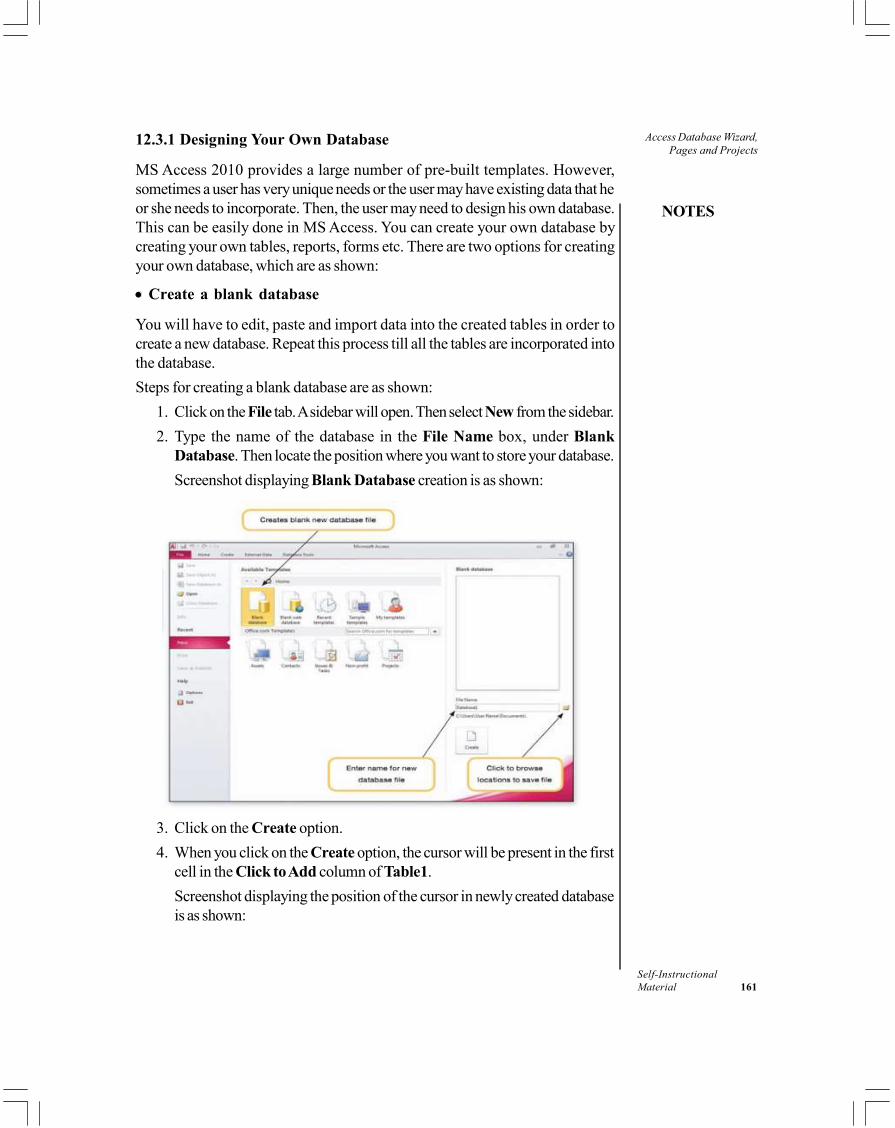
Access Database Wizard,Pages and Projects
NOTES
Self-InstructionalMaterial 161
12.3.1 Designing Your Own Database
MS Access 2010 provides a large number of pre-built templates. However,sometimes a user has very unique needs or the user may have existing data that heor she needs to incorporate. Then, the user may need to design his own database.This can be easily done in MS Access. You can create your own database bycreating your own tables, reports, forms etc. There are two options for creatingyour own database, which are as shown:
• Create a blank database
You will have to edit, paste and import data into the created tables in order tocreate a new database. Repeat this process till all the tables are incorporated intothe database.Steps for creating a blank database are as shown:
1. Click on the File tab. A sidebar will open. Then select New from the sidebar.2. Type the name of the database in the File Name box, under Blank
Database. Then locate the position where you want to store your database.Screenshot displaying Blank Database creation is as shown:
3. Click on the Create option.4. When you click on the Create option, the cursor will be present in the first
cell in the Click to Add column of Table1.Screenshot displaying the position of the cursor in newly created databaseis as shown:
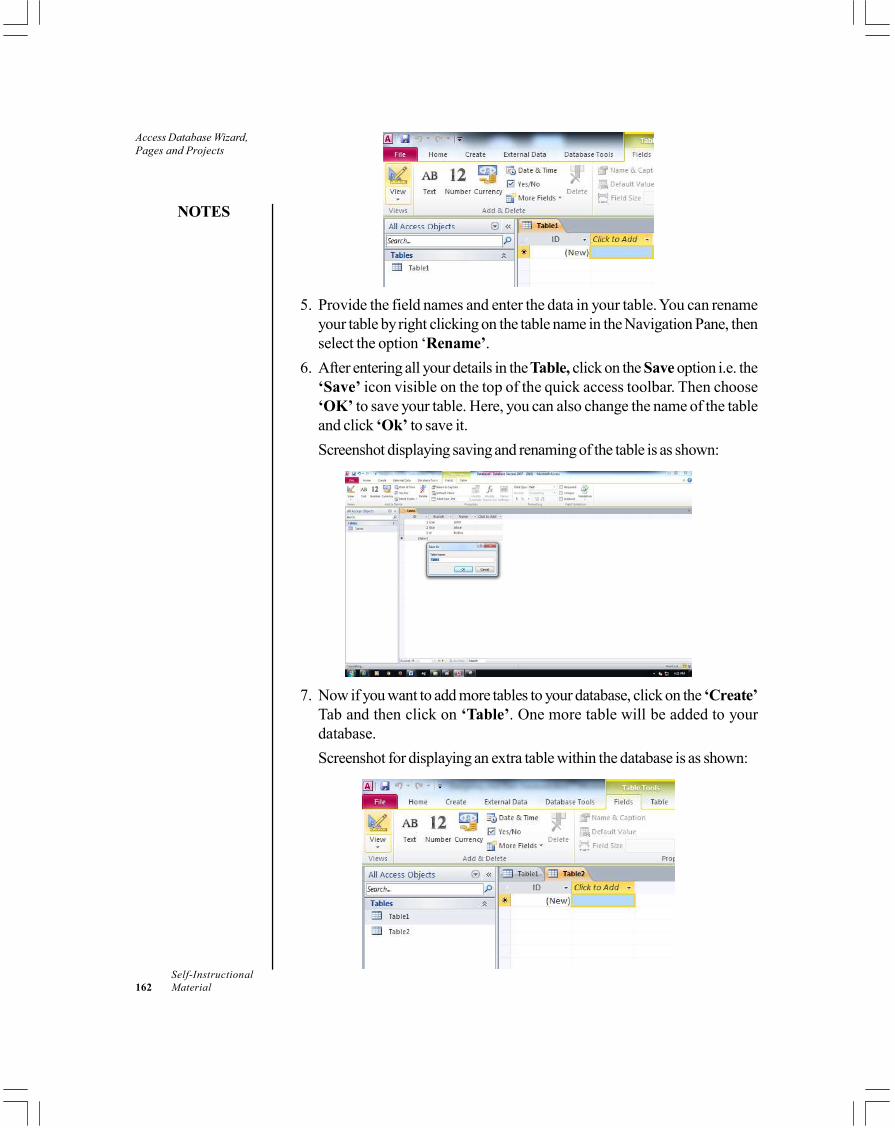
Access Database Wizard,Pages and Projects
NOTES
Self-Instructional162 Material
5. Provide the field names and enter the data in your table. You can renameyour table by right clicking on the table name in the Navigation Pane, thenselect the option ‘Rename’.
6. After entering all your details in the Table, click on the Save option i.e. the‘Save’ icon visible on the top of the quick access toolbar. Then choose‘OK’ to save your table. Here, you can also change the name of the tableand click ‘Ok’ to save it.Screenshot displaying saving and renaming of the table is as shown:
7. Now if you want to add more tables to your database, click on the ‘Create’Tab and then click on ‘Table’. One more table will be added to yourdatabase.Screenshot for displaying an extra table within the database is as shown:
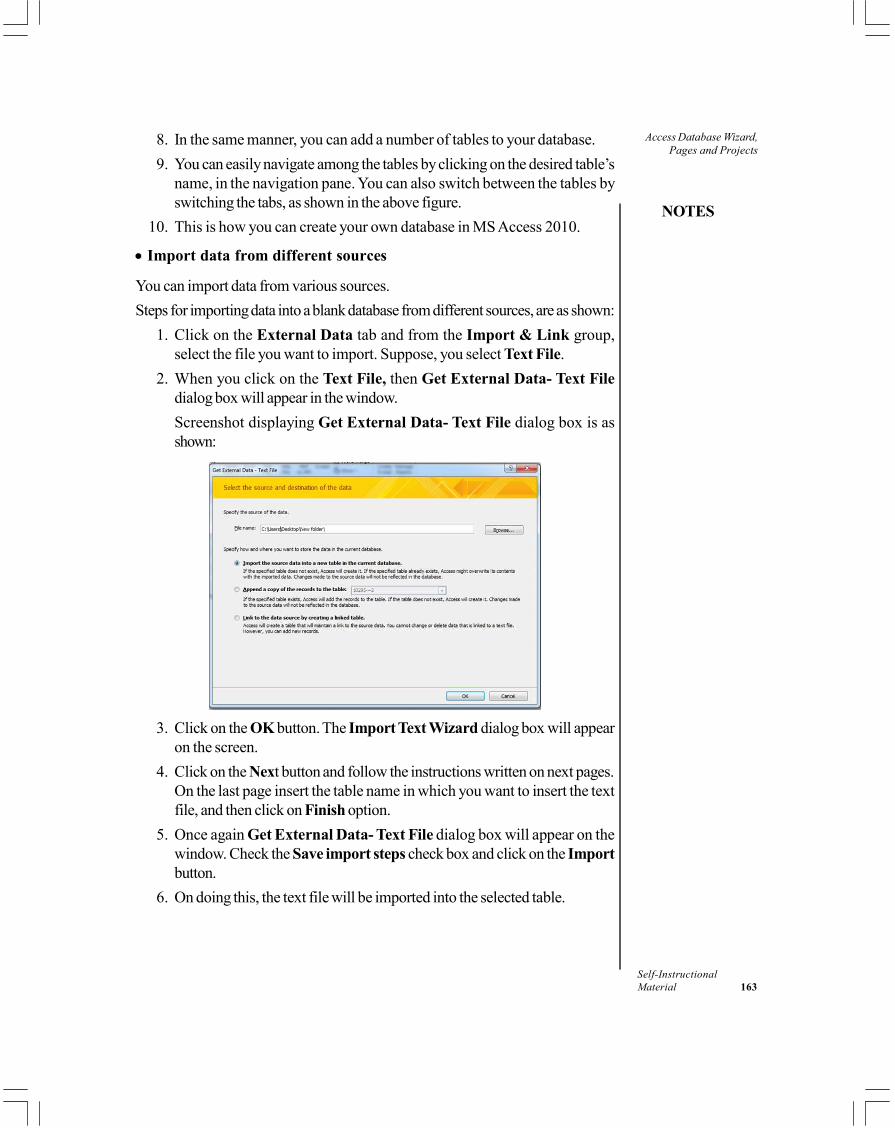
Access Database Wizard,Pages and Projects
NOTES
Self-InstructionalMaterial 163
8. In the same manner, you can add a number of tables to your database.9. You can easily navigate among the tables by clicking on the desired table’s
name, in the navigation pane. You can also switch between the tables byswitching the tabs, as shown in the above figure.
10. This is how you can create your own database in MS Access 2010.
• Import data from different sources
You can import data from various sources.Steps for importing data into a blank database from different sources, are as shown:
1. Click on the External Data tab and from the Import & Link group,select the file you want to import. Suppose, you select Text File.
2. When you click on the Text File, then Get External Data- Text Filedialog box will appear in the window.Screenshot displaying Get External Data- Text File dialog box is asshown:
3. Click on the OK button. The Import Text Wizard dialog box will appearon the screen.
4. Click on the Next button and follow the instructions written on next pages.On the last page insert the table name in which you want to insert the textfile, and then click on Finish option.
5. Once again Get External Data- Text File dialog box will appear on thewindow. Check the Save import steps check box and click on the Importbutton.
6. On doing this, the text file will be imported into the selected table.
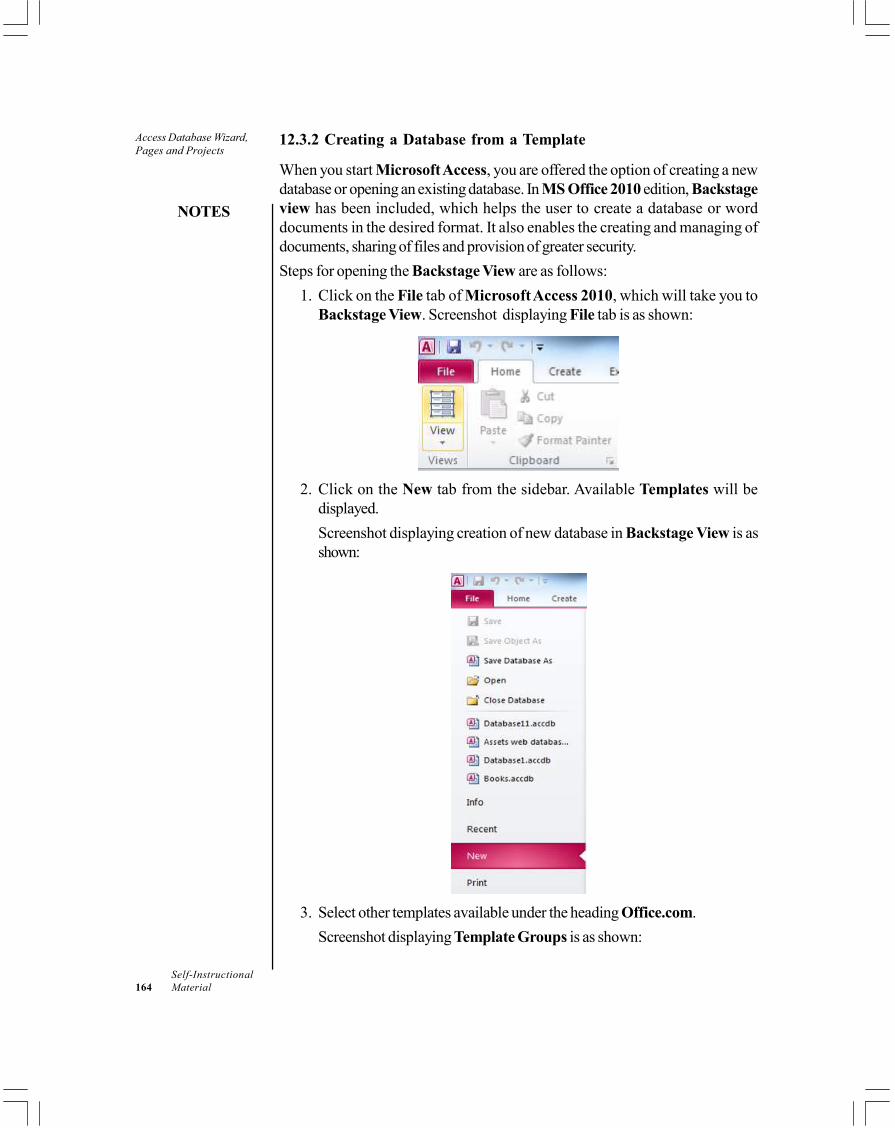
Access Database Wizard,Pages and Projects
NOTES
Self-Instructional164 Material
12.3.2 Creating a Database from a Template
When you start Microsoft Access, you are offered the option of creating a newdatabase or opening an existing database. In MS Office 2010 edition, Backstageview has been included, which helps the user to create a database or worddocuments in the desired format. It also enables the creating and managing ofdocuments, sharing of files and provision of greater security.Steps for opening the Backstage View are as follows:
1. Click on the File tab of Microsoft Access 2010, which will take you toBackstage View. Screenshot displaying File tab is as shown:
2. Click on the New tab from the sidebar. Available Templates will bedisplayed.Screenshot displaying creation of new database in Backstage View is asshown:
3. Select other templates available under the heading Office.com.Screenshot displaying Template Groups is as shown:
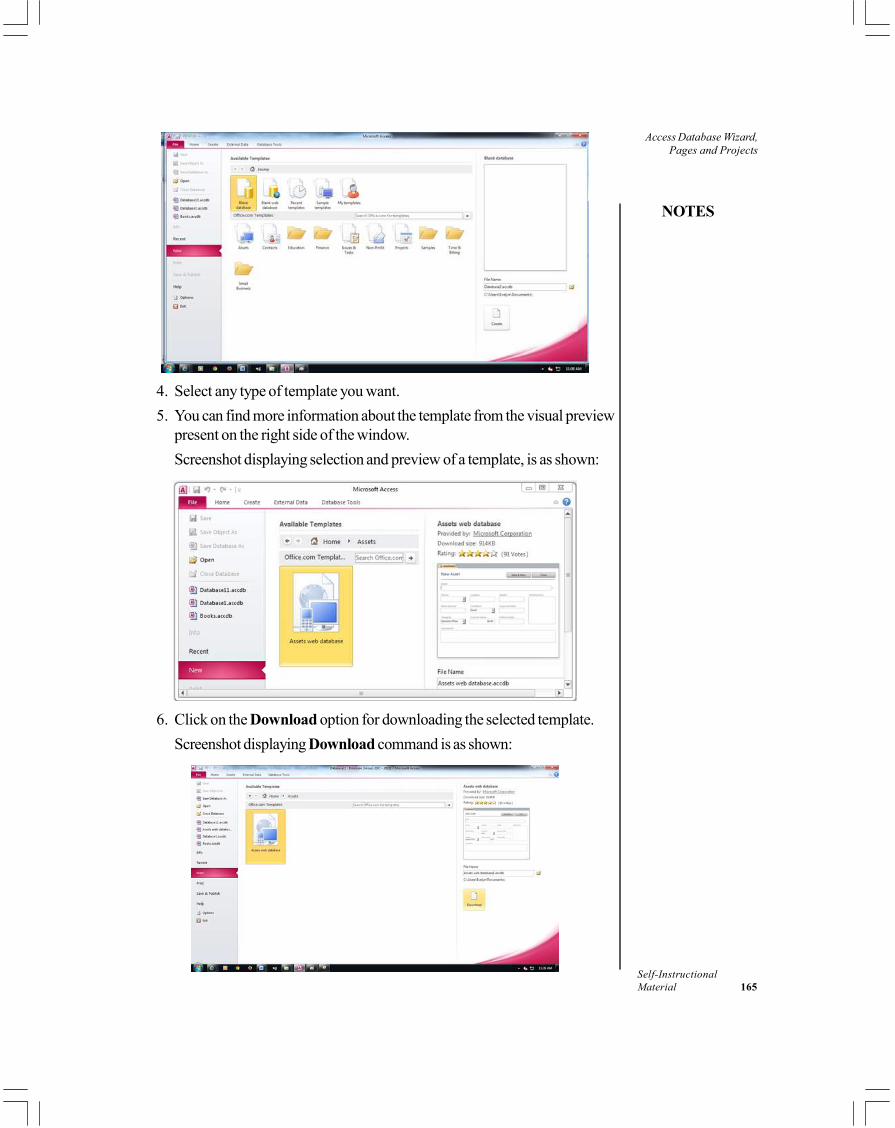
Access Database Wizard,Pages and Projects
NOTES
Self-InstructionalMaterial 165
4. Select any type of template you want.5. You can find more information about the template from the visual preview
present on the right side of the window.Screenshot displaying selection and preview of a template, is as shown:
6. Click on the Download option for downloading the selected template.Screenshot displaying Download command is as shown:
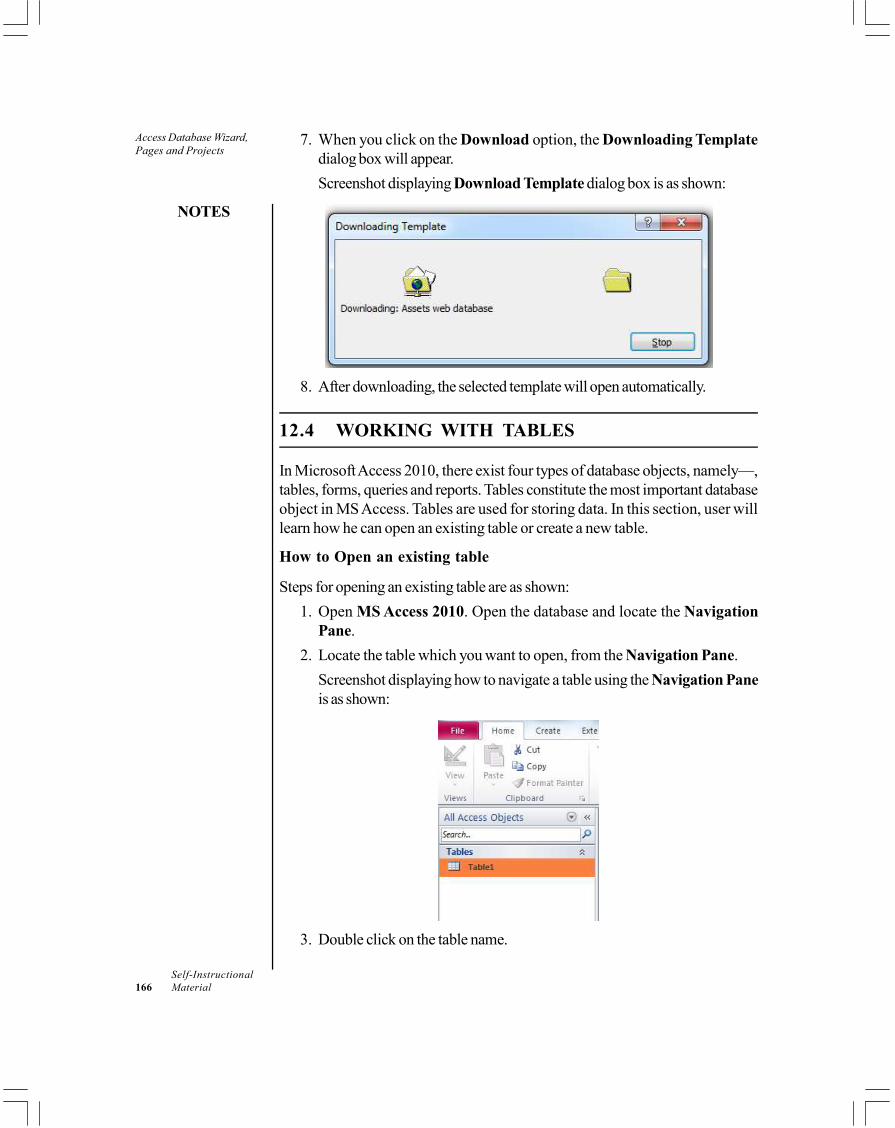
Access Database Wizard,Pages and Projects
NOTES
Self-Instructional166 Material
7. When you click on the Download option, the Downloading Templatedialog box will appear.Screenshot displaying Download Template dialog box is as shown:
8. After downloading, the selected template will open automatically.
12.4 WORKING WITH TABLES
In Microsoft Access 2010, there exist four types of database objects, namely—,tables, forms, queries and reports. Tables constitute the most important databaseobject in MS Access. Tables are used for storing data. In this section, user willlearn how he can open an existing table or create a new table.
How to Open an existing table
Steps for opening an existing table are as shown:1. Open MS Access 2010. Open the database and locate the Navigation
Pane.2. Locate the table which you want to open, from the Navigation Pane.
Screenshot displaying how to navigate a table using the Navigation Paneis as shown:
3. Double click on the table name.
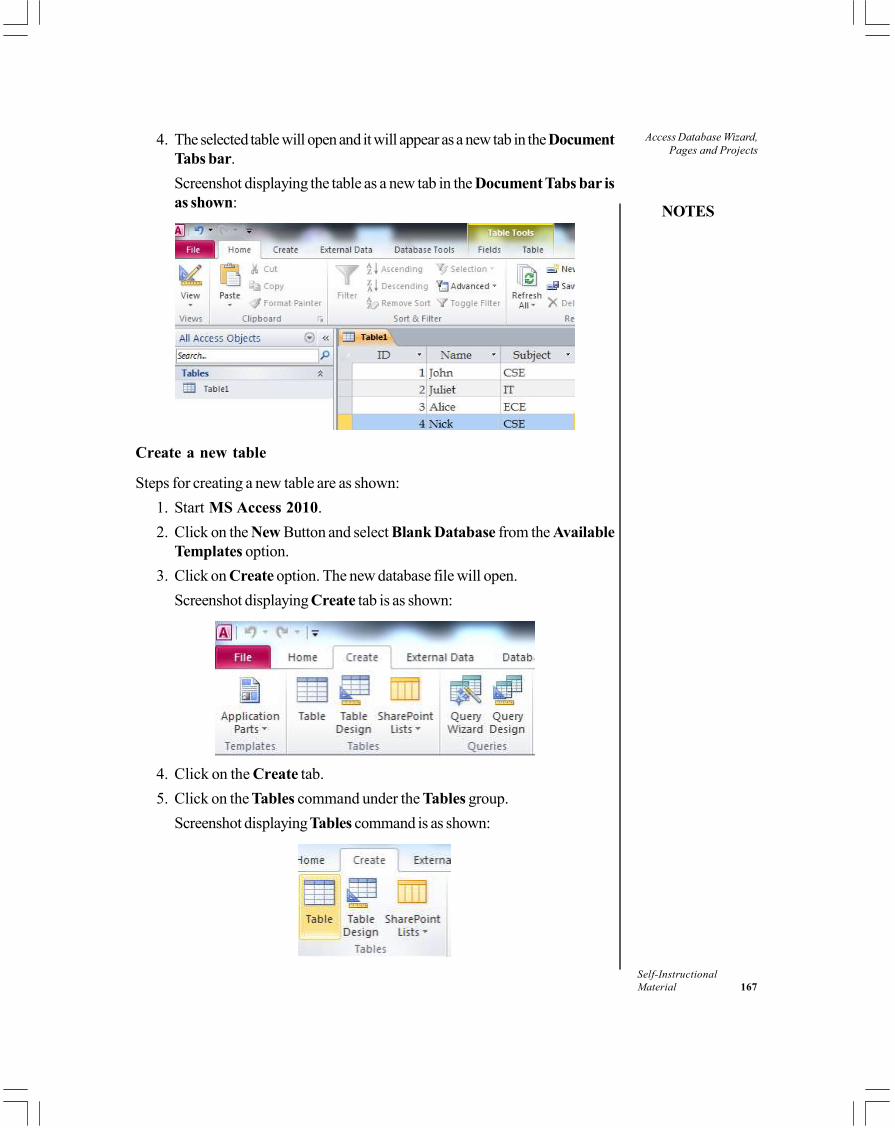
Access Database Wizard,Pages and Projects
NOTES
Self-InstructionalMaterial 167
4. The selected table will open and it will appear as a new tab in the DocumentTabs bar.Screenshot displaying the table as a new tab in the Document Tabs bar isas shown:
Create a new table
Steps for creating a new table are as shown:1. Start MS Access 2010.2. Click on the New Button and select Blank Database from the Available
Templates option.3. Click on Create option. The new database file will open.
Screenshot displaying Create tab is as shown:
4. Click on the Create tab.5. Click on the Tables command under the Tables group.
Screenshot displaying Tables command is as shown:
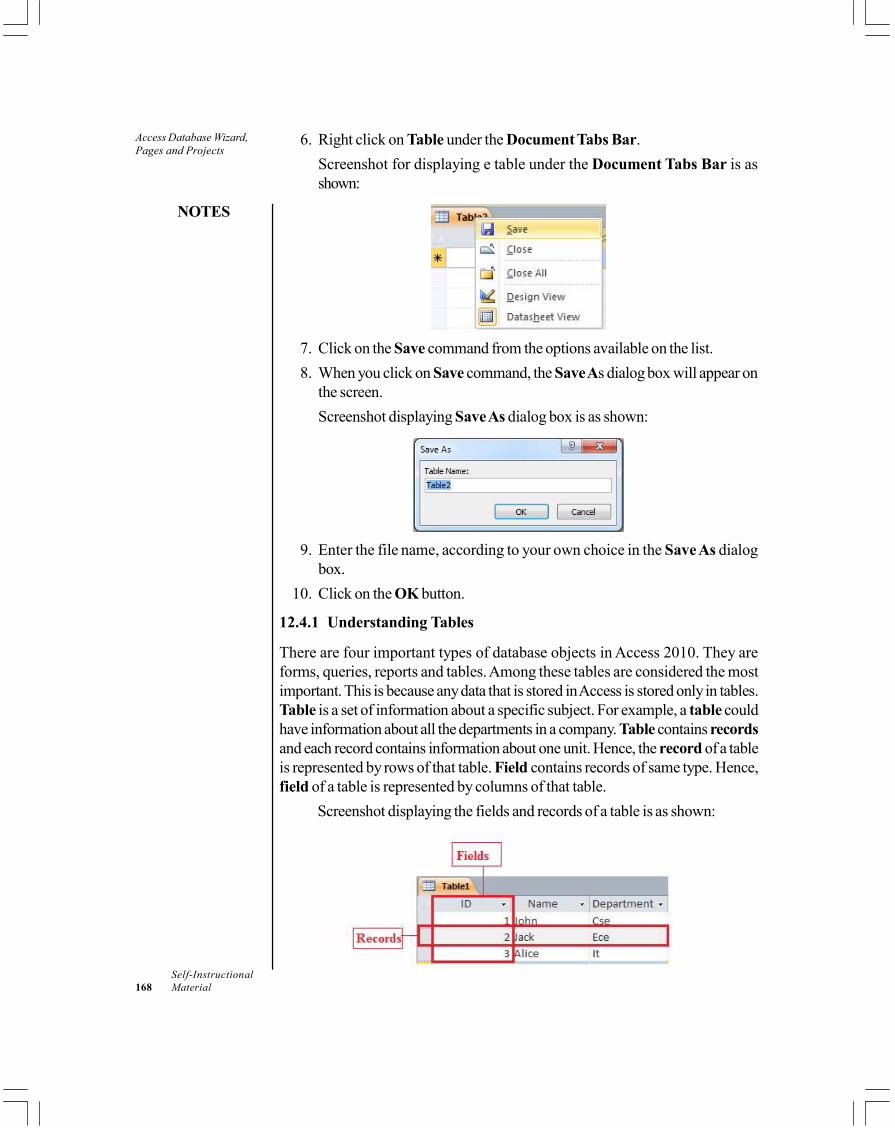
Access Database Wizard,Pages and Projects
NOTES
Self-Instructional168 Material
6. Right click on Table under the Document Tabs Bar.Screenshot for displaying e table under the Document Tabs Bar is asshown:
7. Click on the Save command from the options available on the list.8. When you click on Save command, the Save As dialog box will appear on
the screen.Screenshot displaying Save As dialog box is as shown:
9. Enter the file name, according to your own choice in the Save As dialogbox.
10. Click on the OK button.
12.4.1 Understanding Tables
There are four important types of database objects in Access 2010. They areforms, queries, reports and tables. Among these tables are considered the mostimportant. This is because any data that is stored in Access is stored only in tables.Table is a set of information about a specific subject. For example, a table couldhave information about all the departments in a company. Table contains recordsand each record contains information about one unit. Hence, the record of a tableis represented by rows of that table. Field contains records of same type. Hence,field of a table is represented by columns of that table.
Screenshot displaying the fields and records of a table is as shown:
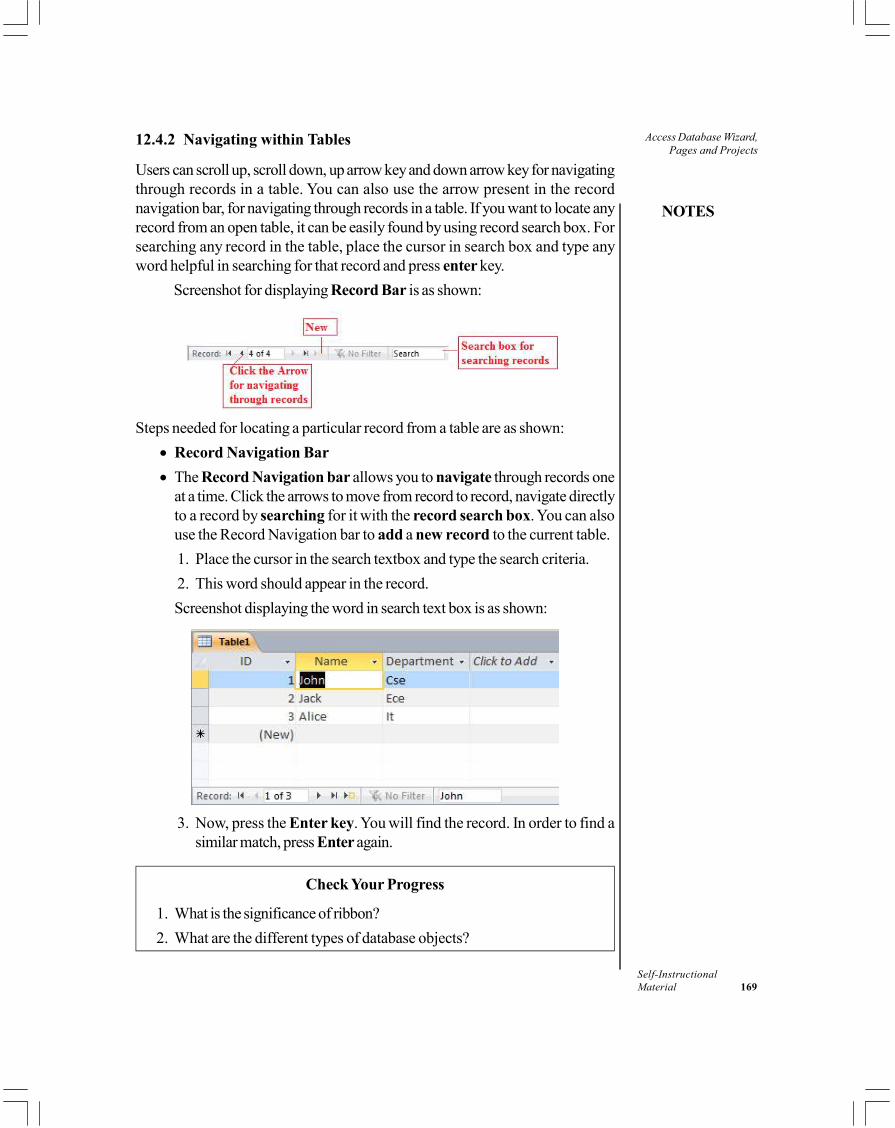
Access Database Wizard,Pages and Projects
NOTES
Self-InstructionalMaterial 169
12.4.2 Navigating within Tables
Users can scroll up, scroll down, up arrow key and down arrow key for navigatingthrough records in a table. You can also use the arrow present in the recordnavigation bar, for navigating through records in a table. If you want to locate anyrecord from an open table, it can be easily found by using record search box. Forsearching any record in the table, place the cursor in search box and type anyword helpful in searching for that record and press enter key.
Screenshot for displaying Record Bar is as shown:
Steps needed for locating a particular record from a table are as shown:• Record Navigation Bar• The Record Navigation bar allows you to navigate through records one
at a time. Click the arrows to move from record to record, navigate directlyto a record by searching for it with the record search box. You can alsouse the Record Navigation bar to add a new record to the current table.1. Place the cursor in the search textbox and type the search criteria.2. This word should appear in the record.Screenshot displaying the word in search text box is as shown:
3. Now, press the Enter key. You will find the record. In order to find asimilar match, press Enter again.
Check Your Progress
1. What is the significance of ribbon?2. What are the different types of database objects?
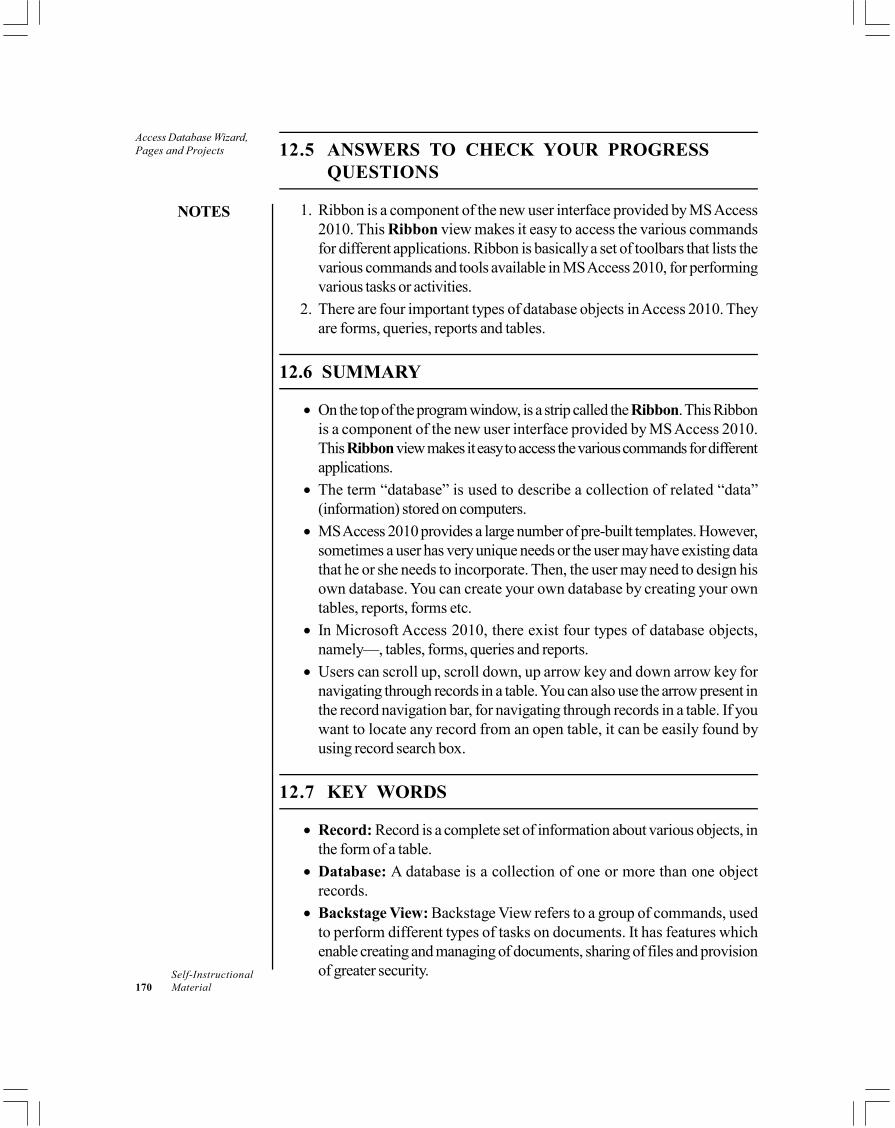
Access Database Wizard,Pages and Projects
NOTES
Self-Instructional170 Material
12.5 ANSWERS TO CHECK YOUR PROGRESSQUESTIONS
1. Ribbon is a component of the new user interface provided by MS Access2010. This Ribbon view makes it easy to access the various commandsfor different applications. Ribbon is basically a set of toolbars that lists thevarious commands and tools available in MS Access 2010, for performingvarious tasks or activities.
2. There are four important types of database objects in Access 2010. Theyare forms, queries, reports and tables.
12.6 SUMMARY
• On the top of the program window, is a strip called the Ribbon. This Ribbonis a component of the new user interface provided by MS Access 2010.This Ribbon view makes it easy to access the various commands for differentapplications.
• The term “database” is used to describe a collection of related “data”(information) stored on computers.
• MS Access 2010 provides a large number of pre-built templates. However,sometimes a user has very unique needs or the user may have existing datathat he or she needs to incorporate. Then, the user may need to design hisown database. You can create your own database by creating your owntables, reports, forms etc.
• In Microsoft Access 2010, there exist four types of database objects,namely—, tables, forms, queries and reports.
• Users can scroll up, scroll down, up arrow key and down arrow key fornavigating through records in a table. You can also use the arrow present inthe record navigation bar, for navigating through records in a table. If youwant to locate any record from an open table, it can be easily found byusing record search box.
12.7 KEY WORDS
• Record: Record is a complete set of information about various objects, inthe form of a table.
• Database: A database is a collection of one or more than one objectrecords.
• Backstage View: Backstage View refers to a group of commands, usedto perform different types of tasks on documents. It has features whichenable creating and managing of documents, sharing of files and provisionof greater security.
Access Database Wizard,Pages and Projects
NOTES
Self-InstructionalMaterial 171
12.8 SELF ASSESSMENT QUESTIONS ANDEXERCISES
1. Create a database on student enrolment information using MS Access.2. Insert a new record in the database you have created.3. Create a database of employees in an organisation using a template.
12.9 FURTHER READINGS
Srivastava, S.S. 2008. MS Office. New Delhi: Firewall Media.Saxena, Sanjay. 2011. MS Office 2007 in a Nutshell. Noida: Vikas Publishing
house.Courter, Gini and Annette Marquis. 1999. Mastering Microsoft Office 2000.
New Delhi: BPB Publications.Blattner, Patrick, Ken Cook, Laurie Ulrich and Timothy Dyck. 1999. Special
Edition Using Microsoft Excel 2000. New Delhi: Prentice-Hall of India.
Datasheet Records
NOTES
Self-Instructional172 Material
UNIT 13 DATASHEET RECORDS
Structure13.0 Introduction13.1 Objectives13.2 Working with Records
13.2.1 Adding Records and Entering Data13.2.2 Editing Records13.2.3 Modifying Table Appearance
13.3 Sorting and Filtering Records13.3.1 Filtering Text and Numbers by a Search Term
13.4 Working with Queries13.4.1 Query Design and Running in MS Access13.4.2 One-Table Queries and Multi-Table Query13.4.3 Joining Tables in Queries13.4.4 Modifying Queries13.4.5 Sorting Queries13.4.6 Hiding Fields within Queries13.4.7 Types of Queries
13.5 Answers to Check Your Progress Questions13.6 Summary13.7 Key Words13.8 Self Assessment Questions and Exercises13.9 Further Readings
13.0 INTRODUCTION
In this unit, you will learn about the adding, editing records and query designing.Database refers to a set of organized data or a collection of records; for example,employee’s records, student’s records, etc. Many tables can be created in onedatabase. Once you have prepared the database, you can add, delete, modifyand manipulate the database, tables or even records. You will also learn about thesorting and filtering. MS Access 2010 provides a special kind of property, tomake working with a large amount of data easier and smoother. When a userworks with a large amount of data, it is very important to sort and filter data foreasy accessibility. Therefore two tools—Sorting and Filtering are available, whichhelp to customize viewing and organization of data.
13.1 OBJECTIVES
After going through this unit, you will be able to:• Insert and edit new records• Sort and filter records• Work with queries

Datasheet Records
NOTES
Self-InstructionalMaterial 173
13.2 WORKING WITH RECORDS
13.2.1 Adding Records and Entering Data
In Access, the user can enter data exactly like it is entered in Excel.Steps for adding a new record are as follows:
Click on the New command under the Records group of Home tab.Screenshot displaying the New command is as shown:
Second way of adding a new record is as follows:Click on the New button visible on the Record Navigation bar, present at
the bottom of the window.
Steps for saving a record are as follows:Click on the Save command under the Records group of Home tab.Screenshot displaying Save command is as shown:
13.2.2 Editing Records
Users can make changes in any record. For making changes just click on theword which you want to replace. You can update records using the find andreplace options.
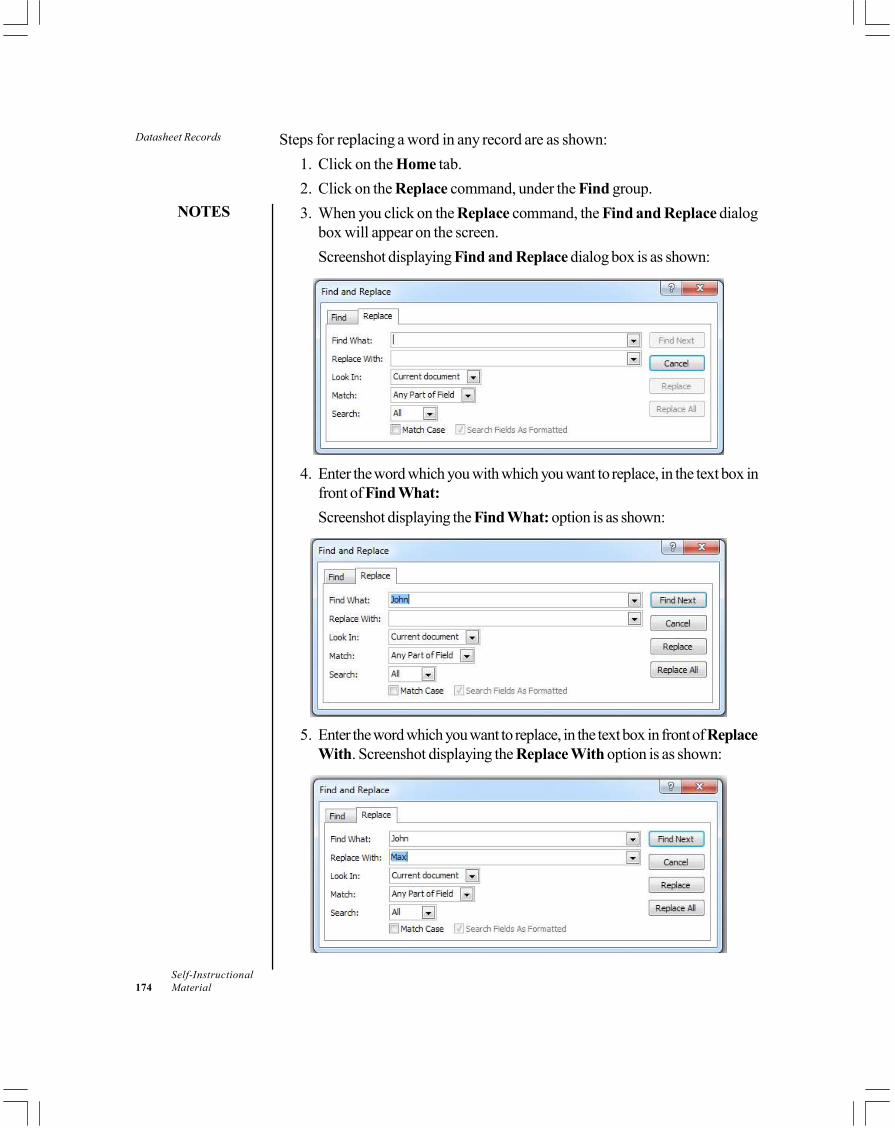
Datasheet Records
NOTES
Self-Instructional174 Material
Steps for replacing a word in any record are as shown:1. Click on the Home tab.2. Click on the Replace command, under the Find group.3. When you click on the Replace command, the Find and Replace dialog
box will appear on the screen.Screenshot displaying Find and Replace dialog box is as shown:
4. Enter the word which you with which you want to replace, in the text box infront of Find What:Screenshot displaying the Find What: option is as shown:
5. Enter the word which you want to replace, in the text box in front of ReplaceWith. Screenshot displaying the Replace With option is as shown:
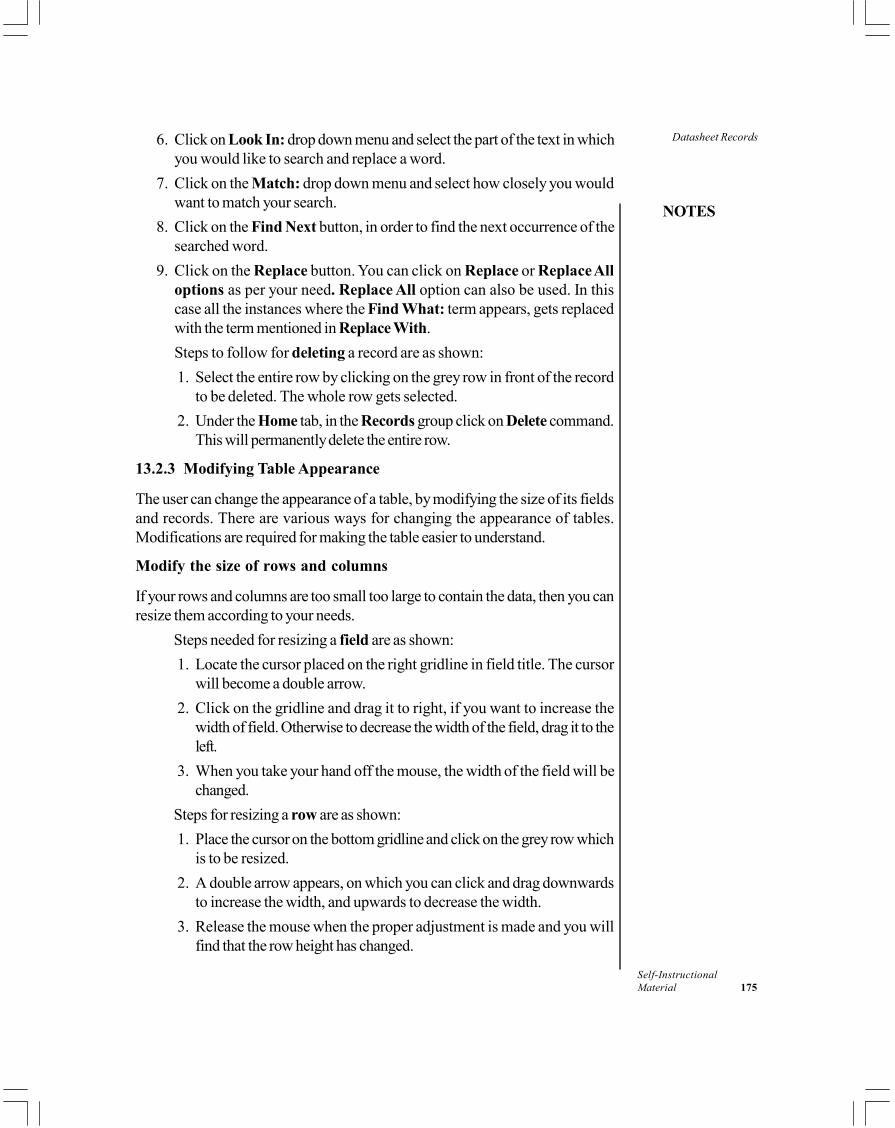
Datasheet Records
NOTES
Self-InstructionalMaterial 175
6. Click on Look In: drop down menu and select the part of the text in whichyou would like to search and replace a word.
7. Click on the Match: drop down menu and select how closely you wouldwant to match your search.
8. Click on the Find Next button, in order to find the next occurrence of thesearched word.
9. Click on the Replace button. You can click on Replace or Replace Alloptions as per your need. Replace All option can also be used. In thiscase all the instances where the Find What: term appears, gets replacedwith the term mentioned in Replace With.Steps to follow for deleting a record are as shown:1. Select the entire row by clicking on the grey row in front of the record
to be deleted. The whole row gets selected.2. Under the Home tab, in the Records group click on Delete command.
This will permanently delete the entire row.
13.2.3 Modifying Table Appearance
The user can change the appearance of a table, by modifying the size of its fieldsand records. There are various ways for changing the appearance of tables.Modifications are required for making the table easier to understand.
Modify the size of rows and columns
If your rows and columns are too small too large to contain the data, then you canresize them according to your needs.
Steps needed for resizing a field are as shown:1. Locate the cursor placed on the right gridline in field title. The cursor
will become a double arrow.2. Click on the gridline and drag it to right, if you want to increase the
width of field. Otherwise to decrease the width of the field, drag it to theleft.
3. When you take your hand off the mouse, the width of the field will bechanged.
Steps for resizing a row are as shown:1. Place the cursor on the bottom gridline and click on the grey row which
is to be resized.2. A double arrow appears, on which you can click and drag downwards
to increase the width, and upwards to decrease the width.3. Release the mouse when the proper adjustment is made and you will
find that the row height has changed.
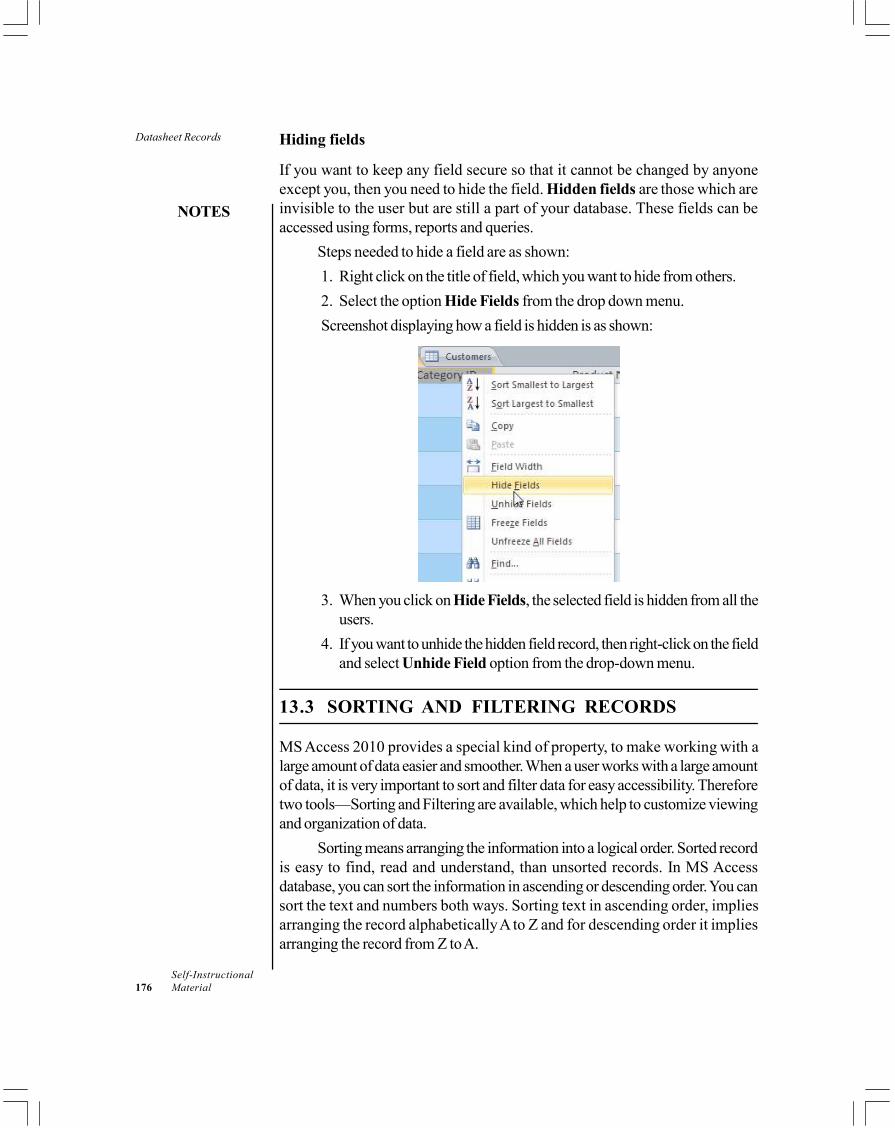
Datasheet Records
NOTES
Self-Instructional176 Material
Hiding fields
If you want to keep any field secure so that it cannot be changed by anyoneexcept you, then you need to hide the field. Hidden fields are those which areinvisible to the user but are still a part of your database. These fields can beaccessed using forms, reports and queries.
Steps needed to hide a field are as shown:1. Right click on the title of field, which you want to hide from others.2. Select the option Hide Fields from the drop down menu.Screenshot displaying how a field is hidden is as shown:
3. When you click on Hide Fields, the selected field is hidden from all theusers.
4. If you want to unhide the hidden field record, then right-click on the fieldand select Unhide Field option from the drop-down menu.
13.3 SORTING AND FILTERING RECORDS
MS Access 2010 provides a special kind of property, to make working with alarge amount of data easier and smoother. When a user works with a large amountof data, it is very important to sort and filter data for easy accessibility. Thereforetwo tools—Sorting and Filtering are available, which help to customize viewingand organization of data.
Sorting means arranging the information into a logical order. Sorted recordis easy to find, read and understand, than unsorted records. In MS Accessdatabase, you can sort the information in ascending or descending order. You cansort the text and numbers both ways. Sorting text in ascending order, impliesarranging the record alphabetically A to Z and for descending order it impliesarranging the record from Z to A.
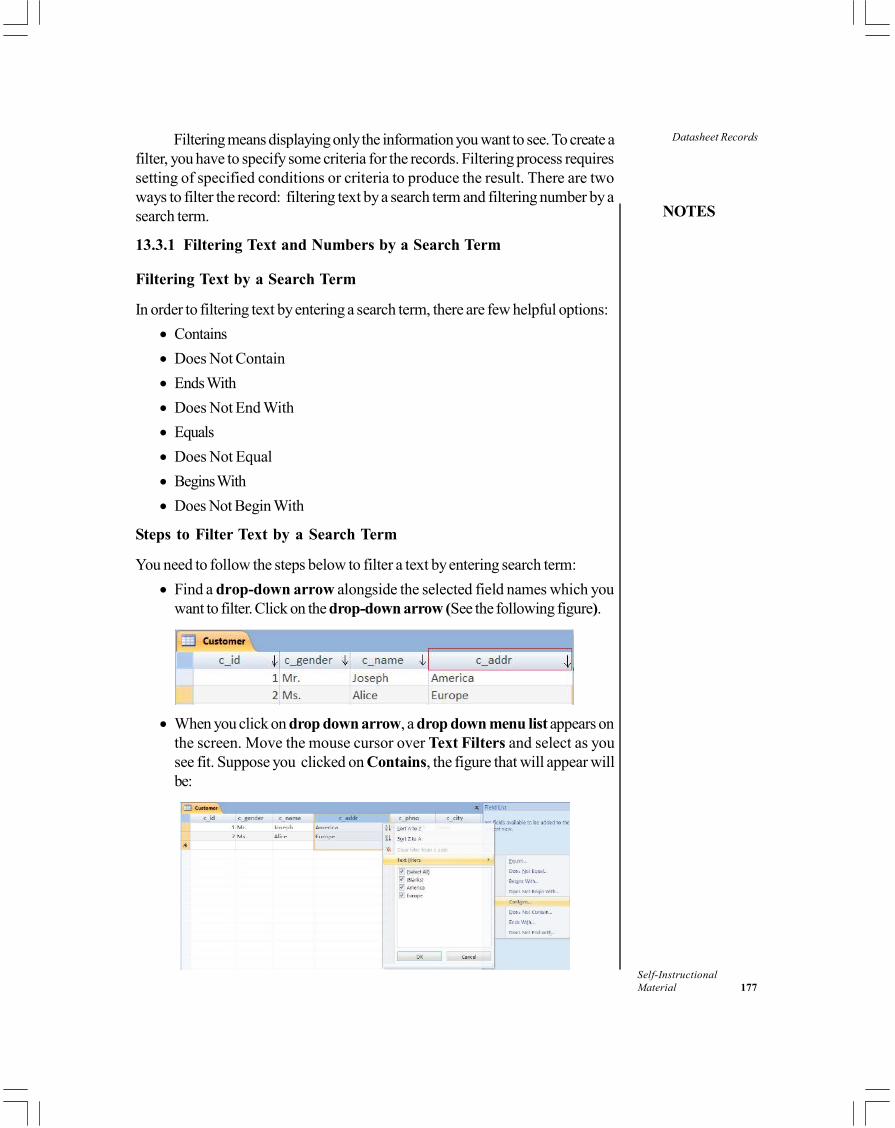
Datasheet Records
NOTES
Self-InstructionalMaterial 177
Filtering means displaying only the information you want to see. To create afilter, you have to specify some criteria for the records. Filtering process requiressetting of specified conditions or criteria to produce the result. There are twoways to filter the record: filtering text by a search term and filtering number by asearch term.
13.3.1 Filtering Text and Numbers by a Search Term
Filtering Text by a Search Term
In order to filtering text by entering a search term, there are few helpful options:• Contains• Does Not Contain• Ends With• Does Not End With• Equals• Does Not Equal• Begins With• Does Not Begin With
Steps to Filter Text by a Search Term
You need to follow the steps below to filter a text by entering search term:• Find a drop-down arrow alongside the selected field names which you
want to filter. Click on the drop-down arrow (See the following figure).
• When you click on drop down arrow, a drop down menu list appears onthe screen. Move the mouse cursor over Text Filters and select as yousee fit. Suppose you clicked on Contains, the figure that will appear willbe:
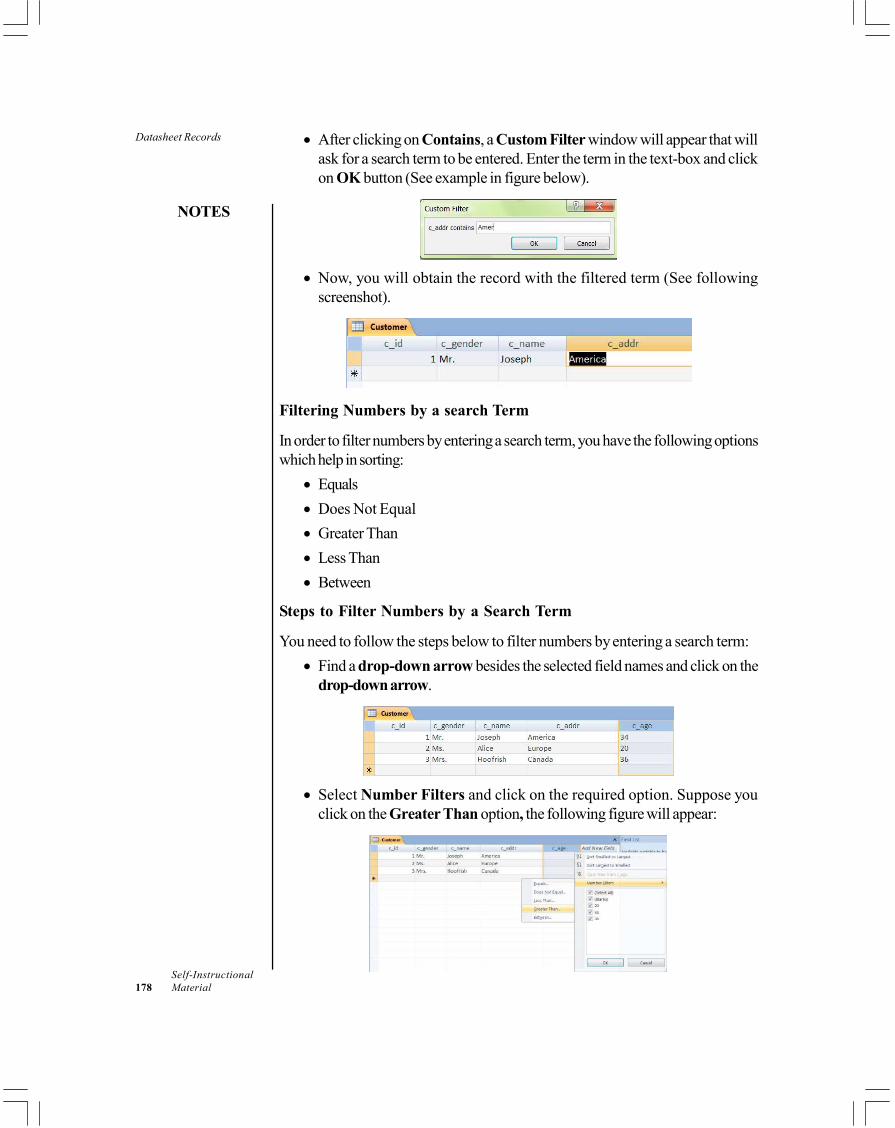
Datasheet Records
NOTES
Self-Instructional178 Material
• After clicking on Contains, a Custom Filter window will appear that willask for a search term to be entered. Enter the term in the text-box and clickon OK button (See example in figure below).
• Now, you will obtain the record with the filtered term (See followingscreenshot).
Filtering Numbers by a search Term
In order to filter numbers by entering a search term, you have the following optionswhich help in sorting:
• Equals• Does Not Equal• Greater Than• Less Than• Between
Steps to Filter Numbers by a Search Term
You need to follow the steps below to filter numbers by entering a search term:• Find a drop-down arrow besides the selected field names and click on the
drop-down arrow.
• Select Number Filters and click on the required option. Suppose youclick on the Greater Than option, the following figure will appear:
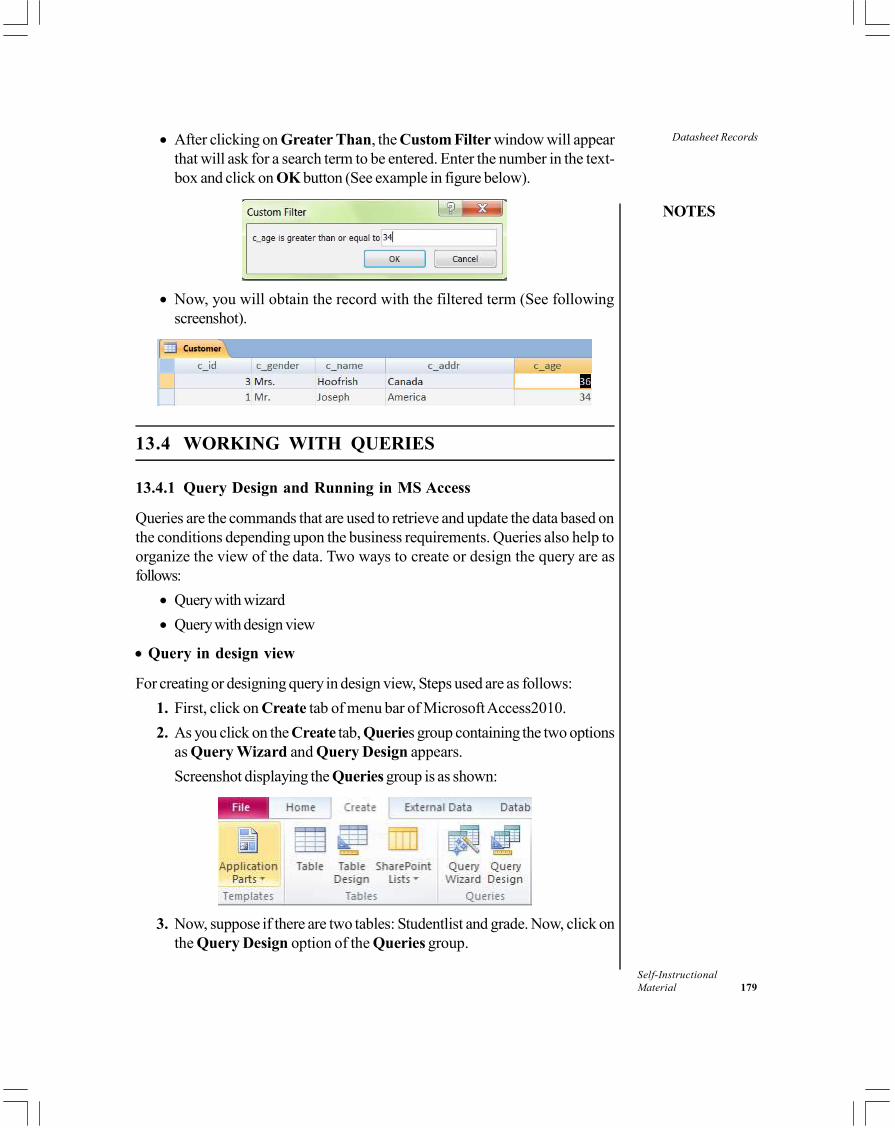
Datasheet Records
NOTES
Self-InstructionalMaterial 179
• After clicking on Greater Than, the Custom Filter window will appearthat will ask for a search term to be entered. Enter the number in the text-box and click on OK button (See example in figure below).
• Now, you will obtain the record with the filtered term (See followingscreenshot).
13.4 WORKING WITH QUERIES
13.4.1 Query Design and Running in MS Access
Queries are the commands that are used to retrieve and update the data based onthe conditions depending upon the business requirements. Queries also help toorganize the view of the data. Two ways to create or design the query are asfollows:
• Query with wizard• Query with design view
• Query in design view
For creating or designing query in design view, Steps used are as follows:1. First, click on Create tab of menu bar of Microsoft Access2010.2. As you click on the Create tab, Queries group containing the two options
as Query Wizard and Query Design appears.Screenshot displaying the Queries group is as shown:
3. Now, suppose if there are two tables: Studentlist and grade. Now, click onthe Query Design option of the Queries group.
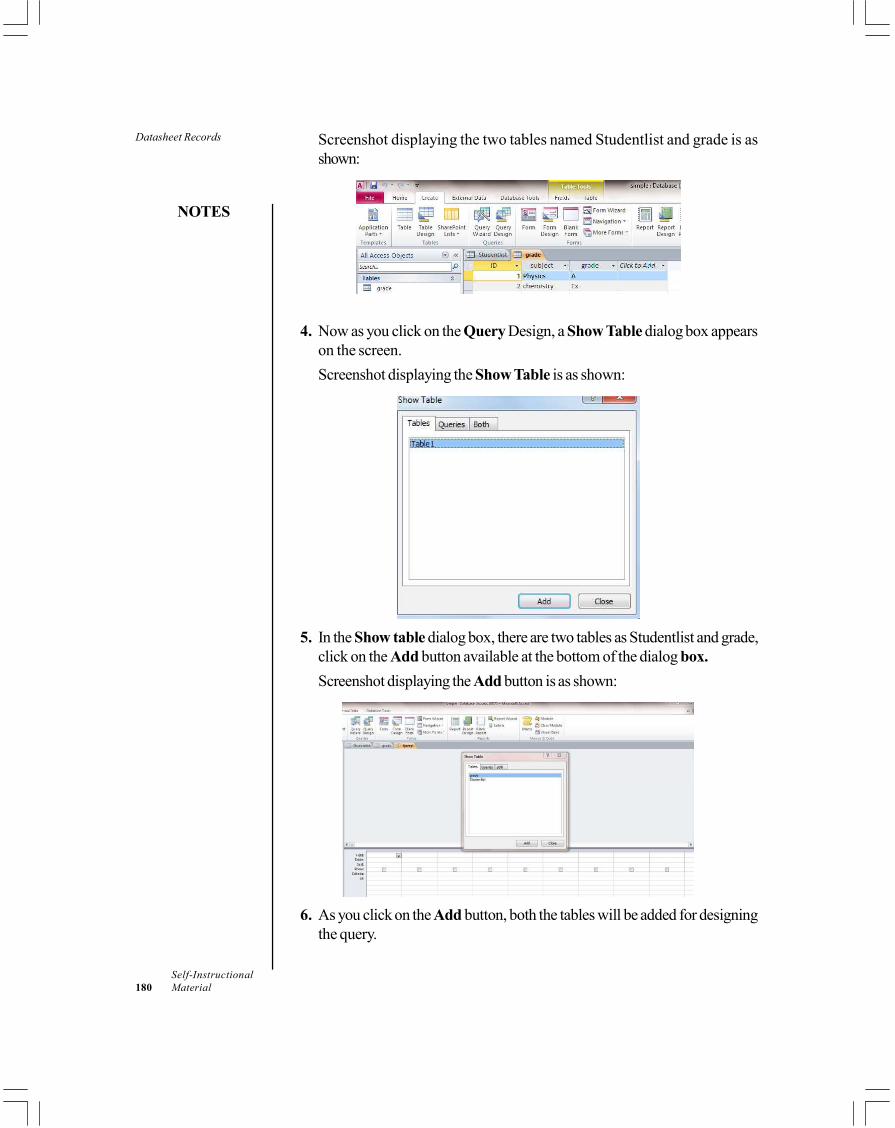
Datasheet Records
NOTES
Self-Instructional180 Material
Screenshot displaying the two tables named Studentlist and grade is asshown:
4. Now as you click on the Query Design, a Show Table dialog box appearson the screen.Screenshot displaying the Show Table is as shown:
5. In the Show table dialog box, there are two tables as Studentlist and grade,click on the Add button available at the bottom of the dialog box.Screenshot displaying the Add button is as shown:
6. As you click on the Add button, both the tables will be added for designingthe query.
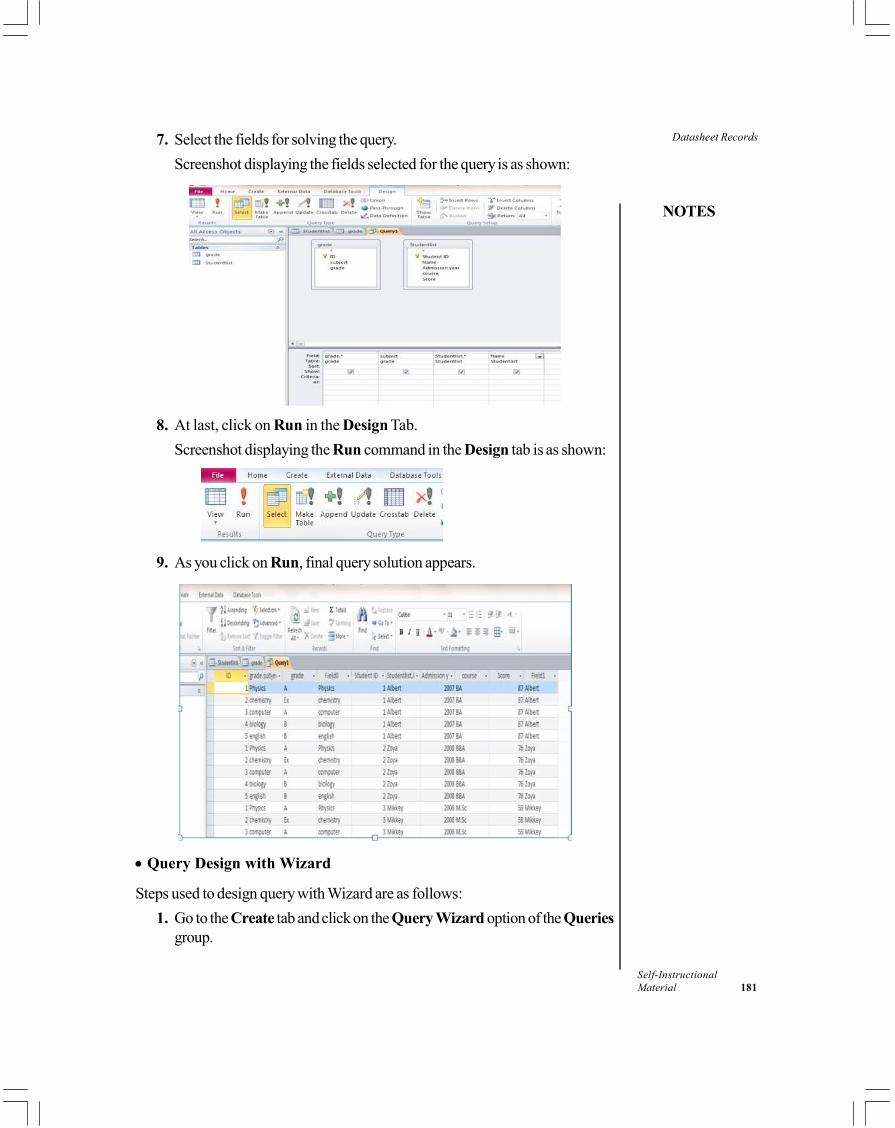
Datasheet Records
NOTES
Self-InstructionalMaterial 181
7. Select the fields for solving the query.Screenshot displaying the fields selected for the query is as shown:
8. At last, click on Run in the Design Tab.Screenshot displaying the Run command in the Design tab is as shown:
9. As you click on Run, final query solution appears.
• Query Design with Wizard
Steps used to design query with Wizard are as follows:1. Go to the Create tab and click on the Query Wizard option of the Queries
group.
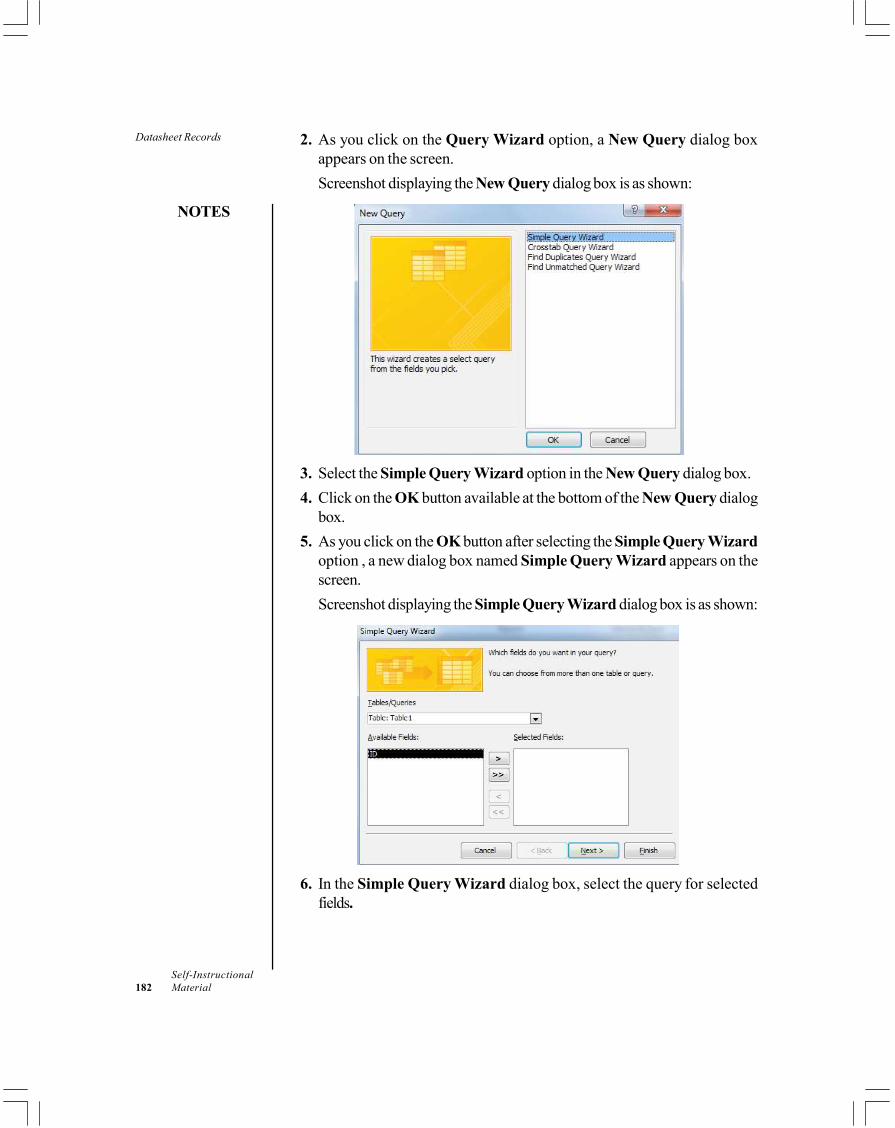
Datasheet Records
NOTES
Self-Instructional182 Material
2. As you click on the Query Wizard option, a New Query dialog boxappears on the screen.Screenshot displaying the New Query dialog box is as shown:
3. Select the Simple Query Wizard option in the New Query dialog box.4. Click on the OK button available at the bottom of the New Query dialog
box.5. As you click on the OK button after selecting the Simple Query Wizard
option , a new dialog box named Simple Query Wizard appears on thescreen.Screenshot displaying the Simple Query Wizard dialog box is as shown:
6. In the Simple Query Wizard dialog box, select the query for selectedfields.
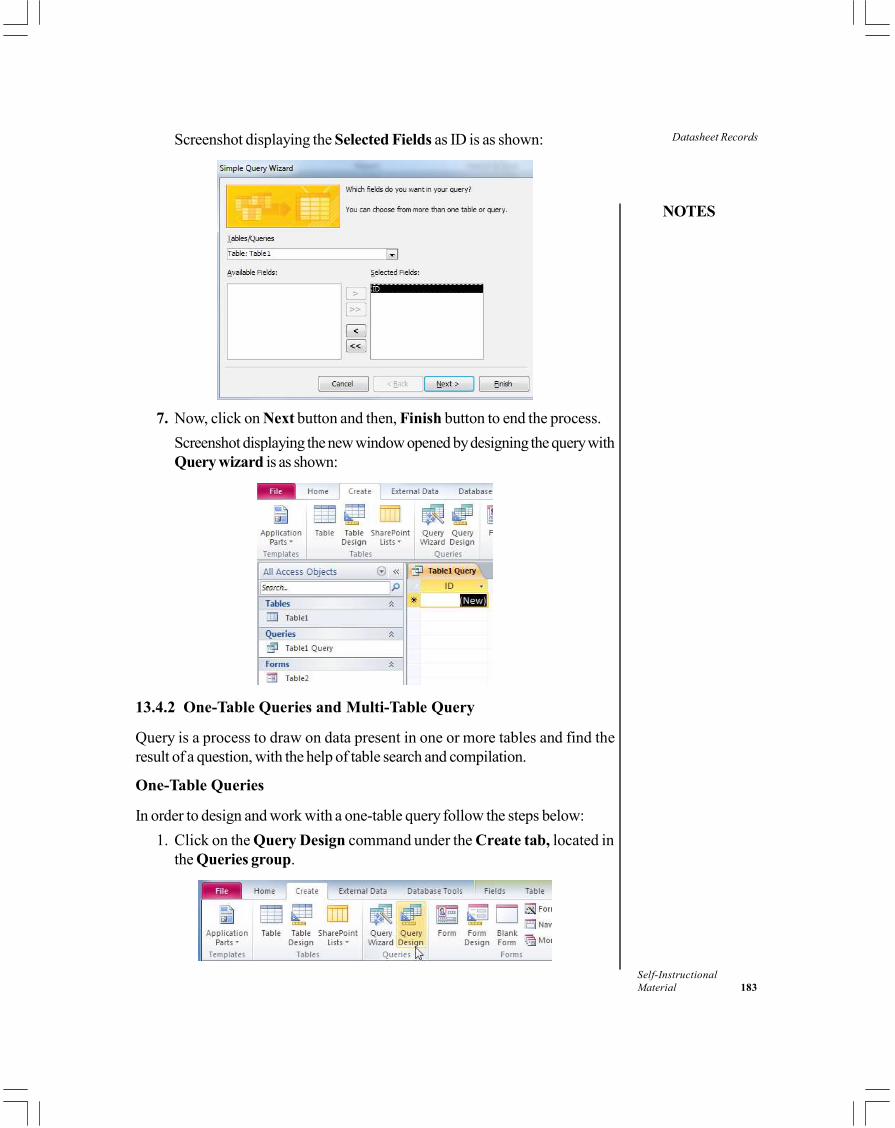
Datasheet Records
NOTES
Self-InstructionalMaterial 183
Screenshot displaying the Selected Fields as ID is as shown:
7. Now, click on Next button and then, Finish button to end the process.Screenshot displaying the new window opened by designing the query withQuery wizard is as shown:
13.4.2 One-Table Queries and Multi-Table Query
Query is a process to draw on data present in one or more tables and find theresult of a question, with the help of table search and compilation.
One-Table Queries
In order to design and work with a one-table query follow the steps below:1. Click on the Query Design command under the Create tab, located in
the Queries group.
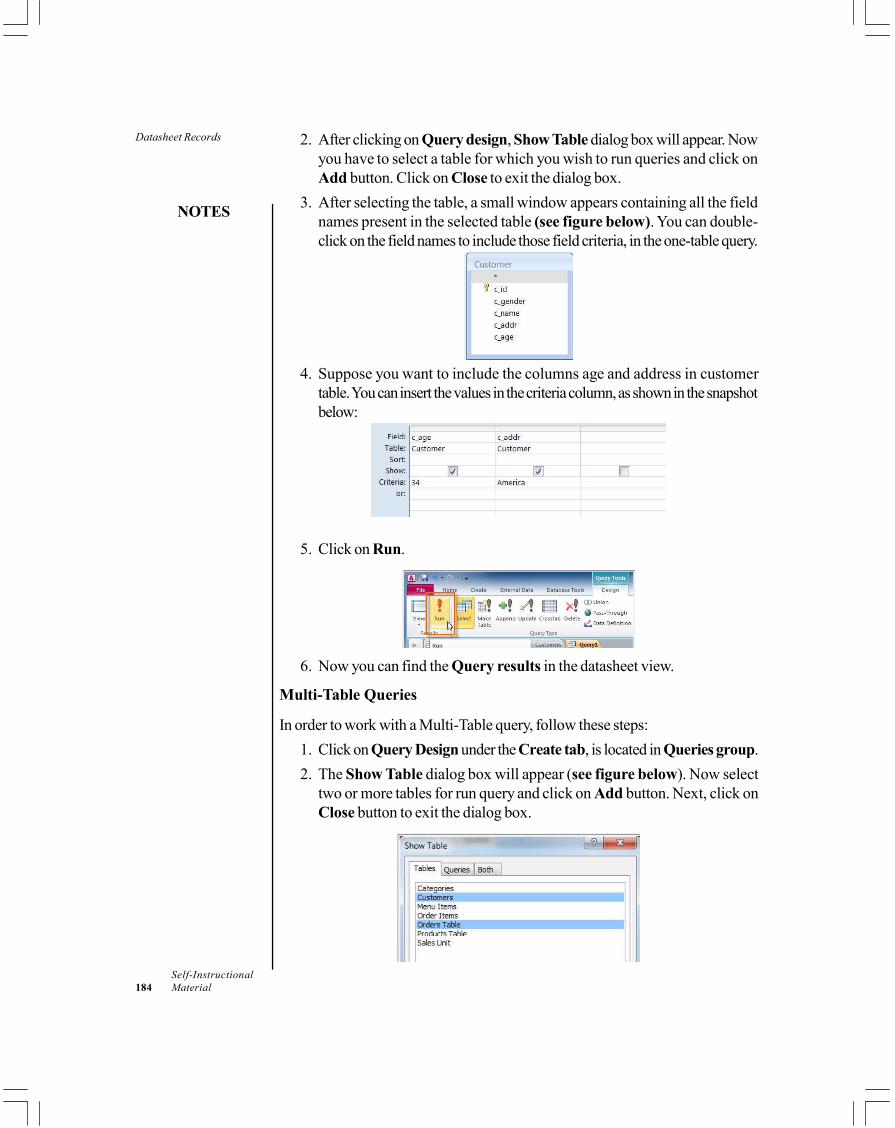
Datasheet Records
NOTES
Self-Instructional184 Material
2. After clicking on Query design, Show Table dialog box will appear. Nowyou have to select a table for which you wish to run queries and click onAdd button. Click on Close to exit the dialog box.
3. After selecting the table, a small window appears containing all the fieldnames present in the selected table (see figure below). You can double-click on the field names to include those field criteria, in the one-table query.
4. Suppose you want to include the columns age and address in customertable. You can insert the values in the criteria column, as shown in the snapshotbelow:
5. Click on Run.
6. Now you can find the Query results in the datasheet view.
Multi-Table Queries
In order to work with a Multi-Table query, follow these steps:1. Click on Query Design under the Create tab, is located in Queries group.2. The Show Table dialog box will appear (see figure below). Now select
two or more tables for run query and click on Add button. Next, click onClose button to exit the dialog box.
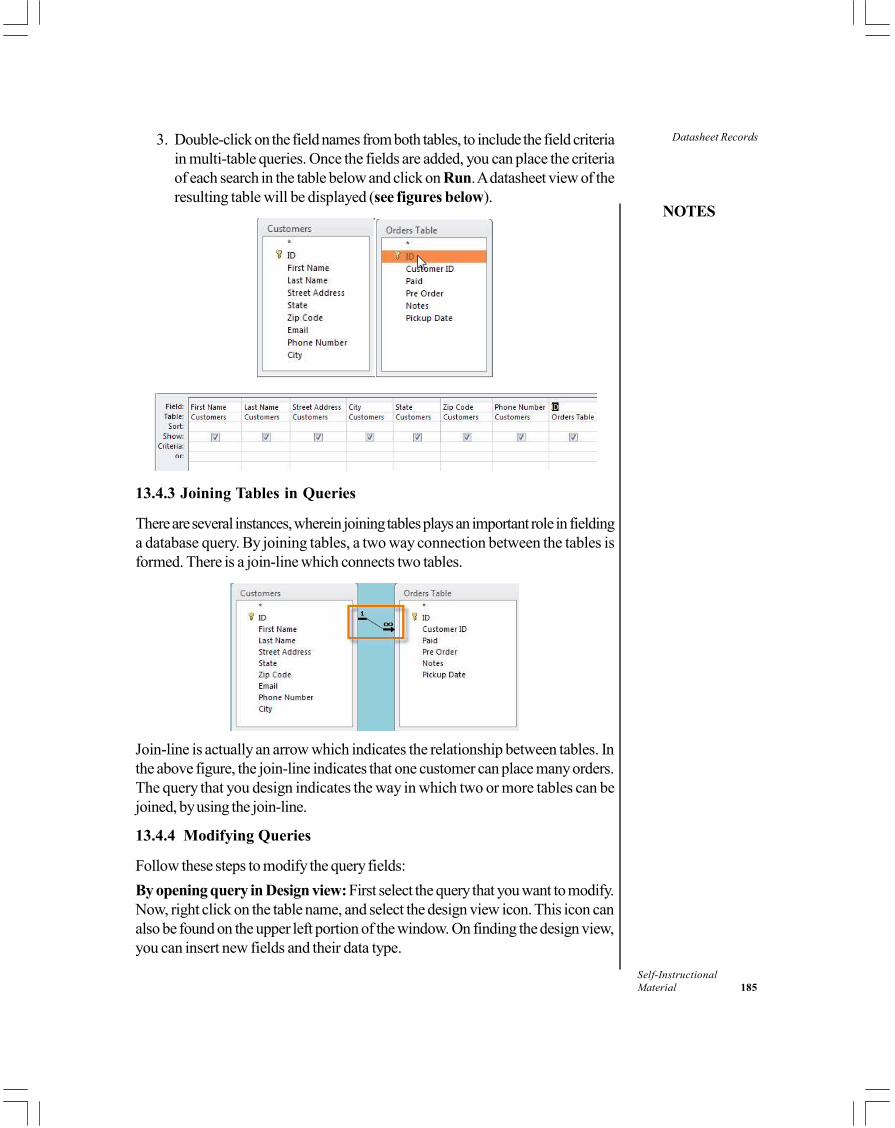
Datasheet Records
NOTES
Self-InstructionalMaterial 185
3. Double-click on the field names from both tables, to include the field criteriain multi-table queries. Once the fields are added, you can place the criteriaof each search in the table below and click on Run. A datasheet view of theresulting table will be displayed (see figures below).
13.4.3 Joining Tables in Queries
There are several instances, wherein joining tables plays an important role in fieldinga database query. By joining tables, a two way connection between the tables isformed. There is a join-line which connects two tables.
Join-line is actually an arrow which indicates the relationship between tables. Inthe above figure, the join-line indicates that one customer can place many orders.The query that you design indicates the way in which two or more tables can bejoined, by using the join-line.
13.4.4 Modifying Queries
Follow these steps to modify the query fields:By opening query in Design view: First select the query that you want to modify.Now, right click on the table name, and select the design view icon. This icon canalso be found on the upper left portion of the window. On finding the design view,you can insert new fields and their data type.
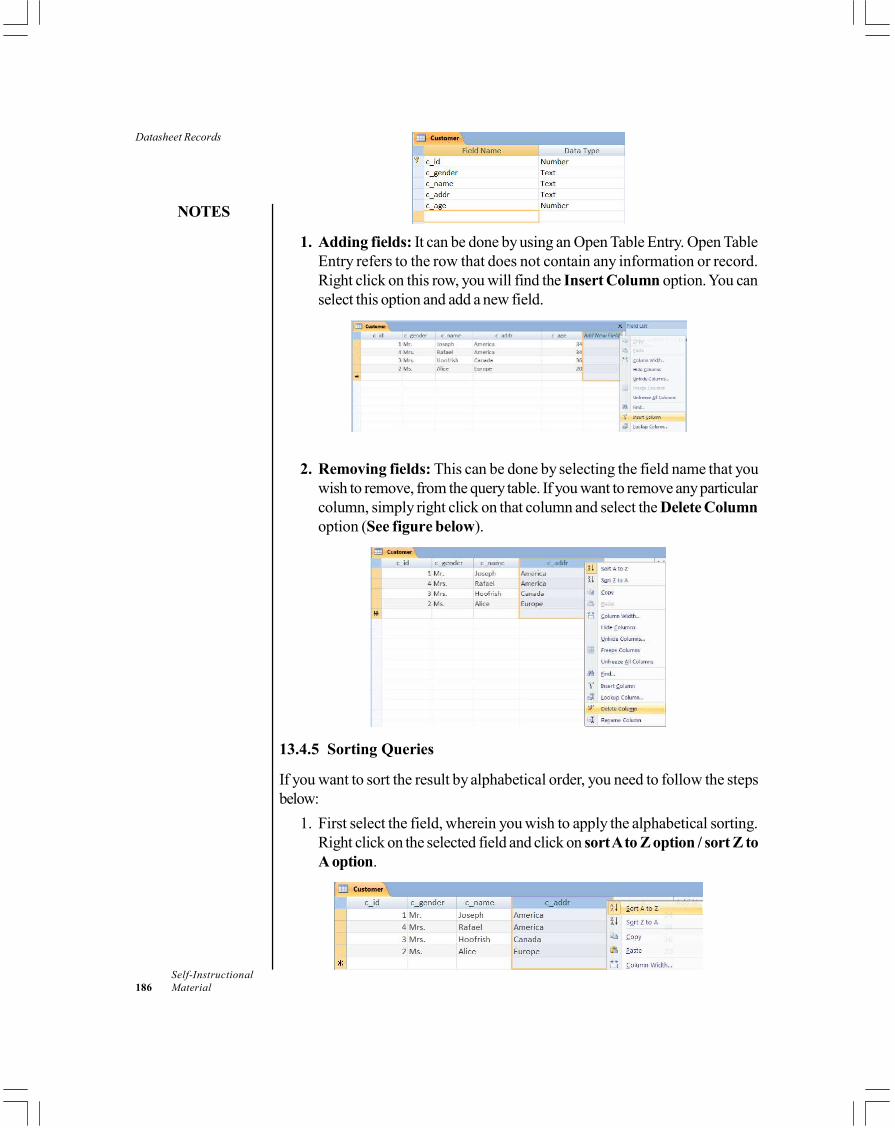
Datasheet Records
NOTES
Self-Instructional186 Material
1. Adding fields: It can be done by using an Open Table Entry. Open TableEntry refers to the row that does not contain any information or record.Right click on this row, you will find the Insert Column option. You canselect this option and add a new field.
2. Removing fields: This can be done by selecting the field name that youwish to remove, from the query table. If you want to remove any particularcolumn, simply right click on that column and select the Delete Columnoption (See figure below).
13.4.5 Sorting Queries
If you want to sort the result by alphabetical order, you need to follow the stepsbelow:
1. First select the field, wherein you wish to apply the alphabetical sorting.Right click on the selected field and click on sort A to Z option / sort Z toA option.
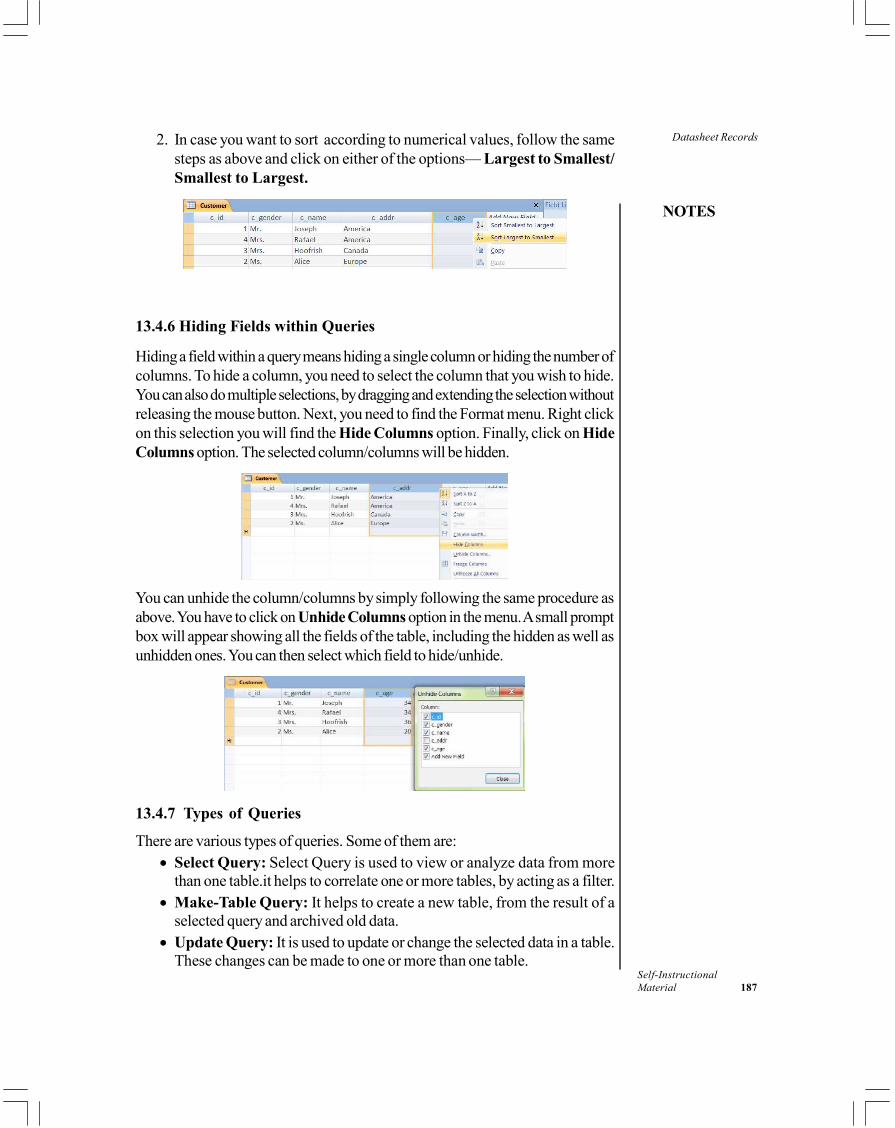
Datasheet Records
NOTES
Self-InstructionalMaterial 187
2. In case you want to sort according to numerical values, follow the samesteps as above and click on either of the options— Largest to Smallest/Smallest to Largest.
13.4.6 Hiding Fields within Queries
Hiding a field within a query means hiding a single column or hiding the number ofcolumns. To hide a column, you need to select the column that you wish to hide.You can also do multiple selections, by dragging and extending the selection withoutreleasing the mouse button. Next, you need to find the Format menu. Right clickon this selection you will find the Hide Columns option. Finally, click on HideColumns option. The selected column/columns will be hidden.
You can unhide the column/columns by simply following the same procedure asabove. You have to click on Unhide Columns option in the menu. A small promptbox will appear showing all the fields of the table, including the hidden as well asunhidden ones. You can then select which field to hide/unhide.
13.4.7 Types of Queries
There are various types of queries. Some of them are:• Select Query: Select Query is used to view or analyze data from more
than one table.it helps to correlate one or more tables, by acting as a filter.• Make-Table Query: It helps to create a new table, from the result of a
selected query and archived old data.• Update Query: It is used to update or change the selected data in a table.
These changes can be made to one or more than one table.
Datasheet Records
NOTES
Self-Instructional188 Material
• Append Query: Append query is used to add records from one table toanother table. Two or more tables can be merged by appending one tableto the end of another.
• Delete Query: Delete query is used to delete data from the selected table.You can delete a set of data from one or more tables.
• Union Query: It is used to put the matching fields in one table from morethan one selected table
Check Your Progress
1. Write the steps for resizing a field.2. What are the two ways of creating or design the query?
13.5 ANSWERS TO CHECK YOUR PROGRESSQUESTIONS
1. Steps needed for resizing a field are as shown:(i) Locate the cursor placed on the right gridline in field title. The cursor
will become a double arrow.(ii) Click on the gridline and drag it to right, if you want to increase the
width of field. Otherwise to decrease the width of the field, drag it tothe left.
(iii) When you take your hand off the mouse, the width of the field will bechanged.
2. Two ways to create or design the query are as follows:(i) Query with wizard(ii) Query with design view
13.6 SUMMARY
• In Access, the user can enter data exactly like it is entered in Excel.• Users can make changes in any record. For making changes just click on
the word which you want to replace. You can update records using the findand replace options.
• Hidden fields are those which are invisible to the user but are still a part ofyour database. These fields can be accessed using forms, reports and queries.
• Sorting means arranging the information into a logical order. Sorted recordis easy to find, read and understand, than unsorted records.
• Filtering means displaying only the information you want to see. To create afilter, you have to specify some criteria for the records.
• Queries are the commands that are used to retrieve and update the databased on the conditions depending upon the business requirements. Queriesalso help to organize the view of the data.
Datasheet Records
NOTES
Self-InstructionalMaterial 189
13.7 KEY WORDS
• Hidden Fields: Fields which are not to be used or edited by other usersare kept hidden and are known as hidden fields.
• Data Types: It refers to the type of data which you want to insert in adatabase. For example: text, numeric or alphanumeric.
• Filter: The filter sorts out records from a single or multiple tables, on thebasis of a specified condition.
• Fields: Vertically arranged columns are called fields.
13.8 SELF ASSESSMENT QUESTIONS ANDEXERCISES
1. Add the following fields to the employee table, with the appropriate datatypes: LName (for last name), TelNum (for telephone number), DOB (fordate of birth), DateJoined, Salary, Address, City, PostalCode, OnLeaveand Gender. Perform the following:
(i) Fill in some records in your table.(ii) Update/ edit the records(iii) Sort and apply filter
2. Perform the following operations on the table that you have created.(i) Create a new query that shows all the information of the table.(ii) Create a new query that displays the name of the employees.(iii) Create a query that displays the name along with the gender of the
employees(iv) Create a query to update the phone number of an employee.
13.9 FURTHER READINGS
Srivastava, S.S. 2008. MS Office. New Delhi: Firewall Media.Saxena, Sanjay. 2011. MS Office 2007 in a Nutshell. Noida: Vikas Publishing
house.Courter, Gini and Annette Marquis. 1999. Mastering Microsoft Office 2000.
New Delhi: BPB Publications.Blattner, Patrick, Ken Cook, Laurie Ulrich and Timothy Dyck. 1999. Special
Edition Using Microsoft Excel 2000. New Delhi: Prentice-Hall of India.
Forms
NOTES
Self-Instructional190 Material
UNIT 14 FORMS
Structure14.0 Introduction14.1 Objectives14.2 Working with Forms
14.2.1 Why Use Forms?14.2.2 Form Design in MS Access14.2.3 Open an Existing Form, Entering and Modifying Data14.2.4 Adding Design Controls14.2.5 Formatting Forms14.2.6 Modifying Form Layout14.2.7 Modifying the Colors and Fonts of Form Components
14.3 Working with Reports14.3.1 Report Design in MS Access14.3.2 Printing and Saving Reports in Print Preview14.3.3 Formatting Reports14.3.4 Modifying the Page Header and Footer14.3.5 Enhancing Report Appearance
14.4 Answers to Check Your Progress Questions14.5 Summary14.6 Key Words14.7 Self Assessment Questions and Exercises14.8 Further Readings
14.0 INTRODUCTION
In this unit, you will learn about the forms and reports. A form in Access is adatabase object that you can use to create a user interface for a databaseapplication. A bound form is one that is directly connected to a data source suchas a table or query, and can be used to enter, edit, or display data from that datasource. Report is an effective way to display the database record in an organizedmanner. It can be created either by using a form or a table or by using a query. Inreport, you can group or summarize information.
14.1 OBJECTIVES
After going through this unit, you will be able to:• Understand the significance of forms• Work with forms and add design controls• Create and design reports• Print and save reports in print preview
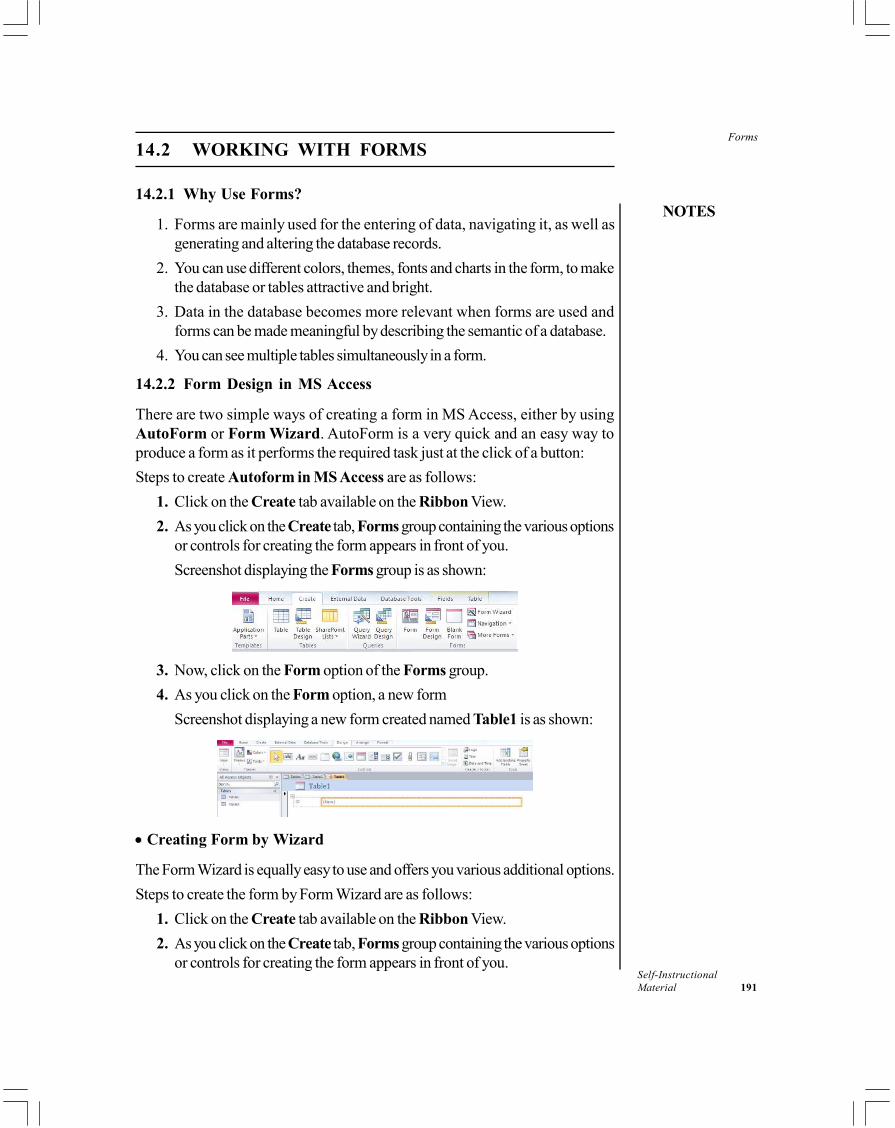
Forms
NOTES
Self-InstructionalMaterial 191
14.2 WORKING WITH FORMS
14.2.1 Why Use Forms?
1. Forms are mainly used for the entering of data, navigating it, as well asgenerating and altering the database records.
2. You can use different colors, themes, fonts and charts in the form, to makethe database or tables attractive and bright.
3. Data in the database becomes more relevant when forms are used andforms can be made meaningful by describing the semantic of a database.
4. You can see multiple tables simultaneously in a form.
14.2.2 Form Design in MS Access
There are two simple ways of creating a form in MS Access, either by usingAutoForm or Form Wizard. AutoForm is a very quick and an easy way toproduce a form as it performs the required task just at the click of a button:Steps to create Autoform in MS Access are as follows:
1. Click on the Create tab available on the Ribbon View.2. As you click on the Create tab, Forms group containing the various options
or controls for creating the form appears in front of you.Screenshot displaying the Forms group is as shown:
3. Now, click on the Form option of the Forms group.4. As you click on the Form option, a new form
Screenshot displaying a new form created named Table1 is as shown:
• Creating Form by Wizard
The Form Wizard is equally easy to use and offers you various additional options.Steps to create the form by Form Wizard are as follows:
1. Click on the Create tab available on the Ribbon View.2. As you click on the Create tab, Forms group containing the various options
or controls for creating the form appears in front of you.
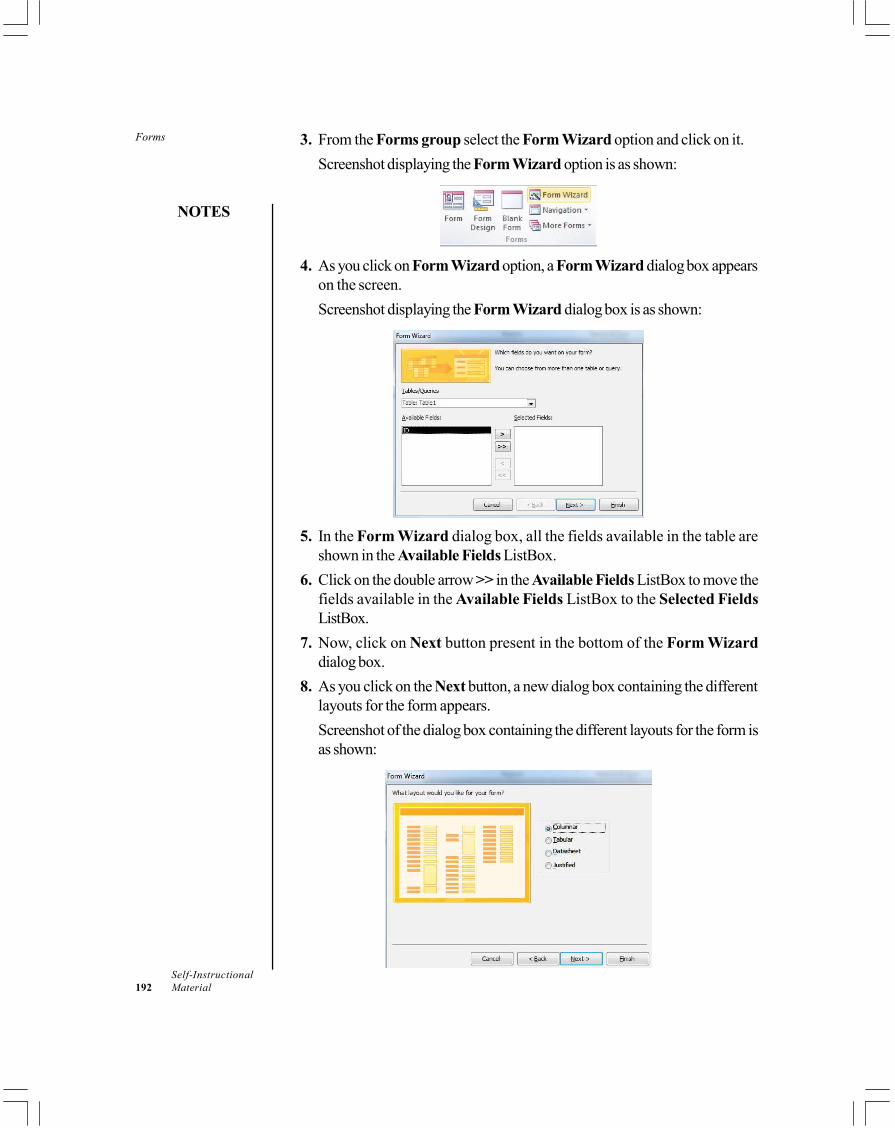
Forms
NOTES
Self-Instructional192 Material
3. From the Forms group select the Form Wizard option and click on it.Screenshot displaying the Form Wizard option is as shown:
4. As you click on Form Wizard option, a Form Wizard dialog box appearson the screen.Screenshot displaying the Form Wizard dialog box is as shown:
5. In the Form Wizard dialog box, all the fields available in the table areshown in the Available Fields ListBox.
6. Click on the double arrow >> in the Available Fields ListBox to move thefields available in the Available Fields ListBox to the Selected FieldsListBox.
7. Now, click on Next button present in the bottom of the Form Wizarddialog box.
8. As you click on the Next button, a new dialog box containing the differentlayouts for the form appears.Screenshot of the dialog box containing the different layouts for the form isas shown:
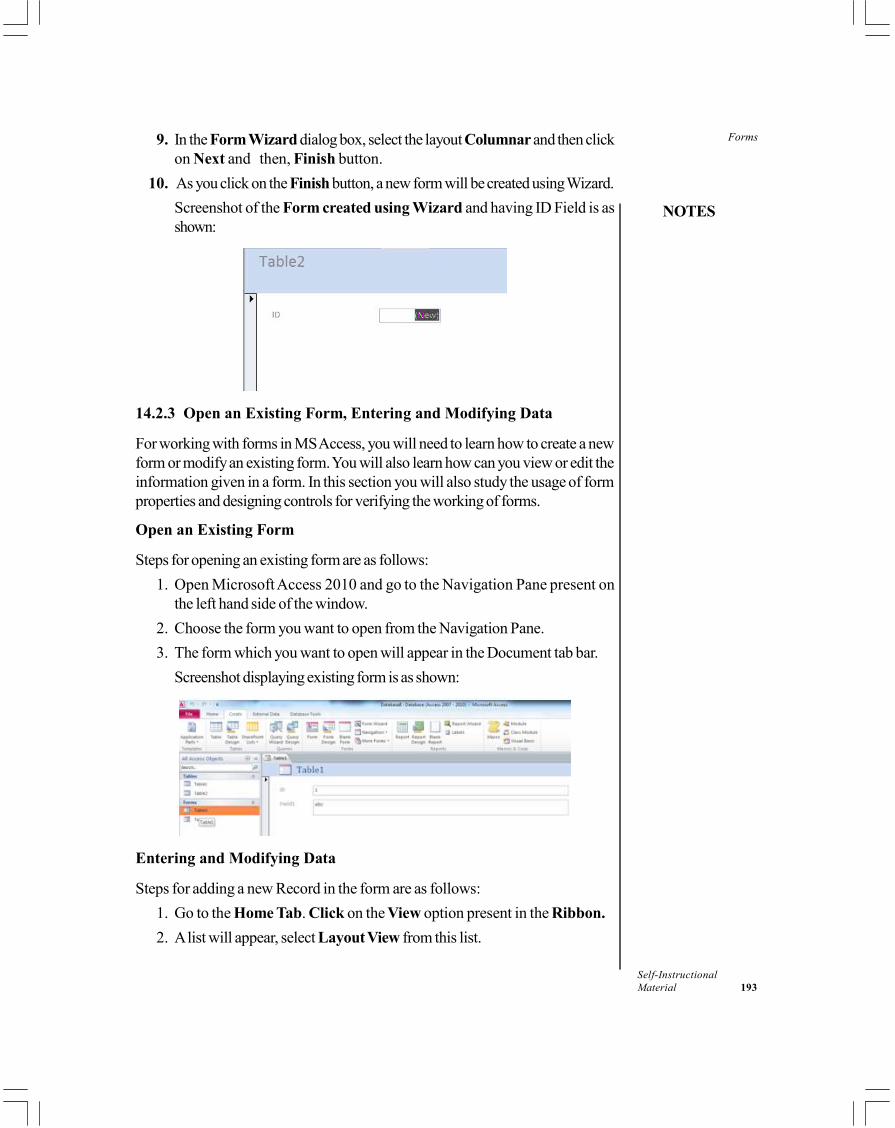
Forms
NOTES
Self-InstructionalMaterial 193
9. In the Form Wizard dialog box, select the layout Columnar and then clickon Next and then, Finish button.
10. As you click on the Finish button, a new form will be created using Wizard.Screenshot of the Form created using Wizard and having ID Field is asshown:
14.2.3 Open an Existing Form, Entering and Modifying Data
For working with forms in MS Access, you will need to learn how to create a newform or modify an existing form. You will also learn how can you view or edit theinformation given in a form. In this section you will also study the usage of formproperties and designing controls for verifying the working of forms.
Open an Existing Form
Steps for opening an existing form are as follows:1. Open Microsoft Access 2010 and go to the Navigation Pane present on
the left hand side of the window.2. Choose the form you want to open from the Navigation Pane.3. The form which you want to open will appear in the Document tab bar.
Screenshot displaying existing form is as shown:
Entering and Modifying Data
Steps for adding a new Record in the form are as follows:1. Go to the Home Tab. Click on the View option present in the Ribbon.2. A list will appear, select Layout View from this list.
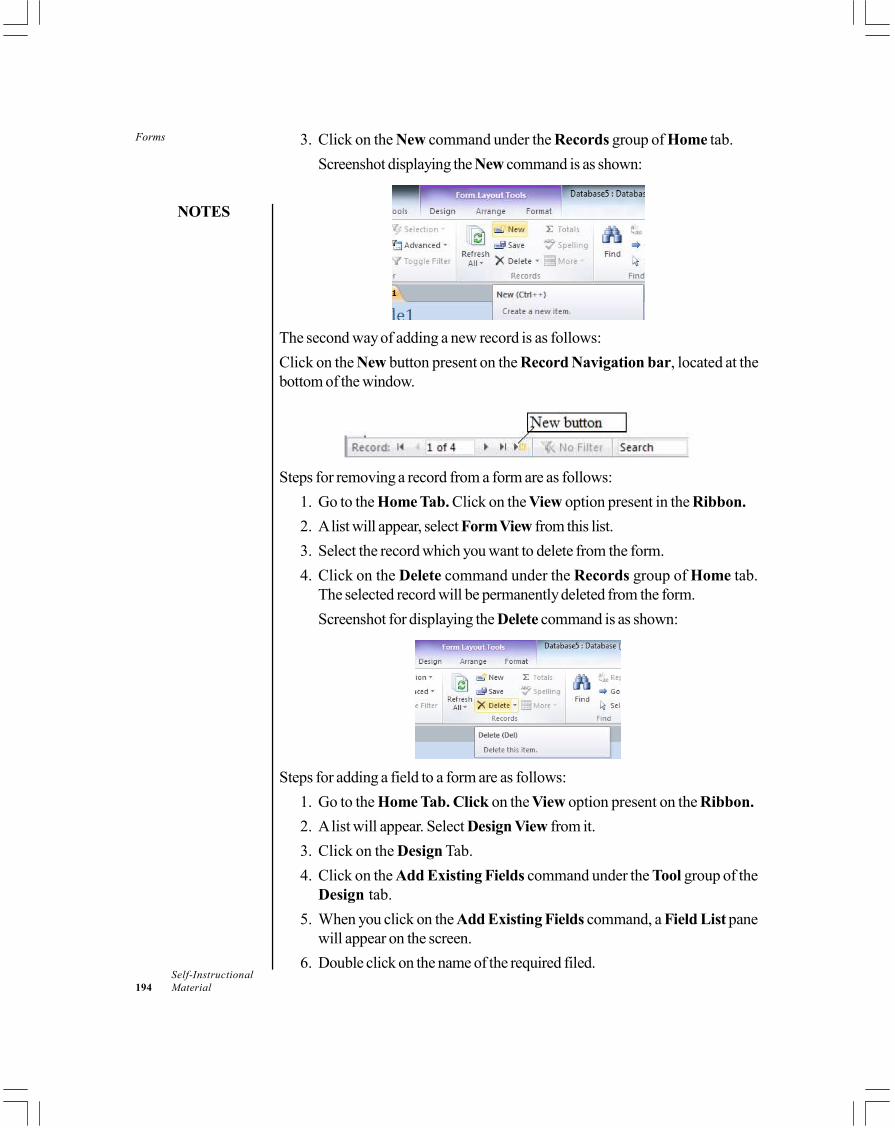
Forms
NOTES
Self-Instructional194 Material
3. Click on the New command under the Records group of Home tab.Screenshot displaying the New command is as shown:
The second way of adding a new record is as follows:Click on the New button present on the Record Navigation bar, located at thebottom of the window.
Steps for removing a record from a form are as follows:1. Go to the Home Tab. Click on the View option present in the Ribbon.2. A list will appear, select Form View from this list.3. Select the record which you want to delete from the form.4. Click on the Delete command under the Records group of Home tab.
The selected record will be permanently deleted from the form.Screenshot for displaying the Delete command is as shown:
Steps for adding a field to a form are as follows:1. Go to the Home Tab. Click on the View option present on the Ribbon.2. A list will appear. Select Design View from it.3. Click on the Design Tab.4. Click on the Add Existing Fields command under the Tool group of the
Design tab.5. When you click on the Add Existing Fields command, a Field List pane
will appear on the screen.6. Double click on the name of the required filed.
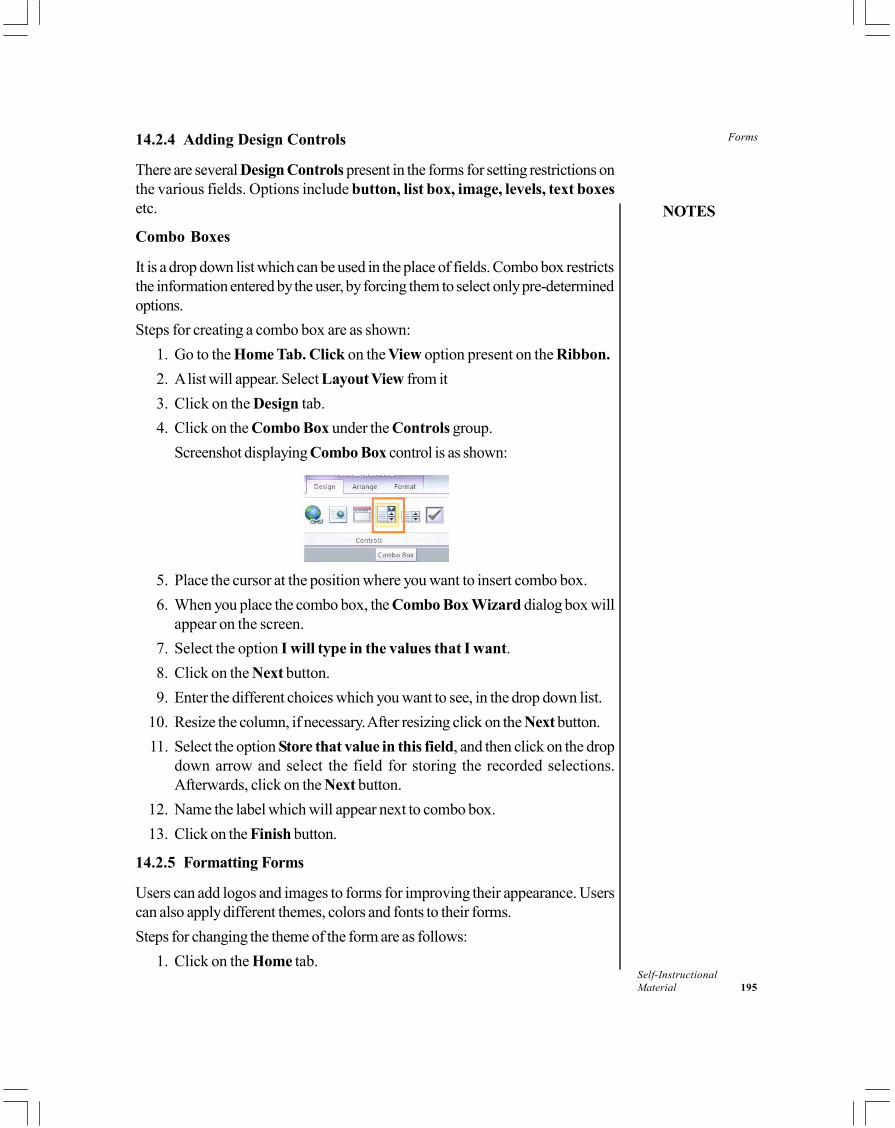
Forms
NOTES
Self-InstructionalMaterial 195
14.2.4 Adding Design Controls
There are several Design Controls present in the forms for setting restrictions onthe various fields. Options include button, list box, image, levels, text boxesetc.
Combo Boxes
It is a drop down list which can be used in the place of fields. Combo box restrictsthe information entered by the user, by forcing them to select only pre-determinedoptions.Steps for creating a combo box are as shown:
1. Go to the Home Tab. Click on the View option present on the Ribbon.2. A list will appear. Select Layout View from it3. Click on the Design tab.4. Click on the Combo Box under the Controls group.
Screenshot displaying Combo Box control is as shown:
5. Place the cursor at the position where you want to insert combo box.6. When you place the combo box, the Combo Box Wizard dialog box will
appear on the screen.7. Select the option I will type in the values that I want.8. Click on the Next button.9. Enter the different choices which you want to see, in the drop down list.
10. Resize the column, if necessary. After resizing click on the Next button.11. Select the option Store that value in this field, and then click on the drop
down arrow and select the field for storing the recorded selections.Afterwards, click on the Next button.
12. Name the label which will appear next to combo box.13. Click on the Finish button.
14.2.5 Formatting Forms
Users can add logos and images to forms for improving their appearance. Userscan also apply different themes, colors and fonts to their forms.Steps for changing the theme of the form are as follows:
1. Click on the Home tab.
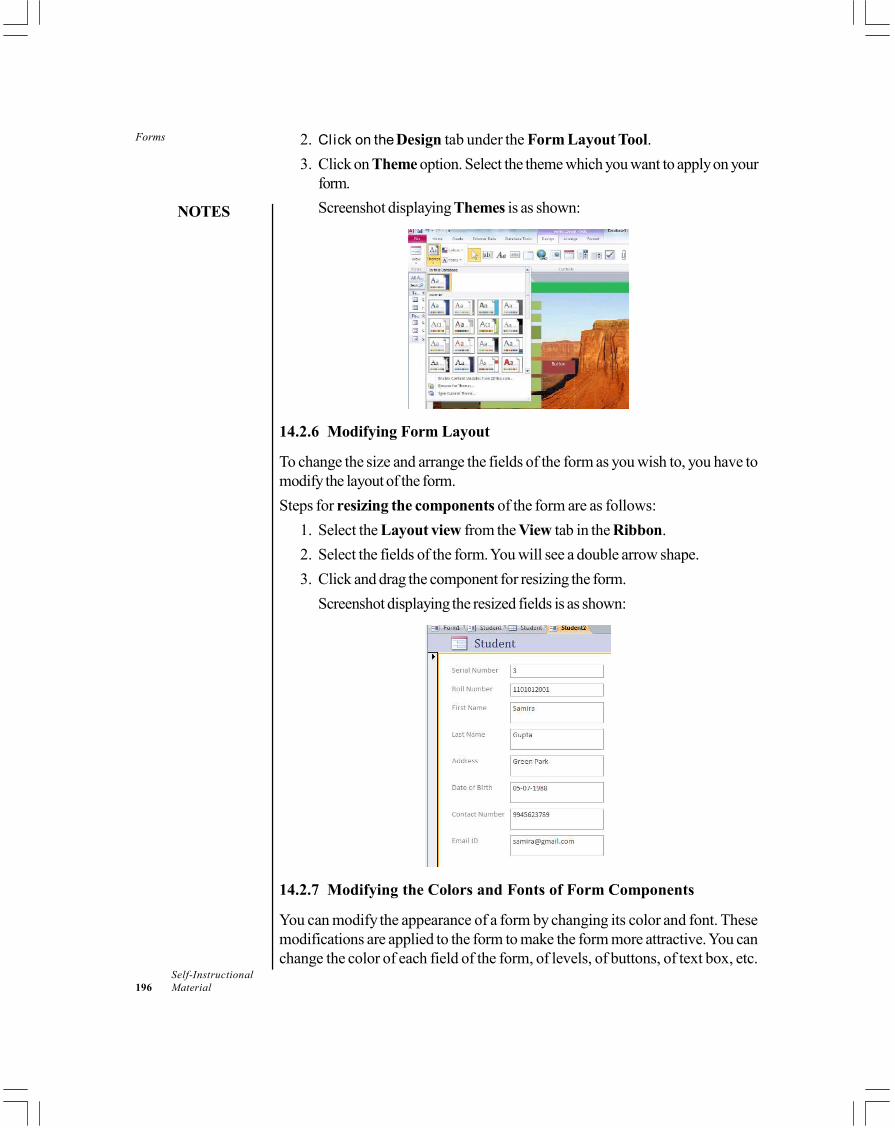
Forms
NOTES
Self-Instructional196 Material
2. Click on the Design tab under the Form Layout Tool.3. Click on Theme option. Select the theme which you want to apply on your
form.Screenshot displaying Themes is as shown:
14.2.6 Modifying Form Layout
To change the size and arrange the fields of the form as you wish to, you have tomodify the layout of the form.Steps for resizing the components of the form are as follows:
1. Select the Layout view from the View tab in the Ribbon.2. Select the fields of the form. You will see a double arrow shape.3. Click and drag the component for resizing the form.
Screenshot displaying the resized fields is as shown:
14.2.7 Modifying the Colors and Fonts of Form Components
You can modify the appearance of a form by changing its color and font. Thesemodifications are applied to the form to make the form more attractive. You canchange the color of each field of the form, of levels, of buttons, of text box, etc.
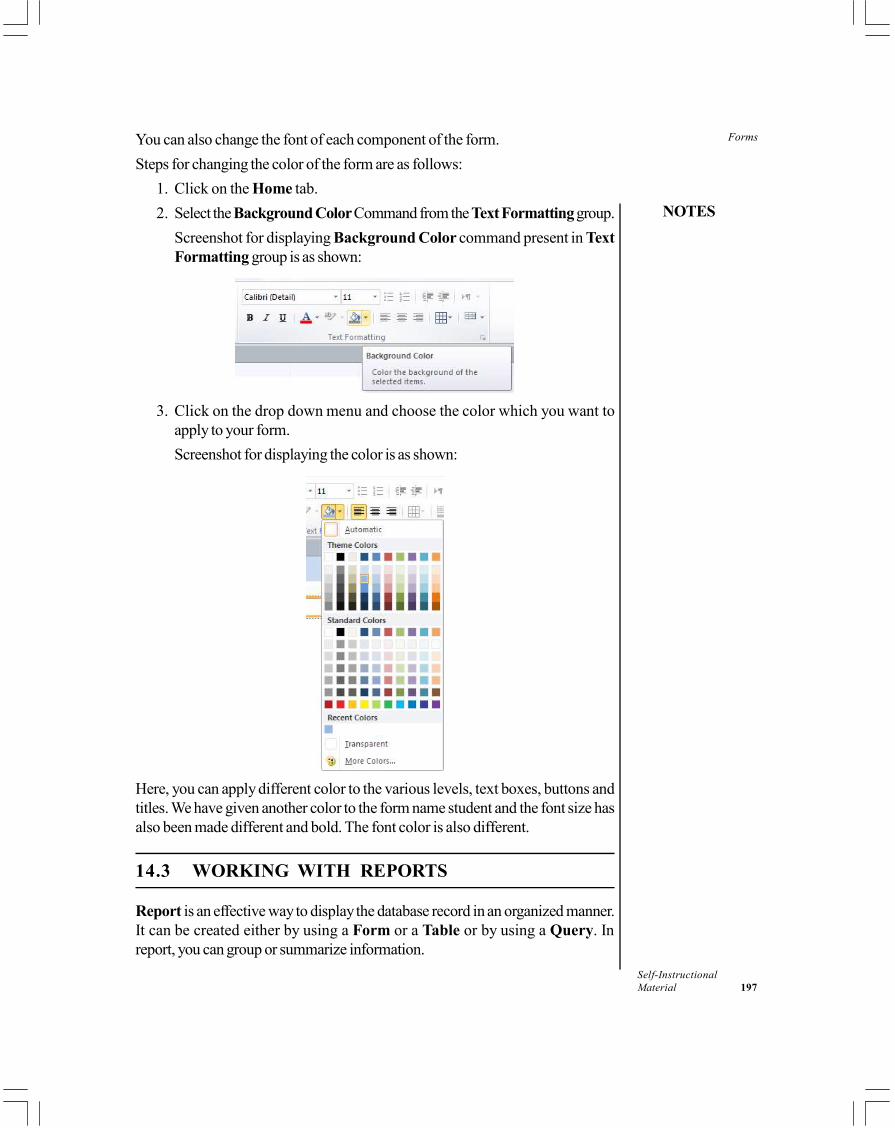
Forms
NOTES
Self-InstructionalMaterial 197
You can also change the font of each component of the form.Steps for changing the color of the form are as follows:
1. Click on the Home tab.2. Select the Background Color Command from the Text Formatting group.
Screenshot for displaying Background Color command present in TextFormatting group is as shown:
3. Click on the drop down menu and choose the color which you want toapply to your form.Screenshot for displaying the color is as shown:
Here, you can apply different color to the various levels, text boxes, buttons andtitles. We have given another color to the form name student and the font size hasalso been made different and bold. The font color is also different.
14.3 WORKING WITH REPORTS
Report is an effective way to display the database record in an organized manner.It can be created either by using a Form or a Table or by using a Query. Inreport, you can group or summarize information.
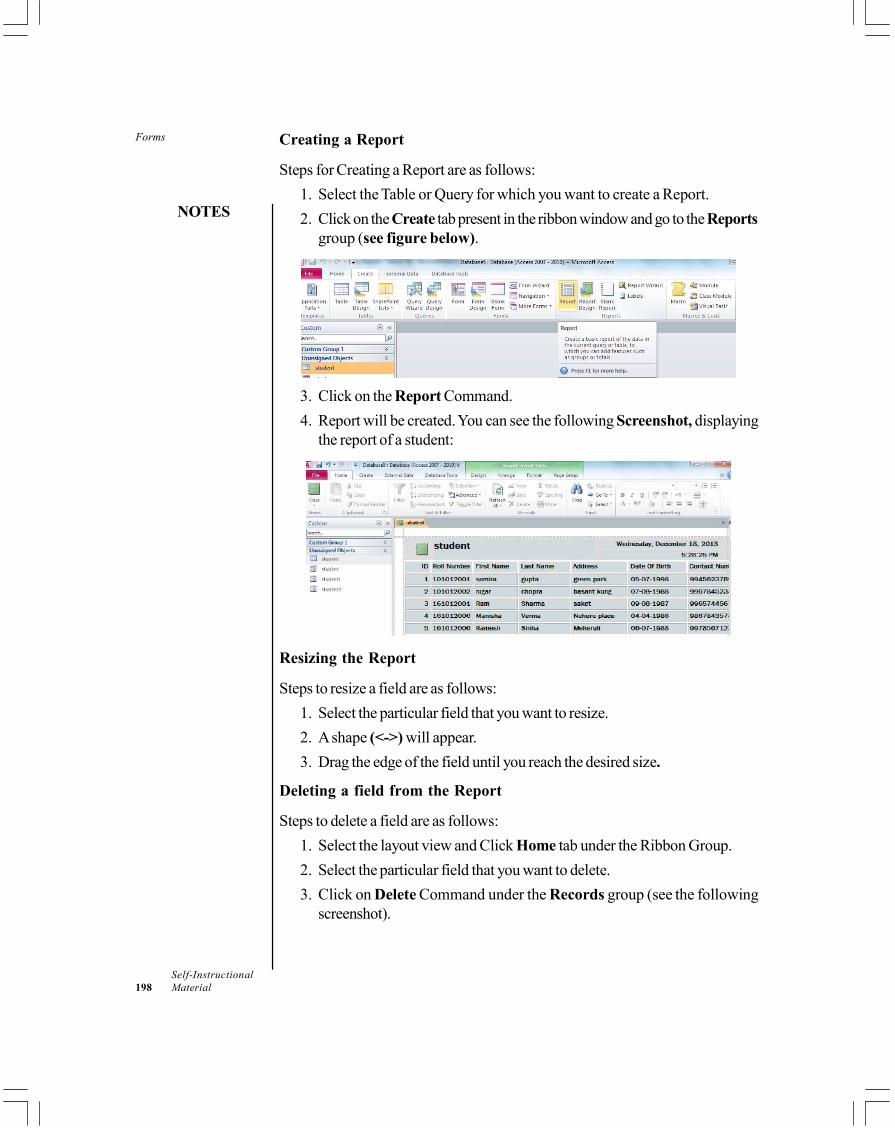
Forms
NOTES
Self-Instructional198 Material
Creating a Report
Steps for Creating a Report are as follows:1. Select the Table or Query for which you want to create a Report.2. Click on the Create tab present in the ribbon window and go to the Reports
group (see figure below).
3. Click on the Report Command.4. Report will be created. You can see the following Screenshot, displaying
the report of a student:
Resizing the Report
Steps to resize a field are as follows:1. Select the particular field that you want to resize.2. A shape (<->) will appear.3. Drag the edge of the field until you reach the desired size.
Deleting a field from the Report
Steps to delete a field are as follows:1. Select the layout view and Click Home tab under the Ribbon Group.2. Select the particular field that you want to delete.3. Click on Delete Command under the Records group (see the following
screenshot).
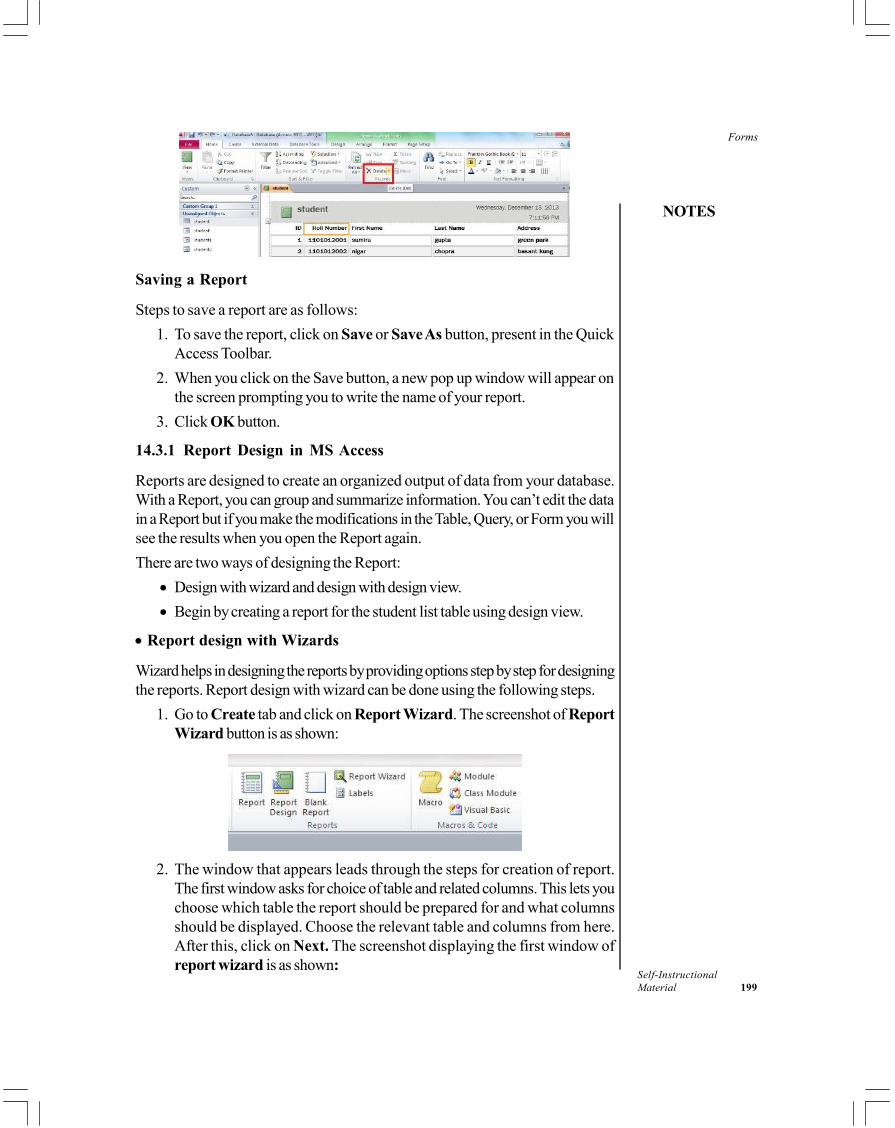
Forms
NOTES
Self-InstructionalMaterial 199
Saving a Report
Steps to save a report are as follows:1. To save the report, click on Save or Save As button, present in the Quick
Access Toolbar.2. When you click on the Save button, a new pop up window will appear on
the screen prompting you to write the name of your report.3. Click OK button.
14.3.1 Report Design in MS Access
Reports are designed to create an organized output of data from your database.With a Report, you can group and summarize information. You can’t edit the datain a Report but if you make the modifications in the Table, Query, or Form you willsee the results when you open the Report again.There are two ways of designing the Report:
• Design with wizard and design with design view.• Begin by creating a report for the student list table using design view.
• Report design with Wizards
Wizard helps in designing the reports by providing options step by step for designingthe reports. Report design with wizard can be done using the following steps.
1. Go to Create tab and click on Report Wizard. The screenshot of ReportWizard button is as shown:
2. The window that appears leads through the steps for creation of report.The first window asks for choice of table and related columns. This lets youchoose which table the report should be prepared for and what columnsshould be displayed. Choose the relevant table and columns from here.After this, click on Next. The screenshot displaying the first window ofreport wizard is as shown:
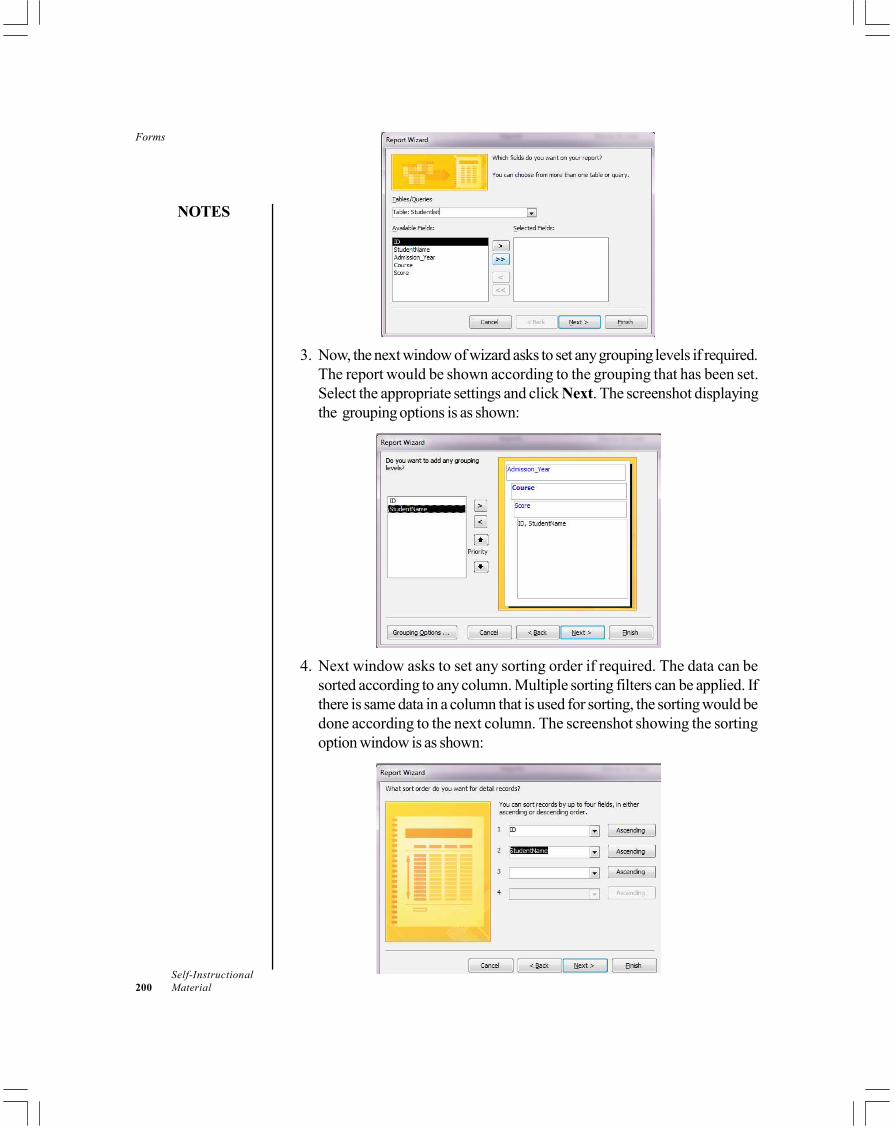
Forms
NOTES
Self-Instructional200 Material
3. Now, the next window of wizard asks to set any grouping levels if required.The report would be shown according to the grouping that has been set.Select the appropriate settings and click Next. The screenshot displayingthe grouping options is as shown:
4. Next window asks to set any sorting order if required. The data can besorted according to any column. Multiple sorting filters can be applied. Ifthere is same data in a column that is used for sorting, the sorting would bedone according to the next column. The screenshot showing the sortingoption window is as shown:
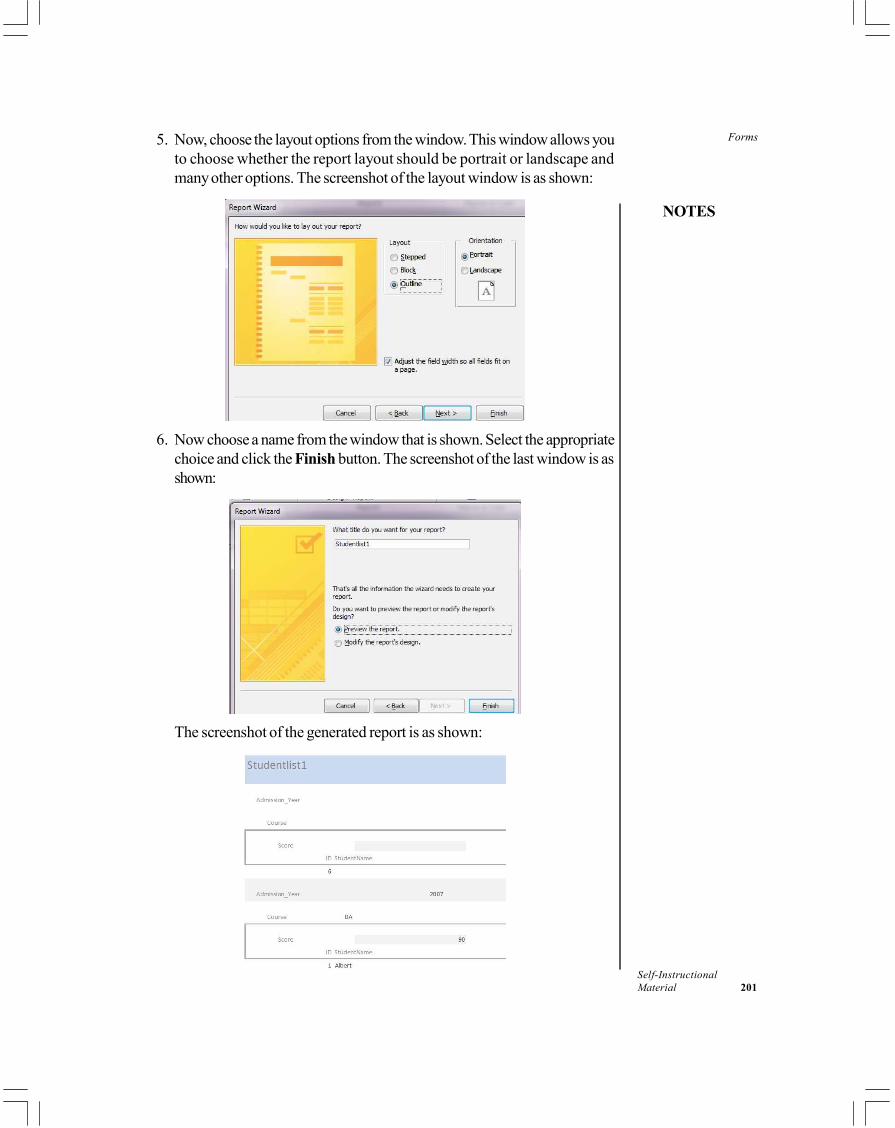
Forms
NOTES
Self-InstructionalMaterial 201
5. Now, choose the layout options from the window. This window allows youto choose whether the report layout should be portrait or landscape andmany other options. The screenshot of the layout window is as shown:
6. Now choose a name from the window that is shown. Select the appropriatechoice and click the Finish button. The screenshot of the last window is asshown:
The screenshot of the generated report is as shown:
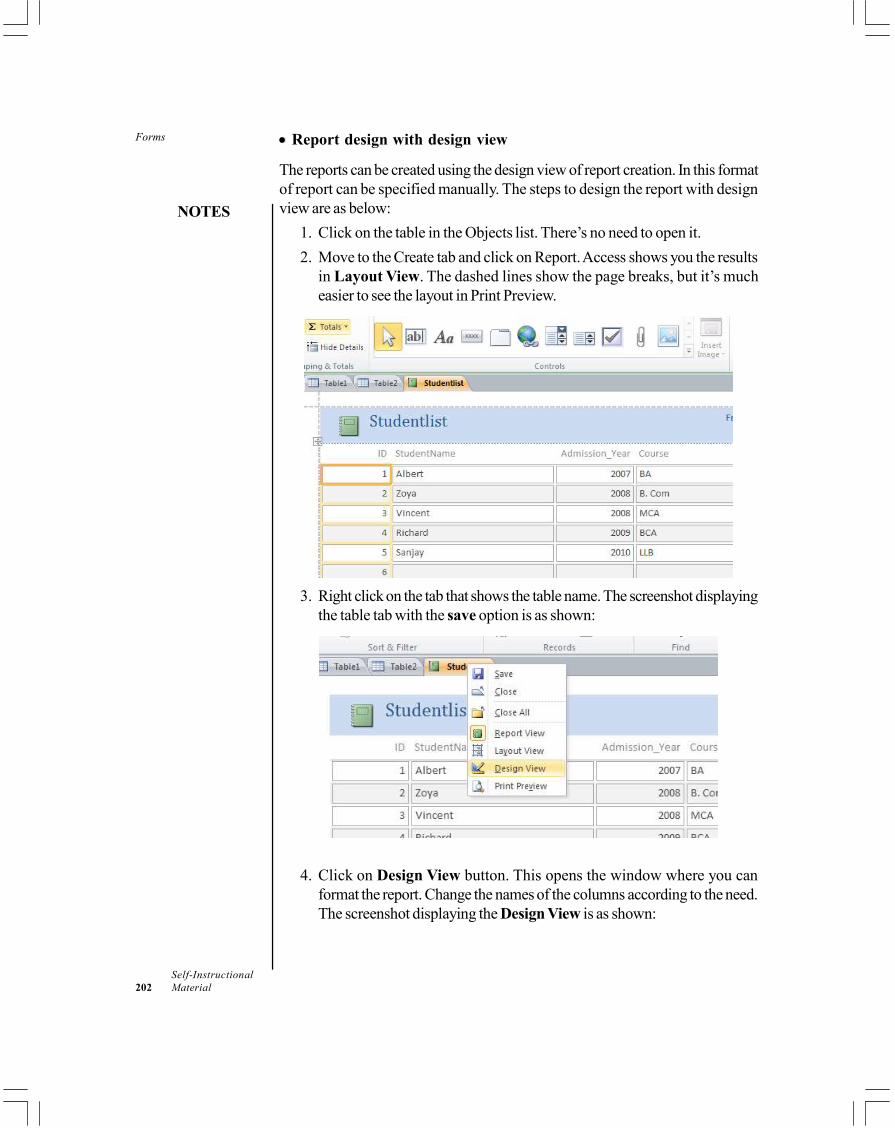
Forms
NOTES
Self-Instructional202 Material
• Report design with design view
The reports can be created using the design view of report creation. In this formatof report can be specified manually. The steps to design the report with designview are as below:
1. Click on the table in the Objects list. There’s no need to open it.2. Move to the Create tab and click on Report. Access shows you the results
in Layout View. The dashed lines show the page breaks, but it’s mucheasier to see the layout in Print Preview.
3. Right click on the tab that shows the table name. The screenshot displayingthe table tab with the save option is as shown:
4. Click on Design View button. This opens the window where you canformat the report. Change the names of the columns according to the need.The screenshot displaying the Design View is as shown:
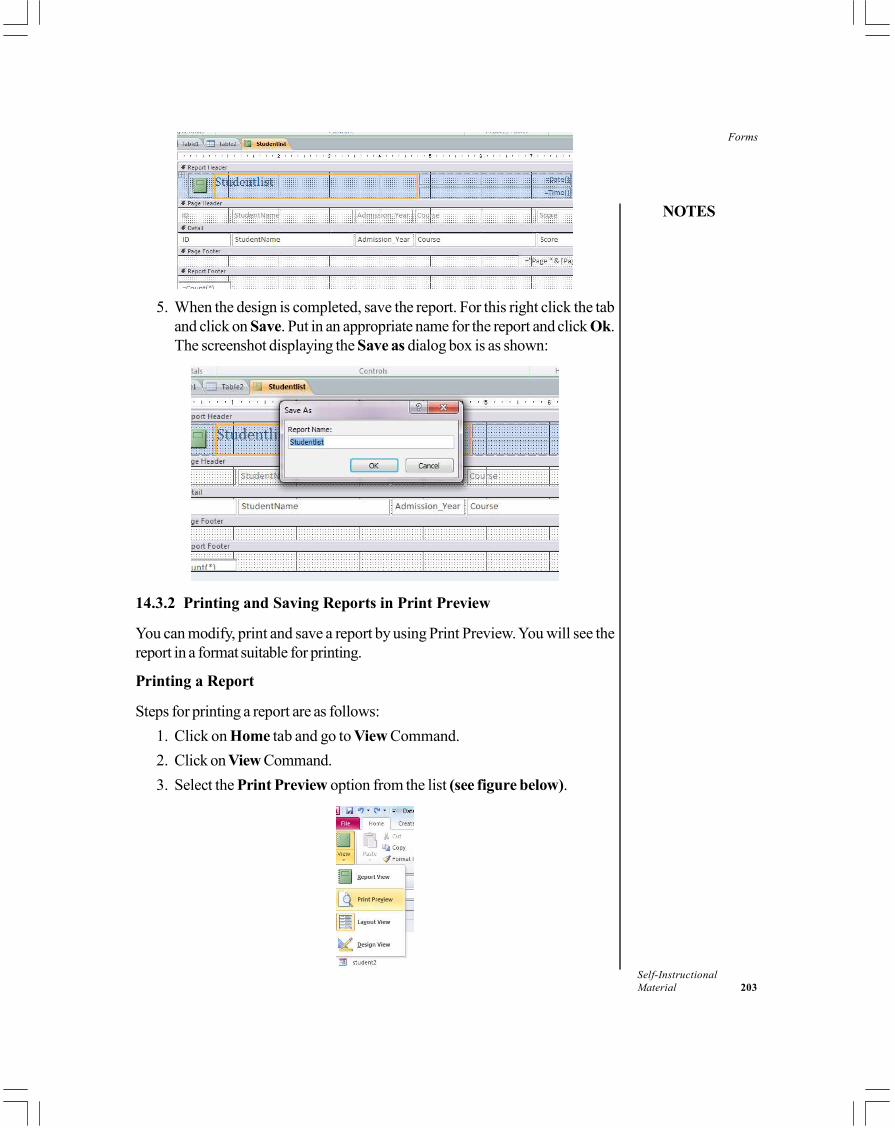
Forms
NOTES
Self-InstructionalMaterial 203
5. When the design is completed, save the report. For this right click the taband click on Save. Put in an appropriate name for the report and click Ok.The screenshot displaying the Save as dialog box is as shown:
14.3.2 Printing and Saving Reports in Print Preview
You can modify, print and save a report by using Print Preview. You will see thereport in a format suitable for printing.
Printing a Report
Steps for printing a report are as follows:1. Click on Home tab and go to View Command.2. Click on View Command.3. Select the Print Preview option from the list (see figure below).
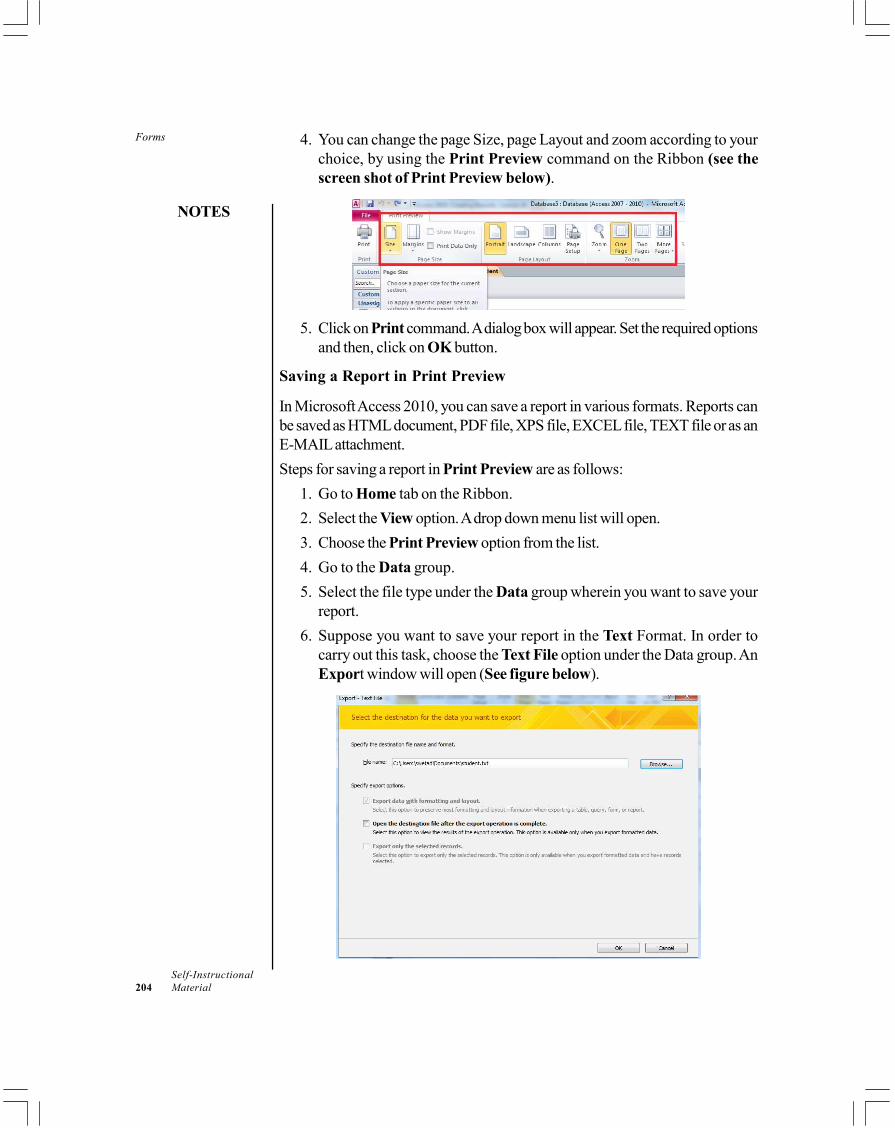
Forms
NOTES
Self-Instructional204 Material
4. You can change the page Size, page Layout and zoom according to yourchoice, by using the Print Preview command on the Ribbon (see thescreen shot of Print Preview below).
5. Click on Print command. A dialog box will appear. Set the required optionsand then, click on OK button.
Saving a Report in Print Preview
In Microsoft Access 2010, you can save a report in various formats. Reports canbe saved as HTML document, PDF file, XPS file, EXCEL file, TEXT file or as anE-MAIL attachment.Steps for saving a report in Print Preview are as follows:
1. Go to Home tab on the Ribbon.2. Select the View option. A drop down menu list will open.3. Choose the Print Preview option from the list.4. Go to the Data group.5. Select the file type under the Data group wherein you want to save your
report.6. Suppose you want to save your report in the Text Format. In order to
carry out this task, choose the Text File option under the Data group. AnExport window will open (See figure below).
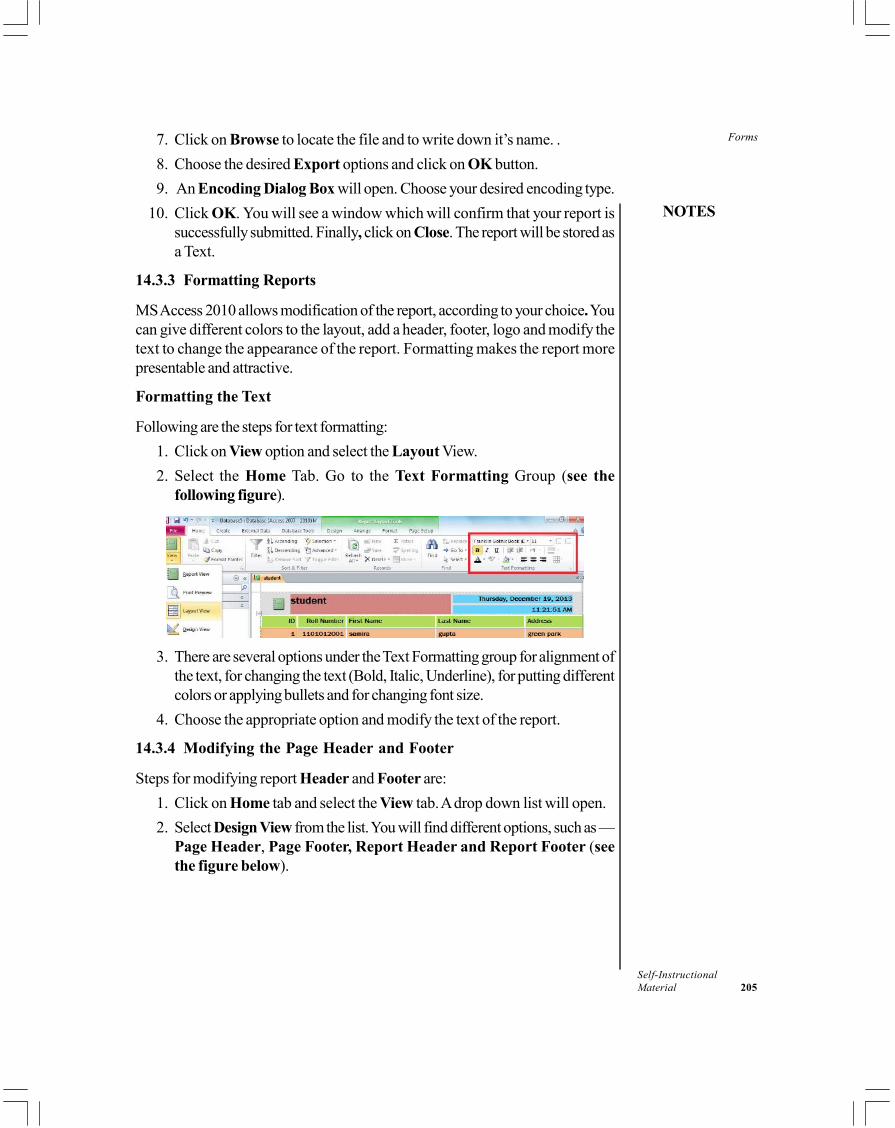
Forms
NOTES
Self-InstructionalMaterial 205
7. Click on Browse to locate the file and to write down it’s name. .8. Choose the desired Export options and click on OK button.9. An Encoding Dialog Box will open. Choose your desired encoding type.
10. Click OK. You will see a window which will confirm that your report issuccessfully submitted. Finally, click on Close. The report will be stored asa Text.
14.3.3 Formatting Reports
MS Access 2010 allows modification of the report, according to your choice. Youcan give different colors to the layout, add a header, footer, logo and modify thetext to change the appearance of the report. Formatting makes the report morepresentable and attractive.
Formatting the Text
Following are the steps for text formatting:1. Click on View option and select the Layout View.2. Select the Home Tab. Go to the Text Formatting Group (see the
following figure).
3. There are several options under the Text Formatting group for alignment ofthe text, for changing the text (Bold, Italic, Underline), for putting differentcolors or applying bullets and for changing font size.
4. Choose the appropriate option and modify the text of the report.
14.3.4 Modifying the Page Header and Footer
Steps for modifying report Header and Footer are:1. Click on Home tab and select the View tab. A drop down list will open.2. Select Design View from the list. You will find different options, such as —
Page Header, Page Footer, Report Header and Report Footer (seethe figure below).
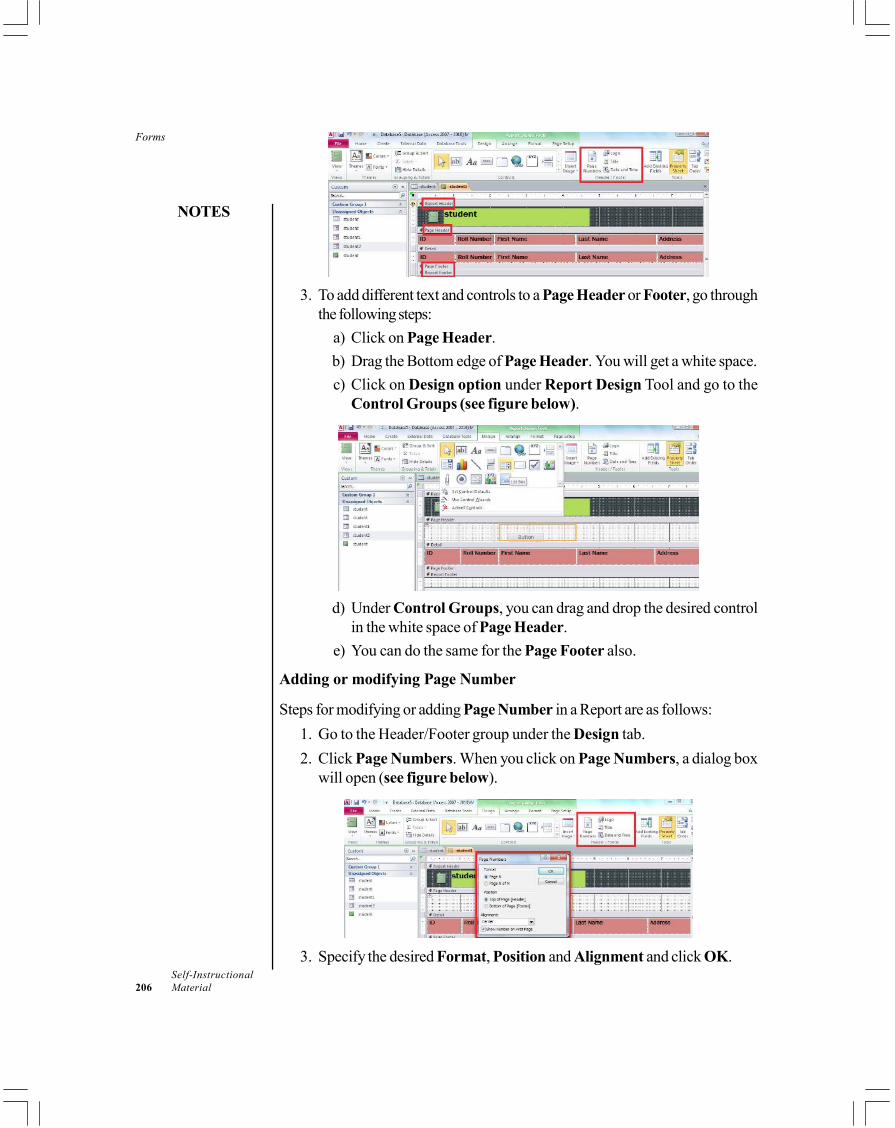
Forms
NOTES
Self-Instructional206 Material
3. To add different text and controls to a Page Header or Footer, go throughthe following steps:
a) Click on Page Header.b) Drag the Bottom edge of Page Header. You will get a white space.c) Click on Design option under Report Design Tool and go to the
Control Groups (see figure below).
d) Under Control Groups, you can drag and drop the desired controlin the white space of Page Header.
e) You can do the same for the Page Footer also.
Adding or modifying Page Number
Steps for modifying or adding Page Number in a Report are as follows:1. Go to the Header/Footer group under the Design tab.2. Click Page Numbers. When you click on Page Numbers, a dialog box
will open (see figure below).
3. Specify the desired Format, Position and Alignment and click OK.
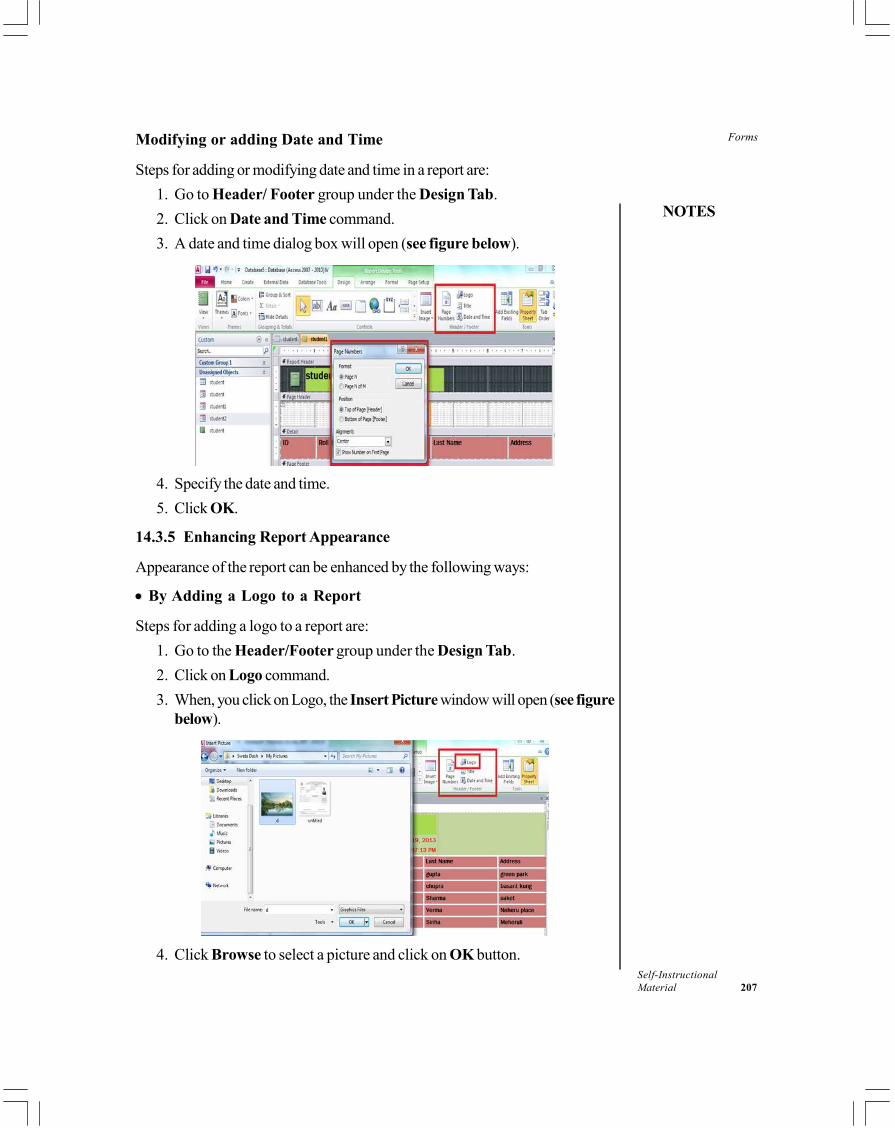
Forms
NOTES
Self-InstructionalMaterial 207
Modifying or adding Date and Time
Steps for adding or modifying date and time in a report are:1. Go to Header/ Footer group under the Design Tab.2. Click on Date and Time command.3. A date and time dialog box will open (see figure below).
4. Specify the date and time.5. Click OK.
14.3.5 Enhancing Report Appearance
Appearance of the report can be enhanced by the following ways:
• By Adding a Logo to a Report
Steps for adding a logo to a report are:1. Go to the Header/Footer group under the Design Tab.2. Click on Logo command.3. When, you click on Logo, the Insert Picture window will open (see figure
below).
4. Click Browse to select a picture and click on OK button.
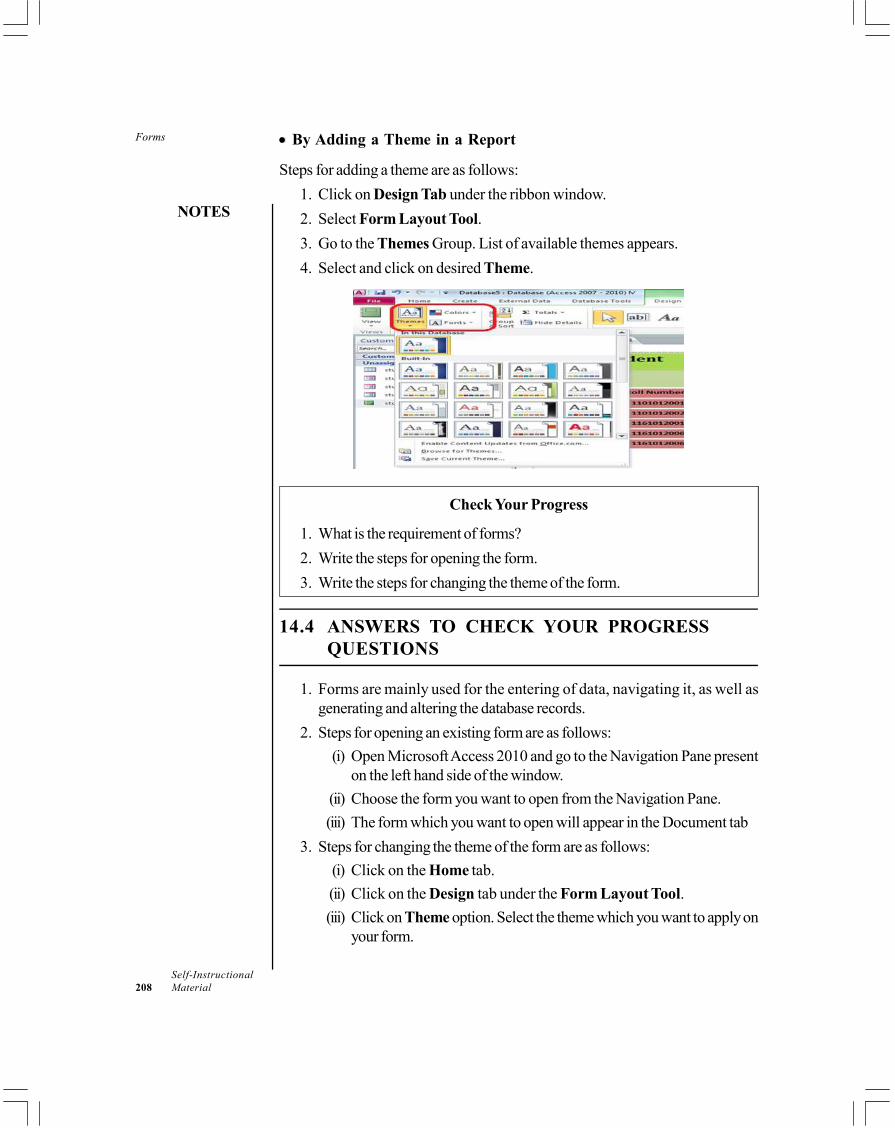
Forms
NOTES
Self-Instructional208 Material
• By Adding a Theme in a Report
Steps for adding a theme are as follows:1. Click on Design Tab under the ribbon window.2. Select Form Layout Tool.3. Go to the Themes Group. List of available themes appears.4. Select and click on desired Theme.
Check Your Progress
1. What is the requirement of forms?2. Write the steps for opening the form.3. Write the steps for changing the theme of the form.
14.4 ANSWERS TO CHECK YOUR PROGRESSQUESTIONS
1. Forms are mainly used for the entering of data, navigating it, as well asgenerating and altering the database records.
2. Steps for opening an existing form are as follows:(i) Open Microsoft Access 2010 and go to the Navigation Pane present
on the left hand side of the window.(ii) Choose the form you want to open from the Navigation Pane.(iii) The form which you want to open will appear in the Document tab
3. Steps for changing the theme of the form are as follows:(i) Click on the Home tab.(ii) Click on the Design tab under the Form Layout Tool.(iii) Click on Theme option. Select the theme which you want to apply on
your form.
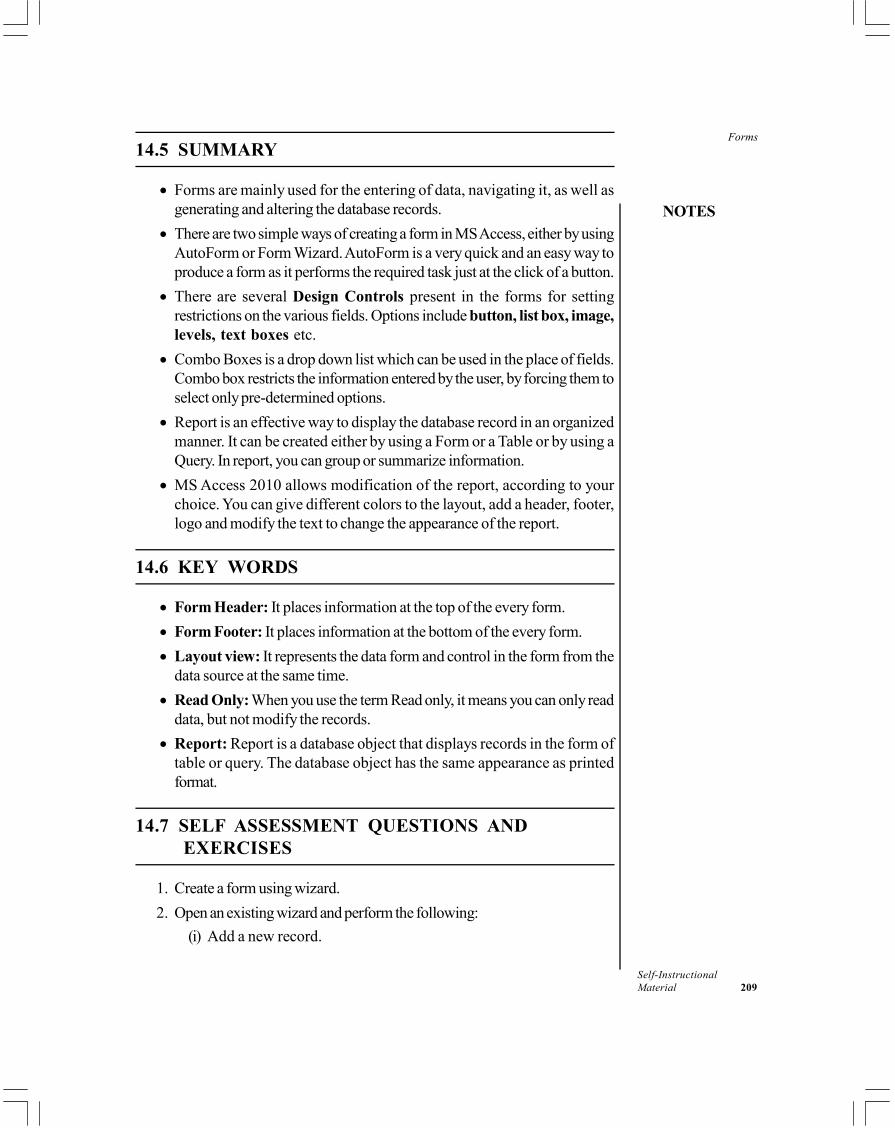
Forms
NOTES
Self-InstructionalMaterial 209
14.5 SUMMARY
• Forms are mainly used for the entering of data, navigating it, as well asgenerating and altering the database records.
• There are two simple ways of creating a form in MS Access, either by usingAutoForm or Form Wizard. AutoForm is a very quick and an easy way toproduce a form as it performs the required task just at the click of a button.
• There are several Design Controls present in the forms for settingrestrictions on the various fields. Options include button, list box, image,levels, text boxes etc.
• Combo Boxes is a drop down list which can be used in the place of fields.Combo box restricts the information entered by the user, by forcing them toselect only pre-determined options.
• Report is an effective way to display the database record in an organizedmanner. It can be created either by using a Form or a Table or by using aQuery. In report, you can group or summarize information.
• MS Access 2010 allows modification of the report, according to yourchoice. You can give different colors to the layout, add a header, footer,logo and modify the text to change the appearance of the report.
14.6 KEY WORDS
• Form Header: It places information at the top of the every form.• Form Footer: It places information at the bottom of the every form.• Layout view: It represents the data form and control in the form from the
data source at the same time.• Read Only: When you use the term Read only, it means you can only read
data, but not modify the records.• Report: Report is a database object that displays records in the form of
table or query. The database object has the same appearance as printedformat.
14.7 SELF ASSESSMENT QUESTIONS ANDEXERCISES
1. Create a form using wizard.2. Open an existing wizard and perform the following:
(i) Add a new record.
Forms
NOTES
Self-Instructional210 Material
(ii) Modify/ update a record.(iii) Add design controls/ Combo boxes.
3. Create a report in MS Access using the records of any database that youhave designed.
14.8 FURTHER READINGS
Srivastava, S.S. 2008. MS Office. New Delhi: Firewall Media.Saxena, Sanjay. 2011. MS Office 2007 in a Nutshell. Noida: Vikas Publishing
house.Courter, Gini and Annette Marquis. 1999. Mastering Microsoft Office 2000.
New Delhi: BPB Publications.Blattner, Patrick, Ken Cook, Laurie Ulrich and Timothy Dyck. 1999. Special
Edition Using Microsoft Excel 2000. New Delhi: Prentice-Hall of India.