research methodology - alagappa university
TRANSCRIPT
Master of Library & Information ScienceII - Semester
323 23
RESEARCH METHODOLOGY
Directorate of Distance Education
ALAGAPPA UNIVERSITY[Accredited with ‘A+’ Grade by NAAC (CGPA:3.64) in the Third Cycle
and Graded as Category–I University by MHRD-UGC]
(A State University Established by the Government of Tamil Nadu)
KARAIKUDI – 630 003
All rights reserved. No part of this publication which is material protected by this copyright noticemay be reproduced or transmitted or utilized or stored in any form or by any means now known orhereinafter invented, electronic, digital or mechanical, including photocopying, scanning, recordingor by any information storage or retrieval system, without prior written permission from the AlagappaUniversity, Karaikudi, Tamil Nadu.
Information contained in this book has been published by VIKAS® Publishing House Pvt. Ltd. and hasbeen obtained by its Authors from sources believed to be reliable and are correct to the best of theirknowledge. However, the Alagappa University, Publisher and its Authors shall in no event be liable forany errors, omissions or damages arising out of use of this information and specifically disclaim anyimplied warranties or merchantability or fitness for any particular use.
Vikas® is the registered trademark of Vikas® Publishing House Pvt. Ltd.
VIKAS® PUBLISHING HOUSE PVT. LTD.E-28, Sector-8, Noida - 201301 (UP)Phone: 0120-4078900 Fax: 0120-4078999Regd. Office: 7361, Ravindra Mansion, Ram Nagar, New Delhi 110 055 Website: www.vikaspublishing.com Email: [email protected]
Work Order No. AU/DDE/DE1-291/Preparation and Printing of Course Materials/2018 Dated 19.11.2018 Copies - 500
"The copyright shall be vested with Alagappa University"
AuthorsDr. Deepak Chawla, Distinguished Professor, Dean (Research & Fellow Programme) International Management Institute (IMI),New DelhiDr. Neena Sondhi, Professor, International Management Institute (IMI), New DelhiUnits (1.2.3, 1.4, 5, 6.0-6.3.2, 8-9, 10.0-10.2, 10.5, 11, 12.0-12.3.3, 13.0-13.3, 14.0-14.2)Prof. Lalit Kumar Sharma, Director, Institute of Advanced Management & Research, GhaziabadUnits (1.3, 4, 7.0-7.2.2, 10.3-10.4)Aakansha Wadehra, Head HR, Morling Global Pvt. Ltd., NoidaUnits (2, 6.4-6.5, 10.6, 13.4, 14.3)Vikas® Publishing House: Units (1.0-1.2.2, 1.5-1.9, 3, 6.6-6.10, 7.3, 7.4-7.8, 10.7-10.11, 12.3.4, 12.4-12.8, 13.5-13.9, 14.4-14.8, 15)
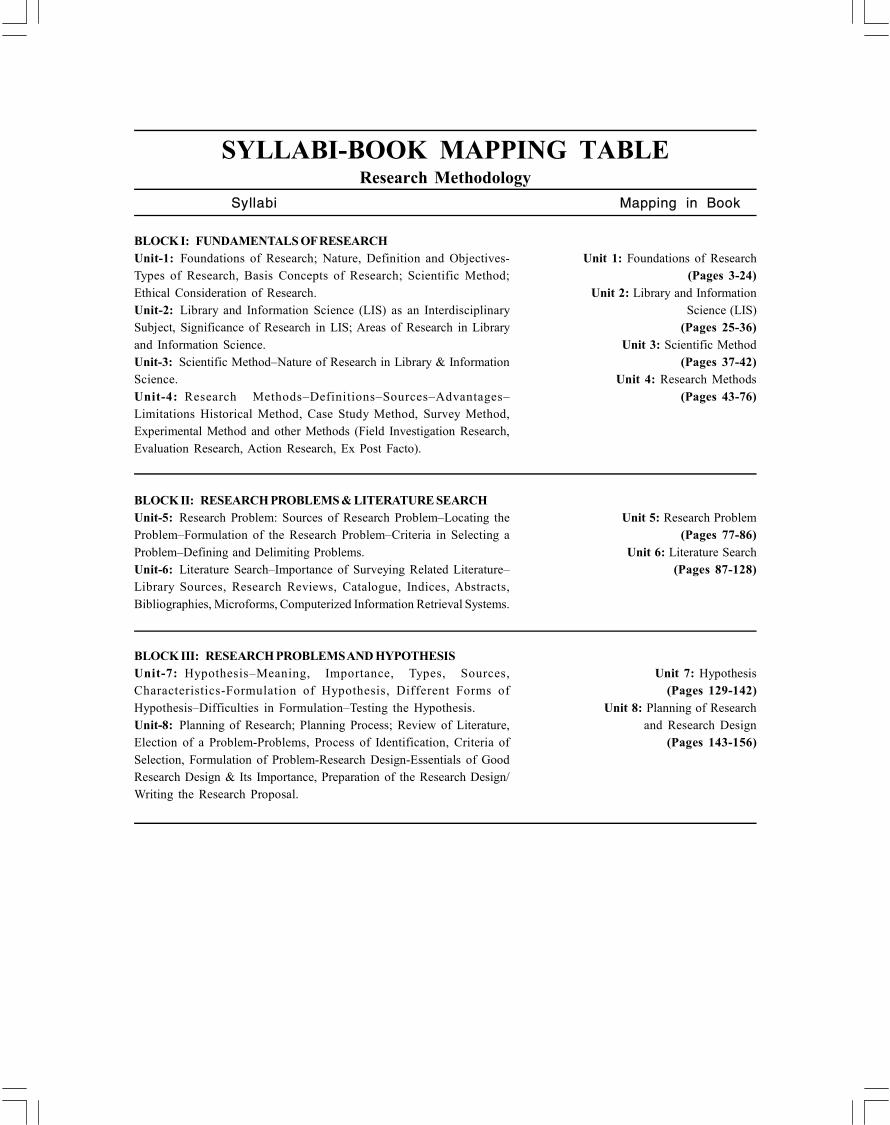
SYLLABI-BOOK MAPPING TABLEResearch Methodology
BLOCK I: FUNDAMENTALS OF RESEARCHUnit-1: Foundations of Research; Nature, Definition and Objectives-Types of Research, Basis Concepts of Research; Scientific Method;Ethical Consideration of Research.Unit-2: Library and Information Science (LIS) as an InterdisciplinarySubject, Significance of Research in LIS; Areas of Research in Libraryand Information Science.Unit-3: Scientific Method–Nature of Research in Library & InformationScience.Unit-4: Research Methods–Definitions–Sources–Advantages–Limitations Historical Method, Case Study Method, Survey Method,Experimental Method and other Methods (Field Investigation Research,Evaluation Research, Action Research, Ex Post Facto).
BLOCK II: RESEARCH PROBLEMS & LITERATURE SEARCHUnit-5: Research Problem: Sources of Research Problem–Locating theProblem–Formulation of the Research Problem–Criteria in Selecting aProblem–Defining and Delimiting Problems.Unit-6: Literature Search–Importance of Surveying Related Literature–Library Sources, Research Reviews, Catalogue, Indices, Abstracts,Bibliographies, Microforms, Computerized Information Retrieval Systems.
BLOCK III: RESEARCH PROBLEMS AND HYPOTHESISUnit-7: Hypothesis–Meaning, Importance, Types, Sources,Characteristics-Formulation of Hypothesis, Different Forms ofHypothesis–Difficulties in Formulation–Testing the Hypothesis.Unit-8: Planning of Research; Planning Process; Review of Literature,Election of a Problem-Problems, Process of Identification, Criteria ofSelection, Formulation of Problem-Research Design-Essentials of GoodResearch Design & Its Importance, Preparation of the Research Design/Writing the Research Proposal.
Syllabi Mapping in Book
Unit 1: Foundations of Research(Pages 3-24)
Unit 2: Library and InformationScience (LIS)
(Pages 25-36)Unit 3: Scientific Method
(Pages 37-42)Unit 4: Research Methods
(Pages 43-76)
Unit 5: Research Problem(Pages 77-86)
Unit 6: Literature Search(Pages 87-128)
Unit 7: Hypothesis(Pages 129-142)
Unit 8: Planning of Researchand Research Design
(Pages 143-156)
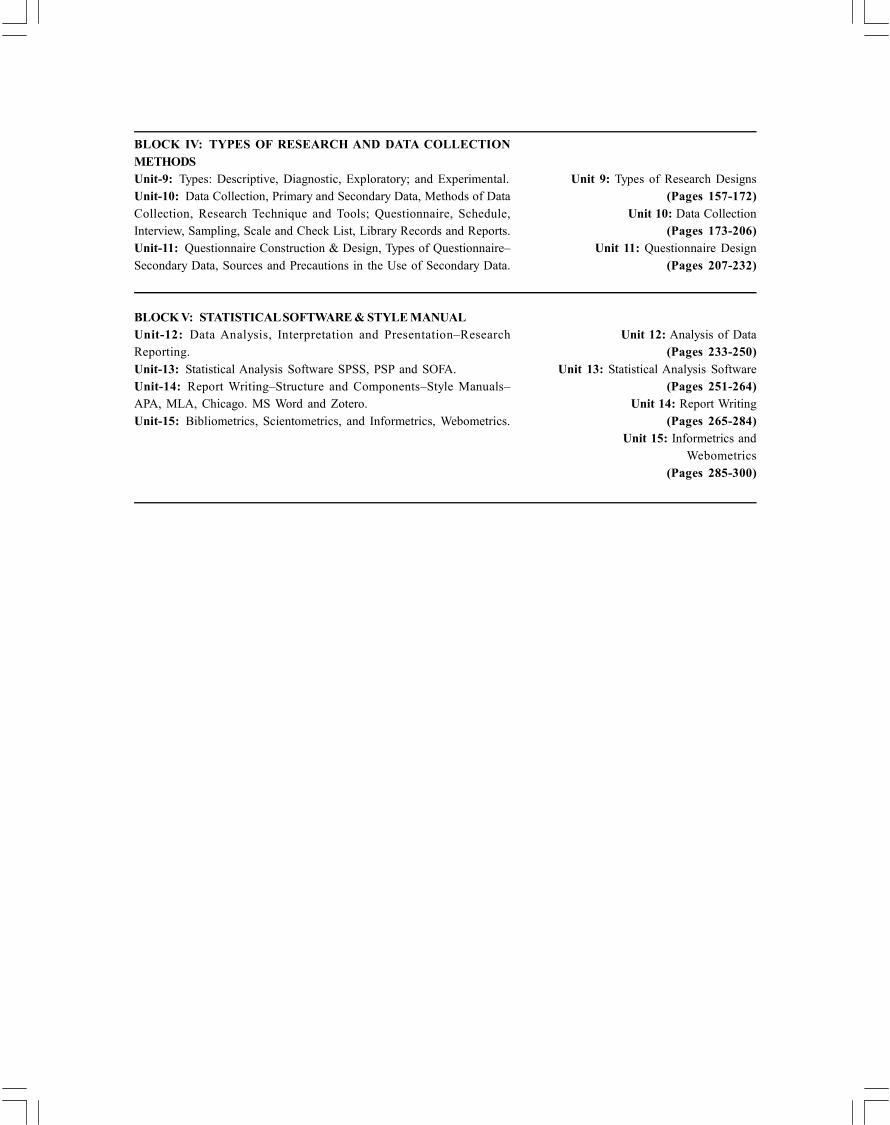
BLOCK IV: TYPES OF RESEARCH AND DATA COLLECTIONMETHODSUnit-9: Types: Descriptive, Diagnostic, Exploratory; and Experimental.Unit-10: Data Collection, Primary and Secondary Data, Methods of DataCollection, Research Technique and Tools; Questionnaire, Schedule,Interview, Sampling, Scale and Check List, Library Records and Reports.Unit-11: Questionnaire Construction & Design, Types of Questionnaire–Secondary Data, Sources and Precautions in the Use of Secondary Data.
BLOCK V: STATISTICAL SOFTWARE & STYLE MANUALUnit-12: Data Analysis, Interpretation and Presentation–ResearchReporting.Unit-13: Statistical Analysis Software SPSS, PSP and SOFA.Unit-14: Report Writing–Structure and Components–Style Manuals–APA, MLA, Chicago. MS Word and Zotero.Unit-15: Bibliometrics, Scientometrics, and Informetrics, Webometrics.
Unit 9: Types of Research Designs(Pages 157-172)
Unit 10: Data Collection(Pages 173-206)
Unit 11: Questionnaire Design(Pages 207-232)
Unit 12: Analysis of Data(Pages 233-250)
Unit 13: Statistical Analysis Software(Pages 251-264)
Unit 14: Report Writing(Pages 265-284)
Unit 15: Informetrics andWebometrics
(Pages 285-300)
INTRODUCTION
BLOCK I: FUNDAMENTALS OF RESEARCH
UNIT 1 FOUNDATIONS OF RESEARCH 1-24
1.0 Introduction
1.1 Objectives
1.2 Basic Concepts of Research: Nature, Definition and Objectives
1.2.1 Research: Significance and Approach
1.2.2 Applications of Research in Business Decisions
1.2.3 Scientific Method
1.3 Types of Research
1.4 Ethical Consideration of Research
1.4.1 Client’s Ethical Code
1.4.2 Researcher’s Ethical Code
1.4.3 Ethical Codes Related to Respondents
1.4.4 Responsibility of Ethics in Research
1.5 Answers to Check Your Progress Questions
1.6 Summary
1.7 Key Words
1.8 Self Assessment Questions and Exercises
1.9 Further Readings
UNIT 2 LIBRARY AND INFORMATION SCIENCE (LIS) 25-36
2.0 Introduction
2.1 Objectives
2.2 Library and Information Science (LIS) as an Interdisciplinary Subject
2.3 Significance of Research in LIS
2.3.1 Definition of Research
2.3.2 Objectives of Research
2.4 Areas of Research in Library and Information Science
2.5 Answers to Check Your Progress Questions
2.6 Summary
2.7 Key Words
2.8 Self Assessment Questions and Exercises
2.9 Further Readings
CONTENTS
UNIT 3 SCIENTIFIC METHOD 37-42
3.0 Introduction
3.1 Objectives
3.2 Understanding Scientific Method of Research
3.2.1 Nature of Research in Library and Information Science
3.3 Answers to Check Your Progress Questions
3.4 Summary
3.5 Key Words
3.6 Self Assessment Questions and Exercises
3.7 Further Readings
UNIT 4 RESEARCH METHODS 43-76
4.0 Introduction
4.1 Objectives
4.2 Definition
4.3 Research Methods and its Advantages and Limitations
4.3.1 Survey
4.3.2 Case Study
4.3.3 Census
4.3.4 Experimental Research
4.3.5 Focused Groups
4.4 Answers to Check Your Progress Questions
4.5 Summary
4.6 Key Words
4.7 Self Assessment Questions and Exercises
4.8 Further Readings
BLOCK II: RESEARCH PROBLEMS & LITERATURE SEARCH
UNIT 5 RESEARCH PROBLEM 77-86
5.0 Introduction
5.1 Objectives
5.2 Formulating the Research Problem
5.3 Answers to Check Your Progress Questions
5.4 Summary
5.5 Key Words
5.6 Self Assessment Questions and Exercises
5.7 Further Readings
UNIT 6 LITERATURE SEARCH 87-128
6.0 Introduction
6.1 Objectives
6.2 Importance of Surveying Related Literature
6.3 Uses of Library and Internet in Research
6.3.1 Uses of Library in Research
6.3.2 Uses of Internet in Research
6.4 Research Reviews, Abstracts and Microforms
6.5 Computerized Information Retrieval System
6.6 Answers to Check Your Progress Questions
6.7 Summary
6.8 Key Words
6.9 Self Assessment Questions and Exercises
6.10 Further Readings
BLOCK III: RESEARCH PROBLEM AND HYPOTHESIS
UNIT 7 HYPOTHESIS 129-142
7.0 Introduction
7.1 Objectives
7.2 Meaning, Importance, Sources and Characteristics
7.2.1 Criteria for Hypothesis Construction
7.2.2 Types of Statistical Hypothesis
7.3 Formulation of Hypothesis and Testing
7.3.1 Procedure for Hypothesis Testing
7.3.2 Committing Errors: Type I and Type II
7.3.3 Null and Alternative Hypotheses
7.4 Answers to Check Your Progress Questions
7.5 Summary
7.6 Key Words
7.7 Self Assessment Questions and Exercises
7.8 Further Readings
UNIT 8 PLANNING OF RESEARCH AND RESEARCH DESIGN 143-156
8.0 Introduction
8.1 Objectives
8.2 Planning of Research and its Process
8.3 Research Design: Essentials of a Good Design and its Importance
8.3.1 Preparation of the Research Design
8.4 Writing the Research Proposal
8.4.1 Contents of a Research Proposal
8.4.2 Types of Research Proposals
8.5 Answers to Check Your Progress Questions
8.6 Summary
8.7 Key Words
8.8 Self Assessment Questions and Exercises
8.9 Further Readings
BLOCK IV: TYPES OF RESEARCH AND DATA COLLECTION METHODS
UNIT 9 TYPES OF RESEARCH DESIGNS 157-172
9.0 Introduction
9.1 Objectives
9.2 Exploratory Research Design
9.2.1 Secondary Resource Analysis
9.2.2 Case Study Method
9.2.3 Expert Opinion Survey
9.2.4 Focus Group Discussions
9.3 Descriptive Research Design
9.3.1 Cross-sectional Studies
9.3.2 Longitudinal Studies
9.4 Experimental Designs
9.5 Diagnostic Research Design
9.6 Answers to Check Your Progress Questions
9.7 Summary
9.8 Key Words
9.9 Self Assessment Questions and Exercises
9.10 Further Readings
UNIT 10 DATA COLLECTION 173-206
10.0 Introduction
10.1 Objectives
10.2 Primary and Secondary Data
10.3 Methods of Data Collection
10.3.1 Observation
10.3.2 Interview
10.3.3 Questionnaire
10.4 Sampling: Introduction
10.5 Scaling and Checklist
10.6 Library Records and Reports
10.7 Answers to Check Your Progress Questions
10.8 Summary
10.9 Key Words
10.10 Self Assessment Questions and Exercises
10.11 Further Readings
UNIT 11 QUESTIONNAIRE DESIGN 207-232
11.0 Introduction
11.1 Objectives
11.2 Questionnaire Construction, Design and Types
11.2.1 Types of Questionnaire
11.3 Process of Questionnaire Designing
11.4 Secondary Data Sources and Precautions
11.4.1 Uses of Secondary Data
11.4.2 Advantages and Disadvantages of Secondary Data
11.4.3 Types and Sources of Secondary Data
11.5 Answers to Check Your Progress Questions
11.6 Summary
11.7 Key Words
11.8 Self Assessment Questions and Exercises
11.9 Further Readings
BLOCK V: STATISTICAL SOFTWARE AND STYLE MANUAL
UNIT 12 ANALYSIS OF DATA 233-250
12.0 Introduction
12.1 Objectives
12.2 Data Analysis
12.3 Research Reporting
12.3.1 Brief Reports
12.3.2 Detailed Reports
12.3.3 Interpretation
12.3.4 Presentation
12.4 Answers to Check Your Progress Questions
12.5 Summary
12.6 Key Words
12.7 Self Assessment Questions and Exercises
12.8 Further Readings
UNIT 13 STATISTICAL ANALYSIS SOFTWARE 251-264
13.0 Introduction
13.1 Objectives
13.2 Statistical Analysis Software: Overview
13.3 Statistical Package for Social Sciences (SPSS)
13.4 Statistical Analysis Software: PSPP and SOFA
13.5 Answers to Check Your Progress Questions
13.6 Summary
13.7 Key Words
13.8 Self Assessment Questions and Exercises
13.9 Further Readings
UNIT 14 REPORT WRITING 265-284
14.0 Introduction
14.1 Objectives
14.2 Structure and Components of Report Writing
14.3 Style Manuals: APA, MLA, Chicago. MS Word and Zotero
14.4 Answers to Check Your Progress Questions
14.5 Summary
14.6 Key Words
14.7 Self Assessment Questions and Exercises
14.8 Further Readings
UNIT 15 INFORMETRICS AND WEBOMETRICS 285-300
15.0 Introduction
15.1 Objectives
15.2 Informetrics
15.3 Bibliometrics
15.4 Scientometrics
15.5 Webometrics
15.6 Answers to Check Your Progress Questions
15.7 Summary
15.8 Key Words
15.9 Self Assessment Questions and Exercises
15.10 Further Readings
Introduction
NOTES
Self-InstructionalMaterial
INTRODUCTION
Research is the quest for knowledge or a systematic investigation in order to establishfacts. It helps to solve problems and increase knowledge. The basic aim of researchis to discover, interpret and develop methods and systems to advance humanknowledge on diverse scientific matters. Thus, research is a process of enquiryand investigation. It helps to solve problems and increase knowledge. One of themain purposes of research is to review the existing knowledge and provide solutionsto problems. There are different types of research, such as exploratory, descriptive,experimental and analytical. Exploratory research is done when few or no previousstudies of the subject exist. Descriptive research is used to classify and identify thecharacteristics of a subject. Experimental research suggests or explains why orhow something happens. Analytical research suggests or explains why or howsomething happens. Thus, one of the primary aims of research is to explain newphenomena and generate new knowledge.
Before conducting any research, a specific approach should be decidedupon, called research methodology. Research methodology refers to the wayresearch can be conducted. It is also known as the process of collecting data forvarious research projects. It helps to understand both the products as well as theprocess of scientific enquiry. A research process involves selection and formulationof a research problem, research design, sample strategy or sample design, as wellas the interpretation and preparation of research report.
Research methodology is a very important function in today’s businessenvironment. There are many new trends in research methodology through whichan organization can function in this dynamic environment. There are two basictypes of research approaches, namely quantitative and qualitative. The mainemphasis of quantitative research is on collecting numerical data. It also concentrateson measuring the scale, range and frequency of a phenomenon. Qualitative researchis more subjective in nature than quantitative research and involves analysis ofdata. Quantitative research involves examining the tangible aspects of research,such as values, attitudes and perceptions.
This book, Research Methodology has been divided into fifteen units. Thebook has been written in keeping with the self-instructional mode or the SIMformat wherein each Unit begins with an Introduction to the topic, followed by anoutline of the Unit Objectives. The detailed content is then presented in a simpleand organized manner, interspersed with Check Your Progress questions to testthe student’s understanding of the topics covered. A Summary along with a list ofKey Words, set of Self-Assessment Questions and Exercises and Further Readingsis provided at the end of each Unit for effective recapitulation.
NOTES
Self-InstructionalMaterial 1
Foundations of ResearchBLOCK - IFUNDAMENTALS OF RESEARCH
UNIT 1 FOUNDATIONS OFRESEARCH
Structure1.0 Introduction1.1 Objectives1.2 Basic Concepts of Research: Nature, Definition and Objectives
1.2.1 Research: Significance and Approach1.2.2 Applications of Research in Business Decisions1.2.3 Scientific Method
1.3 Types of Research1.4 Ethical Consideration of Research
1.4.1 Client’s Ethical Code1.4.2 Researcher’s Ethical Code1.4.3 Ethical Codes Related to Respondents1.4.4 Responsibility of Ethics in Research
1.5 Answers to Check Your Progress Questions1.6 Summary1.7 Key Words1.8 Self Assessment Questions and Exercises1.9 Further Readings
1.0 INTRODUCTION
Research is a watchful process of systematic inquiry that involves the collection ofdata; documentation of information; analysis and interpretation of information, inaccordance with suitable approaches and practices. In this unit, you will studyabout the basics of research along with the definition, nature, objectives and scientificmethod of research. The unit also discusses about the different types of researchand complete process of research. In addition to this, you will also study aboutethical standards of research.
1.1 OBJECTIVES
After going through this unit, you will be able to: Understand the basic concept of research Discuss the nature, definition and objectives of research Describe the different approaches to research
Foundations of Research
NOTES
Self-Instructional2 Material
Analyse the scientific method of research Examine the types of research Understand the code of ethics involved in the research process
1.2 BASIC CONCEPTS OF RESEARCH: NATURE,DEFINITION AND OBJECTIVES
Research in common parlance refers to search for knowledge. One can also defineresearch as a scientific and systematic search for pertinent information on a specifictopic. In fact, research is an art of scientific investigation. According to theAdvancedLearner’s Dictionary of Current English, ‘research is a careful investigation orenquiry, especially a thorough search for new facts in any branch of knowledge.’Well-known authors on research methodology, L.V. Redman and A.V.H. Mory(1923) defined research as a ‘systematized effort to gain new knowledge.’ Somepeople consider research as a voyage of discovery that involves movement fromthe known to the unknown.
Research in a technical sense is an academic activity. Renowned authorClifford Woody defined research as an activity that comprises defining andredefining problems, formulating a hypothesis; collecting, organizing and evaluatingdata; making deductions and reaching conclusions; and carefully testing theconclusions to determine if they support the formulated hypothesis. Eminent authorsD. Slesinger and M. Stephenson, in the Encyclopaedia of Social Sciences, definedresearch as ‘the manipulation of things, concepts or symbols for the purpose ofgeneralizing, extending, correcting or verifying the knowledge, whether thatknowledge aids in the construction of theory or in the practice of an art’. Researchis, thus, an original contribution to the existing stock of knowledge making for itsadvancement.
Principles of Research
The basic principles of research include a systematic process to identify a questionor problem, set forth a plan of action to answer the question or resolve the problem,and meticulously collect and analyse data. In conducting any research, it is crucialto choose the right method and design for a specific researchable problem. Allresearch is different. However, the following factors are common to all good piecesof research:
It is based on empirical data. It involves precise observations and measurements. It is aimed at developing theories, principles and generalizations. There are systematic, logical procedures involved. It is replicable. The findings of the research need to be reported.
NOTES
Self-InstructionalMaterial 3
Foundations of ResearchObjectives of Research
The objective of any research is to find answers to questions through the applicationof scientific procedures. The main aim of any research is to explore the hidden orundiscovered truth. Even though each research study has a specific objective, theresearch objectives in general can be categorized into the following broad categories: Exploratory or Formulative Research Studies: These are aimed at
gaining familiarity with a particular phenomenon or at gaining new insightsinto it. Descriptive Research Studies: These are aimed at accurately portraying
the characteristics of a particular event, phenomenon, individual or situation. Diagnostic Research Studies: These studies try to determine the
frequency with which something occurs. Hypothesis Testing Research Studies: These studies test a hypothesis
and determine a causal relationship between the variables.
Characteristics and purpose of research
The following are the characteristics of research: It is a systematic and critical investigation into a phenomenon. It uses scientific methods. It is goal-orientated and logical. It requires emperial evidence. It focuses on finding answers to questions and solution to problems.
The following points will help in understanding the purpose of research: Research helps in extending the knowledge of human beings, the environment
and natural phenomenon to others. It brings out the information which is not developed fully during the ordinary
course of life. It verifies the existing facts and identifies the changes in these existing facts. It helps in developing facts for critical evaluation. It analyses the interrelationship between variables and derives casual
explanations. It develops new tools and techniques for those who study unknown
phenomenon. It helps in planning and development.
1.2.1 Research: Significance and Approach
Research involves developing a scientific temperament and logical thinking.The significance of research-based answers can never be underestimated. Therole of research is especially important in the fields of economics, business,governance, and so on . Here research helps in finding solutions to problems
Foundations of Research
NOTES
Self-Instructional4 Material
encountered in real life. Decision-making is facilitated by applied research. Researchis also of special significance in the operational and planning processes of businessand industry. Here logical and analytical techniques are applied to business problemsin order to maximize profits and minimize costs. Motivational research is anotherkey tool in understanding consumer behaviour and health related issues. Responsiblecitizenship concerns can all be addressed through good research findings. Socialrelationships involving issues such as attitudes, interpersonal helping behaviour;environmental concerns such as crowding, crime, fatigue, productivity and; otherpractical issues are all capable of being addressed well by scientific research.
Social science research is extremely significant in terms of providing practicalguidance in solving human problems of immediate nature.
Research is also important as a career for those in the field of academics. Itcould be a career option for professionals who wish to undertake research to gainnew insights and idea generation. Research also fosters creative thinking and newtheorizations.
Research for its own sake and for the sake of knowledge, and for solvingdifferent problems, all that is required is formal training in scientific methodology.
Approaches to Research
Quantitative approach and qualitative approach are the two basic approaches toresearch. These two paradigms are based on two different and competing waysof understanding the world. These competing ways of comprehending the worldare reflected in the way research data is collected (for example, words versusnumbers) and the perspective of the researcher (Perspectival versus Objective).The perspectives of the participants are very critical.
(i) Quantitative Approach: If there has been one overwhelming consensusamong academic psychologists on a single point over the past few decades,it is that the best empirical research in the field is firmly grounded in quantitativemethods. In this approach, data is generated in quantitative form, and thenthat data is subjected to rigorous quantitative analysis in a rigid and formalfashion. Inferential, experimental and simulation approaches are the sub-classifications of quantitative approach. Inferential approach to researchfocuses on survey research where databases are built studying samples ofpopulation and then these databases are used to infer characteristics orrelationships in populations. In experimental approach, greater control isexercised over the research environment and often, some independentvariables are controlled or manipulated to record their effects on dependentvariables. In simulation approach, an artificial environment is constructedwithin which relevant data and information is generated. This way, thedynamic behaviours of a system are observed under controlled conditions.
(ii) Qualitative Approach: This approach to research is concerned withsubjective assessment of attitudes, opinions and behaviour. Research insuch a situation is a function of researcher’s insight and impressions. Such
NOTES
Self-InstructionalMaterial 5
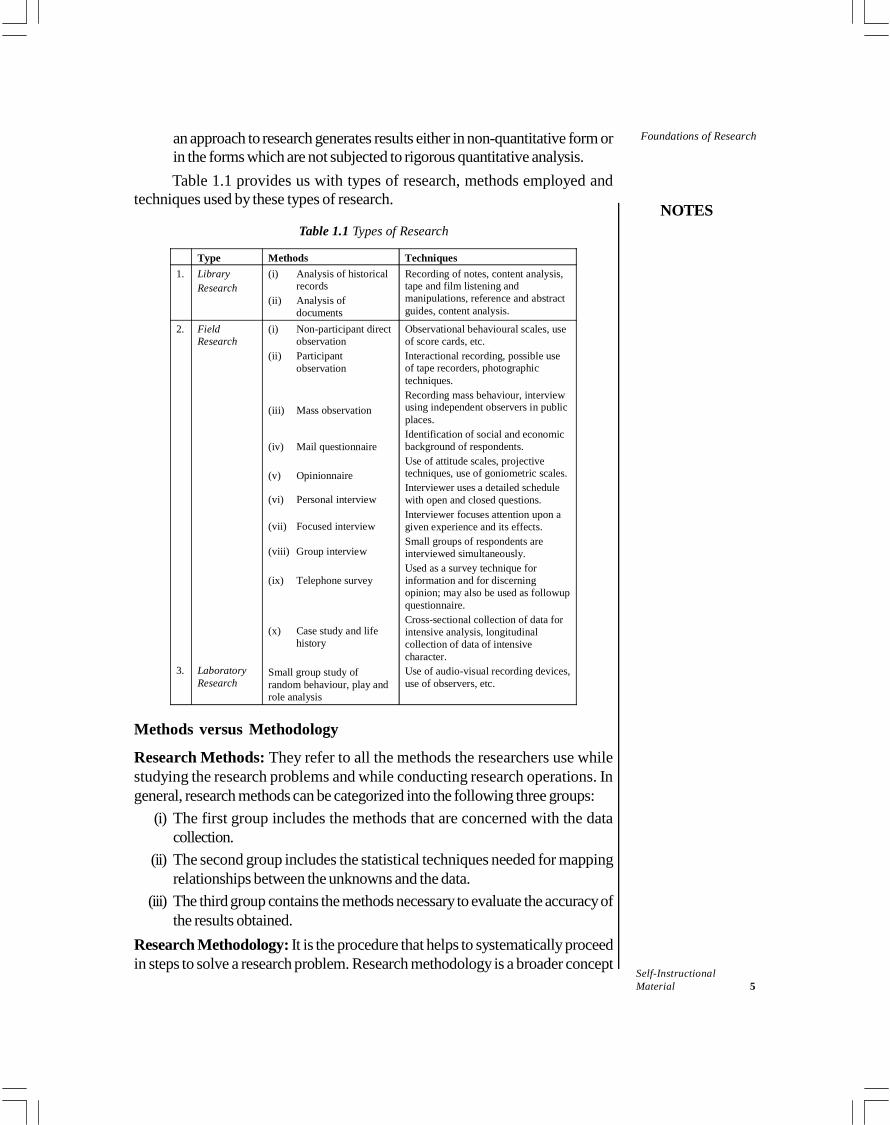
Foundations of Researchan approach to research generates results either in non-quantitative form orin the forms which are not subjected to rigorous quantitative analysis.Table 1.1 provides us with types of research, methods employed and
techniques used by these types of research.
Table 1.1 Types of Research
Type Methods Techniques1. Library
Research(i) Analysis of historical
records(ii) Analysis of
documents
Recording of notes, content analysis,tape and film listening andmanipulations, reference and abstractguides, content analysis.
2.
3.
FieldResearch
LaboratoryResearch
(i) Non-participant directobservation
(ii) Participantobservation
(iii) Mass observation
(iv) Mail questionnaire
(v) Opinionnaire
(vi) Personal interview
(vii) Focused interview
(viii) Group interview
(ix) Telephone survey
(x) Case study and lifehistory
Small group study ofrandom behaviour, play androle analysis
Observational behavioural scales, useof score cards, etc.Interactional recording, possible useof tape recorders, photographictechniques.Recording mass behaviour, interviewusing independent observers in publicplaces.Identification of social and economicbackground of respondents.Use of attitude scales, projectivetechniques, use of goniometric scales.Interviewer uses a detailed schedulewith open and closed questions.Interviewer focuses attention upon agiven experience and its effects.Small groups of respondents areinterviewed simultaneously.Used as a survey technique forinformation and for discerningopinion; may also be used as followupquestionnaire.Cross-sectional collection of data forintensive analysis, longitudinalcollection of data of intensivecharacter.Use of audio-visual recording devices,use of observers, etc.
Methods versus Methodology
Research Methods: They refer to all the methods the researchers use whilestudying the research problems and while conducting research operations. Ingeneral, research methods can be categorized into the following three groups:
(i) The first group includes the methods that are concerned with the datacollection.
(ii) The second group includes the statistical techniques needed for mappingrelationships between the unknowns and the data.
(iii) The third group contains the methods necessary to evaluate the accuracy ofthe results obtained.
Research Methodology: It is the procedure that helps to systematically proceedin steps to solve a research problem. Research methodology is a broader concept

Foundations of Research
NOTES
Self-Instructional6 Material
that includes not the research methods but also the logic behind the researchmethods in the context of a particular research study; and it explains the reasonsfor using particular research methods and statistical techniques. Research mythologyalso defines how the data should be evaluated to get the appropriate results.
1.2.2 Applications of Research in Business Decisions
The discussion so far points out the role and significance of research in aidingbusiness decisions. The question one might ask here is about the critical importanceof research in different areas of management. Is it most relevant in marketing? Dofinancial and production decisions really need research assistance? Does the methodor process of research change with the functional area? Figure 1.1 explains thecomplete research process.
Fig. 1.1 The Process of Research
NOTES
Self-InstructionalMaterial 7
Foundations of ResearchThe answer to all the above questions is NO. Business managers in eachfield—whether human resources or production, marketing or finance—areconstantly being confronted by problem situations that require effective andactionable decision-making. Most of these decisions require additional informationor information evaluation, which can be best addressed by research. While thenature of the decision problem might be singularly unique to the manager,organization and situation, broadly for the sake of understanding, it is possible tocategorize them under different heads.
Marketing Function
This is one area of business where research is the lifeline and is carried out on avast array of topics, and is conducted both in-house by the organization itself andoutsourced to external agencies. Broader industry- or product-category-specificstudies are also carried out by market research agencies and sold as reports forassisting in business decisions. Studies like these could be: Market potential analysis; market segmentation analysis and demand
estimation Market structure analysis which includes market size, players and market
share of the key players Sales and retail audits of product categories by players and regions as well
as national sales; consumer and business trend analysis—sometimes includingshort-and long-term forecasting.However, it is to be understood that the above-mentioned areas need not
always be outsourced; sometimes they might be handled by a dedicated researchor new product development department in the organizations. Other than these,an organization also carries out researches related to all four functions of marketing,such as:
Product Research: This would include new product research; producttesting and development; product differentiation and positioning; testingand evaluating new products, and packaging research; and brandresearch—including equity to tracks and imaging studies.
Pricing Research: Price determination research; evaluating customervalue; competitor pricing strategies, and alternative pricing models andimplications.
Promotional Research: Includes everything from designing of thecommunication mix to design of advertisements, copy testing, measuringthe impact of alternative media vehicles and impact of competitors’strategy.
Place Research: Includes locational analysis, design and planning ofdistribution channels, and measuring the effectiveness of the distributionnetwork.
Foundations of Research
NOTES
Self-Instructional8 Material
These days, with the onset of increased competition and the need to convertcustomers into committed customers, Customer Relationship Management (CRM),customer satisfaction, loyalty studies and lead user analysis are also areas in whichsignificant research is being carried out.
Personnel and Human Resource Management
Human Resources (HR) and organizational behaviour is an area which involvesbasic or fundamental research as a lot of academic, macro level research may beadapted and implemented by organizations into their policies and programmes.Applied HR research by contrast is more predictive and solution oriented. Thoughthere are a number of academic and organizational areas in which research isconducted, yet some key contemporary areas which seem to attract more researchare as follows: Performance Management: Leadership analysis development and
evaluation; organizational climate and work environment studies; talent andaptitude analysis and management; and organizational changeimplementation, management and effectiveness analysis. Employee Selection and Staffing: This includes pre and on-the-job
employee assessment and analysis; and staffing studies. Organizational Planning and Development: Culture assessment—either
organization specific or the study of individual, and merged culture analysisfor mergers and acquisitions; and manpower planning and development. Incentive and Benefit Studies: These include job analysis and
performance appraisal studies; recognition and reward studies, hierarchicalcompensation analysis; and employee benefits and reward analysis, bothwithin the organization and industry best practices. Training and Development: These include training need gap analysis;
training development modules; monitoring and assessing impact; andeffectiveness of training. Other Areas: Other areas include employee relationship analysis; labour
studies; negotiation and wage settlement studies; absenteeism and accidentanalysis; turnover and attrition studies; and work-life balance analysis.
Critical success factor analysis and employer branding are some emerging areasin which HR research is being carried out. The first is a participative form ofmanagement technique, developed by American Organizational theorist John F.Rockart (1981) in which the employees of an organization identify their criticalsuccess factors, and help in customizing and incorporating them in developing themission and vision of their organization. The idea is that a synchronized objectivewill benefit both the individual and the organization, and which will lead to acommitment and ownership on the part of the employees. Employer branding isanother area which is being actively investigated as the customer perception (inthis case, it is the internal customer, i.e., the employee) about the employer or the
NOTES
Self-InstructionalMaterial 9
Foundations of Researchemploying organization has a strong and direct impact on his intentions to stay orleave. Thus, this is a subjective qualitative construct which can have hazardouseffect on organizational effectiveness and efficiency.Financial and Accounting ResearchThe area of financial and accounting research is so vast that it is difficult to providea pen sketch of the research areas. In this section, we are providing just a briefoverview of some research topics: Asset Pricing, Corporate Finance and Capital Markets: The focus
here is on stock market response to corporate actions (IPOs or Initial PublicOfferings, takeovers and mergers), financial reporting (earnings and firmspecific announcements) and the impact of factors on returns, e.g., liquidityand volume. Financial Derivatives and Interest Rate and Credit Risk Modelling:
This includes analysing interest rate derivatives, development and validationof corporate credit rating models and associated derivatives; analysingcorporate-decision making and investment risk appraisal. Market Based Accounting Research: Analysis of corporate financial
reporting behaviour; accounting-based valuations; evaluation and usage ofaccounting information by investors and evaluation of managementcompensation schemes. Auditing and Accountability: This includes both private and public sector
accounting studies, analysis of audit regulations; analysis of different auditmethodologies; governance and accountability of audit committees. Financial Econometrics: This includes modelling and forecasting in
volatility, risk estimation and analysis. Other Areas: Other related areas of investigation are in merchant banking
and insurance sector, and business policy and economics areas.Considering the nature of the decision required in this area; the research is a mix ofhistorical and empirical research. Behavioural finance is a new and contemporaryarea in which, probably, for the first time, subjective and perceptual variables arebeing studied for their predictive value in determining consumer sentiments.
Production and Operation Management
This area of management is one in which quantifiable implementation of the researchresults takes on huge cost and process implications. Research in this area is highlyfocused and problem specific. The decision areas in which research studies arecarried out are as follows: Operation Planning: These include product/service design and
development; resource allocation and capacity planning. Demand forecasting and decision analysis.
Foundations of Research
NOTES
Self-Instructional10 Material
Process Planning: Production scheduling and material requirementmanagement; work design planning and monitoring. Project management and maintenance management studies. Logistics and supply chain, and inventory management analysis. Quality Estimation and Assurance Studies: These include Total Quality
Management (TQM) and quality certification analysis.This area of management also invites academic research which might be
macro and general but helps in developing technologies, such as JIT (Just-In-Time) technology and EOQ (Economy Order Quantity)—an inventory managementmodel), which are then adapted by organizations for optimizing operations.
Cross-Functional Research
Business management being an integrated amalgamation of all these and otherareas sometimes requires a unified thought and approach to research. These studiesrequire an open orientation where experts from across the disciplines contributeto and gain from the study. For example, an area, such as new productdevelopment, requires the commitment of the marketing, production and consumerinsights team to exploit new opportunities. Other areas requiring cross functionalefforts are as follows: Corporate governance and ethics—the role of social values and ethics, and
their integration into a company’s working is an area that is of criticalsignificance to any organization. Technical support systems, enterprise resource planning systems, knowledge
management, and data mining and warehousing are integrated areas requiringresearch on managing coordinated efforts across divisions. Ecological and environmental analysis; legal analysis of managerial actions;
human rights and discrimination studies.
1.2.3 Scientific Method
To distinguish between non-scientific and scientific method, we would like toconsider a few definitions of research.
One of the earliest distinctions was made by Lundberg (1942) who stated‘Scientific methods consist of systematic observation, classification, andinterpretation of data. Now obviously, this process is one in which nearly all peopleengage in their daily life. The main difference between our day-to-daygeneralizations and the conclusions usually recognized as the scientific method liesin the degree of formality, rigorousness, verifiability, and general validity of thelatter.’
Fred Kerlinger (1986) also validated the thought and stated that ‘Scientificresearch is a systematic, controlled and critical investigation of propositions aboutvarious phenomena.’ Grinnell (1993) has simplified the debate and stated ‘The
NOTES
Self-InstructionalMaterial 11
Foundations of Researchword research is composed of two syllables, re and search. The dictionary definesthe former as a prefix meaning again, anew or over again and the latter as a verbmeaning to examine closely and carefully, to test and try, or to probe. Togetherthey form a noun describing a careful, systematic, patient study and investigation insome field of knowledge, undertaken to establish facts or principles.’
Thus, drawing from the common threads of the above definitions, we derivethat management research is an unbiased, structured, and sequential methodof enquiry, directed towards a clear implicit or explicit business objective.This enquiry might lead to validating existing postulates or arriving at newtheories and models.
Check Your Progress
1. What do you mean by research?2. What is the importance of good research?3. Name the two basic approaches to research.4. What are the sub-classifications of quantitative approach?5. What is critical success factor analysis?
1.3 TYPES OF RESEARCH
Although research is a vast subject and is difficult to categorize, it can be classifiedaccording to its intent or as per the methods of study.On the basis of intent, research can be classified as follows: Pure research: It is done only for the sake of knowledge. The intention is
not to apply it in regular practice. Pure research is also called basic orfundamental research. It is not focused on specific problems, but instead itfocuses on the extension of knowledge. New theory or refinements of anexisting theory are developed with the help of pure research. It lays thefoundation for applied research. It helps in finding the critical factors in aproblem. It helps in generating alternative solutions and choosing the bestone amongst them. Applied research: When real-life problems require some solution and
decision-making, applied research is carried out. This means that appliedresearch is problem oriented and action directed. It brings immediate andpractical results; for example, marketing research carried on for identifyingcustomer habits to purchase something. Though it is problem oriented andaction directed, it can contribute to the development of theoretical knowledgeby leading to the discovery of new facts. Exploratory research: It is also called formulative research. When a
researcher has no knowledge or little knowledge about an unfamiliar
Foundations of Research
NOTES
Self-Instructional12 Material
problem, they do a preliminary study. The objective of this research is togenerate new ideas, gather new facts, precise formulation of problem andincreasing familiarity of the researcher to the unfamiliar problem. Renownedtheorist Katz conceptualizes two levels of exploratory research. At the firstlevel is the discovery of significant variables in particular situations; at thesecond, the discovery of relationship between variables. Descriptive research: In this research, facts are analysed in detail for
clear understanding. This research is simple in nature and in its application.It is more specific than exploratory research. It focuses on the problemunder study and also aims at a classification of the range of elementscomprising the subject matter of study. Empirical observations are used toconceptualize the problems and facts. It highlights methods of data collectionand interpretation. Diagnostic research: It is just like descriptive research but with a different
focus. It is aimed towards in depth approaches to reach the basic casualrelations of a problem and possible solutions for it. Prior knowledge of theproblem is required for this type of research. Problem formulation, definingthe population correctly for study purposes, proper methods for collectingaccurate information, correct measurement of variables, statistical analysisand tests of significance are essential in diagnostic research.
The classification of research can be done as per methods of study in the followingmanner: Fundamental: This type of research is mainly concerned with identifying
certain important principles in a specific field. It intends to find out informationthat has a broad base of application. Examples of fundamental research areJohn Robinson’s imperfect competition theory in Economics and Maslow’shierarchy of needs theory in motivation. Applied: This type of research aims at finding a solution to an immediate
problem, faced by a society or an industrial organization. It is supposed todiscover a solution to some basic practical problems. Applied researchsuggests corrective methods to minimize a social or business problem. Historical: Historical research studies the social effects of the past that
may have given rise to current situations, i.e., past incidents are used toanalyse the present as well as the future conditions. The study of the currentstate of Indian labour based on past labour union movements in the Indianeconomy to formulate the Indian Labour Policy is an example of this typeof research. Formulative or exploratory: It helps examine a problem with suitable
hypothesis. This research, on social science, is mainly significant for clarifyingconcepts and innovations for further researches. The researchers are mainlyconcerned with the principles of developing hypothesis and testing withstatistical tools.
NOTES
Self-InstructionalMaterial 13
Foundations of Research Experimental: The experimental type of research enables a person tocalculate the findings, employ the statistical and mathematical devices, andmeasure the results, thus, quantified. Ex post facto: This type of research is the same as experimental research,
which is conducted to deal with the situations that occur in or around anorganization. Examples of such a research are market failure of anorganization’s product being researched later, and research into the causesfor a landslide in the country. Case study: This method undertakes intensive research that requires a
thorough study of a particular unit.
1.4 ETHICAL CONSIDERATION OF RESEARCH
Ethical standards are extremely important no matter what be the field of study.This takes a special meaning in the conduction of research. Rowley (2004) hasput it very simply as ‘conducting research ethically is concerned with respectingprivacy and confidentiality, and being transparent in the use of research data. Ethicalpractices hinge on respect and trust and approaches that seek to build rather thandemolish relationships.’ Russeft et al. (1999) advocated that while conductingbusiness research, the approach must be professional and responsible, the datacollection must be attempted with the respondent's consent under appropriateand ethically correct methods; and, last but not the least, the interpretation has tobe done in a careful unbiased manner.
A number of corporations have developed their own code of ethics regardingthe conduct of research. While this practice of defining business ethics, whichincludes research ethics, is common in most organizations in the West, in India thisis spelt out and documented in the pharmaceutical sector and some banks likeHSBC. Besides this, there are also well established and detailed ethical guidelinesavailable from international bodies, for example, the Social Research Association’s(SRA's) ethical guidelines, the American Psychological Association (APA) codeof ethics, code of standards and ethics for survey research designed by the Councilof American Survey Research Organizations (CASRO), American MarketingAssociation (AMA) and Business Marketing Association (BMA) code of conductand ethics.
To understand the code of ethics involved in research, one needs tounderstand the three significant stakeholders involved in any research, namely:
The sponsoring clients or decision-makers. The respondents from whom one seeks the information. The researcher himself/herself while administering and compiling the study.Each one of these entities has their own specific interests and needs and,
thus, the ethical concerns regarding each one would be unique. Thus, the followingsections present brief guidelines on the ethical issues and their management.
Foundations of Research
NOTES
Self-Instructional14 Material
1.4.1 Client’s Ethical Code
Similar to any other business transaction, research is also an exchange processbetween various people. The first of these is the one between the sponsoringclient and the investigator. Thus both parties have an ethical obligation towards theother. In case the study is being conducted for a business client, completetransparency in terms of data gathering and interpreting is a must. It has beenobserved that the client might be a business manager who because of his ownpersonal interests might steer the results in a specific direction in order to fulfil ahidden agenda. For example, in case a warehousing organization is looking atbusiness expansion and hires a research agency to conduct a research study inorder to provide directions.It might so happen that the business manager from theclient side, who is dealing with the research agency owns a transport fleet and thuswants the researcher to recommend courier and transit warehousing services asbusiness opportunities that the company can go into.
It has been commonly found amongst small and relatively younger firms toask for proposals from research agencies for the conduct of a study. However,once they obtain the details of the intended methodology, they usually get thestudy conducted by their own team or by trainees at a low to minimal cost to thecompany. And since the proposals are the first stage of a research bid, the companyis under no obligation to pay for the research methodology collected by them in anunderhand manner.
Another instance could be that even though the initial exploratory researchand literature review indicate the nature of the respondent population, the clientmight, based on his own notions, force the researcher to undertake the study on aspecific population. For example, if a new technology is being introduced in thecompany and the use requires computer literacy, the client might ask the researcherto measure the acceptability of the product amongst only the computer-savvypopulation. Thus the results would automatically be bent towards acceptance.
Sometimes, the interpretation and recommendations might be beyond thescope of a study. For example, in the organic food study, which was conductedamongst retailers and consumers, the client might ask the researcher to suggeststrategies for educating and building usage and recommendations amongst dieticiansand doctors.
It is recommended in this instance that the researcher must conduct acomprehensive exploratory research and develop clearly stated objectives thatdo not leave any scope for unethical intervention. Secondly, he must tell businessmanager that unless the results are unbiased the study will not contribute to informeddecision making. In case of an unethical manager or client, it is best to avoidmaking recommendations and formulating strategies and leave the use or non-useof the data to the manager. And if nothing works it is best to terminate the researchstudy, as unethical reporting and compilation is bound to spoil the researcher’sreputations.
NOTES
Self-InstructionalMaterial 15
Foundations of Research1.4.2 Researcher’s Ethical Code
Since the researcher is the most involved and main person responsible for thestudy, it is very important that the highest ethical standards be maintained by him.Some specific checks he can look at are as follows:
Quality control
A very important consideration, both short-term and long-term, is to maintain thestandards of quality in the conduct of the study. The researcher must be absolutelyobjective and correct in choosing the research design that would be right for thestudy. For example, for studying the impact of a mathematics study programme onan experimental group of children, the researcher must have a matched controlgroup of children with a similar understanding of mathematics so that the comparisonis correct.
Sometimes, the client might be unaware of the analytical rules and conditionsfor the result to be valid, thus it is the responsibility of the researcher to be absolutelytransparent about the significance of the results obtained and refrain fromemphasizing findings that might be of very little strength or value.
Privacy control
The most significant and important ethical concern of a research study is the issueof trust and confidentiality. At no cost must the researcher reveal any aspect of thestudy without the consent of the client. This could be in terms of not revealing thename of the company. For example, if the client is interested in finding out thecomparative standing of their product with the competitor’s product, it becomescritical to conduct the study amongst users of the product category rather thanonly the company brand in order to get an unbiased evaluation.
The researcher might also need to guard the reason or purpose of the study.For example if the client wants to measure a new product potential, then revealingthe reason for the study might lead to the concept or idea being adopted andconverted into a product prototype by someone else before the client is out withthe offering. The third level of confidentiality that the researcher must ensure is thecomplete confidentiality of the findings till the research outcome has been convertedinto a business decision. For example, based on the organizational health index ofits workers and the attrition rate, the correlation between the two variables mightbe alarming enough to require a major restructuring of the existing employee benefitsand work policy. Or the research study might involve a comprehensive and detailedstudy of potential candidates being considered for the role of the CEO, as theexisting leader is due for retirement. Thus, revelation of the findings of such researchmight lead to turbulence and divided opinion in the organization. Thus the resultsshould not be made available to all till they have been brought into action.
Foundations of Research
NOTES
Self-Instructional16 Material
1.4.3 Ethical Codes Related to Respondents
The most important and vulnerable person in the research study is the respondentfrom whom the data is to be collected. Every association and organization that isdirectly or indirectly involved with research has made clear and detailed guidelinesfor ensuring that unethical treatment of the respondent does not happen.
The American Association for Public Opinion Research has formulated thefollowing code of ethics for survey researchers, with reference to the respondent: We shall strive to avoid the use of practices or methods that may harm,
humiliate or seriously mislead survey respondents. Unless the respondent waives confidentiality for specific uses, we shall hold
as privileged and confidential all information that might identify a respondentwith his or her responses. We shall also not disclose or use the names ofrespondents for non-research purposes unless the respondent grants uspermission to do so.
Study disclosure
The researcher needs to have complete and transparent information regarding thepurpose of collecting data and what sort of information would be required fromthe respondent. The person must know what kind of questioning would be done,so that he is able to understand what the researcher is looking for and whether hehas the information, whether he wants to share all or part of it and also how muchtime and effort would be needed. For example, for a new concept test or asegmentation analysis or an organizational climate survey the administration wouldrequire considerable time and commitment from the respondent. Secondly, if it isa before-and-after product acceptability or usage study, again the person wouldbe contacted twice to assess the experience.Thus the researcher needs to beabsolutely truthful about the nature and objectives of the study.
Coercion and influence
The researcher should not at any stage, either before or during the data collectionstage, try to pressurize the respondent through persuasive influence or by forcinghim to share information. For example, if the respondent has been through sometraumatic experience, he/she might not want to share all details with a stranger,even if it is for an objective study. Schinke and Gilchrist (1993) state that understandards set by the National Commission for the protection of human subjects,all informed-consent procedures must meet three criteria: Participants must be competent to give consent Sufficient information must be provided to allow for a reasonable decision Consent must be voluntary and uncoerced
Sometimes, it may so happen that the respondent is too young or too old ornot literate and thus, unable to understand when the researcher might be either
NOTES
Self-InstructionalMaterial 17
Foundations of Researchleading him/her to give certain preset answers or trying to force the person toshare information that he does not want to reveal or which once shared might bemisinterpreted.
Sensitivity and respect
There are certain issues like shoplifting or sexual orientation, which are not topicsthat can be managed in a structured, impersonal manner. The researcher shoulddevote more time here and also keep the questions more open-ended, and usuallysuch situations need a considerable rapport formation and a non-threateningatmosphere. The researcher, at all times, would need to treat the respondent withdue respect and be transparent about the nature and objective of the questioning.
Experimentation and implication
In case the respondent is going to be part of the experimental group subjected toany sort of treatment, for example, a new shampoo trial or an interventionprogramme that may involve some behavioural change, complete information mustbe given regarding the course of the experiment and any risk, even minimal, whichmight be involved. The researcher, thus, must ensure minimal risk to the respondentand should in no way cause any harm to the person, even if it is for the quest ofknowledge. Bailey (1978) describes this ‘harm’ as not only hazardous or medicalexperiments but also any social research that might involve such things as discomfort,anxiety, harassment, invasion of privacy or demeaning or dehumanizing procedures.
Agreement or consent
Once the researcher has clearly communicated the purpose, the nature and likelyoutcome of the study, it is advisable to make a mutual written or unwritten contract.This ensures that there is no unpleasantness or legal confrontation on either side.Another advantage of this is that in case a point was not very clear the issue getsclarified. For example, for a personal care usage study, the consumer might beunder the impression that a questionnaire on usage would be filled in when actuallythe researcher wants to observe/record the usage ritual. This might call for someinvasion of privacy of the respondent by the researcher, and thus taking the consentbeforehand would make things clear for both the parties.
Sometimes, the nature of the study might require that the name of the companybe disguised. For example, one cannot start a study by saying, ‘We are conductinga survey for Mother Dairy milk; which do you think is the best milk in the city?’Thus, here the debriefing about the company sponsoring the research can berevealed after the data has been collected, and the purpose of the disguise can berevealed. This ensures respondents’ goodwill and cooperation.
1.4.4 Responsibility of Ethics in Research
Besides ensuring that specific protocols and codes be followed for the twobenefactors (client) and contributors (respondents), there are some basic tenets
Foundations of Research
NOTES
Self-Instructional18 Material
that the researcher must not forego. These are significant not only for the body ofknowledge that the researcher is contributing to but also for the society in whichwe exist.
Professional creed
We have already discussed this in detail in both the sections above. However,here for professional creed, we refer to the overall conduct of the researcher, whohas to be truthful during all phases of the study, whether in the conceptualization,conduction or presentation of the research study. At no stage should the researcher exaggerate or underplay the expense or
effort incurred in the conduct of the study. Thus, sometimes the investigatormight overclaim the expense incurred in travel or field visit. On the otherhand, he might underpay the field investigators that he has kept for datacollection by hiring undergraduate students rather than professionalinvestigators. The respondent group being studied should be a true representative of the
identified respondent population studied and not a skewed and biasedsample. Another unethical practice observed is that the researcher mightconduct the study with a professional group of respondents who are wellversed in the response technique and thus give ‘good’ or predictable answers. The data and the questionnaire completed should be on authentic, real-time
conduction, with actual respondents representative of the population understudy and not fake completion done by the field investigators themselves. The findings and results should be presented as they were found based on
actual conduction and under no circumstances must the researcher attemptto fudge or manipulate the results of the study.
Professional confidentiality
The researcher must bear the responsibility to maintain the confidentiality of theresearch findings and not making public any aspects of the study, in an apparent orcamouflaged manner. This code of ethics applies both to the sponsoring client, aswell as the respondent. The anonymity and privacy of the respondent is to berespected and not violated. Also, recording private or personal behaviour withhidden devices is considered a monumental violation of an individual’s right toprivacy (e.g., observing people in a fitting room with a hidden camera).
The right to privacy and confidentiality takes on a new meaning in cyberspace,where the respondent’s personal and demographic details are made available tothe researching company and this could be compiled and collated and sold asdatabases to various service providers as authentic locational details for tappingpotential customers. Thus, maintaining anonymity and confidentiality of informationshared is a professional norm that any ethical researcher should follow. In case thedata is to be shared, it must be done with the consent of the respondent.
NOTES
Self-InstructionalMaterial 19
Foundations of ResearchProfessional objectivity
As a true researcher and contributor to the existing body of knowledge, theresearcher must maintain the objectivity of an absolutely neutral reporter of facts.He must maintain objectivity in all phases of the study while: Designing the research objectives which must be based on facts and sound
analysis rather than simple opinion. Collecting information by using a standard and not differential set of
instructions. For example, in the intervention study quoted earlier, theresearcher must give the instructions in the same way to both the experimentaland control group and in no way try to exaggerate the actual impact of thetreatment. Interpreting and presenting the findings as they are and not in a particular
direction based on the researcher’s own gut feel or liking. For example, aresearcher who is a consumer of organic food will attempt to exaggeratethe health benefits of the products not because that is what was found butbecause as a consumer of the category, that is what he believes.Thus, as stated earlier, just like any other business function a code of ethics
for conducting research is well structured and laid out by almost every businessassociation. At all times, the researcher must remember that besides aiding inbusiness decision-making, research also contributes to the huge domain ofmanagement knowledge. Thus, an authentic, transparent and objective reportingand compilation of the research becomes that much more critical.
Check Your Progress
6. Name the different types of research on the basis of intent.7. What is ethical consideration in research?8. Mention some of the well-established and detailed ethical guidelines from
international bodies.9. What are some specific checks that a researcher look at?
1.5 ANSWERS TO CHECK YOUR PROGRESSQUESTIONS
1. Research is basically a scientific and systematic search for pertinentinformation on a specific topic. It is an art of scientific investigation. Asstated in the Advanced Learner’s Dictionary of Current English, ‘researchis a careful investigation or enquiry, especially a thorough search for newfacts in any branch of knowledge.’
2. Good research plays a vital role in the fields of economics, governance andbusiness etc. Research also plays a significant role in the operational and
Foundations of Research
NOTES
Self-Instructional20 Material
planning processes of business and industry as businesses apply logical andanalytical techniques to business problems in order to maximize profits andminimise costs.
3. The two basic approaches to research are quantitative approach andqualitative approach.
4. Inferential, experimental and simulation approaches are the sub-classifications of quantitative approach.
5. Critical success factor analysis is one of the emerging areas in which HRresearch is being carried out. This is a participative form of managementtechnique which was developed by American Organizational theorist JohnF. Rockart (1981) wherein the employees of an organization identify theircritical success factor, and help in customizing and incorporating them indeveloping the mission and vision of their organization.
6. Research can be classified on the basis of intent as follows:(a) Pure research(b) Applied research(c) Exploratory research(d) Descriptive research(e) Diagnostic research
7. Ethical considerations are very much vital in the field of research. In thewords of Rowley (2004), ‘conducting research ethically is concerned withrespecting privacy and confidentially, and being transparent in the use ofresearch data. Ethical practices hinge on respect and trust and approachesthat seek to build rather than demolish relationships.’
8. The Social Research Association’s (SRA’s) ethical guidelines, the AmericanPsychological Association (APA) code of ethics, code of standards andethics for survey research designed by the Council of American SurveyResearch Organizations (CASRO), American Marketing Association(AMA) and Business Marketing Association (BMA) code of conduct andethics.
9. A researcher is the most involved and key person responsible for the study,hence it is very important that the highest ethical standards maintained byhim. Quality control and privacy control are the specific checks that aresearcher look at in order to maintain the highest ethical standards.
1.6 SUMMARY
Research in common parlance refers to search for knowledge. One canalso define research as a scientific and systematic search for pertinentinformation on a specific topic.
NOTES
Self-InstructionalMaterial 21
Foundations of Research According to the Advanced Learner’s Dictionary of Current English,‘research is a careful investigation or enquiry, especially a thorough searchfor new facts in any branch of knowledge.’ Renowned author Clifford Woody defined research as an activity that
comprises defining and redefining problems, formulating a hypothesis;collecting, organizing and evaluating data; making deductions and reachingconclusions; and carefully testing the conclusions to determine if they supportthe formulated hypothesis. The basic principles of research include a systematic process to identify a
question or problem, set forth a plan of action to answer the question orresolve the problem, and meticulously collect and analyse data. The objective of any research is to find answers to questions through the
application of scientific procedures. The main aim of any research is exploringthe hidden or undiscovered truth. Research involves developing a scientific temperament and logical thinking. The significance of research-based answers can never be underestimated.
The role of research is especially important in the fields of Economics,Business, Governance, and so on. Here research helps in finding solutionsto problems encountered in real life. Research is also important as a career for those in the field of academics. It
could be a career option for professionals who wish to undertake researchto gain new insights and idea generation. Research also fosters creativethinking and new theorizations. Quantitative approach and qualitative approach are the two basic
approaches to research. In quantitative approach, data is generated in quantitative or calculable form,
and then that data is subjected to rigorous quantitative analysis in a rigid andformal fashion. Inferential, experimental and simulation approaches are thesub-classifications of quantitative approach. Qualitative approach to research is concerned with subjective assessment
of attitudes, opinions and behaviour. Research in such a situation is a functionof researcher’s insight and impressions. Research Methods refer to all the methods the researchers use while studying
the research problems and while conducting research operations. Research methodology is a broader concept that includes not the research
methods but also the logic behind the research methods in the context of aparticular research study; and it explains the reasons for using particularresearch methods and statistical techniques. Research mythology also defineshow the data should be evaluated to get the appropriate results.
Foundations of Research
NOTES
Self-Instructional22 Material
Human Resources (HR) and organizational behaviour is an area whichinvolves basic or fundamental research as a lot of academic, macro levelresearch may be adapted and implemented by organizations into theirpolicies and programmes. Critical success factor analysis and employer branding are some emerging
areas in which HR research is being carried out. The first is a participativeform of management technique, developed by American Organizationaltheorist John F. Rockart (1981) in which the employees of an organizationidentify their critical success factors, and help in customizing and incorporatingthem in developing the mission and vision of their organization. mployerbranding is another area which is being actively investigated as the customerperception (in this case, it is the internal customer, i.e., the employee) aboutthe employer or the employing organization has a strong and direct impacton his intentions to stay or leave. ‘Scientific research is a systematic, controlled and critical investigation of
propositions about various phenomena’, as stated by Fred Kerlinger (1986). On the basis of intent, research can be classified as pure research, applied
research, exploratory research, descriptive research, diagnostic research.However, the classification if research can also be done as per the methodsof study such as fundamental research, applied research, historical research,formulative or exploratory research, experimental research, ex post factoresearch, case study research. Ethical standards are extremely important no matter what be the field of
study. This takes a special meaning in the conduction of research. Rowley(2004) has put it very simply as ‘conducting research ethically is concernedwith respecting privacy and confidentiality, and being transparent in the useof research data. Ethical practices hinge on respect and trust and approachesthat seek to build rather than demolish relationships.’ Research is also an exchange process between various people. The first of
these is the one between the sponsoring client and the investigator. Thusboth parties have an ethical obligation towards the other. In case the studyis being conducted for a business client, complete transparency in terms ofdata gathering and interpreting is a must. The most significant and important ethical concern of a research study is the
issue of trust and confidentiality. At no cost must the researcher reveal anyaspect of the study without the consent of the client. The researcher might also need to guard the reason or purpose of the study.
For example if the client wants to measure a new product potential, thenrevealing the reason for the study might lead to the concept or idea beingadopted and converted into a product prototype by someone else beforethe client is out with the offering.
NOTES
Self-InstructionalMaterial 23
Foundations of Research The researcher should not at any stage, either before or during the datacollection stage, try to pressurize the respondent through persuasive influenceor by forcing him to share information. Professional creed, professional confidentiality, and professional objectivity
are some basic tenets that the researcher must not forego. These are significantnot only for the body of knowledge that the researcher is contributing to butalso for the society in which we exist.
1.7 KEY WORDS
Exploratory Research: It refers to a research used to investigate a problemwhich is not clearly defined. Inferential approach: It refers to a survey research where a sample of
population is studied to determine its characteristics. Hypothesis Testing: It refers to a statistical test used to determine whether
the hypothesis assumed for the sample of data stands true for the entirepopulation or not. Cross-functional research: It refers to a research which is used to examine
one variable in different groups that are similar in all other characteristics. Ex post facto research: It refers to a category of research design in which
the investigation starts after the fact has occurred with interference from theresearcher.
1.8 SELF ASSESSMENT QUESTIONS ANDEXERCISES
Short Answer Questions
1. What are the objectives of research?2. Define quantitative and qualitative approach to research.3. What are the three groups under which research methods are categorized?4. Write a short note on the techniques used in field research.5. Briefly mention about applied research and ex post facto research.6. What is client’s ethical code?
Long Answer Questions
1. Discuss the characteristics and purposes of research.2. Examine the significance of research process.3. Give a detailed account of the research topics involved in financial and
accounting research.
Foundations of Research
NOTES
Self-Instructional24 Material
4. Discuss the different types of research on the basis of intent and as permethods of study.
5. Describe the ethical codes related to respondents.
1.9 FURTHER READINGS
Busha, Charles H. and Stephen P. Harter. 1980. Research Methods inLibrarianship: Techniques and Interpretation. Orlando: Academic Press.
Kumar, Krishan. 1992. Research Methods in Library and Information Science.New Delhi: Har-Anand Publications.
Rao, I.K. Ravichandra. 2009. Quantitative Methods for Library andInformation Science. New Delhi: New Age International Publishers.
Slater, Margaret. 1990. Research Methods in Library and Information Studies.London: Facet Pub.
Fowler, F. J. 2008. Survey Research Methods. New Delhi: SAGE Publications.
NOTES
Self-InstructionalMaterial 25
Library and InformationScience (LIS)UNIT 2 LIBRARY AND
INFORMATIONSCIENCE (LIS)
Structure2.0 Introduction2.1 Objectives2.2 Library and Information Science (LIS) as an Interdisciplinary Subject2.3 Significance of Research in LIS
2.3.1 Definition of Research2.3.2 Objectives of Research
2.4 Areas of Research in Library and Information Science2.5 Answers to Check Your Progress Questions2.6 Summary2.7 Key Words2.8 Self Assessment Questions and Exercises2.9 Further Readings
2.0 INTRODUCTION
Library and Information Science (LIS) as the name implies is the combination oftwo fields, i.e., library and information science. In practice, the term LIS isoccasionally used for an area that is not science (or research, a scholarship or anacademic discipline). In suggestive words, the term library and information scienceresearch may be used to make focus entirely on research. In this unit, you willstudy about LIS as an interdisciplinary subject, the significance of research in LISand the areas of research in Library and Information Science
2.1 OBJECTIVES
After going through this unit, you will be able to: Examine LIS as an interdisciplinary subject Analyse the significance of research in LIS Identify the areas of research in Library and Information Science
2.2 LIBRARY AND INFORMATION SCIENCE (LIS)AS AN INTERDISCIPLINARY SUBJECT
The exploration in LIS in the past was principally considered to give a hypotheticalestablishment to proficient practice. The foundations of research in LIS seemed
Library and InformationScience (LIS)
NOTES
Self-Instructional26 Material
by all accounts not to be not profound. Research in library science in the twentiethcentury in the areas of LIS can be traced back to the Library School of the Universityof Chicago, in mid-1920s.
The credit for the formal organization of the doctoral qualification programmein library science in India goes unquestionably to mathematician and librarian DrS.R. Ranganathan (1892– 1972). In 1951, he began giving library science instructionat the University of Delhi, surmounting numerous challenges. The University ofDelhi granted the degree in library science in 1957 to D.B. Krishan Rao whochipped away at ‘faceted order for agriculture’. Doctoral research stayed in thewild when Ranganathan shook the Delhi soil off his feet in 1955. During the 1970s,a few doctorates on library-related subjects were earned by the library expertsunder the direction and supervision of resources having a place with the orders,for example, humanism, history, law, financial aspects, the executives and so forth.The mantle of restoring and assisting doctoral research offices was expected by J.S. Sharma (1924– 1993), the then college curator and leader of the library sciencebureau of the Panjab University, Chandigarh. Under his direction, the second bylaw Ph.D. in library science was granted in 1977 after two decades. From thatpoint, there was no thinking back. Doctoral research got a fillip during the 1980sand continuous enhancement in offices cleared routes for India to keep up itsThird World administration in library research and library writing. Ph.D. programmesfrom there on mushroomed even in spite of the absence of offices or adherence toprinciples.
2.3 SIGNIFICANCE OF RESEARCH IN LIS
Library and Information Science (LIS) is a very broad discipline, which uses awide range of constantly evolving research strategies and techniques.
Research involves ‘imaginative and orderly work attempted to expand theload of information, including learning of people, culture and society, and theutilization of this load of learning to devise new applications’. It is utilized to buildor affirm certainties, reaffirm the aftereffects of past work, tackle new or existingissues, bolster hypotheses, or lead to new speculations.
An examination venture may likewise be an extension on past works in thefield. Research activities can be utilized to further enhance information on a subject,or in the case of a school enquiry about venture, they can be utilized to facilitate anunderstudy’s examination ability to set them up for future occupations or reports.To test the legitimacy of instruments, methods, or investigations, research mayrepeat components of earlier ventures or the undertaking in general. The mainroles of fundamental research (instead of connected research) are documentation,disclosure, translation, or the innovative work (R&D) of techniques andframeworks for the progression of human learning. Ways to deal with researchrely upon epistemologies, which shift significantly both inside and among humanitiesand sciences.
NOTES
Self-InstructionalMaterial 27
Library and InformationScience (LIS)
In the early 1960s, Library and Information Science (LIS), was defined asa merger of librarianship and information science. LIS can be stated as a domainof both professional operations and scientific enquiry. As an area of application, itincludes the profession of librarianship along with the number of other informationprofessions, all of which presume the role of the following:
• Information content• The community who interacts with the content• Technology used to assist the progress of the entity development,
exchanging data and information, depository, or conversion of thecontent.
LIS research aimed at highlighting the substantial information issues, such asthose of ‘information retrieval, information quality and authenticity, policy for accessand preservation, the health and security applications of data mining’. In the domainof LIS research, fields have also been motivated in its research introduction andthe evolution of methodological tools, techniques and other theoretical perspectivesand on the other side, it has a strong network with qualified professionals.
The corrective ground of LIS, which began in the 1920s, targeted at givinga theoretical base to library field. LIS has developed an imminent link with otherareas in relation to the various subjects of research, especially computer science,communication studies and cognitive sciences.
In the late 1990s, the development of data-based librarianship has come upwith some appreciative ways for research in LIS. The nature of research can bestbe described as combination of several branches of learning. It is being highlyaffected by research designs in fields like management sciences, social andbehavioural context and to a minor range by the theoretical analysis chosen in thehumanistic discipline. The usage of various approaches for deriving the informationon research has been influenced from a special domain i.e., computer science.LIS has come up with its own developed methodological approaches, which canbest be cited by example of bibliometrics. Bibliometrics can be defined as ‘theuse of mathematical and statistical methods to study documents and patterns ofpublication’. It is a native research methodology commonly used especially inscience studies.
The Role of Theory in LIS Research
In order to identify the presence factor of theory in LIS we need to understand theimportance of research and integrity including the characteristics of various fieldsinvolved therein. According to Smiraglia, ‘theory does not exist in a vacuum but ina system that explains the domains of human actions, the phenomena found inthese domains, and the ways in which they are affected’. He believed that theoryemerged by methodically experiences, like in two ways; one is Positivism which isa philosophical theory stating that certain (“positive”) knowledge is based on naturalphenomena and their properties and relations. Verified data (positive facts) received
Library and InformationScience (LIS)
NOTES
Self-Instructional28 Material
from the senses are known as empirical evidence; thus, positivism is based onempiricism, and the other one is Hermeneutics. Hermeneutics is a wider disciplinewhich includes written, verbal and non-verbal communication. Exegesis focusesprimarily upon the word and grammar of texts. Hermeneutic, as a count noun inthe singular, refers to some particular method of interpretation (see, in contrast,double hermeneutic).
A common fact is that theory is always used to plan interpretation inquantitative way and comes out with results in qualitative methods of research.
Some others described theory as ‘a law, a hypothesis, group of hypotheses,proposition, supposition, explanation, model, assumption, conjecture, construct,edifice, structure, opinion, speculation, belief, principle, rule, point of view,generalization, scheme, or idea’. According to Babbie, research is ‘a systematicexplanation for the observed facts and laws that related to a particular aspect oflife’. It is ‘a multiple level component of the research process, comprising a rangeof generalizations that move beyond a descriptive level to a more explanatorylevel’.
We can summarize the definition of theory as ‘a set of interrelated concepts,definitions, and propositions that explains or predicts events or situations byspecifying relations among variables.’
According to the data and facts being collected by scholars, Glazier andGrover, they have come up with a model called ‘circuits of theory’ for theorybuilding in LIS. The purpose of this model is to throw light on the technique ofclassification which has been described previously by some of the authors. Themost important point is that research is influenced by psychological and criticalsocial factors. This helps to explain the connection between the concepts ofresearch, theory, paradigms, and phenomena. Phenomena can be defined as ‘eventsexperienced in the empirical world’.
Now the question arises as to how the researchers conceptualize the linkbetween the phenomena and form a hypotheses and questions related to research.So the answer to this question is simple. Researchers by taking the help of symbols(which means digital or iconic representations, usually by words or pictures) givesexact description to phenomena and symbols. It can be summarized as ‘In thetaxonomy, empirical research begins with the formation of research questions tobe answered about the concepts or hypotheses for testing the concepts within anarrow set of predetermined parameters’.
In Library and Information Science, a study has revealed that there aredifferent stages of theories along with their results in terms of research conductedin LIS. They are as follows:
1. Substantive Theory: It is the first level theory which is defined as ‘aset of propositions which furnish an explanation for an applied area ofinquiry’. This cannot be seen as a theory, in fact, it can be treated as aresearch hypothesis been tested or a subject for research finding.
NOTES
Self-InstructionalMaterial 29
Library and InformationScience (LIS)
2. Formal Theory: A second level described as ‘a set of propositionswhich furnish an explanation for a formal or conceptual area of inquirythat is a discipline’.
3. Grand Theory: It can be defined as ‘a set of theories or generalizationsthat transcend the borders of disciplines to explain relationships amongphenomenon’.
4. Paradigm: The best definition is ‘a framework of basic assumptionswith which perceptions are evaluated and relationships are delineatedand applied to a discipline or profession’.
5. World View: It is the most significant theory described as ‘an individual’saccepted knowledge, including values and assumptions, which providea “filter” for perception of all phenomena’.
The two theories, Substantive and Formal theories are being considered as“middle range” theories in social sciences domain. Hence, in order to distinguishbetween the two of them, it can be said that the way or method being used tostructure generalizations and the potential for explanation and prediction are differentfrom each other.
2.3.1 Definition of Research
As per the content available on social networking sites, research can be defined asa ‘detailed study of a subject in order to discover information or achieve a newunderstanding of it’. Till now no one has been able to present the broad definitionof research in Library and Information Science (LIS). As per some of the agreedterminologies, research in LIS is done ‘to solve the professional obstacles, designtools and techniques which can further help in the analysis of organizations, services,and behaviour, to determine costs and benefits of our services, and most importantly,to establish or develop a body of theory on which to base our practice’.
In this modern era, one of the distinguish features is that our great scholarsand scientists with respect to their different domains have shown their fullcooperation and efforts to find the optimum solution to the biggest problem. Theprocess of research is the oldest, i.e., coming from the ancient stages, which keepson providing the solution to the issues in order to come up with the best scientificmethod. Now, the final picture depicts that by introducing the team researchorganization the level of uncertainty has come to the lowest; thus, also reducingthe chances of failure.
The generalized outcome of these actions is being certified as principles,laws, or truths which makes a great impact on one’s understanding of his workand environment. Research is done in an organized way. It can be further definedas to find out more set of facts, or to create a strong bond between various factsand figures and through the formulation of a preliminary explanation or hypothesiswhich is subjected to an appropriate investigation for validation or disproof and‘The men (researcher) of experiment are like the ant; they only collect and use: the
Library and InformationScience (LIS)
NOTES
Self-Instructional30 Material
researchers resemble spiders, who make cobwebs out of their own substance.But the bee takes a middle course; it gathers its material from the flowers of thegarden and of the field, but transforms and digests it by a power of its own’.Clearly, to be an effective research investigator one must resemble the bee-purposeful, industrious, and imaginatively selective in the assembling of evidence.
The research is always based on objectivity. It is a disciplinary course ofaction because it leaves no place for the subjective. In terms of the research process,the complexity of human beings pursued by them has to be overcome. Reasoning orobservation that is diluted with emotion becomes sophistry or dogma. We shouldkeep in mind that librarianship is always a service, as emotions can be a threat to thesame. The duty of librarian is to perform well and make the best out of it.
2.3.2 Objectives of ResearchThe main aim of research is to find out the hidden facts and figures through thescientific method. In a certain way, research is utilized for obtaining the best answersto the questions. It always comes with the representation of data which has notbeen represented anywhere.
As we are aware that every research study has its own predeterminedpurpose. Hence, some of the common objectives are as follows:
(i) To decide the recurrence with which something happens or withsomething different. (It connects with diagnostic research study).
(ii) It depicts the traits of a particular individual, situation or a group in anaccurate manner.
(iii) To pick up nature with a marvel or to accomplish new bits ofknowledge into it. ( It gives the example of exploratory or formulateresearch study).
(iv) To test the theory of a causal connection between factors (Hypothesis-testing research studies).
Research in Library
Research in librarianship quickly implies the accumulation and investigation of uniqueinformation on an issue of librarianship, done inside the library schools as indicatedby logical and insightful gauges. Research in this association comprehensivelyincorporates examination; contemplation; overview; scholastic works; and in reallife investigate by rehearsing custodians; data personnels; and document lists.
Importance of research in Library and Information Science has been statesas follows:
1. The fundamental motivation behind training is to prepare the students orindividuals to gain exposure at the beginning phase of professional training.An extensive preparation in the form of advanced learning leads toeffective and productive specialization in the areas of scholasticlibrarianship, extraordinary librarianship, open libraries, libraryorganization, book reference documentation and data and so forth.
NOTES
Self-InstructionalMaterial 31
Library and InformationScience (LIS)
2. An important significance of research is to be critical in nature. Theprofession requires students who can scrutinize, add to and enhancetheir learning and skill. It involves the basic function and basic ways todeal with librarianship. All the methods, forms, and acts of librarianshipwhich are underestimated at the beginning, such courses ought to be putto critical examination. This kind of basic study empowers the studentsto accomplish and develop an aptitude for research. The learning acquiredin the profession through surveys can be put to use and simple researchon the issues of librarianship can be undertaken. This helps in servingthe basic capacity not for analysis, but rather for the enhancement ofexpert practice.
3. It is the representative capacity. This is an aftereffect of developingpolished skill in library and information science. Since 1930s, expansionof library profession is in progress and the profession started to seemore noteworthy avenues of administration opening before it. The arrivalof an era where we manage PCs, online administrations and complexitiesof data innovation— all these improvements in information technologyhave impacted library and information science. To adapt up to this ever– expanding multi-dimensional learning, we need to keep ourselvesprepared and this requires research in the field of Library and InformationScience.
2.4 AREAS OF RESEARCH IN LIBRARY ANDINFORMATION SCIENCE
Library and Information Science focuses on how individuals or organizations search,use and gain access to information. Also, conditions are studied at the micro andmacro level and include aspects of social strategy and/or informational policy.
Three main areas of research are the following:(i) Information Use/Information Behaviour(ii) Digitalization and Digital Libraries(iii) Libraries, Cultural Policy and Information Policy
Research Methods in Library and Information Science
Let us study the various research methods applied in Library and InformationScience briefly here.
1. Historical Method: We understand our current environment keeping thehistory of mankind in the backdrop. History is a written methodologicalrecord of mankind’s evolution and development and it paves the way forthe present. History of library and information science is a continuousmethodological recounting of the past events pertaining to the establishment,maintenance and utilization of systematically arranged collection of recorded
Library and InformationScience (LIS)
NOTES
Self-Instructional32 Material
information. Hence, historical method is adopted in the research of thisdiscipline. It also lays the foundation for improvement on the basic of thepast study. It can also help to find out various shortcomings in this field onthe basis of the past record.
2. Survey Method: A survey is a systematic collection of data concerning asystem, its activities, operations, persons involved in the system. Thus, thelibrary survey is defined as a systematic collection of data concerning alibrary— its activities, operations, personnel working in the library and itsusers. This objective of the survey method is to make a specialized type ofinvestigation to improve library services. Hence, library surveys areconducted either to assess an existing situation or to check the library systemor to evaluate the area of librarianship in order to removing the shortcomings.Some of the characteristics of the survey method are the following:
(i) It is specifically worried about public activity such as what is beingwatched, depicted, gathered or a group of certainties about the presentscenario.
(ii) It centres upon the given region or geological zone.(iii) A huge amount of data is gathered from an expansive populace.(iv) The data for the most part gathered through study is precise.
3. Case Study Method: The case study method is a technique in which aninstitution is recognized as a unit of study and various aspects to the unit arestudied deeply. In this method, the emphasis is on principles and processesrather than the transfer of factual information. It represents the real situationdrawn from practice and provides an opportunity to enquire skills in analysingproblem, solving them and taking decisions. This method can be used inlibrary management system analysis, cost benefit analysis, cost effectiveness,library effectiveness, library effectiveness and computer application inlibraries.
4. Delphi Method: The Delphi method is basically a technique of obtainingconsensus among experts on a given problem. A questionnaire is preparedhighlighting the aims and objectives of research. The exact problem is putup to the panel of experts in many rounds till a consensus is achieved. Thebasic theory behind this technique is that consensus achieved will havegreater credibility and authority than only the opinion of the most articulatespokesperson in a group of participating respondents. This method is usedin the formulation of library legislation, policy-making for libraries, curriculumdesign, method of teaching and education, process of decision-making andmanpower planning.
5. Statistical Method: The statistical method is used for aggregative analysisand intensive study of individual unit outside its scope. This method is basedupon quantitative analysis. By using this method, the researcher can studythe problem related to libraries such as budget estimates, library planning,
NOTES
Self-InstructionalMaterial 33
Library and InformationScience (LIS)
assessment of library services, evaluation of library services and libraryforecasting studies.Some well-known examples of survey research that are applicable to libraryand information sciences are the following:
(i) User Study or User Survey: To decide the use of library assets,fulfilment of the customers and their need.
(ii) Community Survey: To know the normal usage of library by thepopulace being served by a library.
Research Strategies in LIS
LIS is an exceptionally expansive order, which utilizes a wide scope of continuallyadvancing examination procedures and methods. Different order plans are createdto break down strategies utilized in LIS. In the ‘investigate record’ segment of theJournal of Education for Library and Information Science, Kim incorporated pastclasses and definitions and presented a rundown of research systems, includinginformation gathering and examination strategies. The listing included four generalresearch strategies:
(i) Theoretical/philosophical inquiry (development of conceptual models orframeworks).
(ii) Bibliographic research (descriptive studies of books and their properties aswell as bibliographies of various kinds).
(iii) R&D (advancement of capacity and recovery frameworks, programming,interface and so forth.).
(iv) Tackling issues and realizing change in associations.Methodologies are then bifurcated into quantitative and qualitative types. Primaryclassification incorporates distinct investigations, prescient/illustrative examinations,bibliometrics, content examination and so forth. Qualitative driven methodologiesare viewed as the contextual investigation, true to life technique, authentic strategy,grounded hypothesis, ethnography, phenomenology, emblematic interactionism/semiotics, sociolinguistics/talk examination/ethnographic semantics/ethnography ofcorrespondence and hermeneutics/interpretive interactionism.
Methodologies incorporated concentrate on specific publication years,geographic territories, journal titles, parts of LIS and explicit attributes, for example,subjects, creation and research strategies. The following are a few discoveriesthat are predictable among all examinations:
• Gathering information, data recovery and library and data benefitexercises are among the most widely recognized subjects examined.
• Descriptive research approaches are dependent on reviews andprevalence of surveys.
• Over the years, there has been a significant increase in the variety ofresearch approaches used to investigate library issues.
Library and InformationScience (LIS)
NOTES
Self-Instructional34 Material
• Data investigation is generally restricted to distinct measurements,including frequencies, means and standard deviations.
Data Collection and Analysis
Strategies for information analysis refer to the procedures utilized by the researchersto investigate information and answer their issues or questions. In qualitativeexamination, information investigation includes distinguishing basic examples ofinformation and understanding the implications of information. Informationinvestigation for quantitative examination includes measurable examination andelucidation of figures and numbers. The variety of data analysis methods includedthe following classes: Descriptive statistics Inferential statistics Qualitative data analysis Experimental evaluation Other methods
Check Your Progress
1. Who is credited for creating the formal organization of the doctoralqualification programme in library science in India?
2. State any one aim of research in LIS.3. Name the various stages of theories in terms of research conducted in LIS.
2.5 ANSWERS TO CHECK YOUR PROGRESSQUESTIONS
1. Dr S.R. Ranganathan, mathematician and librarian, is credited for creatingthe formal organization of the doctoral qualification programme in libraryscience in India.
2. LIS research aimed at highlighting the substantial information issues, suchas these of ‘information retrieval, information quality and authenticity, policyfor access and preservation, the health and security applications of datamining’.
3. The various stages of theories in terms of research conducted in LIS are thefollowing: Substantive Theory Formal Theory Grand Theory Paradigm World View
NOTES
Self-InstructionalMaterial 35
Library and InformationScience (LIS)2.6 SUMMARY
The exploration in LIS in the past was principally considered to give ahypothetical establishment to proficient practice. The credit for the formal organization of the doctoral qualification programme
in library science in India goes unquestionably to mathematician and librarianDr S.R. Ranganathan (1892– 1972). Library and Information Science (LIS) is a very broad discipline, which
uses a wide range of constantly evolving research strategies and techniques. In the early 1960s, Library and Information Science (LIS), was defined as
a merger of librarianship and information science. LIS can be stated as adomain of both professional operations and scientific enquiry. In order to identify the presence factor of theory in LIS we need to understand
the importance of research and integrity including the characteristics of variousfields involved therein. The two theories, Substantive and Formal theories are being considered as
“middle range” theories in social sciences domain. As per the content available on social networking sites, research can be
defined as a ‘detailed study of a subject in order to discover information orachieve a new understanding of it’. The main aim of research is to find out the hidden facts and figures through
the scientific method. In a certain way, research is being utilized for obtainingthe best answers to the questions present. The main aim of research is to find out the hidden facts and figures through
the scientific method. In a certain way, research is being utilized for obtainingthe best answers to the questions present. Research in librarianship quickly implies the accumulation and investigation
of unique information on an issue of librarianship, done inside the libraryschools as indicated by logical and insightful gauges. Library and information science focuses on how individuals or organizations
search, use and gain access to information. A survey is a systematic collection of data concerning a system, its activities,
operations, persons involved in the system. Thecase study method is a technique in which an institution is recognized as
a unit of study and various aspects to the unit are studied deeply. Thestatistical method is used for aggregative analysis and intensive study of
individual unit outside its scope. This method is based upon quantitativeanalysis. Strategies for information analysis refer to the procedures utilized by the
researchers to investigate information and answers their issues or questions.
Library and InformationScience (LIS)
NOTES
Self-Instructional36 Material
2.7 KEY WORDS
Epistemology: It a branch of philosophy that investigates the origin, nature,methods and limits of human knowledge. Bibliometrics: It is the application of statistical methods to the study of
bibliographic data. Hermeneutics: It is the science of interpretation, especially of the scriptures.
2.8 SELF ASSESSMENT QUESTIONS ANDEXERCISES
Short Answer Questions
1. Write a short note on Library and Information Science (LIS) as aninterdisciplinary subject.
2. What is the role of theory in LIS research?3. Define research in your own words.4. What are the research methods in Library and Information Science (LIS)?
Long Answer Questions
1. Analyse the significance of research in Library and Information Science(LIS).
2. Discuss the objectives of research.3. Examine the areas of research in Library and Information Science (LIS).4. Explain the research strategies in Library and Information Science (LIS).
2.9 FURTHER READINGS
Busha, Charles H. and Stephen P. Harter. 1980. Research Methods inLibrarianship: Techniques and Interpretation. Orlando: Academic Press.
Kumar, Krishan. 1992. Research Methods in Library and Information Science.New Delhi: Har-Anand Publications.
Rao, I.K. Ravichandra. 2009. Quantitative Methods for Library andInformation Science. New Delhi: New Age International Publishers.
Slater, Margaret. 1990. Research Methods in Library and Information Studies.London: Facet Pub.
Fowler, F. J. 2008. Survey Research Methods. New Delhi: SAGE Publications.
NOTES
Self-InstructionalMaterial 37
Scientific Method
UNIT 3 SCIENTIFIC METHOD
Structure3.0 Introduction3.1 Objectives3.2 Understanding Scientific Method of Research
3.2.1 Nature of Research in Library and Information Science3.3 Answers to Check Your Progress Questions3.4 Summary3.5 Key Words3.6 Self Assessment Questions and Exercises3.7 Further Readings
3.0 INTRODUCTION
In this unit, we will discuss the scientific method of research in reference to researchin library and information sciences. The objective of any research is to find answersto questions through the application of scientific procedures. Thus, we can saythat scientific research is a systematic and objective way of seeking answers tocertain questions that require inquiry and insight or that have been raised on aparticular topic. We have briefly spoken about the scientific method in the firstunit. Here, we will explore the concept of scientific research as well as the natureof research in library and information science.
3.1 OBJECTIVES
After going through this unit, you will be able to: Discuss the scientific method of research Describe the nature of research in Library and Information Science
3.2 UNDERSTANDING SCIENTIFIC METHOD OFRESEARCH
The scientific method encourages doubts and criticism so that what emerges is thereal evidence which has stood the test of reasoning. It makes science progressiveas it is never too sure about its results. A unique characteristic possessed by thismethod is self-correction. A scientist does not believe any proposition withouttesting it. He has a number of built-in checks all along the way to enable him toadhere to the right path and arrive at the ‘truth’. Such checks are free from personalbeliefs, attitudes and values.
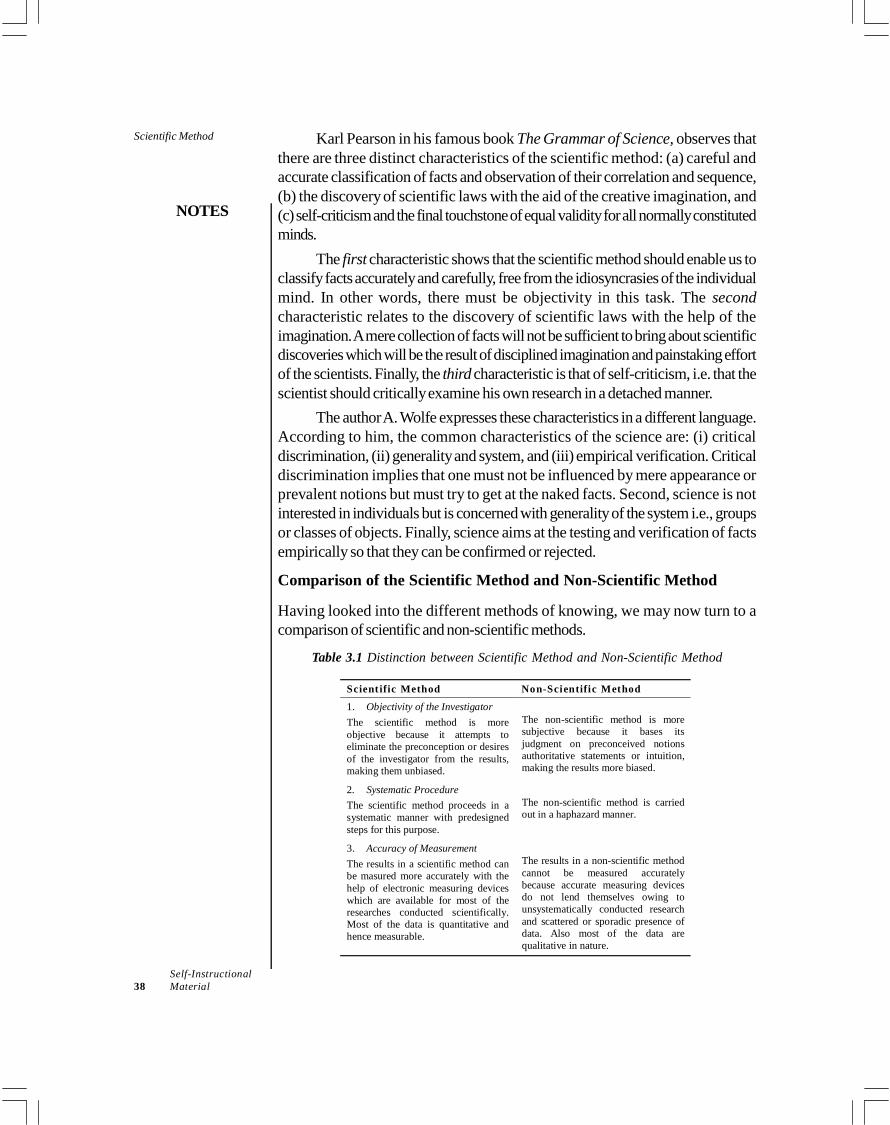
Scientific Method
NOTES
Self-Instructional38 Material
Karl Pearson in his famous book The Grammar of Science, observes thatthere are three distinct characteristics of the scientific method: (a) careful andaccurate classification of facts and observation of their correlation and sequence,(b) the discovery of scientific laws with the aid of the creative imagination, and(c) self-criticism and the final touchstone of equal validity for all normally constitutedminds.
The first characteristic shows that the scientific method should enable us toclassify facts accurately and carefully, free from the idiosyncrasies of the individualmind. In other words, there must be objectivity in this task. The secondcharacteristic relates to the discovery of scientific laws with the help of theimagination. A mere collection of facts will not be sufficient to bring about scientificdiscoveries which will be the result of disciplined imagination and painstaking effortof the scientists. Finally, the third characteristic is that of self-criticism, i.e. that thescientist should critically examine his own research in a detached manner.
The author A. Wolfe expresses these characteristics in a different language.According to him, the common characteristics of the science are: (i) criticaldiscrimination, (ii) generality and system, and (iii) empirical verification. Criticaldiscrimination implies that one must not be influenced by mere appearance orprevalent notions but must try to get at the naked facts. Second, science is notinterested in individuals but is concerned with generality of the system i.e., groupsor classes of objects. Finally, science aims at the testing and verification of factsempirically so that they can be confirmed or rejected.
Comparison of the Scientific Method and Non-Scientific Method
Having looked into the different methods of knowing, we may now turn to acomparison of scientific and non-scientific methods.
Table 3.1 Distinction between Scientific Method and Non-Scientific Method
Scient ific Method Non-Scientific Method1. Objectivity of the InvestigatorThe scientific method is moreobjective because it attempts toeliminate the preconception or desiresof the investigator from the results,making them unbiased.
The non-scientific method is moresubjective because it bases itsjudgment on preconceived notionsauthoritative statements or intuition,making the results more biased.
2. Systematic ProcedureThe scientific method proceeds in asystematic manner with predesignedsteps for this purpose.
The non-scientific method is carriedout in a haphazard manner.
3. Accuracy of MeasurementThe results in a scientific method canbe masured more accurately with thehelp of electronic measuring deviceswhich are available for most of theresearches conducted scientifically.Most of the data is quantitative andhence measurable.
The results in a non-scientific methodcannot be measured accuratelybecause accurate measuring devicesdo not lend themselves owing tounsystematically conducted researchand scattered or sporadic presence ofdata. Also most of the data arequalitative in nature.
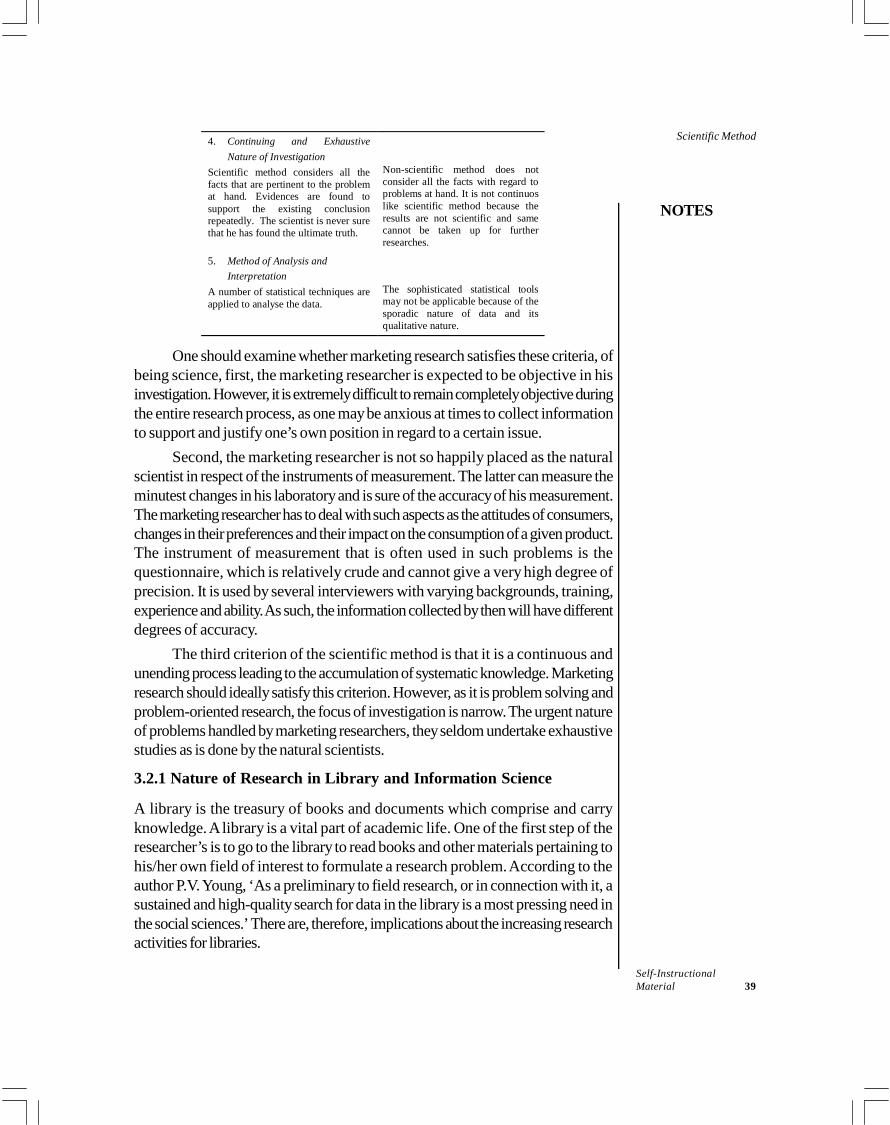
NOTES
Self-InstructionalMaterial 39
Scientific Method4. Continuing and ExhaustiveNature of Investigation
Scientific method considers all thefacts that are pertinent to the problemat hand. Evidences are found tosupport the existing conclusionrepeatedly. The scientist is never surethat he has found the ultimate truth.
Non-scientific method does notconsider all the facts with regard toproblems at hand. It is not continuoslike scientific method because theresults are not scientific and samecannot be taken up for furtherresearches.
5. Method of Analysis andInterpretation
A number of statistical techniques areapplied to analyse the data.
The sophisticated statistical toolsmay not be applicable because of thesporadic nature of data and itsqualitative nature.
One should examine whether marketing research satisfies these criteria, ofbeing science, first, the marketing researcher is expected to be objective in hisinvestigation. However, it is extremely difficult to remain completely objective duringthe entire research process, as one may be anxious at times to collect informationto support and justify one’s own position in regard to a certain issue.
Second, the marketing researcher is not so happily placed as the naturalscientist in respect of the instruments of measurement. The latter can measure theminutest changes in his laboratory and is sure of the accuracy of his measurement.The marketing researcher has to deal with such aspects as the attitudes of consumers,changes in their preferences and their impact on the consumption of a given product.The instrument of measurement that is often used in such problems is thequestionnaire, which is relatively crude and cannot give a very high degree ofprecision. It is used by several interviewers with varying backgrounds, training,experience and ability. As such, the information collected by then will have differentdegrees of accuracy.
The third criterion of the scientific method is that it is a continuous andunending process leading to the accumulation of systematic knowledge. Marketingresearch should ideally satisfy this criterion. However, as it is problem solving andproblem-oriented research, the focus of investigation is narrow. The urgent natureof problems handled by marketing researchers, they seldom undertake exhaustivestudies as is done by the natural scientists.
3.2.1 Nature of Research in Library and Information Science
A library is the treasury of books and documents which comprise and carryknowledge. A library is a vital part of academic life. One of the first step of theresearcher’s is to go to the library to read books and other materials pertaining tohis/her own field of interest to formulate a research problem. According to theauthor P.V. Young, ‘As a preliminary to field research, or in connection with it, asustained and high-quality search for data in the library is a most pressing need inthe social sciences.’ There are, therefore, implications about the increasing researchactivities for libraries.
Scientific Method
NOTES
Self-Instructional40 Material
The research workers visit libraries for their information needs. It is theresponsibility of the librarian to give them the necessary information as quickly andexhaustively as possible. Thus, it is important for librarians to know in detail, theirinformation requirements and hence to know reasons for conducting research,how they arrive at generalizations and generate new knowledge. This is why studentsof library and information science need to know the process of research. A studentof library science who has such knowledge will be better equipped to serve thescientist and other research workers.
Scientific research in librarianship is a cautious process through whichlibrarians can acquire more accurate knowledge and comprehension of librariesand librarianship. Knowledge about the different facets of library and Informationscience can be attained by asking questions, thinking of possible answers andtesting the possibilities by means of careful inquiry. In particular, a researcher inlibrary and information science must have a clear understanding of the user’sbehaviour, nature and demand of the clientele, size and nature of the library, typesof collection it possess and above all the type storage and extent of continuousadvancement taking place in information technology. The researcher in informationscience runs the risk of being out-dated if he/she is not dynamic enough to keeptrack of these fast developments. A more careful and concerned researcher on theother hand may bring in inestimable benefits to a developing country like India ifhe/she succeeds in laying hands on the most suitable technology for the taming ofso many otherwise intractable problems of under development.
Check Your Progress
1. What is the first characteristic of the scientific method according to KarlPearson?
2. In conducting a research, what is the first step a researcher undertakes?
3.3 ANSWERS TO CHECK YOUR PROGRESSQUESTIONS
1. According to Karl Pearson, the first characteristic of the scientific methodshows that the scientific method should enable us to classify facts accuratelyand carefully, free from the idiosyncrasies of the individual mind.
2. One of the first step of the researcher’s is to go to the library to read booksand other materials pertaining to his/her own field of interest to formulate aresearch problem.
3.4 SUMMARY
The scientific method encourages doubts and criticism so that what emergesis the real evidence which has stood the test of reasoning.
NOTES
Self-InstructionalMaterial 41
Scientific Method A unique characteristic possessed by this method is self-correction. A scientistdoes not believe any proposition without testing it. He has a number ofbuilt-in checks all along the way to enable him to adhere to the right pathand arrive at the ‘truth’. The common characteristics of the science are: (i) critical discrimination,
(ii) generality and system, and (iii) empirical verification. A library is the treasury of books and documents which comprise and carry
knowledge. A library is a vital part of academic life. The research workers visit libraries for their information needs. It is the
responsibility of the librarian to give them the necessary information as quicklyand exhaustively as possible. Scientific research in librarianship is a cautious process through which
librarians can acquire more accurate knowledge and comprehension oflibraries and librarianship. The researcher in information science runs the risk of being out-dated if he/
she is not dynamic enough to keep track of fast developments in the field.
3.5 KEY WORDS
Empirical Verification: It refers to the use of empirical data, observation,test, or experiment to confirm the truth or rational justification of a hypothesis.Scientific beliefs must be evaluated and supported by empirical data. Marketing Research: It refers to the systematic collection, analysis, and
interpretation of data pertaining to the marketing conditions.
3.6 SELF ASSESSMENT QUESTIONS ANDEXERCISES
Short Answer Questions
1. Define scientific research.2. Differentiate between scientific and non-scientific research.
Long Answer Questions
1. Discuss the characteristics of scientific research.2. Describe the nature of research in library and information science.
Scientific Method
NOTES
Self-Instructional42 Material
3.7 FURTHER READINGS
Baker, S L. and Lancaster, S.W. 1991. Measurement and Evaluation of LibraryServices, 2nd Ed. Arlinglon: Information Resources Press.
Carpenter, R.L. and Vasu, E.S. 1979. Statistical Methods for Librarian. Chicago:ALA.
Donohue, J C. 1990. Understanding Scientific Literature: A BibliometricApproach. London: MIT.
Egghe, L., and Rousseau, R. 1990. Introduction to Informetrics: QuantitativeMethods in Library, Documentation and Information Science.Amsterdam: Elsevier.
Egghe, L. and Rousseau, R. 2001. Elementary Statistics for Effective Libraryand Information Services Management. London: ASLIB.
Nicholas D. and Ritchil, M. 1979. Literature and Bibliometrics. London: CliveBingley.
NOTES
Self-InstructionalMaterial 43
Research Methods
UNIT 4 RESEARCH METHODS
Structure4.0 Introduction4.1 Objectives4.2 Definition4.3 Research Methods and its Advantages and Limitations
4.3.1 Survey4.3.2 Case Study4.3.3 Census4.3.4 Experimental Research4.3.5 Focused Groups
4.4 Answers to Check Your Progress Questions4.5 Summary4.6 Key Words4.7 Self Assessment Questions and Exercises4.8 Further Readings
4.0 INTRODUCTION
Research methods are basically strategies, techniques, and processes which areapplied in the collection of data for analysis so as to find out new information orcreate better understanding of a topic. Using research methods gives a betterunderstanding to the area of study. Different research methods are used for differentstudies. Though the methods are different but these are closely related to eachother. Choosing a research method depends on the research goal, on the subjects.While choosing one research method over other, one needs to consider factorslike time for data collection and analysis of data.
In this unit, you will study about the definition and sources of research. Theunit goes on discussing different research methods like survey, case study,experimental research, census, focus groups etc. Besides, you will also get tostudy about the merits and demerits of the respective research methods.
4.1 OBJECTIVES
After going through this unit, you will be able to: Discuss the different definitions of research methods Understand the characteristics and features of different research methods
like survey, experimental research, case study, focus groups, census etc. Describe the advantages and limitations of the research methods
Research Methods
NOTES
Self-Instructional44 Material
4.2 DEFINITION
The term ‘research methods’ generally refers to the plan or approach that a weresearcher has in order to gather data or information.
Sources of Research
There are primary two sources of research. These are primary and secondarysources of research. Primary resources contain first-hand information, meaningthat one is reading the author’s own account on a specific topic or event that theyhave participated in. Some examples of primary resources include scholarly researcharticles, books, and diaries. On the other hand, secondary sources describe,summarize, or discuss information or details originally presented in another source.Examples of secondary research include publications such as textbooks, magazinearticles, book reviews, commentaries, encyclopaedias, almanacs, and so on.
4.3 RESEARCH METHODS AND ITSADVANTAGES AND LIMITATIONS
A research method refers to the specific tools or ways which are used to collectand analyse data, such as survey, questionnaire, case study, interview etc. Let usstudy the various methods of research in detail.
4.3.1 Survey
Survey is an important tool in research. No research can be performed without asurvey. Survey can be defined in various ways. Some of the common definitionsof survey are as follows: To view with a scrutinizing eye; to examine To inspect, or take a view of; to view with attention, as from a high place;
to overlook; as to stand on a hill and survey the surrounding country To determine the form, extent, position, and so on, of as a tract of land, a
coast, harbour, or the like, by means of linear and angular measurements,and the application of the principles of geometry and trigonometry; as tosurvey land or a coast A particular view; an examination, especially an official examination, of all
the parts or particulars of a thing, with a design to ascertain the condition,quantity, or quality; as a survey of the stores of a ship; a survey of roads andbridges; a survey of buildings To examine with reference to condition, situation, value, and so on to examine
and ascertain the state of; as to survey a building in order to determine itsvalue and exposure to loss by fire
NOTES
Self-InstructionalMaterial 45
Research MethodsTypes of Survey
There are basically two types of surveys:(i) Descriptive: These surveys generally collect information on what people
think and do.(ii) Analytic: These surveys are generally used to either test hypotheses or to
answer particular research questions.While the most common method of collecting survey data is the ‘questionnaire’,the means by which you gather the information that goes into the survey responsesmay vary. If the survey makes use of a questionnaire, the measuring instrumentsmust have demonstrability, reliability and validity, especially with regard to sampling,questioning and mode of questioning.
Some examples of collecting survey data include self-administered postedquestionnaires, web-based forms, telephonic question and answer interviews orface-to-face interviews. There are advantages and disadvantages of each approach,primarily to do with sample size and open versus closed questions. In order tomake a judgement, the key areas for consideration include the cost, co-ordination,size of the sample, rate of return, nature and quality of the data obtained, and theability to clarify questions or responses. The success of using surveys dependsstrongly on the design of appropriate body of questions and the skill of theinterviewer.
Other important methods of collecting survey data are Interview, Observationand Case Study. All these methods have been discussed in detail later.
Stages in Survey Method
Surveys go through the following seven stages:
(i) Planning and designing the survey
In this stage, you must define the goals and objectives of your survey. You shouldwrite down the outline of your research and also establish a budget for the project.You are also required to plan your schedule, define the population and estimatethe required sample size. The method of data collection and the method fordetermination of the results should also be decided at this stage. Finally, you mustwrite down the questions and design and pretest the questionnaire.
(ii) Collecting data
In this stage, first you have to decide on the survey method that will suit yourresearch needs. There is no best method of collection of data and you must gatherthe required data keeping your resources in mind. You must also decide whatsteps to take in case sufficient data is not collected from the respondents.
Research Methods
NOTES
Self-Instructional46 Material
(iii) Accessing data
The only purpose of this stage is to transfer the data into the analytical software forprocessing it further.
(iv) Preparing and managing data
The main aim of this stage is to get the data ready for analysis. In this step, you arerequired to formulate a ‘codebook’. This codebook must include variable names,variable formats and descriptive variable labels. You should also set up multipleitem indices and scales, i.e., multiple variables that have exactly the same answerset. In this step, you should transform your data, which will help to get the data inthe form and structure required for analysis. Also, the missing data values shouldbe replaced with estimates so that better summary statistics are obtained.
(v) Analysing data
In this stage, you take out all the useful information that you require from the datathat you have collected. This helps you make informed decisions.
(vi) Reporting
After analysing the data, the results need to be reported. The main aim of reportingis to produce results from the data analysis which can be easily understood byothers who can use this information.
(vii) Deployment
You must tailor your results according to the needs of the target audience. This willensure the effectiveness of the results.
4.3.2 Case Study
We explore and analyse the life of a social entity, whether it be a family, a person, aninstitution or a community, with the help of a case study. The purpose of case studymethod is to identify the factors and reasons that account for particular behaviourpatterns of a sample chapter and its association with other social or environmentalfactors. Generally, social researchers use the case study method to understand thecomplex social phenomenon and to identify the factors related to this phenomenon.The case study provides the clues and ideas to a researcher for further researchstudy. By adopting the case study method, a researcher gets to know abouthappenings in the past, which could be related to the research studies and analysethe problem with better perspectives.
Assumptions of the case study method
The assumptions made in a case study method are as follows: Case study depends on the imagination of the investigator who is analysing
the case study. The investigator makes up his procedure as he goes along.
NOTES
Self-InstructionalMaterial 47
Research Methods History related to the case is complete and as coherent as it could be. It is advisable to supplement the case data by observational, statistical and
historical data, since these provide standards for assessing the reliabilityand consistency of the case material. Efforts should be made to ascertain the reliability of life history data by
examining the internal consistency of the material. A judicious combination of data collection techniques is a prerequisite for
securing data that is culturally meaningful and scientifically significant.
Advantages and Disadvantages of Case Study Method
Case study ensures several advantages to the researcher for his research work.The key advantages of the case study method are as follows: Provides the basis for understanding complex social phenomenon and all
related factors affecting the social phenomenon. Provides clues and ideas for exploratory research. When the researcher is
not able to get a fair idea about the research, past happenings mentioned ina case study help the researcher get clues and ideas. Case study helps in generating objectives for exploratory research. It suggests the new courses of inquiry. Case study helps in formulating research hypothesis.
Some important disadvantages of case study method are as follows: Reliability: Data collected through case study may not be reliable or it can
be difficult to verify the reliability of data in the current scenario. Adequacy: Data collected through case studies may not be adequate for
research work as data is not pertinent to the research conditions. Representative: Data presented by case studies represents the happenings
with unknown circumstances to a researcher. Hence, it cannot be the truerepresentation of events to a researcher.
Making Case Study Effective
The criteria for evaluating the adequacy of case history is of central importance forcase study. American psychologist and social scientist John Dollard has proposedseven criteria for evaluating such adequacy. They are as follows:
(i) The subject must be viewed as a specimen in the cultural series, i.e., thecase drawn out from its total context for the purpose of study must beconsidered as a member of the particular cultural group or community. Thescrutiny of life histories of people must be done with a view to identifycommunity values, standards and their shared way of life.
(ii) The organic motto of action must be socially relevant, i.e., the action ofindividual cases must be viewed as a series of reactions to social stimuli or
Research Methods
NOTES
Self-Instructional48 Material
situations. In other words, the social meaning of behaviour must be takeninto consideration.
(iii) The strategic role of the family group in transmitting the culture must berecognized, i.e., in case of the individual being the member of a family inshaping his behaviour must never be overlooked.
(iv) The specific method of elaboration of organic material onto social behaviourmust be clearly shown, i.e., the case history that portrays in detail howbasically a biological organism, the man, gradually blossoms forth into asocial person, is especially fruitful.
(v) The continuous related character of experience for childhood throughadulthood must be stressed. In other words, the life history must be aconfiguration depicting the interrelationships between the persons with variousexperiences.
(vi) The social situation must be carefully and continuously specified as a factor.One of the important criteria for the life history is that a person’s life must beshown as unfolding itself in the context of and partly owing to specific socialsituations.
(vii) The life history material itself must be organized according to some conceptualframework. This, in turn, would facilitate generalizations at a higher level.
Case study as a method of business research
A detailed case study helps the researcher identify the reasons behind business-related problems. As it can be possible that particular incident has happened inpast, so the current issues can be sorted out by referring to the same case. In-depth analysis of selected cases is of particular value to business research when acomplex set of variables may be at work in generating observed results and intensivestudy is needed to unravel the complexities. The exploratory investigator shouldhave an active curiosity and willingness to deviate from the initial plan, when thefinding suggests a new course of enquiry, which might prove more productive.With the help of case study method, the risk can be minimized in any decision-making process.
4.3.3 Census
Census Survey: Census survey means gathering pertinent information about allthe units of population, viz., people, institutions, householders, and so on. As youknow, population may consist of persons, institutions, objects, attributes, qualities,families among others. A population is a well defined group of many of these. Forinstance, the Census Survey of India, which takes place once in ten years, gathersbenchmark data about each and every household of India. Since it concentrateson each and every household, it restricts its scope to certain surface leveldemographic data such as age, sex, income, education, lands possessed, cattle,nature of house, domestic facilities available, and so on. The studies are conducted
NOTES
Self-InstructionalMaterial 49
Research Methodsthrough a quick survey in a stipulated period. However, coverage of units is veryexhaustive. The census survey as a method of research in education can beemployed to understand educational problems and make policy decisions.Strength of Census Survey: The strength of the census survey is associated withgeneralized characteristics of data. Description of population data acts as a majorsource of identifying several pertinent issues and questions for research. It is veryuseful in making a trend analysis of different events. Moreover, hard databasesystem of the entire population is very useful in the development of strategic planningand policy-making of education at the micro level as well as at the macro level.Limitations of Census Survey: As discussed, each and every unit of populationis covered under the census survey. However, data is gathered only under limitedheadings. Also, this data is only surface level information. Through a census survey,one can gather nominal data. Thus, the researcher cannot ask questions in depth.
Many times, such data is gathered mechanically where the investigators arenot well trained about cross examining the evidence at the field level. In suchcases, the probability of getting valid data is also minimized. Census surveys involveemployment of huge manpower and monetary resources. This method is also timeconsuming. Getting each respondent to cooperate for data collection is very difficult.Hence, the feasibility of conducting census studies is very limited. Moreover, becauseof sample surveys, many questions can be well answered by saving time, moneyand human resources; hence, one may look for census studies with limited focusof research.
4.3.4 Experimental ResearchExperimental research refers to the research activity wherein the manipulation ofvariables takes place and the resultant effect on other variables is studied. It providesa logical and structured basis for answering questions. The experimental researchersmanipulate the environment, stimuli or applications and observe the impact of thismanipulation on the condition or behaviour of the subject. The manipulation that theyundertake is deliberate and systematic.
Experimentation is the testing of hypotheses. Once the experimenters havedefined a situation or issue, they formulate a preliminary solution or hypothesis.They then apply their observations of the controlled variable relationships in order totest, and then confirm or reject the hypothesis.
Experimentation is the classic method of experimenting in a science laboratorywhere elements are manipulated and effects observed can be controlled. It is themost sophisticated, exacting and powerful method for discovering and developingan organized body of knowledge.
According to J. W. Best, (Butler University, Emeritus),Experimental researchis the description and analysis of what will be or what will occur under carefullycontrolled conditions.
Research Methods
NOTES
Self-Instructional50 Material
Characteristics of Experimental Research
Experimental research is based on highly rigorous procedures, and aims at producingreliable and valid conclusions. By looking at the various designs and proceduresused, one can formulate some essential characteristics of experimental researchwhich distinguish it from other types of research methods like survey and historical. Pre-Experimental Statistical Equivalence of Subjects in Different
Groups: This pre-condition is achieved by random selection and assignmentof subjects to different groups. This procedure is essential to meet the threatof selection differences to the internal validity of the results. Use of at least Two Groups or Conditions that can be Compared:
An experiment cannot be conducted with one group of subjects or one conditionat a time. The intent of the experimenter is to compare the effect of onecondition on one group with the effect of a different condition on anotherequivalent group. An experiment may take the shape of a comparison of theeffect of one condition on a group of subjects and the effect of anothercondition on the same group. Manipulation of the Independent Variable: It is perhaps the most distinct
feature of experimental research. Manipulation stands for the process ofassignment of different values or magnitudes or conditions or levels of theindependent variable to different groups. Measurement of Dependent Variable in Quantifiable Form:
This distinguishes experimental research from descriptive, qualitative oranalytical research. Use of Inferential Statistics: This is done to make probability statements
about the results, and, thus, meet the requirements of imperfect measurementson which the behavioural sciences base their generalization. Control of Extraneous Variables: Though applicable to any other type of
research, control of extraneous variables is the sine qua non of trueexperimental designs and the experimenter makes a determined effort toachieve it. It helps the experimenter to eliminate the possibility of any otherplausible rival hypothesis claiming to explain the result.
Steps in Experimental Research
The steps in experimental research are as follows:(i) Survey of the Literature Relating to the Problem: In experimentation,
the researcher needs to acquire up-to-date information relating to the problem.(ii) Selection and Definition of the Problem: It needs a rigorous logical analysis
and definition of the problem in precise terms. The variables to be studied aredefined in operational terms clearly and unambiguously. It helps the researcherto convert the problem into a hypothesis that can be verified or refuted by theexperimental data.
NOTES
Self-InstructionalMaterial 51
Research Methods(iii) Statement of Hypotheses: Hypotheses are the heart of experimentalresearch. They suggest that an antecedent condition or phenomenon is relatedto the occurrence of another condition, phenomenon, event or effect. To testa hypothesis, the researcher attempts to control all the conditions except theindependent variable. Therefore, he should give sufficient attention to theformulation of hypotheses. The experimental plant and statistical procedureshelp him in the testing of hypotheses and contribute little in the developmentof theories or advancement of knowledge. However, the hypotheses developedor derived from existing theories contribute to the development of new theoriesand knowledge.
(iv) Construction of Experimental Plan: Experimental plan refers to theconceptual framework within which the experiment is to be conducted.According to well-known theorist Van Dalen, an experimental plan representsall elements, conditions, phenomena and relations of consequences so as to: Identify the non-experimental variables. Identify the most appropriate research design. Identify a sample of subjects that will suitably represent the target
population, form groups of these subjects and decide on the experimentswhich will be conducted on each group. Choose or develop an instrument that can be deployed to measure the
results of the experiment. Lay out the data collection process and conduct a pilot study to test
the instrument and the research design and state the hypotheses.
Variables
A variable is any feature or aspect of an event, function or process that, with itspresence and nature, affects some other event or process which is being studied.According to Professor Fred N. Kerlinger, Variable is a property that takes ondifferent value.
Types of Variables
The various types of variables are as follows: Independent Variables: These are conditions or characteristics that are
manipulated by the researcher in order to identify their relationship to observedphenomena. In the field of educational research, for instance, a specificteaching method or a variety of teaching material are types of independentvariables.The two kinds of independent variables are as follows:
(i) Treatment Variables: These are variables which can be manipulatedby the researcher and to which he assigns subjects.
(ii) Organism or Attribute Variables: These are factors, such as age, sex,race, religion, and so on, which cannot be manipulated.
Research Methods
NOTES
Self-Instructional52 Material
Dependent Variables: Dependent variables represent characteristics thatalter, appear or vanish as a consequence of introduction, change or removalof independent variables. The dependent variable may be a test score orachievement of a student in a test, the number of errors or measured speed inperforming a task. Confounding Variables:A confounding variable is one which is not the subject
of the study but is statistically related with the independent variable.Hence, changes in the confounding variable track the changes in theindependent variable. This creates a situation wherein subjects in a particularcondition differ unintentionally from subjects in another condition. This is nota good result for the experiment which is attempting to create a situationwherein there is no difference between conditions other than the differencein the independent variable. This phenomenon enables us to conclude that themanipulation undertaken directly causes differences in the dependent variable.However, if there is another variable besides the independent variable that isalso changing, then the confounding variable is the likely cause of thedifference. An example of a common confounding variable is that when theresearcher has not randomly assigned participants to groups, and someindividual difference such as ability, confidence, shyness, height, looks, andso on, acts as a confounding variable. For instance, any experiment thatinvolves both men and women is naturally afflicted with confounding variables,one of the most apparent being that males and females operate under diversesocial environments. This should not be confused to mean that gendercomparison studies have no value, or that other studies in which randomassignment is not employed have no value; it only means that the researchermust apply more caution in interpreting the results and drawing conclusions.Let us consider an instance wherein an educational psychologist is keen to
measure how effective is a new learning strategy that he has developed. He assignsstudents randomly to two groups and each of the students study materials on aspecific topic for a defined time period. One group deploys the new strategy that thepsychologist has developed, while the other uses any strategy that they prefer.Subsequently, each participant takes a test on the materials. One of the obviousconfounding variables in this study would be advance knowledge of the topic of thestudy. This variable will affect the test results, no matter which strategy is used.Because of an extraneous variable of this nature, there will be a level of inconsistencywithin and between the groups. It would obviously be the preferred situation if allstudents had the exact same level of pre-knowledge. In any event, the experimenter,by randomly assigning the groups, has already taken an important step to ensure thelikelihood that the extraneous variable will equivalently affect the two groups.
Let us imagine an experiment being undertaken to measure the effect thatnoise has on concentration. Assume that there are 50 subjects each in quiet andnoisy environments. Table 4.1 below illustrates the ideal or perfect version of thisexperiment. ‘IV’ and ‘EV’ represent the independent variable and external variables,respectively. Note that (as shown in the table) the only difference between the twoconditions is the IV, which indicates that the noise level varies from low to high in
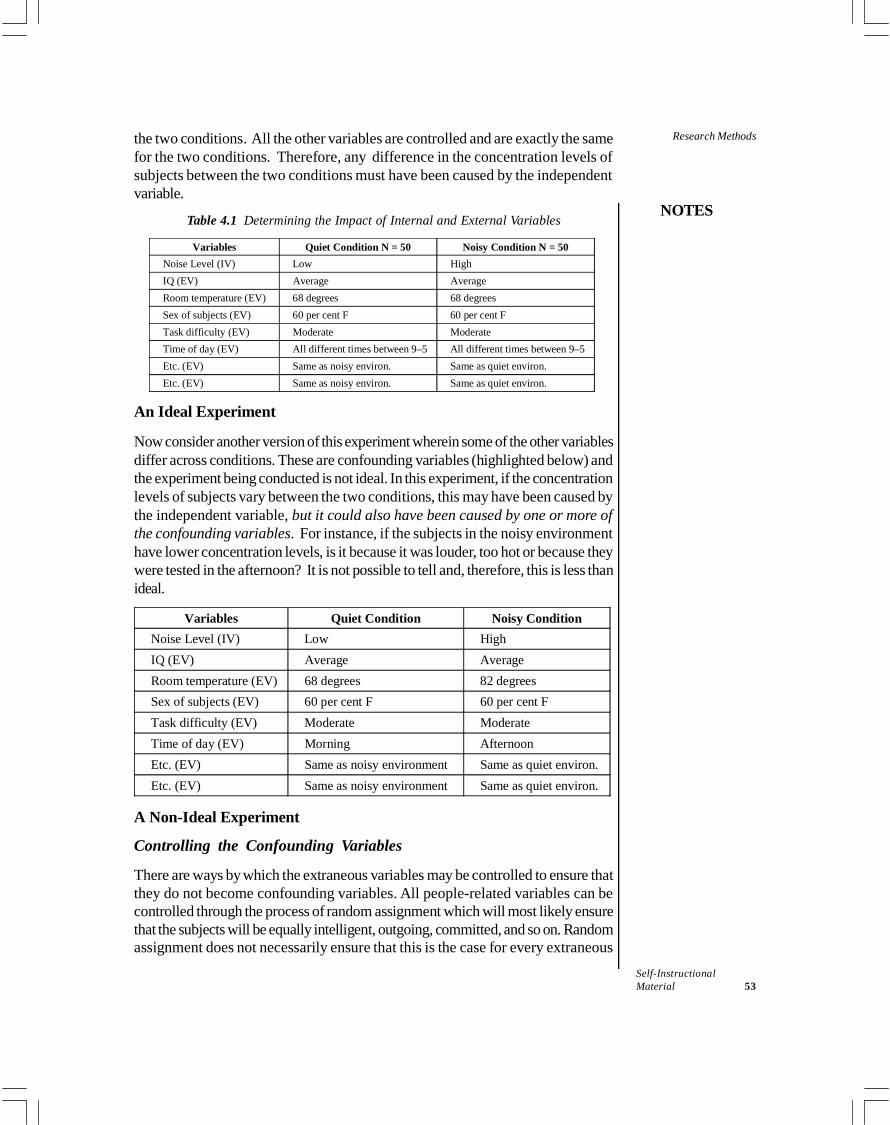
NOTES
Self-InstructionalMaterial 53
Research Methodsthe two conditions. All the other variables are controlled and are exactly the samefor the two conditions. Therefore, any difference in the concentration levels ofsubjects between the two conditions must have been caused by the independentvariable.
Table 4.1 Determining the Impact of Internal and External Variables
Variables Quiet Condition N = 50 Noisy Condition N = 50Noise Level (IV) Low HighIQ (EV) Average AverageRoom temperature (EV) 68 degrees 68 degreesSex of subjects (EV) 60 per cent F 60 per cent FTask difficulty (EV) Moderate ModerateTime of day (EV) All different times between 9–5 All different times between 9–5Etc. (EV) Same as noisy environ. Same as quiet environ.Etc. (EV) Same as noisy environ. Same as quiet environ.
An Ideal Experiment
Now consider another version of this experiment wherein some of the other variablesdiffer across conditions. These are confounding variables (highlighted below) andthe experiment being conducted is not ideal. In this experiment, if the concentrationlevels of subjects vary between the two conditions, this may have been caused bythe independent variable, but it could also have been caused by one or more ofthe confounding variables. For instance, if the subjects in the noisy environmenthave lower concentration levels, is it because it was louder, too hot or because theywere tested in the afternoon? It is not possible to tell and, therefore, this is less thanideal.
Variables Quiet Condition Noisy ConditionNoise Level (IV) Low HighIQ (EV) Average AverageRoom temperature (EV) 68 degrees 82 degreesSex of subjects (EV) 60 per cent F 60 per cent FTask difficulty (EV) Moderate ModerateTime of day (EV) Morning AfternoonEtc. (EV) Same as noisy environment Same as quiet environ.Etc. (EV) Same as noisy environment Same as quiet environ.
A Non-Ideal Experiment
Controlling the Confounding Variables
There are ways by which the extraneous variables may be controlled to ensure thatthey do not become confounding variables. All people-related variables can becontrolled through the process of random assignment which will most likely ensurethat the subjects will be equally intelligent, outgoing, committed, and so on. Randomassignment does not necessarily ensure that this is the case for every extraneous
Research Methods
NOTES
Self-Instructional54 Material
variable in every experiment. However, when a sample is large, it works very welland the researcher’s motives for using this method will never be questioned.
One of the way in which situation variables or task variables can be controlledis basically by keeping them constant. For instance, in the noise-concentrationexperiment above, we could adjust the thermostat and, thereby, keep the roomtemperature constant and test all the subjects in the same room. We would, ofcourse, hold the difficulty of the tasks constant by giving all subjects in bothenvironments the same task. It is common practice for instructions to be written orrecorded and presented to each subject in exactly the same way.
At times, the researcher cannot hold a situation or task variable constant. Inthese situations too, random assignment can be of great help. Consider a situationwhere the same room is not available for testing the two groups and, in fact, onegroup is tested on a Monday in Room 1 and the other group on a Tuesday in Room2. In this situation, we can use random assignment which can result in half theMonday subjects in Condition A and the rest in Condition B, and the same for theTuesday subjects. Hence, both conditions will have roughly the same percentage ofsubjects tested in Room 1 and 2. On the other hand, consider what would happen ifwe did not use random assignment and instead tested the Monday subjects inCondition A and the Tuesday subjects in Condition B. In this situation, we have twoconfounding variables. Subjects in Condition A were tested on different days of theweek and in different rooms from those in Condition B. Any difference in the resultscould have been caused by one or more of the independent variable, the day of theweek, or the room.
In other words, confounding variables are those aspects of a study or samplethat might influence the dependent variable and whose effect may be confused withthe effects of the independent variable. Confounding variables are of two types:
(a) Intervening Variables: In many types of behavioural research, the relationshipbetween independent and dependent variables is not a simple one of stimulusto response. Certain variables that cannot be controlled or measured directlymay have an important effect on the outcome. These modifying variablesintervene between the cause and the effect. For example, in a classroomlanguage experiment, a researcher is interested in determining the effect ofimmediate reinforcement on learning the parts of speech. He suspects thatcertain factors or variables other than the one being studied may be influencingthe result, even though they cannot be observed directly. These factors maybe anxiety, fatigue or motivation. These factors cannot be ignored. Rather,they must be controlled as much as possible through the use of appropriatedesign. For example, a variable (as memory) whose effect occurs betweenthe treatment in a psychological experiment (as the presentation of a stimulus)and the outcome (as a response) is difficult to anticipate or is unanticipated,and may confuse the results.
(b) Extraneous Variables: These are variables that are not the subject of anexperiment but may have an impact on the results. Hence, extraneous variablesare uncontrolled and could significantly influence the results of a study. Often
NOTES
Self-InstructionalMaterial 55
Research Methodswe find that research conclusions need to be questioned further because ofthe influence of extraneous variables. For instance, a popular study wasconducted to compare the effectiveness of three methods of social scienceteaching. Ongoing, regular classes were used, and the researchers were notable to randomize or control the key variables as teacher quality, enthusiasmor experience. Hence, the influence of these variables could be mistaken forthat of an independent variable.For instance, in a study which attempts to measure the effect of temperature
in a classroom on students’ concentration levels, noise coming into the class throughdoors or windows can influence the results and is, therefore, an extraneous variable.This may be controlled by soundproofing the room, which illustrates how theextraneous variable may be controlled in order to eliminate its influence on theresults of the test.
The following are the types of extraneous variables: Subject variables pertain specifically to the people being studied. These
people’s characteristics, such as age, gender, health status, mood,background, and so on, are likely to affect their actions.
Experimental variables pertain to the persons conducting the experiment.Factors, such as gender, racial bias or language influence how a personbehaves.
Situational variables represent the environmental factors which wereprevalent at the time when the study or research was conducted. Theseinclude the temperature, humidity, lighting and the time of day, and couldhave a bearing on the outcome of the experiment.
Continuous variable is one wherein any value is possible within the rangeof the limits of the variable. For instance, the variable ‘time taken to runthe marathon’ is continuous since it could take 2 hours 30 minutes or 3hours 15 minutes to run the marathon. On the other hand, the variable‘number of days in a month that a worker came to office’ is not a continuousvariable since it is not possible to come to office on 14.32 days.
Discrete variable is one that does not take on all values within the limits ofthe variable. For instance, the response to a five-point rating scale mustonly have the specific values of 1, 2, 3, 4 or 5. It cannot have a decimalvalue such as 3.6. Similarly, this variable cannot be in the form of 1.3persons.
Quantitative variable is any variable that can be measured numerically oron a quantitative scale, at an ordinal, interval or ratio scale. For example,a person’s wages, the speed of a car or the person’s waist size are allquantitative variables.
Qualitative variables are also known as categorical variables. Thesevariables vary with no natural sense of ordering. They are, therefore,measured on the quality or characteristic. For example, eye colour (black,brown, or blue) is a qualitative variable, as are a person’s looks (pretty,handsome, ugly, and so on). Qualitative variables may be converted to
Research Methods
NOTES
Self-Instructional56 Material
appear numeric, but this conversion is meaningless and of no real value(as in male = 1, female = 2).
Experimental Designs
The various experimental designs have been discussed in this section.(a) Single Group Design: In this design study is carried out on a single group.
Experiments can be conducted in the following ways:(i) One-Shot Case Study: This is a single group studied only once. A group
is introduced to a treatment or condition and then observed for changeswhich are attributed to the treatment. This is like an expost facto methodin which on the basis of a dependent variable, an independent variableis looked for.
(ii) One Group before after Design: This design entails the inclusion of apre-test in order to establish base level scores. For instance, to use thisdesign in a study of college performance, we could compare collegegrades prior to gaining the experience to the grades after completing asemester of work experience. In this design, we subtract the score ofpre-test from post-test and see the differences. This difference is seenusing a ‘t’ test.
(iii) Time Series Designs: Time series designs refer to the pre-testing andpost-testing of one group of subjects at different intervals. In this design,continuous observation is carried out till a clear result is not seen. Thepurpose is to establish the long-term effects of treatment and can oftenlead to the number of pre- and post-tests varying from just one each tomany. At times, there is a period of interruption between the tests so asto assess the strength of the treatment over a long time frame.
(iv) Counterbalanced Design: Experiments that use counterbalanceddesign are effective ways to avoid the pitfalls of repeated measures,where the subjects are exposed to treatments one after the other.
Typically in an experiment, the order in which the treatments are administeredcan affect the behaviour of the subjects. It may also elicit a false response due tofatigue or any other external factors which may have a bearing on the behaviour ofthe subjects. To control or neutralize this, researchers use a counterbalanced design,which helps to reduce the adverse effects of the order of treatment or other factorson the results.
Counterbalancing helps to avoid confounding among variables. Take forexample an experiment in which subjects are tested on both auditory reaction timetask and visual reaction time task. If each and every subject were first tested on theauditory reaction time task and then on the visual reaction time task, the type of taskand the order of presentation would be confounded. If the visual reaction time waslower, we would not be sure whether reaction time to a visual stimulus is ‘really’faster to an auditory stimulus, as it is quite likely that the subjects would have learnedsomething while performing the auditory task, which led to an improvement of theirperformance on the visual task.
NOTES
Self-InstructionalMaterial 57
Research Methods(b) Two Equivalent Group Design(i) Static Group Comparison Study: This design attempts to make up for
the lack of a control group but falls short in relation to showing if achange has occurred. In this group, no treatment is given but onlyobservation is carried out in a natural way of two groups, e.g., observationof the monkeys living in a city and observation of other monkeys livingin the jungle. It is fair to mention here that in these groups nothing ismanipulated as this design does not include any pre-testing and, therefore,any difference between the two groups prior to the study is unknown.
(ii) Post-Test Equivalent Groups Design: Randomization as well as thecomparison of both the control and experimental group are used in studiesof this nature. Each group is chosen and assigned randomly andpresented with either the treatment or a type of control. Post-tests aresubsequently administered to each subject to establish whether or not adifference exists between the two groups. While this is close to beingthe best possible method, it falls short on account of its lack of a pre-test measure. It is not possible to establish if the difference that seemsto exist at the end of the study actually represents a change from thedifference at the beginning of the study. Hence, while randomizationmixes the subjects well, it does not necessarily create an equivalencybetween the two groups.
(iii) Pre-Test and Post-Test Equivalent Groups Design: This is the mosteffective as well as the most difficult method in terms of demonstratingcause and effect. The pre-test and post-test equivalent groups designensures the presence of a control group as well as a measure of change.Importantly, it also adds a pre-test, thereby, assessing any differencesthat existed between the groups prior to the study taking place. In orderto apply this method, we select students at random and then segregatethem into one of two groups. We would subsequently evaluate theprevious semester’s grades for each group in order to arrive at a meangrade point average. The treatment (work experience) would be appliedto one group, whereas a control would be applied to the other.It is critical that the two groups should be treated similarly in order tocontrol for variables, such as socialization, so that the control groupmay participate in an activity such as a softball league, while the othergroup participates in the work experience programme. The experimentends at the end of the semester and the semester’s grades are compared.If it is found that the grade change for the experimental group wassignificantly different from the grade change of the control group, onecould conclude that a semester of work experience results in a significantdifference in grades when compared to a semester of non-work relatedactivity programme.
(iv) Counterbalanced Randomized Two Groups Design: In this design,the group is divided in two parts on a random basis. This design is alsocalled ‘rotation design’.
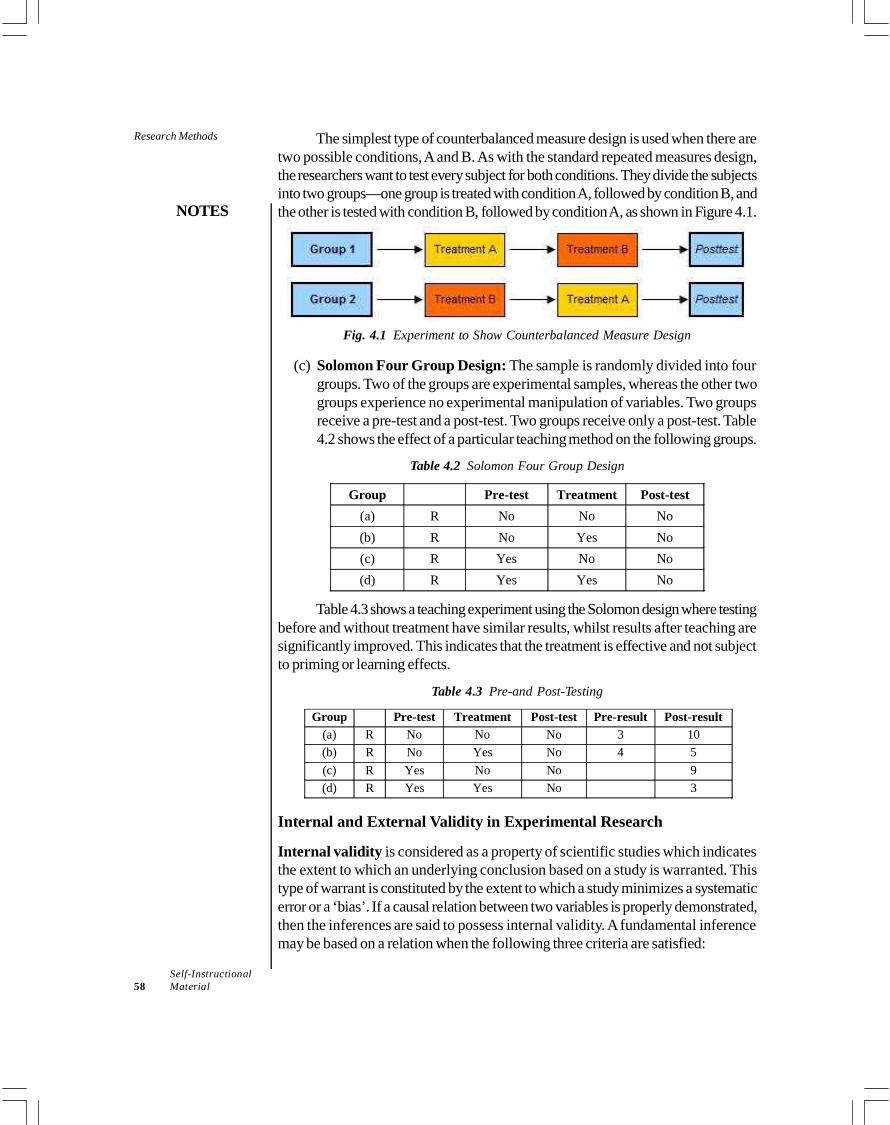
Research Methods
NOTES
Self-Instructional58 Material
The simplest type of counterbalanced measure design is used when there aretwo possible conditions, A and B. As with the standard repeated measures design,the researchers want to test every subject for both conditions. They divide the subjectsinto two groups—one group is treated with condition A, followed by condition B, andthe other is tested with condition B, followed by condition A, as shown in Figure 4.1.
Fig. 4.1 Experiment to Show Counterbalanced Measure Design
(c) Solomon Four Group Design: The sample is randomly divided into fourgroups. Two of the groups are experimental samples, whereas the other twogroups experience no experimental manipulation of variables. Two groupsreceive a pre-test and a post-test. Two groups receive only a post-test. Table4.2 shows the effect of a particular teaching method on the following groups.
Table 4.2 Solomon Four Group Design
Group Pre-test Treatment Post-test(a) R No No No(b) R No Yes No(c) R Yes No No(d) R Yes Yes No
Table 4.3 shows a teaching experiment using the Solomon design where testingbefore and without treatment have similar results, whilst results after teaching aresignificantly improved. This indicates that the treatment is effective and not subjectto priming or learning effects.
Table 4.3 Pre-and Post-Testing
Group Pre-test Treatment Post-test Pre-result Post-result(a) R No No No 3 10(b) R No Yes No 4 5(c) R Yes No No 9(d) R Yes Yes No 3
Internal and External Validity in Experimental Research
Internal validity is considered as a property of scientific studies which indicatesthe extent to which an underlying conclusion based on a study is warranted. Thistype of warrant is constituted by the extent to which a study minimizes a systematicerror or a ‘bias’. If a causal relation between two variables is properly demonstrated,then the inferences are said to possess internal validity. A fundamental inferencemay be based on a relation when the following three criteria are satisfied:
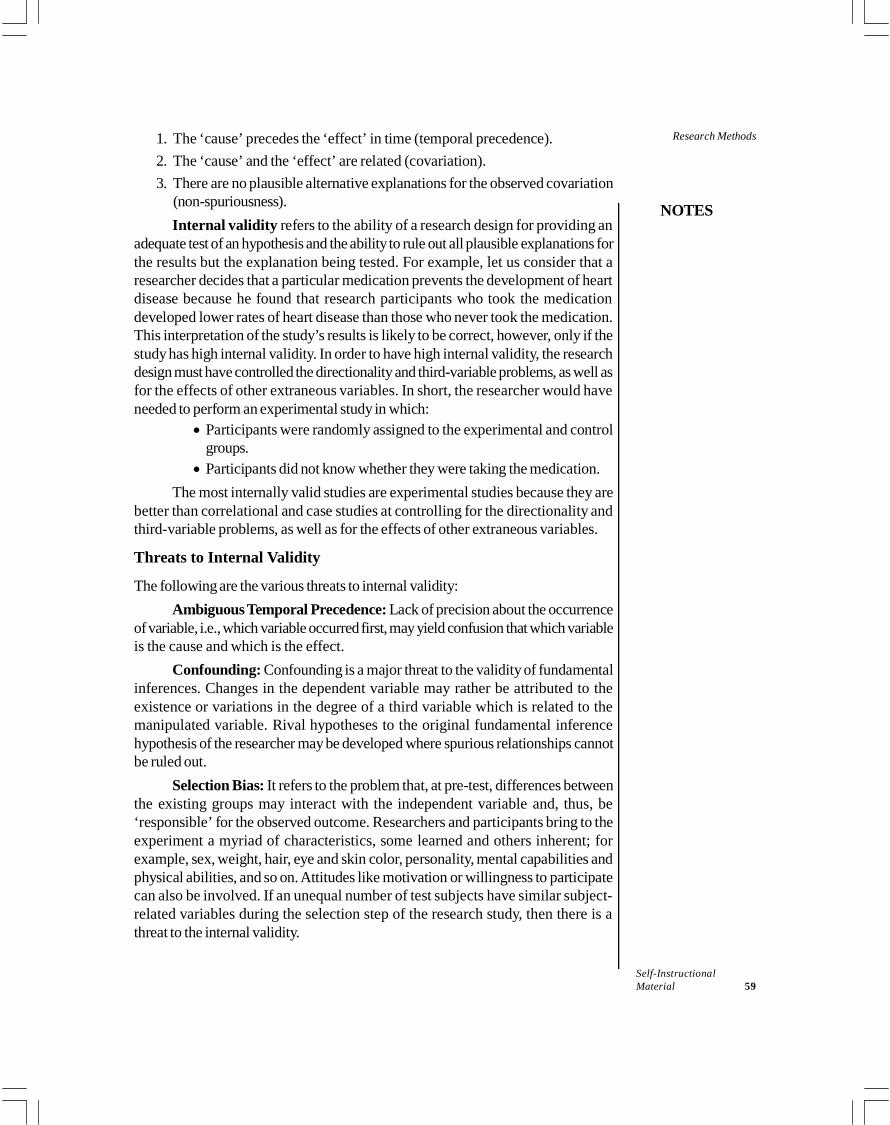
NOTES
Self-InstructionalMaterial 59
Research Methods1. The ‘cause’ precedes the ‘effect’ in time (temporal precedence).2. The ‘cause’ and the ‘effect’ are related (covariation).3. There are no plausible alternative explanations for the observed covariation
(non-spuriousness).Internal validity refers to the ability of a research design for providing an
adequate test of an hypothesis and the ability to rule out all plausible explanations forthe results but the explanation being tested. For example, let us consider that aresearcher decides that a particular medication prevents the development of heartdisease because he found that research participants who took the medicationdeveloped lower rates of heart disease than those who never took the medication.This interpretation of the study’s results is likely to be correct, however, only if thestudy has high internal validity. In order to have high internal validity, the researchdesign must have controlled the directionality and third-variable problems, as well asfor the effects of other extraneous variables. In short, the researcher would haveneeded to perform an experimental study in which:
Participants were randomly assigned to the experimental and controlgroups. Participants did not know whether they were taking the medication.
The most internally valid studies are experimental studies because they arebetter than correlational and case studies at controlling for the directionality andthird-variable problems, as well as for the effects of other extraneous variables.
Threats to Internal Validity
The following are the various threats to internal validity:Ambiguous Temporal Precedence: Lack of precision about the occurrence
of variable, i.e., which variable occurred first, may yield confusion that which variableis the cause and which is the effect.
Confounding: Confounding is a major threat to the validity of fundamentalinferences. Changes in the dependent variable may rather be attributed to theexistence or variations in the degree of a third variable which is related to themanipulated variable. Rival hypotheses to the original fundamental inferencehypothesis of the researcher may be developed where spurious relationships cannotbe ruled out.
Selection Bias: It refers to the problem that, at pre-test, differences betweenthe existing groups may interact with the independent variable and, thus, be‘responsible’ for the observed outcome. Researchers and participants bring to theexperiment a myriad of characteristics, some learned and others inherent; forexample, sex, weight, hair, eye and skin color, personality, mental capabilities andphysical abilities, and so on. Attitudes like motivation or willingness to participatecan also be involved. If an unequal number of test subjects have similar subject-related variables during the selection step of the research study, then there is athreat to the internal validity.
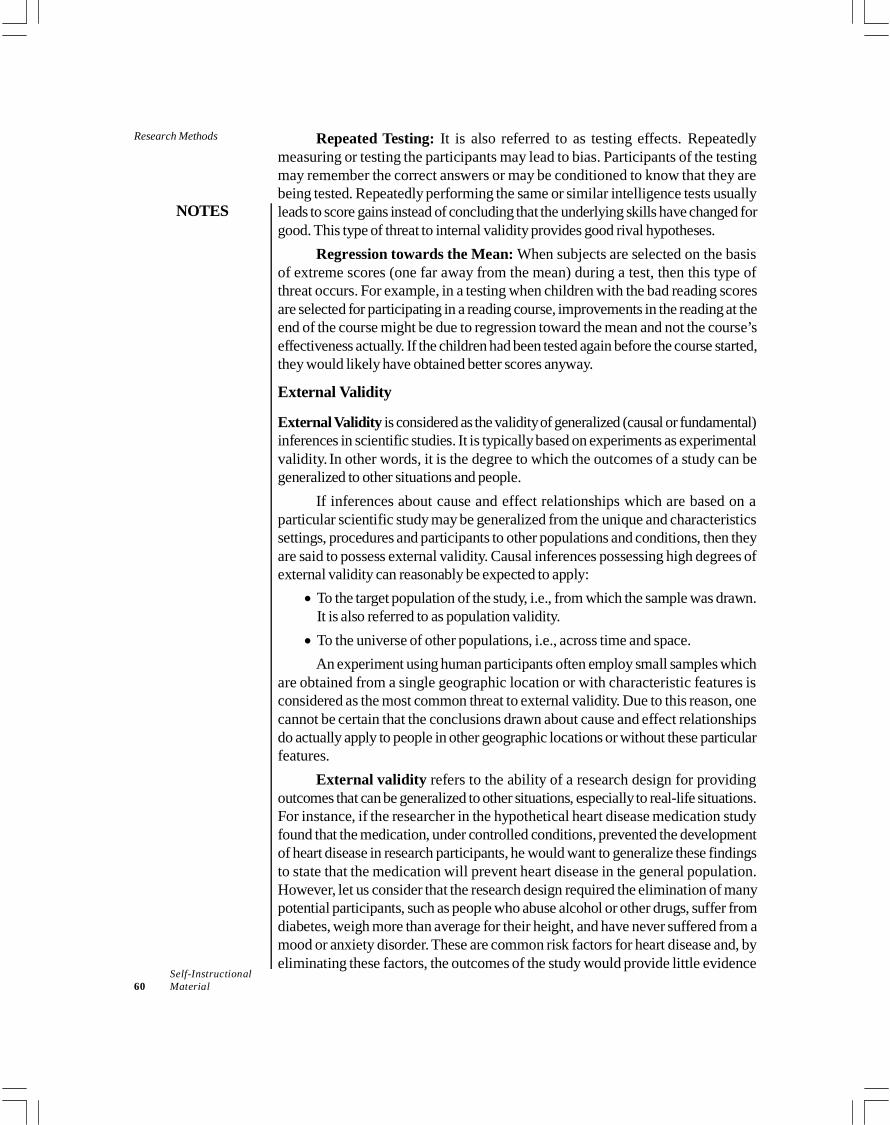
Research Methods
NOTES
Self-Instructional60 Material
Repeated Testing: It is also referred to as testing effects. Repeatedlymeasuring or testing the participants may lead to bias. Participants of the testingmay remember the correct answers or may be conditioned to know that they arebeing tested. Repeatedly performing the same or similar intelligence tests usuallyleads to score gains instead of concluding that the underlying skills have changed forgood. This type of threat to internal validity provides good rival hypotheses.
Regression towards the Mean: When subjects are selected on the basisof extreme scores (one far away from the mean) during a test, then this type ofthreat occurs. For example, in a testing when children with the bad reading scoresare selected for participating in a reading course, improvements in the reading at theend of the course might be due to regression toward the mean and not the course’seffectiveness actually. If the children had been tested again before the course started,they would likely have obtained better scores anyway.
External Validity
External Validity is considered as the validity of generalized (causal or fundamental)inferences in scientific studies. It is typically based on experiments as experimentalvalidity. In other words, it is the degree to which the outcomes of a study can begeneralized to other situations and people.
If inferences about cause and effect relationships which are based on aparticular scientific study may be generalized from the unique and characteristicssettings, procedures and participants to other populations and conditions, then theyare said to possess external validity. Causal inferences possessing high degrees ofexternal validity can reasonably be expected to apply: To the target population of the study, i.e., from which the sample was drawn.
It is also referred to as population validity. To the universe of other populations, i.e., across time and space.
An experiment using human participants often employ small samples whichare obtained from a single geographic location or with characteristic features isconsidered as the most common threat to external validity. Due to this reason, onecannot be certain that the conclusions drawn about cause and effect relationshipsdo actually apply to people in other geographic locations or without these particularfeatures.
External validity refers to the ability of a research design for providingoutcomes that can be generalized to other situations, especially to real-life situations.For instance, if the researcher in the hypothetical heart disease medication studyfound that the medication, under controlled conditions, prevented the developmentof heart disease in research participants, he would want to generalize these findingsto state that the medication will prevent heart disease in the general population.However, let us consider that the research design required the elimination of manypotential participants, such as people who abuse alcohol or other drugs, suffer fromdiabetes, weigh more than average for their height, and have never suffered from amood or anxiety disorder. These are common risk factors for heart disease and, byeliminating these factors, the outcomes of the study would provide little evidence
NOTES
Self-InstructionalMaterial 61
Research Methodsthat the medication will be effective for people with these risk factors. In otherwords, the study would have low external validity and, hence, its outcomes to thegeneral population could not be generalized.
This commonly happens in tests of antidepressant medications. Becauseresearchers want to make sure that the antidepressant effects of the medicationsbeing tested are not hidden by the effects of extraneous variables, they often haveexcluded potential participants with one or more of the following characteristics: People who are addicted to alcohol or illicit drugs People who take various medications People who have anxiety disorders (such as phobic disorders) People who suffer from depression with psychosis People with mild depression (because they would show only a small response
to the medication)If a study excluded people with these characteristic features, then most of
the participants suffering from depression would be excluded from the final pool ofparticipants. The outcomes of the study, therefore, would provide little informationabout how most depressed people will respond to the medication.
Threats to External Validity
A threat to external validity is an explanation of how you might be wrong in makinga generalization. Usually, generalization is limited when the cause, i.e., independentvariable depends on other factors; therefore, all threats to external validity interactwith the independent variable. Aptitude-Treatment Interaction: The sample may have specific
characteristic features that may interact with the independent variable, limitinggeneralization. For example, inferences based on comparative psychotherapystudies often employ specific samples (e.g., volunteers, highly depressed, nocomorbidity). If psychotherapy is found effective for these sample patients,will it also be effective for non-volunteers or the mildly depressed or patientswith concurrent other disorders? Situation: All situational features, such as treatment conditions, time, location,
lighting, noise, treatment administration, investigator, timing, scope and extentof measurement, and so on, of a study potentially limit generalization. Pre-Test Effects: If cause and effect relationships can only be found when
pre-tests are carried out, then this also limits the generality of the findings. Post-Test Effects: If cause and effect relationships can only be found when
post-tests are carried out, then this also limits the generality of the findings. Reactivity (Placebo, Novelty and Hawthorne Effects): If cause and effect
relationships are found, they might not be generalized to other situations if theeffects found only occurred as an effect of studying the situation. Rosenthal Effects: Inferences about cause-consequence relationships may
not be able to generalize to other investigators or researchers.
Research Methods
NOTES
Self-Instructional62 Material
4.3.5 Focused Groups
Focus group as a method was developed in the 1940s in Columbia University bysociologist Robert Merton and his colleagues as part of a sociological technique.This was used as a method for measuring audience reaction to radio programmes.In fact, the method was uniquely adapted and modified in different branches ofsocial sciences namely anthropology, sociology, psychology, education andadvertising. It essentially emerged as an alternative method which was more costeffective and less time consuming, and could generate a large amount of informationin a short time span. Another argument given in its favour was that group dynamicsplay a positive role in generating data that the individual would be hesitant aboutsharing when he was spoken to individually.
A focus group is a highly versatile and dynamic method of collectinginformation from a representative group of respondents. The process generallyinvolves a moderator who manoeuvres the discussion on the topic under study.There are a group of carefully-selected respondents who are specifically invitedand gathered at a neutral setting. The moderator initiates the discussion, and thenthe group carries it forward by holding a focused and an interactive discussion.The technique is extensively used and at the same time also criticized. While oneschool of thought places group dynamics at an important position, another negatesits contribution as detrimental. We will examine these as we go along.Key elements of a focus group: There are certain typical requirements for aconducive discussion. These need to be ensured in order to get meaningful andusable outputs from the technique.Size: The size of the group is extremely critical and should not be too large or toosmall. Edward F. Fern, Professor Emeritus in the Pamplin College of Business atVirginia Tech, stated that every member is assumed to contribute meaningfully tothe discussion; however, if the size of the group is too large, then contribution bythe members might not be premium. Ideal recommended size, thus, for a groupdiscussion is 8 to 12 members. Less than eight would not generate all the possibleperspectives on the topic and the group dynamics required for a meaningful session.Nature: Individuals who are from a similar background—in terms of demographicand psychographic traits—must be included; otherwise the disagreement mightemerge as a result of other factors rather than the one under study. For example,a group of homemakers and working women discussing packaged food might nothave a similar perspective towards the product because they have different rolesto manage and balance; thus, what is perceived as convenience by one is viewedas indifferent and careless attitude towards one’s family by the other. The otherrequirement is that the respondents must be similar in terms of the subject/policy/product knowledge and experience with the product under study. Moreover, theparticipants should be carefully screened to meet a certain criteria.Acquaintance: It has been found that knowing each other in a group discussionis disruptive and hampers the free flow of the discussion, and it is believed that
NOTES
Self-InstructionalMaterial 63
Research Methodspeople reveal their perspectives more freely amongst strangers rather than friends.Terry Bristol, University of Arkansas at Little Rock, found that men revealed moreabout themselves amongst strangers, while females were more comfortable amongstacquaintances. Thus, it is recommended that the group should consist of strangersrather than subjects who know each other. There are exceptions, however, incertain cases; this would be further discussed in a subsequent section.Setting: As far as possible, the external factors which might affect the nature ofthe discussion are to be minimized. One of these could be the space or setting inwhich the discussion takes place. Thus, it should be as neutral, informal andcomfortable as possible. Even the ones that have one-way mirrors or camerasinstalled need to ensure that these gadgets are as unobtrusively placed as possible.Time period: The conduction of the discussion should be held in a single settingunless there is a before and after design which requires group perceptions, initiallybefore the study variable is introduced; and later in order to gauge the group’sreactions. The ideal duration of conduction should not exceed one and a half hour.This is usually preceded by a short rapport formation session between the moderatorand the group members.The recording: Earlier there were human recorders, either sitting behind one-waymirrors or in the discussion room. Today, these have been replaced by camerasthat video- record the entire discussion. This can, then, be replayed for analysisand interpretation. The advantage over human recording is that one is able toobserve the non-verbal cues and body language as well. This technology has beenfurther enhanced and one can evaluate the discussion happening at one location,being observed and transmitted at another.The moderator: He is the key conductor of the whole session. The nature, contentand validity of the data collected are dependent to a large extent on the skills of themoderator. His role might be that of a participant where he might be a part of thegroup discussion or he might be a non-participant and has the task of rapportformation, initiating the discussion and steering the discussion forward. Well-knownresearchers Helen Morgan and Kerry Thomas have stated that any group taskhas two clear agendas. One is the conscious agenda to complete the overt taskand the second, more important, plan is related to the unconscious. This isconcerned with the emotional needs of the group and has been described differentlyas ‘group mind’, ‘group as a whole’ and ‘group as a group’. The moderator isclearly responsible for this as he needs to work with the group as a group in orderto maximize the group performance. Thus, he needs to possess some criticalmoderating skills like: Ability to listen attentively and have a positive demeanour that encourages
others to discuss. At the same time, he must be detached and give noindication about his personal opinion in order to skew the discussion. Heshould be dressed in a manner that is informal and similar to the group. He needs to make others feel comfortable; thus, the language used should
be in the subjects’ lingo, with no use of technical words at all.
Research Methods
NOTES
Self-Instructional64 Material
He needs to be flexible in approach, so that the discussion flows naturallyrather than becoming compartmentalized into a question and answer session.At the same time, he also needs to act as a translator in case someone’spoint is not understood or interpreted correctly. He must also discreetly handle the overbearing and dominating participants
and encourage all the members to contribute by drawing out the hesitantones as well. Thus, sensitivity to the respondents’ feelings must be presentat all times. There is no external signal, so he needs to be sufficiently trained and
acquainted with the topic to understand the specific interval when all thepossible viewpoints get exhausted and the discussion needs to move on.In conducting the discussions, he might use the summary and closure
approach where he might pick up a similar point made by a participant to anotherand summarize it and ask for his opinion. Another tactic that can be used is tobring in the extreme opinions on the topic, in case no counter points are comingthrough; this, then, is able to generate more arguments into the discussion.Sometimes, rather than the moderator introducing another viewpoint, he mightask ‘is that all?’ This might sometimes trigger a fresh stance.Steps in planning and conducting focus groups: The focus group conductionhas to be handled in a structured and stepwise manner as stated below:
(i) Clearly define and enlist the research objectives of the research study thatrequire qualitative research.
(ii) Then these objectives have to be split into information needs to be answeredby the group. These may be bulleted as topics of interest or as broad questionsto be answered by the group.
(iii) Next, a list of characteristics needs to be prepared, which would be usedto select the respondent group. Based on this screening, a questionnaire isprepared to measure the demographic, psychographics, topic-relatedfamiliarity and knowledge. In case of a product or policy, one also needs tofind out the experience and attitude towards it. Next, a comprehensivemoderator’s outline for conducting the whole process needs to be chartedout. Here, it is critical to involve the decision- maker (if any), the businessresearcher as well as the moderator. This is done so that there is completeclarity for the moderator in terms of the intention and potential applicabilityof the discussion output. This involves extensive discussions- among theresearcher, client and the moderator. Another advantage of having astructured guideline is that in case of multiple moderators, who might needto conduct focus group discussions at different locales, collection of similarinformation and reliability of the method can be maintained.
(iv) After this, the actual focus group discussion is carried out. Differentsociologists have enlisted various stages that take place in a focus group.The most famous and comprehensive is the linear model of group
NOTES
Self-InstructionalMaterial 65
Research Methodsdevelopment formulated by Research theorist Tuckman. This has beenadapted by well-known qualitative researcher Joanna Chrzanowska toexplain the stages in the focus group discussions (Table 4.4).
(v) The focus group reveals rich and varied data; thus, the analysis cannot bequantitative or even in frequencies. The summary of the findings are clubbedunder different heads as indicated in the focus group objectives and reportedin a narrative form. This may include expressions like ‘majority of theparticipants were of the view’ or ‘there was a considerable disagreementon this issue’. A summary report on the focus group discussion held in theorganic food study is presented below along with the moderator guide.
Focus group study: Potential consumers
Two separate focus group discussions were conducted—one in Noida (UP) andthe other in Hi-Tech City, Hyderabad. The group at Noida was predominantly ofhousewives and the one in Hi-Tech had professionals from different walks of life.Their opinion on a variety of subjects was sought. A summary of the discussions ispresented below:
Adulteration in food
All the participants were unanimously concerned about adulterated food that theyand their families were consuming. The discussion went from pesticides to chemicalsand spurious food products. The ladies felt that they experienced a lot of healthproblems, specifically acidity, because of adulteration in the food. Some statedthat they tried to grind all masalas at home as they felt that most of the problemwas with masalas. However, some felt that this was meaningless as the wholemasala was adulterated and contaminated by chemical residues. Thus, even thoughit was a matter of concern for them, they felt helpless to verbalize the possiblesolution.
There was one lady (Noida group), however, who felt that some of theproblems were exaggerated and were basically created by the media and wereplain hype. Another lady (HT group) felt that the problem of pollution was toodeep- rooted and just adulterated food or food grown with chemical fertilizersand pesticides was too elementary and small to comprehend the problem of healthhazards of the general population.
Changes in lifestyle
The consumers observed major changes in the recent years. The groups wereunanimously of the opinion that they were more health conscious and concernedthan their mothers and grandmothers. The younger generation (post-teens especially)are extremely conscious about the nutritional content of their food. They activelyavoid excess sugar and fats in their diet. As a regime, people said that they exercisein some form or the other. Some said they drink more water and include healthysupplements like sprouts and olive oil in their diets.
Research Methods
NOTES
Self-Instructional66 Material
Awareness of organic food products
Almost all the consumers, with the exception of one, had read or heard of organicfood. One respondent had tried the product and found it very tasty. Three of thegroup members, as stated earlier, were sceptical about the benefits of organicfood.
Willingness to try
The product was formally introduced to the groups and their reactions were notedto the same. Most of them, with the exception of two, were extremely enthusiasticabout the products and wanted to know more about them, and had a number ofqueries about the availability, price, brands and benefits of the products.
Suggestions for marketing the product
Divided opinion on who should sell the product. Some felt that agovernment-approved outlet like Mother Dairy/Trinetra should sell theproducts, whereas others felt that there should be exclusive organic foodoutlets. There were two or three people who felt that there should be nodistinction and the products should be available everywhere. Some werealso of the opinion that the products could be sold at high-end grocerystores or departmental stores since this was an expensive product. Oneconsumer suggested the vegetable mandi also as a possible outlet; however,most of the others felt that the products would not be purchased by themasses. All the group members were unanimously of the opinion that they would
buy a product only if it was certified as organic from an authentic and reputedbody. The product should be vaccum packed, preferably in a brown paper packet
with the label having the certification information and the source of the productclearly displayed. All felt that the price difference should not be too steep. At the same time,
the Indian consumer who is buying a quality product accepts a pricedifference, so the product should be slightly expensive than the non-organicoption. All the respondents felt that television was the best medium for promoting
the product. All opined that there was a dire need for creating awareness.They felt that there was absolutely no visibility for the products, and moreavailability and awareness would mean more sales and more organicallyconverted consumers. Some suggested popular soap operas and otherswere in favour of educational programmes. Some respondents felt that product promotions should be effectively and
widely-conducted by tying up with environment-related organizations thatwould be willing to promote a healthy cause.
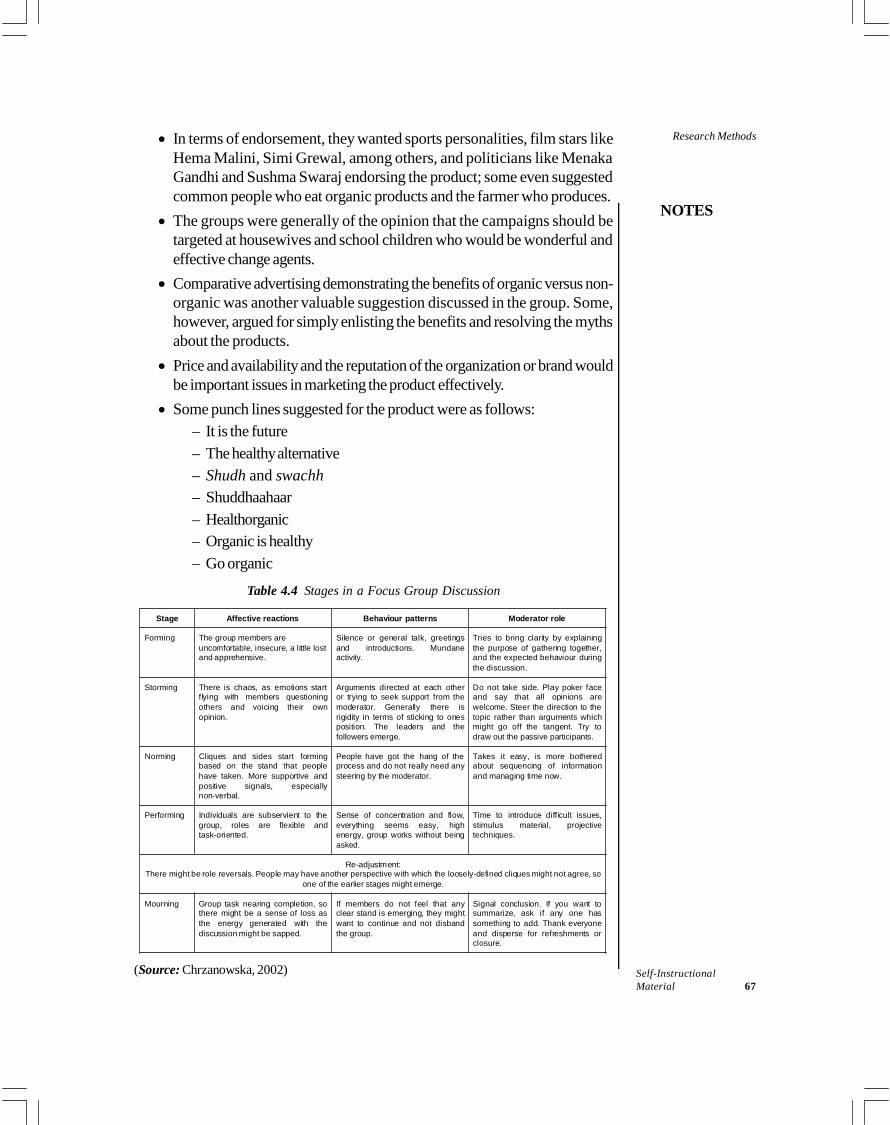
NOTES
Self-InstructionalMaterial 67
Research Methods In terms of endorsement, they wanted sports personalities, film stars likeHema Malini, Simi Grewal, among others, and politicians like MenakaGandhi and Sushma Swaraj endorsing the product; some even suggestedcommon people who eat organic products and the farmer who produces. The groups were generally of the opinion that the campaigns should be
targeted at housewives and school children who would be wonderful andeffective change agents. Comparative advertising demonstrating the benefits of organic versus non-
organic was another valuable suggestion discussed in the group. Some,however, argued for simply enlisting the benefits and resolving the mythsabout the products. Price and availability and the reputation of the organization or brand would
be important issues in marketing the product effectively. Some punch lines suggested for the product were as follows:
– It is the future– The healthy alternative– Shudh and swachh– Shuddhaahaar– Healthorganic– Organic is healthy– Go organic
Table 4.4 Stages in a Focus Group Discussion
Stage Affective reactions Behaviour patterns Moderator role
Forming The group members areuncomfortable, insecure, a little lostand apprehensive.
Silence or general talk, greetingsand introductions. Mundaneactivity.
Tries to bring clarity by explainingthe purpose of gathering together,and the expected behaviour duringthe discussion.
Storming There is chaos, as emotions startflying with members questioningothers and voicing their ownopinion.
Arguments directed at each otheror trying to seek support from themoderator. Generally there isrigidity in terms of sticking to onesposition. The leaders and thefollowers emerge.
Do not take side. Play poker faceand say that all opinions arewelcome. Steer the direction to thetopic rather than arguments whichmight go off the tangent. Try todraw out the passive participants.
Norming Cliques and sides start formingbased on the stand that peoplehave taken. More supportive andpositive signals, especiallynon-verbal.
People have got the hang of theprocess and do not really need anysteering by the moderator.
Takes it easy, is more botheredabout sequencing of informationand managing time now.
Performing Individuals are subservient to thegroup, roles are flexible andtask-oriented.
Sense of concentration and flow,everything seems easy, highenergy, group works without beingasked.
Time to introduce difficult issues,stimulus material, projectivetechniques.
Re-adjustment:There might be role reversals. People may have another perspective with which the loosely-defined cliques might not agree, so
one of the earlier stages might emerge.
Mourning Group task nearing completion, sothere might be a sense of loss asthe energy generated with thediscussion might be sapped.
If members do not feel that anyclear stand is emerging, they mightwant to continue and not disbandthe group.
Signal conclusion. If you want tosummarize, ask if any one hassomething to add. Thank everyoneand disperse for refreshments orclosure.
(Source: Chrzanowska, 2002)
Research Methods
NOTES
Self-Instructional68 Material
Types of focus groups: As stated earlier, there could be several variations to thestandard procedure. Some such innovations and alternative approaches arepresented below:Two-way focus group: Here, one respondent group sits and listens to the otherand after learning from them or understanding the needs of the group, they carryout a discussion amongst themselves.
For example, in a management school, the faculty group could listen to theopinions and needs of the student group. Subsequently, a focus group of the facultycould be held to study the solutions or changes that they perceive which need tobe carried out in the dissemination of the programme.Dual-moderator group: Here, there are two different moderators: one responsiblefor the overt task of managing the group discussion and the other for the secondobjective of managing the ‘group mind’ in order to maximize the group performance.Fencing-moderator group: The two moderators take opposite sides on the topicbeing discussed and, thus, in the short time available, ensure that all possibleperspectives are thoroughly explored.Friendship groups: There are situations where the comfort level of the membersneeds to be high so that they elicit meaningful responses. This is especially thecase when a supportive peer group encourages admission about the relatedorganizations or people/issues. Eminent research thinker Stevens used the techniquesuccessfully when studying women groups for their experiential consumption ofwomen magazines.Mini-groups: These groups might be of a smaller size (usually four to six) and areusually expert groups/committees that on account of their composition are able todecisively contribute to the topic under study.Creativity group: These are usually of longer than one and a half hour durationand might take the workshop mode. Here, the entire group is instructed whichthen brainstorms into smaller sub-groups and then reassembles to present theirsub-groups opinion. They might also stretch across a day or two. A variation ofthe technique uses projective methods to extract alternative thinking.Brand-obsessive group: These are special respondent sub-strata who arepassionately involved with a brand or product category (say cars). They are selectedas they can provide valuable insights that can be successfully incorporated into thebrand’s marketing strategy.Online focus group: This is a recent addition to the methodology and is extensivelyused today. Thus, it will be elaborated in detail. Like in the case of regular groupprocess, the respondents are selected from an online list of people who havevolunteered to participate in the discussion. They are then administered the screening
NOTES
Self-InstructionalMaterial 69
Research Methodsquestionnaire to measure their suitability. Once they qualify, they are given a time,a participating id and password and the venue where they need to be so that theycan be connected with the others. The group size here varies from four to six, asotherwise there might be technical problems and lack of clarity in the voicesreceived. To ensure a standardized way of responding, the respondents are maileddetails of how to use specific symbols to express emotions while typing theresponses. Usual ways of denoting happiness and displeasure are used. Thesecould also be coloured differently; also to show a higher degree of the emotion,additional faces may be used. There are other symbols as well.Besides, a brief about the purpose of the discussion and clarity on specific ortechnical terms is provided before the conduction. At the designated time, thegroup assembles in a web-based chat room and enters their id and password tolog on. Here the chatting between the moderator and the participant is real time.Once the discussion is initiated, the group is on its own and chats amongstthemselves, with the moderator playing the typical role. The session lasts for oneto one and a half hour, and the process is much faster than a normal focus group.
The advantage of the method is that geographic locations are not a constraintand persons from varied locations can participate meaningfully in the discussion.Also, since it does not require a commitment to be physically assembled at aparticular place and time, people who are busy and otherwise are not able toparticipate, can also be tapped. Since the addresses of the members are availableto the moderators, it is also possible subsequently to probe deeper at a later dateor seek clarifications. The interaction is faceless so the person interacting iscompletely assured of his/her anonymity and is thus, less inhibited. The methodalso has a cost advantage as compared to a traditional focus group. People aregenerally less inhibited in their responses and are more likely to fully express theirthoughts. A lot of online focus groups go well past their allotted time since so manyresponses are expressed. Finally, as there is no travel, videotaping or facilities toarrange, the cost is much lower than for traditional focus groups. Firms are able tokeep costs between one-fifth and one-half the cost of traditional focus groups.
However, the method can be actively and constructively used only withthose who are computer savvy. Another disadvantage is that since anonymity isassured, actual authentication of the respondent being a part of the populationunder study might be a little difficult to establish. Thus, to verify the details, onemay use the traditional telephone method and cross check the information. Sincethe person is typing his/her response, other sensory cues of tone, body languageand facial expressions are not available. Thus, while the apparent emotions orattitudes can be tapped, however, the unconscious or sub-conscious cannot bejudged.
Research Methods
NOTES
Self-Instructional70 Material
These techniques have extensive use for companies that are into e-commerce.Most companies today have started using this technique to get employee reactionsto various organizational issues, in what is termed as a ‘virtual town hall meeting’.Thus, cyber dialogues can be carried out and meaningful feedback as well aspopulation reaction can be measured with considerable ease and accuracy.
Evaluating focus group as a method
Focus groups are extensively criticized and yet have widespread usage in all areasof business research, to the extent that the technique is considered by some assynonymous with qualitative research. Before concluding the discussion on focusgroups, let us examine the benefits and drawbacks of using the method.Idea generation: As discussed earlier, the collective group mind creates anatmosphere where ideas and suggestions are churned out which are more holisticand significant than those that would be generated in an individual interview. Theother advantage is that the group process works towards vetting each idea as it ispresented. The dialogue between the members helps to refine and rephrase theperspective into a usable solution at the end of the discussion.Group dynamics: Once the moderator has initiated the debate and some membershave expressed their opinion, the atmosphere becomes charged and therespondents’ involvement with the topic increases with most members presentingreactions and counter reactions. The expressiveness becomes contagious and thecontrived discussion slowly becomes a free-flowing discussion. As the comfortlevel of individuals with the other members increases, they start feeling at easewith the setting and expression becomes more open.Process advantage: The discussion situation permits considerable flexibility inextracting the relevant information as the flow of topics and the extent to which thetopic can be debated is dependent upon the group members and the emergingdynamics. Also, the situation permits a simultaneous conduction and collection ofinformation from a number of individuals at a single point of time.Reliability and validity: Since the objectives of the study have been listed outand the structure of the moderator outline is predetermined, the reliability of theinformation obtained is high. The mechanical recording of the data removes theelement of human bias and error in the information collected.
However, the technique is not without shortcomings.Group dynamics: The advantage could also be a disadvantage. On account ofthe group setting, the members might present a perspective not necessarily theirown, but one that is along the lines of the group expression. This is the ‘noddingdog syndrome’, which is often a result of group conformity.
NOTES
Self-InstructionalMaterial 71
Research MethodsScientific process: The group discussion must be treated as indicative and, thus,generalizing must be avoided. The answers obtained are varied and in a narrativeform. Thus, coding and analysing this data is quite cumbersome.Moderator/investigator bias: As discussed in earlier sections, the success orfailure of the process depends, to a large extent, on the skills of the moderator. Anunbiased and sensitive moderator who is able to generate meaningful and unbiaseddiscussions is quite a rarity.
Check Your Progress
1. What do you mean by research methods?2. What is survey and its importance?3. What are the two types of survey?4. How does case study help in research?5. What do you mean by census survey?6. Define variables.7. What is internal and external validity in experimental research?8. What are the threats to internal validity?9. Who developed focus group and when?
4.4 ANSWERS TO CHECK YOUR PROGRESSQUESTIONS
1. The term ‘research methods’ generally refers to the plan or approach that aresearcher has used in order to gather data or information. To be morespecific, research methods refer to the specific tools or ways which areused to collect and analyse data, such as survey, questionnaire, case study,interview etc.
2. Survey is an important tool in research. No research can be performedwithout a survey. It is an effective, reliable method of getting information orfeedback from the individuals. Some examples of collecting survey data arequestionnaires, web-based forms, telephonic questions and answers,interviews etc.
3. The two types of surveys are: Descriptive: These surveys generally collect information on what people
think and do. Analytic: These surveys are generally used to either test hypotheses or
to answer particular research questions.
Research Methods
NOTES
Self-Instructional72 Material
4. Case study help to explore and analyse the life of a social entity. The casestudy method helps to identify the factors and reasons that account forparticular behaviour patterns of a sample chapter and its association withother social or environmental factors.
5. Census survey means gathering pertinent information about all the units ofpopulation, viz., people, institutions, householders, and so on. Populationmay consist of persons, institutions, objects, attributes, qualities, familiesamong others.
6. A variable is any feature or aspect of an event, function or process that,with its presence and nature, affects some other event or process which isbeing studied. According to Professor Fred N. Kerlinger, Variable is aproperty that takes on different value.
7. Internal validity refers to the ability of a research design for providing anadequate test of a hypothesis and the ability to rule out all plausibleexplanations for the results but the explanation being tested. While externalvalidity refers to the ability of a research design for providing outcomes thatcan be generalized to other situations, especially to real-life situations.
8. The threats to internal validity are as follows:(a) Ambiguous temporal precedence(b) Confounding(c) Selection bias(d) Repeated testing(e) Regression towards the mean
9. Focus group as a method was developed in the 1940s in Columbia Universityby sociologist Robert Merton and his colleagues as part of a sociologicaltechnique.
4.5 SUMMARY
The term ‘research methods’ generally refers to the plan or approach that aresearcher use in order to gather data or information. There are primary two sources of research. These are primary and
secondary sources of research. Primary resources contain first-handinformation, meaning that one is reading the author’s own account on aspecific topic or event that they have participated in. However, secondarysources describe, summarize, or discuss information or details originallypresented in another source. Survey is an important tool in research. No research can be performed
without a survey. Survey is to inspect, or take a view of; to view with
NOTES
Self-InstructionalMaterial 73
Research Methodsattention, as from a high place; to overlook; as to stand on a hill and surveythe surrounding country. There are basically two types of surveys, descriptive surveys and analytic
surveys. Descriptive surveys are generally collect information on what peoplethink and do. Analytic surveys are generally used to either test hypothesesor to answer particular research questions. Some examples of collecting survey data include self-administered posted
questionnaires, web-based forms, telephonic question and answer interviewsor face-to-face interviews. There are advantages and disadvantages of eachapproach, primarily to do with sample size and open versus closed questions. There are seven stages in survey method namely, planning and designing the
survey, collection of data, accessing data, preparing and managing data,analysing data, reporting, and deployment. The purpose of case study method is to identify the factors and reasons that
account for particular behaviour patterns of a sample chapter and itsassociation with other social or environmental factors. By adopting the case study method, a researcher gets to know about
happenings in the past, which could be related to the research studies andanalyse the problem with better perspectives. Census survey means gathering pertinent information about all the units of
population, viz., people, institutions, householders, and so on. Census surveys involve employment of huge manpower and monetary
resources. This method is also time consuming. Getting each respondent to cooperate for data collection is very difficult.
Hence, the feasibility of conducting census studies is very limited. Experimental research refers to the research activity wherein the manipulation
of variables takes place and the resultant effect on other variables is studied.It provides a logical and structured basis for answering questions. The experimental researchers manipulate the environment, stimuli or
applications and observe the impact of this manipulation on the condition orbehaviour of the subject. The manipulation that they undertake is deliberateand systematic. Experimentation is the classic method of experimenting in a science
laboratory where elements are manipulated and effects observed can becontrolled. A variable is any feature or aspect of an event, function or process that,
with its presence and nature, affects some other event or process which isbeing studied.
Research Methods
NOTES
Self-Instructional74 Material
There are various types of variables namely independent variables, dependentvariables, confounding variables. Confounding variables are of two types, namely intervening variables and
extraneous variables. Internal validity is considered as a property of scientific studies which
indicates the extent to which an underlying conclusion based on a study iswarranted. This type of warrant is constituted by the extent to which astudy minimizes a systematic error or a ‘bias’. Internal validity refers to the ability of a research design for providing an
adequate test of a hypothesis and the ability to rule out all plausibleexplanations for the results but the explanation being tested. External Validity is considered as the validity of generalized (causal or
fundamental) inferences in scientific studies. It is typically based onexperiments as experimental validity. In other words, it is the degree towhich the outcomes of a study can be generalized to other situations andpeople. External validity refers to the ability of a research design for providing
outcomes that can be generalized to other situations, especially to real-lifesituations. Focus group as a method was developed in the 1940s in Columbia University
by sociologist Robert Merton and his colleagues as part of a sociologicaltechnique. This was used as a method for measuring audience reaction toradio programmes. In fact, the method was uniquely adapted and modifiedin different branches of social sciences namely anthropology, sociology,psychology, education and advertising. A focus group is a highly versatile and dynamic method of collecting
information from a representative group of respondents. There are certain typical requirements for a conducive discussions. Some
of the key elements of a focus group are size, nature, acquaintance, setting,time period, the recording, the moderator. There are five stages in a focus group discussion such as forming, storming,
norming, performing, and mourning. There could be several variations to the standard procedure. Some such
innovations and alternative approaches are as follows: two-way focus group,dual-moderator group, fencing-moderator group, friendship groups, mini-groups, creativity group, brand obsessive group, online focus group.
NOTES
Self-InstructionalMaterial 75
Research Methods4.6 KEY WORDS
Survey: It refers to examine and record the area and features so as toconstruct a map, plan, or description. Descriptive Surveys: It refers to a type of survey which generally collects
information on what people think and do. Analytic Surveys: It refers to a type of survey which is generally used to
either test hypotheses or to answer particular research questions. Case Study: It refers to a research method which involves an up-close, in-
depth and detailed examination of a subject of study. Census: It refers to a count for official purposes, especially one to count the
number of people living in a country and to collect information about them.
4.7 SELF ASSESSMENT QUESTIONS ANDEXERCISES
Short Answer Questions
1. Write a brief note on survey and its importance along with examples.2. What are the assumptions made in a case study method?3. Briefly discuss about the strengths and limitations of census survey.4. Differentiate between independent and dependent variables.5. What is a focus group and its purpose?
Long Answer Questions
1. Discuss the different stages of survey method in detail.2. Explain the advantages and disadvantages of case study method.3. Assess the characteristics of experimental research.4. Analyse the various experimental designs.5. What are the different types of focus groups? Discuss.6. Describe the benefits and drawbacks of using focus group.
4.8 FURTHER READINGS
Busha, Charles H. and Stephen P. Harter. 1980. Research Methods inLibrarianship: Techniques and Interpretation. Orlando: Academic Press.

Research Methods
NOTES
Self-Instructional76 Material
Kumar, Krishan. 1992. Research Methods in Library and Information Science.New Delhi: Har-Anand Publications.
Rao, I.K. Ravichandra. 2009. Quantitative Methods for Library andInformation Science. New Delhi: New Age International Publishers.
Slater, Margaret. 1990. Research Methods in Library and Information Studies.London: Facet Pub.
Fowler, F. J. 2008. Survey Research Methods. New Delhi: SAGE Publications.
NOTES
Self-InstructionalMaterial 77
Research ProblemBLOCK - IIRESEARCH PROBLEMS & LITERATURE SEARCH
UNIT 5 RESEARCH PROBLEM
Structure5.0 Introduction5.1 Objectives5.2 Formulating the Research Problem5.3 Answers to Check Your Progress Questions5.4 Summary5.5 Key Words5.6 Self Assessment Questions and Exercises5.7 Further Readings
5.0 INTRODUCTION
The challenge for a business manager is not only to identify and define the decisionproblem; the bigger challenge is to convert the decision into a research problemthat can lend itself to scientific enquiry. As Powerset al. (1985) have put it, ‘Potentialresearch questions may occur to us on a regular basis, but the process of formulatingthem in a meaningful way is not at all an easy task.’
One needs to narrow down the decision problem and rephrase it intoresearchable terms. Well-known authors Bonnie L. Yegidis and Robert W.Weinbach (1991) have also referred to the complexity of phrasing the decision inresearch terms.
In this unit you will study about the research problem, formulation of theresearch problem, problem identification process. The unit will also discuss theconversion of management decision problem into research problem and objectivesof formulating the problem and techniques involved in formulating the problem.
5.1 OBJECTIVES
After going through this unit, you will be able to: Discuss the formulation of the research problem Describe the problem identification process Define the research problem Assess the objectives of formulating the problem
Research Problem
NOTES
Self-Instructional78 Material
Explain the internal and external criteria for formulation of the problem Examine the techniques involved in formulating the research problem
5.2 FORMULATING THE RESEARCH PROBLEM
The first and the most important step of the research process is to identify thepath of enquiry in the form of a research problem. It is like the onset of a journey;in this instance, the research journey, and the identification of the problem givesan indication of the expected result being sought. A research problem can bedefined as a gap or uncertainty in the decision-makers’ existing body ofknowledge which inhibits efficient decision-making. Sometimes, it may so happenthat there might be multiple reasons for these gaps, and identifying one of theseand pursuing its solution might be the problem. According to professor Fred N.Kerlinger, a well respected positivist, ‘If one wants to solve a problem, one mustgenerally know what the problem is. It can be said that a large part of the problemlies in knowing what one is trying to do.’ The defined research problem mightbe classified as simple or complex (Hicks, 1991). Simple problems are thosethat are easy to comprehend, and their components and identified relationshipsare linear and easy to understand, e.g., the relation between cigarette smokingand lung cancer. Complex problems, on the other hand, talks aboutinterrelationship between antecedents and subsequently with the consequentialcomponent. Sometimes the relation might be further impacted by the moderatingeffect of external variables as well, e.g., the effect of job autonomy andorganizational commitment on work exhaustion, at the same time considering theinteracting (combined) effect of autonomy and commitment. This might be furtherdifferent for males and females. These kinds of problems require a model orframework to be developed to define the research approach.
Thus, the significance of a clear and well-defined research problem cannotbe overemphasized, as an ambiguous and general issue does not lend itself toscientific enquiry. Even though different researchers have their own methodologyand perspective in formulating the research topic, a general framework whichmight assist in problem formulation is given below.
Problem identification process
The problem recognition process invariably starts with the decision-maker andsome difficulty or decision dilemma that he/she might be facing. This is an actionoriented problem that addresses the question of what the decision-maker shoulddo. Sometimes, this might be related to actual and immediate difficulties faced bythe manager (applied research) or gaps experienced in the existing body of
NOTES
Self-InstructionalMaterial 79
Research Problemknowledge (basic research). The broad decision problem has to be narroweddown to information oriented problem which focuses on the data or informationrequired to arrive at any meaningful conclusion. Given in Figure 5.1 is a set ofdecision problems and the subsequent research problems that might address them.
Management decision problem
The entire process explained above begins with the acknowledgement andidentification of the difficulty encountered by the business manager/researcher. Ifthe manager is skilled enough and the nature of the problem requires to beresolved by him or her alone, the problem identification process is handled byhim or her else he or she outsources it to a researcher or a research agency.This step requires the author to carry out a problem appraisal, which wouldinvolve a comprehensive audit of the origin and symptoms of the diagnosedbusiness problem. For illustration, let us take the first problem listed in the Figure5.1. An organic farmer and trader in Uttarakhand, Nirmal farms, wants to sellhis organic food products in the domestic Indian market. However, he is not awareif this is a viable business opportunity and since he does not have the expertiseor time to undertake any research to aid in the formulation of the marketingstrategy, he decides to outsource the study.
Discussion with subject experts
The next step involves getting the problem in the right perspective throughdiscussions with industry and subject experts. These individuals areknowledgeable about the industry as well as the organization. They could be foundboth within and outside the company. The information on the current and probablescenario required is obtained with the assistance of a semi-structured interview.Thus, the researcher must have a predetermined set of questions related to thedoubts experienced in problem formulation. It should be remembered that thepurpose of the interview is simply to gain clarity on the problem area and not toarrive at any kind of conclusions or solutions to the problem. For example, forthe organic food study, the researcher might decide to go to food experts in theMinistry for Food and Agriculture or agricultural economists, or retailers stockinghealth food as well as doctors and dieticians. This data, however, is not sufficientin most cases, while in other cases, accessibility to subject experts might be anextremely difficult task as they might not be available. The information should, inpractice, be supplemented with secondary data in the form of theoretical as wellas organizational facts.
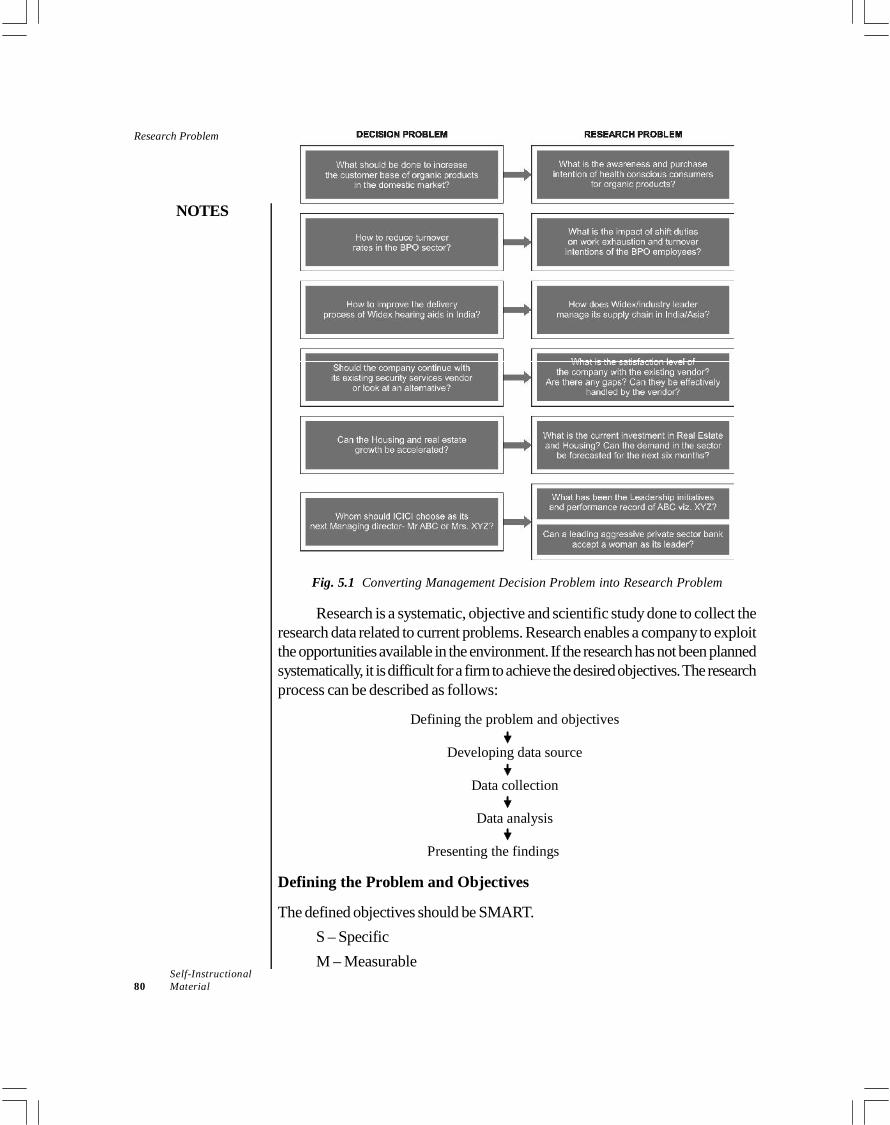
Research Problem
NOTES
Self-Instructional80 Material
Fig. 5.1 Converting Management Decision Problem into Research Problem
Research is a systematic, objective and scientific study done to collect theresearch data related to current problems. Research enables a company to exploitthe opportunities available in the environment. If the research has not been plannedsystematically, it is difficult for a firm to achieve the desired objectives. The researchprocess can be described as follows:
Defining the problem and objectives
Developing data source
Data collection
Data analysis
Presenting the findings
Defining the Problem and Objectives
The defined objectives should be SMART.S – SpecificM – Measurable
NOTES
Self-InstructionalMaterial 81
Research ProblemA – Attainable
R – RealisticT – Time Bound
The first step in research is definition of a problem. Selection of a problem is itselfa difficult decision. The success of research depends on right selection of theproblem. If the problem has not been identified in right manner, it is very difficultfor the researcher to find the right solution of the issue.
The following sources can help a researcher identify the research problems:
Brainstorming: A researcher can learn new dimensions of a problemby discussing ideas, thoughts, facts and data with other people whohave knowledge of the subject.
Consultations: By consulting others, the researcher identifies newdimensions of a problem.
Daily experience: Daily experience develops the evaluative thinkingin a researcher.
Academic experience: Academic experience helps the researcherdevelop critical thinking towards the happenings.
Field situations: Research is done because every field today isdeveloping and, hence, changing constantly.
Objectives of formulating the problem
‘A well-defined problem is half solved.’ This statement reveals the fact that howimportant it is to formulate or define a problem. The primary objective of a researchis to collect relevant data and analyse this data to get answers to the researchproblem. This means that the success of research depends upon accuracy of dataand information required for investigation. Right formulation solves this purpose.Proper definition of the problem, its analysis, identifying questions for data collectionand the formulation of hypothesis to be tested are key steps which are required forformulation of the problem. Once the exact and accurate data is known to theresearcher, he can plan the other steps without wastage of resources. Thus, rightformulation of the problem gives the right direction to the entire research and limitsthe approach towards pertinent facts out of the large variety of facts. It helps us indetermining statistical methods to be used for research.
Criteria for formulation of the problem
Criteria for formulating one problem out of identified problems can be groupedinto internal criteria and external criteria. These are discussed in detail in the followingsection:
Research Problem
NOTES
Self-Instructional82 Material
(i) Internal criteria
Internal criteria consist of the following: Interest of the researcher: The problem should be from the subject of
interest of the researcher and can be challenging to him. Without interest inthe problem, it becomes very difficult for the researcher to sustain continuityin the research. A researcher’s interest depends on his experience,educational background, sensitivity, and so on. Own resources of the researcher: Research requires a lot of money. If
the researcher does not have enough money and he is unable to manageexternal finance, the researcher should not go in for research. Moreover,time resource is more important than money. Research requires more timeand, hence, it should be utilized properly. Competence of the researcher: A mere interest in research is not enough.
The researcher must be competent enough to plan and carry out a study ofthe problem. He should have sufficient knowledge of the subject matter,relevant methodology and statistical procedures.
(ii) External criteria
External criteria consist of the following: Potential for research: Very narrow or extremely vague problems should
be avoided. In order to be researched, a problem must be one for whichobservation or other data collection in real world can provide the answer. Importance and urgency: Issues that require investigation are unlimited
but available research efforts are very limited. Therefore, relative importanceand significance of the problem is required. Important and urgent issuesshould be given priority over an unimportant one. Novelty of the problem: A problem on which a lot of research work has
been done should not be considered for research as there are fewer chancesof throwing light on any new factor. Feasibility: Novelty of the problem is not sufficient if it is not feasible to
conduct the study on problem in real world, i.e., it should contain factswhich can be analysed. Even if the problem is novel, we should make asmall feasibility study first and proceed only after this if study allows. Facilities: A well-equipped library, proper guidance in data analysis, and
so on, are basic facilities which are required to carry on any research. Research personnel: Availability of adequate research personnel including
investigators and research officers is very important for data collection,which is a major issue in many developing countries like India.
NOTES
Self-InstructionalMaterial 83
Research ProblemTechniques involved in formulating the problem
Defining a research problem properly and clearly is a crucial part of the researchstudy and must, in no case, be done hurriedly. The technique for this purposeinvolves undertaking the following steps: Statement of the problem in a general way: The problem should be
carefully worded. The problem statement should indicate nature of theproblem and intention of researcher. Understanding the nature of the problem: The best way to understand
the nature of the problem is to discuss with those who have prior experiencein the same kind of research. This will ensure that the origination of problemand the objectives in view are correct. If the marketer has stated the problemhimself, he should consider all the facts that induced him to make a generalstatement concerning the problem. Developing the ideas through discussions: Many new ideas are
developed by discussing them with others. This discussion provides usefulinformation for research. Discussion is done with those people who haveenough experience in the concerned field. Rephrasing the research problem: After going through the given four
steps, the researcher gets a clear idea about the environment in which theproblem is to be studied. Now rephrasing the problem into analytical oroperational terms is not a difficult task. Through rephrasing, the researcherputs the research problem in as specific terms as possible so that it maybecome operationally viable and may help in the development of workinghypothesis.
Check Your Progress
1. What is the most important step of the research process?2. Define research problem.3. What are the steps involved in the research process?4. Name the sources that can help a researcher to find the right solution of the
issue.5. What is the primary objective of a research?
5.3 ANSWERS TO CHECK YOUR PROGRESSQUESTIONS
1. The first and most important step of the research process is to identify thepath of enquiry in the form of a research problem.
Research Problem
NOTES
Self-Instructional84 Material
2. A research problem can be defined as a gap or uncertainty in the decision-makers' existing body of knowledge which inhibits efficient decision making.Sometimes, it may so happen that there might be multiple reasons for thesegaps, and identifying one of these and pursuing its solution might be theproblem.
3. The steps involved in the research process can be described in five phases,namely defining the problem and objectives, developing data source, datacollection, data analysis, and presentation of the findings.
4. The sources that can help the researcher to find the right solution of theparticular issue are brainstorming, consultations, daily experience, academicexperience, and field situations.
5. The primary objective of a research is to collect relevant data and analysethis data to get answers to the research problem. This means that the successof research depends upon accuracy of data and information required forinvestigation.
5.4 SUMMARY
The first and the most important step of the research process is to identifythe path of enquiry in the form of a research problem. A research problem can be defined as a gap or uncertainty in the decision-
makers’ existing body of knowledge which inhibits efficient decision-making. Simple problems are those that are easy to comprehend, and their
components and identified relationships are linear and easy to understand. Complex problems, on the other hand, talks about interrelationship between
antecedents and subsequently with the consequential component. The problem recognition process invariably starts with the decision-maker
and some difficulty or decision dilemma that he/she might be facing. This isan action oriented problem that addresses the question of what the decision-maker should do. The entire process explained above begins with the acknowledgement and
identification of the difficulty encountered by the business manager/researcher. Research is a systematic, objective and scientific study done to collect the
research data related to current problems. Research enables a company toexploit the opportunities available in the environment. If the research hasnot been planned systematically, it is difficult for a firm to achieve the desiredobjectives. A few stages are involved in the research process, such as defining the
problem and objectives, developing data source, data collection, dataanalysis, and presenting the finding.
NOTES
Self-InstructionalMaterial 85
Research Problem The primary objective of a research is to collect relevant data and analysethis data to get answers to the research problem. This means that the successof research depends upon accuracy of data and information required forinvestigation. The right formulation of the problem gives the right direction to the entire
research and limits the approach towards pertinent facts out of the largevariety of facts. It helps us in determining statistical methods to be used forresearch. Criteria for formulating one problem out of identified problems can be
grouped into internal criteria and external criteria. Internal criteria consist ofinterest of the researcher, own resources of the researcher, competence ofthe researcher. External criteria consist of potential for research, importance and urgency,
novelty of the problem, feasibility, facilities, and research personnel. Defining a research problem properly and clearly is a crucial part of the
research study. The technique involved in formulating the problem involvethe steps like statement of the problem in a general way, understanding thenature of the problem, developing the ideas through discussions and,rephrasing the research problem.
5.5 KEY WORDS
Research Problem: It refers to a definite or clear expression about anarea of concern, a condition to be improved upon, a difficulty to be eliminated. Applied Research: It refers to the methodology used to solve a specific,
practical problem of an individual or group. Data collection: It refers to the process of gathering and measuring
information on variables of interest, in an established systematic fashion thatenables one to answer stated research question hypotheses, and evaluateoutcomes.
5.6 SELF ASSESSMENT QUESTIONS ANDEXERCISES
Short Answer Questions
1. What are simple problems and complex problems?2. What do you mean by criteria for formulation of the problem?3. Define internal criteria and external criteria.4. Write a short note on the techniques involved in formulating the problem.
Research Problem
NOTES
Self-Instructional86 Material
Long Answer Questions
1. Discuss problem identification process.2. Explain the process of converting management decision into research
problem.3. Analyse the components of internal criteria and external criteria.
5.7 FURTHER READINGS
Busha, Charles H. and Stephen P. Harter. 1980. Research Methods inLibrarianship: Techniques and Interpretation. Orlando: Academic Press.
Kumar, Krishan. 1992. Research Methods in Library and Information Science.New Delhi: Har-Anand Publications.
Rao, I.K. Ravichandra. 2009. Quantitative Methods for Library andInformation Science. New Delhi: New Age International Publishers.
Slater, Margaret. 1990. Research Methods in Library and Information Studies.London: Facet Pub.
Fowler, F. J. 2008. Survey Research Methods. New Delhi: SAGE Publications.
NOTES
Self-InstructionalMaterial 87
Literature Search
UNIT 6 LITERATURE SEARCH
Structure6.0 Introduction6.1 Objectives6.2 Importance of Surveying Related Literature6.3 Uses of Library and Internet in Research
6.3.1 Uses of Library in Research6.3.2 Uses of Internet in Research
6.4 Research Reviews, Abstracts and Microforms6.5 Computerized Information Retrieval System6.6 Answers to Check Your Progress Questions6.7 Summary6.8 Key Words6.9 Self Assessment Questions and Exercises
6.10 Further Readings
6.0 INTRODUCTION
A research review is an article or a piece of information that summarizes the currentunderstanding on a topic or previously published studies. If we talk about a literaturereview, it is also on the same lines of research review as it includes the currentknowledge including substantive findings, as well as theoretical and methodologicalcontributions to a particular topic.
In this unit, you will study about the features and characteristics of researchreview, and literature review. You will also study the uses of library and Internet inresearch and get acquainted with the various library research tools. Besides, youwill also get familiar with the concepts like abstracts, index, microforms and wouldbe able to define the computerised information retrieval systems and its types.
6.1 OBJECTIVES
After going through this unit, you will be able to: Understand the uses of library and Internet in research Identify the various library research tools Describe the variety of uses of library resources Comprehend the concept like research reviews, abstracts and microforms Discuss the computerized information retrieval system
Literature Search
NOTES
Self-Instructional88 Material
6.2 IMPORTANCE OF SURVEYING RELATEDLITERATURE
A literature review is a comprehensive compilation of the information obtainedfrom published and unpublished sources of data in the specific area of interest tothe researcher. This may include journals, newspapers, magazines, reports,government publications, and also computerized databases. The advantage of thesurvey is that it provides different perspectives and methodologies to be used toinvestigate the problem, as well as identify possible variables that may need to beinvestigated. Second, the survey might also uncover the fact that the researchproblem being considered has already been investigated and this might be usefulin solving the decision dilemma. It also helps in narrowing the scope of the studyinto a manageable research problem that is relevant, significant and testable.
Once the data has been collected from different sources, the researchermust collate all information together in a cogent and logical manner instead of justlisting the previous findings. This documentation must avoid plagiarism and ensurethat the list of earlier studies is presented in the researcher’s own words. Thelogical and theoretical framework developed on the basis of past studies shouldbe able to provide the foundation for the problem statement.
The reporting should cite clearly the author and the year of the study. Thereare several internationally accepted forms of citing references and quoting frompublished sources. The Publication Manual of the American PsychologicalAssociation (2001) and the Chicago Manual of Style (1993) are academicallyaccepted as referencing styles in management.
To illustrate the significance of a literature review, given below is a smallpart of a literature review done on organic purchase.
Research indicates organic is better quality food. The pesticide residue inconventional food is almost three times the amount found in organic food. Bakeret al. (2002) found that on an average, conventional food is more than five timeslikely to have chemical residue than organic samples. Pesticides toxicity hasbeen found to have detrimental effects on infants, pregnant women and generalpublic (National Research Council, 1993; Ma et al., 2002; Guillete et al., 1998).Major factors that promote growth in organic market are consumer awareness ofhealth, environmental issues and food scandals (Yossefi and Willer, 2002).
This paragraph helps justify the relevance and importance of organic versusnon- organic food products as well as identify variables that might contributepositively to the growth in consumption of organic products.
NOTES
Self-InstructionalMaterial 89
Literature Search6.3 USES OF LIBRARY AND INTERNET IN
RESEARCH
In this section, you will study the aspects of using library and internet in research.
6.3.1 Uses of Library in Research
It is common for a researcher to be confused and disoriented while using thelibrary for research. Usually, this happens because the researchers feel at a loss asto where from and how to start searching the library resources. Therefore, asystematic and methodical approach towards the vast source of information thatlibraries usually offer is very essential. This can facilitate researchers in using qualitytime for conducting his/her search and collecting the essential information.Researchers should, therefore, create a concrete library research plan. Such aplan can enable him/her make an effective use of library materials for research.
Library Research Plan
A library research plan is a predefined activity that gives direction to your research.It is an act that involves evaluation that helps determine the subsequent activities tobe followed by the researcher. As such, the research plan is a sequence of stepsthat the researcher should follow in order to get a comprehensible and reliableoutline to adhere to. The various steps contained in a research plan can be statedas follows: Subject evaluation: This involves analysing the research subject with an
informative perspective. The researcher should find out the extent ofinformation that is already available and known to him/her. This can give aclear idea about the unknown information that needs to be searched in thelibrary. Determine the scope of research: This involves identifying whether the
research is a general study of occurrences or is concerned with more specificinvestigation. For example, whether your research is concerned with studyingthe eating habits of working women or eating habits of working people.Accordingly, you have to search for the relevant content. You should alsocheck the chronological, geographical, political and other such aspects ofyour research study. You need to also analyse if your research deals withany specific locality, a particular time span or any current issue. Sort-out keywords: The research subject should be disintegrated into a
set of key terms or key words. A key word can be defined as a term thatexpresses the most basic words of the research content, which describesyour broad topic. The researcher should separate the distinct and uniquewords and important concepts contained in the research to use as subject
Literature Search
NOTES
Self-Instructional90 Material
key words. This will greatly help the researcher keep in track the relatedtopics of the research subject and avoid deviation. It is thus the mostsignificant activity of a researcher wherein he/she should determine the basicterms to be adhered to while searching for books and other similar informationresources. Select the right library tool: Depending upon the scope of your research,
you can resort to the appropriate library tools required for collecting theinformation for research. There is a wide range of tools offered by a libraryin modern times. These tools span from small almanacs and handbooks tothe most comprehensive books and anthological volumes, and most obviouslythe computerized library catalogue, which is the result of informationtechnology revolution.
Library Research Tools
Once the researcher has executed the activities involved in the research plan, he/she should start looking for the essential and relevant information. This involvesexploring information through traditional and modern library research tools, whichcontain specific bits of information as well as voluminous records and theories. Tobe able to make full use of these tools, it is necessary for the researcher to becomefamiliar with the applications of these specific library tools. The most commonlibrary research tools available in any library are as follows: Library catalogue: A library catalogue is an informative list of resources
and materials available in the library. It comprises the name of books orjournals along with the name of authors, subjects and publishing houses. Itthus, informs the researcher what is available in the library. Usually, in thedeveloped countries, such catalogues are stored as computerized databases,which use featured searches with headings like ‘author,’ ‘title,’ ‘subject’and ‘keywords.’ However, in India, many government-funded educationallibraries are still using the paper-oriented catalogue technique except forsuch private libraries like the British Council Library, American Library,Indian Institute of Technology Library, etc. It is, therefore, advisable for aresearcher to refine his/her research subject to specific key words and searchfor the necessary information using these key words. Almanacs: An almanac is a chronological tabular publication that is published
annually. Traditional almanacs, usually, contained information regardingweather forecasts, astronomical data and several other statistics like therising and setting of sun, moon, eclipses etc. However, in the current times,almanacs have become all comprehensive and include statistical andexplanatory information regarding happenings in the whole world. Topicalweather developments, historical events, factual information, etc., are thefeatures of the present almanacs. A researcher can use these for quickgrasping of facts of his research topic.
NOTES
Self-InstructionalMaterial 91
Literature Search Dictionaries: Dictionaries are most often regarded as a superficial sourceof information as it is supposed to be performing the sole function of definingthe meanings of words. However, contemporary editions of dictionariesare much innovative in their own way and explain innumerable terms incontext of several usages of the specific term. As such, a researcher shouldseek factual information in the dictionary and also search for related phrasesmentioned in the context of the word being searched to get a broader viewof his/her topic of interest. Encyclopaedia: Encyclopaedia, in general, is a bulk informative volume
containing a synopsis of the concerned subject, which is published inalphabetical order. Encyclopaedia is, in fact, an extension of the concept ofdictionary wherein the words are described precisely. A background context,however, can make the reader get more acquainted with the research termand, therefore, it is always preferable to consult an encyclopaedia to get abetter knowledge of the subject matter. This also helps the researcher tounderstand several jargons and terminologies related to his/her subject ofresearch. Bibliographies: A bibliography usually comprises a list of reference materials
mentioned by the researcher. This list gives the names of various sourcesthat the researcher has resorted to, such as books and articles forresearch. The bibliographies are mentioned at the end of the article orresearch paper. It gives information regarding any particular topic that hasbeen published together as a book. There are two types of bibliographiesdepending upon the information they provide. These two types can be statedand explained as follows:o Enumerativebibliography: This is also known as compilative, reference
or systematic bibliography. It gives a general idea of the relevantpublications in a specific subject matter. The most common format to beused by the researcher while giving citations in such bibliography is asfollows: Author Title Publishing company Publication date
o Analyticalbibliography: This type is further classified into descriptive,historical and textual bibliographies. Usually, these are concerned withthe physical attributes and contemporary importance of a book. Theytake into account the size, format and context in which the book wasprinted and published, etc. Therefore, such bibliographies are not veryclosely connected to any form of research.
Literature Search
NOTES
Self-Instructional92 Material
Bibliographies, however, provide a good research tool to refer to for aneffective exploring through the vast data available in a library. Indexes: Indexes, as is well known, are the alphabetical lists of authors’
name and subjects containing the relevant page numbers where these topicsand authors have been discussed or described in the book. In research,they facilitate searching through a number of journals simultaneously andthus provide considerable information at the start of the research process.Indexes cover a large variety of sources, ranging from books, periodicals,conference papers, reports, thesis and articles, etc. Search engines: Search engines refer to software that browse through the
Internet for the queried information and provide sites, which contain theconcerned information within a few seconds. They operate automaticallyand collect words available on a vast number of web pages. A researcherneeds to understand and learn the technique of effective utilization of asearch engine. He/She should also be aware regarding the evaluation of theresults that the search engines provide. The most popular search enginesused all over the world today are Google and Alta Vista.It is evident from the above discussion that with technological inventions,
the nature of library research has changed tremendously. It has extended its scopeand deals with vast range of information simultaneously. The researcher today,therefore, needs to familiarize himself/herself with various jargons and terminologiesto get a good grasp of the research tools. The description that follows includes thevarious words commonly used in library research.
Use of Library Resources
There are innumerable information materials available in a library. In general, theprime sources of information can be classified and explained in the context ofresearch usability as follows: Books: Undoubtedly, books are the most significant and chief resource of
information in any library. However, irrelevance can greatly hamper a book’susability for the researcher. It is, therefore, very essential for a researcher toexamine whether the book he/she is referring is relevant to his/her researchstudy or not. A researcher should also check for the authority of the book,i.e., whether the author is an expert in the field or a well-known publishinghouse has published the book. Checking for the contemporariness will alsofacilitate the researcher to remain up-to-date in conducting his/her researchstudy. Journals: Journals refer to a periodical collection of articles. They also
include such sources like reports, bulletins or proceedings, published monthlyby any organization or an institution. There are also certain scholarly journals,which are of great help to a researcher working in the field of humanities or
NOTES
Self-InstructionalMaterial 93
Literature Searchsocial sciences. Usually, journals contain articles, which can offer thoroughknowledge or up-to-date information regarding the subject matter ofresearch. Thesis: In simple terms, thesis refers to a piece of research work conducted
by an individual to qualify for a degree. Usually, libraries often hold copiesof thesis, which have been submitted and approved for Ph.D. A researchercan browse through such thesis to get an idea of the layout and presentationoptions for his/her own thesis. While making use of such thesis, the researchershould remember that they are copyright protected materials and for quotingfrom a thesis, it is essential to take a prior written consent from the concernedauthor. Manuscripts and archives: These are unpublished, sometimes hand-
written or typed original and primary sources of information. A study ofthese manuscripts gives the researcher an idea of the original study conductedin the past and thus guides him/her in conducting the research. Manuscriptscan be used for citing examples to prove his/her points by referring to pastoccurrences and events. It is, however, absolutely important to preservethe integrity of such sources and, therefore, a researcher should repeat theoriginal text exactly if required without any omissions, additions or corrections.It is absolutely important for the researcher to check the relevance of the
concerned materials while referring anything from the mentioned sources in his/herresearch study. Usually, there is a general tendency to simply use what comes firstat hand. Secondly, one is bound to believe anything when it is in print. However, agood research is not the result of such quick and simple adaptations. A researchershould give plenty of time to conduct the research study. He/She should examineevery available source of information to its fullest usable degree.
It is also necessary to check the accuracy, timeliness and depth of the contentin the concerned source of information. Check out if the topic is being coveredexhaustively by the book, or thesis or journal to which you have resorted. It isalways advisable for the researcher to consider the target audience he/she is goingto address and scrutinize. For example, a research that aims at conducting a studyamong the students of postgraduate courses should use refined and superior levelof vocabulary. In that case, resorting to a book meant for high school studentsshould be restricted till the extent of selecting basic ideas required for the research.However, it is obviously the researcher’s job to adapt his/her target audience andpresent the ideas in his/her own unique style.
The researcher, while conducting a research, collects a large amount ofdata and stores them in the computer. However, it depends on the hardware andsoftware capacity of the computer to store the information and data. The hardwareand software capacity can be changed or managed as per the requirements of theorganization.
Literature Search
NOTES
Self-Instructional94 Material
6.3.2 Uses of Internet in Research
Before the evolution of the Internet, conducting a research work involved a set ofencyclopaedias and a trip to library. However, now we live in an age where theinformation is easily accessible via computer using Internet. Today, informationand data can easily be accessed with the help of the Internet. The Internet is thefastest developing and the largest repository of data. A researcher on the Internetcan find information about any topic he/she desires. The Internet acts as a hugedatabase of the content where a researcher can access an unlimited number ofinformative sources.
Research itself is a very wide term. It means a systematic enquiry of thefacts. There are various common applications of Internet research. One suchapplication of the Internet research includes the personal research that is undertakenin order to enquire about a particular subject such as news or health problems.Various other applications of the Internet research also include research undertakenby the students for academic projects and papers, and writers and journalistsresearching stories.
One of the advantages of conducting research using the Internet is thathundreds or thousands of pages can be found with some relation to the topic,within seconds, which is not possible if the same topic is to be searched frombooks or encyclopaedias. Moreover, the Internet also includes e-mail, onlinediscussion forums and other communication facilities such as instant messagingand newsgroups that help the researchers have a direct access to the experts andother individuals with relevant knowledge and interests.
There are various tools such as Internet search engine and Internet guidethat a researcher can use for collecting the information. A search engine is anonline database of Internet resources. When the researcher poses a query abouta particular topic, the search engine looks for the likely matches within the databaseand displays the relevant content accordingly. Unlike, a standard search engine,the information that is contained within an Internet guide is compiled and organizedby the humans, not computer programmes. Encyclopaedia Britannica is an exampleof Internet guide that covers a vast category of different topics.
However, there is one disadvantage for the researchers in conducting aresearch with the help of the Internet. The disadvantage is that the majority of thecontent available on the Internet is self-submitted and there are few rules andregulations that a researcher has to adhere with regard to what a researcher canpublish and what he/she cannot. Moreover, the content on the Internet maysometimes be inaccurate and opinion based.
However, the Internet must not be disregarded as the major source ofconducting research. It is one of the major sources of journals, books, generalinformation and other relevant content. Therefore, we can say that the Internet is
NOTES
Self-InstructionalMaterial 95
Literature Searcha very important source for the researchers in this modern age for the purpose ofcollecting information.
Check Your Progress
1. What is a literature review?2. Name the academically accepted referencing styles in management.3. Define library research plan.4. What are the most common library research tools available in a library?5. What are journals?6. What is the importance of thesis in research?7. What is the one of the main advantages of conducting research using the
Internet?
6.4 RESEARCH REVIEWS, ABSTRACTS ANDMICROFORMS
Research reviews, abstracts and microforms are the tools that specify the significantpoints of published literature and the various research papers, published orunpublished.
Review of any literature or research paper provides the current knowledgeincluding prominent findings, as well as theoretical and methodological contributionsto a particular topic. A literature review is a search and evaluation of the availableliterature in the given subject or chosen topic area. It documents the state of the artwith respect to the subject or topic you are writing about.
The purpose of any review paper is to compactly evaluate or review therecent progress for the specific topics. Overall, the review paper summarizes thestate of data of the subject. It helps in understanding of the subject for the readerby discussing the findings given in the recent analysed papers.
A literature review may be an intellectual paper, which has this data as wellas substantive findings. Literature reviews are secondary sources, and do not reportnew or original experimental work. Therefore, the literature review helps in explainingthe topics of the research as well as in building a rationale or foundation for theresearch problem that has to be analysed for making decisions and the prerequisitefor additional or further research.
A literature analysis or review might accommodate merely an outline orsummarized framework of significant sources, however if referred to the socialsciences, a literature analysis or review typically has associated structuredand organized pattern or arrangement that combines each outline andsynthesis, usually at intervals that specify the abstract classes within the frameworkof precise theoretical or conceptual classifications. An outline may be a recap of
Literature Search
NOTES
Self-Instructional96 Material
the necessary and significant information about the sources or causes; however, asynthesis may be a re-organization or a re-shuffle of that precise information duringan approach that informs or specifies or aims to investigate a researchexpression or a problem.
The literature analysis or review has the following analytical andmethodological features:
1. Providing a new or different interpretation of previous researched materialor by mixing the new interpretations with the previously given interpretations.
2. Tracing the intellectual or scholarly progression or advancement of the fieldunder study, which includes major discussion and debates.
3. Depending on the condition the research sources are evaluated andrecommend the researcher on the utmost pertinent or appropriate andsignificant research analysis.
4. Typically, within the conclusion or interpretation of a literature analysis andreview for establishing and identifying those research problems wherevergaps exist.Following are the key objectives of a literature analysis and review in
research: Organize every context and its related contributions such that it helps to
understand and analyse the research problem that is under study. Define the relationship or association between every work with the other
research work that has been considered for the research process. Identify and recognize the new and different techniques for interpreting
the previous research analysis. Reveal and ascertain any gaps that are existing within the research literature. Identify and resolve the disputes/collisions/conflicts between apparently
contradictory or inconsistent studies conducted previously. Identify/recognize the regions of previous researches and analysis to
avoid duplication if any. Defining the approach to fulfil the requirement for further research
and analysis. Discover from the existing research literature to analyse the research
framework within the standard or established perspective. This is verysignificant.
Information in any field has three different layers, as such: Researchers conduct and publish the primary studies. The reviews of these studies summarize and provide new interpretations
specifically designed and occasionally extending on the remote side ofthe primary studies.
NOTES
Self-InstructionalMaterial 97
Literature Search There are perceptions, conclusions, opinion, and interpretations that areshared informally which become a part of the traditional knowledge offield.
Types of Literature Reviews
Argumentative Review
This form examines literature by selection so as to support or refute associatedegree argument and the aim is to develop a body of literature that establishesan investor viewpoint. Given the value-laden nature of some science analysis,contentious approaches to analyzing the literature is a legitimate and necessary kindof discourse.
Integrative Review
The body of literature includes all studies that address connected or identicalhypotheses and analysis issues. A cooked integrative review meets theidentical standards as primary analysis in respect to clarity, rigor, andreplication. This is often the foremost common style of review within the socialsciences.
Historical Review
Historical literature reviews specialize in examining analysis throughout theamount of your time, typically beginning with the primary time a problem, concept,theory, phenomena emerged within the literature, then tracing its evolution atintervals the scholarship of a discipline. The aim is to put analysis during a historicalcontext to indicate familiarity with progressive developments and tospot the seemingly directions for future research.
Methodological Review
This approach helps highlight moral problems that you ought to remember ofand contemplate as you undergo your own study. Reviewing ways ofstudy provides a framework of understanding at completely different levels (i.e.those of theory, substantive fields, analysis approaches, and knowledge assortmentand analysis techniques), however researchers draw upon a good styleof information starting from the abstract level to sensible documents to beused in munition within the areas of metaphysics and philosophy thought,quantitative and qualitative integration, sampling, interviewing, knowledgeassortment, and knowledge analysis.
Theoretical Review
The theoretical literature analysis and review helps in determining that whichtheories already exist, the relationships between them, and up to what degree orextent the contemporary theories are being investigated, and to develop newspecific hypotheses which must be tested. Typically, these types of theories are
Literature Search
NOTES
Self-Instructional98 Material
essentially employed for assisting and establishing the insufficient or inadequatetheories that are applicable to reveal or discover that current or existing theoriesare not sufficient and satisfactory for explaining new or differentincreasing analysis issues.
Systematic Review
Systematic reviews formulate analysis queries that are broad or slender in scope,and determine and synthesize studies that directly relate to the systematic reviewquestion. They are designed to produce an entire, thoroughgoing outline ofcurrent proof relevant to a look question. Systematic reviews of randomisedcontrolled trials are key to the evidence-based medication, and a review of existingstudies is usually faster and cheaper than embarking on a replacement study.
Characteristics
1. It aims to produce a whole, thorough outline of current literature relevantto an exploration question. The primary step in conducting a scientific reviewis to make a structured question to guide the review.
2. The second step is to perform an intensive search of the literature for relevantpapers.
3. The methodology section of a scientific review can list all of the databasesand citation indexes that were searched like the Internet of Science,EMBASE, and PubMed/MEDLINE and anyone journals that weresearched.
4. The titles associate degreed abstracts of known articles are checked againstpre-determined criteria for eligibility and relevancy to make an inclusion set.
5. This set can relate back to the analysis drawback. Every enclosed studycould also be allotted associate degree objective assessment of methodquality ideally by exploitation ways orthodox to the well-liked coveragethings for Preferred Reporting Items for Systematic Reviews and Meta-Analyses (PRISMA) statement.
Stages
The main stages of systematic review are as follows:1. Defining a research problem and then agreeing the objective techniques.2. A search for relevant information from analysis of research that
matches bound criteria. As an example, solely choosing analysis that isof sensible quality and then answering the outlined questions. Contacting atrained data skilled or professional person will improve the standard of thesystematic review.
3. ‘Extraction’ of relevant information. This could embrace, however, theanalysis performed often known as the tactic or ‘intervention’. Further, any
NOTES
Self-InstructionalMaterial 99
Literature Searchagency participated within the analysis (including what percentage people),however, it was absolutely bought for example funding sources and theoutcomes.
4. Assess the standard of the info by judgment it against criteria known at theprimary stage.
5. Analyse and mix the information that offers an overall result from all of thedata. This mixture of knowledge is visualized employing a blobbogram(also known as a forest plot).A careful literature review generally comprises of 10 to 25 pages but it
could be longer depending on the process as such the process of reviewing theliterature requires different kinds of activities and ways of thinking. Shields andRangarajan (2013) and Granello (2001) link the activities of doing a literaturereview with Benjamin Bloom’s revised taxonomy of the cognitive domain (waysof thinking: remembering, understanding, applying, analyzing, evaluating, andcreating).
A literature review has following four major purposes and uses. For surveys of literature in the chosen area of study. To synthesize the information in the literature into a summary. To critically analyse the information gathered by identifying gaps in
current knowledge; by showing limitations of theories and points of view;and by formulating areas for further research and reviewing areas ofcontroversy.
To present the literature in an organized manner.A literature review indicates the readers that the writer has an in-depth
grasp of the given subject; and that he understands where the current topic ofresearch fits into and adds to an existing body of agreed knowledge.
Scoping Reviews
Scoping reviews are distinct from systematic reviews. A scoping review is anendeavour to look for ideas, mapping the language that surrounds those andadjusting the search methodology iteratively. A scoping review could usually be apreliminary stage before a scientific review, that ’scopes’ out a region of inquiryand maps the language and key ideas. As it could be a quite review that oughtto be consistently conducted (the methodology is repeatable), some researchpublishers reason them as a sort of ‘systematic review’, which can causeconfusion.Critical evaluation of each literature review should include the following:
1. Provenance – Author’s credentials are to be monitored, i.e., all the argumentsof the author’s should be supported by proper evidences, such as facts,figures, case studies, statistics, recent findings, etc.
Literature Search
NOTES
Self-Instructional100 Material
2. Methodology – Is research problem has been identified properly, thetechniques used to gather information and the sample size chosen. Resultshave been accurately interpreted.
3. Objectivity – Certain data is used or some accurate information being ignoredto validate the author’s point of view.
4. Persuasiveness – The highest most convincing or the least point for theauthor’s work.
5. Value – The work done has come to some significant conclusion.The following are various stages for the development of Literature review:
1. To formulate the problem.2. To search the material related to the subject.3. Evaluation of the data in the right way.4. To analyze and interpret the findings and conclusions.
The significant consideration is that all the assumptions can be predeterminedand essentially be addressed concisely and adequately while performing the literaturereview and for collecting the problem-specific information. Sometimes when theresearcher is operationally defining the variables for literature review, then he/shemay have to restructure questions and consecutively the approach will becomemore authentic and trustworthy.
Thus, the specific framework of literature review specifically created toseek answers to the research question solely depend on the techniques of researchanalysis methods for obtaining the logically authentic information required to answerthe research problem within the specified framework.
In addition, at times the researcher may come across situation when thetopic of a research is such that there is no previous information or any literatureavailable on it. In such cases, the researcher can contact the experts to take helpwho might be able to provide some valuable insights based upon their experiencein the field or with the concept. This methodology of obtaining precise and authenticinformations from the significant and erudite individuals is termed as the expertinformation analysis. This methodology might be formal and structured as it isextremely useful when authenticated by a secondary/primary research analysis.
Abstract
An abstract is a brief summary of a literature, research article, thesis, reviews,conference proceeding, or any in-depth analysis of a particular subject and isoften used to help the reader quickly ascertain the paper’s purpose. To elaboratefurther an abstract is a self-contained, short, and powerful statement that describesa larger content work. Components vary according to subject. An abstract of asocial science or scientific work may contain the scope, purpose, results, andcontents of the work. Whereas an abstract of a humanities work may contain thethesis, background, and conclusion of the larger work. An abstract is not a review,
NOTES
Self-InstructionalMaterial 101
Literature Searchnor does it evaluate the work being abstracted. While it contains key words foundin the larger work, the abstract is an original document rather than an excerptedpassage.
As per law, abstract can be defined as a statement that consists of importantpoints of a legal documents or several legal papers related to it.
To present the complete synopsis of the paper an abstract need to be writtenwithin a tight word limit. A maximum word count for writing an abstract is 200words. Nowadays, scientific papers are usually placed onto an info, with strictlimits on the quantity of words.While writing an abstract some important points to be kept in mind are:
1. A brief explanation of the topic of the subject2. Defining the research question3. The type of methodology used4. Results5. Conclusions
An abstract is generally kept at the beginning of a manuscript or typescript,acting as the point-of-binging for any given academic paper or literature. Abstractingand indexing services for various academic books are aimed at compiling the bodyof literature for that particular subject.
Abstract is also named as synopsis in many a publication just for changebut the purpose is same. In some of the management reports, an executivesummary usually contains more information (and often more sensitive information)than the abstract does.
Abstract: Purpose and Limitations
Abstract is used in many academic literatures just for clear communication aboutthe complex research. An abstract may act even as a stand-alone entity in place ofa full paper. As such, an abstract is used by many organizations as the basis forselecting research that is proposed for presentation in the form of a poster, platform/oral presentation or workshop presentation at an academic conference or seminar.
It will be appropriate to say that most literature database search enginesindex only the abstracts rather than providing the entire text of the paper. Full textsof scientific papers must often be purchased because of copyright and/or publisherfees and therefore the abstract is a significant selling point for the reprint or electronicform of the full text.
Although the abstract can be used just to convey the main results andconclusions of a scientific article but in any case the full text article must be consultedfor details of the methodology, the full experimental results, and a critical discussionof the interpretations and conclusions.
Literature Search
NOTES
Self-Instructional102 Material
An abstract may provide one to sieve or filter through copious numbers ofpapers for ones in which the researcher can have more confidence that they willbe relevant to their research work. Once papers are chosen based on the abstract,they must be read carefully to be evaluated for relevance. It is generally agreedthat one must not base reference citations on the abstract alone, but the content ofan entire paper.
As per the results of a study published in some informative literature, the‘exaggerated and inappropriate coverage of research findings in the news media’is ultimately related to inaccurately reporting or over-interpreting research resultsin many abstract conclusions. A study published in an academic literatureconcluded that ‘inconsistencies in data between abstract and body, reporting ofdata and other information solely in the abstract are relatively common and that asimple educational intervention directed to the author is ineffective in reducing thatfrequency’. Other studies comparing the accuracy of information reported in ajournal abstract with that reported in the text of the full publication have foundclaims that are inconsistent with, or missing from, the body of the full article.
Abstracts are protected under the copyright law just as any other form ofwritten manuscript is protected. However, some publishers of the scientific articlesinvariably make abstracts freely available, even when the article is not free. Forexample, articles in the biomedical literature are available publiclyfrom MEDLINE which is accessible through PubMed.
An academic abstract typically outlines four elements as mentioned belowwhich may be relevant to the completed work: The research focus (i.e., statement of the problem(s)/research issue(s)
addressed). The research methods used (experimental research, case studies,
questionnaires, etc.). The results/findings of the research. The main conclusions and recommendations.
Abstract may also contain brief references, although some publications havethe standard style of excluding the references from the abstract, reserving themfor the article body (which, by definition, treats the same topics but in more depth).
‘Length of Abstract’ varies by discipline and publisher requirements.However typical length ranges from 100 to 500 words, but very rarely more thana page and occasionally just a few words.
An abstract may or may not have the section title as ‘abstract’ prominentlylisted as an antecedent to the content. Abstracts are generally sectioned logicallyas an overview of what appears in the paper, with any of the following subheadings:Objectives, Introduction, Methods, Results, Conclusions, Background. Abstracts,where these subheadings are explicitly given, such abstracts are called ‘structured
NOTES
Self-InstructionalMaterial 103
Literature Searchabstracts’ by publishers. Abstracts that comprise one paragraph (no explicitsubheadings) are often called ‘unstructured abstracts’ by publishers.
Informative
The informative abstract, which is also known as the complete abstract, containcomprehensive summary of a paper’s material including its purpose, background,methodology, results, and conclusion. Usually between 100 to 200 words. Theinformative abstract in general summarizes the structure of any literature, its majortopics and key points. A format for scientific short reports that is similar to aninformative abstract has been proposed in recent years. Informative abstracts maybe viewed as standalone documents.
Descriptive
The descriptive abstract, which has some limitations so is also known as the limitedabstract or the indicative abstract. It provides a description of what the papercovers without going into its subject material.A descriptive abstract is limited toa table of contents in paragraph form.
Graphical Abstracts
A graphical abstract is a single, concise, pictorial and visual summary of the mainfindings of the article. A graphical abstract will be a one-image file and will visualizeone process or make one-point clear. For ease of browsing, the graphical abstractwill have a clear start and end, preferably ‘reading’ from top to bottom or left toright. This could either be the indicative figure from the article or a figure which istypically designed for the purpose, which contain the content of the article forreaders at a single glance.
With the influence of storage and retrieval systems of computer such asthe Internet browsing, some scientific publications, primarily those publishedby Elsevier, started including graphical abstracts alongside the text abstracts. Thegraphic is intended to summarize or be an exemplar for the main thrust of thearticle. It is not intended to be as exhaustive a summary as the text abstract, ratherit is supposed to indicate the type, scope, and technical coverage of the article ata glance. The use of graphical abstracts has been generally well received by thescientific community. Moreover, some journals also include video abstracts andanimated abstracts made by the authors to easily explain their papers. Many scientificpublishers currently encourage authors to supplement their articles with graphicalabstracts, in the hope that such a convenient visual summary will facilitate readerswith a clearer outline of papers that are of interest and will result in improvedoverall visibility of the respective publication. However, the validity of this assumptionhas not been thoroughly studied, and a recent study statistically comparingpublications with or without graphical abstracts with regard to several outputparameters reflecting visibility failed to demonstrate an effectiveness of graphicalabstracts for attracting attention to scientific publications.
Literature Search
NOTES
Self-Instructional104 Material
Critical Abstract
A crucial abstract provides, additionally to describing main findings and data, ajudgement or comment concerning the study’s validity, liableness, or completeness.The man of science evaluates the paper and infrequently compares itwith different works on the identical subject. Crucial abstracts are usually 400-500words long thanks to the extra interpretative comment. These sorts of abstractsare used sometimes.
Highlight Abstract
A highlight abstract is specifically written to draw in the reader’s attention to thestudy. No pretence is created in either a balanced or complete image of the paperand, in fact, incomplete and leading remarks could also be accustomed in orderto spark the reader’s interest. In this a highlight abstract cannot stand independentof its associated article. Highlight abstract is not a real abstract and, therefore, it isseldom employed in tutorial writing.
Abstract Quality Assessment
Various methods can be used to evaluate abstract quality, e.g. rating by readers,checklists (not necessary in structured abstracts), and readability measures.
When the need does arises of writing the abstracts When submitting the articles to journals, especially online journals When applying for research grants When writing a book proposal When completing the Ph.D. dissertation or M.A. thesis When writing a proposal for a conference paper When writing a proposal for a book chapterMost likely, the author of the entire work (or prospective work) writes the
abstract. However, there are professional abstracting services that hire writers todraft abstracts of other people’s work. In a work with multiple authors, the firstauthor usually writes the abstract. Undergraduates are sometimes asked to draftabstracts of books/articles for classmates who have not read the larger work.
Writing Style
Always use active voice wherever possible; however note that a lot of yourabstract might need passive sentence constructions. Regardless, write yourabstract in concise, but giving complete sense. Get to the purpose quickly and usepast tense each time as a result of reportage on a study that has been completed.
Although it is the primary section of your paper, the abstract, bydefinition, ought to be written last as it is like the summary of contents of yourentire paper. To start composing your abstract, take whole sentences or key
NOTES
Self-InstructionalMaterial 105
Literature Searchphrases from every section of the paper and put them in a sequence that summarizesthe contents of the paper. Then revise or add connecting phrases or words tocreate the narrative flow clearly. Before handing in your final paper, check to ensurethat the data within the abstract fully matches with what you have written in thepaper. An abstract is a sequential set of complete sentences which describes themost crucial information using the least required words.
The abstract should not contain the following:1. Avoid ‘Lengthy’ background data.2. References to alternative literature [say one thing like,
“current analysis shows that...” or “studies have indicated...”].3. Using elliptical [i.e., ending with “...”] or incomplete sentences.4. Abbreviations, acronyms, jargon, or terms that will be confusing to
the reader.5. Any form of image, illustration, figure, or table, or references to them.
Abstract Management
Abstract management is a method of accepting and making abstracts ready forpresentation at an academic conference. The method consists of either invited orproffered submissions of the abstract or outline of labour. The abstract usually statesthe hypothesis, tools employed in analysis or investigation, knowledge collected,and an outline or interpretation of the information.
The abstracts typically endure review once that they are accepted or rejectedby the conference chair or committee and so allotted to conference sessions. Theabstracts could also be bestowed as associate degree oral speak or as an illustratedposter throughout the event. Abstracts are usually printed before or once the eventas conference proceedings or in tutorial journals or online. In some cases, submissionof a full paper could also be needed before final acceptance is given. In somefields (e.g., laptop science), most thought conferences associate degreedworkshops arouse the submission of full papers (rather than simply abstracts)and educational program committees review the complete paper to a typical akinto journal publication before accepting a paper for presentation at the conferenceand business enterprise it in an altered proceedings series.
The abstract management method is closely tied to the requirement tosupply continued education to professionals, particularly continued medicaleducation. Several annual conferences hosted by specialty societies giveinstructional credit hours in order that attendees might keep current within the fieldand maintain their skilled certifications.
Software
Historically, abstract management was a long manual method which requires thehandling of enormous amounts of paper and created a substantial body work.
Literature Search
NOTES
Self-Instructional106 Material
The increasing range of organizations currently use Web-based abstractmanagement code to contour and modify the method. The work istypically outsourced to dedicated conference departments at major publishersand skilled conference organisers.
A conference management system is a web-based code that supports theorganization of conferences particularly scientific conferences. It helps the programchair(s), the conference organizers, the authors and therefore the reviewers intheir various activities.
Abstract submission involves the authors in making their abstractsready and sending them to the conference organisers through an internet type,and may be a comparatively easy method. The abstracts are either uploaded asdocuments (typically Microsoft Word, PDF or LaTeX) or, wherever graphics andtables are not needed, they will merely be entered into the shape as plain text.The software package can send an email acknowledgement. Following thecommittee’s judgements on which abstracts are to be accepted for the conferencethe submission software package may additionally be used to collect full papersand PowerPoint presentations.
Fast Abstract
The conception of the ‘Fast Abstract’ was first created at the 28th Fault-TolerantComputing Conference (1998) by Ram Chillarege, where the UN agency wasthe program co-chair of the Conference. They are intended to marketcommunication and discussion of subjects that have nonetheless to be establishedor completed as analysis comes, and to supply a venue for new barelytested concepts, early experiments, or opinions. Whereas informal discussions,stand-up talks, spherical tables offer an avenue for such sharing, they lackthe written account that is essential for progress. Quick abstracts aim to fill thisgap. Since their origin, quick abstract sessions are step-by-step process adoptedby many conferences, in some cases even being among the foremost attendedsessions.
A fast abstract, additionally extended abstract, is a short, gently reviewedtechnical article that is typically given with a brief speak at a scientific conference.The length of the document is typically restricted to two pages (including all text,figures, references and appendices), though some conferences could enable slightlylonger articles. If the conference does not specify a document vogue, thequality double-column IEEE format could be a common follow.
Fast abstracts enable authors to:1. Report technical work preliminary stages, and solicit early feedback.2. Present radical opinions on disputed problems or open issues.3. Introduce new problems to analyse.4. Present expertise obtained from apply.
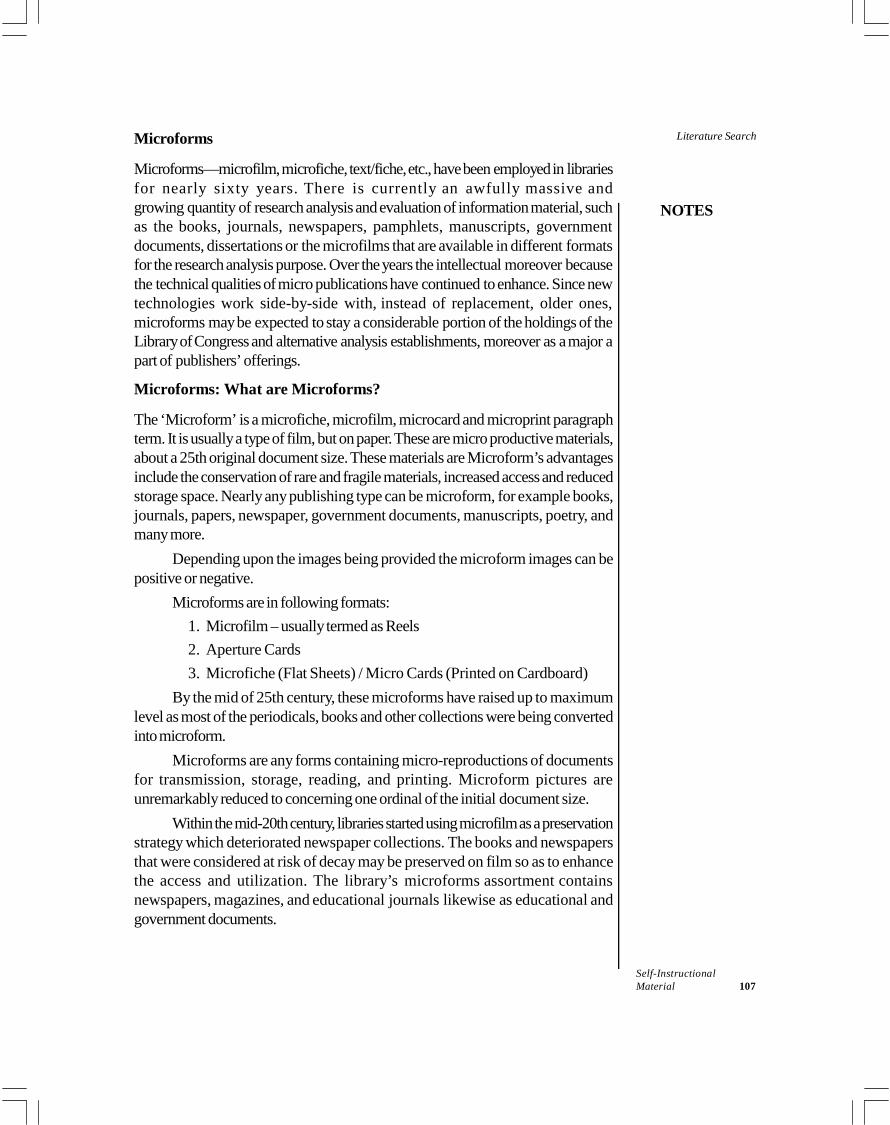
NOTES
Self-InstructionalMaterial 107
Literature SearchMicroforms
Microforms—microfilm, microfiche, text/fiche, etc., have been employed in librariesfor nearly sixty years. There is currently an awfully massive andgrowing quantity of research analysis and evaluation of information material, suchas the books, journals, newspapers, pamphlets, manuscripts, governmentdocuments, dissertations or the microfilms that are available in different formatsfor the research analysis purpose. Over the years the intellectual moreover becausethe technical qualities of micro publications have continued to enhance. Since newtechnologies work side-by-side with, instead of replacement, older ones,microforms may be expected to stay a considerable portion of the holdings of theLibrary of Congress and alternative analysis establishments, moreover as a major apart of publishers’ offerings.
Microforms: What are Microforms?
The ‘Microform’ is a microfiche, microfilm, microcard and microprint paragraphterm. It is usually a type of film, but on paper. These are micro productive materials,about a 25th original document size. These materials are Microform’s advantagesinclude the conservation of rare and fragile materials, increased access and reducedstorage space. Nearly any publishing type can be microform, for example books,journals, papers, newspaper, government documents, manuscripts, poetry, andmany more.
Depending upon the images being provided the microform images can bepositive or negative.
Microforms are in following formats:1. Microfilm – usually termed as Reels2. Aperture Cards3. Microfiche (Flat Sheets) / Micro Cards (Printed on Cardboard)
By the mid of 25th century, these microforms have raised up to maximumlevel as most of the periodicals, books and other collections were being convertedinto microform.
Microforms are any forms containing micro-reproductions of documentsfor transmission, storage, reading, and printing. Microform pictures areunremarkably reduced to concerning one ordinal of the initial document size.
Within the mid-20th century, libraries started using microfilm as a preservationstrategy which deteriorated newspaper collections. The books and newspapersthat were considered at risk of decay may be preserved on film so as to enhancethe access and utilization. The library’s microforms assortment containsnewspapers, magazines, and educational journals likewise as educational andgovernment documents.
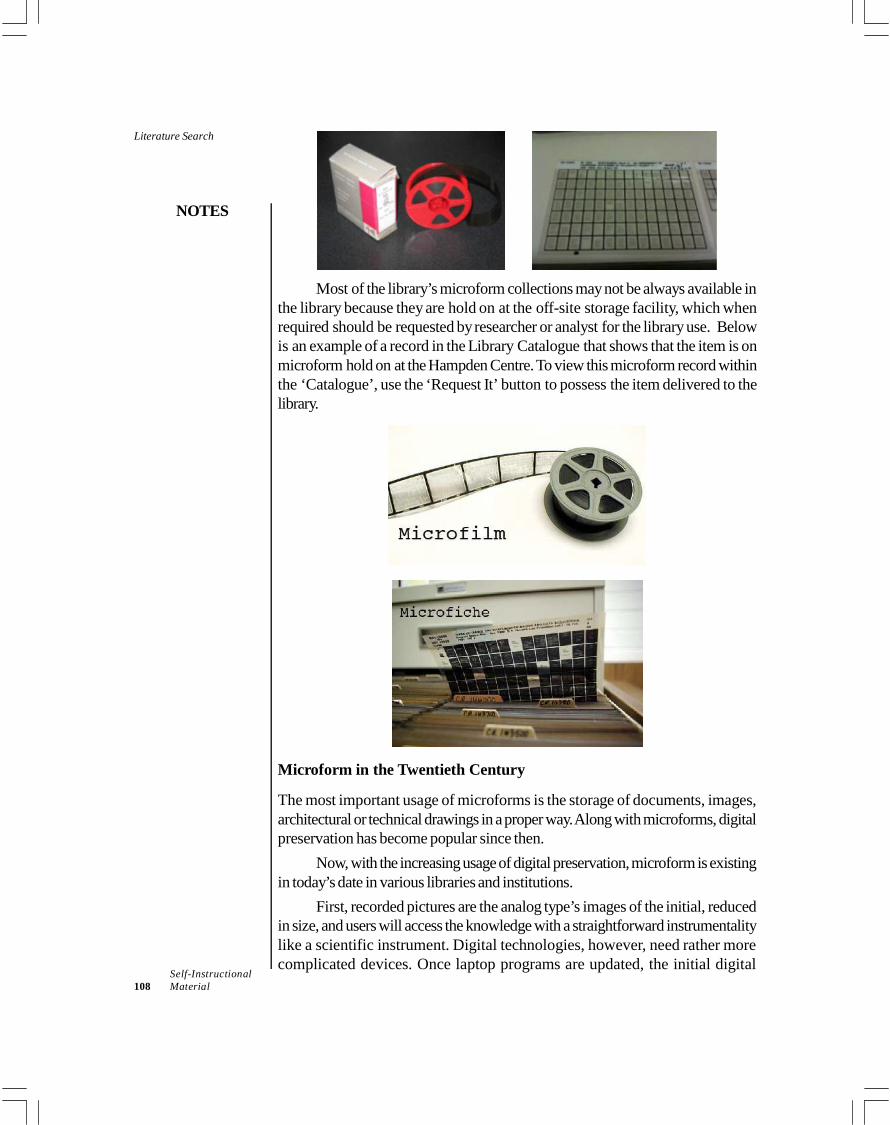
Literature Search
NOTES
Self-Instructional108 Material
Most of the library’s microform collections may not be always available inthe library because they are hold on at the off-site storage facility, which whenrequired should be requested by researcher or analyst for the library use. Belowis an example of a record in the Library Catalogue that shows that the item is onmicroform hold on at the Hampden Centre. To view this microform record withinthe ‘Catalogue’, use the ‘Request It’ button to possess the item delivered to thelibrary.
Microform in the Twentieth Century
The most important usage of microforms is the storage of documents, images,architectural or technical drawings in a proper way. Along with microforms, digitalpreservation has become popular since then.
Now, with the increasing usage of digital preservation, microform is existingin today’s date in various libraries and institutions.
First, recorded pictures are the analog type’s images of the initial, reducedin size, and users will access the knowledge with a straightforward instrumentalitylike a scientific instrument. Digital technologies, however, need rather morecomplicated devices. Once laptop programs are updated, the initial digital
NOTES
Self-InstructionalMaterial 109
Literature Searchknowledge might become inaccessible. The life of CDs, DVDs, and alternativedigital storage devices remains unsure. For these reasons, digital preservation needsconstant and continuous knowledge migration. On the opposite hand, microformsare expected to last concerning five hundred years, if they are properly preserved.
While microform encompasses a variety of benefits, it lacks some functionsdigital preservation that has: search capability; fast data transfer from one location toa different location; huge storage capacity; simple manipulation of information.
To overcome a number of those disadvantages, knowledge preserved inmicroform are also digitized. At some establishments, users will favour to accessdata storage in numerous formats. For instance, the Library of Congress in theU.S. provides copies of their assortment in numerous formats. Users will selectand request from the followings: 35mm Microfilm Film to Paper Original Cinematography Photocopying Cartographical Scanning Digital Pictures to Compact Disc Read-Only Memory (CD-ROM) All Formats of Photographic Reproduction
History and Early Developments
Using the Daguerreotype process, John Benjamin Dancer was one of the first toproduce micro-photographs, in 1839. He achieved a reduction ratio of 160:1.Dancer formed his reduction procedures with Frederick Scott Archer’s wetcollodion process, developed in 1850-1851. However, he laid off his decades-long work on micro-photographs as a personal hobby, and did not document hisprocedures. The notion that microphotography could be no more than a noveltywas an opinion shared by the 1858 Dictionary of Photography, wherein theprocess is called as ‘somewhat trifling and infantile’.
Microphotography was initially proposed as a documentpreservation method in 1851 by James Glaisher, associate physicist, and in 1853by John Herschel. Both men attended the 1851 Great Exhibition held inLondon, wherever the exhibition on photography greatly influenced Glaisher. Hecalled it ‘the most exceptional discovery of contemporary times’, and argued inhis official report for using microphotography to preserve documents.
The developments in microphotography continued through the subsequentdecades, however it had been not till the turn of the century that its potentialfor practical usage was condemned by a wider audience. In 1896, Canadianengineer Reginald A. Fessenden proposed that microforms were acompact solutions to engineers’ unwieldy but frequently consulted materials.
Literature Search
NOTES
Self-Instructional110 Material
He projected that up to a hundred and fifty lacs words could be made to fit in asquare inch, and that a one-foot cube might could contain 1.5 million volumes.
Microfilm first saw military use in the Franco-Prussian War of 1870–1871. During the Seige of Paris, the sole means for the provincial government inTours to speak with Paris was by Colum biform bird post, and, as the pigeons couldnot carry paper dispatches, the Tours government turned to microfilm. Employingmicrophotography unit exhausted from Paris before the seige, clerks in Toursphotographed paper dispatches and compressed them to microfilm, which werecarried by orientating pigeons into Paris and projected by slideprojector whereas clerks copied the dispatches onto paper.
In 1906, Paul Otlet and Robert Goldschmidt projected the ‘livremicrophotographique’ as a way to alleviate the price and area limitationsobligatory by the codex format. Otlet’s overarching goal was to make a WorldCentre Library of Juridical, Social and Cultural Documentation, and hesaw microfilm as a method to supply a stable and long-lasting format thatwas cheap, straightforward to use, straightforward to breed, and very compact.In 1925, the team spoke of a large library where every volume existed as masternegatives and positives, and where things were written on demand for interestedpatrons.
Microform Use in Libraries
At the annual meeting of 1936, the American Library Association endorsedmicroforms. Before this official acceptance, microforms were utilizedin connected fields between 1927 and 1935, the Library of Congress (U.S.)microfilmed over 3 million pages of books and manuscripts in the British Library; in1929 the scientific discipline analysis Council and also the Yankee Council ofLearned Societies joined to form a Joint Committee on Materials analysis, thatlooked closely at microform’s potential to serve little print runs of Educational orTechnical Materials. In 1933, Charles C. Peters developed a way to micro formatdissertations and in 1934 the U. S. National Agriculture Library enforced theprimary microform print-on-demand service which was rapidly followed by ananalogous industrial concern, Science Service, and in 1938 University Microfilmswas established and also the Harvard Foreign Newspapers Microform Projectwas enforced.
The ‘Micro Card’ was outdated by ‘Microfilm’. By the eighties, microfilminghad become customary policy in libraries as a method of reformatting each booksand newspapers.
In 1940, the format most broadly speaking used these days – microfilm –was developed. Formats it bested embody the Photo scope, the Film-O-Graph,the Fiske-O-Scope, film slides.
Early cut sheet microforms and microfilms (to the 1930s) were written on anitrate film and create high risks to their holding establishments, as nitrate film isexplosive and ignitable. From the late 1930s to the 1980s, microfilms were
NOTES
Self-InstructionalMaterial 111
Literature Searchcommonly written on a cellulose acetate base, which is not good for eyes andwas prone to tears, vinegar syndrome and chemical reaction blemishes. Vinegarsyndrome is the results of chemical decay and produces ‘buckling and shrinking,embrittlement, and bubbling’. Chemical reaction blemishes are yellow, orange, redspots which are 15-150 micrometres in diameter created by oxidative attacks onthe film, and are largely due to the poor storage conditions.
Advantages
The medium has numerous advantages: It is compact, with way smaller storage prices than paper documents.
Ordinarily ninety-eight document size pages match on one fiche. Comparedto filing paper, microforms will cut back house storage needs by upto ninety-five per cent. It is cheaper to distribute than paper copy. Most microfilm services get a
bulk discount on replica rights, and have lower replica andcarriage prices than a comparable quantity of written paper. It is a stable depository kind once properly processed. Preservation
commonplace microfilms use wet-processed silver salt dyes in onerousgelatin emulsion on a polyester base. With acceptable storage conditions,this film contains a lifespan of five hundred years. Unfortunately, in tropicalclimates with high wetness, fungus eats the gelatin accustomed bind thesilver salt. Thus, diazo-based systems with lower depository lives (20years) that have polyester or epoxy surfaces are used. Since it is ANALOG, i.e., an actual image of the initial data, hence it is
straightforward to look at. In contrast to digital media, the format needs nopackage to decipher the info keep thereon—it is instantly intelligible to person’sknowledge within the language; the sole instrumentality that s required may bean easy simple microscope. This reduces the chance of degeneration.
Disadvantages
The principal disadvantage of microforms is that the image is justtoo little to scan with the optic. Libraries should use special readers thatproject life-size pictures on a ground-glass screen. Reader machines used to view microform are typically troublesome to use,
requiring the user to rigorously wind and rewind until they have arrived atthe purpose wherever the information they are searching for is stored. Also, photographic illustrations reproduce poorly in microform format, with
the image sometimes not being as sharp as the original. The last drawbackwith the machines is that printers do not seem to be forever out there, limitingthe user’s ability to create copies for his or her own functions. Colour microfilm is extraordinarily pricy, hence most libraries do not opt
for supplying colour films. This ends up in the loss of some info, as colour
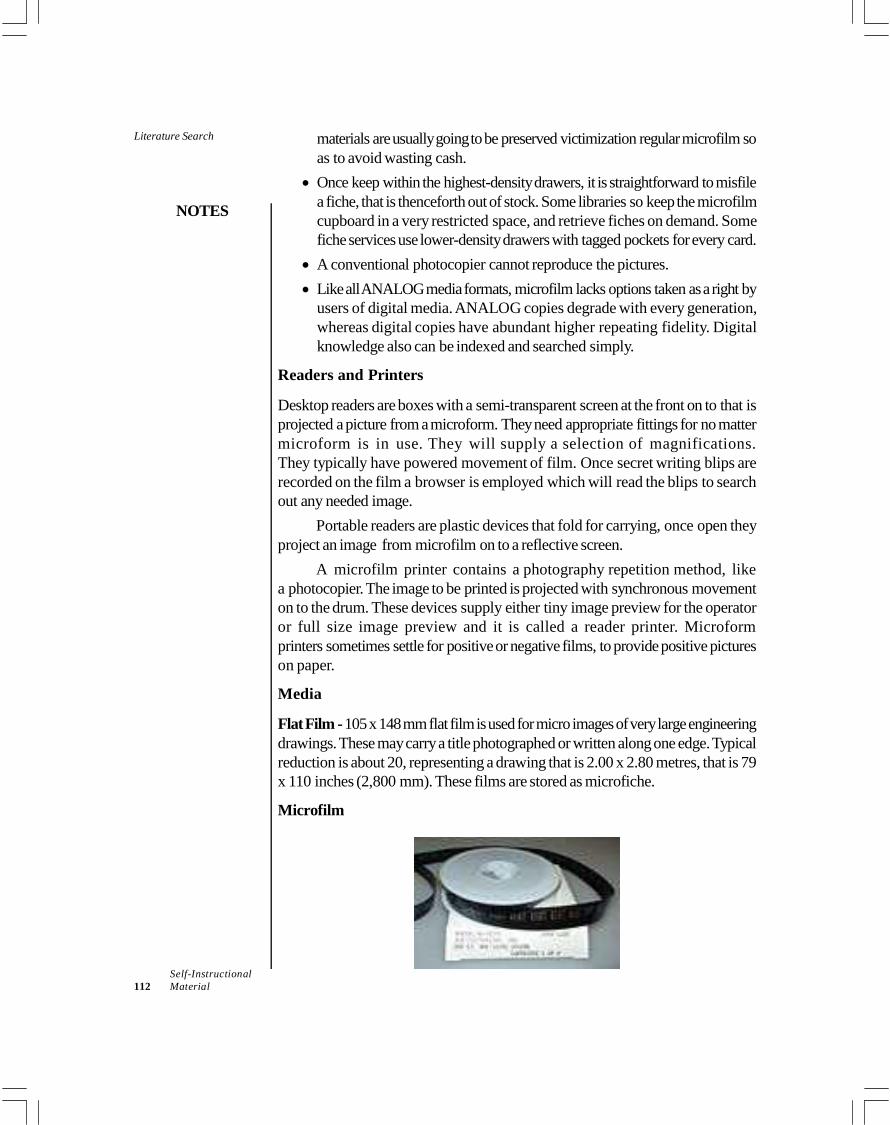
Literature Search
NOTES
Self-Instructional112 Material
materials are usually going to be preserved victimization regular microfilm soas to avoid wasting cash. Once keep within the highest-density drawers, it is straightforward to misfile
a fiche, that is thenceforth out of stock. Some libraries so keep the microfilmcupboard in a very restricted space, and retrieve fiches on demand. Somefiche services use lower-density drawers with tagged pockets for every card. A conventional photocopier cannot reproduce the pictures. Like all ANALOG media formats, microfilm lacks options taken as a right by
users of digital media. ANALOG copies degrade with every generation,whereas digital copies have abundant higher repeating fidelity. Digitalknowledge also can be indexed and searched simply.
Readers and Printers
Desktop readers are boxes with a semi-transparent screen at the front on to that isprojected a picture from a microform. They need appropriate fittings for no mattermicroform is in use. They will supply a selection of magnifications.They typically have powered movement of film. Once secret writing blips arerecorded on the film a browser is employed which will read the blips to searchout any needed image.
Portable readers are plastic devices that fold for carrying, once open theyproject an image from microfilm on to a reflective screen.
A microfilm printer contains a photography repetition method, likea photocopier. The image to be printed is projected with synchronous movementon to the drum. These devices supply either tiny image preview for the operatoror full size image preview and it is called a reader printer. Microformprinters sometimes settle for positive or negative films, to provide positive pictureson paper.
Media
Flat Film -105 x 148 mm flat film is used for micro images of very large engineeringdrawings. These may carry a title photographed or written along one edge. Typicalreduction is about 20, representing a drawing that is 2.00 x 2.80 metres, that is 79x 110 inches (2,800 mm). These films are stored as microfiche.
Microfilm
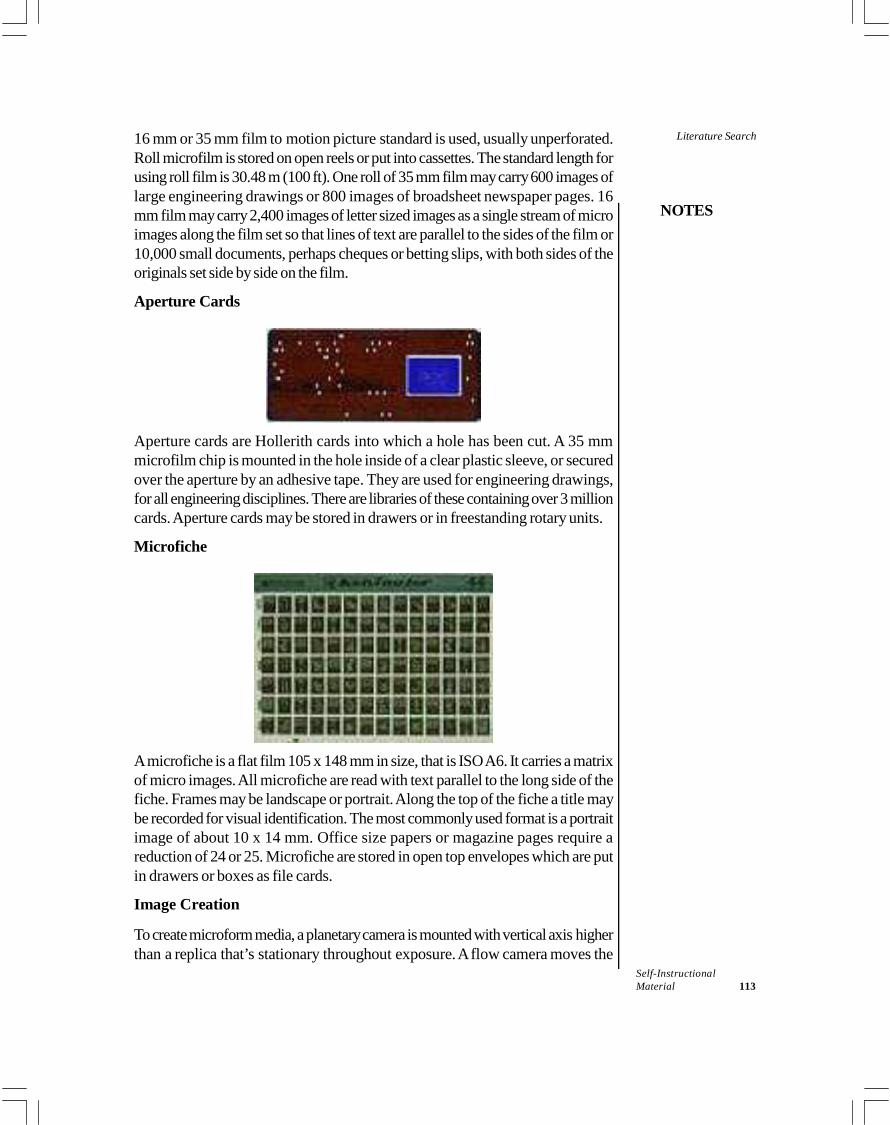
NOTES
Self-InstructionalMaterial 113
Literature Search16 mm or 35 mm film to motion picture standard is used, usually unperforated.Roll microfilm is stored on open reels or put into cassettes. The standard length forusing roll film is 30.48 m (100 ft). One roll of 35 mm film may carry 600 images oflarge engineering drawings or 800 images of broadsheet newspaper pages. 16mm film may carry 2,400 images of letter sized images as a single stream of microimages along the film set so that lines of text are parallel to the sides of the film or10,000 small documents, perhaps cheques or betting slips, with both sides of theoriginals set side by side on the film.
Aperture Cards
Aperture cards are Hollerith cards into which a hole has been cut. A 35 mmmicrofilm chip is mounted in the hole inside of a clear plastic sleeve, or securedover the aperture by an adhesive tape. They are used for engineering drawings,for all engineering disciplines. There are libraries of these containing over 3 millioncards. Aperture cards may be stored in drawers or in freestanding rotary units.
Microfiche
A microfiche is a flat film 105 x 148 mm in size, that is ISO A6. It carries a matrixof micro images. All microfiche are read with text parallel to the long side of thefiche. Frames may be landscape or portrait. Along the top of the fiche a title maybe recorded for visual identification. The most commonly used format is a portraitimage of about 10 x 14 mm. Office size papers or magazine pages require areduction of 24 or 25. Microfiche are stored in open top envelopes which are putin drawers or boxes as file cards.
Image Creation
To create microform media, a planetary camera is mounted with vertical axis higherthan a replica that’s stationary throughout exposure. A flow camera moves the
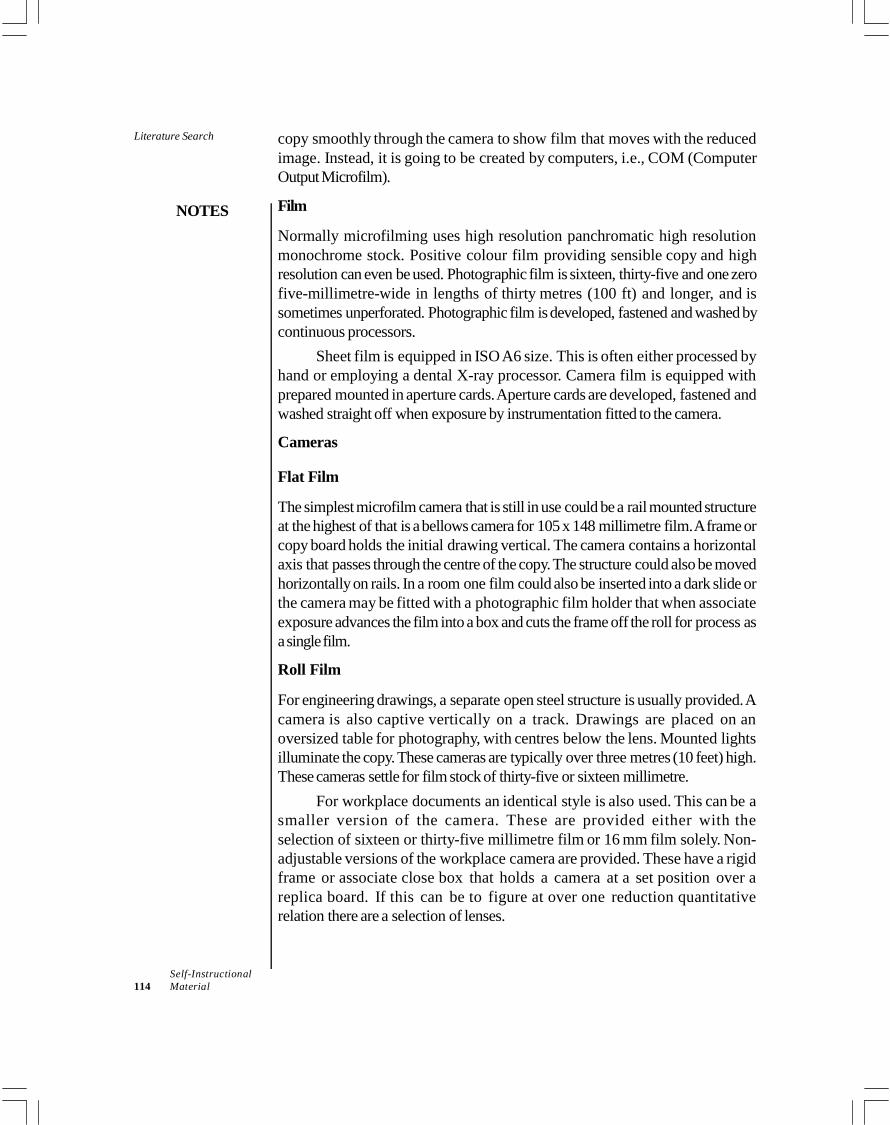
Literature Search
NOTES
Self-Instructional114 Material
copy smoothly through the camera to show film that moves with the reducedimage. Instead, it is going to be created by computers, i.e., COM (ComputerOutput Microfilm).
Film
Normally microfilming uses high resolution panchromatic high resolutionmonochrome stock. Positive colour film providing sensible copy and highresolution can even be used. Photographic film is sixteen, thirty-five and one zerofive-millimetre-wide in lengths of thirty metres (100 ft) and longer, and issometimes unperforated. Photographic film is developed, fastened and washed bycontinuous processors.
Sheet film is equipped in ISO A6 size. This is often either processed byhand or employing a dental X-ray processor. Camera film is equipped withprepared mounted in aperture cards. Aperture cards are developed, fastened andwashed straight off when exposure by instrumentation fitted to the camera.
Cameras
Flat Film
The simplest microfilm camera that is still in use could be a rail mounted structureat the highest of that is a bellows camera for 105 x 148 millimetre film. A frame orcopy board holds the initial drawing vertical. The camera contains a horizontalaxis that passes through the centre of the copy. The structure could also be movedhorizontally on rails. In a room one film could also be inserted into a dark slide orthe camera may be fitted with a photographic film holder that when associateexposure advances the film into a box and cuts the frame off the roll for process asa single film.
Roll Film
For engineering drawings, a separate open steel structure is usually provided. Acamera is also captive vertically on a track. Drawings are placed on anoversized table for photography, with centres below the lens. Mounted lightsilluminate the copy. These cameras are typically over three metres (10 feet) high.These cameras settle for film stock of thirty-five or sixteen millimetre.
For workplace documents an identical style is also used. This can be asmaller version of the camera. These are provided either with theselection of sixteen or thirty-five millimetre film or 16 mm film solely. Non-adjustable versions of the workplace camera are provided. These have a rigidframe or associate close box that holds a camera at a set position over areplica board. If this can be to figure at over one reduction quantitativerelation there are a selection of lenses.
NOTES
Self-InstructionalMaterial 115
Literature SearchSome cameras expose a pattern of sunshine, noted as blips, todigitally determine every adjacent frame. This pattern is traced whenever the filmis copied for looking.
Flow Roll Film Cameras
A camera is made into a box. In some versions this is often for bench prime use,different versions are transportable. The operator maintains a stack of fabric tobe recorded in a very receptacle, the camera mechanically takes one documentonce another for advancement through the machine. The optical lens sees thedocuments as they pass a slot. Film behind the lens advances specifically with theimage.
Special purpose flow cameras film each side of documents, golf shot eachpictures aspect by side on sixteen millimetre film. These cameras are accustomedrecord cheques and sporting slips.
Microfiche Camera
All microfilm cameras are planetary with a step and repeat mechanism to advancethe film once every exposure. The less complicated versions use a dark slide loadedby the operator during a dark room; once exposure the film is processed one byone, which can be by hand or employing a dental X-ray processor. Cameras forprime output are loaded with a roll of 105 millimetre film. The exposed film isdeveloped as a roll; this can be typically move individual fiche once process orunbroken in roll type for duplication.
Computer Output Microfilm (COM)
Equipment is offered that accepts an information stream from a digital computer.This exposes film to supply pictures as if the stream had been sent to a printingmachine and therefore the listing had been microfilmed. Due to the supply run onemight represent several thousands of pages.
Within the instrumentality character pictures are created by a light-weight supply, this can be the negative of text on paper. COM is usually processedcommonly. Alternative applications need that image seems as a standard negative;the film is then reversal processed. This outputs either sixteen millimetre film orfiche pages on a 105 mm roll.
Literature Search
NOTES
Self-Instructional116 Material
Because listing characters is an easy style, a discount magnitude relation offifty provides smart quality and puts regarding three hundred pages on a microfilm.A microfilm plotter, generally known as an aperture card plotter, accepts astream that may be sent to a laptop pen plotter. It produces corresponding framesof microfilm. These manufacture microfilm as thirty-five or sixteen millimetre filmor aperture cards.
Storage and Preservation
Storage facilities are developed by various manufactures in such a way that theyare exceptionally appropriate for the preservation, safekeeping and protection ofthe microfilm, microfiche and aperture cards.
The storage facilities has to maintain and preserve a constant 40 per cent -50 per cent average relative humidity, 68°F/20°C average temperature, irrespectiveof weather or season. Microfilms are specifically stored in ‘Microfilm Vaults’ whichare dehumidified and temperature-controlled as per the specific requirements ofthe users.
The ANSI/NAPM IT9.11 normal specifies the subsequent mixtures oftemperature and ratio for extend-term storage of black and white microfilms of alltypes: 21°C (70°F) with RH of 20-30%; 15°C (60°F) with RH of 20-40%; and10°C (50°F) with RH of 20-50%. For colour microfilm, the ANSI/NAPM IT9.11normal specifies 2°C (36°F) with RH of 20-30%. William Saffady recommendsthat colour microfilm should be kept into heat-sealed foil luggage for wet protectionand to limit exposure to air.
For medium-term storage (at least 10 years), ANSI/NAPM IT9.11 normallyspecifies that temperature should not exceed 25°C (77°F) and RH shouldstay stable inside 20-50 per cent. Wetness variations should not exceed tenth perday, and natural action ought to be reduced.
Microfilm ought to be kept in dark enclosures to reduce harm fromlightweight. Enclosures ought to suits preservation standards.
Microfilm storage areas ought to be situated in a very non-combustiblehouse that is unbroken, clean and freed from mud particles and alternativecontaminants, moreover as gases like sulphur dioxide, sulphide, ammonia, andozone. All building materials and storage instrumentality ought to be fireproof andnoncorrosive.Microfilms ought to be frequently inspected for signs of decay.
Duplication
All regular microfilm repeating involves contact exposure struggling. Then the filmis processed to produce a permanent image. Hand repeating of single fiche oraperture cards uses exposure over a light-weight box and one by one process ofthe film. Silver salt film may be a slow version of camera film with a sturdy primecoat. It is appropriate for prints or to be used as associate degree intermediate
NOTES
Self-InstructionalMaterial 117
Literature Searchfrom that more prints are also made. The result is a negative copy. Preservationstandards need a master negative, a replica negative, and a service copy (positive).Master negatives are unbroken in deep storage, and duplicate negatives are usedto produce service copies, that are the copies accessible to researchers. This multi-generational structure ensures the preservation of the master negative.
Diazo-sensitised film for dye coupling in ammonia gives blue or black dyepositive copies. The black image film is used for more repeating.
Vesicular film is hypersensitive with a caution dye, that once exposure isdeveloped by heat, wherever light-weight has return to the film remains clear, withinthe areas underneath the dark image the caution compound is destroyedquickly, emotional immeasurable minute bubbles of gas into the film. This produces apicture that diffuses light-weight. It produces a decent black look in avery reader, however, it cannot be used for more repeating.
Finding Microforms for Research in the Library of Congress
The Library of Congress acquires microform materials in the same way it acquiresinkprint materials (largely through the operation of the Copyright Law), thereforeit currently owns countless items of microforms, as well as many hundredcollections, that are housed and maintained by completely different sections andreading rooms. The Manuscript Division, the Law Library, the Serials Division, andtherefore the Science and Technology Division, among others, additionally own andrepair massive microform collections. The final rule is that a microform item is withinthe custody of and repaired by the identical section or room that might have custodyand service of the item if it were in paper. As an example, an English newspaperwould move to the Serials Division not considering the format, whereas a book inJapanese would move to the Asian Division no regardless of format, and then forth.
Searching for microforms in LC is generally similar to look for things in printformat. Many of the tools and techniques are identical. Items in microform canusually show up in search results, typically unexpectedly. Following is a list of basicsources to assist you find microforms at the Library of Congress.
Basic Sources: Examples
1. LC computerized card catalogues (MUMS and SCORPIO, 1982- ;Premarc (PREM) -1980. (Also known as LOCIS).2.Card catalogues:
(a) MicRR Card Catalogue (Pre-1982)(b) MicRR Serial File (Pre-1988)(c) Main Card Catalogue (Pre-1980, including the Periodicals Catalogue)
3. MRR CD-ROM NetworkSome of the databases available, such as ERIC, Dissertation Abstracts,Congressional Masterfile I and II, and Statistical Master File IndexMicroforms owned by LC.
Literature Search
NOTES
Self-Instructional118 Material
4. “Microform Collections and Selected Titles in the Microform ReadingRoom” (“K-3” and supplement, “K-4”; future editions to be available onlineand in print) is an annotated list with a subject index which can be consultedin many reading rooms.
5. Guides, indexes, and finding aids to microform collections or collected setsowned by LC:
(a) produced by micropublisher(b) produced by LC staff(c) described in bibliographies on which collections are based(d) combinations of the above
6. Other publications produced by LC staff(a) HSS Research Guides(b) Quicksilver (MicRR publications no longer being issued)(c) Photoduplication Circulars
7. Reference LibrariansBy providing thousands of leading global, national and local newspapersand hundreds of unique research collections on a broad range of subjectson microfilm, ProQuest enables your library to provide researchers withcritical information.
6.5 COMPUTERIZED INFORMATION RETRIEVALSYSTEM
Definition
Information retrieval (IR) is the action of acquiring data framework assets applicableto a data require from an accumulation of data assets. Pursuits can be found onfull-content or other substance-based ordering. Data recovery is the investigationof scanning for data in a record, hunting down reports themselves, and furthermorelooking for metadata that portray information, and for databases of writings, picturesor sounds.
According to Salton (1983), ‘An information retrieval system is an informationsystem, that is, a system used to store items of information that need to be processed,searched, retrieved, and disseminated to various user population’.
Computerized data recovery frameworks are utilized to diminish what hasbeen called data over-burden. An IR framework is a product that give access tobooks, diaries and different records, stores them and deals with the archive. Webindexes are the most obvious IR applications.
Introduction
An information retrieval process starts when a client enters an inquiry into thesystem. Questions are formal articulations of data needs, for instance search strings
NOTES
Self-InstructionalMaterial 119
Literature Searchin web search engines. In data recovery a question does not interestingly recognizea solitary item in the gathering. Rather, a few items may match the inquiry, maybewith various degrees of pertinence.
An item is an element that is spoken to by data in a substance collection ordatabase. Client inquiries are matched against the database data. Be that as itmay, instead of established SQL questions of a database, in information retrievalthe outcomes returned may or may not match the query, so results are ordinarilypositioned. This positioning of results is a key contrast of data recovery seekingcontrasted with database searching.
Depending upon the application the information items might be, for instance,content records, images, audio, mind maps or recordings. Often the documentsthemselves are not kept or stored directly in the IR system, but are insteadrepresented in the system by document surrogates or metadata.
Most IR frameworks register a numeric score on how well each item in thedatabase coordinates the inquiry, and rank the articles as indicated by this esteem.The best positioning items are then appeared to the client. The procedure maythen be iterated if the client wishes to refine the query.
In today’s scenario, we are being equipped with powerful tools forinformation handling – for gathering, organization, classification, retrieval andcirculation. Since the late 1960s, computers have been used for the storage oflarge databases for example, library catalogues and bibliographic references.Further to the advancement, development of optical storage media in the form ofCD-ROM, External Hard Disk, Pen Drive’s has a great advantage of saving costby storing large amount of data, graphics, pictures and sound into them. One ofthe stated feature of this optical memories is that it plays a role of distributed storesfor encyclopaedias, databased, books etc.
There are three aspects of computerised information retrieval:1. Library Catalogues2. Online Databases3. Available databased on CD-ROM
We can retrieve information with the help of following tools:1. Library Catalogue2. Subject Classification3. Systematic arrangement of books4. Bibliographic and table of contents
One of the important point to remember is that these tools can be manual aswell as computerized.
With the help of computers, information can be stored in the simplest wayso that it can be available at any moment when required. Database are stored ina computer as per predefined standards.
Literature Search
NOTES
Self-Instructional120 Material
For better understanding, all academic libraries and some of the publiclibraries are equipped with catalogues which are accessible to public along withretrieval functionalities. To easily identify the location of the books stored, theyhave come across computer-based shelf list.
How to store data1. To choose and obtain source data.2. Creating a vocabulary of terms for their explanation3. Distributing terms to each and every specific data item4. To create records, assigned terms should be arranged in some specific
formats5. Creating a way to access for the records by various means.
Steps for retrieving information
The main objective of storing any data or information is its retrieval at any stage oftime.
1. For command, we should be using terms from the designed vocabulary.2. Searching the data and match the stored information with the requests.3. After retrieving, results to be presented accordingly.
Role of human in Computerised Information System
As we are aware, the computers are being developed to give quick access, storageof large amount of data with simplest form of communication between the humanand system.
To retrieve correct path of information stored, systems has to be dependenton the important and crucial role plays by the human skills. It is the way to obtainthe information source, to observe and put the data in order, to formulate requestfor data required.
Type of Information and Retrieval Systems
1. Database Systems – It is the most basic, all others are categorized on thebasis of various data available and level of complexity involves in processing.Users which performs this function is Federal & local government agencies,Scientific research institutions, Academic libraries & B2B companies etc.
2. Reference Retrieval Systems – It is a database system which storesdocuments in the form of references, which means that for retrieval datawill have terms descriptive of content. With the help of this, records identifythe location of the data and then available for the retrieval to the particularuser as requested. Some of the examples can be MEDLINE (MedicalOnline), OCLC (Online Computer Library Centre), RLIN (ResearchLibraries Information Network), AGRICOLA (Agricultural Online Access)
3. Documents Retrieval Systems – It has an ability to retrieve desired data inthe form of text, images, which can be printed or displayed accordingly.
NOTES
Self-InstructionalMaterial 121
Literature SearchFor example, bounded books and journals of library. In this, documentsare being identified by some specific number and location. Storage of thedocument can be done in the form of printed pages, photographic film,CD-ROMs, Audio tapes and hard disk.
4. Text Retrieval Systems – In this system, text is being used as the source forthe retrieval which means that information is saved in sentence or paragraphform. This type of system is mostly used in fields of law. For better explanation,dictionary is stored in Computer memory to derived alternative meaningsor words.
5. Image Retrieval Systems – For retrieval the source of content, images arecreated with the help of word processing in every commercial enterprise,computer-aided designing, cartooning etc. The requirements for processingof image are as follows: Conversion of any equipment to digitized form, it has to be scanned
properly. Optical storage should be with large volume of capacity. Can be displayed and printed with high resolution. A better communication device with a manageable bandwidth which
can handle the large amount of data in transmitting the image.
Advantages of Computerised Information Retrieval1. It is time saving.2. With the help of the computer we can initiate the detailed search as compared
to the method done manually. Each and every piece of information stored incomputer is searchable at any point of time.
3. The data is more accurate and in current form when stored in a databaserather than any relevant printed publication.
4. In single click we can search the information in several subjects during thesame search engine.
Check Your Progress8. What is a research review?9. What is an argumentative review?
10. What is the role of theoretical review in research?11. Define abstract?12. What measures are used to evaluate abstract quality?13. What do you understand by abstract management?14. When was the concept of ‘Fast Abstract’ created?15. What are aperture cards and what were they used for?16. What are the three aspects of computerised information retrieval system?
Literature Search
NOTES
Self-Instructional122 Material
6.6 ANSWERS TO CHECK YOUR PROGRESSQUESTIONS
1. A literature review is a comprehensive compilation of the informationobtained from published and unpublished sources of data in the specificarea of interest to the researcher. This may include journals, newspapers,magazines, reports, government publications, and also computerizeddatabases.
2. The Publication Manual of the American psychological Association(2001) and the Chicago Manual of Style (1993) are academically acceptedas referencing styles in management.
3. A library research plan is a predefined activity that gives direction to yourresearch. It is an act that involves evaluation that helps determine thesubsequent activities to be followed by the researcher. The research plan isa sequence of steps that the researcher should follow in order to get acomprehensible and reliable outline to adhere to.
4. The most common library research tools available in a library are as follows: Library Catalogue Almanacs Dictionaries Encyclopaedia Bibliographies Indexes Search Engines
5. Journals refer to a periodical collection of articles. They also include sourceslike reports, bulletins or proceedings, published monthly by any organizationor an institution. There are also certain scholarly journals, which are of greathelp to a researcher working in the field of humanities or social sciences.
6. Thesis refers to a piece of research work conducted by an individual toqualify for a degree. A researcher can browse through such thesis to get anidea of the layout and presentation options for his/her own thesis.
7. One of the main advantages of conducting research using the Internet is thathundreds or thousands of pages can be found with some relation to thetopic, within seconds, which is not possible if the same topic is to be searchedfrom books or encyclopaedias.
8. Review of any literature or research paper provides the current knowledgeincluding prominent findings, as well as theoretical and methodologicalcontributions to a particular topic. A literature review is a search and evaluationof the available literature in the given subject or chosen topic area. It
NOTES
Self-InstructionalMaterial 123
Literature Searchdocuments the state of the art with respect to the subject or topic you arewriting about.
9. This form examines literature by selection so as to support or refute associatedegree argument and the aim is to develop a body of literature that establishesan investor viewpoint. Given the value-laden nature of some science analysis,contentious approaches to analyzing the literature is a legitimateand necessary kind of discourse.
10. The theoretical literature analysis or review helps in determining that whichtheories already exist, the relationships between them, and up to whatdegree or extent the contemporary theories are being investigated, and todevelop new specific hypotheses which must be tested.
11. An abstract is a brief summary of a literature, research article, thesis, reviews,conference proceeding, or any in-depth analysis of a particular subject andis often used to help the reader quickly ascertain the paper’s purpose.
12. Various methods are used to evaluate abstract quality e.g., rating by readers,checklists (not necessary in structural abstracts), and readability measures.
13. Abstract management is a method of accepting and making abstracts readyfor presentation at an academic conference. The method consists of eitherinvited or proffered submissions of the abstract or outline of labour. Theabstract usually states the hypothesis, tools employed in analysis orinvestigation, knowledge collected, and an outline or interpretation of theinformation.
14. The conception of the ‘Fast Abstract’ was first created at the 28th Fault-Tolerant Computing Conference (1998) by Ram Chillarege, where the UNagency was the program co-chair of the Conference.
15. Aperture cards are Hollerith cards into which a hole has been cut. A 35 mmmicrofilm chip is mounted in the hole inside of a clear plastic sleeve, orsecured over the aperture by an adhesive tape. They are used for engineeringdrawings, for all engineering disciplines. There are libraries of these containingover 3 million cards. Aperture cards may be stored in drawers or infreestanding rotary units.
16. The three aspects of computerised information retrieval system are as follows: Library Catalogues Online Databases Available database on CD-ROM
6.7 SUMMARY
A library research plan is a predefined activity that gives direction to yourresearch. It is an act that involves evaluation that helps determine the
Literature Search
NOTES
Self-Instructional124 Material
subsequent activities to be followed by the researcher. As such, the researchplan is a sequence of steps that the researcher should follow in order to geta comprehensible and reliable outline to adhere to. Once the researcher has executed the activities involved in the research
plan, he/she should start looking for the essential and relevant information.This involves exploring information through traditional and modern libraryresearch tools, which contain specific bits of information as well as voluminousrecords and theories. To be able to make full use of these tools, it is necessaryfor the researcher to become familiar with the applications of these specificlibrary tools. A library catalogue is an informative list of resources and materials available
in the library. It comprises the name of books or journals along with thename of authors, subjects and publishing houses. An almanac is a chronological tabular publication that is published annually.
Traditional almanacs, usually, contained information regarding weatherforecasts, astronomical data and several other statistics like the rising andsetting of sun, moon, eclipses etc. Dictionaries are most often regarded as a superficial source of information
as it is supposed to be performing the sole function of defining the meaningsof words. Encyclopaedia, in general, is a bulk informative volume containing a synopsis
of the concerned subject, which is published in alphabetical order. A bibliography usually comprises a list of reference materials mentioned by
the researcher. This list gives the names of various sources that the researcherhas resorted to, such as books and articles for research. Enumerative Bibliography is also known as compilative, reference or
systematic bibliography. Analytical Bibliography is further classified into descriptive, historical and
textual bibliographies. Usually, these are concerned with the physicalattributes and contemporary importance of a book. Indexes, as is well known, are the alphabetical lists of authors’ name and
subjects containing the relevant page numbers where these topics and authorshave been discussed or described in the book. Search engines refer to software that browse through the Internet for the
queried information and provide sites, which contain the concernedinformation within a few seconds. Journals refer to a periodical collection of articles. They also include such
sources like reports, bulletins or proceedings, published monthly by anyorganization or an institution.
NOTES
Self-InstructionalMaterial 125
Literature Search Thesis refers to a piece of research work conducted by an individual toqualify for a degree. Usually, libraries often hold copies of thesis, whichhave been submitted and approved for Ph.D. Manuscripts and archives are unpublished, sometimes hand-written or typed
original and primary sources of information. One of the advantages of conducting research using the Internet is that
hundreds or thousands of pages can be found with some relation to thetopic, within seconds, which is not possible if the same topic is to be searchedfrom books or encyclopaedias. There are various tools such as Internet search engine and Internet guide
that a researcher can use for collecting the information. Research reviews, abstracts and microforms are the tools that specify the
significant points of published literature and the various research papers,published or unpublished. The purpose of any review paper is to compactly evaluate or review the
recent progress for the specific topics. Overall, the review papersummarizes the state of data of the subject. Literature reviews are a basis for research in nearly every academic field
introducing new research, serving to position the current study within thebody of the relevant literature and to provide context for the researcher,which generally precedes the methodology and results in possible segmentsof the work. There are different types of literature reviews namely argumentative review,
integrative review, historical review, methodological review, theoretical review,systematic review, scoping review. An abstract is a brief summary of a literature, research article, thesis, reviews,
conference proceeding, or any in-depth analysis of a particular subject andis often used to help the reader quickly ascertain the paper’s purpose. Abstract is used in many academic literatures just for clear communication
about the complex research. An abstract may act even as a stand-aloneentity in place of a full paper. As such, an abstract is used by manyorganizations as the basis for selecting research that is proposed forpresentation in the form of a poster, platform/oral presentation or workshoppresentation at an academic conference or seminar. The informative abstract, which is also known as the complete
abstract, contain comprehensive summary of a paper’s material includingits purpose, background, methodology, results, and conclusion. The descriptive abstract, which has some limitations so is also known as
the limited abstract or the indicative abstract.
Literature Search
NOTES
Self-Instructional126 Material
A graphical abstract is a single, concise, pictorial and visual summary of themain findings of the article. A graphical abstract will be a one-image file andwill visualize one process or make one-point clear. A crucial abstract provides, additionally to describing main findings and data,
a judgement or comment concerning the study’s validity, liableness, orcompleteness. A highlight abstract is specifically written to draw in the reader’s attention
to the study. No pretence is created in either a balanced orcomplete image of the paper and, in fact, incomplete and leadingremarks could also be accustomed in order to spark the reader’s interest. Various methods can be used to evaluate abstract quality, e.g. rating by
readers, checklists (not necessary in structured abstracts), and readabilitymeasures. Abstract management is a method of accepting and making abstracts ready
for presentation at an academic conference. The method consists of eitherinvited or proffered submissions of the abstract or outline of labour. The conception of the ‘Fast Abstract’ was first created at the 28th Fault-
Tolerant Computing Conference (1998) by Ram Chillarege, where the UNagency was the program co-chair of the Conference. Microforms—microfilm, microfiche, text/fiche, etc., have been employed
in libraries for nearly sixty years. There is currently an awfully massive andgrowing quantity of research analysis and evaluation of information material,such as the books, journals, newspapers, pamphlets, manuscripts,government documents, dissertations or the microfilms that are available indifferent formats for the research analysis purpose. The ‘Microform’ is a microfiche, microfilm, microcard and microprint
paragraph term. It is usually a type of film, but on paper. The most important usage of microforms is the storage of documents, images,
architectural or technical drawings in a proper way. Along with microforms,digital preservation has become popular since then. While microform encompasses a variety of benefits, it lacks some functions
digital preservation that has: search capability; fast data transfer from onelocation to a different location; huge storage capacity; simple manipulation ofinformation. Microphotography was initially proposed as a document preservation
method in 1851 by James Glaisher, associate physicist, and in 1853 by JohnHerschel. By the eighties, microfilming had become customary policy in libraries as a
method of reformatting each books and newspapers.
NOTES
Self-InstructionalMaterial 127
Literature Search Desktop readers are boxes with a semi-transparent screen at the front onto that is projected a picture from a microform. They need appropriatefittings for no matter microform is in use. A microfilm printer contains a photography repetition method, like
a photocopier. The image to be printed is projected with synchronousmovement on to the drum. Aperture cards are Hollerith cards into which a hole has been cut. A 35 mm
microfilm chip is mounted in the hole inside of a clear plastic sleeve, orsecured over the aperture by an adhesive tape. A microfiche is a flat film 105 x 148 mm in size, that is ISO A6. It carries a
matrix of micro images. All microfiche are read with text parallel to the longside of the fiche. The simplest microfilm camera that is still in use could be a rail mounted
structure at the highest of that is a bellows camera for 105 x148 millimetre film. A camera is made into a box. In some versions this is often for bench prime
use, different versions are transportable. The operator maintains a stack offabric to be recorded in a very receptacle, the camera mechanically takesone document once another for advancement through the machine. All microfilm cameras are planetary with a step and repeat mechanism to
advance the film once every exposure. There are different types of information and retrieval systems namely database
systems, reference retrieval systems, documents retrieval systems, textretrieval systems, image retrieval systems.
6.8 KEY WORDS
Enumerative Bibliography: It refers to the most common bibliographytype in research writing and it basically the list of sources that most authorsput at the end of a piece of writing so that any reader can be able to knowwhere cited information was sourced from. Microform: It refers to a process for reproducing printed matter in a much
reduced size. Literature Review: It refers to a scholarly paper, which includes the current
knowledge including substantive findings, as well as theoretical andmethodological contributions to a particular topic. Abstract Management: It refers to the process of accepting and preparing
abstracts for presentation at an academic conference. Information Retrieval: It refers to the activity of obtaining information
system resources relevant to an information need from a collection.
Literature Search
NOTES
Self-Instructional128 Material
6.9 SELF ASSESSMENT QUESTIONS ANDEXERCISES
Short Answer Questions
1. What is the purpose of a review paper?2. Write short notes on historical review and methodological review.3. Briefly explain the main stages of systematic review.4. What is an informative abstract?5. Write a note on graphical and critical abstract.6. What are microforms?7. Briefly mention about microfiche.8. What is a Computer Output Microfilm (COM)?
Long Answer Questions
1. Discuss the various steps of a research plan.2. Discuss the analytical and methodological features of literature review?3. What are the characteristics of systematic review? Discuss.4. Describe the purpose and limitations of an abstract.5. Discuss the state of microforms in the twentieth century.6. Examine the advantages and disadvantages of microforms.7. Assess the different types of information and retrieval systems.8. Explain the role of human in computerised information retrieval system.
6.10 FURTHER READINGS
Busha, Charles H. and Stephen P. Harter. 1980. Research Methods inLibrarianship: Techniques and Interpretation. Orlando: Academic Press.
Kumar, Krishan. 1992. Research Methods in Library and Information Science.New Delhi: Har-Anand Publications.
Rao, I.K. Ravichandra. 2009. Quantitative Methods for Library andInformation Science. New Delhi: New Age International Publishers.
Slater, Margaret. 1990. Research Methods in Library and Information Studies.London: Facet Pub.
Fowler, F. J. 2008. Survey Research Methods. New Delhi: SAGE Publications.
NOTES
Self-InstructionalMaterial 129
HypothesisBLOCK - IIIRESEARCH PROBLEM AND HYPOTHESIS
UNIT 7 HYPOTHESIS
Structure7.0 Introduction7.1 Objectives7.2 Meaning, Importance, Sources and Characteristics
7.2.1 Criteria for Hypothesis Construction7.2.2 Types of Statistical Hypothesis
7.3 Formulation of Hypothesis and Testing7.3.1 Procedure for Hypothesis Testing7.3.2 Committing Errors: Type I and Type II7.3.3 Null and Alternative Hypotheses
7.4 Answers to Check Your Progress Questions7.5 Summary7.6 Key Words7.7 Self Assessment Questions and Exercises7.8 Further Readings
7.0 INTRODUCTION
A hypothesis is a speculation which is based on inadequate evidences that isadvanced to further testing and experimentation. After the testing, a hypothesiscan be proven true or false. The unit is all about the importance of hypothesis andits types. The unit also discusses the meaning, sources and characteristics ofhypothesis. You will also learn about the rules for constructing good hypothesis,difference between proposition, hypothesis and theory. Besides, it will also focuson procedure for hypothesis testing and will draw a comparison between bullhypothesis and alternate hypothesis
7.1 OBJECTIVES
After going through this unit, you will be able to: Understand the meaning of hypothesis Describe the importance, sources and characteristics of hypothesis Define the rules for constructing good hypothesis Discuss the types of hypothesis Differentiate between proposition, hypothesis and theory Understand the formulation of hypothesis and testing
Hypothesis
NOTES
Self-Instructional130 Material
Explain the procedure for hypothesis testing Draw comparison between null hypothesis and alternate hypothesis
7.2 MEANING, IMPORTANCE, SOURCES ANDCHARACTERISTICS
According to Theodorson, ‘a hypothesis is a tentative statement asserting arelationship between certain facts’. Kerlinger describes it as ‘a conjectural statementof the relationship between two or more variables’.
Need of hypothesis
The following points help in understanding the importance of hypothesis: A hypothesis is a proposal intended to explain a fact or an observation. A hypothesis specifies the sources of data which shall be studied and in
what context they shall be studied. It determines the data needs. Hypothesis suggests the type of research which is likely to be the most
appropriate. A hypothesis contributes to the development of the theory.
Nature of hypothesis
Hypothesis is more useful when stated in precise and clearly defined terms. Agood hypothesis implies that hypothesis which fulfils its intended purposes and isup to the mark. The following are some important points to be kept in mind:
(a) A good hypothesis should be stated in the simplest possible terms. It is alsocalled the principle of the economy or business. It should be clear andprecise.
(b) A good hypothesis is in agreement with the observed facts. It should bebased on original data derived directly.
(c) It should be so designed that bits test will provide an answer to the originalproblem which farms the primary purpose of the investigation.
(d) Hypothesis should state relationship between variables, if, it happens to bea rational hypothesis.
7.2.1 Criteria for Hypothesis Construction
Once the investigative questions are set up for each of the objectives, the researchershould identify the anticipated or possible answers to the investigative questions.A survey of related theories and earlier studies and discussions with co-scientistswill facilitate this process. He, then, should write down those answers as appropriatetypes of hypotheses—descriptive, relational or causal—as the case may be. Heshould evaluate these tentative hypotheses in terms of the characteristics of a goodhypothesis and refine and record them into logical and testable hypotheses, keepingin mind the rules given below:
NOTES
Self-InstructionalMaterial 131
HypothesisRules for constructing hypotheses
According to research theorist Smith, there are certain rules for constructing goodhypotheses. These are as follows:
(i) Search for variable measurements with the most quantitative characteristicsavailable: Precise quantitative measurements are more critical in testing theorythan qualitative characteristics. Another theorist Hage gives four techniquesto search for and create variables from non-variable concepts. First, theresearcher can search for implied dimensions underlying non-variableconcepts. Campbell provides a good example of this method in the studyof the non-variable concept ‘social group’. He identifies four underlyingdimensions of degrees of proximity, similarity, perceived common fate andperceived spatial pattern. Second, one can create new variables bycomparing conceptual synonyms or analogies. Price used the synonymtechnique in his study of organizational measurement concepts like‘participation in decision making’, ‘organization control’, ‘power’ and‘influence’ refer to the degree of organizational centralization. Third, onecan search the literature for rarely occurring associations betweenphenomena. The cognitive dissonance theory in sociology got its start in thismanner. Fourth, one can generate new variables through ordering manyconcepts from more or less abstract extension of the research variables andtheir applicability in the new order of society, say virtual or networkorganization.
(ii) Make the variable scale properties explicit by stating all of the variable’smutually exclusive and totally inclusive categories by degrees. For example,a variable like ‘income’ may be categorized into (1) up to` 5000 per month,(2) ` 5001 to 10000, (3) ` 10001 to 20000, (4) ` 20001 and above.
(iii) Describe the means used to sort observations into your variables categoriesin sufficient detail so that your methods may be evaluated and replicated byothers. ‘Personality disintegration’ is a good example of a poorlyoperationalised variable. It is an unreliable measure and cannot be replicated.
(iv) Always consider alternative operations that might be more appropriate fora given variable.
(v) Analyse variables through their relationships. Non-ratio uni- or multi-variabledistribution is arbitrary, since it has no intrinsic lower boundary.
(vi) Link two or more formal propositions through a shared independent ordependent variable where possible. For example, from following concreteobservations:
(a) ‘Married persons are less likely than unmarried persons to commitsuicide.’
(b) ‘Married persons with children are less likely than married personswithout children to commit suicide.’
Hypothesis
NOTES
Self-Instructional132 Material
The following abstract formal hypotheses may be inductively produced:(i) ‘Sucide rates vary directly with the degree of individualism.’(ii) ‘Suicide rates vary indirectly with the degree of group cohesion.’
7.2.2 Types of Statistical Hypothesis
In context of statistical analysis, we generally consider two types of hypothesis: Null Hypothesis Alternative Hypothesis
When comparing the superiority of both the methods A and B, if we assume thatboth the methods are equally good, then the assumption is known as ‘nullhypothesis’. On the other hand, if we consider method A to be better, it is alternativehypothesis. These may be, symbolically presented as:
Null Hypothesis = HoAlternative Hypothesis = Ha
Difference between Proposition, Hypothesis and Theory
(i) A proposition is a logical statement of relationship between two or morevariables which has, generally, been confirmed by empirical research. (Aproposition should be distinguished from a hypothesis which is a logicalstatement of an assumed relationship between two or more variables whichmust be empirically tested, replicated and elaborated before being acceptedas confirmed.)
(ii) Proposition is a broad statement drawn from a theory, whereas a hypothesistakes this one step further and formulates a more specific statement that isempirically testable. Proposition states a relationship between two concepts,and a hypothesis operationalizes this relationship and puts it in an empiricallytestable form.
(iii) The term ‘hypothesis’ is used to refer to an explanation of things that occur.In some cases, it may refer to a simple guess. In other instances, it may bea well-developed set of propositions that are crafted to explain the detailedworkings of some occurrence or occurrences. One definition statesspecifically that it is the antecedent to a conditional proposition.
(iv) The hypothesis is formed and tested within the scientific process. One maydevelop the hypothesis while observation is occurring, but that may also beconsidered premature. The act of observation (outside of experimentation)may actually present opportunity to disprove a hypothesis. The hypothesisthough is necessarily well defined and inclusive of details. This allows foraccurate testing. It also, in many cases, distinguishes it from a theory.
(v) The term ‘theory’ is one of a rather scientific nature, but of a less limitednature. Some uses can refer to explanations of occurrences; some do includeusage as referencing a simple guess. There is more though. Theory is used
NOTES
Self-InstructionalMaterial 133
Hypothesisto refer to a branch of study that is focused on the general and conceptual,as compared to the practical and the applied of the same subject. It issignificant that a theory is conjectural in nature.
(vi) A hypothesis is a proposed explanation for something. We call it a theorywhen that hypothesis has been tested with considerable evidence. As aresult, a theory is usually a much larger set of statements than a hypothesisbecause a theory can grow with every new piece of evidence it explains. Inother words, a theory can explain far more than the phenomenon it originallywas proposed to explain.
(vii) A hypothesis attempts to answer questions by putting forth a plausibleexplanation that has yet to be rigorously tested. A theory, on the other hand,has already undergone extensive testing by various scientists and is generallyaccepted as being an accurate explanation of an observation. This does notmean the theory is correct; only that current testing has not yet been able todisprove it, and the evidence as it is understood, appears to support it. Atheory will often start out as a hypothesis — an educated guess to explainobservable phenomenon. The more a hypothesis is tested and holds up, thebetter accepted it becomes as a theory.
7.3 FORMULATION OF HYPOTHESIS ANDTESTING
A claim or hypothesis about the values or population parameters is known as theNull Hypothesis and is written as H0. In the case of the above discussed situation,our assumption that a butler is innocent would form the null hypothesis and would bestated as follows:
H0 = The butler is innocentThis hypothesis is then tested with the available evidence and the decision is
made whether to accept this hypothesis or reject it. If this hypothesis is rejected,then we accept the alternate hypothesis which is that the butler is not innocent.This alternate hypothesis is denoted as H1 and is stated as:
H1 = The butler is not innocentThe process involves testing of the null hypothesis. If the null hypothesis is
rejected, then the alternate hypothesis is accepted. It should be noted that theacceptance of the alternate hypothesis does not mean that it is correct. It simplymeans that there is not enough evidence to be reasonably sure that the null hypothesisis acceptable.
As already explained, there are two types of errors that can be used inmaking decisions regarding accepting or rejecting the null hypothesis. Thefirst type of error, known as Type I error, is used when the null hypothesis isrejected even if it is true. The second type of error, known as Type II error, isused when a null hypothesis is accepted even if it was not true and should havebeen rejected.
Hypothesis
NOTES
Self-Instructional134 Material
In statistical hypothesis testing and decision-making about the values ofpopulation parameters as defined by the sample statistics, the null hypothesis assertsthat there is no true difference between the sample statistics and the correspondingpopulation parameter under consideration and if indeed there is any visibledifference, it is considered to be due to natural fluctuations in sampling.To conclude we say that: Null Hypothesis H0: An assertion about the population parameter that is
being tested by the sample results Alternate Hypothesis H1: A claim about the population parameter that is
accepted when the null hypothesis is rejected Type I Error: An error made in rejecting the null hypothesis, when in fact it
is true Type II Error: An error made in accepting the null hypothesis, when in fact
it is falseType I error is denoted by (Alpha) and is expressed as a probability of
rejecting a true hypothesis. It is also known as the level of significance. 1 – expresses the level of confidence. For example, = 0.05 means that the confidencelevel is 95% or 0.95.
Type II error is denoted by (Beta) and is expressed as the probability ofaccepting a false hypothesis. It is desirable to have the value as low as possiblefor its value reflects the power of the test being performed and a low valueindicates that the test of significance is powerful and reliable. (Type I and Type IIerrors have been discussed in detail in 7.3.2).
7.3.1 Procedure for Hypothesis Testing
The general procedure for hypothesis testing consists of the following steps:1. State the Null Hypothesis as well as the Alternate Hypothesis: This
means stating the assumed value of the population parameter which is tobe tested. For example, suppose we want to test the hypothesis that theaverage IQ of our college students is 130. Then this would become ournull hypothesis and the alternate hypothesis would be that this average IQis not 130. These statements are expressed as follows:
H0 : = 130H1 : 130
2. Establish a Level of Significance Prior to Sampling: The level ofsignificance signifies the probability of committing Type I error and isgenerally taken as equal to 0.05, which really means that after the hypothesishas been tested and a decision is made, we will still be making an errorin rejecting the null hypothesis when in fact it is true, i.e., 5% of the time.Sometimes the value is established as 0.01, but it is at the discretion ofthe investigator to select its value, depending upon the sensitivity of thestudy.
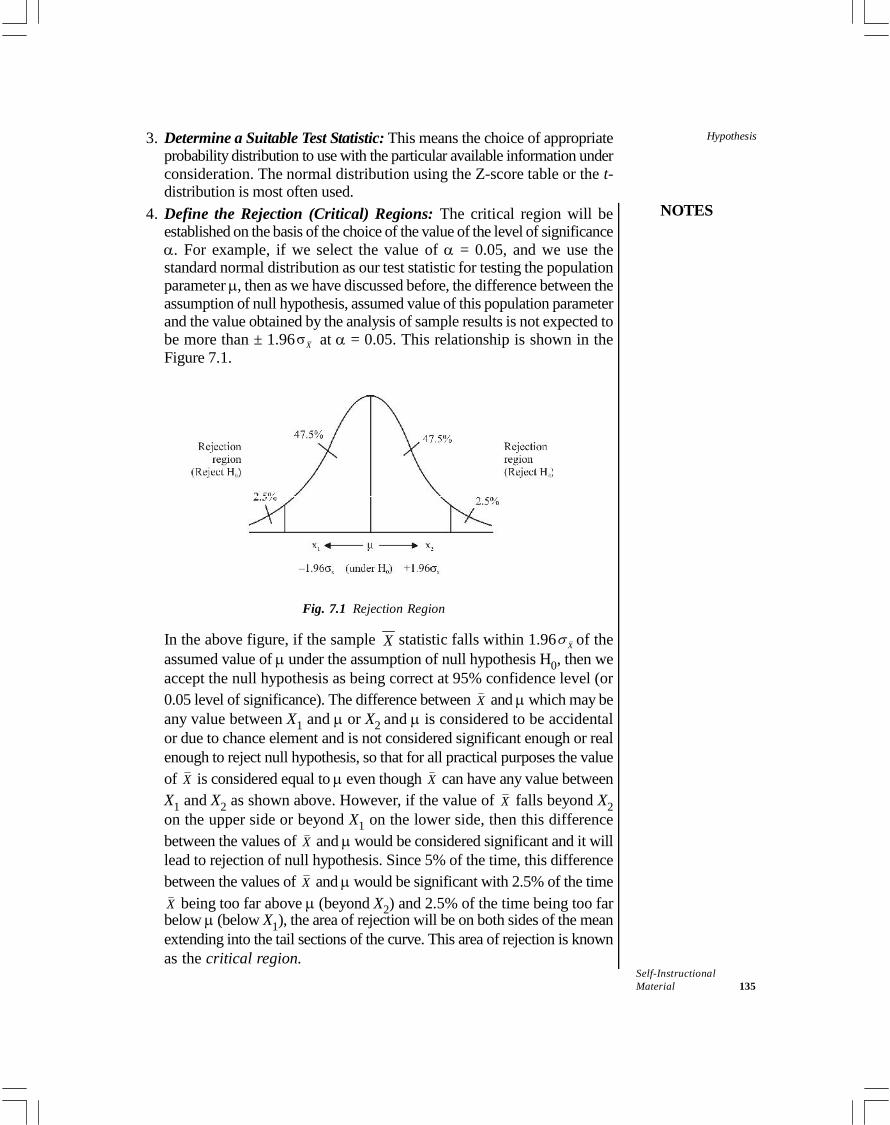
NOTES
Self-InstructionalMaterial 135
Hypothesis3. Determine a Suitable Test Statistic: This means the choice of appropriateprobability distribution to use with the particular available information underconsideration. The normal distribution using the Z-score table or the t-distribution is most often used.
4. Define the Rejection (Critical) Regions: The critical region will beestablished on the basis of the choice of the value of the level of significance. For example, if we select the value of = 0.05, and we use thestandard normal distribution as our test statistic for testing the populationparameter , then as we have discussed before, the difference between theassumption of null hypothesis, assumed value of this population parameterand the value obtained by the analysis of sample results is not expected tobe more than ± 1.96 X at = 0.05. This relationship is shown in theFigure 7.1.
Fig. 7.1 Rejection Region
In the above figure, if the sample X statistic falls within 1.96 X of theassumed value of under the assumption of null hypothesis H0, then weaccept the null hypothesis as being correct at 95% confidence level (or0.05 level of significance). The difference between X and which may beany value between X1 and or X2 and is considered to be accidentalor due to chance element and is not considered significant enough or realenough to reject null hypothesis, so that for all practical purposes the valueof X is considered equal to even though X can have any value betweenX1 and X2 as shown above. However, if the value of X falls beyond X2on the upper side or beyond X1 on the lower side, then this differencebetween the values of X and would be considered significant and it willlead to rejection of null hypothesis. Since 5% of the time, this differencebetween the values of X and would be significant with 2.5% of the timeX being too far above (beyond X2) and 2.5% of the time being too farbelow (below X1), the area of rejection will be on both sides of the meanextending into the tail sections of the curve. This area of rejection is knownas the critical region.
Hypothesis
NOTES
Self-Instructional136 Material
5. Data Collection and Sample Analysis: This involves the actual collectionand computation of the sample data. A sample of the pre-established sizen is collected and the estimate of the population parameter is calculated.This estimate is the value of the test statistic. For example, if we are testinga hypothesis about the value of population mean , then the test statisticwould be the sample mean X . Then we test this statistic to check whetherit falls in the critical region or in the acceptance region. For example, if wewant to test for the average IQ of the college students to be 130, then inthat case, we have to see that our population mean must be tested. Wetake a random sample of a given size n and calculate its mean X , and thentest it to see if the value of this X falls in the area of acceptance or in thearea of rejection at a given level of significance.
6. Making the Decision: Before the statistical decision is made, a decisionrule must be established. Such decision rule will form the basis on whichthe null hypothesis will be accepted or rejected. This decision rule is reallya formal statement of the obvious purpose of the test. For example, thisrule could be stated as follows:Accept the null hypothesis if the value of sample statistic X fallswithin the area of acceptance, otherwise reject the null hypothesis.Based upon this established decision rule, a decision can be made whetherto accept or reject the null hypothesis.
7.3.2 Committing Errors: Type I and Type II
Types of Errors: There are two types of errors in statistical hypothesis, whichare as follows: Type I Error: In this type of error, you may reject a null hypothesis when
it is true. It means rejection of a hypothesis, which should have beenaccepted. It is denoted by (alpha), and is also known alpha error. Type II Error: In this type of error, you are supposed to accept a null
hypothesis when it is not true. It means accepting a hypothesis, which shouldhave been rejected. It is denoted by (beta), and is also known as betaerror.Type I error can be controlled by fixing it at a lower level. For example, if
you fix it at 2%, then the maximum probability to commit Type I error is 0.02.However, reducing Type I error has a disadvantage when the sample size is fixedas it increases the chances of Type II error. In other words, it can be said that bothtypes of errors cannot be reduced simultaneously. The only solution of this problemis to set an appropriate level by considering the costs and penalties attached tothem or to strike a proper balance between both types of errors.
In a hypothesis test, a Type I error occurs when the null hypothesis is rejectedwhen it is in fact true; that is, H0 is wrongly rejected. For example, in a clinical trial
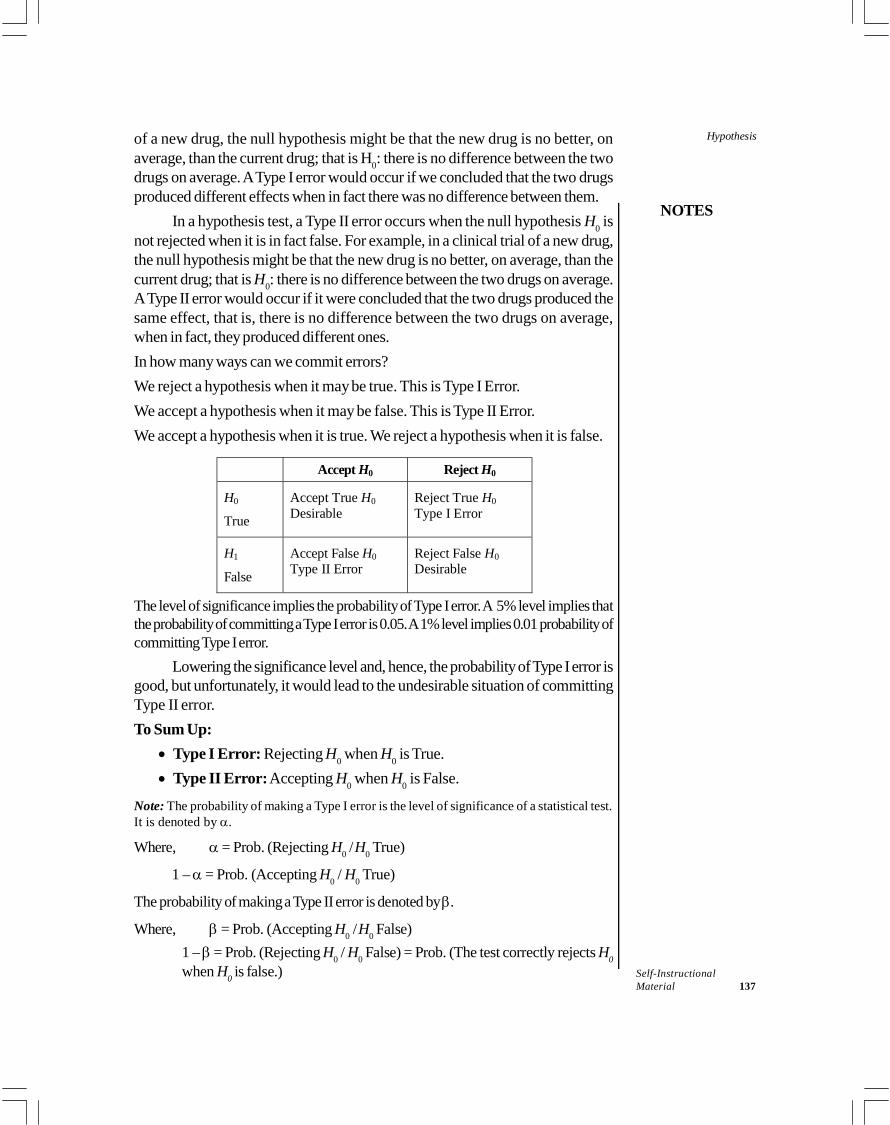
NOTES
Self-InstructionalMaterial 137
Hypothesisof a new drug, the null hypothesis might be that the new drug is no better, onaverage, than the current drug; that is H0: there is no difference between the twodrugs on average. A Type I error would occur if we concluded that the two drugsproduced different effects when in fact there was no difference between them.
In a hypothesis test, a Type II error occurs when the null hypothesis H0 isnot rejected when it is in fact false. For example, in a clinical trial of a new drug,the null hypothesis might be that the new drug is no better, on average, than thecurrent drug; that is H0: there is no difference between the two drugs on average.A Type II error would occur if it were concluded that the two drugs produced thesame effect, that is, there is no difference between the two drugs on average,when in fact, they produced different ones.In how many ways can we commit errors?We reject a hypothesis when it may be true. This is Type I Error.We accept a hypothesis when it may be false. This is Type II Error.We accept a hypothesis when it is true. We reject a hypothesis when it is false.
Accept H0 Reject H0
H0
True
Accept True H0Desirable
Reject True H0Type I Error
H1
False
Accept False H0Type II Error
Reject False H0Desirable
The level of significance implies the probability of Type I error. A 5% level implies thatthe probability of committing a Type I error is 0.05. A 1% level implies 0.01 probability ofcommitting Type I error.
Lowering the significance level and, hence, the probability of Type I error isgood, but unfortunately, it would lead to the undesirable situation of committingType II error.To Sum Up: Type I Error: Rejecting H0 when H0 is True. Type II Error: Accepting H0 when H0 is False.
Note: The probability of making a Type I error is the level of significance of a statistical test.It is denoted by .
Where, = Prob. (Rejecting H0 /H0 True)
1 – = Prob. (Accepting H0 / H0 True)
The probability of making a Type II error is denoted by.
Where, = Prob. (Accepting H0 /H0 False)1 – = Prob. (Rejecting H0 / H0 False) = Prob. (The test correctly rejects H0when H0 is false.)
Hypothesis
NOTES
Self-Instructional138 Material
1 – is called the power of the test. It depends on the level of significance, samplesize n and the parameter value.
7.3.3 Null and Alternative Hypotheses
Hypothesis is usually considered as the principal instrument in research. The basicconcepts regarding the testability of a hypothesis are as follows:
Null Hypothesis and Alternative Hypothesis
In the context of statistical analysis, while comparing any two methods, the followingconcepts or assumptions are taken into consideration: Null Hypothesis: While comparing two different methods in terms of their
superiority, wherein the assumption is that both the methods are equallygood, it is called null hypothesis. It is also known as statistical hypothesisand is symbolized as H0. Alternate Hypothesis: While comparing two different methods, regarding
their superiority, wherein stating a particular method to be good or bad ascompared to the other one, it is called alternate hypothesis. It is symbolizedas H1.
Comparison of Null Hypothesis with Alternate Hypothesis
Following are the points of comparison between null hypothesis and alternatehypothesis: Null hypothesis is always specific, while alternate hypothesis gives an
approximate value. The rejection of Null hypothesis involves great risk, which is not in the case
of alternate hypothesis.Null hypothesis is more frequently used in statistics than alternate hypothesis
because it is specific and is not based on probabilities.The hypothesis to be tested is called the null hypothesis and is denoted by
H0. This is to be tested against other possible states of nature called alternativehypothesis. The alternative is usually denoted byH1.
The null hypothesis implies that there is no difference between the statisticand the population parameter. To test whether there is no difference between thesample mean X and the population, we write the null hypothesis as:
H0: X = µThe alternative hypothesis would be:
H1: µThis means > µ or < µ. This is called a two-tailed hypothesis.The alternative hypothesisH1: > µ is right tailed.The alternative hypothesisH1: < µ is left tailed.
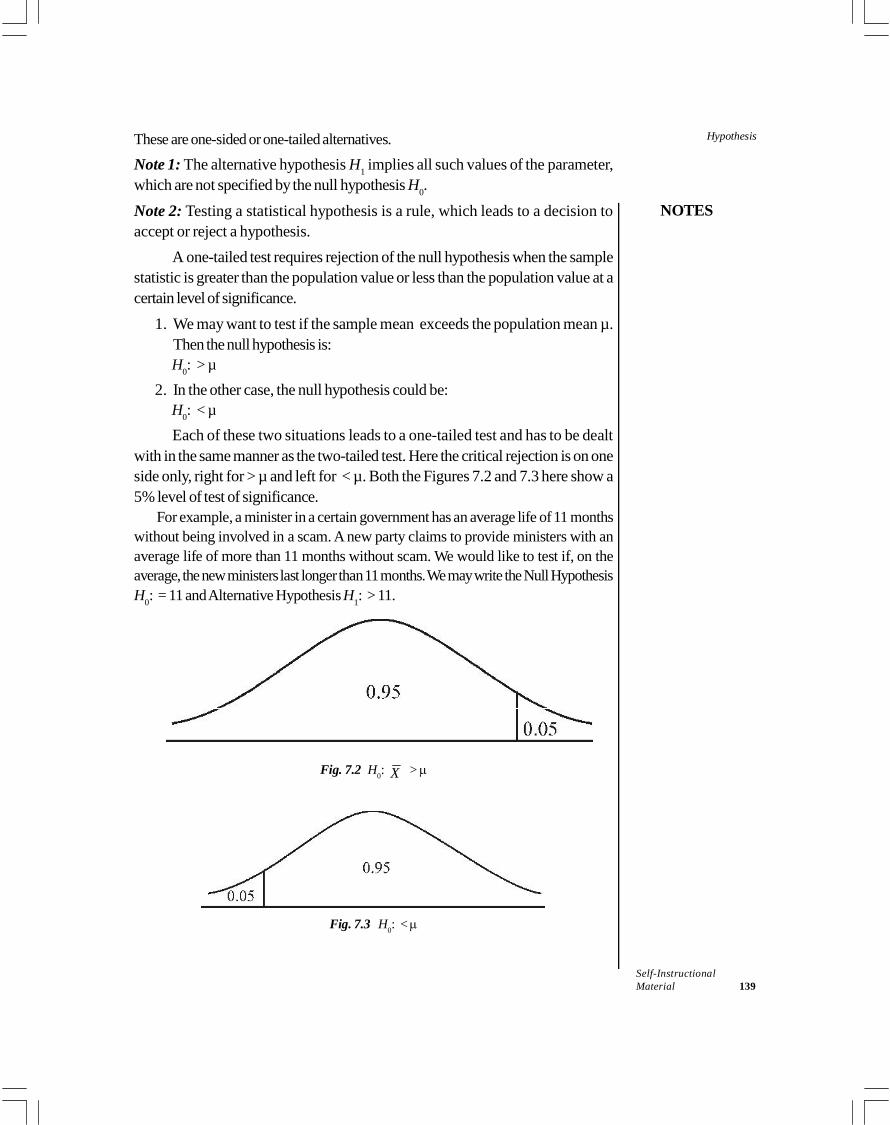
NOTES
Self-InstructionalMaterial 139
HypothesisThese are one-sided or one-tailed alternatives.
Note 1: The alternative hypothesis H1 implies all such values of the parameter,which are not specified by the null hypothesis H0.Note 2: Testing a statistical hypothesis is a rule, which leads to a decision toaccept or reject a hypothesis.
A one-tailed test requires rejection of the null hypothesis when the samplestatistic is greater than the population value or less than the population value at acertain level of significance.
1. We may want to test if the sample mean exceeds the population mean µ.Then the null hypothesis is:H0: > µ
2. In the other case, the null hypothesis could be:H0: < µ
Each of these two situations leads to a one-tailed test and has to be dealtwith in the same manner as the two-tailed test. Here the critical rejection is on oneside only, right for > µ and left for < µ. Both the Figures 7.2 and 7.3 here show a5% level of test of significance.
For example, a minister in a certain government has an average life of 11 monthswithout being involved in a scam. A new party claims to provide ministers with anaverage life of more than 11 months without scam. We would like to test if, on theaverage, the new ministers last longer than 11 months. We may write the Null HypothesisH0: = 11 and Alternative HypothesisH1: > 11.
Fig. 7.2 H0: X >
Fig. 7.3 H0: <
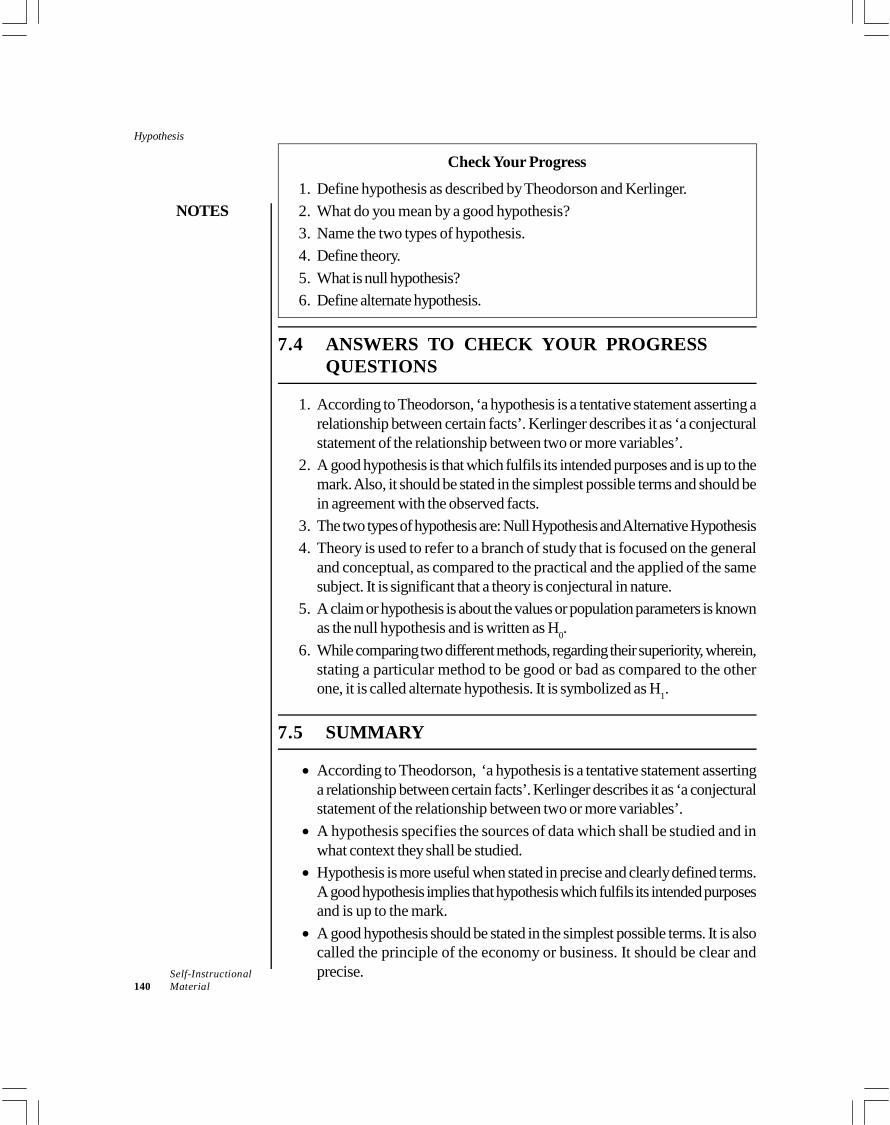
Hypothesis
NOTES
Self-Instructional140 Material
Check Your Progress1. Define hypothesis as described by Theodorson and Kerlinger.2. What do you mean by a good hypothesis?3. Name the two types of hypothesis.4. Define theory.5. What is null hypothesis?6. Define alternate hypothesis.
7.4 ANSWERS TO CHECK YOUR PROGRESSQUESTIONS
1. According to Theodorson, ‘a hypothesis is a tentative statement asserting arelationship between certain facts’. Kerlinger describes it as ‘a conjecturalstatement of the relationship between two or more variables’.
2. A good hypothesis is that which fulfils its intended purposes and is up to themark. Also, it should be stated in the simplest possible terms and should bein agreement with the observed facts.
3. The two types of hypothesis are: Null Hypothesis and Alternative Hypothesis4. Theory is used to refer to a branch of study that is focused on the general
and conceptual, as compared to the practical and the applied of the samesubject. It is significant that a theory is conjectural in nature.
5. A claim or hypothesis is about the values or population parameters is knownas the null hypothesis and is written as H0.
6. While comparing two different methods, regarding their superiority, wherein,stating a particular method to be good or bad as compared to the otherone, it is called alternate hypothesis. It is symbolized as H1.
7.5 SUMMARY
According to Theodorson, ‘a hypothesis is a tentative statement assertinga relationship between certain facts’. Kerlinger describes it as ‘a conjecturalstatement of the relationship between two or more variables’. A hypothesis specifies the sources of data which shall be studied and in
what context they shall be studied. Hypothesis is more useful when stated in precise and clearly defined terms.
A good hypothesis implies that hypothesis which fulfils its intended purposesand is up to the mark. A good hypothesis should be stated in the simplest possible terms. It is also
called the principle of the economy or business. It should be clear andprecise.
NOTES
Self-InstructionalMaterial 141
Hypothesis Precise quantitative measurements are more critical in testing theory thanqualitative characteristics. There are generally two types of hypothesis, namely null hypothesis and
alternative hypothesis. When comparing the superiority of both the methods A and B, if we assume
that both the methods are equally good, then the assumption is known as‘null hypothesis’. On the other hand, if we consider method A to be better,it is alternative hypothesis. These may be, symbolically presented as:
Null Hypothesis = HoAlternative Hypothesis = Ha
A proposition is a logical statement of relationship between two or morevariables which has, generally, been confirmed by empirical research. Proposition states a relationship between two concepts, and a hypothesis
operationalizes this relationship and puts it in an empirically testable form. The hypothesis is formed and tested within the scientific process. One may
develop the hypothesis while observation is occurring, but that may also beconsidered premature. The term ‘theory’ is one of a rather scientific nature, but of a less limited
nature. Theory is used to refer to a branch of study that is focused on thegeneral and conceptual, as compared to the practical and the applied of thesame subject. It is significant that a theory is conjectural in nature. A theory is usually a much larger set of statements than a hypothesis because
a theory can grow with every new piece of evidence it explains. In otherwords, a theory can explain far more than the phenomenon it originally wasproposed to explain. There are two types of errors that can be used in making decisions regarding
accepting or rejecting the null hypothesis. The first type of error, known asType I error, is used when the null hypothesis is rejected even if it is true.The second type of error, known as Type II error, is used when a nullhypothesis is accepted even if it was not true and should have been rejected. A null hypothesis (H0) is an assertion about the population parameter that is
being tested by the sample results. An alternate hypothesis (H1) is a claim about the population parameter that
is accepted when the null hypothesis is rejected. Type I error is denoted by (Alpha) and is expressed as a probability of
rejecting a true hypothesis. It is also known as the level of significance.Type II error is denoted by (Beta) and is expressed as the probability ofaccepting a false hypothesis. Data Collection and sample analysis involves the actual collection and
computation of the sample data. While comparing two different methods in terms of their superiority, wherein
the assumption is that both the methods are equally good, it is called nullhypothesis. It is also known as statistical hypothesis and is symbolized as H0.
Hypothesis
NOTES
Self-Instructional142 Material
While comparing two different methods, regarding their superiority, whereinstating a particular method to be good or bad as compared to the otherone, it is called alternate hypothesis. It is symbolized as H1.
7.6 KEY WORDS
Hypothesis: It refers to the supposition or proposed explanation made onthe basis of limited evidence as a starting point for further investigation. Null Hypothesis: It refers to a general statement or default position that
there is no relationship between two measured phenomena, or no associationamong groups. Alternative Hypothesis: It refers to the one that states there is a statistically
significant relationship between two variables. Hypothesis Testing: It refers to an act in statistics whereby an analyst
tests an assumption regarding a population parameter.
7.7 SELF ASSESSMENT QUESTIONS ANDEXERCISES
Short Answer Questions1. Write a short note on the nature of hypothesis.2. What do you understand by Type I Error and Type II Error?3. Briefly explain Type I error in a hypothesis test with an example.4. Differentiate between null hypothesis and alternate hypothesis.
Long Answer Questions1. Discuss some rules for constructing good hypotheses.2. Examine the steps involved in hypothesis testing.3. Describe the difference between proposition, hypothesis and theory
7.8 FURTHER READINGS
Busha, Charles H. and Stephen P. Harter. 1980. Research Methods inLibrarianship: Techniques and Interpretation. Orlando: Academic Press.
Kumar, Krishan. 1992. Research Methods in Library and Information Science.New Delhi: Har-Anand Publications.
Rao, I.K. Ravichandra. 2009. Quantitative Methods for Library andInformation Science. New Delhi: New Age International Publishers.
Slater, Margaret. 1990. Research Methods in Library and Information Studies.London: Facet Pub.
Fowler, F. J. 2008. Survey Research Methods. New Delhi: SAGE Publications.
NOTES
Self-InstructionalMaterial 143
Planning of Researchand Research DesignUNIT 8 PLANNING OF RESEARCH
AND RESEARCH DESIGN
Structure8.0 Introduction8.1 Objectives8.2 Planning of Research and its Process8.3 Research Design: Essentials of a Good Design and its Importance
8.3.1 Preparation of the Research Design8.4 Writing the Research Proposal
8.4.1 Contents of a Research Proposal8.4.2 Types of Research Proposals
8.5 Answers to Check Your Progress Questions8.6 Summary8.7 Key Words8.8 Self Assessment Questions and Exercises8.9 Further Readings
8.0 INTRODUCTION
A research plan is a vital part of the research. With a research plan, a researchergets an opportunity to discuss the proposed research, its significance and the processin which it will be carried out. A research plan must be designed in a way that itsatisfy the questions like the intention of the research, importance of the research,previous findings, and steps need to be taken to complete the research.
In this unit, you will study about the effective planning of research and alsothe complete process of research. In addition to this, you will also study about theessentials of research design and its importance, preparation and classification ofresearch design. The unit goes on discussing the contents of a research proposaland the types of research proposals.
8.1 OBJECTIVES
After going through this unit, you will be able to: Describe the process and planning of research Discuss the concept of research design Understand the basics of a good research design and its importance Explain the preparation and classification of research design Explain the contents of a research proposal Identify the types of research proposals
Planning of Researchand Research Design
NOTES
Self-Instructional144 Material
8.2 PLANNING OF RESEARCH AND ITSPROCESS
We have placed planning and collecting data for research as simultaneous to thesampling plan. This is because these two—based on the research design—needto be developed concurrently. The reason for this is that the sampling plan helps inidentifying the population under study and the data collection plan helps in workingout ways of obtaining information from the specified population. There is a hugevariety and number of data collection instruments available to the researcher.Broadly, these may be classified into secondary and primary data methods. Eachhas multiple sub-divisions available. Primary, as the name suggests, is original andcollected first hand for the problem under study. There are a variety of primarydata methods available to the researcher ranging from subjective, non-quantifiableinterviews, focus group discussions, personal/telephonic interviews/mail survey tothe well-structured and quantifiable questionnaires. Secondary data is informationthat has been collected and compiled earlier. For example, company records,magazine articles, expert opinion surveys, sales records, customer feedback,government data and previous researches done on the topic of interest. Forexample, a study that measures the acceptability of orange-flavoured drink versusnatural orange juice by consumers requires empirical and primary information. Onthe other hand, a descriptive financial investment behaviour study of consumersmight be able to make use of secondary data. There are sub-steps involved at thisstage—primary data instrument design and pilot testing. For example, if we wantto measure the work-family conflict experienced by women in the healthcare sectorand the steps that women professionals take to balance this, the study requiresempirical data collection and instrument design. Once the instrument has beendesigned, it has to be tested and refined (pilot testing) before actual data collectioncan take place. In case a pre-constructed instrument is available and has beendeveloped to measure the specific construct, the two steps of instrument designand testing can be done away with.
This step in the research process requires careful and rigorous quality checksto ensure the reliability and validity of the data collected. There are measurementoptions available to establish these criteria for the data collection instrument, whichhave been discussed in the subsequent chapter. Once the instrument is ready, thefield work begins and the data is collected from the respondent population basedon the devised sampling plan.
8.3 RESEARCH DESIGN: ESSENTIALS OF AGOOD DESIGN AND ITS IMPORTANCE
Once you have established the what of the study, i.e., the research problem, thenext step is the how of the study, which specifies the method of achieving thestated research objectives in the best possible manner.
NOTES
Self-InstructionalMaterial 145
Planning of Researchand Research Design
As stated earlier, different paradigms will guide the selection of the gamut oftechniques available. These differences in approach have led to varying definitionsof what constitutes a research design.
Green et al. (2008) defines research designs as ‘the specification of methodsand procedures for acquiring the information needed. It is the overall operationalpattern or framework of the project that stipulates what information is to becollected from which sources by what procedures. If it is a good design, it willinsure that the information obtained is relevant to the research questions and that itwas collected by objective and economical procedures.’
Thyer (1993) states that, ‘A traditional research design is a blueprint ordetailed plan for how a research study is to be completed—operationalizingvariables so they can be measured, selecting a sample of interest to study, collectingdata to be used as a basis for testing hypotheses, and analysing the results.’ Theessential requirement of the design is thus to provide a framework and direction tothe investigation in the most efficient manner. Sellitz et al. (1962) states that ‘Aresearch design is the arrangement of conditions for collection and analysis of datain a manner that aims to combine relevance to the research purpose with economyin procedure.’
One of the most comprehensive and holistic definition has been given byKerlinger (1995). He refers to a research design as, ‘….. a plan, structure andstrategy of investigation so conceived as to obtain answers to research questionsor problems. The plan is the complete scheme or programme of the research. Itincludes an outline of what the investigator will do from writing the hypotheses andtheir operational implications to the final analysis of data.’Thus, the formulated design must ensure three basic tenets:
(a) Convert the research question and the stated assumptions/hypotheses intooperational variables that can be measured.
(b) Specify the process that would be followed to complete the above task, asefficiently and economically as possible.
(c) Specify the ‘control mechanism(s)’ that would be used to ensure that theeffect of other variables that could impact the outcome of the study havebeen controlled.The important consideration is that none of these assumptions can be
foregone; all of them must be addressed succinctly and adequately in the designfor it to be able to lead on to the methods to be used for collecting the problem-specific information. Thus, it follows the problem definition stage and precedesthe data collection stage. However, this is not an irreversible step. Sometimeswhen the researcher is operationally defining the variables for study, it might emergethat the research question needs to be restructured and consecutively the approachfor data collection also might oscillate from the quantitative to the qualitative orvice versa.
Planning of Researchand Research Design
NOTES
Self-Instructional146 Material
At this juncture, one needs to understand the distinction between researchdesign and research method. While the design is the specific framework that hasbeen created to seek answers to the research question, the research method is thetechnique to collect the information required to answer the research problem,given the created framework.
Thus, research designs have a critical and directive role to play in the researchprocess. The execution details of the research question to be investigated arereferred to as the research design.
8.3.1 Preparation of the Research Design
Once the researcher has identified the research scope and objectives, he has alsoestablished his/her epistemological position. This could be positivistic—in whichcase the method of enquiry would necessarily be scientific and empirical.Subsequently, this would require a statistical method of analysis (Ackroyd, 1996).The constructivists on the other hand argue for methods that are richer and moreapplicable to the social sciences, unlike the more pedantic experimental approach.Qualitative is a more definitive choice here than the quantitative (Atkinson andHammersley, 1994). Yet another approach is the principle of triangulation (Jick,1979), which advocates the simultaneous or a sequential use of the qualitative andquantitative methods of investigation. The proponents state that when the findingsfrom diverse methods are collated, then the results are richer, more wholistic andthis, in turn, improves the sanctity of the analysis.
The formulated research questions are then, through a comprehensivetheoretical review, put into a practical perspective. The conceptual design thusdeveloped requires and entails specifications of the variables under study as wellas approach to the analysis. This might in turn lead to a refining or rephrasing of thedefined research questions. Thus, the formulation of the research design is not astagnant stage in the research process; rather it is an ongoing backward and forwardintegrated process by itself.
An illustration: Let us take the example of the organic food study. Theformulated research problem was:To investigate the consumer decision-making process for organic foodproducts and to segment the market according to the basket size.On conducting an extensive review of the literature, it was found that organicconsumption is not always a self-driven choice; rather it could be the sellerwho might influence the product choice. Thus, a research design wasformulated to study the organic consumer’s decision stages. However, oncethe design is selected and a proposed sampling plan is developed, the nextstep required is that the constructs and the variables to be studied must beoperationalized. On defining the organic consumer, we realized thesignificance of the psychographics of the individual—the attitude, interestand opinion—which were extremely critical. Thus, to get a wholistic view,
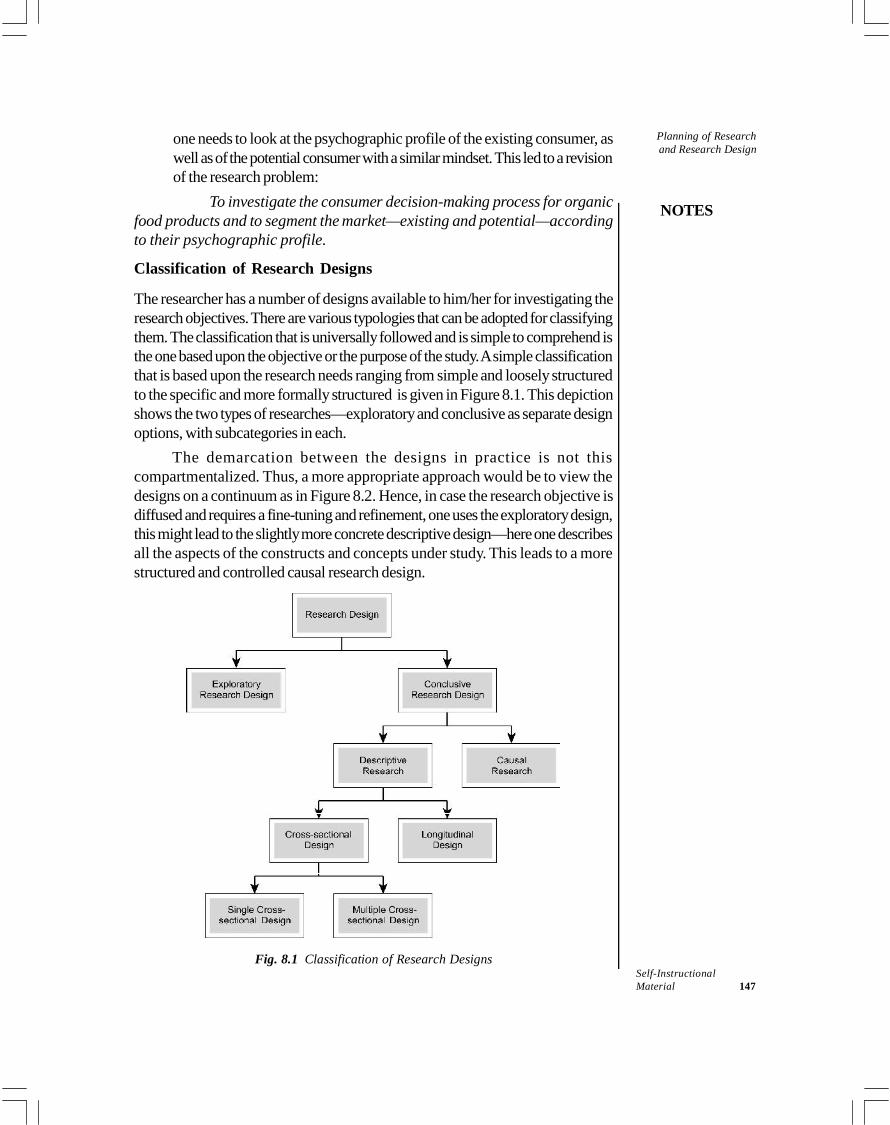
NOTES
Self-InstructionalMaterial 147
Planning of Researchand Research Design
one needs to look at the psychographic profile of the existing consumer, aswell as of the potential consumer with a similar mindset. This led to a revisionof the research problem:
To investigate the consumer decision-making process for organicfood products and to segment the market—existing and potential—accordingto their psychographic profile.
Classification of Research Designs
The researcher has a number of designs available to him/her for investigating theresearch objectives. There are various typologies that can be adopted for classifyingthem. The classification that is universally followed and is simple to comprehend isthe one based upon the objective or the purpose of the study. A simple classificationthat is based upon the research needs ranging from simple and loosely structuredto the specific and more formally structured is given in Figure 8.1. This depictionshows the two types of researches—exploratory and conclusive as separate designoptions, with subcategories in each.
The demarcation between the designs in practice is not thiscompartmentalized. Thus, a more appropriate approach would be to view thedesigns on a continuum as in Figure 8.2. Hence, in case the research objective isdiffused and requires a fine-tuning and refinement, one uses the exploratory design,this might lead to the slightly more concrete descriptive design—here one describesall the aspects of the constructs and concepts under study. This leads to a morestructured and controlled causal research design.
Fig. 8.1 Classification of Research Designs
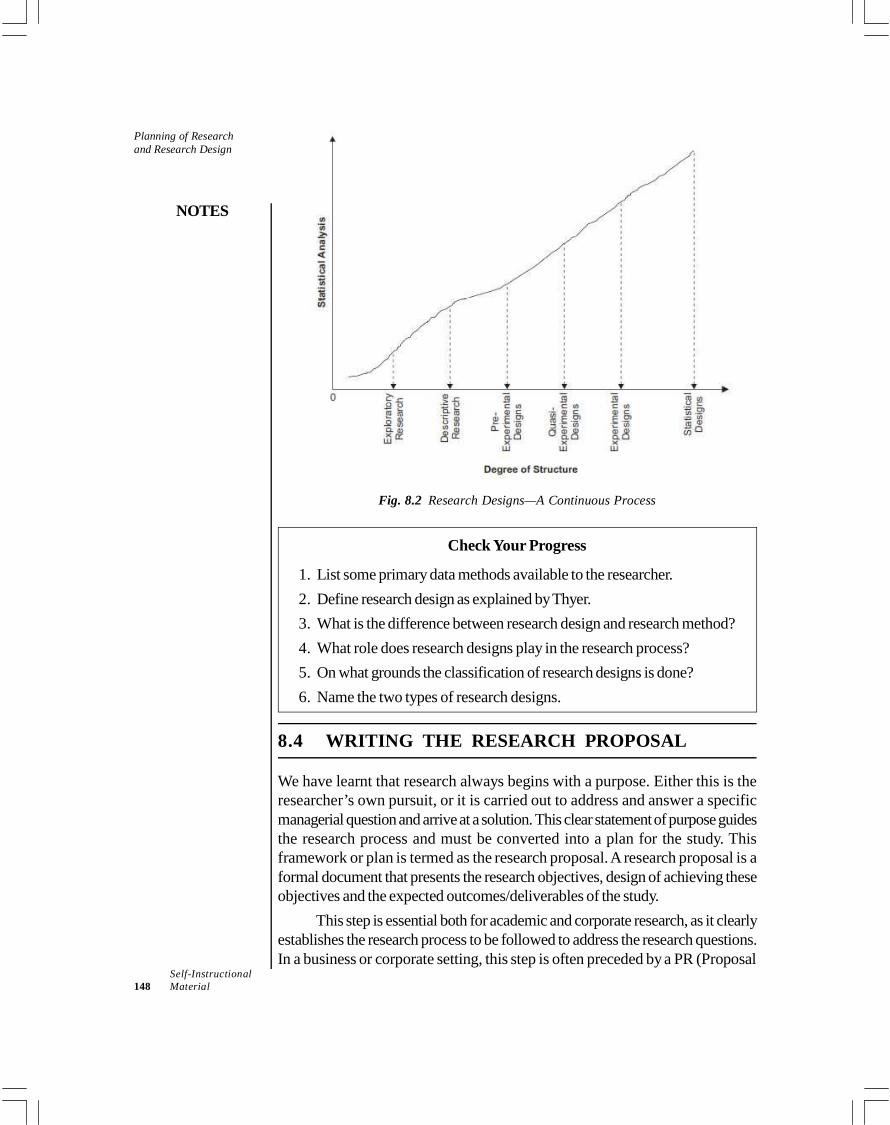
Planning of Researchand Research Design
NOTES
Self-Instructional148 Material
Fig. 8.2 Research Designs—A Continuous Process
Check Your Progress
1. List some primary data methods available to the researcher.2. Define research design as explained by Thyer.3. What is the difference between research design and research method?4. What role does research designs play in the research process?5. On what grounds the classification of research designs is done?6. Name the two types of research designs.
8.4 WRITING THE RESEARCH PROPOSAL
We have learnt that research always begins with a purpose. Either this is theresearcher’s own pursuit, or it is carried out to address and answer a specificmanagerial question and arrive at a solution. This clear statement of purpose guidesthe research process and must be converted into a plan for the study. Thisframework or plan is termed as the research proposal. A research proposal is aformal document that presents the research objectives, design of achieving theseobjectives and the expected outcomes/deliverables of the study.
This step is essential both for academic and corporate research, as it clearlyestablishes the research process to be followed to address the research questions.In a business or corporate setting, this step is often preceded by a PR (Proposal
NOTES
Self-InstructionalMaterial 149
Planning of Researchand Research Design
Request). Here the manager or the corporate spells out his decision problem andrequests the potential suppliers of research to work out a research plan/proposalto address the stated issues.
Another advantage of a formal proposal is that sometimes the manager maynot be able to clearly tell his problem or the researcher might not be able tounderstand and convert the decision into a workable research problem. Theresearcher lists the objectives of the study and then together with the manager, isable to review whether or not the listed objectives and direction of the study willbe able to deliver output for arriving at a workable solution.
For the researcher, the document provides an opportunity to identify anyshortfalls in the logic or the assumption of the study. It also helps to monitor themethodical work being carried out to accomplish the project.
8.4.1 Contents of a Research Proposal
There is a broad framework that most proposals follow. In this section we willbriefly discuss these steps.
Executive summary
This is a broad overview that gives the purpose and objective of the study. In ashort paragraph, the author gives a summary about the management problem/academic concern.
Background of the problem
This is the detailed background of the management problem. It requires a sequentialand systematic build-up to the research questions and also why the study shouldbe done. The researcher has to be able to demonstrate that there could be anumber of ways in which the management dilemma could be answered. Forexample, a pharmaceutical company develops a new hair growing solution andpackages it in two different types of bottles. They want to know which one peoplewill buy. The product testing could be done internally in the company, or the twosample bottles could be formulated and tested for their acceptability amongstlikely consumers or retailers keeping the product; or the two types would bedeveloped and test launched and tested for their sales potential. The researcherthus has to spell out all probabilities and then systematically and logically argue forthe research study. This section has to be objective and written in simple language,avoiding any metaphors or idioms to dramatize the plan. The logical argumentsshould speak for themselves and be able to convince the reader of the need forthe study in order to find probable solutions to the management dilemma.
Problem statement and research objectives
The clear definition of the problem broken down into specific objectives is the nextstep. This section is crisp and to the point. It begins by stating the main thrust area ofthe study. For example, in the above case, the problem statement could be:
Planning of Researchand Research Design
NOTES
Self-Instructional150 Material
To test the acceptability of a spray or capped bottle dispenser for a newhair growing formulation.
The basic objectives of this research would be to: Determine the comparative preference of the two prototypes amongst
customers of hair growing solutions. To conduct a sample usage test of both the bottles with the identified
population. To assess the ease of use for the bottles amongst the respondents. To prepare a comparative analysis of the advantages and problems
associated with each bottle, on the basis of the sample usage test. To prepare a detailed report on the basis of the findings.If the study is addressed towards testing some assumptions in the form of
hypotheses, they have to be clearly stated in this section.
Research design
This is the working section of the proposal as it needs to indicate the logical andsystematic approach intended to be followed in order to achieve the listedobjectives. This would include specifying the population to be studied, the samplingprocess and plan, sample size and selection. It also details the information areas ofthe study and the probable sources of data, i.e., the data collection methods. Incase the process has to include an instrument design, then the intended approachneeds to be detailed here. A note of caution has to be given here: this is not asimple statement of the sampling and data collection plan; it requires a clear andlogical justification of using the techniques over the methods available for research.
Scheduling the research
The time-bound dissemination of the study with the major phases of the researchhas to be presented. This can be done using the CPM/GANTT/PERT charts.This gives a clear way for monitoring and managing the research task. It also hasthe additional benefit of providing the researcher with a means of spelling out thepayment points linked to the delivered phase outputs.
Results and outcomes of the research
Here the clear terms of contract or expected outcomes of the study have to bespelt out. This is essential even if it is an academic research. The expecteddeliverables need to clearly demonstrate how the researcher intends to link thefindings of the proposed study design to the stated research objectives. Forexample, in the pharmaceutical study, the expected deliverables are: To identify the usage problems with each bottle type. To recommend on the basis of the sample study on which bottle to use for
packaging the liquid.
NOTES
Self-InstructionalMaterial 151
Planning of Researchand Research Design
Costing and budgeting the research
In all instances of business research, both internal and external, an estimated costof the study is required.
In addition to these sections, academic research proposals require a sectionon review of related literature; this generally follows the ‘problem background’section. If the proposal is meant to establish the credentials of the research supplier,then detailed qualifications of the research team, including the research experiencein the required or related area, help to aid in the selection of the research proposal.
Sometimes, the research study requires an understanding of some technicalterms or explanations of the constructs under study; in such cases the researcherneeds to attach a glossary of terms in the appendix of the research proposal.
The last section of the proposal is to state the complete details of the referencesused in the formulation of the research proposal. Thus the data source and addresshave to be attached with the formulated document.
8.4.2 Types of Research Proposals
Basically, the proposals formulated could be of three types: Academic research proposals Internal organizational proposal External organizational proposals
Academic research proposal
The academic research proposal might be generated by students or academicianspursuing the study for fundamental academic research. These kind of studies needextensive search of past studies and data on the topic of study. An example is anacademician wanting to explore the viability of different eco-friendly packagingoptions available to a manufacturer.
Internal organizational proposal
The internal organizational proposals are conducted within an organization andare submitted to the management for approval and funding. They are of a highlyfocused nature and are oriented towards solving immediate problems. For example,a pharmaceutical company, which has developed a new hair growing formulationwants to test whether to package the liquid in a spray type or capped dispenser.The solutions are time-driven and applicability is only for this product. These studiesdo not require extensive literature review but do require clearly stated researchobjectives, for the management to assess the nature of work required.
Planning of Researchand Research Design
NOTES
Self-Instructional152 Material
External organizational proposals
External organizational proposals have the base or origin within the company, butthe scope and nature of the study requires a more structured and objective research.For example, if the above stated pharmaceutical company wishes to explore theherbal cosmetic market and wants market analysis and feasibility study conducted;the PR might be spelt out to solicit proposals to address the research question,and execute an outsourced research.
Check Your Progress
7. What is a research proposal?8. List the contents of a research proposal.
8.5 ANSWERS TO CHECK YOUR PROGRESSQUESTIONS
1. There are a variety of primary data methods available to the researcherranging from subjective, non-quantifiable interviews, focus group discussions,personal/ telephonic interviews/ mail survey to the well-structured andquantifiable questionnaires.
2. According to Thyer (1993), ‘A traditional research design is a blueprint ordetailed plan for how a research study is to be completed—operationalizingvariables so they can be measured, selecting a sample of interest to study,collecting data to be used as a basis for testing hypotheses, and analysingthe results.’ The essential requirement of the design is thus to provide aframework and direction to the investigation in the most efficient manner.
3. The research design is the specific framework that has been created toseek answers to the research question, the research method is the techniqueto collect the information required to answer the research problem, giventhe created framework.
4. Research designs play a critical and directive role in the research process.The execution details of the research question to be investigated are referredto as the research design.
5. The classification of research designs is based upon the research needsranging from simple and loosely structured to the specific and more formallystructured.
6. The two types of research designs are exploratory research design andconclusive research design.
NOTES
Self-InstructionalMaterial 153
Planning of Researchand Research Design
7. A research proposal is a formal document that presents the researchobjectives, design of achieving these objectives and the expected outcomes/deliverables of the study.
8. The contents of a research proposal are as follows: Executive Summary Background of the problem Problem statement and research objectives Research design Scheduling the research Results and outcomes of the research Costing and budgeting the research
8.6 SUMMARY
There are a huge variety and number of data collection instruments availableto the researcher. Broadly, these may be classified into secondary andprimary data methods. Primary, as the name suggests, is original andcollected first hand for the problem under study. There are a variety ofprimary data methods available to the researcher ranging from subjective,non-quantifiable interviews, focus group discussions, personal/telephonicinterviews/mail survey to the well-structured and quantifiable questionnaires.Secondary data is information that has been collected and compiled earlier.For example, company records, magazine articles, expert opinion surveys,sales records, customer feedback, government data and previous researchesdone on the topic of interest. This step in the research process requires careful and rigorous quality checks
to ensure the reliability and validity of the data collected. There aremeasurement options available to establish these criteria for the datacollection instrument. Greenet al. (2008) defines research designs as ‘the specification of methods
and procedures for acquiring the information needed. It is the overalloperational pattern or framework of the project that stipulates whatinformation is to be collected from which sources by what procedures. If itis a good design, it will insure that the information obtained is relevant to theresearch questions and that it was collected by objective and economicalprocedures.’ One of the most comprehensive and holistic definition has been given by
Kerlinger (1995). He refers to a research design as, ‘….. a plan, structureand strategy of investigation so conceived as to obtain answers to research
Planning of Researchand Research Design
NOTES
Self-Instructional154 Material
questions or problems. The plan is the complete scheme or programme of theresearch. It includes an outline of what the investigator will do from writing thehypotheses and their operational implications to the final analysis of data.’ One needs to understand the distinction between research design and
research method. While the design is the specific framework that has beencreated to seek answers to the research question, the research method isthe technique to collect the information required to answer the researchproblem, given the created framework. Once the researcher has identified the research scope and objectives, he
has also established his/her epistemological position. This could bepositivistic—in which case the method of enquiry would necessarily bescientific and empirical. Once the design is selected and a proposed sampling plan is developed, the
next step required is that the constructs and the variables to be studied mustbe operationalized. There are two types of researches —exploratory and conclusive as separate
design options, with subcategories in each. A research always begins with a purpose; either it is researcher’s own pursuit
or it is carried out to address and answer a specific managerial question andarrive a solution. The clear purpose guides the research process and mustbe converted into a plan for the study. This framework or plan is termed asthe research proposal. For the researcher, the research proposal document provides an opportunity
to identify any shortfalls in the logic or the assumption of the study. It alsohelps to monitor the methodical work being carried out to accomplish theproject. The contents of a research proposal include executive summary, background
of the problem, problem statement and research objectives, research design,scheduling the research, results and outcomes of the research, costing andbudgeting the research. Basically, the research proposals formulated could be of three types:
o Academic research proposalso Internal organizational proposalso External organizational proposals
The academic research proposal might be generated by students oracademicians pursuing the study for fundamental academic research. The internal organizational proposals are conducted within an organization
and are submitted to the management for approval and funding. They are ofa highly focused nature and are oriented towards solving immediate problems.
NOTES
Self-InstructionalMaterial 155
Planning of Researchand Research Design
External organizational proposals have the base or origin within the company,but the scope and nature of the study requires a more structured and objectiveresearch.
8.7 KEY WORDS
Research Design: It refers to the set of methods and procedures used incollecting and analysing measures of the variables specified in the problemresearch. Exploratory Research Designs: It refers to a research conducted for a
problem that has not been studied more clearly, intended to establishpriorities, develop operational definitions and improve the final researchdesign. Conclusive Research Designs: It is meant to provide information that is
useful in reaching conclusions or decision-making. Research Proposal: It refers to a document proposing a research project
and generally constitutes a request for sponsorship of that research.
8.8 SELF ASSESSMENT QUESTIONS ANDEXERCISES
Short Answer Questions
1. Write a note on research process.2. Mention the three basic tenets for a formulated research design.3. How does a research proposal help a researcher?4. Briefly discuss the basic objectives of the research.
Long Answer Questions
1. What is a research design process? Explain.2. Describe the entire process or steps involved in writing a research proposal.3. Discuss the three types of research proposals in detail.
8.9 FURTHER READINGS
Busha, Charles H. and Stephen P. Harter. 1980. Research Methods inLibrarianship: Techniques and Interpretation. Orlando: Academic Press.
Kumar, Krishan. 1992. Research Methods in Library and Information Science.New Delhi: Har-Anand Publications.

Planning of Researchand Research Design
NOTES
Self-Instructional156 Material
Rao, I.K. Ravichandra. 2009. Quantitative Methods for Library andInformation Science. New Delhi: New Age International Publishers.
Slater, Margaret. 1990. Research Methods in Library and Information Studies.London: Facet Pub.
Fowler, F. J. 2008. Survey Research Methods. New Delhi: SAGE Publications.
NOTES
Self-InstructionalMaterial 157
Types of Research DesignsBLOCK - IVTYPES OF RESEARCH AND DATA
COLLECTION METHODS
UNIT 9 TYPES OF RESEARCHDESIGNS
Structure9.0 Introduction9.1 Objectives9.2 Exploratory Research Design
9.2.1 Secondary Resource Analysis9.2.2 Case Study Method9.2.3 Expert Opinion Survey9.2.4 Focus Group Discussions
9.3 Descriptive Research Design9.3.1 Cross-sectional Studies9.3.2 Longitudinal Studies
9.4 Experimental Designs9.5 Diagnostic Research Design9.6 Answers to Check Your Progress Questions9.7 Summary9.8 Key Words9.9 Self Assessment Questions and Exercises
9.10 Further Readings
9.0 INTRODUCTION
As we know, a research design is a set of methods and procedures used in collectingand analysing measures of the variables specified. In this unit, you will study aboutthe different types of research designs like exploratory research design, descriptiveresearch design, experimental designs and diagnostic research design. Besides thedefinitions of different types of research designs, you will also study about theircategories and sub-categories.
9.1 OBJECTIVES
After going through this unit, you will be able to: Describe the different types of research designs Discuss the purpose and characteristics of exploratory research design Understand the objective and sub-categories of descriptive research design
Types of Research Designs
NOTES
Self-Instructional158 Material
Explain the conditions and types of experimental designs Define diagnostic research design
9.2 EXPLORATORY RESEARCH DESIGN
Exploratory designs, as stated earlier, are the simplest and most loosely structureddesigns. As the name suggests, the basic objective of the study is to explore andobtain clarity about the problem situation. It is flexible in its approach and mostlyinvolves a qualitative investigation. The sample size is not strictly representativeand at times it might only involve unstructured interviews with a couple of subjectexperts. The essential purpose of the study is to: Define and understand the research problem to be investigated. Explore and evaluate the diverse and multiple research opportunities. Assist in the development and formulation of the research hypotheses. Define the variables and constructs under study. Identify the possible nature of relationships that might exist between the
variables under study. Explore the external factors and variables that might impact the research.
For example, a university professor might decide to do an exploratoryanalysis of the new channels of distribution that are being used by the marketers topromote and sell products and services. To do this, a structured and definedmethodology might not be essential as the basic objective is to understand how toteach this to students of marketing. The researcher can make use of differentmethods and techniques in an exploratory research- like secondary data sources,unstructured or structured observations, expert interviews and focus groupdiscussions with the concerned respondent group. Here, we will discuss them inbrief in the light of their use in exploratory research.
9.2.1 Secondary Resource Analysis
Secondary sources of data, as the name suggests, are data in terms of the detailsof previously collected findings in facts and figures—which have been authenticatedand published. It is a fast and inexpensive way of collecting information. The pastdetails can sometimes point out to the researcher that his proposed research isredundant and has already been established earlier. Secondly, the researcher mightfind that a small but significant aspect of the concept has not been addressed andshould be studied. For example, a marketer might have extensively studied thepotential of the different channels of communication for promoting a ‘homemaintenance service’ in Greater Mumbai. However, there is no impact of any mixthat he has tested. An anthropologist research associate, on going through thefindings, postulated the need for studying the potential of WOM (word of mouth)in a close-knit and predominantly Parsi colony where this might be the most effective
NOTES
Self-InstructionalMaterial 159
Types of Research Designsculture-dependent technique that would work. Thus, such insights might provideleads for carrying out an experimental and conclusive research subsequently.
Another valuable secondary resource is the compiled and readily availabledatabases of the entire industry, business or construct. These might be available onfree and public domains or through a structured acquisition process and cost. Theseare both government and non-government publications. Based on the resources andthe level of accuracy required, the researcher might decide to make use of them.
9.2.2 Case Study Method
Another way of conducting an exploratory research is the case study method.This requires an in-depth study and is focused on a single unit of analysis. This unitcould be an employee or a customer; an organization or a complete country analysis.They are by their nature, generally, post-hoc studies and report those incidenceswhich might have occurred earlier. The scenario is reproduced based upon thesecondary information and a primary interview/discussion with those involved inthe occurrence. Thus, there might be an element of bias as the data, in most cases,becomes a judgemental analysis rather than a simple recounting of events.
For example, BCA Corporation wants to implement a performance appraisalsystem in the organization and is debating between the merits of a traditional appraisalsystem and a 360° appraisal system. For a historical understanding of the twotechniques, the HR director makes use of books on the subject. However, for betterunderstanding, he should do an in-depth case accounting of Allied Association whichhad implemented traditional appraisal formats, and Surakhsha International whichuses 360° appraisal systems. Thus, the two exploratory researches carried out weresufficient to arrive at a decision in terms of what would be best for the organization.
9.2.3 Expert Opinion Survey
At times, there might be a situation when the topic of a research is such that thereis no previous information available on it. In these cases, it is advisable to seekhelp from experts who might be able to provide some valuable insights basedupon their experience in the field or with the concept. This approach of collectingparticulars from significant and knowledgeable people is referred to as the expertopinion survey. This methodology might be formal and structured and is usefulwhen authenticated or supported by a secondary/primary research or it might befluid and unstructured and might require an in-depth interviewing of the expert.For example, the evaluation of the merit of marketing organic food products in thedomestic Indian market cannot be done with the help of secondary data as nosuch structured data sources exist. In this case the following can be contacted: Doctors and dieticians as experts would be able to provide information whether
consumers would eat organic food products as a healthier alternative. Chefs who are experimental and would like to look at providing better
value to their clients. Retailers who like to sell contemporary new products.
Types of Research Designs
NOTES
Self-Instructional160 Material
These could be useful in measuring the viability of the proposed plan.Discussions with knowledgeable people may reveal some information regardingwho might be considered as potential consumers. Secondly, the question whethera healthy proposition or a lifestyle proposition would work better to capture thetargeted consumers needs to be examined.Thus, this method can play a directionalrole in shaping the research study.
9.2.4 Focus Group Discussions
Another way to conduct a exploratory analysis is carry out discussions withindividuals associated with the problem under study. This technique, thoughoriginally from sociology, is actively used in business research. In a typical focusgroup, there is a carefully selected small set of individuals representative of thelarger respondent population under study. It is called a focus group as the selectedmembers discuss the concerned topic for the duration of 90 minutes to, sometimes,two hours. Usually the group is made up of six to ten individuals. The number thusstated is because less than six would not be able to throw enough perspectives forthe discussion and there might emerge a one-sided discussion on the topic. On theother hand, more than ten might lead to more confusion rather than any fruitfuldiscussion and that would be unwieldy to manage. Generally, these discussionsare carried out in neutral settings by a trained observer, also referred to as themoderator. The moderator, in most cases, does not participate in the discussion.His prime objective is to manage a relatively non-structured and informal discussion.He initiates the process and then maneuvers it to steer it only to the desiredinformation needs. Sometimes, there is more than one observer to record theverbal and non-verbal content of the discussion. The conduction and recording ofthe dialogue requires considerable skill and behavioural understanding and themanagement of group dynamics. In the organic food product study, the focusgroup discussions were carried out with the typical consumers/buyers of groceryproducts. The objective was to establish the level of awareness about health hazards,environmental concerns and awareness of organic food products. A series of suchfocus group discussions carried out across four metros—Delhi, Mumbai, Bengaluruand Hyderabad—revealed that even though the new age consumer was concernedabout health, the awareness about organic products varied from extremely low tonon-existent. (This study was carried out in the year 2004–05 by one of theauthors for an NGO located in Delhi).
Check Your Progress
1. What is the basic objective of exploratory research design?2. What do you understand by secondary sources of data?3. List the characteristics of a case study method.4. What is the motive of expert opinion survey?
NOTES
Self-InstructionalMaterial 161
Types of Research Designs9.3 DESCRIPTIVE RESEARCH DESIGN
As the name implies, the objective of descriptive research studies is to provide acomprehensive and detailed explanation of the phenomena under study. Theintended objective might be to give a detailed sketch or profile of the respondentpopulation being studied. For example, to design an advertising and sales promotioncampaign for high-end watches, a marketer would require a holistic profile of thepopulation that buys such luxury products. Thus a descriptive study, (whichgenerates data on who, what, when, where, why and how of luxury accessorybrand purchase) would be the design necessary to fulfill the research objectives.
Descriptive research thus are conclusive studies. However, they lack theprecision and accuracy of experimental designs, yet it lends itself to a wide rangeof situations and is more frequently used in business research. Based on the timeperiod of the collection of the research information, descriptive research is furthersubdivided into two categories: cross-sectional studies and longitudinal studies.
9.3.1 Cross-sectional Studies
As the name suggests, cross-sectional studies involve a slice of the population. Justas in scientific experiments one takes a cross-section of the leaf or the cheek cells tostudy the cell structure under the microscope, similarly one takes a current subdivisionof the population and studies the nature of the relevant variables being investigated.There are two essential characteristics of cross-sectional studies: The cross-sectional study is carried out at a single moment in time and thus
the applicability is most relevant for a specific period. For example, onecross-sectional study was conducted in 2002 to study the attitude ofAmericans towards Asian-Americans, after the 9/11 terrorist attack. Thisrevealed the mistrust towards Asians. Another cross-sectional studyconducted in 2012 to study the attitude of Americans towards Asian-Americans revealed more acceptance and less mistrust. Thus the cross-sectional studies cannot be used interchangeably. . Secondly, these studies are carried out on a section of respondents from
the population units under study (e.g., organizational employees, voters,consumers, industry sectors). This sample is under consideration and underinvestigation only for the time coordinate of the study.There are also situations in which the population being studied is not of a
homogeneous nature but composed of different groups. Thus it becomes essentialto study the sub-segments independently. This variation of the design is termed asmultiple cross-sectional studies. Usually this multi-sample analysis is carried outat the same moment in time. However, there might be instances when the data isobtained from different samples at different time intervals and then they arecompared. Cohort analysis is the name given to such cross-sectional surveysconducted on different sample groups at different time intervals. Cohorts are
Types of Research Designs
NOTES
Self-Instructional162 Material
essentially groups of people who share a time zone or have experienced an eventthat took place at a particular time period. For example, in the post-9/11 cross-sectional study done in 2002, we study and compare the attitudes of middle-agedAmericans versus teenaged Americans towards Asian-Americans. These twoAmerican groups are separate cohorts and this would be a cohort analysis. Thusthe teenage American is one cohort and the middle-aged cohort is separate andthinks differently.
The technique is especially useful in predicting election results, cohorts ofmales–females, different religious sects, urban–rural or region-wise cohorts are studiedby leading opinion poll experts like Nielsen, Gallup and others. Thus, Cross-sectionalsstudies are extremely useful to study current patterns of behaviour or opinion.
9.3.2 Longitudinal Studies
A single sample of the identified population that is studied over a longer period oftime is termed as a longitudinal study design. A panel of consumers specificallychosen to study their grocery purchase pattern is an example of a longitudinaldesign. There are certain distinguishing features of the same: The study involves the selection of a representative panel, or a group of
individuals that typically represent the population under study. The second feature involves the repeated measurement of the group over
fixed intervals of time. This measurement is specifically made for the variablesunder study. A distinguishing and mandatory feature of the design is that once the sample
is selected, it needs to stay constant over the period of the study. Thatmeans the number of panel members has to be the same. Thus, in case apanel member due to some reason leaves the panel, it is critical to replacehim/her with a representative member from the population under study.Longitudinal study using the same section of respondents thus provides more
accurate data than one using a series of different samples. These kinds of panelsare defined as true panels and the ones using a different group every time arecalled omnibus panels. The advantages of a true panel are that it has a morecommitted sample group that is likely to tolerate extended or long data collectingsessions. Secondly, the profile information is a one-time task and need not becollected every time. Thus, a useful respondent time can be spent on collectingsome research-specific information.
However, the problem is getting a committed group of people for the entirestudy period. Secondly, there is an element of mortality and attrition where themembers of the panel might leave midway and the replaced new recruits might bevastly different and could skew the results in an absolutely different direction. Athird disadvantage is the highly structured study situation which might be responsiblefor a consistent and structured behaviour, which might not be the case in the realor field conditions.
NOTES
Self-InstructionalMaterial 163
Types of Research Designs
Check Your Progress
5. What types of questions are answered in descriptive research study?6. Define cohort analysis.
9.4 EXPERIMENTAL DESIGNS
Experimental designs are conducted to infer causality. In an experiment, aresearcher actively manipulates one or more causal variables and measures theireffects on the dependent variables of interest. Since any changes in the dependentvariable may be caused by a number of other variables, the relationship betweencause and effect often tends to be probabilistic in nature. It is virtually impossibleto prove a causality. One can only infer a cause-and-effect relationship.
The necessary conditions for making causal inferences are: (i) concomitantvariation, (ii) time order of occurrence of variables and (iii) absence of other possiblecausal factors. The first condition implies that cause and effect variables shouldhave a high correlation. The second condition means that causal variable mustoccur prior to or simultaneously with the effect variable. The third condition meansthat all other variable except the one whose influence we are trying to study shouldbe absent or kept constant.There are two conditions that should be satisfied while conducting an experiment.These are:
(i) Internal validity: Internal validity tries to examine whether the observedeffect on a dependent variable is actually caused by the treatments(independent variables) in question. For an experiment to be possessinginternal validity, all the other causal factors except the one whose influenceis being examined should be absent. Control of extraneous variables is anecessary condition for inferring causality. Without internal validity, theexperiment gets confounded.
(ii) External validity:External validity refers to the generalization of the resultsof an experiment. The concern is whether the result of an experiment can begeneralized beyond the experimental situations. If it is possible to generalizethe results, then to what population, settings, times, independent variables andthe dependent variables can the results be projected. It is desired to have anexperiment that is valid both internally and externally. However, in reality, aresearcher might have to make a trade-off between one type of validity foranother. To remove the influence of an extraneous variable, a researcher mayset up an experiment with artificial setting, thereby increasing its internal validity.However, in the process the external validity will be reduced.
There are four types of experimental designs. These are explained below:1. Pre-experimental designs: There are three designs under this – one short
case study where observation is taken after the application of treatment, one
Types of Research Designs
NOTES
Self-Instructional164 Material
group pre test-post test design where one observation is taken prior to theapplication of treatment and the other one after the application of treatment,and static group comparison, where there are two groups – experimentalgroup and control group. The experiment group is subjected to treatment anda post test measurement is taken. In the control group measurement is takenat the time when it was done for experimental group. These do not make useof any randomization procedures to control the extraneous variables.Therefore, the internal validity of such designs is questionable.
2. Quasi-experimental designs: In these designs the researcher can controlwhen measurements are taken and on whom they are taken. However, thisdesign lacks complete control of scheduling of treatment and also lacks theability to randomize test units’ exposure to treatments. As the experimentalcontrol is lacking, the possibility of getting confounded results is very high.Therefore, the researchers should be aware of what variables are not controlledand the effects of such variables should be incorporated into the findings.
3. True experimental designs: In these designs, researchers can randomlyassign test units and treatments to an experimental group. Here, the researcheris able to eliminate the effect of extraneous variables from both the experimentaland control group. Randomization procedure allows the researcher the useof statistical techniques for analysing the experimental results.
4. Statistical designs: These designs allow for statistical control and analysisof external variables. The main advantages of statistical design are the following: The effect of more than one level of independent variable on the
dependent variable can be manipulated. The effect of more than one independent variable can be examined. The effect of specific extraneous variable can be controlled.
Statistial design includes the following designs:(i) Completely randomized design: This design is used when a
researcher is investigating the effect of one independent variable onthe dependent variable. The independent variable is required to bemeasured in nominal scale i.e. it should have a number of categories.Each of the categories of the independent variable is considered asthe treatment. The basic assumption of this design is that there are nodifferences in the test units. All the test units are treated alike andrandomly assigned to the test groups. This means that there are noextraneous variables that could influence the outcome.Suppose we know that the sales of a product is influenced by theprice level. In this case, sales are a dependent variable and the price isthe independent variable. Let there be three levels of price, namely,low, medium and high. We wish to determine the most effective pricelevel i.e. at which price level the sale is highest. Here, the test units arethe stores which are randomly assigned to the three treatment level.The average sales for each price level is computed and examined to
NOTES
Self-InstructionalMaterial 165
Types of Research Designssee whether there is any significant difference in the sale at variousprice levels. The statistical technique to test for such a difference iscalled analysis of variance (ANOVA).The main limitation of completely randomized designs is that it does nottake into account the effect of extraneous variables on the dependentvariable. The possible extraneous variables in the present example couldbe the size of the store, the competitor’s price and price of the substituteproduct in question. This design assumes that all the extraneous factorshave the same influence on all the test units which may not be true inreality. This design is very simple and inexpensive to conduct.
(ii) Randomized block design: As discussed, the main limitation of thecompletely randomized design is that all extraneous variables wereassumed to be constant over all the treatment groups. This may not betrue. There may be extraneous variables influencing the dependentvariable. In the randomized block design it is possible to separate theinfluence of one extraneous variable on a particular dependent variable,thereby providing a clear picture of the impact of treatment on test units.In the example considered in the completely randomized design, theprice level (low, medium and high) was considered as an independentvariable and all the test units (stores) were assumed to be more or lessequal. However, all stores may not be of the same size and, therefore,can be classified as small, medium and large size stores. In this design,the extraneous variable, like the size of the store could be treated asdifferent blocks. Now the treatments are randomly assigned to theblocks in such a way so that each treatment appears in each block atleast once. The purpose of forming these blocks is that it is hoped thatthe scores of the test units within each block would be more or lesshomogeneous when the treatment is absent. What is assumed here isthat block (size of the store) is correlated with the dependent variable(sales). It may be noted that blocking is done prior to the applicationof the treatment.In this experiment one might randomly assign 12 small-sized stores tothree price levels in such a way that there are four stores for each ofthe three price levels. Similarly, 12 medium-sized stores and12 large-sized stores may be randomly assigned to three price levels.Now the technique of analysis of variance could be employed toanalyse the effect of treatment on the dependent variable andto separate out the influence of extraneous variable (size of store)from the experiment.
(iii) Factorial design: A factorial design may be employed to measurethe effect of two or more independent variables at various levels. Thefactorial designs allow for interaction between the variables. Aninteraction is said to take place when the simultaneous effect of two
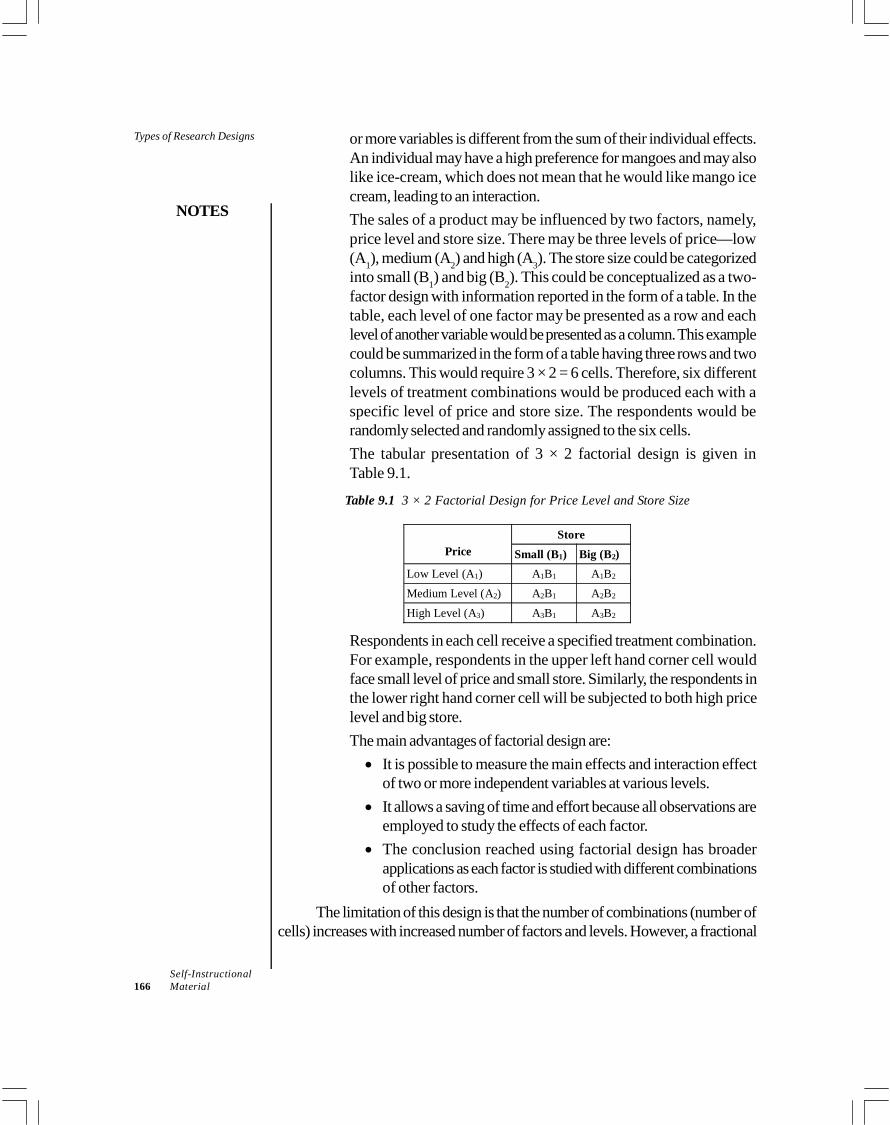
Types of Research Designs
NOTES
Self-Instructional166 Material
or more variables is different from the sum of their individual effects.An individual may have a high preference for mangoes and may alsolike ice-cream, which does not mean that he would like mango icecream, leading to an interaction.The sales of a product may be influenced by two factors, namely,price level and store size. There may be three levels of price—low(A1), medium (A2) and high (A3). The store size could be categorizedinto small (B1) and big (B2). This could be conceptualized as a two-factor design with information reported in the form of a table. In thetable, each level of one factor may be presented as a row and eachlevel of another variable would be presented as a column. This examplecould be summarized in the form of a table having three rows and twocolumns. This would require 3 × 2 = 6 cells. Therefore, six differentlevels of treatment combinations would be produced each with aspecific level of price and store size. The respondents would berandomly selected and randomly assigned to the six cells.The tabular presentation of 3 × 2 factorial design is given inTable 9.1.
Table 9.1 3 × 2 Factorial Design for Price Level and Store Size
PriceStore
Small (B1) Big (B2)Low Level (A1) A1B1 A1B2
Medium Level (A2) A2B1 A2B2
High Level (A3) A3B1 A3B2
Respondents in each cell receive a specified treatment combination.For example, respondents in the upper left hand corner cell wouldface small level of price and small store. Similarly, the respondents inthe lower right hand corner cell will be subjected to both high pricelevel and big store.The main advantages of factorial design are: It is possible to measure the main effects and interaction effect
of two or more independent variables at various levels. It allows a saving of time and effort because all observations are
employed to study the effects of each factor. The conclusion reached using factorial design has broader
applications as each factor is studied with different combinationsof other factors.
The limitation of this design is that the number of combinations (number ofcells) increases with increased number of factors and levels. However, a fractional
NOTES
Self-InstructionalMaterial 167
Types of Research Designsfactorial design could be used if interest is in studying only a few of the interactionsor main effects.
Errors Affecting Research DesignWe have discussed three types of research designs, namely, exploratory, descriptiveand experimental. All of these have some scope of error. There could be varioussources of errors in research design.
Exploratory research is conducted using focus group discussion, secondarydata, analysis of case study and expert opinion survey. It is quite likely that membersof the focus group have not been selected properly. Secondary data may not befree from errors (in fact, one needs to evaluate the methodology used in collectingsuch a data). Also, the experts chosen for the survey may not be experts in thefield. As a matter of fact, getting an expert is very difficult task. All these factorscould lead to errors in the exploratory design.
In the descriptive design, the purpose is to describe a phenomenon. For thisone could use a structured questionnaire. It could always a happen that therespondents do not give correct responses to some of the questions, therebyresulting in wrong information.
In the true experimental design and statistical design, the respondents areselected at random which may not be the case in real life. Many a times, in actualbusiness situation, the value judgements play very important role in selecting therespondents. Further, there can always be errors in observations.
9.5 DIAGNOSTIC RESEARCH DESIGN
In this type of research design, the researcher wants to know about the foundationalcauses of the problem. The researcher describes the factors responsible for theproblematic situation. Therefore it can be said that diagnostic research design is aproblem solving research design that comprises mainly: Emergence of the problem Diagnosis of the problem Solution for the problem and Suggestion for the problem solution
Check Your Progress
7. Name the type of experimental design in which researchers can randomlyassign test units and treatments to an experimental group.
8. State the limitation of the factorial design.
Types of Research Designs
NOTES
Self-Instructional168 Material
9.6 ANSWERS TO CHECK YOUR PROGRESSQUESTIONS
1. The basic objective of the exploratory research design is to explore andobtain clarity about the problem situation. It is flexible in its approach andmostly involves a qualitative investigation.
2. The secondary sources of data are the details of previously collected findingsin facts and figures – which have been authenticated and published. It is afast and inexpensive way of collecting information.
3. The main characteristics of case study method are that it is narrowly focused,provides high level of detail, in-depth understanding. Generally, they arepost-hoc studies and report by nature which are based upon the secondaryinformation.
4. An expert opinion survey is aimed to collect particulars from significant andknowledgeable people. This methodology might be formal and structuredand is useful when authenticated or supported by a secondary/primaryresearch or it might fluid or unstructured or require an in-depth interviewingof the expert.
5. Descriptive studies are conclusive studies and it collects data that are usedto answer a wide range of who, what, when, why, where and how questionspertaining to a particular population or group.
6. Cohort analysis is the name given to such cross-sectional surveys conductedon different sample groups at different time intervals. Cohorts are essentiallygroups of people who share a time zone or have experienced an event thattook place at a particular time period.
7. True experimental designs are the type of experimental design in whichresearchers can randomly assign test units and treatments to an experimentalgroup.
8. The limitation of the factorial design is that the number of combinationsincreases with the increased number of factors and levels.
9.7 SUMMARY
Exploratory designs, as stated earlier, are the simplest and most looselystructured designs. As the name suggests, the basic objective of the study isto explore and obtain clarity about the problem situation. It is flexible in itsapproach and mostly involves a qualitative investigation. Secondary sources of data, as the name suggests, are data in terms of the
details of previously collected findings in facts and figures—which havebeen authenticated and published.
NOTES
Self-InstructionalMaterial 169
Types of Research Designs Another way of conducting an exploratory research is the case study method.This requires an in-depth study and is focused on a single unit of analysis. At times, there might be a situation when the topic of a research is such that
there is no previous information available on it. In these cases, it is advisableto seek help from experts who might be able to provide some valuableinsights based upon their experience in the field or with the concept. Another way to conduct an exploratory analysis is carry out discussions
with individuals associated with the problem under study. This technique,though originally from sociology, is actively used in business research. In atypical focus group, there is a carefully selected small set of individual’srepresentative of the larger respondent population under study. It is called afocus group as the selected members discuss the concerned topic for theduration of 90 minutes to, sometimes, two hours. As the name implies, the objective of descriptive research studies is to
provide a comprehensive and detailed explanation of the phenomena understudy. The intended objective might be to give a detailed sketch or profileof the respondent population being studied. The conduction and recording of the dialogue requires considerable skill
and behavioural understanding and the management of group dynamics. Inthe organic food product study, the focus group discussions were carriedout with the typical consumers/buyers of grocery products. As the name implies, the objective of descriptive research studies is to
provide a comprehensive and detailed explanation of the phenomena understudy. The intended objective might be to give a detailed sketch or profileof the respondent population being studied. A descriptive study, (which generates data on who, what, when, where,
why and how of luxury accessory brand purchase) would be the designnecessary to fulfil the research objectives. Descriptive research thus are conclusive studies. However, they lack the
precision and accuracy of experimental designs, yet it lends itself to a widerange of situations and is more frequently used in business research. The cross-sectional study is carried out at a single moment in time and thus
the applicability is most relevant for a specific period. Cross-sectional studies are carried out on a section of respondents from
the population units under study (e.g., organizational employees, voters,consumers, industry sectors). This sample is under consideration and underinvestigation only for the time coordinate of the study. There are also situations in which the population being studied is not of a
homogeneous nature but composed of different groups. Thus, it becomesessential to study the sub-segments independently. This variation of the designis termed as multiple cross-sectional studies.
Types of Research Designs
NOTES
Self-Instructional170 Material
Cohort analysis is the name given to such cross-sectional surveys conductedon different sample groups at different time intervals. Cohorts are essentiallygroups of people who share a time zone or have experienced an event thattook place at a particular time period. A single sample of the identified population that is studied over a longer
period of time is termed as a longitudinal study design. A panel of consumersspecifically chosen to study their grocery purchase pattern is an example ofa longitudinal design. Longitudinal study using the same section of respondents thus provides
more accurate data than one using a series of different samples. Thesekinds of panels are defined as true panels and the ones using a differentgroup every time are called omnibus panels. Experimental designs are conducted to infer causality. In an experiment, a
researcher actively manipulates one or more causal variables and measurestheir effects on the dependent variables of interest. Since any changes in thedependent variable may be caused by a number of other variables, therelationship between cause and effect often tends to be probabilistic innature. It is virtually impossible to prove a causality. One can only infer acause-and-effect relationship. The necessary conditions for making causal inferences are: (i) concomitant
variation, (ii) time order of occurrence of variables and (iii) absence ofother possible causal factors. The first condition implies that cause and effect variables should have a high
correlation. The second condition means that causal variable must occurprior to or simultaneously with the effect variable. Internal validity tries to examine whether the observed effect on a dependent
variable is actually caused by the treatments (independent variables) inquestion. External validity refers to the generalization of the results of an experiment.
The concern is whether the result of an experiment can be generalized beyondthe experimental situations. If it is possible to generalize the results, then towhat population, settings, times, independent variables and the dependentvariables can the results be projected. There are three designs under pre-experimental designs – one short case
study where observation is taken after the application of treatment, onegroup pre test-post test design where one observation is taken prior to theapplication of treatment and the other one after the application of treatment,and static group comparison, where there are two groups – experimentalgroup and control group. In Quasi-experimental designs, the researcher can control when
measurements are taken and on whom they are taken. However, this design
NOTES
Self-InstructionalMaterial 171
Types of Research Designslacks complete control of scheduling of treatment and also lacks the abilityto randomize test units’ exposure to treatments. In true experimental designs, researchers can randomly assign test units and
treatments to an experimental group. Here, the researcher is able to eliminatethe effect of extraneous variables from both the experimental and controlgroup. Randomization procedure allows the researcher the use of statisticaltechniques for analysing the experimental results. Statistical designs allow for statistical control and analysis of external
variables. Statistical designs includes different designs, namely completelyrandomized design, randomized block design, and factorial design. Completely randomized design is used when a researcher is investigating
the effect of one independent variable on the dependent variable. In the randomized block design it is possible to separate the influence of
one extraneous variable on a particular dependent variable, thereby providinga clear picture of the impact of treatment on test units. A factorial design may be employed to measure the effect of two or more
independent variables at various levels. The factorial designs allow forinteraction between the variables. An interaction is said to take place whenthe simultaneous effect of two or more variables is different from the sum oftheir individual effects. Exploratory research is conducted using focus group discussion, secondary
data, analysis of case study and expert opinion survey. It is quite likely thatmembers of the focus group have not been selected properly. In the descriptive design, the purpose is to describe a phenomenon. For
this one could use a structured questionnaire. It could always a happen thatthe respondents do not give correct responses to some of the questions,thereby resulting in wrong information. In the true experimental design and statistical design, the respondents are
selected at random which may not be the case in real life. Many a times, in actual business situation, the value judgements play very
important role in selecting the respondents. Further, there can always beerrors in observations.
9.8 KEY WORDS
Exploratory Research: It refers to a research used to investigate a problemwhich is not clearly defined. It is conducted to have better understanding ofthe existing problem. Descriptive Research Design: It is used to describe characteristics of a
population or phenomenon being studied.
Types of Research Designs
NOTES
Self-Instructional172 Material
Longitudinal Study: It refers to a research design that involves repeatedobservations of the same variables over short or long periods of time. Quasi-experimental Designs: It refers to an empirical interventional study
used to estimate the causal impact of an intervention on target populationwithout random assignment.
9.9 SELF ASSESSMENT QUESTIONS ANDEXERCISES
Short Answer Questions
1. Write a short note on focus group discussions.2. What are the two essential characteristics of cross-sectional studies?3. Briefly mention about the longitudinal study design.4. Distinguish between internal and external validity of the experiments.5. Write short notes on: Completely randomized design Randomized block design Factorial Design
6. What is diagnostic research design?
Long Answer Questions
1. What are exploratory designs? What are the methods that can be used inan exploratory design?
2. Discuss the two categories of descriptive research design in detail. 3. Explain the four types of experimental designs.
9.10 FURTHER READINGS
Busha, Charles H. and Stephen P. Harter. 1980. Research Methods inLibrarianship: Techniques and Interpretation. Orlando: Academic Press.
Kumar, Krishan. 1992. Research Methods in Library and Information Science.New Delhi: Har-Anand Publications.
Rao, I.K. Ravichandra. 2009. Quantitative Methods for Library andInformation Science. New Delhi: New Age International Publishers.
Slater, Margaret. 1990. Research Methods in Library and Information Studies.London: Facet Pub.
Fowler, F. J. 2008. Survey Research Methods. New Delhi: SAGE Publications.
NOTES
Self-InstructionalMaterial 173
Data Collection
UNIT 10 DATA COLLECTION
Structure10.0 Introduction10.1 Objectives10.2 Primary and Secondary Data10.3 Methods of Data Collection
10.3.1 Observation10.3.2 Interview10.3.3 Questionnaire
10.4 Sampling: Introduction10.5 Scaling and Checklist10.6 Library Records and Reports10.7 Answers to Check Your Progress Questions10.8 Summary10.9 Key Words
10.10 Self Assessment Questions and Exercises10.11 Further Readings
10.0 INTRODUCTION
Data collection is a vital aspect of a research study as inaccurate or improper datacollection can inversely effect the results of a study and lead to invalid results.Several methods of data collection are employed in collecting different types ofdata. In the same line, the unit first gives a slight insight into the types of datacollection like primary and secondary data and then goes on discussing variousmethods of data collection such as observation, interviews and questionnaires.Apart from their definition, the unit will also describe their characteristics,advantages and disadvantages, and uses of respective methods in research. Inaddition to this, you will also learn about sampling design, checklists and the meaningand importance of library records and reports.
10.1 OBJECTIVES
After going through this unit, you will be able to: Understand the concept of data collection Discuss the primary and secondary data collection Analyse the various methods of data collection like observation, interview,
and questionnaire Comprehend the design, procedure, implications and advantages of sampling Describe the concept of checklists Assess the meaning, importance of library records and reports
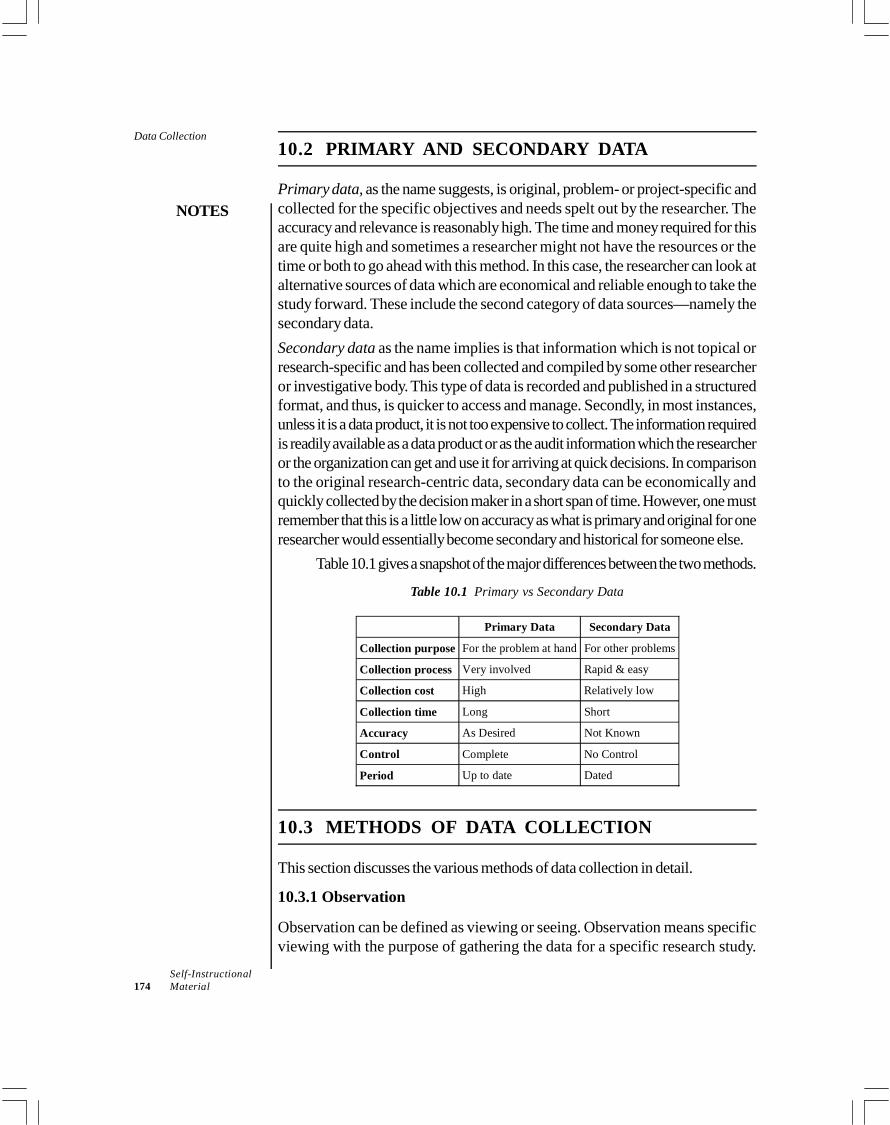
Data Collection
NOTES
Self-Instructional174 Material
10.2 PRIMARY AND SECONDARY DATA
Primary data, as the name suggests, is original, problem- or project-specific andcollected for the specific objectives and needs spelt out by the researcher. Theaccuracy and relevance is reasonably high. The time and money required for thisare quite high and sometimes a researcher might not have the resources or thetime or both to go ahead with this method. In this case, the researcher can look atalternative sources of data which are economical and reliable enough to take thestudy forward. These include the second category of data sources—namely thesecondary data.Secondary data as the name implies is that information which is not topical orresearch-specific and has been collected and compiled by some other researcheror investigative body. This type of data is recorded and published in a structuredformat, and thus, is quicker to access and manage. Secondly, in most instances,unless it is a data product, it is not too expensive to collect. The information requiredis readily available as a data product or as the audit information which the researcheror the organization can get and use it for arriving at quick decisions. In comparisonto the original research-centric data, secondary data can be economically andquickly collected by the decision maker in a short span of time. However, one mustremember that this is a little low on accuracy as what is primary and original for oneresearcher would essentially become secondary and historical for someone else.
Table 10.1 gives a snapshot of the major differences between the two methods.
Table 10.1 Primary vs Secondary Data
Primary Data Secondary Data
Collection purpose For the problem at hand For other problems
Collection process Very involved Rapid & easy
Collection cost High Relatively low
Collection time Long Short
Accuracy As Desired Not Known
Control Complete No Control
Period Up to date Dated
10.3 METHODS OF DATA COLLECTION
This section discusses the various methods of data collection in detail.
10.3.1 Observation
Observation can be defined as viewing or seeing. Observation means specificviewing with the purpose of gathering the data for a specific research study.
NOTES
Self-InstructionalMaterial 175
Data CollectionObservation is a classical method of scientific study. It is very important in anyresearch study as it is an effective method for data collection.
Characteristics of Observation Method
The following are the characteristics of observation method of data collection: Physical and mental activity: Eyes observe so many things in our
surroundings but our focus or attention is only on data which is relevant toresearch study. Observation is selective: It is very difficult for a researcher to observe
everything in his surroundings. He only observes the data which is purposivefor his research study and meets with the scope of his study. The researcherignores all the data which is not relevant to the study. Observation is purposive and not casual: Observation is purposive as
it is relevant to a particular study. The purpose of observation is to collectdata for the research study. It focuses on human behaviour which occurs ina social phenomenon. It analyses the relationship of different variables in aspecific context. Accuracy and standardization: Observation of pertinent data should be
accurate and standardized for its applications.
Types of Observation
Different concepts define the classification of observations.With respect to an investigator’s role, observation may be: Participant observation Non-participant observationWith respect to the method of observation, it can be classified into the
following: Direct observation Indirect observationWith reference to the control on the system to be observed, observation
can be classified into the following: Controlled observation Uncontrolled observation
(i) Participant observation
In participant type of observation, the observer is an active participant of thegroup or process. He participates as well as observes as a part of phenomenon;for example, to study the behaviour of management students towards studyingand understanding marketing management, the observer or researcher has toparticipate in the discussion with students without telling them about the observation
Data Collection
NOTES
Self-Instructional176 Material
or purpose. When respondents are unaware of observations, then only their naturalinterest can be studied.
Advantages
The following are the main advantages of participant observation: In-depth understanding of the respondent group. The context which is meaningful to observed behaviour can be recorded or
documented by the researcher.
Disadvantages
The following are the disadvantages of participant observation: If a participant is at lower level in hierarchy of group, his participation may
be less. Emotions of the observer may result in loss of objectivity.
(ii) Non-participant observation
In non-participant observation, the observer does not participate in the groupprocess. He acknowledges the behaviour of the group without telling therespondents. It requires a lot of skills to record observations in an unnoticeablemanner.
(iii) Direct observation
In direct observation, the observer and researcher personally observe all thehappenings of a process or an event when the event is happening. In this method,the observer records all the relevant aspects of an event which are necessary forstudy. He is free to change the locations and focus of the observation. One majorlimitation of the method is that the observer may not be able to cover all relevantevents when they are happening.
(iv) Indirect observation
Physical presence of an observer is not required and recording is done with thehelp of mechanical, photographic or electronic devices; for example, close circuitTV (CCTV) cameras are used in many showrooms to observe the behaviour ofcustomers. It provides a permanent record for an analysis of different aspects ofthe event.
(v) Controlled observation
All observations are done under pre-specified conditions over extrinsic and intrinsicvariables by adopting experimental design and systematically recordingobservations. Controlled observations are carried out either in the laboratory orthe field.
NOTES
Self-InstructionalMaterial 177
Data Collection(vi) Uncontrolled observation
There is no control over extrinsic and intrinsic variables. It is mainly used fordescriptive research. Participant observation is a typical uncontrolled one.
Prerequisites of Observation
The following are the prerequisites of observation: The conditions of observation must provide accurate results. An observer
should be in a position to observe the object clearly. The right number of respondents should be selected as the sample size for
the observation to produce the desired results. Accurate and complete recording of an event. If it is possible, two separate observers and sets of instruments can be used
in all or some observations. Then the result can be compared to measureaccuracy and completeness.
Advantages and Limitations of Observation
The following are the advantages of observations: It ensures the study of behaviour in accordance with the occurrence of
events. The observer does not ask anything from the representatives; hejust watches the doing and saying of the sample. The data collected by observation defines the observed phenomenon as
they occur in their natural settings. When an object is not able to define the meaning of its behaviour, observation
is best method for analysis; for example, animals, birds and children. Observation covers the entire happenings of an event. Observation is less biased as compared to questioning. It is easier to conduct disguised observation studies as opposed to disguised
questioning. The use of mechanical devices can generate accurate results.
The following are the limitations of observation: Past studies and events are of no use to observation. For these events and
study, one has to go through narrations, people and documents. It is difficult to understand attitudes with the help of observation. Observations cannot be performed by the choice of the observer. He has
to wait for an event to occur. It is difficult to predict when and where the event will occur. Thus, it may
not be possible for an observer to reach in every event. Observation requires more time and money.
Data Collection
NOTES
Self-Instructional178 Material
Uses of observation in business research
Observation is very useful in the following business research purposes: Buying behaviour of customer, lifestyles, customs, interpersonal relations,
group dynamics, leadership styles, managerial style and actions Physical characteristics of inanimate things such as houses, factories, stores,
and so on Movements in a production plant Flow of traffic, crowd and parking on road
10.3.2 Interview
Interviewing is a very effective method of data collection. It is a systematic andobjective conversation between an investigator and respondent for collectingrelevant data for a specific research study. Along with conversation, learning aboutthe gestures, facial expressions and environmental conditions of a respondent arealso very important. Generally, interview collects a wide range of data from factualdemographic data to highly personal and intimate information relating to a person’sopinions, attitudes, values and beliefs, past experience and future intentions. Theinterview method is very important in the collection of data from the respondentwho is less educated or illiterate. Personal interview is more feasible when thearea covered for survey is compact. Probing is a very important part of an interview.
Types of Interview
The following are the various types of interviews:
(i) Structured or directive interview
In this type of interview, the investigator goes to the respondent with a detailedschedule. Some questions in same sequence are asked from all respondents.
(ii) Unstructured or non-directive interview
In this type of interview, the respondent is encouraged to give his honest opinionon a given topic without or with minimum help of others.
(iii) Focused interview
This is a semi-structured interview where the respondent shares the effect of theexperience to the given conditions with the researcher or investigator. It is conductedwith those respondents only who have prior experience of conditions given by theinvestigator. Analysis of the attitude and emotional feelings for the situations understudy is main purpose behind conducting these interviews. A set of fix questionsmay not be required in this interview but a relevant topic is required which isknown to the respondent.
NOTES
Self-InstructionalMaterial 179
Data Collection(iv) Clinical interview
While a focused interview is concerned with effects of specific experience, clinicalinterviews are concerned with broad underlying feelings or motivations or the courseof the individual’s life experiences with reference to the research study. It encouragesthe interviewee to share his experience freely.
(v) Depth interview
To analyse or study the respondent’s emotions, opinions, and so on, depth interviewsare conducted. This kind of interview aims to collect intensive data about individuals,especially their opinions. It is a lengthy process to get unbiased data from therespondent. Interviewers should avoid advising or showing this agreement. Instead,the investigator has to motivate the respondent to answer the questions.
Features of Interviews
The following are some of the features of interviews: The interviewer and the respondent are the participants in any interview.
They both are unknown to each other and so it is important for an interviewerto introduce himself first to the respondent. An interview has a beginning and a termination point in the relationship
between the participants. Interview is not a mere casual conversational exchange. It has a specific
purpose of collecting data which is relevant to the study. Interview is a mode of obtaining a verbal response to questions to put
verbally. It is not always face to face. Success of interview depends on the interviewer and respondent, and how
they perceive each other. It is not a standardized process.
Essentials for an Effective Interview
The following are the requirements for a successful interview: Data availability: The respondent should have complete knowledge of
the information required for specific study. Role perception: The interviewer and the respondent should be aware of
their roles in the interview process. The respondent should be clear aboutthe topic or questions which have to be answered by him. Similarly, it is theresponsibility of the interviewer to make the respondent comfortable byintroducing himself first. The investigator should not affect the interviewsituation through subjective attitude and argumentation. Respondent’s motivation: The respondent can hesitate to answer the
questions. In this case, the approach and skills of the interviewer are veryimportant as he has to motivate the respondent to answer or express himself.
Data Collection
NOTES
Self-Instructional180 Material
Advantages and Disadvantages of Interviews
The following are the advantages of the interview method: In-depth and detailed information is collected. The interviewer tries to improve the responses and quality of data received.
He can control the conditions in favour of the research study. Interviews help in gathering supplementary information which can be helpful
to the study. Interviews use special scoring devices, visuals and materials to improve the
quality of data or information collected. Interviews use observation and probing by the interviewer to see the accuracy
and dependability of given data by the respondent. Interviews are flexible in nature.
The following are the disadvantages of interviews: Interviews consume more time and cost. The respondent’s responses can be affected by the way the interviewer
asks the questions. The respondent may refuse to answer some personal questions which are
relevant to the study. Recording and coding of data during the interview process may sometimes
be difficult for the interviewer. The interviewer may not have good communication or interactive skills.
Interview Process
The following are the stages in an interview process:
(i) Preparation
The interviewer needs to make certain preparations to make an interview successful.The interviewer should keep all the copies of the schedule or guide ready. Heshould prepare the lists of respondents with their addresses, contact number andmeeting time. He should prepare himself with all the approaches and skills requiredto conduct an interview. He should prepare himself to face all adverse situationsduring the interview. If the interviewer is not doing such planning, he can fail tocollect the right information from the respondent.
(ii) Introduction
The interviewer is not known to the respondent. Therefore, the interviewer mustintroduce himself first to every respondent. In the introduction, the interviewershould tell about himself, his organization details and the purpose of his visit. If theinterviewer knows someone who the respondent is familiar with, then he can usethat person’s reference to make the respondent more comfortable. The followingare some steps which help in motivating the respondent:
NOTES
Self-InstructionalMaterial 181
Data Collection The interviewer should introduce himself with a smiling face and alwaysgreet the respondent. He should identify and call the respondent by name. He must describe how the respondent is selected. He should explain the purpose and usefulness of the study. He should focus on the value of the respondent’s cooperation.
(iii) Developing rapport
It is important for an interviewer to develop a rapport with the respondent beforestarting the interview. By doing this, a cordial relationship is established betweenthem. It helps the interviewer understand the inherent nature of the respondentwhich helps in building a rapport and the discussion can be started with somegeneral topic or with the help of a person who is commonly known to both ofthem.
(iv) Carrying the interview forward
After establishing a rapport, the skills of the interviewer are required to carry theinterview forward. The following are some guidelines which should be followed: Start the interview in an informal and natural manner. Ask all the questions in the same sequence as in the schedule. Do not take an answer for granted. It is not necessary that an interviewee
will know all answers or will give all answers. The interviewer has to createinterest for answering questions. The objective of the question should be known to the interviewer to ensure
that the correct information is collected for research study. Explain the question if it has not been understood properly by the respondent. Listen to the respondent carefully with patience. Never argue with the respondent. Show your concern and interest in the information given by the respondent. Do not express your own opinion for answers of any question in the schedule. Continue to motivate the respondent. If the respondent is unable to frame the right answer, the interviewer should
help him by providing alternate questions. Ensure that the conversation does not go off the track. If the respondent is unable to answer a particular question due to some
reasons, drop the question at that moment. This question can be askedindirectly later on.
Data Collection
NOTES
Self-Instructional182 Material
(v) Recording the interview
Responses should be recorded in the same sequence as they are given by therespondent. The response should be recorded at the same time as it is generated.It may be very difficult to remember all the responses later for recording them.Recording can be done in writing but there may be some problems if the writingskills of an interviewer are not good. Hence, use of electronic devices like taperecorders can help in this purpose. The interviewer should also record all hisprobes and other comments on the schedule, but they should be in brackets toensure that they are set off from response.
(vi) Closing the interview
After the interview is over, the interviewer must thank the respondent for hiscooperation. He must collect all the papers before leaving the respondent. If therespondent wants to know the result of the survey, the interviewer must ensurethat the results are mailed to him when they are ready.
(vii) Editing
At the end, the interviewer must edit the schedule to check that all the questionshave been asked and recorded. Also, abbreviations in recording should be replacedby full words.
Problems Faced in an Interview
The following are some of the main problems faced in an interview:
(i) Inadequate response
Kahn and Cannel laid down five principal symptoms of inadequate response.They are given as follows: Partial response in which the respondent gives a relevant but incomplete
answer. Non-response in which the respondent remains silent or refuses to answer
the questions. Irrelevant response in which the respondent’s answer is not relevant to
the question asked. Inaccurate response in which the reply is biased. Verbalized response problem which arises because of the respondent’s
failure to understand the question.
(ii) Interviewer’s biasness, refusal, incapability to understand questions,and so on.
An interviewer can affect the performance of an interview with his own responsesand suggestions. Such biasing factors can never be overcome fully, but their effectcan be reduced by training and development techniques.
NOTES
Self-InstructionalMaterial 183
Data Collection(iii) Non-response
Some respondents out of the total respondents fail to respond to the schedule.The reasons for this non response can be non availability, refusal, incapability tounderstand questions, and so on.
(iv) Non-availability
Some respondents are not available at their places at the time of call. This couldbe because of odd timings or working hours.
(v) Refusal
Some respondents refuse to answer the questions. There can be many reasons forthis, such as language, odd hours, sickness, no interest in such studies, and so on.
(vi) Inaccessibility
Some respondents can be inaccessible because of various reasons such as migration,touring job, and so on.
Methods and aims of controlling non-response
Researcher Kish suggests the following methods to reduce either the percentageof non-response or its effects:
1. Improved procedure for collecting data is the most obvious remedy fornon-response. The improvements advocated are as follows: Guarantee of anonymity Motivation of the respondent to cooperate Arousing the respondent’s interest by clever opening remarks and
questions Advance notice to the respondent
2. Call backs are the most effective way of reducing not-at-home responsesin personal interviews, as are repeated mailings in no-returns in mail survey.
3. Substitution for non-response is often suggested as a remedy. Usually, thisis a mistake because the substitutes resemble the responses rather than thenon-responses. Nevertheless, beneficial substitution methods can sometimesbe designed with references to important characteristics of population.Attempts to reduce the percentage or effect of non-response is aimed at
reducing the bias caused by vast differences between non-respondents andrespondents. The response bias should not be confused with the reduction ofsample size due to non- response. The latter effect can be easily overcome eitherby anticipating the size of non- response in designing the sample size or bycompensating for it with a supplement. These adjustments increase the size of theresponse and the sampling precision, but they do not reduce the non-responsepercentage or bias.
Data Collection
NOTES
Self-Instructional184 Material
Telephonic Interview
Telephonic interview is a non-personal method of data collection. It may be usedas a major method or supplementary method of data collection. It is useful in thefollowing conditions: When the population is composed of those people who are listed in
telephone directories When less number of questions have to be answered by the respondents When the time available for the survey is less When the subject is of the interest to the respondent When the respondents are widely scattered
Advantages
The following are the advantages of telephonic interviews: Less time and low cost Good quality of response Less demanding on interviewer No field work is required Easy to contact those respondents who cannot be reached
Disadvantages
Telephonic interviews have the following limitations: Restricted to persons who are listed in telephone or other relevant directories Not feasible to conduct long interviews Limitation of information collected No answer to personal questions by respondents Respondent’s emotions, facial expressions and other environmental factors
cannot be recorded Difficult to develop rapport
Group Interview
Group interview is the method of collecting primary data from a number of individualswith common interests. In group interviews, the interviewer performs the role of adiscussion leader. Free discussion is encouraged on the same aspects of the subjectunder the study. Information is collected either through a self-administeredquestionnaire or through an interview. Samples for the group can be selected fromschools, colleges, clubs and other associations.
NOTES
Self-InstructionalMaterial 185
Data CollectionAdvantages
The following are the advantages of this technique: Respondent gets freedom to express his views. Flexible method. Use of visual aids. Less time consuming as group can be interviewed in the time required for
one respondent’s interview. Respondents are more confident in groups. Eliminates the limitation of individual interviews.
Disadvantages
The following are the main disadvantages of group interviews: Difficulty in selecting the desired sample group. Dominance of one individual in a group. Respondents can be biased or they can try to please the interviewer or
others.
10.3.3 Questionnaire
Primary data can be collected with the help of mails and surveys. The respondentsreceive the questionnaires from the researcher, and are asked to fill them completelyand return them to the researcher. It can be performed only when the respondentsare educated. The mail questionnaire should be simple and easy to understand, sothat the respondents can answer all questions easily. In mail questionnaires, all theanswers have to be given and recorded by the respondents and not by theresearcher or investigator, as in the case of personal interview method. There is noface-to-face interaction between the investigator and respondent, and so therespondent is free to give answers of his own choice.
Importance of questionnaires
A questionnaire is a very effective method as well as research tool in any researchstudy. It ensures the collection of a diversified and wide range of scientific data tocomplete the research objectives. The questionnaire provides all the inputs in theform of relevant data to all statistical methods used in a research study.
Types of Questionnaire
The following are the various categories of questionnaires:
(i) Structured or standard questionnaire
Structured or standard questionnaires contain predefined questions in order tocollect the required data for research study. These questions are the same for all
Data Collection
NOTES
Self-Instructional186 Material
the respondents. Questions are in the same language and in the same order for allthe respondents.
(ii) Unstructured questionnaire
In unstructured questionnaires, the respondent has the freedom to answer all thequestions in his own frame of reference and in his own terms.
Process of Data Collection
The researcher prepares the mailing list by collecting the addresses of all therespondents with the help of primary and secondary sources of data. A coveringletter must accompany every questionnaire, indicating the purpose and importanceof the research, and importance of cooperation of the respondent for the successof the research study.
Alternate modes of sending questionnaire
The following are the alternate modes of distributing questionnaire to respondents:
(i) Personal delivery
The researcher or investigator himself delivers the questionnaire to the respondentsand requests them to fill it within a specific duration, i.e., one day or two days, asper the convenience of the researcher. After the given duration, they collect thequestionnaire from the respondents. This adds the advantage of personal interviewand mail survey. Alternatively, the questionnaire can be delivered personally to therespondents and the respondents return the questionnaire by mail to the researcher.
(ii) Attaching questionnaire to a product
When a firm is launching a new product or wants to collect the feedback on oldproducts, the firm attaches a questionnaire with its product and requests thecustomers to fill the questionnaire. The company can give some discount or gift tothe respondent of every return questionnaire.
(iii) Advertising the questionnaire
The questionnaire is advertised in magazines and newspapers with instructions tocomplete it. After filling the questionnaire from the magazine or newspaper, therespondents mail it to the advertiser.
(iv) News-stand inserts
In this method of sending questionnaires to the respondents, the questionnaire,along with covering letter and a self addressed reply-paid envelope, is insertedinto a random sample of news-stand copies of a newspaper or magazine.
Improving the Response in a Mail SurveyGenerally, the response rate in mail surveys in countries like India is very low. Thefollowing techniques can be adopted to increase the rate of response:
NOTES
Self-InstructionalMaterial 187
Data Collection Covering letter: The covering letter should be in a language which generatesthe interest of the respondent. It should address the respondent by name. Quality printing: Sometimes the quality of the printed questionnaire is so
bad that the respondent faces a lot of problems in reading it. This results inloss of interest, and so the quality of printing should be excellent and attractive. Prior information: Prior information can be given to the concerned
respondent by telephone, e-mail, newsletters, and so on. Such steps bringmore success than follow-ups. Incentives: Monetary and non-monetary incentives can be given to
respondents who are filling the questionnaire. This generates a higherresponse. Follow-ups: The respondent can be approached with the help of an
investigator to collect the questionnaire or to solve the problems faced bythe respondent in filling the questionnaire. Larger sample size: We should always select a sample size which is larger
than what is actually required. This will help the researcher in getting answersfrom the effective sample size.
Advantages and Disadvantages of Questionnaires
The following are the advantages of questionnaires: Low cost Wide reach and extensive coverage Easy to contact the person who is busy Respondent’s convenience in completion of the questionnaire More impersonal; provides more anonymity No interviewer’s bias Accuracy
The following are the disadvantages of questionnaires: Low response by the respondent Low scope in many societies where literary level is low More time requirement
Preparation of an Effective Questionnaire
While preparing a questionnaire, the researcher must focus on some key parametersto prepare it. These key parameters are as follows: Proper use of open and close probe Proper sequence of questions Use of simple language
Data Collection
NOTES
Self-Instructional188 Material
Asking no personal question in which the respondent is hesitating to answer Should not be time consuming Use of control questions indicating reliability of the respondent
Collecting Data through Schedule
This method is very similar to the collection of data through questionnaires. Theonly difference is that in schedule, enumerators are appointed. These enumeratorsgo to the respondents, ask the stated questions in the same sequence as the scheduleand record the reply of the respondents. Schedules may be given to the respondentsand the enumerators should help them solve the problems faced while answeringthe questions in the given schedule. Thus, enumerator selection is very importantin data collection through schedules.
Distinction between schedule and questionnaire
Both questionnaire and schedule are popular methods of data collection. Thefollowing are the main differences between a questionnaire and a schedule: A questionnaire is generally sent to the respondents through mail, but in
case of schedule, it is sent through enumerators. Questionnaires are relatively cheaper mediums of data collection as
compared to schedules. In the case of questionnaires, the cost is incurred inpreparing it and mailing it to the respondent, while in schedule, more moneyis required for hiring enumerators, training them and incurring their fieldexpenses. The response rate in questionnaires is low as many people return it without
filling. On the other hand, the response rate in schedules is high becausethey are filled by the enumerators. In collecting data through questionnaires, the identity of the respondent may
not be known, but this is not the case when it comes to schedules. Data collection through questionnaires requires a lot of time, which is
comparatively very less in case of schedules. Generally, there is no personal contact in case of questionnaires, but in
schedules, personal contact is always there. The literacy level of the respondent is very important while filling
questionnaires, but in schedules, the literacy level of the respondent is not amajor concern as the responses have to be recorded by the enumerators. Wider distribution of questionnaires is possible but this is difficult with
schedules. There is less accuracy and completeness of responses in questionnaires as
compared to schedules. The success of questionnaires depends on the quality of questions but the
success of a schedule depends on the enumerators.
NOTES
Self-InstructionalMaterial 189
Data Collection The physical appearance of questionnaire matters a lot, which is less importantin case of schedules. Observation method cannot be used along with questionnaires but it can be
used along with schedules.
Check Your Progress
1. Define primary and secondary data.2. List the advantages of participant observation.3. Mention the uses of observation in business research.4. What is a focused interview?5. Name the different stages of an interview.6. State the advantages of questionnaires.
10.4 SAMPLING: INTRODUCTION
A part of the population is called sample. Selecting a part of the ‘universe’ with aview to draw conclusions about the ‘universe’ or ‘population’ for a study is knownas sampling. A researcher uses sampling for saving time and costs as a selectedsample is a replica of the population.
Sampling design: Census and sample survey
All items in any field of inquiry constitute a ‘universe’ or ‘population’. A completeenumeration of all the items in the ‘population’ is known as a census inquiry. It canbe presumed that in such an inquiry, when all the items are covered, no element ofchance is left and highest accuracy is obtained. In practice, this may not be true.Even the slightest element of bias in such an enquiry will get larger and larger as thenumber of observations increase. Moreover, there is no way of checking the elementof bias or its extent, except through a resurvey or use of sample checks. Besides,this type of inquiry involves a great deal of time, money and energy. Therefore,when the field of inquiry is large, this method becomes difficult to adopt becauseof the resources involved. At times, this method is practically beyond the reach ofordinary researchers. Perhaps, the government is the only institution which canget the complete enumeration carried out. Even the government adopts this methodin very rare cases, such as population census conducted once in a decade. Further,many a times, it is not possible to examine every item in the population andsometimes it is possible to obtain sufficiently accurate results by studying only apart of the total population. In such cases, there is no utility of census surveys.
However, it needs to be emphasized that when the universe is a small one,it is no use resorting to a simple survey. When field studies are undertaken inpractical life, consideration of time and cost invariably leads to a selection ofrespondents, i.e., selection of only a few items. The respondents selected should
Data Collection
NOTES
Self-Instructional190 Material
act as representatives of the total population in order to produce a miniature cross-section. The selected respondents constitute what is technically called a ‘sample’and the selection process is called the ‘sampling technique’. The survey soconducted is known as a ‘sample survey’.
Algebraically, let the population size be N and if a part of size n (which is <N) of this population is selected according to some rule for studying somecharacteristics of the population, the group consisting of these n units is known asa ‘sample’. The researcher must prepare a sample design for his study, i.e., hemust decide how a sample should be selected and of what size such a samplewould be.
Implications of a sample design
A sample design is a definite plan for obtaining a sample from a given population.It refers to the technique or the procedure the researcher would adopt in selectingitems for the sample. Sample design may as well lay down the number of items tobe included in the sample, i.e. the size of the sample. Sample design is determinedbefore data are collected. There are many sample designs from which a researchercan choose. Some designs are relatively more precise and easier to apply thanothers. The researcher must select/prepare a sample design which should be reliableand appropriate for his research study.
Advantages of sampling
The following are the advantages of sampling: Size of population: It is very difficult to study a large population for a
research study; hence, a sample from the population is selected for thestudy and it represents all characteristics of population. Funds requirement for the study: When the funds availability is lesser
than the anticipated cost of census survey, sampling is an effective method. Facilities: When facilities like technology and staff members are limited,
sampling is preferable. Time: As the time required for the sampling procedure is less, a researcher
prefers this method.
Sampling procedure
Sampling is a complicated process. A researcher has to identify all the factorswhich can affect the sample. The various criteria related to choice of samplingprocedure are as follows: Purpose of survey: Defining the purpose of a survey helps the researcher
in the selection of a particular method of sampling. A particular method ofsampling choice depends on the geographical area of the survey, and thesize and nature of the study.
NOTES
Self-InstructionalMaterial 191
Data Collection Measurability: The application of statistical inference theory requirescomputation of the sampling error from the sample itself. Probability samplesonly allow such computation. Hence, where the research objectives requirestatistical inference, the sample should be drawn by applying simple randomsampling method or stratified random sampling method, depending whetherthe population is homogeneous or heterogeneous. Degree of precision: A desired level of precision of the result of the survey
decides the method adopted for sampling. Information about population: Details of information available about the
population to be studied help in deciding the method of sampling. If no datais available about population, it is difficult to apply probability randomsampling. In this condition, the non-probability sampling method can beused for getting an idea of the population. Nature of population: Whether the population is homogeneous or
heterogeneous decides the variables to be studied. Simple random samplingcan be used for a homogeneous population. If the population isheterogeneous, stratified random sampling is a better option. Geographical area of study and size of population: Multi-stage, cluster
sampling is used for the study of wide geographical area and large size ofpopulation. Financial resources: Availability of finance decides the need of sampling
method. Time limitation: The time limit to complete a study decides the method of
sampling.
Characteristics of a good sample
The following are the characteristics of a good sample: Representative Accuracy Precision Size
10.5 SCALING AND CHECKLIST
There are four types of measurement scales—nominal, ordinal, interval and ratioscales. We will discuss each one of them in detail. The choice of the measurementscale has implications for the statistical technique to be used for data analysis.Nominal scale: This is the lowest level of measurement. Here, numbers areassigned for the purpose of identification of the objects. Any object which is assigneda higher number is in no way superior to the one which is assigned a lower number.In the nominal scale there is a strict one-to-one correspondence between the
Data Collection
NOTES
Self-Instructional192 Material
numbers and the objects. Each number is assigned to only one object and eachobject has only one number assigned to it. It may be noted that the objects aredivided into mutually exclusive and collectively exhaustive categories.
Examples of nominal scale: What is your religion?(a) Hinduism(b) Sikhism(c) Christianity(d) Islam(e) Any other, (please specify)
A Hindu may be assigned a number 1, a Sikh may be assigned a number 2,a Christian may be assigned a number 3 and so on. Any religion which is assigneda higher number is in no way superior to the one which is assigned a lower number.The assignment of numbers is only for the purpose of identification. We also notethat all respondents have been divided into mutually exclusive and collectivelyexhaustive categories. For example:
Are you married?(a) Yes(b) No
If a person is married, he or she may be assigned a number 101 andan unmarried person may be assigned a number 102.
In which of the following departments do you work?(a) Marketing(b) HR(c) Information Technology(d) Operations(e) Finance and Accounting(f) Any other, (please specify)
Here also, a person working for the marketing department may be assigneda number 1, the one working for HR may be assigned a number 2 and so on.
Nominal scale measurements are used for identifying food habits (vegetarianor non-vegetarian), gender (male/female), caste, respondents, brands, attributes,stores, the players of a hockey team and so on.
The assigned numbers cannot be added, subtracted, multiplied or divided.The only arithmetic operations that can be carried out are the count of each category.Therefore, a frequency distribution table can be prepared for the nominal scalevariables and mode of the distribution can be worked out. One can also use chi-square test and compute contingency coefficient using nominal scale variables.
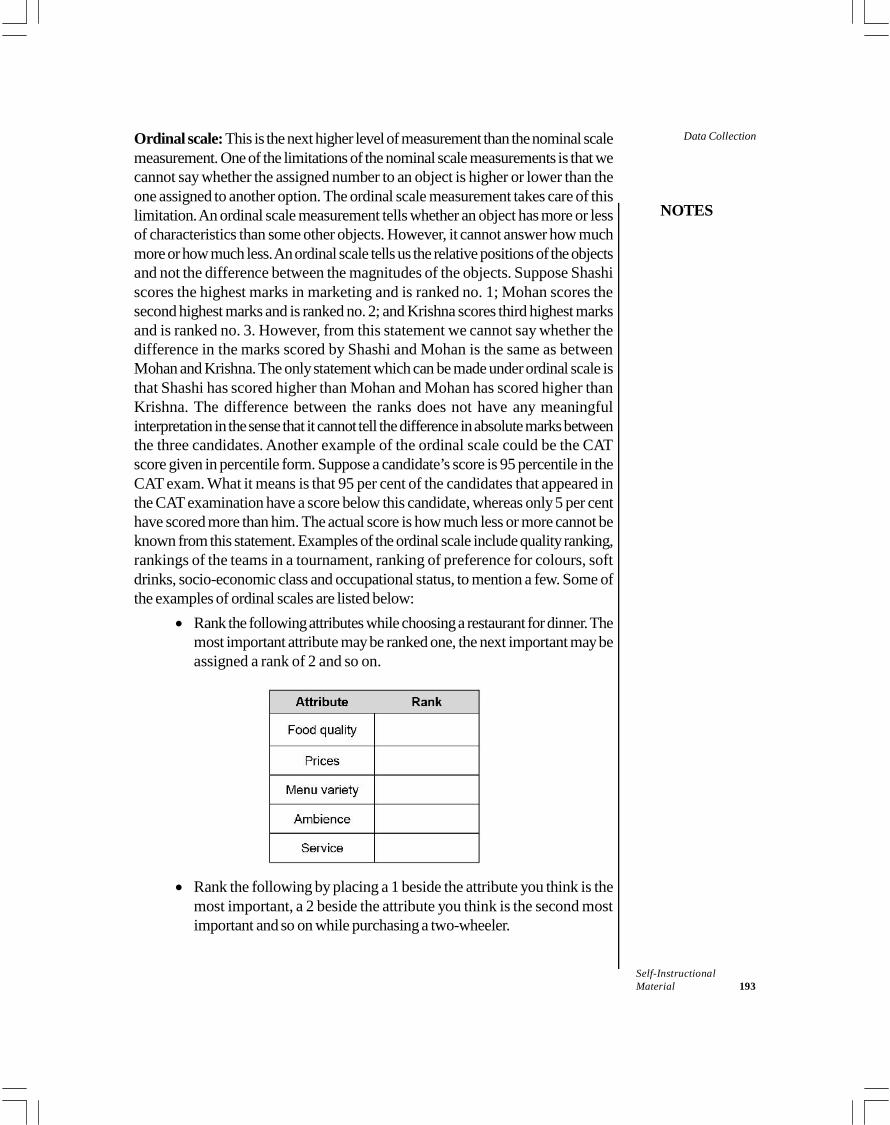
NOTES
Self-InstructionalMaterial 193
Data CollectionOrdinal scale: This is the next higher level of measurement than the nominal scalemeasurement. One of the limitations of the nominal scale measurements is that wecannot say whether the assigned number to an object is higher or lower than theone assigned to another option. The ordinal scale measurement takes care of thislimitation. An ordinal scale measurement tells whether an object has more or lessof characteristics than some other objects. However, it cannot answer how muchmore or how much less. An ordinal scale tells us the relative positions of the objectsand not the difference between the magnitudes of the objects. Suppose Shashiscores the highest marks in marketing and is ranked no. 1; Mohan scores thesecond highest marks and is ranked no. 2; and Krishna scores third highest marksand is ranked no. 3. However, from this statement we cannot say whether thedifference in the marks scored by Shashi and Mohan is the same as betweenMohan and Krishna. The only statement which can be made under ordinal scale isthat Shashi has scored higher than Mohan and Mohan has scored higher thanKrishna. The difference between the ranks does not have any meaningfulinterpretation in the sense that it cannot tell the difference in absolute marks betweenthe three candidates. Another example of the ordinal scale could be the CATscore given in percentile form. Suppose a candidate’s score is 95 percentile in theCAT exam. What it means is that 95 per cent of the candidates that appeared inthe CAT examination have a score below this candidate, whereas only 5 per centhave scored more than him. The actual score is how much less or more cannot beknown from this statement. Examples of the ordinal scale include quality ranking,rankings of the teams in a tournament, ranking of preference for colours, softdrinks, socio-economic class and occupational status, to mention a few. Some ofthe examples of ordinal scales are listed below:
Rank the following attributes while choosing a restaurant for dinner. Themost important attribute may be ranked one, the next important may beassigned a rank of 2 and so on.
Rank the following by placing a 1 beside the attribute you think is themost important, a 2 beside the attribute you think is the second mostimportant and so on while purchasing a two-wheeler.
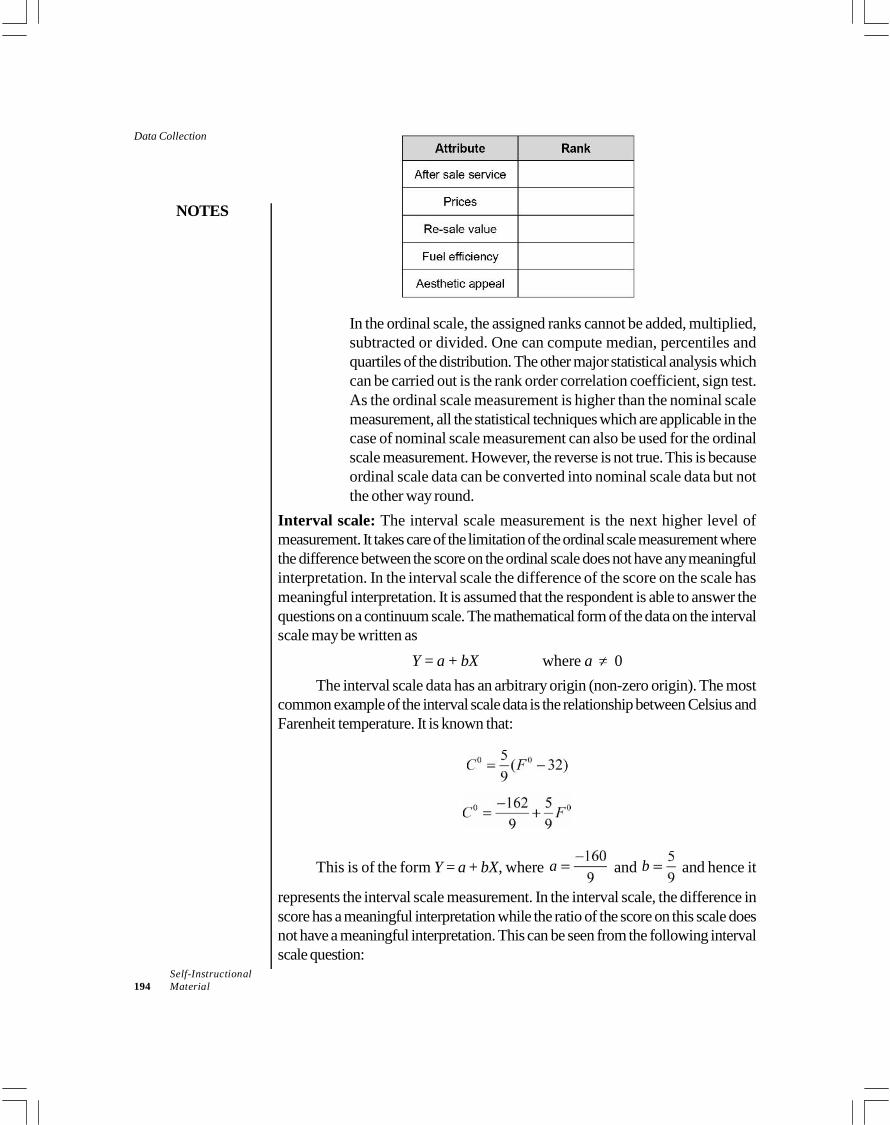
Data Collection
NOTES
Self-Instructional194 Material
In the ordinal scale, the assigned ranks cannot be added, multiplied,subtracted or divided. One can compute median, percentiles andquartiles of the distribution. The other major statistical analysis whichcan be carried out is the rank order correlation coefficient, sign test.As the ordinal scale measurement is higher than the nominal scalemeasurement, all the statistical techniques which are applicable in thecase of nominal scale measurement can also be used for the ordinalscale measurement. However, the reverse is not true. This is becauseordinal scale data can be converted into nominal scale data but notthe other way round.
Interval scale: The interval scale measurement is the next higher level ofmeasurement. It takes care of the limitation of the ordinal scale measurement wherethe difference between the score on the ordinal scale does not have any meaningfulinterpretation. In the interval scale the difference of the score on the scale hasmeaningful interpretation. It is assumed that the respondent is able to answer thequestions on a continuum scale. The mathematical form of the data on the intervalscale may be written as
Y = a + bX where a 0The interval scale data has an arbitrary origin (non-zero origin). The most
common example of the interval scale data is the relationship between Celsius andFarenheit temperature. It is known that:
This is of the form Y = a + bX, where a and b and hence it
represents the interval scale measurement. In the interval scale, the difference inscore has a meaningful interpretation while the ratio of the score on this scale doesnot have a meaningful interpretation. This can be seen from the following intervalscale question:
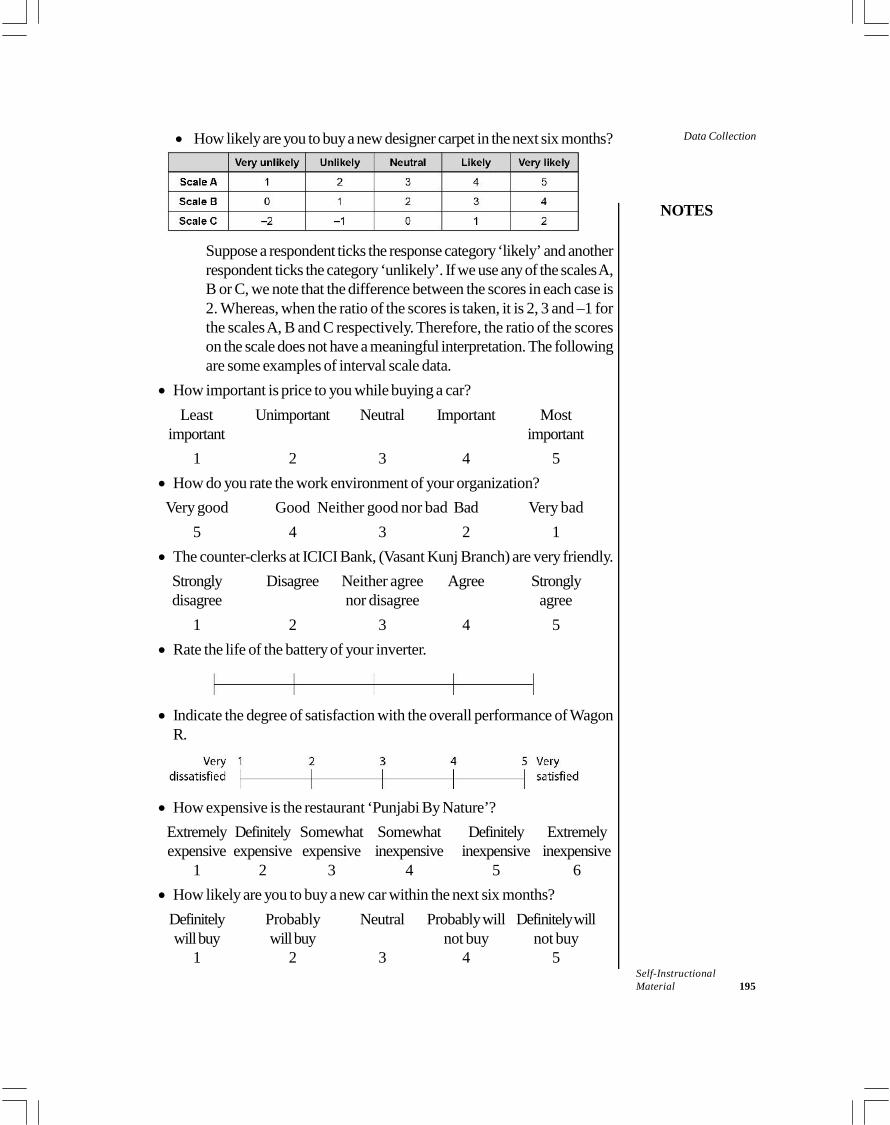
NOTES
Self-InstructionalMaterial 195
Data Collection How likely are you to buy a new designer carpet in the next six months?
Suppose a respondent ticks the response category ‘likely’ and anotherrespondent ticks the category ‘unlikely’. If we use any of the scales A,B or C, we note that the difference between the scores in each case is2. Whereas, when the ratio of the scores is taken, it is 2, 3 and –1 forthe scales A, B and C respectively. Therefore, the ratio of the scoreson the scale does not have a meaningful interpretation. The followingare some examples of interval scale data.
How important is price to you while buying a car?Least Unimportant Neutral Important Most
important important1 2 3 4 5
How do you rate the work environment of your organization?Very good Good Neither good nor bad Bad Very bad
5 4 3 2 1 The counter-clerks at ICICI Bank, (Vasant Kunj Branch) are very friendly.
Strongly Disagree Neither agree Agree Stronglydisagree nor disagree agree
1 2 3 4 5 Rate the life of the battery of your inverter.
Indicate the degree of satisfaction with the overall performance of WagonR.
How expensive is the restaurant ‘Punjabi By Nature’?Extremely Definitely Somewhat Somewhat Definitely Extremelyexpensive expensive expensive inexpensive inexpensive inexpensive
1 2 3 4 5 6 How likely are you to buy a new car within the next six months?
Definitely Probably Neutral Probably will Definitely willwill buy will buy not buy not buy
1 2 3 4 5
Data Collection
NOTES
Self-Instructional196 Material
The numbers on this scale can be added, subtracted, multiplied or divided.One can compute arithmetic mean, standard deviation, correlation coefficient andconduct a t-test, Z-test, regression analysis and factor analysis. As the intervalscale data can be converted into the ordinal and the nominal scale data, thereforeall the techniques applicable for the ordinal and the nominal scale data can also beused for interval scale data.Ratio scale: This is the highest level of measurement and takes care of thelimitations of the interval scale measurement, where the ratio of the measurementson the scale does not have a meaningful interpretation. The ratio scale measurementcan be converted into interval, ordinal and nominal scale. But the other way roundis not possible. The mathematical form of the ratio scale data is given by Y = bX.In this case, there is a natural zero (origin), whereas in the interval scale we had anarbitrary zero. Examples of the ratio scale data are weight, distance travelled,income and sales of a company, to mention a few.
Checklist
A checklist is a type of a data collection aid which is employed to decrease failureby compensating for potential limits of human memory and attention. It helps tomake sure the stability and completeness in carrying out a task. A basic exampleof a check list would be a ‘to do list’. A more advanced checklist would be aschedule, which lays out tasks to be done according to the time of day or otherfactors. A primary task in checklist is documentation of the task and auditing againstthe documentation.
Checklists often come in a format with small checkboxes down the lefthand side of the page. Individuals are required to draw a small tick or checkmarkafter the item has been completed. This is the standard format of a checklist,however, other formats are also used sometimes.
Check Your Progress
7. What is sampling and why a researcher uses sampling?8. Define census inquiry.9. What are the advantages of sampling?
10. List a few characteristics of a good sample.11. Name the four types of measurement scales.12. What is the major difference between ratio and internal scale?
10.6 LIBRARY RECORDS AND REPORTS
We can understand Library definition as an accumulation of various sources ofdata and information, made open to individuals, schools, colleges, business
NOTES
Self-InstructionalMaterial 197
Data Collectionprofessionals etc., for reference or obtaining information. Libraries range in sizefrom a few racks of books to a few million things.
Library Record is an independent record label founded in Melbourne,Australia in 1998. A library’s collection includes data and information in variousforms such as books, periodicals, newspapers, manuscripts, films, maps, microform,CDs, videotapes, DVDs, e-books, audiobooks, databases and many other.
A Library runs through OPAC
It can be defined as Online Public Access Catalogue, a multisource finder for allthe available resources kept in library. With the help of this system, we can cometo know the lists for the number of data and information available along with theirnumbers and current status of their availability in Library or out for issuance tosomeone. Records are being created and pen down by some person’s orassociations during their course of actions.
Most records are confirmations of authoritative, official, administration orbusiness related exchanges. Conventional records positions incorporate letters,minutes, memoranda and reports, and so forth. The electronic record positionsincorporate spreadsheets, databases, messages and copied. Here and there, whatinnovation has done is to re-characterize customary records designs. For instance,email is fundamentally the same as a letter. The reality it is transmitted electronicallythat separates email from letters.
ISO 15489: International Standard on Records Management defines a recordas: ‘recorded information in any form, including data in a computer system, created,received and maintained as evidence and information by an organisation or person,in the transaction of business and kept as evidence of such activity’.
Records give data as portrayal, insights, or schedules did by an individualor a gathering working in an establishment or association. While all records passon data, not all wellsprings of data are essentially records. For instance, a distributedbook or a remotely given database (on the web or disconnected) won’t be arecord, in spite of the fact that data chose from it and reused in another setting mayitself turn into a record.
A library needs records for a variety of reasons such as follows: Records are expected to convey benefits in a reliable and impartial way
as records help to bring and keep up consistency in the schedules. Records give benchmark measures to screen and assess the
advancement in execution, effectiveness and accomplishments. Records are expected to archive moves and choices made in a library
and to direct library business in an organized, effective and responsibleway.
Records are expected to give consistency, progression and profitabilityin the library and organization.
Data Collection
NOTES
Self-Instructional198 Material
Records also encourage the development of arrangements, projects,frameworks and long haul key designs.
Records are expected to help and report strategy plan and administrativebasic leadership and to advance educated basic leadership.
Records fill in as source materials to build library history and keep uplibrary memory.
Records, as a list, fill in as an apparatus for proficient access to thelibrary assets.
Methods to Store Records in Library
In a fully computerised library, records are computer generated by the relevantsoftware modules. In non-automated libraries, the dominant forms of records are:ledgers, registers, files, cards and statistical sheets.
Category for records keeping may be divided into the following: Information presented in which format Content Shared Their life spanFurther to elaborate more, please understand the below concept carefullyRecords as per their life span is: Permanent Records: These records are pertaining to library origin, its
plan of growth, approvals for sanctioning of staff, accession registers,user registration forms, audit reports, furniture inventory and fittings,building plan, electrical and sewage system structure etc.
Semi-permanent Records: These records incorporate among othersfinances use enrol, concurrences with firms about terms and states ofsupply of books and access to databases and library disseminationrecords, in-house utilization records and online use records, and so forth.Budgetary records are held till the review is finished. Also records relatingto the terms and states of supply of a firm need not be held once managingthe firm is finished.
Temporary Records: Records which are produced for a particularwork are to be endless supply of the work. For instance, bookdetermination cards/slips are typically devastated once the books havebeen inventoried. These are not decimated in the event that they areutilized as increase record. Sequential enlistment card is additionally abrief record. When it is full, it is supplanted by another card.
Content Records include following: Records of Resources: Variety of books and non-books like
brochures, posters, slides, microfilms, maps, globes, computer software,audio books, audio visual and photos etc.
NOTES
Self-InstructionalMaterial 199
Data Collection Financial Records: This pertains to books of accounts such as budgetregister, allocation of funds register, bills and all those related to financialparameters.
Library Service Records: These records include among others inter-library loan record, circulation record and reference service record, etc.
Admin Records: There are numerous of staff working under libraryadministration, so all they maintain is a service book which depicts theiroverall service starting from his application for that particular service.
Records by Presentation: Descriptive: All those reports and records linked with library including
annual reports, stated policies, minutes of meeting are maintained underthis section.
Statistical: These kind of records are related to the number of bookspurchased, issued, and number of queries attended by supplyingphotocopies in a year. At the end of the session, the data collected arebeing analysed.
Call number in the library
This is one of the important feature of Library Record keeping which refer to analphanumeric code that uniquely identifies and indicates the location of an item ina library’s collection. Some libraries use library of congress classification(LC Number) in which the call number begins with letters, other libraries use DeweyDecimal method in which the call number begins with numerals.
Card Catalogue
The main motive of Card Catalogue is to help Library users to find a particularbook through multiple options. It can be stated that card catalogue is brief indexfor the Library collection. By the help of this method one can easily locate thebook he/she is looking for as all the cards are alphabetically arranged and beinglabelled outside the shelves/ trays.
There are three types of card catalogue. Author Catalogue: In this all the author last name are being written in
alphabetical manner. Author who are with common surnames are beingdifferentiated by their date of birth or death anniversary or by their middleinitial. If a particular book is being written by various authors, so eachauthor card is being supported by co-authors, so that just be knowingone author name they can still find the book.
Title Catalogue: This includes main title and subtitle of the book alongwith their publishing date and total number of pages.
Subject Catalogue: In this specifications are being done on the topicsstarting from the broadest one and become more specific by subdividingsubjects.
Data Collection
NOTES
Self-Instructional200 Material
Check Your Progress
13. What is a library record and what does it contain?14. What is library card catalogue and name the three types of card in the card
catalogue?
10.7 ANSWERS TO CHECK YOUR PROGRESSQUESTIONS
1. Primary data is original, problem-or project-specific and collected for thespecific objectives and needs spelt out by the researcher. The accuracyand relevance is reasonably high. The time and money required for this arequite high. However, a secondary data is that information which is not topicalor research-specific and has been collected and compiled by some otherresearcher or investigative body. This type of data is collected and publishedin a structured format, and thus, is quicker to access and manage.
2. The following are the advantages of participant observation: In-depth understanding of the respondent group. The context which is meaningful to observed behaviour can be recorded
or documented by the researcher.3. Observation is very useful in the following business research purposes:
(a) Buying behaviour of customer, lifestyles, customs, interpersonalrelations, group dynamics, leadership styles, managerial style andactions
(b) Physical characteristics of inanimate things such as houses, factories,stores, and so on
(c) Movements in a production plant (d) Flow of traffic, crowd and parking on road4 This is a semi-structured interview where the respondent shares the effect
of the experience to the given conditions with the researcher or investigator.It is conducted with those respondents only who have prior experience ofconditions given by the investigator. Analysis of the attitude and emotionalfeelings for the situations under study is main purpose behind conductingthese interviews.
5 The different stages of an interview are as follows: Preparation Introduction Developing rapport Carrying the interview forward
NOTES
Self-InstructionalMaterial 201
Data Collection Recording the interview Closing the interview Editing
6. The following are the advantages of questionnaires:(a) Low cost(b) Wide reach and extensive coverage(c) Easy to contact the person who is busy(d) Respondent’s convenience in completion of questionnaire(e) More impersonal, provides more anonymity(f) No interviewer’s biasness(g) Accuracy
7. A part of population is called sample. Selecting a part of the ‘universe’ witha view to draw conclusions about the ‘universe’ or ‘population’ for a studyis known as sampling. A researcher uses sampling for saving time and costsas a selected sample is a replica of the population.
8. A complete enumeration of all the items in the ‘population’ is known as acensus inquiry. It can be presumed that in such an inquiry, when all the itemsare covered, no element of chance is left and highest accuracy is obtained.
9 The following are the advantages of the sampling:(a) Size of population: It is very difficult to study a large population for
a research study; hence, a sample from the population is selected forthe study and it represents all characteristics of population.
(b) Funds requirement for the study: When the funds availability is lesserthan the anticipated cost of census survey, sampling is an effective method.
(c) Facilities: When facilities like technology and staff members arelimited, sampling is preferable.
(d) Time: As the time required for the sampling procedure is less, aresearcher prefers this method.
10. The following are the characteristics of a good sample: Representative Accuracy Precision Size
11. The four types of measurement scales are – nominal, ordinal, interval andratio scales.
12. The major difference between ratio and interval scale is that an intervalscale has an arbitrary origin i.e., have an arbitrary zero (non-zero origin)whereas in the case of ratio scale, there is a natural zero (origin).
Data Collection
NOTES
Self-Instructional202 Material
13. A Library Record is an independent record label founded in Melbourne,Australia in 1998. A library’s collection includes data and information invarious forms such as books, periodicals, newspapers, manuscripts, films,maps, microform, CDs, videotapes, DVDs, e-books, audiobooks,databases and many other.
14. Card Catalogue is a set of cards in alphabetical order that helps libraryusers to find a particular book through multiple options. It can be statedthat card catalogue is brief index for the library collection. By the help ofthis method one can easily locate the book he/she is looking for as all thecards are alphabetically arranged and being labelled outside the shelves/trays. The three types of card catalogues are author catalogue, title catalogueand subject catalogue.
10.8 SUMMARY
Observation can be defined as viewing or seeing. Observation means specificviewing with the purpose of gathering the data for a specific research study.Observation is a classical method of scientific study. It is very important inany research study as it is an effective method for data collection. Some of the major characteristics of observation method is it is selective, it
is purposive and not casual, it should be accurate and standardized for itsapplications. With respect to an investigator’s role, observation may be classified into
two types namely participant observation and non-participant observation. With respect to the method of observation, it can be classified into the
following: direct observation and indirect observation. With reference to the control on the system to be observed, observation
can be classified into the following: controlled observation and uncontrolledobservation. In participant type of observation, the observer is an active participant of
the group or process. In non-participant observation, the observer does not participate in the
group process. In direct observation, the observer and researcher personally observe all
the happenings of a process or an event when the event is happening. In thismethod, the observer records all the relevant aspects of an event which arenecessary for study. In indirect observation, physical presence of an observer is not required
and recording is done with the help of mechanical, photographic or electronicdevices; for example, close circuit TV (CCTV) cameras are used in manyshowrooms to observe the behaviour of customers.
NOTES
Self-InstructionalMaterial 203
Data Collection All observations are done under pre-specified conditions over extrinsicand intrinsic variables by adopting experimental design and systematicallyrecording observations. Uncontrolled observation is mainly used for descriptive research. Participant
observation is a typical uncontrolled one. Interviewing is a very effective method of data collection. It is a systematic
and objective conversation between an investigator and respondent forcollecting relevant data for a specific research study. The interview method is very important in the collection of data from the
respondent who is less educated or illiterate. Personal interview is morefeasible when the area covered for survey is compact. Probing is a veryimportant part of an interview. There are various types of interview: structured or directive interview,
unstructured or non-directive interview, focused interview, clinical interview,depth interview, telephonic interview, group interview. Some of the main problems faced in an interview are inadequate response,
non-response, interviewer’s biasness, refusal and inaccessibility. Primary data can be collected with the help of mails and surveys. The
respondents receive the questionnaires from the researcher, and are askedto fill them completely and return them to the researcher. The mail questionnaire should be simple and easy to understand, so that the
respondents can answer all questions easily. In mail questionnaires, all theanswers have to be given and recorded by the respondents and not by theresearcher or investigator, as in the case of personal interview method. A questionnaire is a very effective method as well as research tool in any
research study. It ensures the collection of a diversified and wide range ofscientific data to complete the research objectives. The two types of questionnaires are structured or standard questionnaire
and unstructured questionnaire. Group interview is the method of collecting primary data from a number of
individuals with common interests. In group interviews, the interviewerperforms the role of a discussion leader. Free discussion is encouraged onthe same aspects of the subject under the study. Both questionnaire and schedule are popular methods of data collection. A questionnaire is generally sent to the respondents through mail, but in
case of schedule, it is sent through enumerators. A part of the population is called sample. Selecting a part of the ‘universe’
with a view to draw conclusions about the ‘universe’ or ‘population’ for astudy is known as sampling. A researcher uses sampling for saving time andcosts as a selected sample is a replica of the population. All items in any field of inquiry constitute a ‘universe’ or ‘population’. A
complete enumeration of all the items in the ‘population’ is known as acensus inquiry.
Data Collection
NOTES
Self-Instructional204 Material
A sample design is a definite plan for obtaining a sample from a given population. It refers to the technique or the procedure the researcher would adopt in
selecting items for the sample. The few advantages of sampling are it represents all characteristics of
population, sampling is an effective method when the fund availability isless, it is an effective method when facilities are limited, and a samplingprocedure takes less time. Representation, accuracy, precision, and size are the few characteristics of
a good sample. There are four types of measurement scales—nominal, ordinal, interval and
ratio scales. We will discuss each one of them in detail. The choice of themeasurement scale has implications for the statistical technique to be usedfor data analysis. Nominal scale is the lowest level of measurement. Here, numbers are
assigned for the purpose of identification of the objects. Any object whichis assigned a higher number is in no way superior to the one which is assigneda lower number. Ordinal scale is the next higher level of measurement than the nominal scale
measurement. One of the limitations of the nominal scale measurements isthat we cannot say whether the assigned number to an object is higher orlower than the one assigned to another option. The ordinal scale measurementtakes care of this limitation. The interval scale measurement is the next higher level of measurement. It
takes care of the limitation of the ordinal scale measurement where thedifference between the score on the ordinal scale does not have anymeaningful interpretation. In the interval scale the difference of the score onthe scale has meaningful interpretation. Ratio scale is the highest level of measurement and takes care of the
limitations of the interval scale measurement, where the ratio of themeasurements on the scale does not have a meaningful interpretation. Theratio scale measurement can be converted into interval, ordinal and nominalscale. But the other way round is not possible. A checklist is a type of a data collection aid which is employed to decrease
failure by compensating for potential limits of human memory and attention.It helps to make sure the stability and completeness in carrying out a task. Library Record is an independent record label founded in Melbourne,
Australia in 1998. A library’s collection includes data and information invarious forms such as books, periodicals, newspapers, manuscripts, films,maps, microform, CDs, videotapes, DVDs, e-books, audiobooks, databasesand many other.
NOTES
Self-InstructionalMaterial 205
Data Collection Online Public Access Catalogue, a multisource finder for all the availableresources kept in library. With the help of this system, we can come toknow the lists for the number of data and information available along withtheir numbers and current status of their availability in library or out forissuance to someone. Records are being created and pen down by someperson’s or associations during their course of actions. Records give data as portrayal, insights, or schedules did by an individual
or a gathering working in an establishment or association. While all recordspass on data, not all wellsprings of data are essentially records. Permanent records are pertaining to library origin, its plan of growth,
approvals for sanctioning of staff, accession registers, user registration forms,audit reports, furniture inventory and fittings, building plan, electrical andsewage system structure etc. Semi-permanent records incorporate among others finances use enrol,
concurrences with firms about terms and states of supply of books andaccess to databases and library dissemination records, in-house utilizationrecords and online use records, and so forth. Temporary records are those which are produced for a particular work are
to be endless supply of the work. For instance, book determination cards/slips are typically devastated once the books have been inventoried. Card Catalogue helps is to help Library users to find a particular book
through multiple options. It can be stated that card catalogue is brief indexfor the Library collection. The three types of card catalogues are author catalogue, title catalogue,
and subject catalogue.
10.9 KEY WORDS
Descriptive surveys: It refers to the surveys that generally collectinformation on what people think and do. Analytic surveys: It refers to the surveys that are generally used to either
test hypotheses or to answer particular research questions. Group interview: It refers to a method of collecting primary data from a
number of individuals with common interests. Observation: It means specific viewing with the purpose of gathering the
data for a specific research study. Sampling: It refers to selecting a part of the ‘universe’ with a view to draw
conclusions about the ‘universe’ or ‘population’ for a study. Sample design: It refers to a definite plan for obtaining a sample from a
given population.
Data Collection
NOTES
Self-Instructional206 Material
10.10 SELF ASSESSMENT QUESTIONS ANDEXERCISES
Short Answer Questions
1. Write a short note on the types of observation.2. What are the features of an interview?3. Briefly mention the advantages and disadvantages of interviews.4. Briefly describe the various stages of an interview process.5. What is the significance of questionnaires?6. What are the alternate modes of distributing questionnaire to respondents?7. Tabulate the advantages and disadvantages of questionnaires.8. Differentiate between schedule and questionnaires.9. List the merits of sampling.
10. What do you mean by probability sampling?11. Write a brief note on library records.
Long Answer Questions
1. Discuss the different methods of data collection.2. Describe the advantages and limitations of observation.3. What are the different types of interviews? Explain4. Identify the problems faced in an interview. Also, distinguish between
telephonic interview and group interview.5. Discuss various methods of sampling.6. Elaborate the four types of measurement scales.
10.11 FURTHER READINGS
Busha, Charles H. and Stephen P. Harter. 1980. Research Methods inLibrarianship: Techniques and Interpretation. Orlando: Academic Press.
Kumar, Krishan. 1992. Research Methods in Library and Information Science.New Delhi: Har-Anand Publications.
Rao, I.K. Ravichandra. 2009. Quantitative Methods for Library andInformation Science. New Delhi: New Age International Publishers.
Slater, Margaret. 1990. Research Methods in Library and Information Studies.London: Facet Pub.
Fowler, F. J. 2008. Survey Research Methods. New Delhi: SAGE Publications.
NOTES
Self-InstructionalMaterial 207
Questionnaire Design
UNIT 11 QUESTIONNAIRE DESIGN
Structure11.0 Introduction11.1 Objectives11.2 Questionnaire Construction, Design and Types
11.2.1 Types of Questionnaire11.3 Process of Questionnaire Designing11.4 Secondary Data Sources and Precautions
11.4.1 Uses of Secondary Data11.4.2 Advantages and Disadvantages of Secondary Data11.4.3 Types and Sources of Secondary Data
11.5 Answers to Check Your Progress Questions11.6 Summary11.7 Key Words11.8 Self Assessment Questions and Exercises11.9 Further Readings
11.0 INTRODUCTION
A discussion on data collection would be incomplete if one did not talk about thequestionnaire method. This is the most cost effective and widely used method,apart from being extremely user friendly. The questionnaire method is flexible enoughto reveal data that is in the respondents own words and language. It can be madeextremely scientific by framing questions which enable a very advanced level ofquantitative measurement and analysis. The pattern of questioning is always designedin accordance with the respondent’s comfort and ease of answering. Today, withthe wide use of technology it is very easy to use the questionnaire method evenwithout being present physically in front of the respondent.
In this unit, you will study about the significance of questionnaire method inresearch process. The construction and design and the types of questionnaire isalso being discussed in the unit. In addition to this, the unit will also discuss theadvantages and disadvantages of the questionnaire method and will also explain theimportance of secondary data sources along with its advantages, uses and types.
11.1 OBJECTIVES
After going through this unit, you will be able to: Recognize the relevance of questionnaire method in research Describe the construction and design process of a questionnaire Discuss the different types of questionnaire Determine the types of questions asked in questionnaire
Questionnaire Design
NOTES
Self-Instructional208 Material
Examine the advantages and disadvantages of the questionnaire method Discuss the types, uses, and advantages of secondary data sources
11.2 QUESTIONNAIRE CONSTRUCTION, DESIGNAND TYPES
The questionnaire is a research technique that consists of a series of questionsasked to respondents, in order to obtain statistically useful information about agiven topic. It is one of the most cost-effective methods of collecting primary data,which can be used with considerable ease by most individual and businessresearchers. It has the advantage of flexibility of approach and can be successfullyadapted for most research studies. The instrument has been defined differently byvarious researchers. Some take the traditional view of a written document requiringthe subject to record his/her own responses (Kervin,1999). Others have taken abroader perspective to include structured interview also as a questionnaire (Bell,1999). It is essentially a data-collection instrument that has a predesigned set ofquestions, following a particular structure (De Vaus, 2002). Since it includes astandard set of questions, it can be successfully used to collect information from alarge sample in a reasonably short period of time.
However, the use of questionnaire is not always the best method in all researchstudies. For example, at the exploratory stage, rather than questionnaire, it isadvisable to use a more unstructured interview. Secondly, when the number ofrespondents is small and one has to collect more subjective data, then aquestionnaire is not advisable.
Criteria for designning a questionnaire
There are certain criteria that must be kept in mind while designing the questionnaire.The first and foremost requirement is that the spelt-out research objectives mustbe converted into clear questions which will extract answers from the respondent.This is not as easy as it sounds, for example, if one wants to know how manytimes your teacher praised you in the week? It is very difficult to give an exactnumber. The second requirement is, it should be designed to engage the respondentand encourage a meaningful response. For example, a questionnaire measuringstress cannot have a voluminous set of questions which fatigue the subject. Thequestions, thus, should encourage response and be easy to understand. Lastly, thequestions should be self-explanatory and not confusing as then the person willanswer the way he understood the question and not in terms of what was asked.This will be discussed in detail later, when we discuss the wording of the questions.
11.2.1 Types of Questionnaire
There are many different types of questionnaire available to the researcher. Thecategorization can be done on the basis of a variety of parameters. The two criteria
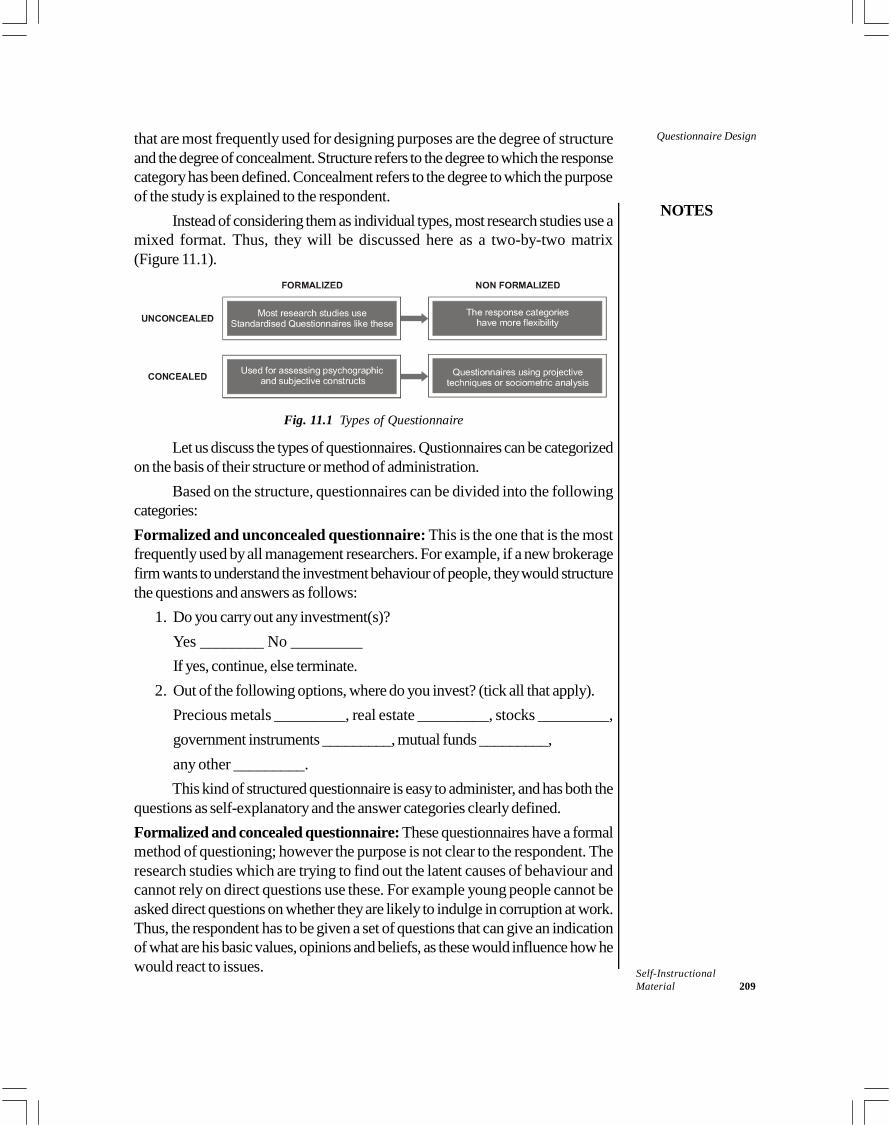
NOTES
Self-InstructionalMaterial 209
Questionnaire Designthat are most frequently used for designing purposes are the degree of structureand the degree of concealment. Structure refers to the degree to which the responsecategory has been defined. Concealment refers to the degree to which the purposeof the study is explained to the respondent.
Instead of considering them as individual types, most research studies use amixed format. Thus, they will be discussed here as a two-by-two matrix(Figure 11.1).
Fig. 11.1 Types of Questionnaire
Let us discuss the types of questionnaires. Qustionnaires can be categorizedon the basis of their structure or method of administration.
Based on the structure, questionnaires can be divided into the followingcategories:Formalized and unconcealed questionnaire: This is the one that is the mostfrequently used by all management researchers. For example, if a new brokeragefirm wants to understand the investment behaviour of people, they would structurethe questions and answers as follows:
1. Do you carry out any investment(s)?Yes ________ No _________If yes, continue, else terminate.
2. Out of the following options, where do you invest? (tick all that apply).Precious metals _________, real estate _________, stocks _________,government instruments _________, mutual funds _________,any other _________.This kind of structured questionnaire is easy to administer, and has both the
questions as self-explanatory and the answer categories clearly defined.Formalized and concealed questionnaire: These questionnaires have a formalmethod of questioning; however the purpose is not clear to the respondent. Theresearch studies which are trying to find out the latent causes of behaviour andcannot rely on direct questions use these. For example young people cannot beasked direct questions on whether they are likely to indulge in corruption at work.Thus, the respondent has to be given a set of questions that can give an indicationof what are his basic values, opinions and beliefs, as these would influence how hewould react to issues.
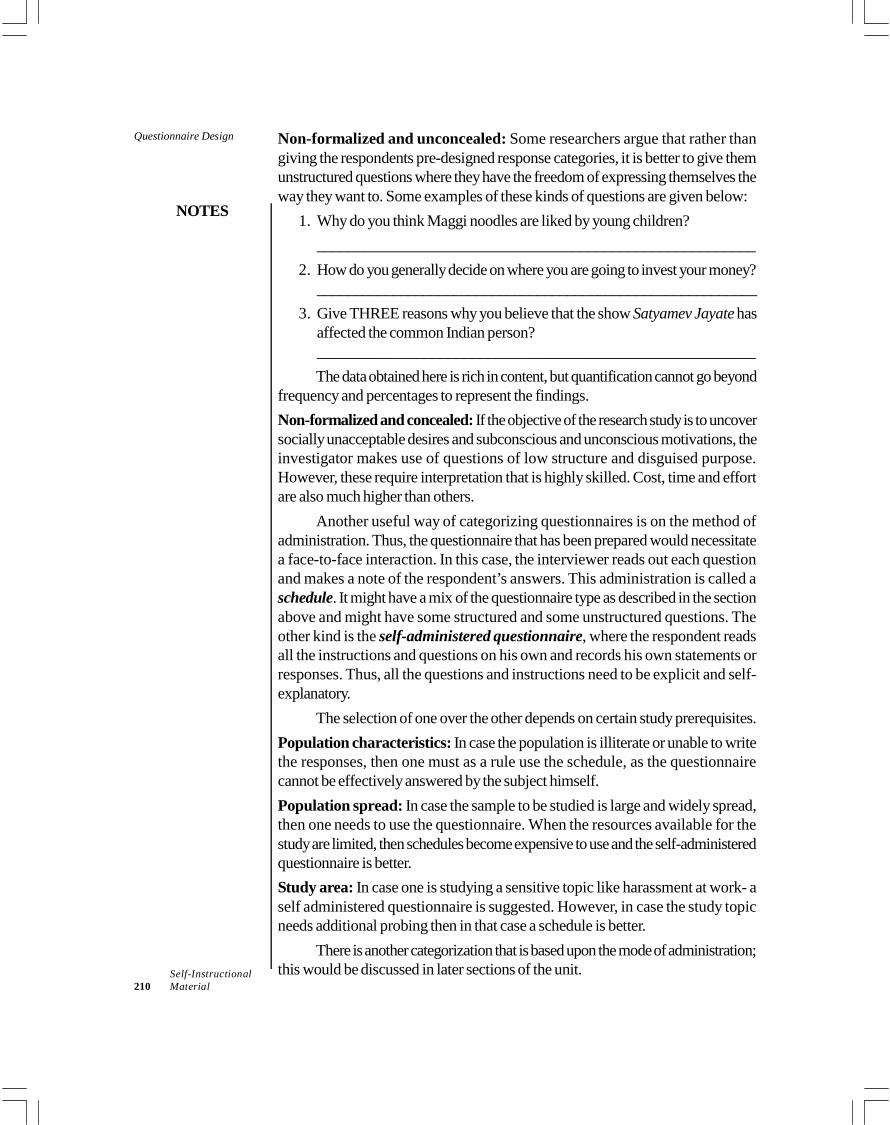
Questionnaire Design
NOTES
Self-Instructional210 Material
Non-formalized and unconcealed: Some researchers argue that rather thangiving the respondents pre-designed response categories, it is better to give themunstructured questions where they have the freedom of expressing themselves theway they want to. Some examples of these kinds of questions are given below:
1. Why do you think Maggi noodles are liked by young children?_______________________________________________________
2. How do you generally decide on where you are going to invest your money?__________________________________________________________
3. Give THREE reasons why you believe that the show Satyamev Jayate hasaffected the common Indian person?_______________________________________________________The data obtained here is rich in content, but quantification cannot go beyond
frequency and percentages to represent the findings.Non-formalized and concealed: If the objective of the research study is to uncoversocially unacceptable desires and subconscious and unconscious motivations, theinvestigator makes use of questions of low structure and disguised purpose.However, these require interpretation that is highly skilled. Cost, time and effortare also much higher than others.
Another useful way of categorizing questionnaires is on the method ofadministration. Thus, the questionnaire that has been prepared would necessitatea face-to-face interaction. In this case, the interviewer reads out each questionand makes a note of the respondent’s answers. This administration is called aschedule. It might have a mix of the questionnaire type as described in the sectionabove and might have some structured and some unstructured questions. Theother kind is the self-administered questionnaire, where the respondent readsall the instructions and questions on his own and records his own statements orresponses. Thus, all the questions and instructions need to be explicit and self-explanatory.
The selection of one over the other depends on certain study prerequisites.Population characteristics: In case the population is illiterate or unable to writethe responses, then one must as a rule use the schedule, as the questionnairecannot be effectively answered by the subject himself.Population spread: In case the sample to be studied is large and widely spread,then one needs to use the questionnaire. When the resources available for thestudy are limited, then schedules become expensive to use and the self-administeredquestionnaire is better.Study area: In case one is studying a sensitive topic like harassment at work- aself administered questionnaire is suggested. However, in case the study topicneeds additional probing then in that case a schedule is better.
There is another categorization that is based upon the mode of administration;this would be discussed in later sections of the unit.
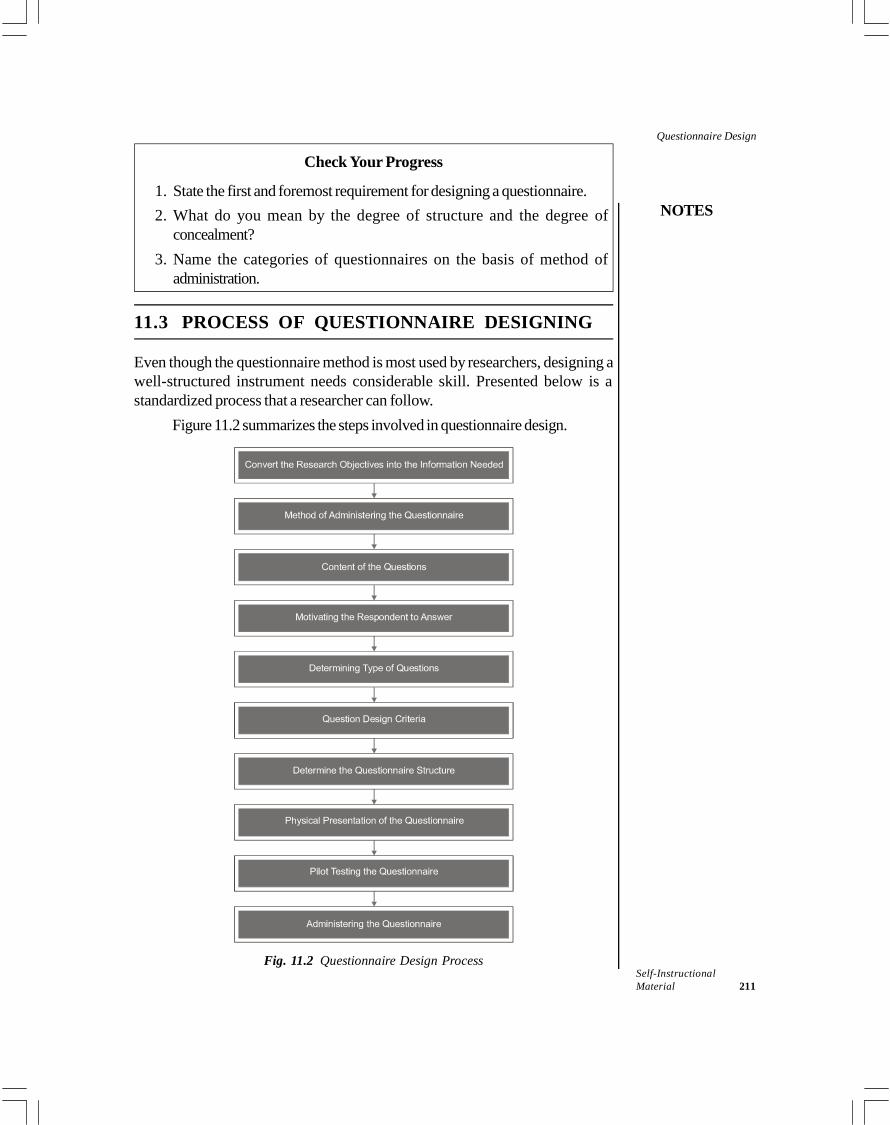
NOTES
Self-InstructionalMaterial 211
Questionnaire Design
Check Your Progress
1. State the first and foremost requirement for designing a questionnaire.2. What do you mean by the degree of structure and the degree of
concealment?3. Name the categories of questionnaires on the basis of method of
administration.
11.3 PROCESS OF QUESTIONNAIRE DESIGNING
Even though the questionnaire method is most used by researchers, designing awell-structured instrument needs considerable skill. Presented below is astandardized process that a researcher can follow.
Figure 11.2 summarizes the steps involved in questionnaire design.
Fig. 11.2 Questionnaire Design Process
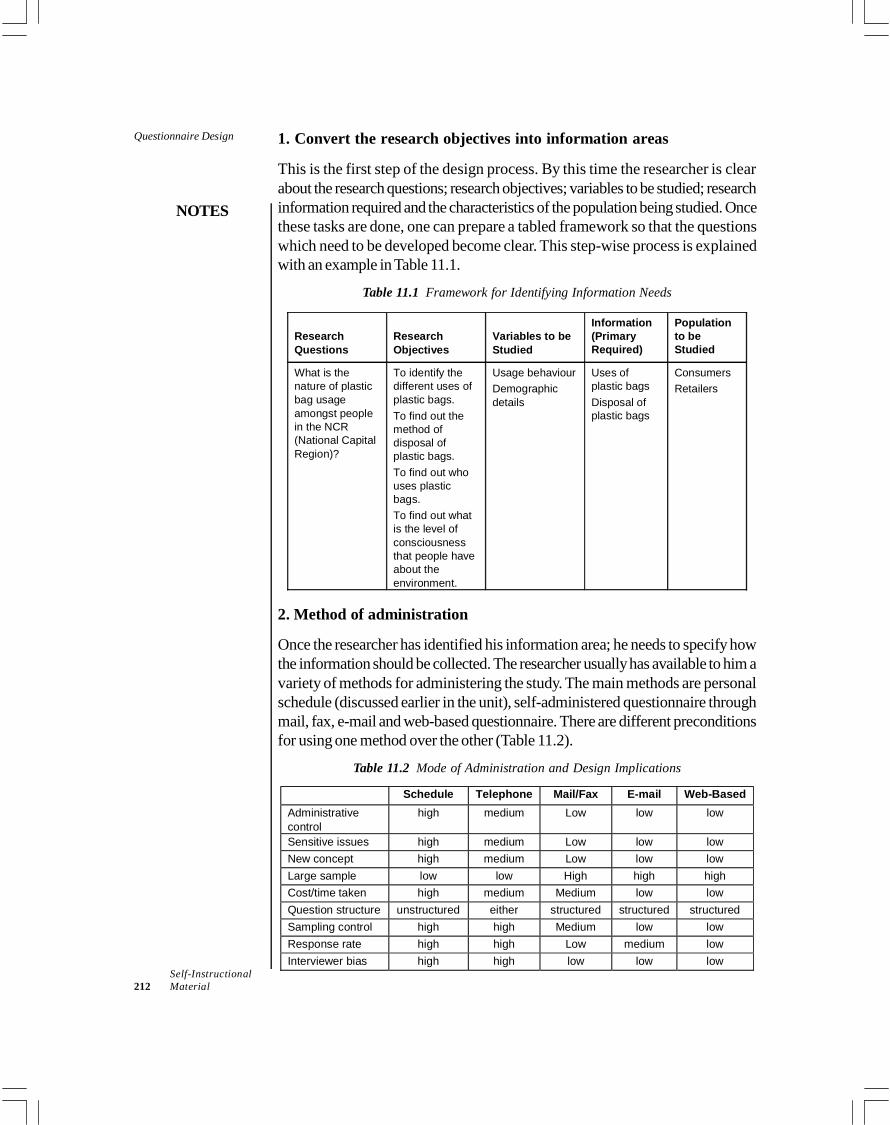
Questionnaire Design
NOTES
Self-Instructional212 Material
1. Convert the research objectives into information areas
This is the first step of the design process. By this time the researcher is clearabout the research questions; research objectives; variables to be studied; researchinformation required and the characteristics of the population being studied. Oncethese tasks are done, one can prepare a tabled framework so that the questionswhich need to be developed become clear. This step-wise process is explainedwith an example in Table 11.1.
Table 11.1 Framework for Identifying Information Needs
ResearchQuestions
ResearchObjectives
Variables to beStudied
Information(PrimaryRequired)
Populationto beStudied
What is thenature of plasticbag usageamongst peoplein the NCR(National CapitalRegion)?
To identify thedifferent uses ofplastic bags.To find out themethod ofdisposal ofplastic bags.To find out whouses plasticbags.To find out whatis the level ofconsciousnessthat people haveabout theenvironment.
Usage behaviourDemographicdetails
Uses ofplastic bagsDisposal ofplastic bags
ConsumersRetailers
2. Method of administration
Once the researcher has identified his information area; he needs to specify howthe information should be collected. The researcher usually has available to him avariety of methods for administering the study. The main methods are personalschedule (discussed earlier in the unit), self-administered questionnaire throughmail, fax, e-mail and web-based questionnaire. There are different preconditionsfor using one method over the other (Table 11.2).
Table 11.2 Mode of Administration and Design Implications
Schedule Telephone Mail/Fax E-mail Web-BasedAdministrativecontrol
high medium Low low low
Sensitive issues high medium Low low lowNew concept high medium Low low lowLarge sample low low High high highCost/time taken high medium Medium low lowQuestion structure unstructured either structured structured structuredSampling control high high Medium low lowResponse rate high high Low medium lowInterviewer bias high high low low low
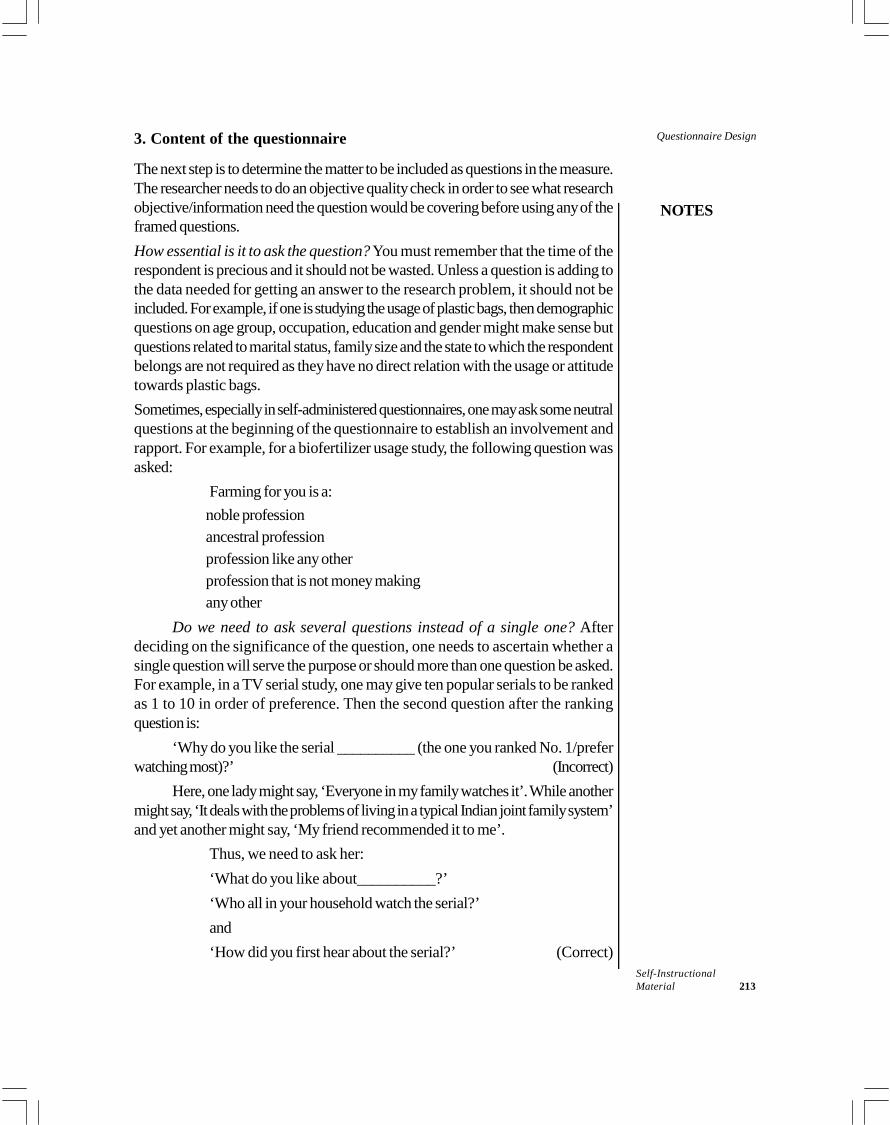
NOTES
Self-InstructionalMaterial 213
Questionnaire Design3. Content of the questionnaire
The next step is to determine the matter to be included as questions in the measure.The researcher needs to do an objective quality check in order to see what researchobjective/information need the question would be covering before using any of theframed questions.How essential is it to ask the question? You must remember that the time of therespondent is precious and it should not be wasted. Unless a question is adding tothe data needed for getting an answer to the research problem, it should not beincluded. For example, if one is studying the usage of plastic bags, then demographicquestions on age group, occupation, education and gender might make sense butquestions related to marital status, family size and the state to which the respondentbelongs are not required as they have no direct relation with the usage or attitudetowards plastic bags.Sometimes, especially in self-administered questionnaires, one may ask some neutralquestions at the beginning of the questionnaire to establish an involvement andrapport. For example, for a biofertilizer usage study, the following question wasasked:
Farming for you is a:noble professionancestral professionprofession like any otherprofession that is not money makingany other
Do we need to ask several questions instead of a single one? Afterdeciding on the significance of the question, one needs to ascertain whether asingle question will serve the purpose or should more than one question be asked.For example, in a TV serial study, one may give ten popular serials to be rankedas 1 to 10 in order of preference. Then the second question after the rankingquestion is:
‘Why do you like the serial __________ (the one you ranked No. 1/preferwatching most)?’ (Incorrect)
Here, one lady might say, ‘Everyone in my family watches it’. While anothermight say, ‘It deals with the problems of living in a typical Indian joint family system’and yet another might say, ‘My friend recommended it to me’.
Thus, we need to ask her:‘What do you like about__________?’‘Who all in your household watch the serial?’and‘How did you first hear about the serial?’ (Correct)
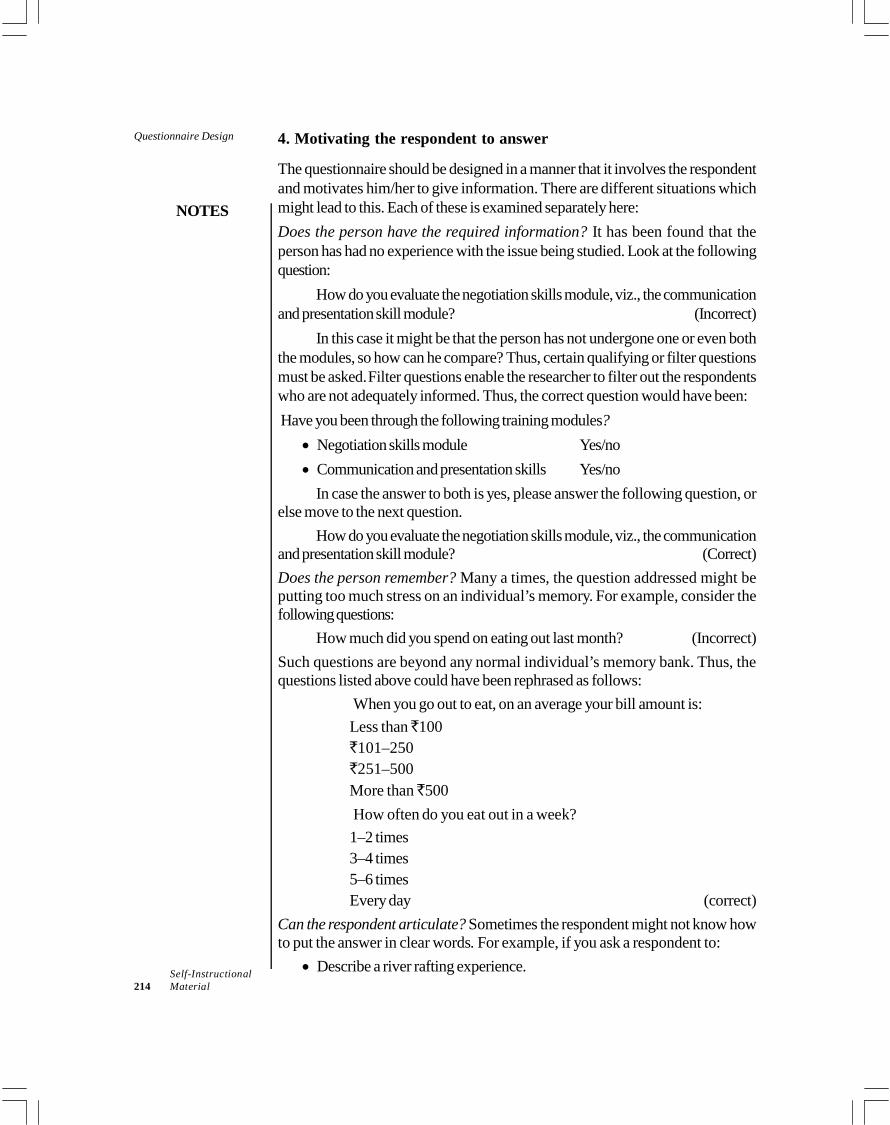
Questionnaire Design
NOTES
Self-Instructional214 Material
4. Motivating the respondent to answer
The questionnaire should be designed in a manner that it involves the respondentand motivates him/her to give information. There are different situations whichmight lead to this. Each of these is examined separately here:Does the person have the required information? It has been found that theperson has had no experience with the issue being studied. Look at the followingquestion:
How do you evaluate the negotiation skills module, viz., the communicationand presentation skill module? (Incorrect)
In this case it might be that the person has not undergone one or even boththe modules, so how can he compare? Thus, certain qualifying or filter questionsmust be asked.Filter questions enable the researcher to filter out the respondentswho are not adequately informed. Thus, the correct question would have been:Have you been through the following training modules? Negotiation skills module Yes/no Communication and presentation skills Yes/no
In case the answer to both is yes, please answer the following question, orelse move to the next question.
How do you evaluate the negotiation skills module, viz., the communicationand presentation skill module? (Correct)Does the person remember? Many a times, the question addressed might beputting too much stress on an individual’s memory. For example, consider thefollowing questions:
How much did you spend on eating out last month? (Incorrect)Such questions are beyond any normal individual’s memory bank. Thus, thequestions listed above could have been rephrased as follows:
When you go out to eat, on an average your bill amount is:Less than `100`101–250`251–500More than `500How often do you eat out in a week?1–2 times3–4 times5–6 timesEvery day (correct)
Can the respondent articulate? Sometimes the respondent might not know howto put the answer in clear words. For example, if you ask a respondent to: Describe a river rafting experience.
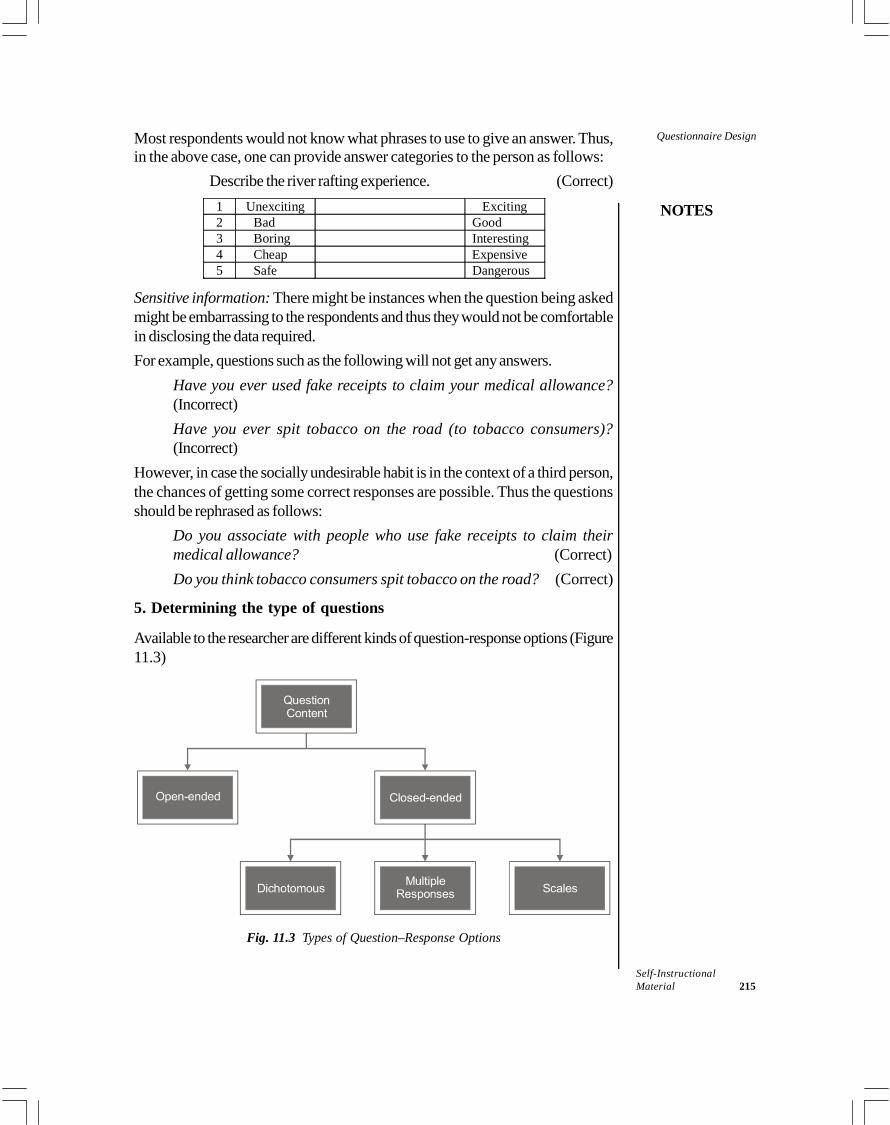
NOTES
Self-InstructionalMaterial 215
Questionnaire DesignMost respondents would not know what phrases to use to give an answer. Thus,in the above case, one can provide answer categories to the person as follows:
Describe the river rafting experience. (Correct)1 Unexciting Exciting2 Bad Good3 Boring Interesting4 Cheap Expensive5 Safe Dangerous
Sensitive information: There might be instances when the question being askedmight be embarrassing to the respondents and thus they would not be comfortablein disclosing the data required.For example, questions such as the following will not get any answers.
Have you ever used fake receipts to claim your medical allowance?(Incorrect)Have you ever spit tobacco on the road (to tobacco consumers)?(Incorrect)
However, in case the socially undesirable habit is in the context of a third person,the chances of getting some correct responses are possible. Thus the questionsshould be rephrased as follows:
Do you associate with people who use fake receipts to claim theirmedical allowance? (Correct)Do you think tobacco consumers spit tobacco on the road? (Correct)
5. Determining the type of questions
Available to the researcher are different kinds of question-response options (Figure11.3)
Fig. 11.3 Types of Question–Response Options
Questionnaire Design
NOTES
Self-Instructional216 Material
Open-ended questions
In open-ended questions, the openness refers to the option of answering in one’sown words. They are also referred to as unstructured questions or free-responseor free-answer questions. Some illustrations of this type are listed below: What is your age? Which is your favourite TV serial? I like Nescafe because ________________________ My career goal is to ________________________
Closed-ended questions
In closed-ended questions, both the question and response formats are structuredand defined.There are three kinds of formats as we observed earlier—dichotomousquestions, multiple–choice questions and those that have a scaled response.i. Dichotomous questions: These are restrictive alternatives and provide therespondents only with two answers. These could be ‘yes’ or ‘no’, like or dislike,similar or different, married or unmarried, etc.
Are you diabetic? Yes/NoHave you read the new book by Dan Brown? Yes/noWhat kind of petrol do you use in your car? Normal/Premium
Dichotomous questions are the easiest type of questions to code and analyse.They are based on the nominal level of measurement and are categorical or binaryin nature.ii. Multiple-choice questions: Unlike dichotomous questions, the person is givena number of response alternatives here. He might be asked to choose the one thatis most applicable. For example, this question was given to a retailer who iscurrently not selling organic food products:Will you consider selling organic food products in your store? Definitely not in the next one year Probably not in the next one year Undecided Probably in the next one year Definitely in the next one year
Sometimes, multiple-choice questions do not have verbal but rather numericaloptions for the respondent to choose from, for example:
How much do you spend on grocery products (average in one month)?Less than `2500/-Between `2500–5000/-More than `5000/-
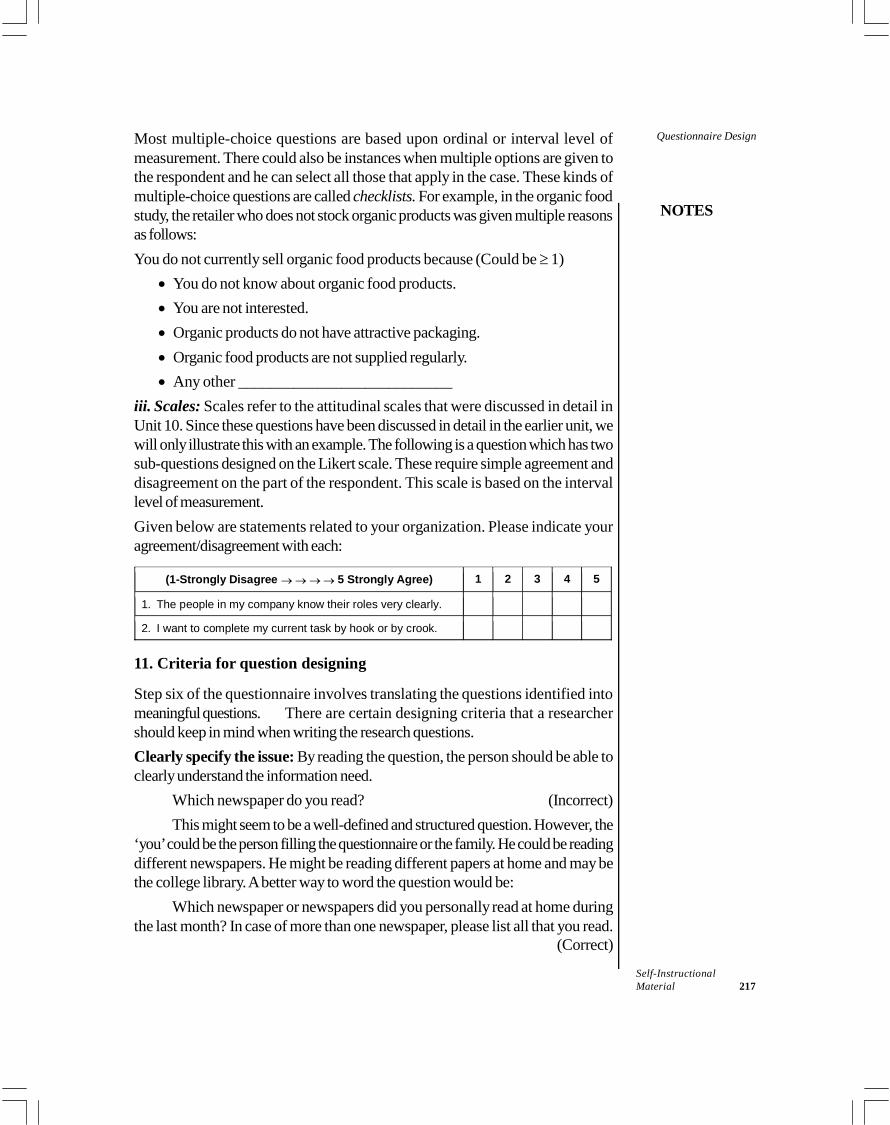
NOTES
Self-InstructionalMaterial 217
Questionnaire DesignMost multiple-choice questions are based upon ordinal or interval level ofmeasurement. There could also be instances when multiple options are given tothe respondent and he can select all those that apply in the case. These kinds ofmultiple-choice questions are called checklists. For example, in the organic foodstudy, the retailer who does not stock organic products was given multiple reasonsas follows:You do not currently sell organic food products because (Could be 1) You do not know about organic food products. You are not interested. Organic products do not have attractive packaging. Organic food products are not supplied regularly. Any other ___________________________
iii. Scales: Scales refer to the attitudinal scales that were discussed in detail inUnit 10. Since these questions have been discussed in detail in the earlier unit, wewill only illustrate this with an example. The following is a question which has twosub-questions designed on the Likert scale. These require simple agreement anddisagreement on the part of the respondent. This scale is based on the intervallevel of measurement.Given below are statements related to your organization. Please indicate youragreement/disagreement with each:
(1-Strongly Disagree 5 Strongly Agree) 1 2 3 4 5
1. The people in my company know their roles very clearly.
2. I want to complete my current task by hook or by crook.
11. Criteria for question designing
Step six of the questionnaire involves translating the questions identified intomeaningful questions. There are certain designing criteria that a researchershould keep in mind when writing the research questions.Clearly specify the issue: By reading the question, the person should be able toclearly understand the information need.
Which newspaper do you read? (Incorrect)This might seem to be a well-defined and structured question. However, the
‘you’ could be the person filling the questionnaire or the family. He could be readingdifferent newspapers. He might be reading different papers at home and may bethe college library. A better way to word the question would be:
Which newspaper or newspapers did you personally read at home duringthe last month? In case of more than one newspaper, please list all that you read.
(Correct)
Questionnaire Design
NOTES
Self-Instructional218 Material
Use simple terminology: The researcher must take care to ask questions in alanguage that is understood by the population under study. Technical words ordifficult words that are not used in everyday communication must be avoided.
Do you think thermal wear provides immunity? (Incorrect)Do you think that thermal wear provides you protection from the cold?
(Correct)Avoid ambiguity in questioning: The words used in the questionnaire shouldmean the same thing to all those answering the questionnaire. A lot of words aresubjective and relative in meaning. Consider the following question:
How often do you visit Pizza Hut?NeverOccasionallySometimesOftenRegularly (Incorrect)
These are ambiguous measures, as occasionally in the above question,might be three to four times in a week for one person it, while for another it couldbe three times in a month. A much better wording for this question would be thefollowing:
In a typical month, how often do you visit Pizza Hut?Less than once1 or 2 times3 or 4 timesMore than 4 times (Correct)
Avoid leading questions: Any question that provides a clue to the respondentsin terms of the direction in which one wants them to answer is called a leading orbiasing question. For example, ‘Do you think that working mothers should buyready-to-eat food when that might contain some chemical preservatives?
YesNoDon’t know (Incorrect)
The question would mostly generate a negative answer, as no working motherwould like to buy something that is convenient but might be harmful. Thus, it isadvisable to construct a neutral question as follows:
Do you think that working mothers should buy ready-to-eat food?YesNoDon’t know (Correct)
NOTES
Self-InstructionalMaterial 219
Questionnaire DesignAvoid loaded questions: Questions that address sensitive issues are termed asloaded questions and the response to these questions might not always be honest,as the person might not wish to admit the answer. For example, questions such asfollows will rarely get an affirmative answer:
Will you take dowry when you get married? (Incorrect)Sensitive questions like this can be rephrased in a variety of ways. For example,the question could be constructed in the context of a third person as follows:
Do you think most Indian men would take dowry when they getmarried?
(Correct)Avoid double-barrelled questions: Questions that have two separate optionsseparated by an ‘or’ or ‘and’ like the following:
Do you think Nokia and Samsung have a wide variety of touchphones? Yes/No (Incorrect)
The problem is that the respondent might believe that Nokia has betterphones or Samsung has better phones or both. These questions are referred to asdouble-barrelled and the researcher should always split them into two separatequestions. For example,A wide variety of touch phones is available for:
NokiaSamsungBoth (Correct)
7. Determine the questionnaire structure
The questions now have to be put together in a proper sequence.Instructions: The questionnaires always, even the schedules, begin withstandardized instructions. These begin by greeting the respondent and thenintroducing the researcher and then the purpose of questionnaire administration.For example, in the study on organic food products, the following instructionswere given at the beginning of the questionnaire:
‘Hi. We __________ are carrying out a market research on the purchasebehaviour of grocery products/organic food. We are conducting a survey ofconsumers, retailers and experts in the NCR for the same.
As you are involved in the purchase and/or consumption of foodproducts, we seek your cooperation for providing the following relevant informationfor our research. Thank you very much.’Opening questions: After instructions come the opening questions, which leadthe reader into the study topic. For example, a questionnaire on understanding theconsumer’s buying behavior in malls can ask an opening question that is generic innature, such as:
What is your opinion about shopping at a mall?
Questionnaire Design
NOTES
Self-Instructional220 Material
Study questions: After the opening questions, the bulk of the instrument needs tobe devoted to the main questions that are related to the specific information needsof the study. Here also, the general rule is that the simpler questions, which do notrequire a lot of thinking or response time should be asked first as they build thetempo for answering the more difficult/sensitive questions later on. This method ofgoing in a sequential manner from the general to the specific is called the funnelapproach.Classification information: This is the information that is related to the basicsocio-economic and demographic traits of the person. These might include name(kept optional in some cases), address, e-mail address and telephone number.Acknowledgement: The questionnaire ends by acknowledging the inputs of therespondent and thanking him for his cooperation and valuable contribution.
8. Physical characteristics of the questionnaire
The researcher must pay special attention to the look of the questionnaire. Thefirst thing is the quality of the paper on which the questionnaire is printed whichshould be of good quality. The font style and spacing used in the entire documentshould be uniform. One must ensure that every question and its response optionsare printed on the same page. Surveys for different groups could be on differentcoloured paper. For example, if Delhi is being studied as five zones, then thequestionnaire used in each zone could be printed on a differently coloured paper.Each question and section must be numbered properly. In case there is any responseinstruction for an individual question, it must be before the question. In case thequestionnaire is going to be administered by the investigator and if there are anyprobing question then they should be clearly written as instructions for theinvestigator.
9. Pilot testing of the questionnaire
Pilot testing refers to testing and administering the designed instrument on a smallgroup of people from the population under study. This is to essentially cover anyerrors that might have still remained even after the earlier eight steps. For examplethe question wording may not be clear, the sequence of questions may not becorrect or the question is not needed as it does not solve any purpose. Thus theseaspects need to be corrected.Every aspect of the questionnaire has to be testedand one must record all the experiences of the conduction, including the timetaken to administer it. Sometimes, the researcher might also get the questionnairewhetted by academic or industry experts for their inputs. As far as possible, thepilot should be a small scale replica of the actual survey that would be subsequentlyconducted.
10. Administering the questionnaire
Once all the nine steps have been completed, the final instrument is ready forconduction and the questionnaire needs to be administered according to thesampling plan.
NOTES
Self-InstructionalMaterial 221
Questionnaire DesignAdvantages and Disadvantages of the Questionnaire Method
The questionnaire has many advantages over the other data collection methodsdiscussed earlier. Probably the greatest benefit of the method is its adaptability. There is,
actually speaking, no domain or branch for which a questionnaire cannotbe designed. It can be shaped in a manner that can be easily understood bythe population under study. The language, the content and the manner ofquestioning can be modified suitably. The instrument is particularly suitablefor studies that are trying to establish the reasons for certain occurrences orbehaviour. The second advantage is that it assures anonymity if it is self-administered
by the respondent, as there is no pressure or embarrassment in revealingsensitive data. A lot of questionnaires do not even require the person to fillin his/her name. Administering the questionnaire is much faster and lessexpensive as compared to other primary and a few secondary sources aswell. There is considerable ease of quantitative coding and analysis of theobtained information as most response categories are closed-ended andbased on the measurement levels as discussed in Unit 5. The chance ofresearcher bias is very little here. Lastly, there is no pressure of immediate response, thus the subject can fill
in the questionnaire whenever he or she wants. The questionnaire is the most economical method as it can be administered
simultaneously to a number of respondents. Thus a large amount of datacan be collected within a short time through a questionnaire.
However, the method does not come without any disadvantages. The major disadvantage is that the inexpensive standardized instrument has
limited applicability, that is, it can be used only with those who can read andwrite. The questionnaire is an impersonal method and sometimes for a sensitive
issue it may not reveal the actual reasons or answers to the questionsthatyou asked.The return ratio, i.e., the number of people who return the dulyfilled in questionnaires are sometimes not even 50 per cent of the number offorms distributed. Skewed sample response could be another problem. This can occur in two
cases; one, if the investigator distributes the same to his friends andacquaintances and second, because of the self-selection of the subjects.This means that the ones who fill in the questionnaire and return it might notbe the representatives of the population at large. In case the person is notclear about a question, clarification with the researcher might not bepossible.
Questionnaire Design
NOTES
Self-Instructional222 Material
Check Your Progress
4. Mention some other names of open-ended questions. 5. Name the method in which sampling control is the highest. 6. What are loaded and double-barrelled questions? 7. State the greatest benefit of the questionnaire method.
11.4 SECONDARY DATA SOURCES ANDPRECAUTIONS
We have already discussed what secondary data is. Let us see what are its uses,types and sources.
11.4.1 Uses of Secondary Data
Secondary data can be used for multiple purposes as follows: Problem identification and formulation stage: Existing information on
the topic under study is useful to help develop the research question. Hypotheses designing: Previous research studies done in the area could
help in hypothesizing about expected results. Sampling considerations: There might be respondent related databases
available to seek respondent statistics and relevant contact details. Thesewould help during sampling for the study. Primary base: The secondary information collected can be used to design
the primary data collection instruments, in order to phrase and design theright questions. Validation board: Earlier records and studies can also be used to support
or validate the information collected through primary sources.Before we examine the wide range of the secondary sources available to
the business researcher, it is essential that one is aware of the advantages anddisadvantages of using secondary sources.
11.4.2 Advantages and Disadvantages of Secondary Data
There are multiple advantages of using secondary data. Resource advantage: Any research that is making use of secondary
information will be able to save immensely in terms of both cost and time Accessibility of data: The other major advantage of secondary sources is
that it is very easy to access this data. Accuracy and stability of data: Data from recognized sources has the
additional advantage of accuracy and reliability
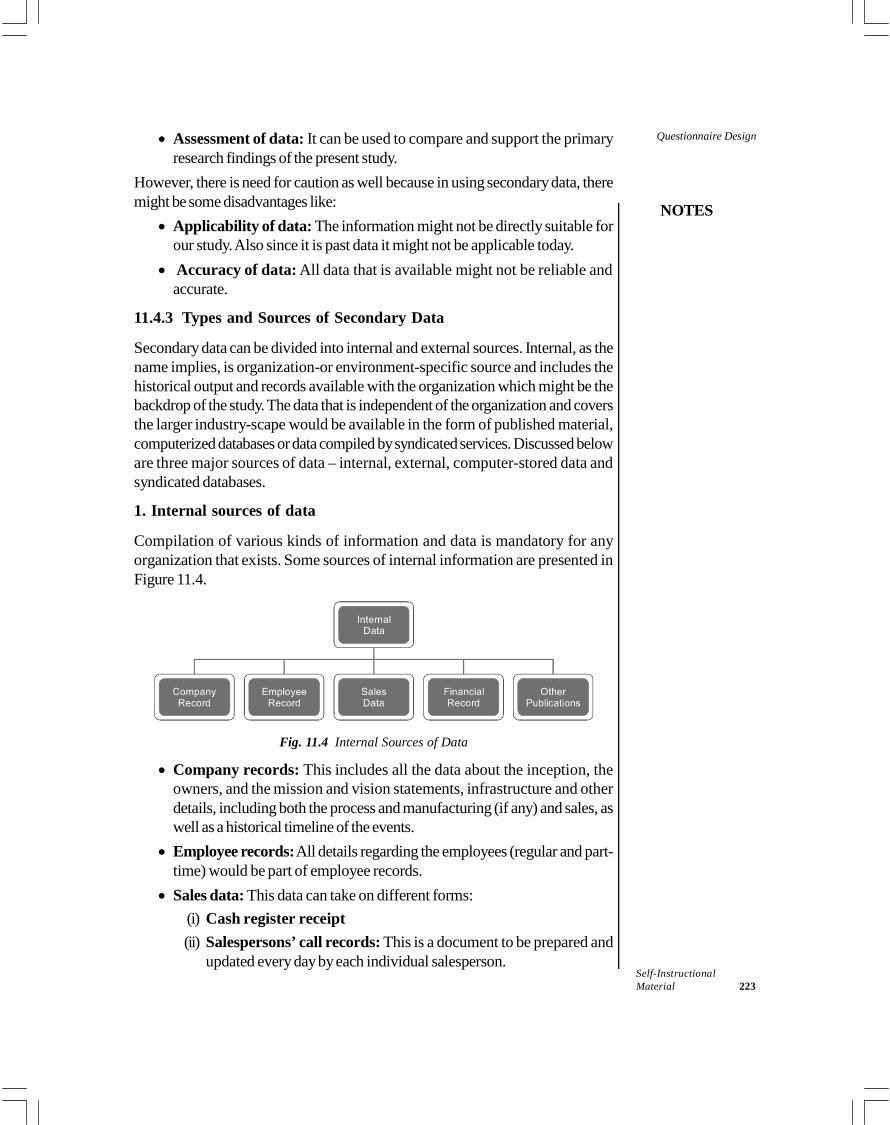
NOTES
Self-InstructionalMaterial 223
Questionnaire Design Assessment of data: It can be used to compare and support the primaryresearch findings of the present study.
However, there is need for caution as well because in using secondary data, theremight be some disadvantages like: Applicability of data: The information might not be directly suitable for
our study. Also since it is past data it might not be applicable today. Accuracy of data: All data that is available might not be reliable and
accurate.
11.4.3 Types and Sources of Secondary Data
Secondary data can be divided into internal and external sources. Internal, as thename implies, is organization-or environment-specific source and includes thehistorical output and records available with the organization which might be thebackdrop of the study. The data that is independent of the organization and coversthe larger industry-scape would be available in the form of published material,computerized databases or data compiled by syndicated services. Discussed beloware three major sources of data – internal, external, computer-stored data andsyndicated databases.
1. Internal sources of data
Compilation of various kinds of information and data is mandatory for anyorganization that exists. Some sources of internal information are presented inFigure 11.4.
Fig. 11.4 Internal Sources of Data
Company records: This includes all the data about the inception, theowners, and the mission and vision statements, infrastructure and otherdetails, including both the process and manufacturing (if any) and sales, aswell as a historical timeline of the events. Employee records: All details regarding the employees (regular and part-
time) would be part of employee records. Sales data: This data can take on different forms:
(i) Cash register receipt(ii) Salespersons’ call records: This is a document to be prepared and
updated every day by each individual salesperson.
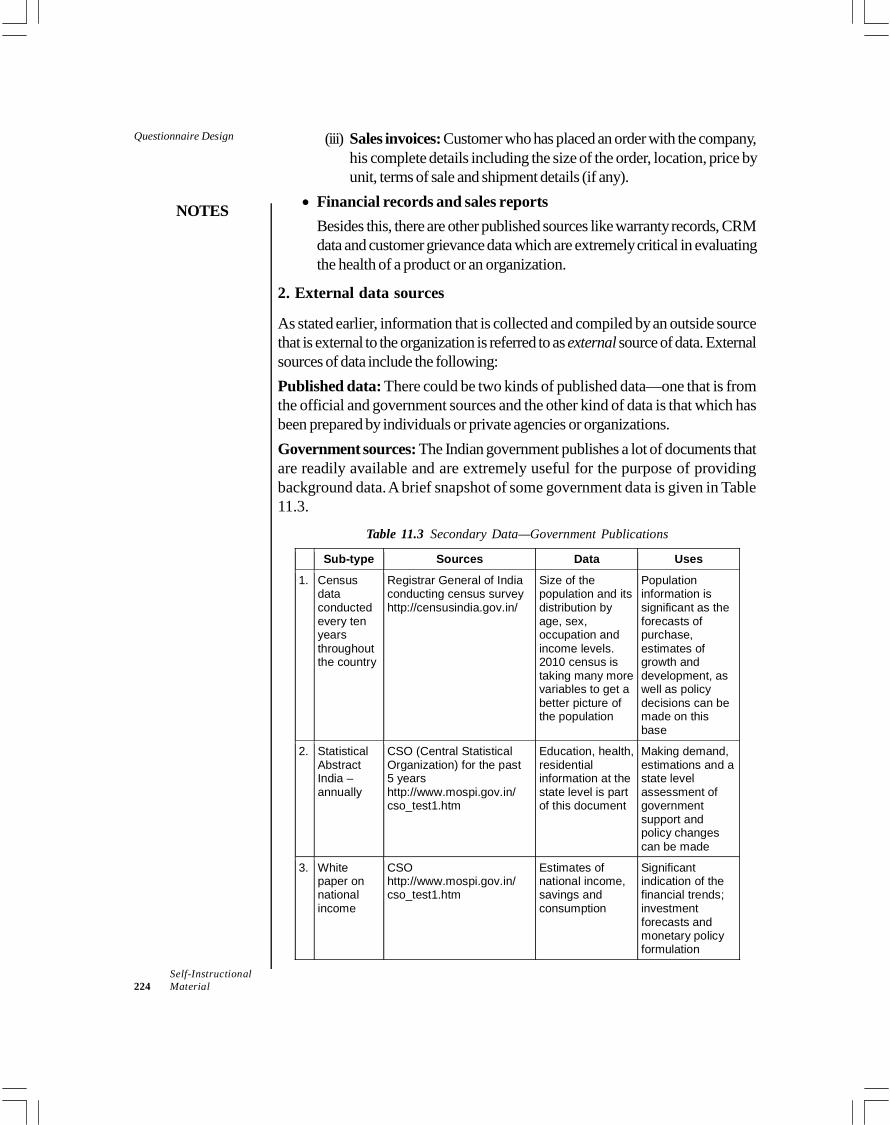
Questionnaire Design
NOTES
Self-Instructional224 Material
(iii) Sales invoices: Customer who has placed an order with the company,his complete details including the size of the order, location, price byunit, terms of sale and shipment details (if any).
Financial records and sales reportsBesides this, there are other published sources like warranty records, CRMdata and customer grievance data which are extremely critical in evaluatingthe health of a product or an organization.
2. External data sources
As stated earlier, information that is collected and compiled by an outside sourcethat is external to the organization is referred to as external source of data. Externalsources of data include the following:Published data: There could be two kinds of published data—one that is fromthe official and government sources and the other kind of data is that which hasbeen prepared by individuals or private agencies or organizations.Government sources: The Indian government publishes a lot of documents thatare readily available and are extremely useful for the purpose of providingbackground data. A brief snapshot of some government data is given in Table11.3.
Table 11.3 Secondary Data—Government Publications
Sub-type Sources Data Uses
1. Censusdataconductedevery tenyearsthroughoutthe country
Registrar General of Indiaconducting census surveyhttp://censusindia.gov.in/
Size of thepopulation and itsdistribution byage, sex,occupation andincome levels.2010 census istaking many morevariables to get abetter picture ofthe population
Populationinformation issignificant as theforecasts ofpurchase,estimates ofgrowth anddevelopment, aswell as policydecisions can bemade on thisbase
2. StatisticalAbstractIndia –annually
CSO (Central StatisticalOrganization) for the past5 yearshttp://www.mospi.gov.in/cso_test1.htm
Education, health,residentialinformation at thestate level is partof this document
Making demand,estimations and astate levelassessment ofgovernmentsupport andpolicy changescan be made
3. Whitepaper onnationalincome
CSOhttp://www.mospi.gov.in/cso_test1.htm
Estimates ofnational income,savings andconsumption
Significantindication of thefinancial trends;investmentforecasts andmonetary policyformulation
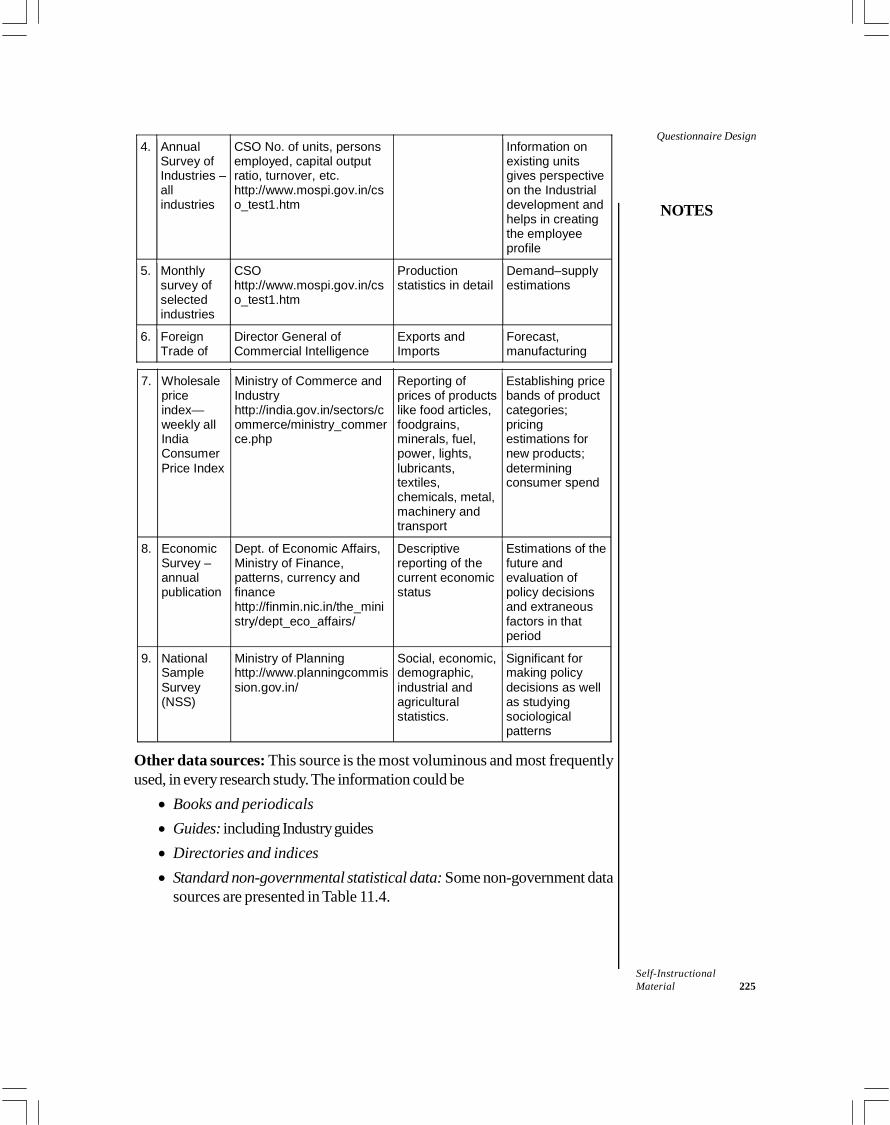
NOTES
Self-InstructionalMaterial 225
Questionnaire Design4. Annual
Survey ofIndustries –allindustries
CSO No. of units, personsemployed, capital outputratio, turnover, etc.http://www.mospi.gov.in/cso_test1.htm
Information onexisting unitsgives perspectiveon the Industrialdevelopment andhelps in creatingthe employeeprofile
5. Monthlysurvey ofselectedindustries
CSOhttp://www.mospi.gov.in/cso_test1.htm
Productionstatistics in detail
Demand–supplyestimations
6. ForeignTrade of
Director General ofCommercial Intelligence
Exports andImports
Forecast,manufacturing
7. Wholesalepriceindex—weekly allIndiaConsumerPrice Index
Ministry of Commerce andIndustryhttp://india.gov.in/sectors/commerce/ministry_commerce.php
Reporting ofprices of productslike food articles,foodgrains,minerals, fuel,power, lights,lubricants,textiles,chemicals, metal,machinery andtransport
Establishing pricebands of productcategories;pricingestimations fornew products;determiningconsumer spend
8. EconomicSurvey –annualpublication
Dept. of Economic Affairs,Ministry of Finance,patterns, currency andfinancehttp://finmin.nic.in/the_ministry/dept_eco_affairs/
Descriptivereporting of thecurrent economicstatus
Estimations of thefuture andevaluation ofpolicy decisionsand extraneousfactors in thatperiod
9. NationalSampleSurvey(NSS)
Ministry of Planninghttp://www.planningcommission.gov.in/
Social, economic,demographic,industrial andagriculturalstatistics.
Significant formaking policydecisions as wellas studyingsociologicalpatterns
Other data sources: This source is the most voluminous and most frequentlyused, in every research study. The information could be Books and periodicals Guides: including Industry guides Directories and indices Standard non-governmental statistical data: Some non-government data
sources are presented in Table 11.4.
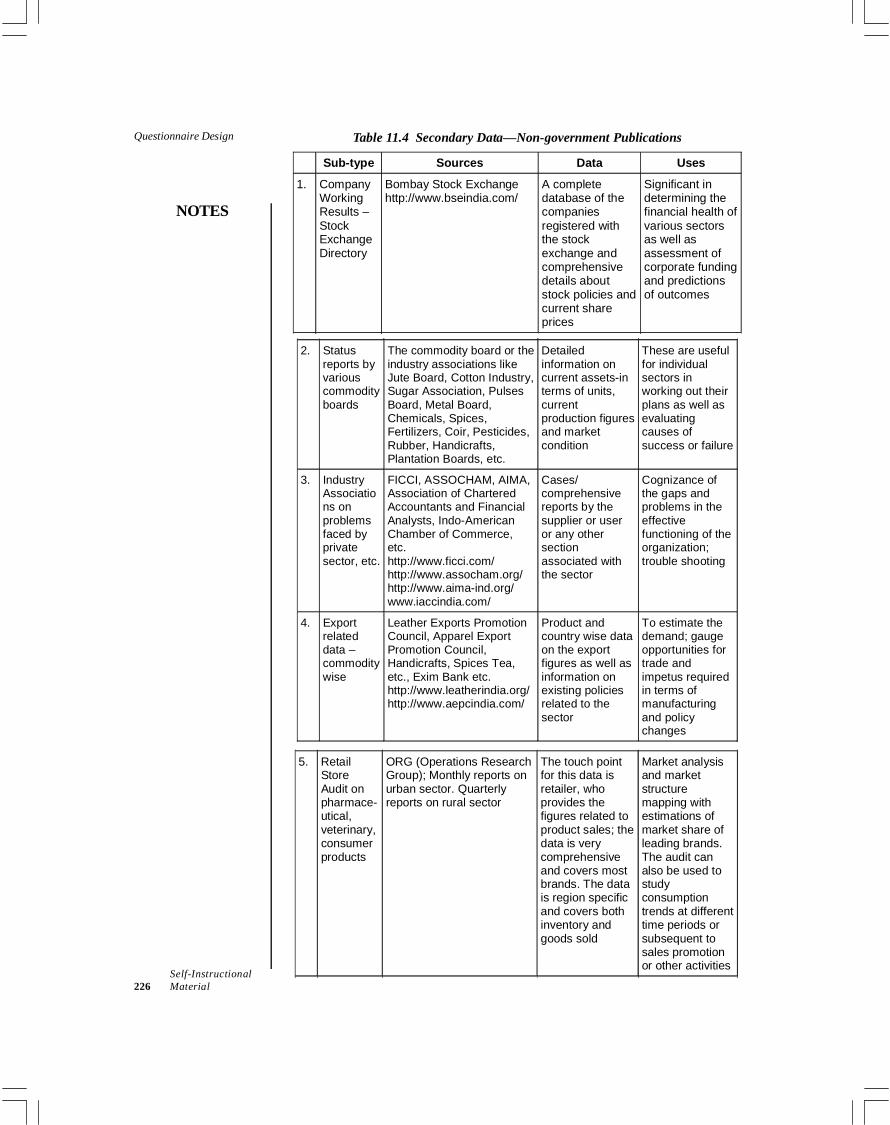
Questionnaire Design
NOTES
Self-Instructional226 Material
Table 11.4 Secondary Data—Non-government Publications
Sub-type Sources Data Uses
1. CompanyWorkingResults –StockExchangeDirectory
Bombay Stock Exchangehttp://www.bseindia.com/
A completedatabase of thecompaniesregistered withthe stockexchange andcomprehensivedetails aboutstock policies andcurrent shareprices
Significant indetermining thefinancial health ofvarious sectorsas well asassessment ofcorporate fundingand predictionsof outcomes
2. Statusreports byvariouscommodityboards
The commodity board or theindustry associations likeJute Board, Cotton Industry,Sugar Association, PulsesBoard, Metal Board,Chemicals, Spices,Fertilizers, Coir, Pesticides,Rubber, Handicrafts,Plantation Boards, etc.
Detailedinformation oncurrent assets-interms of units,currentproduction figuresand marketcondition
These are usefulfor individualsectors inworking out theirplans as well asevaluatingcauses ofsuccess or failure
3. IndustryAssociations onproblemsfaced byprivatesector, etc.
FICCI, ASSOCHAM, AIMA,Association of CharteredAccountants and FinancialAnalysts, Indo-AmericanChamber of Commerce,etc.http://www.ficci.com/http://www.assocham.org/http://www.aima-ind.org/www.iaccindia.com/
Cases/comprehensivereports by thesupplier or useror any othersectionassociated withthe sector
Cognizance ofthe gaps andproblems in theeffectivefunctioning of theorganization;trouble shooting
4. Exportrelateddata –commoditywise
Leather Exports PromotionCouncil, Apparel ExportPromotion Council,Handicrafts, Spices Tea,etc., Exim Bank etc.http://www.leatherindia.org/http://www.aepcindia.com/
Product andcountry wise dataon the exportfigures as well asinformation onexisting policiesrelated to thesector
To estimate thedemand; gaugeopportunities fortrade andimpetus requiredin terms ofmanufacturingand policychanges
5. RetailStoreAudit onpharmace-utical,veterinary,consumerproducts
ORG (Operations ResearchGroup); Monthly reports onurban sector. Quarterlyreports on rural sector
The touch pointfor this data isretailer, whoprovides thefigures related toproduct sales; thedata is verycomprehensiveand covers mostbrands. The datais region specificand covers bothinventory andgoods sold
Market analysisand marketstructuremapping withestimations ofmarket share ofleading brands.The audit canalso be used tostudyconsumptiontrends at differenttime periods orsubsequent tosales promotionor other activities
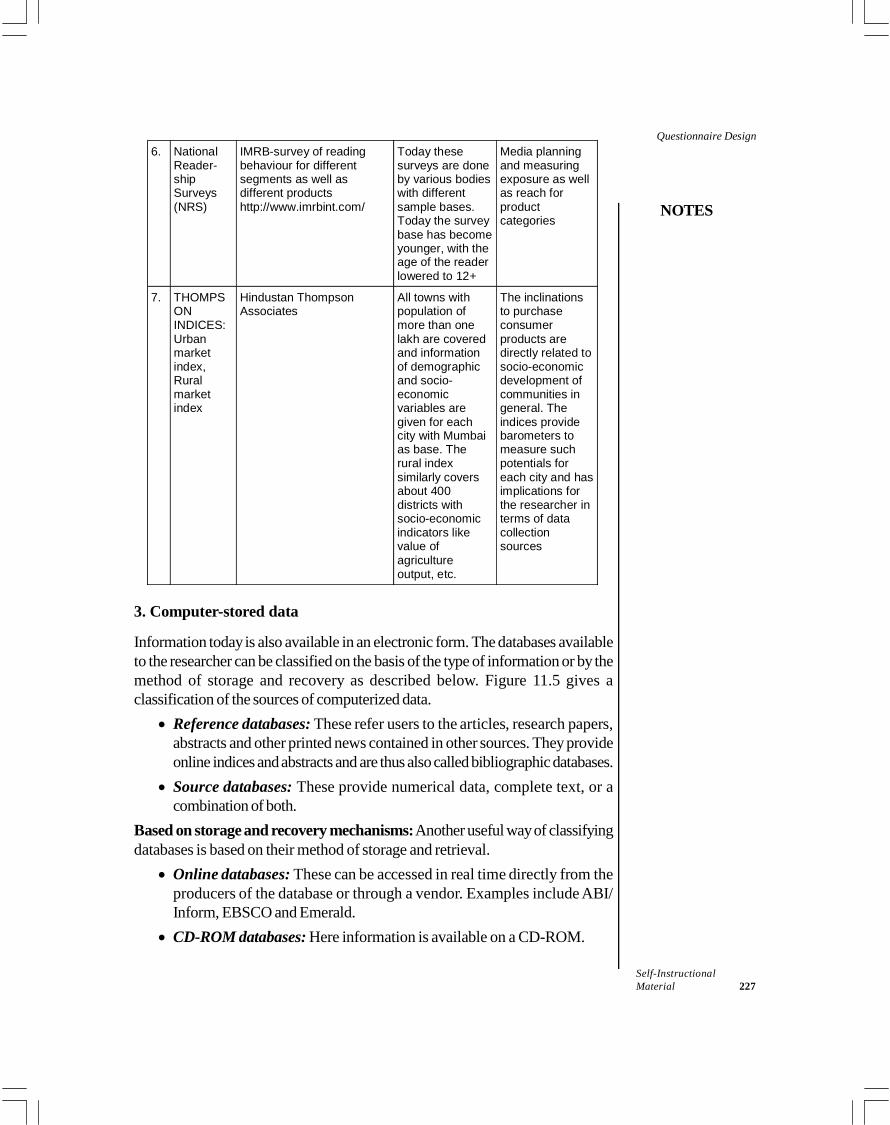
NOTES
Self-InstructionalMaterial 227
Questionnaire Design6. National
Reader-shipSurveys(NRS)
IMRB-survey of readingbehaviour for differentsegments as well asdifferent productshttp://www.imrbint.com/
Today thesesurveys are doneby various bodieswith differentsample bases.Today the surveybase has becomeyounger, with theage of the readerlowered to 12+
Media planningand measuringexposure as wellas reach forproductcategories
7. THOMPSONINDICES:Urbanmarketindex,Ruralmarketindex
Hindustan ThompsonAssociates
All towns withpopulation ofmore than onelakh are coveredand informationof demographicand socio-economicvariables aregiven for eachcity with Mumbaias base. Therural indexsimilarly coversabout 400districts withsocio-economicindicators likevalue ofagricultureoutput, etc.
The inclinationsto purchaseconsumerproducts aredirectly related tosocio-economicdevelopment ofcommunities ingeneral. Theindices providebarometers tomeasure suchpotentials foreach city and hasimplications forthe researcher interms of datacollectionsources
3. Computer-stored data
Information today is also available in an electronic form. The databases availableto the researcher can be classified on the basis of the type of information or by themethod of storage and recovery as described below. Figure 11.5 gives aclassification of the sources of computerized data. Reference databases: These refer users to the articles, research papers,
abstracts and other printed news contained in other sources. They provideonline indices and abstracts and are thus also called bibliographic databases. Source databases: These provide numerical data, complete text, or a
combination of both.Based on storage and recovery mechanisms: Another useful way of classifyingdatabases is based on their method of storage and retrieval. Online databases: These can be accessed in real time directly from the
producers of the database or through a vendor. Examples include ABI/Inform, EBSCO and Emerald. CD-ROM databases: Here information is available on a CD-ROM.
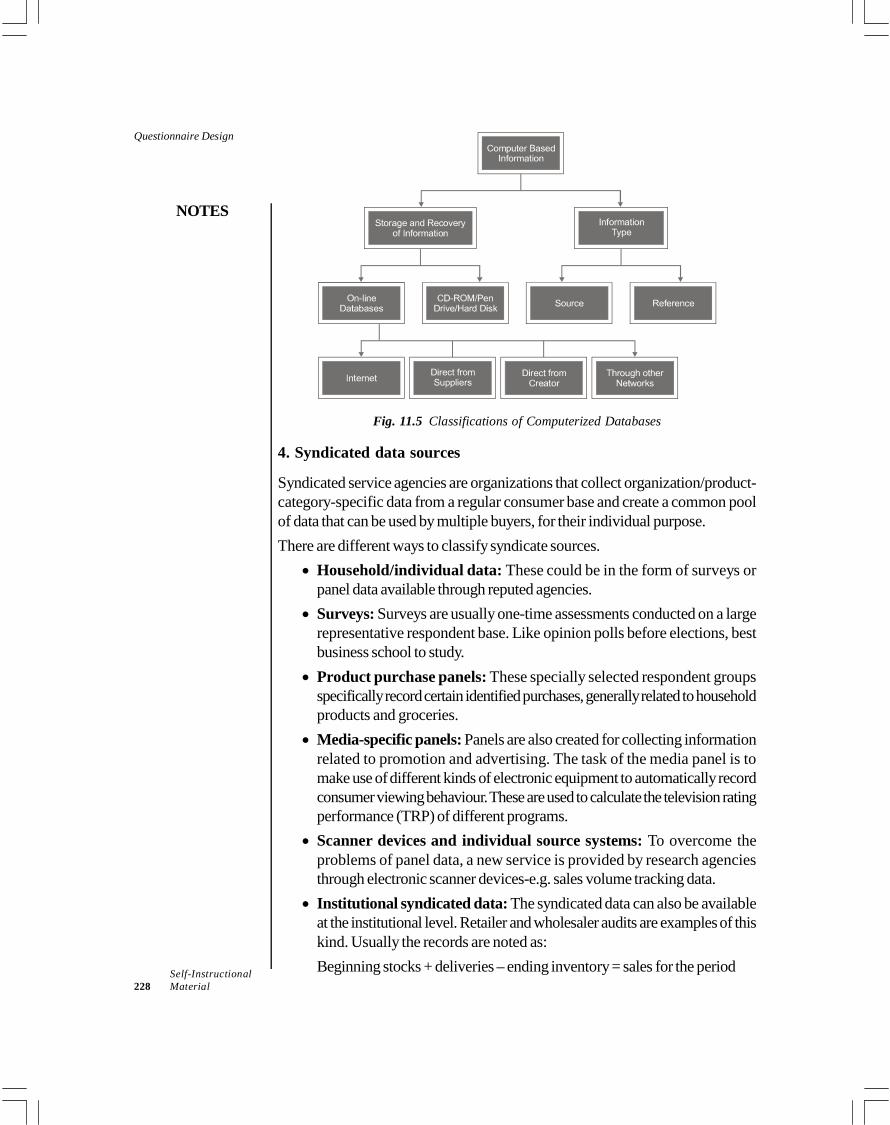
Questionnaire Design
NOTES
Self-Instructional228 Material
Fig. 11.5 Classifications of Computerized Databases
4. Syndicated data sources
Syndicated service agencies are organizations that collect organization/product-category-specific data from a regular consumer base and create a common poolof data that can be used by multiple buyers, for their individual purpose.There are different ways to classify syndicate sources. Household/individual data: These could be in the form of surveys or
panel data available through reputed agencies. Surveys: Surveys are usually one-time assessments conducted on a large
representative respondent base. Like opinion polls before elections, bestbusiness school to study. Product purchase panels: These specially selected respondent groups
specifically record certain identified purchases, generally related to householdproducts and groceries. Media-specific panels: Panels are also created for collecting information
related to promotion and advertising. The task of the media panel is tomake use of different kinds of electronic equipment to automatically recordconsumer viewing behaviour. These are used to calculate the television ratingperformance (TRP) of different programs. Scanner devices and individual source systems: To overcome the
problems of panel data, a new service is provided by research agenciesthrough electronic scanner devices-e.g. sales volume tracking data. Institutional syndicated data: The syndicated data can also be available
at the institutional level. Retailer and wholesaler audits are examples of thiskind. Usually the records are noted as:Beginning stocks + deliveries – ending inventory = sales for the period
NOTES
Self-InstructionalMaterial 229
Questionnaire Design
Check Your Progress
8. How is secondary information collected helpful in for primary data collectioninstruments?
9. Cash registers and sales invoices are the examples of which type ofsecondary data sources?
10. Define syndicated service agencies.
11.5 ANSWERS TO CHECK YOUR PROGRESSQUESTIONS
1. The first and foremost requirement of a questionnaire is that the spelt-outresearch objectives must be converted into clear questions which will extractanswers from the respondent.
2. The degree of structure and the degree of concealment are the two criteriathat are frequently used for designing purposes. Structure refers to the degreeto which the response category has been defined. Concealment refers tothe degree to which the purpose of the study is explained to the respondent.
3. The categories of questionnaires on the basis of method of administrationare schedule and self-administered questionnaire.
4. The other names for open-ended questions are unstructured questions orfree-response or free-answer questions.
5. Schedule is the method in which sampling control is the highest. 6. Questions that address sensitive issues are termed as loaded questions and
the response to these questions might not always be honest, as the personmight not wish to admit the answer. However, double-barred questionshave two separate options which are separated by an ‘or’ or ‘and’. Theresearcher always splits them into two separate questions.
7. The greatest benefit of the questionnaire method is its adaptability. 8. The secondary information collected can be used to design the primary
data collection instruments, in order to phrase and design the right questions. 9. Cash registers and sales invoices are the examples of sales data type of
internal data sources. 10. Syndicated service agencies are organizations that collect organization/
product-category-specific data from a regular consumer base and create acommon pool of data that can be used by multiple buyers, for their individualpurpose.
Questionnaire Design
NOTES
Self-Instructional230 Material
11.6 SUMMARY
The questionnaire is a research technique that consists of a series of questionsasked to respondents, in order to obtain statistically useful information abouta given topic. It is one of the most cost-effective methods of collectingprimary data, which can be used with considerable ease by most individualand business researchers. There are many different types of questionnaire available to the researcher.
The categorization can be done on the basis of a variety of parameters. Thetwo criteria that are most frequently used for designing purposes are thedegree of structure and the degree of concealment. Formalized and unconcealed questionnaire is the most frequently used by
all management researchers. This kind of structured questionnaire is easyto administer, and has both the questions as self-explanatory and the answercategories clearly defined. Formalized and concealed questionnaire have a formal method of
questioning; however the purpose is not clear to the respondent. Theresearch studies which are trying to find out the latent causes of behaviourand cannot rely on direct questions use these. The non-formalized and unconcealed questionnaire comes with unstructured
questions where they have the freedom of expressing themselves the waythey want to. In non-formalized and concealed questionnaire the researcher makes use
of questions of low structure and disguised purpose. The questionnaire that has been prepared would necessitate a face-to-face
interaction. In this case, the interviewer reads out each question and makesa note of the respondent’s answers. This administration is called a schedule.It might have a mix of the questionnaire type as described in the sectionabove and might have some structured and some unstructured questions. The other kind is the self-administered questionnaire, where the
respondent reads all the instructions and questions on his own and recordshis own statements or responses. Thus, all the questions and instructionsneed to be explicit and self-explanatory. The steps involved in questionnaire designing are conversion of research
objectives into information areas, method of administration, content of thequestionnaire, motivating the respondent to answer, determining the type ofquestions, criteria for question designing, determining the questionnairestructure, physical characteristics of the questionnaire, pilot testing of thequestionnaire, and administrating the questionnaire.
NOTES
Self-InstructionalMaterial 231
Questionnaire Design Secondary data can be used for multiple purposes such as problemidentification and formulation, hypotheses designing, sampling considerations,primary base, validation board. Some of the advantages of using secondary data include resource advantage,
accessibility of data, accuracy and stability of data, assessment of data. Besides advantages, there might be some disadvantages of secondary data
such as applicability of data and accuracy of data. Secondary data can be divided into internal and external sources. Internal,
as the name implies, is organization-or environment-specific source andincludes the historical output and records available with the organizationwhich might be the backdrop of the study. The data that is independent ofthe organization and covers the larger industry-scape would be available inthe form of published material, computerized databases or data compiledby syndicated services. There are three major sources of data – internal,external, computer-stored data and syndicated databases. Company records, employee records, sales data, financial records and sales
reports are some of the sources of internal information. Information that is collected and complied by an outside source that is external
to the organization is referred to as external source of data. Publisheddata, government sources, other data sources are the examples of externaldata source. Reference databases refer users to the articles, research papers, abstracts
and other printed news contained in other sources. They provide onlineindices and abstracts and are thus also called bibliographic databases. Sources databases provide numerical data, complete text, or a combination
of both. Online databases can be accessed in real time directly from the producers
of the database or through a vendor. Examples include ABI/Inform, EBSCOand Emerald. Syndicated service agencies are organizations that collect organization/
product-category-specific data from a regular consumer base and create acommon pool of data that can be used by multiple buyers, for their individualpurpose.
11.7 KEY WORDS
Questionnaire: It refers to a research tool that consists of a series ofquestions asked to respondents, in order to obtain statistically usefulinformation about a given topic. Dichotomous Questions: It refers to the questions with restrictive
alternatives that provide the respondents only with two answers.
Questionnaire Design
NOTES
Self-Instructional232 Material
Secondary data: It refers to the information which is not topical or research-specific and has been collected and compiled by some other researcher orinvestigative body. Syndicated data: It refers to the information gathered by a service or
company for public release and sold by subscription.
11.8 SELF ASSESSMENT QUESTIONS ANDEXERCISES
Short Answer Questions1. Define questionnaire.2. Write short notes on the following:
(a) Formalized and concealed questionnaire(b) Non-formalized and unconcealed questionnaire(c) Non-formalized and concealed questionnaire(d) Open –ended questions
3. What are closed-ended questions?4. Briefly discuss the criteria for designing a questionnaire.5. What are the advantages and disadvantages of secondary data?
Long Answer Questions1. Describe the three kinds of formats of closed-ended questions.2. What are the steps involved in the questionnaire design? Explain in detail
the questionnaire design process.3. What are the advantages and disadvantages of the questionnaire method?
Illustrate with suitable examples.4. Discuss the three major sources of secondary data in detail.
11.9 FURTHER READINGS
Busha, Charles H. and Stephen P. Harter. 1980. Research Methods inLibrarianship: Techniques and Interpretation. Orlando: Academic Press.
Kumar, Krishan. 1992. Research Methods in Library and Information Science.New Delhi: Har-Anand Publications.
Rao, I.K. Ravichandra. 2009. Quantitative Methods for Library andInformation Science. New Delhi: New Age International Publishers.
Slater, Margaret. 1990. Research Methods in Library and Information Studies.London: Facet Pub.
Fowler, F. J. 2008. Survey Research Methods. New Delhi: SAGE Publications.
NOTES
Self-InstructionalMaterial 233
Analysis of DataBLOCK - VSTATISTICAL SOFTWARE AND STYLE MANUAL
UNIT 12 ANALYSIS OF DATA
Structure12.0 Introduction12.1 Objectives12.2 Data Analysis12.3 Research Reporting
12.3.1 Brief Reports12.3.2 Detailed Reports12.3.3 Interpretation12.3.4 Presentation
12.4 Answers to Check Your Progress Questions12.5 Summary12.6 Key Words12.7 Self Assessment Questions and Exercises12.8 Further Readings
12.0 INTRODUCTION
Data analysis is the process of systematically applying statistical or logical techniquesto describe, illustrate and evaluate data. The appropriate analysis of researchfindings is essentially important in order to maintain data integrity. Analysis of dataplays a vital role in any research as it summarizes collected data and discuss theinterpretation of outcomes using multiple data sources.
In this unit, you will study the process of data analysis and the techniquesinvolved in the process. You will also be able to differentiate between descriptiveanalysis and inferential analysis and their types with appropriate examples. Theunit goes on discussing the analysis of multiple responses and ordinal scaledquestions. You will also learn the technique of analysing data by calculating rankorder and using data transformation. In addition to this, the unit will also explorethe significant role and meaning of research reporting.
12.1 OBJECTIVES
After going through this unit, you will be able to: Discuss the techniques used in the analysis of data Differentiate between descriptive and inferential analysis Describe the types of descriptive analysis
Analysis of Data
NOTES
Self-Instructional234 Material
Analyse the multiple responses Examine the ordinal scaled questions Analysis of data by calculating rank order and using data transformation Assess the concept and role of research reporting
12.2 DATA ANALYSIS
Once the raw data is collected from both primary and secondary sources, thenext step is to analyse the same so as to draw logical inferences from them. Thedata collected in a survey could be voluminous in nature, depending upon the sizeof the sample. In a typical research study there may be a large number of variablesthat the researcher needs to analyse. The analysis could be univariate, bivariateand multivariate in nature. In the univariate analysis, one variable is analysed at atime. In the bivariate analysis two variables are analysed together and examinedfor any possible association between them. In the multivariate analysis, the concernis to analyse more than two variables at a time.
The type of statistical techniques used for analysing univariate and bivariatedata depends upon the level of measurements of the questions pertaining to thosevariables. Further, the data analysis could be of two types, namely, descriptiveand inferential. Below is mentioned a list of illustrative set of questions which areanswered under both descriptive and inferential analysis.
Descriptive vs Inferential Analysis
Descriptive AnalysisDescriptive analysis refers to transformation of raw data into a form that will facilitateeasy understanding and interpretation. Descriptive analysis deals with summarymeasures relating to the sample data. The common ways of summarizing data areby calculating average, range, standard deviation, frequency and percentagedistribution. The first thing to do when data analysis is taken up is to describe thesample. Below is a set of typical questions that are required to be answered underdescriptive statistics: What is the average income of the sample? What is the average age of the sample? What is the standard deviation of ages in the sample? What is the standard deviation of incomes in the sample? What percentage of sample respondents are married? What is the median age of the sample respondents? Which income group has the highest number of user of product in question
in the sample?
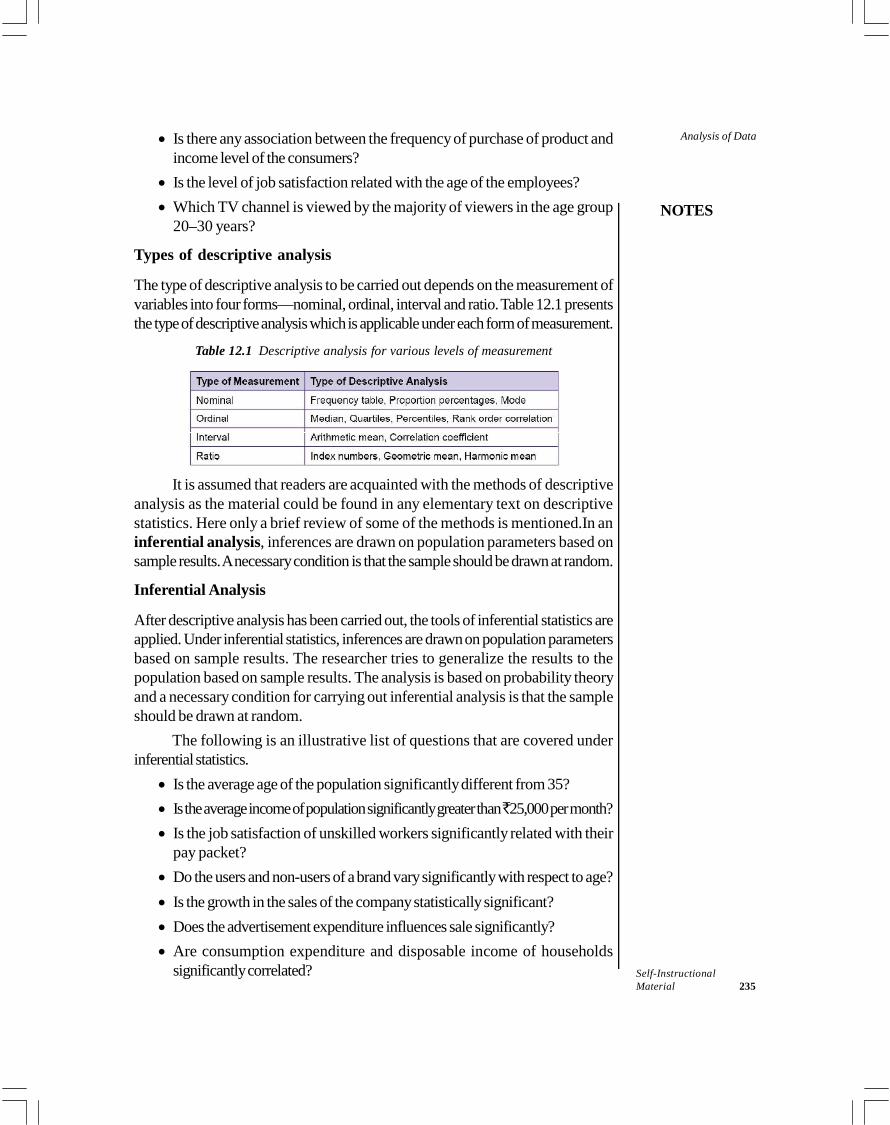
NOTES
Self-InstructionalMaterial 235
Analysis of Data Is there any association between the frequency of purchase of product andincome level of the consumers? Is the level of job satisfaction related with the age of the employees? Which TV channel is viewed by the majority of viewers in the age group
20–30 years?
Types of descriptive analysis
The type of descriptive analysis to be carried out depends on the measurement ofvariables into four forms—nominal, ordinal, interval and ratio. Table 12.1 presentsthe type of descriptive analysis which is applicable under each form of measurement.
Table 12.1 Descriptive analysis for various levels of measurement
It is assumed that readers are acquainted with the methods of descriptiveanalysis as the material could be found in any elementary text on descriptivestatistics. Here only a brief review of some of the methods is mentioned.In aninferential analysis, inferences are drawn on population parameters based onsample results. A necessary condition is that the sample should be drawn at random.
Inferential Analysis
After descriptive analysis has been carried out, the tools of inferential statistics areapplied. Under inferential statistics, inferences are drawn on population parametersbased on sample results. The researcher tries to generalize the results to thepopulation based on sample results. The analysis is based on probability theoryand a necessary condition for carrying out inferential analysis is that the sampleshould be drawn at random.
The following is an illustrative list of questions that are covered underinferential statistics. Is the average age of the population significantly different from 35? Is the average income of population significantly greater than`25,000 per month? Is the job satisfaction of unskilled workers significantly related with their
pay packet? Do the users and non-users of a brand vary significantly with respect to age? Is the growth in the sales of the company statistically significant? Does the advertisement expenditure influences sale significantly? Are consumption expenditure and disposable income of households
significantly correlated?
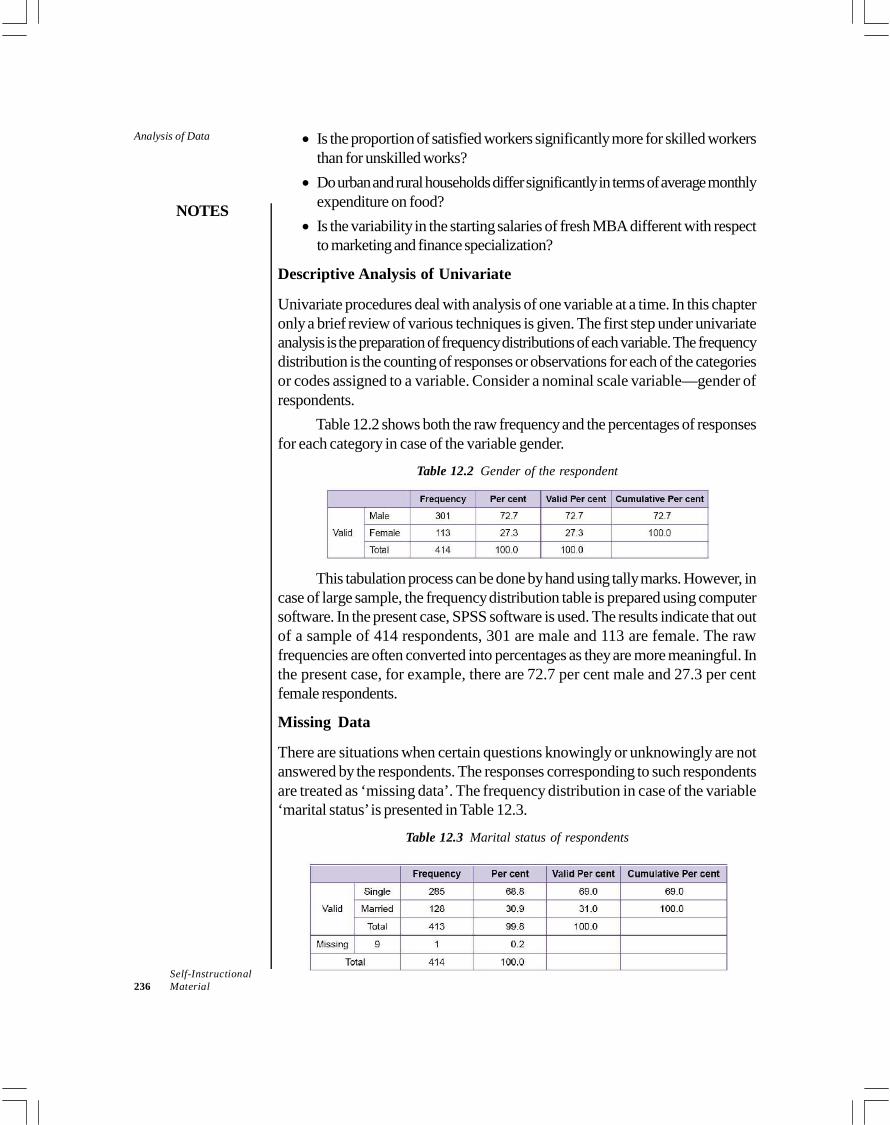
Analysis of Data
NOTES
Self-Instructional236 Material
Is the proportion of satisfied workers significantly more for skilled workersthan for unskilled works? Do urban and rural households differ significantly in terms of average monthly
expenditure on food? Is the variability in the starting salaries of fresh MBA different with respect
to marketing and finance specialization?
Descriptive Analysis of Univariate
Univariate procedures deal with analysis of one variable at a time. In this chapteronly a brief review of various techniques is given. The first step under univariateanalysis is the preparation of frequency distributions of each variable. The frequencydistribution is the counting of responses or observations for each of the categoriesor codes assigned to a variable. Consider a nominal scale variable—gender ofrespondents.
Table 12.2 shows both the raw frequency and the percentages of responsesfor each category in case of the variable gender.
Table 12.2 Gender of the respondent
This tabulation process can be done by hand using tally marks. However, incase of large sample, the frequency distribution table is prepared using computersoftware. In the present case, SPSS software is used. The results indicate that outof a sample of 414 respondents, 301 are male and 113 are female. The rawfrequencies are often converted into percentages as they are more meaningful. Inthe present case, for example, there are 72.7 per cent male and 27.3 per centfemale respondents.
Missing Data
There are situations when certain questions knowingly or unknowingly are notanswered by the respondents. The responses corresponding to such respondentsare treated as ‘missing data’. The frequency distribution in case of the variable‘marital status’ is presented in Table 12.3.
Table 12.3 Marital status of respondents
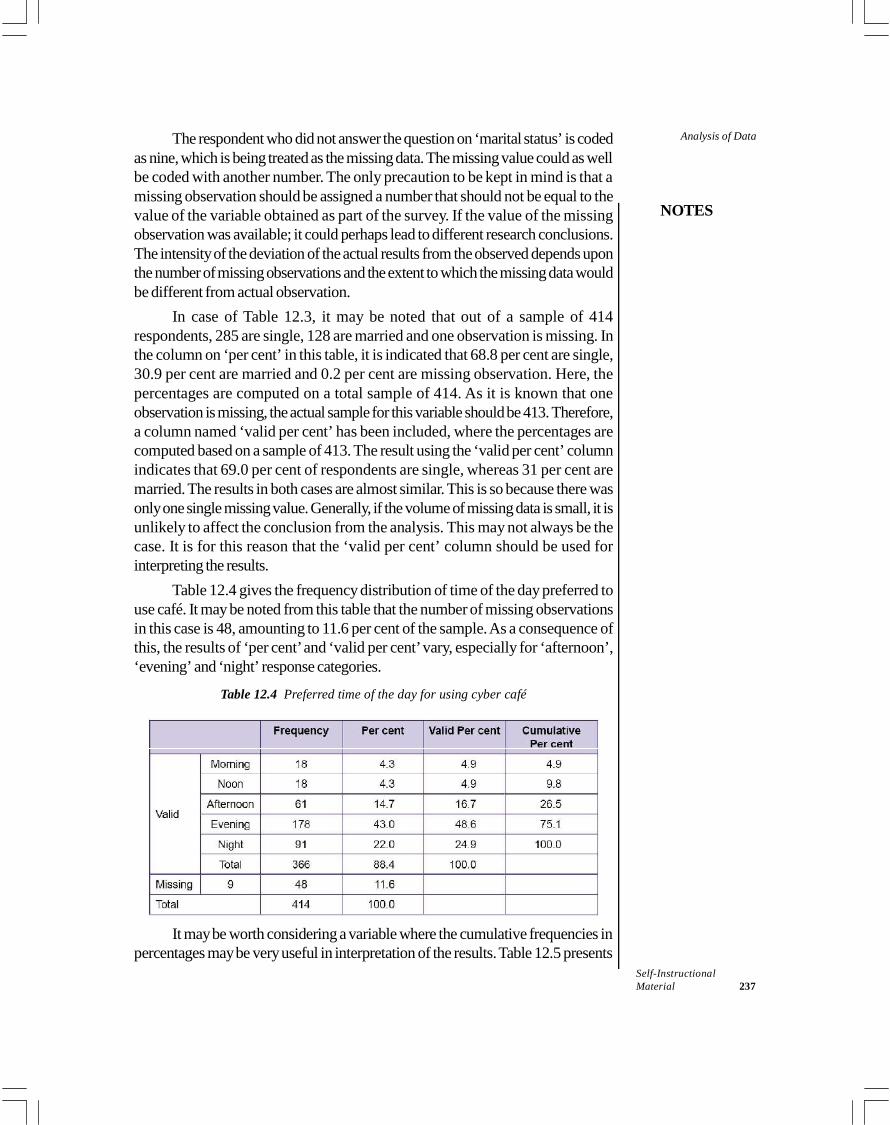
NOTES
Self-InstructionalMaterial 237
Analysis of DataThe respondent who did not answer the question on ‘marital status’ is codedas nine, which is being treated as the missing data. The missing value could as wellbe coded with another number. The only precaution to be kept in mind is that amissing observation should be assigned a number that should not be equal to thevalue of the variable obtained as part of the survey. If the value of the missingobservation was available; it could perhaps lead to different research conclusions.The intensity of the deviation of the actual results from the observed depends uponthe number of missing observations and the extent to which the missing data wouldbe different from actual observation.
In case of Table 12.3, it may be noted that out of a sample of 414respondents, 285 are single, 128 are married and one observation is missing. Inthe column on ‘per cent’ in this table, it is indicated that 68.8 per cent are single,30.9 per cent are married and 0.2 per cent are missing observation. Here, thepercentages are computed on a total sample of 414. As it is known that oneobservation is missing, the actual sample for this variable should be 413. Therefore,a column named ‘valid per cent’ has been included, where the percentages arecomputed based on a sample of 413. The result using the ‘valid per cent’ columnindicates that 69.0 per cent of respondents are single, whereas 31 per cent aremarried. The results in both cases are almost similar. This is so because there wasonly one single missing value. Generally, if the volume of missing data is small, it isunlikely to affect the conclusion from the analysis. This may not always be thecase. It is for this reason that the ‘valid per cent’ column should be used forinterpreting the results.
Table 12.4 gives the frequency distribution of time of the day preferred touse café. It may be noted from this table that the number of missing observationsin this case is 48, amounting to 11.6 per cent of the sample. As a consequence ofthis, the results of ‘per cent’ and ‘valid per cent’ vary, especially for ‘afternoon’,‘evening’ and ‘night’ response categories.
Table 12.4 Preferred time of the day for using cyber café
It may be worth considering a variable where the cumulative frequencies inpercentages may be very useful in interpretation of the results. Table 12.5 presents
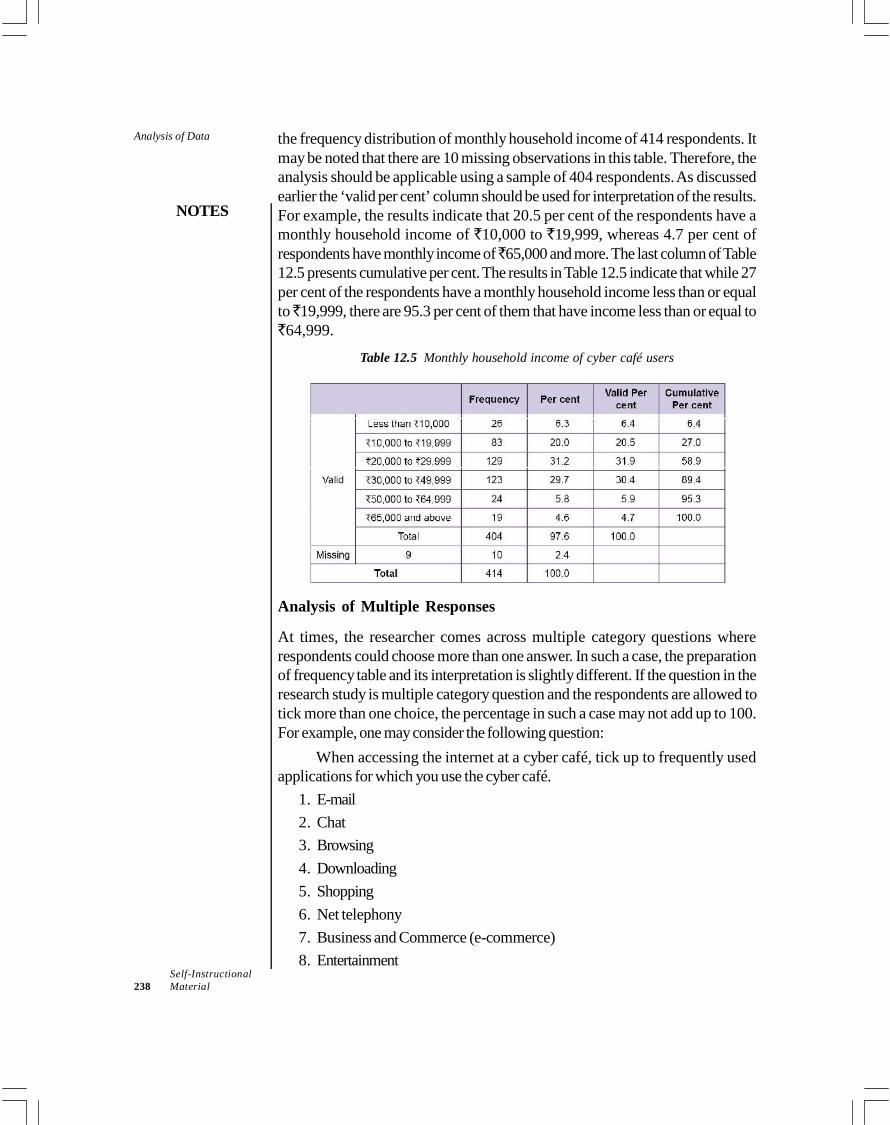
Analysis of Data
NOTES
Self-Instructional238 Material
the frequency distribution of monthly household income of 414 respondents. Itmay be noted that there are 10 missing observations in this table. Therefore, theanalysis should be applicable using a sample of 404 respondents. As discussedearlier the ‘valid per cent’ column should be used for interpretation of the results.For example, the results indicate that 20.5 per cent of the respondents have amonthly household income of `10,000 to `19,999, whereas 4.7 per cent ofrespondents have monthly income of`65,000 and more. The last column of Table12.5 presents cumulative per cent. The results in Table 12.5 indicate that while 27per cent of the respondents have a monthly household income less than or equalto `19,999, there are 95.3 per cent of them that have income less than or equal to`64,999.
Table 12.5 Monthly household income of cyber café users
Analysis of Multiple Responses
At times, the researcher comes across multiple category questions whererespondents could choose more than one answer. In such a case, the preparationof frequency table and its interpretation is slightly different. If the question in theresearch study is multiple category question and the respondents are allowed totick more than one choice, the percentage in such a case may not add up to 100.For example, one may consider the following question:
When accessing the internet at a cyber café, tick up to frequently usedapplications for which you use the cyber café.
1. E-mail2. Chat3. Browsing4. Downloading5. Shopping6. Net telephony7. Business and Commerce (e-commerce)8. Entertainment
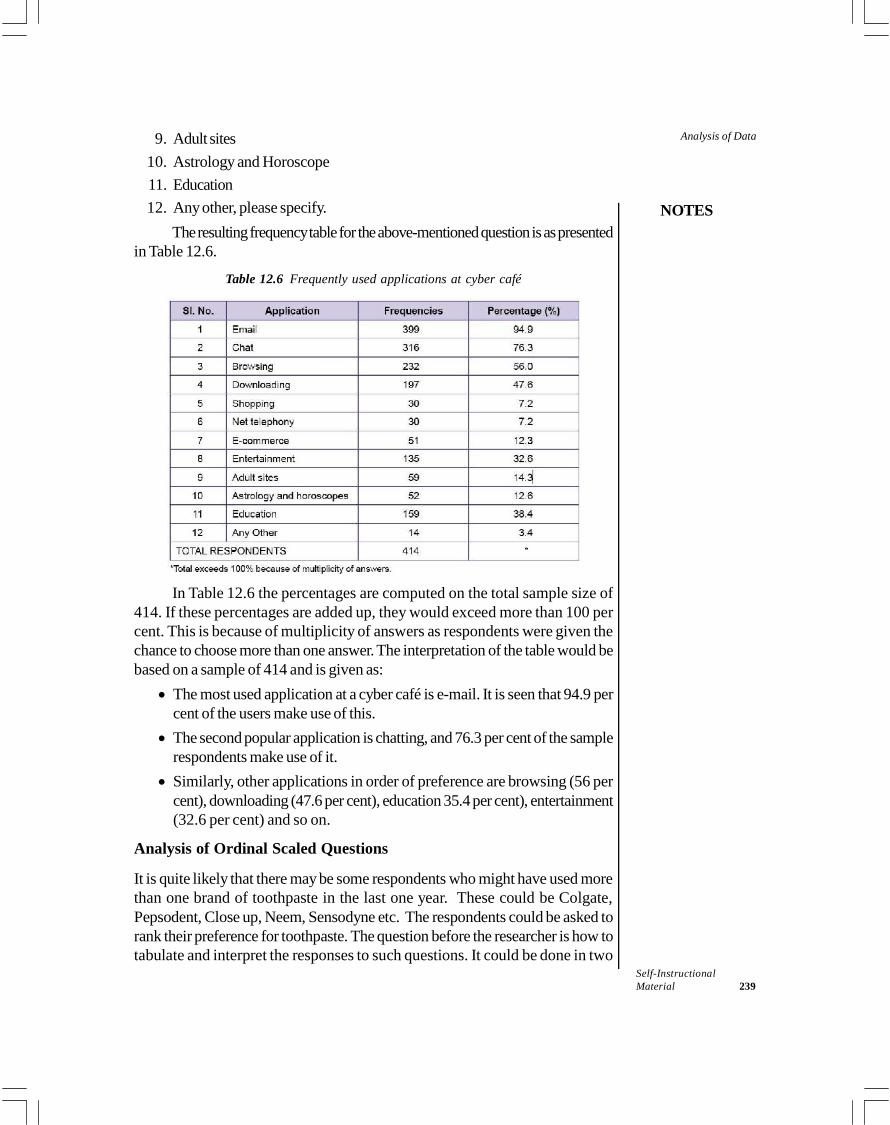
NOTES
Self-InstructionalMaterial 239
Analysis of Data9. Adult sites10. Astrology and Horoscope11. Education12. Any other, please specify.
The resulting frequency table for the above-mentioned question is as presentedin Table 12.6.
Table 12.6 Frequently used applications at cyber café
In Table 12.6 the percentages are computed on the total sample size of414. If these percentages are added up, they would exceed more than 100 percent. This is because of multiplicity of answers as respondents were given thechance to choose more than one answer. The interpretation of the table would bebased on a sample of 414 and is given as: The most used application at a cyber café is e-mail. It is seen that 94.9 per
cent of the users make use of this. The second popular application is chatting, and 76.3 per cent of the sample
respondents make use of it. Similarly, other applications in order of preference are browsing (56 per
cent), downloading (47.6 per cent), education 35.4 per cent), entertainment(32.6 per cent) and so on.
Analysis of Ordinal Scaled Questions
It is quite likely that there may be some respondents who might have used morethan one brand of toothpaste in the last one year. These could be Colgate,Pepsodent, Close up, Neem, Sensodyne etc. The respondents could be asked torank their preference for toothpaste. The question before the researcher is how totabulate and interpret the responses to such questions. It could be done in two
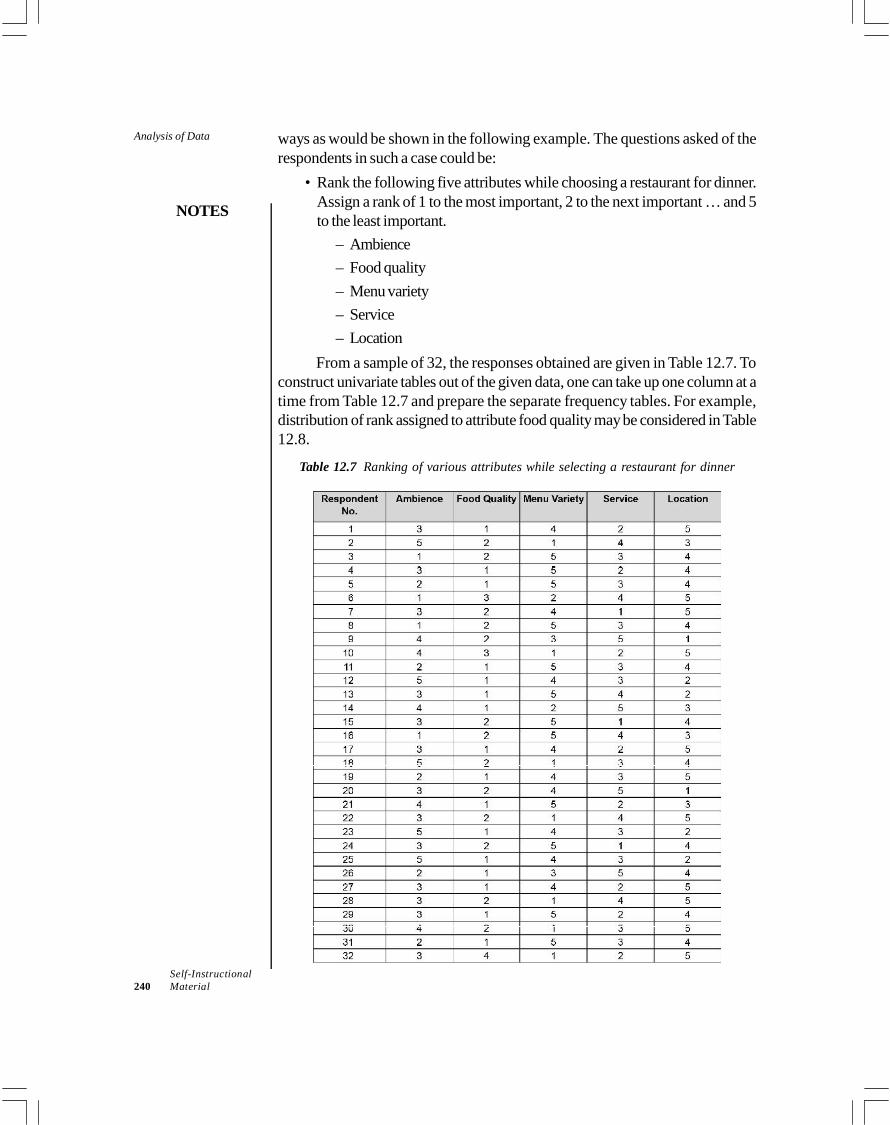
Analysis of Data
NOTES
Self-Instructional240 Material
ways as would be shown in the following example. The questions asked of therespondents in such a case could be:
• Rank the following five attributes while choosing a restaurant for dinner.Assign a rank of 1 to the most important, 2 to the next important … and 5to the least important.
– Ambience– Food quality– Menu variety– Service– Location
From a sample of 32, the responses obtained are given in Table 12.7. Toconstruct univariate tables out of the given data, one can take up one column at atime from Table 12.7 and prepare the separate frequency tables. For example,distribution of rank assigned to attribute food quality may be considered in Table12.8.
Table 12.7 Ranking of various attributes while selecting a restaurant for dinner
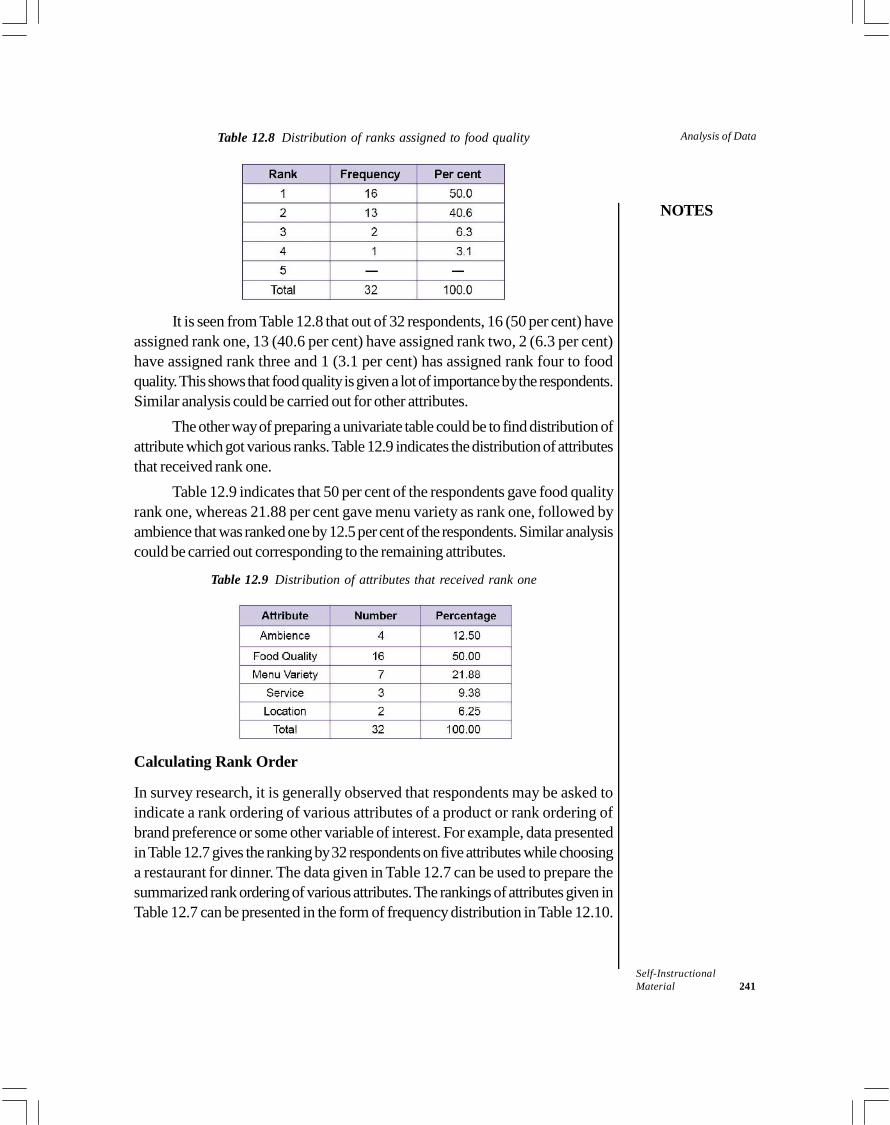
NOTES
Self-InstructionalMaterial 241
Analysis of DataTable 12.8 Distribution of ranks assigned to food quality
It is seen from Table 12.8 that out of 32 respondents, 16 (50 per cent) haveassigned rank one, 13 (40.6 per cent) have assigned rank two, 2 (6.3 per cent)have assigned rank three and 1 (3.1 per cent) has assigned rank four to foodquality. This shows that food quality is given a lot of importance by the respondents.Similar analysis could be carried out for other attributes.
The other way of preparing a univariate table could be to find distribution ofattribute which got various ranks. Table 12.9 indicates the distribution of attributesthat received rank one.
Table 12.9 indicates that 50 per cent of the respondents gave food qualityrank one, whereas 21.88 per cent gave menu variety as rank one, followed byambience that was ranked one by 12.5 per cent of the respondents. Similar analysiscould be carried out corresponding to the remaining attributes.
Table 12.9 Distribution of attributes that received rank one
Calculating Rank Order
In survey research, it is generally observed that respondents may be asked toindicate a rank ordering of various attributes of a product or rank ordering ofbrand preference or some other variable of interest. For example, data presentedin Table 12.7 gives the ranking by 32 respondents on five attributes while choosinga restaurant for dinner. The data given in Table 12.7 can be used to prepare thesummarized rank ordering of various attributes. The rankings of attributes given inTable 12.7 can be presented in the form of frequency distribution in Table 12.10.
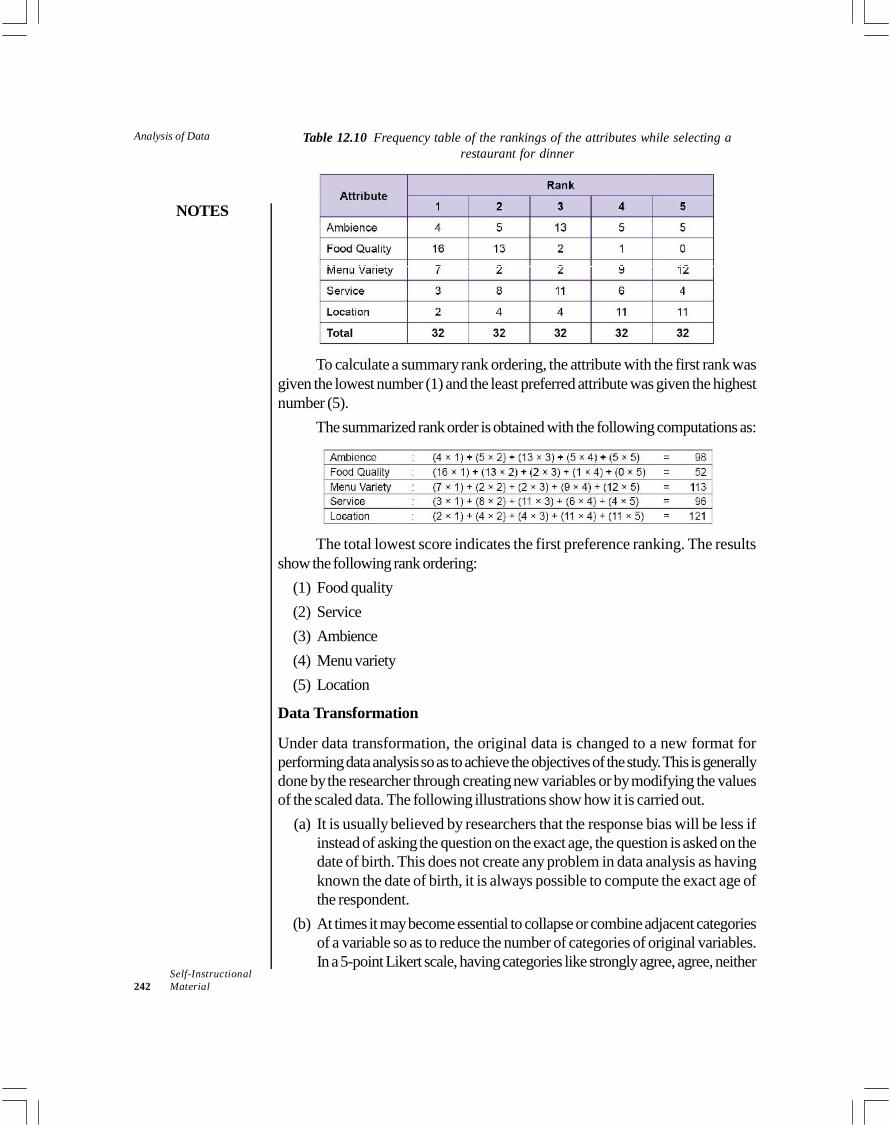
Analysis of Data
NOTES
Self-Instructional242 Material
Table 12.10 Frequency table of the rankings of the attributes while selecting arestaurant for dinner
To calculate a summary rank ordering, the attribute with the first rank wasgiven the lowest number (1) and the least preferred attribute was given the highestnumber (5).
The summarized rank order is obtained with the following computations as:
The total lowest score indicates the first preference ranking. The resultsshow the following rank ordering:
(1) Food quality(2) Service(3) Ambience(4) Menu variety(5) Location
Data Transformation
Under data transformation, the original data is changed to a new format forperforming data analysis so as to achieve the objectives of the study. This is generallydone by the researcher through creating new variables or by modifying the valuesof the scaled data. The following illustrations show how it is carried out.
(a) It is usually believed by researchers that the response bias will be less ifinstead of asking the question on the exact age, the question is asked on thedate of birth. This does not create any problem in data analysis as havingknown the date of birth, it is always possible to compute the exact age ofthe respondent.
(b) At times it may become essential to collapse or combine adjacent categoriesof a variable so as to reduce the number of categories of original variables.In a 5-point Likert scale, having categories like strongly agree, agree, neither
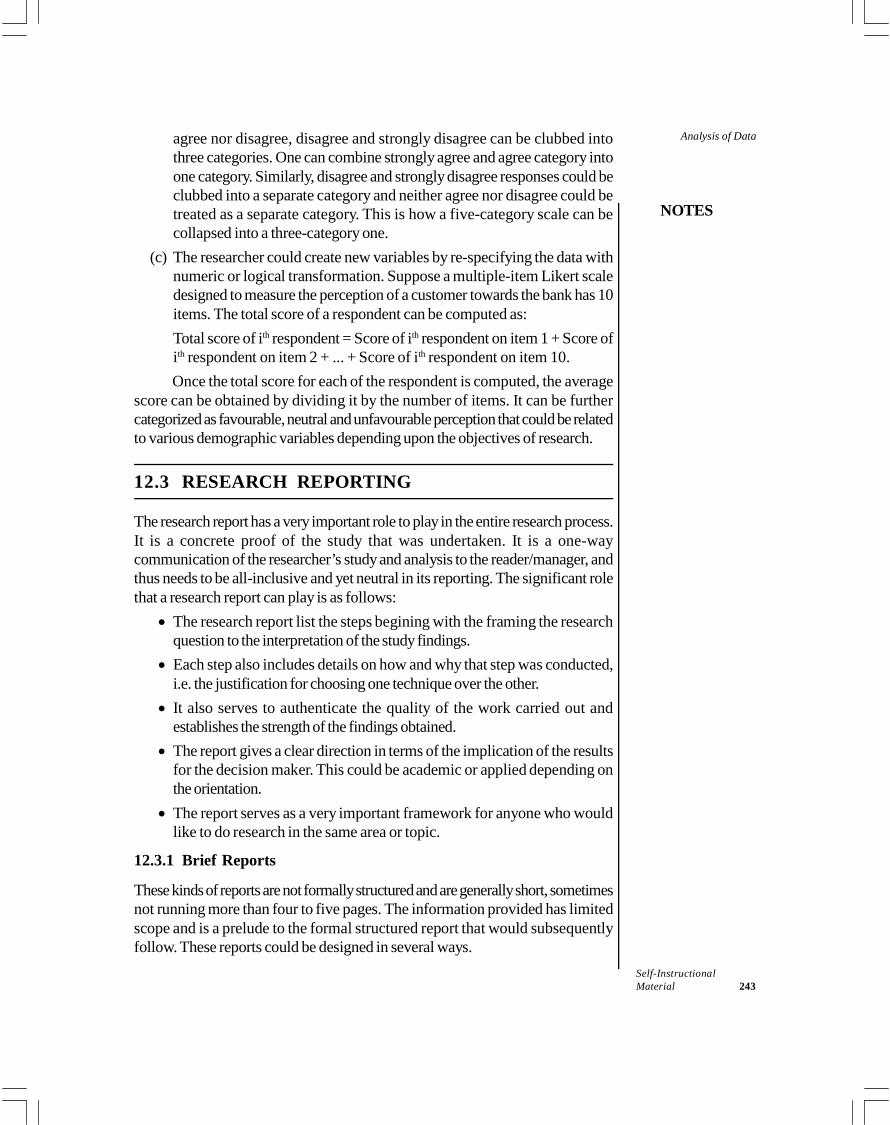
NOTES
Self-InstructionalMaterial 243
Analysis of Dataagree nor disagree, disagree and strongly disagree can be clubbed intothree categories. One can combine strongly agree and agree category intoone category. Similarly, disagree and strongly disagree responses could beclubbed into a separate category and neither agree nor disagree could betreated as a separate category. This is how a five-category scale can becollapsed into a three-category one.
(c) The researcher could create new variables by re-specifying the data withnumeric or logical transformation. Suppose a multiple-item Likert scaledesigned to measure the perception of a customer towards the bank has 10items. The total score of a respondent can be computed as:Total score of ith respondent = Score of ith respondent on item 1 + Score ofith respondent on item 2 + ... + Score of ith respondent on item 10.Once the total score for each of the respondent is computed, the average
score can be obtained by dividing it by the number of items. It can be furthercategorized as favourable, neutral and unfavourable perception that could be relatedto various demographic variables depending upon the objectives of research.
12.3 RESEARCH REPORTING
The research report has a very important role to play in the entire research process.It is a concrete proof of the study that was undertaken. It is a one-waycommunication of the researcher’s study and analysis to the reader/manager, andthus needs to be all-inclusive and yet neutral in its reporting. The significant rolethat a research report can play is as follows: The research report list the steps begining with the framing the research
question to the interpretation of the study findings. Each step also includes details on how and why that step was conducted,
i.e. the justification for choosing one technique over the other. It also serves to authenticate the quality of the work carried out and
establishes the strength of the findings obtained. The report gives a clear direction in terms of the implication of the results
for the decision maker. This could be academic or applied depending onthe orientation. The report serves as a very important framework for anyone who would
like to do research in the same area or topic.
12.3.1 Brief Reports
These kinds of reports are not formally structured and are generally short, sometimesnot running more than four to five pages. The information provided has limitedscope and is a prelude to the formal structured report that would subsequentlyfollow. These reports could be designed in several ways.
Analysis of Data
NOTES
Self-Instructional244 Material
Working papers or basic reports are written for the purpose of recordingthe process carried out in terms of scope and framework of the study, themethodology followed and instrument designed. The results and findingswould also be recorded here. However, the interpretation of the findingsand study background might be missing, as the focus is more on the presentstudy rather than past literature. Survey reports might or might not have an academic orientation. The focus
here is to present findings in easy-to-comprehend format that includes figuresand tables. The advantage of these reports is that they are simple and easyto understand and present the findings in a clear and usable format.
12.3.2 Detailed reports
These are more formal and could be academic, technical or business reports. Technical reports: These are major documents and would include all
elements of the basic report, as well as the interpretations and conclusions,as related to the obtained results. This would have a complete problembackground and any additional past data/records that are essential forunderstanding and interpreting the study results. All sources of data, samplingplan, data collection instrument(s), data analysis outputs would be formallyand sequentially documented. Business reports: These reports include conclusions as understood by
the business manager. The tables, figures and numbers of the first reportwould now be pictorially shown as bar charts and graphs and the reportingtone would be more in business terms. Tabular data might be attached inthe appendix.
12.3.3 Interpretation
This section comes after the main report and contains interpretations of resultsand suggested recommendations. It presents the information in a summarized andnumerical form.
Sometimes, the research results obtained may not be in the direction asfound by earlier researchers. Here, the skill of the researcher in justifying the obtaineddirection is based on his/her individual opinion and expertise in the area of study.After the interpretation of results, sometimes, the study requirement might be toformulate indicative recommendations to the decision-makers as well. Thus, incase the report includes recommendations, they should be realistic, workable andtopically related to the industry studied.
12.3.4 Presentation
It has been observed that report and presentation are the media of conveyingone’s ideas to a group of people. However, the most significant difference betweenthe two of them is that the individual making the presentation becomes visible andis able to connect in a better way with his audience.
NOTES
Self-InstructionalMaterial 245
Analysis of DataA report is also a structured presentation of the results of a research thatinterprets facts and figures and becomes valuable for suggestions. Its foundation isguided by research followed by collection, development and validation ofknowledge. Once all the information/data has been collected it is presented in astructured or logical manner in the form of a presentation. A presentation is alsodeveloped in the same manner like the report; however, the most prominentdifference is that of the human element.
Let us briefly study the essential elements of a presentation.1. Data: The making of a presentation begins with collection ofinformation to be put before an audience. However, in the case of areport, the audience has the advantage of going through the informationat his or her own pace while this is not the same in a presentation.2. Structure: The presenter must ensure that the data or informationbeing presented should have a logical flow, i.e., proper beginning, middleand end. The main challenge for a presenter is to keep the audienceengaged in the presentation. In a report, while the reader is going throughits contents, he is guided by the endnotes, footnotes and suggestedreadings which is not the case of a presentation.3. Presentation: Another significant difference between a presentationand a report is that a report can be read and read again but not apresentation. In case, a linking aspect is missed in the presentation thenthe logical sequencing of the flow of content get eliminated for theaudience thereby, affecting the understanding of the audience.
4. Human element: The most significant differentiating factor is that ofthe presenter making the presentation. Largely, a presentation isremembered by the audience due to the presenter making thepresentation. Here it needs to be mentioned that the presenter throughhis voice quality, accent and pronunciation grasps the attention of theaudience. Also, the body language of the presenter plays a vital role inmaking the presentation successful.
Check Your Progress
1. What is univariate, bivariate and multivariate analysis?2. Define descriptive analysis.3. Name the types of descriptive analysis.4. On which theory is the inferential analysis based?5. What is research reporting?6. What is the purpose of working papers?
Analysis of Data
NOTES
Self-Instructional246 Material
12.4 ANSWERS TO CHECK YOUR PROGRESSQUESTIONS
1. In the univariate analysis, one variable is analysed at a time. In the bivariateanalysis two variables are analysed together and examined for any possibleassociation between them. In the multivariate analysis, the concern is toanalyse more than two variables at a time.
2. Descriptive analysis refers to transformation of raw data into a form thatwill facilitate easy understanding and interpretation. Descriptive analysis dealswith summary measures relating to the sample data. The common ways ofsummarizing data are by calculating average, range, standard deviation,frequency and percentage distribution.
3. The type of descriptive analysis to be carried out depends on the measurementof variables into four forms – nominal, ordinal, interval and ratio.
4. The inferential analysis is based on probability theory and a necessarycondition for carrying out inferential analysis is that the sample should bedrawn at random.
5. The research report has a very important role to play in the entire researchprocess. It is a concrete proof of the study that was undertaken. It is a one-way communication of the researcher’s study and analysis to the reader /manager, and thus needs to be all-inclusive and yet neutral in its reporting.
6. Working papers or basic reports are written for the purpose of recordingthe process carried out in terms of scope and framework of the study, themethodology followed and instrument designed. The results and findingswould also be recorded here. However, the interpretation of the findingsand study background might be missing, as the focus is more on the presentstudy rather than past literature.
12.5 SUMMARY
Once the raw data is collected from both primary and secondary sources,the next step is to analyse the same so as to draw logical inferences fromthem. The data collected in a survey could be voluminous in nature,depending upon the size of the sample. In a typical research study there may be a large number of variables that the
researcher needs to analyse. The analysis could be univariate, bivariate andmultivariate in nature. In the univariate analysis, one variable is analysed ata time. In the bivariate analysis two variables are analysed together and
NOTES
Self-InstructionalMaterial 247
Analysis of Dataexamined for any possible association between them. In the multivariateanalysis, the concern is to analyse more than two variables at a time. The type of statistical techniques used for analysing univariate and bivariate
data depends upon the level of measurements of the questions pertaining tothose variables. Descriptive analysis refers to transformation of raw data into a form that
will facilitate easy understanding and interpretation. Descriptive analysis dealswith summary measures relating to the sample data. The common ways ofsummarizing data are by calculating average, range, standard deviation,frequency and percentage distribution. The type of descriptive analysis to be carried out depends on the measurement
of variables into four forms—nominal, ordinal, interval and ratio. In an inferential analysis, inferences are drawn on population parameters
based on sample results. A necessary condition is that the sample should bedrawn at random. Univariate procedures deal with analysis of one variable at a time. In this
chapter only a brief review of various techniques is given. The first stepunder univariate analysis is the preparation of frequency distributions ofeach variable. The intensity of the deviation of the actual results from the observed depends
upon the number of missing observations and the extent to which the missingdata would be different from actual observation. At times, the researcher comes across multiple category questions where
respondents could choose more than one answer. In such a case, thepreparation of frequency table and its interpretation is slightly different. Ifthe question in the research study is multiple category question and therespondents are allowed to tick more than one choice, the percentage insuch a case may not add up to 100. Under data transformation, the original data is changed to a new format for
performing data analysis so as to achieve the objectives of the study. This isgenerally done by the researcher through creating new variables or bymodifying the values of the scaled data. The researcher could create new variables by re-specifying the data with
numeric or logical transformation. The research report has a very important role to play in the entire research
process. It is a concrete proof of the study that was undertaken. It is a one-way communication of the researcher’s study and analysis to the reader/manager, and thus needs to be all-inclusive and yet neutral in its reporting.
Analysis of Data
NOTES
Self-Instructional248 Material
The report gives a clear direction in terms of the implication of the resultsfor the decision maker. This could be academic or applied depending onthe orientation. Brief reports are not formally structured and are generally short, sometimes
not running more than four to five pages. The information provided haslimited scope and is a prelude to the formal structured report that wouldsubsequently follow. Basic reports could be designed in several ways, namely working papers
or basic reports and survey reports. Detailed reports are more formal and could be academic, technical or
business reports. Technical reports are major documents and would include all elements of
the basic report, as well as the interpretations and conclusions, as related tothe obtained results. This would have a complete problem background andany additional past data/records that are essential for understanding andinterpreting the study results. All sources of data, sampling plan, datacollection instrument(s), data analysis outputs would be formally andsequentially documented. Business reports include conclusions as understood by the business manager.
The tables, figures and numbers of the first report would now be pictoriallyshown as bar charts and graphs and the reporting tone would be more inbusiness terms. This section comes after the main report and contains interpretations of
results and suggested recommendations. It presents the information in asummarized and numerical form. In the management report, the information on the sampling techniques follows
the research intention, and the questionnaire design details need not bereported. The review of past literature would be perfunctory in themanagement report; however, they would be detailed and accompaniedwith the bibliography in the technical report. Then come the background section, which includes the problem statement,
introduction, study background, scope and objectives of the study and thereview of literature (depends on the purpose). In the management report, the sequencing of the report might be reversed
to suit the needs of the decision-maker, as here the reader needs to reviewand absorb the findings. Thus, the entire research project needs to be recorded either as a single
written report or into several reports, depending on the need of the readers.
NOTES
Self-InstructionalMaterial 249
Analysis of Data12.6 KEY WORDS
Data Analysis: It refers to the process of inspecting, cleansing, transforming,and modelling data with the goal of discovering useful information, informingconclusions and supporting decision-making. Likert scale: A Likert scale is a psychometric scale commonly involved in
research that employs questionnaires. Rank Order: It refers to a scale which gives the respondent a set of items
and asks them to put the items in some form of order. Data Transformation: It refers to the process of converting data from
one format or structure into another format or structure. Research Report: It refers to a document prepared by an analyst or
strategist who is a part of investment research team.
12.7 SELF ASSESSMENT QUESTIONS ANDEXERCISES
Short Answer Questions
1. What do you mean by data analysis?2. What is inferential analysis?3. How does a researcher analyse multiple responses?4. Briefly explain calculation of rank order with the help of an example.5. Define data transformation.6. Write short note on brief reports.
Long Answer Questions
1. How is data transformation carried out? Explain.2. Discuss the role of research reporting.3. What do you understand by interpretation and presentation? Explain.4. Examine the types of detailed reports.
12.8 FURTHER READINGS
Busha, Charles H. and Stephen P. Harter. 1980. Research Methods inLibrarianship: Techniques and Interpretation. Orlando: Academic Press.
Analysis of Data
NOTES
Self-Instructional250 Material
Kumar, Krishan. 1992. Research Methods in Library and Information Science.New Delhi: Har-Anand Publications.
Rao, I.K. Ravichandra. 2009. Quantitative Methods for Library andInformation Science. New Delhi: New Age International Publishers.
Slater, Margaret. 1990. Research Methods in Library and Information Studies.London: Facet Pub.
Fowler, F. J. 2008. Survey Research Methods. New Delhi: SAGE Publications.
NOTES
Self-InstructionalMaterial 251
Statistical Analysis Software
UNIT 13 STATISTICAL ANALYSISSOFTWARE
Structure13.0 Introduction13.1 Objectives13.2 Statistical Analysis Software: Overview13.3 Statistical Package for Social Sciences (SPSS)13.4 Statistical Analysis Software: PSPP and SOFA13.5 Answers to Check Your Progress Questions13.6 Summary13.7 Key Words13.8 Self Assessment Questions and Exercises13.9 Further Readings
13.0 INTRODUCTION
Statistical Analysis involves the collecting and examining every data sample. Inevery sector, organizations depend on data and analysis to offer and gain newinsights to the growing market trend and gain a competitive edge. A statisticalanalysis is aimed to identify growing trends and statistical analysis software provideswide-ranging statistical capabilities that aim to meet the expanding requirements.Statistical software are specialised computer programs that are able to solvecomplex business and statistical problems.
In this unit, you will study about the number of specific software programsused in statistical analysis. You will also study about SPSS which is one of themost popular software package for statistical analysis. Apart from SPSS, you willalso learn about PSPP, the alternative for SPSS and also about SOFA which is anopen source user friendly statistical software package considered as an innovativeanalysis tool for statistical calculation and reporting.
13.1 OBJECTIVES
After going through this unit, you will be able to: Understand the System for Statistical Analysis (SAS) Carry out statistical preparation of data Discuss the popular software packages to perform statistical analysis like
SPSS Describe the usage, installation of SOFA statistical software
Statistical Analysis Software
NOTES
Self-Instructional252 Material
13.2 STATISTICAL ANALYSIS SOFTWARE:OVERVIEW
Researchers have advantage of a wide array of statistical programmes to assistthem in both data management and data analysis. In this section we will brieflydiscuss only the most frequently used packages.MS Excel:The simplest and most widely used method of presenting and tabulatingdata is on Excel. The basic mathematical functions can be calculated here. Secondly,the software is easy to understand and used by most computer users. The dataentered on Excel can be transported to most statistical packages for a higher levelanalysis.Minitab: Minitab Inc. was developed more than 20 years ago at the PennsylvaniaState University. It can be used with considerable ease and effectiveness in allbusiness areas. It was originally used by statisticians. However, today it is used formultiple applications—especially quality control, six sigma and the design ofexperiments. The URL for Minitab is http://www.minitab.com/. The researchercan utilize the products and help the guide to undertake a quantitative researchanalysis.Statistical Analysis System (SAS): SAS was created in the late 1960s at NorthCarolina State University. It has been actively and extensively used in managing,storing and analysing information. It has the advantage of being able to managereally bulky data sets with considerable ease. Linear models (Regression, Analysisof variance, Analysis of covariance), Generalized linear models (including Logisticregression and Poisson regression), multivariate methods (MANOVA, Canonicalcorrelation, Discriminant analysis, Factor analysis, Clustering), categorical dataanalysis (including log-linear models), and all the standard techniques for descriptiveand confirmatory statistical analysis are possible with SAS. The statistical analysesmay be interfaced with the graphical products to produce relevant plots such asq-q plots, residual plots, and other relevant graphical descriptions of the data.Forecasting and trend series can also be carried out using the package. It finds ahigher usage amongst industry than students who are more comfortable with SPSS.The URL for package is http://www.sas.com/.SPSS: Amongst the student community as well as with most research agencies,this is the most widely used package. It is adaptable to most business problems.
There are a number of specific software programs like E Views for businessforecasting and LISREL (Linear Structural Relations) for structural equationmodelling. However, for most purposes, SPSS is the most widely used software.
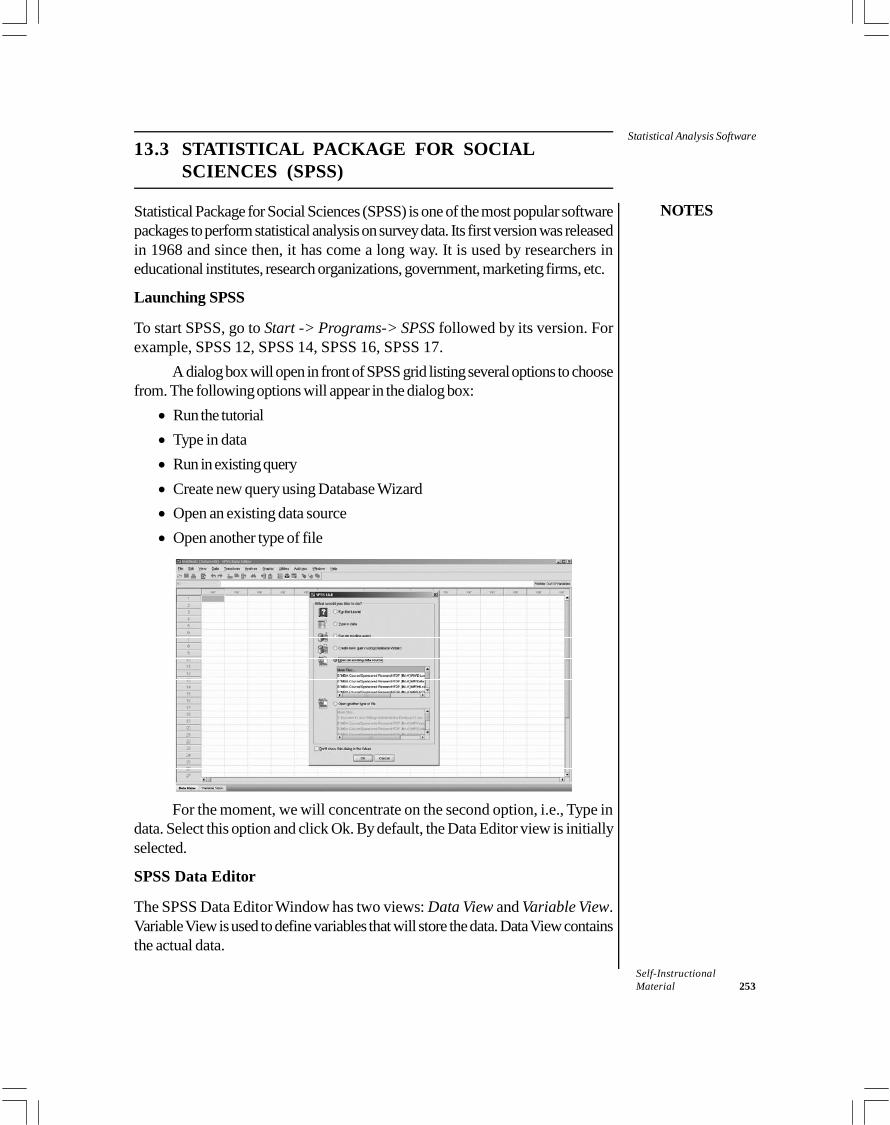
NOTES
Self-InstructionalMaterial 253
Statistical Analysis Software13.3 STATISTICAL PACKAGE FOR SOCIAL
SCIENCES (SPSS)
Statistical Package for Social Sciences (SPSS) is one of the most popular softwarepackages to perform statistical analysis on survey data. Its first version was releasedin 1968 and since then, it has come a long way. It is used by researchers ineducational institutes, research organizations, government, marketing firms, etc.
Launching SPSS
To start SPSS, go to Start -> Programs-> SPSS followed by its version. Forexample, SPSS 12, SPSS 14, SPSS 16, SPSS 17.
A dialog box will open in front of SPSS grid listing several options to choosefrom. The following options will appear in the dialog box: Run the tutorial Type in data Run in existing query Create new query using Database Wizard Open an existing data source Open another type of file
For the moment, we will concentrate on the second option, i.e., Type indata. Select this option and click Ok. By default, the Data Editor view is initiallyselected.
SPSS Data Editor
The SPSS Data Editor Window has two views: Data View and Variable View.Variable View is used to define variables that will store the data. Data View containsthe actual data.
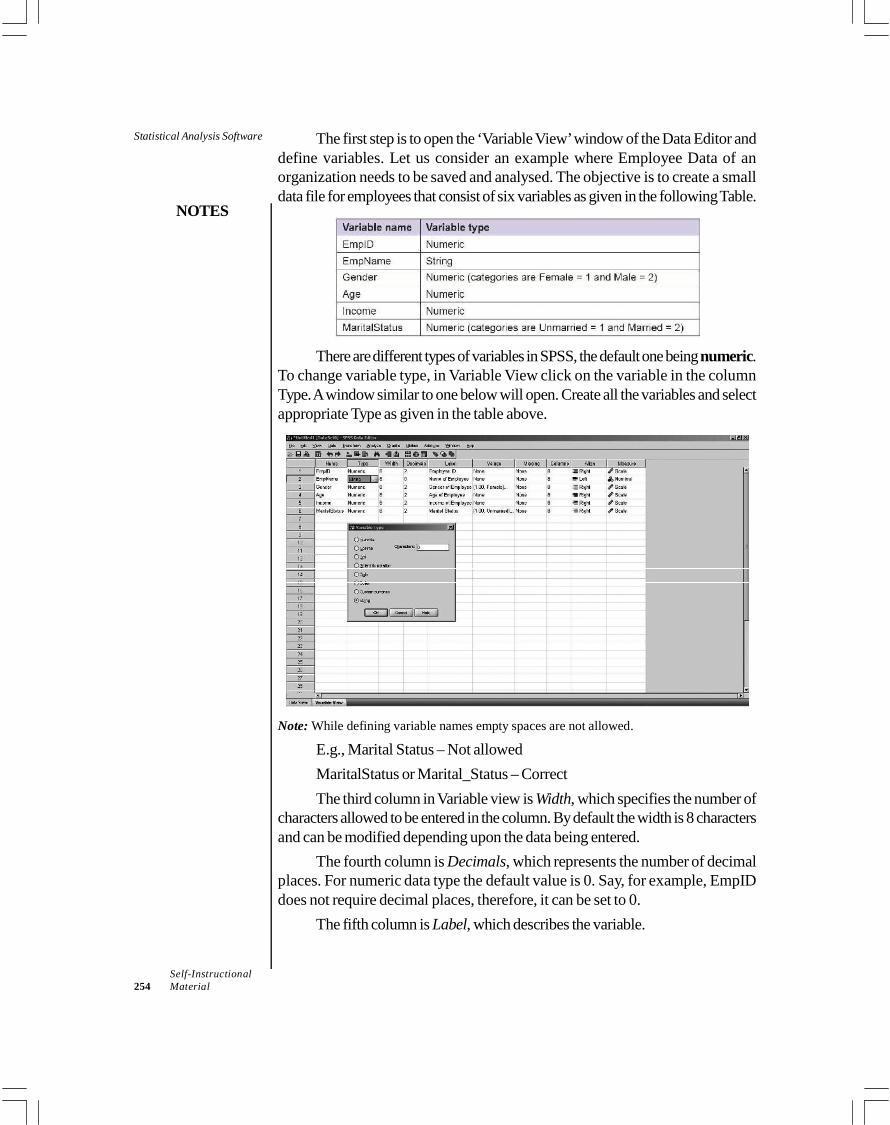
Statistical Analysis Software
NOTES
Self-Instructional254 Material
The first step is to open the ‘Variable View’ window of the Data Editor anddefine variables. Let us consider an example where Employee Data of anorganization needs to be saved and analysed. The objective is to create a smalldata file for employees that consist of six variables as given in the following Table.
There are different types of variables in SPSS, the default one beingnumeric.To change variable type, in Variable View click on the variable in the columnType. A window similar to one below will open. Create all the variables and selectappropriate Type as given in the table above.
Note: While defining variable names empty spaces are not allowed.
E.g., Marital Status – Not allowedMaritalStatus or Marital_Status – CorrectThe third column in Variable view is Width, which specifies the number of
characters allowed to be entered in the column. By default the width is 8 charactersand can be modified depending upon the data being entered.
The fourth column is Decimals, which represents the number of decimalplaces. For numeric data type the default value is 0. Say, for example, EmpIDdoes not require decimal places, therefore, it can be set to 0.
The fifth column is Label, which describes the variable.
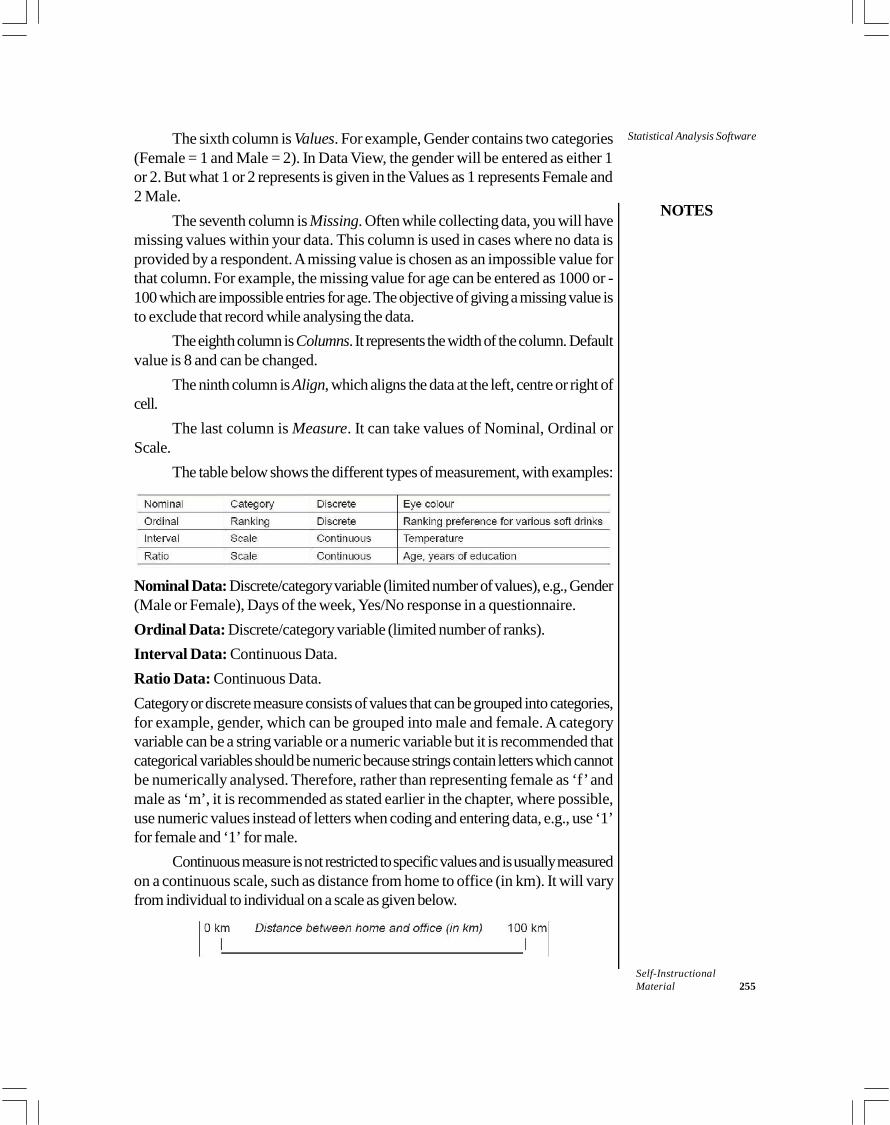
NOTES
Self-InstructionalMaterial 255
Statistical Analysis SoftwareThe sixth column is Values. For example, Gender contains two categories(Female = 1 and Male = 2). In Data View, the gender will be entered as either 1or 2. But what 1 or 2 represents is given in the Values as 1 represents Female and2 Male.
The seventh column is Missing. Often while collecting data, you will havemissing values within your data. This column is used in cases where no data isprovided by a respondent. A missing value is chosen as an impossible value forthat column. For example, the missing value for age can be entered as 1000 or -100 which are impossible entries for age. The objective of giving a missing value isto exclude that record while analysing the data.
The eighth column isColumns. It represents the width of the column. Defaultvalue is 8 and can be changed.
The ninth column is Align, which aligns the data at the left, centre or right ofcell.
The last column is Measure. It can take values of Nominal, Ordinal orScale.
The table below shows the different types of measurement, with examples:
Nominal Data: Discrete/category variable (limited number of values), e.g., Gender(Male or Female), Days of the week, Yes/No response in a questionnaire.Ordinal Data: Discrete/category variable (limited number of ranks).Interval Data: Continuous Data.Ratio Data: Continuous Data.Category or discrete measure consists of values that can be grouped into categories,for example, gender, which can be grouped into male and female. A categoryvariable can be a string variable or a numeric variable but it is recommended thatcategorical variables should be numeric because strings contain letters which cannotbe numerically analysed. Therefore, rather than representing female as ‘f’ andmale as ‘m’, it is recommended as stated earlier in the chapter, where possible,use numeric values instead of letters when coding and entering data, e.g., use ‘1’for female and ‘1’ for male.
Continuous measure is not restricted to specific values and is usually measuredon a continuous scale, such as distance from home to office (in km). It will varyfrom individual to individual on a scale as given below.
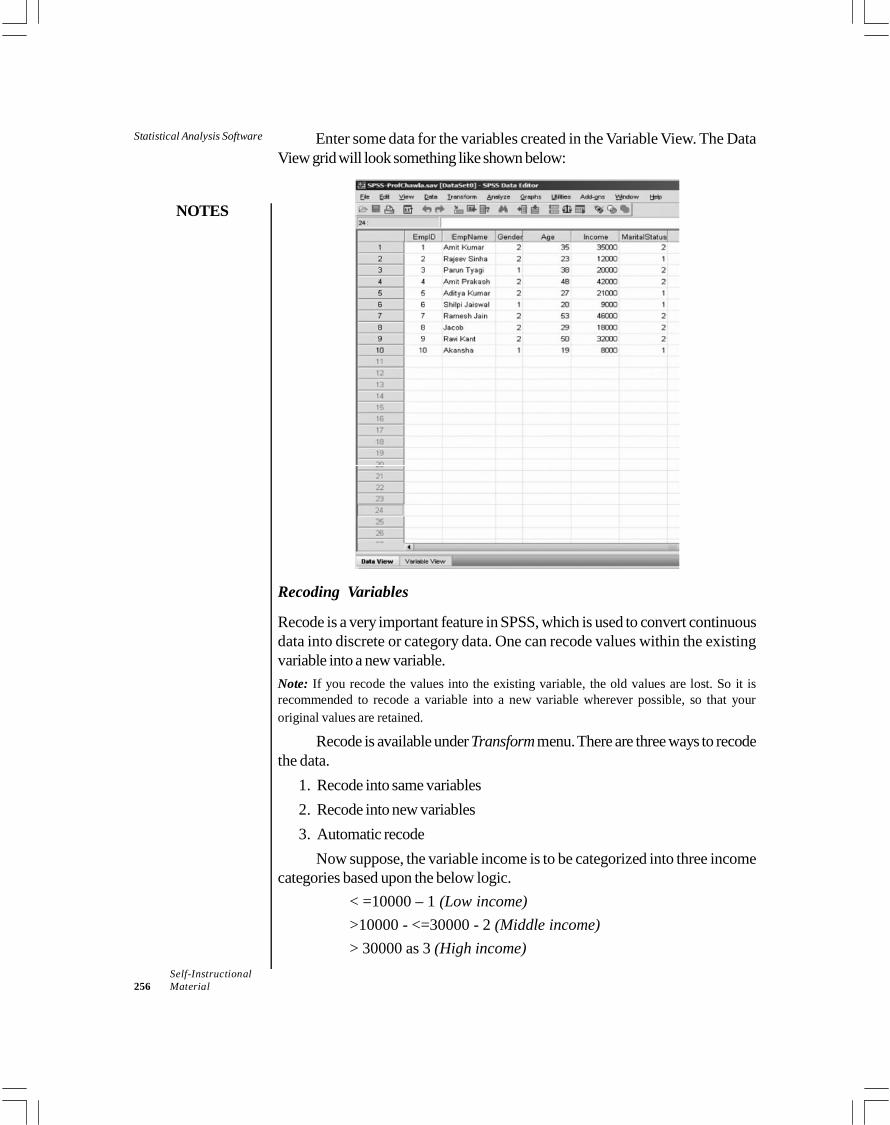
Statistical Analysis Software
NOTES
Self-Instructional256 Material
Enter some data for the variables created in the Variable View. The DataView grid will look something like shown below:
Recoding Variables
Recode is a very important feature in SPSS, which is used to convert continuousdata into discrete or category data. One can recode values within the existingvariable into a new variable.Note: If you recode the values into the existing variable, the old values are lost. So it isrecommended to recode a variable into a new variable wherever possible, so that youroriginal values are retained.
Recode is available under Transform menu. There are three ways to recodethe data.
1. Recode into same variables2. Recode into new variables3. Automatic recode
Now suppose, the variable income is to be categorized into three incomecategories based upon the below logic.
< =10000 – 1 (Low income)>10000 - <=30000 - 2 (Middle income)> 30000 as 3 (High income)
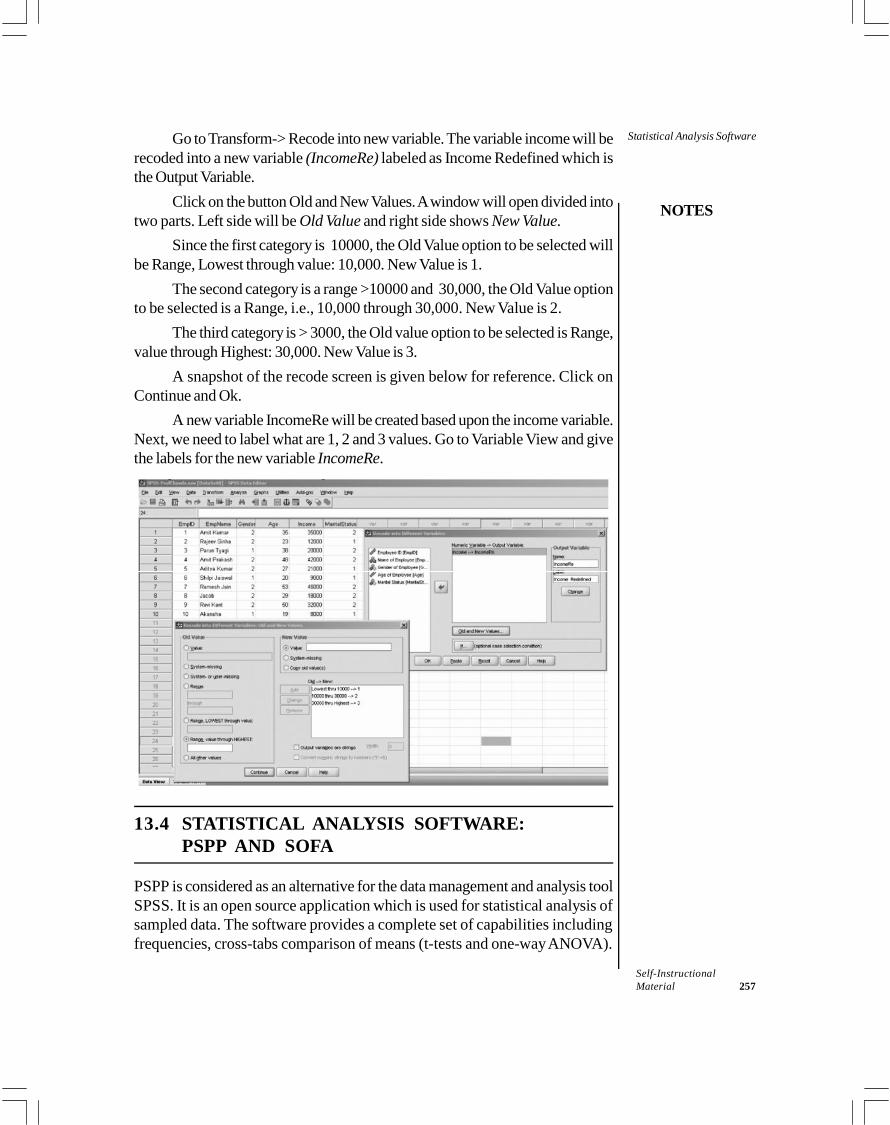
NOTES
Self-InstructionalMaterial 257
Statistical Analysis SoftwareGo to Transform-> Recode into new variable. The variable income will berecoded into a new variable (IncomeRe) labeled as Income Redefined which isthe Output Variable.
Click on the button Old and New Values. A window will open divided intotwo parts. Left side will be Old Value and right side shows New Value.
Since the first category is 10000, the Old Value option to be selected willbe Range, Lowest through value: 10,000. New Value is 1.
The second category is a range >10000 and 30,000, the Old Value optionto be selected is a Range, i.e., 10,000 through 30,000. New Value is 2.
The third category is > 3000, the Old value option to be selected is Range,value through Highest: 30,000. New Value is 3.
A snapshot of the recode screen is given below for reference. Click onContinue and Ok.
A new variable IncomeRe will be created based upon the income variable.Next, we need to label what are 1, 2 and 3 values. Go to Variable View and givethe labels for the new variable IncomeRe.
13.4 STATISTICAL ANALYSIS SOFTWARE:PSPP AND SOFA
PSPP is considered as an alternative for the data management and analysis toolSPSS. It is an open source application which is used for statistical analysis ofsampled data. The software provides a complete set of capabilities includingfrequencies, cross-tabs comparison of means (t-tests and one-way ANOVA).
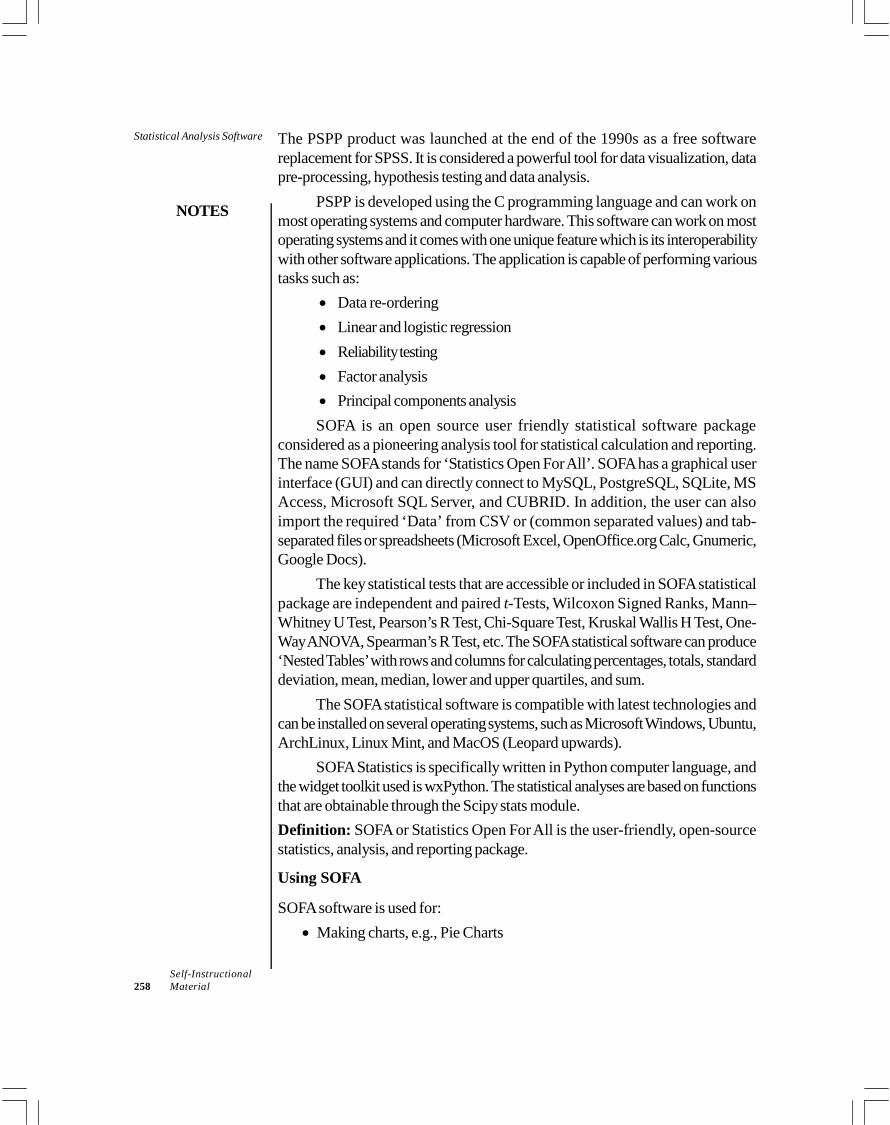
Statistical Analysis Software
NOTES
Self-Instructional258 Material
The PSPP product was launched at the end of the 1990s as a free softwarereplacement for SPSS. It is considered a powerful tool for data visualization, datapre-processing, hypothesis testing and data analysis.
PSPP is developed using the C programming language and can work onmost operating systems and computer hardware. This software can work on mostoperating systems and it comes with one unique feature which is its interoperabilitywith other software applications. The application is capable of performing varioustasks such as:
Data re-ordering Linear and logistic regression Reliability testing Factor analysis Principal components analysisSOFA is an open source user friendly statistical software package
considered as a pioneering analysis tool for statistical calculation and reporting.The name SOFA stands for ‘Statistics Open For All’. SOFA has a graphical userinterface (GUI) and can directly connect to MySQL, PostgreSQL, SQLite, MSAccess, Microsoft SQL Server, and CUBRID. In addition, the user can alsoimport the required ‘Data’ from CSV or (common separated values) and tab-separated files or spreadsheets (Microsoft Excel, OpenOffice.org Calc, Gnumeric,Google Docs).
The key statistical tests that are accessible or included in SOFA statisticalpackage are independent and paired t-Tests, Wilcoxon Signed Ranks, Mann–Whitney U Test, Pearson’s R Test, Chi-Square Test, Kruskal Wallis H Test, One-Way ANOVA, Spearman’s R Test, etc. The SOFA statistical software can produce‘Nested Tables’ with rows and columns for calculating percentages, totals, standarddeviation, mean, median, lower and upper quartiles, and sum.
The SOFA statistical software is compatible with latest technologies andcan be installed on several operating systems, such as Microsoft Windows, Ubuntu,ArchLinux, Linux Mint, and MacOS (Leopard upwards).
SOFA Statistics is specifically written in Python computer language, andthe widget toolkit used is wxPython. The statistical analyses are based on functionsthat are obtainable through the Scipy stats module.Definition: SOFA or Statistics Open For All is the user-friendly, open-sourcestatistics, analysis, and reporting package.
Using SOFA
SOFA software is used for: Making charts, e.g., Pie Charts
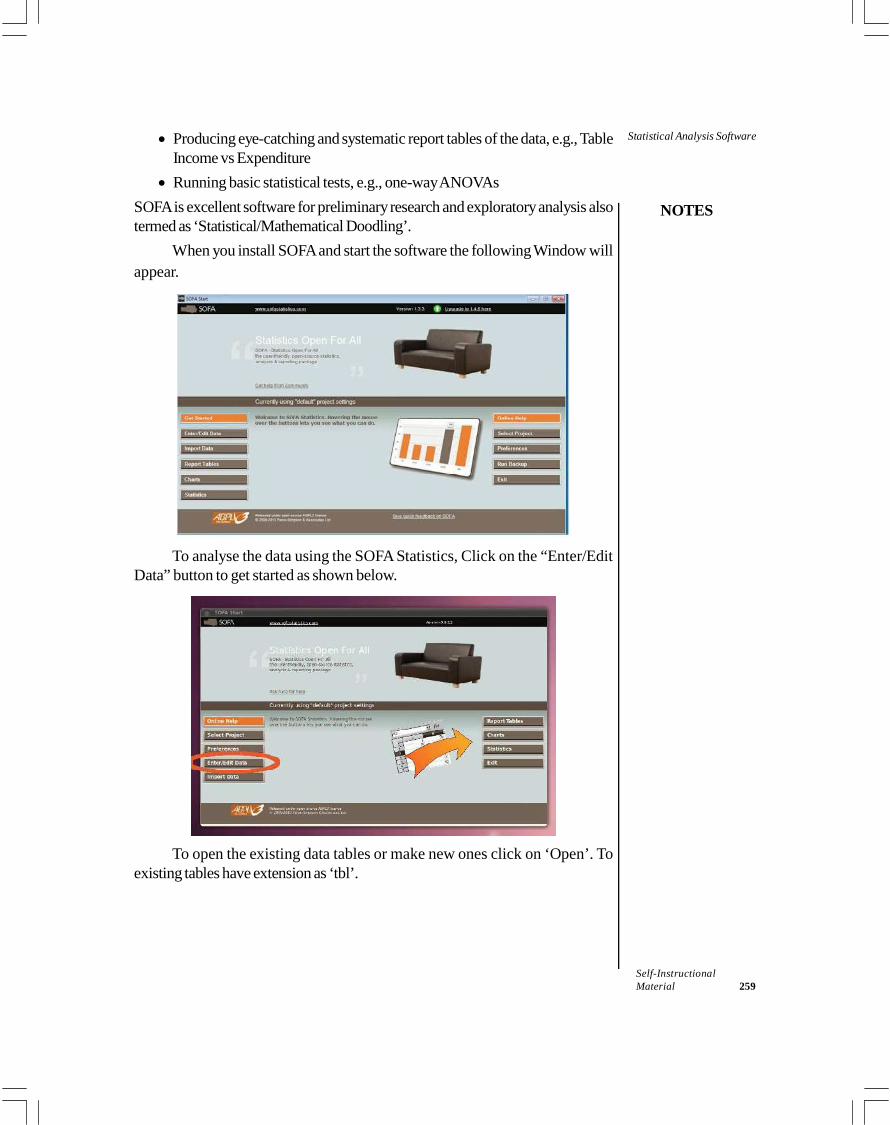
NOTES
Self-InstructionalMaterial 259
Statistical Analysis Software Producing eye-catching and systematic report tables of the data, e.g., TableIncome vs Expenditure Running basic statistical tests, e.g., one-way ANOVAs
SOFA is excellent software for preliminary research and exploratory analysis alsotermed as ‘Statistical/Mathematical Doodling’.
When you install SOFA and start the software the following Window willappear.
To analyse the data using the SOFA Statistics, Click on the “Enter/EditData” button to get started as shown below.
To open the existing data tables or make new ones click on ‘Open’. Toexisting tables have extension as ‘tbl’.
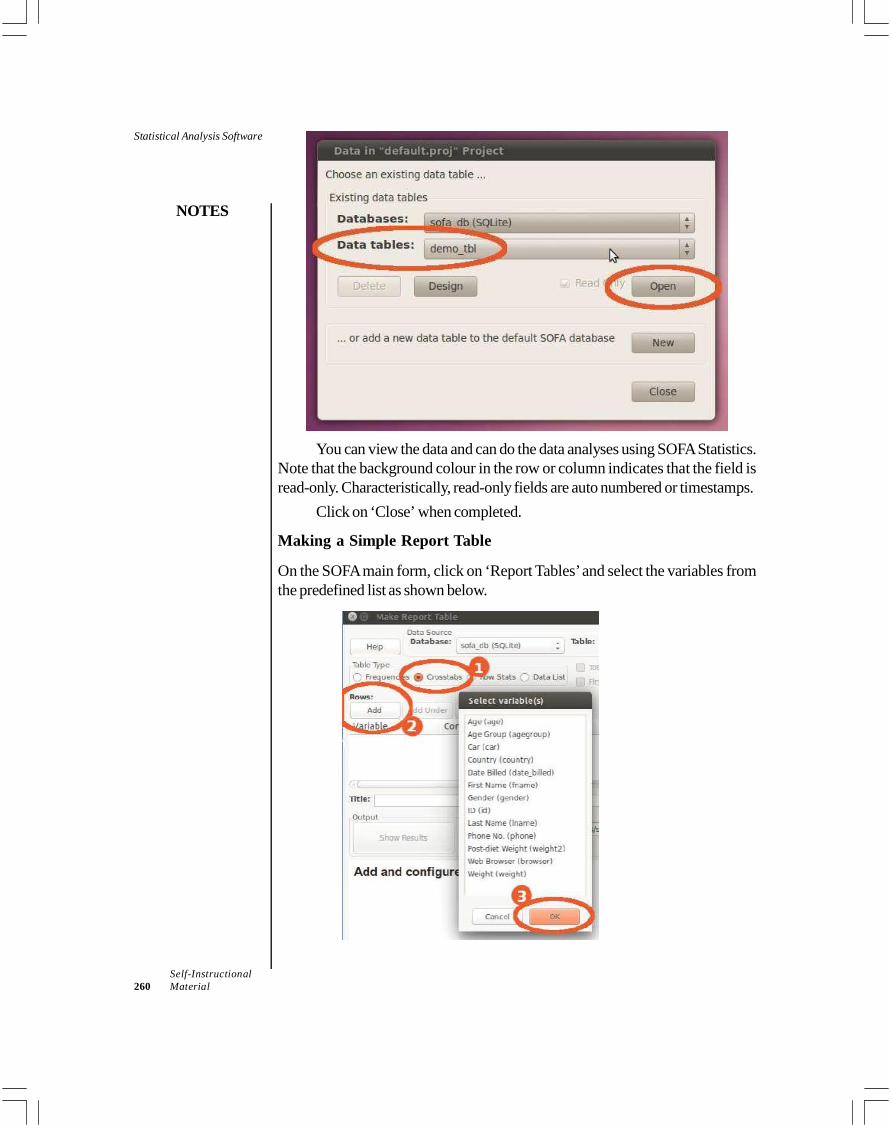
Statistical Analysis Software
NOTES
Self-Instructional260 Material
You can view the data and can do the data analyses using SOFA Statistics.Note that the background colour in the row or column indicates that the field isread-only. Characteristically, read-only fields are auto numbered or timestamps.
Click on ‘Close’ when completed.
Making a Simple Report Table
On the SOFA main form, click on ‘Report Tables’ and select the variables fromthe predefined list as shown below.
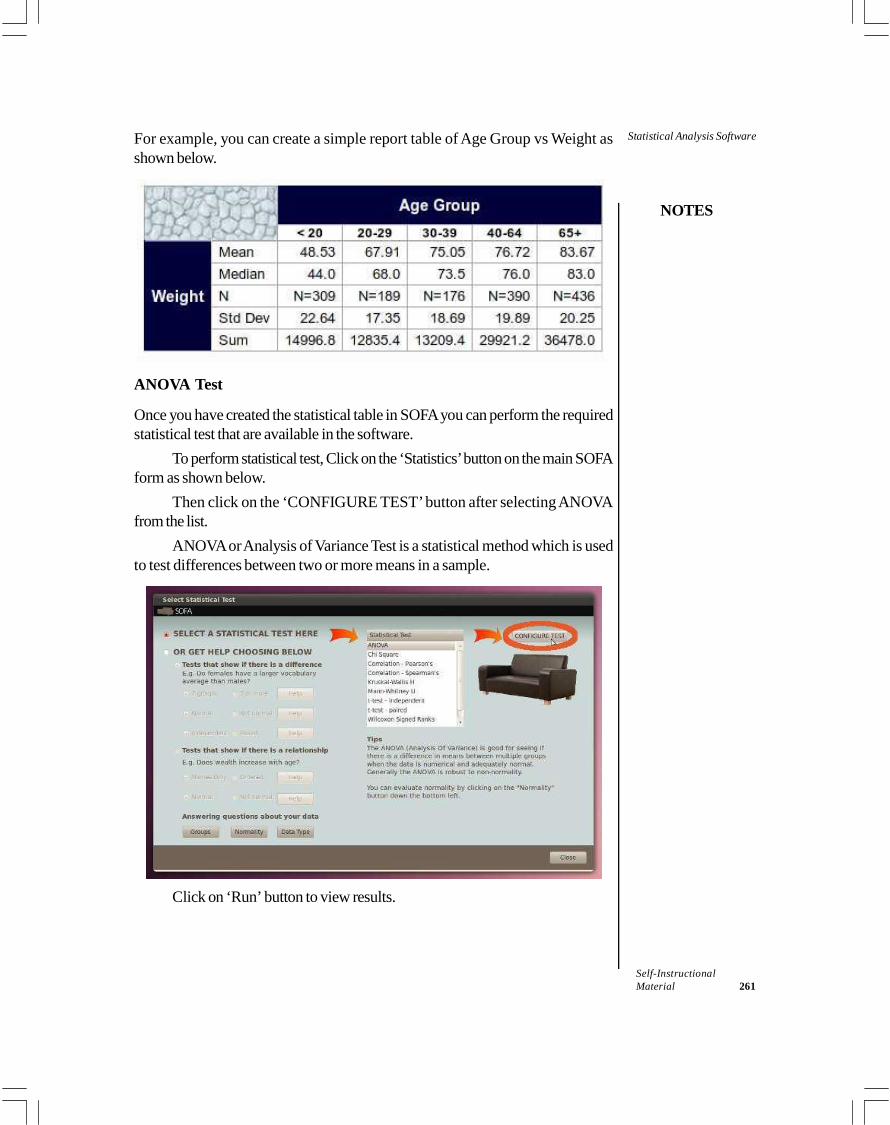
NOTES
Self-InstructionalMaterial 261
Statistical Analysis SoftwareFor example, you can create a simple report table of Age Group vs Weight asshown below.
ANOVA Test
Once you have created the statistical table in SOFA you can perform the requiredstatistical test that are available in the software.
To perform statistical test, Click on the ‘Statistics’ button on the main SOFAform as shown below.
Then click on the ‘CONFIGURE TEST’ button after selecting ANOVAfrom the list.
ANOVA or Analysis of Variance Test is a statistical method which is usedto test differences between two or more means in a sample.
Click on ‘Run’ button to view results.
Statistical Analysis Software
NOTES
Self-Instructional262 Material
Check Your Progress
1. What is Minitab software and why is it used?2. What is the purpose of SAS?3. Define SPSS software.4. What are the two views of SPSS Data Editor?5. Why recode is considered a very important feature of SPSS?
13.5 ANSWERS TO CHECK YOUR PROGRESSQUESTIONS
1. Minitab software was developed more than 20 years ago at the PennsylvaniaState University. It was originally used by statisticians for teaching statistics.It can be used with considerable ease and effectiveness in all business areas.However, today it is used for multiple applications – especially quality control,six sigma and the design of experiments.
2. System for Statistical Analysis (SAS) has been actively and extensivelyused in managing, storing and analysing information. It has the advantage ofbeing able to manage really bulky data sets with considerable ease.
3. Statistical Package for Social Sciences (SPSS) is one of the most popularsoftware packages to perform statistical analysis on survey data. Its firstversion was released in 1968 and since then, it has come a long way. It isused by researchers in educational institutes, research organizations,government, marketing firms, etc.
4. The SPSS Data Editor Window has two views: Data View and VariableView. Variable view is used to define variables that will store the data.However, data view contains the actual data.
5. Recode is a very important feature in SPSS as it is used to convert continuousdata into discrete or category data. One can recode values within the existingvariable into a new variable.
13.6 SUMMARY
MS Excel is the simplest and most widely used method of presenting andtabulating data. The basic mathematical functions can be calculated here.The data entered on Excel can be transported to most statistical packagesfor a higher level analysis. Minitab Inc. was developed more than 20 years ago at the Pennsylvania
State University. It can be used with considerable ease and effectiveness inall business areas. It was originally used by statisticians. However, today it
NOTES
Self-InstructionalMaterial 263
Statistical Analysis Softwareis used for multiple applications—especially quality control, six sigma andthe design of experiments. System for Statistical Analysis (SAS) was created in the late 1960s at North
Carolina State University. It has been actively and extensively used inmanaging, storing and analysing information. It has the advantage of beingable to manage really bulky data sets with considerable ease. The statisticalanalyses may be interfaced with the graphical products to produce relevantplots such as q-q plots, residual plots, and other relevant graphicaldescriptions of the data. Amongst the student community as well as with most research agencies,
this is the most widely used package. It is adaptable to most businessproblems and is extremely user friendly. Statistical Package for Social Sciences (SPSS) is one of the most popular
software packages to perform statistical analysis on survey data. Its firstversion was released in 1968 and since then, it has come a long way. It isused by researchers in educational institutes, research organizations,government, marketing firms, etc. The SPSS Data Editor Window has two views: Data View and Variable
View. Variable View is used to define variables that will store the data. DataView contains the actual data. A category variable can be a string variable or a numeric variable but it is
recommended that categorical variables should be numeric because stringscontain letters which cannot be numerically analysed. Recode is a very important feature in SPSS, which is used to convert
continuous data into discrete or category data. One can recode values withinthe existing variable into a new variable. PSPP is considered as an alternative for the data management and analysis
tool SPSS. It is an open source application which is used for statisticalanalysis of sampled data. The software provides a complete set of capabilitiesincluding frequencies, cross-tabs comparison of means (t-tests and one-way ANOVA). PSPP software can work on most operating systems and it comes with one
unique feature which is its interoperability with other software applications. SOFA is an open source user friendly statistical software package
considered as a pioneering analysis tool for statistical calculation andreporting. The name SOFA stands for ‘Statistics Open For All’. SOFA has a graphical user interface (GUI) and can directly connect to
MySQL, PostgreSQL, SQLite, MS Access, Microsoft SQL Server, andCUBRID. The SOFA statistical software is compatible with latest technologies and
can be installed on several operating systems, such as Microsoft Windows,Ubuntu, ArchLinux, Linux Mint, and MacOS (Leopard upwards).
Statistical Analysis Software
NOTES
Self-Instructional264 Material
SOFA or Statistics Open For All is the user-friendly, open-source statistics,analysis, and reporting package.
13.7 KEY WORDS
Statistical Analysis: It involves collecting and scrutinizing every data samplein a set of items from which samples can be drawn. SPSS (Statistical Package for Social Sciences): It refers to a software
package used for the analysis of statistical data. Interoperability: It refers to the ability of computer systems or software
to exchange and make use of information. SOFA (Statistical Open For All): It refers to the user-friendly, open-
source statistics, analysis and reporting software package. ANOVA: It refers to a statistical technique that is used to check if the
means of two or more groups are significantly different from each other.
13.8 SELF ASSESSMENT QUESTIONS ANDEXERCISES
Short Answer Questions
1. Write a short note on SAS.2. Give a brief overview of few features of SPSS.3. What is PSPP software?4. Define ANOVA test.
Long Answer Questions
1. Discuss the significance of statistical analysis software in today’s businesses.2. Describe SOFA software and its uses.
13.9 FURTHER READINGS
Busha, Charles H. and Stephen P. Harter. 1980. Research Methods inLibrarianship: Techniques and Interpretation. Orlando: Academic Press.
Kumar, Krishan. 1992. Research Methods in Library and Information Science.New Delhi: Har-Anand Publications.
Rao, I.K. Ravichandra. 2009. Quantitative Methods for Library andInformation Science. New Delhi: New Age International Publishers.
Slater, Margaret. 1990. Research Methods in Library and Information Studies.London: Facet Pub.
Fowler, F. J. 2008. Survey Research Methods. New Delhi: SAGE Publications.
NOTES
Self-InstructionalMaterial 265
Report Writing
UNIT 14 REPORT WRITING
Structure14.0 Introduction14.1 Objectives14.2 Structure and Components of Report Writing14.3 Style Manuals: APA, MLA, Chicago. MS Word and Zotero14.4 Answers to Check Your Progress Questions14.5 Summary14.6 Key Words14.7 Self Assessment Questions and Exercises14.8 Further Readings
14.0 INTRODUCTION
On completion of the research study and after obtaining the research results, thereal skill of the researcher lies in analysing and interpreting the findings and linkingthem with the propositions formulated in the form of research hypotheses at thebeginning of the study. The statistical or qualitative summary of results would belittle more than numbers or conclusions unless one is able to present the documentedversion of the research endeavour.
One cannot overemphasize the significance of a well-documented andstructured research report. Just like all the other steps in the research process, thisrequires careful and sequential treatment. In this unit, we will be discussing in detailthe documentation of the research study. The format and the steps might bemoderately adjusted and altered based on the reader’s requirement. Thus, it mightbe for an academic and theoretical purpose or might need to be clearly spelt andlinked with the business manager’s decision dilemma.
14.1 OBJECTIVES
After going through this unit, you will be able to: Discuss the structure and components of report writing Examine the guidelines for presenting tabular data and visual representations Describe the various types of style guides
14.2 STRUCTURE AND COMPONENTS OFREPORT WRITING
Whatever the type of report, the reporting requires a structured format and by andlarge, the process is standardized. The major difference amongst the types of
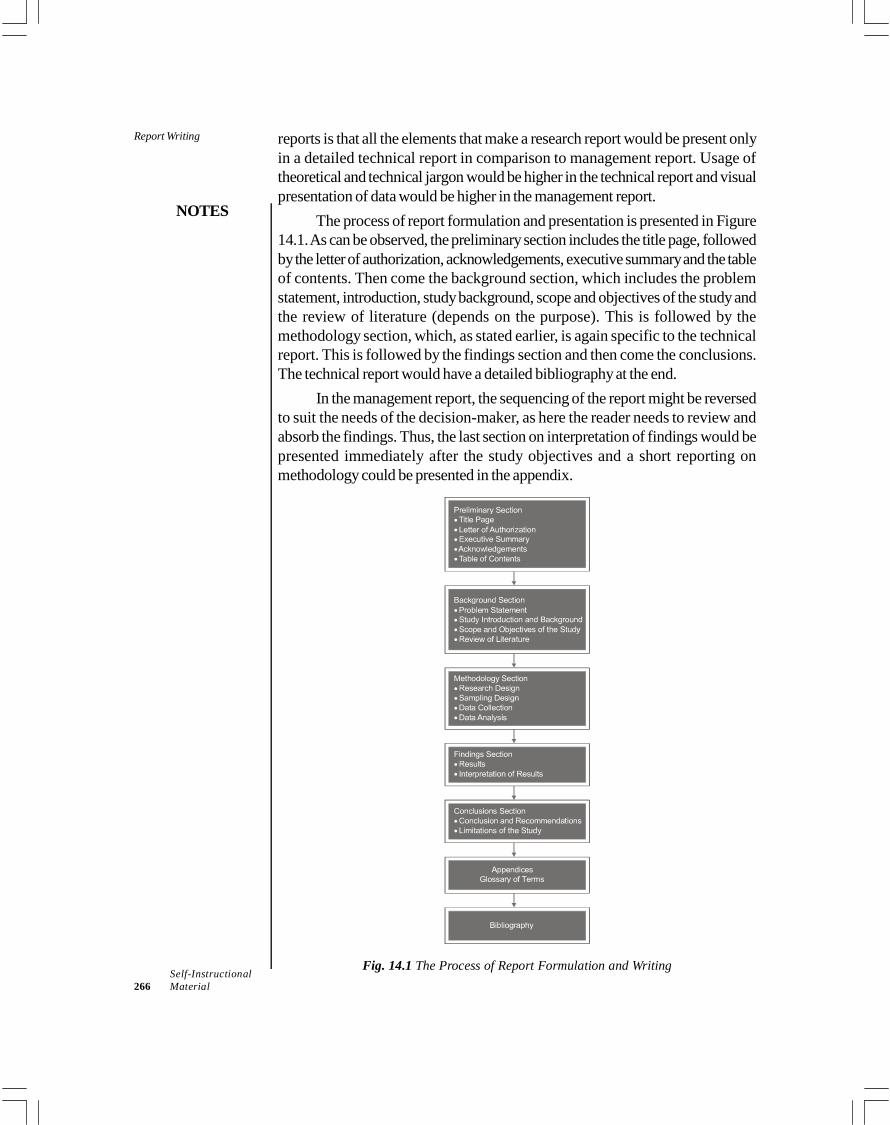
Report Writing
NOTES
Self-Instructional266 Material
reports is that all the elements that make a research report would be present onlyin a detailed technical report in comparison to management report. Usage oftheoretical and technical jargon would be higher in the technical report and visualpresentation of data would be higher in the management report.
The process of report formulation and presentation is presented in Figure14.1. As can be observed, the preliminary section includes the title page, followedby the letter of authorization, acknowledgements, executive summary and the tableof contents. Then come the background section, which includes the problemstatement, introduction, study background, scope and objectives of the study andthe review of literature (depends on the purpose). This is followed by themethodology section, which, as stated earlier, is again specific to the technicalreport. This is followed by the findings section and then come the conclusions.The technical report would have a detailed bibliography at the end.
In the management report, the sequencing of the report might be reversedto suit the needs of the decision-maker, as here the reader needs to review andabsorb the findings. Thus, the last section on interpretation of findings would bepresented immediately after the study objectives and a short reporting onmethodology could be presented in the appendix.
Fig. 14.1 The Process of Report Formulation and Writing
NOTES
Self-InstructionalMaterial 267
Report WritingListed below are some features of a good research study that should be kept inmind while documenting and preparing the report. Clear report mandate: While writing the research problem statement and
study background, the writer needs to be absolutely clear in terms of whyand how the problem was formulated. Clearly designed methodology: Any research study has its unique
orientation and scope and thus has a specific and customized research design,sampling and data collection plan. In researches, that are not completelytransparent on the set of procedures, one cannot be absolutely confident ofthe findings and resulting conclusions. Clear representation of findings: Complete honesty and transparency
in stating the treatment of data and editing of missing or contrary data isextremely critical. Representativeness of study finding: A good research report is also
explicit in terms of extent and scope of the results obtained, and in terms ofthe applicability of findings.
Thus, some guidelines should be kept in mind while writing the report. Command over the medium: A correct and effective language of
communication is critical in putting ideas and objectives in the vernacular ofthe reader/decision-maker. Phrasing protocol: There is a debate about whether or not one makes use
of personal pronoun while reporting. The use of personal pronoun such as ‘Ithink…..’ or ‘in my opinion…..’ lends a subjectivity and personalization ofjudgement. Thus, the tone of the reporting should be neutral. For example:‘Given the nature of the forecasted growth and the opinion of the respondents,
it is likely that the……’Whenever the writer is reproducing the verbatim information from another
document or comment of an expert or published source, it must be in invertedcommas or italics and the author or source should be duly acknowledged. Forexample:
Sarah Churchman, Head of Diversity, PricewaterhouseCoopers, states ‘AtPricewaterhouseCoopers we firmly believe that promoting work–life balance is a‘business-critical’ issue and not simply the ‘right thing to do’.The writer shouldavoid long sentences and break up the information in clear chunks, so that thereader can process it with ease.Simplicity of approach: Along with grammatically and structurally correctlanguage, care must be taken to avoid technical jargon as far as possible. In caseit is important to use certain terminology, then, definition of these terms can beprovided in the glossary of terms at the end of the report.Report formatting and presentation: In terms of paper quality, page marginsand font style and size, a professional standard should be maintained. The fontstyle must be uniform throughout the report. The topics, subtopics, headings and
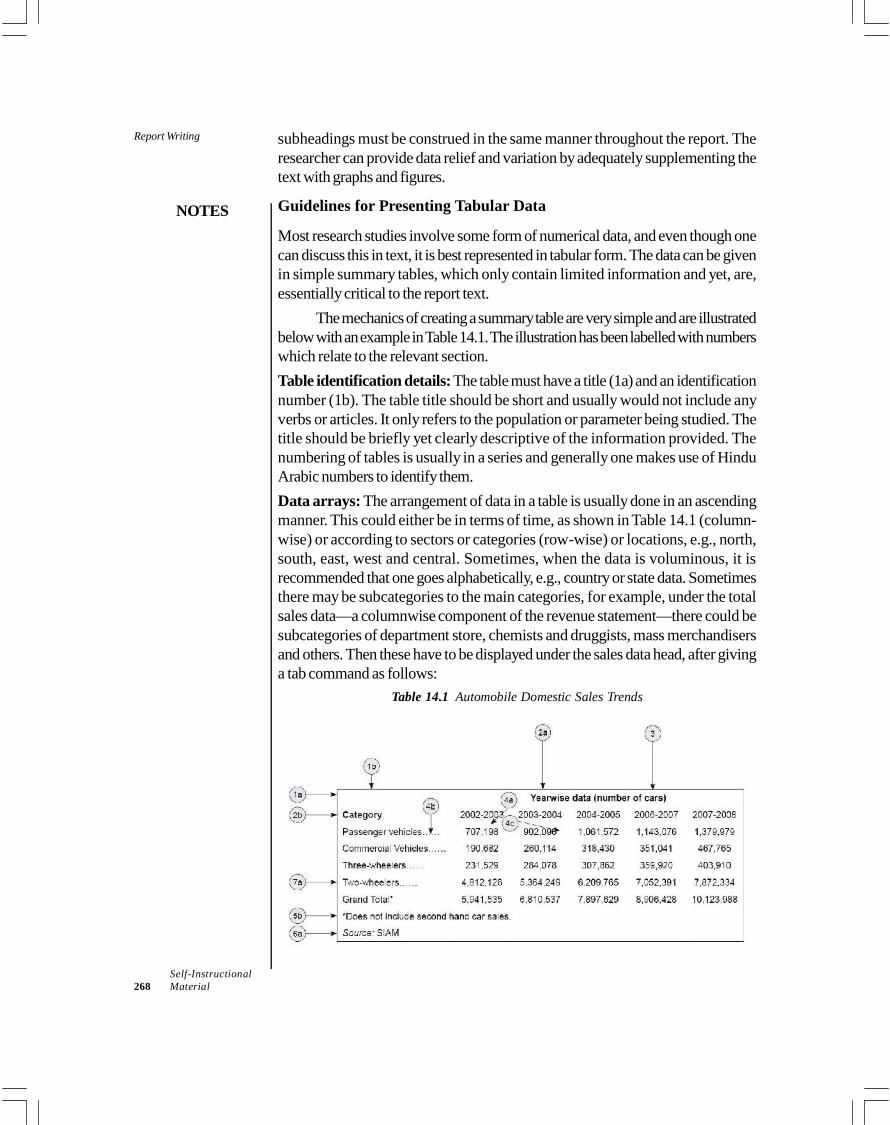
Report Writing
NOTES
Self-Instructional268 Material
subheadings must be construed in the same manner throughout the report. Theresearcher can provide data relief and variation by adequately supplementing thetext with graphs and figures.
Guidelines for Presenting Tabular Data
Most research studies involve some form of numerical data, and even though onecan discuss this in text, it is best represented in tabular form. The data can be givenin simple summary tables, which only contain limited information and yet, are,essentially critical to the report text.
The mechanics of creating a summary table are very simple and are illustratedbelow with an example in Table 14.1. The illustration has been labelled with numberswhich relate to the relevant section.Table identification details: The table must have a title (1a) and an identificationnumber (1b). The table title should be short and usually would not include anyverbs or articles. It only refers to the population or parameter being studied. Thetitle should be briefly yet clearly descriptive of the information provided. Thenumbering of tables is usually in a series and generally one makes use of HinduArabic numbers to identify them.Data arrays: The arrangement of data in a table is usually done in an ascendingmanner. This could either be in terms of time, as shown in Table 14.1 (column-wise) or according to sectors or categories (row-wise) or locations, e.g., north,south, east, west and central. Sometimes, when the data is voluminous, it isrecommended that one goes alphabetically, e.g., country or state data. Sometimesthere may be subcategories to the main categories, for example, under the totalsales data—a columnwise component of the revenue statement—there could besubcategories of department store, chemists and druggists, mass merchandisersand others. Then these have to be displayed under the sales data head, after givinga tab command as follows:
Table 14.1 Automobile Domestic Sales Trends
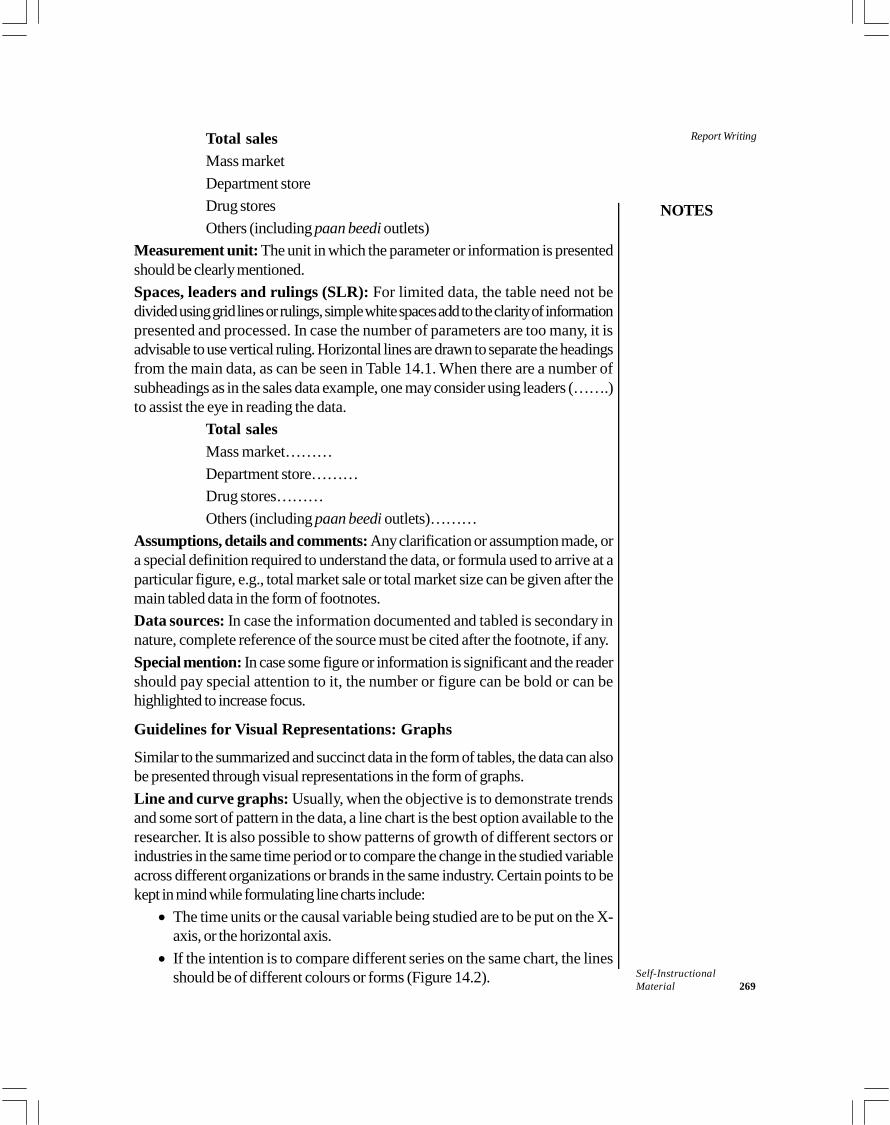
NOTES
Self-InstructionalMaterial 269
Report WritingTotal salesMass marketDepartment storeDrug storesOthers (including paan beedi outlets)
Measurement unit: The unit in which the parameter or information is presentedshould be clearly mentioned.Spaces, leaders and rulings (SLR): For limited data, the table need not bedivided using grid lines or rulings, simple white spaces add to the clarity of informationpresented and processed. In case the number of parameters are too many, it isadvisable to use vertical ruling. Horizontal lines are drawn to separate the headingsfrom the main data, as can be seen in Table 14.1. When there are a number ofsubheadings as in the sales data example, one may consider using leaders (…….)to assist the eye in reading the data.
Total salesMass market………Department store………Drug stores………Others (including paan beedi outlets)………
Assumptions, details and comments: Any clarification or assumption made, ora special definition required to understand the data, or formula used to arrive at aparticular figure, e.g., total market sale or total market size can be given after themain tabled data in the form of footnotes.Data sources: In case the information documented and tabled is secondary innature, complete reference of the source must be cited after the footnote, if any.Special mention: In case some figure or information is significant and the readershould pay special attention to it, the number or figure can be bold or can behighlighted to increase focus.
Guidelines for Visual Representations: Graphs
Similar to the summarized and succinct data in the form of tables, the data can alsobe presented through visual representations in the form of graphs.Line and curve graphs: Usually, when the objective is to demonstrate trendsand some sort of pattern in the data, a line chart is the best option available to theresearcher. It is also possible to show patterns of growth of different sectors orindustries in the same time period or to compare the change in the studied variableacross different organizations or brands in the same industry. Certain points to bekept in mind while formulating line charts include: The time units or the causal variable being studied are to be put on the X-
axis, or the horizontal axis. If the intention is to compare different series on the same chart, the lines
should be of different colours or forms (Figure 14.2).
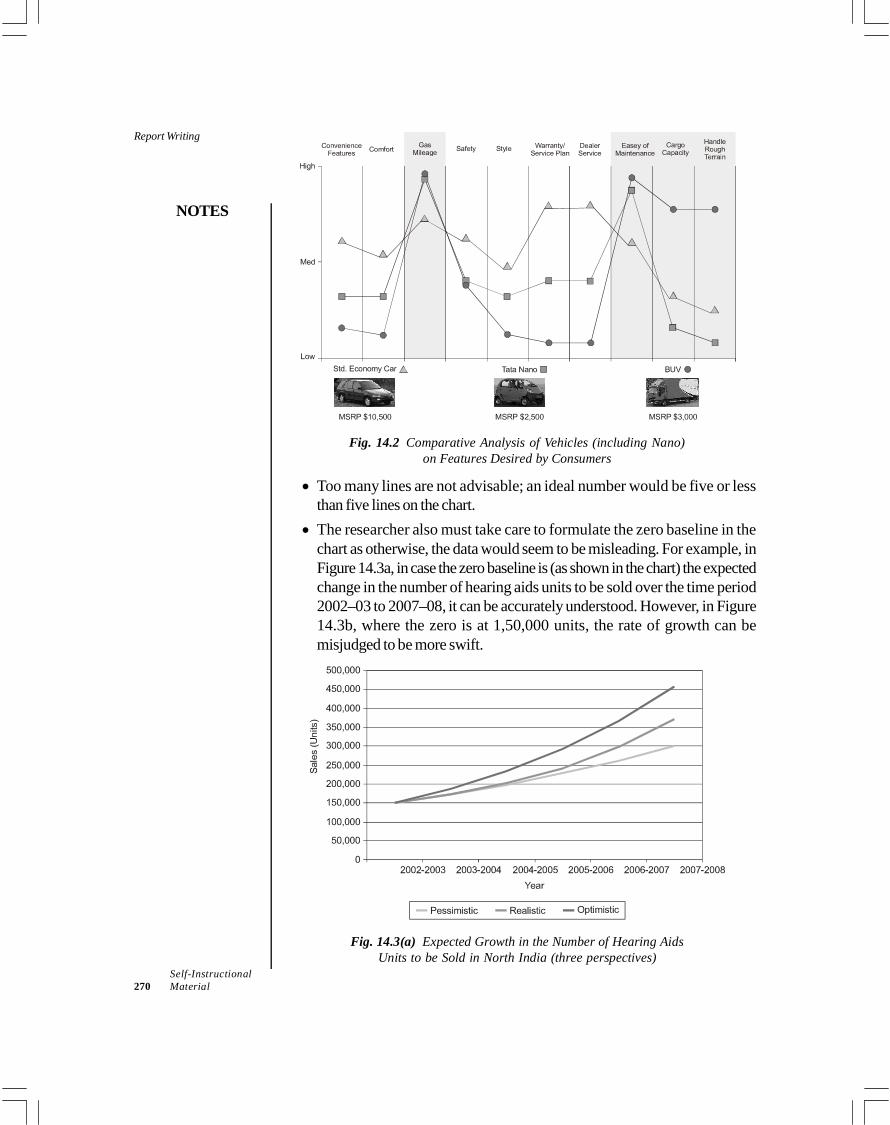
Report Writing
NOTES
Self-Instructional270 Material
Fig. 14.2 Comparative Analysis of Vehicles (including Nano)on Features Desired by Consumers
Too many lines are not advisable; an ideal number would be five or lessthan five lines on the chart. The researcher also must take care to formulate the zero baseline in the
chart as otherwise, the data would seem to be misleading. For example, inFigure 14.3a, in case the zero baseline is (as shown in the chart) the expectedchange in the number of hearing aids units to be sold over the time period2002–03 to 2007–08, it can be accurately understood. However, in Figure14.3b, where the zero is at 1,50,000 units, the rate of growth can bemisjudged to be more swift.
Fig. 14.3(a) Expected Growth in the Number of Hearing AidsUnits to be Sold in North India (three perspectives)
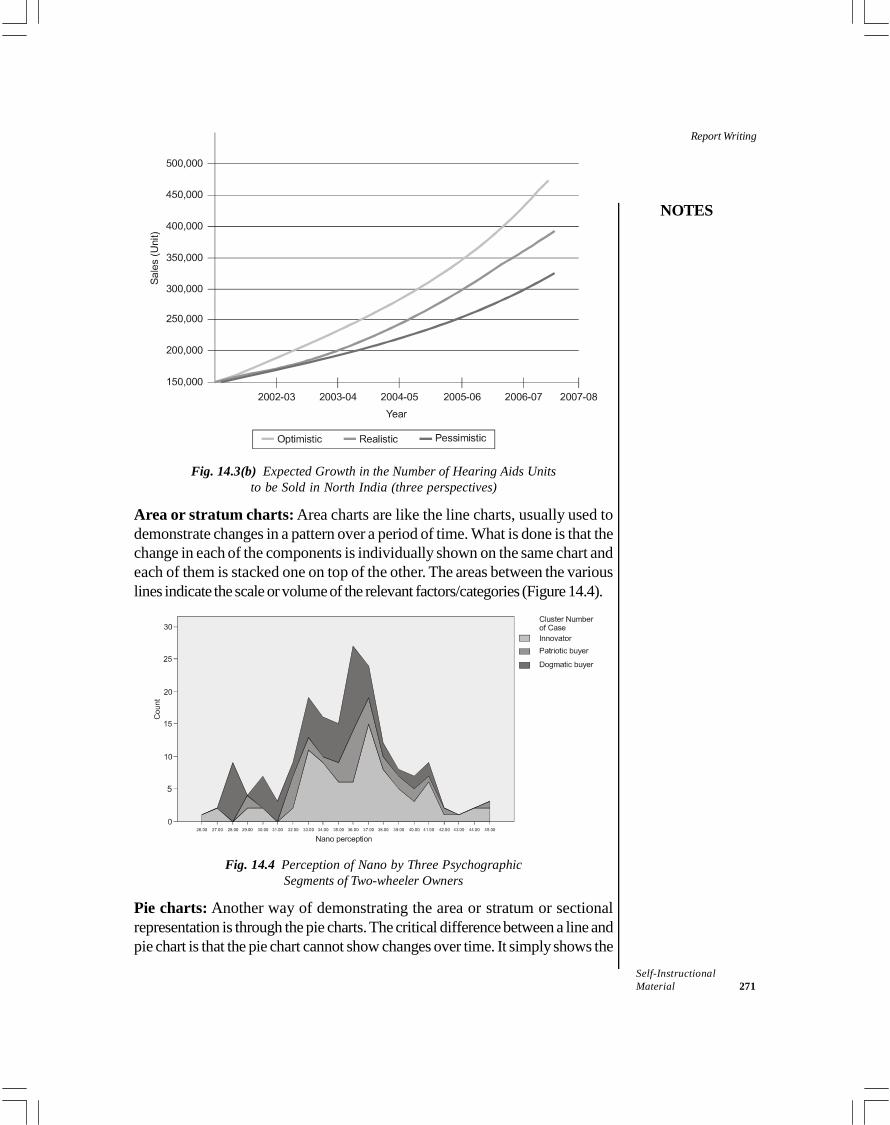
NOTES
Self-InstructionalMaterial 271
Report Writing
Fig. 14.3(b) Expected Growth in the Number of Hearing Aids Unitsto be Sold in North India (three perspectives)
Area or stratum charts: Area charts are like the line charts, usually used todemonstrate changes in a pattern over a period of time. What is done is that thechange in each of the components is individually shown on the same chart andeach of them is stacked one on top of the other. The areas between the variouslines indicate the scale or volume of the relevant factors/categories (Figure 14.4).
Fig. 14.4 Perception of Nano by Three PsychographicSegments of Two-wheeler Owners
Pie charts: Another way of demonstrating the area or stratum or sectionalrepresentation is through the pie charts. The critical difference between a line andpie chart is that the pie chart cannot show changes over time. It simply shows the
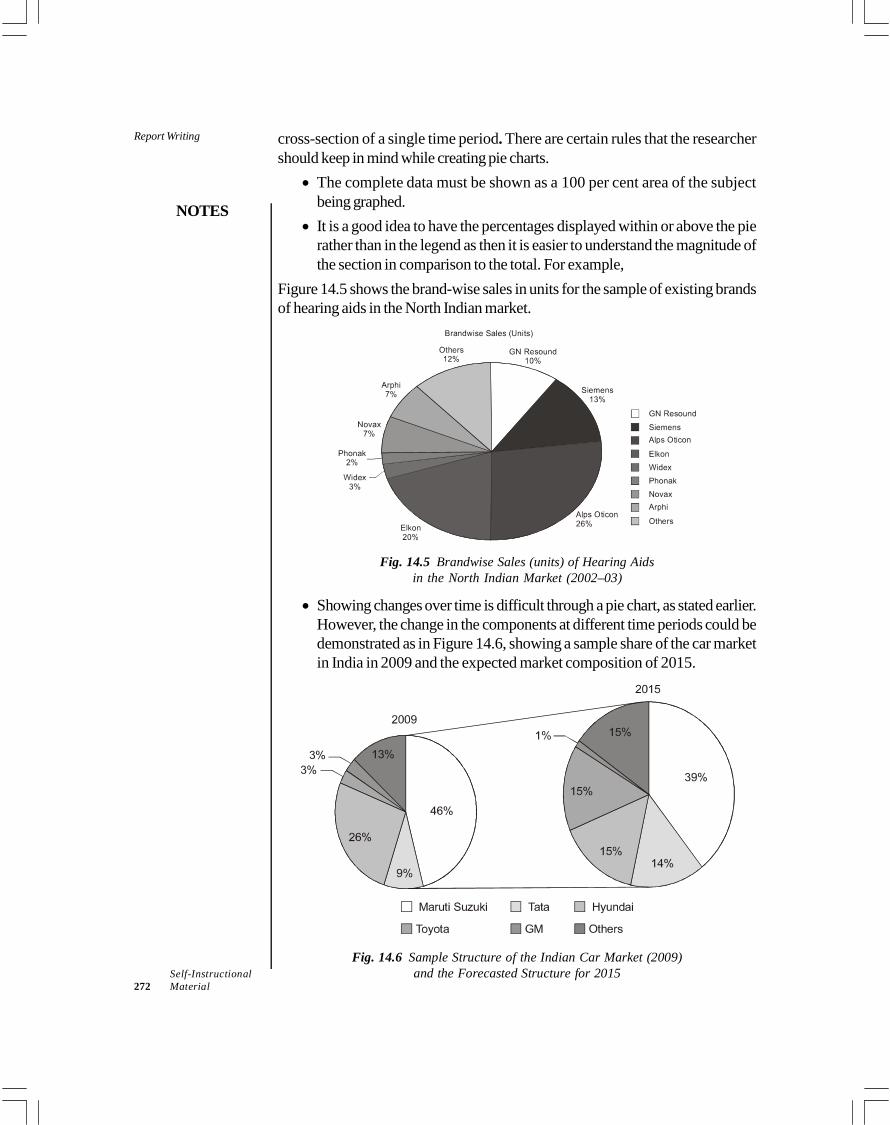
Report Writing
NOTES
Self-Instructional272 Material
cross-section of a single time period. There are certain rules that the researchershould keep in mind while creating pie charts. The complete data must be shown as a 100 per cent area of the subject
being graphed. It is a good idea to have the percentages displayed within or above the pie
rather than in the legend as then it is easier to understand the magnitude ofthe section in comparison to the total. For example,
Figure 14.5 shows the brand-wise sales in units for the sample of existing brandsof hearing aids in the North Indian market.
Fig. 14.5 Brandwise Sales (units) of Hearing Aidsin the North Indian Market (2002–03)
Showing changes over time is difficult through a pie chart, as stated earlier.However, the change in the components at different time periods could bedemonstrated as in Figure 14.6, showing a sample share of the car marketin India in 2009 and the expected market composition of 2015.
Fig. 14.6 Sample Structure of the Indian Car Market (2009)and the Forecasted Structure for 2015
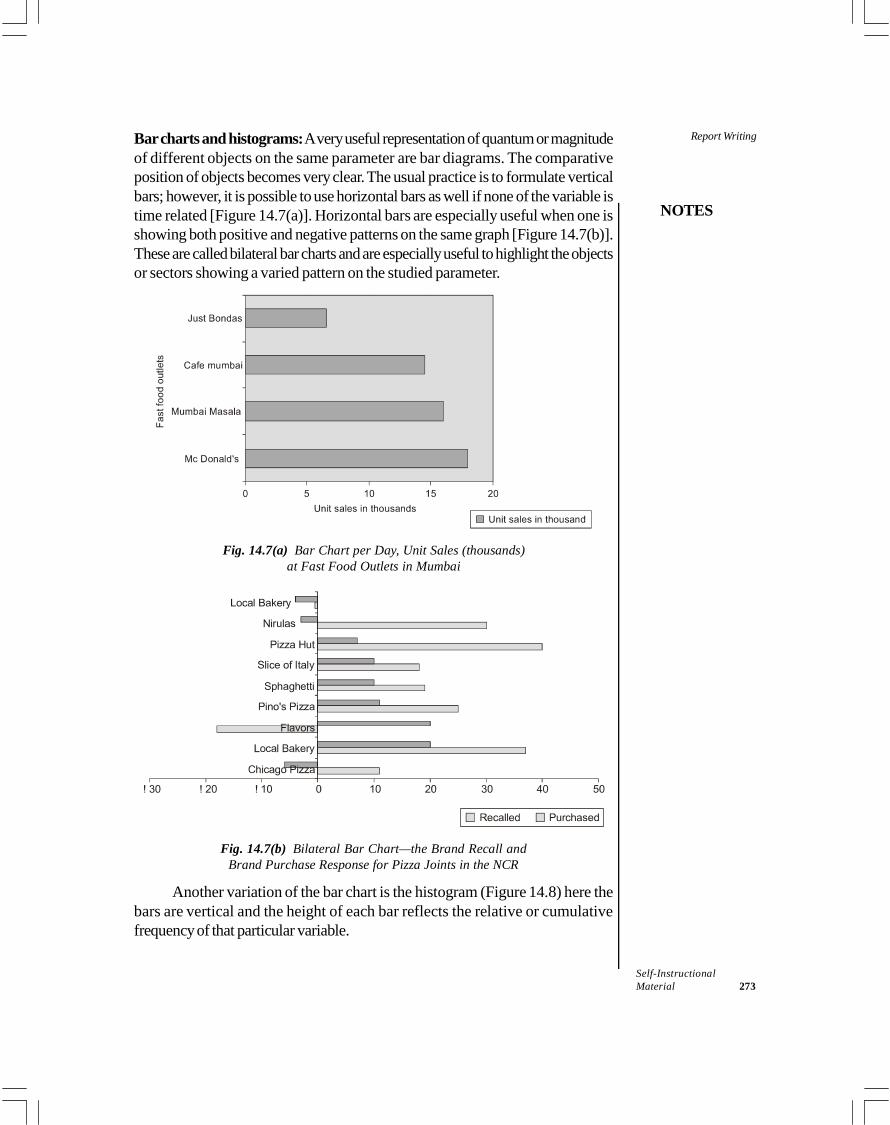
NOTES
Self-InstructionalMaterial 273
Report WritingBar charts and histograms: A very useful representation of quantum or magnitudeof different objects on the same parameter are bar diagrams. The comparativeposition of objects becomes very clear. The usual practice is to formulate verticalbars; however, it is possible to use horizontal bars as well if none of the variable istime related [Figure 14.7(a)]. Horizontal bars are especially useful when one isshowing both positive and negative patterns on the same graph [Figure 14.7(b)].These are called bilateral bar charts and are especially useful to highlight the objectsor sectors showing a varied pattern on the studied parameter.
Fig. 14.7(a) Bar Chart per Day, Unit Sales (thousands)at Fast Food Outlets in Mumbai
Fig. 14.7(b) Bilateral Bar Chart—the Brand Recall andBrand Purchase Response for Pizza Joints in the NCR
Another variation of the bar chart is the histogram (Figure 14.8) here thebars are vertical and the height of each bar reflects the relative or cumulativefrequency of that particular variable.
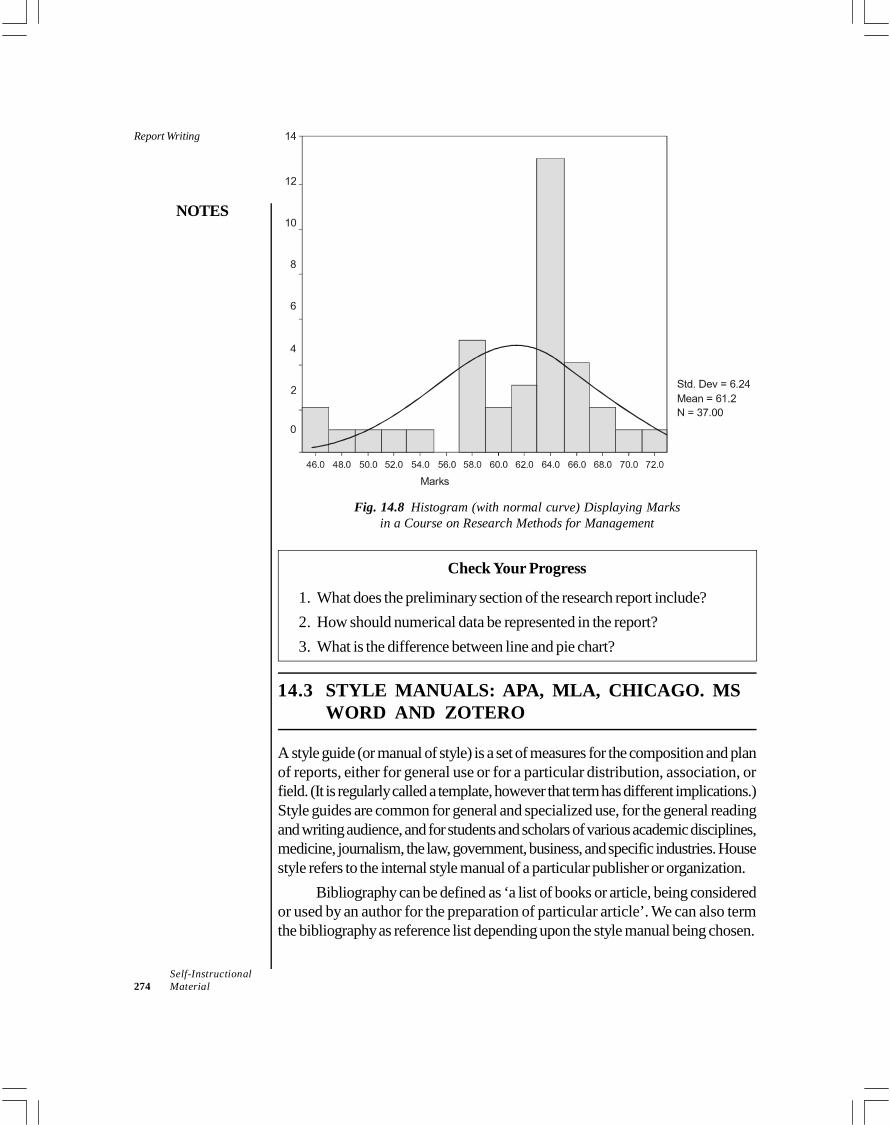
Report Writing
NOTES
Self-Instructional274 Material
Fig. 14.8 Histogram (with normal curve) Displaying Marksin a Course on Research Methods for Management
Check Your Progress
1. What does the preliminary section of the research report include?2. How should numerical data be represented in the report?3. What is the difference between line and pie chart?
14.3 STYLE MANUALS: APA, MLA, CHICAGO. MSWORD AND ZOTERO
A style guide (or manual of style) is a set of measures for the composition and planof reports, either for general use or for a particular distribution, association, orfield. (It is regularly called a template, however that term has different implications.)Style guides are common for general and specialized use, for the general readingand writing audience, and for students and scholars of various academic disciplines,medicine, journalism, the law, government, business, and specific industries. Housestyle refers to the internal style manual of a particular publisher or organization.
Bibliography can be defined as ‘a list of books or article, being consideredor used by an author for the preparation of particular article’. We can also termthe bibliography as reference list depending upon the style manual being chosen.
NOTES
Self-InstructionalMaterial 275
Report WritingStyle manuals refer to such kind of books which help us to understand themethods through which we can format and record the desired information in acorrect way. The usage of these manuals are in much demand due to informationavailable which encompass the location for the bibliography, punctuation rules ingeneral, how to format footnotes, how to give spacing, indention, form of author’sname and many more.
The choice of the right citation style is important for publishing the article ina correct way. Style manuals are found at: -
i. Reference section of academic librariesii. Bookstoresiii. The reference section of some public libraries
For writing a paper and preparing the bibliography, the professor guides astudent about the style manual to be used for that particular article. This choice ofstyle guide can depend upon the domain on which the research is being conductedor paper written on the particular subject area. These style manuals are updatedfrequently, so it becomes necessary to add or modify the content accordingly.
There are various style manuals, but let us focus on some of them in adetailed manner to understand the features being used in them. Some of the majorstyle guides are:
I. APAII. MLA
III. ChicagoIV. MS WordV. Zotero
I. APA
The American Psychological Association (APA) got involved in journal publishingin 1923. The American Psychological Association style originated in 1929 throughthe article published in the Psychological Bulletin. In 1944, a 32-page guideappeared as an article in the same journal. It is used by academic writers to citesources in various disciplines like psychology, education and the social sciences.The first edition of the APA Publication Manual was published in 1952 as a 61-page supplement to the Psychological Bulletin making the beginning of arecognized APA Style. In response to the growing complexities of scientific reporting,subsequent editions were released in 1974, 1983, 1994, 2001, and 2009.
APA Style acts as a tool for formatting the papers and essays written on theabove mentioned fields of subject. The guidelines of APA Style were eventuallyexpanded into the APA Publication Manual.
The importance of using APA style in writing the content for psychology andsocial sciences is that researchers and students can easily express their ideas and
Report Writing
NOTES
Self-Instructional276 Material
can also explain the experiments by routing the information in the particular format.By writing in the consistent format, readers can quickly find out the content theyare looking for in journals or articles.
APA style was developed by social and behavioural scientists to standardizethe scientific writing.
APA style is used for Terms Papers Research Reports Empirical Studies Literature Reviews Theoretical Articles Methodological Articles Case StudiesAPA Style uses five level of headings
i. Level 1 – Centred, Boldface, Uppercase and Lowercase Headingii. Level 2 – Flush Left, Boldface, Uppercase and Lowercase Handlingiii. Level 3 – Indented, Boldface, Lowercase paragraph heading ending
with a periodiv. Level 4 – Indented, Boldface, Italicized, Lowercase paragraph heading
ending with a periodv. Level 5 – Indented, Italicized, Lowercase paragraph heading ending
with a period.The four major sections to be kept in considerations while writing a paper in theAPA style are:
1. Title Page: This is the most important part of APA style as it gives a conclusionof the paper like Article title, Author’s name, Author’s school affiliation,Running head and Page Number. Title should be specific and general sothat it can easily represent what paper is all about. The APA publicationmanual suggests that the title should not be more than 12 words. Alwaysremember that while writing the Author’s name it should be by listing firstname, middle initial’s and the last name. Abbreviations usage such as Dr. orPh.D. is strictly avoidable. School affiliation is the location where the particularresearch is being conducted. A running head should be on the upper left-hand corner on all the pages including the title page. Similarly, all the pagesshould have a page number on the upper right-hand corner. Title, name,and school should be double-spaced and centred on the page.
2. Abstract: It is an important part of any article or paper, which is beingimmediately followed by the title. It serves as overall brief description of thecontents and the information covered in the paper. Abstract should not be
NOTES
Self-InstructionalMaterial 277
Report Writingmore than 150 to 250 words depending upon the requirement of the paper.The APA publication manual suggests that the abstract should much functionlike the title page- which allows the person to quickly determine what thearticle is all about. The APA manual states that the abstract is the singlemost important paragraph in the entire paper. As the reader reads the abstractfirst, then proceed on to the further pages, so the first impression should beinteresting for the reader to read the full paper. According to the officialguidelines of the American Psychological Association, a good abstract shouldbe short but packed with information, objective and accurate.
3. The Main Body: It is just like an essay which has various sections such asintroduction, method, results and discussion sections.
4. References: It includes all the list of sources from where the particularinformation or content is being taken for the consideration. It one cites anypiece of information, anywhere in a paper, it needs to be properly referenced.It should be started on a new page. All the entries should be in alphabeticalorder. The reference section should be double-spaced. Title of the books,journals, magazines, and newspapers should appear in italics.General Guidelines for APA Style are as follows:1. Use 8 ½ x 11” paper.2. Make 1 inch margins on the top, bottom, and sides.3. The first word in every paragraph should be intended one half inch.4. Use Times New Roman font size 12.5. Double space the entire paper.6. Include a page header known as the “running head” at the top of every
pageThe sixth edition of the Publication Manual of the American PsychologicalAssociation is the most current. It was released in July 2009 after fouryears of development. The sixth edition is accompanied by a style website,apastyle.org as well as the APA Style Blog, which answers many commonquestions from users.
Citation and References
Citations are necessary parts of APA style, as they show readers from where theideas and research came from. While writing the paper, we need to refer to otherpublications or journals used for the content or information shared and any of theresearch conducted. APA style uses an author-date reference citation system inthe text with an accompanying reference list. That means that to cite any referencein a paper, the writer should write the author and year of the work, either byputting both in parentheses separated by a comma (parenthetical citation) or byputting the author in the narrative of the sentence and the year in parentheses(narrative citation).
Report Writing
NOTES
Self-Instructional278 Material
II. MLA
It can be defined as a system for documenting the sources in scholarly writing. It isbeing used throughout the world by scholars, journal publishers, academic andcommercial presses. MLA style was updated in 2016 to overcome the difficultiesfaced by the researchers in today’s date. This style is being developed by anorganization named ‘The Modern Language Association’. It helps in using a uniformway to format papers and assignments which in turns lead to easy reading. It is adocumentation style used in scholarship like humanities, especially in English Studies,modern languages, literatures, comparative literature, literature criticism, mediastudies, cultural studies, and other related disciplines. The MLA Handbook, andthe MLA Style both were preceded by a slim booklet titled MLA style sheet, firstpublished in1951 and revised one in 1970.
General Guidelines for writing in MLA Style Use white 8 ½ x 11” paper Make 1 inch margins on the top, bottom and sides The first word in every paragraph should be indented one half inch. Indent set-off quotations one inch from the left margin.
Use any type of font that is easy to read
Font size should be 12.The following elements should be kept in consideration while writing in MLAStyle:
1. Author: Always begin with the author’s last name, followed by a commaand rest of the name, as presented in the work by the ending this elementwith a period.
2. Title of source: The title of the source should be followed by the author’sname depending upon the type of source list the title in Italics, or quotationmarks.
3. Title of container: It is usually italicized and followed by a comma, since theinformation that follows next describes the container. The eight edition refersto “containers” which are the larger wholes in which the source is located.
4. Other Contributors: Other than the author, any other contributor who has arole in contributing to the source like editors, illustrators, translators, etc.,should be given a credit in the documentation.
5. Version: If a source is listed on any edition or version of work, it should beincluded in the citation.
NOTES
Self-InstructionalMaterial 279
Report Writing6. Number: If a source is part of a numbered sequence, such as a multi-volumebook, or journal with both volume and issue numbers, those numbers mustbe listed in the citation.
7. Publisher: The publisher is the one who distributes or produces the book tothe public. So if there is more one publisher who are relevant to the researchwork, then their names should be cited by using a forward slash for theseparation.
8. Publication date: It can happen that the same source may have beenpublished on more than one date, then in that case, use the one which ismost relevant to the research. If not sure about the date, then go with sourceoriginal publication date.
9. Location: We should always be specific to identify the work location. Pagenumbers should be enlisted.
In-text Citations
It is brief reference within the text which indicates the source used. It should besuch which can attribute any ideas, paraphrases, or direct quotations to the source.A reader should follow the source without becoming distracted by any other flowof information.
III. Chicago Style Manual
The Chicago Style manual is the guide for American English published since 1906by the University of Chicago Press. The guidelines for writing and citation styleshas been best described in its seventeen editions. It is ‘one of the most widelyused and respected style guides in the United States’.
There are two ways for citing a source in the Chicago Style-
1. Notes and Bibliography: It is most commonly used for humanities likeliterature, history and the arts. In this sources are cited in numberedfootnotes or endnotes.
2. Author- date: It is for sciences and social sciences. In this, sources arecited in the form of text like parentheses, by author’s last name and yearof publication.
Now let us understand each one of them in detailed.Notes: Here an endnote or footnote which is being used every time source
is being cited. It can be through a direct quote, paraphrase or summary. Footnoteswill be at the end of the page on which the source is referred and endnotes will beat the end of each chapter or document. A superscript number corresponding to a
Report Writing
NOTES
Self-Instructional280 Material
note with the bibliographic information for that source should be placed in the textfollowing the end of the sentence or clause in which the source is referenced.
Bibliographies: It provides an alphabetical list of all sources used in a givenwork. It is placed at the end of the work preceded by Index. It should include allsources cited within the work and may sometimes include other relevant sourcesthat were not cited but provide further reading.
Although bibliographic entries for various sources may be formatteddifferently, all included sources (books, articles, websites, etc.) are arrangedalphabetically by author’s last name. If no author or editor is listed, the title or, asa last resort, a descriptive phrase may be used.
IV. MS – Word
MS-Word is the new blank document just like a normal template where we canadd a text by using the normal style. It can be modified by font name, font size, linespacing, indentation, text alignment and many more.
In Word 2013, style designs are located on the design tab which are acombinations of character, heading and other paragraph styles.
We can apply different set of formatting styles by creating a new style in thestyle gallery. It is always easier to format with MS-Word style. It is just like a paintwhich can be applied again and again on the document content.
Advantages of MS-Word Style: -
1. All the headings, sub-headings, paragraphs and tables are in theconsistent format.
2. It is always faster to apply a style rather than formatting the entiredocument.
3. It helps in navigating by clicking on headers and subheads so that contentrequired can easily be located.
4. We can insert a table of contents by using the inbuilt feature of headingand subheading styles.
MS-Word style has two types of document formatting styles:1. Paragraph Style: It applies to entire paragraph by formatting through
alignments, indents and character formatting such font size, colour etc.2. Character Style: It applies to the smaller ones like one or two more
characters.
Different types of headings are1. Major Headings –It includes important headings like Abstract, Table of
Contents, Acknowledgements, References, Chapter headings etc
NOTES
Self-InstructionalMaterial 281
Report Writing2. Subheadings – It can have divided as primary which is first levelsubheadings and secondary which is second level subheadings etc.
The important points to remember while formatting the headings
1. All the heading size and styles should be written in the same formatthroughout the content. Also all the levels of subheadings including primaryand secondary level should be in the same style.
2. The font size is always larger than the size of the normal text andconsistency should be maintained in the entire document.
3. It should be ensured that all the major headings are included in the tableof contents.
Key note for the requirements to format the particular chapter/sections1. Each chapter/sections should start from the new page.
2. Page numbers should be in continuity while starting a new page orsection.
3. Each chapter must be with the introductions and conclusions.
V. Zotero Style Manual
Zotero is one of the first Firefox extensions to take benefit of the new function inFirefox 2.0 named mozStorage. The Zotero Style repository is automaticallyupdated within the hour whenever we make changes in our GitHub style repository.It offers a lot of ways to capture, transfer and store item, content or information. Ithas an important feature that it automatically senses the particular item we arelocating through the web. It checks the information through site translators. It canbe used with various library catalogues and popular websites such as Amazon,New York Times. We can also add the data manually in Zotero style repository. Itcreates a copy of the database on every shutdown of the system. Site translatorsare the discrete pieces of code that are extracted from web-based metadata andthen finally inserted into a Zotero item.
Zotero uses the Citation style language to configure citation formatting. CSLis new language for citation formatting and designed in such a simple way whichcan be easily be used. We can view and edit CSL files by URL chrome://zotero/content/tools/csledit.xul into the Firefox location. Zotero canimport bibliographic data stored in a variety of standardized formats used bydatabases and other reference management tools. The most popular formats areRIS, Bib(La)Tex, and MODS.
How to add a new style to Zotero:(i) Go to the EndNote styles page and download the style you want.
Report Writing
NOTES
Self-Instructional282 Material
(ii) Open Zotero. Go to Preferences (under Zotero, Edit, or Tools).(iii) Click the "Cite" button.(iv) Click the "Styles" tab.(v) Click the + button at the bottom right.(vi) Select the style file you saved in step 1.
Check Your Progress
4. What is a style guide?5. How is the American Psychological Association style originate?
14.4 ANSWERS TO CHECK YOUR PROGRESSQUESTIONS
1. The preliminary section includes the title page, followed by the letter ofauthorization, acknowledgements, executive summary and the table ofcontents.
2. The numerical data in a research report is best represented in tabular form.3. One critical difference between line and pie chart is that the pie chart cannot
show changes over time.4. A style guide (or manual of style) is a set of measures for the composition
and plan of reports, either for general use or for a particular distribution,association, or field.
5. The American Psychological Association style originated in 1929 throughthe article published in the Psychological Bulletin.
14.5 SUMMARY
Whatever the type of report, the reporting requires a structured format andby and large, the process is standardized. The major difference amongst the types of reports is that all the elements
that make a research report would be present only in a detailed technicalreport in comparison to management report. The preliminary section includes the title page, followed by the letter of
authorization, acknowledgements, executive summary and the table ofcontents. Then come the background section, which includes the problemstatement, introduction, study background, scope and objectives of thestudy and the review of literature (depends on the purpose).
NOTES
Self-InstructionalMaterial 283
Report Writing The background is followed by the methodology section, which, as statedearlier, is again specific to the technical report. This is followed by the findingssection and then come the conclusions. The technical report would have a detailed bibliography at the end. There must be no ambiguity in either presenting the findings or
representativeness of the findings. Visual relief for the written can be provided through figures, tables and
graphs Style guides are common for general and specialized use, for the general
reading and writing audience, and for students and scholars of variousacademic disciplines, medicine, journalism, the law, government, business,and specific industries. There are various style manuals which include APA, MLA, Chicago, MS
Word and Zotero.
14.6 KEY WORDS
Pie Chart: It is a type of graph in which a circle is divided into sectors thateach represent a proportion of the whole. Style Manual: It is a manual detailing the house style of a particular publisher,
publication, etc. Footnote: It is a note printed at the bottom of a page that gives extra
information about something that has been written on that page.
14.7 SELF ASSESSMENT QUESTIONS ANDEXERCISES
Short-Answer Questions
1. What is the process of report formulation?2. Write a short-note on the APA style manual.
Long-Answer Questions
1. Examine the various types of style guides.2. Discuss some of the guidelines for visual representations in reports.
Report Writing
NOTES
Self-Instructional284 Material
14.8 FURTHER READINGS
Creswell, John W. 2002. Research Design: Qualitative, Quantitative, and MixedMethods Approaches. London: Sage Publications Inc.
Booth, Wayne, Gregory G. Colomb and Joseph M. Williams. 1995. The Craft ofResearch. Chicago: University of Chicago Press.
Bryman, Alan and Emma Bell. 2015. Business Research Methods. 4th Edition.United Kingdom: Oxford University Press.
Gupta, S.L. and Hitesh Gupta. 2012. Business Research Methods. New Delhi:Tata McGraw Hill Education Private Limited.
NOTES
Self-InstructionalMaterial 285
Informetrics andWebometricsUNIT 15 INFORMETRICS AND
WEBOMETRICS
Structure15.0 Introduction15.1 Objectives15.2 Informetrics15.3 Bibliometrics15.4 Scientometrics15.5 Webometrics15.6 Answers to Check Your Progress Questions15.7 Summary15.8 Key Words15.9 Self Assessment Questions and Exercises
15.10 Further Readings
15.0 INTRODUCTION
Informetrics is the study of the quantitative aspects of information in any form, notjust records or bibliographies and any social group, not just scientists. You willalso learn about the genesis, scope and definition of informetrics. The major areasof research in the category of information systems are information quality, usabilityresearch and retrieval evaluation. The main thrust of retrieval evaluation is thestudy of a retrieval system’s ability for recall and the precision with which it isdone. The key objectives of usability research are tests of accessibility, accuracy,relevance, completeness, objectivity and timeliness of users. This unit will alsodiscuss about the significance of librametry. Bibliometrics is associated with writtencommunication’s publication pattern, which also comprises their authorship.Moreover, you will about the bibliometrics. Finally, you will learn about the basicconcept of scientometrics and Webometrics.
15.1 OBJECTIVES
After going through this unit, you will be able to: Describe the genesis and scope of informetrics Define bibliometrics Discuss the basic concept of scientometrics and Webometrics
Informetrics andWebometrics
NOTES
Self-Instructional286 Material
15.2 INFORMETRICS
According to Tague – Sutclifle, “Informetrics is the study of the quantitativeaspects of information in any form, not just records or bibliographies andany social group, not just scientists.”
The study of quantitative aspects of information is referred to as Informetrics.Informetrics has its scope in the production or creation, dissemination or dispersal,and the use or employment of each and every information form, irrespective of itsorigin or form. The following fields are the part of informetrics:
Scientometrics: The study of the quantitative aspects of science. Webometrics: The study of the quantitative aspects of the World Wide
Web (WWW). Cybermetrics: It is similar to Webometrics but it differs in that it has a
broader definition which also encompasses electronic resources, Bibliometrics: The study of the quantitative aspects of the recorded
information. Librametrics: this is associated with the study of the aspects pertaining
to library scienceIn 1979, the term informetrics (French: Informetrie) was coined by Nacke.
The 20th century Infometrics as seen in the western region has its basis largely inLotka’s law (Alfred J. Lotka), Zipf’s law (George Kingsley Zipf), Bradford’s law(Samuel C. Bradford) and on works of persons, such as Eugene Garfield, ManfredBonitz, Peter Ingwersen, Olle Persson, Ronald Rousseau, Tibor Braun, Leo EggheGerard Salton and Derek J. de Solla Price.
The one pioneer bibliographic data’s Quantitative analysis was Robert K.Merton in his article titled ‘Science, Technology, and Society’ published in‘Seventeenth Century England’. It has originally been published in 1938 by Merton.
Usage of ‘Informetrics’ in the manner put forth by the two German ScientistsBlackert and Zyge and refers to a recently developed branch of science, whichemploys the use of statistical and mathematical methods for the investigation oftechnical as well as scientific information on their practical information activitiesand their theoretical level.
As has been mentioned above, the first to propose Informetrics was noneother than Otto Nacke of Germany in 1979. FID formed a committee oninformetrics in the year 1984. The committee had its objectives as the makingavailable of data which was reliable and would support research and development,planning and policy making and also aid in the management of activities,programmes, projects and institutions. In the year 1987, Belfium hosted the firstinternational conference on bibliometrics and in 1989; London hosted the secondconference on bibliometrics, scientometrics and informetrics. It was suggested by
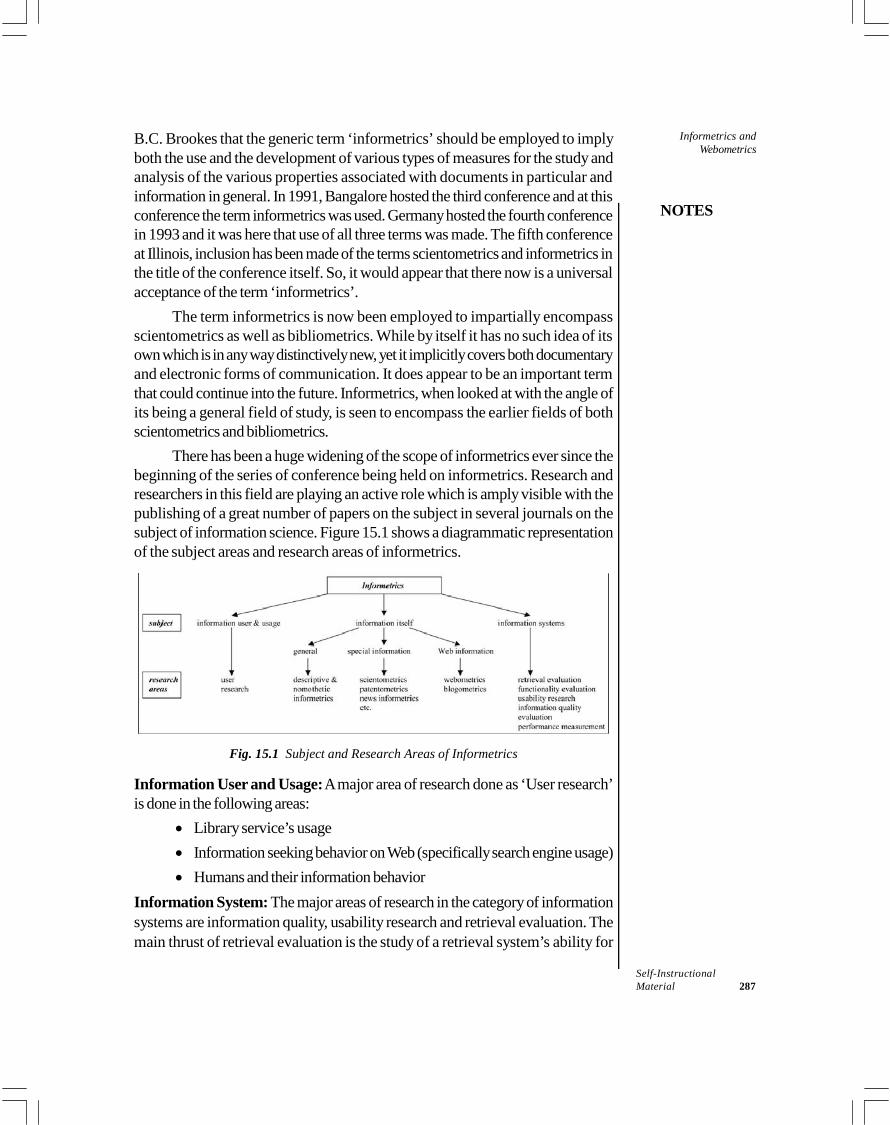
NOTES
Self-InstructionalMaterial 287
Informetrics andWebometrics
B.C. Brookes that the generic term ‘informetrics’ should be employed to implyboth the use and the development of various types of measures for the study andanalysis of the various properties associated with documents in particular andinformation in general. In 1991, Bangalore hosted the third conference and at thisconference the term informetrics was used. Germany hosted the fourth conferencein 1993 and it was here that use of all three terms was made. The fifth conferenceat Illinois, inclusion has been made of the terms scientometrics and informetrics inthe title of the conference itself. So, it would appear that there now is a universalacceptance of the term ‘informetrics’.
The term informetrics is now been employed to impartially encompassscientometrics as well as bibliometrics. While by itself it has no such idea of itsown which is in any way distinctively new, yet it implicitly covers both documentaryand electronic forms of communication. It does appear to be an important termthat could continue into the future. Informetrics, when looked at with the angle ofits being a general field of study, is seen to encompass the earlier fields of bothscientometrics and bibliometrics.
There has been a huge widening of the scope of informetrics ever since thebeginning of the series of conference being held on informetrics. Research andresearchers in this field are playing an active role which is amply visible with thepublishing of a great number of papers on the subject in several journals on thesubject of information science. Figure 15.1 shows a diagrammatic representationof the subject areas and research areas of informetrics.
Fig. 15.1 Subject and Research Areas of Informetrics
Information User and Usage: A major area of research done as ‘User research’is done in the following areas:
Library service’s usage Information seeking behavior on Web (specifically search engine usage) Humans and their information behavior
Information System: The major areas of research in the category of informationsystems are information quality, usability research and retrieval evaluation. Themain thrust of retrieval evaluation is the study of a retrieval system’s ability for
Informetrics andWebometrics
NOTES
Self-Instructional288 Material
recall and the precision with which it is done. The key objectives of usabilityresearch are tests of accessibility, accuracy, relevance, completeness, objectivityand timeliness of users.Information Itself: Bibliometrics, scientometrics and Webometrics are mainresearch area in information itself.
Another categorization of the main areas of study in the field of informetricsis as follows:
1. Statistical facets of language, word, and phrase frequencies, in naturallanguage text as well as in indexes, for the electronic media as well asthe printed media.
2. Characteristics of the productivity of authors measured in respect tothe degree of collaboration, number of papers or other means, toname a few.
3. Publication sources’ characteristics, chiefly the distribution of papersin a discipline across journals.
4. Citation analysis which is the distribution over authors, papers,institutions, journals, countries. It is used for evaluating and is a co-citation based mapping of disciplines.
5. Working with recorded information, such as library circulation anduse of in-house journal and book and use of databases.
6. Literature obsolescence measured in terms citation as well as use.7. Development libraries, databases, subject literatures affiliated growth
in new concepts.The following are two such phenomena which in the past were not looked
upon as being part of scientometrics or bibliometrics yet they have comfortablyfitted into the scope of informetrics:
1. Definition and measurement of information.2. Types and characteristics of retrieval performance measures.
The milestones in the history of informetrics are the various regulations thathave been formulated and implemented. Some of these are as follows:
Lotka’s law (1926) pertaining to author productivity studies Bradford’s law (1934) pertaining to scattering of journals Zipf’s law (1935) pertaining to word occurrenceSince the formulation of the above laws, there has been a huge proliferation
of papers associated with them and their refinements. The result of such writingsled to the creation of new laws like Sengupta’s law of bibliometric, Garfield’s lawof concentration and Price’s square root law of scientific productivity.
NOTES
Self-InstructionalMaterial 289
Informetrics andWebometrics
Various studied that have been conducted resulted in the creation of models,which can be applied to quantitative studies. One of the most important of thesemodels is Price’s cumulative advantage distribution model. Some other is as follows:
Brook’s logarithmic model Bookstein’s model linking the three basic laws Mandelbrot’s model of Zipf’s law Vickery’s model of Bradford’s law Leimkuhler’s model of journal productivity Garfield’s citation analysis Impact factor for scientific journal Sengupta’s weightage formula Narayan’s power law model Goffman’s epidemic process Groos model connecting Keenan – Atherton data to Bradford’s law Kessler’s bibliographic coupling Small’s co-citation and clustering Ravichandra Rao’s negative binomial modelInformetric analysis is the study of science policy studies and it is mostly
undertaken in such nations, such as the Netherlands, UK and USA. Informetricanalysis is of great help for the evaluation of activities connected with research anddevelopment associate with decision-makers with measures, such as researchproductivity, impact and quality. Even in other countries, there is a rise in the interestof people in the use of quantitative indicators in the field of both science andtechnology. Such evaluation proves to be helpful for policy making bodies and fornational funding agencies in the process of proper fund allocation. Yet, these studiesare not without their fair share of criticism. For example, they have faced criticismin the case of citation studies for scientific publication evaluation. Nevertheless,one can rely upon this method when it is combined with certain other measures fordecision-making.
Scientometric and infometrics can be distinguished with their extensiveemploying of qualitative and quantitative techniques. Recent times have also seenextensive use of such quantitative methods for the purpose of studying the structureof literature. These techniques have proved to be of great help in facilitating of themapping of disciplines and also in the study of a discipline’s various transitions ofits composition and structure. As a matter of fact, over the past decade, variousindices, techniques and tools have been formulated and developed with this purposein mind. They have also been applied very successfully to several and variousareas.
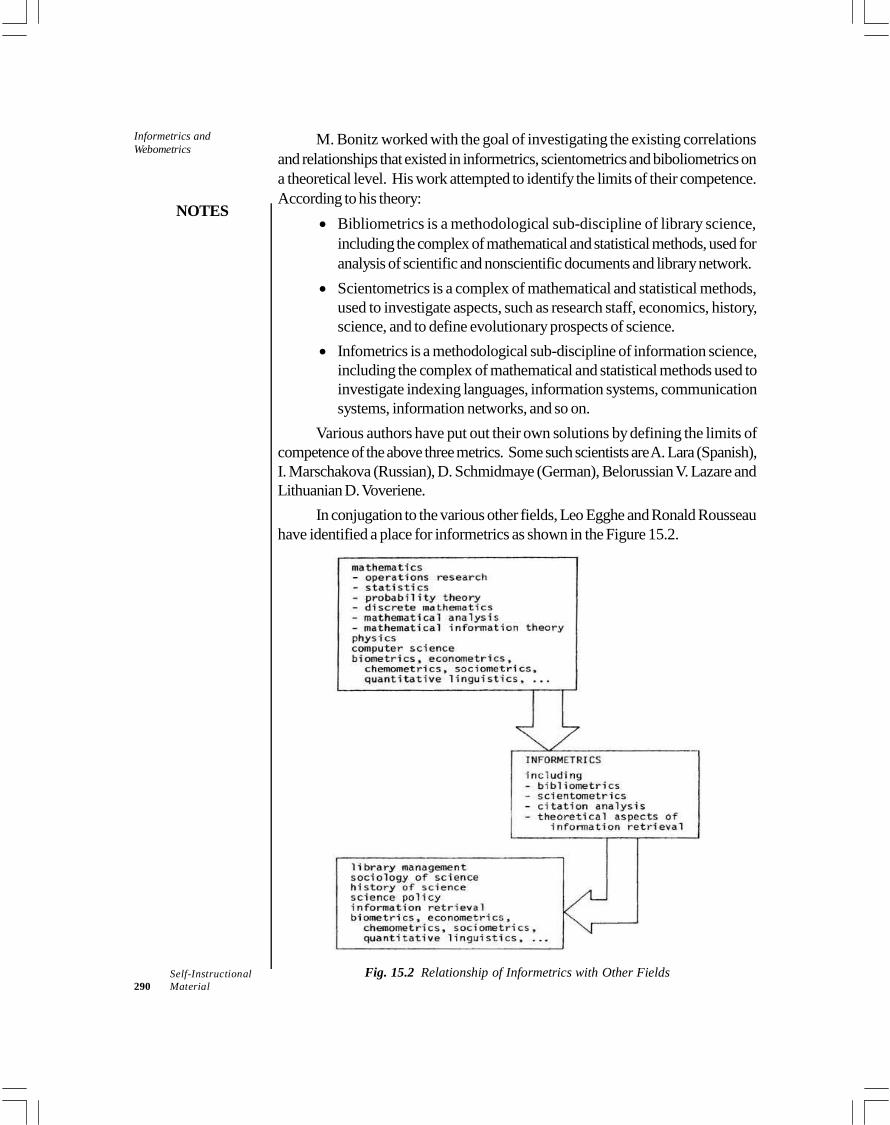
Informetrics andWebometrics
NOTES
Self-Instructional290 Material
M. Bonitz worked with the goal of investigating the existing correlationsand relationships that existed in informetrics, scientometrics and biboliometrics ona theoretical level. His work attempted to identify the limits of their competence.According to his theory:
Bibliometrics is a methodological sub-discipline of library science,including the complex of mathematical and statistical methods, used foranalysis of scientific and nonscientific documents and library network.
Scientometrics is a complex of mathematical and statistical methods,used to investigate aspects, such as research staff, economics, history,science, and to define evolutionary prospects of science.
Infometrics is a methodological sub-discipline of information science,including the complex of mathematical and statistical methods used toinvestigate indexing languages, information systems, communicationsystems, information networks, and so on.
Various authors have put out their own solutions by defining the limits ofcompetence of the above three metrics. Some such scientists are A. Lara (Spanish),I. Marschakova (Russian), D. Schmidmaye (German), Belorussian V. Lazare andLithuanian D. Voveriene.
In conjugation to the various other fields, Leo Egghe and Ronald Rousseauhave identified a place for informetrics as shown in the Figure 15.2.
Fig. 15.2 Relationship of Informetrics with Other Fields
NOTES
Self-InstructionalMaterial 291
Informetrics andWebometrics
Check Your Progress
1. What do you understand by the term informetrics?2. Write the key objectives of usability research.
15.3 BIBLIOMETRICS
The statistical analysis of written publications, like articles and books is referred toas bibliometrics. Bibliometric methods are frequently used in the field of libraryand information science, including scientometrics.
In the recent times, bibliometric analysis has taken on a position of being awell-established component of information research. It is also fast becomingpopular as the quantitative approach to the description of documents andexamination of services both in practice and in research. The first use of bibliometricswas made in early 1969, and it was during the 1980s that it increasingly gained inpopularity. Bibliometrics makes use of bibliometric techniques for the analyticalstudy of the literature. In other words, it is that analysis which is conducted basedon the bibliographic phenomena, such as pattern of citation and development ofliterature.
The term bibliometrics is formed of two Latin and Greek words – ‘biblio’and ‘metrics’. Therefore, etymologically the words bibliometrics means ‘applicationof mathematics to the study of bibliography.’ The British Standards Institutiondefine bibliometrics as, ‘…The study of the use of documents and pattern ofpublication in which mathematical and statistical methods have beenapplied.’
The field of bibliometrics is a branch of information theory, that quantitativelyanalyses recorded knowledge to know the behavior and properties of the same.The recorded knowledge that is being analysed could be in any of the variousforms, such as dissertations, doctoral theses, journals and books, and so on. Fornearly every subject discipline, there has been creation and development bybibliometric research of a body of theoretical knowledge and a group of techniqueswhich has arisen fundamentally from bibliographic data elements. Such studies areemployed for identifying the pattern of citations, authorship, publication and/orsecondary journals coverage, expecting that these regularities will provide someinsight into the dynamics of the field of consideration of information resources thatwill possibly be employed effectively.
There is now a wide use of and acceptance of ‘bibliometrics’ as a term.Various authors have provided their own interpretation of the term. According toAlan Pritchard, bibliometrics is that which deals with all studies that seek to quantifythe processes of written communication. He defines bibliometrics as ‘Theapplication of mathematical methods to books and other media ofcommunication.’
Informetrics andWebometrics
NOTES
Self-Instructional292 Material
According to Fairthorne, bibliometrics is the ‘…Quantitative treatmentof properties of recorded discourse and behavior appertaining to it.’
In the year 1977, during his bibliometric study conducted online, Hawkinsmade his own interpretation of the term. According to him, bibliometrics is the‘Quantitative analysis of the bibliographic features of a body of literature.’In recent times, Potter put out his own interpretation of bibliometrics and describedit as ‘…The study and measurement of the publication patterns of all formsof written communication and their authorship.’
A historic overview of bibliometrics’s various definitions was presented byBroadus. He also put out his own definition as an alternative, defined as,‘Bibliometrics is the quantitative study of physical published units or ofbibliographic or of surrogates of either.’
Broadly speaking, there are two basic groups into which all aspects ofbibliometric studies are divided. While one group deals with describing thecharacteristics or features of literature (descriptive studies), the other deals withexamining those relationships that get created amongst the components of a literature(behavioral studies, sometimes referred to as citation studies but not restricted tothem). Possibly, it is the easiest to understand descriptive studies and can be lookedupon as being in various manners similar to population censuses.
While there are two groups of bibliometric studies, they both have to makeavailable accurate as well as comprehensive data pertaining to the rapidly changingpopulation, while one will do it with respect to literature, the other will do it withrespect to people. Literature descriptions get put together with the help of thebibliographic characteristics of each individual member of the literature.Nevertheless, there are some specific studies connected with bibliographicdescription that are pertinent to bibliometric study which are the ones that makesuch data available which is for the character or condition of the literature as awhole. Thus, a vital difference is present between bibliometric and bibliographicdata.
When considered as a technique, bibliometry has extensive applications foridentification of research trends in a subject, trends in authorship and collaborationin research. Furthermore, it applies to core journals, obsolescence, and dispersionof scientific literature useful in estimating the comprehensiveness of secondaryjournals studying the author productivity, characteristics of subject literature includingstructure of knowledge, historical and sociological aspects of science and helpfulin formulation of need based collection development policy, weeding and stackingpolicy, science policy studies and many others.
15.4 SCIENTOMETRICS
Scientometric research is the quantitative mathematical study of science andtechnology. It comprises economic as well as bibliometric analysis. In the recent
NOTES
Self-InstructionalMaterial 293
Informetrics andWebometrics
times, there has been expansion in this field as a pace that can only be calledenormous. All of the leading journals of the field carry ‘research covering articleoutput, citation relationships between disciplines and linked geographical analysis.
Bibliometric research started in the 19th century and it originated possiblyin the field of law. According to Shapiro (1999) the aspects associated withbibliometrics were practiced in the legal field long before being introduced intoscientific literature. Researches during the 1880s had been reported by Delmas(1992), when he noted and elaborated on the documentation being conducted inFrance. Nevertheless, it has been seen that it was the field of psychology wherethe pioneering studies associated with quantitative and qualitative analysis of scienceoriginated (Godin 2006). The work done by Buchner is cited by Godin whiledescribing the concept of ‘scientific psychology to be factual, inductive, measurableand experimental’. In the year 1920, research was presented by Boring pertainingto geographical and subject analysis of psychologists.
The research that is looked upon as being the earliest and is the, mostdefinable one in the field of scientometric and is the one from which the laws ofbibliometrics were derived. Of these laws, the first law was the one which is namedafter Alfred Lotka and is referred to as the Lotka’s Law, and its origins go as farback as 1926. According to Lotka’s Law, in any defined area, when it is studiedfor a specific period, it is seen that a small number of authors are responsible for alarge percentage of publications associated with that area. Then, in the year 1935the work done by George Kingsley Zipf, which was done with keeping in mind thefrequency of occurrence of words in a text and that came to be known as Zipf’sLaw. Over time, the research done by Zipf got further refined and two specificlaws emerged from it which pertained to the occurrence of low frequency and thehigh frequency words in a text. During the year 1948, the analysis by SamuelClement Bradford arrived at the fact that for a specific time for a specific area asmall number of journals are seen to publish a high percent of articles for thatspecific area while at the same time there are many journals in which just a fewarticles pertaining to that area are published. This is known as Bradford’s Law.
Even in the current times, these are studied at all times and are looked uponas being the very base on which the scientometric literature of these modern rests.
Lehman, in the year 1944, had explained the relationship that existed betweenquality and quantity in the sphere of scientific writing. Later, in the year 1952,Dennis made an analysis of the effect that the age of a scientist would have on thequantity and quality of writing. Even now such analyses are discussed and describedin literature of present times, and are responsible for steering the process of thinkingin the direction of averaged metrics which lies in the scope of bibliometrics.
15.5 WEBOMETRICS
One can define Webometrics, a component of information science as ‘the studyof the quantitative aspects of the construction and use of information
Informetrics andWebometrics
NOTES
Self-Instructional294 Material
resources, structures and technologies on the Web drawing on bibliometricand informetric approaches’. In more generic term, it is ‘the study of Web-based content with primarily quantitative methods for social science researchgoals using techniques that are not specific to one field of study’. Though inthe first definition, the stress is on the informetric heritage of several of the bibliometricmethods, in the second definition, the stress is on the value that Webometricscould provide to the wider social sciences, displaying a move to more appliedstudies and away from theoretical studies, by keeping alive the focus on methodsdevelopment. Currently, in Webometrics there are various software and variousmethods to implement different types of quantitative analyses of the Web. In spiteof the concerns that had arisen initially in regard to the idea that it was easy tomanipulate Web data since such data had no quality-control, it is claimed byWebometrics advocates that it proves to be useful for both studies of the variousaspects like hyperlink between the different Websites geared to being academicWebsites, and also to studies of offline phenomena which could be reflected online,like blogs reflecting political attitudes.
In 1997, Tomas Almind and Peter Ingwersen coined the term Webometricson the basis of the concept that it is possible to apply informetric analyses to theWeb. There was a huge spur in the growth of this field when the Web ImpactFactor (WIF) was introduced. WIF is a metric used for assessing the impact thata specific Website or other area of the Web will have on the basis of the numberof hyperlinks that point to it. There seems to be a lot of sense in WIFs and this isso because such areas on the Web which prove to be more important or usefulwill certainly attract more hyperlinks as compared to such areas that are of averagevalue. This metric’s logic has its basis in the significance of the citations in journalimpact factors, yet there is that advantage that WIFs had of being calculated bymaking use of the new advanced search queries by the commercial search engineAltaVista. Over time, Webometrics has risen to acquire the position of being avast, coherent field that is a subset of information science from the perspective ofbibliometry. It combines in itself various quantative techniques which are Webbased, such as Web citation analysis and link analysis. Furthermore, the usefulnessof Webometrics increased in several applied contexts, like in creation of worldWebometrics ranking of universities and on the scientometric investigations orevaluations of areas of research or bodies of research.
Link analysis impact measurement and network as it is the early researchof Webometrics got conducted mainly via combination of the growth of both betterapplications and methods for a wide range of varying contexts. This gave rise tospecific types of studies which were link network analyses and link impact analyses.Mostly, the link impact studies emphasizing in comparing how many hyperlinks, interms of numbers, point to each Website within a pre-defined set. For example,all of the departments of a specific discipline within a country and all of theuniversities of a specific country. Links that point to the Websites of the universityand possibly in a few cases to the Websites of departments were realized to

NOTES
Self-InstructionalMaterial 295
Informetrics andWebometrics
significantly correlate with the research productivity measures or prestige. Thereby,providing evidence regarding how valid it was to employ the link impact metrics asan indicator for research-related activities. Link impact metrics are used in such amanner to make available the clue to the most important Websites or organizationsin any given group. Furthermore, the breakdown in the sources of links whichhave been used for the calculations show the sources of the impact, like theorganization type or the country which host the majority of the links.
With link network research, there has been the generation of networkdiagrams based upon the links in a specific Website group for the purpose ofconnectivity pattern identification. Besides working with such networks that arebased upon a direct links between site pairs, use has also been made of co-inlinksto show the connection which exists between site pairs. To understand what a co-inlink to a pair of Websites is, consider Websites A and B and if there is a thirdWebsite, let it be called C, which maintains a hyperlink to A and also to B, then Cis the co-inlink to the Websites A and B. Such a relation can be considered todraw a parallel with the concept of co-citation in the field of bibliometrics. Co-inlink is particularly used in the investigation of Websites that might be similar yetare not necessarily having hyperlink with each other. In a network diagram madefor direct links, there is the possibility of the exclusion of links that are there betweenpairs of sites that though in some way similar are not related with one anotherdirectly.
For link analysis, it has already been said that there exist two componentsthat are or major importance and these are the methods and the software whichare used for extract data pertaining to links. For several years, researchers managedto collect information regarding hyperlinks with the help of search engines thatwere commercial, such as Yahoo!, AltaVista and Bing with the help of theirassociated advanced link search commands. However, all of these tools finallywere withdrawn. Data on links is still obtainable through making use of Web crawlersdesigned for specialist link analysis, including free programs, such as IssueCrawlerand SocSciBot. In the field of information science, network diagrams that arehyperlink-based are employed for the purpose of investigating what interconnectionsexist between large groups of organizations, like the specific knowledge sectororganizations and universities within Europe.
There are a number of link analysis researches whose main focus in on thelinks themselves and with respect to the links they study the reason for their creation,and the reason why some pages and sites of the sites pull in more links than otherpages and sites. While these studies have focused on just links, they have alsofocused on those links in the contexts of academics. Some of the content analysesthat have been conducted have revealed that the links that exist between Websitesare academic are mostly created for purposes educational or scholarly. This ispartially the same reason as given for citation analysis. Researchers have evenconducted statistical tests for the purpose of studying which of the attributespossessed by an owner of a Website (besides the already known research
Informetrics andWebometrics
NOTES
Self-Instructional296 Material
productivity or production attribute) happen to associate with higher inlink counts.For example, one of the findings is that the gender of the owner of a researchWebsite is inconsequential. Of late, a very comprehensive study was conductedwhich employed an approach for statistical modeling which was extremelyadvanced an usedit on a massive dataset to obtain such insights which was verysignificant in view of the factors that played a role in academic Website interlinkingwithin Europe. This study found that it was not country, region, domain specialismand that held the most importance in predicting hyperlinks, but rather reputation inthe case of top universities.
From Web Citation Analysis to Altmetrics
Another form of Webometrics that gained a lot of popularity was web citationanalysis. Web citation analysis refers to the counting of the online citations topublished academic documents, such as refereed journal articles. The rationalegiven for conducting of early research was making an assessment of whether ornot the Web would be able to replace traditional citation databases for assessingthe impact that was felt of articles in open access online journals and following thateven in the case of all journals. Through this research, it was revealed that evenwhile the counts of Web citations were in correlation with citation counts found inthe traditional databases. Several of the Web citations were taken from non-academic sources, like online library catalogues. In this manner, it was gleanedthat the Web was a lower or inferior source of citation impact evidence for journalsor individual journal articles.
Then the investigations that followe were much more specialized and gearedtowards specific kinds of Web citations to academic publications, such as citationsfrom Google Books, online syllabi and PowerPoint presentations. Thes investigationswere based on the restricted domains, such as the Web-based citation counts,which show the various different kinds of impact that would differ from the scholarlyimpact observed in the traditional citation counts. For example, the citations ofonline syllabus would reveal the education value or impact of articles. After awhile, even this line of search handed over the reins and this time it was to thealtmetrics initiative.
The analysis of mentione phrases or keywords is yet another relatively lessstudied yet promising type of Webometrics. It does not necessarily deal withcitations. This form of analysis began when investigation was being done on thecontext of online mentions of academics. Research into keywords is also employedfor the purpose of mapping concepts online as also interactions between conceptsonline by tracking similar words in Web pages.
Theoretical Perspectives and Information-Centered Research
Webometrics was and has remained to be a field that is method-centered, and itcontinues to create more and more methods for the purpose of gathering andanalysing data gathered from the Web. Probably due to such focus, majority of
NOTES
Self-InstructionalMaterial 297
Informetrics andWebometrics
the Webometric studies’ theoretical component typically was derived from citationanalysis instead of Web data. For example, several of the studies conducted earliermade an assessment of whether or not Web citation or Web link counts has anycorrelation with traditional citation counts. In this way, they were based uponRobert Merton’s theoretical discussion of citation norms in science. Therefore, toan extent such studies were able to find the extent of Web data built-in Merton’stheory. The area of link analysis is the most developed area of Webometrics andhas no special theories to show that the Web is a space which is much morecomplex and varied than academic journal databases, with theory development inthe latter being recognized as problematic and controversial.
One reason that is given for there being paucity of native theory for the fieldof Webometrics is that research in this field is information-centered, since it isspecifically apt for this area. Any research study that is information-centered willhave as its key focus some new information source. For example, some form ofWeb data, and the study will try to detect the social science research problems forwhich specific date is best placed for addressing instead of employing a prioriintuitions and matching the data with a research problem and then to assess thevalue of the data for the problem. Specifically this particular theory was employedfor the purpose of justifying the growth of a whole range of varying methods foranalysing Web data and for matching the methods with a varied range of problemsrelated with areas of social science.
Web Data Analysis as a Service for the Social Sciences
There is an increase of the Webometrics research as its moving from general to thearea of academic Web analyses for the investigations of social Websites. It can beachieved by downloading and obtaining data automatically from those Websiteswith the help of a Web crawler or data requests sent via routes that are permitted.
For example, RSS feeds and blogs have been analysed in same manner forthe purpose of detecting the fears of public with respect to science and there hasbeen investigation of social network sites to find out patterns for detecting friendshipand language use. Analysis has been done using Twitter to know the publicsentiments caused as a reaction to major media events. There has been an analysisof YouTube for such factors that are linked to discussions which are associatedwith online videos. The research method for all cases was Webometrics – datagathering and analysis on a massive scale for the purpose of social science – withthe research findings being used for disciplines other than information science,like-science communication, and politics and media studies.
Check Your Progress
3. What are bibliometrics?4. Define the term scientometrics.5. What do you understand by the term Webometrics?
Informetrics andWebometrics
NOTES
Self-Instructional298 Material
15.6 ANSWERS TO CHECK YOUR PROGRESSQUESTIONS
1. Informetrics is the study of the quantitative aspects of information in anyform, not just records or bibliographies and any social group, not justscientists.
2. The key objectives of usability research are tests of accessibility, accuracy,relevance, completeness, objectivity and timeliness of users.
3. Bibliometrics is the quantitative study of physical published units or ofbibliographic or of surrogates of either.
4. Scientometrics is defined as a sub-field study of science as an informationprocess. When the information model is considered, all of the publicationswill be looked upon as being communication promoters and informationcarriers.
5. Webometrics, a component of information science is defined as ‘the studyof the quantitative aspects of the construction and use of informationresources, structures and technologies on the Web drawing on bibliometricand informetric approaches’. In more generic term, it is ‘the study of Web-based content with primarily quantitative methods for social science researchgoals using techniques that are not specific to one field of study’.
15.7 SUMMARY
Informetrics is the study of the quantitative aspects of information in anyform, not just records or bibliographies and any social group, not justscientists. Informetrics has its scope in the production or creation, dissemination or
dispersal, and the use or employment of each and every information form,irrespective of its origin or form. The statistical analysis of written publications, like articles and books is
referred to as bibliometrics. Bibliometric methods are frequently used in thefield of library and information science, including scientometrics. The term bibliometrics is formed of two Latin and Greek words – ‘biblio’
and ‘metrics’. Therefore, etymologically the words bibliometrics means‘application of mathematics to the study of bibliography. Bibliometric study is considered to be an important tool for checking the
effectiveness of a system. It is also considered to be a distinctive researchtechnique which helps in measuring science on the basis of citation data. Scientometric research is the quantitative mathematical study of science
and technology. It comprises economic as well as bibliometric analysis.
NOTES
Self-InstructionalMaterial 299
Informetrics andWebometrics
The key purpose of scientometrics is to determine the prospect and thestate of a subject and how it will develop in the future. Various indicators ofscientometry are employed to determine all of this. Webometrics, a component of information science, is defined as ‘the study
of the quantitative aspects of the construction and use of informationresources, structures and technologies on the Web drawing on bibliometricand informetric approaches’.
15.8 KEY WORDS
Informetrics: It is the study of the quantitative aspects of information inany form, not just records or bibliographies and any social group, not justscientists Scientometrics: It is the study of the quantitative aspects of science. Webometrics: It is the study of the quantitative aspects of the World Wide
Web (WWW). Bibliometrics: It is the statistical analysis of written publications, like articles
and books.
15.9 SELF ASSESSMENT QUESTIONS ANDEXERCISES
Short Answer Questions
1. Write a short note on the genesis of informetrics.2. What are the two basic groups in which all aspects of bibliometric studies
are divided?
Long Answer Questions
1. Discuss the main areas of study in the field of informetrics.2. Discuss web citation analysis.
15.10 FURTHER READINGS
Baker, S L. and Lancaster, S.W. 1991. Measurement and Evaluation of LibraryServices, 2nd Ed. Arlinglon: Information Resources Press.
Carpenter, R.L. and Vasu, E.S. 1979 Statistical Methods for Librarian. Chicago:ALA.
Donohue, J C. 1990. Understanding Scientific Literature: A BibliometricApproach. London: MIT.

Informetrics andWebometrics
NOTES
Self-Instructional300 Material
Egghe, L., and Rousseau, R. 1990. Introduction to Informetrics: QuantitativeMethods in Library, Documentation and Information Science.Amsterdam: Elsevier.
Egghe, L. and Rousseau, R. 2001. Elementary Statistics for Effective Libraryand Information Services Management. London: ASLIB.
Nicholas D. and Ritchil, M. 1979. Literature and Bibliometrics. London: CliveBingley.