cost accounting - alagappa university
TRANSCRIPT

BBAII - Semester
104 24
Directorate of Distance Education
COST ACCOUNTING
ALAGAPPA UNIVERSITY[Accredited with ‘A+’ Grade by NAAC (CGPA:3.64) in the Third Cycle
and Graded as Category–I University by MHRD-UGC]
(A State University Established by the Government of Tamil Nadu)
KARAIKUDI – 630 003

All rights reserved. No part of this publication which is material protected by this copyright noticemay be reproduced or transmitted or utilized or stored in any form or by any means now known orhereinafter invented, electronic, digital or mechanical, including photocopying, scanning, recordingor by any information storage or retrieval system, without prior written permission from the AlagappaUniversity, Karaikudi, Tamil Nadu.
Information contained in this book has been published by VIKAS® Publishing House Pvt. Ltd. and hasbeen obtained by its Authors from sources believed to be reliable and are correct to the best of theirknowledge. However, the Alagappa University, Publisher and its Authors shall in no event be liable forany errors, omissions or damages arising out of use of this information and specifically disclaim anyimplied warranties or merchantability or fitness for any particular use.
Vikas® is the registered trademark of Vikas® Publishing House Pvt. Ltd.
VIKAS® PUBLISHING HOUSE PVT. LTD.E-28, Sector-8, Noida - 201301 (UP)Phone: 0120-4078900 Fax: 0120-4078999Regd. Office: A-27, 2nd Floor, Mohan Co-operative Industrial Estate, New Delhi 1100 44 Website: www.vikaspublishing.com Email: [email protected]
Author
M N Arora, Ex-Associate Professor, Department of Commerce, Hans Raj College, Delhi University
Units (1-14)
"The copyright shall be vested with Alagappa University"
Reviewer
Dr SP Mathairaj Associate Professor, Department ofCorporate Secretaryship, AlagappaUniversity, Karaikudi
Work Order No. AU/DDE/DE1-15/Printing of Course Materials/2020 Dated 05.02.2020 Copies – 500

SYLLABI-BOOK MAPPING TABLECost Accounting
BLOCK I: COST ACCOUNTING FEATURES AND FUNCTIONSUNIT 1 Cost Accounting: Meaning, Features, Scope, Techniques,Methods, Objectives, Importance and Limitations. Costing; costaccountancy; cost centres and profit centres, Difference and similaritiesof cost accounting system with financial accounting system. Cost:main elements and types.UNIT 2 Material Control: Meaning and objectives of material control,material purchase procedure, fixation of inventory levels-reorder level,Minimum level, Maximum level, Danger level. EOQ analysis. Methodsof Valuing Material Issues. Wastage of material –main types.UNIT 3 Labour Cost Control : Importance, methods of time keepingand Time Booking; Treatment and control of Labour Turnover, IdleTime, Overtime, Systems of Wage Payment-Time Wage System, PieceWage System. Incentive Wage plans –Individual plans and group plans.UNIT 4 Overheads : Meaning and Types. Collection, Classification;Allocation, Apportionment and Absorption of Overheads –Mainmethods.
BLOCK II: TYPES OF COSTINGUNIT 5 Unit and output costing : meaning and objectives; cost sheet–meaning, Performa, types preparation of cost sheet; determination oftender price; production account –types.UNIT 6 Reconciliation of cost and financial accounts : Meaning.Objectives and procedureUNIT 7 Process Costing: Meaning; Uses; Preparation of processaccount, Treatment of Normal Wastage, Abnormal Wastage, AbnormalEffectiveness;UNIT 8 Treatment of opening and closing stock - .Joint -Product andBy -Product: Main methods of apportionment of Joint cost. Inter processprofits.
BLOCK III: COSTING AND BUDGETING CONTRACTUNIT 9 Contract Costing –meaning, main features, preparation ofcontract account,Escalation clause; contract near completion; cost plus contract.UNIT 10 Job and batch costing - Budgetary control –meaning of budgetand budgetarycontrol, budgetary control as a management toolUNIT 11 limitations of budgetary control, forecasts and budgets,installation of budgetary control system, classification of budgets,fixed and flexible budgeting, performance budgeting, zero basedbudgeting and responsibility accounting
Syllabi Mapping in Book
Unit 1: An Overview of CostAccounting
(Pages 1-27);Unit 2: Material Control
(Pages 28-51);Unit 3: Labour Cost Control
(Pages 52-82);Unit 4: Overheads
(Pages 83-122)
Unit 5: Unit and Output Costing(Pages 123-135);
Unit 6: Reconciliation of Cost andFinal Accounts
(Pages 136-144);Unit 7: Process Costing - I
(Pages 145-158);Unit 8: Process costing - II
(Pages 159-185)
Unit 9: Contract Costing(Pages 186-196);
Unit 10: Job and Batch Costing(Pages 197-206);
Unit 11: Budget and Budgetary Control(Pages 207-229)
BLOCK IV: STANDARD COSTING AND DECISION MAKINGUNIT 12 Standard Costing : meaning, limitations, standard costs andbudgeted costs, determination of standard cost, cost variances, directmaterial and direct labour only.UNIT 13 Marginal Costing and Profit planning: Marginal costing,Absorption costing, Marginal cost, Cost volume Profit analysis, BEPAnalysis, Key factor, BE chart, angle of incidence,UNIT 14 concept of decision-making and steps involved, determinationof sales mix, make or buy Decisions - Cost Ledgers -Reconciliation ofCost and Financial Profits –Need for Control – Integral Accounting.
Unit 12: Standard Costing(Pages 230-254);
Unit 13: Marginal Costing andProfit Planning
(Pages 255-272);Unit 14: Decision-Making, Integrated
and Non-Integrated Accounts(Pages 273-290)
BLOCK 1: COST ACCOUNTING FEATURES AND FUNCTIONS
UNIT 1 AN OVERVIEW OF COST ACCOUNTING 1-27
1.0 Introduction1.1 Objectives1.2 Cost Accounting: Meaning, Features and Scope
1.2.1 Costing and Cost Accountancy1.2.2 Objectives and Functions of Cost Accounting1.2.3 Differences and Similarities of Cost Accounting System with Financial Accounting System1.2.4 Importance and Limitations of Cost Accounting
1.3 Cost Concepts1.3.1 Cost Centre and Profit Centres1.3.2 Methods and Techniques of Costing1.3.3 Types of Cost1.3.4 Elements of Cost
1.4 Answers to Check Your Progress Questions1.5 Summary1.6 Key Words1.7 Self Assessment Questions and Exercises1.8 Further Readings
UNIT 2 MATERIAL CONTROL 28-51
2.0 Introduction2.1 Objectives2.2 Meaning and Objectives of Material Control2.3 Techniques of Inventory Control
2.3.1 Stock Levels or Fixation of Inventory Levels2.3.2 Economic Order Quantity Analysis (EOQ)
2.4 Material Purchase Procedure2.5 Methods of Pricing Material Issues2.6 Material Losses, Wastage of Materials and its Main Types2.7 Answers to Check Your Progress Questions2.8 Summary2.9 Key Words
2.10 Self Assessment Questions and Exercises2.11 Further Readings
UNIT 3 LABOUR COST CONTROL 52-82
3.0 Introduction3.1 Objectives3.2 Importance of Labour Cost Control3.3 Treatment and Control of Labour Turnover3.4 Methods of Time Keeping and Time Booking3.5 Idle Time and Overtime3.6 Systems of Wage Payment Methods of Remuneration
3.6.1 Conventional Methods3.6.2 Incentive Wage Plans
CONTENTS
3.7 Answers to Check Your Progress Questions3.8 Summary3.9 Key Words
3.10 Self Assessment Questions and Exercises3.11 Further Readings
UNIT 4 OVERHEADS 83-122
4.0 Introduction4.1 Objectives4.2 Meaning and Types of Overhead Cost
4.2.1 Classifications of Overhead Costs4.2.2 Standing Order Numbers (Codification of Overheads)
4.3 Overheads Distribution4.3.1 Collection of Overheads4.3.2 Allocation and Apportionment Overheats (Production): Main Methods
4.4 Absorption of Overheads (Production): Main Methods4.4.1 Types of Overhead Rates
4.5 Administration, Selling and Distribution Overheads4.6 Under-Absorption and Over-Absorption of Overheads4.7 Answers to Check Your Progress Questions4.8 Summary4.9 Key Words
4.10 Self Assessment Questions and Exercises4.11 Further Readings
BLOCK 2: TYPES OF COSTING
UNIT 5 UNIT AND OUTPUT COSTING 123-135
5.0 Introduction5.1 Objectives5.2 Meaning of Cost Unit and Cost Accumulation, Procedure in Unit Costing, Preparation of
Cost Sheet5.3 Answers to Check Your Progress Questions5.4 Summary5.5 Key Words5.6 Self Assessment Questions and Exercises5.7 Further Readings
UNIT 6 RECONCILIATION OF COST AND FINAL ACCOUNTS 136-144
6.0 Introduction6.1 Objectives6.2 Reconciliation of Cost Financial Accounts: Meaning
6.2.1 Objectives for Reconciliation6.3 Procedure of Reconciliation of Cost and Final Accounts6.4 Answers to Check Your Progress Questions6.5 Summary6.6 Key Words6.7 Self Assessment Questions and Exercises6.8 Further Readings
UNIT 7 PROCESS COSTING - I 145-158
7.0 Introduction7.1 Objectives7.2 Process Costing: Meaning and Applications
7.2.1 Preparation of Process Accounts7.2.2 Treatment of Normal Wastage, Abnormal Effectiveness
7.3 Answers to Check Your Progress Questions7.4 Summary7.5 Key Words7.6 Self Assessment Questions and Exercises7.7 Further Readings
UNIT 8 PROCESS COSTING - II 159-185
8.0 Introduction8.1 Objectives8.2 Work-in-Progress (Equivalent Production)8.3 Internal Process Profits (Inter-Process Profits)8.4 Joint Products and By-Products8.5 Answers to Check Your Progress Questions8.6 Summary8.7 Key Words8.8 Self Assessment Questions and Exercises8.9 Further Readings
BLOCK 3: COSTING AND BUDGETING CONTRACT
UNIT 9 CONTRACT COSTING 186-196
9.0 Introduction9.1 Objectives9.2 Contract Costing: Meaning and Features
9.2.1 Main Features of Contrast Costing9.2.2 Preparation of Contract Account
9.3 Special Points in Contract Costing9.3.1 Profit on Uncompleted Contracts9.3.2 Escalation Clause9.3.3 Cost-plus Contracts
9.4 Answers to Check Your Progress Questions9.5 Summary9.6 Key Words9.7 Self Assessment Questions and Exercises9.8 Further Readings
UNIT 10 JOB AND BATCH COSTING 197-206
10.0 Introduction10.1 Objectives10.2 Job Costing10.3 Batch Costing10.4 Answers to Check Your Progress Questions

10.5 Summary10.6 Key Words10.7 Self Assessment Questions and Exercises10.8 Further Readings
UNIT 11 BUDGET AND BUDGETARY CONTROL 207-229
11.0 Introduction11.1 Objectives11.2 Meaning of Budget and Budgetary Control
11.2.1 Forecast and Budget11.2.2 Budgetary Control as a Management Tool11.2.3 Limitations of Budgetary Control11.2.4 Preliminaries in the Installation of Budget System
11.3 Classification of Budgets11.3.1 Fixed and Flexible Budgets
11.4 Specific Variants of Budgeting11.4.1 Zero Base Budgeting (ZBB)11.4.2 Performance Budgeting11.4.3 Responsibility Accounting
11.5 Answers to Check Your Progress Questions11.6 Summary11.7 Key Words11.8 Self Assessment Questions and Exercises11.9 Further Readings
BLOCK 4: STANDARD COSTING AND DECISION MAKING
UNIT 12 STANDARD COSTING 230-254
12.0 Introduction12.1 Objectives12.2 Standard costing: meaning and limitations
12.2.1 Standard Costs and Budgeted Costs12.2.2 Concept of Standard Costing12.2.3 Limitations of Standard Costing12.2.4 Preliminaries in Establishing a System of Standard Costing and Determination Standard Cost
12.3 Cost Variances12.3.1 Material Variances12.3.2 Labour Variance
12.4 Answers to Check Your Progress Questions12.5 Summary12.6 Key Words12.7 Self Assessment Questions and Exercises12.8 Further Readings
UNIT 13 MARGINAL COSTING AND PROFIT PLANNING 257-272
13.0 Introduction13.1 Objectives13.2 Marginal and Absorption Costing
13.2.1 Marginal Cost13.2.2 Absorption Costing and Marginal Costing: Differences and Determination
13.3 Cost-Volume-Profit Analysis and Profit Planning13.3.1 Break-even Analysis13.3.2 Profit-Volume Ratio (P/V Ratio)13.3.3 Margin of Safety (M/S)13.3.4 Limiting or Key Factor13.3.5 Break-even Chart and Angle of Incidence
13.4 Answers to Check Your Progress Questions13.5 Summary13.6 Key Words13.7 Self Assessment Questions and Exercises13.8 Further Readings
UNIT 14 DECISION-MAKING, INTEGRATED ANDNON-INTEGRATED ACCOUNTS 273-290
14.0 Introduction14.1 Objectives14.2 Concept of Decision-Making and Steps Involved
14.2.1 Applications of Marginal Costing in Decision-Making and It’s Steps14.3 Non-Integral or Cost Ledger Accounting
14.3.1 Reconciliation of Cost and Financial Profits14.3.2 Control Accounts and Need for Control
14.4 Integral Accounting14.5 Answers to Check Your Progress Questions14.6 Summary14.7 Key Words14.8 Self Assessment Questions and Exercises14.9 Further Readings
INTRODUCTION
Cost Accounting provides financial information concerning the activities of anenterprise to a diverse group of people such as shareholders, managers, creditors,tax authorities, etc. Compared with financial accounting, cost accounting is a relativelyrecent development. Modern cost accounting developed only during the nineteenthcentury. In fact, cost accounting started as a branch of financial accounting, but it isnow regarded as an accounting system in its own right. The vital importance thatcost accounting has acquired in the modern age is because of the increasing complexityof the modern industry.
This book, Cost Accounting, provides a framework of cost accounting,explaining its basic concepts, cost classifications, costing techniques, elements ofcost, overheads etc. It gives students a thorough grounding in cost concepts, costbehaviour and costing methods. Each unit deals with a distinct aspect of costaccounting. Theoretical discussion is well supported by numerical illustrations anddiagrams to help students grasp the subject.
This book, Cost Accounting, is written with the distance learning student inmind. It is presented in a user-friendly format using a clear, lucid language. Each unitcontains an Introduction and a list of Objectives to prepare the student for what toexpect in the text. At the end of each unit are a Summary and a list of Key Words, toaid in recollection of concepts learnt. All units contain Self-Assessment Questionsand Exercises, and strategically placed Check Your Progress questions so the studentcan keep track of what has been discussed.
NOTES
Self-InstructionalMaterial
An Overview ofCost Accounting
NOTES
Self-InstructionalMaterial 1
BLOCK - ICOST ACCOUNTING FEATURES AND FUNCTIONS
UNIT 1 AN OVERVIEW OF COSTACCOUNTING
Structure
1.0 Introduction1.1 Objectives1.2 Cost Accounting: Meaning, Features and Scope
1.2.1 Costing and Cost Accountancy1.2.2 Objectives and Functions of Cost Accounting1.2.3 Differences and Similarities of Cost Accounting System with Financial
Accounting System1.2.4 Importance and Limitations of Cost Accounting
1.3 Cost Concepts1.3.1 Cost Centre and Profit Centres1.3.2 Methods and Techniques of Costing1.3.3 Types of Cost1.3.4 Elements of Cost
1.4 Answers to Check Your Progress Questions1.5 Summary1.6 Key Words1.7 Self Assessment Questions and Exercises1.8 Further Readings
1.0 INTRODUCTION
Cost Accounting is concerned with ascertainment of cost of products/services.Cost accounting has primarily developed to help managers understand the costsof running a business. Profit and loss account and balance sheet are presented tothe management by the financial accountant. But modern management needs muchmore detailed information than those supplied by these financial statements. Costaccounting provides detailed cost information to various levels of management forefficient performance of their functions. The information supplied by cost accountingacts as a management tool for decision making, to optimize the utilization of scarceresources and ultimately add to the profitability of business by controlling expenditureunder various heads. In this unit, you will learn about the concept of cost accounting,costing, cost accountancy, and the main elements and types of costs.
An Overview ofCost Accounting
NOTES
Self-Instructional2 Material
1.1 OBJECTIVES
After going through this unit, you will be able to:
Discuss the meaning features and scope of cost accounting
Describe the importance and limitations of cost accounting
Explain the objectives and functions of cost accounting
Differentiate cost accounting system with financial accounting system
Examine the main elements and types of cost
Recollect the methods and techniques of costing
1.2 COST ACCOUNTING: MEANING, FEATURESAND SCOPE
The importance of accounting information for the successful operation of a businesshas been long recognised. Accounting is used to classify and record businesstransactions and provide financial information concerning the activities of anenterprise to a diverse group of people such as shareholders, managers, creditors,tax authorities, etc. On the basis of the purpose for which this information is used,accounting is divided into three parts—financial accounting, cost accounting andmanagement accounting.
Financial Accounting
Financial accounting is mainly concerned with recording the business transactionsin the books of account for the purpose of presenting final accounts to themanagement, shareholders and tax authorities, etc. It is defined as ‘the art ofrecording, classifying and summarizing in a significant manner and in termsof money, transactions and events, which are in part at least, of a financialcharacter and interpreting the results thereof.’
Cost Accounting
Compared with financial accounting, cost accounting is a relatively recentdevelopment. Modern cost accounting developed only during the nineteenthcentury. In fact, cost accounting started as a branch of financial accounting, but itis now regarded as an accounting system in its own right. The vital importance thatcost accounting has acquired in the modern age is because of the increasingcomplexity of the modern industry.
Management Accounting
Management accounting is the modern concept of accounts as a tool of management.It is concerned with all such accounting information that is useful to management.

An Overview ofCost Accounting
NOTES
Self-InstructionalMaterial 3
In other words, the term management accounting is applied to the provision ofaccounting information for management activities such as decision making, planningand controlling, etc. Thus, any form of accounting, which enables a business to beconducted more efficiently, can be regarded as management accounting. TheChartered Institute of Management Accountants (CIMA), London has definedmanagement accounting as ‘the presentation of accounting information in sucha way as to assist management in the creation of policy and in the day-to-day operations of an undertaking.’
The Chartered Institute of Management Accountants (CIMA), London hasdefined costing as, ‘the techniques and processes of ascertaining costs.’ Wheldonhas defined costing as, ‘the proper allocation of expenditure and involves thecollection of costs for every order, job, process, service or unit.’ Thus, costingsimply means cost finding by any process or technique. It consists of principlesand rules which are used for determining:
(a) the cost of manufacturing a product, e.g., motor car, furniture, chemical,steel and paper and
(b) the cost of providing a service, e.g., electricity, transport and education.
The terms ‘costing’ and ‘cost accounting’ are often used interchangeably.Cost accounting is a formal system of accounting for costs in the books of account,by means of which, costs of products and services are ascertained and controlled.According to L C Cropper, ‘cost accounting means a specialized applicationof the general principles of accounting, in order to ascertain the cost ofproducing and marketing any unit of manufacture or of carrying out anyparticular job or contract.’ An authoritative definition of cost accounting hasbeen given by CIMA, London as follows: ‘Cost accounting is the process ofaccounting for costs from the point at which expenditure is incurred orcommitted to the establishment of its ultimate relationship with cost centresand cost units. In its widest usage, it embraces the preparation of statisticaldata, the application of cost control methods and ascertainment of profitabilityof activities carried out or planned.’
1.2.1 Costing and Cost Accountancy
Though the terms ‘costing’ and ‘cost accounting’ are interchangeably used, thereis a difference between the two. Costing is simply the method of determining costsby using any method like arithmetic process, memorandum statements, etc. Costaccounting, on the other hand, denotes the formal accounting mechanism, by meansof which costs are ascertained by recording them in the books of account. Insimple words, costing means finding out the cost of products or services by anytechnique or method, while cost accounting means costing using the double entrysystem.
Cost Accountancy: Cost accountancy is a very wide term. It means and includesthe principles, conventions, techniques and systems which are employed in a business
An Overview ofCost Accounting
NOTES
Self-Instructional4 Material
to plan and control the utilization of its resources. It is defined by CIMA, Londonas, ‘the application of costing and cost accounting principles, methods andtechniques to the science, art and practice of cost control and theascertainment of profitability. It includes the presentation of informationderived therefrom for the purposes of managerial decision making.’
Cost accountancy is thus the science, art and practice of a cost accountant.It is a science in the sense that it is a body of systematic knowledge, which a costaccountant should possess for the proper discharge of his duties and responsibilities.It is an art as it requires the ability and skill on the part of a cost accountant, inapplying the principles of cost accountancy to various managerial problems, likeprice fixation, cost control, etc. Practice refers to constant efforts on the part ofcost accountant, in the field of cost accountancy. Theoretical knowledge alonewould not enable a cost accountant to deal with the various intricacies involved.He should, thus, have sufficient practical training, and exposure to real life costingdilemmas.
Scope of Cost Accounting
Cost accounting is generally considered as being applicable only to manufacturingconcerns. This is not so. Its applications are in fact much wider. All types of activities,manufacturing and non-manufacturing, in which monetary value is involved, shouldconsider the use of cost accounting. Wholesale and retail businesses, banking andinsurance companies, railways, airways, shipping and road transport companies,hotels, hospitals, schools, colleges, universities, farming and cinema houses, allmay employ cost accounting techniques to operate efficiently. It is only a matter ofrecognition by the management of the applicability of these costing concepts andtechniques in their own fields of endeavour.
1.2.2 Objectives and Functions of Cost Accounting
The main objectives of cost accounting are as follows:
1. Ascertainment of cost: This is the primary objective of cost accounting.In cost accounting, cost of each unit of production, job, process ordepartment, etc., is ascertained. Not only actual costs incurred areascertained but costs are also predetermined for various purposes. Forcost ascertainment, various methods and techniques are employed underdifferent situations.
2. Cost control and cost reduction: Cost accounting aims at improvingprofitability by controlling and reducing costs. For this purpose, variousspecialized techniques, like standard costing, budgetary control, inventorycontrol, value analysis, etc., are used. This objective of cost control andcost reduction is becoming increasingly important in the present scenariobecause of growing competition in the business world.
An Overview ofCost Accounting
NOTES
Self-InstructionalMaterial 5
3. Guide to business policy: Cost accounting aims at serving the needs ofthe management in conducting the business with utmost efficiency. Costdata provide guidelines for various managerial decisions, like making orbuying, selling below cost, utilization of idle plant capacity, introduction of anew product, etc.
4. Determination of selling price: Cost accounting provides cost informationon the basis of which selling prices of products or services may be fixed. Inperiods of depression, cost accounting guides the firms in deciding the extentto which the selling prices may be reduced to meet the situation.
In order to realize these objectives, the data provided by cost accountingmay have to be re-classified, re-organized and supplemented by other relevantbusiness data from outside the formal cost accounting system.
1.2.3 Differences and Similarities of Cost Accounting System withFinancial Accounting System
Both cost accounting and financial accounting are concerned with systematicrecording and presentation of financial data. The two systems rest on the sameprinciples concerning debit and credit and have the same sources of recording thetransactions. But cost accounting is much more detailed than financial accounting.This is because in financial accounting, profit or loss is ascertained for the businessas a whole whereas in cost accounting, detailed cost and profit data for variousparts of business, like departments, products, etc., are shown. This is explained inthe following illustration.
Differences between cost accounting and financial accounting are explainedbelow:
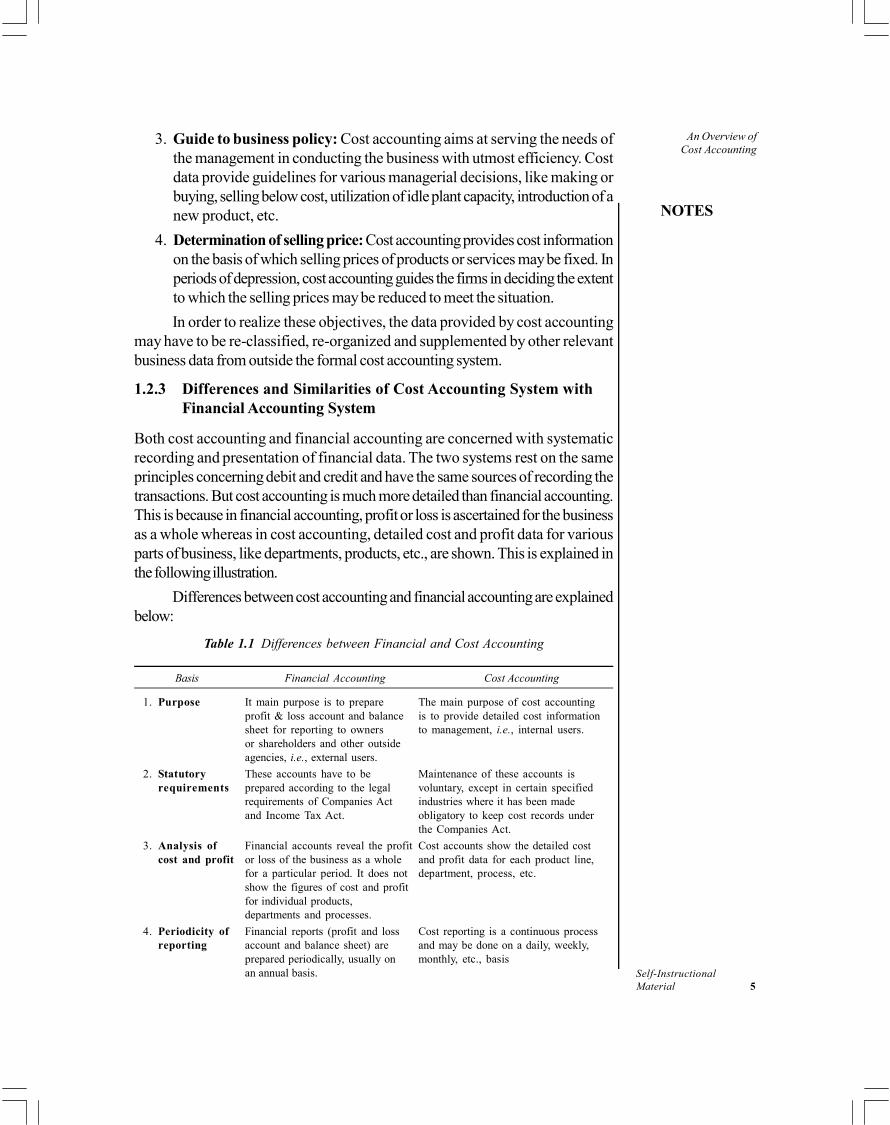
Table 1.1 Differences between Financial and Cost Accounting
Basis Financial Accounting Cost Accounting
1. Purpose It main purpose is to prepare The main purpose of cost accountingprofit & loss account and balance is to provide detailed cost informationsheet for reporting to owners to management, i.e., internal users.or shareholders and other outsideagencies, i.e., external users.
2. Statutory These accounts have to be Maintenance of these accounts isrequirements prepared according to the legal voluntary, except in certain specified
requirements of Companies Act industries where it has been madeand Income Tax Act. obligatory to keep cost records under
the Companies Act.
3. Analysis of Financial accounts reveal the profit Cost accounts show the detailed costcost and profit or loss of the business as a whole and profit data for each product line,
for a particular period. It does not department, process, etc.show the figures of cost and profitfor individual products,departments and processes.
4. Periodicity of Financial reports (profit and loss Cost reporting is a continuous processreporting account and balance sheet) are and may be done on a daily, weekly,
prepared periodically, usually on monthly, etc., basisan annual basis.
An Overview ofCost Accounting
NOTES
Self-Instructional6 Material
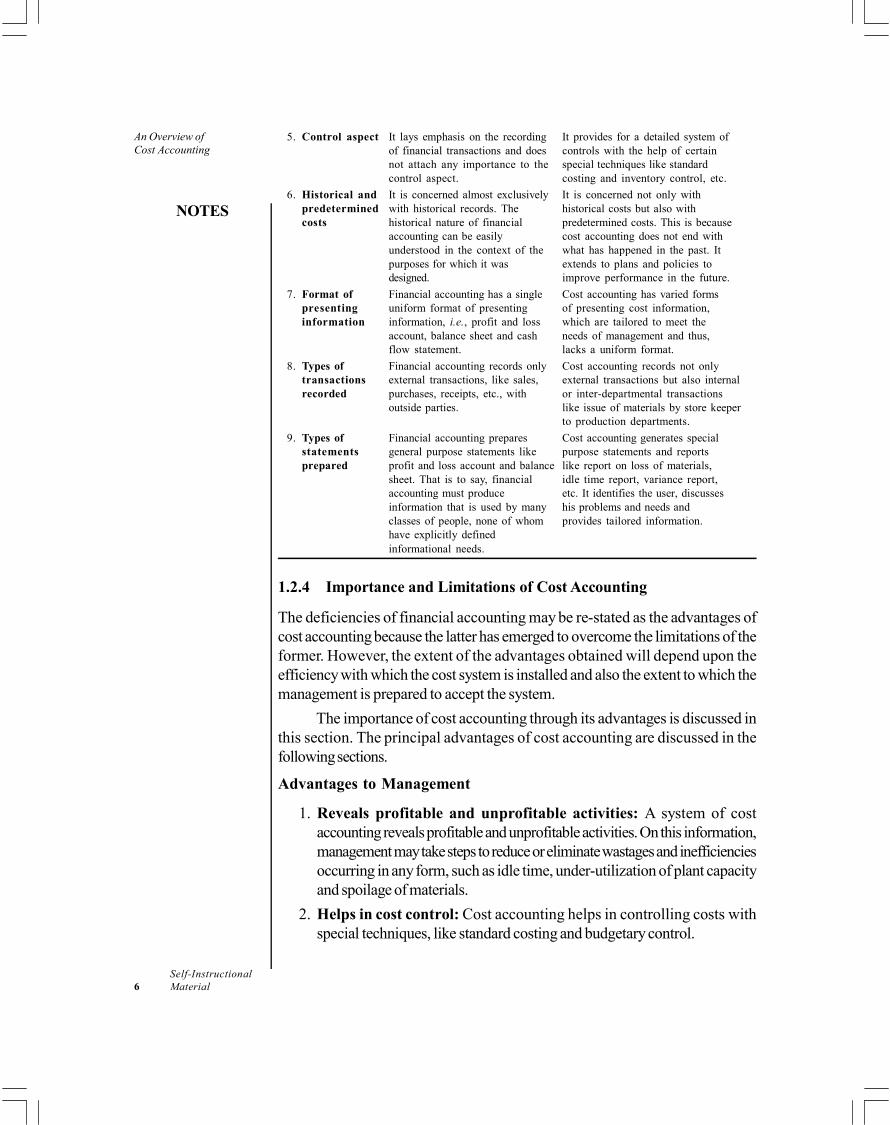
5. Control aspect It lays emphasis on the recording It provides for a detailed system ofof financial transactions and does controls with the help of certainnot attach any importance to the special techniques like standardcontrol aspect. costing and inventory control, etc.
6. Historical and It is concerned almost exclusively It is concerned not only withpredetermined with historical records. The historical costs but also withcosts historical nature of financial predetermined costs. This is because
accounting can be easily cost accounting does not end withunderstood in the context of the what has happened in the past. Itpurposes for which it was extends to plans and policies todesigned. improve performance in the future.
7. Format of Financial accounting has a single Cost accounting has varied formspresenting uniform format of presenting of presenting cost information,information information, i.e., profit and loss which are tailored to meet the
account, balance sheet and cash needs of management and thus,flow statement. lacks a uniform format.
8. Types of Financial accounting records only Cost accounting records not onlytransactions external transactions, like sales, external transactions but also internalrecorded purchases, receipts, etc., with or inter-departmental transactions
outside parties. like issue of materials by store keeperto production departments.
9. Types of Financial accounting prepares Cost accounting generates specialstatements general purpose statements like purpose statements and reportsprepared profit and loss account and balance like report on loss of materials,
sheet. That is to say, financial idle time report, variance report,accounting must produce etc. It identifies the user, discussesinformation that is used by many his problems and needs andclasses of people, none of whom provides tailored information.have explicitly definedinformational needs.
1.2.4 Importance and Limitations of Cost Accounting
The deficiencies of financial accounting may be re-stated as the advantages ofcost accounting because the latter has emerged to overcome the limitations of theformer. However, the extent of the advantages obtained will depend upon theefficiency with which the cost system is installed and also the extent to which themanagement is prepared to accept the system.
The importance of cost accounting through its advantages is discussed inthis section. The principal advantages of cost accounting are discussed in thefollowing sections.
Advantages to Management
1. Reveals profitable and unprofitable activities: A system of costaccounting reveals profitable and unprofitable activities. On this information,management may take steps to reduce or eliminate wastages and inefficienciesoccurring in any form, such as idle time, under-utilization of plant capacityand spoilage of materials.
2. Helps in cost control: Cost accounting helps in controlling costs withspecial techniques, like standard costing and budgetary control.
An Overview ofCost Accounting
NOTES
Self-InstructionalMaterial 7
3. Helps in decision making: It supplies suitable cost data and other relatedinformation for managerial decision making, such as introduction of a newproduct line, replacement of old machinery with an automatic plant, makeor buy.
4. Guides in fixing selling prices: Cost is one of the most important factorsto be considered while fixing prices. A system of cost accounting guides themanagement in the fixation of selling prices, particularly during a depressionperiod when prices may have to be fixed below cost.
5. Helps in inventory control: Perpetual inventory system, which is an integralpart of cost accounting, helps in the preparation of interim profit and lossaccount. Other inventory control techniques, like ABC analysis, level setting,etc., are also used in cost accounting.
6. Aids in formulating policies: Costing provides information that enablesthe management to formulate production and pricing policies and preparingestimates of contracts and tenders.
7. Helps in cost reduction: It helps in the introduction of a cost reductionprogramme and finding out new and improved ways to reduce costs.
8. Reveals idle capacity: A concern may not be working to full capacity dueto reasons, such as shortage of demand, machine breakdown or otherbottlenecks in production. A cost accounting system can easily work outthe cost of idle capacity so that the management may take immediate stepsto remedy the position.
9. Checks the accuracy of financial accounts: Cost accounting provides areliable check on the accuracy of financial accounts with the help ofreconciliation between the two at the end of the accounting period.
10. Prevents frauds and manipulation: Cost audit system, which is a part ofcost accountancy, helps in preventing manipulation and frauds and thusreliable cost data can be furnished to the management and others.
Advantages to Workers
Workers are benefited by introduction of incentive plans which are an integral partof a cost system. This results not only in higher productivity but also higher earningsfor them.
Advantages to Society
An efficient cost system is bound to lower the cost of production, the benefit ofwhich is passed on to the public at large, in the form of lower prices of products orservices.
An Overview ofCost Accounting
NOTES
Self-Instructional8 Material
Advantages to Government Agencies and Others
A cost system produces ready figures for use by government, wage tribunals,chambers of commerce and industry trade unions, etc., for use in problems likeprice fixing, wage level fixing, settlement of industrial disputes, policy matters, etc.
Limitations or Objections Against Cost Accounting
Despite the fact that the development of cost accounting is one of the most significantsteps to improve performance, certain objections are raised against its introduction.These are as follows:
1. It is unnecessary: It is argued that maintenance of cost records is notnecessary and involves duplication of work. It is based on the premise thata good number of concerns are functioning prosperously without any systemof costing. This may be true, but in the present world of competition, toconduct a business with utmost efficiency, the management needs detailedcost information for correct decision making. Only a cost accounting systemcan serve this need of the management and thus help in the efficient conductof a business.
2. It is expensive: It is pointed out that installation of a costing system isquite expensive which only large concerns can afford. It is also argued thatinstallation of the system will involve additional expenditure which will leadto a diminution of profits. In this respect, it may be said that a costing systemshould be treated as an investment and the benefits derived from the systemmust exceed the amount spent on it. It should not prove a burden on thefinances of the company. For an economical operation of the system, themaintenance of the records should be kept to the minimum, taking intoaccount the need and use of each record.
3. It is inapplicable: Another argument sometimes put forward is that modernmethods of costing are not applicable to many types of industry. This plea ishardly tenable, given the complexities of operating any enterprise today.The fault lies in an attempt to introduce a readymade costing system in anindustry. A costing system must be specially designed to meet the needs ofa business. Only then will the system work successfully and achieve theobjectives for which it was introduced. In fact, applications of costing arevery wide. All types of activities, manufacturing and non-manufacturing,should consider the use of cost accounting.
4. It is a failure: The failure of a costing system in some concerns is quotedas an argument against its introduction in other undertakings. This is a veryfallacious argument. If a system does not produce the desired results, it iswrong to jump to the conclusion that the system is at fault. The reasons forits failure should be probed. Often it is discovered that employees wereopposed to the introduction of a costing system because they might havelooked with suspicion at the introduction of any method which was notknown to them or to which they were not accustomed. Thus, to make the
An Overview ofCost Accounting
NOTES
Self-InstructionalMaterial 9
system a success, the utility of the system should be explained to themanagement and the cooperation of the employees should be sought byconvincing them that the system is for the betterment of all.
Check Your Progress
1. Define cost accountancy.
2. Why is cost accounting called much more detailed than financial accounting?
3. What prevents the manipulation and frauds in cost accounting?
1.3 COST CONCEPTS
The term ‘cost’ does not have a definite meaning and its scope is extremely broadand general. It is, therefore, not easy to define or explain this term without leavingany doubt concerning its meaning. Cost accountants, economists and others developthe concept of cost according to their needs because one complete description of‘cost’ to suit all situations is not possible.
According to Cambridge International Dictionary of English, cost means‘the amount of money needed to buy, do or make something.’ However, someauthoritative definitions of cost are given below:
1. Cost is ‘the amount of expenditure (actual or notional), incurred orattributable to a given thing.’ (CIMA, London)
2. ‘A cost is the value of economic resources used as a result of producingor doing the things costed.’ (W M Harper)
3. ‘Cost is a measurement, in monetary terms, of the amount of resourcesused for the purpose of production of goods or rendering of services.’CAS-I of ICAI
In fact, in order to assign a definite meaning to the term ‘cost’, it should beused with a modifier or an adjective, according to the specific purpose for its use.For example, direct cost, fixed cost, variable cost, controllable cost, material cost,selling cost, prime cost, marginal cost, differential cost, standard cost, estimatedcost, actual cost, joint cost, conversion cost, etc., have specific meanings.
Cost vs Expense and Loss
Often the terms ‘cost’ and ‘expense’ are used interchangeably. But cost should bedistinguished from expense and loss.
Expense: Expense is defined as ‘an expired cost resulting from aproductive usage of an asset.’ It is that cost which has been applied againstrevenue of a particular accounting period, in accordance with the principle ofmatching costs to revenue. In other words, an expense is that portion of the revenue-earning potential of an asset which has been consumed in the generation of revenue.Unexpired or unconsumed part of the cost is recorded as an asset in the balance
An Overview ofCost Accounting
NOTES
Self-Instructional10 Material
sheet. Such an unexpired cost is converted into an expense when it expires whilehelping to earn revenue. For example, when a plant is purchased, depreciation onplant (expired cost) is charged to the profit and loss account as an expense andcost of plant remaining after providing depreciation (unexpired cost) is shown asan asset in the balance sheet. Every year, depreciation on plant, representingexpense, is debited to profit and loss account and depreciated value representingunexpired cost is shown in the balance sheet. Pre-paid insurance is also an exampleof unexpired cost which is shown in the balance sheet as an asset.
Loss: Loss is defined as ‘reduction in a firm’s equity, other than fromwithdrawals of capital for which no compensating value has been received.’A loss is an expired cost resulting from the decline in the service potential of anasset that generated no benefit to the firm. Obsolescence or destruction of stockby fire are examples of loss.
1.3.1 Cost Centre and Profit Centres
For the purpose of ascertaining cost, the whole organization is divided into smallparts or sections. Each small section is treated as a cost centre of which cost isascertained. A cost centre is defined by CIMA, London as ‘a location, person,or item of equipment (or group of these), for which costs may be ascertainedand used for the purpose of control.’ Thus, a cost centre refers to a section ofthe business to which costs can be charged. It may be a location (a department,a sales area), an item of equipment (a machine, a delivery van), a person(a salesman, a machine operator) or a group of these (two automatic machinesoperated by one workman). The main purpose of ascertaining the cost of a costcentre is control of cost.
Cost centres are primarily of two types:
(a) Personal cost centre—which consists of a person or a group ofpersons.
(b) Impersonal cost centre—which consists of a location or an item ofequipment or group of these.
From a functional point of view, cost centres may be of the following twotypes:
(a) Production cost centre: These are those cost centres where actualproduction work takes place. Examples are, weaving department in atextile mill, melting shop in a steel mill and cane crushing shop in asugar mill.
(b) Service cost centre: These are those cost centres which are ancillaryto and render services to production cost centres. Examples of servicecost centres are power house, tool room, stores department, repairshop and canteen.
A cost accountant sets up cost centres to enable himself to ascertain thecosts he needs to know. A cost centre is charged with all the costs that relate to it,
An Overview ofCost Accounting
NOTES
Self-InstructionalMaterial 11
e.g., if a cost centre is a machine, it will be charged with the costs of power, light,depreciation and its share of rent, etc. The purpose of ascertaining the cost of acost centre is cost control. The person in charge of a cost centre is held responsiblefor the control of cost of that centre.
Profit Center
A profit center is a section of a company treated as a separate business. Thusprofits or losses for a profit center are calculated separately.
Business organizations may be organized in terms of profit centers wherethe profit center’s revenues and expenses are held separate from the main company’sin order to determine their profitability. Usually different profit centers are separatedfor accounting purposes so that the management can follow how much profit eachcenter makes and compare their relative efficiency and profit. Examples of typicalprofit centers are a store, a sales organization and a consulting organization whoseprofitability can be measured.
A profit center manager is held accountable for both revenues, and costs(expenses), and therefore, profits. What this means in terms of managerialresponsibilities is that the manager has to drive the sales revenue generating activitieswhich leads to cash inflows and at the same time control the cost (cash outflows)causing activities.
This makes the profit center management more challenging than cost centermanagement. Profit center management is equivalent to running an independentbusiness because a profit center business unit or department is treated as a distinctentity enabling revenues and expenses to be determined and its profitability to bemeasured.
Peter Drucker originally coined the term profit center around 1945. Helater recanted, calling it ‘One of the biggest mistakes I have made.’ He later assertedthat there are only cost centers within a business, and ‘The only profit center is acustomer whose cheque hasn’t bounced.’
Cost Unit
“Cost unit is a form of measurement of volume of production or service. This unitis generally adopted on the basis of convenience and practice in the industryconcerned.” CAS-I.
A cost unit is defined by CIMA, London as a ‘unit of product or servicein relation to which costs are ascertained.’ For example, in a sugar mill, the costper tonne of sugar may be ascertained, in a textile mill the cost per metre of clothmay be ascertained. Thus ‘a tonne’ of sugar and ‘a metre’ of cloth are cost units.In short, cost unit is unit of measurement of cost.
All sorts of cost units are adopted, the criterion for adoption being theapplicability of a particular cost unit to the circumstances under consideration.Broadly, cost units may be of two types as explained below:
An Overview ofCost Accounting
NOTES
Self-Instructional12 Material
(i) Units of production, e.g., a ream of paper, a tonne of steel or ametre of cable.
(ii) Units of service, e.g., passenger miles, cinema seats or consultinghours.
The cost units and cost centres should be those which are natural to thebusiness and which are readily understood and accepted by all concerned.
Cost Object
Cost object may be defined as ‘anything for which a separate measurement ofcost may be desired.’ A cost accountant may want to know the cost of a particular‘thing’ and such a ‘thing’ is called a cost object. A cost object may be a product,service, activity, department or process, etc.
1.3.2 Methods and Techniques of Costing
The methods or types of costing refer to the techniques and processes employedin the ascertainment of costs. Several methods have been designed to suit theneeds of different industries. The method of costing to be applied in a particularconcern depends upon the type and nature of manufacturing activity. Basically,there are two methods of costing:
1. Job costing or job order costing
2. Process costing
All other methods are variations of either job costing or process costing.
1. Job order costing: This method ‘applies where work is undertaken tocustomers’ special requirements.’ Cost unit in job order costing is takento be a job or work order for which costs are separately collected andcomputed. A job, big or small, comprises a specific quantity of a product orservice to be provided as per customer’s specifications. Industries wherethis method is used include printing repair shops, interior decoration andpainting.
2. Contract costing or terminal costing: This is a variation of job costingand, therefore, principles of job costing apply to this method. The differencebetween job and contract is that job is small and contract is big. It is wellsaid that a contract is a big job and a job is a small contract. The costunit here is a ‘contract’ which is of a long duration and may continue overmore than one financial year. Contract costing is most suited to constructionof buildings, dams, bridges and roads, shipbuilding, etc.
3. Batch costing: Like contract costing, this is also a variation of job costing.In this method, the cost of a batch or group of identical products isascertained and therefore each batch of products is a cost unit for whichcosts are ascertained. This method is used in companies engaged in theproduction of readymade garments, toys, shoes, tyres and tubes, componentparts, bakery, etc.
An Overview ofCost Accounting
NOTES
Self-InstructionalMaterial 13
4. Process costing: As distinct from job costing, this method is used in massproduction industries manufacturing standardized products in continuousprocesses of manufacturing. Costs are accumulated for each process ordepartment. Here raw material has to pass through a number of processesin a particular sequence to the completion stage. In order to arrive at costper unit, the total cost of a process is divided by the number of units produced.The finished product of one process is passed on to the next process asraw material. Textile mills, chemical works, sugar mills, refineries, soapmanufacturing, etc., may be cited as examples of industries which employthis method.
5. Operation costing: This is nothing but a refinement and a more detailedapplication of process costing. A process may consist of a number ofoperations and operation costing involves cost ascertainment for eachoperation instead of a process where distinctly seperate operations areinvolved in a process, cost of each operation is found for effective controlmechanism.
6. Single, output or unit costing: This method of cost ascertainment is usedwhen production is uniform and consists of a single or two or three varietiesof the same product. Where the product is produced in different grades,costs are ascertained grade-wise. As the units of output are identical, thecost per unit is found by dividing the total cost by the number of unitsproduced. This method is applied in mines, quarries, brick kilns, steelproduction, flour mills, etc.
7. Operating or service costing: This method should not be confused withoperation costing. It is used in undertakings which provide services insteadof manufacturing products. For example, transport undertakings (roadtransport, railways, airlines, shipping companies), electricity companies,hotels, hospitals and cinemas, use this method. The cost units are passenger-kilometre or tonne-kilometre, kilowatt hours, a room per day in a hotel, aseat per show in a cinema hall, etc. This method is a variation of processcosting.
8. Multiple or composite costing: It is an application of more than onemethod of cost ascertainment with respect to the same product. This methodis used in industries where a number of components are separatelymanufactured and then assembled into a final product. For example, in atelevision set manufacturing company, manufacture of different componentparts may require different production methods and thus different methodsof costing may have to be used. Assembly of these components into finalproduct requires yet another method of costing. Other examples of industrieswhich make use of this method are air-conditioners, refrigerators, scooters,cars and locomotives.
An Overview ofCost Accounting
NOTES
Self-Instructional14 Material
Techniques of Costing
It is the type of industry that determines which of the eight methods of costingdiscussed above will be used in a particular enterprise. However, in addition tothese methods, there are certain techniques of costing which are not alternativesto the methods discussed above. These techniques may be used for special purposeof control and policy in any business irrespective of the method of costing beingused there. These techniques have been briefly explained below:
1. Standard costing: This is a very valuable technique of controlling cost. Inthis technique, standard cost is predetermined as target of performance,and actual performance is measured against the standard. The differencebetween standard and actual costs are analysed to know the reasons forthe difference so that corrective actions may be taken.
2. Budgetary control: Closely allied to standard costing is the technique ofbudgetary control. A budget is an expression of a firm’s business plan infinancial form and budgetary control is a technique applied to the control oftotal expenditure on materials, wages and overheads by comparing actualperformance with planned performance. Thus, in addition to its use inplanning, the budget is also used for control and co-ordination of businessoperations.
3. Marginal costing: In this technique, separation of costs into fixed andvariable (marginal) is of special interest and importance. This is so becausemarginal costing regards only variable costs as the cost of the products.Fixed cost is treated as period cost and no attempt is made to allocate orapportion this cost to individual cost centres or cost units. It is transferredto costing profit and loss account of the period. This technique is used tostudy the effect on profit of changes in volume or type of output.
4. Total absorption costing: It is a traditional method of costing wherebytotal costs (fixed and variable) are charged to products. This is in completecontrast to marginal costing where only variable costs are charged toproducts. Although until recently, this was the only technique employed bycost accountants, but now a days it is considered to have only a limitedapplication.
5. Uniform costing: This is not a separate technique or method of costinglike standard costing or process costing. It simply denotes a situation inwhich a number of firms adopt a uniform set of costing principles. It hasbeen defined by CIMA, London as ‘the use by several undertakings ofthe same costing principles and/or practices.’ This helps to compare theperformance of one firm with that of other firms and thus, to derive thebenefit of anyone’s better experience and performance.

An Overview ofCost Accounting
NOTES
Self-InstructionalMaterial 15
Costing Methods and Techniques are Tools
Methods and techniques of costing described above should be regarded as toolsof a cost accountant and it should not be construed that a particular method ortechnique is superior to any other. Just as a skilled workman uses different toolsfor different tasks, similarly, a cost accountant should use these methods andtechniques appropriately either individually or in combination. For example,standard costing may be combined with process costing to give ‘standard processcosting’, or standard costing may be combined with marginal costing as well asprocess costing to give ‘standard marginal process costing’. Although this mayappear confusing, yet if principles involved in each method or technique are clearlyunderstood, there should not be any difficulty in making the best use of thesemethods and techniques.
Cost Ascertainment and Cost Estimation
Cost Ascertainment: Cost ascertainment is concerned with computation of actualcosts incurred. It refers to the methods and processes employed in ascertainingcosts. It has been seen earlier that in different types of industries, different methodsare employed for ascertaining cost.
Cost Estimation: As against ascertainment of actual costs, costs may also bepredetermined. Cost estimation is the process of predetermining costs of goodsor services. The costs are determined in advance of production and precede theoperations. Estimated costs are definitely the future costs and are based on theaverage of past actual costs adjusted for anticipated changes in future.
1.3.3 Types of Cost
Classification is the process of grouping costs according to their commoncharacteristics. It is a systematic placement of like items together according totheir common features.
There are various ways of classifying costs as given below. Each classificationserves a different purpose:
1. Classification into Direct and Indirect Costs
Costs are classified into direct costs and indirect costs on the basis of theiridentifiability with cost units or jobs or processes or cost centres.
Direct costs: These are those costs which are incurred for and easily identifiedwith a particular cost object. Cost of raw materials used and wages of a machineoperator are common examples of direct costs. To be specific, cost of steel usedin manufacturing a machine can be easily known. It is, therefore, a direct cost.Similarly, wages paid to a tailor in a readymade garments company for stitching apair of trousers is a direct cost because it can be easily identified in the cost of thatgarment.
An Overview ofCost Accounting
NOTES
Self-Instructional16 Material
Indirect costs: These are general costs and are incurred for the benefit of anumber of cost object. These costs cannot be easily identified with a particularcost object. Depreciation of machinery, insurance, lighting, power, rent, managerialsalaries, materials used in repairs, etc., are common examples of indirect costs.For example, depreciation of machine for stitching a pair of trousers cannot beknown and thus it is an indirect cost.
Costs are not traced or identified directly with a cost object for one of the followingthree reasons:
1. It is impossible to do so; e.g., rent of building.
2. It is not convenient or feasible to do so; e.g., nails used in furniture orsewing thread.
3. Management chooses not to do so; i.e., many companies classify certainitems of cost as indirect because it is customary in the industry to do so;e.g., carriage inward may be treated as an indirect expense (alternatively, itmay be treated as a part of the cost of materials purchased).
The terms ‘direct’ and ‘indirect’ should be used in relation to the object of costing.An item of cost may be a direct cost in one case and the same may be indirect inanother case. It is the nature of business and the cost unit chosen that will determinewhether a particular cost is direct or indirect. For example, depreciation of asphaltmixing plant used by a road building contractor at site is a direct cost, whereasdepreciation of plant used in a factory is an indirect cost. It is because in thefactory, plant would probably benefit more than one cost unit and it may not beconvenient to allocate depreciation to various cost units with any degree of accuracy.
This classification is important from the point of view of accurateascertainment of cost. Direct costs of a product can be conveniently determinedwhile the indirect costs have to be arbitrarily apportioned to various cost units.For example, in readymade garments, the cost of cloth and wages of tailor areaccurately ascertained without any difficulty and are thus direct costs. But the rentof factory building, managerial salaries, etc., which are indirect costs, have to beapportioned to various cost units on some arbitrary basis and cannot be accuratelyascertained.
2. Classification into Fixed and Variable Costs
Costs behave differently when level of production rises or falls. Certain costschange in accordance with production level while other costs remain unchanged.As such on the basis of behaviour or variability, costs are classified into fixed,variable and semi-variable.
(i) Fixed costs: These costs remain constant in ‘total’ amount over a specificrange of activity for a specified period of time, i.e., these do not increase ordecrease when the volume of production changes. For example, buildingrent and managerial salaries remain constant and do not change with changein output level and thus are fixed costs. But fixed cost ‘per unit’ decreases
An Overview ofCost Accounting
NOTES
Self-InstructionalMaterial 17
when volume of production increases and vice versa, fixed cost per unitincreases when volume of production decreases.
Relevant range – Fixed cost remains fixed only in relation to a given rangeof output and for a given time span. If the output is to be increased beyondthe range, the fixed cost will also increase. Relevent range refers to theband of activity or volume in which specific relationship between the levelof activity and the fixed cost in question is valid.
The characteristics of fixed cost are:
(a) fixed total cost within a relevant range of output;
(b) increase or decrease in per unit fixed cost when quantity of productionchanges;
(c) apportioned to departments on some arbitrary basis;
(d) such cost can be controlled mostly by top level management.
(ii) Variable costs: These costs tend to vary in direct proportion to the volumeof output. In other words, when volume of output increases, total variablecost also increases and vice versa, when volume of output decreases, totalvariable cost also decreases, but the variable cost per unit remains fixed.
Thus, in general, variable costs show the following characteristics:
(a) variability of the total cost in direct proportion to the volume of output;
(b) fixed cost per unit in the face of changing volume;
(c) easy and reasonably accurate distribution of cost to departments;
(d) such costs can be controlled by functional managers.
(iii) Semi-variable or semi-fixed costs (mixed costs): These costs includeboth a fixed and a variable component, i.e. these are partly fixed and partlyvariable. A semi-variable cost has a fixed cost element which needs to beincurred irrespective of the level of activity achieved. On the other hand, thevariable element in semi-variable costs changes either at a constant rate orin lumps.
3. Classification into Committed and Discretionary Costs
It is explained above that costs may be classified into fixed and variable. Fixedcosts are further classified into committed costs and discretionary (or programmed)costs. This classification is based on the degree to which a firm is locked into anasset or service that is generating the fixed cost.
Committed costs: These are those costs that are incurred in maintaining physicalfacilities and managerial set up. Such costs are committed in the sense that oncethe decision to incur them has been made, they are unavoidable and invariant inthe short run. For example, salary of the managing director may represent acommitted cost if, by policy, the managing director is not to be relieved unless the

An Overview ofCost Accounting
NOTES
Self-Instructional18 Material
firm is liquidated. Similarly, depreciation of plant and equipment is committedbecause these facilities cannot be easily changed in the short run.
Discretionary costs: These are those costs which can be avoided by managementdecisions. Such costs are not permanent. Advertising, research and developmentcost and salaries of low level managers are examples of discretionary costs becausethese costs may be avoided or reduced in the short run, if so desired by themanagement.
This classification into committed and discretionary costs is important fromthe point of view of cost control and decision making.
4. Classification into Product Costs and Period Costs
Product costs: These costs include all such costs that are involved in acquiring ormaking a product. For a trader, product cost includes purchase cost plus freightinwards. For a manufacturer, these consist of direct materials, direct labour andfactory overheads. Product costs are ‘absorbed by’ or ‘attached to’ the unitsproduced. These are called inventoriable costs because these are included in thecost of product as work-in-progress, finished goods or cost of sales.
Period costs: These are those costs which are not necessary for production andare incurred even if there is no production. These are written off as expenses in theperiod in which these are incurred. Such costs are incurred for a time period andare charged to the profit and loss account of the period. Showroom rent, salary ofcompany executives and travel expenses are examples of period costs. Thesecosts are not inventoried, i.e., these are not included in the value of stocks.Administration and selling expenses are generally treated as period costs.
Classification into product and period cost is important from the point ofview of profit determination. This is so because product cost is carried forward tothe next accounting period as part of the unsold finished stock, whereas periodcost is written off in the accounting period in which it is incurred.
5. Classification into Controllable and Non-controllable Costs
From the point of view of controllability, costs are classified into controllable costsand non-controllable costs.
Controllable costs: These are the costs which may be directly regulated at agiven level of management authority. In other words, controllable costs are thosecosts which are subject to the discretion of the manager and hence can be keptwithin predefined limits. Variable costs are generally controllable by departmentheads. For example, cost of raw material may be controlled by purchasing inlarger quantities.
Non-controllable costs: These are those costs which cannot be influenced bythe action of a specified member of an enterprise. For example, it is very difficultto control costs like factory rent, managerial salaries, etc.
An Overview ofCost Accounting
NOTES
Self-InstructionalMaterial 19
Two important points should be noted regarding this classification. First,controllable costs cannot be distinguished from non-controllable costs withoutspecifying the level and scope of management authority. In other words, a costwhich is uncontrollable at one level of management may be controllable at anotherlevel of management. For example, a departmental manager may have no controlover the number of supervisors employed in his department, but this decision mayhave to be taken by the production manager. Thus, supervision cost will be non-controllable at the departmental manager’s level, but it will be controllable at thelevel of production manager. Secondly, all costs are controllable in the long run atsome appropriate management level.
It is a misconception that variable costs are controllable and fixed costs arenon-controllable. However, variable costs are more prone to control than fixedcosts.
6. Classification into Historical Costs and Predetermined Costs
On the basis of time of computation, costs are classified into historical costsand predetermined costs.
Historical costs: These are the costs which are ascertained after these havebeen incurred. Historical costs are thus, nothing but actual costs. These costs arenot available until after the completion of the manufacturing operations.
Predetermined costs: These are future costs which are ascertained in advanceof production, on the basis of a specification of all the factors affecting cost. Thesecosts are extensively used for the purpose of planning and control.
7. Classification into Normal and Abnormal Costs
Normal cost may be defined as a cost which is normally incurred on expectedlines at a given level of output. This cost is a part of cost of production. Abnormalcost is that which “is an unusual or a typical cost whose occurence is usuallyirregular and unexpected and due to some abnormal situation of the production.”Such cost is over and above the normal cost and is not treated as a part of the costof production. It is charged to costing profit and loss account.
Special Costs for Management Decision Making
There are certain costs which are specially computed for use by the managementfor the purpose of decision making. These costs may not be recorded in the booksof account. These includes relevant and irrelevant costs, sunk cost, differentialcost, marginal cost, imputed cost, opportunity cost, replacement cost, future cost,conversion cost, etc.
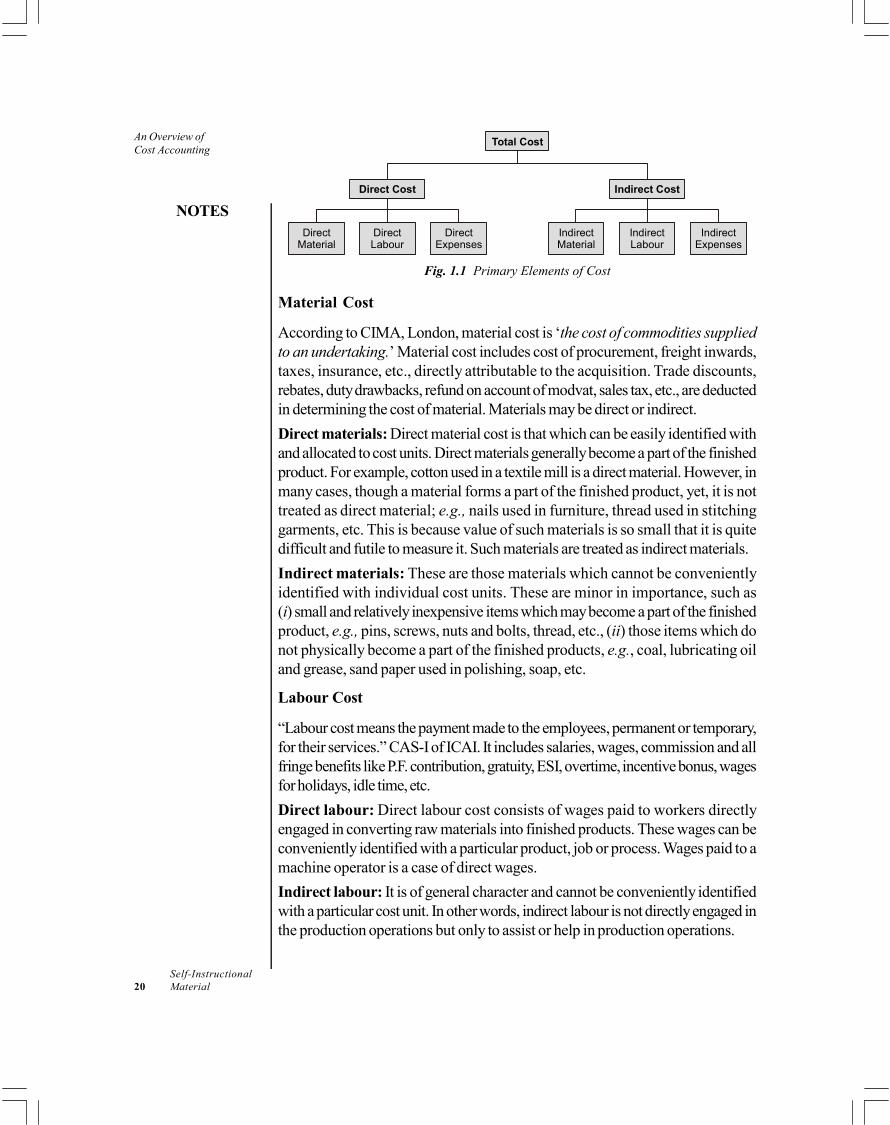
1.3.4 Elements of Cost
A cost is composed of three elements, i.e., material, labour and expense. Each ofthese elements may be direct or indirect. This is shown below:
An Overview ofCost Accounting
NOTES
Self-Instructional20 Material
Direct Cost Indirect Cost
DirectMaterial
DirectLabour
DirectExpenses
IndirectMaterial
IndirectLabour
IndirectExpenses
Total Cost
Fig. 1.1 Primary Elements of Cost
Material Cost
According to CIMA, London, material cost is ‘the cost of commodities suppliedto an undertaking.’ Material cost includes cost of procurement, freight inwards,taxes, insurance, etc., directly attributable to the acquisition. Trade discounts,rebates, duty drawbacks, refund on account of modvat, sales tax, etc., are deductedin determining the cost of material. Materials may be direct or indirect.
Direct materials: Direct material cost is that which can be easily identified withand allocated to cost units. Direct materials generally become a part of the finishedproduct. For example, cotton used in a textile mill is a direct material. However, inmany cases, though a material forms a part of the finished product, yet, it is nottreated as direct material; e.g., nails used in furniture, thread used in stitchinggarments, etc. This is because value of such materials is so small that it is quitedifficult and futile to measure it. Such materials are treated as indirect materials.
Indirect materials: These are those materials which cannot be convenientlyidentified with individual cost units. These are minor in importance, such as(i) small and relatively inexpensive items which may become a part of the finishedproduct, e.g., pins, screws, nuts and bolts, thread, etc., (ii) those items which donot physically become a part of the finished products, e.g., coal, lubricating oiland grease, sand paper used in polishing, soap, etc.
Labour Cost
“Labour cost means the payment made to the employees, permanent or temporary,for their services.” CAS-I of ICAI. It includes salaries, wages, commission and allfringe benefits like P.F. contribution, gratuity, ESI, overtime, incentive bonus, wagesfor holidays, idle time, etc.
Direct labour: Direct labour cost consists of wages paid to workers directlyengaged in converting raw materials into finished products. These wages can beconveniently identified with a particular product, job or process. Wages paid to amachine operator is a case of direct wages.
Indirect labour: It is of general character and cannot be conveniently identifiedwith a particular cost unit. In other words, indirect labour is not directly engaged inthe production operations but only to assist or help in production operations.

An Overview ofCost Accounting
NOTES
Self-InstructionalMaterial 21
Expenses
All costs other than material and labour are termed as expenses. It is defined as‘the cost of services provided to an undertaking and the notional cost of theuse of owned assets’ (CIMA).
Direct expenses: Accord-ing to CIMA, London, ‘direct expenses are thoseexpenses which can be identified with and allocated to cost centres or units.’These are those expenses which are specifically incurred in connection with aparticular job or cost unit. Direct expenses are also known as chargeableexpenses.
Indirect expenses: All indirect costs, other than indirect materials and indirectlabour costs, are termed as indirect expenses. These cannot be directly identifiedwith a particular job, process or work order and are common to cost units or costcentres.
Prime Cost
This is the aggregate of direct material cost, direct labour cost and direct expenses.Thus,
Direct material + Direct labour + Direct expenses = Prime Cost
Overheads
These are the aggregate of indirect material cost, indirect labour cost and indirectexpenses. Thus,
Indirect material + Indirect labour + Indirect expenses = Overheads
Overheads are divided into three groups as follows:
1. Production overheads: Also known as factory overheads, works overheadsor manufacturing overheads, these are those overheads which are concerned withthe production function. They include indirect materials, indirect wages and indirectexpenses in producing goods or services.
(a) Indirect material—Examples: Coal, oil, grease, etc.; stationery in factoryoffice, cotton waste, brush and sweeping broom.
(b) Indirect labour—Examples: Works manager’s salary, salary of factory officestaff, salary of inspector and supervisor, wages of factory sweeper andwages of factory watchman.
(c) Indirect expenses—Examples: Factory rent, depreciation of plant, repairand maintenance of plant, insurance of factory building, factory lighting andpower and internal transport expenses.
2. Office and administration overheads: These are the indirect expendituresincurred in general administrative function, i.e., in formulating policies, planningand controlling the functions, directing and motivating the personnel of anorganization in the attainment of its objectives.
An Overview ofCost Accounting
NOTES
Self-Instructional22 Material
These overheads are of general character and have no direct connectionwith production or sales activities. This category of overheads is also classifiedinto indirect material, indirect labour and indirect expenses.
(a) Indirect material—Examples: Stationery used in general administrativeoffice, postage, sweeping broom and brush.
(b) Indirect labour—Examples: Salary of office staff, salary of managingdirector, remuneration of directors of the company.
(c) Indirect expenses—Examples: Rent of office building, legal expenses, officelighting and power, telephone expenses, depreciation of office furniture andequipments, office air-conditioning and sundry office expenses.
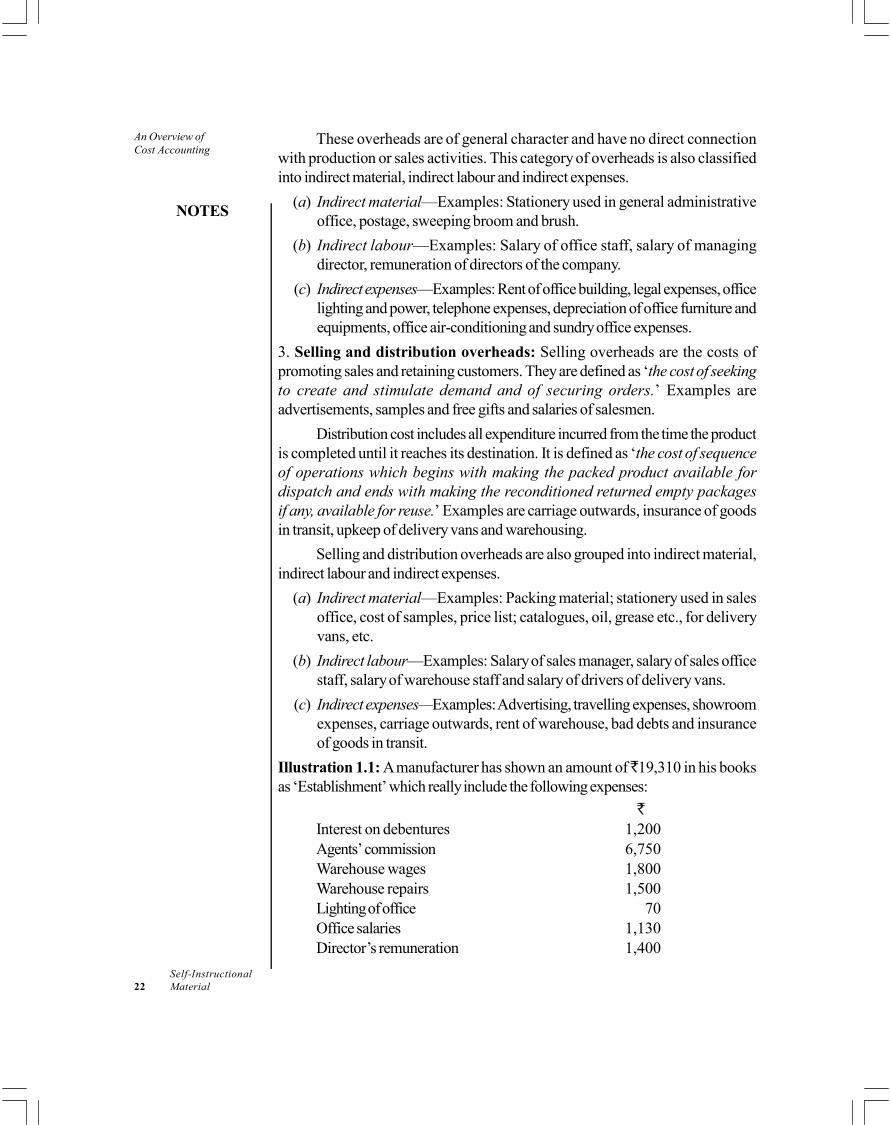
3. Selling and distribution overheads: Selling overheads are the costs ofpromoting sales and retaining customers. They are defined as ‘the cost of seekingto create and stimulate demand and of securing orders.’ Examples areadvertisements, samples and free gifts and salaries of salesmen.
Distribution cost includes all expenditure incurred from the time the productis completed until it reaches its destination. It is defined as ‘the cost of sequenceof operations which begins with making the packed product available fordispatch and ends with making the reconditioned returned empty packagesif any, available for reuse.’ Examples are carriage outwards, insurance of goodsin transit, upkeep of delivery vans and warehousing.
Selling and distribution overheads are also grouped into indirect material,indirect labour and indirect expenses.
(a) Indirect material—Examples: Packing material; stationery used in salesoffice, cost of samples, price list; catalogues, oil, grease etc., for deliveryvans, etc.
(b) Indirect labour—Examples: Salary of sales manager, salary of sales officestaff, salary of warehouse staff and salary of drivers of delivery vans.
(c) Indirect expenses—Examples: Advertising, travelling expenses, showroomexpenses, carriage outwards, rent of warehouse, bad debts and insuranceof goods in transit.
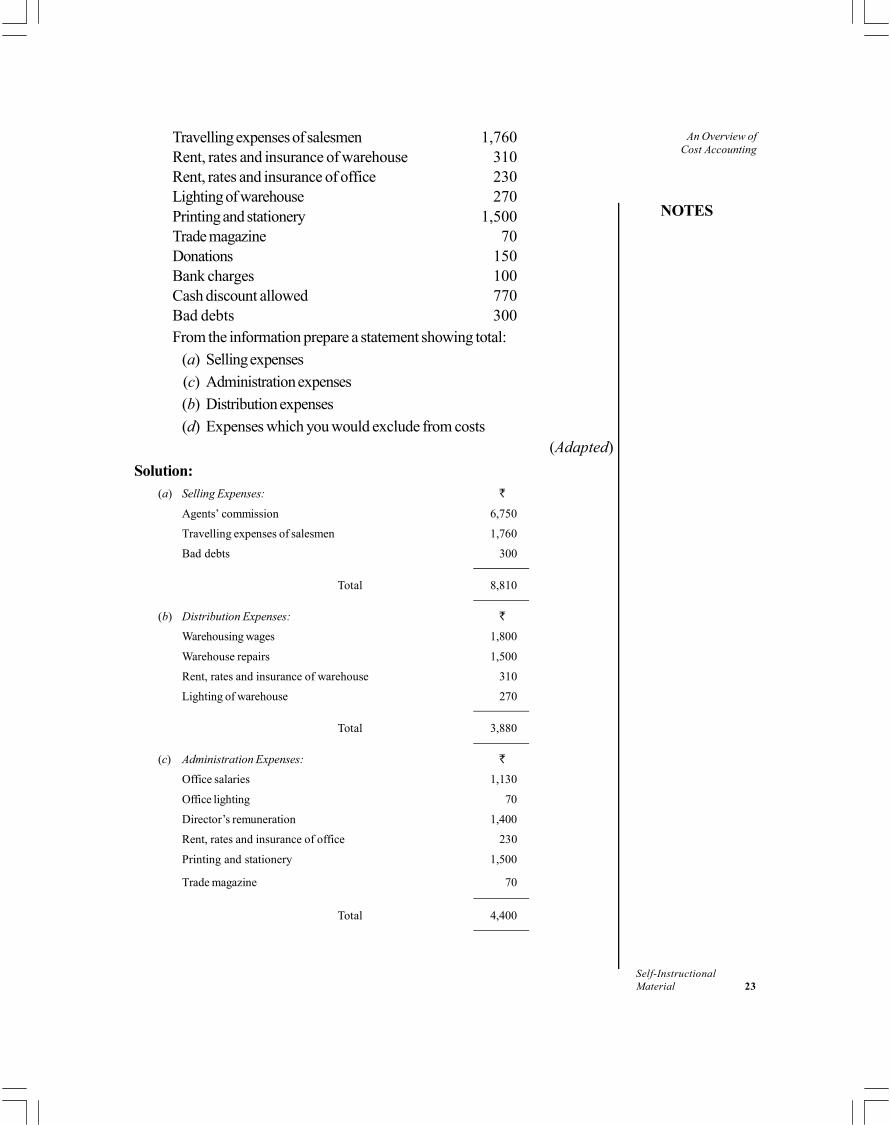
Illustration 1.1: A manufacturer has shown an amount of 19,310 in his booksas ‘Establishment’ which really include the following expenses:
Interest on debentures 1,200Agents’ commission 6,750Warehouse wages 1,800Warehouse repairs 1,500Lighting of office 70Office salaries 1,130Director’s remuneration 1,400
An Overview ofCost Accounting
NOTES
Self-InstructionalMaterial 23
Travelling expenses of salesmen 1,760Rent, rates and insurance of warehouse 310Rent, rates and insurance of office 230Lighting of warehouse 270Printing and stationery 1,500Trade magazine 70Donations 150Bank charges 100Cash discount allowed 770Bad debts 300From the information prepare a statement showing total:
(a) Selling expenses
(c) Administration expenses
(b) Distribution expenses
(d) Expenses which you would exclude from costs(Adapted)
Solution:(a) Selling Expenses:
Agents’ commission 6,750
Travelling expenses of salesmen 1,760
Bad debts 300
Total 8,810
(b) Distribution Expenses:
Warehousing wages 1,800
Warehouse repairs 1,500
Rent, rates and insurance of warehouse 310
Lighting of warehouse 270
Total 3,880
(c) Administration Expenses:
Office salaries 1,130
Office lighting 70
Director’s remuneration 1,400
Rent, rates and insurance of office 230
Printing and stationery 1,500
Trade magazine 70
Total 4,400

An Overview ofCost Accounting
NOTES
Self-Instructional24 Material
(d) Items not included in costs:
Donations 150
Cash discount allowed 770
Bank charges 100
Interest on debentures 1,200
Total 2,220
Note: For details of items not included in cost, refer to chapter 5 – Output or Unit Costing. Cost
Sheet has been discussed in detail in chapter 5.
Components of Total Cost— Elements of cost may be grouped as follows:
(i) Prime Cost = Direct material + Direct labour + Direct expenses
(ii) Works Cost or Factory Cost = Prime cost + Factory overheads
(iii) Cost of Production = Works cost + Administration overheads
(iv) Total Cost or Cost of Sales = Cost of production + Selling anddistribution overheads
Cost Sheet (Cost Statement)
It is a statement which is prepared periodically to provide detailed cost of a costcentre or cost unit. A cost sheet not only shows the total cost but also the variouscomponents of the total cost. Period covered by a cost sheet may be a year, amonth or a week, etc.
Check Your Progress
4. Give some examples of service cost centres.
5. Name the type of costing most suitable to companies involved inconstruction of buildings, dams, bridges and roads, shipbuilding, etc.
6. Which type of costing is in complete contrast to marginal costing?
7. What is prime cost?
1.4 ANSWERS TO CHECK YOUR PROGRESSQUESTIONS
1. Cost accountancy means and includes the principles, conventions, techniquesand systems which are employed in a business to plan and control theutilization of its resources.
2. Cost accounting is called much more detained than financial accountingbecause in financial accounting profit or loss is ascertained for the businessas a whole whereas in cost accounting, detailed costa and profit data forvarious parts of business, like departments, products, etc., are shown.
An Overview ofCost Accounting
NOTES
Self-InstructionalMaterial 25
3. Cost audit system, under cost accounting, is a part of cost accountancy,which helps in preventing manipulation and frauds and thus reliable costdata can be furnished to the management and others.
4. Examples of service cost centres include power house, tool room, storesdepartment, repair shop and canteen.
5. The type of costing most suitable to companies involved in construction ofbuildings, dams, bridges and roads, shipbuilding, etc., is contract or terminalcosting.
6. Total absorption costing is in total contrast to marginal costing.
7. Prime cost is the aggregate of direct material cost, direct labour cost anddirect expenses.
1.5 SUMMARY
On the basis of the purpose for which this information is used, accounting isdivided into three parts—financial accounting, cost accounting andmanagement accounting.
Financial accounting is mainly concerned with recording the businesstransactions in the books of account for the purpose of presenting finalaccounts to the management, shareholders and tax authorities, etc.
Cost accounting provides detailed cost information to various levels ofmanagement for efficient performance of their functions.
The term management accounting is applied to the provision of accountinginformation for management activities such as decision making, planningand controlling, etc. Thus, any form of accounting, which enables a businessto be conducted more efficiently, can be regarded as managementaccounting.
Costing as, ‘the techniques and processes of ascertaining costs.’ Wheldonhas defined costing as, ‘the proper allocation of expenditure and involvesthe collection of costs for every order, job, process, service or unit.’
Cost accounting is a formal system of accounting for costs in the books ofaccount, by means of which, costs of products and services are ascertainedand controlled.
Both cost accounting and financial accounting are concerned with systematicrecording and presentation of financial data. The two systems rest on thesame principles concerning debit and credit and have the same sources ofrecording the transactions. But cost accounting is much more detailed thanfinancial accounting. This is because in financial accounting, profit or loss isascertained for the business as a whole whereas in cost accounting, detailedcost and profit data for various parts of business, like departments, products,etc., are shown.
An Overview ofCost Accounting
NOTES
Self-Instructional26 Material
A cost centre is defined by CIMA, London as ‘a location, person, or itemof equipment (or group of these), for which costs may be ascertained andused for the purpose of control.’ Thus, a cost centre refers to a section ofthe business to which costs can be charged.
The method of costing to be applied in a particular concern depends uponthe type and nature of manufacturing activity. Basically, there are two methodsof costing:
1. Job costing or job order costing
2. Process costing
All other methods are variations of either job costing or process costing.
Techniques of costing include: standard costing, budgetary control, marginalcosting, total absorption costing and uniform costing.
Types of costs include the following: direct costs and indirect costs, fixedand variable costs, committed and discretionary costs, product and periodcosts, controllable and non-controllable costs, historical and predeterminedcosts and normal and abnormal costs.
Elements of cost include: Direct cost and indirect cost
1.6 KEY WORDS
Cost Accounting: It is a specialized branch of accounting, which isconcerned with ‘the techniques and processes of ascertaining costs’ ofproducts and services.
Cost: It is defined as a measurement, in monetary terms, of the amount ofresources used for the purpose of production of goods or rendering ofservices.
Cost centre: It is a section of the organization, like a person, an equipment,a department, etc., for which costs may be ascertained and used for thepurpose of control.
1.7 SELF ASSESSMENT QUESTIONS ANDEXERCISES
Short Answer Questions
1. What is cost accounting? Discuss briefly its objectives.
2. State and explain the main differences between cost accounting and financialaccounting.
3. What are cost and profit centres?

An Overview ofCost Accounting
NOTES
Self-InstructionalMaterial 27
4. Classify the following items of cost into: (a) Prime cost, (b) Factory overhead,(c)Office overhead and (d) Selling and distribution overhead
i. Factory rent
ii. Works expenses
iii. Raw materials
iv. Productive wages
v. Unproductive wages
vi. Plant depreciation
vii. Salary of foreman
viii. Price lists and catalogues
ix. Travelling expenses of salesman
x. Depreciation of delivery vans
5. Mention the different techniques of costing.
6. Distinguish between ‘cost’, ‘expense’ and ‘loss’.
Long Answer Questions
1. Discuss the advantages of cost accounting.
2. ‘Limitations of financial accounting have made the management realize theimportance of cost accounting.’ Comment.
3. Discuss the different methods of costing.
4. Describe the varied ways of classifying costs.
1.8 FURTHER READINGS
Arora, M.N. 2012. A Textbook of Cost and Management Accounting, Tenthedition. New Delhi: Vikas Publishing House.
Arora, M.N. 2010. Cost Accounting: Principles and Practice, Eleventh edition.New Delhi: Vikas Publishing House.
Shillinglow, G. 1982.Managerial Costing Accounting. Homewood: Richard D.Irwin.
Morse, W. J. 1978. Cost Accounting. Massachusetts: Addison-Wesley PublishingCo.
Lal, Jawahar. 2003. Cost Accounting. New Delhi: Tata McGraw Hill.
Material Control
NOTES
Self-Instructional28 Material
UNIT 2 MATERIAL CONTROL
Structure
2.0 Introduction2.1 Objectives2.2 Meaning and Objectives of Material Control2.3 Techniques of Inventory Control
2.3.1 Stock Levels or Fixation of Inventory Levels2.3.2 Economic Order Quantity Analysis (EOQ)
2.4 Material Purchase Procedure2.5 Methods of Pricing Material Issues2.6 Material Losses, Wastage of Materials and its Main Types2.7 Answers to Check Your Progress Questions2.8 Summary2.9 Key Words
2.10 Self Assessment Questions and Exercises2.11 Further Readings
2.0 INTRODUCTION
The term ‘material’ refers to all commodities that are consumed in the process ofmanufacture. It is defined as ‘anything that can be stored, stacked or stockpiled.’Materials are classified into ‘direct’ materials and ‘indirect’ materials.
“Direct material cost is the cost of material which can be direcly allocatedto a cost centre or a cost object in an economically feasible way.” CAS - I ofICAI. Direct materials include not only the raw materials entering at the start ofthe production but all of the following:
(a) Component parts used in a product, e.g., tyres and tubes in a car orpicture tube in a television set.
(b) Any material used in production but wholly consumed in the productionprocess, e.g., fertilizer used in growing plants.
(c) Any primary packing material, i.e., any container sold with the finalproduct, e.g., cans for tinned food and drink, bottles for beer, etc.
Indirect materials are those which cannot be easily identified with a particularcost centre or cost object. Examples are coal, grease and oil, soap and sandpaper.
The term ‘inventory’ is used to cover the stocks of raw materials,components, work-in-progress and finished goods. It has been defined by theAccounting Principles Board as ‘the aggregate of those items of tangiblepersonal property which (i) are held for sale in the ordinary course of business;(ii) are in the process of production for such sales; or (iii) are to be currentlyconsumed in the production of goods or services to be available for sale.’
In this unit, you will learn about the elements related to material control.
Material Control
NOTES
Self-InstructionalMaterial 29
2.1 OBJECTIVES
After going through this unit, you will be able to:
Discuss the meaning and importance of material control
Explain the various techniques used in material control
Describe how stock levels are set to keep them at optimum level
Examine the steps in the procedure of purchasing materials
2.2 MEANING AND OBJECTIVES OF MATERIALCONTROL
No cost accounting system can become effective without proper and efficientcontrol of materials. This is so because quite often material is the single largestelement of cost and as such, an efficient system of material control leads to asignificant economy in the total cost. Material is as much cash as cash itself andany theft, waste and excessive use of materials leads to immediate and directfinancial losses. Where slack methods exist, it is easy for such losses to passunnoticed.
Meaning and Definition: Material or inventory control may be defined as‘systematic control and regulation of purchase, storage and usage of materialsin such a way so as to maintain an even flow of production, at the same timeavoiding excessive investment in inventories. Efficient material control cutsout losses and wastes of materials that otherwise pass unnoticed.’
Thus an efficient system of material control should be comprehensive enoughto cover purchase system, storage system, issue to production and determinationof stock levels for each item of material.
Objectives of Material or Inventory Control
The broad objectives of material control are listed below:
1. No under-stocking: Under-stocking inevitably leads to materials runningout of stock at some time or the other. Shortage of material may arise at atime when they are urgently needed and production may then be held up.The delay or stoppage in production due to non-availability of materials isvery costly and results in loss of profits.
2. No over-stocking: Investment in materials must be kept as low as possibleconsidering the production requirements and the financial resources of thebusiness. Over-stocking of materials locks up capital and causes high storagecosts, thereby resulting in adverse effect on profits. This may also result inloss due to obsolescence.

Material Control
NOTES
Self-Instructional30 Material
3. Economy in purchasing: The purchasing of materials is a highly specializedfunction. By purchasing materials at the most favourable prices, the purchaseris able to make a valuable contribution to the reduction in cost.
4. Proper quality: While purchasing materials, due consideration should begiven to the quality. It is no use purchasing materials of inferior quality orvery superior quality. For each type of product, there is a particular type ofquality of material which is needed and that quality alone should be purchased.
5. Minimum wastage: In order to minimize the loss of materials, properstorage conditions must be provided to different types of materials. Lossesof materials occur due to deterioration, obsolescence, pilferage and theftand evaporation. All round efforts should be made to keep these losses tothe minimum.
6. Information about materials: Not only should materials be available whenrequired, there should also be a system to give complete and up-to-dateaccounting information about the availability of materials. Sometimesinadequate information about availability of materials may cause newpurchases to be made of materials already in stock.
Techniques of Inventory Control
Various techniques commonly used for inventory control are listed below:
1. ABC technique
2. Stock levels—Minimum, maximum and reorder levels
3. Economic order quantity (EOQ)
4. Proper purchase procedure
5. Proper storage of materials
6. Inventory turnover ratio to review slow and non-moving materials
7. Perpetual inventory system
8. Fixation of material cost standards (Used in Standard Costing)
9. Preparation of material budgets (Used in Budgetary Control)
You will study two major types in the next section.
2.3 TECHNIQUES OF INVENTORY CONTROL
In this section, you will learn about two techniques of inventory control: Stocklevels and Economic Order Quantity (EOQ).
2.3.1 Stock Levels or Fixation of Inventory Levels
In order to guard against under-stocking and over-stocking, most of the largecompanies adopt a scientific approach of fixing stock levels. These levels are:
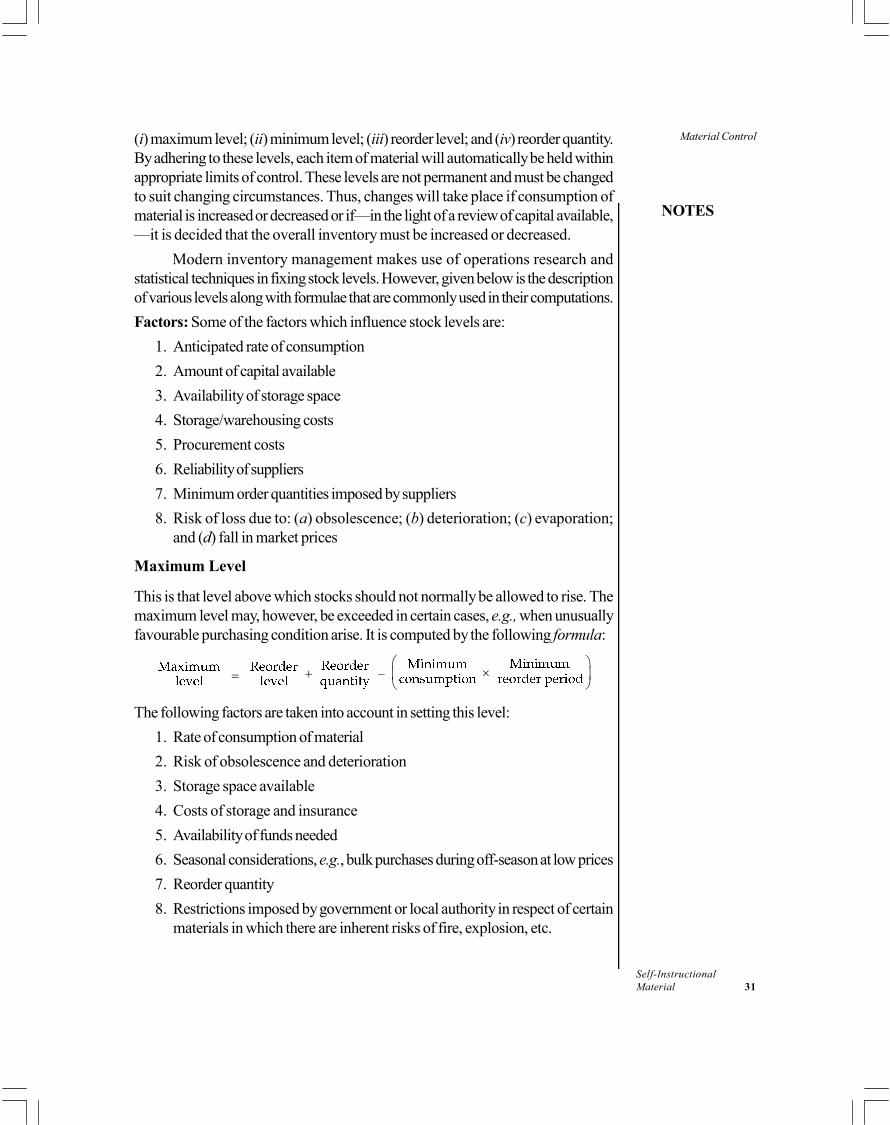
Material Control
NOTES
Self-InstructionalMaterial 31
(i) maximum level; (ii) minimum level; (iii) reorder level; and (iv) reorder quantity.By adhering to these levels, each item of material will automatically be held withinappropriate limits of control. These levels are not permanent and must be changedto suit changing circumstances. Thus, changes will take place if consumption ofmaterial is increased or decreased or if—in the light of a review of capital available,—it is decided that the overall inventory must be increased or decreased.
Modern inventory management makes use of operations research andstatistical techniques in fixing stock levels. However, given below is the descriptionof various levels along with formulae that are commonly used in their computations.
Factors: Some of the factors which influence stock levels are:
1. Anticipated rate of consumption
2. Amount of capital available
3. Availability of storage space
4. Storage/warehousing costs
5. Procurement costs
6. Reliability of suppliers
7. Minimum order quantities imposed by suppliers
8. Risk of loss due to: (a) obsolescence; (b) deterioration; (c) evaporation;and (d) fall in market prices
Maximum Level
This is that level above which stocks should not normally be allowed to rise. Themaximum level may, however, be exceeded in certain cases, e.g., when unusuallyfavourable purchasing condition arise. It is computed by the following formula:
The following factors are taken into account in setting this level:
1. Rate of consumption of material
2. Risk of obsolescence and deterioration
3. Storage space available
4. Costs of storage and insurance
5. Availability of funds needed
6. Seasonal considerations, e.g., bulk purchases during off-season at low prices
7. Reorder quantity
8. Restrictions imposed by government or local authority in respect of certainmaterials in which there are inherent risks of fire, explosion, etc.
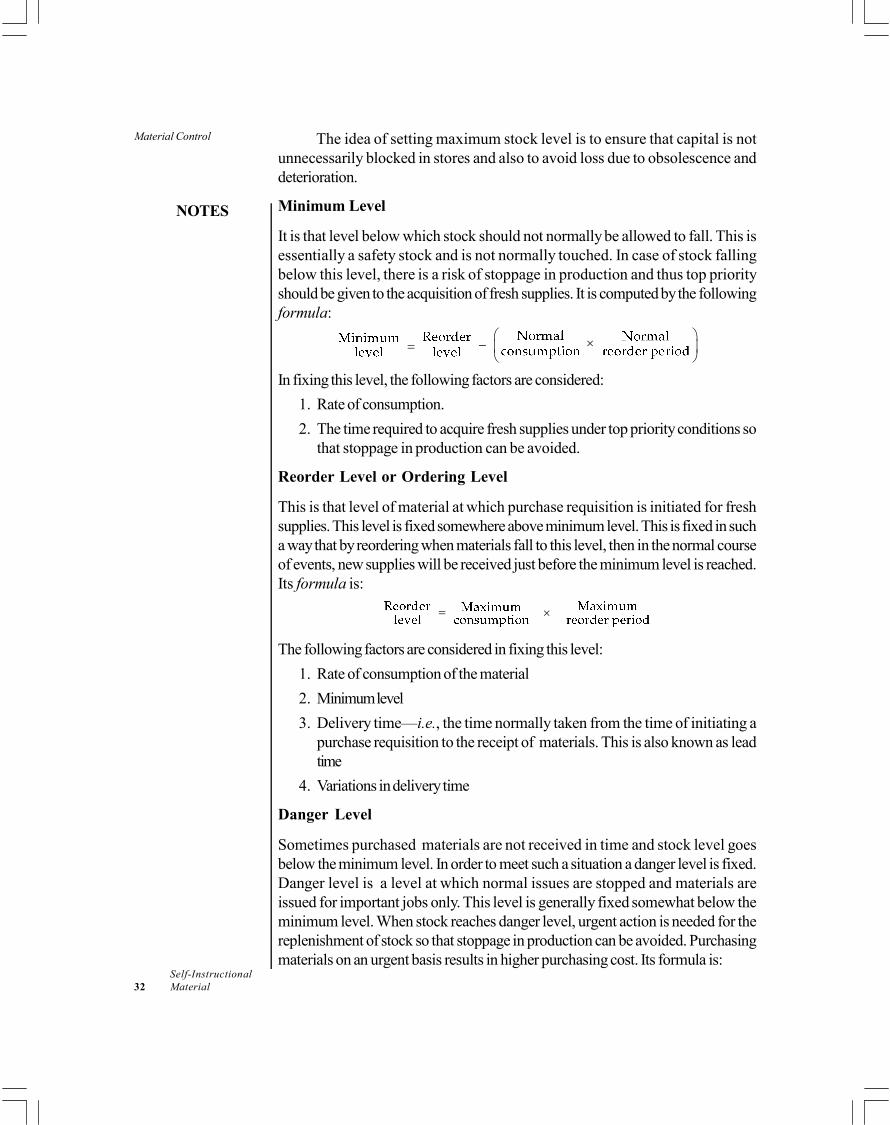
Material Control
NOTES
Self-Instructional32 Material
The idea of setting maximum stock level is to ensure that capital is notunnecessarily blocked in stores and also to avoid loss due to obsolescence anddeterioration.
Minimum Level
It is that level below which stock should not normally be allowed to fall. This isessentially a safety stock and is not normally touched. In case of stock fallingbelow this level, there is a risk of stoppage in production and thus top priorityshould be given to the acquisition of fresh supplies. It is computed by the followingformula:
In fixing this level, the following factors are considered:
1. Rate of consumption.
2. The time required to acquire fresh supplies under top priority conditions sothat stoppage in production can be avoided.
Reorder Level or Ordering Level
This is that level of material at which purchase requisition is initiated for freshsupplies. This level is fixed somewhere above minimum level. This is fixed in sucha way that by reordering when materials fall to this level, then in the normal courseof events, new supplies will be received just before the minimum level is reached.Its formula is:
The following factors are considered in fixing this level:
1. Rate of consumption of the material
2. Minimum level
3. Delivery time—i.e., the time normally taken from the time of initiating apurchase requisition to the receipt of materials. This is also known as leadtime
4. Variations in delivery time
Danger Level
Sometimes purchased materials are not received in time and stock level goesbelow the minimum level. In order to meet such a situation a danger level is fixed.Danger level is a level at which normal issues are stopped and materials areissued for important jobs only. This level is generally fixed somewhat below theminimum level. When stock reaches danger level, urgent action is needed for thereplenishment of stock so that stoppage in production can be avoided. Purchasingmaterials on an urgent basis results in higher purchasing cost. Its formula is:
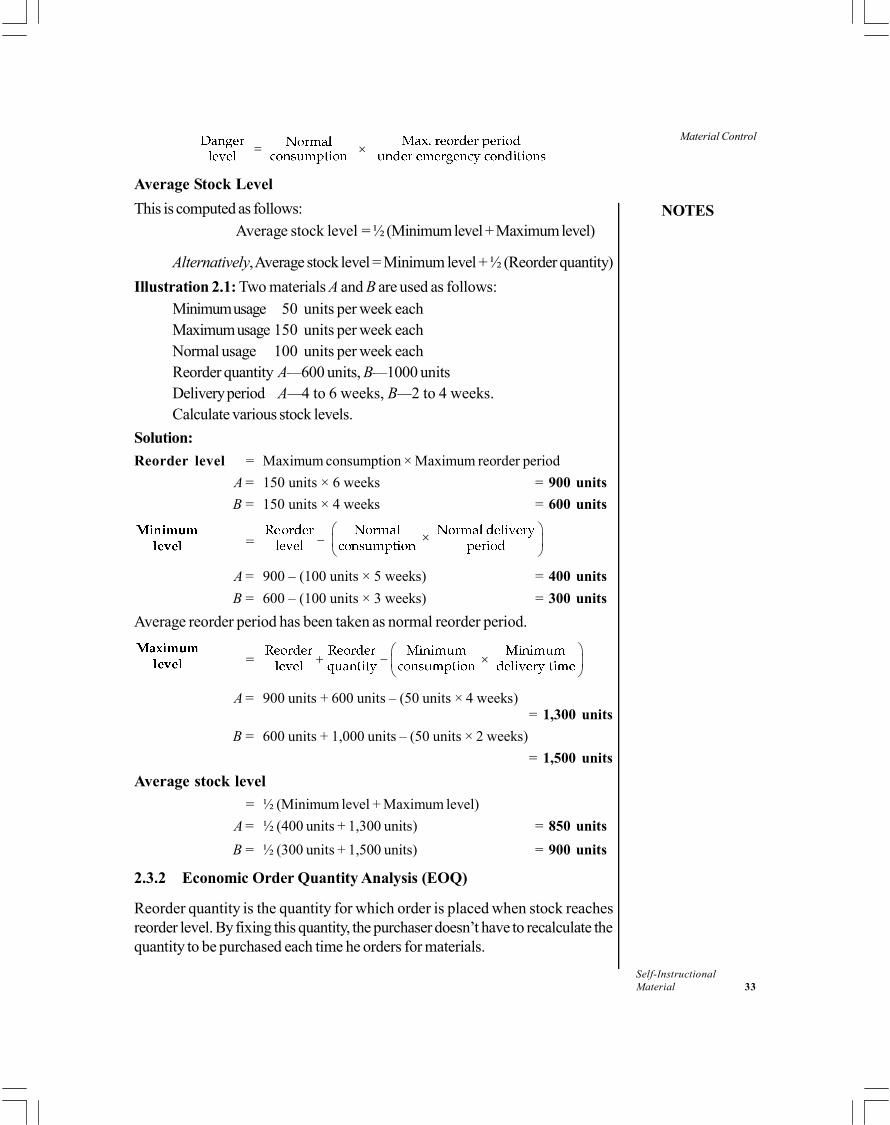
Material Control
NOTES
Self-InstructionalMaterial 33
Average Stock Level
This is computed as follows:
Average stock level = ½ (Minimum level + Maximum level)
Alternatively, Average stock level = Minimum level + ½ (Reorder quantity)
Illustration 2.1: Two materials A and B are used as follows:Minimum usage 50 units per week eachMaximum usage 150 units per week eachNormal usage 100 units per week eachReorder quantity A—600 units, B—1000 unitsDelivery period A—4 to 6 weeks, B—2 to 4 weeks.Calculate various stock levels.
Solution:
Reorder level = Maximum consumption × Maximum reorder period
A = 150 units × 6 weeks = 900 units
B = 150 units × 4 weeks = 600 units
=
A = 900 – (100 units × 5 weeks) = 400 units
B = 600 – (100 units × 3 weeks) = 300 units
Average reorder period has been taken as normal reorder period.
=
A = 900 units + 600 units – (50 units × 4 weeks)= 1,300 units
B = 600 units + 1,000 units – (50 units × 2 weeks)
= 1,500 units
Average stock level
= ½ (Minimum level + Maximum level)
A = ½ (400 units + 1,300 units) = 850 units
B = ½ (300 units + 1,500 units) = 900 units
2.3.2 Economic Order Quantity Analysis (EOQ)
Reorder quantity is the quantity for which order is placed when stock reachesreorder level. By fixing this quantity, the purchaser doesn’t have to recalculate thequantity to be purchased each time he orders for materials.
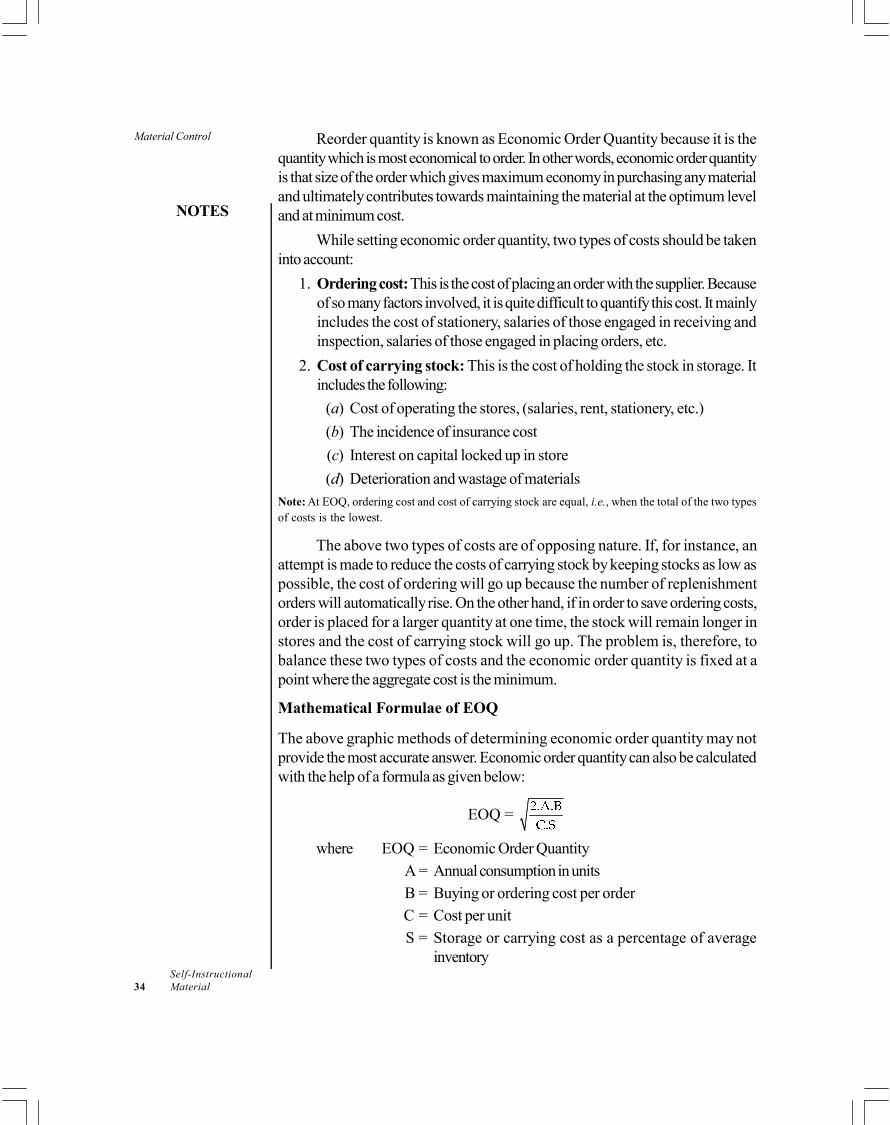
Material Control
NOTES
Self-Instructional34 Material
Reorder quantity is known as Economic Order Quantity because it is thequantity which is most economical to order. In other words, economic order quantityis that size of the order which gives maximum economy in purchasing any materialand ultimately contributes towards maintaining the material at the optimum leveland at minimum cost.
While setting economic order quantity, two types of costs should be takeninto account:
1. Ordering cost: This is the cost of placing an order with the supplier. Becauseof so many factors involved, it is quite difficult to quantify this cost. It mainlyincludes the cost of stationery, salaries of those engaged in receiving andinspection, salaries of those engaged in placing orders, etc.
2. Cost of carrying stock: This is the cost of holding the stock in storage. Itincludes the following:
(a) Cost of operating the stores, (salaries, rent, stationery, etc.)
(b) The incidence of insurance cost
(c) Interest on capital locked up in store
(d) Deterioration and wastage of materialsNote: At EOQ, ordering cost and cost of carrying stock are equal, i.e., when the total of the two typesof costs is the lowest.
The above two types of costs are of opposing nature. If, for instance, anattempt is made to reduce the costs of carrying stock by keeping stocks as low aspossible, the cost of ordering will go up because the number of replenishmentorders will automatically rise. On the other hand, if in order to save ordering costs,order is placed for a larger quantity at one time, the stock will remain longer instores and the cost of carrying stock will go up. The problem is, therefore, tobalance these two types of costs and the economic order quantity is fixed at apoint where the aggregate cost is the minimum.
Mathematical Formulae of EOQ
The above graphic methods of determining economic order quantity may notprovide the most accurate answer. Economic order quantity can also be calculatedwith the help of a formula as given below:
EOQ =
where EOQ = Economic Order Quantity
A = Annual consumption in units
B = Buying or ordering cost per order
C = Cost per unit
S = Storage or carrying cost as a percentage of averageinventory
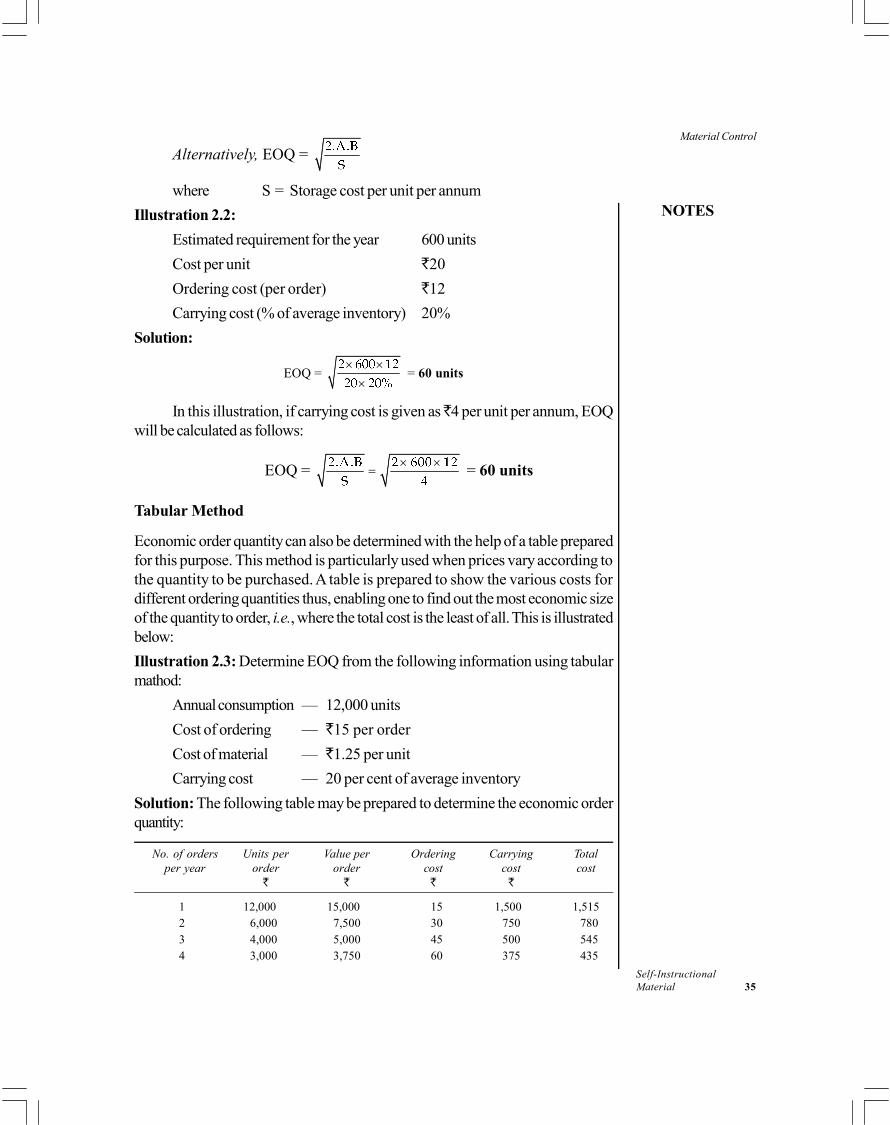
Material Control
NOTES
Self-InstructionalMaterial 35
Alternatively, EOQ =
where S = Storage cost per unit per annum
Illustration 2.2:
Estimated requirement for the year 600 units
Cost per unit 20
Ordering cost (per order) 12
Carrying cost (% of average inventory) 20%
Solution:
EOQ =
= 60 units
In this illustration, if carrying cost is given as 4 per unit per annum, EOQwill be calculated as follows:
EOQ =
= 60 units
Tabular Method
Economic order quantity can also be determined with the help of a table preparedfor this purpose. This method is particularly used when prices vary according tothe quantity to be purchased. A table is prepared to show the various costs fordifferent ordering quantities thus, enabling one to find out the most economic sizeof the quantity to order, i.e., where the total cost is the least of all. This is illustratedbelow:
Illustration 2.3: Determine EOQ from the following information using tabularmathod:
Annual consumption — 12,000 units
Cost of ordering — 15 per order
Cost of material — 1.25 per unit
Carrying cost — 20 per cent of average inventory
Solution: The following table may be prepared to determine the economic orderquantity:
No. of orders Units per Value per Ordering Carrying Totalper year order order cost cost cost
1 12,000 15,000 15 1,500 1,5152 6,000 7,500 30 750 7803 4,000 5,000 45 500 5454 3,000 3,750 60 375 435

Material Control
NOTES
Self-Instructional36 Material
5 2,400 3,000 75 300 3756 2,000 2,500 90 250 3407 1,714 2,142 105 214 3198 1,500 1,875 120 188 3089 1,333 1,667 135 167 30210 1,200 1,500 150 150 30011 1,091 1,364 165 136 30112 1,000 1,250 180 125 30513 923 1,154 195 115 31014 857 1,071 210 107 31715 800 1,000 225 100 325
The above table shows that 1,200 units is the ideal size of the order becausetotal cost at this level is the least of all. This means the number of orders per yearshould be ten. Other order quantities (more than or less than 1,200 units) are notso economical because total cost is higher than this level. The result of this tablecan be verified with the help of mathematical formula as shown below:
EOQ =
= 1,200 units
Check Your Progress
1. What are the aspects that must be covered by an efficient system of materialcontrol?
2. State the idea behind setting maximum stock level.
3. Mention the formula for danger level of stock.
2.4 MATERIAL PURCHASE PROCEDURE
Purchasing is the function of buying raw materials, general supplies, tools, officestationery and other items. The essentials of efficient purchasing are right quantity,right quality, right time, right price, right source and delivery at the right place.
Just-in-time (JIT) Purchasing
Just-in-time purchasing is the purchase of materials immediately before these arerequired for use in production. According to CIMA, London JIT purchasing is‘matching receipts of materials closely with usage so that raw materialinventory is reduced to near zero level.’ The purpose of JIT purchasing is toreduce stock levels to the minimum through creating closer relationship withsuppliers and arranging frequent deliveries of materials in smaller quantities. Itresults in enormous savings in storage costs, material handling costs, spoilage,obsolescence etc. An important effect of JIT purchasing is that with frequentpurchasing the issue price is likely to be closer to market prices. In order to saveon ordering costs, long term agreements may be entered into with suppliers.
Material Control
NOTES
Self-InstructionalMaterial 37
Centralized and Decentralized Purchasing
Broadly speaking, purchase function may be organized in two ways, i.e., centralizedpurchasing and decentralized purchasing.
Centralization: Centralization of purchasing means that all purchases aremade by a single purchase department. Head of this department is designated asPurchase Manager or Chief Buyer.
Decentralization: In decentralized purchasing, each branch or departmentmakes its own purchases. If the branches or plants are located at different places,the decentralized purchasing can better meet the situation by making purchases inthe local market by plant or branch managers.
Advantages of Centralized Purchasing
1. Specialized and expert purchasing staff can be concentrated in onedepartment.
2. A firm policy can be initiated which may result in favourable terms ofpurchase, e.g., higher trade discount or easy terms of payment
3. Standardization of quality of raw material is facilitated.
4. Better control over purchasing is possible because reckless buying by variousindividuals is avoided. Keeping all records of purchase transactions at oneplace also helps in control.
Disadvantages of Centralized Purchasing
1. The creation and maintenance of a special purchasing department leads tohigher administration costs which small concerns may not be in a position toafford.
2. Centralized purchasing is not suitable for plants or branches located atdifferent places which are far apart.
Purchase Procedure
Although the details of a purchase procedure may differ from firm to firm, theimportant steps in purchasing and receiving of materials are as follows, assumingthat purchases are centralized:
1. Purchase Requisition
Purchases of materials are initiated through purchase requisitions. A purchaserequisition is a formal request by the head of a department or an authorized officerto the purchase manager to purchase the specified materials.
(i) Storekeeper: When materials reach ordering level, the storekeeper shouldinitiate purchase procedure.
(ii) Production planner for special materials required for the manufacture of anew product.

Material Control
NOTES
Self-Instructional38 Material
(iii) Plant engineer for repairs and maintenance materials.
(iv) Department heads (e.g., office manager) for any materials required for hisdepartment, like filing cabinets, stationery and office sundries.
Purposes: A purchase requisition serves the following purposes:
1. It initiates the purchase and sets the purchasing process in motion.
2. It provides a written record of details like quantities, specification, etc., ofmaterials to be purchased.
3. It provides dates for reference, e.g., date when materials are required. Datesare particularly important in case responsibility for stoppage in productiondue to shortage of materials is to be determined.
Generally two copies of purchase requisition are prepared. The originalcopy is sent to the purchasing department and carbon copy is retained and filedby the requisitionist for his own reference. (A note of caution: Purchase Requisitionshould not be confused with Stores or Materials Requisition).
2. Selection of Suppliers
When the purchasing department receives a duly authorized purchase requisition,a source of supply has to be selected. The purchase department generally maintainsa list of suppliers for each type of material and selects a particular supplier afterinviting tenders. The important rule is to buy the best quality materials at the lowestpossible price after giving due consideration to delivery dates and other terms ofpurchases. Purchases should be made from dependable sources of supply andethical standards should be maintained in dealing with suppliers.
In many industries, long term contracts are entered into with suppliers. Forexample, a car manufacturer may contract ahead for the supply of tyres and tubesfor a year’s requirement at a time. Such an arrangement has the advantage of nothaving to keep large stocks if the continuity of supply can be relied upon. Moreover,the supplier gets a regular customer and may offer favourable terms. Periodicwithdrawals against the contract are made by raising a purchase order.
3. Purchase Order and Follow-up
When the supplier has been selected, the most common procedure is thepreparation of a purchase order. The purchase order is the form used by thepurchasing department authorizing the suppliers to supply the specified materialsat the price and terms stated therein. A purchase order should be carefully preparedas it forms a basis of legal contract between the parties concerned. For this reason,authority to sign purchase orders should also be restricted to selected responsibleofficials.
Large companies generally prepare five copies of the purchase order. Theoriginal is sent to the supplier. Second copy is retained by the purchase departmentfor its own file. Third copy is sent to the receiving department as an advance
Material Control
NOTES
Self-InstructionalMaterial 39
intimation to expect the materials. Fourth copy is sent to the cost accountingdepartment for entry in the ordered column of the appropriate stores ledger account.The last copy is sent to the department requisitioning the material as an intimationof the order and expected date of receipt of materials.
It is very important to follow up purchase orders so as to ensure timelydelivery. Lack of follow-up measures may cause delay in arrival of materialsresulting in stoppage in production for want of materials.
4. Receipt of Materials
All incoming materials should be received by the Receiving Department. Thisdepartment performs the functions of unpacking the goods received and verifyingtheir quantities and conditions. The quantity is checked against the purchase ordercopy and the supplier’s advice note which is normally received along with thegoods.
Full particulars of the goods received are entered in a Goods ReceivedNote Goods Received Note serves the following purposes:
1. It informs the storekeeper and the requisitionist of the receipt of materials.
2. It notifies the accounting department that the materials have been receivedand that a voucher can be prepared.
3. When it includes columns of cost, it can serve as a source of entry in thestores ledger.
Original copy of the Goods Received Note is sent to the purchasedepartment to be marked completed. Second copy is sent to the storekeeper orthe requisitionist along with the goods. Third copy is sent to the accountingdepartment for entry in the stores ledger and the last copy is retained by thereceiving department for its own file.
5. Inspection and Testing of Materials
Goods received should be inspected for quality to ensure that they comply withthe specifications stated on the purchase order. Where technical or laboratoryinspection is necessary, the goods are passed to a laboratory which will provide areport on the quality of goods.
An inspection report is prepared to show the results of the inspection.In either case, the report is forwarded to the purchasing department.
6. Return of Rejected Materials
Where materials received are damaged or are not in accordance with thespecifications, these are usually returned to the supplier along with a Debit Note,informing him that his account has been debited with the value of materialsconcerned. When such a claim is accepted by the supplier, he signifies hisacceptance by the issue of a Credit Note. The rejected materials may be returnedto the supplier immediately or they may be held pending his instructions.
Material Control
NOTES
Self-Instructional40 Material
This Debit Note may be prepared by the purchase department on the basisof the inspection report. Original copy is sent to the supplier. One copy is sent toaccounts department for adjustment entry and one copy is retained for purchasedepartment file.
7. Passing Invoices for Payment
When the invoices are received by the purchasing department, the process ofassembling the business papers connected with each purchase and preparation ofvoucher begins. Invoices are numbered serially and entered in the Invoice Register.The following documents are assembled in support of the invoice: (a) PurchaseOrder; (b) Goods Received Note; (c) Inspection Report, if not incorporated inthe Goods Received Note and (d) Debit or Credit Note.
After comparing these documents with the invoice, if it is found that theinvoice is in order, the purchase manager will sign it and pass it to the accountsdepartment for payment. All calculations are checked before a voucher authorizingpayment is prepared. All related documents like Purchase Order, Goods ReceivedNote are marked with the invoice number to preclude the passing of a possibleduplicate invoice.
Purchase Price
The invoice received from the supplier provides a base figure of purchase price.The following adjustments have to be made in this figure to arrive at the real materialcost.
Quantity discount: This is an allowance made by the supplier to the purchaser toencourage large orders. The discount often varies according to the size of theorder, i.e., the larger the quantity ordered, the higher is the discount, within fixedlimits. Quantity discount is allowed by a supplier as a measure of the savings in hiscost which arise from the production and distribution on a large scale. Part ofthese savings enjoyed by the supplier is passed on to the purchaser in the form ofquantity discount. The amount of the quantity discount is deducted from thepurchase price to arrive at the material cost.
Trade discount: This is an allowance made by the supplier to a purchaser whohas to re-sell the material, e.g., discount allowed by the manufacturer to thewholesaler. The idea is to cover the expenses (e.g., storage, re-packing) andprofit of the dealer who is providing a service to help the original supplier todistribute his goods. This discount is also deducted from the purchase price toarrive at the material cost.
Cash discount: This discount is allowed by the supplier to a purchaser to encourageprompt payment of invoice, e.g., 2% discount may be allowed if payment is madewithin 30 days and 4% discount if payment is made within 7 days. As cash discountis a form of interest on capital, its treatment is a subject of debate among costaccountants. Generally, it is considered a financial and non-costing item and thusis not included in cost accounts.
Material Control
NOTES
Self-InstructionalMaterial 41
Sales tax and other levies: Items, like sales tax, excise duty, customsduty and octroi, should be added to the purchase price.
Transport charges: These include sea, land and air freight, dock charges,insurance, etc. on materials purchased. Sometimes the purchase price quoted bythe supplier includes all these charges, but where the price does not include thesecharges, these should be added to the purchase price. Where it is impracticable todo so (e.g., where such costs are too small or invoices are received late) thesemay be charged as factory overheads.
Cost of containers: The supplier may or may not charge separately forcontainers. If no such charge is made, no adjustment is required in the purchaseprice. However, if containers are separately charged, all such costs should beincluded in the purchase price i.e. (i) the cost of containers if these are not returnable;and (ii) the difference between the cost of container and the amount refundedwhen container is returned, where containers are returnable.
Check Your Progress
4. What are the essentials of efficient purchasing?
5. What is done when materials received are damaged or are not inaccordance with the specifications?
2.5 METHODS OF PRICING MATERIAL ISSUES
When materials are issued from stores to production department, a question arisesregarding the price at which materials issued are to be charged. This is becausethe same type of material may have been purchased in different lots at differenttimes at several different prices. This means that actual cost can take on severaldifferent values and some method of pricing the issue of materials must be selected.
It should be noted that methods discussed below are methods of pricing theissue of materials and not the methods of physically issuing materials.
These methods are discussed and illustrated below.
First-in, First-out (FIFO) Method
This method is based on the assumption that materials which are purchased firstare issued first. It uses the price of the first batch of materials purchased for allissues until all units from this batch have been issued. After the first batch is fullyissued, the price of the next batch received becomes the issue price. Upon thisbatch also getting fully used, the price of the still next batch is used for pricing andso on. In other words, the materials are issued at the oldest cost price listed in thestores ledger account and thus, the materials in stock are valued at the price of thelatest purchases.
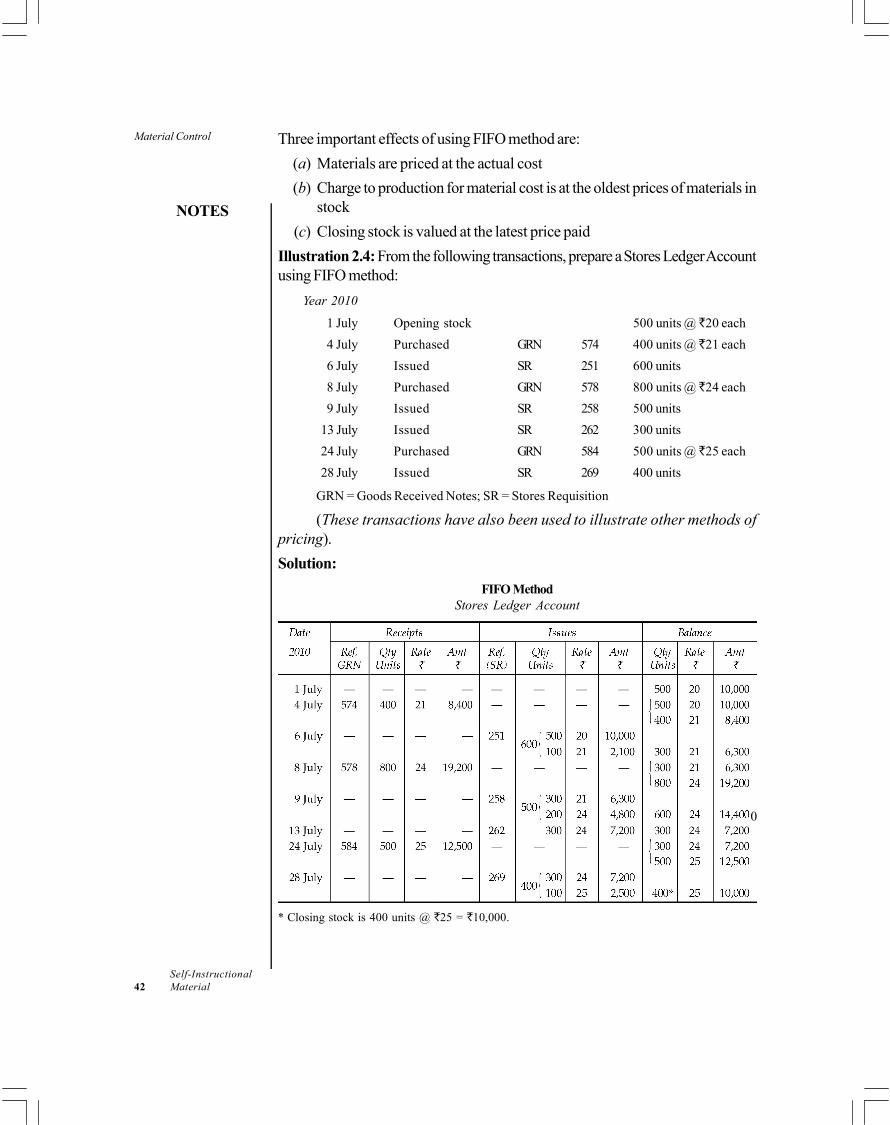
Material Control
NOTES
Self-Instructional42 Material
Three important effects of using FIFO method are:
(a) Materials are priced at the actual cost
(b) Charge to production for material cost is at the oldest prices of materials instock
(c) Closing stock is valued at the latest price paid
Illustration 2.4: From the following transactions, prepare a Stores Ledger Accountusing FIFO method:
Year 2010
1 July Opening stock 500 units @ 20 each
4 July Purchased GRN 574 400 units @ 21 each
6 July Issued SR 251 600 units
8 July Purchased GRN 578 800 units @ 24 each
9 July Issued SR 258 500 units
13 July Issued SR 262 300 units
24 July Purchased GRN 584 500 units @ 25 each
28 July Issued SR 269 400 units
GRN = Goods Received Notes; SR = Stores Requisition
(These transactions have also been used to illustrate other methods ofpricing).
Solution:
FIFO MethodStores Ledger Account
0
* Closing stock is 400 units @ 25 = 10,000.
Material Control
NOTES
Self-InstructionalMaterial 43
It should be noted that the assumption of FIFO is only for accounting purpose,i.e., the physical flow of materials need not necessarily be in the order of the flowof cost, though normally materials would be expected to move out of stock on aFIFO basis because oldest stocks are usually used up first.
Advantages: The following advantages are claimed for FIFO method:
1. It is based on a realistic assumption that materials are issued in the order oftheir receipts.
2. Materials are issued at actual cost and thus no unrealized profit/loss arisesfrom the operation of this method.
3. Valuation of closing inventory is at cost as well as at the latest prices paid.
4. This method is easy to understand and simple to operate.
Disadvantages: The main disadvantages of this method are:
1. As materials are charged to production at the old prices, the cost ofproduction may lag behind the current economic values.
2. This method does not permit comparison of the costs of similar jobs or costunits because similar jobs simultaneously started may be charged materialsat different prices.
3. When prices are subject to frequent changes, this method involvescumbersome records and calculations.
In periods of rising prices, the FIFO method produces higher profits andresults in higher tax liability because lower cost is charged to production. Conversely,in periods of falling prices, the FIFO method produces lower profits and resultsin lower taxes because they are derived from a higher cost of goods sold.
Last-in, First-out (LIFO) Method
This method operates in just the reverse order of FIFO method. It is based on theassumption that the last materials purchased are the first materials to be issued.Thus, the price of the last batch of the materials purchased is used first for allissues until all units from this batch have been issued, after which the price of theprevious batch of materials purchased is used. It should be noted that physicalflow of materials may not conform to LIFO assumption.
Three points should be noted regarding this method:
(a) Material issues are priced at actual cost
(b) Charge to production for material cost is at latest prices paid
(c) Closing stock valuation is at the oldest prices paid and is completely out ofline with the current prices
Illustration 2.5: Prepare a Stores Ledger Account, showing pricing of materialson LIFO basis, from the data given in Illustration 2.4.
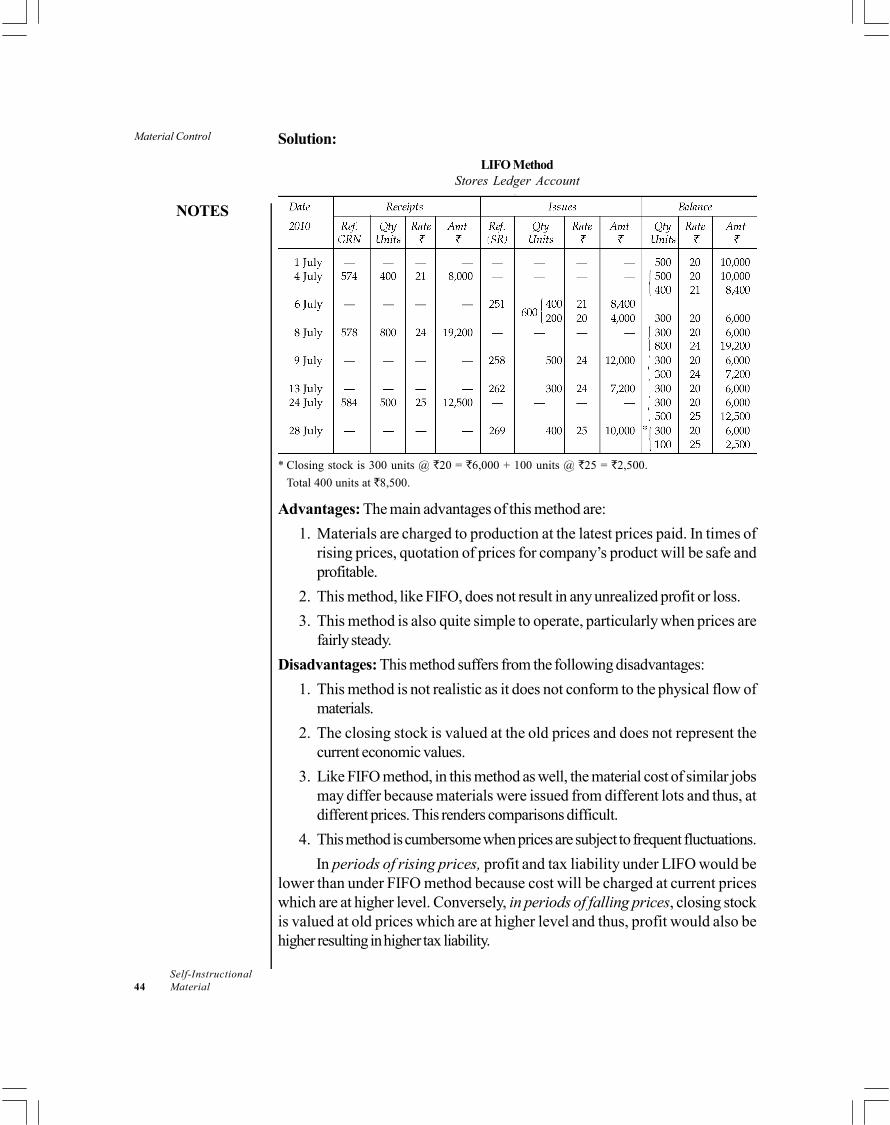
Material Control
NOTES
Self-Instructional44 Material
Solution:
LIFO MethodStores Ledger Account
* Closing stock is 300 units @ 20 = 6,000 + 100 units @ 25 = 2,500.
Total 400 units at 8,500.
Advantages: The main advantages of this method are:
1. Materials are charged to production at the latest prices paid. In times ofrising prices, quotation of prices for company’s product will be safe andprofitable.
2. This method, like FIFO, does not result in any unrealized profit or loss.
3. This method is also quite simple to operate, particularly when prices arefairly steady.
Disadvantages: This method suffers from the following disadvantages:
1. This method is not realistic as it does not conform to the physical flow ofmaterials.
2. The closing stock is valued at the old prices and does not represent thecurrent economic values.
3. Like FIFO method, in this method as well, the material cost of similar jobsmay differ because materials were issued from different lots and thus, atdifferent prices. This renders comparisons difficult.
4. This method is cumbersome when prices are subject to frequent fluctuations.
In periods of rising prices, profit and tax liability under LIFO would belower than under FIFO method because cost will be charged at current priceswhich are at higher level. Conversely, in periods of falling prices, closing stockis valued at old prices which are at higher level and thus, profit would also behigher resulting in higher tax liability.

Material Control
NOTES
Self-InstructionalMaterial 45
2.6 MATERIAL LOSSES, WASTAGE OFMATERIALS AND ITS MAIN TYPES
Losses of materials may arise during handling, storage or during process ofmanufacture. Such losses or wastages are classified into two categories—normalloss and abnormal loss.
Normal Loss: This is that loss which has necessarily to be incurred and thus isunavoidable. Examples are:
(i) Loss by evaporation in case of liquid materials.
(ii) Loss due to loading and unloading of material, say, in case of coal and othermaterials of such nature.
(iii) Loss due to breaking the bulk. When materials are purchased in large quantityand issued to production in small lots, some difference is likely to arise.
Normal losses of material cannot be completely eliminated but may becontrolled to a limited extent.
Abnormal Loss: This is that loss which arises due to inefficiency in operations,bad luck, mischief, etc. Examples are:
(i) Theft or pilferage
(ii) Breakage
(iii) Fire, accident, flood, etc.
(iv) Use of inaccurate weighing instruments
(v) Improper storage resulting in deterioration of materials
Control of Material Losses
The following steps are suggested to control the loss of materials:
1. Proper storage conditions should be provided, particularly in case ofperishable materials.
2. The store room should be well guarded and protected to avoid the risks offire or theft, etc.
3. In order to reduce losses due to obsolescence, materials should be issuedon first-in, first-out basis.
4. Accuracy of weighing instruments should be periodically checked.
5. A systematic procedure should be developed regarding movement ofmaterials from one place to another and no unauthorized movement ofmaterials should be permitted.
6. Specialized material handling equipment should be employed so as tominimize losses in materials handling.
Material Control
NOTES
Self-Instructional46 Material
Accounting Treatment
It is a principle of costing that all normal losses which are necessarily to be incurredare treated as a part of the cost and abnormal losses which are really avoidableshould not be included in the cost. Therefore, in order to absorb normal materiallosses in cost, the rates of usable materials in stock are inflated so that such lossesare covered. Alternatively, normal material loss is transferred to factory overhead.
Abnormal material losses, such as those due to breakage, theft, fire, floodand abnormal evaporation, are charged to Costing Profit and Loss Account.
Waste, Scrap, Spoilage and Defectives
Material losses may arise in the form of waste, scrap, spoilage or defectives.These are explained below:
Waste
Meaning: Waste has been defined as ‘that portion of a basic raw materiallost in processing, having no recovery value.’ In fact, waste is a material lossduring production or storage due to various factors, such as evaporation, chemicalreaction, shrinkage, contamination, unrecoverable residue, which has little or novalue. Waste may be visible or invisible. Visible waste is that which is physicallypresent, e.g., ash and saw dust. An invisible waste, on the other hand, is thedisappearance of basic raw material in the form of evaporation, smoke, etc. Wastein certain industries creates problems of disposal. Usually this is disposed of in theeasiest and cheapest manner, e.g., liquid wastes may be poured into nearby rivers.
Control of waste: Waste has the effect of reducing the quantity of output.Thus, waste should be reduced to the minimum. Allowance for normal waste shouldbe made on the basis of past experience, technical factors and any special featuresof the material, product and process, etc. Responsibilities should be assigned forany waste over and above the normal waste.
A Waste Report should be prepared periodically to compare the actualwaste with the predetermined level.
Accounting of waste: Waste usually has no realizable value. If waste is apart of the normal process loss, the cost will be absorbed by the good production.On the other hand, if it is a part of the abnormal process loss, it is transferred toCosting Profit and Loss Account.
However, if waste has any sale value at all, then the small amount receivedshould be treated as ‘other income’.
Scrap
Meaning: This is defined as ‘the incidental residue from certain types ofmanufacture usually of small amount and low value, recoverable withoutfurther processing.’ According to Cost Accounting Standard-6 (CAS-6), issuedby ICAI, ‘scrap is the “discarded material having some value in a few cases
Material Control
NOTES
Self-InstructionalMaterial 47
and which is usually either disposed of without further treatment (other thanreclamation and handling) or re-introduced into the process in place of rawmaterials.”’ Scrap has the following features:
(a) Scrap is incidentally produced from the manufacturing process.
(b) Scrap is usually of small value.
(c) No further processing is required to realize its saleable value.
(d) Scrap may be used in place of raw material, in some cases.
(e) Unlike waste, scrap is always physically available.
Examples of scrap are trimmings in timber industries; cuttings, pieces, etc.,in leather and readymade garments factory and cut pieces of metal sheets.
Control of scrap: Like waste, scrap also increases the cost of production.Although scrap might realize a nominal amount, the sale value will mostly be muchlower than the cost of raw materials. Therefore, scrap should be kept as low aspossible and a proper control should be exercised on this loss of materials.
Control of scrap is possible by setting standards for scrap, determining theresponsibility for scrap and by keeping proper records of scrap. A Scrap Reportshould be prepared at regular periods whereby a comparison should be madebetween actual scrap and standard allowance for scrap and remedial measuresshould be taken for any adverse variances that may be detected.
Accounting of scrap: The problem of scrap is more complex than that ofwaste. It may be treated in any of the following ways:
(a) As other income: Sales of scrap may simply be treated as ‘other income’and credited to Profit and Loss Account. This method is particularly suitablewhen the scrap has a relatively small realisable value, after taking into accountthe cost of its disposal and marketing.
(b) Credit to overheads: The net value of scrap, i.e., after adjusting sellingand distribution costs, may be credited to production overheads of thedepartment producing the scrap. An alternative to this method is that netrealisable value is credited to the material cost.
(c) Credit to job or process: The realisable value of scrap may be credited tothe job or process which yields the scrap. This method is suitable whenscrap is identifiable with a particular job or process and is of significantvalue.
Spoilage
Meaning: Spoiled work results when materials are damaged in manufacturingoperations is such a way that they cannot be rectified and brought back to normalspecifications. Spoilage differs from scrap in that scrap unavoidably arises as aresult of manufacturing operations, whereas spoilage occurs due to some defect inmaterials or manufacturing operations which could have been avoided. Spoiledwork may have a realisable value and in certain cases, it is sold as ‘seconds’.
Material Control
NOTES
Self-Instructional48 Material
Control of spoilage: Normal spoilage should be determined in advanceand it should be periodically compared with actual spoilage in the Spoilage Report.Causes of any abnormal spoilage should be investigated and remedial measuresimmediately taken.
Accounting of spoilage: For accounting purposes, spoiled work shouldbe divided into normal and abnormal. The cost of normal spoilage should be borneby good production. This can be done by charging the loss due to spoilage toproduction and spreading it over the good units produced.
Abnormal spoilage, caused due to inefficiency and treated as controllableshould be transferred to Costing Profit and Loss Account.
Defectives
Meaning: Defective work may be defined as ‘that production which is belowstandard specifications or quality and can be rectified by incurring additionalexpenditure (of material, labour, etc.) known as rectification costs.’ The maindifference between spoilage and defective is that whereas the former cannot berectified and sold as good units, the latter can be rectified by incurring additionalcosts and brought back to the level of standard product. Sometimes, whendefectives cannot be rectified as standard product, they may be sold as ‘seconds’.
Control of defectives: This should cover not only control over the quantityof defective production but also control over rectification costs. On the basis ofpast experience, standards for defective work and rectification costs should befixed. Reasons for any defectives over and above the normal or standard defectivework should be fully investigated and corrective steps should be taken. If, forexample, defective output is due to bad workmanship, suitable incentives may beprovided to workers for minimizing the defective work. A report on defectivework should be periodically prepared.
Accounting of defective work: The main problem in accounting of defectivework is the problem of treatment of rectification or rework costs. Where defectivework is easily identifiable with specific jobs, the rectification costs should be debitedto the jobs concerned. Where, however, such work cannot be conveniently identifiedwith jobs, the rectification costs may be debited to overheads. In the case ofabnormal type of defective work, the rectification costs may be transferred toCosting Profit and Loss Account.
Check Your Progress
6. Why does the question regarding the price at which materials issued areto be charged arises?
7. What is the profit and tax liability under LIFO and FIFO like in periods ofrising prices?
8. Define invisible waste.
Material Control
NOTES
Self-InstructionalMaterial 49
2.7 ANSWERS TO CHECK YOUR PROGRESSQUESTIONS
1. An efficient system of material control should be comprehensive enough tocover purchase system, storage system, issue to production anddetermination of stock levels for each item of material.
2. The idea of setting maximum stock level is to ensure that capital is notunnecessarily blocked in stores and also to avoid loss due to obsolescenceand deterioration.
3. The formula for danger level of stock is:
Danger level = Normal Consumption x Ma. Reorder period underemergency conditions
4. The essentials of efficient purchasing are right quantity, right quality, righttime, right place, right source and delivery at the right place.
5. When materials received are damaged or are not in accordance with thespecifications, these are usually returned to the supplier along with a DebitNote, informing him that his account has been debited with the value ofmaterials concerned.
6. The question regarding the price at which materials issued are to be chargedarises because the same type of material may have been purchased in differentlots at different times at several different prices.
7. In periods of rising prices, profit and tax liability under LIFO would belower than under FIFO method because cost will be charged at currentprices which are at higher level.
8. An invisible waste is the disappearance of basic raw materials in the form ofevaporation, smoke, etc.
2.8 SUMMARY
The term ‘material’ refers to all commodities that are consumed in the processof manufacture.
Material or inventory control may be defined as ‘systematic control andregulation of purchase, storage and usage of materials in such a way so asto maintain an even flow of production, at the same time avoiding excessiveinvestment in inventories. Efficient material control cuts out losses and wastesof materials that otherwise pass unnoticed.’
Various techniques commonly used for inventory control are listed below:
1. ABC technique
2. Stock levels—Minimum, maximum and reorder levels
Material Control
NOTES
Self-Instructional50 Material
3. Economic order quantity (EOQ)4. Proper purchase procedure5. Proper storage of materials6. Inventory turnover ratio to review slow and non-moving materials7. Perpetual inventory system8. Fixation of material cost standards (Used in Standard Costing)9. Preparation of material budgets (Used in Budgetary Control)
In order to guard against under-stocking and over-stocking, most of thelarge companies adopt a scientific approach of fixing stock levels. Theselevels are: (i) maximum level; (ii) minimum level; (iii) reorder level; and (iv)reorder quantity.
Reorder quantity is the quantity for which order is placed when stock reachesreorder level. By fixing this quantity, the purchaser doesn’t have to recalculatethe quantity to be purchased each time he orders for materials. Reorderquantity is known as Economic Order Quantity because it is the quantitywhich is most economical to order.
Purchasing is the function of buying raw materials, general supplies, tools,office stationery and other items. The essentials of efficient purchasing areright quantity, right quality, right time, right price, right source and deliveryat the right place.
The details of a purchase procedure generally includes: purchase requisition,selection of suppliers, purchase order and follow-up, receipt of materials,inspection and testing of materials, return of rejected materials and passinginvoices for payment.
When materials are issued from stores to production department, a questionarises regarding the price at which materials issued are to be charged. Thisis because the same type of material may have been purchased in differentlots at different times at several different prices. This means that actual costcan take on several different values and some method of pricing the issue ofmaterials must be selected. The methods are FIFO or LIFO.
Material losses may arise in the form of waste, scrap, spoilage or defectives.Accounting treatment for each form differs.
2.9 KEY WORDS
Material: It refers to tangible items that are consumed in the process ofmanufacture.
Economic order quantity (EOQ): It is that size of the purchase orderwhich gives maximum economy in purchasing.
Waste: It is that form of material loss whereby ‘basic raw material is lost inprocessing, having no recovery value.’
Material Control
NOTES
Self-InstructionalMaterial 51
2.10 SELF ASSESSMENT QUESTIONS ANDEXERCISES
Short Answer Questions
1. What do you understand by ‘Inventory Control’? State its objects.
2. What are the advantages and disadvantages of centralized storage?
3. What technique would you follow to detect and prevent slow and non-moving materials?
4. Write short notes on any three of the following:
(i) Reorder quantity (ii) Reorder level (iii) Maximum level (iv) Minimumlevel.
Long Answer Questions
1. Explain the terms ‘minimum level’, maximum level and ‘ordering level’ withregard to maintenance of stocks. What are the factors to be taken intoaccount in fixing these levels? Discuss the relevance of these concepts in amanufacturing organization.
2. What do you understand by economic order quantities? How are theycalculated?
3. Describe the procedure of purchasing materials from outside.
4. Explain the FIFO and LIFO methods of valuing material issues. Discuss theeffect of rising prices and falling prices on these two methods of pricing ofmaterial issues.
5. Discuss the accounting treatment and control of the following in costaccounts:
(a) Waste, (b) Scrap, (c) Defective, (d) Spoilage.
2.11 FURTHER READINGS
Arora, M.N. 2012. A Textbook of Cost and Management Accounting, Tenthedition. New Delhi: Vikas Publishing House.
Arora, M.N. 2010. Cost Accounting: Principles and Practice, Eleventh edition.New Delhi: Vikas Publishing House.
Shillinglow, G. 1982.Managerial Costing Accounting. Homewood: Richard D.Irwin.
Morse, W. J. 1978. Cost Accounting. Massachusetts: Addison-Wesley PublishingCo.
Lal, Jawahar. 2003. Cost Accounting. New Delhi: Tata McGraw Hill.
Labour Cost Control
NOTES
Self-Instructional52 Material
UNIT 3 LABOUR COST CONTROL
Structure
3.0 Introduction3.1 Objectives3.2 Importance of Labour Cost Control3.3 Treatment and Control of Labour Turnover3.4 Methods of Time Keeping and Time Booking3.5 Idle Time and Overtime3.6 Systems of Wage Payment Methods of Remuneration
3.6.1 Conventional Methods3.6.2 Incentive Wage Plans
3.7 Answers to Check Your Progress Questions3.8 Summary3.9 Key Words
3.10 Self Assessment Questions and Exercises3.11 Further Readings
3.0 INTRODUCTION
Labour or manpower represents human resources used in production. After materialcost, labour cost is the second major element of cost. Despite large scale use ofmachinery and advanced technologies in manufacturing, the role of labour inproduction cannot be under-estimated. So significant is the role of labour thatproductivity of all other resources depends on the productivity of human resources.In other words, higher efficiency of labour helps in lowering the cost per unit ofproduction. There is, therefore, a special need for proper organization foraccounting and control of labour cost.
According to Cost Accounting Standard-7 (CAS-7) issued by ICAI,employee cost is ‘the aggregate of all kinds of consideration paid, payableand provision made for future payments, for the services rendered by employeesof an enterprise (including temporary, part time and contract employees).Consideration includes wages, salaries, contractual payments and benefits,as applicable, or any payment made on behalf of the employee. This is alsoknown as labour cost.’
Labour cost is of two kinds:
(i) Direct labour cost
(ii) Indirect labour cost
Direct and Indirect Labour Costs
Direct labour cost is ‘the cost of employees which can be attributed to a costobject in an economically feasible way.’ Direct labour is expended in altering the
Labour Cost Control
NOTES
Self-InstructionalMaterial 53
construction, composition or condition of the product. It is directly engaged inproduction work and can be conveniently identified or attributed wholly to aparticular job, process or cost unit. Wages of a machine operator is a direct labourcost. In a factory of readymade garments, wages paid to a tailor are direct wages.Similarly, in a textile mill, wages paid to a weaver are direct wages.
Indirect labour cost, on the other hand, is the wages paid to those workers whoare not directly engaged in converting raw materials into finished products. Suchcosts cannot be conveniently identified with a particular cost object. Supervisors,inspectors, clerks, instructors, peons, watchmen and cleaners are examples ofindirect workers.
Organization for Accounting and Control of Labour Cost
There are mainly five departments in an organization which deal with labour. Theseare as follows:
Personnel department: This is a service department and is mainly concernedwith the proper selection and training of workers and placing them on jobs forwhich they are best suited.
Engineering department: This department prepares and plans specifications ofjobs makes job analysis, conducts time and motion studies, makes provision forsafe working conditions and supervises production activities.
Time-keeping department: This department is concerned with recording ofworkers’s time. The recording of time put in by workers is required not only forattendance and wage calculation purpose but also for the purpose of cost analysisand apportionment of labour cost over various jobs.
Payroll department: This department maintains a record of job classificationand wage rate of each employee and performs the function of computation ofwages payable to them by preparing payroll or wage sheet. It is also responsiblefor disbursement of wages.
Cost accounting department: This department accumulates and classifies allcost data of which labour is one important element. It analyses the payroll andprepares routine and special labour cost reports for submission to management sothat proper control may be exercised on labour cost.
In this unit, you will study the important aspects of these departments forlabour cost control.
3.1 OBJECTIVES
After going through this unit, you will be able to:
Discuss the meaning and causes of labour turnover and the methods of itsmeasurement
Explain the various methods of time keeping and time booking
Labour Cost Control
NOTES
Self-Instructional54 Material
Describe idle time and overtime and their effect on cost
Explain time rate and piece rate systems of labour remuneration
Classify various incentive plans of labour remuneration
3.2 IMPORTANCE OF LABOUR COST CONTROL
The total costing of a company has an influencing share of the labour costs. Thesemay fluctuate to increase the total cost in case there is a situation of non-productivityof labour, high labour turnover, situations of overtime, excessive idle time, incorrectentries in the wage sheets and other similar factors.
The increasing costs due to rising overhead and material costs is also aresult of inefficient working of labour. This is primarily why the labour costs needto be brought down so that the overall cost of production is kept low.
The following are some of the reasons why labour cost control is importantto the managers:
To check the efficiency of workers
To reduce the overall direct labour costs of different processes, jobs,orders etc., through the correct ascertainment and assignment of labourcosts
To assist with the absorption of overhead through direct labour cost
To reduce the labour turnover
3.3 TREATMENT AND CONTROL OF LABOURTURNOVER
The treatment and control labour turnover falls under the purview of personneldepartment.
In all business organizations, it is a common feature that some workersleave the employment and new workers join in place of those leaving. This changein work force is known as labour turnover. Labour turnover is thus defined as ‘therate of change in the composition of the labour force in an organization.’Labour turnover varies greatly between different trades and industries. For example,where part-time and seasonal labour is employed, the rate will be higher.
Measurement of Labour Turnover
To facilitate comparisons between different periods and different undertakings,labour turnover may be expressed in a rate.
There are three alternative methods by which this rate is computed. Once aparticular method is used, it should be consistently followed for comparativeanalysis. The methods are:
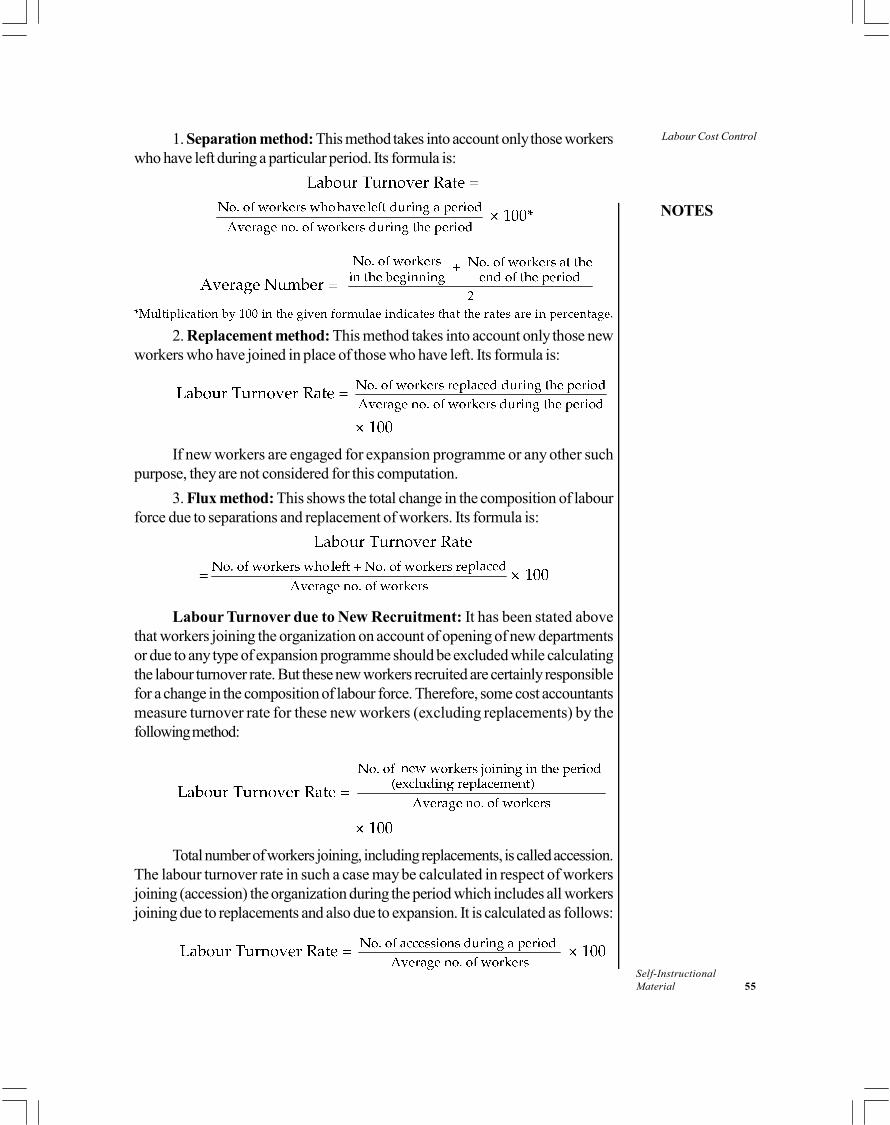
Labour Cost Control
NOTES
Self-InstructionalMaterial 55
1. Separation method: This method takes into account only those workerswho have left during a particular period. Its formula is:
2. Replacement method: This method takes into account only those newworkers who have joined in place of those who have left. Its formula is:
If new workers are engaged for expansion programme or any other suchpurpose, they are not considered for this computation.
3. Flux method: This shows the total change in the composition of labourforce due to separations and replacement of workers. Its formula is:
Labour Turnover due to New Recruitment: It has been stated abovethat workers joining the organization on account of opening of new departmentsor due to any type of expansion programme should be excluded while calculatingthe labour turnover rate. But these new workers recruited are certainly responsiblefor a change in the composition of labour force. Therefore, some cost accountantsmeasure turnover rate for these new workers (excluding replacements) by thefollowing method:
Total number of workers joining, including replacements, is called accession.The labour turnover rate in such a case may be calculated in respect of workersjoining (accession) the organization during the period which includes all workersjoining due to replacements and also due to expansion. It is calculated as follows:

Labour Cost Control
NOTES
Self-Instructional56 Material
When labour turnover rate is computed by taking into account the numberof accessions, the flux method rate will be calculated as follows:
Equivalant Annual Labour Turnover Rate: Labour turnover rate, asexplained above, may be computed for a month, a quarter or for any period otherthan a year. It may be converted into an equivalant annual labour turnover rate byusing the following formula:
Illustration 3.1: From the following data given by the Personnel Department,calculate the labour turnover rate by applying:
(a) Separation method
(b) Replacement method
(c) Flux method
During the month, 10 workers left, 40 persons were discharged and 150workers were recruited. Of these, 25 workers are recruited in the vacancies ofthose leaving, while the rest were engaged for an expansion scheme.
(ICWA Inter)
Solution:
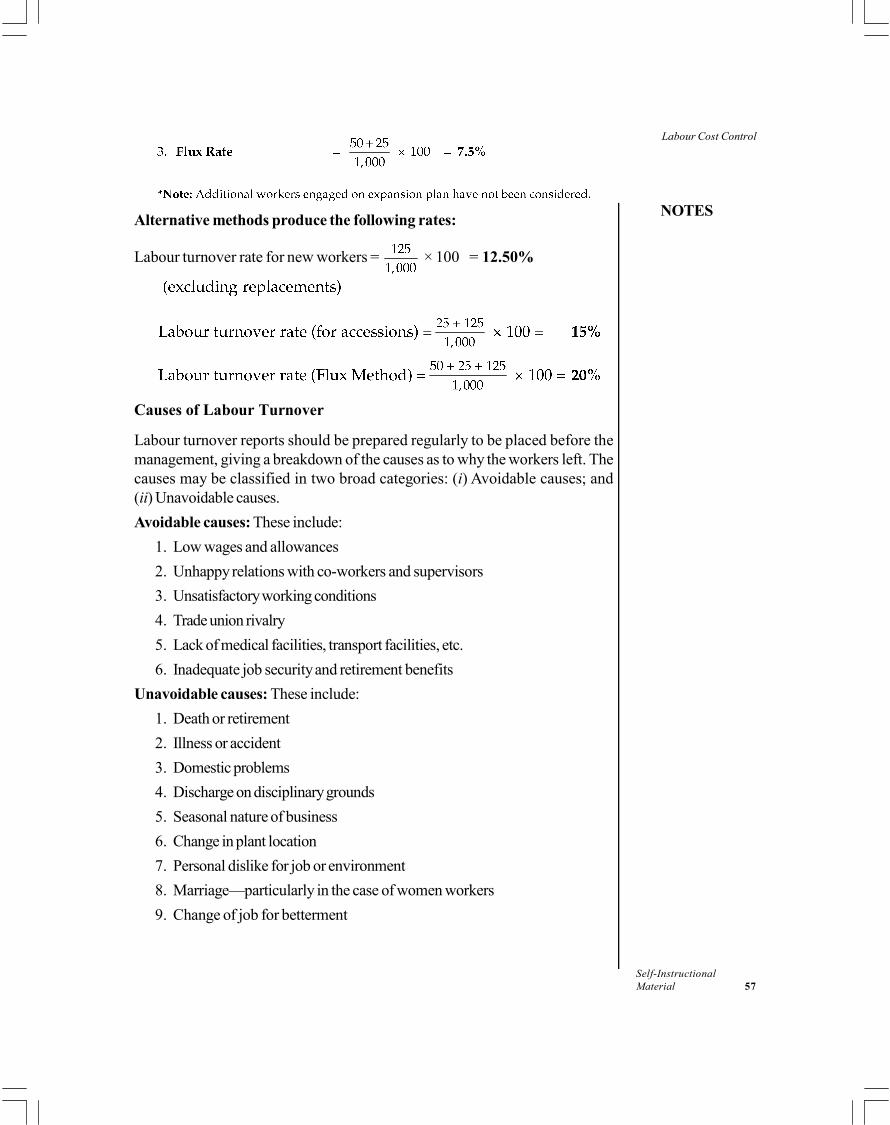
Labour Cost Control
NOTES
Self-InstructionalMaterial 57
Alternative methods produce the following rates:
Labour turnover rate for new workers = × 100 = 12.50%
Causes of Labour Turnover
Labour turnover reports should be prepared regularly to be placed before themanagement, giving a breakdown of the causes as to why the workers left. Thecauses may be classified in two broad categories: (i) Avoidable causes; and(ii) Unavoidable causes.
Avoidable causes: These include:
1. Low wages and allowances
2. Unhappy relations with co-workers and supervisors
3. Unsatisfactory working conditions
4. Trade union rivalry
5. Lack of medical facilities, transport facilities, etc.
6. Inadequate job security and retirement benefits
Unavoidable causes: These include:
1. Death or retirement
2. Illness or accident
3. Domestic problems
4. Discharge on disciplinary grounds
5. Seasonal nature of business
6. Change in plant location
7. Personal dislike for job or environment
8. Marriage—particularly in the case of women workers
9. Change of job for betterment

Labour Cost Control
NOTES
Self-Instructional58 Material
Effect of Labour Turnover
A certain amount of labour turnover will always take place. To a limited extent thismay be welcome, particularly at the lower management level as it creates vacanciesfor internal promotions which acts as motivation for young and ambitious workers.Moreover, new workers bring new ideas and methods of doing work from otherorganizations.
Labour turnover is expensive and generally it should be minimized becauseit leads to increased cost of production for reasons stated below.
Cost of Labour Turnover
The cost of labour turnover may be broadly classified into two broad categories:(i) Preventive costs; and (ii) Replacement costs.
Preventive costs: These costs are those which are incurred to keep thework force satisfied and to prevent or discourage them from leaving theorganization. These include:
1. Cost of personnel management—only that portion of this cost which canbe attributed to the efforts of the personnel department in maintaining goodrelations between management and workers
2. Cost of welfare activities and services, e.g., canteen meals, co-operativestores, educational and transport facilities and housing schemes
3. Cost of medical services
4. Pensions schemes—to provide security and retirement benefits
5. Extra bonus and other perquisites (in excess of those given by other similarconcerns) to discourage their defecting to other undertakings
Replacement costs: These costs include all such losses and wastagesarising because of the inexperienced new labour force replacing the existing oneas well as the cost of recruitment and training of the new workers. These include:
1. Cost of recruitment and selection of new employees
2. Cost of training of new workers
3. Loss of output due to some time gap in recruiting new workers
4. Loss due to inefficiency of new workers
5. Cost of accidents due to lack of experience of new workers
6. Cost of extra scrap and defective work of new workers
7. Cost of tools and machine breakdown due to faulty handling by new workers
Reduction and Control of Labour Turnover
Labour turnover may be reduced by taking action on the basis of avoidable causesgiven earlier. The following steps may be taken in this regard:
Labour Cost Control
NOTES
Self-InstructionalMaterial 59
1. Devising a suitable and satisfactory wage policy
2. Providing working conditions conducive to health and efficiency
3. Impartial and sympathetic attitude of personnel management
4. Introducing financial and non-financial incentive plans
5. Providing promotional opportunities
6. Encouraging labour participation in management
7. Introducing an effective grievance procedure
8. Strengthening the welfare measures
Treatment of Cost of Labour Turnover: The preventive cost of labourturnover should be apportioned to various departments on the basis of number ofworkers in each department.
Regarding the replacement costs, if the replacement is due to the fault of aparticular department, it should be directly charged to that department. If labourturnover is due to the defective management policy, the replacement cost shouldbe apportioned to various departments on the basis of number of workers in eachdepartment.
Check Your Progress
1. What are the three methods of calculating rate in labour turnover?
2. What are the avoidable causes of labour turnover?
3.4 METHODS OF TIME KEEPING AND TIMEBOOKING
The calculation of time-keeping and time booking falls under the perview of time-keeping detartment.
The time-keeping department is an important part of a firm’s system of accountingand control of labour cost. The main function of this department is to accuratelyrecord each worker’s time of arrival and departure in the factory and also the timespent on different jobs or processes. Thus it embraces two functions:
(a) Time keeping, i.e., recording arrival and departure time of workers forattendance purpose and for calculation of wages; and
(b) Time booking, i.e., recording time spent by workers on different jobs orprocesses for determining labour cost of jobs/processes.
The purpose of time recording is to provide basic data for:
(i) Preparation of payroll
(ii) Attendance records, to meet statutory requirements
Labour Cost Control
NOTES
Self-Instructional60 Material
(iii) Computing labour cost of a job or process
(iv) Computing overhead cost of jobs, if based on wages or labour hours
(v) Statistical analysis of labour records for determining productivity and controlof labour cost
Methods of Time Keeping
There are mainly three methods for recording attendance of workers.
1. Attendance register: In this method, attendance of each worker is recordedin the register maintained for this purpose. This register provides sufficient numberof columns for attendance of each worker. Entries in the arrival and departurecolumns may be made by the foreman or the worker himself. If workers areliterate, they should be required to sign against their entries to avoid any disputelater on. Separate attendance register may be maintained in each department if thenumber of workers is large, otherwise one register will serve the purpose.
This method is quite simple and cheap. But it can be used only when thenumber of workers is small. In such cases, generally there is no need for a separatetime keeper as the work is done by the foreman.
2. Token or disc method: Each worker is allotted an identification number issuitably painted or engraved on a round metal token (or disc) with a hole in it. Allsuch tokens are hung in a serial order on a board at the factory gate. As theworker arrives, he removes his token from the board and puts it in a box keptnearby or hangs it on another board which is specially kept for this purpose. Afterthe fixed time, the box or the second board is removed. Those coming late have tohand over their tokens personally at the time office so that exact time of theirarrival can be noted.
The time office records attendance on the basis of tokens in the box. Theabsentees are indicated by the missing tokens. Similar procedure is followed atthe departure time in the evening.
This method is not fool-proof as a worker may try to get his absenteefriends marked present by dropping their tokens in the box.
3. Time-recording clocks: Unlike the first two methods, this is a mechanicalmethod of recording attendance and proves quite useful when the number ofworkers is fairly large.
Each worker is allotted a Clock Card which bears his identification number,name, department, etc. These cards are kept in a rack in a serial order. There areusually two racks—an 'In' rack and an 'Out' rack. On arrival, the worker willpick up his card from the ‘Out’ rack, put it in the slot of the clock, press a buttonand the exact time is printed on the card. After this the card is put in the ‘In’ rack.An inspection of the ‘Out’ racks will reveal absentees.
A similar procedure is followed if workers leave the factory at mid-day forlunch or in the evening at close time. Clocks are adjusted so that late arrivals, early

Labour Cost Control
NOTES
Self-InstructionalMaterial 61
or late leavings, overtime, etc., are automatically printed in red. The time keepermust take care to ensure that no worker places friend’s card in the clock in additionto his own, so as to avoid proxy.
At the end of each week, the cards are sent to the pay office and a fresh setof cards for the ensuing week is placed in the racks.
Advantages: The main advantages of installing time-recording clocks are:
1. The method is quite economical for large concerns as the initial heavy capitalexpenditure in installing clocks is recovered by savings in operating expenses,i.e., economy in wages of time recording staff
2. Chances of disputes are reduced as clocks provide more authentic recordsthan hand-written documents
3. Work in connection with the preparation of wage sheets becomes easierbecause clock cards may be utilized for calculation of wages
The main shortcoming of this method is that heavy initial capital investmentis required which small concerns may find difficult to afford
4. Biometric Time Clock: Biometric time-recording clock is an electronic deviceto record attendance of employees. It is a new generation technique which isreplacing the typical time clock used to track employee attendance. Instead ofemployees punching a time card or logging their attendance by hand, they simplyplace their finger on the Fingerprint Reading Sensor or place their hand into theHand Reader and the rest of the work is done by the machine. This devicecompletely eliminates the time and effort required to monitor the time clock activityat punch in/out times, consequently leading to substantial cost saving and improvedproductivity.
The main features and advantages of biometric system are that it can:
1. Eliminate time card
2. Automatic payroll processing
3. Eliminate buddy-punching
4. Eliminate early punch hours
5. Eliminate unauthorized overtime
6. Eliminate time spent on payroll calculations
7. Accurately report employee time/attendance to payroll and HR
Time Booking
In addition to recording worker’s time of arrival and departure, it is necessary torecord the details of work done by the workers and the time spent on each job orprocess. Recording of worker’s time spent on different jobs is known as timebooking. The objectives of time booking are:
(i) to ensure that the time for which a worker is paid is properly utilized;
(ii) to ascertain the labour cost of work done;

Labour Cost Control
NOTES
Self-Instructional62 Material
(iii) to provide a basis for apportionment of overheads;
(iv) to ascertain the idle time so as to control it.
Methods of Time-booking
The following are the common methods of time booking:
1. Job Ticket: Job tickets or job cards are very commonly used for recordingthe time spent on each job. A card is prepared for each job and is allottedto the worker who takes up that particular job. The worker enters in thiscard the time of starting as well as finishing the job. After finishing the job,the worker submits his work along with his job ticket. He is then issuedanother job ticket for the next job. Thus, only one job ticket is issued to aworker at a time. Such job tickets also serve the purpose of authorizing theworker to carry out the job stated therein.
However, if there is a loss of time between finishing of one job and beginningof the next job, it should be entered on the idle time card so that the recordof his day’s activities may be complete and the time lost is not unduly chargedagainst production. Such idle time card should also show the reasons foridle time, like machine breakdown, waiting for instructions or lack of toolsor materials.
2. Combined Time and Job Card: This card combines the two in one—theclock card and job card, i.e., it records both the attendance time as well astime spent on different jobs. Idle time is automatically revealed as thedifference between attendance time and work time.
3. Daily Time Sheet: Each worker is daily issued a time sheet in which thetime spent on each job during the day is recorded. This sheet must becompleted on the same day and handed over to the foreman for signature.
The main drawback of this method is that it needs a lot of paperwork asconsiderable amount of time will be taken in preparing time sheets and inconsolidating these records for purposes of ascertaining labour cost.However, it is suitable where the workers have to frequently change theirjobs in a day, e.g., maintenance workers.
4. Weekly Time Sheet: Weekly time sheets record almost the sameinformation as the daily time sheet. The main difference is that instead ofrecording the work done for a day only, record of work carried out isentered on a weekly basis. Thus, weekly time sheets need less paperworkas compared to daily time sheets. This method proves useful where thejobs are big and their number is small, e.g., building and construction workand interior decoration.
The entries in the weekly time sheets may not be accurate as some workersmay make entries for two/three days together at one sitting and in the processmay forget time spent on certain jobs.
Labour Cost Control
NOTES
Self-InstructionalMaterial 63
5. Piece Work Card: This card is allotted to a worker who is paid on piecebasis. This card may be made either for each individual job or for recordingthe work done on several jobs. If group system of piece work is in vogue,the card may be allotted to each group of workers.
Though piece rate workers are paid on the basis of number of units producedand not on the basis of time taken, recording their time spent on different jobs isessential, particularly where overheads are absorbed on the basis of labour hours.Moreover, it ensures that piece workers do not cause any interruption in productionby their late arrival or early departure.
Check Your Progress
3. State the main function of the time-keeping department.
4. What is the main drawback of the daily time sheet?
3.5 IDLE TIME AND OVERTIME
The calculation of idle and over time falls under the purview of payroll department.
Idle time represents time lost by workers who are paid on time basis. Whenworkers are paid on time basis, some difference between the time for which theyare paid and that which they actually spend on production is bound to arise. Thisdifference is known as idle time. Idle time is defined as ‘the difference between thetime for which employees are paid and the employees’ time booked against thecost object.’ It represents the time for which they are paid but no production isobtained. For example, time lost between factory gate and the department, timewhen production is interrupted by machine maintenance, allowable time-offs suchas rest intervals, tea breaks, etc.
Causes
Idle time may occur owing to productive, administrative or economic causes.
1. Productive causes: The productive causes are those which result in lossof production. These include:
(a) Idle time due to machine breakdown
(b) Power failures
(c) Waiting for tools and/or raw materials
(d) Waiting for work
(e) Waiting for instructions
Idle time due to productive causes is usually controllable by proper planning,strict supervision and proper maintenance of plant and machinery.
2. Administrative causes: Idle time is sometimes caused by administrativedecisions. Thus, when there is surplus capacity of plant and machinery,

Labour Cost Control
NOTES
Self-Instructional64 Material
which the management decides not to utilize, there may be some idle timedue to administrative decisions. This usually happens during depressionswhen some of the machines have got to work below normal capacity andthe regular workers are paid full amount of wages. This is because themanagement does not want to discharge trained workers temporarily. Suchidle time arises out of abnormal situations and is generally not controllable.
3. Economic causes: Idle time may also be caused by fall in the demand ofproducts, say due to severe competition, seasonal nature of certain industrieslike woollen goods, ice-cream, etc., where production cannot be evenlydistributed throughout the year. In such cases, it is not possible to get rid ofworkers during slack season. Such surplus labour force is usually utilizedfor doing some other jobs and if such complementary jobs cannot be found,there will be some idle time which is beyond control.
Treatment of Idle Time
From the point of view of treatment in cost accounts, idle time is classified asnormal and abnormal.
Normal idle time: This is that wastage of labour time which cannot be avoidedand has to be borne by the employer. For example:
(a) The time which elapses between the completion of one job and thecommencement of the next.
(b) The time taken in going from the factory gate to the department in which theworker is engaged.
(c) Personal needs, tea breaks, rest intervals, etc.
(d) Time spent in setting machines, etc.
The cost of normal idle time may be treated in one of the following two ways:
(i) As overhead cost it may be charged to factory overheads. For this purpose,idle time is allotted a separate standing order number. This helps in its effectivecontrol.
(ii) As direct wages The wage rate may be inflated to make allowance fornormal loss of labour time. Thus, if a worker’s production time is only 7hours during an 8 hours day and his hourly rate of pay is 20, the inflatedwage rate will be:
× 20 = 22.86 per hour..
The second method is not considered very desirable as the cost of idle timeshould be treated separately instead of being absorbed as a part of directlabour cost. In this way, it can prove more helpful for the purpose ofcontrolling and reducing it to the minimum.

Labour Cost Control
NOTES
Self-InstructionalMaterial 65
Abnormal idle time: This is that idle time which arises due to reasons in no wayconnected with the usual routine of manufacture and for which employer must pay.For example:
(a) Time lost due to breakdown of machinery
(b) Strikes and lockouts
(c) Time lost in waiting for tools and/or raw materials
(d) Accidents, etc.
Abnormal idle time is attributed to defective planning, inefficiency or badluck. Payment for such idle time is not included in cost and is transferred to CostingProfit and Loss Account.
Control of Idle Time
From control point of view, idle time should be divided into controllable anduncontrollable. Idle time arising due to controllable causes should be properlyanalysed and responsibility should be fixed on appropriate individuals. It is advisableto prepare an Idle Time Card showing the analysis of idle time so that action maybe taken, where necessary.
The following steps may be taken to control idle time:
(a) Production should be properly planned so that imbalances in productionare avoided or reduced.
(b) Repairs and maintenance of plant and machinery should be regularlyundertaken to avoid breakdown.
(c) Raw materials, tools and instructions should reach the worker well in timeso that no time is wasted in waiting for them.
(d) Supervision should be tightened.
Overtime
Overtime occurs when a worker works beyond normal working hours. The normalworking hours are laid down in the Factories Act. Accordingly, any worker workingfor more than 9 hours per day or more than 48 hours per week is entitled toovertime payment. The Factories Act also provides for payment of overtime wagesat double the normal rates of wages. Overtime is defined ‘as the time spentbeyond normal working hours, which is usually paid at higher rate than thenormal time rate.’ The extra amount beyond normal wages and salaries is calledovertime premium. The overtime work is, therefore, a costly affair and should beavoided as far as possible due to the following disadvantages attached to it.
Disadvantages of Overtime
(a) It leads to excessive labour cost.
(b) During overtime hours, labour productivity is decreased because ofdiminishing labour efficiency.
Labour Cost Control
NOTES
Self-Instructional66 Material
(c) It puts an extra strain on plant and machinery.
(d) It has a bad effect on the health of workers.
(e) Certain overheads, like lighting cost, increase because of work in the evening.
(f) Workers may develop a tendency to work in overtime and take overtimewages as a part of their normal earnings.
(g) If overtime work is not properly distributed among the workers, it may leadto discontent.
Treatment of Overtime
Payment for overtime consists of two elements:
(a) Normal amount of wages, salaries, etc.
(b) Additional amount expended on overtime work, i.e., overtime premium.This is over and above the normal amount of wages and salaries.
The normal amount of wages is charged to the cost unit or production orderon which the worker is working. The difficulty lies in the treatment of overtimepremium. This overtime premium is charged differently, under differentcircumstances, as follows:
1. When overtime is job specific: When overtime is spent on a specific jobat the request of a customer due to urgency of work and the customeragrees to the entire charge of overtime premium, it should be charged to thejob or work order concerned.
2. When overtime is due to general pressure: When a business receivesmore orders than it can cope with in the normal working hours and there isgeneral pressure of work, it may be treated by one of the following twomethods:
(i) Treat overtime premium as direct labour cost by inflating the wagerate and charging to different jobs at the inflated/average rate.
(ii) Alternatively, it may be treated as indirect wages and included inoverheads.
3. When overtime is due to abnormal reasons: Overtime arising due toabnormal factors, like accident, power failure, fire and machine breakdown,or due to factors like defective planning or faulty management, it should notbe included in the cost of products and it should be charged to costingProfit and Loss Account.
Control of Overtime
In order to keep the overtime premium to the minimum, proper control must beexercised on it. The following steps should be taken for this purpose:
(a) All overtime work should be duly authorized by the Works Manager.

Labour Cost Control
NOTES
Self-InstructionalMaterial 67
(b) Overtime cost should be separately recorded for each department for properplanning in future.
(c) Total overtime premium should be regularly reported to the Works Manager.
(d) When overtime becomes a permanent feature, say, due to shortage of plantcapacity, steps may be taken to install additional plant and machinery orintroduce an additional shift to cope with additional work.
Check Your Progress
5. How is payment for abnormal idle time dealt with?
6. What are the two elements of payment for overtime?
3.6 SYSTEMS OF WAGE PAYMENT
Labour remuneration is a concept concerned with the cost accounting department.
The term ‘remuneration’ is used to cover the total monetary earnings ofemployees. It includes wages according to time or piece basis and other financialincentives.
The efficiency in production can be increased by using improved equipment,by more effective utilization of plant and by adoption of better methods ofproduction, but the most important contribution must come from labour.Accordingly, the methods of remuneration of labour should be so designed as toencourage workers to do their best. Methods of remuneration which allow highwages to be paid have the effect of increasing labour cost but may also result inincreased production and productivity, thereby reducing the labour cost per unit.On the other hand, low wages generally result in high labour cost per unit due tolower productivity, high rate of labour turnover, etc.
Requisites of a Satisfactory System of Labour Remuneration
Before deciding on a particular system of labour remuneration, the following factorsshould be taken into account:
1. The system should be such as will produce the best quality and quantity ofwork.
2. It should be satisfactory from the point of view of both employer andemployee and reward should be related to effort.
3. The scheme should be clearly defined and intelligible to workers. The workersshould be able to calculate wages on their own. If the workers do notunderstand the system, they may view it with suspicion.
4. It should guarantee a minimum living wage to each worker, irrespective ofhis efficiency.
5. No maximum limit should be placed on the amount of individual earnings.
Labour Cost Control
NOTES
Self-Instructional68 Material
6. The earnings of the workers should not be affected by matters beyond theircontrol. They should not, for example, be penalized for production lossesdue to power failure, machine breakdown, etc., for which they are notresponsible.
7. It should reduce labour turnover and labour absenteeism.
8. The system should be flexible so that changes may be introduced as andwhen necessary.
9. The system should be capable of operation without excessive clerical work.Those methods should be avoided which demand much detailed recordingof time, quantity of output, etc.
10. If possible, the system adopted should be one which is in vogue in thatparticular industry or in that particular locality.
Methods of remuneration
There are two basic methods of labour remuneration:
(a) Time Rate System
(b) Piece Rate System
In addition, there are a number of incentive plans to induce workers towork hard so as to produce more and earn more.
3.6.1 Conventional Methods
You will first study the conventional methods.
Time Rate System
Under time rate system, workers are paid according to the time for which theywork. Payment may be on hourly basis, daily basis or monthly basis. In this system,no consideration is given to the quantity and quality of work done. When paymentis made on hourly basis, total wages payable are calculated as follows:
Wages = No. of hours worked × Rate per hour
For example, if a worker is paid at the rate of 25 per hour, his wages fora day of 8 hours will be: 8 hours × 25 = 200.
Though this is the oldest system of wage payment, it is still commonly usedthese days.
Suitability: Time wage system is suitable for the following type of situations:
(i) Where quality of work is more important than quantity, e.g., high classtailoring.
(ii) Where output cannot be measured in quantitative terms, e.g., in the case ofindirect workers, like watchman, cleaners and sweepers

Labour Cost Control
NOTES
Self-InstructionalMaterial 69
(iii) Where output is beyond the control of the worker, e.g., in process industriesthe flow of work is regulated by the speed of conveyor belt or where thework of a worker is dependent on the work of other workers.
(iv) Where work is being done on a small scale so that close supervision ispossible.
(v) Where the worker is a learner or an apprentice.
Advantages: The main advantages of time rate system are:
1. Simplicity: The system is simple and calculation of wages is easilyunderstood by the workers.
2. Security to workers: Workers are assured of a certain amount of wagespayable even if there is stoppage of work due to power failure, machinebreakdown, etc. This gives a sense of security to workers.
3. Quality of work: As this method does not give weight to the quantity ofwork done, workers can concentrate on the quality of goods produced.Thus, the quality of work under this method is better.
4. Accepted by trade unions: Trade unions mostly favour this method becauseit treats all workers alike and no distinction is made between efficient andinefficient workers.
5. Economical: Under this method, no detailed records are required to bemaintained regarding the work done by workers. This results in saving ofclerical costs. Moreover, workers avoid over-speeding and cause lessdamage to plant and machinery and also materials. This also results ineconomy.
Disadvantages: The main disadvantages are:
1. No incentive: It offers no positive inducement to workers to improveperformance as it does not distinguish between efficient and inefficientworkers.
2. Low quantity: When workers are paid on time basis, they tend to be slowin work. This results in lower production quantity.
3. Extra supervision costs: Under this method, extra supervision is neededso that workers do not waste time. Appointment of additional supervisorsincreases cost.
4. Costing difficulties: From costing point of view, it creates difficulties inthe calculation of labour cost per unit because the output is constantly,fluctuating.
5. Idle time: Workers waste a lot of time, resulting in increase in idle time.

Labour Cost Control
NOTES
Self-Instructional70 Material
Piece Rate System
Wages under this system are paid according to the quantity of work done. A rateis fixed per unit of production and wages are calculated by the following formula:
Wages = Rate per unit × No. of units produced
For instance, if rate per unit is 17 and during a day a worker has completed10 units, then his wages will be 17 × 10 units = 170.
This method does not give any consideration to the time taken by the workerin completing the work. Only quantity of work is taken into account for calculatingwages.
Suitability of piece rate system: Conditions under which piece ratesmay be usefully employed are:
(a) Where production is standardized and repetitive in nature
(b) When the aim is continuous maximum production
(c) Where the output of workers can be measured
(d) Where workers continue at the same job for long periods
(e) Where the standard time required to complete a job can be measuredaccurately
Advantages: Piece rate system has the following advantages:
1. Incentive to efficient workers: As remuneration is in proportion to theworker’s effort, the method provides a strong incentive to work more.
2. Increase in production: Each worker tries his best to produce more toearn higher wages. This results in increase in production.
3. Lower cost: On account of increase in production, fixed cost per unit isreduced resulting in higher profit.
4. Equitable: This system is more equitable than time rate system becausewages are paid according to the efficiency of each worker.
5. Decrease in the need for supervision: Strict supervision is not necessarybecause the workers are themselves interested in maximizing their earningsthrough the maximization of output.
6. Simplifies costing: As wages are paid at a rate per unit, this methodsimplifies cost ascertainment because labour cost per unit is known inadvance.
7. Simple and easy: This method is simple and is easily understood by theworkers.
Disadvantages: Piece rate system suffers from the following limitations:
1. Poor quality of work: This method lays too much emphasis on quantity ofproduction and ignores quality of work. In order to maximize their wages,
Labour Cost Control
NOTES
Self-InstructionalMaterial 71
workers may try to produce more and more without caring for the qualityof production.
2. No security of wages: This system does not guarantee a minimum wageto a worker. If a worker is not able to complete his day’s work, for anyreason, he is paid less wages. Thus, earnings of workers are uncertain.
3. Misuse of materials and equipment: In the greed to produce more,workers may cause wastage of materials and damage to plant and machinery.
4. Injurious to health of workers: In an effort to earn more wages, workerstry to work excessively and with speed. This proves injurious to the healthof workers.
5. Opposed by trade unions: Piece rate system is generally opposed bytrade unions because it creates inequality in the wages of workers. Slowand inefficient workers feel jealous of the higher wages of their fellow workers.
6. Difficulties in fixing piece rate: Fixing equitable piece rate is quite adifficult task and may require considerable amount of work in the form oftime studies.
7. Unsuitable in certain cases: This method does not suit where work is ofartistic and refined natures.
3.6.2 Incentive Wage Plans
Both time rate system and piece rate system, discussed above, have their meritsand demerits. Incentive plans attempt to combine the good points of both thesystems.
The primary purpose of an incentive plan is to induce a worker to producemore to earn a higher wage. Naturally, producing more in the same period of timeshould result in higher pay for the worker. Because of greater number of unitsproduced, it should also result in a lower cost per unit for fixed factory cost andalso for labour cost.
Principles of a Good Incentive Scheme
A good incentive scheme should have the following features:
1. The scheme should be simple and easily understandable by workers so thata worker should be able to calculate his own wage easily.
2. The scheme should be fair to both employer and employee. It should linkreward with effort.
3. The cost of operating the scheme should be reasonably low.
4. The standard of performance should be scientifically set and should be withinthe reasonable reach of an average worker.
5. No upper limit should be put on the earnings of workers.
6. The scheme should have the approval of workers and the union.
Labour Cost Control
NOTES
Self-Instructional72 Material
7. No worker should suffer a deduction of earnings for factors beyond hiscontrol such as machine breakdown, power failure, etc.
8. The scheme should provide a satisfactory system of supervision andproduction control.
9. The scheme should be conducive to the setting up of standard costs andbudgetary control.
10. Standards once set should not be changed unless there is a change in themethod of production or other factors.
11. The scheme must be relatively permanent and should not be frequentlychanged.
12. Indirect workers should also be included under the incentive scheme.
13. Workers should be properly educated about the scheme and motivated toattain high standards.
A. Types of Individual Plans
1. Halsey Premium Plan
This plan was introduced by F A Halsey in 1891. It is a simple combination of timeand piece rate systems. The main features of this plan are as follows:
(a) Workers are paid at a rate per hour for the actual time taken by them.
(b) A standard time is set for each piece of work, job or operation.
(c) If a worker takes standard time or more than the standard time to completehis work, he is paid wages for the actual time taken by him at the time rate.In other words, time wages are guaranteed.
(d) If a worker takes less than the standard time, he is paid a bonus equal to50% of the time saved at the time rate fixed. Thus, under this system, totalearnings of a worker are equal to wages for the actual time taken by himplus a bonus.
The formula for calculating bonus and total earnings is as follows:
Bonus = 50% of [Time saved × Time rate]
Total earnings = Time rate × Time taken + 50% of [Time saved × Time rate]
Advantages of Halsey Plan
1. It is easy to understand.
2. It guarantees a minimum time wage to all the workers. Thus, slow andrelatively inefficient workers have nothing to fear from it.
3. The benefit resulting from savings in time is equally divided between workerand employer.
4. Bonus is separately calculated for each job. Time saved by a worker onone job is not adjusted against excess time taken by him on another job.

Labour Cost Control
NOTES
Self-InstructionalMaterial 73
Disadvantages of Halsey Plan
1. Workers do not like the idea of sharing the benefit of time saved by them,with the employer.
2. It does not provide the employer with full protection against high rate setting.
3. Extra efficiency of a worker is not fully rewarded.
2. Halsey Weir Plan
This method is precisely the same as Halsey Plan except that in Halsey WeirPlan the bonus is equal to 30% of the time saved.
3. Rowan Plan
This plan is also similar to Halsey Plan except in the calculation of bonus. Themain features of Rowan Plan are as follows:
(a) Wages are paid on time basis for the actual time worked by the workers.
(b) A standard time is determined for each piece of work or job.
(c) If a worker completes his work in standard time or in more than the standardtime, he is paid wages for the time actually taken by him.
(d) If a worker completes his work in less than the standard time, he is entitledto a bonus.
(e) Bonus is that proportion of wages of actual time taken which the time savedbears to the standard time. Its formula is:
Bonus = × Time taken × Time rate
Earnings = (Time taken × Time rate) + Bonus
Advantages of Rowan Plan
1. Like Halsey plan, it provides guaranteed minimum wages to workers.
2. It protects the employer against loose rate setting.
3. It pays a higher bonus than that under the Halsey plan, upto 50 per cent ofthe standard time saved.
4. The worker is not induced to rush through the work because if time savedis more than 50 per cent of the standard time, the bonus increases at adecreasing rate.
5. It provides good incentive for comparatively slow workers and beginners.
Disadvantages of Rowan Plan
1. Calculation of bonus is complicated and may not be easily understood byworkers who may suspect the employer's motives.
2. In case of extra efficient workers, bonus is less than under Halsey Plan.This is so when the time saved is more than the time taken.
Labour Cost Control
NOTES
Self-Instructional74 Material
4. Taylor’s Differential Piece Rate System
This system was introduced by F W Taylor, the father of scientific management.The main features of this incentive plan are as follows:
(a) Day wages are not guaranteed, i.e., it does not assure any minimum amountof wages to workers.
(b) A standard time for each job is set very carefully after time and motionstudies.
(c) Two piece rates are set for each job—the lower rate and the higher rate.The lower piece rate is payable where a worker takes a longer time thanthe standard time to complete the work. Higher rate is payable when aworker completes the work within the standard time. In other words, lowerpiece rate is payable to inefficient workers and higher piece rate is payableto efficient workers. Usually, these rates are 83 per cent of the piece workrate for inefficient workers and 175 per cent of the piece work rate forefficient workers.
Advantages and Disadvantages of Taylor’s Plan: This plan provides strongincentive to efficient workers. The calculation of wages is also not difficult and canbe understood by the workers. However, the system suffers from the followingshortcomings:
(a) It severely penalizes the workers who produce slightly less than the standardoutput.
(b) It does not guarantee minimum wages.
(c) It makes wide discrimination between efficient and inefficient workers andthus creates rivalry. This may weaken their unity.
5. Merrick’s Differential Piece Rate System (Multiple Piece Rate System)
This is a modification of Taylor’s plan. While Taylor prescribed two rates,Merrick’s plan lays down three rates. The lowest rate is for the beginners, themiddle rate is for the developing workers and the highest rate is for the highlyefficient workers. Efficiency of the workers is determined in terms of percentages.Thus, the rates of remuneration are:
Level of efficiency Piece rate
Upto 83% Ordinary piece rate
83% to 100% 110% of ordinary piece rate
Above 100% 120% of ordinary piece rate
Like Taylor’s plan, this method also does not guarantee minimum wages.The general criticism levelled against Taylor’s plan also applies to it except that itlessens the punitive character of Taylor’s plan.
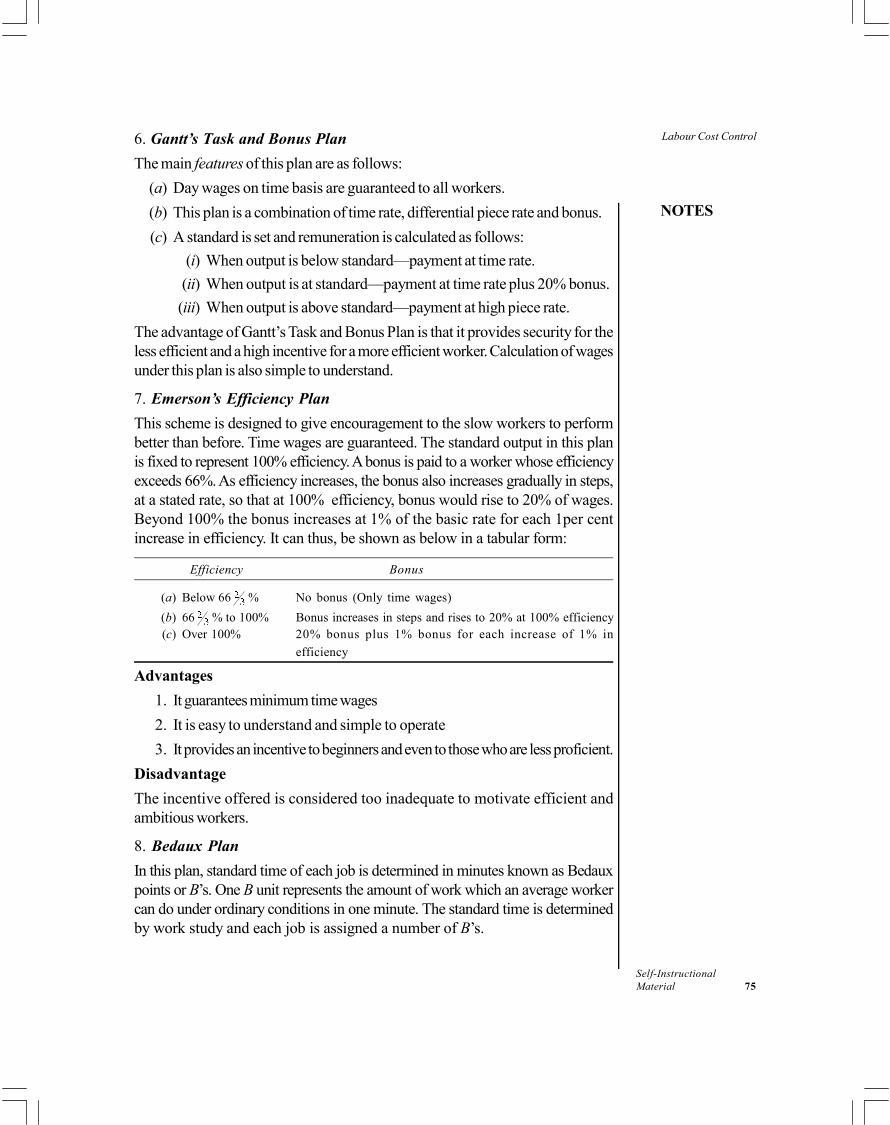
Labour Cost Control
NOTES
Self-InstructionalMaterial 75
6. Gantt’s Task and Bonus Plan
The main features of this plan are as follows:
(a) Day wages on time basis are guaranteed to all workers.
(b) This plan is a combination of time rate, differential piece rate and bonus.
(c) A standard is set and remuneration is calculated as follows:
(i) When output is below standard—payment at time rate.
(ii) When output is at standard—payment at time rate plus 20% bonus.
(iii) When output is above standard—payment at high piece rate.
The advantage of Gantt’s Task and Bonus Plan is that it provides security for theless efficient and a high incentive for a more efficient worker. Calculation of wagesunder this plan is also simple to understand.
7. Emerson’s Efficiency Plan
This scheme is designed to give encouragement to the slow workers to performbetter than before. Time wages are guaranteed. The standard output in this planis fixed to represent 100% efficiency. A bonus is paid to a worker whose efficiencyexceeds 66%. As efficiency increases, the bonus also increases gradually in steps,at a stated rate, so that at 100% efficiency, bonus would rise to 20% of wages.Beyond 100% the bonus increases at 1% of the basic rate for each 1per centincrease in efficiency. It can thus, be shown as below in a tabular form:
Efficiency Bonus
(a) Below 66 % No bonus (Only time wages)
(b) 66 % to 100% Bonus increases in steps and rises to 20% at 100% efficiency(c) Over 100% 20% bonus plus 1% bonus for each increase of 1% in
efficiency
Advantages
1. It guarantees minimum time wages
2. It is easy to understand and simple to operate
3. It provides an incentive to beginners and even to those who are less proficient.
Disadvantage
The incentive offered is considered too inadequate to motivate efficient andambitious workers.
8. Bedaux Plan
In this plan, standard time of each job is determined in minutes known as Bedauxpoints or B’s. One B unit represents the amount of work which an average workercan do under ordinary conditions in one minute. The standard time is determinedby work study and each job is assigned a number of B’s.

Labour Cost Control
NOTES
Self-Instructional76 Material
Under this system, the worker receives his daily or hourly rate plus 75 percent of the points saved, multiplied by one sixtieth of his hourly rate. The remainingbalance of 25 per cent is paid to supervisors and indirect workers.
Thus:
Bonus =
Earnings = (Hours worked × Hourly rate) + Bonus
Time wages are thus guaranteed to those who are not able to save anypoints. It may be noted that the Bedaux Plan is not different from the Halsey Planexcept that bonus is 75 per cent of the time saved instead of 50 per cent. Thesystem is particularly suitable where output can be measured with greater accuracyand conditions are standardized. To make the system a success, very accuratetime study is required for each operation to set standard time in terms of standardminutes.
Advantages
1. It guarantees minimum wages to all workers.
2. Output of workers is measured in terms of common units known as B’s.This makes easier the task of recording production of workers andcomparing it with standard. Suitable data for production control becomeseasily available.
3. As the benefit of 25 per cent of time saved is given to supervisors andindirect workers, Bedaux Plan may be extended to the department as awhole, including indirect workers.
Disadvantages
1. Detailed calculation of ‘B’ units for a large number of jobs involves enormousamount of clerical cost. This is because accurate time study is required forevery operation. This system is thus comparatively costly.
2. This system is generally not preferred by workers because they do not getthe full benefit of the time saved by them.
B. Group Bonus Plans
In the schemes discussed so far, the bonus to be paid has been calculated on thebasis of individual worker’s performance. But there are certain jobs or operationswhich are required to be done collectively, by a group of workers. In continuousproduction, for example, work flows in a sequence or in assembly work fortelevisions, radios, scooters, etc., a team of workers is engaged on variousoperations. As such, it becomes necessary to introduce bonus schemes for collectiveefficiency of the group as a whole. The intention is to create a collective interest inthe work. The total bonus determined is distributed among the members of thegroup on an equitable basis. The following bases of distribution are commonlyused:
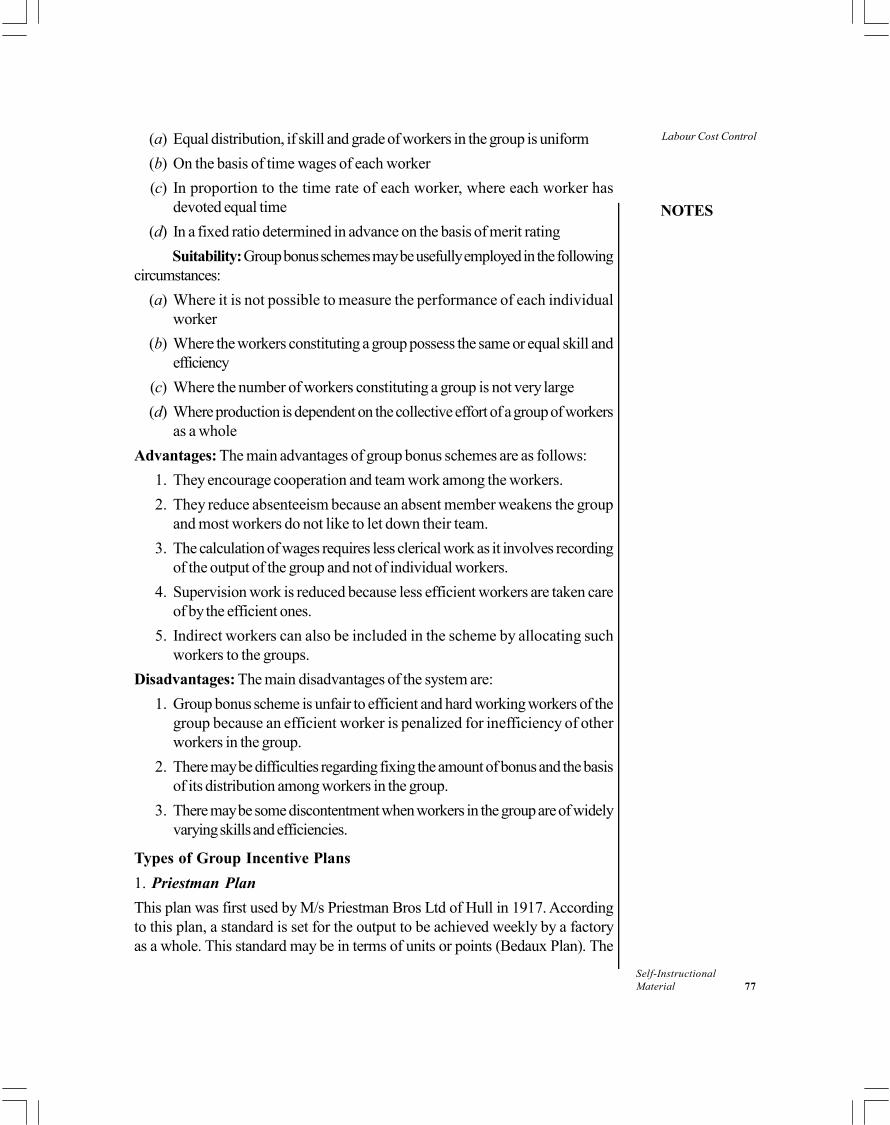
Labour Cost Control
NOTES
Self-InstructionalMaterial 77
(a) Equal distribution, if skill and grade of workers in the group is uniform
(b) On the basis of time wages of each worker
(c) In proportion to the time rate of each worker, where each worker hasdevoted equal time
(d) In a fixed ratio determined in advance on the basis of merit rating
Suitability: Group bonus schemes may be usefully employed in the followingcircumstances:
(a) Where it is not possible to measure the performance of each individualworker
(b) Where the workers constituting a group possess the same or equal skill andefficiency
(c) Where the number of workers constituting a group is not very large
(d) Where production is dependent on the collective effort of a group of workersas a whole
Advantages: The main advantages of group bonus schemes are as follows:
1. They encourage cooperation and team work among the workers.
2. They reduce absenteeism because an absent member weakens the groupand most workers do not like to let down their team.
3. The calculation of wages requires less clerical work as it involves recordingof the output of the group and not of individual workers.
4. Supervision work is reduced because less efficient workers are taken careof by the efficient ones.
5. Indirect workers can also be included in the scheme by allocating suchworkers to the groups.
Disadvantages: The main disadvantages of the system are:
1. Group bonus scheme is unfair to efficient and hard working workers of thegroup because an efficient worker is penalized for inefficiency of otherworkers in the group.
2. There may be difficulties regarding fixing the amount of bonus and the basisof its distribution among workers in the group.
3. There may be some discontentment when workers in the group are of widelyvarying skills and efficiencies.
Types of Group Incentive Plans
1. Priestman Plan
This plan was first used by M/s Priestman Bros Ltd of Hull in 1917. Accordingto this plan, a standard is set for the output to be achieved weekly by a factoryas a whole. This standard may be in terms of units or points (Bedaux Plan). The
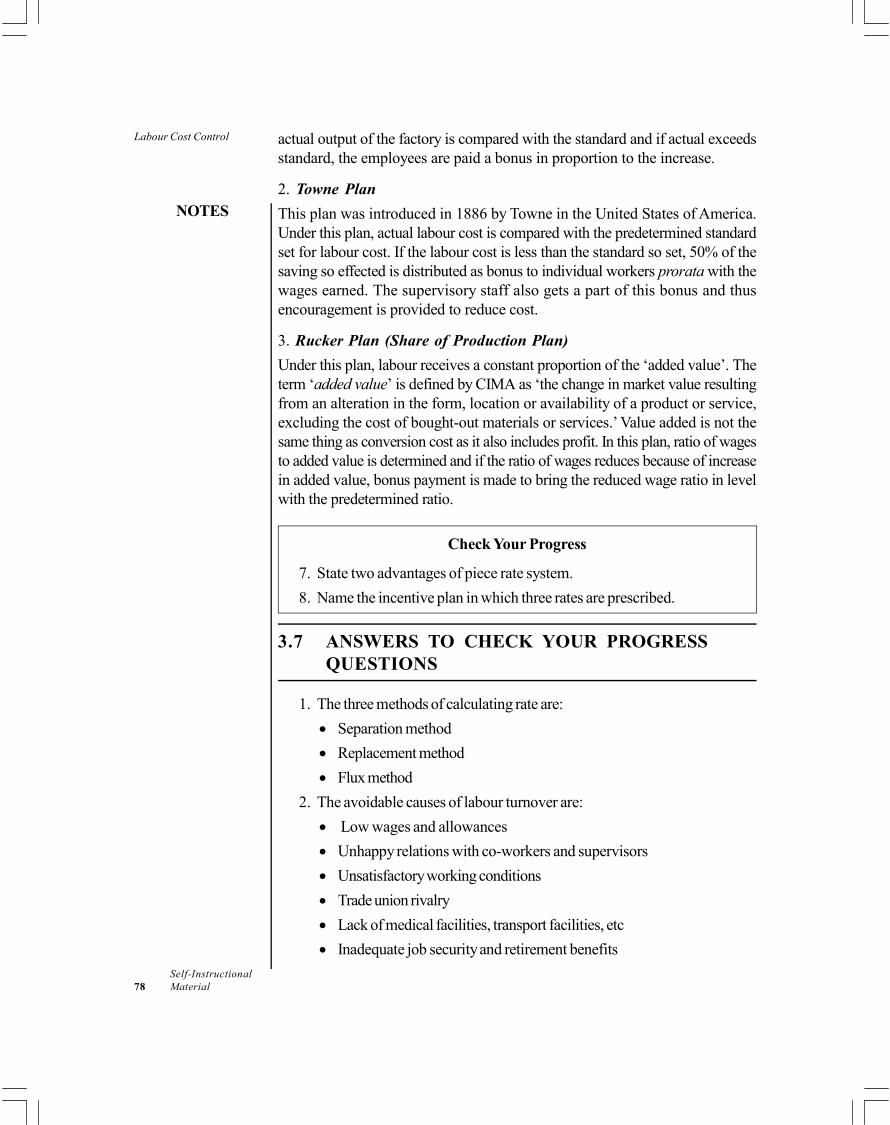
Labour Cost Control
NOTES
Self-Instructional78 Material
actual output of the factory is compared with the standard and if actual exceedsstandard, the employees are paid a bonus in proportion to the increase.
2. Towne Plan
This plan was introduced in 1886 by Towne in the United States of America.Under this plan, actual labour cost is compared with the predetermined standardset for labour cost. If the labour cost is less than the standard so set, 50% of thesaving so effected is distributed as bonus to individual workers prorata with thewages earned. The supervisory staff also gets a part of this bonus and thusencouragement is provided to reduce cost.
3. Rucker Plan (Share of Production Plan)
Under this plan, labour receives a constant proportion of the ‘added value’. Theterm ‘added value’ is defined by CIMA as ‘the change in market value resultingfrom an alteration in the form, location or availability of a product or service,excluding the cost of bought-out materials or services.’ Value added is not thesame thing as conversion cost as it also includes profit. In this plan, ratio of wagesto added value is determined and if the ratio of wages reduces because of increasein added value, bonus payment is made to bring the reduced wage ratio in levelwith the predetermined ratio.
Check Your Progress
7. State two advantages of piece rate system.
8. Name the incentive plan in which three rates are prescribed.
3.7 ANSWERS TO CHECK YOUR PROGRESSQUESTIONS
1. The three methods of calculating rate are:
Separation method
Replacement method
Flux method
2. The avoidable causes of labour turnover are:
Low wages and allowances
Unhappy relations with co-workers and supervisors
Unsatisfactory working conditions
Trade union rivalry
Lack of medical facilities, transport facilities, etc
Inadequate job security and retirement benefits
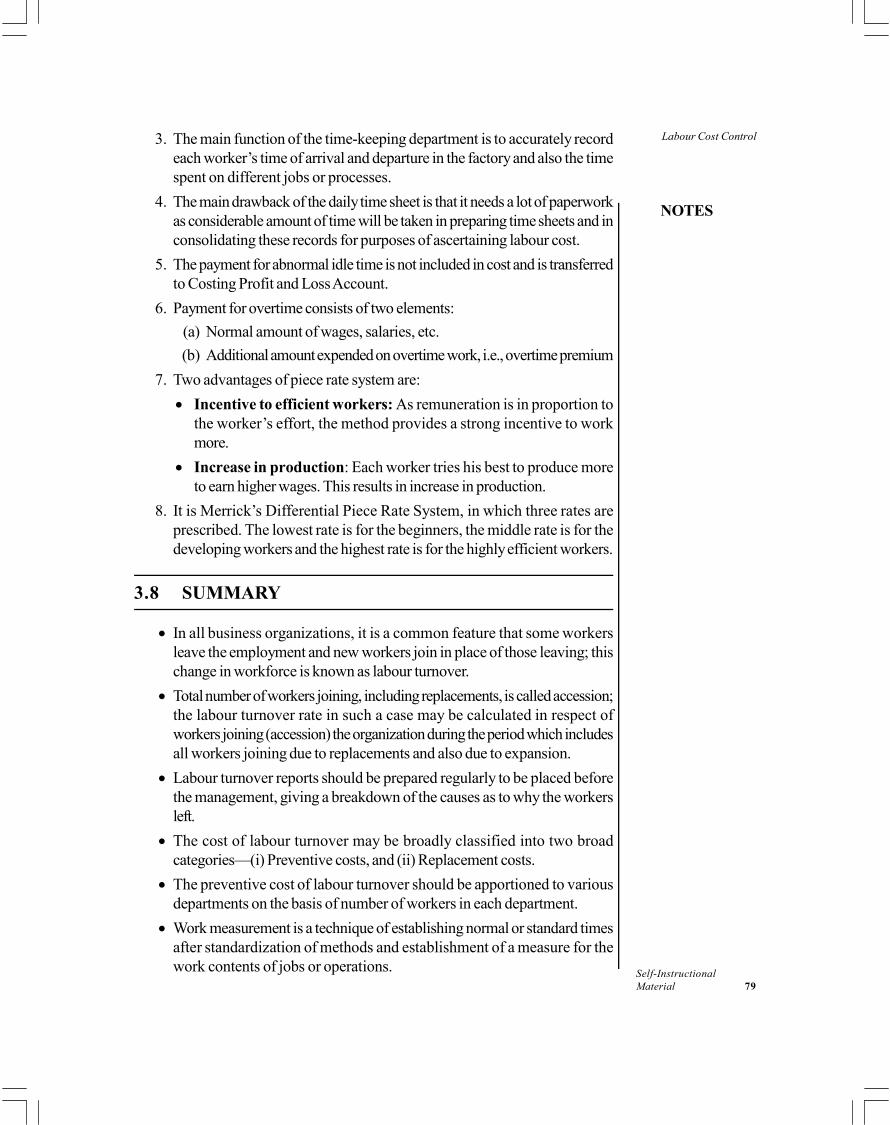
Labour Cost Control
NOTES
Self-InstructionalMaterial 79
3. The main function of the time-keeping department is to accurately recordeach worker’s time of arrival and departure in the factory and also the timespent on different jobs or processes.
4. The main drawback of the daily time sheet is that it needs a lot of paperworkas considerable amount of time will be taken in preparing time sheets and inconsolidating these records for purposes of ascertaining labour cost.
5. The payment for abnormal idle time is not included in cost and is transferredto Costing Profit and Loss Account.
6. Payment for overtime consists of two elements:
(a) Normal amount of wages, salaries, etc.
(b) Additional amount expended on overtime work, i.e., overtime premium
7. Two advantages of piece rate system are:
Incentive to efficient workers: As remuneration is in proportion tothe worker’s effort, the method provides a strong incentive to workmore.
Increase in production: Each worker tries his best to produce moreto earn higher wages. This results in increase in production.
8. It is Merrick’s Differential Piece Rate System, in which three rates areprescribed. The lowest rate is for the beginners, the middle rate is for thedeveloping workers and the highest rate is for the highly efficient workers.
3.8 SUMMARY
In all business organizations, it is a common feature that some workersleave the employment and new workers join in place of those leaving; thischange in workforce is known as labour turnover.
Total number of workers joining, including replacements, is called accession;the labour turnover rate in such a case may be calculated in respect ofworkers joining (accession) the organization during the period which includesall workers joining due to replacements and also due to expansion.
Labour turnover reports should be prepared regularly to be placed beforethe management, giving a breakdown of the causes as to why the workersleft.
The cost of labour turnover may be broadly classified into two broadcategories—(i) Preventive costs, and (ii) Replacement costs.
The preventive cost of labour turnover should be apportioned to variousdepartments on the basis of number of workers in each department.
Work measurement is a technique of establishing normal or standard timesafter standardization of methods and establishment of a measure for thework contents of jobs or operations.
Labour Cost Control
NOTES
Self-Instructional80 Material
Job analysis is the process of determining the tasks which comprise the joband the skills, knowledge, abilities and responsibilities required of the workerfor its successful performance.
The time-keeping department is an important part of a firm’s system ofaccounting and control of labour cost; the main function is to accuratelyrecord each worker’s time of arrival and departure in the factory and alsothe time spent on different jobs or processes.
There are mainly three methods for recording attendance of workers: (i)attendance register, (ii) token or disc method, and (iii) time recording clocks.
The appointment of casual workers is a very common source of fraud in thepayment of wages; it is, therefore, very important to have a proper controlover their appointments, their time of work and payment of their wages.
Idle time due to productive causes is usually controllable by proper planning,strict supervision and proper maintenance of plant and machinery.
According to the Factories Act, any worker working for more than 9 hoursper day or more than 48 hours per week is entitled to overtime payment;the Act also provides for payment of overtime wages at double the normalrates of wages.
The cost of paid leave cannot be charged to any work order or cost unitsince no work is done during this period. It is, therefore, treated as indirectlabour cost and charged to overheads.
The analysis of labour cost is made on a document known as Wages AnalysisSheet or Wages Abstract.
Methods of remuneration which allow high wages to be paid have the effectof increasing labour cost but may also result in increased production andproductivity, thereby reducing the labour cost per unit.
Under time rate system, workers are paid according to the time for whichthey work; and payment may be on hourly basis, daily basis or monthlybasis.
Under Halsey Plan and Rowan Plan, earnings per hour of workers keep onincreasing.
To make the Bedaux plan system a success, very accurate time study isrequired for each operation to set standard time in terms of standard minutes.
In Rucker plan, ratio of wages to added value is determined and if the ratioof wages reduces because of increase in added value, bonus payment ismade to bring the reduced wage ratio in level with the pre-determined ratio.
A co-partnership scheme may be arranged in conjunction with a profit sharingscheme, whereby the bonus to workers is to be retained as an investment inthe company; the investment may be in the form of special shares not carryingvoting rights but entitled to a fixed dividend or in the form of a loan carryinghigher rate of interest.
Labour Cost Control
NOTES
Self-InstructionalMaterial 81
Non-monetary incentives help in attracting better workers, reduce labourturnover and absenteeism, promote better industrial relations, encourageloyalty and keep the workers happy and satisfied.
The three methods of recording attendance of workers include - attendanceregister, token or disc method and time recording clocks.
3.9 KEY WORDS
Flux method: This shows the total change in the composition of labourforce due to separations and replacement of workers.
Idle time: It represents time lost by workers who are paid on time basis.
Preventive costs: These costs are incurred to keep the workforce satisfiedand to prevent or discourage them from leaving the organization.
3.10 SELF ASSESSMENT QUESTIONS ANDEXERCISES
Short Answer Questions
1. How is labour turnover measured?
2. What are the causes of labour turnover?
3. Distinguish between time keeping and time booking.
4. What is the treatment of overtime?
Long Answer Questions
1. Discuss labour turnover due to new recruitment.
2. Describe the effect, costs, reduction and control of labour turnover.
3. From the following information, calculate the labour turnover rate and labourflux rate:
Number of workers at the beginning of the year 3,800
Number of workers at the end of the year 4,200
During the year, 40 workers leave while 160 workers are discharged. 600workers are recruited during the year. Of these, 150 workers are recruitedbecause of leavers and the rest are engaged in accordance with an expansionscheme.
4. Discuss, in detail, the methods of time-booking.
5. Distinguish between time wage system and piece wage system. State theirrelative merits and demerits.

Labour Cost Control
NOTES
Self-Instructional82 Material
6. Examine the concept and treatment of idle time. Explain the followingmethods of wage payment:
Taylor’s Different Piece Rate System
Rowan Scheme
Emerson’s Efficiency Plan
7. Explain the methods and records of time keeping. What are the functions oftime keeping records?
3.11 FURTHER READINGS
Arora, M.N. 2012. A Textbook of Cost and Management Accounting, Tenthedition. New Delhi: Vikas Publishing House.
Arora, M.N. 2010. Cost Accounting: Principles and Practice, Eleventh edition.New Delhi: Vikas Publishing House.
Shillinglow, G. 1982.Managerial Costing Accounting. Homewood: Richard D.Irwin.
Morse, W. J. 1978. Cost Accounting. Massachusetts: Addison-Wesley PublishingCo.
Lal, Jawahar. 2003. Cost Accounting. New Delhi: Tata McGraw Hill.
Overheads
NOTES
Self-InstructionalMaterial 83
UNIT 4 OVERHEADS
Structure
4.0 Introduction4.1 Objectives4.2 Meaning and Types of Overhead Cost
4.2.1 Classifications of Overhead Costs4.2.2 Standing Order Numbers (Codification of Overheads)
4.3 Overheads Distribution4.3.1 Collection of Overheads4.3.2 Allocation and Apportionment Overheats (Production): Main Methods
4.4 Absorption of Overheads (Production): Main Methods4.4.1 Types of Overhead Rates
4.5 Administration, Selling and Distribution Overheads4.6 Under-Absorption and Over-Absorption of Overheads4.7 Answers to Check Your Progress Questions4.8 Summary4.9 Key Words
4.10 Self Assessment Questions and Exercises4.11 Further Readings
4.0 INTRODUCTION
Overhead expenses are all costs on the income statement except for direct labour,direct materials and direct expenses. Overhead costs are usually measured inmonetary terms, but non-monetary overhead is possible in the form of time requiredto accomplish tasks.
As per Harper, overheads ‘are those costs which do not result from theexistence of individual costs units’. Blocker and Weltmer define overhead costs as‘the operating costs of a business enterprise which cannot be traced directly to aparticular unit of output.’
Accounting and control of overhead costs is more complex than that ofother elements of cost, i.e., direct materials and direct labour. This is becauseoverheads by definition, are indirect costs which cannot be conveniently allocatedto cost units. Hence, there arises the knotty problem of apportioning these indirectcosts to cost centres and cost units. In this unit, you will study about the classificationof overheads, the absorption of overhead and its main methods.
4.1 OBJECTIVES
After going through this unit, you will be able to:
Analyse the classification of overhead costs according to functions, elementsand behaviour variability
Overheads
NOTES
Self-Instructional84 Material
Discuss the inclusions of primary and secondary distribution
Describe the process of the absorption of overheads
Explain the methods of overhead absorption
Differentiate between over and under absorption
4.2 MEANING AND TYPES OF OVERHEAD COST
Total cost may be classified into direct cost and indirect cost. The total of all directcosts (i.e., direct material cost, direct labour cost and direct expenses) is knownas Prime cost and the total of all indirect costs (i.e., indirect material cost, indirectlabour cost and indirect expenses) is termed as Overhead cost. Various othernames of overheads are: (a) oncost; (b) supplementary cost; (c) burden; (d) non-productive cost, etc.
Thus, overhead cost is the total of all indirect expenditure. It comprisesthose costs which the cost accountant is either unable or unwilling to allocate toparticular cost units.
Accounting and control of overhead costs is more complex than that ofother elements of cost, i.e., direct materials and direct labour. This is becauseoverheads by definition, are indirect costs which cannot be conveniently allocatedto cost units. Hence, there arises the knotty problem of apportioning these indirectcosts to cost centres and cost units.
4.2.1 Classifications of Overhead Costs
Overhead costs may be classified according to:
1. Functions
2. Elements
3. Behaviour
1. Classification according to Functions
The main groups of overheads on the basis of this classification are as follows:
(a) Production overheads: Also termed as factory overheads, worksoverheads or manufacturing overheads, they are indirect expendituresincurred in connection with production operations. They are the aggregateof factory indirect material cost, indirect wages and indirect expenses. Unlikedirect materials and direct labour, production overheads are an invisiblepart of the finished product. Examples of these overheads are: lubricants,consumable stores, indirect wages, factory power and light, depreciation ofplant and machinery, depreciation of factory building, insurance of plantand factory building, storekeeping expenses, repairs and maintenance.
(b) Administration overheads: These overheads are of general nature andconsist of all costs incurred in the direction, control and administration
Overheads
NOTES
Self-InstructionalMaterial 85
(including secretarial, accounting and financial control) of an undertaking,which are not related directly to production or selling and distribution function.Examples are: general management salaries, audit fees, legal charges, postageand telephone, stationery and printing, office rent and rates, office lightingand salaries of office staff. These overheads are also known as officeoverheads or general overheads.
(c) Selling and distribution overheads: Selling overheads are the cost ofseeking to create and stimulate demand or of securing orders. Examples:advertising, salaries and commission of sales personnel, showroom expenses,travelling expenses, bad debts, catalogues and price lists.
Distribution overheads comprise all expenditures incurred from the timeproduct is completed in the factory till it reaches its destination or customer.It includes packing cost, carriage outward, delivery van expenses,warehousing costs, etc.
Selling overheads and distribution overheads are both related to sales functionand thus are combined into one category of selling and distribution overheads.These are often referred to as ‘after production costs’ because these costsare incurred after production work is over.
2. Element-wise Classification
Under this method, the classification is done according to the nature and sourcesof the expenditure. This method follows logically from the definition of overheadcosts. On this basis, expenses are classified under three main groups given below:
(a) Indirect materials: They are material costs, which cannot be allocatedbut which are to be apportioned to or absorbed by cost centres or costunits. Examples are stationery, coal, lubricants and tools for general use.
(b) Indirect wages: Indirect wages are those which cannot be allocated butwhich are to be apportioned to or absorbed by cost centres or cost units.Examples are wages of sweeper, idle time wages, maintenance and repairwages, foreman’s pay and chowkidar’s pay.
(c) Indirect expenses: Expenses which cannot be allocated but which are tobe apportioned to or absorbed by cost centres or cost units are indirectexpenses. For example, power, depreciation, insurance, taxes and ratesand rent.
3. Classification according to Behaviour or Variability
Different overhead costs behave in different ways when volume of productionchanges. On the basis of behaviour, overheads may be classified into: (a) Fixedoverheads; (b) Variable overheads; and (c) Semi-fixed or semi-variable overheads.
Fixed overheads: These overheads remain unaffected or fixed in total amountby fluctuations in volume of output. Examples are rent and rates, managerial salaries,building depreciation, postage, stationery and legal expenses.
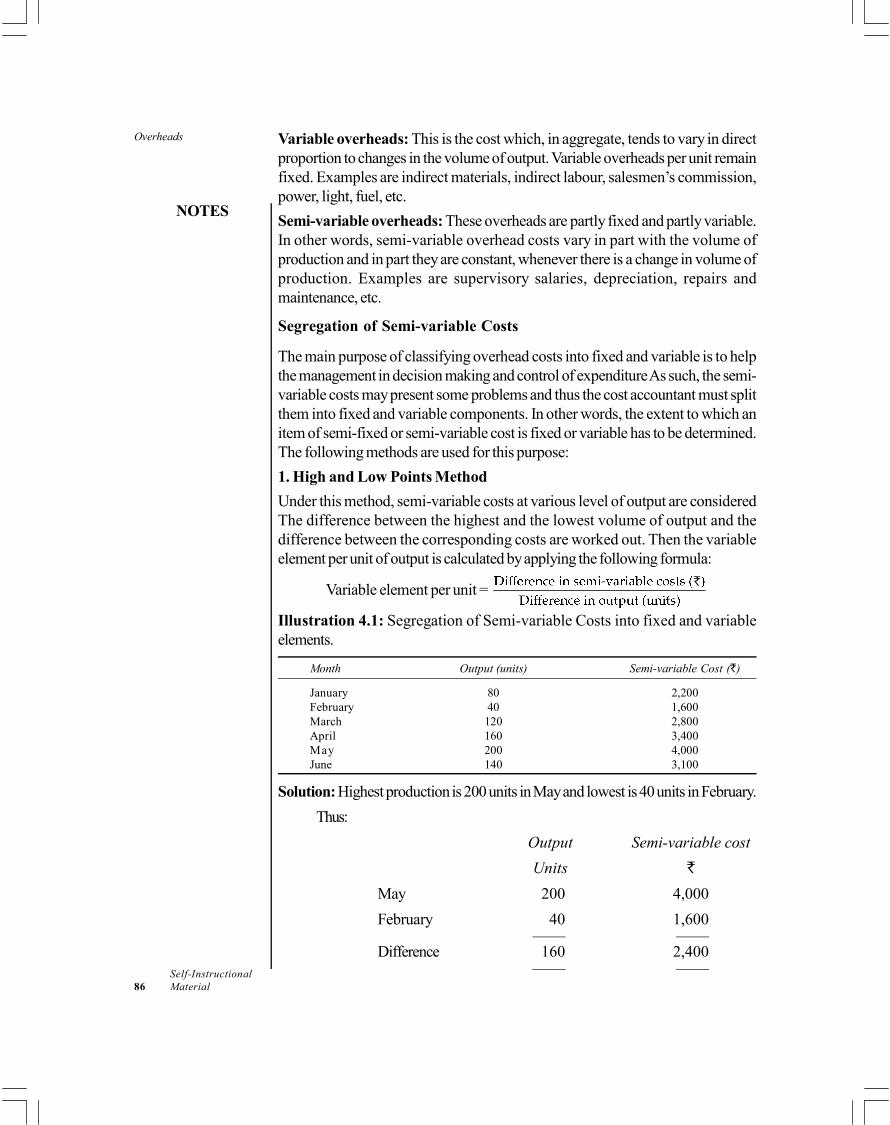
Overheads
NOTES
Self-Instructional86 Material
Variable overheads: This is the cost which, in aggregate, tends to vary in directproportion to changes in the volume of output. Variable overheads per unit remainfixed. Examples are indirect materials, indirect labour, salesmen’s commission,power, light, fuel, etc.
Semi-variable overheads: These overheads are partly fixed and partly variable.In other words, semi-variable overhead costs vary in part with the volume ofproduction and in part they are constant, whenever there is a change in volume ofproduction. Examples are supervisory salaries, depreciation, repairs andmaintenance, etc.
Segregation of Semi-variable Costs
The main purpose of classifying overhead costs into fixed and variable is to helpthe management in decision making and control of expenditure As such, the semi-variable costs may present some problems and thus the cost accountant must splitthem into fixed and variable components. In other words, the extent to which anitem of semi-fixed or semi-variable cost is fixed or variable has to be determined.The following methods are used for this purpose:
1. High and Low Points Method
Under this method, semi-variable costs at various level of output are consideredThe difference between the highest and the lowest volume of output and thedifference between the corresponding costs are worked out. Then the variableelement per unit of output is calculated by applying the following formula:
Variable element per unit =
Illustration 4.1: Segregation of Semi-variable Costs into fixed and variableelements.
Month Output (units) Semi-variable Cost ( )
January 80 2,200February 40 1,600March 120 2,800April 160 3,400May 200 4,000June 140 3,100
Solution: Highest production is 200 units in May and lowest is 40 units in February.
Thus:
Output Semi-variable cost
Units
May 200 4,000
February 40 1,600
Difference 160 2,400
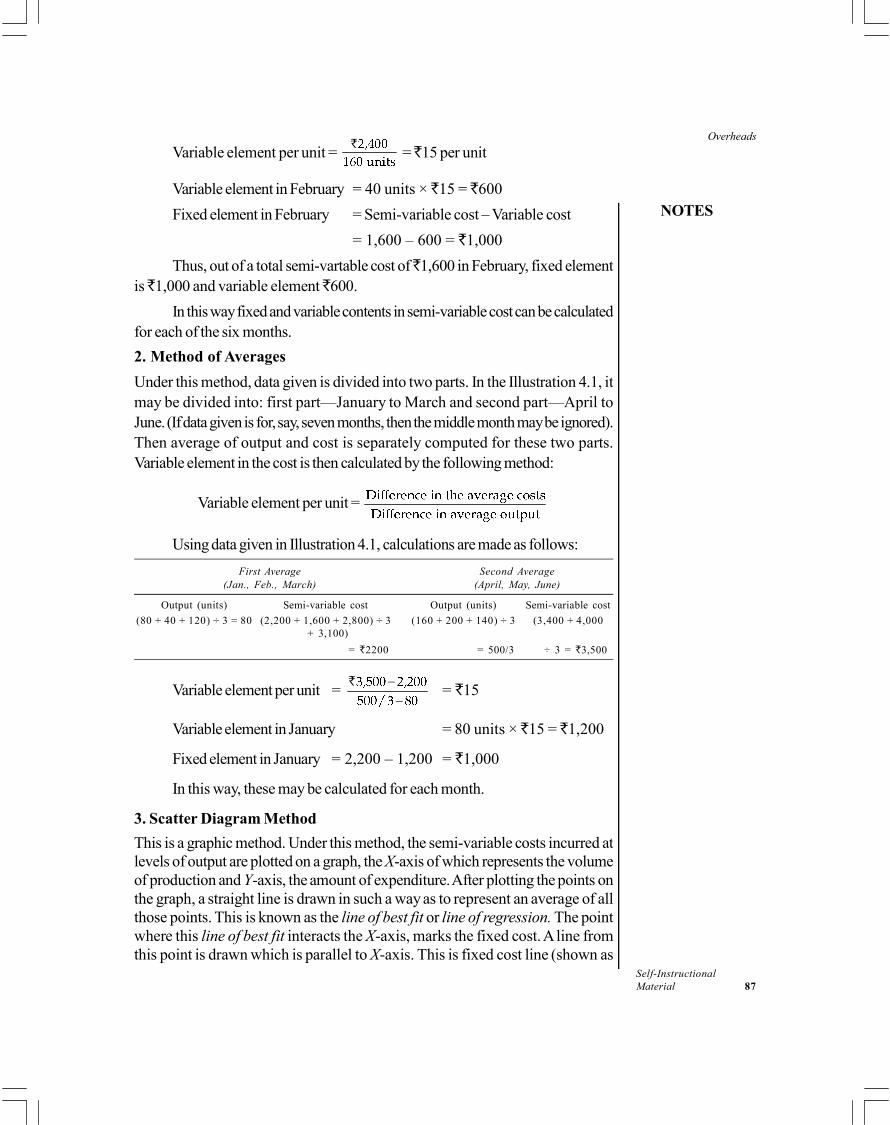
Overheads
NOTES
Self-InstructionalMaterial 87
Variable element per unit = = 15 per unit
Variable element in February = 40 units × 15 = 600
Fixed element in February = Semi-variable cost – Variable cost
= 1,600 – 600 = 1,000
Thus, out of a total semi-vartable cost of 1,600 in February, fixed elementis 1,000 and variable element 600.
In this way fixed and variable contents in semi-variable cost can be calculatedfor each of the six months.
2. Method of Averages
Under this method, data given is divided into two parts. In the Illustration 4.1, itmay be divided into: first part—January to March and second part—April toJune. (If data given is for, say, seven months, then the middle month may be ignored).Then average of output and cost is separately computed for these two parts.Variable element in the cost is then calculated by the following method:
Variable element per unit =
Using data given in Illustration 4.1, calculations are made as follows:
First Average Second Average(Jan., Feb., March) (April, May, June)
Output (units) Semi-variable cost Output (units) Semi-variable cost
(80 + 40 + 120) ÷ 3 = 80 (2,200 + 1,600 + 2,800) ÷ 3 (160 + 200 + 140) ÷ 3 (3,400 + 4,000 + 3,100)
= 2200 = 500/3 ÷ 3 = 3,500
Variable element per unit =
= 15
Variable element in January = 80 units × 15 = 1,200
Fixed element in January = 2,200 – 1,200 = 1,000
In this way, these may be calculated for each month.
3. Scatter Diagram Method
This is a graphic method. Under this method, the semi-variable costs incurred atlevels of output are plotted on a graph, the X-axis of which represents the volumeof production and Y-axis, the amount of expenditure. After plotting the points onthe graph, a straight line is drawn in such a way as to represent an average of allthose points. This is known as the line of best fit or line of regression. The pointwhere this line of best fit interacts the X-axis, marks the fixed cost. A line fromthis point is drawn which is parallel to X-axis. This is fixed cost line (shown as
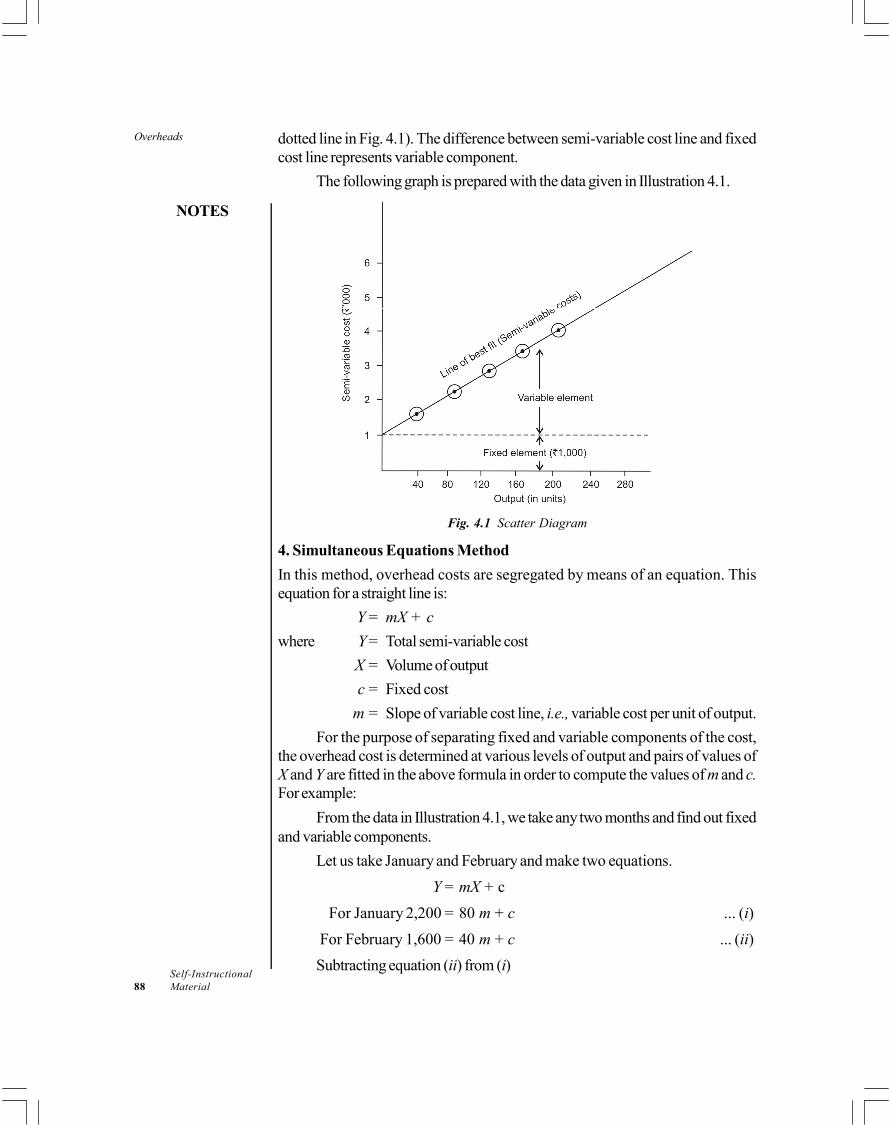
Overheads
NOTES
Self-Instructional88 Material
dotted line in Fig. 4.1). The difference between semi-variable cost line and fixedcost line represents variable component.
The following graph is prepared with the data given in Illustration 4.1.
Fig. 4.1 Scatter Diagram
4. Simultaneous Equations Method
In this method, overhead costs are segregated by means of an equation. Thisequation for a straight line is:
Y = mX + c
where Y = Total semi-variable cost
X = Volume of output
c = Fixed cost
m = Slope of variable cost line, i.e., variable cost per unit of output.
For the purpose of separating fixed and variable components of the cost,the overhead cost is determined at various levels of output and pairs of values ofX and Y are fitted in the above formula in order to compute the values of m and c.For example:
From the data in Illustration 4.1, we take any two months and find out fixedand variable components.
Let us take January and February and make two equations.
Y = mX + c
For January 2,200 = 80 m + c ... (i)
For February 1,600 = 40 m + c ... (ii)
Subtracting equation (ii) from (i)

Overheads
NOTES
Self-InstructionalMaterial 89
We get 600 = 40 m
m = = 15
Variable cost per unit = 15
Put the value of m in equation (i), we get
2,200 = 80 × 15 + c
c = 1,000
Thus, fixed cost is 1,000 and variable cost in January is 1,200 (i.e.,2,200 – 1,000).
In this way, we can place the value of m in any month’s equation and derivethe variable and fixed components.
This method provides a simple and accurate means of separating fixed andvariable overhead costs.
4.2.2 Standing Order Numbers (Codification of Overheads)
After overheads are classified, it is found useful to allot a number or symbol toeach group of expenses so that each such group is easily distinguished from others.Such numbers or symbols are codes for overheads and are called standing ordernumbers. Each standing order number denotes a particular type of expenditureso that items of expenses of similar nature, as and when they are incurred, areappropriately classified into one of these. A schedule or manual is maintained enlistingall standing order numbers. There cannot be a standard list of standing ordernumbers as the number and type under which overheads may be sub-groupedvary with the: (a) size of the factory; (b) type of expenses; and (c) the extent ofcontrol necessary.
Utility
Use of code numbers is preferred to lengthy names of overhead items because ofthe following reasons:
1. It is convenient to write a code number in place of an overhead item.
2. Use of code numbers helps in maintaining secrecy because item name is notrevealed at the time of posting and processing of cost data.
3. Clerical effort is reduced as length in description is minimized.
4. Coding is essential in mechanized accounting.
Check Your Progress
1. What is the other name for production overhead?
2. State the difference between fixed and variable overhead.
Overheads
NOTES
Self-Instructional90 Material
4.3 OVERHEADS DISTRIBUTION
Direct costs are charged direct to the cost centres or cost units without difficulty.But this is not possible in overhead costs. Distribution of overhead costs to costunits is one of the most complex problems of cost accounting. This is becauseoverhead costs cannot be identified with individual cost units and there are noaccounting means of exact distribution. Therefore, such costs are analysed anddistributed to various cost centres and cost units on arbitrary basis. For example,it is not possible to exactly calculate the amount of rent that should be charged toa particular cost unit and thus, it has to be distributed on some arbitrary basis. Thecost accountant is constantly searching for equitable bases to distribute overheadcosts to units and divisions of business enterprise and quite often he needs toexercise his own judgement in this regard. For instance, he may apportion rent tovarious departments of the factory on the basis of area occupied by each suchdepartment. Similarly, labour welfare expenses may be apportioned on the basisof number of workers in each department. The procedure of distribution ofoverhead costs is discussed below.
Steps in Overheads Distribution
Unlike direct materials and direct wages, overheads cannot be charged to costunits directly. The various steps taken for distribution of overhead costs are asfollows:
1. Classification and collection of overheads
2. Allocation and apportionment of overheads to production departments andservice departments
3. Re-apportionment of service department costs to production departments
4. Absorption of overheads of each production department in cost units
These steps are explained in detail in the following sections.
In this section, we will only discuss the collection, allocation andapportionment of overhead of the production and service overhead. The absorptionwill be taken up in next section.
4.3.1 Collection of Overheads
The procedure of classification of production overheads and of assigning standingorder (code) numbers has already been discussed. Such classification andcodification is pre-requisite for the collection of overheads.
Production overheads should be collected under standing order numbers.The main sources from which overhead costs are collected are as follows:
(a) Invoice—for collection of indirect expenses, like rent, insurance, etc.
(b) Stores Requisitions—for collection of indirect materials.
Overheads
NOTES
Self-InstructionalMaterial 91
(c) Wages Analysis Sheet—for collection of indirect wages.
(d) Journal entries—for collection of those overhead items which do not resultin current cash outlay and need some adjustment, e.g., depreciation, chargein lieu of rent, outstanding rent, etc.
4.3.2 Allocation and Apportionment Overheats (Production):Main Methods
After overhead costs have been collected under various standing order numbers,the next step is to allocate and apportion the overheads to production and servicedepartments. Such allocation and apportionment is known as departmentalizationor primary distribution of overheads.
Departmentalization of overheads is the process of allocation andapportionment of overheads to different departments or cost centres. For smoothand efficient working, a factory is sub-divided into a number of departments, eachof which denotes a particular activity of the factory, e.g., purchase department,stores department, time-keeping department, personnel department, crushingdepartment and melting shop. These departments are mainly of two types:
(a) Production departments; and
(b) Service departments.
The administration, selling and distribution overhead will be discussed laterin the unit.
Objectives of Departmentalization
Departmentalization of overheads serves the following purposes:
1. Ensures greater accuracy in cost ascertainment: Departmentalizationhelps in achieving greater accuracy by proper allocation and apportionmentof overheads. For accurate costing of each function or operation, overheadabsorption rates should be determined separately for each cost centre. Thisis possible only with the help of departmentalization.
2. Control of overhead costs: Effective control of overhead costs is possiblebecause departmentalization makes the incurrence of costs in a departmentor cost centre the responsibility of someone who heads the department orthe cost centre. Thus, with the help of departmentalization, responsibilityaccounting can be effectively introduced for control purposes.
3. Use of different methods of absorption: Basis of absorption of overheadsmay be different for different cost centres, e.g., machine hour rate may besuitable for one cost centre whereas direct labour hour rate may be moreappropriate for another cost centre. Different basis may be used for differentcost centres only when overheads are departmentalized.
4. Valuation of work-in-progress: Correct cost of work-in-progress cannotbe ascertained unless overheads are departmentalized.
Overheads
NOTES
Self-Instructional92 Material
5. Cost of service of departments: Departmentalization helps in ascertainingthe cost of various service departments which is useful for making estimatesand submitting quotations for those items which make use of the services ofvarious cost centres.
6. Forecasting and estimating: Because of greater accuracy in costascertainment and cost control, departmentalization ensures more accurateforecasting and estimating and decision making.
Allocation
Certain items of overhead costs can be directly identified with a particulardepartment or cost centre as having been incurred for that cost centre. Allotmentof such costs to departments or cost centres is known as allocation. Thus, allocationmay be defined as ‘the assignment of whole items of cost directly to a costcentre.’ In other words, allocation is charging to a cost centre those overheadsthat result solely from the existence of that cost centre. A point to be clearlyunderstood is that allocation can be made only when exact amount of overheadsincurred in a cost centre is definitely known. For example, rent cannot normally beallocated since rent is payable for the factory as a whole and exact amount of rentfor each department cannot be known. Indirect materials, on the other hand, canbe easily allocated to various departments in which they are incurred. Other itemswhich are allocated include indirect wages, overtime and idle time cost, power(when sub-metres are installed in departments), depreciation of machinery,supervision, etc.
In brief, in order that an overheads can be allocated, they should meet bothof the following conditions:
(a) The cost centre must have caused the overhead cost to be incurred; and
(b) The exact amount incurred in a cost centre must be known.
Apportionment
Certain overhead costs cannot be directly charged to a department or cost centre.Such costs are common to a number of cost centres or departments and do notoriginate from any specific department. Distribution of such overhead costs tovarious departments is known as apportionment. Thus, apportionment may bedefined as ‘the distribution of overheads to more than one cost centre, onsome equitable basis.’ In other words, it is charging a fair share of an overheadcost to a cost centre. Where an item of overhead cost is common to various costcentres, it is allotted to different cost centres proportionately. Again taking thecases of rent, as it cannot be allocated, it is apportioned to various departmentson some equitable basis, i.e., in the ratio of area occupied. Similarly salary of ageneral manager cannot be allocated wholly to any one department as he attendsin general to all the departments. It should, therefore, be apportioned to the requireddepartments on some equitable basis. Other items which generally cannot beallocated but are apportioned include fire insurance, lighting and heating, timekeeping expenses, canteen expenses, medical and other welfare expenses, etc.
Overheads
NOTES
Self-InstructionalMaterial 93
Distinction between Allocation and Apportionment
The distinction between allocation and apportionment is important to understand.As seen above, the purpose of both cost allocation and cost apportionment isthe identification or allotment of items of cost to cost centres or cost units.However, the main difference between the two procedures is that while allocationdeals with whole items of costs, apportionment deals with proportions of theitems of cost. Allocation is a direct process but apportionment may be madeonly indirectly and for which suitable bases are to be selected. Whether an itemof cost can be allocated or apportioned does not depend upon the nature ofcost but upon its relation with the cost centres or cost units to which it is to becharged.
Overheads should always be allocated, as far as possible. If an overheadcost cannot be allocated, it is apportioned. This involves finding some basis ofapportionment that will enable the overhead cost to be equitably distributed overvarious production and service departments.
Production and Service Departments
Departments are classified into production and service departments. A productiondepartment is one that is engaged in the actual manufacture of the product bychanging the shape, form or nature of material worked upon or by assembling theparts into finished product. A service department, on the other hand, is one whichis rendering a service to production departments. It contributes in an indirect mannerto the manufacture of the product but it does not itself change the shape, form ornature of material that is converted into the finished product.
Principles of Apportionment
Apportionment of overheads to various production and service departments isbased on the following principles:
1. Service or use: This is the most common principle of apportionment ofoverhead costs. It is based on the theory that greater the amount of serviceor benefit received by a department, the larger should be the share of thecost to be borne by that department. For example, rent is apportioned tovarious departments according to the floor space occupied; telephone costaccording to the number of extension telephones in each department, andso on.
2. Survey method: This method is used for those overhead costs that are notdirectly related to departments and whose remoteness necessitates anarbitrary distribution. For example, salary of a general manager of a companymay be apportioned on the basis of the results of a survey which may revealthat 30% of his salary should be apportioned to sales, 10% to administrationand 60% to various producing departments. Similarly, lighting expensesmay be apportioned on the basis of a survey of the number of light points,size, estimated hours of use, etc.
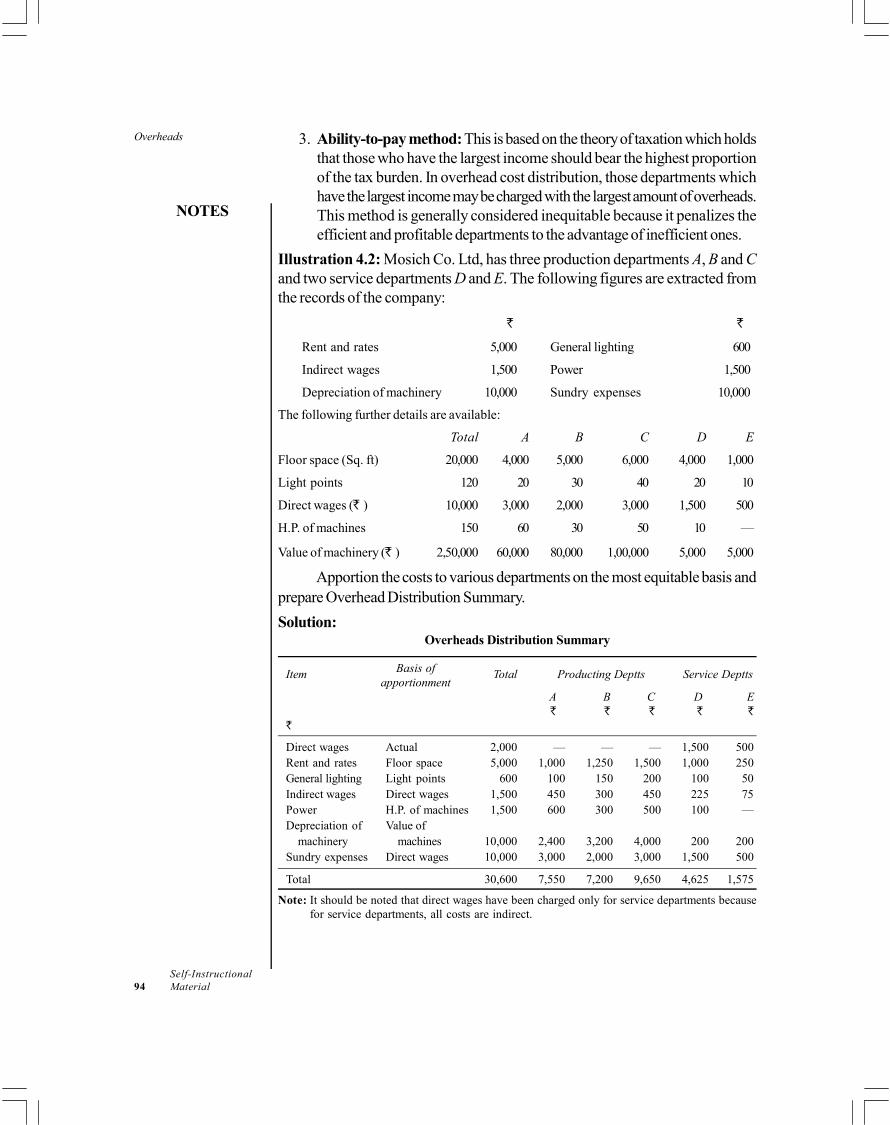
Overheads
NOTES
Self-Instructional94 Material
3. Ability-to-pay method: This is based on the theory of taxation which holdsthat those who have the largest income should bear the highest proportionof the tax burden. In overhead cost distribution, those departments whichhave the largest income may be charged with the largest amount of overheads.This method is generally considered inequitable because it penalizes theefficient and profitable departments to the advantage of inefficient ones.
Illustration 4.2: Mosich Co. Ltd, has three production departments A, B and Cand two service departments D and E. The following figures are extracted fromthe records of the company:
Rent and rates 5,000 General lighting 600
Indirect wages 1,500 Power 1,500
Depreciation of machinery 10,000 Sundry expenses 10,000
The following further details are available:
Total A B C D E
Floor space (Sq. ft) 20,000 4,000 5,000 6,000 4,000 1,000
Light points 120 20 30 40 20 10
Direct wages ( ) 10,000 3,000 2,000 3,000 1,500 500
H.P. of machines 150 60 30 50 10 —
Value of machinery ( ) 2,50,000 60,000 80,000 1,00,000 5,000 5,000
Apportion the costs to various departments on the most equitable basis andprepare Overhead Distribution Summary.
Solution:Overheads Distribution Summary
Item Basis of Total Producting Deptts Service Depttsapportionment
A B C D E
Direct wages Actual 2,000 — — — 1,500 500Rent and rates Floor space 5,000 1,000 1,250 1,500 1,000 250General lighting Light points 600 100 150 200 100 50Indirect wages Direct wages 1,500 450 300 450 225 75Power H.P. of machines 1,500 600 300 500 100 —Depreciation of Value of
machinery machines 10,000 2,400 3,200 4,000 200 200Sundry expenses Direct wages 10,000 3,000 2,000 3,000 1,500 500
Total 30,600 7,550 7,200 9,650 4,625 1,575
Note: It should be noted that direct wages have been charged only for service departments becausefor service departments, all costs are indirect.
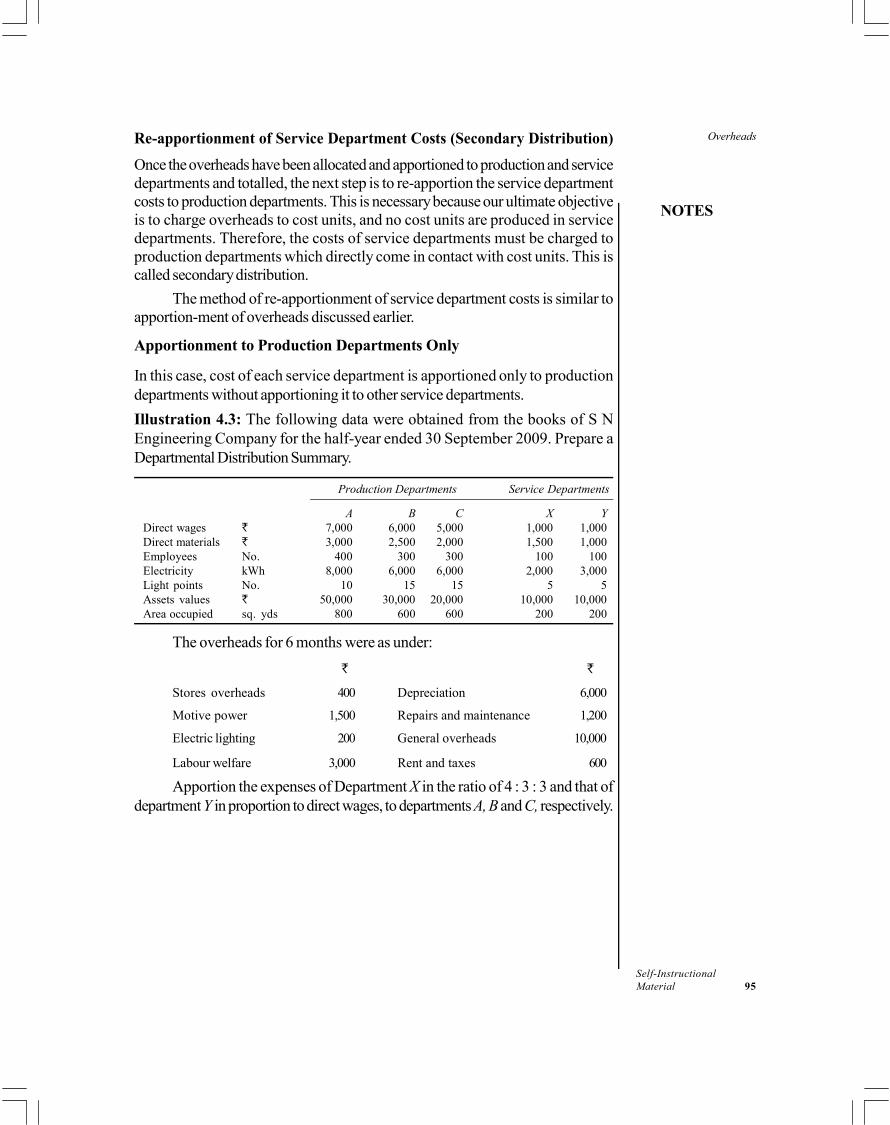
Overheads
NOTES
Self-InstructionalMaterial 95
Re-apportionment of Service Department Costs (Secondary Distribution)
Once the overheads have been allocated and apportioned to production and servicedepartments and totalled, the next step is to re-apportion the service departmentcosts to production departments. This is necessary because our ultimate objectiveis to charge overheads to cost units, and no cost units are produced in servicedepartments. Therefore, the costs of service departments must be charged toproduction departments which directly come in contact with cost units. This iscalled secondary distribution.
The method of re-apportionment of service department costs is similar toapportion-ment of overheads discussed earlier.
Apportionment to Production Departments Only
In this case, cost of each service department is apportioned only to productiondepartments without apportioning it to other service departments.
Illustration 4.3: The following data were obtained from the books of S NEngineering Company for the half-year ended 30 September 2009. Prepare aDepartmental Distribution Summary.
Production Departments Service Departments
A B C X YDirect wages 7,000 6,000 5,000 1,000 1,000Direct materials 3,000 2,500 2,000 1,500 1,000Employees No. 400 300 300 100 100Electricity kWh 8,000 6,000 6,000 2,000 3,000Light points No. 10 15 15 5 5Assets values 50,000 30,000 20,000 10,000 10,000Area occupied sq. yds 800 600 600 200 200
The overheads for 6 months were as under:
Stores overheads 400 Depreciation 6,000
Motive power 1,500 Repairs and maintenance 1,200
Electric lighting 200 General overheads 10,000
Labour welfare 3,000 Rent and taxes 600
Apportion the expenses of Department X in the ratio of 4 : 3 : 3 and that ofdepartment Y in proportion to direct wages, to departments A, B and C, respectively.

Overheads
NOTES
Self-Instructional96 Material
Solution:Overheads Distribution Summary
*Note: Direct wages and direct materials of service departments are indirect costs.
Apportionment to Production as well as Service Departments
Quite often, a service department renders services not only to productiondepartment but also to other service departments. For example, maintenancedepartment looks after not only the plant and machinery of production departmentbut also the equipment of other service departments like power house, materialhandling, etc. Similarly, power house supplies electricity not only to productiondepartments but also to service departments like canteen, maintenance departments,etc.
This type of inter-service department apportionment may be either onreciprocal basis or non-reciprocal basis.
Apportionment on non-reciprocal basis (Stepladder Method): Thismethod is used when a service department renders services to other servicedepartments but does not receive services of the other service departments, i.e.,when service departments are not inter-dependent. In this method, the servicedepartments are arranged in descending order of their serviceability. The cost ofthe most serviceable department, i.e., the department which serves the largestnumber of departments is first apportioned to other service departments. Theservice department which serves the next largest number of departments is takenup next and its cost (including the prorated cost of the first service department) isapportioned to other service and production departments excepting the first servicedepartment. In the same way, while apportioning the cost of the third servicedepartment in this order, the first two service departments are ignored. This processis continued till the cost of the last service department is apportioned. It should benoted that the cost of the last service department is apportioned only to productiondepartments.
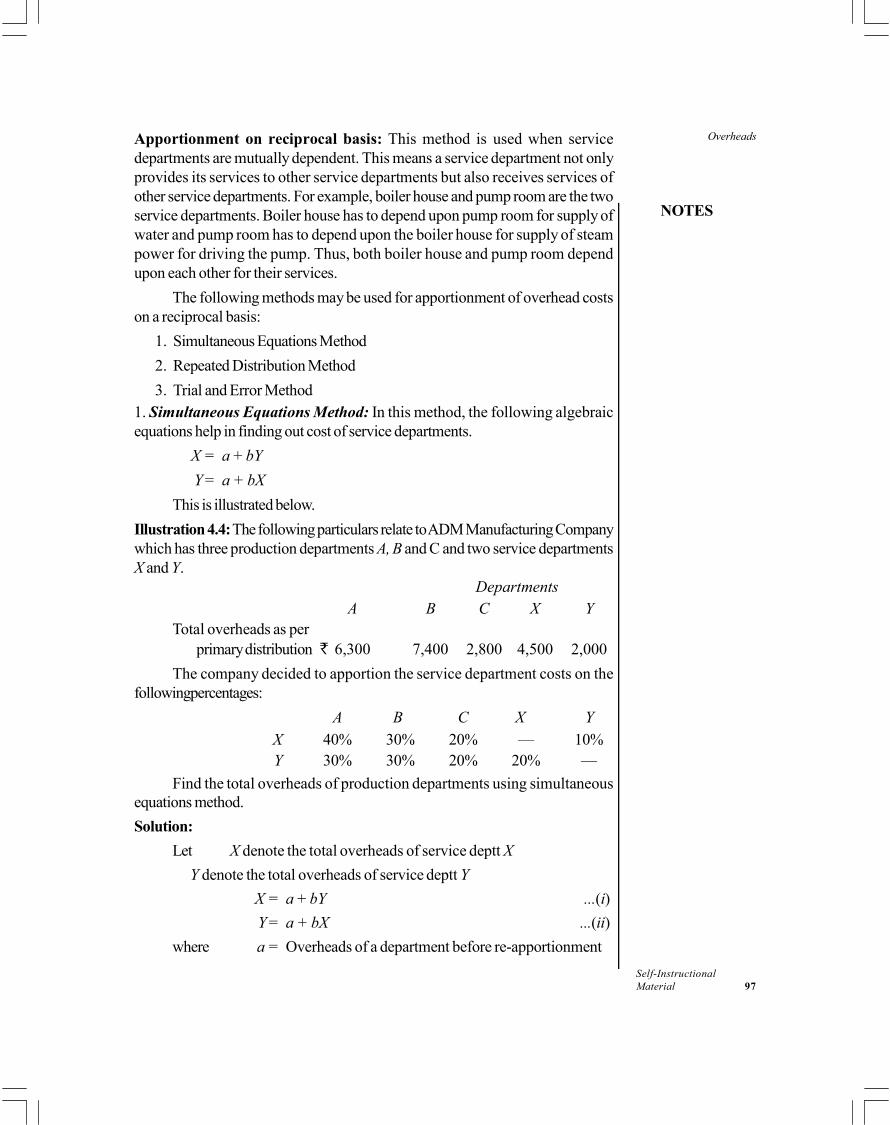
Overheads
NOTES
Self-InstructionalMaterial 97
Apportionment on reciprocal basis: This method is used when servicedepartments are mutually dependent. This means a service department not onlyprovides its services to other service departments but also receives services ofother service departments. For example, boiler house and pump room are the twoservice departments. Boiler house has to depend upon pump room for supply ofwater and pump room has to depend upon the boiler house for supply of steampower for driving the pump. Thus, both boiler house and pump room dependupon each other for their services.
The following methods may be used for apportionment of overhead costson a reciprocal basis:
1. Simultaneous Equations Method
2. Repeated Distribution Method
3. Trial and Error Method1. Simultaneous Equations Method: In this method, the following algebraicequations help in finding out cost of service departments.
X = a + bY
Y = a + bX
This is illustrated below.
Illustration 4.4: The following particulars relate to ADM Manufacturing Companywhich has three production departments A, B and C and two service departmentsX and Y.
DepartmentsA B C X Y
Total overheads as perprimary distribution 6,300 7,400 2,800 4,500 2,000
The company decided to apportion the service department costs on thefollowingpercentages:
A B C X Y
X 40% 30% 20% — 10%Y 30% 30% 20% 20% —
Find the total overheads of production departments using simultaneousequations method.
Solution:
Let X denote the total overheads of service deptt X
Y denote the total overheads of service deptt Y
X = a + bY ...(i)
Y = a + bX ...(ii)
where a = Overheads of a department before re-apportionment

Overheads
NOTES
Self-Instructional98 Material
b = Share of overheads of one service department to bedistributed to the other.
Thus X = 4,500 + 20% of Y ...(i)
Y = 2,000 + 10% of X ...(ii)
or X = 4,500 + 0.2Y ...(i)
Y = 2,000 + 0.1X ...(ii)
To solve the equations, re-arrange these and multiply by 10 to eliminatedecimals.
10X – 2Y = 45,000 ...(i)
–X + 10Y = 20,000 …(ii)
Again multiplying equation (ii) by 10 and adding
10X – 2Y = 45,000 ...(i)
–10X + 100Y = 2,00,000 …(ii)
By adding, we get 98Y = 2,45,000
Y =
Y = 2,500
Putting the value of Y in equation (i), we get
X = 4,500 + 20% of 2,500
X = 5,000
Thus, X = 5,000, and Y = 2,500
These amounts, i.e., 2,500 and 5,000 are then apportioned to productiondepartments in the specified percentages.
Secondary Distribution Summary
Total Production Departments
A B C
Total as per primary summary 16,500 6,300 7,400 2,800
Department X (90% of 5,000) 4,500 2,000 1,500 1,000
Department Y (80% of 2,500) 2,000 750 750 500
Total 23,000 9,050 9,650 4,300
Note: The amount of service deptt X to be distributed to production departments A, B and C isonly 90% as the remaining 10% belongs to service deptt Y. Similarly, only 80% of servicedeptt Y is to be distributed to A, B and C.
This method of simultaneous equations gives accurate results. But when thenumber of service departments exceeds two, calculations become cumbersome.
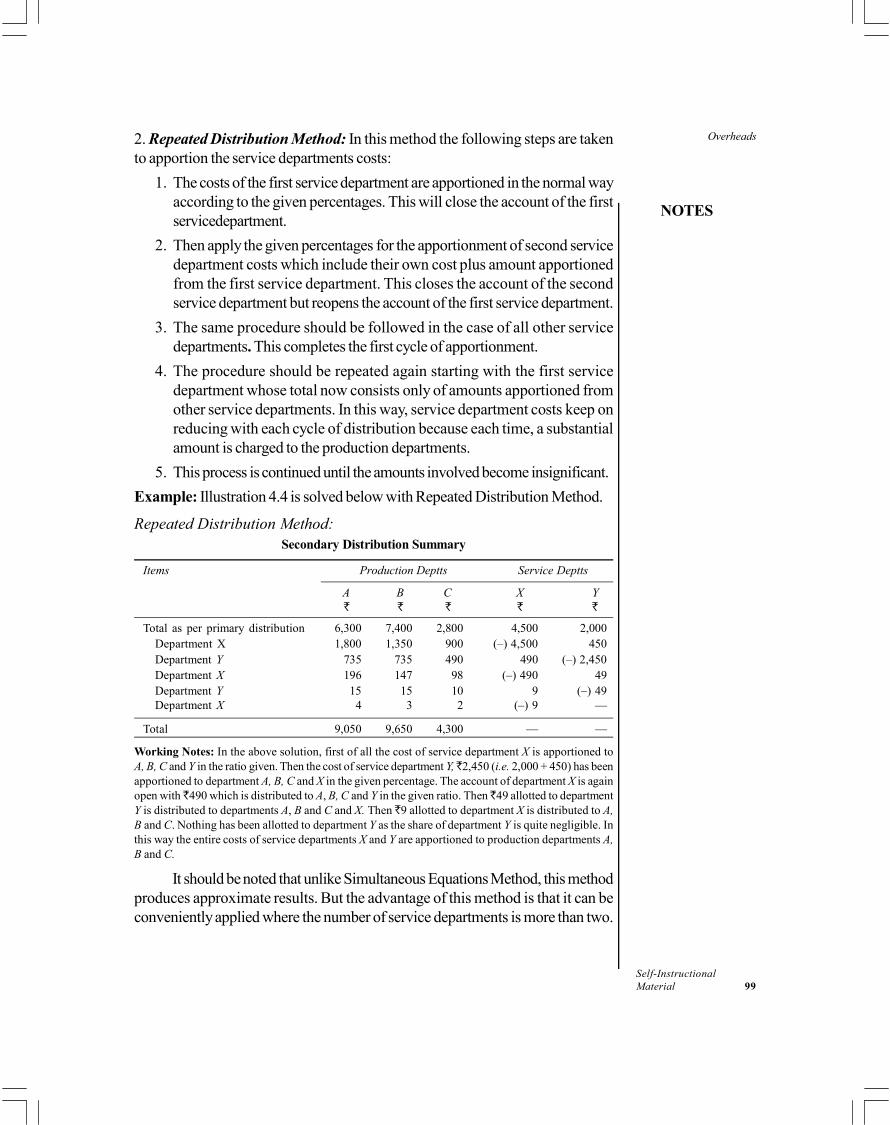
Overheads
NOTES
Self-InstructionalMaterial 99
2. Repeated Distribution Method: In this method the following steps are takento apportion the service departments costs:
1. The costs of the first service department are apportioned in the normal wayaccording to the given percentages. This will close the account of the firstservicedepartment.
2. Then apply the given percentages for the apportionment of second servicedepartment costs which include their own cost plus amount apportionedfrom the first service department. This closes the account of the secondservice department but reopens the account of the first service department.
3. The same procedure should be followed in the case of all other servicedepartments. This completes the first cycle of apportionment.
4. The procedure should be repeated again starting with the first servicedepartment whose total now consists only of amounts apportioned fromother service departments. In this way, service department costs keep onreducing with each cycle of distribution because each time, a substantialamount is charged to the production departments.
5. This process is continued until the amounts involved become insignificant.
Example: Illustration 4.4 is solved below with Repeated Distribution Method.
Repeated Distribution Method:Secondary Distribution Summary
Items Production Deptts Service Deptts
A B C X Y
Total as per primary distribution 6,300 7,400 2,800 4,500 2,000Department X 1,800 1,350 900 (–) 4,500 450Department Y 735 735 490 490 (–) 2,450Department X 196 147 98 (–) 490 49Department Y 15 15 10 9 (–) 49Department X 4 3 2 (–) 9 —
Total 9,050 9,650 4,300 — —
Working Notes: In the above solution, first of all the cost of service department X is apportioned toA, B, C and Y in the ratio given. Then the cost of service department Y, 2,450 (i.e. 2,000 + 450) has beenapportioned to department A, B, C and X in the given percentage. The account of department X is againopen with 490 which is distributed to A, B, C and Y in the given ratio. Then 49 allotted to departmentY is distributed to departments A, B and C and X. Then 9 allotted to department X is distributed to A,B and C. Nothing has been allotted to department Y as the share of department Y is quite negligible. Inthis way the entire costs of service departments X and Y are apportioned to production departments A,B and C.
It should be noted that unlike Simultaneous Equations Method, this methodproduces approximate results. But the advantage of this method is that it can beconveniently applied where the number of service departments is more than two.
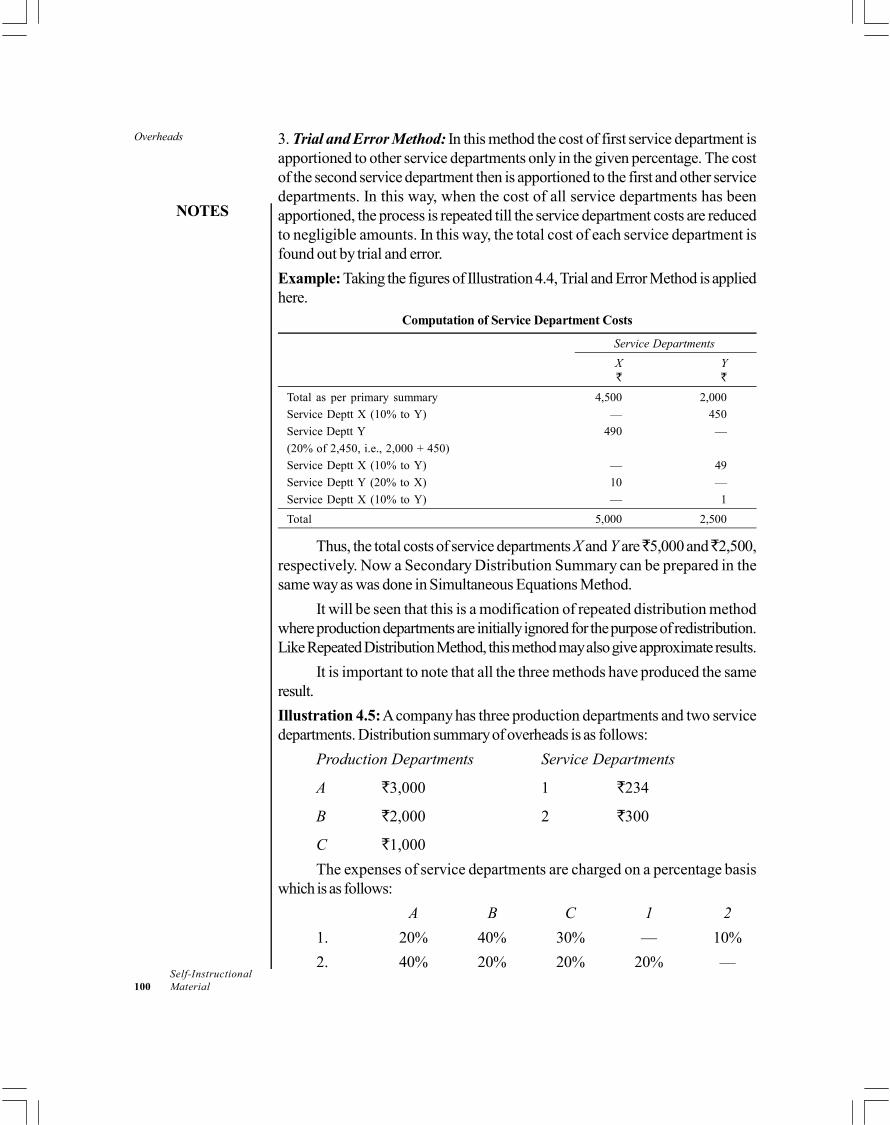
Overheads
NOTES
Self-Instructional100 Material
3. Trial and Error Method: In this method the cost of first service department isapportioned to other service departments only in the given percentage. The costof the second service department then is apportioned to the first and other servicedepartments. In this way, when the cost of all service departments has beenapportioned, the process is repeated till the service department costs are reducedto negligible amounts. In this way, the total cost of each service department isfound out by trial and error.
Example: Taking the figures of Illustration 4.4, Trial and Error Method is appliedhere.
Computation of Service Department Costs
Service Departments
X Y
Total as per primary summary 4,500 2,000
Service Deptt X (10% to Y) — 450
Service Deptt Y 490 —
(20% of 2,450, i.e., 2,000 + 450)
Service Deptt X (10% to Y) — 49
Service Deptt Y (20% to X) 10 —
Service Deptt X (10% to Y) — 1
Total 5,000 2,500
Thus, the total costs of service departments X and Y are 5,000 and 2,500,respectively. Now a Secondary Distribution Summary can be prepared in thesame way as was done in Simultaneous Equations Method.
It will be seen that this is a modification of repeated distribution methodwhere production departments are initially ignored for the purpose of redistribution.Like Repeated Distribution Method, this method may also give approximate results.
It is important to note that all the three methods have produced the sameresult.
Illustration 4.5: A company has three production departments and two servicedepartments. Distribution summary of overheads is as follows:
Production Departments Service Departments
A 3,000 1 234
B 2,000 2 300
C 1,000
The expenses of service departments are charged on a percentage basiswhich is as follows:
A B C 1 2
1. 20% 40% 30% — 10%
2. 40% 20% 20% 20% —
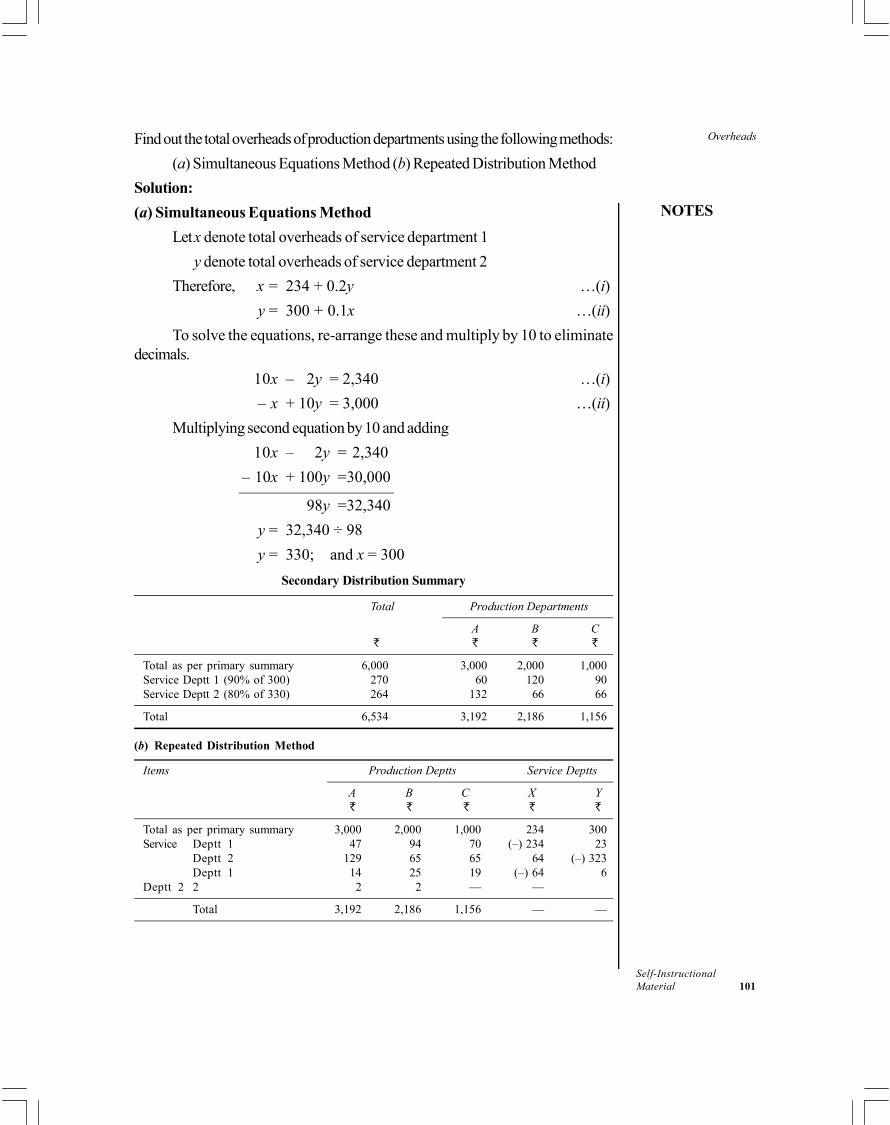
Overheads
NOTES
Self-InstructionalMaterial 101
Find out the total overheads of production departments using the following methods:
(a) Simultaneous Equations Method (b) Repeated Distribution Method
Solution:
(a) Simultaneous Equations Method
Letx denote total overheads of service department 1
y denote total overheads of service department 2
Therefore, x = 234 + 0.2y …(i)
y = 300 + 0.1x …(ii)
To solve the equations, re-arrange these and multiply by 10 to eliminatedecimals.
10x – 2y = 2,340 …(i)
– x + 10y = 3,000 …(ii)
Multiplying second equation by 10 and adding
10x – 2y = 2,340
– 10x + 100y =30,000
98y =32,340
y = 32,340 ÷ 98
y = 330; and x = 300
Secondary Distribution Summary
Total Production Departments
A B C
Total as per primary summary 6,000 3,000 2,000 1,000Service Deptt 1 (90% of 300) 270 60 120 90Service Deptt 2 (80% of 330) 264 132 66 66
Total 6,534 3,192 2,186 1,156
(b) Repeated Distribution Method
Items Production Deptts Service Deptts
A B C X Y
Total as per primary summary 3,000 2,000 1,000 234 300Service Deptt 1 47 94 70 (–) 234 23
Deptt 2 129 65 65 64 (–) 323Deptt 1 14 25 19 (–) 64 6
Deptt 2 2 2 2 — —
Total 3,192 2,186 1,156 — —

Overheads
NOTES
Self-Instructional102 Material
Check Your Progress
3. State the difference between allocation and apportionment.
4. What is trial and error method?
4.4 ABSORPTION OF OVERHEADS(PRODUCTION): MAIN METHODS
Once departmentalization of overheads has been completed, the total cost ofeach production department comprises the following:
(i) Costs allocated and apportioned to production departments.
(ii) Costs of service departments re-apportioned to production departments.
The total overhead cost pertaining to a production department or cost centreis then charged to or absorbed in the cost of the products or cost units passingthrough that centre. This is known as absorption.
The absorption of overheads is the last step in the distribution plan ofoverheads. It is defined as charging of overheads to cost units. In other words,overhead absorption is the apportionment of overheads of the cost centres overcost units. Absorption of overheads is also known as levy, recovery or applicationof overheads.
There are two steps in the absorption of overheads:
1. Computation of overheads absorption rate; and
2. Application of these rates to cost units.1. Computation of Overheads Absorption Rate: Absorption rates arecomputed for the purpose of absorption of overheads in costs of the cost units.There are mainly six methods for determining absorption rates which have beendescribed later in this unit. In all these methods, the overhead rate is computed bydividing the total amount of overheads of department or cost centre by the numberof units in the base, such as number of cost units, machine hours, labour hours,direct labour cost, price cost, etc. This is shown below:
Overheads absorption rate =
It should be noted that only one rate is computed for any single group ofoverheads.2. Application of rates to cost units: In order to arrive at the overhead cost ofeach cost unit, the overhead rate is multiplied by the number of units of base in thecost unit. Thus:
Overhead absorbed = No. of units of base in the cost unit × Overhead rate

Overheads
NOTES
Self-InstructionalMaterial 103
For example, machine hour rate is 25 and a cost units has used 12 hoursof the machine, overheads absorbed will be = 12 hours × 25 = 300.
Methods of Absorption of Production Overheads
Various methods of absorption discussed below are used to determine theoverheads absorption rate for production overheads.
1. Direct Materials Cost Percentage Rate: Under this method, the amount ofoverheads to be absorbed by a cost unit is determined by the cost of direct materialsconsumed in producing it. This rate is computed by dividing the total overheads bythe total cost of direct materials consumed in the department. Thus,
Overhead rate = × 100
Example: Production overheads 40,000
Direct materials 200,000
Overhead rate = × 100 = 20%
Thus, if the direct material cost of a job or cost unit is 1,200, the overheadsto be absorbed by it will be 240, i.e., 20% of 1,200.
Advantages: The main advantages of this method are:
1. Calculation of this rate is simple because cost of direct materials is readilyavailable and no additional records are required to be maintained for thispurpose.
2. This method produces fairly accurate rates where material prices do notfluctuate widely and where output is uniform, i.e., only one type of article isproduced using the same raw material.
Disadvantages: The disadvantages of this method are:
1. Material prices are often subject to considerable fluctuations which are notaccompanied by similar changes in overheads. This causes misleading results.
2. This method is quite illogical and inaccurate because overheads are in noway related to the cost of materials consumed. The amount of overheadsdoes not change because the work is being done on copper instead of iron.Both metals are quite different in prices and by applying the same percentagefor both will obviously be incorrect.
3. This method ignores the importance of time factor that two jobs using thesame raw materials would absorb the same amount of overheads even thoughone may occupy a machine fur much longer period than the other.
4. This method does not distinguish between work done by machines andmanual labour and also between work done by skilled and unskilled workers.
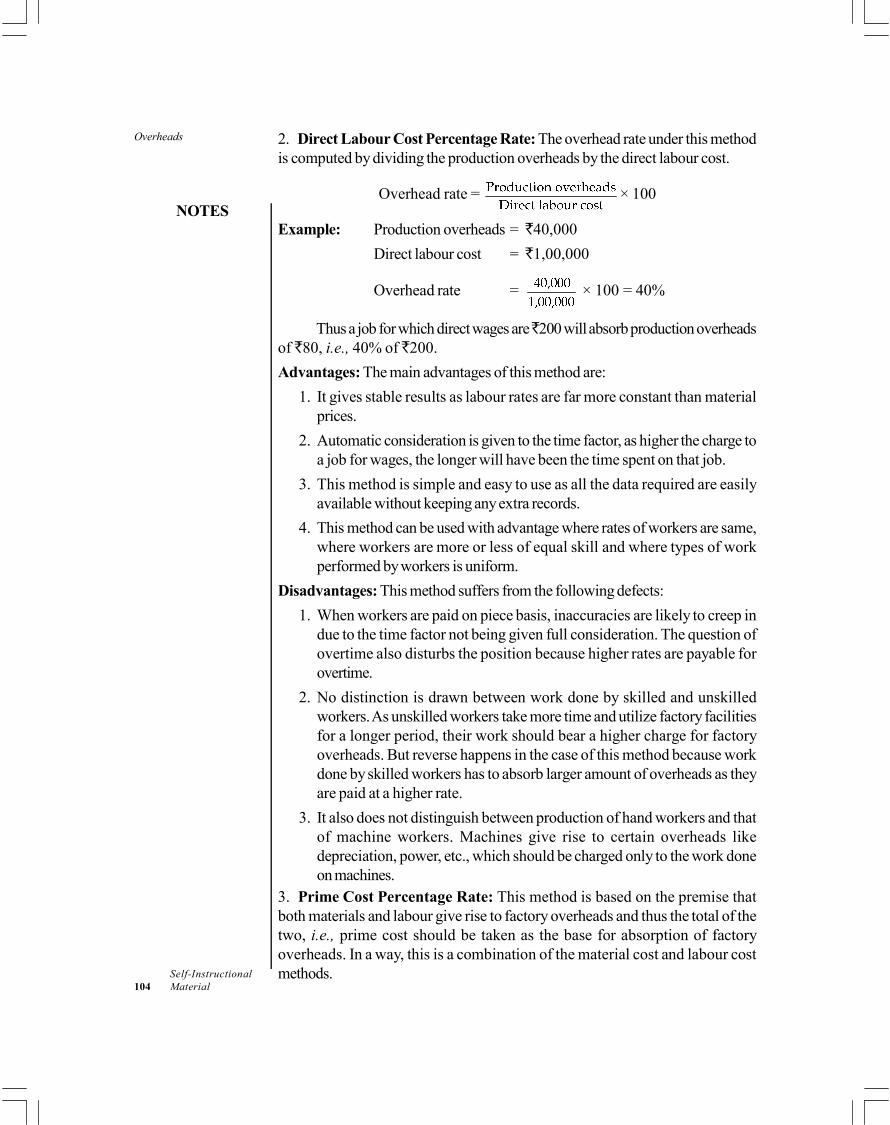
Overheads
NOTES
Self-Instructional104 Material
2. Direct Labour Cost Percentage Rate: The overhead rate under this methodis computed by dividing the production overheads by the direct labour cost.
Overhead rate = × 100
Example: Production overheads = 40,000
Direct labour cost = 1,00,000
Overhead rate = × 100 = 40%
Thus a job for which direct wages are 200 will absorb production overheadsof 80, i.e., 40% of 200.
Advantages: The main advantages of this method are:
1. It gives stable results as labour rates are far more constant than materialprices.
2. Automatic consideration is given to the time factor, as higher the charge toa job for wages, the longer will have been the time spent on that job.
3. This method is simple and easy to use as all the data required are easilyavailable without keeping any extra records.
4. This method can be used with advantage where rates of workers are same,where workers are more or less of equal skill and where types of workperformed by workers is uniform.
Disadvantages: This method suffers from the following defects:
1. When workers are paid on piece basis, inaccuracies are likely to creep indue to the time factor not being given full consideration. The question ofovertime also disturbs the position because higher rates are payable forovertime.
2. No distinction is drawn between work done by skilled and unskilledworkers. As unskilled workers take more time and utilize factory facilitiesfor a longer period, their work should bear a higher charge for factoryoverheads. But reverse happens in the case of this method because workdone by skilled workers has to absorb larger amount of overheads as theyare paid at a higher rate.
3. It also does not distinguish between production of hand workers and thatof machine workers. Machines give rise to certain overheads likedepreciation, power, etc., which should be charged only to the work doneon machines.
3. Prime Cost Percentage Rate: This method is based on the premise thatboth materials and labour give rise to factory overheads and thus the total of thetwo, i.e., prime cost should be taken as the base for absorption of factoryoverheads. In a way, this is a combination of the material cost and labour costmethods.
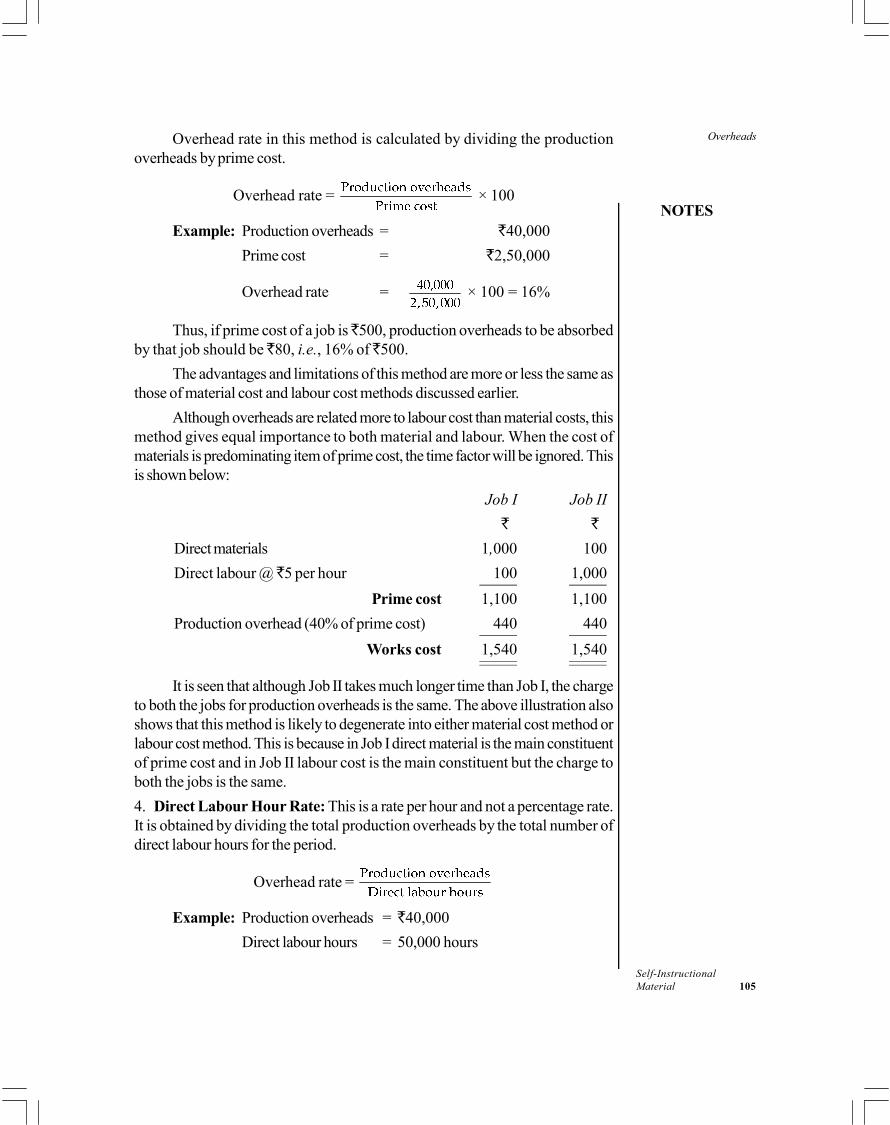
Overheads
NOTES
Self-InstructionalMaterial 105
Overhead rate in this method is calculated by dividing the productionoverheads by prime cost.
Overhead rate = × 100
Example: Production overheads = 40,000
Prime cost = 2,50,000
Overhead rate = × 100 = 16%
Thus, if prime cost of a job is 500, production overheads to be absorbedby that job should be 80, i.e., 16% of 500.
The advantages and limitations of this method are more or less the same asthose of material cost and labour cost methods discussed earlier.
Although overheads are related more to labour cost than material costs, thismethod gives equal importance to both material and labour. When the cost ofmaterials is predominating item of prime cost, the time factor will be ignored. Thisis shown below:
Job I Job II
Direct materials 1,000 100
Direct labour @ 5 per hour 100 1,000
Prime cost 1,100 1,100
Production overhead (40% of prime cost) 440 440
Works cost 1,540 1,540
It is seen that although Job II takes much longer time than Job I, the chargeto both the jobs for production overheads is the same. The above illustration alsoshows that this method is likely to degenerate into either material cost method orlabour cost method. This is because in Job I direct material is the main constituentof prime cost and in Job II labour cost is the main constituent but the charge toboth the jobs is the same.
4. Direct Labour Hour Rate: This is a rate per hour and not a percentage rate.It is obtained by dividing the total production overheads by the total number ofdirect labour hours for the period.
Overhead rate =
Example: Production overheads = 40,000
Direct labour hours = 50,000 hours
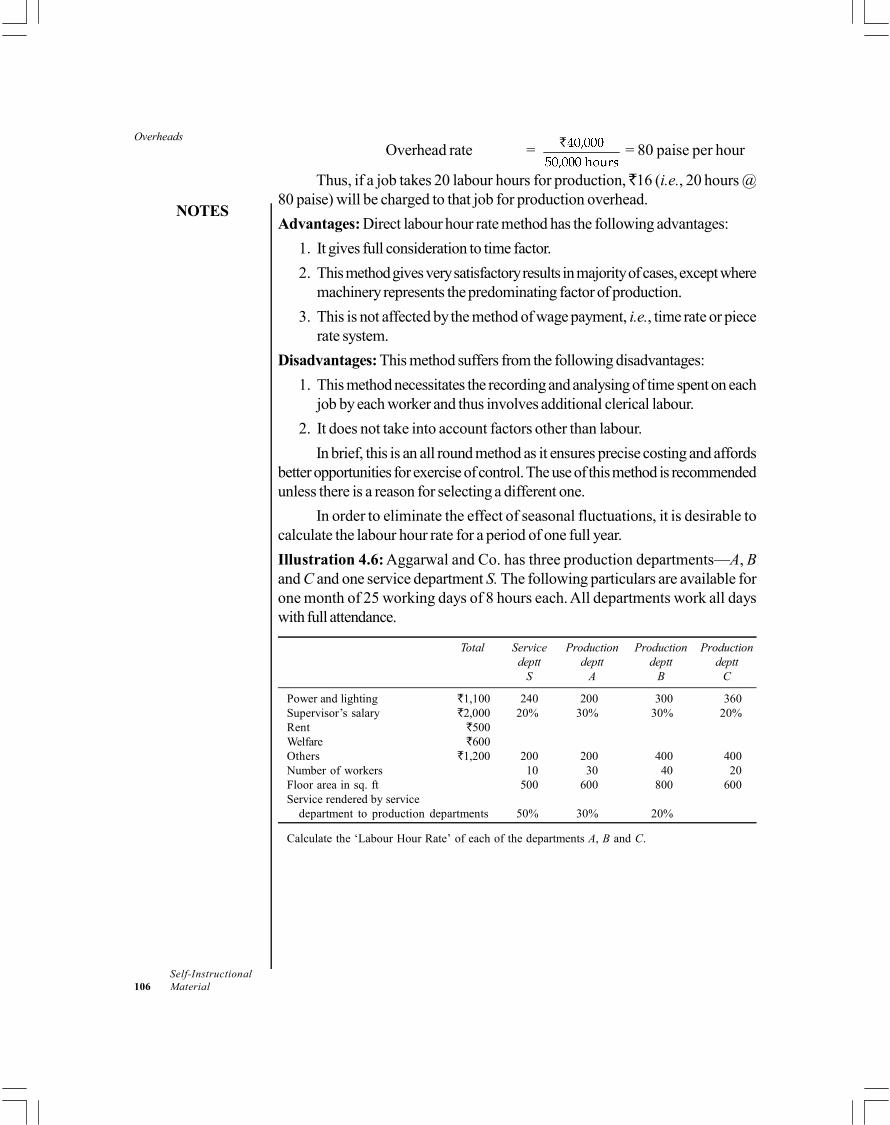
Overheads
NOTES
Self-Instructional106 Material
Overhead rate = = 80 paise per hour
Thus, if a job takes 20 labour hours for production, 16 (i.e., 20 hours @80 paise) will be charged to that job for production overhead.
Advantages: Direct labour hour rate method has the following advantages:
1. It gives full consideration to time factor.
2. This method gives very satisfactory results in majority of cases, except wheremachinery represents the predominating factor of production.
3. This is not affected by the method of wage payment, i.e., time rate or piecerate system.
Disadvantages: This method suffers from the following disadvantages:
1. This method necessitates the recording and analysing of time spent on eachjob by each worker and thus involves additional clerical labour.
2. It does not take into account factors other than labour.
In brief, this is an all round method as it ensures precise costing and affordsbetter opportunities for exercise of control. The use of this method is recommendedunless there is a reason for selecting a different one.
In order to eliminate the effect of seasonal fluctuations, it is desirable tocalculate the labour hour rate for a period of one full year.
Illustration 4.6: Aggarwal and Co. has three production departments—A, Band C and one service department S. The following particulars are available forone month of 25 working days of 8 hours each. All departments work all dayswith full attendance.
Total Service Production Production Productiondeptt deptt deptt deptt
S A B C
Power and lighting 1,100 240 200 300 360Supervisor’s salary 2,000 20% 30% 30% 20%Rent 500Welfare 600Others 1,200 200 200 400 400Number of workers 10 30 40 20Floor area in sq. ft 500 600 800 600Service rendered by service
department to production departments 50% 30% 20%
Calculate the ‘Labour Hour Rate’ of each of the departments A, B and C.
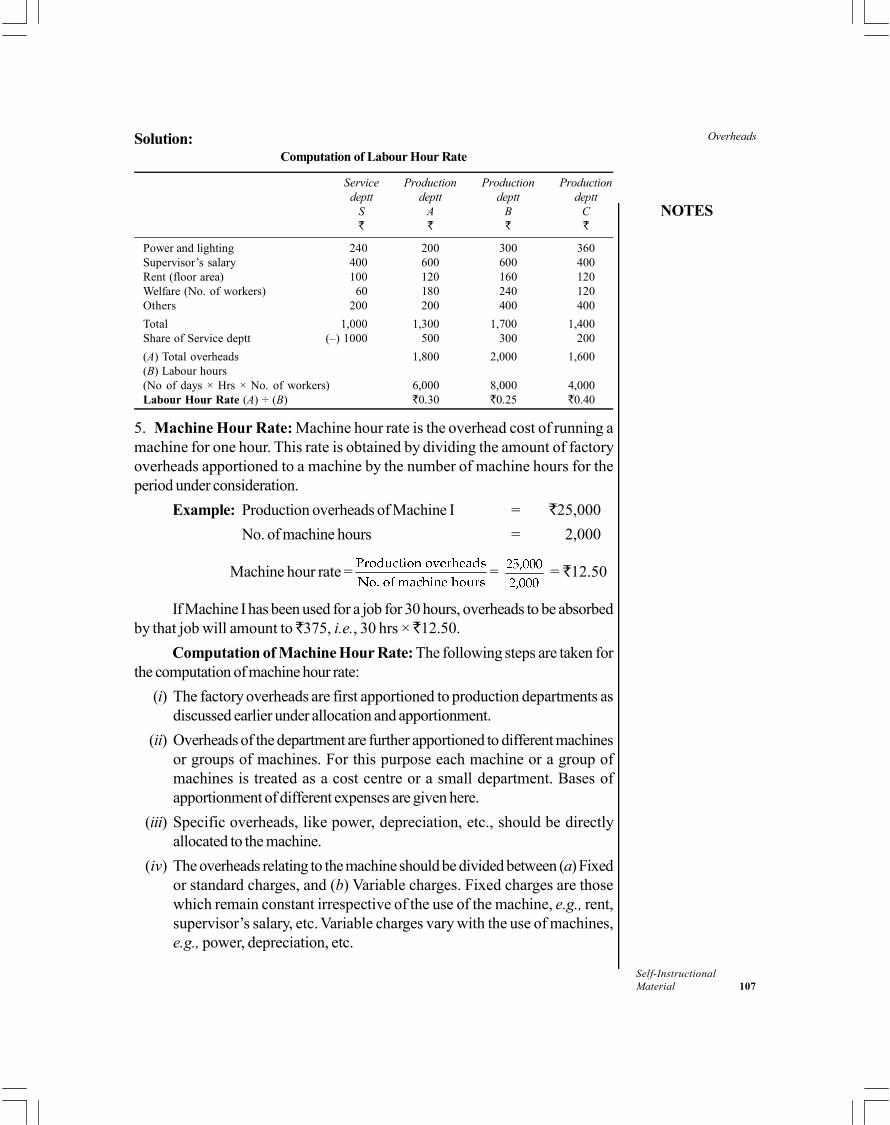
Overheads
NOTES
Self-InstructionalMaterial 107
Solution:Computation of Labour Hour Rate
Service Production Production Productiondeptt deptt deptt deptt
S A B C
Power and lighting 240 200 300 360Supervisor’s salary 400 600 600 400Rent (floor area) 100 120 160 120Welfare (No. of workers) 60 180 240 120Others 200 200 400 400
Total 1,000 1,300 1,700 1,400Share of Service deptt (–) 1000 500 300 200
(A) Total overheads 1,800 2,000 1,600(B) Labour hours(No of days × Hrs × No. of workers) 6,000 8,000 4,000Labour Hour Rate (A) ÷ (B) 0.30 0.25 0.40
5. Machine Hour Rate: Machine hour rate is the overhead cost of running amachine for one hour. This rate is obtained by dividing the amount of factoryoverheads apportioned to a machine by the number of machine hours for theperiod under consideration.
Example: Production overheads of Machine I = 25,000
No. of machine hours = 2,000
Machine hour rate = = = 12.50
If Machine I has been used for a job for 30 hours, overheads to be absorbedby that job will amount to 375, i.e., 30 hrs × 12.50.
Computation of Machine Hour Rate: The following steps are taken forthe computation of machine hour rate:
(i) The factory overheads are first apportioned to production departments asdiscussed earlier under allocation and apportionment.
(ii) Overheads of the department are further apportioned to different machinesor groups of machines. For this purpose each machine or a group ofmachines is treated as a cost centre or a small department. Bases ofapportionment of different expenses are given here.
(iii) Specific overheads, like power, depreciation, etc., should be directlyallocated to the machine.
(iv) The overheads relating to the machine should be divided between (a) Fixedor standard charges, and (b) Variable charges. Fixed charges are thosewhich remain constant irrespective of the use of the machine, e.g., rent,supervisor’s salary, etc. Variable charges vary with the use of machines,e.g., power, depreciation, etc.

Overheads
NOTES
Self-Instructional108 Material
(v) The working hours of a machine are estimated for the period.
(vi) Overheads pertaining to the machine are totalled and divided by the numberof effective machine hours. The resultant figure will be machine hour rate.The time required for setting the machine (unless it is treated as producingtime) should be deducted from the total working hours to arrive at effectivehours.
Treatment of depreciation: Depreciation is a semi-variable item. In thecomputation of machine hour rate, some accountants treat it as a fixed cost whileothers treat it as a variable cost. In fact, whether it is to be treated as fixed orvariable cost, depends upon the method of computing depreciation. In this chapter,it has been mostly treated as a variable item.
Bases of Apportionment of Different Overheads to Machines
Items of overheads Basis of apportionment
1. Rent and rates Ratio of floor area occupied by each machine2. Insurance Insured value of each machine3. Supervision Estimated time devoted by the supervisor to each
machine4. Lighting No. of light points used for each machine, or floor area
occupied by each machine5 Depreciation Capital values/machine hours or multiple of both6. Repairs and maintenance Capital values/machine hours7. Lubricating oil and other Capital values/machine hours
consumable stores
Comprehensive (or composite) machine hour rate: When the direct wagesof machine operators are included in machine hour rate, it is known ascomprehensive machine hour rate. Thus in a comprehensive machine hour rate,overheads and direct wages are absorbed by a single rate.
Advantages: The main advantages of machine hour rate method are:
1. From costing point of view, this is an accurate method of absorption ofoverheads.
2. It gives due consideration to the time factor and thus produces more equitableresults.
3. This is an ideal method of absorption where production is carried out onmachines.
4. When separate rates are calculated for fixed and variable overheads, thecost of idle machines can be measured without difficulty.
Disadvantages: This method suffers from the following limitations:
1. This method is not universally applicable and can be used only for thosecost centres where machine work is predominant.
2. Certain additional records like details of machine time taken by variousjobs have to be maintained which results in additional clerical labour.

Overheads
NOTES
Self-InstructionalMaterial 109
3. Correct estimation of the number of machine hours much in advance ofproduction is quite a difficult task. Any wrong estimate in this regard willproduce misleading results.
Illustration 4.7: From the following information compute the machine hour ratein respect of machine No. 10 for the month of January:
Cost of machine 32,000
Estimated scrap value 2,000
Effective working life 10,000 hours
Repairs and maintenance over the life period of machine 2,500
Standing charges allocated to this machine for January, 400
Power consumed by the machine @ 0.30 per unit, 600
The machine consumes 10 units of power per hour.
Solution:Computation of Machine Hour Rate
per hrStanding charges (400 ÷ 200*) 2.00Variable Charges:
1. Repairs and Maintenance ( 2,500 ÷ 10,000 hrs) 0.252. Power (10 units @ 30 Paise) 3.00
3. Depreciation
3.00
Machine Hour Rate 8.25
*Working Notes: No. of machine hours during the month of January is computed below:
No. of power units consumed in January = 600 ÷ 0.30 = 2,000 units
No. of machine hours = 2,000 units ÷ 10 units = 200 hours.
4.4.1 Types of Overhead Rates
Overhead rates may be: (i) actual or predetermined; and (ii) blanket or multiple.
These are described below.
Actual and Predetermined Rates
Overheads absorption rate may be based on actual figures or estimated figures.
Actual Rate: It is calculated by dividing the actual overheads by actual base.
Thus:
Actual overhead rate =
On account of certain limitations of actual rate, it is not always desirable touse it for the absorption of overheads. These limitations are:

Overheads
NOTES
Self-Instructional110 Material
1. Actual rate cannot be computed until the end of the accounting period. Thisresults in delay in computing cost.
2. When costs are used to calculate the selling prices for quotations and tenders,there is bound to be a considerable delay before the sales department caninvoice customers due to delay in information from costing department.
3. Actual rate may vary from period to period due to fluctuations in the amountof overheads, the volume of output and efficiency of operations. This makescomparisons difficult.
4. These rates do not provide any basis for cost control.
Predetermined Rate: This rate is determined in advance of the period in whichit is to be used. It is computed by dividing the estimated or budgeted amount ofoverheads by the budgeted base. Thus:
Predetermined rate =
As compared to actual rate, a predetermined rate is of greater practicalutility. This is because a predetermined rate enables prompt preparation of tendersand quotations and fixation of selling prices. Cost control is also facilitated bycomparing the actual overheads with the predetermined overheads recovered.The use of predetermined rates thus, helps in deriving some of the benefits ofstandard costing and budgetary control.
Blanket and Multiple Rates
A blanket overhead rate is a single overhead rate for the entire factory. It iscomputed as follows.
Blanket rate =
Blanket overhead rate should not be used except when output is uniform.Otherwise it will result in overcosting or undercosting of certain cost units.Moreover, when a blanket rate is used, performance of individual departments orcost centres cannot be properly assessed and exercise of control becomes difficult.Blanket rate is also known as Plant-wide or Plant-wise rate.
Multiple rates means a number of separate rates for each department,cost centre, etc. For instance, separate rates may be calculated for each of thefollowing:
(a) Production department
(b) Service department
(c) Cost centre
(d) Product
(e) Fixed overheads and variable overheads

Overheads
NOTES
Self-InstructionalMaterial 111
The following formula is used to calculate the multiple rates:
Overhead rate =
Blanket rates have a very limited application and can be usefully employedin (i) small firms, or (ii) when one single product is produced, or (iii) when a firmis producing more than one product and all of these products pass through all thedepartments and the incidence of overheads is uniform. Except in these situations,use of blanket overhead rate may result in distortion of cost. The main disadvantagesof blanket rates are as follows:
1. The use of blanket rate gives misleading and erroneous results, particularlywhere a firm is producing several products and all of theses products passthrough a number of production departments or cost centres.
2. When a blanket rate is used, performance of individual departments or costcentres cannot be properly assessed and exercise of control becomesdifficult.
3. The use of blanket rate may produce an erroneous work-in-progressvaluation because products included in work-in-progress might not havepassed through all the departments and if a blanket rate is charged for itsvaluation, the work-in-progress will be over-valued to the extent of facilitiesnot used in it.
Multiple rates are of more practical utility and should always be preferredover blanket rate for the sake of accuracy and control.
Requisites of a Good Method of Absorption
A satisfactory method of absorption should have the following characteristics:
1. It should be simple and easy to operate.
2. It should give accurate results and provide an equitable basis for overheadsabsorption.
3. Time factor should be given due consideration.
4. The method should distinguish between work done by skilled and unskilledworkers.
5. It should also make a distinction between work done by hand labour andmachines.
6. It should be economical in application and should not require maintenanceof unnecessary clerical records.
7. Multiple rates should be preferred to blanket rates.
Check Your Progress
5. What are the two steps involved in the absorption of overheads?
6. What is machine hour rate?
Overheads
NOTES
Self-Instructional112 Material
4.5 ADMINISTRATION, SELLING ANDDISTRIBUTION OVERHEADS
Up till now, you have studied the departmentalization of production and serviceoverheads, in this section you will first study administration overheads and thenlearn about selling and distributin overheads.
Administration Overheads
Office and administration overheads pertain to general management andadministration of business. They may be defined as the indirect expendituresincurred in formulating the policy, directing the organization and controllingthe operations of an undertaking. These overheads are of a general characterand are incurred for the business as a whole. They have little or no direct connectionwith production or sales activities. As production and sales cannot function withoutsome sort of administrative control, these overheads serve the purpose of such acontrol. Expenses of activities of board of directors, accounting, secretarial, audit,legal, financial, etc., are included in administrative overheads. These overheadsare generally constant in nature and are not affected by any fluctuations in thevolume of production or sales.
Accounting Treatment
Classification and collection of office and admini-strative overheads is done in thesame way as that of production overheads. Separate standing order numbers areallotted to each item of such an overhead cost, such as legal charges. travel-lingexpenses, office rent, audit fees, etc. These overhead costs are then allocated andapportioned to various administrative depart-ments, like general office, lawdepartment, accounts department and secretarial department.
Absorption of Administration Overheads
Office and administrative overheads generally constitute a small portion of thetotal cost as compared to production overheads. For the purpose of absorptionof these overheads, a single (blanket) overhead rate is computed by any one ofthe following methods:
1. Percentage of works cost: Administration overhead cost is generally absorbedas a percentage of works cost. Such a rate is computed by the following formula:
Overhead rate = × 100
For example, if administration overheads are 12,000 and works cost is2,40,000, the overhead rate is computed as follows:
Admn. overhead rate = = 5%
Overheads
NOTES
Self-InstructionalMaterial 113
2. Percentage of sales: Sometimes office and administration overheads areabsorbed as a percentage of sales. Its formula is:
Overhead rate = × 100
3. As a percentage of conversion cost: Conversion cost is the cost of convertingraw material into finished goods. It includes cost of direct labour and factoryoverheads. This method is rarely used.
Overhead rate is calculated by the following formula:
Overhead rate = × 100
Selling and Distribution Overheads
Selling and distribution costs are usually incurred after the production of productsor services is completed, and therefore, such costs are sometimes known as ‘after-production costs.’
Selling cost is the cost of seeking to create and stimulate demand (sometimestermed marketing) and of securing orders. These costs are thus incurred forincreasing sales to the existing and potential customers. Examples are advertisement,samples and free gifts, show-room expenses, etc.
Distribution cost is the cost of the sequence of operations which begins withmaking the packed product available for dispatch and ends with making thereconditioned returned empty packages, if any, available for re-use. Thusdistribution costs are incurred in placing the articles in the possession of thecustomers. Examples are carriage outwards, insurance of goods-in-transit,maintenance of delivery vans and werehousing.
For costing purposes, selling costs and distribution costs are generallyconsidered together, although in some cases these may be dealt with separately.
Difference between selling overheads and distribution overheads: Sellingoverheads and distribution overheads differ in their nature and purpose. Sellingoverheads are incurred for promoting sales and securing orders while distributionoverheads are mainly incurred in moving the goods from the company’s godownto customers’ place. The object of selling overheads is to solicit orders and tomake efforts to find and retain customers. The object of distribution overheads isthe safe delivery of the goods to the customers.
Accounting Treatment
The accounting procedure of selling and distribution cost comprises:
1. Classification, collection and analysis of these expenses
2. Apportionment and allocation to cost centres
3. Absorption by products or product groups

Overheads
NOTES
Self-Instructional114 Material
These three stages are discussed below:
1. Classification, collection and analysis: This is the first step and is similarto classification and collection of production overheads. Selling anddistribution overheads may be classified on the basis of products, salesterritories, channels of distribution, salesmen, etc.
When classification of expenses is complete, expenses are collected understanding order numbers provided for this purpose.
2. Apportionment and allocation to cost centres: In this step, selling anddistribution overheads are allocated or apportioned to various products,sales territories or other cost centres. Some of the common bases used fordistribution of selling and distribution overheads are given below.
3. Absorption of selling and distribution overheads: Absorption of sellingand distribution overheads means charging of these overheads to variousproducts, jobs or orders.
Methods of Absorption
Various methods for absorption of selling and distribution overheads are as follows:
1. A rate per unit of sales: This method is employed when the company isselling one uniform type of product. The total selling and distributionoverheads to be absorbed are divided by the number of units sold to arriveat a rate per unit.
For example, a company is manufacturing only one type of TV picturetube. During the month of May, its selling and distribution overheadsamounted to 75,000 and during this period, the number of picture tubessold is 1,000. The rate per unit for the absorption of selling and distributionoverheads will be 75,000 ÷ 1000 = 75.
2. A percentage of selling price: This method is recommended when theconcern is selling more than one type of product. A percentage of sellingand distribution overheads to selling price is ascertained from an analysis ofpast records. Overhead rate is calculated by the following formula:
Overhead rate = × 100
Example: Selling and distribution overheads 5,000
Total sales 1,00,000
Overhead rate = × 100 = 5% of selling price
3. A percentage of works cost: In this method, a percentage of sellingoverheads to works cost is ascertained. This percentage rate is applied forthe absorption of selling and distribution overheads.
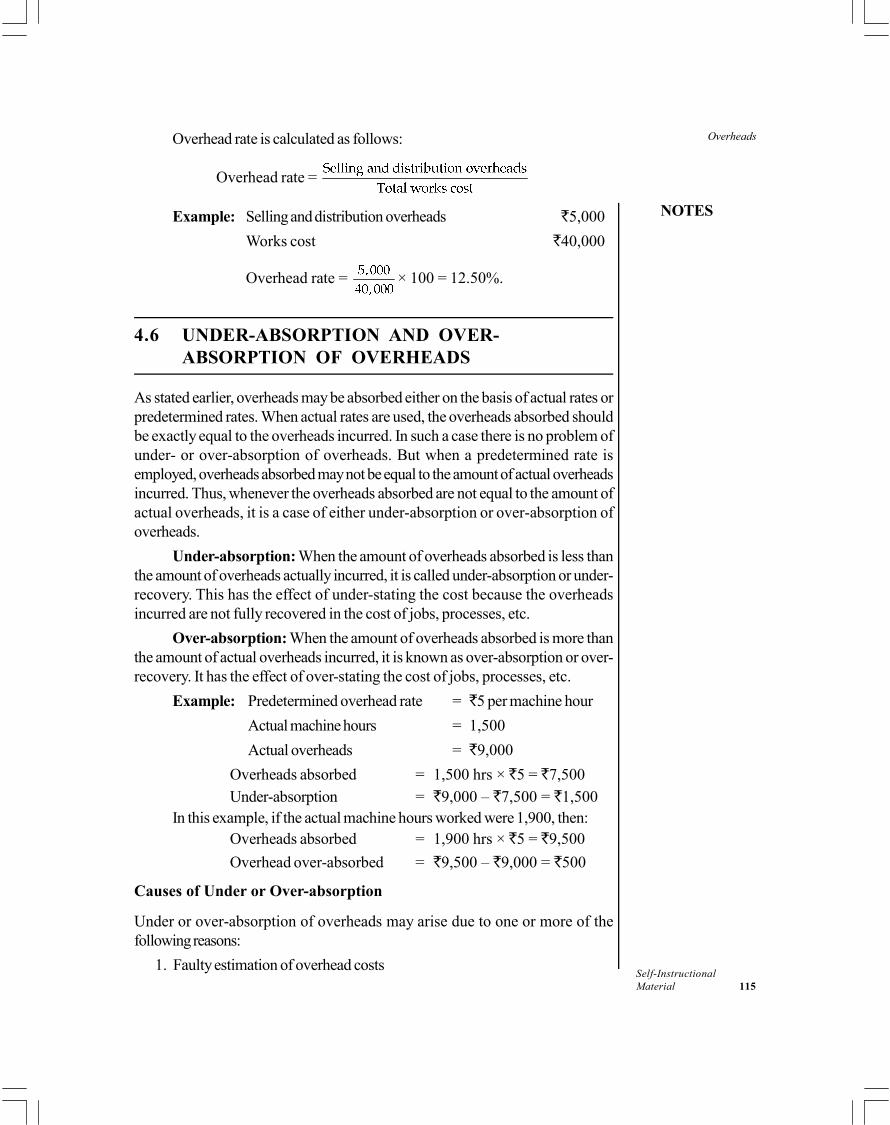
Overheads
NOTES
Self-InstructionalMaterial 115
Overhead rate is calculated as follows:
Overhead rate =
Example: Selling and distribution overheads 5,000
Works cost 40,000
Overhead rate = × 100 = 12.50%.
4.6 UNDER-ABSORPTION AND OVER-ABSORPTION OF OVERHEADS
As stated earlier, overheads may be absorbed either on the basis of actual rates orpredetermined rates. When actual rates are used, the overheads absorbed shouldbe exactly equal to the overheads incurred. In such a case there is no problem ofunder- or over-absorption of overheads. But when a predetermined rate isemployed, overheads absorbed may not be equal to the amount of actual overheadsincurred. Thus, whenever the overheads absorbed are not equal to the amount ofactual overheads, it is a case of either under-absorption or over-absorption ofoverheads.
Under-absorption: When the amount of overheads absorbed is less thanthe amount of overheads actually incurred, it is called under-absorption or under-recovery. This has the effect of under-stating the cost because the overheadsincurred are not fully recovered in the cost of jobs, processes, etc.
Over-absorption: When the amount of overheads absorbed is more thanthe amount of actual overheads incurred, it is known as over-absorption or over-recovery. It has the effect of over-stating the cost of jobs, processes, etc.
Example: Predetermined overhead rate = 5 per machine hour
Actual machine hours = 1,500
Actual overheads = 9,000
Overheads absorbed = 1,500 hrs × 5 = 7,500
Under-absorption = 9,000 – 7,500 = 1,500In this example, if the actual machine hours worked were 1,900, then:
Overheads absorbed = 1,900 hrs × 5 = 9,500
Overhead over-absorbed = 9,500 – 9,000 = 500
Causes of Under or Over-absorption
Under or over-absorption of overheads may arise due to one or more of thefollowing reasons:
1. Faulty estimation of overhead costs

Overheads
NOTES
Self-Instructional116 Material
2. Faulty estimation of the quantity of output
3. Seasonal fluctuation in the amount of overheads in certain industries
4. Unforseen changes in the production capacity
5. Unexpected changes in the method of production affecting changes in theamount of overheads
Whatever be the reason, under- or over-absorption is caused mainly dueto wrong estimation either of the overhead costs or of the base such as machinehours, production quantity, etc.
Accounting Treatment of Under and Over-absorption
Under or over-absorbed amounts of overheads are disposed of in accordancewith any of the following methods, depending upon the circumstances:
1. Use of supplementary rates: Where the amount of under or over-absorbedoverheads is significant, a supplementary overhead absorption rate is calculatedto adjust this amount in the cost. However, adjustment is made in the cost of:(i) work-in-progress; (ii) finished stock; and (iii) cost of sales. In the case ofunder-absorption, the overhead cost is adjusted by a plus rate since the amountis to be added, whereas over-absorption is adjusted by a minus rate since theamount is to be deducted.
Illustration 4.8: A company absorbs overheads on predetermincd rates. For theyear ending 31 Dec. 2009, factory overheads absorbed were 3,66,250. Actualamount of overheads incurred totalled 4,26,890. The following figures are alsoderived from the trial balance.
Finished stock 2,30,732Cost of goods sold 8,40,588Work-in-progress 1,41,480
How would you dispose of under/over-absorbed overheads by use ofsupplementary rate method.
Solution:
Under-absorbed overheads = Actual overheads – Absorbed overheads= 4,26,890 – 3,66,250 = 60,640
Total cost incurred = 230,732 + 840,588 + 1,41,480= 12,12,800
Supplementary Rate =
As there is under-absorption of overheads, it is a plus rate, i.e., the cost offinished goods, work-in-progress and cost of goods sold will be increased by 5%shown as follows:
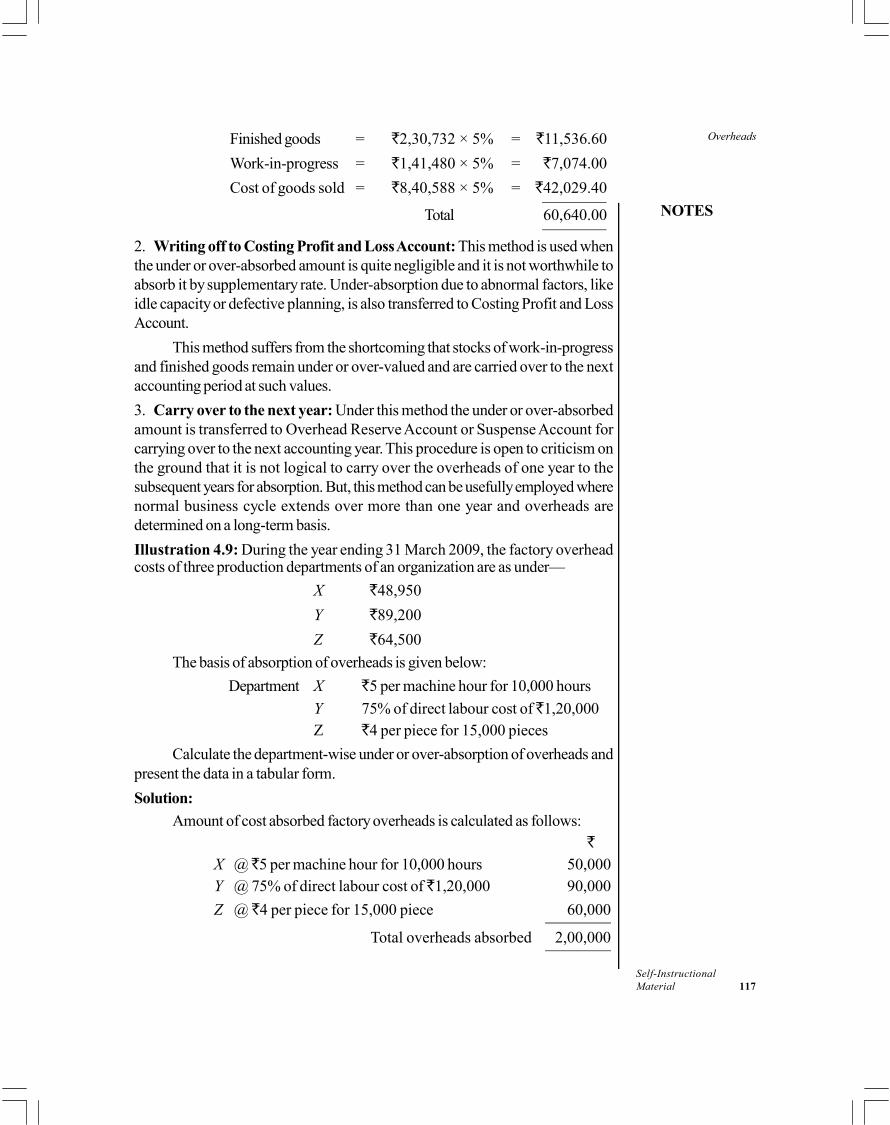
Overheads
NOTES
Self-InstructionalMaterial 117
Finished goods = 2,30,732 × 5% = 11,536.60
Work-in-progress = 1,41,480 × 5% = 7,074.00
Cost of goods sold = 8,40,588 × 5% = 42,029.40
Total 60,640.00
2. Writing off to Costing Profit and Loss Account: This method is used whenthe under or over-absorbed amount is quite negligible and it is not worthwhile toabsorb it by supplementary rate. Under-absorption due to abnormal factors, likeidle capacity or defective planning, is also transferred to Costing Profit and LossAccount.
This method suffers from the shortcoming that stocks of work-in-progressand finished goods remain under or over-valued and are carried over to the nextaccounting period at such values.
3. Carry over to the next year: Under this method the under or over-absorbedamount is transferred to Overhead Reserve Account or Suspense Account forcarrying over to the next accounting year. This procedure is open to criticism onthe ground that it is not logical to carry over the overheads of one year to thesubsequent years for absorption. But, this method can be usefully employed wherenormal business cycle extends over more than one year and overheads aredetermined on a long-term basis.
Illustration 4.9: During the year ending 31 March 2009, the factory overheadcosts of three production departments of an organization are as under—
X 48,950
Y 89,200
Z 64,500
The basis of absorption of overheads is given below:
Department X 5 per machine hour for 10,000 hours
Y 75% of direct labour cost of 1,20,000Z 4 per piece for 15,000 pieces
Calculate the department-wise under or over-absorption of overheads andpresent the data in a tabular form.
Solution:
Amount of cost absorbed factory overheads is calculated as follows:
X @ 5 per machine hour for 10,000 hours 50,000Y @ 75% of direct labour cost of 1,20,000 90,000
Z @ 4 per piece for 15,000 piece 60,000
Total overheads absorbed 2,00,000

Overheads
NOTES
Self-Instructional118 Material
Statement Showing Department-wise Under/Over-absorption
Department Actual Absorbed Under Overoverheads overheads absorption absorption
X 48,950 50,000 — 1,050Y 89,200 90,000 — 800Z 64,500 60,000 4,500 —
Total 2,02,650 2,00,000 4,500 1,850
Net under-absorption ( )= 4,500 – 1,850 = 2,650
or 2,02,650 – 2,00,000 = 2,650
Check Your Progress
7. State the difference between selling and distribution cost.
8. Under what circumstances can under and over absorption of overheadsoccur?
4.7 ANSWERS TO CHECK YOUR PROGRESSQUESTIONS
1. Production overhead is also known as factory overhead, works overheador manufacturing overhead.
2. Fixed overheads remain unaffected or fixed in total amount by fluctuationsin volume of output. Variable overhead is the cost which, in aggregate,tends to vary in direct proportion to changes in the volume of output. Variableoverhead per unit remains fixed.
3. The purpose of both cost allocation and cost apportionment is theidentification or allotment of items of cost to cost centres or cost units.However, the main difference between the two procedures is that whileallocation deals with whole items of costs, apportionment deals withproportions of items of cost.
4. Under trial and error method, the cost of first service department isapportioned to other service departments only in the given percentage. Thecost of the second service department then is apportioned to the first andother service departments.
5. There are two steps in the absorption of overheads: Computation ofoverhead absorption rate, and Application of these rates to cost units.
6. Machine hour rate is the overhead cost of running a machine for one hour.This rate is obtained by dividing the amount of factory overhead apportionedto a machine by the number of machine hours for the period underconsideration.
Overheads
NOTES
Self-InstructionalMaterial 119
7. Selling cost is ‘the cost of seeking to create and stimulate demand (sometimestermed marketing) and of securing orders.’ These costs are thus incurredfor increasing sales to the existing and potential customers.’ Distributioncost is ‘the cost of the sequence of operations which begins with making thepacked product available for dispatch and ends with making the re-conditioned returned empty packages, if any, available for re-use.’
8. Under- or over-absorption of overheads may arise due to one or more ofthe following reasons: Faulty estimation of overhead costs, Faulty estimationof the quantity of output, Seasonal fluctuation in the amount of overheads incertain industries, Unforeseen changes in the production capacity, andUnexpected changes in the method of production affecting changes in theamount of overheads.
4.8 SUMMARY
Total cost may be classified into direct cost and indirect cost. The total of alldirect costs is known as Prime cost and the total of all indirect costs istermed as Overhead cost.
Classifications of overhead costs: functions, elements and behaviour.
On the basis of functions, overheads may be classified into: (i) productionoverheads, (ii) administration overheads, and (iii) selling and distributionoverheads.
On the basis of behaviour, overheads may be classified into: (i) fixedoverhead, (ii) variable overhead, and (iii) semi-fixed or semi-variableoverhead.
On the basis of behaviour, overheads may be classified into: (i) indirectmaterials, (ii) indirect wages and (iii) indirect expenses.
After overhead costs have been collected under various standing ordernumbers, the next step is to allocate and apportion the overheads toproduction and service departments.
‘Allocation’ is a direct process, but ‘apportionment’ may be made onlyindirectly and for which suitable bases are to be selected.
Apportionment on reciprocal basis method is used when service departmentsare mutually dependent.
The absorption of overheads is the last step in the distribution plan ofoverheads.
Overhead rates may be (i) actual or pre-determined; and (ii) blanket ormultiple.
Office and administration overheads pertain to general management andadministration of business. They may be defined as the indirect expendituresincurred in formulating the policy, directing the organization and controllingthe operations of an undertaking.
Overheads
NOTES
Self-Instructional120 Material
Selling overheads are incurred for promoting sales and securing orders whiledistribution overheads are mainly incurred in moving the goods from thecompany’s godown to customers’ place.
Whenever the overheads absorbed are not equal to the amount of actualoverheads, it is a case of either under-absorption or over-absorption ofoverheads.
4.9 KEY WORDS
Allocation: It is charging to a cost centre those overheads that result solelyfrom the existence of that cost centre.
Apportionment: It is charging a fair share of an overhead to a cost centre.
Distribution overhead: It comprises all expenditure incurred from thetime the product is completed in the factory till it reaches its destination orcustomer; includes packing cost, carriage outward, delivery van expenses,warehousing costs, etc.
Idle capacity: This is the difference between practical capacity and capacitybased on sales expectancy or actual capacity.
Production overhead: It is the aggregate of factory indirect material cost,indirect wages and indirect expenses.
Selling overhead: It is the cost of seeking to create and stimulate demandor of securing orders.
4.10 SELF ASSESSMENT QUESTIONS ANDEXERCISES
Short Answer Questions
1. What is the advantage of classifying overheads into fixed and variable items?
2. Distinguish between cost classification and cost allocation.
3. State the objectives of departmentalization.
4. What are the principles of apportionment?
5. State the steps involved in the computation of machine hour rate.
6. What are the special features of selling and distribution overhead?
Long Answer Questions
1. What are the different methods of classifying overheads? Indicate theadvantages of classifying overheads on the basis of variability.
2. Explain with illustration the classification of ‘fixed’, ‘semi-fixed’ and ‘variable’expenses.
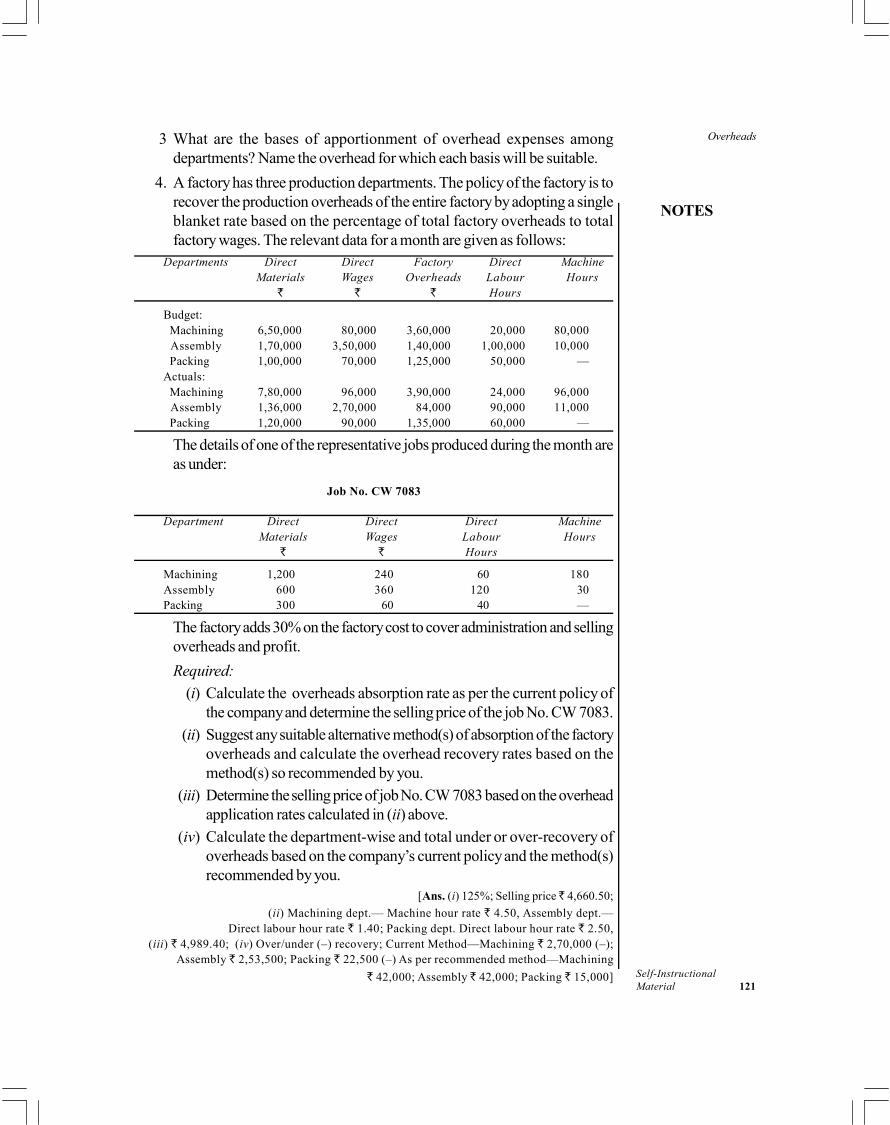
Overheads
NOTES
Self-InstructionalMaterial 121
3 What are the bases of apportionment of overhead expenses amongdepartments? Name the overhead for which each basis will be suitable.
4. A factory has three production departments. The policy of the factory is torecover the production overheads of the entire factory by adopting a singleblanket rate based on the percentage of total factory overheads to totalfactory wages. The relevant data for a month are given as follows:
Departments Direct Direct Factory Direct MachineMaterials Wages Overheads Labour Hours
Hours
Budget: Machining 6,50,000 80,000 3,60,000 20,000 80,000 Assembly 1,70,000 3,50,000 1,40,000 1,00,000 10,000 Packing 1,00,000 70,000 1,25,000 50,000 —Actuals: Machining 7,80,000 96,000 3,90,000 24,000 96,000 Assembly 1,36,000 2,70,000 84,000 90,000 11,000 Packing 1,20,000 90,000 1,35,000 60,000 —
The details of one of the representative jobs produced during the month areas under:
Job No. CW 7083
Department Direct Direct Direct MachineMaterials Wages Labour Hours
Hours
Machining 1,200 240 60 180Assembly 600 360 120 30Packing 300 60 40 —
The factory adds 30% on the factory cost to cover administration and sellingoverheads and profit.
Required:
(i) Calculate the overheads absorption rate as per the current policy ofthe company and determine the selling price of the job No. CW 7083.
(ii) Suggest any suitable alternative method(s) of absorption of the factoryoverheads and calculate the overhead recovery rates based on themethod(s) so recommended by you.
(iii) Determine the selling price of job No. CW 7083 based on the overheadapplication rates calculated in (ii) above.
(iv) Calculate the department-wise and total under or over-recovery ofoverheads based on the company’s current policy and the method(s)recommended by you.
[Ans. (i) 125%; Selling price 4,660.50;
(ii) Machining dept.— Machine hour rate 4.50, Assembly dept.—Direct labour hour rate 1.40; Packing dept. Direct labour hour rate 2.50,
(iii) 4,989.40; (iv) Over/under (–) recovery; Current Method—Machining 2,70,000 (–);Assembly 2,53,500; Packing 22,500 (–) As per recommended method—Machining
42,000; Assembly 42,000; Packing 15,000]

Overheads
NOTES
Self-Instructional122 Material
4.11 FURTHER READINGS
Arora, M.N. 2012. A Textbook of Cost and Management Accounting, Tenthedition. New Delhi: Vikas Publishing House.
Arora, M.N. 2010. Cost Accounting: Principles and Practice, Eleventh edition.New Delhi: Vikas Publishing House.
Shillinglow, G. 1982.Managerial Costing Accounting. Homewood: Richard D.Irwin.
Morse, W. J. 1978. Cost Accounting. Massachusetts: Addison-Wesley PublishingCo.
Lal, Jawahar. 2003. Cost Accounting. New Delhi: Tata McGraw Hill.
Unit and Output Costing
NOTES
Self-InstructionalMaterial 123
BLOCK - IITYPES OF COSTING
UNIT 5 UNIT AND OUTPUTCOSTING
Structure
5.0 Introduction5.1 Objectives5.2 Meaning of Cost Unit and Cost Accumulation, Procedure in Unit Costing,
Preparation of Cost Sheet5.3 Answers to Check Your Progress Questions5.4 Summary5.5 Key Words5.6 Self Assessment Questions and Exercises5.7 Further Readings
5.0 INTRODUCTION
A cost sheet shows every expense involved in creating a product. Companies andcontractors prepare cost sheets to show clients how much money it costs to provideservices, perform repairs or assemble products. Job costs typically involve labour,materials and overhead. Cost sheets show material purchased, labour hours andfigures used for arriving at a fair overhead cost. In this unit, you will study theconcept of unit costing and the preparation of cost sheet.
5.1 OBJECTIVES
After going through this unit, you will be able to:
Discuss the meaning and objectives of unit costing
Explain the meaning and preparation of cost sheet
Describe the determination of tender price
Explain the concept of production account
Unit and Output Costing
NOTES
Self-Instructional124 Material
5.2 MEANING AND OBJECTIVES OF UNIT AND
OUTPUT COSTING
Output costing (or unit costing or single costing) is a method of cost ascertainmentwhich is used in those industries which have the following features :
(i) Production consists of a single product or a few varieties of the same productwith variations in size, shape, quality, etc., and
(ii) Production is uniform and on continuous basis.
Costing Procedure
In order to ascertain the cost of products, a cost sheet is prepared periodically. Asthe production is uniform and cost units are identical, the cost per unit is the averagecost. It is ascertained by dividing the total cost by the number of units produced.Cost unit may be 1,000 bricks, a barrel of beer, a gallon of milk, a tonne of steel/cement/sugar, etc. The cost sheet is designed to show the total cost as well as costper unit of output for the given period.
Objectives of Unit Costing
Unit costing serves the following purposes:
1. It reveals the total cost and cost per unit of goods produced.
2. It discloses the break-up of total cost into different elements of cost.
3. It provides a comparative study of the cost of current period with that ofthe corresponding previous period.
4. It acts as a guide to management in fixation of selling prices and quotationof tenders.
5.2.1 Cost Sheet: Meaning and Performa
Cost sheet is defined as ‘a document which provides for the assembly of thedetailed cost of a cost centre or cost unit.’
Thus cost sheet is a periodical statement of cost, designed to show in detailthe various elements of cost of goods produced, like prime cost, factory cost,cost of production and total cost. It is prepared at regular intervals, e.g., weekly,monthly, quarterly, yearly, etc. Comparative figures of the previous period mayalso be shown in the cost sheet so that assessment can be made about the progressof the business.
Though the term Production Statement is used interchangeably with CostSheet, the former is an expanded form of the latter. In addition to cost elements, aproduction statement includes items of sales, stocks and profits. When the detailsof cost sheet or production statement are shown in a T-shape account, it is knownas Production Account. Other terms used are Cost Statement and Statementof Cost and Profit.
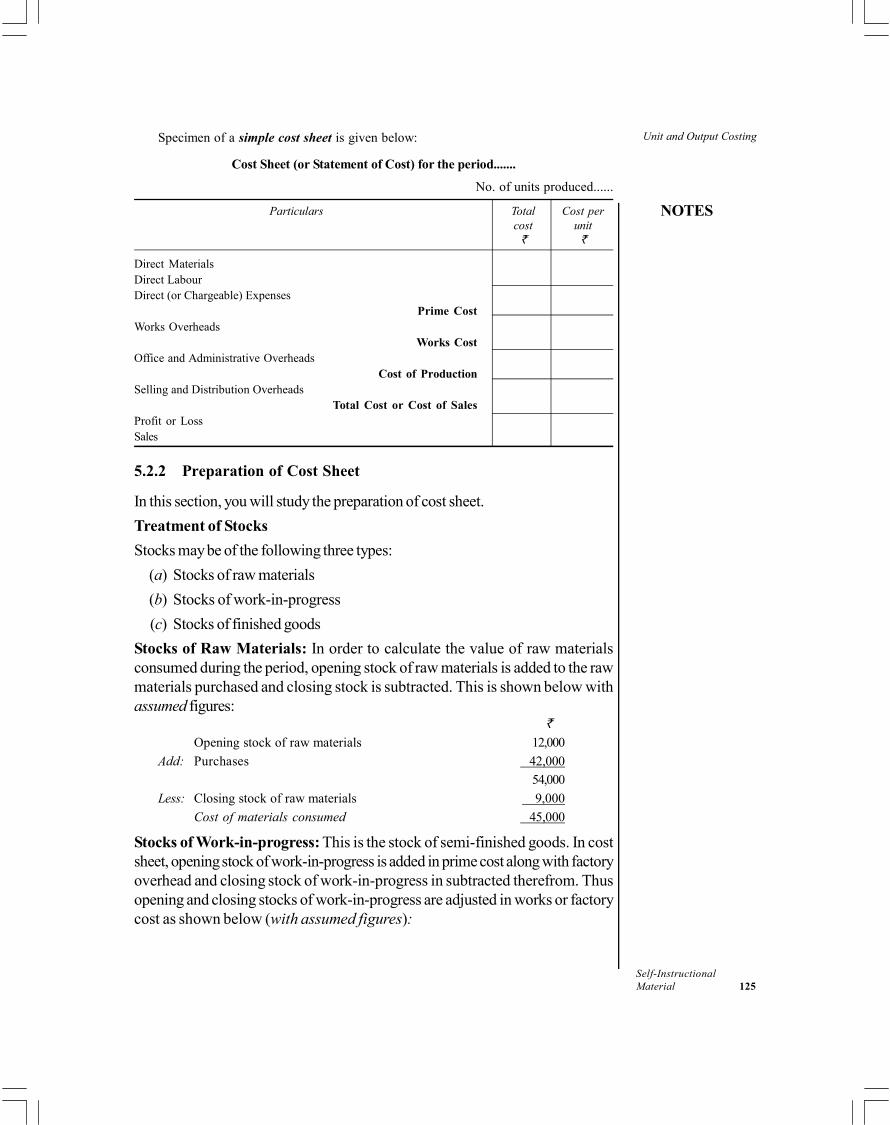
Unit and Output Costing
NOTES
Self-InstructionalMaterial 125
Specimen of a simple cost sheet is given below:
Cost Sheet (or Statement of Cost) for the period.......
No. of units produced......
Particulars Total Cost percost unit
Direct MaterialsDirect LabourDirect (or Chargeable) Expenses
Prime CostWorks Overheads
Works CostOffice and Administrative Overheads
Cost of ProductionSelling and Distribution Overheads
Total Cost or Cost of SalesProfit or LossSales
5.2.2 Preparation of Cost Sheet
In this section, you will study the preparation of cost sheet.
Treatment of Stocks
Stocks may be of the following three types:
(a) Stocks of raw materials
(b) Stocks of work-in-progress
(c) Stocks of finished goods
Stocks of Raw Materials: In order to calculate the value of raw materialsconsumed during the period, opening stock of raw materials is added to the rawmaterials purchased and closing stock is subtracted. This is shown below withassumed figures:
Opening stock of raw materials 12,000
Add: Purchases 42,000
54,000
Less: Closing stock of raw materials 9,000
Cost of materials consumed 45,000
Stocks of Work-in-progress: This is the stock of semi-finished goods. In costsheet, opening stock of work-in-progress is added in prime cost along with factoryoverhead and closing stock of work-in-progress in subtracted therefrom. Thusopening and closing stocks of work-in-progress are adjusted in works or factorycost as shown below (with assumed figures):

Unit and Output Costing
NOTES
Self-Instructional126 Material
Prime cost 62,000
Add: Factory overheads 27,000
Current manufacturing cost 89,000
Add: Opening stock of work-in-progress 13,000
Total goods processed during the period 1,02,000
Less: Closing stock of work-in-progress 11,000
Works or factory cost 91,000
Stock of Finished Goods: In cost sheet, finished goods are adjusted aftercalculating cost of production. Opening stock of finished goods is added to costof production and closing stock of finished goods is subtracted therefrom. Theresultant figure is called cost of goods sold. This is illustrated below (with assumedfigures):
Cost of production 1,15,000
Add: Opening stock of finished goods 17,000
Cost of goods available for sale 1,32,000
Less: Closing stock of finished goods 12,000
Cost of goods sold 1,20,000
The treatment of the above three types of stocks is illustrated in the followingspecimen cost sheet.
Cost Sheet for the period..........Production............units.
Particulars Total cost Cost per unit
Opening stock of raw materials XXXAdd: Purchases XXXAdd: Expenses on purchases XXX
XXXLess: Closing stock of raw materials XXX
Cost of material consumedDirect wagesDirect expenses
Prime CostAdd: Factory overheadsAdd: Opening stock of work-in-progressLess: Closing stock of work-in-progress
Factory or Works CostAdd: Administrative overheads
Cost of ProductionAdd: Opening stock of finished goodsLess: Closing stock of finished goods
Cost of Goods SoldAdd: Selling and distribution overheads
Cost of SalesProfit (or Loss)
Sales
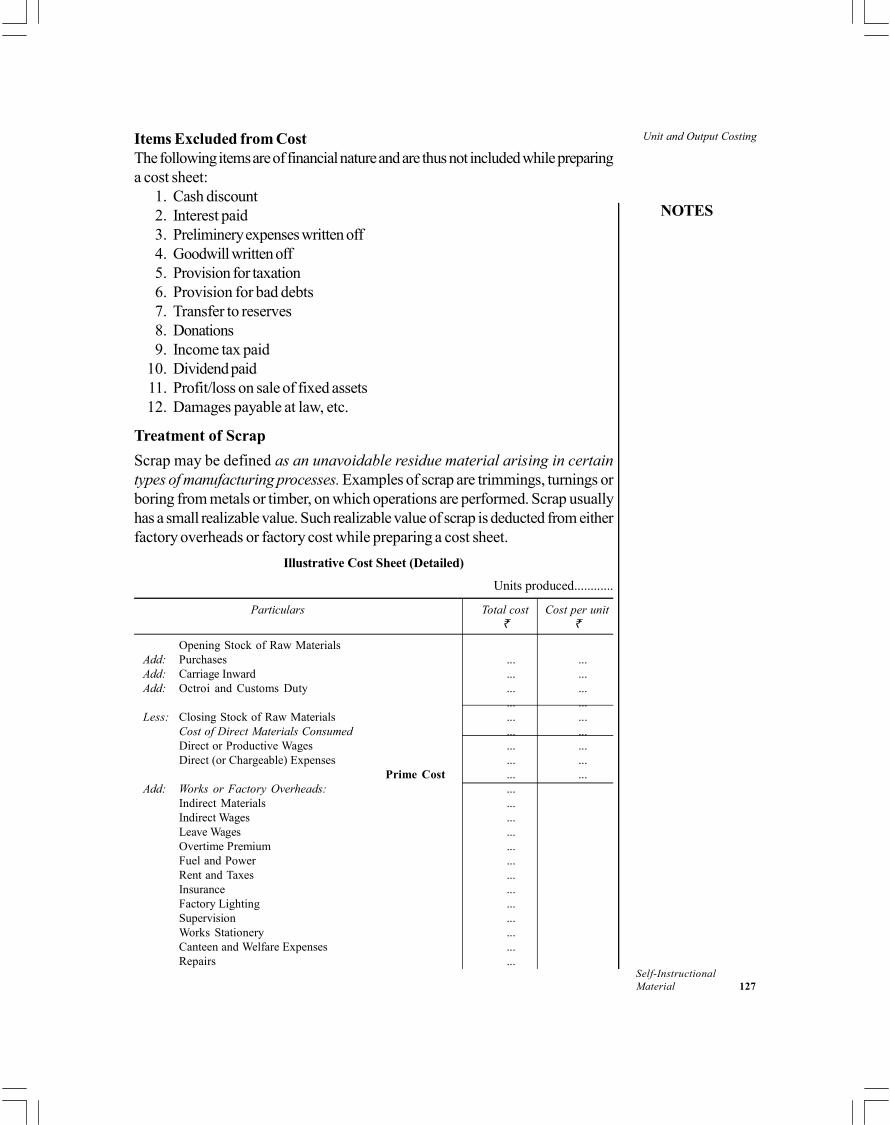
Unit and Output Costing
NOTES
Self-InstructionalMaterial 127
Items Excluded from CostThe following items are of financial nature and are thus not included while preparinga cost sheet:
1. Cash discount2. Interest paid3. Preliminery expenses written off4. Goodwill written off5. Provision for taxation6. Provision for bad debts7. Transfer to reserves8. Donations9. Income tax paid
10. Dividend paid11. Profit/loss on sale of fixed assets12. Damages payable at law, etc.
Treatment of Scrap
Scrap may be defined as an unavoidable residue material arising in certaintypes of manufacturing processes. Examples of scrap are trimmings, turnings orboring from metals or timber, on which operations are performed. Scrap usuallyhas a small realizable value. Such realizable value of scrap is deducted from eitherfactory overheads or factory cost while preparing a cost sheet.
Illustrative Cost Sheet (Detailed)
Units produced............
Particulars Total cost Cost per unit
Opening Stock of Raw MaterialsAdd: Purchases ... ...Add: Carriage Inward ... ...Add: Octroi and Customs Duty ... ...
... ...Less: Closing Stock of Raw Materials ... ...
Cost of Direct Materials Consumed ... ...Direct or Productive Wages ... ...Direct (or Chargeable) Expenses ... ...
Prime Cost ... ...Add: Works or Factory Overheads: ...
Indirect Materials ...Indirect Wages ...Leave Wages ...Overtime Premium ...Fuel and Power ...Rent and Taxes ...Insurance ...Factory Lighting ...Supervision ...Works Stationery ...Canteen and Welfare Expenses ...Repairs ...
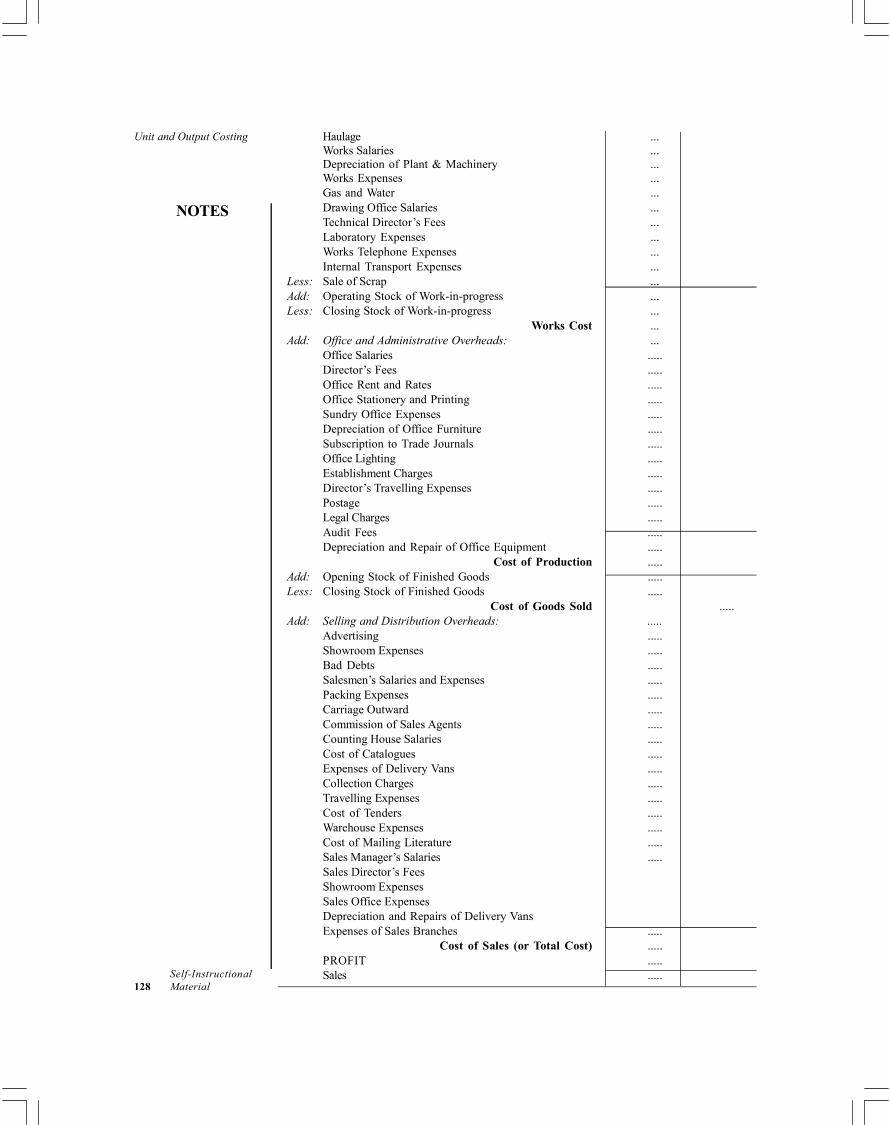
Unit and Output Costing
NOTES
Self-Instructional128 Material
Haulage ...Works Salaries ...Depreciation of Plant & Machinery ...Works Expenses ...Gas and Water ...Drawing Office Salaries ...Technical Director’s Fees ...Laboratory Expenses ...Works Telephone Expenses ...Internal Transport Expenses ...
Less: Sale of Scrap ...Add: Operating Stock of Work-in-progress ...Less: Closing Stock of Work-in-progress ...
Works Cost ...Add: Office and Administrative Overheads: ...
Office Salaries .....Director’s Fees .....Office Rent and Rates .....Office Stationery and Printing .....Sundry Office Expenses .....Depreciation of Office Furniture .....Subscription to Trade Journals .....Office Lighting .....Establishment Charges .....Director’s Travelling Expenses .....Postage .....Legal Charges .....Audit Fees .....Depreciation and Repair of Office Equipment .....
Cost of Production .....Add: Opening Stock of Finished Goods .....Less: Closing Stock of Finished Goods .....
Cost of Goods Sold .....Add: Selling and Distribution Overheads: .....
Advertising .....Showroom Expenses .....Bad Debts .....Salesmen’s Salaries and Expenses .....Packing Expenses .....Carriage Outward .....Commission of Sales Agents .....Counting House Salaries .....Cost of Catalogues .....Expenses of Delivery Vans .....Collection Charges .....Travelling Expenses .....Cost of Tenders .....Warehouse Expenses .....Cost of Mailing Literature .....Sales Manager’s Salaries .....Sales Director’s FeesShowroom ExpensesSales Office ExpensesDepreciation and Repairs of Delivery VansExpenses of Sales Branches .....
Cost of Sales (or Total Cost) .....PROFIT .....Sales .....
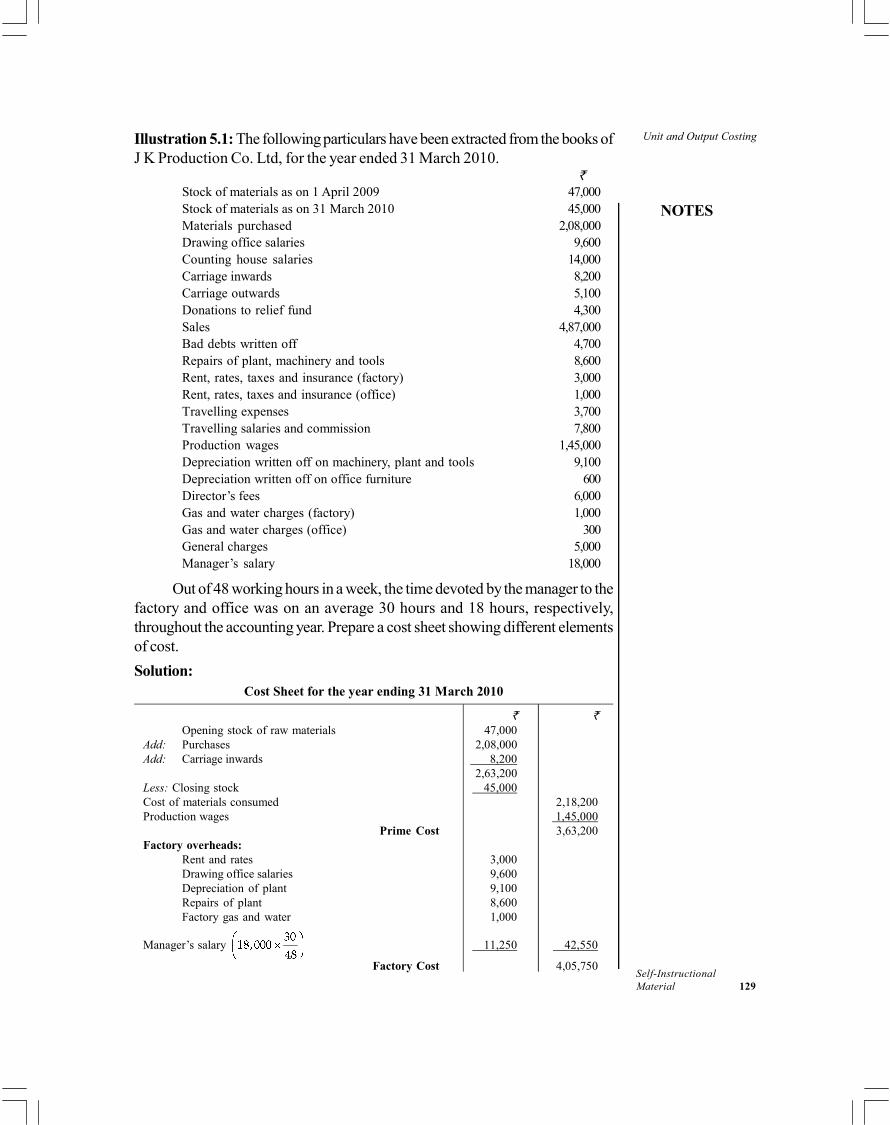
Unit and Output Costing
NOTES
Self-InstructionalMaterial 129
Illustration 5.1: The following particulars have been extracted from the books ofJ K Production Co. Ltd, for the year ended 31 March 2010.
Stock of materials as on 1 April 2009 47,000Stock of materials as on 31 March 2010 45,000Materials purchased 2,08,000Drawing office salaries 9,600Counting house salaries 14,000Carriage inwards 8,200Carriage outwards 5,100Donations to relief fund 4,300Sales 4,87,000Bad debts written off 4,700Repairs of plant, machinery and tools 8,600Rent, rates, taxes and insurance (factory) 3,000Rent, rates, taxes and insurance (office) 1,000Travelling expenses 3,700Travelling salaries and commission 7,800Production wages 1,45,000Depreciation written off on machinery, plant and tools 9,100Depreciation written off on office furniture 600Director’s fees 6,000Gas and water charges (factory) 1,000Gas and water charges (office) 300General charges 5,000Manager’s salary 18,000
Out of 48 working hours in a week, the time devoted by the manager to thefactory and office was on an average 30 hours and 18 hours, respectively,throughout the accounting year. Prepare a cost sheet showing different elementsof cost.
Solution:Cost Sheet for the year ending 31 March 2010
Opening stock of raw materials 47,000Add: Purchases 2,08,000Add: Carriage inwards 8,200
2,63,200Less: Closing stock 45,000Cost of materials consumed 2,18,200Production wages 1,45,000
Prime Cost 3,63,200Factory overheads:
Rent and rates 3,000Drawing office salaries 9,600Depreciation of plant 9,100Repairs of plant 8,600Factory gas and water 1,000
Manager’s salary 11,250 42,550
Factory Cost 4,05,750

Unit and Output Costing
NOTES
Self-Instructional130 Material
Administration overheads:Office rent and rates 1,000Depreciation on furniture 600Director’s fees 6,000Gas and water 300General charges 5,000
Manager’s salary 6,750 19,650
Cost of production 4,25,400Selling and distribution overheads:
Counting house salaries 14,000Carriage outwards 5,100Bad debts 4,700Travelling expenses 3,700Travelling salaries 7,800 35,300
Cost of Sales 4,60,700PROFIT 26,300
Sales 4,87,000
Note: Donation to relief fund is not included in cost.
5.2.3 Production Account
When information shown in a cost sheet is presented in the form of a T-shapeaccount, it is known as Production Account. In this account, debit side shows thevarious item of cost while credit side shows the sales of finished goods. Openingstock is written on the debit side while closing stock is written on the credit side.
Altenatively, closing stock may be shown as a deduction from the items indebit side. In this way this account shows the total cost. The balance in this accountshows profit or loss, as the case may be.
Illustration 5.2: Prepare a Production Account from the information extratedfrom the books of J K Production Co. Ltd as given in Illustration 5.1.
Solution:
Production Accountfor the year ending 31 March 2010
To Opening stock of raw materials 47,000 By Prime cost c/d 3,63,200Add: Purchases 2,08,000Add: Carriage inwards 8,200
2,63,200Less: Closing stock 45,000Cost of materials consumed 2,18,200To Production wages 1,45,000
3,63,200 3,63,200To Prime Cost b/d 3,63,200 By Factory cost c/d 4,05,750To Factory overheads:
Rent and rates 3,000Drawing office salaries 9,600Depreciation of plant 9,100Repairs of plant 8,600Factory gas and water 1,000

Unit and Output Costing
NOTES
Self-InstructionalMaterial 131
Manager’s salary(18,000 × 30/48) 11,250
4,05,750 4,05,750
To Factory Cost b/d 4,05,750 By Cost of production c/d 4,25,400To Administration overheads:
Office rent and rates 1,000Depreciation on furniture 600Director’s fees 6,000Gas and water 300General charges 5,000Manager’s salary
(18,000 × 18/48) 6,750 4,25,400 4,25,400
To Cost of Production b/d 4,25,400 By Cost of sales c/d 4,60,700To Selling and dist. overheads:
Counting house salaries 14,000Carriage outwards 5,100Bad debts 4,700Travelling expenses 3,700Travelling salaries, etc. 7,800
4,60,700 4,60,700
To Cost of Sales b/d 4,60,700 By Sales 4,87,000To Profit 26,300
4,87,000 4,87,000
5.2.4 Determination of Tender Price
Quite often the management has to quote prices of its products in advance or hasto submit tenders for goods to be supplied. For this purpose an estimated costsheet has to be prepared. Such an estimated cost sheet is prepared to show theestimated cost of products to be manufactured. In this cost sheet, cost of directmaterials, direct wages and various types of overheads are predetermined on thebasis of past costs after taking into account the present conditions and also theanticipated changes in the future price level. Overheads are absorbed on the basisof a suitable method of absorption like percentage of direct materials, or wages ormachine hour rate, etc. These methods were discussed in the overhead chapter.
Calculation of profit: After the total cost has been estimated, a desired percentageof profit is added to arrive at the price to be quoted. Such profit may be given asa percentage of cost or percentage of selling price. In order to calculate the amountof profit, it is easy to assume that figure as 100 on which profit percentage is givenand then calculate the amount of profit.
Example 1:
Given: Total cost = 50,000
Profit = 20% of cost
Suppose cost = 100
Profit = 100 × 20% = 20
When cost is 50,000:
Profit = 50,000 × = 10,000
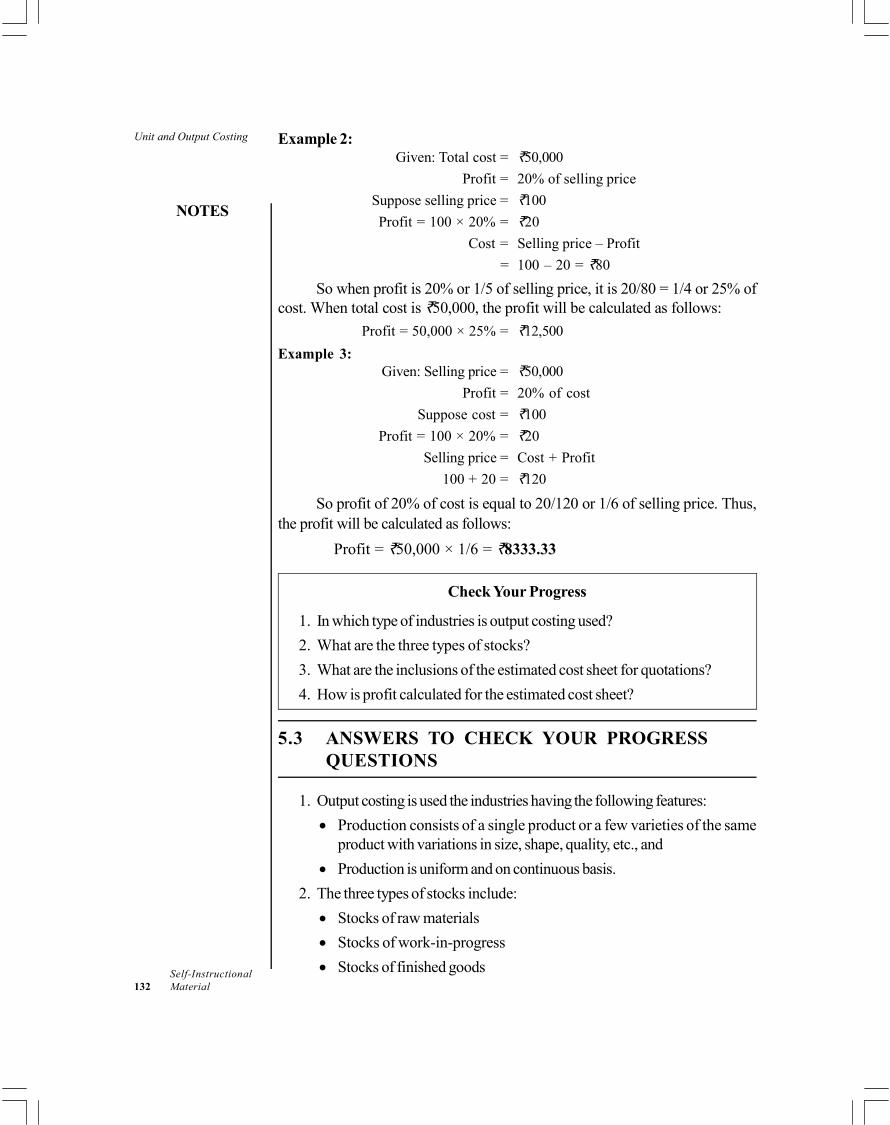
Unit and Output Costing
NOTES
Self-Instructional132 Material
Example 2:Given: Total cost = 50,000
Profit = 20% of selling price
Suppose selling price = 100
Profit = 100 × 20% = 20
Cost = Selling price – Profit
= 100 – 20 = 80
So when profit is 20% or 1/5 of selling price, it is 20/80 = 1/4 or 25% ofcost. When total cost is 50,000, the profit will be calculated as follows:
Profit = 50,000 × 25% = 12,500
Example 3:Given: Selling price = 50,000
Profit = 20% of cost
Suppose cost = 100
Profit = 100 × 20% = 20
Selling price = Cost + Profit
100 + 20 = 120
So profit of 20% of cost is equal to 20/120 or 1/6 of selling price. Thus,the profit will be calculated as follows:
Profit = 50,000 × 1/6 = 8333.33
Check Your Progress
1. In which type of industries is output costing used?
2. What are the three types of stocks?
3. What are the inclusions of the estimated cost sheet for quotations?
4. How is profit calculated for the estimated cost sheet?
5.3 ANSWERS TO CHECK YOUR PROGRESSQUESTIONS
1. Output costing is used the industries having the following features:
Production consists of a single product or a few varieties of the sameproduct with variations in size, shape, quality, etc., and
Production is uniform and on continuous basis.
2. The three types of stocks include:
Stocks of raw materials
Stocks of work-in-progress
Stocks of finished goods

Unit and Output Costing
NOTES
Self-InstructionalMaterial 133
3. An estimated cost sheet is prepared to show the estimated cost of productsto be manufactured. In this cost sheet, cost of direct materials, direct wagesand various types of overheads are predetermined on the basis of pastcosts after taking into account the present conditions and also the anticipatedchanges in the future price level.
4. After the total cost has been estimated, a desired percentage of profit isadded to arrive at the price to be quoted. Such profit may be given as apercentage of cost or percentage of selling price. In order to calculate theamount of profit, it is easy to assume that figure as 100 on which profitpercentage is given and then calculate the amount of profit.
5.4 SUMMARY
In order to ascertain the cost of products, a cost sheet is prepared periodically.As the production is uniform and cost units are identical, the cost per unit isthe average cost. It is ascertained by dividing the total cost by the numberof units produced.
Cost sheet is defined as ‘a document which provides for the assembly ofthe detailed cost of a cost centre or cost unit’.
Though the term production statement is used interchangeably with costsheet, the former is an expanded form of the latter. In addition to costelements, a production statement includes items of sales, stocks and profits.
Scrap may be defined as an unavoidable residue material arising in certaintypes of manufacturing processes. Examples of scrap are trimmings, turningsor boring from metals or timber, on which operations are performed.
Scrap usually has a small realizable value. Such realizable value of scrap isdeducted from either factory overheads or factory cost while preparing acost sheet.
When information shown in a cost sheet is presented in the form of aT-shape account, it is known as production account. In this account, debitside shows the various item of cost while credit side shows the sales offinished goods.
Opening stock is written on the debit side while closing stock is written onthe credit side.
Alternatively, closing stock may be shown as a deduction from the items indebit side. In this way this account shows the total cost. The balance in thisaccount shows profit or loss, as the case may be.
Quite often the management has to quote prices of its products in advanceor has to submit tenders for goods to be supplied. For this purpose anestimated cost sheet has to be prepared. Such an estimated cost sheet isprepared to show the estimated cost of products to be manufactured.
Unit and Output Costing
NOTES
Self-Instructional134 Material
In this cost sheet, cost of direct materials, direct wages and various types ofoverheads are predetermined on the basis of past costs after taking intoaccount the present conditions and also the anticipated changes in the futureprice level.
Overheads are absorbed on the basis of a suitable method of absorptionlike percentage of direct materials, or wages or machine hour rate, etc.
After the total cost has been estimated, a desired percentage of profit isadded to arrive at the price to be quoted. Such profit may be given as apercentage of cost or percentage of selling price.
In order to calculate the amount of profit, it is easy to assume that figure as100 on which profit percentage is given and then calculate the amount ofprofit.
5.5 KEY WORDS
Output costing: Output costing is a method of cost ascertainment, whichis used in those industries in which production consists of a single productor a few varieties of the same product, like cement industry, steel mills,paper mills and sugar mills.
Cost sheet: Cost sheet is a periodical statement of cost, designed to showin detail, the various elements of cost of goods produced like prime cost,factory cost, cost of production and total cost.
Estimated cost sheet: In estimated cost sheet, a fixed percentage ofprofit is added in the estimated total cost to arrive at the selling price to bequoted.
5.6 SELF ASSESSMENT QUESTIONS ANDEXERCISES
Short Answer Questions
1. Write a short note on the treatment of stocks.
2. What items are excluded from the cost sheet. Give relevant examples.
Long Answer Questions
1. What is unit or output costing? In what industries is it used?
2. What is a cost sheet? Explain the purposes served by it.
3. The following data relate to the manufacturing of a standard product duringthe four weeks ending on 31 March 2010:Raw materials consumed 20,000Direct wages 12,000
Unit and Output Costing
NOTES
Self-InstructionalMaterial 135
Machine-hours worked 1,000 hoursMachine-hour rate 2 per hourOffice overhead 20% on works costSelling overheads 0.40 per unitUnits produced 20,000 unitsUnits sold at 3 each 18,000 units
Prepare a Cost Sheet and show the profit.
4. A factory produces a standard product. The following information is givento you from which you are required to prepare a ‘Cost Sheet’ for the periodended 31 July 2010:Consumable materials:
Opening stock 10,000 Purchases 85,000 Closing stock 4,000
Direct wages 20,000Other direct expenses 10,000Factory overheads 100% of direct labourOffice overheads 10% of works costSelling and distribution expenses 2 per unit soldUnits of finished product:
In hand at the beginning of the period Units 1,000 (value 16,000) Produced during the period 10,000 units In hand at the end of the period 2,000 units
Also, find out the selling price per unit on the basis that profit mark-up isuniformly made to yield a profit of 20% of the selling price. There was nowork-in-progress either at the beginning or at the end of the period.
5.7 FURTHER READINGS
Arora, M.N. 2012. A Textbook of Cost and Management Accounting, Tenthedition. New Delhi: Vikas Publishing House.
Arora, M.N. 2010. Cost Accounting: Principles and Practice, Eleventh edition.New Delhi: Vikas Publishing House.
Shillinglow, G. 1982.Managerial Costing Accounting. Homewood: Richard D.Irwin.
Morse, W. J. 1978. Cost Accounting. Massachusetts: Addison-Wesley PublishingCo.
Lal, Jawahar. 2003. Cost Accounting. New Delhi: Tata McGraw Hill.

Reconciliation of Costand Final Accounts
NOTES
Self-Instructional136 Material
UNIT 6 RECONCILIATION OF COSTAND FINAL ACCOUNTS
Structure
6.0 Introduction6.1 Objectives6.2 Reconciliation of Cost Financial Accounts: Meaning
6.2.1 Objectives for Reconciliation6.3 Procedure of Reconciliation of Cost and Final Accounts6.4 Answers to Check Your Progress Questions6.5 Summary6.6 Key Words6.7 Self Assessment Questions and Exercises6.8 Further Readings
6.0 INTRODUCTION
In business concern where non-integrated accounting system is followed, costand financial accounts are maintained separately. The difference between the endresult of these two is required to be reconciled. Reconciliation of cost and financialaccounts means tallying the profit or loss revealed by both sets of accounts. Thechief aim is to find out the reasons for the difference between the results shown bycost accounts and financial accounts. In this unit, you will learn about the accountingprocess of reconciliation of cost and financial accounts.
6.1 OBJECTIVES
After going through this unit, you will be able to:
Discuss the meaning of reconciliation of cost and financial accounts
Recall the objectives of reconciliation of cost and financial accounts
Describe the procedure involved in the reconciliation of the accounts
6.2 RECONCILIATION OF COST FINANCIALACCOUNTS: MEANING
When cost accounts and financial accounts are maintained separately in twodifferent sets of books, two profit and loss accounts will be prepared—one forcosting books and the other for financial books. The profit or loss shown bycosting books may not agree with that shown by financial books. Therefore, itbecomes necessary that profit or loss shown by the two sets of accounts isreconciled.
Reconciliation of Costand Final Accounts
NOTES
Self-InstructionalMaterial 137
It is important to note that the question of reconciliation of cost financialaccounts arises only under non-integral system. However, under the integralaccounts, since cost and financial accounts are integrated into one set of booksand only one Profit and Loss Account is prepared, the problem of reconciliationdoes not arise.
6.2.1 Objectives for Reconciliation
The objectives for reconciliation can be understood through the needs it serves forthe accountants and managers:
1. Reconciliation reveals the reasons for difference in profit or loss betweencost and financial accounts.
2. It also helps in checking the arithmetic accuracy of the costing data. In otherwords, reconciliation enables to test the reliability of cost accounts.
3. It promotes coordination and cooperation between cost accounting andfinancial accounting departments.
Reasons for Disagreement in Profit/Loss
Difference in profit or loss between cost and financial accounts may arise due tothe following reasons:
1. Items shown only in financial accounts: There are a number of items whichappear in financial accounts and not in cost accounts. While reconciling, any itemsunder this category must be considered. These items are classified into threecategories as under:
(a) Purely financial charges—Examples:
(i) Loss on the sale of capital assets
(ii) Discount on bonds, debentures, etc.
(iii) Losses on investments
(iv) Expenses of company’s transfer office
(v) Interest on bank loans and mortgages
(vi) Fines and penalties
(vii) Provision for bad and doubtful debts
(viii) Damages payable at law
(ix) Amounts written off, goodwill, discount on debentures, preliminaryexpenses
(x) Loss due to theft, pilferage, etc.
(b) Purely financial incomes—Examples:
(i) Profit arising from the sale of capital assets
(ii) Rent receivable

Reconciliation of Costand Final Accounts
NOTES
Self-Instructional138 Material
(iii) Dividend and interest received on investments
(iv) Interest received on bank deposits
(v) Transfer fees received
(vi) Income tax refund
(c) Appropriations of profit—Examples:
(i) Dividends paid
(ii) Transfer to reserves
(iii) Charitable donations
(iv) Income-tax
(v) Any other items which appears in Profit and Loss AppropriationAccount
2. Items shown only in cost accounts: There are a few items which are includedin cost accounts and not in financial accounts. Examples:
(a) Notional rent, i.e., charge in lieu of rent when premises are owned and norent is payable
(b) Interest on capital employed but not actually paid, i.e., the notional cost ofemploying capital
(c) Notional salaries
(d) Depreciation on fully depreciated assets still in use
3. Under-absorption or over-absorption of overheads: In cost accounts,overheads are recovered at a predetermined rate whereas in financial accountsthese are recorded at actual cost. This may give rise to a difference betweenoverheads absorbed in cost and actual overhead cost incurred. Such differencesshould be written off to Costing Profit and Loss Account.
However, when under or over-absorbed overheads are not written off toCosting Profit and Loss Account, it results in the amount recovered in cost accountsbeing different from the actual amount shown in financial accounts. In such a case,it becomes necessary to take into account this under/over-absorption whilereconciling the two accounts.
4. Different bases of stock valuation: In cost accounts stocks are valuedaccording to the method adopted in stores accounts, e.g. FIFO, LIFO, etc. Onthe other hand, valuation of stock in financial accounts is invariably based on theprinciple of cost or market price, whichever is less. Different stock values result insome difference in profit or loss as shown by the two sets of account books.
5. Different charges for depreciation: The rates and methods of chargingdepreciation may be different in cost and financial accounts. The financial accountsmay follow straight line or diminishing balance method, etc., whereas in costaccounts machine hour rate, production unit method, etc., may be adopted. Thiswill also cause a difference in the profit/loss figures.
Reconciliation of Costand Final Accounts
NOTES
Self-InstructionalMaterial 139
6.3 PROCEDURE OF RECONCILIATION OF COSTAND FINAL ACCOUNTS
The cost and financial accounts are reconciled by preparing a ReconciliationStatement or a Memorandum Reconciliation Account. The following procedure isrecommended for preparing a Reconciliation Statement:
1. Ascertain the points of difference between cost accounts and financialaccounts.
2. Start with the profit as per cost accounts.
3. (a) Regarding items of expenses and losses:Add: Items over-charged in cost accountsDeduct: Items under-charged in cost accountsFor example, depreciation in cost accounts is 2,500 and that infinancial accounts is 2,700. This has the effect of increasing costingprofit by 200 as compared to financial profit. Then in order toreconcile, 200 will be deducted from costing profit.
(b) Regarding items of incomes and gains:Add: Items under-recorded or not recorded in cost accountsDeduct: Items over-recorded in cost accountsFor example, interest on investments received amounting to 1,500is not recorded in cost accounts. This will have the effect of reducingprofit as per cost books. Thus, in order to reconcile, this amount of1,500 for interest should be added in the costing profit.
(c) Regarding valuation of stock:(i) Opening Stock— Add: Amount of over-valuation in cost accounts
Deduct: Amount of under-valuation in costaccounts
(ii) Closing Stock— Add: Amount of under-valuation in costaccountsDeduct: Amount of over-valuation in costaccounts
4. After making all the above additions and deductions in costing profit, theresulting figure shall be the profit as per financial books.
5. The above treatment of items will be reversed when the starting point in theReconciliation Statement is the profit as per financial accounts or loss asper cost accounts.
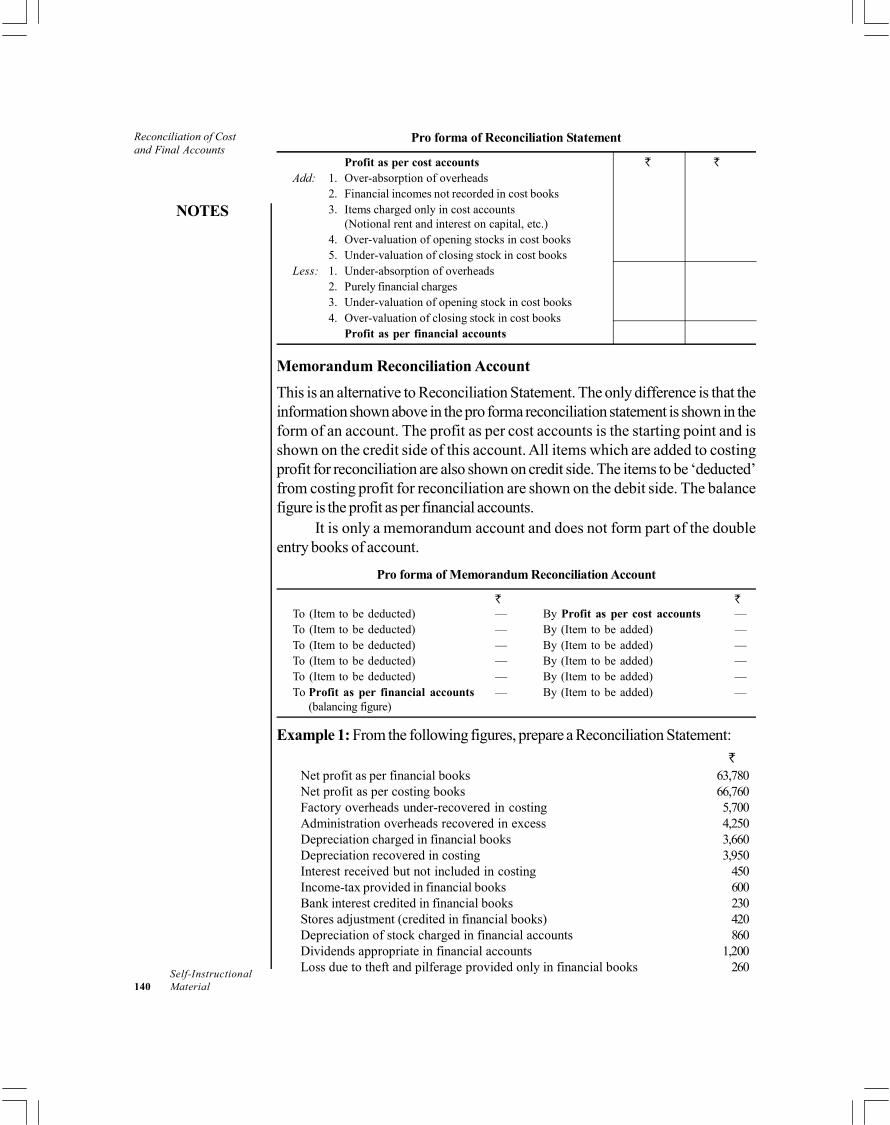
Reconciliation of Costand Final Accounts
NOTES
Self-Instructional140 Material
Pro forma of Reconciliation Statement
Profit as per cost accountsAdd: 1. Over-absorption of overheads
2. Financial incomes not recorded in cost books3. Items charged only in cost accounts
(Notional rent and interest on capital, etc.)4. Over-valuation of opening stocks in cost books5. Under-valuation of closing stock in cost books
Less: 1. Under-absorption of overheads2. Purely financial charges3. Under-valuation of opening stock in cost books4. Over-valuation of closing stock in cost books
Profit as per financial accounts
Memorandum Reconciliation Account
This is an alternative to Reconciliation Statement. The only difference is that theinformation shown above in the pro forma reconciliation statement is shown in theform of an account. The profit as per cost accounts is the starting point and isshown on the credit side of this account. All items which are added to costingprofit for reconciliation are also shown on credit side. The items to be ‘deducted’from costing profit for reconciliation are shown on the debit side. The balancefigure is the profit as per financial accounts.
It is only a memorandum account and does not form part of the doubleentry books of account.
Pro forma of Memorandum Reconciliation Account
To (Item to be deducted) — By Profit as per cost accounts —To (Item to be deducted) — By (Item to be added) —To (Item to be deducted) — By (Item to be added) —To (Item to be deducted) — By (Item to be added) —To (Item to be deducted) — By (Item to be added) —To Profit as per financial accounts — By (Item to be added) —
(balancing figure)
Example 1: From the following figures, prepare a Reconciliation Statement:
Net profit as per financial books 63,780Net profit as per costing books 66,760Factory overheads under-recovered in costing 5,700Administration overheads recovered in excess 4,250Depreciation charged in financial books 3,660Depreciation recovered in costing 3,950Interest received but not included in costing 450Income-tax provided in financial books 600Bank interest credited in financial books 230Stores adjustment (credited in financial books) 420Depreciation of stock charged in financial accounts 860Dividends appropriate in financial accounts 1,200Loss due to theft and pilferage provided only in financial books 260
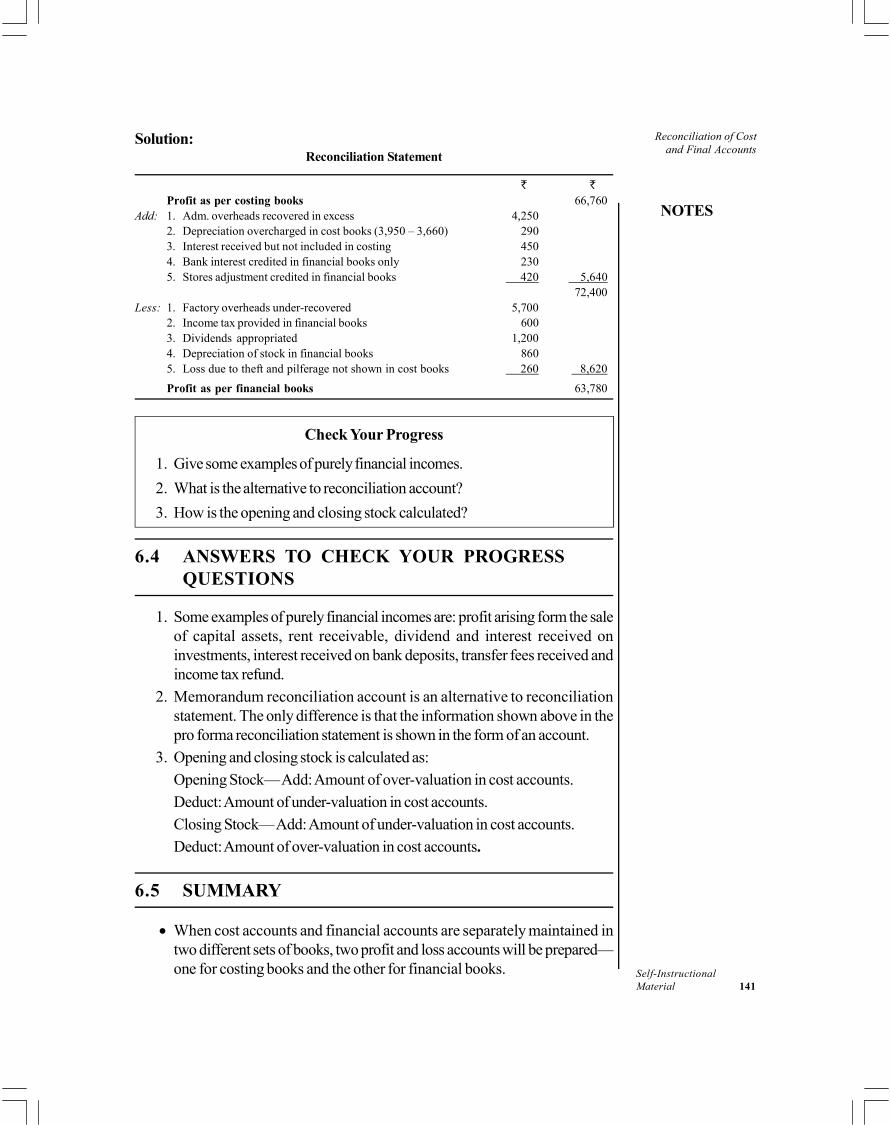
Reconciliation of Costand Final Accounts
NOTES
Self-InstructionalMaterial 141
Solution:Reconciliation Statement
Profit as per costing books 66,760Add: 1. Adm. overheads recovered in excess 4,250
2. Depreciation overcharged in cost books (3,950 – 3,660) 2903. Interest received but not included in costing 4504. Bank interest credited in financial books only 2305. Stores adjustment credited in financial books 420 5,640
72,400Less: 1. Factory overheads under-recovered 5,700
2. Income tax provided in financial books 6003. Dividends appropriated 1,2004. Depreciation of stock in financial books 8605. Loss due to theft and pilferage not shown in cost books 260 8,620
Profit as per financial books 63,780
Check Your Progress
1. Give some examples of purely financial incomes.
2. What is the alternative to reconciliation account?
3. How is the opening and closing stock calculated?
6.4 ANSWERS TO CHECK YOUR PROGRESSQUESTIONS
1. Some examples of purely financial incomes are: profit arising form the saleof capital assets, rent receivable, dividend and interest received oninvestments, interest received on bank deposits, transfer fees received andincome tax refund.
2. Memorandum reconciliation account is an alternative to reconciliationstatement. The only difference is that the information shown above in thepro forma reconciliation statement is shown in the form of an account.
3. Opening and closing stock is calculated as:
Opening Stock— Add: Amount of over-valuation in cost accounts.
Deduct: Amount of under-valuation in cost accounts.
Closing Stock— Add: Amount of under-valuation in cost accounts.
Deduct: Amount of over-valuation in cost accounts.
6.5 SUMMARY
When cost accounts and financial accounts are separately maintained intwo different sets of books, two profit and loss accounts will be prepared—one for costing books and the other for financial books.
Reconciliation of Costand Final Accounts
NOTES
Self-Instructional142 Material
It is important to note that the question of reconciliation of cost financialaccounts arises only under non-integral system.
However, under the integral accounts, since cost and financial accounts areintegrated into one set of books and only one Profit and Loss Account isprepared, the problem of reconciliation does not arise.
There are a number of items which appear in financial accounts and not incost accounts. While reconciling, any items under this category must beconsidered.
In cost accounts overheads are recovered at a predetermined rate whereasin financial accounts these are recorded at actual cost. This may give rise toa difference between overheads absorbed in cost and actual overhead costincurred. Such differences should be written off to Costing Profit and LossAccount.
In cost accounts stocks are valued according to the method adopted instores accounts, e.g. FIFO, LIFO etc. On the other hand, valuation ofstock in financial accounts is invariably based on the principle of cost ormarket price, whichever is less.
The cost and financial accounts are reconciled by preparing a ReconciliationStatement or a Memorandum Reconciliation Account.
6.6 KEY WORDS
Integral accounts: It is a system of accounting under which only one setof account books is maintained to record both the Cost and Financialtransactions.
Financial accounts: This refer to the type of accounting in which actualtransactions of a company are recorded to show the financial position
Costing accounts: This refer to the type of accounting in which actualtransactions as well as estimation of costs of a company are recorded ofaccurate decision making
6.7 SELF ASSESSMENT QUESTIONS ANDEXERCISES
Short Answer Questions
1. What do you understand by reconciliation of cost and financial accounts?
2. List out 10 items, either debit or credit, which appear in financial accountsbut do not appear in cost accounts.
3. What is Memorandum Reconciliation Account?

Reconciliation of Costand Final Accounts
NOTES
Self-InstructionalMaterial 143
Long Answer Questions
1. Indicate the reasons why it is necessary for the cost and financial accountsof an organization to be reconciled and explain the main reasons of differencewhich enter into such accounts.
2. The profit disclosed by company’s cost accounts for the year was 30,114whilst the net profit shown by the financial accounts amounted to 19,760.On reconciling the figures the following differences are brought to light:
(a) Overheads in the cost accounts were estimated at 7,500. The chargefor the year shown by the financial accounts was 6,932.
(b) Director’s fees not charged in the cost accounts amounted to 750.
(c) The company has allocated 600 to general provision for bad debts.
(d) Work was commenced during the year on a new factory andexpenditure of 12,000 was incurred. Depreciation of 5% wasprovided for in the financial accounts.
(e) Transfer fees received amounted to 28.
(f) The amount charged for Income Tax 9,000.
Prepare a statement reconciling the figure shown by cost and financialaccounts.
3. A manufacturing company disclosed a net loss of 3,47,000 as per theircost accounts for the year ended 31 March 2010. The financial accountshowever disclosed a net loss of 5,10,000 for the same period. Thefollowing information was revealed as a result of scrutiny of the figure ofboth the sets of accounts:
(i) Factory overheads under-absorbed 40,000
(ii) Administration overheads over-absorbed 60,000
(iii) Depreciation charged in financial accounts 3,25,000
(iv) Depreciation charged in cost accounts 2,75,000
(v) Interest on investment not included in cost accounts 96,000
(vi) Income-tax provided 54,000
(vii) Interest on loan funds in financial accounts 2,45,000
(viii) Transfer fess (credit in financial books) 24,000
(ix) Store adjustment (credit in financial books) 14,000
(x) Dividend received 32,000
Prepare a Reconciliation Statement.

Reconciliation of Costand Final Accounts
NOTES
Self-Instructional144 Material
6.8 FURTHER READINGS
Arora, M.N. 2012. A Textbook of Cost and Management Accounting, Tenthedition. New Delhi: Vikas Publishing House.
Arora, M.N. 2010. Cost Accounting: Principles and Practice, Eleventh edition.New Delhi: Vikas Publishing House.
Shillinglow, G. 1982.Managerial Costing Accounting. Homewood: Richard D.Irwin.
Morse, W. J. 1978. Cost Accounting. Massachusetts: Addison-Wesley PublishingCo.
Lal, Jawahar. 2003. Cost Accounting. New Delhi: Tata McGraw Hill.
Process Costing - I
NOTES
Self-InstructionalMaterial 145
UNIT 7 PROCESS COSTING - I
Structure
7.0 Introduction7.1 Objectives7.2 Process Costing: Meaning and Applications
7.2.1 Preparation of Process Accounts7.2.2 Treatment of Normal Wastage, Abnormal Effectiveness
7.3 Answers to Check Your Progress Questions7.4 Summary7.5 Key Words7.6 Self Assessment Questions and Exercises7.7 Further Readings
7.0 INTRODUCTION
Industries seldom work on single products. They are mostly involved in the massproduction of several different products. On this account, companies find it hardto differentiate the per unit cost of the different outputs and so the cost of one isassumed to be the same as other. This is known as process costing. Under this,the companies record the production costs for a certain period, summarizes themand then allocates them to the all the units produced for a consistent time.In this unit, you will study the aspects associated with process costing.
7.1 OBJECTIVES
After going through this unit, you will be able to:
Discuss the meaning and uses of process costing
Explain the preparation of process account
Describe the treatment of normal, abnormal wastage and abnormaleffectiveness
7.2 PROCESS COSTING:MEANING AND APPLICATIONS
Process costing is probably the most widely used method of cost ascertainment. Itis used in mass production industries producing standard products, like steel, sugarand chemicals. In all such industries, goods produced are identical and all factoryprocesses are standardized. Goods are produced without waiting for anyinstructions or orders from customers and are put into warehouse for sale. Raw
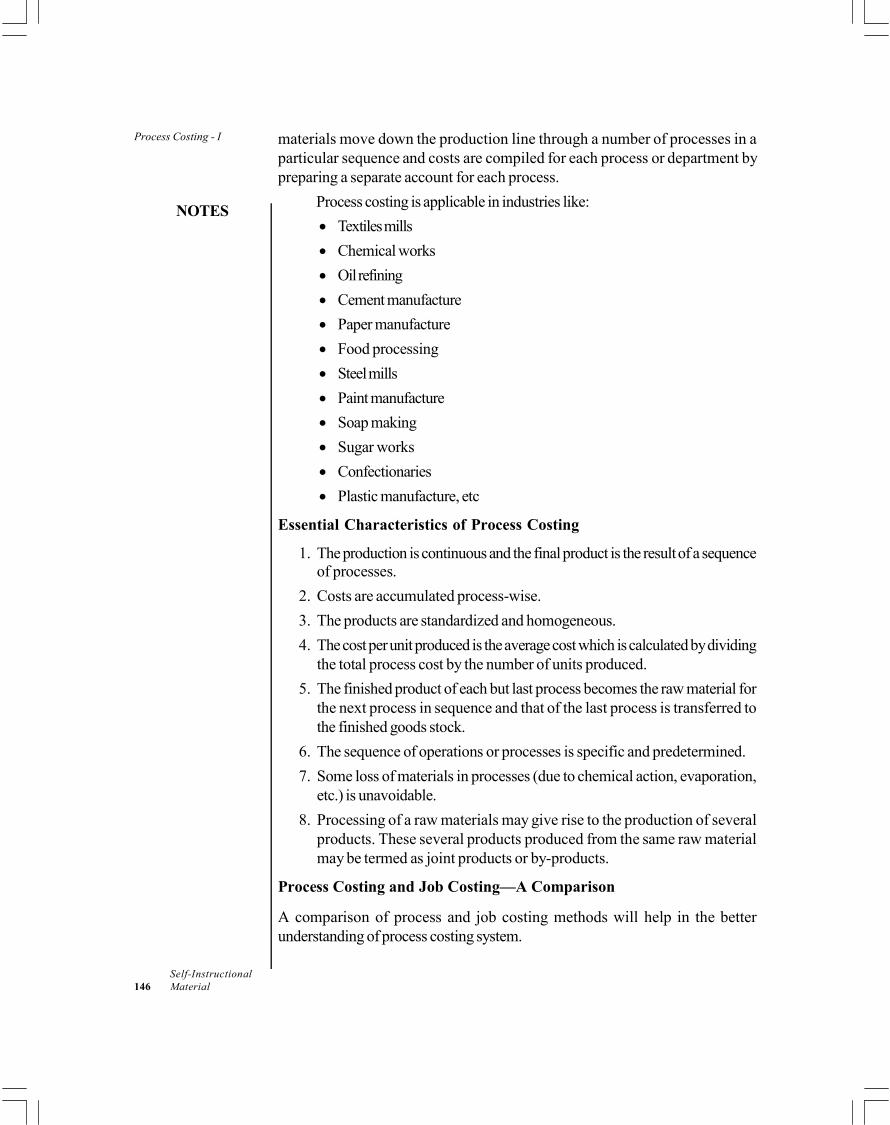
Process Costing - I
NOTES
Self-Instructional146 Material
materials move down the production line through a number of processes in aparticular sequence and costs are compiled for each process or department bypreparing a separate account for each process.
Process costing is applicable in industries like:
Textiles mills
Chemical works
Oil refining
Cement manufacture
Paper manufacture
Food processing
Steel mills
Paint manufacture
Soap making
Sugar works
Confectionaries
Plastic manufacture, etc
Essential Characteristics of Process Costing
1. The production is continuous and the final product is the result of a sequenceof processes.
2. Costs are accumulated process-wise.
3. The products are standardized and homogeneous.
4. The cost per unit produced is the average cost which is calculated by dividingthe total process cost by the number of units produced.
5. The finished product of each but last process becomes the raw material forthe next process in sequence and that of the last process is transferred tothe finished goods stock.
6. The sequence of operations or processes is specific and predetermined.
7. Some loss of materials in processes (due to chemical action, evaporation,etc.) is unavoidable.
8. Processing of a raw materials may give rise to the production of severalproducts. These several products produced from the same raw materialmay be termed as joint products or by-products.
Process Costing and Job Costing—A Comparison
A comparison of process and job costing methods will help in the betterunderstanding of process costing system.
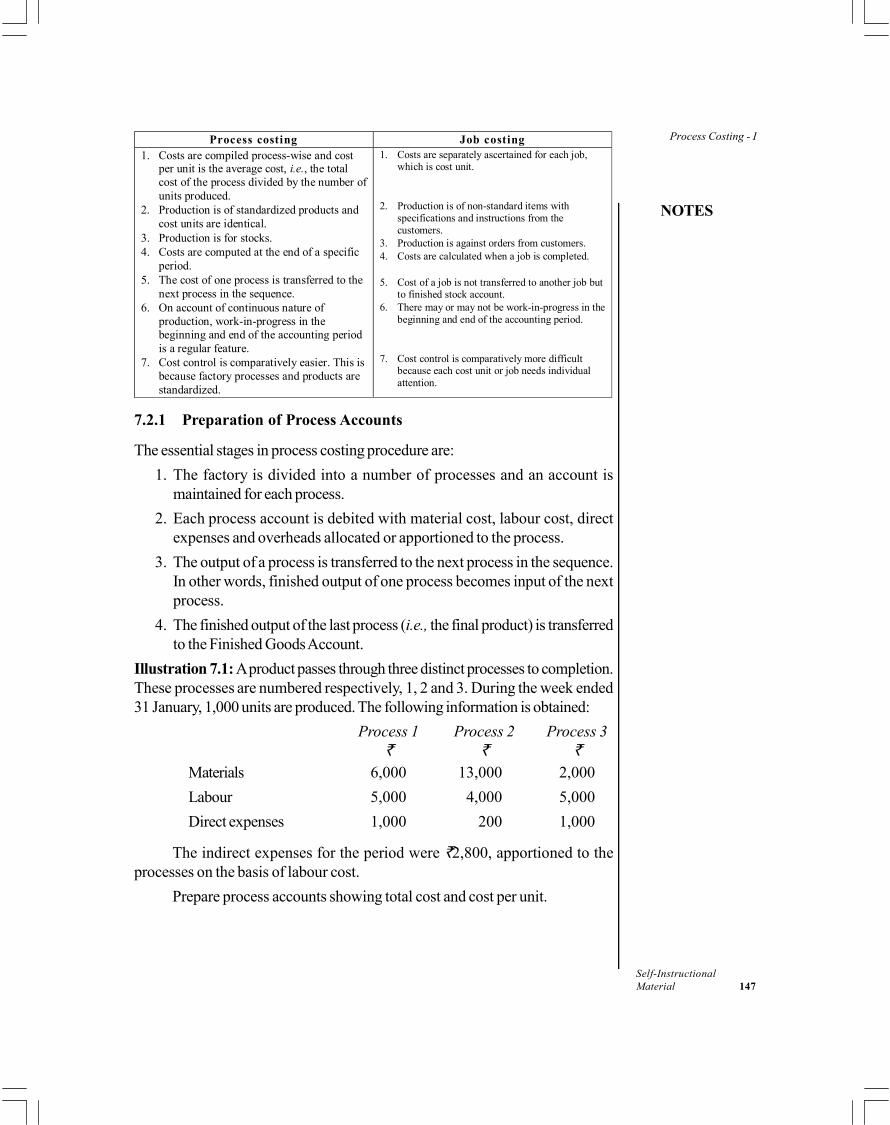
Process Costing - I
NOTES
Self-InstructionalMaterial 147
Process costing Job costing 1. Costs are compiled process-wise and cost
per unit is the average cost, i.e., the total cost of the process divided by the number of units produced.
2. Production is of standardized products and cost units are identical.
3. Production is for stocks. 4. Costs are computed at the end of a specific
period. 5. The cost of one process is transferred to the
next process in the sequence. 6. On account of continuous nature of
production, work-in-progress in the beginning and end of the accounting period is a regular feature.
7. Cost control is comparatively easier. This is because factory processes and products are standardized.
1. Costs are separately ascertained for each job, which is cost unit.
2. Production is of non-standard items with
specifications and instructions from the customers.
3. Production is against orders from customers. 4. Costs are calculated when a job is completed. 5. Cost of a job is not transferred to another job but
to finished stock account. 6. There may or may not be work-in-progress in the
beginning and end of the accounting period. 7. Cost control is comparatively more difficult
because each cost unit or job needs individual attention.
7.2.1 Preparation of Process Accounts
The essential stages in process costing procedure are:
1. The factory is divided into a number of processes and an account ismaintained for each process.
2. Each process account is debited with material cost, labour cost, directexpenses and overheads allocated or apportioned to the process.
3. The output of a process is transferred to the next process in the sequence.In other words, finished output of one process becomes input of the nextprocess.
4. The finished output of the last process (i.e., the final product) is transferredto the Finished Goods Account.
Illustration 7.1: A product passes through three distinct processes to completion.These processes are numbered respectively, 1, 2 and 3. During the week ended31 January, 1,000 units are produced. The following information is obtained:
Process 1 Process 2 Process 3
Materials 6,000 13,000 2,000
Labour 5,000 4,000 5,000
Direct expenses 1,000 200 1,000
The indirect expenses for the period were 2,800, apportioned to theprocesses on the basis of labour cost.
Prepare process accounts showing total cost and cost per unit.
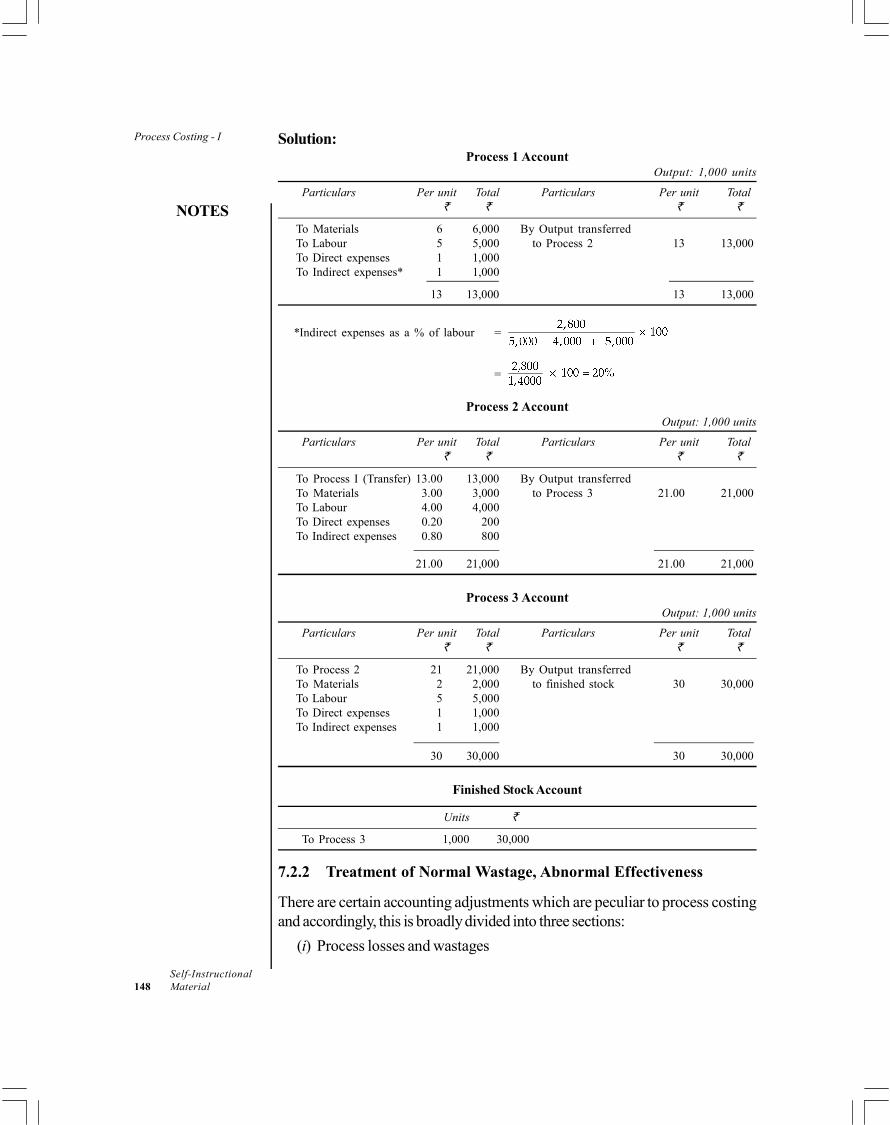
Process Costing - I
NOTES
Self-Instructional148 Material
Solution:Process 1 Account
Output: 1,000 units
Particulars Per unit Total Particulars Per unit Total
To Materials 6 6,000 By Output transferredTo Labour 5 5,000 to Process 2 13 13,000To Direct expenses 1 1,000To Indirect expenses* 1 1,000
13 13,000 13 13,000
*Indirect expenses as a % of labour =
=
Process 2 AccountOutput: 1,000 units
Particulars Per unit Total Particulars Per unit Total
To Process I (Transfer) 13.00 13,000 By Output transferredTo Materials 3.00 3,000 to Process 3 21.00 21,000To Labour 4.00 4,000To Direct expenses 0.20 200To Indirect expenses 0.80 800
21.00 21,000 21.00 21,000
Process 3 AccountOutput: 1,000 units
Particulars Per unit Total Particulars Per unit Total
To Process 2 21 21,000 By Output transferredTo Materials 2 2,000 to finished stock 30 30,000To Labour 5 5,000To Direct expenses 1 1,000To Indirect expenses 1 1,000
30 30,000 30 30,000
Finished Stock Account
Units
To Process 3 1,000 30,000
7.2.2 Treatment of Normal Wastage, Abnormal Effectiveness
There are certain accounting adjustments which are peculiar to process costingand accordingly, this is broadly divided into three sections:
(i) Process losses and wastages

Process Costing - I
NOTES
Self-InstructionalMaterial 149
(ii) Valuation of work-in-progress—Equivalent Production
(iii) Inter-process profits
In this unit, you will only study the first section related to process losses andwastages. The valuation of work-in-progress and inter-process profits will bediscussed in the next unit.
Process Losses and Wastages
In industries which employ process costing, a certain amount of loss occurs atvarious stages of production. Such a loss may arise due to chemical reaction,evaporation, inefficiency, etc. It is, therefore, necessary to keep accurate recordsof both input and output. Where loss occurs at a late stage in manufacture, it isapparent that financial loss is greater. This is because more and more costs areincurred in processes as products move towards completion stage.
Process losses may by classified into (a) normal, and (b) abnormal.
Normal Process Loss
That amount of loss which cannot be avoided because of the nature of material orprocess is normal process loss. Such a loss is quite expected under normalconditions. It is caused by factors, like chemical change, evaporation, withdrawalsfor tests or sampling and unavoidable spoiled quantities.
Abnormal Process Loss
This type of loss consists of loss due to carelessness, machine breakdown, accident,use of defective materials, etc. Thus, it arises due to abnormal factors and representsa loss which is over and above the normal loss.
Accounting procedure for normal and abnormal loss differs.
Accounting Treatment of Normal Loss
It is a fundamental costing principle that the cost of normal losses should be borneby the good production. Normal loss is generally determined as a percentage ofinput. Sometimes such a loss is due to loss of weight, say, due to evaporation orchemical action. Since such a wastage is not physically present, obviously it cannothave any value.
However, when normal loss is physically present in the form of scrap, it mayhave some value, i.e., it may be sold at some price. Whenever scrapped materialhas any value, it is credited to the Process Account. This is illustrated below.
Illustration 7.2: The following information is given in respect of process A.Material 1,000 kgs @ 6 per kgLabour 5,000Direct expenses 1,000Indirect expenses allocated to Process A 1,000Normal wastage 10% of input

Process Costing - I
NOTES
Self-Instructional150 Material
Prepare Process A Account when:
(a) Scrap value of normal loss is nil
(b) Scrap arising out of normal has a sale value of ̀ 1 per unit
Solution:
(a) When scrap value of normal loss is nil:Process A Account
Particulars Kgs Particulars Kgs
To Material 1,000 6,000 By Normal loss 100 —To Labour 5,000 By Transfer toTo Direct exp. 1,000 Process 2 900 13,000To Indirect exp. 1,000
1,000 13,000 1,000 13,000
Cost per unit = 13,000 ÷ 900 units
= 14.44
The normal loss is absorbed by good production and as a result the costper unit of good production inflates. When there is no loss, the cost per unit producedis 13 (i.e., 13,000 ÷ 1,000 units). But when there is a normal loss, the cost perunit is higher at 14.44.
(b) When scrap of normal loss has a sale value of 1 per unit.
Process A Account
Particulars Kgs Particulars Kgs
To Material 1,000 6,000 By Normal loss 100 100To Labour 5,000 By Transfer to Process 2 900 12,900To Direct exp. 1,000To Indirect exp. 1,000
1,000 13,000 1,000 13,000
Cost per unit = 12,900 ÷ 900 units
= 14.33
Whenever any value is realized from the sale of normal wastage, it reducesthe cost to that extent.
Accounting Treatment of Abnormal Process Loss
It has been stated earlier that abnormal loss is due to carelessness, accidents,machine breakdown and other abnormal reasons. Unlike normal loss, abnormalloss is not absorbed by good production, rather it is transferred to Costing Profitand Loss Account. This is because if the cost of abnormal loss were to fall uponthe good production, the cost thereof will fluctuate and the information providedwould be misleading. In order to overcome this and also to disclose the cost ofabnormal loss, the following procedure may be adopted:

Process Costing - I
NOTES
Self-InstructionalMaterial 151
(a) Allow for normal loss in the manner described earlier.
(b) After considering normal loss, find out the cost per unit in that process. Thisis done by the following formula:
Cost per unit =
(c) Multiply the cost per unit (calculated as above) by the number of units ofabnormal loss. This gives the total value of abnormal loss.
(d) Credit the relevant Process Account with the quantity and value of abnormalloss.
(e) The balance figure in the Process Account is the cost of good units producedin the process. This can also be found by multiplying cost per unit with thenumber of good units produced.
(f) Open ‘Abnormal Loss Account’ and debit it with the quantity and value ofabnormal loss shown in the Process Account. Sale proceeds from abnormalloss are credited to Abnormal Loss Account. Any balance left in this accountis net loss and transferred to Costing Profit and Loss Account.
Illustration 7.3: Fifty units are introduced into a process at a cost of rupee oneeach. The total additional expenditure incurred by the Process is 30. Of the unitsintroduced, 10% are normally spoiled in the course of manufacture, these possessa scrap value of 0.25 each. Owing to an accident, only 40 units are produced.You are required to prepare (i) Process Account, and (ii) Abnormal Loss Account.
Solution:Process Account
Particulars Units Particulars Units
To Materials 50 50.00 By Normal loss 5 1.25To Expenses — 30.00 By Abnormal loss 5 8.75*
By Transfer to nextprocess (B/F) 40 70.00
50 80.00 50 80.00
*Cost of abnormal loss is calculated as follows:
Cost per unit = =
Cost of abnormal loss= Abnormal loss units × Cost per unit
= 5 × 1.75 = 8.75
Abnormal Loss Account
Particulars Units Particulars Units
To Process A/c 5 8.75 By Sales 5 1.25By Profit and Loss A/c 7.50(Balanced figure)
5 8.75 5 8.75

Process Costing - I
NOTES
Self-Instructional152 Material
Abnormal Gain or Effectiveness
The normal process loss represents the loss that would be expected under normalconditions. It is an estimated figure. The actual loss may be greater or less than thenormal loss. If the actual loss is greater than normal loss, it is known as abnormalloss. But if actual loss is less than normal loss, a gain is obtained which is termed asabnormal gain or effectiveness. The value of abnormal gain is calculated in amanner similar to abnormal loss. It is shown on the debit side of the ProcessAccount and credit side of the Abnormal Gain Account. Like abnormal loss, it isultimately transferred to Costing Profit and Loss Account. This is illustrated below.
Example: Using the figures of Illustration 7.3, except that output is 47 units, showhow the process account will be prepared. Also prepare Abnormal Gain Account.
Solution: When normal output is 45 units and actual output is 47 units, there is anabnormal gain of 2 units. This is shown in the following account.
Process Account
Particulars Units Particulars Units
To Material 50 50 By Normal loss 5 1.25To Expenses 30 By Transfer to nextTo Abnormal gain* 2 3.50 process 47 82.25
52 83.50 52 83.50
*The value of abnormal gain is calculated as follows:
× 2 units = 3.50
It should be noted that the method of valuation of abnormal gain is the sameas that of abnormal loss.
Abnormal Gain Account
Particulars Units Particulars Units
To Normal loss A/c By Process A/c 2 3.50 (Shortfall in the sale 2 0.50 of normal loss)
To Profit & Loss 3.00A/c (B.F.)
2 3.50 2 3.50
Illustration 7.4: A product passes through three processes A, B and C. Thenormal wastage of each process is as follows: Process A – 3 per cent, Process B– 5 per cent, and Process C – 8 per cent. Wastage of Process A was sold at 25p. per unit, that of Process B at 50 p. per unit and that of Process C at 1 per unit.
10,000 units were issued to Process A in the beginning of October 2005 ata cost of 1 per unit. The other expenses were as follows:

Process Costing - I
NOTES
Self-InstructionalMaterial 153
Process A Process B Process CSundry materials 1,000 1,500 500Labour 5,000 8,000 6,500Direct expenses 1,050 1,188 2,009Actual output 9,500 units 9,100 units 8,100 units
Prepare the Process Accounts, assuming that there were no opening orclosing stocks. Also give the Abnormal Wastage and Abnormal Gain Accounts.
Solution:Process A Account
Particulars Units Particulars Units
To Units introduced 10,000 10,000 By Normal wastage 300 75To Sundry materials 1,000 (3% of 10,000)To Labour 5,000 By Abnormal wastage 200 350*To Direct expenses 1,050 By Process B (transfer) 9,500 16,625
10,000 17,050 10,000 17,050
*Value of abnormal wastage = × 200 units = 350
Process B Account
Particulars Units Particulars Units
To Process A 9,500 16,625 By Normal wastage 475 238To Sundry materials 1,500 (5% or 9,500)To Labour 8,000 By Process C (transfer) 9,100 27,300To Direct exp. 1,118To Abnormal gain 75 225*
9,575 27,538 9,575 27,538
*Abnormal gain = units = 225
Process C Account
Particulars Units Particulars Units
To Process B 9,100 27,300 By Normal wastage 728 728(transfer) 8% of 9,100)
To Sundry materials 500 By Abnormal wastage 272 1156*To Labour 6,500 By Finished goodsTo Direct expenses 2,009 (transfer) 8,100 34,425
9,100 36,309 9,100 36,309
*Abnormal wastage = × 272 units = 1,156
Abnormal Wastage Account
Particulars Units Particulars Units
To Process A 200 350 By Sales of scrap inTo Process B 272 1,156 Process A @ 0.25 200 50
Process C @ 1 272 272By Profit and LossA/c (B/F) 1,184
472 1,506 472 1,506

Process Costing - I
NOTES
Self-Instructional154 Material
Abnormal Gain Account
Particulars Units Particulars Units
To Normal wastage A/c 75 38 By Process B 75 225shortfall in the saleof normal wastage@ 0.50 per unit)
To Profit & Loss 187A/c (B.F.)
75 225 75 225
When the Output of a Process is Partly Sold and Partly Transferredto the Next Process
Sometimes the output of a process may be partly sold and partly transferred tothe next process for further processing. For example, in a textile mill, part of theoutput of a spinning process may be sold and the remaining output is passed on tothe weaving process for further processing. A part of the output so sold will containan element of profit or loss which will be revealed in the Process Account. Butwhen a part of the output is sent to warehouse for sale, it is at cost and does notcontain an element of profit or loss.
Illustration 7.5: XYZ Ltd manufactures and sells three chemicals produced byconsecutive processes known as X, Y and Z. In each process 2% of the totalweight put in is lost and 10% is scrap, which from processes X and Y realized100 a tonne and from Z 200 a tonne. The products of the three processes are
dealt with as follows:X Y Z
Sent to warehouse for sale 25% 50% 100%Passed on the next process 75% 50% —The following particulars relate to the month of May:Materials used (tonnes) 1,000 140 1,348Cost per tonne of materials ( ) 120 200 80
Mfg. expenses ( ) 30,800 25,760 18,100
Prepare an account for each process, showing the cost per tonne of eachproduct.
Solution:Process X Account
Particulars Tonnes Particulars Tonnes
To Materials 1,000 1,20,000 By Loss in weight(@ 120) (2% of 1,000) 20 —
To Mfg. exp. 30,800 By Scrap (10% of 1,000) 100 10,000By Warehouse
(25% of 880) 220 35,200By Process Y (transfer) 660 1,05,600
1,000 1,50,800 1,000 1,50,800
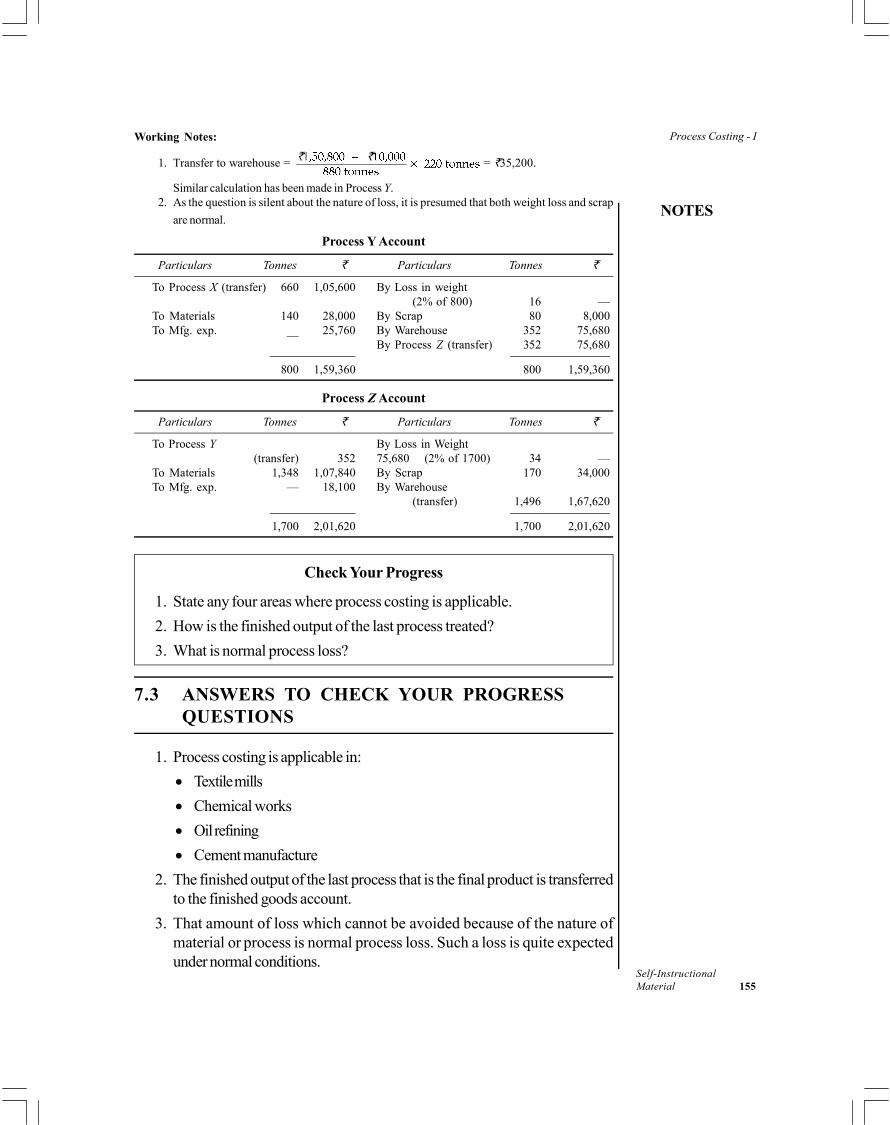
Process Costing - I
NOTES
Self-InstructionalMaterial 155
Working Notes:
1. Transfer to warehouse = = 35,200.
Similar calculation has been made in Process Y.2. As the question is silent about the nature of loss, it is presumed that both weight loss and scrap
are normal.
Process Y Account
Particulars Tonnes Particulars Tonnes
To Process X (transfer) 660 1,05,600 By Loss in weight(2% of 800) 16 —
To Materials 140 28,000 By Scrap 80 8,000To Mfg. exp. __ 25,760 By Warehouse 352 75,680
By Process Z (transfer) 352 75,680
800 1,59,360 800 1,59,360
Process Z Account
Particulars Tonnes Particulars Tonnes
To Process Y By Loss in Weight(transfer) 352 75,680 (2% of 1700) 34 —
To Materials 1,348 1,07,840 By Scrap 170 34,000To Mfg. exp. — 18,100 By Warehouse
(transfer) 1,496 1,67,620
1,700 2,01,620 1,700 2,01,620
Check Your Progress
1. State any four areas where process costing is applicable.
2. How is the finished output of the last process treated?
3. What is normal process loss?
7.3 ANSWERS TO CHECK YOUR PROGRESSQUESTIONS
1. Process costing is applicable in:
Textile mills
Chemical works
Oil refining
Cement manufacture
2. The finished output of the last process that is the final product is transferredto the finished goods account.
3. That amount of loss which cannot be avoided because of the nature ofmaterial or process is normal process loss. Such a loss is quite expectedunder normal conditions.
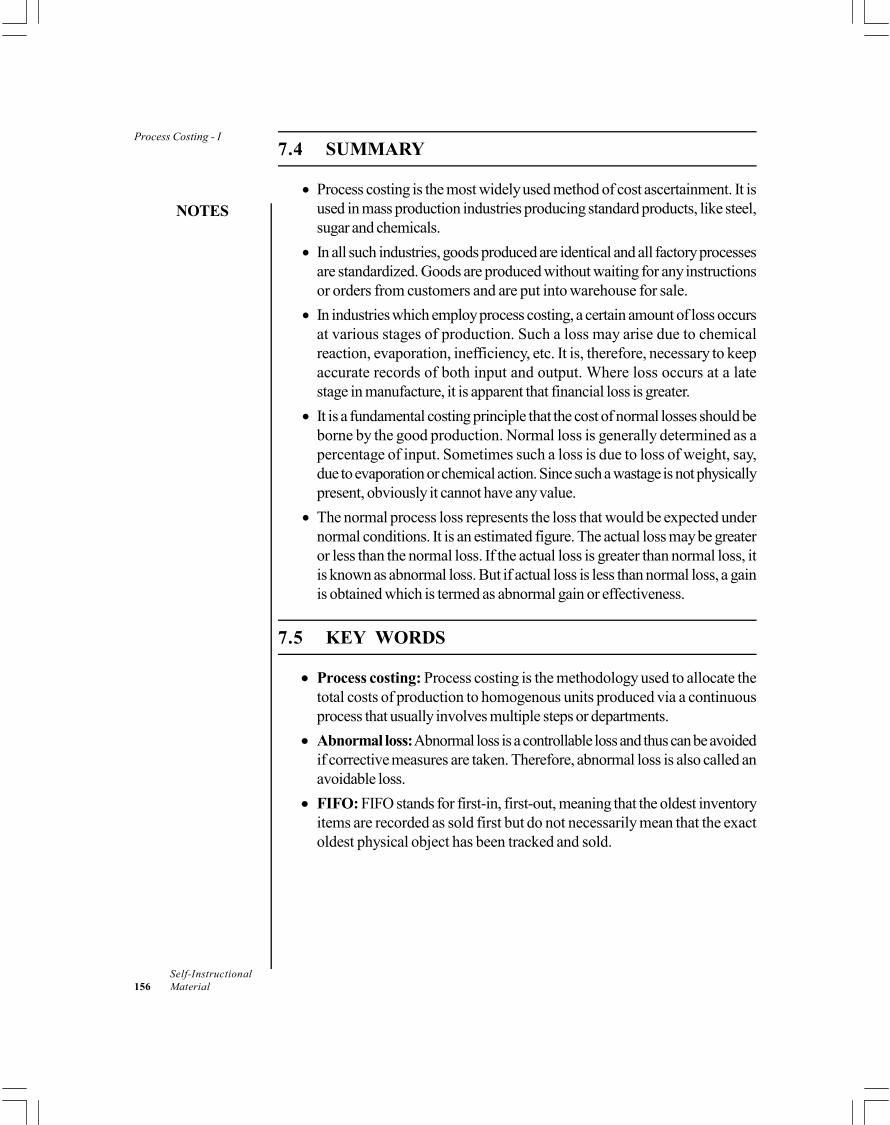
Process Costing - I
NOTES
Self-Instructional156 Material
7.4 SUMMARY
Process costing is the most widely used method of cost ascertainment. It isused in mass production industries producing standard products, like steel,sugar and chemicals.
In all such industries, goods produced are identical and all factory processesare standardized. Goods are produced without waiting for any instructionsor orders from customers and are put into warehouse for sale.
In industries which employ process costing, a certain amount of loss occursat various stages of production. Such a loss may arise due to chemicalreaction, evaporation, inefficiency, etc. It is, therefore, necessary to keepaccurate records of both input and output. Where loss occurs at a latestage in manufacture, it is apparent that financial loss is greater.
It is a fundamental costing principle that the cost of normal losses should beborne by the good production. Normal loss is generally determined as apercentage of input. Sometimes such a loss is due to loss of weight, say,due to evaporation or chemical action. Since such a wastage is not physicallypresent, obviously it cannot have any value.
The normal process loss represents the loss that would be expected undernormal conditions. It is an estimated figure. The actual loss may be greateror less than the normal loss. If the actual loss is greater than normal loss, itis known as abnormal loss. But if actual loss is less than normal loss, a gainis obtained which is termed as abnormal gain or effectiveness.
7.5 KEY WORDS
Process costing: Process costing is the methodology used to allocate thetotal costs of production to homogenous units produced via a continuousprocess that usually involves multiple steps or departments.
Abnormal loss: Abnormal loss is a controllable loss and thus can be avoidedif corrective measures are taken. Therefore, abnormal loss is also called anavoidable loss.
FIFO: FIFO stands for first-in, first-out, meaning that the oldest inventoryitems are recorded as sold first but do not necessarily mean that the exactoldest physical object has been tracked and sold.
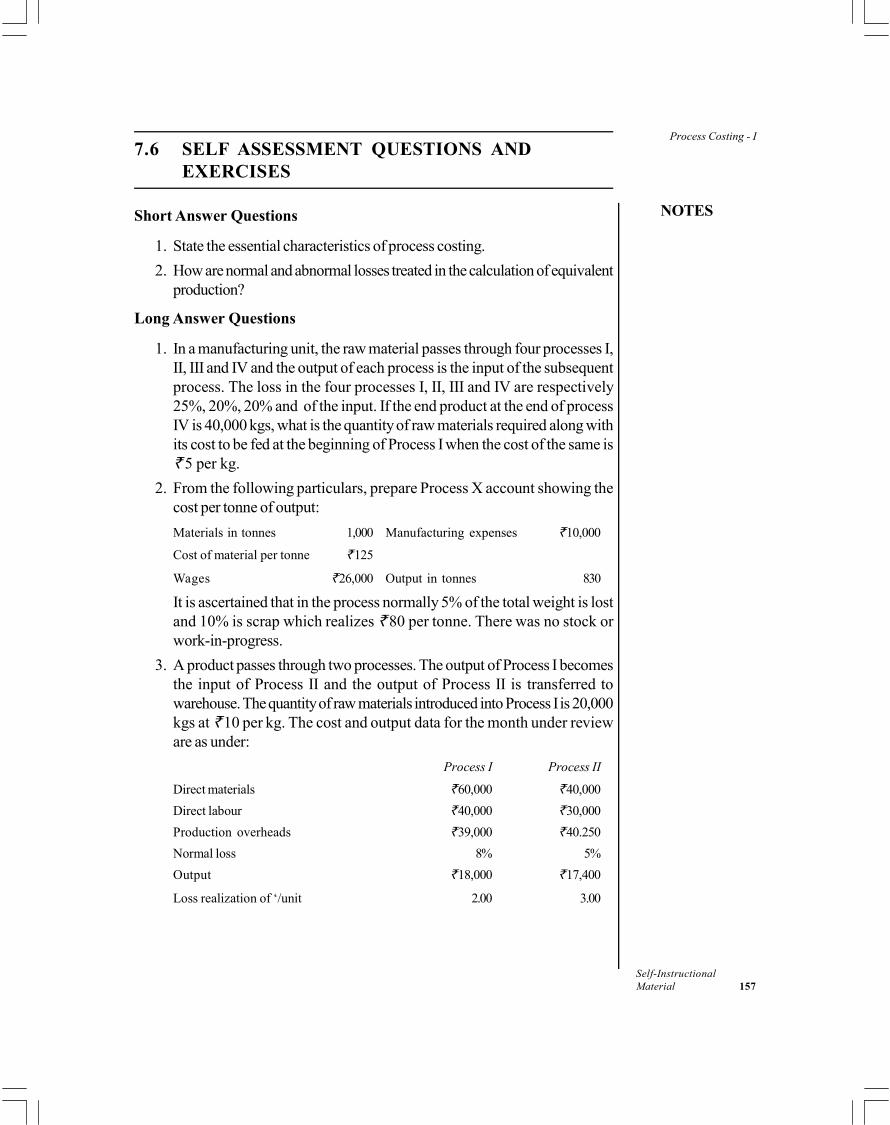
Process Costing - I
NOTES
Self-InstructionalMaterial 157
7.6 SELF ASSESSMENT QUESTIONS ANDEXERCISES
Short Answer Questions
1. State the essential characteristics of process costing.
2. How are normal and abnormal losses treated in the calculation of equivalentproduction?
Long Answer Questions
1. In a manufacturing unit, the raw material passes through four processes I,II, III and IV and the output of each process is the input of the subsequentprocess. The loss in the four processes I, II, III and IV are respectively25%, 20%, 20% and of the input. If the end product at the end of processIV is 40,000 kgs, what is the quantity of raw materials required along withits cost to be fed at the beginning of Process I when the cost of the same is 5 per kg.
2. From the following particulars, prepare Process X account showing thecost per tonne of output:
Materials in tonnes 1,000 Manufacturing expenses 10,000
Cost of material per tonne 125
Wages 26,000 Output in tonnes 830
It is ascertained that in the process normally 5% of the total weight is lostand 10% is scrap which realizes 80 per tonne. There was no stock orwork-in-progress.
3. A product passes through two processes. The output of Process I becomesthe input of Process II and the output of Process II is transferred towarehouse. The quantity of raw materials introduced into Process I is 20,000kgs at 10 per kg. The cost and output data for the month under revieware as under:
Process I Process II
Direct materials 60,000 40,000
Direct labour 40,000 30,000
Production overheads 39,000 40.250
Normal loss 8% 5%
Output 18,000 17,400
Loss realization of ‘/unit 2.00 3.00
Process Costing - I
NOTES
Self-Instructional158 Material
The company’s policy is to fix the selling price of the end product in such away as to yield a profit of 20% on selling price.
Required:
(i) Prepare the Process Accounts
(ii) Determine the selling price per unit of the end product.
7.7 FURTHER READINGS
Arora, M.N. 2012. A Textbook of Cost and Management Accounting, Tenthedition. New Delhi: Vikas Publishing House.
Arora, M.N. 2010. Cost Accounting: Principles and Practice, Eleventh edition.New Delhi: Vikas Publishing House.
Shillinglow, G. 1982.Managerial Costing Accounting. Homewood: Richard D.Irwin.
Morse, W. J. 1978. Cost Accounting. Massachusetts: Addison-Wesley PublishingCo.
Lal, Jawahar. 2003. Cost Accounting. New Delhi: Tata McGraw Hill.
Process Costing - II
NOTES
Self-InstructionalMaterial 159
UNIT 8 PROCESS COSTING - II
Structure
8.0 Introduction8.1 Objectives8.2 Work-in-Progress (Equivalent Production)8.3 Internal Process Profits (Inter-Process Profits)8.4 Joint Products and By-Products8.5 Answers to Check Your Progress Questions8.6 Summary8.7 Key Words8.8 Self Assessment Questions and Exercises8.9 Further Readings
8.0 INTRODUCTION
In the previous unit, you studied the basics of process costing, its essential featuresand the industries in which it is used. You also studied the manner of preparation ofprocess account. It was mentioned in the previous unit that there are certainadjustments that are unique to the process costing. Under this concept, you studiedthe process losses and wastages and its types. Taking the discussion forward, inthis unit, you will learn the other accounting adjustments including: valuation ofwork-in-progress and inter-process profits.
In most of the industries in which process costing is used, two or moreproducts are unavoidably produced from the same process and same raw materials.These products are produced in natural proportions which cannot be changed atthe will of the management. For example, in an oil refinery, when crude oil isprocessed, many products are simultaneously produced from the same set of inputs.Examples of these products are petrol, kerosene oil, diesel, grease and lubricatingoils. Such products are known as joint products or by-products. In this unit, youwill also learn accounting treatment of such products.
8.1 OBJECTIVES
After going through this unit, you will be able to:
Discuss the accounting process of valuation of work-in-progress
Explain the adjustments of inter-process profits
Describe the meaning and apportionment of joint and by-products

Process Costing - II
NOTES
Self-Instructional160 Material
8.2 WORK-IN-PROGRESS (EQUIVALENTPRODUCTION)
Process costing mainly deals with continuous type of production. At the end of theaccounting period, there may be some work-in-progress, i.e., semi-finished goodsmay be in the pipeline. The valuation of such work-in-progress is done in terms ofequivalent or effective production.
Equivalent Production
Equivalent production represents the production of a process in terms of completedunits. Work-in-progress at the end of an accounting period are converted intoequivalent completed units. This is done by the following formula:
For example, if there are 50 units in work-in-progress and these are estimatedto be 60% complete, then their equivalent production is 50 units × 60% = 30units.
In each process, an estimate is made of the degree of completion of work-in-progress in terms of percentage. Such an estimate must be accurate becauseany error in such estimation will lead to erroneous valuation of work-in-progressstock which enters into final accounts.
Evaluation of Equivalent Production
After work-in-progress has been converted into equivalent completed units, thefollowing steps are taken to evaluate it:
(i) Find out the total cost (net) for each element of cost, i.e., material, labourand overheads. Scrap value of normal loss is deducted from the materialcost.
(ii) Ascertain the cost per unit of equivalent production separately for eachelement of cost. This is done by dividing the total cost of each element bythe respective number of equivalent units.
(iii) At this rate of cost per unit, ascertain the value of finished production andwork-in-progress.
For the purpose of computation of equivalent production and its evaluation,the following three statements are generally prepared:
(a) Statement of equivalent production
(b) Statement of cost (per unit)
(c) Statement of evaluation
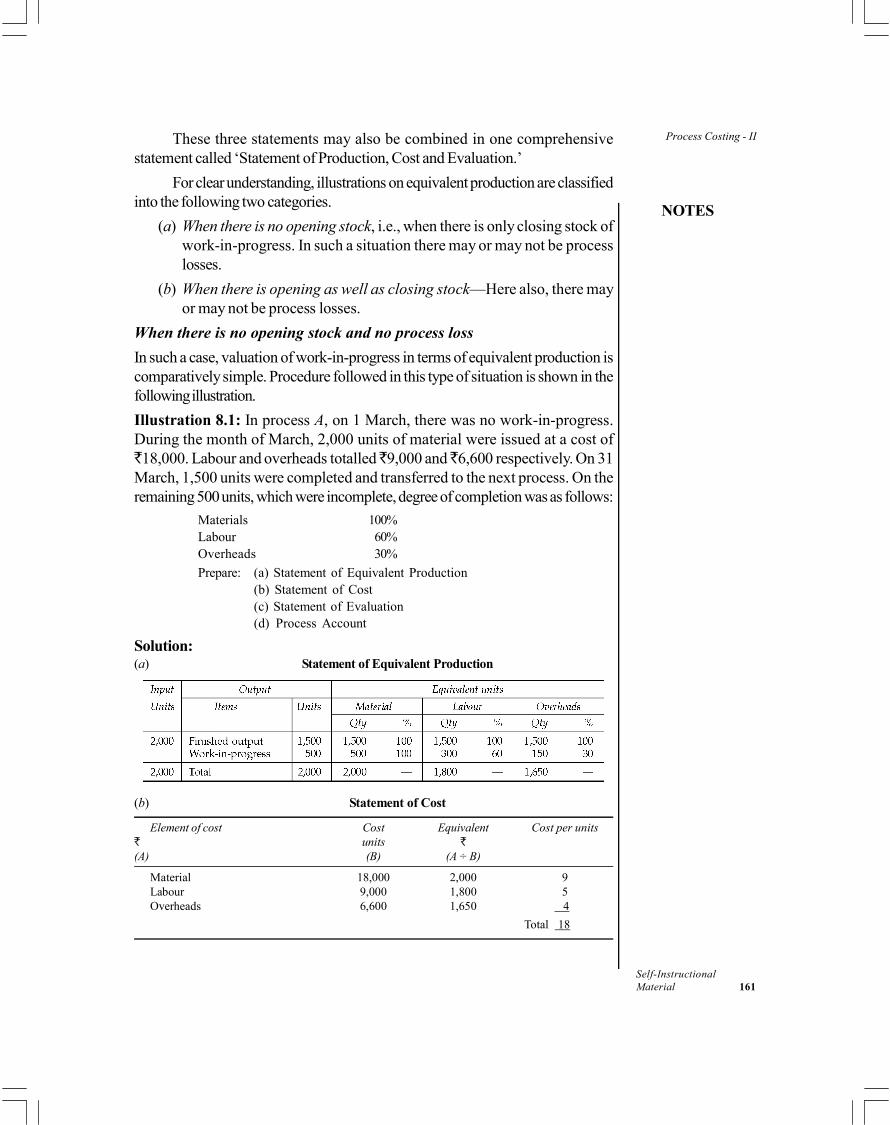
Process Costing - II
NOTES
Self-InstructionalMaterial 161
These three statements may also be combined in one comprehensivestatement called ‘Statement of Production, Cost and Evaluation.’
For clear understanding, illustrations on equivalent production are classifiedinto the following two categories.
(a) When there is no opening stock, i.e., when there is only closing stock ofwork-in-progress. In such a situation there may or may not be processlosses.
(b) When there is opening as well as closing stock—Here also, there mayor may not be process losses.
When there is no opening stock and no process loss
In such a case, valuation of work-in-progress in terms of equivalent production iscomparatively simple. Procedure followed in this type of situation is shown in thefollowing illustration.
Illustration 8.1: In process A, on 1 March, there was no work-in-progress.During the month of March, 2,000 units of material were issued at a cost of18,000. Labour and overheads totalled 9,000 and 6,600 respectively. On 31
March, 1,500 units were completed and transferred to the next process. On theremaining 500 units, which were incomplete, degree of completion was as follows:
Materials 100%Labour 60%Overheads 30%
Prepare: (a) Statement of Equivalent Production(b) Statement of Cost(c) Statement of Evaluation(d) Process Account
Solution:(a) Statement of Equivalent Production
(b) Statement of Cost
Element of cost Cost Equivalent Cost per unitsunits
(A) (B) (A ÷ B)
Material 18,000 2,000 9Labour 9,000 1,800 5Overheads 6,600 1,650 4
Total 18
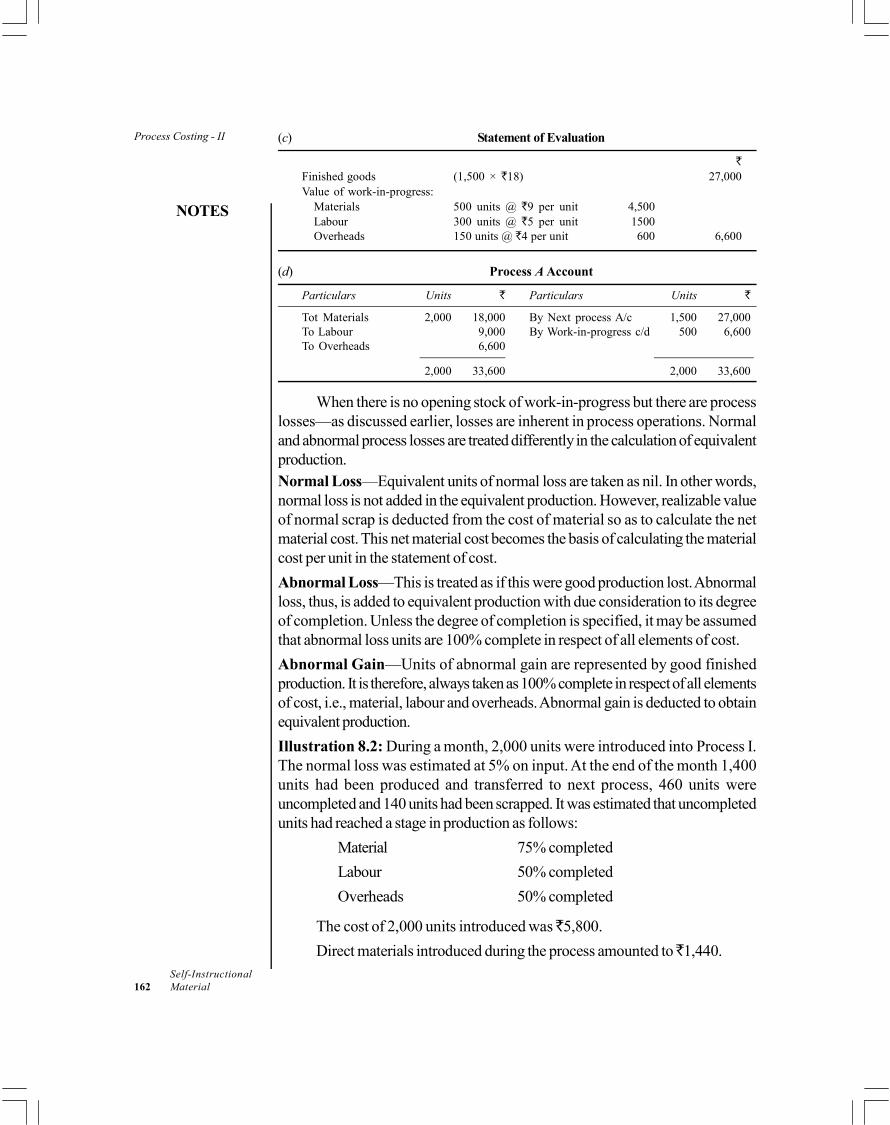
Process Costing - II
NOTES
Self-Instructional162 Material
(c) Statement of Evaluation
Finished goods (1,500 × 18) 27,000Value of work-in-progress:
Materials 500 units @ 9 per unit 4,500Labour 300 units @ 5 per unit 1500Overheads 150 units @ 4 per unit 600 6,600
(d) Process A Account
Particulars Units Particulars Units
Tot Materials 2,000 18,000 By Next process A/c 1,500 27,000To Labour 9,000 By Work-in-progress c/d 500 6,600To Overheads 6,600
2,000 33,600 2,000 33,600
When there is no opening stock of work-in-progress but there are processlosses—as discussed earlier, losses are inherent in process operations. Normaland abnormal process losses are treated differently in the calculation of equivalentproduction.Normal Loss—Equivalent units of normal loss are taken as nil. In other words,normal loss is not added in the equivalent production. However, realizable valueof normal scrap is deducted from the cost of material so as to calculate the netmaterial cost. This net material cost becomes the basis of calculating the materialcost per unit in the statement of cost.
Abnormal Loss—This is treated as if this were good production lost. Abnormalloss, thus, is added to equivalent production with due consideration to its degreeof completion. Unless the degree of completion is specified, it may be assumedthat abnormal loss units are 100% complete in respect of all elements of cost.
Abnormal Gain—Units of abnormal gain are represented by good finishedproduction. It is therefore, always taken as 100% complete in respect of all elementsof cost, i.e., material, labour and overheads. Abnormal gain is deducted to obtainequivalent production.
Illustration 8.2: During a month, 2,000 units were introduced into Process I.The normal loss was estimated at 5% on input. At the end of the month 1,400units had been produced and transferred to next process, 460 units wereuncompleted and 140 units had been scrapped. It was estimated that uncompletedunits had reached a stage in production as follows:
Material 75% completed
Labour 50% completed
Overheads 50% completed
The cost of 2,000 units introduced was 5,800.
Direct materials introduced during the process amounted to 1,440.

Process Costing - II
NOTES
Self-InstructionalMaterial 163
Production overheads incurreds were 1,670. Direct labour 3,340.
Units scrapped realized 1 each.
The units scrapped have passed through the process, so were 100%completed as regards material, labour and overheads.
You are required to: (a) prepare a Statement of Equivalent Production;(b) evaluate the cost of abnormal loss, finished goods and closing stock; and(c) prepare the Process I Account and Abnormal Loss Account. (ICWA Inter, Adapted)
Solution:Statement of Equivalent Production
Statements of Cost
Element of cost Cost Equivalent Cost perproduction unit
(units) (A)(B) (A ÷ B)
Materials:Units introduced 5,800Direct materials 1,440
7,240Less: Scrap value of loss (normal) 100
Material cost 7,140 1,785 4Direct labour 3,340 1,670 2Overheads 1,670 1,670 1
Total 12,150 7
Statement of Evaluation
Particulars Element of Equivalent Cost per Cost Total costcost production unit
Abnormal Loss: Material 40 4 160Labour 40 2 80Overheads 40 1 40 280
Finished Material 1,400 4 5,600Production: Labour 1,400 2 2,800
Overheads 1,400 1 1,400 9,800
Work-in-progress: Material 345 4 1,380Labour 230 2 460Overheads 230 1 230 2,070
12,150
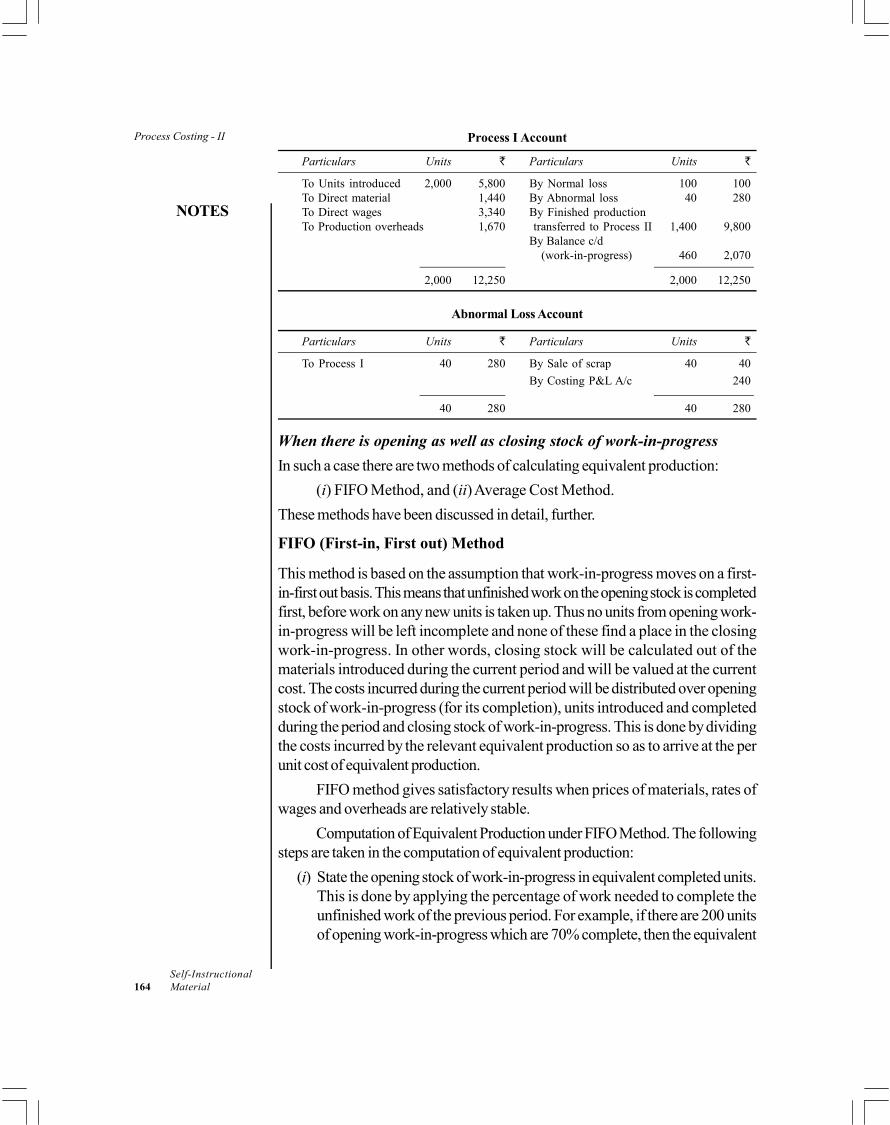
Process Costing - II
NOTES
Self-Instructional164 Material
Process I Account
Particulars Units Particulars Units
To Units introduced 2,000 5,800 By Normal loss 100 100To Direct material 1,440 By Abnormal loss 40 280To Direct wages 3,340 By Finished productionTo Production overheads 1,670 transferred to Process II 1,400 9,800
By Balance c/d(work-in-progress) 460 2,070
2,000 12,250 2,000 12,250
Abnormal Loss Account
Particulars Units Particulars Units
To Process I 40 280 By Sale of scrap 40 40
By Costing P&L A/c 240
40 280 40 280
When there is opening as well as closing stock of work-in-progress
In such a case there are two methods of calculating equivalent production:
(i) FIFO Method, and (ii) Average Cost Method.
These methods have been discussed in detail, further.
FIFO (First-in, First out) Method
This method is based on the assumption that work-in-progress moves on a first-in-first out basis. This means that unfinished work on the opening stock is completedfirst, before work on any new units is taken up. Thus no units from opening work-in-progress will be left incomplete and none of these find a place in the closingwork-in-progress. In other words, closing stock will be calculated out of thematerials introduced during the current period and will be valued at the currentcost. The costs incurred during the current period will be distributed over openingstock of work-in-progress (for its completion), units introduced and completedduring the period and closing stock of work-in-progress. This is done by dividingthe costs incurred by the relevant equivalent production so as to arrive at the perunit cost of equivalent production.
FIFO method gives satisfactory results when prices of materials, rates ofwages and overheads are relatively stable.
Computation of Equivalent Production under FIFO Method. The followingsteps are taken in the computation of equivalent production:
(i) State the opening stock of work-in-progress in equivalent completed units.This is done by applying the percentage of work needed to complete theunfinished work of the previous period. For example, if there are 200 unitsof opening work-in-progress which are 70% complete, then the equivalent
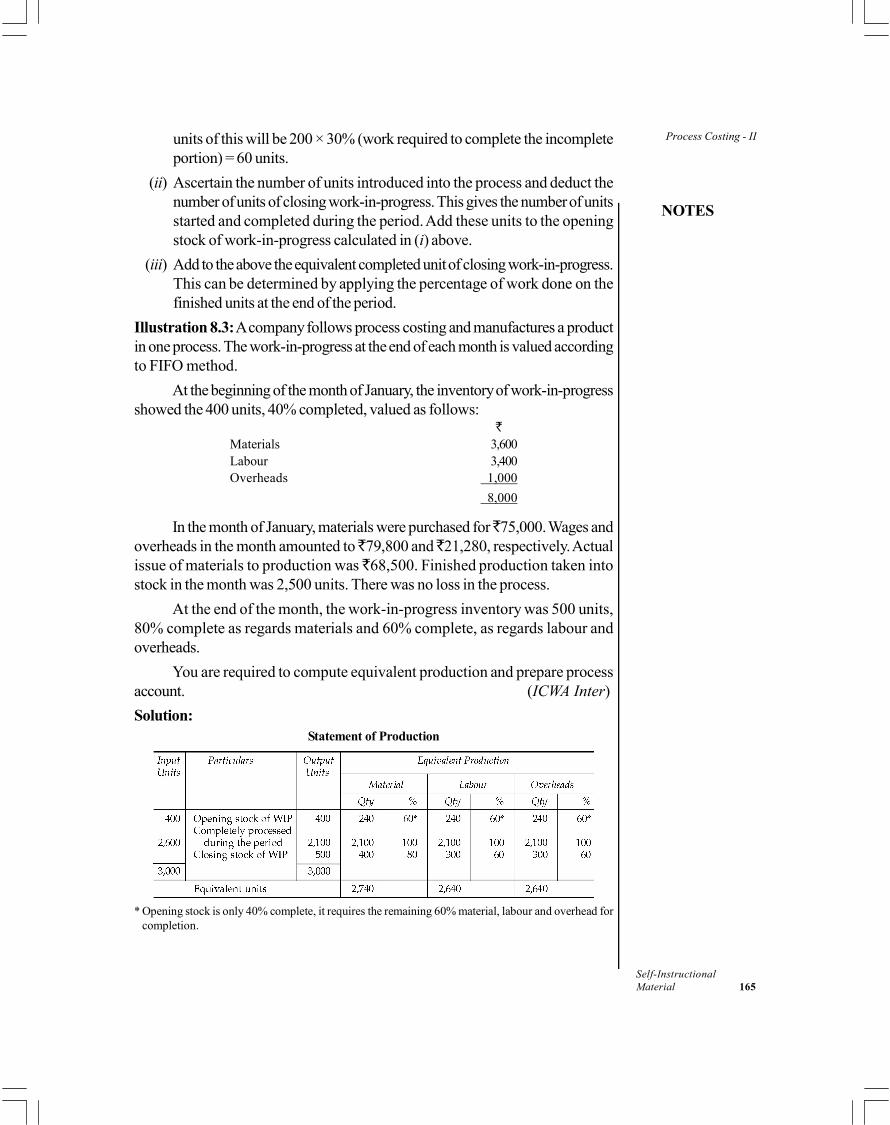
Process Costing - II
NOTES
Self-InstructionalMaterial 165
units of this will be 200 × 30% (work required to complete the incompleteportion) = 60 units.
(ii) Ascertain the number of units introduced into the process and deduct thenumber of units of closing work-in-progress. This gives the number of unitsstarted and completed during the period. Add these units to the openingstock of work-in-progress calculated in (i) above.
(iii) Add to the above the equivalent completed unit of closing work-in-progress.This can be determined by applying the percentage of work done on thefinished units at the end of the period.
Illustration 8.3: A company follows process costing and manufactures a productin one process. The work-in-progress at the end of each month is valued accordingto FIFO method.
At the beginning of the month of January, the inventory of work-in-progressshowed the 400 units, 40% completed, valued as follows:
Materials 3,600Labour 3,400Overheads 1,000
8,000
In the month of January, materials were purchased for 75,000. Wages andoverheads in the month amounted to 79,800 and 21,280, respectively. Actualissue of materials to production was 68,500. Finished production taken intostock in the month was 2,500 units. There was no loss in the process.
At the end of the month, the work-in-progress inventory was 500 units,80% complete as regards materials and 60% complete, as regards labour andoverheads.
You are required to compute equivalent production and prepare processaccount. (ICWA Inter)
Solution:Statement of Production
* Opening stock is only 40% complete, it requires the remaining 60% material, labour and overhead forcompletion.
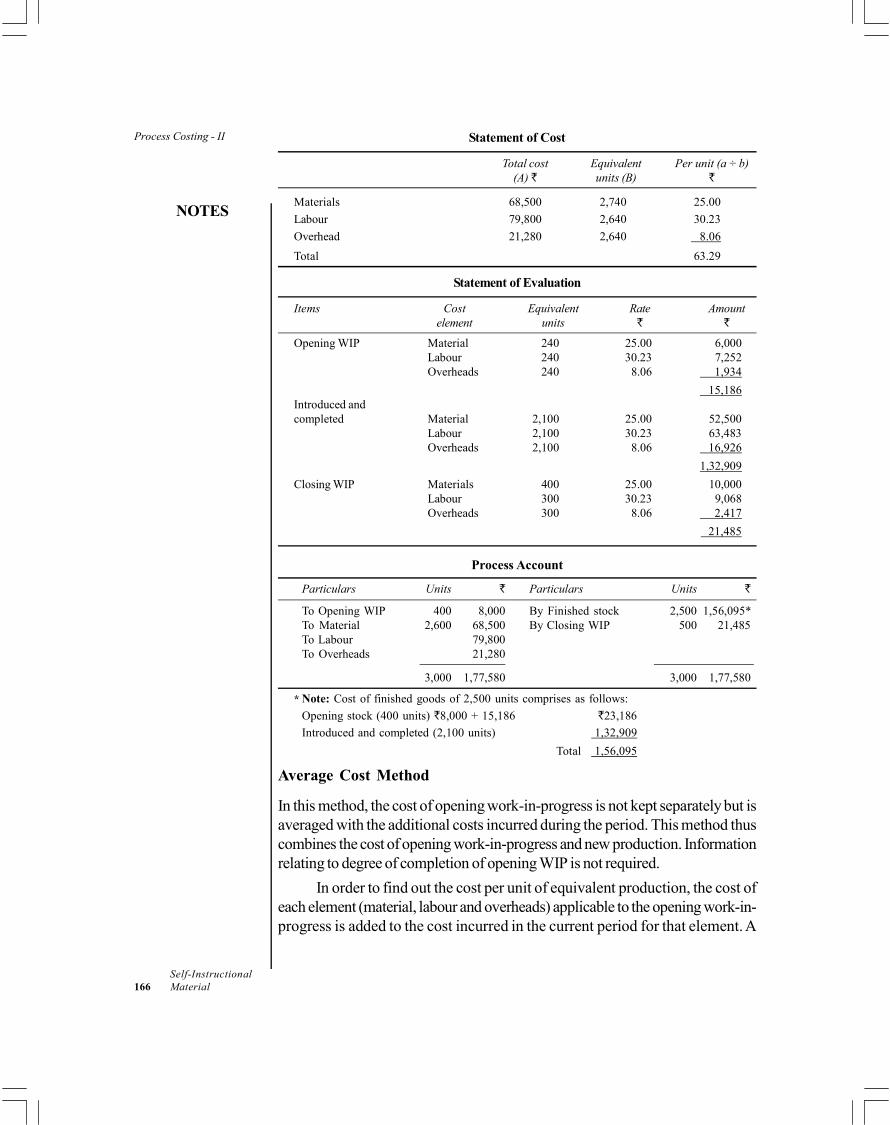
Process Costing - II
NOTES
Self-Instructional166 Material
Statement of Cost
Total cost Equivalent Per unit (a ÷ b)(A) units (B)
Materials 68,500 2,740 25.00
Labour 79,800 2,640 30.23
Overhead 21,280 2,640 8.06
Total 63.29
Statement of Evaluation
Items Cost Equivalent Rate Amountelement units
Opening WIP Material 240 25.00 6,000Labour 240 30.23 7,252Overheads 240 8.06 1,934
15,186Introduced andcompleted Material 2,100 25.00 52,500
Labour 2,100 30.23 63,483Overheads 2,100 8.06 16,926
1,32,909
Closing WIP Materials 400 25.00 10,000Labour 300 30.23 9,068Overheads 300 8.06 2,417
21,485
Process Account
Particulars Units Particulars Units
To Opening WIP 400 8,000 By Finished stock 2,500 1,56,095*To Material 2,600 68,500 By Closing WIP 500 21,485To Labour 79,800To Overheads 21,280
3,000 1,77,580 3,000 1,77,580
* Note: Cost of finished goods of 2,500 units comprises as follows:
Opening stock (400 units) 8,000 + 15,186 23,186
Introduced and completed (2,100 units) 1,32,909
Total 1,56,095
Average Cost Method
In this method, the cost of opening work-in-progress is not kept separately but isaveraged with the additional costs incurred during the period. This method thuscombines the cost of opening work-in-progress and new production. Informationrelating to degree of completion of opening WIP is not required.
In order to find out the cost per unit of equivalent production, the cost ofeach element (material, labour and overheads) applicable to the opening work-in-progress is added to the cost incurred in the current period for that element. A

Process Costing - II
NOTES
Self-InstructionalMaterial 167
single cumulative total and unit cost is obtained. Units completed and transferredas well as closing work-in-progress will be valued at this average unit cost. Theuse of average method is illustrated below.
Illustration 8.4: The following figures related to single industrial process:
Opening stock (10,000 units):Material 2,250Wages 650Overheads 400 3,300
Units introduced (40,000 units):Material 9,250Labour 4,600Overheads 3,100
During the period 30,000 units were completed and 20,000 units remainedin process.
The degree of completion of closing stock or WIP was as under:
Materials 100%
Labour 25%
Overheads 25%
Make the necessary computations and prepare Process Account by usingaverage method.
Solution:Statement of Equivalent Production
Statement of Cost
(A) (B) (C) (D) (C ÷ D)Cost element Opening Cost Total cost Equivalent Cost
cost put in (A + B) production per unitunits
Materials 2,250 9,250 11,500 50,000 0.23Wages 650 4,600 5,250 35,000 0.15Overheads 400 3,100 3,500 35,000 0.10
Total 0.48

Process Costing - II
NOTES
Self-Instructional168 Material
Statement of Evaluation
Cost of finished goods 30,000 units @ 0.48 = 14,400
Closing work-in-progress:Materials (100% complete) 20,000 × 0.23 = 4,600
Labour (25% complete) 5,000 × 0.15 = 750
Overheads (25% complete) 5,000 × 0.10 = 500
Cost of closing WIP = 5,850
Process Account
Particulars Units Particulars Units
To Opening WIP 10,000 3,300 By CompletedTo Material 40,000 9,250 and transferred 30,000 14,400To Wages — 4,600 By ClosingTo Overheads — 3,100 work-in-process 20,000 5,850
50,000 20,250 50,000 20,250
Process Account
Particulars Units Particulars Units
To Opening WIP 10,000 3,300 By CompletedTo Material 40,000 9,250 and transferred 30,000 14,400To Wages — 4,600 By ClosingTo Overheads — 3,100 work-in-process 20,000 5,850
50,000 20,250 50,000 20,250
FIFO Method vs Average Cost Method
Both FIFO and average methods have certain advantages and it cannot be saidthat one method is either simpler or more accurate than the other. The main differencebetween these two methods is regarding the treatment of the opening stock-in-progress.
In FIFO method, opening stock of work-in-progress is kept as a separatefigure. Costs incurred to complete this opening work-in-progress are added tothe opening work-in-progress cost and the sum of these two costs is the total costof completed units of opening work-in-progress at which it is transferred to thenext process. The units which are introduced in the process and finished duringthe same period have their own cost per unit which may be different from thecompleted cost per unit of opening work-in-progress.
In average cost method, on the other hand, the cost of opening work-in-progress is added to material, labour and overhead costs incurred during the period.The cost per unit is computed by dividing the total of these costs by equivalentunits.
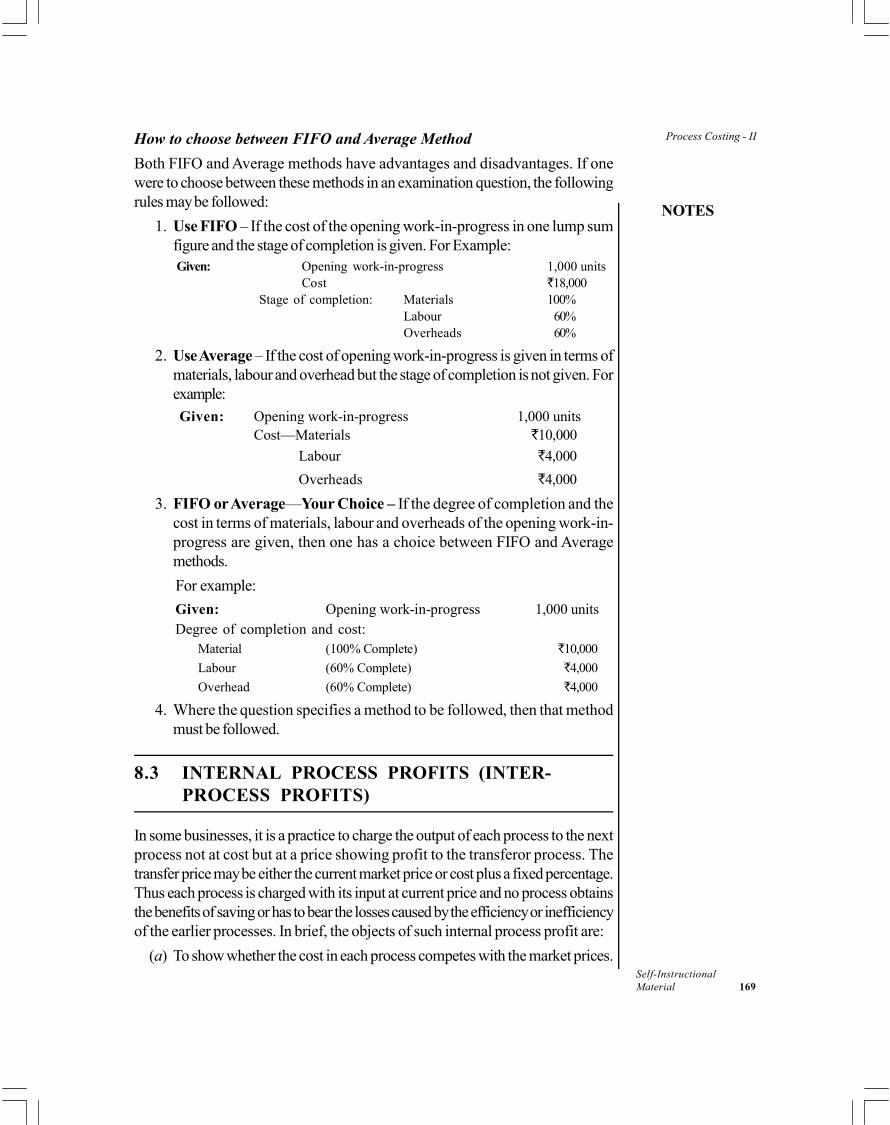
Process Costing - II
NOTES
Self-InstructionalMaterial 169
How to choose between FIFO and Average Method
Both FIFO and Average methods have advantages and disadvantages. If onewere to choose between these methods in an examination question, the followingrules may be followed:
1. Use FIFO – If the cost of the opening work-in-progress in one lump sumfigure and the stage of completion is given. For Example:Given: Opening work-in-progress 1,000 units
Cost 18,000 Stage of completion: Materials 100%
Labour 60%Overheads 60%
2. Use Average – If the cost of opening work-in-progress is given in terms ofmaterials, labour and overhead but the stage of completion is not given. Forexample:
Given: Opening work-in-progress 1,000 unitsCost—Materials 10,000
Labour 4,000
Overheads 4,000
3. FIFO or Average—Your Choice – If the degree of completion and thecost in terms of materials, labour and overheads of the opening work-in-progress are given, then one has a choice between FIFO and Averagemethods.
For example:
Given: Opening work-in-progress 1,000 unitsDegree of completion and cost:
Material (100% Complete) 10,000
Labour (60% Complete) 4,000
Overhead (60% Complete) 4,000
4. Where the question specifies a method to be followed, then that methodmust be followed.
8.3 INTERNAL PROCESS PROFITS (INTER-PROCESS PROFITS)
In some businesses, it is a practice to charge the output of each process to the nextprocess not at cost but at a price showing profit to the transferor process. Thetransfer price may be either the current market price or cost plus a fixed percentage.Thus each process is charged with its input at current price and no process obtainsthe benefits of saving or has to bear the losses caused by the efficiency or inefficiencyof the earlier processes. In brief, the objects of such internal process profit are:
(a) To show whether the cost in each process competes with the market prices.

Process Costing - II
NOTES
Self-Instructional170 Material
(b) To make each process stand on its own efficiency and economy.
(c) To assist in making decisions, such as to buy a partly-processed materialrather than to process work internally or to sell a partly-processed productor to process it further.
Internal process profits have the disadvantage of complicating the costingrecords. The complications brought into the accounts arise from the fact that inter-process profit, so introduced, remains included in the price of process stocks,finished stocks and work-in-progress. For balance sheet purposes, such stockshave to be reduced to actual cost because a firm cannot make profits by tradingwith itself.
The inclusion of inter-process profits should be best avoided unless thebenefits outweigh the added complications. However, the object of internal processprofits can also be achieved by making separate cost analysis and reports outsidethe costing records or by adopting a standard costing system where standardshould be set for each process.
The procedure involved in inter-process profits is demonstrated in thefollowing illustration.
Illustration 8.5: A Ltd produces product ‘AXE’ which passes through twoprocesses before it is completed and transferred to finished stock. The followingdata relate to October 2010:
Processes Finished Stock
Particulars I II
Opening stock 7500 9000 22,500
Direct materials 15,000 15,750 —
Direct wages 11,200 11,250 —
Factory overheads 10,500 4,500 —
Closing Stock 3,700 4,500 11,250
Inter-process profit included inopening stock 1,500 8,250
Output of Process I is transferred to Process II at 25% profit on the transferprice.
Output of Process II is transferred to finished stock at 20% profit on thetransfer price. Stocks in processes are valued at prime cost. Finished stock isvalued at the price at which it is received from Process II. Sales during the periodis 1,40,000.
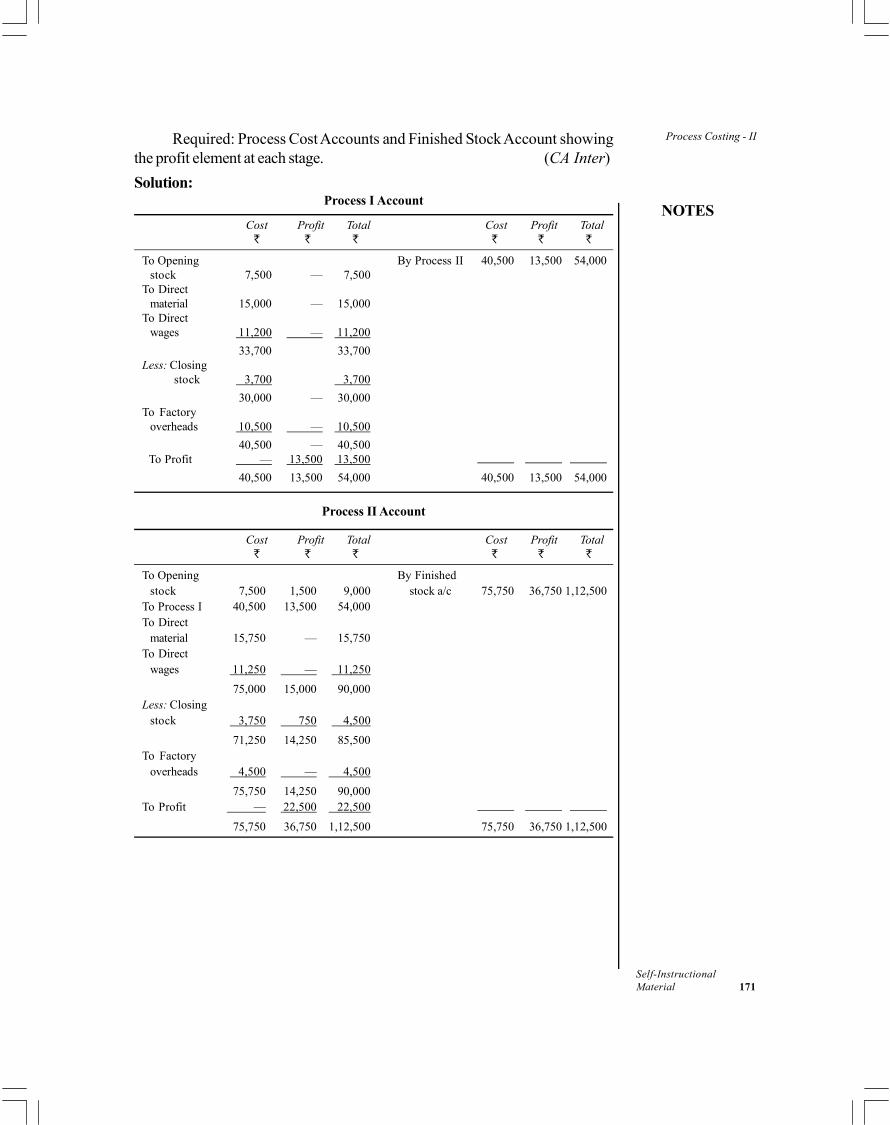
Process Costing - II
NOTES
Self-InstructionalMaterial 171
Required: Process Cost Accounts and Finished Stock Account showingthe profit element at each stage. (CA Inter)
Solution:Process I Account
Cost Profit Total Cost Profit Total
To Opening By Process II 40,500 13,500 54,000stock 7,500 — 7,500
To Directmaterial 15,000 — 15,000
To Directwages 11,200 — 11,200
33,700 33,700Less: Closing
stock 3,700 3,700
30,000 — 30,000To Factory
overheads 10,500 — 10,500
40,500 — 40,500 To Profit — 13,500 13,500
40,500 13,500 54,000 40,500 13,500 54,000
Process II Account
Cost Profit Total Cost Profit Total
To Opening By Finishedstock 7,500 1,500 9,000 stock a/c 75,750 36,750 1,12,500
To Process I 40,500 13,500 54,000To Direct
material 15,750 — 15,750To Direct
wages 11,250 — 11,250
75,000 15,000 90,000Less: Closing
stock 3,750 750 4,500
71,250 14,250 85,500To Factory
overheads 4,500 — 4,500
75,750 14,250 90,000To Profit — 22,500 22,500
75,750 36,750 1,12,500 75,750 36,750 1,12,500
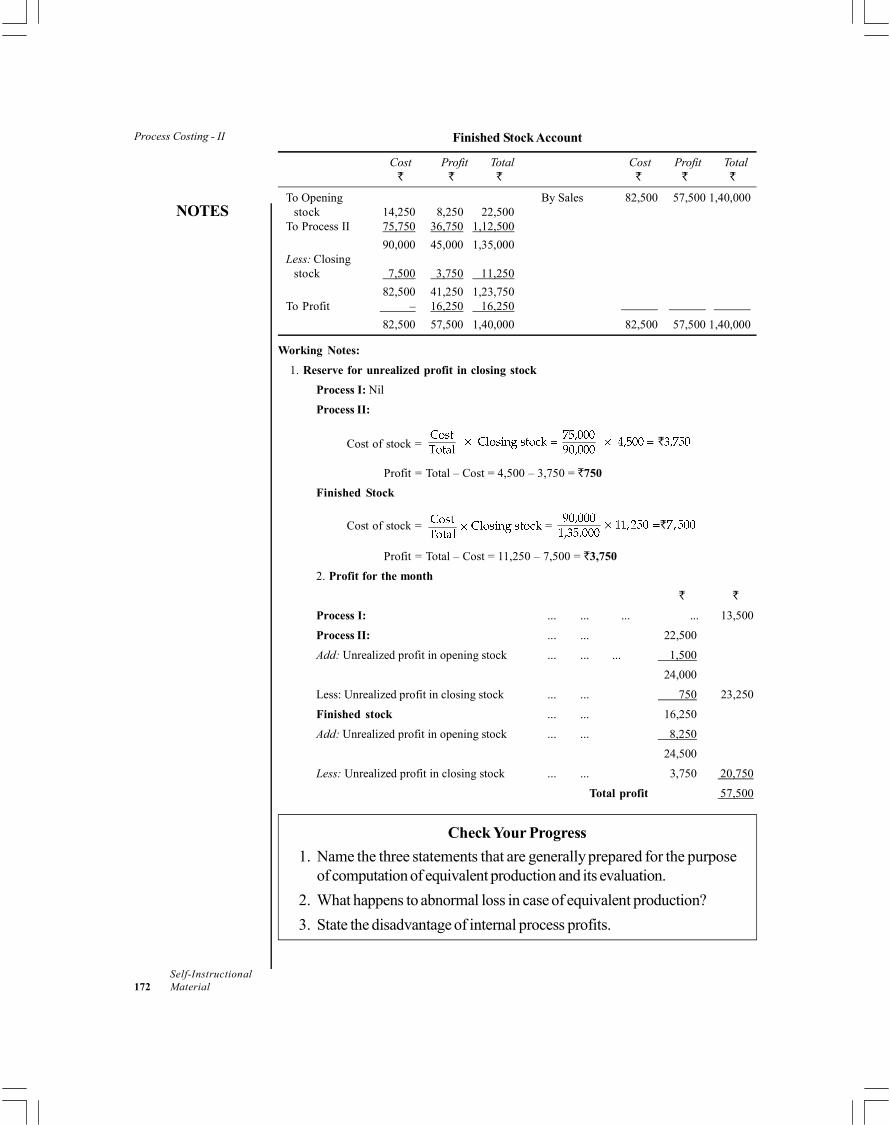
Process Costing - II
NOTES
Self-Instructional172 Material
Finished Stock Account
Cost Profit Total Cost Profit Total
To Opening By Sales 82,500 57,500 1,40,000stock 14,250 8,250 22,500
To Process II 75,750 36,750 1,12,500
90,000 45,000 1,35,000Less: Closing
stock 7,500 3,750 11,250
82,500 41,250 1,23,750To Profit – 16,250 16,250
82,500 57,500 1,40,000 82,500 57,500 1,40,000
Working Notes:
1. Reserve for unrealized profit in closing stock
Process I: Nil
Process II:
Cost of stock =
Profit = Total – Cost = 4,500 – 3,750 = 750
Finished Stock
Cost of stock = =
Profit = Total – Cost = 11,250 – 7,500 = 3,750
2. Profit for the month
Process I: ... ... ... ... 13,500
Process II: ... ... 22,500
Add: Unrealized profit in opening stock ... ... ... 1,500
24,000
Less: Unrealized profit in closing stock ... ... 750 23,250
Finished stock ... ... 16,250
Add: Unrealized profit in opening stock ... ... 8,250
24,500
Less: Unrealized profit in closing stock ... ... 3,750 20,750
Total profit 57,500
Check Your Progress
1. Name the three statements that are generally prepared for the purposeof computation of equivalent production and its evaluation.
2. What happens to abnormal loss in case of equivalent production?
3. State the disadvantage of internal process profits.
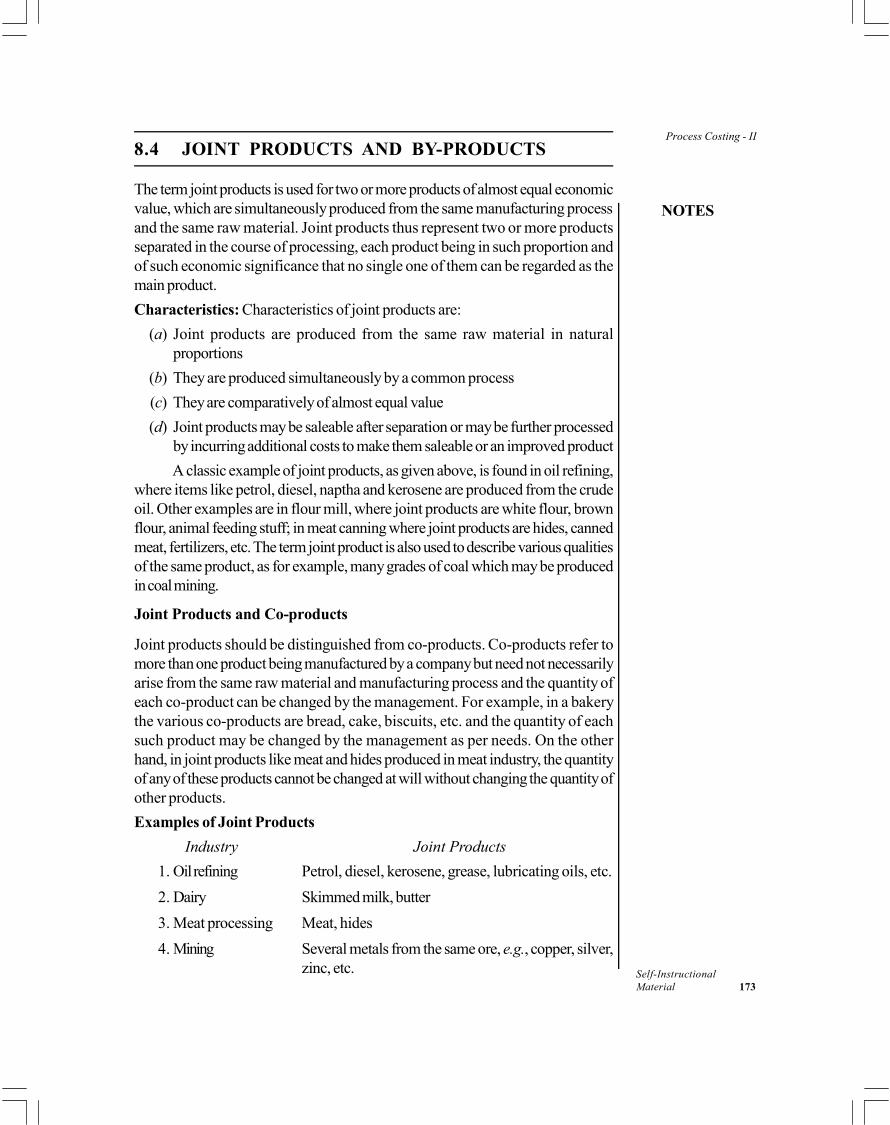
Process Costing - II
NOTES
Self-InstructionalMaterial 173
8.4 JOINT PRODUCTS AND BY-PRODUCTS
The term joint products is used for two or more products of almost equal economicvalue, which are simultaneously produced from the same manufacturing processand the same raw material. Joint products thus represent two or more productsseparated in the course of processing, each product being in such proportion andof such economic significance that no single one of them can be regarded as themain product.
Characteristics: Characteristics of joint products are:
(a) Joint products are produced from the same raw material in naturalproportions
(b) They are produced simultaneously by a common process
(c) They are comparatively of almost equal value
(d) Joint products may be saleable after separation or may be further processedby incurring additional costs to make them saleable or an improved product
A classic example of joint products, as given above, is found in oil refining,where items like petrol, diesel, naptha and kerosene are produced from the crudeoil. Other examples are in flour mill, where joint products are white flour, brownflour, animal feeding stuff; in meat canning where joint products are hides, cannedmeat, fertilizers, etc. The term joint product is also used to describe various qualitiesof the same product, as for example, many grades of coal which may be producedin coal mining.
Joint Products and Co-products
Joint products should be distinguished from co-products. Co-products refer tomore than one product being manufactured by a company but need not necessarilyarise from the same raw material and manufacturing process and the quantity ofeach co-product can be changed by the management. For example, in a bakerythe various co-products are bread, cake, biscuits, etc. and the quantity of eachsuch product may be changed by the management as per needs. On the otherhand, in joint products like meat and hides produced in meat industry, the quantityof any of these products cannot be changed at will without changing the quantity ofother products.
Examples of Joint Products
Industry Joint Products
1. Oil refining Petrol, diesel, kerosene, grease, lubricating oils, etc.
2. Dairy Skimmed milk, butter
3. Meat processing Meat, hides
4. Mining Several metals from the same ore, e.g., copper, silver,zinc, etc.
Process Costing - II
NOTES
Self-Instructional174 Material
Joint Costs and Subsequent Costs
Joint costs are those costs which are incurred before that stage in manufacture atwhich the products get separated. It comprises raw material, labour and overheads.
Subsequent (or attributable) costs, on the other hand, are those costs whichare incurred after the separation or split-off point. These are separately incurredfor individual joint or by-products and thus are identifiable with each product.Subsequent costs are also knows as ‘after separation costs’ or ‘after split-offcosts’.
The distinction between joint costs and subsequent costs is important becausewhen accounting for products, the joint costs are the main problem. This is becausejoint costs cannot be traced to individual products and the cost accountant isfaced with the problem of apportioning the joint costs incurred to various jointproducts produced.
Subsequent costs, on the other hand, pose no accounting problem becausesuch costs relate to individual products. These are, therefore, charged to theappropriate product and not regarded as joint. It should be noted and rememberedthat selling and distribution costs are virtually always subsequent costs.
Accounting for Joint Products
Accounting for joint products means the apportionment of joint cost to each of thejoint product. Such apportionment serves the following objectives:
(a) To determine the cost per unit of products
(b) To help in inventory valuation
(c) To determine the profit or loss on each line of product
(d) To determine the price of each product
The various methods of apportionment of joint costs (discussed below) arebased mainly on individual opinion and tend to produce only approximate results.This is because no perfectly logical basis exists for the apportionment of jointcosts to products and most of the methods are arbitrary. Therefore, while selectinga particular methods it should be kept in mind that the method should be logical,appropriate and reliable and should be consistently followed. Following are themain methods of apportionment of joint costs over joint products:
1. Sales Value Method: Under this method, joint costs are apportioned to variousjoint products on the basis of sales value of each such product. The sale valuemethod has the following variants:
(a) On the basis of unit prices: In this method, the selling prices per unit ofvarious joint products is taken as the basis for apportionment of joint costs. Inother words, joint cost is apportioned to various joint products in the ratio ofselling prices of individual joint products without any regard to the quantities. It is
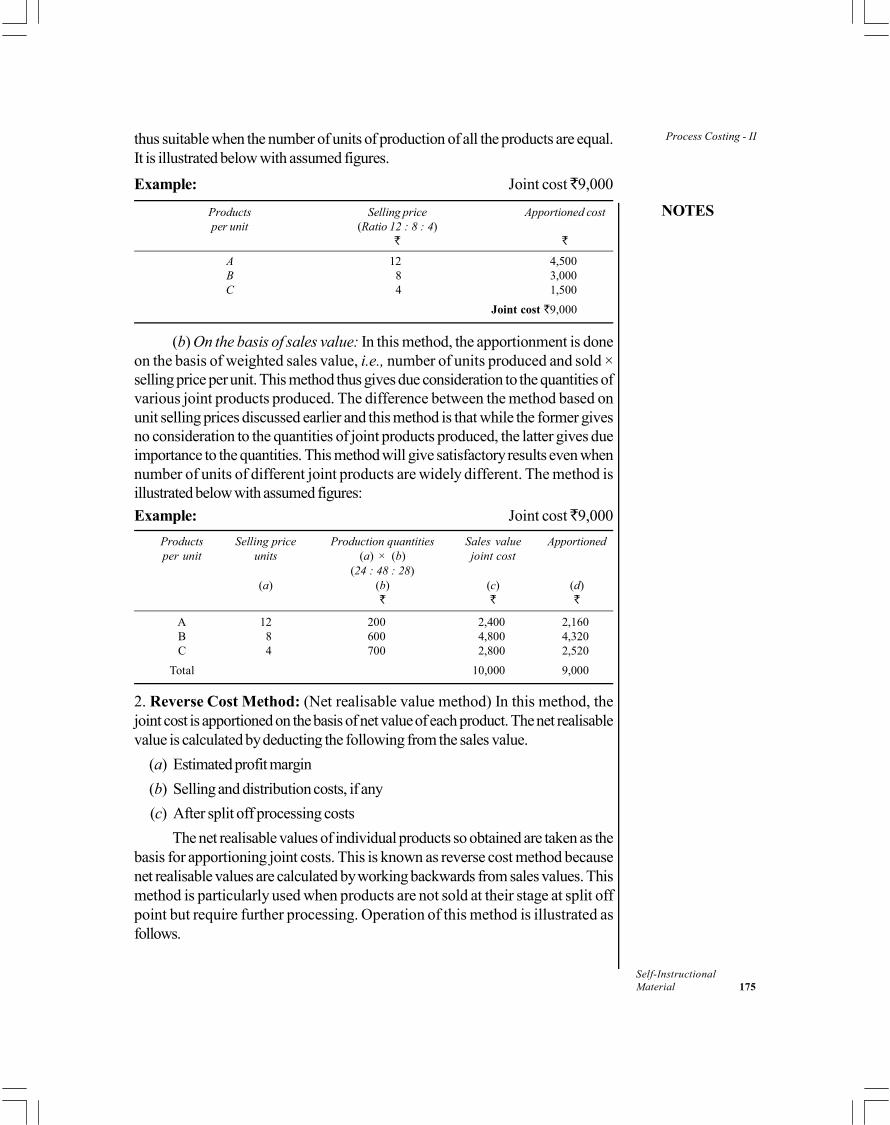
Process Costing - II
NOTES
Self-InstructionalMaterial 175
thus suitable when the number of units of production of all the products are equal.It is illustrated below with assumed figures.
Example: Joint cost 9,000
Products Selling price Apportioned costper unit (Ratio 12 : 8 : 4)
A 12 4,500B 8 3,000C 4 1,500
Joint cost 9,000
(b) On the basis of sales value: In this method, the apportionment is doneon the basis of weighted sales value, i.e., number of units produced and sold ×selling price per unit. This method thus gives due consideration to the quantities ofvarious joint products produced. The difference between the method based onunit selling prices discussed earlier and this method is that while the former givesno consideration to the quantities of joint products produced, the latter gives dueimportance to the quantities. This method will give satisfactory results even whennumber of units of different joint products are widely different. The method isillustrated below with assumed figures:
Example: Joint cost 9,000
Products Selling price Production quantities Sales value Apportionedper unit units (a) × (b) joint cost
(24 : 48 : 28)(a) (b) (c) (d)
A 12 200 2,400 2,160B 8 600 4,800 4,320C 4 700 2,800 2,520
Total 10,000 9,000
2. Reverse Cost Method: (Net realisable value method) In this method, thejoint cost is apportioned on the basis of net value of each product. The net realisablevalue is calculated by deducting the following from the sales value.
(a) Estimated profit margin
(b) Selling and distribution costs, if any
(c) After split off processing costs
The net realisable values of individual products so obtained are taken as thebasis for apportioning joint costs. This is known as reverse cost method becausenet realisable values are calculated by working backwards from sales values. Thismethod is particularly used when products are not sold at their stage at split offpoint but require further processing. Operation of this method is illustrated asfollows.

Process Costing - II
NOTES
Self-Instructional176 Material
Illustration 8.6: In processing a basic raw material, three joint products ‘X’, ‘Y’and ‘Z’ are produced. The joint expenses of manufacturing are: Materials 10,000;Labour 8,000; Overheads 9,000 (Total 27,000). Subsequent expenses areas follows:
X Y Z
Material 2,000 1,600 1,800
Labour 2,500 1,400 1,700
Overheads 2,500 1,000 1,500
Total 7,000 4,000 5,000
Sales Value 42,000 20,000 18,000
Estimated profit on sales 50% 50% 331/3%
Show how you would apportion the joint costs of manufacture by ReverseCost Method.
Solution:Statement of Apportionment of Joint Costs
X Y Z
Sales value 42,000 20,000 18,000Less: Estimated profit on sales 21,000 10,000 6,000
Estimate total cost 21,000 10,000 12,000
Less: Subsequent costs (total) 7,000 4,000 5,000
Joint costs ( 27,000) apportioned 14,000 6,000 7,000
3. Physical Units Method: Under this method, the joint cost is apportioned onthe basis of relative weight, volume or quantity, etc., of each product, obtained atthe point where the split-off occurs. For the method to be suitable, the unit ofmeasurement should be applicable for all products, e.g., usually gases, liquids andsolids cannot be taken together. However, where joint products cannot bemeasured by the same measurement unit, the joint products must be converted toa denominator common to all the units produced. For instance in the manufactureof coke, products such as coke, coal tar, benzol, sulphate of ammonia, gas, etc.,are measured in different units. The yield of these recovered units is measured onthe basis of quantity of product extracted per tonne of coal. This is illustratedbelow.
Illustration 8.7: The following data have been extracted from the books of CokeCo. Ltd:
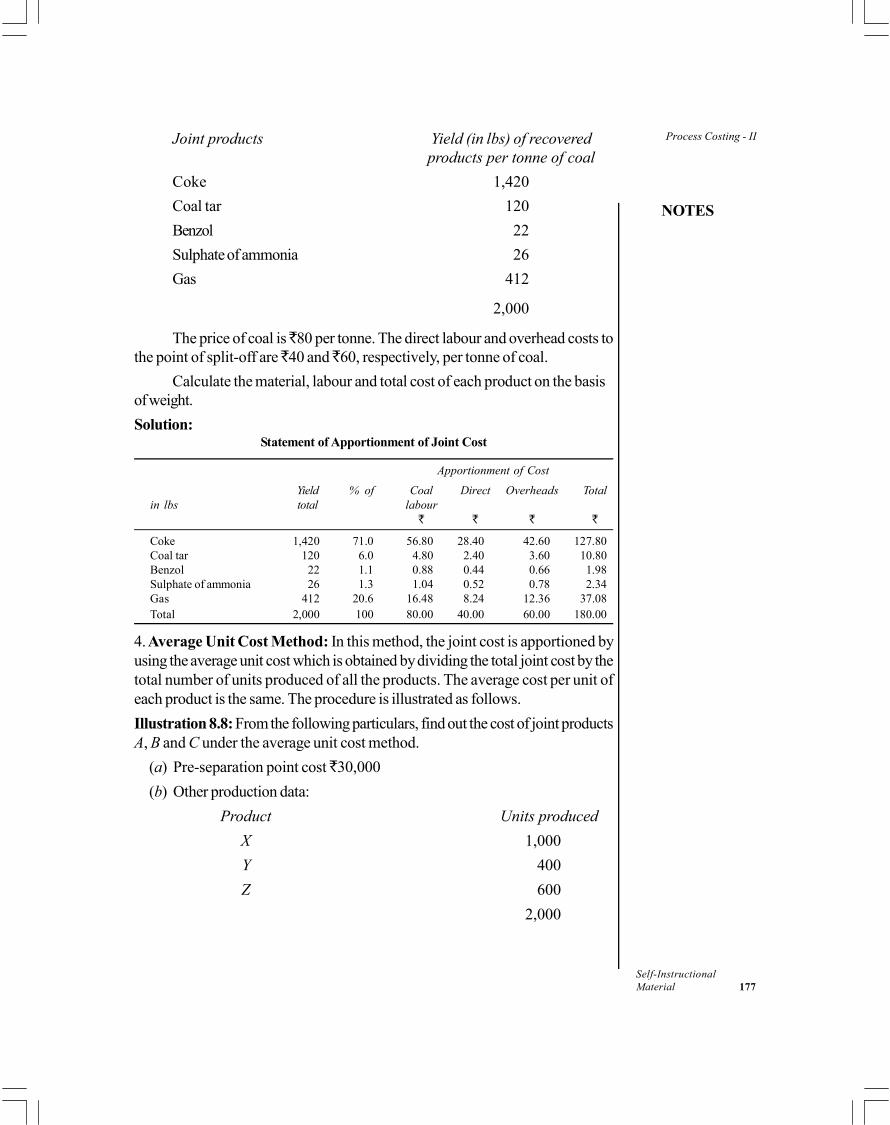
Process Costing - II
NOTES
Self-InstructionalMaterial 177
Joint products Yield (in lbs) of recoveredproducts per tonne of coal
Coke 1,420
Coal tar 120
Benzol 22
Sulphate of ammonia 26
Gas 412
2,000
The price of coal is 80 per tonne. The direct labour and overhead costs tothe point of split-off are 40 and 60, respectively, per tonne of coal.
Calculate the material, labour and total cost of each product on the basisof weight.
Solution:Statement of Apportionment of Joint Cost
Apportionment of Cost
Yield % of Coal Direct Overheads Totalin lbs total labour
Coke 1,420 71.0 56.80 28.40 42.60 127.80Coal tar 120 6.0 4.80 2.40 3.60 10.80Benzol 22 1.1 0.88 0.44 0.66 1.98Sulphate of ammonia 26 1.3 1.04 0.52 0.78 2.34Gas 412 20.6 16.48 8.24 12.36 37.08Total 2,000 100 80.00 40.00 60.00 180.00
4. Average Unit Cost Method: In this method, the joint cost is apportioned byusing the average unit cost which is obtained by dividing the total joint cost by thetotal number of units produced of all the products. The average cost per unit ofeach product is the same. The procedure is illustrated as follows.
Illustration 8.8: From the following particulars, find out the cost of joint productsA, B and C under the average unit cost method.
(a) Pre-separation point cost 30,000
(b) Other production data:
Product Units produced
X 1,000
Y 400
Z 600
2,000

Process Costing - II
NOTES
Self-Instructional178 Material
Solution:
Average unit cost=
=
Statement of Apportionment of Joint Cost
Product Units produced Average cost Apportioned cost(A) (B) ( ) A × B = C
X 1,000 15 15,000Y 400 15 6,000Z 600 15 9,000
Total 2,000 30,000
5. Survey Method: This method apportions the joint cost to various products,on the basis of the results of a survey or technical evaluation. In this survey, variousfactors, like volume, selling price, marketing process, etc., are studied and pointsor weights are assigned to each product. Costs are apportioned on the basis ofsuch weights or points.
Illustration 8.9: X, Y and Z are the three joint products in a factory. Their jointcost is 30,000. Quantities produced are as follows:
X 1,000
Y 400
Z 600
On the basis of technical evaluation, points allotted to X, Y and Z productsare 3.2, 5 and 8 per unit, respectively. Apportion the joint cost.
Solution:Statement of Apportionment of Joint Cost
Product Units Points Weighted *Cost per Apportinedproduced assigned units weighted cost
unit (32 : 20 : 48)(a) (b) (c) = (a) × (b) (d) (e)
X 1,000 3.2 3,200 3.00 9,600Y 400 5.0 2,000 3.00 6,000Z 600 8.0 4,800 3.00 14,400
Total 10,000 3.00 30,000
* = 3 per unit.

Process Costing - II
NOTES
Self-InstructionalMaterial 179
By-Products
By-products are products of relatively small value which are incidentally andunavoidably produced in the course of manufacturing the main product. Forexample, in sugar mills, the main product is sugar. But baggasse and molasses ofcomparatively smaller value are incidentally produced and thus are by-products.Other examples of by-products are oil cake produced in the extraction of edibleoil; cotton seed produced in cotton textile industry, etc. These by-products areunavoidably produced and are of secondary value. The sales value of these by-products is much less as compared to the main product. For example, sales valueof by-products bagasse and molasses is much less than that of the main productsugar.
By-products may be:
(a) Those sold in their original form without further processing
(b) Those which require further processing in order to be saleable
Examples of By-products
Industry By-products
1. Sugar Bagasse, Molasses
2. Cotton textile Cotton seed
3. Edible oil Oil cake
4. Meat Bones
5. Rice mills Husk
Distinction between Joint Products and By-products
There are no hard and fast rules to distinguish between joint products and by-products. A product may be treated as a joint product in one business and thesame product may be treated as a by-product in another business. However, thefollowing factors should be considered to determine if a product is a joint productor aby-product.
(a) Relative sales value: If the sales value of all the products are more orless equal, they are treated as joint products. If, however, there are widedifferences in the relative sales values of products, the product with thegreater sales value is treated as the main product and the products of lowervalue are treated as by-products.
(b) Objective of manufacture: If the objective of manufacturing is productA, then unwanted products B and C be treated as by-products.
(c) Policy of management: The management may decide to treat a particularproduct as the main product and the other products as by-products.Alternatively, it may choose to treat all products as joint products.
Process Costing - II
NOTES
Self-Instructional180 Material
By-products, Scrap and Waste
By-products should not be confused with waste or scrap. Waste is used to describea material which has no value or even negative value, if it has to be disposed of atsome cost. Examples of waste are gases, smoke and other unsaleable residuesfrom the manufacturing process.
Scrap is also different from by-products in the sense that it is the leftoverpart of the raw materials whereas by-products are different from the materialwhich went into the production process. Small pieces of wood left in furnituremanufacture or metal sheet pieces left in utensil manufacture are examples of scrap,whereas minor chemicals, having some value, emerging from a chemical processare classified as by-products. Sale value of scrap is relatively less than that of by-products. However accounting treatment for scrap and by-products is quite similar.
Accounting for By-products
Various methods of accounting for by-products are as follows:
1. Where by-products are of small total value: In such a case it is notconsidered practicable to apportion any part of the joint cost to by-products. Thenet income realized by the sale of by-products may be treated in any one of thefollowing two ways:
(i) It may be treated as ‘miscellaneous income’ and credited to the CostingProfit and Loss Account.
(ii) It may be credited to the process account in which the by-product hasarisen.
In determining the net income from by-products, the following should bededucted from the sales value of by-products: (i) any selling and distributionexpenses incurred in the sale of by-products; and (ii) any costs incurred in furtherprocessing of by-products to make them saleable.
2. Where by-products are of considerable total value: Where by-productsare of considerable sales value, it is proper to apportion a part of the joint cost toby-products. Such apportioned cost of by-products is debited to by-productaccount and credited to the main product account or the relevant process account.Any cost incurred in further processing of the by-product is debited to by-productaccount. The by-product account is credited with its sales value and any profit/loss arising out of this account is transferred to costing Profit and Loss Account.
The apportionment of joint cost to by-products can be done by any of thefour methods discussed earlier in costing of joint products. These methods are:(i) Sales value method; (ii) Physical units method; (iii) Average cost method; and(iv) Points value or survey method.
3. Where by-products require further processing: In such situations, the shareof by-product in joint-cost at the split-off point may be arrived at by subtracting
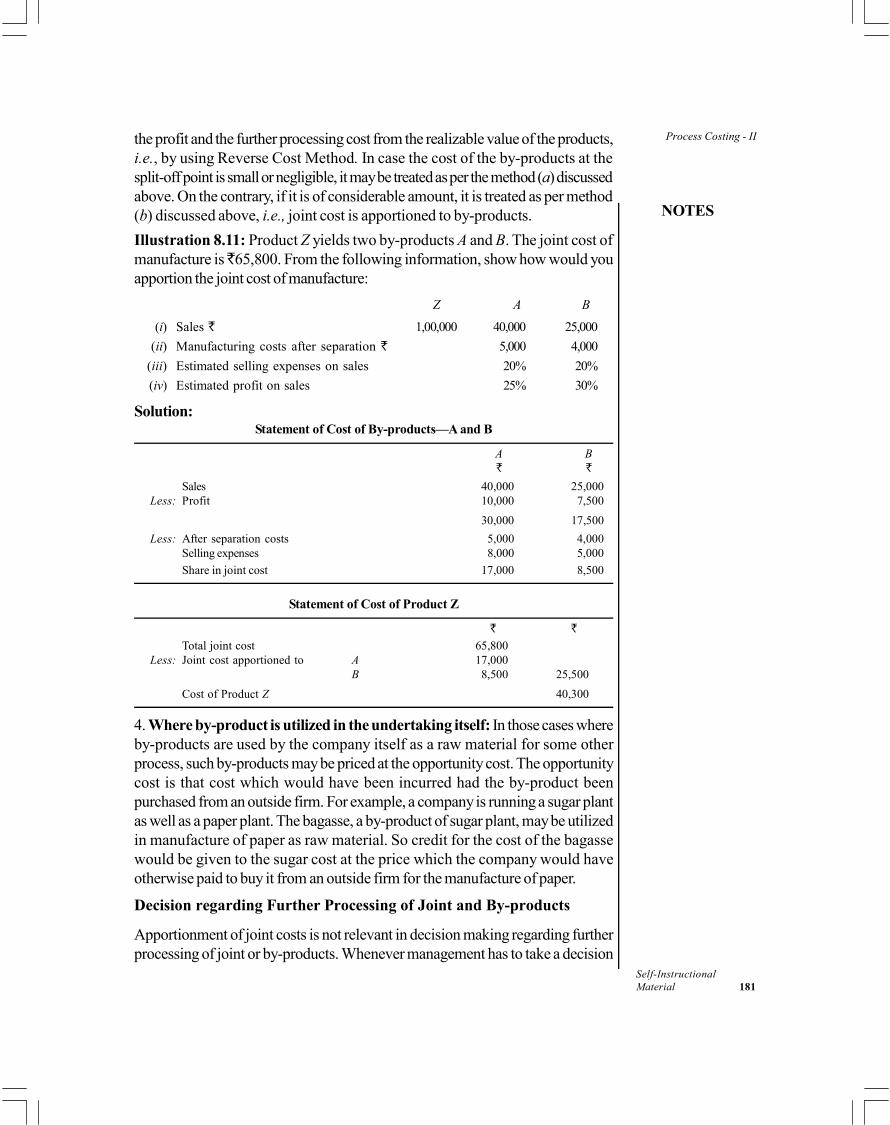
Process Costing - II
NOTES
Self-InstructionalMaterial 181
the profit and the further processing cost from the realizable value of the products,i.e., by using Reverse Cost Method. In case the cost of the by-products at thesplit-off point is small or negligible, it may be treated as per the method (a) discussedabove. On the contrary, if it is of considerable amount, it is treated as per method(b) discussed above, i.e., joint cost is apportioned to by-products.
Illustration 8.11: Product Z yields two by-products A and B. The joint cost ofmanufacture is 65,800. From the following information, show how would youapportion the joint cost of manufacture:
Z A B
(i) Sales 1,00,000 40,000 25,000
(ii) Manufacturing costs after separation 5,000 4,000
(iii) Estimated selling expenses on sales 20% 20%
(iv) Estimated profit on sales 25% 30%
Solution:Statement of Cost of By-products—A and B
A B
Sales 40,000 25,000Less: Profit 10,000 7,500
30,000 17,500
Less: After separation costs 5,000 4,000Selling expenses 8,000 5,000
Share in joint cost 17,000 8,500
Statement of Cost of Product Z
Total joint cost 65,800Less: Joint cost apportioned to A 17,000
B 8,500 25,500
Cost of Product Z 40,300
4. Where by-product is utilized in the undertaking itself: In those cases whereby-products are used by the company itself as a raw material for some otherprocess, such by-products may be priced at the opportunity cost. The opportunitycost is that cost which would have been incurred had the by-product beenpurchased from an outside firm. For example, a company is running a sugar plantas well as a paper plant. The bagasse, a by-product of sugar plant, may be utilizedin manufacture of paper as raw material. So credit for the cost of the bagassewould be given to the sugar cost at the price which the company would haveotherwise paid to buy it from an outside firm for the manufacture of paper.
Decision regarding Further Processing of Joint and By-products
Apportionment of joint costs is not relevant in decision making regarding furtherprocessing of joint or by-products. Whenever management has to take a decision
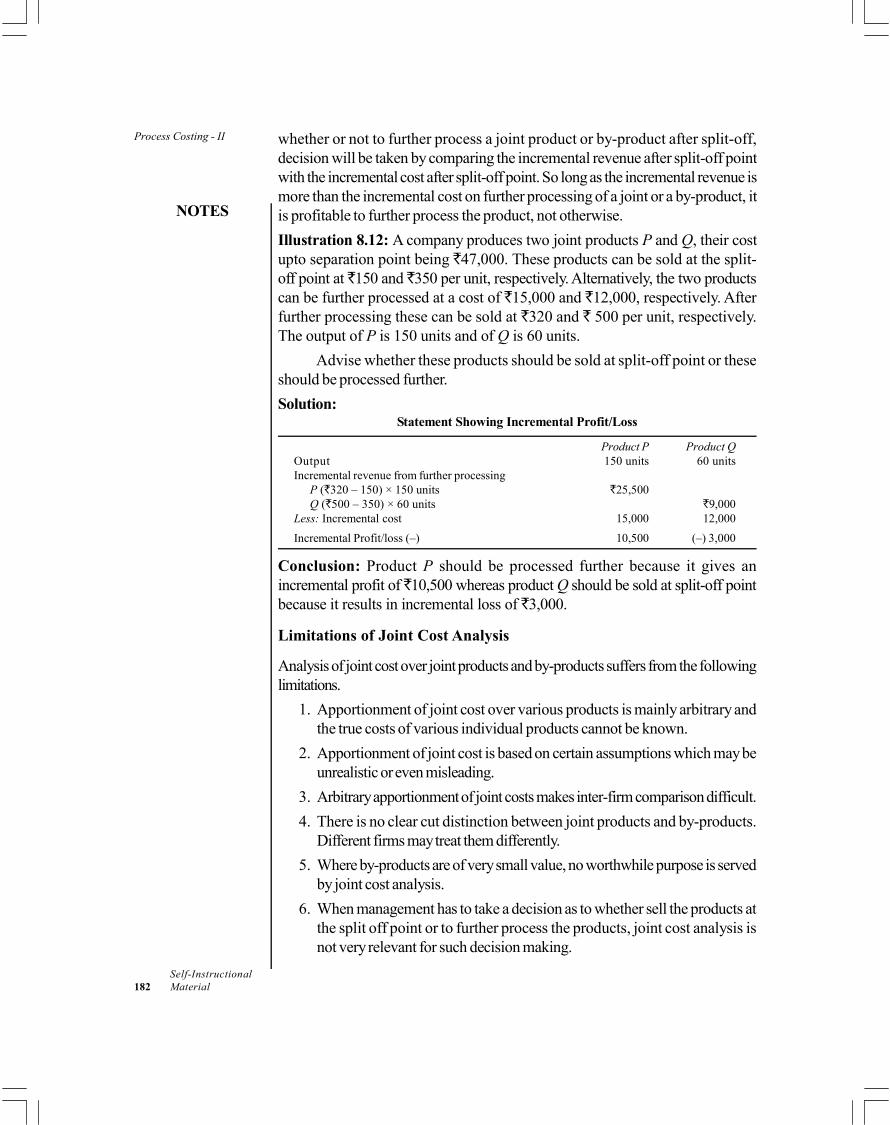
Process Costing - II
NOTES
Self-Instructional182 Material
whether or not to further process a joint product or by-product after split-off,decision will be taken by comparing the incremental revenue after split-off pointwith the incremental cost after split-off point. So long as the incremental revenue ismore than the incremental cost on further processing of a joint or a by-product, itis profitable to further process the product, not otherwise.
Illustration 8.12: A company produces two joint products P and Q, their costupto separation point being 47,000. These products can be sold at the split-off point at 150 and 350 per unit, respectively. Alternatively, the two productscan be further processed at a cost of 15,000 and 12,000, respectively. Afterfurther processing these can be sold at 320 and 500 per unit, respectively.The output of P is 150 units and of Q is 60 units.
Advise whether these products should be sold at split-off point or theseshould be processed further.
Solution:Statement Showing Incremental Profit/Loss
Product P Product QOutput 150 units 60 unitsIncremental revenue from further processing
P ( 320 – 150) × 150 units 25,500Q ( 500 – 350) × 60 units 9,000
Less: Incremental cost 15,000 12,000
Incremental Profit/loss (–) 10,500 (–) 3,000
Conclusion: Product P should be processed further because it gives anincremental profit of 10,500 whereas product Q should be sold at split-off pointbecause it results in incremental loss of 3,000.
Limitations of Joint Cost Analysis
Analysis of joint cost over joint products and by-products suffers from the followinglimitations.
1. Apportionment of joint cost over various products is mainly arbitrary andthe true costs of various individual products cannot be known.
2. Apportionment of joint cost is based on certain assumptions which may beunrealistic or even misleading.
3. Arbitrary apportionment of joint costs makes inter-firm comparison difficult.
4. There is no clear cut distinction between joint products and by-products.Different firms may treat them differently.
5. Where by-products are of very small value, no worthwhile purpose is servedby joint cost analysis.
6. When management has to take a decision as to whether sell the products atthe split off point or to further process the products, joint cost analysis isnot very relevant for such decision making.
Process Costing - II
NOTES
Self-InstructionalMaterial 183
Check Your Progress
4. Give examples of joint costs.5. What is the reason behind the name reverse cost method?
8.5 ANSWERS TO CHECK YOUR PROGRESSQUESTIONS
1. For the purpose of computation of equivalent production and its evaluation,the following three statements are generally prepared: (a) Statement ofequivalent production, (b) statement of cost (per unit) and (c) Statement ofevaluation.
2. Abnormal loss is treated as if this were good production lost. Abnormalloss, thus, is added to equivalent production with due consideration to itsdegree of completion. Unless the degree of completion is specified, it maybe assumed that abnormal loss units are 100% complete in respect of allelements of cost.
3. Internal process profits have the disadvantage of complicating the costingrecords. The complications brought into the accounts arise from the factthat inter-process profit, so introduced, remains included in the price ofprocess stocks.
4. Some examples of joint costs are raw material, labour and overheads.
5. The reverse cost method is named so because net realizable values arecalculated by working backwards from sales values.
8.6 SUMMARY
Process costing mainly deals with continuous type of production. At theend of the accounting period, there may be some work-in-progress, i.e.,semi-finished goods may be in the pipeline. The valuation of such work-in-progress is done in terms of equivalent or effective production.
Equivalent production represents the production of a process in terms ofcompleted units. Work-in-progress at the end of an accounting period areconverted into equivalent completed units.
In average cost method the cost of opening work-in-progress is not keptseparately but is averaged with the additional costs incurred during theperiod. This method thus combines the cost of opening work-in-progressand new production. Information relating to degree of completion of openingWIP is not required.

Process Costing - II
NOTES
Self-Instructional184 Material
In some businesses, it is a practice to charge the output of each process tothe next process not at cost but at a price showing profit to the transferorprocess. The transfer price may be either the current market price or costplus a fixed percentage. Thus each process is charged with its input atcurrent price and no process obtains the benefits of saving or has to bearthe losses caused by the efficiency or inefficiency of the earlier processes.
The term joint products is used for two or more products of almost equaleconomic value, which are simultaneously produced from the samemanufacturing process and the same raw material.
Joint products thus represent two or more products separated in thecourse of processing, each product being in such proportion and of sucheconomic significance that no single one of them can be regarded as themain product.
The various methods of apportionment of joint costs are based mainly onindividual opinion and tend to produce only approximate results. This isbecause no perfectly logical basis exists for the apportionment of joint coststo products and most of the methods are arbitrary. Therefore, while selectinga particular method it should be kept in mind that the method should belogical, appropriate and reliable and should be consistently followed.
By-products should not be confused with waste or scrap. Waste is used todescribe a material which has no value or even negative value, if it has to bedisposed of at some cost. Examples of waste are gases, smoke and otherunsaleable residues from the manufacturing process.
8.7 KEY WORDS
Equivalent production: It represents the production of a process in termsof completed units.
Joint products: Joint products are multiple products generated by a singleproduction process at the same time.
Co-products: It refers to more than one product being manufactured by acompany but need not necessarily arise from the same raw material andmanufacturing process
By-products: It refers to products of relatively small value which areincidentally and unavoidably produced in the course of manufacturing themain product

Process Costing - II
NOTES
Self-InstructionalMaterial 185
8.8 SELF ASSESSMENT QUESTIONS ANDEXERCISES
Short Answer Questions
1. How are normal and abnormal losses treated in the calculation of equivalentproduction?
2. State the characteristics of joint products.
3. Differentiate between joint products and by-products.
4. What is the difference between by-products, scrap and waste?
5. Write a short note on the inter process profits.
Long Answer Questions
1. Discuss the average cost method with the help of illustrations.
2. Describe the different methods of accounting for joint products.
3. Explain accounting for by-products.
4. A coke manufacturing company produces the following products by putting
5,000 tonnes of coal @ 25 per tonne into common process:
Coke 3,500 tonnes
Tar 1,200 tonnes
Sulphate 52 tonnes
Benzol 48 tonnes
Apportion the joint cost amongst the products on the basis of physical unitsmethod.
8.9 FURTHER READINGS
Arora, M.N. 2012. A Textbook of Cost and Management Accounting, Tenthedition. New Delhi: Vikas Publishing House.
Arora, M.N. 2010. Cost Accounting: Principles and Practice, Eleventh edition.New Delhi: Vikas Publishing House.
Shillinglow, G. 1982.Managerial Costing Accounting. Homewood: Richard D.Irwin.
Morse, W. J. 1978. Cost Accounting. Massachusetts: Addison-Wesley PublishingCo.
Lal, Jawahar. 2003. Cost Accounting. New Delhi: Tata McGraw Hill.

Contract Costing
NOTES
Self-Instructional186 Material
BLOCK - IIICOSTING AND BUDGETING CONTRACT
UNIT 9 CONTRACT COSTING
Structure
9.0 Introduction9.1 Objectives9.2 Contract Costing: Meaning and Features
9.2.1 Main Features of Contrast Costing9.2.2 Preparation of Contract Account
9.3 Special Points in Contract Costing9.3.1 Profit on Uncompleted Contracts9.3.2 Escalation Clause9.3.3 Cost-plus Contracts
9.4 Answers to Check Your Progress Questions9.5 Summary9.6 Key Words9.7 Self Assessment Questions and Exercises9.8 Further Readings
9.0 INTRODUCTION
Specific order costing is broad costing system applicable for places where thereare jobs, batches or contracts involved. These specific work jobs are cost unitson their own and different from each other. The specific order costing systemassists which finding the costs of these units. In this unit, you will learn aboutcontract costing. In industries such as railway line contracts, engineering projects,civil construction, construction of bridges, etc., contract costing is used. Thisextension of job costing is relevant for long term contracts. Another way to definecontract costing is that it is used in the types of businesses where the completion ofcontracts takes a longer time, often spanning across different accounting periods.In this unit, you will get acquainted with the concepts related to contract costing.
9.1 OBJECTIVES
After going through this unit, you will be able to:
Discuss the meaning and features of contract costing
Explain the features of contract costing
Describe the preparation of contract account
Examine accounting treatment of escalation clause, contract near completionand cost plus contracts
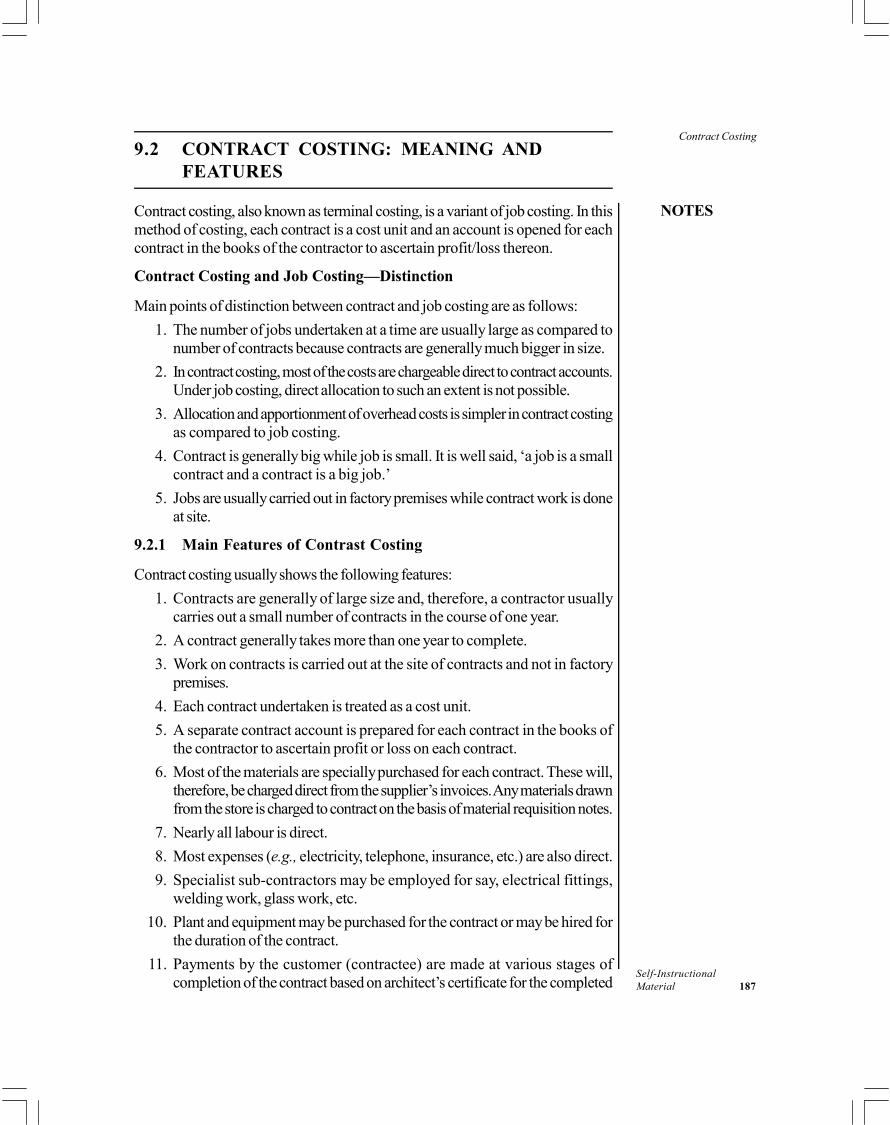
Contract Costing
NOTES
Self-InstructionalMaterial 187
9.2 CONTRACT COSTING: MEANING ANDFEATURES
Contract costing, also known as terminal costing, is a variant of job costing. In thismethod of costing, each contract is a cost unit and an account is opened for eachcontract in the books of the contractor to ascertain profit/loss thereon.
Contract Costing and Job Costing—Distinction
Main points of distinction between contract and job costing are as follows:
1. The number of jobs undertaken at a time are usually large as compared tonumber of contracts because contracts are generally much bigger in size.
2. In contract costing, most of the costs are chargeable direct to contract accounts.Under job costing, direct allocation to such an extent is not possible.
3. Allocation and apportionment of overhead costs is simpler in contract costingas compared to job costing.
4. Contract is generally big while job is small. It is well said, ‘a job is a smallcontract and a contract is a big job.’
5. Jobs are usually carried out in factory premises while contract work is doneat site.
9.2.1 Main Features of Contrast Costing
Contract costing usually shows the following features:
1. Contracts are generally of large size and, therefore, a contractor usuallycarries out a small number of contracts in the course of one year.
2. A contract generally takes more than one year to complete.
3. Work on contracts is carried out at the site of contracts and not in factorypremises.
4. Each contract undertaken is treated as a cost unit.
5. A separate contract account is prepared for each contract in the books ofthe contractor to ascertain profit or loss on each contract.
6. Most of the materials are specially purchased for each contract. These will,therefore, be charged direct from the supplier’s invoices. Any materials drawnfrom the store is charged to contract on the basis of material requisition notes.
7. Nearly all labour is direct.
8. Most expenses (e.g., electricity, telephone, insurance, etc.) are also direct.
9. Specialist sub-contractors may be employed for say, electrical fittings,welding work, glass work, etc.
10. Plant and equipment may be purchased for the contract or may be hired forthe duration of the contract.
11. Payments by the customer (contractee) are made at various stages ofcompletion of the contract based on architect’s certificate for the completed
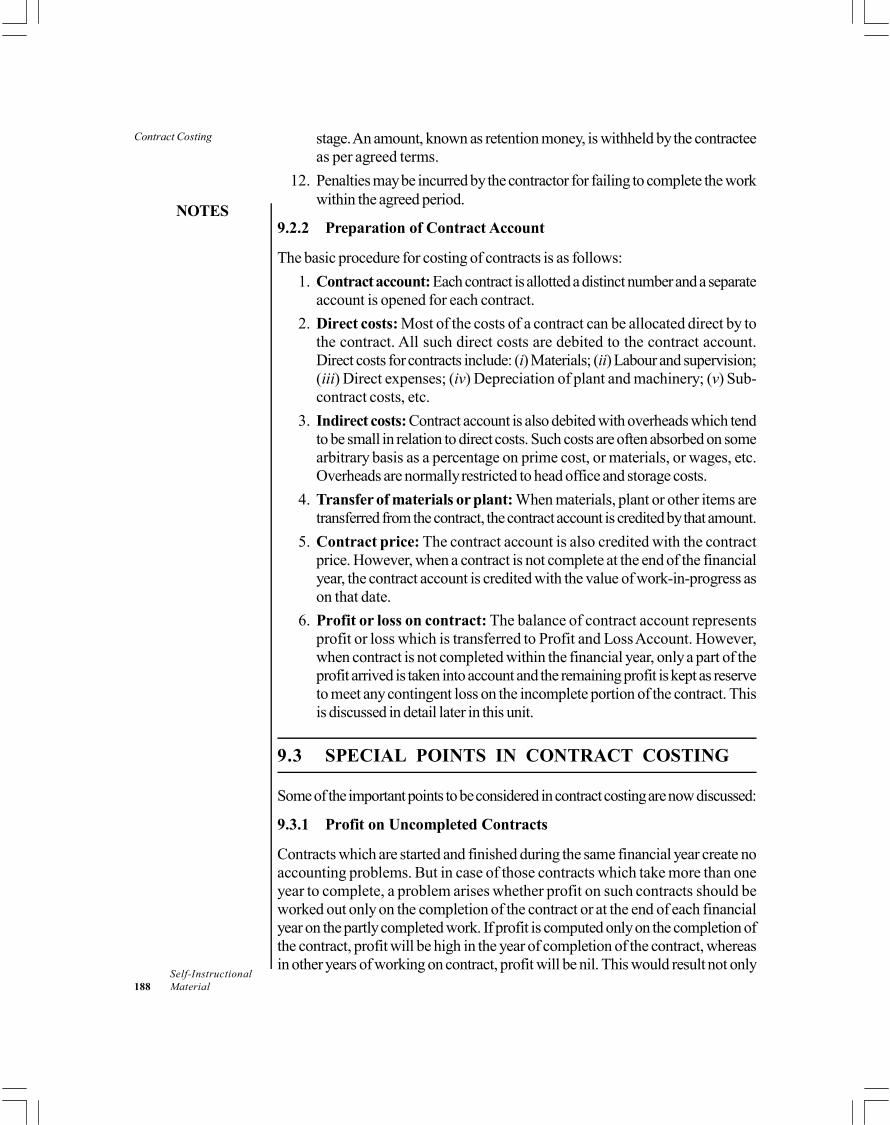
Contract Costing
NOTES
Self-Instructional188 Material
stage. An amount, known as retention money, is withheld by the contracteeas per agreed terms.
12. Penalties may be incurred by the contractor for failing to complete the workwithin the agreed period.
9.2.2 Preparation of Contract Account
The basic procedure for costing of contracts is as follows:
1. Contract account: Each contract is allotted a distinct number and a separateaccount is opened for each contract.
2. Direct costs: Most of the costs of a contract can be allocated direct by tothe contract. All such direct costs are debited to the contract account.Direct costs for contracts include: (i) Materials; (ii) Labour and supervision;(iii) Direct expenses; (iv) Depreciation of plant and machinery; (v) Sub-contract costs, etc.
3. Indirect costs: Contract account is also debited with overheads which tendto be small in relation to direct costs. Such costs are often absorbed on somearbitrary basis as a percentage on prime cost, or materials, or wages, etc.Overheads are normally restricted to head office and storage costs.
4. Transfer of materials or plant: When materials, plant or other items aretransferred from the contract, the contract account is credited by that amount.
5. Contract price: The contract account is also credited with the contractprice. However, when a contract is not complete at the end of the financialyear, the contract account is credited with the value of work-in-progress ason that date.
6. Profit or loss on contract: The balance of contract account representsprofit or loss which is transferred to Profit and Loss Account. However,when contract is not completed within the financial year, only a part of theprofit arrived is taken into account and the remaining profit is kept as reserveto meet any contingent loss on the incomplete portion of the contract. Thisis discussed in detail later in this unit.
9.3 SPECIAL POINTS IN CONTRACT COSTING
Some of the important points to be considered in contract costing are now discussed:
9.3.1 Profit on Uncompleted Contracts
Contracts which are started and finished during the same financial year create noaccounting problems. But in case of those contracts which take more than oneyear to complete, a problem arises whether profit on such contracts should beworked out only on the completion of the contract or at the end of each financialyear on the partly completed work. If profit is computed only on the completion ofthe contract, profit will be high in the year of completion of the contract, whereasin other years of working on contract, profit will be nil. This would result not only

Contract Costing
NOTES
Self-InstructionalMaterial 189
in distorted profit pattern but also higher tax liability because income tax at higherrates may have to be paid. Therefore, when contracts extend beyond a year, itbecomes necessary to take into account the profit earned (or loss incurred) on thework performed during each year. This helps in avoiding distortion of the year-to-year profit trend of the business.
There are two aspects of profit computation:
(a) Computation of notional profit or estimated profit.
(b) Computation of the portion of such profit that is to be transferred toProfit and Loss Account.
Notional Profit
Notional profit is the difference between the value of work-in-progress certifiedand the cost of work-in-progress certified. It is computed as follows (Figures areassumed):
Value of work certified 20,00,000
Add: Cost of work not yet certified 1,50,000
21,50,000
Less: Cost of work to date 19,00,000
Notional Profit 2,50,000
If in any year, cost of work done exceeds the value of work certified anduncertified, the result will be a notional loss.
Estimated Profit
Estimated profit represents the excess of the contract price over the estimatedtotal cost of the contract. It is computed as follows (Figures are assumed):
Contract Price 30,00,000
Less: Total cost already incurred 21,00,000
9,00,000
Less: Estimated additional costs to complete the contract 3,50,000
Estimated Profit 5,50,000
Portion of Notional Profit or Estimated Profit to be Transferred toProfit and Loss Account
The portion of the notional or estimated profit to be transferred to P&L Accountdepends upon the stage of completion of the contract, i.e., ratio of work-in-progress certified to total contract work. For this purpose work-in-progressuncertified is not considered. Prudence requires that the total notional profit shouldnot be transferred to P&L Account but a portion of it should be withheld as areserve to meet any unforeseen future expenses or contingencies.
Rules: There are no hard and fast rules in this regard. However, thefollowing general rules may be followed in this context.

Contract Costing
NOTES
Self-Instructional190 Material
1. When work certified is less than 1/4 of the contract price, no profit istransferred to Profit and Loss Account. This is based on the principle thatno profit should be taken into account unless the contract has advancedreasonably.
2. When work-in-progress certified is 1/4 or more but less than 1/2 of thecontract price, then generally 1/3 of the profit is transferred to Profit andLoss Account. The balance amount is treated as reserve. Thus, profit to betransferred to Profit and Loss Account is computed by the following formula:
Transfer to P&L A/c = Notional Profit ×
Alternatively, a more common practice is to further reduce this amount bythe cash ratio.
Thus: Transfer to P&L A/c = Notional profit × ×
3. When work certified is 1/2 or more but less than 9/10 of the contract price,(i.e. 50% to 90%), then the profit to be transferred to P & L Account iscomputed as follows:
Transfer to P&L A/c = Notional Profit ×
Here also a more common practice is to further reduce this amount by cashratio. This is shown below:
Transfer to P&L A/c = Notional Profit × ×
4. When contract is near completion, then the estimated profit should becalculated on the whole contract. The proportion of estimated profit to betransferred to Profit and Loss Account is computed by any one of thefollowing formulas:
(a) Estimated profit ×
(b) Estimated profit × ×
(c) Estimated profit ×
(d) Estimated profit × ×
5. Loss on Uncompleted Contracts: In the event of a loss on uncompletedcontracts, this should be transferred in full to the Profit and Loss Account,whatever be the stage of completion of the contract.
It was stated earlier also that these are not hard and fast rules. The practicemay vary from firm-to-firm depending upon the nature of work involved, degreeof risk in the business, extent of work completed, etc. But whatever method isadopted, it should be applied consistently from year-to-year so as not to disturbthe trend of profits.
Illustration 9.1: The following was the expenditure on a contract for 12,00,000commenced in January 2009.
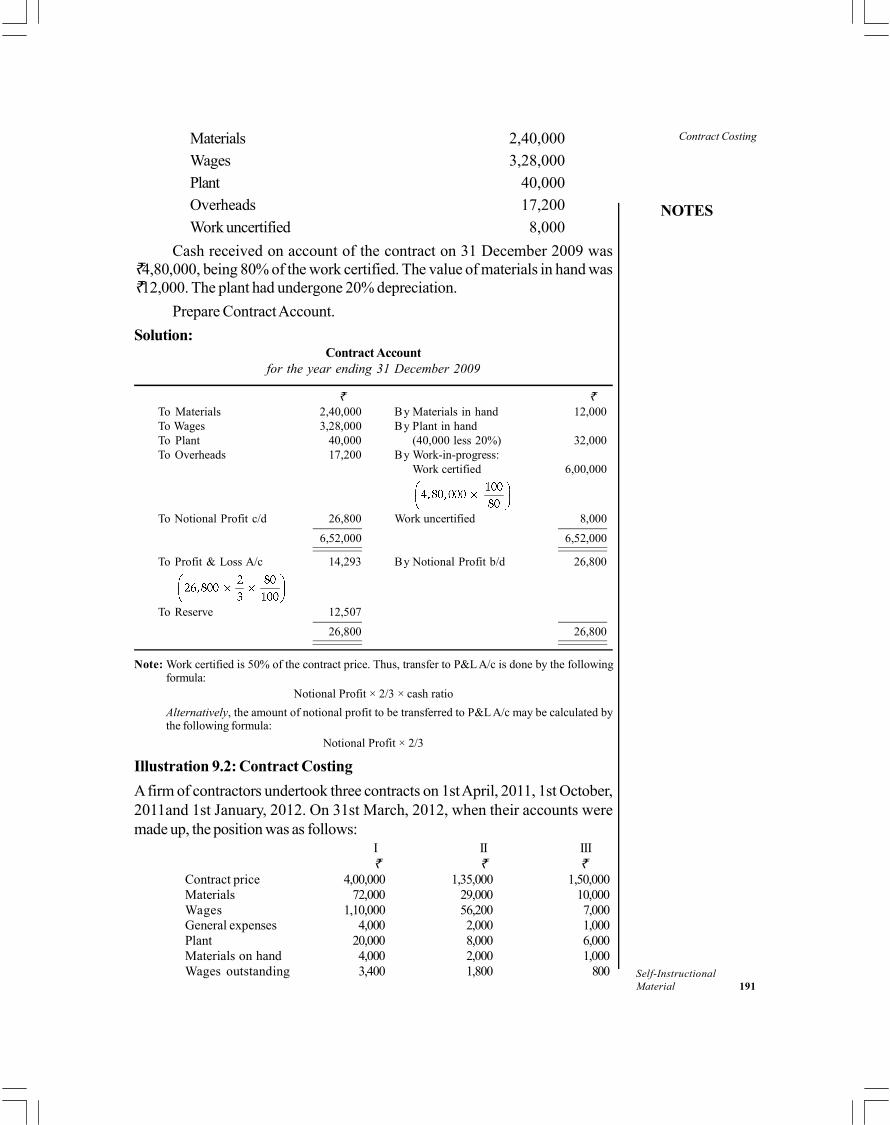
Contract Costing
NOTES
Self-InstructionalMaterial 191
Materials 2,40,000
Wages 3,28,000
Plant 40,000
Overheads 17,200
Work uncertified 8,000
Cash received on account of the contract on 31 December 2009 was4,80,000, being 80% of the work certified. The value of materials in hand was12,000. The plant had undergone 20% depreciation.
Prepare Contract Account.
Solution:Contract Account
for the year ending 31 December 2009
To Materials 2,40,000 By Materials in hand 12,000To Wages 3,28,000 By Plant in handTo Plant 40,000 (40,000 less 20%) 32,000To Overheads 17,200 By Work-in-progress:
Work certified 6,00,000
To Notional Profit c/d 26,800 Work uncertified 8,000
6,52,000 6,52,000
To Profit & Loss A/c 14,293 By Notional Profit b/d 26,800
To Reserve 12,507
26,800 26,800
Note: Work certified is 50% of the contract price. Thus, transfer to P&L A/c is done by the followingformula:
Notional Profit × 2/3 × cash ratio
Alternatively, the amount of notional profit to be transferred to P&L A/c may be calculated bythe following formula:
Notional Profit × 2/3
Illustration 9.2: Contract Costing
A firm of contractors undertook three contracts on 1st April, 2011, 1st October,2011and 1st January, 2012. On 31st March, 2012, when their accounts weremade up, the position was as follows:
I II III
Contract price 4,00,000 1,35,000 1,50,000Materials 72,000 29,000 10,000Wages 1,10,000 56,200 7,000General expenses 4,000 2,000 1,000Plant 20,000 8,000 6,000Materials on hand 4,000 2,000 1,000Wages outstanding 3,400 1,800 800
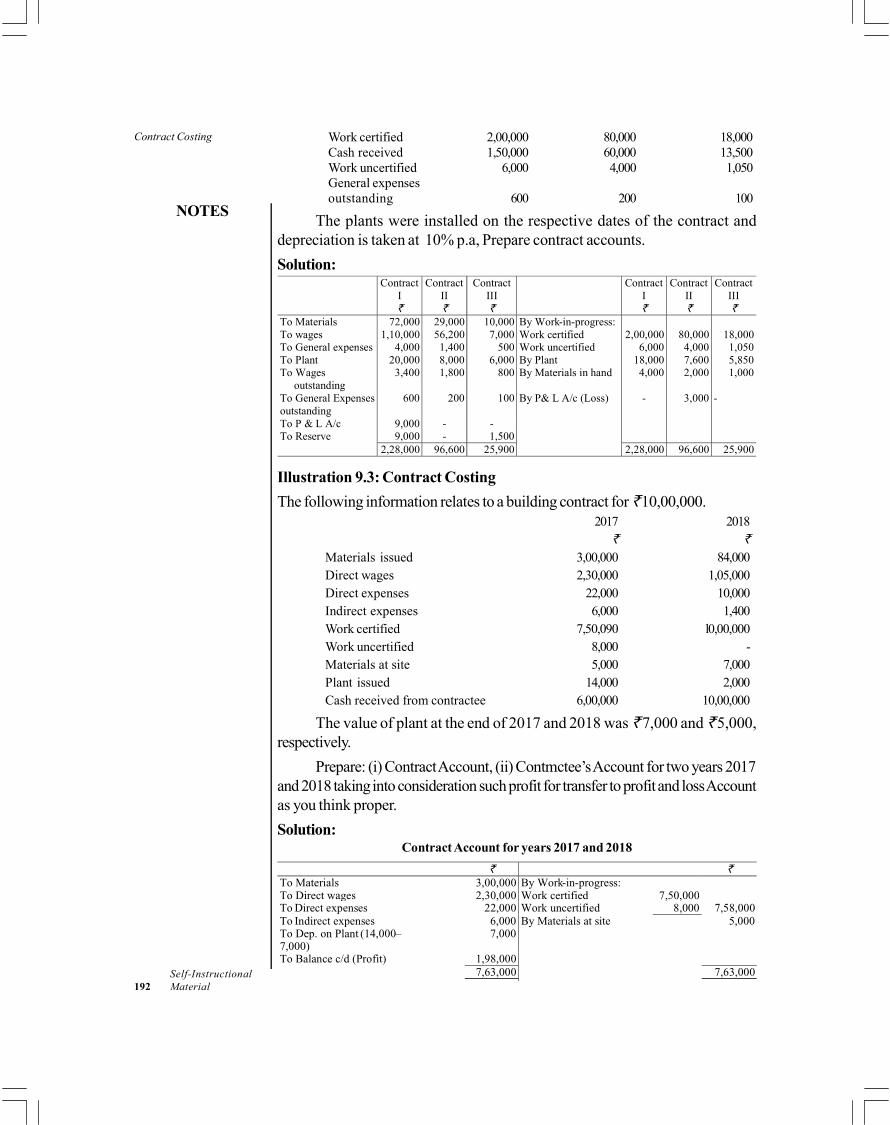
Contract Costing
NOTES
Self-Instructional192 Material
Work certified 2,00,000 80,000 18,000Cash received 1,50,000 60,000 13,500Work uncertified 6,000 4,000 1,050General expensesoutstanding 600 200 100
The plants were installed on the respective dates of the contract anddepreciation is taken at 10% p.a, Prepare contract accounts.
Solution: Contract
I Contract
II Contract
III Contract
I Contract
II Contract
III
To Materials 72,000 29,000 10,000 By Work-in-progress: To wages 1,10,000 56,200 7,000 Work certified 2,00,000 80,000 18,000 To General expenses 4,000 1,400 500 Work uncertified 6,000 4,000 1,050 To Plant 20,000 8,000 6,000 By Plant 18,000 7,600 5,850 To Wages outstanding
3,400 1,800 800 By Materials in hand 4,000 2,000 1,000
To General Expenses outstanding
600 200 100 By P& L A/c (Loss) - 3,000 -
To P & L A/c 9,000 - - To Reserve 9,000 - 1,500 2,28,000 96,600 25,900 2,28,000 96,600 25,900
Illustration 9.3: Contract Costing
The following information relates to a building contract for 10,00,000.2017 2018
Materials issued 3,00,000 84,000Direct wages 2,30,000 1,05,000Direct expenses 22,000 10,000Indirect expenses 6,000 1,400Work certified 7,50,090 l0,00,000Work uncertified 8,000 -Materials at site 5,000 7,000Plant issued 14,000 2,000Cash received from contractee 6,00,000 10,00,000
The value of plant at the end of 2017 and 2018 was 7,000 and 5,000,respectively.
Prepare: (i) Contract Account, (ii) Contmctee’s Account for two years 2017and 2018 taking into consideration such profit for transfer to profit and loss Accountas you think proper.
Solution:Contract Account for years 2017 and 2018

Contract Costing
NOTES
Self-InstructionalMaterial 193
2 6, 00, 0001, 98, 000
3 7, 50, 000
9.3.2 Escalation Clause
This clause is often provided in contracts to cover any likely changes in the priceor utilization of materials and labour. Thus, a contractor is entitled to suitablyenhance the contract price if the cost rises beyond a given percentage. The objectof this clause is to safeguard the interest of the contractor against unfavourablechanges in cost. The escalation clause is of particular importance where prices ofmaterial and labour are anticipated to increase or where quantity of material and/or labour time cannot be accurately estimated.
Just as an escalation clause safeguards the interest of the contractor byupward revision of the contract price, a de-escalation clause may be inserted tolook after the interest of the contractee by providing for downward revision of thecontract price in the event of cost going down beyond an agreed level.
9.3.3 Cost-plus Contracts
Cost-plus contract is a contract in which the price is not fixed at the time of enteringinto the contract. The contract price is determinded by adding a specified amountor percentage of profit to the costs allowed in the contract. The contracteecompensates the contractor for all allowable costs actually incurred by him. Overand above these costs the contractor is paid a fixed amount or a fixed percentageof cost as profit. The items of cost to be included for the purpose of determiningcontract price are broadly agreed upon in advance. The accounts of the contractorare usually subject to audit by the contractee.
Cost-plus contracts are usually entered into for executing special types ofwork, like construction of dam, power house, newly designed ship, etc., whereaccurate cost estimation is difficult. Government often prefers to give contracts on‘cost-plus’ terms.
Advantages: Cost-plus contracts offer the following advantages:
Contract Costing
NOTES
Self-Instructional194 Material
To the Contractor:
1. There is no risk of loss being incurred on such contracts.
2. It protects him from the risk of fluctuations in market prices of material,labour, etc.
3. It simplifies the work of preparing tenders and quotations.
To the Contractee: The contractee can ensure a fair price of the contract bybeing entitled to audit the accounts of the contractor.
Disadvantages
The disadvantages of cost-plus contracts are:
To the Contractor:
1. The contractor is deprived of the advantages which would have accrueddue to favourable market prices.
2. The contractor has to suffer for his own efficiency. This is because profit isusually based as a percentage of cost and efficient working resulting in lowercost also leads to lower profits.
To the Contractee:
1. The contractee has to pay more for the inefficiency of the contactor as thecontractor has no incentive to reduce costs.
2. The price the contractee has to pay is unknown until after the completion ofwork.
Check Your Progress
1. What is the difference between jobs and contracts in terms of where thework is done?
2. Mention the direct costs for contracts.
3. State the object of the escalation clause.
9.4 ANSWERS TO CHECK YOUR PROGRESSQUESTIONS
1. The difference between jobs are usually carried out in factory premiseswhile contract work is done at site.
2. The direct costs for contracts include: (i) Materials; (ii) Labour andsupervision; (iii) Direct expenses; (iv) Depreciation of plant and machinery;(v) Sub-contract costs, etc.
3. The object of the escalation clause is to safeguard the interest of the contractoragainst unfavourable changes in cost.
Contract Costing
NOTES
Self-InstructionalMaterial 195
9.5 SUMMARY
Contract costing also known as terminal costing is a variant of job costingin which each contract is a cost unit and an account is opened for eachcontract in the books of the contractor to ascertain profit/loss thereon.
Contract costing differs from job costing in the following ways: there arelarge number of contracts in contract costing, most of the costs here arechargeable direct to contract accounts, allocation and apportionment ofoverhead costs is simpler, contract is bigger than a job and while jobs arecarried out in factories, contract works are done at site.
The Contract costing procedure includes: preparation of a contract account,allocation of direct and indirect costs, transfer of materials or plant, creditingof the contract price and the determination of profit or loss on contract.
Materials of contracting costing in contract costing can be either materialsreturned to store or materials at site.
Progress payments are part payments of the contract amount which arepaid from time to time on the basis of certificate issued by the architects,certifying the value of the work satisfactorily completed.
When contracts extend beyond a year, it becomes necessary to take intoaccount the profits earned (or loss incurred) on the work performed duringeach year. This helps in avoiding distortion of the year-to-year profit trendof the business.
Escalation clause is a clause often provided in contracts to cover any likelychanges in the price or utilization of materials and labour.
Cost-plus contract is a contract in which the price is not fixed at the time ofentering into the contract.
9.6 KEY WORDS
Contract costing: It is a variant of job costing in which each contract is acost unit and an account is opened for each contract in the books of thecontractor to ascertain profit/loss thereon
Escalation clause: It is a clause which is often provided in contracts tocover any likely changes in the price or utilization of materials and labour
Cost-plus contract: It refers to a contract in which the price is not fixed atthe time of entering into the contract
9.7 SELF ASSESSMENT QUESTIONS ANDEXERCISES
Short Answer Questions
1. How are direct and indirect costs treated in the contract costing procedure?
Contract Costing
NOTES
Self-Instructional196 Material
2. Briefly state the methods of ascertaining profit on the following contracts:
(a) When contract is completed
(b) When contract is not completed
(c) When the contract is nearing completion
Long Answer Questions
1. Distinguish between job costing and contract costing. State the specialfeatures of contract costing.
2. What is a cost-plus contract? Discuss this from the point of view of (a) themanufacturer, (b) the buyer.
3. Explain how the profits are determined in the case of uncompleted contracts.
4. Thekedar accepted a contract for the construction of a building for10,00,000; the contractee agreeing to pay 90% of work certified as completeby the architect.
During the first year, the amounts spent were:
Material 1,20,000 Machinery 30,000
Labour 1,50,000 Other expenses 90,000
At the end of the year, the machinery was considered to be of 20,000, andmaterials at site were of the value of 5000. Work certified during the yeartotalled 4,00,000. In addition, work-in-progress but not certified at theend of year had cost 15,000. Prepare Contract Account in the books ofThekedar. Also show the various figures of profit that can be transferredreasonably to the Profit
and Loss Account.
9.8 FURTHER READINGS
Arora, M.N. 2012. A Textbook of Cost and Management Accounting, Tenthedition. New Delhi: Vikas Publishing House.
Arora, M.N. 2010. Cost Accounting: Principles and Practice, Eleventh edition.New Delhi: Vikas Publishing House.
Shillinglow, G. 1982.Managerial Costing Accounting. Homewood: Richard D.Irwin.
Morse, W. J. 1978. Cost Accounting. Massachusetts: Addison-Wesley PublishingCo.
Lal, Jawahar. 2003. Cost Accounting. New Delhi: Tata McGraw Hill.
Job and Batch Costing
NOTES
Self-InstructionalMaterial 197
UNIT 10 JOB AND BATCH COSTING
Structure
10.0 Introduction10.1 Objectives10.2 Job Costing10.3 Batch Costing10.4 Answers to Check Your Progress Questions10.5 Summary10.6 Key Words10.7 Self Assessment Questions and Exercises10.8 Further Readings
10.0 INTRODUCTION
All industries may be broadly classified into two categories:
1. Job order industries
2. Mass production industries
In job order industries, production work is done against orders fromcustomers. Each job work needs special treatment and can be clearly distinguishedfrom other jobs. Each job is completed as per customer’s specifications. Examplesof job order industries are printing press, construction of buildings, bridges, roadsship building
In mass production, firms manufacture uniform types of products. Sinceproduction is of standard products, it is on a mass scale and on a continuous basis.No customer order or specifications are required for production. Examples ofmass production industries are textiles, paper, sugar, chemicals and steel.
In job order industries, one of the methods used for cost as certainment isjop costing. The basic concepts related to job costing in discussed in this unit.
Batch costing is a variation of job costing. While job costing is concernedwith costing of jobs that are made to a customer’s particular requirements, batchcosting is used when production consists of limited repetitive work and a definitenumber of articles are manufactured in each batch to be held in stock for sale tocustomers generally. In this unit, you will also learn about batch costing.
10.1 OBJECTIVES
After going through this unit, you will be able to:
Describe the meaning and procedure of job costing
Explain the meaning and procedure involved in batch costing
Discuss the concept of economic batch quantity
Job and Batch Costing
NOTES
Self-Instructional198 Material
10.2 JOB COSTING
Job costing or job order costing is a method of cost ascertainment used in joborder industries. Special features of such industries are as follows:
(a) Production is against customer’s orders and not for stocks.
(b) Each job has its own characteristics and requires special attention.
(c) The flow of production from one department to another is not uniform. It isthe nature of job which determines the department through which it is to beprocessed.
Objectives of Job Costing
The following are the main objectives of job costing:
1. Cost of each job/order is ascertained separately. This helps in finding outthe profit or loss on each individual job.
2. It enables the management to know those jobs which are more profitableand those which are unprofitable.
3. It provides a basis for determining the cost of similar jobs undertaken infuture. It thus helps in future production planning.
4. It helps the management in controlling costs by comparing the actual costswith the estimated costs.
Job Costing Procedure
The following steps are taken in job costing:
1. Job number: When an order has been accepted, an individual job numbermust be assigned to each job so that separate jobs are identifiable at all stages ofproduction. Assignment of job numbers also facilitates reference for costingpurposes in the ledger and is conveniently short for use on various forms anddocuments.
2. Production order: The production control department then makes out aProduction Order, thereby authorizing to start work on the job. Several copies ofthe production order are prepared, the copies often being in different colours todistinguish between them more easily. These copies are passed on to the following:
(i) All departmental foremen concerned with the job
(ii) Storekeeper for issuance of materials
(iii) Tool room for an advance notification of tools required
The columns provided in the production order differ widely, depending largelyupon the nature of production. Sometimes orders are accompanied by the blueprints and contain a bill of materials and detailed instructions as to which tools andmachinery are to be used.
Job and Batch Costing
NOTES
Self-InstructionalMaterial 199
3. Job cost sheet: The unique accounting document under job costing is the jobcost sheet. Receipt of production order is the signal for the cost accountant toprepare a job cost sheet on which he will record the cost of materials used and thelabour and machine time taken. Each concern has to design a job cost sheet to suitits needs.
Job cost sheets are not prepared for specified periods but they are madeout for each job regardless of the time taken for its completion. However, material,labour and overhead costs are posted periodically to the relevant cost sheet.
The material, labour and overheads to be absorbed into jobs are collectedand recorded in the following way:
(a) Direct materials: The method of recording receipts and issues of materialson materials requisitions or bill of materials was explained in detail in the uniton materials. It may be recalled that material requisitions or bills on materialsshow the quantities of materials issued to jobs from store. When copies ofthese documents reach the cost office, they are priced and entered in thestores ledger account in the ‘issues’ column. Each requisition shows the jobnumber to which the material is to be charged. Summaries of materialrequisitions are prepared at regular intervals on Materials Abstract orMaterials Issue Analysis Sheet. These summaries facilitate debiting the jobwith total cost of materials rather than charging with many small items. Thesetotals are also used for entries in stores ledger control account and work-in-progress control account.
(b) Direct wages: As explained earlier in the unit on labour cost, the wagespayable to workers are calculated on clock cards, job cards, time sheets,etc. The summaries of job cards are made on Wages Abstract or WagesAnalysis Sheets, which show the direct wages chargeable to each job. Thetotal of wages chargeable to various jobs is debited to work-in-progresscontrol account.
(c) Direct expenses: Direct expenses which can be identified with specificjobs are directly charged to these jobs, the total being debited to work-in-progress control account.
(d) Overheads: Indirect materials, indirect wages and indirect expenses whichcannot be identified with specific jobs are apportioned to cost centres in themanner described earlier in the chapter on overhead cost. Absorption ofoverheads by the jobs passing through the cost centres is based uponpercentage of direct wages or direct material cost, direct labour hours ormachine hours, etc. These methods of absorption have also been discussedin detail in the chapter on overheads.
The direct materials, wages and expenses and the overheads absorbed aretotalled to give the total cost.
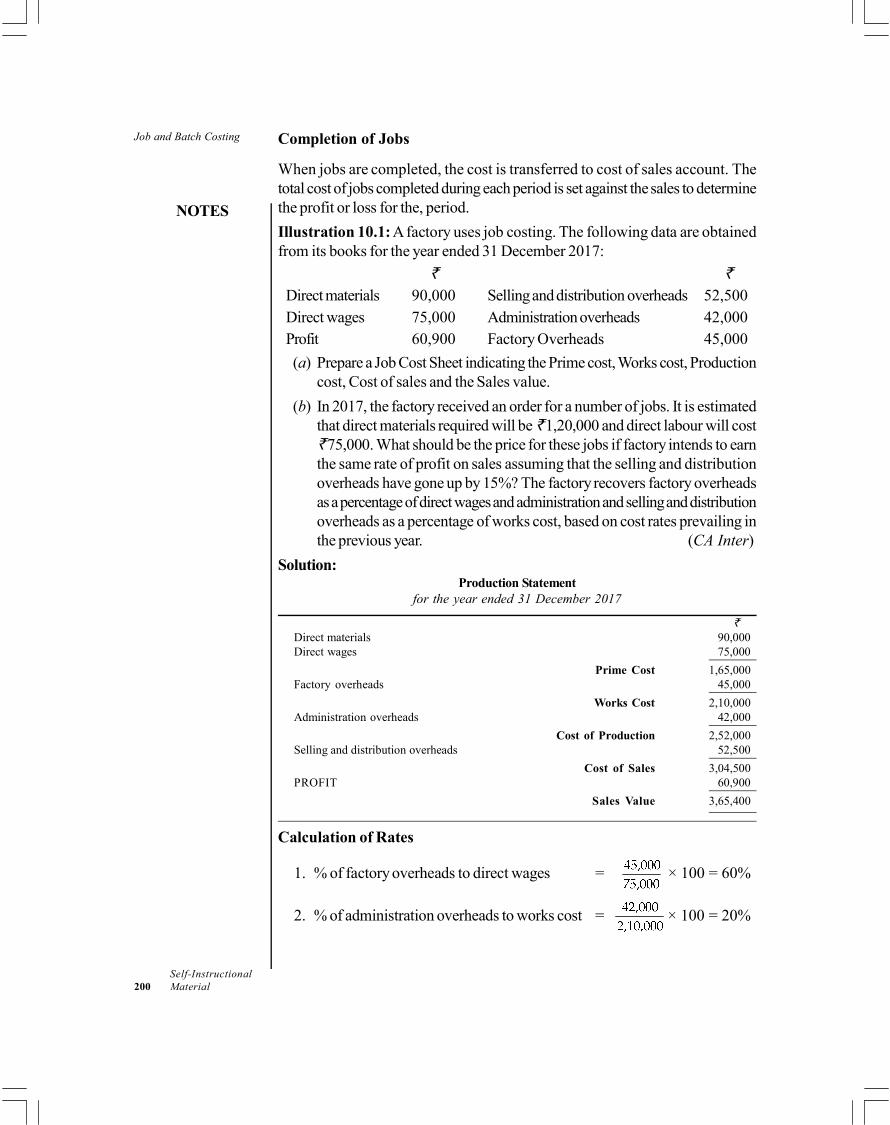
Job and Batch Costing
NOTES
Self-Instructional200 Material
Completion of Jobs
When jobs are completed, the cost is transferred to cost of sales account. Thetotal cost of jobs completed during each period is set against the sales to determinethe profit or loss for the, period.
Illustration 10.1: A factory uses job costing. The following data are obtainedfrom its books for the year ended 31 December 2017:
Direct materials 90,000 Selling and distribution overheads 52,500Direct wages 75,000 Administration overheads 42,000Profit 60,900 Factory Overheads 45,000
(a) Prepare a Job Cost Sheet indicating the Prime cost, Works cost, Productioncost, Cost of sales and the Sales value.
(b) In 2017, the factory received an order for a number of jobs. It is estimatedthat direct materials required will be 1,20,000 and direct labour will cost 75,000. What should be the price for these jobs if factory intends to earn
the same rate of profit on sales assuming that the selling and distributionoverheads have gone up by 15%? The factory recovers factory overheadsas a percentage of direct wages and administration and selling and distributionoverheads as a percentage of works cost, based on cost rates prevailing inthe previous year. (CA Inter)
Solution:Production Statement
for the year ended 31 December 2017
Direct materials 90,000Direct wages 75,000
Prime Cost 1,65,000Factory overheads 45,000
Works Cost 2,10,000Administration overheads 42,000
Cost of Production 2,52,000Selling and distribution overheads 52,500
Cost of Sales 3,04,500PROFIT 60,900
Sales Value 3,65,400
Calculation of Rates
1. % of factory overheads to direct wages = × 100 = 60%
2. % of administration overheads to works cost = × 100 = 20%
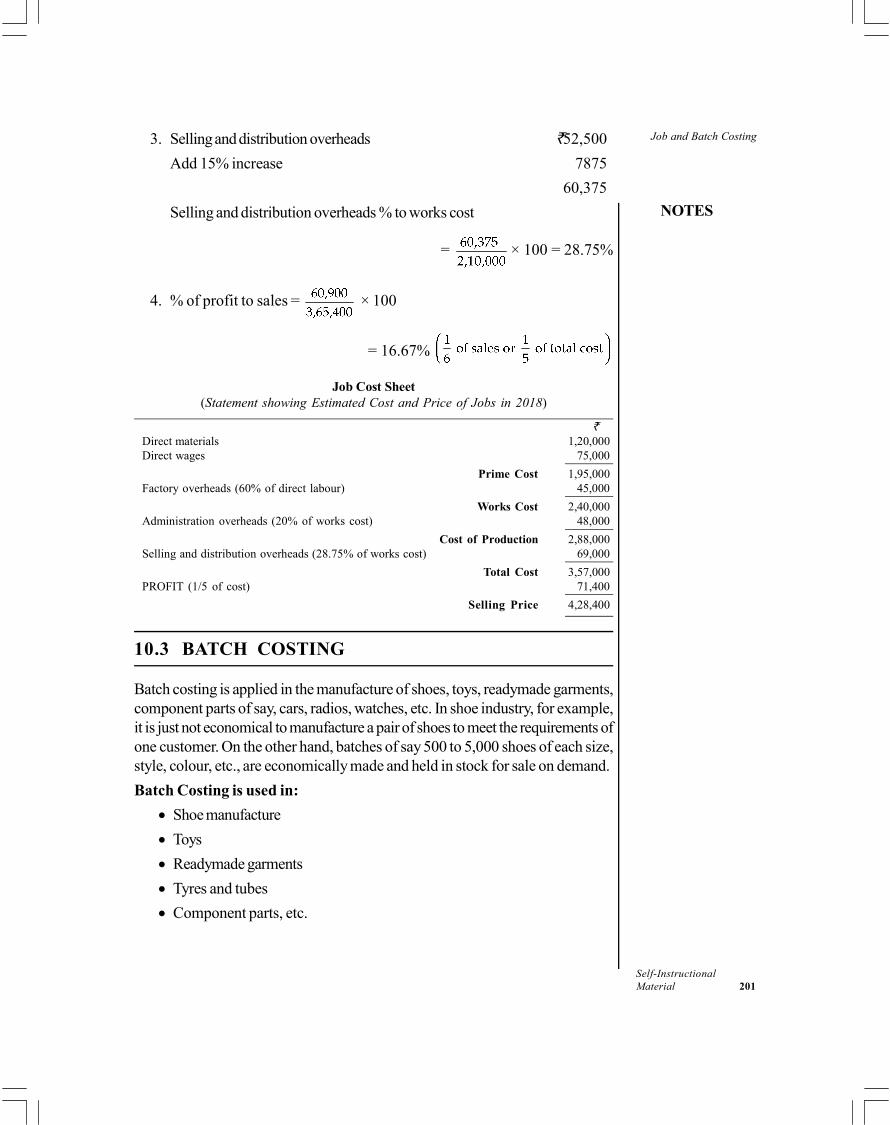
Job and Batch Costing
NOTES
Self-InstructionalMaterial 201
3. Selling and distribution overheads 52,500
Add 15% increase 7875
60,375
Selling and distribution overheads % to works cost
= × 100 = 28.75%
4. % of profit to sales = × 100
= 16.67%
Job Cost Sheet(Statement showing Estimated Cost and Price of Jobs in 2018)
Direct materials 1,20,000Direct wages 75,000
Prime Cost 1,95,000Factory overheads (60% of direct labour) 45,000
Works Cost 2,40,000Administration overheads (20% of works cost) 48,000
Cost of Production 2,88,000Selling and distribution overheads (28.75% of works cost) 69,000
Total Cost 3,57,000PROFIT (1/5 of cost) 71,400
Selling Price 4,28,400
10.3 BATCH COSTING
Batch costing is applied in the manufacture of shoes, toys, readymade garments,component parts of say, cars, radios, watches, etc. In shoe industry, for example,it is just not economical to manufacture a pair of shoes to meet the requirements ofone customer. On the other hand, batches of say 500 to 5,000 shoes of each size,style, colour, etc., are economically made and held in stock for sale on demand.
Batch Costing is used in:
Shoe manufacture
Toys
Readymade garments
Tyres and tubes
Component parts, etc.

Job and Batch Costing
NOTES
Self-Instructional202 Material
Batch Costing Procedure
Each batch is given a batch number in exactly the same way as a job is given a jobnumber. Direct materials, direct labour and direct expenses which can be identifiedwith the batch are recorded on the Batch Cost Card. The costing of materialsrequisitions and time sheets follows normal job costing principles. Overheads areabsorbed on one of the bases already explained as is done is job costing. When abatch is completed, the total cost of the batch is divided by the quantity producedin the batch to arrive at the cost per unit or per dozen etc., as required.
Often, a major cost in producing a batch is the cost of setting up jigs andtools. This is of the nature of fixed cost and is spread over the total number ofarticles in the batch. So the larger the batch size, the lower is the setting up costper article.
Illustration 10.2: Component 89-X is made entirely in cost centre 75. Materialcost is 6 paise per component and each component takes 10 minutes to produce.The machine operator is paid 72 paise per hour, and the machine hour rate is 1.50. The setting up of the machine to produce component 89-X takes 2 hours
20 minutes.
On the basis of this information, prepare a comparative cost sheet showingthe production and setting up cost, both in total and per component assuming abatch of (a) 10 components, (b) 100 components and (c) 1,000 components, isproduced. (CA Inter)
Solution:Comparative Cost Sheet
Component 89-X
Particulars Batch size in components
10 100 1,000
Setting-up CostLabour–2 hrs 20 mts at 72 paise per hour 1.68Overheads–2 hrs 20 mts at 1.50 per
machine hour 3.50 5.18 5.18 5.18
Production CostMaterial cost @ 6 paise per component 0.60 6.00 60.00Wages @ 72 paise per hour
For 10 components 1 hr 40 mts 1.20For 100 components 16 hrs 40 mts 12.00For 1,000 components 166 hrs 40 mts 120.00
Overheads @ 1.50 per machine hourFor 10 components 1 hr 40 mts 2.50For 100 components 16 hrs 40 mts 25.00For 1,000 components 166 hrs 40 mts 250.00
Total Cost 9.48 48.18 435.18
Cost per component (Total cost ÷ No. of Components) 0.94 0.48 0.44
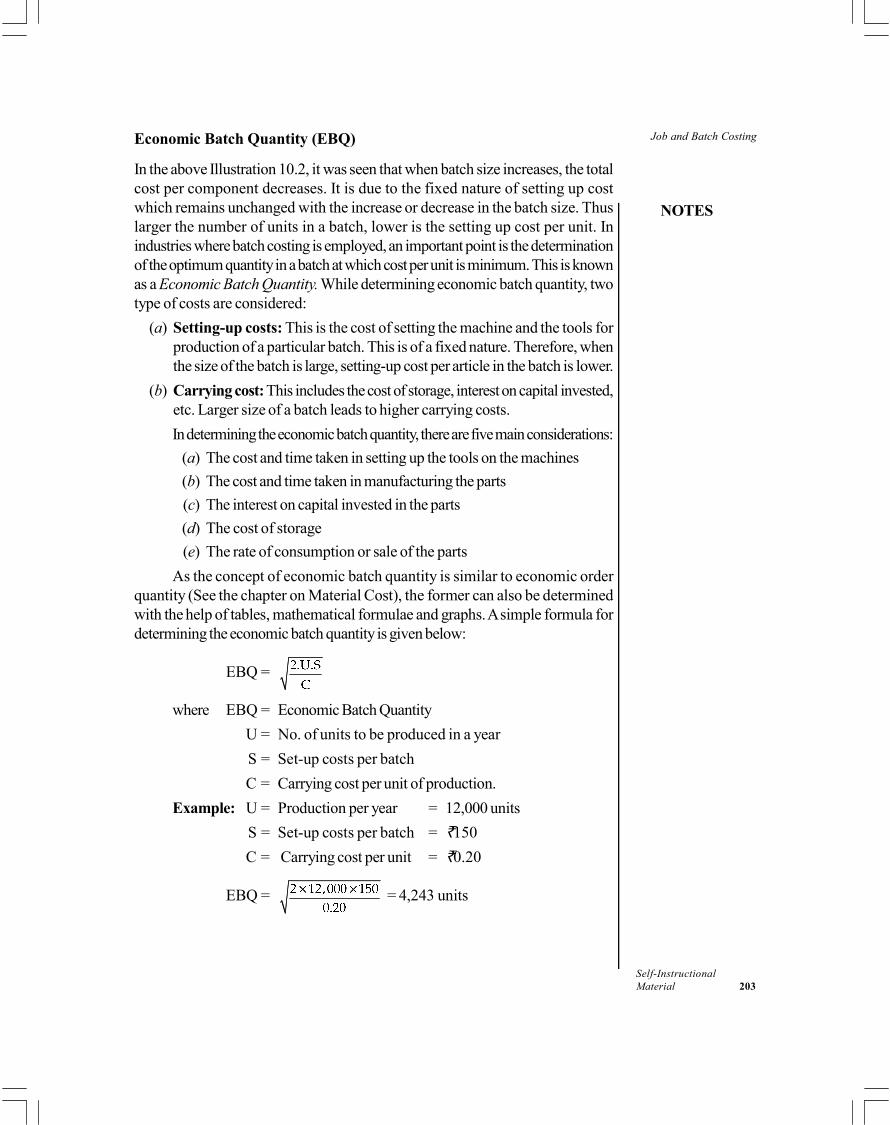
Job and Batch Costing
NOTES
Self-InstructionalMaterial 203
Economic Batch Quantity (EBQ)
In the above Illustration 10.2, it was seen that when batch size increases, the totalcost per component decreases. It is due to the fixed nature of setting up costwhich remains unchanged with the increase or decrease in the batch size. Thuslarger the number of units in a batch, lower is the setting up cost per unit. Inindustries where batch costing is employed, an important point is the determinationof the optimum quantity in a batch at which cost per unit is minimum. This is knownas a Economic Batch Quantity. While determining economic batch quantity, twotype of costs are considered:
(a) Setting-up costs: This is the cost of setting the machine and the tools forproduction of a particular batch. This is of a fixed nature. Therefore, whenthe size of the batch is large, setting-up cost per article in the batch is lower.
(b) Carrying cost: This includes the cost of storage, interest on capital invested,etc. Larger size of a batch leads to higher carrying costs.
In determining the economic batch quantity, there are five main considerations:
(a) The cost and time taken in setting up the tools on the machines
(b) The cost and time taken in manufacturing the parts
(c) The interest on capital invested in the parts
(d) The cost of storage
(e) The rate of consumption or sale of the parts
As the concept of economic batch quantity is similar to economic orderquantity (See the chapter on Material Cost), the former can also be determinedwith the help of tables, mathematical formulae and graphs. A simple formula fordetermining the economic batch quantity is given below:
EBQ =
where EBQ = Economic Batch Quantity
U = No. of units to be produced in a year
S = Set-up costs per batch
C = Carrying cost per unit of production.
Example: U = Production per year = 12,000 units
S = Set-up costs per batch = 150
C = Carrying cost per unit = 0.20
EBQ = = 4,243 units

Job and Batch Costing
NOTES
Self-Instructional204 Material
Check Your Progress
1. List the people to whom the production order copies are passed on to.
2. What is the signal for the cost accountant to prepare a job cost sheet?
3. Give some examples of carrying costs.
10.4 ANSWERS TO CHECK YOUR PROGRESSQUESTIONS
1. The production order copies are passed on to the following people:
All departmental foremen concerned with the job
Storekeeper for insurance of materials
Tool room for an advance notification of tools required
2. Receipt of production order is the signal for the cost accountant to preparea job cost sheet on which he will record the cost of materials used and thelabour and machine time taken.
3. Some examples of carrying cost includes the cost of storage, interest oncapital invested, etc.
10.5 SUMMARY
In job order industries, production work is done against orders fromcustomers. Each job work needs special treatment and can be clearlydistinguished from other jobs. Each job is completed as per customer’sspecifications.
Job costing or job order costing is a method of cost ascertainment used injob order industries.
Objectives of job costing are: cost of each job is ascertained separately, itenables management to know which jobs are more profitable, helps in futureproduction planning and helps in management in controlling costs bycomparing estimated and actual costs.
The steps in the job costing procedure include: assigning of job number,making of the production order, preparation of job cost sheet, and completionof jobs to cost of sales account.
While job costing is concerned with costing of jobs that are made to acustomer’s particular requirements, batch costing is used when productionconsists of limited repetitive work and a definite number of articles aremanufactured in each batch to be held in stock for sale to customers generally.
Job and Batch Costing
NOTES
Self-InstructionalMaterial 205
Procedure of batch costing includes the allotment of a batch number,recording in the batch cost card and on completion of batch, the total costof the batch is divided by the quantity produced in the batch to arrive at thecost per unit or per dozen etc.
In industries where batch costing is employed an important point is thedetermination of the optimum quantity in a batch at which cost per unit isminimum. This is known as economic batch quantity.
Two types of costs are considered while determining the economic batchquantity: these are setting up costs and carrying costs.
10.6 KEY WORDS
Job costing: It is a method of cost ascertainment used in job order industries
Batch costing: It is a method of cost ascertainment used when productionconsists of limited repetitive work and a definitive work and a definite numberof articles are manufactured in each batch to be held in stock for sale tocustomers generally
Economic batch quantity: It refers to the optimum quantity in a batch atwhich cost per unit is minimum
10.7 SELF ASSESSMENT QUESTIONS ANDEXERCISES
Short Answer Questions
1. Write a note on job costing and the industries which adopt job costing.
2. What are the main features of job costing? Give a pro forma cost sheetunder such a system.
3. What is economic batch quantity?
4. What is a job order number?
Long Answer Questions
1. What are the main features of job costing? Describe briefly the procedureof recording costs under job order costing.
2. Write a short note on batch costing.
3. Explain how costs are booked against job order numbers.
Job and Batch Costing
NOTES
Self-Instructional206 Material
10.8 FURTHER READINGS
Arora, M.N. 2012. A Textbook of Cost and Management Accounting, Tenthedition. New Delhi: Vikas Publishing House.
Arora, M.N. 2010. Cost Accounting: Principles and Practice, Eleventh edition.New Delhi: Vikas Publishing House.
Shillinglow, G. 1982.Managerial Costing Accounting. Homewood: Richard D.Irwin.
Morse, W. J. 1978. Cost Accounting. Massachusetts: Addison-Wesley PublishingCo.
Lal, Jawahar. 2003. Cost Accounting. New Delhi: Tata McGraw Hill.
Budget andBudgetary Control
NOTES
Self-InstructionalMaterial 207
UNIT 11 BUDGET AND BUDGETARYCONTROL
Structure
11.0 Introduction11.1 Objectives11.2 Meaning of Budget and Budgetary Control
11.2.1 Forecast and Budget11.2.2 Budgetary Control as a Management Tool11.2.3 Limitations of Budgetary Control11.2.4 Preliminaries in the Installation of Budget System
11.3 Classification of Budgets11.3.1 Fixed and Flexible Budgets
11.4 Specific Variants of Budgeting11.4.1 Zero Base Budgeting (ZBB)11.4.2 Performance Budgeting11.4.3 Responsibility Accounting
11.5 Answers to Check Your Progress Questions11.6 Summary11.7 Key Words11.8 Self Assessment Questions and Exercises11.9 Further Readings
11.0 INTRODUCTION
Budgetary control is an important tool of planning and control. Planning involveslooking systematically at the future so that decisions can be made today which willbring the company its desired results. Control is the process of measuring andcorrecting actual performance to ensure that plans for implementing the chosencourse of action are carried out. In this section, you will learn about the concept ofbudget and bedgetary control.
11.1 OBJECTIVES
After going through this unit, you will be able to:
Understand and define a budget and budgetary control
Explain the limitations of budgetary control and know the role of budgets inplanning, coordinating and controlling
Distinguish between fixed and flexible budgeting
Prepare flexible budgets
Explain the concepts of zero base budgeting, performance budgets andtheir utility
Budget andBudgetary Control
NOTES
Self-Instructional208 Material
11.2 MEANING OF BUDGET AND BUDGETARYCONTROL
Budget refers to a plan relating to a definite future period of time expressed in monetaryand/or quantitative terms. In relation to business, a budget is a formal expression ofthe expected incomes and expenditures for a definite future period. The CharteredInstitute of Management Accountants (CIMA) London, has defined a budget as ‘afinancial and/or quantitative statement, prepared prior to a defined period oftime, of the policy to be pursued during that period for the purpose of attaininga given objective.’ It may include income, expenditure and employment of capital.
Characteristics—Budgets have the following characteristics:
(a) A budget is primarily a planning device but it also serves as a basis forperformance evaluation and control.
(b) A budget is prepared either in money terms or in quantitative terms or inboth.
(c) A budget is prepared for a definite future period.
(d) Purpose of a budget is to implement the policies formulated by managementfor attaining the given objectives.
Budgeting: The act of preparing budgets is called budgeting. In the wordsof J Batty, ‘the entire process of preparing the budgets is known as budgeting.’
Concept of Budgetary Control
Budgetary control is a system of controlling costs through preparation of budgets.Budgeting is thus only a part of the budgetary control. According to CIMA,London, ‘Budgetary control is the establishment of budgets relating to theresponsibilities of executives of a policy and the continuous comparison ofthe actual with the budgeted results, either to secure by individual action theobjective of the policy or to provide a basis for its revision.’
In the words of Brown and Howard, ‘Budgetary control system is a systemof controlling costs which includes the preparation of budgets, co-ordinatingthe departments and establisting responsibilities, comparing actualperformance with the budgeted and acting upon results to achieve maximumprofitability.’
Characteristics—The main characteristics of budgetary control are:
(a) Establishment of budgets for each function/department of the organization.
(b) Comparison of actual performance with the budgets on a continuousbasis.

Budget andBudgetary Control
NOTES
Self-InstructionalMaterial 209
(c) Analysis of variations of actual performance from that the budgetedperformance to know the reasons thereof.
(d) Taking suitable remedial action, where necessary.
(e) Revision of budgets in view of changes in conditions.
The principles involved in budgeting have been likened to those followed bythe captain of a ship. Before the voyage, he will plan his route, taking into accountsuch factors as shipping hazards, tides and possible adverse weather forecasts.During the journey, he will record details of progress and frequently check actualprogress with that planned. Though trying to keep to the plan, he may have todeviate from the plan if prevailing circumstances require it. On completion of thejourney, he will compare the conditions he encountered with those he expected.The experience so gained will be used by him in planning similar voyages in thefuture. This simple analogy serves to illustrate the basic practice used in budgetingand budgetary control.
The technique of budgetary control is now widely used in the business world.Many businesses fail because of lack of efficient planning which could have revealedthat the business should not have been started or that one should have been preparedto face serious dangers ahead.
11.2.1 Forecast and Budget
It is important to note carefully the distinction between forecast and a budget.
A forecast is a prediction of what may happen as a result of a given set ofcircumstances. It is an assessment of probable future events.
A budget, on the other hand, is a planned exercise to achieve a target. It isbased on the pros and cons of a forecast. Forecasting thus precedes the preparationof budget.
Thus the main points of distinction between the two are:
1. Budgets relate to ‘planned events’, i.e., policies and programmes to bepursued. Forecast is concerned with ‘probable events’, i.e., events expectedto happen under anticipated conditions.
2. Budget, being a formal business plan, can be prepared only by the authorizedmanagement but forecast can be made by anybody.
3. Budget is a tool of control while the forecast is simply an anticipation ofevents.
4. Forecasting is a prerequisite for budgeting while budgeting is not a prerequisitefor forecasting.
5. Budgets relate to economic activities of business, enterprises, governmentor others. Forecast may relate to economic as well as non-economicactivities, e.g., weather forecast and stock market forecast.

Budget andBudgetary Control
NOTES
Self-Instructional210 Material
11.2.2 Budgetary Control as a Management Tool
The following are the main objectives of a budgetary control system:
1. Planning: A budget provides a detailed plan of action for a business over adefinite period of time. Detailed plans are drawn up relating to production, sales,raw material requirements, labour needs, advertising and sales promotion,performance, research and development activities, capital additions, etc. Planninghelps in anticipating many problems, long before they may arise and their solutionscan be sought through careful study. Thus most business emergencies can beavoided by planning. In brief, budgeting forces managements to think ahead, toanticipate and prepare for the situation.
2. Co-ordination: Budgeting aids managers in co-ordinating their efforts so thatobjectives of the organization as a whole harmonize with the objectives of itsdivisions. Effective planning and organizing contribute a lot in achieving co-ordination. There should be co-ordination in the budgets of various departments.For example, the budget of sales should be in co-ordination with the budget ofproduction. Similarly, the production budget should be prepared in co-ordinationwith the purchase budget, and so on.
3. Communication: A budget is a communication device. The approved budgetcopies are distributed to all management personnel, which provides not onlyadequate under-standing and knowledge of the programmes and policies to befollowed but also alerts about the restrictions to be adhered to.
It is not the budget itself that facilitates communication, but the vitalinformation is communicated in the act of preparing budgets and participation ofall responsible individuals in this act.
4. Motivation: A budget is a useful device for motivating managers to performin line with the company objectives. If individuals have actively participated inthe preparation of budgets, it acts as a strong motivating force to achieve thetargets.
5. Control: Control is necessary to ensure that plans and objectives as laid downin the budgets are being achieved. Control, as applied to budgeting, is a systematizedeffort to keep the management informed of whether the planned performance isbeing achieved or not. For this purpose, a comparison is made between plans andactual performance. The difference between the two is reported to the managementfor taking corrective action.
6. Performance evaluation: A budget provides a useful means of informingmanagers how well they are performing in meeting targets they have previouslyhelped to set. In many companies there is a practice of rewarding employees onthe basis of their achieving the budget targets or promotion of a manager may belinked to his budget achievement record.
Budget andBudgetary Control
NOTES
Self-InstructionalMaterial 211
11.2.3 Limitations of Budgetary Control
The list of advantages given above is impressive, but a budget is not a cure all fororganization ills. Budgetary control system suffers from certain limitations and thoseusing the system should be fully aware of them.
The main limitations are:
1. The budget plan is based on estimates: Budgets are based on forecastsand forecasting cannot be an exact science. Absolute accuracy, therefore, is notpossible in forecasting and budgeting. The strength or weakness of the budgetarycontrol system depends to a large extent, on the accuracy with which estimatesare made. Thus, while using the system, the fact that budget is based on estimatesmust be kept in view.
2. Danger of rigidity: A budget programme must be dynamic and continuouslydeal with the changing business conditions. Budgets will lose much of their usefulnessif they acquire rigidity and are not revised with the changing circumstances.
3. Budgeting is only a tool of management: Budgeting cannot take the placeof management but is only a tool of management. ‘The budget should be regardednot as a master, but as a servant.’ Sometimes it is believed that introduction of abudget programme is alone sufficient to ensure its success. Execution of a budgetwill not occur automatically. It is necessary that the entire organization mustparticipate enthusiastically in the programme for the realization of the budgetarygoals.
4. Opposition from staff: Employees may not like to be evaluated and thusoppose introduction of budgetary control system. As such, inefficient managersmay try to create difficulties in the way of introducing and operating this system.
5. Expensive technique: The installation and operation of a budgetary controlsystem is a costly affair as it requires the employment of specialized staff andinvolves other expenditure which small concerns may find difficult to incur. However,it is essential that the cost of introducing and operating a budgetary control systemshould not exceed the benefits derived therefrom.
11.2.4 Preliminaries in the Installation of Budget System
Prerequisites for the successful implementation of a budgetary control system areas follows:
1. Creation of budget centres: A budget centre is a section of the organizationof an undertaking for which a separate budget is prepared. A budget centre maybe a department or a part thereof. Budget centre must be clearly defined becausea separate budget has to be set for each such centre with the help of the head ofthe department concerned. For example, in the preparation of purchase budget,the purchase manager has to be consulted. Similarly, while preparing labour costbudget, the personnel manager will be of great help.
Budget andBudgetary Control
NOTES
Self-Instructional212 Material
2. Introduction of adequate accounting records: The accounting system shouldbe so designed as to be able to record and analyse the information required. Thebudget procedures must also employ the same classification of revenues andexpenses as the accounting department. Comparisons cannot be made if theclassifications do not coincide. A chart of accounts corresponding with the budgetcentres should be maintained.
3. Preparation of an organization chart: Proper organization is essential for asuccessful budget system. An organization chart should be prepared which clearlyshows the plan of the organization. Each member of management should knowthe exact scope of his authority and responsibility and his relationship to othermembers. For this purpose, copies of the organization chart and written supplementsshould be distributed to all concerned.
The organization chart will depend upon the nature and size of the company.
4. Establishment of budget committee: In large concerns, the direction andexecution of the budget is delegated to a budget committee which reports directlyto the top management. The financial controller is usually appointed to serve asthe budget director. He is incharge of preparing budget manual of instructions andaccumulates the budget and actual figures for reporting. Other members of thebudget committee usually comprise various heads of functional departments, likesales manager, purchase manager, production manager and chief accountant, asshown in the above organization chart. Each member prepares his own departmentalbudget(s) which are then considered by the committee for coordination.
Functions: The main functions of a budget committee are as follows:
(a) To provide historical data to all departmental heads to help them in estimating
(b) To issue instructions to departments regarding requirements, dates ofsubmission of estimates, etc.
(c) To define the general policies of the management in relation to the budgetsystem
(d) To receive budget estimates from various departments for considerationand review
(e) To discuss difficulties with departmental heads and suggest possible revisions
(f) To evaluate and revise the estimates before preparing the final budget
(g) To make recommendations on budget matters where there is conflict betweendepartments
(h) To prepare budget summaries
(i) To prepare a master budget after functional budgets have been approved
(j) To inform departmental heads of any revisions made in their budgets by thecommittee
(k) To coordinate all budget work
(l) To analyse variances and recommend corrective action, where necessary.
Budget andBudgetary Control
NOTES
Self-InstructionalMaterial 213
5. Preparation of budget manual: A budget manual has been defined by CIMA,London as ‘a document which sets out the responsibilities for the personsengaged in the routine of and the forms and records required for budgetarycontrol.’ A budget manual is thus a statement of budget policies. It lays down thedetails of the organizational set-up with duties and responsibilities of executives,including the budget committee and budget director and the procedures andprogrammes to be followed for developing budgets for various activities.
Contents: The contents of a budget manual are summarized as follows:
(a) Description of the budget system and its objectives
(b) Procedure and forms to be used in budget preparation
(c) Responsibilities of operational executives, budget committee and budgetdirector
(d) Budget calendar, specifying definite dates for the completion of each part ofthe budget and submission of the reports
(e) Method of accounting and account codes in use
(f ) Procedure to be adopted in operating the system
(g) Follow-up procedures.
6. Budget period: Budget period is a length of time for which a budget is preparedand operated. Budget periods vary between short-term and long-term and nospecific period can be laid down for all budgets. It varies among concerns andindustries for several factors.
A budget is usually prepared for one year which corresponds to theaccounting year. It is then sub-divided into quarters and in turn each quarter isbroken down into three separate months. When a business experiences seasonalfluctuations, the budget period may be fixed to cover one seasonal cycle. If theseasonal cycle covers say two or three years, a long-term budget should beprepared to cover that period. The long period may then be broken down intosmaller periods by preparing short-term budgets.
Budgets for capital expenditure are usually prepared on a long-term basis.For example, in electricity companies which incur very heavy capital expenditure,the need for new power stations is forecast possibly five to ten years in advance.Such long-term budgets are supplemented by short-term ones.
7. Determination of the key factor: Also known as limiting factor, governingfactor and principal budget factor, the key factor means the factor which limits thesize of output. It is defined as ‘the factor the extent of whose influence mustfirst be assessed in order to ensure that functional budgets are capable offulfilment’ Such a factor is of vital importance and affects all budgets to a largeextent.
The key factor serves as the starting point for the preparation of budgets.For instance, when sales potential is limited, sales is the key factor. Therefore,
Budget andBudgetary Control
NOTES
Self-Instructional214 Material
sales budget should be prepared first. Production and other budgets will followthe sales budget. Thus a key factor determines priorities in functional budgets.
It is possible that more than one key factor is operating at the same time.Under such conditions, the relative impact of such factors is considered in budgetpreparation. Moreover, key factor is not necessarily a permanent factor. Themanagement may be provided with opportunities to overcome the limitationsimposed by key factors. For example, plant capacity can be increased by theinstallation of new and improved plant and machinery which may be financed bythe issue of new shares.
Check Your Progress
1. State the characteristics of budgets.
2. Differentiate between a forecast and a budget.
3. What serves as the starting point for the preparation of budgets?
11.3 CLASSIFICATION OF BUDGETS
Budgets may be classified into the following categories:
1. On the basis of function and scope:
(a) Functional budgets
(b) Master budget
2. On the basis of flexibility:
(a) Fixed budget
(b) Flexible budget
In this section, we will only concentrate on fixed and flexible budget. Let’sbriefly glance over functional and master budgets.
Functional Budgets
A functional budget is one which relates to a particular function of the business,e.g., Sales Budget, Production Budget, Purchase Budget, etc.
Master Budget
When all the functional budgets have been prepared, these are summarized intowhat is known as a master budget. Thus a master budget is a consolidated summaryof all the functional budgets. According to CIMA, London, ‘master budget is asummary budget incorporating its component functional budgets and whichis finally approved, adopted and employed.’
A master budget has two parts (i) operating budget, i.e., budgeted profitand loss account, and (ii) financial budget, i.e., budgeted balance sheet. Thus, a
Budget andBudgetary Control
NOTES
Self-InstructionalMaterial 215
projected profit and loss account and a balance sheet together constitute a masterbudget.
The master budget is prepared by the budget director (or budget officer)and is presented to the budget committee for approval. If approved, it is submittedto the Board of Directors for final approval. The Board may make certainamendments/alterations before it is finally approved.
11.3.1 Fixed and Flexible Budgets
Based on level of activity or capacity utilization, budgets are classified into fixedbudget and flexible budget.
Fixed Budget
A fixed budget is one which is prepared keeping in mind one level of output. It isdefined as a budget ‘which is designed to remain unchanged irrespective ofthe level of activity attained.’ If actual output differs from budgeted level ofoutput, variances will arise. Fixed budget is prepared on the assumption that outputand sales can be estimated with a fair degree of accuracy. This means that in thosesituations where sales and output cannot be accurately estimated, fixed budgetdoes not suit.
Flexible Budget
In contrast to a fixed budget, a flexible budget is one ‘which is designed to changein relation to the level of activity attained.’ The underlying principle of flexiblebudget is that a budget is of little use unless cost and revenue are related to theactual volume of production. Flexible budgeting has been developed with theobjective of changing the budget figures to correspond with the actual outputachieved. Thus a budget might be prepared for various levels of activity, say,70%, 80%, 90% and 100% capacity utilization. Then whatever the level of outputactually reached, it can be compared with an appropriate level.
Flexible budgets are prepared in those companies where it is extremelydifficult to forecast output and sales with accuracy. Such a situation may arise inthe following cases.
1. Where nature of business is such that sales are difficult to predict, e.g.,demand for luxury goods is quite unpredictable.
2. Where sales are affected by weather conditions, e.g., soft drink industry,woollen garments, etc.
3. Where sales are affected by changes in fashion, e.g., readymade garments.
4. Where company frequently introduces new products.
5. Where large part of output is intended for export.
Uses of Flexible Budgets: The figures in flexible budgets are adaptable to anygiven set of operating conditions. They are, therefore, more realistic than a fixedbudget which is true only in one set of operating conditions.
Budget andBudgetary Control
NOTES
Self-Instructional216 Material
Flexible budgets are also useful from control point of view. Actualperformance of an executive should be compared with what he should haveachieved in the actual circumstances and not with what he should have achievedunder quite different circumstances.
In brief, flexible budgets are more realistic, practical and useful. Fixedbudgets, on the other hand, have a limited application and are suited only for itemslike fixed costs.
Distinction between Fixed and Flexible Budgets
The main points of distinction between the two are as follows:
1. Fixed budget assumes static business conditions whereas flexible budget isbased on the assumption of changing business conditions.
2. Fixed budget is prepared for only one level of activity but flexible budgetsmay be prepared for different capacity levels or for any level of activity.
3. Fixed budget figures are not changed when actual level of activity changes.But in flexible budgets, the figures are adjusted according to the actual levelof activity attained.
4. When actual level of activity differs from budgeted level of activity, then infixed budgets meaningful comparison between actual and budget figures isnot possible. But in flexible budgets, such comparisons are quite meaningful.
5. Under changing business environments, fixed budgets have very limited usefor control. But flexible budgets are very useful for cost control andperformance evaluation under changing business environments.
Preparation of Flexible Budgets
The preparation of flexible budgets necessitates the analysis of all costs into fixedand variable components. This analysis, of course, not peculiar to flexible budgeting,is more important in flexible budgeting than in fixed budgeting. This is so becausein flexible budgeting, varying levels of output are considered and each class ofoverhead will be different for each level. In flexible budgeting, a series of budgetsare prepared for every major level of activity so that whatever that actual level ofoutput, it can be compared with appropriate budget or can be interpolated betweenbudgets of the activity levels on either side. For example, budgets may be preparedfor, say, 60%, 70%, 80%, 90% and 100% levels of activity. If the actual level ofactivity is 85%, then the budget allowance for 85% activity should be computed.
While computing fixed cost at various levels, it is to be noted that fixed costin total amount remains unchanged at various levels of activity. However, fixedcost per unit decreases when level of output increases and vice versa, i.e., fixedcost per unit increases when level of activity decreases.
Regarding the behaviour of variable costs, it is important to note that totalvariable cost increases in proportion to increase in the level of activity and vice
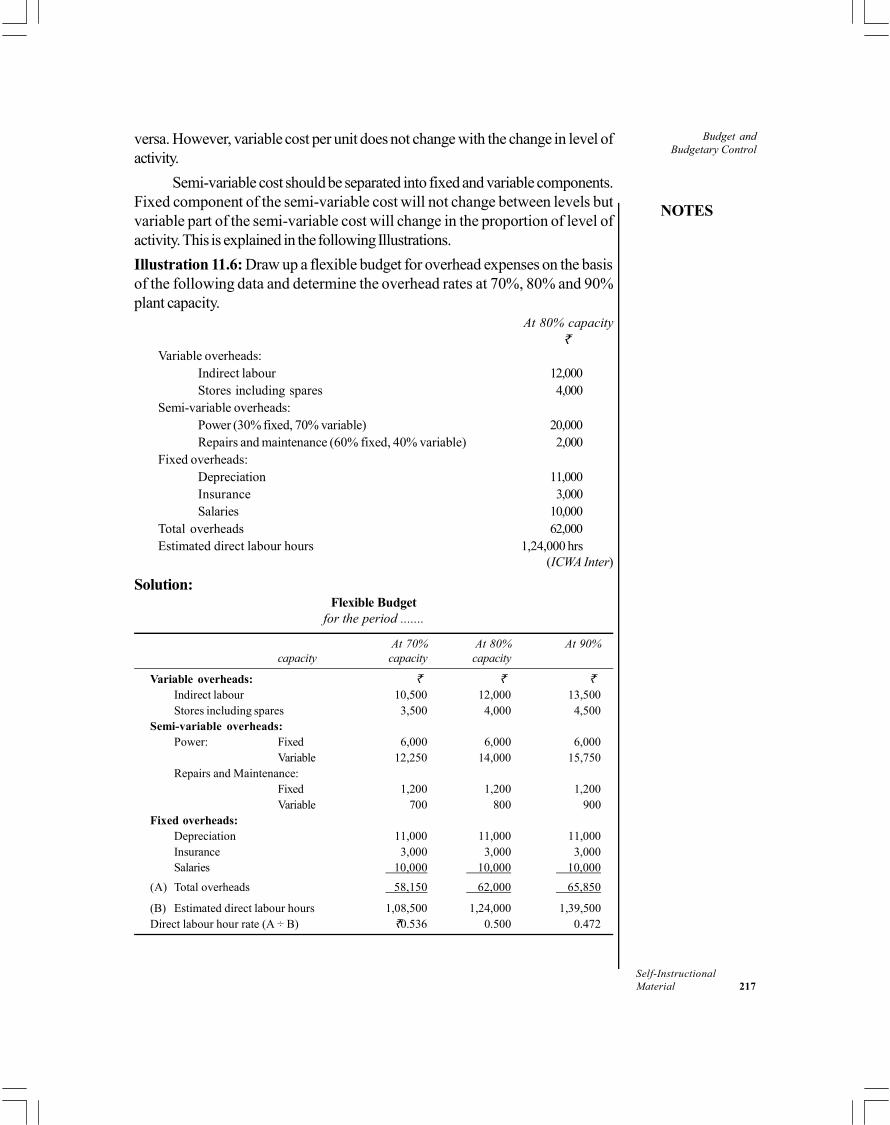
Budget andBudgetary Control
NOTES
Self-InstructionalMaterial 217
versa. However, variable cost per unit does not change with the change in level ofactivity.
Semi-variable cost should be separated into fixed and variable components.Fixed component of the semi-variable cost will not change between levels butvariable part of the semi-variable cost will change in the proportion of level ofactivity. This is explained in the following Illustrations.
Illustration 11.6: Draw up a flexible budget for overhead expenses on the basisof the following data and determine the overhead rates at 70%, 80% and 90%plant capacity.
At 80% capacity
Variable overheads:Indirect labour 12,000Stores including spares 4,000
Semi-variable overheads:Power (30% fixed, 70% variable) 20,000Repairs and maintenance (60% fixed, 40% variable) 2,000
Fixed overheads:Depreciation 11,000Insurance 3,000Salaries 10,000
Total overheads 62,000Estimated direct labour hours 1,24,000 hrs
(ICWA Inter)
Solution:Flexible Budget
for the period .......
At 70% At 80% At 90%capacity capacity capacity
Variable overheads:Indirect labour 10,500 12,000 13,500Stores including spares 3,500 4,000 4,500
Semi-variable overheads:Power: Fixed 6,000 6,000 6,000
Variable 12,250 14,000 15,750Repairs and Maintenance:
Fixed 1,200 1,200 1,200Variable 700 800 900
Fixed overheads:Depreciation 11,000 11,000 11,000Insurance 3,000 3,000 3,000Salaries 10,000 10,000 10,000
(A) Total overheads 58,150 62,000 65,850
(B) Estimated direct labour hours 1,08,500 1,24,000 1,39,500Direct labour hour rate (A ÷ B) 0.536 0.500 0.472
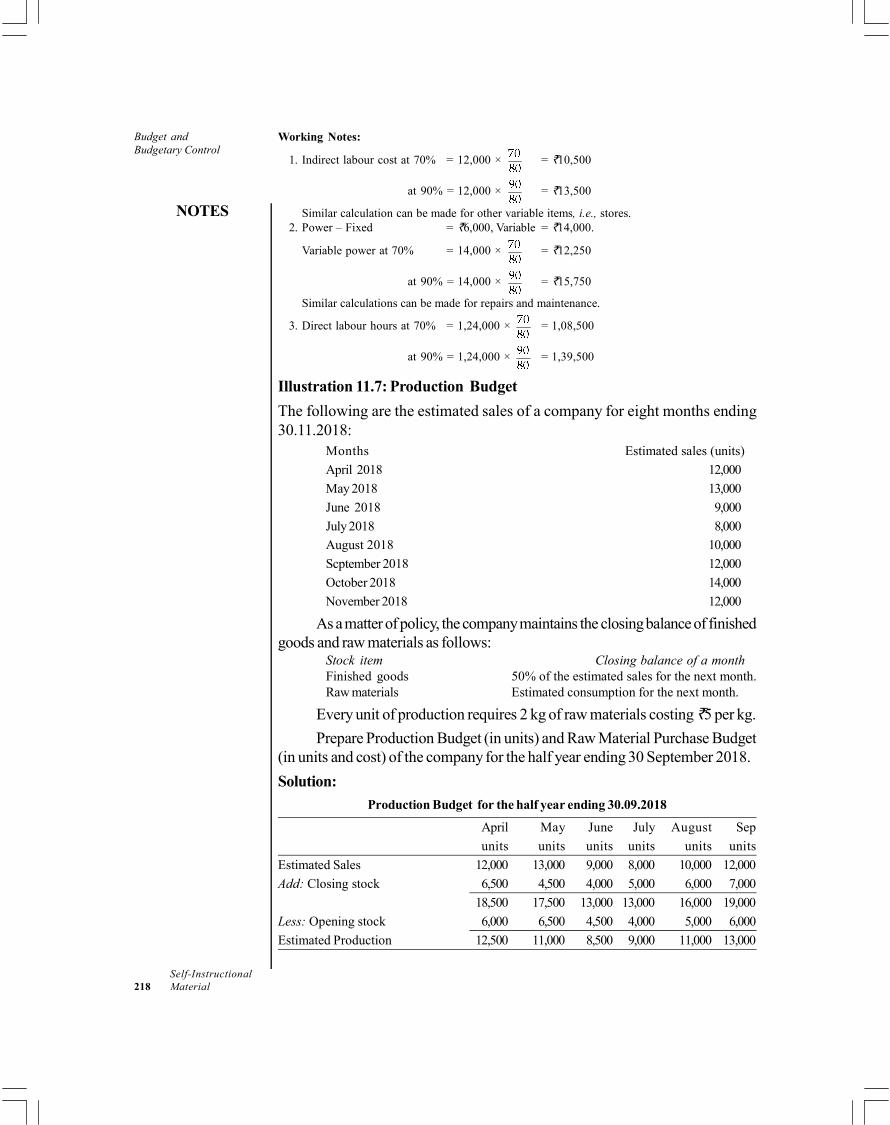
Budget andBudgetary Control
NOTES
Self-Instructional218 Material
Working Notes:
1. Indirect labour cost at 70% = 12,000 × = 10,500
at 90% = 12,000 × = 13,500
Similar calculation can be made for other variable items, i.e., stores.2. Power – Fixed = 6,000, Variable = 14,000.
Variable power at 70% = 14,000 × = 12,250
at 90% = 14,000 × = 15,750
Similar calculations can be made for repairs and maintenance.
3. Direct labour hours at 70% = 1,24,000 × = 1,08,500
at 90% = 1,24,000 × = 1,39,500
Illustration 11.7: Production Budget
The following are the estimated sales of a company for eight months ending30.11.2018:
Months Estimated sales (units)
April 2018 12,000
May 2018 13,000
June 2018 9,000
July 2018 8,000
August 2018 10,000
Scptember 2018 12,000
October 2018 14,000
November 2018 12,000
As a matter of policy, the company maintains the closing balance of finishedgoods and raw materials as follows:
Stock item Closing balance of a monthFinished goods 50% of the estimated sales for the next month.Raw materials Estimated consumption for the next month.
Every unit of production requires 2 kg of raw materials costing 5 per kg.
Prepare Production Budget (in units) and Raw Material Purchase Budget(in units and cost) of the company for the half year ending 30 September 2018.
Solution:
Production Budget for the half year ending 30.09.2018
April May June July August Sep
units units units units units units
Estimated Sales 12,000 13,000 9,000 8,000 10,000 12,000
Add: Closing stock 6,500 4,500 4,000 5,000 6,000 7,000
18,500 17,500 13,000 13,000 16,000 19,000
Less: Opening stock 6,000 6,500 4,500 4,000 5,000 6,000
Estimated Production 12,500 11,000 8,500 9,000 11,000 13,000
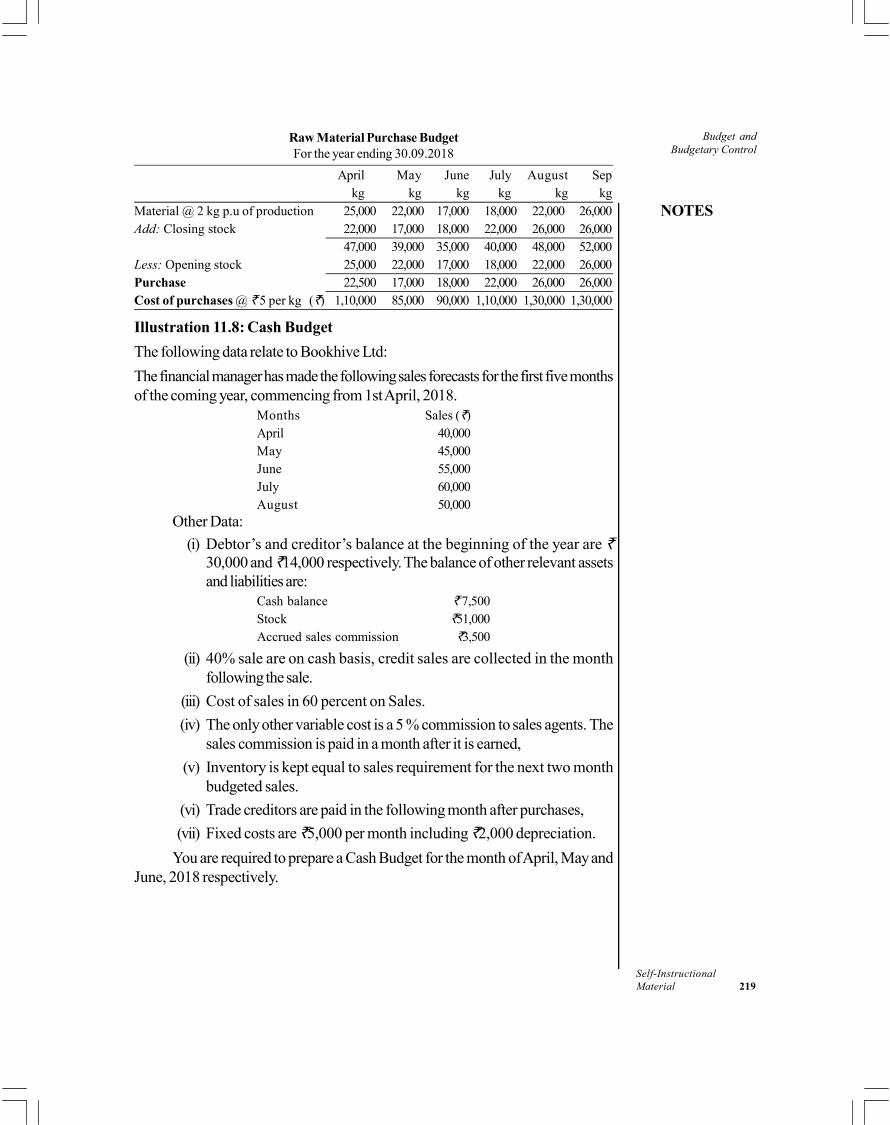
Budget andBudgetary Control
NOTES
Self-InstructionalMaterial 219
Raw Material Purchase BudgetFor the year ending 30.09.2018
April May June July August Sepkg kg kg kg kg kg
Material @ 2 kg p.u of production 25,000 22,000 17,000 18,000 22,000 26,000Add: Closing stock 22,000 17,000 18,000 22,000 26,000 26,000
47,000 39,000 35,000 40,000 48,000 52,000Less: Opening stock 25,000 22,000 17,000 18,000 22,000 26,000Purchase 22,500 17,000 18,000 22,000 26,000 26,000Cost of purchases @ 5 per kg ( ) 1,10,000 85,000 90,000 1,10,000 1,30,000 1,30,000
Illustration 11.8: Cash Budget
The following data relate to Bookhive Ltd:
The financial manager has made the following sales forecasts for the first five monthsof the coming year, commencing from 1st April, 2018.
Months Sales ( )April 40,000May 45,000June 55,000July 60,000August 50,000
Other Data:
(i) Debtor’s and creditor’s balance at the beginning of the year are 30,000 and 14,000 respectively. The balance of other relevant assetsand liabilities are:
Cash balance 7,500Stock 51,000Accrued sales commission 3,500
(ii) 40% sale are on cash basis, credit sales are collected in the monthfollowing the sale.
(iii) Cost of sales in 60 percent on Sales.
(iv) The only other variable cost is a 5 % commission to sales agents. Thesales commission is paid in a month after it is earned,
(v) Inventory is kept equal to sales requirement for the next two monthbudgeted sales.
(vi) Trade creditors are paid in the following month after purchases,
(vii) Fixed costs are 5,000 per month including 2,000 depreciation.
You are required to prepare a Cash Budget for the month of April, May andJune, 2018 respectively.

Budget andBudgetary Control
NOTES
Self-Instructional220 Material
Solution:
Cash Budget
For the month of April, May and June, 2018
April May June
Opening balance 7,500 33,000 37,000Receipts:Cash Sales (40% of Sales) 16,000 18,000 22,000Receipt hr Debtors 30,000 24,000 27,000
Total cash available (A) 53,500 75,000 86,000Payments: Creditors 14,000 33,000 36,000Fixed cost (5000-2000) 3,000 3,000 3,000Commission to sales agents 3,500 2,000 2,250Total Payment (B) 20,500 38,000 41,250
Closing balance (A -B) 33,000 37,000 44,750
Check Your Progress
4. What are the types of budgets according to function and scope?
5. Which budget is considered to be more realistic, practical and useful?
11.4 SPECIFIC VARIANTS OF BUDGETING
In this section, we will discuss certain specific types of budgeting.
11.4.1 Zero Base Budgeting (ZBB)
ZBB is a recent development in the area of management control system and issteadily gaining importance in the business world. Before preparing a budget, abase is determined from which the budget process begins. Quite often currentyear’s budget is taken as the base or the starting point for preparing the nextyear’s budget. The figures in the base are changed as per the plan for the nextyear. This approach of preparing a budget is called incremental budgeting sincethe budget process is concerned mainly with the increases or changes in operationsthat are likely to occur during the budget period. For example, sales of the currentyear’s budget may be taken as the base and next year’s budget for sales will becurrent year’s sales plus an allowance for price increases and expected changes insales volumes. The main drawback of this approach is that it perpetuates the pastinefficiencies.
Zero Base Budgeting or Zero-based Budgeting (ZBB) is an alternative toincremental budgeting. ZBB was introduced at Texas Instruments in USA in 1969,by Peter Phyrr, who is known as the father of ZBB. It is not based on incrementalapproach and previous year’s figures are not taken as the base for preparing next
Budget andBudgetary Control
NOTES
Self-InstructionalMaterial 221
year’s budget. Instead, the budget figures are developed with zero as the base,which means that a budget will be prepared as if it is being prepared for a newcompany for the first time.
In simple words, ZBB is a system whereby each budget item, regardless ofwhether it is new or existing, must be justified in its entirety each time a newbudget is prepared. It is a formalized system of budgeting for the activities of anenterprise as if each activity were being performed for the first time, i.e., from zerobase.
The novel part of the ZBB is the requirement that the budgeting processstarts at zero with all expenditures to be completely justified. This contrasts withthe usual approach in which a certain level of expenditure is allowed as a startingpoint and the budgeting process focuses on requests for incremental expenditures.
In ZBB, budget requests for appropriation are accepted on the basis ofcost/benefit approach which ensures value for money. It questions long standingassumptions and systematically examines and perhaps abandons any unproductiveprojects. This means that those of the activities which are of no value find no placein the forthcoming budget even though these might have been an integral part ofthe past budget prepared under the traditional approach. ZBB in a way tries tolocate those activities which are not essential.
Main Features of Zero Base Budgeting (ZBB)
The main features of ZBB are as under:
1. All budget items, both old and newly proposed, are considered totally afresh
2. Amount to be spent on each budget item is to be totally justified
3. A detailed cost benefit analysis of each budget programme is undertakenand each programme has to compete for scarce resources
4. Departmental objectives are linked to corporate goals
5. The main stress in not on ‘how much’ a department will spend but on ‘why’it needs to spend
6. Managers at all levels participate in ZBB process and they havecorresponding accountabilities.
ZBB is now-a-days widely used. In fact, when Jimmy Carter became thePresident of USA, he directed that all federal government agencies adopt ZBB.On a review of literature on the use of ZBB, it is found that in many organizations,ZBB has led to a considerable improvement in the budget process. But at thesame time, in many organizations it has not proved successful.
11.4.2 Performance Budgeting
Performance budgeting is also a recent development which tries to overcome thelimitations of traditional budgeting. In traditional system of budgeting, as used inbusiness enterprises and government departments, the main defect is that the control
Budget andBudgetary Control
NOTES
Self-Instructional222 Material
of performance in terms of physical units and the related costs is not achieved.This is because in such budgeting, money concept is given more importance.Performance budgeting is a relatively new concept which focuses on functions,programmes and activities.
In other words, in case of traditional budgeting, both input and output aremostly measured in monetary units while performance budgeting lays emphasis onachievement of physical targets. Performance budgets are established in such amanner that each item of expenditure related to a specific responsibility centre isclosely linked with the performance of that centre. Thus performance budgetinglays stress on activities and programmes. It tries to answer questions like—what isto be achieved? How is it to be achieved? When is it to be achieved? etc.
The Government of India has now decided to introduce performancebudgeting in all its departments in a phased manner. An example of performancebudgeting in government system of accounting may be that generally expenditureis classified under the heads like pay and allowances, transport, repairs andmaintenance, etc. In performance budgeting, the classification of expenditure maybe setting up of a steel mill, construction of a railway station, computerization ofrailway booking system, purchase of an aircraft carrier, etc. and other physicaltargets. When work on these activities is started, funds are obtained against thesephysical targets. Reports are then prepared for any under-spending or over-spending which are then analysed for corrective action to be taken.
Performance budgeting is sometimes called Programme Budgeting orPlanning, Programme and Budget System (PPBS).
Steps in Performance Budgeting
1. Establishment of responsibility centre: First of all, responsibility centresare established. A responsibility centre is a segment of an organization wherean individual manager is held responsible for the performance of the segment.
2. Establishment of performance targets: For each responsibility centre,targets are set in terms of physical performance to be achieved. For example,for sales department, which is a responsibility centre, targets may be set interms of number of units to be sold during the budget period. For productiondepartment, the target would then be the number of units to be produced.
3. Estimating financial requirements: In this step, the financial supportneeded to achieve the physical targets is estimated. In other words, theamount of expenditure involved under various heads to meet the physicalperformance is forecasted.
4. Comparison of actual with budgeted performance: This is a usual stepin budgetary control to evaluate the actual performance.
5. Reporting and action: Variances from budgeted performance are analysedand reported for corrective action to be taken.
Budget andBudgetary Control
NOTES
Self-InstructionalMaterial 223
11.4.3 Responsibility Accounting
Responsibility accounting is one of the basic components of a good controlsystem, in large and decentralized companies. This is a system of responsibility,accountability and performance evaluation. The main characteristic feature of thiscontrol system is that it is relevant to measurement of performance of divisions ofan organization while other control systems are applicable to the organization as awhole. Budgeting and variance analysis (standard costing) are thus part of theresponsibility accounting process.
Responsibility accounting has close link with the size of an organization. Ithas no scope in a small organization because in such a business all decision makingis centralized at one place and in one individual. However, in big and diversifiedcompanies like ITC Ltd and Hindustan Uniliver Ltd, which produce and sell awide variety of products/services, responsibility accounting proves extremely useful.Because of the complexity of operations in such companies, it is very difficult forthe head office to directly control the operations of all divisions of business. It is,therefore, appropriate to divide the company into separate self-contained divisionsand to allow all divisional managers to operate with a great deal of independence.Take the case of ITC Ltd, which is in the business of hotels, packaged food,FMCG, cigarettes, information technolgy, branded apparel, etc., all over India. Inapplying responsibility accounting to such a business model, each individual hotelmanager may be asked to run the hotel as an independent unit, like a small business.Each hotel will then be treated as a responsibility centre. Similarly, the cigarettebusiness may be decentralized and made a responsibility centre. In this way, anumber of responsibility centres will be created for different divisions, which shouldpromote the long-term interests of the larger organization and coordinate theiractivities with other responsibility centres of the company.
Meaning and Definition
Responsibility accounting is a method of accumulating and reporting both budgetedand actual costs and revenues by divisional managers responsible for them. Itmeans in responsibility accounting, business activities are identified with personsrather than products or functions and responsibility is assigned to the managerbest placed to effect control. The idea of responsibility accounting is that managerswill be held responsible only for those items over which they can exercise a significantamount of control.
Horngren has defined responsibility accounting as ‘a system of accountingthat recognizes various responsibility centres throughout the organizationand reflects the plans and actions of each of these centres by assigningparticular revenues and costs to the one having the pertinent responsibility.’
Responsibility accounting is also defined as ‘that segregates revenues andcosts into areas of personal responsibility, in order to assess performanceattained by persons to whom authority has been assigned.’

Budget andBudgetary Control
NOTES
Self-Instructional224 Material
Prerequisites for Responsibility Accounting
Responsibility accounting is based on certain assumptions. These prerequisites/assump-tions are as follows:
1. It should be a big company with a divisionalized organizational structureand where areas of responsibility are well defined at different levels of theorganization.
2. There are clearly set goals and targets for each responsibility centre.
3. Managers actively participate in establishing the budgets against which theirperformance is measured.
4. Accounting system generates correct and dependable information for eachresponsibility centre.
5. The managers are held responsible only for those activities over which theyexercise significant degree of control.
6. Managers must try to attain the goals and objectives.
7. Goals for each area of responsibility should be attainable with efficientperformance.
8. Performance reporting should be timely and should contain significantinformation relating to the responsibility centre.
Responsibility Centre
The basic idea of responsibility accounting is that large diversified organizationsare difficult, if not impossible, to manage as a single segment. Thus they must bedecentralized or separated into smaller manageable divisions. The divisions orsegments are referred to as responsibility centres.
A responsibility centre ‘is a division of the organization for which amanager is held responsible.’ CIMA, London has defined responsibility centreas ‘a segment of the organization, where an individual manager is heldresponsible for its segment’s performance.’
In the words of Horngren, ‘a responsibility centre is a part, segment orsub-unit of an organization whose manager is accountable for a specifiedset of activities.’ Example of a responsibility centre in a company running a chainof hotels may be one hotel whose manager will be accountable for its performance.A responsibility centre is like a small business to achieve the objectives of a largeorganization. For an organization to be successful, the activities of its responsibilitycentres must be coordinated. An important criterion for creating responsibilitycentre is that the unit of organization should be seperate and identifiable for thepurpose of its performance evaluation. It should also be understood that for creatingresponsibility centre, it is not necessary that organization must be decentralizedbecause responsibility centres can be found in both centralized and decentralizedorganizations.
Budget andBudgetary Control
NOTES
Self-InstructionalMaterial 225
Types of Responsibility Centre
Responsibility centres are of four types — cost centre, revenue centre, profitcentre and investment centre. Together they form the basis of responsibilityaccounting.
Features of Responsibility Accounting
The basic method of control in responsibility accounting is the same as used inbudgetary control and standard costing and may be stated in the following points:
1. Responsibility centres are created.
2. A plan is prepared in the form of budgets or standards for each responsibilitycentre.
3. The performance of the responsibility centre is evaluated by comparingactual results with those budgeted in the regular monthly reports.
4. Variances between actual and budgeted performance are analysed so as tofix responsibility.
5. Corrective and preventive action is taken, wherever possible.
Check Your Progress
6. State the novel part of the ZBB as compared to the usual approach.
7. Mention other names for performance budgeting.
8. Name the four types of responsibility centres.
11.5 ANSWERS TO CHECK YOUR PROGRESSQUESTIONS
1. Budgets have the following characteristics:
A budget is primarily a planning device but it also serves as a basis forperformance evaluation and control.
A budget is prepared either in money terms or in quantitative terms or inboth.
A budget is prepared for a definite future period.
Purpose of a budget is to implement the policies formulated bymanagement for attaining the given objectives.
2. A forecast is a prediction of what may happen as a result of a given set ofcircumstances. It is an assessment of probable future events. A budget is aplanned exercise to achieve a target. It is based on the pros and cons of aforecast.
Budget andBudgetary Control
NOTES
Self-Instructional226 Material
3. The key factor serves as the starting point for the preparation of budgets.
4. According to function and scope, there are two types of budgets:
Functional Budget
Master Budget
5. Flexible budget is considered to be more realistic, practical and useful.
6. The novel part of the ZBB is the requirement that the budgeting processstarts at zero with all expenditures to be completely justified.
7. Performance budgeting is sometimes called Programme Budgeting orPlanning, Programme and Budget System (PPBS).
8. The four types of responsibility centres are cost centre, revenue centre,profit centre and investment centre.
11.6 SUMMARY
Budgetary control is an important tool of planning and control. Planninginvolves looking systematically at the future so that decisions can be madetoday which will bring the company its desired results.
Control is the process of measuring and correcting actual performance toensure that plans for implementing the chosen course of action are carriedout.
Budget refers to a plan relating to a definite future period of time expressedin monetary and/or quantitative terms. In relation to business, a budget is aformal expression of the expected incomes and expenditures for a definitefuture period.
Budgetary control is a system of controlling costs through preparation ofbudgets. Budgeting is thus only a part of the budgetary control. Accordingto CIMA, London, ‘Budgetary control is the establishment of budgetsrelating to the responsibilities of executives of a policy and the continuouscomparison of the actual with the budgeted results, either to secure byindividual action the objective of the policy or to provide a basis for itsrevision.’
The technique of budgetary control is now widely used in the business world.Many businesses fail because of lack of efficient planning which could haverevealed that the business should not have been started or that one shouldhave been prepared to face serious dangers ahead.
Budgeting aids managers in co-ordinating their efforts so that objectives ofthe organization as a whole harmonize with the objectives of its divisions.Effective planning and organizing contribute a lot in achieving co-ordination.
Budget andBudgetary Control
NOTES
Self-InstructionalMaterial 227
A budgetary control system can prove successful only when certainconditions and attitudes exist, absence of which will negate to a large extent,the value of a budget system is any business.
In large concerns, the direction and execution of the budget is delegated toa budget committee which reports directly to the top management. Thefinancial controller is usually appointed to serve as the budget director.
Budget period is a length of time for which a budget is prepared and operated.Budget periods vary between short-term and long-term and no specificperiod can be laid down for all budgets. It varies among concerns andindustries for several factors.
Budgets may be classified into the following categories: On the basis offunction and scope as functional and master budgets and on the basis offlexibility as fixed and flexible budgets.
Budget reports should be prepared at regular intervals (say, every month)showing the reasons for the differences between actual and budget figures.The reports should be prepared in such a way that they establish theresponsibility for the variances. Reports should also reveal whether a varianceis favourable or unfavourable and also whether a variance is controllable oruncontrollable.
In ZBB, budget requests for appropriation are accepted on the basis ofcost/benefit approach which ensures value for money. It questions longstanding assumptions and systematically examines and perhaps abandonsany unproductive projects.
Performance budgeting are established in such a manner that each item ofexpenditure related to a specific responsibility centre is closely linked withthe performance of that centre.
Responsibility accounting is one of the basic components of a good controlsystem, in large and decentralized companies. This is a system ofresponsibility, accountability and performance evaluation.
11.7 KEY WORDS
Zero base budgeting (ZBB): It is a method of budgeting whereby allactivities are revaluated each time a budget is set. The novel part of theZBB is that the budgeting process starts with zero as the base, with allbudget items to be justified as is done in the case of a new company.
Performance budgeting: It is a relatively new concept which focuses onfunctions, programmes and activities as it lays emphasis on achievement ofphysical targets.

Budget andBudgetary Control
NOTES
Self-Instructional228 Material
11.8 SELF ASSESSMENT QUESTIONS ANDEXERCISES
Short Answer Questions
1. Define budget and budgetary control.
2. What are the limitations of budgetary control?
3. Distinguish between fixed budget and flexible budget. Briefly state thecircumstances in which flexible budgets are used.
4. What is zero base budgeting? What are the advantages of zero baseapproach over traditional approach?
5. What do you understand by Performance Budgeting? What steps arerequired to be taken for preparing performance budgets?
Long Answer Questions
1. Explain the process by which the various budgets are prepared.
2. What do you understand by the term flexible budget? How is it drawn upand what difficulties do you expect to face in its compilation? Is flexiblebudget useful to management?
3. Mr Managing Director is surprised that his profit every year is quite differentfrom what he wants or expects to achieve. Someone advised him to installa formal system of budgeting. He employs a fresh cost accountant to dothis. For two years, the accountant faithfully makes all the assumption basedon previous years accounts. The problem remains unsolved. Advise MrManaging Director and the accountant on what steps they should take.Make assumptions about what is lacking.
4. The following data are available in a manufacturing company for a yearlyperiod:
Fixed expenses: lakh
Wages and salaries 9.5
Rent, rates and taxes 6.6
Depreciation 7.4
Sundry administration expenses 6.5
Semi-variable expenses (At 50% of capacity):
Maintenance and repairs 3.5
Indirect labour 7.9
Sales department salaries, etc. 3.8
Sundry administration salaries 2.8
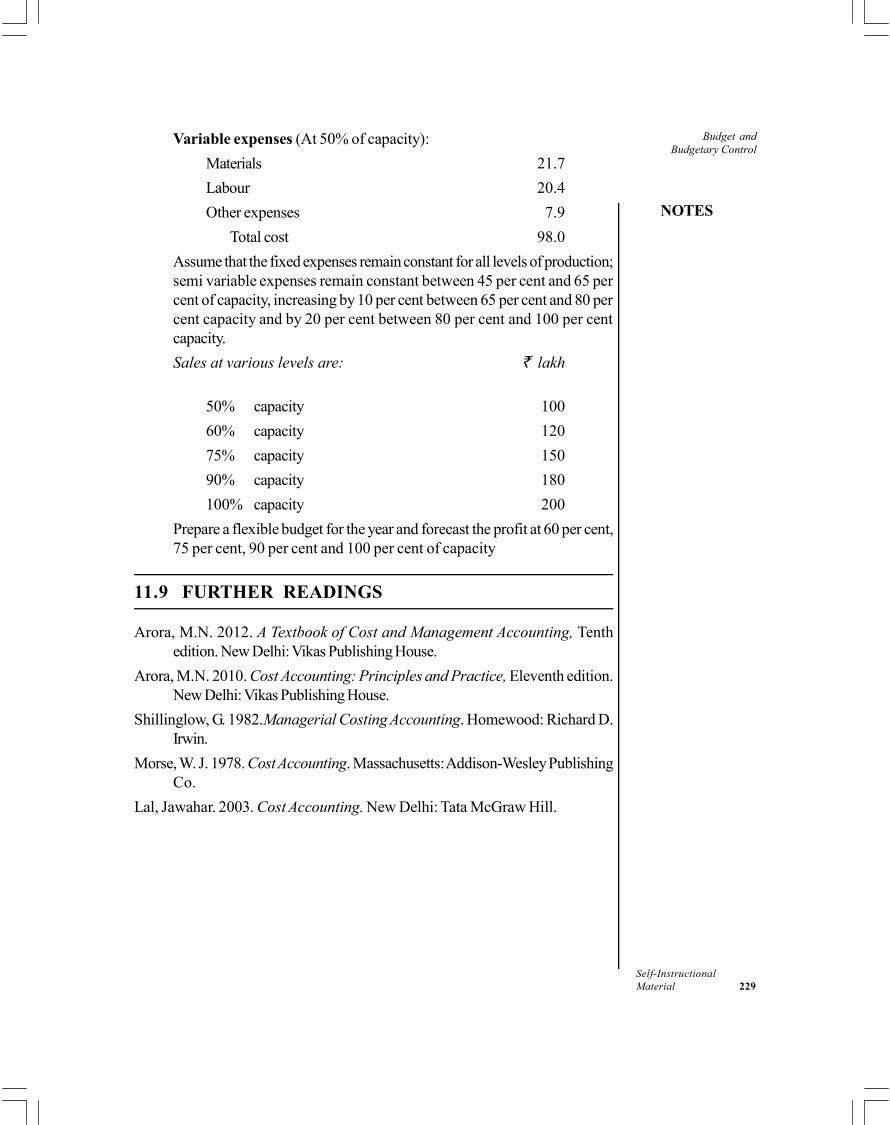
Budget andBudgetary Control
NOTES
Self-InstructionalMaterial 229
Variable expenses (At 50% of capacity):
Materials 21.7
Labour 20.4
Other expenses 7.9
Total cost 98.0
Assume that the fixed expenses remain constant for all levels of production;semi variable expenses remain constant between 45 per cent and 65 percent of capacity, increasing by 10 per cent between 65 per cent and 80 percent capacity and by 20 per cent between 80 per cent and 100 per centcapacity.
Sales at various levels are: lakh
50% capacity 100
60% capacity 120
75% capacity 150
90% capacity 180
100% capacity 200
Prepare a flexible budget for the year and forecast the profit at 60 per cent,75 per cent, 90 per cent and 100 per cent of capacity
11.9 FURTHER READINGS
Arora, M.N. 2012. A Textbook of Cost and Management Accounting, Tenthedition. New Delhi: Vikas Publishing House.
Arora, M.N. 2010. Cost Accounting: Principles and Practice, Eleventh edition.New Delhi: Vikas Publishing House.
Shillinglow, G. 1982.Managerial Costing Accounting. Homewood: Richard D.Irwin.
Morse, W. J. 1978. Cost Accounting. Massachusetts: Addison-Wesley PublishingCo.
Lal, Jawahar. 2003. Cost Accounting. New Delhi: Tata McGraw Hill.
Standard Costing
NOTES
Self-Instructional230 Material
BLOCK - IVSTANDARD COSTING AND DECISION MAKING
UNIT 12 STANDARD COSTING
Structure
12.0 Introduction12.1 Objectives12.2 Standard costing: meaning and limitations
12.2.1 Standard Costs and Budgeted Costs12.2.2 Concept of Standard Costing12.2.3 Limitations of Standard Costing12.2.4 Preliminaries in Establishing a System of Standard Costing and
Determination Standard Cost12.3 Cost Variances
12.3.1 Material Variances12.3.2 Labour Variance
12.4 Answers to Check Your Progress Questions12.5 Summary12.6 Key Words12.7 Self Assessment Questions and Exercises12.8 Further Readings
12.0 INTRODUCTION
Standard costing is a specialised technique of cost management to control thecost. From the point of view of cost control, ‘what a product should have costed’in more important than ‘what it did actually cost’. Standard costing tells whatthe cost should be.
As against standard costing, in historical costing only actual costs areascertained. Historical costs are the actual costs which have been incurred in thepast. Such costs are ascertained only after these have been incurred. In the initialstages of development of cost accounting, historical costing was the only systemavailable for ascertaining costs.
In this unit, you will learn about the concept of standard costing.
12.1 OBJECTIVES
After going through this unit, you will be able to:
Discuss the meaning and limitations of standard costing
Explain the concept of standard costs and budgeted costs
Standard Costing
NOTES
Self-InstructionalMaterial 231
Describe the determination of standard cost
Explain the concept of cost variances including direct material and directlabour
12.2 STANDARD COSTING: MEANING ANDLIMITATIONS
Standard costing was introduced in 1920s as an alternative for the traditional orhistorical costing. So, to understand the meaning of standard costing, let’s learnabout the limitations of historical costing.
A system of historical costing suffers from the following limitations:
1. No basis for cost control: Historical costs cannot be used for thepurpose of cost control as the cost has already been incurred before thecost figures can become available to management.
2. No yardstick for measuring efficiency: Historical costs do not provideany yardstick against which efficiency can be measured. It only indicatesthe actual cost which is of little value in measuring performance efficiency.
3. Delay in availability of information: Cost data under historical costingis obtained too late and is not of much use in price quotations andproduction planning.
4. Expensive system: Historical costing is comparatively an expensivesystem of costing as it involves the maintenance of a larger volume ofrecords.
The above given limitations of Historical costing encouraged the developmentof a more satisfactory standard costing approach based on predetermined costs.Standard costing is not an alternative system to job order on process costing. It isa special technique to control costs and can be used in conjunction with any othersystem like job costing, process costing or marginal costing.
12.2.1 Standard Costs and Budgeted Costs
The word standard means ‘a norm’ or a criterion. Standard cost is thus a criterioncost which may be used as a yardstick to measure the efficiency with which actualcost has been incurred. In other words, standard costs are predetermined costsor target costs that should be incurred under efficient operating conditions.
According to Chartered Institute of Management Accountants (CIMA),London, ‘Standard cost is the predetermined cost based on technical estimatesfor materials, labour and overhead for a selected period of time for aprescribed set of working conditions’.
In the words of Brown and Howard, ‘the standard cost is a predeterminedcost which determines what each product or service should cost under given

Standard Costing
NOTES
Self-Instructional232 Material
circumstances’. Thus standard costs are planned costs that should be attainedunder a given set of operating conditions. The main object of standard cost is tolook forward and assess what the cost ‘should be’ as distinct from what the costhas been in the past.
Budgeted Costs
In comparison to standard costs, budgeted costs reflect the projected revenues,costs and expenses. These are based on established forecasts and goals.
12.2.2 Concept of Standard Costing
Standard costing is simply the name given to a technique whereby standard costsare computed and subsequently compared with the actual costs to find out thedifferences between the two. These differences (known as variances) are thenanalysed to know the causes thereof so as to provide a basis of control. TheCIMA, London has defined standard costing as ‘the preparation of standardcosts and applying them to measure the variations from actual costs andanalysing the courses of variations with a view to maintain maximumefficiency in production.’ Brown and Howard have defined it, ‘as a techniqueof cost accounting which compares the standard cost of each product orservice with the actual costs, to determine the efficiency of the operations sothat any remedial action may be taken immediately.’
Steps: Standard costing system involves the following steps:
1. The setting of standard costs for different elements of cost, i.e., material,labour and overheads.
2. Ascertaining actual costs.
3. Comparing standard with actual costs to determine the differences betweenthe two, known as ‘variances’.
4. Analysing variances for ascertaining reasons thereof.
5. Reporting of these variances and analysis thereof to management forappropriate action, where necessary.
Applicability of Standard Costing
The application of standard costing requires certain conditions to be fulfilled. Theseare:
(a) A sufficient volume of standard products or components should be produced.
(b) Methods, operations and processes should be capable of being standardized.
(c) A sufficient number of costs should be capable of being controlled.
Industries producing standardized products which are repetitive in nature,i.e., industries using process costing method, fulfil all the above conditions andthus the system can be used to the best advantage in such industries. Examples arefertilizers, cement, steel and sugar.

Standard Costing
NOTES
Self-InstructionalMaterial 233
In jobbing industries, it is not worthwhile to develop and employ a full systemof standard costing. This is because in such industries each job undertaken may bedifferent from another and setting standards for each job may prove difficult andexpensive. In such industries, therefore, a partial system may be adopted inappropriate circumstances. For example, certain processes and operationsperformed may be of a repetitive nature and thus the principles of standard costingmay be applied by setting standard for each such process or operation.
12.2.3 Limitations of Standard Costing
Standard costing system may suffer from certain disadvantages. This may bebecause of lack of education and communication and resultant misunderstandingon the part of managerial staff. Possible disadvantages are:
1. The system may not be appropriate to the business.
2. The staff may not be capable of operating the system.
3. A business may not be able to keep standards up-to-date. In other words,a business may not revise standards to keep pace with the frequent changesin manufacturing conditions. Firms may avoid revising standards as it is acostly affair.
4. Inaccurate and unreliable standards cause misleading results and thus maynot enjoy the confidence of the users of the system.
5. Operation of the standard costing system is a costly affair and small firmscannot afford it.
6. Standard costing is expensive and unsuitable in job order industries whichare manufacturing non-standardized products.
12.2.4 Preliminaries in Establishing a System of Standard Costingand Determination Standard Cost
In establishing a system of standard costing, there are a number of preliminaries tobe considered. These are as follows:
1. Establishment of Cost Centres
The first step in the establishment of a system of standard costing is the establishmentof cost centres with clearly defined areas of responsibility. The meaning of costcentre is explained in Chapter One. In this context it may be noted that in establishingcost centres, there should be no doubt about the responsibility of each cost centreso that in case of off standard performance, responsibility may be identified.
2. Classification of Accounts
Accounts are classified according to the purpose in hand. Classification may beby function, revenue item, etc. For speedy collection and analysis of accounts,codes and symbols may be used.
Standard Costing
NOTES
Self-Instructional234 Material
3. Types of Standards
Standards may be divided into the following two main classes—basic and current.
Basic standards: These are the standards which are established for an indefiniteperiod of time. They are similar to an index number against which all later resultsare measured. Variances from basic standards show trends of deviation of theactual cost. However, basic standards are of no practical utility from the point ofview of cost control.
Current Standards: Such standards remain in operation for a limited period andare related to current conditions. These standards are revised at regular intervals.Current standards are of three types: (i) Ideal standards; (ii) Expected standards;and (iii) Normal standards.
(i) Ideal standard: This is a theoretical standard which is rather not practicableto attain. It pre-supposes that the performance of men, materials andmachines is perfect and thus makes no allowance for loss of time, accidents,machine breakdowns, wastage of materials and any other type of waste orloss. This ideal is obviously unrealistic and unattainable. Such a standardhas the advantage of establishing a goal, which, though not attainable inpractice, is always aimed at.
(ii) Expected or practical standards: This is a standard, which may beanticipated to be attained during a future period. Such standards are basedon expected performance after making a reasonable allowance forunavoidable losses and other inevitable lapses from perfect efficiency. Byfar this is the most commonly used type of standard and is best suited fromcost control point of view.
(iii) Normal standards: This is known as Past Performance Standardbecause it is based on the average performance in the past. The aim of sucha standard may be to eliminate the variations in the cost which arise out oftrade cycles.
4. Setting Standard Costs
The success of a standard costing system depends on the reliability, accuracy andacceptance of the standards. Extreme care, therefore, must be taken to ensurethat all factors have been considered in the establishment of standards.
Standard costs are set for each element of cost, i.e., direct materials, directlabour and overheads. These are described below:
Setting standards for direct materials: Two standards are developed formaterial costs:
(a) Material price standard
(b) Material usage (or quantity) standard
(a) Material price standard: This is a forecast of the average prices of materialsduring the future period. This standard is quite difficult to establish because prices

Standard Costing
NOTES
Self-InstructionalMaterial 235
are regulated more by the external factors than by the company management. Thepurchasing department notifies the standard prices after considering factors like:
(i) Purchase prices of recent orders
(ii) Prices specified in the long-term contracts
(iii) Forecasts of the commodity price trends
Provision should be made for discounts, packing and delivery charges.
(b) Material quantity (or usage) standard: While setting quantity standard,the quality and size of material items to be consumed should be standardized. Thestandard is usually developed from material specifications prepared by thedepartment of engineering of product design.
Setting standards for direct labour: The following two standards are usuallyestablished for direct labour costs:
(a) Labour rate standard
(b) Labour time standard
(a) Labour rate standard: This standard is determined having regard to thecurrent rates of pay and any anticipated variations. Sometimes an agreementbetween trade unions and employer covers a number of future months or years. Insuch cases, the agreed rate should be adopted as the standard rate for the period.
Where workers are paid on time basis, it is necessary to establish:
(i) the labour time standard for each operation
(ii) the wage rate of each grade of labour
(iii) the grades of labour to be employed
The type of operation will determine the grade of labour to be employed—male or female, skilled, unskilled or semi-skilled.
Where workers are paid on piece basis, the standard cost will be a fixedrate per piece.
(b) Labour time (or efficiency) standard: Standard time for labour should bescientifically determined by time and motion studies, carried out in conjunctionwith a study to determine the most efficient method of working. Due allowanceshould be made for normal loss of labour time, like fatigue, idle time, tool setting,etc.
Setting Standards for Direct Expenses: Direct expenses are not very common,but if there are any direct expenses relating to the cost unit, standards for these toomust be set. Setting these standards is usually quite simple, as these may be basedon past records, adjusted according to anticipated changes therein.
Setting Standards for Overheads: Setting standards for overheads is morecomplex than the development of material and labour standards. Developing thisstandard involves the following two distinct calculations:

Standard Costing
NOTES
Self-Instructional236 Material
(a) Determination of the standard overhead costs; and
(b) Determination of the estimates of production, i.e., standard level of activityreduced to a common base, such as direct labour hours, units of productionor machine hours.
A standard overheads absorption rate is computed with the use of thesetwo figures by the following formula:
or
Thus this rate may be per unit of production when base is in units of productionand it will be per hour, if base is the number of hours.
An overall blanket rate of overheads absorption is rarely accurate in anycosting system. Thus a separate rate should be computed for each cost centre (ordepartment) created for this purpose.
Overhead standards will be more useful to management if they are dividedto show fixed and variable components. Separate overheads absorption ratesshould be computed for these two types of overheads, i.e., fixed overheads andvariable overheads.
Standard Hour
Production may be expressed in diverse type of units such as kilograms, tonnes,litres, gallons, numbers, etc. When a company is manufacturing different types ofproducts, it is almost impossible to aggregate the production, which cannot beexpressed in the same unit. Therefore, it is essential to have a common unit inwhich the production, which is measured in different type of units, can beexpressed. As time factor is common to all operations, a common practice is toexpress the various units in terms of time, known as standard hour. The standardhour is the quantity of output or amount of work which should be performed inone hour. In the words of CIMA, London, a standard hour is ‘a hypotheticalhour which represents the amount of work which should be performed inone hour under stated conditions.’ Time and motion studies may indicate whatthe output of each process in one hour should be. For example, if 10 units ofproduct should be produced in one hour, then an output of 200 units wouldrepresent 20 standard hours.
Standard Cost Card (Standard Cost Sheet)
Once the standard costs have been established, these are recorded on a standardcost card. A standard cost card is thus a record of the standard material, labourand overhead costs. Such a card is maintained for each product or service. The

Standard Costing
NOTES
Self-InstructionalMaterial 237
card will normally show the quantity and price of each material item to be consumed,the time and rate of labour required, the overheads to be absorbed and the totalcost. Costs shown in the card should be approved by the person who will beresponsible for the operations concerned, otherwise he may not cooperate withmuch enthusiasm in attaining the standards.
Check Your Progress
1. Why is it not worthwhile to develop and employ a full system of standardcosting in jobbing industries?
2. Name the three types of current standards.
12.3 COST VARIANCES
Cost variance is the difference between a standard cost and the comparableactual cost incurred during a period. CIMA, London.
Variance analysis is the process of analysing variances by sub-dividing thetotal variance in such a way that management can assign responsibility for any offstandard performance. According to CIMA, London, Terminology, varianceanalysis is the process of computing the amount of variance and isolating thecauses of variance between actual and standard. An important aspect of varianceanalysis is the need to separate controllable from uncontrollable variances. A detailedanalysis of controllable variances will help the management to identify the personsresponsible for its occurrence so that corrective action can be taken.
Favourable and Unfavorable Variances
Where the actual cost is less than standard cost, it is known as favourable orcredit variance. On the other hand, where the actual cost is more than standardcost, the difference is referred to as unfavourable, adverse or debit variance.
In simple words, any variance that has a favourable effect on profit isfavourable variance and any variance which has an adverse or unfavourable effecton profit is unfavourable variance.
Many students experience difficulty in ascertaining whether a variance isfavourable or adverse. In the formulae given in this book, positive (+) variance willindicate favourable variance and negative (–) variance will indicate adverse variance.Favourable variances will be designated by (F) and Adverse by (A).
Controllable and Uncontrollable Variances
If a variance can be regarded as the responsibility of a particular person, with theresult that his degree of efficiency can be reflected in its size, then it is said to be acontrollable variance. For example, excess usage of material is usually theresponsibility of the foreman concerned. However, if the excessive usage is due to

Standard Costing
NOTES
Self-Instructional238 Material
material being defective, the responsibility may rest with the Inspection Departmentfor non-detection of the defects.
If a variance arises due to certain factors beyond the control of management,it is known as uncontrollable variance. For example, change in the market pricesof materials, general increase in the labour rates, increase in the rates of power orinsurance premium, etc., are not within the control of the management of thecompany. Responsibility for uncontrollable variances cannot be assigned to anyperson or department.
The division of variances into controllable and uncontrollable is extremelyimportant. The management should place more emphasis on controllable varianceas it is these variances which require investigation and possibly corrective action.The uncontrollable variances, on the other hand, may be ignored. This follows thewell known principle of exception whereby those matters which are going rightare ignored and any deviations from efficient performance are investigated.
Methods Variance
While setting standards, specific methods of production are kept in view. If, forsome reason or the other, a different method of production is adopted, it will giverise to a different amount of cost, thereby resulting in a variance. Such a varianceis known as methods variance. Thus a methods variance arises due to the use ofmethods other than those specified. According to CIMA, London Terminology,methods variance is ‘the difference between the standard cost of a product oroperation, produced or performed by the normal method and the standardcost of a product or operation, produced or performed by the alternativemethod actually employed.’
Revision Variance
After setting standards, sometimes standard cost has to be revised on account ofunavoidable changes in prices of various factors like wages, materials, etc. Thestandard costs once set are not disturbed every now and then to account for theseuncontrollable factors. Rather a revision variance is created and the basic standardcost is allowed to stand. This revision variance is the difference between the standardcost originally set and the revised standard cost.
Thus:
Creation of revision variance is only an interim adjustment which allows thestandard costing system to operate usefully even when there are changes in standardcosts.
Variances for each Element of Cost
The total cost variance is divided into Material, Labour and Overheads variances.
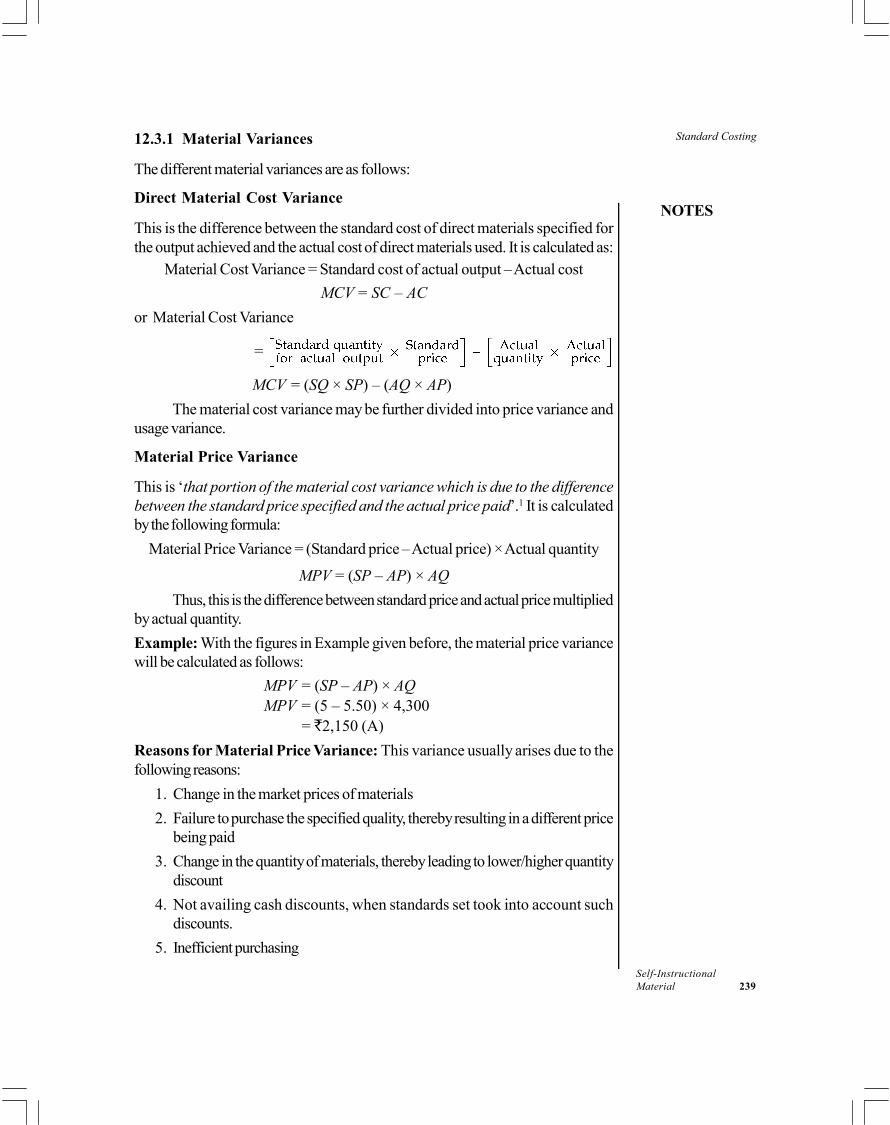
Standard Costing
NOTES
Self-InstructionalMaterial 239
12.3.1 Material Variances
The different material variances are as follows:
Direct Material Cost Variance
This is the difference between the standard cost of direct materials specified forthe output achieved and the actual cost of direct materials used. It is calculated as:
Material Cost Variance = Standard cost of actual output – Actual cost
MCV = SC – AC
or Material Cost Variance
=
MCV = (SQ × SP) – (AQ × AP)
The material cost variance may be further divided into price variance andusage variance.
Material Price Variance
This is ‘that portion of the material cost variance which is due to the differencebetween the standard price specified and the actual price paid’.1 It is calculatedby the following formula:
Material Price Variance = (Standard price – Actual price) × Actual quantity
MPV = (SP – AP) × AQ
Thus, this is the difference between standard price and actual price multipliedby actual quantity.
Example: With the figures in Example given before, the material price variancewill be calculated as follows:
MPV = (SP – AP) × AQMPV = (5 – 5.50) × 4,300
= 2,150 (A)
Reasons for Material Price Variance: This variance usually arises due to thefollowing reasons:
1. Change in the market prices of materials
2. Failure to purchase the specified quality, thereby resulting in a different pricebeing paid
3. Change in the quantity of materials, thereby leading to lower/higher quantitydiscount
4. Not availing cash discounts, when standards set took into account suchdiscounts.
5. Inefficient purchasing
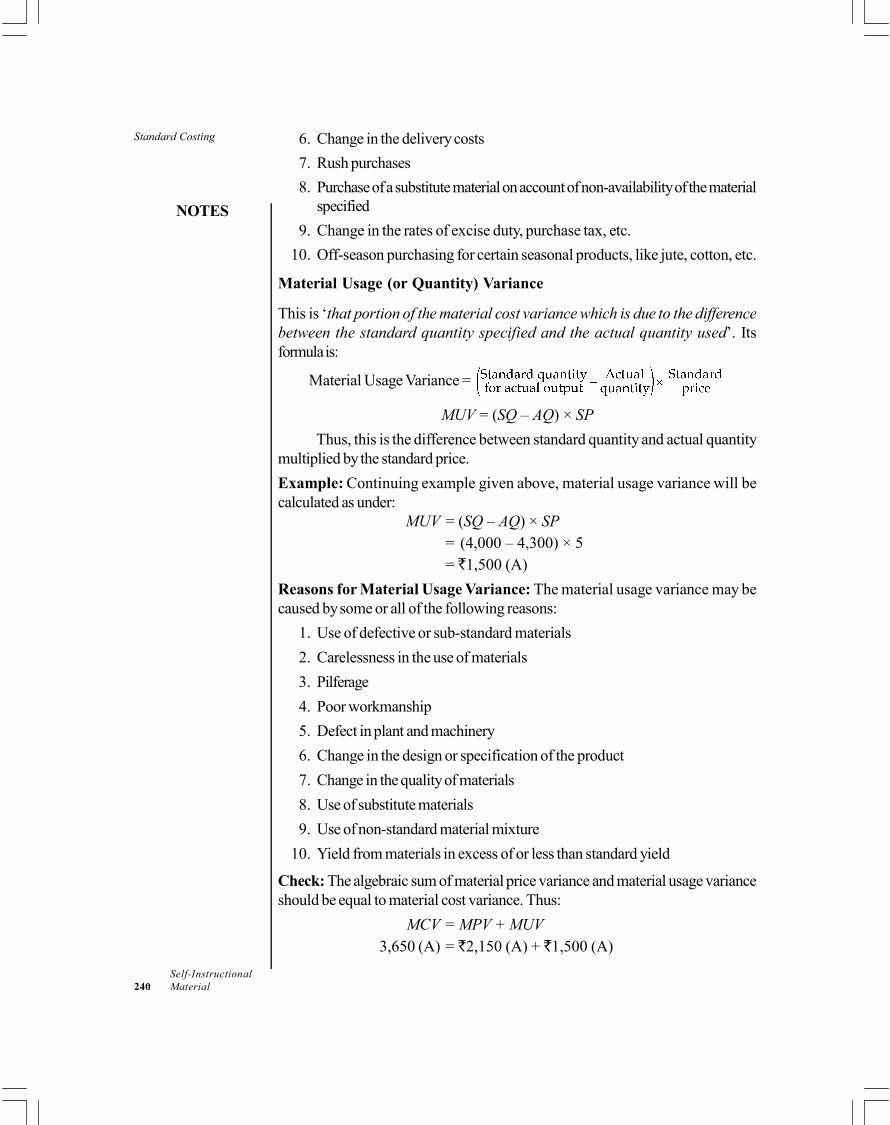
Standard Costing
NOTES
Self-Instructional240 Material
6. Change in the delivery costs
7. Rush purchases
8. Purchase of a substitute material on account of non-availability of the materialspecified
9. Change in the rates of excise duty, purchase tax, etc.
10. Off-season purchasing for certain seasonal products, like jute, cotton, etc.
Material Usage (or Quantity) Variance
This is ‘that portion of the material cost variance which is due to the differencebetween the standard quantity specified and the actual quantity used’. Itsformula is:
Material Usage Variance =
MUV = (SQ – AQ) × SP
Thus, this is the difference between standard quantity and actual quantitymultiplied by the standard price.
Example: Continuing example given above, material usage variance will becalculated as under:
MUV = (SQ – AQ) × SP= (4,000 – 4,300) × 5= 1,500 (A)
Reasons for Material Usage Variance: The material usage variance may becaused by some or all of the following reasons:
1. Use of defective or sub-standard materials
2. Carelessness in the use of materials
3. Pilferage
4. Poor workmanship
5. Defect in plant and machinery
6. Change in the design or specification of the product
7. Change in the quality of materials
8. Use of substitute materials
9. Use of non-standard material mixture
10. Yield from materials in excess of or less than standard yield
Check: The algebraic sum of material price variance and material usage varianceshould be equal to material cost variance. Thus:
MCV = MPV + MUV3,650 (A) = 2,150 (A) + 1,500 (A)
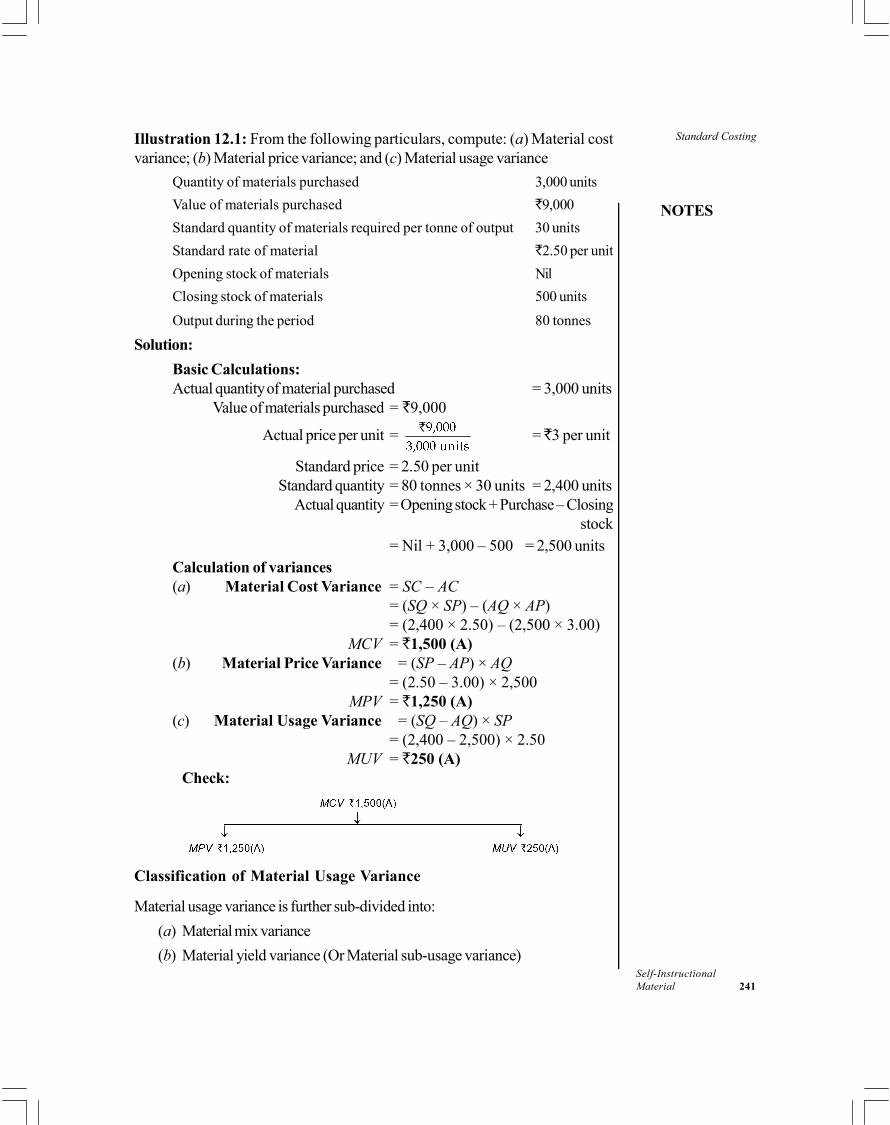
Standard Costing
NOTES
Self-InstructionalMaterial 241
Illustration 12.1: From the following particulars, compute: (a) Material costvariance; (b) Material price variance; and (c) Material usage variance
Quantity of materials purchased 3,000 units
Value of materials purchased 9,000
Standard quantity of materials required per tonne of output 30 units
Standard rate of material 2.50 per unit
Opening stock of materials Nil
Closing stock of materials 500 units
Output during the period 80 tonnes
Solution:
Basic Calculations:Actual quantity of material purchased = 3,000 units
Value of materials purchased = 9,000
Actual price per unit = = 3 per unit
Standard price = 2.50 per unitStandard quantity = 80 tonnes × 30 units = 2,400 units
Actual quantity = Opening stock + Purchase – Closingstock
= Nil + 3,000 – 500 = 2,500 unitsCalculation of variances(a) Material Cost Variance = SC – AC
= (SQ × SP) – (AQ × AP)= (2,400 × 2.50) – (2,500 × 3.00)
MCV = 1,500 (A)(b) Material Price Variance = (SP – AP) × AQ
= (2.50 – 3.00) × 2,500MPV = 1,250 (A)
(c) Material Usage Variance = (SQ – AQ) × SP= (2,400 – 2,500) × 2.50
MUV = 250 (A)Check:
Classification of Material Usage Variance
Material usage variance is further sub-divided into:
(a) Material mix variance
(b) Material yield variance (Or Material sub-usage variance)
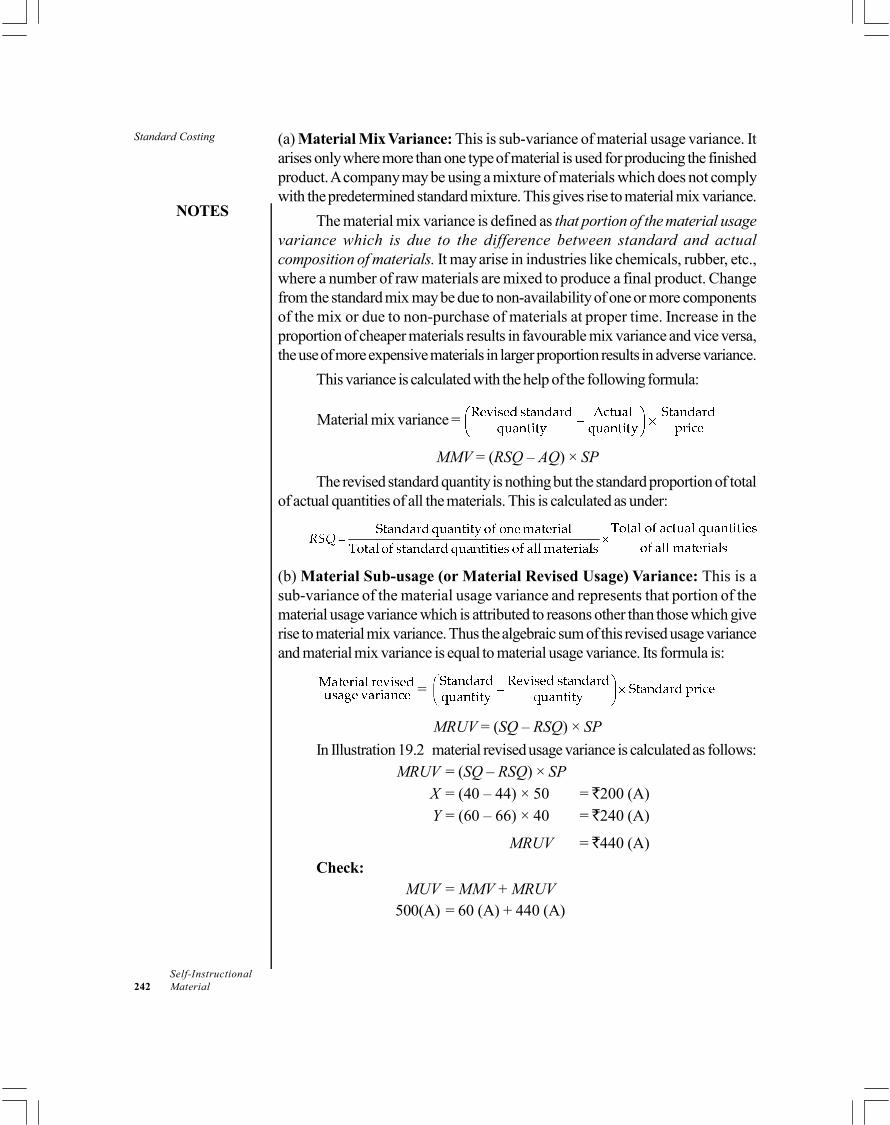
Standard Costing
NOTES
Self-Instructional242 Material
(a) Material Mix Variance: This is sub-variance of material usage variance. Itarises only where more than one type of material is used for producing the finishedproduct. A company may be using a mixture of materials which does not complywith the predetermined standard mixture. This gives rise to material mix variance.
The material mix variance is defined as that portion of the material usagevariance which is due to the difference between standard and actualcomposition of materials. It may arise in industries like chemicals, rubber, etc.,where a number of raw materials are mixed to produce a final product. Changefrom the standard mix may be due to non-availability of one or more componentsof the mix or due to non-purchase of materials at proper time. Increase in theproportion of cheaper materials results in favourable mix variance and vice versa,the use of more expensive materials in larger proportion results in adverse variance.
This variance is calculated with the help of the following formula:
Material mix variance =
MMV = (RSQ – AQ) × SP
The revised standard quantity is nothing but the standard proportion of totalof actual quantities of all the materials. This is calculated as under:
(b) Material Sub-usage (or Material Revised Usage) Variance: This is asub-variance of the material usage variance and represents that portion of thematerial usage variance which is attributed to reasons other than those which giverise to material mix variance. Thus the algebraic sum of this revised usage varianceand material mix variance is equal to material usage variance. Its formula is:
=
MRUV = (SQ – RSQ) × SP
In Illustration 19.2 material revised usage variance is calculated as follows:MRUV = (SQ – RSQ) × SP
X = (40 – 44) × 50 = 200 (A)Y = (60 – 66) × 40 = 240 (A)
MRUV = 440 (A)
Check:MUV = MMV + MRUV
500(A) = 60 (A) + 440 (A)

Standard Costing
NOTES
Self-InstructionalMaterial 243
Material Yield Variance: This is also a sub-variance of material usage variance.It arises in process industries, like chemicals, where loss of materials in productionis inevitable. While setting standards, the normal or standard loss is taken intoaccount. But actual loss may differ from normal or standard loss. This results inactual yield or output being different from standard yield.
Thus material yield variance is that portion of the material usage variancewhich is due to the difference between standard yield specified and actual yieldobtained. The standard yield is the output expected to be obtained from the actualusage of raw materials. It should be noted that yield variance as used in standardcosting is the same thing as abnormal loss or abnormal gain in the other costingsystems.
One important feature of yield variance which differentiates it from othermaterial variances (price, usage and mix variances) is that yield variance is anoutput variance, while others are input variances. In other words, yield variancerepresents a gain or loss on output in terms of finished production, while othervariances represent a gain or loss on the cost of material input. Its formula is givenon the following page:
=
MYV = (AY – SY) × SOP
Standard output price (SOP) is the standard material cost per unit of output.
Note: Material revised usage variance and Material yield variance are two different methodsof calculating the same thing and are hence clubbed together.
Illustration 12.2: The standard mix to produce one unit of product is as follows:
Material A 60 units @ 15 per unit = 900
Material B 80 units @ 20 per unit = 1,600
Material C 100 units @ 25 per unit = 2,500
240 units 5,000
During the month of April, 10 units were actually produced and consumptionwas as follows:
Material A 640 units @ 17.50 per unit = 11,200
Material B 950 units @ 18.00 per unit = 17,100
Material C 870 units @ 27.50 per unit = 23,925
2,460 units 52,225
Calculate all material variances.
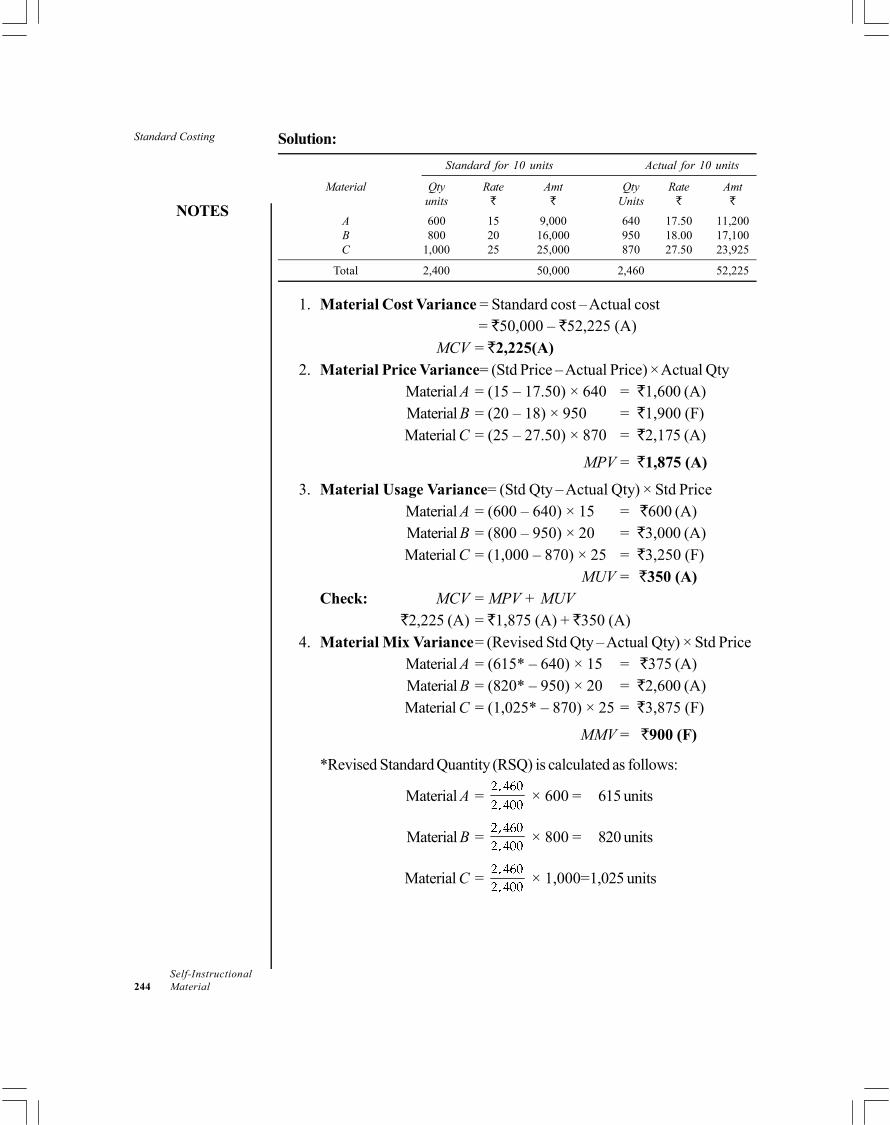
Standard Costing
NOTES
Self-Instructional244 Material
Solution:
Standard for 10 units Actual for 10 units
Material Qty Rate Amt Qty Rate Amtunits Units
A 600 15 9,000 640 17.50 11,200B 800 20 16,000 950 18.00 17,100C 1,000 25 25,000 870 27.50 23,925
Total 2,400 50,000 2,460 52,225
1. Material Cost Variance = Standard cost – Actual cost = 50,000 – 52,225 (A)
MCV = 2,225(A)2. Material Price Variance= (Std Price – Actual Price) × Actual Qty
Material A = (15 – 17.50) × 640 = 1,600 (A)Material B = (20 – 18) × 950 = 1,900 (F)Material C = (25 – 27.50) × 870 = 2,175 (A)
MPV = 1,875 (A)
3. Material Usage Variance= (Std Qty – Actual Qty) × Std PriceMaterial A = (600 – 640) × 15 = 600 (A)Material B = (800 – 950) × 20 = 3,000 (A)Material C = (1,000 – 870) × 25 = 3,250 (F)
MUV = 350 (A)Check: MCV = MPV + MUV
2,225 (A) = 1,875 (A) + 350 (A)4. Material Mix Variance= (Revised Std Qty – Actual Qty) × Std Price
Material A = (615* – 640) × 15 = 375 (A)Material B = (820* – 950) × 20 = 2,600 (A)Material C = (1,025* – 870) × 25 = 3,875 (F)
MMV = 900 (F)
*Revised Standard Quantity (RSQ) is calculated as follows:
Material A = × 600 = 615 units
Material B = × 800 = 820 units
Material C = × 1,000=1,025 units

Standard Costing
NOTES
Self-InstructionalMaterial 245
5. Material Yield Variance
For yield variance, certain basic calculations have to be made as follows:
Standard yield = = = 10.25 units
SOP (Std material cost per unit of output)= 50,000 ÷ 10 units= 5,000Material Yield Variance = (AY – SY) × SOP
MYV = (10 – 10.25) × 5,000 = 1,250(A)Material Revised Usage (or Sub-usage) Variance (MRUV)= (Standard Quantity – Revised Standard Quantity) × Standard Price
Material A = (600 – 615) × 15 = 225 (A)Material B = (800 – 820) × 20 = 400 (A)Material C = (1,000 – 1,025) × 25 = 625 (A)
MRUV = 1,250 (A)
Note: Either MMV or MRUV is calculated. These two are always equal.
Check:
12.3.2 Labour Variances
The analysis and computation of labour variances is quite similar to materialvariances.
Labour Cost Variance
This is the difference between the standard direct labour cost specified for theactivity achieved and the actual direct labour cost incurred. It is calculated asunder:
Labour Cost Variance =
LCV = SC – AC
Or, Labour Cost Variance
=
LCV = (SH × SR) – (AH × AR)
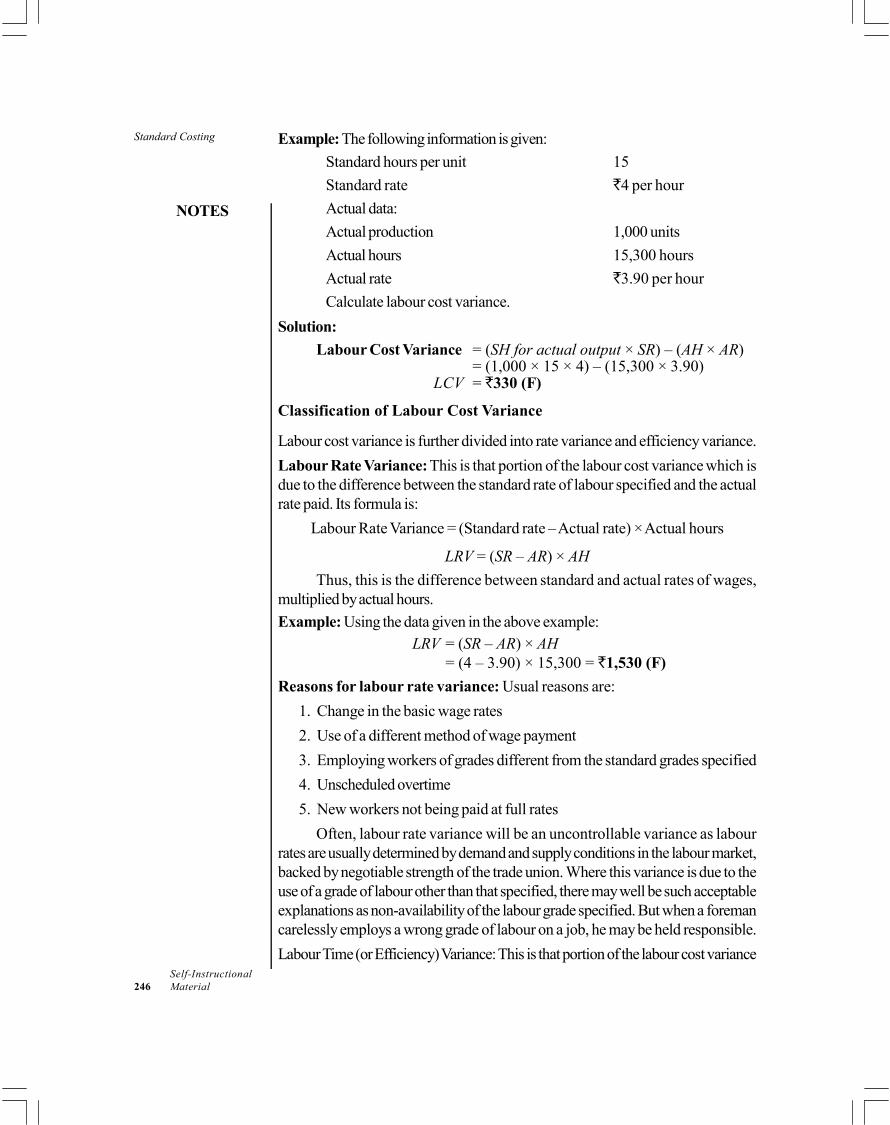
Standard Costing
NOTES
Self-Instructional246 Material
Example: The following information is given:
Standard hours per unit 15
Standard rate 4 per hour
Actual data:
Actual production 1,000 units
Actual hours 15,300 hours
Actual rate 3.90 per hour
Calculate labour cost variance.
Solution:
Labour Cost Variance = (SH for actual output × SR) – (AH × AR)= (1,000 × 15 × 4) – (15,300 × 3.90)
LCV = 330 (F)
Classification of Labour Cost Variance
Labour cost variance is further divided into rate variance and efficiency variance.
Labour Rate Variance: This is that portion of the labour cost variance which isdue to the difference between the standard rate of labour specified and the actualrate paid. Its formula is:
Labour Rate Variance = (Standard rate – Actual rate) × Actual hours
LRV = (SR – AR) × AH
Thus, this is the difference between standard and actual rates of wages,multiplied by actual hours.
Example: Using the data given in the above example:LRV = (SR – AR) × AH
= (4 – 3.90) × 15,300 = 1,530 (F)
Reasons for labour rate variance: Usual reasons are:
1. Change in the basic wage rates
2. Use of a different method of wage payment
3. Employing workers of grades different from the standard grades specified
4. Unscheduled overtime
5. New workers not being paid at full rates
Often, labour rate variance will be an uncontrollable variance as labourrates are usually determined by demand and supply conditions in the labour market,backed by negotiable strength of the trade union. Where this variance is due to theuse of a grade of labour other than that specified, there may well be such acceptableexplanations as non-availability of the labour grade specified. But when a foremancarelessly employs a wrong grade of labour on a job, he may be held responsible.
Labour Time (or Efficiency) Variance: This is that portion of the labour cost variance
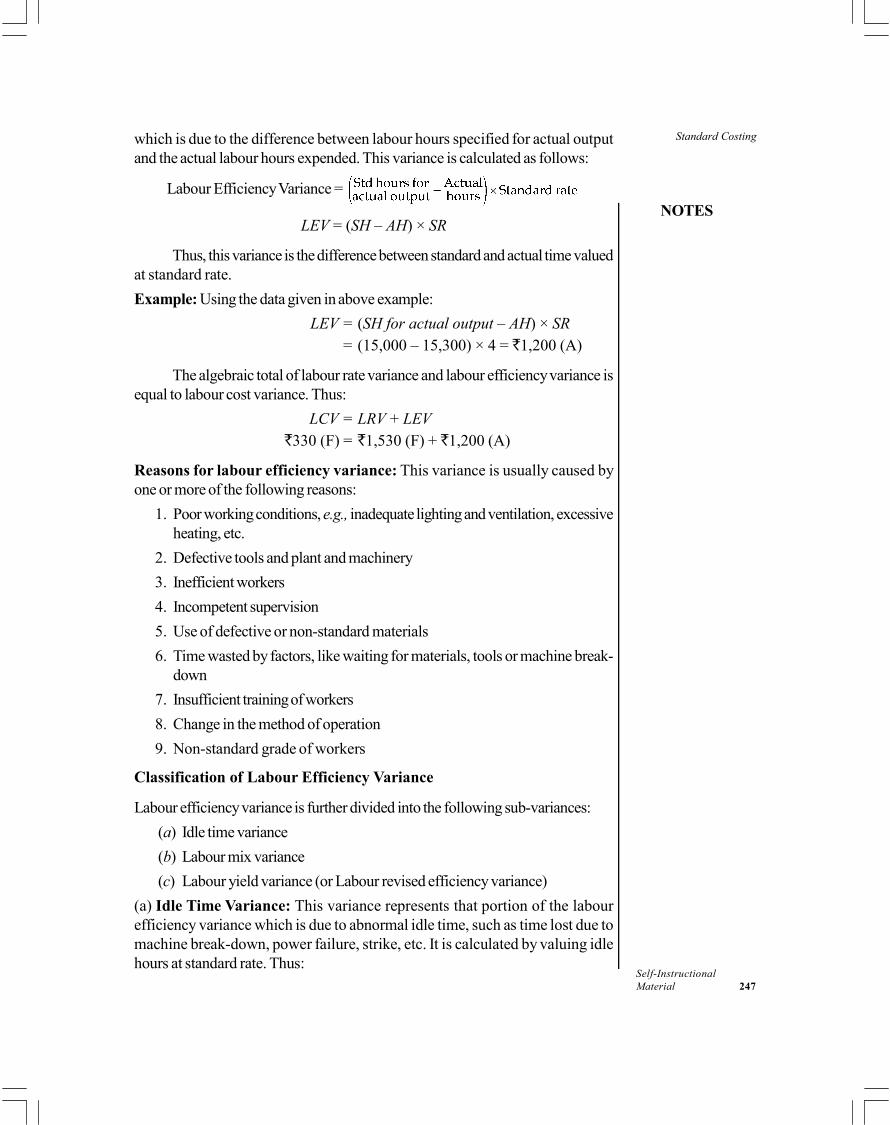
Standard Costing
NOTES
Self-InstructionalMaterial 247
which is due to the difference between labour hours specified for actual outputand the actual labour hours expended. This variance is calculated as follows:
Labour Efficiency Variance =
LEV = (SH – AH) × SR
Thus, this variance is the difference between standard and actual time valuedat standard rate.
Example: Using the data given in above example:
LEV = (SH for actual output – AH) × SR= (15,000 – 15,300) × 4 = 1,200 (A)
The algebraic total of labour rate variance and labour efficiency variance isequal to labour cost variance. Thus:
LCV = LRV + LEV330 (F) = 1,530 (F) + 1,200 (A)
Reasons for labour efficiency variance: This variance is usually caused byone or more of the following reasons:
1. Poor working conditions, e.g., inadequate lighting and ventilation, excessiveheating, etc.
2. Defective tools and plant and machinery
3. Inefficient workers
4. Incompetent supervision
5. Use of defective or non-standard materials
6. Time wasted by factors, like waiting for materials, tools or machine break-down
7. Insufficient training of workers
8. Change in the method of operation
9. Non-standard grade of workers
Classification of Labour Efficiency Variance
Labour efficiency variance is further divided into the following sub-variances:
(a) Idle time variance
(b) Labour mix variance
(c) Labour yield variance (or Labour revised efficiency variance)
(a) Idle Time Variance: This variance represents that portion of the labourefficiency variance which is due to abnormal idle time, such as time lost due tomachine break-down, power failure, strike, etc. It is calculated by valuing idlehours at standard rate. Thus:
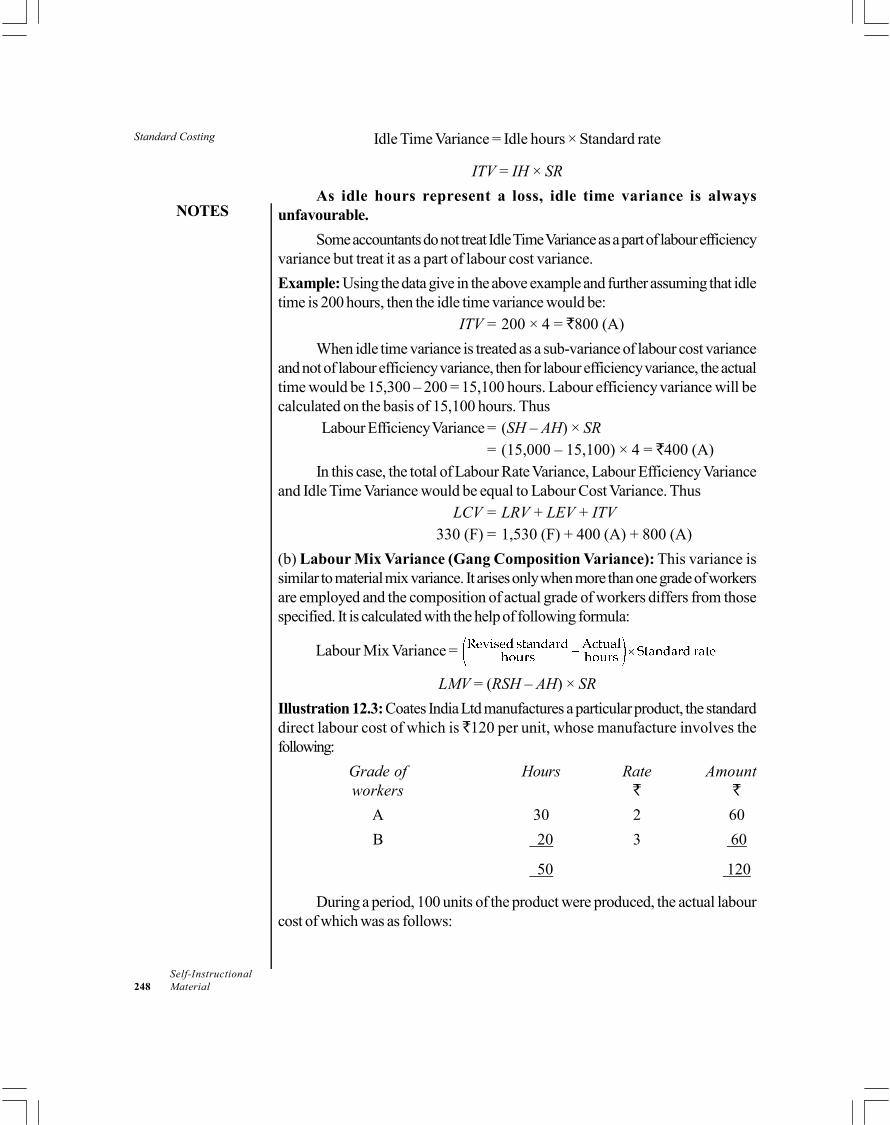
Standard Costing
NOTES
Self-Instructional248 Material
Idle Time Variance = Idle hours × Standard rate
ITV = IH × SR
As idle hours represent a loss, idle time variance is alwaysunfavourable.
Some accountants do not treat Idle Time Variance as a part of labour efficiencyvariance but treat it as a part of labour cost variance.
Example: Using the data give in the above example and further assuming that idletime is 200 hours, then the idle time variance would be:
ITV = 200 × 4 = 800 (A)
When idle time variance is treated as a sub-variance of labour cost varianceand not of labour efficiency variance, then for labour efficiency variance, the actualtime would be 15,300 – 200 = 15,100 hours. Labour efficiency variance will becalculated on the basis of 15,100 hours. Thus
Labour Efficiency Variance = (SH – AH) × SR= (15,000 – 15,100) × 4 = 400 (A)
In this case, the total of Labour Rate Variance, Labour Efficiency Varianceand Idle Time Variance would be equal to Labour Cost Variance. Thus
LCV = LRV + LEV + ITV330 (F) = 1,530 (F) + 400 (A) + 800 (A)
(b) Labour Mix Variance (Gang Composition Variance): This variance issimilar to material mix variance. It arises only when more than one grade of workersare employed and the composition of actual grade of workers differs from thosespecified. It is calculated with the help of following formula:
Labour Mix Variance =
LMV = (RSH – AH) × SR
Illustration 12.3: Coates India Ltd manufactures a particular product, the standarddirect labour cost of which is 120 per unit, whose manufacture involves thefollowing:
Grade of Hours Rate Amountworkers
A 30 2 60
B 20 3 60
50 120
During a period, 100 units of the product were produced, the actual labourcost of which was as follows:
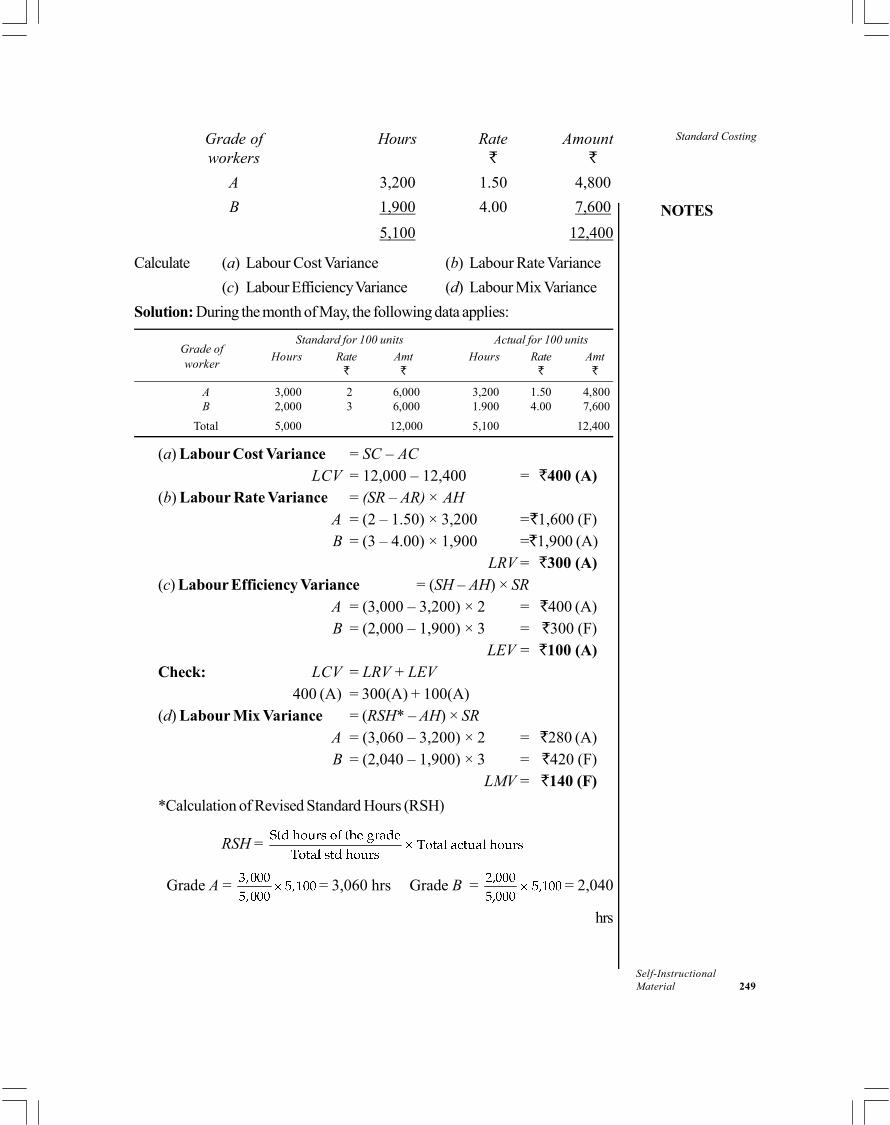
Standard Costing
NOTES
Self-InstructionalMaterial 249
Grade of Hours Rate Amountworkers
A 3,200 1.50 4,800
B 1,900 4.00 7,600
5,100 12,400
Calculate (a) Labour Cost Variance (b) Labour Rate Variance
(c) Labour Efficiency Variance (d) Labour Mix Variance
Solution: During the month of May, the following data applies:
Grade ofStandard for 100 units Actual for 100 units
workerHours Rate Amt Hours Rate Amt
A 3,000 2 6,000 3,200 1.50 4,800B 2,000 3 6,000 1.900 4.00 7,600
Total 5,000 12,000 5,100 12,400
(a) Labour Cost Variance = SC – ACLCV = 12,000 – 12,400 = 400 (A)
(b) Labour Rate Variance = (SR – AR) × AHA = (2 – 1.50) × 3,200 = 1,600 (F)B = (3 – 4.00) × 1,900 = 1,900 (A)
LRV = 300 (A)(c) Labour Efficiency Variance = (SH – AH) × SR
A = (3,000 – 3,200) × 2 = 400 (A)B = (2,000 – 1,900) × 3 = 300 (F)
LEV = 100 (A)Check: LCV = LRV + LEV
400 (A) = 300(A) + 100(A)(d) Labour Mix Variance = (RSH* – AH) × SR
A = (3,060 – 3,200) × 2 = 280 (A)B = (2,040 – 1,900) × 3 = 420 (F)
LMV = 140 (F)
*Calculation of Revised Standard Hours (RSH)
RSH =
Grade A = = 3,060 hrs Grade B = = 2,040
hrs

Standard Costing
NOTES
Self-Instructional250 Material
(c) Labour Revised Efficiency Variance (Or Labour Sub-efficiencyVariance): This is similar to Material Revised Usage Variance and is a sub-varianceof labour efficiency variance. It arises due to factors other than those which giverise to idle time variance and labour mix variance. Thus, this is a residue of labourefficiency variance left after idle time and mix variance have been separated. Itsformula is:
Labour Revised Efficiency Variance =
LREV = (SH – RSH) × SH
Labour Yield Variance: This is quite similar to Material Yield Variance. Thisvariance reveals the effect on labour cost of actual output or yield being more orless than the standard yield. Its formula is:
Labour Yield Variance =
Note: Labour revised efficiency variance and Labour yield variance are two methods ofcalculating the same thing, and are hence clubbed together.
Illustration 12.4: The standard labour employment and the actual labour engagedin a week for a job are as under:
Skilled Semi-skilled Unskilledworkers workers workers
Standard no. of workers in the gang 32 12 6
Actual no. of workers employed 28 18 4
Standard wage rate per hour 3 2 1
Actual wage rate per hour 4 3 2
During the 40 hours working week, the gang produced 1,800 standardlabour hours of work. Calculate:
(a) Labour Cost Variance (b) Labour Rate Variance
(c) Labour Efficiency Variance (d) Labour Mix Variance
(e) Labour Yield Variance (CA Inter)
Solution:
Standard Actual
Category Hrs* Rate Amount Hrs* Rate Amountof workers
Skilled 1,280 3 3,840 1,120 4 4,480Semi-skilled 480 2 960 720 3 2,160Unskilled 240 1 240 160 2 320
2,000 5,040 2,000 6,960
*Hrs = No. of workers × 40 hours.

Standard Costing
NOTES
Self-InstructionalMaterial 251
Std cost of actual output = × 1,800 hrs = 4,536
Labour Cost Variance = Std cost of actualoutput – Actual cost
LCV = 4,536 – 6,960 = 2,424 (A)
Labour Rate Variance = (SR – AR) × AH
Skilled = (3 – 4) ×1,120 = 1,120 (A)
Semi-skilled = (2 – 3) × 720 = 720 (A)
unskilled = (1 – 2) × 160 = 160 (A)
LRV = 2,000 (A)
Labour Efficiency Variance = (*SH for actual output – AH) × SR
Skilled = (1,152 – 1,120) × 3 = 96 (F)
Semi-skilled = (432 – 720) × 2 = 576 (A)
Unskilled = (216 – 260) × 1 = 56 (F)
LEV = 424 (A)
*Std hrs for actual output are calculated as follows:
Skilled = 1 800
2 000
,
, × 1,280 = 1,152 hrs
Semi-skilled = 1 800
2 000
,
, × 480 = 432 hrs
Unskilled = 1 800
2 000
,
, × 240 = 216 hrs
Labour Mix Variance = (Revised std hrs – AH) × SR
Skilled = (1,280 – 1,120) × 3 = 480 (F)
Semi-skilled = (480 – 720) × 2 = 480 (A)
Unskilled = (240 – 160) × 1 = 80 (F)
LMV = 80 (F)
Labour Yield Variance
=
LYV = (1,800 – 2,000) × = 504 (A)
Check:
Standard Costing
NOTES
Self-Instructional252 Material
Check Your Progress
3. What is known as the difference between the standard cost originally setand the revised standard cost?
4. State the formula for labour mix variance.
12.4 ANSWERS TO CHECK YOUR PROGRESSQUESTIONS
1. In jobbing industries, it is not worthwhile to develop and employ a full systemof standard costing because in such industries each job undertaken may bedifferent from another and setting standards for each job may prove difficultand expensive.
2. The three types of current standards are: ideal standards, expected andnormal standards.
3. The revision variance is known as the difference between the standard costoriginally set and the revised standard cost.
4. The formula for labour mix variance is
Labour Mix Variance= (Revised standard hours- Actual Hours) x StandardRate
12.5 SUMMARY
Standard costing is a specialized technique of cost management to controlthe cost.
The limitations of historical costing encouraged the development of a moresatisfactory standard costing approach based on predetermined costs.
Standard costing is not an alternative system to job order on process costing.It is a special technique to control costs and costs and can be used inconjunction with any other system like job costing, process costing ormarginal costing.
Standard costing system may suffer from certain disadvantages. This maybe because of lack of education and communication and resultantmisunderstanding on the part of managerial staff.
Establishing a system of standard costing: establishment of cost centres,classification of accounts, types of standards, and setting of standard costs.
Cost variance is the difference between a standard cost and the comparableactual cost incurred during a period. These variances can be favourable orunfavourable and controllable and uncontrollable variances.
Standard Costing
NOTES
Self-InstructionalMaterial 253
While setting standards, specific methods of production are kept in view. If,for some reason or the other, a different method of production is adopted,it will give rise to a different method of production is adopted, it will giverise to a different amount of cost, thereby resulting in a variance. Such avariance is known as methods variance.
The total cost variance is divided into material, labour and overheadsvariances.
The material cost variance is further divided into material price and materialusage variances.
The labour cost variance is divided into labour rate variance and labourefficiency variance.
12.6 KEY WORDS
Historical costing: It is a cost accounting concept in which the assets andliabilities are reported at their historical costs, which does not account forchanges in the item’s value
Standard costs: These are predetermined costs or target costs that shouldbe incurred under efficient operating conditions
Standard hour: It refers to the quantity of output or amount of work whichshould be performed in one hour
Cost variance: It refers to the difference between a standard costa andthe comparable actual cost incurrent during a period
12.7 SELF ASSESSMENT QUESTIONS ANDEXERCISES
Short Answer Questions
1. What are the limitations of historical costing?
2. Define standard and budgeted costs.
3. Write a short note on the applicability of standard costing.
4. List the limitation of standard costing.
5. What are the different types of variances?
Long Answer Questions
1. Explain the steps involved in the establishment of standard costing.
2. Describe the process of setting standard costs.
3. Discuss the different material and labour variances.
Standard Costing
NOTES
Self-Instructional254 Material
12.8 FURTHER READINGS
Arora, M.N. 2012. A Textbook of Cost and Management Accounting, Tenthedition. New Delhi: Vikas Publishing House.
Arora, M.N. 2010. Cost Accounting: Principles and Practice, Eleventh edition.New Delhi: Vikas Publishing House.
Shillinglow, G. 1982.Managerial Costing Accounting. Homewood: Richard D.Irwin.
Morse, W. J. 1978. Cost Accounting. Massachusetts: Addison-Wesley PublishingCo.
Lal, Jawahar. 2003. Cost Accounting. New Delhi: Tata McGraw Hill.
Marginal Costing andProfit Planning
NOTES
Self-InstructionalMaterial 255
UNIT 13 MARGINAL COSTING ANDPROFIT PLANNING
Structure
13.0 Introduction13.1 Objectives13.2 Marginal and Absorption Costing
13.2.1 Marginal Cost13.2.2 Absorption Costing and Marginal Costing: Differences and
Determination13.3 Cost-Volume-Profit Analysis and Profit Planning
13.3.1 Break-even Analysis13.3.2 Profit-Volume Ratio (P/V Ratio)13.3.3 Margin of Safety (M/S)13.3.4 Limiting or Key Factor13.3.5 Break-even Chart and Angle of Incidence
13.4 Answers to Check Your Progress Questions13.5 Summary13.6 Key Words13.7 Self Assessment Questions and Exercises13.8 Further Readings
13.0 INTRODUCTION
Marginal cost is defined as the amount of any given volume of output by whichaggregate costs are changed, if the volume of output is increased or decreased byone unit.
Marginal Costing may be defined as ‘the ascertainment by differentiatingbetween fixed cost and variable cost, of marginal cost and of the effect on profit ofchanges in volume or type of output.’ With marginal costing procedure costs areseparated into fixed and variable cost.
Break-even point is that point at which there is neither profit nor loss. It is atthis point costs are equal to sales. It is otherwise called as balancing point, neutralpoint, equilibrium point, loss ending point, profit beginning point, etc. After breakevenpoint is achieved, all the further sales will contribute to profit.
In this unit, you will learn about the concept or marginal costing and profitplanning.
Marginal Costing andProfit Planning
NOTES
Self-Instructional256 Material
13.1 OBJECTIVES
After going through this unit, you will be able to:
Define and understand marginal (variable) cost and marginal costing
Distinguish between marginal costing and absorption costing
Describe break-even analysis/cost-volume-profit (CVP) analysis
Draw a break-even chart
Explain key terms, like contribution, P/V ratio, margin of safety, angle ofincidence
13.2 MARGINAL AND ABSORPTION COSTING
There are mainly two techniques of product costing and income determination —(a) Absorption costing; (b) Marginal costing.
Absorption Costing
This is a total cost technique under which total cost (i.e., fixed cost as well asvariable cost) is charged as production cost. In other words, in absorption costing,all manufacturing costs are absorbed in the cost of the products produced. In thissystem, fixed factory overheads are absorbed on the basis of a predeterminedoverhead rates, based on normal capacity. Under/over absorbed overheads areadjusted before computing profit for a particular period. Closing stock is alsovalued at total cost which includes all direct costs and fixed factory overheads(and sometimes administration overheads also).
Absorption costing is a traditional approach and is also known asConventional Costing or Full Costing.
Marginal Costing
An alternative to absorption costing is marginal costing, also known as ‘variablecosting’ or direct costing. Under this technique, only variable costs are chargedas product costs and included in inventory valuation. Fixed manufacturing costsare not allotted to products but are considered as period costs and thus chargeddirectly to Profit and Loss Account of that year. Fixed costs also do not enter instock valuation.
Both absorption costing and marginal costing treat non-manufacturing costs(i.e., administration, selling and distribution overheads) as period costs. In otherwords, these are not inventoriable costs.
Marginal Costing andProfit Planning
NOTES
Self-InstructionalMaterial 257
Meaning of Marginal Costing
Marginal costing is defined by CIMA London as ‘The accounting system inwhich variable costs are charged to cost units and fixed costs of the periodare written off in full, against the aggregate contribution. Its special value isin decision making’.
Characteristics of Marginal Costing
The essential characteristics and mechanism of marginal costing technique may besummed up as follows:
1. Segregation of costs into fixed and variable elements: In marginalcosting all costs are classified into fixed and variable. Semi-variable costsare also segregated into fixed and variable elements.
2. Marginal costs as products costs: Only marginal (variable) costs arecharged to products produced during the period.
3. Fixed costs as period costs: Fixed costs are treated as period costs andare charged to Costing Profit and Loss Account of the period in which theyare incurred.
4. Valuation of inventory: The work-in-progress and finished stocks arevalued at marginal cost only.
5. Contribution: Contribution is the difference between sales value andmarginal cost of sales. The relative profitability of products or departmentsis based on a study of ‘contribution’ made by each of the products ordepartments.
6. Pricing: In marginal costing, prices are based on marginal cost pluscontribution.
7. Marginal costing and profit: In marginal costing, profit is calculated by atwo-stage approach. First of all, contribution is determined for each productor department. The contributions of various products or departments arepooled together and such a total of contributions from all products is called‘Fund’. Then from this fund is deducted the total fixed cost to arrive at aprofit or loss.
Product Costs and Period Costs
The concepts of product costs and period costs was explained in Chapter 1 ofthis book. It may be recalled that product costs are those costs which become apart of production cost. Such costs are also included in inventory valuation. Periodcosts, on the other hand, are those costs which are not associated with production.Such costs are treated as an expense of the period in which these are incurred.
Marginal Costing andProfit Planning
NOTES
Self-Instructional258 Material
These do not form part of the cost of products or inventory. These are directlytransferred to Profit and Loss Account of the period.
13.2.1 Marginal Cost
Marginal cost is the additional cost of producing an additional unit of product. It isthe total of all variable costs. It is composed of all direct costs and variableoverheads. The CIMA London has defined marginal cost ‘as the amount at anygiven volume of output by which aggregate costs are changed, if volume ofoutput is increased or decreased by one unit’. It is the cost of one unit of productwhich would be avoided if that unit were not produced. An important point is thatmarginal cost per unit remains unchanged, irrespective of the level of activity.
13.2.2 Absorption Costing and Marginal Costing: Differences andDetermination
The points of distinction between marginal costing and absorption costing aresummarized as follows:
1. Treatment of fixed and variable costs: In marginal costing, only variablecosts are charged to products. Fixed costs are treated as period costs andcharged to Profit and Loss Account of the period.
In absorption costing, all costs (both fixed and variable) are charged to theproduct. The fixed factory overhead cost is absorption in units produced ata rate predetermined on the basis of normal capacity utilization (and not onthe basis of actual production).
2. Valuation of stock: In marginal costing, stock of work-in-progress andfinished goods are valued at marginal cost only.
In absorption costing, stocks are valued at total cost which includes bothfixed and variable costs. Thus stock values in marginal costs are lower thanthat in absorption costing.
3. Measurement of profitability: In marginal costing, relative profitabilityof pro-ducts or departments is based on a study of relative contributionmade by respective products or departments. The managerial decisions arethus guided by contribution.
In absorption costing, relative profitability is judged by profit figures whichis also a guiding factor for managerial decisions.
Income Determination under Marginal Costing and Absorption Costing
The net profit under the two systems may be same or may be different. Differencein profit may be because of the different basis of inventory valuation. In marginalcosting stocks of work-in-progress and finished goods are valued at variable costwhereas in absorption costing stocks are valued at total cost.
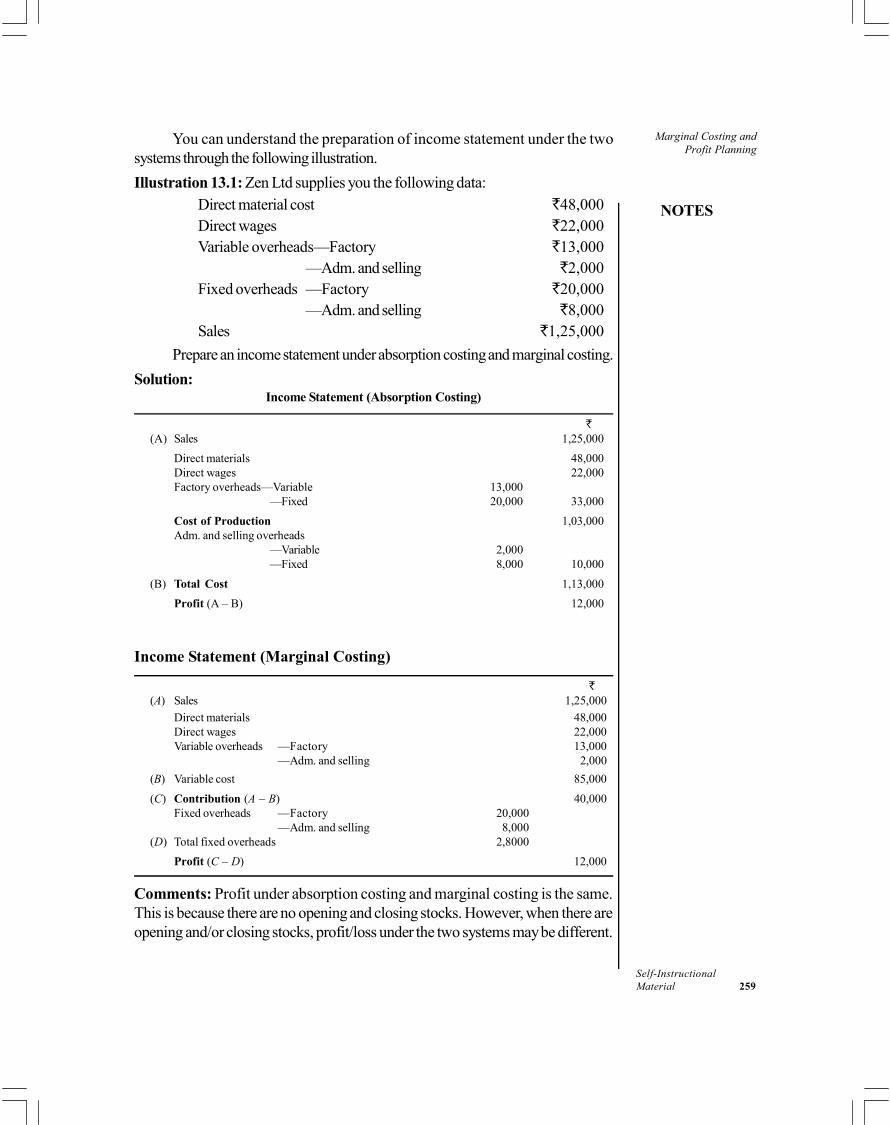
Marginal Costing andProfit Planning
NOTES
Self-InstructionalMaterial 259
You can understand the preparation of income statement under the twosystems through the following illustration.
Illustration 13.1: Zen Ltd supplies you the following data:Direct material cost 48,000Direct wages 22,000Variable overheads—Factory 13,000
—Adm. and selling 2,000Fixed overheads —Factory 20,000
—Adm. and selling 8,000Sales 1,25,000
Prepare an income statement under absorption costing and marginal costing.
Solution:Income Statement (Absorption Costing)
(A) Sales 1,25,000
Direct materials 48,000Direct wages 22,000Factory overheads—Variable 13,000
—Fixed 20,000 33,000
Cost of Production 1,03,000Adm. and selling overheads
—Variable 2,000—Fixed 8,000 10,000
(B) Total Cost 1,13,000
Profit (A – B) 12,000
Income Statement (Marginal Costing)
(A) Sales 1,25,000
Direct materials 48,000Direct wages 22,000Variable overheads —Factory 13,000
—Adm. and selling 2,000
(B) Variable cost 85,000
(C) Contribution (A – B) 40,000Fixed overheads —Factory 20,000
—Adm. and selling 8,000(D) Total fixed overheads 2,8000
Profit (C – D) 12,000
Comments: Profit under absorption costing and marginal costing is the same.This is because there are no opening and closing stocks. However, when there areopening and/or closing stocks, profit/loss under the two systems may be different.

Marginal Costing andProfit Planning
NOTES
Self-Instructional260 Material
Check Your Progress
1. What are some of the other names for absorption costing?
2. How are stock of work-in-progress and finished goods valued undermarginal and absorption costing?
13.3 COST-VOLUME-PROFIT ANALYSIS ANDPROFIT PLANNING
Cost-volume-profit analysis (CVP analysis) is an extension of the principles ofmarginal costing. It studies the interrelationship of three basic factors of businessoperations:
(a) Cost of production
(b) Volume of production/sales
(c) Profit
These three factors are interconnected in such a way that they act and reacton one another because of cause and effect relationship amongst them. The costof a product determines its selling price and the selling price determines the level ofprofit. The selling price also affects the volume of sales which directly affects thevolume of production and volume of production in turn influences cost. In brief,variations in volume of production results in changes in cost and profit. CIMALondon has defined CVP analysis as, ‘the study of the effects on future profitsof changes in fixed cost, variable cost, sales price, quantity and mix.’
An understanding of CVP analysis is extremely useful to management inbudgeting and profit planning. It explains the impact of the following on the netprofit:
(a) Changes in selling prices
(b) Changes in volume of sales
(c) Changes in variable cost
(d) Changes in fixed cost
In fact, CVP analysis helps in determining the probable effect of change inany one of these factors on the remaining factors.
13.3.1 Break-even Analysis
Break-even analysis is a widely-used technique to study the CVP relationship. Itis interpreted in narrow as well as broad sense.
In its narrow sense, break-even analysis is concerned with determiningbreak-even point, i.e., that level of production and sales where there is no profitand no loss. At this point total cost is equal to total sales revenue.
Marginal Costing andProfit Planning
NOTES
Self-InstructionalMaterial 261
When used in broad sense, break-even analysis is used to determineprobable profit/loss at any given level of production/sales. It is also used to determinethe amount of sales to earn a desired amount of profit.
Assumptions underlying Break-even Analysis
The break-even analysis is based on the following assumptions:
1. All costs can be separated into fixed and variable components.
2. Variable cost per unit remains constant and total variable cost varies indirect proportion to the volume of production.
3. Total fixed cost remains constant.
4. Selling price per unit does not change as volume changes.
5. There is only one product or in the case of multiple products, the sales mixdoes not change. In other words, when several products are being sold, thesale of various products will always be in some predetermined proportion.
6. There is synchronization between production and sales. In other words,volume of production equals volume of sales.
7. Productivity per worker does not change.
8. There will be no change in the general price level.
Contribution and Marginal Cost Equation
As stated earlier, contribution is the difference between sales and the marginal(variable) cost of sales. It is also known as contribution margin (C
m) or gross
margin. Thus contribution is calculated by the following formula:
Contribution = Sales – Variable cost (C = S – V)
Also, Contribution = Fixed cost + Profit (C = F + P)
or Contribution = Fixed cost – Loss (C = F – L)
From this, the following marginal cost equation is developed:
S – V = F + P
If any three of the above four factors in the equation are known, the fourthone can be easily found out. Thus:
or P = S – V – F
P = C – F
F = C – P
V = S – F – P
The concept of contribution is extremely helpful in the study of break-evenanalysis and management decision making.
Marginal Costing andProfit Planning
NOTES
Self-Instructional262 Material
13.3.2 Profit-Volume Ratio (P/V Ratio)
The profit/volume ratio, better known as contribution/sales ratio (C/S ratio),expresses the relation of contribution to sales.
Symbolically, P/V ratio =
By transposition, we have
(i) C = S × P/V ratio
(ii) S =
Uses of P/V ratio
P/V ratio is one of the most important ratios to watch in business. It is an indicatorof the rate at which profit is being earned. A high P/V ratio indicates high profitabilityand a low ratio indicates low profitability in the business. The profitability of differentsections of the business such as sales areas, classes of customers, product lines,methods of production, etc., may also be compared with the help of profit-volumeratio. The P/V ratio is also used in making the following type of calculations:
(a) Calculation of break-even point
(b) Calculation of profit at a given level of sales
(c) Calculation of the volume of sales required to earn a given profit
(d) Calculation of profit when margin of safety is given
(e) Calculation of the volume of sales required to maintain the present level ofprofit, if selling price is reduced
Methods of Break-even Analysis
Break-even analysis may be performed by the following two methods:
(a) Algebraic calculations
(b) Graphic presentation
Algebraic Method (Calculations in Break-even Analysis)
Break-even point: The break-even point is the volume of output or sales atwhich total cost is exactly equal to sales. It is a point of no profit and no loss. Thisis the minimum point of production at which total cost is recovered and after thispoint profit begins.
The fundamental formula to calculate break-even point is:
Break-even point (in units) =
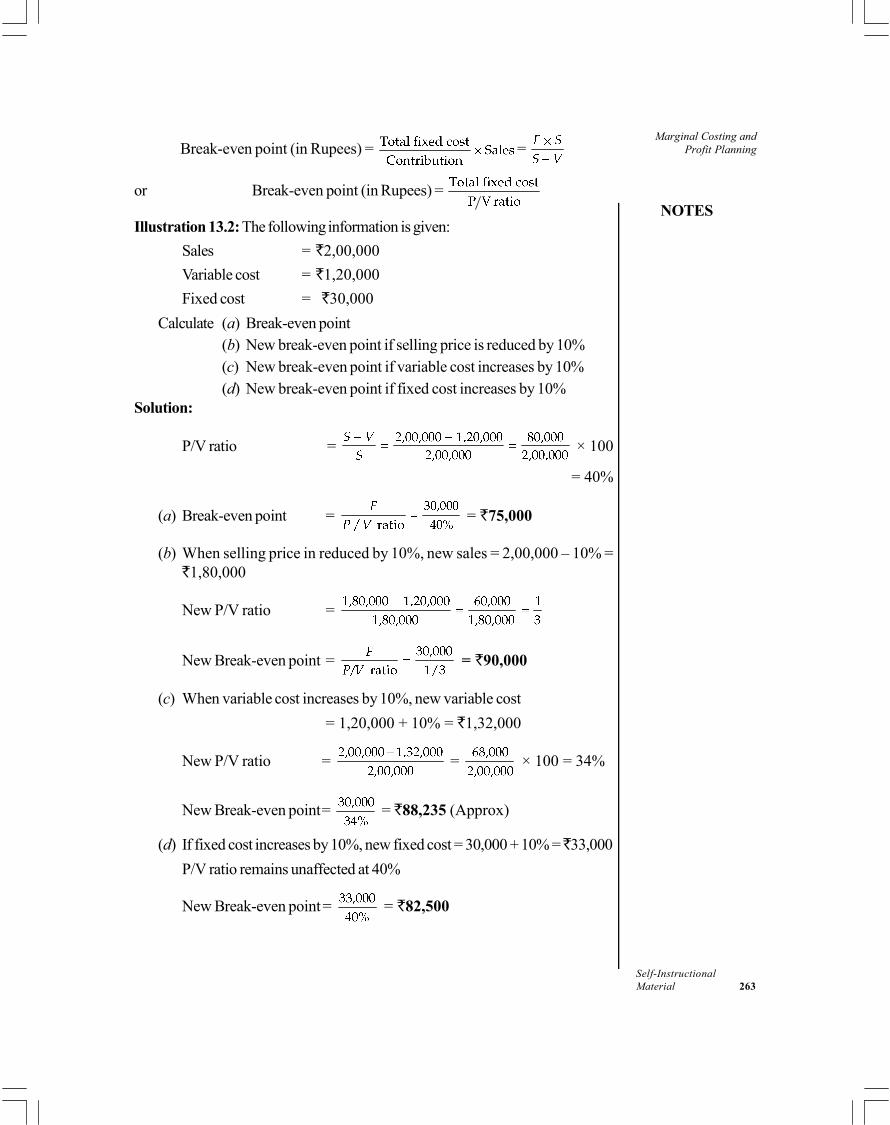
Marginal Costing andProfit Planning
NOTES
Self-InstructionalMaterial 263
Break-even point (in Rupees) = =
or Break-even point (in Rupees) =
Illustration 13.2: The following information is given:
Sales = 2,00,000
Variable cost = 1,20,000
Fixed cost = 30,000
Calculate (a) Break-even point(b) New break-even point if selling price is reduced by 10%(c) New break-even point if variable cost increases by 10%(d) New break-even point if fixed cost increases by 10%
Solution:
P/V ratio = × 100
= 40%
(a) Break-even point = = 75,000
(b) When selling price in reduced by 10%, new sales = 2,00,000 – 10% =1,80,000
New P/V ratio =
New Break-even point = = 90,000
(c) When variable cost increases by 10%, new variable cost
= 1,20,000 + 10% = 1,32,000
New P/V ratio = = × 100 = 34%
New Break-even point= = 88,235 (Approx)
(d) If fixed cost increases by 10%, new fixed cost = 30,000 + 10% = 33,000
P/V ratio remains unaffected at 40%
New Break-even point= = 82,500

Marginal Costing andProfit Planning
NOTES
Self-Instructional264 Material
Cash Break-even Point
When break-even point is calculated only with those fixed costs which are payablein cash, such a break-even point is known as cash break-even point. This meansthat depreciation and other non-cash fixed costs are excluded from the fixed costsin computing cash break-even point. Its formula is—
Cash break even point =
13.3.3 Margin of Safety (M/S)
Margin of safety may be defined as the difference between actual sales and salesat break-even point. In other words, it is the amount by which actual volume ofsales exceeds the break-even point. Margin of safety may be expressed in absolutemoney terms or as a percentage of sales. Thus,
M/S = Actual sales – Break-even point
The size of the margin of safety indicates soundness of a business. Whenmargin of safety is large, it means the business can still make profits even after aserious fall in sales. In such a situation, the business stands better chance of survivalin times of depression. A large margin of safety usually indicates low fixed costs.When margin of safety is low, any loss of sales may be a matter of a seriousconcern.
Margin of safety is directly related to profit. This is shown below:
Profit = Margin of safety × Profit/volume ratio
P = M/S × P/V ratio
Thus M/S =
If profit is 10% and P/V ratio is 40%, then
M/S = = 25%
When actual sales are given—
Profit = M/S ratio × P/V ratio × Actual sales
When profit is not known but M/S is known, then
P = M/S × P/V ratio
P = 25% × 40% = 10%
Improvement in M/S: When margin of safety is not satisfactory, the followingsteps may be taken to improve it:
(a) Increase the volume of sales; (b) Increase the selling price; (c) Reducefixed cost; (d) Reduce variable cost; (e) Improve sales mix by increasing the salesof products with larger P/V ratio.

Marginal Costing andProfit Planning
NOTES
Self-InstructionalMaterial 265
The effect of a price reduction is always to reduce P/V ratio, raise thebreak-even point and shorten the margin of safety.
This is illustrated on the following page:
Example: Suppose price is reduced from 75 to 60, variable cost 50 per unit,fixed cost 10,000, calculate margin of safety.
Before Afterprice reduction price reduction
Selling price per unit (S) 75 60
Variable cost per unit (V) 50 50
Total fixed cost (F) 10,000 10,000
Contribution (S – V) 25 10
P/V ratio
Break-even point
= 30,000 = 60,000
Actual sales (assumed) 75,000 75,000
M/S (Actual sales – B.E. Point) 75,000 – 30,000 75,000 – 60,000
= 45,000 = 15,000
Cost Indifference Point
Cost indifference point refers to that level of output where the total cost or theprofit of the two alternatives is equal. Such a level may be calculated where two ormore alternative methods of production or machines are considered and the useof one machine involves higher fixed cost and lower variable cost per unit whilethe other machine involves lower fixed cost and higher variable cost per unit. Thecalculation of point of cost indifference helps in a cost minimization exercise andidentifies the alternative which is more profitable for a given level of output orsales. A machine with a lower fixed cost and a higher variable cost per unit is moreprofitable when actual sales are below the point of cost indifference and viceversa, a machine with a higher fixed cost and a lower variable cost per unit is moreprofitable when actual sales are more than the point of cost indifference. Theformula for calculation is as follows:
Cost indifference point (in units) =
Cost indifference point (in ) =

Marginal Costing andProfit Planning
NOTES
Self-Instructional266 Material
Illustration 13.3: GMR Co. Ltd has to choose between machine X1 and X
2 and
provides the following data:
X1
X2
Output per annum (units) 10,000 10,000
Profit at the above level 30,000 24,000
Fixed cost per annum 30,000 16,000
Compute:
(i) B.E. Point of the two machines
(ii) Level of output where the two machines are equally profitable
(iii) The machine suitable for different levels of output of the product
Solution:
Contribution = Fixed cost + Profit
Machine A = 30,000 + 30,000 = 60,000
Machine B = 16,000 + 24,000 = 40,000
C or contribution per unit – A = 60,000 10,000 units = 6
– B = 40,000 10,000 units = 4
(i) Break-even point = FC C
A = 30,000 6 = 5,000 units
B = 16,000 4 = 4,000 units
(ii) Cost indifference point =
= = 7,000 units
At 7,000 units, both the machines will produce the same amount of profit.
(iii) Machine B will be more profitable between break-even point and point ofcost indifference, i.e., between 4,000 units and 7,000 units.
A is more profitable when sales one more than 7,000 units.
13.3.4 Limiting or Key Factor
The objective of a business is to earn maximum profit. However, it is not alwayseasy to achieve this objective because profit earning is affected by a variety offactors. For example, an undertaking may have sufficient orders on hand, ampleskilled labour and production capacity, but may be unable to obtain all the quantityof material it needs for the manufacture of maximum quantities which could be
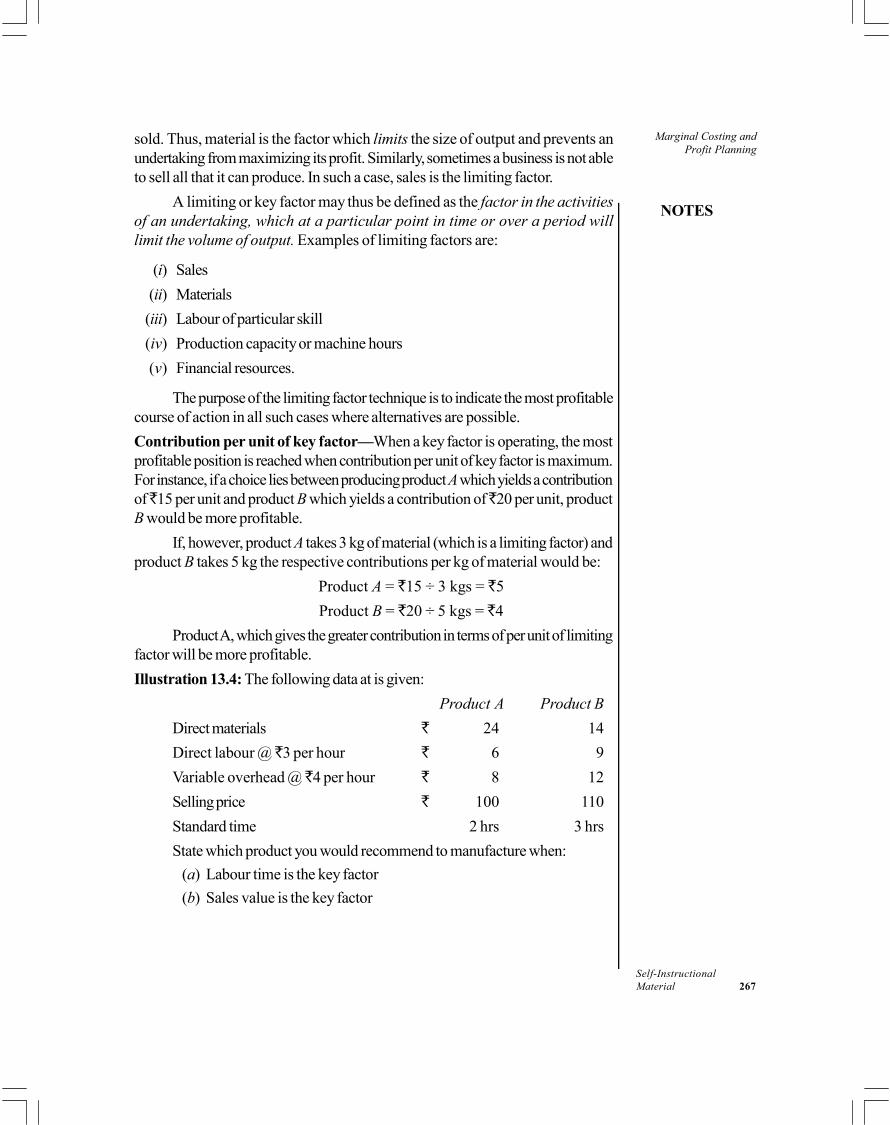
Marginal Costing andProfit Planning
NOTES
Self-InstructionalMaterial 267
sold. Thus, material is the factor which limits the size of output and prevents anundertaking from maximizing its profit. Similarly, sometimes a business is not ableto sell all that it can produce. In such a case, sales is the limiting factor.
A limiting or key factor may thus be defined as the factor in the activitiesof an undertaking, which at a particular point in time or over a period willlimit the volume of output. Examples of limiting factors are:
(i) Sales
(ii) Materials
(iii) Labour of particular skill
(iv) Production capacity or machine hours
(v) Financial resources.
The purpose of the limiting factor technique is to indicate the most profitablecourse of action in all such cases where alternatives are possible.
Contribution per unit of key factor—When a key factor is operating, the mostprofitable position is reached when contribution per unit of key factor is maximum.For instance, if a choice lies between producing product A which yields a contributionof 15 per unit and product B which yields a contribution of 20 per unit, productB would be more profitable.
If, however, product A takes 3 kg of material (which is a limiting factor) andproduct B takes 5 kg the respective contributions per kg of material would be:
Product A = 15 ÷ 3 kgs = 5
Product B = 20 ÷ 5 kgs = 4
Product A, which gives the greater contribution in terms of per unit of limitingfactor will be more profitable.
Illustration 13.4: The following data at is given:
Product A Product B
Direct materials 24 14
Direct labour @ 3 per hour 6 9
Variable overhead @ 4 per hour 8 12
Selling price 100 110
Standard time 2 hrs 3 hrs
State which product you would recommend to manufacture when:
(a) Labour time is the key factor
(b) Sales value is the key factor

Marginal Costing andProfit Planning
NOTES
Self-Instructional268 Material
Solution:
Product A Product B
Selling price (S) 100 110
Direct material 24 14Direct labour 6 9Variable overhead 8 12
Variable cost (V) 38 35
Contribution (S – V) 62 75(a) Contribution per labour hour 62 ÷ 2 hrs 75 ÷ 3 hrs
= 31 = 25(b) Contribution per rupee of sales value = 62 ÷ 100 = 75 ÷ 110
= 62 paise = 68 paise
Conclusion
(a) Product A is recommended when labour time is the key factor becausecontribution per labour hour of product A is more than that of product B.
(b) When sales value is the key factor, product B is recommended becausecontribution per rupee of sales value of product B is more than that ofproduct A.
(c) When sale quantity is the key factor, product B is more profitable becauseits contribution per unit is higher than that of product A.
13.3.5 Break-even Chart and Angle of Incidence
Break-even chart is a graphic presentation of break-even analysis. This charttakes its name from the fact that the point at which the total cost line and the salesline intersect is the break-even point. A break-even chart not only shows thebreak-even point but also shows profit and loss at various levels of activity. Thusa break-even chart portrays the following information:
(i) Break-even point—the point at which neither profit nor loss is made
(ii) The profit/loss at different levels of output
(iii) The relationship between variable cost, fixed cost and total cost
(iv) The margin of safety
(v) The angle of incidence, indicating the rate at which profit is being made
(vi) The amount of contribution at various levels of sales. (This can be shownonly on a specially designed ‘contribution break-even chart.’)
Angle of Incidence
This angle is formed by the intersection of sales line and total cost line at thebreak-even point (see Fig. 13.1). This angle shows the rate at which profits arebeing earned once the break-even point has been reached. The wider the angle,the greater is the rate of earning profits. Therefore, the aim of management will beto have as large an angle as possible.

Marginal Costing andProfit Planning
NOTES
Self-InstructionalMaterial 269
Fig. 13.1 Break-even Chart
The angle of incidence is of particular importance in boom periods whensales are expanding. Taking in conjunction with margin of safety, therefore, a largeangle of incidence with a high margin of safety indicates and extremely favourableposition.
Construction of Break-even Chart
The principal steps in the construction of a break-even chart are as follows:
1. Select a scale on X-axis: The X-axis is a horizontal base line which is drawnand spaced into equal distances to represent any one or more of the followingfactors:
(i) Volume of output (units)
(ii) Volume of output (in rupee value)
(iii) Volume of sales (units)
(iv) Volume of sales (in rupee value)
(v) Production capacity (in percentage)
2. Select scale on Y-axis: The Y-axis is a vertical line at the extreme left of thechart which is spaced into equal distances. On this Y-axis, it is usual to show costand sales in rupee value.
3. Draw the fixed cost line: This is drawn parallel to X-axis, starting from anappropriate point on Y-axis.
4. Draw the total cost lineL The variable cost is depicted in the chart by super-imposing it on the fixed cost line. Thus a total cost line is drawn starting from thepoint on the Y-axis which represents fixed cost.
5. Drawn the sales line: This line starts from the 0 point at the left (the intersectionof X-axis and Y-axis, where there is no production at a nil cost) and extends to thepoint of maximum or any other sales value.
Marginal Costing andProfit Planning
NOTES
Self-Instructional270 Material
The sales line intersects the total cost line at break-even point representing60,000 sales and output.
Effect of Change in the Profit Factors
The break-even chart can also show the effect of change in any of the followingfactors, which affect profit:
(a) Change in fixed cost (b) Change in variable cost
(c) Change in selling price (d) Change in sales volume
The profit of a business can be increased when there is (a) decrease in fixed cost,and/or (b) decrease in variable cost, and/or (c) increase in selling price, and(d) increase in sales volume. The first three, i.e., (a), (b) and (c) factors will havethe effect of lowering the break-even point and thus increasing profit.
Check Your Progress
3. List the factors whose effect on net profit is revealed by the CVP analysis.
4. Name the point after which the minimum point of production at whichtotal cost is recovered.
5. State the purpose of the limiting factor technique.
13.4 ANSWERS TO CHECK YOUR PROGRESSQUESTIONS
1. Absorption costing is also known as conventional costing or full costing.
2. In marginal costing, stocks of work-in-progress and finished goods arevalued at variable cost whereas in absorption costing stocks are valued attotal cost.
3. An understanding of CVP analysis is extremely useful to management inbudgeting and profit planning. It explains the impact of the following on thenet profit: (a) Changes in selling prices, (b) changes in volume of sales, (c)changes in variable cost and (d) changes in fixed cost.
4. The break-even point is the minimum point of production at which totalcost is recovered and after this point profit begins.
5. The purpose of the limiting factor technique is to indicate the most profitablecourse of action in all such cases where alternatives are possible.
13.5 SUMMARY
There are mainly two techniques of product costing and incomedetermination: (a) Absorption costing; (b) Marginal costing.
Marginal Costing andProfit Planning
NOTES
Self-InstructionalMaterial 271
Absorption costing is a total cost technique under which total cost (i.e.,fixed cost as well as variable cost) is charged as production cost. In otherwords, in absorption costing, all manufacturing costs are absorbed in thecost of the products produced.
Marginal cost is the additional cost of producing an additional unit of product.It is the total of all variable costs. It is composed of all direct costs andvariable overheads.
Marginal costing is defined by CIMA London as ‘The accounting system inwhich variable costs are charged to cost units and fixed costs of the periodare written off in full, against the aggregate contribution. Its special value isin decision making’.
In marginal costing, profit is calculated by a two-stage approach. First ofall, contribution is determined for each product or department. Thecontributions of various products or departments are pooled together andsuch a total of contributions from all products is called ‘Fund’. Then fromthis fund is deducted the total fixed cost to arrive at a profit or loss.
Cost-volume-profit analysis (CVP analysis) is an extension of the principlesof marginal costing. It studies the interrelationship of three basic factors ofbusiness operations:
(a) Cost of production, (b) Volume of production/sales, (c) Profit
Break-even analysis is a widely-used technique to study the CVPrelationship. It is interpreted in narrow as well as broad sense.
In its narrow sense, break-even analysis is concerned with determiningbreak-even point, i.e., that level of production and sales where there is noprofit and no loss. At this point total cost is equal to total sales revenue.
When used in broad sense, break-even analysis is used to determineprobable profit/loss at any given level of production/sales. It is also used todetermine the amount of sales to earn a desired amount of profit.
P/V ratio is one of the most important ratios to watch in business. It is anindicator of the rate at which profit is being earned. A high P/V ratio indicateshigh profitability and a low ratio indicates low profitability in the business.
Margin of safety may be defined as the difference between actual sales andsales at break-even point. In other words, it is the amount by which actualvolume of sales exceeds the break-even point.
Cost indifference point refers to that level of output where the total cost orthe profit of the two alternatives is equal. Such a level may be calculatedwhere two or more alternative methods of production or machines areconsidered and the use of one machine involves higher fixed cost and lowervariable cost per unit while the other machine involves lower fixed cost andhigher variable cost per unit.
Marginal Costing andProfit Planning
NOTES
Self-Instructional272 Material
Break-even chart is a graphic presentation of break-even analysis. Thischart takes its name from the fact that the point at which the total cost lineand the sales line intersect is the break-even point.
13.6 KEY WORDS
Profit Volume Ratio: The Profit Volume (PV) Ratio is the ratio ofContribution over Sales. It measures the Profitability of the firm and is oneof the important ratios for computing profitability.
Margin of safety: Margin of safety (safety margin) is the difference betweenthe intrinsic value of a stock and its market price.
13.7 SELF ASSESSMENT QUESTIONS ANDEXERCISES
Short Answer Questions
1. State the characteristics of marginal costing.
2. Differentiate between marginal and absorption costing.
3. What are the assumptions underlying break-even analysis?
4. Write a short note on cost indifference point.
5. Briefly explain the limiting or key factor.
6. What is the angle of incidence?
Long Answer Questions
1. Describe the concept of Profit-Volume Ratio.
2. Explain the margin of safety.
3. Describe the construction of Break-even Chart.
13.8 FURTHER READINGS
Arora, M.N. 2012. A Textbook of Cost and Management Accounting, Tenthedition. New Delhi: Vikas Publishing House.
Arora, M.N. 2010. Cost Accounting: Principles and Practice, Eleventh edition.New Delhi: Vikas Publishing House.
Shillinglow, G. 1982.Managerial Costing Accounting. Homewood: Richard D.Irwin.
Morse, W. J. 1978. Cost Accounting. Massachusetts: Addison-Wesley PublishingCo.
Lal, Jawahar. 2003. Cost Accounting. New Delhi: Tata McGraw Hill.
Decision-Making,Integrated and Non-Integrated Accounts
NOTES
Self-InstructionalMaterial 273
UNIT 14 DECISION-MAKING,INTEGRATED AND NON-INTEGRATED ACCOUNTS
Structure
14.0 Introduction14.1 Objectives14.2 Concept of Decision-Making and Steps Involved
14.2.1 Applications of Marginal Costing in Decision-Making and It’s Steps14.3 Non-Integral or Cost Ledger Accounting
14.3.1 Reconciliation of Cost and Financial Profits14.3.2 Control Accounts and Need for Control
14.4 Integral Accounting14.5 Answers to Check Your Progress Questions14.6 Summary14.7 Key Words14.8 Self Assessment Questions and Exercises14.9 Further Readings
14.0 INTRODUCTION
More than any sophisticated technology, decision-making for managers finds itsfoundational basis on relevant costs. These costs assist the managers in identifyingareas where the expenses are going as well as plan ahead for future transactions.There are varied costs which help in such decision-making; examples include futurecosts, sunk costs, common costs, committed costs, as well as non-cash expenses.Cost accounting then becomes the backbone of the decision-making process.But how does companies use this in the process. In this unit, you will learn aboutthe concepts related to cost accounting in decision-making.
The manner in which books are kept in the companies is essential for all therecording of transactions. In the double entry system of book-keeping, thecompanies have two options: integral accounts and non-integral accounts. In theformer, the financial and cost books are kept integrated while in another twoseparate books are maintained to record the transactions. In this unit, you will alsolearn about the basics of non-integral and integral accounting.
14.1 OBJECTIVES
After going through this unit, you will be able to:
Discuss the concept of decision-making
Explain the steps involved in decision-making

Decision-Making, Integratedand Non-IntegratedAccounts
NOTES
Self-Instructional274 Material
Describe the determination of sales mix and make or buy decisions
Examine the non-integral and integral systems of keeping account books
Know the meaning and purpose cost ledger and subsidiary ledgers
Explain the meaning of control accounts
14.2 CONCEPT OF DECISION-MAKING ANDSTEPS INVOLVED
Decision-making is the basic function of management. If involves selection of thebest course of action from out of several alternatives available. Tactical decision-making is “choosing among alternatives with only an immediate or limitedend in view”. (Hanson and Mowen). These decisions are short term and the goalis to ensure success in what it is set to accomplish. Thus management is continuouslyengaged in evaluating various alternative courses of action and in selecting the bestout of these. For each managerial problem, generally there are at least twoalternatives available. For example, in a company, which is manufacturing televisions,the management may have to decide whether to make the picture tube within thecompany or to buy it from an outside supplier at lower than own cost. Similarly, acompany may have to decide whether to accept or not an export order at lessthan prevailing domestic price. The decision to be taken will be affected by costand non-cost factors and the cost accountant must use all the information at hisdisposal to help management make the right decision.
Short-term and Long-term Decisions
The focus of this unit is on short-term decisions. Most managers consider a decisionas a short-term if it involves a period of one year or less. This cut off period isarbitrary but commonly used, though a better distinction is that long-term decisionsnormally require substantial capital investment with implications for several futureyears. Moreover, short-term decisions can be more easily reversed than long-term. For example, price of a product can always be changed according to marketconditions, export sales can be stopped, if necessary, and so on.
Long-term decisions involve consideration of return on capital employed,discounted cash flow, etc. Such decisions have not been discussed in this unit.
Relevant Costs and Relevant Revenues
When management makes decisions, it has to concentrate on relevant costs andrelevant revenues. Not all costs and revenues are relevant. The relevant costs andrelevant revenues are those expected future costs and expected future revenuesthat differ under different alternative courses of action being considered. Thusrelevant costs and relevant revenues should have two characteristics:
(a) The costs and revenues must relate to future; and
(b) They must differ among different courses of action.
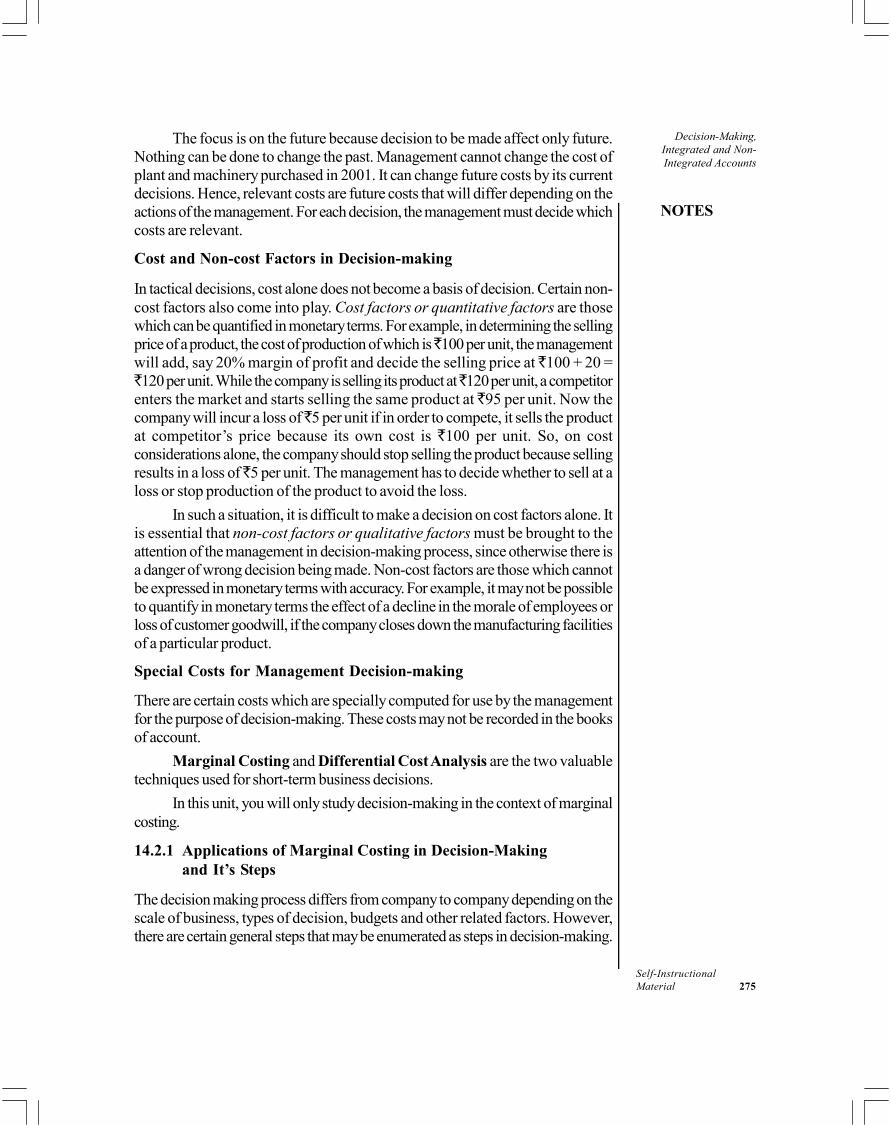
Decision-Making,Integrated and Non-Integrated Accounts
NOTES
Self-InstructionalMaterial 275
The focus is on the future because decision to be made affect only future.Nothing can be done to change the past. Management cannot change the cost ofplant and machinery purchased in 2001. It can change future costs by its currentdecisions. Hence, relevant costs are future costs that will differ depending on theactions of the management. For each decision, the management must decide whichcosts are relevant.
Cost and Non-cost Factors in Decision-making
In tactical decisions, cost alone does not become a basis of decision. Certain non-cost factors also come into play. Cost factors or quantitative factors are thosewhich can be quantified in monetary terms. For example, in determining the sellingprice of a product, the cost of production of which is 100 per unit, the managementwill add, say 20% margin of profit and decide the selling price at 100 + 20 =120 per unit. While the company is selling its product at 120 per unit, a competitor
enters the market and starts selling the same product at 95 per unit. Now thecompany will incur a loss of 5 per unit if in order to compete, it sells the productat competitor’s price because its own cost is 100 per unit. So, on costconsiderations alone, the company should stop selling the product because sellingresults in a loss of 5 per unit. The management has to decide whether to sell at aloss or stop production of the product to avoid the loss.
In such a situation, it is difficult to make a decision on cost factors alone. Itis essential that non-cost factors or qualitative factors must be brought to theattention of the management in decision-making process, since otherwise there isa danger of wrong decision being made. Non-cost factors are those which cannotbe expressed in monetary terms with accuracy. For example, it may not be possibleto quantify in monetary terms the effect of a decline in the morale of employees orloss of customer goodwill, if the company closes down the manufacturing facilitiesof a particular product.
Special Costs for Management Decision-making
There are certain costs which are specially computed for use by the managementfor the purpose of decision-making. These costs may not be recorded in the booksof account.
Marginal Costing and Differential Cost Analysis are the two valuabletechniques used for short-term business decisions.
In this unit, you will only study decision-making in the context of marginalcosting.
14.2.1 Applications of Marginal Costing in Decision-Makingand It’s Steps
The decision making process differs from company to company depending on thescale of business, types of decision, budgets and other related factors. However,there are certain general steps that may be enumerated as steps in decision-making.

Decision-Making, Integratedand Non-IntegratedAccounts
NOTES
Self-Instructional276 Material
These are: Perception of the deviation and defining the problem, Collection ofrelevant data, Diagnosis and analysis of the problem, Finding the root cause of theproblem, Identification of resources and constraints, Development of criteria forsuccessful solutions, Generation and development of alternatives, evaluatingalternatives and selecting an alternative, Implementation of the decision andMonitoring feedback. In cost accounting, the accounting costs assists the managerswith the decision making. As mentioned earlier, in accounting, marginal anddifferential cost analysis are used for decision-making.
The most useful contribution of marginal costing is the assistance that itrenders to the management in vital decision making. This is to say that marginal costingis an invaluable aid to management decision making. Specific areas where marginalcosting proves its worth in decision-making are: Selling price decisions, Make orbuy decisions, Sales mix decisions, Selection of a suitable of method productionand Plant shut down decision. In this section, you will only study the decisionmaking related to make-or-buy decisions and the determination of sales mix.
1. Make or Buy Decisions (Insourcing vs Outsourcing)
Marginal cost analysis renders useful assistance when a decision has to be takenby the management on whether a component part should be manufactured internallyor purchased from an outside firm. Insourcing is producing the goods by the firmitself whereas outsourcing is the process of purchasing the goods or servicesfrom outside suppliers. For example, a car manufacture may rely on outside vendorsto supply some component parts but may choose to manufacture other partsinternally.
This is particularly common when a component part is available in the marketat a price below firm’s own total cost. This type of decision based on total costanalysis may be misleading. Such a decision can be arrived at by comparing theoutside supplier’s price with firm’s own marginal cost. On the face of it, since theonly cost to manufacture the component is its marginal cost, then the amount bywhich marginal cost falls below supplier’s price is the saving that arises in making.Therefore, it will be profitable to buy from outside only when supplier’s price isbelow firm’s own marginal cost.
Illustration 14.1: Auto Parts Ltd has an annual production of 90,000 units for amotor component. The component cost structure is as below:
Materials 270 per unitLabour (25% fixed) 180 per unitExpenses:
Variable 90 per unitFixed 135 per unit
Total 675 per unit
(a) The purchase manager has an offer from a supplier who is willing to supplythe component at 540. Should the component be purchased and productionstopped?
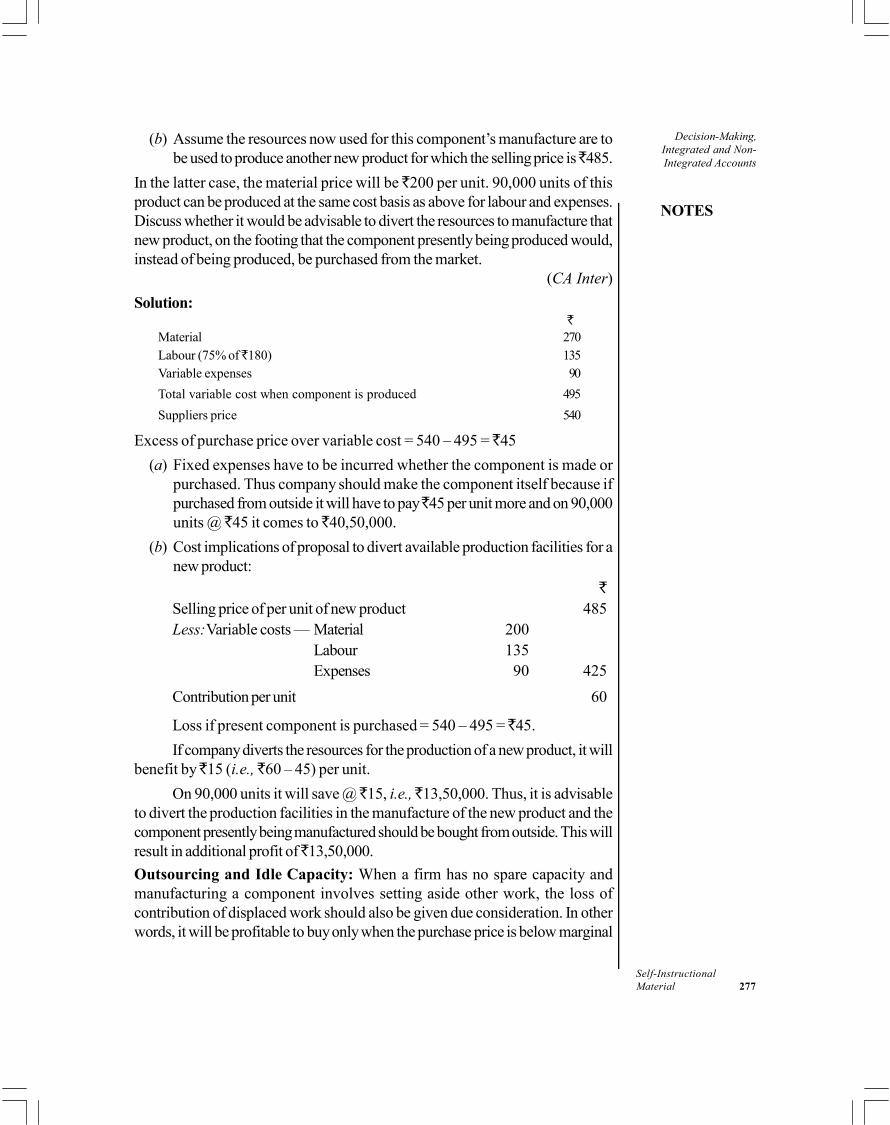
Decision-Making,Integrated and Non-Integrated Accounts
NOTES
Self-InstructionalMaterial 277
(b) Assume the resources now used for this component’s manufacture are tobe used to produce another new product for which the selling price is 485.
In the latter case, the material price will be 200 per unit. 90,000 units of thisproduct can be produced at the same cost basis as above for labour and expenses.Discuss whether it would be advisable to divert the resources to manufacture thatnew product, on the footing that the component presently being produced would,instead of being produced, be purchased from the market.
(CA Inter)
Solution:
Material 270Labour (75% of 180) 135Variable expenses 90
Total variable cost when component is produced 495
Suppliers price 540
Excess of purchase price over variable cost = 540 – 495 = 45
(a) Fixed expenses have to be incurred whether the component is made orpurchased. Thus company should make the component itself because ifpurchased from outside it will have to pay 45 per unit more and on 90,000units @ 45 it comes to 40,50,000.
(b) Cost implications of proposal to divert available production facilities for anew product:
Selling price of per unit of new product 485Less:Variable costs — Material 200
Labour 135Expenses 90 425
Contribution per unit 60
Loss if present component is purchased = 540 – 495 = 45.
If company diverts the resources for the production of a new product, it willbenefit by 15 (i.e., 60 – 45) per unit.
On 90,000 units it will save @ 15, i.e., 13,50,000. Thus, it is advisableto divert the production facilities in the manufacture of the new product and thecomponent presently being manufactured should be bought from outside. This willresult in additional profit of 13,50,000.
Outsourcing and Idle Capacity: When a firm has no spare capacity andmanufacturing a component involves setting aside other work, the loss ofcontribution of displaced work should also be given due consideration. In otherwords, it will be profitable to buy only when the purchase price is below marginal

Decision-Making, Integratedand Non-IntegratedAccounts
NOTES
Self-Instructional278 Material
cost plus loss of contribution of displaced work. The loss of contribution is usuallybest found by the use of contribution per unit of key factor.
Non-cost or Qualitative Factors: While making a decision on make or buy acomponent, the following non-cost factors should also be considered.
(a) Assurance of continued supply, if bought from outside
(b) Assurance of quality of the product by the supplier
(c) Assurance of no price increase during the period of agreement
2. Sales Mix Decisions
Sales mix or product mix denotes the proportion in which various products aresold or produced. The problem of selecting a profitable mix of sales thus, arisesonly when a business enterprise has a variety of product lines and each making acontribution of its own. Any change in sales mix also results in the change in profitposition. The technique of marginal costing helps the management in determiningthe most profitable sale mix.
The discussion on selection of the most profitable product mix may bediscussed in two parts:
(a) When there is no key factor; and (b) When there is a key factor.
(a) When key (or limiting) factor is not given
The concept of key factor was explained in the chapter on Cost-volume-profitAnalysis. When there is no key factor, the product mix that provides the highestamount of contribution is considered as the most profitable sales mix. This holdsgood when fixed cost does not change due to changes in sales mix.
However, when changes in sales mix are associated with changes in fixedcost, then that sales mix which provides the highest profit is considered as themost profitable sales mix. In other words, relative profitability of mixes will beevaluated on the basis of their profit and not on the basis of their contribution whena change in product mix is associated with change in fixed cost.
Illustration 14.2: Allied Manufacturing Company given you the followinginformation.
Product A Product B
Fixed overheads – 10,000 p.a.Direct materials per unit 20 25Direct labour per unit 10 15Variable overheads (100% of direct labour)Selling price per unit 60 100
You are required to present a statement showing the marginal cost of eachproduct and recommend which of the following sales mixes should be adopted:
(a) 900 units of A and 600 units of B
(b) 1,800 units of A only
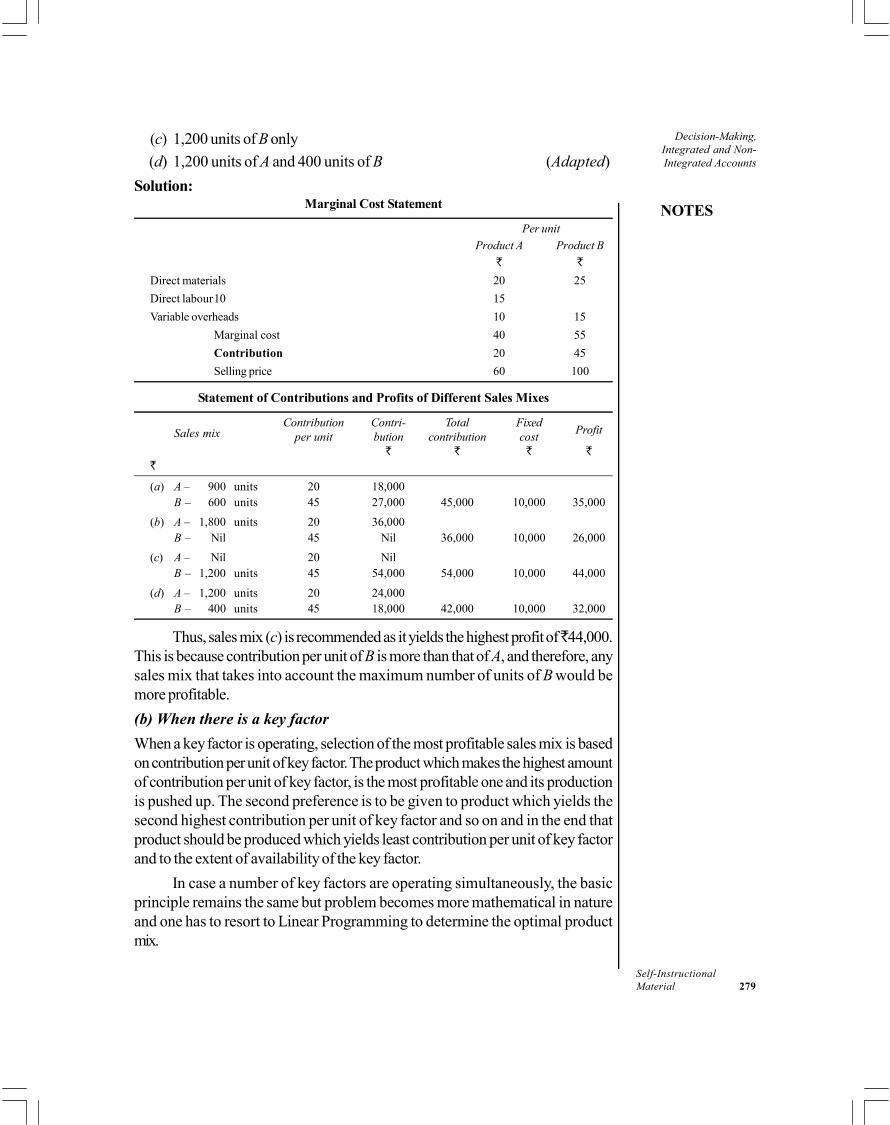
Decision-Making,Integrated and Non-Integrated Accounts
NOTES
Self-InstructionalMaterial 279
(c) 1,200 units of B only
(d) 1,200 units of A and 400 units of B (Adapted)
Solution:Marginal Cost Statement
Per unit
Product A Product B
Direct materials 20 25
Direct labour10 15
Variable overheads 10 15
Marginal cost 40 55
Contribution 20 45
Selling price 60 100
Statement of Contributions and Profits of Different Sales Mixes
Sales mixContribution Contri- Total Fixed
Profitper unit bution contribution cost
(a) A – 900 units 20 18,000B – 600 units 45 27,000 45,000 10,000 35,000
(b) A – 1,800 units 20 36,000B – Nil 45 Nil 36,000 10,000 26,000
(c) A – Nil 20 NilB – 1,200 units 45 54,000 54,000 10,000 44,000
(d) A – 1,200 units 20 24,000B – 400 units 45 18,000 42,000 10,000 32,000
Thus, sales mix (c) is recommended as it yields the highest profit of 44,000.This is because contribution per unit of B is more than that of A, and therefore, anysales mix that takes into account the maximum number of units of B would bemore profitable.
(b) When there is a key factor
When a key factor is operating, selection of the most profitable sales mix is basedon contribution per unit of key factor. The product which makes the highest amountof contribution per unit of key factor, is the most profitable one and its productionis pushed up. The second preference is to be given to product which yields thesecond highest contribution per unit of key factor and so on and in the end thatproduct should be produced which yields least contribution per unit of key factorand to the extent of availability of the key factor.
In case a number of key factors are operating simultaneously, the basicprinciple remains the same but problem becomes more mathematical in natureand one has to resort to Linear Programming to determine the optimal productmix.

Decision-Making, Integratedand Non-IntegratedAccounts
NOTES
Self-Instructional280 Material
Illustration 14.3: A company manufactures three products. The budgeted quantity,selling prices and unit costs are as under:
A B C
Raw materials (@ 20 per kg) 80 40 20
Direct wages (@ 5 per hour) 5 15 10
Variable overheads 10 30 20
Fixed overheads 9 22 18
Budgeted production (in units) 6,400 3,200 2,400
Selling price per unit (in ) 140 120 90
Required:
(i) Present a statement of budgeted profit.
(ii) Set optimal product mix and determine the profit, if the supply of rawmaterials is restricted to 18,400 kgs.
Solution:(i) Statement of Budgeted Profit
A B C Total
Budgeted production (units) 6,400 3,200 2,400Selling price 140 120 90Sales (S) 8,96,000 3,84,000 2,16,000 14,96,000Raw materials 5,12,000 1,28,000 48,000Direct wages 32,000 48,000 24,000Variable overheads 64,000 96,000 48,000Total variable cost (V) 6,08,000 2,72,000 1,20,000 10,00,000Contribution (S – V) 2,88,000 1,12,000 96,000 4,96,000Less: fixed cost* 1,71,200Profit 3,24,800
*Calculation of Fixed CostA = 6,400 unit × 9 57,600B = 3,200 units × 22 70,400C = 2,400 units × 18 43,200
Total fixed cost = 1,71,200
(ii) When raw material is the key factor
A B CRaw material per unit of output 4 kgs 2 kgs 1 kgsTotal raw material consumed (kg) 6400 × 4 3200 × 2 2400 × 1
= 25,600 = 6,400 = 2,400
*Contribution per kg of raw material = = =
= 11.25 = 17.50 = 40Ranks III II I
* Contribution per kg of raw material is calculated as:Total contribution ÷ Total raw materials consumed
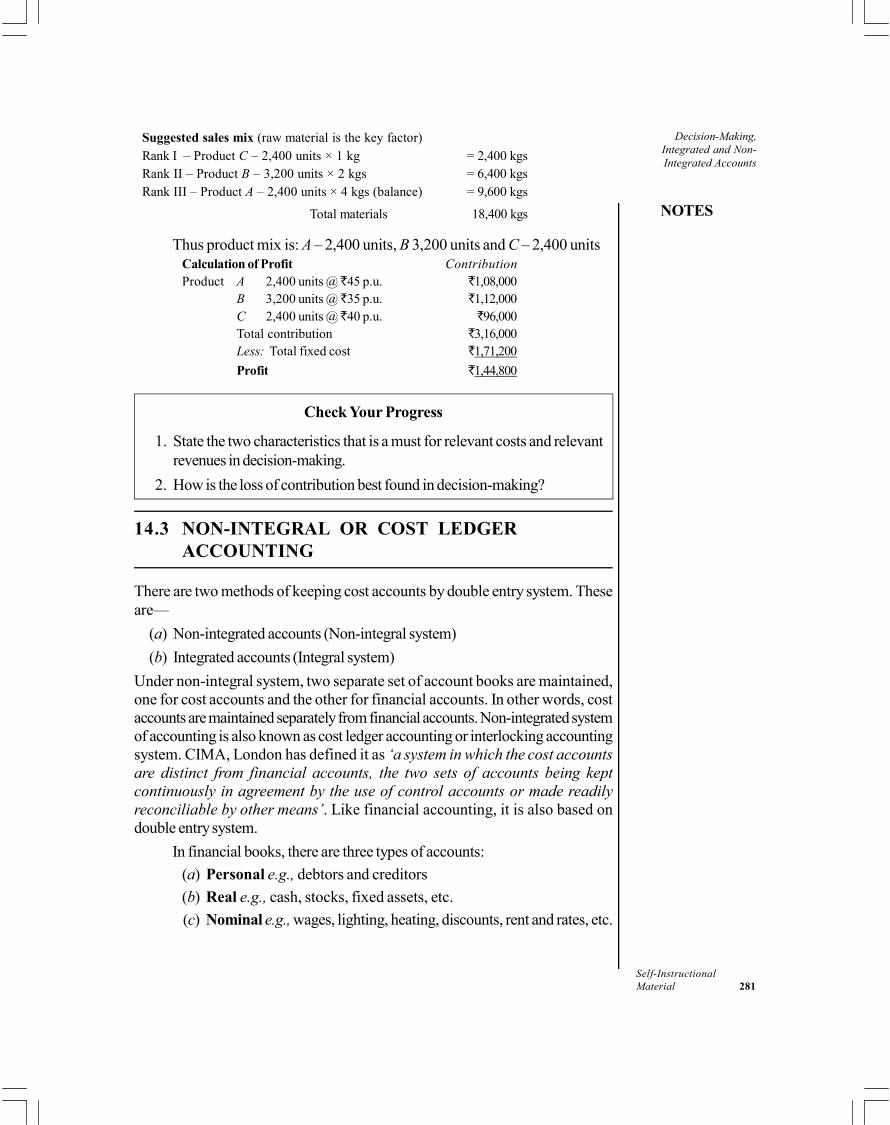
Decision-Making,Integrated and Non-Integrated Accounts
NOTES
Self-InstructionalMaterial 281
Suggested sales mix (raw material is the key factor)Rank I – Product C – 2,400 units × 1 kg = 2,400 kgsRank II – Product B – 3,200 units × 2 kgs = 6,400 kgsRank III – Product A – 2,400 units × 4 kgs (balance) = 9,600 kgs
Total materials 18,400 kgs
Thus product mix is: A – 2,400 units, B 3,200 units and C – 2,400 unitsCalculation of Profit ContributionProduct A 2,400 units @ 45 p.u. 1,08,000
B 3,200 units @ 35 p.u. 1,12,000C 2,400 units @ 40 p.u. 96,000Total contribution 3,16,000Less: Total fixed cost 1,71,200
Profit 1,44,800
Check Your Progress
1. State the two characteristics that is a must for relevant costs and relevantrevenues in decision-making.
2. How is the loss of contribution best found in decision-making?
14.3 NON-INTEGRAL OR COST LEDGERACCOUNTING
There are two methods of keeping cost accounts by double entry system. Theseare—
(a) Non-integrated accounts (Non-integral system)
(b) Integrated accounts (Integral system)
Under non-integral system, two separate set of account books are maintained,one for cost accounts and the other for financial accounts. In other words, costaccounts are maintained separately from financial accounts. Non-integrated systemof accounting is also known as cost ledger accounting or interlocking accountingsystem. CIMA, London has defined it as ‘a system in which the cost accountsare distinct from financial accounts, the two sets of accounts being keptcontinuously in agreement by the use of control accounts or made readilyreconciliable by other means’. Like financial accounting, it is also based ondouble entry system.
In financial books, there are three types of accounts:
(a) Personal e.g., debtors and creditors
(b) Real e.g., cash, stocks, fixed assets, etc.
(c) Nominal e.g., wages, lighting, heating, discounts, rent and rates, etc.

Decision-Making, Integratedand Non-IntegratedAccounts
NOTES
Self-Instructional282 Material
In cost accounts, there are no personal accounts because cost accounts donot show relationship with outsiders. In real accounts, only stocks are shown incost accounts. The main emphasis is on nominal accounts where costs are analysedin detail. Thus cost accounting department is concerned mainly with theascertainment of income and expenditure of the business. It is particularly interestedin nominal accounts, to some extent in real accounts but in no way in personalaccounts. In other words cost accounts, are concerned with impersonal accounts,i.e., real and nominal accounts.
Ledgers to be Maintained
The following four important ledgers are maintained by the costing departmentunder non-integrated system.
1. Cost ledger: This is the principal ledger in cost books which controls allother ledgers in the costing department. It contains all impersonal accountsand is similar to general ledger of financial accounts. It contains, inter alia,a number of control accounts like stores ledger control accounts, wagescontrol account, factory overheads control account, etc. and also a costledger control account to make the cost ledger self-balancing.
2. Stores ledger: This ledger maintains a separate account for each item ofstore (raw material, components, consumable stores, etc.). It is used forrecording receipts, issues and balances of stores, both in quantity and amount.A reference to stores ledger was also made in the chapter on pricing thematerials issues.
3. Work-in-progress ledger or job ledger: It contains a separate accountfor each job in progress. Each such account is debited with the materialcosts, wages and overheads chargeable to the jobs and credited with thecost of work completed. The balance in this account represents the cost ofunfinished work.
4. Finished goods ledger: It contains an account for each item of finishedproduct.
As stated above, the cost ledger is the principal ledger. Other ledgers, i.e.,stores ledger, work-in-progress ledger and finished goods ledger are referred toas subsidiary ledgers of the cost accounting department. The cost ledger is madeself-balancing by opening a control account for each of these subsidiary ledgers.
14.3.1 Reconciliation of Cost and Financial Profits
We have already studied this topic under Unit 6 of this book. Let’s recapitulate theconcept here briefly. Reconciliation of cost and financial profits might arise due toitems being shown only in financial books, or shown only in cost accounts; there isover and under absorption of overheads; different bases of stock valuation isused; or different depreciation charges are applied. For reconciliation, one needsto make all the additions and deductions in costing profit, the resulting figure shallbe the profit as per financial books.
Decision-Making,Integrated and Non-Integrated Accounts
NOTES
Self-InstructionalMaterial 283
14.3.2 Control Accounts and Need for Control
Control accounts are the total accounts in the cost ledger. In these accounts,entries are made once in each accounting period on the basis of the periodicaltotals of transactions in related subsidiary ledgers and books. For example, storesledger control account represents stores ledger in a summary form. Purchases ofindividual items of stores shown in individual accounts in the stores ledger aretotalled and shown in stores ledger control account as total purchases. Similarly,other individual debits and credits in individual accounts in stores ledger areabstracted, totalled and taken to stores ledger control account. Thus the openingbalance of this control account should always equal the total of opening balanceson each individual account in the stores ledger. In this way, a control account isalso kept for each of the other subsidiary ledger, i.e., job ledger and finishedgoods ledger. In addition, a control account is opened for cost ledger with themain object of completing the double entry and making the cost ledger self-balancing.
Need for Control
This can be understood through analysing the advantages of control account.
Advantages: The main advantages of control accounts are:
1. Control accounts present the management with a summary of detailedinformation contained in various subsidiary ledgers.
2. It makes possible the division of accounting work among ledger keepers,thereby resulting in specialization in work.
3. It permits prompt preparation of profit and loss account and balance sheet,at the end of each period, by providing stock figures without delay.
4. It provides internal check leading to greater accuracy of records.
5. It provides a basis for reconciliation of cost and financial accounts.
Principal Accounts to be Maintained
The principal accounts in the cost ledger and their functions are summarized below:
1. Stores Ledger Control Account: This account deals with material transactions.It is a summary of the value of stores received, issued and balance in store. Receiptsare posted from goods received notes or invoices to the debit side of this account.Similarly, issues of materials are posted from material requisitions or materialsissues analysis sheet to the credit side of this account. The balance of this accountrepresents the total balance of stock which should agree with the aggregate of thebalances of individual accounts in the Stores Ledger.
2. Wages Control Account: This account records wage transactions in aggregate.Postings are made from wages analysis sheet. This account is debited with grosswages (paid and accrued) and is closed by transfer of direct wages to work-in-

Decision-Making, Integratedand Non-IntegratedAccounts
NOTES
Self-Instructional284 Material
progress and indirect wages to factory, admi-nistration and selling and distri-butionoverheads control accounts.
3. Factory Overheads Control Account: This account deals with factoryoverheads in aggregate. It is debited with indirect material cost, indirect wagesand indirect expenses and is credited with overheads absorbed, which aretransferred to work-in-progress. The balance in this account represents under orover-absorbed overheads and is transferred to Overheads Adjustment Accountor Costing Profit and Loss Account.
4. Work-in-progress Ledger Control Account: This account starts with openingbalance of work-in-progress and is debited with materials, labour and factoryoverheads charged. It is credited with cost of finished goods. Closing balanceshows the value of unfinished jobs.
5. Finished Goods Ledger Control Account: This account starts with openingbalance of finished stock. It is debited with cost of finished goods transferred fromwork-in-progress control account and the amount of administration overheadsabsorbed. This account is credited with cost of sales by transferring to cost ofsales account. The closing balance of this account represents the cost of goodsremaining unsold at the end of the period.
6. Administration Overheads Account: This account is debited withadministration overhead cost incurred and is credited with overheads absorbedby finished goods. The balance in this account represents under or over-absorbedoverheads which is transferred to Overheads Adjustment Account or to CostingProfit and Loss Account.
However, when administration overheads are excluded from costs, the entireamount is straight away transferred to costing profit and loss account, and whenadministration overheads are apportioned to production and selling and distributionoverheads, the amounts are transferred to the respective accounts.
7. Cost of Sales Account: This account is debited with the cost of goods sold bytransfer from finished goods ledger control account and also selling and distributionoverheads absorbed. It is closed by transfer to Costing Profit and Loss account.
8. Selling and Distribution Overheads Account: This account is debited withselling and distribution overheads incurred and is credited with overheads absorbedby cost of sales. It is closed by transferring the balance to costing Profit and LossAccount or Overheads Adjustment Account for under or over-absorbed overhead.
9. Overheads Adjustment Account: This account is debited with under-absorbedoverheads for factory, administration and selling and distribution overheads and iscredited with over-absorbed overheads. The balance in this account representsthe net amount of over or under-absorption which is transferred to Costing Profitand Loss Account.
Decision-Making,Integrated and Non-Integrated Accounts
NOTES
Self-InstructionalMaterial 285
Sometimes, this account is not maintained and the amount of under or over-absorbed overheads of each category is directly transferred to Costing Profit andLoss Account.
10. Costing Profit and Loss Account: This account is debited with the cost ofsales, abnormal losses and under-absorbed overheads. It is credited with salevalue of goods sold, abnormal gains and over-absorbed overheads. The balancein this account represents costing profit or loss which is transferred to cost ledgercontrol account. It is shown below:
11. Cost Ledger Control Account: This account is also known as General LedgerAdjustment Account or Financial Ledger Control Account. The purpose of thisaccount is to complete the double entry and make the cost ledger self-balancing.As no personal accounts are kept in the cost books, in order to complete thedouble entry, all accounts relating to financial accounts but not required for costaccounting are debited or credited to the cost ledger control account. For example,wages paid amount to 250 and as no cash or bank account is maintained in thecost ledger, then in order to complete the double entry, the following entry will bemade, so as to credit cost ledger control account in place of cash or bank.
Wages Account ......... Dr. 250
To Cost Ledger Control Account 250
Cost ledger control account is sometimes disrespectfully referred to as‘dustbin account’ because it is for disposing of the odds and ends of double entrywhich do not find any other place.
Thus, the cost ledger control account is equivalent to debtors, creditors andcash or bank accounts in the financial ledger. Sales are debited to this account andnet profit or loss is also transferred to this account. All transfer entries of internalnature which affect only cost accounts and have no implications in financial accountsdo not appear in cost ledger control account. For example, transfer from storesledger to work-in-progress, from work-in-progress to finished goods, etc., arenot shown in cost ledger control account. The balance of cost ledger controlaccount represents the total of all balances of impersonal accounts.
14.4 INTEGRAL ACCOUNTING
Integrated or Integral accounting is a system in which cost and financial accountsare kept in the same set of books. In such a system, transactions of both cost andfinancial accounts are recorded in one combined set of books based on doubleentry system. This system eliminates the need for separate sets of account booksfor costing and financial accounting purposes. Accounts are designed in such away that full information required for costing as well as financial accounting purposesis obtained from one set of books.

Decision-Making, Integratedand Non-IntegratedAccounts
NOTES
Self-Instructional286 Material
Advantages
Integrated system of accounting offers the following advantages:
1. Economical system: Integral system is quite economical as it eliminates theduplication of recording the transactions in two separate sets of books.This results in saving of clerical costs.
2. No need for reconciliation: As only one set of accounts is maintained,there will be only one profit or loss figure and as such there will be no needfor reconciliation between costing and financial profit or loss.
3. Centralization of accounting work: Centralization of accounting functionin one department helps in achieving greater control and saves administrationcosts.
4. Information available without delay: There is no delay in the availabilityof cost information because cost accounts are directly written-up from thebooks of original entry.
5. Pooling of knowledge: The knowledge of cost and financial accountingmay be combined together to achieve better results.
6. Better coordination: The system helps in achieving better coordination inthe activities of cost accounting and financial accounting staff.
7. Suitable in mechanized accounting: Integral system is quite suitable inmechanized accounting and other data processing techniques.
8. Wide outlook: The system tends to broaden the outlook of the accountingstaff who are in a better position to appreciate one set of account booksrevealing so much.
Disadvantages
Integrated system suffers from the following drawbacks:
1. Unsuitable for large concerns: Integrated system is not very suitable forvery large concerns which require detailed cost and financial information ona continuous basis.
2. Complicated system: A system which is expected to provide costing aswell as financial information is quite cumbersome and complicated andrequires the services of expert accountants.
3. Need for reconciliation: Unless there is full integration of cost and financialaccounts, there may be a need for reconciliation between the two.
Distinctive Features
Integral accounting has the following distinctive features:
1. In integral accounting, there is no need to open a Cost Ledger ControlAccount as it is possible to complete double entry without this account.
Decision-Making,Integrated and Non-Integrated Accounts
NOTES
Self-InstructionalMaterial 287
2. Subsidiary ledgers, i.e., stores ledger, work-in-progress ledger and finishedgoods ledger are maintained as is done in non-integrated accounting. Inaddition, a sales ledger (containing personal accounts of all customers) anda purchase ledger (containing personal accounts of all suppliers) are alsomaintained. Overheads ledger is maintained to contain separate accountsfor factory, administration and selling and distribution overheads.
3. For each subsidiary ledger, a control account is opened in the general ledger.Main control accounts are as follows:
(i) Stores ledger control account
(ii) Work-in-progress ledger control account
(iii) Finished goods ledger control account
(iv) Wages control account
(v) Factory overheads control account
(vi) Administrative overheads control account
(vii) Selling and distribution overheads control account
(viii) Sales ledger control account
(ix) Purchase ledger control account
4. Balance in various overheads control accounts represents over or underabsorption which is transferred to Profit and Loss Account.
5. Balance in Profit and Loss Accounts represents profit or loss which istransferred to Profit and Loss Appropriation Account.
6. Degree of integration must be determined in advance. Many firms integratethe cost and financial accounts completely while other firms integrate thetwo only upto a stage of prime cost or factory cost.
7. A suitable coding system is generally developed to serve the purposes ofboth cost accounts as well as financial accounts.
Check Your Progress
3. Mention some of the other names for non-integrated system of accounting.
4. Why is the control account opened for cost ledger?
14.4 ANSWERS TO CHECK YOUR PROGRESSQUESTIONS
1. The relevant costs and relevant revenues should have two characteristics:
The costs and revenues should relate to future; and
They must differ among different courses of action.
Decision-Making, Integratedand Non-IntegratedAccounts
NOTES
Self-Instructional288 Material
2. The loss of contribution is usually best found by the use of contribution perunit of key factor.
3. Some of the other names for non-integrated system of accounting are: costledger accounting or interlocking accounting system.
4. The control account is opened for cost ledger with the main object ofcompleting the double entry and making the cost ledger self-balancing.
14.5 SUMMARY
One of the major objectives of management accounting to help managementin decision making, i.e., in selecting the best course of action from two ormore available alternatives. For this the management has to evaluate variousalternative courses of action.
In making decisions, management should consider all relevant costs, i.e.,the future costs which differ among alternative courses of action. Thosecosts which were incurred in the past and also which do not change betweenalternatives are irrelevant costs.
Specific areas where marginal (variable) costing proves its worth in short-term decisions include selling price decisions, make or buy decisions, salesmix decisions, selection of a suitable of method production, etc.
Variable cost analysis also helps in make or buy decisions. In such decisions,outside supplier’s price should be compared with firm’s own variable cost.It is profitable to buy from outside if supplier’s price is below firm’s ownvariable cost of manufacture. But before arriving at a final decision, themanagement should also consider certain non-cost factors, such as assuranceof continued supply, quality of the product, etc.
In sales or product mix decisions, a mix that provides the highest amount ofcontribution is considered as the most profitable mix. When a key factor isoperating, selection of the most profitable sales mix is based on contributionper unit of key factor. The product which makes the highest amount ofcontribution per unit of key factor, is the most profitable one.
Cost accounting books may be maintained either independent of financialaccounting books or these two set of books may be merged into one set ofbooks.
When these books are merged or integrated, the system is known asintegrated accounts or integral system.
But when cost and financial books are kept separately, it is called non-integrated accounts or non-integral system.
Under non-integral system, the two separate set of account books aremaintained, one for cost accounts and the other for financial accounts. Non-

Decision-Making,Integrated and Non-Integrated Accounts
NOTES
Self-InstructionalMaterial 289
integrated system of accounting is also known as cost ledger accounting orinterlocking accounting system. Under this system, cost ledger is the principalledger and other ledgers, i.e., stores ledger, work-in-progress ledger andfinished goods ledger are referred to as subsidiary ledgers.
Control accounts are the total accounts which are opened in the cost ledgerwith the main object of completing the double entry and making the costledger self-balancing.
14.6 KEY WORDS
Decision making: It is the basic function of management which involvesselection of best course of action from out of several alternatives available
Cost factors: These refer to the quantitative factors which can be quantifiedin monetary terms
Non-cost factors: These refer to the qualitative factors which cannot beexpressed in monetary terms with accuracy
Sales mix: It denotes the proportion in which various products are sold orproduced
Control accounts: These refer to the total accounts in the cost ledger
14.7 SELF ASSESSMENT QUESTIONS ANDEXERCISES
Short Answer Questions
1. What are the relevant costs and relevant revenues in decision making?
2. Write a short note on cost and non-cost factors in decision making.
3. What are the ledgers to be maintained in costing department under non-integrated system?
4. Enlist the advantages of control accounts.
Long Answer Questions
1. Explain the make or buy decisions in management decision making.
2. Describe the sales mix decisions in decision making.
3. Discuss the principle accounts to be made in control accounts.
4. Examine the advantages, disadvantages and distinctive features of integralaccounting.

Decision-Making, Integratedand Non-IntegratedAccounts
NOTES
Self-Instructional290 Material
14.8 FURTHER READINGS
Arora, M.N. 2012. A Textbook of Cost and Management Accounting, Tenthedition. New Delhi: Vikas Publishing House.
Arora, M.N. 2010. Cost Accounting: Principles and Practice, Eleventh edition.New Delhi: Vikas Publishing House.
Shillinglow, G. 1982.Managerial Costing Accounting. Homewood: Richard D.Irwin.
Morse, W. J. 1978. Cost Accounting. Massachusetts: Addison-Wesley PublishingCo.
Lal, Jawahar. 2003. Cost Accounting. New Delhi: Tata McGraw Hill.