advanced physcial chemistry - alagappa university
TRANSCRIPT
DIRECTORATE OF DISTANCE EDUCATION
M.Sc.,(Chemistry) IV-SEMESTER
34444
ADVANCED PHYSCIAL CHEMISTRY PRATICHAL
Copy Right Reserved For Private use only
ALAGAPPA UNIVERSITY [Accredited with ’A+’ Grade by NAAC (CGPA:3.64) in the Third Cycle
and Graded as Category–I University by MHRD-UGC]
(A State University Established by the Government of Tamilnadu)
KARAIKUDI – 630 003

1
“The Copyright shall be vested with Alagappa University”
All rights reserved. No part of this publication which is material protected by this copyright notice may be reproduced or transmitted or utilized or stored in any form or by any means now known or hereinafter invented, electronic, digital or mechanical, including photocopying, scanning, recording or by any information storage or retrieval system, without prior written permission from the Alagappa University, Karaikudi, Tamil Nadu .
Author Dr. T. Stalin Assistant Professor Alagappa University Karaikudi -3
2
PHYSICAL CHEMISTRY PRACTICAL
Block-1: Partition coefficient Unit 1: Partition Co-efficient - 1 Determination of Partition Co-efficient of iodine in water/CCl4
Unit 2: Partition Co-efficient - 2 Determination of Equilibrium constant of KI Unit 3: Partition Co-efficient - 3 Determination of Unknown KI
Block-2: Conductometric titration Unit 4: Conductometric titration of Acid vs Base Cconductometric titration of (i) strong acid vs strong base, (ii) weak acid vs strong base (iii) mixture of acids vs strong base Unit 5: Conductometric titration of Mixed halides Conductometric titrations of mixed halides Unit 6: Conductometric titration of solubility prod uct Solubility product by conductivity measurement Unit 7: Determine the strength of the given salt by conductometric titration Determine the strength of the given salt solution by conductometric titration
Block-3: Potentiometric titration Unit 8: Potentiometric titration of Acid vs Base Potentiometric titration of strong acid vs strong base and weak acid vs strong base Unit 9: Determine the strength of the given salt by Potentiometric titration Determine the strength of the given salt solution by potentiometric titration (FAS vs K2Cr2O7 and FAS vs KMnO4) Unit 10: Potentiometric titration of simple halides and Mixed halides potentiometric titration of simple halide and mixture of halides 44
Block-4: Chemical Kinetics and Spectrophotometric method
3
Unit 11: First order and second order kinetics of hydrolysis of ester Acid catalyzed hydrolysis of an ester, base catalyzed hydrolysis of an ester by titration method Unit 12: Kinetics of hydrolysis of ester by conductivity method Base catalyzed hydrolysis of an ester by conductivity method Unit 13: Determination of metal by colorimeter Determine the amount of manganese present in the given steel sample. Unit 14: Determination of Iron by spectrophotometer method Determine the amount of iron present in the given water sample by spectrophotometeric method. Unit 15: Determination of Copper by spectrophotometer method Determine the amount of copper present in the given sample by spectrophotometeric method.
REFERENCE BOOKS
1. Findlay’s Practical Physical Chemistry, Revised and edited by ‘B.P.Levitt, 9th edn., Longman, London, 1985. 2. Advanced Experimental Chemistry, J.N.Gurtu and R. Kapoor, Vol.I, S.Chand & Co. Ltd., New Delhi (1980).
Course Materials Prepared by Dr.T.Stalin Ph.D Department of Industrial Chemistry, School of Chemistry, Alagappa University, Karaikudi – 630 003.

4
Partition coefficient
Introduction
The system which consists of two or more phases is known as heterogeneous system. The effect of pressure, temperature and concentration on the heterogeneous system in
where, F is the number of degree of freedom, C is the number of components in the system and P is the number of phases present.
The degree of freedom is defined as the minimum number of variable factors, such as temperature, pressure and concentration, which must be specified so that the remaining variables are automatically fixed and the system in equilibrium is completely defined. The number of component in a system at equilibrium is the smallesmeans of which the composition of every phase can be expressed in the form of a chemical equation.
Principle
To a system of two liquid layers made up of two immiscible or partially miscible components, if distributes itself between the two layers in a definite proportion. Such systems follow the ‘Nernst distribution law’ according to which the ratio of the concentrations (c) of the solute distributing is a constant (i.e) Cand the other, water. The ratio is writtenCorg/Caq =K, the constant K is called the distribution coefficient or the partition coefficient. This is a direct consequence of thermodynamic requirements for equilibrium. If the solute undergoes any chemical change any one of the phases ,the above law applicable to the concentration of particular species present in both the laters and not to the total concentration of the substance.
5
BLOCK-I
PARTITION COEFFICIENT
The system which consists of two or more phases is known as heterogeneous system. The effect of pressure, temperature and concentration on the heterogeneous system in equilibrium is given by the phase rule,
F = C – P + 2 where, F is the number of degree of freedom, C is the number of components in the system and P is the number of phases present.
The degree of freedom is defined as the minimum number of variable factors, such as temperature, pressure and concentration, which must be specified so that the remaining variables are automatically fixed and the system in equilibrium is completely defined. The number of component in a system at equilibrium is the smallest number of independent chemical constituents by means of which the composition of every phase can be expressed in the form of
To a system of two liquid layers made up of two immiscible or partially miscible components, if a third substance soluble in both the layer is added it distributes itself between the two layers in a definite proportion. Such systems follow the ‘Nernst distribution law’ according to which the ratio of the concentrations (c) of the solute distributing itself between two solvents A and B is a constant (i.e) CA/CB =constant. Ususally, one of the liquids being organic and the other, water. The ratio is written as
=K, the constant K is called the distribution coefficient or the partition
t. This is a direct consequence of the thermodynamic requirements for equilibrium. If the solute undergoes any chemical change in any one of the phases ,the above law is applicable to the concentration of any
species present in both the laters and not to the total concentration of
The system which consists of two or more phases is known as heterogeneous system. The effect of pressure, temperature and concentration on
equilibrium is given by the phase rule,
where, F is the number of degree of freedom, C is the number of components in
The degree of freedom is defined as the minimum number of variable factors, such as temperature, pressure and concentration, which must be specified so that the remaining variables are automatically fixed and the system in equilibrium is completely defined. The number of component in a system at
t number of independent chemical constituents by means of which the composition of every phase can be expressed in the form of
To a system of two liquid layers made up of two immiscible or partially a third substance soluble in both the layer is added it
distributes itself between the two layers in a definite proportion. Such systems follow the ‘Nernst distribution law’ according to which the ratio of the
itself between two solvents A and B =constant. Ususally, one of the liquids being organic
species present in both the laters and not to the total concentration of
6
Theory When a system of two immiscible solvents in contact with each other, a
small quantity of solute which is soluble in both the solvents is added, the solute distribute itself between the two solvents in a definite proportion depending upon its solubility. At equilibrium, the ratio of the concentration (i.e. activities) of the solute in two liquids is constant at a particular temperature. This constant is called as distribution co-efficient or partition co-efficient. If C1 and C2 are the concentrations of the solute in solvent 1 and 2 at equilibrium, then C1 = K C2
(Constant)
The above law is called as Distribution law.
The law can also be represented as, a1 = Constant a2
where, a1 and a2 are the activities of solute in two solvents. The law is strictly obeyed only when there is no association or
dissociation of the solute in any of the two solvents. If both the solvents are saturated with the solute, then the terms, C1 and C2 may be replaced by respective solubilities, S1 and S2,
S1 = K S 2
Applications 1.Measure of the lipophilic character of the drug. 2.Solubility study. 3.Drug absorption in vivo can be predicted.
7
UNIT-I
PARTITION CO-EFFICIENT-I
PARTITION CO-EFFICIENT OF IODINE IN WATER/ CCl 4
Aim (i) To determine the partition coefficient for the distribution of iodine in carbon
tetrachloride and water. (ii) To find out the equilibrium constant of the reaction
KI + I2 ↔KI 3
(iii) To find out the strength of unknown KI using equilibrium constant.
Principle According to Nernst distribution law, when a solute is added to a system
of two immiscible solvents, the solute will get distributed between two layers of the solvent in a constant ratio at constant temperature provided there is no dissociation or association of the solute. The ratio is known as partition coefficient. This principle is used in finding out the equilibrium constant and the strength of the given KI.
Procedure Standardisation of sodium thiosulphate
0.1N K2Cr2O7 is prepared by weighing 0.49g of K2Cr2O7 crystals and dissolved in 100ml of distilled water and made upto the mark. 20 ml of this solution is pipetted out in to a clean conical flask. 10ml of dilute sulphuric acid and 10ml of 10% KI are added to the conical flask and titrated against thio (0.1 N) taken in the burette using starch as the indicator. Starch is added only when the solution becomes pale yellow in colour. The endpoint is the appearance of green colour. 0.01 N thio is prepared by quantitative dilution and standardized using the above procedure.
Preparation of reaction mixture bottles
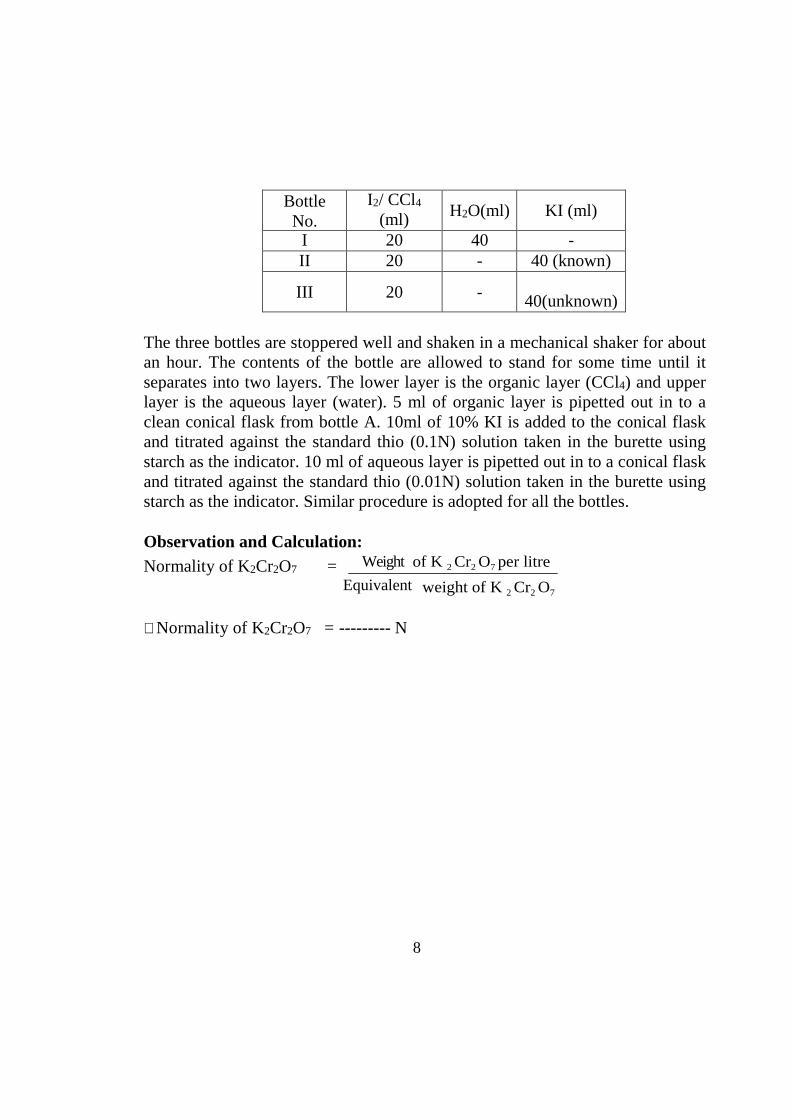
Three stoppered bottles are taken. Iodine in carbon tetrachloride, water and KI are mixed as per the following Table.
8
Bottle No.
I2/ CCl4
(ml) H2O(ml) KI (ml)
I 20 40 - II 20 - 40 (known)
III 20 - 40(unknown)
The three bottles are stoppered well and shaken in a mechanical shaker for about an hour. The contents of the bottle are allowed to stand for some time until it separates into two layers. The lower layer is the organic layer (CCl4) and upper layer is the aqueous layer (water). 5 ml of organic layer is pipetted out in to a clean conical flask from bottle A. 10ml of 10% KI is added to the conical flask and titrated against the standard thio (0.1N) solution taken in the burette using starch as the indicator. 10 ml of aqueous layer is pipetted out in to a conical flask and titrated against the standard thio (0.01N) solution taken in the burette using starch as the indicator. Similar procedure is adopted for all the bottles.
Observation and Calculation: Normality of K2Cr2O7 = Weight of K 2 Cr2 O7 per litre
Equivalent weight of K 2 Cr2 O7
∴Normality of K2Cr2O7 = --------- N
9
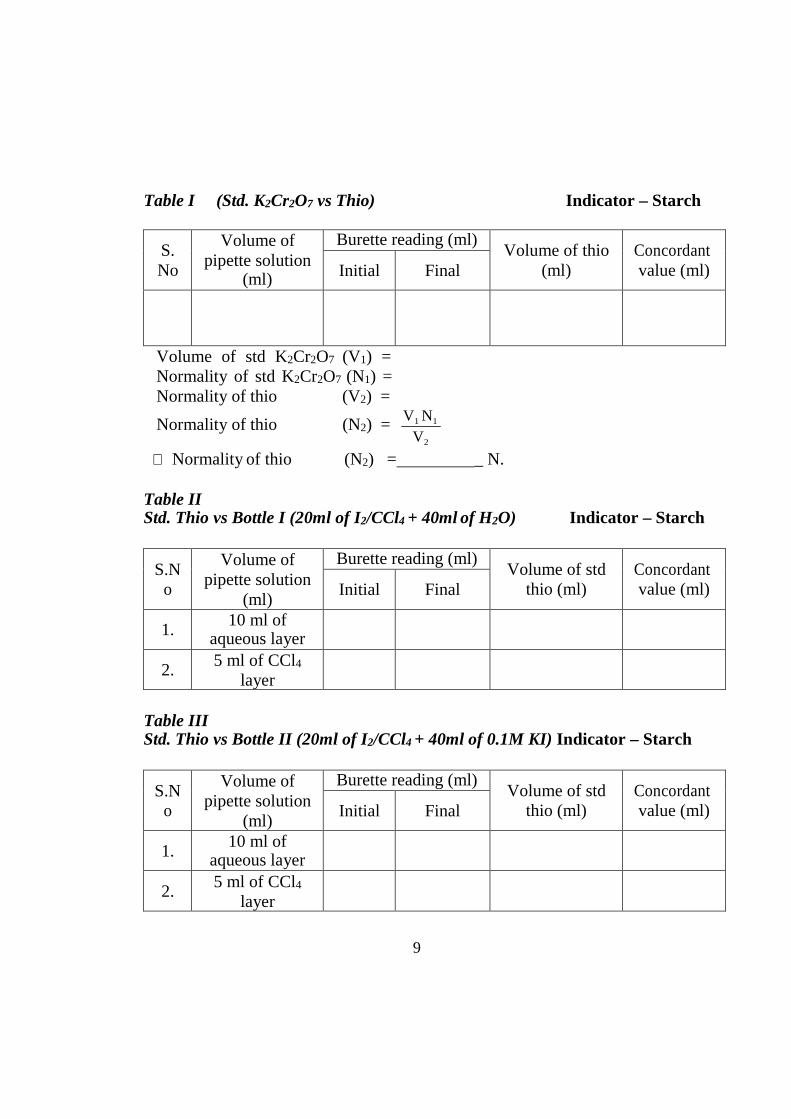
Table I (Std. K2Cr2O7 vs Thio) Indicator – Starch
S. No
Volume of pipette solution
(ml)
Burette reading (ml) Volume of thio
(ml) Concordant value (ml) Initial Final
Volume of std K2Cr2O7 (V1) = Normality of std K2Cr2O7 (N1) = Normality of thio (V2) =
Normality of thio (N2) =
V1 N1
V2
∴ Normality of thio (N2) = _ N.
Table II Std. Thio vs Bottle I (20ml of I2/CCl4 + 40ml of H2O) Indicator – Starch
S.N o
Volume of pipette solution
(ml)
Burette reading (ml) Volume of std
thio (ml) Concordant value (ml) Initial Final
1. 10 ml of
aqueous layer
2. 5 ml of CCl4
layer
Table III Std. Thio vs Bottle II (20ml of I2/CCl4 + 40ml of 0.1M KI) Indicator – Starch
S.N o
Volume of pipette solution
(ml)
Burette reading (ml) Volume of std
thio (ml) Concordant value (ml) Initial Final
1. 10 ml of
aqueous layer
2. 5 ml of CCl4
layer
10
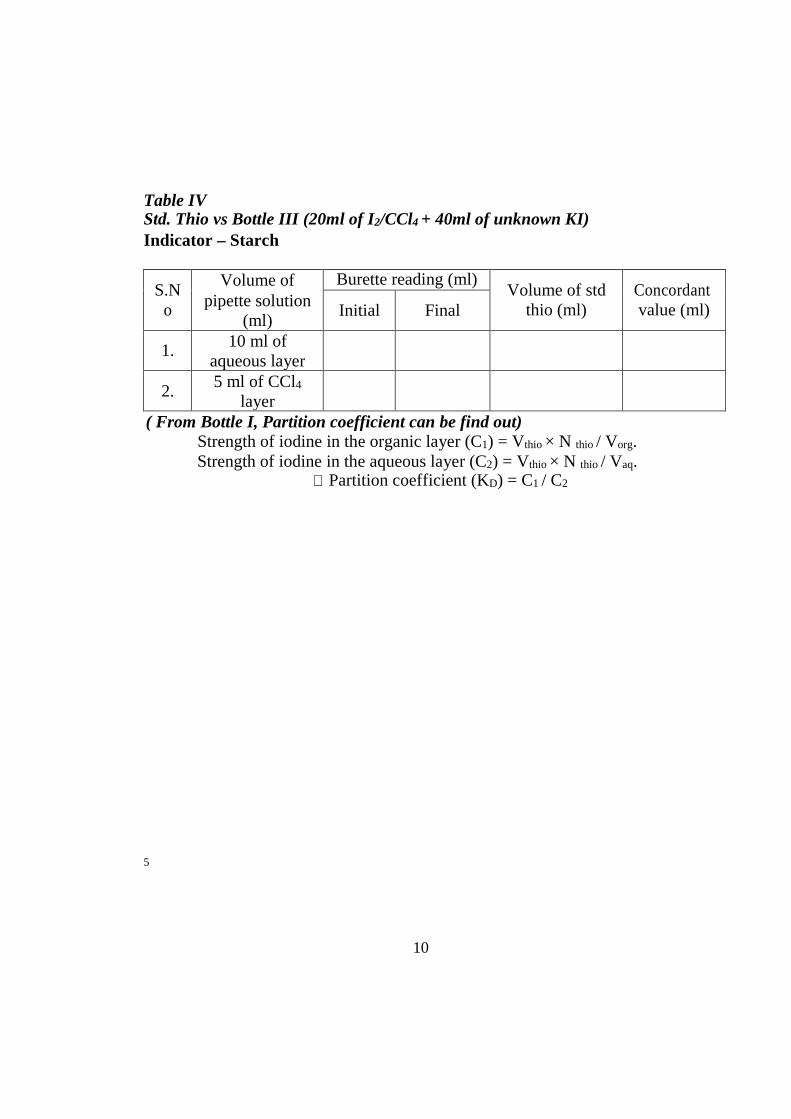
Table IV Std. Thio vs Bottle III (20ml of I2/CCl4 + 40ml of unknown KI) Indicator – Starch
S.N o
Volume of pipette solution
(ml)
Burette reading (ml) Volume of std
thio (ml) Concordant value (ml) Initial Final
1. 10 ml of aqueous layer
2. 5 ml of CCl4
layer
( From Bottle I, Partition coefficient can be find out) Strength of iodine in the organic layer (C1) = Vthio × N thio / Vorg. Strength of iodine in the aqueous layer (C2) = Vthio × N thio / Vaq.
∴ Partition coefficient (KD) = C1 / C2
5
11
C3
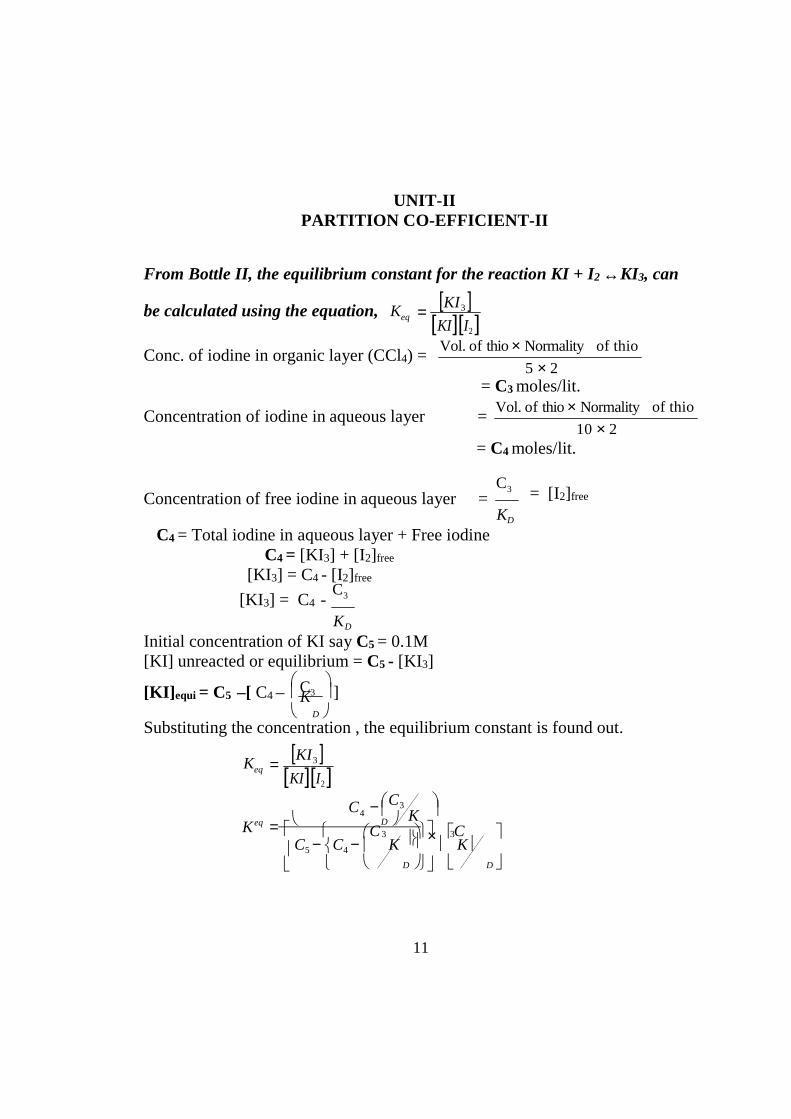
UNIT-II PARTITION CO-EFFICIENT-II
From Bottle II, the equilibrium constant for the reaction KI + I2 ↔KI3, can
be calculated using the equation, Keq =
[KI3 ] [KI ][I 2 ]
Conc. of iodine in organic layer (CCl4) = Vol. of thio × Normality
5 × 2 = C3 moles/lit.
of thio
Concentration of iodine in aqueous layer = Vol. of thio × Normality
10 × 2
of thio
= C4 moles/lit.
Concentration of free iodine in aqueous layer =
C4 = Total iodine in aqueous layer + Free iodine C4 = [KI 3] + [I2] free
[KI 3] = C4 - [I2] free
C3 = [I2] free
KD
[KI 3] = C4 - C3
KD
Initial concentration of KI say C5 = 0.1M [KI] unreacted or equilibrium = C5 - [KI 3]
[KI] equi = C5 –[ C4 – ] K
D Substituting the concentration , the equilibrium constant is found out.
Keq =
[KI3 ]
[KI ][I 2 ] C4 −
C3 K
K = D eq C C C5 − C4 −
3 K ×
3 K
D D
12
K
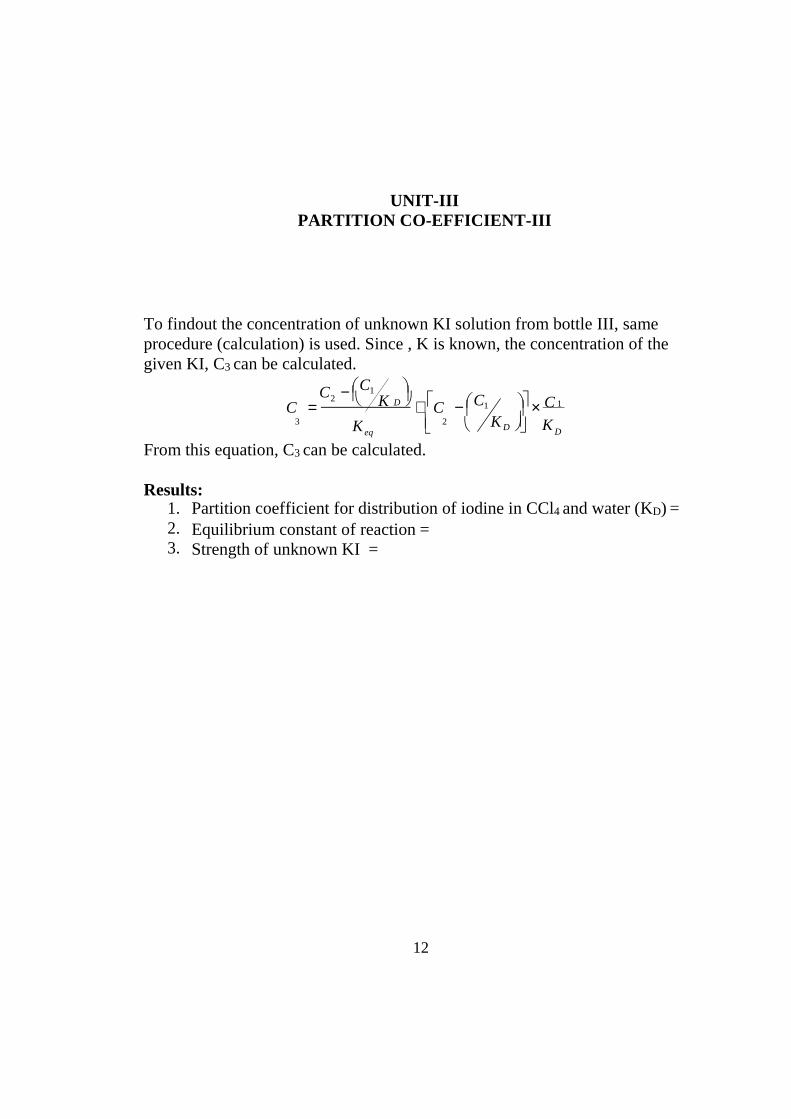
UNIT-III PARTITION CO-EFFICIENT-III
To findout the concentration of unknown KI solution from bottle III, same procedure (calculation) is used. Since , K is known, the concentration of the given KI, C3 can be calculated.
C2 − C1
K C
C = D + C −
C1 × 1
3 2 eq
K D K D
From this equation, C3 can be calculated.
Results: 1. Partition coefficient for distribution of iodine in CCl4 and water (KD) = 2. Equilibrium constant of reaction = 3. Strength of unknown KI =
13
BLOCK-2
CONDUCTOMETRIC TITRATIONS
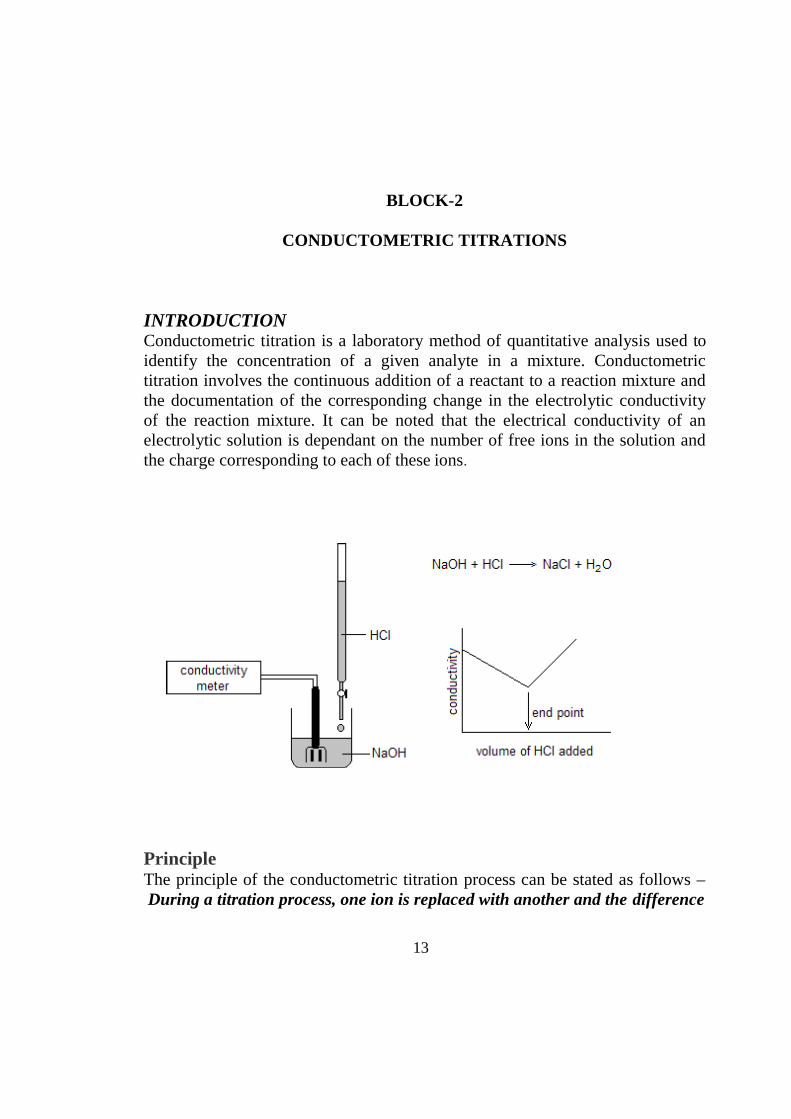
INTRODUCTION Conductometric titration is a laboratory method of quantitative analysis used to identify the concentration of a given analyte in a mixture. Conductometric titration involves the continuous addition of a reactant to a reaction mixture and the documentation of the corresponding change in the electrolytic conductivity of the reaction mixture. It can be noted that the electrical conductivity of an electrolytic solution is dependant on the number of free ions in the solution and the charge corresponding to each of these ions.
Principle The principle of the conductometric titration process can be stated as follows – During a titration process, one ion is replaced with another and the difference
14
in the ionic conductivities of these ions directly impacts the overall electrolytic conductivity of the solution.
Theory
The theory behind this type of titration states that the end-point corresponding to the titration process can be determined by means of conductivity measurement. For a neutralization reaction between an acid and a base, the addition of the base would lower conductivity of the solution initially. This is because the H+ ions would be replaced by the cationic part of the base.
After the equivalence point is reached, the concentration of the ionic entities will increase. This, in turn, increases the conductance of the solution. Therefore, two straight lines with opposite slopes will be obtained when the conductance values are plotted graphically. The point where these two lines intersect is the equivalence point.
Application The method of conductometric titration is very useful in the titration of homogeneous suspensions or coloured solutions as these titrations cannot be done with the use of normal chemical indicators.
15
UNIT-4
CONDUCTOMETRIC TITRATION OF ACID VS BASE
Aim:
1. CONDUCTOMETRIC TITRATION OF STRONG ACID vs STRONG BASE
To determine the strength of given hydrochloric acid solution by
conductometric titration against standard sodium hydroxide solution.
Apparatus required: Conductometric bridge, Conductivity cell etc.
Principle:
Initially when acid is taken in the beaker, it contains only H+ ions and Cl-
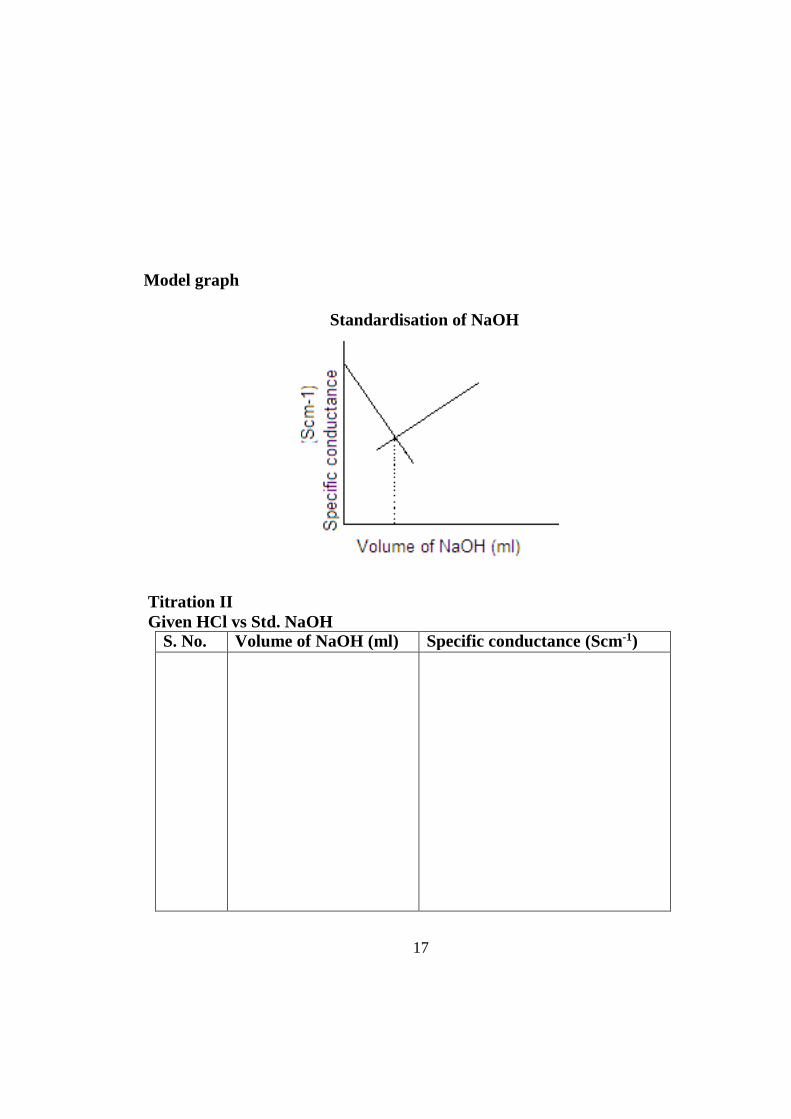
ions. Since the H+ ions possess the greatest mobility, it follows that the conductivity of this solution is mainly due to H+ ions. As sodium hydroxide is added, the H+ ions are removed as slightly ionized water. Therefore, the conductivity will decrease, as Na+ ions do not possess much mobility compared to H+ . At the neutralization point, the solution contains Na+ and Cl- ions and has a considerably less conductivity than the original value. If a drop of sodium hydroxide is added after the neutralization point, there will be a small concentration of OH- ions further introduced and so the conductivity increases, OH- ions have the second highest mobility. As more sodium hydroxide is added, the conductivity goes on increasing continuously. Hence on plotting the conductivity values as ordinate against milli litre of titrant added as abscissa, we get two straight lines, the point of intersection of which gives the equivalence point.
Procedure:
40ml of HCl is pipetted out into a dry beaker and the conductivity cell is put into the solution. The standard alkali is taken in the burette. A known volume of alkali is added and the solution is stirred well. The specific conductivity is measured. The titration is continued till the solution becomes distinctly basic in character. The conductivity of the solution is measured periodically corresponding to each addition. A graph is plotted between the volume of alkali and the conductance. The volume of alkali needed for complete neutralization is
16
read from the graph corresponding to the intersection of two distinct portions of the conductivity curves. From this, the strength of acid can be calculated.
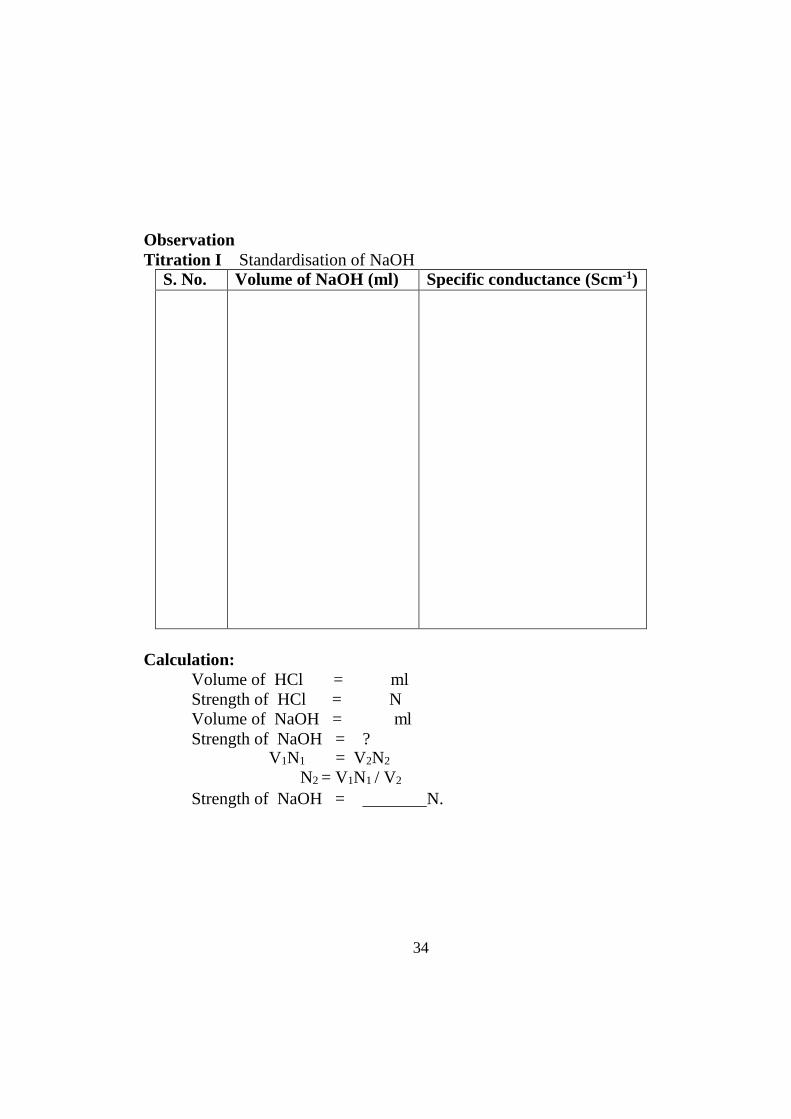
Observation Titration I Standardisation of NaOH
S. No. Volume of NaOH (ml) Specific conductance (Scm-1)
Calculation
Volume of HCl = ml Strength of HCl = N Volume of NaOH = ml Strength of NaOH = ?
V1N1 = V2N2
N2 = V1N1 / V2
Strength of NaOH = N.
17
Model graph
Standardisation of NaOH
Titration II Given HCl vs Std. NaOH
S. No. Volume of NaOH (ml) Specific conductance (Scm-1)
18
Calculation
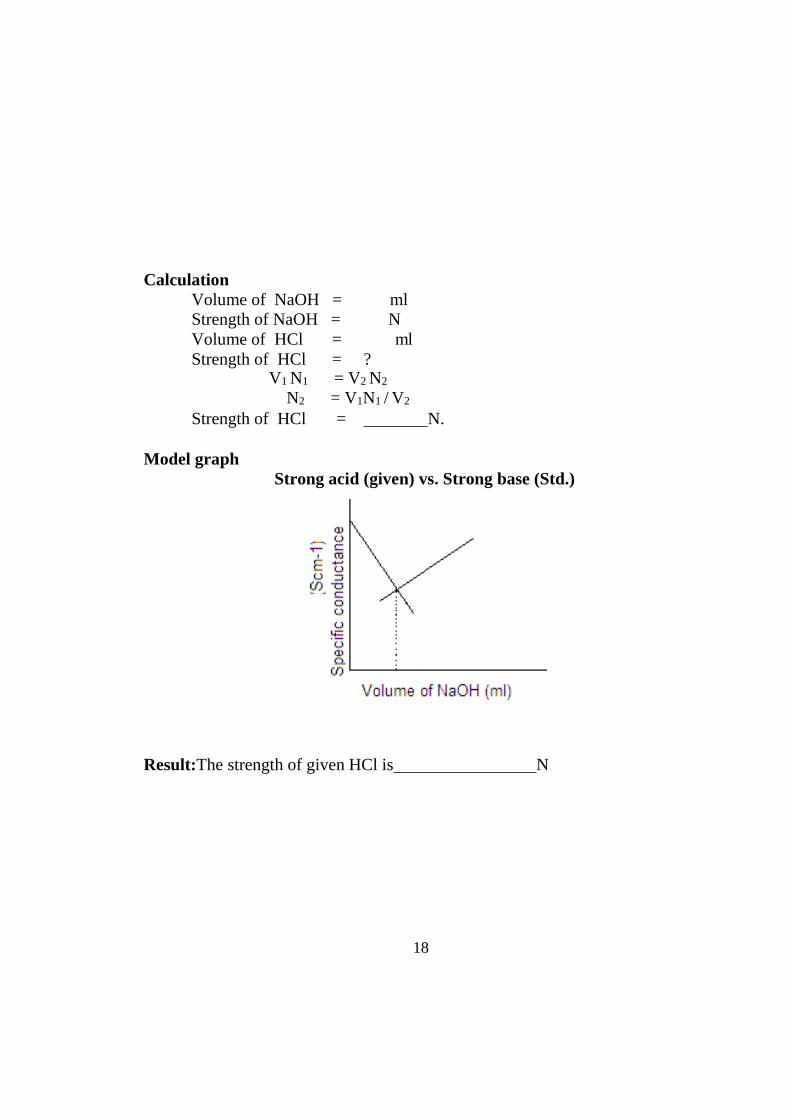
Volume of NaOH = ml Strength of NaOH = N Volume of HCl = ml Strength of HCl = ?
V1 N1 = V2 N2
N2 = V1N1 / V2
Strength of HCl = N.
Model graph Strong acid (given) vs. Strong base (Std.)
Result:The strength of given HCl is N
19
Aim:
2. CONDUCTOMETRIC TITRATION OF WEAK ACID Vs STRONG BASE
To determine the strength of acetic acid by titrating it against strong alkali
conductometrically.
Apparatus required: Conductometric bridge, conductivity cell etc.
Principle:
During the titration of acetic acid with NaOH, the salt CH3COONa is formed. Inspite of the effect of common ion (neutral salt, which is formed during the first part of titration, tends to express the ionization of acetic acid still present), the conductivity increases because the conducting power of highly ionized salt exceeds that of weak acid. The conductivity increases more rapidly after the endpoint is just passed, because of the presence of hydroxyl ions from the alkali added. Hence on plotting the conductivity values as ordinate against milli litre of titrant added as abscissa, we get two straight lines, the point of intersection of which gives the equivalence point.
Procedure:
40ml of acetic acid is pipetted out into a dry beaker and the conductivity cell is put into the solution. The standard alkali is taken in the burette. A known volume of alkali is added and the solution is stirred well. The specific conductivity is measured. The titration is continued till the solution becomes distinctly basic in character. The conductivity of the solution is measured periodically corresponding to each addition. A graph is plotted between the volume of alkali and the conductance and the volume of alkali needed for complete neutralization is read as a point of intersection of two straight line portions.
20
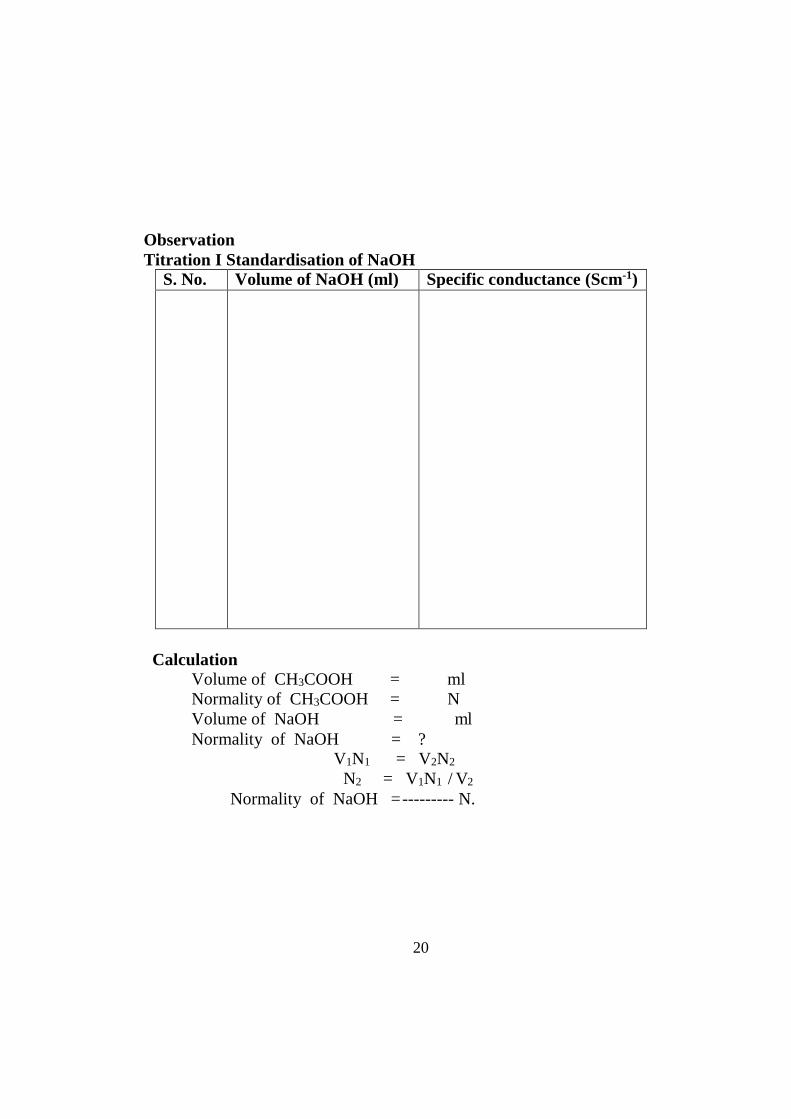
Observation Titration I Standardisation of NaOH
S. No. Volume of NaOH (ml) Specific conductance (Scm-1)
Calculation
Volume of CH3COOH = ml Normality of CH3COOH = N Volume of NaOH = ml Normality of NaOH = ?
V1N1 = V2N2
N2 = V1N1 / V2
Normality of NaOH = --------- N.
21
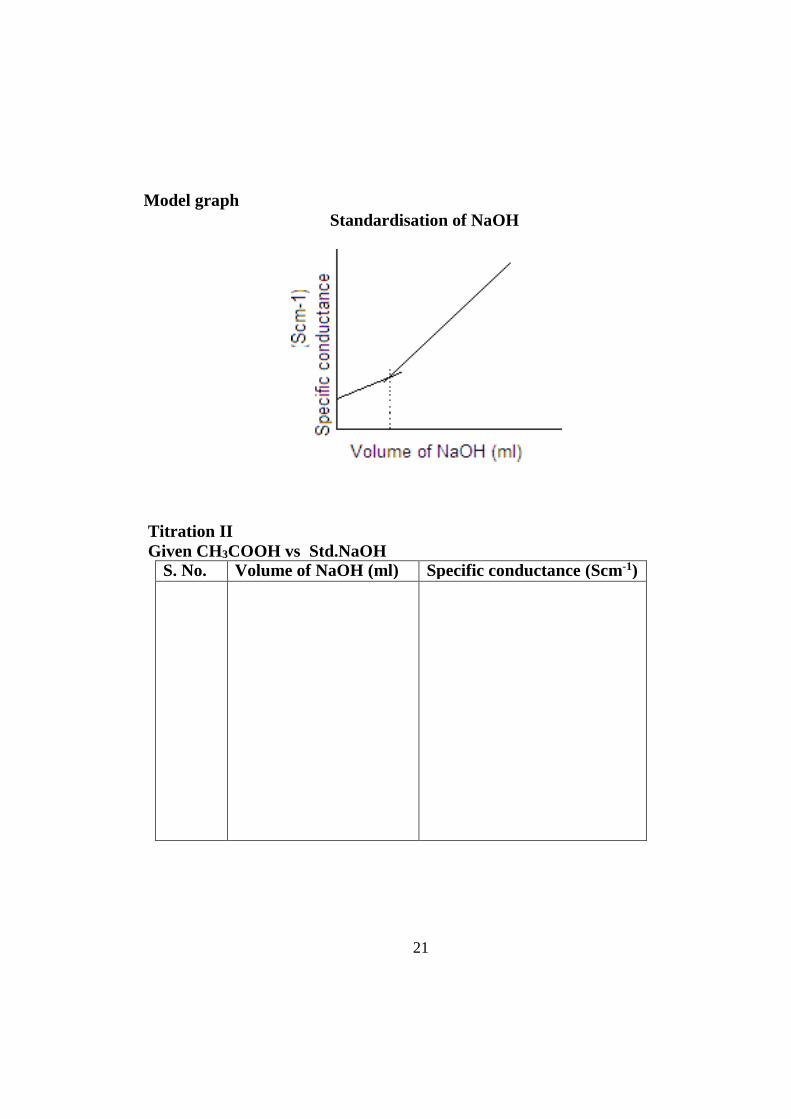
Model graph Standardisation of NaOH
Titration II Given CH3COOH vs Std.NaOH
S. No. Volume of NaOH (ml) Specific conductance (Scm-1)
22
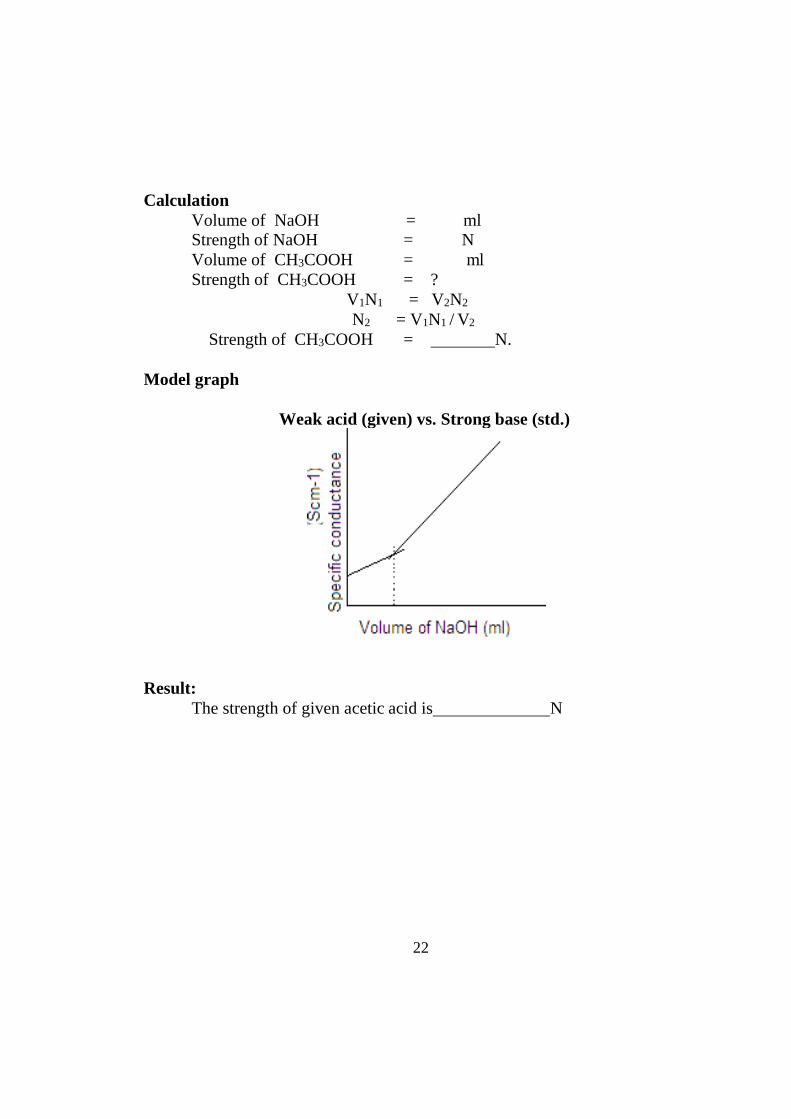
Calculation Volume of NaOH = ml Strength of NaOH = N Volume of CH3COOH = ml Strength of CH3COOH = ?
V1N1 = V2N2
N2 = V1N1 / V2
Strength of CH3COOH = N.
Model graph
Weak acid (given) vs. Strong base (std.)
Result: The strength of given acetic acid is N
23
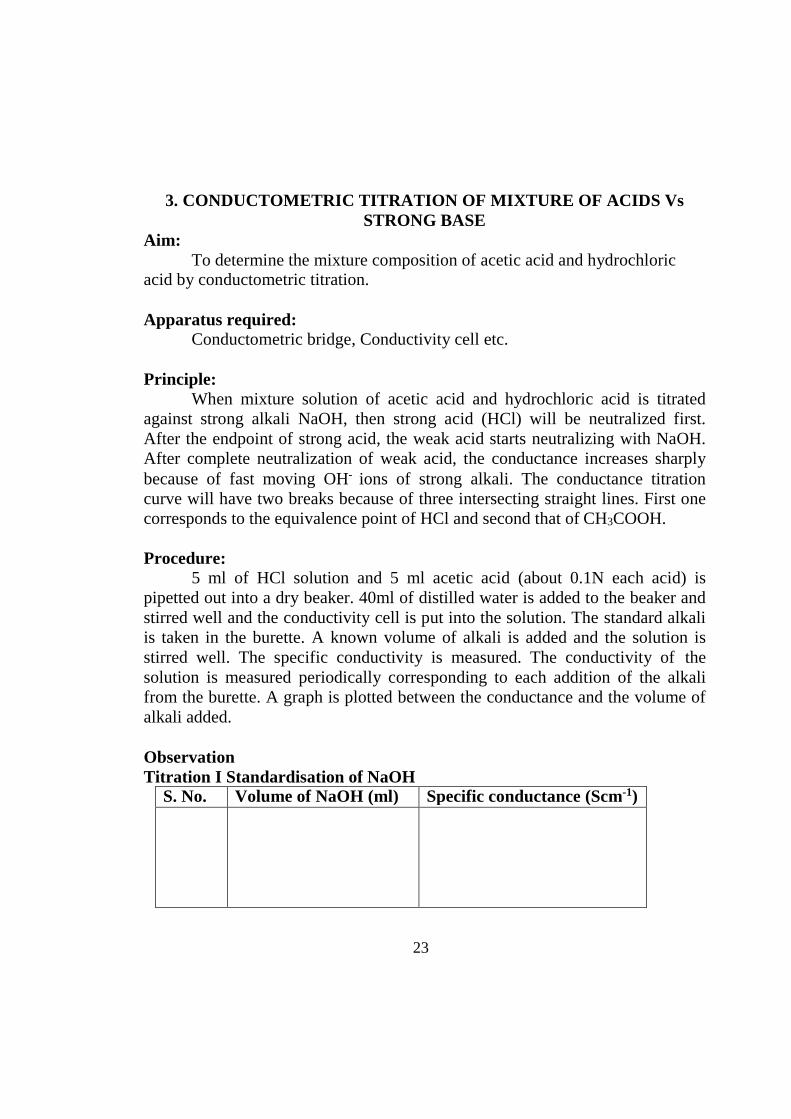
3. CONDUCTOMETRIC TITRATION OF MIXTURE OF ACIDS Vs STRONG BASE
Aim: To determine the mixture composition of acetic acid and hydrochloric
acid by conductometric titration.
Apparatus required: Conductometric bridge, Conductivity cell etc.
Principle:
When mixture solution of acetic acid and hydrochloric acid is titrated against strong alkali NaOH, then strong acid (HCl) will be neutralized first. After the endpoint of strong acid, the weak acid starts neutralizing with NaOH. After complete neutralization of weak acid, the conductance increases sharply because of fast moving OH- ions of strong alkali. The conductance titration curve will have two breaks because of three intersecting straight lines. First one corresponds to the equivalence point of HCl and second that of CH3COOH.
Procedure:
5 ml of HCl solution and 5 ml acetic acid (about 0.1N each acid) is pipetted out into a dry beaker. 40ml of distilled water is added to the beaker and stirred well and the conductivity cell is put into the solution. The standard alkali is taken in the burette. A known volume of alkali is added and the solution is stirred well. The specific conductivity is measured. The conductivity of the solution is measured periodically corresponding to each addition of the alkali from the burette. A graph is plotted between the conductance and the volume of alkali added.
Observation Titration I Standardisation of NaOH
S. No. Volume of NaOH (ml) Specific conductance (Scm-1)
24
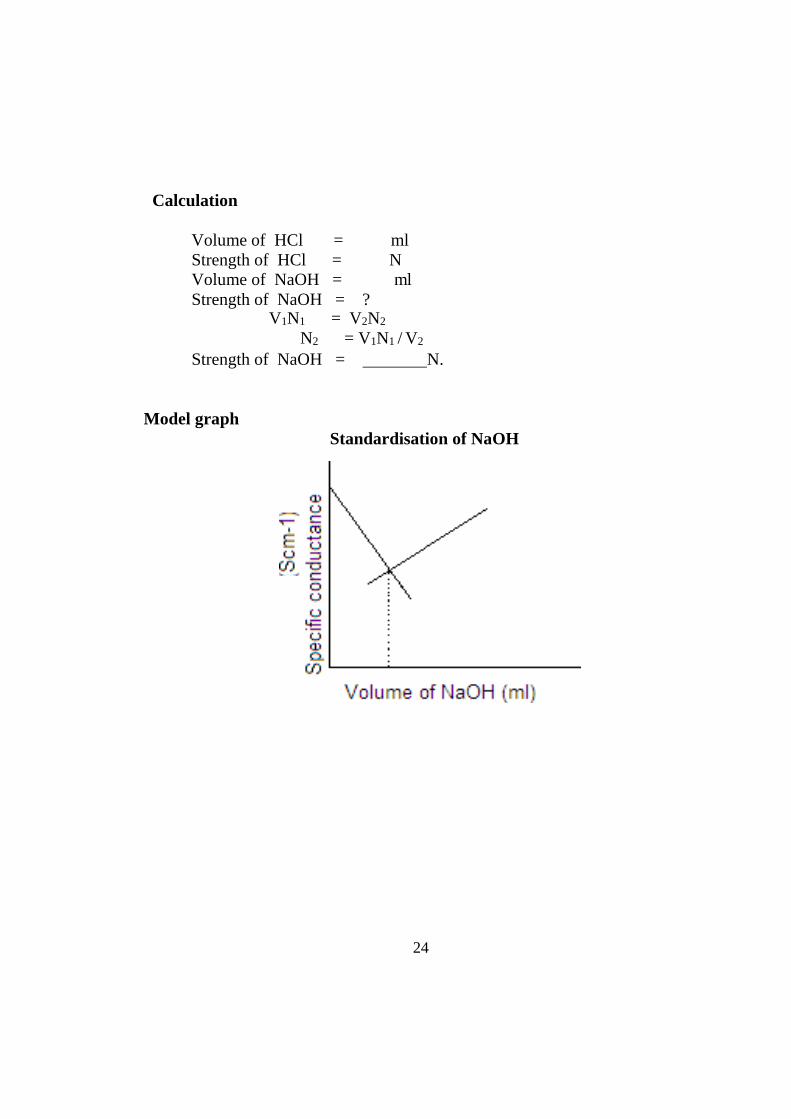
Calculation
Volume of HCl = ml Strength of HCl = N Volume of NaOH = ml Strength of NaOH = ?
V1N1 = V2N2
N2 = V1N1 / V2
Strength of NaOH = N.
Model graph Standardisation of NaOH
25
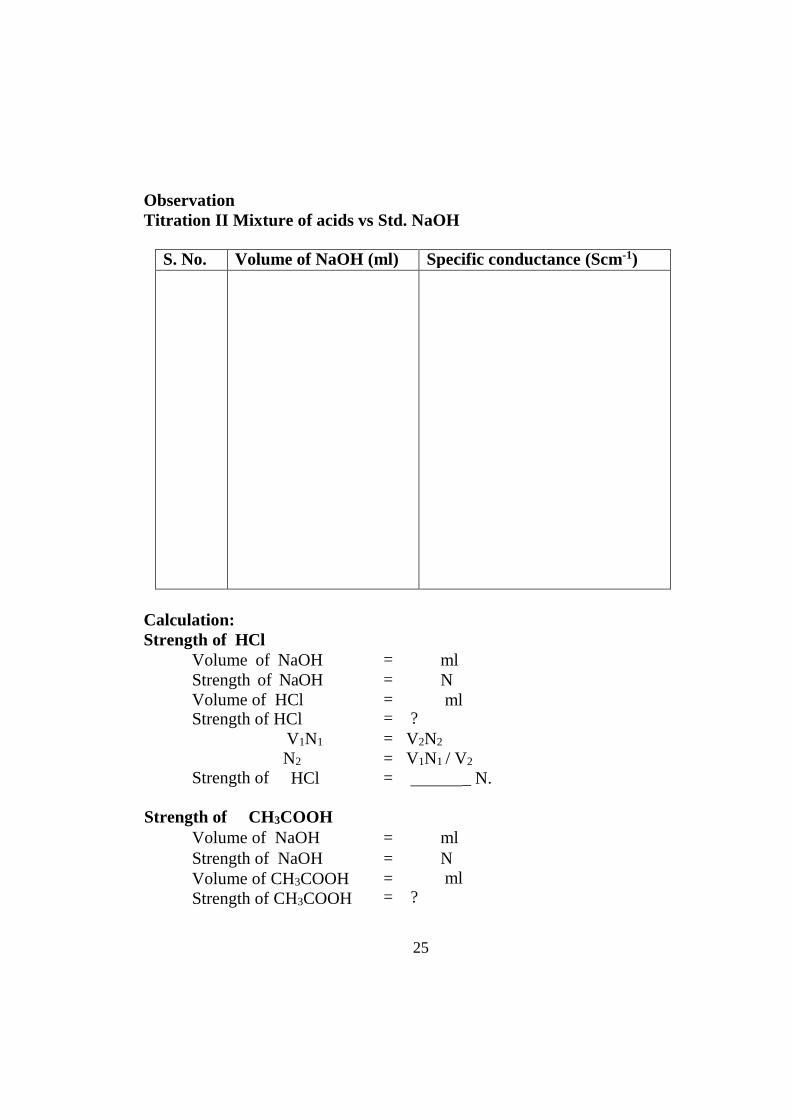
Observation Titration II Mixture of acids vs Std. NaOH
S. No. Volume of NaOH (ml) Specific conductance (Scm-1)
Calculation: Strength of HCl
Volume of NaOH Strength of NaOH Volume of HCl Strength of HCl
= = = =
?
ml N ml
Strength of
V1N1
N2
HCl
= = =
V2N2
V1N1 / V2
_ N.
Strength of CH3COOH Volume of NaOH
=
ml
Strength of NaOH Volume of CH3COOH Strength of CH3COOH
= = =
?
N ml
26
V1N1 = V2N2
N2 = V1N1 / V2
Strength of CH3COOH = _ N.
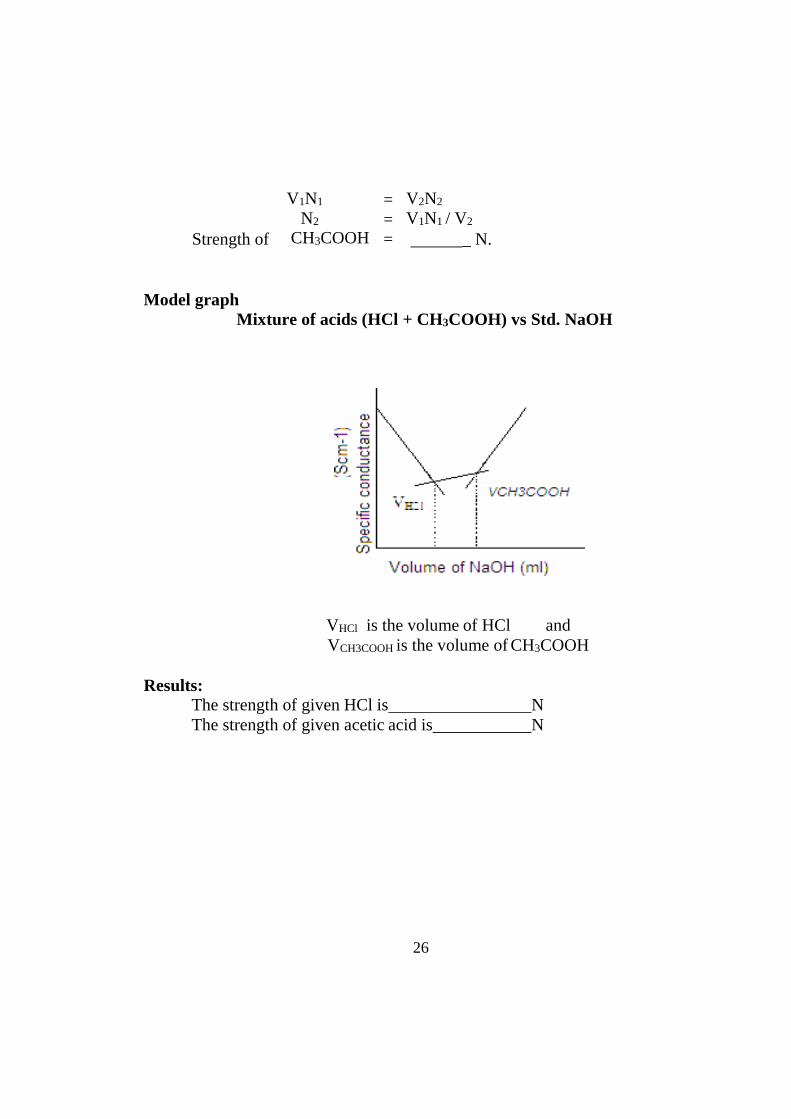
Model graph Mixture of acids (HCl + CH3COOH) vs Std. NaOH
VHCl is the volume of HCl and VCH3COOH is the volume of CH3COOH
Results:
The strength of given HCl is N The strength of given acetic acid is N
27
UNIT-5
Aim:
CONDUCTOMETRIC TITRATIONS OF MIXED HALIDES
To determine the strength of mixed halides by conductometric titration
using silver nitrate solution.
Apparatus required: Conductivity bridge, Conductivity cell etc.
Principle:
The strength of silver nitrate is ten fold higher than that of the halides. When a mixture of iodide and chloride is allowed to react with silver nitrate, first iodide precipitates for the reason of lower solubility and then chloride gets precipitated. When studying the conductance of the titration of completion of iodide precipitation does not give a sharp change but it is observed only when both the ions gets precipitated as silver salts. To find the individual concentration of halide, first the total volume of silver nitrate required for both halides is found out and then excess of ammonia is added before starting the titration which complexes chloride and remains in solution without precipitation, therefore the endpoint now is due to iodide alone. So by performing two separate titrations, the individual concentrations of iodide and chloride can be calculated.
Procedure:
40ml of given halide mixture is taken in a clean beaker and its conductivity was measured. Silver nitrate taken in a burette is added in 0.5ml fractions. After each additions, stirred well and conductance is measured. The sharp peak indicate the completion of precipitation of both iodide and chloride ions. The total volume of AgNO3 is found out from the graph plotted between volume and conductance.
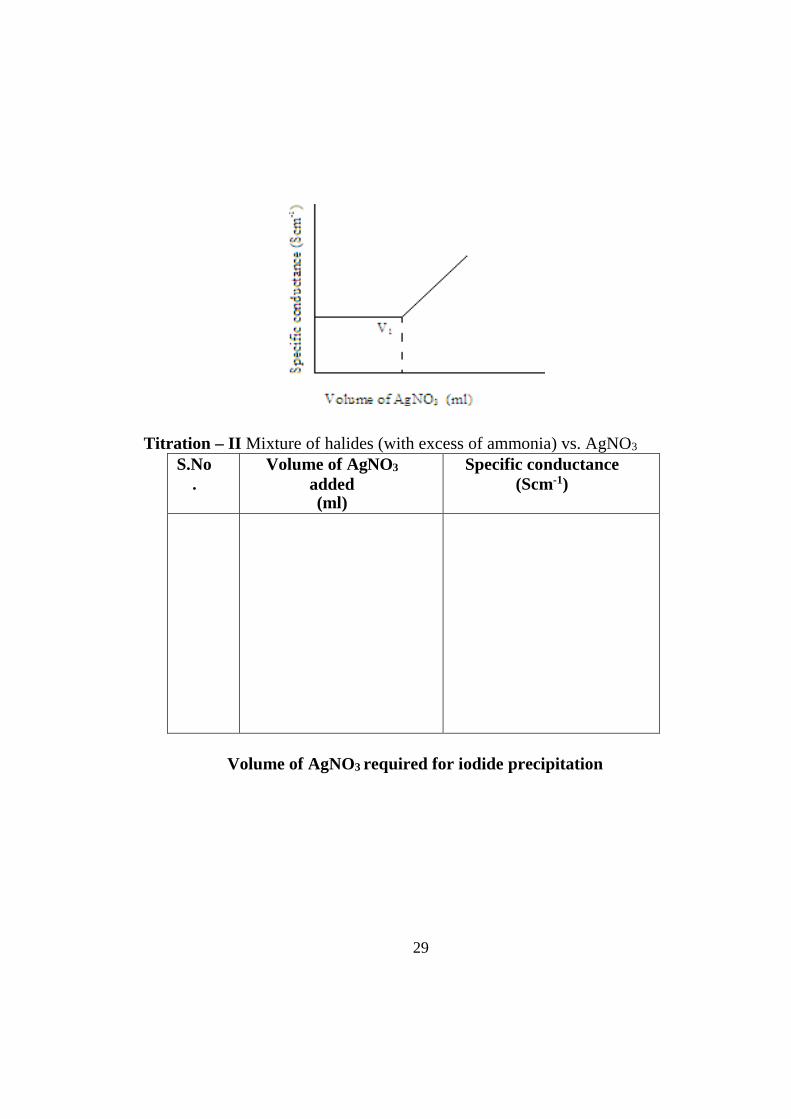
The same experiment is repeated by adding excess of ammonia to the halide mixture before the addition of fraction of AgNO3. A graph is drawn as in the previous case and the volume of AgNO3 required for iodide precipitation is readout and the difference of the two values gives the volume of AgNO3 required for chloride precipitation in solution.
28
Observation: Titration – I Mixture of halides vs. AgNO3
S.
No. Volume of AgNO3
added (ml)
Specific conductance (Scm-1)
To find out the total volume of AgNO3
29
Titration – II Mixture of halides (with excess of ammonia) vs. AgNO3
S.No .
Volume of AgNO3
added (ml)
Specific conductance (Scm-1)
Volume of AgNO3 required for iodide precipitation
30
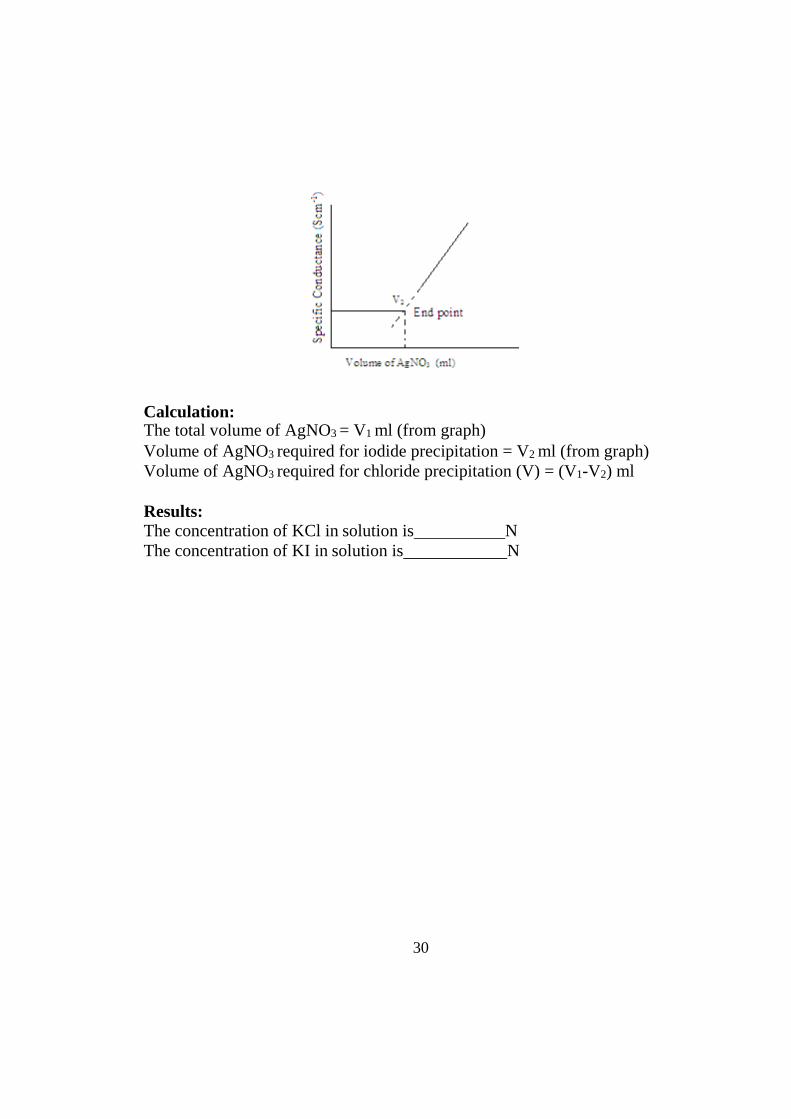
Calculation: The total volume of AgNO3 = V1 ml (from graph) Volume of AgNO3 required for iodide precipitation = V2 ml (from graph) Volume of AgNO3 required for chloride precipitation (V) = (V1-V2) ml
Results: The concentration of KCl in solution is N The concentration of KI in solution is N
31
UNIT-6
CONDUCTIVITY TITRATION OF SOLUBILITY PRODUCT
Aim: To determine the solubility product of silver chloride in water at room
temperature by conductivity measurement.
Apparatus required: Conductivity bridge, Conductivity cell etc.
Principle:
The conductance method is applicable for finding the concentration of the saturated solution, provided that the salt is not hydrolyzed and that the solubility is not too high. It may then be assumed that the ions possess their limiting conductivities and equivalent conductivity at infinite dilution may be taken as the sum of the ionic conductivities. Hence measurement of the specific conductivity of the saturated solution leads to a value for the concentration. The specific conductance of the salt is obtained from the specific conductance of solution and that of water.
Procedure:
The conductivity of the water employed is determined first. The conductivity measurements are taken for freshly prepared silver chloride. The precipitate is thoroughly and repeatedly washed with distilled water first and then with conductivity water several times to remove all the soluble impurities. The sparingly soluble salt is suspended in conductivity water shaken well and measurement is done. The specific conductance of water subtracted from that of the solution. The solubility is calculated by means of the equation, λ = 1000Κ
0 C
where C is the solubility of the sparingly soluble salt in gram equivalence/litre, K is the specific conductivity of the sparingly soluble salt and λ0 is obtained by the sum of ionic conductances of silver and chloride
ions. From solubility, solubility product is calculated by (C× C).

32
Results: The solubility of the silver chloride = g.eq/l Solubility product = .
33
UNIT-7 DETERMINE THE STRENGTH OF THE GIVEN SALT BY
CONDUCTOMETRIC TITRATION
Aim: To estimate the concentrations of sulphuric acid, acetic acid and copper
sulphate in the given solution by conductometric titration method.
Apparatus required: Conductivity bridge, Conductivity cell etc.
Principle:
When strong acid, weak acid and salt in a mixture are titrated against strong alkali, then sulphuric acid being strong acid will be neutralized first and then conductance will fall rapidly. Then acetic acid neutralizes, being a weak acid, conductivity rises slowly. The slight increase in conductance is due to incomplete dissociation of acetic acid. Finally NaOH reacts with copper sulphate and precipitation reaction takes place as follows,
CuSO4 + 2NaOH → Cu(OH)2 + Na2SO4
The Cu2+ ions are replaced by slightly less mobile Na+ ions and hence conductivity decreases very slowly until the precipitation is complete. After equivalence point, conductance increases rapidly due to fast moving OH- ions by further addition of NaOH solution. Hence the titration curve will be marked by three breaks. The three intersection points give volume of NaOH required to neutralize H2SO4, CH3COOH and copper sulphate respectively.
Procedure:
5 ml of acetic acid solution, 5 ml of sulphuric acid solution and 5 ml of copper sulphate solution are pipetted out into a clean dry beaker. 35 ml of distilled water is added and the conductivity cell is put into the solution. The standard alkali is taken in the burette. A known volume of alkali is added and the solution is stirred well. The specific conductivity is measured. The conductivity of the solution is measured periodically corresponding to each addition of the alkali from the burette. A graph is plotted between the conductance and the volume of alkali added.
34
Observation Titration I Standardisation of NaOH
S. No. Volume of NaOH (ml) Specific conductance (Scm-1)
Calculation:
Volume of HCl = ml Strength of HCl = N Volume of NaOH = ml Strength of NaOH = ?
V1N1 = V2N2
N2 = V1N1 / V2
Strength of NaOH = N.
35
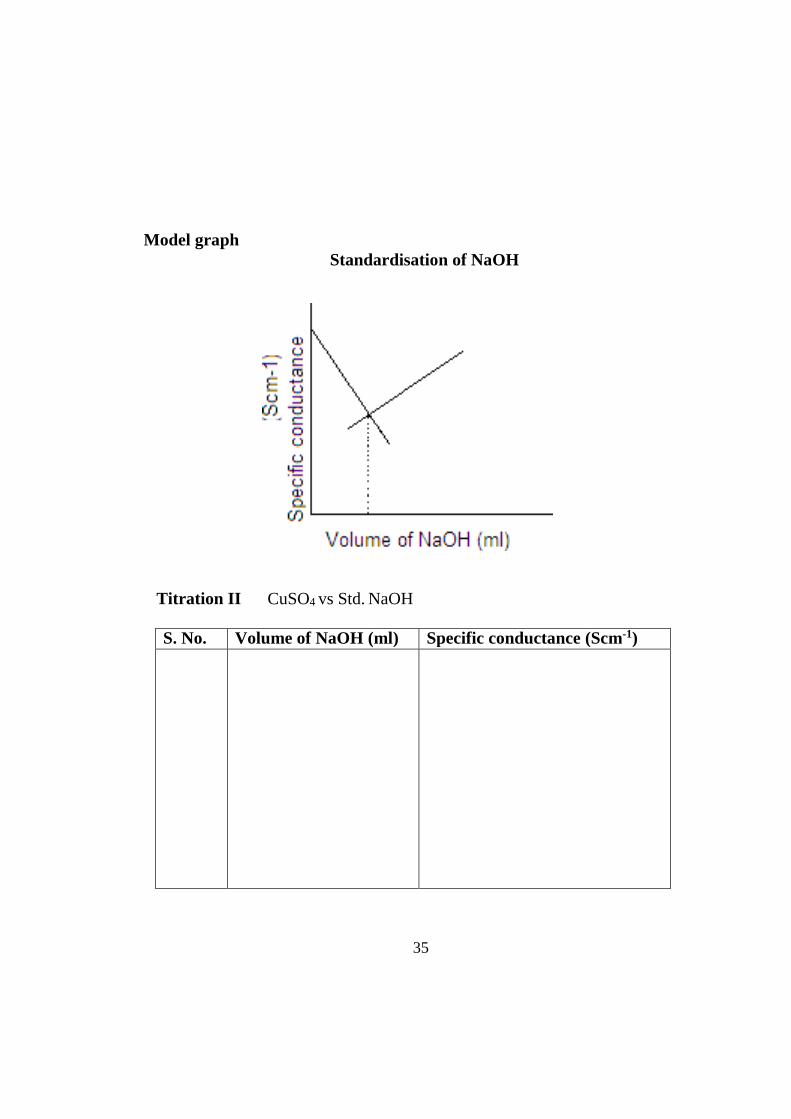
Model graph Standardisation of NaOH
Titration II CuSO4 vs Std. NaOH
S. No. Volume of NaOH (ml) Specific conductance (Scm-1)
36
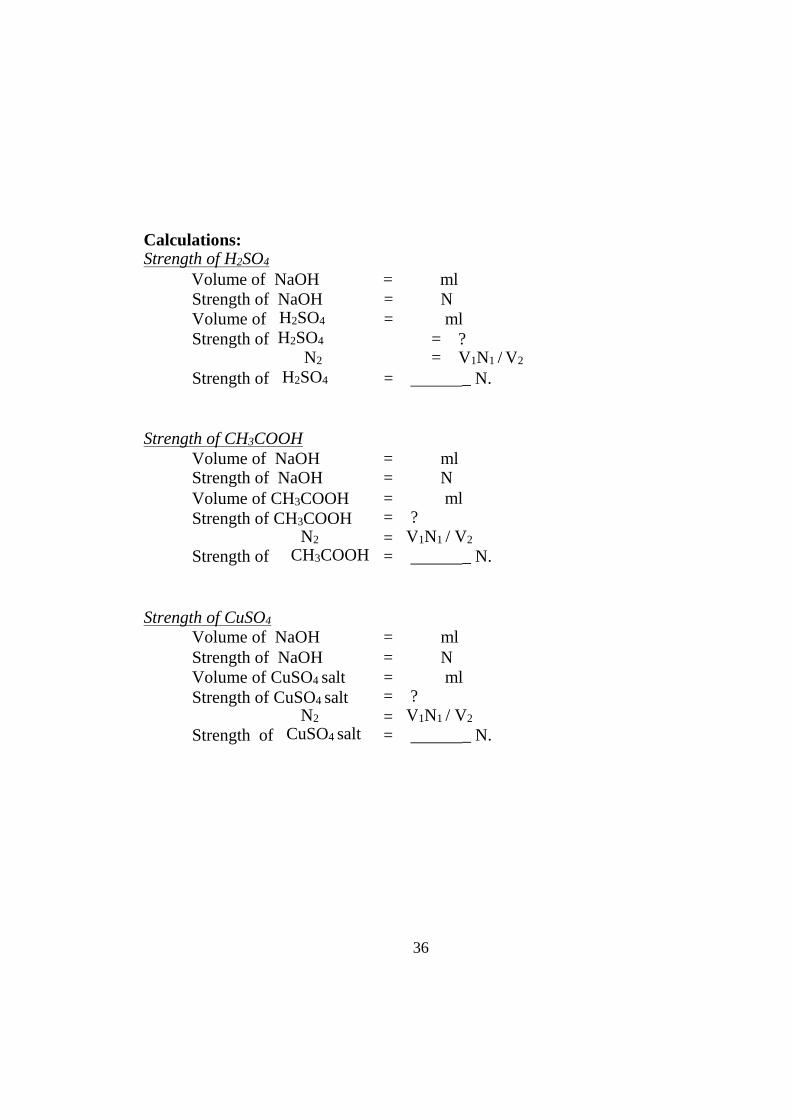
Calculations: Strength of H2SO4
Volume of NaOH = ml Strength of NaOH = N Volume of H2SO4 = ml Strength of H2SO4 = ? N2 = V1N1 / V2
Strength of H2SO4 = _ N.
Strength of CH3COOH Volume of NaOH Strength of NaOH
= =
ml N
Volume of CH3COOH Strength of CH3COOH
= =
?
ml
Strength of
N2
CH3COOH = =
V1N1 / V2
_ N.
Strength of CuSO4
Volume of NaOH = ml Strength of NaOH Volume of CuSO4 salt Strength of CuSO4 salt
= = =
?
N ml
Strength of
N2
CuSO4 salt = =
V1N1 / V2
_ N.
37
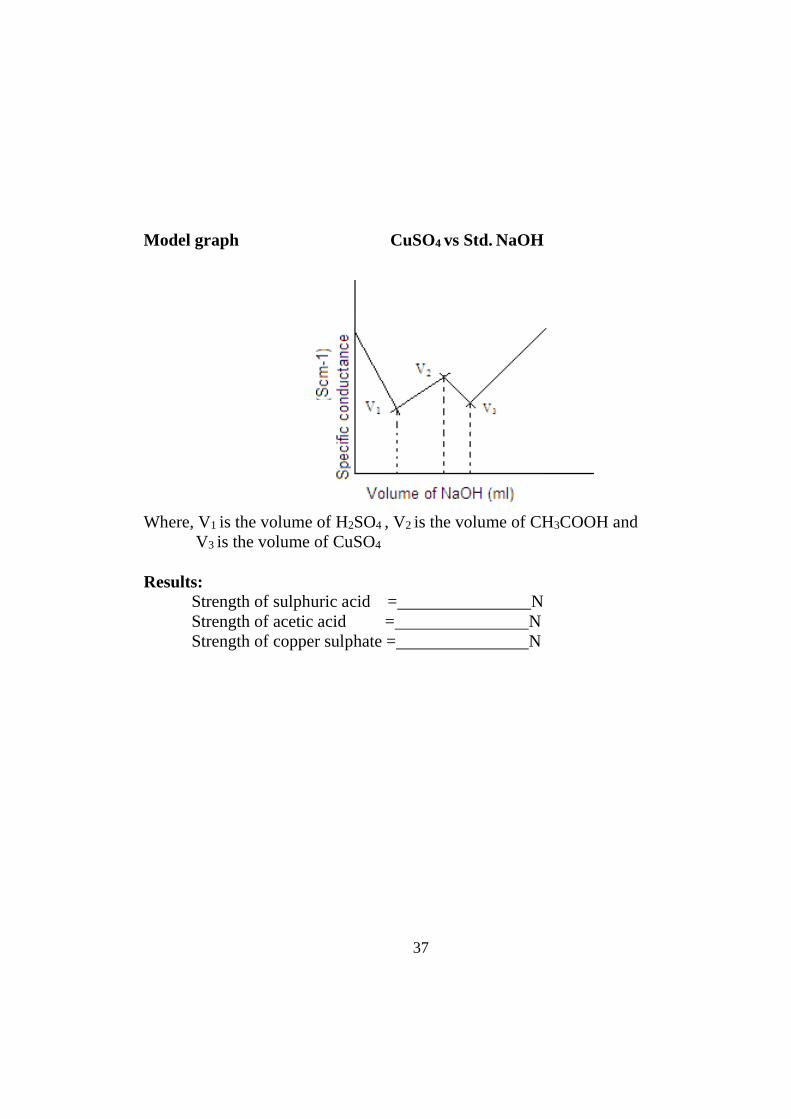
Model graph CuSO4 vs Std. NaOH
Where, V1 is the volume of H2SO4 , V2 is the volume of CH3COOH and V3 is the volume of CuSO4
Results:
Strength of sulphuric acid = N Strength of acetic acid = N Strength of copper sulphate = N
38
Aim:
7. CONDUCTOMETRIC TITRATION OF BaCl 2 vs MgSO4
To determine the strength of the given MgSO4 solution using BaCl2 by
conductometric titration.
Apparatus required: Conductivity bridge, Conductivity cell etc.
Principle:
When BaCl2 is added to MgSO4, BaSO4 is precipitated with the formation of MgCl2.
MgSO4 + BaCl2 → BaSO4 + MgCl2
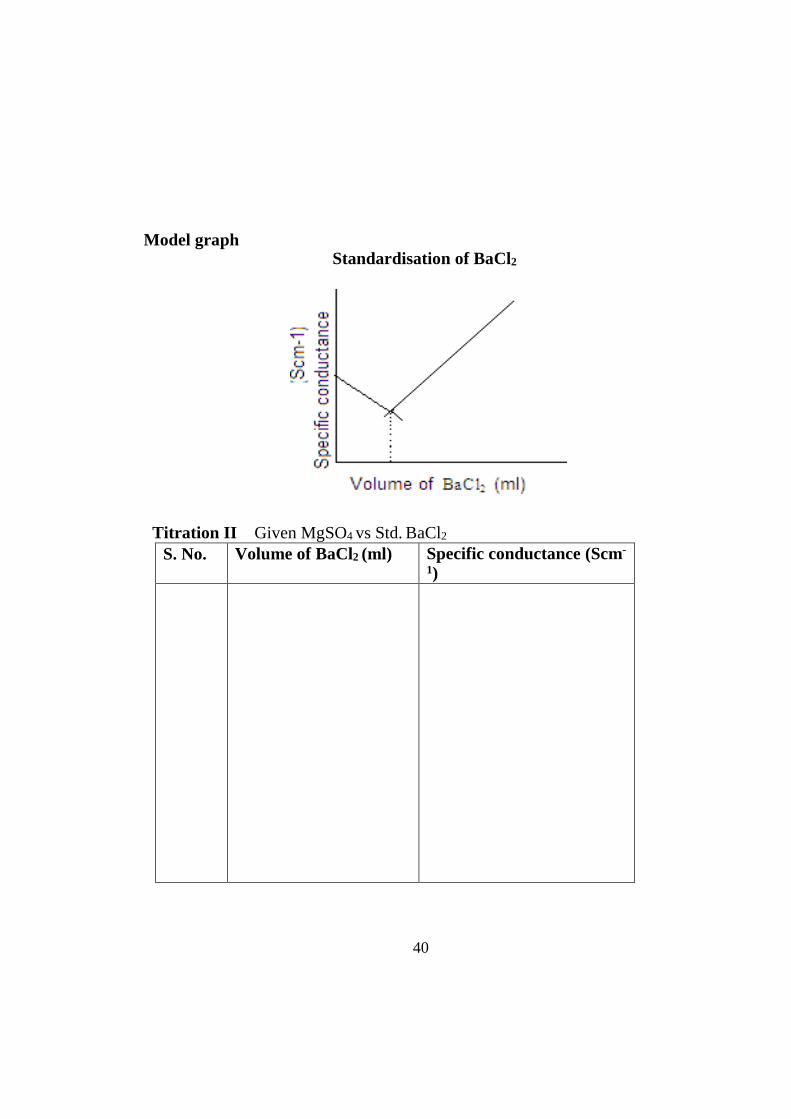
The conductance of the solution varies gradually up to the endpoint. Beyond the end point, conductance increases rapidly due to the increasing concentration of BaCl2. Conductance is plotted against the volume of BaCl2
added. The point of intersection of two lines gives the endpoint from which the strength of MgSO4 is calculated. BaCl2 is standardized using a standard solution of MgSO4 of strength 0.02N.
Procedure:
A standard solution of MgSO4 0.02N is accurately prepared. 10 ml of this solution is taken in a clean beaker and diluted by adding water. A conductivity cell is placed in the solution and the conductance is measured. BaCl2 solution is added from a burette in 0.2 ml portion. After each addition, the solution is stirred well and conductance is measured. The conductance decreases and then increases. About equal number of readings is taken after the conductance begins to increase. Conductance is plotted against volume of BaCl2 to get two straight lines intersecting at a point. This gives the end point. From the volume of BaCl2, its strength is calculated.
The given solution of MgSO4 is made up to 100 ml. It is then titrated as
above against BaCl2 in the burette. From the volume of BaCl2 and its strength, the strength of the given MgSO4 solution is calculated.
39
Observation Titration I Standardisation of BaCl2
S. No. Volume of BaCl2 (ml) Specific conductance (Scm- 1)
Calculation Volume of MgSO4 = ml Normality of MgSO4 = N Volume of BaCl2 = ml Normality of BaCl2 = ?
V1N1 = V2N2
N2 = V1N1 / V2
Normality of BaCl2 = _ N.
40
Model graph Standardisation of BaCl2
Titration II Given MgSO4 vs Std. BaCl2
S. No. Volume of BaCl2 (ml) Specific conductance (Scm- 1)
41
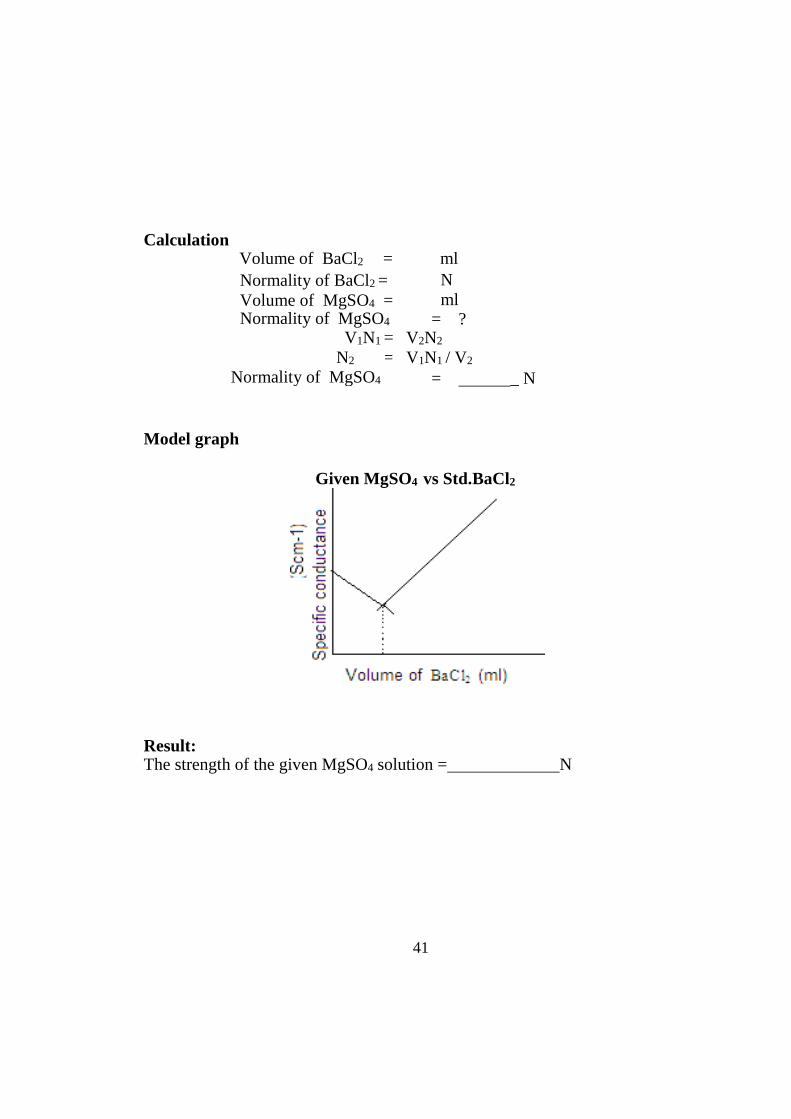
Calculation Volume of BaCl2 = ml Normality of BaCl2 = Volume of MgSO4 = Normality of MgSO4
N ml
= ? V1N1 = V2N2
N2 = V1N1 / V2
Normality of MgSO4 = _ N
Model graph
Given MgSO4 vs Std.BaCl2
Result: The strength of the given MgSO4 solution = N
42
Potentiometric titration
43
Block-3 Potentiometric titration
POTENTIOMETRIC TITRATION
Potentiometric titration s involve the measurement of the potential difference between two electrodes of a cell; conductometric titrations, the electrical conductance or resistance; amperometry titrations, the electric current passing during the course of the titration Potentiometry is an electrochemical technique which involves charge transfer at zero faradaic current. In this method, the electrode/electrolyte interface remains at dynamic equilibrium and hence thermodynamic considerations of the electroactive species through Nernst equation is given by,
Ε = Ε0 + 2.303RT
nF log( a)
Thus, the above equation enables the estimation of activity or concentration through potential measurements. In practice, potentiometry can be applied in three different modes (a) direct potentiometry (b) null point potentiometry (c) Potentiometric titrations. Direct potentiometry involves a single measurement of potential. This method has two disadvantages, (i) Junction potentials are also included in the measured potential values and (ii) Measured potential is determined by activity rather than concentration of the species unless and otherwise the solution is very strong.
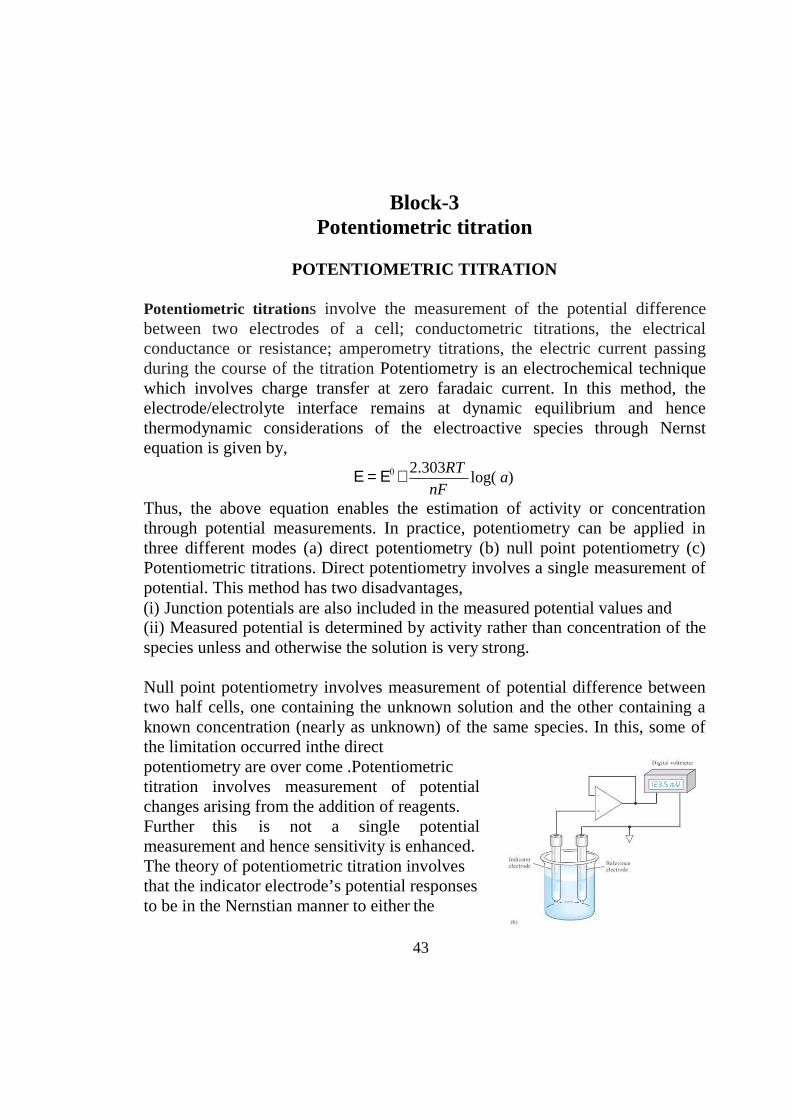
Null point potentiometry involves measurement of potential difference between two half cells, one containing the unknown solution and the other containing a known concentration (nearly as unknown) of the same species. In this, some of the limitation occurred inthe direct potentiometry are over come .Potentiometric titration involves measurement of potential changes arising from the addition of reagents. Further this is not a single potential measurement and hence sensitivity is enhanced. The theory of potentiometric titration involves that the indicator electrode’s potential responses to be in the Nernstian manner to either the
44
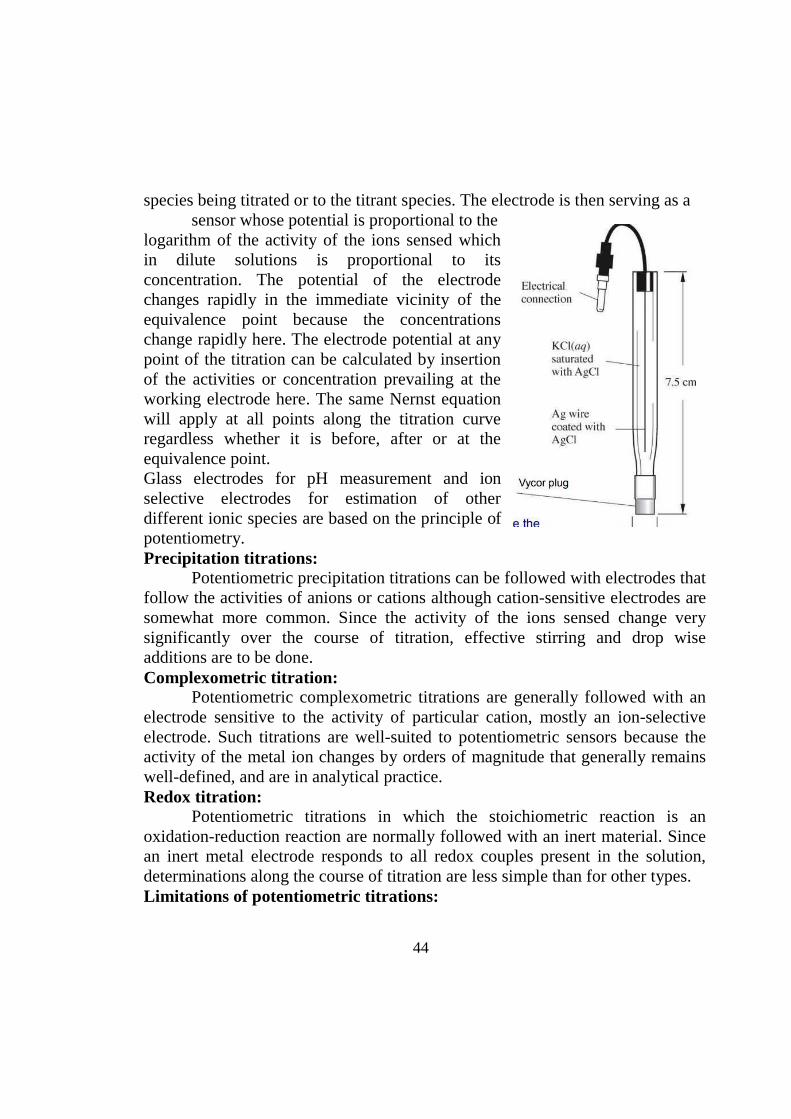
species being titrated or to the titrant species. The electrode is then serving as a sensor whose potential is proportional to the
logarithm of the activity of the ions sensed which in dilute solutions is proportional to its concentration. The potential of the electrode changes rapidly in the immediate vicinity of the equivalence point because the concentrations change rapidly here. The electrode potential at any point of the titration can be calculated by insertion of the activities or concentration prevailing at the working electrode here. The same Nernst equation will apply at all points along the titration curve regardless whether it is before, after or at the equivalence point. Glass electrodes for pH measurement and ion selective electrodes for estimation of other different ionic species are based on the principle of potentiometry. Precipitation titrations:
Potentiometric precipitation titrations can be followed with electrodes that follow the activities of anions or cations although cation-sensitive electrodes are somewhat more common. Since the activity of the ions sensed change very significantly over the course of titration, effective stirring and drop wise additions are to be done. Complexometric titration:
Potentiometric complexometric titrations are generally followed with an electrode sensitive to the activity of particular cation, mostly an ion-selective electrode. Such titrations are well-suited to potentiometric sensors because the activity of the metal ion changes by orders of magnitude that generally remains well-defined, and are in analytical practice. Redox titration:
Potentiometric titrations in which the stoichiometric reaction is an oxidation-reduction reaction are normally followed with an inert material. Since an inert metal electrode responds to all redox couples present in the solution, determinations along the course of titration are less simple than for other types. Limitations of potentiometric titrations:
45
1. The first problem in potentiometric titration is slow chemical titration reaction. Slow chemical reactions which are not unique to the potentiometric titrations will affect both precision and accuracy of the titration. The general remedy for this is possibly changing the reaction conditions to make it fast.
2. The second problem that usually arises is the mixed potential. These greatly arise only at the inert metal electrodes, although under unusual conditions they can be observed at electrodes of other types. These occurs when two more potential – determining couples are present in the solution at the same time and when the conditions in the solution are such that these couples do not rapidly reach equilibrium with each other. These can be overcome by creating a steady state potential that is not equilibrium on the immediate vicinity of the electrode which may produce a stable potential.
3. The third problem in potentiometric titrations is that of electrode polarization. Potentiometric measurements will draw a finite but small amount of current from the cell whose potential is being measured. When this measurement current is of the same order of magnitude as that of the exchange current of the potential determining couple, or larger, enormous potentials will be observed by the use of apparatus requiring less current. But sometimes it is necessary to change the electrode reaction to which the electrode is responding.
46
Aim:
Unit 7 1. POTENTIOMETRIC TITRATION OF STRONG ACID Vs
STRONG BASE To determine the concentration of the given strong acid by
potentiometrically using standard NaOH. Apparatus required:
Potentiometer, Platinum electrode, Calomel electrode, Burette, Pipette, Beaker etc. Chemicals required:
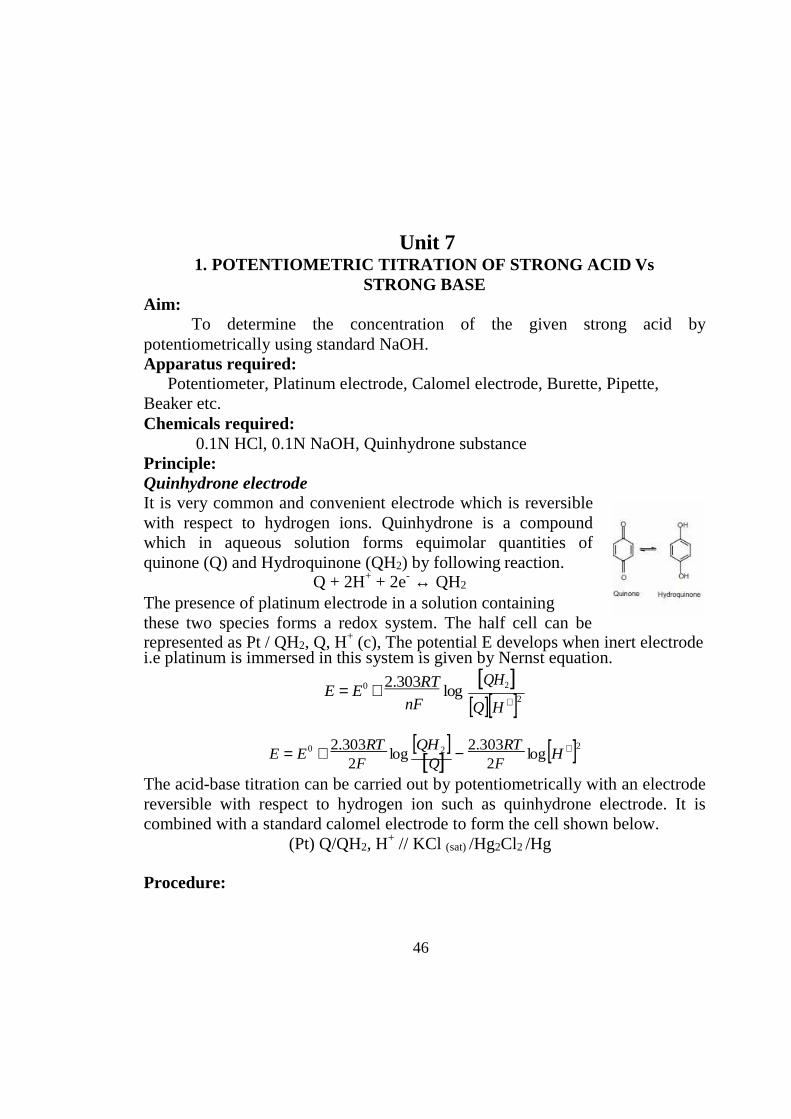
0.1N HCl, 0.1N NaOH, Quinhydrone substance Principle: Quinhydrone electrode It is very common and convenient electrode which is reversible with respect to hydrogen ions. Quinhydrone is a compound which in aqueous solution forms equimolar quantities of quinone (Q) and Hydroquinone (QH2) by following reaction.
Q + 2H+ + 2e- ↔ QH2
The presence of platinum electrode in a solution containing these two species forms a redox system. The half cell can be represented as Pt / QH2, Q, H+ (c), The potential E develops when inert electrode i.e platinum is immersed in this system is given by Nernst equation.
E = E0 + 2.303RT
log
nF
[QH 2 ] [Q][H + ]2
E = E0 + 2.303RT
log [QH 2 ] −
2.303RT log[H + ]2
2F [Q] 2F The acid-base titration can be carried out by potentiometrically with an electrode reversible with respect to hydrogen ion such as quinhydrone electrode. It is combined with a standard calomel electrode to form the cell shown below.
(Pt) Q/QH2, H+ // KCl (sat) /Hg2Cl2 /Hg
Procedure:
47
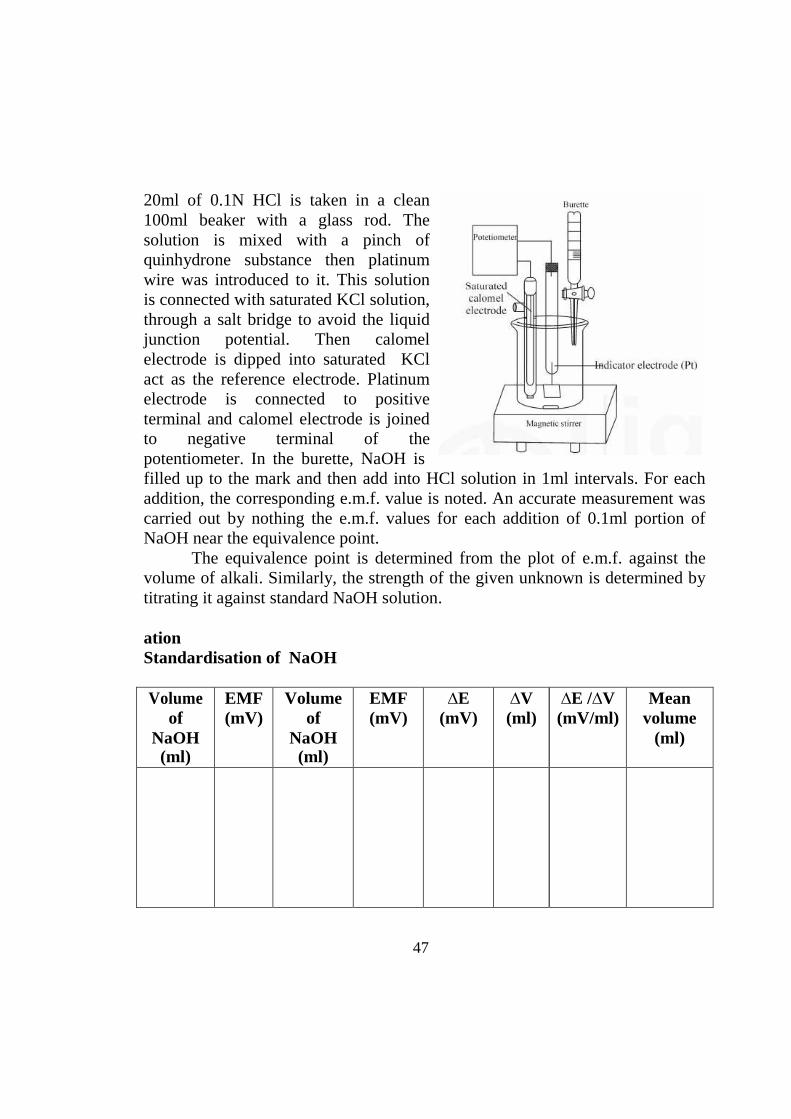
20ml of 0.1N HCl is taken in a clean 100ml beaker with a glass rod. The solution is mixed with a pinch of quinhydrone substance then platinum wire was introduced to it. This solution is connected with saturated KCl solution, through a salt bridge to avoid the liquid junction potential. Then calomel electrode is dipped into saturated KCl act as the reference electrode. Platinum electrode is connected to positive terminal and calomel electrode is joined to negative terminal of the potentiometer. In the burette, NaOH is filled up to the mark and then add into HCl solution in 1ml intervals. For each addition, the corresponding e.m.f. value is noted. An accurate measurement was carried out by nothing the e.m.f. values for each addition of 0.1ml portion of NaOH near the equivalence point.
The equivalence point is determined from the plot of e.m.f. against the volume of alkali. Similarly, the strength of the given unknown is determined by titrating it against standard NaOH solution.
ation Standardisation of NaOH
Volume
of NaOH (ml)
EMF (mV)
Volume of
NaOH (ml)
EMF (mV)
∆E (mV)
∆V (ml)
∆E /∆V (mV/ml)
Mean volume
(ml)
48
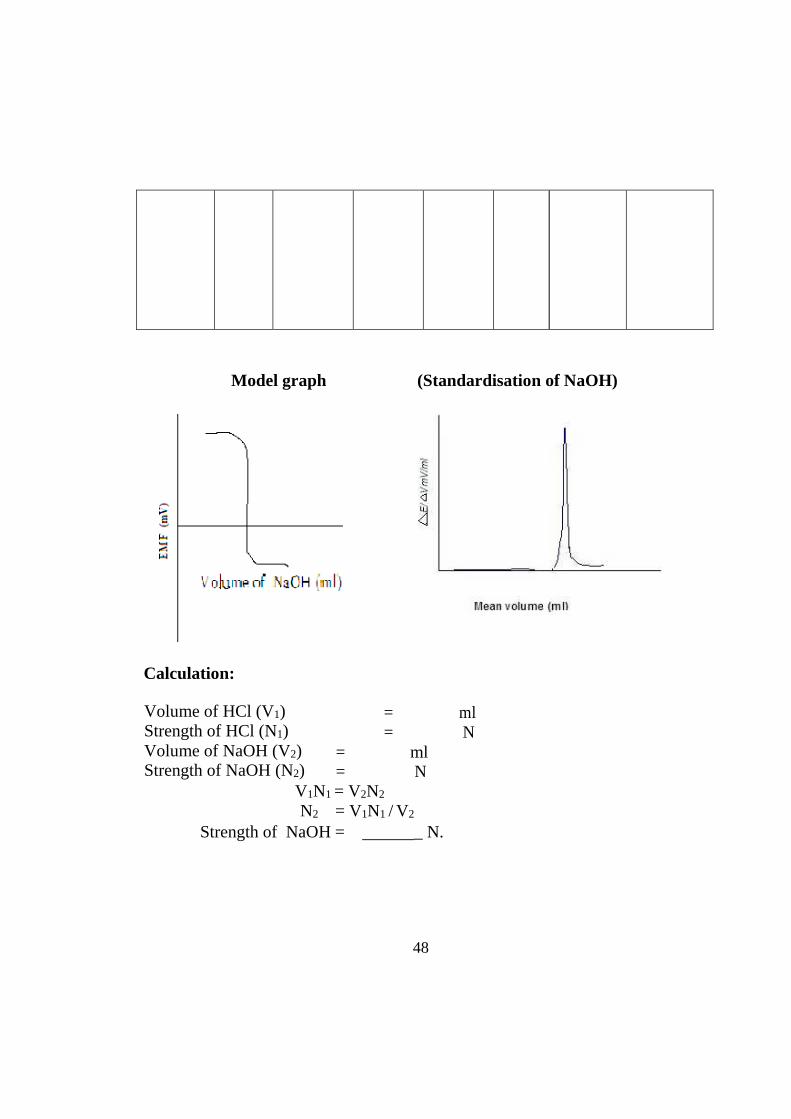
Model graph (Standardisation of NaOH)
Calculation:
Volume of HCl (V1) = ml Strength of HCl (N1) = N Volume of NaOH (V2) = ml Strength of NaOH (N2) = N
V1N1 = V2N2
N2 = V1N1 / V2
Strength of NaOH = _ N.
49
Unknown HCl vs Std. NaOH Volume
of NaOH (ml)
EMF (mV)
Volume of
NaOH (ml)
EMF (mV)
∆E (mV)
∆V (ml)
∆E /∆V (mV/ml)
Mean volume
(ml)
50
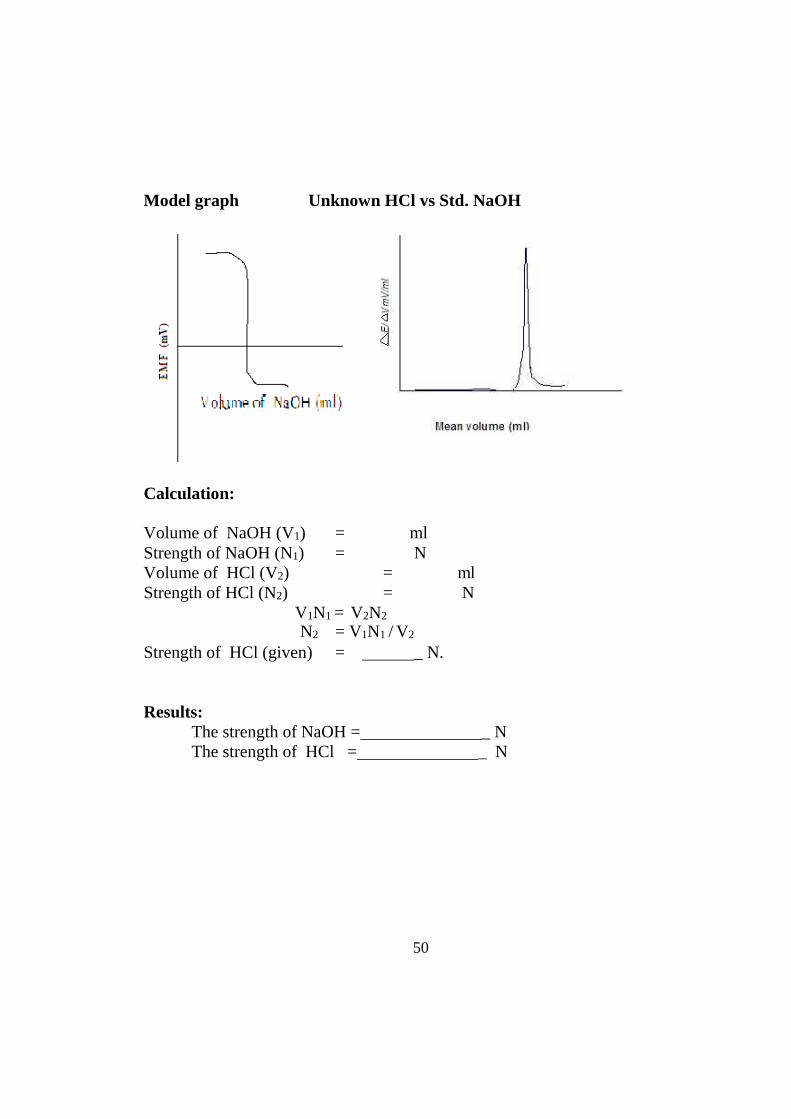
Model graph Unknown HCl vs Std. NaOH
Calculation:
Volume of NaOH (V1) = ml Strength of NaOH (N1) = N Volume of HCl (V2) = ml Strength of HCl (N2) = N
V1N1 = V2N2
N2 = V1N1 / V2
Strength of HCl (given) = _ N.
Results: The strength of NaOH = _ N The strength of HCl = _ N
51
Aim:
2. POTENTIOMETRIC TITRATION OF WEAK ACID VS STRONG BASE
To determine the concentration of the given weak acid by
potentiometrically using standard NaOH.
Apparatus required: Potentiometer, Platinum electrode, Calomel electrode, Burette, Pipette,
Beaker etc.
Chemicals required: 0.1 N HCl, 0.1N NaOH, Quinhydrone substance
Principle:
Quinhydrone electrode is very common and convenient electrode which is reversible with respect to hydrogen ions. Quinhydrone is a compound which in aqueous solution forms equimolar quantities of quinone (Q) and Hydroquinone (QH2) by following reaction.
Q + 2H+ + 2e- ↔ QH2
The presence of platinum electrode in a solution containing these two
species forms a redox system. The half cell can be represented as Pt / QH2, Q, H+ (c ). The potential, E develops when an inert electrode i.e. platinum is immersed in this system is given by Nernst equation,
E = E0 + 2.303RT
log
nF
[QH 2 ]
[Q][H + ]2
E = E0 + 2.303RT
log [QH 2 ] −
2.303RT log[H + ]2
2F [Q] 2F
The acid base titration can be carried out by potentiometrically with an electrode reversible with respect to hydrogen ion such as quinhydrone electrode. It is combined with a standard calomel electrode to form the cell shown below.
(Pt) Q/QH2, H+ // KCl (sat) /Hg2Cl2 /Hg
52
Procedure: 20ml of 0.1N of CH3COOH is taken in a clean 100ml beaker with a glass
rod. The solution is mixed with a pinch of quinhydrone substance then platinum wire was introduced to it. This solution is connected with saturated KCl solution, through a salt bridge to avoid the liquid junction potential. Then calomel electrode was dipped into saturated KCl act as the reference electrode. Platinum electrode is connected to positive terminal and calomel electrode is joined to negative terminal of the potentiometer. From the burette, NaOH is filled up to the mark and then add into CH3COOH solution in 1ml internals. For each addition, the corresponding e.m.f. value was noted. From the e.m.f. values the range of equilibrium point is known. An accurate measurement is carried out by noting the e.m.f. values for each addition of 0.1ml portion of NaOH near the equivalence point.
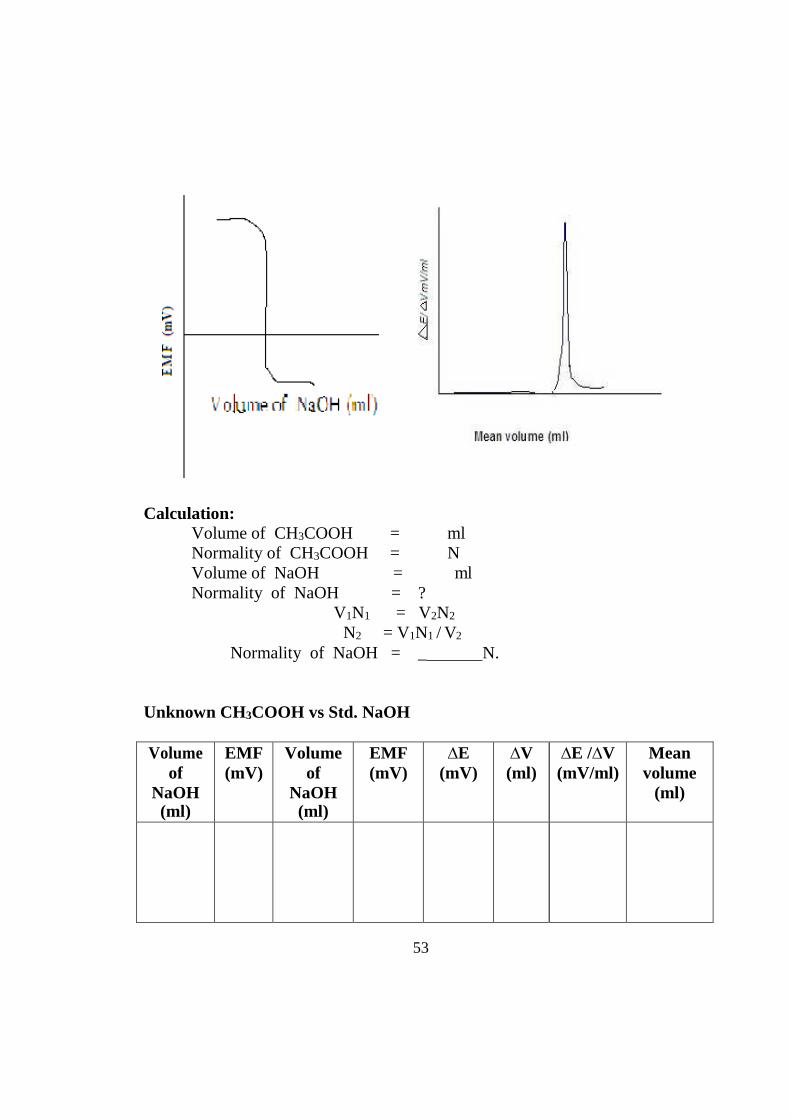
The equivalence point is determined from the plot of e.m.f. against the volume of alkali. Similarly, the strength of the given unknown is determined by titrating it against standard NaOH solution.
Observation: Standardisation of NaOH
Volume
of NaOH (ml)
EMF (mV)
Volume of
NaOH (ml)
EMF (mV)
∆E (mV)
∆V (ml)
∆E /∆V (mV/ml)
Mean volume
(ml)
53
Calculation: Volume of CH3COOH = ml Normality of CH3COOH = N Volume of NaOH = ml Normality of NaOH = ?
V1N1 = V2N2
N2 = V1N1 / V2
Normality of NaOH = _ N.
Unknown CH3COOH vs Std. NaOH
Volume of
NaOH (ml)
EMF (mV)
Volume of
NaOH (ml)
EMF (mV)
∆E (mV)
∆V (ml)
∆E /∆V (mV/ml)
Mean volume
(ml)
54
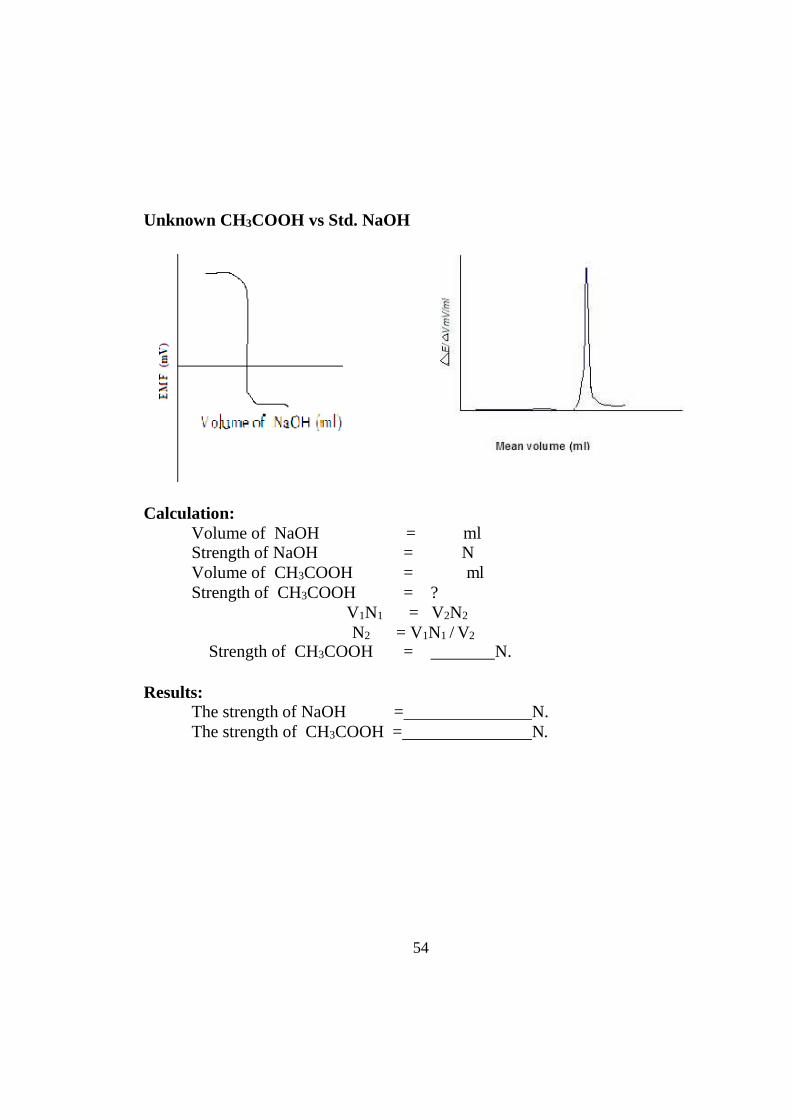
Unknown CH3COOH vs Std. NaOH
Calculation:
Volume of NaOH = ml Strength of NaOH = N Volume of CH3COOH = ml Strength of CH3COOH = ?
V1N1 = V2N2
N2 = V1N1 / V2
Strength of CH3COOH = N.
Results: The strength of NaOH = N. The strength of CH3COOH = N.
55
3+
Fe3+ Fe2+
Unit 8
1. POTENTIOMETRIC TITRATION OF FAS Vs K 2CR2O7
(REDOX REACTION)
Aim: To determine the concentration of ferrous ammonium sulphate using
standard K2Cr2O7 potentiometrically.
Apparatus required: Potentiometer, Platinum electrode, Calomel electrode, Burette, Pipette,
Beaker etc.
Chemicals required: Ferrous ammonium sulphate solution (0.1N), 0.1N K2Cr2O7 , 4N
H2SO4.
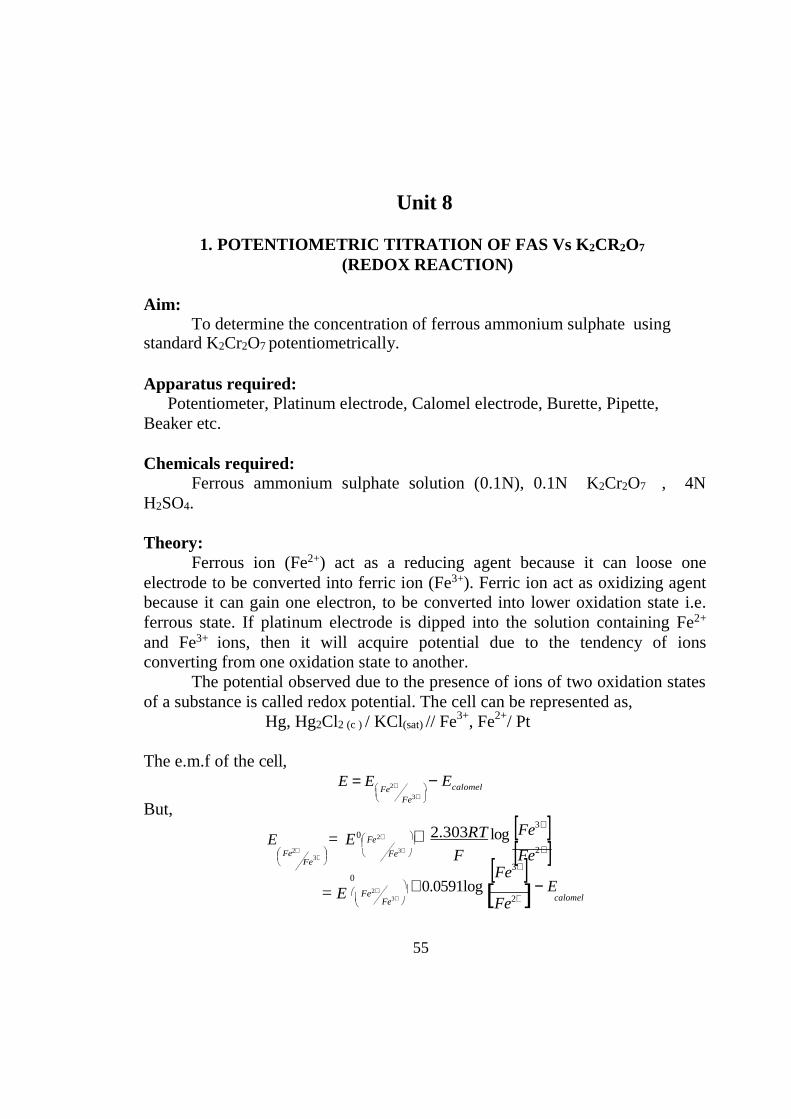
Theory: Ferrous ion (Fe2+) act as a reducing agent because it can loose one
electrode to be converted into ferric ion (Fe3+). Ferric ion act as oxidizing agent because it can gain one electron, to be converted into lower oxidation state i.e. ferrous state. If platinum electrode is dipped into the solution containing Fe2+
and Fe3+ ions, then it will acquire potential due to the tendency of ions converting from one oxidation state to another.
The potential observed due to the presence of ions of two oxidation states of a substance is called redox potential. The cell can be represented as,
Hg, Hg2Cl2 (c ) / KCl(sat) // Fe3+, Fe2+/ Pt
The e.m.f of the cell,
But,
E = E
Fe2+
− Ecalomel
Fe3+
E = E0
Fe2+
+ 2.303RT log [Fe3+ ]
Fe2+
Fe Fe3+
0
F [Fe2+ ] [Fe3+ ]
= E Fe2+
+ 0.0591log [ ]− E
calomel
56
3+
3+
when K2Cr2O7 is added [Fe2+] decreases and Fe3+ increases and as a result, the e.m.f. of cell also increases.
At the end point, there is sudden increase of e.m.f. because of complete oxidation of Fe2+ ions to Fe3+ ions. At half equivalence point [Fe2+] = [Fe3+] ∴ log 1= 0 Hence,
E = E0 Fe
2+ − E
cell Fe3+ calomel
E = E0 Fe
2+
− 0.246
Fe at 25°C
Procedure:
Ecell + 0.246 = E Fe2+
Fe
Standardization of K2Cr 2O7
20 ml of 0.1N of ferrous ammonium sulphate solution is pipetted out into clean 100 ml beaker and 20ml of 4N H2SO4 is added to it. Then platinum
electrode is dipped into the solution, which is connected to positive terminal of the potentiometer, calomel electrode [reference electrode] is dipped into
saturated KCl solution, which is joined to negative terminal of the potentiometer. In the burette, the K2Cr2O7 is filled upto the mark and then add into
ferrous ammonium sulphate solution with 1ml interval. The e.m.f value is recorded to corresponding volume of K2Cr2O7 solution. The saturated KCl solution is connected to the acidified ferrous ammonium sulphate solution to avoid the liquid junction potential.
A rough titration is carried out by adding 1ml of aliquot of the titrant and the e.m.f. of the cell is measured after each addition of K2Cr2O7. The volume of the titrant giving the maximum change of e.m.f. per aliquot of ‘X’ noted. The content of the beaker is poured out. The beaker together with electrode is rinsed with distilled water. The titration is repeated with a fresh 20ml of FAS solution before noting the cell e.m.f. The titrant is continued with 0.1 ml aliquot of the titrant until a volume of (V+2) ml of the titrant.
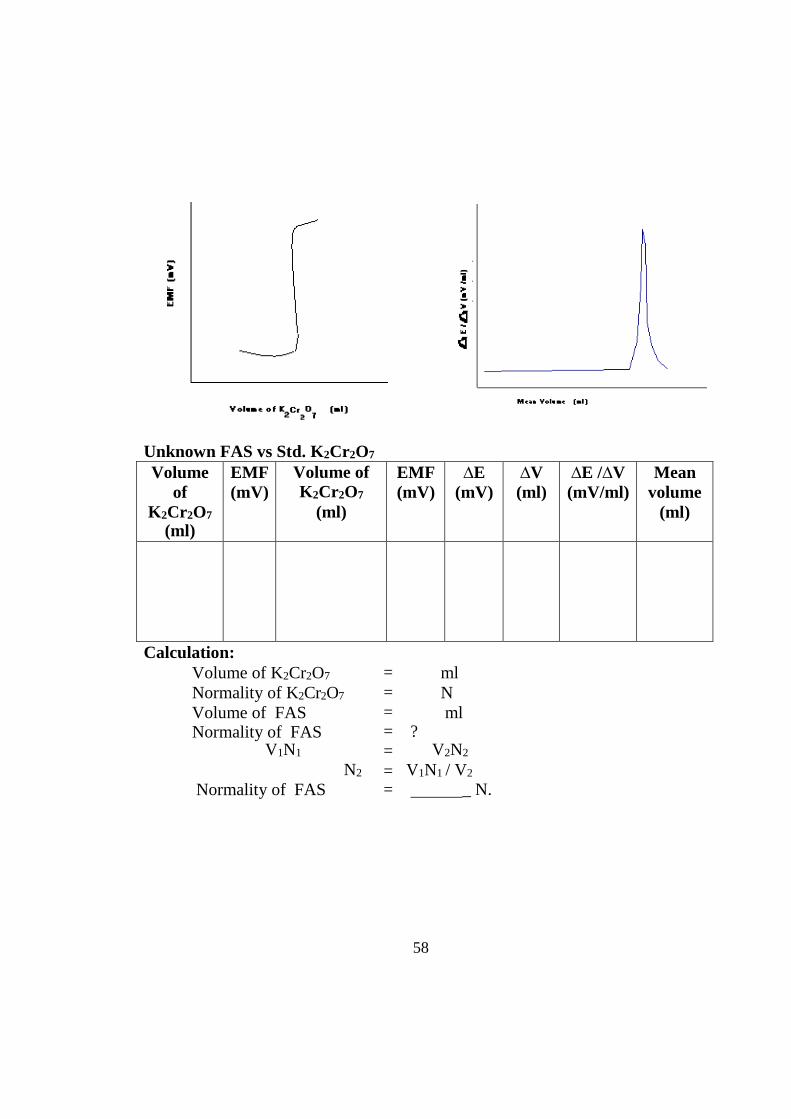
A graph is plotted with cell e.m.f. against volume of titrant added. The steepest portion of the curve corresponding to the end point. To obtain a more accurate end point, a graph change of e.m.f. per 0.1ml of the titrant against mean volume of titrant is plotted. The resulting curve has a maximum at the end point. The same above find procedure is adopted for determining FAS solution. Observation:
57
Standardization of K2Cr 2O7
Volume of K 2Cr 2O7
(ml)
EMF (mV)
Volume of K 2Cr 2O7
(ml)
EMF (mV)
∆E (mV)
∆V (ml)
∆E /∆V (mV/ml)
Mean volume (ml)
Calculation:
Volume of FAS Normality of FAS
= =
ml N
Volume of K2Cr2O7
Normality of K2Cr2O7
= =
?
ml
V1N1 = V2N2
N2 = V1N1 / V2
Normality of K2Cr2O7 = _ N. Model graph
Standardisation of K2Cr 2O7
58
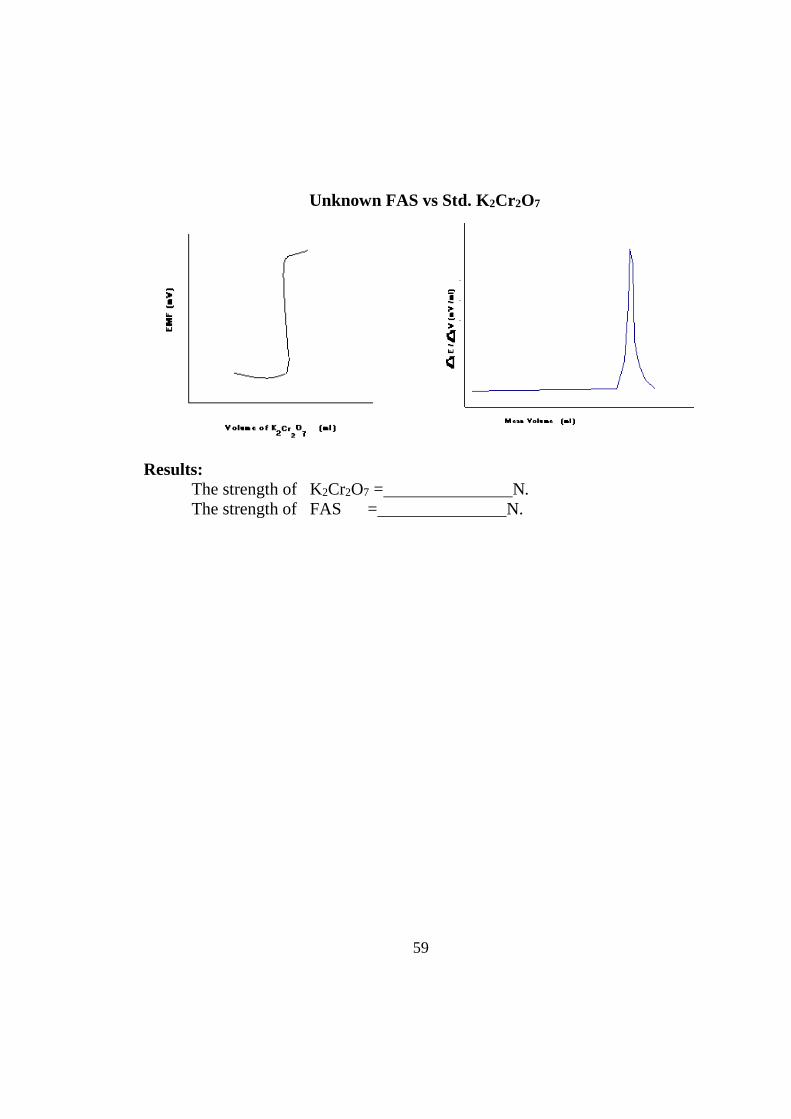
Unknown FAS vs Std. K2Cr 2O7
Volume of
K 2Cr 2O7
(ml)
EMF (mV)
Volume of K 2Cr 2O7
(ml)
EMF (mV)
∆E (mV)
∆V (ml)
∆E /∆V (mV/ml)
Mean volume
(ml)
Calculation: Volume of K2Cr2O7
Normality of K2Cr2O7
Volume of FAS Normality of FAS
= = = =
?
ml N ml
V1N1 = V2N2
Normality of FAS
N2 = =
V1N1 / V2
_ N.
59
Unknown FAS vs Std. K2Cr 2O7
Results:
The strength of K2Cr2O7 = N. The strength of FAS = N.
60
2. POTENTIOMETRIC TITRATION OF FAS Vs KMNO 4
(REDOX REACTION)
Aim: To determine the strength of ferrous ammonium sulphate solution using
standard solution of KMnO4 by potentiometry.
Apparatus required: Potentiometer, Platinum electrode, Calomel electrode, Burette, Pipette,
Beaker etc.
Chemicals required: Ferrous ammonium sulphate solution (0.1N), 0.1N KMnO4, H2SO4
Principle:
The potential of the metal electrode in a solution of its own ions at 25°C is given by the expression,
E = E0 + 0.0591
log Cm+ n
where E0 is standard electrode potential of the metal n is the valency of the ions and Cm+ is the ionic concentration. For an oxidation and reduction system the potential determining factor is
the ratio of the concentration of the oxidized and reduced forms of certain ionic species. For the reaction,
Oxidized form + ne- ↔ Reduced form The potential E acquired by the indicator electrode at 25°C is given by
E = E0 + 0.0591
log [Ox]
n [red ] The potential of the immersed electrode is thus controlled by the ratio of
these concentrations. During the oxidation of a reducing agent or reduction of an oxidizing agent the ratio and therefore the potential changes more rapidly in the vicinity of the end point of the titration. FAS vs KMnO4 titration can be followed potentiometrically and the curve obtained is characterized by the sudden change of potential at the equivalence point. The indicator electrode is
61
usually a bright platinum electrode and the half cell used along with this is the calomel electrode. Procedure:
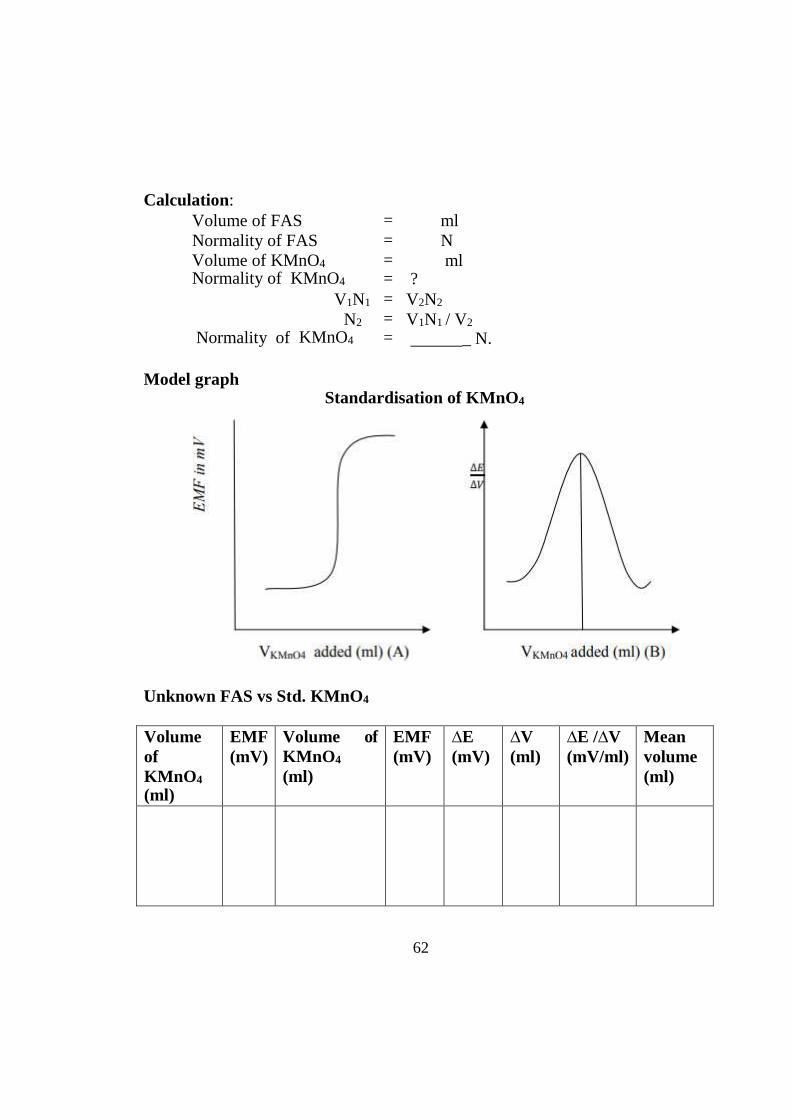
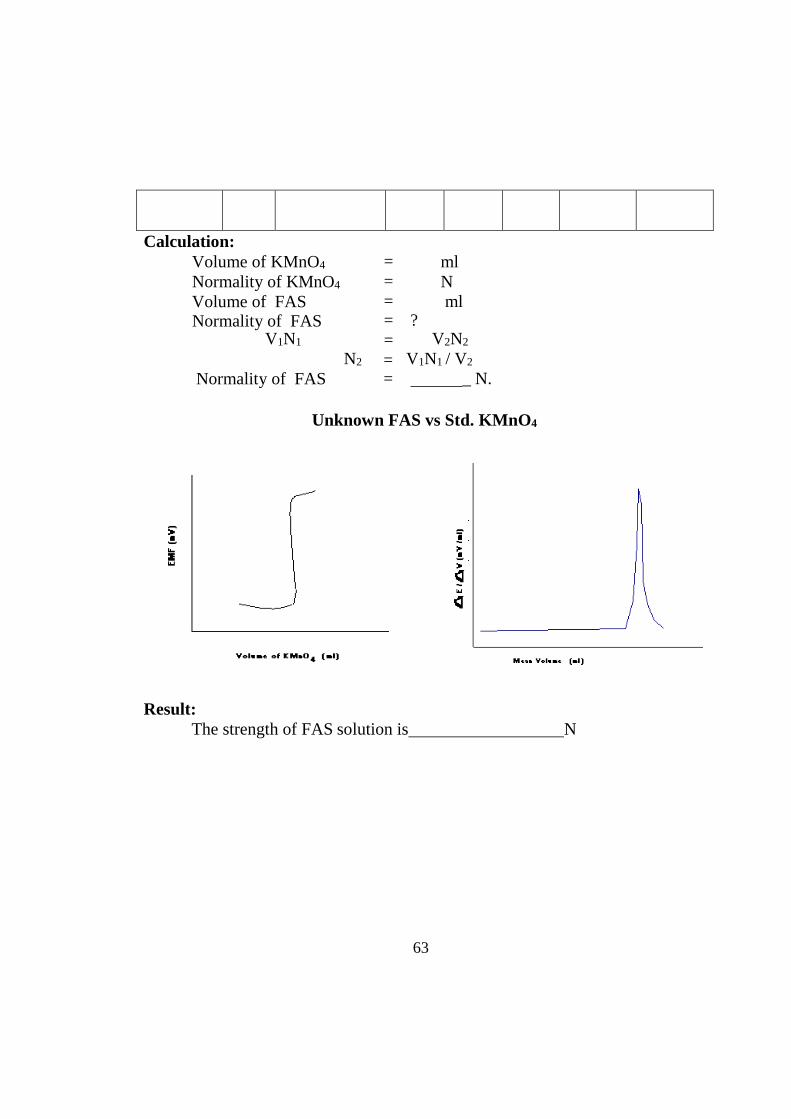
20 ml of the solution of FAS prepared in dilute sulphuric acid is pipetted out into a beaker. The platinum electrode is dipped in to the solution. Calomel half cell is used which is connected by means of a saturated ammonium nitrate salt bridge. Initial readings are found out. Potassium permanganate solution is taken in the burette is added in 0.5 ml fractions and the mixture is stirred well. The change in the reduction potential due to the oxidation of the ferrous sulfate is reflected in the reading. Near the endpoint, the oxidant is added in 0.2 ml fractions and the readings are noted. Few more readings are taken beyond the equivalence point and a graph is drawn the volume of KMnO4 and the potential. From the derivative graph drawn, the equivalent point of KMnO4 for 20 ml of FAS is found out and the strength of permanganate being known, the strength of the FAS solution is calculated.
Observation: Standardisation of KMnO4
Volume of KMnO 4
(ml)
EMF (mV)
Volume of KMnO 4
(ml)
EMF (mV)
∆E (mV)
∆V (ml)
∆E /∆V (mV/ml)
Mean volume (ml)
62
Calculation: Volume of FAS Normality of FAS Volume of KMnO4
Normality of KMnO4
= = = =
?
ml N ml
Normality of
V1N1
N2
KMnO4
= = =
V2N2
V1N1 / V2
_ N.
Model graph Standardisation of KMnO4
Unknown FAS vs Std. KMnO4
Volume of KMnO 4
(ml)
EMF (mV)
Volume of KMnO 4
(ml)
EMF (mV)
∆E (mV)
∆V (ml)
∆E /∆V (mV/ml)
Mean volume (ml)
63
Calculation: Volume of KMnO4
Normality of KMnO4
Volume of FAS Normality of FAS
= = = =
?
ml N ml
V1N1 = V2N2
Normality of FAS
N2 = =
V1N1 / V2
_ N.
Unknown FAS vs Std. KMnO4
Result: The strength of FAS solution is N
64
Unit 9 1. POTENTIOMETRIC TITRATION OF SIMPLE HALIDES
Aim: To find out the strength of the given halide solution by potentiometric
titration using standard silver nitrate solution.
Apparatus required: Silver electrode, Standard Calomel electrode, Potentiometer etc.
Principle:
Silver ionizes to give Ag ↔ Ag+ + e-
E = E0 + RT
log (C ) nF
The following cell is constructed, Hg, Hg2Cl2, KCl (salt) // Ag+/ Ag
Eobs = E – E1
Where E1 is the potential of the SCE E = E0 +
RT log [Ag + ]− E
F 1
Therefore when the halide is added to the system, eg., KCl is added, Ag+ is removed as AgCl.
Procedure:
20 ml of KCl solution is taken in the beaker and a clean Ag electrode is kept in contact with the solution by dipping. The silver electrode is connected to the potentiometer. The half cell is connected with the standard calomel electrode by means of ammonium nitrate salt bridge. The initial readings are noted and silver nitrate is added in small quantities with stirring. The e.m.f is determined after each addition. Near the end point silver nitrate is added in 0.2 ml fractions.
Graph was plotted for Eobs against the volume of silver nitrate and from the derivative graph end point is noted and the strength of KCl is determined.
Result:
The strength of KCl solution = ---------------- N
65
2. POTENTIOMETRIC TITRATION OF MIXTURE OF HALIDES
Aim: To determine the strength of the halides in a mixture using standard silver
nitrate solution.
Apparatus required: Silver electrode, Standard calomel electrode, Potentiometer etc.
Principle:
A mixture of iodide and chloride may be titrated with AgNO3 solution potentiometrically using a silver electrode. The first point of the inflection is the equivalence point of iodide ions and the second is that for chlorine ion reaction. The indicator electrode must be reversible to the halides and silver electrode serves this purpose. The following cell is constructed,
Pt, Hg/Hg2Cl2(S), KCl// Ag+ / Ag (E1) (E) Eobs = E – E1
= E0 + RT
log[Ag + ]− E F 1
Therefore when AgNO3 is added to the system, e.g. KCl, KI etc., AgCl and AgI is formed which in turn dissociates to produce Ag+ ions and this becomes reversible to the silver electrode.
Procedure:
The cell is set up and connections are made carefully, calomel electrode is used as the other half cell along with ammonium nitrate salt bridge. At the beginning of the titration calomel electrode is positive, while the silver electrode dipping in the mixture of halides is negative. When all the iodide ions have been precipitated as AgI, the first equivalent point is noted and the electrode terminals are reversed indicated by change in sign of electrode potential such that the silver electrode becomes positive when the titration is being continued. 20 ml of the mixture of the halides is taken in a beaker and the clean silver electrode is immersed in the solution. The e.m.f reading are taken as the volume of silver nitrate added. The addition causes the e.m.f to change and consequently the
66
e.m.f changes are measured. The addition of silver nitrate is carefully done such that the equivalence points are clearly found out.
The volume of silver nitrate is plotted in a graph against the e.m.f and the first derivative graph of Eobs vs volume of silver nitrate is made. Two maxima are observed, one for the iodide and the other for the chloride ion. Knowing the strength of silver nitrate, the strength of halides can be calculated.
Results: Strength of iodide ion in the mixture = N Strength of chloride ion in the mixture = _ N
67
Block-4
Chemical Kinetics and Spectrophotometric method
68
Block-4 Chemical Kinetics and Spectrophotometric method
CHEMICAL KINETICS
Chemical kinetics is the branch of chemistry that deals with the rates or velocity, at which a chemical reaction occurs and also the factors affecting the rates. The word “kinetic” means the movement or change; here it refers to the velocity of a reaction, which is the change in the concentration of a reactant or a product with time. Kinetic investigation of a reaction is usually carried out with two main objectives in mind.
1. Analysis of the sequence of elementary reactions leading to the overall
reaction. i.e. To arrive at the plausible reaction mechanism. 2. Determination of absolute rate of the reaction.
69
Reactants →Products
This equation indicates that as the reaction proceeds, reactants are consumed and products are formed. Consequently, the progress of the reaction can be followed by monitoring the change in the concentration of reactants (decrease) or products (increase).
The study of chemical kinetics includes the determination of rate of
reaction. The velocity or rate of reaction provides very useful information regarding nature and mechanism of chemical reaction. A chemical reaction essentially involves the breaking of existing chemical bonds and formation of new bonds. The formation of a bond liberates energy while the breaking of a bond requires absorption of energy. Like other forms of energy, the chemical energy may be converted into heat energy. The heat energy may be released or absorbed when new substances are formed from the reacting substances. Thus the energy change during most of the chemical reactions is measured in terms of heat released or absorbed.
Some reactions are very fast. The rate of such reactions is so high that it cannot be easily determined in ordinary laboratory, life time of such reaction is being counted in terms of seconds or fraction of seconds.
There are some reactions which are found to be very slow so that no detectable change would be observed in the course of days or months. Therefore it will not be practically possible to study these two extreme types of chemical reaction in ordinary laboratory. There are some processes which are having measurable velocity of reaction and are accessible in laboratory.
Rate of reaction
The rate of a chemical reaction at a given temperature may depend on the concentration of one or more reactants and products. The representation of rate of reaction in terms of concentration of the reactants is known as rate law. It is also called as rate equation or rate expression.
The rate of chemical reaction is the rate at which the concentration of
reacting substances vary with time and it is denoted by dc
dt
The rate of reaction is proportional to concentration of reactant. Therefore
− dc α C dt
70
dc/dt=KC K = rate constant. The negative sign shows that the concentration of reactants are decreasing with time. If dx is the very small change in the concentration of reactant with respect to small interval of time, dt at that instant then the rate of reaction =
Concentration of product dx is increasing with dt.
dx .
dt
Order of reaction The number of reacting molecules whose concentration alters as a result
of chemical change is termed as order of reaction. The reactions are classified as first order, second order and third order depending upon the number of molecules undergoing change is one, two or three respectively. It is found that all the molecules represented in chemical equation of a reaction do not determine the rate of reaction. Only those molecules whose concentration changes during the reaction determine the rate and order of reaction.
Effect of temperature on rate of reaction
The rate of a chemical reaction is sensitive to temperature. The rate of reaction increases with temperature. The energy of activation of a chemical reaction can be known from the temperature coefficient of the rate constant. The energy of activation is the minimum thermal energy which the molecules must get before they undero the reaction. It means the amount of energy which the reactants must absorb to pass over the activated energy barrier. It means reactants do not pass directly to product but they first acquire necessary energy to pass over an energy barrier known as activated state or transition state. The amount of energy which the reactants must absorb to pass over this activated energy barrier is known as activation energy. The relation between rate constant and activation energy given by Arrhenius is as below:
K = Ae −
Ea RT
where A = frequency factor, R = Gas constant, T = Absolute temperature.
∴ log K =
log K =
− Ea
2.303RT − Ea
2.303RT
+ log A + constant
71
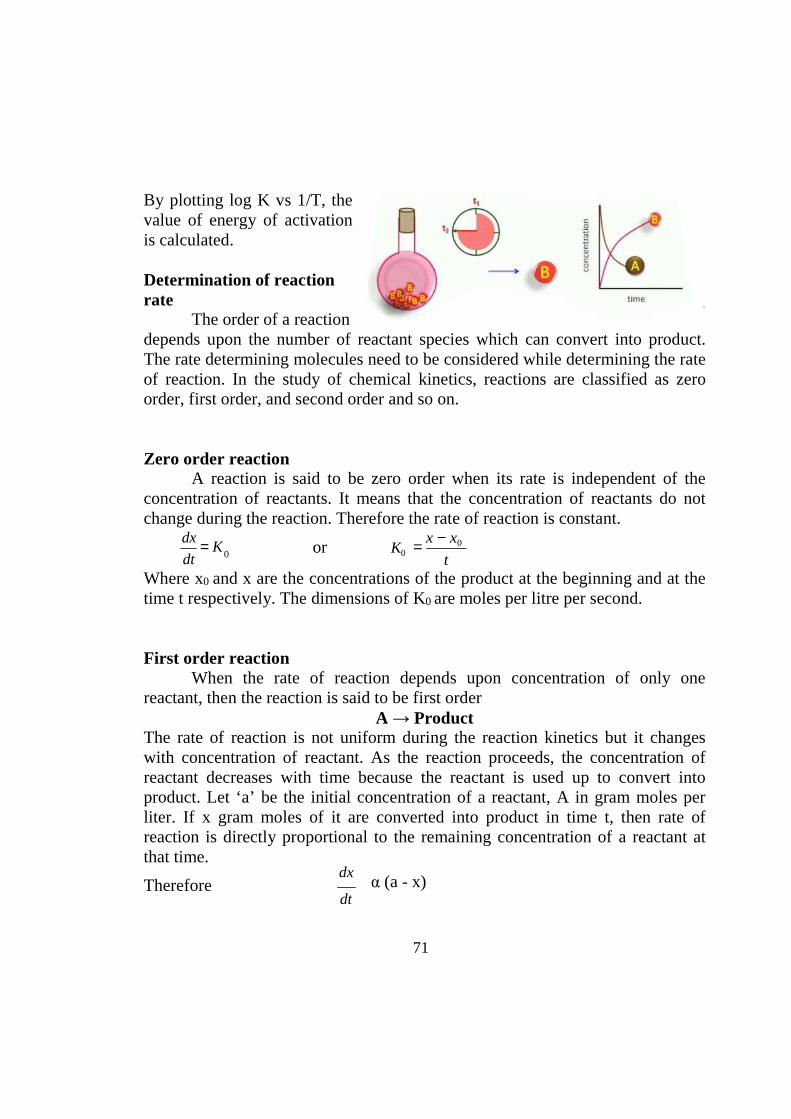
By plotting log K vs 1/T, the value of energy of activation is calculated.
Determination of reaction rate
The order of a reaction depends upon the number of reactant species which can convert into product. The rate determining molecules need to be considered while determining the rate of reaction. In the study of chemical kinetics, reactions are classified as zero order, first order, and second order and so on.
Zero order reaction A reaction is said to be zero order when its rate is independent of the
concentration of reactants. It means that the concentration of reactants do not change during the reaction. Therefore the rate of reaction is constant.
dx = K dt 0
or K0 = x − x0
t Where x0 and x are the concentrations of the product at the beginning and at the time t respectively. The dimensions of K0 are moles per litre per second.
First order reaction When the rate of reaction depends upon concentration of only one
reactant, then the reaction is said to be first order A → Product
The rate of reaction is not uniform during the reaction kinetics but it changes with concentration of reactant. As the reaction proceeds, the concentration of reactant decreases with time because the reactant is used up to convert into product. Let ‘a’ be the initial concentration of a reactant, A in gram moles per liter. If x gram moles of it are converted into product in time t, then rate of reaction is directly proportional to the remaining concentration of a reactant at that time.
Therefore dx
α (a - x) dt
72
t a − x
a − x 2.303
a
a
Integrating the equation
dx = K (a − x)
dt
x dx t
∫ (a − x) = ∫ Kdt
0 0
ln ( ) = Kt
a − x
2.303 log ( ) = Kt
∴K =
a − x
2.303 log (
a
)
For graphical method
K = 2.303 log (
a
)
∴ log (
t a − x
a
) = Kt
log a – log (a-x) = Kt
2.303
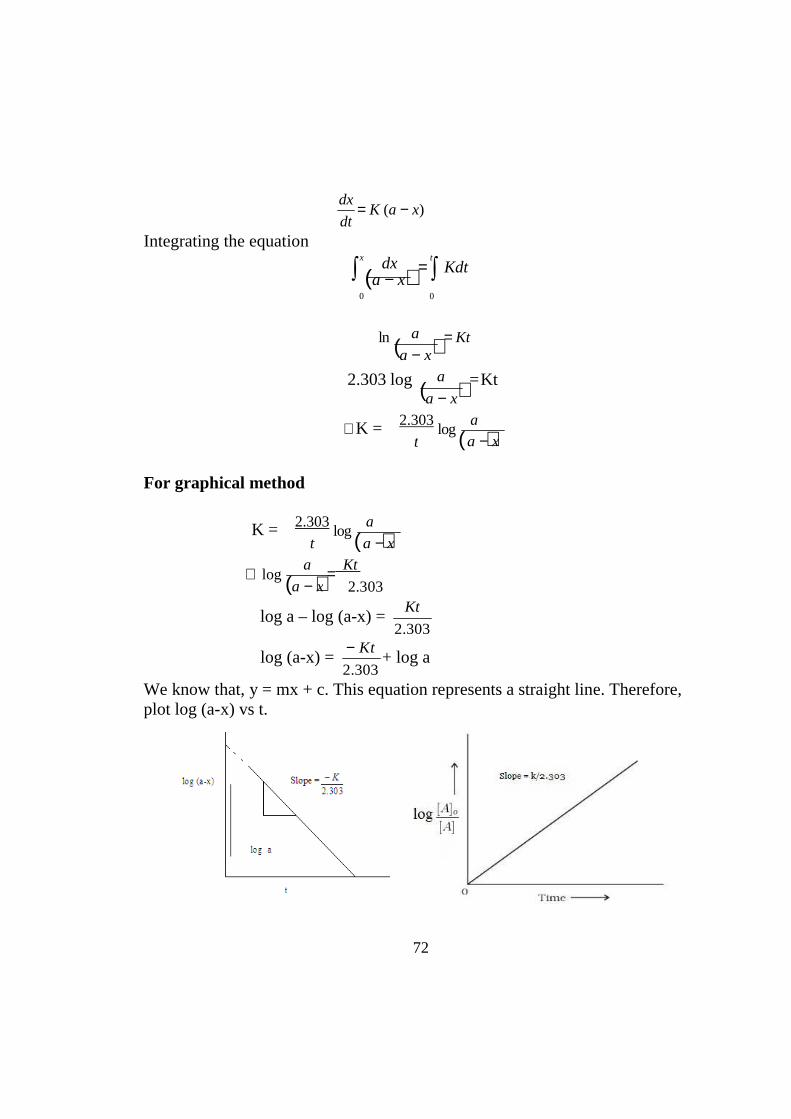
log (a-x) = − Kt
2.303 + log a
We know that, y = mx + c. This equation represents a straight line. Therefore, plot log (a-x) vs t.
73
K = -2.303 × slope (moles / litre/ minutes) Intercept = log a Therefore anti-log value of intercept will give initial concentration of the reactant.
Second order reaction (when a ≠ b) When the rate of reaction depends upon concentration of two reactants
then this reaction is said to be second order reaction. A + B → Product
The rate of reaction changes with change in concentration of two reactants. Let a and b are the initial concentrations of A and B respectively and x is
the decrease in each after time t. The remaining concentrations of A and B will be (a-x) and (b-x) respectively. The rate of reaction is directly proportional to concentration of both reactants.
∴ dx
α (a - x) (b-x) dt
dx = K (a − x)(b − x)
dt Integrating it
x dx t
∫ (a − x)(b − x) = ∫ Kdt
0 0 1 (a − x) 1 a
ln − ln a − b (b − x) a − b = Kt b
Kt = (
) ln b(a − x)
a − b a(b − x) K = 2.303
log b(a − x)
t(a − b) a(b − x) The rate constant can be calculated by using this formula when a ≠ b.
Graphical methods (when a ≠ b)
K = 2.303 log
b(a − x) t(a − b) a(b − x)
This can be written as
1
74
(a − b)K t = log b(a − x)
2.303 a(b − x) Or (a − b)K t = log
(a − x) + log b
2.303 (b − x) a
(a − b)K t − log b = log
(a − x) 2.303 a (b − x)
Or log (a − x) =
(a − b)K t + log a
(b − x) 2.303 b y = mx + c
This represents a straight line, plot
Slope = (a − b)K
2.303
log (a − x) (b − x)
vs t.
Therefore, K = Slope × 2.303
(litre / mole / unittime) (a − b)
The intercept K = log a
b
When a and b are initial concentrations of A and B, which are already known. In this way the rate constant can be determined when the concentrations of reactants, A and B are different.
Second order reaction (when a = b)
If there are two reactants A and B, but their initial concentration are equal, denoted by ‘a’
A + B → Product The rate of reaction depends upon the concentration of two reactants. Let ‘a’ gram mole be the initial concentration of reactants. A and B and x gm mole is the decrease in concentration of A and B in time t. It means x gram moles are converted into product in time t. The remaining concentration of each A and B will be (a-x)
The rate of reaction
reactants.
dx is directly proportional to the concentration of both
dt
75
0
t a a − x
t a a − x
a
0
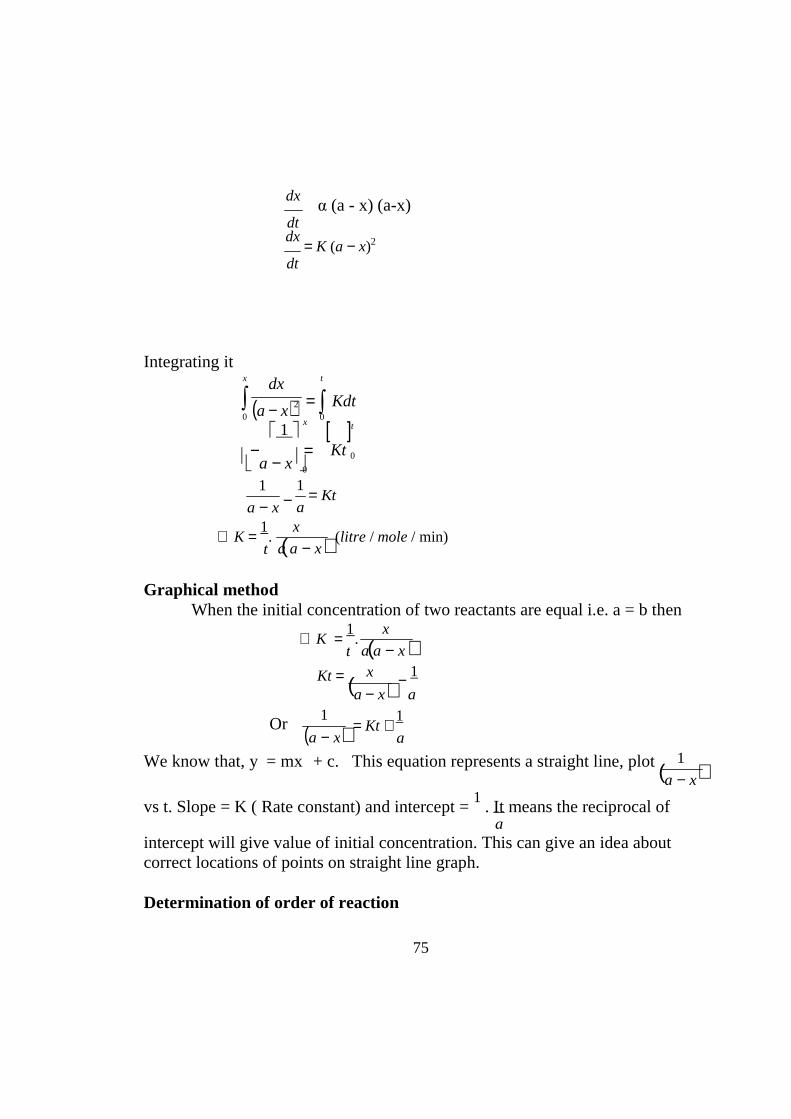
1
dx α (a - x) (a-x)
dt dx
= K (a − x)2 dt
Integrating it x dx t
∫ (a − x)2 = ∫ Kdt
0
1 x [ ]t
−
a − x =
Kt 0
1
a − x − 1
= Kt a
∴ K = 1. (
x ) (litre / mole / min)
Graphical method When the initial concentration of two reactants are equal i.e. a = b then
∴ K = 1. (
x
)
Kt = ( ) − 1
Or (
a − x a
) = Kt + 1
We know that, y = mx + c. This equation represents a straight line, plot ( ) a − x
vs t. Slope = K ( Rate constant) and intercept = 1
. It means the reciprocal of a
intercept will give value of initial concentration. This can give an idea about correct locations of points on straight line graph.
Determination of order of reaction
a − x
x
1
76
2
2
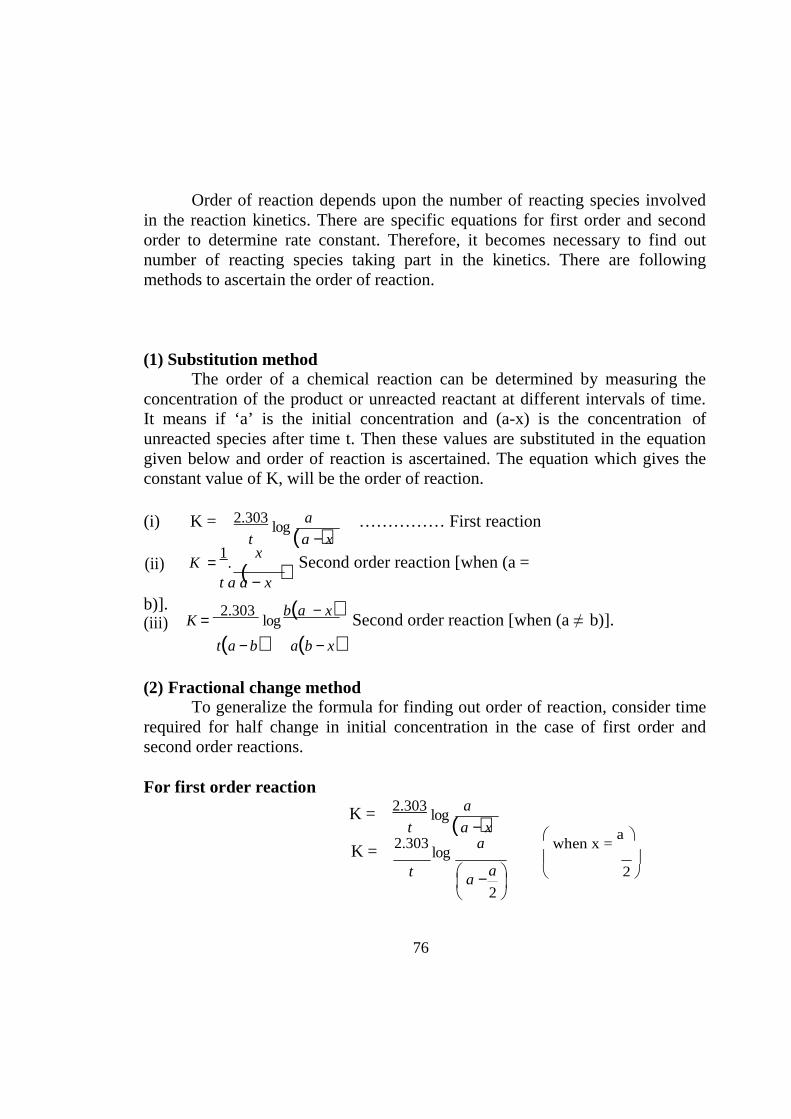
Order of reaction depends upon the number of reacting species involved in the reaction kinetics. There are specific equations for first order and second order to determine rate constant. Therefore, it becomes necessary to find out number of reacting species taking part in the kinetics. There are following methods to ascertain the order of reaction.
(1) Substitution method The order of a chemical reaction can be determined by measuring the
concentration of the product or unreacted reactant at different intervals of time. It means if ‘a’ is the initial concentration and (a-x) is the concentration of unreacted species after time t. Then these values are substituted in the equation given below and order of reaction is ascertained. The equation which gives the constant value of K, will be the order of reaction.
(i) K = 2.303 log (
a
)
…………… First reaction
(ii)
t a − x
K = 1. (
x
) Second order reaction [when (a =
b)]. (iii)
t a a − x
K = 2.303
log b(a − x)
Second order reaction [when (a ≠ b)].
t(a − b) a(b − x)
(2) Fractional change method To generalize the formula for finding out order of reaction, consider time
required for half change in initial concentration in the case of first order and second order reactions.
For first order reaction
K = 2.303 log (
a
)
t a − x
K = 2.303 log
a
when x =
a
t a − a
77
2
1
2
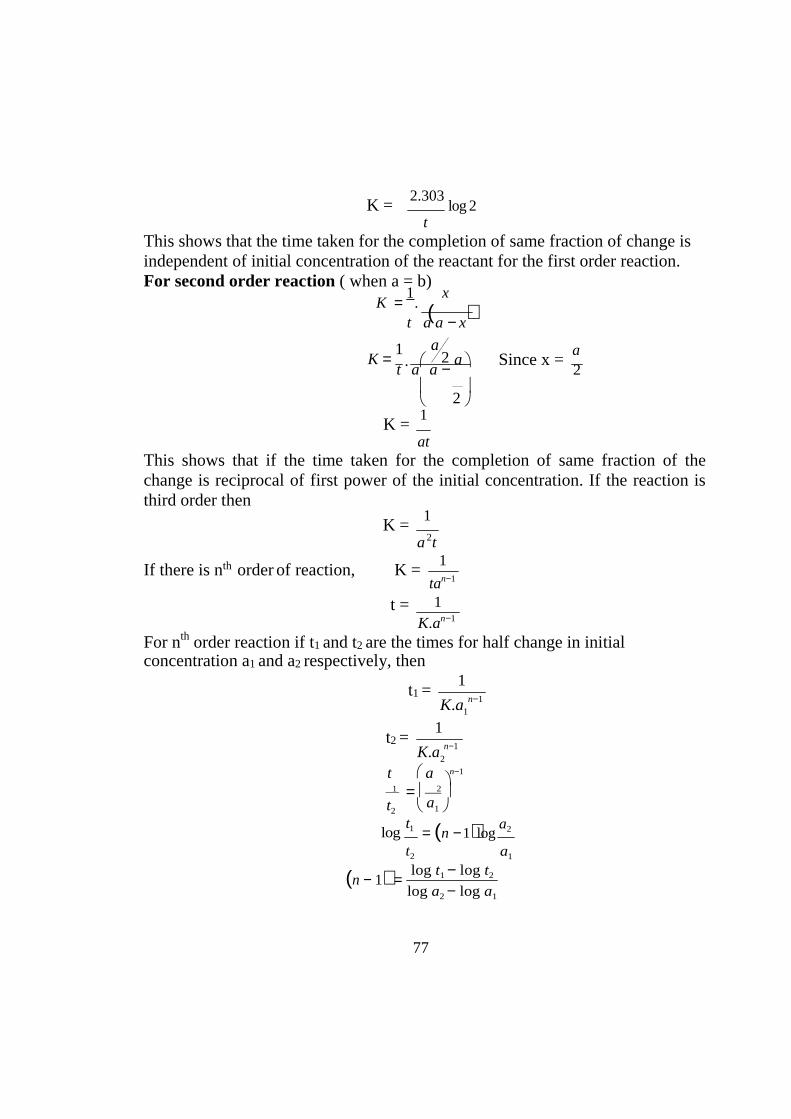
K = 2.303
log 2 t
This shows that the time taken for the completion of same fraction of change is independent of initial concentration of the reactant for the first order reaction. For second order reaction ( when a = b)
K = 1. (
x
)
K = 1
t
t a a − x
. a a −
a
Since x =
a
2
K = 1
at This shows that if the time taken for the completion of same fraction of the change is reciprocal of first power of the initial concentration. If the reaction is third order then
K = 1
a 2t
If there is nth order of reaction, K =
t =
1
tan−1
1
K.an−1
For nth order reaction if t1 and t2 are the times for half change in initial concentration a1 and a2 respectively, then
t1 = 1
K.a n−1
t2 = 1
K.a n−1
t a n−1
1 = 2 t2
log t1
t2
a1
= (n − 1)log a2
a1
(n − 1) = log t1 − log t2
log a2 − log a1
a 2
78
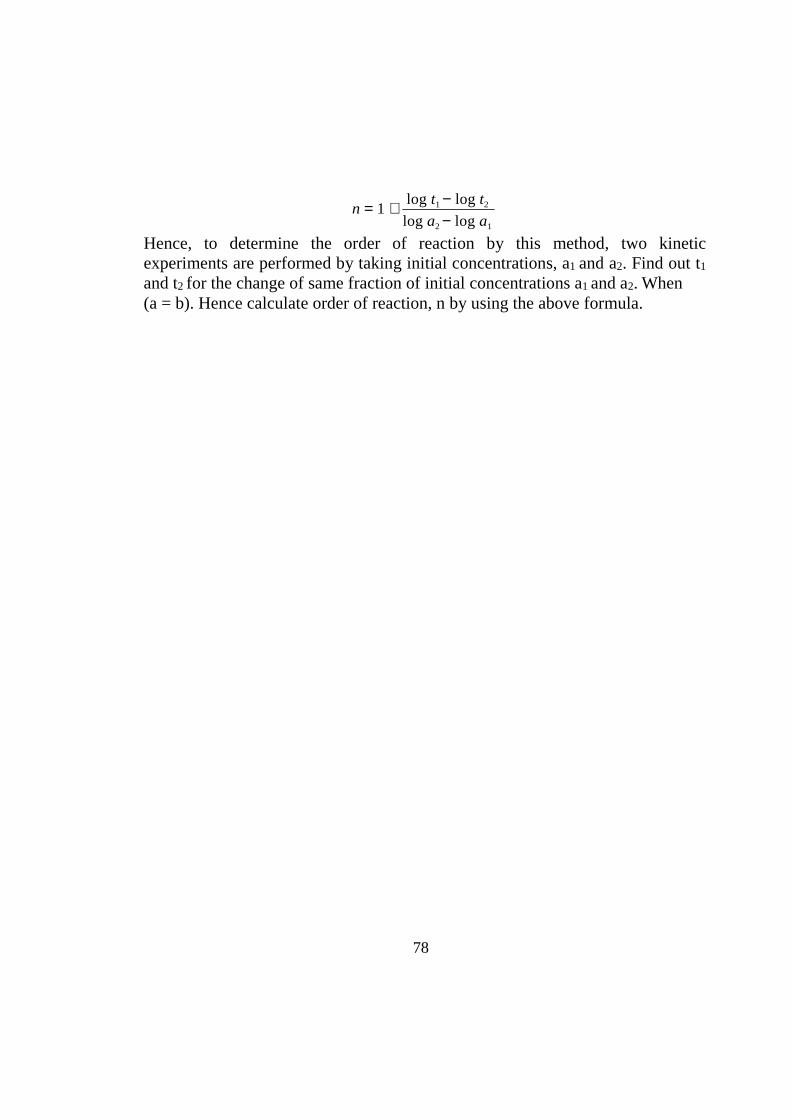
n = 1 + log t1 − log t2
log a2 − log a1
Hence, to determine the order of reaction by this method, two kinetic experiments are performed by taking initial concentrations, a1 and a2. Find out t1
and t2 for the change of same fraction of initial concentrations a1 and a2. When (a = b). Hence calculate order of reaction, n by using the above formula.
79
UNIT-10
FIRST ORDER AND SECOND ORDER KINETICS OF HYDROLYSIS OF ESTER
[ACID CATALYZED HYDROLYSIS OF AN ESTER] (FIRST ORDER KINETICS)
Aim: To find out the hydrolysis of an ester catalyzed by an acid.
Apparatus required: Conical flasks, beakers, stop-watch, burettes, pipettes, etc.
Principle:
Hydrolysis of methyl acetate ester in aqueous solution is too slow to be studied. Therefore, the reaction is catalyzed by using 0.5N HCl. The concentration of water remains practically constant. It means that the reaction is dependent only on one molecule. The reaction of this kinetics may be represented as,
CH3COOCH3 + H2O → CH3COOH + CH3OH -
dx = K [CH COOCH ][H O]
dt 3 3 2
Following the kinetic equation of first order,
K = 2.303
log
t
a
a − x where various notations have their usual significance. Since acetic acid is produced as a result of hydrolysis, the kinetics of reaction can be followed by withdrawing a fixed volume of the reaction mixture from time to time and titrating with a standard alkali. The titrate value is equivalent to the sum of the acid used as a catalyst which remains constant throughout the acetic acid produced during the reaction. The difference in the titrate values at any time after the commencement of the reaction and at the commencement gives the formation of acetic acid and hence the amount of methyl acetate hydrolysis at that instant.
Since the reaction is catalyzed by the H+ ions, the rate is approximately proportional to the concentration or more correctly to the activity of H+ ions.
80
Hence it may be assumed that rate constant of the reaction is catalyzed by equal concentration of the acids are directly proportional to the degree of dissociation of respective acids. Thus the relative strength is given by,
Relative strength = Strength of one acid
Strength of
= α1 = K1
other acid
α2 K2
where, α1 and α2 are the degrees of dissociation of two acids. K1 and K2 are the rate constants in presence of ( equinormal solution of the respective acids) equal volumes of the acids.
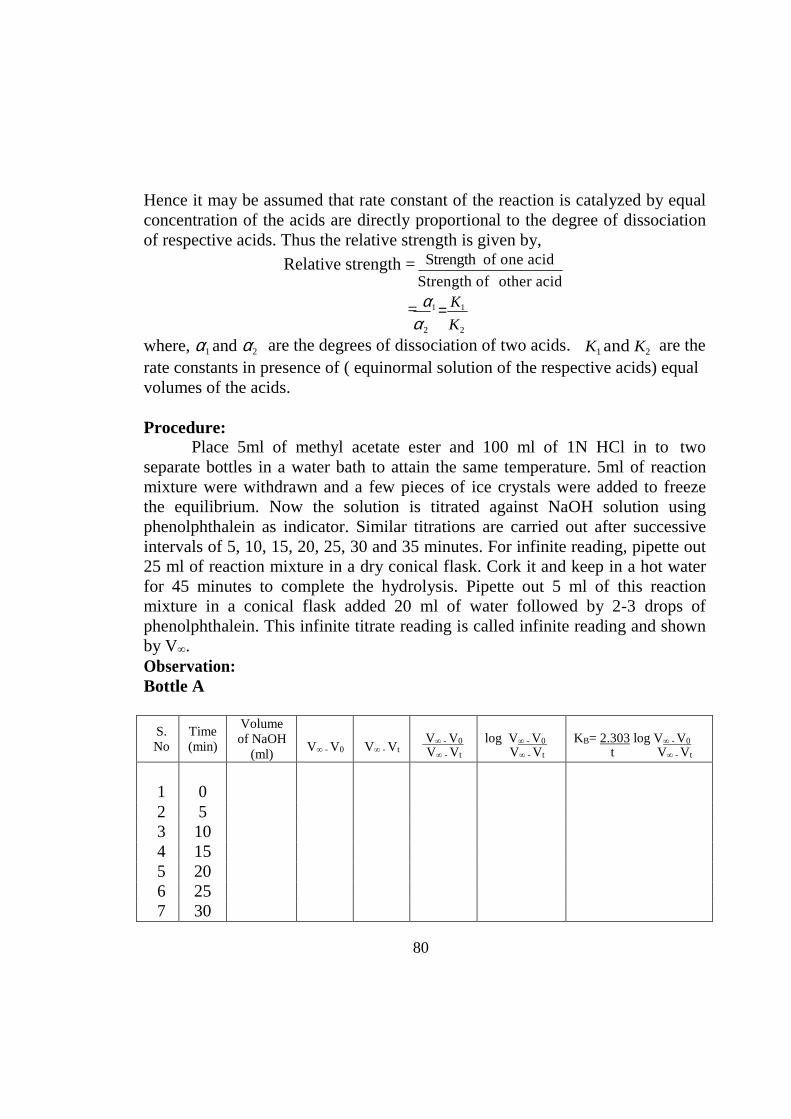
Procedure:
Place 5ml of methyl acetate ester and 100 ml of 1N HCl in to two separate bottles in a water bath to attain the same temperature. 5ml of reaction mixture were withdrawn and a few pieces of ice crystals were added to freeze the equilibrium. Now the solution is titrated against NaOH solution using phenolphthalein as indicator. Similar titrations are carried out after successive intervals of 5, 10, 15, 20, 25, 30 and 35 minutes. For infinite reading, pipette out 25 ml of reaction mixture in a dry conical flask. Cork it and keep in a hot water for 45 minutes to complete the hydrolysis. Pipette out 5 ml of this reaction mixture in a conical flask added 20 ml of water followed by 2-3 drops of phenolphthalein. This infinite titrate reading is called infinite reading and shown by V∞. Observation: Bottle A
S. No
Time (min)
Volume of NaOH
(ml)
V∞ - V0
V∞ - V t
V∞ - V0
V∞ - V t
log V∞ - V0
V∞ - V t
KB= 2.303 log V∞ - V0
t V∞ - V t
1
0
2 5 3 10 4 15 5 20 6 25 7 30
81
8 35
9 ∞
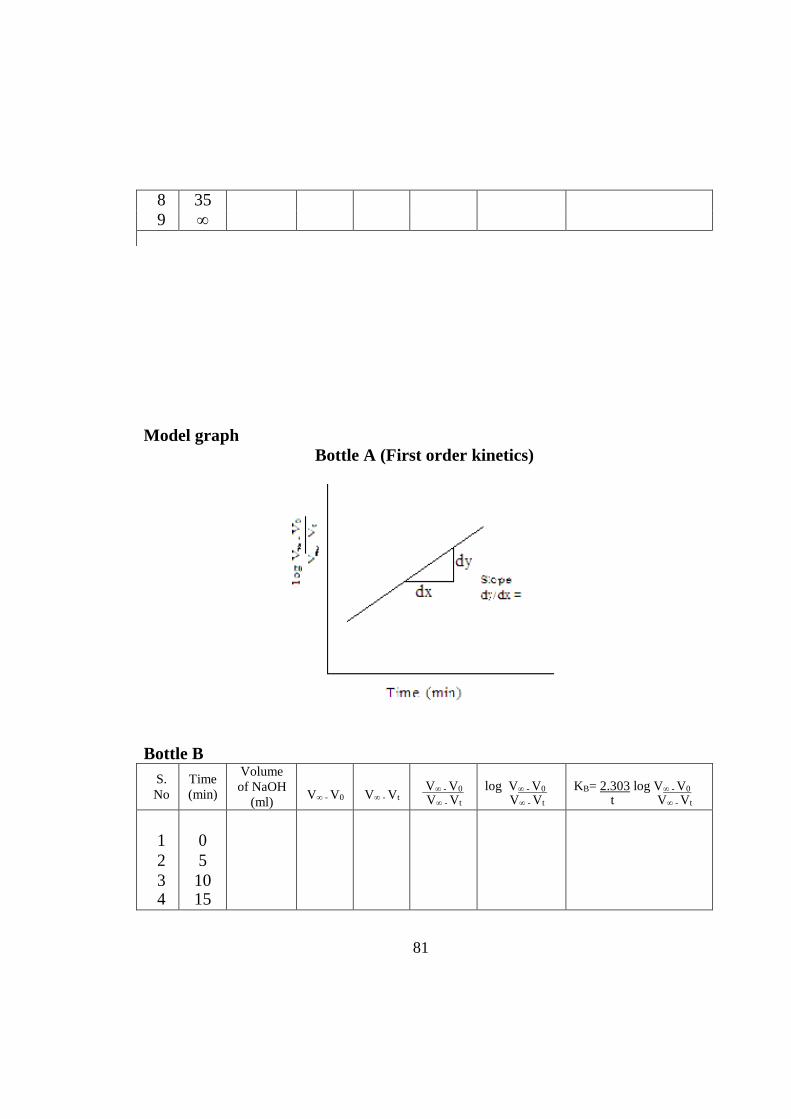
Model graph Bottle A (First order kinetics)
Bottle B S. No
Time (min)
Volume of NaOH
(ml)
V∞ - V0
V∞ - V t
V∞ - V0
V∞ - V t
log V∞ - V0
V∞ - V t
KB= 2.303 log V∞ - V0
t V∞ - V t
1 2 3 4
0 5 10 15
82
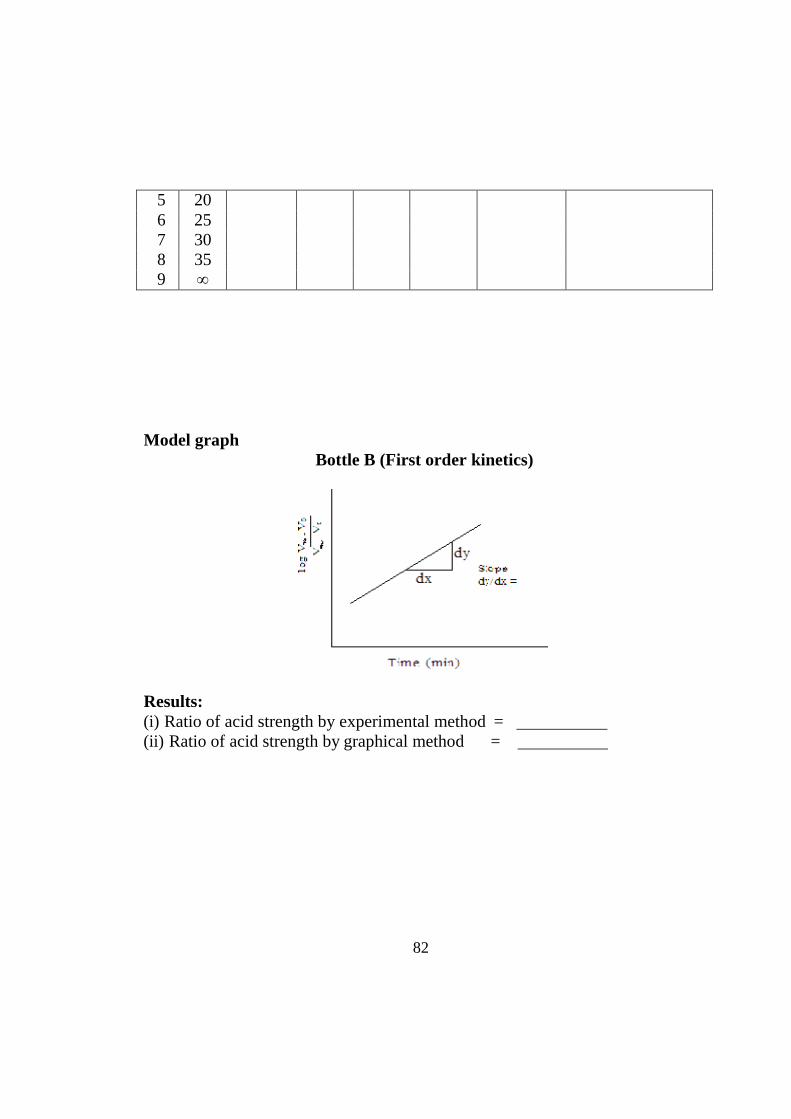
5 20 6 25 7 30 8 35 9 ∞
Model graph Bottle B (First order kinetics)
Results: (i) Ratio of acid strength by experimental method = (ii) Ratio of acid strength by graphical method =
83
t a a − x
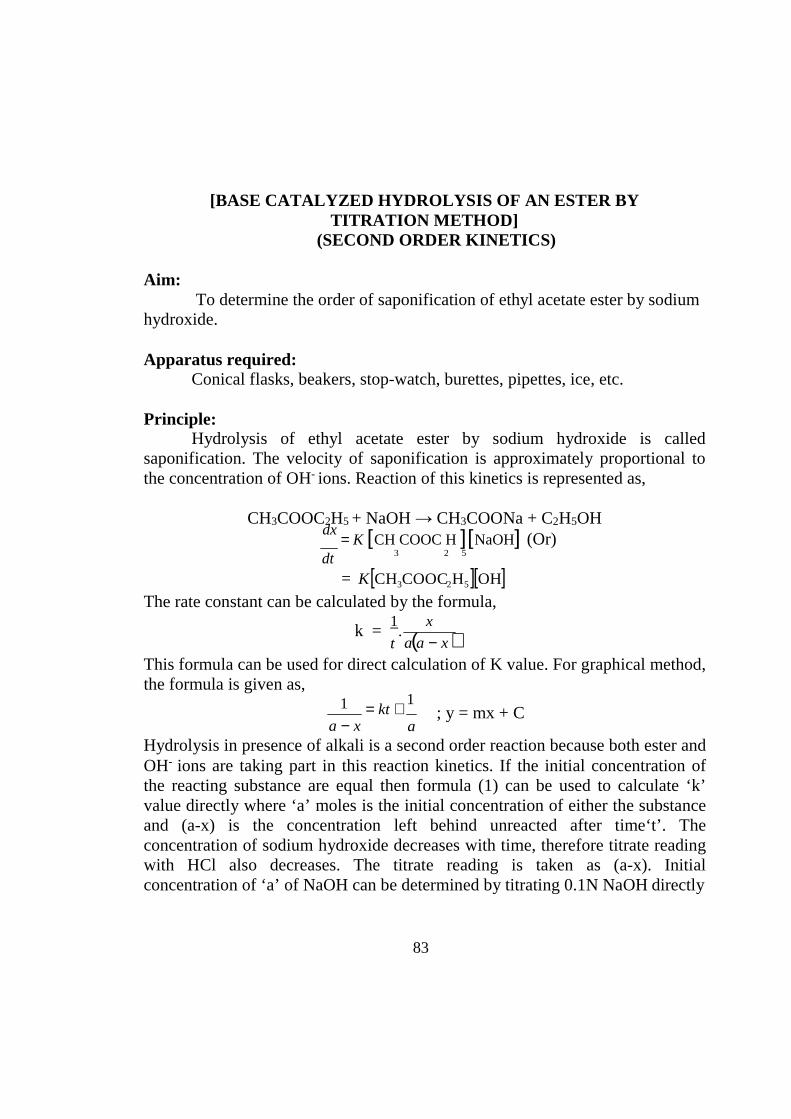
[BASE CATALYZED HYDROLYSIS OF AN ESTER BY TITRATION METHOD]
(SECOND ORDER KINETICS)
Aim: To determine the order of saponification of ethyl acetate ester by sodium
hydroxide.
Apparatus required: Conical flasks, beakers, stop-watch, burettes, pipettes, ice, etc.
Principle:
Hydrolysis of ethyl acetate ester by sodium hydroxide is called saponification. The velocity of saponification is approximately proportional to the concentration of OH- ions. Reaction of this kinetics is represented as,
CH3COOC2H5 + NaOH → CH3COONa + C2H5OH
dx = K [CH COOC H ][NaOH] (Or)
dt 3 2 5
= K[CH3COOC2H5 ][OH] The rate constant can be calculated by the formula,
k = 1. (
x
)
This formula can be used for direct calculation of K value. For graphical method, the formula is given as,
1
a − x = kt +
1
a ; y = mx + C
Hydrolysis in presence of alkali is a second order reaction because both ester and OH- ions are taking part in this reaction kinetics. If the initial concentration of the reacting substance are equal then formula (1) can be used to calculate ‘k’ value directly where ‘a’ moles is the initial concentration of either the substance and (a-x) is the concentration left behind unreacted after time‘t’. The concentration of sodium hydroxide decreases with time, therefore titrate reading with HCl also decreases. The titrate reading is taken as (a-x). Initial concentration of ‘a’ of NaOH can be determined by titrating 0.1N NaOH directly
84
with 0.1N HCl. To determine the value of ‘k’ graphically formula (2) can be employed by graph. k = Slope
Procedure:
Place 50 ml M/40 ethyl acetate solution and 50 ml of M/40 NaOH solution are taken in separate flasks and kept in a water bath at room temperature. Now alkali is poured as rapidly as possible into ester solutions. After 3 minutes, pipette out 10 ml of reaction mixture in ice cold water and 20 ml M/40 HCl, the excess of acid is back titrated by means of standard alkali solution. Similar titrations are performed after successive intervals of 5, 10, 15, 20, 25 minutes. Also the infinite reading is taken by warming the solution and titrating in the same way (V∞). Let the titrate value at anytime ‘t’ be Vt. Titrate values will increase as the concentration of NaOH gradually falls.
Observation:
S. No
Time (min)
Volume of NaOH (ml)
V∞ - V0
V∞ - V t
V t - V0
Vt - V0
(V∞ - V0)(V∞ - V t)
K = 1 Vt - V0
t (V∞ - V0)(V∞ - V t) litremol-1min-1
1 0
2 5
3 10
4 15
5 20
6 25
7 30
8 35
9 ∞
85
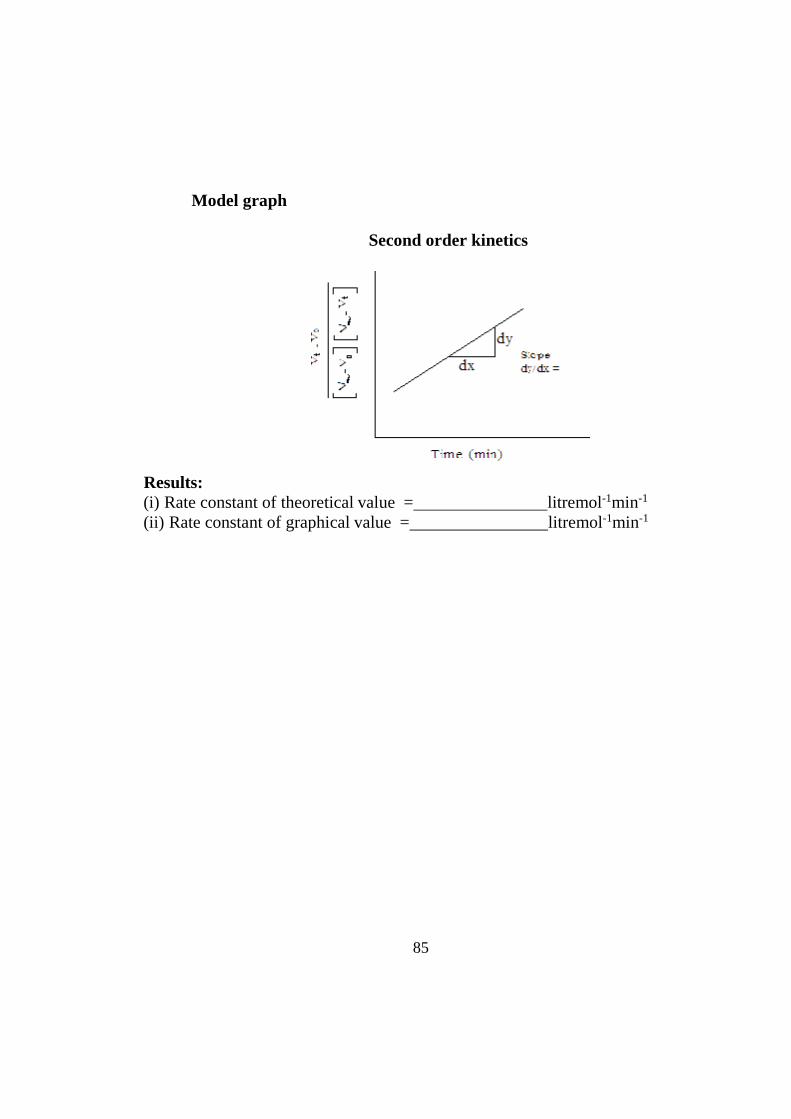
Model graph
Second order kinetics
Results: (i) Rate constant of theoretical value = litremol-1min-1
(ii) Rate constant of graphical value = litremol-1min-1
86
UNIT-11
KINETICS OF HYDROLYSIS OF ESTER BY CONDUCTIVITY METHOD
Aim: To determine the basic hydrolysis of ethyl acetate by conductivity
measurements.
Apparatus required: Conductivity Bridge with cell, conical flasks, beakers, stop-watch,
burettes, pipettes, volumetric flasks, etc.
Chemicals: N/20 NaOH, N/100 NaOH, N/20 CH3COOH , N/100 CH3COONa, N/5
ethyl acetate, phenolphthalein indicator.
Principle: Basic hydrolysis of ethyl acetate is a second order reaction as acetate and
hydroxyl ions are taking part in reaction kinetics. It means rate of reaction depends upon these two species. The fast moving OH- ions are replaced by CH3COO- ions and therefore conductivity decreases with time. Conductivity depends upon concentration and speed of ions therefore initial concentration changes slowly and hence there is change in conductivity value. Hence formula for second order reaction can be used to calculate rate constant. This type of reaction kinetics is called saponification.
Procedure: (1) Pipette out 20 ml of N/20 CH3COOH solution in a conical flask. Add to it 2-
3 drops of phenolphthalein indicator and titrate with N/20 NaOH solution. Note down the volume of NaOH required to neutralise acetic acid.
(2) Pipette out 20 ml of N/20 CH3COOH solution again in a 100 ml volumetric flask. Add to it the required volume of N/20 NaOH solution to neutralise completely the acid solution. Dilute the neutralised solution to 100 ml so that normality of CH3COONa becomes equal to N/100 . Note down its conductivity as C∞ .
87
a − x a
(3) Find out conductivity of N/100 NaOH solution and name it as C0.
(4) To start reaction kinetics, pipette out 5 ml of N/5 ethyl acetate and 25 ml distiled water in a beaker. Take 20 ml of N/20 NaOH and 50 ml of distilled water in another beaker. Keep these two beakers in thermostat to attain same temperature.
(5) Mix one solution into other and start a stop watch immediately. (6) Note down conductivity values for 5 minutes interval of time upto 30
minutes.
Observation
S. No
Time (min)
Volume of NaOH (ml)
Ct - C∞
C∞ Co Co - C∞ K = 1 Co – Ct
t (Co - C∞)( Ct - C∞)
1 0
2 5
3 10
4 15
5 20
6 25
7 30
Calculation: Rate constant can be measured by
K =
1 x
t a(a − x)
where a = initial concentration, x = amount reactant converted into product in time t. As the conductivity is proportional to concentration of reactants. Therefore, a = (C0 - C∞) , x = (C0 – Ct) and (a-x) = (Ct - C∞)
K = 1
( (Co − Ct ) t Co − C∞ )(Ct − C∞ )
For graphical use the expression for second order reaction can be expressed as
( 1
) = Kt + 1
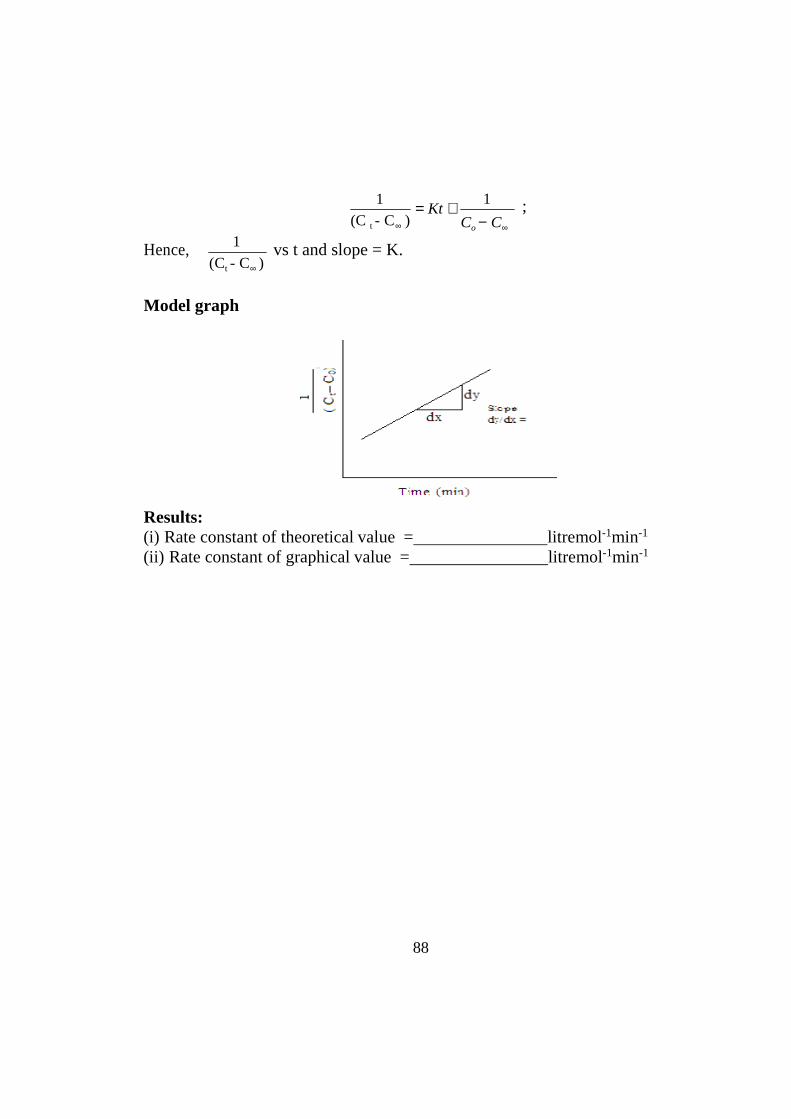
88
1
(C t - C∞ ) = Kt + 1 ;
Co − C∞
Hence, 1
(Ct - C∞ ) vs t and slope = K.
Model graph
Results: (i) Rate constant of theoretical value = litremol-1min-1
(ii) Rate constant of graphical value = litremol-1min-1
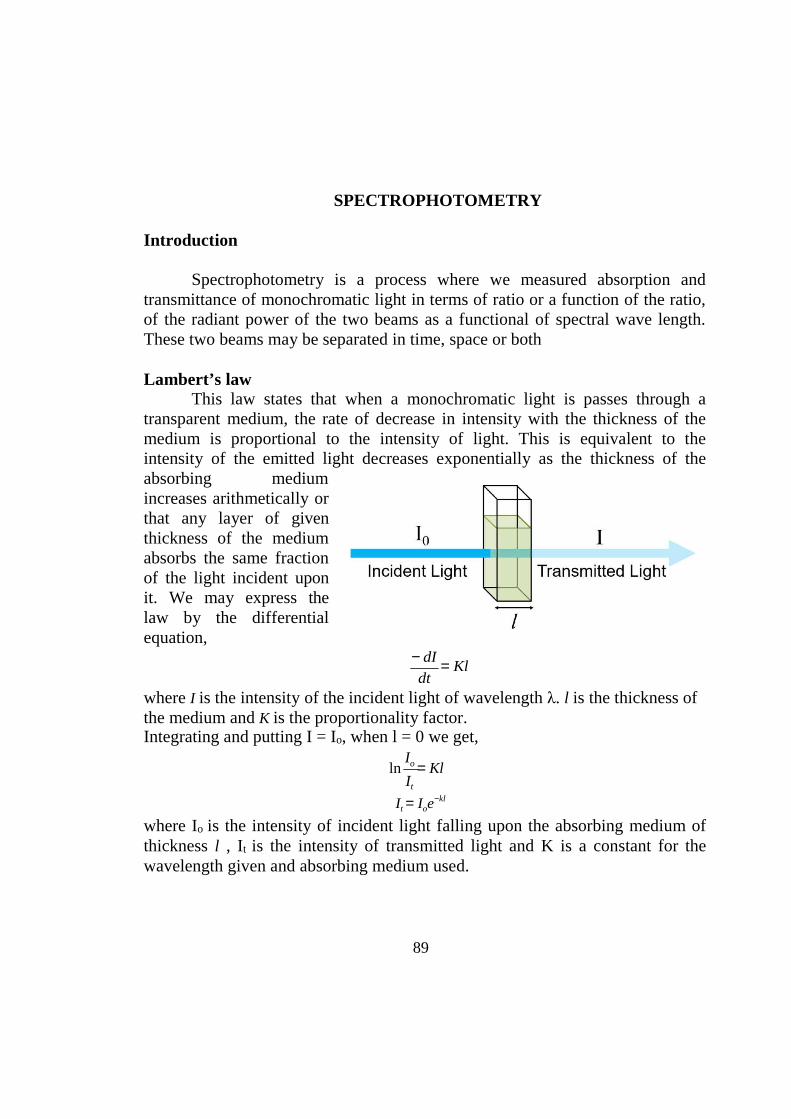
89
SPECTROPHOTOMETRY
Introduction
Spectrophotometry is a process where we measured absorption and transmittance of monochromatic light in terms of ratio or a function of the ratio, of the radiant power of the two beams as a functional of spectral wave length. These two beams may be separated in time, space or both
Lambert’s law
This law states that when a monochromatic light is passes through a transparent medium, the rate of decrease in intensity with the thickness of the medium is proportional to the intensity of light. This is equivalent to the intensity of the emitted light decreases exponentially as the thickness of the absorbing medium increases arithmetically or that any layer of given thickness of the medium absorbs the same fraction of the light incident upon it. We may express the law by the differential equation,
− dI = Kl
dt where I is the intensity of the incident light of wavelength λ. l is the thickness of the medium and K is the proportionality factor. Integrating and putting I = Io, when l = 0 we get,
ln Io = Kl It
It = Ioe−kl
where Io is the intensity of incident light falling upon the absorbing medium of thickness l , It is the intensity of transmitted light and K is a constant for the wavelength given and absorbing medium used.
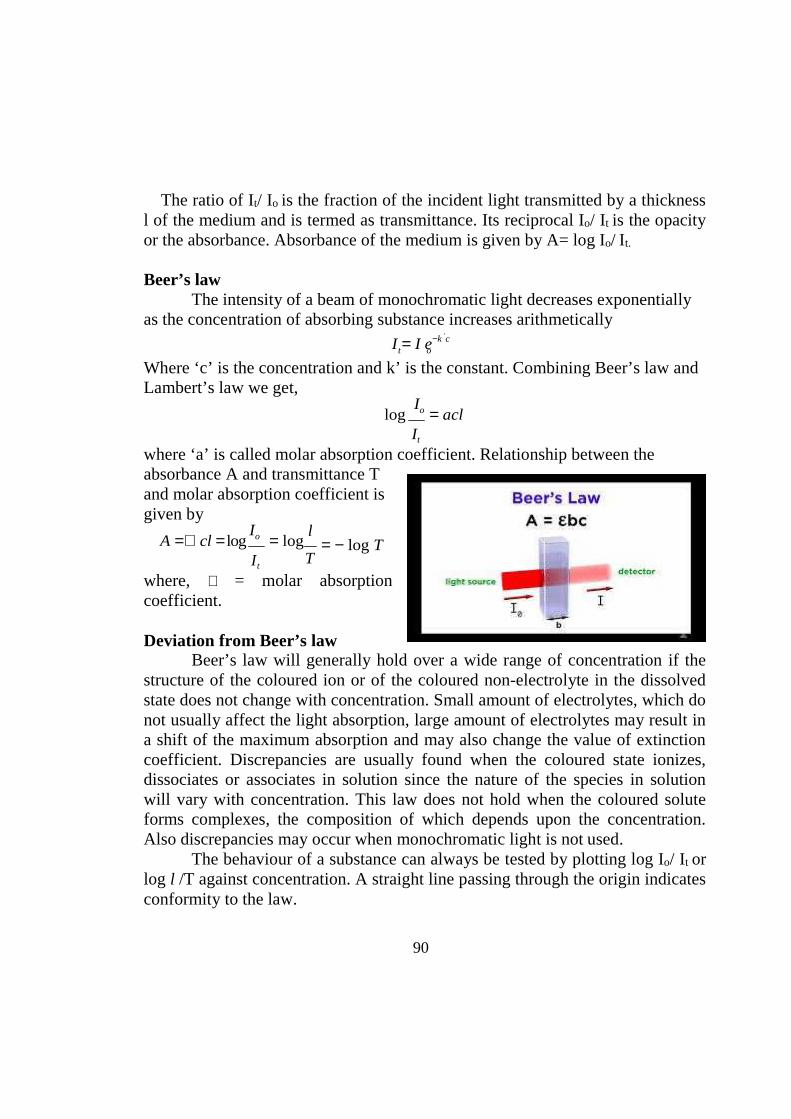
90
t o
The ratio of It/ Io is the fraction of the incident light transmitted by a thickness l of the medium and is termed as transmittance. Its reciprocal Io/ It is the opacity or the absorbance. Absorbance of the medium is given by A= log Io/ It.
Beer’s law
The intensity of a beam of monochromatic light decreases exponentially as the concentration of absorbing substance increases arithmetically
I = I e−k 'c
Where ‘c’ is the concentration and k’ is the constant. Combining Beer’s law and Lambert’s law we get,
log Io = acl It
where ‘a’ is called molar absorption coefficient. Relationship between the absorbance A and transmittance T and molar absorption coefficient is given by
A =∈ cl = log Io
It
= log l
T = − log T
where, ∈ = molar absorption coefficient.
Deviation from Beer’s law
Beer’s law will generally hold over a wide range of concentration if the structure of the coloured ion or of the coloured non-electrolyte in the dissolved state does not change with concentration. Small amount of electrolytes, which do not usually affect the light absorption, large amount of electrolytes may result in a shift of the maximum absorption and may also change the value of extinction coefficient. Discrepancies are usually found when the coloured state ionizes, dissociates or associates in solution since the nature of the species in solution will vary with concentration. This law does not hold when the coloured solute forms complexes, the composition of which depends upon the concentration. Also discrepancies may occur when monochromatic light is not used.
The behaviour of a substance can always be tested by plotting log Io/ It or log l /T against concentration. A straight line passing through the origin indicates conformity to the law.
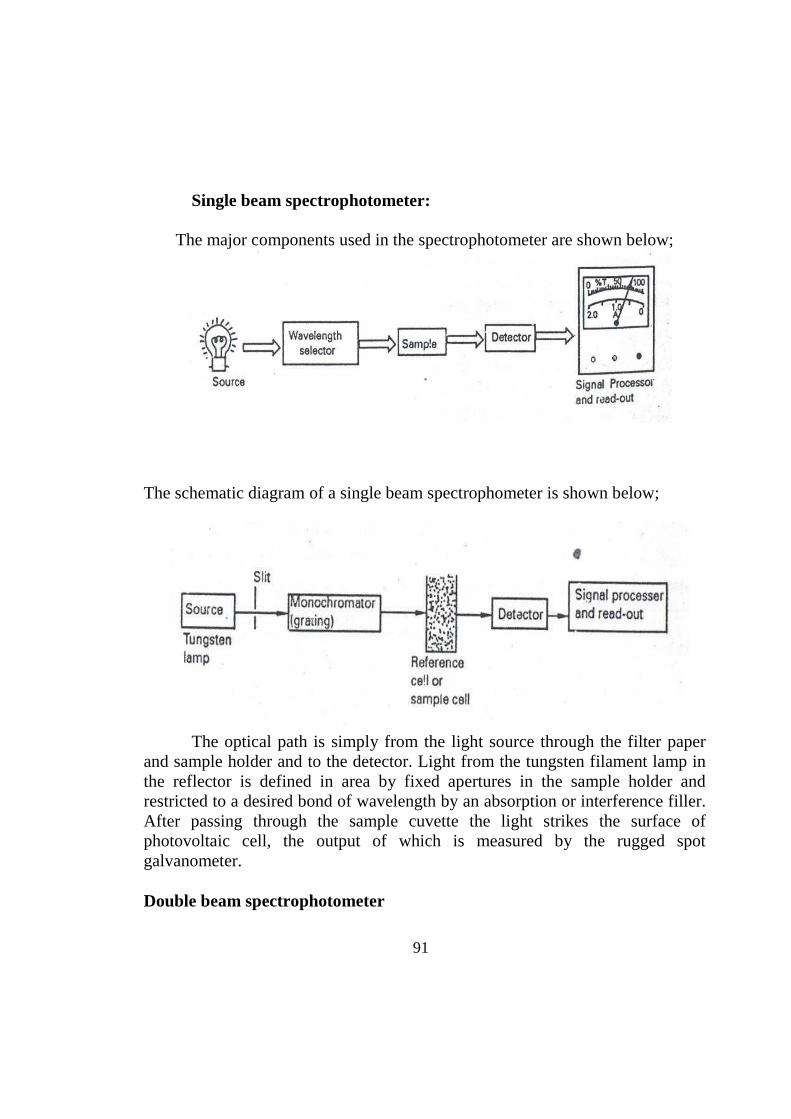
91
Single beam spectrophotometer:
The major components used in the spectrophotometer are shown below;
The schematic diagram of a single beam spectrophometer is shown below;
The optical path is simply from the light source through the filter paper and sample holder and to the detector. Light from the tungsten filament lamp in the reflector is defined in area by fixed apertures in the sample holder and restricted to a desired bond of wavelength by an absorption or interference filler. After passing through the sample cuvette the light strikes the surface of photovoltaic cell, the output of which is measured by the rugged spot galvanometer.
Double beam spectrophotometer
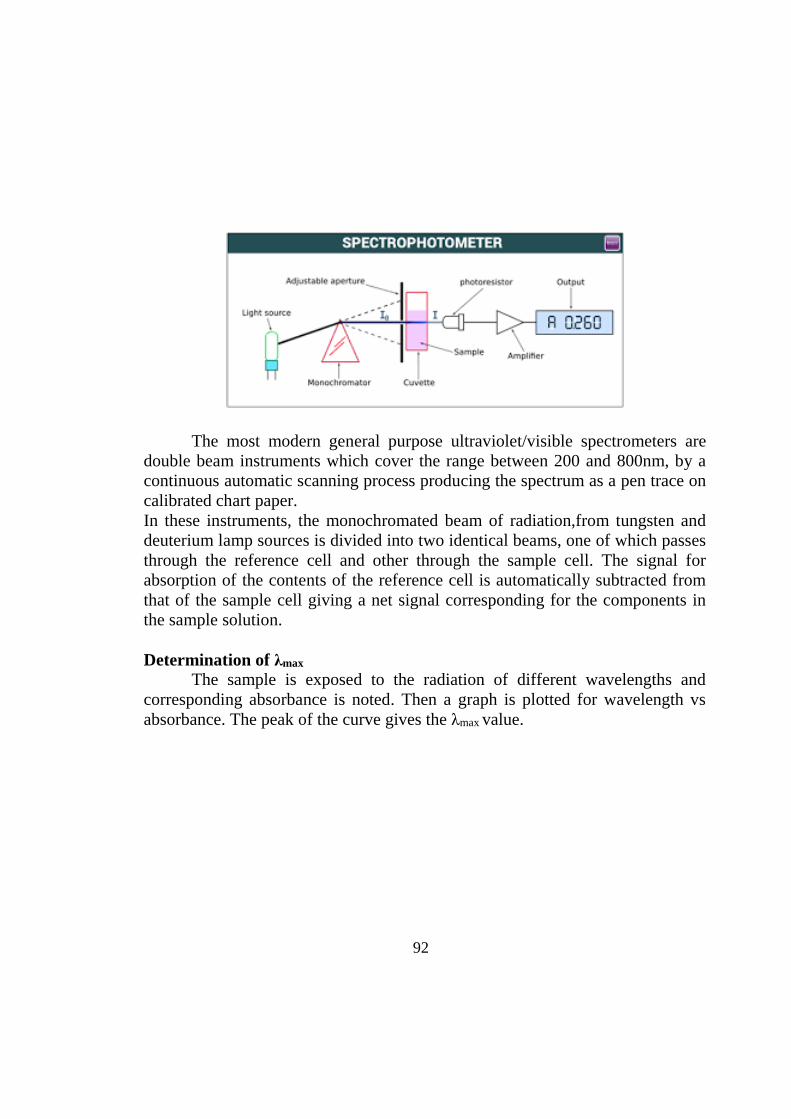
92
The most modern general purpose ultraviolet/visible spectrometers are double beam instruments which cover the range between 200 and 800nm, by a continuous automatic scanning process producing the spectrum as a pen trace on calibrated chart paper. In these instruments, the monochromated beam of radiation,from tungsten and deuterium lamp sources is divided into two identical beams, one of which passes through the reference cell and other through the sample cell. The signal for absorption of the contents of the reference cell is automatically subtracted from that of the sample cell giving a net signal corresponding for the components in the sample solution.
Determination of λmax
The sample is exposed to the radiation of different wavelengths and corresponding absorbance is noted. Then a graph is plotted for wavelength vs absorbance. The peak of the curve gives the λmax value.
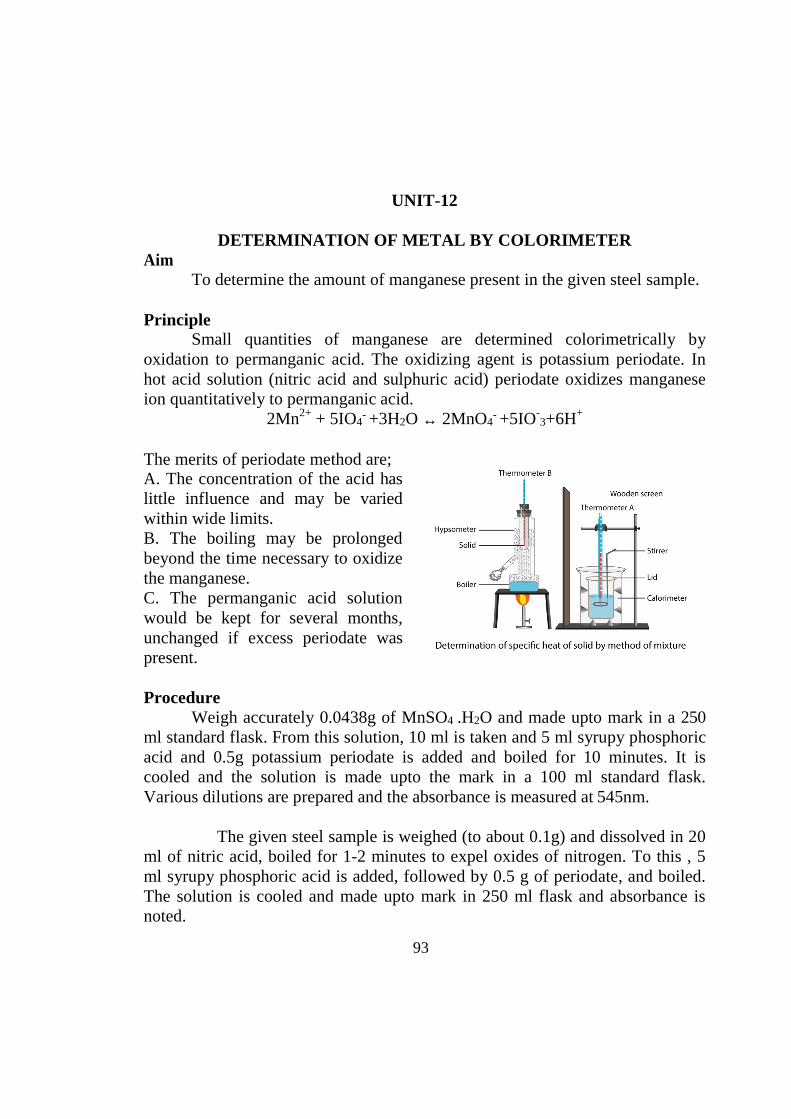
93
UNIT-12
Aim
DETERMINATION OF METAL BY COLORIMETER
To determine the amount of manganese present in the given steel sample.
Principle Small quantities of manganese are determined colorimetrically by
oxidation to permanganic acid. The oxidizing agent is potassium periodate. In hot acid solution (nitric acid and sulphuric acid) periodate oxidizes manganese ion quantitatively to permanganic acid.
2Mn2+ + 5IO4- +3H2O ↔ 2MnO4
- +5IO-3+6H+
The merits of periodate method are; A. The concentration of the acid has little influence and may be varied within wide limits. B. The boiling may be prolonged beyond the time necessary to oxidize the manganese. C. The permanganic acid solution would be kept for several months, unchanged if excess periodate was present.
Procedure
Weigh accurately 0.0438g of MnSO4 .H2O and made upto mark in a 250 ml standard flask. From this solution, 10 ml is taken and 5 ml syrupy phosphoric acid and 0.5g potassium periodate is added and boiled for 10 minutes. It is cooled and the solution is made upto the mark in a 100 ml standard flask. Various dilutions are prepared and the absorbance is measured at 545nm.
The given steel sample is weighed (to about 0.1g) and dissolved in 20
ml of nitric acid, boiled for 1-2 minutes to expel oxides of nitrogen. To this , 5 ml syrupy phosphoric acid is added, followed by 0.5 g of periodate, and boiled. The solution is cooled and made upto mark in 250 ml flask and absorbance is noted.
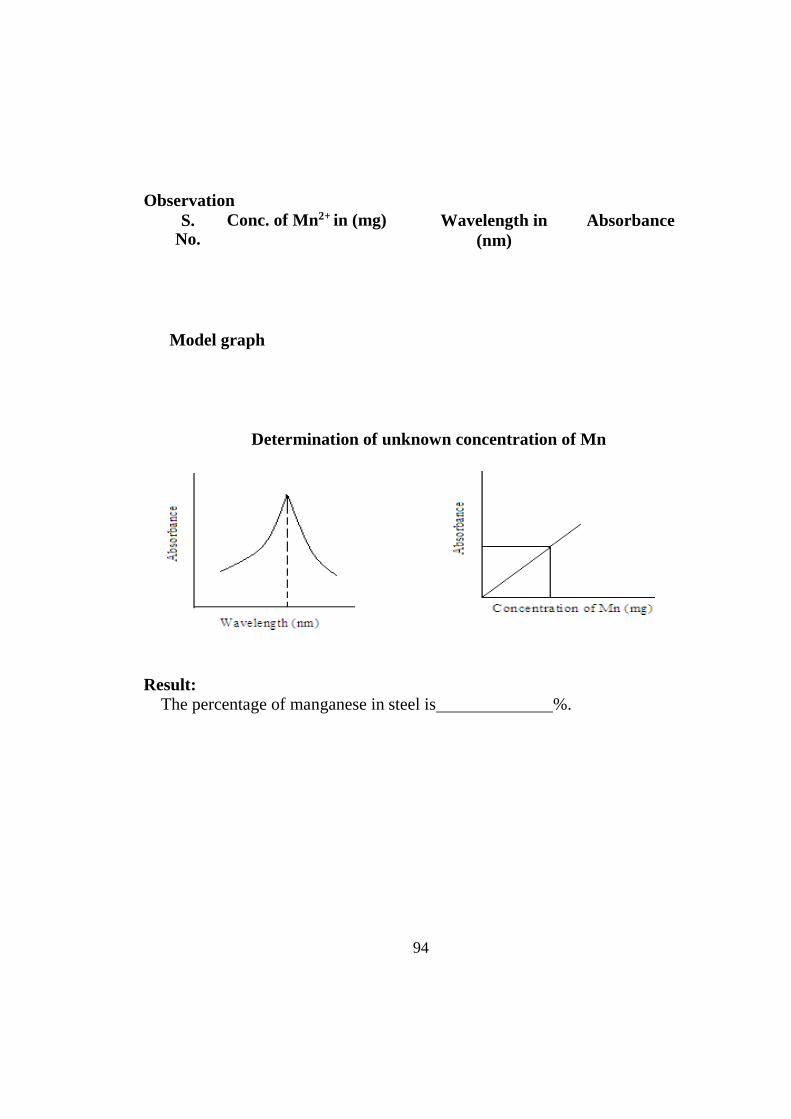
94
Observation S.
No. Conc. of Mn2+ in (mg) Wavelength in
(nm) Absorbance
Model graph
Determination of unknown concentration of Mn
Result: The percentage of manganese in steel is %.
95
UNIT-13
DETERMINATION OF IRON BY SPECTROPHOTOMETER METHOD
Aim To determine the amount of iron present in the given water sample by
spectrophotometer method.
Principle Potassium thiocyanate forms a complex with iron in strongly acidic
condition. KMnO4 is added so that ferrous gets oxidized to ferric condition in acid medium. The colour of the complex is bright red and absorbance is measured at 480nm.
Procedure
Dissolve 7.022g of ferrous ammonium sulphate in distilled water and make up to 1000 ml standard flask. From this stock solution, take 1 to 5 ml of standard Fe(NH4)SO4 solution in different 100 ml standard flask and a drop of 0.1N KMnO4 solution and 2-4 ml of 20% potassium thiocyanate (KCNS) solution and make up to 100 ml. Measure the corresponding absorbance of the respective solution at 480nm. Draw the calibration curve with concentration of iron vs absorbance.
Then the given sample is acidified with 1:1 HCl and added a drop of 0.1N KMnO4 solution and 2-4 drops of 20% KCNS solution and make up to 100 ml. Measure the absorbance. From the calibration curve, the concentration of iron for the given sample is calculated. Observation:
S. No. Conc. of Fe2+ (in mg) Absorbance
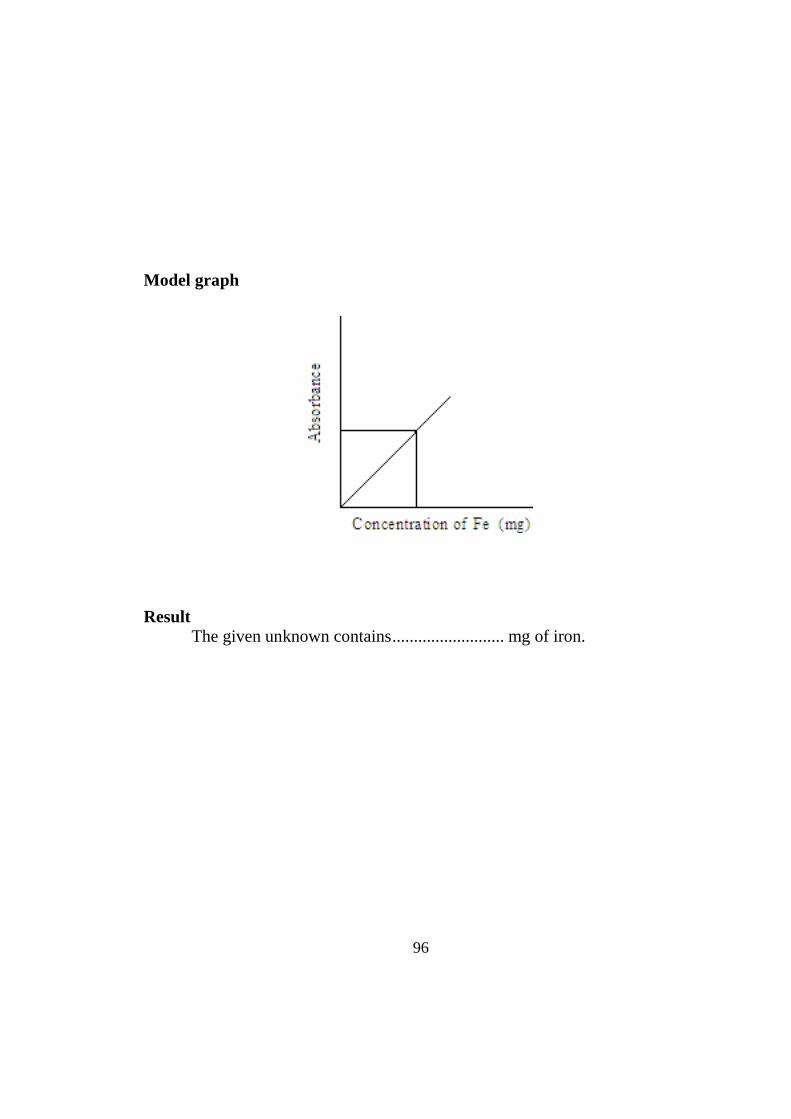
96
Model graph
Result
The given unknown contains .......................... mg of iron.
97
UNIT-14
Aim
DETERMINATION OF COPPER BY SPECTROPHOTOMETER METHOD
To determine the amount of copper using EDTA by photometric titration.
Principle In this experiment, EDTA is used as chelating reagent. At wavelength of
745nm and pH above 4, Cu-EDTA complex is formed. At first when only Cu2+
is present, absorbance is zero. On adding EDTA, Cu-EDTA complex is formed. upon more and more addition of EDTA, there is an increase in absorbance. After the equivalence point on further addition of EDTA, there is no change in absorbance.
Procedure
Pipette out 10 ml of standard Cu2+ solution and transfer into a beaker. Add 20 ml of sodium acetate buffer and 120ml of water and mix well. An aliquot is taken in the cuvette and the absorbance is measured at λ = 745nm. Transfer the solution to the beaker. Titrate with standard EDTA and the absorbance is noted for every 0.5 ml addition of EDTA. After the endpoint, the absorbance becomes fairly constant. Absorbance vs volume of titrant is plotted and the endpoint is calculated. From this, the amount of copper present is estimated.
Observation
S. No.
Conc. of Cu2+ (in mg) Volume of EDTA (in ml)
Absorbance
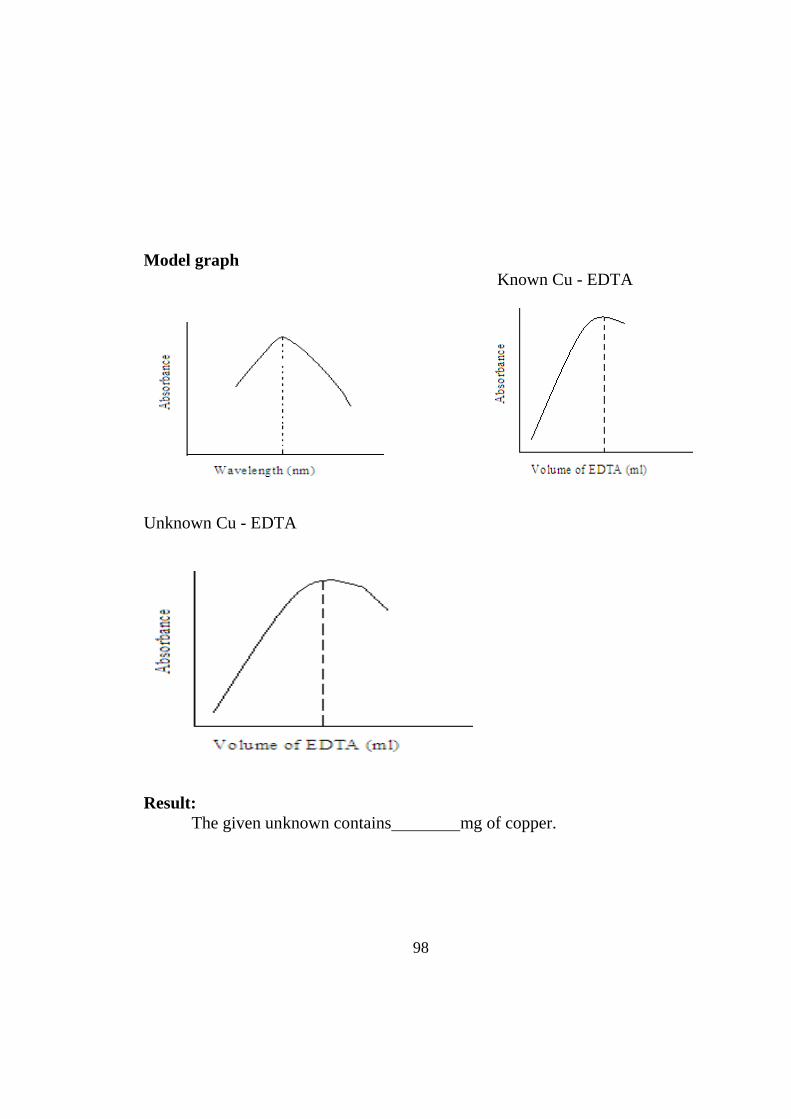
98
Model graph Known Cu - EDTA
Unknown Cu - EDTA
Result: The given unknown contains mg of copper.
99
Applications of kinetics
The chemist uses kinetics to plan new and better ways of achieving desired chemical reactions. This may involve in increasing the yield of desired products or discovering a better catalyst. The mathematical models, which are used by chemists and chemical engineer to predict chemical kinetics, provide information to understand and describe chemical processes such as ozone depletion, waste water treatment, decaying of food and vegetables, microorganism growth, and the chemistry of biological systems. The mathematical models can also be applied in the design and fabrication of chemical reactors for optimization to get good yield, better separation of products, and to eliminate environmentally hazardous by-products.
Kinetics has an ample of applications in the field of medicine. Chemical kinetics plays an important role in the administration of drugs, in addition to respiration and metabolism mechanisms. For example, the mechanisms for the controlled/sustained release of drugs are based on the half-life period of the substances used and sometimes the pH of the body as well. Half life period and pH have an effect on the way in which dosages are determined and prescribed. The reaction rates and the conditions in which the reactions occur are vital for determining certain aspects of environmental protection. For example, the depletion of ozone layer by chlorofluorocarbons (CFCs) is best understood through an analysis of catalyzed chemical reactions.
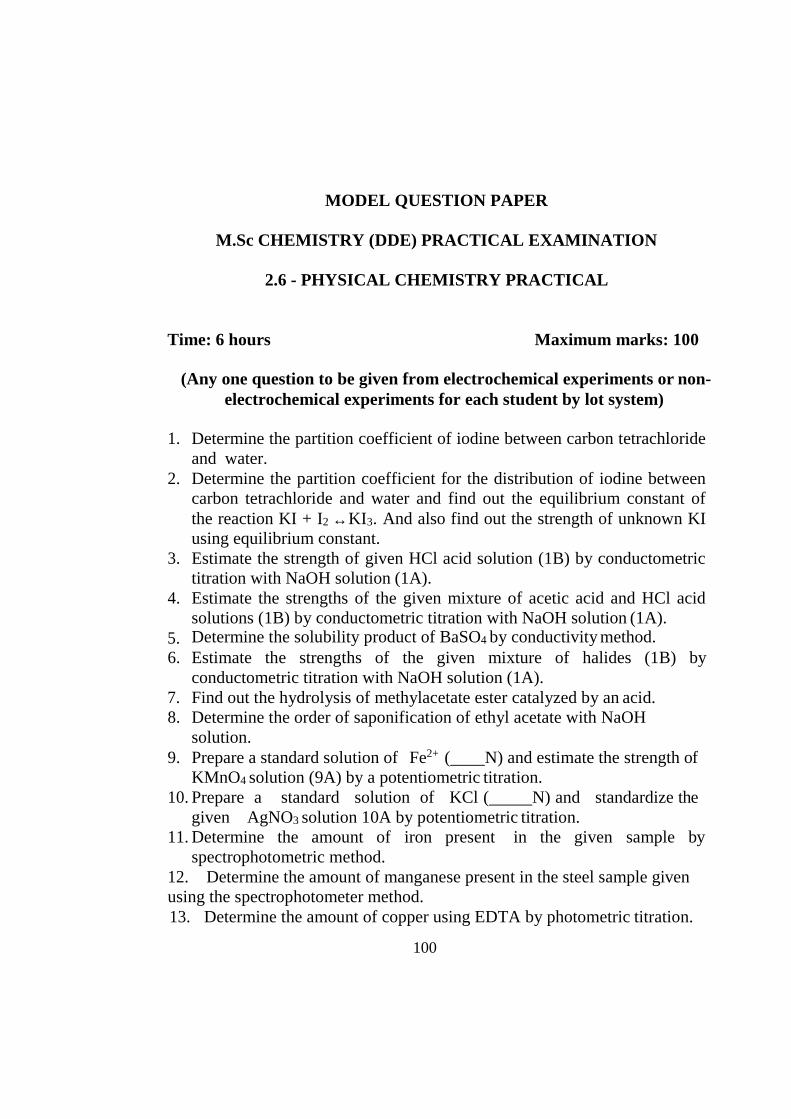
100
MODEL QUESTION PAPER
M.Sc CHEMISTRY (DDE) PRACTICAL EXAMINATION
2.6 - PHYSICAL CHEMISTRY PRACTICAL
Time: 6 hours Maximum marks: 100
(Any one question to be given from electrochemical experiments or non- electrochemical experiments for each student by lot system)
1. Determine the partition coefficient of iodine between carbon tetrachloride
and water. 2. Determine the partition coefficient for the distribution of iodine between
carbon tetrachloride and water and find out the equilibrium constant of the reaction KI + I2 ↔KI 3. And also find out the strength of unknown KI using equilibrium constant.
3. Estimate the strength of given HCl acid solution (1B) by conductometric titration with NaOH solution (1A).
4. Estimate the strengths of the given mixture of acetic acid and HCl acid solutions (1B) by conductometric titration with NaOH solution (1A).
5. Determine the solubility product of BaSO4 by conductivity method. 6. Estimate the strengths of the given mixture of halides (1B) by
conductometric titration with NaOH solution (1A). 7. Find out the hydrolysis of methylacetate ester catalyzed by an acid. 8. Determine the order of saponification of ethyl acetate with NaOH
solution. 9. Prepare a standard solution of Fe2+ ( N) and estimate the strength of
KMnO4 solution (9A) by a potentiometric titration. 10. Prepare a standard solution of KCl ( N) and standardize the
given AgNO3 solution 10A by potentiometric titration. 11. Determine the amount of iron present in the given sample by
spectrophotometric method. 12. Determine the amount of manganese present in the steel sample given using the spectrophotometer method. 13. Determine the amount of copper using EDTA by photometric titration.
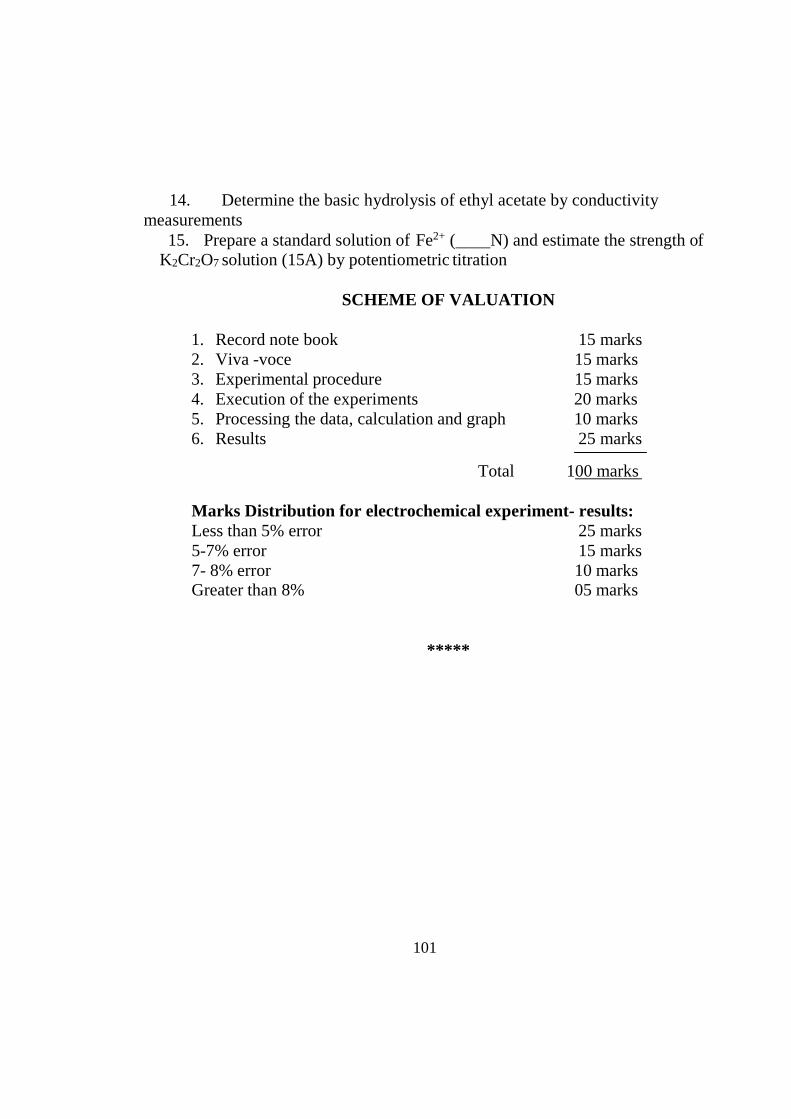
101
14. Determine the basic hydrolysis of ethyl acetate by conductivity measurements
15. Prepare a standard solution of Fe2+ ( N) and estimate the strength of K2Cr2O7 solution (15A) by potentiometric titration
SCHEME OF VALUATION
1. Record note book 15 marks 2. Viva -voce 15 marks 3. Experimental procedure 15 marks 4. Execution of the experiments 20 marks 5. Processing the data, calculation and graph 10 marks 6. Results 25 marks
Total 100 marks
Marks Distribution for electrochemical experiment- results: Less than 5% error 25 marks 5-7% error 15 marks 7- 8% error 10 marks Greater than 8% 05 marks
*****

102