domestic and export market access and trade viability issues
TRANSCRIPT

Domestic and Export Market Access and Trade Viability Issues – A Strategy to
Address
Michael Clarke
AgEconPlus Pty Ltd
Project Number: VG12042

VG12042
This report is published by Horticulture Australia Ltd to pass on information concerning horticultural research and development undertaken for the vegetables industry.
The research contained in this report was funded by Horticulture Australia Ltd with the financial support of the vegetables industry.
All expressions of opinion are not to be regarded as expressing the opinion of Horticulture Australia Ltd or any authority of the Australian Government. The Company and the Australian Government accept no responsibility for any of the opinions or the accuracy of the information contained in this report and readers should rely upon their own enquiries in making decisions concerning their own interests.
ISBN 0 7341 3117 8 Published and distributed by: Horticulture Australia Ltd Level 7 179 Elizabeth Street Sydney NSW 2000 Telephone: (02) 8295 2300 Fax: (02) 8295 2399 © Copyright 2013
VEGETABLE INDUSTRY: Domestic and Export Market Access
and Trade Viability Issues – A Strategy to Address
Project Number: VG12042 Draft Report
26 April 2013
Prepared for
Horticulture Australia Limited
Prepared by
(Contact for correspondence and administration)
John Baker Produce Marketing Australia PO Box 80 Croydon, NSW 2132 P: 02 9642 1555 E: [email protected] W: www.producemarketing.com.au
Mike Titley MHT Consulting PO Box 538 Pennant Hills NSW 2120 P: (02) 9484‐8970 E: [email protected]
Michael Clarke AgEconPlus ABN 41 107 715 364 44 Barons Crescent Hunters Hill NSW 2110 P: 02 09817 5888 E: [email protected] W: www.ageconplus.com.au

Contents
Project Summary ..................................................................................................... 6
1 Introduction .................................................................................................... 1 1.1 Study Purpose and Objectives ............................................................................. 1 1.2 Project Approach and Analysis Scoping ............................................................... 1
2 Analysis of Leviable Vegetable Products ............................................................. 2 2.1 Key Vegetable Characteristics Relevant to Export ............................................... 2 2.2 Levied Vegetables Shortlisted for Detailed Analysis ............................................ 8
3 Impediments and Opportunities for Australian Vegetables ................................... 9 3.1 Australian Situation Assessment .......................................................................... 9 3.2 Export Market Impediments .............................................................................. 11 3.3 Domestic Market Impediments ......................................................................... 14 3.4 Current and Potential Competitive Advantages ................................................ 15 3.5 Why Exporting is Important to Growers ............................................................ 17 3.6 Lessons from Case Study Analysis ...................................................................... 17
4 Priority Export Markets ................................................................................... 20 4.1 World Situation Assessment .............................................................................. 20 4.2 Initial Market Selection ...................................................................................... 21 4.3 Explanation of Detailed Analysis Criteria ........................................................... 22 4.4 Markets with Additional Export Potential.......................................................... 23 4.5 China – A Vegetable Market Case Study ............................................................ 24
5 Market Access and Trade Viability Improvement Plan ........................................ 27 5.1 Market Access Program ..................................................................................... 27 5.2 Specific Actions for Levied Crops ....................................................................... 29 5.3 Industry Development........................................................................................ 32 5.4 Market Development ......................................................................................... 33 5.5 Marketing ........................................................................................................... 34 5.6 Policy Research ................................................................................................... 35
6 Export Accreditation Program ‐ Analysis of Options ........................................... 37 6.1 Analysis Purpose................................................................................................. 37 6.2 Use of HAL’s Export Efficiency Powers (EEP) ..................................................... 37 6.3 Copy the New Zealand Horticulture Export Authority (NZHEA) Model ............. 37 6.4 Expansion of Existing Central Market Credit Systems ....................................... 38 6.5 Insurance to Cover Non Payment by Export Agents .......................................... 39 6.6 Training including Credit Risk Assessment for Growers New to Export ............ 39 6.7 AUSVEG Maintain a Bad Debtors Register ......................................................... 39 6.8 Conclusions on the Potential of an Export Accreditation Program ................... 40
7 Information for Growers Considering New Markets ........................................... 41

7.1 Checklist Purpose ............................................................................................... 41 7.2 Viability of Growers Expanding their Business into Exports – A Checklist ......... 41
8 Study Conclusions .......................................................................................... 43
9 References .................................................................................................... 44
10 Stakeholders Consulted .................................................................................. 47
Appendix 1 Case Studies on Export Success – Four of the Best ................................... 49
Appendix 2 Export Market Access Process and Assessment Summary ......................... 52
Appendix 3 Detailed Market Analysis – 19 Export Destinations .................................. 53
Abbreviations / Glossary AANZFTA ASEAN-Australia-New Zealand FTA ABARES Australian Bureau of Agricultural and Resource Economics and Sciences APAL Apple and Pear Australia Limited ASEAN Association of South East Asian Nations ASIC Australian Securities Investment Commission ABL Australian Business Limited AHEA Australian Horticultural Exporters Association ASEAN Association of South East Asian Nations BOM Bureau of Meteorology CIQ China Inspection and Quarantine DA Dairy Australia DC Distribution Centre DFAT (Australian Government) Department of Foreign Affairs and Trade DPI Department of Primary Industries EEP Export Efficiency Powers ERS USDA Economic Research Service FTA Free Trade Agreement GAP Good Agricultural Practice GCC Gulf Cooperation Council GDP Gross Domestic Product GFC Global Financial Crisis GVP Gross Value of Production HAL Horticulture Australia Limited HS Harmonised Standard Code IPM Integrated Pest Management MAFF (Japanese) Ministry of Agriculture, Forestry and Fisheries MRL Maximum Residue Limit NESOI Not Elsewhere Specified or Included NZHEA New Zealand Horticulture Export Authority OHMA Office of Horticultural Market Access PNG Papua New Guinea PRC Peoples Republic of China QDAFF Queensland Department of Agriculture, Fisheries and Forestry QSR Quick Service Restaurant RMB Chinese currency ROK Republic of Korea (South Korea) SIP Strategic Investment Plan SPS Sanitary, Phytosanitary UAE United Arab Emirates USDA United States Department of Agriculture VAT Value Added Tax WTO World Trade Organisation

DISCLAIMER
All description, figures, analyses, forecasts and other details have been prepared in good faith from information furnished to Mike Titley, John Baker and Michael Clarke by other parties. These data are believed to be correct at the date of preparation of this report. However, it should be noted that predictions, forecasts and calculations are subject to assumptions which may or may not turn out to be correct and AgEconPlus Pty Ltd, Produce Marketing Australia and MHT Consulting expressly disclaim all and any liability to any persons in reliance, in whole or in part, on the report in total or any part of its contents. Michael Clarke AgEconPlus Pty Ltd

Project Summary
This document details a strategy to assist the Australian vegetable industry to open new domestic and export markets and make existing markets more viable. To deliver the strategy it was necessary to focus on three key issues: domestic and export impediments; relevant leviable products; and existing and potential markets. Despite a long and somewhat obvious set of impediments, Australia retains a foundation in vegetable exporting that can be used to deliver additional export success. Comparative advantages include commercial and personal relationships in Asia; world class food safety systems; mechanisation of production in some crops; relative proximity to Asia and the Middle East; technological developments that improve fresh vegetable shelf life; and innovations in domestic market value-adding and category management that have potential in overseas markets. The research has shown that a subset of levied Australian vegetables has potential for additional sales in export markets. Products with additional export potential include beans; broccoli; capsicum; carrots; celery; leeks; lettuce (baby leaf salad and head) and sweet corn. Australia is not competitive on price in export markets selling traditional undifferentiated commodity lines. Australia’s successful carrot export sector has demonstrated how a sector can differentiate itself on the basis of food safety, quality and reliability. Additional sales in both domestic and export markets will require a ‘package’ that includes product development; targeting market segments; building relationships; promotion and long term commitment. Markets with additional sales potential were selected following application of appropriate criteria including current and future market access; trade relationships with Australia; demographics and capacity to pay; vegetable consumption and production; relative size of market segments; supply windows; freight and logistics. Preferred destinations and specific market segments were selected in East Asia, the Middle East and New Zealand. China may not be as prospective for sales of fresh Australian vegetables as believed by some industry stakeholders. Recommendations to assist the Australian vegetable industry to open new markets and make existing markets more viable include domestic and export market access, as well as specific actions for priority levied crops, industry development, market development, marketing and a program of policy initiatives. Twenty seven actions are identified, prioritised and presented in a format that facilitates their funding under the Vegetable Industry’s Strategic Investment Plan. Specific actions within the trade improvement plan target improved domestic market access. The most important action is research to support improved interstate access for Queensland vegetables through continued investment in fruit fly research – additional data sets, appropriate lures and a trial of the domestic protocol for fruit fly irradiation. To facilitate export development the potential of an export/import agent accreditation program was explored. The goal of such a program would be to provide additional assurance of payment to vegetable growers contemplating export for the first time. The program would also be applicable to established vegetable exporters interested in expanding their business. Despite a number of prima facie benefits associated with a legislation backed accreditation scheme, it is unlikely that government, and many established businesses in the vegetable export industry, would be convinced of its overall merit. The preferred approach for vegetable growers concerned about credit risk is a combination of Credit Risk Assessment Training and the keeping of a simple information register by AUSVEG or a similar body. Finally, an export viability checklist is provided for growers contemplating expansion of their business into export markets.

__________________________________________________________________________________ AgEconPlus, MHT Consulting and Produce Marketing Australia 1
1 Introduction
1.1 Study Purpose and Objectives Consistent with the Vegetable Industry Strategic Investment Plan 2012 – 2017 Strategic Priority 2, Market and Value Chain Development, research was required to identify and address vegetable industry market access and trade viability issues. The project was to deliver a strategy to assist the Australian vegetable industry to open new markets and make existing markets more viable. Study objectives were to:
1. Prioritise export market opportunities for leviable vegetable products – i.e. build upon past work to identify and prioritise existing and potential new export markets for relevant exportable vegetable products taking into account that trade policies and sanitary and phytosanitary protocols are product specific.
2. Identify key impediments in both Australia and in priority export markets – identify key impediments to trade in both the domestic market and in priority export markets.
3. Prepare a trade improvement plan – develop a clear, prioritised domestic and export market access and trade viability improvement plan outlining strategies and programs to address the impediments to trade in priority markets.
4. Explore the potential of an export/import agent accreditation program – that provides greater confidence to growers wishing to develop their export business through the use of local and international agents.
5. Document and communicate relevant trade information to vegetable growers – to assist them to evaluate whether it is viable to expand their business into the export market or provide information on how they can improve their existing export operations.
The research was completed by MHT Consulting, Produce Marketing Australia and AgEconPlus between December 2012 and June 2013. 1.2 Project Approach and Analysis Scoping The study was delivered using a combination of desk based research, detailed analysis of trade data, project team experience in many of the potential markets in Asia and the Middle East and stakeholder consultation. A list of references and online resources consulted is provided at Chapter 9 of this report. Wayne Prowse of Fresh Intelligence Consulting was commissioned by the study team to interrogate the United Nations (UN) Comtrade database and assemble relevant Australian and export competitor data in time series by value and volume for prospective export markets. Consultation included Horticulture Australia Limited (HAL) Program Manager and Market Access, the Office of Horticulture Market Access (OHMA), AUSVEG, the market place (including supermarkets in Asia and the Middle East), and Australian vegetable growers. An Industry Reference Group was convened by HAL and included AUSVEG and a vegetable grower representative from Western Australia. A complete list of those consulted, including an extensive list of vegetable growers and exporters is included as Chapter 10. To deliver a vegetable export trade improvement plan it was necessary to focus on three key issues: relevant leviable products; domestic and export impediments; and existing and potential markets. The process of plan development is summarised in Figure 1.1.

__________________________________________________________________________________ AgEconPlus, MHT Consulting and Produce Marketing Australia 2
Figure 1.1 Vegetable Industry Market Access and Trade Improvement Plan Schematic
2 Analysis of Leviable Vegetable Products
The focus of investigations was the levied Australian vegetable crops i.e. carrots, cucurbits (cucumber, pumpkins, squash and zucchini, but excluding melons), sweet corn, beans, peas, lettuce, broccoli, cabbage, cauliflower, sweet potatoes, beetroot, celery and capsicums along with smaller volume vegetables, including Asian leafy greens and babyleaf (mainly spinach) lines. With the agreement of the Industry Reference Group, emphasis was placed on fresh and value-added fresh products. Frozen and processed vegetable products are a mature sector and largely controlled by multinational enterprises. Australian businesses have little, if any, influence or impact on decisions made by multinational vegetable processors. 2.1 Key Vegetable Characteristics Relevant to Export Table 2.1 summarises key points pertinent to Australian fresh and value-added fresh vegetables considered in this study.

__________________________________________________________________________________ AgEconPlus, MHT Consulting and Produce Marketing Australia 3
Table 2.1 Key Vegetable Characteristics Relevant to Export Market Development Vegetable Key points relevant to priority setting
Beans 2012 export value $4.1m, compared with $2.1m in 2002. In 2002, 93% of Australian bean exports were shipped to NZ with the balance to
Malaysia. In 2012, 99% of Australian bean exports were shipped to NZ with the next most important market being Papua New Guinea.
In 2013 NZ are growing beans in greenhouses for transplanting in late winter. In the future beans from this source may compete with Australian exports, although Australia will have a price advantage.
Beans are widely consumed in Asia (e.g. snake beans) and Australian beans can be airfreighted cost effectively as far north as Hong Kong.
Some Australian beans are consumed in the Middle East. Bean production is mechanised which gives Australia a basis to establish an
export comparative advantage. Value added ‘top and tailed’, hydro cooled, pre-packed and microwavable beans
are available in Australia (e.g. www.Mulgowie.com.au) and could provide a point of difference for Australia on export markets.
Beetroot No history of fresh export sales Competent large scale growers, highly mechanised and low labour input, year
round supply. Traditionally grown for processing. Would need to be a value added product for export. Vaccine packaging par cooked potential. Not part of traditional Asian or Middle Eastern cuisine.
Beetroot is excluded from the export market development shortlist.
Broccoli 2012 export value $6.0m, compared with $15.7m in 1998. Main export markets in 1998: Singapore $6.5m, Malaysia $3.2m, Japan $2.3m,
Hong Kong $1.2m and Taiwan $1.1m. Main markets 2012: Singapore (77%); UAE (5%); and Malaysia (4%). Broccoli was a major Western Australian (WA) export industry in the 1990s and
a major export crop from S E Queensland into Japan since late 80’s until 2007. Strong competition from other Australian states resulted in oversupply. The commodity end of the Asian market is now dominated by China.
Mechanisation of broccoli harvesting is well advanced in Australia and commercialisation of this technology will assist with our competitiveness in the medium term.
QDAFF (pers com) concurred with this sentiment drive cost out of the system with mechanical harvesting research, direct seeding and sound post-harvest care.
In the short term Australia may be able to secure additional export broccoli sales through further product differentiation on food safety and quality grounds.
Broccolini 2012 export value less than $0.5m, no data available for 1998 or 2002. Four international seed companies have this product and China will be well
placed to supply other parts of Asia. Domestic sales offer Australian growers higher returns than they can achieve on export markets.
Broccolini is excluded from the export market development shortlist.
Cabbage 2012 export value less than $0.5m, in 2002 it was $2.2m. Cabbage is a high volume low value product. Australian cabbage must compete in many export markets against locally grown
product and cabbage supplied at low cost by China. Asian countries which once purchased Australian exports are now self-sufficient Asian consumers prefer a smaller variety (1.2-1.5 kg) than that grown by
Australia and this small variety is supplied cost effectively by China. Cabbage is excluded from the export market development shortlist.
__________________________________________________________________________________ AgEconPlus, MHT Consulting and Produce Marketing Australia 4
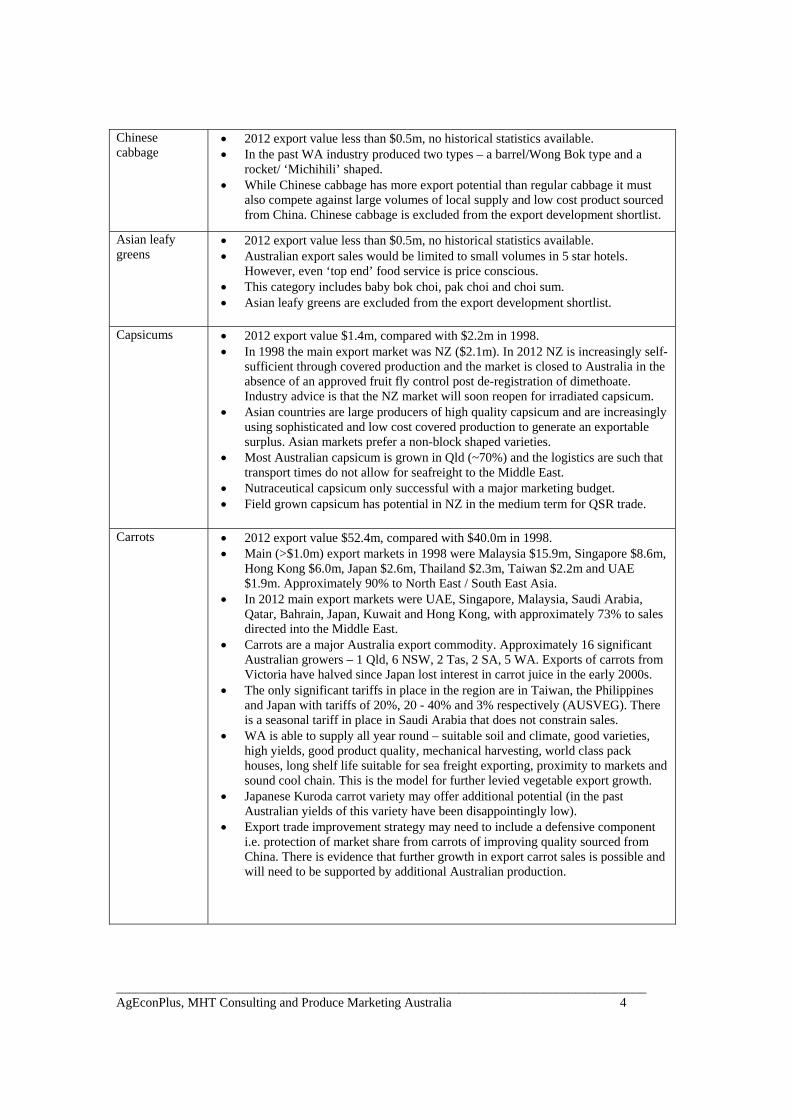
Chinese cabbage
2012 export value less than $0.5m, no historical statistics available. In the past WA industry produced two types – a barrel/Wong Bok type and a
rocket/ ‘Michihili’ shaped. While Chinese cabbage has more export potential than regular cabbage it must
also compete against large volumes of local supply and low cost product sourced from China. Chinese cabbage is excluded from the export development shortlist.
Asian leafy greens
2012 export value less than $0.5m, no historical statistics available. Australian export sales would be limited to small volumes in 5 star hotels.
However, even ‘top end’ food service is price conscious. This category includes baby bok choi, pak choi and choi sum. Asian leafy greens are excluded from the export development shortlist.
Capsicums 2012 export value $1.4m, compared with $2.2m in 1998. In 1998 the main export market was NZ ($2.1m). In 2012 NZ is increasingly self-
sufficient through covered production and the market is closed to Australia in the absence of an approved fruit fly control post de-registration of dimethoate. Industry advice is that the NZ market will soon reopen for irradiated capsicum.
Asian countries are large producers of high quality capsicum and are increasingly using sophisticated and low cost covered production to generate an exportable surplus. Asian markets prefer a non-block shaped varieties.
Most Australian capsicum is grown in Qld (~70%) and the logistics are such that transport times do not allow for seafreight to the Middle East.
Nutraceutical capsicum only successful with a major marketing budget. Field grown capsicum has potential in NZ in the medium term for QSR trade.
Carrots 2012 export value $52.4m, compared with $40.0m in 1998. Main (>$1.0m) export markets in 1998 were Malaysia $15.9m, Singapore $8.6m,
Hong Kong $6.0m, Japan $2.6m, Thailand $2.3m, Taiwan $2.2m and UAE $1.9m. Approximately 90% to North East / South East Asia.
In 2012 main export markets were UAE, Singapore, Malaysia, Saudi Arabia, Qatar, Bahrain, Japan, Kuwait and Hong Kong, with approximately 73% to sales directed into the Middle East.
Carrots are a major Australia export commodity. Approximately 16 significant Australian growers – 1 Qld, 6 NSW, 2 Tas, 2 SA, 5 WA. Exports of carrots from Victoria have halved since Japan lost interest in carrot juice in the early 2000s.
The only significant tariffs in place in the region are in Taiwan, the Philippines and Japan with tariffs of 20%, 20 - 40% and 3% respectively (AUSVEG). There is a seasonal tariff in place in Saudi Arabia that does not constrain sales.
WA is able to supply all year round – suitable soil and climate, good varieties, high yields, good product quality, mechanical harvesting, world class pack houses, long shelf life suitable for sea freight exporting, proximity to markets and sound cool chain. This is the model for further levied vegetable export growth.
Japanese Kuroda carrot variety may offer additional potential (in the past Australian yields of this variety have been disappointingly low).
Export trade improvement strategy may need to include a defensive component i.e. protection of market share from carrots of improving quality sourced from China. There is evidence that further growth in export carrot sales is possible and will need to be supported by additional Australian production.

__________________________________________________________________________________ AgEconPlus, MHT Consulting and Produce Marketing Australia 5
Cauliflower 2012 export value <$0.5m, compared with $22.8m in 1998. Main (>$1.0m) export markets in 1998 were Malaysia $12.5m and Singapore
$8.7m. Approximately 99% of exports were destined for North East or South East Asia.
Was a major industry in WA in the 1990s centred out of Manjimup. WA cauliflower was a very well presented product wrapped in rice paper for export.
Plant breeders in Asia have developed early maturing heat tolerant cauliflower cultivars suitable for the tropics and subtropics (www.eastwestseeds.com) which have effectively closed the market gap previously filled by WA.
Furthermore, newer brassica types (e.g. broccoli and leafy brassicas) have taken market share away from cauliflower in Australia and overseas.
Cauliflower is excluded from the export market development shortlist.
Celery 2012 export value $1.0m, compared with $2.7m in 1998. Main (>$1.0m) export market in 1998 was Malaysia $1.4m. 92% to NE/SE Asia.
Main export markets in 2012 were to Malaysia (57%) and Singapore (17%). WA did well with export celery and Sumich had a consumer brand presence in Asia. Australian export sales into Malaysia and Singapore have been slowly contracting and less celery is being grown in WA. California USA has captured this market.
In 2012 some 75% of Australian production is grown in Cranbourne and South Gippsland Victoria.
Australia has a seafreight advantage over product originating in California but would need to improve presentation techniques if it was to be competitive in export markets. Multinational Dole is growing celery in Asia and this may also be a threat to future Australian exports.
Cucumber Exports are low and declining – 86 tonnes in 2012, 203 tonnes in 2008. Potential markets are either significant lower cost producers (Malaysia) or can
source cheap product (Singapore from Malaysia). Product, which is relatively low value, needs to be air freighted, making it
generally uncompetitive. SE Asia is able to produce high quality Lebanese (Beit Alpha types) and
continental cucumber using protective cropping. The only significant market has been NZ in winter and access has been impacted
by de-registration of dimethoate for fruit fly control. Even if resolved this market is unlikely to expand.
Cucumber is excluded from the export market development shortlist.
Leeks 2012 export value of $0.6m, compared with $1.7m in 2002. In 2002 major export market was Japan (92%), Singapore and Hong Kong. In
2012 major markets are Japan (60%) and Singapore (20%). Leek production in Australia has made major mechanisation advances which
favour future export growth. Target export growth in Singapore and Japan by addressing market share lost to
NZ when the Millennium Drought constrained production. Well-trimmed and presented leeks are required in Japan.
__________________________________________________________________________________ AgEconPlus, MHT Consulting and Produce Marketing Australia 6
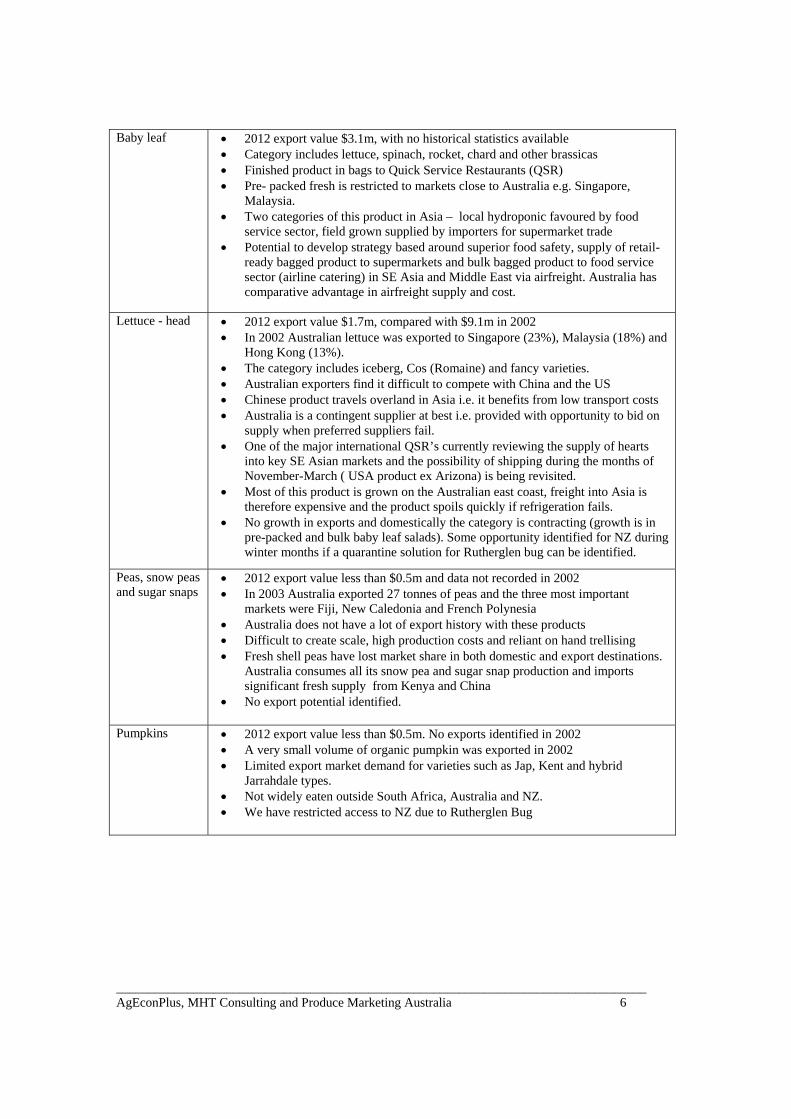
Baby leaf
2012 export value $3.1m, with no historical statistics available Category includes lettuce, spinach, rocket, chard and other brassicas Finished product in bags to Quick Service Restaurants (QSR) Pre- packed fresh is restricted to markets close to Australia e.g. Singapore,
Malaysia. Two categories of this product in Asia – local hydroponic favoured by food
service sector, field grown supplied by importers for supermarket trade Potential to develop strategy based around superior food safety, supply of retail-
ready bagged product to supermarkets and bulk bagged product to food service sector (airline catering) in SE Asia and Middle East via airfreight. Australia has comparative advantage in airfreight supply and cost.
Lettuce - head 2012 export value $1.7m, compared with $9.1m in 2002 In 2002 Australian lettuce was exported to Singapore (23%), Malaysia (18%) and
Hong Kong (13%). The category includes iceberg, Cos (Romaine) and fancy varieties. Australian exporters find it difficult to compete with China and the US Chinese product travels overland in Asia i.e. it benefits from low transport costs Australia is a contingent supplier at best i.e. provided with opportunity to bid on
supply when preferred suppliers fail. One of the major international QSR’s currently reviewing the supply of hearts
into key SE Asian markets and the possibility of shipping during the months of November-March ( USA product ex Arizona) is being revisited.
Most of this product is grown on the Australian east coast, freight into Asia is therefore expensive and the product spoils quickly if refrigeration fails.
No growth in exports and domestically the category is contracting (growth is in pre-packed and bulk baby leaf salads). Some opportunity identified for NZ during winter months if a quarantine solution for Rutherglen bug can be identified.
Peas, snow peas and sugar snaps
2012 export value less than $0.5m and data not recorded in 2002 In 2003 Australia exported 27 tonnes of peas and the three most important
markets were Fiji, New Caledonia and French Polynesia Australia does not have a lot of export history with these products Difficult to create scale, high production costs and reliant on hand trellising Fresh shell peas have lost market share in both domestic and export destinations.
Australia consumes all its snow pea and sugar snap production and imports significant fresh supply from Kenya and China
No export potential identified.
Pumpkins 2012 export value less than $0.5m. No exports identified in 2002 A very small volume of organic pumpkin was exported in 2002 Limited export market demand for varieties such as Jap, Kent and hybrid
Jarrahdale types. Not widely eaten outside South Africa, Australia and NZ. We have restricted access to NZ due to Rutherglen Bug

__________________________________________________________________________________ AgEconPlus, MHT Consulting and Produce Marketing Australia 7
Squash (Kabocha)
2012 export value less than $0.5m A very small volume of organic squash was exported in 2002 Kabocha squash was exported to Japan from Tasmania (which has access) until
2010, when it ceased, because the market is dominated by NZ and Pacific Islands (to a lesser extent)
NZ (marketing as buttercup squash) have been very professional in export marketing squash.
In 2012 NZ exported 98,000 tonne of butternut squash and the top 4 markets were Japan (72%); Korea (25%); China (2%) and the US (<1%).
Competition from NZ with lower cost labour and supply chains limits opportunity for Australia.
This product is excluded from further consideration.
Sweet corn 2012 export value less than $0.5m. Small volumes of frozen sweet corn were exported to Japan (99% of sales), NZ, PNG and Indonesia. In 2002 Aust exports were dominated by Japan with the balance to NZ, Singapore and Malaysia.
NZ is a major exporter of sweet corn (25,000t valued at $50m) and frozen product is available all year in both cob and kernel form.
Australia has a potential comparative advantage in sweet corn exports - production is highly mechanised and a year round supply program could be put together: Dry Tropics and Bowen Qld (winter and early spring); Bundaberg and Gatton for the transition months; and East Gippsland Victoria in the summer.
Value added products have shown potential on the domestic Australian market. Aust has developed lines with eye health qualities (Vegetables Australia Feb 13).
Sweet potatoes 2012 export value was $0.3m. Sales were dominated by the UAE (77%); and Singapore (16%). NZ was a significant importer in 2010. No data for 2002.
Australia used to do well in Kuala Lumpur Malaysia with sweet potatoes Varieties grown in Australia are not those preferred in Japan and Korea. Hong
Kong is well supplied by China (pers com Qld Sweet Potato Association). US exports receive USDA assistance e.g. subsidised crop insurance. Sweet potatoes are an expensive crop to grow. R&D investment needed in
mechanical planting and machine harvesting before this crop is export ready (pers com Qld Sweet Potato Association).
This product is excluded from further consideration.
Zucchini 2012 export value less than $0.5m. There were no export statistics for 2002. Export niche to NZ was lost with the de-registration of dimethoate. It is noted
that irradiation of zucchini is technically possible. Labour intensive at harvesting, packing and grading stages. Predominately Qld grown which constraints seafreight exports to Asia and the
Middle East. Short shelf live means expensive airfreight is required. Market analysis indicates limited potential. Even if irradiation is approved for
fruit fly treatment in NZ there is limited market potential for zucchini. This product is excluded from further consideration.
NB: Asian vegetables like snake beans grown in Darwin are a RIRDC responsibility and do not pay the vegetable levy

__________________________________________________________________________________ AgEconPlus, MHT Consulting and Produce Marketing Australia 8
2.2 Levied Vegetables Shortlisted for Detailed Analysis A number of leviable vegetables listed in the above table have been discounted from the more detailed analysis, based on one or more of the following criteria:
There is no history of export demand
Australia has become uncompetitive in export markets, compared to other suppliers
Appropriate production cannot be developed e.g. the crop does not suit mechanisation
Market access is limited or prohibited and change will not occur in even the medium term. However, there will always be opportunities for individual businesses with some of these commodities, either by:
1. Offering the products as part of just-in-time air-freight ‘providoring’ sales
2. Developing market segments with unique offerings, such as innovative products, packaging, service/relationships etc.
3. Building on personal relationships established over many years and resulting in profitable niches. Products excluded from further analysis are:
Broccolini Cabbage Chinese cabbage Cucumber Asian Leafy greens Cauliflower Peas, snow peas and sugar snaps Pumpkins Squash Sweet potatoes. Zucchini.
Products with additional export potential are:
Beans Broccoli Capsicum Carrots Celery Leeks Lettuce – baby leaf Lettuce – head Sweet corn.
The above analysis informs development of the Market Access and Trade Viability Improvement Plan. Chapter 3 provides an overview of existing Australian fresh and value added fresh vegetable exports. It also includes a review of both export and domestic market impediments.

__________________________________________________________________________________ AgEconPlus, MHT Consulting and Produce Marketing Australia 9
3 Impediments and Opportunities for Australian Vegetables
3.1 Australian Situation Assessment
Australian vegetable exports have remained relatively steady over the four years 2009 – 2012. They account for between 5% and 7% of total Australian production (AUSVEG and HAL 2012). Never the less total vegetable exports have declined since levels achieved in the late 1990’s (Table 3.2). Approximately 50% by value of Australian fresh vegetable exports are destined for four markets – Singapore, Japan, the United Arab Emirates (UAE) and New Zealand (Table 3.1). Major exports were carrots, onions (non-vegetable levy) and potatoes (non-vegetable levy). Exports of most other vegetables are relatively minor – Figure 3.1. In 2012 carrots accounted for approximately two thirds of vegetable leviable crop export sales (Table 3.2).
Table 3.1 Fresh Vegetable Exports by Country of Destination - Top 20 Countries in 2011-12 ($M) Country 2009 2010 2011 2012 Singapore 22.6 22.9 22.0 22.5 Japan 27.0 20.5 24.4 22.3 UAE 13.9 14.8 16.4 16.4 New Zealand 12.9 14.8 13.0 11.2 Malaysia 11.2 12.4 11.8 10.9 Indonesia 5.2 8.5 11.1 8.3 South Korea 2.0 3.1 7.3 8.3 Germany 3.3 7.5 6.4 8.1 Saudi Arabia 4.8 5.5 6.9 7.5 Hong Kong 5.9 5.5 5.2 4.7 Qatar 2.9 3.6 3.4 3.9 PNG 1.0 1.4 2.1 2.8 Bahrain 3.1 3.2 3.2 2.6 Thailand 1.7 1.3 2.0 2.2 Kuwait 1.6 1.7 2.1 2.2 Belgium 9.3 1.6 8.2 2.1 Netherlands 1.2 3.1 3.1 1.9 UK 1.3 0.9 1.6 1.6 Taiwan 2.3 1.5 1.2 1.5 Italy 2.0 1.4 1.3 1.3 Top 20 Total 135.2 135.2 152.7 142.3 Source: AUSVEG using Global Trade Atlas/World Trade Atlas data supplied by ABS Table 3.2 Fresh Vegetable Exports by Leviable Vegetable ($’ million) Vegetable 1998 2003 2008 2009 2010 2011 2012 Carrots and turnips 42.3 47.5 38.3 46.1 51.5 52.0 51.3 Broccoli 15.7 13.3 4.6 5.4 5.0 5.9 6.5 Beans 1.7 1.9 3.2 3.3 3.9 3.7 3.6 Lettuce – other 2.4 2.9 2.4 2.9 3.6 3.8 3.1 Lettuce – head 5.2 2.9 2.5 2.7 1.7 1.7 1.8 Capsicum 2.2 1.8 3.7 2.6 2.9 2.4 1.4 Celery 2.7 3.1 1.0 1.4 1.2 1.0 1.0 Cabbages 7.9 1.9 1.3 1.2 0.8 0.8 0.7 Cauliflower 22.8 23.4 0.7 0.6 0.5 0.3 0.5
Total 102.9 98.7 57.7 66.2 71.1 71.6 69.9 Source: AUSVEG using Global Trade Atlas/World Trade Atlas data supplied by ABS
NB: Decline in vegetable exports since the early 2000s has been most pronounced in broccoli and cauliflower. The decline in broccoli exports has been due to the rise of China as a broccoli exporter. Cauliflower has lost both market place popularity and been replaced by ‘home grown’ tropical cultivars in South East Asia.

__________________________________________________________________________________ AgEconPlus, MHT Consulting and Produce Marketing Australia 10
Figure 3.1 Vegetable Exports by Crop (kg)
In 2012 total fresh vegetable exports were valued at $151.2 million (Table 3.2) for 179,000 tonnes of produce with an average unit value of $AUD0.84/kg. Volume overall has marginally increased since 2008 driven by increasing potato exports to Indonesia and South Korea and carrot exports to the Middle East. Although the average price of exported vegetables appears to be reducing, the influence of higher volumes of lower value potato is the main driver of this trend. The higher unit value of Australian vegetable exports in 2008 (see Figure 3.2) was also influenced by a low Australian dollar during the peak of the Global Financial Crisis (GFC). Figure 3.2 Australian Vegetable Exports – Volume
__________________________________________________________________________________ AgEconPlus, MHT Consulting and Produce Marketing Australia 11
3.2 Export Market Impediments Exporters comprise a very small share of growers, with only 4% of vegetable farms selling offshore in 2007-08 (ABARE 2009). ABARE identified a range of factors explaining the Australian vegetable industry’s poor export performance:
Additional complexity above domestic sales
Lack of understanding of crop scheduling for continuity of supply
Lack of knowledge and relationships in export markets
An absence of local (in-market) agents
Returns that are not high enough to compensate for additional costs
High freight costs / the non-availability of transport
Lack of competitive scale and infrastructure. The ABARE-generated list of export impediments was supplemented and expanded through project consultation and analysis. Export market impediments were grouped into ‘generic’, ‘product specific’ and ‘market specific’. Generic impediments include:
High levels of global self-sufficiency –world trade as a share of vegetable production (3%) is half that of fresh fruit (6%) indicating that there is a higher level of individual country self-sufficiency in vegetables (Rabobank 2006). World vegetable trade is dominated by tomatoes; onion; watermelon; capsicum; and cucumber. Only capsicum and cucumbers are relevant to this study.
A number of Asian markets that have traditionally imported Australian vegetables are becoming self-sufficient and even net exporters of temperate vegetable crops. Self-sufficiency has been aided by the rapid adoption of modern production systems i.e. covered production. (See Figure 3.3 below). This expansion in covered production is relevant to China, South Korea, Thailand, Malaysia (e.g. Cameron Highlands) and Vietnam (e.g. Dalat).
International seed companies have bred vegetable varieties specifically for the tropics and subtropics. For example new lines of cauliflower are available for the subtropics in Asia, which effectively close a niche previously filled by Australian exports.
Additional non-tariff barriers in the form of sanitary-phytosanitary (SPS) restrictions are emerging, especially in Asian markets, as traditional tariffs are rolled back (Simon Hegarty, NZ Horticultural Export Authority in Asia Fruit Magazine March 2013).
The exchange rate – including a strong Australian dollar relative to levels from the late 1990s / early 2000s and an undervalued Chinese currency. Most vegetable export sales are completed in US dollars which has moved from AUD$1.68 to below AUD$1.00 over the ten year period to 2013. The outlook for the period to 2017-18 is for the $AUD to remain at parity with the US currency (Figure 3.4). China is a major competitor in vegetable export markets and has held its currency at what is believed to be artificially low levels over the period 2000 to 2013.
High production costs – including labour and government imposed regulatory charges. In many markets Australia competes against developing countries with low wage rates. There are also high costs associated with export documentation and compliance. In particular, Australian export inspection has moved to full cost recovery.
Contraction of production during the extended drought of the first decade of the twenty first century – most of the major Australian production areas were severely impacted by multi-year drought (the Millennium Drought), resulting in commercial vegetable growers concentrating on satisfying highest returning domestic markets.

__________________________________________________________________________________ AgEconPlus, MHT Consulting and Produce Marketing Australia 12
Faltering rates of productivity gain – linked to declining real rates of investment in research, development and extension (ABARES 2013).
A lack of scale – which results in small volumes, less capacity to harvest, grade and pack cost-effectively, and a lack of cost economies through the supply chain. Countries whose production systems are ‘geared’ for export are able to produce long lines of quality product on a consistent basis at competitive prices.
Lack of export marketing/promotion support - i.e. there is no vegetable marketing levy and for many of Australia’s competitors growers have either joined together or a large enough in their own right to support their vegetable products with marketing and promotion.
Lack of collaboration to achieve production and infrastructure scale – Australian growers, with few exceptions, tend to market and work through the supply chain as individuals rather than form domestic or even international supply partnerships. Possibly because of Australia’s capacity to supply for most of the year by drawing from various regions the industry has not developed international partnerships.
Lack of knowledge and relationships in export markets – small scale works against growers and packers developing business relationships in other countries. A common comment received during consultation was in relation to not knowing where to start.
Inadequate returns to cover costs associated with export – relative to export, Australian domestic market prices are favourable and when risk is taken into account, exporting is perceived not to yield an appropriate return. Risk includes the threat of non-payment.
Decline in international container trade, combined with significant cost increases. Growers point out that the cost of shipping is increasing, with major sea freight lines having lost money since the GFC, now trying to recoup it from surviving exporters.
Figure 3.3 Protected Crop Area in Greenhouses and Tunnels (‘000 ha)
Source: International Society for Horticultural Science 2012

__________________________________________________________________________________ AgEconPlus, MHT Consulting and Produce Marketing Australia 13
Figure 3.4 US$/A$ Exchange Rate 1999-00 to 2017-18
Source: ABARES Australian Commodities – Vol 3 No1 March quarter 2013
Product specific export impediments (i.e. impediments within Australia) include a lack of:
Suitable infrastructure, including appropriate packing houses and refrigerated supply chains
Declining levels of service as production has declined. This includes input providers, transport and extension services
Understanding of crop scheduling for continuity of supply
Product and packaging innovation. Market specific export impediments include:
Trade and quarantine barriers – market access is a slow and painstaking process that may be held hostage to broader trade negotiation priorities. Access is also product specific; for example Australian mainland grown fruiting vegetables are subject to widespread restrictions in export markets due to fruit fly contamination concerns (see Appendix 1).
Market structures within importing countries – including supply chain structures, product form requirements and competing sources of supply.
Domestic policies, including policies aimed at self-sufficiency and development of export markets. This is relevant to many South East Asian countries, including Indonesia and Thailand.
Strong competition from China – with an exchange rate, labour cost, domestic policy and proximity advantage, China has increased market share at Australia’s expense.
Strong competition from New Zealand – NZ vegetable production is focussed on export. NZ provides strong competition for Australia in buttercup squash, carrots, glasshouse capsicums and

__________________________________________________________________________________ AgEconPlus, MHT Consulting and Produce Marketing Australia 14
in the past broccoli (but their exports have declined like those from Australia). The New Zealanders are aware that their export windows are shortening and are looking at opportunities to send more produce to Australia.
Shipping scheduling and infrastructure compared with other competitors like California and NZ. Both these sources have access to reliable and regular shipping services, plus appropriate equipment, crew knowledge on temperature control, regular supply and lower cost shipping that facilitates the export process. The possible Australian source that has a similar advantage is WA which has a solid trade based on carrots and is closer to Asian and Middle East ports.
Market specific export impediments are further detailed in Chapter 4 of this report. In addition to export market impediments, the Australian vegetable industry faces a range of domestic barriers that hinder market expansion and retention. 3.3 Domestic Market Impediments Impediments that impact on the interstate trade in vegetables include both economic and quarantine barriers:
The high cost of trucking vegetables from northern Australia to southern markets and population centres.
The loss of the Freight Equalisation Scheme to help offset expenses incurred by Tasmanian vegetable growers shipping product to the mainland.
Restrictions on Queensland growers supplying vegetables to southern states – including restrictions resulting from the loss of dimethoate as a post-harvest fruit fly control. Improved data sets and appropriate lures are a high priority for improved domestic access (pers com QDAFF).
Restrictions on eastern states supplying vegetables into WA – quarantine barriers are applied on the basis of both Queensland fruit fly and snails.
Inconsistent state regulations and residue testing; inconsistent data sharing on state border activities and across industries that share regions; lack of coordination in establishing area freedom status and the threat posed by viruses in imported seeds (McMichael 2008).
Gaps that create domestic market impediments include insufficient awareness, commitment to, preparedness and response capacity in relation to vegetable industry biosecurity (McMichael 2008).
R&D investments needed include coordinated regional and national surveillance, coordinated data acquisition and sharing mechanisms, human capacity building and communication (McMichael 2008).
Increasingly the vegetable industry will be required to monitor pest status on farm and collate farm data into regionally accessible surveillance data if it is to access export and even domestic interstate markets (McMichael 2008).
The spread of production across several regions means many growers are not fully aware of developments in other areas.
These domestic market impediments inform the Market Access and Trade Viability Implementation Plan developed in Chapter 5.

__________________________________________________________________________________ AgEconPlus, MHT Consulting and Produce Marketing Australia 15
3.4 Current and Potential Competitive Advantages Current Competitive Advantages Despite a reasonably long list of export market impediments, Australia is able to offer a valuable package of vegetable export comparative advantages. These include:
A successful export history and commercial and personal relationships in Asia (e.g. personal relationships throughout South East Asia developed with those who trained under the Colombo Plan or through a long established and trusted export – import partnership).
Food safety - capacity to differentiate our vegetable products against market-dominating China on the basis of credible Maximum Residue Limits (MRLs) and robust food safety programs. For example if one of the international QSR’s implements its proposed Global GAP + + it will be very difficult for salad vegetables grown in Asia to meet its standards. Australia is a trusted supplier and this will be increasingly important in most export markets.
Mechanisation – with Europe (France, Holland and Germany) and the US, Australia has world leading mechanisation technology. Mechanisation drives labour cost out of the supply chain and will be increasingly important as wage costs increase in Asia. This is one reason why the Australian baby leaf salad industry is a commercially successful exporter - Australia no longer hand harvests baby leaf lines. Twomey (2005) identified the following crops as having mechanised harvest potential: Asian vegetables; celery; cauliflower; baby leafy salad; tomato; wong bok (Chinese cabbage); and zucchini.
Relative proximity and shipping service frequency from Western Australia to South East Asia– e.g. Fremantle is five to six days from Singapore and 8 to 10 days to Kuala Lumpur. However, for other destinations and from Australia’s east coast there are no time advantages, as the following table shows: Table 3.3 Shipping Time – Major Australian Ports
Depart Arrive Singapore Arrive Hong Kong Arrive Dubai
Fremantle 5-6 days 16 days 28 days
Brisbane 14 days 14 days None found
Melbourne 11-13 days 20 days 28-31 days Source: www.australiatrade.com.au
Technological developments are assisting to improve fresh vegetable shelf life and make relatively short sea freight distances even more commercially viable.
Climate – including counter seasonal supply for some commodities and year round supply for others (e.g. carrots from Western Australia are available fifty two weeks of the year).
Human capital – the Australian vegetable industry is now being driven by young, well-educated and visionary growers. Precision farming is the norm and Australia has a well-funded and effective research, development and extension (RD&E) base.
Packaging capacity and ability to innovate with packaging.
Traditional advantage in the ability to provide mixed consignments of airfreight vegetables at short notice to a range of markets in Asia and the Middle East.
Potential Competitive Advantages Review of the literature reveals a range of modern domestic and overseas market trends that might be garnered into competitive advantages for the Australian vegetable industry in the future:

__________________________________________________________________________________ AgEconPlus, MHT Consulting and Produce Marketing Australia 16
Domestic Market Trends
1. Changing perceptions on pre-packs – moving from lower grade and small size to premium price points and smaller proportions. Pre-packs suit consumers doing ‘top up shops’ and align with sensitivity to home waste.
2. Maturation of bagged salads following year on year growth of 30% since 1995. Bagged salads are now tracking back to simpler lines and the need to deliver value as well as quality.
3. Packaging for vegetables - less product damage / less waste; bar codes can be used – easier at the checkout and for inventory control; packaging can be used for marketing and other messages; modern packaging can also be eco-friendly (Retail World November 2012).
4. Growth of alternative channels – including fresh food and complete meal delivery services. Three supplier tiers – ‘traditional’ comprehensive offering (Coles and Woolworths), ‘Lite and Easy’ Style corporates and local greengrocers offering a home delivery service. The growth in alternative channels includes home delivery services like Aussie Farmers Direct.
5. Home cooking with a gourmet twist – but preparing the ingredients takes time. Enter Dinner Hero – online home delivery service. Service includes chef and nutritionist prepared recipe and all ingredients. Five meals home delivered early on a Monday. Based on a Swedish model and inspired by Aussie Farmers Direct.
International Market Trends
1. Fruit and vegetable products that can be eaten ’on-the-go’; even smaller portion sizes for children; organics; more packaging and supplier branding; wider range of salad mixes (Fresh Insight 2012)
2. Fresh cut ‘hard’ vegetables such as squash - demand for fresh cut hard produce is on the rise, packaging companies are innovating to meet the challenge e.g. peel and reseal packs for fresh-cut squash. Advantages include convenience and portion control; marketing / branding space.
3. Tesco new range of 39 different fresh prepared salads and vegetables - products are ready to cook vegetable kits for casseroles and stews; salad kits; micro steamers, sliced and diced vegetables. Offers convenience plus labels to help consumers with their health goals i.e. how many serves of recommended daily intake. Products in the new line include kale salad, gourmet veggie salad, baby gem salad, broccoli cranberry salad kit, spinach bacon salad kit, shredded red cabbage and broccoli coleslaw (Tesco – ‘Fresh and Easy’ Stores – ‘Made Easy’ range press release October 2012).
4. Micro-greens (also known as micro-herbs, micro-leaves) for garnishing – herbs, vegetables and even fruit for upper-end restaurant garnishing.
5. Duo packs – two varieties of potato, say potatoes for chips and mash, in the one clean, well labelled, cooking instruction driven pack (Potatoes Australia, October / November 2012).
6. Consumer education e.g. howtoherbs.com – teaching consumers use and storage of fresh herbs (Asia Fruit Magazine July 2012).
7. Bello Rosso baby red capsicums – small, single serve, no waste, round, sit well on the plate for entertaining (Retail World November 2012).
8. In developing countries in Asia and the Middle East, middle-class growth is bringing more modern supermarkets online. Today, there are 352,000 supermarkets worldwide versus 220,000 in 2002. It is projected that by 2017, Asia will have 226,000 supermarkets, which is just over half of the 431,000 expected worldwide (Source: Good Fruit Grower, Feb 2013). These stores, with their up-to-date storage and merchandising fixtures, are significant markets for imported produce.

__________________________________________________________________________________ AgEconPlus, MHT Consulting and Produce Marketing Australia 17
3.5 Why Exporting is Important to Growers Export is important to growers. The reality is that unless an industry is competitive in some export markets, it ultimately becomes an export target for other countries. Sanitary and phytosanitary (SPS) barriers are less likely to protect horticultural industries in the future, as would-be importers seek redress for ‘unfair’ quarantine barriers through the World Trade Organisation (Balmer 2012). Small producers will be even less likely to be able to export in the future as supply chains continue to consolidate, but may be able to participate by supplying export packers. Consistent product quality suited to specific market requirements becomes critical. Small growers must supply fit-for-purpose product. Export is important to small growers, as its absence impacts on domestic prices as export product is diverted onto local supply chains. For large growers, export should be on an ongoing and consistent basis. It provides options for dealing with an oversupply of product and opportunities for marketing product with a wider range of specifications e.g. large or small grades, certain varieties, etc. It also contributes to redressing the current domestic grower-retailer power imbalance. Supply chain relationships allow commitment to export programs on an annual basis, build direct relationships with retailers, build reputation and a brand, joint promotions and contribute to category management. These principles behind export development and their importance to small and large vegetables growers are articulated in the ‘real world’ through a series of international and domestic case studies. 3.6 Lessons from Case Study Analysis The project team reviewed domestic and international case studies in order to draw out principles relevant to the selection of priority export markets. Case studies reviewed included: International
Prince de Bretagne, France – successful cooperative marketing by 2,500 small to medium sized vegetable growers (Appendix 1)
Love Sweet Potatoes, US – created a new vegetable category in Europe with grower cooperation (Appendix 1)
Grimmway Carrots, California – domestic and export are an integrated part of total marketing mix (www.Grimmway.com)
Washington Apple Commission, US – a grower commodity board supporting high cost producers delivering grower profits in India (Appendix 1)
Fresh Fruit Association, Chile – a unified industry body with consistent clear sighted goals, long term effort, investment before entering markets and frequent evaluation (www.fruitsfromchile.com)
Zespri Gold Kiwifruit, NZ – grower owned company, with unique product, effective single desk marketing, which generates additional returns.
Domestic
Australian Chilli – internationally successful exporter of branded products (Appendix 1)
Gourmet Garden –an internationally successful company in fresh produce with squeeze tube herbs (www.gourmetgarden.com)
Center West Carrots – expanding in the Middle East in spite of a high Australian dollar (www.centerwest.com.au)
Flowerdale Sprout Farm – exports of ‘micro-greens’ to Singapore, Indonesia, HK, Philippines, Dubai and Malaysia (www.flowerdalesproutfarm.com.au).

__________________________________________________________________________________ AgEconPlus, MHT Consulting and Produce Marketing Australia 18
‘Four of the best’ case studies are presented in Appendix 1. Common case study success features are summarised in Table 3.4. Product price does not seem to be the feature that determines export success across the fresh produce case studies analysed. Table 3.4 Lessons from Case Study Analysis PRODUCT Vegetable varieties that meet the demands of
consumers in the importing country Packaging that adds to product appeal Product sophistication – vegetables are low
interest products that can become more appealing
A clear and sustainable point of difference Health benefits - a key selling point A strong brand with QA underpinnings Compulsory grading and food safety standards Consistency – size, taste, etc. Crop scheduling and forecasting to ensure
demand at the required quality can be met Investment in new product development R&D Develop new uses for the product (e.g. sweet
potato ice cream and beer)
PLACE Strong and routine communication and
cooperation right through the supply chain An in country marketing arm Profitable partnerships with importers State of the art cool chain systems Targeting premium retail customers Direct supply arrangements Collaboration with retailers to market supplier-
branded products at the store level Look for efficiency in supply chains, but
avoiding indiscriminate cost cutting .
PROMOTION Investment in educating the trade –so they can
be ambassadors for the product Training – product management, use and
features Dedicated marketing team / on ground
representatives in major markets Monitor consumer and competitor trends Innovative merchandising to add to the
shopping experience Qualitative (dialogue with consumer) as well
as quantitative market research Recognise the importance of promotion and
fund accordingly
OTHER Price – needs to be competitive but not the
driving determinant for success Avoid spot selling (ABL 2002) Export must be considered as part of the
overall product placement mix – e.g. this size and grade for supermarkets, this one for wholesale markets and this one for export to Indonesia
Target upper end consumers with capacity to pay
Scale – for cost savings and consistent product Satisfying stakeholders who are now
constantly demanding innovative, differentiated, sustainable and cost-efficient products
Review of the case studies shows the emergence of a new export paradigm – see Table 3.5.
__________________________________________________________________________________ AgEconPlus, MHT Consulting and Produce Marketing Australia 19
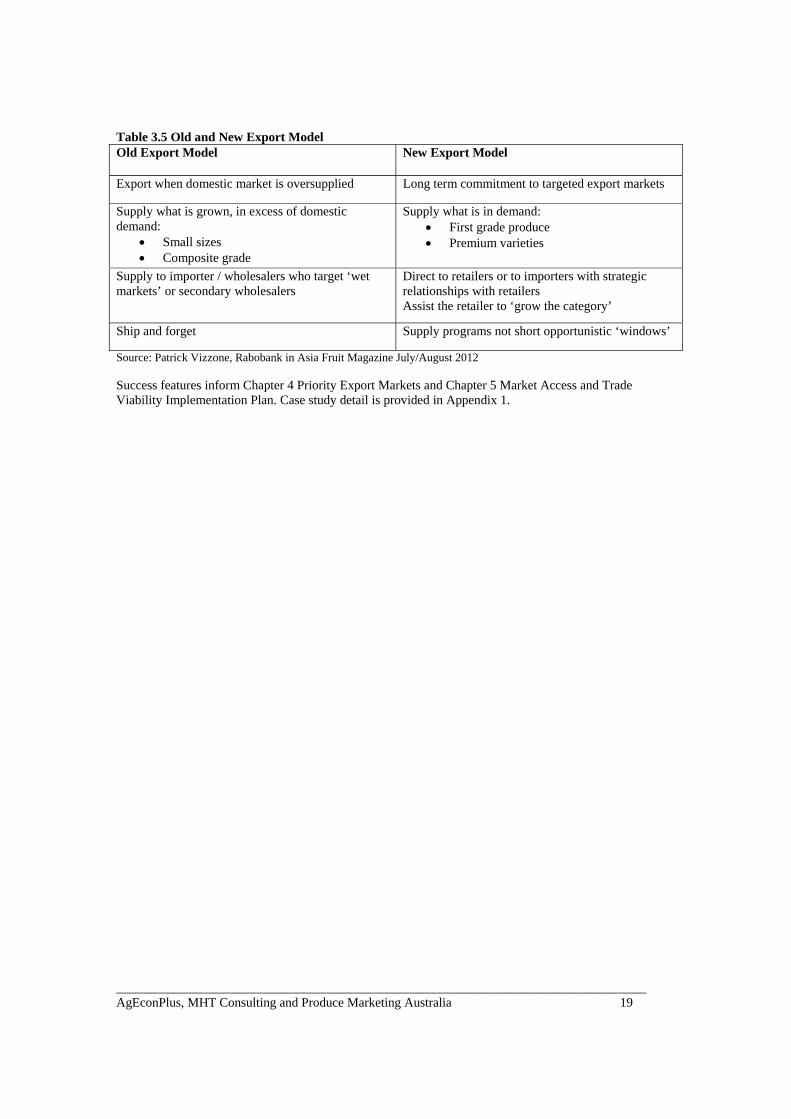
Table 3.5 Old and New Export Model Old Export Model New Export Model
Export when domestic market is oversupplied Long term commitment to targeted export markets
Supply what is grown, in excess of domestic demand:
Small sizes Composite grade
Supply what is in demand: First grade produce Premium varieties
Supply to importer / wholesalers who target ‘wet markets’ or secondary wholesalers
Direct to retailers or to importers with strategic relationships with retailers Assist the retailer to ‘grow the category’
Ship and forget Supply programs not short opportunistic ‘windows’
Source: Patrick Vizzone, Rabobank in Asia Fruit Magazine July/August 2012 Success features inform Chapter 4 Priority Export Markets and Chapter 5 Market Access and Trade Viability Implementation Plan. Case study detail is provided in Appendix 1.

__________________________________________________________________________________ AgEconPlus, MHT Consulting and Produce Marketing Australia 20
4 Priority Export Markets
4.1 World Situation Assessment Figure 4.1 shows the world’s ten largest fresh vegetable exporters and volumes of fresh vegetables exported. Figure 4.2 shows the world’s ten largest fresh vegetable importers. Figure 4.1 Top 10 Fresh Vegetable Exporters by Volume 2000 and 2004 (million tonne)
Source: Rabobank 2006 using FAO data Figure 4.2 Top 10 Fresh Vegetable Importers by Volume 2000 and 2004 (million tonne)
Source: Rabobank 2006 using FAO data NB: Within the Australian region Japan and Malaysia are the two largest fresh vegetable importers while China and India dominate exports. Most imports in Europe and Russia are sourced from within the EU.

__________________________________________________________________________________ AgEconPlus, MHT Consulting and Produce Marketing Australia 21
4.2 Initial Market Selection Potential Australian fresh vegetable export markets were selected following a review of world trade data, current Australian vegetable export statistics, team knowledge and stakeholder consultation, which revealed:
Strong potential for growth in East Asia and South East Asia – eleven of nineteen markets selected for initial consideration were Asian markets. Asian markets evaluated included China, Hong Kong, Taiwan, Japan, Republic of Korea (ROK, South Korea), Vietnam, Thailand, Philippines, Malaysia, Singapore and Indonesia. Note two Asian markets are already ‘Top 10’ importers of fresh vegetables (Figure 4.2).
New Zealand – an important export destination for Australian vegetable products with clear cultural and physical proximity advantages. Seasonal (winter) advantage for cold-sensitive field grown crops.
Strong potential for growth in the Middle East and potentially the Indian Subcontinent – seven markets selected for initial consideration. These included the United Arab Emirates (UAE), Saudi Arabia, other Middle East (Qatar, Kuwait, Bahrain and Oman), Jordan, Iran, India and Sri Lanka.
A number of markets receiving relatively high volumes of Australian vegetables were discounted after initial consideration given that they were either mixed consignment providor markets (e.g. those servicing the likes of international airlines), ‘parallel importers’ (those that receive Australian fresh vegetables and re-export them to other destinations) or ‘mature’. These markets included the Pacific Islands and Brunei.
The European Union (EU) – this market was excluded due to the increasing burden of regulatory costs and additional requirements such as retailer-specific Good Agricultural Practice (GAP) and more.
Russia and Eastern Europe – distance and infrastructure constraints, along with a lack of shared horticultural business history, excluded this group of countries.
North America – is well served by supplies from within the Americas e.g. domestic production plus seasonal supplies from Mexico and Central America.
Africa – lack of infrastructure, shipping, ability to pay and an absence of horticultural business history with Australia.
Table 4.1 summarises countries under initial consideration in this study. Analysis results for all countries shortlisted in Table 4.1 are reported in Appendix 3.
Table 4.1 Export Markets within Initial Project Scope Countries Under Initial Consideration
East Asian Markets (eleven) China Thailand Hong Kong Philippines Taiwan Singapore Japan Malaysia South Korea Indonesia Vietnam
Oceania (one) New Zealand
Middle East and Indian Subcontinent (seven) United Arab Emirates India Other Middle East (Qatar, Kuwait, Bahrain, Oman) Sri Lanka Saudi Arabia Jordan Iran

__________________________________________________________________________________ AgEconPlus, MHT Consulting and Produce Marketing Australia 22
The group of nineteen countries shown in Table 4.1 was agreed with the Industry Reference Group prior to commencing the study at the project launch meeting 9 January 2013. Further shortlisting was completed by the study team after initial research using the analysis criteria described below. 4.3 Explanation of Detailed Analysis Criteria Seven criteria were established in order to prioritise export market opportunities shortlisted for Australian fresh vegetables. The criteria were used in the analysis as ‘filters’ with export opportunity needing to pass successfully from one to seven in order to be considered in the Market Access and Trade Viability Improvement Plan. The criteria were:
1. Market access – this criterion includes analysis of the general access status for Australian vegetables; the existence and level of any import tariffs; and quarantine certificate requirements. Appendix 2 includes a tabular summary of access status. Comment is also provided on the likelihood and impact of any potential changes in access regimes such as the existence of negotiations on a Free Trade Agreement (FTA) or likely changes in importing country domestic policies (e.g. drives for food self-sufficiency).
2. Trade relationships with Australia – including the existence and longevity of trade relationships and any history of cultural ties. The relative importance of the country as a purchaser of the Australian vegetables targeted by this study is also reported.
3. Demographics and capacity to pay – covers the potential market’s population, its population growth rate, the percentage of the population that lives in urban centres and major cities. Urbanised populations are more inclined to purchase imported vegetables than are poorer rural communities. This criterion also includes Gross Domestic Product (GDP) per capita. Low GDP per capita means that an ordinary person cannot afford imported fresh vegetables. Low GDP per capita is defined in this study as being less than $US5,000 per annum. Data to inform development of the demographics and capacity to pay criteria was sourced from the CIA World Fact Book (https://www.cia.gov/library/publications/the-world-factbook/geos/ch.html)1.
4. Vegetable consumption and production – works through UN Comtrade and other data for vegetables shortlisted in Chapter 2 and where relevant, provides comment on domestic production, sources of imports and possible Australian supply windows.
5. Relative size of market segments – provides comment on the size of any Australian fresh vegetable market opportunity identified in criterion four.
6. Supply windows – provides a summary of each prospective vegetables possible supply period.
7. Freight and logistics – addresses seafreight time, air freight availability, and in-country supply chain data.
1 NB: A low GDP per capita does not necessarily exclude Australian vegetables from this country – for example profitable markets may be available in the food service sector and this is considered in the analysis.

__________________________________________________________________________________ AgEconPlus, MHT Consulting and Produce Marketing Australia 23
4.4 Markets with Additional Export Potential Following application of the above criteria, the list of nineteen prospective export destinations was further shortlisted and the following countries were excluded:
Thailand – relatively small consumer demand for imported vegetables with limited capacity to pay for imports. Thailand is further developing domestic supply capacity and receives product overland from neighbouring producers.
South Korea – major vegetable grower, government investing in self-sufficiency, supplied overland by China, zealous inspection and subsequent fumigation make access difficult in commercial turns regardless of written protocols.
Vietnam – limited premium market, access to large volumes of low cost Chinese vegetables plus local seasonal production that satisfies domestic needs. Vietnam is working towards an exportable surplus of vegetables and will compete with Australia in SE Asian markets within 5 to 10 years.
Philippines – limited capacity to pay across the general population, limited premium market sector, poor growth outlook and opaque market structures.
Jordan – limited capacity to pay, distant market with higher freight costs than say the UAE, limited trade history with Australia in fresh vegetables.
Iran – subject to United Nations trade sanctions for the foreseeable future.
India – no market access for Australian fresh vegetables and no access likely in the medium to longer term. Domestic vegetable production is a sensitive political issue. India, the world’s second largest vegetable producer, is also a significant net vegetable exporter.
Sri Lanka – limited capacity to pay and no vegetable trade history with Australia. The diverse Sri Lankan climate allows for temperate vegetable production.
Countries with additional export potential for Australian fresh vegetables are:
China – see case study analysis below. Hong Kong Taiwan Japan Singapore Malaysia Indonesia New Zealand United Arab Emirates Other Middle East (Qatar, Kuwait, Bahrain, Oman) Saudi Arabia
The above analysis informs development of the Market Access and Trade Viability Improvement Plan.

__________________________________________________________________________________ AgEconPlus, MHT Consulting and Produce Marketing Australia 24
4.5 China – A Vegetable Market Case Study Consultation completed as part of this study revealed considerable enthusiasm for China as a high priority market for Australian vegetables. Given this high priority, it was appropriate to summarise the positives and negatives of this destination in addition to the analysis presented in Appendix 3 – Table 4.2. Table 4.2 Positive and Negative Features of China as a Market for Australian Fresh Vegetables
Positive Market Features Negative Market Features
1. Rapidly expanding modern retail including international supermarket and hypermarket chains from the US and EU (1)
1. Competition from increasingly high quality domestic product. Quality and safety are improving and eroding imported produce’s point of difference (1,2,3)
2. Some of these retailers also operate in other markets, where local and or Chinese product is sold alongside more expensive imported vegetables(5)
2. Larger scale cooperative and corporate vegetable production farms are developing and supplying import equivalent vegetables(1)
3. Increasing demand for ‘safe’ foods (1) (2)
3. Government pressure on modern retailers to source locally displacing imports before they become established (5)
4. Price increases and seasonality will create opportunities for certain vegetable categories(2)
4. Government's ‘Farmer-Supermarket Partnership’ Initiative has shaped the market since 2008 (1)
5. Potential customer base, which is expanding. Over 200 cities with 1+million population compared to 35 in Europe (3)
5. Retailers have programs to assist local vegetable growers to deliver high quality, safe vegetables e.g. Metro 'Star' program. Carrefour have developed a similar initiative(1,5)
6. Incomes and consumption of fruits/vegetables are increasing (1)
6. Late start (1990s) then rapid expansion of modern retail has resulted in lack of skilled staff at all levels – imported vegetables poorly managed with excessive waste (1)
7. Distribution/supply chain is shortening (1,2,3)
7. Inexperienced buyers use price as their main/only tool with suppliers – imports are not competitive(5,7)
8. At some stage the RMB has to move to a more realistic (expensive) level and that will make imports more competitive (5)
8. Category management has generally not been adopted- imported vegetables fail to ‘slot’ into planned supermarket programs(5,7)
9. Cold chain is improving (1)
9. Wastage is high, due to lack of product management skills in store (1,7)
10. E-commerce and TV sale increasingly popular (for imported fruits) (1)
10. High (20% to 25% estimate) wastage for vegetables along the supply chain – erodes margins on imported vegetable lines (1)
11. Market access is available for some Australian vegetables including carrots – 20 tonnes valued at $11,580 were exported in 2012 (9)
11. Most retailers do not have Distribution Centres (DCs), relying on suppliers for delivery to stores and adding to the cost/difficulty of importing vegetables (NB: in 2013 Wal Mart
are investing in DCs) (5,7) 12. Rest of the world is focusing on fruit
opportunities, not vegetables. Imported fruit is given as a prestige gift (5,7)
13. Lack of or broken cold chains (1,3,5)
14. Long internal transit times (1)

__________________________________________________________________________________ AgEconPlus, MHT Consulting and Produce Marketing Australia 25
15. High internal logistics (transport plus cold storage) costs (1)
16. China's vegetable production is the world’s largest and is increasing: 356mt in 2000 increasing to 561mt in 2011 (up 58%). Main crops: tomatoes, cucumbers, brassica, eggplant, onions, garlic, spinach, carrots, beans , peppers/chilli(6)
17. A range of climates for year-round production of most vegetables (see Figure 4.3) plus investment in greenhouse production(5)
18. Modest US vegetable imports have actually declined: 10,366 tonnes in 2000 v. 438 tonnes in 2010 reflecting poor prospects for imports from Australia- Table 4.3(8).
19. Wet markets continue to dominate, due to cost, freshness, range and convenience e.g. almost 900 wet markets in Shanghai (1)
20. Restricted market access for Australian vegetables including those susceptible to fruit fly (i.e. cucurbits and solanaceae). An Import Risk Assessment (IRA) would be required by China before imports would be allowed. An IRA would take several years to complete and approve (5) (8)
1. Fresh Produce Distribution in China, PMA December 2012 2. Patrick Vissone, Rabobank, PMA Fresh Connections China March 2013 3. Mabel Zhuang, PMA Fresh Connections China March 20134. USDA Foreign Agricultural Service 5. Exporter/others observations during consultation 6. FAOSTAT 7. John Baker, via retail training for modern retailers in China 2008-2012 8. Chris Langley Office of Horticultural Market Access 9. UN Comtrade data
China is the biggest vegetable producer in the world. It offers low cost year round supply (see Figure 4.3) as well as rapid adoption of improved growth systems and covered production. Planted area is estimated at close to 20 million hectares and continues to rise. The area under protected cultivation has increased significantly, extending the supply season and consistency for many vegetables. Access to this market is constrained for vegetables susceptible to fruit flies and an IRA will take time to complete and have approved.
Table 4.3 US Exports of Fresh Vegetables to China (tonnes) Product 2000 2001 2002 2003 2004 2005 2006 2007 2008 2009 2010 Fresh Veg (not potatoes)
10,366 6,682 2,453 1,961 1,139 556 286 433 368 303 438
Celery 6,678 2,458 364 105 50 154 26 0 25 0 19 Onions/shallots 166 1,230 1,074 1,098 346 119 1 59 3 2 29 Broccoli 868 590 0 80 18 35 3 38 0 0 35 Peas 0 149 200 0 306 0 15 19 0 0 107 Beans 0 0 3 48 27 13 0 56 60 62 56 Peppers 0 56 0 0 19 0 4 0 0 0 44 Other 2,653 2,199 813 631 375 237 237 261 280 239 148 Source: USDA Foreign Agricultural Service 2011

__________________________________________________________________________________ AgEconPlus, MHT Consulting and Produce Marketing Australia 26
Figure 4.3 China has Capacity to Produce Vegetables and Export All Year Round
Source: Mike Titley 2013 Following this analysis China has been included in the Market Access and Trade Viability Improvement Plan (Section 5.1, Action 5)
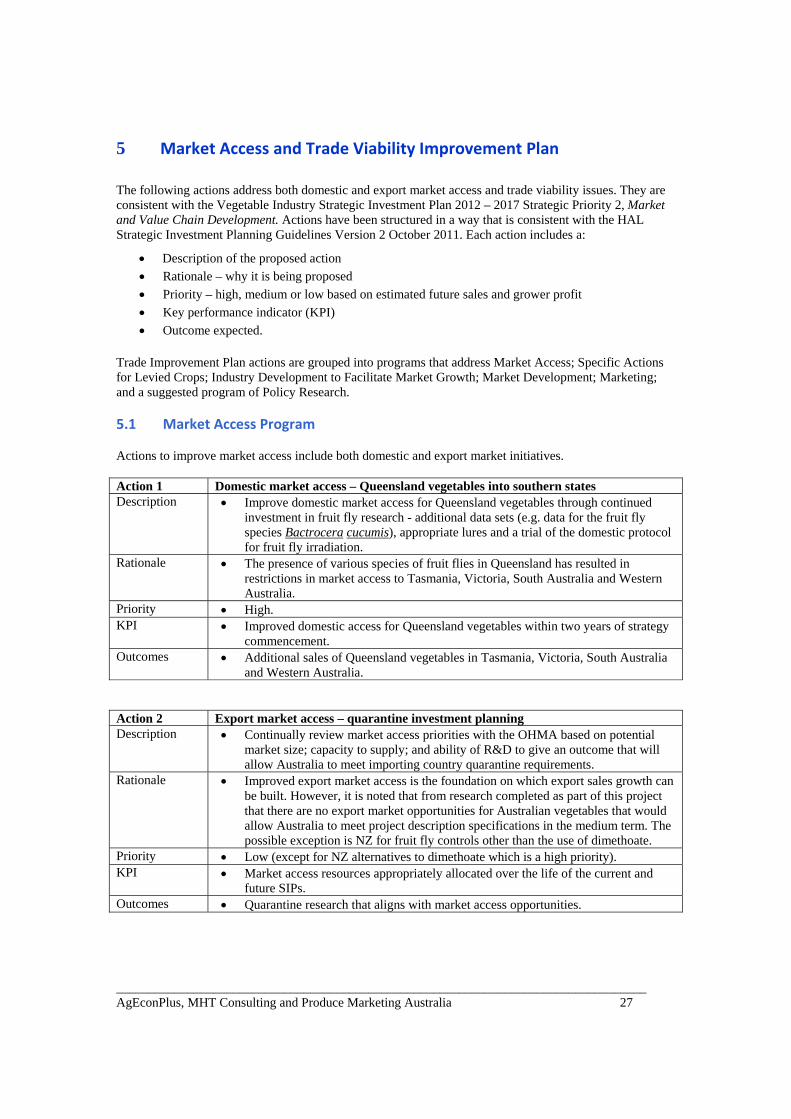
__________________________________________________________________________________ AgEconPlus, MHT Consulting and Produce Marketing Australia 27
5 Market Access and Trade Viability Improvement Plan
The following actions address both domestic and export market access and trade viability issues. They are consistent with the Vegetable Industry Strategic Investment Plan 2012 – 2017 Strategic Priority 2, Market and Value Chain Development. Actions have been structured in a way that is consistent with the HAL Strategic Investment Planning Guidelines Version 2 October 2011. Each action includes a:
Description of the proposed action
Rationale – why it is being proposed
Priority – high, medium or low based on estimated future sales and grower profit
Key performance indicator (KPI)
Outcome expected. Trade Improvement Plan actions are grouped into programs that address Market Access; Specific Actions for Levied Crops; Industry Development to Facilitate Market Growth; Market Development; Marketing; and a suggested program of Policy Research. 5.1 Market Access Program Actions to improve market access include both domestic and export market initiatives. Action 1 Domestic market access – Queensland vegetables into southern states Description Improve domestic market access for Queensland vegetables through continued
investment in fruit fly research - additional data sets (e.g. data for the fruit fly species Bactrocera cucumis), appropriate lures and a trial of the domestic protocol for fruit fly irradiation.
Rationale The presence of various species of fruit flies in Queensland has resulted in restrictions in market access to Tasmania, Victoria, South Australia and Western Australia.
Priority High. KPI Improved domestic access for Queensland vegetables within two years of strategy
commencement. Outcomes Additional sales of Queensland vegetables in Tasmania, Victoria, South Australia
and Western Australia. Action 2 Export market access – quarantine investment planning Description Continually review market access priorities with the OHMA based on potential
market size; capacity to supply; and ability of R&D to give an outcome that will allow Australia to meet importing country quarantine requirements.
Rationale Improved export market access is the foundation on which export sales growth can be built. However, it is noted that from research completed as part of this project that there are no export market opportunities for Australian vegetables that would allow Australia to meet project description specifications in the medium term. The possible exception is NZ for fruit fly controls other than the use of dimethoate.
Priority Low (except for NZ alternatives to dimethoate which is a high priority). KPI Market access resources appropriately allocated over the life of the current and
future SIPs. Outcomes Quarantine research that aligns with market access opportunities.

__________________________________________________________________________________ AgEconPlus, MHT Consulting and Produce Marketing Australia 28
Action 3 Export market access – non-quarantine (i.e. tariffs and FTAs) Description Negotiate improved market access for Australian vegetable exports including
elimination of tariffs on carrots in Taiwan, the Philippines, Japan and Saudi Arabia. Longer term market access priorities for the vegetable industry include the completion of current FTA negotiations with China (commenced 2005), Japan (commenced 2007), the Gulf Cooperative Council (commenced 2007) and South Korea (commenced 2009) and the commencement of negotiations with India.
Rationale Lower tariffs improve the competitiveness of Australian exports. Priority Medium KPI Tariffs eliminated on Australian carrots by 2015 in three key markets.
AUSVEG priorities incorporated into one completed FTA within five years. Outcomes Additional carrot sales in Taiwan, the Philippines, Japan and Saudi Arabia.
Action 4 Export market access – joint investment, dimethoate alternatives for New Zealand Description Invest jointly with other industries to continue to develop post-harvest solutions
for fruit fly control following the de-registration of dimethoate for this purpose. This urgent action is relevant to capsicum, pumpkin, zucchini and other fruiting vegetables particularly for access to NZ. The possible approval of irradiation for use on capsicum and other vegetables exported to NZ will be a significant step, however some vegetables are unlikely to withstand irradiation treatment and further alternatives need to be found.
Rationale Australian capsicums fill a low cost niche with field grown product in winter compared to more expensive domestic NZ greenhouse production. Furthermore there is an opportunity to supply NZ QSRs with fresh Australian capsicum for processing during the winter months. In addition whole head lettuce hearts for processing in winter may be possible with a solution, acceptable to NZ quarantine authorities, for Rutherglen Bug. NZ market access is a high priority action.
Priority High KPI Alternative to dimethoate in place one year from strategy commencement. Outcomes Profitable sales of capsicum and potentially head lettuce in New Zealand.
Action 5 Export market access - China Description Confirm the future importance of China as an export market for Australian
vegetables. Rationale There are mixed messages on the value and importance of achieving market access
into China. On the one hand, there is data and experience to suggest the market for imported vegetables in China is, and will continue to be, negligible. For example, imports of fresh US Vegetables declined from 10,366 tonnes in 2000 to 438 tonnes in 2010 (Source: USDA Foreign Agricultural Service). In addition, some Australian exporters familiar with the China market have observed there is potential for fresh fruit imports, but not for vegetables. This view is supported by one of the project team, who has delivered retail training in the past four years to major international and national chains present in China, including Wal-Mart, Carrefour, RT-Mart and CRC-Vanguard. On the other hand, there is also a view that China could be a two-tier market, with demand for both low cost local vegetables and higher-cost western, safe vegetables, as is the case in some other Asian markets. It has not been possible to fully test and confirm this hypothesis. Action: test and confirm the hypothesis through a separate R&D project that includes field investigations.
Priority High KPI Research project report which ‘fleshes out’ the preliminary conclusions reached
for China by this project. Outcomes Efficient and effective future research investment through confirmation of the
extent of China’s potential for Australian fresh vegetables.

__________________________________________________________________________________ AgEconPlus, MHT Consulting and Produce Marketing Australia 29
5.2 Specific Actions for Levied Crops Specific actions for levied crops target high priority vegetables identified in Chapter 2 of this report. Actions are listed in simple alphabetical order. Action 6 Beans – New Zealand Description Implement a market monitoring strategy to ensure this important winter trade
continues at the existing level (based on mechanised production from Queensland, seafreight via the Port of Brisbane).
Rationale An Australian monopoly during the seasonal window may expose the trade to other competitors.
Priority High KPI New Zealand purchases of Australian beans remains at $4 million pa. Outcomes Profitable trade is protected. Action 7 Beans – South East Asia and the Middle East Description Direct sales of value added beans to ‘high end’ supermarkets, restaurants/hotels
and other food service sectors (e.g. airline catering) in SE Asia and the Middle East
Rationale Beans are a staple of Asian cuisine and some Australian beans are already consumed in the Middle East.
Bean production is mechanised which gives Australia a basis to establish a comparative advantage.
Value added bean lines have proved to be successful in Australian supermarkets. Priority Medium. KPI Value added bean sales to South East Asia and the Middle East valued at $1
million within three years of strategy commencement Outcomes Direct sales established for ready to eat fresh green beans Action 8 Broccoli – reinvigorate broccoli exports especially Japan Description Reinvigorate broccoli exports through a recovery strategy based on investment in
crop scheduling for continuity of supply, alternative cost effective establishment methods, improved varieties with white blister tolerance, mechanical harvesting, and seafreight. Priority market is Japan.
Rationale Australia has had a proven track record of seafreight exports to Japan, the market has continued to expand, potential clients in Japan are concerned by residues in Chinese product and are impressed with Australia’s sound track record in brassica IPM.
Priority High KPI Research projects commissioned that work toward the goal of reinvigorating
exports to Japan in the first year of strategy commencement. Outcomes If Australia was able to secure 10% of the Japanese broccoli market it would be
equivalent to 5,000 tonnes with a value of $10 million. Specifically investigate the supply window outside when broccoli is not sourced from the Salinas Valley. There were no sales of Australian broccoli to Japan in either 2011 or 2012.

__________________________________________________________________________________ AgEconPlus, MHT Consulting and Produce Marketing Australia 30
Action 9 Carrots – export market expansion and defence strategy Description Develop a market expansion and defensive strategy to protect Australian carrot
exports in six key markets, currently valued at $52 million pa. A defensive strategy would include diversifying production to reduce risks associated with disease, climate change and drought; collaboration between growing regions including east coast production regions; and researching alternatives to the soil fumigant metham sodium. Market based actions include building on the current good reputation of key Australian exporters, through deeper analysis of price differentials in export markets (those valued over $1million pa), value adding (e.g. alternative sizes, packaging), cementing trade relationships through communication; retail training; and promotion.
Rationale There is evidence for further market growth, through a combination of additional markets and more customers in existing markets, particularly in the Middle East. Currently Australian carrot supply is a constraint. In addition, Australian carrot exports are under increasing threat from lower cost Chinese product of improving quality.
Priority High KPI Increase Australian carrot exports by $20 million within three years of strategy
commencement. Outcomes A secure and expanded future for Australia’s most successful fresh vegetable
export. Action 10 Celery – recover lost market share in Singapore and Malaysia Description Recover lost market share in Singapore and Malaysia markets by displacing US
sales (currently valued $9 million in 2012). Examine the potential of value added products including sleeved celery sticks. Value added uses product that has been a waste material outside of domestic supermarket specs. Source product from Tasmania , Southern Victoria and Queensland to complement WA production and create a year-round supply. Understand any threat posed by Dole’s production of celery in Asia.
Rationale Make the most of Australia’s ‘time on water’ seafreight advantage and do this by utilising undervalued celery ‘waste’.
Priority High KPI Capture 30% of current US celery market in Singapore and Malaysia within 3
years. Outcomes A new $3 million per annum celery trade in Singapore and Malaysia within three
years of strategy commencement. Action 11 Lettuce – iceberg hearts for QSR’s to New Zealand Description Expand exports to NZ during the winter months when it is too difficult to grow
lettuce domestically. This initiative will require deeper action to understand reasons for the loss of market share and explore ways to re-establish competitive advantage.
Rationale A $0.5 million trade to NZ in 2011 has dropped to $50k in 2012 and should be resurrected.
Priority Medium KPI Levy investments allocated to understand and resurrect lost NZ lettuce sales. Outcomes Annual sales of lettuce to NZ valued at $0.5 million.

__________________________________________________________________________________ AgEconPlus, MHT Consulting and Produce Marketing Australia 31
Action 12 Lettuce - baby leaf/bulk shredded to South East Asia and the Middle East Description Become a preferred baby leaf / bulk shredded lettuce supplier through a strategy to
shift Australia’s status in Asia from contingent to regular shipments. Strategy to address service, packaging and food safety. Higher levels of food safety are required for this product including triple wash, no manures in production, regular MRL monitoring - initiatives already practised by suppliers servicing the Australian domestic market. Strategy to be based around supply of retail packs to supermarkets and bulk packs to the food services sector (e.g. airline catering) in South East Asia and Middle East via airfreight.
Rationale Australia has comparative advantage in airfreight (destinations and frequency), as well as mechanised harvest systems. Australian product has a shelf life and flavour advantage over Asian grown hydroponic lines.
Priority High KPI KPI: Target is for $10 million in sales across SE Asia and the Middle East within 3
years (current sales to these destinations are approximately $3 million pa). Outcomes Profitable sales of higher value lettuce in line with Australia’s competitive
advantage in mechanisation and food safety. Action 13 Leeks – target market recovery in Singapore and Japan Description Target export growth in Japan and Singapore by addressing market share lost to
NZ due to a drought-induced decline in production of Australian leeks in prime growing areas (e.g. Adelaide Hills SA, Mangrove Mountain NSW, and Stanthorpe Qld). Target market recovery with identification of best growing regions, an appropriate package of agronomy ( varieties, seedling size and mechanisedplanting ) and pack house mechanisation.
Rationale Japan is the world’s largest importer of leeks and Australia has a 1% and growing share of this market. Australian market share also grew in Singapore 2010 to 2012.
Priority Medium KPI Within three years of strategy commencement turn $0.6m in export sales to Japan
and Singapore into $1.2 million. Outcomes Market recovery with identification of best growing regions, an appropriate
package of agronomy and pack house mechanisation. Action 14 Sweet corn – explore value added potential Asia and the Middle East Description Explore the potential for sales of value added Australian sweet corn in Japan,
Singapore, Malaysia and the Middle East. This action would support private supplier level market research/ intelligence. There is no data currently available on this potential opportunity.
Rationale NZ has demonstrated market potential in Japan. Sweet corn is a highly mechanised product so Australia could be competitive. Varieties required in overseas markets must be super sweet and may be bicolour which Australia can supply. Recent innovations in value adding on the Australian domestic market could be applicable to overseas supermarkets.
Priority High KPI Market research generated that confirms this opportunity within twelve months. Outcomes Market research completed for Japan, Singapore, Malaysia and the Middle East.
Conclusion reached on the prospectivity of Australian sweet corn exports.

__________________________________________________________________________________ AgEconPlus, MHT Consulting and Produce Marketing Australia 32
5.3 Industry Development Industry development actions target research, development and extension to improve Australia’s capacity in both domestic and export markets. Action 15 Industry development – support ongoing mechanisation research Description Support ongoing mechanisation research, to improve cost-efficiencies in
production, harvest and post-harvest, for the broccoli, carrot, celery, cauliflower, baby leaf salad, Chinese cabbage and leek, sectors. These crops have been identified as providing the most potential for further mechanisation of production.
Rationale Reduce reliance on high cost and short supplied Australian labour. This must always be a high priority for Australian vegetable industry regardless of whether the domestic or export markets are being targeted.
Priority High KPI Projects relevant to each of the broccoli, carrot, celery, cauliflower, baby leaf
salad, Chinese cabbage and leek are funded over the next five years. Outcomes The total units of high cost Australian labour used to produce and market each
tonne of levied vegetables decreases over time. Action 16 Industry development – export production training Description Develop and deliver training packages focused on advanced crop scheduling
(timing and volume) for existing and prospective export oriented growers. Critical crops include those with value adding potential i.e. sweet corn, beans, leek, broccoli and baby leaf lines as well as capsicum. In addition, include training on the role of growers in supply chain and category management.
Rationale To ensure continuity of supply to international customers and to address changing climate conditions (e.g. colder winters in Gatton). Contribute to creating value-added points of difference in servicing export customers. Training will be valuable for growers targeting both domestic as well as export markets.
Priority Medium KPI Relevant training courses prepared and delivered to interested growers. Outcomes Increased capacity to reliably service export markets. Action 17 Industry development – export vegetable genetics symposium Description Arrange a symposium of Asian / Middle East supermarket buyers, seed companies
and Australian growers and exporters to review market and agronomic performance of key Australian vegetable crop varieties and identify gaps. Key crops include broccoli, capsicum, celery, leeks, lettuce, and baby leaf lines. Consider a wider set of vegetables beyond levied crops to ensure market participation in the forum.
Rationale To ensure Australia has the best genetics for production and marketing. This action has been completed for carrots, in the form of the Carrot Conference Australia in Perth WA in 2000 and Australia is still competitive in this commodity. Furthermore, communication has been less than ideal between key players (seed companies, the market and growers) in accessing varieties for Australian conditions as a result of loss of key person expertise in places like Gatton UQ and flow on impact in the seeds industry. There is a need to develop varieties with uniform maturity that can be ‘once over’ harvested (e.g. to support mechanised harvesting).
Priority High KPI Symposium held for one crop, say broccoli in the next twelve months with
additional events planned in subsequent years. Outcomes Improved genetics and linkages through the vegetable export supply chain.

__________________________________________________________________________________ AgEconPlus, MHT Consulting and Produce Marketing Australia 33
5.4 Market Development Market development actions include cross industry collaboration, intelligence gathering and investment in international benchmarking of new vegetable products. Action 18 Market development – cross HAL industry collaboration targeting food service Description Collaborate with other HAL industries to address areas of common interest and
endeavour in export markets, including understanding the potential and distribution systems used in the food service sector in South East Asia and the Middle East, market intelligence, trade communication and logistics. HAL industries with an interest in export market development include but are not limited to table grapes, citrus, apple/pear and avocado.
Rationale To build goodwill in markets and create a ‘Brand Australia’ – see for example Fruits from Chile – www.fruitsfromchile.com. This initiative would build on goodwill generated at HAL’s 2012 Export Forum and is a cost effective way of sharing export resources. In addition the food service sector is largely undeveloped for Australian suppliers.
Priority High KPI A cross sector planning forum including exporters as well as growers is held
within twelve months of the 2012 HAL Export Forum.Outcomes Cost effective collection and dissemination of market development intelligence. Action 19 Market development – export market intelligence Description Develop detailed market intelligence possibly including an ‘on ground’ presence
in major markets and specific strategies to protect and grow markets were Australia has either individual crop or collective critical mass. These markets include Singapore (for carrots $11m, broccoli $6.5m and specialty lettuce $2m); Malaysia (for carrots $10m); and the Middle East (for carrots $28m).
Rationale Even larger individual vegetable exporters lack the resources to collect and analyse market trends and opportunities in all prospective export markets.
Priority High KPI Projects initiated and initial market intelligence generated within twelve months of
strategy commencement. Outcomes Improved knowledge leading to protection of existing export markets and
development of new opportunities. Action 20 Market development – value added sweet corn, bean, celery and leek products Description Allocate R&D funding to support business level research into market and value
added product development for four levied vegetables - i.e. sweet corn, beans, celery and leek directed at modern retailers in Asia and the Middle East.
Rationale Provide businesses with resources to identify enterprise-level opportunities for new products and/or new value added products and create additional export value. Care will be needed to ensure management of public and private good outcomes.
Priority High KPI Three levy funded projects let within twelve months of strategy commencement. Outcomes New Australian fresh vegetable products that recognise the reality of Australia’s
future comparative advantage being in vegetable ‘products’ rather than ‘commodities’.

__________________________________________________________________________________ AgEconPlus, MHT Consulting and Produce Marketing Australia 34
Action 21 Market development – international benchmarking of new vegetable innovation Description Complete a global scan of innovation in relation to new varieties, new value added
initiatives, new forms of packaging and new uses for levied vegetables. Rationale It is well established that in the long term Australia is unable to compete on the
international commodity market. Products tailored for specific markets is the fresh vegetable industry’s export future. This sector is highly dynamic and understanding and investment in innovation is essential.
Priority High KPI Scan completed within two years of strategy commencement. Outcomes A listing of potential new vegetable innovations that has been prepared in
consultation with leading Australian packers and exporters. 5.5 Marketing Marketing actions are only possible with an export marketing levy in place - see action number 25 below. An export marketing levy could be established on either a statutory (compulsory) or voluntary basis. Action 22 Marketing – category management support for exporters Description Support those exporters providing category management services to their
customers. Encourage and support those vegetable marketers who are practising category management with domestic retailers, and who have expressed interest in utilising those skills to develop exports. Support might include training, tools, data and other resources.
Rationale Category management is one of the best tools to develop and cement relationships with customers, and acts as a defence against spot or commodity selling by competitors. Some of the best category manager-suppliers are to be found in the Australian vegetable sector. Effective category management may include partnerships with exporters from the northern hemisphere.
Priority High KPI Appropriate existing and aspiring exporters receive support in developing category
management capacity Outcomes Exporters with additional skill and capacity who are able to drive exports and
create additional profitable sales for vegetable growers. Action 23 Marketing – support and promotion in South East Asia and the Middle East Description Develop market-based cross product marketing support and promotion strategies
in Singapore, Malaysia, the UAE and Saudi Arabia with leading supermarket chains (training, relationships and planned programs).
Rationale These are markets where there is critical mass for vegetables and other products sufficient to create a presence, profile and preference for Australian product. Examine the feasibility for the vegetable industry and exporters to utilise ‘Australia fresh’ and alternative promotion models, such as those developed by ‘Prince de Bretagne’ (see Appendix 1) and ‘Fruits from Chile’ (www.fruitsfromchile.com).
Priority Medium KPI Understanding of the potential of umbrella marketing for Australian fresh
vegetables in overseas markets within three years of strategy commencement. Outcomes Branded product that creates additional and less price sensitive sales.

__________________________________________________________________________________ AgEconPlus, MHT Consulting and Produce Marketing Australia 35
Action 24 Marketing – build capacity in airfreighting mixed vegetable consignments Description Build on Australia’s capacity to supply air-freighted mixed vegetable
consignments to Asia and the Middle East. Increase awareness of this opportunity with existing and prospective export oriented growers. Provide appropriate training including use of improved crop forecasting capacity from the likes of the Bureau of Meteorology.
Rationale Australian exporters are in a unique position to provide ‘just in time’ product across Asia and the Middle East via airfreight with product sourced from a combination of domestic wholesale markets and direct relationships with growers. Developing this trade takes supply out of the domestic market and pressure off price.
Priority Medium KPI Training programs developed and delivered to existing and potential mixed
consignment providers. Outcomes Additional ‘value added’ export sales. Value is added through a more informed
schedule of exports that profits the mixed consignment exporter, the grower and does not interrupt category management programs.
5.6 Policy Research Trade Viability Improvement plan actions include measures that address both industry and government policy. Action 25 Policy – establish either a voluntary or statutory export marketing fund Description Canvass support for the establishment of a vegetable industry export marketing
fund, to be used specifically for export development including promotion. While HAL industry marketing levies are statutory and address both domestic and export marketing, the vegetable levy is for R&D purposes only. This proposal; suggests investigating either a statutory (HAL) levy or a voluntary fund, drawing on success in NZ with voluntary arrangements. (See for example the NZ Fresh Produce Importers Association).
Rationale Marketing and promotion support would facilitate differentiation of Australian product on attributes other than price.
Priority Medium KPI The feasibility of an export marketing fund is tested with vegetable industry
stakeholders, including current and/r potential exporters and their grower suppliers.
Outcomes Feasibility tested by the end of third year of strategy implementation. Action 26 Policy – measures to address the high Australian dollar Description Commission research to identify policy responses to help counter the effect of a
high Australian dollar compared with competitors such as China (trades in US dollars), the US, the EU and NZ. Policy options for research might include changes to the Export Market Development Grant Scheme, tax rebates for new products and new markets.
Rationale Assist businesses establish a track record with a new vegetable products and/or market combinations.
Priority Low (there will be considerable work in convincing Government of the merit of this proposal)
KPI Research completed to identify policy responses within four years of strategy commencement.
Outcomes Research on the merit of incentives for new export product development.

__________________________________________________________________________________ AgEconPlus, MHT Consulting and Produce Marketing Australia 36
Action 27 Policy – export accreditation including credit risk training and a bad debts register Description Communicate findings from this study on the merits of an export accreditation
program requiring legislation. Fill current market gap with credit risk training and a bad debts register.
Rationale A program is required to address medium sized grower concerns regarding non-receipt of payment from export partners. Non-receipt of payment was identified as an issue during consultation, by ABARES and through the study terms of reference.
Priority High KPI Credit risk training delivered to growers new to export and a bad debtor’s register
maintained by AUSVEG or a similar industry body. Outcomes An increase in Australian vegetable exports facilitated by payment assurance. Action 27 is further detailed in Chapter 6 Export Accreditation Program Analysis.

__________________________________________________________________________________ AgEconPlus, MHT Consulting and Produce Marketing Australia 37
6 Export Accreditation Program ‐ Analysis of Options
6.1 Analysis Purpose The terms of reference for the study requested an examination of the potential of an export / import accreditation program to provide greater confidence to growers wishing to develop their businesses into export markets or provide information to growers on how they can improve their existing export operations. At the project launch meeting of 9 January 2013, the Industry Reference Group clarified the request, stating that it related to vegetable growers who are of medium scale who are not big enough to export on their own but who receive inquiries from exporters/agents and are unsure of the exporters’ capacity to pay. The request is echoed in the ABARES survey of 2007-08 which found that a lack of relationships was one of seven major reasons why Australian vegetable growers did not export. Research revealed six potential options to address lack of payment certainty and each is analysed below. 6.2 Use of HAL’s Export Efficiency Powers (EEP) HAL managed Export Efficiency Power (EEP) legislation provided for the licencing of exporters of apples, pears, oranges and dried grapes. Licenses were not issued to companies that were under financial administration or were without experience in exporting horticultural produce. Licensing was aimed at providing a measure of protection to growers, packers and importers. The legislation was repealed in 2012 following an ABARES review which found that ‘more effective industry arrangements to accredit exporters and provide insurance against failure could be adopted outside of the EEP system if industry considered this to be beneficial’ (ABARES 2012). Statutory powers requiring export agent licencing are no longer available to HAL and are unlikely to be revived. Consequently this option to address lack of payment certainty is rejected. 6.3 Copy the New Zealand Horticulture Export Authority (NZHEA) Model A program based on the New Zealand Horticulture Export Authority (NZHEA) model addresses both concerns raised through the study terms of reference – payment assurance and the provision of information to growers. NZHEA provides an export structure and support network to the NZ horticultural export industry. This structure and network takes the form of an export licensing system for grower groups who choose to come under the NZHEA banner. This structure requires export groups to develop an Export Marketing Strategy (i.e. their rules for exporting). NZHEA also provides support and information through newsletters, and occasional conferences/workshops to assist industry development. NZHEA liaises with sector stakeholder groups on matters relating to market access, trade barriers and their removal, and plays a role in lobbying government on such matters on behalf of the industry (http://www.hea.co.nz/). The operation of NZHEA is dependent on supporting government legislation. Positives of this approach include:
Exporters could be required to prove they are ‘of sound financial standing’ – e.g. NZHEA requires exporters to confirm their equity investment in exporting via a minimum Paid-Up Share Capital of NZ$100,000 or similar in the case of applications by partnerships.
A mechanism to manage the product export marketing strategy.

__________________________________________________________________________________ AgEconPlus, MHT Consulting and Produce Marketing Australia 38
Potential to provide specific product by market conditions to support orderly marketing e.g. import panels, minimum pricing, quality specs etc.
Potential to collect data in real time e.g. what is being shipped, market returns etc.
Potential to plan marketing support/trade communication, knowing where product is destined.
A mechanism to stop unmanaged spot selling – which undermines planned marketing programs. Negatives aspects of the NZHEA model include:
Interventions of this type are not supported by exporters/or their association in Australia (i.e. AHEA).
NZHEA's legal advice is that relying on regulatory powers (such as an accreditation scheme) to enforce minimum selling prices is likely to breach WTO rules.
Additional costs are incurred in complying, participating, implementation and enforcement.
Indirect costs in the form of market distortions and losses in economic efficiency do occur (see for example the Productivity Commission’s review of Wheat Accreditation Scheme 2008).
Practical difficulties arise with implementation (e.g. convincing established exporters of their need to participate).
Initiatives must be funded – by exporters or by using a vegetable export levy/fund.
The NZ model does not include the whole supply chain i.e. growers, pack-houses and importing country retailers.
The Australian Government continues to ‘wind back’ these types of market interventions (e.g. HAL Export Efficiency Powers, deregulation of Australian wheat export arrangements) and is unlikely to support new market initiatives. Consequently, attempting to establish a New Zealand style Horticulture Export Authority model is not recommended. 6.4 Expansion of Existing Central Market Credit Systems Central wholesale markets operate credit systems to ensure grower payments. For example the Credit Service operated by Brismark is a clearing house for wholesalers, buyers and other related businesses operating in the Brisbane Produce Market. (http://www.brismark.com.au/cms/index.php/Wholesaler-Credit-Service.html). All Credit Service users are given a unique buying or selling code to identify them at the time of any transaction inside the market. Following each day’s trade invoices are sent to the Credit Service for sorting and collection. At the end of each week buyer’s statements are sent to the Credit Service and the information is consolidated onto a single billing statement for each buyer. Credit Service staff follow up buyers to ensure that payments are received on time. The payments received from buyers are subsequently distributed to the relevant wholesalers. Benefits include:
Payment terms of 7 to 14 days with on time payment rates of around 96%
An extremely low bad debt rate of 0.000012%.
A Bad Debt Reserve of over $3 million which guarantees up to 90% of each debt
A credit risk evaluation of all buyers
Follow up of all overdue payments.

__________________________________________________________________________________ AgEconPlus, MHT Consulting and Produce Marketing Australia 39
Consultation was completed with Stephen Hunt, Brismark Credit Service Manager who advised that Brismark’s Credit Service was not available for exporters and is only applicable to wholesalers who operate at the Rocklea Brisbane Markets. He understood the situation to be similar in other wholesale markets including the Sydney Wholesale Markets, Sydney Markets Credit Service. Stephen advised that the only current option available to growers wishing to engage export agents and concerned about payment risk would be commercial insurance. 6.5 Insurance to Cover Non Payment by Export Agents Insurance to cover non-payment by export agents can be arranged through, for example, National Credit Insurance Brokers (www.nci.com.au). Adelaide based National Credit Insurance Brokers specialise in Indemnity Insurance i.e. cover to ensure that the recipient of goods will pay for them. Insurance is commensurate with risk and premiums are substantial. 6.6 Training including Credit Risk Assessment for Growers New to Export Growers establishing business relationships with export agents are able to reduce the risk of non-payment by completing their own credit risk assessments. The efficacy of these assessments could be improved with training and could be funded using the vegetable industry R&D levy. Training course material could include how to use various online resources such as the Australian Securities and Investment Commission (ASIC) website (http://www.asic.gov.au/asic/asic.nsf). Resources on the ASIC website relevant to credit risk assessment include:
Banned Bodies Corporate Register Credit and ASIC Act Infringements Company alerts Enforceable Undertakings Register Insolvency Notices Summary prosecutions of companies and directors
Training in Credit Risk Assessment is only applicable to Australian entities and would not reduce the risk of non-payment if the agent was overseas based. 6.7 AUSVEG Maintain a Bad Debtors Register AUSVEG role is to provide advocacy, R&D management and services to Australian vegetable growers. One possible service that it might consider is the establishment of a Bad Debtors Register for growers who have had difficulty in securing payment from an export agent. The base model would be a simple online listing of export agents who have been in dispute with growers over payment with appropriate caveats around responsibility (i.e. the register would need to note that non-payment could be for any number of reasons not related to the agent’s trustworthiness). A more sophisticated model requiring additional resources would include voluntary accreditation whereby export agents with a secure payment history could also be listed and or receive some form of AUSVEG branding. Both options would need to be tested for demand and their standing in the law. As an aside it is noted that Apple and Pear Australia Limited (APAL) are currently in the process of building an Information Register to connect growers with overseas buyers and potential export opportunities (APAL Industry News, 2 April 2013). Provision of export services is consistent with this Peak Industry Body’s role.

__________________________________________________________________________________ AgEconPlus, MHT Consulting and Produce Marketing Australia 40
6.8 Conclusions on the Potential of an Export Accreditation Program Despite a number of prima facie benefits associated with a legislation backed accreditation scheme, it is unlikely that government, and many established players in the vegetable industry, would be convinced of its overall merit. The preferred approach for mid-sized vegetable growers concerned about credit risk is a combination of Credit Risk Assessment Training and the keeping of a simple information register by AUSVEG or a similar body.

__________________________________________________________________________________ AgEconPlus, MHT Consulting and Produce Marketing Australia 41
7 Information for Growers Considering New Markets
7.1 Checklist Purpose The final term of reference for the study was to document and communicate relevant trade information to vegetable growers to assist them to evaluate whether it is viable to expand their business into the export market or provide information on how they can improve their existing export operations. Chapters 1 to 6 of this document provides information for growers on which levied vegetables have the most potential in export markets; which are the priority export markets; impediments faced and investments needed to secure export success. This chapter provides a checklist for growers who have considered the above information and wish to either expand their business into the export market or improve their existing export operations. 7.2 Viability of Growers Expanding their Business into Exports – A Checklist The export viability checklist is a template for the preparation of a vegetable export plan. Checklist questions one to six provide a framework for individual business export planning.
1. What am I growing/could grow: 1. Products 2. Varieties 3. Seasonality 4. Volume
2. Where is their demand for these products to match what I am growing 1. Market/ country 2. Market segments/target markets e.g. supermarkets, food service
3. Can I supply what is required: 1. Product specifications 2. Volume specifications 3. Packaging specifications 4. Post-harvest/cool chain specifications 5. Quality/food safety requirements and acceptable documentation 6. Distribution options
1. Direct to customer 2. Via import agent/distributor 3. Via exporter 4. Via packer/exporter 5. Collaboration with similar growers/packers
7. What resources do I need: 1. Human resources e.g. production, post-harvest, marketing, financial 2. Physical resources 3. Financial resources 4. Marketing resources e.g. local representation, promotion 5. Timeframe for implementation
8. Ability to expand
4. Am I competitive 1. Price competitive 2. Service competitive
1. Reliability/consistency of supply 2. Relationships/communication 3. Marketing support and promotion

__________________________________________________________________________________ AgEconPlus, MHT Consulting and Produce Marketing Australia 42
5. Financial: 1. Terms of trade/payment 2. Reliability of others in the supply/marketing chain 3. Legal requirements 4. Am I eligible for EMDG grants
6. Results 1. When and how will I measure results 2. Timeframe for reviewing the export plan

__________________________________________________________________________________ AgEconPlus, MHT Consulting and Produce Marketing Australia 43
8 Study Conclusions
The research has shown that a subset of levied Australian vegetables has potential for additional sales in export markets in East Asia, the Middle East and New Zealand. China may not be as prospective for sales of fresh Australian vegetables as believed by some industry stakeholders. Australia is not competitive on price in export markets selling traditional undifferentiated commodity lines. Even our successful carrot export sector differentiates itself on the basis of food safety, quality and reliability. Despite a long and somewhat obvious set of impediments, Australia retains a foundation in vegetable exporting that can be used to deliver additional export success. Recommendations to assist the Australian vegetable industry to open new markets and make existing markets more viable target domestic and export market access; specific actions for priority levied crops, industry development, market development, marketing and a program of policy initiatives. The market access and trade viability improvement plan prioritises proposed investments.

__________________________________________________________________________________ AgEconPlus, MHT Consulting and Produce Marketing Australia 44
9 References
ABARE (2009) Management Practices on Australian Vegetable Farms ABARES (2012) Horticulture: Review of Export Efficiency Powers
http://www.daff.gov.au/__data/assets/pdf_file/0006/2168466/Horticulture-review-of-the-export-efficiency-powers.pdf
ABARES (2013) OUTLOOK Conference 2013 report by ABARES Executive Director. Ada, R, Lakin, M and Shannon, P (1998) Export of frozen low chemical and organic vegetables to East
Asia and the European Union VG98007 Asia Fruit Magazine (March 2012) India Special: Getting in on the Ground Floor Asia Fruit Magazine (various issues including March 2013) ASIC http://www.asic.gov.au/asic/asic.nsf/byheadline/Introduction+to+ASIC+Connect?openDocument Australian Business Limited (2002) Export Opportunity Evaluation Study for the Australian Vegetable
Industry, HAL Project VG 01090 AUSVEG and HAL (2012) Vegetable Industry Strategic Investment Plan 2012 – 2017 AUSVEG – Vegetable Export Statistics http://ausveg.com.au/resources/statistics/trade-in-
vegetables/export-value.htm AUSVEG – Economic Analysis of Vegetable Production http://ausveg.com.au/resources/statistics/ AUSVEG – Sourcing of vegetables by Asian economies – a look at the data
http://ausveg.businesscatalyst.com/resources/AsianImportsOfVegetables.pdf Baker, J (2012) Making the Fresh Produce Offer More Attractive to Consumers, Asia Fruit Congress
(Produce Marketing Australia) Balmer, B (2001) Apple Industry Export Paper – What’s in it for Growers? DPI Victoria. Bayer Crop Sciences – Vegetable Industry Outlook 2012 Beckingham, C (2002) Development of an Internationally Competitive Eastern Australian Cauliflower
Export Industry, HAL Project VG 00037 Bicknell, T (2012) Salad Market Trends in Asia Fruit Magazine July / Aug 2012 Carrot Conference Australia Proceeding (2000) - Conference held in in Perth WA October 2000 CIA World Fact Book (https://www.cia.gov/library/publications/the-world-factbook/geos/ch.html) Creese, Paech, Fraval (2010) Future Farming: Victoria’s Southern Hemisphere Competitors for Exports to
Asia, Ten Competitiveness Factors. A Victorian Government Initiative DAFF Market Access Data Base (http://www.daff.gov.au/micor/plants) Ellis, Foster, McVeigh (2008) Vegetable Industry Export Business Plan prepared for the Australian
Vegetable Industry Development Group VG 06143

__________________________________________________________________________________ AgEconPlus, MHT Consulting and Produce Marketing Australia 45
Eurofruit Congress (2012) Trade Middle East Magazine. The Annual Publication from Euro Fruit, Asia Fruit and America Fruit
Eurofruit Congress (2013) Trade Middle East Magazine. The Annual Publication from Euro Fruit, Asia
Fruit and America Fruit Eurofruit Congress Southern Hemisphere, which took place on 17-19 October 2012 in Cape Town, South
Africa Fresh Fruit Portal (March 2013) China: from ‘small ripples to huge waves’ for produce industry
http://www.freshfruitportal.com/china-from-small-ripples-to-huge-waves-for-produce-industry/ Fresh Fruit Portal (March 2013) HK “gray market” to Chinese mainland on the way out
http://www.freshfruitportal.com/hk-gray-market-to-chinese-mainland-on-the-way-out-says-provost/
Fresh Insights (December 2012) Japan’s Society in Crisis https://promo-manager.server-
secure.com/download/files/05830/258265/freshincite%20Xmas%202012%20final.pdf Fruits from Chile – www.fruitsfromchile.com/ Gartrell Export Market Appraisal for Broccoli and Cauliflower, prepared by WA Department of
Agriculture & Food, HAL Project VG 05028 Hey, J (September 2012) Global Trends in Industry Export Programs, HAL Symposium Export
Development in Horticulture 26 September 2012 John Hey is from Asia Fruit Magazine HAL (2003) Australian Horticultural Industry Statistics Handbook HAL (2012) Australian Horticultural Industry Statistics Handbook HAL (October 2011) Strategic Investment Planning Guidelines Version 2 October 2011 Horticulture Industry Network http://www.hin.com.au/resources/industry-situation-statement-other-leafy-
vegetables International Society for Horticultural Science (2012) Harvesting the Sun – A Profile of World Horticulture James, I (2012) ‘Advancing Australia’s Share: Do high Costs Preclude Australian Vegetable Growers from
Asian Markets’, Vegetables Australia July / August 2012 Jauncey, P (undated) The Matilda Story – Broccoli, Cauliflower and Onions Karnjanakesorn, C (2013) Indonesia Regulations on agricultural Products. Office of Agricultural Affairs,
Royal Thai Embassy Jakarta Indonesia Lancaster, R (1999) An Industry Driven Process to Promote the Expansion of a Competitive Australian
Export Cauliflower Industry prepared by WA Department of Agriculture & Food, HAL Project VG 98014
McMichael, P (2008) Vegetable Biosecurity & Quarantine Gap Analysis, HAL Project VG07087 prepared
by Scolefield Robinson Horticultural Services Midmore, White, Nguyen, Hicks, Coleman, Newman, Wilk, Reeve and McLaughlin (2006) Development
of taro, yam, yam bean and sweet potato exports to Japan and USA, RIRDC Publication N0 06/101

__________________________________________________________________________________ AgEconPlus, MHT Consulting and Produce Marketing Australia 46
New Zealand Horticulture Export Authority http://www.hea.co.nz/index.php/2012-05-11-03-05-28/buttercup-squash-trade
Potatoes Australia (October/November 2012) Chipping Away at the Market: The Australian Industry and
Market Led Success Produce Plus Magazine (Issue Three Summer 2011) - Packaging Innovation Rabobank (2006) The World of Vegetables – Challenges and Opportunities for Vegetable Suppliers. Retail World (November 2012) Baby Capsicum Innovation Retail World (November 2012) Packaging Advantages Tesco Supermarkets Press Release (October 2012) ‘Fresh and Easy’ Stores – ‘Made Easy’ New Vegetable
Range press release Twomey (2005) Mechanical Harvesting of Selected Vegetables – Feasibility Study. HAL project VG05073 USDA GAIN Reports on Line http://gain.fas.usda.gov/Lists/Advanced%20Search/AllItems.aspx searched
30 January 2012 and nothing found – general report on vegetable bans in Iraq from 2010 only! Plus stuff on asparagus in China (not one of our vegetables
Vietnam Trade Promotion Agency Export Promotion Centre (20108) Report on Vietnamese Vegetable and
Fruit Sector Vizzone, P (2012) The Rise of Asia – Challenges and Opportunities for the New World Order, Asia Fruit
Congress (Rabobank) along with Asia Fruit Magazine article July/August 2012

__________________________________________________________________________________ AgEconPlus, MHT Consulting and Produce Marketing Australia 47
10 Stakeholders Consulted
Stakeholder
Growers Jeff McSpedden, (Springfield the Lagoon Bathurst, NSW) Kim Martin (Frias Farm, East Gippsland Victoria)Jeremy Haw (Rootz, South East Melbourne Victoria) Troy Cukro, (Supafresh, WA) Anthony Houston (Houston Farms, multiple locations) Nick Tana (Sumich WA) David East (Bewray, Manjimup WA) Andrew and Michael Bogdanich (Bogdanich Farms Gin Gin WA)Luc Monte (Lancelin, WA) Linda and Tran Do (TC Do Gin Gin WA)Eric Coleman, Grower and Consultant to Qld sweet potato industry Integrated Grower/Packer/Marketers Peter Schreurs (Peter Schreurs & Sons, South East Melbourne, Victoria) Chris Schreurs (J & J Schreurs, South East Melbourne, Victoria))Peter Wauchope (Centre West Exports, WA) David de Paoli (Austchilli Pty Ltd, Qld) Neil Armstrong (Harvest Moon, Tasmania) Fabien Carniel (Mulgowie Farms, multiple locations) John Said (Fresh Select, Werribee, Victoria) Exporters John Antico and Hugh Molloy (Antico International, Sydney) Malcolm McLean (Perfection Fresh, Sydney) Neil Barker (BGP International, Melbourne) Michael Worthington (PMA-ANZ and ex-CEO Sumich Group, Melbourne) Bruce Bergmans (Fresh Express, Perth WA) Alistair Scott (Hannay Douglas, Brisbane Qld) Tony Walsh (MG Marketing, Brisbane Qld) Alistair Brown (Harrowsmiths International, Brisbane Qld) Murray McCallum (Delica, Melbourne) Quentin Carter (QC Fresh, Brisbane Qld) Produce Buyers and Other John Wafer (GSF Australia and New Zealand) Richard Dickmann (New Business Development, Bayer Crop Science) DPIs and Researchers Jodie Campbell ( Business Manager with DAFF Qld) Ray Collins (Gatton, Qld) Peter Leach (Biosecurity, Fruit Fly and Irradiation with DAFF Qld) Market Accreditation Stephen Hunt (Brismark Credit Service Manager) AUSVEG Jamie Racicos Courtney Burger Andrew White Simon Coburn Kurt Hermann HAL and OHMA Kim James Will Gordon Byron de Kock
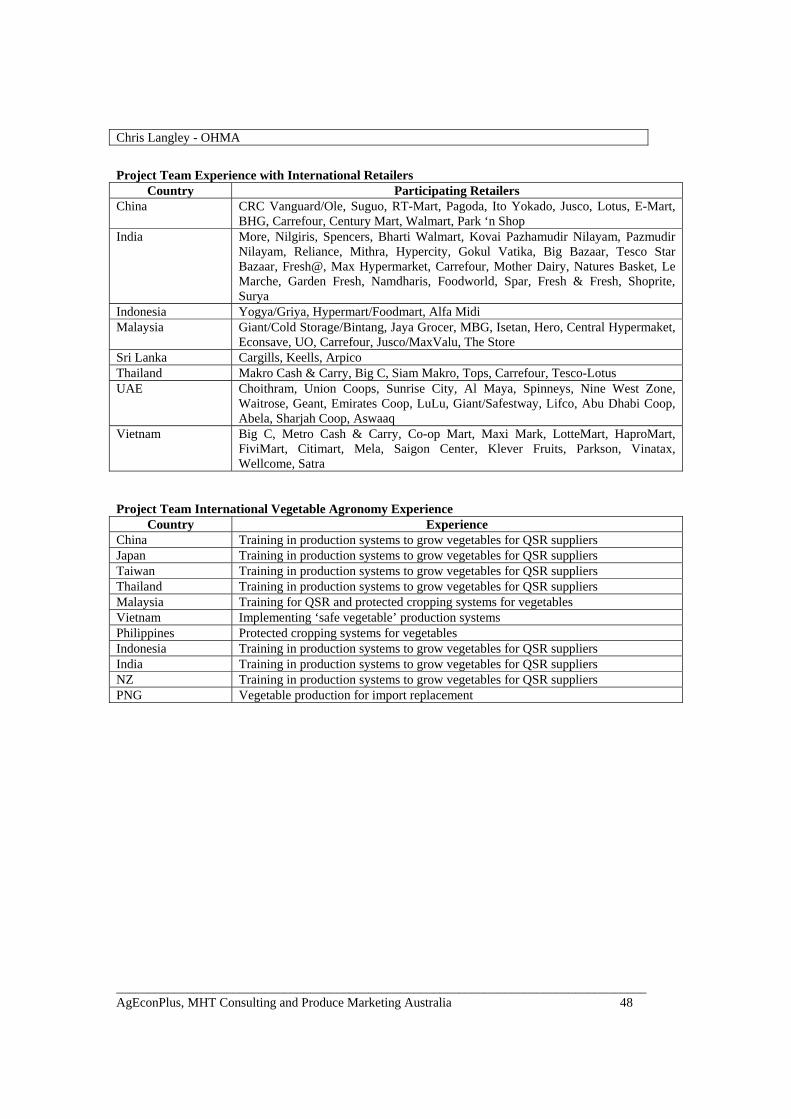
__________________________________________________________________________________ AgEconPlus, MHT Consulting and Produce Marketing Australia 48
Chris Langley - OHMA
Project Team Experience with International Retailers
Country Participating Retailers China CRC Vanguard/Ole, Suguo, RT-Mart, Pagoda, Ito Yokado, Jusco, Lotus, E-Mart,
BHG, Carrefour, Century Mart, Walmart, Park ‘n Shop India More, Nilgiris, Spencers, Bharti Walmart, Kovai Pazhamudir Nilayam, Pazmudir
Nilayam, Reliance, Mithra, Hypercity, Gokul Vatika, Big Bazaar, Tesco Star Bazaar, Fresh@, Max Hypermarket, Carrefour, Mother Dairy, Natures Basket, Le Marche, Garden Fresh, Namdharis, Foodworld, Spar, Fresh & Fresh, Shoprite, Surya
Indonesia Yogya/Griya, Hypermart/Foodmart, Alfa Midi Malaysia Giant/Cold Storage/Bintang, Jaya Grocer, MBG, Isetan, Hero, Central Hypermaket,
Econsave, UO, Carrefour, Jusco/MaxValu, The Store Sri Lanka Cargills, Keells, Arpico Thailand Makro Cash & Carry, Big C, Siam Makro, Tops, Carrefour, Tesco-Lotus UAE Choithram, Union Coops, Sunrise City, Al Maya, Spinneys, Nine West Zone,
Waitrose, Geant, Emirates Coop, LuLu, Giant/Safestway, Lifco, Abu Dhabi Coop, Abela, Sharjah Coop, Aswaaq
Vietnam Big C, Metro Cash & Carry, Co-op Mart, Maxi Mark, LotteMart, HaproMart, FiviMart, Citimart, Mela, Saigon Center, Klever Fruits, Parkson, Vinatax, Wellcome, Satra
Project Team International Vegetable Agronomy Experience
Country Experience China Training in production systems to grow vegetables for QSR suppliers Japan Training in production systems to grow vegetables for QSR suppliers Taiwan Training in production systems to grow vegetables for QSR suppliers Thailand Training in production systems to grow vegetables for QSR suppliers Malaysia Training for QSR and protected cropping systems for vegetables Vietnam Implementing ‘safe vegetable’ production systems Philippines Protected cropping systems for vegetables Indonesia Training in production systems to grow vegetables for QSR suppliers India Training in production systems to grow vegetables for QSR suppliers NZ Training in production systems to grow vegetables for QSR suppliers PNG Vegetable production for import replacement

__________________________________________________________________________________ AgEconPlus, MHT Consulting and Produce Marketing Australia 49
Appendix 1 Case Studies on Export Success – Four of the Best
Case Study 1: US ‘Love Sweet Potatoes’ Increasingly Popular in Europe At a time when produce exports from the United States to the European Union (EU) are generally in decline, sweet potatoes are certainly bucking the trend. Between 2003 and 2011 US sweet potato exports grew from 6,300 tonnes to almost 43,000 tonnes, according to USDA statistics. A number of family based companies were behind the success story. What has contributed to the continuing success of one of the main companies involved, Scott Farms, an integrated grower/exporter/marketer?
Selecting and marketing varieties according to the demands of customers – consistent size and sweet taste, features found in the Covington variety
Establishing their own UK-based marketing arm, to drive trade and consumer programs
Coordinating trade and consumer education and promotions under the umbrella “Love Sweet Potatoes”
Educating the trade about sweet potatoes, a product new to Europeans, via trade shows such as Fruit Logistica to build trade relationships across Europe and using high-visibility “Love Sweet Potatoes”/”Scott Farms” trucks to move product around the UK and Europe. Key messages include the value of the product to the trade, their versatility and ease of storage and handling. This has led to profitable supply arrangements
Building business with a major UK foodservice company by developing new and innovative uses for sweet potatoes
Using profile-raising media activities, celebrity chefs and social media to lift the profile of sweet potatoes.
The situation is not without challenges – the largest being how to keep growing the market. With a planned approach, building on activities to date and developing new recipe ideas, like sweet potato ice cream, Scott Farms intends to continue to generate interest and excitement from both the trade and consumers. Case Study 2: French Regional Growers Working Together Under a Single Brand The “Prince de Bretagne” brand was created in 1970 to provide a clear identity and emphasise the regional heritage of the vegetables produced along Brittany’s northern coast of France. Brittany is the leading vegetable production region in France and is number one for cauliflowers, artichokes, early potatoes, shallots, broccoli, iceberg lettuces. Over one third of production is exported. Although the family farms are smaller than in many other parts of France, the 2,500 member-producers grow almost 650,000 tonnes of fresh vegetables each year, growing 46 different products. The vegetables produced by growers participating in six cooperatives which are members of CERAFEL Bretagne (the regional producer organisation) are marketed under this brand. The brand is underpinned by a focus on quality, and is much more than a regional logo. For example, the Prince de Bretagne network is committed to an Environment-Quality plan which sets the rules for operators at regional, cooperative, grower and packer levels. Features include product specifications, adherence to Good Agricultural Practice and authorised crop protection treatments. Sales are undertaken through around 60 companies, based on crop forecasts and daily actual volumes supplied and collated from the participating packing stations. These companies sell to the full range of customers – retailers, wholesale markets, food service etc – across 23 countries.
__________________________________________________________________________________ AgEconPlus, MHT Consulting and Produce Marketing Australia 50
The use of the unifying “Prince de Bretagne” brand means the brand image can be shared right across the network of growers, cooperatives, sales force, retailers and through to the final consumer by their dedicated marketing team. Marketing support for the products and the brand is provided in many ways, including:
Communication to consumers via the media: press, magazines, internet sites, newsletters, in-store promotion activities etc.
Support to shippers and distributors (supermarkets, wholesalers, greengrocers) by providing point of sale material, in-store activities, participation in exhibitions etc.
Monitoring of consumer trends and competition
Creation of packaging formats and innovative solutions
Research and assessment of new products to broaden the product range available, and
Responding to customer queries. The activities of the marketing team covers not only the French market; it also extends across most of Europe, as well as Asia and North America. Case Study 3: US Apple Producers Developing Emerging Export Markets The Washington Apple Commission (WAC) is an industry-funded commodity board, responsible for promoting Washington state apples internationally. Success for apple growers has come from the industry and the Commission working and investing together to develop and expand export markets. Industry investment has included:
R&D into new varieties, production systems and IPM
New planting systems, based on R&D outcomes
State-of-the-art cool chain systems, including controlled atmosphere technology
Funding the WAC, which has resulted in attracting additional USDA funding for export activities
In the past decade, there has been significant consolidation at the packer/marketer level of the industry, meaning these now-larger operations are better able to justify significant investment along the supply chain. At the same time, apple growers still have a range of choices in selecting packer/marketers to supply. Other features of the industry include:
Gazetted product grade standards and food safety standards, providing international customers with certainty and confidence and
A wide range of varieties
WAC support has played a key role in developing and expanding apple export markets for the industry. A feature of their programs is differentiating Washington apples from competition, by having on-the-ground representatives in all their major markets, which are mostly developing markets and economies, such as China and India. Activities include building trade and retail relationships, promotions, via both modern retail and traditional markets, retail training and support, and providing market information back to the industry. This combination has resulted in exports continuing to grow, even though Washington is a high-cost producer, relative to competitors such as China and India. The Commission and the industry have successfully combined to differentiate their product, backed by the internationally recognised “Washington” brand, to establish a profitable premium for growers, packers and marketers.

__________________________________________________________________________________ AgEconPlus, MHT Consulting and Produce Marketing Australia 51
Case Study 4: Austchilli Value Added Export Success Austchilli supply fresh chilli and value-added fruit, vegetable and herb products to Australian multi-national food companies, and export to 14 countries around the world. Founded by David De Paoli in 1995, Austchilli and its subsidiary companies have grown into a major value adding success. David De Paoli was interviewed for the study and firmly believes there is very little or no future for Australian vegetable exports as a commodity, unless there is a natural disaster somewhere, and then it will only be short-term. However, there is a future for value-added products, if:
There is a point of difference / uniqueness Gaps are identified and something different is supplied Long-term relationships are established with end-users/retailers.
He gave the example of supplying value added chillies to a QSR in Malaysia. When the A$ went through 80 cents, a cheaper supplier was appointed, but Austchilli is now back, even though the dollar is at $1+, because the alternative ‘cheaper’ supplier was not reliable and could not manage the ‘just in time’ supply required by the QSR. He felt it was important to reach the position where end users need you more than you need them, through category management, staff and consumer education, and they can’t do without the product. He is applying his lessons from the domestic retailer relationships to export. Consistent supply and quality is achieved “given”. If customers want ‘just in time supply’, provide it to them. It is not easy and it reduces the competition. The end user/retailer recognises the value – in the product, the service and the consistency. Furthermore, value-adding product helps eliminate/minimise some of the duty and quarantine access barriers. With value-adding there is sometimes flexibility in how product is classified, to minimise/eliminate barriers. It is important for crop protectants / seed companies, end users/retailers and those in between to work together to develop the varieties most suited to the market. We need to know, via benchmarking, what the competition is doing and what we are up against – costs, returns, value-adding and government support. What can be done by government: provide tax breaks on returns generated from new exports, for a period of say up to 5 years, to allow exporters to develop new products/export markets. For example, if a 30% tax rebate (equal to an exchange rate of A$0.70) was applied on returns generated from new exports, it would make Australian exports more competitive, result in an increase in exports, provide a hedge against oversupply/supermarket duopoly pressures and result in more business (and taxes) along the supply chain. What can be done by government with industry: be better coordinated on market access, like the Chileans. The Chilean industry works alongside government to gain access, then provides the coordinated marketing support, under which the individual growers and exporters get on with the business of exporting. What can be done by industry: allocate a significant proportion of R&D funds to ‘genetic pooling’, to identify unique points of difference for new Australian vegetable products (a form of value adding in itself). Encourage whole-of-chain collaboration, from seed companies to end users/retailers, to develop unique points of difference. Revisit the benchmarking studies undertaken by HAL some years ago, to bring the information up to date. What can be done by businesses: apply the concepts of value-added exports, be competitive; and get on and do it when the above are in place or move offshore where you have the knowledge with a lower cost of production with government support.

__________________________________________________________________________________ AgEconPlus, MHT Consulting and Produce Marketing Australia 52
Appendix 2 Export Market Access Process and Assessment Summary
Country General Situation Quarantine Tariffs Other Website/National Plant Protection Org
China Specific requirements for fruiting veg Phyto
Fruiting veg: cucurbits, solanaceae
General Administration of Quality, Supervision, Inspection & Quarantine
Hong Kong Specific requirements for fruiting veg
No, except fruiting veg Zero?
Fruiting veg: cucurbits, solanaceae
Agriculture, Fisheries & Conservation Department Kowloon
Taiwan Access Phyto Additional quarantine Declaration www.baphiq.gov.tw
South Korea
Beetroot(Tas), Carrots, Kohl Rabi Phyto www.npqs.go.kr
Vietnam Specific requirements for fruiting veg Phyto
Fruiting veg: cucurbits, solanaceae Ministry of Agriculture & Rural Development
Thailand Access Phyto
Reports of a review currently underway – January 2013
Plant Protection Research & Development Office, Department of Agriculture
Philippines Access Phyto www.acfs.go.th
Singapore Access Phyto Zero? Agri‐Food & Veterinary Authority
Malaysia Specific requirements for fruiting veg
No, except fruiting veg Zero?
Fruiting veg: cucurbits, solanaceae Department of Agriculture
Indonesia Specific requirements for fruiting veg Phyto
Fruiting veg: cucurbits, solanaceae Ministry of Agriculture
India Prohibited
United Arab Emirates
Specific requirements for fruiting veg Phyto
Fruiting veg: cucurbits, solanaceae http://moew.gov.ae/portal/en/home.aspx
Saudi Arabia Access ?? www.moa.gov.sa/public/portal
Iran No information Source: Quarantine: www.daff.gov.au/micor/plants

__________________________________________________________________________________ AgEconPlus, MHT Consulting and Produce Marketing Australia 53
Appendix 3 Detailed Market Analysis – 19 Export Destinations
Appendix 3 reviews nineteen markets against seven analysis criteria. Markets analysed are:
China – Peoples’ Republic Hong Kong Taiwan Japan South Korea Vietnam Thailand Philippines Singapore Malaysia Indonesia New Zealand United Arab Emirates Other Middle East – Qatar, Kuwait, Bahrain and Oman Saudi Arabia Jordan Iran India Sri Lanka
Criteria employed are:
1. Market access 2. Trade relationships with Australia 3. Demographics and capacity to pay 4. Vegetable consumption and production 5. Relative size of market segments 6. Supply windows 7. Freight and logistics

__________________________________________________________________________________ AgEconPlus, MHT Consulting and Produce Marketing Australia 54
China – Peoples’ Republic Market Access
Specific restrictions on fruiting vegetables from Australia (e.g. capsicum, pumpkins, etc.). Concerns relate primarily to fruit flies and a full IRA would be required before imports would be allowed
Phytosanitary certificates required for fresh vegetables IRA’s are time consuming and improved access would not occur inside a 3 to 5 year period An Australia – China FTA has been in negotiation since 2005 The FTA offers the potential for elimination of tariffs over a three to five year period Other nations (e.g. NZ and Chile), which have already concluded successful FTAs, have a
competitive advantage over Australia in China Historically produce has entered China duty free via Hong Kong, through what is known as the
‘grey trade’. The Chinese Government makes periodic crackdowns on this ‘grey trade’ and border closures persist.
Trade Relationships with Australia
Australia and China have a strong and rapidly growing trade relationship (DFAT website http://www.dfat.gov.au/fta/acfta/ accessed 6 February 2013)
China is Australia’s largest two-way trading partner (DFAT website). Demographics and Capacity to Pay
Population: 1.3 billion (2012 estimate) Population growth rate 0.48% (2012 estimate) Urban population: 50% (2012) and will be 70% by 2050 Urban Chinese spend 2.5 times more on food than do rural dwellers GDP per capita: US$8,400 (2011) Major cities: Shanghai (16.575 M); Beijing (12.214 M); Chongqing (9.401 M); Shenzhen (9.005
M); and Guangzhou (8.884 M). There are 200 cities with 1+million population Middle class estimated at 248 million in 2012 China is one of the world’s fastest aging countries. Longer term a supply of low cost labour will be a problem. Second tier cities offer growth potential for fresh fruit imports. These include Tianjin, Dalian,
Shenzhen and Qingdao and twenty one others. Washington apples are one product moving into second tier cities such as Chengdu, Xian and
Shenyang, demonstrating there is a market and an adequate distribution system at least for this product.
Vegetable Production
China has an active food security policy which supports self-sufficiency. China is currently ranked as the world’s largest producer of vegetables. Until the mid-2000s most of this production was consumed domestically. Increasingly China is a
major player in world vegetable export markets, especially in the East and South East Asian region.
China’s extensive range of latitude allows for year round growing of most vegetable types including vegetables that are ‘in scope’ for this study.
The vegetable seed industry is representing itself in China rather than just having distributorships; this means the market is growing and becoming more sophisticated – moving from open pollinated varieties to hybrids. All the major vegetable seed companies (Monsanto Seeds, Bayer Seeds (as Nunhem Seeds), Syngenta Seeds, Enza Zaden Seeds, Rijk Zwaan and Clause HM Seeds have breeding stations and commercial wholesaling operations in China. This is a major indicator of an expanding industry embracing western style systems.
In 1999 China’s food safety was substandard but by 2005 there was a massive improvement. US agribusinesses and processors have invested and supplied state of the art food safety systems. Slowly China is assembling sophisticated supply chains supported by international companies.

__________________________________________________________________________________ AgEconPlus, MHT Consulting and Produce Marketing Australia 55
Large scale commercial vegetable farming has been adopted in the productive Kunming Region. The Kunming Region is located in the country’s south and is well serviced with infrastructure that
makes it able to supply large Chinese cities as well as those in countries like Thailand, Malaysia and Singapore via road.
By 2009 – farmer social status was improving; educated vegetable growers were forward looking and seeking new production technology. Chinese farmers haven’t grasped that they are a major risk from rising labour costs – all Chinese vegetables are presently hand grown and harvested. In time, scale of production and mechanisation will be needed.
Technical competence is now internal rather than reliant on those trained in the western world. Chinese production is moving away from animal manures to properly composted fertilisers, drip
irrigation, crop monitoring and use of IPM rather than scheduled spraying. Chinese vegetable growers know they will be audited and must pass relevant food safety requirements.
More growers are applying agricultural chemicals correctly and adhering to the relevant MRL’s. Vegetable Consumption
China is importing fruit to supply the rising middle and higher income groups who are shopping for premium products as a definition of class and style.
This demand for fresh fruit has not translated in the same way to fresh vegetables. Vegetables are not given as gifts in the same way as fruit, and preferences remain for low-cost,
fresh product sourced daily from traditional markets. Small import volumes from the US in 2000 have fallen away over the last ten years. At this point in time China is not a major market for Australian fresh vegetables – see table.
China Vegetable Imports from Australia 2010 to 2012 – Vegetables in Scope ($AUD) Vegetable Value 2010 Value 2011 Value 2012 Broccoli 0 18,390 0 Beans 0 0 0 Capsicum 0 0 0 Carrots 0 0 11,580 Celery 0 0 0 Leek 0 0 0 Lettuce 0 0 0 Squash and pumpkin 0 0 0 Sweet corn 0 0 0 Sweet potato 0 0 0
Total 0 18,390 11,580 Source: ITC Comtrade
Relative Size of Market Segments
Because few retailers have their own distribution centres they rely on preferred suppliers/importers to deliver stock direct to stores. In some instances suppliers have been given a ‘franchise’ to retail a line of products at store level. As a result, relationships with these preferred suppliers are essential
Retailers present in China include the major global operations, such as WalMart, Tesco and Carrefour, Asian retail chains such as E-Mart, RT-Mart and Jusco, and domestic chains such as CRC Vanguard/Ole. The majority are hypermarket formats.
In time more direct to supermarket supply programs will emerge. Ongoing investment will be needed in cool chain infrastructure
Supply Windows
Year round domestic production of most ‘in scope’ vegetables limits Australian supply windows. Better opportunities are likely in the period December to March when northern parts are under
snow.

__________________________________________________________________________________ AgEconPlus, MHT Consulting and Produce Marketing Australia 56
Freight and Logistics Sea freight Sydney direct 16 days Sea freight Brisbane direct 14 days Sea freight Melbourne takes 19 days Sea freight Fremantle is direct and takes 16 days Longer freight distances and hence costs than Australia supplying SE Asia
Market Access and Trade Viability Improvement Plan
China warrants inclusion in the market access and trade viability improvement strategy given industry enthusiasm for this destination. Actions address additional research aimed at ‘proving’ the market in the event of enhanced access.

__________________________________________________________________________________ AgEconPlus, MHT Consulting and Produce Marketing Australia 57
Hong Kong Market Access
Hong Kong (HK) is a free trade port. There are no duties or tariffs imposed on food imports Phytosanitary certificates are not required for fresh vegetables.
Trade Relationships with Australia
Australia has a long history of supplying fresh produce to Hong Kong By value HK was the tenth largest purchaser of Australian fresh vegetables in 2012.
Demographics and Capacity to Pay
Population: 7.2 million (2012 estimate) Population growth rate 0.42% (2012 estimate) Urban population: 100% GDP per capita: US$49,400 (2011).
Vegetable Consumption
HK is an affluent economy and a net food importer. The Island has a developed modern retail trade with an interest in novelty, new and different imported food products.
There is a large expat community with a high disposable income that demands safe, reliable and premium food. There is some resistance to cheap and historically unreliable Chinese vegetables
The key drivers of HK food trends are food safety, increasing health consciousness, changing demographics and busy lifestyles. Some emerging food consumption trends include organic food, functional food, convenience food, snack food and food for gifts.
Australia’s food safety programs are well regarded in Hong Kong. Hong Kong is a mature market with modest growth potential. While there is a market for premium fresh produce, Australia faces strong competition in
vegetable markets from China which has production cost, culture and freight advantages.
Hong Kong Vegetable Imports from Australia 2010 to 2012 – Vegetables in Scope ($AUD) Vegetable Value 2010 Value 2011 Value 2012 Broccoli 93,480 104,510 137,3670 Beans 21,740 2,900 2,900 Capsicum 0 0 0 Carrots 1,545,760 1,077,070 1,359,200 Cauliflower 0 970 673 Celery 0 970 0 Leek 1,090 1,940 970 Lettuce - head 157,620 162,580 124,530 Lettuce – other 597,870 438,380 566,650 Peas 29,350 17,420 0 Squash and pumpkin 0 0 182,450 Sweet corn – fresh N/a N/a N/a Sweet corn – frozen 3,260 3,870 0 Sweet potato 2,170 5,810 4,830
Total 2,452,340 1,816,420 3,615,873 Source: ITC Comtrade
Australian sales are dominated by carrots and pre packed and bulk baby leaf salads. Profiles are provided for all ‘shortlisted’ levied vegetables (see Chapter 2). Beans
A small and stable market for Australian product.

__________________________________________________________________________________ AgEconPlus, MHT Consulting and Produce Marketing Australia 58
Broccoli Chinese sourced product dominates the winter (December, January and February) as does the US
(California) product in summer (June, July and August). Australian product from Queensland production would compete with Salinas Valley California i.e.
both arrive at the same time. Californian broccoli is all sea freighted and there were some reports that their freight rates are
lower than those available from Australia. No Asian markets will accept broccoli with purple colouring in the head which is associated with
broccoli growing in cooler weather and florets become purple (anthocyanin pigment) – rejected in market.
Capsicum
HK imports relatively small quantities of capsicum. Imports are supplied by Canada, Australia, China, Indonesia, and the Netherlands. Capsicums have limited post-harvest shelf life – 14 days and non-Asian product is airfreighted Netherlands offer ‘spectacular quality’ from greenhouses, Australian are currently field grown
Carrots
In 2002 most HK carrot imports came from Taiwan (38%), Australia (29%), China (20%) and NZ (9%). Medium to large Kuroda were required in 1kg packs. Australian carrots are marketed primarily through supermarkets. Chinese/Taiwan carrots are marketed through wet markets (variable size and colour).
In 2012 China has increased market share, Taiwan has fallen away. NZ and Australia remain competitive. The low pack out rate of Kuroda (40%) make profitability on this line difficult. Nantes-Berlicum types from Western Australia are acceptable in the HK market.
VOLUME CARROTS HONG KONG
2010 2011 YEAR 2012 share Jan‐12 Feb‐12 Mar‐12 Apr‐12 May‐12 Jun‐12 Jul‐12 Aug‐12 Sep‐12 Oct‐12 Nov‐12 Dec‐12
Tonnes Tonnes Tonnes Tonnes Tonnes Tonnes Tonnes Tonnes Tonnes Tonnes Tonnes Tonnes Tonnes Tonnes Tonnes Tonnes
China 25,158 21,733 16,337 67% 2,347 3,193 1,669 1,195 1,063 1,070 921 945 1,043 876 968 1,047
Australia 2,526 1,763 2,172 9% 173 123 132 185 188 176 202 194 224 188 171 216
Taiwan 6,971 9,091 5,689 23% 387 482 599 653 694 798 709 638 472 168 91
United States 48 90 114 0% 5 4 13 10 10 14 7 17 11 6 8 10
Total Tonnes 34,736 32,730 24,316 100% 2,912 3802 2414 2044 1954 2058 1839 1794 1750 1238 1238 1273
VALUE CARROTS HONG KONG
A$ '000 2010 2011 YEAR 2012 share Jan‐12 Feb‐12 Mar‐12 Apr‐12 May‐12 Jun‐12 Jul‐12 Aug‐12 Sep‐12 Oct‐12 Nov‐12 Dec‐12
China 3,564 3,540 4,321 63% 640 958 498 378 237 268 149 198 246 186 203 360
Australia 1,546 1,077 1,358 20% 94 80 71 99 110 96 127 134 154 132 113 147
Taiwan 1,221 1,568 991 14% 68 86 105 123 122 139 119 108 81 26 14
United States 79 173 196 3% 10 7 23 20 19 27 7 20 16 12 14 20
Total A$ '000 6,448 6,404 6,882 100% 813 1,132 704 620 488 530 406 460 497 356 345 533
A$ per kg CARROTS HONG KONG
A$ per kg 2010 2011 YEAR 2012 Jan‐12 Feb‐12 Mar‐12 Apr‐12 May‐12 Jun‐12 Jul‐12 Aug‐12 Sep‐12 Oct‐12 Nov‐12 Dec‐12
China 0.14 0.16 0.26 0.27 0.30 0.30 0.32 0.22 0.25 0.16 0.21 0.24 0.21 0.21 0.34
Australia 0.61 0.61 0.63 0.55 0.65 0.54 0.54 0.59 0.55 0.63 0.69 0.69 0.70 0.66 0.68
Taiwan 0.18 0.17 0.17 0.18 0.18 0.18 0.19 0.18 0.17 0.17 0.17 0.17 0.16 0.16
United States 1.65 1.92 1.71 2.06 1.96 1.70 1.94 1.99 1.89 0.98 1.19 1.44 2.04 1.85 2.11
A$ per kg 0.19 0.20 0.28 0.28 0.30 0.29 0.30 0.25 0.26 0.22 0.26 0.28 0.29 0.28 0.42
Sources : ITC calculations based on UN COMTRADE statistics; Fresh Intelligence analysis based on MIRROR data supplied by exporters to Hong Kong
Notes : Hong Kong records data to 2011 though for consistency all above is Mirror data.
The Hong Kong direct data is consistent for Australia and Taiwan though records around 20% of the recorded China export data to Hong Kong.
Carrots and Turnips are combined
HONG KONG IMPORTS A$ per kg
Product : 070610 Carrots and turnips, fresh or chilled
HONG KONG IMPORTS Tonnes
Product : 070610 Carrots and turnips, fresh or chilled
Exporters
HONG KONG IMPORTS A$ '000
Product : 070610 Carrots and turnips, fresh or chilled

__________________________________________________________________________________ AgEconPlus, MHT Consulting and Produce Marketing Australia 59
Celery
Minimal celery exports from Australia between 2000 and 2012. The US dominates this market with 95% market share and year round supply. US product is well trimmed and tightly bunched. Australia has potential in this market.
VOLUME CELERY HONG KONG
2010 2011 YEAR 2012 share Jan‐12 Feb‐12 Mar‐12 Apr‐12 May‐12 Jun‐12 Jul‐12 Aug‐12 Sep‐12 Oct‐12 Nov‐12 Dec‐12
Tonnes Tonnes Tonnes Tonnes Tonnes Tonnes Tonnes Tonnes Tonnes Tonnes Tonnes Tonnes Tonnes Tonnes Tonnes Tonnes
United States 4,093 4,622 5,512 55% 132 163 337 461 742 605 546 616 484 547 645 234
China 5,311 4,896 4,529 45% 462 436 407 461 277 238 268 223 265 463 546 485
Taiwan 2 17 0% 6 10
Australia ‐ ‐ ‐ 0%
Total Tonnes 9,506 9,525 10,058 100% 594 599 750 932 1019 843 814 838 749 1010 1191 719
VALUE CELERY HONG KONG
A$ '000 2010 2011 YEAR 2012 share Jan‐12 Feb‐12 Mar‐12 Apr‐12 May‐12 Jun‐12 Jul‐12 Aug‐12 Sep‐12 Oct‐12 Nov‐12 Dec‐12
United States 3,857 2,813 3,395 80% 93 127 227 269 462 358 321 353 300 324 380 180
China 1,273 977 847 20% 156 113 113 126 37 30 29 27 30 55 63 68
Taiwan 1 14 0% 6 9
Australia ‐ ‐ ‐ 0%
Total A$ '000 3,857 3,807 4,242 100% 232 240 346 404 499 389 350 380 330 380 446 248
A$ per kg CELERY HONG KONG
A$ per kg 2010 2011 YEAR 2012 Jan‐12 Feb‐12 Mar‐12 Apr‐12 May‐12 Jun‐12 Jul‐12 Aug‐12 Sep‐12 Oct‐12 Nov‐12 Dec‐12
United States 0.94 0.61 0.62 0.71 0.78 0.67 0.58 0.62 0.59 0.59 0.57 0.62 0.59 0.59 0.77
China 0.24 0.20 0.19 0.34 0.26 0.28 0.27 0.13 0.13 0.11 0.12 0.11 0.12 0.12 0.14
Taiwan 0.55 0.79 0.88 0.86
Australia
A$ per kg 0.41 0.40 0.42 0.39 0.40 0.46 0.43 0.49 0.46 0.43 0.45 0.44 0.38 0.37 0.34
Sources : ITC calculations based on UN COMTRADE statistics; Fresh Intelligence analysis based on MIRROR data supplied by exporters to Hong Kong
Notes : Australia supplied up to 71 tonnes per year until 2004. Since then trade has been nil or negligible and was NIL in 2012
Product : 070940 Celery, other than celeriac, fresh or chilled
HONG KONG IMPORTS Tonnes
Product : 070940 Celery, other than celeriac, fresh or chilled
Exporters
HONG KONG IMPORTS A$ '000
Product : 070940 Celery, other than celeriac, fresh or chilled
HONG KONG IMPORTS A$ per kg
Leeks
A small and stable market for Australian leeks. Pre packed and bulk baby leafed salads
The high $A has been problematic for this trade. Leaf salads are supplied from China via US Fresh Express / Chiquita and OSI, so technology and
food safety is improving. This product would be field grown. Hydroponic produce is also available from China and Malaysia. Hydroponic is generally thought to be less flavoursome than field grown
There is some market place resistance to low cost unreliable Chinese grown salads. With HK only 7 hours flight from Perth Australian growers are able to harvest, wash, pack and
deliver leafy salads within 24 hours providing an edge in freshness. In time Australia will export fresh herbs to complement packaged baby leaf salads – especially for
the food service sector. Pre-packed salad demand has spread from expats to local white collar consumers – advice
received from supermarket chain Pick n Pack Australia will need to compete with EU product sourced from Koppert Cress, Chiquita’s Fresh
Express brand from US, also Ready Pac, Earthbound and Dole Sales through hotel salad bars are possible. US chain store Just Salad has closed one store in HK due to high rent costs; UK chain Pret a
Manger has scaled back due to rent costs; UK M&S has opened sandwich – salad sections; Pizza Express and Pizza Hut are serving salads in HK (but both use low cost Chinese salads)/

__________________________________________________________________________________ AgEconPlus, MHT Consulting and Produce Marketing Australia 60
Lettuce - head
Australia is a contingent supplier at best– hard to compete with China and the US. Chinese product travels overland by refrigerated truck at low cost. There are opportunities in this market as food safety standards are raised eg QSR restaurants
require global GAP++ as well as the new ISO standard. There is a trend toward increased packaging and Australia would need to respond to this
requirement. Sweet Corn
Majority of Australian and New Zealand exports are destined for Japan rather than Hong Kong. Baby corn is not currently an option. This product is sourced from Thailand or even Africa as it
requires labour intensive handpicking. Research into mechanical baby corn harvesting is underway Value added sweet corn may be possible. Sweet corn is well suited for export - it offers a long
ship and shelf life. Long life packaging further extents the retail window. Opportunities may be present in Asian fresh and QSR markets. Australian growers are mechanised and a year round supply program is possible. Import competition is Thailand and New Zealand.
Relative Size of Market Segments
Modern retail is well developed, with Wellcome Supermarkets comprising 270 stores and Parkn Shop with over 250 stores, along with other Asian retailers. Both major chains are launching new formats to attract a wider range of customers.
Traditional markets remain popular for fresh vegetable purchase. The food service sector includes hotels, restaurants and institutions (e.g. airlines and hospitals).
Due to growth in tourism, demand for quality food is expected to increase at 5-star hotels and high end restaurants. There is also a trend for non-Chinese restaurants including Japanese food, fast food, coffee and snacks and casual dining.
In- country infrastructure is well developed Supply Windows
Year round supply is possible given the absence of domestic production. Freight and Logistics
Longer freight distances and hence costs than Australia supplying SE Asia Sea freight Sydney direct 10 days Sea freight Brisbane direct 9 days Sea freight Melbourne takes 19 days Sea freight Fremantle is direct and takes 9 days
Market Access and Trade Viability Improvement Plan
Hong Kong warrants inclusion in the market access and trade viability improvement strategy. The focus of investments needs to be value added lines direct to the supermarket / hypermarket sector.

__________________________________________________________________________________ AgEconPlus, MHT Consulting and Produce Marketing Australia 61
Taiwan Market Access
Specific restrictions on fruiting vegetables from Australia (e.g. capsicum, pumpkins) with concerns particularly related to fruit flies
Phytosanitary certificates required for fresh vegetables Access for fresh carrots from NSW and Qld was cancelled in 2010, and has since been reinstated Tariffs on Australian lines include a 27% duty on broccoli.
Trade Relationships with Australia
No FTA agreement under negotiation between Australia and Taiwan Australia’s trade relationship with Taiwan is mature.
Demographics and Capacity to Pay
Population: 23.2 million (2012 estimate) Population growth rate 0.29% (2012 estimate) GDP per capita: US$37,700 (2011).
Vegetable Consumption and Production
Historically Taiwan has had a strong self-sufficiency focus, plus an emphasis on supply from the US, linked to defence provision (ABL 2002).
Domestic production is constrained during the countries seven month long wet season. QSRs import all their vegetable needs during this period. Taiwan is low lying and vegetable farms tend to be small scale, uneconomic sized units. The Asian Vegetable R&D Centre is based in Taiwan and assists with the provision of technology.
By value Taiwan was the nineteenth largest purchaser of Australian fresh vegetables in 2012
Taiwan Vegetable Imports from Australia 2010 to 2012 – Vegetables in Scope ($AUD) Vegetable Value 2010 Value 2011 Value 2012 Broccoli 0 0 0 Beans 353,280 26,130 0 Capsicum 0 0 0 Carrots 210,880 20,320 193,070 Cauliflower 0 0 0 Celery 0 0 0 Leek 0 0 0 Lettuce - head 0 0 0 Lettuce – other 0 0 0 Peas 0 0 0 Squash and pumpkin 0 0 0 Sweet corn – fresh N/a N/a N/a Sweet corn – frozen 0 0 0 Sweet potato 0 0 0
Total 564,160 46,450 193,070 Source: ITC Comtrade
Beans Small trade with Australia that offers potential for additional, possibly value added sales e.g. top
and tailed, microwavable and ready to eat. Broccoli
The US accounts for 95% of broccoli imports which are seasonal and co-inside with the northern summer/autumn monsoon season.

__________________________________________________________________________________ AgEconPlus, MHT Consulting and Produce Marketing Australia 62
Capsicum Taiwan is a significant capsicum producer with Thailand, Netherlands, Indonesia and New
Zealand also supplying this market. Taiwan grows capsicums December through August. The major Taiwanese import season is from August to November. Fruit fly restrictions prevent import of capsicum from the Australian mainland.
Carrots
Market supplied by China, New Zealand and Australia. The New Zealand supply early in the season (May and June) and there may be opportunity to take
market share from them with Nantes/Berlicum sourced from WA/ Queensland or Kuroda from Tasmania.
Celery
Minimal exports from Australia between 2000 and 2012. The US dominates with 95% market share and year round supply. The US offers a range of
varieties and consistent quality. Lettuce – baby leaf and bulk shredded
There is some potential to establish a market for Australian lines through QSR during the period from May-December.
Supply Windows
The supply window for ‘in scope’ vegetables is generally from March through to and including October.
Freight and Logistics
In- country infrastructure is well developed Longer freight distances and hence costs than Australia supplying SE Asia Sea freight Sydney direct 18 days Sea freight Brisbane direct 16 days Sea freight Melbourne direct 22 days Sea freight Fremantle is direct and takes 13 days
Market Access and Trade Viability Improvement Plan
Taiwan warrants inclusion in the market access and trade viability improvement strategy. The focus of investments needs to be Quick Service Restaurants and potentially supermarkets with value added lines.

__________________________________________________________________________________ AgEconPlus, MHT Consulting and Produce Marketing Australia 63
Japan Market Access
Specific restrictions in place for fruiting vegetables (e.g. capsicum and pumpkin) OHMA has the negotiation of access for pumpkins as a stated industry priority Tariffs are a modest 5%
Established Trade Relationships with Australia Japan is a vital and long standing export market for Australian business (DFAT website) Australia has been in negotiation with Japan on a FTA since April 2007 (DFAT website)
Demographics and Capacity to Pay Population: 127.4 million (2012 estimate) Population growth rate: minus 0.8% (2012 estimate) Urban population: 67% Major cities: Tokyo (36.5 M); Osaka-Kobe (11.3 M); Nagoya (3.3 M); Fukuoka-Kitakyushu (2.8
M); and Sapporo (2.7 M) GDP per capita: US$34,700 (2011) The number of people in Japan is falling due to an aging population and declining birth rates.
Vegetable Production and Consumption Domestic vegetable production has been decreasing since the mid-1980s and has accelerated
through the 1990s and into the new century. Japanese farmers are retiring and the next generation continue to seek off-farm employment.
Consequently fresh vegetable imports as a share of consumption continue to rise. Japan is the world’s ninth largest importer of vegetables (Rabobank 2006).
Vegetable Imports as a Percentage of Japan’s Total Consumption (‘000 tonnes) Production Imports Consumption Imports Share (%)
1990 15,845 1,550 17,394 9% 1995 14,671 2,628 17,229 15% 2000 13,704 3,124 16,826 19% 2011 8,784 2,899 11,672 25%
Source: MAFF data reproduced by Promar Consulting and published in Asia Fruit Magazine July/August 2012
The Japanese consume relatively large amounts of vegetables compared to most other countries. Health conscious consumers and an aging population are expected to propel future demand. Japanese consumers are fastidious about product freshness, safety and appearance. The slightest
suggestion of chemical contamination will see purchases cease. Consequently the market is characterised by stringent safety and quality controls on fresh vegetable imports. There is a preference for domestic production followed by imports from countries with recognised food safety systems. These countries include the US, NZ and Australia.
Regardless of these China is the leading supplier of imported vegetables to Japan. By value Japan was the second largest purchaser of Australian fresh vegetables in 2012
Japan Vegetable Imports from Australia 2010 to 2012 – Vegetables in Scope ($AUD) Vegetable Value 2010 Value 2011 Value 2012 Broccoli 5,440 0 0 Beans 0 0 0 Capsicum 0 0 0 Carrots 2,413,210 1,443,830 2,164,290 Celery 0 0 0 Leek 317,410 329,0200 379,380 Lettuce – other 0 0 63,710 Peas 0 0 33,790 Squash and pumpkin 0 0 0 Sweet corn – frozen 0 0 152,520 Sweet potato 0 0 0
Total 2,736,060 4,734,030 2,793,690

__________________________________________________________________________________ AgEconPlus, MHT Consulting and Produce Marketing Australia 64
Beans
Fresh beans are not a significant part of the Japanese diet. Broccoli
In 2012 imported broccoli was sourced from the US and China, but not Australia. In the past Japan has been an important Australian broccoli market and product was supplied mid-
May to end October. From late 80’s until 2007 ‘Matilda’ were dominant in this market and their success was attributable to programmed crop scheduling, appropriate varieties, establishment by direct seeding scale in layout, laser levelling and good rotations to minimise diseases. Product was pre-sold and this is what was produced. Most of Matilda’s broccoli was sea freighted from the eastern Darling Downs through port of Brisbane.
There is potential to resurrect the Matilda model and Japan is supportive of Australia’s low chemical / IPM success.
VOLUME BROCCOLI JAPAN
2010 2011 YEAR 2012 share Jan‐12 Feb‐12 Mar‐12 Apr‐12 May‐12 Jun‐12 Jul‐12 Aug‐12 Sep‐12 Oct‐12 Nov‐12 Dec‐12
Tonnes Tonnes Tonnes Tonnes Tonnes Tonnes Tonnes Tonnes Tonnes Tonnes Tonnes Tonnes Tonnes Tonnes Tonnes Tonnes
United States 35,281 34,111 45,090 91% 2,506 4,450 3,593 4,889 5,032 4,290 3,453 3,321 3,655 4,420 2,207 3,274
China 299 2,347 6,175 12% 2,506 1,062 612 85 27 223 233 336 298 791
Taiwan ‐ 24 22 0% 17 5
Australia 2 0%
Total Tonnes 35,683 36,580 49,735 100% 3,400 5530 4210 4975 5032 4290 3480 3544 3889 4755 2505 4127
VALUE BROCCOLI JAPAN
A$ '000 2010 2011 YEAR 2012 share Jan‐12 Feb‐12 Mar‐12 Apr‐12 May‐12 Jun‐12 Jul‐12 Aug‐12 Sep‐12 Oct‐12 Nov‐12 Dec‐12
United States 74,004 67,675 83,238 92% 5,386 7,904 5,849 8,845 8,612 8,197 6,743 5,627 6,493 8,940 3,831 6,811
China 447 3,461 7,059 8% 1,328 1,533 946 134 ‐ ‐ 42 366 412 552 465 1,282
Taiwan ‐ 46 29 0% ‐ 21 9 ‐ ‐ ‐ ‐ ‐ ‐ ‐ ‐ ‐
Australia 11 ‐ ‐ 0% ‐
Total A$ '000 74,737 71,372 90,441 100% 6,713 9,457 6,803 8,980 8,612 8,197 6,784 5,993 6,904 9,492 4,297 8,207
A$ per kg BROCCOLI JAPAN
A$ per kg 2010 2011 YEAR 2012 Jan‐12 Feb‐12 Mar‐12 Apr‐12 May‐12 Jun‐12 Jul‐12 Aug‐12 Sep‐12 Oct‐12 Nov‐12 Dec‐12
United States 2.10 1.98 1.85 2.15 1.78 1.63 1.81 1.71 1.91 1.95 1.69 1.78 2.02 1.74 2.08
China 1.49 1.47 1.14 0.53 1.44 1.55 1.57 1.54 1.64 1.76 1.64 1.56 1.62
Taiwan 1.93 1.31 1.20 1.66
Australia 5.23
A$ per kg 2.09 1.95 1.82 1.97 1.71 1.62 1.81 1.71 1.91 1.95 1.69 1.78 2.00 1.72 1.99
Sources : ITC calculations based on UN COMTRADE statistics; Fresh Intelligence analysis.
Notes : China supplied up to 15,000 tonnes p.a until 2006, then out of market for a few years and has started to supply again
Australia supplied up to 800 tonnes per year until 2006. Since 2006 has supplied 2 t in 2008 and 2010 only
Exporters
JAPAN IMPORTS A$ '000
Product : 070490010 Cabbages,kohlrabi,kale and sim edible brassicas nes,fresh or chilled: Broccoli
JAPAN IMPORTS A$ per kg
Product : 070490010 Cabbages,kohlrabi,kale and sim edible brassicas nes,fresh or chilled: Broccoli
Product : 070490010 Cabbages,kohlrabi,kale and sim edible brassicas nes,fresh or chilled: Broccoli
JAPAN IMPORTS Tonnes
Capsicum
Historically the key suppliers to Japan have been the Netherlands, New Zealand and South Korea. South Korea supplied Japan all year round. Netherlands supplied July, August and September. NZ imports were concentrated between October and March.
Concern was expressed in the literature about the reliability of South Korean exporters who will supply the local market if prices are higher in Seoul. The Dutch have moved to fill this gap.
NZ send lots of capsicums but there are the smaller types grown in glasshouses with 3-4 lobes Capsicums from Tasmania were identified as a market growth opportunity by ABL in 2002.
Increased production from covered sources in Asia has now closed this market opportunity. Carrot
Imports are dominated by China with significant sales also achieved by Taiwan, Australia and NZ.

__________________________________________________________________________________ AgEconPlus, MHT Consulting and Produce Marketing Australia 65
NZ carrot sales would ‘piggy back’ off squash and onion shipments i.e. share shipping space and be handled by the same agents.
There may be some additional medium term potential for Australian carrot sales to Japan. Carrot juice was a short lived fad in Japan that temporarily lifted sales from Australia’s east coast.
Carrot Exports to Japan (Calendar Year 2011)
Value (US$ million)
Quantity (tonnes) Market Share (%)
Price (US$ per tonne)
China 33.4 66,471 83.0 500 Taiwan 4.7 5,355 6.7 680 NZ 3.7 5,314 6.6 880 Australia 2.2 2,621 3.3 860 Source: Ian James Vegetables Australia July / August 2012 using World Trade Atlas data VOLUME CARROTS JAPAN
2010 2011 YEAR 2012 share Jan‐12 Feb‐12 Mar‐12 Apr‐12 May‐12 Jun‐12 Jul‐12 Aug‐12 Sep‐12 Oct‐12 Nov‐12 Dec‐12
Tonnes Tonnes Tonnes Tonnes Tonnes Tonnes Tonnes Tonnes Tonnes Tonnes Tonnes Tonnes Tonnes Tonnes Tonnes Tonnes
China 55,817 66,471 71,282 86% 5,154 4,805 7,862 6,403 5,656 4,978 10,003 4,434 5,312 6,954 4,738 4,983
New Zealand 3,588 5,314 4,527 5% ‐ ‐ 1,119 1,254 1,116 397 424 218 0 ‐ ‐ ‐
Taiwan 2,251 5,355 3,682 4% 125 499 1,683 1,182 193 ‐ ‐ ‐ ‐ ‐ ‐ ‐
Australia 3,302 2,621 3,048 4% 104 207 408 318 223 475 577 183 49 185 205 113
Total Tonnes 65,187 80,059 82,951 100% 5,395 5527 11132 9365 7209 5862 11021 4849 5373 7149 4959 5111
VALUE CARROTS JAPAN
A$ '000 2010 2011 YEAR 2012 share Jan‐12 Feb‐12 Mar‐12 Apr‐12 May‐12 Jun‐12 Jul‐12 Aug‐12 Sep‐12 Oct‐12 Nov‐12 Dec‐12
China 26,986 32,297 35,999 79% 1,843 1,909 3,359 3,578 4,086 3,704 5,073 2,320 2,797 3,535 1,923 1,872
New Zealand 2,958 4,619 3,865 8% ‐ ‐ 960 1,107 995 308 330 161 3 ‐ ‐ ‐
Taiwan 1,331 3,658 2,660 6% 83 333 1,165 932 148 ‐ ‐ ‐ ‐ ‐ ‐ ‐
Australia 3,128 2,192 2,641 6% 96 191 383 300 208 324 416 179 53 189 190 111
Total A$ '000 34,769 43,179 45,700 100% 2,053 2,478 5,907 6,031 5,494 4,370 5,862 2,695 2,884 3,751 2,150 2,026
A$ per kg CARROTS JAPAN
A$ per kg 2010 2011 YEAR 2012 Jan‐12 Feb‐12 Mar‐12 Apr‐12 May‐12 Jun‐12 Jul‐12 Aug‐12 Sep‐12 Oct‐12 Nov‐12 Dec‐12
China 0.48 0.49 0.51 0.36 0.40 0.43 0.56 0.72 0.74 0.51 0.52 0.53 0.51 0.41 0.38
New Zealand 0.82 0.87 0.85 0.86 0.88 0.89 0.78 0.78 0.74 12.80
Taiwan 0.59 0.68 0.72 0.66 0.67 0.69 0.79 0.77
Australia 0.95 0.84 0.87 0.92 0.92 0.94 0.94 0.93 0.68 0.72 0.98 1.07 1.03 0.93 0.98
A$ per kg 0.53 0.54 0.55 0.38 0.45 0.53 0.64 0.76 0.75 0.53 0.56 0.54 0.52 0.43 0.40
Sources : ITC calculations based on UN COMTRADE statistics; Fresh Intelligence analysis.
Product : 070610 Carrots and turnips, fresh or chilled
Exporters
JAPAN IMPORTS A$ '000Product : 070610 Carrots and turnips, fresh or chilled
JAPAN IMPORTS A$ per kg
Product : 070610 Carrots and turnips, fresh or chilled
JAPAN IMPORTS Tonnes
Celery
Japan is not a significant celery consumer and there is no opportunity for Australian product. Leek
Japan is both a significant producer and consumer of leeks. A colder climate favours dishes which include leek. Australia has lost market share in Japan due to reduced local production during the Millennium Drought. There is opportunity to recover Australian leek export sales to Japan.
Lettuce – head and other
Japan sources most of its lettuce imports from China and USA. Australia is too far away to be competitive on freight. Japan has a seasonal schedule based on local supply summer sourced from cool mountain regions; contracts from China to supply (year round) and US (California– June till October )

__________________________________________________________________________________ AgEconPlus, MHT Consulting and Produce Marketing Australia 66
Australian producers have been asked to quote for supply of lettuce to Japan but are simply too expensive. There is no medium term opportunity for Australian lettuce or lettuce products except as a contingent supplier for the QSR sector.
Sweet Corn
Traditionally Japan is a major importer of sweet corn, and most was sourced from New Zealand. The market wanted bi-colour and super sweet and Australia was a late adopter of bi-colour and super sweets, which are difficult to grow.
There is opportunity in Japan for Australian sweet corn. Relative Size of Market Segments
Modern retail dominates Japanese vegetable sales In-country infrastructure is well developed The key feature of imports of vegetables into Japan is not so much about price but windows of
seasonal opportunity Supply Windows
Broccoli – April to November Carrots – February to August Leek – January to October Sweet corn – year round
Freight and Logistics
Longer freight distances and hence costs than Australia supplying SE Asia Sea freight Sydney direct 10 days Sea freight Brisbane direct 8 days Sea freight Melbourne direct 12 days Sea freight Fremantle is direct and takes 16 days
Market Access and Trade Viability Improvement Plan
Japan warrants inclusion in the market access and trade viability improvement strategy. The focus of efforts needs to be completion of the relevant Free Trade Agreement; broccoli, carrots, leek, and sweet corn.

__________________________________________________________________________________ AgEconPlus, MHT Consulting and Produce Marketing Australia 67
South Korea (ROK) Market Access
Specific restrictions on fresh vegetables susceptible to fruit flies Phytosanitary certificates required for fresh vegetables Access for carrots achieved in 2006 (freedom from nematode was the issue) FTA under negotiation since May 2009 FTA offers potential for elimination of 30% duty on carrots and 20% duty on broccoli Zealous inspection and subsequent fumigation make access to this market difficult on commercial
terms.
Trade Relationships with Australia ROK is one of Australia’s largest export markets and overall trading partners By value the ROK was the seventh largest purchaser of Australian fresh vegetables in 2012
Demographics and Capacity to Pay
Population: 49 million (2011 estimate) Population growth rate 0.2% (2012 estimate) Urban population: 83% Major cities: Seoul (9.8 M); Busan (3.4 M); Incheon (2.6 M); Daegu (2.5 M); Daejon (1.5 M) GDP per capita: US$22,778 (2011)
Vegetable Consumption and Production
South Korea is a major vegetable grower with annual production approaching 10 million tonnes. The country is fairly self-sufficient in vegetables and can grow most types year round open field
and protected cropping. The Korean Government supports vegetable production with financial assistance for infrastructure,
building and equipment. This is expected to continue through to at least 2020 (USDA conclusion). Extreme weather conditions mean that most vegetables are grown in greenhouses, the balance are
imported from China. Vegetable exports are growing e.g. capsicum to Japan. The consumption of vegetables in Korea is mainly though stews, soups and condiments (i.e.
kimchee). Consequently there is little need for appearance, texture or taste and purchase is price driven. Traditionally the Koreans are large users of cabbage for kimchee and carrots and there is less awareness of vegetables such as broccoli, celery, capsicum and cauliflower.
Consumers generally favour locally produced agricultural products. Many consumers still maintain the idea that local products are superior in quality and safety to imported products.
Historically Australia has exported small volumes of carrots, broccoli and celery to Korea. Between 2010 and 2012 there were no exports of vegetables to the ROK.
South Korea Vegetable Imports from Australia 2010 to 2012 – Vegetables in Scope ($AUD) Vegetable Value 2010 Value 2011 Value 2012 Broccoli 0 0 0 Beans 0 0 0 Capsicum 0 0 0 Carrots 0 0 0 Celery 0 0 0 Leek 0 0 0 Lettuce - head 0 0 0 Lettuce – other 0 0 0 Squash and pumpkin 0 0 0 Sweet corn – fresh N/a N/a N/a
Total 0 0 0 Source: ITC Comtrade
__________________________________________________________________________________ AgEconPlus, MHT Consulting and Produce Marketing Australia 68
Relative Size of Market Segments There is a large Korean middle class some of whom are concerned with food safety This group is driven by an interest in western diets and is health conscious There is a large and well established food service sector Premium markets include hotels, department stores and institutions In- country infrastructure is well developed
Supply Windows
Supply is most prospective in the period April through November. Freight and Logistics
High cost of shipping, documentation, inspection, and labelling, coupled with high distributor mark-ups deteriorate price competitiveness of many imported products. Imports of agricultural products may require clearance from several agencies and are, thus, more likely to encounter port delays than other imported products. All new-to-market products are subject to mandatory laboratory testing conducted by the relevant inspection agency. (USDA GAIN Report)
Sea freight Sydney direct 14 days Sea freight Brisbane direct 12 days Sea freight Melbourne takes 16 days Sea freight Fremantle is direct and takes 12 days
Market Access and Trade Viability Improvement Plan
South Korea is not included in the Market Access and Trade Development Strategy. The ROK is a major vegetable grower in its own right, government is investing in self-sufficiency, it is supplied overland by China, and zealous inspection and subsequent fumigation make access difficult in commercial turns.

__________________________________________________________________________________ AgEconPlus, MHT Consulting and Produce Marketing Australia 69
Vietnam Market Access
Specific restrictions on fruiting vegetables due to fruit fly concerns (e.g. capsicums and pumpkin). Phytosanitary certificates required for fresh vegetables. Under the ASEAN-Australia-New Zealand FTA (AANZFTA) vegetable tariffs will be phased
down from 15% to zero for most Australian vegetable types.
Trade Relationships with Australia There are strong expat links between Australia and Vietnam Vietnam is a rapidly emerging economy
Demographics and Capacity to Pay Population: 91.5 million (2012 estimate) Population growth rate: 1.1% (2012 estimate) Urban population: 30% Major cities: Ho Chi Minh City (6.0 M), Hanoi (2.7 M); Haiphong (1.9 M); Da Nang 807,000 GDP per capita: US$3,300 (2010 estimate)
Vegetable Production and Consumption
Vietnam is one of the world’s top 15 vegetable producing countries (Rabobank 2006). The Dalat area of Vietnam is able to grow a wide range and abundance of temperate vegetables.
Other major vegetable production areas include Salat; Red River Delta, and Cuu Long River Delta A range of latitudes in Vietnam means that year round production is possible. Vegetable production policy is directed toward import replacement with sophisticated crop
scheduling and year round supply. By 2018 Vietnam will be a major competitor for Australia in Thailand, Malaysia and Singapore. Vietnam is already exporting lettuce and capsicum to QSRs in these markets.
In addition to Vietnam becoming more self-sufficient in vegetables, they are well supplied with low cost imports from China. There is some concern among consumers about food safety in local and Chinese vegetables and this may be a point of difference for Australian vegetables.
International Vegetable seed companies are basing themselves in Vietnam rather than just having distributorships, this means market is growing and getting more sophisticated – transitioning from open pollinators to hybrids. A big indicator of being more self-sufficient in vegetables.
Vietnam’s domestic post-harvest technology is lacking and this may provide opportunity for imports in the short term.
Research completed by the study team concluded that 60% of supermarket consumers stated that safe certification of vegetables was either important or very important to them and 82% said product country of origin was either important or very important.
Vietnam does not currently feature in the list of ‘Top 20’ importers of Australian vegetables
Vietnam Vegetable Imports from Australia 2010 to 2012 – Vegetables in Scope ($AUD) Vegetable Value 2010 Value 2011 Value 2012 Broccoli 0 0 0 Beans 0 0 0 Capsicum 0 0 0 Carrots 0 0 0 Cauliflower 0 0 0 Celery 0 0 0 Leek 0 0 0 Lettuce 0 0 0 Squash and pumpkin 0 0 0 Sweet corn 0 0 0 Sweet potato 0 0 0
Total 0 0 0 Source: ITC Comtrade
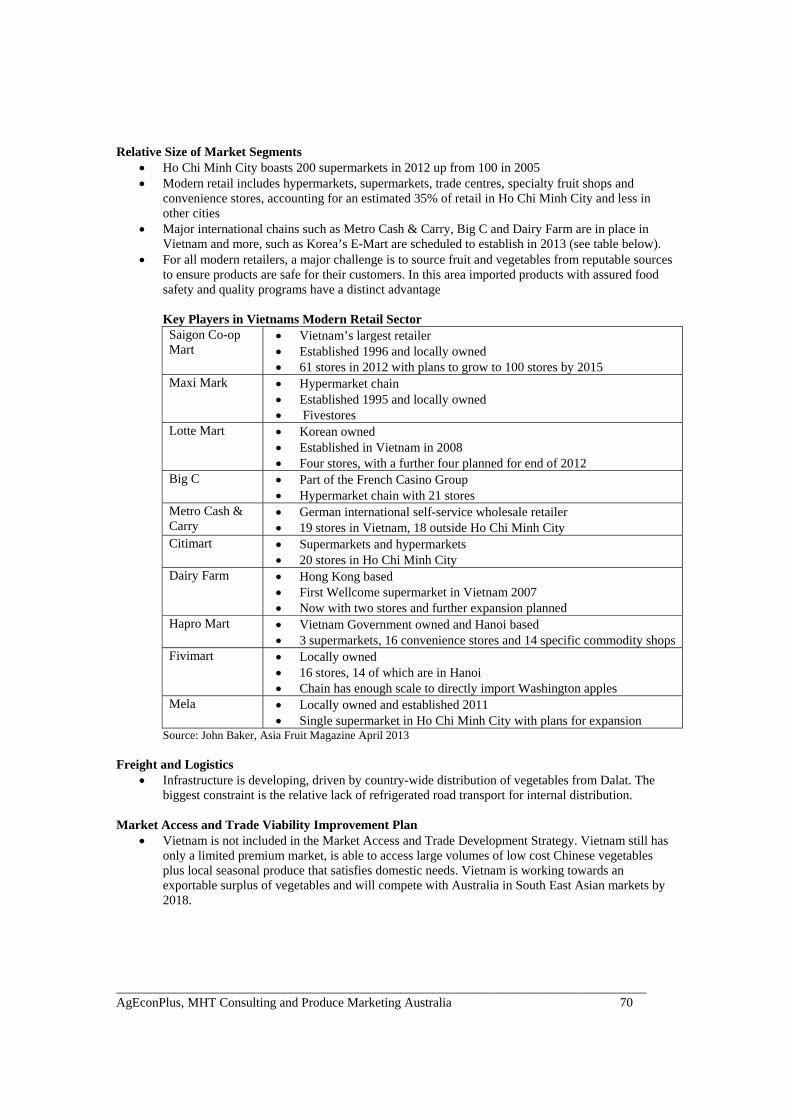
__________________________________________________________________________________ AgEconPlus, MHT Consulting and Produce Marketing Australia 70
Relative Size of Market Segments
Ho Chi Minh City boasts 200 supermarkets in 2012 up from 100 in 2005 Modern retail includes hypermarkets, supermarkets, trade centres, specialty fruit shops and
convenience stores, accounting for an estimated 35% of retail in Ho Chi Minh City and less in other cities
Major international chains such as Metro Cash & Carry, Big C and Dairy Farm are in place in Vietnam and more, such as Korea’s E-Mart are scheduled to establish in 2013 (see table below).
For all modern retailers, a major challenge is to source fruit and vegetables from reputable sources to ensure products are safe for their customers. In this area imported products with assured food safety and quality programs have a distinct advantage
Key Players in Vietnams Modern Retail Sector Saigon Co-op Mart
Vietnam’s largest retailer Established 1996 and locally owned 61 stores in 2012 with plans to grow to 100 stores by 2015
Maxi Mark Hypermarket chain Established 1995 and locally owned Fivestores
Lotte Mart Korean owned Established in Vietnam in 2008 Four stores, with a further four planned for end of 2012
Big C Part of the French Casino Group Hypermarket chain with 21 stores
Metro Cash & Carry
German international self-service wholesale retailer 19 stores in Vietnam, 18 outside Ho Chi Minh City
Citimart Supermarkets and hypermarkets 20 stores in Ho Chi Minh City
Dairy Farm Hong Kong based First Wellcome supermarket in Vietnam 2007 Now with two stores and further expansion planned
Hapro Mart Vietnam Government owned and Hanoi based 3 supermarkets, 16 convenience stores and 14 specific commodity shops
Fivimart Locally owned 16 stores, 14 of which are in Hanoi Chain has enough scale to directly import Washington apples
Mela Locally owned and established 2011 Single supermarket in Ho Chi Minh City with plans for expansion
Source: John Baker, Asia Fruit Magazine April 2013 Freight and Logistics
Infrastructure is developing, driven by country-wide distribution of vegetables from Dalat. The biggest constraint is the relative lack of refrigerated road transport for internal distribution.
Market Access and Trade Viability Improvement Plan
Vietnam is not included in the Market Access and Trade Development Strategy. Vietnam still has only a limited premium market, is able to access large volumes of low cost Chinese vegetables plus local seasonal produce that satisfies domestic needs. Vietnam is working towards an exportable surplus of vegetables and will compete with Australia in South East Asian markets by 2018.

__________________________________________________________________________________ AgEconPlus, MHT Consulting and Produce Marketing Australia 71
Thailand Market Access
FTA with Australia negotiated in 2003 and effective since 2005 (DFAT website) Phytosanitary certificates required for fresh vegetables Tariffs abolished in 2010
Trade Relationships with Australia The FTA has resulted in a doubling of trade between Australia and Thailand Thailand is the second largest economy in South East Asia Politically Australia has had a close association with the Thais
Demographics and Capacity to Pay Population: 67.1 million (2012 estimate) Population growth rate 0.54% (2012 estimate) Urban population: 34% Major cities: Bangkok (6.9 M) GDP per capita: US$5,394 (2011)
Vegetable Production Thailand is the world’s ninth largest vegetable producer. Since the late 1990s the Thai Government has pursued a food development and export policy. This policy has included development of temperate vegetable production in both Chang Mai and
Chang Rai. Cold climate vegetables (cauliflower, broccoli, carrots and celery) are now grown domestically where previously they were imported, primarily from Australia (ABL 2002).
International vegetable seed companies are basing themselves in Thailand. Despite the progress made Thailand still uses a lot of traditional open pollinated cultivars, grower
skills need to be developed and post-harvest technology is poor. A lack of mechanisation and increasing labour costs will constrain future growth in vegetable production.
There may be opportunities for carrots as these are difficult to grow in Thailand.
Vegetable Consumption Thailand’s major supermarket chains (e.g. Supavadee at Central / Tops) report that many of their
customers, particularly in their upscale chains, want to know the origin of vegetables being stocked because of concern for the safety of vegetables from some countries
Despite this concern Thailand is a very price competitive market and product which cannot be sourced domestically is supplied overland from China. A lot of this trade is ‘leakage’ and does not show up in the official data. There are strong bilateral trade between Thailand and China (Thais supply tropical fruits and Chinese supply temperate vegetables).
By value Thailand with the fourteenth largest purchaser of Australian fresh vegetables in 2012
Thailand Vegetable Imports from Australia 2010 to 2012 – Vegetables in Scope ($AUD) Vegetable Value 2010 Value 2011 Value 2012 Broccoli 23,910 8,710 4,276 Beans 1,090 0 0 Capsicum 0 0 0 Carrots 776,140 601,920 862,050 Cauliflower 3,260 970 554 Celery 3,260 3,870 33,790 Leek 3,260 7,740 6,760 Lettuce - head 6,520 1,940 5,790 Lettuce – other 20,650 26,130 72,400 Peas 25,000 0 0 Squash and pumpkin 0 0 0 Sweet corn – fresh N/a N/a N/a Sweet corn – frozen 6,520 6,770 2,900 Sweet potato 0 0 0
Total 869,610 658,050 988,520 Source: ITC Comtrade

__________________________________________________________________________________ AgEconPlus, MHT Consulting and Produce Marketing Australia 72
Beans Fresh beans are not a significant part of the Thai diet.
Broccoli
Broccoli stem is a key ingredient in Thai cooking Thai production in Chang Mai and Chang Rai is year round Australia has maintained a modest market for broccoli since at least 2000 China has also created a window of opportunity between local and Australian supply for broccoli
that is better than domestic production but cheaper than Australian sourced supply. There is little opportunity to grow broccoli exports outside the food service and upscale
supermarket sectors. Ordinary Thai consumers have limited capacity to pay and are price sensitive. Capsicum
Australia was the sole exporter in 2000 with a modest 6 tonnes; by 2010 there were no Australian capsicum exports.
Domestic production of capsicum is now too strong for Australia to compete and Holland dominates any upscale imports (colours, sizes, shapes, etc.).
Carrots
Thai domestic product is available all year but quality is poor (small, skinny, pointy, dark, not sweet)
Consequently Thailand is a significant carrot importer. Imported product is sourced from China, Australia, New Zealand and Taiwan. China and Taiwan are an emerging threat and their season coincides with Australia Nevertheless there are likely to be opportunities to grow carrot exports to Thailand over both the
short and medium term. Celery
Thailand has a year round production sector and only small volumes are required for augmentation Celery is used in Thai stir fries, Australian imports are directed to the food service sector The market for Australian celery is mature.
Leek
Leeks are not a significant part of the Thai diet. Lettuce
China can supply lettuce from Kunming province (like Atherton Tablelands) to Thailand in less than two hours by road. They grow a wide range of temperate vegetables in Kunming.
The balance of Thailand’s lettuce needs are met by Vietnam, when the wet season destroys local production
At best Australia is a contingent supplier and QSR is less popular in Thailand.
Sweet Corn Significant domestic producers, net exporters, no opportunities for Australia.
Relative Size of Market Segments
Thailand has a modern retail sector in major urban areas, and world class retail in the major cities.
Urban Thailand – Expenditure by Trade Channel (%) Channel Upper Income Middle Income Lower Income Hypermarket 13 10 7 Supermarket 4 3 2 Wet Market 77 81 84 Other 6 5 7
Total 100 100 100 Source: The Neilson Company (presented by Supavadee Central Tops Thailand to Asia Fruit Congress 2012

__________________________________________________________________________________ AgEconPlus, MHT Consulting and Produce Marketing Australia 73
Supply Windows
Broccoli – April to November Carrots – August to February Celery – September to January
Freight and Logistics
Infrastructure exists to service major population centres Sea freight Sydney involves transhipment and takes 22 days Sea freight Brisbane via Singapore14 days Sea freight Melbourne involves transhipment and takes 22 days Sea freight Fremantle is direct and takes 11 days
Market Access and Trade Viability Improvement Plan
Thailand is not included in the Market Access and Trade Development Strategy. Thailand is a relatively small consumer of imported vegetables with limited capacity to pay for imports. Thailand is developing domestic supply capacity, plus it receives product overland from neighbouring producers.

__________________________________________________________________________________ AgEconPlus, MHT Consulting and Produce Marketing Australia 74
Philippines Market Access
Under the ASEAN-Australia-New Zealand FTA vegetable tariffs will be phased down to zero for most vegetables but for vegetables with high tariffs only modest reductions will be made. Tariffs on Australian vegetables are typically around 25%. Fresh vegetables with high tariffs include celery, carrots, cauliflower, broccoli and lettuce (DFAT website).
Phytosanitary certificates required for fresh vegetables. Specific restrictions on capsicums due to fruit fly but not for Tasmania, the Northern Territory and
South Australia. Trade Relationships with Australia
Relative to other ASEAN countries, the Philippines is a less significant Australian trading partner The Philippines business culture is challenging for Australian nationals.
Demographics and Capacity to Pay
Population: 103.8 million (2012 estimate) Population growth rate 1.9% (2012 estimate) Urban population: 49% Major cities: Manilla (11.4 M); Davao (1.48 M); Cebu City (845,000); Zamboanga (827,000) GDP per capita: US$4,100 (2011).
Vegetable Production
The Philippines does not have a strong vegetable growing culture and vegetable production does not have the same prestige as fruit and cattle grazing. Corporates dominate fruit production (e.g. banana and pineapple), however there are no standout large scale vegetable producers.
East West Seeds (owned by Dutch seed company Enza Zaden) is supporting modern vegetable varieties in the Philippines
However the Philippines have not adopted hybrids at the same rates as other Asian vegetable producing countries.
At the present time there is investment in low cost protected cropping ( ACIAR international project) to deal with what is a difficult vegetable producing climate that is subject to widespread flooding.
There is a production shortfall during the monsoon. Vegetable Consumption
The demand for imported vegetables is small – price premiums place consumption beyond most consumers. Demand for imports is derived from the hospitality industry and upscale supermarkets
Capacity to pay for imports is limited to these niches. Both Australia and the US have been traditional suppliers to the Philippines Importers have preferred Australia because of the freight cost advantage Costs for air and sea freight are similar for Australia, and the US but US only supplies sea freight
in 40 foot reefers and these are often too large for the market to absorb. Growth in the sector has been through QSR and has created demand for tomatoes, lettuce head,
capsicum, corn, potato and onion. However, imports are only used to fill domestic supply shortfalls.
HAVI Foods – logistics company are probably relying on imported product for its QSR business. Consequently the Philippines with its narrow production is import dependent. Australia receives offers to quote to supply the QSR sector but is usually beaten by US (e.g. airfreight lettuce).
The Philippines was not one of the ‘Top 20’ purchasers of Australian fresh vegetables in 2012
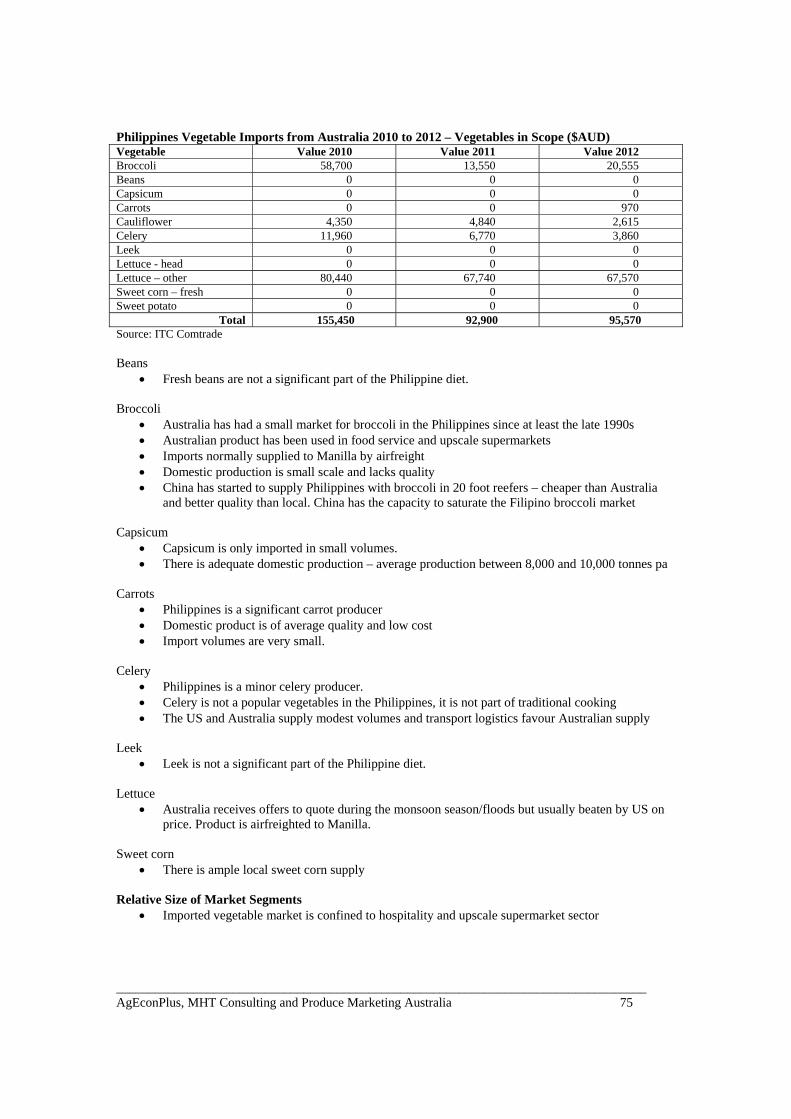
__________________________________________________________________________________ AgEconPlus, MHT Consulting and Produce Marketing Australia 75
Philippines Vegetable Imports from Australia 2010 to 2012 – Vegetables in Scope ($AUD) Vegetable Value 2010 Value 2011 Value 2012 Broccoli 58,700 13,550 20,555 Beans 0 0 0 Capsicum 0 0 0 Carrots 0 0 970 Cauliflower 4,350 4,840 2,615 Celery 11,960 6,770 3,860 Leek 0 0 0 Lettuce - head 0 0 0 Lettuce – other 80,440 67,740 67,570 Sweet corn – fresh 0 0 0 Sweet potato 0 0 0
Total 155,450 92,900 95,570 Source: ITC Comtrade Beans
Fresh beans are not a significant part of the Philippine diet. Broccoli
Australia has had a small market for broccoli in the Philippines since at least the late 1990s Australian product has been used in food service and upscale supermarkets Imports normally supplied to Manilla by airfreight Domestic production is small scale and lacks quality China has started to supply Philippines with broccoli in 20 foot reefers – cheaper than Australia
and better quality than local. China has the capacity to saturate the Filipino broccoli market Capsicum
Capsicum is only imported in small volumes. There is adequate domestic production – average production between 8,000 and 10,000 tonnes pa
Carrots
Philippines is a significant carrot producer Domestic product is of average quality and low cost Import volumes are very small.
Celery
Philippines is a minor celery producer. Celery is not a popular vegetables in the Philippines, it is not part of traditional cooking The US and Australia supply modest volumes and transport logistics favour Australian supply
Leek
Leek is not a significant part of the Philippine diet. Lettuce
Australia receives offers to quote during the monsoon season/floods but usually beaten by US on price. Product is airfreighted to Manilla.
Sweet corn
There is ample local sweet corn supply Relative Size of Market Segments
Imported vegetable market is confined to hospitality and upscale supermarket sector

__________________________________________________________________________________ AgEconPlus, MHT Consulting and Produce Marketing Australia 76
Supply Windows Supply opportunities are best during the Philippine monsoon season which runs from May till
October. Freight and Logistics (ABL 2002)
Poor internal roads make domestic supply difficult Sea freight Sydney involves transhipment and takes 20 days Sea freight Brisbane via Kaohsiung 14 days ( Sea freight Melbourne direct and takes 22 days ( Sea freight Fremantle is direct and takes 19 days
Market Access and Trade Viability Improvement Plan
The Philippines is not included in the Market Access and Trade Development Strategy. The Philippines has limited capacity to pay across the general population, a limited premium market sector, poor growth outlook and opaque market structures.

__________________________________________________________________________________ AgEconPlus, MHT Consulting and Produce Marketing Australia 77
Singapore Market Access
The Singapore-Australia Free Trade Agreement (SAFTA) became operational in July 2003. Tariffs on Australian products exported to Singapore were eliminated.
Singapore has an open import regime and food products are imported from all over the world. Trade Relationships with Australia
Singapore was the single most important purchaser of Australian fresh vegetables by value in 2012.
Australia is perceived as ‘traditional’ supplier by Singapore. Demographics and Capacity to Pay
Population: 5.4 million (2012 estimate) Population growth rate: 2% (2012 estimate) Urban population: 100% GDP per capita: US$59,700 (2011)
Vegetable Consumption
Singapore is highly reliant on imported vegetables, with Australia a major supplier of fresh vegetables.
Other major sources of supply include China, Malaysia and Thailand. It is estimated that between 25% and 75% of Singapore’s food imports are re-exported to
neighbouring countries. A small local population limits total food demand. Nevertheless Singaporeans spend an estimated 22% of their income on food – this is very high by
world standards and Singapore residents have an enviable lifestyle (pers. comm.. QDAFF 2012). There is capacity to pay for imported vegetables however for the middle income group, which is
most Singaporeans, there is price sensitivity on staples such as fresh vegetables. Singaporean consumers are becoming increasingly health conscious and local supermarket chains
like NTUC Fair Price and Dairy Farm have been developing their upmarket stores to capture premium sales.
Wealth and health trends have led to an increasing interest in organic produce albeit off a low base however demand is sensitive to pricing. At the premium end of the market consumers are also displaying a strong interest in novelty and variety.
Australia has a good reputation for quality, a time zone that is convenient for business and both air and sea freight shipping services that are fast, frequent and relatively cheap.
Singapore Vegetable Imports from Australia 2010 to 2012 – Vegetables in Scope ($AUD) Vegetable Value 2010 Value 2011 Value 2012 Broccoli 4,113,320 3,697,650 4,630,832 Beans 7,610 0 0 Capsicum 0 0 0 Carrots 10,043,070 9,291,050 8,887,890 Cauliflower 80,440 51,290 78,098 Celery 183,710 160,640 164,110 Leek 56,530 71,6100 122,600 Lettuce - head 270,670 441,280 548,310 Lettuce – other 1,962,090 1,489,320 1,388,160 Peas 22,830 1,940 2,900 Squash and pumpkin N/a N/a 1,109,180 Sweet corn – fresh N/a N/a N/a Sweet corn – frozen 0 8,710 0 Sweet potato 102,180 86,130 51,160
Total 16,842,450 15,944,110 16,983,240 Source: ITC Comtrade

__________________________________________________________________________________ AgEconPlus, MHT Consulting and Produce Marketing Australia 78
Beans Indonesia has 20% market share but is three times more expensive than Malaysia which is the
major source country. Australia has potential to increase sales in this market, potentially through the development of
value added lines for supermarket retail. Close links with the two main supermarket groups Cold Storage and NTUC would be required.
Broccoli In 2001 Australia exported 3,800 tonnes of broccoli to Singapore. In 2012 Australia supplied 1,719 tonnes of broccoli or 20% of the market which was dominated by
imports from China with a 74% market share. Australia’s share has increased since 2009 (15%) despite price rises. Importers say quality of Qld broccoli is superior; regular supply and price is an issue.
AUSTRADE: 50% of consumers purchase on head size or price, 30% on country of origin. Individual packaging for broccoli was seen as appealing to 20% of consumers for convenience,
hygiene and food safety reasons. Importers looking to direct source from Australian farmers, selling directly to supermarkets. Growers, exporters and importers need to work together to develop a set of product specifications. Clean and green status of Australian broccoli offers opportunity to expand sales. Use quality and reliability of supply to offer an alternative to cheap Chinese broccoli.
Broccoli Exports to Singapore (Calendar Year 2011)
Value (US$ million)
Quantity (tonnes) Market Share (%) Price (US$ per tonne)
Australia 4.8 1,550 18.2 3,094 China 8.3 6,479 76.1 1,281 Source: Ian James Vegetables Australia July / August 2012 using World Trade Atlas data NB: balance of market was Malaysia and US (pers. comm. QDAFF) VOLUME BROCCOLI SINGAPORE
2010 2011 YEAR 2012 share Jan‐12 Feb‐12 Mar‐12 Apr‐12 May‐12 Jun‐12 Jul‐12 Aug‐12 Sep‐12 Oct‐12 Nov‐12 Dec‐12
Tonnes Tonnes Tonnes Tonnes Tonnes Tonnes Tonnes Tonnes Tonnes Tonnes Tonnes Tonnes Tonnes Tonnes Tonnes Tonnes
China 5,419 6,479 6,259 74% 716 585 612 501 332 368 426 548 415 542 527 687
Australia 1,751 1,549 1,719 20% 36 63 46 136 250 208 213 151 183 206 144 83
Malaysia 201 250 248 3% 17 18 21 19 19 21 24 22 20 23 22 22
United States 80 78 154 2% 4 3 4 4 67 23 4 5 25 6 5 4
Total Tonnes 7,596 8,515 8,506 100% 786 698 724 666 672 623 687 730 643 778 701 798
VALUE BROCCOLI SINGAPORE
A$ '000 2010 2011 YEAR 2012 share Jan‐12 Feb‐12 Mar‐12 Apr‐12 May‐12 Jun‐12 Jul‐12 Aug‐12 Sep‐12 Oct‐12 Nov‐12 Dec‐12
China 7,748 8,030 9,273 54% 887 702 808 771 625 576 664 871 696 825 768 1080
Australia 5,334 4,644 6,527 38% 152 228 163 459 1028 821 858 639 725 775 418 262
Malaysia 350 565 532 3% 37 40 49 37 40 45 47 45 43 51 49 50
United States 287 286 447 3% 22 21 23 19 115 66 24 24 47 31 30 25
Total A$ '000 14,038 13,771 17,041 100% 1,120 1,038 1,129 1,303 1,817 1,515 1,628 1,592 1,515 1,690 1,272 1,423
A$ per kg BROCCOLI SINGAPORE
A$ per kg 2010 2011 YEAR 2012 Jan‐12 Feb‐12 Mar‐12 Apr‐12 May‐12 Jun‐12 Jul‐12 Aug‐12 Sep‐12 Oct‐12 Nov‐12 Dec‐12
China 1.43 1.24 1.48 1.24 1.20 1.32 1.54 1.88 1.57 1.56 1.59 1.68 1.52 1.46 1.57
Australia 3.05 3.00 3.80 4.23 3.61 3.54 3.37 4.11 3.95 4.03 4.23 3.96 3.76 2.91 3.16
Malaysia 1.74 2.26 2.14 2.15 2.23 2.34 1.93 2.10 2.15 1.94 2.04 2.16 2.20 2.23 2.26
United States 3.59 3.67 2.90 5.54 6.84 5.68 4.83 1.72 2.88 6.07 4.77 1.88 5.18 5.96 6.22
A$ per kg 1.85 1.62 2.00 1.42 1.49 1.56 1.96 2.70 2.43 2.37 2.18 2.36 2.17 1.82 1.78
Sources : ITC calculations based on International Enterprise Singapore, Ministry of Trade and Industry statistics; Fresh Intelligence analysis
SINGAPORE IMPORTS A$ per kg Product : 07041020 Headed broccoli fresh or chilled
SINGAPORE IMPORTS Tonnes
Product : 07041020 Headed broccoli fresh or chilled
Exporters
SINGAPORE IMPORTS A$ '000
Product : 07041020 Headed broccoli fresh or chilled

__________________________________________________________________________________ AgEconPlus, MHT Consulting and Produce Marketing Australia 79
Capsicum Major supplier is Malaysia (Cameron Highlands) year round via truck without the cost of
airfreight. Australia tends to be used as the fall back supplier for Malaysia. Malaysia has a freight/proximity
advantage with this time sensitive vegetable and is reported as supplying quality product into Singapore year round. Indonesia provides an alternative source when needed. A small amount is also sourced from the Netherlands. Opportunities for Australia to significantly increase exports seem remote.
Carrots
ABL 2002: in 2002 Australia had an 80% market share and the only competitor was NZ who can only supply February to August. Chinese carrots were unwashed and poor quality but perceived as a threat for the future. The Nantes variety was well regarded in Singapore.
Australia has been the dominant supplier of carrots to Singapore in the last three years 2010 to 2012 with a market share in 2012 of 56%, followed by China and Malaysia with market shares of 37% and 4% respectively. The price received by Australia has been significantly higher than China over the last three years: in 2012, Australia’s price was 82% higher.
Carrot Exports to Singapore (Calendar Year 2011)
Value (US$ million)
Quantity (tonnes) Market Share (%) Price (US$ per tonne)
Australia 11.0 11,651 57.7 948 China 3.4 6,915 34.2 491 NZ 0.7 398 2.0 876
Source: Ian James Vegetables Australia July / August 2012 using World Trade Atlas data VOLUME CARROTS SINGAPORE
2010 2011 YEAR 2012 share Jan‐12 Feb‐12 Mar‐12 Apr‐12 May‐12 Jun‐12 Jul‐12 Aug‐12 Sep‐12 Oct‐12 Nov‐12 Dec‐12
Tonnes Tonnes Tonnes Tonnes Tonnes Tonnes Tonnes Tonnes Tonnes Tonnes Tonnes Tonnes Tonnes Tonnes Tonnes Tonnes
Australia 12,253 11,652 11,874 56% 890 976 898 863 1062 943 949 1299 815 1257 1024 897
China 5,656 6,916 7,924 37% 994 419 875 519 622 541 690 544 659 585 663 813
Malaysia 599 798 849 4% 76 63 69 64 71 67 73 77 65 72 73 79
United States 186 240 236 1% 19 19 24 21 16 16 23 12 24 24 21 17
New Zealand 158 399 239 1% 61 51 74 50
Total Tonnes 19,073 20,200 21,212 100% 1993 1485 1879 1541 1826 1642 1790 1938 1568 1945 1786 1819
VALUE CARROTS SINGAPORE
A$ '000 2010 2011 YEAR 2012 share Jan‐12 Feb‐12 Mar‐12 Apr‐12 May‐12 Jun‐12 Jul‐12 Aug‐12 Sep‐12 Oct‐12 Nov‐12 Dec‐12
Australia 10,902 10,694 11,032 65% 807 876 831 799 967 844 863 1363 746 1144 962 829
China 2,788 3,285 4,041 24% 457 171 400 283 445 384 358 294 380 298 264 318
Malaysia 366 774 898 5% 93 66 64 63 74 69 76 82 73 77 79 80
United States 554 642 630 4% 51 50 62 55 41 45 59 39 60 59 55 53
New Zealand 110 337 219 1% 54 45 64 45
Total A$ '000 15,102 16,051 17,037 100% 1,435 1,187 1,388 1,275 1,584 1,416 1,411 1,794 1,274 1,597 1,374 1,312
A$ per kg CARROTS SINGAPORE
A$ per kg 2010 2011 YEAR 2012 Jan‐12 Feb‐12 Mar‐12 Apr‐12 May‐12 Jun‐12 Jul‐12 Aug‐12 Sep‐12 Oct‐12 Nov‐12 Dec‐12
Australia 0.89 0.92 0.93 0.91 0.90 0.93 0.93 0.91 0.90 0.91 1.05 0.92 0.91 0.94 0.92
China 0.49 0.48 0.51 0.46 0.41 0.46 0.55 0.72 0.71 0.52 0.54 0.58 0.51 0.40 0.39
Malaysia 0.61 0.97 1.06 1.23 1.05 0.93 0.98 1.04 1.03 1.04 1.07 1.12 1.07 1.08 1.02
United States 2.98 2.67 2.67 2.69 2.65 2.60 2.62 2.56 2.82 2.58 3.26 2.48 2.47 2.61 3.09
New Zealand 0.69 0.84 0.92 0.89 0.88 0.87 0.89
A$ per kg 0.79 0.79 0.80 0.72 0.80 0.74 0.83 0.87 0.86 0.79 0.93 0.81 0.82 0.77 0.72
Sources : ITC calculations based on International Enterprise Singapore, Ministry of Trade and Industry statistics; Fresh Intelligence analysis
SINGAPORE IMPORTS A$ per kg
Product : 07061010 Carrots fresh or chilled
SINGAPORE IMPORTS TonnesProduct : 07061010 Carrots fresh or chilled
Exporters
SINGAPORE IMPORTS A$ '000
Product : 07061010 Carrots fresh or chilled

__________________________________________________________________________________ AgEconPlus, MHT Consulting and Produce Marketing Australia 80
Celery Australia has not performed well in Singapore with celery – 500 tonnes in 2001 (sourced from
WA), dropping to 146 tonnes in 2012. In 2012, the US (California) had 77% market share with their product being cheaper than the
Australian product with a 3% market share and having a longer shelf life and better packaging. However the US product was 32% more expensive than the Chinese celery which had a market share of 11% in 2012.
VOLUME CELERY SINGAPORE
2010 2011 YEAR 2012 share Jan‐12 Feb‐12 Mar‐12 Apr‐12 May‐12 Jun‐12 Jul‐12 Aug‐12 Sep‐12 Oct‐12 Nov‐12 Dec‐12
Tonnes Tonnes Tonnes Tonnes Tonnes Tonnes Tonnes Tonnes Tonnes Tonnes Tonnes Tonnes Tonnes Tonnes Tonnes Tonnes
United States 3,933 3,646 4,489 77% 343 320 337 392 426 383 444 251 385 493 414 301
China 807 1,186 651 11% 99 61 54 26 27 37 42 36 50 60 62 97
Malaysia 524 399 451 8% 26 35 37 37 31 36 33 52 44 42 39 39
Australia 189 157 146 3% 9 12 11 13 12 9 10 16 14 15 13 12
Total Tonnes 5,479 5,456 5,817 100% 493 432 451 491 501 468 531 358 497 611 532 451
VALUE CELERY SINGAPORE
A$ '000 2010 2011 YEAR 2012 share Jan‐12 Feb‐12 Mar‐12 Apr‐12 May‐12 Jun‐12 Jul‐12 Aug‐12 Sep‐12 Oct‐12 Nov‐12 Dec‐12
United States 3,926 3,617 4,292 77% 318 311 299 352 382 351 406 251 395 534 405 288
China 587 745 478 9% 60 35 36 25 33 34 29 30 46 48 40 63
Malaysia 575 496 433 8% 37 35 27 32 27 30 31 45 33 34 46 56
Australia 249 218 198 4% 13 16 15 17 16 12 14 21 20 20 17 16
Total A$ '000 5,392 5,171 5,574 100% 457 409 399 446 472 440 489 358 509 645 517 434
A$ per kg CELERY SINGAPORE
A$ per kg 2010 2011 YEAR 2012 Jan‐12 Feb‐12 Mar‐12 Apr‐12 May‐12 Jun‐12 Jul‐12 Aug‐12 Sep‐12 Oct‐12 Nov‐12 Dec‐12
United States 1.00 0.99 0.96 0.93 0.97 0.89 0.90 0.90 0.92 0.91 1.00 1.03 1.08 0.98 0.96
China 0.73 0.63 0.73 0.60 0.57 0.67 0.97 1.22 0.92 0.69 0.82 0.92 0.79 0.65 0.65
Malaysia 1.10 1.24 0.96 1.41 1.01 0.72 0.86 0.87 0.84 0.94 0.86 0.74 0.81 1.18 1.45
Australia 1.32 1.39 1.35 1.39 1.32 1.38 1.34 1.33 1.34 1.36 1.31 1.44 1.36 1.33 1.35
A$ per kg 0.98 0.95 0.96 0.93 0.95 0.88 0.91 0.94 0.94 0.92 1.00 1.02 1.06 0.97 0.96
Sources : ITC calculations based on International Enterprise Singapore, Ministry of Trade and Industry statistics; Fresh Intelligence analysis
SINGAPORE IMPORTS A$ per kg
Product : 070940 Celery, other than celeriac, fresh or chilled
SINGAPORE IMPORTS Tonnes
Product : 070940 Celery, other than celeriac, fresh or chilled
Exporters
SINGAPORE IMPORTS A$ '000
Product : 070940 Celery, other than celeriac, fresh or chilled
Lettuce – head
In 2012, the US and Malaysia dominated imports, with a market share of 34% each, followed by China with a market share of 20%. In 2012, Australia had a negligible volume of lettuce exports to Singapore with its price being more than twice that of the three main suppliers.
Chinese product travels overland by truck at low cost. Australia is a contingent supplier at best – hard to compete with China and the US.

__________________________________________________________________________________ AgEconPlus, MHT Consulting and Produce Marketing Australia 81
VOLUME
2010 2011 YEAR 2012 share Jan‐12 Feb‐12 Mar‐12 Apr‐12 May‐12 Jun‐12 Jul‐12 Aug‐12 Sep‐12 Oct‐12 Nov‐12 Dec‐12
Tonnes Tonnes Tonnes Tonnes Tonnes Tonnes Tonnes Tonnes Tonnes Tonnes Tonnes Tonnes Tonnes Tonnes Tonnes Tonnes
United States 4,113 2,769 3,791 34% 174 243 290 397 333 281 486 314 418 454 284 117
Malaysia 2,079 2,521 3,775 34% 237 232 230 177 211 256 415 382 420 471 387 357
China 2,914 3,492 2,252 20% 456 194 130 203 211 226 124 107 124 58 160 259
Australia 129 38 39 0% 4 2 1 14 5 2 3 4 3 1 0 0
Total Tonnes 10,479 10,414 11,185 100% 1101 864 875 971 817 828 1089 860 1017 1032 901 830
VALUE
A$ '000 2010 2011 YEAR 2012 share Jan‐12 Feb‐12 Mar‐12 Apr‐12 May‐12 Jun‐12 Jul‐12 Aug‐12 Sep‐12 Oct‐12 Nov‐12 Dec‐12
United States 5,442 3,392 4,552 35% 222 283 318 402 364 386 544 343 518 587 391 193
Malaysia 2,191 3,236 3,863 30% 226 219 262 236 283 286 390 349 379 467 388 379
China 2,921 3,302 2,395 19% 499 198 139 206 233 230 150 123 140 66 142 270
Australia 289 160 112 1% 20 13 7 17 11 5 12 13 9 4 1 0
Total A$ '000 12,492 12,155 12,867 100% 1,316 935 974 1,075 995 1,011 1,192 909 1,139 1,248 1,049 1,024
A$ per kg
A$ per kg 2010 2011 YEAR 2012 Jan‐12 Feb‐12 Mar‐12 Apr‐12 May‐12 Jun‐12 Jul‐12 Aug‐12 Sep‐12 Oct‐12 Nov‐12 Dec‐12
United States 1.32 1.22 1.20 1.28 1.16 1.10 1.01 1.09 1.38 1.12 1.09 1.24 1.29 1.38 1.65
Malaysia 1.05 1.28 1.02 0.95 0.94 1.14 1.33 1.34 1.12 0.94 0.91 0.90 0.99 1.00 1.06
China 1.00 0.95 1.06 1.09 1.02 1.07 1.01 1.10 1.02 1.21 1.15 1.13 1.14 0.89 1.04
Australia 2.24 4.20 2.87 5.06 6.53 6.63 1.24 2.20 2.51 3.89 3.34 2.88 3.89
A$ per kg 1.19 1.17 1.15 1.20 1.08 1.11 1.11 1.22 1.22 1.09 1.06 1.12 1.21 1.16 1.23
Sources : ITC calculations based on International Enterprise Singapore, Ministry of Trade and Industry; Fresh Intelligence analysis
Product : 070511 Cabbage lettuce (head lettuce) fresh or chilled
SINGAPORE IMPORTS A$ '000
SINGAPORE IMPORTS A$ per kg
SINGAPORE IMPORTS Tonnes
Product : 070511 Cabbage lettuce (head lettuce) fresh or chill
Exporters
Product : 070511 Cabbage lettuce (head lettuce) fresh or chilled
Pre packed and bulk baby leaf salads
In the last three years Malaysia has dominated imports with an 81% market share in 2012 followed by China with a 9% market share. Australian exports over these three years have averaged approximately 270 tonnes with a market share of 7% in 2012, with the Australian product more than three times the price of the Malaysian and Chinese product.
Supafresh WA (Asia Fruit Mag July 2012) export baby leaf salad to Singapore on a ‘random and un-programmed basis’. The high $A has been a problem. This is a market with plenty of opportunity; it has a large expat community with a high disposable income that demands safe, reliable and premium food product. There is resistance to cheap unreliable Chinese grown salads.
With Singapore only 5 hours flight from Perth, Australian growers can harvest, wash, pack and deliver leafy salads within 24 hours, giving Australian sourced produce the edge in freshness.
In time Supafresh will export fresh herbs to complement packaged baby leaf salads – especially for the food service sector. International airlines are re-provisioning in Singapore so this creates a market.
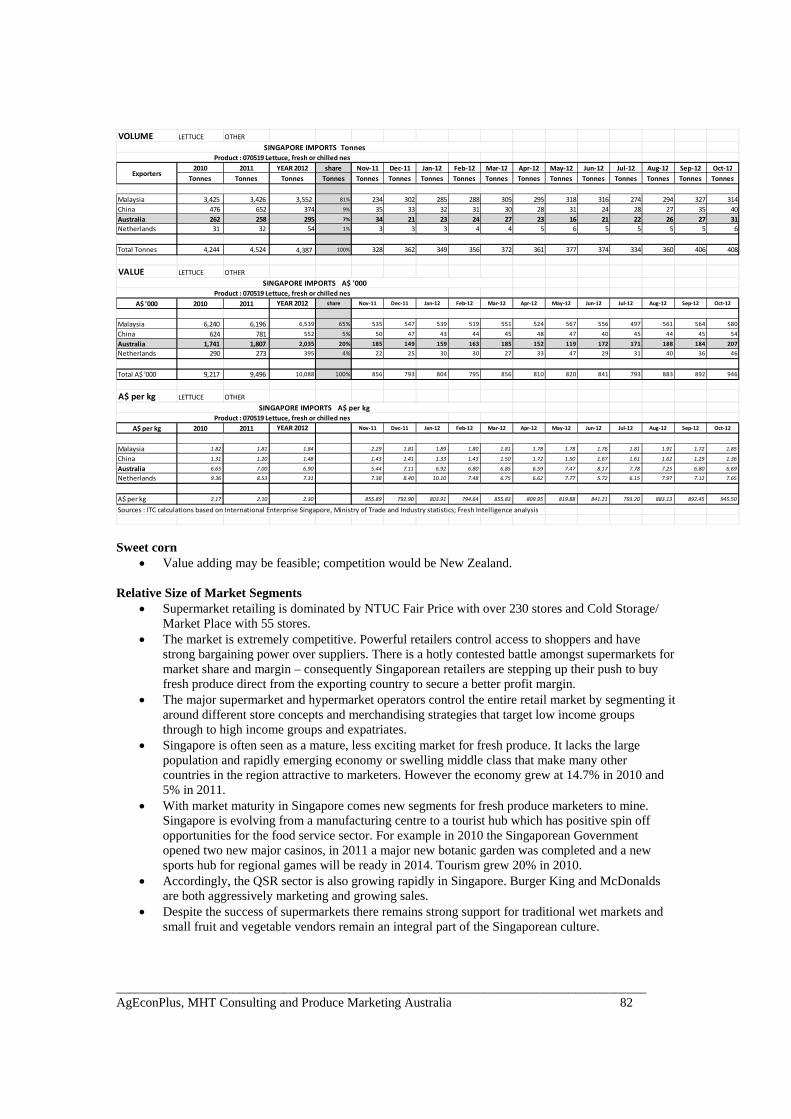
__________________________________________________________________________________ AgEconPlus, MHT Consulting and Produce Marketing Australia 82
VOLUME LETTUCE OTHER
2010 2011 YEAR 2012 share Nov‐11 Dec‐11 Jan‐12 Feb‐12 Mar‐12 Apr‐12 May‐12 Jun‐12 Jul‐12 Aug‐12 Sep‐12 Oct‐12
Tonnes Tonnes Tonnes Tonnes Tonnes Tonnes Tonnes Tonnes Tonnes Tonnes Tonnes Tonnes Tonnes Tonnes Tonnes Tonnes
Malaysia 3,425 3,426 3,552 81% 234 302 285 288 305 295 318 316 274 294 327 314
China 476 652 374 9% 35 33 32 31 30 28 31 24 28 27 35 40
Australia 262 258 295 7% 34 21 23 24 27 23 16 21 22 26 27 31
Netherlands 31 32 54 1% 3 3 3 4 4 5 6 5 5 5 5 6
Total Tonnes 4,244 4,524 4,387 100% 328 362 349 356 372 361 377 374 334 360 406 408
VALUE LETTUCE OTHER
A$ '000 2010 2011 YEAR 2012 share Nov‐11 Dec‐11 Jan‐12 Feb‐12 Mar‐12 Apr‐12 May‐12 Jun‐12 Jul‐12 Aug‐12 Sep‐12 Oct‐12
Malaysia 6,240 6,196 6,539 65% 535 547 539 519 551 524 567 556 497 561 564 580
China 624 781 552 5% 50 47 43 44 45 48 47 40 45 44 45 54
Australia 1,741 1,807 2,035 20% 185 149 159 163 185 152 119 172 171 188 184 207
Netherlands 290 273 395 4% 22 25 30 30 27 33 47 29 31 40 36 46
Total A$ '000 9,217 9,496 10,088 100% 856 793 804 795 856 810 820 841 793 883 892 946
A$ per kg LETTUCE OTHER
A$ per kg 2010 2011 YEAR 2012 Nov‐11 Dec‐11 Jan‐12 Feb‐12 Mar‐12 Apr‐12 May‐12 Jun‐12 Jul‐12 Aug‐12 Sep‐12 Oct‐12
Malaysia 1.82 1.81 1.84 2.29 1.81 1.89 1.80 1.81 1.78 1.78 1.76 1.81 1.91 1.72 1.85
China 1.31 1.20 1.48 1.43 1.41 1.33 1.43 1.50 1.72 1.50 1.67 1.61 1.62 1.29 1.36
Australia 6.65 7.00 6.90 5.44 7.11 6.92 6.80 6.85 6.59 7.47 8.17 7.78 7.25 6.80 6.69
Netherlands 9.36 8.53 7.31 7.38 8.40 10.10 7.48 6.75 6.62 7.77 5.72 6.15 7.97 7.12 7.65
A$ per kg 2.17 2.10 2.30 855.89 792.90 803.91 794.64 855.83 809.95 819.88 841.21 793.20 883.13 892.45 945.50
Sources : ITC calculations based on International Enterprise Singapore, Ministry of Trade and Industry statistics; Fresh Intelligence analysis
SINGAPORE IMPORTS A$ per kg
Product : 070519 Lettuce, fresh or chilled nes
SINGAPORE IMPORTS Tonnes
Product : 070519 Lettuce, fresh or chilled nes
Exporters
SINGAPORE IMPORTS A$ '000
Product : 070519 Lettuce, fresh or chilled nes
Sweet corn
Value adding may be feasible; competition would be New Zealand. Relative Size of Market Segments
Supermarket retailing is dominated by NTUC Fair Price with over 230 stores and Cold Storage/ Market Place with 55 stores.
The market is extremely competitive. Powerful retailers control access to shoppers and have strong bargaining power over suppliers. There is a hotly contested battle amongst supermarkets for market share and margin – consequently Singaporean retailers are stepping up their push to buy fresh produce direct from the exporting country to secure a better profit margin.
The major supermarket and hypermarket operators control the entire retail market by segmenting it around different store concepts and merchandising strategies that target low income groups through to high income groups and expatriates.
Singapore is often seen as a mature, less exciting market for fresh produce. It lacks the large population and rapidly emerging economy or swelling middle class that make many other countries in the region attractive to marketers. However the economy grew at 14.7% in 2010 and 5% in 2011.
With market maturity in Singapore comes new segments for fresh produce marketers to mine. Singapore is evolving from a manufacturing centre to a tourist hub which has positive spin off opportunities for the food service sector. For example in 2010 the Singaporean Government opened two new major casinos, in 2011 a major new botanic garden was completed and a new sports hub for regional games will be ready in 2014. Tourism grew 20% in 2010.
Accordingly, the QSR sector is also growing rapidly in Singapore. Burger King and McDonalds are both aggressively marketing and growing sales.
Despite the success of supermarkets there remains strong support for traditional wet markets and small fruit and vegetable vendors remain an integral part of the Singaporean culture.

__________________________________________________________________________________ AgEconPlus, MHT Consulting and Produce Marketing Australia 83
Supply Windows Opportunities are available throughout the year through the supermarket sector.
Freight and Logistics
Sea freight Sydney direct and takes 13 days Sea freight Brisbane via Tanjung, Pelepas 9 days but can take up to 12 days from Qld Sea freight Melbourne takes 15 days ( Sea freight Fremantle is direct and takes 5 days Sea freight: although Australian west coast much quicker than east coast, Taiwan can supply in 3
to 5 days and China in 9 to 10 days Air freight: air freight is overnight and in the market the next morning – Changi Airport is very
efficient, it is much easier to service Singapore than say Kuala Lumpur. Market Access and Trade Viability Improvement Plan
Singapore warrants inclusion in the market access and trade viability improvement strategy. The focus of investments needs to be value added lines direct to the supermarket.

__________________________________________________________________________________ AgEconPlus, MHT Consulting and Produce Marketing Australia 84
Malaysia Market Access
Under the ASEAN-Australia-New Zealand FTA (AANZFTA) tariffs will be phased down to zero. AANZFTA commenced for Australia and Malaysia in 2010.
Malaysia-Australia Free Trade Agreement (MAFTA) was signed in Kuala Lumpur in May 2012 and entered into force on 1 January 2013.
There are no tariffs on fresh vegetables and this has been the case since at least 2000. Phytosanitary certificates required for fresh vegetables
Trade Relationships with Australia
Malaysia is Australia’s tenth largest trading partner (DFAT website) By value, Malaysia was the fifth largest purchaser of Australian fresh vegetables in 2012 There are very good trade and personal relationships between the Australian vegetable industry
and Malaysia especially WA vegetable growers. Demographics and Capacity to Pay
Population: 29.2 million (2012) with a sizable middle and upper income group of about 15 million persons (Sarah Xu)
Population growth rate: 1.5% (2012 estimate) Urban population: 72% Major cities: Kuala Lumpur 1.493 M; Klang 1.071 M; Johor Bahru 958,000 GDP per capita: US$16,200 (2011) Household incomes are continuing to grow in Malaysia GDP per capita would indicate capacity to pay for imported vegetables beyond the hotel sector.
Vegetable Production and Consumption
Malaysia is the world’s tenth largest importer of vegetables (Rabobank 2006) Malaysia has developed a modern retail sector. Malaysia has highly productive vegetable growing regions in the Genting and Cameron Highlands.
Their food safety programs in these areas are also well organised (Bicknell 2012) Quality of produce from Cameron Highlands, predominately grown under protected cropping is
excellent quality – across high value tomato, capsicum, eggplant, cucumber, lettuce and leafy lettuce. , Primarily for domestic consumption, with some export to Singapore.
Malaysia Vegetable Imports from Australia 2010 to 2012 – Vegetables in Scope ($AUD) Vegetable Value 2010 Value 2011 Value 2012 Broccoli 202,190 167,420 213,849 Beans 0 970 970 Capsicum 4,350 5,810 11,580 Carrots 6,863,510 5,516,950 6,499,630 Cauliflower 139,140 25,160 95,061 Celery 617,430 569,020 551,210 Leek 10,870 4,840 10,620 Lettuce - head 70,660 67,740 111,010 Lettuce – other 442,420 348,380 372,620 Peas 9,780 970 14,480 Squash and pumpkin N/a N/a 100,400 Sweet corn – fresh N/a N/a N/a Sweet corn – frozen 5,440 2,900 7,720 Sweet potato 9,780 13,550 5,790
Total 8,375,570 6,723,710 7,994,940 Source: ITC Comtrade
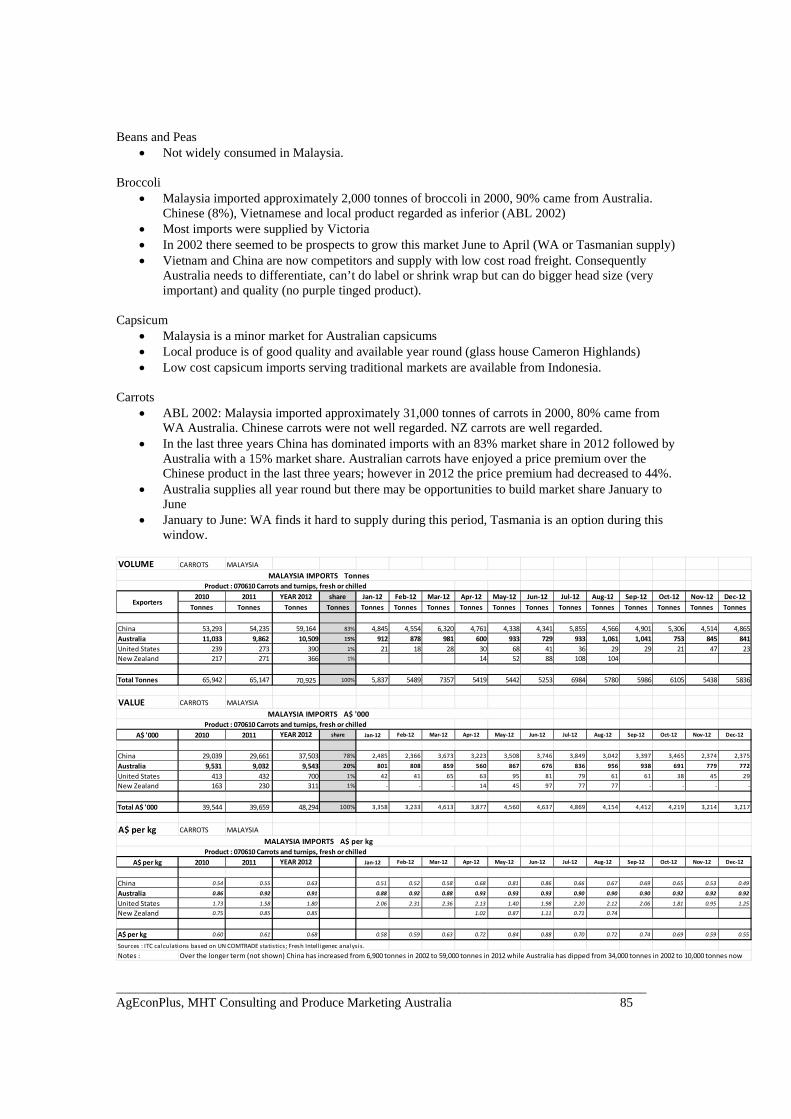
__________________________________________________________________________________ AgEconPlus, MHT Consulting and Produce Marketing Australia 85
Beans and Peas Not widely consumed in Malaysia.
Broccoli
Malaysia imported approximately 2,000 tonnes of broccoli in 2000, 90% came from Australia. Chinese (8%), Vietnamese and local product regarded as inferior (ABL 2002)
Most imports were supplied by Victoria In 2002 there seemed to be prospects to grow this market June to April (WA or Tasmanian supply) Vietnam and China are now competitors and supply with low cost road freight. Consequently
Australia needs to differentiate, can’t do label or shrink wrap but can do bigger head size (very important) and quality (no purple tinged product).
Capsicum
Malaysia is a minor market for Australian capsicums Local produce is of good quality and available year round (glass house Cameron Highlands) Low cost capsicum imports serving traditional markets are available from Indonesia.
Carrots
ABL 2002: Malaysia imported approximately 31,000 tonnes of carrots in 2000, 80% came from WA Australia. Chinese carrots were not well regarded. NZ carrots are well regarded.
In the last three years China has dominated imports with an 83% market share in 2012 followed by Australia with a 15% market share. Australian carrots have enjoyed a price premium over the Chinese product in the last three years; however in 2012 the price premium had decreased to 44%.
Australia supplies all year round but there may be opportunities to build market share January to June
January to June: WA finds it hard to supply during this period, Tasmania is an option during this window.
VOLUME CARROTS MALAYSIA
2010 2011 YEAR 2012 share Jan‐12 Feb‐12 Mar‐12 Apr‐12 May‐12 Jun‐12 Jul‐12 Aug‐12 Sep‐12 Oct‐12 Nov‐12 Dec‐12
Tonnes Tonnes Tonnes Tonnes Tonnes Tonnes Tonnes Tonnes Tonnes Tonnes Tonnes Tonnes Tonnes Tonnes Tonnes Tonnes
China 53,293 54,235 59,164 83% 4,845 4,554 6,320 4,761 4,338 4,341 5,855 4,566 4,901 5,306 4,514 4,865
Australia 11,033 9,862 10,509 15% 912 878 981 600 933 729 933 1,061 1,041 753 845 841
United States 239 273 390 1% 21 18 28 30 68 41 36 29 29 21 47 23
New Zealand 217 271 366 1% 14 52 88 108 104
Total Tonnes 65,942 65,147 70,925 100% 5,837 5489 7357 5419 5442 5253 6984 5780 5986 6105 5438 5836
VALUE CARROTS MALAYSIA
A$ '000 2010 2011 YEAR 2012 share Jan‐12 Feb‐12 Mar‐12 Apr‐12 May‐12 Jun‐12 Jul‐12 Aug‐12 Sep‐12 Oct‐12 Nov‐12 Dec‐12
China 29,039 29,661 37,503 78% 2,485 2,366 3,673 3,223 3,508 3,746 3,849 3,042 3,397 3,465 2,374 2,375
Australia 9,531 9,032 9,543 20% 801 808 859 560 867 676 836 956 938 691 779 772
United States 413 432 700 1% 42 41 65 63 95 81 79 61 61 38 45 29
New Zealand 163 230 311 1% ‐ ‐ ‐ 14 45 97 77 77 ‐ ‐ ‐ ‐
Total A$ '000 39,544 39,659 48,294 100% 3,358 3,233 4,613 3,877 4,560 4,637 4,869 4,154 4,412 4,219 3,214 3,217
A$ per kg CARROTS MALAYSIA
A$ per kg 2010 2011 YEAR 2012 Jan‐12 Feb‐12 Mar‐12 Apr‐12 May‐12 Jun‐12 Jul‐12 Aug‐12 Sep‐12 Oct‐12 Nov‐12 Dec‐12
China 0.54 0.55 0.63 0.51 0.52 0.58 0.68 0.81 0.86 0.66 0.67 0.69 0.65 0.53 0.49
Australia 0.86 0.92 0.91 0.88 0.92 0.88 0.93 0.93 0.93 0.90 0.90 0.90 0.92 0.92 0.92
United States 1.73 1.58 1.80 2.06 2.31 2.36 2.13 1.40 1.98 2.20 2.12 2.06 1.81 0.95 1.25
New Zealand 0.75 0.85 0.85 1.02 0.87 1.11 0.71 0.74
A$ per kg 0.60 0.61 0.68 0.58 0.59 0.63 0.72 0.84 0.88 0.70 0.72 0.74 0.69 0.59 0.55
Sources : ITC calculations based on UN COMTRADE statistics; Fresh Intel ligenec analysis.
Notes : Over the longer term (not shown) China has increased from 6,900 tonnes in 2002 to 59,000 tonnes in 2012 while Australia has dipped from 34,000 tonnes in 2002 to 10,000 tonnes now
MALAYSIA IMPORTS TonnesProduct : 070610 Carrots and turnips, fresh or chilled
Exporters
MALAYSIA IMPORTS A$ '000
Product : 070610 Carrots and turnips, fresh or chilled
MALAYSIA IMPORTS A$ per kg
Product : 070610 Carrots and turnips, fresh or chilled

__________________________________________________________________________________ AgEconPlus, MHT Consulting and Produce Marketing Australia 86
Celery Current data (ITC Comtrade 2010 to 2012) shows that Malaysia is Australia’s best celery export
market Malaysia imported approximately 1,000 tonnes of celery in 2000, 56% came from Australia Supply came from Qld, Victoria and WA (dominant) In 2012, the US and China dominated imports with a market shares of 62% and 29% respectively
with Australia having a 6% market share. Over the last three years, the price of Chinese celery has been significantly higher than the price of the Australian product. As Australia supplies all year round, there should be significant opportunities to build market share.
VOLUME CELERY MALAYSIA
2010 2011 YEAR 2012 share Jan‐12 Feb‐12 Mar‐12 Apr‐12 May‐12 Jun‐12 Jul‐12 Aug‐12 Sep‐12 Oct‐12 Nov‐12 Dec‐12
Tonnes Tonnes Tonnes Tonnes Tonnes Tonnes Tonnes Tonnes Tonnes Tonnes Tonnes Tonnes Tonnes Tonnes Tonnes Tonnes
China 2,018 1,737 2,712 29% 152 149 162 255 207 370 278 198 243 234 212 252
United States 6,269 7,087 5,705 62% 934 483 411 424 346 475 421 339 421 299 507 646
Australia 608 589 572 6% 63 34 32 21 39 56 54 57 58 56 58 45
Thailand 68 102 71 1% 13 6 3 7 15 9 4 2 6 1 4 2
Total Tonnes 9,126 9,619 9,220 100% 1,163 723 619 726 616 922 767 615 729 594 782 965
VALUE CELERY MALAYSIA
A$ '000 2010 2011 YEAR 2012 share Jan‐12 Feb‐12 Mar‐12 Apr‐12 May‐12 Jun‐12 Jul‐12 Aug‐12 Sep‐12 Oct‐12 Nov‐12 Dec‐12
China 4,342 4,460 4,681 55% 681 326 290 452 370 436 350 292 373 264 387 461
United States 2,175 1,797 2,822 33% 161 155 168 255 254 345 260 204 245 279 241 255
Australia 839 786 784 9% 82 46 45 37 53 79 77 75 76 76 79 59
Thailand 30 45 52 1% 6 5 4 6 8 6 3 2 4 2 5 3
Total A$ '000 7,630 7,198 8,475 100% 933 549 531 767 695 879 703 585 701 627 715 792
A$ per kg CELERY MALAYSIA
A$ per kg 2010 2011 YEAR 2012 Jan‐12 Feb‐12 Mar‐12 Apr‐12 May‐12 Jun‐12 Jul‐12 Aug‐12 Sep‐12 Oct‐12 Nov‐12 Dec‐12
China 2.15 2.57 1.73 4.47 2.18 1.79 1.77 1.79 1.18 1.26 1.47 1.54 1.13 1.82 1.83
United States 0.35 0.25 0.49 0.17 0.32 0.41 0.60 0.73 0.73 0.62 0.60 0.58 0.93 0.48 0.40
Australia 1.38 1.33 1.37 1.30 1.36 1.42 1.71 1.37 1.42 1.43 1.32 1.32 1.35 1.36 1.33
Thailand 0.45 0.45 0.74 0.45 0.83 1.50 0.82 0.54 0.64 0.66 1.22 0.61 3.05 1.37 1.23
A$ per kg 0.84 0.75 0.92 0.80 0.76 0.86 1.06 1.13 0.95 0.92 0.95 0.96 1.06 0.91 0.82
Sources : ITC calculations based on Department of Statistics Malaysia; Fresh Intelligence analysis
Exporters
MALAYSIA IMPORTS A$ '000
Product : 070940 Celery, other than celeriac, fresh or chilled
MALAYSIA IMPORTS A$ per kg
Product : 070940 Celery, other than celeriac, fresh or chilled
MALAYSIA IMPORTS Tonnes
Product : 070940 Celery, other than celeriac, fresh or chilled
Leeks
Limited opportunity for Australian leeks in Malaysia. Pre packed and bulk baby leaf salads
Malaysia has stepped up hydroponic production and can supply considerably cheaper than imports from Australia, EU and US.
Hydroponics is cleaner and has less food safety risk than field grown salads but lacks flavour and texture and discerning chefs in Asia recognise this limitation
Australia is able to offer food safety with a wider range of salad varieties e.g. European wild rocket, snow pea tendrils (Bicknell 2012)
Local hydroponic product dominates the food service sector (Bicknell 2012) but not the QSR sector – hydroponics does not offer sufficient shelf life to meet their logistics needs.
Lettuce – head
Chinese product travels overland by truck at low cost. Australia is a contingent supplier at best – hard to compete with China and the US. Local from Cameron Highlands is OK for domestic market, for QSR with high shelf life
requirements imports are needed.

__________________________________________________________________________________ AgEconPlus, MHT Consulting and Produce Marketing Australia 87
Sweet Corn
Baby sweet corn used in stir fry but this would be supplied, if imported by Thailand. Relative Size of Market Segments
Supermarket retailers (2011 data) include: 142 Giant/Cold Storage/Bintang/Mercato hypermarkets and supermarkets (Dairy Farm Group), The Store 56 supermarkets, Jusco and MaxValu (AEON) 28 stores. In mid-2012 AEON also bought Carrefour’s 26 Malaysian hypermarkets.
Malaysia’s demand for sophisticated food and beverage is increasing, especially with regard to quality aspects, food health, safety and nutrition.
Urban Malaysians are brand conscious and prefer to shop in stores which offer convenience and good product selections
Hypermarkets are now the dominate format in urban / metropolitan areas with about 45% to 60% of urban household shoppers using them as the main outlet for packaged groceries (Sarah Xu, DA)
The modern retail sector continues to expand its footprint in Malaysia. Those present include Tesco Malaysia, Giant, Econ-save (locally owned), and Jusco/Aeon (Japanese owned). These chains mainly target medium to low income customers and work on a low price, high volume model. They advertise heavily in local newspapers.
Also present are rapidly growing chains that target middle to high income groups. This group is expanding their floor space and chiller capacity for fresh produce. This demographic is serviced by the likes of Cold Storage, Mercato, Village Grocer and MBG Fruit Shop. These chains hardly advertise but are service-oriented and have strong loyalty programs – this group of retailers has the infrastructure and desire to conduct promotional activities.
Despite overall growth in the modern trade its overall share of fresh produce sales in Malaysia remains very low compared with that of the traditional retail trade – some say as low as 10% of the total.
Traditional retail is structured around morning markets, night markets and farmers’ markets, and small fresh produce vendors in these markets do very well.
Supply Windows
Broccoli – January to December Carrots – January to December Celery – January to December
Freight and Logistics
Sea freight Sydney direct and takes 10 days Sea freight Brisbane direct and takes 8 days Sea freight Melbourne takes 18 days Sea freight Fremantle is direct and takes 5 days
Market Access and Trade Viability Improvement Plan
Malaysia warrants inclusion in the market access and trade viability improvement strategy. The focus of investments needs to be value added lines direct to the supermarket / hypermarket sector.
__________________________________________________________________________________ AgEconPlus, MHT Consulting and Produce Marketing Australia 88
Indonesia Market Access
Under the ASEAN-Australia-New Zealand FTA (AANZFTA) vegetable tariffs will be phased down to zero for most vegetables but for vegetables with high tariffs only modest reductions will be made.
Vegetables with high tariffs include carrots (DFAT website http://www.daff.gov.au/market-access-trade/fta/the_association_of_southeast_asian_nations_asean-australia-newzealand_free_trade_area_aanzfta#horticulture )
Indonesia implemented the ASEAN-Australia-New Zealand FTA in January 2012. In 2013 Australia and Indonesia are in the early stages of negotiating a Comprehensive Economic
Partnership Agreement Indonesia announced a temporary ban on 15 types of horticultural products for the period January
to June 2013. Products included broccoli, cabbage, cauliflower, carrots and capsicum. Regional trade agreements involving Indonesia and the rest of ASEAN, China, Australia, New
Zealand, and India have lowered tariff barriers to imports from those areas, while leaving barriers intact for the remaining major competitors, the United States and the EU. ASEAN, China, and Oceania have obvious advantages in shipping to Indonesia in a more timely way than can U.S. exporters. On the other hand, U.S. advantages include the strength of its branded products in the eyes of consumers and the vast size and diversity of U.S. food production (Source: USDA ERS 2011).
Trade Relationships with Australia
Indonesia has introduced a number of new and revised regulations governing the importation of horticultural products to minimise the risk of exotic plant and pest organisms entering Indonesia and to ensure the safety of imported food. The regulations include extensive testing and certification requirements for horticulture and grain imports that Australia had previously avoided through Indonesia recognising Australia’s food safety system for plant products. Australia is currently undergoing a verification process for Indonesia to extend its recognition of our food safety system for plant products.
Indonesia announced on 19 June 2012 that countries with recognised food safety systems would maintain access to all international ports of entry for horticulture goods.
Separately, Indonesia has passed further trade regulations to give effect to additional verification requirements of Australian horticulture exports.
Demographics and Capacity to Pay
Population: 248.6 million (2012 estimate) Population growth rate: 1% Urban population: 44% Major Cities: Jakarta (9.121 million); Surabaya (2.509 million); Bandung (2.412 million); Medan
(2.131 million); and Semarang (1.296 million) GDP per capita: US$4,700 (2011) 56.6% of the population (131 million individuals) now classified as middle class. 7 million people
added to the middle class each year between 2003 and 2010. Swelling middle class is seeking out healthy food choices.
Vegetable Production and Consumption
Indonesia is the sixth largest vegetable producer in the world Indonesian vegetable imports increased by 98% in the 10 years to 2010. This was due, in part, to
internal transport in Indonesia often being slow, and sometimes perishable foods can be obtained more cheaply through import channels than domestic supply.
East West Seeds (owned by Dutch seed company Enza Zaden) is supporting modern vegetable varieties in Indonesia in a joint venture using hybrids and local open pollinated selection for their climate.

__________________________________________________________________________________ AgEconPlus, MHT Consulting and Produce Marketing Australia 89
Indonesian food consumption patterns have also changed since the late 1990s. Packaged and prepared food sales have grown strongly. Changes in food retailing and in food consumption patterns in Indonesia have been slower than in some comparable countries and might occur more quickly if economic barriers and constraints were removed.
Growth in consumption of vegetables and fruits has been modest. (Source: USDA ERS 2011). Indonesia is one of the best performing economies in the G20, growing at 6% pa in 2010 Food is a very important part of household expenditure: in 2010 consumers spent over half of their
monthly shopping budget on fresh produce. Upper middle class are seeking premium products that deliver health, convenience and lifestyle - consumers are becoming quality rather than price focussed.
Food imports have grown, but not as a proportion of food spending. In part, this may be the result of regulations by the Indonesian Government, which has voiced support for free trade in goods but often encourages food self-sufficiency in practice. Farmers sometimes wish to slow or stop competition from imports. At the border, imports of some products are effectively banned and many other foods face slow and uncertain import procedures. Indonesia’s requirements for Government-issued registration numbers for each import can be a particularly serious impediment. Recent restrictions on the number of ports through which horticultural imports are allowed to pass could lead to lower imports in the future. Other regulations limit the location of new large stores. As a result, modern food retailing in Indonesia faces constraints in procuring products efficiently from both international and domestic sources and in obtaining sites for expansion. (Source: USDA ERS 2011)
Access for horticultural products to Indonesia has become more opaque since Indonesia’s Ministry of Trade published new regulations in September/October 2012 in relation to imports. The regulations relate to new requirements not only for port access, but also documentation (third party surveys, certificates of origin, import permits etc.) and labelling. The practical implications are to make access significantly more difficult.
In broad terms, the regulations establish a registration system for all importers of fruits and vegetables. Importers must obtain an import recommendation letter from the Ministry of Agriculture and then submit the recommendation letter to the Ministry of Trade to apply for an import permit. Additionally, the regulations also impose pre–export survey requirements for horticulture exports. (Source: DAFF)
Indonesia Vegetable Imports from Australia 2010 to 2012 – Vegetables in Scope ($AUD) Vegetable Value 2010 Value 2011 Value 2012 Broccoli 284,800 127,740 88,516 Beans 0 0 0 Capsicum 4,350 31,930 5,790 Carrots 396,770 321,280 448,880 Cauliflower 64,130 67,740 28,294 Celery 44,570 37,740 33,790 Leek 17,390 24,190 17,380 Lettuce - head 690,260 464,500 477,840 Lettuce – other 104,350 116,130 92,670 Peas 2,170 0 0 Squash and pumpkin 0 0 141,900 Sweet corn – fresh N/a N/a N/a Sweet corn – frozen 70,660 54,190 68,540 Sweet potato 1,090 970 0
Total 1,680,540 1,246,410 1,403,600 Source: ITC Comtrade
Beans Little opportunity for Australian beans.
Broccoli Indonesia grows broccoli of reasonable quality that is affordable to middle income families

__________________________________________________________________________________ AgEconPlus, MHT Consulting and Produce Marketing Australia 90
Makro Supermarket prefers to source local broccoli rather than use imports but use Australian imports to fill short term supply gaps
In 2000 Australia exported 45 tonnes of broccoli to Indonesia and had a 95% share of the import market. Australian broccoli was destined for the hotel and restaurant sector and upmarket supermarkets.
In 2002 importers was examining the feasibility of importing Chinese broccoli in 20 foot reefers – this product would be considerably cheaper than that supplied by Australia
Capsicums
In 2000 Indonesia imported 155 tonnes of capsicums – China (68.3%), Australia (22.5%) and India (9%)
New growing techniques have been introduced to Sumatra and Java allowing Indonesia to grow and export high quality capsicums (ABL 2002)
ABL 2002: import market has been subsumed by domestic production Carrots
In 2000 Australia supplied 306 tonnes of carrots – 66% of imports. Other suppliers included Thailand (8.8%), Malaysia (6.8%), China (9.5%), Taiwan (4.2%) and NZ (4.2%)
The market is relatively small and is supplied by average quality domestic production The Koyo variety from Qld is preferred and importers will switch suppliers to secure it ABL 2002: further growth opportunities for Australia if exporters maintain consistent quality and
set prices at a level that can be afforded by most average income families. China and Thailand are the major threats to further market growth
Celery
In 2000 Australia exported 118 tonnes of celery and was the sole supplier Celery is not part of traditional Indonesian cooking and is used primarily in food service - Chinese
and western restaurants In 2000 local growers were still refining celery production techniques Outlook is for a small but stable Australian import demand
Lettuce – head VOLUME HEAD LETTUCE INDONESIA
2010 2011 YEAR 2012 share Dec‐11 Jan‐12 Feb‐12 Mar‐12 Apr‐12 May‐12 Jun‐12 Jul‐12 Aug‐12 Sep‐12 Oct‐12 Nov‐12
Tonnes Tonnes Tonnes Tonnes Tonnes Tonnes Tonnes Tonnes Tonnes Tonnes Tonnes Tonnes Tonnes Tonnes Tonnes Tonnes
China 58 50 58 53% 1.3 5.3 7.5 5.7 9.8 6.4 3.8 2.8 5.4 4.2 3.7 1.9
Australia 6 16 23 21% 0.1 0.1 4.2 3.7 5.4 3.8 3.4 2.7
India ‐ ‐ 28 26% 28.0
Total Tonnes 67 66 109 100% 1.3 33.4 7.7 5.7 14.0 10.1 9.1 2.9 9.2 7.6 3.7 4.6
VALUE HEAD LETTUCE INDONESIA
A$ '000 2010 2011 YEAR 2012 share Dec‐11 Jan‐12 Feb‐12 Mar‐12 Apr‐12 May‐12 Jun‐12 Jul‐12 Aug‐12 Sep‐12 Oct‐12 Nov‐12
China 76 51 63 40% 1 6 7 6 11 7 5 3 7 5 5 2
Australia 22 62 89 56% 0 0 16 15 20 15 13 0 10
India ‐ ‐ 6 4% 6
0%
Total A$ '000 103 113 157 100% 1 12 7 6 27 22 25 3 21 17 5 12
A$ per kg HEAD LETTUCE INDONESIA
A$ per kg 2010 2011 YEAR 2012 Dec‐11 Jan‐12 Feb‐12 Mar‐12 Apr‐12 May‐12 Jun‐12 Jul‐12 Aug‐12 Sep‐12 Oct‐12 Nov‐12
China 1.31 1.03 1.09 0.75 1.10 0.87 0.99 1.08 1.09 1.32 1.04 1.24 1.15 1.32 1.00
Australia 3.62 3.87 3.79 3.91 4.06 3.75 3.99 3.64 3.58
India 0.21 0.21
A$ per kg 1.54 1.72 1.44 0.75 0.35 0.97 0.99 1.93 2.18 2.74 1.02 2.27 2.27 1.32 2.51
Sources : ITC calculations based on BPS ‐ Statistic Indonesia; Fresh Intelligence analysis
INDONESIA IMPORTS A$ per kg
Product : 070511 Cabbage lettuce (head lettuce) fresh or chilled
INDONESIA IMPORTS Tonnes
Product : 070511 Cabbage lettuce (head lettuce) fresh or chill
Exporters
INDONESIA IMPORTS A$ '000
Product : 070511 Cabbage lettuce (head lettuce) fresh or chilled
__________________________________________________________________________________ AgEconPlus, MHT Consulting and Produce Marketing Australia 91
Relative Size of Market Segments
While traditional markets still dominate, supermarket growth continues at a significant pace. Modern retailers include:
o Giant hypermarkets and supermarkets (Hero Group), with around 50 hypermarket format stores and over 100 supermarkets
o Hypermart hypermarkets and Foodmart supermarkets, with over 100 outlets o Alfa Midi, with over 150 small to medium supermarkets o Yogya Group, approaching 100 stores, and focusing on regional cities outside Jakarta
Import, distribution and modern retail infrastructure are sufficient for the successful supply and sales of imported produce. For example, retailers generally have cool rooms and refrigerated display units sufficient to store and merchandise higher-value imported produce.
Modern retail is becoming more important for fruit and vegetable sales, although sales through traditional markets still predominate. Modern retail also provides the best opportunity to undertake targeted marketing support, as well as being able to supply a rapidly expanding sector of the market. Accelerating growth has been due to a combination of two developments – expansion in the number of retailers and new store openings in second-tier and regional cities, providing a wider spread of markets.
Most modern retailers have preferred importers/suppliers to source product on their behalf. This includes deliveries direct to stores, as investment in assembly/distribution centres is not seen as a high priority. A modern food retail chain has an interest in exploiting global supplies of foods unavailable in Indonesia or lower priced than domestic production, and has the advantage of being able to place large orders, which can often be filled at a lower per-unit price.
Food service: The Indonesian foodservice industry grew at a rate of 6.1% between 2004 and 2008, and has grown continuously since that time, led by tourism, rising disposable income and an increase in the population of working women. (MC: the food service sector is price conscious)
Supply Windows
Opportunities are available throughout the year through the supermarket sector. Freight and Logistics
Sea freight Sydney via Singapore and takes 15 days Sea freight Brisbane direct and takes 11 days Sea freight Melbourne direct and takes 10 days Sea freight Fremantle is direct and takes 7 days
Market Access and Trade Viability Implementation Plan
Indonesia warrants inclusion in the market access and trade viability improvement strategy. The focus of investments needs to be value added lines direct to the supermarket / hypermarket sector.

__________________________________________________________________________________ AgEconPlus, MHT Consulting and Produce Marketing Australia 92
New Zealand Market Access
Specific restrictions on fruiting vegetables from Australia (e.g. capsicum, pumpkins and zucchini) Phytosanitary certificates required for fresh vegetables Australia has restricted access to NZ for products like lettuce due Rutherglen Bug Loss of access to dimethoate for fruit fly control has further restricted trade opportunities short
term There are no tariffs on fresh vegetables imported from Australia.
Trade Relationships with Australia
Culturally, politically and legally the two nations are closely aligned. Australia has proximity and freight advantages over other importers targeting NZ By value NZ was the fourth largest purchaser of Australian fresh vegetables in 2012.
Demographics and Capacity to Pay
Population: 4.3 million (2012) Population growth rate: 0.9% (2012 estimate) Urban population: 86% Major cities: Auckland (1.4 M); Wellington 391,000 GDP per capita: US$28,800 (2012 estimate)
Vegetable Production and Consumption
NZ has ample capacity to produce temperate vegetables relevant to the scope of this project Market opportunities will be limited to smallish seasonal supply windows – until 2009 this was:
winter tomatoes zucchini and Capsicum. Now this has all stopped due to deregistration on the fruit fly control dimethoate.
July, Aug Sept – wet and cold in NZ so supermarkets supply Australian broccoli into this market. New Zealand Vegetable Imports from Australia 2010 to 2012 – Vegetables in Scope ($AUD) Vegetable Value 2010 Value 2011 Value 2012 Broccoli 31,520 355,150 15,450 Beans 3,463,280 3,486,680 4,067940 Capsicum 1,914,260 1,222,230 0 Carrots 0 0 0 Cauliflower 0 0 0 Celery 0 0 0 Leek 0 0 0 Lettuce - head 121,750 542,890 52,130 Lettuce – other 0 0 0 Squash and pumpkin 0 0 0 Sweet corn – fresh N/a N/a N/a Sweet corn – frozen 351,110 350,310 352,350 Sweet potato 63,050 0 0
Total 5,944,970 5,957,260 4,487,870 Source: ITC Comtrade Beans
NZ is an important market for Australian fresh beans. Supply is sourced during winter months from Bowen & Ayr in north Queensland.
Capsicum
NZ was an important market for Australian capsicums but loss of dimethoate for fruit fly control has closed this market to Australia (see table above).

__________________________________________________________________________________ AgEconPlus, MHT Consulting and Produce Marketing Australia 93
NZ are now growing capsicums in greenhouses and exporting to Australia Lettuce
Opportunities would be iceberg lettuce hearts exported into Auckland for shredding for the QSR market in the months, July, Aug and Sept when it is too cold to produce quality and high yielding local lettuce . Would likely be supplied from Lockyer Valley Qld via sea freight – Port of Brisbane to Auckland is 3 days
Relative Size of the Market Segments
New Zealand retailing is dominated by two chains. Under the three regional Foodstuffs cooperatives are 138 independently owned Foodstuffs supermarkets and 49 Pak n Save large format discount stores. Progressive Enterprises (Owned by Australian company Woolworths) has over 160 Countdown stores nationwide.
Supply Windows
Primarily winter, when Qld is able to offer a seasonal growing advantage. Freight and Logistics
Port of Brisbane to Auckland is 3 days Market Access and Trade Viability Improvement Plan
New Zealand warrants inclusion in the market access and trade viability improvement strategy. The focus of investments needs to on market access, capsicums and lettuce plus defence of the Australian fresh bean market.

__________________________________________________________________________________ AgEconPlus, MHT Consulting and Produce Marketing Australia 94
United Arab Emirates (UAE) Market Access
Specific restrictions on fruiting vegetables from Australia (e.g. capsicum, pumpkins) Phytosanitary certificates required for fresh vegetables Free Trade Agreement negotiations with the Gulf Cooperation Council (GCC), comprising
Bahrain, Kuwait, Oman, Qatar, Saudi Arabia and the United Arab Emirates, commenced in July 2007.
GCC has paused its trade negotiations with all partners pending a review of its trade agreement policy. The Australian Government is committed to resuming the negotiations with the GCC (DFAT website).
Trade Relationships with Australia
Bilateral relations between Australia and the UAE are warm, multi-faceted and growing rapidly. They are underpinned by extensive trade relations as well as people-to-people contacts arising
from the strong growth of direct air links, including 91 flights per week from the UAE to Australia, and a large population of approximately 12,000 to 15,000 expatriate Australians living and working in the UAE (DFAT website). By value, the UAE was the third largest purchaser of Australian fresh veg in 2012
Demographics and Capacity to Pay
Population: 5.31 million (2012 estimate) Population growth rate: 3.0% (2012 estimate) Median age 30.2 years Urban population: 84% (2010 estimate) Major cities: Abu Dhabi (666,000), Dubai, Sharjah, Al Ain, Ajman, Ras al Khaymah GDP per capita US$48,800
Vegetable Consumption and Production
The UAE supplies Saudi Arabia, Bahrain, Qatar and others with a very wide range of re-exported fresh produce (Trade Middle East Magazine 2012)
A lot of fresh produce exported to the UAE is re-exported to other markets in the region – Saudi Arabia, Iraq, Kuwait, Oman, Qatar, Bahrain, and Jordan and there is a trend toward these regional countries doing their own direct sourcing, ‘the days of the UAE being the fresh produce conduit for the region may be numbered’ (Trade Middle East Magazine 2013)
UAEs statistics look very encouraging but it is mainly re-export. A lot of it goes to Saudi Arabia where there are 33 million people. The population of UAE is small – better to think Saudi Arabia.
The UAE normally sources its vegetables from Turkey and Syria – both interrupted by the civil war in Syria (Trade Middle East Magazine 2013)
The UAE has recovered from the GFC linked construction crash of 2009. Some 80% of the UAE’s food spend is on imports which totalled US$6.9 billion in 2010. Food
spend will increase 5% from 2012 to 2014 (Trade Middle East Magazine 2012) Organic products are on the rise in the UAE. In 2010 organic greenhouse farming increased by
15%, an output of 5,000 tonnes. Specialist organic retailers have been able to grow their store numbers in Dubai and expand into Abu Dhabi, Saudi Arabia and Qatar. This trend started with the expat population but has not been embraced by the locals.

__________________________________________________________________________________ AgEconPlus, MHT Consulting and Produce Marketing Australia 95
UAE Vegetable Imports from Australia 2010 to 2012 – Vegetables in Scope ($AUD) Vegetable Value 2010 Value 2011 Value 2012 Broccoli 977,240 317,410 320,250 Beans 0 0 0 Capsicum 0 1,940 0 Carrots 11,821,450 11,009,720 13,835,250 Cauliflower 0 970 240 Celery 7,610 16,450 2,900 Leek 0 0 0 Lettuce - head 10,870 970 5,790 Lettuce – other 269,580 127,740 112,940 Peas 1,090 0 1,930 Squash and pumpkin N/a N/a 188,240 Sweet corn – frozen 970 970 Sweet potato 293,500 270,960 244,230
Total 13,381,340 11,747,130 14,712,740 Source: ITC Comtrade Beans
There is no history of trade in fresh beans in this market. Broccoli
Over the last three years Jordan has dominated imports and in 2012 had a market share of 88% whilst Australia had a market share of 1%. Over the last three years, the price of Australian broccoli has been between 3 and 6 times that of Jordan.
VOLUME BROCCOLI UAE
2010 2011 YEAR 2012 share Nov‐11 Dec‐11 Jan‐12 Feb‐12 Mar‐12 Apr‐12 May‐12 Jun‐12 Jul‐12 Aug‐12 Sep‐12 Oct‐12
Tonnes Tonnes Tonnes Tonnes Tonnes Tonnes Tonnes Tonnes Tonnes Tonnes Tonnes Tonnes Tonnes Tonnes Tonnes Tonnes
Jordan 15,318 13,704 11,681 88% 1,060 377 298 400 192 2,041 2,898 1,263 1,101 775 689 586
Iran 8,480 ‐ 0%
Spain 293 648 977 7% 81 59 31 30 70 104 222 118 52 30 67 113
Oman 61 1,265 ‐ 0%
Australia 348 146 104 1% 22.4 8.7 10.1 0.1 3.6 5.9 1.1 5.1 10.5 12.6 6.8 17.2
Total Tonnes 27,855 16,422 13,283 100% 1,163 445 418 474 357 2191 3159 1450 1170 848 796 813
* Excl Iran 19,375
VALUE BROCCOLI UAE
A$ '000 2010 2011 YEAR 2012 share Nov‐11 Dec‐11 Jan‐12 Feb‐12 Mar‐12 Apr‐12 May‐12 Jun‐12 Jul‐12 Aug‐12 Sep‐12 Oct‐12
Jordan 8,589 8,578 7,672 75% 548 200 106 354 186 1,171 1,600 951 1,001 681 591 283
Iran 5,824 ‐ 0%
Spain 532 648 1,634 16% 139 102 46 49 115 173 386 183 81 46 102 214
Oman 57 874 ‐ 0%
Australia 952 297 359 4% 38 23 29 1 11 21 5 30 46 42 28 86
Total A$ '000 17,904 11,426 10,198 100% 758 369 251 444 368 1,405 2,043 1,221 1,141 818 780 598
* Excl Iran 12,080
A$ per kg BROCCOLI UAE
A$ per kg 2010 2011 YEAR 2012 Jan‐12 Feb‐12 Mar‐12 Apr‐12 May‐12 Jun‐12 Jul‐12 Aug‐12 Sep‐12 Oct‐12 Nov‐12 Dec‐12
Jordan 0.56 0.63 0.66 0.52 0.53 0.36 0.88 0.97 0.57 0.55 0.75 0.91 0.88 0.86 0.48
Iran 0.69
Spain 1.81 1.00 1.67 1.72 1.72 1.49 1.62 1.64 1.66 1.74 1.55 1.55 1.53 1.52 1.89
Oman 0.93 0.69
Australia 2.74 2.03 3.45 1.68 2.62 2.85 8.23 3.19 3.59 4.47 5.87 4.33 3.34 4.13 4.96
A$ per kg 0.64 0.70 0.77 0.65 0.83 0.60 0.94 1.03 0.64 0.65 0.84 0.98 0.96 0.98 0.74
Sources : ITC calculations based on UN COMTRADE statistics based on MIRROR data from suppliers to UAE; Fresh Intelligence analysis.
Notes : Data is sourced from supplier data as UAE has no recorded import data since 2008
Iran appears to be No 2 based on 2010 figure though has not reported since ‐ average trade from Iran pre 2010 was 1059 tonnes so treat 8000 tonnes with caution.
Jordan is clearly the major supplier with peak supply from April to July
Oman appears to have supplied over 1000 tonnes in 2011 though has not reported in 2012 to date and had minimal trade pre 2011
Product : 070410 Cauliflowers and headed broccoli, fresh or chilled
UAE IMPORTS Tonnes
Product : 070410 Cauliflowers and headed broccoli, fresh or chilled
Exporters
UAE IMPORTS A$ '000
Product : 070410 Cauliflowers and headed broccoli, fresh or chilled
UAE IMPORTS A$ per kg

__________________________________________________________________________________ AgEconPlus, MHT Consulting and Produce Marketing Australia 96
Carrots
Over the last three years China has dominated imports of carrots and in 2012 had a market share of 66% whilst Australia had a market share of 29%. Over the last three years, the price of Australian carrots has been approximately 50% higher than the price of carrots from China.
Carrots from China are available all year round, plus local produce from Oman is of good quality and is available January to March.
Demand for Australian product is gaining momentum. VOLUME CARROTS UAE
2010 2011 YEAR 2012 share Jan‐12 Feb‐12 Mar‐12 Apr‐12 May‐12 Jun‐12 Jul‐12 Aug‐12 Sep‐12 Oct‐12 Nov‐12 Dec‐12
Tonnes Tonnes Tonnes Tonnes Tonnes Tonnes Tonnes Tonnes Tonnes Tonnes Tonnes Tonnes Tonnes Tonnes Tonnes Tonnes
China 31,371 34,925 39,487 66% 1,738 2,378 3,046 1,238 1,885 4,246 4,771 3,231 5,118 4,702 4,191 2,944
Australia 15,988 15,191 17,417 29% 1,207 1,138 1,331 1,433 1,492 1,351 2,080 1,093 1,357 1,433 1,505 1,997
Oman 2,170 1,866 2,018
United States 243 457 506 1% 21 6 39 56 59 48 18 10 119 47 33 49
Total Tonnes 51,958 53,289 59,952 100% 3,235 3,674 4,813 3,827 3,436 5,776 6,948 4,436 6,816 6,232 5,733 5,025
VALUE CARROTS UAE
A$ '000 2010 2011 YEAR 2012 share Jan‐12 Feb‐12 Mar‐12 Apr‐12 May‐12 Jun‐12 Jul‐12 Aug‐12 Sep‐12 Oct‐12 Nov‐12 Dec‐12
China 15,065 16,798 20,141 56% 839 1,088 1,460 678 1,282 3,056 2,502 1,657 2,607 2,139 1,770 1,064
Australia 11,821 11,010 13,848 38% 921 905 1,029 1,118 1,205 1,143 1,635 833 1,120 1,139 1,218 1,583
Oman 1,339 1,006 1,179 3%
United States 266 574 803 2% 37 12 44 70 76 64 28 18 188 80 87 99
Total A$ '000 29,467 29,722 35,972 100% 1,379 2,058 2,554 1,874 2,563 4,345 4,218 2,574 4,055 3,375 3,077 2,774
A$ per kg CARROTS UAE
A$ per kg 2010 2011 YEAR 2012 Jan‐12 Feb‐12 Mar‐12 Apr‐12 May‐12 Jun‐12 Jul‐12 Aug‐12 Sep‐12 Oct‐12 Nov‐12 Dec‐12
China 0.48 0.48 0.51 0.48 0.46 0.48 0.55 0.68 0.72 0.52 0.51 0.51 0.45 0.42 0.36
Australia 0.74 0.72 0.80 0.76 0.79 0.77 0.78 0.81 0.85 0.79 0.76 0.83 0.79 0.81 0.79
Oman 0.62 0.54 0.58
United States 1.10 1.26 1.59 1.76 2.04 1.11 1.27 1.29 1.35 1.54 1.73 1.58 1.68 2.62 2.02
A$ per kg 0.57 0.56 0.60 0.43 0.56 0.53 0.49 0.75 0.75 0.61 0.58 0.59 0.54 0.54 0.55
Sources : ITC calculations based on UN COMTRADE statistics based on MIRROR data from suppliers to UAE; Fresh Intelligence analysis.
Notes : Data combined Carrots and Turnips ‐ carrots estimated as more than 90%
There is no data available for Oman in 2012 ‐ used average of previous 2 years
Product : 070610 Carrots and turnips, fresh or chilled
UAE IMPORTS A$ per kg
UAE IMPORTS Tonnes
Product : 070610 Carrots and turnips, fresh or chilled
Exporters
UAE IMPORTS A$ '000
Product : 070610 Carrots and turnips, fresh or chilled
Relative size of Market Segments
Supermarket retailing continues to develop in the UAE and retailers include: o Choithram is one of the biggest supermarket groups in the Middle East. They have 27
stores in the UAE. In addition, they also have a Food Service division, servicing hotels, restaurants etc
o Union Coops is a local chain, with four hypermarkets and eight large supermarkets o Sunrise City has around 10 smaller-format supermarkets o Spinneys, the South African backed chain, has at least 25 stores in the UAE o Al Maya Group has a mix of 13 to 14 large supermarkets and hypermarkets o LuLu has 20 hypermarkets o Emirates Coop has 11 stores o Abu Dhabi Coop has at least 10 stores, covering a range of hypermarket, class A
supermarkets and smaller store formats. The international makeup of consumers in the UAE means that the widest selection of fruit and
vegetables is sold in Dubai supermarkets.
__________________________________________________________________________________ AgEconPlus, MHT Consulting and Produce Marketing Australia 97
Supply Windows Opportunities are available throughout the year through the supermarket sector.
Freight and Logistics
14 days sea freight from Fremantle WA to Dubai Market Access and Trade Viability Improvement Plan
UAE warrants inclusion in the market access and trade viability improvement strategy. The focus of investments needs to be value added lines direct to the supermarket / hypermarket sector.

__________________________________________________________________________________ AgEconPlus, MHT Consulting and Produce Marketing Australia 98
Other Middle East (Qatar, Kuwait, Bahrain, Oman) Market Access
Free Trade Agreement negotiations with the GCC commenced in July 2007 (DFAT website). The GCC has paused its trade negotiations with all partners pending a review of its trade
agreement policy. The Australian Government is committed to resuming the negotiations with the GCC (DFAT website accessed 18 February 2013).
Trade Relationships with Australia
The GCC is a key market for agricultural exports such a livestock, meat, dairy products, vegetables, sugar, wheat and other grains. An FTA agreement provides an opportunity to address a range of tariff and non-tariff barriers related to Australia’s food exports (DFAT website).
Demographics and Capacity to Pay
Qatar Kuwait Bahrain Oman Population: 2 million
(estimate 2012) 3.2 million (estimate 2012)
1.2 million (estimate 2012)
3 million (estimate 2012)
Population growth rate:
4.9% (estimate 2012)
1.9% (estimate 2012)
2.7% (estimate 2012)
2.0% (estimate 2012)
Urban population: 96% 98% 89% 73%
Major cities: Doha (487,000)
Kuwait (2.2 million)
Manama (163,000)
Muscat (634,000)
GDP per capita: US$102,800 (2012 estimate)
US$43,800 (estimate 2012)
US$28,200 (estimate 2012)
US$28,500 (estimate 2012)
Source: CIA World Fact Book\ Vegetable Consumption and Production
Australian carrots had a 85% market share in Qatar in 2011-12 Australian carrots had a 20% market share in Oman in 2011-12 Competition is from Chinese carrots which are available all year round and local produce from
Oman which is of good quality and is available January to March Other Middle East Vegetable Imports from Australia 2010 to 2012 – Vegetables in Scope ($AUD) Vegetable Value 2010 Value 2011 Value 2012 Broccoli 176,100 335,800 127,830 Beans 1,090 970 970 Capsicum 0 0 0 Carrots 9,208,220 7,347,870 10,002,860 Cauliflower 1,090 1,940 560 Celery 43,480 15,490 44,410 Leek 0 1,940 0 Lettuce - head 17,400 1940 970 Lettuce – other 35,880 31,940 36,070 Peas 0 0 0 Squash and pumpkin 0 0 2,900 Sweet corn – fresh N/a N/a N/a Sweet corn – frozen 6,520 0 0 Sweet potato 17,390 11,610 0
Total 9,507,170 7,888,910 10,216,570 Source: ITC Comtrade NB: Oman does not register outside of carrots ~ $1m

__________________________________________________________________________________ AgEconPlus, MHT Consulting and Produce Marketing Australia 99
Carrots – Qatar Over the last three years Australia has dominated imports of carrots and in 2012 had a market
share of 51%, followed by Saudi Arabia 36% and China 4%. VOLUME CARROTS QATAR
2010 2011 YEAR 2012 share Jan‐12 Feb‐12 Mar‐12 Apr‐12 May‐12 Jun‐12 Jul‐12 Aug‐12 Sep‐12 Oct‐12 Nov‐12 Dec‐12
Tonnes Tonnes Tonnes Tonnes Tonnes Tonnes Tonnes Tonnes Tonnes Tonnes Tonnes Tonnes Tonnes Tonnes Tonnes Tonnes
Australia 4,593 4,021 4,919 51% 402 426 301 351 478 278 506 405 434 403 378 557
Saudi Arabia* 2,917 3,105 3,435 36%
China 921 884 433 4% 27 27 27 ‐ ‐ 56 74 ‐ 27 63 ‐ 81
Oman* 169 223 254 3%
Total Tonnes 9,233 8,819 9,622 100%
VALUE CARROTS QATAR
A$ '000 2010 2011 YEAR 2012 share Jan‐12 Feb‐12 Mar‐12 Apr‐12 May‐12 Jun‐12 Jul‐12 Aug‐12 Sep‐12 Oct‐12 Nov‐12 Dec‐12
Australia 3,322 2,798 3,894 72% 304 323 230 267 362 211 381 495 335 305 276 401
Saudi Arabia* 917 928 980 18%
China 419 407 194 4% 32 9 10 35 38 13 29 28
Oman* 121 158 180 3%
Total A$ '000 4,927 4,453 5,416 100%
A$ per kg CARROTS QATAR
A$ per kg 2010 2011 YEAR 2012 Jan‐12 Feb‐12 Mar‐12 Apr‐12 May‐12 Jun‐12 Jul‐12 Aug‐12 Sep‐12 Oct‐12 Nov‐12 Dec‐12
Australia 0.72 0.70 0.79 0.76 0.76 0.77 0.76 0.76 0.76 0.75 1.22 0.77 0.76 0.73 0.72
Saudi Arabia* 0.31 0.30 0.29
China 0.45 0.46 0.45 1.18 0.35 0.39 0.63 0.51 0.51 0.46 0.34
Oman* 0.72 0.71 0.71
A$ per kg 0.53 0.50 0.56
Sources : ITC calculations based on UN COMTRADE statistics; Fresh Intelligence analysis based in MIRROR data supplied by exporters to Qatar
Notes : There were no current direct data records for Qatar ‐ Australia and China data was MIRROR data (ie supplied by Australia and China exports)
* Saudi Arabia and Oman based on Qatar imports 2002 ‐ 2008 extrapolated using trend analysis formula. Saudi Arabia and Omanhave not reported export data.
Product : 070610 Carrots and turnips, fresh or chilled
QATAR IMPORTS A$ per kg
Product : 070610 Carrots and turnips, fresh or chilled
QATAR IMPORTS A$ '000
QATAR IMPORTS Tonnes
Product : 070610 Carrots and turnips, fresh or chilled
Exporters
Carrots – Kuwait
Over the last three years Australia has dominated imports of carrots and in 2012 had a market share of 48% whilst China had a market share of 39%.

__________________________________________________________________________________ AgEconPlus, MHT Consulting and Produce Marketing Australia 100
VOLUME CARROTS KUWAIT
2010 2011 YEAR 2012 share Jan‐12 Feb‐12 Mar‐12 Apr‐12 May‐12 Jun‐12 Jul‐12 Aug‐12 Sep‐12 Oct‐12 Nov‐12 Dec‐12
Tonnes Tonnes Tonnes Tonnes Tonnes Tonnes Tonnes Tonnes Tonnes Tonnes Tonnes Tonnes Tonnes Tonnes Tonnes Tonnes
Australia 2,216 2,785 2,583 48% 207 151 230 281 228 178 306 230 206 204 181 181
China 1,907 2,540 2,102 39% 110 138 111 28 28 291 260 234 330 175 326 72
United States 633 602 475 9% 18 43 63 49 77 11 13 8 63 30 44 56
Oman 404 0%
Total Tonnes 6,392 6,149 5,390 100%
VALUE CARROTS KUWAIT
A$ '000 2010 2011 YEAR 2012 share Jan‐12 Feb‐12 Mar‐12 Apr‐12 May‐12 Jun‐12 Jul‐12 Aug‐12 Sep‐12 Oct‐12 Nov‐12 Dec‐12
Australia 1,662 2,013 1,933 49% 151 122 164 197 166 137 238 182 159 156 132 129
China 966 1,226 1,094 28% 49 45 47 16 19 227 133 126 190 93 122 26
United States 716 861 850 22% 26 85 120 76 97 14 17 12 90 78 122 112
Oman 263 0%
Total A$ '000 3,880 4,173 3,924 100%
A$ per kg CARROTS KUWAIT
A$ per kg 2010 2011 YEAR 2012 Jan‐12 Feb‐12 Mar‐12 Apr‐12 May‐12 Jun‐12 Jul‐12 Aug‐12 Sep‐12 Oct‐12 Nov‐12 Dec‐12
Australia 0.75 0.72 0.75 0.73 0.81 0.71 0.70 0.73 0.77 0.78 0.79 0.77 0.77 0.73 0.71
China 0.51 0.48 0.52 0.45 0.32 0.43 0.60 0.69 0.78 0.51 0.54 0.58 0.53 0.37 0.36
United States 1.13 1.43 1.79 1.47 1.96 1.92 1.56 1.27 1.25 1.33 1.50 1.43 2.56 2.80 1.99
Oman 0.65
A$ per kg 0.61 0.68 0.73
Sources : ITC calculations based on UN COMTRADE statistics; Fresh Intelligence analysis based on MIRROR data supplied by exporters to Kuwait
Notes : There is no recent data supplied by Oman
Exporters
KUWAIT IMPORTS A$ '000Product : 070610 Carrots and turnips, fresh or chilled
KUWAIT IMPORTS A$ per kg Product : 070610 Carrots and turnips, fresh or chilled
Product : 070610 Carrots and turnips, fresh or chilled
KUWAIT IMPORTS Tonnes
Carrots – Bahrain
Over the last three years Australia has dominated imports of carrots and in 2012 had a market share of 39% whilst China had a market share of 35%.

__________________________________________________________________________________ AgEconPlus, MHT Consulting and Produce Marketing Australia 101
VOLUME CARROTS BAHRAIN
2010 2011 YEAR 2012 share Jan‐12 Feb‐12 Mar‐12 Apr‐12 May‐12 Jun‐12 Jul‐12 Aug‐12 Sep‐12 Oct‐12 Nov‐12 Dec‐12
Tonnes Tonnes Tonnes Tonnes Tonnes Tonnes Tonnes Tonnes Tonnes Tonnes Tonnes Tonnes Tonnes Tonnes Tonnes Tonnes
2011
Australia 5,394 3,520 4,223 39% 178 141 156 348 449 434 637 312 345 406 438 480
China 3,260 3,158 3,121 35% ‐ 189 190 108 108 467 603 136 245 353 585 135
Saudi Arabia* 351 2,156 No data 24%
Oman 65 79 No data
Total Tonnes 9,233 9,050 100%
VALUE CARROTS BAHRAIN
A$ '000 2010 2011 YEAR 2012 share Jan‐12 Feb‐12 Mar‐12 Apr‐12 May‐12 Jun‐12 Jul‐12 Aug‐12 Sep‐12 Oct‐12 Nov‐12 Dec‐12
2011
Australia 5,101 3,220 3,291 57% 140 129 106 253 331 329 489 241 276 325 332 356
China 2,103 1,722 1,524 30% 73 80 59 74 327 320 70 121 166 203 44
Saudi Arabia* 80 533 No data 9%
Oman 30 37 No data
Total A$ '000 7,403 5,698 100%
A$ per kg CARROTS BAHRAIN
A$ per kg 2010 2011 YEAR 2012 Jan‐12 Feb‐12 Mar‐12 Apr‐12 May‐12 Jun‐12 Jul‐12 Aug‐12 Sep‐12 Oct‐12 Nov‐12 Dec‐12
Australia 0.95 0.91 0.78 0.79 0.91 0.68 0.73 0.74 0.76 0.77 0.77 0.80 0.80 0.76 0.74
China 0.65 0.55 0.49 0.38 0.42 0.55 0.69 0.70 0.53 0.51 0.49 0.47 0.35 0.33
Saudi Arabia* 0.23 0.25
Oman
A$ per kg 0.80 0.63
Sources : ITC calculations based on UN COMTRADE statistics; Fresh Intelligence analysis based on direct data (2010 & 2011) and MIRROR data (2012) supplied by exporters to Bahrain
Notes : Consider with caution where the volume from Saudi Arabi has been re exported, also value appears very low. Bahrain also appear to re export
BAHRAIN IMPORTS Tonnes
Product : 070610 Carrots and turnips, fresh or chilled
Exporters
BAHRAIN IMPORTS A$ '000
Product : 070610 Carrots and turnips, fresh or chilled
BAHRAIN IMPORTS A$ per kg
Product : 070610 Carrots and turnips, fresh or chilled
Relative size of Market Segments Outside the United Arab Emirates, supermarket retailing is a major outlet for fresh produce. Retailers include:
Abu-Dhabi based LuLu has 100 stores across the GCC (Gulf Cooperation Council) state – UAE, Saudi Arabia, Oman, Bahrain, Kuwait and Qatar, as well as Yemen and Egypt.
Carrefour, in partnership with Majid Al Futtaim Retail, has around 50 stores across the Middle East.
Geant, a French-backed hypermarket retailer, has stores in Kuwait and Qatar (in addition to the UAE)
Market Access and Trade Viability Improvement Plan
Other Middle East warrants inclusion in the market access and trade viability improvement strategy. The focus of investments needs to be value added lines direct to the supermarket / hypermarket sector.

__________________________________________________________________________________ AgEconPlus, MHT Consulting and Produce Marketing Australia 102
Saudi Arabia Market Access
Free Trade Agreement negotiations with the GCC commenced in July 2007 (DFAT website). GCC has paused its trade negotiations with all partners pending a review of its trade agreement
policy. Access to this market is not problematic; a 15% import duty on carrots is imposed for a few weeks
starting in May but can be accommodated. Trade Relationships with Australia
Saudi Arabia was the ninth largest purchaser of Australian fresh vegetables in 2012. The Saudi culture is somewhat different to that of Australia but can be successfully negotiated.
Demographics and Capacity to Pay
Population: 26.5 million (2012 estimate) Population growth rate: 1.5% (2012 estimate) Median age: 25.7 years Urban population: 82% Major cities: Riyadh (4.725 million); Jeddah (3.234 million); Mecca (1.484 million); Medina
(1.104 million); and Ad Dammam (902,000) GDP per capita: US$24,500 (2012 estimate) High unemployment rates in the country and development of horticulture is viewed, amongst other
things as an employment generating opportunity (Trade Middle East Magazine 2012) Since King Abdullah came to power in 2005 wealth is being redistributed and there are a large
number of building projects including schools, hospitals and universities. (Trade Middle East Magazine 2013).
Vegetable Production and Consumption
Cucumbers and tomatoes are the most important greenhouse crops, contributing more than 94% of the total Saudi production.
The Saudis are willing to pay for guaranteed safe product/don’t want dubious Chinese quality Saudi Arabia relies on a combination of direct imports and re-export from the UAE for Saudi
Arabia attracts 2 million visitors each year to religious festivals (food service opportunities), has rising consumer purchasing power and a ‘burgeoning middle class’.
Saudis have recently banned the export of produce grown in open fields as a way of conserving depleted groundwater; this includes onions, water melons and potatoes.
Saudi Arabia supplies the whole Gulf with potatoes which have very strong demand – French fries Major sources of imported vegetables include the Netherlands, the US, Kenya, Australia, South
Africa, Thailand and India. The Saudis are phasing out wheat production to grow more fruit and vegetables for domestic consumption. Vegetables whose production base is likely to grow include carrots.
The organic vegetable sector is growing in Saudi Arabia and the US is one of the main suppliers (Trade Middle East Magazine 2013)

__________________________________________________________________________________ AgEconPlus, MHT Consulting and Produce Marketing Australia 103
Saudi Arabia Vegetable Imports from Australia 2010 to 2012 – Vegetables in Scope ($AUD) Vegetable Value 2010 Value 2011 Value 2012 Broccoli 397,850 257,410 56,960 Beans 0 970 0 Capsicum 0 0 0 Carrots 6,308,040 6,228,230 6,358,690 Cauliflower 0 0 0 Celery 3,260 0 0 Leek 0 0 0 Lettuce - head 0 0 0 Lettuce – other 0 0 0 Peas 0 0 0 Squash and pumpkin 0 0 1,930 Sweet corn – fresh N/a N/a N/a Sweet corn – frozen 0 0 0 Sweet potato 2,170 0 0
Total 6,711,320 6,486,610 6,417,580 Source: ITC Comtrade Carrots:
There has been significant growth in demand for Australian carrots despite a 15% tariff (Asia Fruit Magazine December 2012 / January 2013)
Over the last three years Australia has dominated imports of carrots and in 2012 had a market share of 42% with Turkey the next largest supplier with a market share of 28%. Australia has received a significant price premium over Turkey during the last three years with the price of Australian carrots approximately 3 times the price of carrots from Turkey.
Competition is also from Chinese carrots which are available all year round and local produce from Oman which is of good quality and is available January to March.

__________________________________________________________________________________ AgEconPlus, MHT Consulting and Produce Marketing Australia 104
VOLUME CARROTS SAUDI ARABIA
2010 2011 YEAR 2012 share Jan‐12 Feb‐12 Mar‐12 Apr‐12 May‐12 Jun‐12 Jul‐12 Aug‐12 Sep‐12 Oct‐12 Nov‐12 Dec‐12
Tonnes Tonnes Tonnes Tonnes Tonnes Tonnes Tonnes Tonnes Tonnes Tonnes Tonnes Tonnes Tonnes Tonnes Tonnes Tonnes
Australia 8,650 9,763 9,146 42% 554 24 435 812 1,129 992 1,579 837 736 654 682 712
Turkey 6,004 7,348 5,958 28% 23 15 89 161 1,353 1,242 1,894 798 381
China 2,154 4,350 3,858 18% 2 162 351 108 55 710 850 467 359 303 329 163
Bahrain 3,004 1,682 1,998 9%
Total Tonnes 20,367 23,502 21,602 100% 556 209 805 929 1276 1883 3890 2597 3086 1824 1424 943
VALUE CARROTS SAUDI ARABIA
A$ '000 2010 2011 YEAR 2012 share Jan‐12 Feb‐12 Mar‐12 Apr‐12 May‐12 Jun‐12 Jul‐12 Aug‐12 Sep‐12 Oct‐12 Nov‐12 Dec‐12
Australia 6,308 6,228 6,359 60% 395 20 352 582 745 659 1095 607 541 456 462 483
Turkey 1,457 1,594 1,341 13% 4 4 18 33 284 310 499 155 83
China 1,006 1,800 1,972 19% 1 59 148 51 45 472 422 265 185 152 131 57
Bahrain 995 433 713 7%
Total A$ '000 9,978 10,245 10,639 100% 396 82 512 641 809 1174 1800 1212 1294 787 700 581
A$ per kg CARROTS SAUDI ARABIA
A$ per kg 2010 2011 YEAR 2012 Jan‐12 Feb‐12 Mar‐12 Apr‐12 May‐12 Jun‐12 Jul‐12 Aug‐12 Sep‐12 Oct‐12 Nov‐12 Dec‐12
Australia 0.73 0.64 0.70 0.71 0.82 0.81 0.72 0.66 0.66 0.69 0.72 0.74 0.70 0.68 0.68
Turkey 0.24 0.22 0.23 0.16 0.25 0.20 0.21 0.21 0.25 0.26 0.19 0.22
China 0.47 0.41 0.51 0.48 0.36 0.42 0.47 0.81 0.66 0.50 0.57 0.51 0.50 0.40 0.35
Bahrain 0.33 0.26 0.36
A$ per kg 0.49 0.44 0.49 0.71 0.39 0.64 0.69 0.63 0.62 0.46 0.47 0.42 0.43 0.49 0.62
Sources : ITC calculations based on UN COMTRADE statistics; Fresh Intelligence analysis. Saudi Arabia data is MIRROR data ‐ data from exporters to Saudi Arabia.
Notes FAO STAT records Saudi Arabia as a producer of around 50,000 tonnes of carrots ‐ may explain lower demand from October ‐ May.
Bahrain is most likely a source for re export of carrots from elesewhere ‐ their annual production is recorded by FAO STAT as 260 tonnes.
SAUDI ARABIA IMPORTS Tonnes
Product : 070610 Carrots and turnips, fresh or chilled
Exporters
SAUDI ARABIA IMPORTS A$ '000
Product : 070610 Carrots and turnips, fresh or chilled
SAUDI ARABIA IMPORTS A$ per kg
Product : 070610 Carrots and turnips, fresh or chilled
Relative Size of Market Segments
The market in Saudi Arabia is increasingly modern with western style supermarkets and hypermarkets and include:
o Azizia Panda with 50 supermarkets and 6 hypermarkets o Al Oithaim with over 40 supermarkets o Farm superstores, with 19 major outlets o LuLu and Carrefour
There is plenty of sophisticated retail in Saudi Arabia – the grocery market is now valued at US$20 billion per annum (Planet Retail data) and is supported by burgeoning middle class and rising GDP per capita.
Retail sector is becoming ever more concentrated - domestic and foreign (e.g. Carrefour and Casino) owned hypermarkets are wining market share. Hypermarkets are squeezing out small independently owned fruit & vegetable retailers and emptying out traditional wholesale markets. Hypermarkets are also attempting to move back down the supply chain and squeeze out wholesalers and capture their margins.
The convenience sector is expanding quickly from a small base. While direct supply to retailers has been forecast, wholesalers still appear to play an important
function. Wholesalers are able to segregate and grade produce for individual retailers.
Supply Windows Carrots – August to February
Freight and Logistics
Shipping is good and takes only 22 days.
Market Access and Trade Viability Improvement Plan Prospective market for Australian vegetable exports
__________________________________________________________________________________ AgEconPlus, MHT Consulting and Produce Marketing Australia 105
Jordan Demographics and Capacity to Pay
Population: 6.5 million (2012 estimate) Population growth rate: -0.96% (2012 estimate) Urban population: 79% Major cities: Amman (1.01 M) GDP per capita: US$6,000 (2012 estimate)
Market Access and Trade Viability Improvement Plan
Low opportunity market Little capacity to pay Distant with higher freight costs than UAE
Market Access and Trade Viability Improvement Plan
Jordan is not included in the Market Access and Trade Development Strategy. There is limited capacity to pay and it is a distant market with higher freight costs than say the UAE. There is a limited trade history with Australian fresh vegetables.
Iran Market access:
This country was initially included as a speculative longer term prospect Current crippling sanctions imposed by the US and EU in response to Iran’s nuclear program
mean that even basic foodstuffs are beyond the capacity to pay of many Iranians. Sanctions have resulted in higher shipping costs and longer transit times. Logistical bottlenecks at
ports – ports are not state of the art. Transport is problematic, with major shipping companies refusing to service the market due to the
risk of retaliatory action from the US. Iran is losing its re-export market. Demographics and Capacity to Pay
Population: 78.9 million Median age 27.4 years GDP: US$1,003 billion GDP per capita: US$13,200 Sanctions have hit the value of the rial and given limited sources of foreign currency, the risks
associated with importing have increased. Vegetable Production and consumption: Trade Middle East Magazine 2012
Second largest population in ME, youthful population and strong culture of fruit consumption Large importers of bananas, citrus, apples, pears, garlic and ginger. Short duration import bans are often imposed to protect domestic production. Bans can be seasonal
or be duty based with duties of up to 90% common. Iran is a major year round producer of watermelons and tomatoes Around 70% of Iran’s fresh produce is imported (Trade Middle East Magazine 2013) There is evidence of products being re-exported from Dubai to Iran
Market Access and Trade Viability Improvement Plan
Iran is not included in the Market Access and Trade Development Strategy.

__________________________________________________________________________________ AgEconPlus, MHT Consulting and Produce Marketing Australia 106
India Market access:
Access is difficult - fresh vegetable imports are prohibited World Bank ‘Ease of Doing Business’ report 2012 ranked India 132 out of 183 countries. The
Federal structure means that importers face conditions that change across state and local levels due to political leadership, quality of governance, regulations, taxation, labour relations and education levels.
Agriculture, horticulture, food ownership and imports are all politically sensitive issues in India. India is a difficult place to do business
Demographics and Capacity to Pay
In 2013, GVP is expected to reach US$2,000 billion, in 2016 it is expected to reach US$3,000 billion
Population will increase from 1 billion plus to 1.3 billion by 2016 Unlike Japan and China, India does not have a problem with an aging workforce India has a rising middle class with increasing purchasing power with a desire to try new and
better quality products Vegetable Production and consumption:
India is the world’s second largest (after China) vegetable producer, with an estimated 133 million tonnes in 2011
The vegetable seed industry is representing itself in India rather than just having distributorships; this means the market is growing and becoming more sophisticated – moving from open pollinated varieties to hybrids. All the major vegetable seed companies ( Monsanto Seeds, Bayer Seeds ( as Nunhem Seeds), Syngenta Seeds, Enza Zaden Seeds, Rijk Zwaan and Clause HM Seeds have breeding stations and commercial wholesaling operations in India.
Rising incomes are fuelling increased consumption of fresh produce Imports are only affordable by upper income families Cucumber and cauliflower (and tomato) are traditional Indian staples. Good quality lettuce can be
grown, but there is basically no cool chain In terms of horticultural production, India has an under developed resource base with considerable
potential to expand output. Appalling post-harvest: estimates suggest that post-harvest losses are as high as 40% of
production. Food safety is a huge cultural problem. Seed industry has tried with seeds and found it too difficult – poor areas can’t afford to purchase
seeds. Too poor for protected cropping. Land tenure – best areas are Punjab and this is highly fragmented and very small holdings.
Relative Size of Market Segments:
Supermarkets and other forms of modern retail only account for a modest 4% to 5% of fresh produce sales in 2012. Nevertheless this is up from less than 1% in 2005 and is widely forecast to be between 20% and 30% by 2020 (Professor Thomas Reardon, Michigan State University in Asia Fruit Magazine July / August 2011).
Many of the ‘modern’ retailers, such as Spencers, Reliance, More and Fresh @, have only small areas at the store-front for fruits and vegetables, reflecting the difficulty they have in managing and competing with traditional markets and street vendors, especially with vegetables.
Larger formats, such as Big Bazaar, Star Bazaar, Easy Day and Hyper City have been more successful with vegetables, catering to more upscale customers with better quality and generally assured safe product.
While retail reforms have in theory allowed for foreign direct investment, foreign direct investment in multi-brand retail remains effectively blocked (Asia Fruit Magazine March 2012). Foreign supermarket chains such as Metro Cash & Carry and Walmart have Indian joint venture partners

__________________________________________________________________________________ AgEconPlus, MHT Consulting and Produce Marketing Australia 107
Market Access and Trade Viability Improvement Plan
India is not included in the Market Access and Trade Development Strategy. There is no market access for Australian fresh vegetables nor is access likely in the medium to longer term. Domestic vegetable production is a sensitive political issue. India is also a significant net vegetable exporter.
Sri Lanka Market access:
Access is available There are specific requirements for fruiting vegetables Lettuce and sweet potato imports are prohibited
Demographics and Capacity to Pay Population: 21.5 million (2012) Population growth rate: 0.93% (2012 estimate) Urban population: 14% Major cities: Colombo 681,000 GDP per capita: US$6,100 (2012 estimate)
Vegetable Production and consumption:
Production is estimated at around 700,000 tonnes, across over 40 vegetables. A range of climates means production can be scheduled at different locations over the year Vegetebale production has expanded in the North East, at the end of the long-running civil war Less than 4 per cent of total production of fruits and vegetables undergo some sort of added-value
in the form of export, processing or marketing to the high value market through supermarkets (Esham et al., 2006). The main vegetables that are exported include green beans, leeks, capsicum, cabbage, carrot, tomato, bell pepper and gherkin. Tomato, chili and gherkin are the major vegetables used for processing, mainly to produce chutney, pickles, sauce and gherkin in brine and vinegar.
Relative Size of Market Segments:
Sri Lanka has a well developed and long-standing supermarket sector, with three chains dominating. They all have small to medium-sized formats, with fruit and vegetable departments to match. All have refrigerated display sections, for high-value products.
The largest is Cargills Food City with 230 stores at the end of 2012. Keells has 42 stores and Arpico 17 (late 2012)
All are expanding into the north of the country, following the end of the civil war.
Market Access and Trade Viability Improvement Plan
Sri Lanka is not included in the Market Access and Trade Development Strategy. There is limited capacity to pay and no vegetable trade history with Australia. The diverse Sri Lankan climate allows for temperate production.