does foreign direct investment have an impact on the growth in labor productivity of vietnamese...
TRANSCRIPT
DPRIETI Discussion Paper Series 07-E-021
Does Foreign Direct Investment Have an Impact on the Growthin Labor Productivity of Vietnamese Domestic Firms?
LE Thanh ThuyForeign Trade University, Hanoi
The Research Institute of Economy, Trade and Industryhttp://www.rieti.go.jp/en/
1
RIETI Discussion Paper Series 07-E-021
Does Foreign Direct Investment Have an Impact on the Growth in Labor Productivity of
Vietnamese Domestic Firms?
Le Thanh Thuy*
March 2007
Abstract
Foreign direct investment has been considered a very important factor in the recent growth of
Vietnam’s economy and thus far has drawn a great deal of concern from economic
researchers in Vietnam. However, studies on the impacts of foreign direct investment on
Vietnam’s economy, especially the technological spillovers, are still very scarce compared with
other developing countries. This study makes an attempt to determine the main channels and
estimate the degree of spillover effects in Vietnam using industry level data for the 1995-1999
and 2000-2002 periods. The linkage between foreign investors and domestic private sectors is
found to play an important role for technological spillovers from foreign direct investment in
Vietnam. Key words: FDI, Vietnam, Spillovers
*Faculty of International Economics and Business, Foreign Trade University, Hanoi, Vietnam
Email: [email protected]
2
1. Introduction
Since its Doimoi policy in 1986, Vietnam has experienced high rates of economy growth,
changing the nation from a backward and underdeveloped country in the 1980s to a developing
economy increasingly converging to fast-growing regional economies. The adoption of market-
oriented institutions and an open-door policy have opened the countries to the international
economy, which has brought in many structural transformations. Together with exports,
Foreign Direct Investment (FDI) has been considered to contribute substantially to the recent
speedy growth of Vietnam. With its issue in 1987 and a great many reforms up to now, the Law
on Foreign Investment of Vietnam (LFI) has played an important role in attracting substantial
amounts of FDI inflows to Vietnam. Economic studies on FDI have been concentrating on
determinants of FDI; the question of how to invite more FDI to Vietnam is a central matter of
concern in research. However, it is no less important to analyze the impacts of existing FDI to
make FDI more effective to the country’s growth, and it is unfortunate that studies on this
approach in Vietnam’s case are still very few. This study focuses on the technological spillover
effects of FDI on Vietnam’s industry.
There has been a great amount of research examining the technological spillover effect of FDI
in various countries in the world since the 1970s. Economists have done a great deal of
research to discuss through what channels Multinational Corporations (MNCs) spillover
technologies to host-country enterprises and whether there are positive spillovers, as well as to
what extent these effects occur. The empirical evidence shows mixed results, and the degree of
spillover effects is argued to depend on characteristics of the host country and investing firms,
such as the technology gap between FDI and host country enterprises, ‘absorptive capability’ of
the host country, the ownership structure of foreign firms, etc.
Similar to other latecomers, the technological level of Vietnam’s economy in general, and the
manufacturing industry in particular, might be too low to be capable of adopting advanced
technologies brought in by foreign investors. Therefore, despite the increasing FDI flows into
Vietnam, its spillover impacts on domestic production may be small or even negative.
Nevertheless, there is a special characteristic for Vietnam’s case—FDI flows into Vietnam
during periods when the country is experiencing important structural reforms—hence, its impact
in introducing new ideas, skills and know-how, and of opening export markets may be
higher and more crucial compared to the cases of other developing countries. This effect
might be substantial enough to offset the negative impacts stated above. This paper makes
attempts to answer the question of whether there is a positive spillover of FDI to Vietnam’s
domestic firms in two ways: analyzing recent trends and characteristics of FDI and Vietnam’s
economy and industry, and doing empirical work on 29 industrial sectors during the 1995-1999
and 2000-2002 periods. In addition, this paper also tries to elicit policy implications as to how to
enhance spillover effects. The findings support positive spillover hypothesis and promotion of
the domestic private sector is suggested to strengthen the impact.
The paper is constructed as follows. Section 2 presents previous literature on technological
3
spillover effects, while Section 3 analyzes the trend of FDI in Vietnam, characteristics of
Vietnam’s industry and presents empirical work on spillover effects in Vietnam during 1995-
1999 and 2000-2002. The last section summarizes concluding remarks and results of the paper. 2. Previous studies on technological spillover effects
With the characteristic of a public good, FDI technologies have been considered an important
externality with long-run effects in endogenous growth models (Grossman and Helpman, 1991;
Lucas, 1988; Romer, 1990). Technology transfer through trade has become a popular area of
research (Krugman,1979). Nevertheless, models and research on the interaction of FDI and
growth are still scarce.
Despite of this, there have been a great many of empirical studies on the Spillover Effects of
Foreign Direct Investment. FDI spillovers are discussed to have positive effects on the
productivity of the host country though three main channels: demonstration, competition and
labor turnover. Demonstration effects represent the ‘imitation’ channel of spillover or
‘learning-by-watching effect’ (Jutta Gunther, 2002). Foreign capital is supposed to have
advantages due to the possession of proprietary technology (Hufbaeuer and Nunns, 1975),
marketing and managing skills, and if these factors are transferred to the subsidiaries (brought
in to the host country market), technical progress in industry in the host country is expected
(Blomstrom, 1986). As new technologies are introduced to the host country, domestic firms can
observe foreign firms’ actions, skills or techniques and ‘imitate’ them or make efforts to acquire
these techniques and apply them, which results in production improvements. Multinational
Corporations (MNCs) are also discussed as having positive spillover effects on domestic firms
through competition. Under increased competition, domestic firms are forced to operate more
efficiently and introduce new technologies earlier than would otherwise have been the case
(Kokko, 1994). Moreover, MNCs can furthermore create spillover effects on domestic
production through the channel of labor turnover. This effect occurs when workers employed in
foreign affiliates who have been trained with advanced technical and managerial skills move to
other domestic firms or open their own enterprises (Fosfuri, 1996).
Besides these three so-called ‘horizontal effects’ of spillovers, several researchers also discuss
linkage effects, or ‘vertical effects,’ brought about by FDI. (Lall, 1978; Clare, 1996). This is
the case when MNCs are suppliers (forward linkages) or buyers (backward linkages) of
domestic firms. MNCs can help local firms break the market constraints to acquire increased
returns by boosting demand, which leads to efficient production (enhancing production under
lower costs). FDI can also contribute to the technology improvement of domestic suppliers by
offering technical assistance and support to these firms. This kind of vertical spillover occurs in
the interaction between foreign and domestic firms not in the same industry, therefore it is also
called inter-industry spillover (the above horizontal effect is called intra-industry spillover).
In contrast to the positive effects of spillovers, it is also argued that FDI may create negative
spillovers to domestic firms’ productivity and this effect may be large enough to offset the
4
above positive ones. As MNCs enter the market, their advantages on technology and know-
how may take in the market share of the domestic firms and make them produce in less
efficient scales, which leads to less productiveness of domestic firms (so-called ‘market
stealing effects’).
Using data at both industry and plant levels, researchers have done a lot of empirical work on a
variety of both developed and developing countries in different periods of time. The
frameworks of most of the research are relatively similar. Spillover effects are measured by the
impact of foreign presence on output level or labor productivity of domestic firms. Together
with other factors that are supposed to have influence on the productivity of domestic firms or
industries, such as capital intensity, labor quality, production scales, and competitiveness of the
market, the foreign presence proxy is put as an independent variable in a linear or log-linear
regression with the labor productivity of the domestic sector being the dependent variable. In the
estimations, if a significant positive sign of the foreign presence coefficient is found, a positive
spillover is concluded.
Caves (1974) employs data of 23 Australian manufacturing industries in1962 and 1966 and
finds that a higher productivity level (value-added per employee) of local firms is related to
higher foreign subsidiary shares of employment in the same industry; however, changes in
foreign share in the industries have ins ign i f ican t negative impacts on productivity levels.
Globerman (1979) also finds the positive effects of foreign shares in output of the industry on
the labor productivity in Canadian manufacturing industries in 1972. Blomstrom and Persson
(1983), Blomstrom (1986), Blomstrom and Edward Wolff (1994), Blomstrom and Sjoholm
(1999) find positive spillovers for Mexican and Indonesian manufacturing sectors. Others
researchers who also find positive spillovers are, for instance, Hirschberg and Lloyd (2000) for
China, K. Kozlov (2001) for Russia from 1992 to 1997, Evis Sinani and Klaus Meyer (2002)
for Estonia during 1995-1999, among others. On the other hand, a number of researchers cannot
find evidence supporting positive effects, and significant negative spillover results are not scarce
in literature. Haddad and Harrison (1993), who study data on Moroccan manufacturing
industries 1985-1989 find no significant positive relationship between higher productivity
growth in domestics firms and the foreign presence in the sector. Aitken and Harrison (1999)
report similar findings for Indonesia during 1980-1991 and Venezuelan from 1976 to 1989,
except that the negative effects are smaller in Indonesia than those found in Venezuela. Studies
on several Eastern European countries, such as those done by Djankov and Hoekman (1998) for
the Czech Republic during 1992-96, Konings (2001) for Bulgaria, Romania and Poland 1993-
1997, also find negative or insignificant spillover impacts.
In making efforts of finding the causes of mixed results and searching for factors affecting the
magnitude of spillovers, researchers look into the characteristics of the host country and FDI.
The first factor to mention influencing spillover effects is the technology gap between the host
country and FDI. As argued by Lapan and Bardhan (1973), “Technical advances applicable to
the factor-proportions of capital-rich developed countries are hardly of any use in improving
5
techniques of low capital-intensity in less developed countries.” Borensztein (1998) refers to this
as ‘absorptive capability’ of host countries “FDI is more productive than domestic investment
only when the host country has a minimum threshold stock of human capital.” K. Kozlov
(2001) also shows in Russia that “The level of education of the adult population in Russia is
quite high, so spillovers are positive in almost all the regions. Furthermore, regions with higher
educational levels benefit from FDI to a greater extent”. The technology gap between MNCs
and domestic firms is also analyzed at industry level. Using 1970 Mexico data, Kokko (1994),
Kokko, Tasini and Zejan (1996), Barrios (1999), and Konings (2001) find that spillovers are
smaller in industries with larger labor productivity gap between local and foreign firms.
However, the study of Sjoholm (1999) on Indonesia shows a completely contrasting result.
There is a hypothesis that the relation between technology gap and spillovers is not linear: “a
certain gap is required for spillovers, but if the gap is too large, it may be impossible for
domestic firms to absorb foreign technology.”
The second host-country factor affecting spillovers of FDI to mention is the competition of
domestic market. As discussed by Wang and Blomstrom (1992) in a model of strategic
interaction between MNCs and domestic firms, high competition forces MNCs to bring in
relatively new and sophisticated technologies from their parent company in order to retain their
market shares. The technology that is transferred to the subsidiaries might leak out to the
domestic firms and thereby increase the competition facing subsidiaries even more. The
stronger the competition is, the more advanced technology brought into the domestic market.
Sjoholm (1999) finds in Indonesia in 1980 and 1991 evidence supporting this argument:
higher spillovers of FDI are found in industries with higher domestic competition. The result
is consistent to Blomstrom et al. (1994), who find that competition spurs technology transfers to
subsidiaries, and to Kokko (1996), who finds some support for a positive effect from
competition on spillovers.
There are arguments about whether spillover effects towards domestic firms differ between
export-oriented domestic firms and non-exporting domestic firms. Export-oriented domestic
firms are argued to be more capable of learning or copying technology, so the impact on their
productivity may be larger than non-exporting ones. However, Evis Sinani and Klaus
Meyer’s 2002 study on Estonia and Barrios’s 1999 study on Spain indicate a contrasting result.
Their explanation for this is that export-oriented firms supply to the international market, and
so the MNEs’ activities in the domestic market do not influence their productivity or there may
be a international competition by MNEs towards exporting domestic firms. Concerning the characteristics of the FDI that have impacts on the spillovers, researchers
examine mainly the ownership structure and scale of FDI. Blomstrom and Sjoholm (1999)
argue that “majority ownership results in greater control over profits, which in turn provides a
greater incentive to transfer technology and management skills to subsidiaries. Hence, the
greater the foreign control over an affiliate, the more sophisticated technologies would be
transferred from the parent firm.” On the contrary, Dimelis and Louri (2002) discuss that
6
foreign firms of minority ownership have more interaction with domestic firms, thereby
creating more spillovers. Blomstrom and Sjoholm find no significant evidence supporting
majority ownership impact, while Dimelis and Louri find spillovers of minority ownership
are significantly positive. Based on similar explanations, Dimelis and Louri argue that small
foreign firms exert higher spillover effects: Large foreign firms may be better prepared to face
their needs on their own, thus operating in isolation from the local environment. On the other
hand, small foreign firms may be more willing to buy from or subcontract to local firms,
engaging in more intensive interaction, resulting in higher spillovers. Their findings support the
hypothesis.
Kokko, Tasini and Zejan (2001) consider whether MNEs entering different trade regimes
have different spillover effects. It is remarked that “Import-substituting MNCs enter with
technologies that are missing or weakly developed in the local industry, which creates a large
potential for demonstration effects. Exported-oriented MNCs often base their strength on their
international distribution and marketing networks, thus they do not have much impact on local
productivity, but rather on the international sale performance of local firms.”
Recently, there are also a few studies analyzing different results of spillovers based upon
methodology. Holger Gorg and Eric Strobl (2001) find in their meta-analysis of the published
results “on average, cross-sectional studies report higher coefficients of the effect of foreign
presence than panel data studies.” They comment that the results do not seem to be affected
whether the data employed in the studies are industry level or firm level data, and that “the
definition of the foreign presence variable included in some studies seems to affect the results
obtained.” In a recent study, Lipsey and Sjoholm (2004) suggest that results of degree of
spillovers are different across different definitions of industry level and choices of measuring
spillovers on national or regional level.
In summary, although FDI are theoretically believed by researchers to have positive spillover
effects on host country productivity, empirical evidence shows mixed results, and the
magnitude of spillovers varies across the technology level of host countries, characteristics of
industries and firms, and characteristics of FDI. The technological gap between MNCs and host
country and the local market competition are the two factors most emphasized and concentrated
on in searching for the causes of mixed results.
The overview of research presented above indicates that in Vietnam, the technology gap
between foreign and domestic sectors may be too large to restrict the spillover effects from FDI.
In any case, this effect may differ across industries (for example, in export-oriented industries,
the gap may be small and hence strengthen spillovers); and as FDI flows in Vietnam’s process
of reforms, the demonstration effect might be especially large. Positive spillovers from FDI are
expected for the case of Vietnam. Furthermore, the country’s process of reforms goes along
with the development of domestic private sector, there is a possibility that the growth of this
sector influence spillovers. We discuss this in the next section.
7
Figure 1
0
2
4
6
8
10
12
1987
1989
1991
1993
1995
1997
1999
2001
2003
2005
*
Perc
enta
ge
GDP Growth
3. Case study: Vietnam
This section makes attempts to find spillover effects in Vietnam’s industry in two approaches.
We first analyze the recent trend and characteristics of FDI and Vietnam’s industry and then do
empirical study on Vietnam’s industry in the two periods of 1995-1999 and 2000-2002. 3.1 Current trend of Foreign Direct Investment in Vietnam and Vietnam’s Industry
Overview of Vietnamese Economy
The development of the Vietnamese economy can be divided into two major stages: before
1986 (pre-reform) period and after 1986 (post-reform) period. Before 1986, Vietnam was a
centralized economy, in which the Government determined all economic targets and prices.
Since the issue of the market reform policy, Vietnam has undergone market-oriented economy,
where all the prices and quantities are determined by market rules. This substantial institutional
reform, which is also called the ‘Big bang’ (Carolyn, 2000), has brought out dramatic changes to
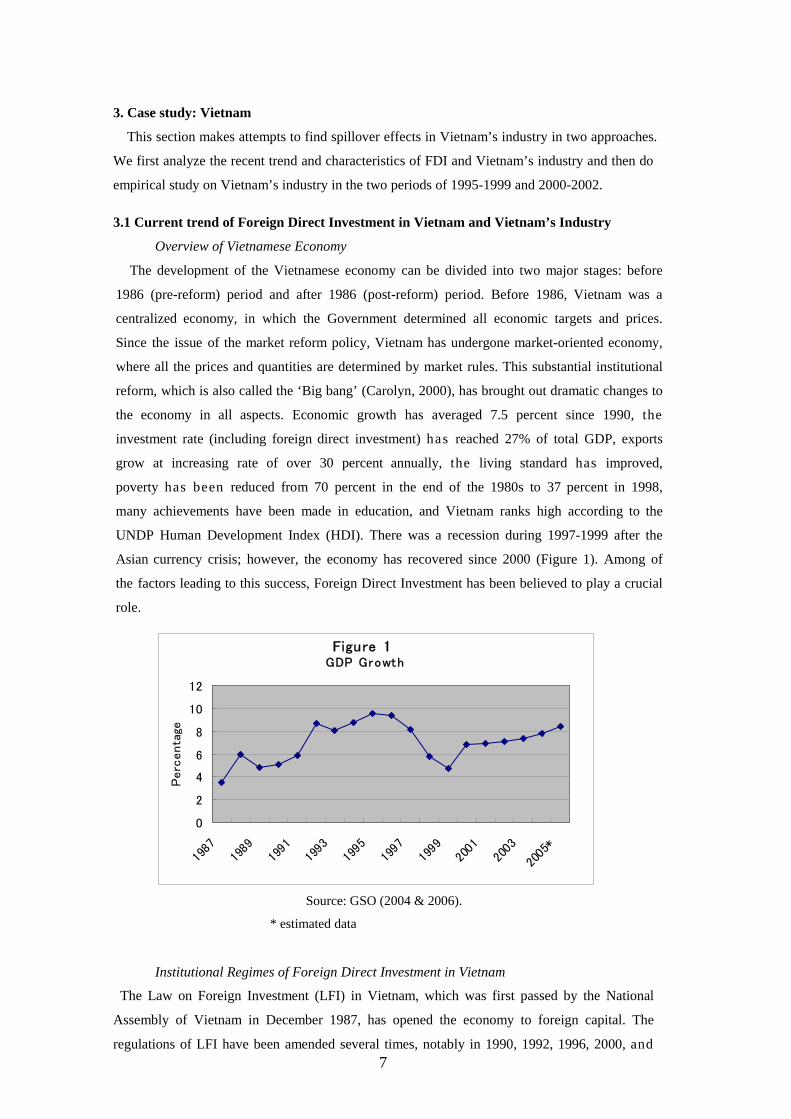
the economy in all aspects. Economic growth has averaged 7.5 percent since 1990, the
investment rate (including foreign direct investment) has reached 27% of total GDP, exports
grow at increasing rate of over 30 percent annually, the living standard has improved,
poverty has been reduced from 70 percent in the end of the 1980s to 37 percent in 1998,
many achievements have been made in education, and Vietnam ranks high according to the
UNDP Human Development Index (HDI). There was a recession during 1997-1999 after the
Asian currency crisis; however, the economy has recovered since 2000 (Figure 1). Among of
the factors leading to this success, Foreign Direct Investment has been believed to play a crucial
role.
Source: GSO (2004 & 2006).
* estimated data
Institutional Regimes of Foreign Direct Investment in Vietnam
The Law on Foreign Investment (LFI) in Vietnam, which was first passed by the National
Assembly of Vietnam in December 1987, has opened the economy to foreign capital. The
regulations of LFI have been amended several times, notably in 1990, 1992, 1996, 2000, and
8
2003, and thus have had a great many positive impacts. They are, for instance, reducing risks
for foreign-invested enterprises in land clearance by shifting responsibility for employee
compensation and land clearance from the foreign to the Vietnamese partner in joint ventures
(2000); offering special conditions for foreign investors in Export Processing Zones (EPZs)
(1991), Industrial Zones (IZs) (1994) and Hi-tech Zones; increasing the scope for import tariff
exemptions and reductions, and reducing the tax on profit remittances (1996), etc. Yet there are
still numerous restrictions in the LFI, such as those relating to regulations on the stake and
legal capital held by the foreign investors of joint ventures (JVs), local content requirements in
the motorcycle, electronic and engineering fields, restrictions on establishment of equity-based
cross border production and relevant M&A activity: These restrictions essentially aim to protect
the state-owned enterprise (SOE) sector as emphasized at the 9th Communist Party Congress
(Bui, 2004).
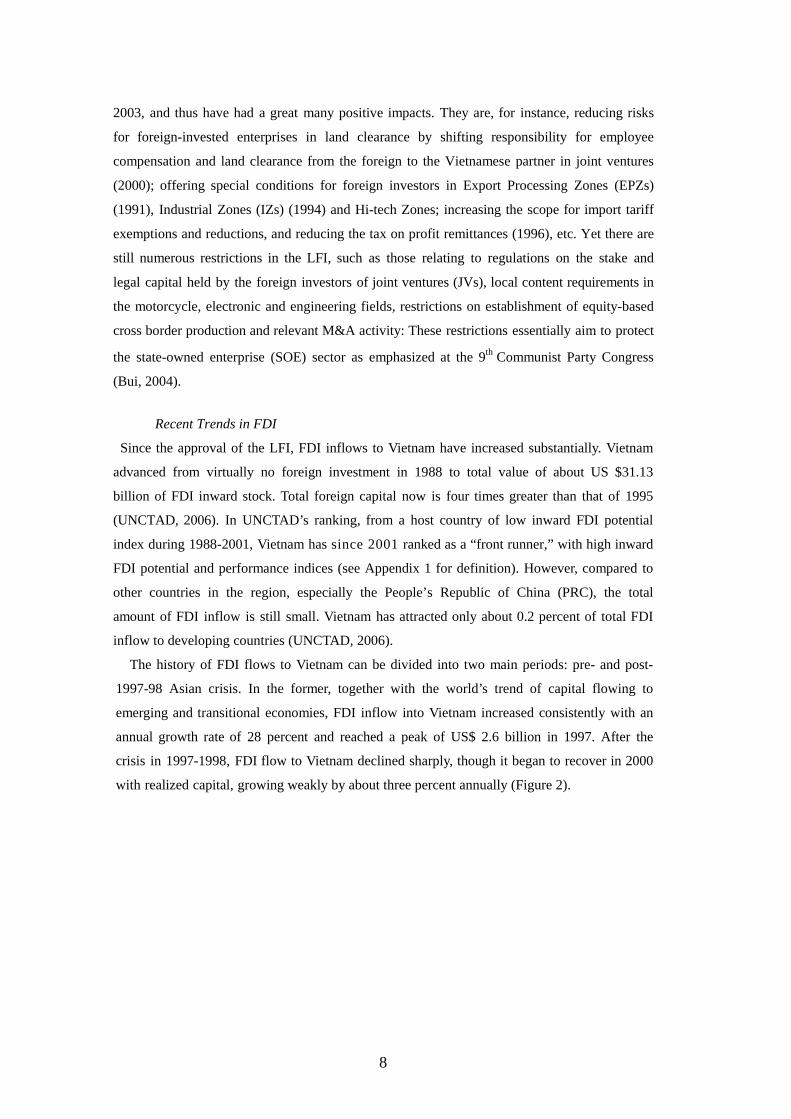
Recent Trends in FDI
Since the approval of the LFI, FDI inflows to Vietnam have increased substantially. Vietnam
advanced from virtually no foreign investment in 1988 to total value of about US $31.13
billion of FDI inward stock. Total foreign capital now is four times greater than that of 1995
(UNCTAD, 2006). In UNCTAD’s ranking, from a host country of low inward FDI potential
index during 1988-2001, Vietnam has since 2001 ranked as a “front runner,” with high inward
FDI potential and performance indices (see Appendix 1 for definition). However, compared to
other countries in the region, especially the People’s Republic of China (PRC), the total
amount of FDI inflow is still small. Vietnam has attracted only about 0.2 percent of total FDI
inflow to developing countries (UNCTAD, 2006).
The history of FDI flows to Vietnam can be divided into two main periods: pre- and post-
1997-98 Asian crisis. In the former, together with the world’s trend of capital flowing to
emerging and transitional economies, FDI inflow into Vietnam increased consistently with an
annual growth rate of 28 percent and reached a peak of US$ 2.6 billion in 1997. After the
crisis in 1997-1998, FDI flow to Vietnam declined sharply, though it began to recover in 2000
with realized capital, growing weakly by about three percent annually (Figure 2).
9
Source: UNCTAD (2006).
Before 1994, FDI in Vietnam was concentrated on the oil and gas sector, which contributed
a great deal to crude oil export promotion, making it the biggest share of total exports until 1996.
From 1994 to 1997, foreign investment expanded to a range of new sectors, such as real
estate and various other industrial activities. During this time, FDI in industry was mainly
performed by East Asian countries who sought new locations for their export production to
face the increasing cost of their domestic workforces. This rising boom in capital flow
continued until the regional currency crisis occurred. FDI flows into Vietnam during these
years played a very important role not only in providing finance, but also in opening access to
export markets for existing domestic producers, introducing new ideas, skills and know-how,
and proposing models that were imitated by domestic investors.
The reasons for the decline of FDI after 1997-98 are mainly the crisis and its associated
problems, from which most of Vietnam’s investors suffered at that time. However, there is also
an argument that the reduction was due to the slow reform process of regulations. “The decline
in implementation of investment commitments started before 1997, so the regional crisis made
evident problems existing prior to the crisis; and that after 1999, investments returned to
Korea, Malaysia, and Thailand but not to Vietnam.” (Leproux and Brooks, 2004) Moreover,
as pointed out by Freeman (2002), forecasts by foreign investors before 1997 for Vietnam’s
domestic market demand “often based on rather euphoric straight-line growth projections–were
proved to be exaggerated;” therefore, the rising wave of foreign capital inflows calmed down.
Up to the end of 2005, Vietnam has attracted investors from 65 countries. Among them,
Asian countries account for the largest proportion (57.2 percent). The following are European
countries (30.2 percent), the Americas (6.4 percent), Africa (3.2 percent) and finally Australia (3.0
percent) (data are registered capital). Taipei, China is the largest foreign investor with 1,615
projects and $3.7901 billion of registered capital; followed by Singapore (484 projects and
$3.2707 billion; in legal capital; as for registered capital, Singapore ranks first); Japan (684
projects and $3.109 billion); Republic of Korea (henceforth Korea; 1185 projects and $2.6185
0
500
1000
1500
2000
2500
3000
1988 1990 1992 1994 1996 1998 2000 2002 2004
Mill
ions
0fU
S$
Figure 2FDI inflows in Vietnam 1988-2005
10
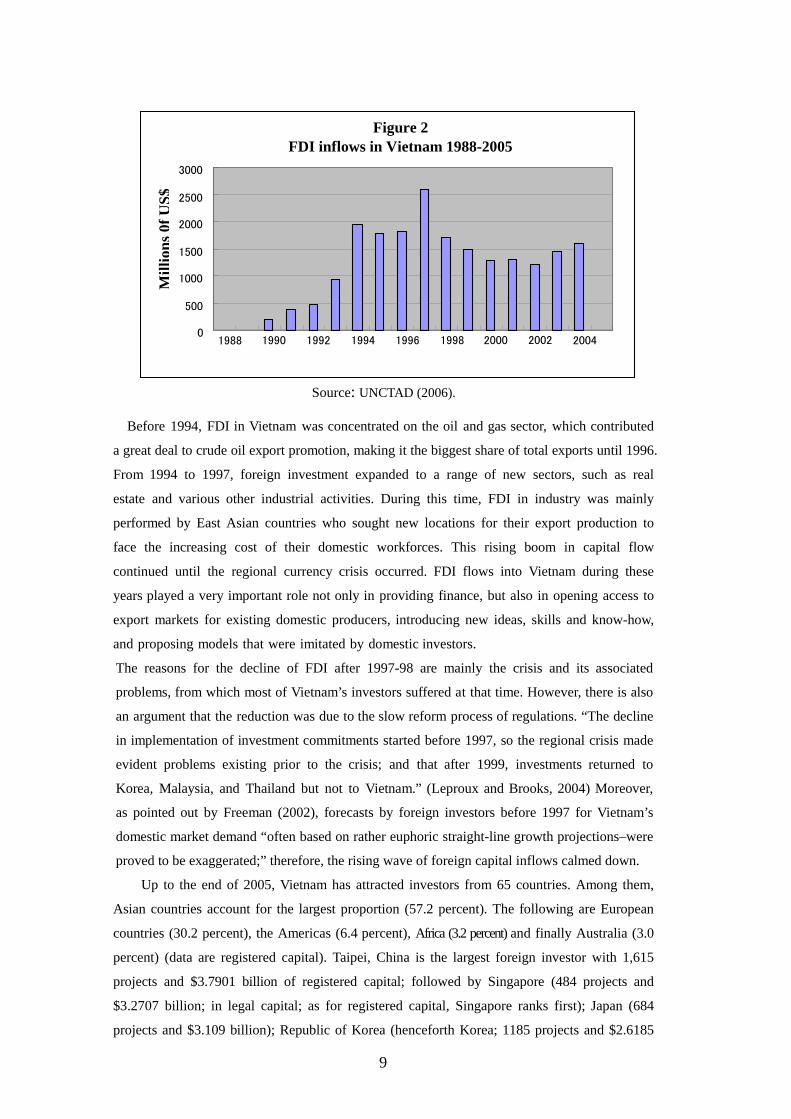
million); and Hong Kong, China (520 projects and $2.1027 million). The total amount of
capital of these top five investors accounts for 50 percent of total FDI commitments during
the period 1988-2005. Since the signing of the US-Vietnam Bilateral Trade Agreement in July
2000, FDI from western countries such as France, the Netherlands, and the United States has
been increasing. Meanwhile, FDI from the United Kingdom is mainly connected to investments
of the 1990s in the oil and gas sector (Figure 3).
Source: GSO (2006).
FDI has flowed into all sectors of Vietnam, of which industry and services occupy a large
proportion. In industry, manufacturing sector attracts the largest FDI (50.1 percent in 2005),
followed by real estate and renting business activities, construction, hotels and restaurants, (9.4
percent, 7.8 percent, and 7.7 percent, respectively). The share of agriculture, forestry, and fisheries
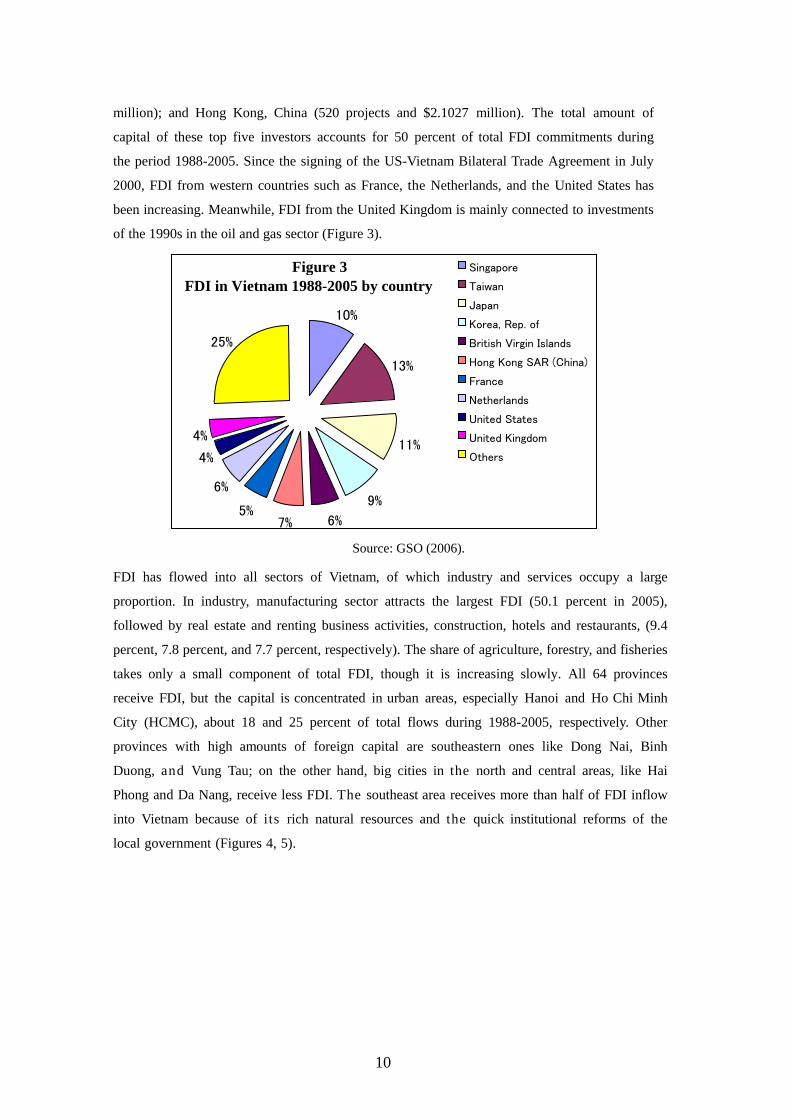
takes only a small component of total FDI, though it is increasing slowly. All 64 provinces
receive FDI, but the capital is concentrated in urban areas, especially Hanoi and Ho Chi Minh
City (HCMC), about 18 and 25 percent of total flows during 1988-2005, respectively. Other
provinces with high amounts of foreign capital are southeastern ones like Dong Nai, Binh
Duong, and Vung Tau; on the other hand, big cities in the north and central areas, like Hai
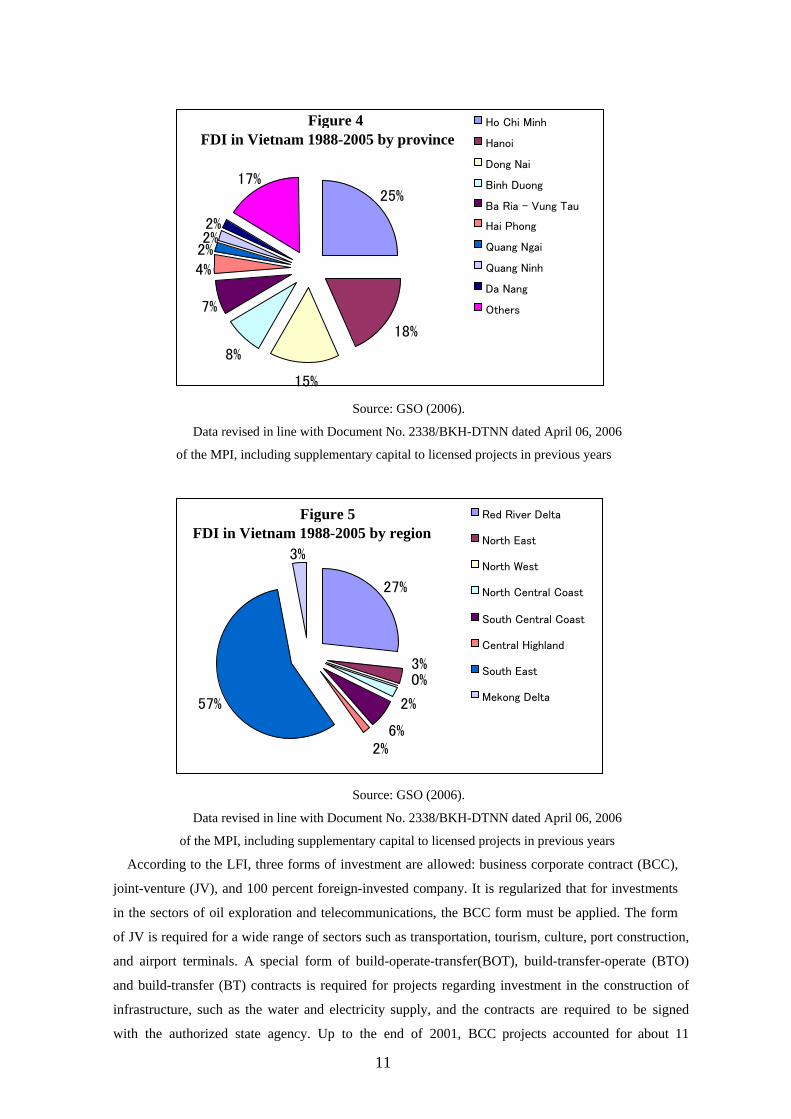
Phong and Da Nang, receive less FDI. The southeast area receives more than half of FDI inflow
into Vietnam because of its rich natural resources and the quick institutional reforms of the
local government (Figures 4, 5).
10%
13%
11%
9%
6%7% 5%
6%
4%
4%
25%
Singapore
Taiwan
Japan
Korea, Rep. of
British Virgin Islands
Hong Kong SAR (China)
France
Netherlands
United States
United Kingdom
Others
Figure 3FDI in Vietnam 1988-2005 by country
11
Source: GSO (2006).
Data revised in line with Document No. 2338/BKH-DTNN dated April 06, 2006
of the MPI, including supplementary capital to licensed projects in previous years
Source: GSO (2006).
Data revised in line with Document No. 2338/BKH-DTNN dated April 06, 2006
of the MPI, including supplementary capital to licensed projects in previous years According to the LFI, three forms of investment are allowed: business corporate contract (BCC),
joint-venture (JV), and 100 percent foreign-invested company. It is regularized that for investments
in the sectors of oil exploration and telecommunications, the BCC form must be applied. The form
of JV is required for a wide range of sectors such as transportation, tourism, culture, port construction,
and airport terminals. A special form of build-operate-transfer(BOT), build-transfer-operate (BTO)
and build-transfer (BT) contracts is required for projects regarding investment in the construction of
infrastructure, such as the water and electricity supply, and the contracts are required to be signed
with the authorized state agency. Up to the end of 2001, BCC projects accounted for about 11
25%
18%
15%
8%
7%
4% 2% 2% 2%
17%
Ho Chi Minh
Hanoi
Dong Nai
Binh Duong
Ba Ria - Vung Tau Hai Phong
Quang Ngai
Quang Ninh
Da Nang
Others
27%
3%0%
2%
6%2%
57%
3%
Red River Delta
North East
North West
North Central Coast
South Central Coast Central Highland
South East
Mekong Delta
Figure 4FDI in Vietnam 1988-2005 by province
Figure 5FDI in Vietnam 1988-2005 by region
12
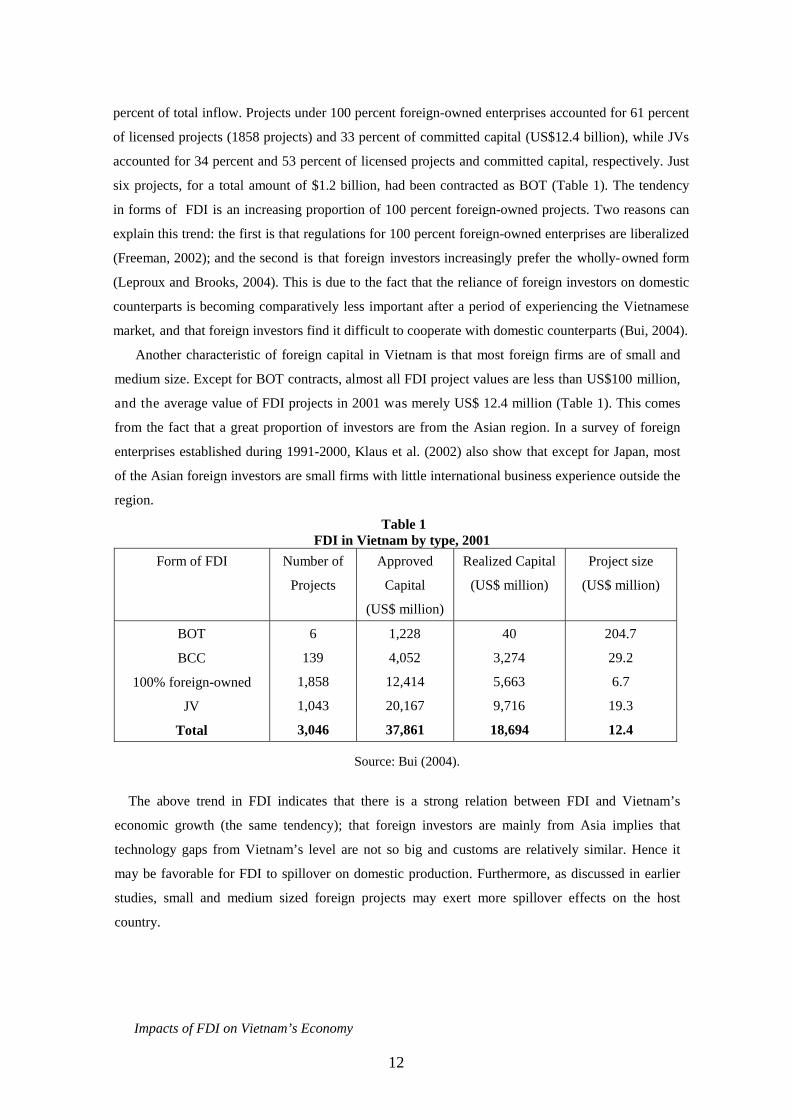
percent of total inflow. Projects under 100 percent foreign-owned enterprises accounted for 61 percent
of licensed projects (1858 projects) and 33 percent of committed capital (US$12.4 billion), while JVs
accounted for 34 percent and 53 percent of licensed projects and committed capital, respectively. Just
six projects, for a total amount of $1.2 billion, had been contracted as BOT (Table 1). The tendency
in forms of FDI is an increasing proportion of 100 percent foreign-owned projects. Two reasons can
explain this trend: the first is that regulations for 100 percent foreign-owned enterprises are liberalized
(Freeman, 2002); and the second is that foreign investors increasingly prefer the wholly-owned form
(Leproux and Brooks, 2004). This is due to the fact that the reliance of foreign investors on domestic
counterparts is becoming comparatively less important after a period of experiencing the Vietnamese
market, and that foreign investors find it difficult to cooperate with domestic counterparts (Bui, 2004).
Another characteristic of foreign capital in Vietnam is that most foreign firms are of small and
medium size. Except for BOT contracts, almost all FDI project values are less than US$100 million,
and the average value of FDI projects in 2001 was merely US$ 12.4 million (Table 1). This comes
from the fact that a great proportion of investors are from the Asian region. In a survey of foreign
enterprises established during 1991-2000, Klaus et al. (2002) also show that except for Japan, most
of the Asian foreign investors are small firms with little international business experience outside the
region.
Table 1 FDI in Vietnam by type, 2001
Form of FDI Number of
Projects Approved
Capital
(US$ million)
Realized Capital
(US$ million) Project size
(US$ million)
BOT
BCC
100% foreign-owned
JV
Total
6
139
1,858
1,043
3,046
1,228
4,052
12,414
20,167
37,861
40
3,274
5,663
9,716
18,694
204.7
29.2
6.7
19.3
12.4 Source: Bui (2004).
The above trend in FDI indicates that there is a strong relation between FDI and Vietnam’s
economic growth (the same tendency); that foreign investors are mainly from Asia implies that
technology gaps from Vietnam’s level are not so big and customs are relatively similar. Hence it
may be favorable for FDI to spillover on domestic production. Furthermore, as discussed in earlier
studies, small and medium sized foreign projects may exert more spillover effects on the host
country. Impacts of FDI on Vietnam’s Economy
13
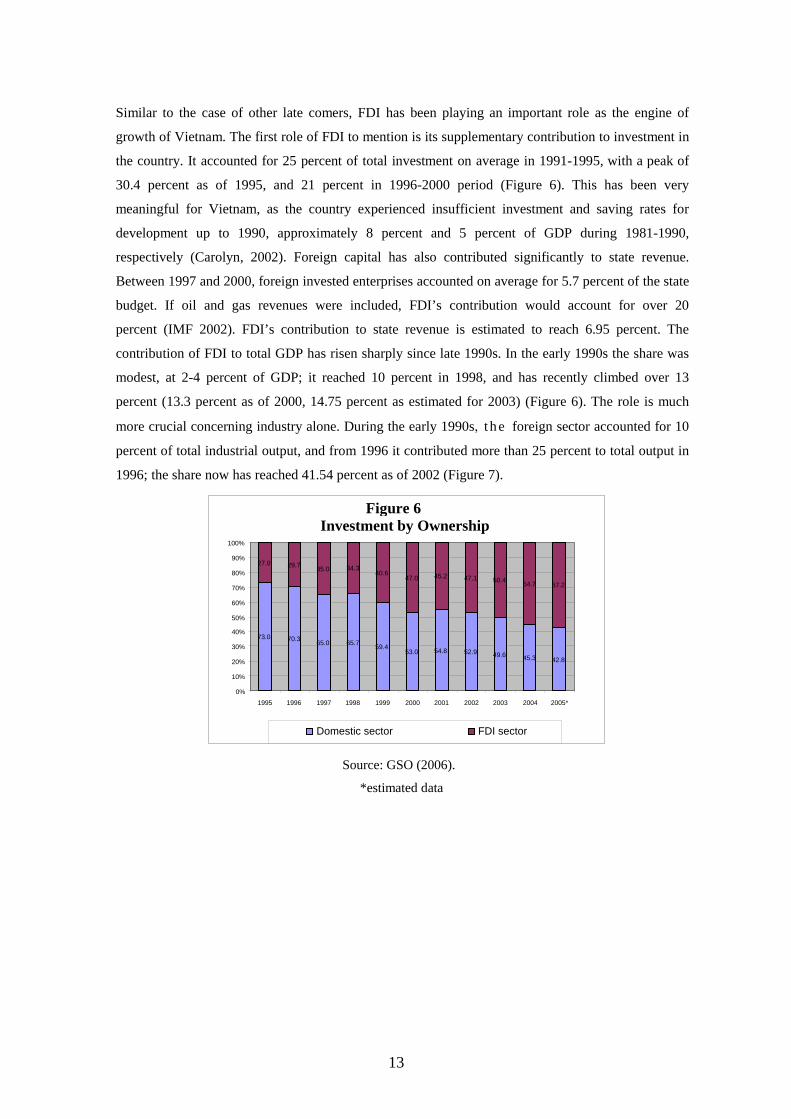
Similar to the case of other late comers, FDI has been playing an important role as the engine of
growth of Vietnam. The first role of FDI to mention is its supplementary contribution to investment in
the country. It accounted for 25 percent of total investment on average in 1991-1995, with a peak of
30.4 percent as of 1995, and 21 percent in 1996-2000 period (Figure 6). This has been very
meaningful for Vietnam, as the country experienced insufficient investment and saving rates for
development up to 1990, approximately 8 percent and 5 percent of GDP during 1981-1990,
respectively (Carolyn, 2002). Foreign capital has also contributed significantly to state revenue.
Between 1997 and 2000, foreign invested enterprises accounted on average for 5.7 percent of the state
budget. If oil and gas revenues were included, FDI’s contribution would account for over 20
percent (IMF 2002). FDI’s contribution to state revenue is estimated to reach 6.95 percent. The
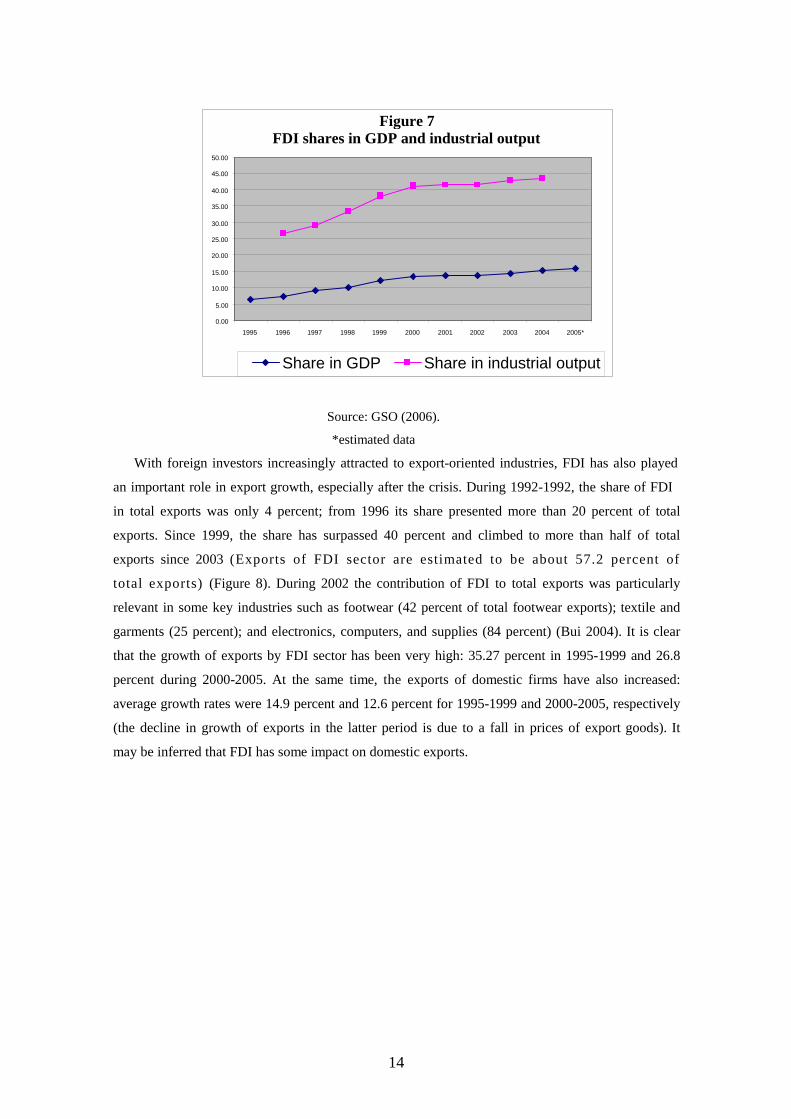
contribution of FDI to total GDP has risen sharply since late 1990s. In the early 1990s the share was
modest, at 2-4 percent of GDP; it reached 10 percent in 1998, and has recently climbed over 13
percent (13.3 percent as of 2000, 14.75 percent as estimated for 2003) (Figure 6). The role is much
more crucial concerning industry alone. During the early 1990s, t h e foreign sector accounted for 10
percent of total industrial output, and from 1996 it contributed more than 25 percent to total output in
1996; the share now has reached 41.54 percent as of 2002 (Figure 7).
Source: GSO (2006).
*estimated data
73.0 70.3 65.0 65.7 59.453.0 54.8 52.9 49.6 45.3 42.8
27.0 29.7 35.0 34.340.6
47.0 45.2 47.1 50.4 54.7 57.2
0% 10%
20%
30%
40%
50%
60%
70%
80%
90%
100%
1995 1996 1997 1998 1999 2000 2001 2002 2003 2004 2005*
Domestic sector FDI sector
Figure 6Investment by Ownership
14
Source: GSO (2006). *estimated data
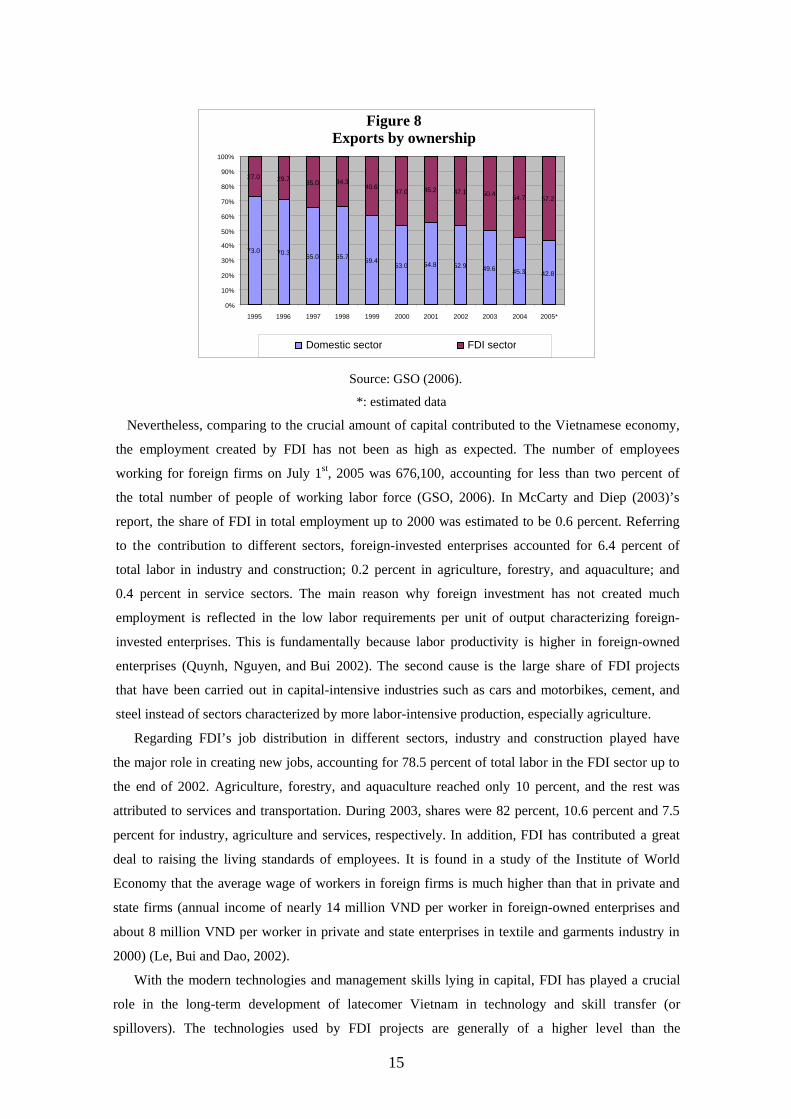
With foreign investors increasingly attracted to export-oriented industries, FDI has also played
an important role in export growth, especially after the crisis. During 1992-1992, the share of FDI
in total exports was only 4 percent; from 1996 its share presented more than 20 percent of total
exports. Since 1999, the share has surpassed 40 percent and climbed to more than half of total
exports since 2003 (Exports of FDI sector are estimated to be about 57.2 percent of
total exports) (Figure 8). During 2002 the contribution of FDI to total exports was particularly
relevant in some key industries such as footwear (42 percent of total footwear exports); textile and
garments (25 percent); and electronics, computers, and supplies (84 percent) (Bui 2004). It is clear
that the growth of exports by FDI sector has been very high: 35.27 percent in 1995-1999 and 26.8
percent during 2000-2005. At the same time, the exports of domestic firms have also increased:
average growth rates were 14.9 percent and 12.6 percent for 1995-1999 and 2000-2005, respectively
(the decline in growth of exports in the latter period is due to a fall in prices of export goods). It
may be inferred that FDI has some impact on domestic exports.
0.00 5.00
10.00 15.00 20.00 25.00 30.00 35.00 40.00 45.00 50.00
1995 1996 1997 1998 1999 2000 2001 2002 2003 2004 2005*
Share in GDP Share in industrial output
Figure 7FDI shares in GDP and industrial output
15
Source: GSO (2006).
*: estimated data
Nevertheless, comparing to the crucial amount of capital contributed to the Vietnamese economy,
the employment created by FDI has not been as high as expected. The number of employees
working for foreign firms on July 1st, 2005 was 676,100, accounting for less than two percent of
the total number of people of working labor force (GSO, 2006). In McCarty and Diep (2003)’s
report, the share of FDI in total employment up to 2000 was estimated to be 0.6 percent. Referring
to the contribution to different sectors, foreign-invested enterprises accounted for 6.4 percent of
total labor in industry and construction; 0.2 percent in agriculture, forestry, and aquaculture; and
0.4 percent in service sectors. The main reason why foreign investment has not created much
employment is reflected in the low labor requirements per unit of output characterizing foreign-
invested enterprises. This is fundamentally because labor productivity is higher in foreign-owned
enterprises (Quynh, Nguyen, and Bui 2002). The second cause is the large share of FDI projects
that have been carried out in capital-intensive industries such as cars and motorbikes, cement, and
steel instead of sectors characterized by more labor-intensive production, especially agriculture.
Regarding FDI’s job distribution in different sectors, industry and construction played have
the major role in creating new jobs, accounting for 78.5 percent of total labor in the FDI sector up to
the end of 2002. Agriculture, forestry, and aquaculture reached only 10 percent, and the rest was
attributed to services and transportation. During 2003, shares were 82 percent, 10.6 percent and 7.5
percent for industry, agriculture and services, respectively. In addition, FDI has contributed a great
deal to raising the living standards of employees. It is found in a study of the Institute of World
Economy that the average wage of workers in foreign firms is much higher than that in private and
state firms (annual income of nearly 14 million VND per worker in foreign-owned enterprises and
about 8 million VND per worker in private and state enterprises in textile and garments industry in
2000) (Le, Bui and Dao, 2002).
With the modern technologies and management skills lying in capital, FDI has played a crucial
role in the long-term development of latecomer Vietnam in technology and skill transfer (or
spillovers). The technologies used by FDI projects are generally of a higher level than the
73.0 70.3 65.0 65.7 59.453.0 54.8 52.9 49.6 45.3 42.8
27.0 29.7 35.0 34.340.6
47.0 45.2 47.1 50.4 54.7 57.2
0%
10%
20%
30%
40%
50%
60%
70%
80%
90%
100%
1995 1996 1997 1998 1999 2000 2001 2002 2003 2004 2005*
Domestic sector FDI sector
Figure 8 Exports by ownership
16
technologies currently in use in Vietnam, especially in the oil and gas, telecommunications, chemical,
electronics, and automobile sectors. These new technologies are supposed to generate relevant
spillover effects. The above study of the Institute of World Economy in 2002 finds that among the
three types of ownership, foreign invested enterprises take the most importance on the OJT (On-
Job-Training). FDI has helped to modernize management and corporate governance, and to train a
new group of young managers. According to Le (2002) about 300,000 workers have been trained or
retrained, and 25,000 technicians and 6,000 managers have been trained, partially abroad. By
comparing the assessments of local industry at the time of entry and at the time of the survey,
the study also finds that there is an ‘observed improvement’ by foreign enterprises in local industry
production, which implies a technological spillover from foreign firms to local ones, ranked by trade
and tourism, machinery and equipment and construction. Tran (2002) analyzed a set of ten sample
studies on foreign firms operating in different industries—oil and gas, telecommunications,
automobiles, and information technologies—for technological spillovers effects through three
channels: between joint ventures from foreign to Vietnamese partners; from JVs to Vietnamese
organizations (institutions and firms); and direct spillovers from multinationals to Vietnamese
organizations. The result shows that in all cases, foreign investors transfer the technologies through
the first two channels, only in one case was there transfer via the third channel. However, the study
also indicates that host country firms are often not ready and not organized well enough for
learning and upgrading their industrial capabilities. In part this reflects the SOEs’ persistently
predominant role in Vietnam’s economy. In his earlier study in 1999, Tran already indicates that
joint ventures and other connections between Vietnamese and foreign firms have not produced wide
knowledge dissemination in either marketing or management of technical change. This could be
related to the low familiarity that characterizes most Vietnamese firms on utilizing partnership
arrangements with foreign firms in order to increase technological capabilities. Moreover, the same
study noted that a relevant part of the foreign firms showed insufficient determination to structure
and facilitate learning.
It is claimed that linkages between research and development institutions and the production
sector in Vietnam remain weak. Moreover, “at present, cooperation between the domestic sector,
which is protected from foreign competition on the one hand, and the export-oriented FDI sector,
which already participates in the international division of labor on the other is extremely weak…the
private sector in Vietnam is dominated by small businesses such as street shops, family factories”
(Onno, 2003). FDI in t he textile and garments industry in Vietnam in 1999-2000 did not use
very much domestic material or input—just above 20 percent of their total input value, compared to
62 percent for the domestic private sector and more than 50 percent for the SOEs. The share of sub-
contract revenue by foreign investors in total was only 6.4 percent, compared to 10.8 percent for the
domestic private sector. This implies that FDI generates a linkage of production which is not as
strong as the private firms (Le, Bui and Dao, 2002). So while FDI has had important effects on
upgrading the Vietnamese economy’s technology and providing technology and knowledge to its
local partners, its impact on other domestic firms of the same industry is limited by the weak
17
linkages between foreign-invested enterprises and domestic enterprises, and by the steady weakness
of the domestic private sector.
In summary, with its growing share in the economy, FDI has had important impacts on the
Vietnamese economy in all aspects, short-term as well as long-term, concerning both quantity and
quality for the past 15 years. FDI has shown to be a crucial and steadily growing economic sector of
Vietnam. At the same time, FDI has contributed to the development of domestic sector indirectly
through increasing incomes and expenditure, hence boosting demand for domestic goods, and
directly through increasing competition, forcing domestic firms to invest more and produce more
efficiently, and introducing new technologies and skills. FDI is therefore considered to exert
positive spillover effects on Vietnam’s domestic production.
Vietnam’s Industry: History and Characteristics
Vietnam’s industry after the reform in 1986 can be divided into three periods: 1986-1994, 1995-
1999, and from 2000 to the present (Ministry of Industry, 2004). After the reform and until 1990,
with the development of market industrial output grew at a stable rate of 6.07 percent; in 1991-1994
industry overall grew quickly and achieved recording annual rate of 13.5 percent. Industrial exports
increased sharply from 1990 to 1994 in both volume and type of export goods; the foreign sector’s
share in exports also started to rise from 1994. In the later two periods, gross industrial output
increased steadily, with an annual average growth rate of 13.03 percent and 16.1 percent in 1995-
1999 and 2000-2004, respectively; gross output in 1999 was VND 168,749 billion (at 1994 prices),
as much as 1.7 times of that of 1994, and in 2004 output reached 355,624 billion VND (at 1994
price), more than double that of 1999.
Since there was a change in sector division of industry in 1995 (before 1995 industrial data was
divided into 20 sectors; from 1995 there is 29 industrial sectors) and the empirical work could cover
data only from 1995 to 2002, this study is concentrated on the development of industry in the time
between 1995 and 1999 and the post-2000 period, especially up to 2002.
Recent Characteristics of Vietnam’s Industry
There is a tendency of structural change in industrial output during the 1995-1999 and post-2000
periods. Mining and quarrying tends to reduce in total share: in 1995 its share of total output
was 13.47 percent, reducing to 12.9 percent in 2002 and 12.8 in 2004; manufacturing and electricity,
and gas and water supply kept stable shares of 79.5-81 percent and 5.9-6.1 percent, respectively. In
manufacturing industries, the share of machinery, chemical and other heavy industries declined,
while the share of electric and electronic industries climbed sharply despite a fall in the growth rate
of the electronics industry from 30.2 percent in 1995-1999 to 8.1 percent during 2000-2002. For
nearly ten years, the textile and garments industry kept a stable share from 12.0 to 12.5 percent in
the total output; construction, water and gas, and the remaining other industries experienced
increasing shares. The same trend is observed output growth. During 2000-2002, the growth rate of
mining and quarrying dropped sharply, to 7.3 percent, while the rates of manufacturing and
18
electricity, gas and water supply rose to 16.9 and 17.8 percent, respectively. Electronic industry
annual growth rate reduced from around 30.2 percent in 1995-1999 to 8.1 percent in 2000-2002.
(The estimated growth rate for mining and quarrying; manufacturing and electricity, and gas and
water supply in 2005 were 1.4 percent, 19.5 percent, and 14.1 percent, respectively).
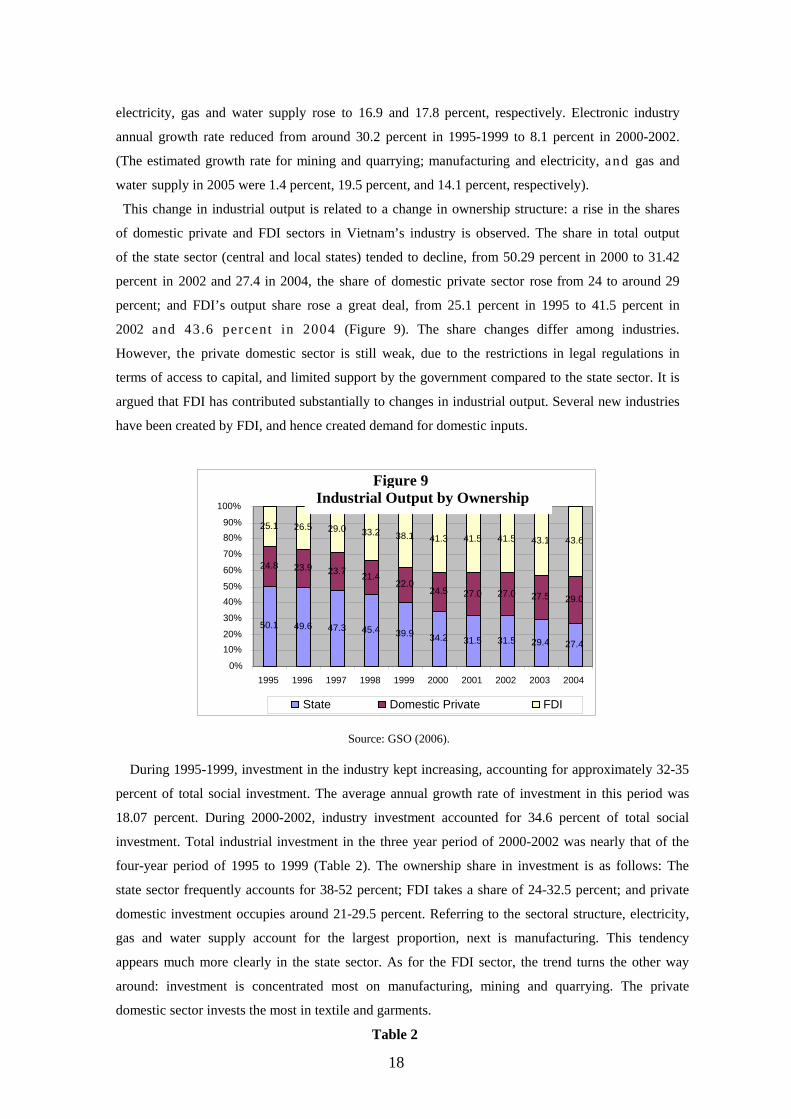
This change in industrial output is related to a change in ownership structure: a rise in the shares
of domestic private and FDI sectors in Vietnam’s industry is observed. The share in total output
of the state sector (central and local states) tended to decline, from 50.29 percent in 2000 to 31.42
percent in 2002 and 27.4 in 2004, the share of domestic private sector rose from 24 to around 29
percent; and FDI’s output share rose a great deal, from 25.1 percent in 1995 to 41.5 percent in
2002 and 43.6 percent in 2004 (Figure 9). The share changes differ among industries.
However, the private domestic sector is still weak, due to the restrictions in legal regulations in
terms of access to capital, and limited support by the government compared to the state sector. It is
argued that FDI has contributed substantially to changes in industrial output. Several new industries
have been created by FDI, and hence created demand for domestic inputs.
Source: GSO (2006).
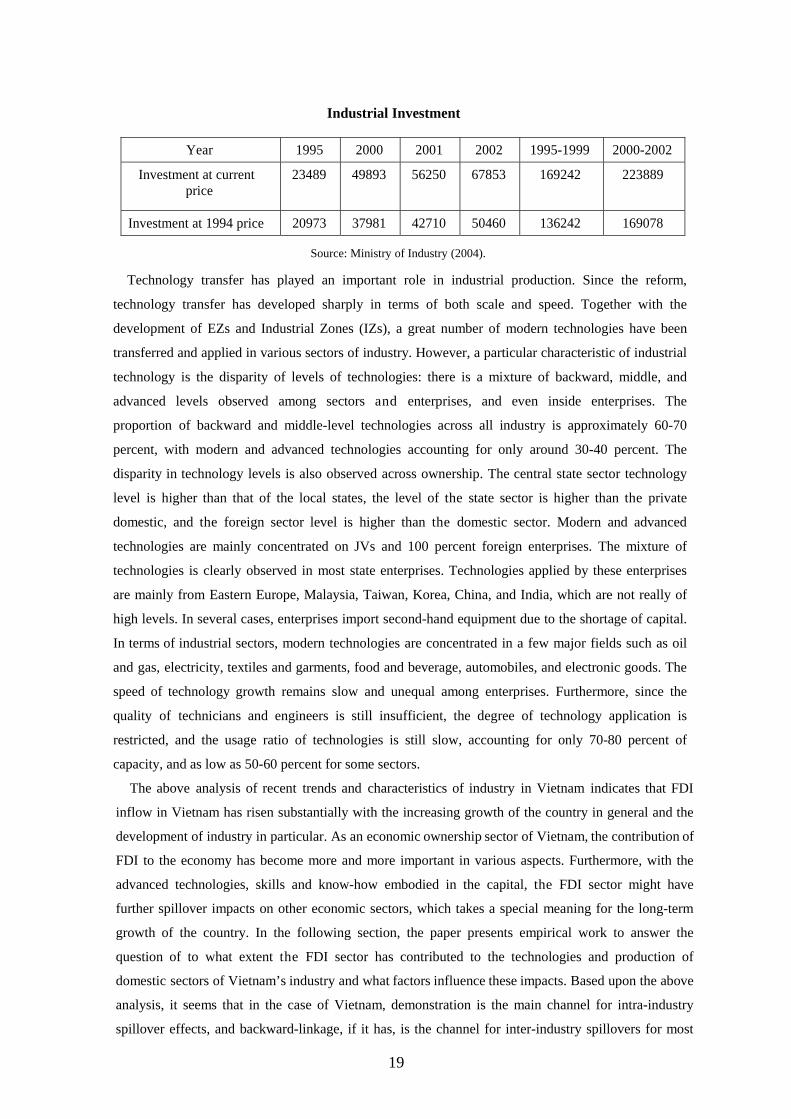
During 1995-1999, investment in the industry kept increasing, accounting for approximately 32-35
percent of total social investment. The average annual growth rate of investment in this period was
18.07 percent. During 2000-2002, industry investment accounted for 34.6 percent of total social
investment. Total industrial investment in the three year period of 2000-2002 was nearly that of the
four-year period of 1995 to 1999 (Table 2). The ownership share in investment is as follows: The
state sector frequently accounts for 38-52 percent; FDI takes a share of 24-32.5 percent; and private
domestic investment occupies around 21-29.5 percent. Referring to the sectoral structure, electricity,
gas and water supply account for the largest proportion, next is manufacturing. This tendency
appears much more clearly in the state sector. As for the FDI sector, the trend turns the other way
around: investment is concentrated most on manufacturing, mining and quarrying. The private
domestic sector invests the most in textile and garments.
Table 2
50.1 49.6 47.3 45.4 39.9 34.2 31.5 31.5 29.4 27.4
24.8 23.9 23.7 21.422.0
24.5 27.0 27.0 27.5 29.0
25.1 26.5 29.0 33.2 38.1 41.3 41.5 41.5 43.1 43.6
0%
10%20%
30%
40%50%
60%
70%
80%90%
100%
1995 1996 1997 1998 1999 2000 2001 2002 2003 2004 State Domestic Private FDI
Figure 9 Industrial Output by Ownership
19
Industrial Investment
Year 1995 2000 2001 2002 1995-1999 2000-2002
Investment at current price
23489 49893 56250 67853 169242 223889
Investment at 1994 price 20973 37981 42710 50460 136242 169078 Source: Ministry of Industry (2004).
Technology transfer has played an important role in industrial production. Since the reform,
technology transfer has developed sharply in terms of both scale and speed. Together with the
development of EZs and Industrial Zones (IZs), a great number of modern technologies have been
transferred and applied in various sectors of industry. However, a particular characteristic of industrial
technology is the disparity of levels of technologies: there is a mixture of backward, middle, and
advanced levels observed among sectors and enterprises, and even inside enterprises. The
proportion of backward and middle-level technologies across all industry is approximately 60-70
percent, with modern and advanced technologies accounting for only around 30-40 percent. The
disparity in technology levels is also observed across ownership. The central state sector technology
level is higher than that of the local states, the level of the state sector is higher than the private
domestic, and the foreign sector level is higher than the domestic sector. Modern and advanced
technologies are mainly concentrated on JVs and 100 percent foreign enterprises. The mixture of
technologies is clearly observed in most state enterprises. Technologies applied by these enterprises
are mainly from Eastern Europe, Malaysia, Taiwan, Korea, China, and India, which are not really of
high levels. In several cases, enterprises import second-hand equipment due to the shortage of capital.
In terms of industrial sectors, modern technologies are concentrated in a few major fields such as oil
and gas, electricity, textiles and garments, food and beverage, automobiles, and electronic goods. The
speed of technology growth remains slow and unequal among enterprises. Furthermore, since the
quality of technicians and engineers is still insufficient, the degree of technology application is
restricted, and the usage ratio of technologies is still slow, accounting for only 70-80 percent of
capacity, and as low as 50-60 percent for some sectors.
The above analysis of recent trends and characteristics of industry in Vietnam indicates that FDI
inflow in Vietnam has risen substantially with the increasing growth of the country in general and the
development of industry in particular. As an economic ownership sector of Vietnam, the contribution of
FDI to the economy has become more and more important in various aspects. Furthermore, with the
advanced technologies, skills and know-how embodied in the capital, the FDI sector might have
further spillover impacts on other economic sectors, which takes a special meaning for the long-term
growth of the country. In the following section, the paper presents empirical work to answer the
question of to what extent the FDI sector has contributed to the technologies and production of
domestic sectors of Vietnam’s industry and what factors influence these impacts. Based upon the above
analysis, it seems that in the case of Vietnam, demonstration is the main channel for intra-industry
spillover effects, and backward-linkage, if it has, is the channel for inter-industry spillovers for most
20
industrial sectors; the technology level of the domestic sector (‘absorptive capability’) is an important
factor determining technological spillovers by FDI. In addition, the weak linkage between domestic
sectors, especially the domestic private sector and foreign sector in Vietnam, has probably been an
obstacle to these effects. Therefore it is necessary to promote this domestic private sector.
3.2 Technological Spillovers from Foreign Direct Investment in Vietnam’s Industry
3.2.1 Framework: Data and Model
This section explores the spillover effects FDI on the productivity of domestic firms in
Vietnamese industries during the 1995-1999 and 2000-2002 periods. Analyzing various
characteristics of industrial sectors, such as manufacturing or mining, labor-intensive or capital-
intensive, and sectors with a high technology gap between domestic and foreign sectors, we try to elicit
policy implications to enhance the spillover effects of FDI.
Data description
This study employs industry-level panel data, published and unpublished, on Vietnam’s industrial
sectors from 1995 to 2002 provided by the General Statistical Office of Vietnam (GSO). The data
include 29 sectors from three industrial groups of mining and quarrying, manufacturing and electricity,
gas and water supply. There are four industries in mining and quarrying, 23 sectors in manufacturing
and two in electricity, gas & water supply (Appendix 1). The data are divided by two sub-samples of
1995-1999 and 2000-2002 periods. The former data are mainly based on Statistical Yearbook 1999,
2002, which includes the household sector, while the latter sample is comprised of data from
Statistical Yearbook 2003 and The Real Situation of Enterprises through the results of surveys
conducted in 2001, 2002, 2003, and hence excludes the household sector.
The domestic sector is defined to include state-owned-Enterprises (SOEs), non-state collective
establishments, domestic private firms and households; foreign sector includes all establishments with
foreign investors (JVs and 100 percent foreign-invested firms). Therefore, in 2000-2002 the sample,
domestic sector is considered to include only SOEs, non-state collectives, and domestic private firms.
The data sets include information on gross output, fixed assets, and employment. Data on gross output
and employment are available separately for all of given economic sectors, while data on fixed assets
are available only for the foreign sector and overall domestic sector, without further division inside
the domestic one. Gross outputs are fixed values at 1994 prices; fixed assets are calculated as 1994
asset deflators, according to prior research.
Model
The data employed are panel at industry level; the model applied in this paper is similar to those
of earlier empirical studies of aggregate industry (Caves, 1974; Globerman, 1979; Blomstrom and
Persson, 1983; Kokko, 1994; Sjoholm, 1999; etc.). The production function of the domestic sector in
industry i is assumed to have a Cobb-Douglas form and be homogenous with degree one as follows.
iZd
idi
di eLKY αα −= 1)()( (1)
21
where d denotes domestic, i denotes industrial sector i, diY is output, d
idi LK , are capital and labor
of the domestic sector in industry i and iZ presents sectoral externalities which will be explained
specifically later, α is a parameter. Foreign presence is assumed to be an externality affecting output
among other factors such as sectorial capital-labor ratio, labor quality, scale economics, concentration
(Zi in general). Due to the limitation of data, this paper employs only the proxy for concentration;
the output function of domestic sector is expressed as follows.
FORGOVdi
di
di eeLKY **1)()( γβαα −= (2)
Dividing both side by diL , we have the following function for labor productivity of domestic sector.
FORGOVdi
di
di
di ee
LK
LY ** γβ
α
⎟⎟⎠
⎞⎜⎜⎝
⎛+ (3)
γβα ,, are parameters, the proxies are defined as follows: average labor productivity in domestic
sector di
di
LY
is measured as the ration of gross output to total employees in domestic sector, domestic
sector’s capital-labor ratio di
di
LK
is measured as the ratio of total fixed assets to total employees in
domestic sector. In earlier studies, the Herfindahl index is used as a proxy for concentration of
industry; however since the data for this index is not available in Vietnam, the share of SOEs in total
output of each industry denoted by GOV is alternatively used. This comes from the particular
characteristic of Vietnam that industries with higher presence of SOEs tend to be more concentrated.
FOR, finally, is the degree of foreign presence in each industry measured by foreign the percentage
of the foreign sector’s employees of overall industry’s employees. This proxy is argued by Caves
(1974) to be better than the share of foreign sector output (as an proxy of input should be used to
explain productivity). The omission of other externalities in the equation, such as labor quality and
scale economies, might cause a bias; this bias, however, is expected to be small. In earlier studies,
scale economies did not show a significant impact on output (Kokko,1994; etc.). Furthermore, applied
to the case of small production in Vietnam, it is supposed that only a few firms have acquired scale
economies. Thus, on average it is likely that there is yet virtually no impact of scale on productivity.
Applying log-linear regression, the labor productivity of domestic sector is estimated as follows.
ititdit
dit
dit
dit FORGOV
LK
LY
εγβαμ +++⎟⎟⎠
⎞⎜⎜⎝
⎛+=⎟⎟
⎠
⎞⎜⎜⎝
⎛lnln (4)
where μ is constant, t denotes time; ε is error term absorbing all other technology factors
influencing labor productivity and measurement error. Small characters present variables in log-values.
The coefficient α is undoubtedly expected to be positive. The coefficient β is also expected to be
positive under the hypothesis that “more concentrated industries are supposedly better able to engage
22
in monopoly pricing and should therefore display higher labor productivity” (Kokko, 1994). γ
estimates spillovers. If it has significant positive value, spillover from the foreign presence on
domestic productivity are concluded.
As argued in earlier studies, there is a possibility that foreign investors are attracted to industries
with higher labor productivity. Therefore, the observed correlation between foreign presence and
domestic productivity may overestimate the positive impact of the foreign sector. The OLS estimator
can have an upward bias. Assuming that the unobserved characteristics of industries are time-
invariant, we use a fixed-effect estimation method to control for the bias. Since there might be a
possibility that unobserved factors do not affect domestic output, we also run random effect
estimations and do Hausman tests for the difference between fixed and random effect estimators.
The second purpose of the empirical study is to search for factors affecting the magnitude of
spillovers of foreign presence on domestic productivity. As presented before, this paper examines
the effects of the size of technology gap between foreign and domestic firms, industry characteristics
such as capital-intensive or labor-intensive and the domestic private firms’ linkage role. The proxy
chosen for the technology gap is productivity gap PRG, defined as the ratio of gross output per
employee in the foreign sector to that of the whole industrial sector (an observed technology gap).
Capital intensity proxy CAI is defined as capital-labor ratio of foreign sector in each industry. It
shows whether the industrial sector is labor-intensive or capital-intensive. The proxy for domestic
private activities PRI is defined as the percentage of domestic private sector’s output in the whole
industrial sector’s output. By including interaction terms of the above proxies and foreign presence
FOR into (1) regression, we can see whether these factors have an impact on spillover, which is
expressed as follows.
ititititdit
dit
dit
dit proxyFORFORGOV
LK
LY
ελγβαμ ++++⎟⎟⎠
⎞⎜⎜⎝
⎛+=⎟⎟
⎠
⎞⎜⎜⎝
⎛*lnln (5)
where proxy=(PRG, CAI, PRI). If the coefficient λ of the interaction term is significantly positive, it
is concluded that the factor enhances spillovers, and it restricts spillover if λ is significantly negative.
We use here the assumption that these proxies have virtually no impacts on other variables; however,
we also do estimation with interaction terms of proxy and other variables. As expressed above,
t h e technology gap is a condition for spillover effects but if it is too large, foreign firms may
crowd out domestic enterprises. Hence, the impact of the technology gap is ambiguous. A trend in
Vietnam’s industry labor-intensive industrial sectors is that they are often export-oriented, hence
these sectors are comparatively efficient and at a high technological level compared to other sectors.
This implies that the spillover effects of foreign presence are greater in favor of labor-intensive
industries compared to capital-intensive ones; thus the coefficient of interaction term for CAI is
expected to be negative. Finally, as discussed by Tran (2002) and other researchers, domestic private
firms have played a very important role of linkages between foreign and local technologies; private
firms determine the degree of technology transfer, and the coefficient of interaction term of PRI is
expected to be positive.
23
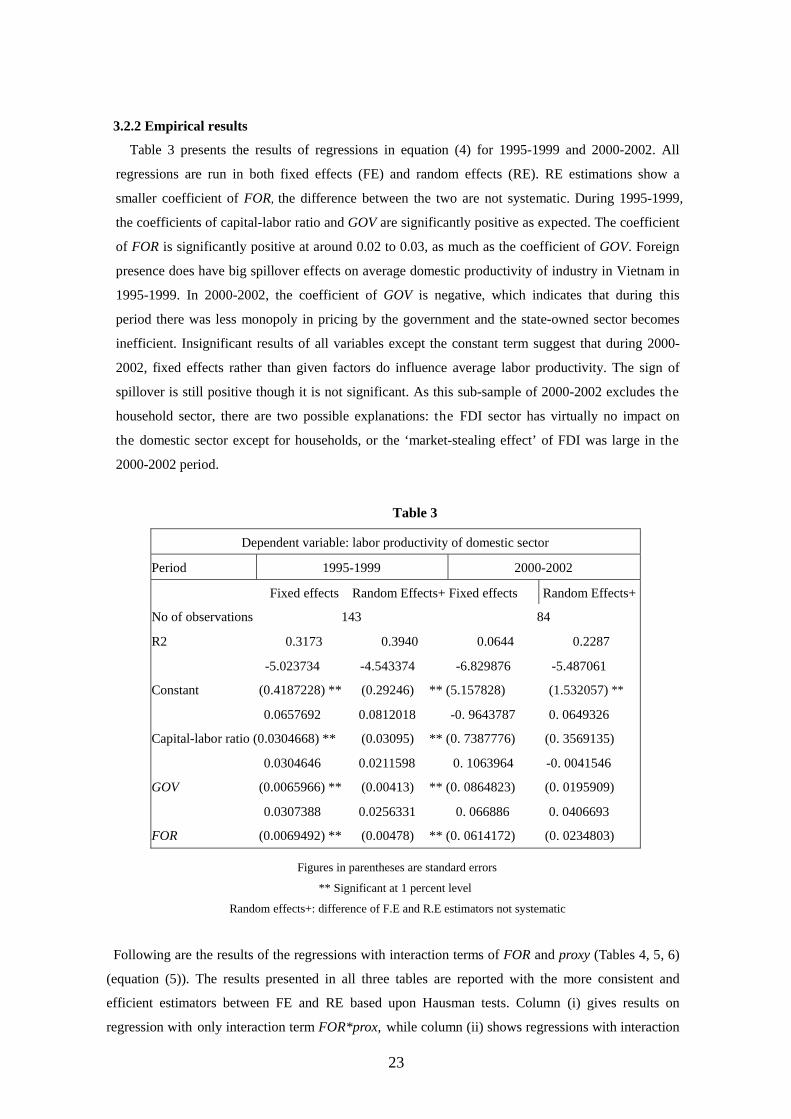
3.2.2 Empirical results
Table 3 presents the results of regressions in equation (4) for 1995-1999 and 2000-2002. All
regressions are run in both fixed effects (FE) and random effects (RE). RE estimations show a
smaller coefficient of FOR, the difference between the two are not systematic. During 1995-1999,
the coefficients of capital-labor ratio and GOV are significantly positive as expected. The coefficient
of FOR is significantly positive at around 0.02 to 0.03, as much as the coefficient of GOV. Foreign
presence does have big spillover effects on average domestic productivity of industry in Vietnam in
1995-1999. In 2000-2002, the coefficient of GOV is negative, which indicates that during this
period there was less monopoly in pricing by the government and the state-owned sector becomes
inefficient. Insignificant results of all variables except the constant term suggest that during 2000-
2002, fixed effects rather than given factors do influence average labor productivity. The sign of
spillover is still positive though it is not significant. As this sub-sample of 2000-2002 excludes the
household sector, there are two possible explanations: the FDI sector has virtually no impact on
the domestic sector except for households, or the ‘market-stealing effect’ of FDI was large in the
2000-2002 period.
Table 3
Dependent variable: labor productivity of domestic sector Period 1995-1999 2000-2002
Fixed effects Random Effects+ Fixed effects Random Effects+ No of observations 143 84
R2 0.3173 0.3940 0.0644 0.2287
-5.023734 -4.543374 -6.829876 -5.487061
Constant (0.4187228) ** (0.29246) ** (5.157828) (1.532057) **
0.0657692 0.0812018 -0. 9643787 0. 0649326
Capital-labor ratio (0.0304668) ** (0.03095) ** (0. 7387776) (0. 3569135)
0.0304646 0.0211598 0. 1063964 -0. 0041546
GOV (0.0065966) ** (0.00413) ** (0. 0864823) (0. 0195909)
0.0307388 0.0256331 0. 066886 0. 0406693
FOR (0.0069492) ** (0.00478) ** (0. 0614172) (0. 0234803) Figures in parentheses are standard errors
** Significant at 1 percent level
Random effects+: difference of F.E and R.E estimators not systematic
Following are the results of the regressions with interaction terms of FOR and proxy (Tables 4, 5, 6)
(equation (5)). The results presented in all three tables are reported with the more consistent and
efficient estimators between FE and RE based upon Hausman tests. Column (i) gives results on
regression with only interaction term FOR*prox, while column (ii) shows regressions with interaction
24
terms of all variables.
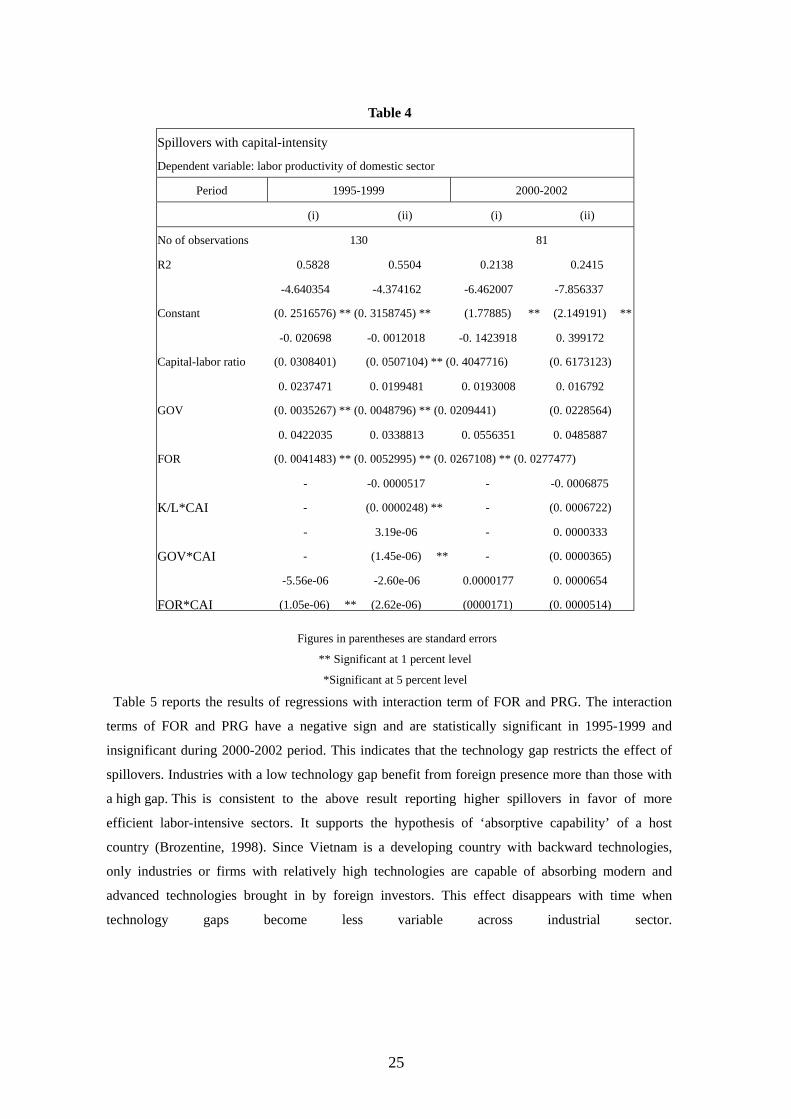
Table 4 presents the results of regression with interaction term of FOR and CAI. The results in both
equations (i) and (ii) shows a significantly negative sign of the interaction term FOR*CAI during
1995-1999. It shows that the spillovers of FDI on the domestic sector are bigger in labor-intensive
industries and smaller in capital-intensive ones. This supports the hypothesis that spillovers are
bigger in industrial sectors with smaller gap between FDI and domestic firms. However, an
insignificant negative sign of the interaction term is found as for 2000-2002. It can be inferred
that in Vietnam, across time, domestic firms in capital-intensive sectors can achieve high
technologies so that the gap between them and their foreign competitors becomes not too big
compared to that in labor-intensive ones, there is no significant difference in spillover between these
two types of industrial sectors.
25
Table 4
Spillovers with capital-intensity Dependent variable: labor productivity of domestic sector
Period 1995-1999 2000-2002 (i) (ii) (i) (ii)
No of observations 130 81 R2 0.5828 0.5504 0.2138 0.2415
-4.640354 -4.374162 -6.462007 -7.856337 Constant (0. 2516576) ** (0. 3158745) ** (1.77885) ** (2.149191) **
-0. 020698 -0. 0012018 -0. 1423918 0. 399172 Capital-labor ratio (0. 0308401) (0. 0507104) ** (0. 4047716) (0. 6173123)
0. 0237471 0. 0199481 0. 0193008 0. 016792 GOV (0. 0035267) ** (0. 0048796) ** (0. 0209441) (0. 0228564)
0. 0422035 0. 0338813 0. 0556351 0. 0485887 FOR (0. 0041483) ** (0. 0052995) ** (0. 0267108) ** (0. 0277477)
- -0. 0000517 - -0. 0006875 K/L*CAI - (0. 0000248) ** - (0. 0006722)
- 3.19e-06 - 0. 0000333 GOV*CAI - (1.45e-06) ** - (0. 0000365)
-5.56e-06 -2.60e-06 0.0000177 0. 0000654 FOR*CAI (1.05e-06) ** (2.62e-06) (0000171) (0. 0000514)
Figures in parentheses are standard errors
** Significant at 1 percent level
*Significant at 5 percent level
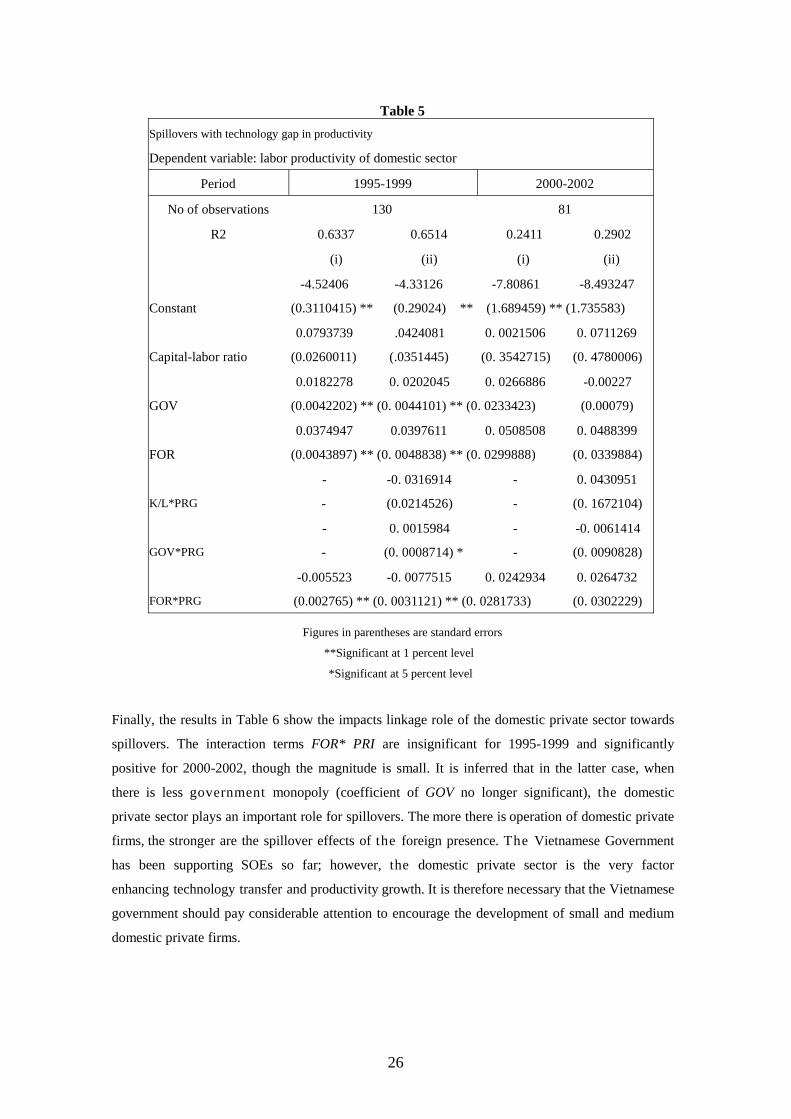
Table 5 reports the results of regressions with interaction term of FOR and PRG. The interaction
terms of FOR and PRG have a negative sign and are statistically significant in 1995-1999 and
insignificant during 2000-2002 period. This indicates that the technology gap restricts the effect of
spillovers. Industries with a low technology gap benefit from foreign presence more than those with
a high gap. This is consistent to the above result reporting higher spillovers in favor of more
efficient labor-intensive sectors. It supports the hypothesis of ‘absorptive capability’ of a host
country (Brozentine, 1998). Since Vietnam is a developing country with backward technologies,
only industries or firms with relatively high technologies are capable of absorbing modern and
advanced technologies brought in by foreign investors. This effect disappears with time when
technology gaps become less variable across industrial sector.
26
Table 5
Spillovers with technology gap in productivity Dependent variable: labor productivity of domestic sector
Period 1995-1999 2000-2002 No of observations 130 81
R2 0.6337 0.6514 0.2411 0.2902
(i) (ii) (i) (ii)
-4.52406 -4.33126 -7.80861 -8.493247
Constant (0.3110415) ** (0.29024) ** (1.689459) ** (1.735583)
0.0793739 .0424081 0. 0021506 0. 0711269
Capital-labor ratio (0.0260011) (.0351445) (0. 3542715) (0. 4780006)
0.0182278 0. 0202045 0. 0266886 -0.00227
GOV (0.0042202) ** (0. 0044101) ** (0. 0233423) (0.00079)
0.0374947 0.0397611 0. 0508508 0. 0488399
FOR (0.0043897) ** (0. 0048838) ** (0. 0299888) (0. 0339884)
- -0. 0316914 - 0. 0430951
K/L*PRG - (0.0214526) - (0. 1672104)
- 0. 0015984 - -0. 0061414
GOV*PRG - (0. 0008714) * - (0. 0090828)
-0.005523 -0. 0077515 0. 0242934 0. 0264732
FOR*PRG (0.002765) ** (0. 0031121) ** (0. 0281733) (0. 0302229) Figures in parentheses are standard errors
**Significant at 1 percent level
*Significant at 5 percent level
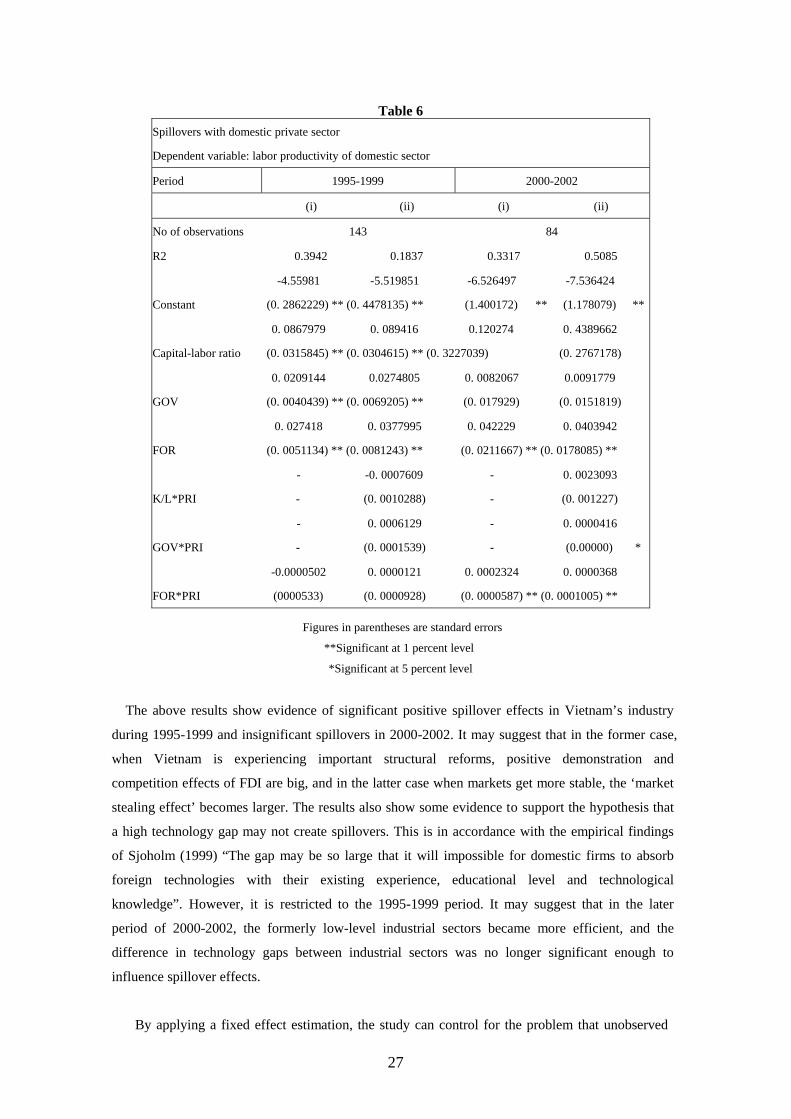
Finally, the results in Table 6 show the impacts linkage role of the domestic private sector towards
spillovers. The interaction terms FOR* PRI are insignificant for 1995-1999 and significantly
positive for 2000-2002, though the magnitude is small. It is inferred that in the latter case, when
there is less government monopoly (coefficient of GOV no longer significant), the domestic
private sector plays an important role for spillovers. The more there is operation of domestic private
firms, the stronger are the spillover effects of the foreign presence. The Vietnamese Government
has been supporting SOEs so far; however, the domestic private sector is the very factor
enhancing technology transfer and productivity growth. It is therefore necessary that the Vietnamese
government should pay considerable attention to encourage the development of small and medium
domestic private firms.
27
Table 6 Spillovers with domestic private sector Dependent variable: labor productivity of domestic sector Period 1995-1999 2000-2002
(i) (ii) (i) (ii) No of observations 143 84 R2 0.3942 0.1837 0.3317 0.5085
-4.55981 -5.519851 -6.526497 -7.536424 Constant (0. 2862229) ** (0. 4478135) ** (1.400172) ** (1.178079) **
0. 0867979 0. 089416 0.120274 0. 4389662 Capital-labor ratio (0. 0315845) ** (0. 0304615) ** (0. 3227039) (0. 2767178)
0. 0209144 0.0274805 0. 0082067 0.0091779 GOV (0. 0040439) ** (0. 0069205) ** (0. 017929) (0. 0151819)
0. 027418 0. 0377995 0. 042229 0. 0403942 FOR (0. 0051134) ** (0. 0081243) ** (0. 0211667) ** (0. 0178085) **
- -0. 0007609 - 0. 0023093 K/L*PRI - (0. 0010288) - (0. 001227)
- 0. 0006129 - 0. 0000416 GOV*PRI - (0. 0001539) - (0.00000) *
-0.0000502 0. 0000121 0. 0002324 0. 0000368 FOR*PRI (0000533) (0. 0000928) (0. 0000587) ** (0. 0001005) **
Figures in parentheses are standard errors
**Significant at 1 percent level
*Significant at 5 percent level
The above results show evidence of significant positive spillover effects in Vietnam’s industry
during 1995-1999 and insignificant spillovers in 2000-2002. It may suggest that in the former case,
when Vietnam is experiencing important structural reforms, positive demonstration and
competition effects of FDI are big, and in the latter case when markets get more stable, the ‘market
stealing effect’ becomes larger. The results also show some evidence to support the hypothesis that
a high technology gap may not create spillovers. This is in accordance with the empirical findings
of Sjoholm (1999) “The gap may be so large that it will impossible for domestic firms to absorb
foreign technologies with their existing experience, educational level and technological
knowledge”. However, it is restricted to the 1995-1999 period. It may suggest that in the later
period of 2000-2002, the formerly low-level industrial sectors became more efficient, and the
difference in technology gaps between industrial sectors was no longer significant enough to
influence spillover effects.
By applying a fixed effect estimation, the study can control for the problem that unobserved
28
time-invariant factors of industrial sectors may influence the incentive of FDI operation; therefore,
it may cause biased estimation. However, further estimation should be made if the assumption is
relaxed, i.e., unobserved sectoral factors such as production efficiency are time-variant. A 2SLS
estimation with investment of domestic firms used as an instrumental variable can probably
control for this bias (We could not do this in the study as we were not able to acquire this kind of
data). The omission of labor quality in the regressions may cause a bias since there is a
possibility that it is correlated with FOR. In addition, as the data employed are at aggregate
industry level, even with a positive spillover of FDI on the domestic sector’s productivity, it can
not be concluded that MNCs’ operation does make a positive impact on the productivity of
domestic firms. There is a possibility that with the entry of foreign firms, inefficient domestic
firms will go bankrupt or get out of the market, leaving only efficient firms in the market and
making the average productivity higher even there is no spillover of the FDI. Finally, this paper
does study on factors influencing spillover effects on the demand side (characteristics of
industry in Vietnam); however, factors on the supply side, such as origin country of FDI,
incentives for projects, and ownership structure of FDI can also have an impact on spillovers.
This aspect and the above restrictions are left for future research. 3.2.3 Policy implications
Empirical study suggests that spillover effects from FDI in Vietnam were greater in the
period just after the country’s reform policy, and in the later period it may be that the market-
stealing effect becomes larger. There may be more competition created by FDI in later periods.
However, this effect may be only contemporary, and spillovers may turn positive again if
domestic sectors develop well enough to be able to compete with the foreign sector and take
advantage of the advanced technologies, know-how, and skills introduced to the country through
FDI. The presence of foreign investors is good for the country, the question is how to support and
develop domestic sectors.
The empirical evidence also supports the argument that the domestic private sector has been
playing a crucial role in technological transfer from FDI to domestic production. The analysis is
restricted to spillover effects on the total domestic sector; a stronger effect is expected if we
exclude SOEs from domestic sector. As discussed by Tran (2002) and Ohno (2003), the
interaction of domestic private and foreign-owned firms has been the technological linkage for
spillovers. It is the small and medium enterprises that have more contacts with foreign-owned
firms and react more to the markets, and hence bring about more changes. The argument may be
strengthened if we study inter-industry spillovers. Therefore, it is suggested that the government
should develop more policies encouraging the domestic private sector. At present, the domestic
private sector is still unbeneficial in terms of tax regimes and access to loans from state banks,
these institutions should be abolished, and an equal investment environment for state and
private producers should be created and protected. In addition, policies strengthening linkages
between domestic and foreign sectors, such as local content requirements in the automobile
29
industry, should be spread widely. 4. Concluding remarks
FDI has been considered to be the engine growth for developing countries. FDI flows to
Vietnam have been increasing dramatically since the issue of the Law of Foreign Direct
Investment (LFI) in 1988. FDI has been a major concern in the research of Vietnamese
economists and politicians. However, most of the existing studies concentrate on the objective and
subjective factors and institutions attracting FDI to Vietnam. This paper studies the impacts of FDI
on Vietnam’s economy, particularly the technological spillovers effects brought in by MNCs.
Focusing on the spillover effects of FDI, two approaches were employed: the first an indirect
approach analyzing recent trends and characteristics of FDI and Vietnam’s economy and industry
and the second doing empirical work using industry-level panel data for 29 industrial sectors
during the 1995-1999 and 2000-2002 periods. In addition to the attempts to estimate whether
and to what extent there has been a spillover effect of current FDI on the industries, the empirical
study also attempts to find out what characteristics of industries influence the degree of spillovers,
and thereby suggest several policy implications to enhance spillover effects of FDI.
Although the value of FDI inflows to the country decreased in 1997-1998 owing to the
regional currency crisis, FDI has quickly recovered since 1999 and contributed a great deal to the
growth of the country. FDI has complemented insufficient domestic investments for enlarging
production, helped to reduce government budget deficits, contributed to rising exports to
international markets and increased employment, and with advanced technologies and know-how
embodied in the capital, FDI has been discussed as having a long-term effect of contributing
significantly to the growth of productivity in Vietnam’s industries. There is a tendency for the
enlargement of FDI to go along with the development of domestic sectors, suggesting a positive
spillover from FDI. The empirical study shows that spillovers were significantly positive during
1995-1999 and insignificantly positive in 2000-2002. The results also indicate that technology
restricted spillover effects in the earlier period but has no effect in the later years. The findings
support the argument that the domestic private sector plays a crucial role in spreading out spillovers
from FDI. This suggests that policies strengthening the growth of private sectors should be
promoted to enhance the spillover effects of FDI. However, it should be pointed out that
despite of the findings, the results and implications of the study is still restricted due to the
unavailability of data. These questions are left for further study.
30
References Aitken, Brian, and Ann Harrison (1999), “Do Domestic Firms Benefit from Direct Foreign
Investment? Evidence from Venezuela,” American Economic Review, Vol. 89, No. 3, pp. 605-
618.
Barrios, Salvador (1997) “Foreign Direct Investment and Productivity Spillovers Evidence from the
Spanish Experience,” University of Manchester.
Blomström, Magnus and H. Persson (1983) “Foreign Investment and Spillover Efficiency in an
underdeveloped Economy: Evidence from the Mexican Manufacturing Industry,” World
Development, Vol. 11, pp. 493-501.
Blomström, Magnus, Robert E. Lipsey and Ksenia Kulchycky (1988) “US and Swedish Direct
Investment and Exports,” in Baldwin, Robert E. (ed.), Trade Policy Issues and Empirical Analysis,
University of Chicago Press, pp 259-297.
Blomström, Magnus and Ari Kokko (1997) “Regional Integration and Foreign Direct Investment,”
NBER Working Paper, no. 6019, National Bureau of Economic Research, US: Mass.
Blomström, and Edward N. Wolff (1994) “Multinational Corporations and Productivity
Convergence in Mexico,” in William Baumol, Richard Nelson, and Edward.
Borensztein E. et al. (1998) “How does foreign direct investment affect economic growth? ”
Journal of International Economics, Vol 45, 115-135.
Bui, Tuan (2004) “Viet Nam.” In D. Brooks and H. Hill, eds., Managing FDI in a Globalizing
Economy. London: Palgrave Macmillan.
Caves, Richard E. (1974) “Multinational Firms, Competition, and Productivity in Host-Country
Markets,” Economica, Vol. , May.
Caves, Richard E. (1996) “Multinational Enterprise and Economic Analysis,” Second Edition,
Cambridge Surveys of Economic Literature, Cambridge, Cambridge University Press.
Dapice, D. (2003) “Vietnam’s Economy: Success Story or Weird Dualism? A SWOT Analysis,”
Working Paper 2003-15, Department of Economics, Tufts University, Medford, Massachusetts.
Djankov, Simeon and Bernard Hoekman (1998), “Foreign Investment and Productivity Growth in
Czech Enterprises,” World Bank Economic Review.
Doanh, Le Dang (2002) “Foreign Direct Investment in Viet Nam: Results, Achievements,
Challenges and Prospects.” Paper prepared for the Conference on Foreign Direct Investment,
16-17 August, Hanoi.
Findlay, Ronald (1978) “Relative Backwardness, Direct Foreign Investment, and the Transfer of
Technology: A Simple Dynamic Model,” Quarterly Journal of Economics, Vol. 92, Issue 1, pp.
1-16.
Fosfuri, A., Motta, M. and T. Ronde (2001) “Foreign Direct Investment and Spillovers
through workers’ mobility,” Journal of International Economics, Vol. 53, 205-222.
Freeman, N. J. (2002) “Foreign Direct Investment in Vietnam: An Overview.” Paper prepared for
the DFID Workshop on Globalisation and Poverty Reduction in Vietnam, 23-24 September,
Hanoi.
Girma, Sourafel, David Greenaway, and Katherine Wakelin (2001), “Who Benefits from Foreign
31
Direct Investment in the UK?” Scottish Journal of Political Economy, Vol. 48, No. 2, pp.
119-133.
Glass, Amy J. and Kamal Saggi (1998) “International Technology Transfer and the Technology
Gap,” Journal of Development Economics, Vol. 55, pp. 369-398.
Globerman, Steven (1979) “Foreign Direct Investment and ‘Spillover’ Efficiency Benefits in
Canadian Manufacturing Industries,” Canadian Journal of Economics, Vol. XII, No. 1.
Görg, Holger and Eric Strobl. 2001. “Multinational Companies and Productivity Spillovers: A
Meta-Analysis,” The Economic Journal, Vol. 111,pp. 723-39.
GSO (2003) “Statistical Yearbook 2002,” Hanoi: General Statistical Office.
GSO (2004) “Statistical Yearbook 2003,” Hanoi: General Statistical Office.
GSO (2004) “The real situation of enterprises through the results of surveys conducted in 2001,
2002, 2003,” Hanoi: General Statistical Office.
Haddad, Mona, and Ann Harrison (1993) “Are There Positive Spillovers from Direct Foreign
Investment?” Journal of Development Economics, Vol. 42, pp. 51-74.
Institute of World Economy-IDRC/CIDA Project (2002), “FDI and Development of Manufacturing
Industries in Vietnam,” Hanoi.
International Monetary Fund, 2002. Vietnam: Selected Issues and Statistical Appendix. IMF Country
Report No. 02/5, International Monetary Fund, Washington, D.C.
Kokko, Ari (1994) “Technology, Market Characteristics, and Spillovers, “Journal of
Development Economics,” Vol. 4, pp. 279-293.
Kokko, Ari (1998) “Vietnam: Ready for Doi Moi II?” SSE/EFI Working Paper Series in Economics
and Finance No.286, Stockholm.
Kokko Ari, Mario Zejan, and Ruben Tansini (2001) “Trade Regimes and Spillover Effects of FDI:
Evidence from Uruguay,” Weltwirtschaftliches Archiv, Vol. 137, No.1, pp. 124-149.
Konings, J. (2001) “The Effects of Foreign Direct Investment on Domestic Firms: Evidence from
Firm- Level Panel Data in Emerging Economies,” Economics of Transition, Vol. 9 (3), pp.
619-633.
Leproux, Vttorio and Brooks, Douglas H. (2004) “Vietnam: Foreign Direct Investment and
Post-Crisis Regional Integration,” ERD Working Paper No. 56.
Lipsey, Robert E. and Sjöholm, Freddrik (2004) “Host Country Impacts of Inward FDI: Why such
different answers?” Working Paper No. 192. Mc Carty, A., and T. T. N. Diep (2003) “Between Integration and Exclusion—The Impact of
Globalisation on Developing Countries: The Case of Vietnam.” Mekong Economics, Hanoi.
Pain, Nigel and Wakelin, Katharine (1997) “Export Performance and the role of Foreign Direct
Investment,” National Institute of Economic and Social Research and Maastricht Economic
Research Institute on Innnovation and Technology.
Pfaffermayr, M. (1996) “Foreign Outward Direct Investment And Exports In Austrian
Manufacturing: Substitutes Or Complements?, Weltwirtschaftliches Archiv, Vol.132.
Rodriguez-Clare, Andres (1996) “Multinationals, linkages, and economic development,”
32
American Economic Review, Vol. 85, pp. 852-73.
Quynh, P., H. Nguyen, and T. Bui (2002) “A Study of Trade, Foreign Direct Investment and Labour
in Vietnam,” Mekong Economics, Hanoi.
Sinani, Evis and Klaus Meyer (2002) “Identifying Spillovers of Technology Transfer from FDI: The
case of Estonia,” Centre for East European Studies, Copenhagen Business School.
Sjöholm, Fredrik (1999) “Technology Gap, Competition and Spillovers from Foreign Direct
Investment: Evidence from Establishment Data,” Journal of Developme nt Studies, Vol.36, No. 1,
pp. 53-73.
Smarzynska, Beata K (2002) “Does Foreign Direct Investment Increase the Productivity of
Domestic Firms? In Search of Spillovers through Backward Linkages,” World Bank Policy
Research Working Paper 2923.
Svensson, Roger (1993) "Production in Foreign Affiliates- Effects on Home Country Exports and
Modes of Entry." Licentiate Thesis, Gothenburg University.
Svensson, Roger (1996) “Effects of Overseas Production on Home Country Exports: Evidence
Based on Swedish Multinationals, Weltwirtschaftliches Archiv Vol. 132, pp. 304–29. Swedenborg,
Birgitta (1979) “The Multinational Operations of Swedish Firms” Stockholm The I ndustrial
Institute for Economic and Social Research.
Tran, Ngoc Ca (1999) “Technological Capability and Learning in Firms: Vietnamese Industries in
Transition,” Aldershot: Ashgate Publishing.
Tran, Ngoc Ca (2002) “Learning Technological Capabilities for Vietnam’s Industrial Upgrading:
Challenges of Globalization,” Working Paper 165, National Institute for Science and Technology
Policy and Strategy Studies and Stockholm School of Economics.
UNCTAD. (2004) “Foreign Direct Investment Database,” United Nations, New York.
UNIDO/DSI (1999), “Industrial Competitiveness Review”, Final Report. Hanoi.
Wang, J.Y., and Magnus Blomström (1992) “Foreign Investment and Technology Transfer: A
Simple Model,” European Economic Review, Vol. 36, pp. 137-155.
Yudaeva, K., K. Kozlov, N. Melentieva and N. Ponomareva (2000) “Does Foreign
Ownership Matter? Russian Experience,” CEFIR Working Paper No.1.