distribution of canadian rocky mountain wetlands impacted by beaver
TRANSCRIPT

ORIGINAL RESEARCH
Distribution of Canadian Rocky MountainWetlands Impacted by Beaver
Alasdair Morrison & Cherie J. Westbrook &
Angela Bedard-Haughn
Received: 26 May 2014 /Accepted: 17 October 2014# Society of Wetland Scientists 2014
Abstract Mountain wetlands, although limited in their spatialextent, provide many important hydrological and ecologicalservices. There is a need to know existing beaver habitationpatterns across mountain wetlands because of emerging inter-est in using beaver to restore and protect riparian and wetlandhabitats. However, there exist few inventories of wetlands, ortheir use as beaver habitat, for any mountain region of NorthAmerica. We studied the distribution of beaver-impacted min-eral wetlands and peatlands in a 7,912 km2 area of theCanadian Rocky Mountains. Using aerial photography andan existing wetland database, we inventoried 529 wetlands atelevations of 1,215 to 2,194 m; peat soils were found at 69 %of the 81 field verified wetlands. Wetland distribution andbeaver habitation varied by physiography and jurisdiction.While 75 % of the wetlands identified were located in thefoothills region, beaver were twice as likely to inhabit those inthe mountain region owing to differences in land use activitiesand wildlife conservation measures. Wetlands inhabited bybeaver had an order of magnitude greater area of open waterand 12 times the number of individual open water featuresthan those without. Beaver-enhanced open water extent hasfar-reaching consequences for wetland ecohydrological andbiogeochemical functioning.
Keywords Castor canadensis . Ecohydrology . OpenWater .
Peatlands .MineralWetlands . Inventory
Introduction
Beaver (Castor canadensis and C. fiber) have long beenrecognized as agents of hydrogeomorphic and ecologicalchange, owing largely to their dam building abilities(Gurnell 1998). Although best known for building damsacross streams that create and maintain wetland conditionsin riparian areas (Westbrook et al. 2006), beaver can alsoinhabit pre-existing wetlands, including peatlands (Johnston2012). The beaver population is believed to be rebounding inNorth America due to conservation measures (Gibson andOlden 2014). Climate change may also increase the beaverpopulation; Jarema et al. (2009) predicted that the beaverpopulation would respond to a warmer future climate with amodest range expansion a substantial increase in density in therange interior (Jarema et al. 2009). Other factors that affect theNorth American beaver population include new re-introduction efforts geared toward using beaver as a tool forwetland restoration (Conover 2011) and water management(Törnblom et al. 2011), particularly in North America's watertowers, the Rocky Mountains (Baldwin 2013; Pollock et al.2014). Information on existing beaver pond density is there-fore desirable (Butler 2012), but unfortunately, there exist fewinventories of wetlands (Chimner et al. 2010), or their use asbeaver habitat, for any mountain region of North America.The purpose of this research is thus to better understand howbeaver modify the environment by evaluating the distributionand abundance of beaver ponds in mineral wetlands andpeatlands across varying land management jurisdictions inthe Northern Rocky Mountains.
Evaluating wetland extent and distribution in the moun-tains is challenging because a wide range of wetland typesoccurs over very short distances. This is because thesupporting hydrological characteristics can change at smallspatial scales owing to variations in topography, geology andgeochemistry (Cooper et al. 2012). Although there has yet to
A. Morrison : C. J. Westbrook (*)Centre for Hydrology and Department of Geography and Planning,University of Saskatchewan, Saskatoon, SK S7N 5C8, Canadae-mail: [email protected]
A. Bedard-HaughnDepartment of Soil Science, University of Saskatchewan, Saskatoon,SK S7N 5A8, Canada
WetlandsDOI 10.1007/s13157-014-0595-1

be a systematic inventory of wetland distribution in the RockyMountains as a whole, it is estimated that they make up 2% ofthe land cover, with peatlands being the most common wet-land type (Cooper et al. 2012). Inventories of peatlands inselect areas of the Rocky Mountains have been conducted atboth fine (Chadde et al. 1998; Chimner et al. 2010) and coarse(Vitt et al. 1996; Halsey et al. 1997; Zoltai et al. 2000) spatialscales, using aerial or satellite imagery. These inventoriescommonly report the presence of beaver ponds (Cooperet al. 2012), despite reports in the literature of peatlands beingmarginal beaver habitat (Rebertus 1986; Pastor et al. 1993).
Beaver can dam stream channels in both mineral wetlandsand peatlands (Watters and Stanley 2007; Janzen andWestbrook 2011), but they do not require channels to builddams (Racine and Walters 1994; Walbridge 1994). Wherechannelized surface drainage is lacking, beaver dredge canalsand dam groundwater seepage (Mitchell and Niering 1993).This causes anchored mat vegetation to be eliminated orpartially sheared, thereby resulting in open water formation(Ray et al. 2001; Cunningham et al. 2006). The tight arrange-ment of small branches in beaver dams, as compared to debrisdams, is an architecture that further promotes upstreampooling of water at the land surface (Bisson et al. 2006). Anincrease in open water can fundamentally modify wetlandstructure and function, through affecting processes such aswater storage-runoff relations (Tardif et al. 2009), water tabledynamics (Janzen and Westbrook 2011) and carbon accumu-lation rates (Blodau 2002) at the local (Wieder et al. 1981) orregional scale (Rebertus 1986). Modification to wetland struc-ture and function by beaver may be temporally persistent(Gorham et al. 2007) because dams and ponds in wetlandsare less prone to washout than those in riverine environmentsdue to the flowing water having less energy (Ray et al. 2001).As a result, ponds could remain in a stable state in mineralwetlands and peatlands for centuries (Westbrook et al. 2013).The objectives of this research are to: 1) determine the distri-bution and abundance of mineral wetlands and peatlands inthe Northern Rocky Mountains; 2) assess beaver habitationpatterns of these ecosystems; and 3) determine the impactbeaver activity has on one ecohydrologically important vari-able, open water extent.
Methods
Study Area
Wetland and beaver pond distributions were evaluated in a7,912 km2 area of the Canadian Rocky Mountains west ofCalgary, Alberta (Fig. 1). The study area consists of theentirety of Kananaskis Country (a series of protected areas –provincial parks and improvement areas), part of the Stoney-Nakoda First Nations reserve, and three Municipal Districts.
The boundary of the study area was determined by the avail-ability of recent (2007 and 2008) high-resolution aerial im-ages, and the geographical limit of the foothills region. It isbordered to the west by Banff and Jasper National Parks. Thestudy area forms the western margin of the Western Canadasedimentary basin and is therefore geologically complex. Thestrata (sandstone, limestone, shale and dolomite) are foldedand faulted, range in age from Cambrian to Cretaceous (Toopand de la Cruz 2002), and are covered by glacial, lacustrineand fluvial materials (Gignac et al. 1991).
Elevation of the study area ranges from 1,161 to 3,427 m,with the highest areas occurring in the Kananaskis Range inthe south. The mountain region is characterized by glaciatedU-shaped valleys, with tarns, cirques and moraines at higherelevations and valleys bisected by rivers at lower elevations.Land use activities are restricted across the entire mountainregion, with uses such as forest harvesting permitted in theImprovement Districts but not the Provincial Parks. The foot-hills region is characterized by a rolling topography and morevaried land uses, such as ranching, recreational vehicle use,and forestry.
Beaver were extensively trapped in the study area from the1790s through the mid-1800s, with several fur trading out-posts on the nearby Bow (Peigan Post), Kootenay (KootenaePost) and North Saskatchewan (Rocky Mountain House) riv-ers (Moore 2012). The history of fur trading with the Ktuxana,Piikani, and Niitsitapi First Nations indicates that there was anabundant beaver population into at least the beginning of the1800s (Moore 2012). Aerial photography from 1949 showsno evidence of beaver activity in the study area; however, inthe 1970s, there was abundant evidence in the images, sug-gesting that the beaver population rebounded in the 1950s and1960s.
Wetland Identification and Mapping
Inventorying of wetlands in the study area involved both ageneral analysis of the 2007 and 2008 aerial photographyimagery (scale 1:30,000 in nearly all instances) within ageographic information system (GIS) and field verificationof a subset of the GIS identified wetlands. The 2007 imageswere taken in October, and contained 202 of the wetlands. The2008 images were taken between mid-August and mid-September, and contained 327 of the wetlands. Wetlandshapefiles available from the National Topographic Database(NTDB; Natural Resources Canada) were used as a startingpoint for the GIS wetland delineation. The wetland NTDBshapefiles are a summary of data gathered between 1972 and1996. Owing to the fact that the metadata for this GIS layer didnot describe the method by which it was produced, the wet-land shapefile was overlain on the 2007 and 2008 aerialimagery and manually inspected to ensure that it did coincidewith apparent wetland features. This assessment revealed that
Wetlands

the majority of the wetland polygons coincided with apparentwetlands on the aerial images as assessed manually. Theaccuracy of the shapefiles in depicting wetland location wasalso assessed during field verification, where 100 % of wet-land sites identified from the shapefiles proved to be wetlandson the ground. We recorded the UTM coordinates of thewetland centroid, wetland area, physiographic region andjurisdiction. The smallest wetland identified in the GIS anal-ysis was 0.2 ha; however, many wetlands smaller than thiswere observed during the field verification.
To distinguish peatlands from mineral wetlands, soil or-ganic composition and peat thickness were measured duringthe field verification stage using cores. The distinction be-tween peat and mineral soils was based on soil organic mattercontent by mass, where peat has >30% organic matter contentand >17 % organic carbon content (Soil Classification
Working Group, 1998). In each field-verified wetland, multi-ple cores (up to 10) were collected using a Russian corer(50 cm in length). The sampling location with the thickestpeat deposit was used for organic matter analysis; samples ofthe top 40-cm from the core were sealed on-site in polypro-pylene bags and refrigerated within 10 h until lab analysis.Samples were dried at 105 °C for 24 h, homogenized, andsubsampled. Subsamples were burned in a muffle furnace at500 °C for 5 h to determine the percentage of organic matter.We broadly defined peatlands as both wetlands that were truepeatlands (i.e. had at least 40 cm of peat; Soil ClassificationWorking Group (1998)) and wetlands that were peat-forming,(i.e. had at least 20 cm of continuous peat in the surface40 cm). Although a wetland must technically have at least40 cm of peat to be considered a peatland, the sloping gradientcommon to mountain wetlands meant highly variable depths
Fig. 1 The 7,912 km2 study areain the Canadian RockyMountains, Alberta. Aerialimages are from 2007 and 2008;linear grey features are roads
Wetlands

to peat within a single wetland. This variability wascompounded by interbedded mineral material in a peat matrix,which was found in many of the wetlands.
Assessment of Wetlands as Beaver Habitat
All delineated wetlands were assessed for evidence of beaverhabitation by visually inspecting the aerial images. Two basicidentifiers were used: 1) wetlands with ponds that had clearindications of being created by beaver because of identifyingfeatures such as dams (linear structures), lodges (circularfeatures within ponds), and visible food caches; and 2) wet-lands with relict beaver structures that indicated past beaveractivity, but were not accompanied by the presence of pondedwater on the surface at the time that the image was taken.These structures included relict dams (broken linear struc-tures) and patches of relatively homogenous vegetation thatwere different than the surrounding area (see Wright et al.2003).
Field verification was performed for 15 % of the 529delineated wetlands at a ratio of 3:1 beaver impacted to non-beaver impacted wetlands. A ranked list of the 161 beaverimpacted wetlands identified on the aerial imagery was creat-ed in the database, as was a number of other metrics likeaccessibility by road, number of wetlands nearby, and acces-sibility during the usually wet summer conditions. Of the 129potential wetlands listed, 81 were visited between 1 July and20 August 2012.
The GIS analysis indicated that 59 of the wetlands hadrecent evidence of beaver impact and 22 did not. Field visitsshowed that of the 59 wetlands predicted to show beaverimpact, two were misidentified due to an oversight duringthe site selection phase, as confirmed by repeating the desktopmethods for those sites. Of the 22 wetlands predicted to showno clear evidence of beaver, 20 were correctly identified. Thetwo wetlands misidentified as not having evidence of beaverimpact were a result of relict features being small and over-grown, and the aerial imagery not having the necessary reso-lution for identification. Therefore, the GIS delineation wasmostly accurate, with limitations in photograph quality morelikely to lead to an underestimate of beaver impacted sitesrather than an overestimate.
Open Water
Polygons were manually digitized in ArcGIS for each wateropen water feature in each wetland using the aerial imagesfrom 2007 and 2008. Although the smallest identifiable wet-land in the GIS analysis was 0.2 ha, the smallest identifiablearea of open water within any identified wetland was 5 m2.Open water area for wetlands impacted and not impacted bybeaver activity was compared using theWilcoxon test becausedata were non-normal.
Results
Distribution and Abundance of Wetlands
Wetlands occurred at elevations between 1,215 m and 2,194 mthroughout the study area and those that were field verifiedoccurred at 1,286–1,968 m.Wetland distribution varied by bothphysiographic location and jurisdiction. The GIS inventory ofwetlands identified that of the 529 wetlands, 25 % were in themountain region and 75%were in the foothills region.Wetlanddensity in the study area was 0.067/ km2, but there was a cleardifference between the physiographic regions, with the moun-tains having a lower wetland density (0.026/ km2) than thefoothills (0.137/km2). Alberta Parks (0.020/ km2) andImprovement Districts (0.026/ km2) had lower wetland densitythan Municipal Districts (0.121/ km2) and First NationsReserves (0.146/ km2). The Municipal Districts contained thegreatest number of wetlands of all the jurisdictions.
We found peat soils at 69 % of the 81 field-verified wetlands(Fig. 2) at elevations of 1,286–1,889 m. Proportionally fewerwetlands in the mountains were peatlands (57 %) than in thefoothills (71%). The jurisdiction with the greatest proportion ofpeatlands was the Municipal Districts (75 %), which waslocated wholly in the foothills region (Table 1). Unfortunately,field verification for wetlands in the Stoney-Nakoda FirstNation was not possible as land access was not granted.
Wetlands as Beaver Habitat
Beaver impacts were evident in 30 % of the wetlands identi-fied (Fig. 3) across nearly the entire elevation range (1,215–2,152 m; Fig. 4). Distribution of beaver-created features dif-fered by both physiographic and jurisdictional region(Table 1). In the mountain region, 43 % of wetlands hadevidence of beaver impact, whereas only 26 % of foothill
Fig. 2 Organic content of the top 50 cm of soil at each field verifiedwetland. Soils with an organic matter content of 30 % or greater wereconsidered peat
Wetlands
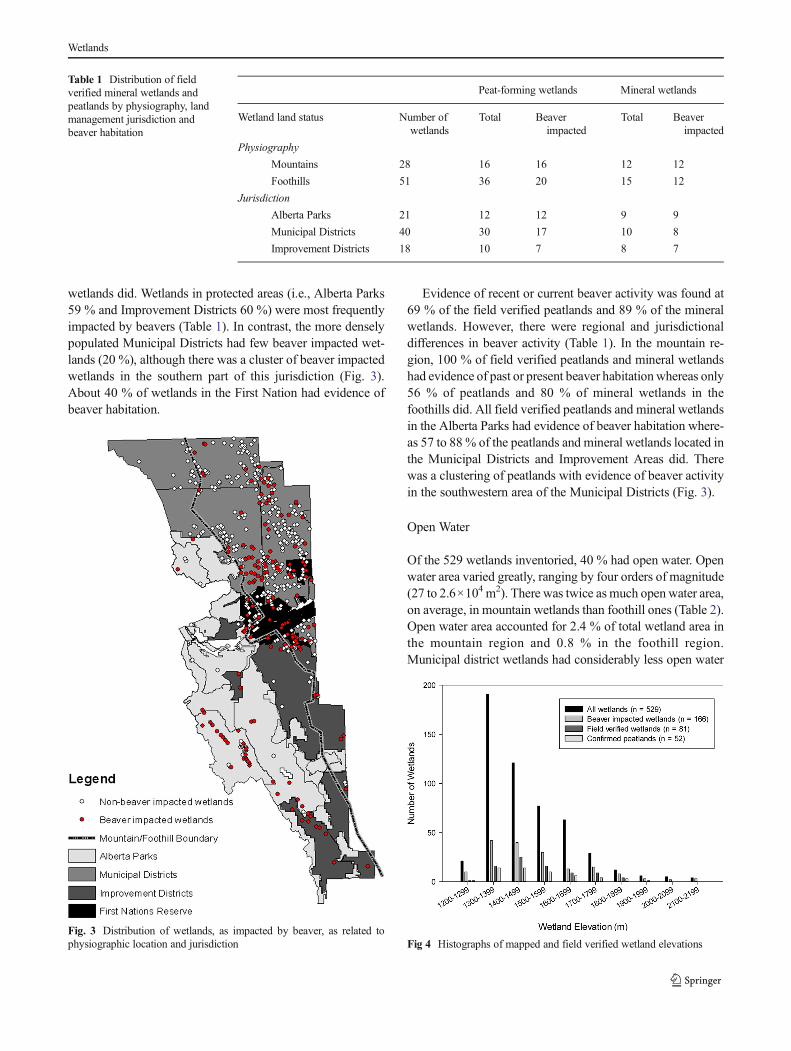
wetlands did. Wetlands in protected areas (i.e., Alberta Parks59 % and Improvement Districts 60 %) were most frequentlyimpacted by beavers (Table 1). In contrast, the more denselypopulated Municipal Districts had few beaver impacted wet-lands (20 %), although there was a cluster of beaver impactedwetlands in the southern part of this jurisdiction (Fig. 3).About 40 % of wetlands in the First Nation had evidence ofbeaver habitation.
Evidence of recent or current beaver activity was found at69 % of the field verified peatlands and 89 % of the mineralwetlands. However, there were regional and jurisdictionaldifferences in beaver activity (Table 1). In the mountain re-gion, 100 % of field verified peatlands and mineral wetlandshad evidence of past or present beaver habitationwhereas only56 % of peatlands and 80 % of mineral wetlands in thefoothills did. All field verified peatlands and mineral wetlandsin the Alberta Parks had evidence of beaver habitation where-as 57 to 88% of the peatlands and mineral wetlands located inthe Municipal Districts and Improvement Areas did. Therewas a clustering of peatlands with evidence of beaver activityin the southwestern area of the Municipal Districts (Fig. 3).
Open Water
Of the 529 wetlands inventoried, 40 % had open water. Openwater area varied greatly, ranging by four orders of magnitude(27 to 2.6×10⁴ m2). There was twice as much openwater area,on average, in mountain wetlands than foothill ones (Table 2).Open water area accounted for 2.4 % of total wetland area inthe mountain region and 0.8 % in the foothill region.Municipal district wetlands had considerably less open water
Table 1 Distribution of fieldverified mineral wetlands andpeatlands by physiography, landmanagement jurisdiction andbeaver habitation
Peat-forming wetlands Mineral wetlands
Wetland land status Number ofwetlands
Total Beaverimpacted
Total Beaverimpacted
Physiography
Mountains 28 16 16 12 12
Foothills 51 36 20 15 12
Jurisdiction
Alberta Parks 21 12 12 9 9
Municipal Districts 40 30 17 10 8
Improvement Districts 18 10 7 8 7
Fig. 3 Distribution of wetlands, as impacted by beaver, as related tophysiographic location and jurisdiction Fig 4 Histographs of mapped and field verified wetland elevations
Wetlands

area on average than the other jurisdictions owing to a greatertotal wetland area. Wetlands with beaver impact had signifi-cantly more (p<0.001) open water than those not impacted(Table 3). The number of individual open water features perwetland was 12 times higher on beaver impacted wetlandscompared to non-impacted ones (Table 3).
Discussion
We found that most of the wetlands inventoried in thisNorthern Rocky Mountain region were peatlands, and thatthere were differences in whether beaver used the wetlands ashabitat based on physiography and land status. Wetlands usedas beaver habitat had many more open water features thanthose not inhabited, which has wide-ranging implications forwetland form and functioning.
Distribution and Abundance of Wetlands
In the greater Kananaskis region of Alberta, wetlands occur ata density of 0.07/km2, with their distribution reflecting thephysiography of the landscape. In the mountain region, wet-lands tended to occur primarily in the major valleys, particu-larly those of the Spray Lakes, Upper Kananaskis andHighwood (see Fig. 1). Wetlands are common in valley bot-toms because this physiographic position lends itself to aconvergence of flow paths that can maintain wet conditions
at the near surface (Cole et al. 1997;Westbrook et al. 2006). Inthe foothills region, wetlands also occur in low-lying posi-tions, but these are more evenly distributed owing to therolling topography. Where the topography was steep in thefoothills, wetland density was lower.
Although we identified 529 wetlands in this inventory, itis likely that there are more wetlands in the study region,especially small ones. While the field verification showedthat the wetlands on the GIS layer were indeed wetlands outin the field, we observed a number of wetlands not capturedby the GIS data layer. There may be several reasons for this:i) these wetlands may have formed after the GIS layer wasproduced; ii) they may have been too small for the originalanalysis method to detect; or iii) they may have been ob-scured by trees or snow cover on the imagery used todevelop the GIS layer. Technology has developed since theGIS layer was created, which has improved the ability toremotely sense wetlands (Halabisky et al. 2013). The accu-racy of the manual wetland inventory in the United States,for example, was improved 25 % by using a 1-m LiDARbased DEM (Maxa and Bolstad 2009) in part becauseLiDAR can be used to detect wetlands obscured by theforest canopy (Lang and McCarty 2009). When LiDARbecomes available for the study area, wetland mappingshould be repeated to ensure this important ecological re-source is properly inventoried.
Our study provides a detailed estimate of the distribution ofindividual peatlands in the southern Canadian Rockies. We
Table 2 Area and abundance of open water in mapped wetlands for each physiographic location and jurisdiction
No. Wetlands No. wetlandswith open water
Total wetlandarea
Mean individualwetland area
Total openwater area
Mean openwater area
Physiographic location m2 x 105 m2 x 105 m2 x 1055 m2 x 103 SE
Mountains 133 75 130.75 0.99 3.10 2.31 0.29
Foothills 396 135 604.42 1.50 4.85 1.22 0.21
Total 529 210 735.59 1.4 7.92 1.50
Jurisdictional location
Alberta Parks 59 42 42.68 0.83 1.38 2.27 0.43
Municipal Districts 361 106 556.35 1.52 2.88 0.80 0.13
Improvement Districts 42 25 56.04 1.23 1.81 4.30 1.27
First Nations Reserve 67 30 81.14 1.36 1.85 5.00 0.57
Total 529 210 735.59 1.4 7.92 1.50
Table 3 Comparison of openwater area and number of indi-vidual open water features inbeaver impacted and non-impacted mapped wetlands
No.Wetlands
No. wetlandswith open water
Mean openwater area
No. Individualponds
SE
m2 × 103
Beaver impacted 166 147 3.9 782 0.47
Non-beaver impacted 363 63 0.4 155 0.12
Total 529 210 1.5 937
Wetlands

identified 77 % of the field-verified wetlands as peatlands orpeat forming wetlands. Our research complements Halseyet al.'s (1997) provincial peatland inventory and Zoltaiet al.'s (2000) national inventory by providing a regionallydense dataset. Extending our field results to the GIS inventoryindicates that ~397 of the 529 identified wetlands could bepeatlands. This is a much higher number than Chadde et al.(1998) reported for the Rocky Mountains in the northernUnited States (61 peatlands in Idaho, Washington, MontanaandWyoming). If the ecological value (in terms of uniquenessand ecosystem services) of peatlands presented in Chaddeet al. is similar for those in our study area, then the peatlandsof the greater Kananaskis region represent a substantial re-gional natural resource. Given the expansiveness of theCanadian Rockies, its peatland resource is likely to be large.
The challenges encountered while inventorying thepeatlands have important implications for relying solely onremote sensing imagery for this task, such as is the currenttrend (Krankina et al. 2008). We discovered out in the fieldthat wetlands that appear as peatlands at the land surface,based on their vegetation composition and wetness, had astratigraphy in the upper 40 cm that ranged from pure peatto heavily stratified with mineral layers; layers of pure peatand stratified peat were found not only in different wetlandsbut also often at different locations within the same wetland.Many of those heavily stratified ended up not meeting thecriteria of >17 % organic carbon by weight in the upper 40 cm(Soil Classification Working Group, 1998) and thus could notbe considered a peatland despite having many of the requisitefunctional characteristics.
Beaver Habitation Patterns
Beaver disturbance varied by wetland physiographic locationand jurisdiction. Even though there were fewer wetlands in themountain region, beaver impacts were twice as likely therethan the foothills region. While there could be a number ofcauses for this, the most likely one is differing priorities of themain land managers in each jurisdiction. The mountain areaconsists primarily of Improvement Districts and ProvincialParks whereas the foothills region consists primarily ofMunicipal Districts and a First Nations Reserve. None of thesejurisdictions have an official published policy on beaver man-agement, although there is a provincial quota system to limitthe beaver harvest. The Government of Alberta (2012) reportsthat the average harvest of beaver pelts from 2008 to 2012was12,075. Beaver are also removed in many Alberta municipal-ities as part of regular road maintenance and in response tolandowner complaints. Trapping and land/infrastructure re-moval are thus likely to be the main causes of the lowproportion of wetlands (20 %) in the municipal districts foundto have beaver ponds. Ranching and forestry may also con-tribute to low pond densities in the Municipal Districts as
beaver tend to be perceived as a nuisance to these two indus-tries (Bhat et al. 1993; Conover 1994; Messmer 2000;Törnblom et al. 2011).
In the Improvement Districts, the proportion of beaverimpacted wetlands is 40 % higher than the MunicipalDistricts. This jurisdiction does not have the same intensityof forestry or ranching found in the Municipal Districts.Further, it contains some wildlife protection areas that aremostly used for recreational purposes. Thus beaver are morelikely to be tolerated as they are rarely directly impactingpeoples’ livelihoods. Indeed, in many cases their presencecould be seen as beneficial. For example, beaver ponds areknown to provide good conditions for fishing, and wildlifeviewing as they attract a plethora of other wildlife (Conover2011). Other factors that may be important in influencing thelocal beaver population are food availability and predatordensity. For example, the interaction of predators such aswolves with their prey can be complex. Elk herbivory canreduce the available food source for beaver (Wolff et al. 2007),but the predation of wolves on elk reduces this impact(Hebblewhite et al. 2005).Wolves are discouraged from livingin areas of high human population (Hebblewhite et al. 2005),which impacts their distribution and density.
The Alberta Parks jurisdiction had a similar proportion ofwetlands impacted by beaver as the Improvement Districts.There are stringent rules on development and a high degree ofwildlife protection in the park area. The unofficial policy ofAlberta Parks is to adapt management practices to allow co-existence with beaver, and to remove them only when abso-lutely necessary to protect infrastructure (M. Percy, pers.comm.). That there were similar proportions of inhabitedwetlands in the parks and Improvement Districts indicates thatthe suitable wetland habitat in both jurisdictions is alreadycolonized, and that landmanagement and land use practices inthe Improvement Districts are sufficient to protect beaverpopulations. The similarity is perhaps surprising as loggingand seasonal grazing does occur in the Improvement Districts.It may be that licensing of these activities provides adequateprotection of beaver, compared to logging and ranching prac-tices on private land, but further study is needed.
Interestingly, the proportion of wetlands on the FirstNations reserve with evidence of beaver activities (40 %)fell halfway between that of the protected regions and theMunicipal Districts. Physiographically, the reserve sits inthe foothills region, and so should be more densely im-pacted by beaver than the Municipal Districts. Beavermanagement policy is decided at the reserve level, andwas not publicly available for the Stoney-Nakoda FirstNation. Without knowing more about the way beaver aremanaged on the reserve, specific conclusions cannot bedrawn other than to note that sharing of managementstrategies across jurisdictions is the region could aid inthe development of a regional beaver management policy
Wetlands

that provides a balance of protection of both beaver andhuman interests while promoting the important ecosystemservices provided by beavers.
Although the Municipal Districts generally had a low den-sity of beaver-impacted wetlands, there was a high-densitycluster in one Municipal District, coincident with the GhostValley Forest Recreation Area (GVFRA). Land use inGVFRA is restricted to recreation activities such as ATV trailsand fishing and this land was an Improvement District until1988. Interestingly, the average distance from wetlands to aroad was higher within this cluster (average of just over 3 km)than for other wetlands in the Municipal District (average of1.5 km). High road density fragments habitats and increasesbeaver mortality through road kills (Gunther et al. 1998). Ourresults suggest that the proportion of wetlands impacted bybeaver can be changed through modifying socioeconomicforces and/or land and wildlife management practices. If prac-tices are designed in a way that increases beaver inhabitationof wetlands, this approach is likely to help towards balancinghuman interests with the improvement of wetland functionsand services (Törnblom et al. 2011).
Peatlands, in particular, appear to be good beaver habitat:73 % of the peatlands visited had evidence of beaver habita-tion. The widespread use of peatlands as beaver habitat con-tradicts descriptions from the literature of peatlands as mar-ginal habitat (Rebertus 1986; Pastor et al. 1993), but theseassertions were not based on scientific evidence. Studiesfocused on peatlands have shown that beaver commonlyinhabit them. For example, Milbrath (2013) described beavercolonization patterns in nine peatlands in the RockyMountainfoothills of Montana, and although Rebertus (1986) conclud-ed that peatlands were marginal habitat, he documented that42 % of the peatlands studied his northcentral Minnesotastudy site had evidence beaver impact. Further, researchersstudying other peatland attributes have noted the presence ofbeaver at their study sites (Yavitt et al. 1990; Roulet et al.1997; Turetsky and St. Louis 2006). At a continental scale,Gorham et al. (2007) showed that there is evidence of beaverin peatlands throughout the Holocene. This finding suggeststhat beaver readily colonize peatlands. It would be interestingto revisit Rebertus’ study site to determine if more (or fewer)peatlands have been colonized by beaver since his research,given that Johnston and Naiman (1990) concluded that therate of pond creation after the first two decades of beaver re-colonization of a landscape becomes limited by lack ofgeomorphically suitable habitat.
One Ecohydrological Impact of Beaver on Wetlands
Our results indicated beaver commonly use mountainpeatlands as habitat, which opened the question of resultingimpacts on peatland function.We focused our attention on oneecohydrological impact, open water area, and found that
peatlands inhabited by beaver had much more of it. The ideathat beaver enhance open water extent in ecosystems theyinhabit is not new; there are many descriptions in the literatureof increased open water area in riverine systems dammed bybeaver, and how it turns lotic habitat into lentic (Johnston andNaiman 1987; Gurnell 1998). However, the changes incurredto pre-existing wetlands (mineral and peat) are often quitedifferent than those in riverine systems. In shallow open waterwetlands, such as those common in the western boreal forestof Canada, beaver can increase the extent of flooding (Hoodand Bayley 2008). For other types of wetlands though, beavercreate open water features where they did not previouslyoccur. Although the formation of open water features bybeaver activity in wetlands, particularly peatlands has beenpreviously documented (see Johnston et al. 1990), the area isonly infrequently quantified, and linkages to peatland hydro-logic function have yet to be explored. The form of beaverponds are similar to peat pools in that they are open waterbodies within the peat matrix, but they are different in thattheir persistence is influenced by dam intactness (Woo andWaddington 1990). Although they did not study beaverponds, Tardif et al. (2009) showed that the presence, shapeand location of pools changed the way peatlands store andrelease rain water. An important research avenue is the explo-ration of rainfall and snowmelt runoff generation in mountainmineral wetlands and peatlands as impacted by beaver ponds.
Biogeochemical impacts of open water areas of peatlandshave been studied, and been shown to be distinct from non-open water areas. In particular, carbon (C) sequestration andrelease are impacted by changed wetness conditions (Belyeaand Malmer 2004; Strack et al. 2005; Ise et al. 2008). Forexample, Roulet et al. (1997) reported a C flux from a beaverpond in a boreal peatland as more than 200 g C/m2 per yearand Crill et al. (1988) found that methane flux from an openpeat bog was 107 g C/m2 per year. Given the differences in theclimate and peatland forms present in the Canadian Rockies ascompared to the boreal forest, along with the large enhance-ment of open water features documented here, investigationsof C dynamics in Rocky Mountain peatlands, as affected bybeaver, are warranted.
Conclusions
Wetlands are abundant in this Rocky Mountain environmentand, despite their small areal extent, provide critical elementsof landscape diversity. They were physiographicallyconstrained mainly to valley bottom positions in the mountainregion and more evenly distributed in the foothills regionowing to the rolling topography. Challenges encounteredwhen mapping peat wetlands serve as a cautionary note forrelying solely on digital mapping to infer wetland type. In
Wetlands

several cases wetlands appeared as peatlands based on theirfunctional characteristics, but could not be classified as suchbecause the coring revealed heavily stratified soils that did notmeet the criteria for organic soil.
Our research also highlights the widespread use of moun-tain wetlands, both mineral wetlands and peatlands, as beaverhabitat. Although our study design did not permit an in-depthevaluation, research is needed on the differences in the waysbeaver use mineral wetlands vs. peatlands. Even though therewere fewer wetlands in the mountain region, beaver impactswere twice as likely there than in the foothills region,reflecting different land use zoning and wildlife managementstrategies. Human-wildlife interactions also appear to greatlyenhance pooling of water on the surface of wetlands. Openwater has far-reaching implications for wetland ecosystemfunction and service, in particular, water storage-runoff rela-tions and nutrient cycling. Specifically, the role of beaver indelaying the transmission of runoff to downstream waterbodies is under-researched, which is important to know formountain wetlands, as they tend to be located at the criticaljuncture between mountain hillsides and major rivers.Changes in the abundance of keystone species, in this casebeaver, that influence water and nutrient dynamics should thusbe monitored to protect key wetland ecosystem functions.
Acknowledgements We thank Jeff Kardas for his hard work in the fieldand May Guan and Dhiraj Pradhanaga for their jeep extraction skills. Weappreciate the insightful comments provided by Bob Clark, Bruce Bakerand two anonymous reviewers. Staff at University of Calgary's Biogeo-sciences Institute provided much needed logistical support. This researchwas supported by grants from the Global Institute for Water Security andthe Natural Sciences and Engineering Research Council of Canada.
References
Baldwin J (2013) Problematizing beaver habitat identification models forreintroduction application in the western United States. Yearb AssocPac C Geo 75:104–120
Belyea L, Malmer N (2004) Carbon sequestration in peatlands: patternsand mechanisms of response to climate change. Glob Change Biol10:1042–1052
Bhat MG, Huffaker RG, Lenhart SM (1993) Controlling forest damageby dispersive beaver populations: centralized optimal managementstrategy. Ecol Appl 3(3):518–530
Bisson PA, Buffington JM, Montgomery DR (2006) Valley segments,stream reaches, and channel units. In: Hauer FR, Lamberti GA (eds)Methods in Stream Ecology, 2nd edn. Elsevier, California, pp 23–49
Blodau C (2002) Carbon cycling in peatlands: a review of processes andcontrols. Environ Rev 10(2):111–134. doi:10.1139/a02-004
Butler DR (2012) The impact of climate change on zoogeomorphologicalinfluence: examples from the Rocky Mountains of the WesternU.S.A. Geomorphology 157–158:183–191
Chadde S, Shelly S, Bursik R, Moseley R, Evenden A, Mantas M, RabeF, Heidel B (1998) Peatlands on national forests of the northernRocky Mountains: Ecology and conservation. US Forest Service,Rocky Mountain Research Station, General Technical ReportRMRS-GTR-11.
Chimner RA, Lemly JM, Cooper DJ (2010) Mountain fen distribution,types and restoration priorities, San Juan Mountains, Colorado.Wetlands 30:763–771. doi:10.1007/s13157-010-0039-5
Conover MR (1994) Perceptions of grass-roots leaders of the agriculturalcommunity about wildlife damage on their farms and ranches. WildlSoc Bull 22(1):94–100
Conover D (2011) The keystone role of beavers in a restored wetland(Ohio). Ecol Restor 29(3):212–213
Cooper DJ, Chimner RA,Merritt DA (2012)Western mountain wetlands.In: Batzer DP, BaldwinAH (eds)Wetland habitats of North Americaecology and conservation concerns. University of California Press,California, pp 313–328
Crill PM, Bartlett KB et al (1988) Methane flux from Minnesotapeatlands. Glob Biogeochem Cycles 2(4):371–384
Cunningham JM, Calhoun AJK, Glanz WE (2006) Patterns of beavercolonization and wetland change in Acadia National Park. NortheastNat 13(4):583–596
Gibson PP, Olden JD (2014) Ecology, management and conservation im-plications of North American beaver (Castor canadensis) in drylandstreams. Aquatic Conservation doi:10.1002/aqc.2432 (2014).
Gignac LD, Vitt DH, Zoltai SC, Bayley SE (1991) Bryophyte responsesurfaces along climatic, chemical, and physical gradients inpeatlands of western Canada. Nova Hedwigia 53(1–2):27–71
Gorham E, Lehman C, Dyke A, Janssens J, Dyke L (2007) Temporal andspatial aspects of peatland initiation following deglaciation in NorthAmerica. Quat Sci Rev 26:300–311
Gunther KA, Biel MJ, Robison HL (1998) Factors influencing thefrequency of road-killed wildlife in Yellowstone National Park.Proceedings of the international conference on wildlife, the environ-ment and transportation, Report No. FL-ER-69S58.
Gurnell AM (1998) The hydrogeomorphological effects of beaver dam-building activity. Prog Phys Geogr 22(2):167–189
Halabisky M, Hannam Long AL, Vondrasek C, Moskal M (2013) Thesharper image: hyperspatial remote sensing of wetlands. Wetl Scieand Prac 30(2):12–31
Halsey L, Vitt D, Zoltai S (1997) Alberta wetland inventory standards. InNesby R (ed) Alberta vegetation inventory standards manual, ver-sion 2.2, Alberta Environmental Protection, Alberta.
Hebblewhite M, White C et al (2005) Human activity mitigates a trophiccascade caused by wolves. Ecology 86(8):2135–2144
Hood GA, Bayley SE (2008) Beaver (Castor canadensis) mitigate theeffects of climate on the area of open water in boreal wetlands inwestern Canada. Biol Cons 141:556–567
Ise T, Dunn A, Wofsy S, Moorcroft P (2008) High sensitivity of peatdecomposition to climate change through water-table feedback. NatGeosci 1:763–766
Janzen KF, Westbrook CJ (2011) Hyporheic flows along a channelledpeatland: influence of beaver dams. CanWater Res J 36(4):331–347
Jarema SI, Samson J, Mcgill BJ, Humphries MM (2009) Variationin abundance across a species’ range predicts climate changeresponses in the range interior will exceed those at the edge:a case study with North American beaver. Glob Chang Biol15:508–522
Johnston CA (2012) Beaver wetlands. In: Batzer DP, Baldwin A (eds)Wetland habitats of North America: Ecology and ConservationConcerns. University of California Press, California, pp 161–172
Johnston CA, Naiman RJ (1987) Boundary dynamics at theaquaticterrestrial interface: The influence of beaver and geo-mor-phology. Landscape Ecol 1:47–57
Johnston C, Naiman R (1990) Aquatic patch creation in relation to beaverpopulation trends. Ecology 71(4):1617–1621
Krankina ON, Pflugmacher D, FriedlM, CohenWB,Nelson P, Baccini A(2008) Meeting the challenge of mapping peatlands with remotelysensed data. Biogeosciences 5:1809–1820
Lang M, McCarty G (2009) Lidar intensity for improved detection ofinundation below the forest canopy. Wetlands 29(4):1166–1178
Wetlands

Maxa M, Bolstad P (2009) Mapping northern wetlands with high reso-lution satellite images and lidar. Wetlands 29(1):248–260
Messmer T (2000) The emergence of human-wildlife conflict: turningchallenges into opportunities. Int Biodeterior Biodegrad 45:97–102
Milbrath J (2013) Land cover change within the peatlands along theRocky Mountain Front, Montana: 1937–2009. University ofMontana, Thesis
Mitchell CC, Niering WA (1993) Vegetation change in a topogenic bogfollowing beaver flooding. Bull Tor Bot Club 120(2):136–147
Moore K (2012) Negotiating the middle ground in a world-system: TheNiitsitapi (Blackfoot) and Ktunaxa (Kootenai) in the NorthernRocky Mountain Fur Trade. University of Arizona, MSc Thesis
Pastor J, Bonde J, Johnston C, Naiman R (1993) Markovian analysis ofthe spatially dependent dynamics of beaver ponds. Lect Mathe iLifeSc 23:5–28
Pollock MM, Beechie TJ et al (2014) Using beaver dams to restoreincised streams. Bioscience. doi:10.1093/biosci/biu036
Racine CH,Walters JC (1994) Groundwater-discharge fens in the Tananalowlands, interior Alaska, U.S.A. Arct Alp Res 26(4):418–426
Ray AM, Rebertus AJ, Ray HL (2001) Macrophyte succession inMinnesota beaver ponds. Can J Bot 79:487–499
Rebertus AJ (1986) Bogs as beaver habitat on north-central Minnesota.Am Midl Nat 116(2):240–245
Roulet N, Crill P, Comer N, Dove A, Boubonniere R (1997) CO2 andCH4 flux between a boreal beaver pond and the atmosphere. JGeophys Res 102(D24):29313–29319
Strack M, Kellner E, Waddington J (2005) Dynamics of biogenic gasbubbles in peat and their effects on peatland biogeochemistry. GlobBiogeochem Cycles 19:1–9
Tardif S, St-Hilaire A, Roy R, Bernier M, Payette S (2009) Statisticalproperties of hydrographs in minerotrophic fens and small lakes inmid-latitude Quebec, Canada. Can Water Reso J 34(4):365–380
Toop D, de la Cruz NN (2002) Hydrogeology of the Canmore corridorand northwestern Kananaskis Country. Alberta, AlbertaEnvironment, Hydrogeology Section, Edmonton, AB
Törnblom J, Angelstam P, Hartman G, Henrikson L, Sjoberg G(2011) Toward a research agenda for water policy implemen-tation: Knowledge about beaver (Castor fiber) as a tool for
water management with a catchment perspective. Balt For17(1):154–161
Turetsky M, St. Louis V (2006) Disturbance in boreal peatlands. EcolStud 188:359–379
Vitt D, Haley L, Thormann M, Martin R (1996) Peatland inven-tory of Alberta. Alberta Peat Task Force, Network of Centresof Excellence in Sustainable Forest Management, Universityof Alberta, Alberta.
Walbridge M (1994) Plant community composition and surface waterchemistry of fen peatlands in West Virginia's Appalachian plateau.Water Air Soil Pollut 77:247–269
Watters JR, Stanley EH (2007) Stream channels in peatlands: the role ofbiological processes in controlling channel form. Geomorphology89:97–110
Westbrook CJ, Cooper DJ, Baker BW (2006) Beaver dams and overbankfloods influence groundwater – surface water interactions of aRocky Mountain riparian area. Water Resources Research 42 doi:10.1029/2005WR004560
Westbrook C, Cooper D, Butler D (2013) Beaver geomorphology andhydrology. In Treatise on Geomorphology – Ecogeomorphology(Butler D, Hupp C, eds.), Elsevier, pp 293–306.
Wieder RK, McCormick AM, Lang GE (1981) Vegetational analysis ofBig Run Bog, a nonglaciated Sphagnum bog in West Virginia.Castanea 46(1):16–29
Wolff E, Cooper D, Hobbs N (2007) Hydrologic regime and herbivorystabilize an alternative state in Yellowstone National Park. EcolAppl 17(6):1572–1587
Woo M-K, Waddington JM (1990) Effects of beaver dams on sub-arcticwetland hydrology. Arctic 43:223–230
Wright J, Flecker A, Jones C (2003) Local vs. landscape controlson plant species richness in beaver meadows. Ecology84(12):3162–3173
Yavitt J, Lang G, SexstoneA (1990)Methane fluxes in wetland and forestsoils, beaver ponds and low-order streams of a temperate forestecosystem. J Geophys Res 95(D13):22463–22474
Zoltai SC, Siltanen R, Johnson J (2000) Awetland database for the westernboreal subarctic and arctic regions of Canada. Natural ResourcesCanada, Northern Forestry Centre, Information report NOR-X-386
Wetlands