disruption of human serum albumin fibrils by a static electric field
TRANSCRIPT

This content has been downloaded from IOPscience. Please scroll down to see the full text.
Download details:
IP Address: 203.110.246.230
This content was downloaded on 04/07/2014 at 02:36
Please note that terms and conditions apply.
Disruption of human serum albumin fibrils by a static electric field
View the table of contents for this issue, or go to the journal homepage for more
2014 J. Phys. D: Appl. Phys. 47 305401
(http://iopscience.iop.org/0022-3727/47/30/305401)
Home Search Collections Journals About Contact us My IOPscience

Journal of Physics D: Applied Physics
J. Phys. D: Appl. Phys. 47 (2014) 305401 (9pp) doi:10.1088/0022-3727/47/30/305401
Disruption of human serum albumin fibrilsby a static electric field
Nitin K Pandey1, Subhadeep Mitra2, Monojit Chakraborty2,Sudeshna Ghosh1, Shubhatam Sen3, Swagata Dasgupta1,4
and Sunando DasGupta2,4
1 Department of Chemistry, Indian Institute of Technology, Kharagpur, 721302, India2 Department of Chemical Engineering, Indian Institute of Technology, Kharagpur, 721302, India3 Advanced Technology Development Centre, Indian Institute of Technology, Kharagpur, 721302, India
E-mail: [email protected] and [email protected]
Received 4 March 2014, revised 4 June 2014Accepted for publication 6 June 2014Published 3 July 2014
AbstractProtein self-association leads to toxic filamentous plaques believed to be the key reason behindseveral neurodegenerative diseases. Stabilization of the fibrillar architecture is guided byseveral forces; primarily electrostatic, hydrophobic, and the extent of hydrogen bonding. Inthis study, we experimentally demonstrate, for the first time, the effect of varying static electricfields on preformed fibrils of human serum albumin (HSA) in an electrowetting on dielectrictype setup using spectroscopic and microscopic techniques. We have found appreciable andcontinuous reduction in the β-sheet content of HSA fibrils up to an applied field of∼8 × 10⁶ V m−1. The observed disruption of the fibrils has been attributed to the combinedeffects of electrostatic interactions and electrowetting phenomena. Kinetic studies indicate aprior intermediate formation followed by disruption of HSA fibrils after application of theelectric field.
Keywords: human serum albumin, fibrillation, electric field
(Some figures may appear in colour only in the online journal)
1. Introduction
The formation of highly ordered fibrillar aggregates withβ-sheet structure by several proteins has of late been ofmuch interest due to its pathogenesis towards neurologicaldisorders [1–6]. Due to this association with these disordersit is important to understand the factors behind amyloidfibril formation. Several approaches have been made in thepast few years to address this problem. Many aromaticdrugs, antibodies and polyphenolic compounds have beenfound to disintegrate preformed fibrils or inhibit amyloid fibrilformation [7–11]. However, the cytotoxicity of these drugs isa matter of concern [12–14]. Thus it is important to developa proficient analytical tool which can provide an efficienttechnique to screen different candidates that could play atherapeutic role in neurodegenerative disorders.
The effect of electromagnetic radiation on proteins ingeneral has received significant attention for its increasing
4 Authors to whom any correspondence should be addressed.
applications in biomedical research, particularly in biosensorsand signal processes. Proteins are known to possess electricdipoles which are many folds higher than those of watermolecules [15]. This property enables proteins to respondto external electromagnetic radiation. However, extensiveexposure to an electromagnetic field may pose a risk to humanlife [16–18]. A recent article has reported that non-thermalmicrowave radiation can damage brain tissues in rats [17].Microwave radiation is also able to induce conformationalchanges in protein structures to encourage amyloid fibrilformation [19]. An electric field has previously been used asa therapeutic technique to stimulate the brain for the treatmentof Parkinson’s disease symptoms [20]. Alteration in electricfields associated with membranes is also believed to play akey role in neurological disorders [21, 22]. The effects onthe application of an electric field on a β-amyloid peptidehave been studied using molecular dynamics (MD) simulationmethods [23]. In a similar simulation study, the presence of anelectric field was found to induce helical structure formation
0022-3727/14/305401+09$33.00 1 © 2014 IOP Publishing Ltd Printed in the UK

J. Phys. D: Appl. Phys. 47 (2014) 305401 N K Pandey et al
within a natively β-sheet protein [24]. Another study hasrevealed that it is possible to influence the stability of amyloidfibrils by the application of an electric field with a strengthof 5 × 10⁸ V m−1 [25]. In the case of α-synuclein, proteinaggregation but not fibrillation occurred on the application ofa voltage of 1 V [26]. A pulsed electric field (3.5×10⁶ V m−1),along with thermal stress, have been found to induce α-helixto β-sheet transitions in lysozyme [27]. Pepsin was alsofound to undergo a self-association process in the presenceof a high intensity pulsed electric field (35.6 kV cm−1) wherethe intermolecular hydrophobic interactions are the governingforces [28, 29]. Fibrillation of human serum albumin (HSA)has been studied extensively under different experimentalconditions thus making it an appropriate model to exploreprotein aggregation [30–36].
However, to the best of our knowledge, there has beenno study on the effect of a static electric field on preformedHSA fibrils. Our study involves the investigation of theeffect of electric fields on the structure of mature HSAfibrils. HSA fibrils were prepared in the presence of 50%(v/v) ethanol in 20mM Tris-HCl buffer of pH 7.0 at 37 ◦Cfollowing a similar protocol used in our earlier study [37].For the ease of electric field application, an arrangementsimilar to an electrowetting on dielectric (EWOD) setup wasused. Electric fields of varying strength ((0–23) × 106 V m−1)
were applied on HSA fibril droplets for a period of 10 min.The residual aliquots were analysed via thioflavin T (ThT)fluorescence, circular dichroism (CD), Fourier transforminfrared (FTIR), fluorescence and transmission electronmicroscopic techniques. It was observed that the applicationof the electric field resulted in the disintegration of HSA fibrils.
2. Materials and methods
2.1. Materials
HSA and ThT were purchased from Sigma Chemical Co.(St Louis, MO, USA) and used as received. Electricallyconducting indium tin oxide (ITO) coated glasses werepurchased from Sigma-Aldrich, St Louis, USA (specification25 mm × 25 mm × 1.1 mm), with a surface resistivityof 30–60 �/sq. The polydimethylsiloxane (PDMS) kitconsisting of silicone elastomer sylgard-184 and an elastomercuring agent was purchased from Dow Corning Corporation,Midland, USA. All experiments were conducted at least intriplicate.
2.2. Preparation of HSA fibrils
HSA was dissolved in double distilled water and theconcentration measured spectrophotometrically at 280 nmusing a molar extinction coefficient of 35 219 M−1 cm−1 [38].Fibrils were prepared keeping the protein concentration at150µM for each set, with an ethanol concentration of 50%(v/v) at pH 7.0 (20mM, Tris-HCl buffer) after incubation for24 h at 37 ◦C.
2.3. PDMS preparation
Preparation of PDMS, to be used as the dielectric, was a two-step process. PDMS consists of sylgard-184, and a curingagent. Sylgard and the curing agent were mixed in a ratio of10 : 1 (w/w). After mixing, the solution was stirred vigorouslyand degassed to remove any bubbles using a vacuum pump.
2.4. Surface coating
Coating of the ITO glass with a thin layer of PDMS wasachieved by pouring a small amount of PDMS solution onan ITO coated glass, which was rotated at 400 rpm in a spincoater for 30 s, followed by 4500 rpm for 70 s. The coatedsurface was kept at 95 ◦C overnight. The PDMS surface thusproduced acted as the dielectric. However, to address thehygroscopic nature of the PDMS surface it was further coatedwith a thin layer of Teflon. The Teflon coating was achievedby spin coating a thin film of Teflon (5 wt%), dissolved in asolvent (FC-40), at 3000 rpm for 30 s, followed by baking it at130 ◦C for 15–20 min [39, 40]. This Teflon layer also providedadditional hydrophobicity and facilitated the repeated use ofthe surface.
2.5. Method of application of electric field and contact anglemeasurement
A small droplet of protein solution was placed over theprepared substrate on a goniometer (Rame-Hart InstrumentCo., model no 290-G1) platform. A copper electrodewas placed at the tip of the droplet with the ITO layeracting as the other electrode. Using a dc source meter,(Model2410 Keithley, USA), constant electric fields rangingfrom (0–23) × 106 V m−1 were applied between the dropletand the electrode for a period of 10 min. Samples were kept atroom temperature and subjected to measurements at differenttime intervals.
The angle measured through the liquid, where aliquid/vapour interface meets a solid surface, is termed thecontact angle. A given system of solid, liquid, and vapour ata given temperature and pressure has a unique equilibriumcontact angle and depends on the relative strengths of theliquid, solid, and vapour molecular interaction. However,during spreading (or retraction) of a liquid droplet as wouldbe the case when an electric field is applied to (or withdrawnfrom) a droplet, the values of the contact angles, known morecommonly as the dynamic contact angle, may differ from thatof the equilibrium value. The goniometer directly provides thevalues of the dynamic contact angle during experimentationwith an accuracy of ±2◦. The droplet contact angles on thedielectric were measured before and after the application of anelectric field. All of the measurements were repeated at leastthree times and only the average values of the observations arereported here.
2.6. ThT binding study
The ThT binding assay, after the application of an electric field,was performed using aliquots from different experimental
2

J. Phys. D: Appl. Phys. 47 (2014) 305401 N K Pandey et al
sets. ThT was added to the aliquot which was kept for 5 minprior to being scanned on a Horiba Jobin Yvon Fluoromax-4spectrofluorimeter. Aliquots were diluted with 20mM Tris-HCl buffer of pH 7.0 to achieve a final protein concentrationof 2µM with a ThT concentration of 10µM in the final workingsolutions. The excitation and emission wavelengths were450 nm and 485 nm respectively, keeping the slit width at 5 nmand integration time of 0.3 s. All spectra were corrected withrespect to the corresponding blank. To perform the kineticstudy, preformed HSA fibrillar solutions were subjected to theapplication of static electric field strengths (0–19)×106 V m−1
and further incubated at room temperature for a time span of0–8 h. The ThT binding affinity of all the treated HSA solutionswas monitored, keeping all the other parameters similar tothose mentioned earlier.
2.7. Circular dichroism
Far-UV CD spectra were recorded on a Jasco-810automatic recording spectrophotometer keeping the proteinconcentration at 2µM. A quartz cuvette with a 0.1 cm pathlength was used. CD spectra were accumulated at 25 ◦C at ascan rate of 50 nm min−1 from 190 to 240 nm. The proteinsecondary structure content was determined using the onlineDICHROWEB server [41].
2.8. FTIR spectroscopy
The FTIR spectra of the HSA fibrillar samples were acquiredbefore and after the application of the electric field using aThermo Nicolet 6700 FTIR spectrometer, attached with a zincselenide (ZnSe) attenuated total reflectance (ATR) accessory, adeuterated triglycine sulfate (DTGS) detector and a KBr beamsplitter. After the application of the electric field, the residualaliquots were diluted using 20mM Tris-HCl buffer of pH 7.0.200 µl aliquots from the resulting solutions were withdrawnand subjected to spectral measurement. Each spectrumrepresents the average of 256 scans recorded in the regionof 4000–400 cm−1 with a 4 cm−1 resolution. Blank spectrawere accumulated under the same experimental conditionsand subtracted from the corresponding spectra. The amide Iband obtained was subjected to second derivative and Gaussiancurve fitting to measure the total area and area correspondingto each secondary structure component in the 1700–1600 cm−1
region. Secondary structure parameters were determined usingthe method defined by Byler and Susi [42].
2.9. Fluorescence microscopy
5 µl of 1mM ThT was mixed with 10 µl of each solutionset to achieve the required staining, and placed on a glassslide, covered with a cover slip, and monitored by means ofa Leica DM 2500 microscope equipped with a fluorescenceattachment. Filter cube number 2 (Leica I3 11513878, BZ:01) was used for ThT excitation and emission. The imagesof HSA fibrillar solutions were acquired before and after theapplication of the electric field using a Leica DFC 310 FXcamera attached to the microscope. All observations wereperformed at 10 × /0.25.
Figure 1. (a) Schematic diagram of the EWOD setup for theapplication of electric fields of variable field strengths((0–23) × 106 V m−1) on HSA fibrillar droplets. (b) Snapshots ofthe HSA fibrillar droplets obtained before and after the applicationof electric field. Droplets were placed on a PDMS coated surfaceand images were obtained with an attached CCD camera.
2.10. Transmission electron microscopy (TEM)
HSA fibrillar solutions were diluted to a concentration of15µM and were applied to carbon coated TEM grids. Thesamples were then air dried and images were acquired usingthe TECNAI G2 20S-TWIN transmission electron microscope,operating at an accelerating voltage of 80 kV.
3. Results and discussion
When an electric field is applied to a sessile droplet of anon-wetting liquid on a substrate, the surface energies of theliquid/solid interface changes, leading to a decrease in thecontact angle and spreading [43]. As a result, the surface startsto become increasingly hydrophilic. Electrowetting, usingan insulating layer on top of the conducting surface, wherethe insulating layer acts like a dielectric, is more commonand is called EWOD to distinguish it from conventionalelectrowetting on the bare electrode [44–47]. In our case, wehave used a similar EWOD setup for the application of electricfields on protein samples. An electric field with varyingstrength ((0–23) × 106 V m−1) was applied on HSA fibrillardroplets for a period of 10 min, and the schematic diagramof which is shown in figure 1(a). The snapshot of the fibrillardroplet before and after application of the electric field is shownin figure 1(b). The HSA fibrillar solution was placed as adroplet on the PDMS/Teflon coated ITO glass surface. Thefollowing factors govern the shape of this droplet: (i) a criticalbalance between solid–liquid, liquid–vapour and solid–vapourinterfacial tensions; (ii) the morphology of the concerned solidsurface; and (iii) the volume and composition of the liquidat equilibrium [47]. It may be emphasized that the ‘electricfield strength’ (∼106 V m−1) used in our study is considerablyless than the strength (∼108 V m−1) used in the simulationstudies [23–25].
3

J. Phys. D: Appl. Phys. 47 (2014) 305401 N K Pandey et al
Figure 2. Time-dependent ThT fluorescence intensity profile of the propagation and disruption of preformed HSA fibrils in the presence ofstatic electric fields of varying strength (a) (4–12) × 106 V m−1; (b) 15 × 106 and 19 × 106 V m−1.
Figure 3. (a) Percentage reduction in β-sheet content of HSA fibrils with the applied electric field strength of (4–23) × 106 V m−1,estimated with respect to the HSA fibrillar solution in the absence of an electric field (% β-sheet content of the HSA fibrils were estimatedusing CD data for the respective solutions via online server DICHROWEB). (b) Far-UV CD spectra of HSA fibrils before and after 24 h ofthe application of electric field strength (EF) of ∼8 × 10⁶ V m−1.
3.1. ThT binding study
ThT, an amyloid specific dye, upon excitation at 450 nm,fluoresces strongly at ∼485 nm upon binding with amyloidfibrils [48, 49]. Electric field treated HSA fibrillar sampleswere subjected to a ThT binding study after incubation atroom temperature for different time intervals. The observedThT intensity profile shows an interesting trend (figure 2).During incubation at room temperature for the initial 2 h, asignificant propagation in the growth of amyloid fibrils wasfound. However, after attaining a threshold critical point (at∼2 h), a continual decrease in the ThT intensity was observedat all electric field strength values. A similar trend has alsobeen found in the case of laser induced disruption of Aβ(1–40)fibrils, where it has been suggested that an initial disruptionof preformed fibrils produces active ends, leading to thepropagation of fibrils [50]. It was reported that beyond a critical
point corresponding to an optimum laser irradiation energy, asignificant disruption of the Aβ(1–40) fibrils occurred [50].Interestingly, our observations on the application of varyingelectric field strengths to preformed HSA fibrils follow asimilar pattern. In the present study, after application ofthe electric field, a favourable rearrangement in the fibrillarassembly gradually occurs within the first 2 h period, whichleads to an initial increase in the ThT intensity. This impliesthat during this time period, the observed growth of fibrils canbe attributed to the generation of active regions of the proteinconducive to fibrillation. As such, these regions of the proteinare able to reconstitute to form fibrils similar to what is seenin the laser induced study for Aβ(1–40) fibrils [50]. However,beyond the 2 h incubation at room temperature, a significantreduction in the ThT intensity is observed. Therefore it appearsthat, after 2 h incubation at room temperature, the disruptioneffect of the electric field is predominant, which is clearly
4

J. Phys. D: Appl. Phys. 47 (2014) 305401 N K Pandey et al
evident in the attenuated ThT intensity of the HSA fibrillarsolution. It appears that the static electric field affects thepreformed HSA fibrils in two ways: (i) associative in the shorttime period; and (ii) disruptive in a longer span of time. Apartfrom this, we have found that the maximum disruption of HSAfibrils occurs at an electric field strength of ∼8 × 10⁶ V m−1
(figure 2(a)), whereas for higher electric field strengths thetrend was found to be irregular (figure 2(b)). The reasonbehind the greater potency of the electric field strength of∼8×10⁶ V m−1 will be discussed later. The fibrillation processof proteins is known to be associated with significant non-covalent interactions among the polypeptide chains [51]. Theobserved reduction in the ThT fluorescence intensity in thepresence of the electric field occurs due to the perturbation inthese interactions to different extents.
3.2. Secondary structural changeover: CD and FTIR studies
Protein fibrillation is accompanied by a disruption in the overallstructure, with the most significant change occurring as a resultof the formation of a predominantly β-sheet structure. Thisalteration in the secondary structure of the protein duringthe fibrillation process can be monitored by the means ofCD spectroscopy. The enhancement of β-sheet formationobserved for HSA has been monitored in a similar mannerin a previous study [36]. The HSA fibrillar solution before theapplication of electric field shows a distinct β-sheet structure,whereas application of the electric field causes a reductionin the β-sheet content. The % reduction in β-sheet contentafter application of electric fields (of varying strength) wasplotted against the ‘electric field strength’ (E(appl)/(V m−1))
(figure 3(a)). The % reduction in β-sheet content is calculatedby using the following formula:
%Y = Y (1) − Y (2)
Y (1)× 100 (1)
where %Y = % reduction in β-sheet content, Y (1) = % ofβ-sheet content in HSA fibril in the absence of an electric field,and Y (2) = % of β-sheet content in HSA fibril in the presenceof an electric field.
In the absence of an electric field there is no reductionin β-sheet content, as expected. However, on applicationof the electric field there is a substantial reduction in theβ-sheet content of ∼17% for an ‘electric field strength’ of∼8 × 10⁶ V m−1. The CD spectra of HSA fibrils beforeand after the application of ∼8 × 10⁶ V m−1 ‘electric fieldstrength’ are shown in figure 3(b). The signature of the α-helical structure appears at 208 and 222 nm in the presenceof the electric field, implying that the attenuation in β-sheetcontent is accompanied by a rise in helicity. A similar kind ofresult has been found in a theoretical study where a relativelyhigher ‘electric field strength’ of the order of 108 V m−1 causesa β-sheet to α-helix transition in a natively β-sheet protein [24].The observed sheet to helix transition has been attributed to therearrangement of the anti-parallel dipoles of the β-sheet in thepresence of the external electric field, resulting in structuralchanges in the protein [24]. This structural rearrangement,due to the interaction between anti-parallel dipoles of β-sheet
Figure 4. Deconvoluted FTIR spectra of (a) native has, (b) HSAfibrils and (c) HSA fibrils after 24 h of application of electric fieldstrength of ∼8 × 10⁶ V m−1 (y-axis corresponds to the absorbancevalue).
and electric dipoles, appears to be the governing factor. Wespeculate that the observed decrease in the β-sheet contentin the presence of an electric field is most likely due to aperturbation in the electrostatic interactions which stabilizesfibrils.
FTIR spectra were acquired to further probe the variationin the secondary structure for the electric field driven disruptionof the preformed HSA fibrils. The α-helical and β-sheetconformations correspond to the range ∼1648–1660 cm−1
5

J. Phys. D: Appl. Phys. 47 (2014) 305401 N K Pandey et al
Figure 5. ThT stained fluorescence microscopic images of HSA solutions obtained after the application of varying electric field strengths:(a) 0 × 106 V m−1, (b) ∼4 × 10⁶ V m−1, (c) ∼8 × 10⁶ V m−1, (d) ∼12 × 106 V m−1, (e) ∼15 × 106 V m−1, (f ) ∼19 × 106 V m−1 and (g)∼23 × 106 V m−1 on preformed HSA fibrils. Scale bars represent 20 µm.
and ∼1610–1640 cm−1 respectively, and random and turnstructures correspond to the range 1640–1648 cm−1 and1660–1680 cm−1 respectively (amide I band region of theproteins) [42, 52, 53]. The deconvoluted spectra of the amide Iband (1700–1600 cm−1) of different HSA solutions have beenshown in figure 4. The native HSA solution shows 57% α-helixand 25% β-sheet content (figure 4(a)). The HSA fibrillarsolution before the application of an electric field shows asevere loss in the helical content with a predominant β-sheetstructure (53%) (figure 4(b)). After the application of anelectric field of strength ∼8×10⁶ V m−1, a significant decrease(∼28%) in the β-sheet content was found with an increasein the turn structure (figure 4(c)). This clearly indicates areduction in the fibrillar species after application of the electricfield. Therefore, it is evident that the disruption of preformedHSA fibrils occurs on the application of a static electricfield, which further supports the results obtained from theCD study.
3.3. Fluorescence microscopy and TEM: morphologicalaspect of fibril disintegration
Fluorescence microscopy is a widely used tool to monitorthe growth of fibrils, and we observe an intense network offibrillar species of HSA in the absence of an electric field. HSAfibrillar species (before and after the application of the electricfield) were stained with ThT, the amyloid marker dye, priorto the microscopic observation of the samples. A reductionin fluorescence intensity with electric field was observed,indicating disintegration of fibrillar species in the presence ofthe electric field (figures 5(a)–(g)) after 24 h of application ofthe electric field. However, as observed in the ThT bindingand CD studies, the decrease in fluorescence intensity was
Table 1. Densitometry analysis of the fluorescence microscopicimages of HSA fibrils in the absence and presence of ‘electric fieldstrength’.
E (appl)/(V m−1) × 106 a Mean intensity ± SEb
0 52.29 ± 0.204 6.21 ± 0.018 3.53 ± 0.18
12 19.72 ± 0.0515 13.01 ± 0.0319 10.40 ± 0.2823 5.44 ± 0.01
a Electric field strength in V m−1.b Standard error of three individual measurements.
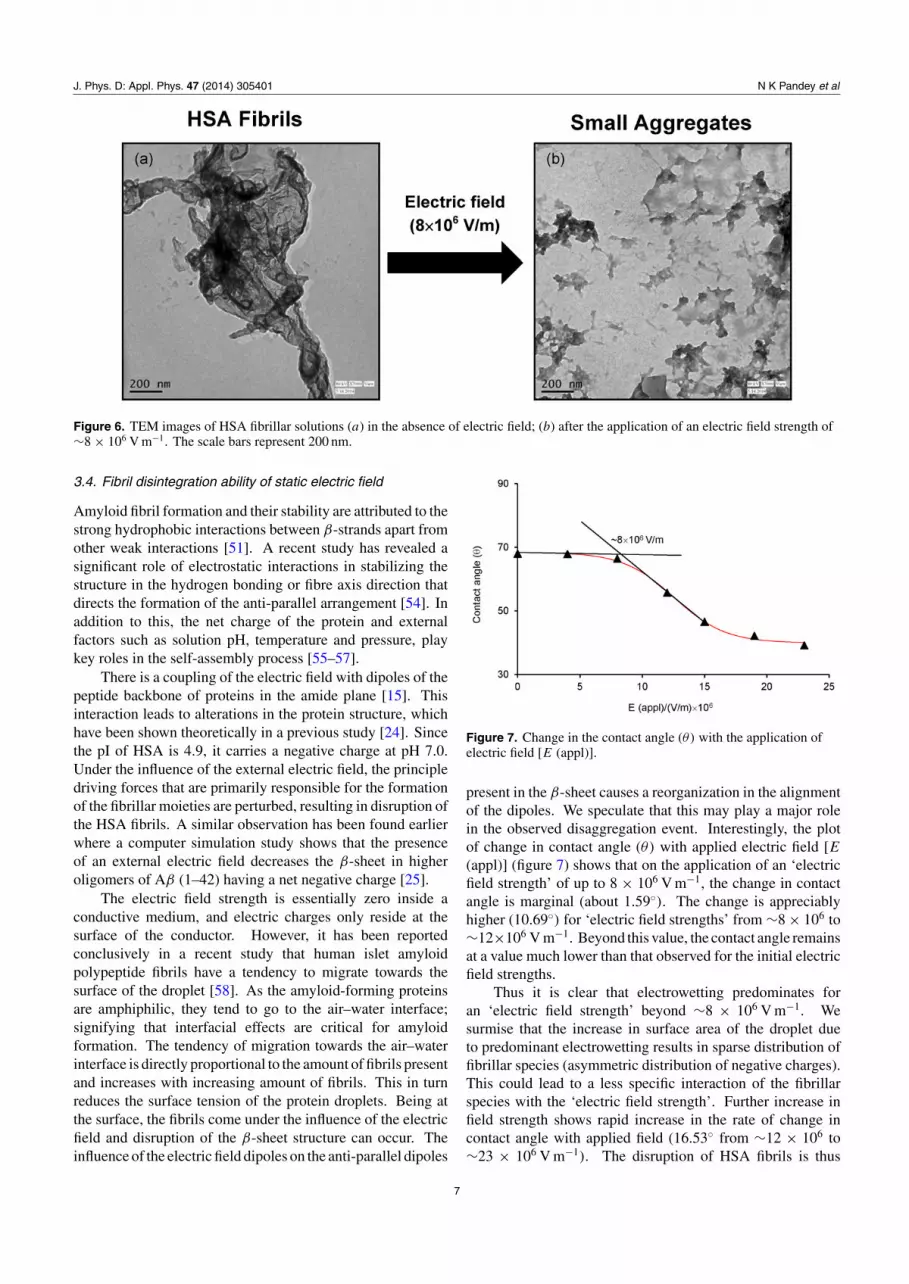
observed until ∼8×10⁶ V m−1 (figure 5(c)). This trend is alsoobserved in the densitometry analysis of the correspondingmicroscopic images (table 1). It shows that in the absence ofthe electric field, the intensity of the HSA fibrillar species was∼52% which reduced to ∼6% for ∼4 × 10⁶ V m−1 and ∼3%for ∼8 × 10⁶ V m−1, respectively. Fluctuation in fluorescenceintensity was observed for higher voltages, supporting theThT and CD study and suggesting ∼8 × 10⁶ V m−1 to bethe optimum voltage for the disintegration of HSA fibrils.Moreover, to further obtain a clear picture of disintegration,we have performed TEM measurements for HSA fibrils beforeand after application of the optimum electric field strength(8 × 10⁶ V m−1) which are shown in figure 6. TEM imagesof HSA samples in the absence of an electric field clearlyshow an abundance of fibrillar species, whereas after theapplication of 8 × 10⁶ V m−1 electric field strength theyshow the disintegration of fibrillar network into smalleraggregates.
6
J. Phys. D: Appl. Phys. 47 (2014) 305401 N K Pandey et al
Figure 6. TEM images of HSA fibrillar solutions (a) in the absence of electric field; (b) after the application of an electric field strength of∼8 × 10⁶ V m−1. The scale bars represent 200 nm.
3.4. Fibril disintegration ability of static electric field
Amyloid fibril formation and their stability are attributed to thestrong hydrophobic interactions between β-strands apart fromother weak interactions [51]. A recent study has revealed asignificant role of electrostatic interactions in stabilizing thestructure in the hydrogen bonding or fibre axis direction thatdirects the formation of the anti-parallel arrangement [54]. Inaddition to this, the net charge of the protein and externalfactors such as solution pH, temperature and pressure, playkey roles in the self-assembly process [55–57].
There is a coupling of the electric field with dipoles of thepeptide backbone of proteins in the amide plane [15]. Thisinteraction leads to alterations in the protein structure, whichhave been shown theoretically in a previous study [24]. Sincethe pI of HSA is 4.9, it carries a negative charge at pH 7.0.Under the influence of the external electric field, the principledriving forces that are primarily responsible for the formationof the fibrillar moieties are perturbed, resulting in disruption ofthe HSA fibrils. A similar observation has been found earlierwhere a computer simulation study shows that the presenceof an external electric field decreases the β-sheet in higheroligomers of Aβ (1–42) having a net negative charge [25].
The electric field strength is essentially zero inside aconductive medium, and electric charges only reside at thesurface of the conductor. However, it has been reportedconclusively in a recent study that human islet amyloidpolypeptide fibrils have a tendency to migrate towards thesurface of the droplet [58]. As the amyloid-forming proteinsare amphiphilic, they tend to go to the air–water interface;signifying that interfacial effects are critical for amyloidformation. The tendency of migration towards the air–waterinterface is directly proportional to the amount of fibrils presentand increases with increasing amount of fibrils. This in turnreduces the surface tension of the protein droplets. Being atthe surface, the fibrils come under the influence of the electricfield and disruption of the β-sheet structure can occur. Theinfluence of the electric field dipoles on the anti-parallel dipoles
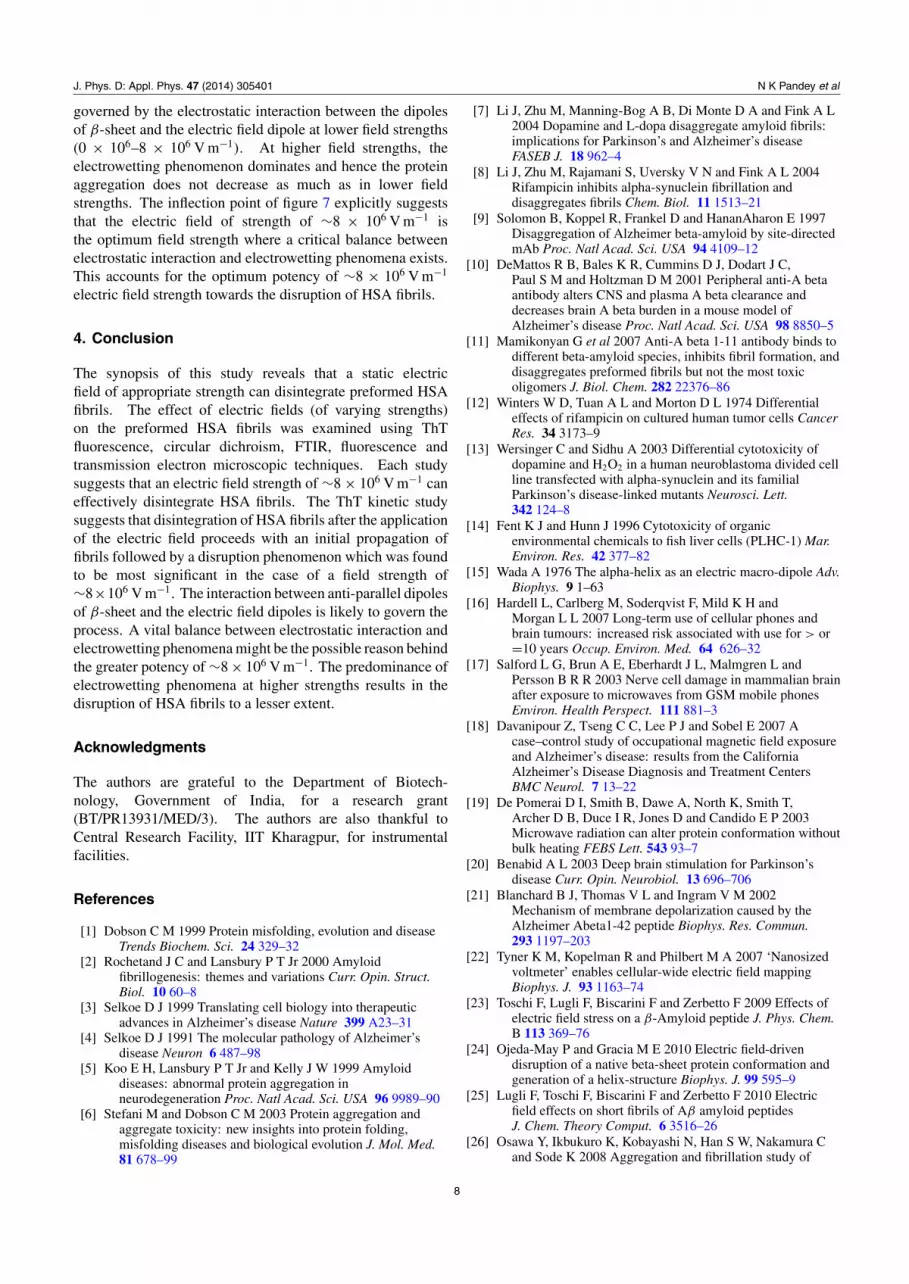
Figure 7. Change in the contact angle (θ) with the application ofelectric field [E (appl)].
present in the β-sheet causes a reorganization in the alignmentof the dipoles. We speculate that this may play a major rolein the observed disaggregation event. Interestingly, the plotof change in contact angle (θ) with applied electric field [E(appl)] (figure 7) shows that on the application of an ‘electricfield strength’ of up to 8 × 10⁶ V m−1, the change in contactangle is marginal (about 1.59◦). The change is appreciablyhigher (10.69◦) for ‘electric field strengths’ from ∼8 × 10⁶ to∼12×106 V m−1. Beyond this value, the contact angle remainsat a value much lower than that observed for the initial electricfield strengths.
Thus it is clear that electrowetting predominates foran ‘electric field strength’ beyond ∼8 × 10⁶ V m−1. Wesurmise that the increase in surface area of the droplet dueto predominant electrowetting results in sparse distribution offibrillar species (asymmetric distribution of negative charges).This could lead to a less specific interaction of the fibrillarspecies with the ‘electric field strength’. Further increase infield strength shows rapid increase in the rate of change incontact angle with applied field (16.53◦ from ∼12 × 106 to∼23 × 106 V m−1). The disruption of HSA fibrils is thus
7
J. Phys. D: Appl. Phys. 47 (2014) 305401 N K Pandey et al
governed by the electrostatic interaction between the dipolesof β-sheet and the electric field dipole at lower field strengths(0 × 106–8 × 10⁶ V m−1). At higher field strengths, theelectrowetting phenomenon dominates and hence the proteinaggregation does not decrease as much as in lower fieldstrengths. The inflection point of figure 7 explicitly suggeststhat the electric field of strength of ∼8 × 10⁶ V m−1 isthe optimum field strength where a critical balance betweenelectrostatic interaction and electrowetting phenomena exists.This accounts for the optimum potency of ∼8 × 10⁶ V m−1
electric field strength towards the disruption of HSA fibrils.
4. Conclusion
The synopsis of this study reveals that a static electricfield of appropriate strength can disintegrate preformed HSAfibrils. The effect of electric fields (of varying strengths)on the preformed HSA fibrils was examined using ThTfluorescence, circular dichroism, FTIR, fluorescence andtransmission electron microscopic techniques. Each studysuggests that an electric field strength of ∼8 × 10⁶ V m−1 caneffectively disintegrate HSA fibrils. The ThT kinetic studysuggests that disintegration of HSA fibrils after the applicationof the electric field proceeds with an initial propagation offibrils followed by a disruption phenomenon which was foundto be most significant in the case of a field strength of∼8×10⁶ V m−1. The interaction between anti-parallel dipolesof β-sheet and the electric field dipoles is likely to govern theprocess. A vital balance between electrostatic interaction andelectrowetting phenomena might be the possible reason behindthe greater potency of ∼8 × 10⁶ V m−1. The predominance ofelectrowetting phenomena at higher strengths results in thedisruption of HSA fibrils to a lesser extent.
Acknowledgments
The authors are grateful to the Department of Biotech-nology, Government of India, for a research grant(BT/PR13931/MED/3). The authors are also thankful toCentral Research Facility, IIT Kharagpur, for instrumentalfacilities.
References
[1] Dobson C M 1999 Protein misfolding, evolution and diseaseTrends Biochem. Sci. 24 329–32
[2] Rochetand J C and Lansbury P T Jr 2000 Amyloidfibrillogenesis: themes and variations Curr. Opin. Struct.Biol. 10 60–8
[3] Selkoe D J 1999 Translating cell biology into therapeuticadvances in Alzheimer’s disease Nature 399 A23–31
[4] Selkoe D J 1991 The molecular pathology of Alzheimer’sdisease Neuron 6 487–98
[5] Koo E H, Lansbury P T Jr and Kelly J W 1999 Amyloiddiseases: abnormal protein aggregation inneurodegeneration Proc. Natl Acad. Sci. USA 96 9989–90
[6] Stefani M and Dobson C M 2003 Protein aggregation andaggregate toxicity: new insights into protein folding,misfolding diseases and biological evolution J. Mol. Med.81 678–99
[7] Li J, Zhu M, Manning-Bog A B, Di Monte D A and Fink A L2004 Dopamine and L-dopa disaggregate amyloid fibrils:implications for Parkinson’s and Alzheimer’s diseaseFASEB J. 18 962–4
[8] Li J, Zhu M, Rajamani S, Uversky V N and Fink A L 2004Rifampicin inhibits alpha-synuclein fibrillation anddisaggregates fibrils Chem. Biol. 11 1513–21
[9] Solomon B, Koppel R, Frankel D and HananAharon E 1997Disaggregation of Alzheimer beta-amyloid by site-directedmAb Proc. Natl Acad. Sci. USA 94 4109–12
[10] DeMattos R B, Bales K R, Cummins D J, Dodart J C,Paul S M and Holtzman D M 2001 Peripheral anti-A betaantibody alters CNS and plasma A beta clearance anddecreases brain A beta burden in a mouse model ofAlzheimer’s disease Proc. Natl Acad. Sci. USA 98 8850–5
[11] Mamikonyan G et al 2007 Anti-A beta 1-11 antibody binds todifferent beta-amyloid species, inhibits fibril formation, anddisaggregates preformed fibrils but not the most toxicoligomers J. Biol. Chem. 282 22376–86
[12] Winters W D, Tuan A L and Morton D L 1974 Differentialeffects of rifampicin on cultured human tumor cells CancerRes. 34 3173–9
[13] Wersinger C and Sidhu A 2003 Differential cytotoxicity ofdopamine and H2O2 in a human neuroblastoma divided cellline transfected with alpha-synuclein and its familialParkinson’s disease-linked mutants Neurosci. Lett.342 124–8
[14] Fent K J and Hunn J 1996 Cytotoxicity of organicenvironmental chemicals to fish liver cells (PLHC-1) Mar.Environ. Res. 42 377–82
[15] Wada A 1976 The alpha-helix as an electric macro-dipole Adv.Biophys. 9 1–63
[16] Hardell L, Carlberg M, Soderqvist F, Mild K H andMorgan L L 2007 Long-term use of cellular phones andbrain tumours: increased risk associated with use for > or=10 years Occup. Environ. Med. 64 626–32
[17] Salford L G, Brun A E, Eberhardt J L, Malmgren L andPersson B R R 2003 Nerve cell damage in mammalian brainafter exposure to microwaves from GSM mobile phonesEnviron. Health Perspect. 111 881–3
[18] Davanipour Z, Tseng C C, Lee P J and Sobel E 2007 Acase–control study of occupational magnetic field exposureand Alzheimer’s disease: results from the CaliforniaAlzheimer’s Disease Diagnosis and Treatment CentersBMC Neurol. 7 13–22
[19] De Pomerai D I, Smith B, Dawe A, North K, Smith T,Archer D B, Duce I R, Jones D and Candido E P 2003Microwave radiation can alter protein conformation withoutbulk heating FEBS Lett. 543 93–7
[20] Benabid A L 2003 Deep brain stimulation for Parkinson’sdisease Curr. Opin. Neurobiol. 13 696–706
[21] Blanchard B J, Thomas V L and Ingram V M 2002Mechanism of membrane depolarization caused by theAlzheimer Abeta1-42 peptide Biophys. Res. Commun.293 1197–203
[22] Tyner K M, Kopelman R and Philbert M A 2007 ‘Nanosizedvoltmeter’ enables cellular-wide electric field mappingBiophys. J. 93 1163–74
[23] Toschi F, Lugli F, Biscarini F and Zerbetto F 2009 Effects ofelectric field stress on a β-Amyloid peptide J. Phys. Chem.B 113 369–76
[24] Ojeda-May P and Gracia M E 2010 Electric field-drivendisruption of a native beta-sheet protein conformation andgeneration of a helix-structure Biophys. J. 99 595–9
[25] Lugli F, Toschi F, Biscarini F and Zerbetto F 2010 Electricfield effects on short fibrils of Aβ amyloid peptidesJ. Chem. Theory Comput. 6 3516–26
[26] Osawa Y, Ikbukuro K, Kobayashi N, Han S W, Nakamura Cand Sode K 2008 Aggregation and fibrillation study of
8
J. Phys. D: Appl. Phys. 47 (2014) 305401 N K Pandey et al
α-synuclein under applied voltage Electrochemistry76 614–18
[27] Zhao W and Yang R 2010 Experimental study onconformational changes of lysozyme in solution induced bypulsed electric field and thermal stresses J. Phys. Chem. B114 503–10
[28] Yang R, Li S Q and Zhang Q H 2004 Effects of pulsed electricfields on the activity and structure of pepsin J. Agric. FoodChem. 52 7400–6
[29] Zhao W and Yang R 2009 Effect of high-intensity pulsedelectric fields on the activity, conformation andself-aggregation of pepsin Food Chem. 114 777–81
[30] Taboada P, Barbosa S, Castro E and Mosquera V 2006Amyloid fibril formation and other aggregate speciesformed by human serum albumin association J. Phys.Chem. B 110 20733–6
[31] Juarez J, Taboada P and Mosquera V 2009 Existence ofdifferent structural intermediates on the fibrillationpathway of human serum albumin Biophys. J.96 2353–70
[32] Juarez J, Goy-Lopez S, Cambon A, Taboada P andMosquera V 2009 Influence of electrostatic interactions onthe fibrillation process of human serum albumin J. Phys.Chem. B 113 10521–9
[33] Juarez J, Taboada P, Goy-Lopez S, Cambon A, Madec M B,Yeates S G and Mosquera V 2009 Additionalsupra-self-assembly of human serum albumin underamyloid-like-forming solution conditions J. Phys. Chem. B113 12391–9
[34] Juarez J, Manuel A M, Cambon A, Topete A, Barbosa S,Taboada P and Mosquera V 2012 Hydration effects on thefibrillation process of a globular protein: the case of humanserum albumin Soft Matter 8 3608–19
[35] Goy-Lopez S, Juarez J, Manuel A M, Casals E, Puntes V F,Taboada P and Mosquera V 2012 Physicochemicalcharacteristics of protein-NP bioconjugates: the role ofparticle curvature and solution conditions on human serumalbumin conformation and fibrillogenesis inhibitionLangmuir 28 9113–26
[36] Pandey N K, Ghosh S and Dasgupta S 2010 Fibrillation inhuman serum albumin is enhanced in the presence ofcopper(II) J. Phys. Chem. B 114 10228–33
[37] Pandey N K, Ghosh S and Dasgupta S 2013 Fructose restrainsfibrillogenesis in human serum albumin Int. J. Biol.Macromol. 61 424–32
[38] Pace C N, Vajdos F, Fee L, Grimsley G and Gray T 1995 Howto measure and predict the molar absorption coefficient of aprotein Protein Sci. 4 2411–23
[39] Pollack M G, Shenderov A D and Fair R B 2002Electrowetting-based actuation of droplets for integratedmicrofluidics Lab Chip 2 96–101
[40] Kuo J S, Spicar-Mihalic P, Rodriguez I and Chiu D T 2003Electro wetting-induced droplet movement in an immisciblemedium Langmuir 19 250–5
[41] Whitmore L and Wallace B A 2004 CD spectroscopy hasintrinsic limitations for protein secondary structure analysisNucleic Acids Res. 32 W668–73
[42] Byler D M and Susi H 1986 Examination of the secondarystructure of proteins by deconvolved FTIR spectraBiopolymers 25 469–87
[43] Mugele F and Baret J C 2005 Electrowetting: from basics toapplications J. Phys.: Condens. Matter 17 R705–74
[44] Paneru M, Priest C, Sedev R and Ralston J 2010 Static anddynamic electrowetting of an ionic liquid in asolid/liquid/liquid system J. Am. Chem. Soc. 132 8301–8
[45] Shapiro B, Moon H, Garrell R L and Kim C J 2003Equilibrium behavior of sessile drops under surface tension,applied external fields, and material variations J. Appl.Phys. 93 5794–811
[46] Li D 2008 Encyclopedia of Microfluidics and Nanofluidics 1stedn (Berlin: Springer)
[47] Dhindsa M, Heikenfeld J, Kwon S, Park J, Rack P D andPapautsky I 2010 Virtual electrowetting channels:electronic liquid transport with continuous channelfunctionality Lab Chip 10 832–6
[48] Naiki H, Higuchi K, Hosokawa M and Takeda T 1989Fluorometric determination of amyloid fibrils in vitro usingthe fluorescent dye, thioflavin T1 Anal. Biochem. 177 244–9
[49] Biancalana M, Makabe K, Koide A and Koide S 2009Molecular mechanism of thioflavin-T binding to the surfaceof beta-rich peptide self-assemblies J. Mol. Biol.385 1052–63
[50] Yagi H, Ozawa D, Sakurai K, Kawakami T, Kuyama H,Nishimura O, Shimanouchi T, Kuboi R, Naiki H andGoto Y 2010 Laser-induced propagation and destruction ofamyloid beta fibrils J. Biol. Chem. 285 19660–7
[51] Buchete N V, Tycko R and Hummer G 2005 Moleculardynamics simulations of Alzheimer’s beta-amyloidprotofilaments J. Mol. Biol. 353 804–21
[52] Dong A, Huang P and Caughey W S 1992 Redox-dependentchanges in β-extended chain and turn structures ofcytochrome c in water solution determined by secondderivative amide I infrared spectra Biochemistry 31 182–9
[53] Pelton J T and McLean L R 2000 Spectroscopic methods foranalysis of protein secondary structure Anal. Biochem.277 167–76
[54] Marshall K E, Morris K L, Charlton D, Reilly N O, Lewis L,Walden H and Serpell L C 2011 Hydrophobic, aromatic,and electrostatic interactions play a central role in amyloidfibril formation and stability Biochemistry 50 2061–71
[55] Calamai M, Taddei N, Stefani M, Ramponi G and Chiti F 2003Relative influence of hydrophobicity and net charge in theaggregation of two homologous proteins Biochemistry42 15078–83
[56] Schmittschmitt J P and Scholtz J M 2003 The role of proteinstability, solubility, and net charge in amyloid fibrilformation Protein Sci. 12 2374–8
[57] Schneider J P, Pochan D J, Ozbas B, Rajagopal K, Pakstis Land Kretsinger J 2002 Responsive hydrogels from theintramolecular folding and self-assembly of a designedpeptide J. Am. Chem. Soc. 124 15030–7
[58] Jean L, Lee C F and Vaux D J 2012 Enrichment ofamyloidogenesis at an air–water interface Biophys. J.102 1154–62
9