discovery and rossiter-mclaughlin effect of exoplanet kepler-8b
TRANSCRIPT

arX
iv:1
001.
0416
v1 [
astr
o-ph
.EP]
4 J
an 2
010
Discovery and Rossiter-McLaughlin Effect
of Exoplanet Kepler-8b0
Jon M. Jenkins2, William J. Borucki1, David G. Koch1, Geoffrey W. Marcy3,
William D. Cochran8, Gibor Basri,3 Natalie M. Batalha4, Lars A. Buchhave5,6, Tim M. Brown7,
Douglas A. Caldwell2, Edward W. Dunham9, Michael Endl8, Debra A. Fischer10,
Thomas N. Gautier III11, John C. Geary5, Ronald L. Gilliland12, Steve B. Howell13,
Howard Isaacson3, John Asher Johnson14, David W. Latham5, Jack J. Lissauer1,
David G. Monet15, Jason F. Rowe1,16, Dimitar D. Sasselov5, William F.Welsh17,
Andrew W. Howard3, Phillip MacQueen8, Hema Chandrasekaran2, Joseph D. Twicken2,
Stephen T. Bryson1, Elisa V. Quintana2, Bruce D. Clarke2, Jie Li2, Christopher Allen18,
Peter Tenenbaum2, Hayley Wu2, Soren Meibom5, Todd C. Klaus18, Christopher K. Middour18,
Miles T. Cote1, Sean McCauliff18, Forrest R. Girouard18, Jay P. Gunter18, Bill Wohler18,
Jennifer R. Hall18, Khadeejah Ibrahim18, AKM Kamal Uddin18, Michael S. Wu19,
Paresh A. Bhavsar1, Jeffrey Van Cleve2, David L. Pletcher1, Jessie A. Dotson1, Michael R. Haas1
0Based in part on observations obtained at the W. M. Keck Observatory, which is operated as a scientific part-
nership among the California Institute of Technology, the University of California, and the National Aeronautics
and Space Administration. The Observatory was made possible by the generous financial support of the W.M. Keck
Foundation.

– 2 –
ABSTRACT
We report the discovery and the Rossiter-McLaughlin effect of Kepler-8b, a transit-
ing planet identified by the NASAKepler Mission. Kepler photometry and Keck-HIRES
radial velocities yield the radius and mass of the planet around this F8IV subgiant host
star. The planet has a radius RP = 1.419RJ and a mass, MP = 0.60MJ, yielding
a density of 0.26 g cm−3, among the lowest density planets known. The orbital pe-
riod is P = 3.523 days and orbital semimajor axis is 0.0483+0.0006−0.0012AU. The star has
a large rotational v sin i of 10.5 ± 0.7 km s−1and is relatively faint (V ≈ 13.89 mag),
both properties deleterious to precise Doppler measurements. The velocities are indeed
noisy, with scatter of 30 m s−1, but exhibit a period and phase consistent with the
planet implied by the photometry. We securely detect the Rossiter-McLaughlin effect,
confirming the planet’s existence and establishing its orbit as prograde. We measure
an inclination between the projected planetary orbital axis and the projected stellar
rotation axis of λ = −26.9 ± 4.6◦, indicating a moderate inclination of the planetary
orbit. Rossiter-McLaughlin measurements of a large sample of transiting planets from
Kepler will provide a statistically robust measure of the true distribution of spin-orbit
1NASA Ames Research Center, Moffett Field, CA 94035
2SETI Institute/NASA Ames Research Center, Moffett Field, CA 94035
3University of California, Berkeley, Berkeley, CA 94720
4San Jose State University, San Jose, CA 95192
5Harvard-Smithsonian Center for Astrophysics, 60 Garden Street, Cambridge, MA 02138
6Niels Bohr Institute, Copenhagen University, DK-2100 Copenhagen, Denmark
7Las Cumbres Observatory Global Telescope, Goleta, CA 93117
8University of Texas, Austin, TX 78712
9Lowell Observatory, Flagstaff, AZ 86001
10Radcliffe Institute, Cambridge, MA & Yale University, New Haven, CT
11Jet Propulsion Laboratory/California Institute of Technology, Pasadena, CA 91109
12Space Telescope Science Institute, Baltimore, MD 21218
13National Optical Astronomy Observatory, Tucson, AZ 85719
14California Institute of Technology, Pasadena, CA 91109
15US Naval Observatory, Flagstaff Station, Flagstaff, AZ 86001
16NASA Postdoctoral Fellow Program
17San Diego State University, San Diego, CA
18Orbital Sciences Corporation/NASA Ames Research Center, M/S 244-30, Moffett Field, CA 94035, USA
19Bastion Technologies/NASA Ames Research Center, M/S 244-30, Moffett Field, CA 94035, USA
– 3 –
orientations for hot jupiters in general.
Subject headings: planetary systems — stars: fundamental parameters — stars: indi-
vidual (Kepler-8, KIC 6922244, 2MASS 18450914+4227038)
1. Introduction
To date, 90 “hot jupiters”—gas giant planets with periods ≤10 days—have been detected
around Sun-like stars (Torres et al. 2008). The front-running formation scenario supposes that
these planets did not form where they reside today, close the host star, because the inner regions
of protoplanetary disks have inadequate surface densities and high temperatures (Lin et al. 1996).
Instead hot jupiters are presumed to form several astronomical units (AU) from their host stars
followed by subsequent migration inward to their current locations. One likely migration sce-
nario involves tidal interactions between the planet and a remaining gaseous disk (Lin et al. 1996;
Moorhead & Adams 2008), causing the planet to spiral inward while maintaining its nearly circular
orbit that is co-planar with the disk. Alternatively, migration may occur by N-body gravitational
interactions, such as planet–planet scattering (Rasio & Ford 1996; Chatterjee et al. 2008), dy-
namical relaxation (Papaloizou & Terquem 2001; Adams & Laughlin 2003), and Kozai interactions
with a distant object, and damped later by tidal friction (Holman et al. 1997; Fabrycky & Tremaine
2007; Wu et al. 2007; Nagasawa et al. 2008). Thus, measurements of both the orbital eccentricities
and the orbital inclinations relative to the star’s equator offer diagnostics of the original migration
process.
We assume that planets form in protoplanetary disks with the stellar spin and planetary
orbital axes aligned. If so, the nearly adiabatic tidal interactions between planets and disks would
maintain the alignment (Ward & Hahn 1994). In contrast, few-body gravitational interactions
would typically cause misalignments. Few-body models by Adams & Laughlin (2003) predict a
final inclination distribution for dynamically relaxed planetary systems that peaks near 20◦ and
which extends to inclinations as high as 85◦. Kozai interactions between a planet and an outer
body (star or planet) result in a wide distribution of final orbital inclinations for the inner planet,
including retrograde orbits (Fabrycky & Tremaine 2007; Wu et al. 2007; Nagasawa et al. 2008).
The Rossiter-McLaughlin (R-M) effect offers a way to assess quantitatively the spin-orbit align-
ment of a planetary system by measuring the Doppler effect of the star’s light during a planetary
transit. As the planet blocks receding portion of a rotating star’s surface, the spectrum from the un-
obscured surface has a net Doppler shift toward shorter wavelengths, and vice versa for blocking the
approaching portion of the star. The R-M effect has been measured in 18 stars to date (Queloz et al.
2000; Winn et al. 2005, 2006, 2007; Wolf et al. 2007; Narita et al. 2007, 2008; Bouchy et al. 2008;
Cochran et al. 2008; Loeillet et al. 2008; Winn et al. 2008; Johnson et al. 2009; Pont et al. 2009;
Moutou et al. 2009; Pont et al. 2009; Winn et al. 2009; Narita et al. 2009a,b; Simpson et al. 2010;
Anderson et al. 2009; Gillon 2010; Pont et al. 2009; Amaury, A. et al. 2010).
– 4 –
About 2/3 of the 18 planetary systems measured by the R-M effect have an orbital plane well
aligned with the star’s equatorial plane, as projected onto the sky, giving λ near 0◦. This alignment
is as expected from simple migration theory due to gentle loss of orbital energy to the gas in the
protoplnaetary disk (Lin et al. 1996). However, six exoplanetary systems show a significant spin-
orbit misalignment, namely HD 80606 (Winn et al. 2009; Moutou et al. 2009; Pont et al. 2009;
Gillon 2010), WASP-14b (Johnson et al. 2009; Joshi et al. 2009), XO-3b (Hebrard et al. 2009;
Winn et al. 2009), HAT-P-7b (Winn et al. 2009; Narita et al. 2009a), CoRoT-1 (Pont et al. 2009)
Wasp-17b (Anderson et al. 2009).
The variety of alignments support the bimodal distribution found by Fabrycky & Winn (2009).
Interestingly, all four misaligned systems contain quite massive planets, above 1 MJ. This cor-
relation may be related to the association of massive planets with higher orbital eccentricity
(Wright et al. 2009), as both eccentricity and inclination may arise from perturbations of plan-
ets from their original circular orbits. But there are two massive planets on eccentric orbits for
which λ appears to be consistent with zero, namely HD 17156b (Cochran et al. 2008; Barbieri et al.
2009; Narita et al. 2009b), and HATp–2b (Winn et al. 2007; Loeillet et al. 2008). There is currently
no dominant and secure explanation for the misaligned or eccentric hot jupiters.
Here, we present the first detection of the Rossiter-McLaughlin effect from a planet detected by
the Kepler Mission. As this mission is expected to detect dozens of transiting hot jupiters, Kepler
offers an opportunity to provide a statistically robust measure of the distribution of spin-orbit
angles, and to correlate that angle with other physical properties of the systems.
2. Kepler Photometry
Nearly continuous photometry in a 100 square degrees field near Cygnus and Lyra was carried
out during 42 days by the Kepler spaceborne telescope, as described previously (Borucki et al.
2010; Borucki et al. 2010; Koch et al. 2010; Jenkins et al. 2010; Batalha et al. 2010; Gautier et al.
2010). The star Kepler-8 (= KIC 6922244, α = 18h45m09s.15, δ = +42◦27′03′′.9, J2000, KIC
r = 13.511mag) exhibits a repeated dimming of 9.82± 0.22millimag, obvious against uncertainties
in each 30 minute integration of 0.1 millimag. The light curve for Kepler-8 is plotted in Figure
1. The numerical data are available electronically in the online edition of the journal. A modest
amount of detrending has been applied (Koch et al. 2010; Rowe et al. 2010) to the time series.
We detect no systematic difference between alternating transit events at 50 µmag levels, ruling
out nearly equal components of an eclipsing binary star, (see Fig. 1). We also see no evidence of
dimming at the expected times of a secondary eclipse, which would be visible for most eclipsing
binary systems of unequal surface brightness. The photocenter shows no displacement astrometri-
cally above millipixel levels (0.5 mas) during times in and out of transit as would be seen if there
were a background eclipsing binary masquerading as a transiting planet. Thus the photometric
and astrometric non-detections of an eclipsing binary support the planet interpretation for the re-

– 5 –
peated transit signatures. Moreover, the shape of the photometric transit is adequately fit with a
planet-transit model further supporting the planet interpretation.
We fit the light curves by solving for a/RStar, the density of the star, and the ratio of planet
to stellar radius. We follow the method for estimating stellar radii and other stellar parameters
described by Sozzetti et al. (2007), Bakos et al. (2007), Winn et al. (2007) and Charbonneau et al.
(2007). This method extracts physical properties directly from the light curve, geometry, and
Newtonian physics, and it uses the greater orthogonality of parameters to yield more robust fits to
observables (Torres et al. 2008). We fit explicitly for a/R⋆, b, and r/R⋆using a procedure developed
by one of us (J.Rowe) and described by Koch et al. (2010); Borucki et al. (2010).
We begin with an LTE spectroscopic analysis (Valenti & Piskunov 1996; Valenti & Fischer
2005) of a high resolution template spectrum from Keck-HIRES of Kepler-8 to derive an effective
temperature, Teff= 6213 ± 150 K, surface gravity, log g= 4.28 ± 0.10(cgs), metallicity, and the
associated error distribution for each of them. The multitude of Yale-Yonsei stellar evolution models
(Demarque et al. 2004) are constrained by both those LTE measurements and by the stellar density
that stems directly from the orbital period, the fractional dimming during transit, and measures
of transit durations (Sozzetti et al. 2007; Brown et al. 2010). By Monte Carlo analysis, those
photometric and spectroscopic constraints and their uncertainties establish the probabiliby density
contours among the evolutionary tracks where the star may reside. We iterate the self-consistent
fitting of light curves, radial velocities, and evolutionary models until a domain of stellar mass,
radius, and age is identified. That domain encompasses a range of evolutionary states that satisfy
all of the constraints within their error distributions. The resulting mass and radius of Kepler-8
are given in Table 1, along with other associated stellar properties such as luminosity and age.
3. A Background Eclipsing Binary: Follow-up Imaging
We carried out extensive tests of the possibility that the apparent photometric transit was
actually caused by a background eclipsing binary star within the photometric aperture of radius
∼8 ′′. We obtained images with 0.8 arcsec seeing with the Keck telescope HIRES guider camera and
the bg38 filter to search for stellar companions that might be eclipsing. This filter combined with
the CCD detector have a response similar to the V plus R bands, in turn similar to the bandpass of
the Kepler photometer. This Keck image is shown in 2. There is one star having 0.0075 the flux of
the main star (V and R band) that resides 3.8′′northwest of Kepler-8. This background star resides
within the Kepler aperture and could conceiveably be an eclipsing binary that is masquerading as
a transiting planet.
But this faint neighboring star cannot be the source of the photometric transit signature for
two reasons. If the background star were the cause of the observed 1% dimming, the photocenter
centroid shifts would be 3-20 millipixel on the Kepler CCD. Instead, astrometric measurements in
and out of transit (Jenkins et al. 2010) show shifts of no more than 0.1 millipixel in and out of

– 6 –
transit. Figure 3 shows both the flux and astrometric photocenter (centroid) of the Kepler images
during quarter 1 month of data. We applied a high-pass filter to remove non-transit signatures
on timescales longer than 2 days. At times of transits there are no displacements in either the
row or column direction at a level above a millipixel. This indicates that any background eclipsing
binary would need to be well within ∼0.1 pixels or 0.4′′of the target star in order to explain the
photometric transit signals.
To hunt further for background eclipsing binaries we plotted flux versus the photocenter cen-
troids in both the row and column directions, as shown in Figure 4. These so-called “rain plots”
would reveal an eclipsing binary as a “breeze” in the centroids to the left or right as the flux drops.
No such breeze is detected at a level near 0.1 millipixel, ruling out all but eclipsing binaries located
within a few tenths of an arcsec of Kepler-8. Finally, we looked directly at the Kepler images taken
both during and out of transit to detect motion of the centroid of light, as shown in Figure 5.
We formed the difference of the images in and out of transit to detect astrometric displacements
associated with the flux dimming, as would occur if a neighboring eclipsing binary were the cause.
Those difference images show no shift of the photocenter. We conclude that the transit photometry
with its 1% dimming cannot be explained by any eclisping binary companions beyond 1 arcsecond
of Kepler-8.
Furthermore, the flux ratio of the two stars is only 0.0075, making it impossible for the back-
ground star to cause the 1% photometric dimming. Even if that background star were to vanish,
the total flux would decline by less than the observed 1%. We conclude that the 1% photometric
dimming is not caused by an eclipsing binary star within the Kepler photometric aperture, from 1
- 10 arcsec of the target star.
To hunt for additional stars in the field within an arcsec of Kepler-8 we used both speckle
imaging and adaptive optics imaging. Kepler-8 was observed at the Palomar Hale 200-inch telescope
on 09 Sep 2009 UT with Palomar near-infrared adaptive optics system [PHARO] (Hayward et al.
2001). The PHARO instrument was utilized in the J-band filter with the 25 mas per pixel (25′′FOV)
mode. The source was observed with a 5-point dither and an integration time of 2.8 seconds
per frame. The dither pattern was repeated 7 times for a total on-source integration time of 98
seconds. The average uncorrected seeing during the observations at J-band was 0.65′′, and the
average AO corrected images produced point spread functions that were 0.09′′FWHM. There are
two faint sources within 4′′of Kepler-8; these objects are 7 and 8.4 magnitudes fainter than the
primary target and are too faint to produce the Kepler -observed transit and centroid shift. The
AO imaging detected no sources at J-band down to within 0.1′′ − 0.2′′ of the primary target that
are within ∆m ≈ 6− 7 mag at J.
Speckle observations of Kepler-8 were made on 1 October 2009 (UT) at the WIYN observatory
located on Kitt Peak. The observations were made using the WIYN speckle camera during a night
of very good seeing (0.62 ′′) and under clear conditions. We used a narrow bandpass 40 nm wide
centered at 692 nm. The Kepler speckle program obtains observations of both double and single

– 7 –
standard stars throughout the night. We use a robust background estimator on the reconstructed
images to set a limit for the level of companion star we should detect if present. The speckle
observations show that Kepler-8 has no companion star between 0.05 and 2.0 arcsec within a delta
magnitude of <4.2 mags. These AO and speckle observations effectively rule out the possibility of
an eclipsing binary star to within as close as 0.1 arcsec from Kepler-8.
3.1. Covariance of Inclination, Limb Darkening, and Stellar Parameters
As Kepler-8 has a large impact parameter, the solution is quite sensitive to errors in limb-
darkening. The derived impact parameter and inclination angle are directly related to the assumed
limb-darkening law, poorly known for the wide Kepler bandpass. We adopted an adhoc approach
to estimate the limb-darkening parameters (Rowe et al. 2010) as follows. We noted that fits to the
observed Rossiter-McLaughlin effect (see section 6), coupled with the measured v sin i= 10.5± 0.7
km s−1offered a constraint on the inclination angle and the impact parameter, and hence on the
inferred stellar radius, for a given limb-darkening law. To solve the genereal case for eccentric orbits
see Pal et al. (2010).
For the cases of Kepler-4 and Kepler-5 (Borucki et al. 2010; Koch et al. 2010), we discovered
that a model using tabular values (Prsa & Zwitter 2006) for limb darkening over-predicted the
amount of curvature in the variation of flux as a function of time during transit. We therefore
modified the limb-darkening parameters by fitting the three known exoplanets, TRES-2, HAT-P-7,
and HAT-P-11, and using published values for their stellar and planetary parameters. We linearly
interpolated over the values of effective temperature to derive a superior measure of the true limb-
darkening law for the Kepler bandpass. The photometry from new transiting planets found by
Kepler, along with IR photometry that is less sensitive to limb darkening, will allow us to refine
the limb-darkening law for the Kepler bandpass in the coming months. The resulting fits to the
photometric transits of Kepler-4, 5, 6, 7, and 8 were all improved with our new limb-darkening
treatment (Rowe et al. 2010).
For Kepler-8, the resulting impact parameter and inclination were b=0.724 ± 0.020 and i =
84.07±+0.33 both about 10% smaller than we had obtained by using the first-guess limb-darkening
law. The transit duration in turn dictates the best-fit stellar radius, and after iterating with the
Yale-Yonsei models, the resulting stellar radius is R = 1.486+0.053−0.062 R⊙. The stellar mass has a value
within a narrow range, M = 1.213+0.067−0.063 M⊙, again derived from iteration between the fit to the
light curve and to the Yale-Yonsei models. Additional information on stellar mass comes from the
projected rapid rotation of the star, v sin i= 10.5 ± 0.7 km s−1. This v sin iis faster than typical
rotation for stars at the lower end of the mass range quoted above, especially as some evolution and
associated increase in moment of inertia has occurred. Thus we marginally favor the upper half of
the quoted mass range, i.e. M > 1.213 M⊙. The stellar gravity is log g= 4.174 ± 0.026(cgs), and
the approximate age is 3.84± 1.5Gyr, both indicating a star nearing the end of its main sequence
lifetime.

– 8 –
4. Radial Velocities
We took high resolution spectra of Kepler-8 using HIRES on the Keck I 10-m telescope
(Vogt et al. 1994). We set up the HIRES spectrometer in the same manner that has been used
consistently for 10 years with the California planet search (Marcy et al. 2008). We employed the
red cross-disperser and used the I2 absorption cell to measure the instrumental profile and the
wavelength scale. The slit width was set at 0.′′87 by the “B5 decker”, giving a resolving power
of about 60,000 at 5500ABetween 2009 June 1 and 2009 October 31 we gathered 15 spectra of
Kepler-8 out of transit (See Figure 6). Typical exposure times were between 10 - 45 min, yielding
signal-to-noise of 20 - 40 pixel−1. These are quite low S/N ratios with which to attempt precise
Doppler measurements. We tested the Doppler precision from such low SNR spectra on standard
stars, notably HD 182488 and HD 9407, and found that the expected errors are ∼5 m s−1, as ex-
pected from Poisson statistics of the photons, with no systematic errors above 1 m s−1, as usual for
the iodine technique. On 2009 October 29 (UT) we obtained nine spectra of Kepler-8 during transit
(the last taken during egress). The observations were taken between airmass 1.9 and 3.8, while the
star was setting, the last exposure occurring at hour angle 5 hr 35 min with extreme atmospheric
refraction and dispersion. Again, tests with standard stars observed at such high airmass show no
systematic errors in the Doppler measurements above 1 m s−1.
We carried out careful reduction of the raw images, including cosmic ray elimination and
optimal extraction of the spectra, to minimize the background moonlight. We performed the
Doppler analysis with the algorithm of Johnson et al. (2009). We estimated the measurement error
in the Doppler shift derived from a given spectrum based on the weighted standard deviation of the
mean among the solutions for individual 2 A spectral segments. The typical internal measurement
error was 7-10 m s−1. The resulting velocities are given in Table 2 and plotted in Figure 6.
The actual uncertainties in the velocities are certainly closer to 20-25m s−1 for several reasons.
The spectra have such low photon levels, ∼200 photons per pixel in the raw CCD images, that
cosmic rays and background sky are significant noise sources. The latter was especially problematic
as we used an entrance slit with dimensions 0.87 x 3.5 arcsec, not long enough to separate the
wings of the star’s point spread function from the background sky. Nearly all HIRES spectra were
taken with the moon gibbous or full, and about half of the nights had moderate cirrus that scatters
moonlight into the slit. A few observations made with a 14 arcsec slit revealed that 1-3% of the light
came from the moonlit sky in typical observations. Simulations with stellar spectra contaminated
by moonlit sky suggested that errors of ∼10 m s−1would accrue, no doubt systematic as well. Errors
in the velocities are large because of relatively rapid rotation, v sin i= 10.5 ± 0.7, broadening the
absorption lines by 5x that of the slowest rotating stars. Doppler errors increase linearly with
line widths. Thus, while the S/N=40 might be expected to yield velocities of ∼5 m s−1, the high
v sin i increases that error to ∼25 m s−1. Indeed, the best orbital fit to the velocities, shown in
Figure 6, exhibit discrepancies of 20-30m s−1. We estimate that the true errors in velocities are
thus ∼25m s−1. We have accounted for these errors by adding a ”jitter” of 25m s−1to the internal
velocity errors. Those augmented uncertainties are reflected in Table 2.
– 9 –
We carried out a Levenberg-Marquardt least-squares fit of a Keplerian, single-planet model to
the observed velocities. In all models the orbital period and the time of mid-transit was constrained
to be that found in the photometric fit. We first assumed a circular orbit leaving only two free
parameters in our fit, namely the velocity amplitude and the gamma velocity of the system. The
best-fit model is overplotted in Figure 6. The best-fit value of the amplitude isK = 68.4±12.0m s−1.
This, coupled with the adopted stellar mass of 1.213+0.067−0.063 M⊙, yields a planet mass of 0.603+0.13
−0.19MJ.
We also carried out fits in which the eccentricity was allowed to float. The best-fit model
has an eccentricity = 0.24, K = 71.4 m s−1, yielding a planet mass of 0.62 MJ. The RMS of the
residuals is 39 m s−1compared with 40 m s−1 for the circular orbit, rendering the eccentric orbit no
better than the circular. Indeed a bootstrap Monte Carlo estimate of the parameter uncertainties
gives a formal error in eccentricity of 0.16 . We conclude that the eccentricity is consistent with
zero, but could be as high as 0.4. This large uncertainty stems from the high v sin i of the star and
it’s relative faintness, V = 13.9 mag.
A line bisector analysis showed no variation at a level of a few meters per second and no
correlation with measured radial velocities. Thus, the velocity variation appears to represent actual
acceleration of the center of mass of the star.
5. Properties of the Planet Kepler-8b
With the planet interpretation highly likely, the properties of the host star and the depth of
transit directly yield a planet radius of 1.419+0.056−0.058RJ and a mass of 0.603+0.13
−0.19MJ . The errors
represent the 68%-probability domain of integrated uncertainty from all input measurements and
models. The planet density is 0.261 ± 0.071 g cm−3apparently placing it among the low density
exoplanets. Assuming a bond albedo of 0.1, its orbital radius of 0.0483+0.0006−0.0012 AU, and the best-fit
stellar luminosity from the Yale-Yonsei models gives an equilibrium temperature for the planet of
1764 ± 200 K, assuming rapid and complete redistribution of thermal energy around the planet’s
surface. This planet apparently is a member of the population of low density, bloated hot jupiters
having thermal histories yet to be firmly understood. The planet properties are listed in Table 1.
6. Rossiter-McLaughlin Effect
The radial velocities obtained during the transit of 2009 October 29 (UT) were modeled using
the techniques described by Cochran et al. (2008). The models adopted the system parameters in
Table 1, and searched for the value of λ that best matched the observed velocities. In particular, we
assumed the zero eccentricity orbit, as the Kepler photometric lightcurve gives no indication of non-
zero eccentricity. We used a Claret (2004) four parameter limb-darkening law, although running
similar models with both a linear and a quadratic limb-darkening law gave essentially the same
results. We derive a value of λ = −26.9± 4.6◦ for the angle between the projected stellar rotation

– 10 –
axis and the projected planetary orbital axis. The model fit to the data gives a reduced chi-squared
χ20 = 0.66 for the velocities obtained during the transit, indicating that the uncertainties in these
velocities are probably slightly overestimated.
The radial velocities measured during the transit and the Rossiter-McLaughlin effect model
fit are shown in Figure 7. The observed asymmetric Rossiter-McLaughlin effect, with a positive
deviation of larger amplitude and longer duration than the negative amplitude is a result of the
combination of the large impact parameter and the non-zero value of λ. A central transit would
give a symmetric Rossiter-McLaughlin deviation, with the amplitude of the effect then depending
on λ. However, for an off-center transit, the overall shape depends critically on both the impact
parameter and on λ (cf. Figure 2 of Gaudi & Winn (2007)).
This Rossiter-McLaughlin analysis provides independent verification of the major results of
the transit lightcurve analysis. The lightcurve analysis alone suggested a transit chord that is
significantly off-center, with impact parameter, b = 0.724±0.020 and inclination, i = 84.07±+0.33.
This large impact parameter coupled with the non-zero value of λ results in the planet transit
blocking mostly the approaching (blue-shifted) half of the rotating star, as indicated in 8. The
planet crosses to the receding (red-shifted) portion of the stellar disk just before the end of the
transit. This causes the observed asymmetry in the Rossiter McLaughlin velocity perturbation
during the transit. The observed amplitude of the R-M effect is in excellent agreement with
the photometrically determined stellar radius and impact paramter, and with the spectroscopically
determined v sin i. The duration of the photometric transit agrees with the duration of the observed
R-M velocity perturbation. This consistency between the properties of the system as derived from
the transit photometry and from the R-M velocity perturbation gives a confirmation that both
phenomena were caused by an orbiting, planet-sized companion to the star. There is no other
explanation of the observed R-M variations that is also consistent with both the photometric and
the radial velocity observations.
This observation of the Rossiter-McLaughlin effect in Kepler-8 is important because it confirms
that the observed lightcurve and radial velocity variations in Kepler-8 were indeed caused by an
orbiting planetary companion. The amount of scatter in the radial velocity data giving the solution
shown in Figure 6 is uncomfortably large, even given the lack of line bisector variations in these
spectra. However, the R-M data absolutely confirm the existence of the planet. There is no other
explanation of the observed R-M variations that is also consistent with both the photometric,
astrometric, imaging, and the radial velocity observations.
7. DISCUSSION
We have carried out a wide array of observations of Kepler-8 that pinpoint the existence and
properties of the exoplanet. The Kepler photometric measurements, with ∼0.1 mmag errors in 30
min intervals, are tightly fit by a model of a transiting exoplanet (Figure 1). This good fit to the

– 11 –
inflections of the photometric data provide immediate support for the planet interpretation, with
few plausible alternative interpretations except for a background, diluted eclipsing binary system
having just the right brightness and radius ratio to mimic a planet. We note that, unlike ground-
based transit work that has lower photometric precision, the Kepler photometry is so precise that
blends of eclipsing binaries are more readily identified from the photometry alone.
Nonetheless, to test the unlikely possibility of a blend, we carried out a battery of astrometric
tests to hunt for an eclipsing binary. The resulting steadiness of the position of the primary star,
Kepler-8, during and out of transit, argues against any eclipsing binary in the photometric aperture.
We further carried out both adaptive optics imaging and speckle interferometric measurments to
hunt for faint eclipsing binaries located within an arcsec of the Kepler-8. None was found, further
diminishing the chance of such a masquerade. We followed with high resolution spectroscopy at
both low and high signal-to-noise ratio, finding no evidence of double lines nor rapid rotation.
Further support for the planet interpretation came from the precise radial velocities that varied in
phase with, and had the same period as, the photometric light curve, further supporting the planet
model and constraining the planet mass.
Finally, the Rossiter-McLaughlin effect confirmed independently the planet interpretation and
provided further geometrical information about the orbit, notably λ = −26.9 ± 4.6◦. A sketch
of the star and planet’s orbit are shown in (Figure 8). Remaining unknown is the inclination of
the star’s rotation axis, as indicated in 8. But continued photometry during the Kepler mission
lifetime may reveal a photometric periodicity caused by the rotation of spots around the star. The
resulting rotation period, coupled with the measured rotational v sin i= 10.5 ± 0.7of the star, will
allow the star’s inclination to be measured, putting the R-M geometry on firmer ground.
The suite of ground-based observations obtained for Kepler-8described above over-constrained
a set of parameters that were obligated to mutually agree, including such subtle issues as the limb-
darkening, the stellar rotation rate, and stellar radius, mass, and density. Thus, the R-M effect can,
in general, be used to confirm the existence of a planetary companion in the case where standard
follow-up observing procedures may provide somewhat ambiguous or equivocal results. Examples
would be Kepler stars that are sufficiently saturated that measurement of photocenter shifts during
transits is problematic, or stars like Kepler-8with large v sin ithat make orbit determination via
precise RV measurement difficult.
Observations of the Rossiter-McLaughlin effect in dozens of transiting planets, discovered from
the ground and from Kepler, offer an excellent opportunity to determine the distribution of orbital
geometries of the short-period planetary systems in general. These planetary systems will continue
to be studied in an extraordinarily unform and consistent manner with the same set of tools. The
sample selection effects are extremely well understood and documented. The Kepler lightcurves
are of unprecidented precision, allow sensitive searches for additional planets in the system via
transit timing variations, and significantly tighter limits to be placed in the future on the orbital
eccentricity. Coupling these data with R-M measurements of the orbital alignment in these systems
– 12 –
will allow us to correlate the observed properties with the degree of orbital alignment, and thus
to search for the physical mechanisms causing observed misalignments. We will also have the
information to be able to begin to back-out the physical angle between the spin and orbital angular
momentum vectors, not just the projection of these angles on the plane of the sky.
Funding for this Discovery mission is provided by NASA’s Science Mission Directorate. Many
people have contributed to the success of the Kepler Mission, and it is impossible to acknowledge
them all. Valuable advice and assistance were provided by Willie Torres, Riley Duren. M. Crane,
and D. Ciardi. Special Technical help was provided by Carly Chubak, G. Mandushev, and Josh
Winn. We thank E. Bachtel and his team at Ball Aerospace for their work on the Kepler pho-
tometer and R. Thompson for key contributions to engineering; and C. Botosh, and J. Fanson,
for able management. GWM thanks acknowledges support from NASA Cooperative Agreement
NNX06AH52G.
Facilities: Kepler.
REFERENCES
Adams, F. C. & Laughlin, G. 2003, Icarus, 163, 290
Amaury et al. arxiv0907.2956
Anderson, D. R., et al. ApJ submitted, arXiv0908.1553
Bakos, G. A., et al. 2007, ApJ, 670, 826
Barbieri, M., et al. 2009, A&A, 503, 601
Batalha, N. M., et al. 2010 ApJL Submitted
Borucki,W. et al. 2010, Science Submitted
Borucki, et al. 2010, ApJL Submitted
Bouchy, F., Queloz, D., Deleuil, M., Loeillet, B., Hatzes, A. P., Aigrain, S., Alonso, R., Auvergne,
M., Baglin, A., Barge, P., Benz, W., Borde, P., Deeg, H. J., De la Reza, R., Dvorak, R.,
Erikson, A., Fridlund, M., Gondoin, P., Guillot, T., Hebrard, G., Jorda, L., Lammer, H.,
Leger, A., Llebaria, A., Magain, P., Mayor, M., Moutou, C., Ollivier, M., Patzold, M., Pepe,
F., Pont, F., Rauer, H., Rouan, D., Schneider, J., Triaud, A. H. M. J., Udry, S., & Wuchterl,
G. 2008, ArXiv e-prints, 0803.3209
Brown, T. M., et al. 2010, ApJL Submitted
Charbonneau, D., Winn, J. N., Everett, M. E., Latham, D. W., Holman, M. J., Esquerdo, G. A.,
& O’Donovan, F. T. 2007, ApJ, 658, 1322

– 13 –
Chatterjee, A., Sarkar, A., Barat, P., Mukherjee, P., & Gayathri, N. 2008, ArXiv e-prints, 0804.1670
Cochran,W.D., Redfield,S., Endl,M., & Cochran, A. L. 2008, ApJ, 683, L59
Claret, A. 2004, A&A, 428, 1001
Demarque, P., Woo, J.-H., Kim, Y.-C., & Yi, S. K. 2004, ApJS, 155, 667
Dunham, E. W., et al 2010 ApJL Submitted
Fabrycky, D. & Tremaine, S. 2007, ApJ, 669, 1298
Fabrycky, D. C., & Winn, J. N. 2009, ApJ, 696, 1230
Gaudi, B. S. & Winn, J. N. 2007, ApJ, 655, 550
Gautier, T. N., et al. 2010, ApJL, in press
Gillon,M. 2009, archiv0906.4904
Gimenez, A. 2006, ApJ, 650, 408
Hayward, T. L., Brandl, B., Pirger, B., Blacken, C., Gull, G. E., Schoenwald, J., & Houck, J. R.
2001, PASP, 113, 105
Hebrard, G., et al. 2009, IAU Symposium, 253, 508
Holman, M., Touma, J., & Tremaine, S. 1997, Nature, 386, 254
Jenkins et al. 2010, ApJL, in press
Johnson, J. A., et al. 2008, ApJ, 686, 649
Johnson, J. A., Winn, J. N., Albrecht, S., Howard, A. W., Marcy, G. W., & Gazak, J. Z. 2009,
PASP, 121, 1104
Joshi, Y. C., et al. 2009, MNRAS, 392, 1532
Koch et al. 2010, ApJL, in press
Koch, et al. 2010, ApJL, in press
Kobayashi, Y., Yoshii, Y., Peterson, B. A., Minezaki, T., Enya, K., Suganuma, M., & Yamamuro,
T. 1998, 3354, 769
Lin, D. N. C., Bodenheimer, P., & Richardson, D. C. 1996, Nature, 380, 606

– 14 –
Loeillet, B., Shporer, A., Bouchy, F., Pont, F., Mazeh, T., Beuzit, J. L., Boisse, I., Bonfils, X.,
da Silva, R., Delfosse, X., Desort, M., Ecuvillon, A., Forveille, T., Galland, F., Gallenne,
A., Hebrard, G., Lagrange, A.-M., Lovis, C., Mayor, M., Moutou, C., Pepe, F., Perrier,
C., Queloz, D., Segransan, D., Sivan, J. P., Santos, N. C., Tsodikovich, Y., Udry, S., &
Vidal-Madjar, A. 2008, A&A, 481, 529
Mandel, K. & Agol, E. 2002, ApJ, 580, L171
Marcy, G. W., et al. 2008, Physica Scripta Volume T, 130, 014001
Minezaki, T., Yoshii, Y., Kobayashi, Y., Enya, K., Suganuma, M., Tomita, H., Aoki, T., & Peterson,
B. A. 2004, ApJ, 600, L35
Moorhead, A. V. & Adams, F. C. 2008, Icarus, 193, 475
Moutou, C., et al. 2009, A&A, 498, L5
Nagasawa, M., Ida, S., & Bessho, T. 2008, ArXiv e-prints, 0801.1368
Narita, N., Enya, K., Sato, B., Ohta, Y., Winn, J. N., Suto, Y., Taruya, A., Turner, E. L., Aoki,
W., Yoshii, M., Yamada, T., & Tamura, Y. 2007a, PASJ, 59, 763
Narita, N., Sato, B., Ohshima, O., & Winn, J. N. 2007, ArXiv e-prints, 0712.2569
Narita, N., Sato, B., Hirano, T., & Tamura, M. 2009, PASJ, 61, L35
Narita, N., et al. 2009, PASJ, 61, 991
Noguchi, K., Aoki, W., Kawanomoto, S., Ando, H., Honda, S., Izumiura, H., Kambe, E., Okita,
K., Sadakane, K., Sato, B., Tajitsu, A., Takada-Hidai, T., Tanaka, W., Watanabe, E., &
Yoshida, M. 2002, PASJ, 54, 855
Ohta, Y., Taruya, A., & Suto, Y. 2005, ApJ, 622, 1118
Pal,A. et al. 2010, MNRAS, in press.
Papaloizou, J. C. B. & Terquem, C. 2001, MNRAS, 325, 221
Pont, F., et al. 2009, arXiv0908.3032
Pont, F., et al. 2009, A&A, 502, 695
Pont, F., et al. 2009, MNRAS, L360
Prsa,A., & Zwitter, T. 2006, Ap&SS, 304, 347.
Queloz, D., Eggenberger, A., Mayor, M., Perrier, C., Beuzit, J. L., Naef, D., Sivan, J. P., & Udry,
S. 2000, A&A, 359, L13

– 15 –
Rasio, F. A. & Ford, E. B. 1996, Science, 274, 954
Pal, A., et al. 2008, ApJ, 680, 1450
Rowe, J. F., et al. 2010, ApJL Submitted
Simpson,E.K., Pollacco,D. and Hebrard,G. and Gibson,N.P. and Barros,S.C.C. and Bouchy,F. and
Collier Cameron,A. and Boisse,I. and Watson,C.A., and Keenan,F., arXiv.org0912.3643
Skrutskie, M. J., et al. 2006, AJ, 131, 1163
Southworth, J. 2008, ArXiv e-prints, 0802.3764
Sozzetti, A., Torres, G., Charbonneau, D., Latham, D. W., Holman, M. J., Winn, J. N., Laird,
J. B., & O’Donovan, F. T. 2007, ApJ, 664, 1190
Torres, G., Winn, J. N., & Holman, M. J. 2008, ApJ, 677, 1324
Valenti, J. A., & Piskunov, N. 1996, A&AS, 118, 595
Valenti, J. A., & Fischer, D.A. 2005, ApJS, 159, 141
Vogt, S. S., Allen, S. L., Bigelow, B. C., Bresee, L., Brown, B., Cantrall, T., Conrad, A., Couture,
M., Delaney, C., Epps, H. W., Hilyard, D., Hilyard, D. F., Horn, E., Jern, N., Kanto, D.,
Keane, M. J., Kibrick, R. I., Lewis, J. W., Osborne, J., Pardeilhan, G. H., Pfister, T.,
Ricketts, T., Robinson, L. B., Stover, R. J., Tucker, D., Ward, J., & Wei, M. Z. 1994, in
Proc. SPIE Instrumentation in Astronomy VIII, David L. Crawford; Eric R. Craine; Eds.,
Volume 2198, p. 362, ed. D. L. Crawford & E. R. Craine, 362–+
Ward, W. R. & Hahn, J. M. 1994, Icarus, 110, 95
Winn, J. N., Noyes, R. W., Holman, M. J., Charbonneau, D., Ohta, Y., Taruya, A., Suto, Y.,
Narita, N., Turner, E. L., Johnson, J. A., Marcy, G. W., Butler, R. P., & Vogt, S. S. 2005,
ApJ, 631, 1215
Winn, J. N., Johnson, J. A., Marcy, G. W., Butler, R. P., Vogt, S. S., Henry, G. W., Roussanova,
A., Holman, M. J., Enya, K., Narita, N., Suto, Y., & Turner, E. L. 2006, ApJ, 653, L69
Winn, J. N., Holman, M. J., & Fuentes, C. I. 2007b, AJ, 133, 11
Winn, J. N., Johnson, J. A., Peek, K. M. G., Marcy, G. W., Bakos, G. A., Enya, K., Narita, N.,
Suto, Y., Turner, E. L., & Vogt, S. S. 2007c, ApJ, 665, L167
Winn, J., et al. 2007, ApJ, 657, 1098
Winn, J. N., Johnson, J. A., Narita, N., Suto, Y., Turner, E. L., Fischer, D. A., Butler, R. P., Vogt,
S. S., O’Donovan, F. T., & Gaudi, B. S. 2008, ArXiv e-prints, 804.2259

– 16 –
Winn, J. N., et al. 2009, ApJ, 700, 302
Winn, J. N., et al. 2009, ApJ, 703, 2091
Winn, J. N., Johnson, J. A., Albrecht, S., Howard, A. W., Marcy, G. W., Crossfield, I. J., &
Holman, M. J. 2009, ApJ, 703, L99
Wolf, A. S., Laughlin, G., Henry, G. W., Fischer, D. A., Marcy, G., Butler, P., & Vogt, S. 2007,
ApJ, 667, 549
Wright, J. T., Upadhyay, S., Marcy, G. W., Fischer, D. A., Ford, E. B., & Johnson, J. A. 2009,
ApJ, 693, 1084
Wu, Y., Murray, N. W., & Ramsahai, J. M. 2007, ApJ, 670, 820
Yi, S. K., Demarque, P., Kim, Y.-C., Lee, Y.-W., Ree, C. H., Lejeune, T., & Barnes, S. 2001, ApJS,
136, 417
This preprint was prepared with the AAS LATEX macros v5.2.
– 17 –
Table 1. System Parameters for Kepler-8
Parameter Value Notes
Transit and orbital parameters
Orbital period P (d) 3.52254+0.00003−0.00005 A
Midtransit time E (HJD) 2454954.1182+0.0003−0.0004 A
Scaled semimajor axis a/R⋆ 6.97+0.20−0.24 A
Scaled planet radius RP/R⋆ 0.09809+0.00040−0.00046 A
Impact parameter b ≡ a cos i/R⋆ 0.724± 0.020 A
Orbital inclination i (deg) 84.07±+0.33 A
Orbital semi-amplitude K (m s−1) 68.4± 12.0 A,B
Orbital eccentricity e 0 (adopted) A,B
Observed stellar parameters
Effective temperature Teff (K) 6213± 150 C
Spectroscopic gravity log g (cgs) 4.28± 0.10 C
Metallicity [Fe/H] −0.055± 0.03 C
Projected rotation Velocity v sin i (km s−1) 10.5± 0.7 C
Absolute (Helio) radial velocity (km s−1) −52.72± 0.10 B
Derived stellar parameters
Mass M⋆(M⊙) 1.213+0.067−0.063 C,D
Radius R⋆(R⊙) 1.486+0.053−0.062 C,D
Surface gravity log g⋆ (cgs) 4.174± 0.026 C,D
Luminosity L⋆ (L⊙) 4.03+0.52−0.54 C,D
Absolute V magnitude MV (mag) 3.28± 0.15 D
Age (Gyr) 3.84± 1.5 C,D
Distance (pc) 1330± 180 D
Planetary parameters
Mass MP (MJ) 0.603+0.13−0.19 A,B,C,D
Radius RP (RJ) 1.419+0.056−0.058 A,BC,D
Density ρP (g cm−3) 0.261± 0.071 A,B,C,D
Surface gravity log gP (cgs) 2.871± 0.119 A,B,C,D
Orbital semimajor axis a (AU) 0.0483+0.0006−0.0012 E
Equilibrium temperature Teq (K) 1764± 200 F
Note. —
A: Based on the photometry.
B: Based on the radial velocities.
C: Based on an SME analysis of the Keck-HIRES spectra,
D: Based on the Yale-Yonsei stellar evolution tracks.
E: Based on Newton’s version of Kepler’s Third Law and total mass.
F: Assumes Bond albedo = 0.1 and complete redistribution.

– 18 –
Table 2. Relative Doppler Velocity Measurements of Kepler-8
HJD RV σRV(-2450000) (m s−1) (m s−1)
4984.040 -22.15 34.5
4985.043 52.45 34.5
4986.065 -42.39 34.0
4987.060 -74.37 33.6
4988.027 63.04 33.7
4988.973 98.87 33.8
4995.103 46.58 34.2
5014.891 -64.61 33.7
5015.975 -29.97 33.4
5017.020 -28.28 33.3
5075.788 41.65 33.9
5109.850 -122.00 32.8
5110.790 -67.42 31.9
5133.839 49.58 32.8
5133.718 58.11 32.6
5133.732 51.13 32.5
5133.747 71.85 32.7
5133.761 34.51 32.8
5133.776 24.38 32.6
5133.790 -9.49 33.2
5133.805 -31.04 33.2
5133.821 -14.32 32.6
5134.740 -23.48 31.9
5135.790 48.50 32.6
– 19 –
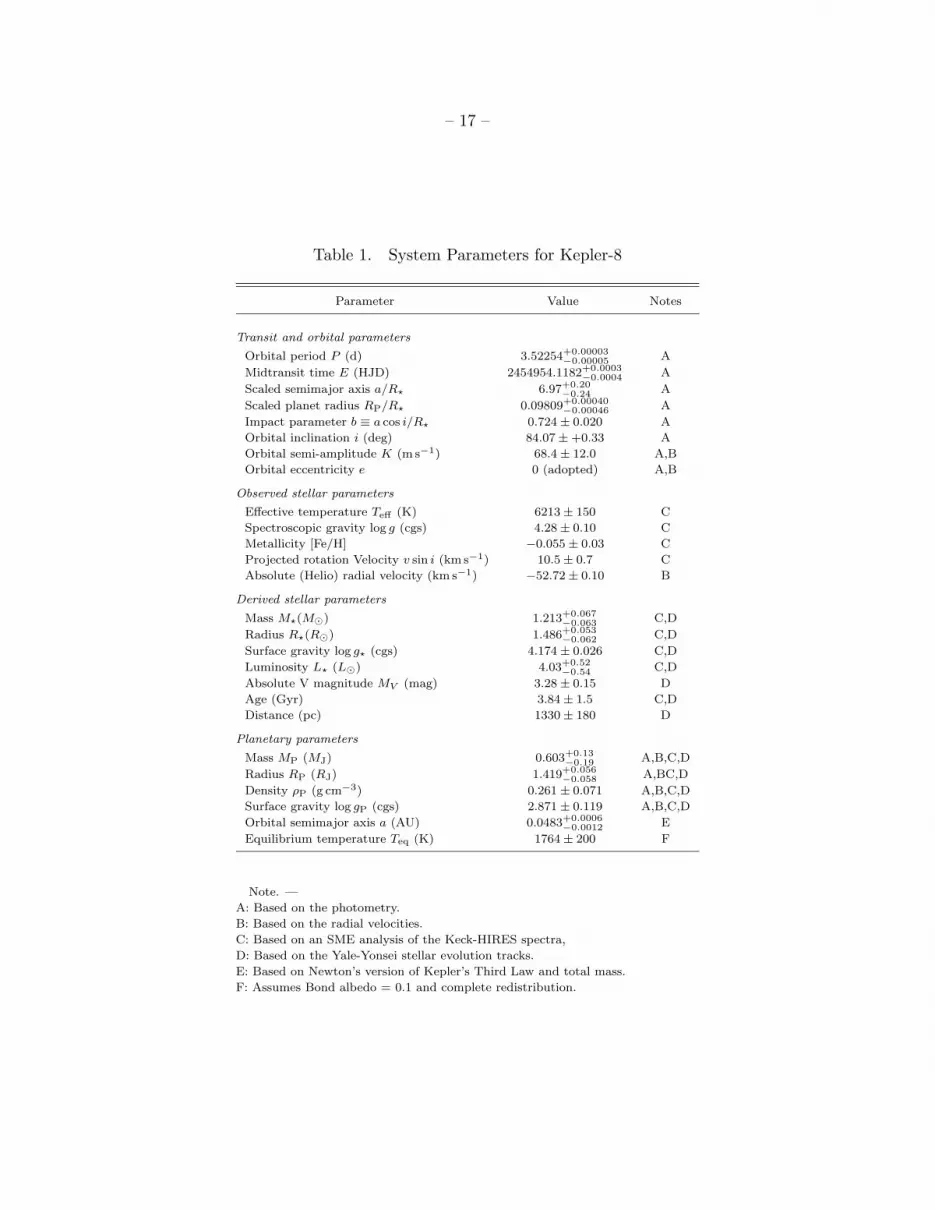
Fig. 1.— The detrended light curve for Kepler-8. The time series for the entire Kepler photometric
data set is plotted in the upper panel. The lower panel shows the photometry folded by the period
P = 3.52254 days, and the model fit to the primary transit is plotted as a solid line. Data for even
and for odd transits are denoted by ’+’s and ’*’s, respectively. The even and odd transits do not
exhibit significant variations in transit depth indicative of the primary and secondary eclipses of an
eclipsing binary. The photometry at the predicted time of occultation of the planet is shown just
above the phased transit curve, showing no significant dimming at the level of 0.1 mmag. The lack
of any dimming at the predicted time of occulation, along with the absence of both astrometric
motion in and out of transit and the absence of detected stellar companions, leaves the planetary
interpretation as the only plausible model, confirmed by the Rossiter-McLaughlin detection.

– 20 –
Fig. 2.— The image of the field near Kepler-8 obtained from the Keck 1 telescope guider camera
with a bg38 filter, making the bandpass approximately V and R combined, similar to that of the
Kepler photometer. North is up, and east to the left, and the plate scale is 0.397 ′′per pixel. The
main star, Kepler-8 is the brightest source at the center of the image. A faint star is located
3.8 ′′to the northwest of Kepler-8, having a flux 0.75% that of Kepler-8 and residing within the
Kepler photometric aperture. With a flux less than 1% that of Kepler-8, the companion cannot be
responsible for the periodici 1% dimming, even if it were a background eclipsing binary. But this
neighboring star is sufficiently bright to account for the astrometric displacement of the Kepler-8
that occurs during transit of its planet, explaining the shift of the photocenter of the two stars by
0.0001 Kepler pixels.
– 21 –
5 10 15 20 25 30−0.01
0
0.01
Time − 54964, MJD
Nor
mal
ized
Flu
x R
esid
uals KOI 10 13.6
5 10 15 20 25 30−1
0
1x 10
−3
Time − 54964, MJD
Row
Res
idua
ls
5 10 15 20 25 30−1
0
1x 10
−3
Time − 54964, MJD
Col
umn
Res
idua
ls
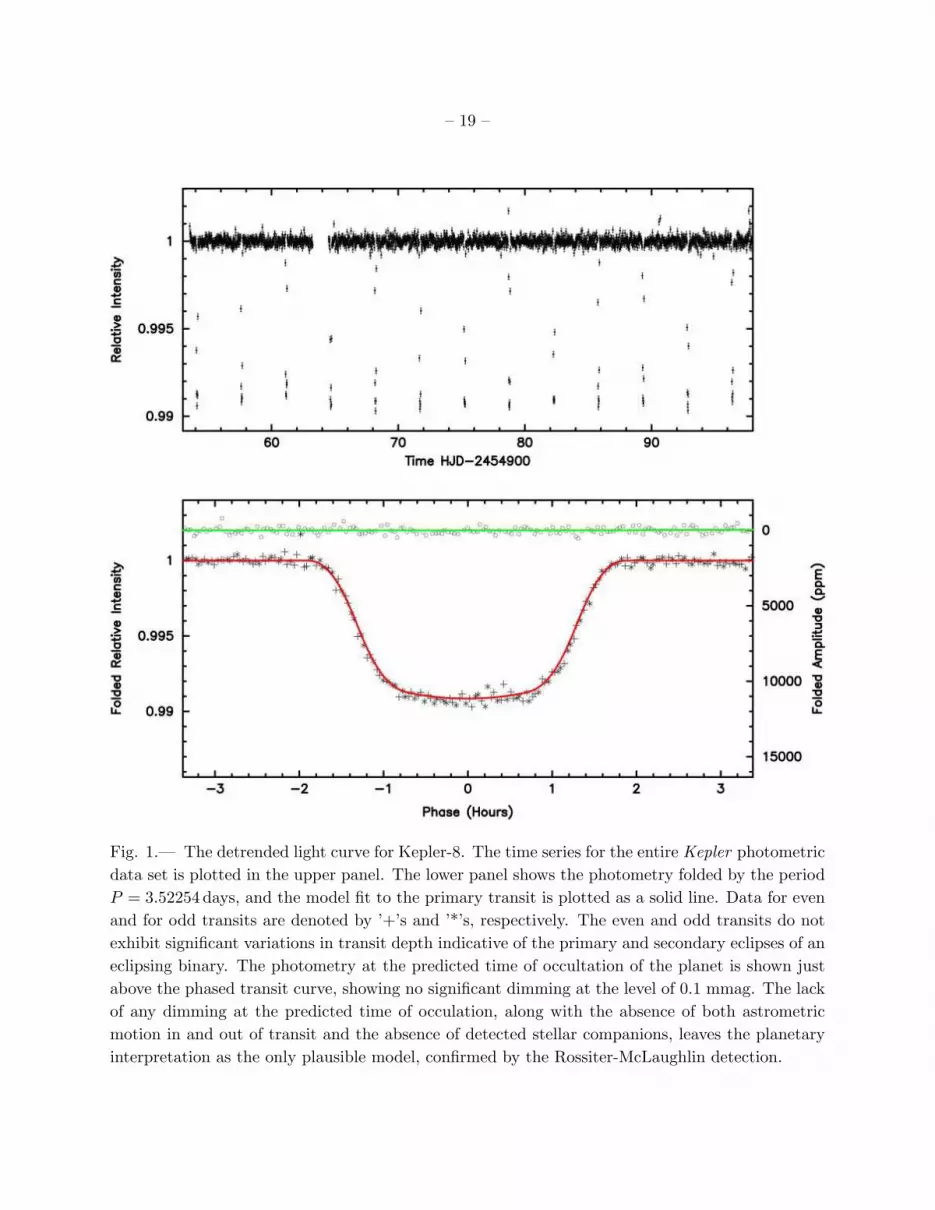
Fig. 3.— Flux(upper) and astrometric centroid (middle, lower) timeseries of Kepler-8b from Kepler
quarter-1 data. A high-pass filter has been applied to each time series to remove non-transit
signatures on timescales longer than 2 days. There is no obvious displacement of the centroid of
light in either the row or column residuals. This lack of motion indicates that any background
eclipsing binary would need to be located within ∼0.001/.01 = 0.1 pixels corresponding to 0.4 ′′of
the target star in order to explain the photometric transit signals but avoid showing motion.
– 22 –
−0.8 −0.6 −0.4 −0.2 0 0.2 0.4 0.6 0.8−1
−0.8
−0.6
−0.4
−0.2
0
0.2
Centroid Shift, millipixels
Nor
mal
ized
Flu
x R
esid
uals
, %
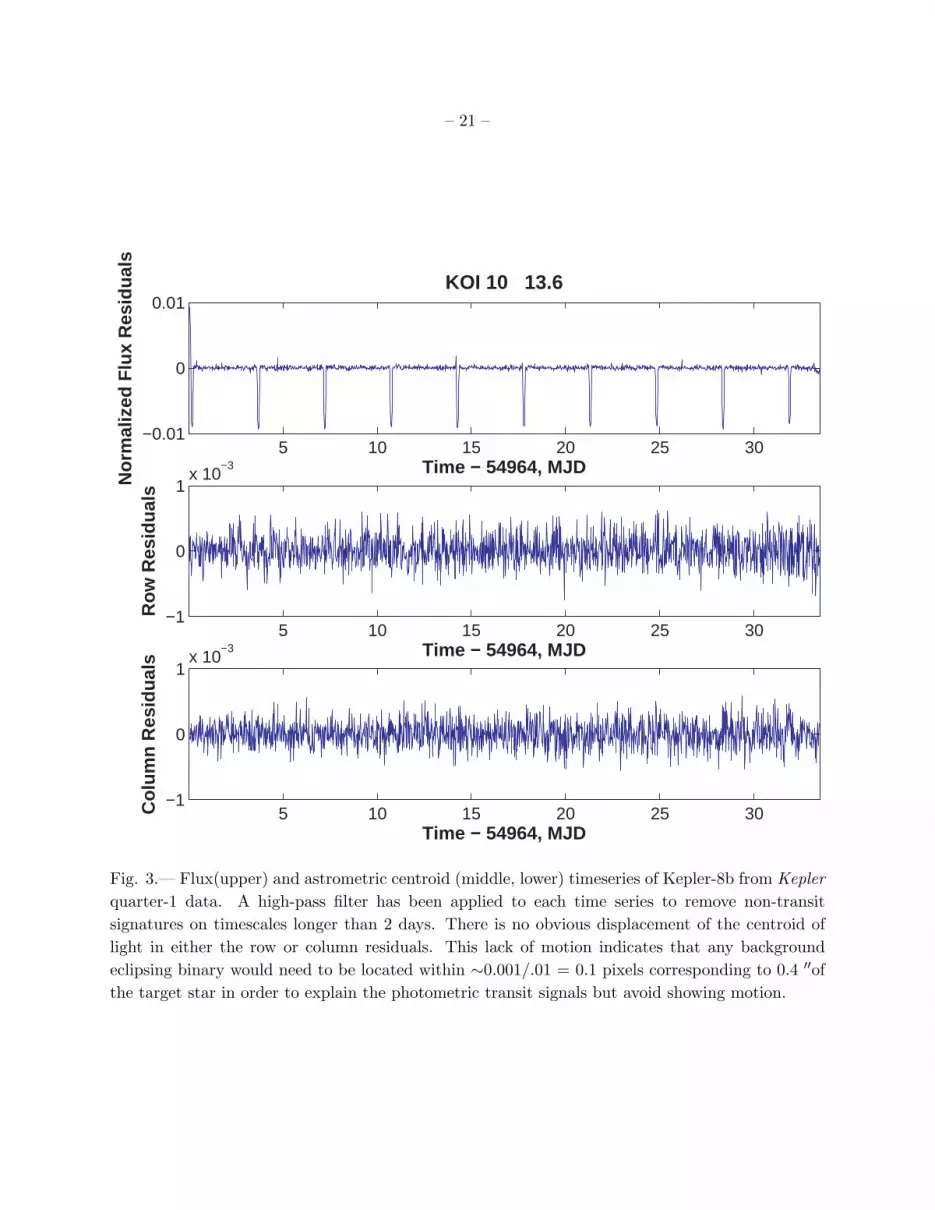
Fig. 4.— Flux versus residual astrometric centroids in row (x) and column (+) for Kepler-8. The
measurements are the same as those presented in Figure 3. This “rainplot” shows no evidence that
the centroids are systematically shifting during each transit event, which would be indicative of a
blend with a background star. If this were the case, identification of the actual star responsible for
the transit features in the light curve would require inspection of a high resolution image or catalog
to unravel the mystery. Since the in-transit points ”rain” straight down, rather than slanting along
a diagonal, any blend scenario would require a very small separation on the sky between the two
sources.

– 23 –
KOI 10 diff
columns, pixels
row
s, p
ixel
s
2 4 6 8
1
2
3
4
5
6
7
8
direct
columns, pixelsro
ws,
pix
els
2 4 6 8
1
2
3
4
5
6
7
8
direct
columns, pixels
row
s, p
ixel
s
2 4 6 8
1
2
3
4
5
6
7
8
0 2 4 6 8 10−15
−10
−5
0
5x 10
−3
Time, Days
Nor
mal
ized
Rel
ativ
e F
lux
Fig. 5.— The results of a ”poor man’s” difference image analysis are presented in this figure: (A)
(upper left) is the result of subtracting the average of the in-transit images from the average of a
similar number of just out-of-transit images for one of Kepler-8b’s transits. The pixels summed to
form the photometric brightness measurements are indicated by the blue circles. For comparison,
the average of the out-of-transit images are displayed in (B – upper right) and (C – lower left). The
raw flux light curve from Q0 is displayed panel (D – lower right). The difference image, Panel (A)
is remarkably similar to the direct images. Had the transits been due to a background eclipsing
binary that were 0.5 or more pixels offset from the target star, then the difference image would
display a noticeable shift in the location of the pixel containing the peak energy. Instead, both
difference and direct images supporting a coincident localization of the source of the transits to the
target star, Kepler-8.

– 24 –
−0.5 0.0 0.5 Orbital Phase
−150
−100
−50
0
50
100
150
V
elo
city
(m
s−
1 )
Fig. 6.— The orbital solution for Kepler-8. The observed radial velocities obtained with HIRES on
the Keck 1 Telescope are plotted together with the best-fit velocity curve for a circular orbit with
the period and time of transit fixed by the photometric ephemeris. Uncertainties are large due to
the faintness of the star (V=13.9 mag), the high rotational Doppler broadening (v sin i= 10.5±0.7),
and contamination from background moonlight in most spectra. The measured velocities vary high
and low as predicted by the orbit from the photometric transit curve, supporting the planet model.

– 25 –
Fig. 7.— The Rossiter-McLaughlin effect for Kepler-8. The observed radial velocities obtained
with HIRES on the Keck 1 Telescope are plotted together with the predicted velocities from the
best-fit model of the Rossiter-McLaughlin effect. The high velocities near ingress and low velocities
near egress imply a prograde orbit. The asymmetry in the model curve indicates a projected tilt
of the orbit relative to the star’s equator, as well as a transit with a large impact parameter on the
star.

– 26 –
Fig. 8.— A sketch of the transit geometry for Kepler-8. The Kepler photometry and R-M
measurements set the impact parameter, b = 0.724 ± 0.020, and the angle projected on the sky
between the star’s spin axis and the normal to the orbital plane, λ = −27◦, indicating a prograde
orbit with a moderate inclination.