diagnostic accuracy of neuroimaging to delineate diffuse
TRANSCRIPT
ORIGINAL RESEARCHADULT BRAIN
Diagnostic Accuracy of Neuroimaging to Delineate DiffuseGliomas within the Brain: A Meta-Analysis
X N. Verburg, X F.W.A. Hoefnagels, X F. Barkhof, X R. Boellaard, X S. Goldman, X J. Guo, X J.J. Heimans, X O.S. Hoekstra, X R. Jain,X M. Kinoshita, X P.J.W. Pouwels, X S.J. Price, X J.C. Reijneveld, X A. Stadlbauer, X W.P. Vandertop, X P. Wesseling,
X A.H. Zwinderman, and X P.C. De Witt Hamer
ABSTRACT
BACKGROUND: Brain imaging in diffuse glioma is used for diagnosis, treatment planning, and follow-up.
PURPOSE: In this meta-analysis, we address the diagnostic accuracy of imaging to delineate diffuse glioma.
DATA SOURCES: We systematically searched studies of adults with diffuse gliomas and correlation of imaging with histopathology.
STUDY SELECTION: Study inclusion was based on quality criteria. Individual patient data were used, if available.
DATA ANALYSIS: A hierarchic summary receiver operating characteristic method was applied. Low- and high-grade gliomas were ana-lyzed in subgroups.
DATA SYNTHESIS: Sixty-one studies described 3532 samples in 1309 patients. The mean Standard for Reporting of Diagnostic Accuracyscore (13/25) indicated suboptimal reporting quality. For diffuse gliomas as a whole, the diagnostic accuracy was best with T2-weightedimaging, measured as area under the curve, false-positive rate, true-positive rate, and diagnostic odds ratio of 95.6%, 3.3%, 82%, and 152. Forlow-grade gliomas, the diagnostic accuracy of T2-weighted imaging as a reference was 89.0%, 0.4%, 44.7%, and 205; and for high-gradegliomas, with T1-weighted gadolinium-enhanced MR imaging as a reference, it was 80.7%, 16.8%, 73.3%, and 14.8. In high-grade gliomas, MRspectroscopy (85.7%, 35.0%, 85.7%, and 12.4) and 11C methionine–PET (85.1%, 38.7%, 93.7%, and 26.6) performed better than the referenceimaging.
LIMITATIONS: True-negative samples were underrepresented in these data, so false-positive rates are probably less reliable than true-positive rates. Multimodality imaging data were unavailable.
CONCLUSIONS: The diagnostic accuracy of commonly used imaging is better for delineation of low-grade gliomas than high-gradegliomas on the basis of limited evidence. Improvement is indicated from advanced techniques, such as MR spectroscopy and PET.
ABBREVIATIONS: hsROC � hierarchic summary receiver operating characteristic; ROC � receiver operating characteristic; STARD � Standard for Reporting ofDiagnostic Accuracy; CI � credibility interval; TP � true-positive; TN � true-negative; FP � false-positive; FN � false-negative
Diffuse gliomas are the most common primary brain tumors in
adults, with an annual incidence of approximately 6 per
100,000. Despite advances in neurosurgery, radiation therapy,
and chemotherapy, gliomas are fatal.1 Brain imaging is indispens-
able for diagnosis, treatment planning, evaluation, and follow-up.
Received January 15, 2017; accepted after revision May 30.
From the Neurosurgical Center Amsterdam (N.V., F.W.A.H., W.P.V., P.C.D.W.H.), andDepartments of Radiology and Nuclear Medicine (F.B., R.B., O.S.H.), Neurology(J.J.H., J.C.R.), Physics and Medical Technology (P.J.W.P.), and Pathology (P.W.), VUUniversity Medical Center, Amsterdam, the Netherlands; Service of Nuclear Medi-cine and PET/Biomedical Cyclotron Unit (S.G.), l’universite libre de Bruxelles–Hopi-tal Erasme, Brussels, Belgium; Shanghai Medical College (J.G.), Fudan University,Shanghai, China; Department of Radiology (R.J.), New York University School ofMedicine, New York, New York; Department of Neurosurgery (M.K.), Osaka Uni-versity Graduate School of Medicine, Osaka, Japan; Academic Neurosurgery Divi-sion (S.J.P.), Department of Clinical Neurosciences, Addenbrooke’s Hospital, Cam-bridge, UK; Department of Neurosurgery (A.S.), University of Erlangen-Nuremberg,Erlangen, Germany; Department of Pathology (P.W.), Radboud University MedicalCentre, Nijmegen, the Netherlands; Department of Clinical Epidemiology and Bio-statistics (A.H.Z.), Academic Medical Center, University of Amsterdam, the Nether-
lands; and Institutes of Neurology and Healthcare Engineering (F.B.), UniversityCollege London, London, UK.
This work was supported by a residency fellow grant from the Dutch Cancer Soci-ety (nr OAA/H1/VU 2015-7502 to N.V.) and an institutional grant from the CancerCenter Amsterdam (nr 2012-2-05 to P.C.D.W.H.).
Paper previously presented as a poster at: Annual Meeting of the Society forNeuro-Oncology, November 21–14, 2013; San Francisco, California; Annual Meetingof the European Association of Neurosurgical Societies, November 11–14, 2013; TelAviv, Israel.
Please address correspondence to Philip C. De Witt Hamer, MD, NeurosurgicalCenter Amsterdam, VU University Medical Center, 2F-010, De Boelelaan 1117, 1081HV Amsterdam, the Netherlands; e-mail: [email protected]
Indicates article with supplemental on-line appendix.
Indicates article with supplemental on-line photos.
http://dx.doi.org/10.3174/ajnr.A5368
1884 Verburg Oct 2017 www.ajnr.org
Although imaging standards to plan resection and radiation ther-
apy vary between institutions and specialists, conventional imag-
ing is in common use, typically consisting of T1-weighted MR
imaging before and after gadolinium and T2/FLAIR-weighted
imaging for gliomas. Of these conventional sequences, T2/
FLAIR-weighted imaging is often considered as a reference for
low-grade gliomas, and T1-weighted gadolinium-enhanced im-
aging, for high-grade gliomas in neurosurgical planning, com-
bined with T2-weighted imaging in radiation therapy planning.2,3
Compared with other cancer types, accurate delineation of
gliomas within the brain for treatment planning is particularly
important due to the proximity of eloquent brain structures,
which are vulnerable to surgery and radiation therapy.4 Con-
versely, more extensive resections and boosted radiation therapy
correlate with longer survival.5-7 At the same time, clinical obser-
vations challenge the diagnostic accuracy of current imaging pro-
tocols: Gliomas recur even after a radiologically complete resec-
tion,8,9 and glioma cells have been detected outside MR imaging
abnormalities.10,11 Brain imaging techniques, such as multivoxel
spectroscopy and PET, were developed to improve tumor grading
and delineation.12,13
Inherent in any regional treatment, such as surgery and radi-
ation therapy, is the need to delineate a target volume, which
mandates a dichotomous classification into tumor and normal
tissue. Low- and high-grade gliomas have different treatment
strategies and prognosis, while both are characterized by diffuse
tumor infiltration. This supports our pooled analysis for diffuse
glioma in addition to subgroup analysis by glioma grade. More
accurate glioma delineation may improve the consistency be-
tween treatment results and survival. For instance, more accurate
delineation may serve to identify patients eligible for more aggres-
sive surgery than would have been considered on the basis of
conventional imaging and may identify patients with glioma in-
filtration beyond meaningful surgical therapy so that useless and
possibly harmful resections can be avoided.
The diagnostic accuracy of imaging techniques to delineate
gliomas has not been systematically addressed, to our knowledge.
In this meta-analysis, we estimate and compare the diagnostic
accuracies of conventional imaging techniques and advanced MR
imaging and PET to delineate newly diagnosed diffuse gliomas
within brain tissue in adults.
MATERIALS AND METHODSSearch StrategyWe aimed to identify all publications reporting glioma imaging
correlated with histopathology for the sampled locations. Our
data sources were the National Library of Medicine (PubMed/
MEDLINE, beginning in 1966) and the Excerpta Medica Data-
BASE (EMBASE, beginning in 1947), accessed on February 29,
2016, searching MeSH and Emtree subject headings (On-line
Appendix: Methods 1). The publication language was re-
stricted to Western languages; the publication date was re-
stricted until January 1, 2016. References of identified studies
were reviewed for further eligible publications in adherence
with the Preferred Reporting Items for Systematic Reviews
and Meta-Analyses (PRISMA) statement guidelines (http://
prisma-statement.org/).
Study Selection CriteriaStudies were eligible for further analysis on the basis of 5 inclusion
criteria: First, an adult population or subpopulation was required
with patients at least 18 years of age. Second, only newly diag-
nosed diffuse gliomas of World Health Organization grades II–IV
were included to avoid imaging artifacts from previous treatment.
Third, brain imaging of any technique was allowed as a diagnostic
test. Fourth, histopathology of tissue samples was required as a
reference test. Fifth, histopathology of samples and imaging test
measurements had to be directly correlated by surgical navigation
with 3D coordinates. When duplicate reports on the same popu-
lation were retrieved, only the report with the most complete data
was used for analysis. Studies also including patients of pediatric
age or pathology other than diffuse glioma were included if the
population of interest could be extracted from the data. Postmor-
tem studies were excluded to avoid bias from end-stage disease.
For interobserver agreement on study inclusion, a � statistic was
used.14
Quality and Outcome MeasuresAny study reporting glioma imaging correlated with histopathol-
ogy was independently assessed in full text for quality criteria by 2
observers (N.V. and F.W.A.H, with 3 and 8 years of experience in
clinical neurosurgery) using the Standard for Reporting of Diag-
nostic Accuracy (STARD) guidelines, a 25-item checklist to ex-
plore reporting quality.15 Disagreements were resolved through
adjudication by a third observer (P.C.D.W.H., with 15 years of
experience in clinical neurosurgery). For interobserver agreement
on quality assessment, the intraclass correlation coefficient was
calculated. One observer extracted the study data (N.V.) on the
imaging techniques, the histopathologic examination method,
the colocalization method between imaging and histopathology,
and the number of patients and samples categorized by glioma
grades. The extracted data were verified by another observer
(P.C.D.W.H.). Biopsy sample locations were categorized for each
imaging technique as normal or abnormal signal according to the
authors’ test positivity criteria and as glioma or normal brain in
correlated histopathologic examination according to the authors’
definitions. We aimed to include individual sample data as much
as possible, either by availability from the publication, by request
for original data to corresponding authors (up to 3 times in case of
nonresponse), or by estimation of data points from plots of image
measurements versus tumor characteristics. If individual sample
data were unavailable, we included the aggregated data as sum-
maries of true-positive (TP), true-negative (TN), false-positive
(FP), and false-negative (FN) samples. Accordingly, each imaging
technique in every study provided at least 1 estimate of diagnostic
accuracy.
Statistical AnalysisWe used hierarchic summary receiver operating characteristic
(hsROC) curve analysis with random effects for within-study and
between-study variation to summarize estimates of the diagnostic
accuracy for each imaging technique with �1 study available
(On-line Appendix: Methods 2).16 The available data allowed hi-
erarchic analysis of samples within techniques. The estimates with
95% credibility intervals (CIs) consisted of the summary true-
AJNR Am J Neuroradiol 38:1884 –91 Oct 2017 www.ajnr.org 1885
positive rate (sensitivity: TP / [TP � FN]), the summary false-
positive rate (1-specificity: FP/ [FP � TN]), the diagnostic odds
ratio ([TP/FN]/[FP/TN]),17 and the summary area under the re-
ceiver operating characteristic (ROC) curve. Differences in esti-
mates between imaging techniques in relation to reference imag-
ing were also calculated and considered significant when the CI
excluded zero. A Bayesian Markov chain Monte Carlo algorithm
with 3 chains modeled the hsROC curve with the CI for each
imaging technique on the basis of 5 parameters: the accuracy and
its precision, the cut-point and its precision, and the scale param-
eter.18 The accuracy and the cut-point were allowed to vary
among studies; the scale was allowed to vary among imaging tech-
niques. These parameters provide an hsROC curve with an oper-
ating point on the curve representing the summary true-positive
and false-positive rates. A Bayesian hsROC analysis was used for
the following reasons: First, this approach is considered the stan-
dard for meta-analysis of diagnostic accuracy, taking into account
the correlation between the true-positive and false-positive
rates.18,19 Second, individual sample data and aggregated data, if
individual data are unavailable, can be analyzed together per im-
aging technique to estimate its diagnostic accuracy.20,21 Third,
varying test positivity criteria for imaging in studies can be accom-
modated.22 Fourth, partly missing data
can be handled with this model. For the
meta-analysis, vague priors were chosen
for the prior distributions, so that the
results primarily reflect inference from
the presented data without prior knowl-
edge. Normal distributions with mean
of zero and variance of 10,000 repre-
sented the accuracy, cut-point and scale
parameters, and inverse � distributions,
with a shape and rate of 0.01 represent-
ing the precisions. Uniform distribu-
tions were used as alternative vague pri-
ors. Summary estimates consisted of the
median values with CIs of the posterior
distributions. For the analysis, we used
JAGS software, Version 4.0.1 (Jags Soft-
ware; Newark, Delaware; http://mcmc-
jags.sourceforge.net) from the rjags pack-
age (Version 4 –3) for R statistical and
computing software (http://www.r-
project.org/). Sampling traces and dis-
tributions and Gelman-Rubin diag-
nostics were evaluated for evidence
against convergence by using the coda
package (Version 0.17.1; https://www.
rdocumentation.org/packages/coda/
versions/0.17-1).
Statistical tests for heterogeneity be-
tween studies are unavailable for diag-
nostic accuracy meta-analysis; there-
fore, heterogeneity was explored with
subgroup analysis.23 Sensitivity analysis
included analysis of the following: 1) the
subset of higher quality studies, consid-
ered those with a prospective design, including quantified sample
data in at least 15 patients and qualifying for the methodologic
description of both neuroimaging and histopathology24; 2) the
subset of studies with individual patient data; and 3) alternative
vague prior distributions. Subgroups of low-grade (World Health
Organization grade II) and high-grade (World Health Organiza-
tion grade III or IV) gliomas were reported separately. Publication
bias was explored graphically.
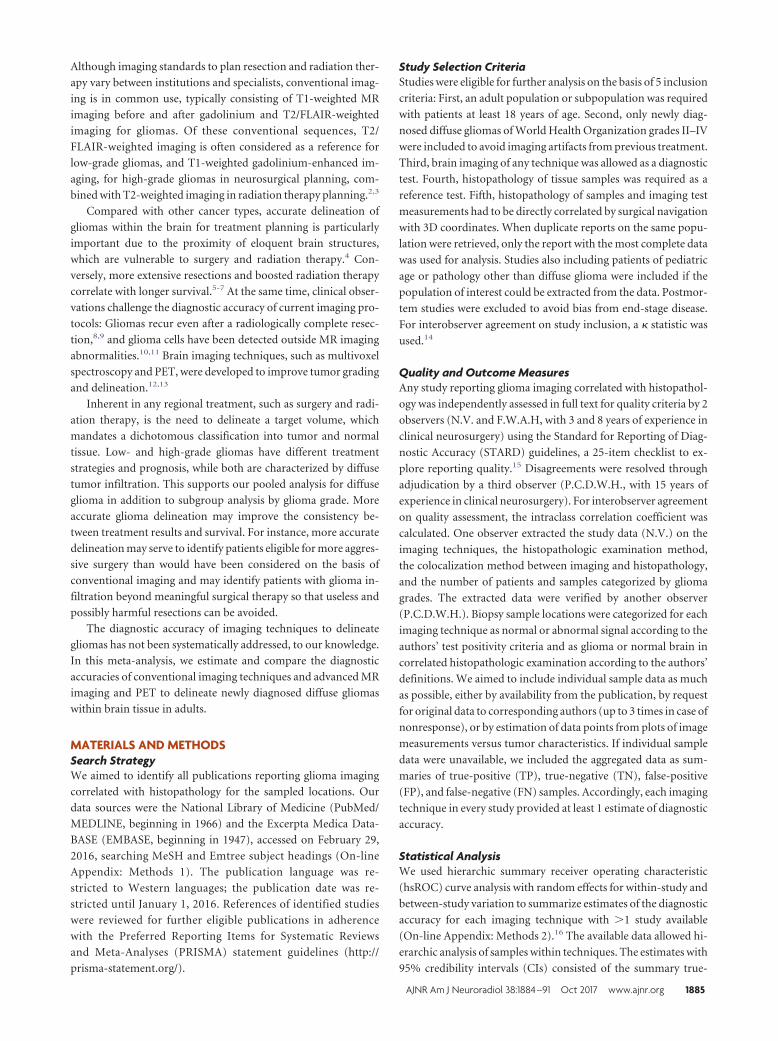
RESULTSThe search strategy identified 8558 unique citations (Fig 1), of
which 272 full-text publications were assessed for eligibility. Sub-
sequently, 61 articles were included for meta-analysis on the basis
of the 5 selection criteria. The interobserver agreement for inclu-
sion was moderate (� � 0.47; 95% CI, 0.37– 0.57). A total of 3532
samples with correlated histopathologic examinations and imag-
ing were included from 1309 patients with gliomas. For subgroup
analysis by glioma grade, data could be extracted for 907 samples
in 421 patients with low-grade gliomas and for 1380 samples in
814 patients with high-grade gliomas. Glioma subtypes, such as
astrocytoma or oligodendroglioma, could not be analyzed in sub-
groups because data for these subgroups could usually not be
FIG 1. Flow chart of publication selection. The asterisk indicates that multiple exclusion criteriacould apply to studies.
1886 Verburg Oct 2017 www.ajnr.org
extracted. Individual sample data were available from 19 studies.
The higher quality subset consisted of 29 studies.
The mean STARD score of the included studies was 13 � 2.8.
The interobserver agreement for STARD quality assessment was
substantial (intraclass coefficient � 0.66; 95% CI, 0.49 – 0.78).
The included studies reported on 16 imaging techniques, in-
cluding T1-weighted imaging before and after gadolinium, T2-,
T2/FLAIR-, perfusion- and diffusion-weighted imaging (appar-
ent diffusion coefficient), MR spectroscopy (choline to N-acetyla-
spartate ratio), diffusion tensor imaging (fractional anisotropy),
and PET with these tracers: FDG, 11C methionine (MET), 18F
fluoroethyltyrosine (FET), 18F fluorthymidine, or 18F or 11C cho-
line (Cho). Imaging protocols varied widely; for instance, 22 stud-
ies used 1.5T MR imaging field strength, 15 used 3T, 1 used 0.15T;
and field strength was unspecified in 11 studies. The number of
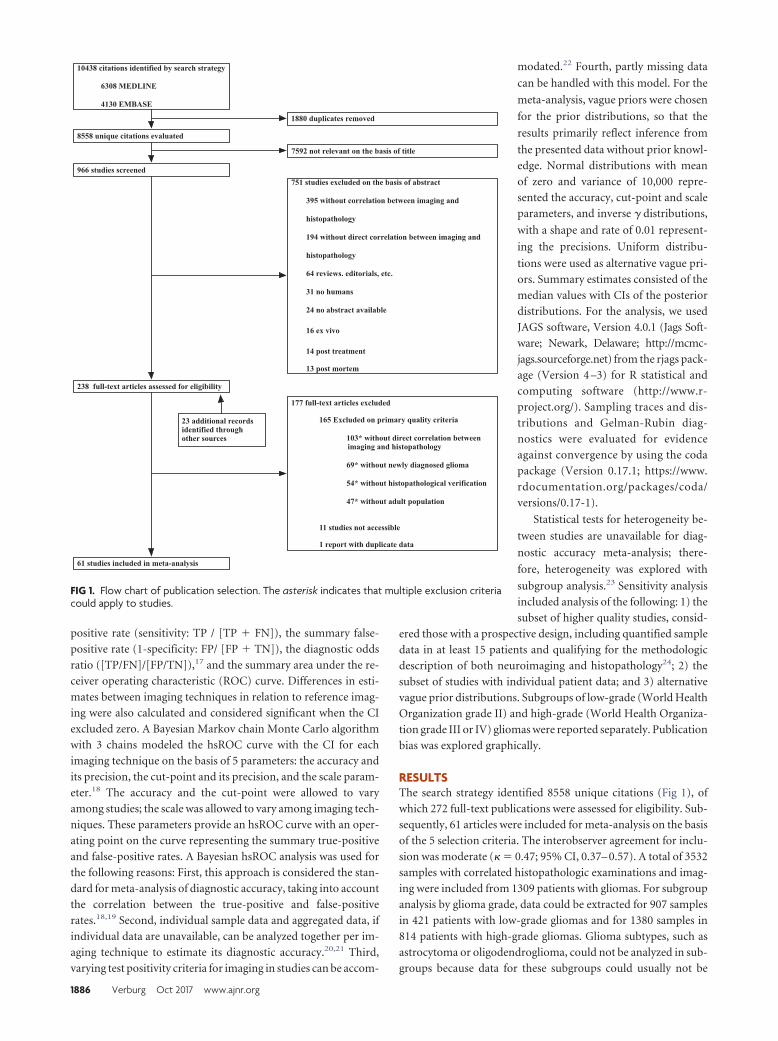
studies, patients, and samples for each imaging technique catego-
rized by glioma grades is plotted in Fig 2.
The reference standard to distinguish tumor and normal brain
in tissue samples for all studies was microscopic examination with
hematoxylin-eosin staining and immunohistochemical analysis.
Nine studies reported the reference standard as the labeling index
of proliferating cells; 6 studies reported the reference standard as
the tumor infiltration index; and 2 studies, as the cellularity index.
We followed the authors’ definition to differentiate normal brain
and glioma.
The method to correlate the histopathology with imaging was
frameless stereotactic needle biopsies in 27 studies, frame-based
stereotactic needle biopsies in 14, neuronavigated resection biop-
sies in 12, and unspecified stereotactic needle biopsies in 8.
The hsROC curves of imaging techniques for diffuse glioma as
a whole are plotted in Fig 3A, and for the subgroups of low- and
high-grade gliomas, in Fig 3B, -C, respectively. The characteristics
of these hsROC curves are listed in Fig 4.
The estimates of false-positive rates need to be interpreted
with caution due to relative lack of data on true-negative samples.
This “underrepresentation” of true-negatives and consequently
bias in false-positive rates may be unbalanced across imaging
techniques, creating additional biases when comparing the ROC
curves.
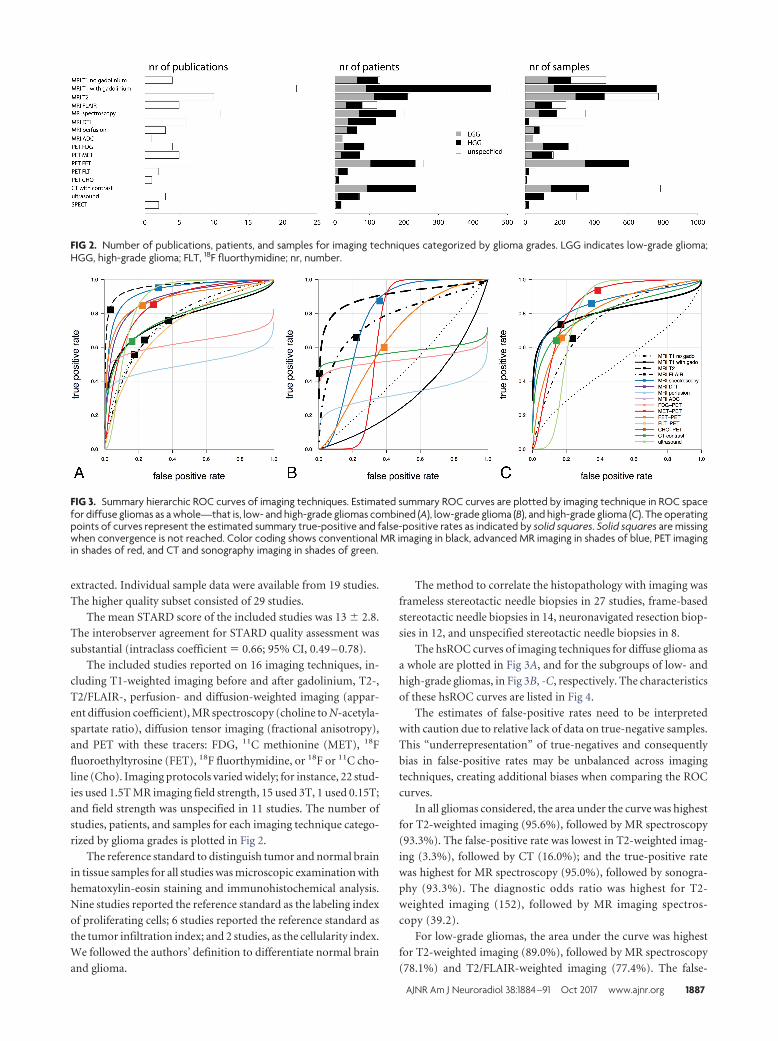
In all gliomas considered, the area under the curve was highest
for T2-weighted imaging (95.6%), followed by MR spectroscopy
(93.3%). The false-positive rate was lowest in T2-weighted imag-
ing (3.3%), followed by CT (16.0%); and the true-positive rate
was highest for MR spectroscopy (95.0%), followed by sonogra-
phy (93.3%). The diagnostic odds ratio was highest for T2-
weighted imaging (152), followed by MR imaging spectros-
copy (39.2).
For low-grade gliomas, the area under the curve was highest
for T2-weighted imaging (89.0%), followed by MR spectroscopy
(78.1%) and T2/FLAIR-weighted imaging (77.4%). The false-
FIG 2. Number of publications, patients, and samples for imaging techniques categorized by glioma grades. LGG indicates low-grade glioma;HGG, high-grade glioma; FLT, 18F fluorthymidine; nr, number.
FIG 3. Summary hierarchic ROC curves of imaging techniques. Estimated summary ROC curves are plotted by imaging technique in ROC spacefor diffuse gliomas as a whole—that is, low- and high-grade gliomas combined (A), low-grade glioma (B), and high-grade glioma (C). The operatingpoints of curves represent the estimated summary true-positive and false-positive rates as indicated by solid squares. Solid squares are missingwhen convergence is not reached. Color coding shows conventional MR imaging in black, advanced MR imaging in shades of blue, PET imagingin shades of red, and CT and sonography imaging in shades of green.
AJNR Am J Neuroradiol 38:1884 –91 Oct 2017 www.ajnr.org 1887
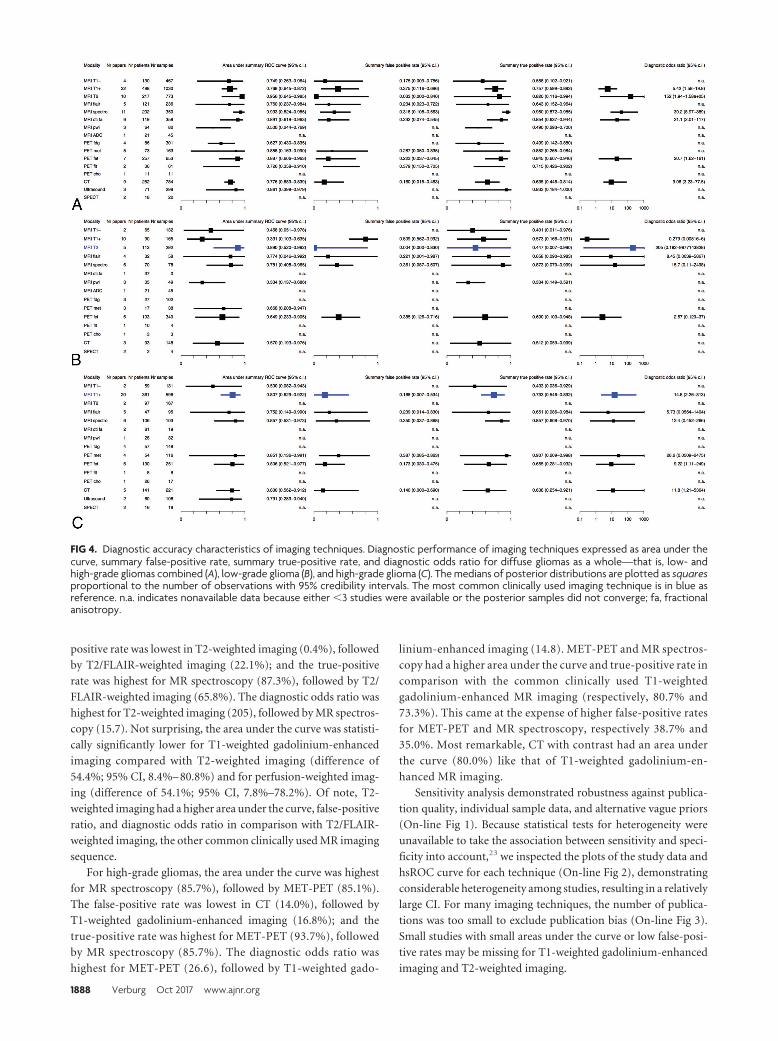
positive rate was lowest in T2-weighted imaging (0.4%), followed
by T2/FLAIR-weighted imaging (22.1%); and the true-positive
rate was highest for MR spectroscopy (87.3%), followed by T2/
FLAIR-weighted imaging (65.8%). The diagnostic odds ratio was
highest for T2-weighted imaging (205), followed by MR spectros-
copy (15.7). Not surprising, the area under the curve was statisti-
cally significantly lower for T1-weighted gadolinium-enhanced
imaging compared with T2-weighted imaging (difference of
54.4%; 95% CI, 8.4%– 80.8%) and for perfusion-weighted imag-
ing (difference of 54.1%; 95% CI, 7.8%–78.2%). Of note, T2-
weighted imaging had a higher area under the curve, false-positive
ratio, and diagnostic odds ratio in comparison with T2/FLAIR-
weighted imaging, the other common clinically used MR imaging
sequence.
For high-grade gliomas, the area under the curve was highest
for MR spectroscopy (85.7%), followed by MET-PET (85.1%).
The false-positive rate was lowest in CT (14.0%), followed by
T1-weighted gadolinium-enhanced imaging (16.8%); and the
true-positive rate was highest for MET-PET (93.7%), followed
by MR spectroscopy (85.7%). The diagnostic odds ratio was
highest for MET-PET (26.6), followed by T1-weighted gado-
linium-enhanced imaging (14.8). MET-PET and MR spectros-
copy had a higher area under the curve and true-positive rate in
comparison with the common clinically used T1-weighted
gadolinium-enhanced MR imaging (respectively, 80.7% and
73.3%). This came at the expense of higher false-positive rates
for MET-PET and MR spectroscopy, respectively 38.7% and
35.0%. Most remarkable, CT with contrast had an area under
the curve (80.0%) like that of T1-weighted gadolinium-en-
hanced MR imaging.
Sensitivity analysis demonstrated robustness against publica-
tion quality, individual sample data, and alternative vague priors
(On-line Fig 1). Because statistical tests for heterogeneity were
unavailable to take the association between sensitivity and speci-
ficity into account,23 we inspected the plots of the study data and
hsROC curve for each technique (On-line Fig 2), demonstrating
considerable heterogeneity among studies, resulting in a relatively
large CI. For many imaging techniques, the number of publica-
tions was too small to exclude publication bias (On-line Fig 3).
Small studies with small areas under the curve or low false-posi-
tive rates may be missing for T1-weighted gadolinium-enhanced
imaging and T2-weighted imaging.
FIG 4. Diagnostic accuracy characteristics of imaging techniques. Diagnostic performance of imaging techniques expressed as area under thecurve, summary false-positive rate, summary true-positive rate, and diagnostic odds ratio for diffuse gliomas as a whole—that is, low- andhigh-grade gliomas combined (A), low-grade glioma (B), and high-grade glioma (C). The medians of posterior distributions are plotted as squaresproportional to the number of observations with 95% credibility intervals. The most common clinically used imaging technique is in blue asreference. n.a. indicates nonavailable data because either �3 studies were available or the posterior samples did not converge; fa, fractionalanisotropy.
1888 Verburg Oct 2017 www.ajnr.org
DISCUSSIONThe main findings of this meta-analysis for the diagnostic accu-
racy of neuroimaging to delineate diffuse gliomas are the follow-
ing: 1) It is best with T2-weighted imaging, followed by MR spec-
troscopy. 2) It is better for low-grade gliomas with T2-weighted
imaging than for high-grade gliomas with T1-weighted gadolini-
um-enhanced MR imaging; considering the area under the curve
(89.0% versus 80.7%) and the diagnostic odds ratio (205 versus
14.8). 3) it may be improved in high-grade gliomas with MR spec-
troscopy or MET-PET. 4) It is not superior with T2/FLAIR-
weighted imaging for low-grade gliomas. 5) It is not inferior with
CT with contrast for high-grade gliomas. 6) It varies considerably
between imaging techniques and shows heterogeneity between
studies.
Thresholds for acceptable diagnostic accuracy of tumor imag-
ing are undetermined. The accuracy of imaging for glioma delin-
eation by MR imaging is, for instance, less than that for lesion
detection in hepatocellular carcinoma by sonography, CT, or MR
imaging.25 It is comparable with detection of metastatic lymph
nodes in non-small cell lung cancer by CT or MR imaging, but it
is less than that of PET.26,27 Moreover, it is less than that of the
diagnosis of breast cancer by MR imaging.28 These studies, how-
ever, address the radiologic diagnosis of cancer by imaging, not
the delineation of infiltrative cancer within normal tissue. The
identification of cancer cells within normal-appearing imaging
regions seems to be specific for glioma.10,29 We did not find meta-
analyses of tumor delineation in other solid cancers.
The variation in diagnostic performance may be explained by
the notoriously difficult diagnostic problem of delineating glioma
cells, which gradually infiltrate brain tissue. Therefore, the con-
cept of delineating a tumor by the presence or absence of cancer
cells, on which ROC analysis is based, may oversimplify gradual
glioma infiltration. Nevertheless, treatment target volumes are
required for patient care.
Several factors may contribute to the observed variation in
diagnostic performance. First, the scan protocols have not been
standardized for any of these sequences. For the diagnostic stan-
dard of MR imaging, for instance, variation exists in scanner
equipment, quality assessment and control, acquisition protocols,
image processing, quantification, and interpretation by radiolo-
gists. Second, histopathologic examinations may vary due to in-
complete sampling of heterogeneous tumors and interpretation
differences among neuropathologists.30-32 Third, the correlation
between imaging measurements and histopathologic examina-
tion may be another source of variation. This colocalization de-
pends on the precision of the navigated locations of tissue sam-
ples. Navigation precision has been found to be within several
millimeters,33,34 whereas tissue may be heterogeneous at smaller
distances.35
Improvement of diagnostic accuracy to delineate gliomas for
regional therapy requires an offset between increasing the true-
positive rate and decreasing the false-positive rate. Increasing the
true-positive rate may be preferable for tumor control, whereas
decreasing the false-positive rate may be preferable for preserva-
tion of functional integrity. From the perspective of tumor con-
trol, the overestimation of diffuse glioma (ie, the inadvertent
declaration of normal brain as diffuse glioma) would be more
acceptable than underestimation. Nevertheless, this is only ac-
ceptable when at the same time, surgery aims to minimize neuro-
logic deficits from removal of critical brain regions whether or not
they are infiltrated by tumor. This is usually done by brain map-
ping of functions with the patient under local anesthesia to push
the resection to the functional limits.4 In other words, a more
sensitive imaging delineation would be even more likely to require
functional brain mapping as a safeguard against removal of criti-
cal brain regions potentially infiltrated by tumor. In this perspec-
tive, MR spectroscopy and PET might have the potential to in-
crease the true-positive rate of glioma delineation for surgical
strategies. However, a more sensitive tumor delineation should
probably not prompt larger high-dose radiation fields because a
similar safeguard against cognitive decline from radiation therapy
is unavailable. Perhaps high-dose radiation therapy should rather
focus on regions at high risk for tumor progression, whereas a
lower dose could be acceptable in regions with a low risk for tu-
mor progression.
Our observations may challenge current care standards. First,
T2/FLAIR-weighted imaging has been proposed as the standard
for radiologic response measurements in low-grade gliomas,3
whereas our data indicate that T2-weighted imaging has better
diagnostic performance before treatment than T2/FLAIR-
weighted imaging. Second, MR imaging, including T1-weighted
gadolinium-enhanced and T2-weighted imaging, is considered
the standard for treatment planning and radiologic response mea-
surements in high-grade gliomas,2 whereas our data indicate that
the diagnostic performance of CT with contrast to delineate high-
grade gliomas before treatment is not necessarily inferior. Clearly,
anatomy is better visualized with MR imaging than CT. Further-
more, subtle areas of disease progression that may be outside the
main tumor mass are better identified on MR imaging than on
CT.
Third, in particular for high-grade gliomas, there is room for
improvement in tumor delineation. For instance, radiation on-
cology guidelines are heterogeneous regarding target delinea-
tion.36-38 MR spectroscopy and PET hold promise as additives to
the current standard, but availability and standardization are lim-
itations to more widespread use. For a detailed discussion of these
techniques, we suggest recent reviews.39-43 Furthermore, T2-
weighted imaging performed best for diffuse gliomas as a whole
and for low-grade-gliomas but could not be estimated for high-
grade gliomas in these data because quantitative information was
only available from 2 studies. Nevertheless, T2-weighted imaging
may contribute to better delineation of high-grade gliomas as
well.
Strengths of this meta-analysis include a thorough search
strategy, assessment of reporting quality by STARD criteria, and
analysis using the hsROC method, whenever available, with indi-
vidual sample data.
Our results should be interpreted within the limits of the qual-
ity of observational data that were retrieved with the limited num-
ber of patients and samples from publications with suboptimal
reporting quality. Due to obvious reluctance to sample tissue out-
side imaging abnormalities, true-negative samples are underrep-
resented in these data; thus, estimates of false-positive rates are
probably less reliable than those of true-positive rates. Further-
AJNR Am J Neuroradiol 38:1884 –91 Oct 2017 www.ajnr.org 1889
more, the available data only allowed indirect comparison of im-
aging techniques because only 2 studies were identified with
quantitative head-to-head comparison of techniques.44,45 Last,
several potential biases in this meta-analysis should be consid-
ered.46 Methodologic heterogeneity is likely to exist. Publication
bias was suggested, though population bias is unlikely because all
patients were required to have a glioma, control cases were ex-
cluded, and all samples from patients were examined with the
same reference standard of histopathologic examination. Never-
theless, verification bias may be present because imaging charac-
teristics have probably guided biopsy sampling strategies. The
studies may be biased by patient selection, and we cannot exclude
heterogeneity from subjective interpretation of image measure-
ments. Furthermore, clinical heterogeneity is likely because in
addition to unstandardized imaging and pathology protocols,
positivity criteria of diagnostic and reference tests may have var-
ied among studies.
The implication of our findings is that planning of surgery or
radiation therapy for diffuse gliomas using current imaging pro-
tocols should be performed with caution because these have only
moderate accuracy for glioma delineation based on limited evi-
dence. The sensitivity of imaging to delineate all regions of exist-
ing tumor infiltration seems to be less than the specificity to rule
out tumor from normal brain. The true-positive rate of conven-
tional imaging for high-grade gliomas may be improved by MR
spectroscopy and PET. Furthermore, future effort to quantify and
improve this accuracy may aim at combinations of imaging and
head-to-head comparison with molecular characterization as the
criterion standard.
CONCLUSIONSIn this meta-analysis, the diagnostic accuracy of imaging for de-
lineation of diffuse gliomas (low- and high-grade gliomas com-
bined) is best with T2-weighted imaging, followed by MR spec-
troscopy. The diagnostic accuracy of the common clinically used
imaging is better for low-grade gliomas with T2-weighted imag-
ing than for high-grade gliomas with T1-weighted gadolinium-
enhanced imaging. Improvement is indicated for high-grade
gliomas using advanced imaging techniques, such as MR spec-
troscopy and PET. Current imaging protocols are based on lim-
ited evidence from heterogeneous studies, and future studies with
head-to-head comparison and combinations of imaging tech-
niques are required to improve glioma delineation.
Disclosures: Niels Verburg—RELATED: Grant: Dutch Cancer Society resident grant.
REFERENCES1. Ricard D, Idbaih A, Ducray F, et al. Primary brain tumours in adults.
Lancet 2012;379:1984 –96 CrossRef Medline2. Wen PY, Macdonald DR, Reardon DA, et al. Updated response
assessment criteria for high-grade gliomas: Response Assess-ment in Neuro-Oncology working group. J Clin Oncol 2010;28:1963–72 CrossRef Medline
3. van den Bent MJ, Wefel JS, Schiff D, et al. Response Assessment inNeuro-Oncology (a report of the RANO group): assessment of out-come in trials of diffuse low-grade gliomas. Lancet Oncol 2011;12:583–93 CrossRef Medline
4. De Witt Hamer PC, Robles SG, Zwinderman AH, et al. Impactof intraoperative stimulation brain mapping on glioma surgery
outcome: a meta-analysis. J Clin Oncol 2012;30:2559 – 65 CrossRefMedline
5. Sanai N, Polley MY, McDermott MW, et al. An extent of resectionthreshold for newly diagnosed glioblastomas. J Neurosurg 2011;115:3– 8 CrossRef Medline
6. Capelle L, Fontaine D, Mandonnet E, et al; French Reseau d’Etudedes Gliomes. Spontaneous and therapeutic prognostic factors inadult hemispheric World Health Organization Grade II gliomas:a series of 1097 cases: clinical article. J Neurosurg 2013;118:1157– 68 CrossRef Medline
7. Einstein DB, Wessels B, Bangert B, et al. Phase II trial of radiosurgeryto magnetic resonance spectroscopy-defined high-risk tumor vol-umes in patients with glioblastoma multiforme. Int J Radiat OncolBiol Phys 2012;84:668 –74 CrossRef Medline
8. Smith JS, Chang EF, Lamborn KR, et al. Role of extent of resection inthe long-term outcome of low-grade hemispheric gliomas. J ClinOncol 2008;26:1338 – 45 CrossRef Medline
9. Pichlmeier U, Bink A, Schackert G, et al; ALA Glioma Study Group.Resection and survival in glioblastoma multiforme: an RTOG re-cursive partitioning analysis of ALA study patients. Neuro Oncol2008;10:1025–34 CrossRef Medline
10. Pallud J, Varlet P, Devaux B, et al. Diffuse low-grade oligodendro-gliomas extend beyond MRI-defined abnormalities. Neurology2010;74:1724 –31 CrossRef Medline
11. Kelly PJ, Daumas-Duport C, Kispert DB, et al. Imaging-based stereo-taxic serial biopsies in untreated intracranial glial neoplasms.J Neurosurg 1987;66:865–74 CrossRef Medline
12. la Fougere C, Suchorska B, Bartenstein P, et al. Molecular imaging ofgliomas with PET: opportunities and limitations. Neuro Oncol 2011;13:806 –19 CrossRef Medline
13. Waldman AD, Jackson A, Price SJ, et al; National Cancer ResearchInstitute Brain Tumour Imaging Subgroup. Quantitative imagingbiomarkers in neuro-oncology. Nat Rev Clin Oncol 2009;6:445–54CrossRef Medline
14. Landis JR, Koch GG. The measurement of observer agreement forcategorical data. Biometrics 1977;33:159 –74 CrossRef Medline
15. Bossuyt PM, Reitsma JB, Bruns DE, et al; STARD Group. STARD2015: an updated list of essential items for reporting diagnostic ac-curacy studies. Radiology 2015;277:826 –32 CrossRef Medline
16. Rutter CM, Gatsonis CA. A hierarchical regression approach tometa-analysis of diagnostic test accuracy evaluations. Stat Med2001;20:2865– 84 CrossRef Medline
17. Glas AS, Lijmer JG, Prins MH, et al. The diagnostic odds ratio: asingle indicator of test performance. J Clin Epidemiol 2003;56:1129 –35 CrossRef Medline
18. Macaskill P. Empirical Bayes estimates generated in a hierarchicalsummary ROC analysis agreed closely with those of a full Bayesiananalysis. J Clin Epidemiol 2004;57:925–32 CrossRef Medline
19. Harbord RM, Whiting P, Sterne JA, et al. An empirical comparisonof methods for meta-analysis of diagnostic accuracy showed hier-archical models are necessary. J Clin Epidemiol 2008;61:1095–103CrossRef Medline
20. Riley RD, Dodd SR, Craig JV, et al. Meta-analysis of diagnostic teststudies using individual patient data and aggregate data. Stat Med2008;27:6111–36 CrossRef Medline
21. Sutton AJ, Kendrick D, Coupland CA. Meta-analysis of individ-ual- and aggregate-level data. Stat Med 2008;27:651– 69 CrossRefMedline
22. Dukic V, Gatsonis C. Meta-analysis of diagnostic test accuracy as-sessment studies with varying number of thresholds. Biometrics2003;59:936 – 46 CrossRef Medline
23. Leeflang MM, Deeks JJ, Gatsonis C, et al; Cochrane Diagnostic TestAccuracy Working Group. Systematic reviews of diagnostic test ac-curacy. Ann Intern Med 2008;149:889 –97 CrossRef Medline
24. Rutjes AW, Reitsma JB, Di Nisio M, et al. Evidence of bias andvariation in diagnostic accuracy studies. CMAJ 2006;174:469 –76CrossRef Medline
25. Chou R, Cuevas C, Fu R, et al. Imaging techniques for the diagnosis
1890 Verburg Oct 2017 www.ajnr.org
of hepatocellular carcinoma: a systematic review and meta-analy-sis. Ann Intern Med 2015;162:697–711 CrossRef Medline
26. Silvestri GA, Gonzalez AV, Jantz MA, et al. Methods for staging non-small cell lung cancer: diagnosis and management of lung cancer, 3rded—American College of Chest Physicians evidence-based clini-cal practice guidelines. Chest 2013;143:e211S–50S CrossRef Medline
27. Zhang Y, Qin Q, Li B, et al. Magnetic resonance imaging for N stag-ing in non-small cell lung cancer: a systematic review and meta-analysis. Thorac Cancer 2015;6:123–32 CrossRef Medline
28. Peters NH, Borel Rinkes IH, Zuithoff NP, et al. Meta-analysis of MRimaging in the diagnosis of breast lesions. Radiology 2008;246:116 –24 CrossRef Medline
29. Lemee JM, Clavreul A, Aubry M, et al. Characterizing the peritu-moral brain zone in glioblastoma: a multidisciplinary analysis.J Neurooncol 2015;122:53– 61 CrossRef Medline
30. Kros JM, Gorlia T, Kouwenhoven MC, et al. Panel review of anaplas-tic oligodendroglioma from European Organization For Researchand Treatment of Cancer Trial 26951: assessment of consensus indiagnosis, influence of 1p/19q loss, and correlations with outcome.J Neuropathol Exp Neurol 2007;66:545–51 CrossRef Medline
31. Scott CB, Nelson JS, Farnan NC, et al. Central pathology review in clin-ical trials for patients with malignant glioma: a report of RadiationTherapy Oncology Group 83– 02. Cancer 1995;76:307–13 Medline
32. van den Bent MJ. Interobserver variation of the histopathologicaldiagnosis in clinical trials on glioma: a clinician’s perspective. ActaNeuropathol 2010;120:297–304 CrossRef Medline
33. Bjartmarz H, Rehncrona S. Comparison of accuracy and precisionbetween frame-based and frameless stereotactic navigation fordeep brain stimulation electrode implantation. Stereotact FunctNeurosurg 2007;85:235– 42 CrossRef Medline
34. Zacest A, Berk C, Burchiel KJ. Precision and accuracy of stereotactictargeting in patients undergoing repeat stereotactic surgery. Ste-reotact Funct Neurosurg 2009;87:168 –73 CrossRef Medline
35. Sottoriva A, Spiteri I, Piccirillo SG, et al. Intratumor heterogeneity inhuman glioblastoma reflects cancer evolutionary dynamics. ProcNatl Acad Sci U S A 2013;110:4009 –14 CrossRef Medline
36. Zhao F, Li M, Kong L, et al. Delineation of radiation therapy targetvolumes for patients with postoperative glioblastoma: a review.Onco Targets Ther 2016;9:3197–204 CrossRefMedline
37. Niyazi M, Brada M, Chalmers AJ, et al. ESTRO-ACROP guideline“target delineation of glioblastomas.” Radiother Oncol 2016;118:35– 42 CrossRef Medline
38. Cabrera AR, Kirkpatrick JP, Fiveash JB, et al. Radiation therapy forglioblastoma: executive summary of an American Society for Radi-ation Oncology Evidence-Based Clinical Practice Guideline. PractRadiat Oncol 2016;6:217–25 CrossRef Medline
39. Albert NL, Weller M, Suchorska B, et al. Response Assessment inNeuro-Oncology working group and European Association forNeuro-Oncology recommendations for the clinical use of PET im-aging in gliomas. Neuro Oncol 2016;18:1199 –208 CrossRef Medline
40. Fink JR, Muzi M, Peck M, et al. Multimodality brain tumor imaging:MR imaging, PET, and PET/MR imaging. J Nucl Med 2015;56:1554 – 61 CrossRef Medline
41. Langen KJ, Galldiks N, Hattingen E, et al. Advances in neuro-oncol-ogy imaging. Nat Rev Neurol 2017;13:279 – 89 CrossRef Medline
42. Brandao LA, Castillo M. Adult brain tumors: clinical applications ofmagnetic resonance spectroscopy. Magn Reson Imaging Clin N Am2016;24:781– 809 CrossRef Medline
43. Kalpathy-Cramer J, Gerstner ER, Emblem KE, et al. Advanced mag-netic resonance imaging of the physical processes in human glio-blastoma. Cancer Res 2014;74:4622–37 CrossRef Medline
44. Jain R, Gutierrez J, Narang J, et al. In vivo correlation of tumorblood volume and permeability with histologic and molecularangiogenic markers in gliomas. AJNR Am J Neuroradiol 2011;32:388 –94 CrossRef Medline
45. Pauleit D, Floeth F, Hamacher K, et al. O-(2-[18F]fluoroethyl)-L-tyrosine PET combined with MRI improves the diagnostic as-sessment of cerebral gliomas. Brain 2005;128:678 – 87 CrossRefMedline
46. Lijmer JG, Bossuyt PMM, Heisterkamp SH. Exploring sources ofheterogeneity in systematic reviews of diagnostic tests. Stat Med2002;21:1525–37 CrossRef Medline
AJNR Am J Neuroradiol 38:1884 –91 Oct 2017 www.ajnr.org 1891