hbcd neuroimaging working group summary - final report
TRANSCRIPT
Neuroimaging Working Group Report
Working Group Chairs:
Christopher D. Smyser, MD, MSCI
Charles A. Nelson, PhD
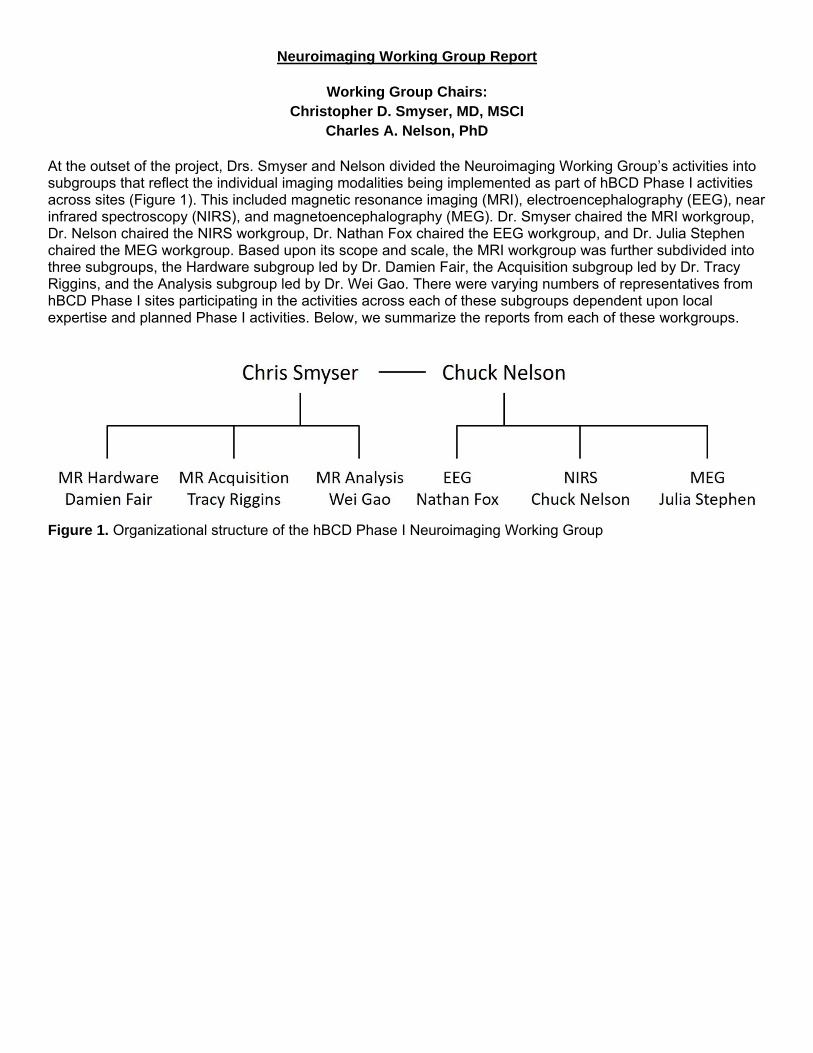
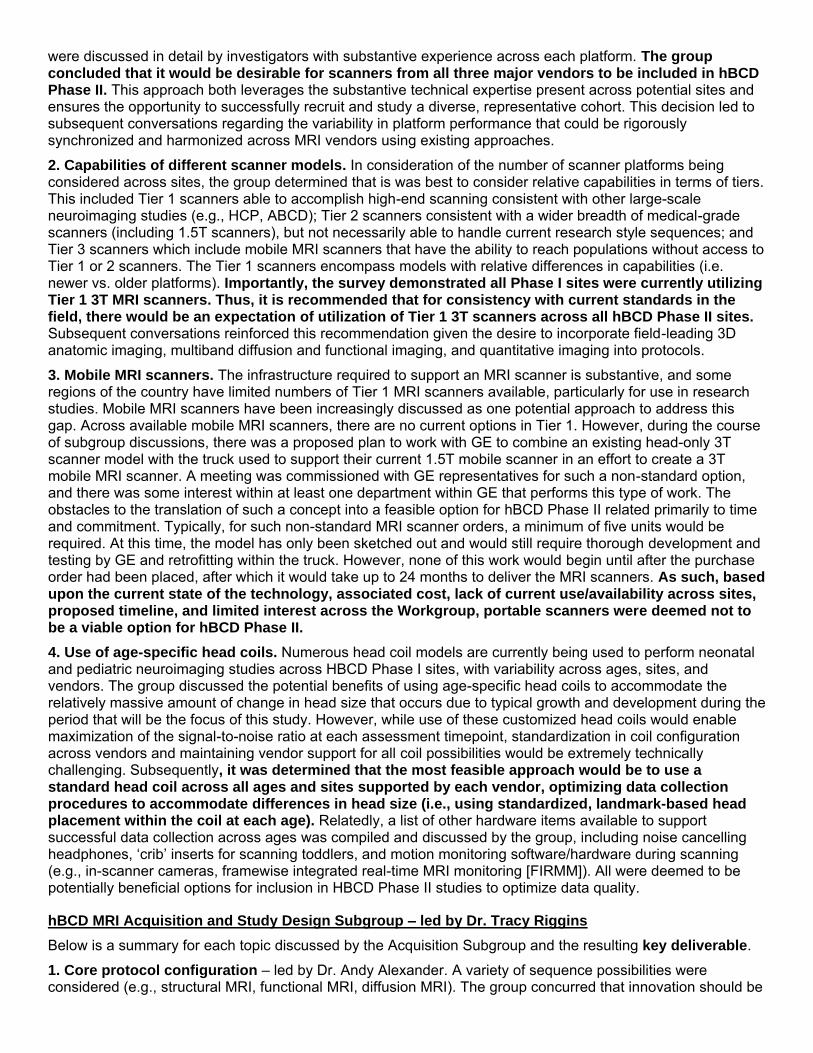
At the outset of the project, Drs. Smyser and Nelson divided the Neuroimaging Working Group’s activities into subgroups that reflect the individual imaging modalities being implemented as part of hBCD Phase I activities across sites (Figure 1). This included magnetic resonance imaging (MRI), electroencephalography (EEG), near infrared spectroscopy (NIRS), and magnetoencephalography (MEG). Dr. Smyser chaired the MRI workgroup, Dr. Nelson chaired the NIRS workgroup, Dr. Nathan Fox chaired the EEG workgroup, and Dr. Julia Stephen chaired the MEG workgroup. Based upon its scope and scale, the MRI workgroup was further subdivided into three subgroups, the Hardware subgroup led by Dr. Damien Fair, the Acquisition subgroup led by Dr. Tracy Riggins, and the Analysis subgroup led by Dr. Wei Gao. There were varying numbers of representatives from hBCD Phase I sites participating in the activities across each of these subgroups dependent upon local expertise and planned Phase I activities. Below, we summarize the reports from each of these workgroups.
Figure 1. Organizational structure of the hBCD Phase I Neuroimaging Working Group
MRI Workgroup Final Report
The MRI Workgroup was comprised of individuals from current hBCD sites that have expertise/capabilities
within the fields of infant and child MRI. The group included:
Christopher Smyser (Chair)
Damien Fair
Wei Gao
Tracy Riggins
Andy Alexander
Arvind Caprihan
Anders Dale
Doug Dean
Sean Deoni
Courtney Filippi
James Fishbaugh
Ellen Grant
Matt Gurka
Weili Lin
Bea Luna
Mary Beth Nebel
Chuck Nelson
Xiawei Ou
Ashok Panigraphy
Jim Pekar
Susan Perlman
Julia Stephen
Mike Suttie
Dylan Tisdall
Jennifer Vannest
Peter Van Zijl
Jessica Wisnowski
Essa Yacoub
Washington University in St. Louis
Oregon Health Sciences University
Cedars Sinai
University of Maryland
University of Wisconsin
Mind Research Network
University of California-San Diego
University of Wisconsin
Brown University
University of Maryland
New York University
Harvard Medical School
University of Florida
University of North Carolina
University of Pittsburgh
Johns Hopkins University
Harvard Medical School
University of Arkansas
University of Pittsburgh
Kennedy Krieger Institute
Washington University in St. Louis
Mind Research Institute
Oxford University
University of Pittsburgh
University of Cincinnati
Kennedy Krieger Institute
Children’s Hospital of Los Angeles
University of Minnesota
NIH Representatives
Minki Chatterji
Michelle Freund
Elizabeth Hoffman
Katia Howlett
Chloe Jordan
Vani Pariyadath
Janani Prabhakar
Luke Stoeckel
Susan Weiss
Ben Xu
Overview and Strengths of MRI
Among neuroimaging modalities, MRI provides unparalleled power and capabilities to elucidate the structural and functional mechanisms that underpin typical and atypical brain development and define their role in longitudinal brain-behavior relationships. There are now numerous MRI techniques that can be used to study typical brain development and the sequelae of early life adversity and environmental exposures in a detailed manner. This includes sequences commonly employed in MRI research studies such as high-resolution T1- and T2-weighted imaging, providing measures of global and regional brain volumes and cortical folding, diffusion imaging providing measures of white and gray matter microstructure, and task and resting-state
functional MRI providing measures of functional brain networks. As we seek to leverage recent technical and methodological innovations in the field, this may expand to encompass sequences such as MR spectroscopy, which measures brain metabolism, arterial spin labeling, which measures cerebral blood flow, tissue iron imaging, and quantitative MRI analysis techniques such as relaxometry and MR fingerprinting, which efficiently measure multiple tissue properties.
The hBCD Phase I MRI Workgroup brought together recognized experts in the fields of neonatal and pediatric neuroimaging in an effort to define a framework for how these different MRI modalities could be leveraged to provide complementary information helping us better understand not only typical brain development across the period from infancy through age 10 years, but also 1) the deleterious and protective effects of risk and resilience factors such as drug exposure, early life stress, and family support and 2) the relations between these markers of brain structure and function and measures of neurodevelopmental and neurobehavioral performance including motor, cognitive, socioemotional, and psychiatric outcomes.
In pursuit of this goal, the MRI Workgroup included representatives from all hBCD Phase I sites. It was divided into three subgroups, the Hardware subgroup led by Dr. Fair, the Acquisition subgroup led by Dr. Riggins, and the Analysis subgroup led by Dr. Gao. Each of these subgroups included approximately 15-20 researchers and met biweekly, with meetings and efforts focused on prioritized topics identified in initial meetings and led by subgroup members. Some of these topics necessarily overlapped across subgroups. In addition, monthly meetings including all members of the MRI Workgroup were conducted in order to provide relevant updates on subgroup activities, facilitate collaboration and communication, and liaise with members of other hBCD Phase I Working Groups.
As part of their initial activities and to help guide subsequent discussions, all three subgroups assisted with development of a survey detailing current MRI hardware/software capabilities, research practices, and scientific priorities for neonatal and pediatric neuroimaging across hBCD sites. This survey was distributed to the full Consortium, and a total of 25 sites completed the survey. Key results from the survey included:
All Phase I sites report having 3T MRI scanners available across two tiers of capabilities; 72% of sites have Siemens, 16% Philips, and 12% GE scanners; head coil availability is less standardized across sites
Sites report having access to a research-dedicated MRI scanner (87.5%), the capability to run leading-edge MRI sequences (85-100% depending on sequence type), and on-site technical support (100%)
Only one site currently has a portable 1.5T MRI scanner; the majority of sites were not interested in this portable technology (62.5%)
Only two sites have access to a neonate/infant-specific MRI scanner
Sites report having requisite technology available for stimulus administration for task fMRI
Sites prioritized collection of T1-weighted, T2-weighted, diffusion weighted (± multiple b-values), and resting-state fMRI sequences; interest in additional sequences was mixed across sites
Innovative/additional MRI sequences beyond the core protocol would be desirable if scanning time permits
Sites perform repeated scanning in children <2 years of age and yearly scans in children ≥2 years of age
Task fMRI is most successful in children ≥4-5 years of age
Optimal scanning duration is 40-60 minutes in the targeted age groups (often shorter at youngest ages)
There is substantive heterogeneity in analysis pipelines and atlases across sites; ‘in-house’ (i.e., locally developed, non-public) pipelines are most popular across all modalities; improved atlases are desired
Sites have mock scanners (75%) and experience with desensitization procedures to improve compliance
Sites have participated in multi-site projects that include MRI scanning (70%), including in Phase I projects
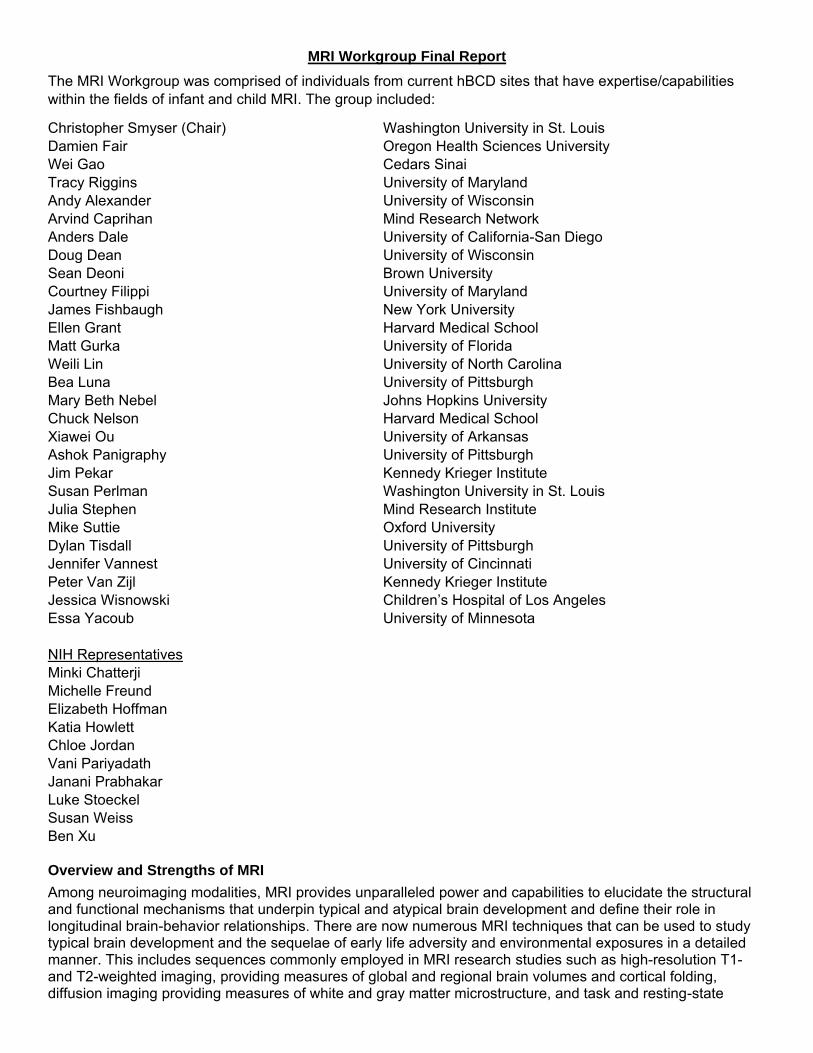
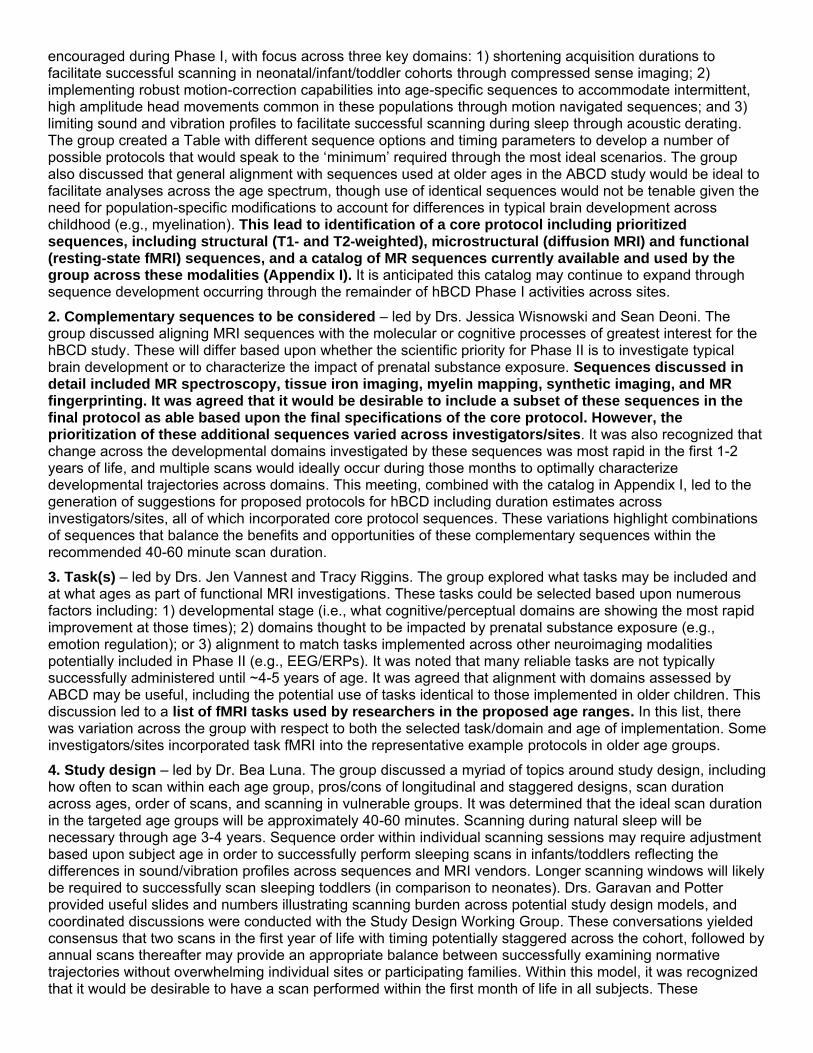
Building upon the survey results, the Workgroup developed a summary workflow diagram which detailed the domains of greatest scientific interest, primary outcomes, and current gaps in the field (Figure 2). This organizational structure provided a foundation for the activities across the subgroups which are detailed below.
hBCD MRI Hardware Subgroup – led by Dr. Damien Fair
Below is a summary for each topic discussed by the Hardware Subgroup and the resulting key deliverable.
1. Variability in MRI vendors and scanner models across sites. The MRI survey compiled a detailed accounting of the current/planned scanner models from the three major MRI vendors (Siemens, GE, Philips) available across hBCD Phase I sites. The relative strengths and limitations of each of these models/vendors
Hardware
Acquisition
Analysis
Priority Topics Domains of Interest Primary Outcomes Gaps/Limitations/Opportunities
1. Scanner/hardware survey across Consortium sites – assess heterogeneity
2. Evaluate variability in data quality across available scanner/hardware platforms
3. Vendor comparability/available options 4. Feasibility of portable MRI scanner 5. Establish scanner/data quality criteria –
floor/widely achievable/optimal
Vendor Scanner Coils Scanner software Sequence collection capability – core+others Compressed sensing
Motion detection/correction capability – in/out scanner Stimulus administration Scan equipment Mock scanner Technical support on site Non‐standard scanner types
1. Criteria for floor/widely achievable/optimal across sites for: • Scanner type • Hardware • Acquisition capabilities (not sequences)
2. Information on how to attain resources for sites to satisfy these criteria
3. Best practices for data harmonization across vendors
4. Feasibility of portable MRI
1. Minimal/achievable/optimal scanner and hardware capability requirements TBD
2. Best practices for evaluating data harmonization across platforms
3. Availability of comparable data across platforms/ages for harmonization analyses
4. Tradeoffs between standardization/inclusion of large number of sites
5. Data to evaluate portable scanners 6. Opportunities to leverage HBCD project to
enhance vendor collaboration/compatibility 7. ABCD compatibility
Priority Topics Domains of Interest Primary Outcomes Gaps/Limitations/Opportunities
1. Core protocol config – sMRI/rsMRI/ dMRI; minimum vs ideal; age effects
2. Other sequences to consider – MRS, iron,myelin, synthetic imaging
3. Tasks – what to include and when 4. Study design – how often to scan at each
age; pros/cons of longitudinal and staggered designs; scan duration across ages; order of scans; vulnerable groups
5. Scan collection procedures – prep, mock scans, motion minimization across ages
Structural MRI Diffusion MRI Rest fMRI Task fMRI Synthetic imaging Non‐core sequences Motion detection/correction during scanning
Sleep versus awake Effects of age Protocol priorities Protocol burden – scan frequency/duration Practices to increase scan success rates across age Vulnerable populations
1. Core protocol composition – minimum vs ideal; sequence order
2. Pros/cons of additional sequences + task imaging across ages
3. Pros/cons of study design models 4. Best practices for scanning across ages
including optimal duration 5. Best practices to limit subject burden/
accommodate vulnerable populations
1. Minimum vs ideal requirements across core sequences and ages TBD
2. Availability of data directly comparing sequences across ages
3. Success/benefits of ‘other sequences’ 4. Efficacy of within scan motion correction 5. Identification of key developmental processes
to be studied/effects of substance exposure 6. Tradeoffs between standardization/inclusion
of large number of sites 7. Vulnerable population MRI data across ages 8. ABCD compatibility
Priority Topics Available Pipelines/Approaches/Atlases Primary Outcomes Gaps/Limitations/Opportunities
Best practices infants (+children) for: 1. Skull stripping/segmentation 2. Motion correction during processing 3. Atlas generation/registration
Necessary to facilitate utilization of pipeline based analysis approaches across all ages
Macrostructure 1. Freesurfer –
baby/adult 2. MCRIB 3. UK/dHCP 4. ANTS 5. DCP 6. FSL 7. iBEAT
Microstructure 1. Tracula/traculina2. FSL EXTRACT 3. TrackVis 4. MTRIX 5. DIPY 6. DTIStudio 7. RSI
fMRI 1. FSL
2. AFNI 3. CONN 4. SPM 5. BCT
1. List of primary measures of interest across modalities
2. Best practices for infant preprocessing to facilitate pipeline compatibility
3. List of vetted pipelines/approaches capable of generating primary measures
4. Motion correction procedures implementable during processing
5. Data standards/quality criteria to facilitate pipeline utilization
1. Variability in data due to hardware/quality – minimum quality standards TBD
2. Robust approach for evaluating data quality – flagging/removing/correcting
3. Approaches for motion correction during processing across modalities
4. Robust approach(es) across age categories 5. Harmonization in measures across methods
(hardware group addresses critical front end) 6. Consider non‐publically available pipelines? 7. Need for k‐space data 8. ABCD compatibility
were discussed in detail by investigators with substantive experience across each platform. The group concluded that it would be desirable for scanners from all three major vendors to be included in hBCD Phase II. This approach both leverages the substantive technical expertise present across potential sites and ensures the opportunity to successfully recruit and study a diverse, representative cohort. This decision led to subsequent conversations regarding the variability in platform performance that could be rigorously synchronized and harmonized across MRI vendors using existing approaches.
2. Capabilities of different scanner models. In consideration of the number of scanner platforms being considered across sites, the group determined that is was best to consider relative capabilities in terms of tiers. This included Tier 1 scanners able to accomplish high-end scanning consistent with other large-scale neuroimaging studies (e.g., HCP, ABCD); Tier 2 scanners consistent with a wider breadth of medical-grade scanners (including 1.5T scanners), but not necessarily able to handle current research style sequences; and Tier 3 scanners which include mobile MRI scanners that have the ability to reach populations without access to Tier 1 or 2 scanners. The Tier 1 scanners encompass models with relative differences in capabilities (i.e. newer vs. older platforms). Importantly, the survey demonstrated all Phase I sites were currently utilizing Tier 1 3T MRI scanners. Thus, it is recommended that for consistency with current standards in the field, there would be an expectation of utilization of Tier 1 3T scanners across all hBCD Phase II sites. Subsequent conversations reinforced this recommendation given the desire to incorporate field-leading 3D anatomic imaging, multiband diffusion and functional imaging, and quantitative imaging into protocols.
3. Mobile MRI scanners. The infrastructure required to support an MRI scanner is substantive, and some regions of the country have limited numbers of Tier 1 MRI scanners available, particularly for use in research studies. Mobile MRI scanners have been increasingly discussed as one potential approach to address this gap. Across available mobile MRI scanners, there are no current options in Tier 1. However, during the course of subgroup discussions, there was a proposed plan to work with GE to combine an existing head-only 3T scanner model with the truck used to support their current 1.5T mobile scanner in an effort to create a 3T mobile MRI scanner. A meeting was commissioned with GE representatives for such a non-standard option, and there was some interest within at least one department within GE that performs this type of work. The obstacles to the translation of such a concept into a feasible option for hBCD Phase II related primarily to time and commitment. Typically, for such non-standard MRI scanner orders, a minimum of five units would be required. At this time, the model has only been sketched out and would still require thorough development and testing by GE and retrofitting within the truck. However, none of this work would begin until after the purchase order had been placed, after which it would take up to 24 months to deliver the MRI scanners. As such, based upon the current state of the technology, associated cost, lack of current use/availability across sites, proposed timeline, and limited interest across the Workgroup, portable scanners were deemed not to be a viable option for hBCD Phase II.
4. Use of age-specific head coils. Numerous head coil models are currently being used to perform neonatal and pediatric neuroimaging studies across HBCD Phase I sites, with variability across ages, sites, and vendors. The group discussed the potential benefits of using age-specific head coils to accommodate the relatively massive amount of change in head size that occurs due to typical growth and development during the period that will be the focus of this study. However, while use of these customized head coils would enable maximization of the signal-to-noise ratio at each assessment timepoint, standardization in coil configuration across vendors and maintaining vendor support for all coil possibilities would be extremely technically challenging. Subsequently, it was determined that the most feasible approach would be to use a standard head coil across all ages and sites supported by each vendor, optimizing data collection procedures to accommodate differences in head size (i.e., using standardized, landmark-based head placement within the coil at each age). Relatedly, a list of other hardware items available to support successful data collection across ages was compiled and discussed by the group, including noise cancelling headphones, ‘crib’ inserts for scanning toddlers, and motion monitoring software/hardware during scanning (e.g., in-scanner cameras, framewise integrated real-time MRI monitoring [FIRMM]). All were deemed to be potentially beneficial options for inclusion in HBCD Phase II studies to optimize data quality.
hBCD MRI Acquisition and Study Design Subgroup – led by Dr. Tracy Riggins
Below is a summary for each topic discussed by the Acquisition Subgroup and the resulting key deliverable.
1. Core protocol configuration – led by Dr. Andy Alexander. A variety of sequence possibilities were considered (e.g., structural MRI, functional MRI, diffusion MRI). The group concurred that innovation should be
encouraged during Phase I, with focus across three key domains: 1) shortening acquisition durations to facilitate successful scanning in neonatal/infant/toddler cohorts through compressed sense imaging; 2) implementing robust motion-correction capabilities into age-specific sequences to accommodate intermittent, high amplitude head movements common in these populations through motion navigated sequences; and 3) limiting sound and vibration profiles to facilitate successful scanning during sleep through acoustic derating. The group created a Table with different sequence options and timing parameters to develop a number of possible protocols that would speak to the ‘minimum’ required through the most ideal scenarios. The group also discussed that general alignment with sequences used at older ages in the ABCD study would be ideal to facilitate analyses across the age spectrum, though use of identical sequences would not be tenable given the need for population-specific modifications to account for differences in typical brain development across childhood (e.g., myelination). This lead to identification of a core protocol including prioritized sequences, including structural (T1- and T2-weighted), microstructural (diffusion MRI) and functional (resting-state fMRI) sequences, and a catalog of MR sequences currently available and used by the group across these modalities (Appendix I). It is anticipated this catalog may continue to expand through sequence development occurring through the remainder of hBCD Phase I activities across sites.
2. Complementary sequences to be considered – led by Drs. Jessica Wisnowski and Sean Deoni. The group discussed aligning MRI sequences with the molecular or cognitive processes of greatest interest for the hBCD study. These will differ based upon whether the scientific priority for Phase II is to investigate typical brain development or to characterize the impact of prenatal substance exposure. Sequences discussed in detail included MR spectroscopy, tissue iron imaging, myelin mapping, synthetic imaging, and MR fingerprinting. It was agreed that it would be desirable to include a subset of these sequences in the final protocol as able based upon the final specifications of the core protocol. However, the prioritization of these additional sequences varied across investigators/sites. It was also recognized that change across the developmental domains investigated by these sequences was most rapid in the first 1-2 years of life, and multiple scans would ideally occur during those months to optimally characterize developmental trajectories across domains. This meeting, combined with the catalog in Appendix I, led to the generation of suggestions for proposed protocols for hBCD including duration estimates across investigators/sites, all of which incorporated core protocol sequences. These variations highlight combinations of sequences that balance the benefits and opportunities of these complementary sequences within the recommended 40-60 minute scan duration.
3. Task(s) – led by Drs. Jen Vannest and Tracy Riggins. The group explored what tasks may be included and at what ages as part of functional MRI investigations. These tasks could be selected based upon numerous factors including: 1) developmental stage (i.e., what cognitive/perceptual domains are showing the most rapid improvement at those times); 2) domains thought to be impacted by prenatal substance exposure (e.g., emotion regulation); or 3) alignment to match tasks implemented across other neuroimaging modalities potentially included in Phase II (e.g., EEG/ERPs). It was noted that many reliable tasks are not typically successfully administered until ~4-5 years of age. It was agreed that alignment with domains assessed by ABCD may be useful, including the potential use of tasks identical to those implemented in older children. This discussion led to a list of fMRI tasks used by researchers in the proposed age ranges. In this list, there was variation across the group with respect to both the selected task/domain and age of implementation. Some investigators/sites incorporated task fMRI into the representative example protocols in older age groups.
4. Study design – led by Dr. Bea Luna. The group discussed a myriad of topics around study design, including how often to scan within each age group, pros/cons of longitudinal and staggered designs, scan duration across ages, order of scans, and scanning in vulnerable groups. It was determined that the ideal scan duration in the targeted age groups will be approximately 40-60 minutes. Scanning during natural sleep will be necessary through age 3-4 years. Sequence order within individual scanning sessions may require adjustment based upon subject age in order to successfully perform sleeping scans in infants/toddlers reflecting the differences in sound/vibration profiles across sequences and MRI vendors. Longer scanning windows will likely be required to successfully scan sleeping toddlers (in comparison to neonates). Drs. Garavan and Potter provided useful slides and numbers illustrating scanning burden across potential study design models, and coordinated discussions were conducted with the Study Design Working Group. These conversations yielded consensus that two scans in the first year of life with timing potentially staggered across the cohort, followed by annual scans thereafter may provide an appropriate balance between successfully examining normative trajectories without overwhelming individual sites or participating families. Within this model, it was recognized that it would be desirable to have a scan performed within the first month of life in all subjects. These
conversations ultimately led to collection of preliminary study design options, including feasibility estimates for individual sites, potential sample sizes, and scan ordering within scanning sessions. In general, individual sites estimated an average scanning capacity of 10-12 participants per week (minimum=4, maximum=40) through a combination of both day and nighttime scan sessions. The suggested order of scanning varied substantially based on the age of the subject, scanner, and sequences under consideration.
5. Scan collection procedures – led by Dr. Doug Dean. This session included discussion of options and equipment for age-specific scan session preparation, mock scanning, motion minimization, and equipment for use in and out of the MRI scanner to facilitate successful scanning. This resulted in generation of a catalog of necessary/recommended scanning materials (Appendix II), including both MR compatible and non-MR compatible equipment (commercially available vs. custom built; if commercially available, vendors that can be used for purchase) and recommended approaches by age group (e.g., sleep vs. wake). Building upon this work, there are also now multiple sites/investigators that have created and distributed training procedures/documentation designed to instruct and train new sites in best practices for successfully studying neonates, infants, and toddlers during natural sleep using MRI, information critical for further expanding scanning efforts in these populations across hBCD sites.
HBCD MRI Analysis Subgroup – led by Dr. Wei Gao
Below is a summary for each topic discussed by the Analysis Subgroup and the resulting key deliverable.
1. Identification of primary outcome measures of interest across modalities (i.e., biological processes to be evaluated). The group collectively identified key structural and functional brain measures of interest obtainable through analyses of T1-weighted, T2-weighted, diffusion MRI, and resting-state fMRI sequences. These core measures can provide quantitative assessments of both typical brain growth/development and the potential effects of opioid and/or other environmental exposures on the developing brain from the neonatal period through childhood. Task-driven fMRI activations represented another quantitative measure of interest in older children, though the measures obtained from these studies are often more specific (i.e., tied to specific brain regions) than those from alternative modalities. There were substantive discussions around measures obtainable using MR spectroscopy, quantitative imaging/relaxometry/fingerprinting, tissue iron imaging, and arterial spin labeling, though interest in these modalities was less consistent across the group and often subject to site-specific interests and expertise.
2. Core list of analysis pipelines used across modalities – led by Drs. Wei Gao and Chris Smyser. The subgroup has compiled an extensive list of existing analysis and quality control pipelines used across modalities and sites based upon the survey results depicting the current state of the field of neonatal and infant imaging. Overall, there is considerable variability across sites with respect to preferred pipelines, with in-house (i.e., locally developed, non-public) analysis approaches consistently representing the most common choice across both structural and functional modalities. This is driven to a large degree by an inability to successfully implement analysis pipelines standardly employed in older pediatric and adult populations in neonates and infants as they fail to accurately account for changes in the brain due to normative brain development (i.e., changes in tissue contrast on T1- and T2-weighted imaging during the first year of life due to myelination). These results suggest that additional targeted efforts remain necessary to evaluate, optimize, and ideally standardize analysis and quality control pipelines across hBCD Phase II Consortium sites.
3. Identification of key focus areas to facilitate successful neonatal data processing – led by Drs. Wei Gao, Doug Dean, and Arvind Caprihan. The group reviewed the current state of the field reflecting upon the identified neonatal neuroimaging analysis pipelines, defining priority analysis domains in which collaborative efforts across the hBCD Consortium could meaningfully advance, standardize, and harmonize practices in the field. These included: 1) infant structural data skull stripping, segmentation, and registration, topics representing the most acknowledged areas for potential improvement and optimization amongst existing neonatal pipelines; 2) the absence of well-agreed upon structural, functional, and diffusion atlases, with many sites using local, non-public atlases, also widely recognized as a critical gap in the field; and 3) robust motion correction strategies implementable during processing and appropriate for infant imaging. It is recommended that these topics remain recognized priorities during subsequent hBCD activities.
4. Data repository to facilitate evaluation of data quality/pipeline implementation – led by Dr. Weili Lin. The FlyWheel organization gave a presentation to the subgroup on their data management platform, including providing secure space for unrestricted sharing of de-identified neuroimaging data and analysis
pipelines across sites. This enables shared evaluation of both data quality across sequences and vendors and efficacy and compatibility of neuroimaging analysis pipelines to facilitate harmonization and standardization. The group later presented to the full hBCD Consortium during a second session, which also included information on the capabilities of the platform across other imaging modalities and in coordination with electronic health record and clinical databases (e.g., REDCap). Another platform for more limited data sharing across the hBCD group was created using github. These repositories will remain available for use by the Consortium when data collection resumes and newly developed acquisition sequences are implemented across hBCD sites as COVID-19 related human subjects assessment restrictions are lifted.
Summary and Conclusions
The MRI Workgroup collaborated closely to synthesize and combine the data generated across the highly productive subgroups into a one-page summary document that provides the full Consortium and NIH staff with detailed information reflecting the current state of the field in neonatal and pediatric neuroimaging and priorities and opportunities across the Workgroup in anticipation of hBCD Phase II (Table 1). Building upon these efforts, there are multiple key take-home messages from the activities of the Workgroup including:
The requisite MRI hardware, sequences, and expertise exist to robustly investigate key domains of early brain development in typical and high-risk populations
The availability of 3T MRI scanners across all hBCD Phase I sites, even if encompassing two tiers of scanner technology, facilitates protocol harmonization and implementation, though will require careful accounting for relative scanner capabilities across platforms
Portable and neonate-specific MRI scanners were discussed extensively; based upon the current state of the technology, associated cost, lack of current use across sites, and limited interest across the Workgroup, these were deemed not to be viable options for hBCD Phase II
Consensus exists across the Workgroup on the most salient elements of the imaging protocol, including composition of the core protocol (high-resolution T1- and T2-weighted, diffusion MRI, and resting-state fMRI), goal duration of 40-60 minutes, scanning procedures (sleep vs. awake based upon age), benefits of desensitization procedures, and desire for increased sampling over the first two years of life
The core protocol enables robust assessment of prioritized outcome measures of brain development sensitive to potential effects of environmental exposures, including growth, folding, microstructure, and functional networks; key decisions pertain to the duration of diffusion (dependent upon the number of b-values) and resting-state fMRI sequences (dependent upon minimum low-motion data quantity criteria)
There is strong desire across the Workgroup to build upon this core protocol and leverage recent advances in scanner technology and sequence development to foster new lines of research on the developing brain encompassing cerebral metabolism, myelination, tissue iron, and/or blood flow, if feasible within the constraints of the scanning requirements/limitations in neonatal and pediatric populations
Detailed information has been compiled regarding the MRI resources currently available across Consortium sites and those necessary for successful participation during hBCD Phase II, defining both opportunities and gaps across groups
Next Steps
Based upon the efforts of the MRI Workgroup to date, the priorities across the upcoming phase of the hBCD Phase I projects are apparent. These include:
MR sequence development centered upon shortening acquisition times, enhancing motion resistance, and reducing noise profiles without compromising data quality to facilitate expanded lines of investigation
Utilizing the established data repository to facilitate shared evaluation of these products/data across sites
Harmonization of MRI data collected across existing scanner platforms from Siemens, Philips, and GE
Development of optimized age-specific analysis and QC pipelines and atlases for use across sites
Establishing best practices for performing neonatal and pediatric neuroimaging research in the COVID-19 landscape which will require sites to continue to work and learn together
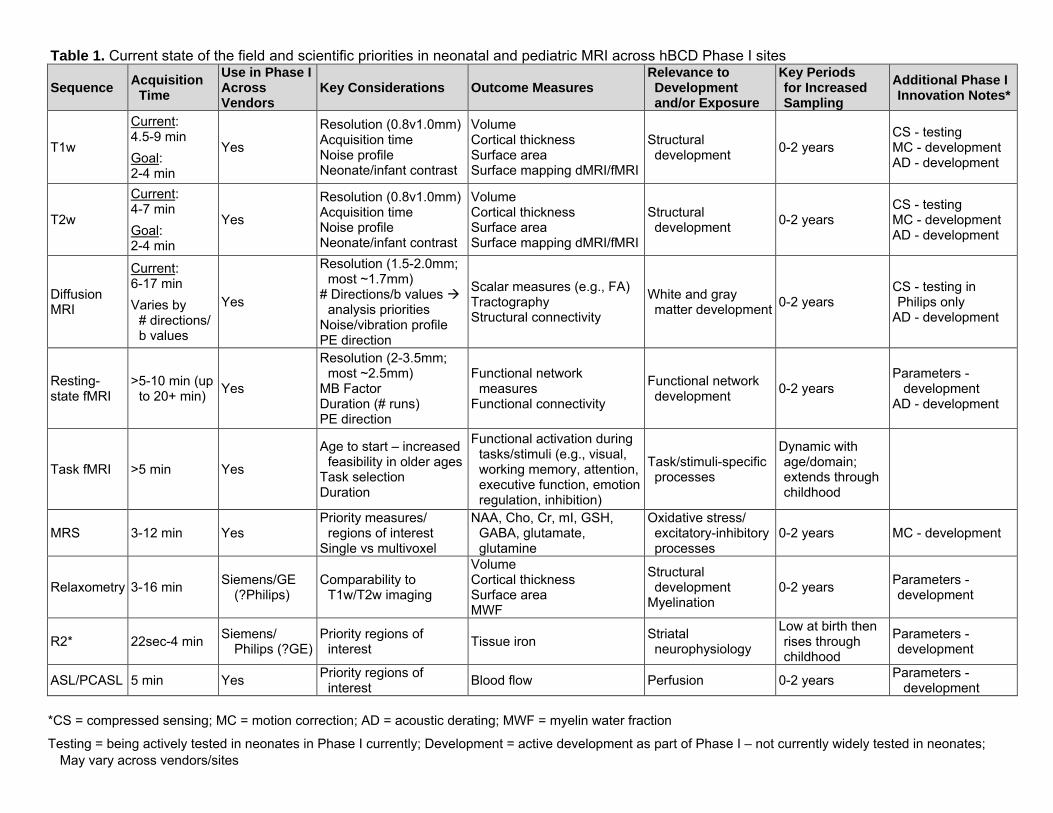
Table 1. Current state of the field and scientific priorities in neonatal and pediatric MRI across hBCD Phase I sites
Sequence Acquisition
Time
Use in Phase I Across Vendors
Key Considerations Outcome Measures Relevance to Development and/or Exposure
Key Periods for Increased Sampling
Additional Phase I Innovation Notes*
T1w
Current: 4.5-9 min
Goal: 2-4 min
Yes
Resolution (0.8v1.0mm) Acquisition time Noise profile Neonate/infant contrast
Volume Cortical thickness Surface area Surface mapping dMRI/fMRI
Structural development
0-2 years CS - testing MC - development AD - development
T2w
Current: 4-7 min
Goal: 2-4 min
Yes
Resolution (0.8v1.0mm) Acquisition time Noise profile Neonate/infant contrast
Volume Cortical thickness Surface area Surface mapping dMRI/fMRI
Structural development
0-2 years CS - testing MC - development AD - development
Diffusion MRI
Current: 6-17 min
Varies by # directions/ b values
Yes
Resolution (1.5-2.0mm; most ~1.7mm)
# Directions/b values analysis priorities
Noise/vibration profile PE direction
Scalar measures (e.g., FA) Tractography Structural connectivity
White and gray matter development
0-2 years CS - testing in Philips only
AD - development
Resting-state fMRI
>5-10 min (up to 20+ min)
Yes
Resolution (2-3.5mm; most ~2.5mm)
MB Factor Duration (# runs) PE direction
Functional network measures
Functional connectivity
Functional network development
0-2 years Parameters -
development AD - development
Task fMRI >5 min Yes
Age to start – increased feasibility in older ages
Task selection Duration
Functional activation during tasks/stimuli (e.g., visual, working memory, attention, executive function, emotion regulation, inhibition)
Task/stimuli-specific processes
Dynamic with age/domain; extends through childhood
MRS 3-12 min Yes Priority measures/
regions of interest Single vs multivoxel
NAA, Cho, Cr, mI, GSH, GABA, glutamate, glutamine
Oxidative stress/ excitatory-inhibitory processes
0-2 years MC - development
Relaxometry 3-16 min Siemens/GE
(?Philips) Comparability to
T1w/T2w imaging
Volume Cortical thickness Surface area MWF
Structural development
Myelination 0-2 years
Parameters -development
R2* 22sec-4 min Siemens/
Philips (?GE) Priority regions of
interest Tissue iron
Striatal neurophysiology
Low at birth then rises through childhood
Parameters -development
ASL/PCASL 5 min Yes Priority regions of
interest Blood flow Perfusion 0-2 years
Parameters -development
*CS = compressed sensing; MC = motion correction; AD = acoustic derating; MWF = myelin water fraction
Testing = being actively tested in neonates in Phase I currently; Development = active development as part of Phase I – not currently widely tested in neonates;
May vary across vendors/sites
EEG Workgroup Final Report
The EEG Workgroup was comprised of individuals from current hBCD sites that have expertise/capabilities within the fields of infant and child EEG. The group included:
Nathan Fox (Chair) University of Maryland Anders Dale University of California-San Diego Beth Smith University of Southern California Charles Nelson Harvard Medical School Christopher Conway Boys Town Hospital Damien Fair Oregon Health Sciences University Doug Dean University of Wisconsin Elizabeth Norton Northwestern University Jamie Listokin University of Maryland George Buzzell University of Maryland Julia Stephen Mind Research Network Kenneth Loparo Case Western Reserve University Michael Decker Case Western Reserve University Michael Murias Northwestern University Neely Miller University of Minnesota Dylan Tisdall University of Pennsylvania Ranjan Debnath University of Maryland Bill Fifer Columbia University Sahana Nagabhushan Kalburgi University of Southern California Tim Brown University of California-San Diego Chris Smyser and Chuck Nelson also participated as Co-Chairs of the hBCD Neuroimaging Working Group
NIH Representatives
Michelle Freund Chloe Jordan Janani Prabhakar Minki Chatterji Benjamin Xu
Overview
This report summarizes the EEG workgroup discussions for the hBCD project. An EEG group was formed and a questionnaire sent to all sites that received funding under the auspices of the R34 mechanism. Subsequently, bi-weekly meetings were held with interested participants discussing issues of feasibility, hardware, acquisition, and analysis. The current report is in three main sections: Hardware, Acquisition, and Analysis. Hardware focuses on the EEG equipment (e.g., EEG system, nets/caps) across Consortium sites. Acquisition focuses on which tasks can and should be used for EEG visits and at what ages they will be performed. Finally, Analysis focuses on what preprocessing pipelines/programs should be used to clean the EEG data after it has been collected and the primary measures of interest.
Strengths of EEG
EEG is a widely available and utilized method of brain imaging. It has significant advantages over other approaches in that the hardware is relatively inexpensive, is amenable to a range of populations (infants, children, special populations) and (like MEG) provides excellent temporal resolution. Its disadvantage is the lack of spatial resolution (i.e., the ability to identify the neural sources underlying scalp-recorded activity). However, with the advent some 30 years ago of high density EEG systems (128 or 256 electrodes on the head), complex analytic methods coupled with advances in structural brain imaging have allowed approaches such as source modeling that can approximate with greater precision the spatial sources in the brain from where the signals are emanating. An additional advantage of EEG is that it can be acquired in a range of environments and does not require (as do MEG and MRI) specially shielded rooms and locations. Indeed, there are portable systems that can be used in the home or classroom. The temporal resolution (msec) has particular advantages in task-elicited EEG (generally referred to as evoked or event-related potentials; ERPs). Sensory, language, and
cognitive tasks (e.g., attention, memory) can be administered to a wide age range of participants synchronized to the ongoing EEG to provide millisecond accuracy of the brain response to these tasks. Thus, EEG provides a powerful tool for longitudinal studies of brain development.
Hardware
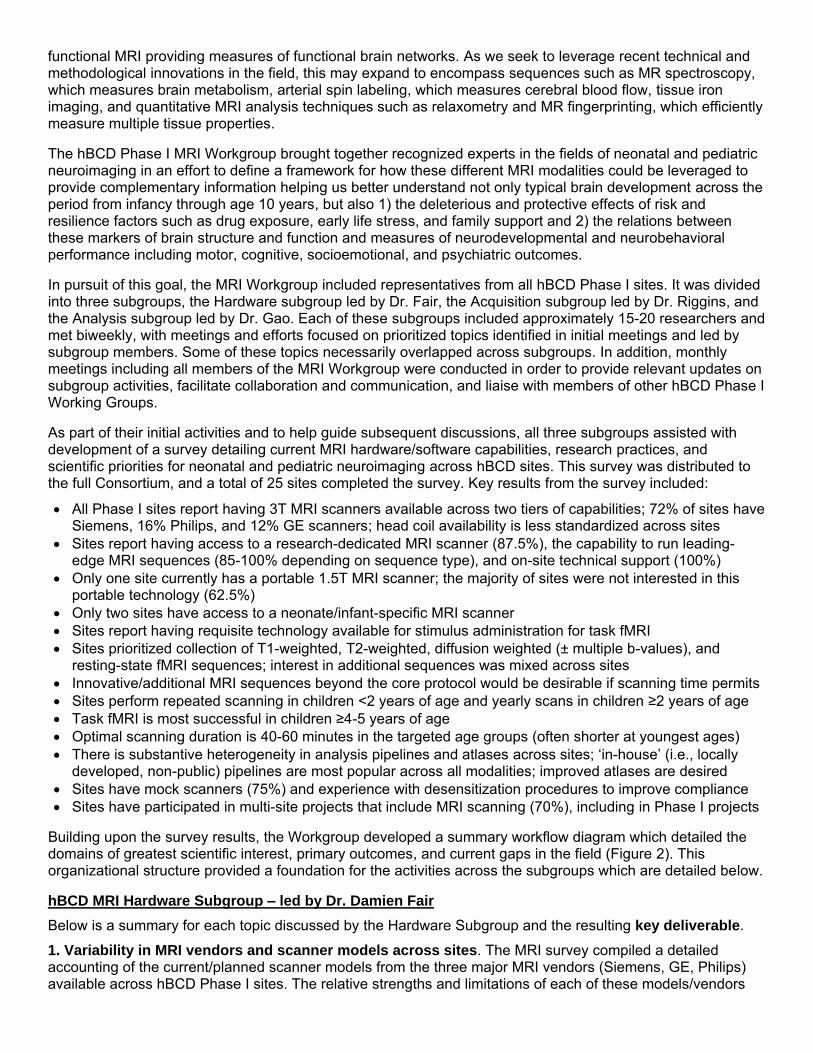
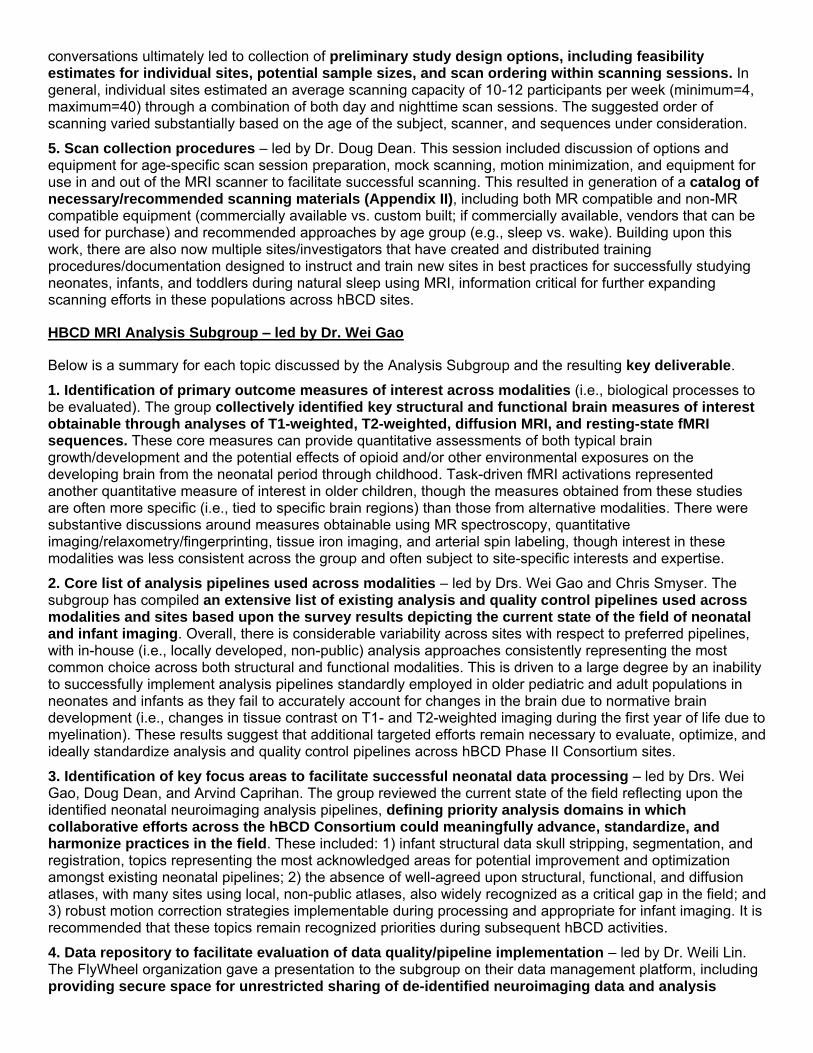
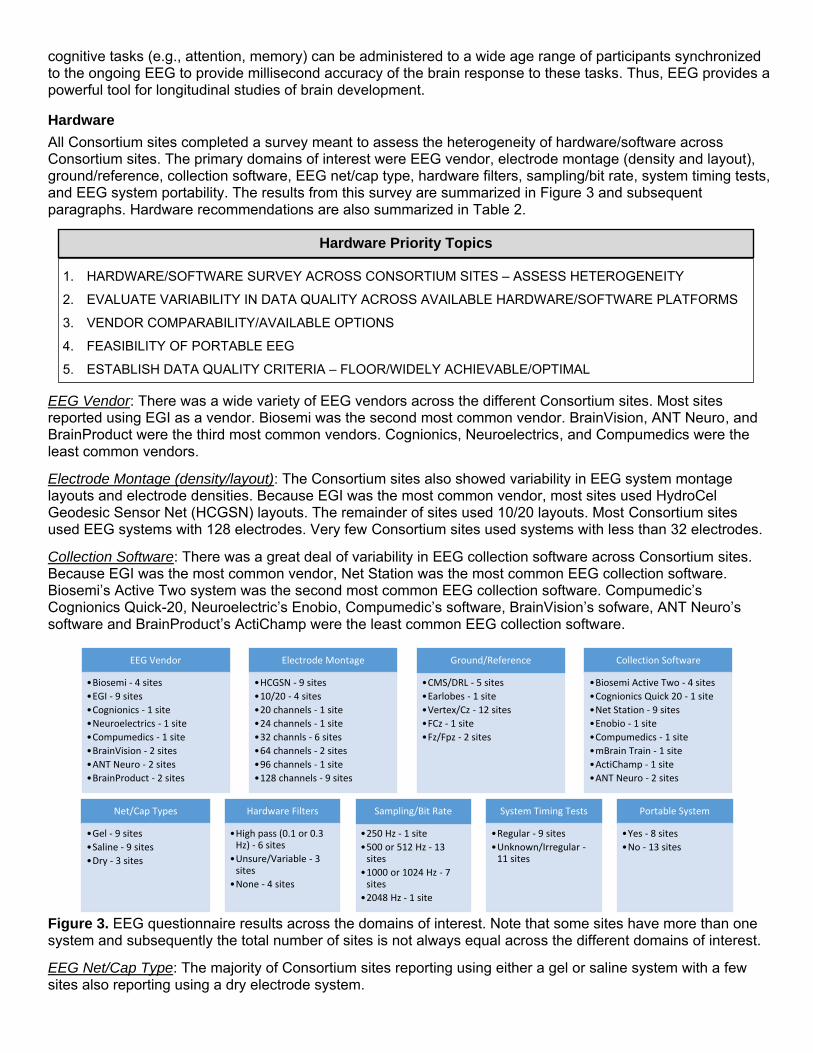
All Consortium sites completed a survey meant to assess the heterogeneity of hardware/software across Consortium sites. The primary domains of interest were EEG vendor, electrode montage (density and layout), ground/reference, collection software, EEG net/cap type, hardware filters, sampling/bit rate, system timing tests, and EEG system portability. The results from this survey are summarized in Figure 3 and subsequent paragraphs. Hardware recommendations are also summarized in Table 2.
Hardware Priority Topics
1. HARDWARE/SOFTWARE SURVEY ACROSS CONSORTIUM SITES – ASSESS HETEROGENEITY
2. EVALUATE VARIABILITY IN DATA QUALITY ACROSS AVAILABLE HARDWARE/SOFTWARE PLATFORMS
3. VENDOR COMPARABILITY/AVAILABLE OPTIONS
4. FEASIBILITY OF PORTABLE EEG
5. ESTABLISH DATA QUALITY CRITERIA – FLOOR/WIDELY ACHIEVABLE/OPTIMAL
EEG Vendor: There was a wide variety of EEG vendors across the different Consortium sites. Most sites reported using EGI as a vendor. Biosemi was the second most common vendor. BrainVision, ANT Neuro, and BrainProduct were the third most common vendors. Cognionics, Neuroelectrics, and Compumedics were the least common vendors.
Electrode Montage (density/layout): The Consortium sites also showed variability in EEG system montage layouts and electrode densities. Because EGI was the most common vendor, most sites used HydroCel Geodesic Sensor Net (HCGSN) layouts. The remainder of sites used 10/20 layouts. Most Consortium sites used EEG systems with 128 electrodes. Very few Consortium sites used systems with less than 32 electrodes.
Collection Software: There was a great deal of variability in EEG collection software across Consortium sites. Because EGI was the most common vendor, Net Station was the most common EEG collection software. Biosemi’s Active Two system was the second most common EEG collection software. Compumedic’s Cognionics Quick-20, Neuroelectric’s Enobio, Compumedic’s software, BrainVision’s sofware, ANT Neuro’s software and BrainProduct’s ActiChamp were the least common EEG collection software.
EEG Vendor
•Biosemi - 4 sites
•EGI - 9 sites
•Cognionics - 1 site
•Neuroelectrics - 1 site
•Compumedics - 1 site
•BrainVision - 2 sites
•ANT Neuro - 2 sites
•BrainProduct - 2 sites
Electrode Montage
•HCGSN - 9 sites
•10/20 - 4 sites
•20 channels - 1 site
•24 channels - 1 site
•32 channls - 6 sites
•64 channels - 2 sites
•96 channels - 1 site
•128 channels - 9 sites
Ground/Reference
•CMS/DRL - 5 sites
•Earlobes - 1 site
•Vertex/Cz - 12 sites
•FCz - 1 site
•Fz/Fpz - 2 sites
Collection Software
•Biosemi Active Two - 4 sites
•Cognionics Quick 2 0 - 1 site
•Net Station - 9 sites
•Enobio - 1 site
•Compumedics - 1 site
•mBrain Train - 1 site
•ActiChamp - 1 site
•ANT Neuro - 2 sites
Net/Cap Types
•Gel - 9 sites
•Saline - 9 sites
•Dry - 3 sites
Hardware Filters
•High pass (0.1 or 0.3 Hz) - 6 sites
•Unsure/Variable - 3 sites
•None - 4 sites
Sampling/Bit Rate
•250 Hz - 1 site
•500 or 512 Hz - 13 sites
•1000 or 1024 Hz - 7 sites
•2048 Hz - 1 site
System Timing Tests
•Regular - 9 sites
•Unknown/Irregular -11 sites
Portable System
•Yes - 8 sites
•No - 13 sites
Figure 3. EEG questionnaire results across the domains of interest. Note that some sites have more than one system and subsequently the total number of sites is not always equal across the different domains of interest.
EEG Net/Cap Type: The majority of Consortium sites reporting using either a gel or saline system with a few sites also reporting using a dry electrode system.
Sampling/Bit Rate: Most Consortium sites used a sampling/bit rate of 500 Hz (512 for Biosemi systems) or 1000 Hz (1024 for Biosemi systems). Only two sites used sampling/bit rates either below or above this range.
System Timing Tests: Around half of the Consortium sites reported conducting regular timing tests. The other half either did not report conducting timing tests or they reported conducting timing tests on irregular schedules (i.e., not monthly).
Portability: Slightly less than half of the Consortium sites reported having portable EEG systems.
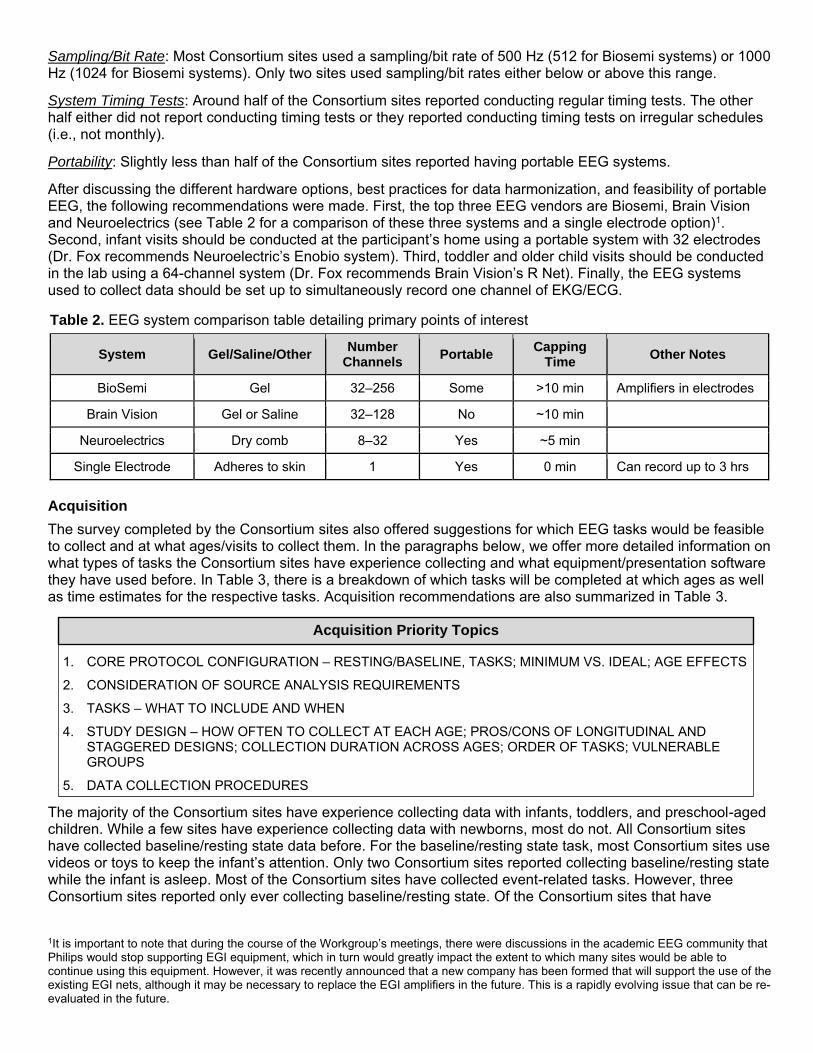
After discussing the different hardware options, best practices for data harmonization, and feasibility of portable EEG, the following recommendations were made. First, the top three EEG vendors are Biosemi, Brain Vision and Neuroelectrics (see Table 2 for a comparison of these three systems and a single electrode option)1. Second, infant visits should be conducted at the participant’s home using a portable system with 32 electrodes (Dr. Fox recommends Neuroelectric’s Enobio system). Third, toddler and older child visits should be conducted in the lab using a 64-channel system (Dr. Fox recommends Brain Vision’s R Net). Finally, the EEG systems used to collect data should be set up to simultaneously record one channel of EKG/ECG.
Table 2. EEG system comparison table detailing primary points of interest
System Gel/Saline/Other Number
Channels Portable
Capping Time
Other Notes
BioSemi Gel 32–256 Some >10 min Amplifiers in electrodes
Brain Vision Gel or Saline 32–128 No ~10 min
Neuroelectrics Dry comb 8–32 Yes ~5 min
Single Electrode Adheres to skin 1 Yes 0 min Can record up to 3 hrs
Acquisition
The survey completed by the Consortium sites also offered suggestions for which EEG tasks would be feasible to collect and at what ages/visits to collect them. In the paragraphs below, we offer more detailed information on what types of tasks the Consortium sites have experience collecting and what equipment/presentation software they have used before. In Table 3, there is a breakdown of which tasks will be completed at which ages as well as time estimates for the respective tasks. Acquisition recommendations are also summarized in Table 3.
Acquisition Priority Topics
1. CORE PROTOCOL CONFIGURATION – RESTING/BASELINE, TASKS; MINIMUM VS. IDEAL; AGE EFFECTS
2. CONSIDERATION OF SOURCE ANALYSIS REQUIREMENTS
3. TASKS – WHAT TO INCLUDE AND WHEN
4. STUDY DESIGN – HOW OFTEN TO COLLECT AT EACH AGE; PROS/CONS OF LONGITUDINAL AND STAGGERED DESIGNS; COLLECTION DURATION ACROSS AGES; ORDER OF TASKS; VULNERABLE GROUPS
5. DATA COLLECTION PROCEDURES
The majority of the Consortium sites have experience collecting data with infants, toddlers, and preschool-aged children. While a few sites have experience collecting data with newborns, most do not. All Consortium sites have collected baseline/resting state data before. For the baseline/resting state task, most Consortium sites use videos or toys to keep the infant’s attention. Only two Consortium sites reported collecting baseline/resting state while the infant is asleep. Most of the Consortium sites have collected event-related tasks. However, three Consortium sites reported only ever collecting baseline/resting state. Of the Consortium sites that have
1It is important to note that during the course of the Workgroup’s meetings, there were discussions in the academic EEG community that Philips would stop supporting EGI equipment, which in turn would greatly impact the extent to which many sites would be able to continue using this equipment. However, it was recently announced that a new company has been formed that will support the use of the existing EGI nets, although it may be necessary to replace the EGI amplifiers in the future. This is a rapidly evolving issue that can be re-evaluated in the future.
collected event-related tasks, most of them present both visual and auditory stimuli. Only a few Consortium sites reported conducting somatosensory tasks.
Slightly less than half of the Consortium sites have previously collected MRI data. Of these Consortium sites, most collect T1 and some also collect T2 and diffusion data. Furthermore, most of the Consortium sites that have collected MRI data have also conducted source analysis with their EEG data.
The three most used presentation software programs for event-related tasks are Eprime, Presentation, and PsychoPy/Python. Only one Consortium site did not report using any of these three programs to present data for event-related tasks. Most Consortium sites conducting auditory event-related tasks reported presenting auditory stimuli through speakers. Only two sites reported using either speakers or headphones to present auditory stimuli.
Even though eight Consortium sites reported having portable EEG systems, only five Consortium sites reported collecting some data in the home. All Consortium sites reported collecting at least some data in the lab. However, the majority of Consortium sites do not have an electrically shielded room and only half have a sound-attenuated room for EEG collection in the lab.
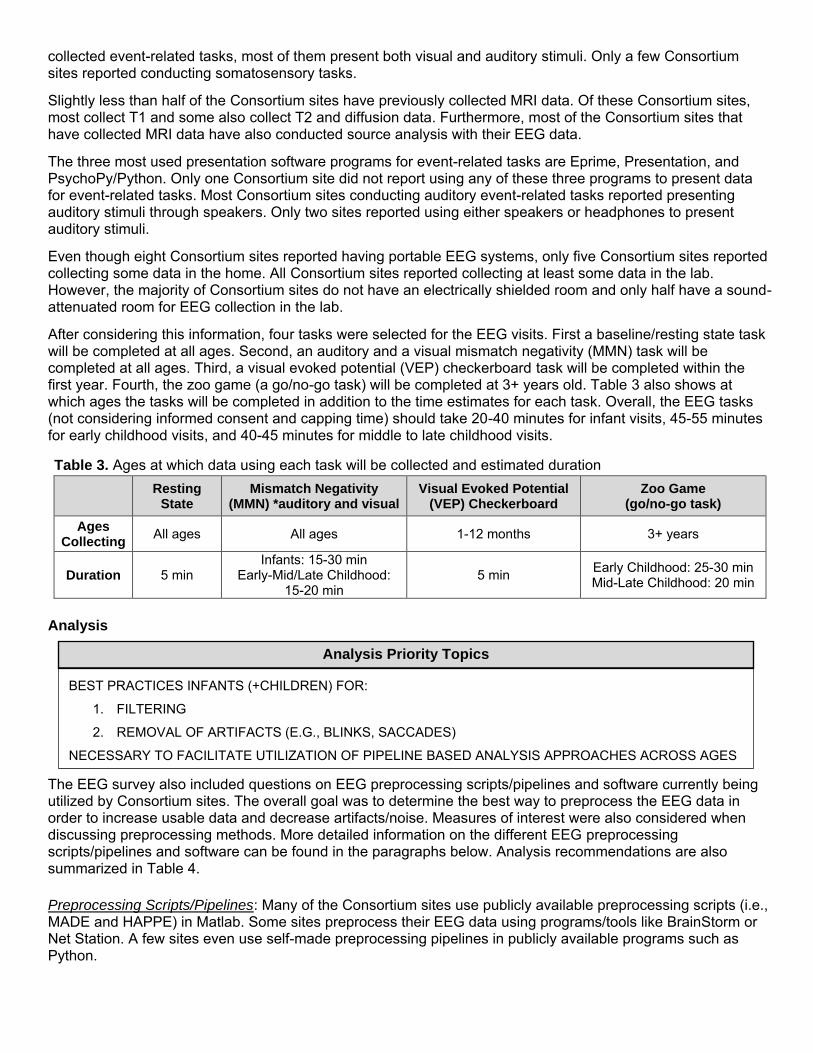
After considering this information, four tasks were selected for the EEG visits. First a baseline/resting state task will be completed at all ages. Second, an auditory and a visual mismatch negativity (MMN) task will be completed at all ages. Third, a visual evoked potential (VEP) checkerboard task will be completed within the first year. Fourth, the zoo game (a go/no-go task) will be completed at 3+ years old. Table 3 also shows at which ages the tasks will be completed in addition to the time estimates for each task. Overall, the EEG tasks (not considering informed consent and capping time) should take 20-40 minutes for infant visits, 45-55 minutes for early childhood visits, and 40-45 minutes for middle to late childhood visits.
Table 3. Ages at which data using each task will be collected and estimated duration
Resting State
Mismatch Negativity (MMN) *auditory and visual
Visual Evoked Potential (VEP) Checkerboard
Zoo Game (go/no-go task)
Ages Collecting
All ages All ages 1-12 months 3+ years
Duration 5 min Infants: 15-30 min
Early-Mid/Late Childhood: 15-20 min
5 min Early Childhood: 25-30 min Mid-Late Childhood: 20 min
Analysis
Analysis Priority Topics
BEST PRACTICES INFANTS (+CHILDREN) FOR:
1. FILTERING
2. REMOVAL OF ARTIFACTS (E.G., BLINKS, SACCADES)
NECESSARY TO FACILITATE UTILIZATION OF PIPELINE BASED ANALYSIS APPROACHES ACROSS AGES
The EEG survey also included questions on EEG preprocessing scripts/pipelines and software currently being utilized by Consortium sites. The overall goal was to determine the best way to preprocess the EEG data in order to increase usable data and decrease artifacts/noise. Measures of interest were also considered when discussing preprocessing methods. More detailed information on the different EEG preprocessing scripts/pipelines and software can be found in the paragraphs below. Analysis recommendations are also summarized in Table 4.
Preprocessing Scripts/Pipelines: Many of the Consortium sites use publicly available preprocessing scripts (i.e., MADE and HAPPE) in Matlab. Some sites preprocess their EEG data using programs/tools like BrainStorm or Net Station. A few sites even use self-made preprocessing pipelines in publicly available programs such as Python.
References
Preprocessing Software: Almost all Consortium sites have some experience with using Matlab to preprocess their data. Within Matlab, the most used toolboxes are EEGLab, FieldTrip, and ERPLab.
Because almost all Consortium sites have experience with Matlab, two preprocessing pipelines were recommended: MADE1 (with adjusted-ADJUST2) and HAPPE3. The MADE pipeline (with adjusted-ADJUST) can clean both resting state and event-related EEG data. The HAPPE pipeline, on the other hand, is only recommend for cleaning resting state EEG data (the 1 Hz high pass filter can alter some ERPs). As for EEG measures of interest, eight measures were proposed: ERP, time-frequency, inter trial phase coherence (ITPC), inter channel phase coherence (ICPS), spectral power, individualized alpha band analysis, non-linear measures (e.g., FOOOF), and graph theory based on network analysis (e.g., connectivity degree, clustering coefficient, path length, small world network).
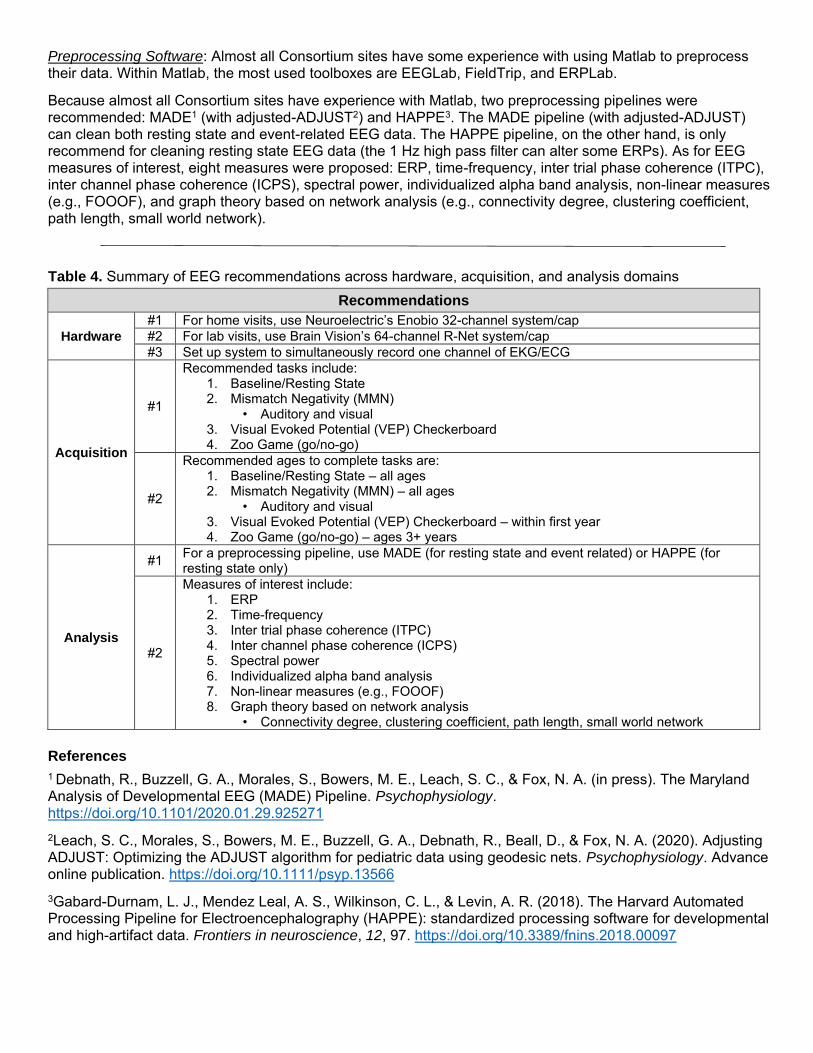
Table 4. Summary of EEG recommendations across hardware, acquisition, and analysis domains
Recommendations
Hardware
#1 For home visits, use Neuroelectric’s Enobio 32-channel system/cap
#2 For lab visits, use Brain Vision’s 64-channel R-Net system/cap
#3 Set up system to simultaneously record one channel of EKG/ECG
Acquisition
#1
Recommended tasks include: 1. Baseline/Resting State 2. Mismatch Negativity (MMN)
• Auditory and visual 3. Visual Evoked Potential (VEP) Checkerboard 4. Zoo Game (go/no-go)
#2
Recommended ages to complete tasks are: 1. Baseline/Resting State – all ages 2. Mismatch Negativity (MMN) – all ages
• Auditory and visual 3. Visual Evoked Potential (VEP) Checkerboard – within first year 4. Zoo Game (go/no-go) – ages 3+ years
Analysis
#1 For a preprocessing pipeline, use MADE (for resting state and event related) or HAPPE (for resting state only)
#2
Measures of interest include: 1. ERP 2. Time-frequency 3. Inter trial phase coherence (ITPC) 4. Inter channel phase coherence (ICPS) 5. Spectral power 6. Individualized alpha band analysis 7. Non-linear measures (e.g., FOOOF) 8. Graph theory based on network analysis
• Connectivity degree, clustering coefficient, path length, small world network
1 Debnath, R., Buzzell, G. A., Morales, S., Bowers, M. E., Leach, S. C., & Fox, N. A. (in press). The Maryland Analysis of Developmental EEG (MADE) Pipeline. Psychophysiology. https://doi.org/10.1101/2020.01.29.925271
2Leach, S. C., Morales, S., Bowers, M. E., Buzzell, G. A., Debnath, R., Beall, D., & Fox, N. A. (2020). Adjusting ADJUST: Optimizing the ADJUST algorithm for pediatric data using geodesic nets. Psychophysiology. Advance online publication. https://doi.org/10.1111/psyp.13566
3Gabard-Durnam, L. J., Mendez Leal, A. S., Wilkinson, C. L., & Levin, A. R. (2018). The Harvard Automated Processing Pipeline for Electroencephalography (HAPPE): standardized processing software for developmental and high-artifact data. Frontiers in neuroscience, 12, 97. https://doi.org/10.3389/fnins.2018.00097
NIRS Workgroup Final Report
The NIRS Workgroup was comprised of individuals from current hBCD sites that have expertise/capabilities within the fields of infant and child functional NIRS (fNIRS). The group included:
Charles A. Nelson, PhD (Chair) Harvard Medical School Susan Perlman (Co-Chair) Washington University in St. Louis Beth Smith University of Southern California Doug Dean University of Wisconsin Nathan Fox University of Maryland Andy Alexander University of Wisconsin Xin Zhou University of Wisconsin Chris Smyser also participated as Co-Chair of the hBCD Neuroimaging Working Group
NIH Representatives Michelle Freund Chloe Jordan
Overview
A NIRS group was formed and a questionnaire distributed to all sites receiving funding under the auspices of the R34. After surveying Phase I investigators who expressed interest in using fNIRS in hBCD, we assembled a working group to deliberate the pros and cons of using NIRS in this project. Susan Perlman (Washington University) and Charles Nelson (Harvard Medical School) led the working group as highly experienced NIRS investigators. Four other sites reported having the necessary NIRS equipment and seven investigators expressed interest in using NIRS in their Phase I or Phase II projects. The fNIRS group held one meeting with interested participants discussing issues of feasibility, hardware, acquisition, and analysis.
This report summarizes the fNIRS workgroup discussions for the hBCD project. The current report is delineated in the three main sections below: Hardware, Acquisition, and Analysis. Hardware focuses on the specific fNIRS equipment (e.g., fNIRS system, caps) across Consortium sites. Acquisition focuses on which tasks can and should be used for fNIRS visits and at which ages they will be collected. Finally, Analysis focuses on preprocessing pipelines/programs recommended to clean the fNIRS data after it has been collected. Further, it highlights the selected measures of interest.
Strengths of fNIRS
The first task of the working group was to examine fNIRS utility in hBCD. Below we summarize the key points on which a consensus was reached:
1) Similar to EEG, fNIRS has the ability to test infants while awake, behaving, and cognitively engaged. This provides the ability to test specific developmental constructs (e.g., executive function, language) during correlated behavior. In contrast, the most we can accomplish during natural sleep (when most MRI studies are performed) is to examine the connections in regions known to be associated with developmentally acquired skills and then correlating it with behavior taken from a laboratory assessment.
2) There is a lower subject burden with fNIRS than there is with MRI. Families can come for a NIRS scan in a comfortable lab setting at the time of their choice and not have to negotiate with scanner schedules or come in in the middle of the night while their baby is sleeping. This is a major burden for overburdened caregivers who may have other priorities than to participate in a research study. NIRS is also a quick setup and visits can be done in under an hour (rather than waiting for a baby to fall asleep). Families can also do NIRS in the comfort of the same laboratory where they are doing all their other assessments rather than having to move around to a different building that houses the MRI scanner.
3) Cost is low, so volume can be high. For example, we anticipate that the per-site cost of purchasing a NIRS system to be <$100,000, inclusive, with few if any recurring costs.
4) For longitudinal studies, data loss with NIRS will be lower than with MRI. As babies get older, it becomes more difficult to encourage them to sleep during an MRI scan, and each baby may lose at least one scan visit, costing money and leading to data loss. NIRS is more likely to retain all data (and if a baby fusses and you cannot get the data, then there is no major cost).
5) There is a growing literature using both EEG and NIRS that demonstrates the feasibility of examining neural synchrony (i.e., simultaneous recordings of both infant and caregiver).
6) Not all sites participating in hBCD will have access to a research dedicated MRI scanner, and the use of clinical scanners brings with it constraints on availability. By contrast, NIRS can be installed in any lab or office. This may be particularly important for remote sites that do not have MRI access, but have a unique population unavailable elsewhere (e.g., Native American, migrant worker)
7) Whereas EEG reflects the physiological activity of large populations of synchronously firing neurons, NIRS provides an index of the neural metabolism, similar to MRI. And, in contrast to EEG, fNIRS has good spatial resolution (so long as the question of interest is localizable to the cortical surface), particularly when the data are co-registered to an age-appropriate MRI template.
8) Training multiple sites/investigators can be easily accomplished, and there are currently several labs (notably Perlman’s and Nelson’s) that could establish such training programs. In a supplement available as needed, we have outlined what such a program might look like and the associated costs.
9) For hBCD to succeed we need to have a metric of brain function that can easily and with great success be obtained in the infancy period. Although most of the emphasis so far in hBCD has been on MRI, there are a number of limitations to MRI that must be acknowledged:
a. MRI is challenging to do in infancy and not all sites will have experience in scanning sleeping infants
b. Structural MRI will only tell us about structure and the only functional MRI metric that can be done in infancy is resting state
c. Not all sites will have the ability to scan infants (e.g., scan time might not be available at night, when it is easiest to scan infants; there may not be a research dedicated scanner and, thus, some sites might be reluctant to scan sleeping infants
d. Given that we will be studying complex families, how willing will such families be to come into a University or Hospital setting at night so their baby can be scanned? And, if this is the family’s first visit to hBCD, will they be disinclined to return for subsequent visits?
10) NIRS can be done on the families’ first visit to the laboratory during the day, which gives them a potentially easier first experience. If we want these families to return multiple times over the first years of life, their first scan experience should be a good one.
11) Given the challenges of doing MRI in the first few years of life, what if that is not successful? Does that not argue for having some other functional measure that has a high success rate?
Collectively, there is much to recommend NIRS as a modality to consider incorporating into hBCD. The one downside, of course, is that only a minority of Phase I sites have NIRS and, thus, there would be an initial outlay of funds dedicated to purchasing equipment and training investigators.
Hardware
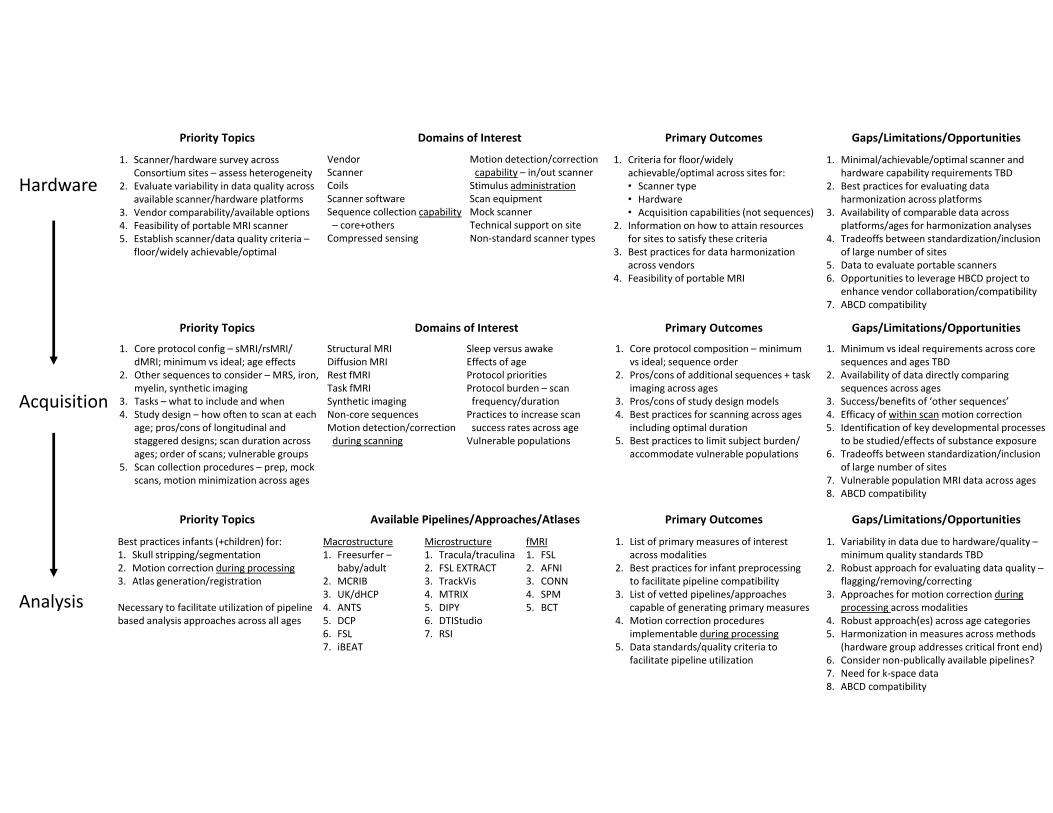
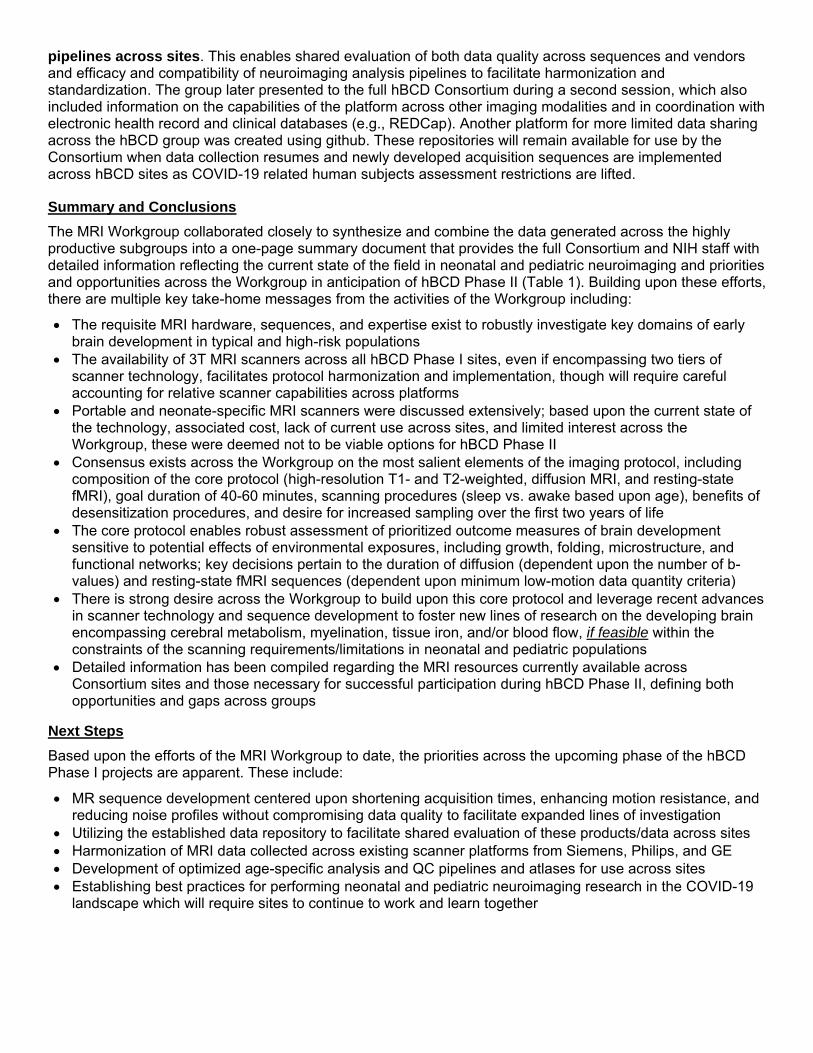
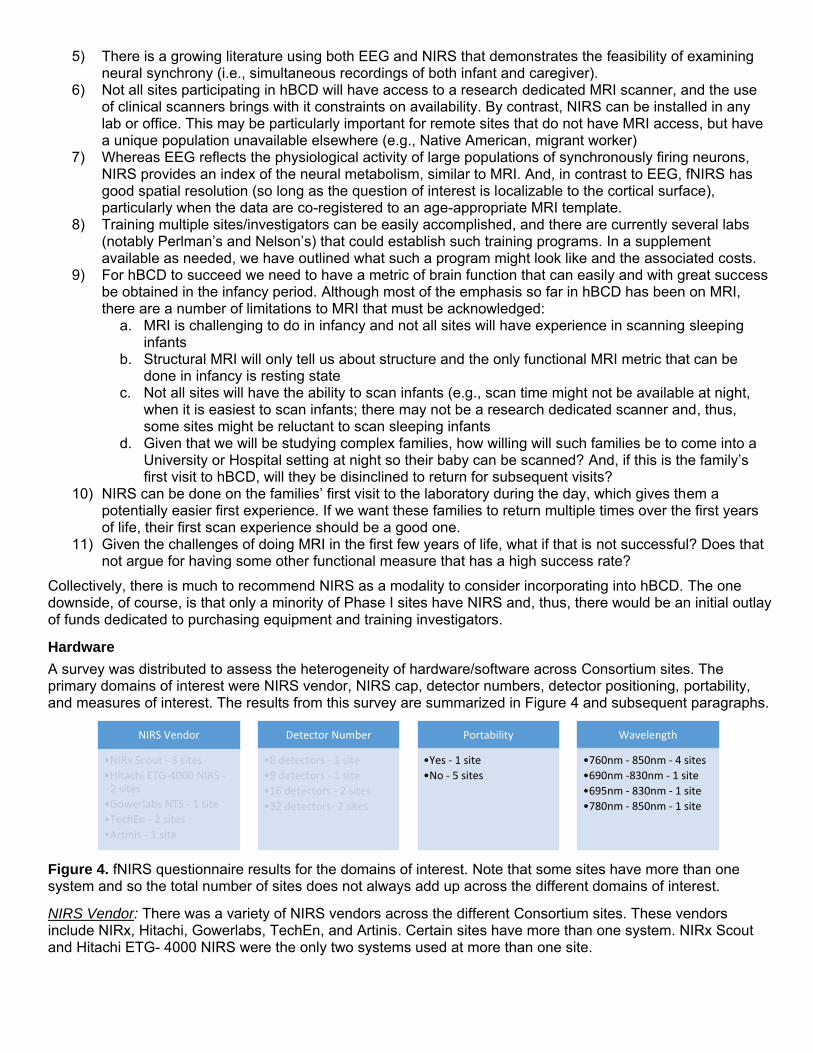
A survey was distributed to assess the heterogeneity of hardware/software across Consortium sites. The primary domains of interest were NIRS vendor, NIRS cap, detector numbers, detector positioning, portability, and measures of interest. The results from this survey are summarized in Figure 4 and subsequent paragraphs.
NIRS Vendor
•NIRx Scout - 3 sites
•Hitachi ETG-4000 NIRS -2 sites
•Gowerlabs NTS - 1 site
•TechEn - 2 sites
•Artinis - 1 site
Detector Number
•8 detectors - 1 site
•9 detectors - 1 site
•16 detectors - 2 sites
•32 detectors- 2 sites
Portability
•Yes - 1 site
•No - 5 sites
Wavelength
•760nm - 850nm - 4 sites
•690nm -830nm - 1 site
•695nm - 830nm - 1 site
•780nm - 850nm - 1 site
Figure 4. fNIRS questionnaire results for the domains of interest. Note that some sites have more than one system and so the total number of sites does not always add up across the different domains of interest.
NIRS Vendor: There was a variety of NIRS vendors across the different Consortium sites. These vendors include NIRx, Hitachi, Gowerlabs, TechEn, and Artinis. Certain sites have more than one system. NIRx Scout and Hitachi ETG- 4000 NIRS were the only two systems used at more than one site.
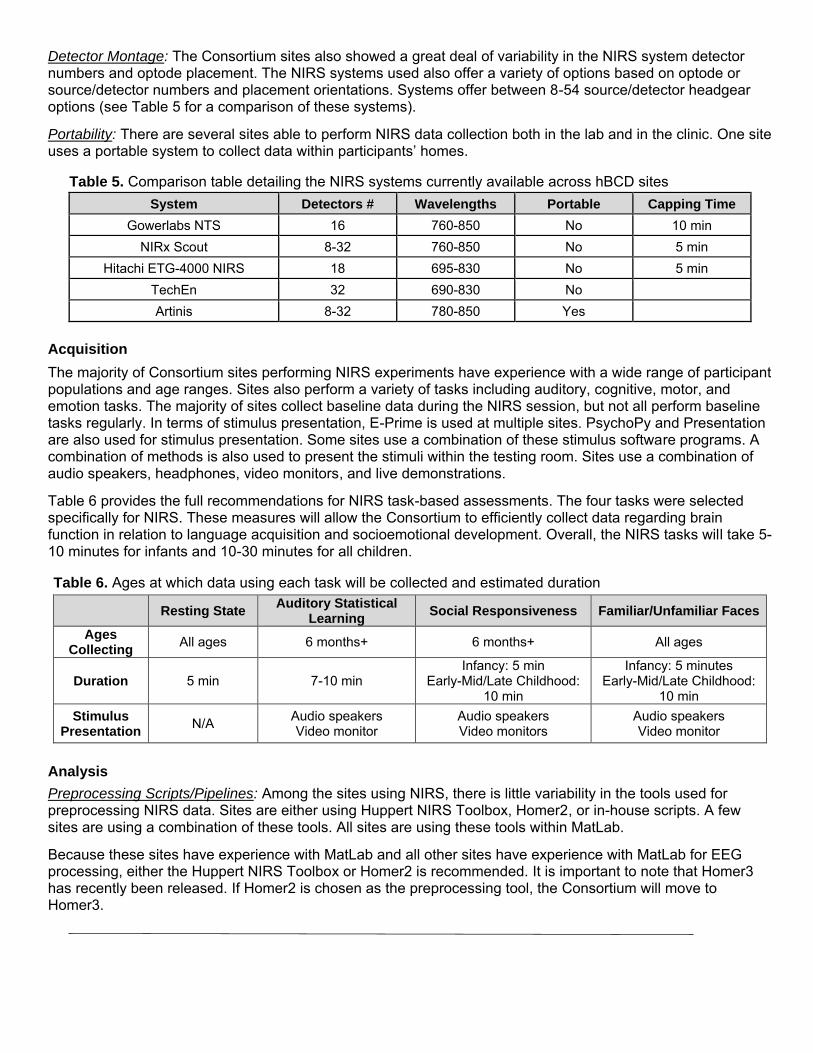
Detector Montage: The Consortium sites also showed a great deal of variability in the NIRS system detector numbers and optode placement. The NIRS systems used also offer a variety of options based on optode or source/detector numbers and placement orientations. Systems offer between 8-54 source/detector headgear options (see Table 5 for a comparison of these systems).
Portability: There are several sites able to perform NIRS data collection both in the lab and in the clinic. One site uses a portable system to collect data within participants’ homes.
Table 5. Comparison table detailing the NIRS systems currently available across hBCD sites
System Detectors # Wavelengths Portable Capping Time
Gowerlabs NTS 16 760-850 No 10 min
NIRx Scout 8-32 760-850 No 5 min
Hitachi ETG-4000 NIRS 18 695-830 No 5 min
TechEn 32 690-830 No
Artinis 8-32 780-850 Yes
Acquisition
The majority of Consortium sites performing NIRS experiments have experience with a wide range of participant populations and age ranges. Sites also perform a variety of tasks including auditory, cognitive, motor, and emotion tasks. The majority of sites collect baseline data during the NIRS session, but not all perform baseline tasks regularly. In terms of stimulus presentation, E-Prime is used at multiple sites. PsychoPy and Presentation are also used for stimulus presentation. Some sites use a combination of these stimulus software programs. A combination of methods is also used to present the stimuli within the testing room. Sites use a combination of audio speakers, headphones, video monitors, and live demonstrations.
Table 6 provides the full recommendations for NIRS task-based assessments. The four tasks were selected specifically for NIRS. These measures will allow the Consortium to efficiently collect data regarding brain function in relation to language acquisition and socioemotional development. Overall, the NIRS tasks will take 5-10 minutes for infants and 10-30 minutes for all children.
Table 6. Ages at which data using each task will be collected and estimated duration
Resting State Auditory Statistical
Learning Social Responsiveness Familiar/Unfamiliar Faces
Ages Collecting
All ages 6 months+ 6 months+ All ages
Duration 5 min 7-10 min Infancy: 5 min
Early-Mid/Late Childhood: 10 min
Infancy: 5 minutes Early-Mid/Late Childhood:
10 min
Stimulus Presentation
N/A Audio speakers Video monitor
Audio speakers Video monitors
Audio speakers Video monitor
Analysis
Preprocessing Scripts/Pipelines: Among the sites using NIRS, there is little variability in the tools used for preprocessing NIRS data. Sites are either using Huppert NIRS Toolbox, Homer2, or in-house scripts. A few sites are using a combination of these tools. All sites are using these tools within MatLab.
Because these sites have experience with MatLab and all other sites have experience with MatLab for EEG processing, either the Huppert NIRS Toolbox or Homer2 is recommended. It is important to note that Homer3 has recently been released. If Homer2 is chosen as the preprocessing tool, the Consortium will move to Homer3.
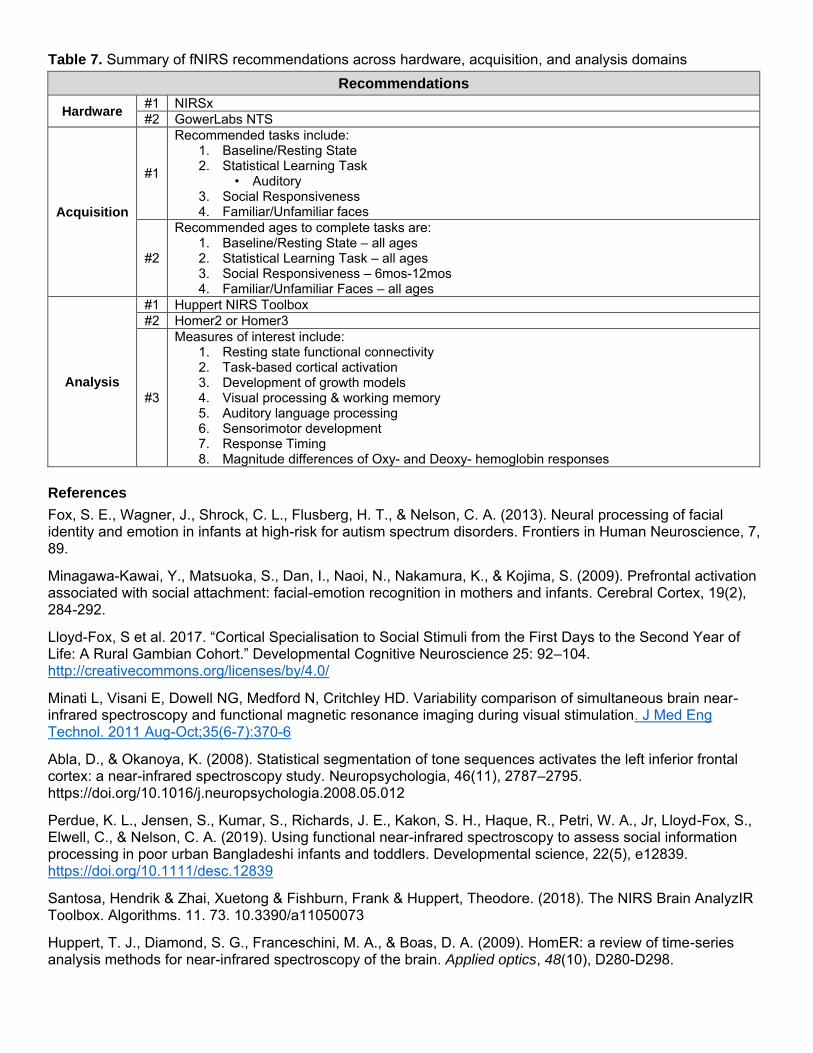
Table 7. Summary of fNIRS recommendations across hardware, acquisition, and analysis domains
Recommendations
Hardware #1 NIRSx
#2 GowerLabs NTS
Acquisition
#1
Recommended tasks include: 1. Baseline/Resting State 2. Statistical Learning Task
• Auditory 3. Social Responsiveness 4. Familiar/Unfamiliar faces
#2
Recommended ages to complete tasks are: 1. Baseline/Resting State – all ages 2. Statistical Learning Task – all ages 3. Social Responsiveness – 6mos-12mos 4. Familiar/Unfamiliar Faces – all ages
Analysis
#1 Huppert NIRS Toolbox
#2 Homer2 or Homer3
#3
Measures of interest include: 1. Resting state functional connectivity 2. Task-based cortical activation 3. Development of growth models 4. Visual processing & working memory 5. Auditory language processing 6. Sensorimotor development 7. Response Timing 8. Magnitude differences of Oxy- and Deoxy- hemoglobin responses
References
Fox, S. E., Wagner, J., Shrock, C. L., Flusberg, H. T., & Nelson, C. A. (2013). Neural processing of facial identity and emotion in infants at high-risk for autism spectrum disorders. Frontiers in Human Neuroscience, 7, 89.
Minagawa-Kawai, Y., Matsuoka, S., Dan, I., Naoi, N., Nakamura, K., & Kojima, S. (2009). Prefrontal activation associated with social attachment: facial-emotion recognition in mothers and infants. Cerebral Cortex, 19(2), 284-292.
Lloyd-Fox, S et al. 2017. “Cortical Specialisation to Social Stimuli from the First Days to the Second Year of Life: A Rural Gambian Cohort.” Developmental Cognitive Neuroscience 25: 92–104. http://creativecommons.org/licenses/by/4.0/
Minati L, Visani E, Dowell NG, Medford N, Critchley HD. Variability comparison of simultaneous brain near-infrared spectroscopy and functional magnetic resonance imaging during visual stimulation. J Med Eng Technol. 2011 Aug-Oct;35(6-7):370-6
Abla, D., & Okanoya, K. (2008). Statistical segmentation of tone sequences activates the left inferior frontal cortex: a near-infrared spectroscopy study. Neuropsychologia, 46(11), 2787–2795. https://doi.org/10.1016/j.neuropsychologia.2008.05.012
Perdue, K. L., Jensen, S., Kumar, S., Richards, J. E., Kakon, S. H., Haque, R., Petri, W. A., Jr, Lloyd-Fox, S., Elwell, C., & Nelson, C. A. (2019). Using functional near-infrared spectroscopy to assess social information processing in poor urban Bangladeshi infants and toddlers. Developmental science, 22(5), e12839. https://doi.org/10.1111/desc.12839
Santosa, Hendrik & Zhai, Xuetong & Fishburn, Frank & Huppert, Theodore. (2018). The NIRS Brain AnalyzIR Toolbox. Algorithms. 11. 73. 10.3390/a11050073
Huppert, T. J., Diamond, S. G., Franceschini, M. A., & Boas, D. A. (2009). HomER: a review of time-series analysis methods for near-infrared spectroscopy of the brain. Applied optics, 48(10), D280-D298.
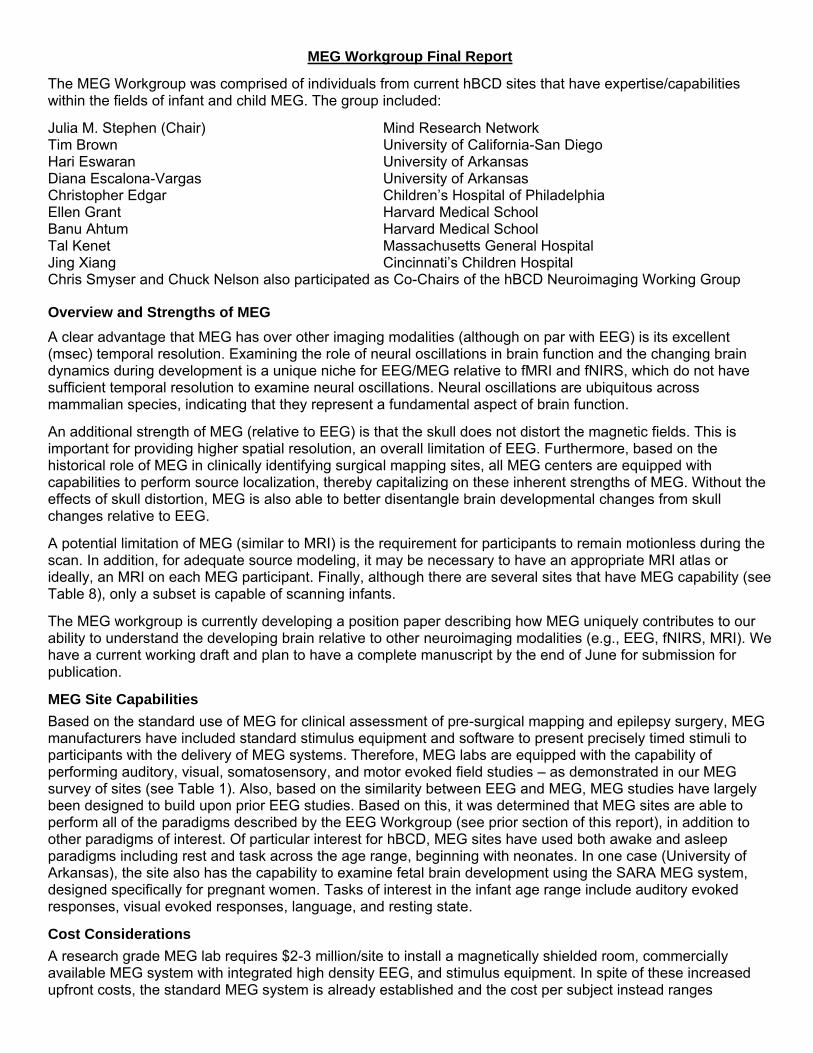
MEG Workgroup Final Report
The MEG Workgroup was comprised of individuals from current hBCD sites that have expertise/capabilities within the fields of infant and child MEG. The group included:
Julia M. Stephen (Chair) Tim Brown Hari Eswaran Diana Escalona-Vargas Christopher Edgar Ellen Grant Banu Ahtum Tal Kenet Jing Xiang
Mind Research Network University of California-San Diego University of Arkansas University of Arkansas Children’s Hospital of Philadelphia Harvard Medical School Harvard Medical School Massachusetts General Hospital Cincinnati’s Children Hospital
Chris Smyser and Chuck Nelson also participated as Co-Chairs of the hBCD Neuroimaging Working Group
Overview and Strengths of MEG
A clear advantage that MEG has over other imaging modalities (although on par with EEG) is its excellent (msec) temporal resolution. Examining the role of neural oscillations in brain function and the changing brain dynamics during development is a unique niche for EEG/MEG relative to fMRI and fNIRS, which do not have sufficient temporal resolution to examine neural oscillations. Neural oscillations are ubiquitous across mammalian species, indicating that they represent a fundamental aspect of brain function.
An additional strength of MEG (relative to EEG) is that the skull does not distort the magnetic fields. This is important for providing higher spatial resolution, an overall limitation of EEG. Furthermore, based on the historical role of MEG in clinically identifying surgical mapping sites, all MEG centers are equipped with capabilities to perform source localization, thereby capitalizing on these inherent strengths of MEG. Without the effects of skull distortion, MEG is also able to better disentangle brain developmental changes from skull changes relative to EEG.
A potential limitation of MEG (similar to MRI) is the requirement for participants to remain motionless during the scan. In addition, for adequate source modeling, it may be necessary to have an appropriate MRI atlas or ideally, an MRI on each MEG participant. Finally, although there are several sites that have MEG capability (see Table 8), only a subset is capable of scanning infants.
The MEG workgroup is currently developing a position paper describing how MEG uniquely contributes to our ability to understand the developing brain relative to other neuroimaging modalities (e.g., EEG, fNIRS, MRI). We have a current working draft and plan to have a complete manuscript by the end of June for submission for publication.
MEG Site Capabilities
Based on the standard use of MEG for clinical assessment of pre-surgical mapping and epilepsy surgery, MEG manufacturers have included standard stimulus equipment and software to present precisely timed stimuli to participants with the delivery of MEG systems. Therefore, MEG labs are equipped with the capability of performing auditory, visual, somatosensory, and motor evoked field studies – as demonstrated in our MEG survey of sites (see Table 1). Also, based on the similarity between EEG and MEG, MEG studies have largely been designed to build upon prior EEG studies. Based on this, it was determined that MEG sites are able to perform all of the paradigms described by the EEG Workgroup (see prior section of this report), in addition to other paradigms of interest. Of particular interest for hBCD, MEG sites have used both awake and asleep paradigms including rest and task across the age range, beginning with neonates. In one case (University of Arkansas), the site also has the capability to examine fetal brain development using the SARA MEG system, designed specifically for pregnant women. Tasks of interest in the infant age range include auditory evoked responses, visual evoked responses, language, and resting state.
Cost Considerations
A research grade MEG lab requires $2-3 million/site to install a magnetically shielded room, commercially available MEG system with integrated high density EEG, and stimulus equipment. In spite of these increased upfront costs, the standard MEG system is already established and the cost per subject instead ranges
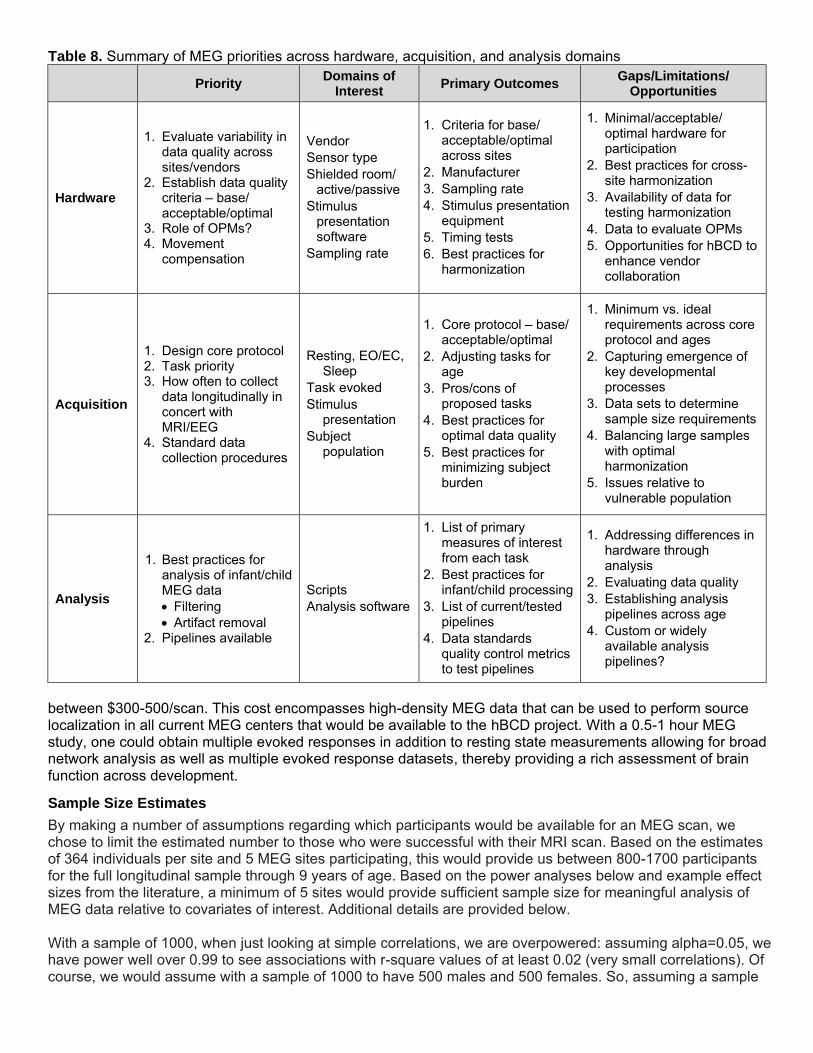
Table 8. Summary of MEG priorities across hardware, acquisition, and analysis domains
Priority Domains of
Interest Primary Outcomes
Gaps/Limitations/ Opportunities
Hardware
1. Evaluate variability in data quality across sites/vendors
2. Establish data quality criteria – base/ acceptable/optimal
3. Role of OPMs? 4. Movement
compensation
Vendor
Sensor type
Shielded room/ active/passive
Stimulus presentation software
Sampling rate
1. Criteria for base/ acceptable/optimal across sites
2. Manufacturer
3. Sampling rate
4. Stimulus presentation equipment
5. Timing tests
6. Best practices for harmonization
1. Minimal/acceptable/ optimal hardware for participation
2. Best practices for cross-site harmonization
3. Availability of data for testing harmonization
4. Data to evaluate OPMs
5. Opportunities for hBCD to enhance vendor collaboration
Acquisition
1. Design core protocol 2. Task priority 3. How often to collect
data longitudinally in concert with MRI/EEG
Resting, EO/EC, Sleep
Task evoked
Stimulus presentation
1. Core protocol – base/ acceptable/optimal
2. Adjusting tasks for age
3. Pros/cons of proposed tasks
4. Best practices for
1. Minimum vs. ideal requirements across core protocol and ages
2. Capturing emergence of key developmental processes
3. Data sets to determine sample size requirements
4. Standard data collection procedures
Subject population
optimal data quality
5. Best practices for minimizing subject burden
4. Balancing large samples with optimal harmonization
5. Issues relative to vulnerable population
Analysis
1. Best practices for analysis of infant/child MEG data
Filtering
Artifact removal 2. Pipelines available
Scripts
Analysis software
1. List of primary measures of interest from each task
2. Best practices for infant/child processing
3. List of current/tested pipelines
4. Data standards quality control metrics to test pipelines
1. Addressing differences in hardware through analysis
2. Evaluating data quality
3. Establishing analysis pipelines across age
4. Custom or widely available analysis pipelines?
between $300-500/scan. This cost encompasses high-density MEG data that can be used to perform source localization in all current MEG centers that would be available to the hBCD project. With a 0.5-1 hour MEG study, one could obtain multiple evoked responses in addition to resting state measurements allowing for broad network analysis as well as multiple evoked response datasets, thereby providing a rich assessment of brain function across development.
Sample Size Estimates
By making a number of assumptions regarding which participants would be available for an MEG scan, we chose to limit the estimated number to those who were successful with their MRI scan. Based on the estimates of 364 individuals per site and 5 MEG sites participating, this would provide us between 800-1700 participants for the full longitudinal sample through 9 years of age. Based on the power analyses below and example effect sizes from the literature, a minimum of 5 sites would provide sufficient sample size for meaningful analysis of MEG data relative to covariates of interest. Additional details are provided below.
With a sample of 1000, when just looking at simple correlations, we are overpowered: assuming alpha=0.05, we have power well over 0.99 to see associations with r-square values of at least 0.02 (very small correlations). Of course, we would assume with a sample of 1000 to have 500 males and 500 females. So, assuming a sample
of 500, we still have power greater than 0.80 to see associations with r-square values of at least 0.02. Assuming for some analyses we would further subdivide the groups, with a sample of 250 we can still see associations with r-square values of at least 0.03 and power >0.80. So, regarding simple correlations, we are more than sufficiently powered to see any brain function and structure associations of interest.
With respect to statistically assessing group differences in correlation values, using another online calculator, a sample of 500 per group (e.g., males versus females) provides sufficient power to examine group correlation differences as small as 0.10 (so r=.15 versus r=.25). That's with a sample of 1000. Assuming a sample of 2000, we will be sufficiently powered to do other analyses to examine the effects of different rearing variables (and a sample of 2000 would also allow more missing data).
Current MEG results suggest that correlations between MEG data and behavioral measures are considerably higher than the minimum correlation required for the sample size (e.g., Bolanos et al. 2017, Matsuzaki et al. 2019, Dymond et al. 2014, Sanjuan et al. 2016).
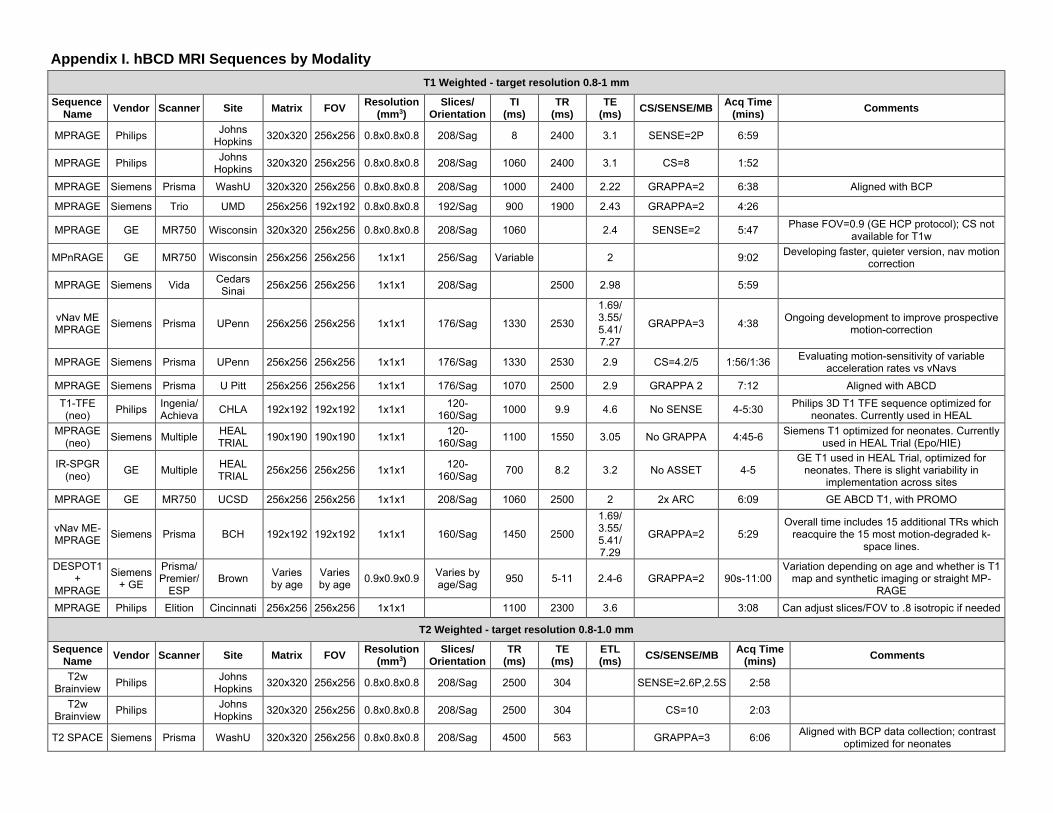
Appendix I. hBCD MRI Sequences by Modality
T1 Weighted - target resolution 0.8-1 mm
Sequence Name
Vendor Scanner Site Matrix FOV Resolution
(mm3) Slices/
Orientation TI
(ms) TR
(ms) TE
(ms) CS/SENSE/MB
Acq Time (mins)
Comments
MPRAGE Philips Johns
Hopkins 320x320 256x256 0.8x0.8x0.8 208/Sag 8 2400 3.1 SENSE=2P 6:59
MPRAGE Philips Johns
Hopkins 320x320 256x256 0.8x0.8x0.8 208/Sag 1060 2400 3.1 CS=8 1:52
MPRAGE Siemens Prisma WashU 320x320 256x256 0.8x0.8x0.8 208/Sag 1000 2400 2.22 GRAPPA=2 6:38 Aligned with BCP
MPRAGE Siemens Trio UMD 256x256 192x192 0.8x0.8x0.8 192/Sag 900 1900 2.43 GRAPPA=2 4:26
MPRAGE GE MR750 Wisconsin 320x320 256x256 0.8x0.8x0.8 208/Sag 1060 2.4 SENSE=2 5:47 Phase FOV=0.9 (GE HCP protocol); CS not
available for T1w
MPnRAGE GE MR750 Wisconsin 256x256 256x256 1x1x1 256/Sag Variable 2 9:02 Developing faster, quieter version, nav motion
correction
MPRAGE Siemens Vida Cedars Sinai
256x256 256x256 1x1x1 208/Sag 2500 2.98 5:59
vNav ME MPRAGE
Siemens Prisma UPenn 256x256 256x256 1x1x1 176/Sag 1330 2530
1.69/ 3.55/ 5.41/ 7.27
GRAPPA=3 4:38 Ongoing development to improve prospective
motion-correction
MPRAGE Siemens Prisma UPenn 256x256 256x256 1x1x1 176/Sag 1330 2530 2.9 CS=4.2/5 1:56/1:36 Evaluating motion-sensitivity of variable
acceleration rates vs vNavs
MPRAGE Siemens Prisma U Pitt 256x256 256x256 1x1x1 176/Sag 1070 2500 2.9 GRAPPA 2 7:12 Aligned with ABCD
T1-TFE (neo)
Philips Ingenia/ Achieva
CHLA 192x192 192x192 1x1x1 120-
160/Sag 1000 9.9 4.6 No SENSE 4-5:30
Philips 3D T1 TFE sequence optimized for neonates. Currently used in HEAL
MPRAGE (neo)
Siemens Multiple HEAL TRIAL
190x190 190x190 1x1x1 120-
160/Sag 1100 1550 3.05 No GRAPPA 4:45-6
Siemens T1 optimized for neonates. Currently used in HEAL Trial (Epo/HIE)
IR-SPGR (neo)
GE Multiple HEAL TRIAL
256x256 256x256 1x1x1 120-
160/Sag 700 8.2 3.2 No ASSET 4-5
GE T1 used in HEAL Trial, optimized for neonates. There is slight variability in
implementation across sites
MPRAGE GE MR750 UCSD 256x256 256x256 1x1x1 208/Sag 1060 2500 2 2x ARC 6:09 GE ABCD T1, with PROMO
vNav ME-MPRAGE
Siemens Prisma BCH 192x192 192x192 1x1x1 160/Sag 1450 2500
1.69/ 3.55/ 5.41/ 7.29
GRAPPA=2 5:29 Overall time includes 15 additional TRs which
reacquire the 15 most motion-degraded k-space lines.
DESPOT1 +
MPRAGE
Siemens + GE
Prisma/ Premier/
ESP Brown
Varies by age
Varies by age
0.9x0.9x0.9 Varies by age/Sag
950 5-11 2.4-6 GRAPPA=2 90s-11:00 Variation depending on age and whether is T1
map and synthetic imaging or straight MP-RAGE
MPRAGE Philips Elition Cincinnati 256x256 256x256 1x1x1 1100 2300 3.6 3:08 Can adjust slices/FOV to .8 isotropic if needed
T2 Weighted - target resolution 0.8-1.0 mm
Sequence Name
Vendor Scanner Site Matrix FOV Resolution
(mm3) Slices/
Orientation TR
(ms) TE
(ms) ETL (ms)
CS/SENSE/MB Acq Time
(mins) Comments
T2w Brainview
Philips Johns
Hopkins 320x320 256x256 0.8x0.8x0.8 208/Sag 2500 304 SENSE=2.6P,2.5S 2:58
T2w Brainview
Philips Johns
Hopkins 320x320 256x256 0.8x0.8x0.8 208/Sag 2500 304 CS=10 2:03
T2 SPACE Siemens Prisma WashU 320x320 256x256 0.8x0.8x0.8 208/Sag 4500 563 GRAPPA=3 6:06 Aligned with BCP data collection; contrast
optimized for neonates
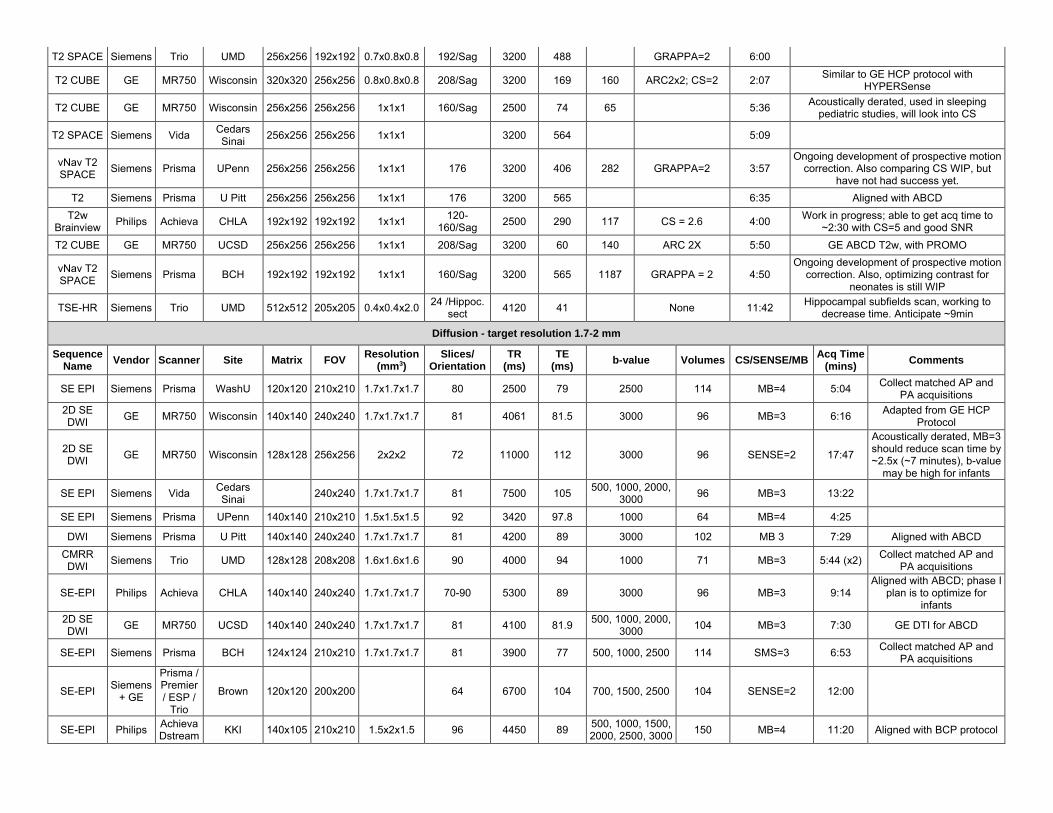
T2 SPACE Siemens Trio UMD 256x256 192x192 0.7x0.8x0.8 192/Sag 3200 488 GRAPPA=2 6:00
T2 CUBE GE MR750 Wisconsin 320x320 256x256 0.8x0.8x0.8 208/Sag 3200 169 160 ARC2x2; CS=2 2:07 Similar to GE HCP protocol with
HYPERSense
T2 CUBE GE MR750 Wisconsin 256x256 256x256 1x1x1 160/Sag 2500 74 65 5:36 Acoustically derated, used in sleeping
pediatric studies, will look into CS
T2 SPACE Siemens Vida Cedars Sinai
256x256 256x256 1x1x1 3200 564 5:09
vNav T2 SPACE
Siemens Prisma UPenn 256x256 256x256 1x1x1 176 3200 406 282 GRAPPA=2 3:57 Ongoing development of prospective motion
correction. Also comparing CS WIP, but have not had success yet.
T2 Siemens Prisma U Pitt 256x256 256x256 1x1x1 176 3200 565 6:35 Aligned with ABCD
T2w Brainview
Philips Achieva CHLA 192x192 192x192 1x1x1 120-
160/Sag 2500 290 117 CS = 2.6 4:00
Work in progress; able to get acq time to ~2:30 with CS=5 and good SNR
T2 CUBE GE MR750 UCSD 256x256 256x256 1x1x1 208/Sag 3200 60 140 ARC 2X 5:50 GE ABCD T2w, with PROMO
vNav T2 SPACE
Siemens Prisma BCH 192x192 192x192 1x1x1 160/Sag 3200 565 1187 GRAPPA = 2 4:50 Ongoing development of prospective motion
correction. Also, optimizing contrast for neonates is still WIP
TSE-HR Siemens Trio UMD 512x512 205x205 0.4x0.4x2.0 24 /Hippoc.
sect 4120 41 None 11:42
Hippocampal subfields scan, working to decrease time. Anticipate ~9min
Diffusion - target resolution 1.7-2 mm
Sequence Name
Vendor Scanner Site Matrix FOV Resolution
(mm3) Slices/
Orientation TR
(ms) TE
(ms) b-value Volumes CS/SENSE/MB
Acq Time (mins)
Comments
SE EPI Siemens Prisma WashU 120x120 210x210 1.7x1.7x1.7 80 2500 79 2500 114 MB=4 5:04 Collect matched AP and
PA acquisitions
2D SE DWI
GE MR750 Wisconsin 140x140 240x240 1.7x1.7x1.7 81 4061 81.5 3000 96 MB=3 6:16 Adapted from GE HCP
Protocol
2D SE DWI
GE MR750 Wisconsin 128x128 256x256 2x2x2 72 11000 112 3000 96 SENSE=2 17:47
Acoustically derated, MB=3 should reduce scan time by ~2.5x (~7 minutes), b-value
may be high for infants
SE EPI Siemens Vida Cedars Sinai
240x240 1.7x1.7x1.7 81 7500 105 500, 1000, 2000,
3000 96 MB=3 13:22
SE EPI Siemens Prisma UPenn 140x140 210x210 1.5x1.5x1.5 92 3420 97.8 1000 64 MB=4 4:25
DWI Siemens Prisma U Pitt 140x140 240x240 1.7x1.7x1.7 81 4200 89 3000 102 MB 3 7:29 Aligned with ABCD
CMRR DWI
Siemens Trio UMD 128x128 208x208 1.6x1.6x1.6 90 4000 94 1000 71 MB=3 5:44 (x2) Collect matched AP and
PA acquisitions
SE-EPI Philips Achieva CHLA 140x140 240x240 1.7x1.7x1.7 70-90 5300 89 3000 96 MB=3 9:14 Aligned with ABCD; phase I
plan is to optimize for infants
2D SE DWI
GE MR750 UCSD 140x140 240x240 1.7x1.7x1.7 81 4100 81.9 500, 1000, 2000,
3000 104 MB=3 7:30 GE DTI for ABCD
SE-EPI Siemens Prisma BCH 124x124 210x210 1.7x1.7x1.7 81 3900 77 500, 1000, 2500 114 SMS=3 6:53 Collect matched AP and
PA acquisitions
SE-EPI Siemens
+ GE
Prisma / Premier / ESP /
Trio
Brown 120x120 200x200 64 6700 104 700, 1500, 2500 104 SENSE=2 12:00
SE-EPI Philips Achieva Dstream
KKI 140x105 210x210 1.5x2x1.5 96 4450 89 500, 1000, 1500, 2000, 2500, 3000
150 MB=4 11:20 Aligned with BCP protocol
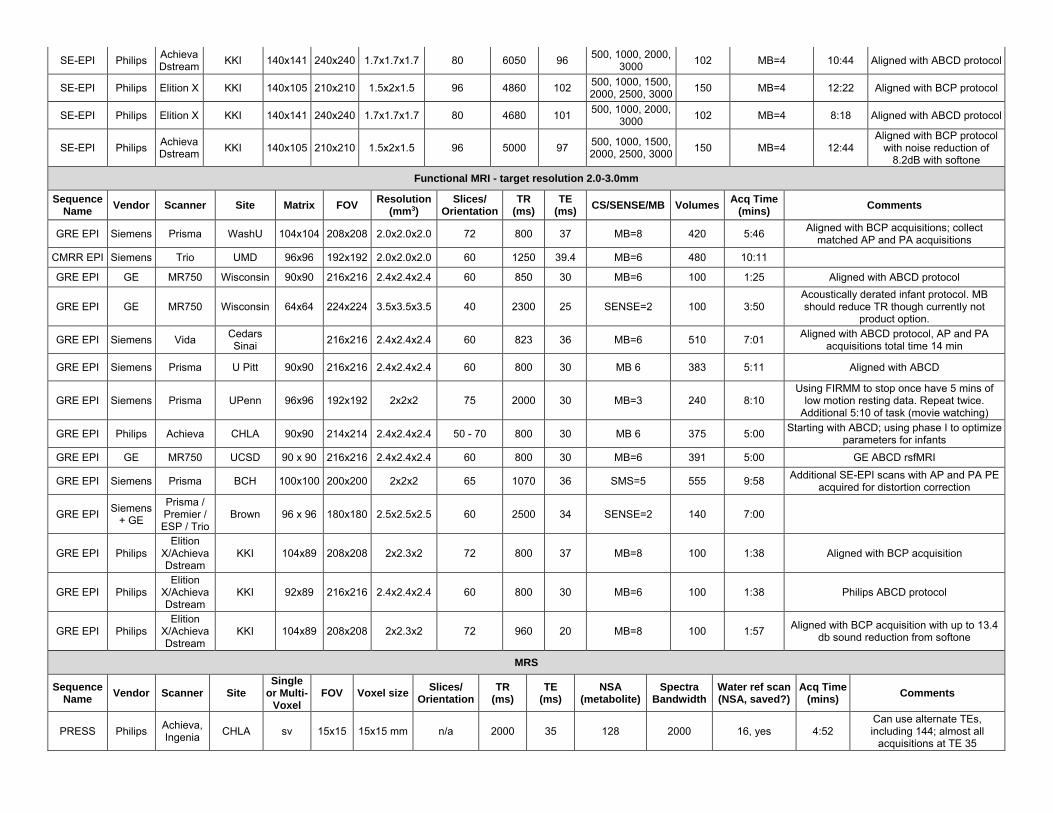
SE-EPI Philips Achieva Dstream
KKI 140x141 240x240 1.7x1.7x1.7 80 6050 96 500, 1000, 2000,
3000 102 MB=4 10:44 Aligned with ABCD protocol
SE-EPI Philips Elition X KKI 140x105 210x210 1.5x2x1.5 96 4860 102 500, 1000, 1500, 2000, 2500, 3000
150 MB=4 12:22 Aligned with BCP protocol
SE-EPI Philips Elition X KKI 140x141 240x240 1.7x1.7x1.7 80 4680 101 500, 1000, 2000,
3000 102 MB=4 8:18 Aligned with ABCD protocol
SE-EPI Philips Achieva Dstream
KKI 140x105 210x210 1.5x2x1.5 96 5000 97 500, 1000, 1500, 2000, 2500, 3000
150 MB=4 12:44 Aligned with BCP protocol
with noise reduction of 8.2dB with softone
Functional MRI - target resolution 2.0-3.0mm
Sequence Name
Vendor Scanner Site Matrix FOV Resolution
(mm3) Slices/
Orientation TR
(ms) TE
(ms) CS/SENSE/MB Volumes
Acq Time (mins)
Comments
GRE EPI Siemens Prisma WashU 104x104 208x208 2.0x2.0x2.0 72 800 37 MB=8 420 5:46 Aligned with BCP acquisitions; collect
matched AP and PA acquisitions
CMRR EPI Siemens Trio UMD 96x96 192x192 2.0x2.0x2.0 60 1250 39.4 MB=6 480 10:11
GRE EPI GE MR750 Wisconsin 90x90 216x216 2.4x2.4x2.4 60 850 30 MB=6 100 1:25 Aligned with ABCD protocol
GRE EPI GE MR750 Wisconsin 64x64 224x224 3.5x3.5x3.5 40 2300 25 SENSE=2 100 3:50 Acoustically derated infant protocol. MB should reduce TR though currently not
product option.
GRE EPI Siemens Vida Cedars Sinai
216x216 2.4x2.4x2.4 60 823 36 MB=6 510 7:01 Aligned with ABCD protocol, AP and PA
acquisitions total time 14 min
GRE EPI Siemens Prisma U Pitt 90x90 216x216 2.4x2.4x2.4 60 800 30 MB 6 383 5:11 Aligned with ABCD
GRE EPI Siemens Prisma UPenn 96x96 192x192 2x2x2 75 2000 30 MB=3 240 8:10 Using FIRMM to stop once have 5 mins of
low motion resting data. Repeat twice. Additional 5:10 of task (movie watching)
GRE EPI Philips Achieva CHLA 90x90 214x214 2.4x2.4x2.4 50 - 70 800 30 MB 6 375 5:00 Starting with ABCD; using phase I to optimize
parameters for infants
GRE EPI GE MR750 UCSD 90 x 90 216x216 2.4x2.4x2.4 60 800 30 MB=6 391 5:00 GE ABCD rsfMRI
GRE EPI Siemens Prisma BCH 100x100 200x200 2x2x2 65 1070 36 SMS=5 555 9:58 Additional SE-EPI scans with AP and PA PE
acquired for distortion correction
GRE EPI Siemens
+ GE
Prisma / Premier / ESP / Trio
Brown 96 x 96 180x180 2.5x2.5x2.5 60 2500 34 SENSE=2 140 7:00
GRE EPI Philips Elition
X/Achieva Dstream
KKI 104x89 208x208 2x2.3x2 72 800 37 MB=8 100 1:38 Aligned with BCP acquisition
GRE EPI Philips Elition
X/Achieva Dstream
KKI 92x89 216x216 2.4x2.4x2.4 60 800 30 MB=6 100 1:38 Philips ABCD protocol
GRE EPI Philips Elition
X/Achieva Dstream
KKI 104x89 208x208 2x2.3x2 72 960 20 MB=8 100 1:57 Aligned with BCP acquisition with up to 13.4
db sound reduction from softone
MRS
Sequence Name
Vendor Scanner Site Single
or Multi-Voxel
FOV Voxel size Slices/
Orientation TR
(ms) TE
(ms) NSA
(metabolite) Spectra
Bandwidth Water ref scan (NSA, saved?)
Acq Time (mins)
Comments
PRESS Philips Achieva, Ingenia
CHLA sv 15x15 15x15 mm n/a 2000 35 128 2000 16, yes 4:52 Can use alternate TEs, including 144; almost all
acquisitions at TE 35
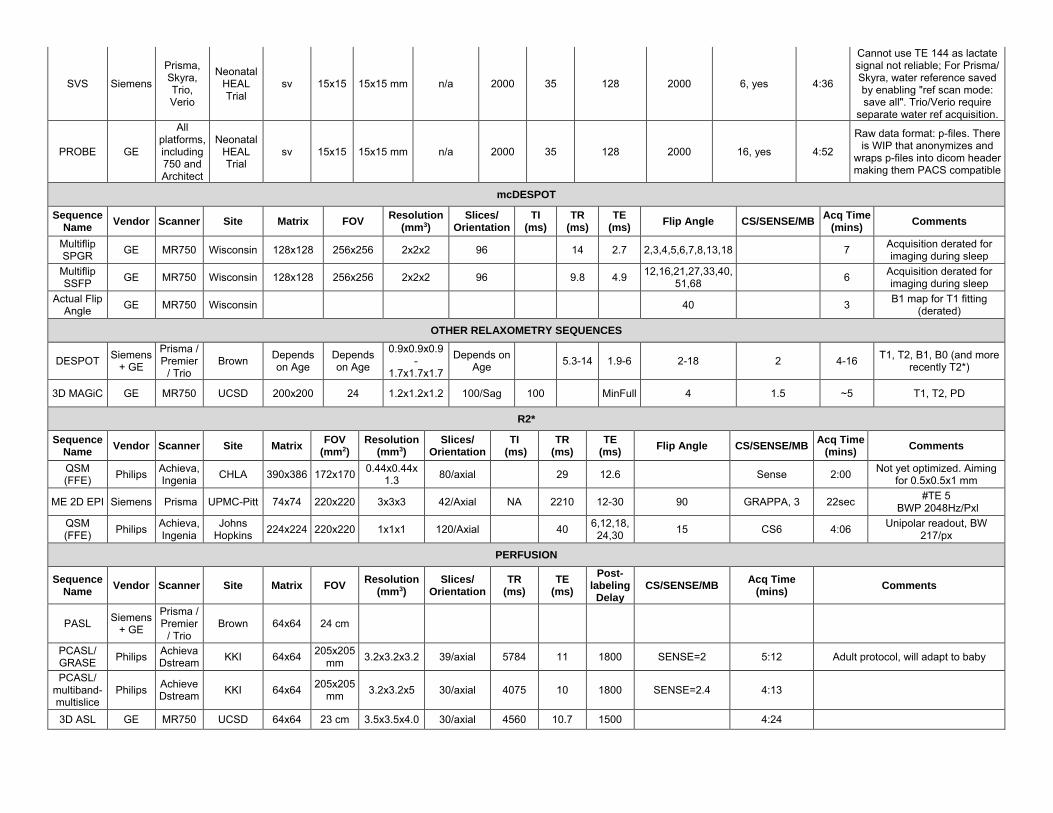
SVS Siemens
Prisma, Neonatal
Skyra, HEAL
Trio, Trial
Verio
sv 15x15 15x15 mm n/a 2000 35 128
Cannot use TE 144 as lactate signal not reliable; For Prisma/ Skyra, water reference saved
2000 6, yes 4:36 by enabling "ref scan mode: save all". Trio/Verio require
separate water ref acquisition.
PROBE GE
All platforms, Neonatal including HEAL 750 and Trial Architect
sv 15x15 15x15 mm n/a 2000 35 128
Raw data format: p-files. There is WIP that anonymizes and
2000 16, yes 4:52 wraps p-files into dicom header making them PACS compatible
mcDESPOT
Sequence Name
Vendor Scanner Site Matrix FOV Resolution
(mm3) Slices/
Orientation TI
(ms) TR
(ms) TE
(ms) Flip Angle CS/SENSE/MB
Acq Time (mins)
Comments
Multiflip SPGR
GE MR750 Wisconsin 128x128 256x256 2x2x2 96 14 2.7 2,3,4,5,6,7,8,13,18 7 Acquisition derated for imaging during sleep
Multiflip SSFP
GE MR750 Wisconsin 128x128 256x256 2x2x2 96 9.8 4.9 12,16,21,27,33,40,
51,68 6
Acquisition derated for imaging during sleep
Actual Flip Angle
GE MR750 Wisconsin 40 3 B1 map for T1 fitting
(derated)
OTHER RELAXOMETRY SEQUENCES
DESPOT Siemens
+ GE
Prisma / Premier
/ Trio Brown
Depends on Age
Depends on Age
0.9x0.9x0.9 -
1.7x1.7x1.7
Depends on Age
5.3-14 1.9-6 2-18 2 4-16 T1, T2, B1, B0 (and more
recently T2*)
3D MAGiC GE MR750 UCSD 200x200 24 1.2x1.2x1.2 100/Sag 100 MinFull 4 1.5 ~5 T1, T2, PD
R2*
Sequence Name
Vendor Scanner Site Matrix FOV
(mm 2) Resolution
(mm3) Slices/
Orientation TI
(ms) TR
(ms) TE
(ms) Flip Angle CS/SENSE/MB
Acq Time (mins)
Comments
QSM (FFE)
Philips Achieva, Ingenia
CHLA 390x386 172x170 0.44x0.44x
1.3 80/axial 29 12.6 Sense 2:00
Not yet optimized. Aiming for 0.5x0.5x1 mm
ME 2D EPI Siemens Prisma UPMC-Pitt 74x74 220x220 3x3x3 42/Axial NA 2210 12-30 90 GRAPPA, 3 22sec #TE 5
BWP 2048Hz/Pxl
QSM (FFE)
Philips Achieva, Ingenia
Johns Hopkins
224x224 220x220 1x1x1 120/Axial 40 6,12,18,
24,30 15 CS6 4:06
Unipolar readout, BW 217/px
PERFUSION
Sequence Name
Vendor Scanner Site Matrix FOV Resolution
(mm3) Slices/
Orientation TR
(ms) TE
(ms)
Post-labeling
Delay CS/SENSE/MB
Acq Time (mins)
Comments
PASL Siemens
+ GE
Prisma / Premier
/ Trio Brown 64x64 24 cm
PCASL/ GRASE
Philips Achieva Dstream
KKI 64x64 205x205
mm 3.2x3.2x3.2 39/axial 5784 11 1800 SENSE=2 5:12 Adult protocol, will adapt to baby
PCASL/ multiband-multislice
Philips Achieve Dstream
KKI 64x64 205x205
mm 3.2x3.2x5 30/axial 4075 10 1800 SENSE=2.4 4:13
3D ASL GE MR750 UCSD 64x64 23 cm 3.5x3.5x4.0 30/axial 4560 10.7 1500 4:24
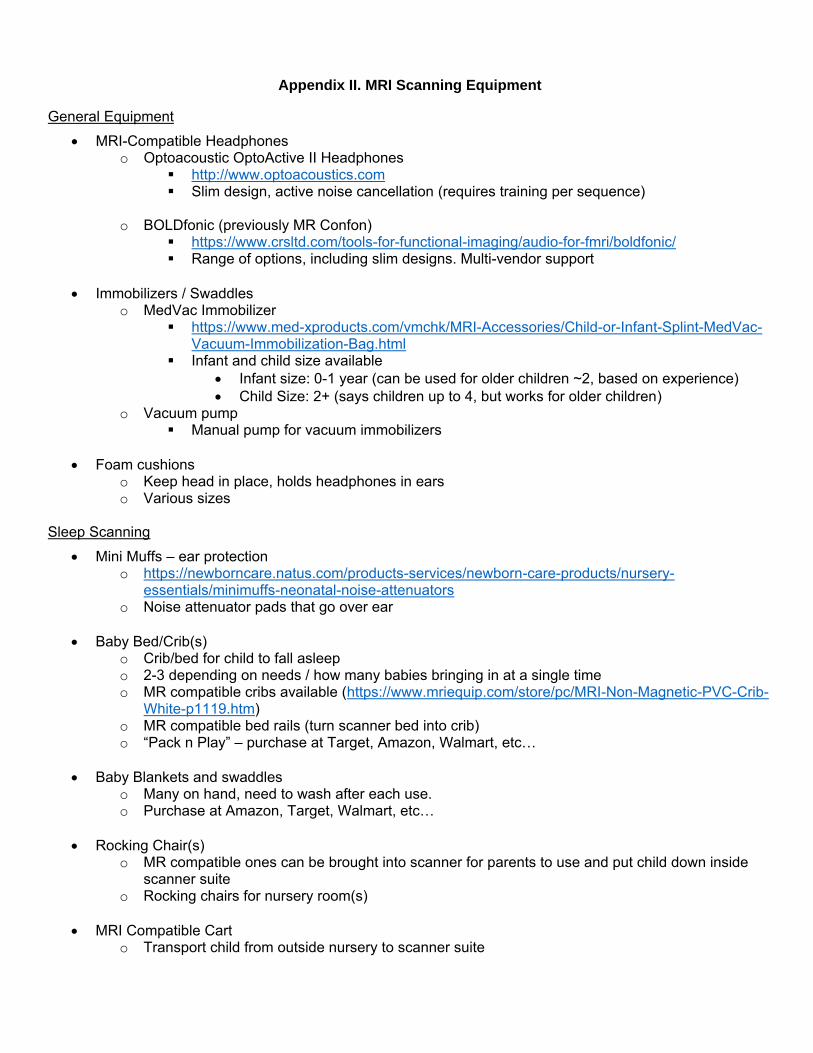
Appendix II. MRI Scanning Equipment
General Equipment
MRI-Compatible Headphones o Optoacoustic OptoActive II Headphones
http://www.optoacoustics.com Slim design, active noise cancellation (requires training per sequence)
o BOLDfonic (previously MR Confon)
https://www.crsltd.com/tools-for-functional-imaging/audio-for-fmri/boldfonic/ Range of options, including slim designs. Multi-vendor support
Immobilizers / Swaddles o MedVac Immobilizer
https://www.med-xproducts.com/vmchk/MRI-Accessories/Child-or-Infant-Splint-MedVac-Vacuum-Immobilization-Bag.html
Infant and child size available
Infant size: 0-1 year (can be used for older children ~2, based on experience)
Child Size: 2+ (says children up to 4, but works for older children) o Vacuum pump
Manual pump for vacuum immobilizers
Foam cushions o Keep head in place, holds headphones in ears o Various sizes
Sleep Scanning
Mini Muffs – ear protection o https://newborncare.natus.com/products-services/newborn-care-products/nursery-
essentials/minimuffs-neonatal-noise-attenuators o Noise attenuator pads that go over ear
Baby Bed/Crib(s) o Crib/bed for child to fall asleep o 2-3 depending on needs / how many babies bringing in at a single time o MR compatible cribs available (https://www.mriequip.com/store/pc/MRI-Non-Magnetic-PVC-Crib-
White-p1119.htm) o MR compatible bed rails (turn scanner bed into crib) o “Pack n Play” – purchase at Target, Amazon, Walmart, etc…
Baby Blankets and swaddles o Many on hand, need to wash after each use. o Purchase at Amazon, Target, Walmart, etc…
Rocking Chair(s) o MR compatible ones can be brought into scanner for parents to use and put child down inside
scanner suite o Rocking chairs for nursery room(s)
MRI Compatible Cart o Transport child from outside nursery to scanner suite
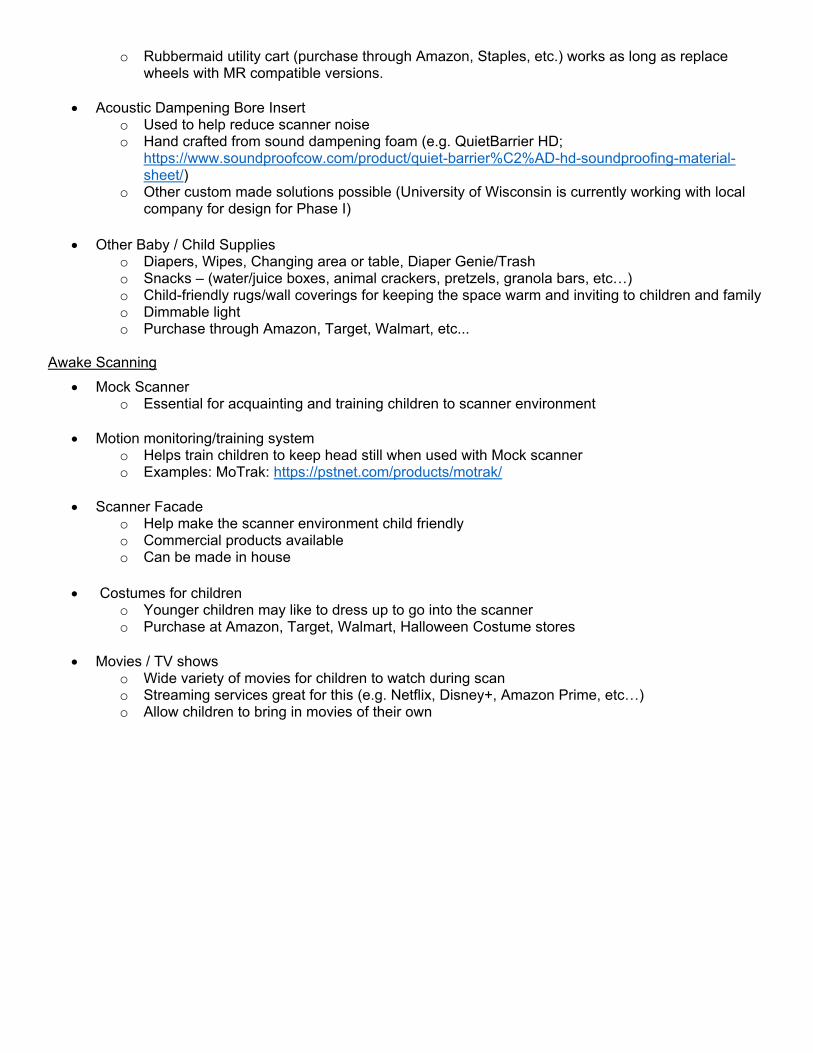
o Rubbermaid utility cart (purchase through Amazon, Staples, etc.) works as long as replace wheels with MR compatible versions.
Acoustic Dampening Bore Insert o Used to help reduce scanner noise o Hand crafted from sound dampening foam (e.g. QuietBarrier HD;
https://www.soundproofcow.com/product/quiet-barrier%C2%AD-hd-soundproofing-material-sheet/)
o Other custom made solutions possible (University of Wisconsin is currently working with local company for design for Phase I)
Other Baby / Child Supplies o Diapers, Wipes, Changing area or table, Diaper Genie/Trash o Snacks – (water/juice boxes, animal crackers, pretzels, granola bars, etc…) o Child-friendly rugs/wall coverings for keeping the space warm and inviting to children and family o Dimmable light o Purchase through Amazon, Target, Walmart, etc...
Awake Scanning
Mock Scanner o Essential for acquainting and training children to scanner environment
Motion monitoring/training system o Helps train children to keep head still when used with Mock scanner o Examples: MoTrak: https://pstnet.com/products/motrak/
Scanner Facade o Help make the scanner environment child friendly o Commercial products available o Can be made in house
Costumes for children o Younger children may like to dress up to go into the scanner o Purchase at Amazon, Target, Walmart, Halloween Costume stores
Movies / TV shows o Wide variety of movies for children to watch during scan o Streaming services great for this (e.g. Netflix, Disney+, Amazon Prime, etc…) o Allow children to bring in movies of their own