developments in tourism climatology - citeseerx
TRANSCRIPT
Developments in Tourism Climatology – A. Matzarakis, C. R. de Freitas, D. Scott, 2007
1
Developments in Tourism Climatology
A. Matzarakis, C. R. de Freitas and D. Scott
(Eds.)
3rd International Workshop on Climate, Tourism and Recreation
Alexandroupolis, Greece19 – 22 September 2007
Commission on Climate, Tourism and Recreation
Commission on Climate, Tourism and Recreation
International Society of Biometeorology
Freiburg, December 2007
ISBN: 978-3-00-024110-9
Developments in Tourism Climatology – A. Matzarakis, C. R. de Freitas, D. Scott, 2007
2
Developments in Tourism Climatology
Edited by: Andreas Matzarakis, Christopher de Freitas and Daniel Scott
Commission Climate, Tourism and Recreation, International Society of Biometeorology
Contact: [email protected]
Pages: 289
ISBN: 978-3-00-024110-9
Developments in Tourism Climatology – A. Matzarakis, C. R. de Freitas, D. Scott, 2007
3
CONTENTS Preface 5 Climate, tourism and recreation – A decade of the ISB’s Commission on Climate, Tourism and Recreation - C. R. de Freitas, A. Matzarakis and D. Scott
7
Climate and bioclimate information for tourism – The example of Evros prefecture in Greece - A. Matzarakis
12
Climate preferences for tourism: An exploratory Tri-Nation comparison - D. Scott, S. Gössling and C. R. de Freitas
18
Biometeorological basis for Croatian tourism - K. Zaninovic and A. Matzarakis 24 The importance of climate for recreational planning in rural areas - Case Study of Mugla province - M. Topay
29
Variation of thermal bioclimate in the Lake Balaton tourist region (Hungary) -A. Nemeth, V. Schlanger and A. Katona
37
Snow baseline conditions and changes for winter tourism - M. Gajic-Capka 43 Assessment method for climate and tourism based on daily data - A. Matzarakis 52 Bioclimate and tourism potential in National Parks of Taiwan - T.-P. Lin and A. Matzarakis
59
North-South variation of bioclimatic parameters in Argentina during summer months - A. Helbig, A. Matzarakis and E. Piacentini
66
How does climate effectively affect tourism? The advantage of weather type methodology - H. Andrade, M. J. Alcoforado and S. Oliveira
74
Using webcam images for climate and tourism research - A. Moreno 80 Estimation of climatic resources for summer sport recreation in the Jewish Autonomous Region of Russia - E. Grigorieva and E. Fetisov
87
The heatwaves over southern Balkans as an indicator of the climate change: A case study on August 2006 - Ch. Balafoutis
93
"The sky fell down” - Perceptions and implications of extreme weather events for Hungarian tourism - T. Rátz and K. Szalai
101
Weather and climate as limiting factors in winter tourism in polar areas: Changing climate and nature-based tourism in Northern Finland - K. Tervo
109
Weather limitations for winter and summer tourism in Central Europe - K. Blazejczyk 116Analysis of summer tourism period for Austria based on climate variables on daily basis - A. Matzarakis, E. Koch and E. Rudel
122
RayMan: A tool for tourism and applied climatology - A. Matzarakis and F. Rutz 129The need of the weather forecasts adapted for recreation in Lithuania - J. Liukaityte 139Biometeorological conditions in mountainous communities and adjacent urban center in Greece by the use of indices: The case study of Mountainous Nafpaktia - A. Kamoutsis, A. Matsoukis, I. Charalampopoulos and A. Chronopoulou-Sereli
144
The human comfort conditions in Bulgarian Black seaside - A. Tzenkova, J. Ivancheva, ´ E. Koleva and P. Videnov
150
Spa destination development using a decision support system - The role of climate and bioclimate - E. A. Didascalou, P. Th. Nastos and A. Matzarakis
158
Bioclimate information for climate therapy in Istanbul - A. Matzarakis and Z. Karagülle 166The impacts of climate change on ski resorts and tourist traffic - M. Tepfenhart, W. Mauser and F. Siebel
172
Snowmaking - A suitable adaptation strategy? Examples from Tyrol/Austria - R. Steiger 178Using an analogue approach to examine climate change vulnerability of the New England (USA) ski tourism industry - J. Dawson, D. Scott and G. McBoyle
183
Climate change vulnerability of the US Northeast ski industry - D. Scott and J. Dawson 191
Developments in Tourism Climatology – A. Matzarakis, C. R. de Freitas, D. Scott, 2007
4
The potential influences of climate change on tourist demand in winter sport centres in Slovenia - K. Vrtacnik Garbas
199
Climate trends and sustainable development of tourism in coastal and low mountain range regions (CAST) - C. Bartels, H. Heinrichs, M. Barth, E. Kreilkamp, A. Matzarakis and A. Möller
207
Acclimatization demands of recreationists moving within the southern region of the Russian Far East - E. Grigorieva
214
Weather dependence of tourist’s spatial behaviour and destination choices: Case study with passive mobile positioning data in Estonia - O. Järv, A. Aasa, R. Ahas and E. Saluveer
221
“Summer (2007) set in with its usual severity” (Coleridge) - Impacts on tourism and the insurance industries - A. Perry
228
Sensitivity of thermal conditions for tourism to climate change and variability: A comparison of regional scale case studies - C. R. de Freitas and A. Matzarakis
232
Climate change scenarios and tourism - How to handle and operate with data – A. Matzarakis, O. Matuschek, R. Neumcke, F. Rutz and M. Zalloom
240
Climate Change = Tourism Change? Likely impacts of climate change on tourism in Germany's North Sea Coast Destinations - J. Willms
246
The impacts of climate change on tourism and potential adaptation responses in Coastal and Alpine Regions - T. Cegnar
254
Climate change and climate-tourism relationships in Germany - C. Endler and A. Matzarakis
260
Climate change and tourism in the Black Forest in Germany – A tourism and climate approach for forest areas - K. Oehler and A. Matzarakis
267
How can recreation and tourism benefit from multi-disciplinary approaches to assess and adapt to climate change? Lessons from the U.S. Southwest -B. Morehouse, G. Frisvold and R. Bark
274
Adaptive responses of tourism to climate change - A sociological perspective - J. Jetzkowitz
282
Developments in Tourism Climatology – A. Matzarakis, C. R. de Freitas, D. Scott, 2007
5
PREFACE
This publication grew out of the Third International Workshop of the International Society of
Biometeorology, Commission on Climate Tourism and Recreation (CCTR), held in
Alexandropoulos, Greece from 19 to 22 September 2007. The aims of the Workshop were to bring
together a selection of researchers and tourism experts to review the current state of knowledge of
tourism and recreation climatology and explore possibilities for future work and the role of the
CCTR in this.
A total of 38 delegates from 22 countries attended the meeting. Their fields of expertise included
biometeorology, bioclimatology, thermal comfort and heat balance modelling, tourism marketing
and planning, urban and landscape planning, architecture, sociology, geography, meteorology,
environmental physics, ecology, emission reduction and climate change impact assessment.
Participants came from universities and research institutions in 22 countries, including: Austria,
Bulgaria, Canada, Croatia, Estonia, Lithuania, Finland, France, Germany, Greece, Hungary, Italy,
the Netherlands, New Zealand, Portugal, Russia, Slovenia, Switzerland, Taiwan, Turkey, United
Kingdom and United States of America.
Business conducted during the Workshop was divided between nine sessions, namely: 1) climate as
nature based resource for tourism; 2) weather and climate as limiting factors for tourism and
recreation; 3) development and presentation of new climate tourism indices; 4) relationships
between climate and tourism; 5) effects of weather and climate extremes on tourism and recreation;
6) climate therapy for tourism and recreation; 7) effects of climate change on winter tourism and
tourism industry; 8) economic effects of climate change on tourism industry; and 9) adaptation of
tourists and tourism industry on climate change. The oral presentations and posters covered a wide
spectrum of themes; many were the product of co-operative research projects between members of
the CCTR.
The content of this publication is based on the presentations made at the Workshop and reflects the
new perspectives and methods that have evolved since the CCTR was established. To enable all
presentations to be included in one volume, papers were limited to a maximum of eight pages.
Readers are advised that English is not the first language of many of the contributors to this
publication and no attempt was made by the editors to re-write any part of the submissions received
from the authors. Consequently, the grammar and syntax in some of the articles is quaint but the
meaning is clear.
Many Thanks to Nikola Sander and Jackie Dawson for editing the papers.
Developments in Tourism Climatology – A. Matzarakis, C. R. de Freitas, D. Scott, 2007
6
3rd International Workshop on Climate, Tourism and Recreation
Alexandroupolis, Greece19 – 22 September 2007
Commission on Climate, Tourism and Recreation
Figure 1: Poster for the CCTR Third International Workshop
We would like to thank Mr. Jiannis Balafoutis from Greek Hospitality for the management of
accommodation and other matters related to holding the Workshop in Greece and also Mr.
Panagiotis Kyrou for his support and help. The financial support provided by TUI AG in Hannover,
Germany, is gratefully acknowledged. We would also like to thank the management and staff of
Alexander Beach Hotel in Alexandropoulos for their hospitality and support, including the facilities
provided at the Hotel’s Thrace Conference and Convention Centre.
Andreas Matzarakis, Chris de Freitas and Daniel Scott December 2007
Developments in Tourism Climatology – A. Matzarakis, C. R. de Freitas, D. Scott, 2007
7
CLIMATE, TOURISM AND RECREATION: A DECADE OF THE
ISB’S COMMISSION ON CLIMATE, TOURISM AND RECREATION
C. R. de Freitas1, A. Matzarakis2 and Daniel Scott3
1School of Geography, Geology and Environmental Science, University of Auckland, New Zealand.
2Meteorological Institute, University of Freiburg, Freiburg, Germany 3 Department of Geography, University of Waterloo, Waterloo, Canada
The International Society of Biometeorology’s Commission on Climate, Tourism and Recreation
(CCTR) was founded at the 15th International Congress of Biometeorology in Sydney, Australia in
1999 (from 1996 to 1999 it was an ISB Working Group). The co-founders were Andreas Matzarakis
of the University of Freiberg, Germany, and Chris de Freitas of the University of Auckland, New
Zealand. The aims of the CCTR are to: a) bring together a selection of researchers and tourism
experts from around the world to review the current state of knowledge of tourism and recreation
climatology; and b) explore possibilities for future research and the role of the CCTR in this. A
decade on research in tourism and recreation climatology has developed and expanded due in large
part to the initiatives and activities of the CCTR, including collaborative research projects run under
the auspices of the CCTR and three international workshops.
The collaborative research projects included: 1) a research project on devising and testing a second
generation climate index for tourism (CIT) conducted by Chris de Freitas (New Zealand), Daniel
Scott and Geoff McBoyle (Canada); 2) a cross-cultural analysis of climate preferences for tourism
by Daniel Scott (Canada), Chris de Freitas (New Zealand) and Stefan Gossling (Sweden); 3)
preparation of a chapter on ‘Climate Change Adaptation in Tourism and Recreation’ by Daniel
Scott (Canada), Chris de Freitas (New Zealand) and Andreas Matazarakis (Germany) in the ISB-
sponsored book ‘Biometeorology for Adaptation’; 4) an comprehensive bibliography of work in
tourism and recreation climatology by the Canadian team of Daniel Scott, Brenda Jones and Geoff
McBoyle covering the period 1936 to 2005; 5) a research project investigating climate change and
tourism in the Black Forest and North Sea region of Germany by researchers from the University of
Freiburg (Andreas Matzarakis) and the University Lüneburg (Harald Heinrichs); and 6) an
investigation into the effects of climate change on the climatic tourism potential in Austria by
Andreas Matzarakis and the Central Institute of Meteorology and Geodynamics.
Three international workshops of climate, tourism and recreation have been convened by the CCTR
since its inception in 1999. The initial conference was the “First International Workshop on
Climate, Tourism and Recreation: The Way Forward” held in Halkidiki in northern Greece from 5-
10 October 2001. The was attended by 25 delegates representing fields of expertise that included
Developments in Tourism Climatology – A. Matzarakis, C. R. de Freitas, D. Scott, 2007
8
climatology, thermal comfort and heat balance modelling, climate change impact assessment,
tourism marketing and planning, urban and landscape planning, architecture and UV-radiation.
Delegates were from Australia, Austria, Bulgaria, Canada, Croatia, Germany, Greece, New
Zealand, Poland, United Kingdom, USA, and Switzerland. The First Workshop noted that: a)
tourism is one of the world’s biggest industries and also the fastest growing, b) for many regions,
tourism is the most important source of income, and c) generally accepted that climate is an
important part of the tourism resource base. Despite this the Workshop highlighted
The fact that little is known about: a) the effects of climate on tourism, or the role it plays; the
economic impacts of climate on commercial prospects for tourism; and c) which climate related-
criteria people use to make decisions about tourism choices. The Workshop identified several
research themes that warrant attention:
• Better understanding of what climate-related information is required by tourists and the
tourism industry.
• The need to explore the distinction between impacts of climate on tourists versus the impact
on the tourism industry.
• The need to assess the role of weather and longer term expectations of climate on
destination choices.
• To identify what climate related-criteria people use to make decisions about tourism choices
• Determine how climate information products are currently used by the tourism industry.
• Identify the sort of climate information required by the tourism sector.
• The need for a tourism climate index that integrates all facets of climate, uses standard data,
and is objectively tested and verified.
Overall delegates concluded that future research directions should depend to a large extent on what
is required by tourism planners, members of the tourism industry and tourists themselves.
Determining what these requirements should be a high priority. The presentations at the meeting
were published as the ‘Proceedings of the First Workshop of the Commission on Climate, Tourism
and Recreation’, edited by at Andreas Matazarakis. and Chris de Freitas (Available at:
<http://www.mif.uni-freiburg.de/isb/>).
The Second International Workshop on Climate, Tourism and Recreation was held at the village of
Kolimbari, Crete, from 9-12 June 2004. A total of 40 international delegates attended. A substantial
publication covered the proceedings of the Workshop in the form of a book edited by A.
Matzarakis, C.R. de Freitas, C.R. and D. Scott, 2004, ‘Advances in Tourism Climatology’ (Berichte
des Meteorologischen Institutes der Universität Freiburg, Nr. 12, 260 pp). Hard copies were sent to
over 500 libraries and made available free of charge electronically at <http://www.mif.uni-
freiburg.de/isb/ws2/report.htm>. The reports on both the First and Second Workshops were cited in
Developments in Tourism Climatology – A. Matzarakis, C. R. de Freitas, D. Scott, 2007
9
the Fourth Assessment Report of the Intergovernmental Panel on Climate Change (2007), which
can be taken as recognition of the work of the CCTR and its standing among the research
community.
The Third International CCTR Workshop was held in Alexandropoulos, Greece from 19 to 22
September 2007, and is the basis of the current book ‘Developments in Tourism Climatology’. The
aims of the Workshop were to bring together a selection of researchers and tourism experts to
review the current state of knowledge of tourism and recreation climatology and explore
possibilities for future work and what the role of the CCTR might be in this research agenda..
Attending the workshop were 38 delegates from 22 countries, including Austria, Bulgaria, Canada,
Croatia, Estonia, Lithuania, Finland, France, Germany, Greece, Hungary, Italy, the Netherlands,
New Zealand, Portugal, Russia, Slovenia, Switzerland, Taiwan, Turkey, United Kingdom and
United States of America. Their fields of expertise included biometeorology, bioclimatology,
thermal comfort and heat balance modelling, tourism marketing and planning, urban and landscape
planning, architecture, sociology, geography, climate change, meteorology, environmental physics,
ecology, emission reduction and climate change impact assessment. Highly encouraging was that
more than the half of those who attended were female and about one third of the delegates were
young scientists under 35 years old. These demographics portend a very positive future for progress
in tourism climatology over the next two decades.
The programme of the Third Workshop consisted of nine sessions and three brainstorming
sessions. Each day the Workshop had two separate types of meetings. Oral and poster presentations
of scientific papers took place during the day. This was followed by evening sessions at which the
results of day’s presentations and various themes were discussed and key points summarised for
publication in a report on the findings of the CCTR Workshop.
Business conducted during the Workshop was divided between nine sessions, namely:
1) climate as nature based resource for tourism; 2) weather and climate as limiting factors for
tourism and recreation; 3) development and presentation of new climate tourism indices; 4)
relationships between climate and tourism; 5) effects of weather and climate extremes on tourism
and recreation; 6) climate therapy for tourism and recreation; 7) effects of climate change on winter
tourism and tourism industry; 8) economic effects of climate change on tourism industry; and 9)
adaptation of tourists and tourism industry on climate change.
The oral presentations and posters covered a wide spectrum of themes; many were the product of
co-operative research projects between members of the CCTR. Among these were: processing and
presentation of meteorological and climatological data for tourism purposes; processing of GSG
data and links with tourism; observations via webcams and the perception of weather; ways for
integrating weather and climate information in spa therapy; software and analytical tools in tourism
Developments in Tourism Climatology – A. Matzarakis, C. R. de Freitas, D. Scott, 2007
10
climate research; effects of climate on tourism in coastal and mountainous areas; effects of extreme
events on tourism and recreation and their causes and consequences; sensitivity of thermal
conditions with regard to climate variability and change; interactions between ecological and socio-
economical factors; and risks and opportunities from climate change. The themes of the
brainstorming sessions were: development of indices for climate and tourism; weather and climate
information for media and tourism industry; winter sports and climate change; climate preferences
of tourists and reflect areas where substantial research is taking place.
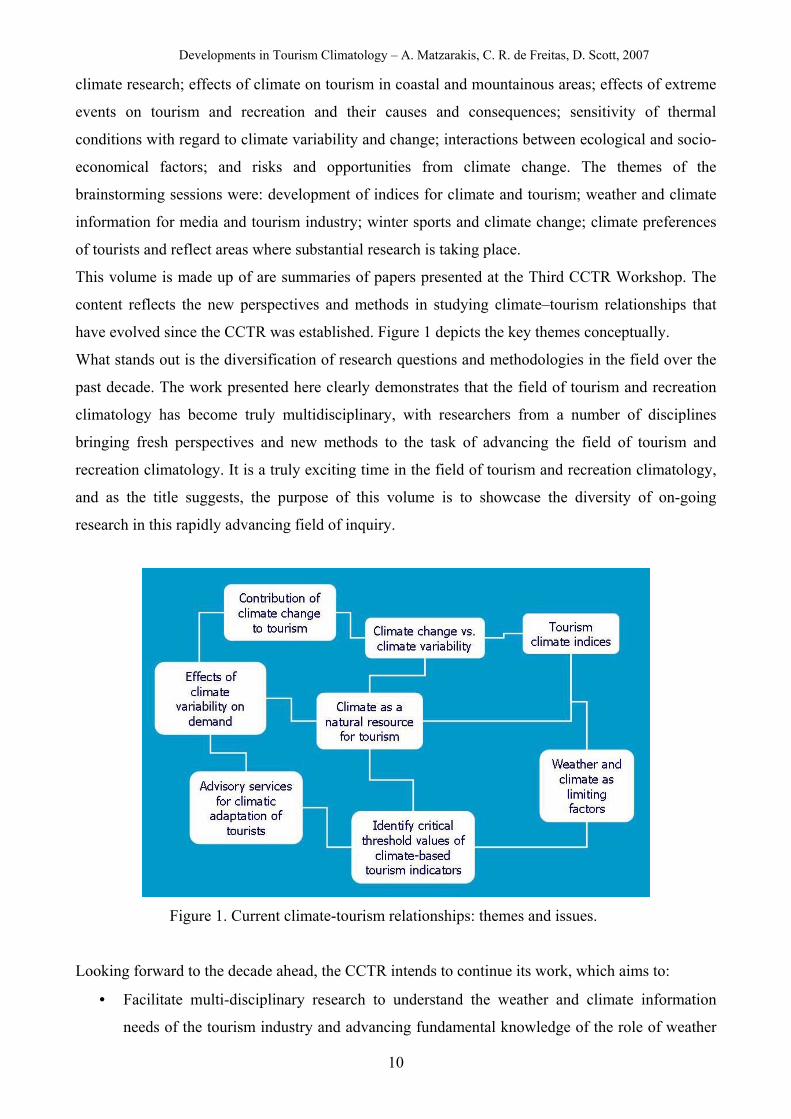
This volume is made up of are summaries of papers presented at the Third CCTR Workshop. The
content reflects the new perspectives and methods in studying climate–tourism relationships that
have evolved since the CCTR was established. Figure 1 depicts the key themes conceptually.
What stands out is the diversification of research questions and methodologies in the field over the
past decade. The work presented here clearly demonstrates that the field of tourism and recreation
climatology has become truly multidisciplinary, with researchers from a number of disciplines
bringing fresh perspectives and new methods to the task of advancing the field of tourism and
recreation climatology. It is a truly exciting time in the field of tourism and recreation climatology,
and as the title suggests, the purpose of this volume is to showcase the diversity of on-going
research in this rapidly advancing field of inquiry.
Figure 1. Current climate-tourism relationships: themes and issues.
Looking forward to the decade ahead, the CCTR intends to continue its work, which aims to:
• Facilitate multi-disciplinary research to understand the weather and climate information
needs of the tourism industry and advancing fundamental knowledge of the role of weather

Developments in Tourism Climatology – A. Matzarakis, C. R. de Freitas, D. Scott, 2007
11
and climate in tourist decision-making. Identifying critical indicators and threshold values of
climate-based indices for tourism and recreation.
• Develop frameworks for collaborative research on climatic risks, opportunities, and
research/information needs for reducing impacts on the tourism and recreation industries;
• Identify sources of data and potential partnerships to investigate interactions between
tourism and climate variability and change and to provide usable information for planning
and management; and
• Encourage the development of young scholars interested in the multi-faceted dimensions of
weather-climate and tourism-recreation.
Developments in Tourism Climatology – A. Matzarakis, C. R. de Freitas, D. Scott, 2007
12
CLIMATE AND BIOCLIMATE INFORMATION FOR TOURISM
– THE EXAMPLE OF EVROS PREFECTURE
A. Matzarakis
Meteorological Institute, University of Freiburg, D-79085 Freiburg, Germany
ABSTRACT There is demand for climate data and information it can provide, but in regions with a
poor network of climate stations there is a shortage of appropriate quantity of climate data. A two
way approach for the creation of climate information is developed here and tested on the Evros
prefecture of northeastern Greece. We use the data from the collation program of the Climatic
Research Unit, based on climatological observations between 1960 and 1990, to produce seasonal
maps. The existing data sets provide adequate information for the production of high spatial
resolution maps. The results were presented by mapping the generated parameters using digital
elevation models. The available data were processed with modern geo-statistical methods. Maps for
air temperature, relative humidity, sunshine duration, wind speed, precipitation and physiologically
equivalent temperature have been generated. This approach generates climate and climate related
information for areas with a low density of climate stations.
KEYWORDS: Tourism, climatology, climate data, Evros
INTRODUCTION
On the whole Greece has a low density network of climate stations. The poor spatial coverage
results in a shortage of good quality climate data for applied climate rsearch in areas such as
agriculture and tourism (Matzarakis, 2006) and for bioclimate applications in particular (Matzarakis
et al., 1999). The aim of this study is to present a bioclimatic analysis of Evros prefecture by means
of climate mapping with the aid of geo-statistical methods (between the meso and macro scale).
STUDY AREA
The study area is the Evros prefecture of northeastern Greece comprised of two national parks, the
forest reserve of Dadia and the river delta of the river Evros, the island Samothraki, which also
belongs to the district of Evros, is also a government controlled reserve. The climate can be
described as a mix of Mediterranean and Central European climate. Τhe national parks of Evros
contain special ecosystems that are home to a number of rare animal species which are a major
tourst attraction of the region.
Developments in Tourism Climatology – A. Matzarakis, C. R. de Freitas, D. Scott, 2007
13
In the west, the district of Evros adjoins the district of Rodopi, in the east it borders Turkey (East
Thracia). The river Evros is the natural border to Bulgaria in the northeast and with Turkey in the
east. In the south the district Evros abuts on the Aegean Sea. The district of Evros extends between
40° and 42° degrees latitude and 25° to 27° degrees longitude. In the east, the topography is
dominated by rivers - predominantly by the river Evros - and areas with heights of less than 100 m.
In the west the district’s topography rises up to 1200 m. The island Samothraki is mountainous,
with 1611 m the highest point of the island
METHODS AND DATA
The used climate data for this analysis was provided by the data collation program at the Climatic
Research Unit of the University of Norwich (New et al., 1999, 2000). The method employed uses
this to data to to produce high spatial (ten minute) resolution climate information for applications at
the meso scale. The data required for thermal bioclimate analysis are air temperature, relative
humidity, solar radiation (sunshine duration) and wind speed. These are available at monthly
resolution for the climate period 1961 to 1990 for the Evros prefecture. The grid referernces of the
climate data are used as the dependent variable. They are recalculated to provide a higher spatial
resolution (1 km) through the use of geo-statistical methods, where the independent variables are
latitude, longitude and elevation. The multiple regression using the three factors is accurate enough
to contruct maps. Digital elevation data of the GLOBE data set (Hastings et al., 1999) was used.
Mean monthly data is used for the following variables: air temperature, relative humidity, wind
speed, percentages of sunshine duration, monthly temperature amplitude, precipitation amount and
days with precipitation a simple statistical downscaling based on latitude, longitude and elevation
have been applied for the target areas.
The statistical correlation for the applied spatial resolution of approximately one kilometer show
that the correlation coefficient between the climate parameters and the geographical and
topographical factors depend more or less on the distribution of the land and sea masses and the size
of the target area. Nevertheless, the statistical results allow the production of high resolution climate
and bioclimate maps for Evros and other parts of Greece.
The calculation of PET is performed with the aid of the RayMan Model, which calculates the
thermal indices mentioned above (Matzarakis et al. 2000, 2007).
Additionally, daily data of the Alexandroupolis airport station of the Hellenic National Weather
Service have been analysed for tourism purposes.
Developments in Tourism Climatology – A. Matzarakis, C. R. de Freitas, D. Scott, 2007
14
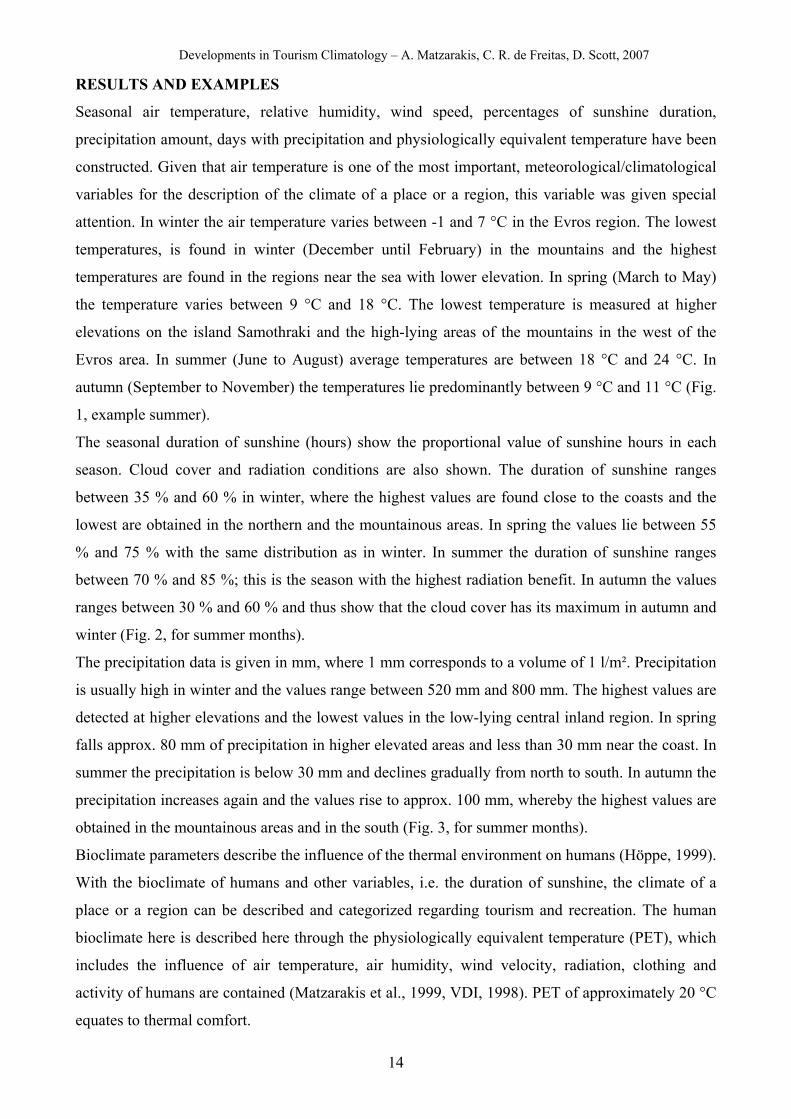
RESULTS AND EXAMPLES
Seasonal air temperature, relative humidity, wind speed, percentages of sunshine duration,
precipitation amount, days with precipitation and physiologically equivalent temperature have been
constructed. Given that air temperature is one of the most important, meteorological/climatological
variables for the description of the climate of a place or a region, this variable was given special
attention. In winter the air temperature varies between -1 and 7 °C in the Evros region. The lowest
temperatures, is found in winter (December until February) in the mountains and the highest
temperatures are found in the regions near the sea with lower elevation. In spring (March to May)
the temperature varies between 9 °C and 18 °C. The lowest temperature is measured at higher
elevations on the island Samothraki and the high-lying areas of the mountains in the west of the
Evros area. In summer (June to August) average temperatures are between 18 °C and 24 °C. In
autumn (September to November) the temperatures lie predominantly between 9 °C and 11 °C (Fig.
1, example summer).
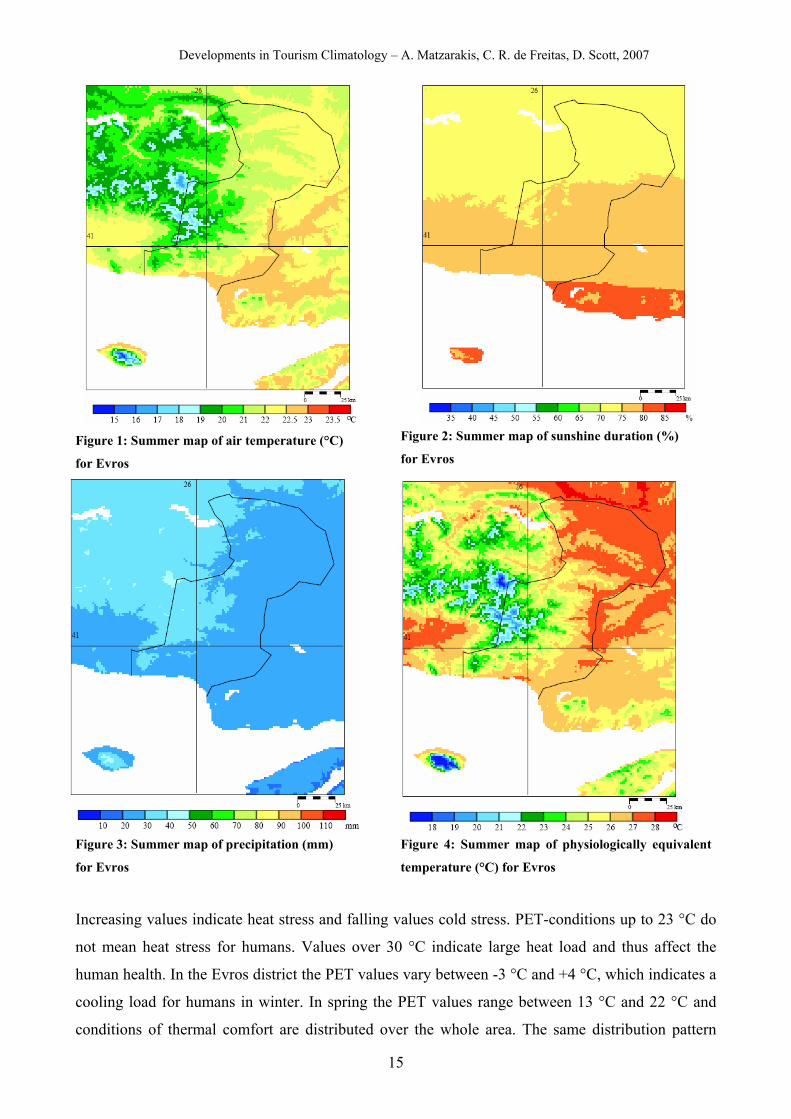
The seasonal duration of sunshine (hours) show the proportional value of sunshine hours in each
season. Cloud cover and radiation conditions are also shown. The duration of sunshine ranges
between 35 % and 60 % in winter, where the highest values are found close to the coasts and the
lowest are obtained in the northern and the mountainous areas. In spring the values lie between 55
% and 75 % with the same distribution as in winter. In summer the duration of sunshine ranges
between 70 % and 85 %; this is the season with the highest radiation benefit. In autumn the values
ranges between 30 % and 60 % and thus show that the cloud cover has its maximum in autumn and
winter (Fig. 2, for summer months).
The precipitation data is given in mm, where 1 mm corresponds to a volume of 1 l/m². Precipitation
is usually high in winter and the values range between 520 mm and 800 mm. The highest values are
detected at higher elevations and the lowest values in the low-lying central inland region. In spring
falls approx. 80 mm of precipitation in higher elevated areas and less than 30 mm near the coast. In
summer the precipitation is below 30 mm and declines gradually from north to south. In autumn the
precipitation increases again and the values rise to approx. 100 mm, whereby the highest values are
obtained in the mountainous areas and in the south (Fig. 3, for summer months).
Bioclimate parameters describe the influence of the thermal environment on humans (Höppe, 1999).
With the bioclimate of humans and other variables, i.e. the duration of sunshine, the climate of a
place or a region can be described and categorized regarding tourism and recreation. The human
bioclimate here is described here through the physiologically equivalent temperature (PET), which
includes the influence of air temperature, air humidity, wind velocity, radiation, clothing and
activity of humans are contained (Matzarakis et al., 1999, VDI, 1998). PET of approximately 20 °C
equates to thermal comfort.
Developments in Tourism Climatology – A. Matzarakis, C. R. de Freitas, D. Scott, 2007
15
Figure 1: Summer map of air temperature (°C)
for Evros
Figure 2: Summer map of sunshine duration (%)
for Evros
Figure 3: Summer map of precipitation (mm)
for Evros
Figure 4: Summer map of physiologically equivalent
temperature (°C) for Evros
Increasing values indicate heat stress and falling values cold stress. PET-conditions up to 23 °C do
not mean heat stress for humans. Values over 30 °C indicate large heat load and thus affect the
human health. In the Evros district the PET values vary between -3 °C and +4 °C, which indicates a
cooling load for humans in winter. In spring the PET values range between 13 °C and 22 °C and
conditions of thermal comfort are distributed over the whole area. The same distribution pattern
Developments in Tourism Climatology – A. Matzarakis, C. R. de Freitas, D. Scott, 2007
16
exists also in autumn, although the values are lower than in spring. In summer the highest values are
observed in the central parts of the region and the areas with more pleasant bioclimate are located in
the coastal zone and in the mountainous areas (Fig. 4, for summer months).
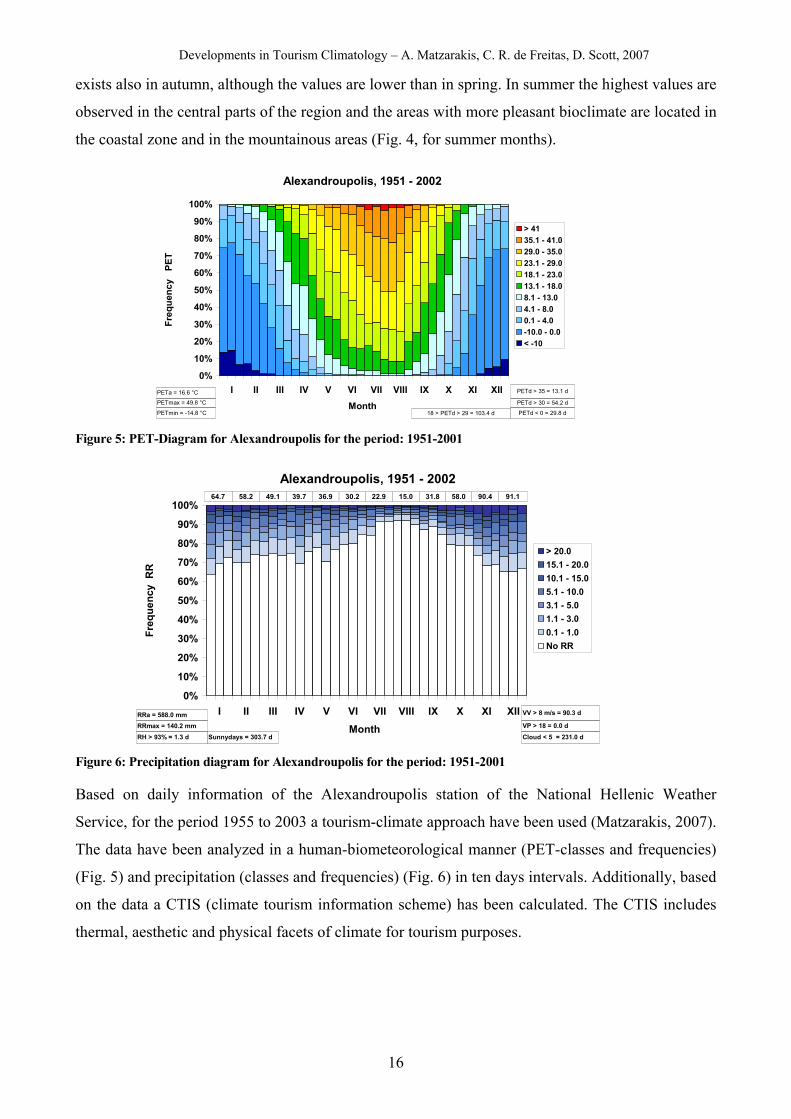
Alexandroupolis, 1951 - 2002
0%
10%
20%
30%
40%
50%
60%
70%
80%
90%
100%
I II III IV V VI VII VIII IX X XI XIIMonth
Freq
uenc
y P
ET
> 4135.1 - 41.029.0 - 35.023.1 - 29.018.1 - 23.013.1 - 18.08.1 - 13.04.1 - 8.00.1 - 4.0-10.0 - 0.0< -10
PETa = 16.6 °C
PETmax = 49.8 °C
PETmin = -14.8 °C PETd < 0 = 29.8 d
PETd > 30 = 54.2 d
PETd > 35 = 13.1 d
18 > PETd > 29 = 103.4 d Figure 5: PET-Diagram for Alexandroupolis for the period: 1951-2001
Alexandroupolis, 1951 - 2002
0%
10%
20%
30%
40%
50%
60%
70%
80%
90%
100%
I II III IV V VI VII VIII IX X XI XIIMonth
Freq
uenc
y R
R
> 20.015.1 - 20.010.1 - 15.05.1 - 10.03.1 - 5.01.1 - 3.00.1 - 1.0No RR
RRa = 588.0 mmRRmax = 140.2 mmRH > 93% = 1.3 d Cloud < 5 = 231.0 d
VP > 18 = 0.0 d
VV > 8 m/s = 90.3 d
64.7 58.2 49.1 39.7 36.9 30.2 22.9 15.0 31.8 91.190.458.0
Sunnydays = 303.7 d Figure 6: Precipitation diagram for Alexandroupolis for the period: 1951-2001
Based on daily information of the Alexandroupolis station of the National Hellenic Weather
Service, for the period 1955 to 2003 a tourism-climate approach have been used (Matzarakis, 2007).
The data have been analyzed in a human-biometeorological manner (PET-classes and frequencies)
(Fig. 5) and precipitation (classes and frequencies) (Fig. 6) in ten days intervals. Additionally, based
on the data a CTIS (climate tourism information scheme) has been calculated. The CTIS includes
thermal, aesthetic and physical facets of climate for tourism purposes.
Developments in Tourism Climatology – A. Matzarakis, C. R. de Freitas, D. Scott, 2007
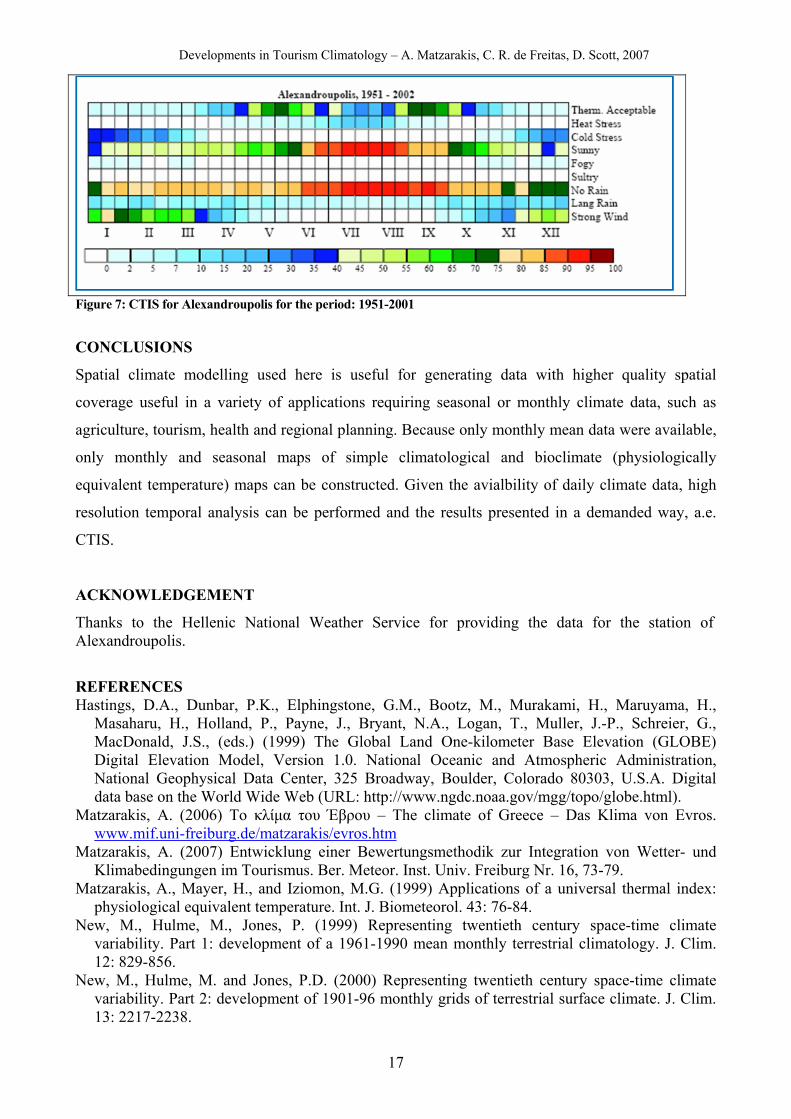
17
Figure 7: CTIS for Alexandroupolis for the period: 1951-2001
CONCLUSIONS
Spatial climate modelling used here is useful for generating data with higher quality spatial
coverage useful in a variety of applications requiring seasonal or monthly climate data, such as
agriculture, tourism, health and regional planning. Because only monthly mean data were available,
only monthly and seasonal maps of simple climatological and bioclimate (physiologically
equivalent temperature) maps can be constructed. Given the avialbility of daily climate data, high
resolution temporal analysis can be performed and the results presented in a demanded way, a.e.
CTIS.
ACKNOWLEDGEMENT
Thanks to the Hellenic National Weather Service for providing the data for the station of Alexandroupolis.
REFERENCES Hastings, D.A., Dunbar, P.K., Elphingstone, G.M., Bootz, M., Murakami, H., Maruyama, H.,
Masaharu, H., Holland, P., Payne, J., Bryant, N.A., Logan, T., Muller, J.-P., Schreier, G., MacDonald, J.S., (eds.) (1999) The Global Land One-kilometer Base Elevation (GLOBE) Digital Elevation Model, Version 1.0. National Oceanic and Atmospheric Administration, National Geophysical Data Center, 325 Broadway, Boulder, Colorado 80303, U.S.A. Digital data base on the World Wide Web (URL: http://www.ngdc.noaa.gov/mgg/topo/globe.html).
Matzarakis, A. (2006) Το κλίμα του Έβρου – The climate of Greece – Das Klima von Evros. www.mif.uni-freiburg.de/matzarakis/evros.htm
Matzarakis, A. (2007) Entwicklung einer Bewertungsmethodik zur Integration von Wetter- und Klimabedingungen im Tourismus. Ber. Meteor. Inst. Univ. Freiburg Nr. 16, 73-79.
Matzarakis, A., Mayer, H., and Iziomon, M.G. (1999) Applications of a universal thermal index: physiological equivalent temperature. Int. J. Biometeorol. 43: 76-84.
New, M., Hulme, M., Jones, P. (1999) Representing twentieth century space-time climate variability. Part 1: development of a 1961-1990 mean monthly terrestrial climatology. J. Clim. 12: 829-856.
New, M., Hulme, M. and Jones, P.D. (2000) Representing twentieth century space-time climate variability. Part 2: development of 1901-96 monthly grids of terrestrial surface climate. J. Clim. 13: 2217-2238.
Developments in Tourism Climatology – A. Matzarakis, C. R. de Freitas, D. Scott, 2007
18
CLIMATE PREFERENCES FOR TOURISM: AN EXPLORATORY TRI-NATION COMPARISON
D. Scott*1, S. Gössling2 and C. R de Freitas3
1Dept. of Geography, University of Waterloo, Waterloo, Ontario, Canada
2Dept. of Service Management, Lund University, Helsingborg, Sweden 3School of Geography, Geology and Environmental Science, University of Auckland, Auckland,
New Zealand
ABSTRACT This study examines tourist perceptions of optimal climatic conditions for tourism
and the relative importance of four climatic parameters (air temperature, precipitation, sunshine,
wind) in three major tourism environments (beach-coastal, urban, mountains). A survey instrument
was administered to 831 university students representative of the young-adult travel segment, in
three countries (Canada, New Zealand, Sweden). Three salient findings included: the perceived
optimum climatic conditions varied significantly among the three major tourism environments, the
relative importance of the four climatic parameters was not the same in the three tourism
environments, and the climatic preferences of respondents from the three nations were found to be
consistent in some ways but varied significantly in others. The findings have a number of important
implications for the literature on climate and tourism, including the development of climate indices
for tourism, the definition of single optimal climate for global tourism, and climate change impact
assessments. We believe that with a broader cross-cultural sample of tourist segments, this
approach holds much promise for revealing the detailed complexities of tourist preferences for
climate.
KEYWORDS: Preference, Canada, New Zealand, Sweden
INTRODUCTION
A number of lines of evidence indicate that the atmospheric environment is a dominant attribute of
a tourist destination and has a major effect on tourism demand and satisfaction (de Freitas, 2003).
Weather and climate affect tourists and the desirability of tourist destinations in different ways.
Weather is the current state of the atmospheric environment and is what tourists actually experience
when at a destination, affecting their activities and holiday satisfaction. Weather also affects key
aspects of tourism operations, including infrastructure, activity programming, and operating costs.
Climate is the weather that is expected at a location for a certain time and is typically expressed as
‘average weather’ (sometimes referred to as ‘climate normals’ or ‘climate means’) over a 30-year
Developments in Tourism Climatology – A. Matzarakis, C. R. de Freitas, D. Scott, 2007
19
period, which is the technical standard established by the World Meteorological Organization.
Climate is what a tourist would anticipate experiencing at a specific destination and time and is a
key factor considered by tourists, consciously or implicitly during travel planning, For these reasons
it is an important attribute taken into account in locational planning, infrastructure development and
destination marketing.
Weather and climate are an intrinsic component of the vacation experience and can act as a central
motivator in an individual’s selection of holiday destination and timing of holiday travel, and be a
salient factor in tourism spending and holiday satisfaction. Hu and Ritchie (1993) reviewed several
destination image studies and found that ‘natural beauty and climate’ were of universal importance
in defining destination attractiveness. Weather has been found to influence travel patterns and
expenditures in several nations (see Scott 2006, for a review). It is thought that for many travellers,
weather conditions at the destination are central to overall trip satisfaction, although further research
to understand the influence of weather on consumer travel satisfaction is required. Seasonal climate
fluctuations at tourism destinations and at high latitude source regions are considered a key driver
of the seasonality of global tourism demand (Gossling and Hall, 2006).
The aforementioned body of research indicates clearly that climate is a resource that is exploited by
the tourism industry and tourists alike and as such is a resource that can be measured and evaluated
(de Freitas, 2003). An important challenge of doing so rests in the selection of appropriate
meteorological variables (e.g., temperature, rain, wind, sunshine, visibility, humidity, air quality,
UV radiation, etc.) and in the definition of ‘optimal’ through to ‘unacceptable’ climatic states, as
perceived by tourists.
The preferences of tourists for all aspects of climate have been explored in various ways. Several
attempts have been made to identify most favourable or ‘optimal’ climate conditions for tourism
generally and for specific tourism segments or activities (e.g., 3S holidays in beach environments).
The purpose of evaluating climate for tourism and identifying ‘optimal’ climate conditions has
varied in the literature. Overall, the heterogeneous approaches to examining tourist climate
preferences and defining ‘optimal’ climates for tourism can be grouped into three types of studies:
expert-based, revealed preference and stated preference. These respective bodies of literature are
reviewed by the authors elsewhere and cannot be adequately discussed in this short paper.
The purpose of this study is to examine these two central questions using a survey of climatic
preferences of a sample of tourists from three nations: Canada, New Zealand and Sweden. Four
specific research questions guiding the study included:
1) What is the range of climate preferences among tourists in terms of the optimal conditions for
certain variables, such as temperature? Are tourists homogenous in their climate preferences so
that a common ‘optimum climate’ for tourism could be identified?
Developments in Tourism Climatology – A. Matzarakis, C. R. de Freitas, D. Scott, 2007
20
2) What is the relative importance of different climate parameters to tourists? Is temperature the
dominant climate variable or are other variables equally important?
3) In what way, if at all, do the climate preferences of tourists differ among tourism environments
or destinations where the dominant tourist activities would differ substantially?
4) Do cultural or ethnic differences exist in tourist climate preferences?
METHOD
To our knowledge, this study represents the first ex situ study of tourist climate preferences, where
the survey is administered in a climate controlled laboratory setting, free of potential bias from
existing or recent weather conditions and where respondents can express their perceived satisfaction
with a wide range of climate conditions in very different tourism settings. A sample of university
students was used for this study of stated climate preferences for tourism. Structured questionnaires
were administered to undergraduate students attending upper year classes in the University of
Waterloo (Waterloo, Canada), the University of Auckland (Auckland, New Zealand) and Lund
University, Helsingborg Campus (Helsingborg, Sweden). The total survey sample consists of 831
students, with 333 from Canada, 207 from New Zealand and 291 from Sweden. A pre-test of the
survey instrument (n=35) was conducted in Canada and slight modifications made to improve the
clarity of some questions. The survey was conducted in English in all three countries.
RESULTS
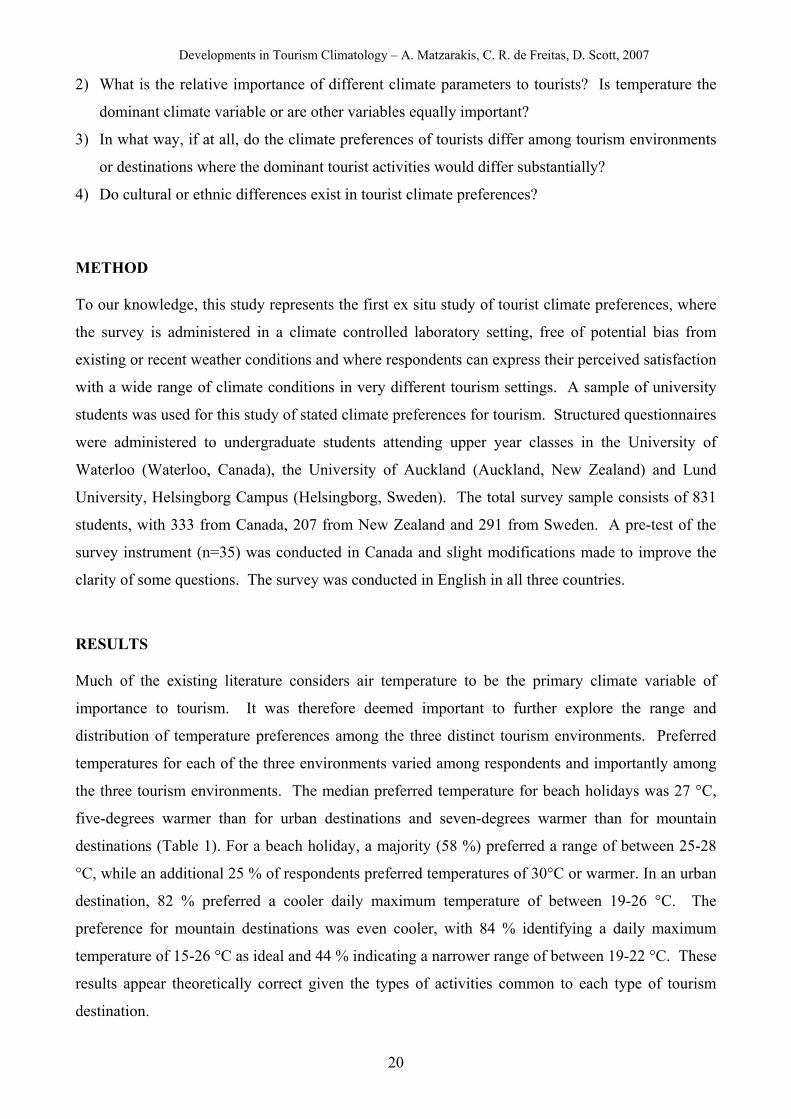
Much of the existing literature considers air temperature to be the primary climate variable of
importance to tourism. It was therefore deemed important to further explore the range and
distribution of temperature preferences among the three distinct tourism environments. Preferred
temperatures for each of the three environments varied among respondents and importantly among
the three tourism environments. The median preferred temperature for beach holidays was 27 °C,
five-degrees warmer than for urban destinations and seven-degrees warmer than for mountain
destinations (Table 1). For a beach holiday, a majority (58 %) preferred a range of between 25-28
°C, while an additional 25 % of respondents preferred temperatures of 30°C or warmer. In an urban
destination, 82 % preferred a cooler daily maximum temperature of between 19-26 °C. The
preference for mountain destinations was even cooler, with 84 % identifying a daily maximum
temperature of 15-26 °C as ideal and 44 % indicating a narrower range of between 19-22 °C. These
results appear theoretically correct given the types of activities common to each type of tourism
destination.
Developments in Tourism Climatology – A. Matzarakis, C. R. de Freitas, D. Scott, 2007
21
Table 1: Ideal temperature in different tourism environments (°C)
Beach Urban Mountain Mean 26.8 22.5 20.5 Median 27 22 20 Std Dev 4.54 4.12 3.96
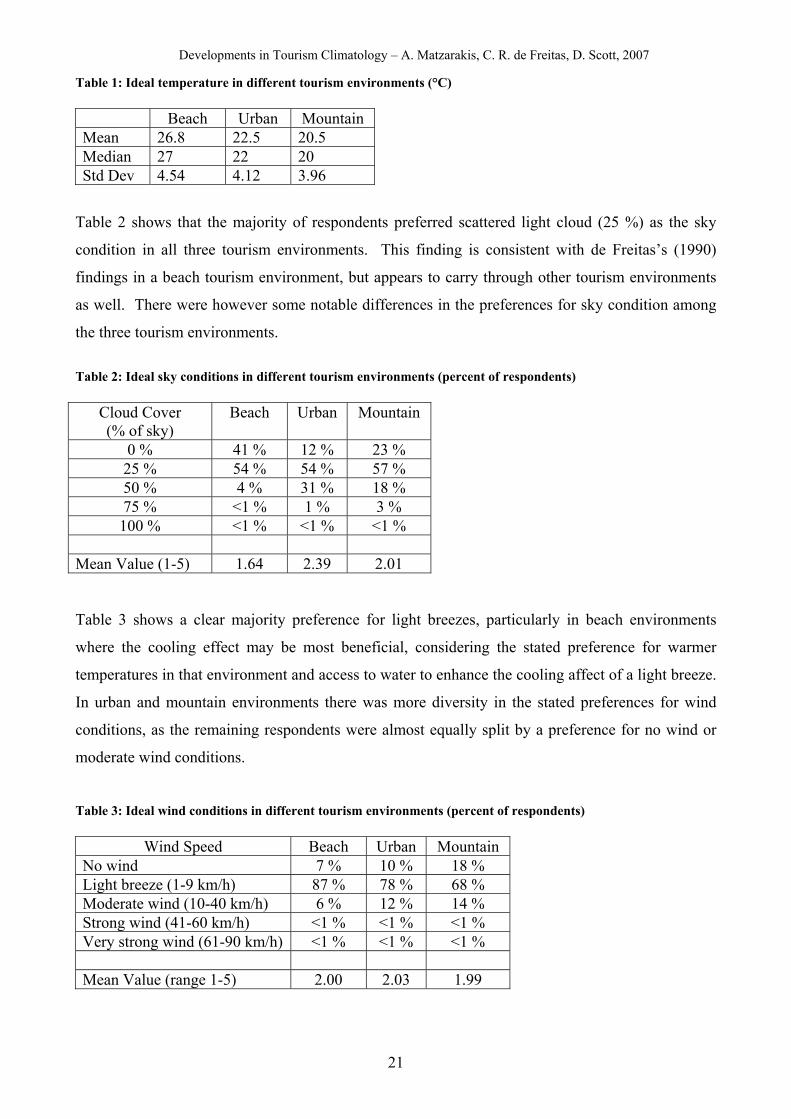
Table 2 shows that the majority of respondents preferred scattered light cloud (25 %) as the sky
condition in all three tourism environments. This finding is consistent with de Freitas’s (1990)
findings in a beach tourism environment, but appears to carry through other tourism environments
as well. There were however some notable differences in the preferences for sky condition among
the three tourism environments.
Table 2: Ideal sky conditions in different tourism environments (percent of respondents)
Cloud Cover (% of sky)
Beach Urban Mountain
0 % 41 % 12 % 23 % 25 % 54 % 54 % 57 % 50 % 4 % 31 % 18 % 75 % <1 % 1 % 3 % 100 % <1 % <1 % <1 %
Mean Value (1-5) 1.64 2.39 2.01
Table 3 shows a clear majority preference for light breezes, particularly in beach environments
where the cooling effect may be most beneficial, considering the stated preference for warmer
temperatures in that environment and access to water to enhance the cooling affect of a light breeze.
In urban and mountain environments there was more diversity in the stated preferences for wind
conditions, as the remaining respondents were almost equally split by a preference for no wind or
moderate wind conditions.
Table 3: Ideal wind conditions in different tourism environments (percent of respondents)
Wind Speed Beach Urban Mountain No wind 7 % 10 % 18 % Light breeze (1-9 km/h) 87 % 78 % 68 % Moderate wind (10-40 km/h) 6 % 12 % 14 % Strong wind (41-60 km/h) <1 % <1 % <1 % Very strong wind (61-90 km/h) <1 % <1 % <1 % Mean Value (range 1-5) 2.00 2.03 1.99
Developments in Tourism Climatology – A. Matzarakis, C. R. de Freitas, D. Scott, 2007
22
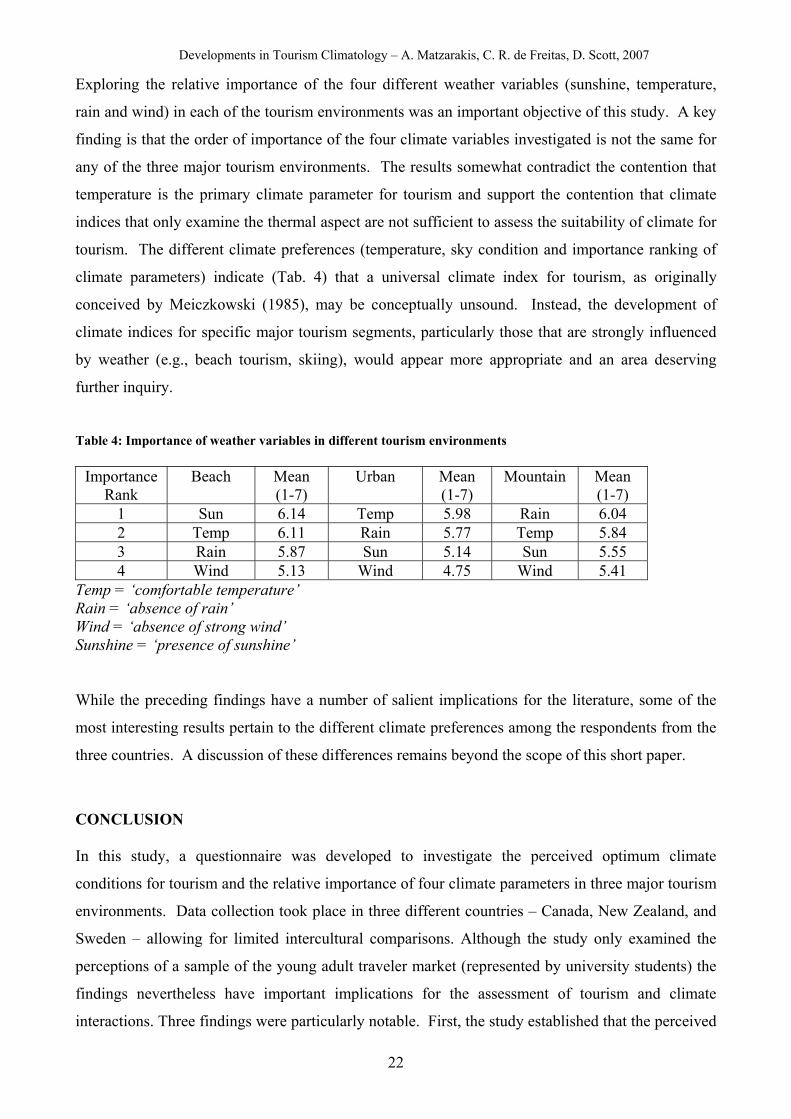
Exploring the relative importance of the four different weather variables (sunshine, temperature,
rain and wind) in each of the tourism environments was an important objective of this study. A key
finding is that the order of importance of the four climate variables investigated is not the same for
any of the three major tourism environments. The results somewhat contradict the contention that
temperature is the primary climate parameter for tourism and support the contention that climate
indices that only examine the thermal aspect are not sufficient to assess the suitability of climate for
tourism. The different climate preferences (temperature, sky condition and importance ranking of
climate parameters) indicate (Tab. 4) that a universal climate index for tourism, as originally
conceived by Meiczkowski (1985), may be conceptually unsound. Instead, the development of
climate indices for specific major tourism segments, particularly those that are strongly influenced
by weather (e.g., beach tourism, skiing), would appear more appropriate and an area deserving
further inquiry.
Table 4: Importance of weather variables in different tourism environments
Importance Rank
Beach Mean (1-7)
Urban Mean (1-7)
Mountain Mean (1-7)
1 Sun 6.14 Temp 5.98 Rain 6.04 2 Temp 6.11 Rain 5.77 Temp 5.84 3 Rain 5.87 Sun 5.14 Sun 5.55 4 Wind 5.13 Wind 4.75 Wind 5.41
Temp = ‘comfortable temperature’ Rain = ‘absence of rain’ Wind = ‘absence of strong wind’ Sunshine = ‘presence of sunshine’
While the preceding findings have a number of salient implications for the literature, some of the
most interesting results pertain to the different climate preferences among the respondents from the
three countries. A discussion of these differences remains beyond the scope of this short paper.
CONCLUSION
In this study, a questionnaire was developed to investigate the perceived optimum climate
conditions for tourism and the relative importance of four climate parameters in three major tourism
environments. Data collection took place in three different countries – Canada, New Zealand, and
Sweden – allowing for limited intercultural comparisons. Although the study only examined the
perceptions of a sample of the young adult traveler market (represented by university students) the
findings nevertheless have important implications for the assessment of tourism and climate
interactions. Three findings were particularly notable. First, the study established that the perceived
Developments in Tourism Climatology – A. Matzarakis, C. R. de Freitas, D. Scott, 2007
23
optimum climate conditions differed in some ways in the three major tourism environments
examined. Second, the relative importance of the four climate variables examined (temperature,
sunshine, rain and wind) was not the same in any of the three major tourism environments. Third,
climate preferences were found to differ among respondents from the three nations in some ways,
yet were highly consistent in others. The relative importance of the four climate parameters in the
three tourism environments was also found to differ among the respondents from the three nations.
The main limitations of this study are the relatively narrow tourist market segment it examined
(young adults) and the restricted spatial coverage of the survey (only three nations). However, we
believe this limitation is compensated for by the novel ability of the approach to explore the climate
preferences of tourists in a detailed manner. Future research with a broader cross-cultural sample
from more diverse climatic regions (tropical, temperate, monsoon and semi-arid) remains a
potentially productive direction. It would seem that the existing literature has only begun to unveil
the complexities of the interactions between climate and tourism and much more remains to be
explored.
REFERENCES
de Freitas CR (1990) Recreation climate assessment. International Journal of Climatology 10: 89-103.
de Freitas CR (2003) Tourism climatology: evaluating environmental information for decision making and business planning in the recreation and tourism sector. International Journal of Biometeorology 4:45-54.
Gössling S, Hall CM (eds) (2006). Tourism and Global Environmental Change. Ecological, social, economic and political interrelationships. Routledge, London.
Hu Y, Ritchie J (1993) Measuring destination attractiveness: a contextual approach. Journal of Travel Research 32(20):25-34.
Mieczkowski Z (1985) The tourism climatic index: a method of evaluating world climates for tourism. The Canadian Geographer 29(3): 220-33.
Scott, D. (2006) Climate change and sustainable tourism in the 21st century. In: Tourism Research: Policy, Planning, and Prospects. J. Cukier (ed.). Waterloo: Department of Geography Publication Series, University of Waterloo. 175-248.
Developments in Tourism Climatology – A. Matzarakis, C. R. de Freitas, D. Scott, 2007
24
BIOMETEOROLOGICAL BASIS FOR TOURISM
Ksenija Zaninović1 and Andreas Matzarakis2
1Meteorological and Hydrological Service of Croatia, Zagreb, Croatia
2Meteorological Institute, University of Freiburg, Germany,
[email protected] ABSTRACT Climate is an important resource for tourism and must be taken into account in
tourism promotions. Here the biometeorological conditions on the Adriatic coast and in the Croatian
inland are compared. The biometeorological conditions are analyzed by means of frequency of
thermal sensation based on physiologically equivalent temperature in ten-day periods throughout
the year. In combination with some other meteorological parameters, such as air and sea
temperature, sunshine duration, amount and number of days with precipitation and wind roses can
be valuable for tourists, enabling everyone to choose the most convenient period for holidays,
depending on personal conditions and needs.
KEYWORDS: Thermal sensation, physiologically equivalent temperature, meteorological leaflet
INTRODUCTION
Weather and climate, together with some other natural resources, such as geographical location,
orography and landscape, play important roles for tourism and recreation (de Freitas, 2003). Since
outdoor recreation is very weather sensitive (Perry, 1972), weather and climate can be one of the
most important features attracting tourists, but also present limiting factors. The role of climate in
determining the suitability of a region for tourism or outdoor recreation is often assumed to be self-
evident and therefore to require no elaboration. Climate-related information is often very poor and
barely helps tourists in planning and scheduling their holidays or the promotion of a tourist
destination in publicity campaigns.
Climatic information can be useful in decision-making if presented in an appropriate form.
Therefore it is important to identify which climate-related criteria people use to make their
decisions about holiday destinations, taking into account that the human response to climate
depends on individual perception and sensitivity. The atmospheric conditions can be divided into
three main groups – thermal, physical and aesthetic (de Freitas, 1990). The “thermal” climate
variable is air temperature or thermal sensation, “physical” variables are rain, snow and wind, while
sunshine and cloudiness can be treated as the “aesthetic” climate variables (de Freitas, 1990).
Developments in Tourism Climatology – A. Matzarakis, C. R. de Freitas, D. Scott, 2007
25
DATA AND METHOD
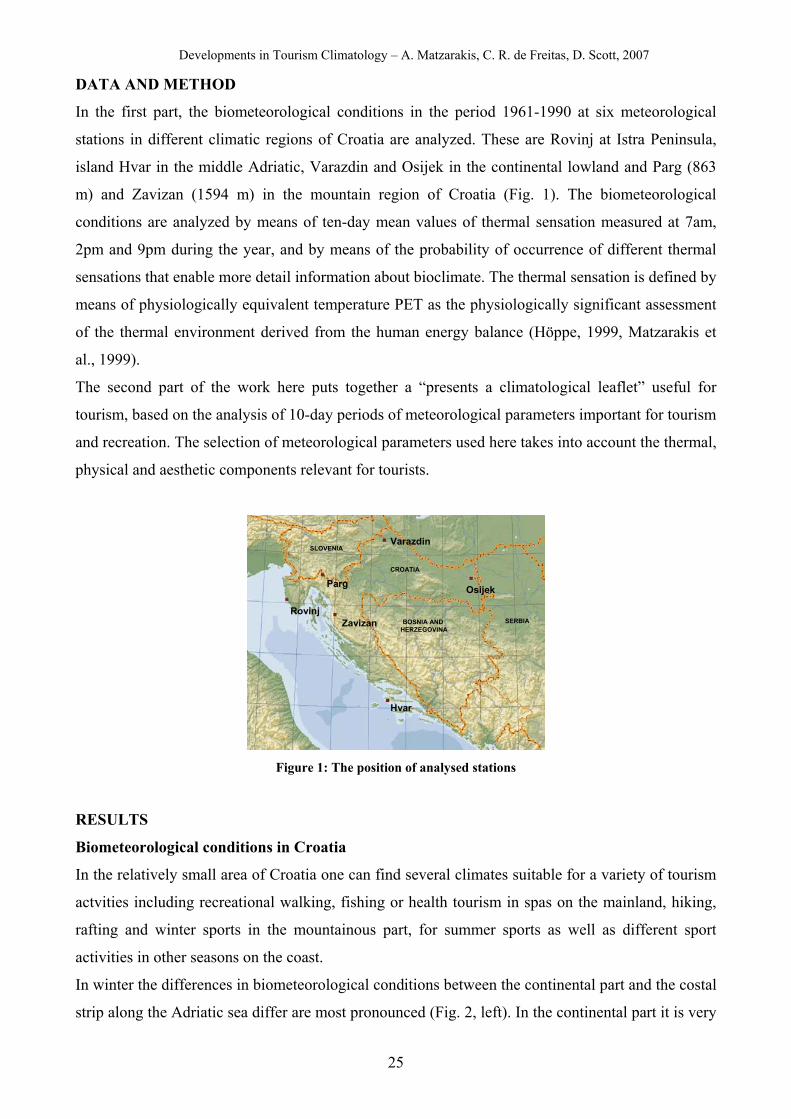
In the first part, the biometeorological conditions in the period 1961-1990 at six meteorological
stations in different climatic regions of Croatia are analyzed. These are Rovinj at Istra Peninsula,
island Hvar in the middle Adriatic, Varazdin and Osijek in the continental lowland and Parg (863
m) and Zavizan (1594 m) in the mountain region of Croatia (Fig. 1). The biometeorological
conditions are analyzed by means of ten-day mean values of thermal sensation measured at 7am,
2pm and 9pm during the year, and by means of the probability of occurrence of different thermal
sensations that enable more detail information about bioclimate. The thermal sensation is defined by
means of physiologically equivalent temperature PET as the physiologically significant assessment
of the thermal environment derived from the human energy balance (Höppe, 1999, Matzarakis et
al., 1999).
The second part of the work here puts together a “presents a climatological leaflet” useful for
tourism, based on the analysis of 10-day periods of meteorological parameters important for tourism
and recreation. The selection of meteorological parameters used here takes into account the thermal,
physical and aesthetic components relevant for tourists.
Varazdin
OsijekParg
ZavizanRovinj
Hvar
BOSNIA AND HERZEGOVINA
CROATIA
SLOVENIA
SERBIA
Varazdin
OsijekParg
ZavizanRovinj
Hvar
BOSNIA AND HERZEGOVINA
CROATIA
SLOVENIA
SERBIA
Figure 1: The position of analysed stations
RESULTS
Biometeorological conditions in Croatia
In the relatively small area of Croatia one can find several climates suitable for a variety of tourism
actvities including recreational walking, fishing or health tourism in spas on the mainland, hiking,
rafting and winter sports in the mountainous part, for summer sports as well as different sport
activities in other seasons on the coast.
In winter the differences in biometeorological conditions between the continental part and the costal
strip along the Adriatic sea differ are most pronounced (Fig. 2, left). In the continental part it is very
Developments in Tourism Climatology – A. Matzarakis, C. R. de Freitas, D. Scott, 2007
26
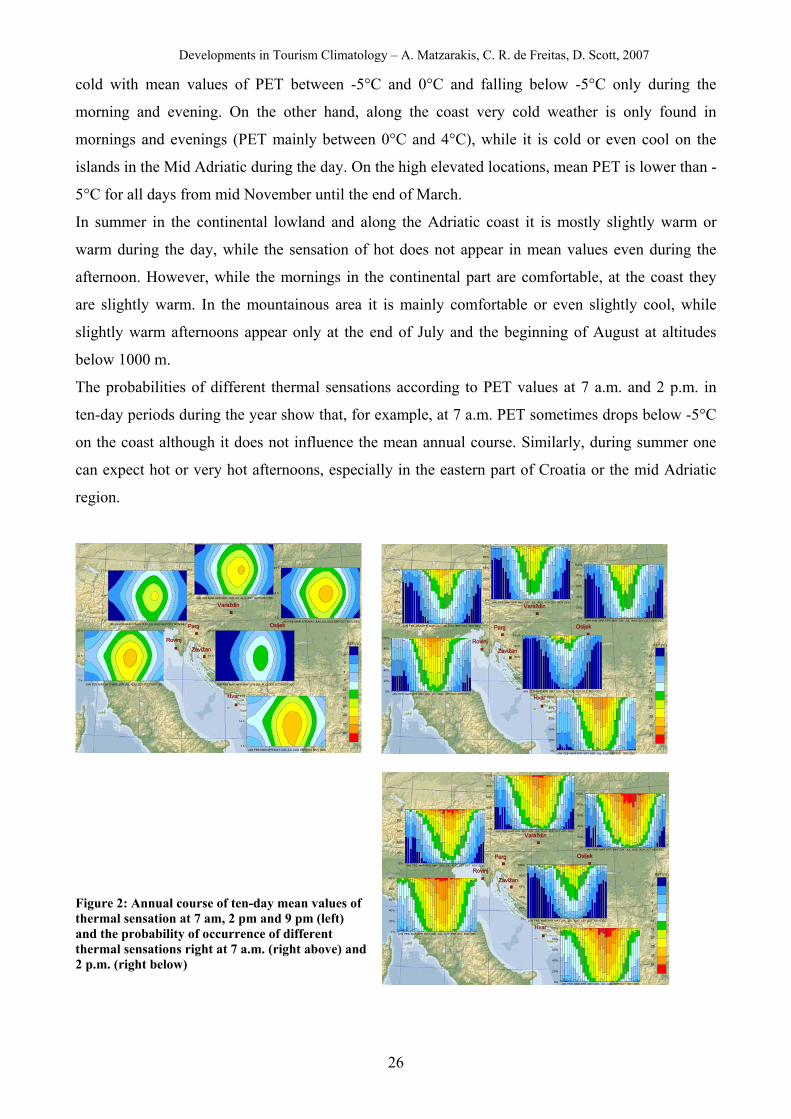
cold with mean values of PET between -5°C and 0°C and falling below -5°C only during the
morning and evening. On the other hand, along the coast very cold weather is only found in
mornings and evenings (PET mainly between 0°C and 4°C), while it is cold or even cool on the
islands in the Mid Adriatic during the day. On the high elevated locations, mean PET is lower than -
5°C for all days from mid November until the end of March.
In summer in the continental lowland and along the Adriatic coast it is mostly slightly warm or
warm during the day, while the sensation of hot does not appear in mean values even during the
afternoon. However, while the mornings in the continental part are comfortable, at the coast they
are slightly warm. In the mountainous area it is mainly comfortable or even slightly cool, while
slightly warm afternoons appear only at the end of July and the beginning of August at altitudes
below 1000 m.
The probabilities of different thermal sensations according to PET values at 7 a.m. and 2 p.m. in
ten-day periods during the year show that, for example, at 7 a.m. PET sometimes drops below -5°C
on the coast although it does not influence the mean annual course. Similarly, during summer one
can expect hot or very hot afternoons, especially in the eastern part of Croatia or the mid Adriatic
region.
Varaždin
Osijek
Rovinj
Parg
Zavižan
Hvar
21 h
I
7 h
14 h
JAN FEB MAR APR MAY JUN JUL AUG SEP OCT NOV DEC
21 h
I
7 h
14 h
JAN FEB MAR APR MAY JUN JUL AUG SEP OCT NOV DEC
21 h
I
7 h
14 h
JAN FEB MAR APR MAY JUN JUL AUG SEP OCT NOV DEC
21 h
I
7 h
14 h
JAN FEB MAR APR MAY JUN JUL AUG SEP OCT NOV DEC
I
7 h
14 h
21 h
JAN FEB MAR APR MAY JUN JUL AUG SEP OCT NOV DEC
21 h
I
7 h
14 h
JAN FEB MAR APR MAY JUN JUL AUG SEP OCT NOV DEC
PET (°C)
-5
0
4
8
13
18
23
29
35
41
Varaždin
Osijek
Rovinj
Parg
Zavižan
Hvar
Varaždin
Osijek
Rovinj
Parg
Zavižan
Hvar
21 h
I
7 h
14 h
JAN FEB MAR APR MAY JUN JUL AUG SEP OCT NOV DEC
21 h
I
7 h
14 h
JAN FEB MAR APR MAY JUN JUL AUG SEP OCT NOV DEC
21 h
I
7 h
14 h
JAN FEB MAR APR MAY JUN JUL AUG SEP OCT NOV DEC
21 h
I
7 h
14 h
JAN FEB MAR APR MAY JUN JUL AUG SEP OCT NOV DEC
I
7 h
14 h
21 h
JAN FEB MAR APR MAY JUN JUL AUG SEP OCT NOV DEC
21 h
I
7 h
14 h
JAN FEB MAR APR MAY JUN JUL AUG SEP OCT NOV DEC
PET (°C)
-5
0
4
8
13
18
23
29
35
41
Varaždin
Osijek
Rovinj
Parg
Zavižan
Hvar
PET (°C)
-5
0
4
8
13
18
23
29
35
41
0%
20%
40%
60%
80%
100%
JAN FEB MAR APR MAY JUN JUL AUG SEP OCT NOV DEC
0%
20%
40%
60%
80%
100%
JAN FEB MAR APR MAY JUN JUL AUG SEP OCT NOV DEC
0%
20%
40%
60%
80%
100%
JAN FEB MAR APR MAY JUN JUL AUG SEP OCT NOV DEC0%
20%
40%
60%
80%
100%
JAN FEB MAR APR MAY JUN JUL AUG SEP OCT NOV DEC
0%
20%
40%
60%
80%
100%
JAN FEB MAR APR MAY JUN JUL AUG SEP OCT NOV DEC
0%
20%
40%
60%
80%
100%
JAN FEB MAR APR MAY JUN JUL AUG SEP OCT NOV DEC
Varaždin
Osijek
Rovinj
Parg
Zavižan
Hvar
Varaždin
Osijek
Rovinj
Parg
Zavižan
Hvar
PET (°C)
-5
0
4
8
13
18
23
29
35
41
0%
20%
40%
60%
80%
100%
JAN FEB MAR APR MAY JUN JUL AUG SEP OCT NOV DEC
0%
20%
40%
60%
80%
100%
JAN FEB MAR APR MAY JUN JUL AUG SEP OCT NOV DEC
0%
20%
40%
60%
80%
100%
JAN FEB MAR APR MAY JUN JUL AUG SEP OCT NOV DEC0%
20%
40%
60%
80%
100%
JAN FEB MAR APR MAY JUN JUL AUG SEP OCT NOV DEC
0%
20%
40%
60%
80%
100%
JAN FEB MAR APR MAY JUN JUL AUG SEP OCT NOV DEC
0%
20%
40%
60%
80%
100%
JAN FEB MAR APR MAY JUN JUL AUG SEP OCT NOV DEC
Figure 2: Annual course of ten-day mean values of thermal sensation at 7 am, 2 pm and 9 pm (left) and the probability of occurrence of different thermal sensations right at 7 a.m. (right above) and 2 p.m. (right below)
Varaždin
Osijek
Rovinj
Parg
Zavižan
Hvar
PET (°C)
-5
0
4
8
13
18
23
29
35
41
0%
20%
40%
60%
80%
100%
JAN FEB MAR APR MAY JUN JUL AUG SEP OCT NOV DEC
0%
20%
40%
60%
80%
100%
JAN FEB MAR APR MAY JUN JUL AUG SEP OCT NOV DEC
0%
20%
40%
60%
80%
100%
JAN FEB MAR APR MAY JUN JUL AUG SEP OCT NOV DEC
0%
20%
40%
60%
80%
100%
JAN FEB MAR APR MAY JUN JUL AUG SEP OCT NOV DEC
0%
20%
40%
60%
80%
100%
JAN FEB MAR APR MAY JUN JUL AUG SEP OCT NOV DEC
0%
20%
40%
60%
80%
100%
JAN FEB MAR APR MAY JUN JUL AUG SEP OCT NOV DEC
Varaždin
Osijek
Rovinj
Parg
Zavižan
Hvar
Varaždin
Osijek
Rovinj
Parg
Zavižan
Hvar
PET (°C)
-5
0
4
8
13
18
23
29
35
41
0%
20%
40%
60%
80%
100%
JAN FEB MAR APR MAY JUN JUL AUG SEP OCT NOV DEC
0%
20%
40%
60%
80%
100%
JAN FEB MAR APR MAY JUN JUL AUG SEP OCT NOV DEC
0%
20%
40%
60%
80%
100%
JAN FEB MAR APR MAY JUN JUL AUG SEP OCT NOV DEC
0%
20%
40%
60%
80%
100%
JAN FEB MAR APR MAY JUN JUL AUG SEP OCT NOV DEC
0%
20%
40%
60%
80%
100%
JAN FEB MAR APR MAY JUN JUL AUG SEP OCT NOV DEC
0%
20%
40%
60%
80%
100%
JAN FEB MAR APR MAY JUN JUL AUG SEP OCT NOV DEC
Developments in Tourism Climatology – A. Matzarakis, C. R. de Freitas, D. Scott, 2007
27
The leaflet of climate and bioclimate
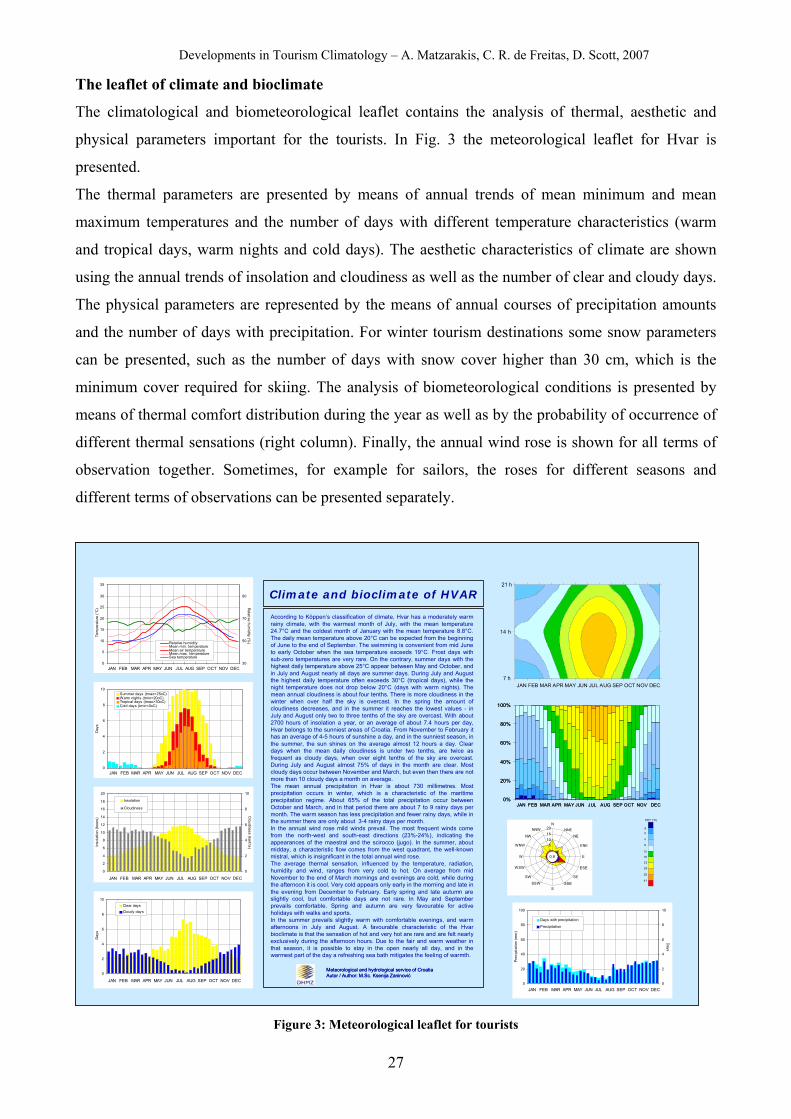
The climatological and biometeorological leaflet contains the analysis of thermal, aesthetic and
physical parameters important for the tourists. In Fig. 3 the meteorological leaflet for Hvar is
presented.
The thermal parameters are presented by means of annual trends of mean minimum and mean
maximum temperatures and the number of days with different temperature characteristics (warm
and tropical days, warm nights and cold days). The aesthetic characteristics of climate are shown
using the annual trends of insolation and cloudiness as well as the number of clear and cloudy days.
The physical parameters are represented by the means of annual courses of precipitation amounts
and the number of days with precipitation. For winter tourism destinations some snow parameters
can be presented, such as the number of days with snow cover higher than 30 cm, which is the
minimum cover required for skiing. The analysis of biometeorological conditions is presented by
means of thermal comfort distribution during the year as well as by the probability of occurrence of
different thermal sensations (right column). Finally, the annual wind rose is shown for all terms of
observation together. Sometimes, for example for sailors, the roses for different seasons and
different terms of observations can be presented separately.
Climate and bioclimate of HVAR
According to Köppen’s classification of climate, Hvar has a moderately warm rainy climate, with the warmest month of July, with the mean temperature 24.7°C and the coldest month of January with the mean temperature 8.8°C. The daily mean temperature above 20°C can be expected from the beginning of June to the end of September. The swimming is convenient from mid June to early October when the sea temperature exceeds 19°C. Frost days with sub-zero temperatures are very rare. On the contrary, summer days with the highest daily temperature above 25°C appear between May and October, and in July and August nearly all days are summer days. During July and August the highest daily temperature often exceeds 30°C (tropical days), while the night temperature does not drop below 20°C (days with warm nights). The mean annual cloudiness is about four tenths. There is more cloudiness in the winter when over half the sky is overcast. In the spring the amount of cloudiness decreases, and in the summer it reaches the lowest values - in July and August only two to three tenths of the sky are overcast. With about 2700 hours of insolation a year, or an average of about 7.4 hours per day, Hvar belongs to the sunniest areas of Croatia. From November to February it has an average of 4-5 hours of sunshine a day, and in the sunniest season, in the summer, the sun shines on the average almost 12 hours a day. Clear days when the mean daily cloudiness is under two tenths, are twice as frequent as cloudy days, when over eight tenths of the sky are overcast. During July and August almost 75% of days in the month are clear. Most cloudy days occur between November and March, but even then there are not more than 10 cloudy days a month on average.The mean annual precipitation in Hvar is about 730 millimetres. Most precipitation occurs in winter, which is a characteristic of the maritime precipitation regime. About 65% of the total precipitation occur between October and March, and in that period there are about 7 to 9 rainy days per month. The warm season has less precipitation and fewer rainy days, while in the summer there are only about 3-4 rainy days per month.In the annual wind rose mild winds prevail. The most frequent winds come from the north-west and south-east directions (23%-24%), indicating the appearances of the maestral and the scirocco (jugo). In the summer, about midday, a characteristic flow comes from the west quadrant, the well-known mistral, which is insignificant in the total annual wind rose.The average thermal sensation, influenced by the temperature, radiation, humidity and wind, ranges from very cold to hot. On average from mid November to the end of March mornings and evenings are cold, while during the afternoon it is cool. Very cold appears only early in the morning and late in the evening from December to February. Early spring and late autumn are slightly cool, but comfortable days are not rare. In May and September prevails comfortable. Spring and autumn are very favourable for active holidays with walks and sports.In the summer prevails slightly warm with comfortable evenings, and warm afternoons in July and August. A favourable characteristic of the Hvar bioclimate is that the sensation of hot and very hot are rare and are felt nearly exclusively during the afternoon hours. Due to the fair and warm weather in that season, it is possible to stay in the open nearly all day, and in the warmest part of the day a refreshing sea bath mitigates the feeling of warmth.
Meteorological and hydrological service of CroatiaAutor / Author: M.Sc. Ksenija Zaninović
0
5
10
15
20
25
30
35
1 3 5 7 9 11 13 15 17 19 21 23 25 27 29 31 33 35
Tem
pera
ture
(°C
)
30
50
70
90
Relative hum
idity (%)Relative humidity
Mean min. temperatureMean air temperatureMean max. temperatureSea temperature
JAN FEB MAR APR MAY JUN JUL AUG SEP OCT NOV DEC
0
2
4
6
8
10
1 3 5 7 9 11 13 15 17 19 21 23 25 27 29 31 33 35
Day
s
Summer days (tmax>25oC)Warm nights (tmin>20oC)Tropical days (tmax>30oC)Cold days (tmin<0oC)
JAN FEB MAR APR MAY JUN JUL AUG SEP OCT NOV DEC
0
2
4
6
8
10
12
14
16
18
20
1 3 5 7 9 11 13 15 17 19 21 23 25 27 29 31 33 35
Inso
latio
n (h
ours
)
0
2
4
6
8
10
Cloudiness (tenths)
Insolation
Cloudiness
JAN FEB MAR APR MAY JUN JUL AUG SEP OCT NOV DEC
0
2
4
6
8
10
1 3 5 7 9 11 13 15 17 19 21 23 25 27 29 31 33 35
Day
s
Clear daysCloudy days
JAN FEB MAR APR MAY JUN JUL AUG SEP OCT NOV DEC
I
7 h
14 h
21 h
JAN FEB MAR APR MAY JUN JUL AUG SEP OCT NOV DEC
0%
20%
40%
60%
80%
100%
JAN FEB MAR APR MAY JUN JUL AUG SEP OCT NOV DEC
-505
101520
NNNE
NE
ENE
E
ESE
SE
SSES
SSW
SW
WSW
W
WNW
NW
NNW
0.8
PET (°C)
-50
4
8
13
18
23
29
35
41
0
20
40
60
80
100
1 3 5 7 9 11 13 15 17 19 21 23 25 27 29 31 33 35
Pre
cipi
tatio
n (m
m)
0
2
4
6
8
10
Days
Days with precipitation
Precipitation
JAN FEB MAR APR MAY JUN JUL AUG SEP OCT NOV DEC
Climate and bioclimate of HVARClimate and bioclimate of HVAR
According to Köppen’s classification of climate, Hvar has a moderately warm rainy climate, with the warmest month of July, with the mean temperature 24.7°C and the coldest month of January with the mean temperature 8.8°C. The daily mean temperature above 20°C can be expected from the beginning of June to the end of September. The swimming is convenient from mid June to early October when the sea temperature exceeds 19°C. Frost days with sub-zero temperatures are very rare. On the contrary, summer days with the highest daily temperature above 25°C appear between May and October, and in July and August nearly all days are summer days. During July and August the highest daily temperature often exceeds 30°C (tropical days), while the night temperature does not drop below 20°C (days with warm nights). The mean annual cloudiness is about four tenths. There is more cloudiness in the winter when over half the sky is overcast. In the spring the amount of cloudiness decreases, and in the summer it reaches the lowest values - in July and August only two to three tenths of the sky are overcast. With about 2700 hours of insolation a year, or an average of about 7.4 hours per day, Hvar belongs to the sunniest areas of Croatia. From November to February it has an average of 4-5 hours of sunshine a day, and in the sunniest season, in the summer, the sun shines on the average almost 12 hours a day. Clear days when the mean daily cloudiness is under two tenths, are twice as frequent as cloudy days, when over eight tenths of the sky are overcast. During July and August almost 75% of days in the month are clear. Most cloudy days occur between November and March, but even then there are not more than 10 cloudy days a month on average.The mean annual precipitation in Hvar is about 730 millimetres. Most precipitation occurs in winter, which is a characteristic of the maritime precipitation regime. About 65% of the total precipitation occur between October and March, and in that period there are about 7 to 9 rainy days per month. The warm season has less precipitation and fewer rainy days, while in the summer there are only about 3-4 rainy days per month.In the annual wind rose mild winds prevail. The most frequent winds come from the north-west and south-east directions (23%-24%), indicating the appearances of the maestral and the scirocco (jugo). In the summer, about midday, a characteristic flow comes from the west quadrant, the well-known mistral, which is insignificant in the total annual wind rose.The average thermal sensation, influenced by the temperature, radiation, humidity and wind, ranges from very cold to hot. On average from mid November to the end of March mornings and evenings are cold, while during the afternoon it is cool. Very cold appears only early in the morning and late in the evening from December to February. Early spring and late autumn are slightly cool, but comfortable days are not rare. In May and September prevails comfortable. Spring and autumn are very favourable for active holidays with walks and sports.In the summer prevails slightly warm with comfortable evenings, and warm afternoons in July and August. A favourable characteristic of the Hvar bioclimate is that the sensation of hot and very hot are rare and are felt nearly exclusively during the afternoon hours. Due to the fair and warm weather in that season, it is possible to stay in the open nearly all day, and in the warmest part of the day a refreshing sea bath mitigates the feeling of warmth.
Meteorological and hydrological service of CroatiaAutor / Author: M.Sc. Ksenija ZaninovićMeteorological and hydrological service of CroatiaAutor / Author: M.Sc. Ksenija Zaninović
0
5
10
15
20
25
30
35
1 3 5 7 9 11 13 15 17 19 21 23 25 27 29 31 33 35
Tem
pera
ture
(°C
)
30
50
70
90
Relative hum
idity (%)Relative humidity
Mean min. temperatureMean air temperatureMean max. temperatureSea temperature
JAN FEB MAR APR MAY JUN JUL AUG SEP OCT NOV DEC
0
2
4
6
8
10
1 3 5 7 9 11 13 15 17 19 21 23 25 27 29 31 33 35
Day
s
Summer days (tmax>25oC)Warm nights (tmin>20oC)Tropical days (tmax>30oC)Cold days (tmin<0oC)
JAN FEB MAR APR MAY JUN JUL AUG SEP OCT NOV DEC
0
2
4
6
8
10
12
14
16
18
20
1 3 5 7 9 11 13 15 17 19 21 23 25 27 29 31 33 35
Inso
latio
n (h
ours
)
0
2
4
6
8
10
Cloudiness (tenths)
Insolation
Cloudiness
JAN FEB MAR APR MAY JUN JUL AUG SEP OCT NOV DEC
0
2
4
6
8
10
1 3 5 7 9 11 13 15 17 19 21 23 25 27 29 31 33 35
Day
s
Clear daysCloudy days
JAN FEB MAR APR MAY JUN JUL AUG SEP OCT NOV DEC
I
7 h
14 h
21 h
JAN FEB MAR APR MAY JUN JUL AUG SEP OCT NOV DEC
0%
20%
40%
60%
80%
100%
JAN FEB MAR APR MAY JUN JUL AUG SEP OCT NOV DEC0%
20%
40%
60%
80%
100%
JAN FEB MAR APR MAY JUN JUL AUG SEP OCT NOV DEC
-505
101520
NNNE
NE
ENE
E
ESE
SE
SSES
SSW
SW
WSW
W
WNW
NW
NNW
0.8
PET (°C)
-50
4
8
13
18
23
29
35
41
0
20
40
60
80
100
1 3 5 7 9 11 13 15 17 19 21 23 25 27 29 31 33 35
Pre
cipi
tatio
n (m
m)
0
2
4
6
8
10
Days
Days with precipitation
Precipitation
JAN FEB MAR APR MAY JUN JUL AUG SEP OCT NOV DEC
Figure 3: Meteorological leaflet for tourists
Developments in Tourism Climatology – A. Matzarakis, C. R. de Freitas, D. Scott, 2007
28
CONCLUSIONS
The analysis of climate and bioclimate, especially if presented in a clear and simple way
understandable for everyone provides a basis for the promotion of tourism destinations. The
information can be used by tourist managers in advertising, by tourists who want to decide as to
when to take their holidays and by physicians to warn their patients of periods that are unsuitable or
ideal for health therapy. For example, the people who have difficulty tolerating summer heat, such
as the elderly and infirm, could choose the best period of biometeorological conditions to take
vacation, which prevail at the Adriatic coast during spring and autumn or in the mountains during
summer. For sportsmen, who prefer an active vacation, pleasant or even cool conditions would be
more convenient than summer heat, when the body has to spend energy for defence from heat.
REFERENCES
de Freitas, C.R. (1990) Recreation climate assessment. Int. J. Climatol. 10: 89-103. de Freitas, C.R. (2003) Tourism climatology: evaluating environmental information for decision
making and business planning in the recreation and tourism sector. Int. J. Biometeorol. 48: 45-54 Höppe, P. (1999) The physiological equivalent temperature – a universal index for the
biometeorological assessment of the thermal environment. Int. J. Biometeorol. 43: 71–75. Matzarakis, A., Mayer, H., Iziomon, M.G. (1999) Applications of a universal thermal index:
physiological equivalent temperature, Int. J. Biometeorol. 43: 76-84. Perry, A. H. (1972) Weather, climate and tourism. Weather 27: 199-203.
Developments in Tourism Climatology – A. Matzarakis, C. R. de Freitas, D. Scott, 2007
29
THE IMPORTANCE OF CLIMATE FOR RECREATIONAL PLANNING OF RURAL
AREAS; CASE STUDY OF MUĞLA PROVINCE, TURKEY
M. Topay
Zonguldak Karaelmas University, Bartin Forestry Faculty, Department of Landscape Architecture
Bartin-TURKEY
ABSTRACT In recent years, alternative tourism activities have gained significance in the world
and in Turkey. For this reason, the rural areas which have a lot of opportunities for recreational
activities have become more important for the Turkish tourism industry. In this context, planning
decisions should ensure optimal usage of these rural areas. The aim of Landscape Planning is to
provide detailed information about the natural and cultural landscape values, and to implement a
sustainable planning process based on this information. One of the main landscape values is
climate. Humans are situated at the intersection of planning and climate. In this context, bioclimatic
comfort, which depends on climatic effects, is important for planning.
The aim of this study is to identify the most suitable areas and months for human bioclimatic
comfort in Muğla Province according to its climate data. For this reason, climate data was collected
from 11 different climate stations in Muğla Province. Different climate stations, which lie at
different altitudes between 3 and 850 meters, were chosen to analyse climatic variations. Average
temperature, humidity and wind speed values of these climate stations were transferred into a
Geographic Information Systems (GIS) using Arc View 3.2 software. The climate maps were
calculated from the data which was transferred into GIS software. The most suitable areas and
months for bioclimatic comfort were determined. In conclusion, the most suitable months in Muğla
Province are June, August and September. The most suitable areas in terms of bioclimatic comfort
conditions are situated in the north and the centre of the province.
KEYWORDS: Recreation, Bioclimate comfort, Landscape planning, Muğla Province.
INTRODUCTION
Recreation is increasingly viewed as an important factor in maintaining adult health - both
physically and mentally. The aim of recreation is physical or psychological revitalization through
the voluntary pursuit of leisure time (Princeton, 2007). In this context, people have been searching
for different areas to respond to their recreational needs. In many cities, recreational activities
cannot be realised because of the building structure, the lack of suitable open space and
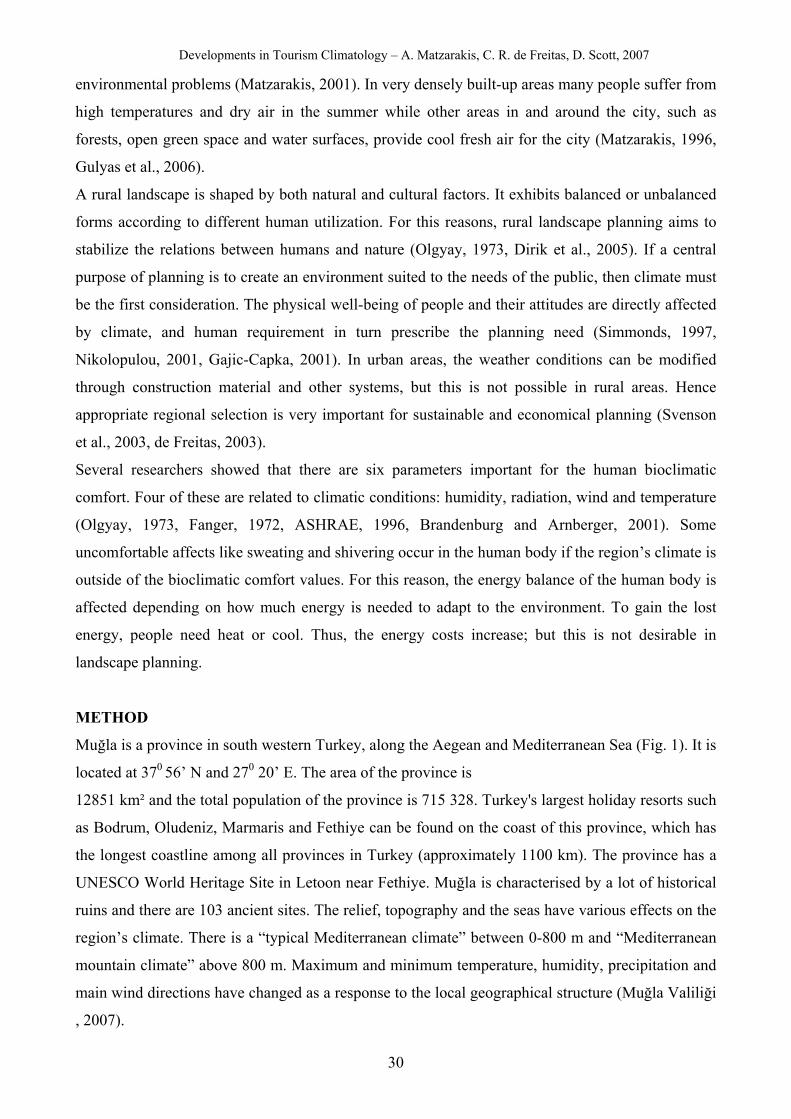
Developments in Tourism Climatology – A. Matzarakis, C. R. de Freitas, D. Scott, 2007
30
environmental problems (Matzarakis, 2001). In very densely built-up areas many people suffer from
high temperatures and dry air in the summer while other areas in and around the city, such as
forests, open green space and water surfaces, provide cool fresh air for the city (Matzarakis, 1996,
Gulyas et al., 2006).
A rural landscape is shaped by both natural and cultural factors. It exhibits balanced or unbalanced
forms according to different human utilization. For this reasons, rural landscape planning aims to
stabilize the relations between humans and nature (Olgyay, 1973, Dirik et al., 2005). If a central
purpose of planning is to create an environment suited to the needs of the public, then climate must
be the first consideration. The physical well-being of people and their attitudes are directly affected
by climate, and human requirement in turn prescribe the planning need (Simmonds, 1997,
Nikolopulou, 2001, Gajic-Capka, 2001). In urban areas, the weather conditions can be modified
through construction material and other systems, but this is not possible in rural areas. Hence
appropriate regional selection is very important for sustainable and economical planning (Svenson
et al., 2003, de Freitas, 2003).
Several researchers showed that there are six parameters important for the human bioclimatic
comfort. Four of these are related to climatic conditions: humidity, radiation, wind and temperature
(Olgyay, 1973, Fanger, 1972, ASHRAE, 1996, Brandenburg and Arnberger, 2001). Some
uncomfortable affects like sweating and shivering occur in the human body if the region’s climate is
outside of the bioclimatic comfort values. For this reason, the energy balance of the human body is
affected depending on how much energy is needed to adapt to the environment. To gain the lost
energy, people need heat or cool. Thus, the energy costs increase; but this is not desirable in
landscape planning.
METHOD
Muğla is a province in south western Turkey, along the Aegean and Mediterranean Sea (Fig. 1). It is
located at 370 56’ N and 270 20’ E. The area of the province is
12851 km² and the total population of the province is 715 328. Turkey's largest holiday resorts such
as Bodrum, Oludeniz, Marmaris and Fethiye can be found on the coast of this province, which has
the longest coastline among all provinces in Turkey (approximately 1100 km). The province has a
UNESCO World Heritage Site in Letoon near Fethiye. Muğla is characterised by a lot of historical
ruins and there are 103 ancient sites. The relief, topography and the seas have various effects on the
region’s climate. There is a “typical Mediterranean climate” between 0-800 m and “Mediterranean
mountain climate” above 800 m. Maximum and minimum temperature, humidity, precipitation and
main wind directions have changed as a response to the local geographical structure (Muğla Valiliği
, 2007).
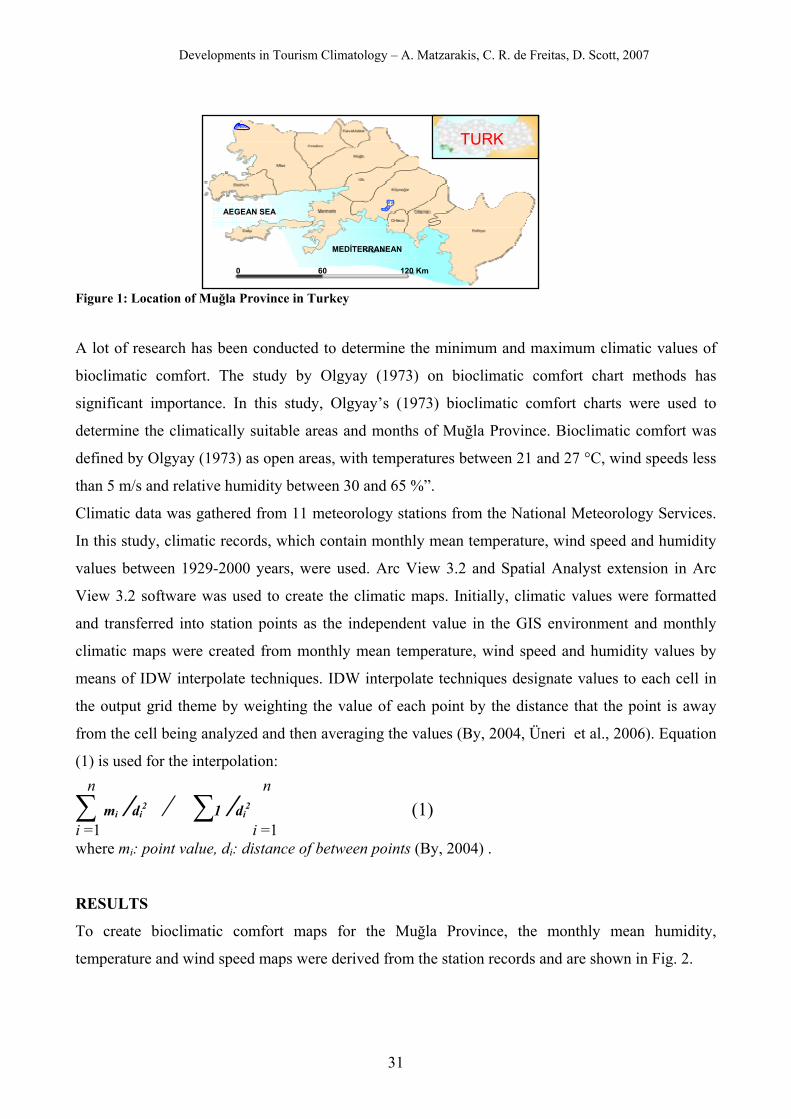
Developments in Tourism Climatology – A. Matzarakis, C. R. de Freitas, D. Scott, 2007
31
Figure 1: Location of Muğla Province in Turkey
A lot of research has been conducted to determine the minimum and maximum climatic values of
bioclimatic comfort. The study by Olgyay (1973) on bioclimatic comfort chart methods has
significant importance. In this study, Olgyay’s (1973) bioclimatic comfort charts were used to
determine the climatically suitable areas and months of Muğla Province. Bioclimatic comfort was
defined by Olgyay (1973) as open areas, with temperatures between 21 and 27 °C, wind speeds less
than 5 m/s and relative humidity between 30 and 65 %”.
Climatic data was gathered from 11 meteorology stations from the National Meteorology Services.
In this study, climatic records, which contain monthly mean temperature, wind speed and humidity
values between 1929-2000 years, were used. Arc View 3.2 and Spatial Analyst extension in Arc
View 3.2 software was used to create the climatic maps. Initially, climatic values were formatted
and transferred into station points as the independent value in the GIS environment and monthly
climatic maps were created from monthly mean temperature, wind speed and humidity values by
means of IDW interpolate techniques. IDW interpolate techniques designate values to each cell in
the output grid theme by weighting the value of each point by the distance that the point is away
from the cell being analyzed and then averaging the values (By, 2004, Üneri et al., 2006). Equation
(1) is used for the interpolation: n n ∑ mi ⁄di
2 ⁄ ∑1 ⁄di2 (1)
i =1 i =1 where mi: point value, di: distance of between points (By, 2004) .
RESULTS
To create bioclimatic comfort maps for the Muğla Province, the monthly mean humidity,
temperature and wind speed maps were derived from the station records and are shown in Fig. 2.
AEGEAN SEA
TURK
0 60 120 Km
MEDİTERRANEAN
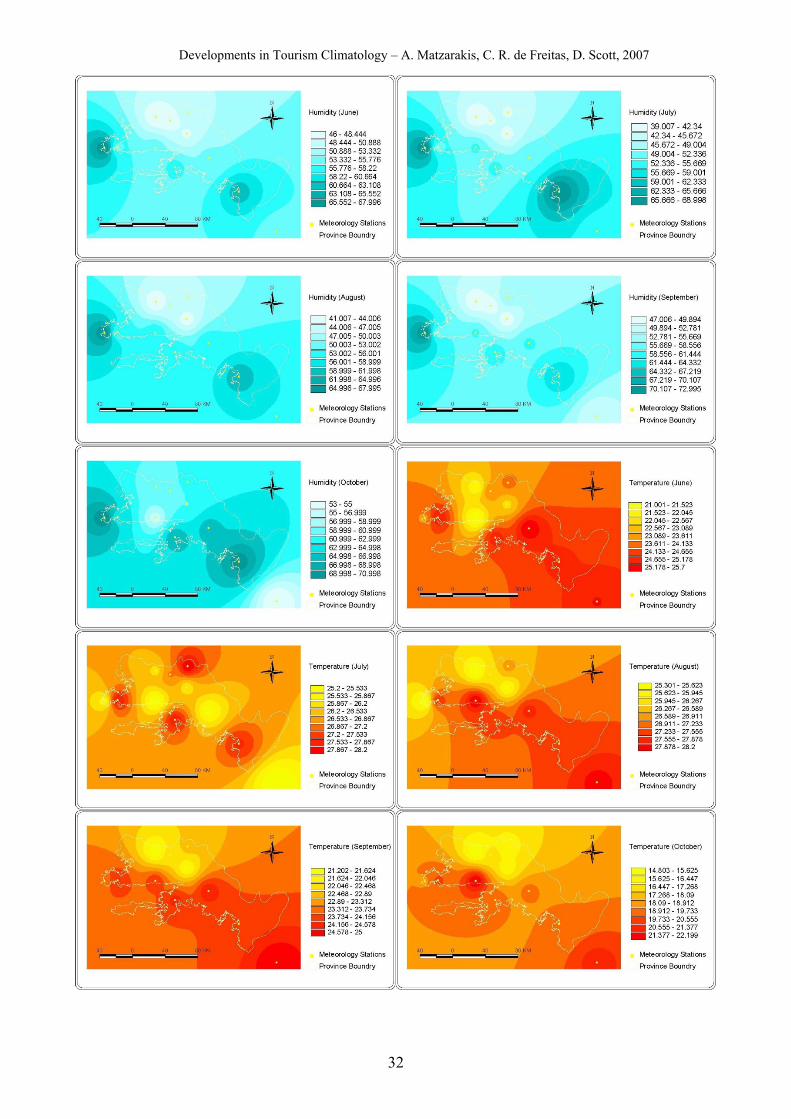
Developments in Tourism Climatology – A. Matzarakis, C. R. de Freitas, D. Scott, 2007
32
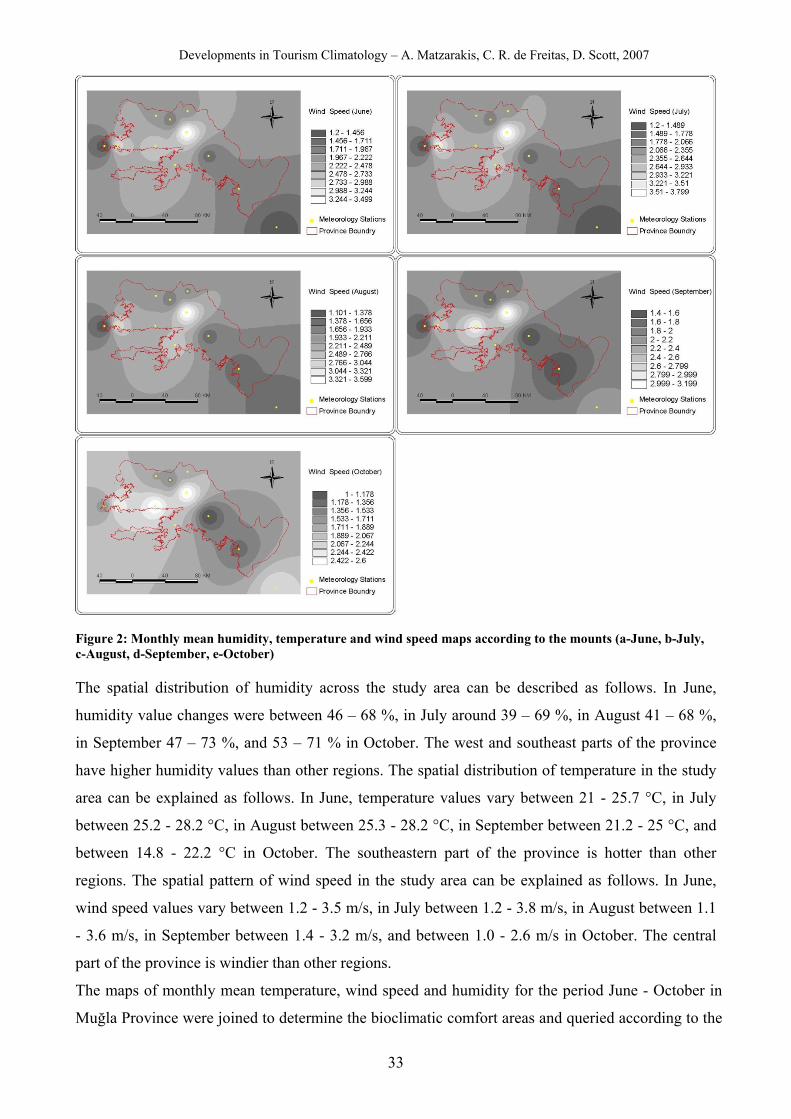
Developments in Tourism Climatology – A. Matzarakis, C. R. de Freitas, D. Scott, 2007
33
Figure 2: Monthly mean humidity, temperature and wind speed maps according to the mounts (a-June, b-July, c-August, d-September, e-October) The spatial distribution of humidity across the study area can be described as follows. In June,
humidity value changes were between 46 – 68 %, in July around 39 – 69 %, in August 41 – 68 %,
in September 47 – 73 %, and 53 – 71 % in October. The west and southeast parts of the province
have higher humidity values than other regions. The spatial distribution of temperature in the study
area can be explained as follows. In June, temperature values vary between 21 - 25.7 °C, in July
between 25.2 - 28.2 °C, in August between 25.3 - 28.2 °C, in September between 21.2 - 25 °C, and
between 14.8 - 22.2 °C in October. The southeastern part of the province is hotter than other
regions. The spatial pattern of wind speed in the study area can be explained as follows. In June,
wind speed values vary between 1.2 - 3.5 m/s, in July between 1.2 - 3.8 m/s, in August between 1.1
- 3.6 m/s, in September between 1.4 - 3.2 m/s, and between 1.0 - 2.6 m/s in October. The central
part of the province is windier than other regions.
The maps of monthly mean temperature, wind speed and humidity for the period June - October in
Muğla Province were joined to determine the bioclimatic comfort areas and queried according to the
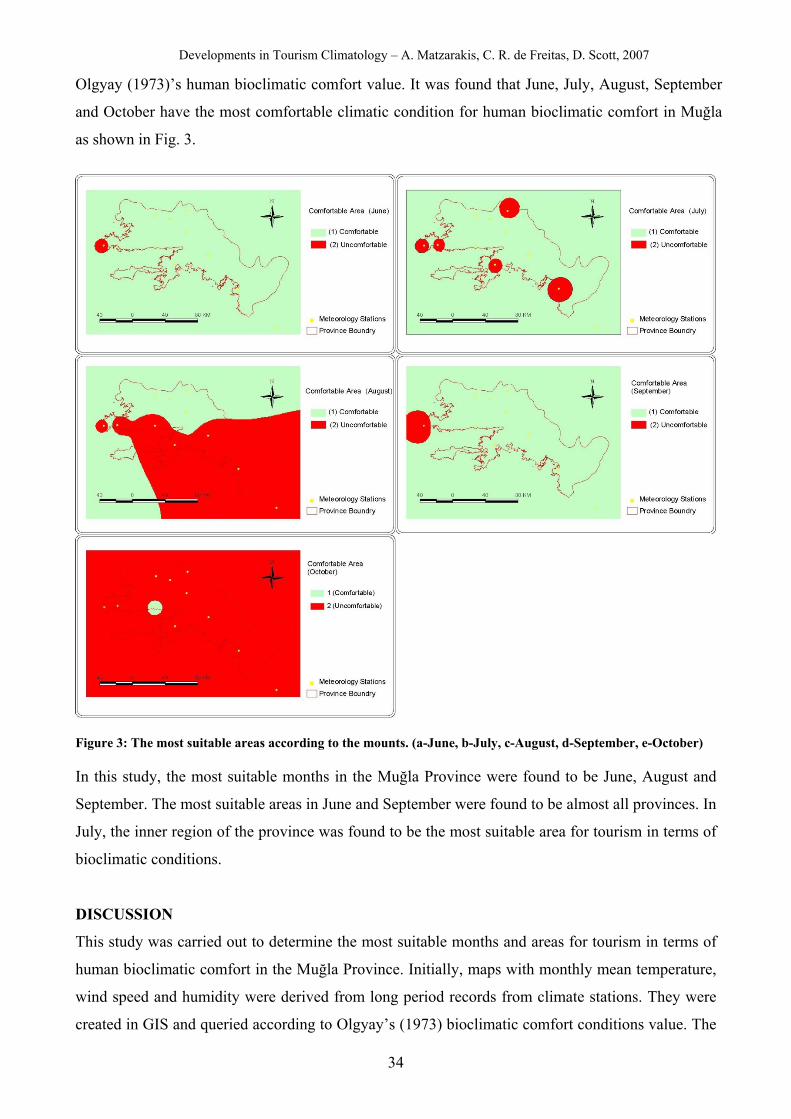
Developments in Tourism Climatology – A. Matzarakis, C. R. de Freitas, D. Scott, 2007
34
Olgyay (1973)’s human bioclimatic comfort value. It was found that June, July, August, September
and October have the most comfortable climatic condition for human bioclimatic comfort in Muğla
as shown in Fig. 3.
Figure 3: The most suitable areas according to the mounts. (a-June, b-July, c-August, d-September, e-October) In this study, the most suitable months in the Muğla Province were found to be June, August and
September. The most suitable areas in June and September were found to be almost all provinces. In
July, the inner region of the province was found to be the most suitable area for tourism in terms of
bioclimatic conditions.
DISCUSSION
This study was carried out to determine the most suitable months and areas for tourism in terms of
human bioclimatic comfort in the Muğla Province. Initially, maps with monthly mean temperature,
wind speed and humidity were derived from long period records from climate stations. They were
created in GIS and queried according to Olgyay’s (1973) bioclimatic comfort conditions value. The
Developments in Tourism Climatology – A. Matzarakis, C. R. de Freitas, D. Scott, 2007
35
most suitable months in the Muğla Province were found to be June, July and September. In June
and September, conditions were mostly comfortable in the province, in July the inner region of the
province was also comfortable. In August and October, the bioclimatic comfort values decreased. In
August conditions were comfortable only in the southern parts of the province. In October, only
Oren Town had comfortable conditions. It was also was found that temperature and humidity had
the strongest effects on bioclimatic comfort. Wind speed did not negatively affect the bioclimatic
comfort in the province.
The results of this study clearly show that June, July and September are the most suitable months
with regards to bioclimatic comfort. In this context, tourism and recreation should be carried out
during these months. The results are similar to those of previous studies (Topay and Yilmaz, 2004,
Çınar, 2004) and further research in this matter is advisable. This study and further research will
help local authorities to make sustainable landscape planning decision with regards to recreation.
REFERENCES ASHRAE (1966) Thermal Comfort Condition, AHRAE Standard 55-66, New York. USA. Brandenburg, C., Arnberger, A. (2001) The Influence of the Weather upon Recreation Activities,
Proceedings of the 1st Int. Workshop on Climate, Tourism and Recreation. Int. Society of Biometeorology, Commission on Climate Tourism and Recreation. December 2001. p: 123-132.
By, R. A. (2004) Principle of GIS, ITC Educational Textbook Series, Netherlands. Çınar, İ. (2004) Biyoklimatik Konfor Ölçütlerinin Peyzaj Planlama Sürecinde Etkinliği Üzerinde
Muğla-Karabağlar Yaylası Örneğinde Araştırmalar (Phd Thesis), E. Ü. Fen Bilimleri Enstitüsü, İzmir, Türkiye.
De Freitas, C. R. (2003) Tourism Climatology: Evaluating Environmental Information for Decision Making and Business Planning in the Recreation and Tourism Sector, Int. J. Biometeorology 48: 45-54.
Dirik, H. (2005) Kırsal Peyzaj, İÜ. Orman Fakültesi Yayını, Yayın No: 4559, İstanbul, Türkiye. Fanger, P. O. (1972) Thermal Comfort, McGraw Hill Book Comp., New York. Gajik-Capka, M. (2001) Climatological Basis for Planning in Mountain Recreation. Proceedings of
the 1st Int. Workshop on Climate, Tourism and Recreation. Int. Society of Biometeorology, Commission on Climate Tourism and Recreation. December 2001. p: 227-237.
Gulyas, Á., Unger, J., Matzarakis, A. (2005) Assesment of the Microclimatic and Human Comfort Conditions in a Complex Urban Environment: Modelling and Measurements, Building and Environment 41: 1713-1722.
Matzarakis, A. (2001) Assessing Climate for Tourism Purposes: Existing Methods and Tools for the Thermal Complex. Proceedings of the 1st Int. Workshop on Climate, Tourism and Recreation. Int. Society of Biometeorology, Commission on Climate Tourism and Recreation. December 2001. p: 101-111.
Matzarakis, A., Mayer, H. (1996) Bioclimate Maps of Greece for Touristic Aspect, Proceedings of 14th Int. Congress of Biometeorology, September 1996, Biometeorology 14, Part 2, Volume 3, p: 222-229.
Muğla Valiliği (2007) Muğla Province, http://www.mugla.gov.tr. Nikolopoulou, M. (2001) The Effect of Climate on the Use of Open Spaces in the Urban
Environment: Relation to Tourism. Proceedings of the 1st Int. Workshop on Climate, Tourism and Recreation. Int. Society of Biometeorology, Commission on Climate Tourism and Recreation. December 2001. p: 185-193.

Developments in Tourism Climatology – A. Matzarakis, C. R. de Freitas, D. Scott, 2007
36
Olgyay, V. (1973) Design with Climate, Bioclimatic Approach to Architectural Regionalism, Princeton University Press, New Jersey.
Princeton (2007) Defining of Recreation, http://www.wordnet.princeton.edu. Simonds, J.O (1997) Landscape Architecture, A Manuel Site Planning and Design, Mc Graw Hill
Book, New York. Svensson, M. K., Thorsson, S., Lindqvist, S. (2003) A GIS Model for Creating Bioclimatic Maps-
Examples from a High, Mid-latitude City, Int. J. Biometeorology 47: 102-112. Topay, M., Yılmaz, B. (2004) Biyoklimatik Konfora Sahip Alanların Belirlenmesinde CBS’den
Yararlanma Olanakları: Muğla İli Örneği, Proceedings of 3th GIS Days in Turkey, September 6-9 2004, Turkey. p: 425-434.
Üneri, D., Kara, S., Özdemir, H. (2006) İklim Verilerinin Haritalanmasında CBS’nin Kullanımı.: Kasatura Körfezi ve Çevresi Örneği, Proceedings of 4th GIS Days in Turkey, September 13-16, 2006, Turkey. p: 503-510.
Developments in Tourism Climatology – A. Matzarakis, C. R. de Freitas, D. Scott, 2007
37
VARIATIONS OF THERMAL BIOCLIMATE IN THE LAKE BALATON TOURISM REGION (HUNGARY)
Á. Németh1,2, V. Schlanger1 and Á. Katona3
1Climate Division, Hungarian Meteorological Service; Budapest, Hungary
2Institute of Geography, University of Miskolc; Hungary 3Department of Meteorology, Eötvös Lóránd University; Budapest, Hungary
ABSTRACT Tourism is the most important branch of the service sector in Hungary. According to
the Hungarian Tourist Authority, tourism in Hungary adds up to 8.7% of the GDP and 12% of the
number of employees. Higher rate can only be found in the Mediterranean countries. Therefore it is
important to provide satisfactory climatological information to this considerable economic sector.
In this paper at first we analyse the variations of some conventional climate parameters
(temperature, precipitation, sunshine duration, etc.) at the Lake Balaton Tourism Region. Secondly
we analyse the variations of PET, the thermal bioclimate indices based on the human energy
balance models. For calculating PET indices we used measurements of Siófok synoptic station.
According to our results, PET is applicable to examine climate change. Our most important results
were that at winter bioclimate did not change significantly while in summer the frequency of days
with strong and extreme heat stress increased widely during the last 40 years.
KEYWORDS: Thermal bioclimate, Physiologically Equivalent Temperature, Climate change,
Lake Balaton
INTRODUCTION
Lake Balaton is the largest freshwater lake in Central-Europe and represents one of the greatest
environmental treasures and a unique ecological fortune of Hungary. The Lake Balaton’s surface is
about 600 km2; it is 77 km long and 14 km wide at its largest width. The deepest point of the lake is
11 m, but its average depth is only 2 to 3 meters. Its popularity results from the lake’s favourable
climate, its warm water in summer, and the nice landscape surrounding the lake. The Lake Balaton
Tourism Region [LBTR] (Fig. 1) is part of three counties, three different statistical (NUTS-II)
regions and involves 41 settlements situated right on the lakeside and 123 nearby. The total area of
the LBTR is 3780 km2.
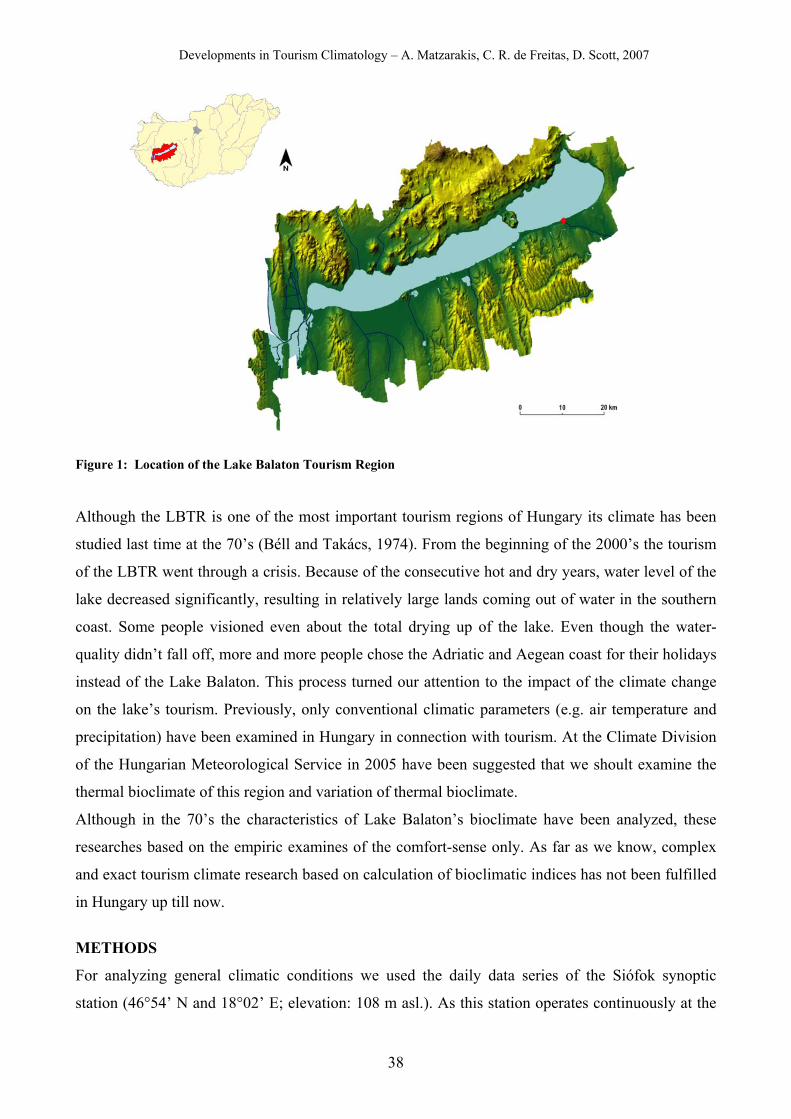
Developments in Tourism Climatology – A. Matzarakis, C. R. de Freitas, D. Scott, 2007
38
Figure 1: Location of the Lake Balaton Tourism Region
Although the LBTR is one of the most important tourism regions of Hungary its climate has been
studied last time at the 70’s (Béll and Takács, 1974). From the beginning of the 2000’s the tourism
of the LBTR went through a crisis. Because of the consecutive hot and dry years, water level of the
lake decreased significantly, resulting in relatively large lands coming out of water in the southern
coast. Some people visioned even about the total drying up of the lake. Even though the water-
quality didn’t fall off, more and more people chose the Adriatic and Aegean coast for their holidays
instead of the Lake Balaton. This process turned our attention to the impact of the climate change
on the lake’s tourism. Previously, only conventional climatic parameters (e.g. air temperature and
precipitation) have been examined in Hungary in connection with tourism. At the Climate Division
of the Hungarian Meteorological Service in 2005 have been suggested that we shoult examine the
thermal bioclimate of this region and variation of thermal bioclimate.
Although in the 70’s the characteristics of Lake Balaton’s bioclimate have been analyzed, these
researches based on the empiric examines of the comfort-sense only. As far as we know, complex
and exact tourism climate research based on calculation of bioclimatic indices has not been fulfilled
in Hungary up till now.
METHODS
For analyzing general climatic conditions we used the daily data series of the Siófok synoptic
station (46°54’ N and 18°02’ E; elevation: 108 m asl.). As this station operates continuously at the
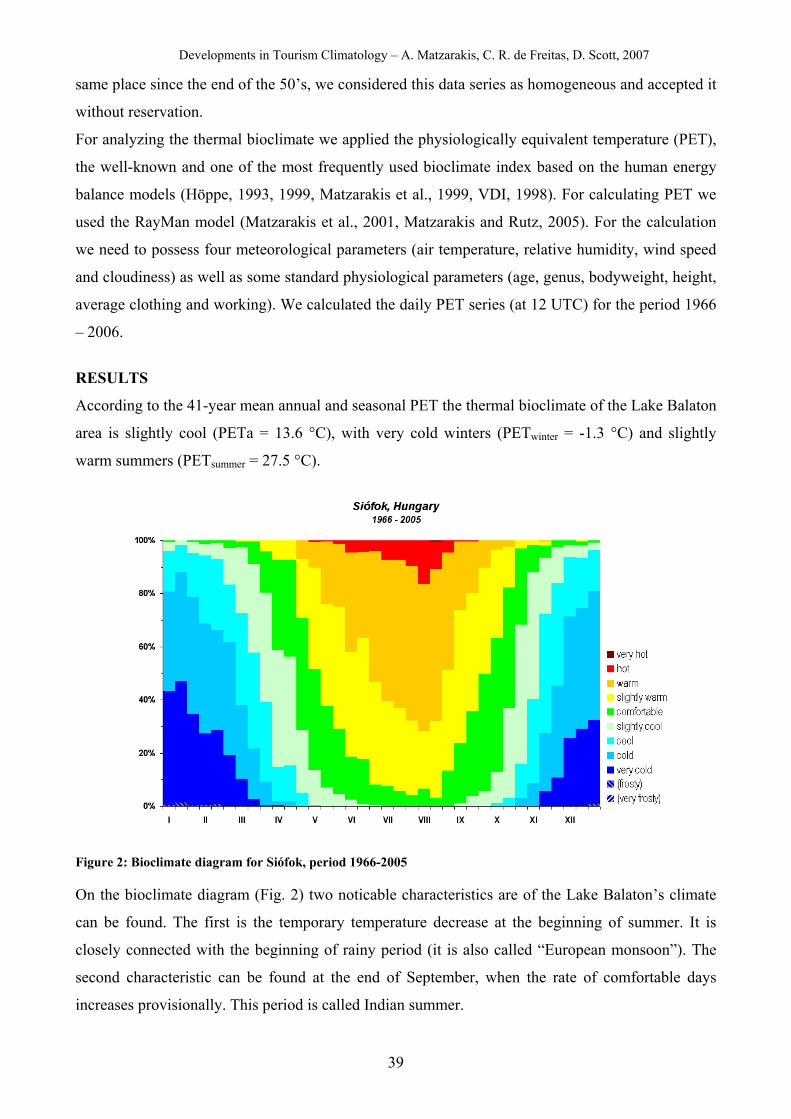
Developments in Tourism Climatology – A. Matzarakis, C. R. de Freitas, D. Scott, 2007
39
same place since the end of the 50’s, we considered this data series as homogeneous and accepted it
without reservation.
For analyzing the thermal bioclimate we applied the physiologically equivalent temperature (PET),
the well-known and one of the most frequently used bioclimate index based on the human energy
balance models (Höppe, 1993, 1999, Matzarakis et al., 1999, VDI, 1998). For calculating PET we
used the RayMan model (Matzarakis et al., 2001, Matzarakis and Rutz, 2005). For the calculation
we need to possess four meteorological parameters (air temperature, relative humidity, wind speed
and cloudiness) as well as some standard physiological parameters (age, genus, bodyweight, height,
average clothing and working). We calculated the daily PET series (at 12 UTC) for the period 1966
– 2006.
RESULTS
According to the 41-year mean annual and seasonal PET the thermal bioclimate of the Lake Balaton
area is slightly cool (PETa = 13.6 °C), with very cold winters (PETwinter = -1.3 °C) and slightly
warm summers (PETsummer = 27.5 °C).
Figure 2: Bioclimate diagram for Siófok, period 1966-2005
On the bioclimate diagram (Fig. 2) two noticable characteristics are of the Lake Balaton’s climate
can be found. The first is the temporary temperature decrease at the beginning of summer. It is
closely connected with the beginning of rainy period (it is also called “European monsoon”). The
second characteristic can be found at the end of September, when the rate of comfortable days
increases provisionally. This period is called Indian summer.
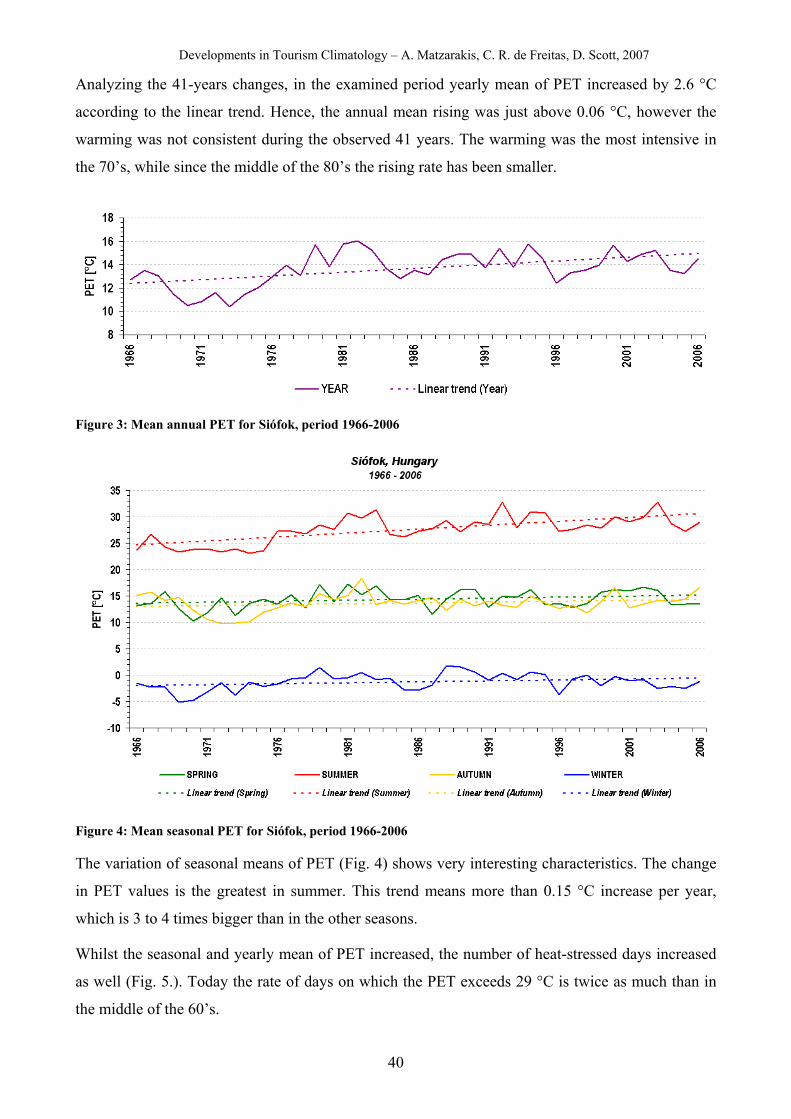
Developments in Tourism Climatology – A. Matzarakis, C. R. de Freitas, D. Scott, 2007
40
Analyzing the 41-years changes, in the examined period yearly mean of PET increased by 2.6 °C
according to the linear trend. Hence, the annual mean rising was just above 0.06 °C, however the
warming was not consistent during the observed 41 years. The warming was the most intensive in
the 70’s, while since the middle of the 80’s the rising rate has been smaller.
Figure 3: Mean annual PET for Siófok, period 1966-2006
Figure 4: Mean seasonal PET for Siófok, period 1966-2006
The variation of seasonal means of PET (Fig. 4) shows very interesting characteristics. The change
in PET values is the greatest in summer. This trend means more than 0.15 °C increase per year,
which is 3 to 4 times bigger than in the other seasons.
Whilst the seasonal and yearly mean of PET increased, the number of heat-stressed days increased
as well (Fig. 5.). Today the rate of days on which the PET exceeds 29 °C is twice as much than in
the middle of the 60’s.
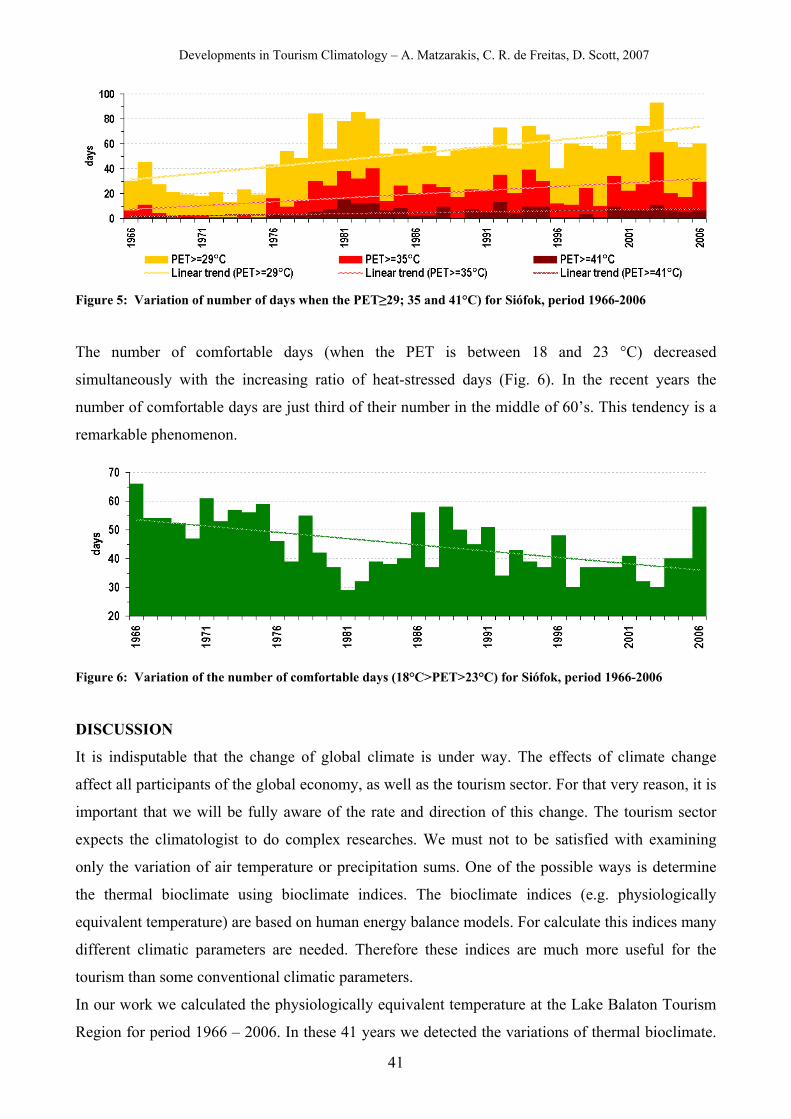
Developments in Tourism Climatology – A. Matzarakis, C. R. de Freitas, D. Scott, 2007
41
Figure 5: Variation of number of days when the PET≥29; 35 and 41°C) for Siófok, period 1966-2006
The number of comfortable days (when the PET is between 18 and 23 °C) decreased
simultaneously with the increasing ratio of heat-stressed days (Fig. 6). In the recent years the
number of comfortable days are just third of their number in the middle of 60’s. This tendency is a
remarkable phenomenon.
Figure 6: Variation of the number of comfortable days (18°C>PET>23°C) for Siófok, period 1966-2006
DISCUSSION
It is indisputable that the change of global climate is under way. The effects of climate change
affect all participants of the global economy, as well as the tourism sector. For that very reason, it is
important that we will be fully aware of the rate and direction of this change. The tourism sector
expects the climatologist to do complex researches. We must not to be satisfied with examining
only the variation of air temperature or precipitation sums. One of the possible ways is determine
the thermal bioclimate using bioclimate indices. The bioclimate indices (e.g. physiologically
equivalent temperature) are based on human energy balance models. For calculate this indices many
different climatic parameters are needed. Therefore these indices are much more useful for the
tourism than some conventional climatic parameters.
In our work we calculated the physiologically equivalent temperature at the Lake Balaton Tourism
Region for period 1966 – 2006. In these 41 years we detected the variations of thermal bioclimate.
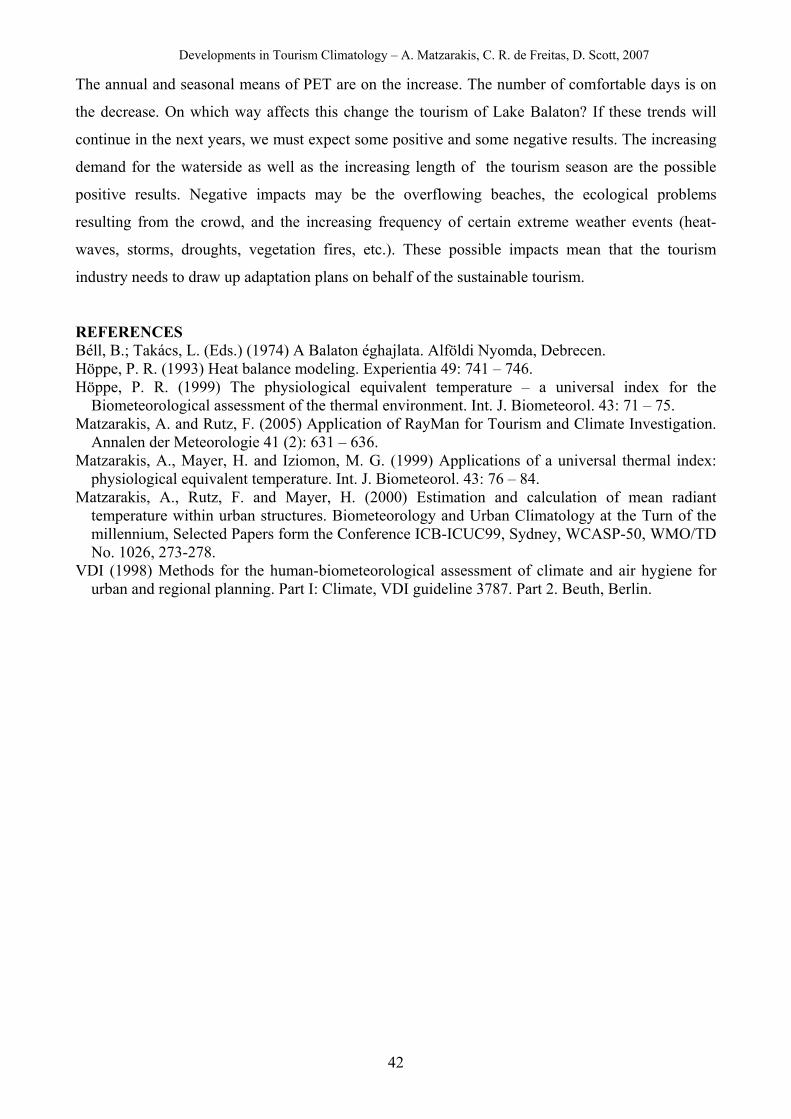
Developments in Tourism Climatology – A. Matzarakis, C. R. de Freitas, D. Scott, 2007
42
The annual and seasonal means of PET are on the increase. The number of comfortable days is on
the decrease. On which way affects this change the tourism of Lake Balaton? If these trends will
continue in the next years, we must expect some positive and some negative results. The increasing
demand for the waterside as well as the increasing length of the tourism season are the possible
positive results. Negative impacts may be the overflowing beaches, the ecological problems
resulting from the crowd, and the increasing frequency of certain extreme weather events (heat-
waves, storms, droughts, vegetation fires, etc.). These possible impacts mean that the tourism
industry needs to draw up adaptation plans on behalf of the sustainable tourism.
REFERENCES Béll, B.; Takács, L. (Eds.) (1974) A Balaton éghajlata. Alföldi Nyomda, Debrecen. Höppe, P. R. (1993) Heat balance modeling. Experientia 49: 741 – 746. Höppe, P. R. (1999) The physiological equivalent temperature – a universal index for the
Biometeorological assessment of the thermal environment. Int. J. Biometeorol. 43: 71 – 75. Matzarakis, A. and Rutz, F. (2005) Application of RayMan for Tourism and Climate Investigation.
Annalen der Meteorologie 41 (2): 631 – 636. Matzarakis, A., Mayer, H. and Iziomon, M. G. (1999) Applications of a universal thermal index:
physiological equivalent temperature. Int. J. Biometeorol. 43: 76 – 84. Matzarakis, A., Rutz, F. and Mayer, H. (2000) Estimation and calculation of mean radiant
temperature within urban structures. Biometeorology and Urban Climatology at the Turn of the millennium, Selected Papers form the Conference ICB-ICUC99, Sydney, WCASP-50, WMO/TD No. 1026, 273-278.
VDI (1998) Methods for the human-biometeorological assessment of climate and air hygiene for urban and regional planning. Part I: Climate, VDI guideline 3787. Part 2. Beuth, Berlin.
Developments in Tourism Climatology – A. Matzarakis, C. R. de Freitas, D. Scott, 2007
43
SNOW BASELINE CONDITIONS AND CHANGES FOR THE WINTER TOURISM
Marjana Gajić-Čapka
Meteorological and Hydrological Service of Croatia, HR-10000 Zagreb, Croatia
ABSTRACT Croatian tourism is the most developed on the Croatian Adriatic coast and on the
islands. Croatia’s highland areas consist of parts that belong to the Dinaric Alps and other isolated
mountains in the northern lowlands. These areas are suitable for tourism, both in summer and in
winter. Good snow conditions in the Croatian highlands, including depth of snow cover as well as
its duration allow the development of winter tourism oriented also on snow related activities such as
cross-country skiing or snow mobiling rather than on alpine skiing only.
This study focuses on the area of the Medvednica Mountain located in the south-eastern corner of
the Alps. This is an isolated mountain in the vicinity of the Croatian capital Zagreb. But the snow
regime on the Medvednica Mountain, which lies at about 1000 m, represents a very risky factor in
winter tourism development plans. This is the reason why the interest in snow activities and the
possibility to develop them (cost-benefit effect) depend not only on the snow regime characteristics,
but also on the artificial snow production.
The climatological study includes analyses of the annual course and probability of snow parameters
at different altitudes and comparisons to the reference period 1961/62-1990/91. Due to users request
the relationship between air temperature and relative humidity at 7 a.m. was analysed with regards
to snow making purposes for the period from November to February. We used these climatological
data as they are generally available and are the closest to the daily temperature minimum.
At the same time concerns with climate variability and change put special emphasis on time
analysis (fluctuations and trends) of snow parameters (intensity and frequency) and different
meteorological parameters related to snow (air temperature, total precipitation and air pressure)
during the second half of the 20th century.
KEYWORDS: Snow climate, fluctuations, trend, snow making, winter tourism, Croatia
INTRODUCTION
The main resources for tourism development in many countries, as well as in Croatia, are landscape
characteristics and climate, which attract tourists to particular destinations (Weber et al., 2002).
Therefore, information and knowledge of climate should be incorporated into the strategic plans of
Developments in Tourism Climatology – A. Matzarakis, C. R. de Freitas, D. Scott, 2007
44
particular areas. Nowadays, they have to be supplemented by the impact of climate change on
tourism (Buerki et al., 2003, Gajić-Čapka and Horak, 2005).
Croatian tourism is most developed along the Croatian Adriatic coast and on the islands. At the
same time, lots of other resources suitable for tourism development in Croatia are still not
recognized nor valued up to their full potential. Croatia’s highlands within the Dinaric Alps, or the
isolated mountains in the northern lowlands are highly attractive to tourists throughout the year,
particularly in summer and, traditionally, in winter.
Snow conditions along parts of the Croatian highlands (snow cover depth and duration) allow the
development of winter tourism focused mainly on snow-related activities such as cross-country
skiing or snow mobiling rather than solely on alpine skiing.
At the same time, climate variability and change raise concerns as they could decrease the economic
effects of tourism, increase adaptation costs and the necessary investments in winter tourism
content. Therefore, a climatological base for tourism estimates should be determined which should
include snow regime characteristics, with special emphasis on the time analysis (fluctuations and
trends) of different meteorological parameters related to snow (air temperature, precipitation and air
pressure) as well as on the snow parameters themselves (snow cover frequency, duration and
magnitude).
An example of such a study refers to the area of the Medvednica Mountain, located at the SE edge
of the Alps, an isolated mountain in the vicinity of the Croatian capital, Zagreb. Medvednica is an
attractive destination for a large number of visitors during the winter skiing season. Most people
come there for one-day vacation as this resort is close to the urban area. But the snow regime on the
Medvednica Mountain, which lies only about 1000 m high, represents a very risky factor in its
winter tourism development plans. For this reason, the existing interest in snow activities and the
possibility to operate them (cost-benefit effect) depends not only on the snow regime
characteristics, but also on artificial snow production.
DATA AND METHOD
This climatological study includes analyses of the annual course and probability of snow parameters
at different altitudes and exposures for the period 1961/62-1990/91. The snow parameters selected
for this analysis are: the beginning and the end of the snow season, the number of days with a snow
cover ≥1 cm, ≥10 cm, ≥30 cm, and ≥50 cm, the number of days with snowfall (precipitation ≥0.1
mm), the daily snow depth and the maximum snow depth. The relationship between air temperature
and relative humidity at 7 a.m., in the period from November to February, during the period 1981-
1998, was checked at the mountain summit for snow-making purposes. These are climatological
data generally available and the closest ones to the daily temperature minimum.
Developments in Tourism Climatology – A. Matzarakis, C. R. de Freitas, D. Scott, 2007
45
The indications are given for a correlation between some snow parameters (snow cover ≥ 1 cm,
snow cover ≥ 10 cm, snow cover ≥ 30 cm, snowfall and snow depth) and air temperature,
precipitation and air pressure for the winter period (December, January and February), as well as
time fluctuations and trends in the snow parameters and winter temperature, precipitation and air
pressure during the second half of the 20th century.
RESULTS
SNOW CLIMATE CONDITIONS
Snowfall
The mean annual number of days with snowfall (precipitation ≥0.1 mm) is 54 days at the
mountain’s summit, about 30 % of days less at heights of about 600 m (St. Gora – 30 days), and
about 20 days at heights of 200-250 m. Over the course of the year, snow falls most frequently in
January and February.
According to the annual frequency distribution of the number of days with snow precipitation ≥0.1
mm (Fig. 1) snow falls at the mountain’s summit for 13 -80 days, mostly lasting 41 to 50 days and
61 to 70 days (Puntijarka), while at the height of 600 m snow falls at most 60 days per year (most
frequently between 21 and 30 days (St. Gora)). At lower altitudes, at about 200 to 250 m, snow falls
almost for 11 to 20 days (all slopes). The longest snowfall on the NW and NE slopes lasted 44 days,
and 35 days at the edge of the urban area.
Snowfall does not necessarily result in a snow cover. Whether the fallen snow will accumulate on
the ground or melt depends on the amount of snow, on the air and ground temperature and the
exposure of the location to wind and direct solar radiation. During low-temperature periods, when
the air temperature is below 0 °C for most of the day, the snow cover will remain on the ground for
a longer time even after snow has stopped falling.
Snow cover
A snow cover ≥1 cm can be expected at the summit of Medvednica Mt. from the first half of
November until the end of April. This means that a snowy winter lasts on average for more than
five months (of course, not with a continuous snow cover) (Tab. 1). On the northern slopes, at an
altitude of 600 m, the snow cover lasts a little bit shorter (from mid-November till the first half of
April). At the bottom of the mountain, the duration of a snowy winter is about 40 % shorter than at
the top.
The annual course of the mean monthly number of days with snow cover of different depth classes
(≥1 cm, ≥10 cm, ≥30 cm and ≥50 cm) indicates that autumn (September - November) and the first
part of winter (December) are characterized by a rarer appearance of snow cover than the second
half of the snow season (January and February). The difference in the mean monthly number of
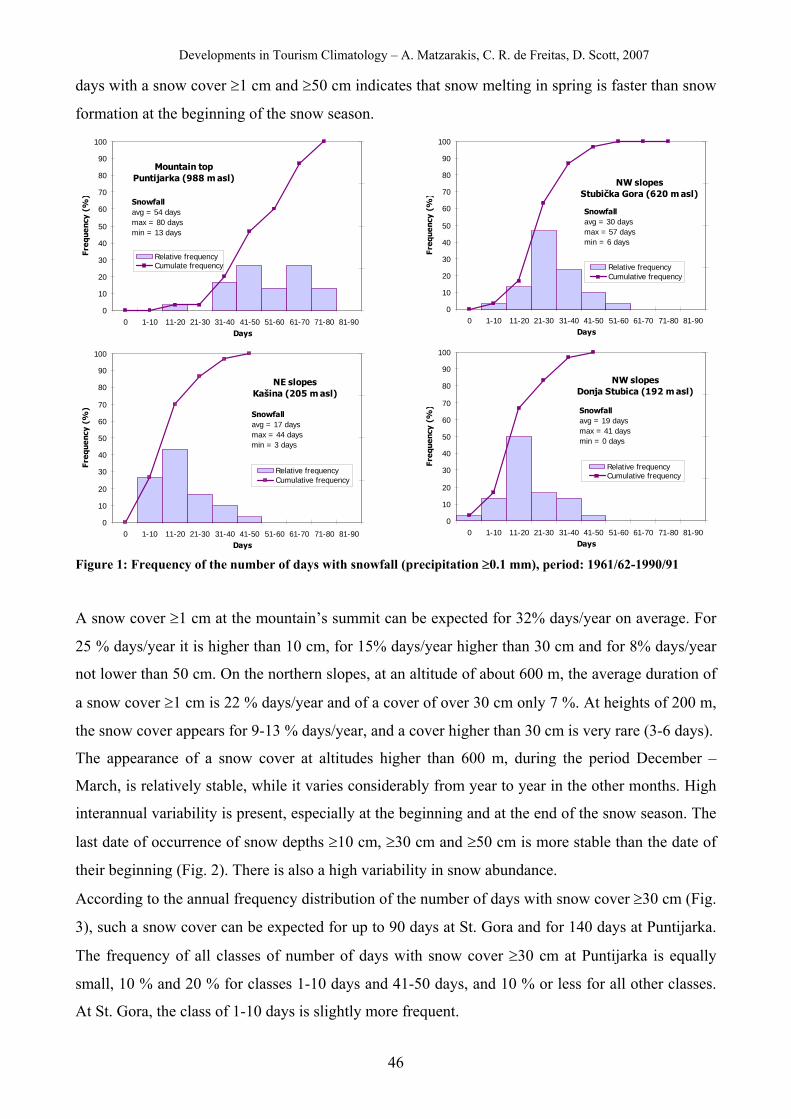
Developments in Tourism Climatology – A. Matzarakis, C. R. de Freitas, D. Scott, 2007
46
days with a snow cover ≥1 cm and ≥50 cm indicates that snow melting in spring is faster than snow
formation at the beginning of the snow season.
0
10
20
30
40
50
60
70
80
90
100
0 1-10 11-20 21-30 31-40 41-50 51-60 61-70 71-80 81-90Days
Freq
uenc
y (%
)
0%
25%
50%
75%
100%
Relative frequencyCumulate frequency
Mountain topPuntijarka (988 m asl)
Snowfallavg = 54 daysmax = 80 daysmin = 13 days
0
10
20
30
40
50
60
70
80
90
100
0 1-10 11-20 21-30 31-40 41-50 51-60 61-70 71-80 81-90Days
Freq
uenc
y (%
)
0%
25%
50%
75%
100%
Relative frequencyCumulative frequency
NE slopesKašina (205 m asl)
Snowfallavg = 17 daysmax = 44 daysmin = 3 days
0
10
20
30
40
50
60
70
80
90
100
0 1-10 11-20 21-30 31-40 41-50 51-60 61-70 71-80 81-90Days
Freq
uenc
y (%
)
0%
25%
50%
75%
100%
Relative frequencyCumulative frequency
NW slopesStubička Gora (620 m asl)
Snowfallavg = 30 daysmax = 57 daysmin = 6 days
0
10
20
30
40
50
60
70
80
90
100
0 1-10 11-20 21-30 31-40 41-50 51-60 61-70 71-80 81-90Days
Freq
uenc
y (%
)
0%
25%
50%
75%
100%
Relative frequencyCumulative frequency
NW slopesDonja Stubica (192 m asl)
Snowfallavg = 19 daysmax = 41 daysmin = 0 days
Figure 1: Frequency of the number of days with snowfall (precipitation ≥0.1 mm), period: 1961/62-1990/91
A snow cover ≥1 cm at the mountain’s summit can be expected for 32% days/year on average. For
25 % days/year it is higher than 10 cm, for 15% days/year higher than 30 cm and for 8% days/year
not lower than 50 cm. On the northern slopes, at an altitude of about 600 m, the average duration of
a snow cover ≥1 cm is 22 % days/year and of a cover of over 30 cm only 7 %. At heights of 200 m,
the snow cover appears for 9-13 % days/year, and a cover higher than 30 cm is very rare (3-6 days).
The appearance of a snow cover at altitudes higher than 600 m, during the period December –
March, is relatively stable, while it varies considerably from year to year in the other months. High
interannual variability is present, especially at the beginning and at the end of the snow season. The
last date of occurrence of snow depths ≥10 cm, ≥30 cm and ≥50 cm is more stable than the date of
their beginning (Fig. 2). There is also a high variability in snow abundance.
According to the annual frequency distribution of the number of days with snow cover ≥30 cm (Fig.
3), such a snow cover can be expected for up to 90 days at St. Gora and for 140 days at Puntijarka.
The frequency of all classes of number of days with snow cover ≥30 cm at Puntijarka is equally
small, 10 % and 20 % for classes 1-10 days and 41-50 days, and 10 % or less for all other classes.
At St. Gora, the class of 1-10 days is slightly more frequent.
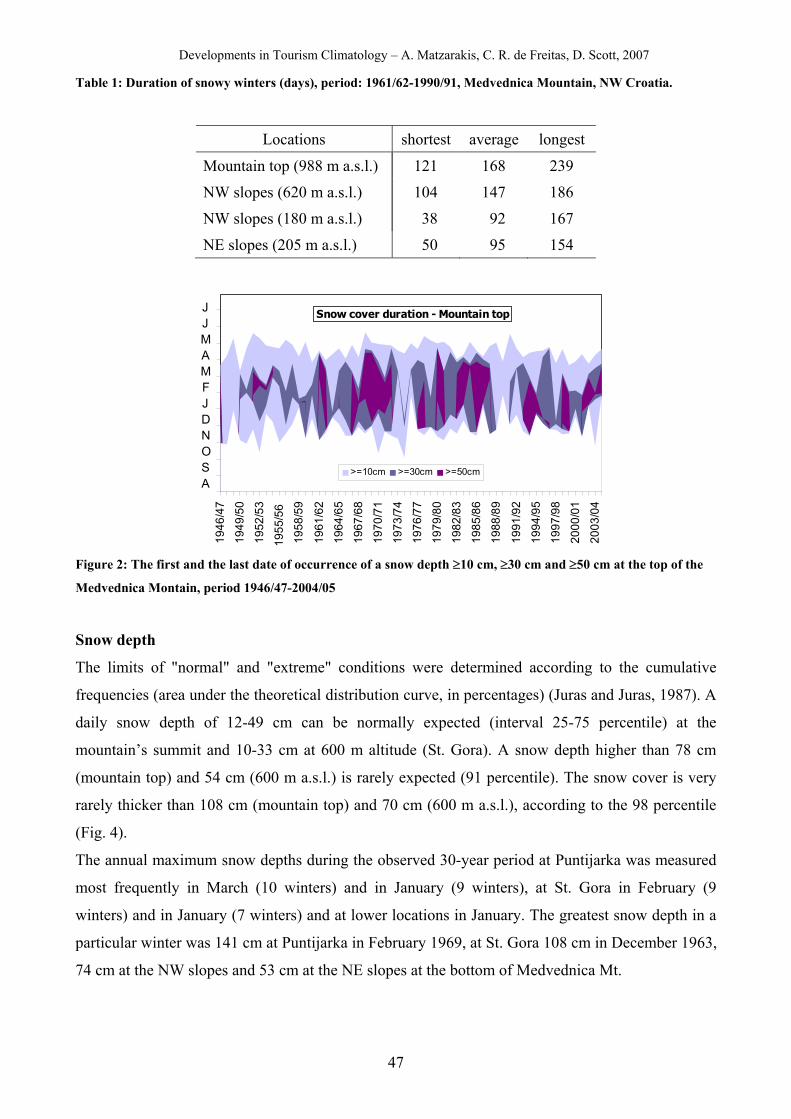
Developments in Tourism Climatology – A. Matzarakis, C. R. de Freitas, D. Scott, 2007
47
Table 1: Duration of snowy winters (days), period: 1961/62-1990/91, Medvednica Mountain, NW Croatia.
Locations shortest average longest
Mountain top (988 m a.s.l.) 121 168 239
NW slopes (620 m a.s.l.) 104 147 186
NW slopes (180 m a.s.l.) 38 92 167
NE slopes (205 m a.s.l.) 50 95 154
194
6/47
194
9/50
195
2/53
195
5/56
195
8/59
196
1/62
196
4/65
196
7/68
197
0/71
197
3/74
197
6/77
197
9/80
198
2/83
198
5/86
198
8/89
199
1/92
1994
/95
1997
/98
2000
/01
2003
/04
>=10cm >=30cm >=50cm
Snow cover duration - Mountain topJJMAMFJDNOSA
Figure 2: The first and the last date of occurrence of a snow depth ≥10 cm, ≥30 cm and ≥50 cm at the top of the
Medvednica Montain, period 1946/47-2004/05
Snow depth
The limits of "normal" and "extreme" conditions were determined according to the cumulative
frequencies (area under the theoretical distribution curve, in percentages) (Juras and Juras, 1987). A
daily snow depth of 12-49 cm can be normally expected (interval 25-75 percentile) at the
mountain’s summit and 10-33 cm at 600 m altitude (St. Gora). A snow depth higher than 78 cm
(mountain top) and 54 cm (600 m a.s.l.) is rarely expected (91 percentile). The snow cover is very
rarely thicker than 108 cm (mountain top) and 70 cm (600 m a.s.l.), according to the 98 percentile
(Fig. 4).
The annual maximum snow depths during the observed 30-year period at Puntijarka was measured
most frequently in March (10 winters) and in January (9 winters), at St. Gora in February (9
winters) and in January (7 winters) and at lower locations in January. The greatest snow depth in a
particular winter was 141 cm at Puntijarka in February 1969, at St. Gora 108 cm in December 1963,
74 cm at the NW slopes and 53 cm at the NE slopes at the bottom of Medvednica Mt.
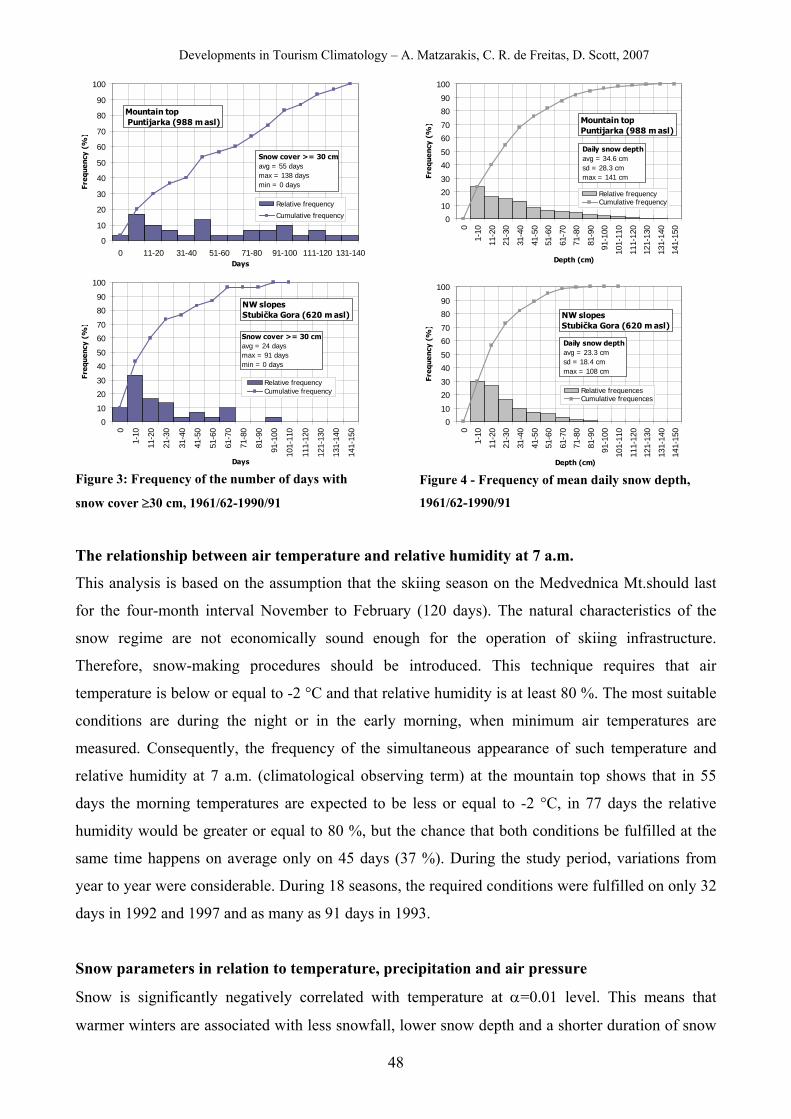
Developments in Tourism Climatology – A. Matzarakis, C. R. de Freitas, D. Scott, 2007
48
0
10
20
30
40
50
60
70
80
90
100
0 11-20 31-40 51-60 71-80 91-100 111-120 131-140Days
Freq
uenc
y (%
)
Relative frequency
Cumulative frequency
Mountain top Puntijarka (988 m asl)
Snow cover >= 30 cm avg = 55 days max = 138 days min = 0 days
0
10
20
30
40
50
60
70
80
90
100
0
1-10
11-2
0
21-3
0
31-4
0
41-5
0
51-6
0
61-7
0
71-8
0
81-9
0
91-1
00
101-
110
111-
120
121-
130
131-
140
141-
150
Days
Freq
uenc
y (%
)
Relative frequencyCumulative frequency
NW slopesStubička Gora (620 m asl)
Snow cover >= 30 cm avg = 24 daysmax = 91 daysmin = 0 days
Figure 3: Frequency of the number of days with
snow cover ≥30 cm, 1961/62-1990/91
0
10
20
30
40
50
60
70
80
90
100
0
1-10
11-2
0
21-3
0
31-4
0
41-5
0
51-6
0
61-7
0
71-8
0
81-9
0
91-1
00
101-
110
111-
120
121-
130
131-
140
141-
150
Depth (cm)
Freq
uenc
y (%
)
0%
25%
50%
75%
100%
Relative frequencyCumulative frequency
Mountain topPuntijarka (988 m asl)
Daily snow depth avg = 34.6 cm sd = 28.3 cm max = 141 cm
0
10
20
30
40
50
60
70
80
90
100
0
1-10
11-2
0
21-3
0
31-4
0
41-5
0
51-6
0
61-7
0
71-8
0
81-9
0
91-1
00
101-
110
111-
120
121-
130
131-
140
141-
150
Depth (cm)
Freq
uenc
y (%
)0%
25%
50%
75%
100%
Relative frequencesCumulative frequences
NW slopesStubička Gora (620 m asl)
Daily snow depth avg = 23.3 cm sd = 18.4 cm max = 108 cm
Figure 4 - Frequency of mean daily snow depth,
1961/62-1990/91
The relationship between air temperature and relative humidity at 7 a.m.
This analysis is based on the assumption that the skiing season on the Medvednica Mt.should last
for the four-month interval November to February (120 days). The natural characteristics of the
snow regime are not economically sound enough for the operation of skiing infrastructure.
Therefore, snow-making procedures should be introduced. This technique requires that air
temperature is below or equal to -2 °C and that relative humidity is at least 80 %. The most suitable
conditions are during the night or in the early morning, when minimum air temperatures are
measured. Consequently, the frequency of the simultaneous appearance of such temperature and
relative humidity at 7 a.m. (climatological observing term) at the mountain top shows that in 55
days the morning temperatures are expected to be less or equal to -2 °C, in 77 days the relative
humidity would be greater or equal to 80 %, but the chance that both conditions be fulfilled at the
same time happens on average only on 45 days (37 %). During the study period, variations from
year to year were considerable. During 18 seasons, the required conditions were fulfilled on only 32
days in 1992 and 1997 and as many as 91 days in 1993.
Snow parameters in relation to temperature, precipitation and air pressure
Snow is significantly negatively correlated with temperature at α=0.01 level. This means that
warmer winters are associated with less snowfall, lower snow depth and a shorter duration of snow
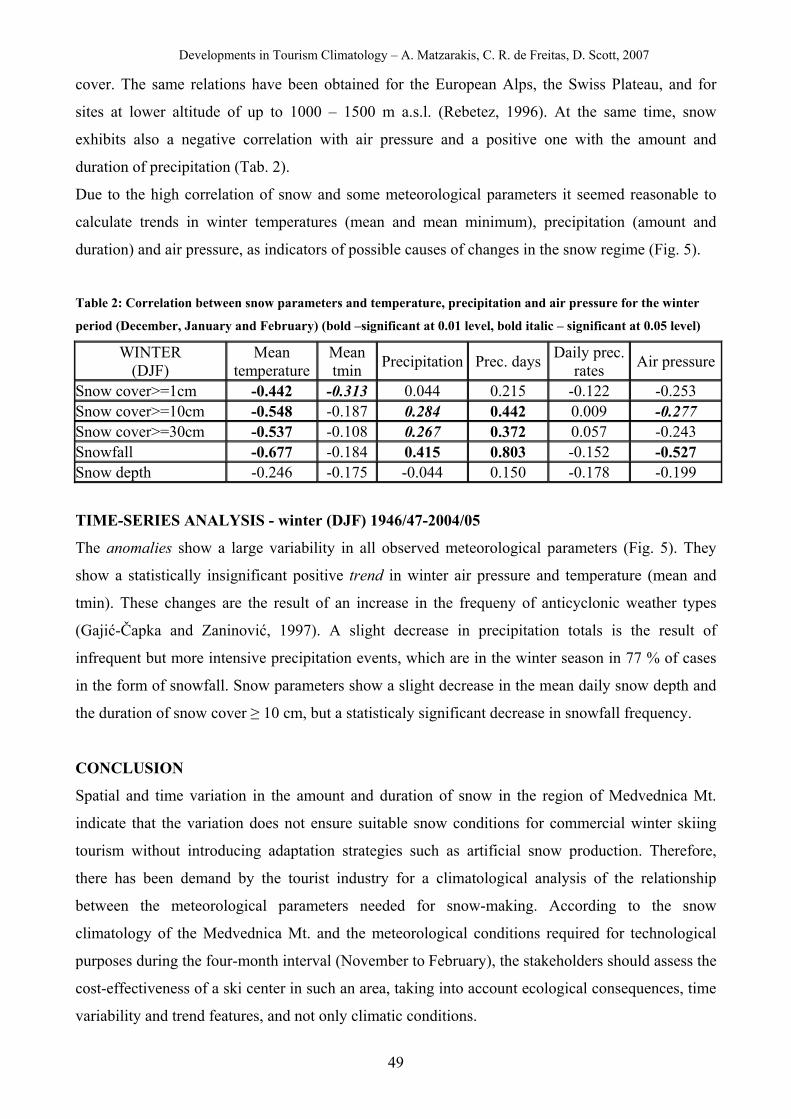
Developments in Tourism Climatology – A. Matzarakis, C. R. de Freitas, D. Scott, 2007
49
cover. The same relations have been obtained for the European Alps, the Swiss Plateau, and for
sites at lower altitude of up to 1000 – 1500 m a.s.l. (Rebetez, 1996). At the same time, snow
exhibits also a negative correlation with air pressure and a positive one with the amount and
duration of precipitation (Tab. 2).
Due to the high correlation of snow and some meteorological parameters it seemed reasonable to
calculate trends in winter temperatures (mean and mean minimum), precipitation (amount and
duration) and air pressure, as indicators of possible causes of changes in the snow regime (Fig. 5).
Table 2: Correlation between snow parameters and temperature, precipitation and air pressure for the winter
period (December, January and February) (bold –significant at 0.01 level, bold italic – significant at 0.05 level)
WINTER (DJF)
Mean temperature
Mean tmin Precipitation Prec. days Daily prec.
rates Air pressure
Snow cover>=1cm -0.442 -0.313 0.044 0.215 -0.122 -0.253 Snow cover>=10cm -0.548 -0.187 0.284 0.442 0.009 -0.277 Snow cover>=30cm -0.537 -0.108 0.267 0.372 0.057 -0.243 Snowfall -0.677 -0.184 0.415 0.803 -0.152 -0.527 Snow depth -0.246 -0.175 -0.044 0.150 -0.178 -0.199
TIME-SERIES ANALYSIS - winter (DJF) 1946/47-2004/05
The anomalies show a large variability in all observed meteorological parameters (Fig. 5). They
show a statistically insignificant positive trend in winter air pressure and temperature (mean and
tmin). These changes are the result of an increase in the frequeny of anticyclonic weather types
(Gajić-Čapka and Zaninović, 1997). A slight decrease in precipitation totals is the result of
infrequent but more intensive precipitation events, which are in the winter season in 77 % of cases
in the form of snowfall. Snow parameters show a slight decrease in the mean daily snow depth and
the duration of snow cover ≥ 10 cm, but a statisticaly significant decrease in snowfall frequency.
CONCLUSION
Spatial and time variation in the amount and duration of snow in the region of Medvednica Mt.
indicate that the variation does not ensure suitable snow conditions for commercial winter skiing
tourism without introducing adaptation strategies such as artificial snow production. Therefore,
there has been demand by the tourist industry for a climatological analysis of the relationship
between the meteorological parameters needed for snow-making. According to the snow
climatology of the Medvednica Mt. and the meteorological conditions required for technological
purposes during the four-month interval (November to February), the stakeholders should assess the
cost-effectiveness of a ski center in such an area, taking into account ecological consequences, time
variability and trend features, and not only climatic conditions.
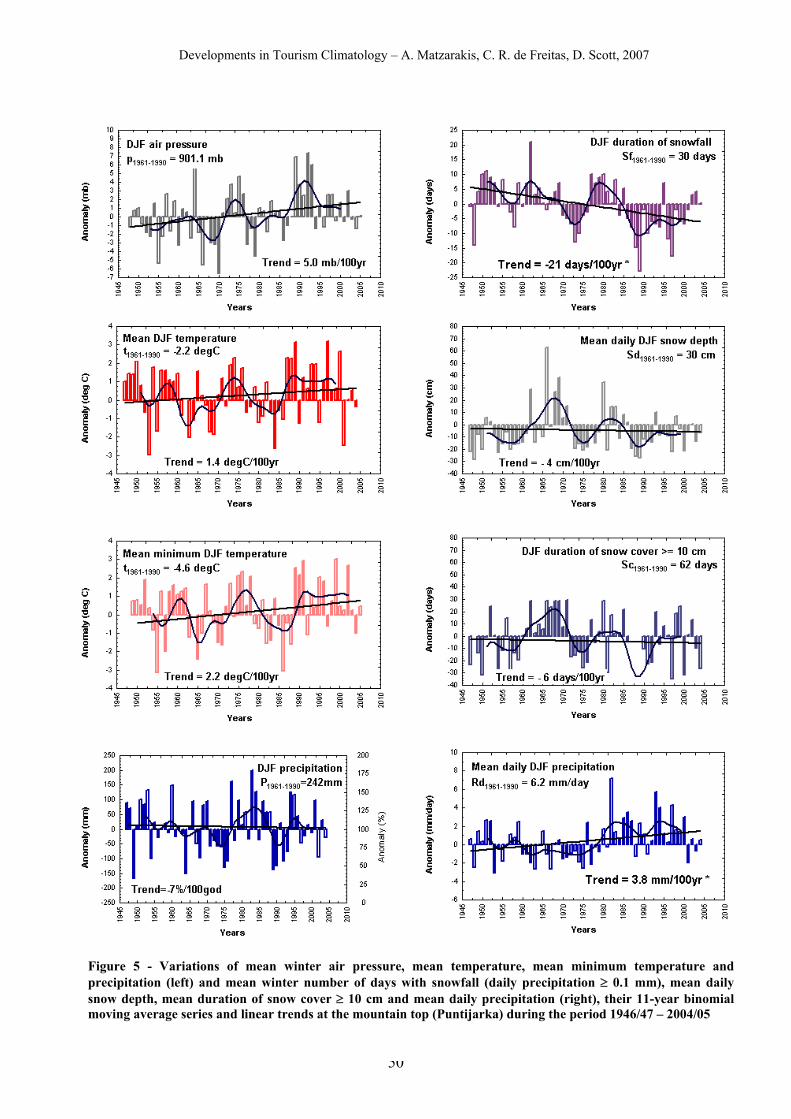
Developments in Tourism Climatology – A. Matzarakis, C. R. de Freitas, D. Scott, 2007
50
Figure 5 - Variations of mean winter air pressure, mean temperature, mean minimum temperature and precipitation (left) and mean winter number of days with snowfall (daily precipitation ≥ 0.1 mm), mean daily snow depth, mean duration of snow cover ≥ 10 cm and mean daily precipitation (right), their 11-year binomial moving average series and linear trends at the mountain top (Puntijarka) during the period 1946/47 – 2004/05
Developments in Tourism Climatology – A. Matzarakis, C. R. de Freitas, D. Scott, 2007
51
REFERENCES Buerki, R., Elsasser, H., Abegg, B. (2003) Climate Change – Impacts on the Tourism Industry
in Mountain Areas. First Int. Conference on Climate Change and Tourism, Djebra 9-11 April 2003.
Gajić-Čapka, M., Horak, S. (2005) Changes in snow parameters in Croatian highland. In: Climate Change and Tourism: Assessment and Coping Strategies (in print).
Gajić-Čapka, M., Zaninović, K. (1997) Changes in Temperature Extremes and Their Possible Causes at the SE Boundary of the Alps. Theor. Appl. Climatol., 57, 1-2, 89-94.
Juras, V., Juras, J. (1987) Methods of classification of extraordinary meteorological phenomena (in Croatian, abstract in English). Treće jugoslavensko savjetovanje o elem. atm. nepogodama - Opasne pojave na moru, Split, 16-18 XII 1987, Zbornik radova, 1-8.
Rebetez, M. (1996) Seasonal Relationship between Temperature, Precipitation and Snow Cover in a Mountainous Region.Theor. Appl. Climatol. 54: 99-106.
Weber S. et al. (2002) Stavovi i potrošnja turista u Hrvatskoj – TOMAS Ljeto 2001, 2002 (Statements and Consumptions of Tourists in Croatia - TOMAS Summer 2001), Institut za turizam, Zagreb, 32 pp.
Developments in Tourism Climatology – A. Matzarakis, C. R. de Freitas, D. Scott, 2007
52
ASSESSMENT METHOD FOR CLIMATE AND TOURISM BASED ON DAILY
DATA
A. Matzarakis
Meteorological Institute, University of Freiburg, D-79085 Freiburg, Germany
ABSTRACT The described method allows the integration of weather and climate for tourism
and recreation issues as it implements several factors and facets, like thermal (a.e.
physiologically equivalent temperature), physical (a.e. precipitation and wind) and aesthetical
(a.e. sunshine duration and cloud cover). Spliting up the months into three periods, which
represent more accurately the vacation times, provides more reliable information for tourism
and recreation. Additionally, detailed information about extreme events can be given through
the use of frequencies of classes and amounts of threshold values.
KEYWORDS: Tourism, climatology, Climate-Tourism Index
INTRODUCTION
Existing methods for the evaluation of climate for tourism purposes are based on mean
monthly values, and climate indices consider only basic climate elements, a.e. air temperature,
air humidity or precipitation (Mieczkowski, 1985, Abegg, 1996, Matzarakis and de Freitas,
2001, Matzarakis et al., 2004). The climate indices do not have a thermo-physiological
relevance nor do they provide information about frequencies of classes or extreme events.
Additionally, they do not offer high temporal resolution. The existing indices do not cover all
relevant and important parameters and facets (de Freitas, 2003, Matzarakis and de Freitas,
2005). New approaches for the development include the diverse facets of climate for tourism
and a subject of research (de Freitas, 2003, Matzarakis et al., 2007, Matzarakis, 2007).
METHODS AND DATA
In the past, tourism climatology information was provided through climate indices such as
those found in applied climatology and humanbiometeorology. There are more than 200
climate indices. In general, the tourism climate indices can be classified into three categories
(after Abegg, 1996). Elementary indices are synthetic values that do not have any thermo-
physiological relevance and are generally unproven. The bioclimatic and combined tourism
Developments in Tourism Climatology – A. Matzarakis, C. R. de Freitas, D. Scott, 2007
53
climate indices involve more than one climatological parameter and consider the combined
effects of them.
An example of a combined index is the Tourism Climate Index (TCI). Developed by
Mieczkowski (1985) the TCI uses a combination of seven parameters, three of which are
independent and two in a bioclimatic combination (Eq. 1).
W* 2 S * 4 R * 4 Cla *2 Cld * 8 TCI ++++= (1)
Where Cld is a daytime comfort index, consisting of the mean maximum air temperature
Ta,max (°C) and the mean minimum relative humidity RH (%), Cla is the daily comfort index,
consisting of the mean air temperature (°C) and the mean relative humidity (%), R is the
precipitation (mm), S is the daily sunshine duration (h), and W is the mean wind speed (m/s).
In contrast to other climate indices, every contributing parameter is assessed. Because of a
weighting factor (a value for TCI of 100), every factor can reach 5 points. TCI values >= 80
are excellent, while values between 60 and 79 are regarded as good to very good. Lower
values (40 – 59) are acceptable, but values < 40 indicate bad or difficult conditions for tourism
(Abetz, 1996; Mieczkowski, 1985).
The climatic indices shown have a number of weaknesses. From a climatology point of view,
they do not include the effects of short and long wave radiation fluxes, since they are generally
not included in climatic records. The required short and long wave radiation fluxes are
calculated using synoptic data and theoretical calculations from astronomical data (VDI, 1998;
Matzarakis et al., 2007). A full application of thermal indices on the energy balance of the
human body gives detailed information about the effect of the thermal environment on humans
(VDI, 1998). Common applications are PMV (Predicted Mean Vote), PET (Physiologically
Equivalent Temperature), SET* (Standard Effective Temperature) and Perceived Temperature
pT (in Matzarakis, 2006). All those thermal indices are well documented and include
important meteorological and thermo-physiological parameters (Matzarakis, 2007).
The advantage of these thermal indices is that they all require the same meteorological input
parameters: air temperature, air humidity, wind speed, short and long wave radiation fluxes. In
table 4, threshold values of the thermal indices Predicted Mean Vote (PMV) and
Physiologically Equivalent Temperature (PET) are explained for different levels of thermal
sensitivity and physiological stress on humans. Internal heat production: 80 W, heat transfer
resistance of clothing: 0.9 clo (according to Matzarakis and Mayer, 1996) giving a possibility
to access the thermal environment of humans (Tab. 4). The thermal environment of humans
Developments in Tourism Climatology – A. Matzarakis, C. R. de Freitas, D. Scott, 2007
54
can be altered by parameters such as ‘Internal heat production’ (e.g. 80 W) and ‘Heat transfer
resistance of clothing’ (e.g. 0.9 clo).
Based on recent findings (de Freitas, 2003; Matzarakis et al., 2004; Matzarakis, 2006) the
following scheme was developed. The presented method considers thermal/human-
biometeorological, physical and aesthetical facets, which include most factors and parameters
for the description of climate in tourism (de Freitas, 2003; Matzarakis, 2006).
The following factors are considered in detail:
a) Basic and available parameters (air temperature, air humidity, wind speed, precipitation)
on daily basis,
b) High temporal resoluted information in decades (separation of months in three intervals),
c) Analysis of climatological and human-biometeorological conditions based on frequency
classes and threshold values,
d) Consideration of thermal comfort, heat stress, cold stress and “sultriness” based on
human-biometeorological thresholds and human energy balance i.e. PET,
e) Consideration of precipitation and its amount and type i.e. snow cover, dry days or wet
days,
f) Consideration of fog and sunshine/cloudiness conditions,
g) Consideration of high wind conditions.
In the following section the climate-tourism analysis is outlined and some examples for
Heraklion in Crete/Greece are given.
RESULTS AND EXAMPLES
The results presented here are based on an analysis of daily data from the station Heraklion of
the Hellenic National Weather Service for the period 1951 to 2011. Classical analysis of
monthly means and frequencies was performed but results are not presented here (Matzarakis
et al., 2005). In Fig. 1 the temporal development of physiologically equivalent temperature of
the annual, seasonal and tourism period (April to October) is shown for the period 1955 –
2001. Fig. 2 contains the temporal development of the annual precipitation sum and the
amount of days (precipitation higher than 1 mm). On the one side, detailed information (Fig. 1
and 2) about the temporal development and the annual variability of important climate
variables can be extracted. On the other side, these graphs do not allow conclusions about
frequencies and extreme events.
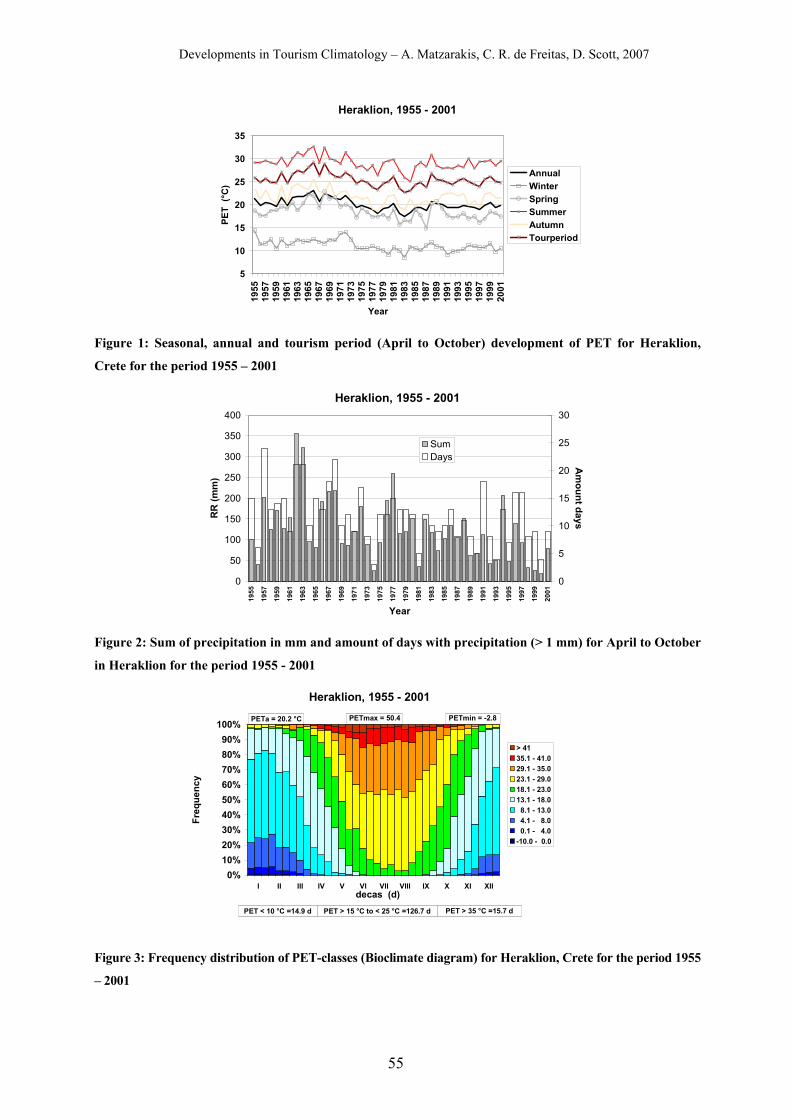
Developments in Tourism Climatology – A. Matzarakis, C. R. de Freitas, D. Scott, 2007
55
Heraklion, 1955 - 2001
5
10
15
20
25
30
35
1955
1957
1959
1961
1963
1965
1967
1969
1971
1973
1975
1977
1979
1981
1983
1985
1987
1989
1991
1993
1995
1997
1999
2001
Year
PET
(°C
)
AnnualWinterSpringSummerAutumnTourperiod
Figure 1: Seasonal, annual and tourism period (April to October) development of PET for Heraklion,
Crete for the period 1955 – 2001
Heraklion, 1955 - 2001
0
50
100
150
200
250
300
350
400
1955
1957
1959
1961
1963
1965
1967
1969
1971
1973
1975
1977
1979
1981
1983
1985
1987
1989
1991
1993
1995
1997
1999
2001
Year
RR
(mm
)
0
5
10
15
20
25
30
Am
ount days
SumDays
Figure 2: Sum of precipitation in mm and amount of days with precipitation (> 1 mm) for April to October
in Heraklion for the period 1955 - 2001
Heraklion, 1955 - 2001
0%10%20%30%40%50%60%70%80%90%
100%
I II III IV V VI VII VIII IX X XI XIIdecas (d)
Freq
uenc
y
> 4135.1 - 41.029.1 - 35.023.1 - 29.018.1 - 23.013.1 - 18.0 8.1 - 13.0 4.1 - 8.0 0.1 - 4.0-10.0 - 0.0
PETa = 20.2 °C PETmax = 50.4 °C
PETmin = -2.8 °C
PET > 35 °C =15.7 dPET < 10 °C =14.9 d PET > 15 °C to < 25 °C =126.7 d
Figure 3: Frequency distribution of PET-classes (Bioclimate diagram) for Heraklion, Crete for the period 1955
– 2001
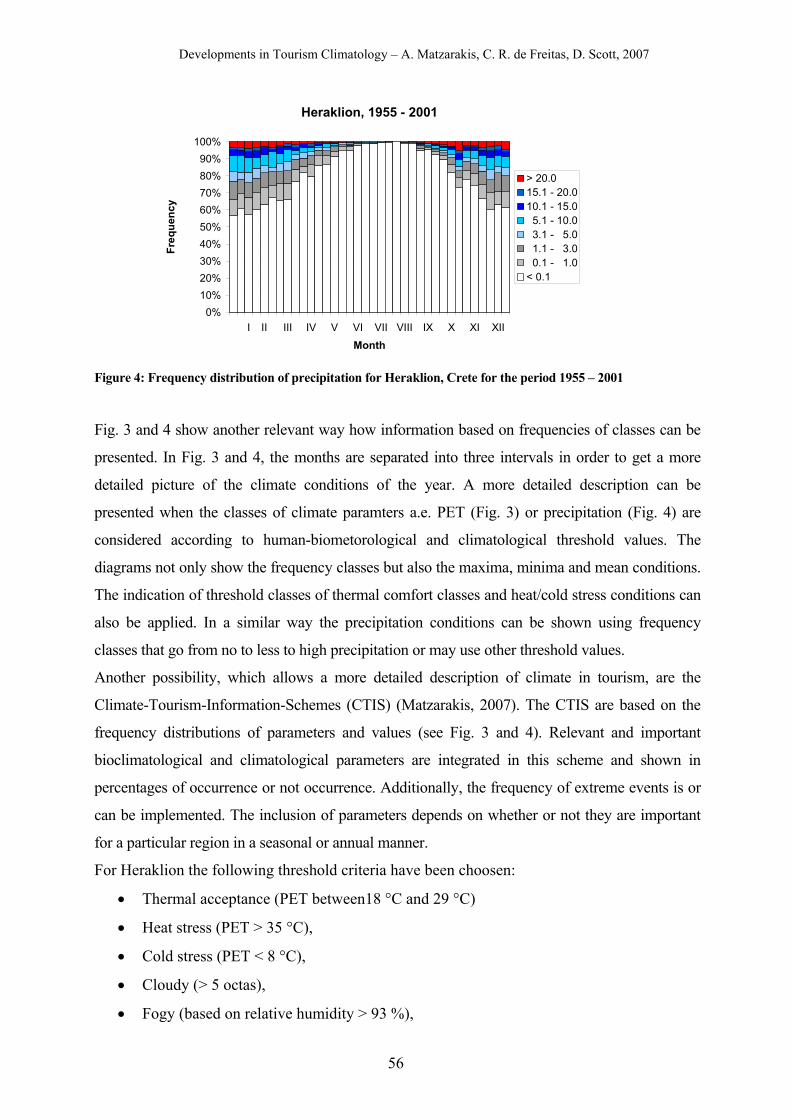
Developments in Tourism Climatology – A. Matzarakis, C. R. de Freitas, D. Scott, 2007
56
Heraklion, 1955 - 2001
0%10%20%30%40%50%60%70%80%90%
100%
I II III IV V VI VII VIII IX X XI XII
Month
Freq
uenc
y> 20.015.1 - 20.010.1 - 15.0 5.1 - 10.0 3.1 - 5.0 1.1 - 3.0 0.1 - 1.0< 0.1
Figure 4: Frequency distribution of precipitation for Heraklion, Crete for the period 1955 – 2001
Fig. 3 and 4 show another relevant way how information based on frequencies of classes can be
presented. In Fig. 3 and 4, the months are separated into three intervals in order to get a more
detailed picture of the climate conditions of the year. A more detailed description can be
presented when the classes of climate paramters a.e. PET (Fig. 3) or precipitation (Fig. 4) are
considered according to human-biometorological and climatological threshold values. The
diagrams not only show the frequency classes but also the maxima, minima and mean conditions.
The indication of threshold classes of thermal comfort classes and heat/cold stress conditions can
also be applied. In a similar way the precipitation conditions can be shown using frequency
classes that go from no to less to high precipitation or may use other threshold values.
Another possibility, which allows a more detailed description of climate in tourism, are the
Climate-Tourism-Information-Schemes (CTIS) (Matzarakis, 2007). The CTIS are based on the
frequency distributions of parameters and values (see Fig. 3 and 4). Relevant and important
bioclimatological and climatological parameters are integrated in this scheme and shown in
percentages of occurrence or not occurrence. Additionally, the frequency of extreme events is or
can be implemented. The inclusion of parameters depends on whether or not they are important
for a particular region in a seasonal or annual manner.
For Heraklion the following threshold criteria have been choosen:
• Thermal acceptance (PET between18 °C and 29 °C)
• Heat stress (PET > 35 °C),
• Cold stress (PET < 8 °C),
• Cloudy (> 5 octas),
• Fogy (based on relative humidity > 93 %),
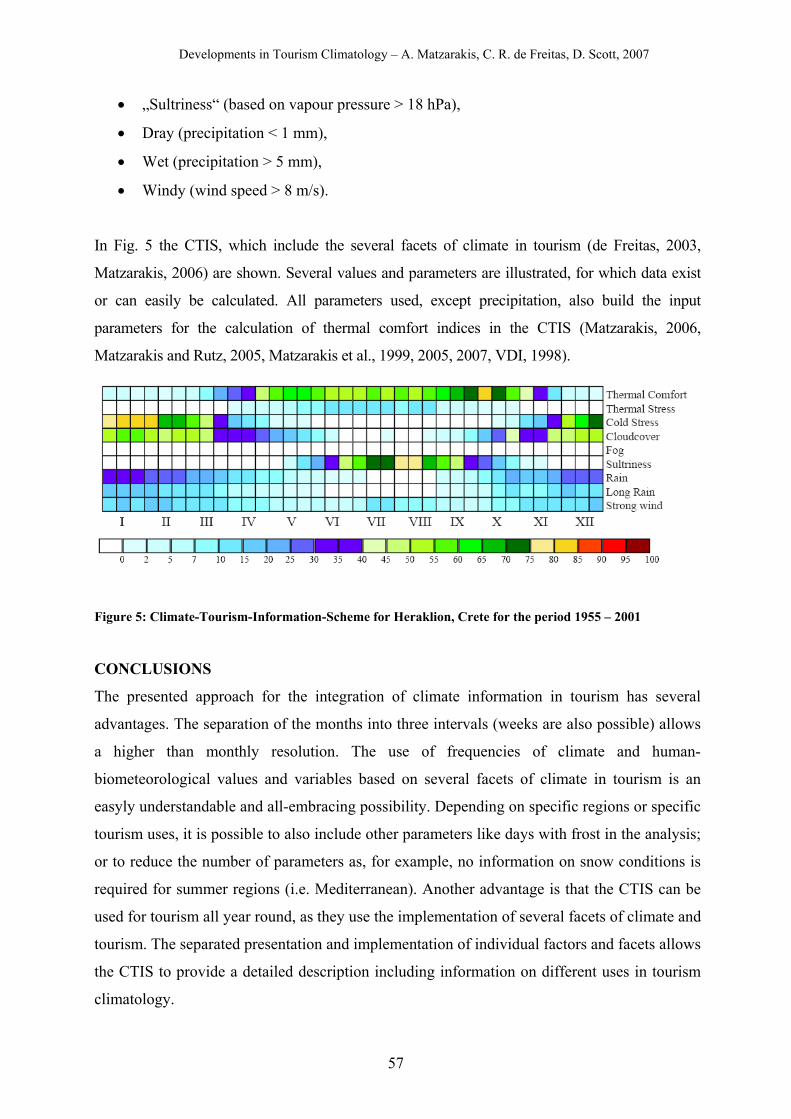
Developments in Tourism Climatology – A. Matzarakis, C. R. de Freitas, D. Scott, 2007
57
• „Sultriness“ (based on vapour pressure > 18 hPa),
• Dray (precipitation < 1 mm),
• Wet (precipitation > 5 mm),
• Windy (wind speed > 8 m/s).
In Fig. 5 the CTIS, which include the several facets of climate in tourism (de Freitas, 2003,
Matzarakis, 2006) are shown. Several values and parameters are illustrated, for which data exist
or can easily be calculated. All parameters used, except precipitation, also build the input
parameters for the calculation of thermal comfort indices in the CTIS (Matzarakis, 2006,
Matzarakis and Rutz, 2005, Matzarakis et al., 1999, 2005, 2007, VDI, 1998).
Figure 5: Climate-Tourism-Information-Scheme for Heraklion, Crete for the period 1955 – 2001
CONCLUSIONS
The presented approach for the integration of climate information in tourism has several
advantages. The separation of the months into three intervals (weeks are also possible) allows
a higher than monthly resolution. The use of frequencies of climate and human-
biometeorological values and variables based on several facets of climate in tourism is an
easyly understandable and all-embracing possibility. Depending on specific regions or specific
tourism uses, it is possible to also include other parameters like days with frost in the analysis;
or to reduce the number of parameters as, for example, no information on snow conditions is
required for summer regions (i.e. Mediterranean). Another advantage is that the CTIS can be
used for tourism all year round, as they use the implementation of several facets of climate and
tourism. The separated presentation and implementation of individual factors and facets allows
the CTIS to provide a detailed description including information on different uses in tourism
climatology.
Developments in Tourism Climatology – A. Matzarakis, C. R. de Freitas, D. Scott, 2007
58
ACKNOWLEDGEMENT
Thanks to the Hellenic National Weather Service for providing the data for the station of
Heraklion.
REFERENCES de Freitas, C.R. (2003) Tourism climatology: evaluating environmental information for
decision making and business planning in the recreation and tourism sector. - Int. J. Biometeorology 48: 45-54.
Höppe, P. (1999) The physiological equivalent temperature – a universal index for the biometeorological assessment of the thermal environment. - International Journal of Biometeorology 43: 71-75.
Koch, E., Marktl, W., Matzarakis, A., Nefzger, H., Rudel, E., Schunder-Tatzber, S., Zygmuntowski, M. (2005) Klimatherapie in Österreich. Broschüre zu den Potentialen der Klimatherapie in Österreich. - Bundesministerium für Wirtschaft und Arbeit.
Matzarakis, A. (2006) Weather and climate related information for tourism. - Tourism and Hospitality Planning & Development 3: 99-115.
Matzarakis, A., de Freitas, C.R. (eds) (2001) Proceedings of the first international workshop on climate, tourism and recreation. - International Society of Biometeorology, Commission on Climate Tourism and Recreation. December 2001.
Matzarakis, A., de Freitas, C., Scott, D. (eds.) (2004) Advances in tourism climatology. - Ber. Meteorol. Inst. Univ. Freiburg Nr. 12.
Matzarakis, A., Rutz, F. (2005) Application of RayMan for tourism and climate investigations. Annalen der Meteorologie 41: Vol. 2, 631-636.
Matzarakis, A., Karatarakis, N. Sarantopoulos, A. (2005) Tourism climatology and tourism potential for Crete, Greece. - Annalen der Meteorologie 41: Vol. 2, 616-619.
Matzarakis, A., Mayer, H., and Iziomon, M.G. (1999) Applications of a universal thermal index: physiological equivalent temperature, Int. J. Biometeorol. 43: 76-84.
Matzarakis, A., Rutz, F., Mayer, H. (2007) Modelling Radiation fluxes in simple and complex environments – Application of the RayMan model. Int. J. Biomet. 51: 323-334.
Mieczkowski, Z. (1985) The tourism climate index: A method for evaluating world climates for tourism. - The Canadian Geographer 29: 220-233.
VDI (1998) Methods for the human-biometerological assessment of climate and air hygiene for urban and regional planning. Part I: Climate, VDI guideline 3787. Part 2. Beuth, Berlin.
Developments in Tourism Climatology – A. Matzarakis, C. R. de Freitas, D. Scott, 2007
59
BIOCLIMATE AND TOURISM POTENTIAL IN NATIONAL PARKS OF TAIWAN
T.-P. Lin1 and A. Matzarakis2
1Department of Leisure Planning, National Formosa University, 632 Yunlin, Taiwan 2Meteorological Institute, University of Freiburg, D-79085 Freiburg, Germany
[email protected] (Tzu-Ping Lin)
ABSTRACT Possible changes in global climate will affect tourism, as most tourism takes
place outdoors. The research presented here analyzes single climatological parameters such as
air temperature and rain. It also includes an analysis of thermal comfort conditions in four
National Parks in Taiwan. The analysis is based not only on mean values of parameters and
factors but also on frequencies of classes of individual climatological parameters and thermal
comfort factors based on the division of 10-day intervals and an analysis of extreme events,
which are important for tourism. The temporal-spatial distribution and mobility of tourists is
also discussed based on the climatological parameters in order to present the potential of
tourism in each National Parks in Taiwan
KEYWORDS: Tourism Climatology, Physiologically Equivalent Temperature, National
Parks Taiwan
INTRODUCTION
Previous studies reveal that weather and climate are important factors for tourism decision
making (Lin et al., 2006, Hamilton and Lau, 2005, de Freitas, 2003, Matzarakis et al., 2004).
In order to evaluate the suitability of climate for tourism, several climate-tourism indices were
employed in past research (Murray, 1972, Rackliffe, 1965, Davies, 1968, Yapp and Mc
Donald, 1978, Mieczkowski, 1985). However, some important issues still need to be clarified
with regards to the practical aspect of tourism-climate information. How can an index for
tourism climate be established and presented in an easily understandable way? How to
include subjective thermal perception of tourists in the tourism-climate index? What is the
relationship between tourist flow and climate, and the tourism potential for a particular travel
destination? Parts of these issues have been discussed for the tourism-climate and thermal
comfort in Sun Moon Lake, Taiwan (Lin and Matzarakis, 2008). However, more research is
needed into the correlation between tourists’ attendance and climate parameters. Therefore,
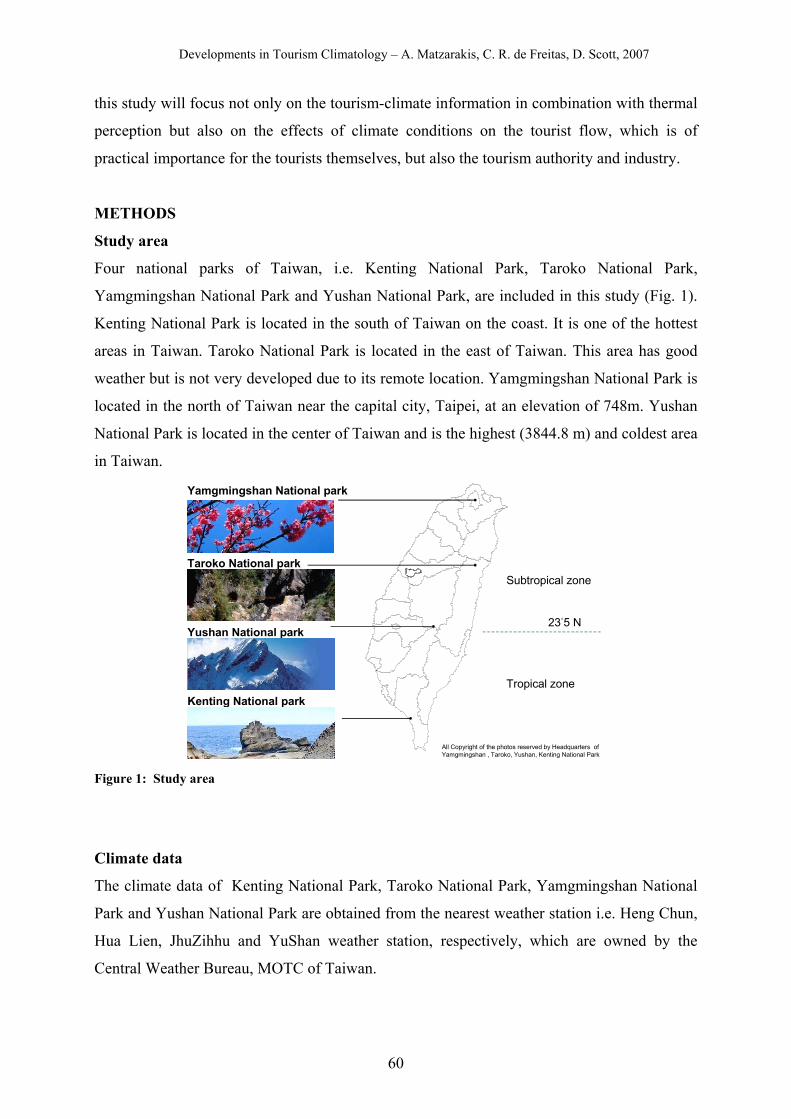
Developments in Tourism Climatology – A. Matzarakis, C. R. de Freitas, D. Scott, 2007
60
this study will focus not only on the tourism-climate information in combination with thermal
perception but also on the effects of climate conditions on the tourist flow, which is of
practical importance for the tourists themselves, but also the tourism authority and industry.
METHODS
Study area
Four national parks of Taiwan, i.e. Kenting National Park, Taroko National Park,
Yamgmingshan National Park and Yushan National Park, are included in this study (Fig. 1).
Kenting National Park is located in the south of Taiwan on the coast. It is one of the hottest
areas in Taiwan. Taroko National Park is located in the east of Taiwan. This area has good
weather but is not very developed due to its remote location. Yamgmingshan National Park is
located in the north of Taiwan near the capital city, Taipei, at an elevation of 748m. Yushan
National Park is located in the center of Taiwan and is the highest (3844.8 m) and coldest area
in Taiwan.
23°5 N
Tropical zone
Subtropical zone
Kenting National park
Taroko National park
Yamgmingshan National park
Yushan National park
All Copyright of the photos reserved by Headquarters of Yamgmingshan , Taroko, Yushan, Kenting National Park
23°5 N
Tropical zone
Subtropical zone
Kenting National park
Taroko National park
Yamgmingshan National park
Yushan National park
All Copyright of the photos reserved by Headquarters of Yamgmingshan , Taroko, Yushan, Kenting National Park
Figure 1: Study area
Climate data
The climate data of Kenting National Park, Taroko National Park, Yamgmingshan National
Park and Yushan National Park are obtained from the nearest weather station i.e. Heng Chun,
Hua Lien, JhuZihhu and YuShan weather station, respectively, which are owned by the
Central Weather Bureau, MOTC of Taiwan.
Developments in Tourism Climatology – A. Matzarakis, C. R. de Freitas, D. Scott, 2007
61
Calculation of climate parameters
In order to offer more comprehensive and useful weather information, climate parameters are
calculated for each ten-day interval. Although it is possible to present the climate data on a
daily basis as hourly data are available for this study, we suggested presenting the climate
data in ten-day units as climate parameters for ten-day periods are more stable and easier to
interpret than those for one-day units. Furthermore, a tourist is generally defined by WTO as a
person who spends more than 24 hours but less than a year away from his or her usual place
of residence. Vacations typically last for 1, 2 or 3 weeks. Therefore, climate data for ten-day
intervals help tourists to determine which periods are suitable for travel. Compared to one-day
data, ten-day intervals provide long-range information for tourists. In order to calculate PET
in the RayMan model (Matzarakis et al., 2007), the following variables were included in the
model: air temperature, vapour pressure, average wind speed, and global radiation.
Thermal comfort database
In order to account for tourists’ thermal perception under different temperatures of PET, it is
necessary to define PET ranges in which tourists feel comfortable, i.e. the “thermal comfort
range” for PET. People from different regions may have different thermal perceptions toward
the same PET. Therefore, the thermal comfort range of Taiwan, which was already
established (Lin and Matzarakis, 2008) in an earlier study, is applied in this study to fit the
thermal sensation of Taiwanese people.
RESULTS
Frequencies of PET
The thermal comfort classification using the Taiwan scale is applied to the PET frequencies
for the four national parks (Fig. 2). The frequencies of “neutral” using the Taiwan scale (26-
30 °C PET) are similar in Kenting, Taroko and Yamgmingshan National Park, but do not
occur in Yushan National Park for the whole year. If we suggest that 22-34 °C PET are in a
acceptable thermal range, Kenting is the most comfortable park throughout the whole year
among the four national parks.
Climate Tourism Information Scheme
Different people have different recognitions of the climate parameters priority. Even the same
person will have different climate preference depending on location. Therefore, the climate
information should be flexible for the tourists so that they can evaluate the climate
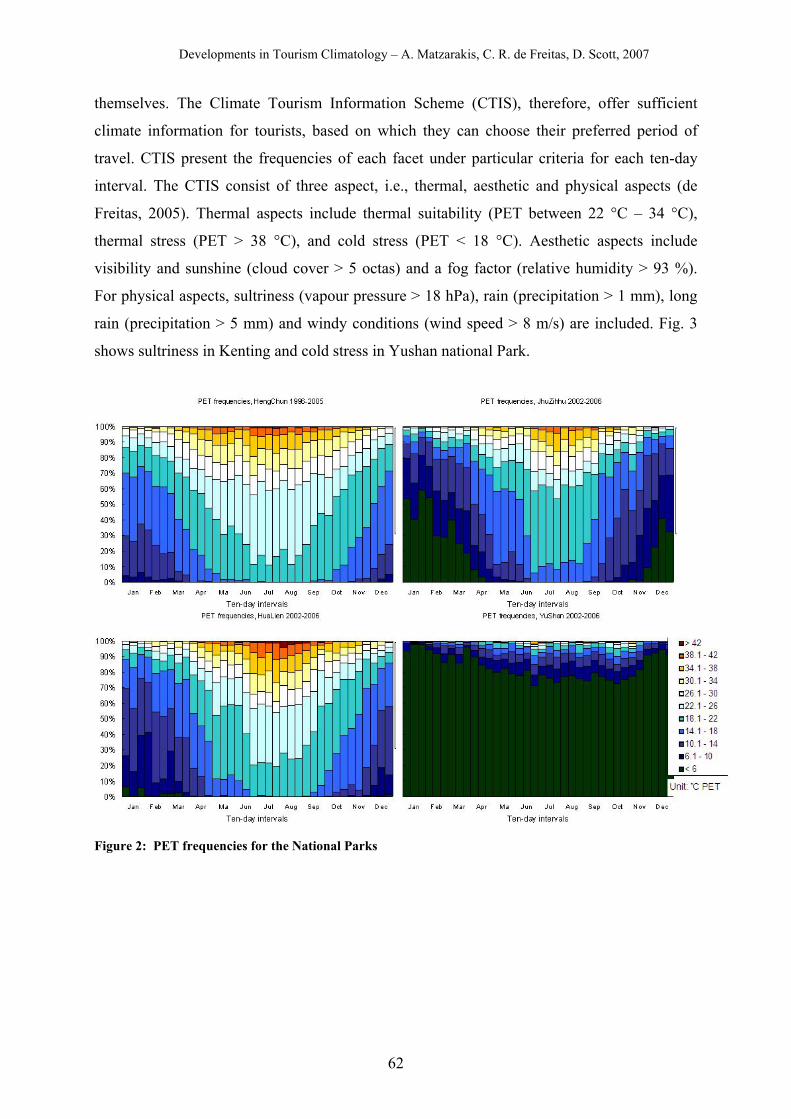
Developments in Tourism Climatology – A. Matzarakis, C. R. de Freitas, D. Scott, 2007
62
themselves. The Climate Tourism Information Scheme (CTIS), therefore, offer sufficient
climate information for tourists, based on which they can choose their preferred period of
travel. CTIS present the frequencies of each facet under particular criteria for each ten-day
interval. The CTIS consist of three aspect, i.e., thermal, aesthetic and physical aspects (de
Freitas, 2005). Thermal aspects include thermal suitability (PET between 22 °C – 34 °C),
thermal stress (PET > 38 °C), and cold stress (PET < 18 °C). Aesthetic aspects include
visibility and sunshine (cloud cover > 5 octas) and a fog factor (relative humidity > 93 %).
For physical aspects, sultriness (vapour pressure > 18 hPa), rain (precipitation > 1 mm), long
rain (precipitation > 5 mm) and windy conditions (wind speed > 8 m/s) are included. Fig. 3
shows sultriness in Kenting and cold stress in Yushan national Park.
Figure 2: PET frequencies for the National Parks
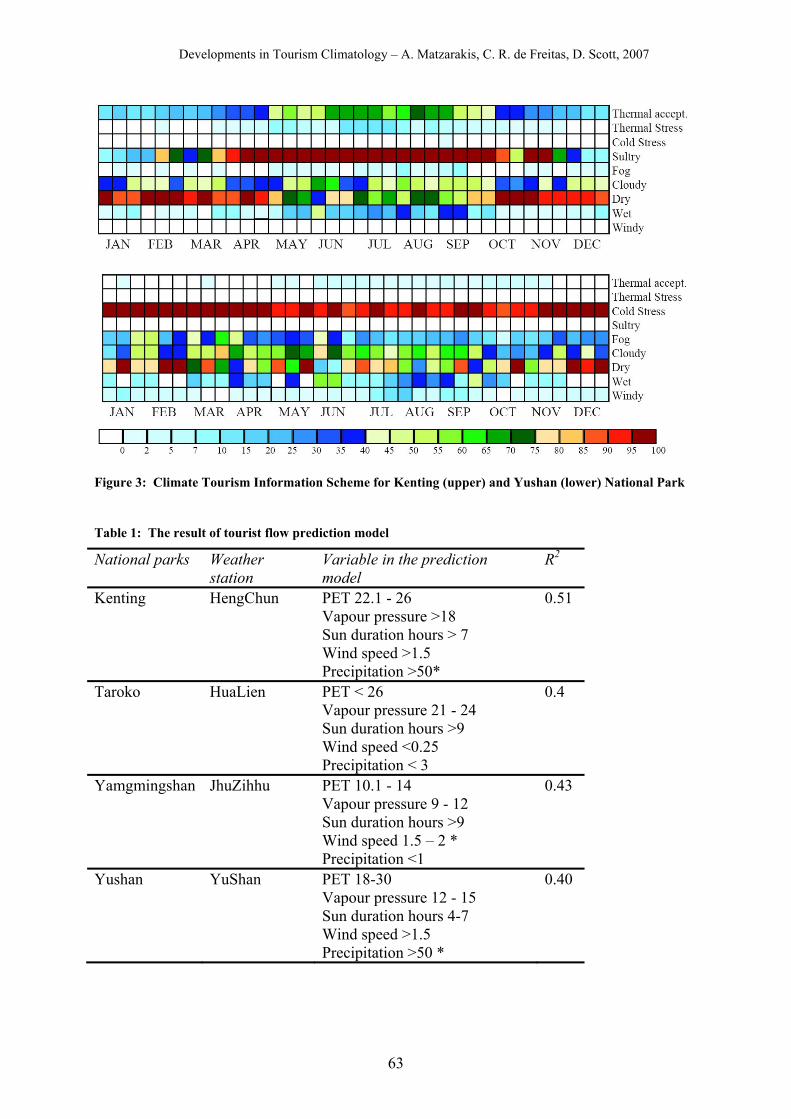
Developments in Tourism Climatology – A. Matzarakis, C. R. de Freitas, D. Scott, 2007
63
Figure 3: Climate Tourism Information Scheme for Kenting (upper) and Yushan (lower) National Park Table 1: The result of tourist flow prediction model
National parks Weather station
Variable in the prediction model
R2
Kenting HengChun PET 22.1 - 26 Vapour pressure >18 Sun duration hours > 7 Wind speed >1.5 Precipitation >50*
0.51
Taroko HuaLien PET < 26 Vapour pressure 21 - 24 Sun duration hours >9 Wind speed <0.25 Precipitation < 3
0.4
Yamgmingshan JhuZihhu PET 10.1 - 14 Vapour pressure 9 - 12 Sun duration hours >9 Wind speed 1.5 – 2 * Precipitation <1
0.43
Yushan YuShan PET 18-30 Vapour pressure 12 - 15 Sun duration hours 4-7 Wind speed >1.5 Precipitation >50 *
0.40
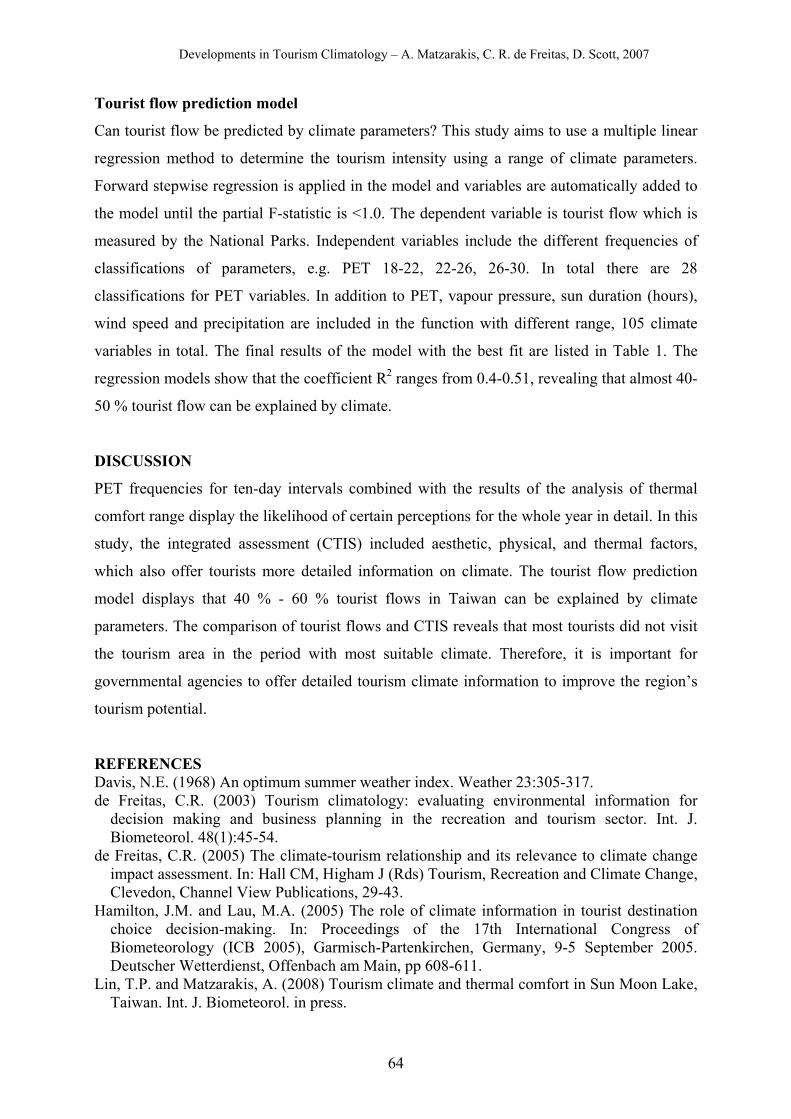
Developments in Tourism Climatology – A. Matzarakis, C. R. de Freitas, D. Scott, 2007
64
Tourist flow prediction model
Can tourist flow be predicted by climate parameters? This study aims to use a multiple linear
regression method to determine the tourism intensity using a range of climate parameters.
Forward stepwise regression is applied in the model and variables are automatically added to
the model until the partial F-statistic is <1.0. The dependent variable is tourist flow which is
measured by the National Parks. Independent variables include the different frequencies of
classifications of parameters, e.g. PET 18-22, 22-26, 26-30. In total there are 28
classifications for PET variables. In addition to PET, vapour pressure, sun duration (hours),
wind speed and precipitation are included in the function with different range, 105 climate
variables in total. The final results of the model with the best fit are listed in Table 1. The
regression models show that the coefficient R2 ranges from 0.4-0.51, revealing that almost 40-
50 % tourist flow can be explained by climate.
DISCUSSION
PET frequencies for ten-day intervals combined with the results of the analysis of thermal
comfort range display the likelihood of certain perceptions for the whole year in detail. In this
study, the integrated assessment (CTIS) included aesthetic, physical, and thermal factors,
which also offer tourists more detailed information on climate. The tourist flow prediction
model displays that 40 % - 60 % tourist flows in Taiwan can be explained by climate
parameters. The comparison of tourist flows and CTIS reveals that most tourists did not visit
the tourism area in the period with most suitable climate. Therefore, it is important for
governmental agencies to offer detailed tourism climate information to improve the region’s
tourism potential.
REFERENCES Davis, N.E. (1968) An optimum summer weather index. Weather 23:305-317. de Freitas, C.R. (2003) Tourism climatology: evaluating environmental information for
decision making and business planning in the recreation and tourism sector. Int. J. Biometeorol. 48(1):45-54.
de Freitas, C.R. (2005) The climate-tourism relationship and its relevance to climate change impact assessment. In: Hall CM, Higham J (Rds) Tourism, Recreation and Climate Change, Clevedon, Channel View Publications, 29-43.
Hamilton, J.M. and Lau, M.A. (2005) The role of climate information in tourist destination choice decision-making. In: Proceedings of the 17th International Congress of Biometeorology (ICB 2005), Garmisch-Partenkirchen, Germany, 9-5 September 2005. Deutscher Wetterdienst, Offenbach am Main, pp 608-611.
Lin, T.P. and Matzarakis, A. (2008) Tourism climate and thermal comfort in Sun Moon Lake, Taiwan. Int. J. Biometeorol. in press.
Developments in Tourism Climatology – A. Matzarakis, C. R. de Freitas, D. Scott, 2007
65
Lin, T.P., Hwang, C.C. and Cheng, H.Y. (2006) The Influence of Climate Information on Travel Arrangements. In: Proceedings of the 8th Leisure, Recreation and Tourism Research Symposium, Taipei, 7 October 2006. Outdoor Recreation Association, Taipei, pp 120-126.
Matzarakis, A., de Freitas, C. and Scott, D. (2004) Advances in tourism climatology. Freiburg. Ber. Meteorol. Inst. Univ. Freiburg No. 12.
Matzarakis, A., Rutz, F. and Mayer, H. (2007) Modelling Radiation fluxes in simple and complex environments- Application of the RayMan model. Int. J. Biometeorol. 51:323-334.
Mieczkowski, Z. (1985) The tourism climate index: a method for evaluating world climates for tourism. Can. Geogr. 29:220-233.
Murray, R. (1972) A simple summer index with an illustration for summer 1971. Weather 27:161-169.
Rackliffe, P.G. (1965) Summer and winter indices at Armagh. Weather 20:38-44. Yapp, G.A. and McDonald, N.S. (1978) A recreation climate model. J. Environ. Manage.
7:235-252.
Developments in Tourism Climatology – A. Matzarakis, C. R. de Freitas, D. Scott, 2007
66
NORTH-SOUTH VARIATION OF BIOCLIMATIC PARAMETERS IN ARGENTINA DURING SUMMER MONTHS
A. Helbig1, A. Matzarakis2 and E. Piacentini3
1Fach Umweltmeteorologie, FB VI, University of Trier, Germany 2Meteorological Institute, University of Freiburg, Germany
3Servicio Meteorologico Nacional, Buenos Aires, Argentina
[email protected] ABSTRACT For the description of the thermal bioclimatic factors the parameters Predicted
Mean Vote (PMV) and Physiologically Equivalent Temperature (PET) are well suitable. With
the software RayMan we, for the first time, computed daily values for PMV and PET on the
basis of the 8 or 24 per day synoptic observations at eight Argentine stations of La Quiaca
(24° S) to Ushuaia (55° S) for 12 h, 15 h and 18 h local time for the period 1.1.1996 to
31.12.2005. To ensure comparability the calculations refer to a standard person with given
clothing and activity. The investigated bioclimate conditions of a ten year period of PMV and
PET for the summer months (December to February) show the variability of thermal comfort
conditions at eight locations from north (La Quiaca) to south (Ushuaia) of Argentina. In the
histograms, the frequency with which threshold values of PET were exceeded are shown.
Clear differences between the locations in terms of bioclimate are also visible. The latter are of
particular relevance for the description of climate for tourism as well as other recreational
outdoor activities in Argentina.
KEYWORDS: Argentina, bioclimatic indices, Predicted Mean Vote, Physiologically Equivalent Temperature INTRODUCTION The human biometeorological conditions of a location can not only be described by
meteorological parameters like air temperature, air humidity, wind vector and short- and long
wave radiation fluxes, but also by thermal indices. These are depending on the meteorological
conditions of the thermal environment of humans. Several models and methods exist: a)
Predicted Mean Vote (PMV) after Fanger (1972) based on the thermal comfort equation or as
a function of the full human energy balance of the human body and the derived PET
(Physiologically Equivalent Temperature) (VDI, 1998). Both indices and methods link the
meteorological and thermo-physiological conditions and describe the interactions between the
human body and the thermal environment (Jendritzky et al., 1990, VDI, 1998).
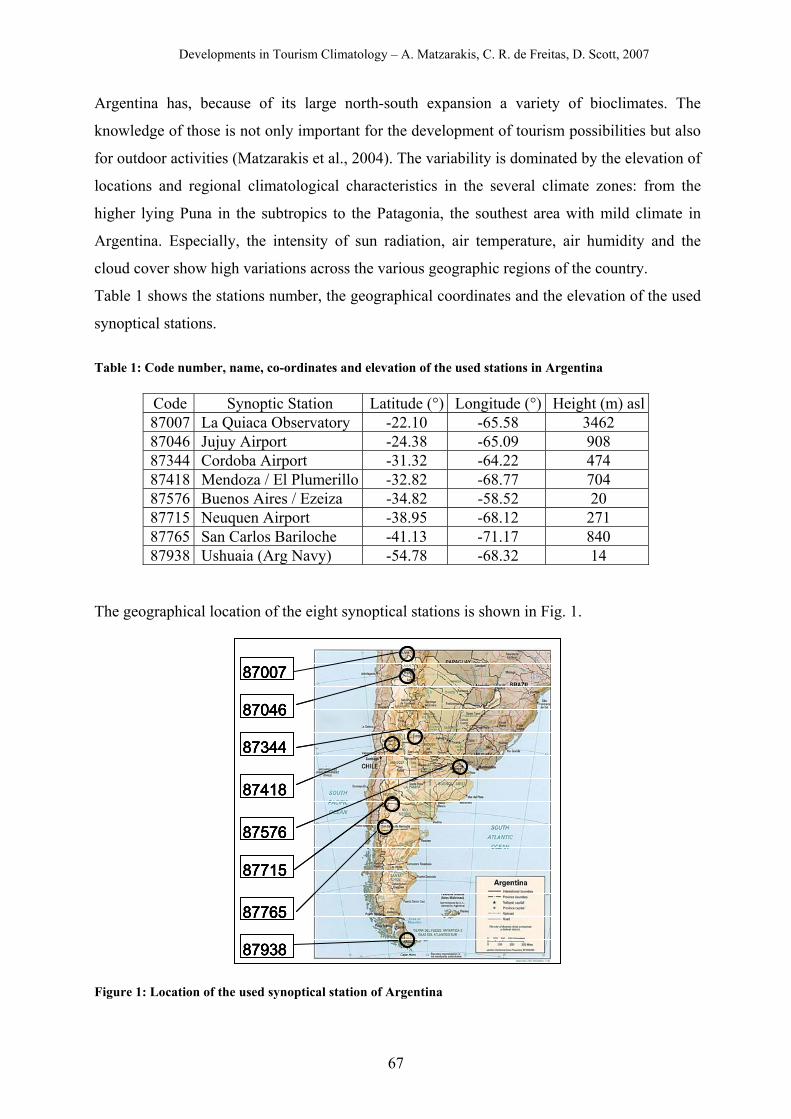
Developments in Tourism Climatology – A. Matzarakis, C. R. de Freitas, D. Scott, 2007
67
Argentina has, because of its large north-south expansion a variety of bioclimates. The
knowledge of those is not only important for the development of tourism possibilities but also
for outdoor activities (Matzarakis et al., 2004). The variability is dominated by the elevation of
locations and regional climatological characteristics in the several climate zones: from the
higher lying Puna in the subtropics to the Patagonia, the southest area with mild climate in
Argentina. Especially, the intensity of sun radiation, air temperature, air humidity and the
cloud cover show high variations across the various geographic regions of the country.
Table 1 shows the stations number, the geographical coordinates and the elevation of the used
synoptical stations.
Table 1: Code number, name, co-ordinates and elevation of the used stations in Argentina
Code Synoptic Station Latitude (°) Longitude (°) Height (m) asl 87007 La Quiaca Observatory -22.10 -65.58 3462 87046 Jujuy Airport -24.38 -65.09 908 87344 Cordoba Airport -31.32 -64.22 474 87418 Mendoza / El Plumerillo -32.82 -68.77 704 87576 Buenos Aires / Ezeiza -34.82 -58.52 20 87715 Neuquen Airport -38.95 -68.12 271 87765 San Carlos Bariloche -41.13 -71.17 840 87938 Ushuaia (Arg Navy) -54.78 -68.32 14
The geographical location of the eight synoptical stations is shown in Fig. 1.
8700787007
8704687046
8734487344
8741887418
8757687576
8771587715
8776587765
8793887938
8700787007
8704687046
8734487344
8741887418
8757687576
8771587715
8776587765
8793887938 Figure 1: Location of the used synoptical station of Argentina
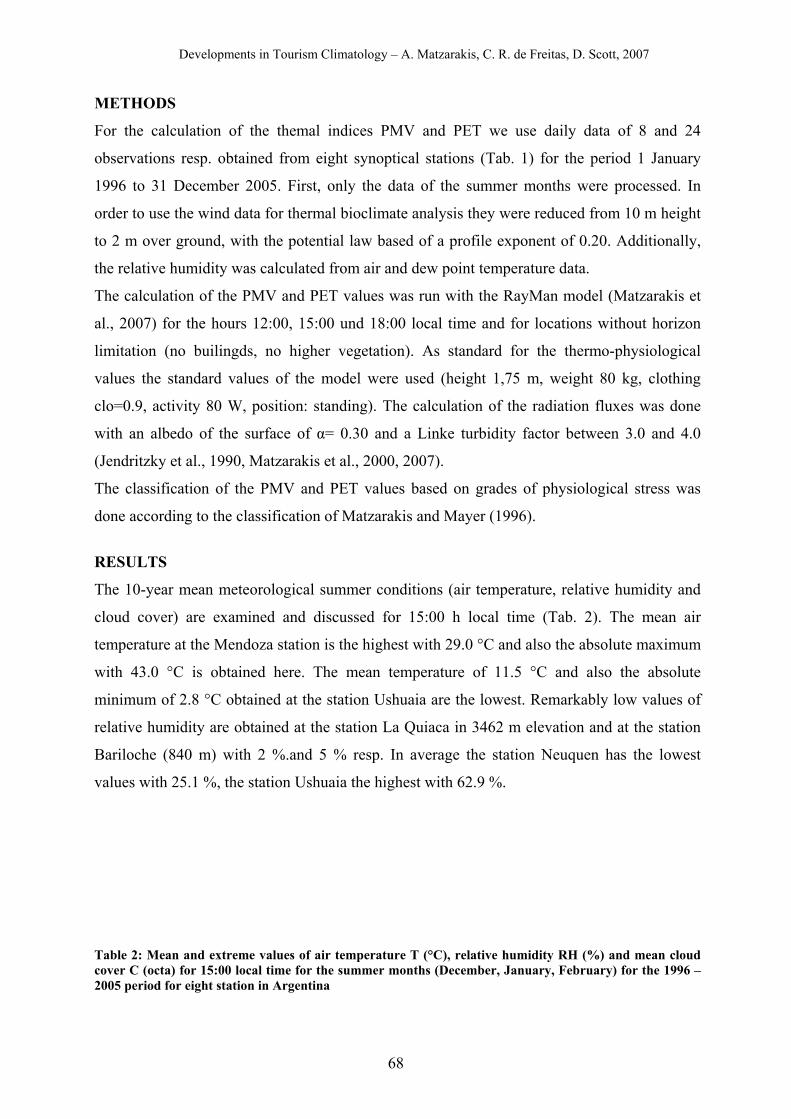
Developments in Tourism Climatology – A. Matzarakis, C. R. de Freitas, D. Scott, 2007
68
METHODS
For the calculation of the themal indices PMV and PET we use daily data of 8 and 24
observations resp. obtained from eight synoptical stations (Tab. 1) for the period 1 January
1996 to 31 December 2005. First, only the data of the summer months were processed. In
order to use the wind data for thermal bioclimate analysis they were reduced from 10 m height
to 2 m over ground, with the potential law based of a profile exponent of 0.20. Additionally,
the relative humidity was calculated from air and dew point temperature data.
The calculation of the PMV and PET values was run with the RayMan model (Matzarakis et
al., 2007) for the hours 12:00, 15:00 und 18:00 local time and for locations without horizon
limitation (no builingds, no higher vegetation). As standard for the thermo-physiological
values the standard values of the model were used (height 1,75 m, weight 80 kg, clothing
clo=0.9, activity 80 W, position: standing). The calculation of the radiation fluxes was done
with an albedo of the surface of α= 0.30 and a Linke turbidity factor between 3.0 and 4.0
(Jendritzky et al., 1990, Matzarakis et al., 2000, 2007).
The classification of the PMV and PET values based on grades of physiological stress was
done according to the classification of Matzarakis and Mayer (1996).
RESULTS
The 10-year mean meteorological summer conditions (air temperature, relative humidity and
cloud cover) are examined and discussed for 15:00 h local time (Tab. 2). The mean air
temperature at the Mendoza station is the highest with 29.0 °C and also the absolute maximum
with 43.0 °C is obtained here. The mean temperature of 11.5 °C and also the absolute
minimum of 2.8 °C obtained at the station Ushuaia are the lowest. Remarkably low values of
relative humidity are obtained at the station La Quiaca in 3462 m elevation and at the station
Bariloche (840 m) with 2 %.and 5 % resp. In average the station Neuquen has the lowest
values with 25.1 %, the station Ushuaia the highest with 62.9 %.
Table 2: Mean and extreme values of air temperature T (°C), relative humidity RH (%) and mean cloud cover C (octa) for 15:00 local time for the summer months (December, January, February) for the 1996 – 2005 period for eight station in Argentina
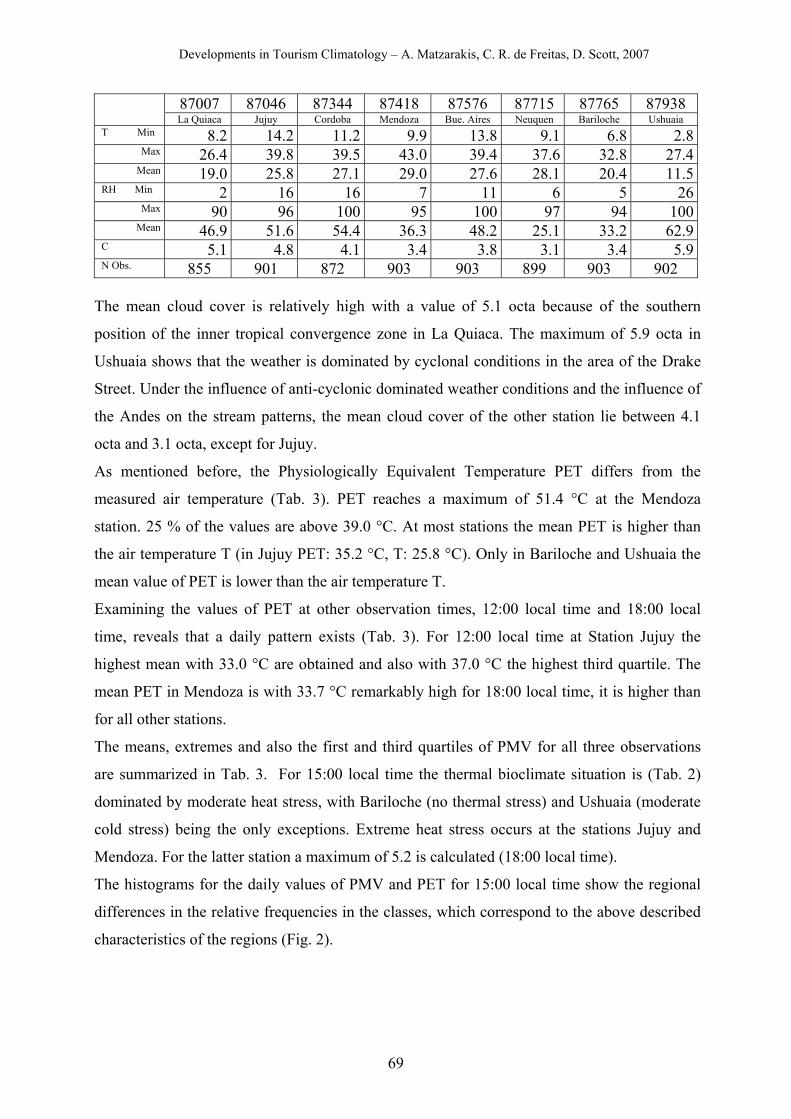
Developments in Tourism Climatology – A. Matzarakis, C. R. de Freitas, D. Scott, 2007
69
87007 87046 87344 87418 87576 87715 87765 87938 La Quiaca Jujuy Cordoba Mendoza Bue. Aires Neuquen Bariloche Ushuaia
T Min 8.2 14.2 11.2 9.9 13.8 9.1 6.8 2.8Max 26.4 39.8 39.5 43.0 39.4 37.6 32.8 27.4
Mean 19.0 25.8 27.1 29.0 27.6 28.1 20.4 11.5RH Min 2 16 16 7 11 6 5 26
Max 90 96 100 95 100 97 94 100Mean 46.9 51.6 54.4 36.3 48.2 25.1 33.2 62.9
C 5.1 4.8 4.1 3.4 3.8 3.1 3.4 5.9N Obs. 855 901 872 903 903 899 903 902
The mean cloud cover is relatively high with a value of 5.1 octa because of the southern
position of the inner tropical convergence zone in La Quiaca. The maximum of 5.9 octa in
Ushuaia shows that the weather is dominated by cyclonal conditions in the area of the Drake
Street. Under the influence of anti-cyclonic dominated weather conditions and the influence of
the Andes on the stream patterns, the mean cloud cover of the other station lie between 4.1
octa and 3.1 octa, except for Jujuy.
As mentioned before, the Physiologically Equivalent Temperature PET differs from the
measured air temperature (Tab. 3). PET reaches a maximum of 51.4 °C at the Mendoza
station. 25 % of the values are above 39.0 °C. At most stations the mean PET is higher than
the air temperature T (in Jujuy PET: 35.2 °C, T: 25.8 °C). Only in Bariloche and Ushuaia the
mean value of PET is lower than the air temperature T.
Examining the values of PET at other observation times, 12:00 local time and 18:00 local
time, reveals that a daily pattern exists (Tab. 3). For 12:00 local time at Station Jujuy the
highest mean with 33.0 °C are obtained and also with 37.0 °C the highest third quartile. The
mean PET in Mendoza is with 33.7 °C remarkably high for 18:00 local time, it is higher than
for all other stations.
The means, extremes and also the first and third quartiles of PMV for all three observations
are summarized in Tab. 3. For 15:00 local time the thermal bioclimate situation is (Tab. 2)
dominated by moderate heat stress, with Bariloche (no thermal stress) and Ushuaia (moderate
cold stress) being the only exceptions. Extreme heat stress occurs at the stations Jujuy and
Mendoza. For the latter station a maximum of 5.2 is calculated (18:00 local time).
The histograms for the daily values of PMV and PET for 15:00 local time show the regional
differences in the relative frequencies in the classes, which correspond to the above described
characteristics of the regions (Fig. 2).
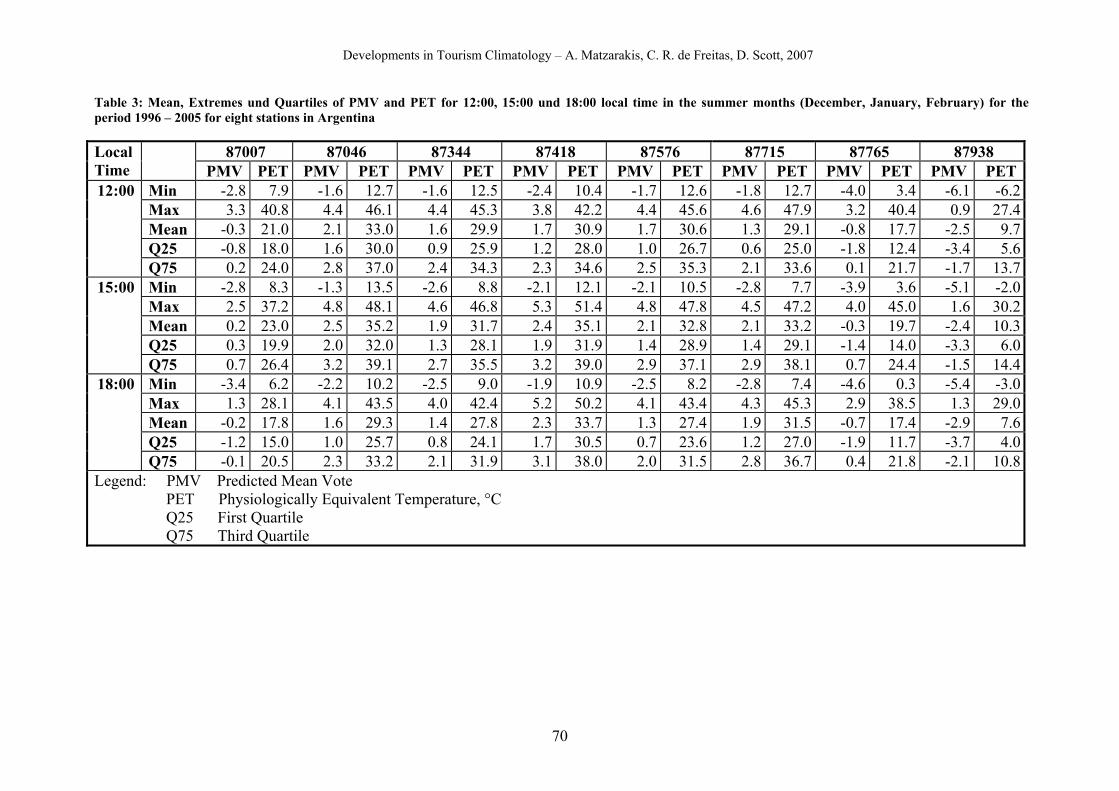
Developments in Tourism Climatology – A. Matzarakis, C. R. de Freitas, D. Scott, 2007
70
Table 3: Mean, Extremes und Quartiles of PMV and PET for 12:00, 15:00 und 18:00 local time in the summer months (December, January, February) for the period 1996 – 2005 for eight stations in Argentina Local Time
87007 87046 87344 87418 87576 87715 87765 87938 PMV PET PMV PET PMV PET PMV PET PMV PET PMV PET PMV PET PMV PET
12:00 Min -2.8 7.9 -1.6 12.7 -1.6 12.5 -2.4 10.4 -1.7 12.6 -1.8 12.7 -4.0 3.4 -6.1 -6.2 Max 3.3 40.8 4.4 46.1 4.4 45.3 3.8 42.2 4.4 45.6 4.6 47.9 3.2 40.4 0.9 27.4 Mean -0.3 21.0 2.1 33.0 1.6 29.9 1.7 30.9 1.7 30.6 1.3 29.1 -0.8 17.7 -2.5 9.7 Q25 -0.8 18.0 1.6 30.0 0.9 25.9 1.2 28.0 1.0 26.7 0.6 25.0 -1.8 12.4 -3.4 5.6 Q75 0.2 24.0 2.8 37.0 2.4 34.3 2.3 34.6 2.5 35.3 2.1 33.6 0.1 21.7 -1.7 13.7
15:00 Min -2.8 8.3 -1.3 13.5 -2.6 8.8 -2.1 12.1 -2.1 10.5 -2.8 7.7 -3.9 3.6 -5.1 -2.0 Max 2.5 37.2 4.8 48.1 4.6 46.8 5.3 51.4 4.8 47.8 4.5 47.2 4.0 45.0 1.6 30.2 Mean 0.2 23.0 2.5 35.2 1.9 31.7 2.4 35.1 2.1 32.8 2.1 33.2 -0.3 19.7 -2.4 10.3 Q25 0.3 19.9 2.0 32.0 1.3 28.1 1.9 31.9 1.4 28.9 1.4 29.1 -1.4 14.0 -3.3 6.0 Q75 0.7 26.4 3.2 39.1 2.7 35.5 3.2 39.0 2.9 37.1 2.9 38.1 0.7 24.4 -1.5 14.4
18:00 Min -3.4 6.2 -2.2 10.2 -2.5 9.0 -1.9 10.9 -2.5 8.2 -2.8 7.4 -4.6 0.3 -5.4 -3.0 Max 1.3 28.1 4.1 43.5 4.0 42.4 5.2 50.2 4.1 43.4 4.3 45.3 2.9 38.5 1.3 29.0 Mean -0.2 17.8 1.6 29.3 1.4 27.8 2.3 33.7 1.3 27.4 1.9 31.5 -0.7 17.4 -2.9 7.6 Q25 -1.2 15.0 1.0 25.7 0.8 24.1 1.7 30.5 0.7 23.6 1.2 27.0 -1.9 11.7 -3.7 4.0 Q75 -0.1 20.5 2.3 33.2 2.1 31.9 3.1 38.0 2.0 31.5 2.8 36.7 0.4 21.8 -2.1 10.8
Legend: PMV Predicted Mean Vote PET Physiologically Equivalent Temperature, °C Q25 First Quartile Q75 Third Quartile
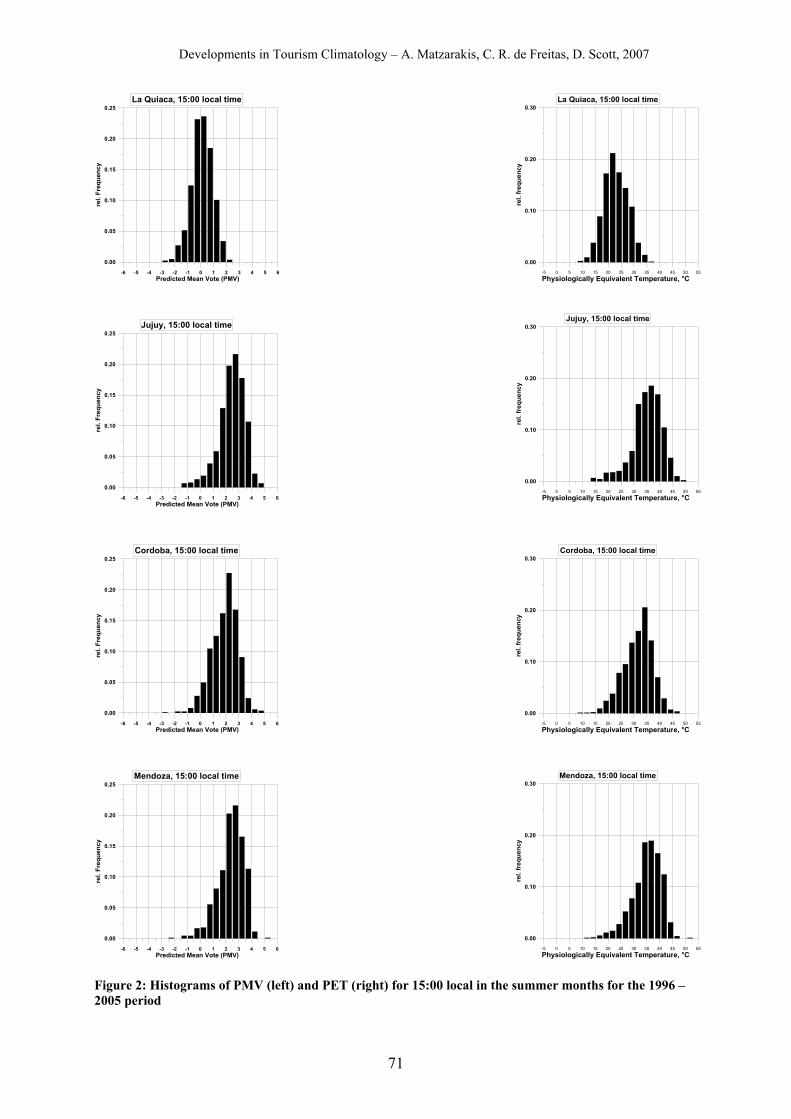
Developments in Tourism Climatology – A. Matzarakis, C. R. de Freitas, D. Scott, 2007
71
-6 -5 -4 -3 -2 -1 0 1 2 3 4 5 6Predicted Mean Vote (PMV)
0.00
0.05
0.10
0.15
0.20
0.25
rel.
Freq
uenc
yLa Quiaca, 15:00 local time
-6 -5 -4 -3 -2 -1 0 1 2 3 4 5 6Predicted Mean Vote (PMV)
0.00
0.05
0.10
0.15
0.20
0.25
rel.
Freq
uenc
y
Jujuy, 15:00 local time
-6 -5 -4 -3 -2 -1 0 1 2 3 4 5 6Predicted Mean Vote (PMV)
0.00
0.05
0.10
0.15
0.20
0.25
rel.
Freq
uenc
y
Cordoba, 15:00 local time
-6 -5 -4 -3 -2 -1 0 1 2 3 4 5 6Predicted Mean Vote (PMV)
0.00
0.05
0.10
0.15
0.20
0.25
rel.
Freq
uenc
y
Mendoza, 15:00 local time
Figure 2: Histograms of PMV (left) and PET (right) for 15:00 local in the summer months for the 1996 – 2005 period
-5 0 5 10 15 20 25 30 35 40 45 50 55
Physiologically Equivalent Temperature, °C
0.00
0.10
0.20
0.30
rel.
freq
uenc
y
La Quiaca, 15:00 local time
-5 0 5 10 15 20 25 30 35 40 45 50 55
Physiologically Equivalent Temperature, °C
0.00
0.10
0.20
0.30
rel.
freq
uenc
y
Jujuy, 15:00 local time
-5 0 5 10 15 20 25 30 35 40 45 50 55
Physiologically Equivalent Temperature, °C
0.00
0.10
0.20
0.30
rel.
freq
uenc
y
Cordoba, 15:00 local time
-5 0 5 10 15 20 25 30 35 40 45 50 55
Physiologically Equivalent Temperature, °C
0.00
0.10
0.20
0.30
rel.
freq
uenc
y
Mendoza, 15:00 local time
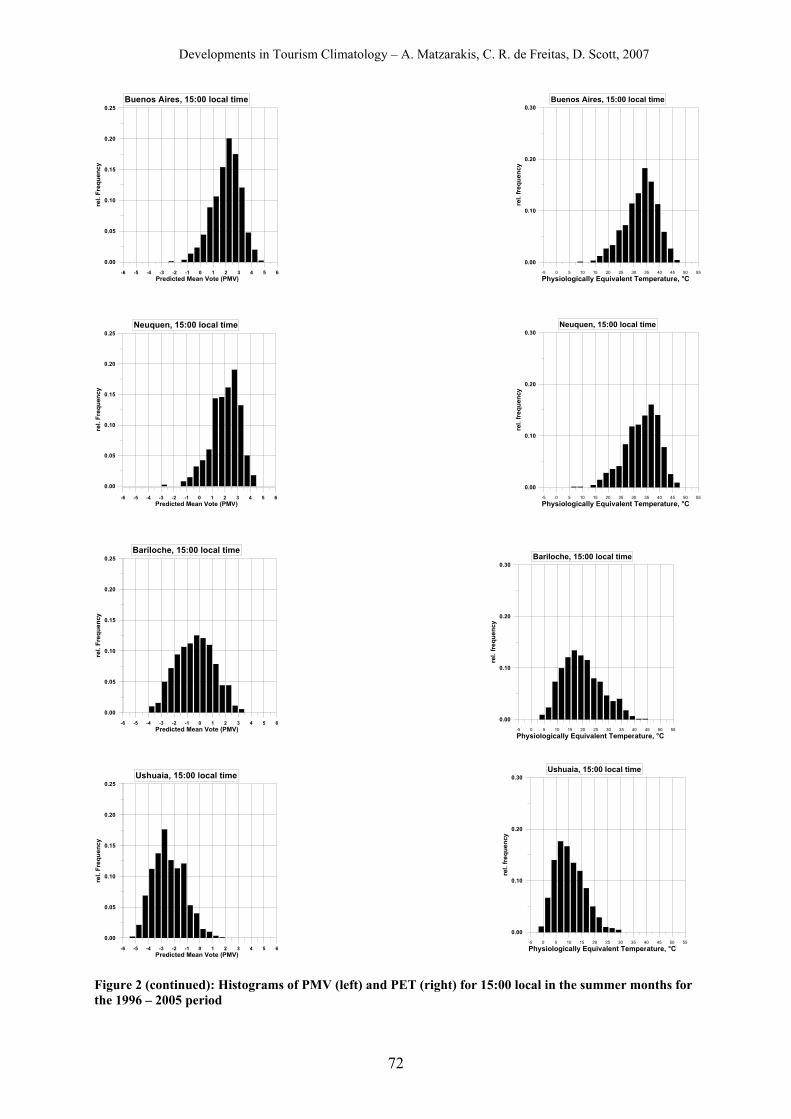
Developments in Tourism Climatology – A. Matzarakis, C. R. de Freitas, D. Scott, 2007
72
-6 -5 -4 -3 -2 -1 0 1 2 3 4 5 6Predicted Mean Vote (PMV)
0.00
0.05
0.10
0.15
0.20
0.25
rel.
Freq
uenc
yBuenos Aires, 15:00 local time
-6 -5 -4 -3 -2 -1 0 1 2 3 4 5 6Predicted Mean Vote (PMV)
0.00
0.05
0.10
0.15
0.20
0.25
rel.
Freq
uenc
y
Neuquen, 15:00 local time
-6 -5 -4 -3 -2 -1 0 1 2 3 4 5 6Predicted Mean Vote (PMV)
0.00
0.05
0.10
0.15
0.20
0.25
rel.
Freq
uenc
y
Bariloche, 15:00 local time
-6 -5 -4 -3 -2 -1 0 1 2 3 4 5 6Predicted Mean Vote (PMV)
0.00
0.05
0.10
0.15
0.20
0.25
rel.
Freq
uenc
y
Ushuaia, 15:00 local time
Figure 2 (continued): Histograms of PMV (left) and PET (right) for 15:00 local in the summer months for the 1996 – 2005 period
-5 0 5 10 15 20 25 30 35 40 45 50 55
Physiologically Equivalent Temperature, °C
0.00
0.10
0.20
0.30
rel.
freq
uenc
y
Buenos Aires, 15:00 local time
-5 0 5 10 15 20 25 30 35 40 45 50 55
Physiologically Equivalent Temperature, °C
0.00
0.10
0.20
0.30
rel.
freq
uenc
y
Neuquen, 15:00 local time
-5 0 5 10 15 20 25 30 35 40 45 50 55
Physiologically Equivalent Temperature, °C
0.00
0.10
0.20
0.30
rel.
freq
uenc
y
Bariloche, 15:00 local time
-5 0 5 10 15 20 25 30 35 40 45 50 55
Physiologically Equivalent Temperature, °C
0.00
0.10
0.20
0.30
rel.
freq
uenc
y
Ushuaia, 15:00 local time
Developments in Tourism Climatology – A. Matzarakis, C. R. de Freitas, D. Scott, 2007
73
DISCUSSION AND CONCLUSION
The thermal bioclimatic conditions in Argentina are described here for first time based on the
thermal indices Predicted Mean Vote and Physiologically Equivalent Temperature. Based on
different synoptical time observations and stations of Servicio Meteorologico Nacional the
calculation was performed using the RayMan model. Here the calculations were carried out
for rural environments.
With the results obtained here a more adequate thermal bioclimatic assessment of individual
locations can be carried out, compared to the primary or simple meteorological parameters
used previously.
In addition, the analysis will be extended to more stations and other regions of Argentina. The
calculations will be also performed for urban areas and forests.
Nevertheless, the analysis presented here represents the first step towards an integral analysis
of the climatic tourism potential for a country with a very high variety of bioclimate in a north
to south transect and elevation.
ACKNOWLEDGEMENTS
The authors thank the Servicio Meteorologico Nacional (SMN), Buenos Aires for providing us
the meteorological data used for this analysis.
REFERENCES Fanger, P. O. (1970) Thermal comfort: Analysis and Applications in Environmental
Engineering. McGraw Hill, New York. VDI-Richtlinie 3787, Bl. 2. Methoden zur human-biometeorologischen Bewertung von Klima
und Lufthygiene für die Stadt- und Regionalplanung. Jendritzky, G., Grätz, A. (1999): Das Bioklima des Menschen in der Stadt. In: Helbig, A.,
Baumüller, J.., Kerschgens, M. J. (Hrsg.): Stadtklima und Luftreinhaltung, 2., vollst. überarb. Auflage, Springer,467 S.
Matzarakis, A., Mayer, H. (1996) Another Kind of Environmental Stress: Thermal Stress. WHO Colloborating Centre for Air Quality Management and Air Pollution Control. NEWSLETTERS 1996, 18:7-10.
Matzarakis, A., de Freitas C. R., Scott D. (Eds.)(2004): Advances in Tourism Climatology. Ber. Meteor. Inst. Univ. Freiburg Nr. 12.
Matzarakis, A., Rutz, F., Mayer, H. (2007) Modelling radiation fluxes in simple and complex environments – application of the RayMan model. Int J Biometeorol. 51: 323-334.
Matzarakis, A., Rutz, F., Mayer, H. (2000): Estimation and calculation of the mean radiant temperature within urban structures. WMO/TD No. 1026, 273 – 278.
Developments in Tourism Climatology – A. Matzarakis, C. R. de Freitas, D. Scott, 2007
74
METHODOLOGIES TO ASSESS THE EFFECTS OF CLIMATE ON TOURISM:
WEATHER TYPE AND INDIVIDUAL PERCEPTION
H. Andrade, M.J. Alcoforado and S. Oliveira
Centro de Estudos Geográficos, University of Lisbon
ABSTRACT Tourism is an important activity in many countries. The climatic conditions are
part of the image created about these places, mainly as a factor of attraction but sometimes
also as a risk factor. The climatic information available for tourism purposes usually
comprises the mean values of some specific variables. However, it must be kept in mind that
the individuals are sensitive to particular combinations of meteorological parameters, rather
than to single ones. This paper provides a review of some different methods used to assess the
influence of weather and climate on tourism.
It is important to carry out the assessment of the relationship between climate and tourism by
considering the frequency of weather types and/or indices, as well as their time variation. In
general, the use of a thermo-physiological index, such as the Physiological Equivalent
Temperature, is advantageous as it allows the evaluation of the combined influences of the
atmospheric parameters, defining the thermal aspects of the atmospheric environment. This
index can be combined with physical parameters and aesthetical aspects (such as cloud cover)
to form weather type classes. Two examples are given, one from Funchal (Madeira Island) and
the other from a sea-side resort in Sintra, western Portugal.
The second step of the research should involve a validation of the weather perception by
tourists; this can be achieved by means of questionnaires, which must include subjective
factors (motivation, individual preferences and cultural aspects), as they influence the
perception of weather conditions and level of bioclimatic comfort.
The use of both methodologies (weather typing and questionnaires) will enable us to assess
more accurately the weather perception of different groups of tourists.
KEYWORDS: tourism, weather types, weather perception, climatic information, spatial
representativeness
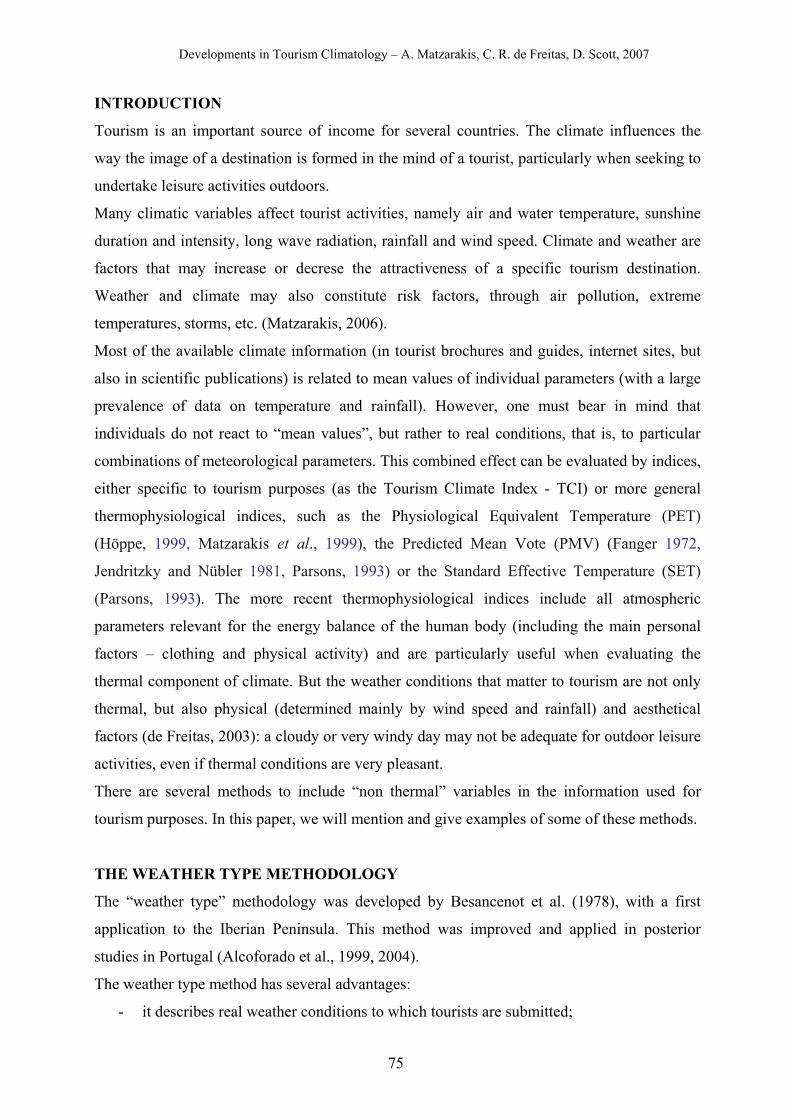
Developments in Tourism Climatology – A. Matzarakis, C. R. de Freitas, D. Scott, 2007
75
INTRODUCTION
Tourism is an important source of income for several countries. The climate influences the
way the image of a destination is formed in the mind of a tourist, particularly when seeking to
undertake leisure activities outdoors.
Many climatic variables affect tourist activities, namely air and water temperature, sunshine
duration and intensity, long wave radiation, rainfall and wind speed. Climate and weather are
factors that may increase or decrese the attractiveness of a specific tourism destination.
Weather and climate may also constitute risk factors, through air pollution, extreme
temperatures, storms, etc. (Matzarakis, 2006).
Most of the available climate information (in tourist brochures and guides, internet sites, but
also in scientific publications) is related to mean values of individual parameters (with a large
prevalence of data on temperature and rainfall). However, one must bear in mind that
individuals do not react to “mean values”, but rather to real conditions, that is, to particular
combinations of meteorological parameters. This combined effect can be evaluated by indices,
either specific to tourism purposes (as the Tourism Climate Index - TCI) or more general
thermophysiological indices, such as the Physiological Equivalent Temperature (PET)
(Höppe, 1999, Matzarakis et al., 1999), the Predicted Mean Vote (PMV) (Fanger 1972,
Jendritzky and Nübler 1981, Parsons, 1993) or the Standard Effective Temperature (SET)
(Parsons, 1993). The more recent thermophysiological indices include all atmospheric
parameters relevant for the energy balance of the human body (including the main personal
factors – clothing and physical activity) and are particularly useful when evaluating the
thermal component of climate. But the weather conditions that matter to tourism are not only
thermal, but also physical (determined mainly by wind speed and rainfall) and aesthetical
factors (de Freitas, 2003): a cloudy or very windy day may not be adequate for outdoor leisure
activities, even if thermal conditions are very pleasant.
There are several methods to include “non thermal” variables in the information used for
tourism purposes. In this paper, we will mention and give examples of some of these methods.
THE WEATHER TYPE METHODOLOGY
The “weather type” methodology was developed by Besancenot et al. (1978), with a first
application to the Iberian Peninsula. This method was improved and applied in posterior
studies in Portugal (Alcoforado et al., 1999, 2004).
The weather type method has several advantages:
- it describes real weather conditions to which tourists are submitted;
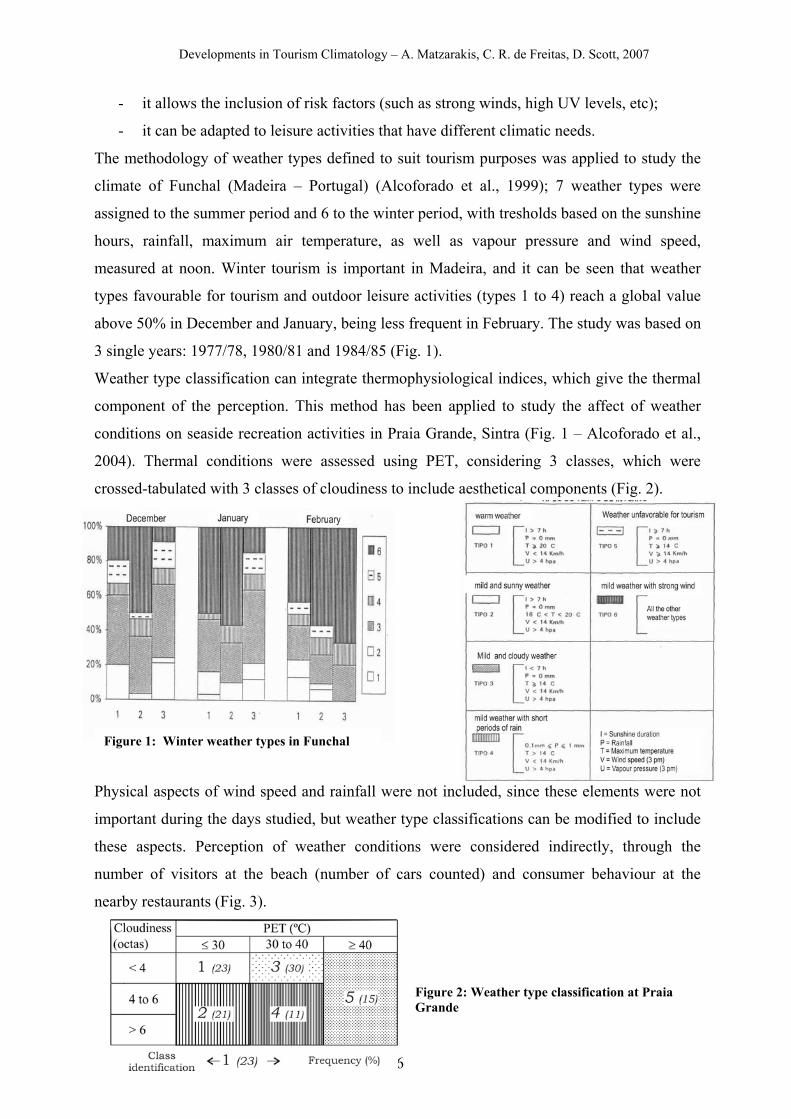
Developments in Tourism Climatology – A. Matzarakis, C. R. de Freitas, D. Scott, 2007
76
- it allows the inclusion of risk factors (such as strong winds, high UV levels, etc);
- it can be adapted to leisure activities that have different climatic needs.
The methodology of weather types defined to suit tourism purposes was applied to study the
climate of Funchal (Madeira – Portugal) (Alcoforado et al., 1999); 7 weather types were
assigned to the summer period and 6 to the winter period, with tresholds based on the sunshine
hours, rainfall, maximum air temperature, as well as vapour pressure and wind speed,
measured at noon. Winter tourism is important in Madeira, and it can be seen that weather
types favourable for tourism and outdoor leisure activities (types 1 to 4) reach a global value
above 50% in December and January, being less frequent in February. The study was based on
3 single years: 1977/78, 1980/81 and 1984/85 (Fig. 1).
Weather type classification can integrate thermophysiological indices, which give the thermal
component of the perception. This method has been applied to study the affect of weather
conditions on seaside recreation activities in Praia Grande, Sintra (Fig. 1 – Alcoforado et al.,
2004). Thermal conditions were assessed using PET, considering 3 classes, which were
crossed-tabulated with 3 classes of cloudiness to include aesthetical components (Fig. 2).
Physical aspects of wind speed and rainfall were not included, since these elements were not
important during the days studied, but weather type classifications can be modified to include
these aspects. Perception of weather conditions were considered indirectly, through the
number of visitors at the beach (number of cars counted) and consumer behaviour at the
nearby restaurants (Fig. 3).
Figure 1: Winter weather types in Funchal
Figure 2: Weather type classification at Praia Grande
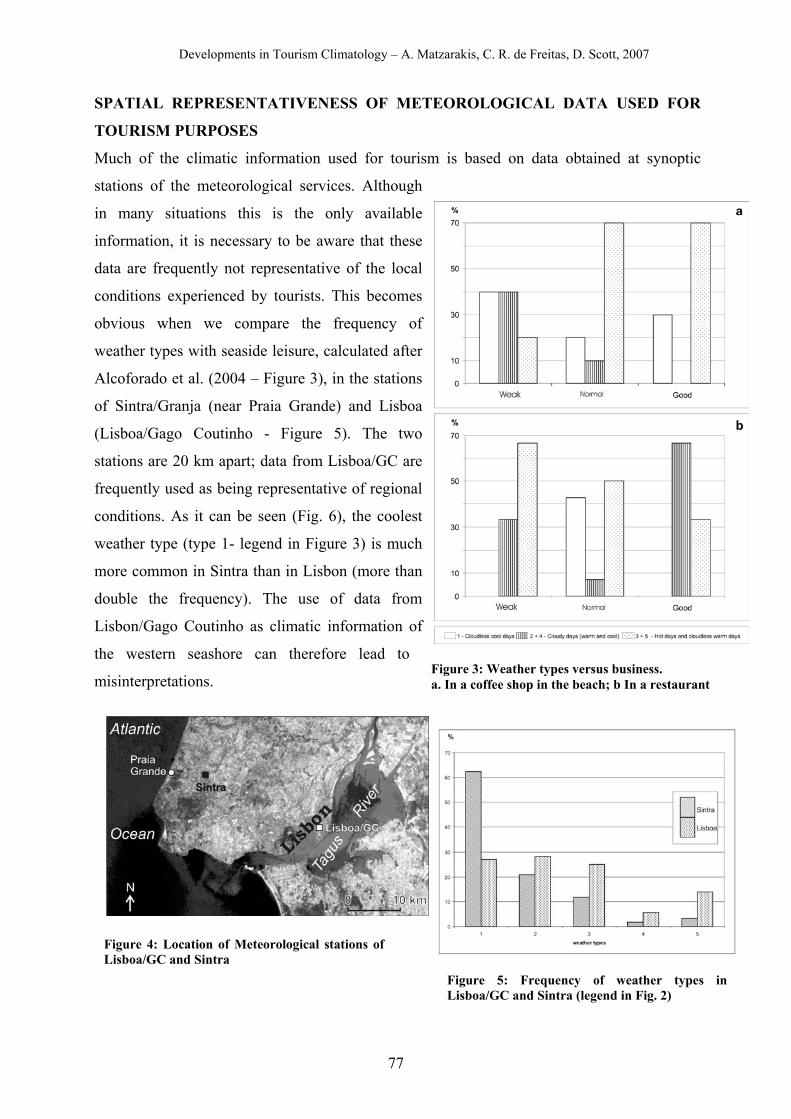
Developments in Tourism Climatology – A. Matzarakis, C. R. de Freitas, D. Scott, 2007
77
SPATIAL REPRESENTATIVENESS OF METEOROLOGICAL DATA USED FOR
TOURISM PURPOSES
Much of the climatic information used for tourism is based on data obtained at synoptic
stations of the meteorological services. Although
in many situations this is the only available
information, it is necessary to be aware that these
data are frequently not representative of the local
conditions experienced by tourists. This becomes
obvious when we compare the frequency of
weather types with seaside leisure, calculated after
Alcoforado et al. (2004 – Figure 3), in the stations
of Sintra/Granja (near Praia Grande) and Lisboa
(Lisboa/Gago Coutinho - Figure 5). The two
stations are 20 km apart; data from Lisboa/GC are
frequently used as being representative of regional
conditions. As it can be seen (Fig. 6), the coolest
weather type (type 1- legend in Figure 3) is much
more common in Sintra than in Lisbon (more than
double the frequency). The use of data from
Lisbon/Gago Coutinho as climatic information of
the western seashore can therefore lead to
misinterpretations.
Figure 4: Location of Meteorological stations of Lisboa/GC and Sintra
Figure 5: Frequency of weather types in Lisboa/GC and Sintra (legend in Fig. 2)
Figure 3: Weather types versus business. a. In a coffee shop in the beach; b In a restaurant
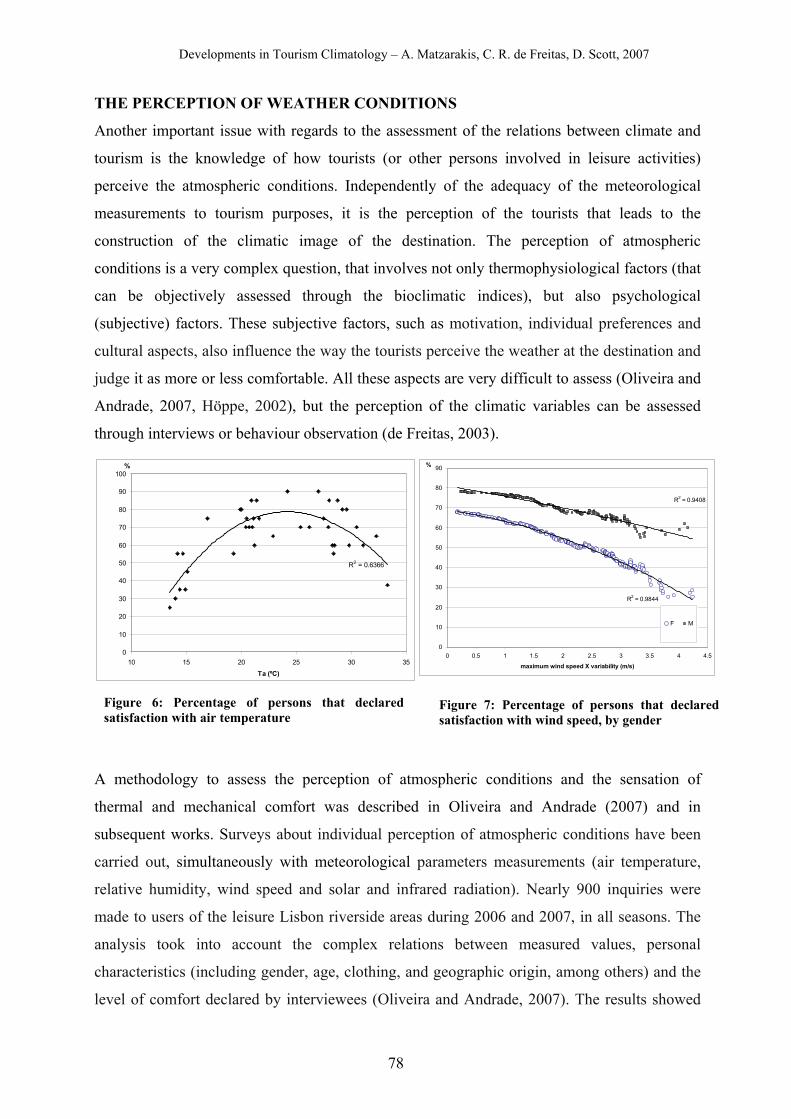
Developments in Tourism Climatology – A. Matzarakis, C. R. de Freitas, D. Scott, 2007
78
R2 = 0.6366
0
10
20
30
40
50
60
70
80
90
100
10 15 20 25 30 35
Ta (ºC)
%
R2 = 0.9408
R2 = 0.9844
0
10
20
30
40
50
60
70
80
90
0 0.5 1 1.5 2 2.5 3 3.5 4 4.5
maximum wind speed X variability (m/s)
%
F M
THE PERCEPTION OF WEATHER CONDITIONS
Another important issue with regards to the assessment of the relations between climate and
tourism is the knowledge of how tourists (or other persons involved in leisure activities)
perceive the atmospheric conditions. Independently of the adequacy of the meteorological
measurements to tourism purposes, it is the perception of the tourists that leads to the
construction of the climatic image of the destination. The perception of atmospheric
conditions is a very complex question, that involves not only thermophysiological factors (that
can be objectively assessed through the bioclimatic indices), but also psychological
(subjective) factors. These subjective factors, such as motivation, individual preferences and
cultural aspects, also influence the way the tourists perceive the weather at the destination and
judge it as more or less comfortable. All these aspects are very difficult to assess (Oliveira and
Andrade, 2007, Höppe, 2002), but the perception of the climatic variables can be assessed
through interviews or behaviour observation (de Freitas, 2003).
A methodology to assess the perception of atmospheric conditions and the sensation of
thermal and mechanical comfort was described in Oliveira and Andrade (2007) and in
subsequent works. Surveys about individual perception of atmospheric conditions have been
carried out, simultaneously with meteorological parameters measurements (air temperature,
relative humidity, wind speed and solar and infrared radiation). Nearly 900 inquiries were
made to users of the leisure Lisbon riverside areas during 2006 and 2007, in all seasons. The
analysis took into account the complex relations between measured values, personal
characteristics (including gender, age, clothing, and geographic origin, among others) and the
level of comfort declared by interviewees (Oliveira and Andrade, 2007). The results showed
Figure 7: Percentage of persons that declared satisfaction with wind speed, by gender
Figure 6: Percentage of persons that declared satisfaction with air temperature
Developments in Tourism Climatology – A. Matzarakis, C. R. de Freitas, D. Scott, 2007
79
that, in spite of a large level of acceptability of outdoor atmospheric conditions by persons
involved in leisure activities, it is possible to define boundaries beyond which this
acceptability greatly decreases (Fig. 7). It was also possible to demonstrate the obvious
significance of personal characteristics (such as geographical origin and gender – see Figure 8)
and of the subjective parameters in the perception of atmospheric conditions.
CONCLUSION
The image of a tourist destination and the preference of the tourists for specific places are
greatly influenced by the climatic conditions, including the physical, aesthetical and
meteorological aspects. Therefore, it is extremely important to consider the combination of
these variables in the climatic information available for tourism purposes. Furthermore, it is
also important to consider the way tourists perceive the meteorological parameters, since this
contributes to the construction of the mental image of the tourism areas.
There are several methodologies available to incorporate these different variables; the
“weather type” methodology can be combined with bioclimatic indices. In addition, surveys
about the perception of atmospheric conditions, carried out simultaneously with measurements
of climatic variables, can complement the climatic information available for tourism.
Akowledgements: This study was integrated in the research project “URBKLIM: Climate and
Urban Sustainability. Perception of comfort and climatic risks” - POCI/GEO/61148/2004.
REFERENCES Alcoforado, M. J., Andrade, H., Paulo, M. J. (2004) Weather and recreation at the Atlantic
shore near Lisbon, Portugal. A study on applied climatology. In A. Matzarakis, DeFreitas, C.R., Scott, D. (eds), Advances in Tourism Climatology, Special issue of Berichte des Meteorologishen Institutes der Universitaet Freiburg, 12, 38-48.
Alcoforado, M. J., Dias, A., Gomes, V. (1999) Bioclimatologia e Turismo, exemplo de aplicação ao Funchal. Islenha. 25: 29-37.
Besancenot, J. P., Mounier, J., Lavenne, J. (1978) Les conditions climatiques du tourisme littoral: une méthode de recherche compréhensive. Norois. 99: 357-382.
De Freitas, C. R. (2003) Tourism climatology: evaluating environmental information for decision making and business planning in the recreation and tourism sector. Int Jour Biomet, 48, 45–54.
Höppe, P. (2002) Different aspects of assessing indoor and outdoor thermal comfort. Energy Build 34:661–665.
Matzarakis, A. (2006) Weather and climate related information for tourism. Tourism and Hospitality Planning & Development 3, 99-115.
Oliveira, S., Andrade, H. (2007) An initial assessment of the bioclimatic comfort in an outdoor public space in Lisbon. Int Jour Biomet, On line first,.
Parsons, K. C. (1993) Human thermal environments. Taylor & Francis, London.
Developments in Tourism Climatology – A. Matzarakis, C. R. de Freitas, D. Scott, 2007
80
THE ROLE OF WEATHER IN BEACH RECREATION – A CASE STUDY USING
WEBCAM IMAGES
A. Moreno
International Centre for Integrated assessment & Sustainable development (ICIS), Maastricht
University, P.O. Box 616, 6200 MD Maastricht, Netherlands
ABSTRACT Beach recreation is one of the most weather-sensitive leisure activities. However, there is a lack of scientific knowledge about how the different weather/climate variables influence beach visitation, and previous work on this area of research is based on stated preferences of respondents and not on behaviour. This study uses webcams in combination with onsite weather data to study the relationship between weather and beach use. Rosas, a seaside town in Spain, was used as a case study. During a period of one and a half months, images were taken every hour and then compared to the specific weather conditions provided by a nearby weather station to assess the relationship between beach visitation densities and atmospheric conditions. Precipitation is the dominating effect and is more important than other weather variables. Wind speed between 4 and 5 m/s is related to high density of users at the beach, while 7 m/s seems to be a threshold for ideal conditions. Finally, the role of temperature is somehow unclear, with tourists leaving the beach during the hottest hours of the day, although it seems that this is related to time and not weather. This pilot study provides an innovative approach to the analysis of the relationship between weather conditions and beach recreation. It raises some interesting questions about tourists’ adaptation to weather and potentially to climate change. KEYWORDS: Beach recreation, weather, webcams, climate change
INTRODUCTION
There is relatively little scientific knowledge about the exact relationships between weather factors and beach visitation. Although the weather has always been highly variable, the climate was considered relatively stable. Climate change is projected to lead to structural shifts in the spatial and temporal patterns of climatological suitability for tourism purposes (Hamilton and Tol, 2004, Todd, 2003). To be able to estimate the magnitude of these shifts, more knowledge about the current influence of the weather on tourist and leisure behaviour is indispensable.
Developments in Tourism Climatology – A. Matzarakis, C. R. de Freitas, D. Scott, 2007
81
Models relating weather or climate conditions to tourism or recreation activities are typically of a linear nature. This implies that low scores on one factor can somehow be compensated by high scores on other factors. While this may make sense for factors such as temperature and sunshine, there may be other factors at play whose influence cannot be compensated (de Freitas et al., 2004), such as precipitation and strong wind (de Freitas, 1990). On the other hand, research in the field of weather and beach tourism is primarily based on ‘stated preferences’ (de Freitas, 1990, Gómez Martín, 2006), and problems like the multiple interpretations that respondents might associate with questions and answers could affect the results (Suchman and Jordan, 1990). The objective of this research is to explore the relationships between weather conditions and beach visitation levels. The frequency of beach visitations is analysed in combination with easily accessible and temporally detailed weather data. The technology of webcams is also used. Increased access to high-speed internet has proliferated webcam use in many fields, including the tourism sector, which has used them as a marketing tools for destinations and other tourism attractions (Timothy and Groves, 2001). Timothy and Groves (2001) were the first to explore the multiple uses that webcam images could have for tourism research. Benefits of this technology include the possibility to study behaviour, as opposed to ‘stated preferences’ survey-based studies, and the opportunity to analyze different locations at the same time. In beach tourism research Kammler and Schernewski (2004) have used webcams. Their study focused on temporal and spatial patterns of visitors on a German beach. Martínez Ibarra (2006) aimed at identifying the thresholds and optimal weather conditions for different kinds of beach recreation (sunbathing and swimming) along the coast of Alicante (Spain). More case studies on weather and beach use are needed to verify the results obtained by previous studies, to test new hypotheses, and to allow for comparisons of case study results. Two pilot studies were performed in Zandvoort (The Netherlands) and Rosas (Spain), during July and August 2006. This paper reports the results obtained for the Spanish coastal town of Rosas (for more information about the other case study the reader is referred to Moreno et al., in press). The paper is organised as follows. Section two describes the layout of the study, and its methodological setup. The results are described in section three, and discussed in the last section. It is important to note that in this research the terms ‘tourist’, ‘visitor’ and ‘user’ are used interchangeably to refer to people who are present at the beach with the aim of sunbathing or swimming, thus excluding other uses from the analysis.
Developments in Tourism Climatology – A. Matzarakis, C. R. de Freitas, D. Scott, 2007
82
METHODS
Rosas is located in Catalonia (Northeast Spain), in the northern parts of what is known as
Costa Brava. Its location, less than 30 km to the French border and 160 km from Barcelona,
makes it an attractive destination for both international and Spanish tourists. This location
fulfilled the following basic criteria: (a) the webcam images were of high enough quality to
extract information about density of use, while being coarse enough to avoid moral and legal
issues associated with identifying individuals; (b) the images were provided continuously and
refreshed regularly; (c) detailed weather data was available from a weather station in the same
locality.
Two webcam views were systematically recorded, one for the analysis and one for
verification purposes (available at www.roses.net). The images cover an area of several
hundred meters of the beach and are updated every 5 minutes. Weather data was obtained
from the automatic station that the Meteorological Service of Catalonia has in this locality
(available at www.meteocat.com), which provides data in 30 minutes intervals. The weather
variables included in this study are: daily precipitation, wind speed and temperature.
A total of 211 images of the coast and weather data were saved every hour between 9 am and
9 pm (July and August 2006). This set of 'raw' data was processed to filter out unusable
images. Various techniques were reviewed for assigning images to density classes: the
software-based approach used by Kammler and Schernewski (2004), which analyses the
pixels to extract information about beach use, was considered very promising but technically
unfeasible. Therefore, the more qualitative approach proposed by Martínez Ibarra (2006) was
used instead, albeit slightly adjusted. A number of density classes were established, the most
representative image for each of them identified, and subsequently all remaining images were
allocated to the different density classes based on their similarity to the model images. Instead
of the four classes used by the author, three were used in this study: 'low' for situations of low
use, 'intermediate' for medium densities and 'high' for a crowded beach.
In recognition of the possible existence of climate-overriding factors, the analysis was
performed in two steps. Step 1 tested for the existence of overriding factors: precipitation and
strong wind (de Freitas, 1990). If these events were found to be overriding, then these cases
were eliminated from the dataset that was used to analyze the influence of temperatures (step
2).
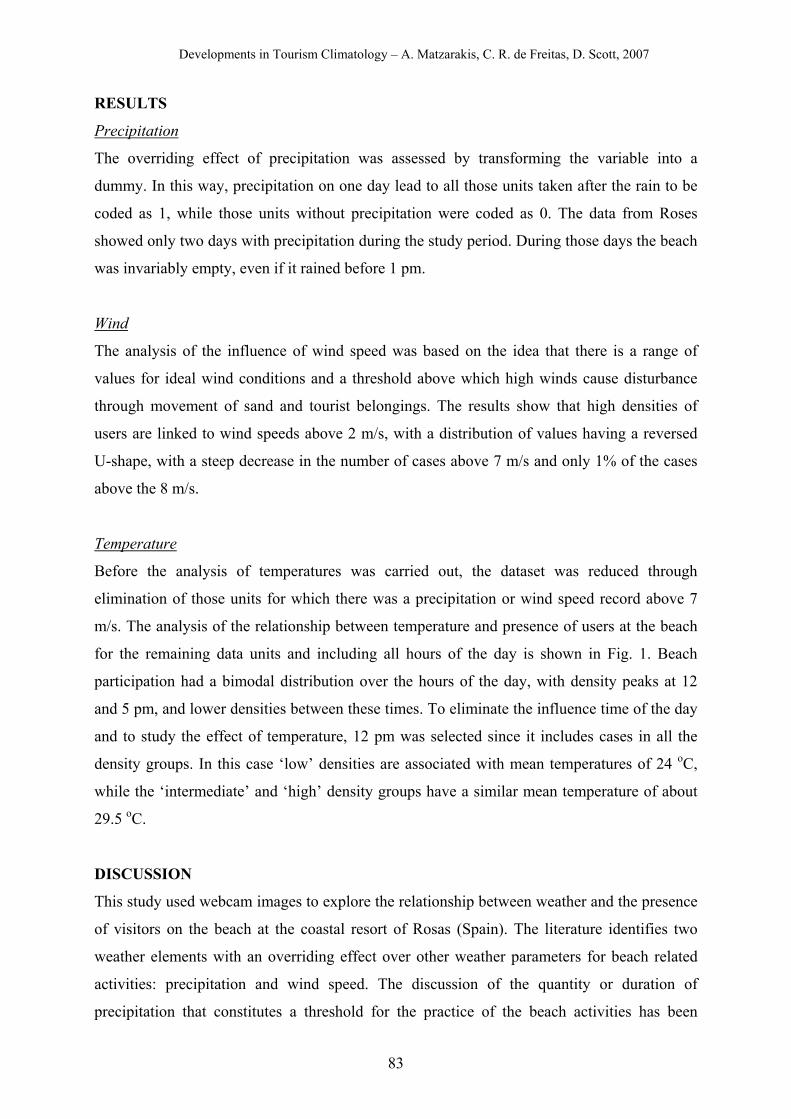
Developments in Tourism Climatology – A. Matzarakis, C. R. de Freitas, D. Scott, 2007
83
RESULTS
Precipitation
The overriding effect of precipitation was assessed by transforming the variable into a
dummy. In this way, precipitation on one day lead to all those units taken after the rain to be
coded as 1, while those units without precipitation were coded as 0. The data from Roses
showed only two days with precipitation during the study period. During those days the beach
was invariably empty, even if it rained before 1 pm.
Wind
The analysis of the influence of wind speed was based on the idea that there is a range of
values for ideal wind conditions and a threshold above which high winds cause disturbance
through movement of sand and tourist belongings. The results show that high densities of
users are linked to wind speeds above 2 m/s, with a distribution of values having a reversed
U-shape, with a steep decrease in the number of cases above 7 m/s and only 1% of the cases
above the 8 m/s.
Temperature
Before the analysis of temperatures was carried out, the dataset was reduced through
elimination of those units for which there was a precipitation or wind speed record above 7
m/s. The analysis of the relationship between temperature and presence of users at the beach
for the remaining data units and including all hours of the day is shown in Fig. 1. Beach
participation had a bimodal distribution over the hours of the day, with density peaks at 12
and 5 pm, and lower densities between these times. To eliminate the influence time of the day
and to study the effect of temperature, 12 pm was selected since it includes cases in all the
density groups. In this case ‘low’ densities are associated with mean temperatures of 24 oC,
while the ‘intermediate’ and ‘high’ density groups have a similar mean temperature of about
29.5 oC.
DISCUSSION
This study used webcam images to explore the relationship between weather and the presence
of visitors on the beach at the coastal resort of Rosas (Spain). The literature identifies two
weather elements with an overriding effect over other weather parameters for beach related
activities: precipitation and wind speed. The discussion of the quantity or duration of
precipitation that constitutes a threshold for the practice of the beach activities has been
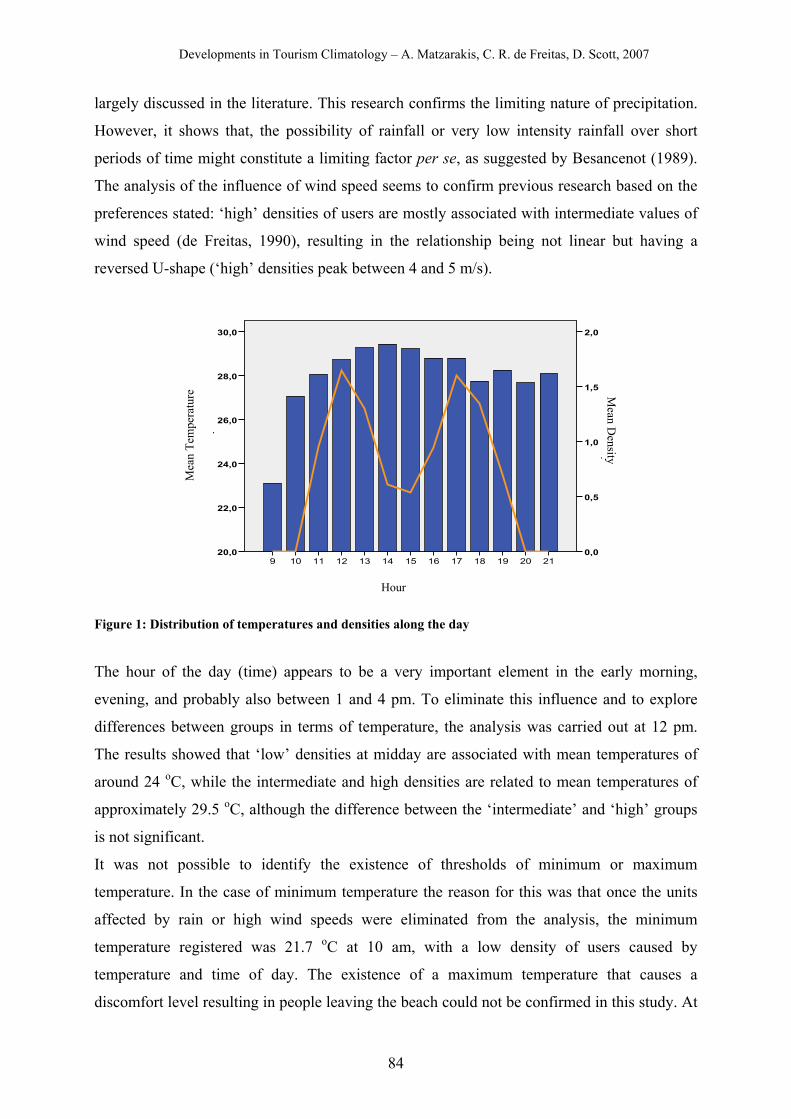
Developments in Tourism Climatology – A. Matzarakis, C. R. de Freitas, D. Scott, 2007
84
largely discussed in the literature. This research confirms the limiting nature of precipitation.
However, it shows that, the possibility of rainfall or very low intensity rainfall over short
periods of time might constitute a limiting factor per se, as suggested by Besancenot (1989).
The analysis of the influence of wind speed seems to confirm previous research based on the
preferences stated: ‘high’ densities of users are mostly associated with intermediate values of
wind speed (de Freitas, 1990), resulting in the relationship being not linear but having a
reversed U-shape (‘high’ densities peak between 4 and 5 m/s).
2120191817161514131211109
p
30,0
28,0
26,0
24,0
22,0
20,0
y
2,0
1,5
1,0
0,5
0,0
Figure 1: Distribution of temperatures and densities along the day
The hour of the day (time) appears to be a very important element in the early morning,
evening, and probably also between 1 and 4 pm. To eliminate this influence and to explore
differences between groups in terms of temperature, the analysis was carried out at 12 pm.
The results showed that ‘low’ densities at midday are associated with mean temperatures of
around 24 oC, while the intermediate and high densities are related to mean temperatures of
approximately 29.5 oC, although the difference between the ‘intermediate’ and ‘high’ groups
is not significant.
It was not possible to identify the existence of thresholds of minimum or maximum
temperature. In the case of minimum temperature the reason for this was that once the units
affected by rain or high wind speeds were eliminated from the analysis, the minimum
temperature registered was 21.7 oC at 10 am, with a low density of users caused by
temperature and time of day. The existence of a maximum temperature that causes a
discomfort level resulting in people leaving the beach could not be confirmed in this study. At
Hour
Mea
n Te
mpe
ratu
re M
ean Density
Developments in Tourism Climatology – A. Matzarakis, C. R. de Freitas, D. Scott, 2007
85
12 pm, the time of maximum density, and at 3 pm, the time of minimum density, the
maximum temperatures reached similar values of about 34 oC. Therefore, the decrease in the
number of people that can be observed during the hottest hours of the day (between 1 and 4
pm) does not seem to be related to the temperatures but other causes, probably cultural
reasons (the lunch hour in Spain is between 1 and 4 pm). However, whether cultural or
weather related, people leaving the beach between 1 and 4 pm coincides with the hottest hours
of the day and somehow it could be seen as an indication of a certain adaptation to high
temperatures. This would suggest that previous studies stating that higher temperatures due to
climate change might cause fewer tourists to travel to these regions (Perry, 2005) might be
overstated, since tourists can adapt to this conditions by, for example, leaving the beach
during the hours of maximum heat.
This pilot study attempts to complement those studies which are based on interviewing
tourists about their preferences. However, the observed behavior does not necessarily relate to
the way tourists perceive their environment and, therefore, the first studies are essential in that
they analyse how tourists experience and come into contact with the different weather
elements. Only through studies that combine both methodologies it will be possible to
improve our understanding about the multiple relationships between weather/climate and
tourism and the consequences that climate change might have for the tourism sector.
REFERENCES Besancenot, J. (1989) Climat et tourisme. Paris: Masson. de Freitas, C. R. (1990) Recreation climate assessment. International Journal of Climatology,
10, 89-103. de Freitas, C. R., Scott, D., McBoyle, G. (2004) A new generation climate index for tourism
and recreation. Paper presented at the International Society of Biometeorology Commission on Climate, Tourism and Recreation. 9-12 June, Kolimbari, Creete.
Gómez Martín, B. (2006) Climate potential and tourist demand in Catalonia (Spain) during the summer season. Climate Research, 32, 75-87.
Hamilton, J. M., Tol, R. S. J. (2004) The impact of climate change on tourism and recreation: Research Unit Sustainability and Global Change FNU-52, Hamburg University and Centre for Marine and Atmospheric Science, Hamburg.
Kammler, M., Schernewski, G. (2004) Spatial and temporal analysis of beach tourism using webcam and aerial photographs. Paper presented at the BaltCoast 2004 - Managing the Baltic Sea, Warnemünde, Germany.
Martínez Ibarra, E. (2006) Consideraciones geográficas en torno al binomio clima-turismo: aplicación al litoral alicantino. University of Alicante, Alicante.
Moreno, A., Amelung, B., Santamarta, L. (in press) Linking beach recreation to weather conditions. A case study in Zandvoort, Netherlands. Tourism in Marine Environments.
Perry, A. (2005) The Mediterranean: how can the world's most popular and successful tourist destination adapt to a changing climate? In M. Hall and J. Higham (Eds.), Tourism, Recreation and Climate Change (pp. 86-96). London, UK: Channel View Publications.

Developments in Tourism Climatology – A. Matzarakis, C. R. de Freitas, D. Scott, 2007
86
Suchman, L., Jordan, B. (1990) Interactional troubles in face-to-face survey interviews. Journal of the American Statistical Association, 85(409), 232-241.
Timothy, D., Groves, D. (2001) Research Note: Webcam Images as Potential Data Sources for Tourism Research. Tourism Geographies, 3(4), 394-404.
Todd, G. (2003) WTO Background Paper on Climate Change and Tourism.
Developments in Tourism Climatology – A. Matzarakis, C. R. de Freitas, D. Scott, 2007
87
ESTIMATION OF CLIMATIC RESOURCES FOR SUMMER SPORT RECREATION
IN THE JEWISH AUTONOMOUS REGION OF RUSSIA
E. Grigorieva and D. Fetisov
Institute for Complex Analysis of Regional Problems FEB RAS, 679016, Birobidzhan, Russia
ABSTRACT This paper presents the results of an assessment of climatic resources for
summer sport recreation. The focus in on the physical facets of climate (referred to in Russia
as technological assessment of climate) to determine the number of days that are favorable for
certain types of recreational activity such as hiking, rafting, swimming etc. Taking into
account both climate and the various physiological aspect of the human body, it is possible to
determine circumstances that are best suited to, or that limit, recreational activities. The study
region is the Jewish Autonomous Region of Russia. The analysis identifies two recreational
climate zones. They differ in the amount of days favorable for summer recreation, including
opportunities for swimming etc. For the warm season, the periods and regions are identified in
which it is not desirable to undertake certain activities because of the strong influence of the
limiting factors such as sultry weather, precipitation, cold, strong wind etc. The characteristics
of sport-climatic resources of the Jewish Autonomous Region that were identified may be
useful for the seasonal planning and timing of outdoor recreational activities in a region
characterized by climate extremes.
KEYWORDS: Sport recreation, limiting factors, warm period, monsoon climate, southern
Far East of Russia
INTRODUCTION
Tourism is considered to be of economic benefit in many countries and like recreation relies
heavily on natural resources. The climatic resources have special importance as they
determine the attractiveness of conditions for tourism and recreation, they can limit times
during which a particular recreational activity can take place and they can have medical-
biological implications (Mirzekhanova, 2003). Where improved health is a motive for
recreation, the aim avoid morphological and functional deterioration of the body, but it is
assumed that exposure to the climate elements during exercise will not itself put stresses or
Developments in Tourism Climatology – A. Matzarakis, C. R. de Freitas, D. Scott, 2007
88
strains on the body leading to undesirable consequences (Ivanov, 2001). In this case, severe or
extreme climatic conditions will be unfavorable for health or ‘spa tourism’ because of the risk
to the body’s well-being.
So called sport recreation is motivated by people’s desire to relax and enjoy the experience.
Hiking can still take place while it drizzles, but strong precipitation hinders this type of
recreational activity. The best conditions for hiking are those that result in no negative effects.
Some weather phenomena such as high temperatures, sultry humid weather conditions may
recreational activities must stop, as conditions can cause physiological strain even in a healthy
person. Thus, if both weather conditions and their physiological effect are taking into account
simultaneously the suitability of various climates for sports recreation can be assessed and
used to provide information that may be useful for the seasonal planning and timing of
outdoor recreational activities, especially in regions with extreme climatic conditions.
METHODS
Data for the study area is drawn from five hydrometeorological stations (HMS) in the Jewish
Autonomous Region (JAR) (Climatic Books of the USSR, 1967-1969). The archival data
from the Centre on Hydrometeorology and Monitoring of the Environment in Khabarovsk
were also used. HMS Obluchye and Bira are situated in the mountains. The stations
Smidovich, Yekaterino-Nikolskoye and Leninskoye are located in the plains.
The Jewish Autonomous Region is located in the southern far east of Russia. The study area
is located in the temperate monsoon climatic zone characterized by an extreme continental
regime of annual temperatures. The typical feature here is the effect that winter and summer
monsoons have on each other. Winter monsoons cause frosty weather with few clouds and
low snow cover. The mean monthly temperature in January (the coldest winter month) ranges
from -21.2 oС in the south to -26.5 oС in the north (with an absolute minimum of -52 oС). The
summer monsoon is characterized by warm damp conditions with mean temperatures in July
of 19 – 21 oС (with the absolute maximum of +40 oС). In this season 60 % of the annual
precipitation is recorded. Several authors (e.g. Gorbatcevic, 1894, Matukhin, 1971) have
highlighted the extreme climate found in this area: in winter the conditions in the southern far
east are similar to those in Siberia; and in the summer the climate is similar to that of the
warm humid tropics. Human discomfort in monsoon climate conditions in the far east is a
function of the low temperatures and high wind in winter and the combination of high air
temperatures with high relative humidity creating an unpleasant, sultry feeling in summer.
Developments in Tourism Climatology – A. Matzarakis, C. R. de Freitas, D. Scott, 2007
89
The physical facets of climate (referred to in Russia as technological assessment of climate)
can be used to ascertain the number of days that are favorable for certain types of recreation.
Here we analyze what is the required by recreationists of the climatic environment taking into
account the physiological effects. The parameters that are used for this in the warm period of
the year are: equivalent-effective temperature (EET); radiation-effective temperature (RET);
sultry weather (mean daily air temperature is higher 23 oС with relative humidity over 80%)
and weather dryness (mean daily air temperature is higher than 27 oС with relative humidity <
30 - 40 %); precipitation (> 1 mm) and wind over 7-8 m/s; and water temperature in lakes
and water bodies used for recreation (Kolotova, 1998, Derkacheva, 2000, Grigorieva, 2003).
EET (oC) is an indicator of thermophysiological well-being given by Aizenshtat (1964) as:
EET = T (1 – 0.003(100 – f)) – 0.385 V0.59 ((36.6 – T) + 0.622 (V – 1)) +
+ ((0.0015 V + 0/008)(36.6 – T) – 0.0167) (100 – f),
where T is the temperature of the air outdoors (oC), V is wind speed (m s-1), and f is relative
humidity (%). Thermal environment in the warm period of the year is usually classified
according to scale of thermal sensation as presented by Kolotova (1998). Comfortable
conditions are taken as those that are thermally neutral EET = 17–22oС, cool conditions when
EET = 8–16oС, cold when EET < 8oС and very hot when EET > 23oС.
RET (oC) is an indicator of the appeal of conditions for people to sunbathing and can be
estimated by the formula devised by Butyeva (Isaev, 2001):
RET = 0.83 EET + 12.
In all of the above assessments it is assumed the recreationist is a healthy adult.
RESULTS
The duration of the period that is favorable for summer sport recreation in the JAR is
determined by EET using a scale of thermal sensation described by Kolotova (1998) and
shown in Table 1. On average, the period with comfortable thermal sensation favorable for
summer recreation lasts 55 days (28 % of the entire warm period). It lasts from the end of
June to the end of August. Together with cool thermal sensation, when some restrictions for
recreational activity are necessary, the beginning of the examined period shifts to the first
week of May and ends the last week of September. In this case the duration is about 135
days.
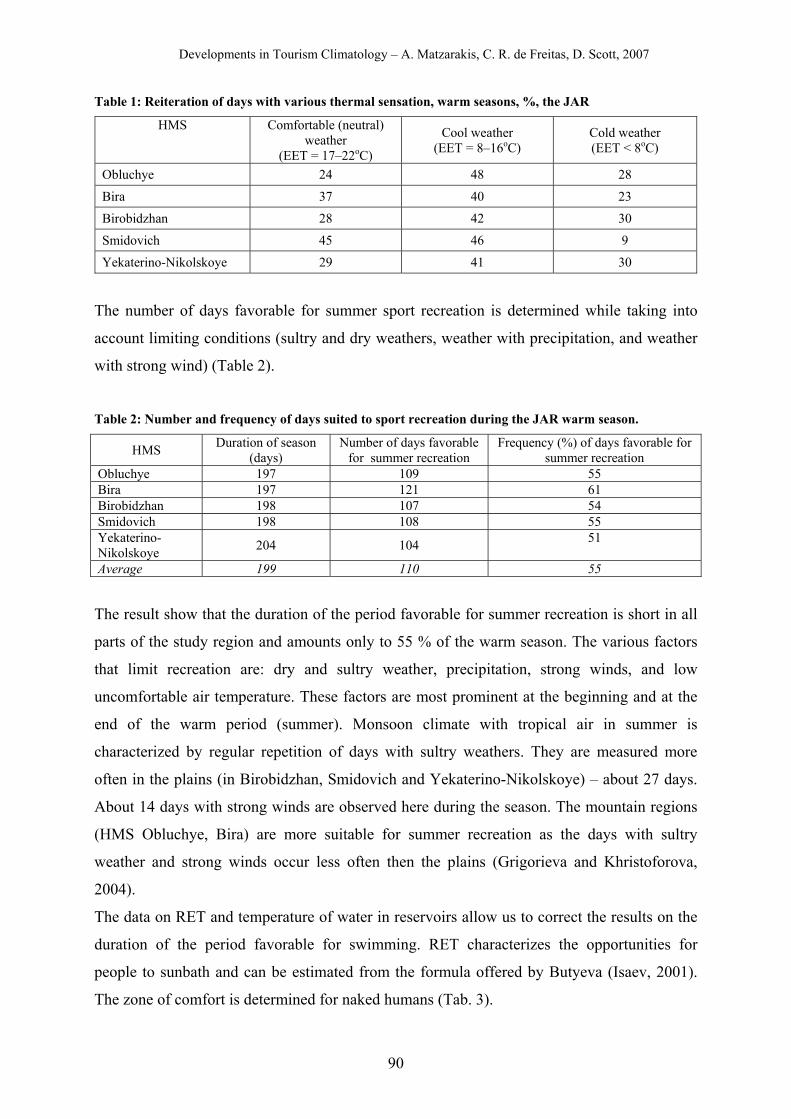
Developments in Tourism Climatology – A. Matzarakis, C. R. de Freitas, D. Scott, 2007
90
Table 1: Reiteration of days with various thermal sensation, warm seasons, %, the JAR
HMS Comfortable (neutral) weather
(EET = 17–22oС)
Cool weather (EET = 8–16oС)
Cold weather (EET < 8oС)
Obluchye 24 48 28
Bira 37 40 23
Birobidzhan 28 42 30
Smidovich 45 46 9
Yekaterino-Nikolskoye 29 41 30
The number of days favorable for summer sport recreation is determined while taking into
account limiting conditions (sultry and dry weathers, weather with precipitation, and weather
with strong wind) (Table 2).
Table 2: Number and frequency of days suited to sport recreation during the JAR warm season.
HMS Duration of season (days)
Number of days favorable for summer recreation
Frequency (%) of days favorable for summer recreation
Obluchye 197 109 55 Bira 197 121 61 Birobidzhan 198 107 54 Smidovich 198 108 55 Yekaterino-Nikolskoye 204 104 51
Average 199 110 55
The result show that the duration of the period favorable for summer recreation is short in all
parts of the study region and amounts only to 55 % of the warm season. The various factors
that limit recreation are: dry and sultry weather, precipitation, strong winds, and low
uncomfortable air temperature. These factors are most prominent at the beginning and at the
end of the warm period (summer). Monsoon climate with tropical air in summer is
characterized by regular repetition of days with sultry weathers. They are measured more
often in the plains (in Birobidzhan, Smidovich and Yekaterino-Nikolskoye) – about 27 days.
About 14 days with strong winds are observed here during the season. The mountain regions
(HMS Obluchye, Bira) are more suitable for summer recreation as the days with sultry
weather and strong winds occur less often then the plains (Grigorieva and Khristoforova,
2004).
The data on RET and temperature of water in reservoirs allow us to correct the results on the
duration of the period favorable for swimming. RET characterizes the opportunities for
people to sunbath and can be estimated from the formula offered by Butyeva (Isaev, 2001).
The zone of comfort is determined for naked humans (Tab. 3).
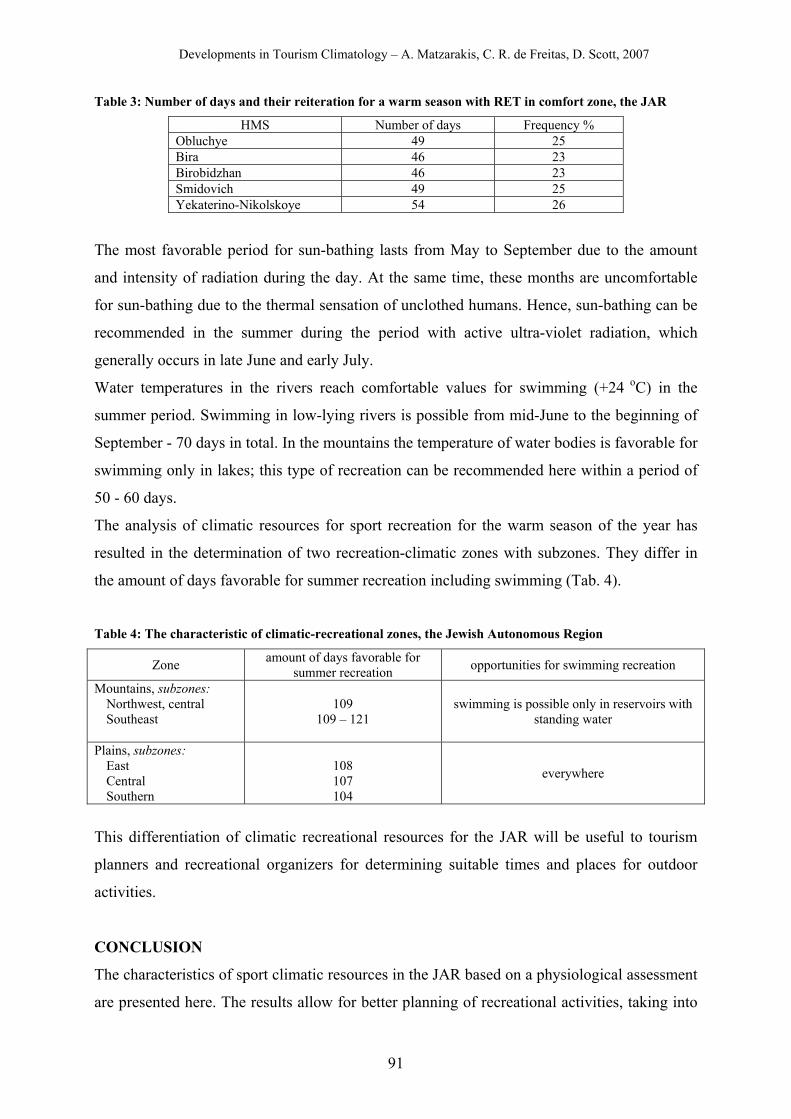
Developments in Tourism Climatology – A. Matzarakis, C. R. de Freitas, D. Scott, 2007
91
Table 3: Number of days and their reiteration for a warm season with RET in comfort zone, the JAR
HMS Number of days Frequency % Obluchye 49 25 Bira 46 23 Birobidzhan 46 23 Smidovich 49 25 Yekaterino-Nikolskoye 54 26
The most favorable period for sun-bathing lasts from May to September due to the amount
and intensity of radiation during the day. At the same time, these months are uncomfortable
for sun-bathing due to the thermal sensation of unclothed humans. Hence, sun-bathing can be
recommended in the summer during the period with active ultra-violet radiation, which
generally occurs in late June and early July.
Water temperatures in the rivers reach comfortable values for swimming (+24 oС) in the
summer period. Swimming in low-lying rivers is possible from mid-June to the beginning of
September - 70 days in total. In the mountains the temperature of water bodies is favorable for
swimming only in lakes; this type of recreation can be recommended here within a period of
50 - 60 days.
The analysis of climatic resources for sport recreation for the warm season of the year has
resulted in the determination of two recreation-climatic zones with subzones. They differ in
the amount of days favorable for summer recreation including swimming (Tab. 4).
Table 4: The characteristic of climatic-recreational zones, the Jewish Autonomous Region
Zone amount of days favorable for summer recreation opportunities for swimming recreation
Mountains, subzones: Northwest, central Southeast
109
109 – 121
swimming is possible only in reservoirs with standing water
Plains, subzones: East Central Southern
108 107 104
everywhere
This differentiation of climatic recreational resources for the JAR will be useful to tourism
planners and recreational organizers for determining suitable times and places for outdoor
activities.
CONCLUSION
The characteristics of sport climatic resources in the JAR based on a physiological assessment
are presented here. The results allow for better planning of recreational activities, taking into
Developments in Tourism Climatology – A. Matzarakis, C. R. de Freitas, D. Scott, 2007
92
account the influences of the climatic environment on humans. During the warm season the
time-periods and regions are identified when and where outdoor recreation should be avoided
because of limiting factors, such sultry or excessively dry weather, heavy precipitation, strong
wind etc. This information on climatic recreational resources can be used to plan different
types of summer sport recreation without risking harm to the human body.
REFERENCES Aizenshtat, B. (1964) Methods for assessment of bioclimatical indices. Meteorol. and
Hydrolog. 12:9-16. Climatic Books of the USSR (1967-1969). Issue 25: Khabarovsky Kray, Amur Region.
Leningrad, Hydrometeoizdat. Derkacheva, L. (2000) Methodical approaches to the integrated analysis of climatic
conditions for the recreational purposes. Geogr. and Natural Res. 4:124-130. Gorbatcevich, E. (1894) A climate of Khabarovsk. Hygienic studies. Khabarovsk, Priamurye
Military District Press. Grigorieva, Е. (2003) Ecological-climatic conditions of the Jewish Autonomous Region and
their influence on health of the population. Vladivostok, Far-Eastern State University. Grigorieva, Е. and Khristoforova, N. (2004) Climatic Discomfort of the Jewish Autonomous
Region. Geogr. and Natural Res. 4:101-104. Isaev, A. (2001) Ecological climatology. Moscow, Scientific World. Ivanov, Ye. (2001) Important questions of the curative medicine in Primorye. Vladivostok,
Far-Eastern State Academy. Kolotova, Ye. (1998), Recreational resources and their using. Moscow, Russian International
Academy of tourism. Matukhin, V. (1971) Bioclimatilogy of human in the monsoon conditions. Leningrad, Nauka. Mirzekhanova, Z. (2003) Natural resources and their using. Vladivostok, FEB RAS.
Developments in Tourism Climatology – A. Matzarakis, C. R. de Freitas, D. Scott, 2007
93
THE RECENT HEATWAVES OVER BALKANS AS AN INDICATOR OF CLIMATE CHANGE AND A SIGNAL FOR NEW PLANNING
DECISIONS
Ch. J. Balafoutis Department of Meteorology and Climatology, University of Thessaloniki, Greece 54124
ABSTRACT The appearance of heatwaves on the Balkan Peninsula is a phenomenon that
caught the interest of scientists over the last 20 years. The first heatwave appeared in Greece
in July 1987. In the following years a frequent presence of heatwaves is observed was also
studied by various researchers. The detailed study of heatwaves shows that to they are caused
by the transport of hot air masses from Africa. These masses are characterized by a large
atmospheric thickness. The analysis reveals that the transport of African hot air to regions far
north of the equator is driven by a shift to the pole of the subtropical jet stream, which
coincides with the behaviour of the Hadley cell. In summer 2007 three heatwaves occurred
which were characterized by larger geographical extension. These heatwaves extended much
further north covering large part of Bulgaria, Serbia, Romania, part of Asia Minor and
southern Italy. The weather conditions that prevail in these regions during the heatwaves are
analyzed in detail. It is realized that, in these cases, the subtropical jet stream was shifted
much further north compared with the areas that were affected by previous heatwaves. This
evidence shows that a new dynamic in the atmospheric circulation has developed which leads
to strong fluctuations of the Hadley cell, with shifts of the cell much further north. All these
processes are clearly a result of the high energy amounts that concentrate over the tropics. An
increase in the energy budged in the tropics finally leads to more intense disturbances of the
tropic atmospheric circulation. A first indication for this is the higher frequency of hotter
summers on the Balkan with serious impacts on health, energy consumption agriculture,
irrigation, transportation, tourism and other fields.
KEYWORDS: Heat waves, Balcans, Climate change
INTRODUCTION
The first heatwave ever recorded in Greece had reached the country in July 1987 (Giles and
Balafoutis, 1990). The affected area was delimited over the Greek peninsula with the most
unfavorable weather conditions in the two larger urban areas of Athens and Thessaloniki. This
heatwave was responsible for the death of more than 2500 people. In the following year, on
Developments in Tourism Climatology – A. Matzarakis, C. R. de Freitas, D. Scott, 2007
94
August 1988, a new heatwave stroke again in Greece. This time, the influences on the human
bodies were much less severe as the Greek government had set up a system to deal with the
heatwave impacts.
Since then, heatwaves have become a common summer phenomenon in Greece with many
occurrences over the next decade. Until the end of the 20th century, the heatwaves
concentrated geographically on the Greek peninsula. In August 1999, another strong
heatwave stroke Greece (Balafoutis and Makrogiannis, 2000) but did not affect the public, as
until then the public offices, busses, trains and many houses were air-conditioned. The same
heatwave impact also happened in Greece in 2000.
At the beginning of this century the dimensions of the heatwaves changed dramatically as the
heatwaves increased in frequency, in geographical extension and also in severity. At this point
the heatwaves were no longer only a Greek problem. During the period 6-12th August 2003 a
heatwave with very high temperatures (records in many cities) stroke Western Europe and
especially France, where about 15000 people lost there life due to the sultry conditions owed
to this weather phenomenon.
After the year 2000, the heatwaves over Greece appeared more frequently. Some of them
were weak and did not attract the attention of researchers but others were very strong and
required further scientific attention. In this paper we will concentrate our interest on a number
of heatwaves that stroke Greece during the summer of 2007 as they were characterized not
only by very high temperature records, but also a very large geographical area that extended
from southern Italy, all of Greece, almost all of the Balkan countries up to the Crimea
peninsula and the Asia Mirror (Fig. 2, left).
This geographical extension of the heatwaves, which were characterized by very high
temperatures of up to 47 °C, indicates that more warm summers are to come in the
Mediterranean area. This exhorts the authorities to change the strategy with regards to health
protection, transportation, agriculture, energy production and consumption, water resources
and also tourism.
In the following paragraphs, the causes and consequences of these heatwaves will be
analysed.
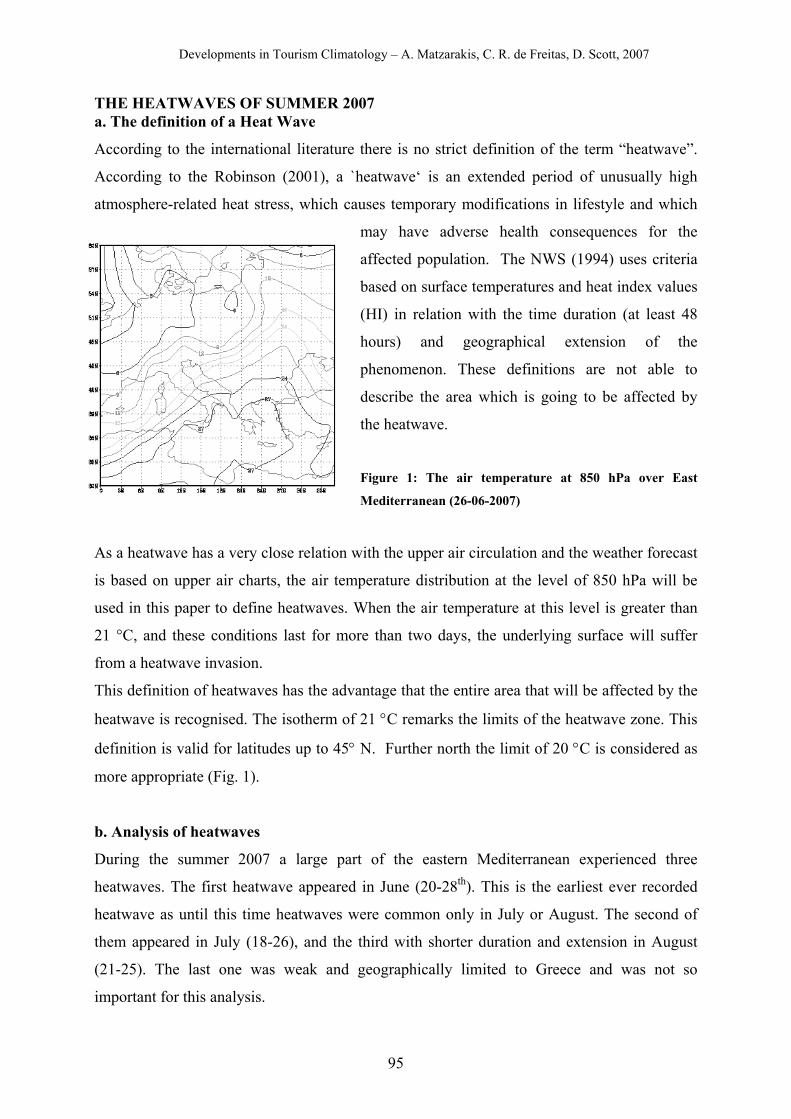
Developments in Tourism Climatology – A. Matzarakis, C. R. de Freitas, D. Scott, 2007
95
THE HEATWAVES OF SUMMER 2007 a. The definition of a Heat Wave
According to the international literature there is no strict definition of the term “heatwave”.
According to the Robinson (2001), a `heatwave‘ is an extended period of unusually high
atmosphere-related heat stress, which causes temporary modifications in lifestyle and which
may have adverse health consequences for the
affected population. The NWS (1994) uses criteria
based on surface temperatures and heat index values
(HI) in relation with the time duration (at least 48
hours) and geographical extension of the
phenomenon. These definitions are not able to
describe the area which is going to be affected by
the heatwave.
Figure 1: The air temperature at 850 hPa over East
Mediterranean (26-06-2007)
As a heatwave has a very close relation with the upper air circulation and the weather forecast
is based on upper air charts, the air temperature distribution at the level of 850 hPa will be
used in this paper to define heatwaves. When the air temperature at this level is greater than
21 °C, and these conditions last for more than two days, the underlying surface will suffer
from a heatwave invasion.
This definition of heatwaves has the advantage that the entire area that will be affected by the
heatwave is recognised. The isotherm of 21 °C remarks the limits of the heatwave zone. This
definition is valid for latitudes up to 45° N. Further north the limit of 20 °C is considered as
more appropriate (Fig. 1).
b. Analysis of heatwaves
During the summer 2007 a large part of the eastern Mediterranean experienced three
heatwaves. The first heatwave appeared in June (20-28th). This is the earliest ever recorded
heatwave as until this time heatwaves were common only in July or August. The second of
them appeared in July (18-26), and the third with shorter duration and extension in August
(21-25). The last one was weak and geographically limited to Greece and was not so
important for this analysis.
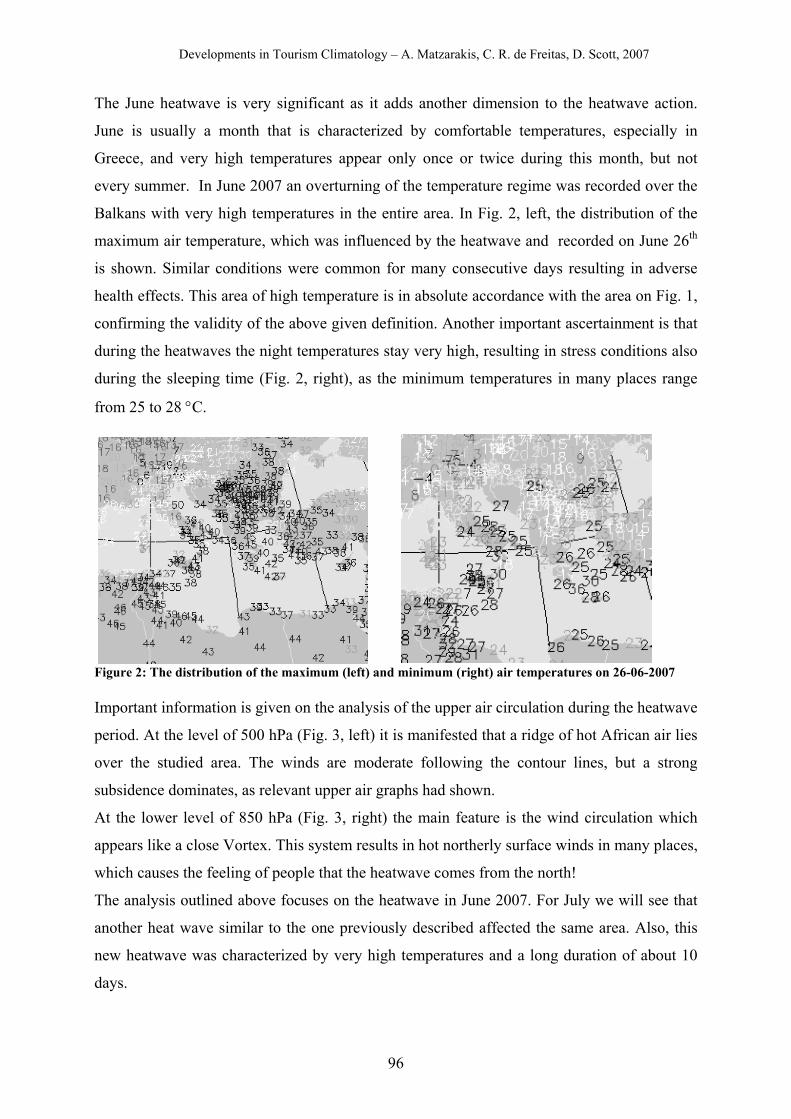
Developments in Tourism Climatology – A. Matzarakis, C. R. de Freitas, D. Scott, 2007
96
The June heatwave is very significant as it adds another dimension to the heatwave action.
June is usually a month that is characterized by comfortable temperatures, especially in
Greece, and very high temperatures appear only once or twice during this month, but not
every summer. In June 2007 an overturning of the temperature regime was recorded over the
Balkans with very high temperatures in the entire area. In Fig. 2, left, the distribution of the
maximum air temperature, which was influenced by the heatwave and recorded on June 26th
is shown. Similar conditions were common for many consecutive days resulting in adverse
health effects. This area of high temperature is in absolute accordance with the area on Fig. 1,
confirming the validity of the above given definition. Another important ascertainment is that
during the heatwaves the night temperatures stay very high, resulting in stress conditions also
during the sleeping time (Fig. 2, right), as the minimum temperatures in many places range
from 25 to 28 °C.
Figure 2: The distribution of the maximum (left) and minimum (right) air temperatures on 26-06-2007 Important information is given on the analysis of the upper air circulation during the heatwave
period. At the level of 500 hPa (Fig. 3, left) it is manifested that a ridge of hot African air lies
over the studied area. The winds are moderate following the contour lines, but a strong
subsidence dominates, as relevant upper air graphs had shown.
At the lower level of 850 hPa (Fig. 3, right) the main feature is the wind circulation which
appears like a close Vortex. This system results in hot northerly surface winds in many places,
which causes the feeling of people that the heatwave comes from the north!
The analysis outlined above focuses on the heatwave in June 2007. For July we will see that
another heat wave similar to the one previously described affected the same area. Also, this
new heatwave was characterized by very high temperatures and a long duration of about 10
days.
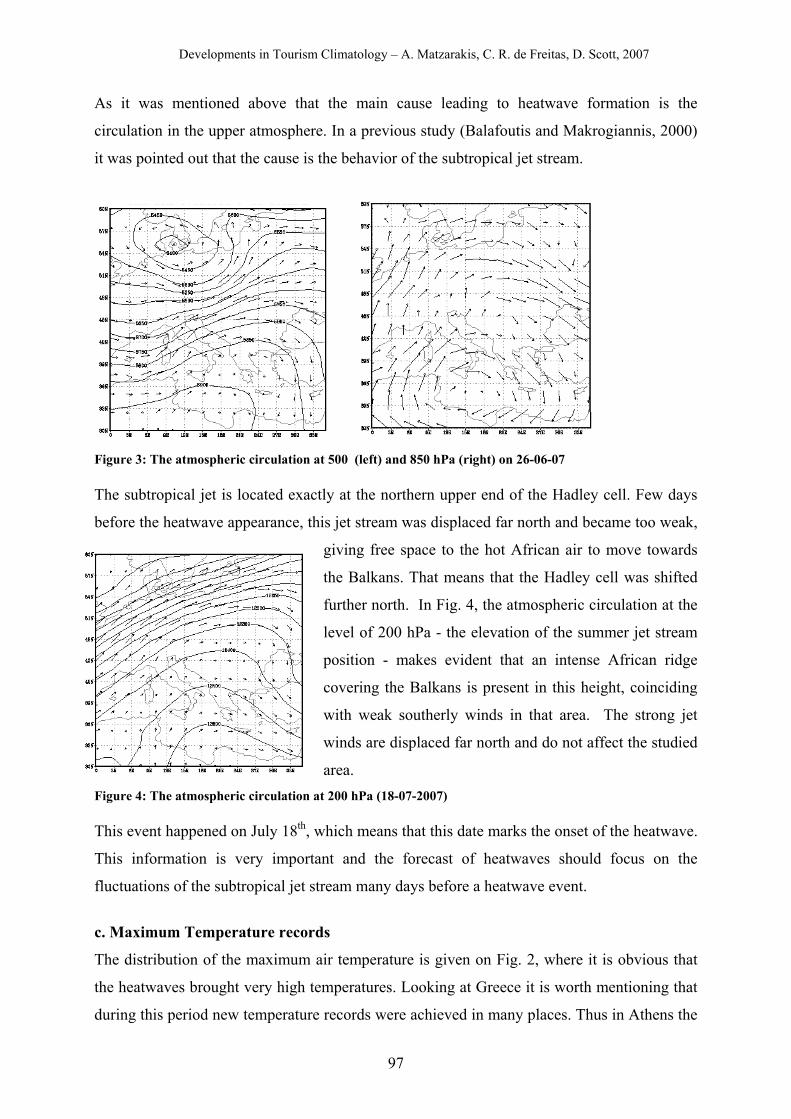
Developments in Tourism Climatology – A. Matzarakis, C. R. de Freitas, D. Scott, 2007
97
As it was mentioned above that the main cause leading to heatwave formation is the
circulation in the upper atmosphere. In a previous study (Balafoutis and Makrogiannis, 2000)
it was pointed out that the cause is the behavior of the subtropical jet stream.
Figure 3: The atmospheric circulation at 500 (left) and 850 hPa (right) on 26-06-07 The subtropical jet is located exactly at the northern upper end of the Hadley cell. Few days
before the heatwave appearance, this jet stream was displaced far north and became too weak,
giving free space to the hot African air to move towards
the Balkans. That means that the Hadley cell was shifted
further north. In Fig. 4, the atmospheric circulation at the
level of 200 hPa - the elevation of the summer jet stream
position - makes evident that an intense African ridge
covering the Balkans is present in this height, coinciding
with weak southerly winds in that area. The strong jet
winds are displaced far north and do not affect the studied
area. Figure 4: The atmospheric circulation at 200 hPa (18-07-2007) This event happened on July 18th, which means that this date marks the onset of the heatwave.
This information is very important and the forecast of heatwaves should focus on the
fluctuations of the subtropical jet stream many days before a heatwave event.
c. Maximum Temperature records
The distribution of the maximum air temperature is given on Fig. 2, where it is obvious that
the heatwaves brought very high temperatures. Looking at Greece it is worth mentioning that
during this period new temperature records were achieved in many places. Thus in Athens the
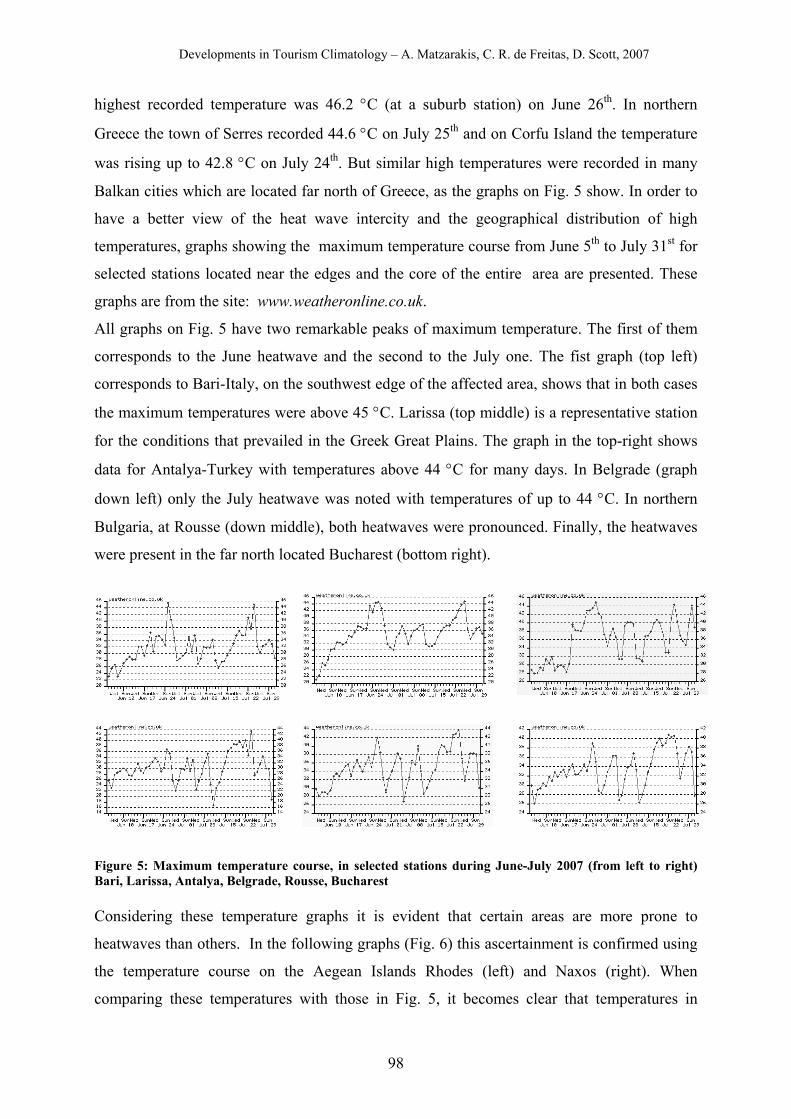
Developments in Tourism Climatology – A. Matzarakis, C. R. de Freitas, D. Scott, 2007
98
highest recorded temperature was 46.2 °C (at a suburb station) on June 26th. In northern
Greece the town of Serres recorded 44.6 °C on July 25th and on Corfu Island the temperature
was rising up to 42.8 °C on July 24th. But similar high temperatures were recorded in many
Balkan cities which are located far north of Greece, as the graphs on Fig. 5 show. In order to
have a better view of the heat wave intercity and the geographical distribution of high
temperatures, graphs showing the maximum temperature course from June 5th to July 31st for
selected stations located near the edges and the core of the entire area are presented. These
graphs are from the site: www.weatheronline.co.uk.
All graphs on Fig. 5 have two remarkable peaks of maximum temperature. The first of them
corresponds to the June heatwave and the second to the July one. The fist graph (top left)
corresponds to Bari-Italy, on the southwest edge of the affected area, shows that in both cases
the maximum temperatures were above 45 °C. Larissa (top middle) is a representative station
for the conditions that prevailed in the Greek Great Plains. The graph in the top-right shows
data for Antalya-Turkey with temperatures above 44 °C for many days. In Belgrade (graph
down left) only the July heatwave was noted with temperatures of up to 44 °C. In northern
Bulgaria, at Rousse (down middle), both heatwaves were pronounced. Finally, the heatwaves
were present in the far north located Bucharest (bottom right).
Figure 5: Maximum temperature course, in selected stations during June-July 2007 (from left to right) Bari, Larissa, Antalya, Belgrade, Rousse, Bucharest Considering these temperature graphs it is evident that certain areas are more prone to
heatwaves than others. In the following graphs (Fig. 6) this ascertainment is confirmed using
the temperature course on the Aegean Islands Rhodes (left) and Naxos (right). When
comparing these temperatures with those in Fig. 5, it becomes clear that temperatures in
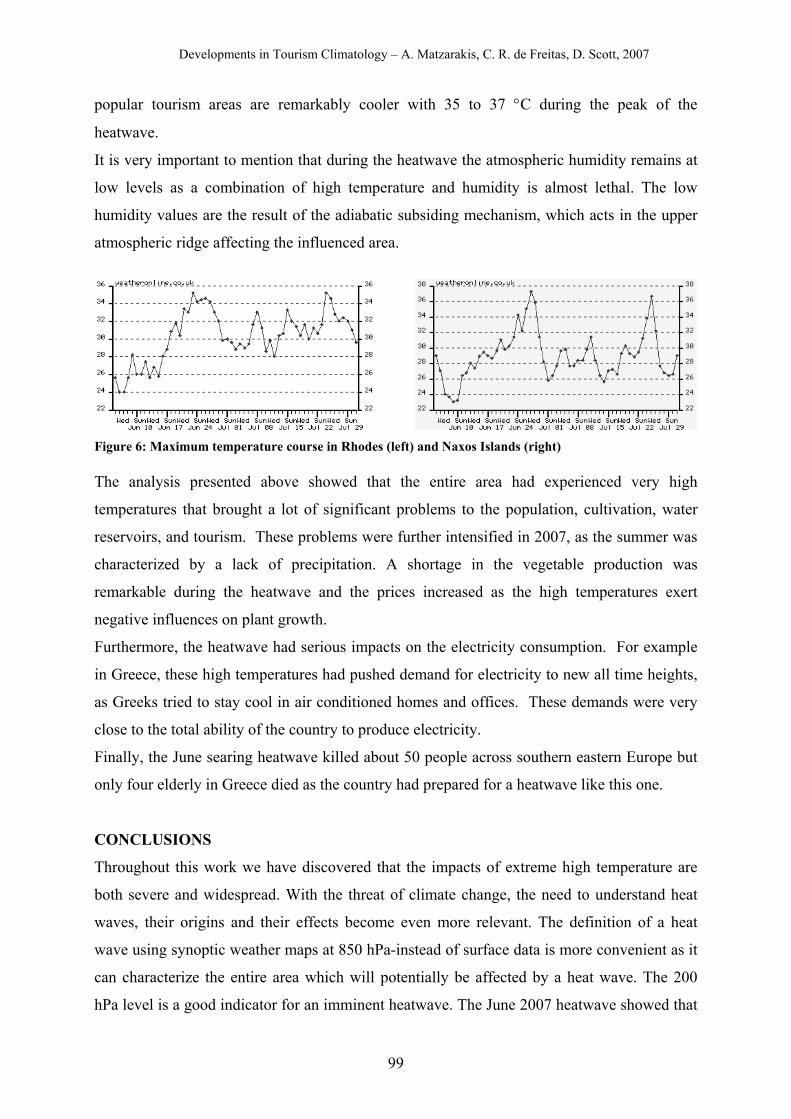
Developments in Tourism Climatology – A. Matzarakis, C. R. de Freitas, D. Scott, 2007
99
popular tourism areas are remarkably cooler with 35 to 37 °C during the peak of the
heatwave.
It is very important to mention that during the heatwave the atmospheric humidity remains at
low levels as a combination of high temperature and humidity is almost lethal. The low
humidity values are the result of the adiabatic subsiding mechanism, which acts in the upper
atmospheric ridge affecting the influenced area.
Figure 6: Maximum temperature course in Rhodes (left) and Naxos Islands (right) The analysis presented above showed that the entire area had experienced very high
temperatures that brought a lot of significant problems to the population, cultivation, water
reservoirs, and tourism. These problems were further intensified in 2007, as the summer was
characterized by a lack of precipitation. A shortage in the vegetable production was
remarkable during the heatwave and the prices increased as the high temperatures exert
negative influences on plant growth.
Furthermore, the heatwave had serious impacts on the electricity consumption. For example
in Greece, these high temperatures had pushed demand for electricity to new all time heights,
as Greeks tried to stay cool in air conditioned homes and offices. These demands were very
close to the total ability of the country to produce electricity.
Finally, the June searing heatwave killed about 50 people across southern eastern Europe but
only four elderly in Greece died as the country had prepared for a heatwave like this one.
CONCLUSIONS
Throughout this work we have discovered that the impacts of extreme high temperature are
both severe and widespread. With the threat of climate change, the need to understand heat
waves, their origins and their effects become even more relevant. The definition of a heat
wave using synoptic weather maps at 850 hPa-instead of surface data is more convenient as it
can characterize the entire area which will potentially be affected by a heat wave. The 200
hPa level is a good indicator for an imminent heatwave. The June 2007 heatwave showed that
Developments in Tourism Climatology – A. Matzarakis, C. R. de Freitas, D. Scott, 2007
100
strong heatwaves can come earlier in the beginning of the summer and not only during the
hottest months July and August. The remarkable finding of this study is that these heat waves
hade a large geographical extension covering an area that until now had not any experience
with heat strokes and the people were not ready to be confronted with disasters of that kind.
These heatwaves have had a broad and far-reaching set of impacts on the area. These include
significant loss of life, economic cost of transportation, agriculture, energy production and
also cancelling of programming arrivals of tourist groups.
The repetition of the heatwave in July was a warning signal that due to climate change the
future summer conditions will be worse with severe influences on humans.
Or results send a warning to the authorities that it is time to make plans to manipulate the
climate crisis.
REFERENCES Balafoutis Ch., Makrogiannis, T. (2000) A contribution to the study of the heatwave
phenomenon over Greece in August 1999. 3rd conference of applied climatology, tools for the environment and man of year 2000, ECAC 2000, Session 5, Urban, Heat and Tourism, 16-20 October, Piza, Italy.
Giles, B. D., Balafoutis, C. (1990) The Greek Heatwaves on 1987 and 1988. International Journal of Climatology10: 505-517
NWS (National Weather Service) (1994) Excessive heat watch, warning and advisory heat index criteria. Regional Operations Manual Letter E-5-94, Eastern Region, NWS, Bohemia, NY, 3 pp.
Robinson, P. J. (2001) On the Definition of a Heat Wave. Journal of Applied Meteorology 40: 762-775.
Developments in Tourism Climatology – A. Matzarakis, C. R. de Freitas, D. Scott, 2007
101
“THE SKY FELL DOWN” PERCEPTIONS AND IMPLICATIONS OF EXTREME WEATHER EVENTS FOR
HUNGARIAN TOURISM
T. Rátz and K. Szalai
Department of Tourism, Kodolányi János University College, Hungary
[email protected] ABSTRACT Extreme weather events include droughts, floods and associated landslides,
storms, cyclones and tornadoes, ocean and coastal surges, heat waves and cold snaps. As it is
assumed by scientists that global climate change leads to an increase in the frequency of
extreme events, it is becoming more important to understand how tourist demand is affected
by extreme weather phenomena and how tourist destinations and tourist enterprises are able
to react to such events. The paper presents some of the findings of a questionnaire survey
carried out in 2007 that aims to investigate the short- and medium term implications of a
tragic storm of 20th August 2006 for Hungarians’ travel decision making and travel
behaviour. In addition, the vulnerability of Hungarian tourism to extreme weather phenomena
and the industry’s ability to cope with such events are assessed.
Among weather- and climate-related sources, the most common ones proved to be significant
(personal experience, television/radio), in spite of the fact that one can reach more detailed
and up-to-date information on the internet. The importance of providing commonly
understood weather forecasts (especially warnings) has to be highlighted. Since awareness
has an exceedingly important role in tourism due to the unpredictability of natural events, the
development of a more effective advance warning and disaster management system is
required in Hungary.
KEY WORDS: Extreme weather, tourist behaviour, Hungary
INTRODUCTION
On 20th August 2006 – St Stephen’s Day and a national holiday in Hungary –, a violent storm
hit Budapest, the capital of the country, that killed four people and injured about 300, as huge
crowds watched the celebratory fireworks display. Winds of up to 100 km/h (62 mph) tore
down trees, smashed cars and windows and ripped off roof tiles, and torrential rain poured
down on more than one million onlookers gathered along the banks of the Danube. Boats
collided on the river and several people fell overboard. Although the possibility of a heavy
storm was emphasised in the Hungarian Meteorological Service’s advance forecasts and
Developments in Tourism Climatology – A. Matzarakis, C. R. de Freitas, D. Scott, 2007
102
warnings, the strength and exact movement of the storm could only be predicted 1-2 hours
before the beginning of the fireworks display.
Extreme weather is weather that lies outside a locale’s normal range of weather intensity. It
is, by definition, infrequent or rare, and is also potentially destructive (Francis and
Hengeveld, 1998). Obviously, the concept of what constitutes an extreme varies from place to
place, since it is the given area’s climatic characteristics that define the extremity of certain
weather conditions. Although summer storms occur regularly in Hungary – in most cases less
violent than the one discussed in this study –, the chance that such a storm hits a highly
populated area is quite low. However, as global climate change seems to generate an increase
in extreme weather events (Francis and Hengeveld, 1998), and most of the potential
damaging consequences relating to climate change are associated with extremes – the number
of heat waves, floods, or severe storms, for example –, it is important to understand what
impact global warming may have on their occurrence. In addition, it is also vital for the
tourism industry to recognise the impacts of such events on tourist attitudes and behaviour,
and the need to prepare for the occurrence of extreme weather conditions. Owing to the fact
that scientists soon realized the significant influence of special weather events on tourism,
several related studies have been published in the past few years. In the Mediterranean for
instance, the number of heat waves increased and caused deaths among tourists (Katsouyanni,
1988, Conte et al., 2000, Perry 2001). In conjunction with drops in precipitation, forests
became more vulnerable to fire in this region, and, subsequently, the number of forest fires
rose lately (Pinol et al., 1998, Perry, 2001). The tourism industry soon reacted to the weather
changes by inspiring related research work and by adopting measures that allow resorts to
adapt to these changes (e.g. campaigns to raise awareness among tourists, providing them
with more information) (Gómez Martín 2005). Extreme weather events generally have
ecological, socio-cultural and economic consequences – such as higher mortality rates if the
mean temperatures exceed 30 °C or increasing insurance claims following thunderstorms –,
but the impacts of weather extremes are not universal: it is the vulnerability of human and
natural systems that determine the severity of such impacts (e.g. Diaz and Pulwarty, 1997,
Pielke and Pielke, 1997).
It should also be noted that there is little consensus in the literature concerning the
contribution of global climate change to extreme weather events. However, some of the
recent climate models are in agreement with respect to possible future changes, such as a
greater frequency of extreme warm days and lower frequency of extreme cold days associated
with a warmer mean climate, increased precipitation intensity, as well as mid-continent
Developments in Tourism Climatology – A. Matzarakis, C. R. de Freitas, D. Scott, 2007
103
summer drying. On the other hand, there is little consensus about the possible future
behaviour of mid-latitude storms, their intensity or frequency changes, or storm track changes
(Easterling et al., 2000, Meehl et al., 2000).
METHODS
In order to explore the effects of extreme weather events on Hungarian tourists’ perceptions
and attitudes, a questionnaire survey with a sample size of 1000 persons was carried out in
spring 2007. Due to financial limitations, quota sampling was used, based on respondents’
age and gender, so the selected sample represents the Hungarian population by these two
variables. Participation was limited to persons above 15 years of age, as at this age cognitive
abilities are considered to be stable (e.g. Apter et al., 1998 cited by Poria et al., 2003).
Descriptive characteristics of the sample’s socio-demographic distribution are summarised in
Table 1. The qualification of the respondents refers to diverse socio-economic circumstances.
Table 1: Respondents’ characteristics (%)
Gender Male Female Total 49.1 50.9 100.0 Age 15-19 20-34 35-44 45-59 60+ Total 11.1 29.6 15.5 21.1 22.6 100.0 Education Lower
than elementary
Elementary school
Vocational Training
Secondary school
Higher vocational training
College/ University
Total*
0.8 7.0 12.7 34.2 15.7 25.3 95.7 * Less than 100% due to no response Due to the locality of the examined extreme weather event, Budapest and Central Hungary
are overrepresented in the sample. The distribution of the respondents’ permanent residence is
the following: Budapest 50.2 %, Central Hungary 18.2 %, Northern Hungary 9.1 %, Southern
Great Plain 6.0 %, Northern Great Plain 5.0 %, Central Transdanubia 4.1 %, Western
Transdanubia 3.9 %, Southern Transdanubia 3.6 %.
The questions included in the survey focused on two main areas: the reactions of respondents
following the August storm and the event’s medium term impacts on their leisure behaviour
on the one hand, and their perceptions of extreme weather phenomena occurring in major
tourist destinations, as well as their experiences with such phenomena, on the other hand. Due
to limitations in length, the present paper discusses findings related to the first group of
questions.
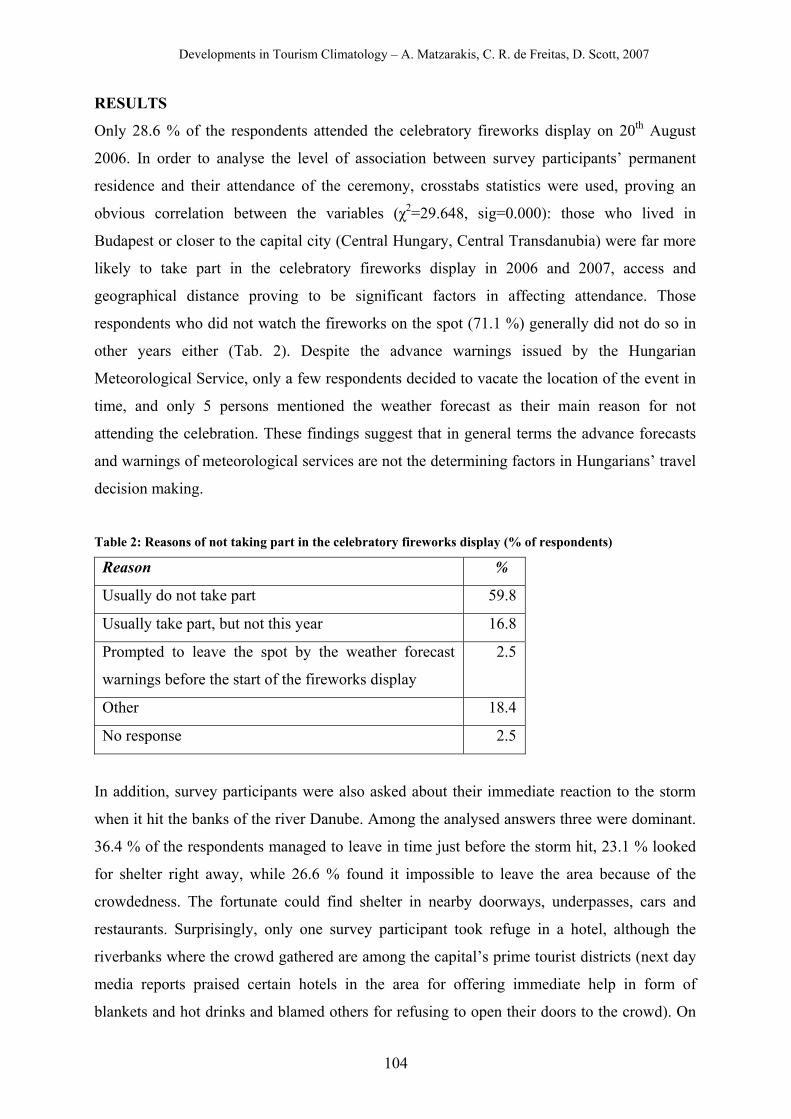
Developments in Tourism Climatology – A. Matzarakis, C. R. de Freitas, D. Scott, 2007
104
RESULTS
Only 28.6 % of the respondents attended the celebratory fireworks display on 20th August
2006. In order to analyse the level of association between survey participants’ permanent
residence and their attendance of the ceremony, crosstabs statistics were used, proving an
obvious correlation between the variables (χ2=29.648, sig=0.000): those who lived in
Budapest or closer to the capital city (Central Hungary, Central Transdanubia) were far more
likely to take part in the celebratory fireworks display in 2006 and 2007, access and
geographical distance proving to be significant factors in affecting attendance. Those
respondents who did not watch the fireworks on the spot (71.1 %) generally did not do so in
other years either (Tab. 2). Despite the advance warnings issued by the Hungarian
Meteorological Service, only a few respondents decided to vacate the location of the event in
time, and only 5 persons mentioned the weather forecast as their main reason for not
attending the celebration. These findings suggest that in general terms the advance forecasts
and warnings of meteorological services are not the determining factors in Hungarians’ travel
decision making.
Table 2: Reasons of not taking part in the celebratory fireworks display (% of respondents)
Reason %
Usually do not take part 59.8
Usually take part, but not this year 16.8
Prompted to leave the spot by the weather forecast
warnings before the start of the fireworks display
2.5
Other 18.4
No response 2.5
In addition, survey participants were also asked about their immediate reaction to the storm
when it hit the banks of the river Danube. Among the analysed answers three were dominant.
36.4 % of the respondents managed to leave in time just before the storm hit, 23.1 % looked
for shelter right away, while 26.6 % found it impossible to leave the area because of the
crowdedness. The fortunate could find shelter in nearby doorways, underpasses, cars and
restaurants. Surprisingly, only one survey participant took refuge in a hotel, although the
riverbanks where the crowd gathered are among the capital’s prime tourist districts (next day
media reports praised certain hotels in the area for offering immediate help in form of
blankets and hot drinks and blamed others for refusing to open their doors to the crowd). On
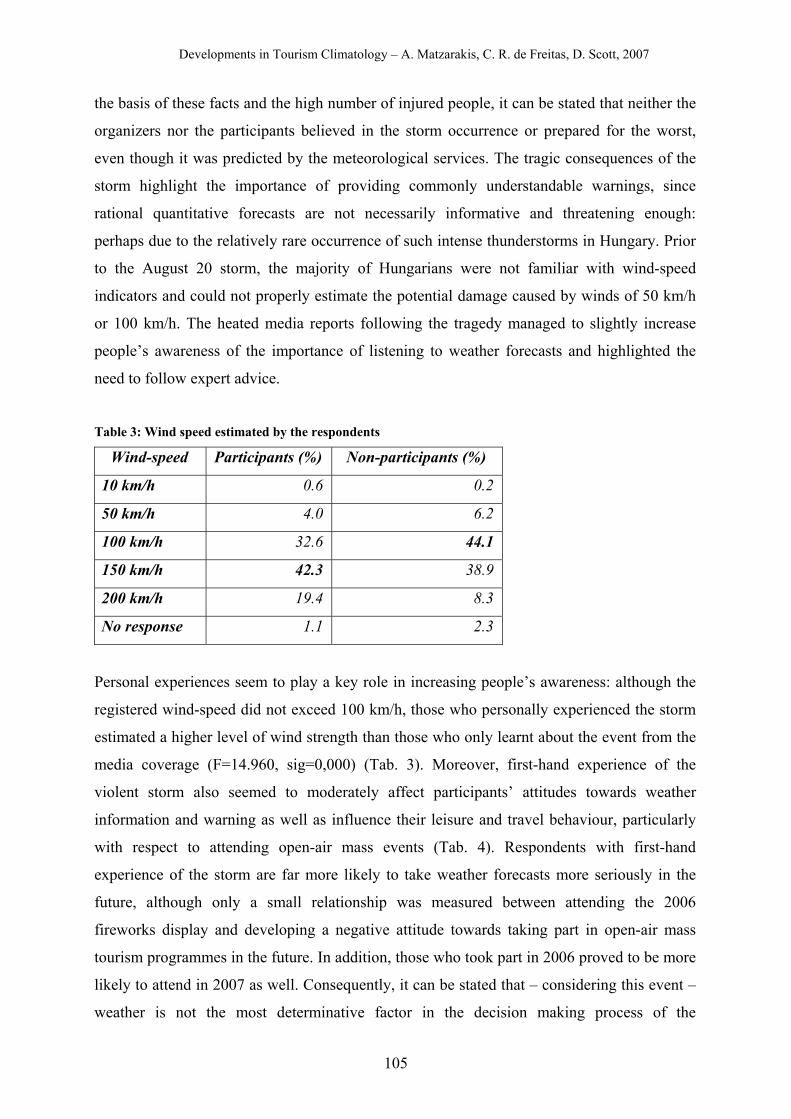
Developments in Tourism Climatology – A. Matzarakis, C. R. de Freitas, D. Scott, 2007
105
the basis of these facts and the high number of injured people, it can be stated that neither the
organizers nor the participants believed in the storm occurrence or prepared for the worst,
even though it was predicted by the meteorological services. The tragic consequences of the
storm highlight the importance of providing commonly understandable warnings, since
rational quantitative forecasts are not necessarily informative and threatening enough:
perhaps due to the relatively rare occurrence of such intense thunderstorms in Hungary. Prior
to the August 20 storm, the majority of Hungarians were not familiar with wind-speed
indicators and could not properly estimate the potential damage caused by winds of 50 km/h
or 100 km/h. The heated media reports following the tragedy managed to slightly increase
people’s awareness of the importance of listening to weather forecasts and highlighted the
need to follow expert advice.
Table 3: Wind speed estimated by the respondents
Wind-speed Participants (%) Non-participants (%)
10 km/h 0.6 0.2
50 km/h 4.0 6.2
100 km/h 32.6 44.1
150 km/h 42.3 38.9
200 km/h 19.4 8.3
No response 1.1 2.3
Personal experiences seem to play a key role in increasing people’s awareness: although the
registered wind-speed did not exceed 100 km/h, those who personally experienced the storm
estimated a higher level of wind strength than those who only learnt about the event from the
media coverage (F=14.960, sig=0,000) (Tab. 3). Moreover, first-hand experience of the
violent storm also seemed to moderately affect participants’ attitudes towards weather
information and warning as well as influence their leisure and travel behaviour, particularly
with respect to attending open-air mass events (Tab. 4). Respondents with first-hand
experience of the storm are far more likely to take weather forecasts more seriously in the
future, although only a small relationship was measured between attending the 2006
fireworks display and developing a negative attitude towards taking part in open-air mass
tourism programmes in the future. In addition, those who took part in 2006 proved to be more
likely to attend in 2007 as well. Consequently, it can be stated that – considering this event –
weather is not the most determinative factor in the decision making process of the
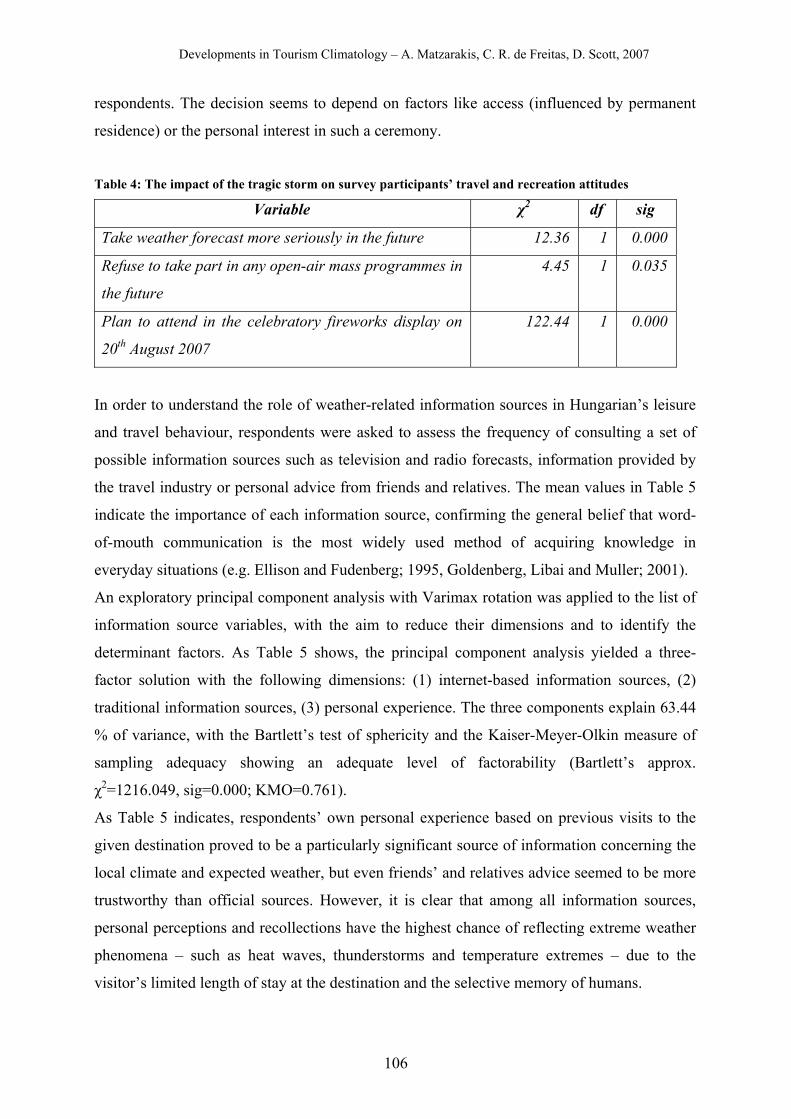
Developments in Tourism Climatology – A. Matzarakis, C. R. de Freitas, D. Scott, 2007
106
respondents. The decision seems to depend on factors like access (influenced by permanent
residence) or the personal interest in such a ceremony.
Table 4: The impact of the tragic storm on survey participants’ travel and recreation attitudes
Variable χ2 df sig
Take weather forecast more seriously in the future 12.36 1 0.000
Refuse to take part in any open-air mass programmes in
the future
4.45 1 0.035
Plan to attend in the celebratory fireworks display on
20th August 2007
122.44 1 0.000
In order to understand the role of weather-related information sources in Hungarian’s leisure
and travel behaviour, respondents were asked to assess the frequency of consulting a set of
possible information sources such as television and radio forecasts, information provided by
the travel industry or personal advice from friends and relatives. The mean values in Table 5
indicate the importance of each information source, confirming the general belief that word-
of-mouth communication is the most widely used method of acquiring knowledge in
everyday situations (e.g. Ellison and Fudenberg; 1995, Goldenberg, Libai and Muller; 2001).
An exploratory principal component analysis with Varimax rotation was applied to the list of
information source variables, with the aim to reduce their dimensions and to identify the
determinant factors. As Table 5 shows, the principal component analysis yielded a three-
factor solution with the following dimensions: (1) internet-based information sources, (2)
traditional information sources, (3) personal experience. The three components explain 63.44
% of variance, with the Bartlett’s test of sphericity and the Kaiser-Meyer-Olkin measure of
sampling adequacy showing an adequate level of factorability (Bartlett’s approx.
χ2=1216.049, sig=0.000; KMO=0.761).
As Table 5 indicates, respondents’ own personal experience based on previous visits to the
given destination proved to be a particularly significant source of information concerning the
local climate and expected weather, but even friends’ and relatives advice seemed to be more
trustworthy than official sources. However, it is clear that among all information sources,
personal perceptions and recollections have the highest chance of reflecting extreme weather
phenomena – such as heat waves, thunderstorms and temperature extremes – due to the
visitor’s limited length of stay at the destination and the selective memory of humans.
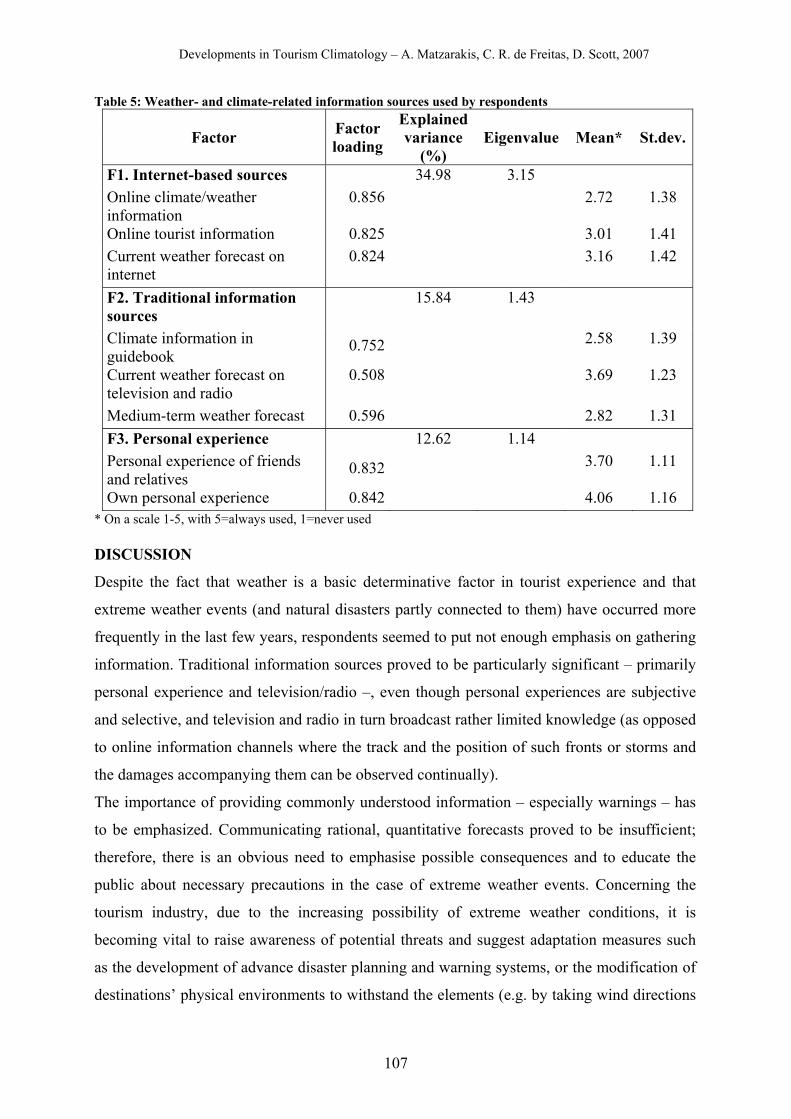
Developments in Tourism Climatology – A. Matzarakis, C. R. de Freitas, D. Scott, 2007
107
Table 5: Weather- and climate-related information sources used by respondents
Factor Factor loading
Explained variance
(%) Eigenvalue Mean* St.dev.
F1. Internet-based sources 34.98 3.15 Online climate/weather information
0.856 2.72 1.38
Online tourist information 0.825 3.01 1.41 Current weather forecast on internet
0.824 3.16 1.42
F2. Traditional information sources
15.84 1.43
Climate information in guidebook
0.752 2.58 1.39
Current weather forecast on television and radio
0.508 3.69 1.23
Medium-term weather forecast 0.596 2.82 1.31 F3. Personal experience 12.62 1.14 Personal experience of friends and relatives
0.832 3.70 1.11
Own personal experience 0.842 4.06 1.16 * On a scale 1-5, with 5=always used, 1=never used DISCUSSION
Despite the fact that weather is a basic determinative factor in tourist experience and that
extreme weather events (and natural disasters partly connected to them) have occurred more
frequently in the last few years, respondents seemed to put not enough emphasis on gathering
information. Traditional information sources proved to be particularly significant – primarily
personal experience and television/radio –, even though personal experiences are subjective
and selective, and television and radio in turn broadcast rather limited knowledge (as opposed
to online information channels where the track and the position of such fronts or storms and
the damages accompanying them can be observed continually).
The importance of providing commonly understood information – especially warnings – has
to be emphasized. Communicating rational, quantitative forecasts proved to be insufficient;
therefore, there is an obvious need to emphasise possible consequences and to educate the
public about necessary precautions in the case of extreme weather events. Concerning the
tourism industry, due to the increasing possibility of extreme weather conditions, it is
becoming vital to raise awareness of potential threats and suggest adaptation measures such
as the development of advance disaster planning and warning systems, or the modification of
destinations’ physical environments to withstand the elements (e.g. by taking wind directions
Developments in Tourism Climatology – A. Matzarakis, C. R. de Freitas, D. Scott, 2007
108
in consideration during the design and construction of buildings, cutting down dry or rotten
trees, or providing elevated foundations on areas regularly affected by flooding).
Hungarian media and politicians learnt from the tragic event and responded more readily to
potentially threatening weather incidents; although this also led to several unnecessary
warnings during the last year (such overreactions were mainly explained by political reasons,
as decision makers made an effort to keep clear of any responsibility in a similar tragic case).
As a matter of fact, an appropriate awareness plan is still missing (see the heat wave warnings
in Hungary in the last weeks of July 2007 – the role and the task of those concerned were
rather ambiguous).
REFERENCES Conte, M., Sorani, N., Piervitali, E. (2000) Extreme Climatic Events Over the Mediterranean.
In: Brandt, J., Geeson, N., Thornes, J. (eds.), Mediterranean Desertification: A Mosaic of Process and Responses (vol. 1). London, Wiley.
Diaz, H. F., Pulwarty, R. S. (1997) Hurricanes, Climate and Socioeconomic Impacts. Berlin: Springer-Verlag.
Easterling, D. R., Evans, J. L., Groisman, P. Ya., Karl, T. R., Kunkel, K. E., Ambenje, P. (2000) Observed Variability and Trends in Extreme Climate Events: A Brief Review. Bulletin of the American Meteorological Society 81(3): 417-425.
Ellison, G., Fudenberg, D. (1995) Word-of-mouth Communication and Social Learning. The Quarterly Journal of Economics 110(1): 93-125.
Francis, D., Hengeveld, H. (1998) Extreme Weather and Climate Change. Downsview, Ontario, Climate and Water Products Division – Atmospheric Environment Service.
Goldenberg, J., Libai, B., Muller, E. (2001) Talk of the Network: A Complex Systems Look at the Underlying Process of Word-of-Mouth. Marketing Letters 12(3):211-223.
Gómez Martín, M. B. (2005) Weather, Climate and Tourism. A geographical perspective. Annals of Tourism Research. 32(3): 571-591.
Katsouyanni, K. (1988) The 1987 Athens Heat Wave. Lancet 3: 573. Meehl, G.A., Zwiers, F., Evans, J., Knutson, T., Mearns, L., Whetton, P. (2000) Trends in
Extreme Weather and Climate Events: Issues Related to Modeling Extremes in Projections of Future Climate Change. Bulletin of the American Meteorological Society 81(3):427-436.
Perry, A. (2001) More Heat and Drought: Can Mediterranean Tourism Survive and Prosper? In: Matzarakis, A. and de Freitas, C.R. (eds.), Proceedings of the First International Workshop on Climate, Tourism and Recreation, Freiburg, International Society of Biometeorology, 1-6.
Pielke, R.A. Jr., Pielke, R.A. Sr. (1997) Hurricanes: Their Nature and Impact on Society. Chichester: John Wiley and Sons.
Pinol, J., Terradas, J., Lloret, F. (1998) Climate Warming, Wildfire Hazard and Wildfire Occurence in Coastal Eastern Spain. Climatic Change 38: 345-357.
Poria, Y., Butler, R., Airey, D. (2003) Tourism, Religion and Religiosity: A Holy Mess. Current Issues in Tourism 6(4): 340-363.
Developments in Tourism Climatology – A. Matzarakis, C. R. de Freitas, D. Scott, 2007
109
WEATHER AND CLIMATE AS LIMITING FACTORS IN WINTER TOURISM IN POLAR AREAS: CHANGING CLIMATE AND NATURE-BASED TOURISM IN
NORTHERN FINLAND
K. Tervo
Department of Geography/Thule Institute, FI-90014 University of Oulu, Finland
ABSTRACT Climate and weather conditions play an important role in nature-based tourism
and especially in snow-based winter activities. Earlier studies on climate change and winter
tourism have mainly focused on ski-related activities and their capability to adapt, while the
futures of other types of snow-activities, such as cross-country skiing, snowmobiling, reindeer-
and dog-sledding, have received little analysis. Nevertheless, these activities form an important
part of nature-based winter tourism in Finland, often combined with skiing or other snow-
activities as part of a comprehensive tourist experience.
The study aims to survey the attitudes and preparedness for climate change of nature-based
tourism entrepreneurs in Finland. As climate change is predicted to cause more intense and
harmful effects to winter tourism, the study also assesses which climatic conditions and
weather events affect or limit the viability of snow-based tourism activities, including the
differences between skiing and other snow-based activities. Based on thematic interviews and a
questionnaire of nature-based tourism entrepreneurs, the results indicate that entrepreneurs
providing tourism activities seem to be well prepared for normal climatic variability. This may
enhance their preparedness for climate change, even though hardly any adaptation strategies
have been developed for it. Thresholds to realise activities depend on the type of activity, but
climate and weather induced cancellations are ordinary events in all winter tourism. The most
common reasons for cancellations are either warm or extremely cold temperatures, but rain also
affects business operations.
KEYWORDS: Nature-based tourism, snow-based tourism, climate change, Finland, tourism
entrepreneurs
INTRODUCTION
The potential effects of climate change on tourism have received minimal attention in Finland.
The first reports dealing with climate change from a tourism perspective were published in
2005 (Martilla et al., 2005, Sievänen et al., 2005) and noted that climate change was considered
Developments in Tourism Climatology – A. Matzarakis, C. R. de Freitas, D. Scott, 2007
110
mainly as a positive phenomenon for summer tourism due to lengthening and warming of the
season. For winter tourism climate change was viewed as both a positive and a negative matter.
In southern and western Finland warming winters were regarded as endangering snow-related
tourism activities while northern parts of the country may, in the short run, gain competitive
advantage at the expense of southern Finland and central Europe. The influence of climate
change on both summer and winter tourism depends on the adaptive capacity of the tourism
sector. This especially applies to the future of nature-based tourism, which has internationally
been defined as one of the most vulnerable and climate-sensitive tourism activities (Scott et al.,
2007). The fact that nature-based tourism is of great importance for Finland, whose image as a
tourist destination is closely connected with nature - especially in northern Finland (Finnish
Lapland) where the employment effect of nature-related tourism is higher than any other
regional industry (Saarinen, 2003) - raises the importance of adaptation to even higher level.
Approximately one-third of the total tourism revenue in Finland comes from nature-based
tourism and related activities, which means that radical changes in climate and weather
conditions may have significant impact.
This paper assesses the future of Finnish nature-based tourism by examining the adaptive
capacity of the industry and the intensity of climate and weather conditions as limiting factors
for winter tourism. It is based on a study that sought knowledge of the adaptation strategies of
Finnish tourism industry (Saarinen and Tervo, 2005) and on a study on the vulnerability of
snow tourism to changes in climatic conditions. Winter tourism activities were chosen as a
target for more detailed analysis since the predicted effects of climate change are considered
more harmful and intense than on summer tourism.
METHODS
The study material consists of semi-structured interviews and a questionnaire survey targeting
nature-based tourism entrepreneurs. Tourism operators offering either snow- or water-related
activities from northern and eastern Finland (n=19) were chosen as representatives for summer
and winter tourism for the interviews, the aim of which was to analyse entrepreneurs’
perceptions and awareness concerning climate change and adaptation. For financial and
temporal reasons, most representatives for summer (water) tourism were selected from the
Savonlinna area and for winter (snow) tourism from the Rovaniemi area. The sample was
completed with snowball sampling. Thematic interviews were completed in spring 2005. The
issues covered were entrepreneurs’ knowledge about climate change and its potential impacts
and their attitudes towards adaptation strategies. The results and feedback of the interview
Developments in Tourism Climatology – A. Matzarakis, C. R. de Freitas, D. Scott, 2007
111
study led to the development of the questionnaire that was executed in the second part of the
study.
The mail questionnaire was sent to nature-based winter tourism entrepreneurs to gather data
from different winter tourism activities and their climatic sensitivity. The questionnaire form
with cover letter was mailed to 540 nature-based tourism entrepreneurs in June 2007 and the
non-respondents were contacted twice after the first mailing. The questions dealt with such
issues as length of the season, the preconditions (snow, ice, temperature) for starting the winter
season and weather conditions preventing the production of activities during the season. Both
qualitative and quantitative methods were used to analyse the data. The analyses were based on
descriptive and statistical approaches, and also comparative perspective was used to define the
differences between winter and summer tourism, different regions and different winter
activities.
RESULTS
Most entrepreneurs were aware of climate change and had an understanding that reflected
contemporary scientific understanding about it. They were able to list many climate change
induced impacts such as winters getting shorter and milder, summers getting longer,
environmental changes (flora and fauna), northern areas attracting more tourists and extreme
weather events becoming more frequent. Most of them did not believe, however, that climate
change would affect their operations. Attitudes towards climate change and its impacts varied
according to location and main season (Tab. 1). In general, nature-based tourism was defined as
non-vulnerable and tourism entrepreneurs were not worried about their future, except for the
Christmas and New Year seasons, which are the most important seasons for many animation
service enterprises. Only two of the interviewed entrepreneurs stated to have adaptation plans
in order to cope with the changing climate.
However, the entrepreneurs also note that in order to be able to operate in varying conditions
and to keep their customers satisfied they need to have some contingency plans regarding
natural climate variability (e. g. differences in season lengths) and sudden changes or
extraordinary weather conditions. Almost two-thirds of those interviewed had recently
observed climatic phenomena that had affected their business (Tab. 1) and most of them had
also prepared for these events. In order to prevent climatic events causing cancellations the
tourism operators had, among others, invested in snowmaking facilities, developed
substitutional activities and changed their marketing strategies.
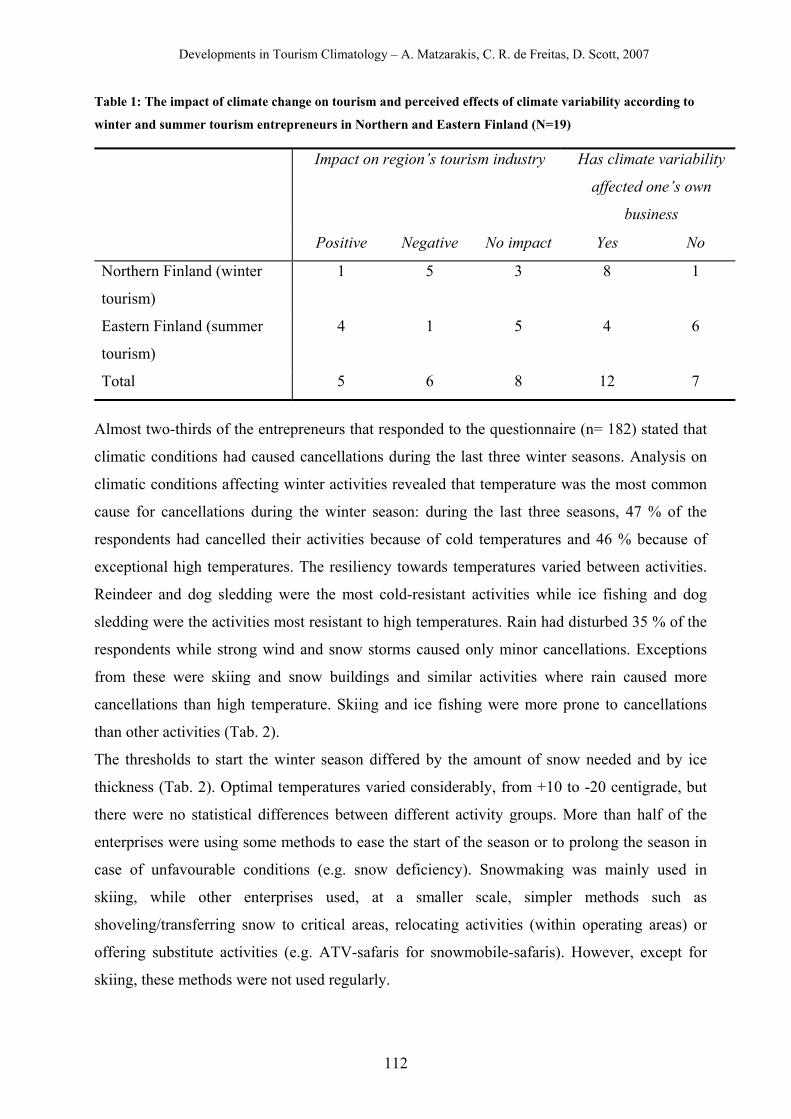
Developments in Tourism Climatology – A. Matzarakis, C. R. de Freitas, D. Scott, 2007
112
Table 1: The impact of climate change on tourism and perceived effects of climate variability according to
winter and summer tourism entrepreneurs in Northern and Eastern Finland (N=19)
Impact on region’s tourism industry Has climate variability
affected one’s own
business
Positive Negative No impact Yes No
Northern Finland (winter
tourism)
1 5 3 8 1
Eastern Finland (summer
tourism)
4 1 5 4 6
Total 5 6 8 12 7
Almost two-thirds of the entrepreneurs that responded to the questionnaire (n= 182) stated that
climatic conditions had caused cancellations during the last three winter seasons. Analysis on
climatic conditions affecting winter activities revealed that temperature was the most common
cause for cancellations during the winter season: during the last three seasons, 47 % of the
respondents had cancelled their activities because of cold temperatures and 46 % because of
exceptional high temperatures. The resiliency towards temperatures varied between activities.
Reindeer and dog sledding were the most cold-resistant activities while ice fishing and dog
sledding were the activities most resistant to high temperatures. Rain had disturbed 35 % of the
respondents while strong wind and snow storms caused only minor cancellations. Exceptions
from these were skiing and snow buildings and similar activities where rain caused more
cancellations than high temperature. Skiing and ice fishing were more prone to cancellations
than other activities (Tab. 2).
The thresholds to start the winter season differed by the amount of snow needed and by ice
thickness (Tab. 2). Optimal temperatures varied considerably, from +10 to -20 centigrade, but
there were no statistical differences between different activity groups. More than half of the
enterprises were using some methods to ease the start of the season or to prolong the season in
case of unfavourable conditions (e.g. snow deficiency). Snowmaking was mainly used in
skiing, while other enterprises used, at a smaller scale, simpler methods such as
shoveling/transferring snow to critical areas, relocating activities (within operating areas) or
offering substitute activities (e.g. ATV-safaris for snowmobile-safaris). However, except for
skiing, these methods were not used regularly.
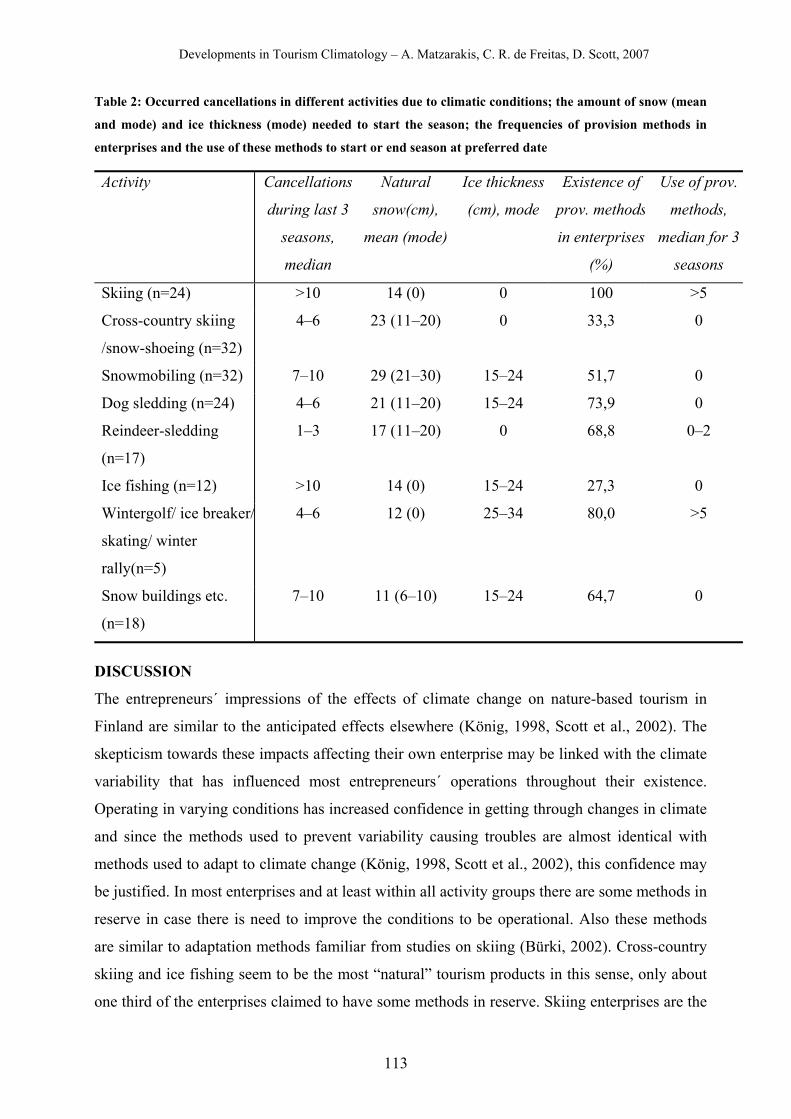
Developments in Tourism Climatology – A. Matzarakis, C. R. de Freitas, D. Scott, 2007
113
Table 2: Occurred cancellations in different activities due to climatic conditions; the amount of snow (mean
and mode) and ice thickness (mode) needed to start the season; the frequencies of provision methods in
enterprises and the use of these methods to start or end season at preferred date
Activity Cancellations
during last 3
seasons,
median
Natural
snow(cm),
mean (mode)
Ice thickness
(cm), mode
Existence of
prov. methods
in enterprises
(%)
Use of prov.
methods,
median for 3
seasons
Skiing (n=24) >10 14 (0) 0 100 >5
Cross-country skiing
/snow-shoeing (n=32)
4–6 23 (11–20) 0 33,3 0
Snowmobiling (n=32) 7–10 29 (21–30) 15–24 51,7 0
Dog sledding (n=24) 4–6 21 (11–20) 15–24 73,9 0
Reindeer-sledding
(n=17)
1–3 17 (11–20) 0 68,8 0–2
Ice fishing (n=12) >10 14 (0) 15–24 27,3 0
Wintergolf/ ice breaker/
skating/ winter
rally(n=5)
4–6 12 (0) 25–34 80,0 >5
Snow buildings etc.
(n=18)
7–10 11 (6–10) 15–24 64,7 0
DISCUSSION
The entrepreneurs´ impressions of the effects of climate change on nature-based tourism in
Finland are similar to the anticipated effects elsewhere (König, 1998, Scott et al., 2002). The
skepticism towards these impacts affecting their own enterprise may be linked with the climate
variability that has influenced most entrepreneurs´ operations throughout their existence.
Operating in varying conditions has increased confidence in getting through changes in climate
and since the methods used to prevent variability causing troubles are almost identical with
methods used to adapt to climate change (König, 1998, Scott et al., 2002), this confidence may
be justified. In most enterprises and at least within all activity groups there are some methods in
reserve in case there is need to improve the conditions to be operational. Also these methods
are similar to adaptation methods familiar from studies on skiing (Bürki, 2002). Cross-country
skiing and ice fishing seem to be the most “natural” tourism products in this sense, only about
one third of the enterprises claimed to have some methods in reserve. Skiing enterprises are the
Developments in Tourism Climatology – A. Matzarakis, C. R. de Freitas, D. Scott, 2007
114
other extreme with every respondent having access to at least one method (most often
snowmaking facilities).
In the questionnaire, the respondents assessed the instances when provision methods had been used in order to start the season or to prolong the season in spring. The use has mainly aimed at reaching the thresholds for snow, since other factors (temperature, ice cover on rivers/lakes/sea) are harder to manipulate. Respondents stated to have drawn on them during the season as well, but, especially for smaller enterprises, it was found too hard to estimate the frequency of use for the whole season. This indicates that entrepreneurs in Finland are familiar with a range of provision and adaptation methods, even though accessibility to these methods and their suitability for different enterprises varies. Climatic conditions have, nevertheless, led to cancellations in winter tourism, and more often in skiing and ice fishing than in other activities. This may be surprising for skiing, which mainly operates on constructed slopes and unnatural snow. Climate change will possibly increase the number of climate-related cancellations, even though the main cause for cancellations has been frost (-20/-40 centigrade depending on activity), which event should happen less frequently in warming climate (Jylhä et al., 2004). Warming will add to the number of occurrence of high temperatures and also rain, if precipitation coincides with days of temperature above 0 centigrade. High temperatures do not necessarily threat operations unless the warm period continues several days. Rain, on the contrary, causes a severe threat, since even small amount of precipitation increases snow melting and easily leads to cancellations or bad tourist experiences. Even though the study reveals rather small differences in the vulnerability, research should not focus only on skiing as it has been the trend. For example, little is known about the interrelationships between different products, how some activities “feed” visitors to other activities and what their combined value for different tourist groups is. In this sense, it may be too early to predict the future of nature-based tourism in Finland. It is also noteworthy that only one operational aspect was taken into account in this vulnerability study. In this way the results are indicative. Given that climate conditions, forms of tourism and tourist groups in the southern and northern regions of Finland differ considerably, a more thorough analysis that takes account of both regional and operational perspectives will probably give more detailed results concerning both vulnerability and adaptation to climate change.
ACKNOWLEDGEMENTS
The study has been funded by European Social Fund (KeMMI-project), Academy of Finland under the FiDiPro-programme and Thule Institute. I wish to thank Jarkko Saarinen and C. Michael Hall for their collaboration and comments on this paper.
Developments in Tourism Climatology – A. Matzarakis, C. R. de Freitas, D. Scott, 2007
115
REFERENCES Bürki, R. (2000) Klimaänderung und Anpassungsprozesse im Wintertourismus.
Ostschweizerischen Geographischen Gesellschaft, St. Gallen. Jylhä, K., Tuomenvirta, H. and Ruosteenoja, K. (2004) Climate change projections for Finland
during the 21st century. Boreal Environment Research 9,2: 127–152. König, U. (1998) Tourism in a warmer world. Implications of climate change due to enhanced
greenhouse effect for the ski industry in the Australian Alps. Wirtschaftgeographie und Raumplanung 28.
Marttila, V., Granholm, H., Laanikari, J., Yrjölä, T., Aalto, A., Heikinheimo, P., Honkatukia, J., Järvinen, H., Liski, J., Merivirta, R., Paunio, M. (2005) Finland’s national strategy for adaptation to climate change. Publications of the Ministry of Agriculture and Forestry 1a/2005.
Saarinen, J. (2003) The regional economics of tourism in northern Finland: the socio-economic implications of recent tourism development and future possibilities for regional development. Scandinavian J. Hospitality and Tourism 3,2: 91-113.
Saarinen, J. and Tervo, K. (2006) Perceptions and adaptation strategies of the tourism industry to climate change: the case of Finnish nature-based tourism entrepreneurs. Int. J. Innovation and Sustainable Development 1,3: 214-228.
Scott, D., Jones B. and Konopek, J. (2007) Implications of climate and environmental change for nature-based tourism in the Canadian Rocky Mountains: a case study of Waterton Lakes National Park. Tourism Management 28,2: 570-579.
Scott, D., Jones, B., Lemieux, C., McBoyle, G., Mills, B., Svenson, S., Wall, G. (2002) The vulnerability of winter recreation to climate change in Ontario’s Lakelands Tourism Region. Department of Geography Publication Series, Occasional Paper 18, University of Waterloo.
Sievänen, T., Tervo, K., Neuvonen, M., Pouta, E., Saarinen, J., Peltonen, A. (2005) Nature-based tourism, outdoor recreation and adaptation to climate change. FINADAPT Working Paper 11. Finnish Environment Institute Mimeographs 341.
Developments in Tourism Climatology – A. Matzarakis, C. R. de Freitas, D. Scott, 2007
116
WEATHER LIMITATIONS FOR WINTER AND SUMMER TOURISM IN EUROPE
K. Blazejczyk
Institute of Geography and Spatial Organization, Polish Academy of Science
ABSTRACT Weather is a factor that influences the possibility of outdoor recreation and tourism. However, the typical feature of climate in Central Europe is great and frequent change of weather that can influence outdoor activity. The aim of the paper is to discuss possible weather limitations for tourism, their frequency and seasonal pattern. A special bioclimatic typology of weather was used for this purpose. The examples are taken from the Polish lowlands, the Alps, the Carpathians and the Hungarian Plain. In summer the most frequent and the most dangerous weather conditions for humans are related to extreme hot as well as prolongued and heavy rains. In winter outdoor recreation is hindered by frosty weather and intensive snow falls and/or lack of snow cover. The frequency of unfavourable weather in summer has increased during the last decade. The frequency also increases from the North to the South of studied region. In the winter season inter-annual variability of snow cover is the greatest limitation in the mountain areas. However, extreme frost can limit outdoor recreation as well. KEYWORDS: Tourism, Mountains, Lowland, Europe INTRODUCTION
Over the last decades a significant increase in the number of people interested in tourism and recreation was observed. Tourism and recreation are also important for national economies. When choosing location and time for recreation we should consider climate and weather features, paying particular attention to their seasonality (Blazejczyk, 2001, Kozlowska-Szczesna et al., 1997). They are the key elements for outdoor recreation abilities and they affect our satisfaction/dissatisfaction as well as human’s health (Blazejczyk 2000, 2005, Matzarakis and Mayer, 1991, 1997, Parsons, 2003). Favourable climate and weather conditions are essential advantages for recreation and tourism activity (Blazejczyk, 2001, de Freitas 1990, 2003). The aim of the paper is to assess weather limitations for outdoor recreation that occur in Europe
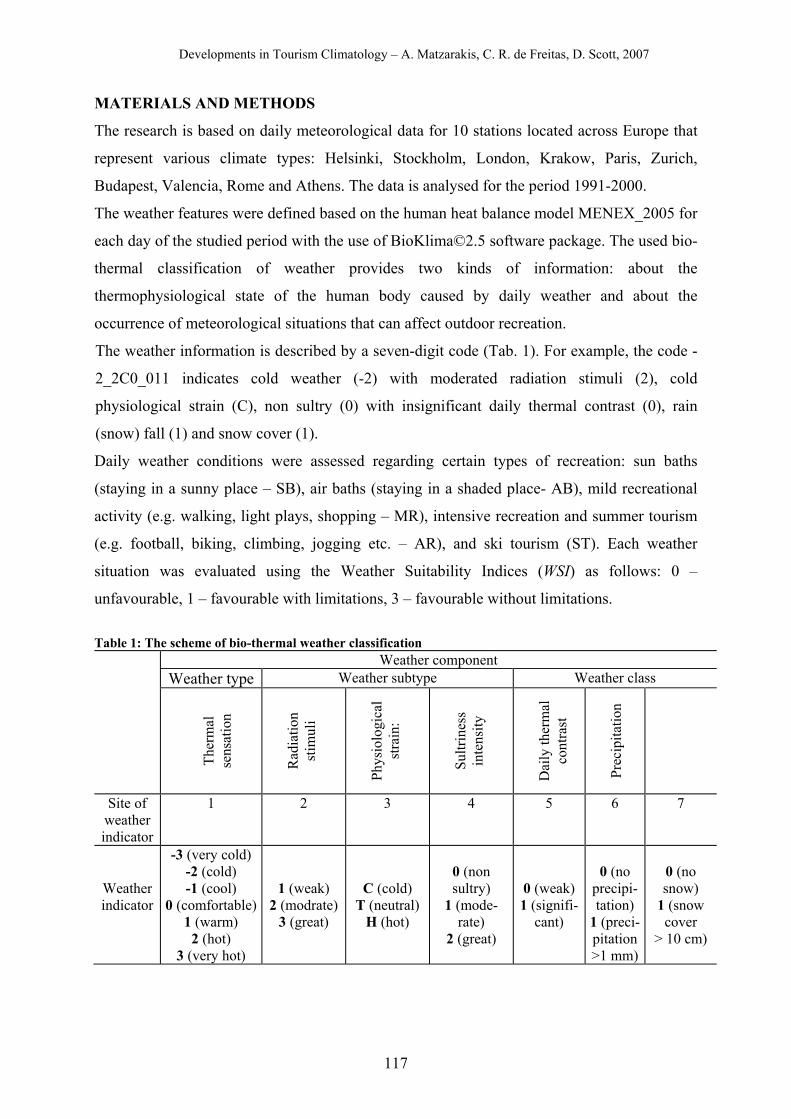
Developments in Tourism Climatology – A. Matzarakis, C. R. de Freitas, D. Scott, 2007
117
MATERIALS AND METHODS
The research is based on daily meteorological data for 10 stations located across Europe that
represent various climate types: Helsinki, Stockholm, London, Krakow, Paris, Zurich,
Budapest, Valencia, Rome and Athens. The data is analysed for the period 1991-2000.
The weather features were defined based on the human heat balance model MENEX_2005 for
each day of the studied period with the use of BioKlima©2.5 software package. The used bio-
thermal classification of weather provides two kinds of information: about the
thermophysiological state of the human body caused by daily weather and about the
occurrence of meteorological situations that can affect outdoor recreation.
The weather information is described by a seven-digit code (Tab. 1). For example, the code -
2_2C0_011 indicates cold weather (-2) with moderated radiation stimuli (2), cold
physiological strain (C), non sultry (0) with insignificant daily thermal contrast (0), rain
(snow) fall (1) and snow cover (1).
Daily weather conditions were assessed regarding certain types of recreation: sun baths
(staying in a sunny place – SB), air baths (staying in a shaded place- AB), mild recreational
activity (e.g. walking, light plays, shopping – MR), intensive recreation and summer tourism
(e.g. football, biking, climbing, jogging etc. – AR), and ski tourism (ST). Each weather
situation was evaluated using the Weather Suitability Indices (WSI) as follows: 0 –
unfavourable, 1 – favourable with limitations, 3 – favourable without limitations.
Table 1: The scheme of bio-thermal weather classification
Weather component Weather type Weather subtype Weather class
Th
erm
al
sens
atio
n
R
adia
tion
stim
uli
Ph
ysio
logi
cal
stra
in:
Su
ltrin
ess
inte
nsity
D
aily
ther
mal
co
ntra
st
Pr
ecip
itatio
n
Site of weather indicator
1 2 3 4 5 6 7
Weather indicator
-3 (very cold) -2 (cold) -1 (cool)
0 (comfortable) 1 (warm)
2 (hot) 3 (very hot)
1 (weak) 2 (modrate)
3 (great)
C (cold) T (neutral)
H (hot)
0 (non sultry)
1 (mode-rate)
2 (great)
0 (weak) 1 (signifi-
cant)
0 (no
precipi-tation)
1 (preci-pitation >1 mm)
0 (no snow)
1 (snow cover
> 10 cm)
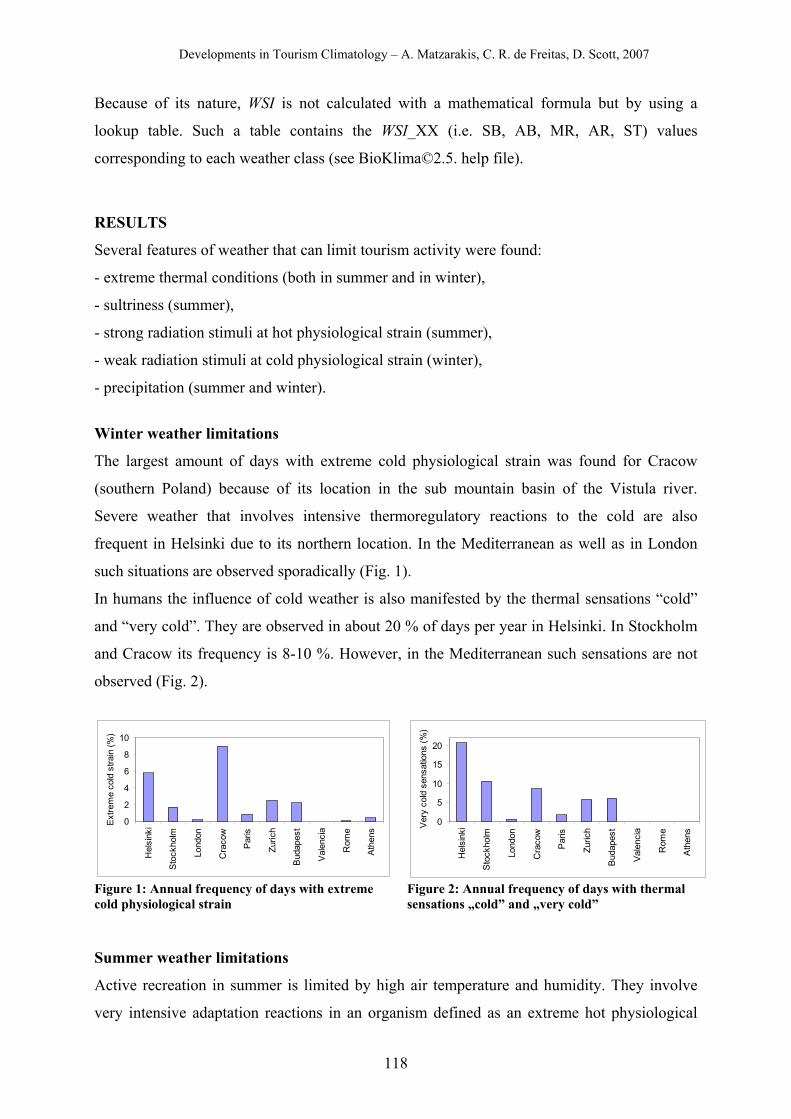
Developments in Tourism Climatology – A. Matzarakis, C. R. de Freitas, D. Scott, 2007
118
Because of its nature, WSI is not calculated with a mathematical formula but by using a
lookup table. Such a table contains the WSI_XX (i.e. SB, AB, MR, AR, ST) values
corresponding to each weather class (see BioKlima©2.5. help file).
RESULTS
Several features of weather that can limit tourism activity were found:
- extreme thermal conditions (both in summer and in winter),
- sultriness (summer),
- strong radiation stimuli at hot physiological strain (summer),
- weak radiation stimuli at cold physiological strain (winter),
- precipitation (summer and winter).
Winter weather limitations
The largest amount of days with extreme cold physiological strain was found for Cracow
(southern Poland) because of its location in the sub mountain basin of the Vistula river.
Severe weather that involves intensive thermoregulatory reactions to the cold are also
frequent in Helsinki due to its northern location. In the Mediterranean as well as in London
such situations are observed sporadically (Fig. 1).
In humans the influence of cold weather is also manifested by the thermal sensations “cold”
and “very cold”. They are observed in about 20 % of days per year in Helsinki. In Stockholm
and Cracow its frequency is 8-10 %. However, in the Mediterranean such sensations are not
observed (Fig. 2).
0
2
4
6
8
10
Hel
sink
i
Sto
ckho
lm
Lond
on
Cra
cow
Par
is
Zuric
h
Bud
apes
t
Val
enci
a
Rom
e
Ath
ens
Ext
rem
e co
ld s
train
(%)
0
5
10
15
20
Hel
sink
i
Sto
ckho
lm
Lond
on
Cra
cow
Par
is
Zuric
h
Bud
apes
t
Vale
ncia
Rom
e
Ath
ensV
ery
cold
sen
satio
ns (%
)
Figure 1: Annual frequency of days with extreme cold physiological strain
Figure 2: Annual frequency of days with thermal sensations „cold” and „very cold”
Summer weather limitations
Active recreation in summer is limited by high air temperature and humidity. They involve
very intensive adaptation reactions in an organism defined as an extreme hot physiological
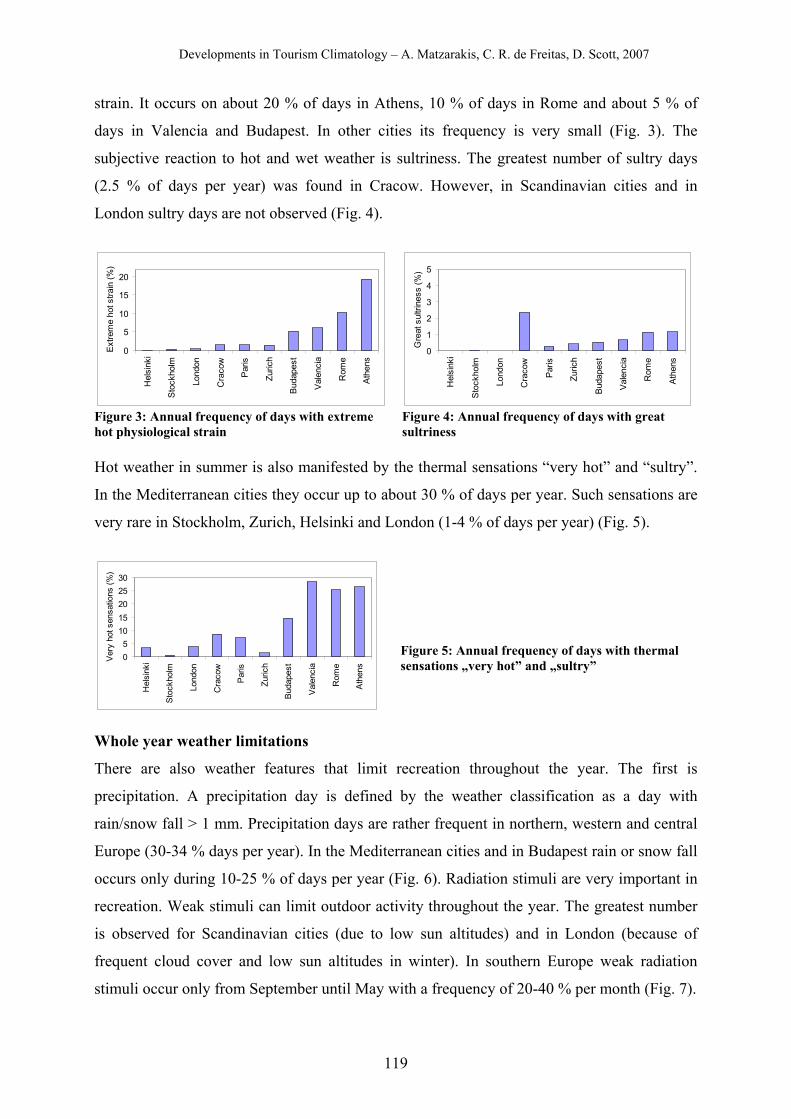
Developments in Tourism Climatology – A. Matzarakis, C. R. de Freitas, D. Scott, 2007
119
strain. It occurs on about 20 % of days in Athens, 10 % of days in Rome and about 5 % of
days in Valencia and Budapest. In other cities its frequency is very small (Fig. 3). The
subjective reaction to hot and wet weather is sultriness. The greatest number of sultry days
(2.5 % of days per year) was found in Cracow. However, in Scandinavian cities and in
London sultry days are not observed (Fig. 4).
0
5
10
15
20
Hel
sink
i
Stoc
khol
m
Lond
on
Cra
cow
Par
is
Zuric
h
Buda
pest
Val
enci
a
Rom
e
Athe
ns
Extre
me
hot s
train
(%)
0
1
2
3
4
5
Hel
sink
i
Sto
ckho
lm
Lond
on
Cra
cow
Paris
Zuric
h
Buda
pest
Vale
ncia
Rom
e
Athe
ns
Gre
at s
ultri
ness
(%)
Figure 3: Annual frequency of days with extreme hot physiological strain
Figure 4: Annual frequency of days with great sultriness
Hot weather in summer is also manifested by the thermal sensations “very hot” and “sultry”.
In the Mediterranean cities they occur up to about 30 % of days per year. Such sensations are
very rare in Stockholm, Zurich, Helsinki and London (1-4 % of days per year) (Fig. 5).
05
1015202530
Hel
sink
i
Sto
ckho
lm
Lond
on
Cra
cow
Paris
Zuric
h
Buda
pest
Vale
ncia
Rom
e
Ath
ens
Ver
y ho
t sen
satio
ns (%
) Figure 5: Annual frequency of days with thermal sensations „very hot” and „sultry”
Whole year weather limitations
There are also weather features that limit recreation throughout the year. The first is
precipitation. A precipitation day is defined by the weather classification as a day with
rain/snow fall > 1 mm. Precipitation days are rather frequent in northern, western and central
Europe (30-34 % days per year). In the Mediterranean cities and in Budapest rain or snow fall
occurs only during 10-25 % of days per year (Fig. 6). Radiation stimuli are very important in
recreation. Weak stimuli can limit outdoor activity throughout the year. The greatest number
is observed for Scandinavian cities (due to low sun altitudes) and in London (because of
frequent cloud cover and low sun altitudes in winter). In southern Europe weak radiation
stimuli occur only from September until May with a frequency of 20-40 % per month (Fig. 7).
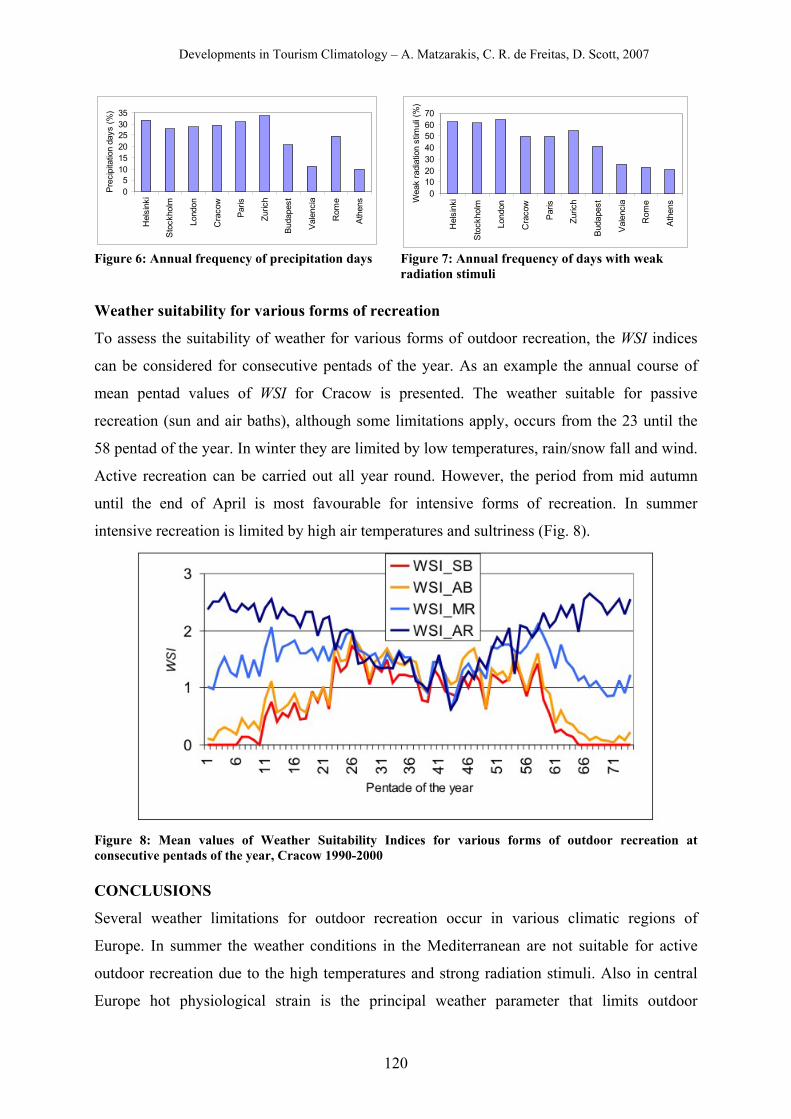
Developments in Tourism Climatology – A. Matzarakis, C. R. de Freitas, D. Scott, 2007
120
05
101520253035
Hel
sink
i
Sto
ckho
lm
Lond
on
Cra
cow
Paris
Zuric
h
Buda
pest
Vale
ncia
Rom
e
Ath
ens
Pre
cipi
tatio
n da
ys (%
)
010203040506070
Hel
sink
i
Sto
ckho
lm
Lond
on
Cra
cow
Par
is
Zuric
h
Bud
apes
t
Val
enci
a
Rom
e
Ath
ensW
eak
radi
atio
n st
imul
i (%
)
Figure 6: Annual frequency of precipitation days
Figure 7: Annual frequency of days with weak radiation stimuli
Weather suitability for various forms of recreation
To assess the suitability of weather for various forms of outdoor recreation, the WSI indices
can be considered for consecutive pentads of the year. As an example the annual course of
mean pentad values of WSI for Cracow is presented. The weather suitable for passive
recreation (sun and air baths), although some limitations apply, occurs from the 23 until the
58 pentad of the year. In winter they are limited by low temperatures, rain/snow fall and wind.
Active recreation can be carried out all year round. However, the period from mid autumn
until the end of April is most favourable for intensive forms of recreation. In summer
intensive recreation is limited by high air temperatures and sultriness (Fig. 8).
Figure 8: Mean values of Weather Suitability Indices for various forms of outdoor recreation at consecutive pentads of the year, Cracow 1990-2000 CONCLUSIONS
Several weather limitations for outdoor recreation occur in various climatic regions of
Europe. In summer the weather conditions in the Mediterranean are not suitable for active
outdoor recreation due to the high temperatures and strong radiation stimuli. Also in central
Europe hot physiological strain is the principal weather parameter that limits outdoor
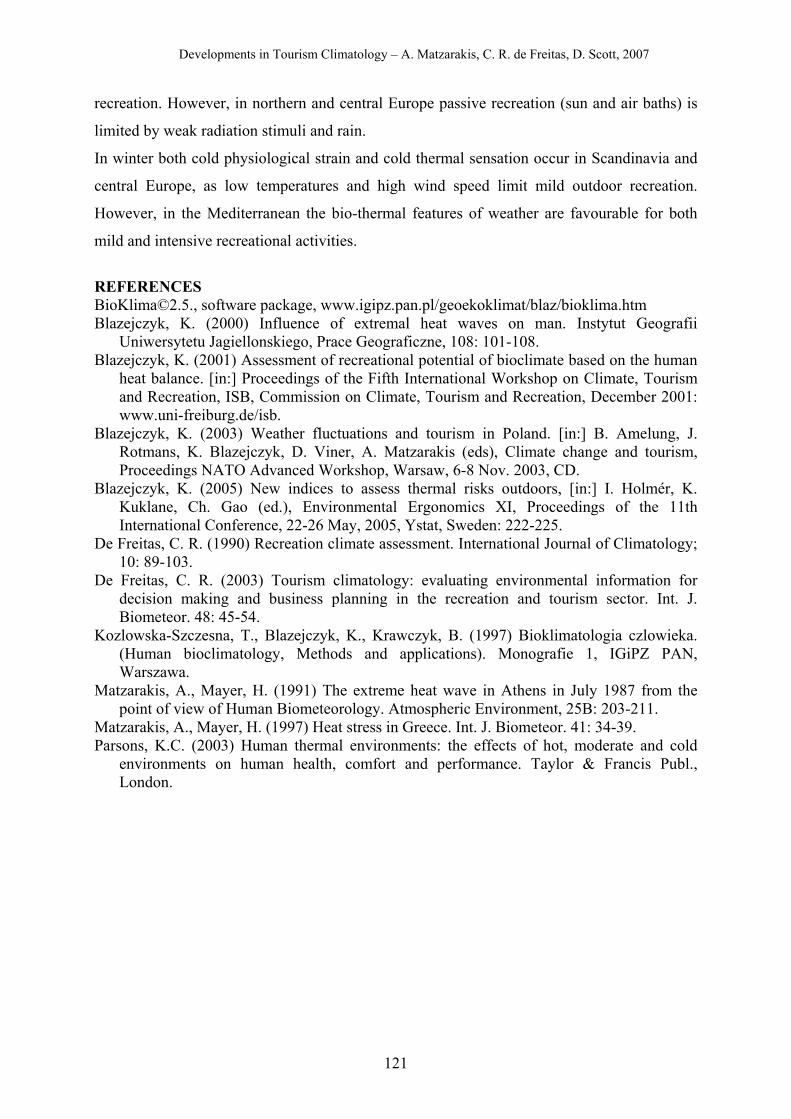
Developments in Tourism Climatology – A. Matzarakis, C. R. de Freitas, D. Scott, 2007
121
recreation. However, in northern and central Europe passive recreation (sun and air baths) is
limited by weak radiation stimuli and rain.
In winter both cold physiological strain and cold thermal sensation occur in Scandinavia and
central Europe, as low temperatures and high wind speed limit mild outdoor recreation.
However, in the Mediterranean the bio-thermal features of weather are favourable for both
mild and intensive recreational activities.
REFERENCES BioKlima©2.5., software package, www.igipz.pan.pl/geoekoklimat/blaz/bioklima.htm Blazejczyk, K. (2000) Influence of extremal heat waves on man. Instytut Geografii
Uniwersytetu Jagiellonskiego, Prace Geograficzne, 108: 101-108. Blazejczyk, K. (2001) Assessment of recreational potential of bioclimate based on the human
heat balance. [in:] Proceedings of the Fifth International Workshop on Climate, Tourism and Recreation, ISB, Commission on Climate, Tourism and Recreation, December 2001: www.uni-freiburg.de/isb.
Blazejczyk, K. (2003) Weather fluctuations and tourism in Poland. [in:] B. Amelung, J. Rotmans, K. Blazejczyk, D. Viner, A. Matzarakis (eds), Climate change and tourism, Proceedings NATO Advanced Workshop, Warsaw, 6-8 Nov. 2003, CD.
Blazejczyk, K. (2005) New indices to assess thermal risks outdoors, [in:] I. Holmér, K. Kuklane, Ch. Gao (ed.), Environmental Ergonomics XI, Proceedings of the 11th International Conference, 22-26 May, 2005, Ystat, Sweden: 222-225.
De Freitas, C. R. (1990) Recreation climate assessment. International Journal of Climatology; 10: 89-103.
De Freitas, C. R. (2003) Tourism climatology: evaluating environmental information for decision making and business planning in the recreation and tourism sector. Int. J. Biometeor. 48: 45-54.
Kozlowska-Szczesna, T., Blazejczyk, K., Krawczyk, B. (1997) Bioklimatologia czlowieka. (Human bioclimatology, Methods and applications). Monografie 1, IGiPZ PAN, Warszawa.
Matzarakis, A., Mayer, H. (1991) The extreme heat wave in Athens in July 1987 from the point of view of Human Biometeorology. Atmospheric Environment, 25B: 203-211.
Matzarakis, A., Mayer, H. (1997) Heat stress in Greece. Int. J. Biometeor. 41: 34-39. Parsons, K.C. (2003) Human thermal environments: the effects of hot, moderate and cold
environments on human health, comfort and performance. Taylor & Francis Publ., London.
Developments in Tourism Climatology – A. Matzarakis, C. R. de Freitas, D. Scott, 2007
122
ANALYSIS OF SUMMER TOURISM PERIOD FOR AUSTRIA BASED ON
CLIMATE VARIABLES ON DAILY BASIS
A. Matzarakis1, E. Koch2 and E. Rudel 2
1Meteorological Institute, University of Freiburg, Freiburg, Germany 2Central Institute for Meteorology and Geodynamics, Vienna, Austria
ABSTRACT An analysis of the meteorological and climatological parameters relevant for
tourism climatology and human biometeorology is based on climate conditions for 1961 –
1990 and scenarios for the period 2021 – 2050, calculated by the Max-Planck-Institute for
Meteorology in Hamburg. For Austria it can be expected that in the future (2021-2050) the
summer tourism period will start earlier and end later in the year compared to the current
situation. The period for recreation and leisure will be extended; also the months in spring and
fall will offer comfortable thermal conditions for outdoor activities. However, this positive
trend is opposed by not only an increase of the frequency and intensity of heat stress but also
by an increase in days with sultriness in areas below 1000 m above sea level. It is also likely
that there will be a slight increase of days with longer rain events. An decrease of the number
of days with light or no rain will not compensate for that. The Climatic Tourism Information
Scheme CTIS, which we developed, gives an overall view on the climatic conditions in a
certain location and makes it also possible to compare the present situation with the future.
KEYWORDS: Summer tourism, climate change scenarios, CTIS
INTRODUCTION
Weather and climate as well as topographical and orographical conditions, vegetation and
fauna play a prominent part in the assessment of tourism and leisure facilities (Abegg, 1996).
However, they are also limiting and controlling factors. Therefore climate change will have
considerable consequences on summer tourism in Austria (Rudel et al., 2005). However,
several other factors important for tourism also play a significant role: starting from the
weather conditions at home and the weather experience during the last holiday to the variety
of activities, advertising campaigns and last but not least costs and prices (Harlfinger, 1985,
Matzarakis et al., 2004, WTO, 2003). Some existing studies take into account all the
influencing factors. The present study focuses on the variability of weather and climate
Developments in Tourism Climatology – A. Matzarakis, C. R. de Freitas, D. Scott, 2007
123
conditions of specific destination areas, and also on a subjective assessment of the climate
sensitivity of different kinds of holidays (Koch et al., 2005).
According to the 4th assessment report 4AR of IPCC the increase of global air temperature in
the 21st Century will be strongest for the continents in higher northern latitudes. Here an
increase of extremely hot temperatures and heat waves is very likely (probability > 90 %).
Austria - situated between 46° and 49° northern latitude - and its economy are strongly
affected by climate change and its consequences. Two thirds of the GDP comes from the
service sector, where Austria benefits particularly from tourism. The effect of climate change
on winter sports has been the topic of many scientific studies, but summer tourism will also be
affected. The outcome of most of these studies was that a shortening of the winter sport season
will occur over the next decades. The logical consequence is an extension of the summer
season. The climatic tourism potential, which can be determined with meteorological
parameters, will change in future. In the paper presented here special attention is paid to
summer tourism.
METHODS AND DATA
First the question has to be answered as to whether one can use simple climate parameters
(Mieczkowski, 1985) like e.g. air temperature, or snow cover, etc. to describe the present and
potential future climatic tourism conditions, or has to use interdisciplinary approaches (de
Freitas, 2003, Matzarakis et al., 2004, Matzarakis, 2006, 2007). For the project “StartClim
2006” we decided to use an integral approach which is based on climatological, human-
biometeorological and climatic – tourism (leisure time and tourism) methods (Matzarakis,
2007). This approach combines the thermal conditions with physical elements (rain, wind) and
aesthetic factors (sunshine, clouds, visibility) and thus gives a comprehensive quantitative
description of the climatic tourism potential.
The physiologically equivalent temperature PET (Höppe, 1999, Matzarakis et al., 1999, VDI,
1998), which considers the influence of the complete thermal environment (i.e. air
temperature, air humidity, wind velocity, as well as short and long-wave radiation) on humans
describes the thermal facet of the climate for tourism purposes. The frequency of certain PET
classes quantifies thermally suitable conditions for leisure and recreation and gives
information about cold and heat stress. Additionally, the term „sultriness“ is calculated using
the classical criterion of the excess of a certain water vapour pressure.
The aesthetic facet covers factors such as duration of sunshine, cloudiness and fog, range of
visibility and day length. We incorporated this aspect into the present study through the use of
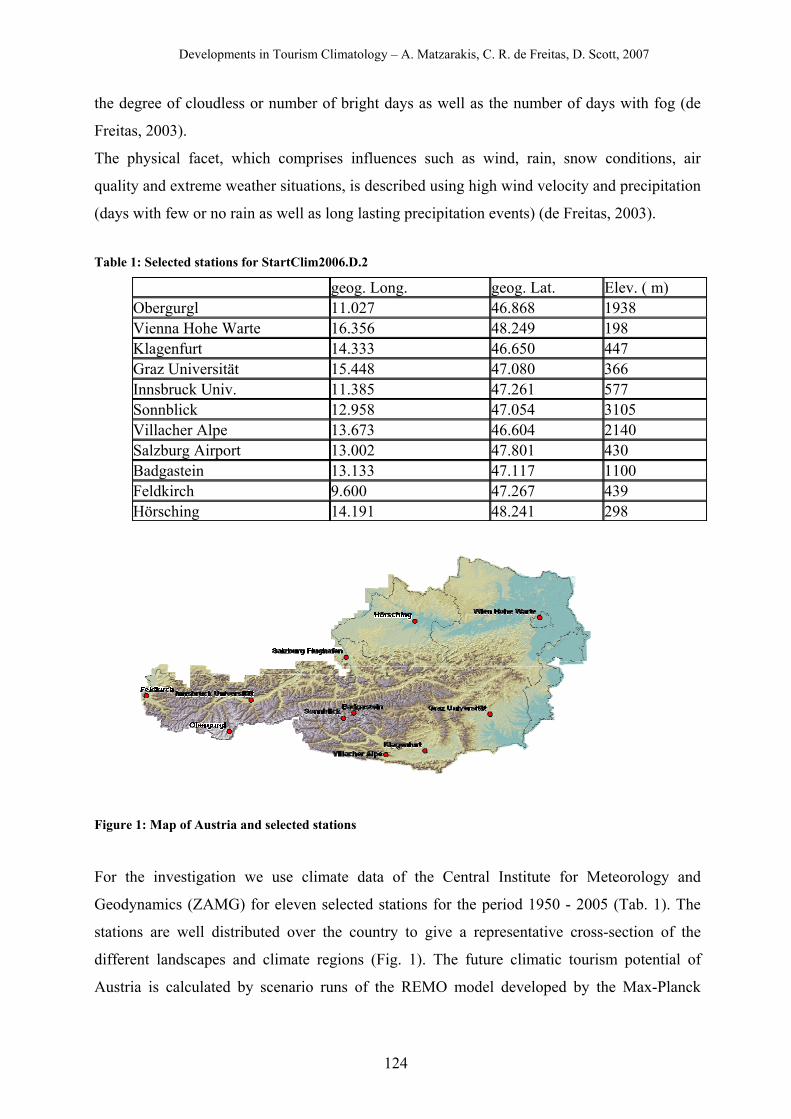
Developments in Tourism Climatology – A. Matzarakis, C. R. de Freitas, D. Scott, 2007
124
the degree of cloudless or number of bright days as well as the number of days with fog (de
Freitas, 2003).
The physical facet, which comprises influences such as wind, rain, snow conditions, air
quality and extreme weather situations, is described using high wind velocity and precipitation
(days with few or no rain as well as long lasting precipitation events) (de Freitas, 2003).
Table 1: Selected stations for StartClim2006.D.2
geog. Long. geog. Lat. Elev. ( m) Obergurgl 11.027 46.868 1938 Vienna Hohe Warte 16.356 48.249 198 Klagenfurt 14.333 46.650 447 Graz Universität 15.448 47.080 366 Innsbruck Univ. 11.385 47.261 577 Sonnblick 12.958 47.054 3105 Villacher Alpe 13.673 46.604 2140 Salzburg Airport 13.002 47.801 430 Badgastein 13.133 47.117 1100 Feldkirch 9.600 47.267 439 Hörsching 14.191 48.241 298
Figure 1: Map of Austria and selected stations
For the investigation we use climate data of the Central Institute for Meteorology and
Geodynamics (ZAMG) for eleven selected stations for the period 1950 - 2005 (Tab. 1). The
stations are well distributed over the country to give a representative cross-section of the
different landscapes and climate regions (Fig. 1). The future climatic tourism potential of
Austria is calculated by scenario runs of the REMO model developed by the Max-Planck
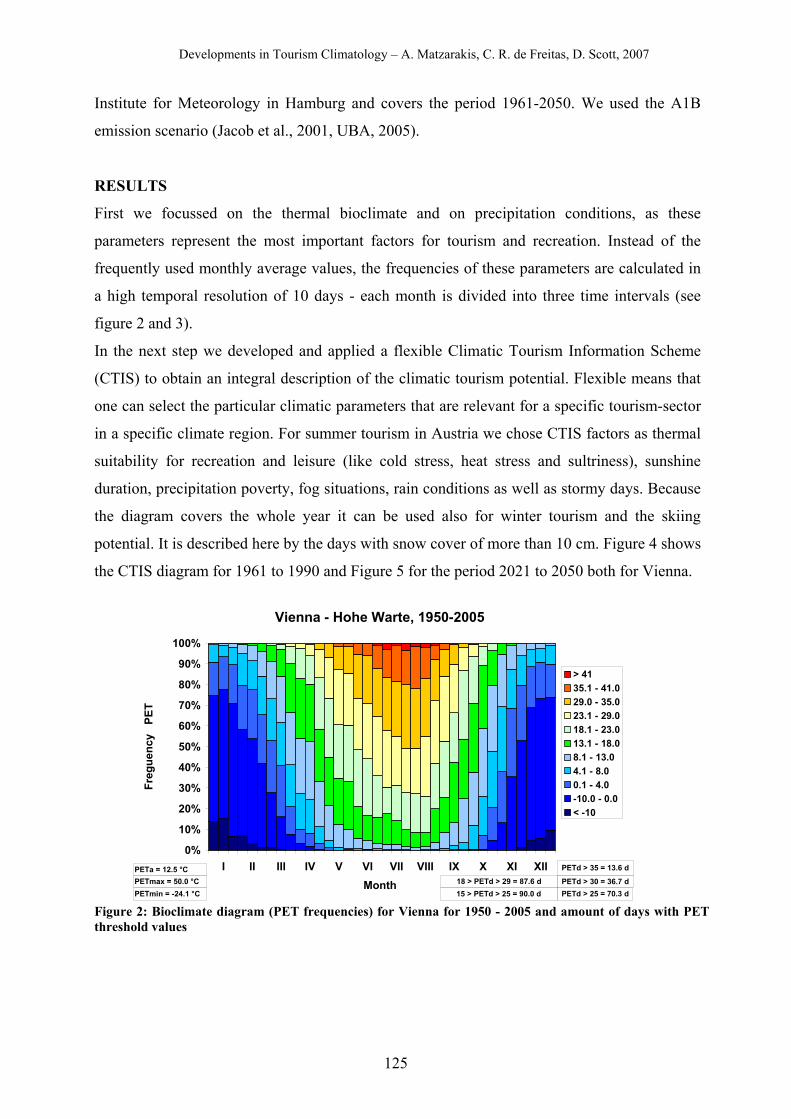
Developments in Tourism Climatology – A. Matzarakis, C. R. de Freitas, D. Scott, 2007
125
Institute for Meteorology in Hamburg and covers the period 1961-2050. We used the A1B
emission scenario (Jacob et al., 2001, UBA, 2005).
RESULTS
First we focussed on the thermal bioclimate and on precipitation conditions, as these
parameters represent the most important factors for tourism and recreation. Instead of the
frequently used monthly average values, the frequencies of these parameters are calculated in
a high temporal resolution of 10 days - each month is divided into three time intervals (see
figure 2 and 3).
In the next step we developed and applied a flexible Climatic Tourism Information Scheme
(CTIS) to obtain an integral description of the climatic tourism potential. Flexible means that
one can select the particular climatic parameters that are relevant for a specific tourism-sector
in a specific climate region. For summer tourism in Austria we chose CTIS factors as thermal
suitability for recreation and leisure (like cold stress, heat stress and sultriness), sunshine
duration, precipitation poverty, fog situations, rain conditions as well as stormy days. Because
the diagram covers the whole year it can be used also for winter tourism and the skiing
potential. It is described here by the days with snow cover of more than 10 cm. Figure 4 shows
the CTIS diagram for 1961 to 1990 and Figure 5 for the period 2021 to 2050 both for Vienna.
Vienna - Hohe Warte, 1950-2005
0%
10%
20%
30%
40%
50%
60%
70%
80%
90%
100%
I II III IV V VI VII VIII IX X XI XIIMonth
Freg
uenc
y P
ET
> 4135.1 - 41.029.0 - 35.023.1 - 29.018.1 - 23.013.1 - 18.08.1 - 13.04.1 - 8.00.1 - 4.0-10.0 - 0.0< -10
PETa = 12.5 °CPETmax = 50.0 °CPETmin = -24.1 °C PETd > 25 = 70.3 d
PETd > 30 = 36.7 d
PETd > 35 = 13.6 d
15 > PETd > 25 = 90.0 d18 > PETd > 29 = 87.6 d
Figure 2: Bioclimate diagram (PET frequencies) for Vienna for 1950 - 2005 and amount of days with PET threshold values
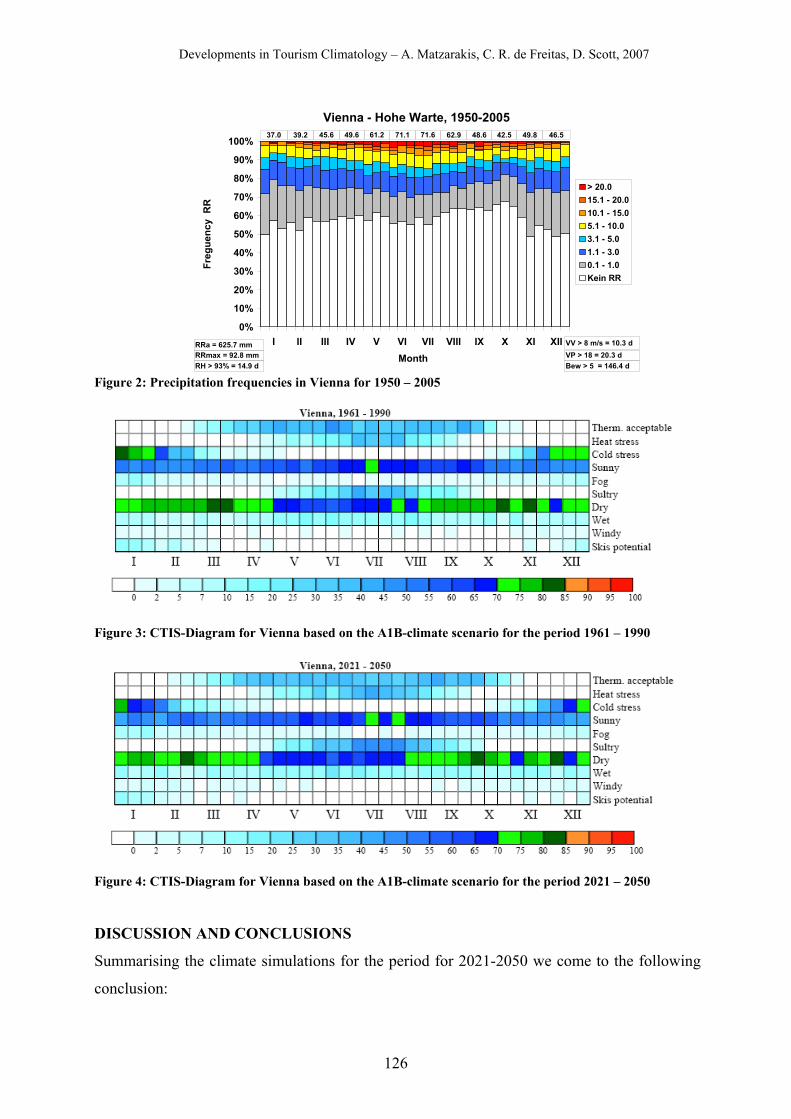
Developments in Tourism Climatology – A. Matzarakis, C. R. de Freitas, D. Scott, 2007
126
Vienna - Hohe Warte, 1950-2005
0%
10%
20%
30%
40%
50%
60%
70%
80%
90%
100%
I II III IV V VI VII VIII IX X XI XIIMonth
Freg
uenc
y R
R
> 20.015.1 - 20.010.1 - 15.05.1 - 10.03.1 - 5.01.1 - 3.00.1 - 1.0Kein RR
RRa = 625.7 mmRRmax = 92.8 mmRH > 93% = 14.9 d Bew > 5 = 146.4 d
VP > 18 = 20.3 dVV > 8 m/s = 10.3 d
37.0 39.2 45.6 49.6 61.2 71.1 71.6 62.9 48.6 46.549.842.5
Figure 2: Precipitation frequencies in Vienna for 1950 – 2005
Figure 3: CTIS-Diagram for Vienna based on the A1B-climate scenario for the period 1961 – 1990
Figure 4: CTIS-Diagram for Vienna based on the A1B-climate scenario for the period 2021 – 2050
DISCUSSION AND CONCLUSIONS
Summarising the climate simulations for the period for 2021-2050 we come to the following
conclusion:
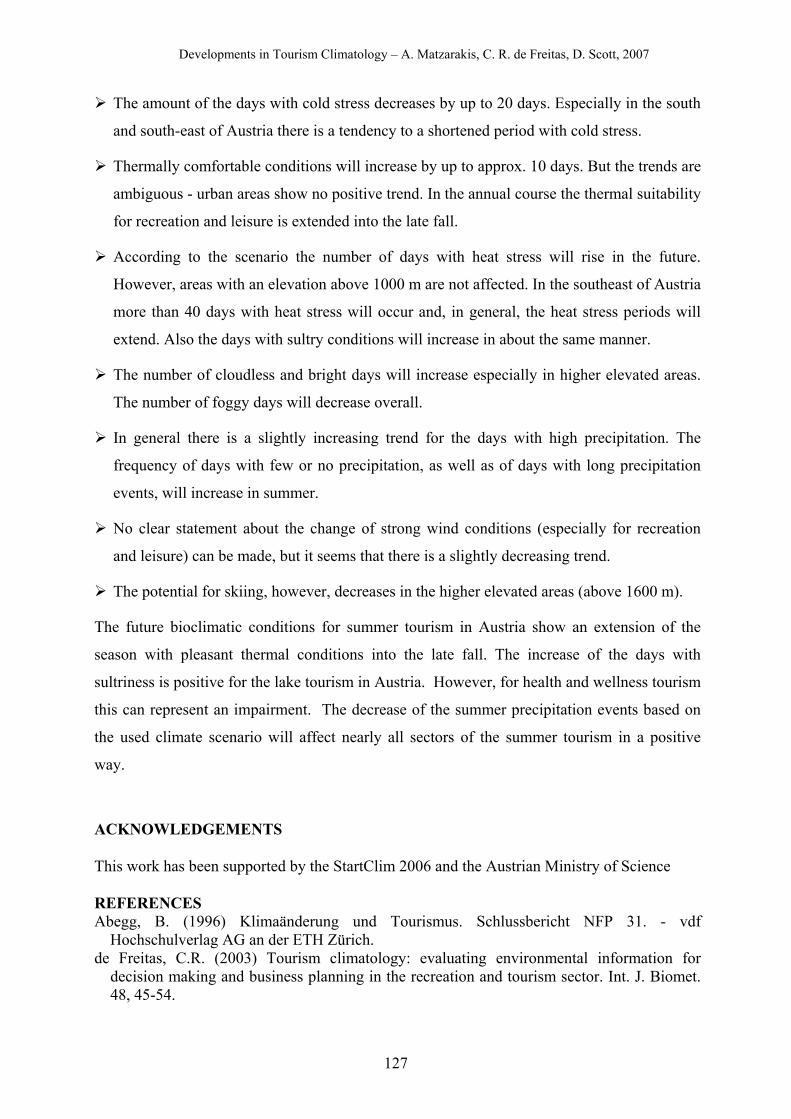
Developments in Tourism Climatology – A. Matzarakis, C. R. de Freitas, D. Scott, 2007
127
The amount of the days with cold stress decreases by up to 20 days. Especially in the south
and south-east of Austria there is a tendency to a shortened period with cold stress.
Thermally comfortable conditions will increase by up to approx. 10 days. But the trends are
ambiguous - urban areas show no positive trend. In the annual course the thermal suitability
for recreation and leisure is extended into the late fall.
According to the scenario the number of days with heat stress will rise in the future.
However, areas with an elevation above 1000 m are not affected. In the southeast of Austria
more than 40 days with heat stress will occur and, in general, the heat stress periods will
extend. Also the days with sultry conditions will increase in about the same manner.
The number of cloudless and bright days will increase especially in higher elevated areas.
The number of foggy days will decrease overall.
In general there is a slightly increasing trend for the days with high precipitation. The
frequency of days with few or no precipitation, as well as of days with long precipitation
events, will increase in summer.
No clear statement about the change of strong wind conditions (especially for recreation
and leisure) can be made, but it seems that there is a slightly decreasing trend.
The potential for skiing, however, decreases in the higher elevated areas (above 1600 m).
The future bioclimatic conditions for summer tourism in Austria show an extension of the
season with pleasant thermal conditions into the late fall. The increase of the days with
sultriness is positive for the lake tourism in Austria. However, for health and wellness tourism
this can represent an impairment. The decrease of the summer precipitation events based on
the used climate scenario will affect nearly all sectors of the summer tourism in a positive
way.
ACKNOWLEDGEMENTS
This work has been supported by the StartClim 2006 and the Austrian Ministry of Science
REFERENCES Abegg, B. (1996) Klimaänderung und Tourismus. Schlussbericht NFP 31. - vdf
Hochschulverlag AG an der ETH Zürich. de Freitas, C.R. (2003) Tourism climatology: evaluating environmental information for
decision making and business planning in the recreation and tourism sector. Int. J. Biomet. 48, 45-54.
Developments in Tourism Climatology – A. Matzarakis, C. R. de Freitas, D. Scott, 2007
128
Harlfinger, O. (1985) Bioklimatischer Ratgeber für Urlaub und Erholung. Gustav Fischer Verlag.
Höppe, P. (1999) The physiological equivalent temperature – a universal index for the biometeorological assessment of the thermal environment. Int.l J.Biomet. 43, 71-75.
Jacob, D., U. Andrae, G. Elgered, C. Fortelius, L. P. Graham, S. D. Jackson, U. Karstens, Chr. Koepken, R. Lindau, R. Podzun, B. Rockel, F. Rubel, H.B. Sass, R.N.D. Smith, B.J.J.M. Van den Hurk, X. Yang, (2001) A Comprehensive Model Intercomparison Study Investigating the Water Budget during the BALTEX-PIDCAP Period. Meteorology and Atmospheric Physics 77, 19-43.
Koch, E., Marktl, W., Matzarakis, A., Nefzger, H., Rudel, E., Schunder-Tatzber, S., Zygmuntowski, M. (2005) Klimatherapie in Österreich. Broschüre zu den Potentialen der Klimatherapie in Österreich. Bundesministerium für Wirtschaft und Arbeit.
Matzarakis, A. (2006) Weather and climate related information for tourism. Tourism and Hospitality Planning & Development 3, 99-115.
Matzarakis, A. (2007) Entwicklung einer Bewertungsmethodik zur Integration von Wetter- und Klimabedingungen im Tourismus. Ber. Meteor. Inst. Univ. Freiburg Nr. 16, 73-79.
Matzarakis, A., de Freitas, C., Scott, D., 2004 (eds.): Advances in tourism climatology. Ber. Meteorol. Inst. Univ. Freiburg Nr. 12.
Matzarakis, A., Mayer, H., Iziomon, M. (1999) Heat stress in Greece. Applications of a universal thermal index: physiological equivalent temperature. Int. J. Biomet. 43, 76-84.
Matzarakis, A., Rutz, F., Mayer, H. (2007) Modelling Radiation fluxes in simple and complex environments – Application of the RayMan model. Int. J. Biomet. 51, 323-334.
Mieczkowski, Z. (1985) The tourism climate index: A method for evaluating world climates for tourism. The Canadian Geographer 29, 220-233.
Rudel, E., Matzarakis, A., Koch, E. (2005) Potential increase of heat load on humans in a changing climate. World Resource Review 17, 32-44.
UBA (2005) Klimawandel in Deutschland. Vulnerabilität und Anpassunkstrategien klimarelevanter Systeme. - Climate Change 08/05.
VDI (1998) Methoden zur human-biometeorologischen Bewertung von Klima und Lufthygiene für die Stadt- und Regionalplanung, Teil I: Klima. - VDI-Richtlinie 3787 Blatt 2. Berlin, Beuth-Verlag.
WTO (2003) Climate Change and Tourism. Proc. of the 1st International Conference on Climate Change and Tourism. WTO.
Developments in Tourism Climatology – A. Matzarakis, C. R. de Freitas, D. Scott, 2007
129
RAYMAN: A TOOL FOR TOURISM AND APPLIED CLIMATOLOGY
A. Matzarakis1 and F. Rutz 2
1Meteorological Institute, University of Freiburg, Freiburg, Germany
2Fraunhofer Institute for Applied Solid-State Physics, Freiburg, Germany
ABSTRACT The „RayMan“ model presented here is developed to calculate short wave and
long wave radiation fluxes that affect the human body. ”RayMan” estimates the radiation
fluxes and the effects of clouds on short and long wave radiation fluxes. The model, which
takes complex building structures into account, is suitable for various planning purposes in
different micro to regional levels. The final output of the model is the calculated mean radiant
temperature, which is required in the human energy balance model and, thus, also for the
assessment of thermal bioclimate. It is also relevant for thermal indices that facilitate the
human-biometeorological assessment of the thermal component of the climate.
Additional features, which can be used for the evaluation of climate in a region or for diverse
other applications, are: calculation of sunshine duration with or without sky view factors;
estimation of daily mean, max or sum of global radiation; calculation of shade for existing or
future complex environments. Here, several analyses for different scenarios, i.e. urban
climatology and tourism climatology, and different locations (Freiburg and Athens) are
presented.
KEYWORDS: Tourism, applied climatology, radiation, thermal comfort
INTRODUCTION
Many climatic parameters and conditions are affected in their temporal and spatial behaviour
by the natural and artificial morphology on a meso- and micro scale. These effects are
significant on different levels of regional and urban planning, i.e. the tourism industry and also
the owners of holiday homes, but they are also of importance for the planning and design of
tourism buildings, recreational facilities, urban parks, and a variety of other applications. With
some modifications, existing methods for assessing climate in human biometeorology and
applied climatology can be applied, a.e. to tourism climatology (Matzarakis, 2001, Matzarakis
et al., 2004).
Developments in Tourism Climatology – A. Matzarakis, C. R. de Freitas, D. Scott, 2007
130
For example, thermal indices that are derived from the energy balance of the human body can
be of great advantage for tourism and regional/urban planning. Standard climate data, such as
air temperature, air humidity and wind speed, are needed to calculate and quantify thermal
bioclimatic conditions (Höppe, 1999, Matzarakis et al., 2001). The most important
environmental parameters used to derive modern thermal indices, however, are short and long
wave radiation (and the derived mean radiant temperature). These can be determined using
special techniques that have been implemented in several models. The RayMan model, which
was developed for urban climate studies, has a broader use in applied climatology (Matzarakis
et al., 2004). Further outputs, such as sunshine duration and shade, can assist in the design and
planning of recreation areas and the design of urban structures.
METHODS AND DATA
The model „RayMan“ estimates the radiation fluxes and the effects of clouds and solid
obstacles on short wave radiation fluxes (Fig. 1). The model, which takes complex structures
into account, is suitable for utilization and planning purposes on a local and regional level
(Fig. 2 left). The final output of this model is the calculated mean radiant temperature, which
is required in the energy balance model of humans. Consequently, it is also required for the
assessment of urban bioclimate and thermal indices, such as Predicted Mean Vote (PMV),
Physiologically Equivalent Temperature (PET), and Standard Effective Temperature (SET*).
The development of the model is based on the German VDI-Guidelines 3789, Part II:
Environmental Meteorology, Interactions between Atmosphere and Surfaces; Calculation of
the short- and long wave radiation and VDI-3787: Environmental Meteorology, Methods for
the human-biometeorological evaluation of climate and air quality for the urban and regional
planning at regional level. Part I: Climate (VDI, 1994, 1998). For the calculation of thermal
indices based on the human energy balance, meteorological (air temperature, wind speed, air
humidity and short and long wave radiation fluxes) and thermo-physiological (activity and
clothing) data are required. Data on air temperature, humidity and wind speed are required to
run RayMan (Matzarakis et al., 2000, 2007, Matzarakis and Rutz, 2005).
Additional features, which are included in the output of RayMan and that can be used for the
evaluation of a region’s climate or the development of new tourism facilities, are: a)
calculation of sunshine duration with or without sky view factor; b) estimation of daily mean,
maximum or total global radiation; and c) determination of shaded areas.
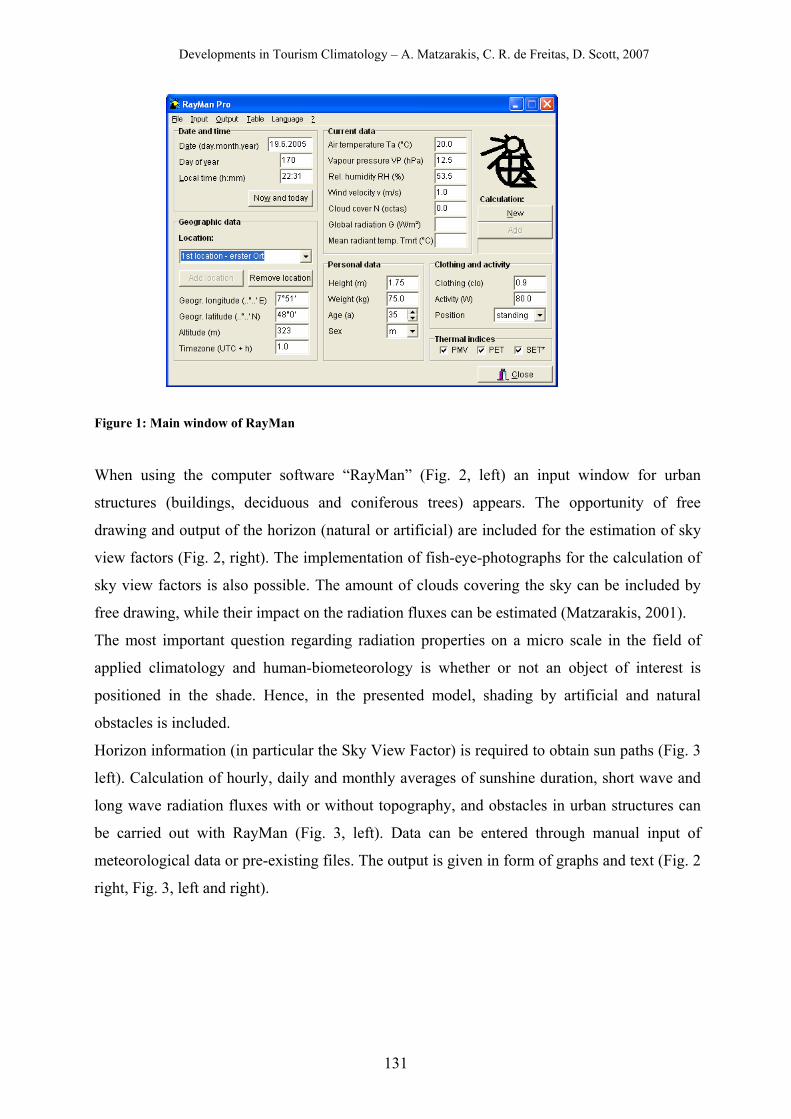
Developments in Tourism Climatology – A. Matzarakis, C. R. de Freitas, D. Scott, 2007
131
Figure 1: Main window of RayMan
When using the computer software “RayMan” (Fig. 2, left) an input window for urban
structures (buildings, deciduous and coniferous trees) appears. The opportunity of free
drawing and output of the horizon (natural or artificial) are included for the estimation of sky
view factors (Fig. 2, right). The implementation of fish-eye-photographs for the calculation of
sky view factors is also possible. The amount of clouds covering the sky can be included by
free drawing, while their impact on the radiation fluxes can be estimated (Matzarakis, 2001).
The most important question regarding radiation properties on a micro scale in the field of
applied climatology and human-biometeorology is whether or not an object of interest is
positioned in the shade. Hence, in the presented model, shading by artificial and natural
obstacles is included.
Horizon information (in particular the Sky View Factor) is required to obtain sun paths (Fig. 3
left). Calculation of hourly, daily and monthly averages of sunshine duration, short wave and
long wave radiation fluxes with or without topography, and obstacles in urban structures can
be carried out with RayMan (Fig. 3, left). Data can be entered through manual input of
meteorological data or pre-existing files. The output is given in form of graphs and text (Fig. 2
right, Fig. 3, left and right).
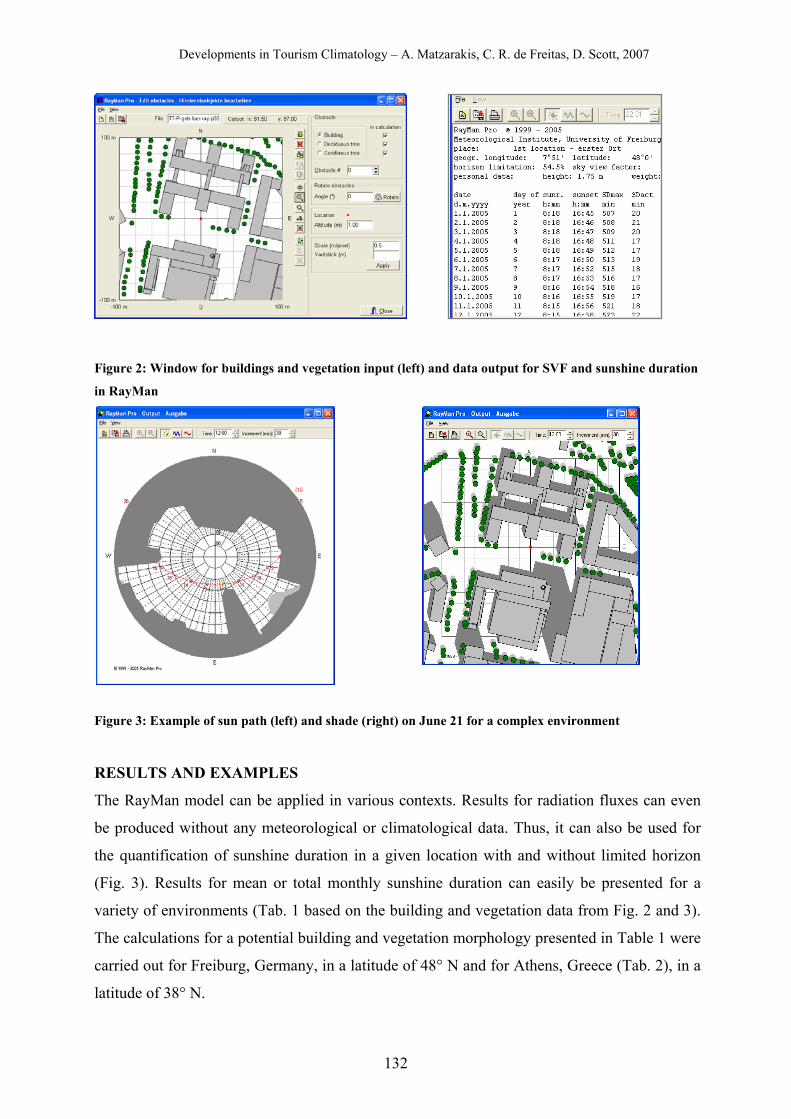
Developments in Tourism Climatology – A. Matzarakis, C. R. de Freitas, D. Scott, 2007
132
Figure 2: Window for buildings and vegetation input (left) and data output for SVF and sunshine duration
in RayMan
Figure 3: Example of sun path (left) and shade (right) on June 21 for a complex environment
RESULTS AND EXAMPLES
The RayMan model can be applied in various contexts. Results for radiation fluxes can even
be produced without any meteorological or climatological data. Thus, it can also be used for
the quantification of sunshine duration in a given location with and without limited horizon
(Fig. 3). Results for mean or total monthly sunshine duration can easily be presented for a
variety of environments (Tab. 1 based on the building and vegetation data from Fig. 2 and 3).
The calculations for a potential building and vegetation morphology presented in Table 1 were
carried out for Freiburg, Germany, in a latitude of 48° N and for Athens, Greece (Tab. 2), in a
latitude of 38° N.
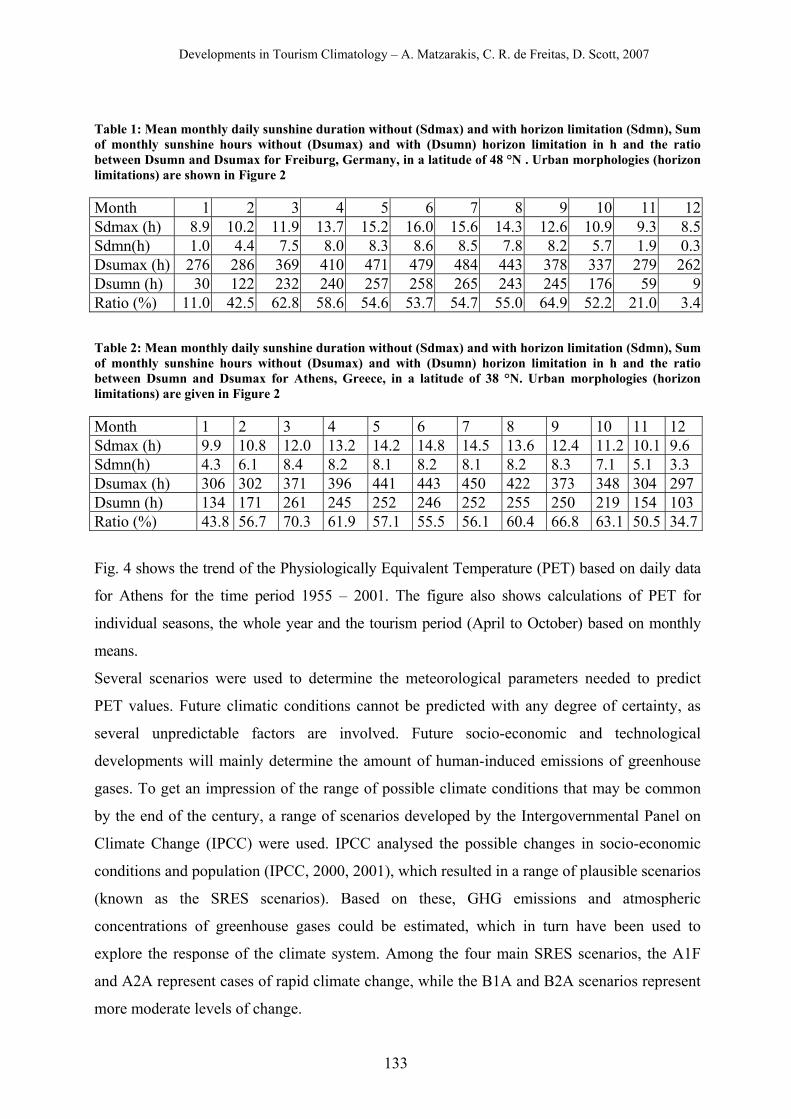
Developments in Tourism Climatology – A. Matzarakis, C. R. de Freitas, D. Scott, 2007
133
Table 1: Mean monthly daily sunshine duration without (Sdmax) and with horizon limitation (Sdmn), Sum of monthly sunshine hours without (Dsumax) and with (Dsumn) horizon limitation in h and the ratio between Dsumn and Dsumax for Freiburg, Germany, in a latitude of 48 °N . Urban morphologies (horizon limitations) are shown in Figure 2 Month 1 2 3 4 5 6 7 8 9 10 11 12Sdmax (h) 8.9 10.2 11.9 13.7 15.2 16.0 15.6 14.3 12.6 10.9 9.3 8.5Sdmn(h) 1.0 4.4 7.5 8.0 8.3 8.6 8.5 7.8 8.2 5.7 1.9 0.3Dsumax (h) 276 286 369 410 471 479 484 443 378 337 279 262Dsumn (h) 30 122 232 240 257 258 265 243 245 176 59 9Ratio (%) 11.0 42.5 62.8 58.6 54.6 53.7 54.7 55.0 64.9 52.2 21.0 3.4 Table 2: Mean monthly daily sunshine duration without (Sdmax) and with horizon limitation (Sdmn), Sum of monthly sunshine hours without (Dsumax) and with (Dsumn) horizon limitation in h and the ratio between Dsumn and Dsumax for Athens, Greece, in a latitude of 38 °N. Urban morphologies (horizon limitations) are given in Figure 2 Month 1 2 3 4 5 6 7 8 9 10 11 12 Sdmax (h) 9.9 10.8 12.0 13.2 14.2 14.8 14.5 13.6 12.4 11.2 10.1 9.6 Sdmn(h) 4.3 6.1 8.4 8.2 8.1 8.2 8.1 8.2 8.3 7.1 5.1 3.3 Dsumax (h) 306 302 371 396 441 443 450 422 373 348 304 297 Dsumn (h) 134 171 261 245 252 246 252 255 250 219 154 103 Ratio (%) 43.8 56.7 70.3 61.9 57.1 55.5 56.1 60.4 66.8 63.1 50.5 34.7
Fig. 4 shows the trend of the Physiologically Equivalent Temperature (PET) based on daily data
for Athens for the time period 1955 – 2001. The figure also shows calculations of PET for
individual seasons, the whole year and the tourism period (April to October) based on monthly
means.
Several scenarios were used to determine the meteorological parameters needed to predict
PET values. Future climatic conditions cannot be predicted with any degree of certainty, as
several unpredictable factors are involved. Future socio-economic and technological
developments will mainly determine the amount of human-induced emissions of greenhouse
gases. To get an impression of the range of possible climate conditions that may be common
by the end of the century, a range of scenarios developed by the Intergovernmental Panel on
Climate Change (IPCC) were used. IPCC analysed the possible changes in socio-economic
conditions and population (IPCC, 2000, 2001), which resulted in a range of plausible scenarios
(known as the SRES scenarios). Based on these, GHG emissions and atmospheric
concentrations of greenhouse gases could be estimated, which in turn have been used to
explore the response of the climate system. Among the four main SRES scenarios, the A1F
and A2A represent cases of rapid climate change, while the B1A and B2A scenarios represent
more moderate levels of change.
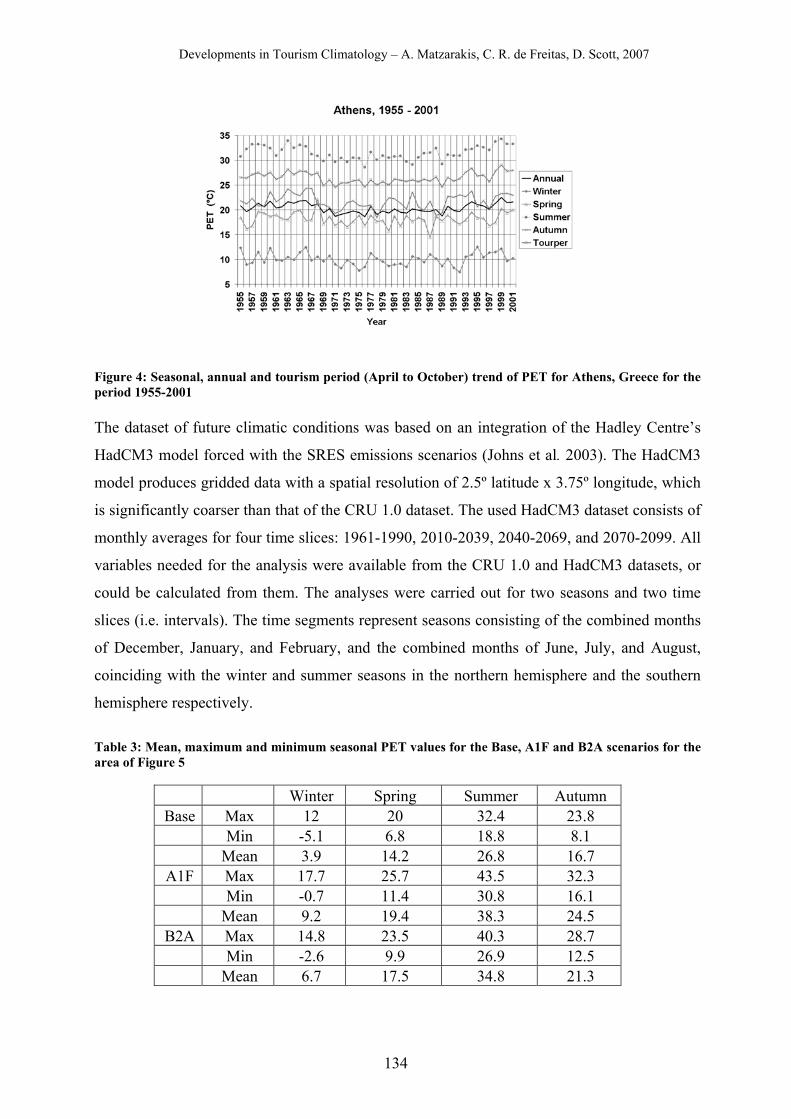
Developments in Tourism Climatology – A. Matzarakis, C. R. de Freitas, D. Scott, 2007
134
Figure 4: Seasonal, annual and tourism period (April to October) trend of PET for Athens, Greece for the period 1955-2001 The dataset of future climatic conditions was based on an integration of the Hadley Centre’s
HadCM3 model forced with the SRES emissions scenarios (Johns et al. 2003). The HadCM3
model produces gridded data with a spatial resolution of 2.5º latitude x 3.75º longitude, which
is significantly coarser than that of the CRU 1.0 dataset. The used HadCM3 dataset consists of
monthly averages for four time slices: 1961-1990, 2010-2039, 2040-2069, and 2070-2099. All
variables needed for the analysis were available from the CRU 1.0 and HadCM3 datasets, or
could be calculated from them. The analyses were carried out for two seasons and two time
slices (i.e. intervals). The time segments represent seasons consisting of the combined months
of December, January, and February, and the combined months of June, July, and August,
coinciding with the winter and summer seasons in the northern hemisphere and the southern
hemisphere respectively.
Table 3: Mean, maximum and minimum seasonal PET values for the Base, A1F and B2A scenarios for the area of Figure 5
Winter Spring Summer Autumn Base Max 12 20 32.4 23.8
Min -5.1 6.8 18.8 8.1 Mean 3.9 14.2 26.8 16.7
A1F Max 17.7 25.7 43.5 32.3 Min -0.7 11.4 30.8 16.1 Mean 9.2 19.4 38.3 24.5
B2A Max 14.8 23.5 40.3 28.7 Min -2.6 9.9 26.9 12.5 Mean 6.7 17.5 34.8 21.3
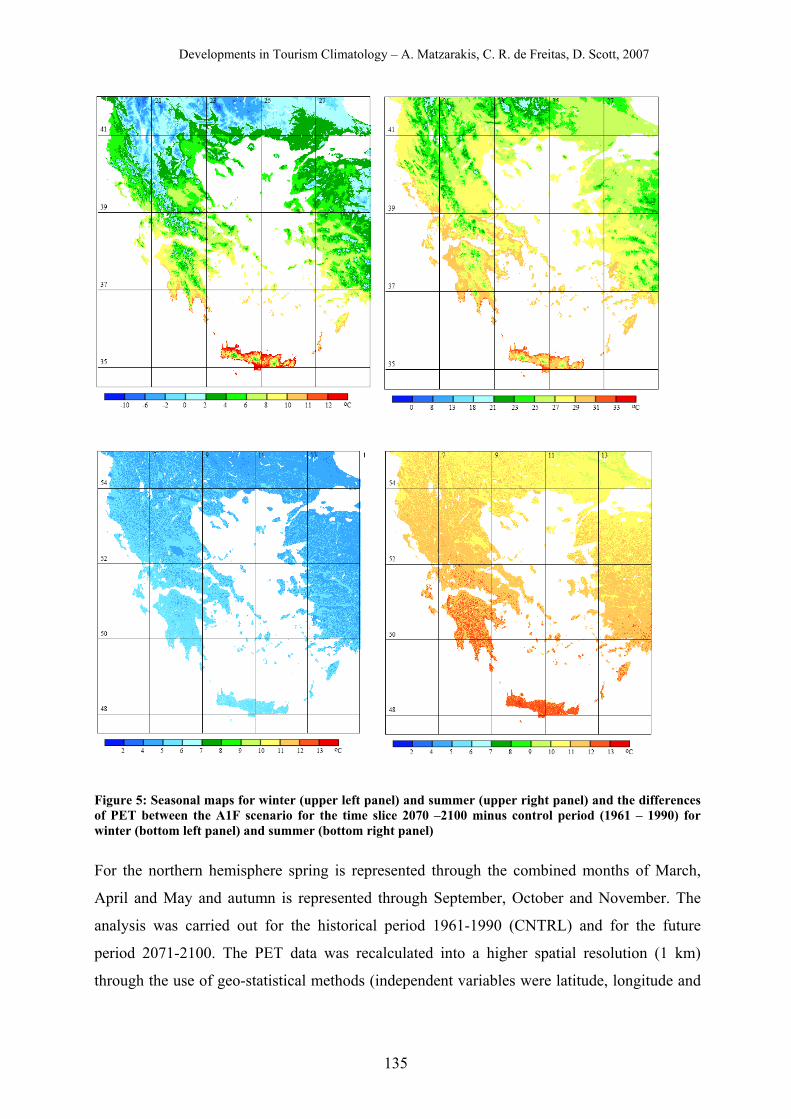
Developments in Tourism Climatology – A. Matzarakis, C. R. de Freitas, D. Scott, 2007
135
Figure 5: Seasonal maps for winter (upper left panel) and summer (upper right panel) and the differences of PET between the A1F scenario for the time slice 2070 –2100 minus control period (1961 – 1990) for winter (bottom left panel) and summer (bottom right panel)
For the northern hemisphere spring is represented through the combined months of March,
April and May and autumn is represented through September, October and November. The
analysis was carried out for the historical period 1961-1990 (CNTRL) and for the future
period 2071-2100. The PET data was recalculated into a higher spatial resolution (1 km)
through the use of geo-statistical methods (independent variables were latitude, longitude and
Developments in Tourism Climatology – A. Matzarakis, C. R. de Freitas, D. Scott, 2007
136
elevation). For this purpose the digital elevation data of the GLOBE datasets (Hastings et al.,
1999) built the basis.
In Table 3 the maximum, mean and minimum values of PET for the seasons in the
geographical area are presented. The mean values for the CNTRL conditions are 6.3 °C lower
for winter and for 12.5 °C lower for the summer months. For spring and autumn the
differences are 5.2 °C and 7.8 °C, respectively. For the B2A scenario the differences are lower
and range between 3.8 °C for winter, 8.2 °C for summer, 3.3 °C for spring and 4.6 °C for
autumn.
Figure 5 shows the geographical distribution for CNTRL conditions (1961 – 1990) of PET for
the area of longitude between 19° and 29° E and latitude between 34.5° and 42 °N for winter
(upper left) and summer (bottom left). The upper and bottom figure on the right side of Figure
5 show the differences of the A1F scenario minus the CNTRL conditions of the left side
figures for winter and summer. From Table 4 and Figure 5 it can be extracted that the thermal
bioclimatic conditions are expected to change drastically based on the A1F scenario. For
summer covering changes more than three stress levels in the southern part of the study area
and less than two levels for the northern part of the area. For winter the expected changes are
ranging between one and two stress levels in the south and one in the northern parts.
CONCLUSIONS
The presented model provides diverse opportunities for research in applied climatology and
also for education. Radiation fluxes, as well as thermal indices for simple and complex
environments can be estimated with readily available climate or meteorological data, such as
air temperature, air humidity, and wind speed. Additional information about clouds and global
radiation included into the model can built the basis for a more appropriate estimation of
radiation fluxes. Useful information an a higher level of detail can be derived in order to create
climate-oriented dwellings and facilities for tourism resorts and urban planning. It can also be
used for the calculation of shade to be provided by special devices in tourism areas and resorts
in order to create more comfortable thermal conditions with protection from direct sunlight for
tourists and visitors.
From a human-biometeorological point of view the presented thermal indices can describe and
quantify not only mean conditions but also extremes like heat waves and other climate and
health issues.
In order to quantify bioclimate conditions for future scenarios, the model can produce
information through the use of global and regional climate model outputs. Through the use of
Developments in Tourism Climatology – A. Matzarakis, C. R. de Freitas, D. Scott, 2007
137
geo-statistical techniques and tools, the data can be regionalized and provide more detailed
information on the spatial conditions of present and future climate conditions. Through the
implementation of different land use patterns and their surface properties, a more appropriate
and realistic picture can be created.
When used for education purposes, the model can be applied in exercises as to how to operate
these models and in what way land and urban morphology influences short and long wave
radiation fluxes in simple and complex environments. Additionally, it can be used for the
comparison between experimental and modelling studies in teaching.
ACKNOWLEDGEMENT
Thanks to the Hellenic National Weather Service for providing the data for the station of
Hellinikon station.
REFERENCES Hastings, D.A., Dunbar, P.K., Elphingstone, G.M., Bootz, M., Murakami, H., Maruyama, H.,
Masaharu, H., Holland, P., Payne, J., Bryant, N.A., Logan, T., Muller, J.-P., Schreier, G., MacDonald, J.S., (eds.) (1999) The Global Land One-kilometer Base Elevation (GLOBE) Digital Elevation Model, Version 1.0. National Oceanic and Atmospheric Administration, National Geophysical Data Center, 325 Broadway, Boulder, Colorado 80303, U.S.A. Digital data base on the World Wide Web (URL: http://www.ngdc.noaa.gov/mgg/topo/globe.html).
Höppe, P. (1999) The physiological equivalent temperature in an universal index for the bio-meteorological assessment of the thermal environment. Int. J. Biometeorol. 43: 71-75.
IPCC (2000) Emission scenarios: A special report of working group III of the Intergovernmental Panel on climate change. Cambridge University Press: Cambridge.
IPCC (2001) Climate change, The Scientific Basis: Contribution of Working Group I to the Third Assessment Report of the Intergovernmental Panel on Climate Change (eds Houghton, J. T. et al.), Cambridge Univ. Press, Cambridge, UK.
John, T.C., Gregory, J.M., Ingram, W.J., Johnson, C.E., Jones, A., Lowe, J.A., Mitchell, J.F.B., Roberts, D.L., Sexton, D.M.H., Stevenson, D.S., Tett, S.F.B., Woodage, M.J. (2003) Anthropogenic climate change for 1860 to 2100 simulated with the HadCM3 model under updated emission scenarios. Climate dynamics 20: 583-612.
Matzarakis, A. (2001) Die thermische Komponente des Stadtklimas. Ber. Meteorol. Inst. Univ. Freiburg Nr. 6.
Matzarakis, A., Mayer, H., and Iziomon, M.G. (1999) Applications of a universal thermal index: physiological equivalent temperature, Int. J. Biometeorol. 43: 76-84.
Matzarakis, A., Rutz, F. (2005) Application of RayMan for tourism and climate investigations. Annalen der Meteorologie 41: Vol. 2, 631-636.
Matzarakis, A.; Rutz, F.; Mayer, H. (2000) Estimation and calculation of the mean radiant temperature within urban structures. In: Biometeorology and Urban Climatology at the Turn of the Millenium (ed. by R.J. de Dear, J.D. Kalma, T.R. Oke and A. Auliciems): Selected Papers from the Conference ICB-ICUC’99, Sydney. WCASP-50, WMO/TD No. 1026, 273-278.
Matzarakis, A., Rutz, F., Mayer, H. (2007) Modelling Radiation fluxes in simple and complex environments – Application of the RayMan model. Int. J. Biomet. 51: 323-334.

Developments in Tourism Climatology – A. Matzarakis, C. R. de Freitas, D. Scott, 2007
138
Matzarakis, A., de Freitas, C., Scott, D. (2004) (eds.): Advances in tourism climatology. Ber. Meteorol. Inst. Univ. Freiburg Nr. 12.
New, M., Hulme, M., Jones, P. (1999) Representing twentieth century space-time climate variability. Part 1: development of a 1961-1990 mean monthly terrestrial climatology. J. Clim. 12, 829-856.
New, M., Hulme, M. and Jones, P.D. (2000) Representing twentieth century space-time climate variability. Part 2: development of 1901-96 monthly grids of terrestrial surface climate. J. Clim. 13, 2217-2238.
VDI (1994) VDI 3789, Part 2: Environmental Meteorology, Interactions between Atmosphere and Surfaces; Calculation of the short- and long wave radiation. Beuth, Berlin. pp. 52.
VDI (1998) Methods for the human-biometerological assessment of climate and air hygiene for urban and regional planning. Part I: Climate, VDI guideline 3787. Part 2. Beuth, Berlin.
Developments in Tourism Climatology – A. Matzarakis, C. R. de Freitas, D. Scott, 2007
139
THE NEED OF WEATHER FORECASTS ADAPTED FOR RECREATION IN
LITHUANIA
J. Liukaityte
Department of Hydrology and Meteorology of the Vilnius University, Ciurlionio str. 21/27,
LT-03101 Vilnius, Lithuania
ABSTRACT In 2005-2006 a survey was carried out in Lithuania on the need of weather
forecasts for holiday planning and recreational activities. The survey also determined
comfortable weather conditions and those having no negative influence on people. Moreover,
it found that the existing weather forecasts are sufficiently informative.
For the purpose of obtaining more detailed data and carrying out qualitative analysis, 500
respondents were surveyed in all regions of Lithuania. Respondents were chosen based on
their age, education, work, place of residence, etc.
Most of the respondents pointed out that one day weather forecasts were insufficient for their
planning of recreation. 50 per cent of respondents needed a forecast for two days and 40 per
cent of respondents needed the whole week’s weather forecast. The need for weather forecasts
differs by season. It was not so important in winter, while in spring or in autumn it was
important to 30 per cent of all respondents. In summer, weather forecasts were very important
to 62-65 per cent of the respondents.
The most comfortable weather for Lithuanians was clear and slightly windy weather with a
temperature of 23-25 °C.
KEYWORDS: Weather forecasts, survey, recreation, comfortable weather, Lithuania
INTRODUCTION
When beginning to publish new specialized weather forecasts or improving the existing ones,
it is very important to find out the needs of their users. In order to improve the format of
presentation of weather forecasts and to supplement them with biometeorological forecasts, in
2005-2006 a popular survey was carried out in Lithuania requesting respondents to assess the
presented forecasts and to answer additional questions about their sensitivity to weather
conditions, their perception of comfortable weather conditions, etc.
Developments in Tourism Climatology – A. Matzarakis, C. R. de Freitas, D. Scott, 2007
140
The Lithuanian Hydrometeorological Service currently provides its customers with regular
weather forecasts, including maximum and minimum air temperature, precipitation, general
cloudiness, wind and anticipated dangerous phenomena for 5 days in advance. The
biometeorological forecast only includes an ultraviolet radiation index forecast.
Therefore, it was very important to find out whether people were satisfied with the provided
information, what basic parameters should be published and which additional
biometeorological forecasts should be included.
METHODS
The Survey was carried out in different regions of Lithuania taking into consideration the
number of local inhabitants, their age, education, type of employment, residential area, etc. In
total 500 inhabitants were surveyed.
The Questionnaire comprised three main groups of questions: use of weather information,
perception of comfortable weather and individual sensitivity to weather conditions. Questions
included in the latter part were compiled based on similar research carried out in Germany
and Canada (Mackensen et al., 2005).
RESULTS
Having analysed responses regarding comfortable weather conditions it was established that
as many as 58 % of responders considered to be comfortable on summer days with a
maximum air temperature of 23–26 ºC, with the most comfortable range being between 19
and 22 ºC. An interval between 27–30 ºC was selected by merely 14 % of the respondents.
Comfortable summer nighttime temperature were considered to be either 13–16 ºC or 17–
20ºC, according to two equal groups of 40 % of all interviewed Lithuanians.
The most favourable weather was considered to be clear or slightly cloudy with light to
moderate winds, at night as well as in daytime. Remaining wind speed categories were
considered to be uncomfortable.
In the opinion of the most respondents (42 %), comfortable wintertime conditions were
characterised by clear and slightly windy weather with air temperature varying between -5
and -9 ºC.
Respondents were also inquired about comfortable water temperature for swimming. The vast
majority (54 %) went swimming when the water temperature reached 18 degrees, while 20-
degrees warm water was satisfactory for 79 %.
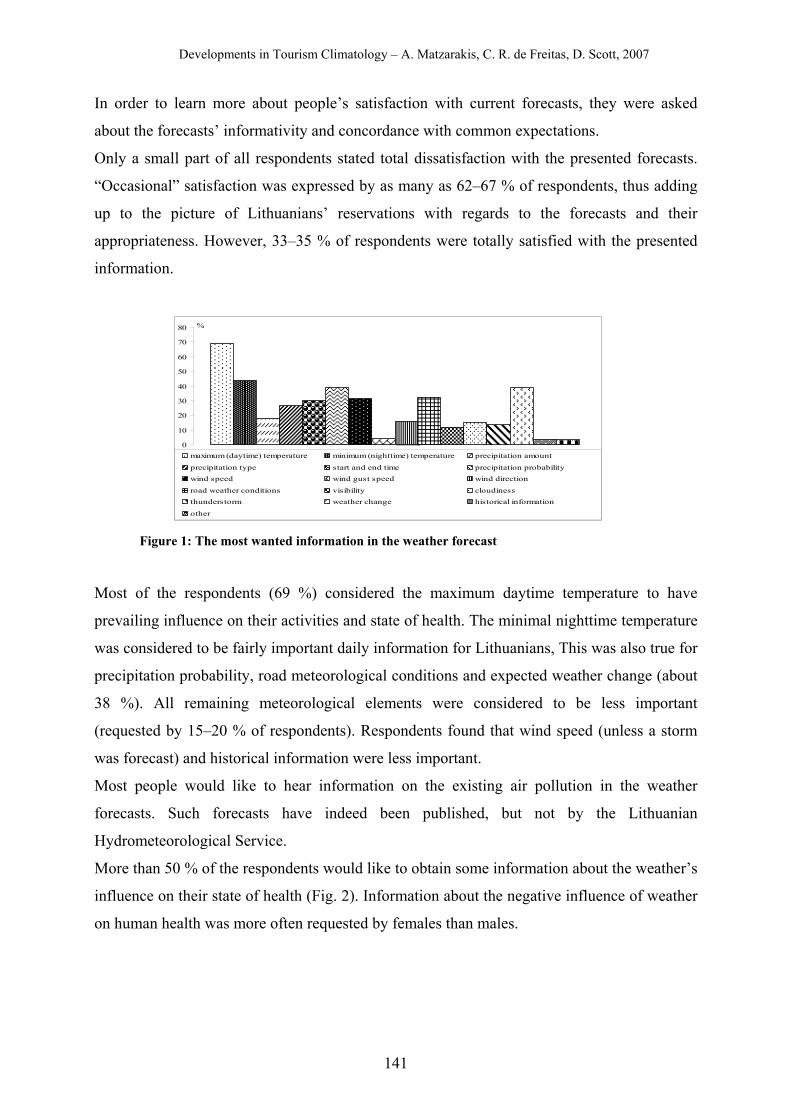
Developments in Tourism Climatology – A. Matzarakis, C. R. de Freitas, D. Scott, 2007
141
In order to learn more about people’s satisfaction with current forecasts, they were asked
about the forecasts’ informativity and concordance with common expectations.
Only a small part of all respondents stated total dissatisfaction with the presented forecasts.
“Occasional” satisfaction was expressed by as many as 62–67 % of respondents, thus adding
up to the picture of Lithuanians’ reservations with regards to the forecasts and their
appropriateness. However, 33–35 % of respondents were totally satisfied with the presented
information.
0
10
20
30
40
50
60
70
80
1
%
maximum (daytime) temperature minimum (nighttime) temperature precipitation amount
precipitation type start and end time precipitation probabilitywind speed wind gust speed wind direction
road weather conditions visibility cloudinessthunderstorm weather change historical information
other Figure 1: The most wanted information in the weather forecast
Most of the respondents (69 %) considered the maximum daytime temperature to have
prevailing influence on their activities and state of health. The minimal nighttime temperature
was considered to be fairly important daily information for Lithuanians, This was also true for
precipitation probability, road meteorological conditions and expected weather change (about
38 %). All remaining meteorological elements were considered to be less important
(requested by 15–20 % of respondents). Respondents found that wind speed (unless a storm
was forecast) and historical information were less important.
Most people would like to hear information on the existing air pollution in the weather
forecasts. Such forecasts have indeed been published, but not by the Lithuanian
Hydrometeorological Service.
More than 50 % of the respondents would like to obtain some information about the weather’s
influence on their state of health (Fig. 2). Information about the negative influence of weather
on human health was more often requested by females than males.
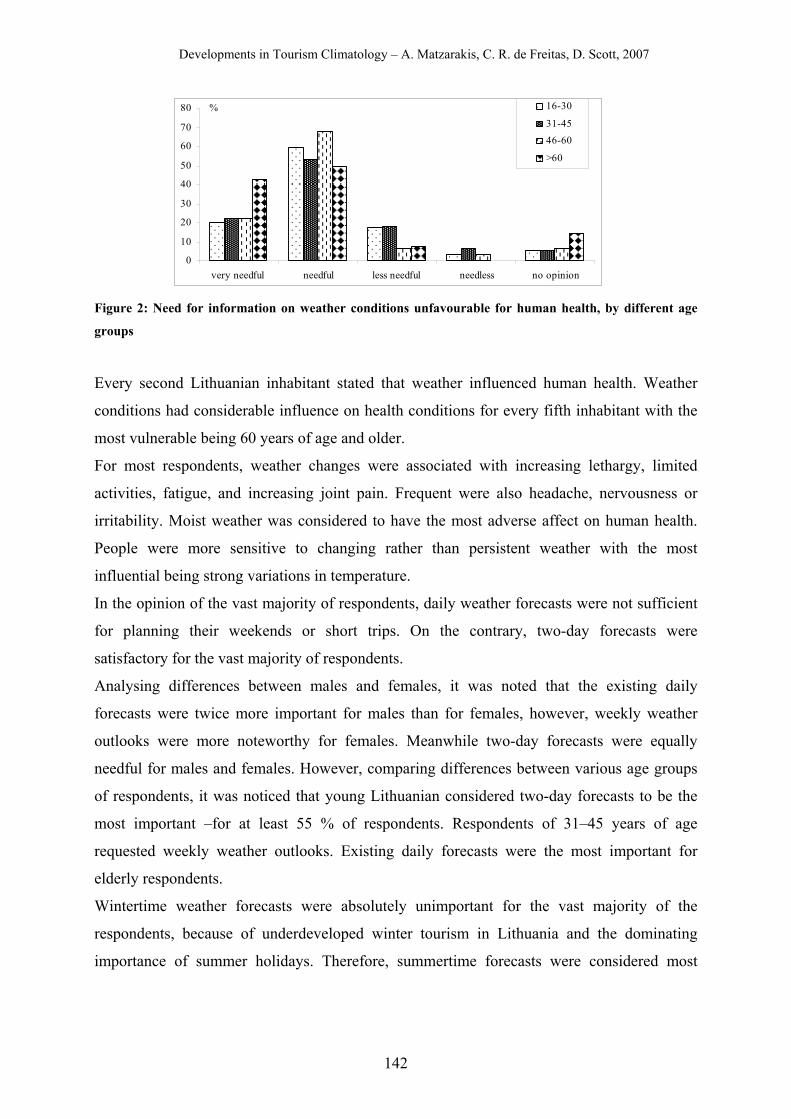
Developments in Tourism Climatology – A. Matzarakis, C. R. de Freitas, D. Scott, 2007
142
0
10
20
30
40
50
60
70
80
very needful needful less needful needless no opinion
% 16-30
31-4546-60
>60
Figure 2: Need for information on weather conditions unfavourable for human health, by different age
groups
Every second Lithuanian inhabitant stated that weather influenced human health. Weather
conditions had considerable influence on health conditions for every fifth inhabitant with the
most vulnerable being 60 years of age and older.
For most respondents, weather changes were associated with increasing lethargy, limited
activities, fatigue, and increasing joint pain. Frequent were also headache, nervousness or
irritability. Moist weather was considered to have the most adverse affect on human health.
People were more sensitive to changing rather than persistent weather with the most
influential being strong variations in temperature.
In the opinion of the vast majority of respondents, daily weather forecasts were not sufficient
for planning their weekends or short trips. On the contrary, two-day forecasts were
satisfactory for the vast majority of respondents.
Analysing differences between males and females, it was noted that the existing daily
forecasts were twice more important for males than for females, however, weekly weather
outlooks were more noteworthy for females. Meanwhile two-day forecasts were equally
needful for males and females. However, comparing differences between various age groups
of respondents, it was noticed that young Lithuanian considered two-day forecasts to be the
most important –for at least 55 % of respondents. Respondents of 31–45 years of age
requested weekly weather outlooks. Existing daily forecasts were the most important for
elderly respondents.
Wintertime weather forecasts were absolutely unimportant for the vast majority of the
respondents, because of underdeveloped winter tourism in Lithuania and the dominating
importance of summer holidays. Therefore, summertime forecasts were considered most
Developments in Tourism Climatology – A. Matzarakis, C. R. de Freitas, D. Scott, 2007
143
important for as many as 62–65 % of respondents. Forecasts in autumn and spring were
important for about 20–30 % of respondents.
CONCLUSIONS
Popular surveys are one of the main sources of information on the matter in question. In
Lithuania, it was one of the first surveys of its kind, especially when considering the popular
opinion about the weather forecasts, comfortable weather conditions and weather sensitivity.
The results obtained are useful in improving the presentations of the weather forecasts and
inclusion of new biometeorological forecasts.
ACKNOWLEDGEMENTS
The survey was carried out under the auspices of the Department of Hydrology and
Meteorology of the Vilnius University with the assistance of its student, Ms Roma Kutkaite.
REFERENCES Mackensen S., Höppe P., Maarouf A., Tourigny P. and Nowak D. (2005) Prevalence of
weather sensitivity in Germany and Canada. Int. J. Biometeorol. 49, 156-166.
Developments in Tourism Climatology – A. Matzarakis, C. R. de Freitas, D. Scott, 2007
144
BIOMETEOROLOGICAL CONDITIONS IN MOUNTAINOUS COMMUNITIES
AND ADJACENT URBAN CENTER IN GREECE BY THE USE OF INDICES: THE
CASE STUDY OF MOUNTAINOUS NAFPAKTIA DISTRICT
A. Kamoutsis, A. Matsoukis, I. Charalampopoulos and A. Chronopoulou-Sereli
Laboratory of General and Agricultural Meteorology, Agricultural University of Athens,
75 Iera Odos Str., 118 55 Athens, Greece
ABSTRACT This study was carried out to determine the biometeorological conditions in the
mountainous communities of Nafpaktia (MNC) in West Greece (Municipulity of Apodotia,
Prefecture of Aitoloakarnania), a rural and unexploited region in comparison with the nearby
urban center, Lamia, the capital of the Periphery of Central Greece. Air temperature and
humidity data were recorded by the meteorological station of Lamia and from sensors with
loggers at selected sites of the mountainous Nafpaktia district. Data were used for the
calculation of the thermohygrometric (THI) and the humidex (H) indices, based on which
biometeorological conditions were evaluated. It was concluded that the THI index provides
more detailed information for the asssesment of biometeorological conditions of MNC than
the H index. In July this district is characterized by more advantageous biometeorological
conditions than the ones in Lamia. MNC can be seen as an ideal tourism and recreation
destination for summer vacation.
KEYWORDS: Mountainous communities, Nafpaktia district, thermohygrometric index,
Humidex, tourism
INTRODUCTION
It is widely recognized that, during the summer period, cities and urban centers in general do
not provide satisfying environmental conditions in contrast to agricultural and mountainous
areas.
Tourism is a major source of economic and social activity and is influenced both by weather
and climate. Bioclimatic conditions are of high interest for decision makers in the recreation
tourism policy field (Matzarakis et al., 2004). The attractive rural landscapes with small
villages and picturesque communities, the rich flora and fauna, the river springs and the
Developments in Tourism Climatology – A. Matzarakis, C. R. de Freitas, D. Scott, 2007
145
network of rivers in the mountain districts offer recreation and relaxation to the residents of
urban centers who visit in the vacation period.
Nafpaktia is an amenity-rich mountainous region in the central part of mainland Greece with
evergreen forests. It is a potentially ideal destination for people from the urban centers. The
aim of this research is the assessment of the biometeorological conditions in the mountainous
communities of Nafpaktia and the nearby urban center of Lamia in Central Greece. We use
two simple indices, the thermohygrometric and the humidex index, which require only
temperature and humidity data as input.
MATERIALS AND METHODS
Study areas and measurement sites
This study was carried out in two regions. The first one, Lamia, a medium size city in Central
Greece is the capital of the Prefecture of Phtiotis and of the Periphery of Central Greece.
According to the 2001 census, the population of Lamia was 58,601. The measurement site s1
(380 53´ N, 220 23´ E) in Lamia was located at 144 m above sea level. The second study site
comprised a large part of the mountainous communities of Nafpaktia district (Municipality of
Apodotia, Prefecture of Aitoloakarnania) in the central part of mainland Greece. This region
is rural and unexploited and is characterized by few agricultural, industrial or tourism
businesses or other activities. Its natural beauty, fir (Abies sp.) forests, diverse topography and
the river Evinos, indicate good tourism potential. There were eight study sites in the
mountainous Nafpaktia communities (MNC) which covered the whole study region (676 -
1455 m altitude). In this study, the two most representative sites of the MNC (with regards to
the biometeorological conditions that were determined in preliminary work) are presented.
The first site, s2 (38043´ N, 21057´ E), was located at 676 m altitude, near the river Evinos, in
an area with various riverside plant species. The second site, s3 (38043´N, 22001´E), was
located at 986 m altitude in a forest area with chestnut trees (Castanea sp.) and firs.
Instrumentation and meteorological data
In order to investigate the biometeorological conditions of MNC, we monitored air
temperature and humidity, measured 1.5 m above ground surface, every 15 minutes using
sensors with data loggers (Hobo type Pro, H08-032-08, accuracy ±0.2 0C at 25 0C and ±3 %
RH over the range of 0 to 50 0C). One logger was used on each site for the period from 1st to
31st of July 2006. The data loggers were enclosed in appropriate shelters, protected from
rainfall and direct solar radiation. The shelters allowed for air ventilation. For Lamia, air
Developments in Tourism Climatology – A. Matzarakis, C. R. de Freitas, D. Scott, 2007
146
temperature and humidity data for the same period were provided by the Hellenic National
Meteorological Service.
Biometeorological Indices
Means on an hourly basis were calculated for the air temperature and humidity data for each
study site. The means were used for the calculation of two widely used biometeorological
indices (Conti et al., 2005, Toy et al., 2007), the thermohygrometric (THI) and the humidex
(H) indices, according to the following equations:
THI=t-[(0.55-0.0055ּ f)ּ(t-14.5)] (1)
H=t + 5/9 ּ (e-10) as modified by (2)
where t = air temperature (0C), f=relative humidity (%) and e=vapor pressure (hPa) which was
calculated by the following function combining t and f (2).
e=6.112 ּ10[(7.5t)/(237.7+t)]ּf /100 (3)
Average values for THI and H were used in the evaluation of the human thermal comfort
according to Table 1 (adapted from Conti et al., 2005, Toy et al., 2007). The relative
frequencies of different classes of the above indices were calculated on an hourly basis for the
examined period.
RESULTS
Biometeorological conditions as expressed through the relative frequencies of different
classes of THI and H values per hour for the examined period for the two sites of Nafpaktia
district (s2, s3) and the urban region of Lamia (s1) are presented in Figure 1. Five THI classes
(very hot, hot, comfortable, cool and cold) and four H classes (dangerous, great discomfort,
some discomfort and comfortable) were determined. Results are discussed for average values.
From the 11th to the 20th hour, 19 % of all THI values lie in the “very hot” class and 2.8 % of
H values were classed as “dangerous”. The majority of the THI values (77.4 %) was classed
as “hot” and 78.6 % of all H values were in the “great discomfort” class at the study site in
Lamia (Fig. 1a, b).
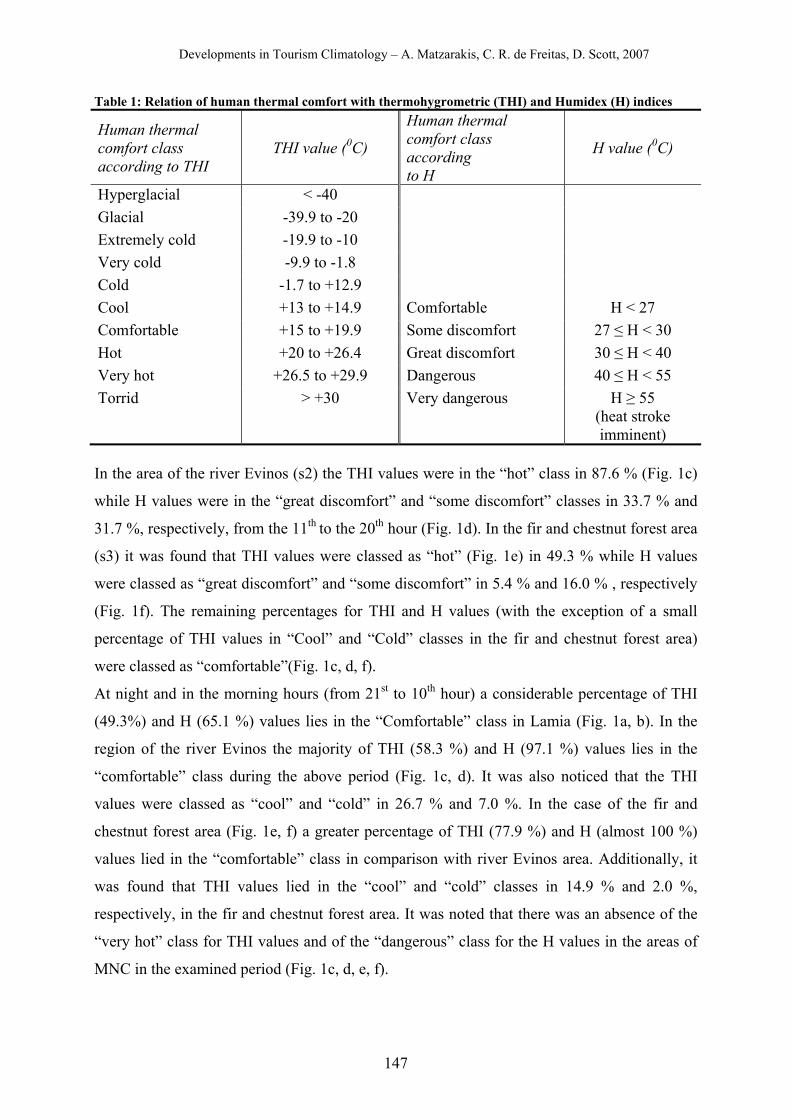
Developments in Tourism Climatology – A. Matzarakis, C. R. de Freitas, D. Scott, 2007
147
Table 1: Relation of human thermal comfort with thermohygrometric (THI) and Humidex (H) indices
In the area of the river Evinos (s2) the THI values were in the “hot” class in 87.6 % (Fig. 1c)
while H values were in the “great discomfort” and “some discomfort” classes in 33.7 % and
31.7 %, respectively, from the 11th to the 20th hour (Fig. 1d). In the fir and chestnut forest area
(s3) it was found that THI values were classed as “hot” (Fig. 1e) in 49.3 % while H values
were classed as “great discomfort” and “some discomfort” in 5.4 % and 16.0 % , respectively
(Fig. 1f). The remaining percentages for THI and H values (with the exception of a small
percentage of THI values in “Cool” and “Cold” classes in the fir and chestnut forest area)
were classed as “comfortable”(Fig. 1c, d, f).
At night and in the morning hours (from 21st to 10th hour) a considerable percentage of THI
(49.3%) and H (65.1 %) values lies in the “Comfortable” class in Lamia (Fig. 1a, b). In the
region of the river Evinos the majority of THI (58.3 %) and H (97.1 %) values lies in the
“comfortable” class during the above period (Fig. 1c, d). It was also noticed that the THI
values were classed as “cool” and “cold” in 26.7 % and 7.0 %. In the case of the fir and
chestnut forest area (Fig. 1e, f) a greater percentage of THI (77.9 %) and H (almost 100 %)
values lied in the “comfortable” class in comparison with river Evinos area. Additionally, it
was found that THI values lied in the “cool” and “cold” classes in 14.9 % and 2.0 %,
respectively, in the fir and chestnut forest area. It was noted that there was an absence of the
“very hot” class for THI values and of the “dangerous” class for the H values in the areas of
MNC in the examined period (Fig. 1c, d, e, f).
Human thermal comfort class according to THI
THI value (0C)
Human thermal comfort class according to H
H value (0C)
Hyperglacial < -40 Glacial -39.9 to -20 Extremely cold -19.9 to -10 Very cold -9.9 to -1.8 Cold -1.7 to +12.9 Cool +13 to +14.9 Comfortable H < 27 Comfortable +15 to +19.9 Some discomfort 27 ≤ H < 30 Hot +20 to +26.4 Great discomfort 30 ≤ H < 40 Very hot +26.5 to +29.9 Dangerous 40 ≤ H < 55 Torrid > +30 Very dangerous H ≥ 55
(heat stroke imminent)
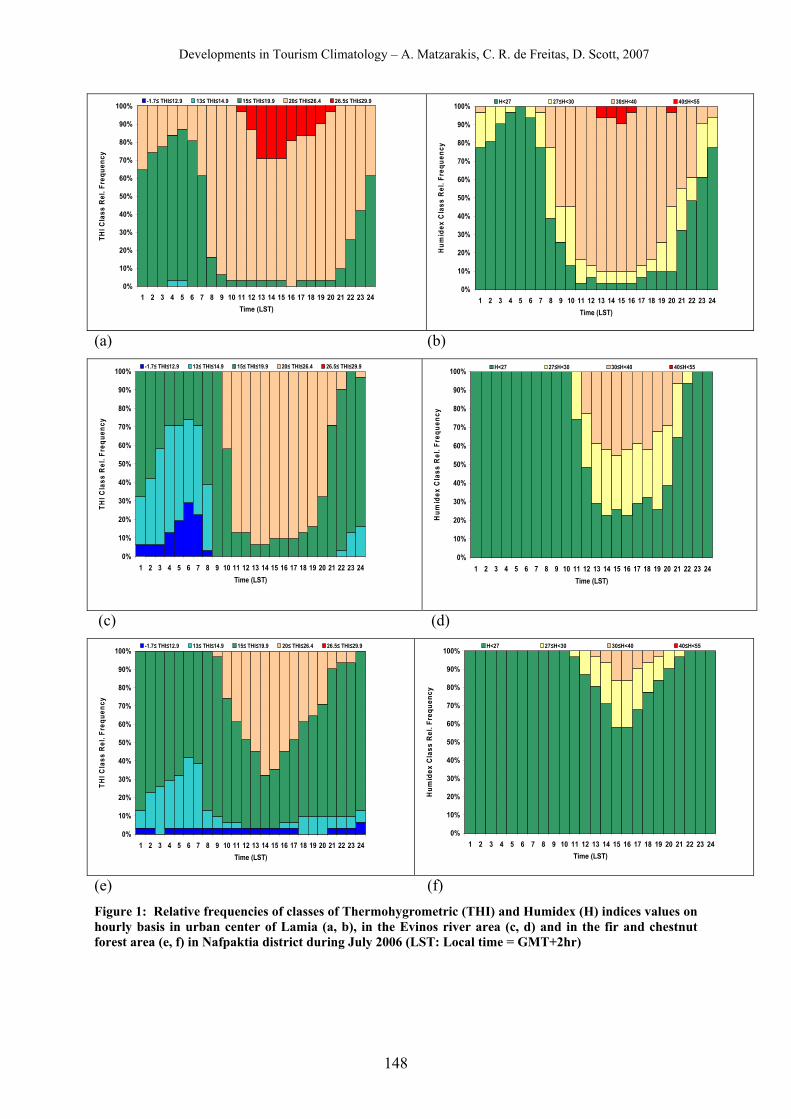
Developments in Tourism Climatology – A. Matzarakis, C. R. de Freitas, D. Scott, 2007
148
0%
10%
20%
30%
40%
50%
60%
70%
80%
90%
100%
1 2 3 4 5 6 7 8 9 10 11 12 13 14 15 16 17 18 19 20 21 22 23 24Time (LST)
THI C
lass
Rel
. Fre
quen
cy-1.7≤ THI≤12.9 13≤ THI≤14.9 15≤ THI≤19.9 20≤ THI≤26.4 26.5≤ THI≤29.9
0%
10%
20%
30%
40%
50%
60%
70%
80%
90%
100%
1 2 3 4 5 6 7 8 9 10 11 12 13 14 15 16 17 18 19 20 21 22 23 24Time (LST)
Hum
idex
Cla
ss R
el. F
requ
ency
H<27 27≤H<30 30≤H<40 40≤H<55
(a) (b)
0%
10%
20%
30%
40%
50%
60%
70%
80%
90%
100%
1 2 3 4 5 6 7 8 9 10 11 12 13 14 15 16 17 18 19 20 21 22 23 24Time (LST)
THI C
lass
Rel
. Fre
quen
cy
-1.7≤ THI≤12.9 13≤ THI≤14.9 15≤ THI≤19.9 20≤ THI≤26.4 26.5≤ THI≤29.9
0%
10%
20%
30%
40%
50%
60%
70%
80%
90%
100%
1 2 3 4 5 6 7 8 9 10 11 12 13 14 15 16 17 18 19 20 21 22 23 24Time (LST)
Hum
idex
Cla
ss R
el. F
requ
ency
H<27 27≤H<30 30≤H<40 40≤H<55
(c) (d)
0%
10%
20%
30%
40%
50%
60%
70%
80%
90%
100%
1 2 3 4 5 6 7 8 9 10 11 12 13 14 15 16 17 18 19 20 21 22 23 24Time (LST)
THI C
lass
Rel
. Fre
quen
cy
-1.7≤ THI≤12.9 13≤ THI≤14.9 15≤ THI≤19.9 20≤ THI≤26.4 26.5≤ THI≤29.9
0%
10%
20%
30%
40%
50%
60%
70%
80%
90%
100%
1 2 3 4 5 6 7 8 9 10 11 12 13 14 15 16 17 18 19 20 21 22 23 24Time (LST)
Hum
idex
Cla
ss R
el. F
requ
ency
H<27 27≤H<30 30≤H<40 40≤H<55
(e) (f) Figure 1: Relative frequencies of classes of Thermohygrometric (THI) and Humidex (H) indices values on hourly basis in urban center of Lamia (a, b), in the Evinos river area (c, d) and in the fir and chestnut forest area (e, f) in Nafpaktia district during July 2006 (LST: Local time = GMT+2hr)
Developments in Tourism Climatology – A. Matzarakis, C. R. de Freitas, D. Scott, 2007
149
DISCUSSION
Unfavourable biometeorological conditions in Lamia were clearly detected, attributed to the
occurrence of a large percentage of THI and H values in the “very hot” and “great
discomfort” classes from 11 h to 20 h. On the contrary, good biometeorological conditions
prevailed in the MNC, when compared to Lamia. This may be explained by the more frequent
occurrence of the “comfortable” class in MNC compared to Lamia during the study period.
The fir and chestnut forest area had a more comfortable climate, which can be seen in the
more frequent occurrence of “comfortable” weather, compared to the river Evinos area. Close
to the ground solar radiation and temperature (at least on sunny days) are lower in the forest
compared to open sites (Morecroft et al., 1998).
The “cold” THI values, especially at the river Evinos area, can be attributed to the movement
of cold air, formed by nocturnal radiative cooling under calm clear sky conditions from
elevated areas towards the lower altitudes in July (Barry, 2001). The detected “Cool” and
“Cold” classes of THI lead us to the conclusion that the previous index provides a more
detailed approach to biometeorological conditions in MNC compared to H. Nevertheless,
Nafpaktia district can be seen as a reliable tourism and recreation destination for vacation in
summer, resulting in the improvement of local development through the construction of eco-
and rural- tourism infrastructures.
ACKNOWLEDGEMENTS
This research is a part of the project co-funded by European Social Fund & National
Resources – Operational Programme for Education and Initial Vocational Training-“EPEAEK
II-Pythagoras II”.
REFERENCES Matzarakis, A., Zygmuntowski, M., Rudel., E., Koch, E. (2004) Mapping the thermal
bioclimate of Austria for health and recreation tourism. In: Matzarakis, A., de Freitas, C.R. and Scott, D. (Eds.), Advances in Tourism Climatology. Freiburg, Germany, 10-18.
Conti, S. et al. (2005) Epidimiological study of mortality during the summer 2003 heat wave in Italy. Environmental Research, 98: 390 – 399.
Toy S., Yilmaz S., Yilmaz H. (2007) Determination of bioclimatic comfort in three different land uses in the city of Erzurum, Turkey. Building and Environment, 42: 1315-1318.
Morecroft, M.D., Taylor, M.E. and Oliver H.R. (1998) Air and soil microclimates of deciduous woodland compared to an open site. Agricultural and Forest Meteorology, 90: 141-156.
Barry, L.G. (2001) Mountain weather and climate. 2nd edition, Routledge, Taylor and Francis Group, New York, USA.
Developments in Tourism Climatology – A. Matzarakis, C. R. de Freitas, D. Scott, 2007
150
THE HUMAN COMFORT CONDITIONS AT BULGARIAN BLACK SEA SIDE
A. Tzenkova, J. Ivancheva, E. Koleva and P. Videnov National Institute of Meteorology and Hydrology, Bulgarian Academy of Sciences, Sofia,
Bulgaria,
ABSTRACT As Bulgaria becomes more and more integrated into the European Union, the
tourism sector is expected to become a more important part of the economy. In order to
determine sustainability of the tourism industry and to meet the needs of a fast and expansive
development of tourism in Bulgaria, it is necessary to have detailed information about the
climate potential and the length of the tourism season.
The aim of this work is to estimate the human comfort conditions in the Bulgarian Black Sea
coastal area. The analysis is based on daily data from the Varna, Burgas and Ahtopol
meteorological stations.
Different indexes such as SSI, THI, PMV and PET have been used to determine human
comfort conditions. The results show that the region of the Bulgarian Black Sea is suitable for
tourism and sport activities betweenApril to October.
KEYWORDS: Thermal comfort, bioclimate, tourism
INTRODUCTION Since appearing on earth and up to now, human society has had to deal with weather and
climatic changes. One of the socio-economic areas that is subject to the impact of atmospheric
conditions is resort activity.
The present changes to the standard of living, cultural values, and transport development has
lead to an increase in demand for weather information during the holiday season. So the
necessity arises for timely, accurate and up to date information about local weather
peculiarities of a specific resort.
Knowledge about the bioclimatic resources in turn allows for an optimal and profitable
planning process and construction of resort areas. This considerably affects foreign currency
revenue. Standard meteorological information quite often turns out to be insufficient for the
aims of recreation and tourism.
Developments in Tourism Climatology – A. Matzarakis, C. R. de Freitas, D. Scott, 2007
151
The purpose of this work is to make an assessment of the bioclimatic conditions for some parts
of the Bulgarian Black Sea coastal area using various complex estimates.
METHODS There are several theoretical and empirical indexes accounting for single or combined
meteorological parameters, which give to some extent an assessment of the level of human
comfort. Such approaches are covered in the works of many authors (Kyle, 1994, Matzarakis
at al., 2004, 2007, Morabito and Bacci, 2003, Unger, 1999, Höppe, 1999, Tzenkova et al.,
2003). The most adequate thermophysiological assessment of the thermal environment can be
done only on the basis of a complete heat transfer model of the man-environment system,
accounting for all energy exchange mechanisms. Such models are MEMI (Höppe, 1999),
Klima-Michel-Modell (Jendritzky еt al., 1990), PMV and PET (Matzarakis at al., 2007),
among others. They are already used in practice. All these models require extensive
meteorological input data(e.g. the values of radiation fluxes, data for human clothing and
activity, etc.).
In this work four different methods are used for the assessment of human comfort conditions,
all of which are frequently employed in various countries. This allows an easy comparison
with already published results for other resort areas in the world.
Assessment of bioclimatic conditions by Thom index Thom index (THI) is determined by the formula (1)
THI = T – (0.55 – 0.0055RH)(T – 14.5)°C (1)
where T is air temperature in °C and RH is air relative humidity.
THI index was initially used to determine discomfort due to “heat stress”, and was at a later
stage assessed on a much wider range of meteorological conditions by Kyle (1994), and until
today has been used by a number of authors (Unger, 1999, Morabito and Bacci, 2003,
Tzenkova et al., 2003). The classification of the comfort level is based on the Besansenot
classification scheme.
New summer heat index SSI
The new summer index SSI (Summer Simmer Index) is a further developed version of
Summer Comfort indexes, and was presented at the Meeting of the American Meteorological
Society in Long Beach, California in July, 2000 as the New Millennium Index. It is derived
from studies by the American Society of Heating and Refrigeration Engineers (ASHRAE) and
Developments in Tourism Climatology – A. Matzarakis, C. R. de Freitas, D. Scott, 2007
152
validated by tests and analyses done at Kansas State University over the past 75 years using
the results of proven physiological models. This index is also determined on the basis of air
temperature and relative humidity
SSI = 1.98 • (Ta - ( 0.55 - 0.0055 • Ur ) • ( Ta – 58 ) ) - 56.83 (2)
where Ta is air temperature in degrees Fahrenheit and Ur is relative humidity (%)
РМV and PET
PMV (Predicted Mean Vote) (Fanger, 1972) and PET (Physiologically Equivalent
Temperature) are based on models of the human body energy exchange and are calculated
using the RayMan model (e.g. Mayer and Höppe, 1987, Matzarakis et al., 2007).
The advantage of this model is that it uses air temperature and humidity as input information.
Wind speed and radiation characteristics of the air are then calculated. The classification
schemes of these indexes are given in Table 1.
Table 1: Bioclimatic weather classes of the PMV and PET indexes
PMV PET Physiological sensitivity # <-3.5 < 4 very cold 1
-3.5≤ PMV ≤-2.5 4 ≤ PET ≤ 8 cold 2 -2.5 ≤ PMV ≤ -1.5 -8 ≤ PET ≤ 13 cool 3 -1.5 ≤ PMV ≤ -0.5 13 ≤ PET ≤ 18 slightly cool 4 -0.5 ≤ PMV ≤ 0.5 18 ≤ PET ≤ 23 comfortable 5 0.5≤ PMV ≤ 1.5 23≤ PET ≤ 29 slightly warm 6 1.5≤ PMV ≤ 2.5 29≤ PET ≤ 35 warm 7 2.5≤ PMV ≤ 3.5 35≤ PET ≤ 41 hot 8
3.5≤ PMV 41≤ PET very hot 9 Daily climatological data from the stations in Varna, Burgas and Ahtopol for the period 1992
– 2006 and the synoptical data of Varna for the period 2001-2006 are used.
RESULTS The results are presented for each of the used indexes separately.
Thom´s index - ТНІ The annual variation of THI indicates that there is a stable formation of comfortable weather
conditions along the entire coastline of the Black Sea starting in the beginning of the second
week of May. This weather condition persists until the beginning of the second week of
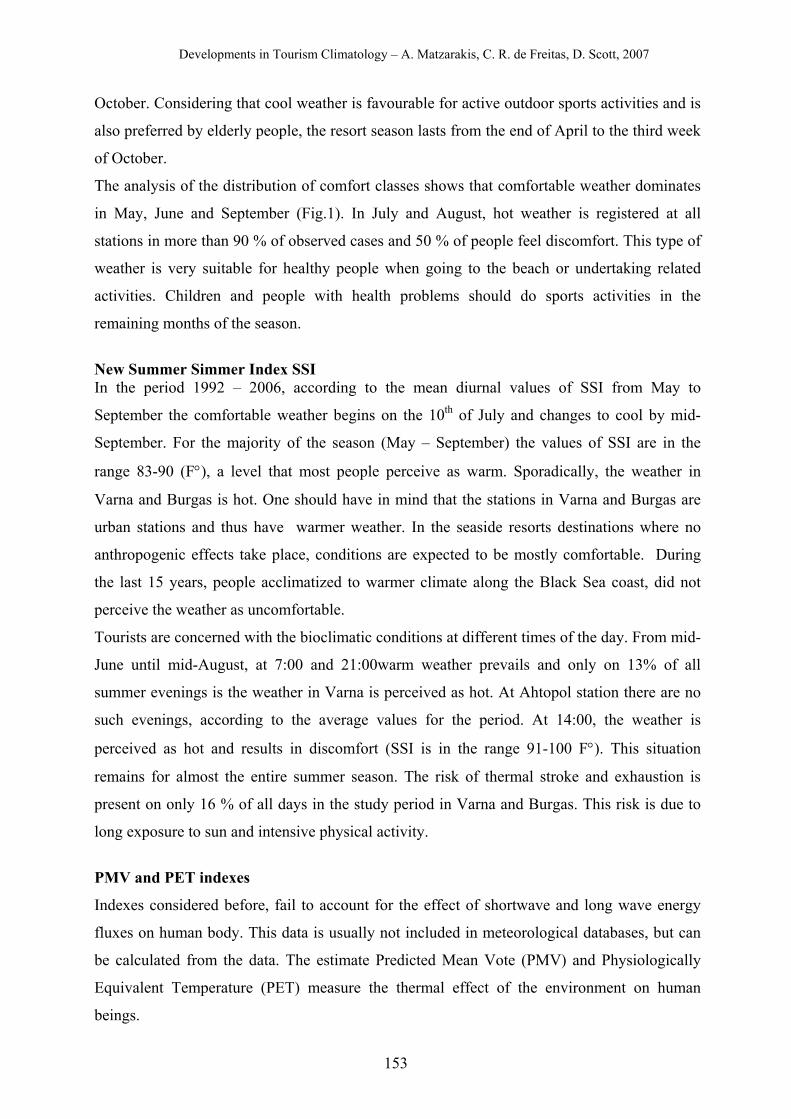
Developments in Tourism Climatology – A. Matzarakis, C. R. de Freitas, D. Scott, 2007
153
October. Considering that cool weather is favourable for active outdoor sports activities and is
also preferred by elderly people, the resort season lasts from the end of April to the third week
of October.
The analysis of the distribution of comfort classes shows that comfortable weather dominates
in May, June and September (Fig.1). In July and August, hot weather is registered at all
stations in more than 90 % of observed cases and 50 % of people feel discomfort. This type of
weather is very suitable for healthy people when going to the beach or undertaking related
activities. Children and people with health problems should do sports activities in the
remaining months of the season.
New Summer Simmer Index SSI In the period 1992 – 2006, according to the mean diurnal values of SSI from May to
September the comfortable weather begins on the 10th of July and changes to cool by mid-
September. For the majority of the season (May – September) the values of SSI are in the
range 83-90 (F°), a level that most people perceive as warm. Sporadically, the weather in
Varna and Burgas is hot. One should have in mind that the stations in Varna and Burgas are
urban stations and thus have warmer weather. In the seaside resorts destinations where no
anthropogenic effects take place, conditions are expected to be mostly comfortable. During
the last 15 years, people acclimatized to warmer climate along the Black Sea coast, did not
perceive the weather as uncomfortable.
Tourists are concerned with the bioclimatic conditions at different times of the day. From mid-
June until mid-August, at 7:00 and 21:00warm weather prevails and only on 13% of all
summer evenings is the weather in Varna is perceived as hot. At Ahtopol station there are no
such evenings, according to the average values for the period. At 14:00, the weather is
perceived as hot and results in discomfort (SSI is in the range 91-100 F°). This situation
remains for almost the entire summer season. The risk of thermal stroke and exhaustion is
present on only 16 % of all days in the study period in Varna and Burgas. This risk is due to
long exposure to sun and intensive physical activity.
PMV and PET indexes
Indexes considered before, fail to account for the effect of shortwave and long wave energy
fluxes on human body. This data is usually not included in meteorological databases, but can
be calculated from the data. The estimate Predicted Mean Vote (PMV) and Physiologically
Equivalent Temperature (PET) measure the thermal effect of the environment on human
beings.
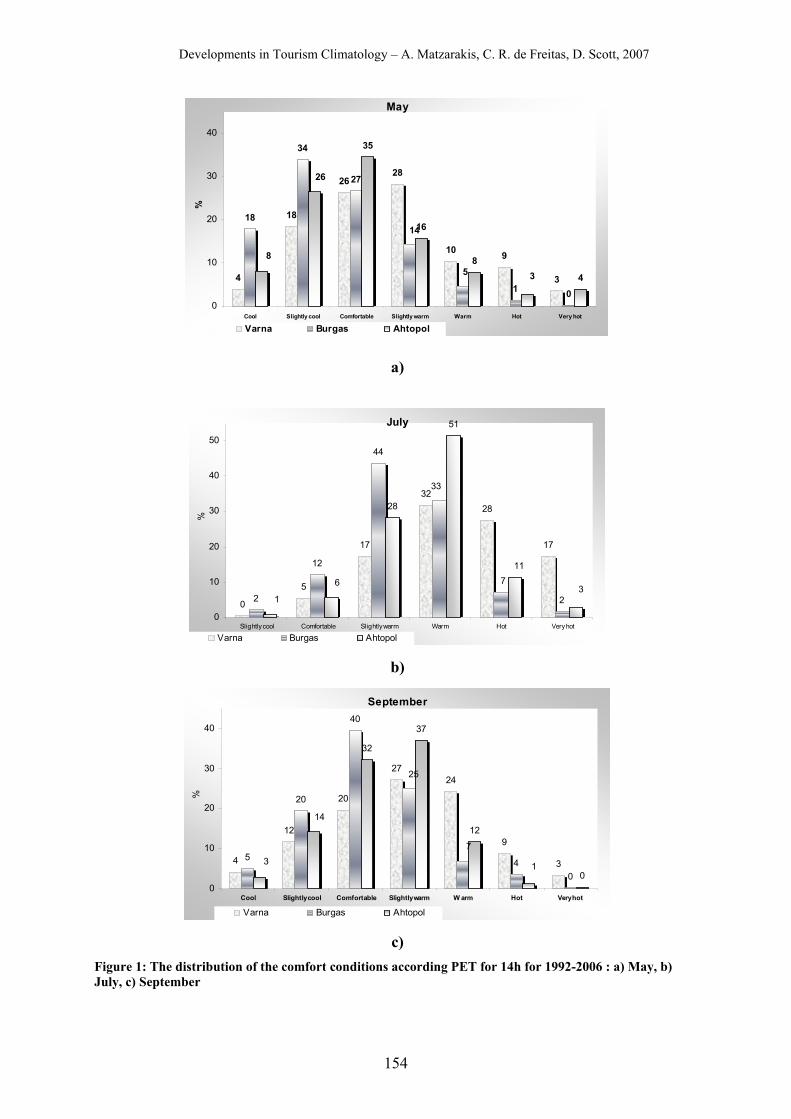
Developments in Tourism Climatology – A. Matzarakis, C. R. de Freitas, D. Scott, 2007
154
May
4
18
2628
10 9
3
18
34
27
1 0
35
16
8
4
14
5 3
8
26
0
10
20
30
40
Cool Slightly cool Comfortable Slightly warm Warm Hot Very hot
%
Varna Burgas Ahtopol
a)
July
0
5
17
3228
17
2
12
44
2
28
51
7
33
6
13
11
0
10
20
30
40
50
Slightly cool Comfortable Slightly warm Warm Hot Very hot
%
Varna Burgas Ahtopol b)
September
4
12
20
2724
9
35
20
40
40
32
37
12
0
7
25
14
3 1
0
10
20
30
40
Cool Slightly cool Comfortable Slightly warm W arm Hot Very hot
%
Varna Burgas Ahtopol c)
Figure 1: The distribution of the comfort conditions according PET for 14h for 1992-2006 : a) May, b) July, c) September
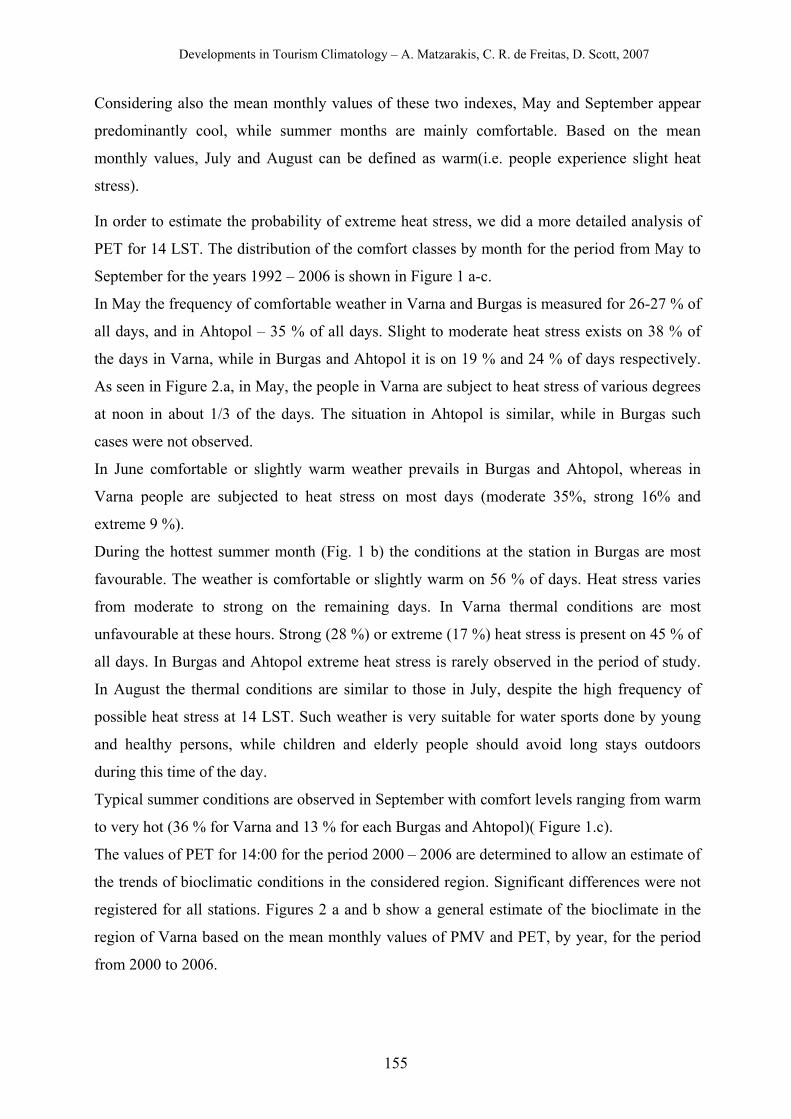
Developments in Tourism Climatology – A. Matzarakis, C. R. de Freitas, D. Scott, 2007
155
Considering also the mean monthly values of these two indexes, May and September appear
predominantly cool, while summer months are mainly comfortable. Based on the mean
monthly values, July and August can be defined as warm(i.e. people experience slight heat
stress).
In order to estimate the probability of extreme heat stress, we did a more detailed analysis of
PET for 14 LST. The distribution of the comfort classes by month for the period from May to
September for the years 1992 – 2006 is shown in Figure 1 a-c.
In May the frequency of comfortable weather in Varna and Burgas is measured for 26-27 % of
all days, and in Ahtopol – 35 % of all days. Slight to moderate heat stress exists on 38 % of
the days in Varna, while in Burgas and Ahtopol it is on 19 % and 24 % of days respectively.
As seen in Figure 2.a, in May, the people in Varna are subject to heat stress of various degrees
at noon in about 1/3 of the days. The situation in Ahtopol is similar, while in Burgas such
cases were not observed.
In June comfortable or slightly warm weather prevails in Burgas and Ahtopol, whereas in
Varna people are subjected to heat stress on most days (moderate 35%, strong 16% and
extreme 9 %).
During the hottest summer month (Fig. 1 b) the conditions at the station in Burgas are most
favourable. The weather is comfortable or slightly warm on 56 % of days. Heat stress varies
from moderate to strong on the remaining days. In Varna thermal conditions are most
unfavourable at these hours. Strong (28 %) or extreme (17 %) heat stress is present on 45 % of
all days. In Burgas and Ahtopol extreme heat stress is rarely observed in the period of study.
In August the thermal conditions are similar to those in July, despite the high frequency of
possible heat stress at 14 LST. Such weather is very suitable for water sports done by young
and healthy persons, while children and elderly people should avoid long stays outdoors
during this time of the day.
Typical summer conditions are observed in September with comfort levels ranging from warm
to very hot (36 % for Varna and 13 % for each Burgas and Ahtopol)( Figure 1.c).
The values of PET for 14:00 for the period 2000 – 2006 are determined to allow an estimate of
the trends of bioclimatic conditions in the considered region. Significant differences were not
registered for all stations. Figures 2 a and b show a general estimate of the bioclimate in the
region of Varna based on the mean monthly values of PMV and PET, by year, for the period
from 2000 to 2006.
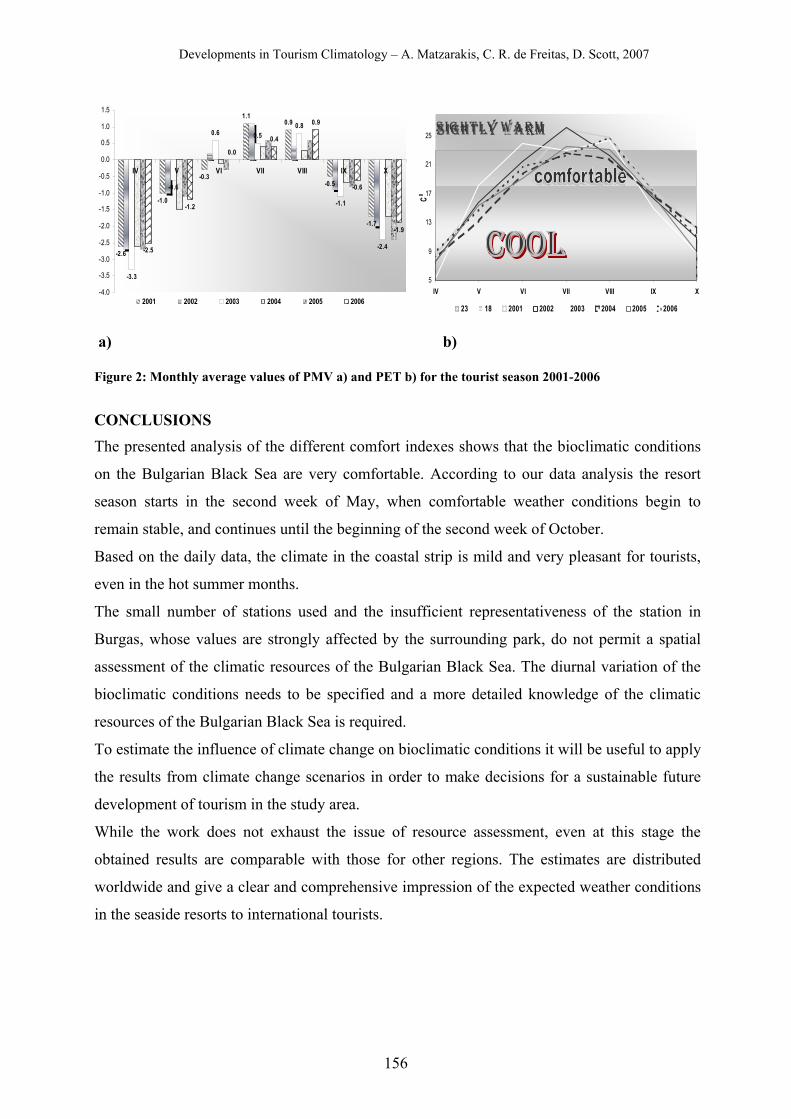
Developments in Tourism Climatology – A. Matzarakis, C. R. de Freitas, D. Scott, 2007
156
a) b) Figure 2: Monthly average values of PMV a) and PET b) for the tourist season 2001-2006
CONCLUSIONS The presented analysis of the different comfort indexes shows that the bioclimatic conditions
on the Bulgarian Black Sea are very comfortable. According to our data analysis the resort
season starts in the second week of May, when comfortable weather conditions begin to
remain stable, and continues until the beginning of the second week of October.
Based on the daily data, the climate in the coastal strip is mild and very pleasant for tourists,
even in the hot summer months.
The small number of stations used and the insufficient representativeness of the station in
Burgas, whose values are strongly affected by the surrounding park, do not permit a spatial
assessment of the climatic resources of the Bulgarian Black Sea. The diurnal variation of the
bioclimatic conditions needs to be specified and a more detailed knowledge of the climatic
resources of the Bulgarian Black Sea is required.
To estimate the influence of climate change on bioclimatic conditions it will be useful to apply
the results from climate change scenarios in order to make decisions for a sustainable future
development of tourism in the study area.
While the work does not exhaust the issue of resource assessment, even at this stage the
obtained results are comparable with those for other regions. The estimates are distributed
worldwide and give a clear and comprehensive impression of the expected weather conditions
in the seaside resorts to international tourists.
-2.6
-1.0
-0.3
1.10.9
-0.5
-1.7
-3.3
-0.6
0.6 0.50.8
-1.1
-2.4-2.5
-1.2
0.0
0.4
0.9
-0.6
-1.9
-4.0
-3.5
-3.0
-2.5
-2.0
-1.5
-1.0
-0.5
0.0
0.5
1.0
1.5
IV V VI VII VIII IX X
2001 2002 2003 2004 2005 2006
5
9
13
17
21
25
IV V VI VII VIII IX X
C0
23 18 2001 2002 2003 2004 2005 2006
Developments in Tourism Climatology – A. Matzarakis, C. R. de Freitas, D. Scott, 2007
157
REFERENCES Höppe P. R. (1999) The physiological equivalent temperature – a universal index for
thebiometeorological assessment of the thermal environment. Int. J. Biometeorol. 43: 71-75. Jendritzky, G., Menz, G., Schirmer, H., Schmidt-Kessen, W. (1990) Methodik zur
raumbezogenen Bewertung der thermischen Komponente im Bioklima des Menschen, (Fortgeschriebenes Klima-Michel-Modell). Beiträge d. Akad. f. Raumforschung und Landsplanung, 114, Hanover.
Kyle WJ (1994) The human bioclimate of Hong Kong. In Brazdil R, Kola´ Þ M (eds) Proceedings of the Contemporary Climatology Conference, Brno. TISK LITERA, Brno., pp 345–350.
Matzarakis, A. – Mayer, H. – Iziomon, M. (1999) Applications of a universal thermal index: physiological equivalent temperature. International Journal of Biometeorology 43: 76-84.
Matzarakis, A., Rutz, F., Mayer, H. (2007) Modelling Radiation fluxes in easy and complex environments – Application of the RayMan model. Int. J. Biometeor. 51: 323-334.
Matzarakis, A. – de Freitas, C. – Scott, D. (eds.) (2004) Advances in tourism climatology. Ber. Meteorol. Inst. Univ. Freiburg Nr. 12.
Morabito, M., Bacci, A.C.I. (2003) ARPA Rivista No2, Caldo, freddo e biometeorologici. April 2003, 29-31.
Tzenkova, A., Kandjov, I. Ivancheva, J. (2003) Biometeorological Aspects of Urban Climate in Sofia. EURASAP Newsletter, June 2003, 49.
Unger, J. (1999); Comparisons of urban and rural bioclimatological conditions in the case of a Central-European city. Int. J. Biometeor. 43: 139-144.
Developments in Tourism Climatology – A. Matzarakis, C. R. de Freitas, D. Scott, 2007
158
SPA DESTINATION DEVELOPMENT USING A DECISION SUPPORT SYSTEM - THE ROLE OF CLIMATE AND BIOCLIMATE INFORMATION
E.A. Didascalou1, P.Th. Nastos2, A. Matzarakis3
1Department of Business Administration, University of Piraeus, Greece
2Laboratory of Climatology and Atmospheric Environment, University of Athens, Greece 3Meteorological Institute, University of Freiburg, Germany
ABSTRACT The success of a tourism destination in attracting tourists depends upon the
quality of the essential benefits that it offers. Especially for spa tourism (the term spa is used
here to describe health-oriented vacation opportunities) it is crucial to offer not only facilities,
accessibility and attractions, but also natural factors such as a good bioclimate regime. The
study will propose a decision support system (DSS) that takes into account the bioclimate
regime and spa features crucial for spa tourism development in Greece. The DSS will be
based on a computer based information system and will aid an evaluation of the factors
mentioned previously and is the decision making regarding the suitability of a place for a
health/spa resort.
KEYWORDS: Spa/health/wellness tourism, bioclimate regime, DSS, Analytical Hierarchy Process INTRODUCTION Previous papers on health tourism have defined climate as an important factor that satisfies
the needs of visitors of a spa/health resort (Didaskalou et al., 2004). The good climatic and
bioclimatic conditions are of crucial importance for the competitiveness of a destination as
weather and climate are the main motivations for travel, apart from the destination’s natural
resource base and attractions. Effective planning and management of a destination must take
account of many factors that influence one’s choice of a holiday to a specific region,
especially when the tourism product is coherent with the market segment of spa tourism. It
must be mentioned that, although the term health/spa/wellness tourism is widely used in
European tourism, unfortunately there is no universally agreed-upon definition of spa tourism.
For the purposes of this study it is assumed that tourism activities of this market segment are
for “healthy” people whose main motive is to preserve or improve their health.
The diverse nature of recreation and tourism makes it hard for policy-makers and planners to
define it and grasp it conceptually. This has resulted in substantial difficulties to develop
appropriate policies, while the coordination of the various elements of the recreation and
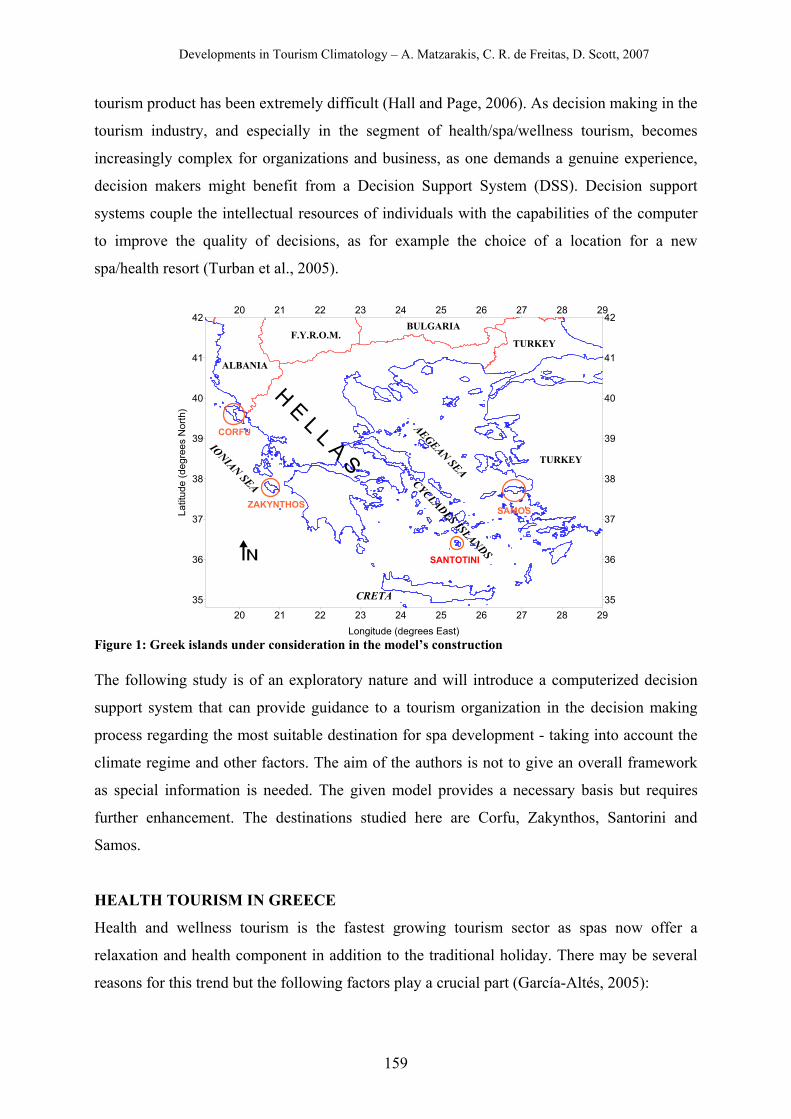
Developments in Tourism Climatology – A. Matzarakis, C. R. de Freitas, D. Scott, 2007
159
tourism product has been extremely difficult (Hall and Page, 2006). As decision making in the
tourism industry, and especially in the segment of health/spa/wellness tourism, becomes
increasingly complex for organizations and business, as one demands a genuine experience,
decision makers might benefit from a Decision Support System (DSS). Decision support
systems couple the intellectual resources of individuals with the capabilities of the computer
to improve the quality of decisions, as for example the choice of a location for a new
spa/health resort (Turban et al., 2005).
20 21 22 23 24 25 26 27 28 29Longitude (degrees East)
20 21 22 23 24 25 26 27 28 29
35
36
37
38
39
40
41
42
Latit
ude
(deg
rees
Nor
th)
35
36
37
38
39
40
41
42
ALBANIA
F.Y.R.O.M.BULGARIA
TURKEY
TURKEY
IONIAN SEA
AEGEAN SEACYCLADES ISLANDS
CRETA
H E L L A S
SANTOTINI
ZAKYNTHOS
CORFU
SAMOS
Figure 1: Greek islands under consideration in the model’s construction The following study is of an exploratory nature and will introduce a computerized decision
support system that can provide guidance to a tourism organization in the decision making
process regarding the most suitable destination for spa development - taking into account the
climate regime and other factors. The aim of the authors is not to give an overall framework
as special information is needed. The given model provides a necessary basis but requires
further enhancement. The destinations studied here are Corfu, Zakynthos, Santorini and
Samos.
HEALTH TOURISM IN GREECE
Health and wellness tourism is the fastest growing tourism sector as spas now offer a
relaxation and health component in addition to the traditional holiday. There may be several
reasons for this trend but the following factors play a crucial part (García-Altés, 2005):
Developments in Tourism Climatology – A. Matzarakis, C. R. de Freitas, D. Scott, 2007
160
Population Ageing: The postwar baby-boom cohort is approaching the age of highest
disposable income and highest propensity to travel. They may be less price-conscious and
also more sensitive to other aspects of the marketing mix (location, destinations,
confidentiality, quality, etc.)
Lifestyle Changes: Demographics and lifestyles of these target markets will mean a marked
increase in demand for cosmetic surgery, spas, retirement communities, fitness centres, and
addiction treatment centres.
Tourism Alternatives: Today’s consumers are already well-traveled and look for a new and
different holiday experience.
As there will be an increasing demand for spiritual products based on inner experiences, a
current boom for health and spa products is expected. Health products will also increasingly
be added to other tourism and leisure products and accommodation operators will develop
combined products in the areas of health and creative tourism.
Tourism in Greece has been growing significantly in certain areas such as Rodos, Crete,
Corfu and Myconos. As the environmental impact is very extensive, the attempt to promote
off-peak tourism to these or other destinations represents one way of reducing the pressure on
the environment (Didaskalou and Nastos, 2003). The issue of seasonality in tourism flows has
attracted the attention of tourism researchers for several decades (Amelung et al., 2007). The
conventional sun-and-sea segment is still the dominating form of Greek tourism, but the
seasonality in tourism flows has attracted the attention of those who are responsible for
providing guidance for the industry. One of the objectives of the Greek tourism strategy is to
promote various forms of tourism and, indirectly, reduce the seasonality of demand. Within
the scope of this strategy investments of special tourism infrastructure for the development of
thematic forms of tourism (hydrotherapy centres etc.) are financed. The trend of decline in spa
tourism in Greece is a consequence of the focus that is set on reducing the guest’s illness. On
the other hand, wellness is seen as a new market segment and is being strongly encouraged
through attractive package deals. The enrichment of the Greek spa tourism product is
necessary as it is affected by a growing competition from emerging countries, especially from
Eastern Europe. Competition is also emerging from countries that reposition themselves in the
market by diversifying the old-fashioned image these resorts conveys, which is basically
linked to health and mainly addressed to an aged segment. Facilities that may be provided by
spa resorts are: sauna, solarium, sport/fitness, steam bath, swimming pool, whirlpool and a
medical centre (Müller and Kaufmann, 2001). It is an asset if the resort offers services using
thermal spring water.
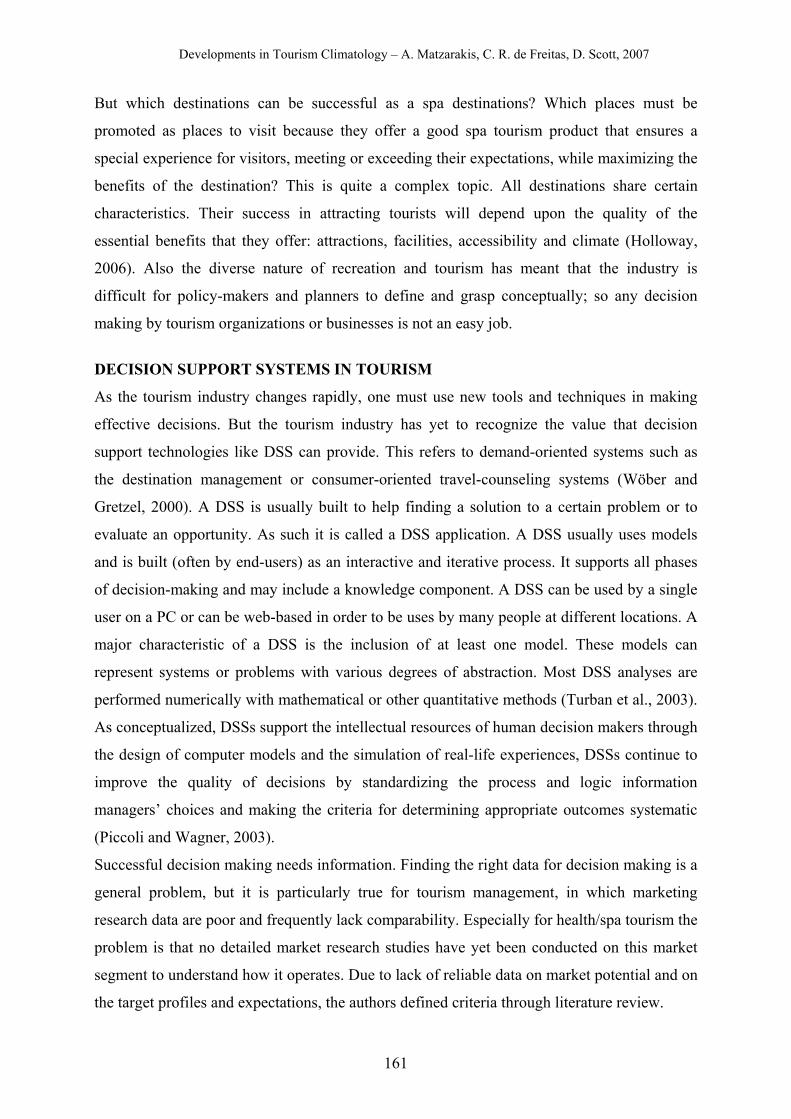
Developments in Tourism Climatology – A. Matzarakis, C. R. de Freitas, D. Scott, 2007
161
But which destinations can be successful as a spa destinations? Which places must be
promoted as places to visit because they offer a good spa tourism product that ensures a
special experience for visitors, meeting or exceeding their expectations, while maximizing the
benefits of the destination? This is quite a complex topic. All destinations share certain
characteristics. Their success in attracting tourists will depend upon the quality of the
essential benefits that they offer: attractions, facilities, accessibility and climate (Holloway,
2006). Also the diverse nature of recreation and tourism has meant that the industry is
difficult for policy-makers and planners to define and grasp conceptually; so any decision
making by tourism organizations or businesses is not an easy job.
DECISION SUPPORT SYSTEMS IN TOURISM
As the tourism industry changes rapidly, one must use new tools and techniques in making
effective decisions. But the tourism industry has yet to recognize the value that decision
support technologies like DSS can provide. This refers to demand-oriented systems such as
the destination management or consumer-oriented travel-counseling systems (Wöber and
Gretzel, 2000). A DSS is usually built to help finding a solution to a certain problem or to
evaluate an opportunity. As such it is called a DSS application. A DSS usually uses models
and is built (often by end-users) as an interactive and iterative process. It supports all phases
of decision-making and may include a knowledge component. A DSS can be used by a single
user on a PC or can be web-based in order to be uses by many people at different locations. A
major characteristic of a DSS is the inclusion of at least one model. These models can
represent systems or problems with various degrees of abstraction. Most DSS analyses are
performed numerically with mathematical or other quantitative methods (Turban et al., 2003).
As conceptualized, DSSs support the intellectual resources of human decision makers through
the design of computer models and the simulation of real-life experiences, DSSs continue to
improve the quality of decisions by standardizing the process and logic information
managers’ choices and making the criteria for determining appropriate outcomes systematic
(Piccoli and Wagner, 2003).
Successful decision making needs information. Finding the right data for decision making is a
general problem, but it is particularly true for tourism management, in which marketing
research data are poor and frequently lack comparability. Especially for health/spa tourism the
problem is that no detailed market research studies have yet been conducted on this market
segment to understand how it operates. Due to lack of reliable data on market potential and on
the target profiles and expectations, the authors defined criteria through literature review.
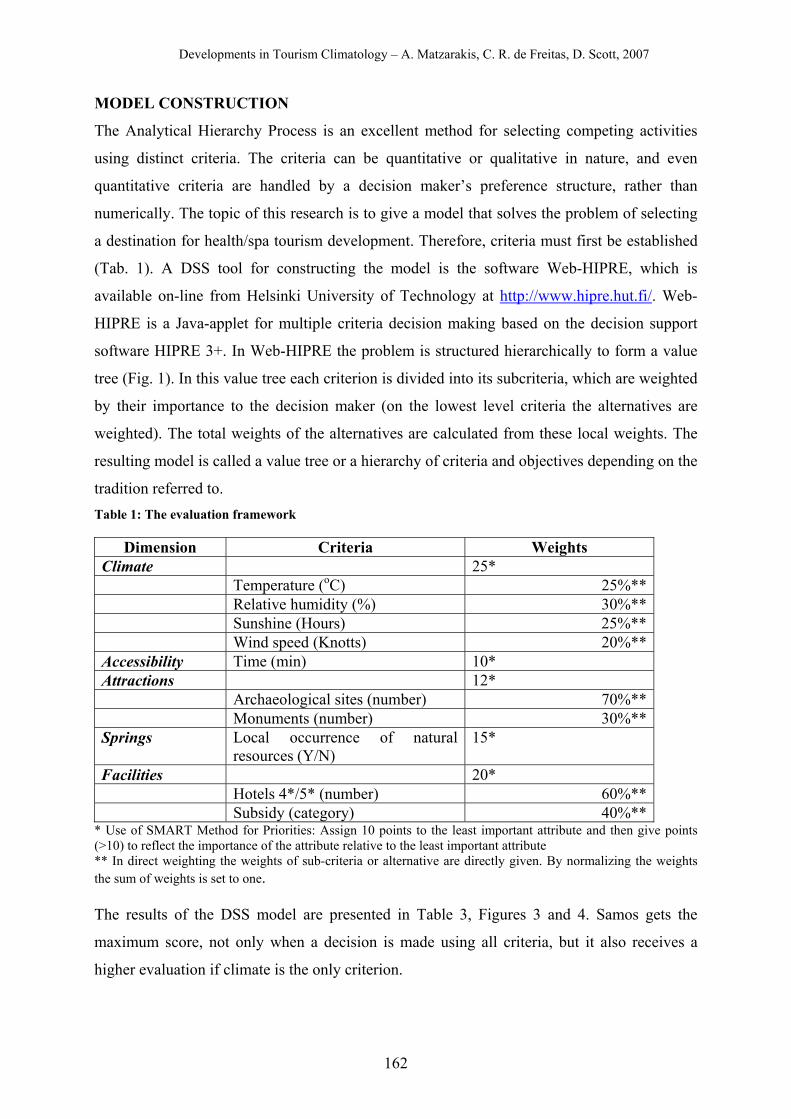
Developments in Tourism Climatology – A. Matzarakis, C. R. de Freitas, D. Scott, 2007
162
MODEL CONSTRUCTION
The Analytical Hierarchy Process is an excellent method for selecting competing activities
using distinct criteria. The criteria can be quantitative or qualitative in nature, and even
quantitative criteria are handled by a decision maker’s preference structure, rather than
numerically. The topic of this research is to give a model that solves the problem of selecting
a destination for health/spa tourism development. Therefore, criteria must first be established
(Tab. 1). A DSS tool for constructing the model is the software Web-HIPRE, which is
available on-line from Helsinki University of Technology at http://www.hipre.hut.fi/. Web-
HIPRE is a Java-applet for multiple criteria decision making based on the decision support
software HIPRE 3+. In Web-HIPRE the problem is structured hierarchically to form a value
tree (Fig. 1). In this value tree each criterion is divided into its subcriteria, which are weighted
by their importance to the decision maker (on the lowest level criteria the alternatives are
weighted). The total weights of the alternatives are calculated from these local weights. The
resulting model is called a value tree or a hierarchy of criteria and objectives depending on the
tradition referred to. Table 1: The evaluation framework
Dimension Criteria Weights Climate 25* Temperature (oC) 25%** Relative humidity (%) 30%** Sunshine (Hours) 25%** Wind speed (Knotts) 20%** Accessibility Time (min) 10* Attractions 12* Archaeological sites (number) 70%** Monuments (number) 30%** Springs Local occurrence of natural
resources (Y/N) 15*
Facilities 20* Hotels 4*/5* (number) 60%** Subsidy (category) 40%**
* Use of SMART Method for Priorities: Assign 10 points to the least important attribute and then give points (>10) to reflect the importance of the attribute relative to the least important attribute ** In direct weighting the weights of sub-criteria or alternative are directly given. By normalizing the weights the sum of weights is set to one. The results of the DSS model are presented in Table 3, Figures 3 and 4. Samos gets the
maximum score, not only when a decision is made using all criteria, but it also receives a
higher evaluation if climate is the only criterion.
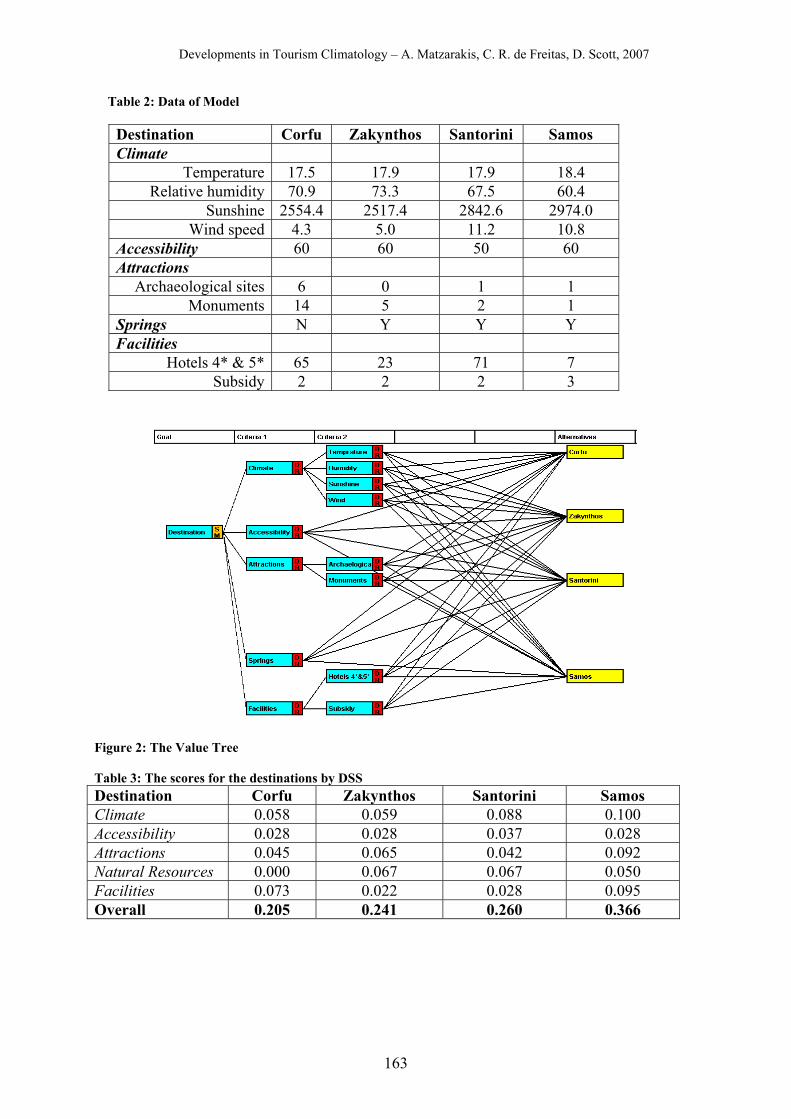
Developments in Tourism Climatology – A. Matzarakis, C. R. de Freitas, D. Scott, 2007
163
Table 2: Data of Model
Destination Corfu Zakynthos Santorini Samos Climate
Temperature 17.5 17.9 17.9 18.4 Relative humidity 70.9 73.3 67.5 60.4
Sunshine 2554.4 2517.4 2842.6 2974.0 Wind speed 4.3 5.0 11.2 10.8
Accessibility 60 60 50 60 Attractions
Archaeological sites 6 0 1 1 Monuments 14 5 2 1
Springs N Y Y Y Facilities
Hotels 4* & 5* 65 23 71 7 Subsidy 2 2 2 3
Figure 2: The Value Tree Table 3: The scores for the destinations by DSS Destination Corfu Zakynthos Santorini Samos Climate 0.058 0.059 0.088 0.100 Accessibility 0.028 0.028 0.037 0.028 Attractions 0.045 0.065 0.042 0.092 Natural Resources 0.000 0.067 0.067 0.050 Facilities 0.073 0.022 0.028 0.095 Overall 0.205 0.241 0.260 0.366
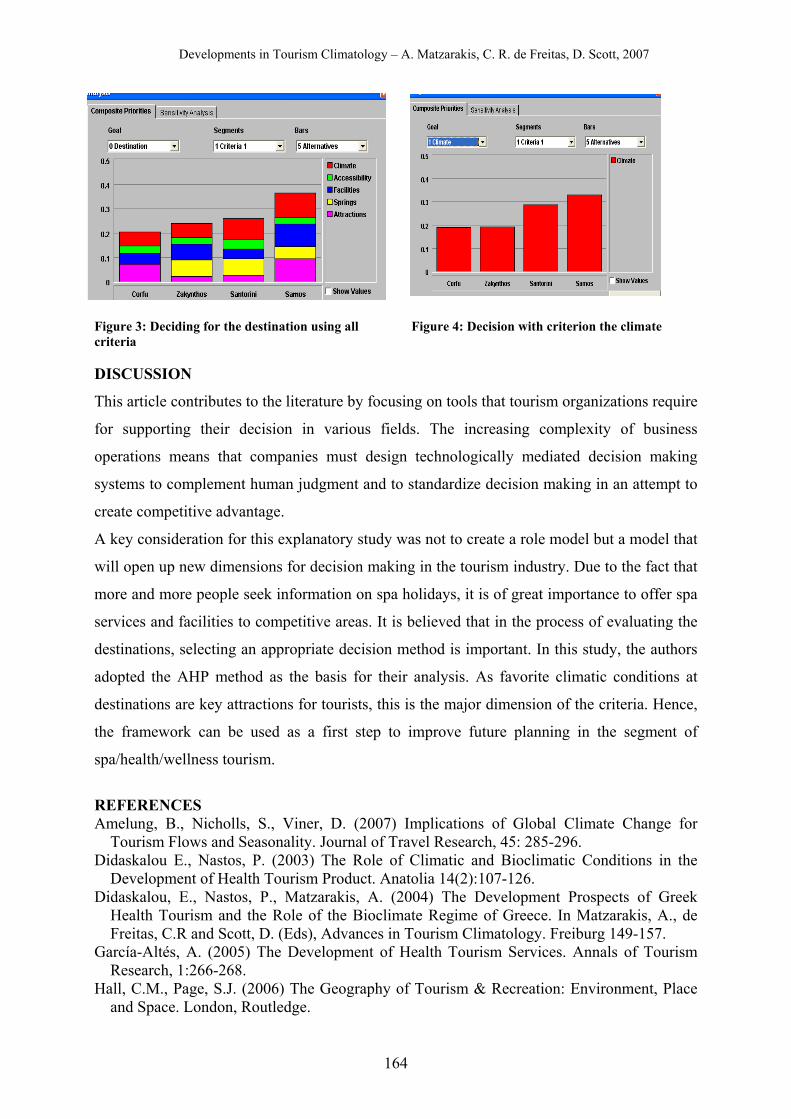
Developments in Tourism Climatology – A. Matzarakis, C. R. de Freitas, D. Scott, 2007
164
Figure 3: Deciding for the destination using all criteria
Figure 4: Decision with criterion the climate
DISCUSSION
This article contributes to the literature by focusing on tools that tourism organizations require
for supporting their decision in various fields. The increasing complexity of business
operations means that companies must design technologically mediated decision making
systems to complement human judgment and to standardize decision making in an attempt to
create competitive advantage.
A key consideration for this explanatory study was not to create a role model but a model that
will open up new dimensions for decision making in the tourism industry. Due to the fact that
more and more people seek information on spa holidays, it is of great importance to offer spa
services and facilities to competitive areas. It is believed that in the process of evaluating the
destinations, selecting an appropriate decision method is important. In this study, the authors
adopted the AHP method as the basis for their analysis. As favorite climatic conditions at
destinations are key attractions for tourists, this is the major dimension of the criteria. Hence,
the framework can be used as a first step to improve future planning in the segment of
spa/health/wellness tourism.
REFERENCES Amelung, B., Nicholls, S., Viner, D. (2007) Implications of Global Climate Change for
Tourism Flows and Seasonality. Journal of Travel Research, 45: 285-296. Didaskalou E., Nastos, P. (2003) The Role of Climatic and Bioclimatic Conditions in the
Development of Health Tourism Product. Anatolia 14(2):107-126. Didaskalou, E., Nastos, P., Matzarakis, A. (2004) The Development Prospects of Greek
Health Tourism and the Role of the Bioclimate Regime of Greece. In Matzarakis, A., de Freitas, C.R and Scott, D. (Eds), Advances in Tourism Climatology. Freiburg 149-157.
García-Altés, A. (2005) The Development of Health Tourism Services. Annals of Tourism Research, 1:266-268.
Hall, C.M., Page, S.J. (2006) The Geography of Tourism & Recreation: Environment, Place and Space. London, Routledge.

Developments in Tourism Climatology – A. Matzarakis, C. R. de Freitas, D. Scott, 2007
165
Holloway, J.C. (2006) The Business of Tourism. England, Pearson Education Limited Mueller, H., Kaufmann E.L. (2001) Wellness tourism: Market Analysis of a Special Health
Tourism Segment and Implications for the Hotel Industry. Journal of Vacation Marketing, 7:5-17.
Piccoli, G., Wagner, E.L (2003) The Value of Academic Research. Cornell Hotel and Restaurant Administration Quarterly, 44 (29): 29-38.
Turban, E., Aronson J. E., Liang T.-P. (2005) Decision Support Systems and Intelligent Systems. New Jersey, Pearson Education.
Wöber, K., Gretzel, U. (2000) Tourism Managers’ Adoption of Marketing Decision Support Systems. Journal of Travel Research 39:172-181.
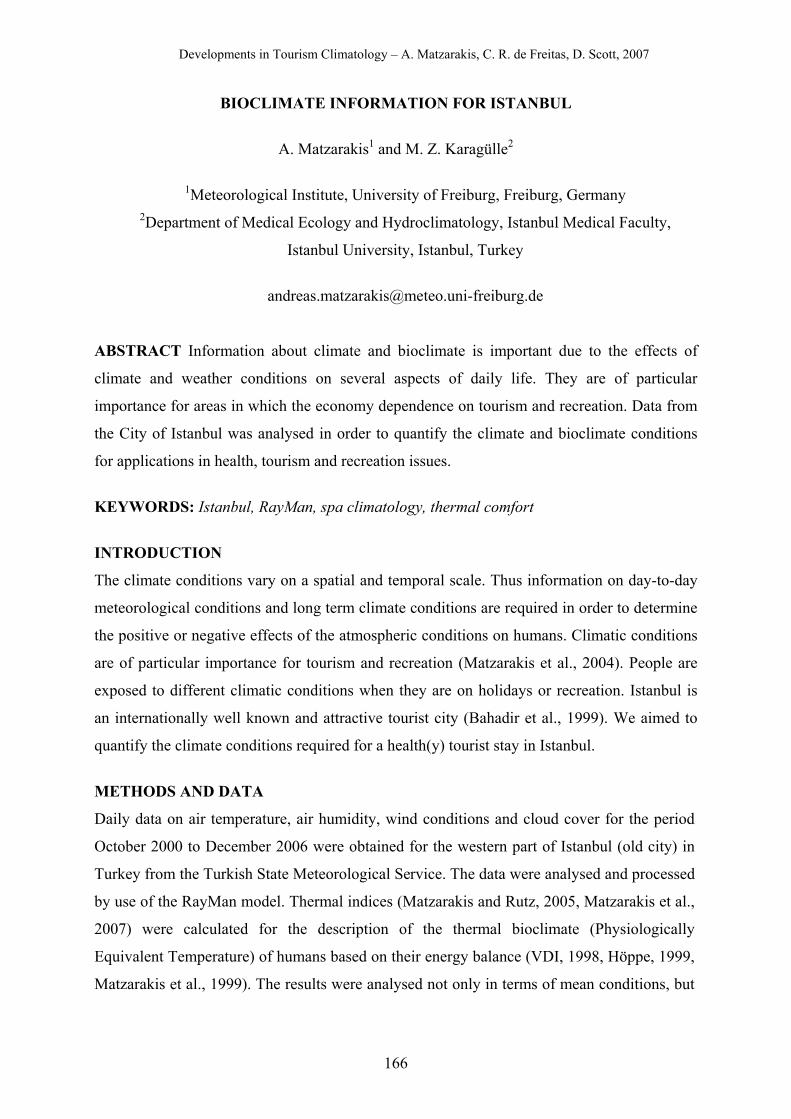
Developments in Tourism Climatology – A. Matzarakis, C. R. de Freitas, D. Scott, 2007
166
BIOCLIMATE INFORMATION FOR ISTANBUL
A. Matzarakis1 and M. Z. Karagülle2
1Meteorological Institute, University of Freiburg, Freiburg, Germany
2Department of Medical Ecology and Hydroclimatology, Istanbul Medical Faculty,
Istanbul University, Istanbul, Turkey
ABSTRACT Information about climate and bioclimate is important due to the effects of
climate and weather conditions on several aspects of daily life. They are of particular
importance for areas in which the economy dependence on tourism and recreation. Data from
the City of Istanbul was analysed in order to quantify the climate and bioclimate conditions
for applications in health, tourism and recreation issues.
KEYWORDS: Istanbul, RayMan, spa climatology, thermal comfort
INTRODUCTION
The climate conditions vary on a spatial and temporal scale. Thus information on day-to-day
meteorological conditions and long term climate conditions are required in order to determine
the positive or negative effects of the atmospheric conditions on humans. Climatic conditions
are of particular importance for tourism and recreation (Matzarakis et al., 2004). People are
exposed to different climatic conditions when they are on holidays or recreation. Istanbul is
an internationally well known and attractive tourist city (Bahadir et al., 1999). We aimed to
quantify the climate conditions required for a health(y) tourist stay in Istanbul.
METHODS AND DATA
Daily data on air temperature, air humidity, wind conditions and cloud cover for the period
October 2000 to December 2006 were obtained for the western part of Istanbul (old city) in
Turkey from the Turkish State Meteorological Service. The data were analysed and processed
by use of the RayMan model. Thermal indices (Matzarakis and Rutz, 2005, Matzarakis et al.,
2007) were calculated for the description of the thermal bioclimate (Physiologically
Equivalent Temperature) of humans based on their energy balance (VDI, 1998, Höppe, 1999,
Matzarakis et al., 1999). The results were analysed not only in terms of mean conditions, but
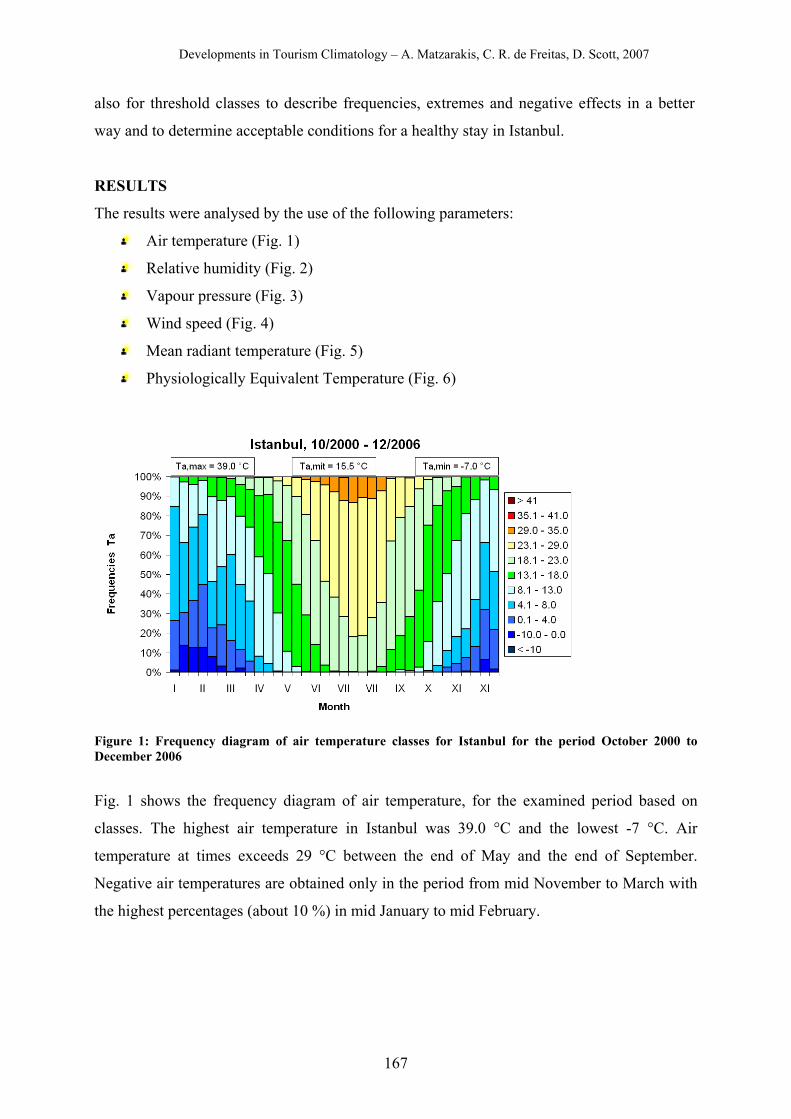
Developments in Tourism Climatology – A. Matzarakis, C. R. de Freitas, D. Scott, 2007
167
also for threshold classes to describe frequencies, extremes and negative effects in a better
way and to determine acceptable conditions for a healthy stay in Istanbul.
RESULTS
The results were analysed by the use of the following parameters:
Air temperature (Fig. 1)
Relative humidity (Fig. 2)
Vapour pressure (Fig. 3)
Wind speed (Fig. 4)
Mean radiant temperature (Fig. 5)
Physiologically Equivalent Temperature (Fig. 6)
Figure 1: Frequency diagram of air temperature classes for Istanbul for the period October 2000 to December 2006
Fig. 1 shows the frequency diagram of air temperature, for the examined period based on
classes. The highest air temperature in Istanbul was 39.0 °C and the lowest -7 °C. Air
temperature at times exceeds 29 °C between the end of May and the end of September.
Negative air temperatures are obtained only in the period from mid November to March with
the highest percentages (about 10 %) in mid January to mid February.
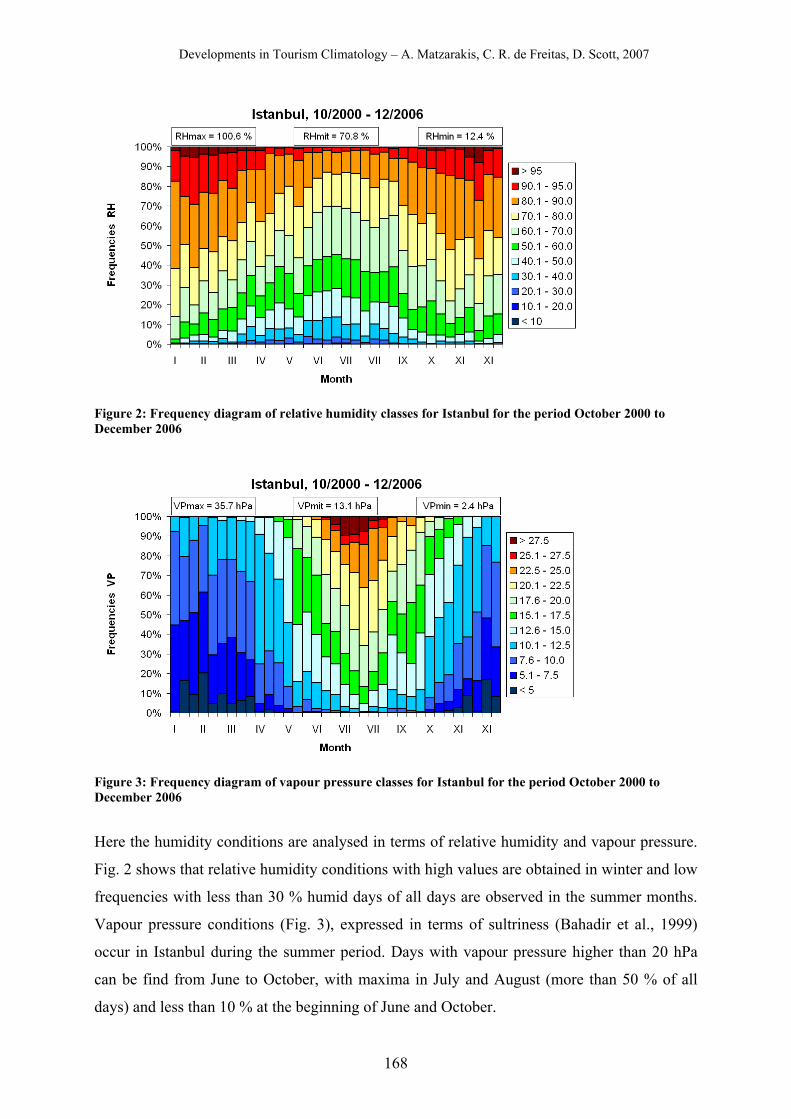
Developments in Tourism Climatology – A. Matzarakis, C. R. de Freitas, D. Scott, 2007
168
Figure 2: Frequency diagram of relative humidity classes for Istanbul for the period October 2000 to December 2006
Figure 3: Frequency diagram of vapour pressure classes for Istanbul for the period October 2000 to December 2006
Here the humidity conditions are analysed in terms of relative humidity and vapour pressure.
Fig. 2 shows that relative humidity conditions with high values are obtained in winter and low
frequencies with less than 30 % humid days of all days are observed in the summer months.
Vapour pressure conditions (Fig. 3), expressed in terms of sultriness (Bahadir et al., 1999)
occur in Istanbul during the summer period. Days with vapour pressure higher than 20 hPa
can be find from June to October, with maxima in July and August (more than 50 % of all
days) and less than 10 % at the beginning of June and October.
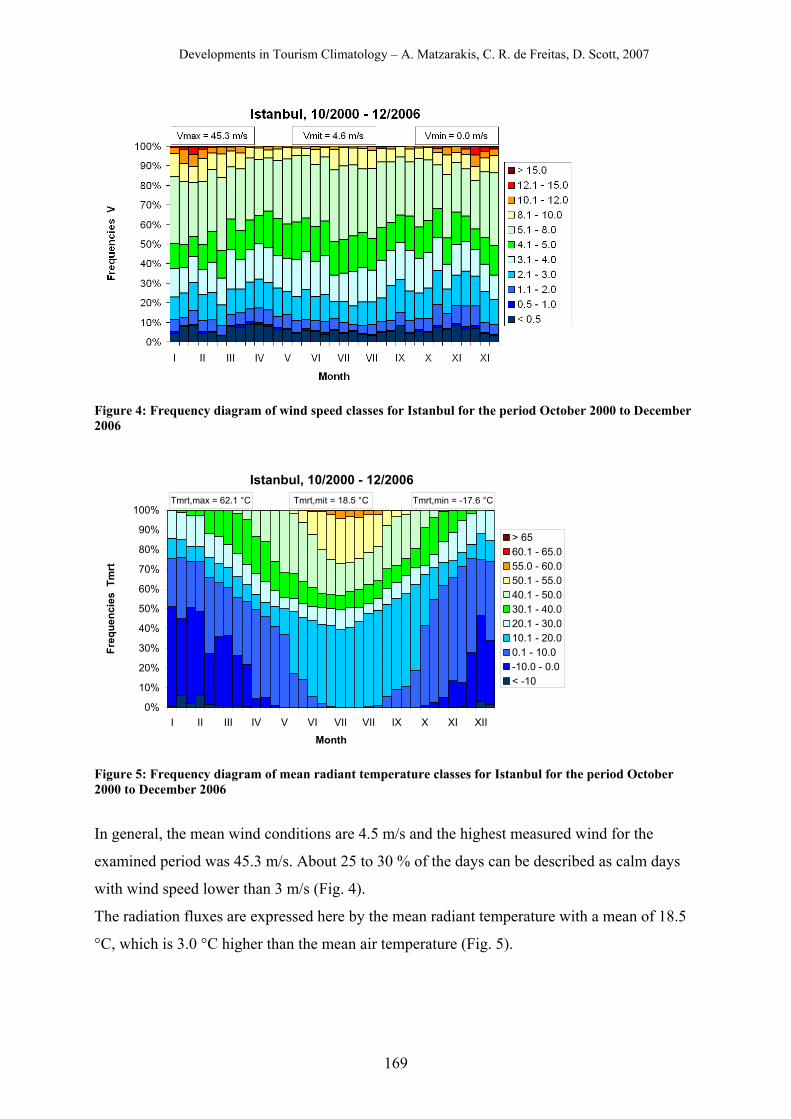
Developments in Tourism Climatology – A. Matzarakis, C. R. de Freitas, D. Scott, 2007
169
Figure 4: Frequency diagram of wind speed classes for Istanbul for the period October 2000 to December 2006
Istanbul, 10/2000 - 12/2006
0%
10%
20%
30%
40%
50%
60%
70%
80%
90%
100%
I II III IV V VI VII VII IX X XI XII
Month
Freq
uenc
ies
Tm
rt
> 6560.1 - 65.055.0 - 60.050.1 - 55.040.1 - 50.030.1 - 40.020.1 - 30.010.1 - 20.00.1 - 10.0-10.0 - 0.0< -10
Tmrt,max = 62.1 °C Tmrt,mit = 18.5 °C Tmrt,min = -17.6 °C
Figure 5: Frequency diagram of mean radiant temperature classes for Istanbul for the period October 2000 to December 2006
In general, the mean wind conditions are 4.5 m/s and the highest measured wind for the
examined period was 45.3 m/s. About 25 to 30 % of the days can be described as calm days
with wind speed lower than 3 m/s (Fig. 4).
The radiation fluxes are expressed here by the mean radiant temperature with a mean of 18.5
°C, which is 3.0 °C higher than the mean air temperature (Fig. 5).
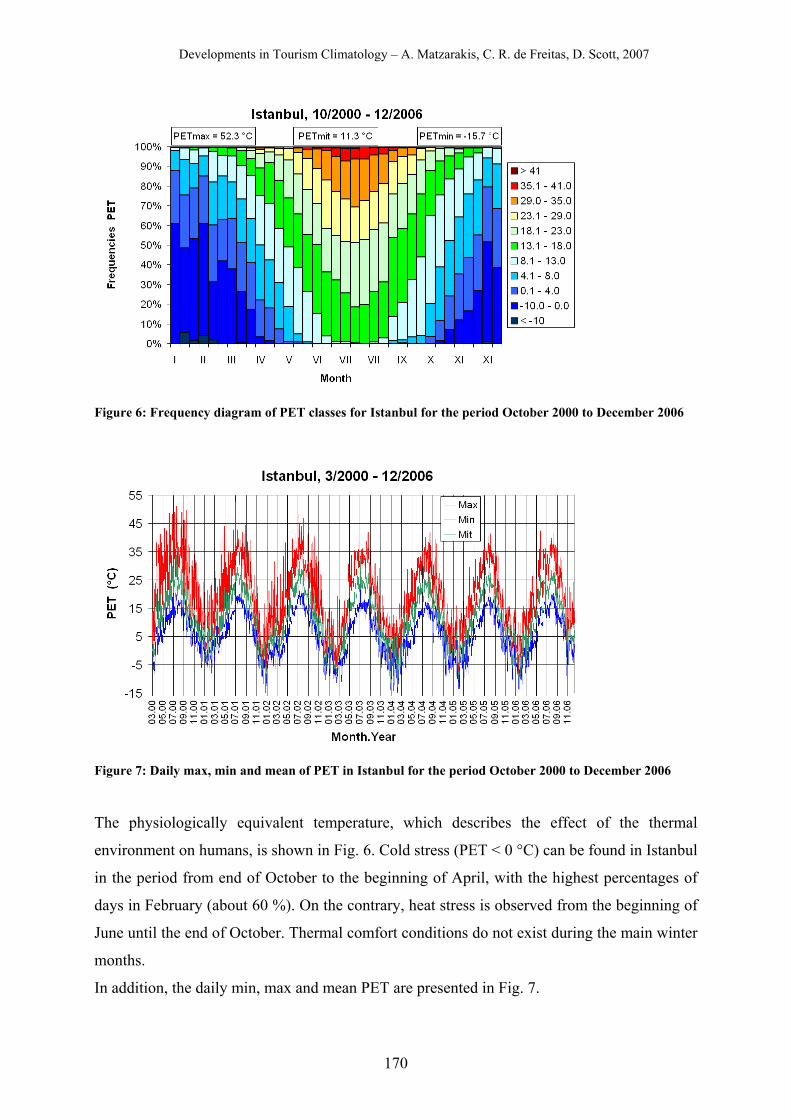
Developments in Tourism Climatology – A. Matzarakis, C. R. de Freitas, D. Scott, 2007
170
Figure 6: Frequency diagram of PET classes for Istanbul for the period October 2000 to December 2006
Figure 7: Daily max, min and mean of PET in Istanbul for the period October 2000 to December 2006
The physiologically equivalent temperature, which describes the effect of the thermal
environment on humans, is shown in Fig. 6. Cold stress (PET < 0 °C) can be found in Istanbul
in the period from end of October to the beginning of April, with the highest percentages of
days in February (about 60 %). On the contrary, heat stress is observed from the beginning of
June until the end of October. Thermal comfort conditions do not exist during the main winter
months.
In addition, the daily min, max and mean PET are presented in Fig. 7.
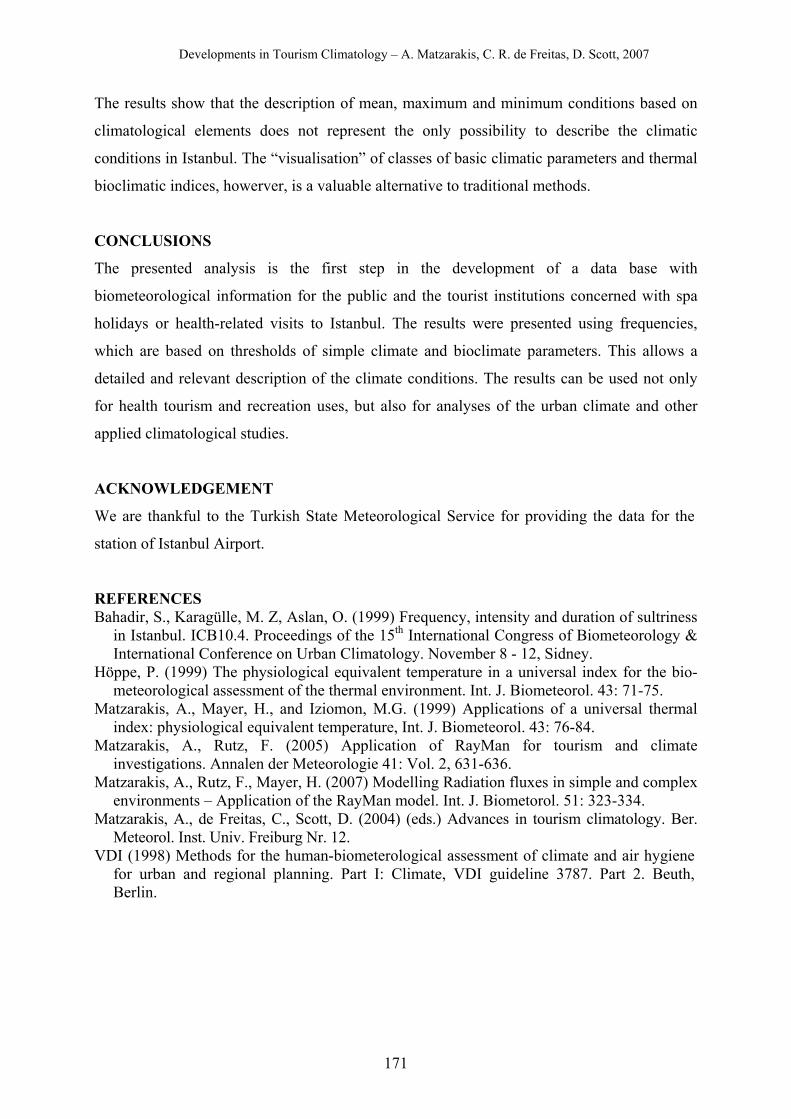
Developments in Tourism Climatology – A. Matzarakis, C. R. de Freitas, D. Scott, 2007
171
The results show that the description of mean, maximum and minimum conditions based on
climatological elements does not represent the only possibility to describe the climatic
conditions in Istanbul. The “visualisation” of classes of basic climatic parameters and thermal
bioclimatic indices, howerver, is a valuable alternative to traditional methods.
CONCLUSIONS
The presented analysis is the first step in the development of a data base with
biometeorological information for the public and the tourist institutions concerned with spa
holidays or health-related visits to Istanbul. The results were presented using frequencies,
which are based on thresholds of simple climate and bioclimate parameters. This allows a
detailed and relevant description of the climate conditions. The results can be used not only
for health tourism and recreation uses, but also for analyses of the urban climate and other
applied climatological studies.
ACKNOWLEDGEMENT
We are thankful to the Turkish State Meteorological Service for providing the data for the
station of Istanbul Airport.
REFERENCES Bahadir, S., Karagülle, M. Z, Aslan, O. (1999) Frequency, intensity and duration of sultriness
in Istanbul. ICB10.4. Proceedings of the 15th International Congress of Biometeorology & International Conference on Urban Climatology. November 8 - 12, Sidney.
Höppe, P. (1999) The physiological equivalent temperature in a universal index for the bio-meteorological assessment of the thermal environment. Int. J. Biometeorol. 43: 71-75.
Matzarakis, A., Mayer, H., and Iziomon, M.G. (1999) Applications of a universal thermal index: physiological equivalent temperature, Int. J. Biometeorol. 43: 76-84.
Matzarakis, A., Rutz, F. (2005) Application of RayMan for tourism and climate investigations. Annalen der Meteorologie 41: Vol. 2, 631-636.
Matzarakis, A., Rutz, F., Mayer, H. (2007) Modelling Radiation fluxes in simple and complex environments – Application of the RayMan model. Int. J. Biometorol. 51: 323-334.
Matzarakis, A., de Freitas, C., Scott, D. (2004) (eds.) Advances in tourism climatology. Ber. Meteorol. Inst. Univ. Freiburg Nr. 12.
VDI (1998) Methods for the human-biometerological assessment of climate and air hygiene for urban and regional planning. Part I: Climate, VDI guideline 3787. Part 2. Beuth, Berlin.
Developments in Tourism Climatology – A. Matzarakis, C. R. de Freitas, D. Scott, 2007
172
THE IMPACTS OF CLIMATE CHANGE ON SKI RESORTS AND TOURIST
TRAFFIC
M. Tepfenhart, W. Mauser and F. Siebel
Department of Geography, University of Munich, Luisenstr. 37, D - 80333 Munich,
Germany, Sebastian – Andre – Weg 8, D – 82362 Weilheim, Germany
ABSTRACT We analyze possible impacts of climate change on the traffic dynamics on
access roads to ski resorts. We applied a discrete choice model for day tourism (1) to the
hydrological catchment of the Upper Danube, covering parts of southern Germany, Austria
and Switzerland. As a consequence of the spatial concentration of ski resorts, the current
infrastructure is prone to traffic jams. We apply a macroscopic traffic model (2) in order to
simulate the traffic dynamics on the road network. In different scenarios we systematically
study the traffic dynamics on the access roads to the ski areas, varying the shift of the lower
limit of snow-reliability (3) and hence the concentration of ski resorts. We analyze the total
length of the resulting traffic jams. The results show that with increasing lower limit of snow-
reliability traffic jams will become significantly more frequent on the access roads to the ski
resorts.
KEYWORDS: Climate change, traffic dynamics, traffic jam, ski tourists, discrete choice
model
INTRODUCTION
Little is known about the potential impacts of climate change on the traffic dynamics. The
decreased risk of traffic-restricting factors in winter, such as frost and snow, road and rail
traffic is expected to have a slightly positive impact on the transportation sector. It is further
expected, that streams of traffic will relocate due to changes in recreational and holiday
behavior (Zebisch et al., 2005).
The impact of climate change on winter tourism has been examined in several studies
(Elsasser and Bürki, 2002). It is expected that the percentage of snow-reliable ski resorts in
Switzerland will drop from 85 % to 44 % if the elevation above which the snow cover is
reliable increases from 1200 m a.s.l. to 1800 m a.s.l. (Elsasser and Bürki, 2002). In this paper
we will call the elevation above which the snow cover is reliable “lower limit of snow-
Developments in Tourism Climatology – A. Matzarakis, C. R. de Freitas, D. Scott, 2007
173
reliability“. Given the possibility of artificial snow production the situation is less dramatic.
This was shown for the skiing industry in Southern Ontario (Canada) (Scott et al., 2003).
As a consequence of the spatial clustering of ski resorts at the higher elevations, the current
traffic infrastructure is prone to traffic jams. We study the traffic dynamics on the access
roads to the ski areas in different scenarios, varying the shift of the lower limit of snow-
reliability and hence the concentration of ski resorts. We analyze the total length of the
resulting traffic jams.
SKI RESORTS AND TRAFFIC DYNAMICS
We use a discrete choice model for day tourism to ski resorts in order to calculate the number
of sold tickets for each ski area (Tepfenhart et al., 2006). The model takes into account the
displacement of the lower limit of snow-reliability, the attractiveness due to existing
infrastructure and the travel times between the places of residence of day tourists and the ski
areas.
We apply DaTraM (Siebel and Mauser, 2007) in order to simulate the traffic dynamics on the
road network. DaTraM is a macroscopic model for vehicular traffic flow in a network with
multi – destinations and is based on the classic Lighthill-Whitham model.
The Origin Destination - flows (OD – flows) determined by the model for day tourism serve
as input data for DaTraM. We assume that the traffic dynamics in the network are caused
solely by day tourism to ski resorts. We further assume that tourists leave their home between
07:00 and 11:00 am, the corresponding OD-flows are equally distributed over the considered
period of time. For performance reasons, we only used major street types for the simulations.
We work on a grid with the dimensions 425 km × 430 km. Our area under investigation,
which is shown in Fig. 1, corresponds the hydrological catchment of the Upper Danube
(~75000 km²) Catchment (Zebisch et al., 2005) and contains 237 ski resorts with maximum
altitudes between 557 m a.s.l. and 3440 m a.s.l. and lift capacities between 500 persons/h and
77500 persons/h. The ski resorts are numbered in ascending order according to their maximal
height. The travel times used by the model for day tourism are calculated with DaTraM for
ideal conditions, i.e. for empty roads. Fig. 2 shows the network - the width represents the
street type and the color the corresponding degree of utilization. The figure corresponds to the
traffic situation after two hours simulation time.
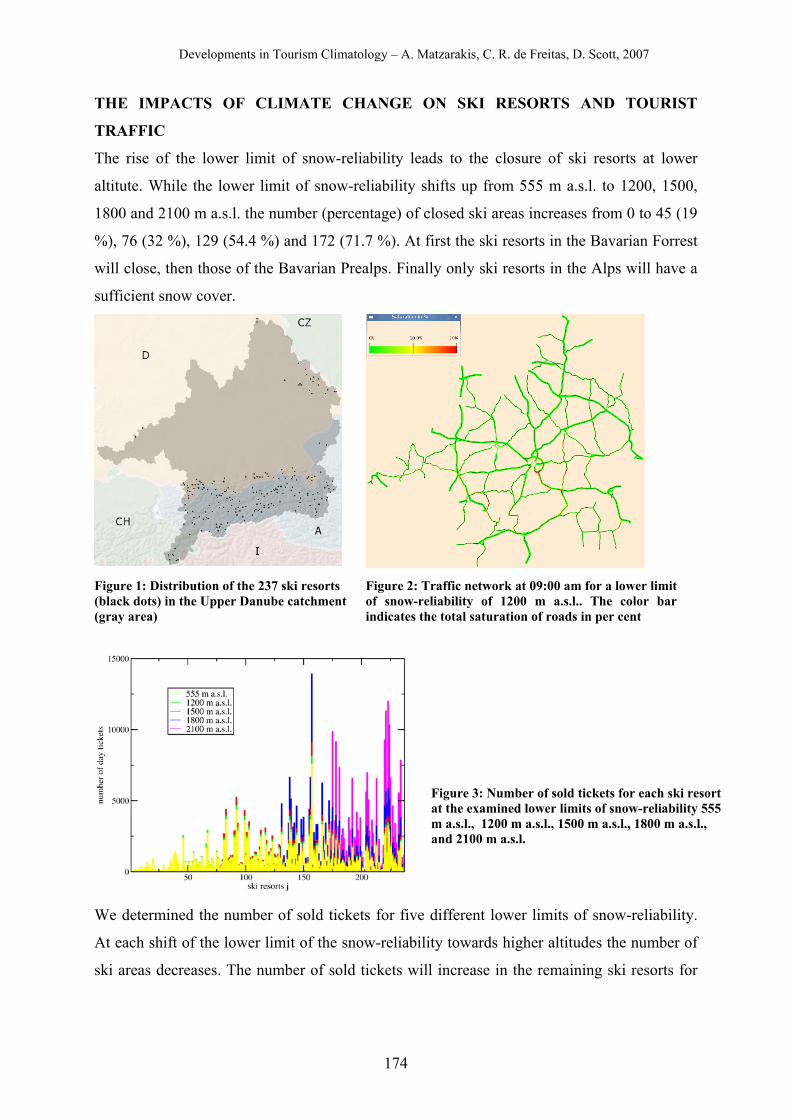
Developments in Tourism Climatology – A. Matzarakis, C. R. de Freitas, D. Scott, 2007
174
THE IMPACTS OF CLIMATE CHANGE ON SKI RESORTS AND TOURIST
TRAFFIC
The rise of the lower limit of snow-reliability leads to the closure of ski resorts at lower
altitute. While the lower limit of snow-reliability shifts up from 555 m a.s.l. to 1200, 1500,
1800 and 2100 m a.s.l. the number (percentage) of closed ski areas increases from 0 to 45 (19
%), 76 (32 %), 129 (54.4 %) and 172 (71.7 %). At first the ski resorts in the Bavarian Forrest
will close, then those of the Bavarian Prealps. Finally only ski resorts in the Alps will have a
sufficient snow cover.
Figure 1: Distribution of the 237 ski resorts (black dots) in the Upper Danube catchment (gray area)
Figure 2: Traffic network at 09:00 am for a lower limit of snow-reliability of 1200 m a.s.l.. The color bar indicates the total saturation of roads in per cent
We determined the number of sold tickets for five different lower limits of snow-reliability.
At each shift of the lower limit of the snow-reliability towards higher altitudes the number of
ski areas decreases. The number of sold tickets will increase in the remaining ski resorts for
Figure 3: Number of sold tickets for each ski resort at the examined lower limits of snow-reliability 555 m a.s.l., 1200 m a.s.l., 1500 m a.s.l., 1800 m a.s.l., and 2100 m a.s.l.
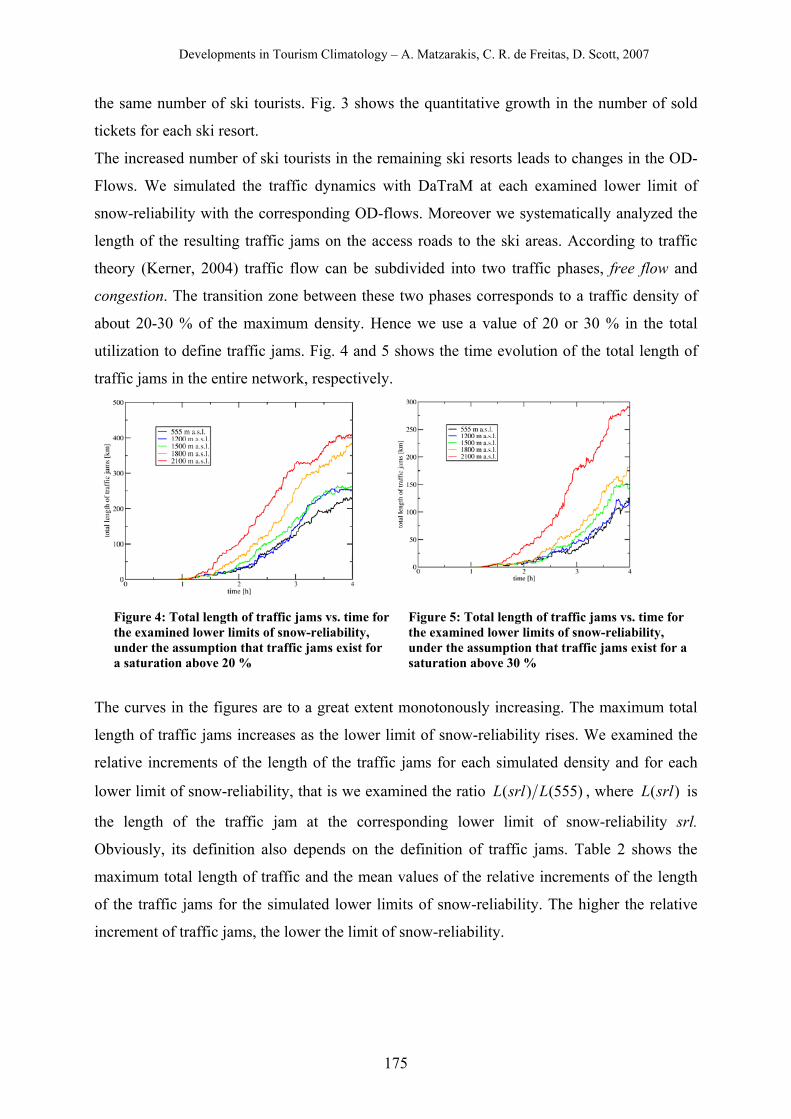
Developments in Tourism Climatology – A. Matzarakis, C. R. de Freitas, D. Scott, 2007
175
the same number of ski tourists. Fig. 3 shows the quantitative growth in the number of sold
tickets for each ski resort.
The increased number of ski tourists in the remaining ski resorts leads to changes in the OD-
Flows. We simulated the traffic dynamics with DaTraM at each examined lower limit of
snow-reliability with the corresponding OD-flows. Moreover we systematically analyzed the
length of the resulting traffic jams on the access roads to the ski areas. According to traffic
theory (Kerner, 2004) traffic flow can be subdivided into two traffic phases, free flow and
congestion. The transition zone between these two phases corresponds to a traffic density of
about 20-30 % of the maximum density. Hence we use a value of 20 or 30 % in the total
utilization to define traffic jams. Fig. 4 and 5 shows the time evolution of the total length of
traffic jams in the entire network, respectively.
Figure 4: Total length of traffic jams vs. time for the examined lower limits of snow-reliability, under the assumption that traffic jams exist for a saturation above 20 %
Figure 5: Total length of traffic jams vs. time for the examined lower limits of snow-reliability, under the assumption that traffic jams exist for a saturation above 30 %
The curves in the figures are to a great extent monotonously increasing. The maximum total
length of traffic jams increases as the lower limit of snow-reliability rises. We examined the
relative increments of the length of the traffic jams for each simulated density and for each
lower limit of snow-reliability, that is we examined the ratio )555()( LsrlL , where )(srlL is
the length of the traffic jam at the corresponding lower limit of snow-reliability srl.
Obviously, its definition also depends on the definition of traffic jams. Table 2 shows the
maximum total length of traffic and the mean values of the relative increments of the length
of the traffic jams for the simulated lower limits of snow-reliability. The higher the relative
increment of traffic jams, the lower the limit of snow-reliability.
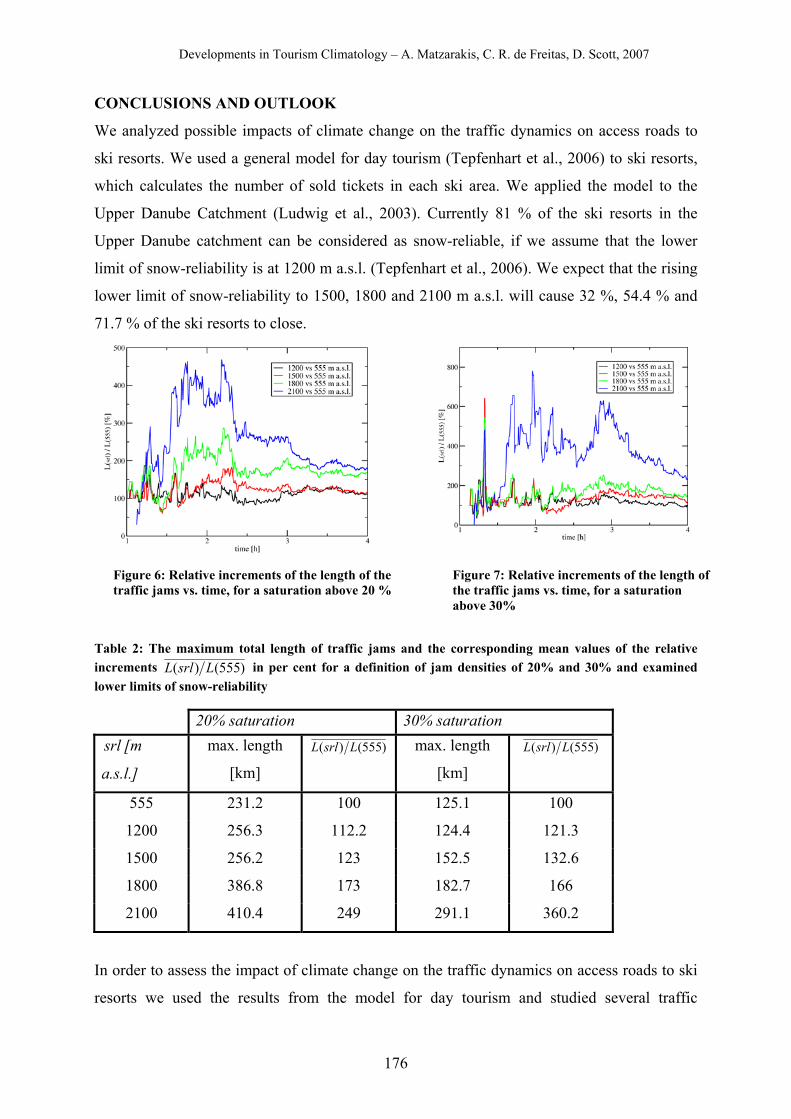
Developments in Tourism Climatology – A. Matzarakis, C. R. de Freitas, D. Scott, 2007
176
CONCLUSIONS AND OUTLOOK
We analyzed possible impacts of climate change on the traffic dynamics on access roads to
ski resorts. We used a general model for day tourism (Tepfenhart et al., 2006) to ski resorts,
which calculates the number of sold tickets in each ski area. We applied the model to the
Upper Danube Catchment (Ludwig et al., 2003). Currently 81 % of the ski resorts in the
Upper Danube catchment can be considered as snow-reliable, if we assume that the lower
limit of snow-reliability is at 1200 m a.s.l. (Tepfenhart et al., 2006). We expect that the rising
lower limit of snow-reliability to 1500, 1800 and 2100 m a.s.l. will cause 32 %, 54.4 % and
71.7 % of the ski resorts to close.
Figure 6: Relative increments of the length of the traffic jams vs. time, for a saturation above 20 %
Figure 7: Relative increments of the length of the traffic jams vs. time, for a saturation above 30%
Table 2: The maximum total length of traffic jams and the corresponding mean values of the relative increments )555()( LsrlL in per cent for a definition of jam densities of 20% and 30% and examined lower limits of snow-reliability
20% saturation 30% saturation srl [m
a.s.l.]
max. length
[km]
)555()( LsrlL max. length
[km]
)555()( LsrlL
555 231.2 100 125.1 100
1200 256.3 112.2 124.4 121.3
1500 256.2 123 152.5 132.6
1800 386.8 173 182.7 166
2100 410.4 249 291.1 360.2
In order to assess the impact of climate change on the traffic dynamics on access roads to ski
resorts we used the results from the model for day tourism and studied several traffic
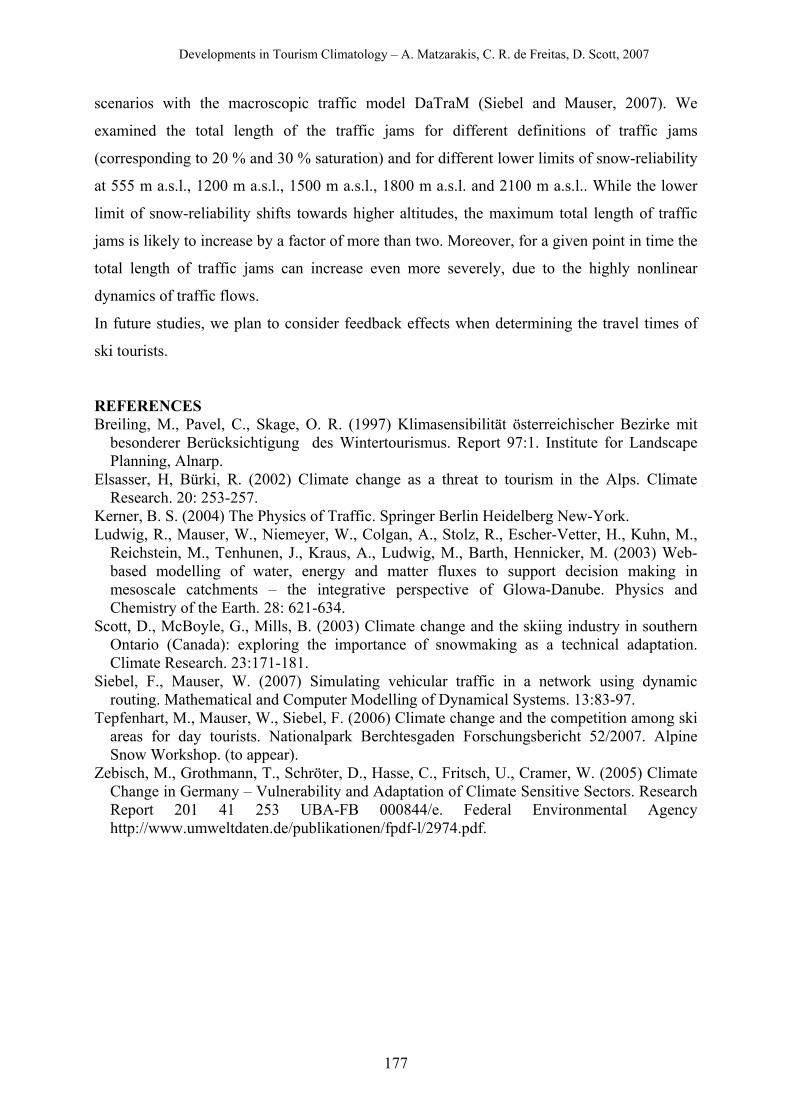
Developments in Tourism Climatology – A. Matzarakis, C. R. de Freitas, D. Scott, 2007
177
scenarios with the macroscopic traffic model DaTraM (Siebel and Mauser, 2007). We
examined the total length of the traffic jams for different definitions of traffic jams
(corresponding to 20 % and 30 % saturation) and for different lower limits of snow-reliability
at 555 m a.s.l., 1200 m a.s.l., 1500 m a.s.l., 1800 m a.s.l. and 2100 m a.s.l.. While the lower
limit of snow-reliability shifts towards higher altitudes, the maximum total length of traffic
jams is likely to increase by a factor of more than two. Moreover, for a given point in time the
total length of traffic jams can increase even more severely, due to the highly nonlinear
dynamics of traffic flows.
In future studies, we plan to consider feedback effects when determining the travel times of
ski tourists.
REFERENCES Breiling, M., Pavel, C., Skage, O. R. (1997) Klimasensibilität österreichischer Bezirke mit
besonderer Berücksichtigung des Wintertourismus. Report 97:1. Institute for Landscape Planning, Alnarp.
Elsasser, H, Bürki, R. (2002) Climate change as a threat to tourism in the Alps. Climate Research. 20: 253-257.
Kerner, B. S. (2004) The Physics of Traffic. Springer Berlin Heidelberg New-York. Ludwig, R., Mauser, W., Niemeyer, W., Colgan, A., Stolz, R., Escher-Vetter, H., Kuhn, M.,
Reichstein, M., Tenhunen, J., Kraus, A., Ludwig, M., Barth, Hennicker, M. (2003) Web-based modelling of water, energy and matter fluxes to support decision making in mesoscale catchments – the integrative perspective of Glowa-Danube. Physics and Chemistry of the Earth. 28: 621-634.
Scott, D., McBoyle, G., Mills, B. (2003) Climate change and the skiing industry in southern Ontario (Canada): exploring the importance of snowmaking as a technical adaptation. Climate Research. 23:171-181.
Siebel, F., Mauser, W. (2007) Simulating vehicular traffic in a network using dynamic routing. Mathematical and Computer Modelling of Dynamical Systems. 13:83-97.
Tepfenhart, M., Mauser, W., Siebel, F. (2006) Climate change and the competition among ski areas for day tourists. Nationalpark Berchtesgaden Forschungsbericht 52/2007. Alpine Snow Workshop. (to appear).
Zebisch, M., Grothmann, T., Schröter, D., Hasse, C., Fritsch, U., Cramer, W. (2005) Climate Change in Germany – Vulnerability and Adaptation of Climate Sensitive Sectors. Research Report 201 41 253 UBA-FB 000844/e. Federal Environmental Agency http://www.umweltdaten.de/publikationen/fpdf-l/2974.pdf.
Developments in Tourism Climatology – A. Matzarakis, C. R. de Freitas, D. Scott, 2007
178
SNOWMAKING – A SUITABLE ADAPTATION STRATEGY?
EXAMPLES FROM TYROL / AUSTRIA
R. Steiger
Department of Geography, University Innsbruck, A-6020 Innsbruck, Austria
ABSTRACT Ski tourism is among those sectors of tourism that are affected the most by
climate change. Snowmaking represents in the view of ski area managers the only possible
adaptation strategy to rising temperatures, although it is dependent on cool temperatures.
Previous studies about climate impact on ski tourism in Austria only focused on natural snow
conditions. The present situation with snowmaking capacities covering 50 % of the skiing
terrain in Austria and about 75 % in Tyrol (in the year 2007) raises the question if
snowmaking can be a suitable adaptation strategy for low elevated ski areas in Tyrol. In this
study climate data and lift operation data were analyzed to visualize the correlation between
climate and season length. A snowmaking model was integrated to assess the technology´s
potential for today and a +2°C climate scenario. The results demonstrate that snowmaking can
provide desired season lengths today, but also that – even with an intensification of
snowmaking – it cannot solve the problem of shortening ski seasons at lower elevations in the
future.
KEYWORDS: Climate change, ski tourism, snowmaking, Austria
INTRODUCTION
Ski tourism has been identified as highly vulnerable to climate change (Abegg, 1996, Breiling
et al., 1997, Scott et al., 2003, 2006). Warmer winter seasons will result in less snow at lower
elevations, where skiing takes place in the tourism-intense eastern part of Tyrol. The most
common method to define snow-reliability is the 100-days-rule stating that ski resorts can be
considered as snow-reliable “if, in 7 out of 10 winters, a sufficient snow covering of at least
30-50 cm is available for ski sport on at least 100 days between December 1 and April 15”
(Abegg, 1996). This methodology was adopted by the recent OECD study (Abegg et al.,
2007) with the result that - with a 2 °C warming - only 60 % of today´s existing ski areas in
the European Alps will remain snow-reliable. Technical development outdated this
Developments in Tourism Climatology – A. Matzarakis, C. R. de Freitas, D. Scott, 2007
179
methodology, as today snowmaking is widely spread all over the Alps - in Tyrol, for example,
approximately 75 % of the skiing area is covered by snowmaking facilities (Fachverband der
Seilbahnen Österreichs, 2007). Even high elevated ski resorts like Obergurgl equipped most
of their slopes with snowmaking machines to become independent of natural snow-falls (in
Obergurgl snowmaking up to 3027 m covers 80 % of the ski slopes). Although the spread of
artificial snowmaking is not solely caused by climate change (Mayer et al., 2008), continuous
investments in this technology necessitate its integration into the 100-days-rule in order to get
more realistic results. (Breiling et al., 1997) gave a first estimation for future snowmaking in
Austria, based on monthly average temperature. But they also stated that snowmaking can be
possible in cooler periods of the month even if the monthly average lies above their defined
threshold of -2 °C. To get a better idea of the ability of snowmaking to balance poor snow-
conditions, a higher temporal resolution is required (Scott et al., 2003, 2006). The
extraordinary warm winter season 2006/07 with average temperature (Dec-Mar) 4.3 °C above
the 30-year average (ZAMG, 2007) showed two important facts:
1) Several ski resorts were not able to offer a continuous season from December to April
although they were equipped with snowmaking facilities and 2) snow conditions in ski resorts
with state-of-the-art artificial snowmaking did not differ much from snow conditions in
average or good seasons.
METHODS
The chosen study area is the region of Kitzbuehel / Austria. Three skiing areas (Skiwelt
Wilder Kaiser, St.Johann and Kitzbuehel) with 144 lifts and 480km of ski slopes within an
area of approximately 330 km² and an altitudinal range from 625 m – 1995 m mark this
region as one of the most important ski destinations in Austria. Appropriate climate data was
available for 4 stations from 1971/72-1999/00 for snow and from 1981/82-1999/00 for daily
average temperatures: Hopfgarten (600 m), Ellmau (750 m), Aschau (1005 m) and St.Anton
(1275 m). The latter was used to extrapolate temperature to a height of 1500 m, representing
the upper part of the ski areas. Lift operation days of 4 chairlifts (referred to as A-D) were
analyzed for the same time period: (A) Hochfeld 668-814m (snowmaking since 1988), (B)
Gaisberg 850 – 1382 m (snowmaking since 1995), (C) Penzing 919 – 1469 m (snowmaking
since 1998/99) and (D) Steinbergkogel 1447 – 1971 m (no snowmaking until 2007/08).
Artificial snowmaking is considered possible at daily average temperatures ≤ -2 °C, and
suitable if snow cover is below 50 cm. The capacity of snowmaking facilities varies strongly
from slope to slope (due to the different intensity of snowmaking). In the 1980s only exposed
Developments in Tourism Climatology – A. Matzarakis, C. R. de Freitas, D. Scott, 2007
180
parts of slopes were equipped with snow-guns, at the end of the research period (mid-end of
1990s) ski resorts with state-of-the-art snowmaking systems could open the ski run after 5
snowmaking days (Steiger, 2007), resulting in a snow production of 6 cm a day. On days
without natural snow cover, snow-melt is simulated with a degree-day factor of 3mm, the
average density of technical snow is 523 g/l (10), thus 1 mm run-off water equivalent means
1,91 mm melted snow depth. For an analysis based on future climate conditions, a scenario of
+2 °C is assumed.
Natural snow is not included in the scenario because of its high annual variability. This urges
ski resort operators to invest millions of Euros each year to become independent of natural
snow falls, in 2006, for example, € 55 million (of total investments 270 million) were spent
for new snowmaking facilities in Tyrol (Tiroler Tageszeitung, 2006). Besides that, future
snowfall is all but predictable and therefore not practical for this model.
Future winter sport days are calculated with a snowmaking intensity of 5 snowmaking days
(to maintain comparability of data) and 2 snowmaking days, representing the snowmaking
industry´s target to adapt to rising temperatures (Mountain Manager, 2007).
RESULTS
None of the climate stations is snow-reliable (e.g. the median of winter sport days at 1005 m
is 91 for 1979/80-1999/00). An interpolation of winter sport days with a height-gradient of
9,91 winter sport days / 100 m as suggested by Abegg (1996) in order to calculate the
threshold line of snow-reliability, did not provide suitable results.
The correlation between the calculated winter sport days and the lift operation days is quite
good (see Fig. 1). The smaller variability of annual operation days compared to the winter
sport days can be explained by measures like grooming of the slopes and snow farming.
A lack of demand at the end of the season and on the early Easter holidays are reasons for less
operation days than possible in years with above-average winter sport days.
Lift A and B show that snowmaking can reduce the variability of season length significantly:
Prior to the installation of snowmaking facilities at lift A in 1988, season length was similar.
In the consecutive years operation days differed by up to 100 %.
In order to differentiate between snow-reliability with and without snowmaking, it is defined
as “natural snow-reliability” (without snowmaking) and “technical snow-reliability” (with
snowmaking). As natural snowfall is not included in the climate scenario, future technical
snow-reliability cannot be calculated. Therefore the percentage of winters reaching 100 winter
Developments in Tourism Climatology – A. Matzarakis, C. R. de Freitas, D. Scott, 2007
181
sport days without natural snowfall is defined as “snow-guarantee” - to use the stakeholders´
vocabulary.
Figure 1: Natural and technical winter sport days at 1.005m and lift operation days
(Official lift statistics changed from an annual to a seasonal data preparation in 1997/98, therefore also climate data was adjusted). Data source: ZAMG and Eisenbahn- und Seilbahnstatistik Whether snowmaking is a suitable adaptation strategy can be answered using three questions:
1) To what extend is snowmaking able to enhance snow-reliability (= technical snow-
reliability)?
2) What are the consequences of a 2 °C warming for snow-guarantee with today´s
snowmaking intensity?
3) Is it possible to sustain the current snow-guarantee by intensifying snowmaking?
Table 1: Natural and Technical Snow-Reliability (SR) and Snow-Guarantee (SG) in years within a 19 years time-span (*sds = snow-making days necessary for a snow layer of 30 cm) Today Climate Scenario [+ 2°C]
Natural SR [years]
Technical SR (5 sds*) [years]
SG (5 sds*) [years]
SG (5 sds*) [years]
Difference of SG (5 sds*)
[years]
SG (2 sds*) [years]
600m 1 (5%) 9 (47%) 8 (42%) 1 (5%) 7 (-88%) 5 (26%) 750m 1 (5%) 14 (74%) 12 (63%) 4 (21%) 8 (-67%) 7 (37%)
1.005m 7 (37%) 19 (100%) 17 (90%) 8 (42%) 9 (-53%) 11 (58%) 1.500m no data no data 19 (100%) 9 (47%) 10 (-53%) 16 (84%)
1) Today the climate station “1005 m” is technically snow-reliable. Although the climate
station “600 m” does not reach 100 winter sport days in all years, snowmaking enables the
operators to open the slopes to the villages significantly longer than without snowmaking (see
Tab. 1)
Developments in Tourism Climatology – A. Matzarakis, C. R. de Freitas, D. Scott, 2007
182
2) A 2°C warming with today´s snowmaking intensity results in a reduction of the snow-
guarantee by 53 % (“1005 m” and “1500 m”) to 88 % (“600 m”). Even at 1500 m the
threshold of 100 days will be reached only in 9 of 19 years.
3) If snowmaking is intensified to a capacity of 2 snowmaking days, snow-guarantee will still
be lower than today with 5 snowmaking days at all elevations analyzed.
DISCUSSION
Although the used model is rather simple, the results show that statements like “snowmaking won´t be possible” as well as “snowmaking is the cure-all-strategy” do not support a sustainable development of ski tourism in Austria. It will not be possible to reach current season lengths, which ensure the economic survival of ski resorts, without chemical additives or temperature-independent snowmaking systems. Besides strong ecological concerns, the increasing costs of snowmaking – caused by rising energy prices, higher snowmelt-rate, less natural snow and days suitable for snowmaking – disqualify snowmaking as a suitable adaptation strategy for lower elevated ski resorts. In order to get more detailed information about future ski tourism, upcoming studies need to combine a detailed snow model including snowmaking with an economic model calculating the ski area’s rising operating costs. REFERENCES Abegg, B. (1996) Klimaänderung und Tourismus : Klimafolgenforschung am Beispiel des
Wintertourismus in den Schweizer Alpen. Zürich, vdf. Abegg, B. et al. (2007). Climate change impacts and adaptation in winter tourism. In:
Agrawala, S. (ed.), Climate change in the European Alps. Paris, OECD, 25-60. Breiling, M., Charamza, P. and Skage, O. (1997) Klimasensibilität österreichischer Bezirke
mit besonderer Berücksichtigung des Wintertourismus. Rapport 1, 1997. Department of Landscape Planning Alnarp, Swedish University of Agricultural Sciences.
Fachverband der Seilbahnen Österreichs (2007). personal communication. http://www.zamg.ac.at (accessed on 11.04.2007). Mayer, M., Steiger, R. and Trawöger, L. (2008). Technischer Schnee rieselt leise vom
touristischen Machbarkeitshimmel. Mitteilungen der österreichischen Geographischen Gesellschaft, Wien (in press).
Mountain Manager (2007). Gemini: Schneeerzeugung bei Klimaerwärmung. MM 2: 80-81. Rixen, C., Haeberli, W. and Stoeckli, V. (2004). Ground temperatures under ski pistes with
artificial and natural snow. AAAR 36: 419-427. Scott, D., McBoyle, G. and Mills, B. (2003). Climate change and the skiing industry in
southern Ontario (Canada). Clim.Res. 23 (2): 171-181. Scott, D., McBoyle, G., Minogue, A. and Mills, B. (2006). Climate Change and the
Sustainability of Ski-based Tourism in Eastern North America: A Reassessment. Journal of Leisure Research 14: 376-98.
Steiger, R. (2007). Klimaänderung und Skigebiete im bayerischen Alpenraum. Bremen, CT Salzwasser-Verlag.
Tiroler Tageszeitung (2006). „Rekord-Rüsten der Seilbahner“. TT 27.11.2006.
Developments in Tourism Climatology – A. Matzarakis, C. R. de Freitas, D. Scott, 2007
183
USING AN ANOLOGUE APPROACH TO EXAMINE CLIMATE CHANGE VULNERABILTY OF THE NEW ENGLAND (USA) SKI TOURISM INDUSTRY
J. Dawson, D. Scott and G. McBoyle
Department of Geography, University of Waterloo, Waterloo, ON, Canada
ABSTRACT Climate change is projected to have a significant impact on winter recreation-
tourism sector including the multi-billion dollar ski tourism industry. Detrimental effects for
the industry have been projected in numerous studies throughout several continents including,
Australia, Asia, Europe and North America. Modeling based studies have revealed shortened
ski seasons and increased snowmaking requirements under warmer temperatures. This study
uses a climate change analogue approach to examine how a wider range of ski area
performance indicators were affected by anomalously warm winters in the New England
region of the USA.
The record warm winter of 2001-02 is representative of projected future average winter
climate conditions in the New England region under a high greenhouse gas emission scenario
for the 2040-69 period and was used as one climate change analogue for this analysis. The
1998-99 ski season was also used as a climate change analogue as it represents the last of
three consecutive warm winters that are representative of average winter conditions for the
2010-39 period. Ski area performance indicators for the 2001-02 and 1998-99 analogue years
were compared to the climatically normal (for 1961-90) years of 2000-01 and 2004-05. The
indicators examined include: ski season length, snowmaking (hours of operation and % fuel
utilized as a proxy for fuel costs), total skier visits, visitation by time of year, average season
passes sold, and operating profit (% of total gross revenue and % of total gross fixed assets).
The revealed impact on ski season length during these climate change analogue years is also
compared with modeled impacts for the region.
KEYWORDS: Ski tourism, analogue, climate change, New England, USA INTRODUCTION
The impact of climate change on the highly climate-sensitive winter-tourism sector is
expected to generate significant consequences for those not prepared for warming
temperatures and changing precipitation patterns. Academic research in the field of climate
change and winter-tourism has paid particular attention to the vulnerability within the multi-
billion dollar international ski tourism industry (Australia, Austria, Canada, France, Germany,
Developments in Tourism Climatology – A. Matzarakis, C. R. de Freitas, D. Scott, 2007
184
Italy, Japan, Switzerland, United States). All of these international studies predict negative
consequences for the ski industry to varying degrees and over varying timeframes.
The focus of climate change and ski tourism research in North America has been on modeling
decreasing ski season lengths and increasing snowmaking requirements which compensate for
significant reductions in natural snow availability (Scott et al., 2003; Scott et al., 2006, 2007).
Limitations in the North American research have thus far included a lack of studies examining
the impact of climate change on tourist demand patterns, as well as difficulty in determining
the economic implications of climate change due to restrictions on proprietary financial
information from ski area businesses. Ski area expenditures are however, expected to rise due
to increased snowmaking requirements which will augment labor and power/fuel expenditures
as well as water requirements. Expenses will be greater for lower elevation ski areas where
more snowmaking will be required to compensate for warmer temperatures in comparison to
ski areas located at cooler higher altitudes.
The U.S. New England ski region, which includes that states of Connecticut, Maine,
Massachusetts, New Hampshire, New York, Rhode Island and Vermont consist of over 150
ski areas ranging from 137 meters above sea level (masl) to 1353 masl. Although, mountains
in this region represent some of the highest ski area elevation in Eastern North America many
ski resorts in the area have base levels lower than 450 masl. These lower resorts are expected
to be particularly vulnerable under warming trends because of a reduced season length and the
aforementioned increase in costs due to increased snowmaking.
Skiing in New England is not only culturally important it is also economically significant.
Individuals ski an average of 10 times per season in New England, which is the highest rate
recorded in the country (National Sporting Goods Association, 2005). Of the ski regions in
the U.S as defined by the National Ski Area Association [NSAA], New England consistently
hosts the second highest total visitation rate (>13 million) across the United States, second
only to the Rocky Mountain region (>19 million) (NSAA, 2005). Ski operations in Vermont
and New Hampshire alone contribute in excess of US$1.8 billion annually to state economies
through direct and indirect spending.
This paper uses an analogue approach to examine some demand- and supply-side
performance indicators that have not previously been assessed in a climate change context.
Aggregated regional ski area information available from two annual NSAA reports (Kottke
End of Season Survey and Economic Analysis of United States Ski Areas) provide
operational performance information on New England ski areas for the past two decades.
Performance indicators can be compared between climatically normal (average of 1961-90
Developments in Tourism Climatology – A. Matzarakis, C. R. de Freitas, D. Scott, 2007
185
period) versus anomalously warm winters to determine the impacts of warmer temperatures
considered analogues for normal winter conditions under future climate change scenarios.
The advantage of the analogue approach is that it uses observed data, not only abstracted
model outputs, and captures the impacts when the full range of current supply- and demand-
side adaptations occur.
METHODS
In 2001-02 the New England region experienced a record warm winter season that is
representative of projected future average winter climate conditions under a high greenhouse
gas emission scenario for the 2040-2069 time period. Regional ski area information including
ski season length, snowmaking requirements, visitation, and operating profits from this
analogue year are compared with reported ski area information from the 2000-01 and 2004-05
seasons, which are representative of climatically average years for the 1961-90 baseline
period. The 1998-99 ski season is also used as a second analogue as it represents the last of
three consecutively warm winters that are representative of average winter conditions for the
2010-2039 time period. The examination of the 1998-99 ski season as an analogue for 2010-
2039 allows conclusions to be made regarding the impact that several consecutively warm
seasons may have on ski area operations versus the impact that may be experienced in a single
marginal year (i.e. 2001-02). It is possible that a ski area may be able to more easily rebound
financially after experiencing one marginal snow season amongst a series of average or above
average seasons. However, it is likely more difficult to recover after experiencing two and
three poor seasons consecutively (Scott and McBoyle, 2006).
The climatic average (2000-01 and 2004-05) seasons used in this study were chosen from
winter climate data from the past 12 years which best represent the 1961-90 climatic average
winter seasons (NOAA, 2007). The absolute best climatologically average year actually
occurred 20 years ago in 1987, prior to the large-scale expansion of snowmaking in the region
which was not relatively complete until the mid-late 1990’s. Because snowmaking is an
integral part of ski area operations today, the climatically normal year, 1987 was not used in
this study as it would not be directly comparable to currently standard operations. In addition,
post mid 1990’s ski area business models have stayed reasonably consistent therefore
allowing for a more reliable comparison between marginal and average ski area performance
in this timeframe (i.e. heavy real estate development, diversified revenue sources,
establishment of conglomerates).
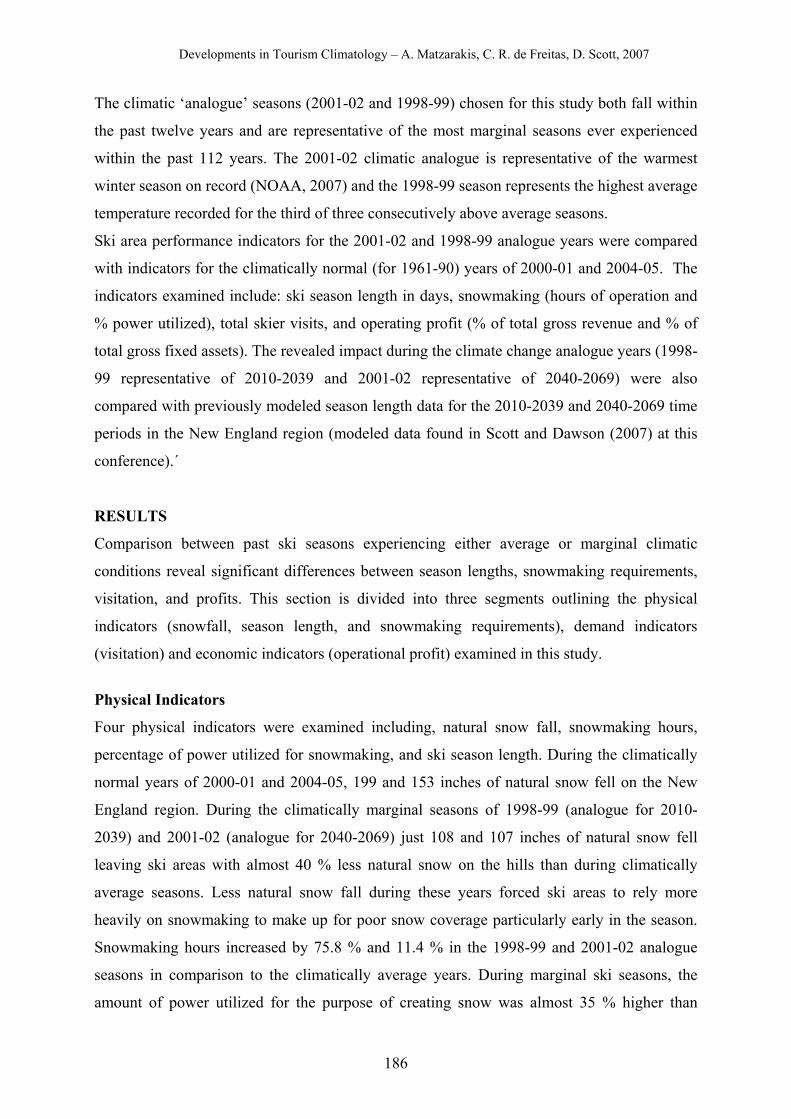
Developments in Tourism Climatology – A. Matzarakis, C. R. de Freitas, D. Scott, 2007
186
The climatic ‘analogue’ seasons (2001-02 and 1998-99) chosen for this study both fall within
the past twelve years and are representative of the most marginal seasons ever experienced
within the past 112 years. The 2001-02 climatic analogue is representative of the warmest
winter season on record (NOAA, 2007) and the 1998-99 season represents the highest average
temperature recorded for the third of three consecutively above average seasons.
Ski area performance indicators for the 2001-02 and 1998-99 analogue years were compared
with indicators for the climatically normal (for 1961-90) years of 2000-01 and 2004-05. The
indicators examined include: ski season length in days, snowmaking (hours of operation and
% power utilized), total skier visits, and operating profit (% of total gross revenue and % of
total gross fixed assets). The revealed impact during the climate change analogue years (1998-
99 representative of 2010-2039 and 2001-02 representative of 2040-2069) were also
compared with previously modeled season length data for the 2010-2039 and 2040-2069 time
periods in the New England region (modeled data found in Scott and Dawson (2007) at this
conference).´
RESULTS
Comparison between past ski seasons experiencing either average or marginal climatic
conditions reveal significant differences between season lengths, snowmaking requirements,
visitation, and profits. This section is divided into three segments outlining the physical
indicators (snowfall, season length, and snowmaking requirements), demand indicators
(visitation) and economic indicators (operational profit) examined in this study.
Physical Indicators
Four physical indicators were examined including, natural snow fall, snowmaking hours,
percentage of power utilized for snowmaking, and ski season length. During the climatically
normal years of 2000-01 and 2004-05, 199 and 153 inches of natural snow fell on the New
England region. During the climatically marginal seasons of 1998-99 (analogue for 2010-
2039) and 2001-02 (analogue for 2040-2069) just 108 and 107 inches of natural snow fell
leaving ski areas with almost 40 % less natural snow on the hills than during climatically
average seasons. Less natural snow fall during these years forced ski areas to rely more
heavily on snowmaking to make up for poor snow coverage particularly early in the season.
Snowmaking hours increased by 75.8 % and 11.4 % in the 1998-99 and 2001-02 analogue
seasons in comparison to the climatically average years. During marginal ski seasons, the
amount of power utilized for the purpose of creating snow was almost 35 % higher than
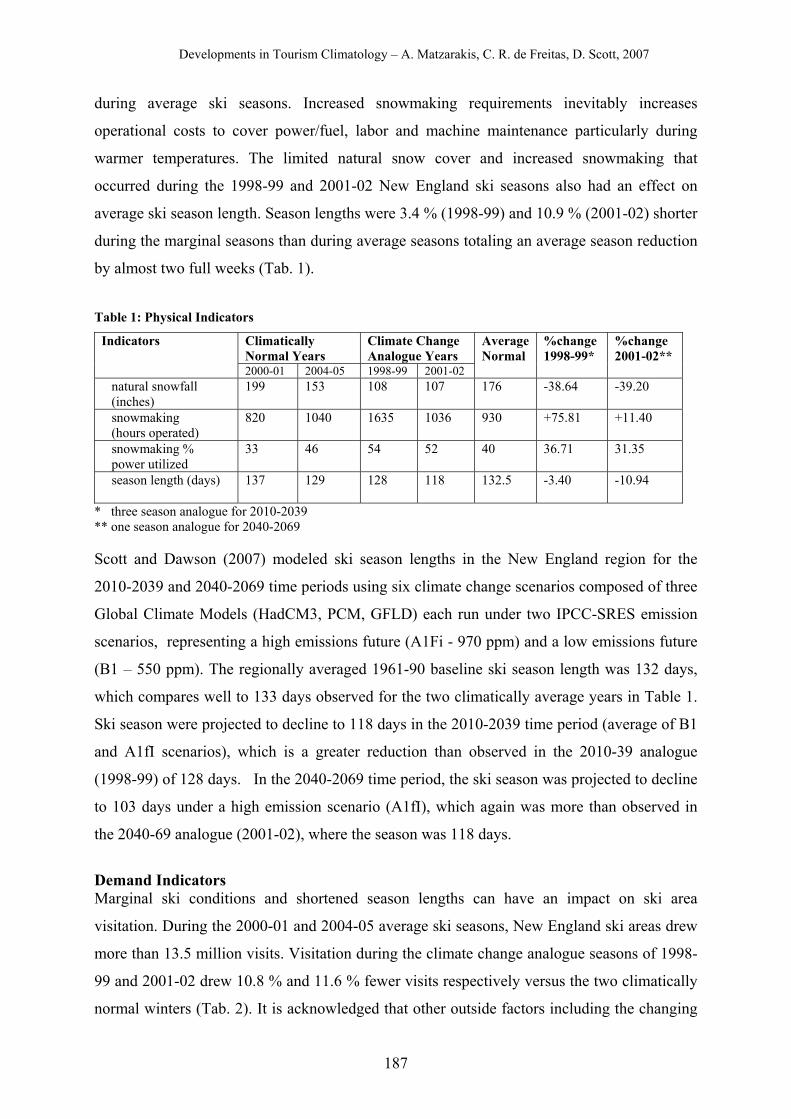
Developments in Tourism Climatology – A. Matzarakis, C. R. de Freitas, D. Scott, 2007
187
during average ski seasons. Increased snowmaking requirements inevitably increases
operational costs to cover power/fuel, labor and machine maintenance particularly during
warmer temperatures. The limited natural snow cover and increased snowmaking that
occurred during the 1998-99 and 2001-02 New England ski seasons also had an effect on
average ski season length. Season lengths were 3.4 % (1998-99) and 10.9 % (2001-02) shorter
during the marginal seasons than during average seasons totaling an average season reduction
by almost two full weeks (Tab. 1).
Table 1: Physical Indicators Indicators Climatically
Normal Years Climate Change Analogue Years
AverageNormal
%change 1998-99*
%change 2001-02**
2000-01 2004-05 1998-99 2001-02 natural snowfall (inches)
199 153 108 107 176 -38.64 -39.20
snowmaking (hours operated)
820 1040 1635 1036 930 +75.81 +11.40
snowmaking % power utilized
33 46 54 52 40 36.71 31.35
season length (days)
137 129 128 118 132.5 -3.40 -10.94
* three season analogue for 2010-2039 ** one season analogue for 2040-2069 Scott and Dawson (2007) modeled ski season lengths in the New England region for the
2010-2039 and 2040-2069 time periods using six climate change scenarios composed of three
Global Climate Models (HadCM3, PCM, GFLD) each run under two IPCC-SRES emission
scenarios, representing a high emissions future (A1Fi - 970 ppm) and a low emissions future
(B1 – 550 ppm). The regionally averaged 1961-90 baseline ski season length was 132 days,
which compares well to 133 days observed for the two climatically average years in Table 1.
Ski season were projected to decline to 118 days in the 2010-2039 time period (average of B1
and A1fI scenarios), which is a greater reduction than observed in the 2010-39 analogue
(1998-99) of 128 days. In the 2040-2069 time period, the ski season was projected to decline
to 103 days under a high emission scenario (A1fI), which again was more than observed in
the 2040-69 analogue (2001-02), where the season was 118 days.
Demand Indicators Marginal ski conditions and shortened season lengths can have an impact on ski area
visitation. During the 2000-01 and 2004-05 average ski seasons, New England ski areas drew
more than 13.5 million visits. Visitation during the climate change analogue seasons of 1998-
99 and 2001-02 drew 10.8 % and 11.6 % fewer visits respectively versus the two climatically
normal winters (Tab. 2). It is acknowledged that other outside factors including the changing
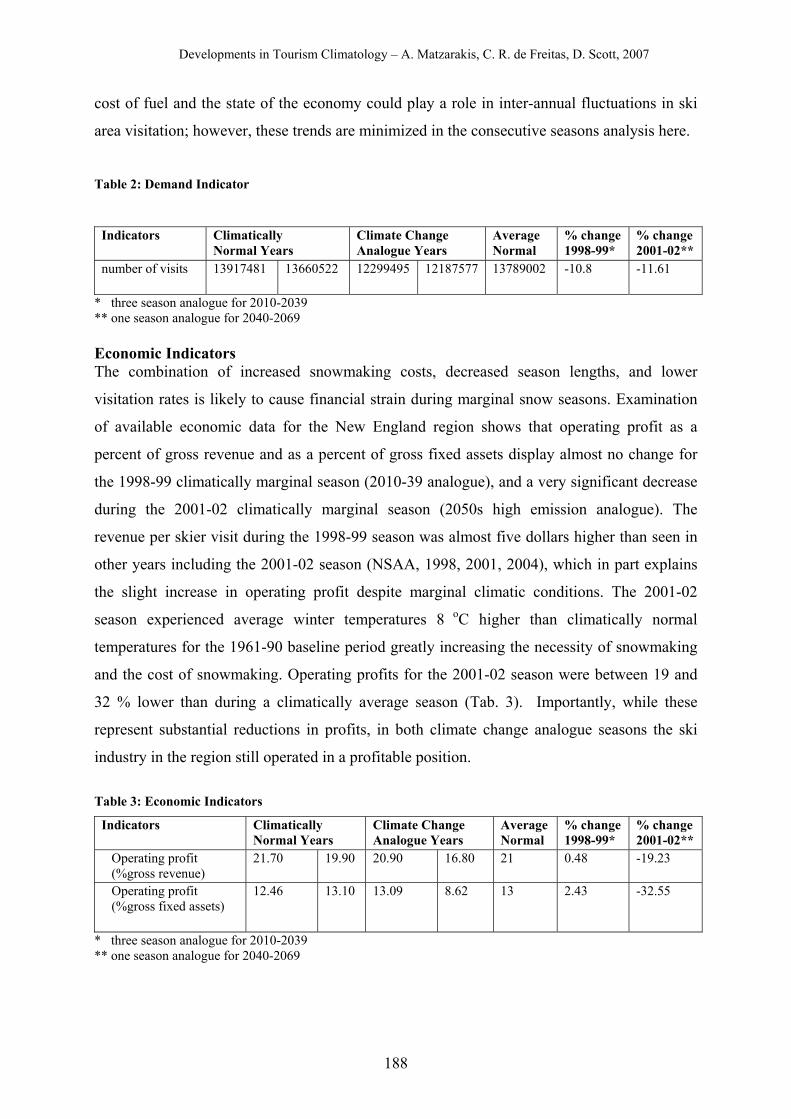
Developments in Tourism Climatology – A. Matzarakis, C. R. de Freitas, D. Scott, 2007
188
cost of fuel and the state of the economy could play a role in inter-annual fluctuations in ski
area visitation; however, these trends are minimized in the consecutive seasons analysis here.
Table 2: Demand Indicator
Indicators Climatically
Normal Years Climate Change Analogue Years
Average Normal
% change 1998-99*
% change 2001-02**
number of visits 13917481 13660522 12299495 12187577 13789002 -10.8 -11.61
* three season analogue for 2010-2039 ** one season analogue for 2040-2069 Economic Indicators The combination of increased snowmaking costs, decreased season lengths, and lower
visitation rates is likely to cause financial strain during marginal snow seasons. Examination
of available economic data for the New England region shows that operating profit as a
percent of gross revenue and as a percent of gross fixed assets display almost no change for
the 1998-99 climatically marginal season (2010-39 analogue), and a very significant decrease
during the 2001-02 climatically marginal season (2050s high emission analogue). The
revenue per skier visit during the 1998-99 season was almost five dollars higher than seen in
other years including the 2001-02 season (NSAA, 1998, 2001, 2004), which in part explains
the slight increase in operating profit despite marginal climatic conditions. The 2001-02
season experienced average winter temperatures 8 oC higher than climatically normal
temperatures for the 1961-90 baseline period greatly increasing the necessity of snowmaking
and the cost of snowmaking. Operating profits for the 2001-02 season were between 19 and
32 % lower than during a climatically average season (Tab. 3). Importantly, while these
represent substantial reductions in profits, in both climate change analogue seasons the ski
industry in the region still operated in a profitable position.
Table 3: Economic Indicators
Indicators Climatically Normal Years
Climate Change Analogue Years
Average Normal
% change 1998-99*
% change 2001-02**
Operating profit (%gross revenue)
21.70 19.90 20.90 16.80 21 0.48 -19.23
Operating profit (%gross fixed assets)
12.46 13.10 13.09 8.62 13 2.43 -32.55
* three season analogue for 2010-2039 ** one season analogue for 2040-2069
Developments in Tourism Climatology – A. Matzarakis, C. R. de Freitas, D. Scott, 2007
189
DISCUSSION
This study used an analogue approach to examine a variety of physical, demand and
economic impacts experienced by ski areas in the New England region during abnormally
warm winter that are anticipated to be representative of average climatic conditions in the
future. The 1998-99 season was chosen to represent an analogue for the 2010-2039s as an
example of the third of three consecutively marginal ski seasons. The three seasons occurring
between 1996/97 and 1998/99 all experienced average temperatures of at least 4.5 oC above
the climatic average. Results indicate that during the third poor season (1998-99), ski areas
experienced significant increases in snowmaking hours (+75 %) and costs (+36.7 % power
required), a shortened ski season (-5 days), and a 10.8 % loss in visitation but still managed
to produce a profit. In this example of consecutively marginal seasons, ski areas adapted well
to warmer conditions. However, this may not be the case if temperatures experienced in the
2001-02 season (+8 oC) were to occur in successive seasons. During the 2001-02 analogue
season ski areas were forced to increase snowmaking requirements by 31 % (power used),
season lengths decreased by 15 days, visitation was down by almost 12 % and operating
profits declined by 19 and 32 %.
The strength of an analogue approach is that the ipacts of climate are based on actual
occurrences and fully account for current adaptation practices. However, like other methods
this approach can not account for future changes including advancing technology, changing
demographics, increasing price of fuel (etc.). Further research in this area might include
considering these factors and accounting for them in modeled projections. Future work could
also incorporate a more detailed examination of ski area indicators beyond that which are
considered here. For example, other indicators that could be examined also include, season
pass sales, % visitation at different times of year (beginning, end, during important holiday
seasons) and a more detailed summary of revenue sources (i.e. lessons, ticket sales, food and
beverage, retail etc.). A more detailed analysis of indicators based on the size of ski resorts
would be fruitful in determining which ski areas are more or less vulnerable to climate change
and allow a determination of how the regional ski marketplace may evolve over time (i.e.,
where might the ski industry contract and which communities may need to prepare to adapt to
this economic loss).
Developments in Tourism Climatology – A. Matzarakis, C. R. de Freitas, D. Scott, 2007
190
ACKNOWLEDGEMENTS
We would like to acknowledge Ms. Margaret Yuen and the staff at the interlibrary loan office
at the University of Waterloo for their assistance in obtaining the NSAA reports required for
this study.
REFERENCES National Ski Areas Association (2005) Kottke national end of season survey 2004/05 (26th
edition). Lakewood, Colorado: National Ski Areas Association. NSGA Sports Participation Study (2005) National Sporting Goods Association Illinois. Scott, D., McBoyle, G. (2006 – Available from ‘Online First’) Climate change adaptation in
the ski industry. Mitigation and Adaptation Strategies to Global Change. http://www.springerlink.com/content/dm4268764054v902/fulltext.html.
Scott, D., McBoyle, G., Mills, B. (2003) Climate change and the skiing industry in Southern Ontario (Canada): exploring the importance of snowmaking as a technical adaptation. Climate Research 23: 171-181.
Scott, D., McBoyle, G., Mills, B. et al. (2006) Climate change and the sustainability of ski-based tourism in eastern North America; a reassessment. Journal of Sustainable Tourism 14(4): 376-398.
Scott, D., McBoyle, G., Minogue, A. (2007) The implications of climate change for the Québec ski industry. Global Environmental Change, 17, 181-190.
Developments in Tourism Climatology – A. Matzarakis, C. R. de Freitas, D. Scott, 2007
191
CLIMATE CHANGE VULNERABILTY OF THE US NORTHEAST (USA) SKI INDUSTRY
D. Scott and J. Dawson
Department of Geography, University of Waterloo, Waterloo, ON, Canada
ABSTRACT Winter recreation is an important part of the cultural identity of the Northeast
United States and is a multi-billion dollar contributor to the regional economy. This study
examined the supply-side vulnerability of the alpine skiing industry under six climate change
scenarios for the 21st century using the ski operations modeling approach developed by Scott
et al. (2003; 2006; 2007) in Canada. Under all scenarios, natural snow became an increasingly
scarce resource. The large investment in snowmaking over the past 25 years would
substantially reduce the vulnerability of the ski industry until at least mid-century. Climate
change posed a risk to only four of the 14 study areas in 2010-2039, where average ski
seasons declined below 100 days and the probability of being open for the entire Christmas-
New Year’s holiday declined below 75 %. Conversely, by 2070-2099 only four study areas
had not reached these same economic risk criteria. In order to minimize ski season losses,
snowmaking requirements are projected to increase substantially, raising important
uncertainties about water availability and cost. Climate change represents a notable risk to the
ski industry in the Northeast under warmer scenarios, particularly more southerly ski areas
and those at lower elevations. The potential economic ramifications for businesses and
communities heavily invested in winter tourism and related real estate is sizeable and all
communities with large ski tourism business should begin strategic planning to adapt to the
anticipated impacts of climate change on the regional ski industry.
KEYWORDS: Ski tourism, climate change, vulnerability, Northeast U.S.A., impacts INTRODUCTION
The winter-recreation sector has been identified as particularly vulnerable to climate change
and is expected to see some of the first signs of change within the tourism-recreation sector
(UNWTO, 2003, Scott et al., 2007). Changes will bring both negative impacts as well as
potential opportunities for business operators as well as surrounding communities that rely on
regional and local tourism infrastructure. The businesses and regions that are best able to
adapt to potential changes will prosper and those which are unable to cope with rising
Developments in Tourism Climatology – A. Matzarakis, C. R. de Freitas, D. Scott, 2007
192
temperatures, changing snowfall patterns, weather extremes and other related challenges will
be most negatively effected. Ski tourism in particular is has been the focus of many climate
vulnerability studies conducted around the world (Australia, Austria, France, Germany, Italy,
Japan, Switzerland and the United States). Study results have consistently projected negative
consequences for the ski industry mainly through altered amount and timing of natural snow
fall causing a reduction in ski season lengths.
Climate change impacts on the winter-recreation sector could be significant considering
snow-based recreation in the United States alone (encompassing alpine skiing Nordic skiing,
snowboarding, and snowshoeing) was recently estimated to contribute $66 billion to the US
economy and support approximately 556,000 jobs (Southwick Associates 2006). Just over 8%
of the US population (15.5 million people) participate in these forms of snow-based
recreation. The same study indicated that participation in snow-based recreation was higher
(13%) in the U.S. Northeast (encompassing the states of Connecticut, Maine, Massachusetts,
New Hampshire, New York, Rhode Island, and Vermont) and the economic contribution to
the regional economy was $4.6 billion annually. Winter ski tourism in the U.S. Northeast
alone has supported approximately thirteen million skiers and snowboarders annually for the
past ten years (NSAA, 2005). There are over 100 ski areas in the region including small and
large scale resorts located at both low and high elevations (ranging from 137 metres above sea
level [masl] to 1353 masl).
As an economic sector that is highly influenced by climate, the U.S. Northeast ski industry
may be profoundly affected by future global climate change. Since 1900, annual temperatures
across the U.S. Northeast have increased an average of 0.08 °C (0.14 °F) per decade (Hayhoe
et al., 2006). From 1970 to 2002, however, the region has been warming at a higher average
rate of 0.28 °C (0.5 °F) per decade. This corresponds to an overall warming for the entire
region during the last three decades of 0.97°C (1.75°F). The increase in average winter
temperatures is even greater, rising an average 0.72°C (1.3°F) per decade since 1970 (Hayhoe
et al., in press).
This paper examines the vulnerability of the U.S. Northeast ski industry at both a regional and
market level scale. A total of 14 ski study areas (Connecticut, western and southeastern
Maine, western and eastern Massachusetts, northeastern and southeastern New Hampshire,
western, northeastern, and southeastern New York, western Pennsylvania, eastern
Pennsylvania, and northern and southern Vermont) where selected to provide spatial coverage
of the Northeast ski industry. From these study areas, 103 individual ski areas were examined
allowing for investigation of both regional and local level vulnerabilities.
Developments in Tourism Climatology – A. Matzarakis, C. R. de Freitas, D. Scott, 2007
193
METHODS To assess climate change vulnerability of the U.S. Northeast skiing industry gridded climate
data (daily temperature and precipitation at 1/8° resolution) was used for both the baseline
(1961-90) and future climate change scenarios. Six climate change scenarios were utilized
including three different GCMs (HadCM3, PCM, GFLD) each run under two IPCC-SRES
emission scenarios, representing a high emissions future (A1FI - 970 ppm) and a relatively
lower emissions future (B1 - 550ppm). Changes in ski areas operations (season length and
snowmaking requirements) were projected for three future time periods (2010-39, 2040-69,
and 2070-99). These climate change scenarios are consistent with those used in the recent
Northeast Climate Impact Assessment (Union of Concerned Scientists, 2006). The GCMs
were specifically chosen for that assessment and also for this study because of their superior
performance in reproducing historical climate in the region relative to other GCMs (Hayhoe
et al., in press).
Ski operation data (i.e. season length and snowmaking requirements) are extracted using the
ski operations modeling approach developed by Scott et al. (2003). The method has been
applied in Canada and the United states (Scott et al. 2003, 2006, 2007, Dawson and Scott, in
press). A physical snow model is at the core of the ski operations model, which uses daily
temperature and precipitation inputs to model snow depth based on the calculation of three
parameters: amount of precipitation that falls as snow and rain; snow accumulation; and
snowmelt. A key limitation of previous climate change and ski tourism vulnerability studies
was the complete absence of snowmaking causing over-estimations of the potential future
impacts. The approach developed by Scott et al. (2003) considers snowmaking by including
certain technical capacities (minimum temperature at which snow can be made economically,
daily snowmaking capacity) and decision making rules within the snowmaking module
(start/end dates, target snow pack depth to maintain). The snowmaking capabilities modeled
represent those of an advanced snowmaking system and assumes 100 % coverage of skiable
terrain. The assumption of 100 % coverage of advanced snowmaking capability is reasonable
for most of the US Northeast ski areas in this study considering 81 of the 103 individual ski
areas examined have snowmaking capabilities of between 75 and 100 % terrain coverage and
only seven resorts have less than 50 % coverage capability. Because of this, and because it is
possible for all resorts to develop a larger snowmaking capacity (i.e. adaptive capacity) all ski
areas were modeled using the same snowmaking parameters.
The regional level assessment which examined 14 ski study areas evenly dispersed throughout
the U.S. Northeast was modeled using a single hypothetical ski area with identical
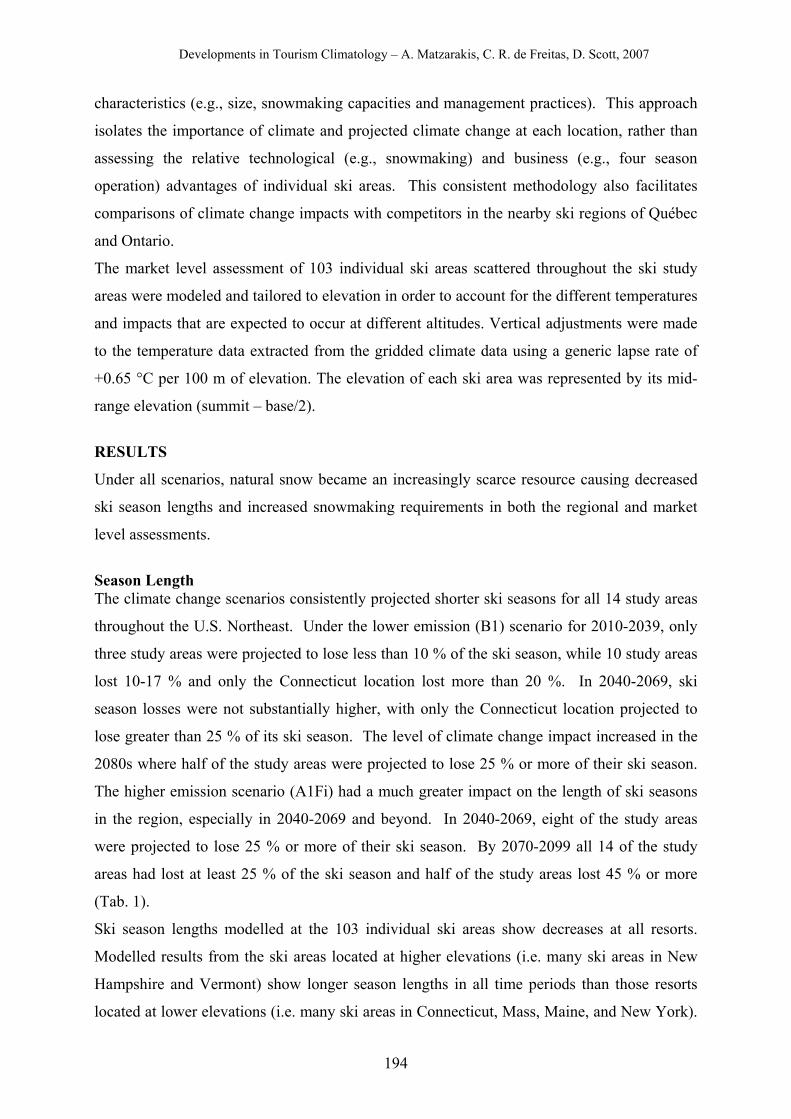
Developments in Tourism Climatology – A. Matzarakis, C. R. de Freitas, D. Scott, 2007
194
characteristics (e.g., size, snowmaking capacities and management practices). This approach
isolates the importance of climate and projected climate change at each location, rather than
assessing the relative technological (e.g., snowmaking) and business (e.g., four season
operation) advantages of individual ski areas. This consistent methodology also facilitates
comparisons of climate change impacts with competitors in the nearby ski regions of Québec
and Ontario.
The market level assessment of 103 individual ski areas scattered throughout the ski study
areas were modeled and tailored to elevation in order to account for the different temperatures
and impacts that are expected to occur at different altitudes. Vertical adjustments were made
to the temperature data extracted from the gridded climate data using a generic lapse rate of
+0.65 °C per 100 m of elevation. The elevation of each ski area was represented by its mid-
range elevation (summit – base/2).
RESULTS
Under all scenarios, natural snow became an increasingly scarce resource causing decreased
ski season lengths and increased snowmaking requirements in both the regional and market
level assessments.
Season Length The climate change scenarios consistently projected shorter ski seasons for all 14 study areas
throughout the U.S. Northeast. Under the lower emission (B1) scenario for 2010-2039, only
three study areas were projected to lose less than 10 % of the ski season, while 10 study areas
lost 10-17 % and only the Connecticut location lost more than 20 %. In 2040-2069, ski
season losses were not substantially higher, with only the Connecticut location projected to
lose greater than 25 % of its ski season. The level of climate change impact increased in the
2080s where half of the study areas were projected to lose 25 % or more of their ski season.
The higher emission scenario (A1Fi) had a much greater impact on the length of ski seasons
in the region, especially in 2040-2069 and beyond. In 2040-2069, eight of the study areas
were projected to lose 25 % or more of their ski season. By 2070-2099 all 14 of the study
areas had lost at least 25 % of the ski season and half of the study areas lost 45 % or more
(Tab. 1).
Ski season lengths modelled at the 103 individual ski areas show decreases at all resorts.
Modelled results from the ski areas located at higher elevations (i.e. many ski areas in New
Hampshire and Vermont) show longer season lengths in all time periods than those resorts
located at lower elevations (i.e. many ski areas in Connecticut, Mass, Maine, and New York).
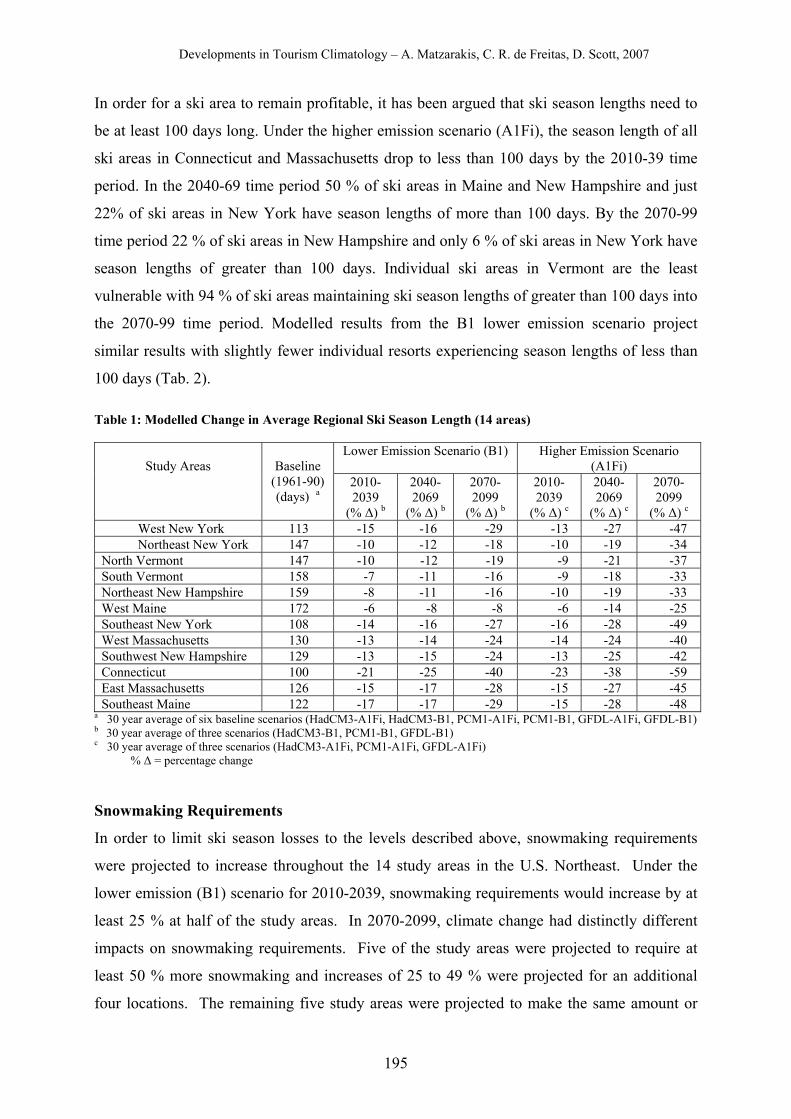
Developments in Tourism Climatology – A. Matzarakis, C. R. de Freitas, D. Scott, 2007
195
In order for a ski area to remain profitable, it has been argued that ski season lengths need to
be at least 100 days long. Under the higher emission scenario (A1Fi), the season length of all
ski areas in Connecticut and Massachusetts drop to less than 100 days by the 2010-39 time
period. In the 2040-69 time period 50 % of ski areas in Maine and New Hampshire and just
22% of ski areas in New York have season lengths of more than 100 days. By the 2070-99
time period 22 % of ski areas in New Hampshire and only 6 % of ski areas in New York have
season lengths of greater than 100 days. Individual ski areas in Vermont are the least
vulnerable with 94 % of ski areas maintaining ski season lengths of greater than 100 days into
the 2070-99 time period. Modelled results from the B1 lower emission scenario project
similar results with slightly fewer individual resorts experiencing season lengths of less than
100 days (Tab. 2).
Table 1: Modelled Change in Average Regional Ski Season Length (14 areas)
Study Areas
Baseline
(1961-90) (days) a
Lower Emission Scenario (B1) Higher Emission Scenario (A1Fi)
2010-2039
(% Δ) b
2040-2069
(% Δ) b
2070-2099
(% Δ) b
2010-2039
(% Δ) c
2040-2069
(% Δ) c
2070-2099
(% Δ) c West New York 113 -15 -16 -29 -13 -27 -47 Northeast New York 147 -10 -12 -18 -10 -19 -34
North Vermont 147 -10 -12 -19 -9 -21 -37 South Vermont 158 -7 -11 -16 -9 -18 -33 Northeast New Hampshire 159 -8 -11 -16 -10 -19 -33 West Maine 172 -6 -8 -8 -6 -14 -25 Southeast New York 108 -14 -16 -27 -16 -28 -49 West Massachusetts 130 -13 -14 -24 -14 -24 -40 Southwest New Hampshire 129 -13 -15 -24 -13 -25 -42 Connecticut 100 -21 -25 -40 -23 -38 -59 East Massachusetts 126 -15 -17 -28 -15 -27 -45 Southeast Maine 122 -17 -17 -29 -15 -28 -48
a 30 year average of six baseline scenarios (HadCM3-A1Fi, HadCM3-B1, PCM1-A1Fi, PCM1-B1, GFDL-A1Fi, GFDL-B1) b 30 year average of three scenarios (HadCM3-B1, PCM1-B1, GFDL-B1) c 30 year average of three scenarios (HadCM3-A1Fi, PCM1-A1Fi, GFDL-A1Fi)
% Δ = percentage change
Snowmaking Requirements
In order to limit ski season losses to the levels described above, snowmaking requirements
were projected to increase throughout the 14 study areas in the U.S. Northeast. Under the
lower emission (B1) scenario for 2010-2039, snowmaking requirements would increase by at
least 25 % at half of the study areas. In 2070-2099, climate change had distinctly different
impacts on snowmaking requirements. Five of the study areas were projected to require at
least 50 % more snowmaking and increases of 25 to 49 % were projected for an additional
four locations. The remaining five study areas were projected to make the same amount or
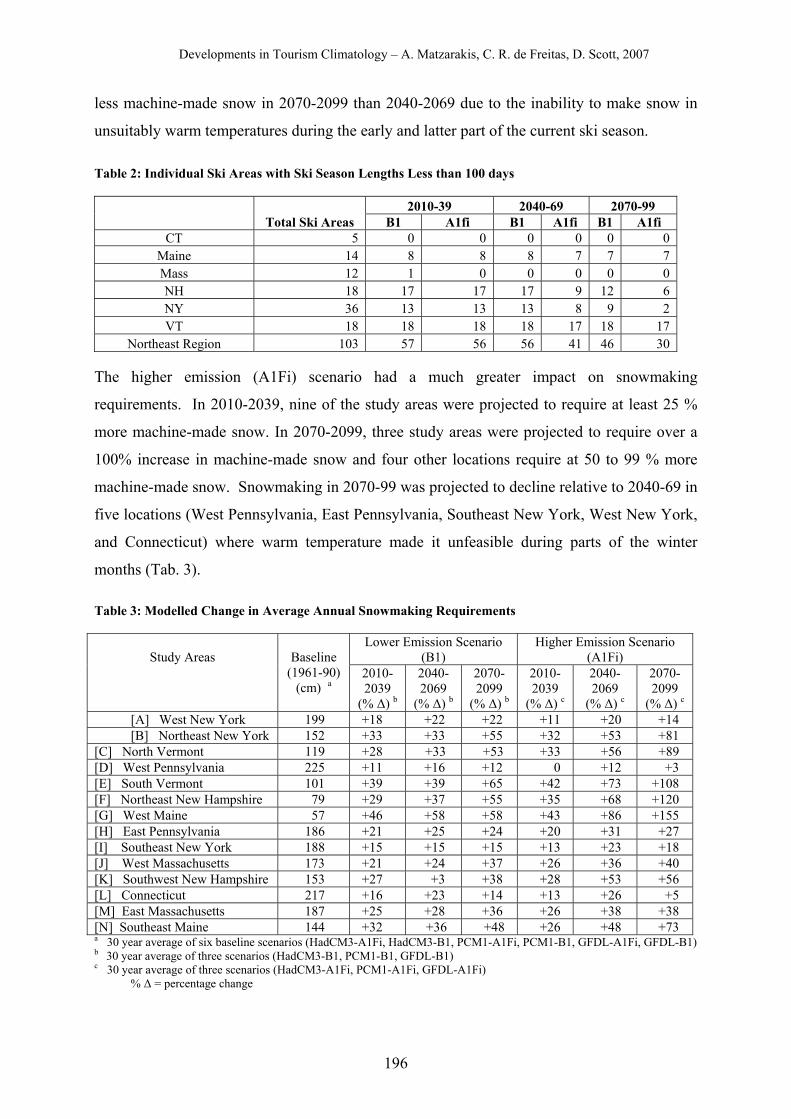
Developments in Tourism Climatology – A. Matzarakis, C. R. de Freitas, D. Scott, 2007
196
less machine-made snow in 2070-2099 than 2040-2069 due to the inability to make snow in
unsuitably warm temperatures during the early and latter part of the current ski season.
Table 2: Individual Ski Areas with Ski Season Lengths Less than 100 days
Total Ski Areas 2010-39 2040-69 2070-99
B1 A1fi B1 A1fi B1 A1fi CT 5 0 0 0 0 0 0
Maine 14 8 8 8 7 7 7 Mass 12 1 0 0 0 0 0 NH 18 17 17 17 9 12 6 NY 36 13 13 13 8 9 2 VT 18 18 18 18 17 18 17
Northeast Region 103 57 56 56 41 46 30
The higher emission (A1Fi) scenario had a much greater impact on snowmaking
requirements. In 2010-2039, nine of the study areas were projected to require at least 25 %
more machine-made snow. In 2070-2099, three study areas were projected to require over a
100% increase in machine-made snow and four other locations require at 50 to 99 % more
machine-made snow. Snowmaking in 2070-99 was projected to decline relative to 2040-69 in
five locations (West Pennsylvania, East Pennsylvania, Southeast New York, West New York,
and Connecticut) where warm temperature made it unfeasible during parts of the winter
months (Tab. 3).
Table 3: Modelled Change in Average Annual Snowmaking Requirements
Study Areas
Baseline
(1961-90) (cm) a
Lower Emission Scenario (B1)
Higher Emission Scenario (A1Fi)
2010-2039
(% Δ) b
2040-2069
(% Δ) b
2070-2099
(% Δ) b
2010-2039
(% Δ) c
2040-2069
(% Δ) c
2070-2099
(% Δ) c [A] West New York 199 +18 +22 +22 +11 +20 +14 [B] Northeast New York 152 +33 +33 +55 +32 +53 +81
[C] North Vermont 119 +28 +33 +53 +33 +56 +89 [D] West Pennsylvania 225 +11 +16 +12 0 +12 +3 [E] South Vermont 101 +39 +39 +65 +42 +73 +108 [F] Northeast New Hampshire 79 +29 +37 +55 +35 +68 +120 [G] West Maine 57 +46 +58 +58 +43 +86 +155 [H] East Pennsylvania 186 +21 +25 +24 +20 +31 +27 [I] Southeast New York 188 +15 +15 +15 +13 +23 +18 [J] West Massachusetts 173 +21 +24 +37 +26 +36 +40 [K] Southwest New Hampshire 153 +27 +3 +38 +28 +53 +56 [L] Connecticut 217 +16 +23 +14 +13 +26 +5 [M] East Massachusetts 187 +25 +28 +36 +26 +38 +38 [N] Southeast Maine 144 +32 +36 +48 +26 +48 +73 a 30 year average of six baseline scenarios (HadCM3-A1Fi, HadCM3-B1, PCM1-A1Fi, PCM1-B1, GFDL-A1Fi, GFDL-B1) b 30 year average of three scenarios (HadCM3-B1, PCM1-B1, GFDL-B1) c 30 year average of three scenarios (HadCM3-A1Fi, PCM1-A1Fi, GFDL-A1Fi)
% Δ = percentage change
Developments in Tourism Climatology – A. Matzarakis, C. R. de Freitas, D. Scott, 2007
197
DISCUSSION Shortened ski seasons and increased snowmaking requirements, which could potentially
reduce revenues and increase operating costs, have important implications for the economic
sustainability of ski businesses in the U.S. Northeast. Resorts that are most adaptable to
changing climate generally include those at higher elevation where temperatures are lower,
those with a diversified tourist product (i.e. all-season resorts), and those who are part of
larger business conglomerates such as Interwest Corporation. Based on this analysis, it would
appear that it is not the entire U.S. Northeast ski industry that is at risk to climate change but
rather individual ski businesses and communities that rely on ski tourism. The probable
consequence of climate change will be a continuation of the historic contraction and
consolidation of the ski industry in the region. Although projected climate change would
contribute to the demise of ski businesses in some parts of Northeast, it could advantage some
of the ski operations that remain (e.g., northern Vermont and New Hampshire).
The large increase in snowmaking requirements under climate change scenarios also raises
important questions about the sustainability of this critical adaptation strategy in certain
locations. Communities and environmental organizations have expressed concern about the
environmental impact of water withdrawals associated with snowmaking. Under the higher
emission (A1Fi) scenario, where a 50-100 % increase in snowmaking was modeled at several
locations, water conflicts may be heightened and access to water may be a critical constraint
for future snowmaking. The economic costs of increased snowmaking (energy and water
costs) were not factored into this assessment because the detailed economic information
required is not publicly available. This remains a critical uncertainty for the future
profitability of ski areas in the region and is a question that can only be adequately answered
by ski area managers themselves.
REFERENCES Dawson, J., and Scott, D. (in press) Climate change vulnerability in the Vermont ski tourism
sector. Annals of Leisure Research. Hayhoe, K., C.P. Wake, T.G. Huntington, L. Luo, M.D. Schwartz, J. Sheffield, E.F. Wood, B. Anderson, J. Bradbury, A. DeGaetano, T. Troy, & D. Wolfe. (2006). Past and future changes
in climate and hydrological indicators in the U.S. Northeast. Climate Dynamics 28, 381-407.
Hayhoe, K., C.P. Wake, B. Anderson, J. Bradbury, A. DeGaetano, A. Hertel, X-Z Liang, E. Maurer, D. Wuebbles & J. Zhu. (in press) Quantifying the regional impacts of global climate
change: Evaluating AOGCM simulations of past and future trends in temperature, precipitation, and atmospheric circulation in the Northeast U.S. In review at the Bulletin of the American Meteorological Society.
Developments in Tourism Climatology – A. Matzarakis, C. R. de Freitas, D. Scott, 2007
198
NSAA (2005) Kottke national end of season survey 2004/05 (26th edition). Lakewood, Colorado:
OECD, 2006 OECD (2006) Climate Change in the European Alps: Adapting Winter Tourism and Natural Hazards Management. Paris: OECD. accessed December 19, 2006, available at,
http://www.oecd.org/document/45/0,2340,en_2649_34361_37819437_1_1_1_1,00.html# Scott D, McBoyle G, Mills B (2003) Climate change and the skiing industry in Southern
Ontario (Canada): exploring the importance of snowmaking as a technical adaptation. Climate Research 23: 171-181
Scott D, McBoyle G, Mills B et al (2006) Climate change and the sustainability of ski-based tourism in eastern North America; a reassessment. Journal of Sustainable Tourism 14(4): 376-
398 Scott, D., McBoyle, G., & Minogue, A. (2007) The implications of climate change for the
Québec ski industry. Global Environnemental Change 1: 181-190. Scott, D., Amelung, B., Becken, S., Ceron, JP., Dubois, G., Gossling, S., Peeters, P., Simpson,
M. (2007) Climate Change and Tourism: Responding to Global Challenges. World Tourism Organization: Madrid and United Nations Environment Programme: Paris.
Serreze, M. C., Holland, M. M., & Stroeve, J. C. (2007) Perspectives on the Arctic's shrinking sea-ice cover. Science 316:1533-1536.
Southwick Associates (2006) The economic contribution of active outdoor recreation. Boulder, Colorado: Outdoor Industry Foundation.
UNWTO (2003) Climate change and tourism. Djerba, Climate Change and Tourism, Djerba, Tunisia, WTO.
Developments in Tourism Climatology – A. Matzarakis, C. R. de Freitas, D. Scott, 2007
199
THE POTENTIAL INFLUENCES OF CLIMATE CHANGES ON TOURIST DEMAND IN WINTER SPORT CENTRES IN SLOVENIA
Vrtačnik Garbas Katja
University of Ljubljana, Faculty of Arts, Department of Geography, Aškerčeva 2, 1000
Ljubljana, Slovenia
[email protected]; [email protected] ABSTRACT The article deals with the potential influences of climate changes on tourist
demand in selected winter sport centres in Slovenia. By using the method of inquiry we tried
to ascertain how skiers perceive climate changes and what their potential responses are.
The results of the survey, which was carried out according to König’s example (1998) in four
winter sport centres in Slovenia in the winter 2004/05, showed that climate change would
have a great influence on the structure of tourist demand and the frequency of visits. The loss
of half of the present skiers would mean an enormous loss of profits and a majority of ski
centres (mostly smaller and middle size ones) would probably stop operating.
The factors which would, in the case of snow deficient winters, influence the skiers’ decision
about where to ski the most would be arrangement of ski tracks, possibility of artificial snow-
making, ticket price, remoteness of a ski centre and catering and hotel offers. A slightly less
important factor would be the aesthetic attractiveness of a ski centre.
Seasons with less snow cover could, to a certain extent, be improved through
additional/supplementary offers, but this will not replace the winter sport activities.
According to the results of the survey, skiers in Slovenia are well acquainted with climate
change and are well aware of the potential consequences. But conversations with the people
who are responsible for the development of winter sport tourism in Slovenia have
demonstrated that they are much less aware of climate change than skiers.
KEYWORDS: Climate changes, tourist demand, winter sport centres, Slovenia INTRODUCTION Climate change and the corresponding changes in snow cover which are required for winter
sport tourism definitely influence tourist supply and they will also influence tourist demand.
Namely, tourists will, to a certain extent, get used to climate change. However, there will also
be changes in their travelling motives and thus also in travelling habits (König, 1998).
Since tourism and recreation represent voluntary activities, it is very important to know how
tourists perceive climate change and how, in their oppinion, travelling habits might change in
Developments in Tourism Climatology – A. Matzarakis, C. R. de Freitas, D. Scott, 2007
200
case of climate changes. This knowledge is crucial in predicting the influences of climate
change on tourism.
Therefore, the main aim of the study was to find out how skiers in selected ski centres in
Slovenia perceive climate change, and what their potential responses to climate change were.
To my knowledge, thus far, at least two studies on the perception of climate change by skiers
were carried out (Bürki, 2000).
In the winter of 1996, König (1998) carried out a survey in the three biggest ski centres in
Australia. The results show that climate change will have a significant influence on the
structure of tourist demand and the frequency of visits to Australian ski centres.
Another survey was carried out in the winter of 1996/97 in ski centres in the cantons
Obwalden and Nidwalden in Switzerland (Bürki, 2000). The results show that in Switzerland
climate changes will also lead to dramatic changes in tourist demand regarding winter
tourism.
METHODS This research was carried out according to König’s example, but his questionnaire was
slightly adapted to Slovene conditions. In this way the results of our research can be
compared to the results of the previous studies (König, 1998, Bürki, 2000).
Due to temporal and financial limitations, the survey was carried out only in four ski centres
in Slovenia, which are appropriate for beginners as well as for advanced skiers. The ski
centres included into the research also had to be located at different altitudes. On the basis of
these criteria the following centres were selected: Kranjska Gora (758 m - 1570 m / 1623 m),
Rogla (1069 m - 1512 m), Vogel (569 m / 1309 m - 1795 m) and Cerkno (938 m - 1294 m).
The targeted population were skiers, snow-boarders and cross-country skiers in winter sport
recreation centres in Slovenia. Since there are no data on this population, it was impossible to
form a statistically representative sample. Therefore, the results of the survey yield
information valid only for the selected winter sport recreation centres. However, some results
they provide may also be valid for the other ski centres.
The survey was carried out, according to König’s (König, 1998) example, in front of catering
facilities or inside the catering facilities in the selected ski resorts.
The survey was carried out with the method of approaching the visitors. Questionnaires were
personally distributed amongst visitors. After a short explanation of the topic they were given
a few minutes to fill in the questionnaires and then handed them back to our interviewers. Due
to direct contact between the interviewers and the interviewed skiers, the latter were much
Developments in Tourism Climatology – A. Matzarakis, C. R. de Freitas, D. Scott, 2007
201
more motivated to cooperate than they would have been without such a contact. One of the
most important reasons for the use of this survey method was a very fast way of gathering a
large number of filled-in questionnaires. However, the down side of it was that the questioned
skiers were careless with certain questions and did not complete the questionnaire in a
completely right way, which is why the results for certain questions differ.
In each ski centre the survey was carried out twice; during the week and at the weekend. The
survey was carried out in the week from 28.2.2005 to 6.3.2005. It would be ideal to carry out
the survey during peak season at the end of January or in February, but due to organizational
difficulties this was impossible. Nevertheless, it should be noted that the winter 2004/05 was
not an average winter because it started rather late (in the second half of January).
RESULTS
Within the scope of the survey we managed to get 855 filled-in questionnaires. 51,4 % of the
interviewed persons were men and 48,6 % were women.
Question 4: If there is enough snow, do you ski/snow-board also in spring? (N = 851)
Slightly more than a half (62 %) of the questioned skiers also ski in spring. This confirms the
observations that the abundance of snow or a long-lasting snow cover appropriate for skiing
do not assure a great number of skiers, as many of them do other activities in spring (for
example, cycling, walking, gardening…). Besides, the majority has already spent all savings
meant for skiing activities.
However, in recent years in Slovenia the ski season started rather late (in January). Therefore,
we wanted to know whether, in the case of a continuation of this trend, skiers would change
their skiing habits and go skiing also in spring. Therefore, another question was asked.
Question 5: In recent winters the ski season in Slovenia started rather late (January). If in the
future ski season started at the end of January or in February, would you start skiing/snow-
boarding also in spring (in March, April, May)? (N = 318)
More than half of the skiers (58,5 %) who currently, even in the case of sufficient snow cover
do not ski, think that in the future they would adapt to the late start of a ski season by skiing
also in spring.
Question 6: If you knew that the next five winters would have very little snow, how would this
influence your decision on if and where to ski/snow board? (N = 836)
Developments in Tourism Climatology – A. Matzarakis, C. R. de Freitas, D. Scott, 2007
202
If there was insufficient snow cover in winter slightly more than a fourth (28,2 %) of the
questioned skiers would still ski in Slovenia, and as often as they currently do. One quarter
(25,4 %) would still ski in Slovenia but less frequently. Most questioned skiers (42,2 %) think
that instead of in Slovenia, they would ski/snow-board elsewhere, and only 2,9 % of the
questioned persons stated that they would stop skiing.
A χ2 analysis showed that it would be mostly skiers with elementary and intermediate skiing
skills who would ski in Slovenia. On the other hand, very good skiers, who are usually also
more demanding, would more frequently decide to ski in other countries. Skiers with
elementary skiing skills are most likely to stop skiing.
As for the type of activity performed, cross-country skiers represent a special group. Namely,
the majority (80 %) would still ski in Slovenia (30 % as frequently as up to now, 50 % less
frequently). This is probably the result of the special character of cross-country skiing.
Namely, this activity can be performed even if the snow cover is not very deep (10 to 15 cm).
The χ2 analysis showed that the persons who remain in Slovenia for skiing tend to have a
lower income, whereas almost half of the skiers with an above average income (47,7 %)
would decide to ski abroad. In addition, the skiers that stopped skiing tend to have a lower
income.
It was assumed that in the case of winters with the lack of snow it would be mostly Slovenes
and Croatians who would ski in Slovenia, but this assumption was only partly confirmed. The
analysis showed that there is a statistically significant relationship between the variables but
results do not confirm that Croatians are more loyal to Slovene ski centres in comparison with
other foreigners.
Question 7: If you kept on skiing in Slovenia even in the case of winters with very little snow,
would you plan more shorter trips to ski centres (a day or a weekend) or longer holidays in a
selected winter-sport centre?(N = 557)
The skiers who will continue skiing in Slovenia even in the case of winters with a lack of
snow tend to undertake more one-day trips than longer holidays. 75 % of the skiers stated that
they would make shorter trips more often.
Question 8: How important would be the following elements at your decision on where to
ski/snow-board if winters with very little snow continued?
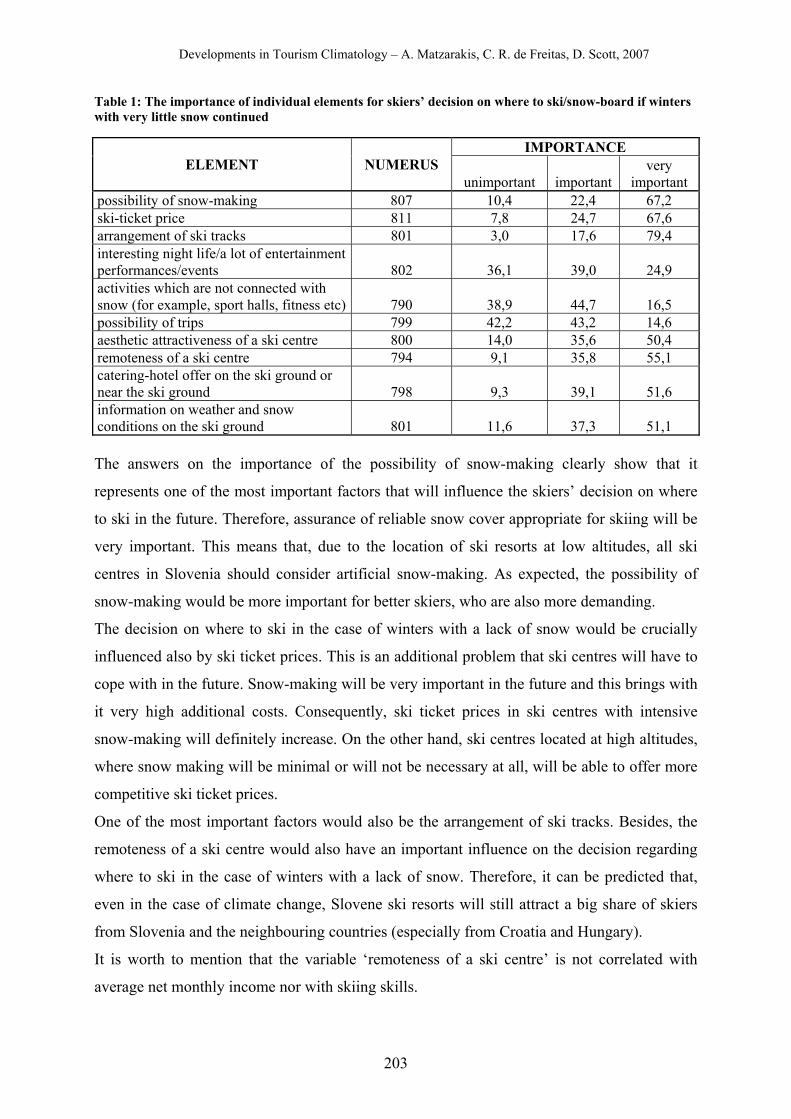
Developments in Tourism Climatology – A. Matzarakis, C. R. de Freitas, D. Scott, 2007
203
Table 1: The importance of individual elements for skiers’ decision on where to ski/snow-board if winters with very little snow continued
The answers on the importance of the possibility of snow-making clearly show that it
represents one of the most important factors that will influence the skiers’ decision on where
to ski in the future. Therefore, assurance of reliable snow cover appropriate for skiing will be
very important. This means that, due to the location of ski resorts at low altitudes, all ski
centres in Slovenia should consider artificial snow-making. As expected, the possibility of
snow-making would be more important for better skiers, who are also more demanding.
The decision on where to ski in the case of winters with a lack of snow would be crucially
influenced also by ski ticket prices. This is an additional problem that ski centres will have to
cope with in the future. Snow-making will be very important in the future and this brings with
it very high additional costs. Consequently, ski ticket prices in ski centres with intensive
snow-making will definitely increase. On the other hand, ski centres located at high altitudes,
where snow making will be minimal or will not be necessary at all, will be able to offer more
competitive ski ticket prices.
One of the most important factors would also be the arrangement of ski tracks. Besides, the
remoteness of a ski centre would also have an important influence on the decision regarding
where to ski in the case of winters with a lack of snow. Therefore, it can be predicted that,
even in the case of climate change, Slovene ski resorts will still attract a big share of skiers
from Slovenia and the neighbouring countries (especially from Croatia and Hungary).
It is worth to mention that the variable ‘remoteness of a ski centre’ is not correlated with
average net monthly income nor with skiing skills.
ELEMENT NUMERUS IMPORTANCE
unimportant important very
important possibility of snow-making 807 10,4 22,4 67,2 ski-ticket price 811 7,8 24,7 67,6 arrangement of ski tracks 801 3,0 17,6 79,4 interesting night life/a lot of entertainment performances/events 802 36,1 39,0 24,9 activities which are not connected with snow (for example, sport halls, fitness etc) 790 38,9 44,7 16,5 possibility of trips 799 42,2 43,2 14,6 aesthetic attractiveness of a ski centre 800 14,0 35,6 50,4 remoteness of a ski centre 794 9,1 35,8 55,1 catering-hotel offer on the ski ground or near the ski ground 798 9,3 39,1 51,6 information on weather and snow conditions on the ski ground 801 11,6 37,3 51,1
Developments in Tourism Climatology – A. Matzarakis, C. R. de Freitas, D. Scott, 2007
204
High quality catering-hotel offers also represent an opportunity for winter-sport centres in
Slovenia.
The results on the elements of additional/supplementary supply show that seasons with less
snow could to a certain extent be improved by this type of supply.
It was ascertained that interesting night life and entertainment events would be most
important to snowboarders and also skiers, but cross-country skiers are less interested. With a
reason for this is the age of skiers. Namely, snow-boarders are mostly of young ages. Parties
and night life are definitely more important to them than to older skiers.
Activities which are not dependent on snow are more important to skiers with higher incomes.
This probably reflects the pretentiousness of wealthier skiers and their capability to afford
such additional activities.
Considering the data in table 1, the possibility of trips does not represent an important factor
that influences the decision of skiers as to where to ski. On the other hand, aesthetic
attractiveness of a ski centre would have an important influence.
Results of the survey show that information on weather and snow conditions in a ski resort are
important. Therefore, information services, such as snow phone and daily internet information
on snow conditions are definitely welcome, especially for day-trippers.
Question 9: Have you ever heard of climate changes (warming of the atmosphere, higher
temperatures, less snow…)? (N = 850)
This question was answered in an affirmative way by 786 of the questioned skiers (92,5 %),
which means that skiers are very well familiar with this issue.
As expected, it turned out that familiarity with climate change is statistically significant
connected with age. The youngest (below 19 years old) and the oldest (60 or more years old)
are least familiar with this issue.
Question 10: Do you think that global warming resulting from the increased green house
effect could threaten skiing/snow-boarding in Slovenia? (N = 843)
Two thirds (68,4 %) of the questioned skiers believe that global warming could threaten
skiing/snow boarding in Slovenia. This result shows that a significant percentage of skiers are
aware of the threat posed by climate changes to winter-sport recreation and tourism in
Slovenia.
Developments in Tourism Climatology – A. Matzarakis, C. R. de Freitas, D. Scott, 2007
205
DISCUSSION
The results of the survey carried out in four winter sport recreation centres in Slovenia in the
winter 2004/05 show that climate change would have a great influence on the structure of
tourist demand and the frequency of visits. If, in the future, the so called ‘green winters’
continued, or if they occurred more frequently, Slovene ski centres would loose almost half
(46,3 %) of the visitors (42,2 % would ski elsewhere and 2,9 % would stop skiing). Only 28,2
% of the questioned skiers would still keep on skiing in Slovenia as often as they do now and
25,4 % would still ski in Slovenia but less frequently.
When analysing the results we need to be aware that also those skiers, who stated that they
would ski abroad in the case of climate change, would at least occasionally still ski in
Slovenia because of the closeness of Slovene ski centres.
Nevertheless, the loss of half of the present skiers would mean a huge loss of profit and the
majority of ski centres (especially smaller and the middle-size ones) would stop operating,
since the lack of snow results in a lack of profits.
It turned out that the skiers that would ski abroad are mostly good skiers, which would mean
an additional disadvantage for Slovene ski centres, as they represent visitors who ski most
frequently and who also spend most money. Similar conclusions were drawn also by König
(1998) and Bürki (2000).
Cross-country skiers would keep on skiing in Slovenia. They represent a relatively small
percentage of visitors of winter-sport recreation and tourism centres. However, it is possible
that this activity will become more popular and widely spread in the future. The reason for
this is the lack of snow for alpine skiing and lower prices.
Factors which, based on the skiers’ responses, have the greatest influence on the decision
about where to ski in winters with a lack of snow would be the arrangement of ski tracks, the
possibility of snow-making, ski-ticket prices, remoteness of a ski centre and catering-hotel
offer. Less important is aesthetic attractiveness of a ski centre.
Well maintained ski tracks and modernization of the existing infrastructure will be crucial to
the economic survival of ski resorts. Besides, snow-making will become a necessity, which
means that many ski centres will find snow-making inevitable. This is naturally connected
with additional costs and higher ski-ticket prices, which has a negative influence on tourist
demand.
A number of Slovene ski centres have not yet fully utilized the possibilities regarding
accommodation capacities and catering services, which, according to this survey, are
important to visitors of winter-sport centres.
Developments in Tourism Climatology – A. Matzarakis, C. R. de Freitas, D. Scott, 2007
206
The results of the survey show that the elements of additional offer would have a minor
influence on the decision of skiers as to where to ski in winters with less snow. However, it is
very likely that the questioned skiers gave the answers to the hypothetical questions
considering the conditions at present, travelling motives and trends, which are subject to
change. They can be very easily influenced by the media and tourist brochures, which will in
the future have a very important influence on the survival of individual tourist products and
the introduction of new ones. As a matter of fact it is very difficult to provide the answer to
the question on how visitors would actually react in changed conditions before the influences
of climate change become obvious. Therefore, the results of our survey represent only
potential reactions.
Results of the survey show that skiers are very familiar with the issue of climate change.
Namely, 92,5 % answered that they have already heard of climate change. With regards to the
perception of climate change it has been ascertained that two thirds (68,4 %) of the questioned
skiers believe that global warming could threaten skiing/snow-boarding in Slovenia.
However, tourism operators are much less aware of this problem as are skiers.
The results of the survey cannot be considered as a prognosis of ski tourism in Slovenia in the
case of climate change but they indicate that climate change would have a big influence on
tourist demand, which would (have to) trigger important influences on the planning and
development of winter-sport recreation centres in Slovenia.
One of the best adaptation strategies would definitely be the development of whole-year
tourism. Namely, climate change does not represent just a threat to mountain tourist centres in
Slovenia but also provide opportunities for further development.
REFERENCES König, U. (1998) Tourism in a warmer world: Implications of climate change due to enhanced
greenhouse effect to the ski industry in the Australian Alps. Zürich, Philosophiche Fakultät II der Universität Zürich.
Bürki, R. (2000) Klimaänderung und Anpassungsprozesse im Winterturismus. St. Gallen, Ostschweizeriche Geographische Gesellschaft, Neue Reihe Heft 6.
Developments in Tourism Climatology – A. Matzarakis, C. R. de Freitas, D. Scott, 2007
207
TOURISM STRATEGIES FOR ADAPTATION AND SUSTAINALBE DEVELOPMENT IN MOUNTAIN AND COASTAL DESTINATIONS IN GERMANY
C. Bartels1, M. Barth2, H. Heinrichs2, E. Kreilkamp1, A. Matzarakis3 and A. Moeller2
1Strategic Management and Tourism Management, Leuphana University of Lueneburg
2Institute for Environmental and Sustainability Communication, Leuphana University of Lueneburg, Germany
3Meteorological Institute, University of Freiburg, Freiburg, Germany
ABSTRACT The interdisciplinary project “Climate Change and Sustainable Development of
Tourism in Coastal Zones and Mountain Regions” (CAST) combines natural and social
sciences (in the fields of cooperation processes, tourism analysis and strategy, weather and
climate change analysis, information and communication and knowledge transfer) in a
transdisciplinary approach that includes players from tourism policy and business and which
focuses on the North Sea Coast and the Black Forest. The project is divided into four phases –
diagnosis, assessment, strategy/design of solutions, and evaluation – where scientific sub-
projects and practical partners meet regularly to discuss the research activities, identify the
needs of the actors and to jointly develop adaptation strategies like installing weather-
independent alternative products and infrastructure, implementing technical improvements or
offering activities for tourism all year round. These instruments should be implemented,
including mitigation strategies to stabilize the anthropological greenhouse effect. The
anticipatory adaptation requires communication activities on the level of the individual
tourism actors among themselves and with visitors as well as processes of cooperative
learning and joint decision-making in tourism regions.
KEYWORDS: Climate change, tourism, adaptation, cooperation, capacity building INTRODUCTION
The adaptation to extreme weather events and outcomes of climate change plays an important
role in sustainable development. Especially for industries like tourism, that are weather and
climate sensitive, climate change constitutes a new mayor challenge beside other elements.
Tourism is confronted with prognoses and scenarios, such as decrease of snow liability,
increase of severe storms and sea-level rise (Agnew and Viner, 2001, Beniston, 2005,
Matzarakis et al., 2004). As a questionnaire (2006) carried out in Austria shows that climate
change will also affect tourist behaviour. Asked in which areas climate change will influence
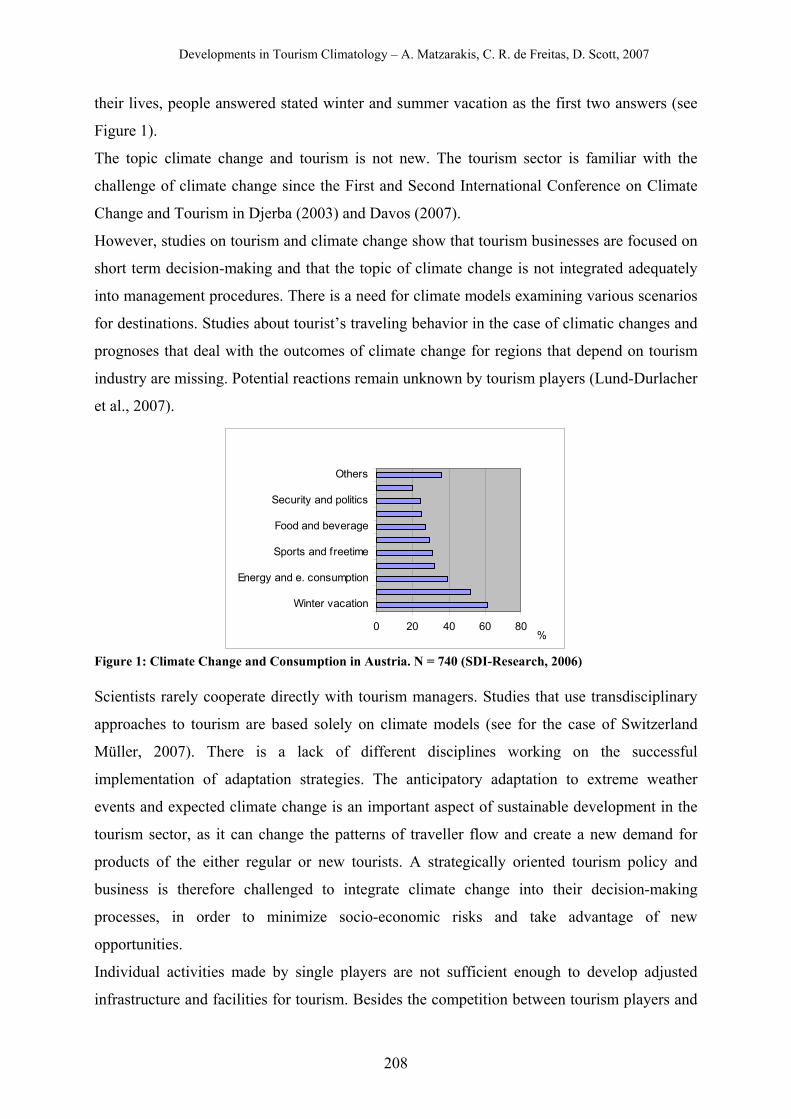
Developments in Tourism Climatology – A. Matzarakis, C. R. de Freitas, D. Scott, 2007
208
their lives, people answered stated winter and summer vacation as the first two answers (see
Figure 1).
The topic climate change and tourism is not new. The tourism sector is familiar with the
challenge of climate change since the First and Second International Conference on Climate
Change and Tourism in Djerba (2003) and Davos (2007).
However, studies on tourism and climate change show that tourism businesses are focused on
short term decision-making and that the topic of climate change is not integrated adequately
into management procedures. There is a need for climate models examining various scenarios
for destinations. Studies about tourist’s traveling behavior in the case of climatic changes and
prognoses that deal with the outcomes of climate change for regions that depend on tourism
industry are missing. Potential reactions remain unknown by tourism players (Lund-Durlacher
et al., 2007).
%0 20 40 60 80
Winter vacation
Energy and e. consumption
Sports and freetime
Food and beverage
Security and politics
Others
Figure 1: Climate Change and Consumption in Austria. N = 740 (SDI-Research, 2006) Scientists rarely cooperate directly with tourism managers. Studies that use transdisciplinary
approaches to tourism are based solely on climate models (see for the case of Switzerland
Müller, 2007). There is a lack of different disciplines working on the successful
implementation of adaptation strategies. The anticipatory adaptation to extreme weather
events and expected climate change is an important aspect of sustainable development in the
tourism sector, as it can change the patterns of traveller flow and create a new demand for
products of the either regular or new tourists. A strategically oriented tourism policy and
business is therefore challenged to integrate climate change into their decision-making
processes, in order to minimize socio-economic risks and take advantage of new
opportunities.
Individual activities made by single players are not sufficient enough to develop adjusted
infrastructure and facilities for tourism. Besides the competition between tourism players and
Developments in Tourism Climatology – A. Matzarakis, C. R. de Freitas, D. Scott, 2007
209
an innovation of products for a sustainable development in destinations, there is a need for
learning cooperation processes. Current tourism-based analyses stress the importance of
collective learning for the future of tourism destinations (Saretzi et al., 2002).
Social and scientific complexity of adaptation strategies (diversity of partners, correlations of
impacts, uncertainty of future trends) are to be considered for cooperation processes in
tourism. To achieve this collaboration, a link between tourism as well as climatic knowledge
and operating experience, concerns and perspectives is needed. In order to stimulate social
learning to allow proactive action under uncertainty, scientists and players have to be
involved into a transdisciplinary research, design and development process.
METHOD
Based on these facts a new transdisciplinary and interdisciplinary project called CAST funded
by the Federal Ministry of Education and Research was innitiated in 2006. Two German
destinations are used as study regions (the Black Forest as a mountain region and the
Northern Sea Coast as a coastal area). Three main goals lead to the implementation of new
products in the tourism sector. First, products and infrastructure as specific adaptation
measures to climate change and weather extremes for the destinations will be designed
following an analysis of climate and tourist trends. Second, further development of
sustainable and strategic qualification for political or economic tourist players takes place in
order to deal with new activities and decisions. Last, an integrative concept to support
sustainable adaptation strategies by implementing a process of cooperation and joint decision-
making in tourism regions is developed.
The project aims at six main „products“: Cooperation network, information and
communication infrastructure, strategy and product innovation, knowledge transfer, further
education, best-practice guideline, and scientific publications and presentations.
• Cooperation network: The creation and implementation of a cooperation network for a
proactive adaptation to climate change in both destinations (Black Forest and North Sea) is a
result of the project. The adaptation processes in the tourist regions require an agreement
between the political and economic level of tourism. The situation will be analysed
collectively through cooperation in learning and designing methods. Afterwards, visions for
a sustainable approach and innovative products in the tourism sector can be developed and
used. Thus, the project aims to develop communication and cooperation structures of the
relevant players in the two destination regions.
Developments in Tourism Climatology – A. Matzarakis, C. R. de Freitas, D. Scott, 2007
210
• Information and communication infrastructure: The development and supply of an
information and communication platform is important for the construction and stabilization
of a cooperation network. Technology is therefore used on the one hand within the project
(via homepage, weblogs, online section for registered users only) to distribute complex
information and data (especially collected at tourist and climate researches) between all
scientists working on the project, but also in dialog with the tourism players and other
stakeholders. On the other hand the tool is externally used to inform anybody who is
interested in the project or further research on the topic of climate change and tourism in
Germany or other countries. After the end of the project the webpage will remain available
for the regions to be continued by the acteurs to complete the adaptation strategies, which
will probably not be completed by the end of the project.
• Strategy and product innovation: Both, the implementation of cooperation networks in both
regions and the development or use of computer-based information and communication
platforms provide a basis to improve the design of reasonable and sustainable products for
the tourism sector that consider chances and risks of climate change. The knowledge gained
from tourism and climate research about situational and future analyses can be used to define
requirements for the integration of climate change into the conventional (marketing)
management. Together with the players, the project generates innovative adaptation
strategies and concrete operational procedures for the tourism industry on site. Thus, the
development and design of examples that illustrate practical adaptation measures are major
results of the project.
• Knowledge transfer, further education: To ensure a long-term integration of the results on
sustainable tourism strategies, further education and qualifications of tourism players are
important. After the development of new measures, individual and organisational learning
can help to form decision and to design competences. To achieve this goal the sub-projects
provide together with the tourism players material which can be used as information for
specific target groups. A computer-based learning platform for self-education will be tested
and evaluated. The final product presents a module for further education to assist tourism
players in skills to implement sustainable adaptation strategies in both the destinations as
well as the tourism sector in general.
• Best-practice guideline: The results based on the research in the two destinations Black
Forest and North Sea will be combined at the end of the project to create an integrative
concept. This best-practice guideline can be used by any tourism player who is interested in
Developments in Tourism Climatology – A. Matzarakis, C. R. de Freitas, D. Scott, 2007
211
adaptation strategies, either on a political or business level. The two studied destinations
serve as examples of coastal and mountain regions and illustrate the theory, process and
success possibilities of the project. With the best-practice guideline a transfer of the
knowledge gained from the project for practical experience in tourism will be available. A
working group of politicians and tourism players on a national level will assist in distributing
the gained knowledge among other German destinations.
• Scientific publications and presentations: Besides this report, the understanding of the
interdisciplinary and transdisciplinary process is passed on to the scientific community via
publications and presentations at conferences to initiate further discussion and research in
the topic of tourism and climate change.
These „products“ are supposed to help to achieve the three goals mentioned before. However,
the project should stress the five real-situation-oriented outcomes rather than the scientific
publications and presentations.
Goals and products of the project are to be achieved with the help of a transdisciplinary
approach formed with the knowledge of scientists and tourism players. Five sub-projects (SP)
provide the competence in the following scientific fields (see Figure 2):
SP 1 Cooperation processes
SP 2 Tourism analysis and strategy
SP 3 Weather and climate change analysis
SP 4 Information and communication and
SP 5 Knowledge transfer and development of competences
In order to establish the link between the sub-projects, but also between scientists and tourism
player’s work and activities, a controlled interface management is systematically created by
SP 1. The organisation of the multilateral correlation is important for the orientation of the
project members, especially for the general perspective, data transfer, and communication.
Instruments like meetings and workshops support the collective knowledge background. For
the organisation of the cooperation network SP 1 analyses with the assistance of SP 2
(tourism analysis and strategy) the needed tourism players available on site.
SP 4 establishes at the same time an information and communication infrastructure. To
provide a user-friendly platform, the structure is adjusted and based on the tourism player’s
judgement. SP 2 and SP 3 integrate data from tourism management and meteorology in the
information system while SP 1 supports an efficient use of the communication platform.
SP 2 is responsible for the development of strategies and innovative products in marketing
planning, which are created together with the practical knowledge of the tourism players in
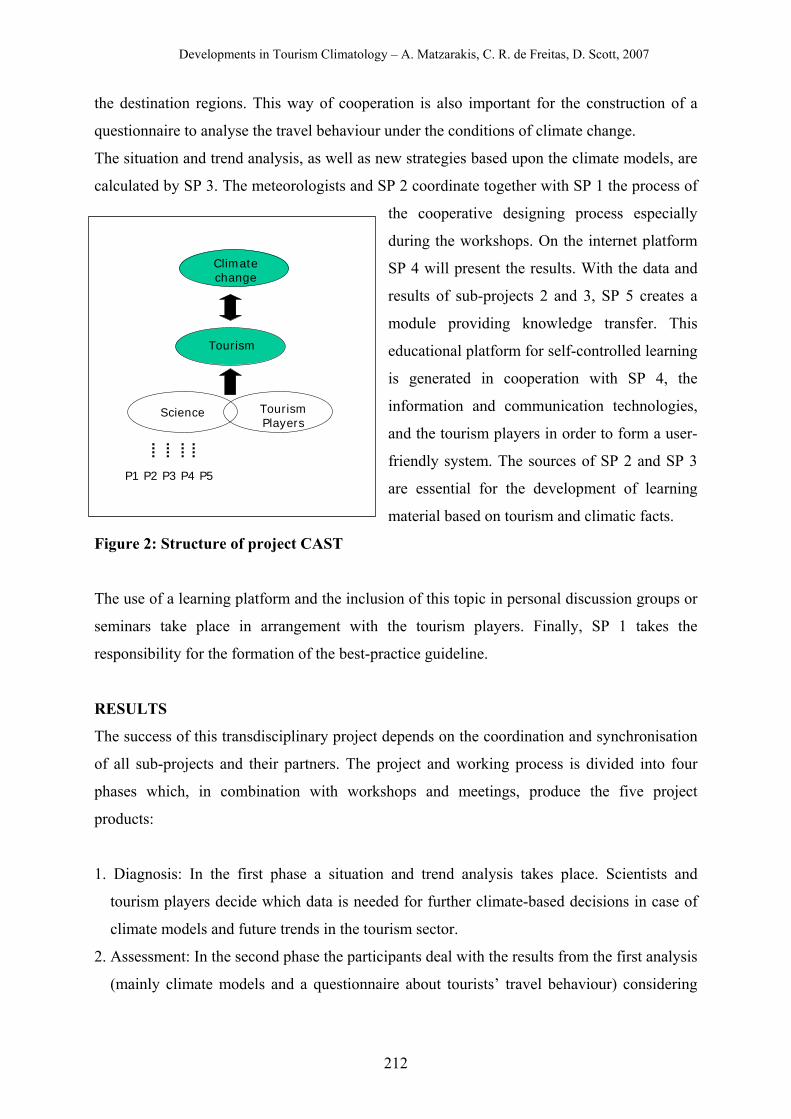
Developments in Tourism Climatology – A. Matzarakis, C. R. de Freitas, D. Scott, 2007
212
the destination regions. This way of cooperation is also important for the construction of a
questionnaire to analyse the travel behaviour under the conditions of climate change.
The situation and trend analysis, as well as new strategies based upon the climate models, are
calculated by SP 3. The meteorologists and SP 2 coordinate together with SP 1 the process of
the cooperative designing process especially
during the workshops. On the internet platform
SP 4 will present the results. With the data and
results of sub-projects 2 and 3, SP 5 creates a
module providing knowledge transfer. This
educational platform for self-controlled learning
is generated in cooperation with SP 4, the
information and communication technologies,
and the tourism players in order to form a user-
friendly system. The sources of SP 2 and SP 3
are essential for the development of learning
material based on tourism and climatic facts.
Figure 2: Structure of project CAST
The use of a learning platform and the inclusion of this topic in personal discussion groups or
seminars take place in arrangement with the tourism players. Finally, SP 1 takes the
responsibility for the formation of the best-practice guideline.
RESULTS
The success of this transdisciplinary project depends on the coordination and synchronisation
of all sub-projects and their partners. The project and working process is divided into four
phases which, in combination with workshops and meetings, produce the five project
products:
1. Diagnosis: In the first phase a situation and trend analysis takes place. Scientists and
tourism players decide which data is needed for further climate-based decisions in case of
climate models and future trends in the tourism sector.
2. Assessment: In the second phase the participants deal with the results from the first analysis
(mainly climate models and a questionnaire about tourists’ travel behaviour) considering
Tourism
Climatechange
Science TourismPlayers
P1 P2 P3 P4 P5
Tourism
Developments in Tourism Climatology – A. Matzarakis, C. R. de Freitas, D. Scott, 2007
213
the question what the data show about future development in the two destinations North
Sea and Black Forest. The assessment aims at identifying the possible actions.
3. Strategy design: The strategic development of new infrastructures and products in the two
model destinations is the aim of the third phase. A mixture of methods for participation,
cooperation and development of creative techniques is introduced to allow learning
processes and to analyse the necessity of new products in a sustainable tourism.
4. Evaluation: In the last phase scientists and tourism players evaluate which possibilities and
limits are to be expected during the implementation and whether this transdisciplinary and
interdisciplinary approach helps for a successful adaptation to climate change in the
tourism sector. A cooperation analysis is the base of a concept which includes the single
components information and communication platform, innovative strategies and products,
and knowledge transfer.
With this approach the project CAST wants to support both the scientific discussion about
climate change and tourism as well as the capability of adaptation for economic and political
players in tourism.
ACKNOWLEDGEMENT This research is supported by The Federal Ministry of Education and Research (Bundesministerium
für Bildung und Forschung, BMBF).
REFERENCES Agnew, M.D. and Viner, D. (2001) Potential impacts of climate change on international
tourism. Tourism and Hos. Res. 3(1), 37-60. Beniston, M. (2005) Warm winter spells in the Swiss Alps: Strong heat waves in a cold
season? A study focusing on climate observations at the Saentis high mountain site. Geophys. Research Letters, 32, L01812.
Matzarakis, A., de Freitas, C., and Scott, D. (Eds.) (2004) Advances in tourism climatology. Ber. Meteorol. Inst. Univ. Freiburg Nr. 12.
Lund-Durlacher, D., Strasdas, W., and Seltmann, E. (2007) Klimawandel und Tourismus" Problemwahrnehmung und Loesungsvorschlaege aus Sicht der Touristiker. [Ergebnisse der Blitzumfrage] http://www.fh-eberswalde.de/de/Studium/Master-Studiengaenge/ Nachhaltiger_Tourismus/Aktuelle_Projekte/Veranstaltungen/K1643.htm (accessed on 08.06.2007)
Mueller, H.R. (2007) Klimaszenarien für das Berner Oberland 2030. http://www.fif.unibe.ch/Klima%20BeO%20Thun-070305.pdf (accessed on 01.08.2007)
Saretzi, A., Wilken, M., and Woehler, K.H. (2002) Lernende Tourismusregionen: Vernetzung als strategischer Erfolgsfaktor kleiner und mittlerer Unternehmen. Muenster.
SDI-Research (2006) Klimawandel und Konsumverhalten. http://www.sdi-research.at/aktuell/hintergrund/ studie-klimawandel-veraendert-konsumverhalten-sdi-research.html (accessed on 12.09.2007)
Developments in Tourism Climatology – A. Matzarakis, C. R. de Freitas, D. Scott, 2007
214
ACCLIMATIZATION DEMANDS OF RECREATIONISTS MOVING WITHIN THE
SOUTHERN REGION OF THE RUSSIAN FAR EAST
E. Grigorieva
Institute for Complex Analysis of Regional Problems FEB RAS, 679016, Birobidzhan, Russia
ABSTRACT Recreation often involves traveling to a distant place at which the climatic
conditions differ from those the recreationist is used to. If the climatic conditions at the
holiday destination are very different, it may be necessary to take into account the thermal
strain of the body expressed as an adjustment loading. This phenomenon is also called
“acclimatization thermal loading” and first affects the respiratory system. It is of special
importance for people considering to travel to Siberia and the Russian Far East, where they
would have to cope with long periods of extreme cold. The effects of travel from the centre of
the Russian Far East Federal Okrug – Khabarovsk to all locations of this district are
examined. In the period from September to March, respiratory organs acclimatization loading
is positive for visitors moving from Khabarovsk to the south of territory to Vladivostok. This
means that they will experience a reduction of the stress level of respiratory organs. In
summer, when the sun-bathing season begins, it is better to travel to the far south of Primorye,
but only in July and August. The northern part of the territory is well suited to eco tourism,
hunting and fishing, but only a healthy person who is not affected badly by large changes in
the respiratory loading should go there. It is not advisable that weak or ill individuals visit this
area, as acclimatization loading is negative throughout the year.
KEYWORDS: respiratory organs, heat losses, acclimatization thermal loading, tourism,
interregional traveling, monsoon climate, Russian Far East
INTRODUCTION
Weather and climate can have a large effect on the thermal condition of the human body,
which is determined by the body-atmosphere heat balance (De Freitas, 1985). Recreation
often involves traveling to a distant place at which the climatic conditions differ from those
the recreationist is used to. If the climatic conditions at the holiday destination are very
different, it may be necessary to take into account the thermal strain of the body expressed as
an adjustment loading. This phenomenon is also called “acclimatization thermal loading” and
first affects the respiratory system (Rusanov, 1989).
Developments in Tourism Climatology – A. Matzarakis, C. R. de Freitas, D. Scott, 2007
215
Regulation of heat exchange is one of the fundamental ways the human body maintains a
constant core temperature. Heat loss through skin accounts for about 82 % of the entire heat
loss, while about 13 % heat loss occurs through respiration (Rusanoiv, 1973). In the winter
period, when the skin is covered by clothing, the respiratory organs are not protected from the
influence of cold conditions, and thus are the main way of heat loss. Under certain conditions
losses of heat via respiratory organs could comprise as much as 30 % of the body’s heat
losses (Rusanov, 1989), which could result in a cold. Given long periods of extreme cold in
Siberia and the Russian Far East, this holds special importance for people considering to
travel to these places for recreation. Variability is also large; it is estimated that heat loss
from the body within these regions differs by up to 300 % (Matukhin, 1971, Derkatcheva,
2000).
METHODS
Data for the study area is drawn from 53 hydrometeorological stations (HMS) in
Khabarovsky Krai, Primorsky Kray, Amursk Region and Jewish Autonomous Region,
situated at the northern latitudes from 43о to 57о and at the eastern longitudes from 125о to
142о (Scientific - Applied Climate Book of the USSR, 1988, 1992). Data on mean monthly
and mean yearly air temperature, relative humidity and wind velocity are used.
Heat loss of the human body for an average man Ql (W) are estimated by a simple technique
that takes into account the heat loss from the respiratory track caused by heating of inhaled air
Pl (W) and evaporative heat loss caused by moisture loss from the surface of respiratory
organs, depending on the temperature and relative humidity of air LE (W) using formula of
Rusanov (1989):
Ql = Pl + LE.
The rate of respiration depends on the level of physical activity, and heat exchange rates have
to be adjusted accordingly. There may be two corrections: the first one for the differences in
atmospheric pressure, and the second for higher altitude. The very small differences in
average atmospheric pressure in the study areas mean that their effects can be ignored. The
second correction may be ignored for the weathers stations located in the lowland plains, all
located at heights below 500 m a.s.l. However, a correction for increased lung ventilation
must be taken into account at the mountain stations in Khabarovsky Krai – Sofiisky Priisk
(902 m a.s.l.) and Solekul (899 m a.s.l.).
Wind has a significant influence on respiratory heat loss by increasing lung ventilation and
respiratory organs heat loss. Strong winds that are common in the coastal territories during

Developments in Tourism Climatology – A. Matzarakis, C. R. de Freitas, D. Scott, 2007
216
times of low air temperatures increase an already strongly negative body heat balance. Hence,
for a reliable estimation of respiratory heat losses in various climatic conditions, it is
necessary to take wind speed into account. This is done by using an adjusted temperature
from the work of Arnoldy (1962) given as
tA = t – 2* V
where tA is adjusted temperature (oC), t is the temperature of the air outdoors (oC), and V is
wind speed (m s-1).
The absolute heat loss values are compared with the physiological norm of 15 W, the latter is
based on winter heat losses in the resort Arkadia-Lermontovsky near Sochi. In this case,
losses create discomfort at any relative humidity level with air temperatures below 5 oC
(Rusanov, 1989). Research on conditions in the Far North and in Antarctic Continent shows
that heat loss of more than 50 W can cause human overcooling, resulting in lung chilblain or
death. Respiratory organs acclimatization loading (ROAL) is calculated as the ratio of heat
loss at the tourist’s home location to heat loss at the holiday destination upon arrival,
expressed as a percentage (Rusanov, 1989). Thus, a value equal to zero means there is no
loading. If the calculated value is greater than zero, a tourist experiences a reduction of the
ROAL. The negative value means an increase in the acclimatization loading and heat loss
from the respiratory track.
Most of the study area is located in the temperate monsoon climatic zone characterized by an
extreme continental regime of annual temperatures. The annual temperature range is 45-50 oС, the annual mean temperatures are between -7.3 oС and 4.5 oС, which characterizes the
continentality of Middle Siberia. Several authors (e.g. Matukhin, 1971, Gorbatcevich, 1894)
have highlighted the extreme bioclimates found in these areas: conditions in the southern Far
East in winter are similar to those in Siberia; and in summer they are comparable to the warm,
humid tropics. Human discomfort in monsoon climatic conditions of the Far East is a function
of the combination of the low temperatures and high wind speed in winter and the
combination of high air temperatures with high relative humidity creating an unpleasant,
sultry feeling in summer (Grigorieva and Khristoforova, 2004).
RESULTS
The analysis of respiratory organs acclimatization loading shows that heat loss by respiration
for a human at rest or at different levels of physical work in the winter period from November
to March can be as much as seven times above the physiological norm. For example, Figure 1
shows the heat loss of a person in Khabarovsk over the year. For light work, seasonal
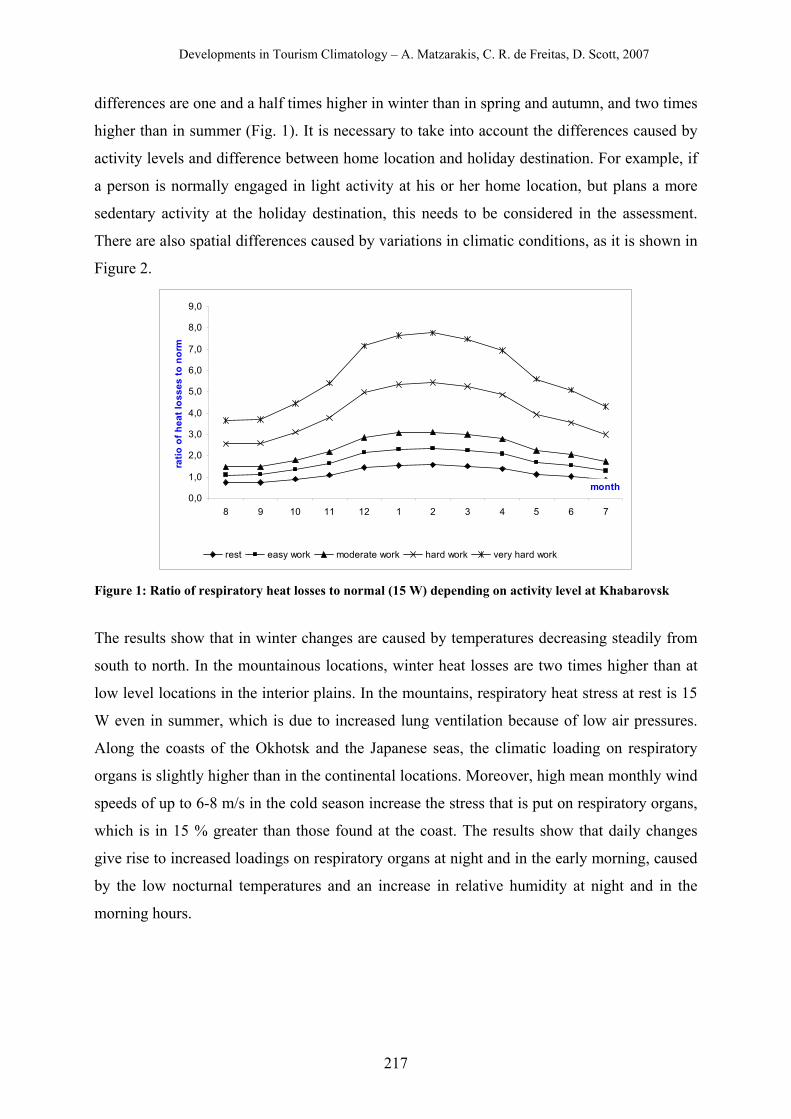
Developments in Tourism Climatology – A. Matzarakis, C. R. de Freitas, D. Scott, 2007
217
differences are one and a half times higher in winter than in spring and autumn, and two times
higher than in summer (Fig. 1). It is necessary to take into account the differences caused by
activity levels and difference between home location and holiday destination. For example, if
a person is normally engaged in light activity at his or her home location, but plans a more
sedentary activity at the holiday destination, this needs to be considered in the assessment.
There are also spatial differences caused by variations in climatic conditions, as it is shown in
Figure 2.
0,0
1,0
2,0
3,0
4,0
5,0
6,0
7,0
8,0
9,0
8 9 10 11 12 1 2 3 4 5 6 7
month
ratio
of h
eat l
osse
s to
nor
m
rest easy work moderate work hard work very hard work
Figure 1: Ratio of respiratory heat losses to normal (15 W) depending on activity level at Khabarovsk
The results show that in winter changes are caused by temperatures decreasing steadily from
south to north. In the mountainous locations, winter heat losses are two times higher than at
low level locations in the interior plains. In the mountains, respiratory heat stress at rest is 15
W even in summer, which is due to increased lung ventilation because of low air pressures.
Along the coasts of the Okhotsk and the Japanese seas, the climatic loading on respiratory
organs is slightly higher than in the continental locations. Moreover, high mean monthly wind
speeds of up to 6-8 m/s in the cold season increase the stress that is put on respiratory organs,
which is in 15 % greater than those found at the coast. The results show that daily changes
give rise to increased loadings on respiratory organs at night and in the early morning, caused
by the low nocturnal temperatures and an increase in relative humidity at night and in the
morning hours.
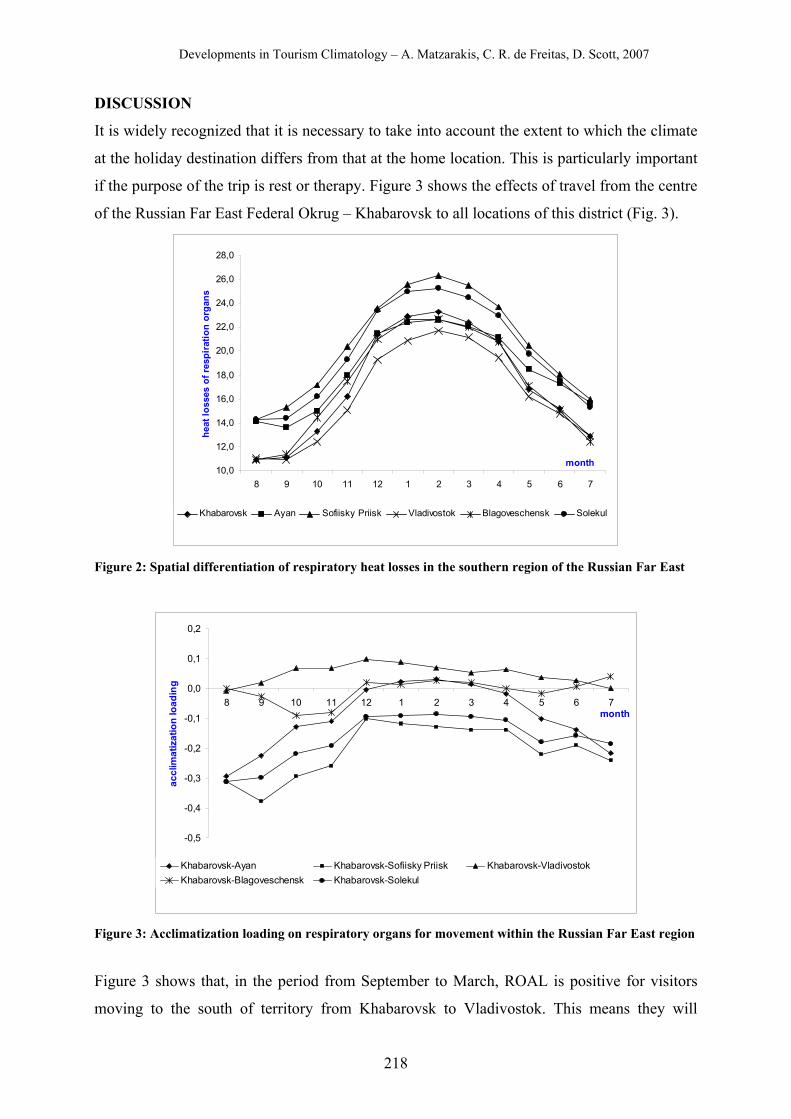
Developments in Tourism Climatology – A. Matzarakis, C. R. de Freitas, D. Scott, 2007
218
DISCUSSION
It is widely recognized that it is necessary to take into account the extent to which the climate
at the holiday destination differs from that at the home location. This is particularly important
if the purpose of the trip is rest or therapy. Figure 3 shows the effects of travel from the centre
of the Russian Far East Federal Okrug – Khabarovsk to all locations of this district (Fig. 3).
10,0
12,0
14,0
16,0
18,0
20,0
22,0
24,0
26,0
28,0
8 9 10 11 12 1 2 3 4 5 6 7
month
heat
loss
es o
f res
pira
tion
orga
ns
Khabarovsk Ayan Sofiisky Priisk Vladivostok Blagoveschensk Solekul
Figure 2: Spatial differentiation of respiratory heat losses in the southern region of the Russian Far East
-0,5
-0,4
-0,3
-0,2
-0,1
0,0
0,1
0,2
8 9 10 11 12 1 2 3 4 5 6 7month
accl
imat
izat
ion
load
ing
Khabarovsk-Ayan Khabarovsk-Sofiisky Priisk Khabarovsk-VladivostokKhabarovsk-Blagoveschensk Khabarovsk-Solekul
Figure 3: Acclimatization loading on respiratory organs for movement within the Russian Far East region
Figure 3 shows that, in the period from September to March, ROAL is positive for visitors
moving to the south of territory from Khabarovsk to Vladivostok. This means they will
Developments in Tourism Climatology – A. Matzarakis, C. R. de Freitas, D. Scott, 2007
219
experience a reduction of the thermal stress put on the respiratory organs. The reason is higher
temperatures of the cold season period in the south of Far East (at Vladivostok) compared to
the temperatures of Khabarovsk at a higher latitude. In summer when the sun-bathing season
begins, it is better to travel to the far south of the Primorye region with the administrative
center in Vladivostok, and this only in July and August. This is because of the differences in
action of the first phase of summer monsoon in Primorye (HMS Vladivostok) and Priamurye
(HMS Khabarovsk). In Priamurye, the period from June to the first half of July is
characterized by hot weather with a small amount of precipitation. In contrast to conditions in
the central parts of the Far East monsoon climatic zone in Priamurye, the resort zone in
Primorye in the south at this time is under the influence of the maritime air masses giving rise
to foggy and cooler weather.
When travelling to the west of the district (Amur Region, HMS Blagoveschensk), the loading
on respiratory organs is close to zero. A restful stay here is best done in winter or summer, as
acclimatization loadings are slightly negative in autumn and spring.
The northern part of the territory is well suited to eco tourism, hunting and fishing, but only a
healthy person who is not put off by large changes in respiratory loadings should go there. It
is not advisable that weak or ill individuals visit this area, as the acclimatization loading is
negative throughout the year (HMS Sofiisky Priisk, Solekul). In addition, the loadings are
much higher than those discussed earlier. The increase of respiratory loadings caused by
traveling to the coastal locations of the Okhotsk and the Japanese seas (HMS Ayan) is caused
by higher wind speeds, especially in winter (Fig. 3). In all cases, acclimatization to new
conditions should be gradual at the times indicated.
ACKNOWLEDGEMENTS
The work was supported by Russian Fund for Basic Research, project № 07-05-08312-з, FEB
RAS: project № 06-III-А-09-392, and advice and editorial assistance from Prof. Dr. Chris de
Freitas, University of Auckland, New Zealand .
REFERENCES de Freitas, C. (1985) Assessment of Human Bioclimate based on Thermal Response. Int. J.
Biometeor. 29:97-119. Rusanov, V. (1989) Appraisal of Meteorological Conditions defining Human Respiration.
Bull. Rus. Academy of Medical Scien. 1:57-60. Rusanov, V. (1973) Methods of Climate Research for Medical Purposes. Tomsk, Tomsk State
University. Matukhin, V. (1971) Bioclimatilogy of human in the monsoon conditions. Leningrad, Nauka.

Developments in Tourism Climatology – A. Matzarakis, C. R. de Freitas, D. Scott, 2007
220
Derkatcheva, L. (2000) Medical-climatic conditions of the Far East and their Influence on Respiration System. Bull. Phys. and Pathol. of Resp. Organs. 6:51-54.
Scientific - Applied Climate Book of the USSR (1992) Issue 25: Khabarovsky Kray, Amur Region. St.-Petersburg, Hydrometeoizdat.
Scientific - Applied Climate Book of the USSR (1988) Issue 26: Primorsky Kray. Leningrad, Hydrometeoizdat.
Arnoldy, I. (1962) Acclimatization of the man in north and south. Moscow, Medgiz. Gorbatcevich, E. (1894) A climate of Khabarovsk. Hygienic studies. Khabarovsk, Priamurye
Military District Press. Grigorieva, Е. and Khristoforova, N. (2004) Climatic Discomfort of the Jewish Autonomous
Region. Geogr. and Natural Res. 4:101-104.
Developments in Tourism Climatology – A. Matzarakis, C. R. de Freitas, D. Scott, 2007
221
WEATHER DEPENDENCE OF TOURIST’S SPATIAL BEHAVIOUR AND DESTINATION CHOICES: CASE STUDY WITH PASSIVE MOBILE POSITIONING
DATA IN ESTONIA
O. Järv1, A. Aasa1, R. Ahas1 and E. Saluveer2
1Institute of Geography, University of Tartu, Vanemuise 46, Tartu, Estonia 2Positium LBS, Tartu, Estonia
ABSTRACT The aim of this paper is to study the impact of air temperature on international
tourists´ spatial behaviour when traveling to Estonia. Tourists´ spatial behaviour depends on
many factors, weather dependence is one important aspect that has been studied. This study
applies passive mobile positioning; a relatively new data collecting method that has many
advantages but also some disadvantages in studying tourists´ spatial behaviour within a
destination at a local scale. The passive mobile positioning dataset consisted of 6.1 million
locations of call activities made by foreign mobile phones (roaming service) during the
summer periods (June 1-August 31) of 2004 and 2005. The results of the study show that
correlation between air temperature and tourists` locations is significant in 50-60% of the
study area, mainly in coastal and resort areas where correlations are the strongest. In bigger
cities and inland areas the activities of tourists were the least weather dependent. The study
confirms the great potential of the passive positioning method for studying tourists’ space-
time behaviour at local destinations.
KEYWORDS: Tourism climatology, spatial behaviour, mobile positioning, weather, destination choice. INTRODUCTION
Tourists’ destination choices and local behaviour regularities are essential information for
planning public services, businesses and tourism marketing. The space-time behaviour of a
tourist depends on his/her decisions and perceptions that are affected by many external factors
(natural, socio-cultural, economical etc). Studies show that weather/climate is one of the most
significant factors for destination choice (e.g. Lohmann and Kaim, 1999, Hamilton and Lau,
2004). Few studies have thus far observed the weather/climate impact on tourist spatial
behaviour on a micro-scale level (e.g. Perry, 1970, Kammler and Schernewski, 2004).
However, on a medium scale, the impact of weather/climate on tourists’ spatial behaviour has
been very little studied within a destination country (e.g. Debbage, 1991). This is, in part,
since tourists’ spatial behaviour is often assumed to be self-evident and is often overlooked as
Developments in Tourism Climatology – A. Matzarakis, C. R. de Freitas, D. Scott, 2007
222
tourists movements have not yet been examined (Lew and McKercher, 2006, ten Hagen et al.,
2006).
As a result the tourists’ actual behaviour during the time between arrival and departure from a
destination is known in very general terms. The main reasons for this are the lack of a suitable
method and the sporadic nature of existing data on the spatial behaviour (Wermuth et al.,
2003). For example, with the traditional travel-diary method tourists’ actual spatial behaviour
remains unclear because of spatial inaccuracy and the poor reliability of diaries, which rely on
a respondent’s honesty and memory (ten Hagen et al., 2006). In addition, tourists’ spatial
behaviour has been studied with different indirect statistics (logged data like overnight stays),
but the results are given in relatively general terms. Until recently, several new data collecting
methods (GPS, GSM, webcams) have been adopted into tourism studies enabling a more
accurate study of tourists’ space-time movements (Brown and Chalmers, 2003). This paper
analyses tourists’ spatial behaviour using passive mobile phone positioning. Advantages of
using mobile positioning are the convenience and cost of positioning and also the possibility
for indoor positioning (conversely to GPS). In addition, all data are already in a digital form.
Asakura and Iryo (2007) and Ahas et al. (2007a) have successfully used mobile positioning
for studying tourists.
The aim of this paper is to describe the impacts of weather on tourists’ spatial behaviour
within a local destination and to analyse the spatial differences in Estonia. For this paper, a
local destination (Estonia) is defined as the area that could be visited in a daytrip from the
place of temporary residence. This paper tries to find answers to the following questions:
How weather (air temperature) affects tourist spatial movement within a local destination?
Whether tourists’ behaviour patterns in inland areas resemble those in coastal areas? Does
weather (air temperature) affect tourist’s behaviour in bigger cities?
STUDY AREA AND METHODS
The study area, Estonia, is located on the eastern coast of the Baltic Sea in Northern Europe
covering around 45000 km2. Estonia is located in a climate transition zone where a wet
maritime climate meets a dry continental climate and, as a result, the four seasons – spring,
summer, autumn, winter – are clearly distinguishable. Regional climatic differences are
affected by the Baltic Sea causing temperature differences between coastal and inland areas.
Summer is a period where the daily mean air temperature is over + 1 °C. The summer period
lasts for three months (June-August), varying in length from 88 to 102 days. The recreation
and tourism sector is an important source of income and contributes about 17 % of the gross
Developments in Tourism Climatology – A. Matzarakis, C. R. de Freitas, D. Scott, 2007
223
domestic product (GPD) for Estonia. 2/3 of international tourists come for holidays; during
the summer period the percentage rises to 78 %.
Inbound tourists were studied during two summer periods from June 1 to August 31 in 2004
and 2005. In this paper the local destination is defined as the area that could be visited in a
daytrip from the place of overnight stay (Lew and McKercher, 2006) and therefore a local
destination could be anywhere in Estonia. For this study, the inbound tourist is defined as the
foreign visitor who visited Estonia irrespective of the purpose of the visit and during that time
used his/her mobile phone in the biggest mobile network provider in Estonia during the study
period.
For this study the passive mobile positioning data of inbound tourists’ roaming activities was
analyzed. The roaming service enables the use of foreign mobile phones (non-Estonian sim-
card) in the local mobile network. Roaming activity is any active use of a mobile phone:
incoming/outgoing calls and SMSs and MMSs; data communication services (internet,
location based services etc). Passive mobile positioning data means that the location of a call
is stored automatically to the log file of a mobile operator whenever a mobile phone interacts
with the mobile network. The location of every call activity is determined by the accuracy of a
mobile network base station. For every base station a theoretical service area was calculated
as Thiessen polygons, defining these service areas as network cells. The density of the
network cells is related to the density of a settlement area, and hence, the accuracy of a
passive mobile positioning is variable in space: average positioning error in rural areas is
about 4.3km and in urban areas 1.7 km respectively (Ahas et al., 2007b).
The passive mobile positioning dataset, consisting over 6.1 million call activities, contains
also the time and date of every call activity and country identification code where the mobile
phone (sim-card) is registered. All call activities are anonymous and can not be associated
with any particular person. Collecting, storing and processing of call activities are in
accordance with the Directive on privacy and electronic communications of the European
Parliament and of the Council (DIRECTIVE 2002/58/EC). The distribution of tourists by
country of origin correlates closely with Estonian accommodation statistics (Ahas et al.,
2007b). In this paper, roaming call activity is used as the location of an inbound tourist.
Daily air temperature data was obtained from 8 weather stations of the Estonian
Meteorological and Hydrological Institute in Estonia. The relationship between the locations
of tourists and air temperature is studied using the average for Estonia as well as data for each
weather station separately. For assessing and ranking the relationships, Spearman´s rank
correlations were used. Correlations are studied at two levels: at the level of all of Estonia and
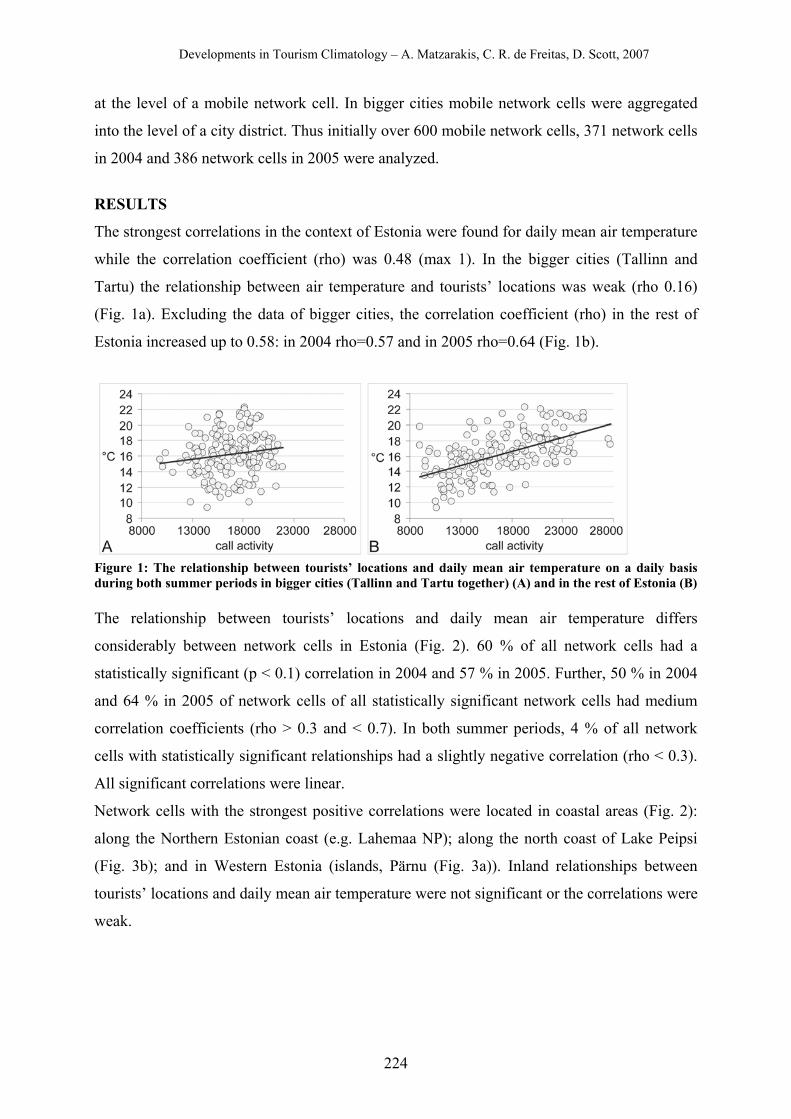
Developments in Tourism Climatology – A. Matzarakis, C. R. de Freitas, D. Scott, 2007
224
at the level of a mobile network cell. In bigger cities mobile network cells were aggregated
into the level of a city district. Thus initially over 600 mobile network cells, 371 network cells
in 2004 and 386 network cells in 2005 were analyzed.
RESULTS
The strongest correlations in the context of Estonia were found for daily mean air temperature
while the correlation coefficient (rho) was 0.48 (max 1). In the bigger cities (Tallinn and
Tartu) the relationship between air temperature and tourists’ locations was weak (rho 0.16)
(Fig. 1a). Excluding the data of bigger cities, the correlation coefficient (rho) in the rest of
Estonia increased up to 0.58: in 2004 rho=0.57 and in 2005 rho=0.64 (Fig. 1b).
Figure 1: The relationship between tourists’ locations and daily mean air temperature on a daily basis during both summer periods in bigger cities (Tallinn and Tartu together) (A) and in the rest of Estonia (B) The relationship between tourists’ locations and daily mean air temperature differs
considerably between network cells in Estonia (Fig. 2). 60 % of all network cells had a
statistically significant (p < 0.1) correlation in 2004 and 57 % in 2005. Further, 50 % in 2004
and 64 % in 2005 of network cells of all statistically significant network cells had medium
correlation coefficients (rho > 0.3 and < 0.7). In both summer periods, 4 % of all network
cells with statistically significant relationships had a slightly negative correlation (rho < 0.3).
All significant correlations were linear.
Network cells with the strongest positive correlations were located in coastal areas (Fig. 2):
along the Northern Estonian coast (e.g. Lahemaa NP); along the north coast of Lake Peipsi
(Fig. 3b); and in Western Estonia (islands, Pärnu (Fig. 3a)). Inland relationships between
tourists’ locations and daily mean air temperature were not significant or the correlations were
weak.
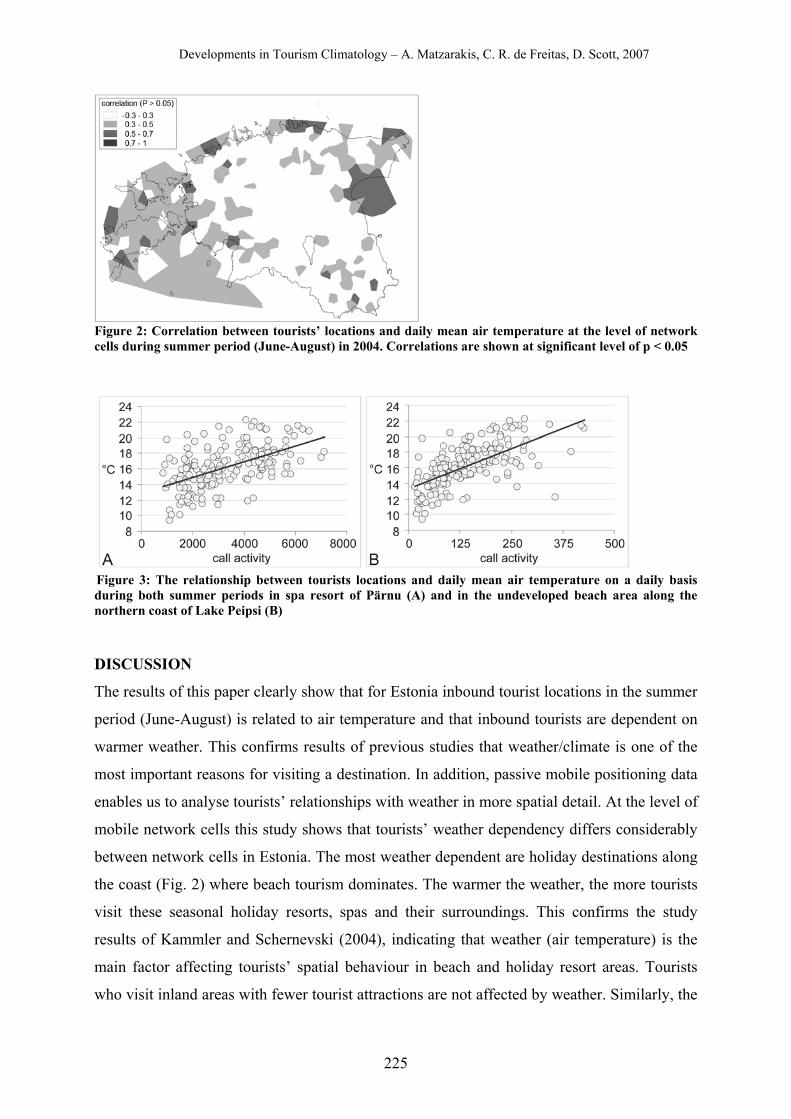
Developments in Tourism Climatology – A. Matzarakis, C. R. de Freitas, D. Scott, 2007
225
Figure 2: Correlation between tourists’ locations and daily mean air temperature at the level of network cells during summer period (June-August) in 2004. Correlations are shown at significant level of p < 0.05
Figure 3: The relationship between tourists locations and daily mean air temperature on a daily basis during both summer periods in spa resort of Pärnu (A) and in the undeveloped beach area along the northern coast of Lake Peipsi (B) DISCUSSION
The results of this paper clearly show that for Estonia inbound tourist locations in the summer
period (June-August) is related to air temperature and that inbound tourists are dependent on
warmer weather. This confirms results of previous studies that weather/climate is one of the
most important reasons for visiting a destination. In addition, passive mobile positioning data
enables us to analyse tourists’ relationships with weather in more spatial detail. At the level of
mobile network cells this study shows that tourists’ weather dependency differs considerably
between network cells in Estonia. The most weather dependent are holiday destinations along
the coast (Fig. 2) where beach tourism dominates. The warmer the weather, the more tourists
visit these seasonal holiday resorts, spas and their surroundings. This confirms the study
results of Kammler and Schernevski (2004), indicating that weather (air temperature) is the
main factor affecting tourists’ spatial behaviour in beach and holiday resort areas. Tourists
who visit inland areas with fewer tourist attractions are not affected by weather. Similarly, the
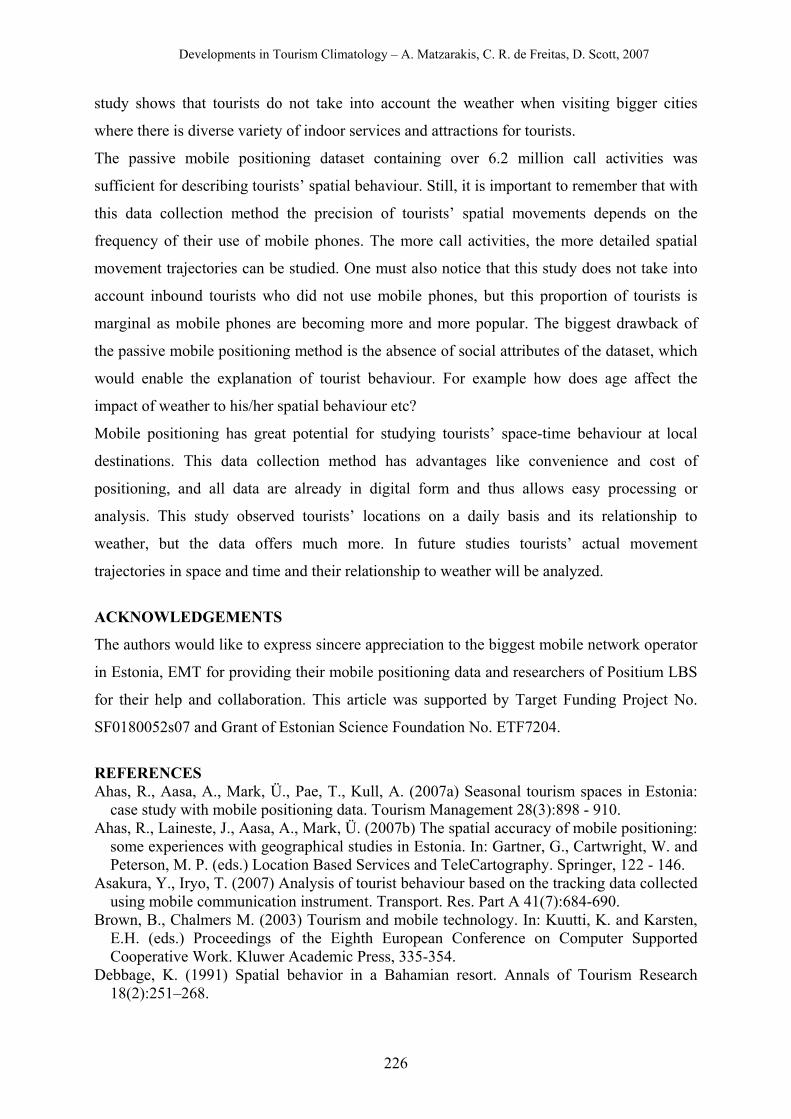
Developments in Tourism Climatology – A. Matzarakis, C. R. de Freitas, D. Scott, 2007
226
study shows that tourists do not take into account the weather when visiting bigger cities
where there is diverse variety of indoor services and attractions for tourists.
The passive mobile positioning dataset containing over 6.2 million call activities was
sufficient for describing tourists’ spatial behaviour. Still, it is important to remember that with
this data collection method the precision of tourists’ spatial movements depends on the
frequency of their use of mobile phones. The more call activities, the more detailed spatial
movement trajectories can be studied. One must also notice that this study does not take into
account inbound tourists who did not use mobile phones, but this proportion of tourists is
marginal as mobile phones are becoming more and more popular. The biggest drawback of
the passive mobile positioning method is the absence of social attributes of the dataset, which
would enable the explanation of tourist behaviour. For example how does age affect the
impact of weather to his/her spatial behaviour etc?
Mobile positioning has great potential for studying tourists’ space-time behaviour at local
destinations. This data collection method has advantages like convenience and cost of
positioning, and all data are already in digital form and thus allows easy processing or
analysis. This study observed tourists’ locations on a daily basis and its relationship to
weather, but the data offers much more. In future studies tourists’ actual movement
trajectories in space and time and their relationship to weather will be analyzed.
ACKNOWLEDGEMENTS
The authors would like to express sincere appreciation to the biggest mobile network operator
in Estonia, EMT for providing their mobile positioning data and researchers of Positium LBS
for their help and collaboration. This article was supported by Target Funding Project No.
SF0180052s07 and Grant of Estonian Science Foundation No. ETF7204.
REFERENCES Ahas, R., Aasa, A., Mark, Ü., Pae, T., Kull, A. (2007a) Seasonal tourism spaces in Estonia:
case study with mobile positioning data. Tourism Management 28(3):898 - 910. Ahas, R., Laineste, J., Aasa, A., Mark, Ü. (2007b) The spatial accuracy of mobile positioning:
some experiences with geographical studies in Estonia. In: Gartner, G., Cartwright, W. and Peterson, M. P. (eds.) Location Based Services and TeleCartography. Springer, 122 - 146.
Asakura, Y., Iryo, T. (2007) Analysis of tourist behaviour based on the tracking data collected using mobile communication instrument. Transport. Res. Part A 41(7):684-690.
Brown, B., Chalmers M. (2003) Tourism and mobile technology. In: Kuutti, K. and Karsten, E.H. (eds.) Proceedings of the Eighth European Conference on Computer Supported Cooperative Work. Kluwer Academic Press, 335-354.
Debbage, K. (1991) Spatial behavior in a Bahamian resort. Annals of Tourism Research 18(2):251–268.
Developments in Tourism Climatology – A. Matzarakis, C. R. de Freitas, D. Scott, 2007
227
DIRECTIVE 2002/58/EC (2002) Directive on privacy and electronic communications of the European Parliament and of the Council. Official Journal of the European Communities, L201:37-47.
Hamilton, J. M., Lau, M. A. (2004) The role of climate information in tourist destination choice decision-making. Research Unit Sustainability and Global Change Working Paper FNU-56. Hamburg University and Centre for Marine and Climate Research.
Kammler, M., Schernewski, G. (2004) Spatial and temporal analysis of beach tourism using webcam and aerial photographs. In: Schernewski, G. and Löser, N (eds), Managing the Baltic Sea: Coastline Reports 2:121 – 128.
Lew, A., McKercher, B. (2006) Modeling tourist movements A local destination analysis. Annals of Tourism Research 33(2):403–423.
Lohmann, M., Kaim, E. (1999) Weather and holiday destination preferences: Image attitude and experience. Tourist Review 54 (2):54-64.
Perry, A. H. (1972) Weather, climate and tourism. Weather 27:199–203. ten Hagen, K., Kramer, R., Modsching, M., Gretzel, U. (2006) Capturing the beaten paths: A
novel method for analysing tourists' spatial behaviour at an urban destination. In: Hitz, M., Sigala, M., Murphy, J. (eds) Information and Communication Technologies in Tourism. Vienna, Springer, 75-86.
Wermuth, M., Sommer, C., Kreitz, M. (2003) Impact of new technologies in travel surveys. In: Stopher, P. and Jones, P. (eds) Transport Survey Quality and Innovation. Pergamon Press, 465-469.
Developments in Tourism Climatology – A. Matzarakis, C. R. de Freitas, D. Scott, 2007
228
“SUMMER (2007) SET IN WITH ITS USUAL SEVERITY” (COLERIDGE) -
IMPACTS ON TOURISM
Allen Perry
University of Swansea, United Kingkom
ABSTRACT Summer 2007 was highly anomalous over Europe with extreme wetness in NW
Europe and extreme and persistent heat in SE Europe. Being very different from recent
summers, how did tourists respond? In UK it was the wettest summer that most people under
50 have ever experienced. Was it forecasts or actuality that determined their holiday patterns?
How important was weather compared with terrorist threats, rising inflation and other non-
meteorological factors?
KEYWORDS: Summer, tourism, United Kingdom
INTRODUCTION
Smith (1990) showed that the level of tourism from the UK to the Mediterranean was
influenced by precipitation in the UK during the previous summer. A study from the
Netherlands (Lise and Tol, 2002) has extended this analysis and shown how models can be
built linking tourist demand to climate. If the current mass travel movement is viewed as a
kind of import substitution, then such trends as growth of the domestic short-holiday market
in northern European countries could have an impact on the balance of payments of several
countries. In the last few years there has been a big rise in the numbers of holiday-makers
booking holidays at the last minute, rather than several months ahead. This change has been
made possible by the rise in internet bookings, low-cost airlines and a general move away
from the traditional package holiday booked with a travel agent. Late decision making on
where to holiday allow for the weather in a particular year to play a more major role in the
holiday destination decision. To further understand the role of a particular seasons weather on
tourist demand a number of studies have been carried out in the last 5 years, monitoring
holiday demand and price in individual years.
Developments in Tourism Climatology – A. Matzarakis, C. R. de Freitas, D. Scott, 2007
229
The heat and drought summer of Summer 2003
The three summer months, June – August 2003, broke both heat and drought records over a
large area of Western Europe from Germany in the north to Spain in the south, and from
Portugal in the west to Switzerland in the east. Temperatures were above normal over almost
the whole of Europe, with anomalies reaching more than 5 degrees C in southern France.
Drought conditions were widespread with the largest negative anomalies of precipitation
further north in central and eastern Europe . National temperature records were broken in the
UK, Switzerland, Germany and Belgium but not in France, Spain, Portugal or Italy. The first
heatwave in Italy and Spain began in mid-June with Majorca recording 39.5 degrees C, a new
record for the month. There was a slight lull in the hot weather in early July but by the middle
of the month temperatures of between 38-40 degrees C were recorded in several
Mediterranean countries. The most intense phase of the heatwave occurred from 4th-13th
August and during this period 70 out of 180 stations in France broke all-time records and in
15 % of towns temperatures exceeded 40 degrees C. The intense heat was protracted,
unremitting and severe and in many places in central, southern and western Europe,
unprecedented .since at least 1500 (Beniston, 2004). This type of summer is entirely
consistent with what computer models of the climate are saying will become more frequent
over the next century.
The main impacts of the extreme weather on tourism appear to have been the
following:-
Holiday demand was more related to the actual than the forecast weather. The prices of late-
availability holidays were monitored on a day-by-day basis using the Web sites of both an
up-market tour operator specializing in Greece and Turkey and a holiday consolidator for the
period from July 16th -August 20th.. At the beginning of the survey period holiday demand
was lower than normal with prices quite weak, but after a delay of just a few days as the more
unsettled weather began, prices began to rise by between 25-40 % on both web-sites. Peak
prices were achieved in the first few days of August, following nearly two weeks of unsettled
weather and continued until the hot, settled weather was re-established. After this they fell
dramatically and by mid-August, normally an extremely busy time, demand had fallen and
prices had eased considerably, in some cases to lower levels than had been prevailing at the
start of the survey period. This limited survey suggests that for a wide range of differently
priced Mediterranean holidays catering to different price-brackets, late-bookers tend to be
Developments in Tourism Climatology – A. Matzarakis, C. R. de Freitas, D. Scott, 2007
230
highly influenced by the prevailing, as opposed to the forecast, conditions in the home
country. Such tactical booking is probably a result of several factors acting in tandem, for
example the desire to achieve a bargain holiday by very late booking, the inability to plan
holidays ahead because of work commitments, or possibly a dislike of foreign travel unless
there are perceived weather advantages to be derived from it. By mid-August there were
numerous press reports that camp sites in many holiday areas of the UK were full, and
camping and holiday center operators reported exceptionally high booking rates.
Summer 2006—the warmest summer on record in the UK
The weather during summer 2006 was consistently warm and dry, and the summer included
the warmest individual month ever recorded (July) and the highest temperature ever recorded
in July. Although August was a somewhat disappointing month for holidays, especially in the
east of the UK, the protracted good summer weather led to an increase in demand for holidays
at home and a reduced demand for overseas holidays. There was a need to extensively
discount the price of Mediterranean holidays, even in the peak season, and this widespread
discounting subsequently led to the financial failure of a number of small and medium size
operators.
Summer 2007—the wettest in the UK since 1912
Summer 2007 was highly anomalous over Europe with extreme wetness in NW Europe and
extreme and persistent heat in SE Europe. Despite the poor weather, holiday demand was less
buoyant than might have been expected. Non-climatic factors such as the terrorist threat and
increased airport security ,rising inflation and probably plans made to holiday in the UK on
the basis of the preceding good summers, meant that for many tour operators, summer 2007,
although better than the previous year, was not outstanding and tactical discounting of
holidays still took place. There was also considerable negative publicity concerning the
repeated heatwaves in Greece and particularly the forest fires that ravaged the country
towards the end of the holiday season. Following the fires demand for holidays to all of
Greece dropped by nearly 20 %. Holiday demand was above normal after the traditional end
of the peak season, as holiday-makers, feeling themselves deprived of summer sun, rushed to
book autumn holidays in the Mediterranean.
A further factor that may well have been influential was the fact that the British
Meteorological office issued a forecast in the spring of 2007 which suggested temperatures
Developments in Tourism Climatology – A. Matzarakis, C. R. de Freitas, D. Scott, 2007
231
were likely to be above normal in the UK. The text of this forecast was as follows: for the
remainder of summer (i.e. until the end of August).
Temperature
Near average temperatures are likely to continue for the rest of July. However, during August
there are signs of a change of weather type, with an indication that most regions will
experience some periods with above average temperatures.
Precipitation
Above-average rainfall is likely to continue in most regions for the rest of July and at first in
August. For the remainder of August current indicators favour a trend to drier-than-normal
conditions for most of the UK.
In fact the mean summer temperature was almost exactly normal ( compared with the 1971-
2000 period),but it was still the coolest summer since 1998.
CONCLUSIONS
Recent summers provide a possible analogue to summers in the future and illustrate how
holiday consumer taste may vary in the light of projected climate change. The balance
between the attractions of holidays in Northern and Southern Europe varies from year to year
and is closely related to prevailing conditions from one year to the next
REFERENCES Beniston, M. (2004) Extreme climatic events: Examples from the Alpine region. Journal de
Physique IV, 121, 139-149. Lise, W., Tol, R. (2002), Impact of Climate on Tourism Demand. Climatic Change 55, 429-
449. Smith, K. (1990) Tourism and climate change, Land Use Policy 7 176-180.
Developments in Tourism Climatology – A. Matzarakis, C. R. de Freitas, D. Scott, 2007
232
SENSITIVITY OF THERMAL CONDITIONS FOR TOURISM TO CLIMATE
CHANGE AND VARIABILITY:
A COMPARISON OF REGIONAL SCALE CASE STUDIES
C R de Freitas1 and A. Matzarakis2 1School of Geography, Geology & Environmental Science, University of Auckland, New
Zealand 2 Meteorological Institute, University of Freiburg, Germany
ABSTRACT
Many tourist destinations rely heavily on thermal environmental assets and a generally agreeable
climate to attract visitors. Climate change, whether natural or anthropogenic, could modify these
assets. Yet the topic of future climate is plagued with uncertainty. In addition, climate change
impact assessment often relies on a greatly simplified picture of climate, mainly because it
usually deals with change in terms of single, secondary climatic variables. Here a body-
atmosphere energy balance is used to assess the significance of change using a sensitivity
analysis. Two well-tested schemes for integrating thermal bioclimatic variables are used to assess
sensitivity to climate change in a variety of regions of the world well known tourist locations
globally. The approach produces integrated output indices in the form of the Predicted Mean
Vote (PMV) and Physiologically Equivalent Temperature (PET). High resolution gridded data
for the period 1961–1990 was used to produce monthly maps. Response surface are used to show
sensitivity to change in two regions that are the focal point for tourism in the Southern
Hemisphere. Overall the results show that the quantification of the thermal impact of changed
climate cannot be adequately assessed using temperature alone. The generalised mapped results
are useful for identifying areas of high sensitivity to climate change as well as the extent to
which potential impact on thermal climate appeal for tourism is likely to be negative or positive.
KEYWORDS: Predicted Mean Vote, Physiologically Equivalente Temperature, Thermal
Sensitivity, Australia, New Zealand
Developments in Tourism Climatology – A. Matzarakis, C. R. de Freitas, D. Scott, 2007
233
INTRODUCTION
Many tourist destinations rely heavily on thermal environmental assets that create a generally
agreeable climate to attract visitors. Climate change, whether natural or anthropogenic, could
modify these assets and result in significant impacts, posing both risks and opportunities. There
are two ways assessing the effect of these changes on tourism climate, these are the so called
top down or bottom up approach. The top down method is by far the most common. In this
approach, a future climate state is identified using global climate models and impacts
evaluated. But this method is hampered by the unreliability of climate models. The fact is that
there are no dependable predictions of future climate, especially at the regional scale;
consequently the topic of future climate and possible impacts is plagued with uncertainty (de
Freitas and Fowler, 1989). Another problem is that there is often an implicit assumption that a
specific changed climate condition is predicted. This is reinforced by the fact that global
climate models are limited to calculating a single equilibrium response condition. Clearly, the
consequences of models being ‘wrong’ could have serious planning implications. To make
matters worse, there are large discrepancies between predictions from different global climate
models, especially when model output is transformed into impacts at the regional scale, the
very scale at which planners and policy-makers typically operate.
An additional problem is that top down climate change impact assessment often relies on a
greatly simplified picture of climate, mainly because it usually deals with change in terms of
single climate variables that allow for only elementary statistical connections to be made with
impacts.. This approach is of limited use since the significance of change will depend on the net
effect of the changed variables. Clearly, thermal climate in terms of human comfort is a function
of the combined effect of several atmospheric variables, including air temperature, humidity,
solar radiation and wind, as well a the body’s metabolic rate and clothing.
The alternative bottom up approach, circumnavigates many of these problems. First
sensitivity of a tourism activity to climate is assessed, and then the question asked: What is
the net effect of change on the tourism activity or tourism-related socioeconomic exposure
unit? By identifying its sensitivity to climate and evaluating this in terms of the adaptive
capacity of the exposure unit, vulnerability of tourism to change may be determined and
assessed. With this information, planning decisions would be possible without knowing
precisely what future climate will be like.
In the current study bottom up approach is used to assess the sensitivity to change of the
thermal environmental assets that create a generally agreeable climate to attract visitors. Two
regions that are heavily used for outdoor tourism activities are considered together for
Developments in Tourism Climatology – A. Matzarakis, C. R. de Freitas, D. Scott, 2007
234
comparative purposes. The Southern Hemisphere is used as this part of the global often
neglected in regional climate assessments. To overcome the deficiency caused by using a single
climate variable, typically air temperature, a body-atmosphere energy balance approach is
employed. This approach deals with thermal climate in terms human comfort as a function of
the combined effect several atmospheric variables as well as the individual’s activity level,
posture and clothing. Thus he information provided is an expression of the integrated effect of all
thermal aspects of climate. From here the significance of change can be related to overall
sensitivity of the climate condition to those aspects of climate that do change. For example, an
average 1oC air temperature rise may be of little consequence where high temperatures, high
solar heat loads, high relative humidity and low wind speeds are commonplace. On the other
hand, marginal tourism climates may be highly sensitive and respond dramatically to even the
smallest change in thermal conditions in an already short tourist season. Also, more subtle
changes in climate can be assessed, such as those due to changes in cloud cover, which affects
the solar heat load on the human body and thus the body net thermal state.
METHOD
Two refined and well-tested schemes for integrating thermal bioclimatic variables are used to
assess sensitivity of the climate of Australia and New Zealand generally to climate change. The
tourism focus in both cases is outdoor recreation. In addition, two of regions that are well heavily
used tourist locations, namely the Auckland region of the North Island of New Zealand and the
Sunshine and Gold coasts of southeast Queensland Australia, are the subject of more in depth
analysis. Detailed assessment of data from the climate stations at Auckland and Brisbane
Australia are used as indicative of the climate of these important tourist regions.
Two refined and well-tested schemes for integrating thermal bioclimatic variables are used to
assess sensitivity to climate change in a variety of regions of the world well known tourist
locations globally. The approach produces integrated output indices in the form of the Predicted
Mean Vote (Fanger, 1972, VDI, 1998) and Physiologically Equivalent Temperature (Höppe,
1999, Matzarakis et al., 1999). Predicted Mean Vote (PMV) or its equivalent the ASHRAE
Temperature Sensation Scale (TSN) quantifies comfort/discomfort based on human-assessed
response to thermal stress. PMV and TSN one of the most widely used thermal indices
(McGregor et al., 2002). Physiological Equivalent Temperature (PET) integrates all thermal
variables relevant to the body-atmosphere energy balance and expresses the result in terms of an
“effective air temperature” (Höppe, 1999, Matzarakis et al., 1999).
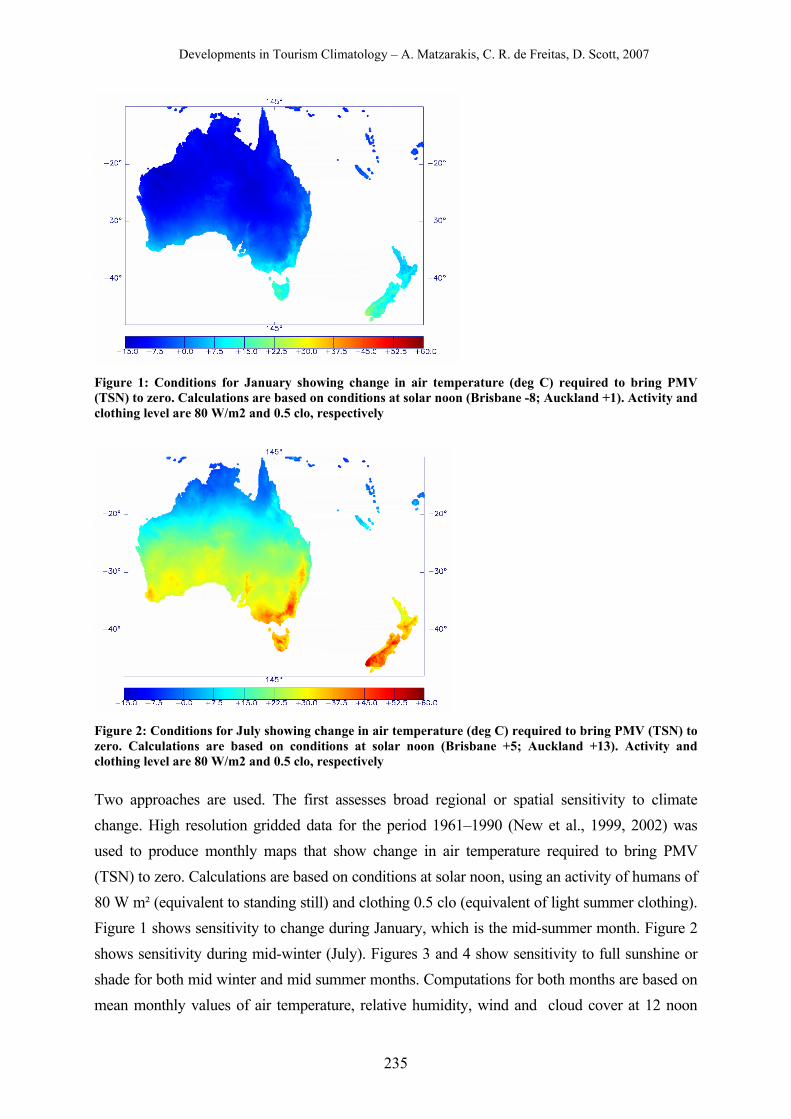
Developments in Tourism Climatology – A. Matzarakis, C. R. de Freitas, D. Scott, 2007
235
Figure 1: Conditions for January showing change in air temperature (deg C) required to bring PMV (TSN) to zero. Calculations are based on conditions at solar noon (Brisbane -8; Auckland +1). Activity and clothing level are 80 W/m2 and 0.5 clo, respectively
Figure 2: Conditions for July showing change in air temperature (deg C) required to bring PMV (TSN) to zero. Calculations are based on conditions at solar noon (Brisbane +5; Auckland +13). Activity and clothing level are 80 W/m2 and 0.5 clo, respectively
Two approaches are used. The first assesses broad regional or spatial sensitivity to climate change. High resolution gridded data for the period 1961–1990 (New et al., 1999, 2002) was used to produce monthly maps that show change in air temperature required to bring PMV (TSN) to zero. Calculations are based on conditions at solar noon, using an activity of humans of 80 W m² (equivalent to standing still) and clothing 0.5 clo (equivalent of light summer clothing). Figure 1 shows sensitivity to change during January, which is the mid-summer month. Figure 2 shows sensitivity during mid-winter (July). Figures 3 and 4 show sensitivity to full sunshine or shade for both mid winter and mid summer months. Computations for both months are based on mean monthly values of air temperature, relative humidity, wind and cloud cover at 12 noon
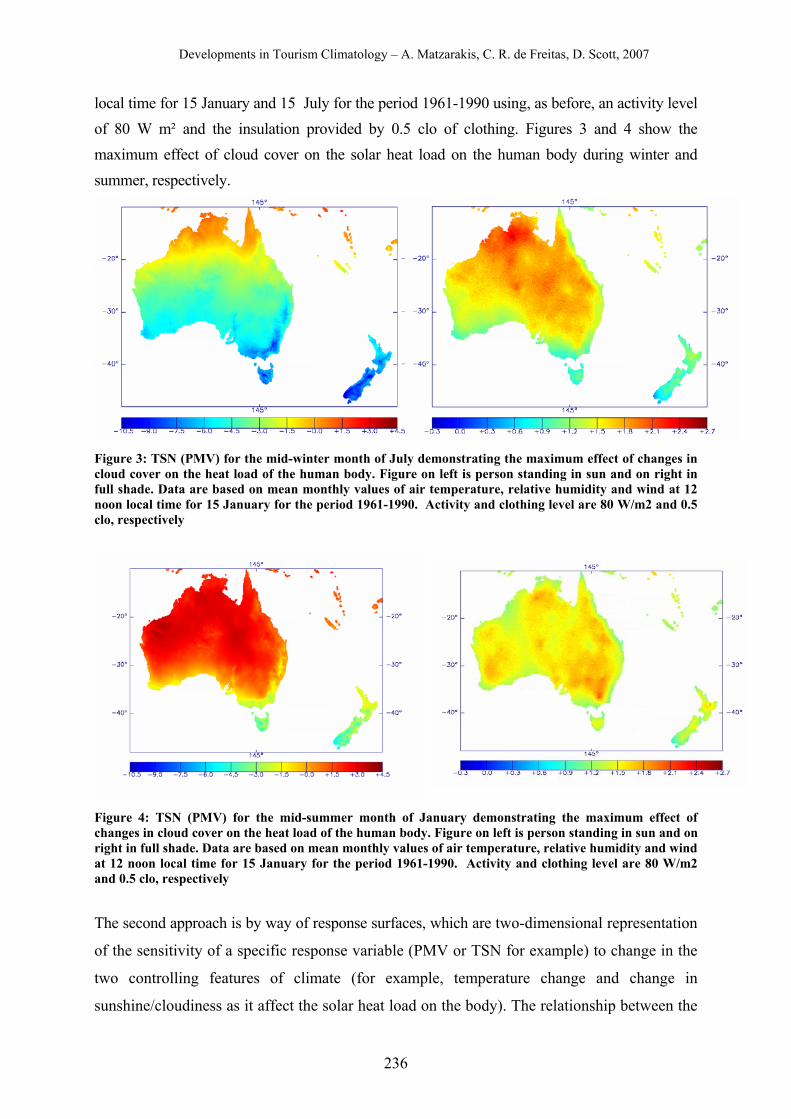
Developments in Tourism Climatology – A. Matzarakis, C. R. de Freitas, D. Scott, 2007
236
local time for 15 January and 15 July for the period 1961-1990 using, as before, an activity level of 80 W m² and the insulation provided by 0.5 clo of clothing. Figures 3 and 4 show the maximum effect of cloud cover on the solar heat load on the human body during winter and summer, respectively.
Figure 3: TSN (PMV) for the mid-winter month of July demonstrating the maximum effect of changes in cloud cover on the heat load of the human body. Figure on left is person standing in sun and on right in full shade. Data are based on mean monthly values of air temperature, relative humidity and wind at 12 noon local time for 15 January for the period 1961-1990. Activity and clothing level are 80 W/m2 and 0.5 clo, respectively
Figure 4: TSN (PMV) for the mid-summer month of January demonstrating the maximum effect of changes in cloud cover on the heat load of the human body. Figure on left is person standing in sun and on right in full shade. Data are based on mean monthly values of air temperature, relative humidity and wind at 12 noon local time for 15 January for the period 1961-1990. Activity and clothing level are 80 W/m2 and 0.5 clo, respectively
The second approach is by way of response surfaces, which are two-dimensional representation
of the sensitivity of a specific response variable (PMV or TSN for example) to change in the
two controlling features of climate (for example, temperature change and change in
sunshine/cloudiness as it affect the solar heat load on the body). The relationship between the
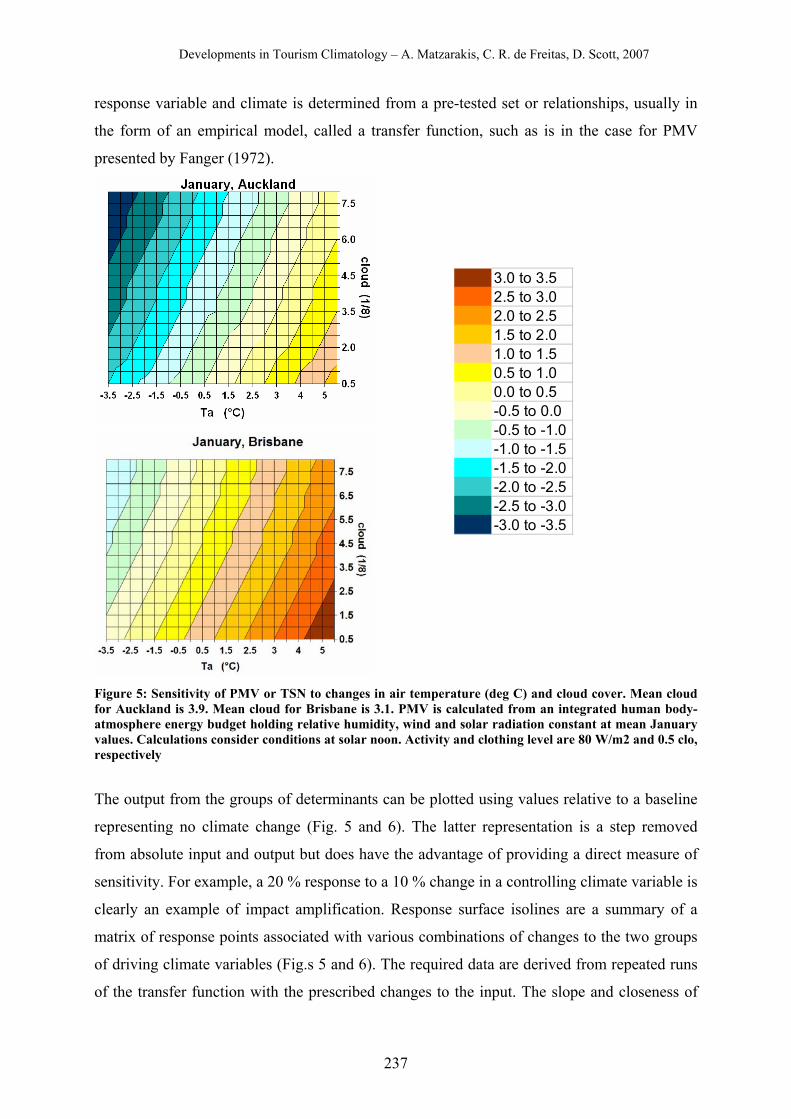
Developments in Tourism Climatology – A. Matzarakis, C. R. de Freitas, D. Scott, 2007
237
response variable and climate is determined from a pre-tested set or relationships, usually in
the form of an empirical model, called a transfer function, such as is in the case for PMV
presented by Fanger (1972).
Figure 5: Sensitivity of PMV or TSN to changes in air temperature (deg C) and cloud cover. Mean cloud for Auckland is 3.9. Mean cloud for Brisbane is 3.1. PMV is calculated from an integrated human body-atmosphere energy budget holding relative humidity, wind and solar radiation constant at mean January values. Calculations consider conditions at solar noon. Activity and clothing level are 80 W/m2 and 0.5 clo, respectively
The output from the groups of determinants can be plotted using values relative to a baseline
representing no climate change (Fig. 5 and 6). The latter representation is a step removed
from absolute input and output but does have the advantage of providing a direct measure of
sensitivity. For example, a 20 % response to a 10 % change in a controlling climate variable is
clearly an example of impact amplification. Response surface isolines are a summary of a
matrix of response points associated with various combinations of changes to the two groups
of driving climate variables (Fig.s 5 and 6). The required data are derived from repeated runs
of the transfer function with the prescribed changes to the input. The slope and closeness of
3.0 to 3.52.5 to 3.02.0 to 2.51.5 to 2.01.0 to 1.50.5 to 1.00.0 to 0.5-0.5 to 0.0-0.5 to -1.0-1.0 to -1.5-1.5 to -2.0-2.0 to -2.5-2.5 to -3.0-3.0 to -3.5
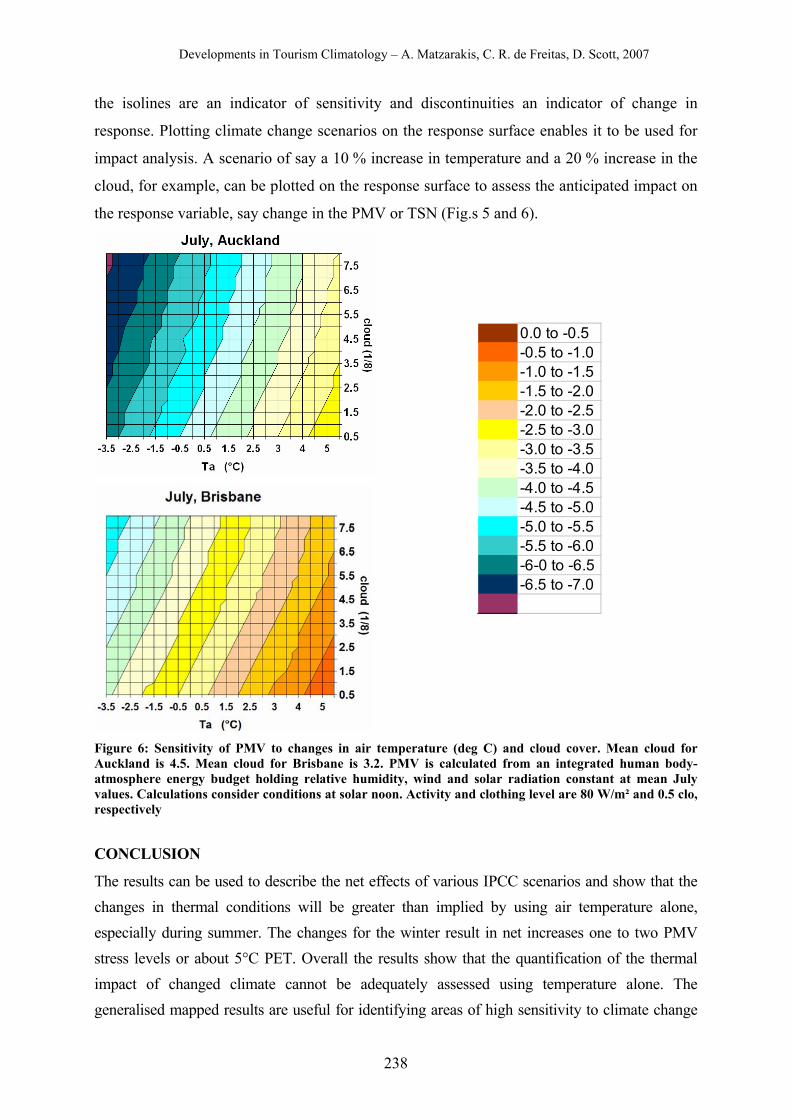
Developments in Tourism Climatology – A. Matzarakis, C. R. de Freitas, D. Scott, 2007
238
the isolines are an indicator of sensitivity and discontinuities an indicator of change in
response. Plotting climate change scenarios on the response surface enables it to be used for
impact analysis. A scenario of say a 10 % increase in temperature and a 20 % increase in the
cloud, for example, can be plotted on the response surface to assess the anticipated impact on
the response variable, say change in the PMV or TSN (Fig.s 5 and 6).
Figure 6: Sensitivity of PMV to changes in air temperature (deg C) and cloud cover. Mean cloud for Auckland is 4.5. Mean cloud for Brisbane is 3.2. PMV is calculated from an integrated human body-atmosphere energy budget holding relative humidity, wind and solar radiation constant at mean July values. Calculations consider conditions at solar noon. Activity and clothing level are 80 W/m² and 0.5 clo, respectively
CONCLUSION
The results can be used to describe the net effects of various IPCC scenarios and show that the changes in thermal conditions will be greater than implied by using air temperature alone, especially during summer. The changes for the winter result in net increases one to two PMV stress levels or about 5°C PET. Overall the results show that the quantification of the thermal impact of changed climate cannot be adequately assessed using temperature alone. The generalised mapped results are useful for identifying areas of high sensitivity to climate change
0.0 to -0.5-0.5 to -1.0-1.0 to -1.5-1.5 to -2.0-2.0 to -2.5-2.5 to -3.0-3.0 to -3.5-3.5 to -4.0-4.0 to -4.5-4.5 to -5.0-5.0 to -5.5-5.5 to -6.0-6-0 to -6.5-6.5 to -7.0
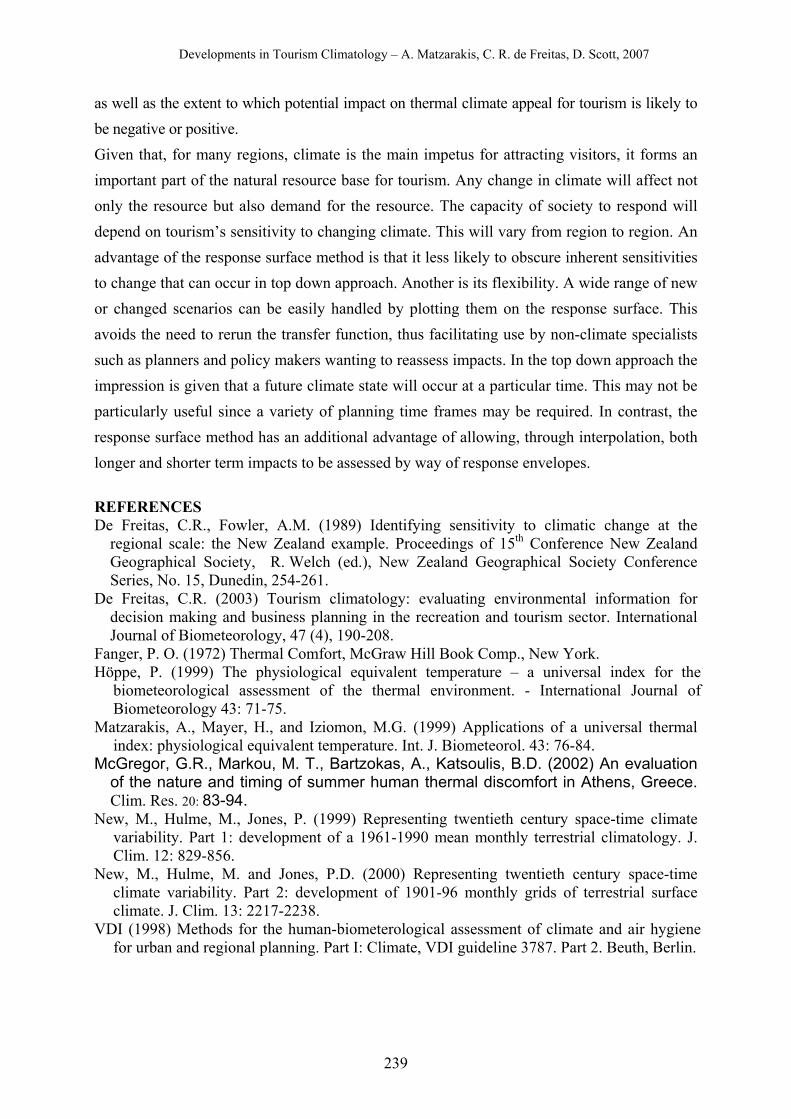
Developments in Tourism Climatology – A. Matzarakis, C. R. de Freitas, D. Scott, 2007
239
as well as the extent to which potential impact on thermal climate appeal for tourism is likely to be negative or positive. Given that, for many regions, climate is the main impetus for attracting visitors, it forms an important part of the natural resource base for tourism. Any change in climate will affect not only the resource but also demand for the resource. The capacity of society to respond will depend on tourism’s sensitivity to changing climate. This will vary from region to region. An advantage of the response surface method is that it less likely to obscure inherent sensitivities to change that can occur in top down approach. Another is its flexibility. A wide range of new or changed scenarios can be easily handled by plotting them on the response surface. This avoids the need to rerun the transfer function, thus facilitating use by non-climate specialists such as planners and policy makers wanting to reassess impacts. In the top down approach the impression is given that a future climate state will occur at a particular time. This may not be particularly useful since a variety of planning time frames may be required. In contrast, the response surface method has an additional advantage of allowing, through interpolation, both longer and shorter term impacts to be assessed by way of response envelopes. REFERENCES De Freitas, C.R., Fowler, A.M. (1989) Identifying sensitivity to climatic change at the
regional scale: the New Zealand example. Proceedings of 15th Conference New Zealand Geographical Society, R. Welch (ed.), New Zealand Geographical Society Conference Series, No. 15, Dunedin, 254-261.
De Freitas, C.R. (2003) Tourism climatology: evaluating environmental information for decision making and business planning in the recreation and tourism sector. International Journal of Biometeorology, 47 (4), 190-208.
Fanger, P. O. (1972) Thermal Comfort, McGraw Hill Book Comp., New York. Höppe, P. (1999) The physiological equivalent temperature – a universal index for the
biometeorological assessment of the thermal environment. - International Journal of Biometeorology 43: 71-75.
Matzarakis, A., Mayer, H., and Iziomon, M.G. (1999) Applications of a universal thermal index: physiological equivalent temperature. Int. J. Biometeorol. 43: 76-84.
McGregor, G.R., Markou, M. T., Bartzokas, A., Katsoulis, B.D. (2002) An evaluation of the nature and timing of summer human thermal discomfort in Athens, Greece. Clim. Res. 20: 83-94.
New, M., Hulme, M., Jones, P. (1999) Representing twentieth century space-time climate variability. Part 1: development of a 1961-1990 mean monthly terrestrial climatology. J. Clim. 12: 829-856.
New, M., Hulme, M. and Jones, P.D. (2000) Representing twentieth century space-time climate variability. Part 2: development of 1901-96 monthly grids of terrestrial surface climate. J. Clim. 13: 2217-2238.
VDI (1998) Methods for the human-biometerological assessment of climate and air hygiene for urban and regional planning. Part I: Climate, VDI guideline 3787. Part 2. Beuth, Berlin.
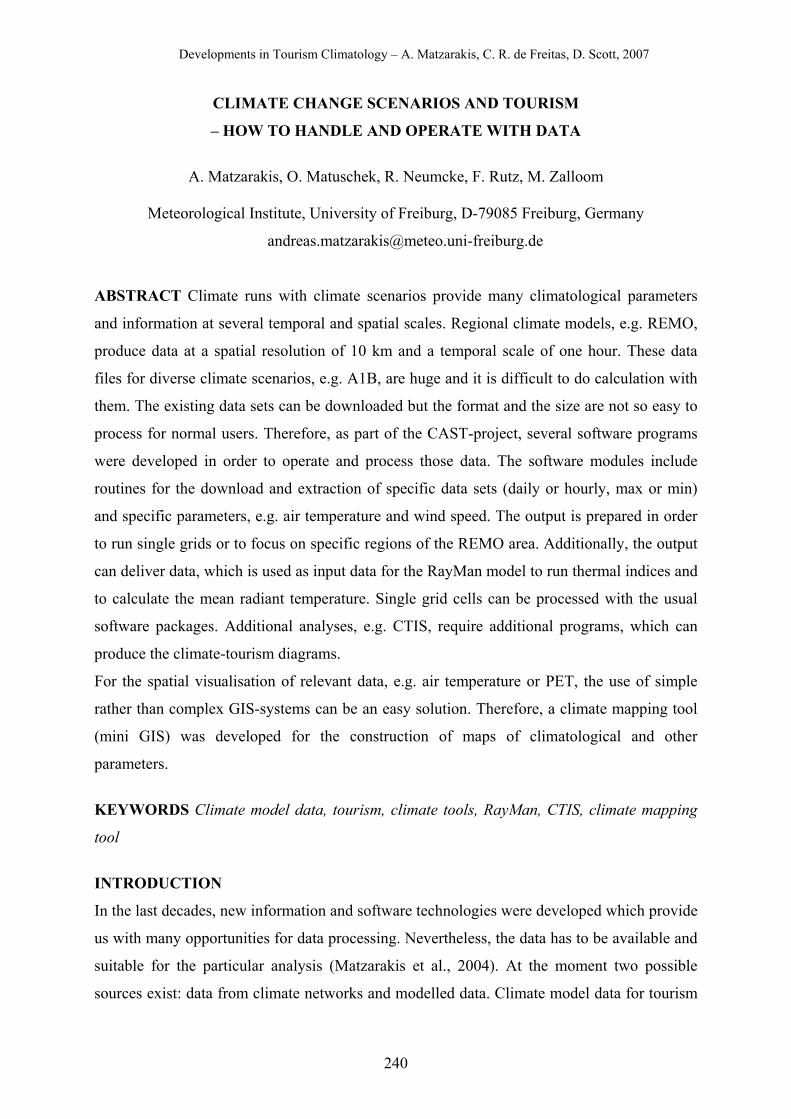
Developments in Tourism Climatology – A. Matzarakis, C. R. de Freitas, D. Scott, 2007
240
CLIMATE CHANGE SCENARIOS AND TOURISM
– HOW TO HANDLE AND OPERATE WITH DATA
A. Matzarakis, O. Matuschek, R. Neumcke, F. Rutz, M. Zalloom
Meteorological Institute, University of Freiburg, D-79085 Freiburg, Germany
ABSTRACT Climate runs with climate scenarios provide many climatological parameters
and information at several temporal and spatial scales. Regional climate models, e.g. REMO,
produce data at a spatial resolution of 10 km and a temporal scale of one hour. These data
files for diverse climate scenarios, e.g. A1B, are huge and it is difficult to do calculation with
them. The existing data sets can be downloaded but the format and the size are not so easy to
process for normal users. Therefore, as part of the CAST-project, several software programs
were developed in order to operate and process those data. The software modules include
routines for the download and extraction of specific data sets (daily or hourly, max or min)
and specific parameters, e.g. air temperature and wind speed. The output is prepared in order
to run single grids or to focus on specific regions of the REMO area. Additionally, the output
can deliver data, which is used as input data for the RayMan model to run thermal indices and
to calculate the mean radiant temperature. Single grid cells can be processed with the usual
software packages. Additional analyses, e.g. CTIS, require additional programs, which can
produce the climate-tourism diagrams.
For the spatial visualisation of relevant data, e.g. air temperature or PET, the use of simple
rather than complex GIS-systems can be an easy solution. Therefore, a climate mapping tool
(mini GIS) was developed for the construction of maps of climatological and other
parameters.
KEYWORDS Climate model data, tourism, climate tools, RayMan, CTIS, climate mapping
tool
INTRODUCTION
In the last decades, new information and software technologies were developed which provide
us with many opportunities for data processing. Nevertheless, the data has to be available and
suitable for the particular analysis (Matzarakis et al., 2004). At the moment two possible
sources exist: data from climate networks and modelled data. Climate model data for tourism
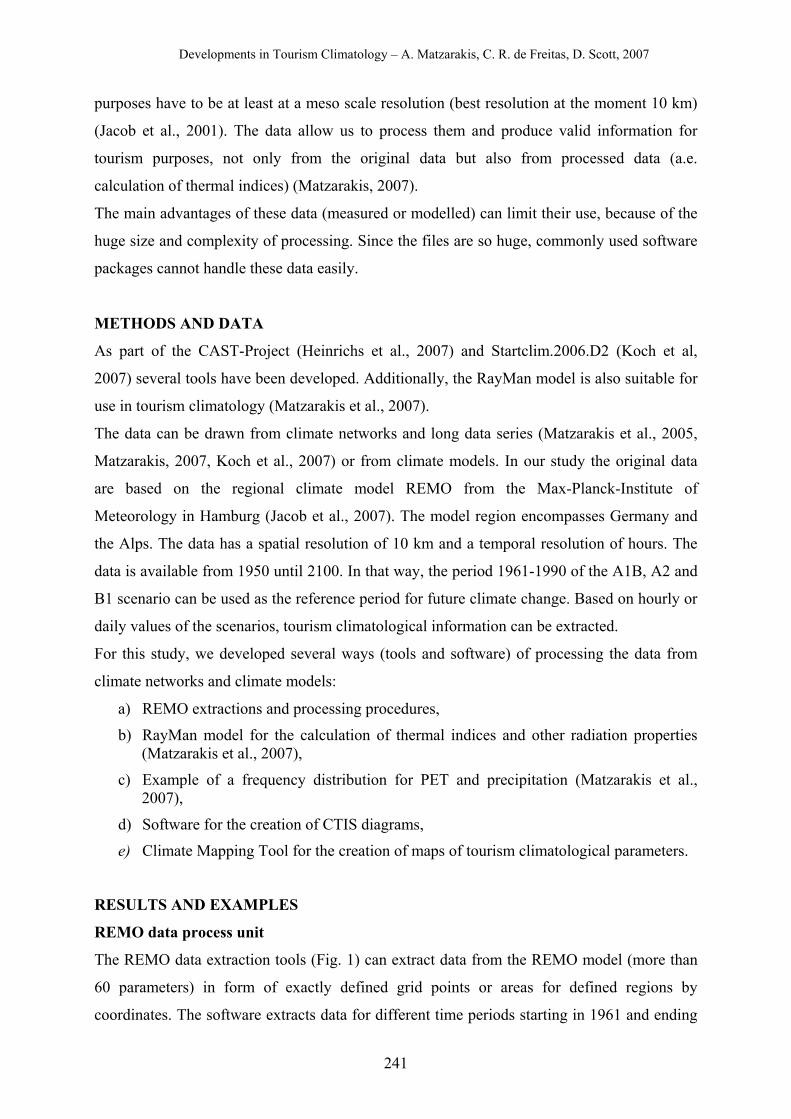
Developments in Tourism Climatology – A. Matzarakis, C. R. de Freitas, D. Scott, 2007
241
purposes have to be at least at a meso scale resolution (best resolution at the moment 10 km)
(Jacob et al., 2001). The data allow us to process them and produce valid information for
tourism purposes, not only from the original data but also from processed data (a.e.
calculation of thermal indices) (Matzarakis, 2007).
The main advantages of these data (measured or modelled) can limit their use, because of the
huge size and complexity of processing. Since the files are so huge, commonly used software
packages cannot handle these data easily.
METHODS AND DATA
As part of the CAST-Project (Heinrichs et al., 2007) and Startclim.2006.D2 (Koch et al,
2007) several tools have been developed. Additionally, the RayMan model is also suitable for
use in tourism climatology (Matzarakis et al., 2007).
The data can be drawn from climate networks and long data series (Matzarakis et al., 2005,
Matzarakis, 2007, Koch et al., 2007) or from climate models. In our study the original data
are based on the regional climate model REMO from the Max-Planck-Institute of
Meteorology in Hamburg (Jacob et al., 2007). The model region encompasses Germany and
the Alps. The data has a spatial resolution of 10 km and a temporal resolution of hours. The
data is available from 1950 until 2100. In that way, the period 1961-1990 of the A1B, A2 and
B1 scenario can be used as the reference period for future climate change. Based on hourly or
daily values of the scenarios, tourism climatological information can be extracted.
For this study, we developed several ways (tools and software) of processing the data from
climate networks and climate models:
a) REMO extractions and processing procedures,
b) RayMan model for the calculation of thermal indices and other radiation properties (Matzarakis et al., 2007),
c) Example of a frequency distribution for PET and precipitation (Matzarakis et al., 2007),
d) Software for the creation of CTIS diagrams,
e) Climate Mapping Tool for the creation of maps of tourism climatological parameters.
RESULTS AND EXAMPLES
REMO data process unit
The REMO data extraction tools (Fig. 1) can extract data from the REMO model (more than
60 parameters) in form of exactly defined grid points or areas for defined regions by
coordinates. The software extracts data for different time periods starting in 1961 and ending
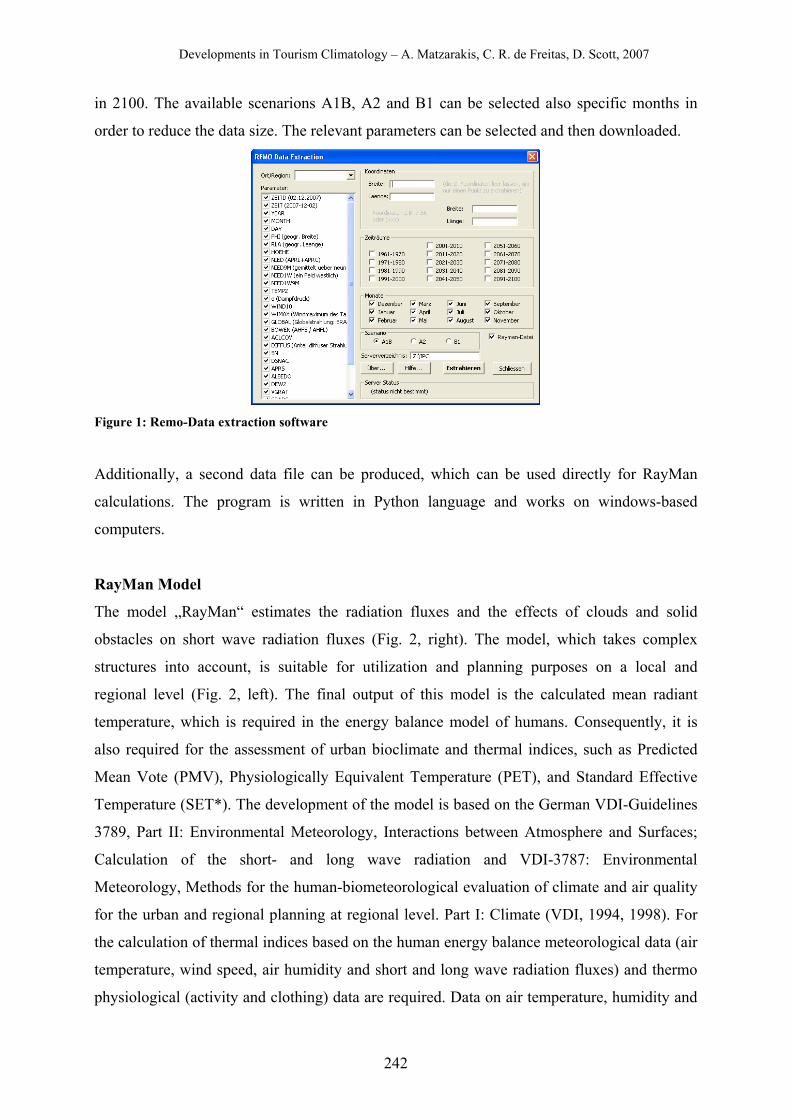
Developments in Tourism Climatology – A. Matzarakis, C. R. de Freitas, D. Scott, 2007
242
in 2100. The available scenarions A1B, A2 and B1 can be selected also specific months in
order to reduce the data size. The relevant parameters can be selected and then downloaded.
Figure 1: Remo-Data extraction software
Additionally, a second data file can be produced, which can be used directly for RayMan
calculations. The program is written in Python language and works on windows-based
computers.
RayMan Model
The model „RayMan“ estimates the radiation fluxes and the effects of clouds and solid
obstacles on short wave radiation fluxes (Fig. 2, right). The model, which takes complex
structures into account, is suitable for utilization and planning purposes on a local and
regional level (Fig. 2, left). The final output of this model is the calculated mean radiant
temperature, which is required in the energy balance model of humans. Consequently, it is
also required for the assessment of urban bioclimate and thermal indices, such as Predicted
Mean Vote (PMV), Physiologically Equivalent Temperature (PET), and Standard Effective
Temperature (SET*). The development of the model is based on the German VDI-Guidelines
3789, Part II: Environmental Meteorology, Interactions between Atmosphere and Surfaces;
Calculation of the short- and long wave radiation and VDI-3787: Environmental
Meteorology, Methods for the human-biometeorological evaluation of climate and air quality
for the urban and regional planning at regional level. Part I: Climate (VDI, 1994, 1998). For
the calculation of thermal indices based on the human energy balance meteorological data (air
temperature, wind speed, air humidity and short and long wave radiation fluxes) and thermo
physiological (activity and clothing) data are required. Data on air temperature, humidity and
Developments in Tourism Climatology – A. Matzarakis, C. R. de Freitas, D. Scott, 2007
243
wind speed are required to run RayMan (Matzarakis et al., 2007). The software is written in
Borland Delphi.
Figure 2: RayMan software for the calculation of thermal indices and radiation
Figure 3: Frequency diagram (produced by Microsoft Excel)
Frequency diagrams
The frequency diagrams (Fig. 3) can be produced with regular software a.e. Microsoft Excel.
The diagrams are based on pivot tables and then the frequencies are calculated with Excel. Fig. 3
gives an example how a diagram looks like. The diagrams can not only be used for PET
diagrams (Matzarakis et al., 2007), but also for other climatic parameters, a.e. precipitation or
wind classes.
Climate-Tourism-Information-Scheme Software
Based on the Climate Tourism Information Scheme (CTIS) (Matzarakis et al., 2007) a software
tool has been developed in order to produce CTIS-diagrams. The diagrams can be produced for
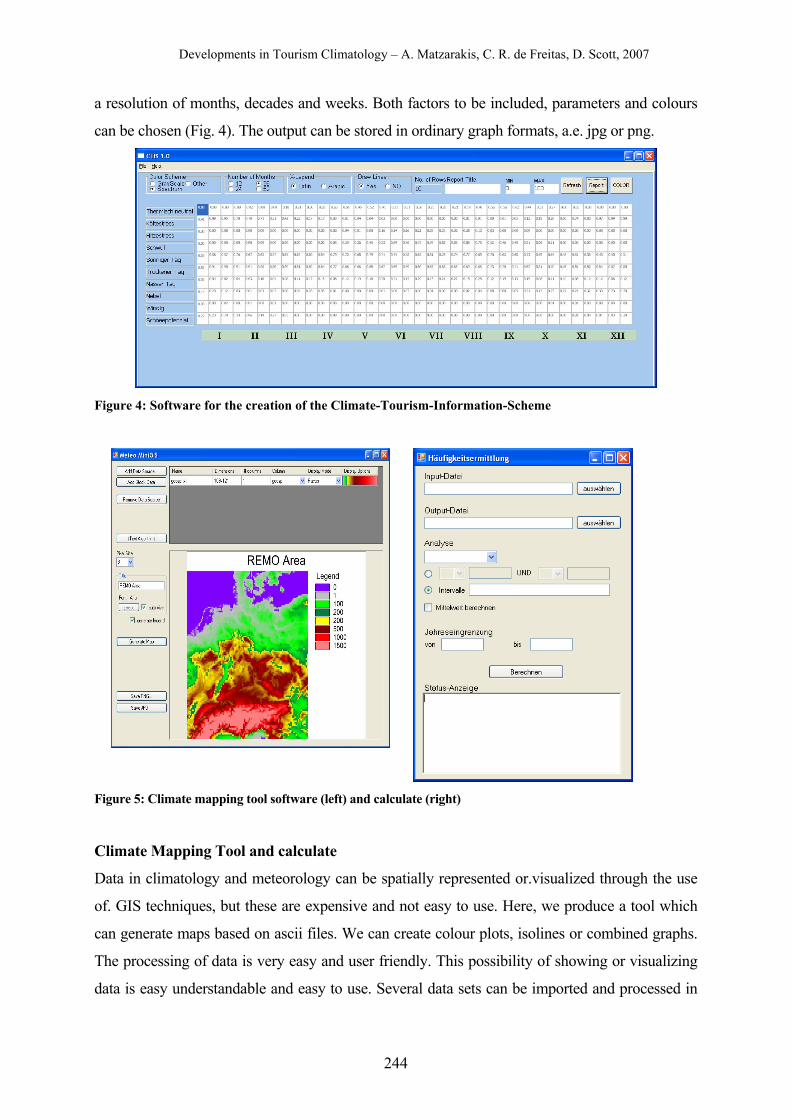
Developments in Tourism Climatology – A. Matzarakis, C. R. de Freitas, D. Scott, 2007
244
a resolution of months, decades and weeks. Both factors to be included, parameters and colours
can be chosen (Fig. 4). The output can be stored in ordinary graph formats, a.e. jpg or png.
Figure 4: Software for the creation of the Climate-Tourism-Information-Scheme
Figure 5: Climate mapping tool software (left) and calculate (right)
Climate Mapping Tool and calculate
Data in climatology and meteorology can be spatially represented or.visualized through the use
of. GIS techniques, but these are expensive and not easy to use. Here, we produce a tool which
can generate maps based on ascii files. We can create colour plots, isolines or combined graphs.
The processing of data is very easy and user friendly. This possibility of showing or visualizing
data is easy understandable and easy to use. Several data sets can be imported and processed in
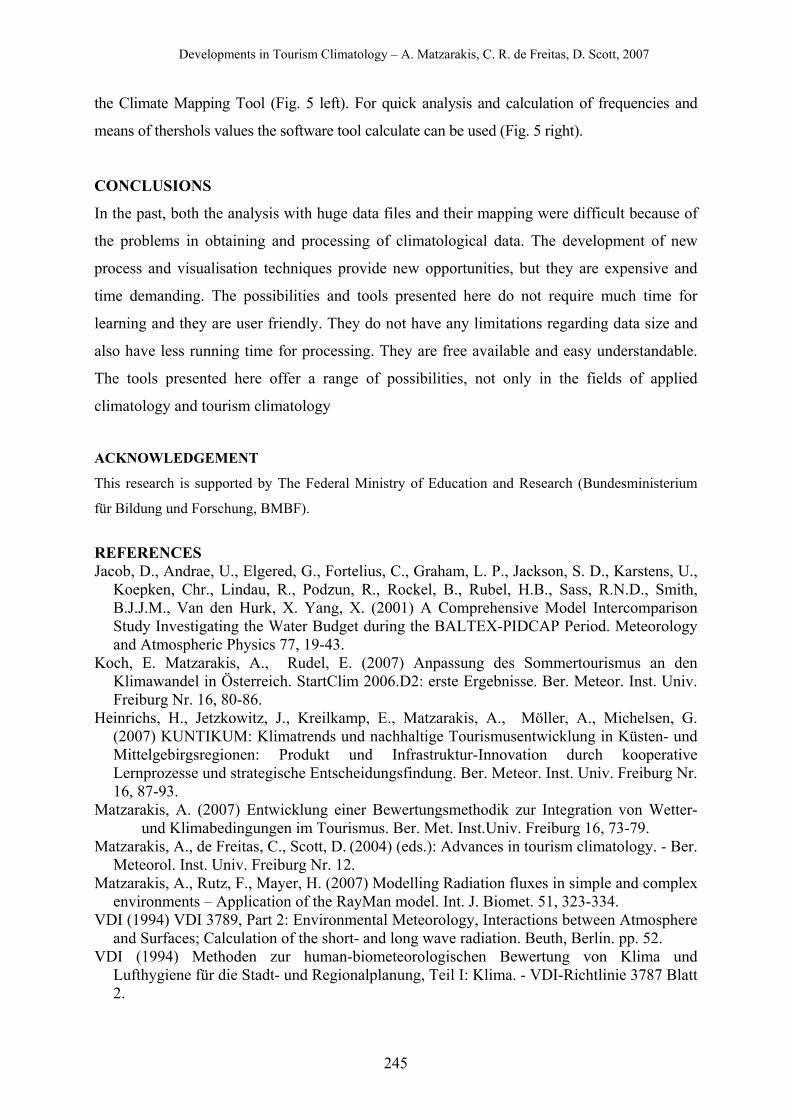
Developments in Tourism Climatology – A. Matzarakis, C. R. de Freitas, D. Scott, 2007
245
the Climate Mapping Tool (Fig. 5 left). For quick analysis and calculation of frequencies and
means of thershols values the software tool calculate can be used (Fig. 5 right).
CONCLUSIONS
In the past, both the analysis with huge data files and their mapping were difficult because of
the problems in obtaining and processing of climatological data. The development of new
process and visualisation techniques provide new opportunities, but they are expensive and
time demanding. The possibilities and tools presented here do not require much time for
learning and they are user friendly. They do not have any limitations regarding data size and
also have less running time for processing. They are free available and easy understandable.
The tools presented here offer a range of possibilities, not only in the fields of applied
climatology and tourism climatology
ACKNOWLEDGEMENT This research is supported by The Federal Ministry of Education and Research (Bundesministerium
für Bildung und Forschung, BMBF).
REFERENCES Jacob, D., Andrae, U., Elgered, G., Fortelius, C., Graham, L. P., Jackson, S. D., Karstens, U.,
Koepken, Chr., Lindau, R., Podzun, R., Rockel, B., Rubel, H.B., Sass, R.N.D., Smith, B.J.J.M., Van den Hurk, X. Yang, X. (2001) A Comprehensive Model Intercomparison Study Investigating the Water Budget during the BALTEX-PIDCAP Period. Meteorology and Atmospheric Physics 77, 19-43.
Koch, E. Matzarakis, A., Rudel, E. (2007) Anpassung des Sommertourismus an den Klimawandel in Österreich. StartClim 2006.D2: erste Ergebnisse. Ber. Meteor. Inst. Univ. Freiburg Nr. 16, 80-86.
Heinrichs, H., Jetzkowitz, J., Kreilkamp, E., Matzarakis, A., Möller, A., Michelsen, G. (2007) KUNTIKUM: Klimatrends und nachhaltige Tourismusentwicklung in Küsten- und Mittelgebirgsregionen: Produkt und Infrastruktur-Innovation durch kooperative Lernprozesse und strategische Entscheidungsfindung. Ber. Meteor. Inst. Univ. Freiburg Nr. 16, 87-93.
Matzarakis, A. (2007) Entwicklung einer Bewertungsmethodik zur Integration von Wetter- und Klimabedingungen im Tourismus. Ber. Met. Inst.Univ. Freiburg 16, 73-79.
Matzarakis, A., de Freitas, C., Scott, D. (2004) (eds.): Advances in tourism climatology. - Ber. Meteorol. Inst. Univ. Freiburg Nr. 12.
Matzarakis, A., Rutz, F., Mayer, H. (2007) Modelling Radiation fluxes in simple and complex environments – Application of the RayMan model. Int. J. Biomet. 51, 323-334.
VDI (1994) VDI 3789, Part 2: Environmental Meteorology, Interactions between Atmosphere and Surfaces; Calculation of the short- and long wave radiation. Beuth, Berlin. pp. 52.
VDI (1994) Methoden zur human-biometeorologischen Bewertung von Klima und Lufthygiene für die Stadt- und Regionalplanung, Teil I: Klima. - VDI-Richtlinie 3787 Blatt 2.
Developments in Tourism Climatology – A. Matzarakis, C. R. de Freitas, D. Scott, 2007
246
CLIMATE CHANGE = TOURISM CHANGE? - THE LIKELY IMPACTS OF CLIMATE CHANGE ON TOURISM IN GERMANY'S NORTH SEA COAST
DESTINATIONS
J. Willms
Tourism Futures Institute, Göttingen and Merkur University of Applied Sciences, Karlsruhe, Germany
ABSTRACT Due to the strong evidence of global warming and climate change at a global
scale, there is a need of studies that focus on the future impacts of climate change at a smaller
scale and in a more regional context. Albeit the predicted changes in climate and i. g. water
and ground surface temperatures in Western Europe may be less dramatic and extreme than in
Southern Europe or Eastern North America, these changes shall induce adaptations of the
natural and cultural, i. g. economic environments. In the rim areas of Germany's North Sea
coast, tourism is important for the regional economy, especially during the summer season.
But for Germans and potential tourists from other European countries these North Sea coast
tourist destinations are currently secondary destinations; primary destinations are mainly
located in the Mediterranean climate of Southern Europe. This paper focusses on these likely
endogenous and exogenous climate-change-derived impacts on tourism on Germany's North
Sea coast and takes into account the international competition of tourist destinations and
tourism products.
KEYWORDS: North Sea Tourism, Germany, climate change, climate perceptions, tourist
behaviours, tourism products, future tourism
INTRODUCTION
Over the last two to three years, the growing public awareness of global warming and the so
called „climate change scenarios“ have raised attention among Germany's tourism
professionals and local politicians in tourist areas. Even the federal government of Germany
has started to finance interdisciplinary studies on the regional and local consequences and
impacts of global warming and the forecasted climate change on Germany's tourist
destinations. A more or less simple picture is promoted about tourism and climate change in
the public as well as in academia: Germany will not be on the looser side, the losers shall be
found among the Southern European countries like Spain, Italy and Greece.
Developments in Tourism Climatology – A. Matzarakis, C. R. de Freitas, D. Scott, 2007
247
A short geographical introduction of the study area: Germany's North Sea Coast Destinations
are located on the south-eastern shores of the German Bight, the most south-eastern part of
the North Sea. The coastal areas are formed by barrier islands, the wadden sea, the Halligen
(island-like rests of former marshland), coastal marshland and river estuaries. As a classical
lowland and wetland area, the dune formations on the barrier islands and the postglacial
inland dune formations with heights of about 15m are the highest parts of the area. The North
Sea wadden sea is the world largest tital landscape with typical tidal flats, tidal gullies and
coastal saltmarshes. It stretches from Den Helder (NL) in the West up to the middle of Danish
Jutland Peninsula in the North. Like the Mediterranean Sea and the Baltic Sea the North Sea
is an interregional trade sea since prehistoric times and played a major role in the cultural,
political and economic development of Europe. Germany's North Sea barrier islands, Halligen
and coastal rim belonged traditionally to the historical tribe area of the Frisians and therefore
many landform and cultural area names refer to the Frisians and Frisia as there settlement
region, i. g. the East and North Frisian and the Frisian Islands, East Frisia, North Frisia. The
German North Sea coast is home of summer tourist destinations since the late 19th century,
when seaside resorts became popular among the upper and middle class in an industrialising
Germany. The tourism economy has developed ever since but only managed to become of
national importance. Even for the Germans the Mediterranean areas became more important
summer destinations since the beginning of mass tourism after World War II.
Because the paper deals with climate, climate change and impacts of climate change on
tourism and tourist destinations, it is worth to mention that the coastal landscapes of this part
of the North Sea are traditionally very instable landformations. The re- and transgression of
the North Sea, which are expressed, for example, in historic floods in medieval times (i. g.
1362, 1634), lead to a loss of thousands of hectars of cultivated land since the 14th century and
forced the local people to protect their settlements by warf building and dyking. Due to the
marine plenty of the wadden seas and due to the fertile marshes, fishery and agriculture
became the major source of regional income in medieval times. But crises due to, for
example, floods and saltination were also common. Tourism became a well supported
economic alternative, especially in those areas where the sandy and/or salty soils limited,
restricted or prohibited agriculture. This was the case on the sandy barrier islands with their
lack of fertile soils, and on the coastal shores, where the marshes outside the dyked areas
where exposed to tidal or seasonal flooding, which both resulted in high saltination of the
soils. But because of the climatic situation tourism was and still is mainly a summer-saeson-
business. Many people in the local tourism industry have to make their annual income to more
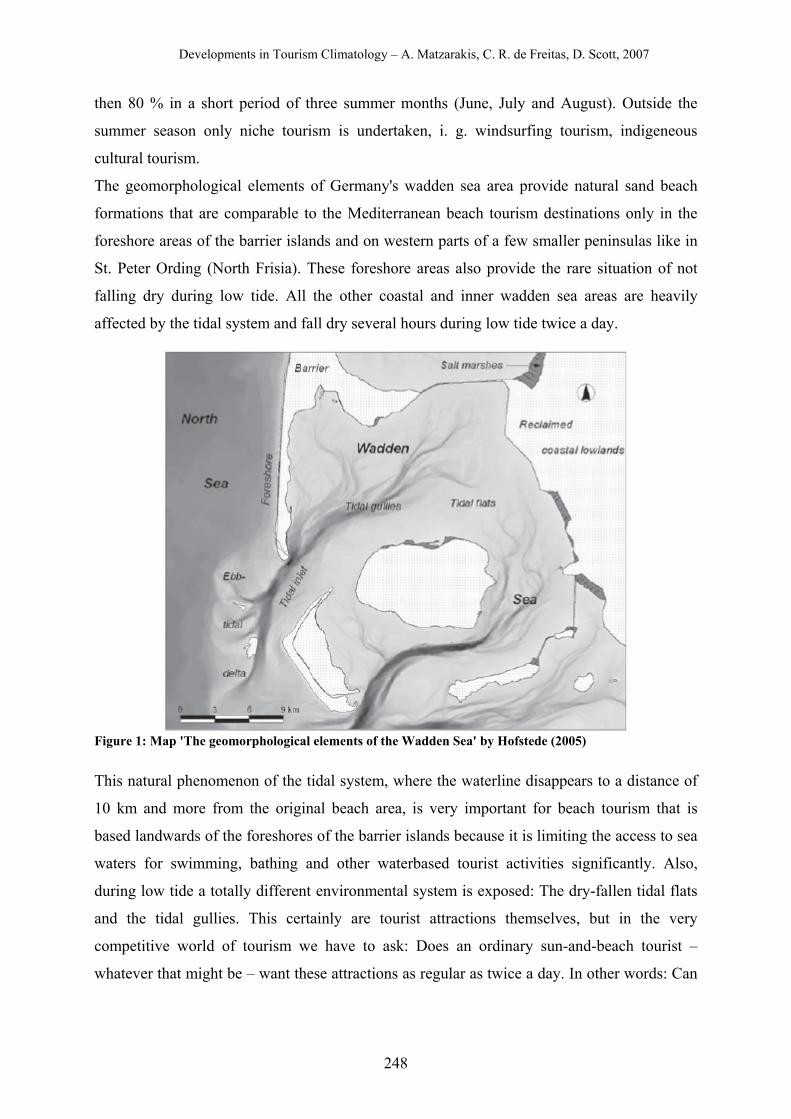
Developments in Tourism Climatology – A. Matzarakis, C. R. de Freitas, D. Scott, 2007
248
then 80 % in a short period of three summer months (June, July and August). Outside the
summer season only niche tourism is undertaken, i. g. windsurfing tourism, indigeneous
cultural tourism.
The geomorphological elements of Germany's wadden sea area provide natural sand beach
formations that are comparable to the Mediterranean beach tourism destinations only in the
foreshore areas of the barrier islands and on western parts of a few smaller peninsulas like in
St. Peter Ording (North Frisia). These foreshore areas also provide the rare situation of not
falling dry during low tide. All the other coastal and inner wadden sea areas are heavily
affected by the tidal system and fall dry several hours during low tide twice a day.
Figure 1: Map 'The geomorphological elements of the Wadden Sea' by Hofstede (2005)
This natural phenomenon of the tidal system, where the waterline disappears to a distance of
10 km and more from the original beach area, is very important for beach tourism that is
based landwards of the foreshores of the barrier islands because it is limiting the access to sea
waters for swimming, bathing and other waterbased tourist activities significantly. Also,
during low tide a totally different environmental system is exposed: The dry-fallen tidal flats
and the tidal gullies. This certainly are tourist attractions themselves, but in the very
competitive world of tourism we have to ask: Does an ordinary sun-and-beach tourist –
whatever that might be – want these attractions as regular as twice a day. In other words: Can
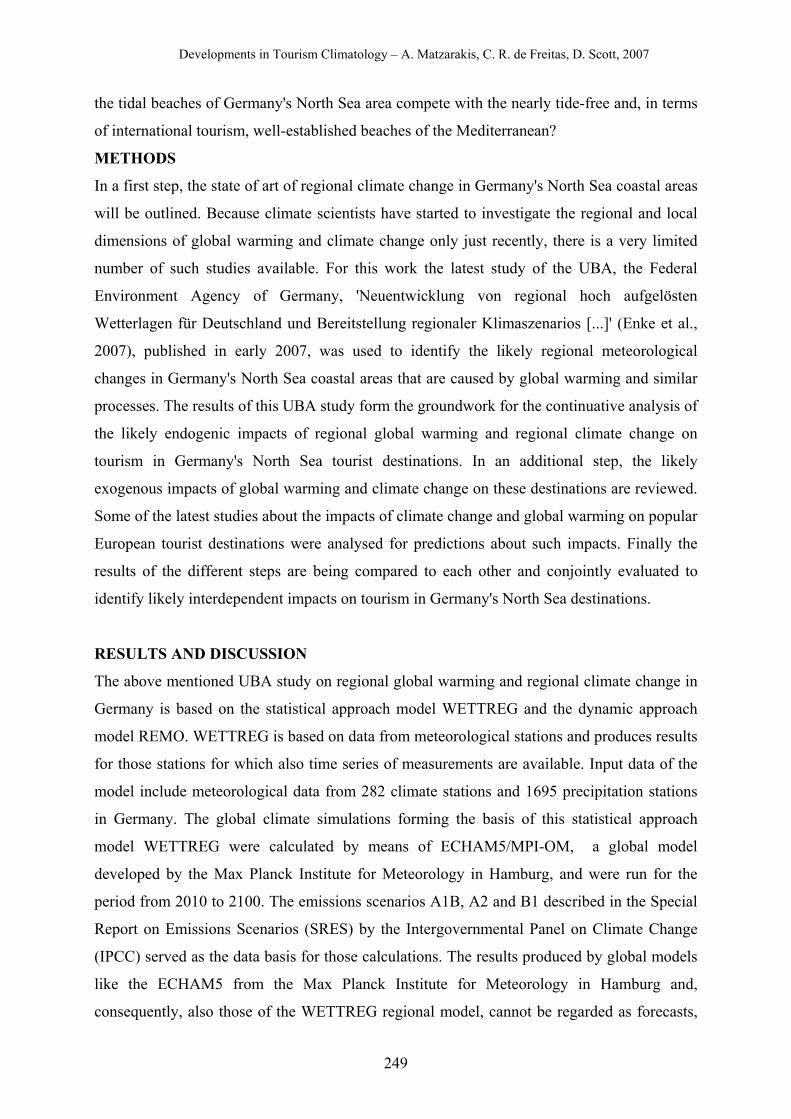
Developments in Tourism Climatology – A. Matzarakis, C. R. de Freitas, D. Scott, 2007
249
the tidal beaches of Germany's North Sea area compete with the nearly tide-free and, in terms
of international tourism, well-established beaches of the Mediterranean?
METHODS
In a first step, the state of art of regional climate change in Germany's North Sea coastal areas
will be outlined. Because climate scientists have started to investigate the regional and local
dimensions of global warming and climate change only just recently, there is a very limited
number of such studies available. For this work the latest study of the UBA, the Federal
Environment Agency of Germany, 'Neuentwicklung von regional hoch aufgelösten
Wetterlagen für Deutschland und Bereitstellung regionaler Klimaszenarios [...]' (Enke et al.,
2007), published in early 2007, was used to identify the likely regional meteorological
changes in Germany's North Sea coastal areas that are caused by global warming and similar
processes. The results of this UBA study form the groundwork for the continuative analysis of
the likely endogenic impacts of regional global warming and regional climate change on
tourism in Germany's North Sea tourist destinations. In an additional step, the likely
exogenous impacts of global warming and climate change on these destinations are reviewed.
Some of the latest studies about the impacts of climate change and global warming on popular
European tourist destinations were analysed for predictions about such impacts. Finally the
results of the different steps are being compared to each other and conjointly evaluated to
identify likely interdependent impacts on tourism in Germany's North Sea destinations.
RESULTS AND DISCUSSION
The above mentioned UBA study on regional global warming and regional climate change in
Germany is based on the statistical approach model WETTREG and the dynamic approach
model REMO. WETTREG is based on data from meteorological stations and produces results
for those stations for which also time series of measurements are available. Input data of the
model include meteorological data from 282 climate stations and 1695 precipitation stations
in Germany. The global climate simulations forming the basis of this statistical approach
model WETTREG were calculated by means of ECHAM5/MPI-OM, a global model
developed by the Max Planck Institute for Meteorology in Hamburg, and were run for the
period from 2010 to 2100. The emissions scenarios A1B, A2 and B1 described in the Special
Report on Emissions Scenarios (SRES) by the Intergovernmental Panel on Climate Change
(IPCC) served as the data basis for those calculations. The results produced by global models
like the ECHAM5 from the Max Planck Institute for Meteorology in Hamburg and,
consequently, also those of the WETTREG regional model, cannot be regarded as forecasts,
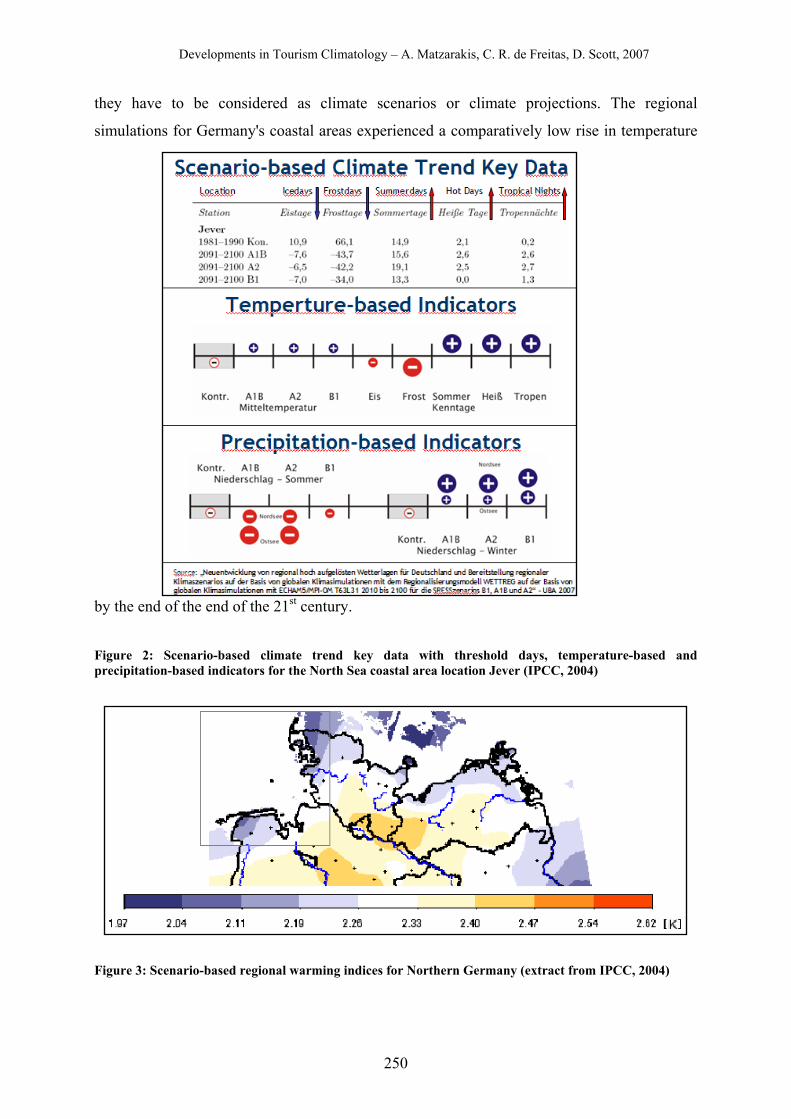
Developments in Tourism Climatology – A. Matzarakis, C. R. de Freitas, D. Scott, 2007
250
they have to be considered as climate scenarios or climate projections. The regional
simulations for Germany's coastal areas experienced a comparatively low rise in temperature
by the end of the end of the 21st century.
Figure 2: Scenario-based climate trend key data with threshold days, temperature-based and precipitation-based indicators for the North Sea coastal area location Jever (IPCC, 2004)
Figure 3: Scenario-based regional warming indices for Northern Germany (extract from IPCC, 2004)
Developments in Tourism Climatology – A. Matzarakis, C. R. de Freitas, D. Scott, 2007
251
Reasons for this include the proximity to the North and Baltic Sea and the in general
relatively balanced and moderate character of the coastal climate in Germany. In addition, the
WETTREG regional scenarios experienced only a slight decrease of precipitation during the
tourism-relevant summer months, but a more significant increase in wintertime precipitation.
In Figure 3 the blue color which is widely distributed across the map of the North Sea coast
area represents a slight increase in temperature experienced in the WETTREG scenarios. This
can be interpreted as a slight pull-factor for summer tourism, as the higher day temperatures
during summer and the corresponding decrease of precipitation may attract more tourists to
the shores and beaches of the North Sea area. But this is clearly not a 'Mediterranisation' of
summer tourism conditions due to regional warming and regional climate change.
As well as the endogenous climatic pull-factors, the exogenous climatic push-factors that
operate in favour of tourism in Germany's North Sea destinations also have to be evaluated.
However, recently published research studies, which are partly based on grid cell climate
change projections (Schröter et al., 2005), and also older tourists' climate perceptions studies
(Mieczkowski, 1985), predict significant changes in tourists flows from the Mediterranean to
more northern destinations. This will be due to the declining climatic attractiveness in the
Mediterranean areas in summer. For this comparative content analysis the following recently
published studies were considered (Berrittella et al., 2004, Hamilton, 2003, 2006, Hamilton et
al., 2004, 2005, Lise et al., 2002, Maddison, 2001, MCCIP, 2006, Viner et al., 2003). In a
generalised approach one can summarise the tourist-flows regarding conclusions of these
studies in two statements:
1. The European South will lose summer tourists in significant numbers due to climate
change and regional warming.
2. The European Northwest (North Sea destinations) and Northeast (Baltic Sea
destinations) will gain summer tourists from the Mediterranean areas in significant
numbers.
But from the viewpoint of tourist-behaviour-focused social sciences, all of these studies
contain a combination of all or some of the same conceptual hidden faults:
In opposition to tourism market realities these studies deal with stereotyped tourists
behaviours and stereotyped tourists’ reactions to regional climate change and regional
warming.
These studies are based on the unrealistic believe system that tourists react and decide
on statistical or quantitative thresholds like maximum or minimum temperatures,
maximum monthly precipitation etc. Qualitative decision factors and behavioural

Developments in Tourism Climatology – A. Matzarakis, C. R. de Freitas, D. Scott, 2007
252
paterns are widely ignored.
These studies underestimate the possibility and potential of tourism continuing due to
behavioural changes of tourists.
And these studies ignore essential intrinsic differences of apparent equal or very
similar tourism products, as there are in the case of Mediterranean beach tourism and
North Sea tidal-system-integrated beach tourism.
Taking these conceptual hidden faults into account, we have to express our doubt about
predictions of these studies regarding tourism and tourists behaviours; especially about
predictions that significant numbers of beach tourists will be pushed out of the Mediterranean
destinations and instead choose the tidal beaches of the North Sea area as climatic fitting
substitute. We have to be very careful with the determination of the dimension and grade of
this possible exogenous push-factor in favour of tourism in the North Sea area. Just as well,
due to a growing competition among European beach destinations in the future, these
moderate positive impacts on summer tourism climatic conditions in Germany's North Sea
area may just be able to stabalise the current tourism market situations and may help to
prevent these areas from a tourism decline. To predict the impact of regional global warming
and regional climate change on tourism in Europe, more qualitative behavioural research in
needed: we have to know more about the tourists, at least about their divers and complex
behaviours and multimotivated decision making in the tourism markets.
REFERENCES Berrittella, M., Bigano, A., Roson, R., Tol, R. S. J. (2004) A general equilibrium analysis of
climate change. FEEM Working Paper No. 127.04 (Online: http://ssm.com/abstract=609742).
Enke, A., Kreienkamp, F., Spekat, A. (2007) Neuentwicklung von regional hoch aufgelösten Wetterlagen für Deutschland und Bereitstellung regionaler Klimaszenarios auf der Basis von globalen Klimasimulationen mit dem Regionalisierungsmodell WETTREG auf der Basis von globalen Klimasimulationen mit ECHAM5/MPI-OM T63L31 2010 bis 2100 f¨ur die SRES-Szenarios B1, A1B und A2. UBA (Federal Environment Agency, Germany) (Ed.). Potsdam.
Hamilton J. M. (2006) Tourism, climate change and the coastal zone. University of Hamburg Faculty of Economic and Social Sciences Doctoral Thesis, Hamburg. Retrieved from http://www.sub.unihamburg.de/opus/volltexte/2006/3062.
Hamilton, J. M. (2003) Climate and the destination choice of German tourists. DINAS-COAST Working Paper Number 2 (revised), Potsdam, PIK (online: http://www.pik-potsdam.de/DINAS-COAST/Publications/dinas-coast_wp2_hamilton.pdf).
Hamilton, J. M., Maddison, D.J., Tol, R.S.J. (2004) The effects of climate change on international tourism. FNU-36, Centre for Marine and Climate Research, Hamburg.
Hamilton, J. M., Maddison, D. J., Tol, R. S. J. (2005) Climate change and international tourism: a simulation study. Global Environmental Change 15: 253-266.
Developments in Tourism Climatology – A. Matzarakis, C. R. de Freitas, D. Scott, 2007
253
Hofstede, J. (2005) The geomorphological elements of the Wadden Sea. In: CWSS - Common Wadden Sea Secretariat (Ed.) (2005) Wadden Sea Ecosystem No 21:13 (Online: http://cwss.www.de/news/documents/cpsl2/CPSL-II-2005.pdf).
IPCC - Intergovernmental Panel on Climate Change (2004): SRES - Special Report on Emissions Scenarios (Online: http://www.grida.no/climate/ipcc/emission/index.htm).
Lise, W., Tol, R. S. J. (2002) Impact of climate on tourism demand. Climatic Change, 55(4): 429-449.
Maddison, D. (2001) In search of warmer climates? The impact of climate change on flows of British tourists. In Maddison, D. (Ed.) The amenity value of the global climate, London, Earthscan, 53-76.
MCCIP (2006) Impacts of climate change on tourism in marine climate change impacts. Buckley, P.J; Dye, S.R. and Baxter, J. M. (Eds.): Annual Report Card 2006. Online Summary Reports, MCCIP, Lowestoft (Online: http://www.mccip.org.uk/).
Mieczkowski, Z. (1985) The tourism climatic index: a method of evaluating world climates for tourism. The Canadian Geographer 29: 220-233.
Schröter, D.; Cramer, W.; Leemans, R.; Prentice, I. C.; Araújo, M. B.; Arnell, N. B.; Bondeau, A.; Bugmann, H.; Carter, T. R.; Gracia, C. A.; de la Vega-Leinert, A. C.; Erhard, M.; Ewert, F.; Glendining, M.; House, J. I.; Kankaanpää, S.; Klein, R. J. T.; Lavorel, S.; Lindner, M.; Metzger, M. J.; Meyer, J.; Mitchell, T. D.: Reginster, I.; Rounsevell, M.; Sabaté, S.; Sitch, S.; Smith, B.; Smith, J.; Smith, P.; Sykes, M: T.; Thonicke, K.; Thuiller, W.; Tuck, G.; Zaehle, S., Zierl, B. (2005) Ecosystem service supply and vulnerability to global change in Europe. (Originally published in 'Science Express' on 27 October 2005), Science Vol. 310. no. 5752: 1333-1337 .
Viner, D. and Amelung, B. (2003) Climate change, the environment and tourism: the interactions. Proceedings of the ESF-LESC Workshop, Milan 4-6th June Publ. eCLAT, Climatic Research Unit, Norwich, UK (Online: http://www.esf.org/fileadmin/be_user/research _areas/social_sciences/documents/Climate_change__the_environment_and_tourism.pdf).
Developments in Tourism Climatology – A. Matzarakis, C. R. de Freitas, D. Scott, 2007
254
THE IMPACTS OF CLIMATE CHANGE ON TOURISM AND POTENTIAL
ADAPTATION RESPONSES IN COASTAL AND ALPINE REGIONS
Tanja Cegnar
Environmental Agency of the Republic of Slovenia, Ljubljana, Slovenia
ABSTRACT As in many other countries Slovenian tourism is an important and fast
developing economic sector. It is highly climate and weather dependent, and in recent years,
it has benefited from improved weather and climate information. Since the tourism industry is
quite fragmented, climate change represents a significant threat to tourism. It forces the
industry to adapt already. Future adaptation to climate change is a major challenge for
tourism.
KEYWORDS: Climate change, tourism, adaptation, natural resources, climatic diversity
INTRODUCTION
The main tourist attraction in Slovenia is the well-preserved nature with beautiful landscapes
and rich cultural heritage. Snowy alpine peaks and the Triglav National Park with many
glacial valleys, gorges, waterfalls, lakes and crystal-clear wild waters attract visitors looking
for peace in the mountains, as well as sports climbers, skiers, rafters, canoeists, gliders and
others in search of relaxation and excitement in everyday life. The landscape and also the
opportunities for sports, recreation and leisure are highly dependent on local climate. Climatic
conditions in Slovenia vary. There are a continental climate in the northeast, a severe alpine
climate in the high mountain regions, and a sub-Mediterranean climate in the coastal region.
Yet, there is a strong interaction between these three climatic systems across most of the
country. This spatial variety is also reflected in climatic variability over time and is an
important factor in the determination of the impact of global climate change.
NATURAL RESOURCES
As nature-based tourism prevails in Slovenia, climatic change could endanger some of the
touristic resorts and activities. Already now, it is evident that winter tourism based on sports
and recreation on ice and snow is highly vulnerable. Immediate efforts for adaptation are
Developments in Tourism Climatology – A. Matzarakis, C. R. de Freitas, D. Scott, 2007
255
needed. For example, snowmaking is already one of the most widely spreaded adaptation
measures. Climate change will shorten the tourist season in some parts of the country, but on
the other hand, there are locations, which will benefit from the more favourable climatic
conditions for selected sports, recreation and leisure activities like hiking. It is also expected
that more tourists will concentrate in selected zones, thus increasing environmental stress in
these regions. There are some natural phenomena (like caves with underground rivers in the
karst terrain, wetlands, lakes and waterfalls), which are very sensitive to changes in the
precipitation regime. Some of those natural beauties could even disappear if climate changes
significantly. Ecosystems including some rare and protected species will be highly
endangered in unstable climatic conditions. Already now, tourism represents a significant
environmental burden for some fragile ecosystems, which may be unable to stand any
additional stress caused by climate change.
CLIMATE SENSITIVE NATURAL FEATURES
The coastal region is under stress if high tides occur in combination with special weather
conditions (low air pressure and jugo wind in combination with high tide). Expected sea level
rise will increase the problems in that region. The first to suffer is the salina landscape, a
precious area protected for its cultural and environmental value.
Snežna jama cave with its frozen stalactites in alpine Mount Raduha is a special sight, and the
caves in the shallow karst of Dolenjska are unique. The karst springs of rivers are a surprising
feature in the Julian Alps; waterfalls and white-water rapids are found on many rivers and
streams that flow here through narrow gorges. Charms of a special kind are shown by karst
lakes, among which the disappearing Cerknica Lake is the largest and the most picturesque.
This is an intermittent lake, which starts to disappear in spring and lives behind a field
(Cerkniško polje). When the largest lake in Slovenia is full, the surface can reach up to 38
km2. In case of Cerknica Lake, the precipitation regime is crucial. The Škocjan caves are a
unique natural feature and cultural heritage; they have been on the UNESCO world heritage
list since 1986, and in 1999 were put on the Ramsar List of Wetlands of International
Importance as the world’s largest underground wetlands. However, these ecosystems are also
very sensitive to changes in environment and consequently to climate change. Changes in
precipitation regimes will have significant impact on all above-mentioned features.
Especially in costal regions and karst water supply is limited during the summer, which
means that different sectors have to compete for water. If there is a low water level, the water
Developments in Tourism Climatology – A. Matzarakis, C. R. de Freitas, D. Scott, 2007
256
quality is also compromised. Due to warm weather, the temperature of surface water increases
and the level of ground water decreases in summer.
CLIMATIC DIVERSITY
Slovenia is a heterogeneous country not only in its climate and topography, but also in its
vegetation. This diversity in vegetation is affected by varying temperature conditions and
precipitation regimes, which directly define the length of the yearly vegetation period. Forests
cover more than one-half of the national territory. Throughout Slovenia, there are forest
reserves, and primeval forests are still found in some parts of Slovenia. Protected forests,
trees, and the autochthonous flora and fauna are often part of the landscape parks that
preserve the heritage of individual areas. We can also find about 850 endemic species in
Slovenia, which can easily become endangered and extinct due to their vulnerability and
restricted habitat; the most important are Campanula zoysii and Proteus anguinus, but there
are also many others (hladnikovka, kranjski jeglič, kratkodlakava popkoresa, Savinjski
deževnik, pajek Polenčev lijakar, primorski rjavček…). Many of Slovenia's natural sites are
included in theme trails, forest education trails, and various local excursion programs.
Droughts, flash floods, wild fires and severe storms can endanger them. Single weather events
and slow changes in temperature and precipitation regimes could jeopardize them.
NATURAL HERITAGE
The natural heritage of Slovenia is protected either as national park, regional park, nature park, Natura 2000 park or as a natural monument. Triglav National Park (TNP) is the only Slovenian national park. It was named after Triglav, the highest mountain in the center of the park, which is also the highest mountain in Slovenia (2864 m) and a national symbol. The park covers 3% of the territory of Slovenia. It is among the first established European parks; the first protection dates back to 1924 when the Alpine Conservation Park was founded. Škocjan caves, which are the most important underground phenomenon of the karst region, are strongly connected with Škocjan caves regional park. Škocjan caves are among the finest caves in the world. The largest of them is 123 m wide and 300 m long Martel's chamber that reaches, at its highest point, the stunning height of 146 m. This is one of the most famous sites in the world for the study of karstic (limestone) phenomena. In the village Cerknica is situated the Notranjska regional park, is extended on 222 km2. Kozjansko regional park was registered in 1999, it covers 196 km2.
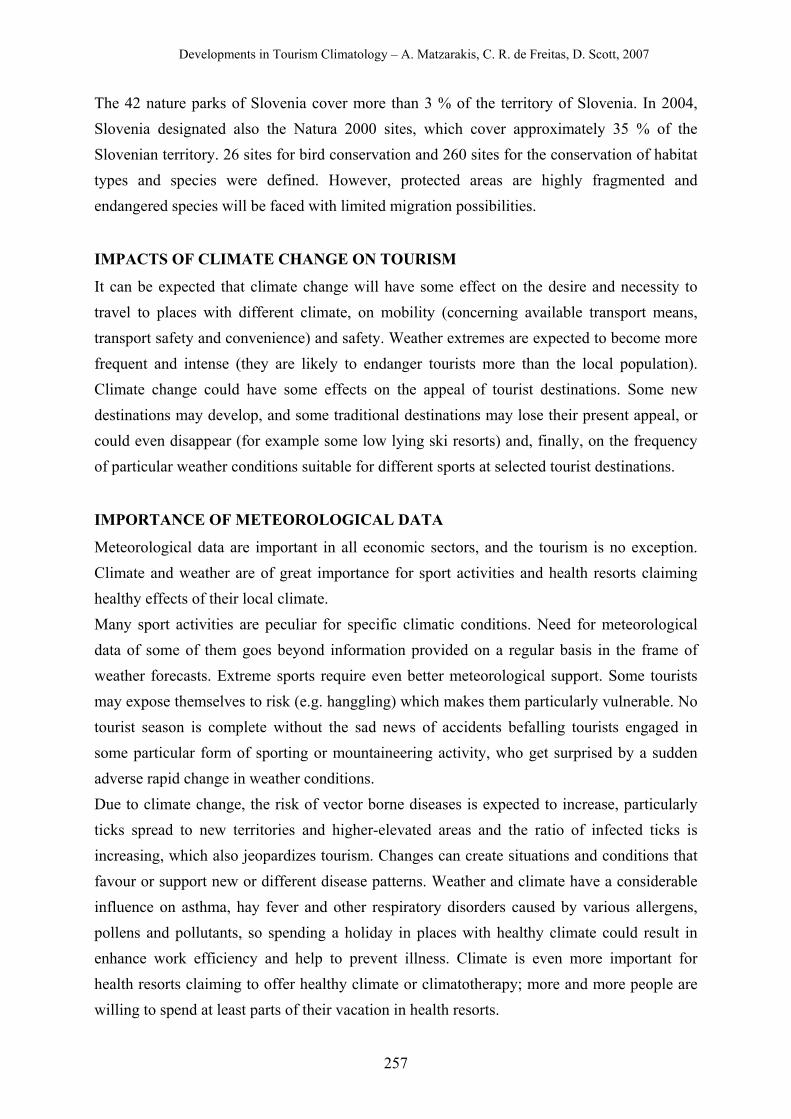
Developments in Tourism Climatology – A. Matzarakis, C. R. de Freitas, D. Scott, 2007
257
The 42 nature parks of Slovenia cover more than 3 % of the territory of Slovenia. In 2004, Slovenia designated also the Natura 2000 sites, which cover approximately 35 % of the Slovenian territory. 26 sites for bird conservation and 260 sites for the conservation of habitat types and species were defined. However, protected areas are highly fragmented and endangered species will be faced with limited migration possibilities.
IMPACTS OF CLIMATE CHANGE ON TOURISM
It can be expected that climate change will have some effect on the desire and necessity to travel to places with different climate, on mobility (concerning available transport means, transport safety and convenience) and safety. Weather extremes are expected to become more frequent and intense (they are likely to endanger tourists more than the local population). Climate change could have some effects on the appeal of tourist destinations. Some new destinations may develop, and some traditional destinations may lose their present appeal, or could even disappear (for example some low lying ski resorts) and, finally, on the frequency of particular weather conditions suitable for different sports at selected tourist destinations.
IMPORTANCE OF METEOROLOGICAL DATA
Meteorological data are important in all economic sectors, and the tourism is no exception. Climate and weather are of great importance for sport activities and health resorts claiming healthy effects of their local climate. Many sport activities are peculiar for specific climatic conditions. Need for meteorological data of some of them goes beyond information provided on a regular basis in the frame of weather forecasts. Extreme sports require even better meteorological support. Some tourists may expose themselves to risk (e.g. hanggling) which makes them particularly vulnerable. No tourist season is complete without the sad news of accidents befalling tourists engaged in some particular form of sporting or mountaineering activity, who get surprised by a sudden adverse rapid change in weather conditions. Due to climate change, the risk of vector borne diseases is expected to increase, particularly ticks spread to new territories and higher-elevated areas and the ratio of infected ticks is increasing, which also jeopardizes tourism. Changes can create situations and conditions that favour or support new or different disease patterns. Weather and climate have a considerable influence on asthma, hay fever and other respiratory disorders caused by various allergens, pollens and pollutants, so spending a holiday in places with healthy climate could result in enhance work efficiency and help to prevent illness. Climate is even more important for health resorts claiming to offer healthy climate or climatotherapy; more and more people are willing to spend at least parts of their vacation in health resorts.
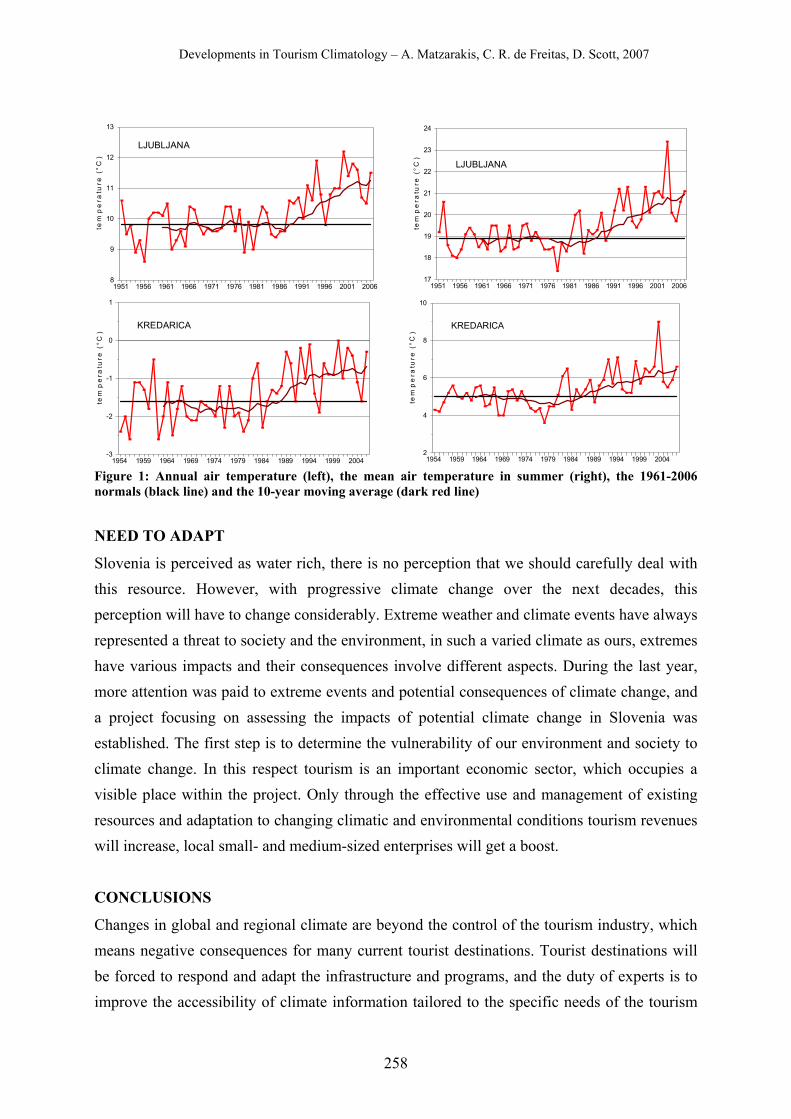
Developments in Tourism Climatology – A. Matzarakis, C. R. de Freitas, D. Scott, 2007
258
8
9
10
11
12
13
tem
pe
ratu
re (
°C)
1951 1956 1961 1966 1971 1976 1981 1986 1991 1996 2001 2006
LJUBLJANA
17
18
19
20
21
22
23
24
tem
pe
ratu
re (
°C)
1951 1956 1961 1966 1971 1976 1981 1986 1991 1996 2001 2006
LJUBLJANA
-3
-2
-1
0
1
tem
pe
ratu
re (
°C)
1954 1959 1964 1969 1974 1979 1984 1989 1994 1999 2004
KREDARICA
2
4
6
8
10
tem
pe
ratu
re (
°C)
1954 1959 1964 1969 1974 1979 1984 1989 1994 1999 2004
KREDARICA
Figure 1: Annual air temperature (left), the mean air temperature in summer (right), the 1961-2006 normals (black line) and the 10-year moving average (dark red line)
NEED TO ADAPT
Slovenia is perceived as water rich, there is no perception that we should carefully deal with this resource. However, with progressive climate change over the next decades, this perception will have to change considerably. Extreme weather and climate events have always represented a threat to society and the environment, in such a varied climate as ours, extremes have various impacts and their consequences involve different aspects. During the last year, more attention was paid to extreme events and potential consequences of climate change, and a project focusing on assessing the impacts of potential climate change in Slovenia was established. The first step is to determine the vulnerability of our environment and society to climate change. In this respect tourism is an important economic sector, which occupies a visible place within the project. Only through the effective use and management of existing resources and adaptation to changing climatic and environmental conditions tourism revenues will increase, local small- and medium-sized enterprises will get a boost. CONCLUSIONS
Changes in global and regional climate are beyond the control of the tourism industry, which means negative consequences for many current tourist destinations. Tourist destinations will be forced to respond and adapt the infrastructure and programs, and the duty of experts is to improve the accessibility of climate information tailored to the specific needs of the tourism
Developments in Tourism Climatology – A. Matzarakis, C. R. de Freitas, D. Scott, 2007
259
sector. Diversification of tourism activities is inevitable. Some destinations are already adapting their own offer; ski resorts are forced to make the artificial snow, but also to develop alternative programs. Snow making is not among the sustainable adaptation measures, but it is widely taking place in spite of high energy and water consumption, and also higher prices in ski resorts.
Figure 2: Precipitation in the period 1951-2006 (left), precipitation in summer (right) and the 10-year moving average
Tourism is a continuously adapting industry, responding to changing demographic and
economic conditions, as well as to new demands, technologies and fashion. Due to its
fragmented structure, adaptation is likely to be gradual, with new investment in tune with
other strategic decision. For tourism adaptation is vital; in costal regions and karst more
efficient water use to prevent the deficit of water in summer seems to be inevitable in the
future. Some measures will be necessary to enable migration of endangered species and
carefully developed forestry policy to be implemented, especially for low land forests that
now consist mostly of spruce not inclined to prosper in warmer climate. Sultriness is
becoming more and more frequent in the lowlands; therefore, some health resorts will have to
develop alternative programs during summer and cities will become less appealing during
summer because of more frequent heat waves. But these are only some of the preliminary
results within the national Climate Change Adaptation project running at the Environmental
Agency.
REFERENCES National Climate Change Adaptation Project, in development at the Environmental Agency of the Republic of Slovenia
0
100
200
300
400
500
600
pre
cip
ita
tio
n (
mm
)1951 1956 1961 1966 1971 1976 1981 1986 1991 1996 2001 2006
PORTOROŽ
0
500
1000
1500
pre
cip
ita
tio
n (
mm
)
1951 1956 1961 1966 1971 1976 1981 1986 1991 1996 2001 2006
PORTOROŽ
Developments in Tourism Climatology – A. Matzarakis, C. R. de Freitas, D. Scott, 2007
260
CLIMATE CHANGE AND CLIMATE–TOURISM RELATIONSHIPS IN GERMANY
C. Endler and A. Matzarakis
Meteorological Institute, University of Freiburg, Freiburg, Germany
ABSTRACT Climate change, mitigation and adaptation are highly discussed research topics.
Global warming, sea level rise and extreme weather events, e.g., heat waves and storms, are
closely related to climate change. That results in both negative and positive consequences for
tourism. The project CAST (“climate trends and sustainable tourism development in coastal
and mountain regions”) and its five sub-projects aim to answer the questions as to how the
tourism potential will change and how the society will adapt to changing climate conditions.
Therefore, the climatic tourism potential will be analysed under modified climate conditions
by means of two different climatic sensitive regions in Germany: the North Sea and the Black
Forest.
Human-biometeorological computations related to tourism, based on the IPCC scenarios A1B,
A2 and B1, are carried out by use of the regional climate model REMO from the Max-Planck-
Institute for Meteorology Hamburg. Human-biometeorological, physical, thermal and
aesthetic facets are used for the validation of climate-tourism relationships. The aim is to
quantify the climatic tourism potential for stakeholders. Frequency classes and frequencies of
extreme weather events are generated based on 10-day-intervals. The derived results, in terms
of so called climate tourism information schemata (CTIS), and maps are made available for
the stakeholders.
KEYWORDS: Climate change, tourism, CTIS, North Sea, Black Forest
INTRODUCTION
Tourism is closely linked to weather and climate. Weather and climate are both limited and
advantaged parameters. They influence summer and winter tourism, e.g. hiking, swimming,
skiing and other activities related to tourism. Therefore, two different climate-sensitive regions
will be analysed: a coastal and a mountain area. Many people choose the North Sea and the
Black Forest for vacation. In comparison to urban areas, the North Sea and the Black Forest
offer beneficial weather conditions, especially in the summer season. In the context of global
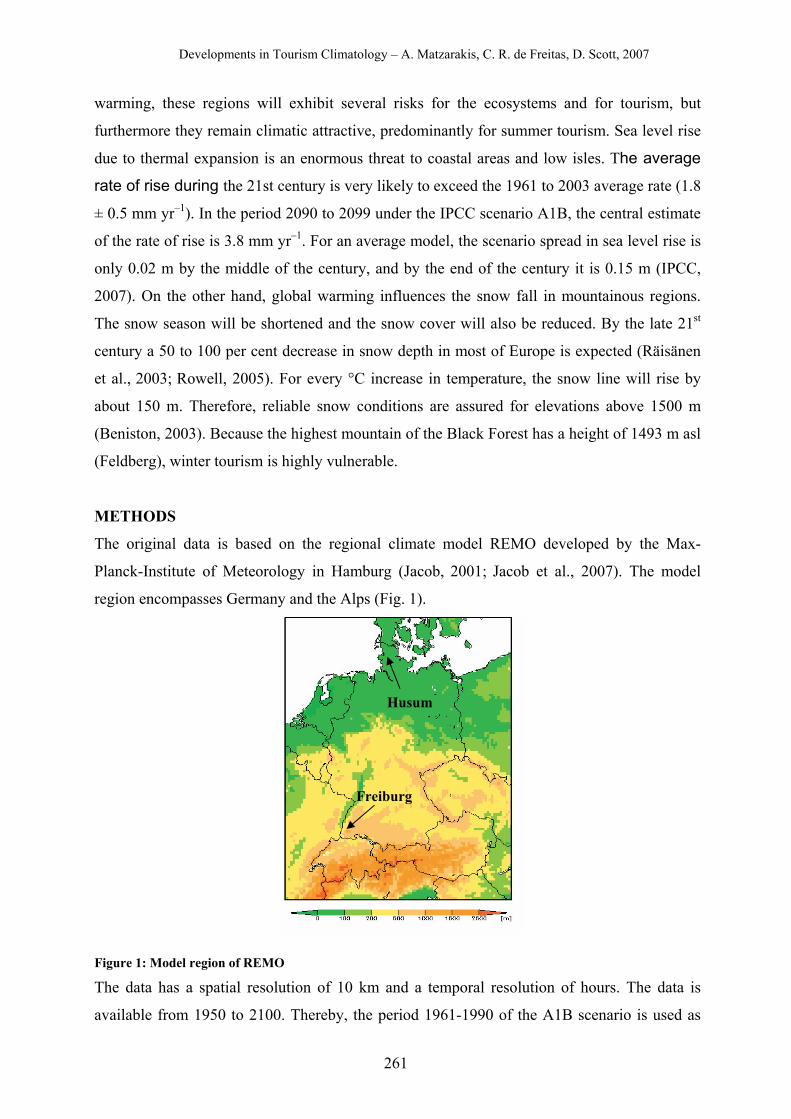
Developments in Tourism Climatology – A. Matzarakis, C. R. de Freitas, D. Scott, 2007
261
warming, these regions will exhibit several risks for the ecosystems and for tourism, but
furthermore they remain climatic attractive, predominantly for summer tourism. Sea level rise
due to thermal expansion is an enormous threat to coastal areas and low isles. The average
rate of rise during the 21st century is very likely to exceed the 1961 to 2003 average rate (1.8
± 0.5 mm yr–1). In the period 2090 to 2099 under the IPCC scenario A1B, the central estimate
of the rate of rise is 3.8 mm yr–1. For an average model, the scenario spread in sea level rise is
only 0.02 m by the middle of the century, and by the end of the century it is 0.15 m (IPCC,
2007). On the other hand, global warming influences the snow fall in mountainous regions.
The snow season will be shortened and the snow cover will also be reduced. By the late 21st
century a 50 to 100 per cent decrease in snow depth in most of Europe is expected (Räisänen
et al., 2003; Rowell, 2005). For every °C increase in temperature, the snow line will rise by
about 150 m. Therefore, reliable snow conditions are assured for elevations above 1500 m
(Beniston, 2003). Because the highest mountain of the Black Forest has a height of 1493 m asl
(Feldberg), winter tourism is highly vulnerable.
METHODS
The original data is based on the regional climate model REMO developed by the Max-
Planck-Institute of Meteorology in Hamburg (Jacob, 2001; Jacob et al., 2007). The model
region encompasses Germany and the Alps (Fig. 1).
Figure 1: Model region of REMO
The data has a spatial resolution of 10 km and a temporal resolution of hours. The data is
available from 1950 to 2100. Thereby, the period 1961-1990 of the A1B scenario is used as
Freiburg
Husum
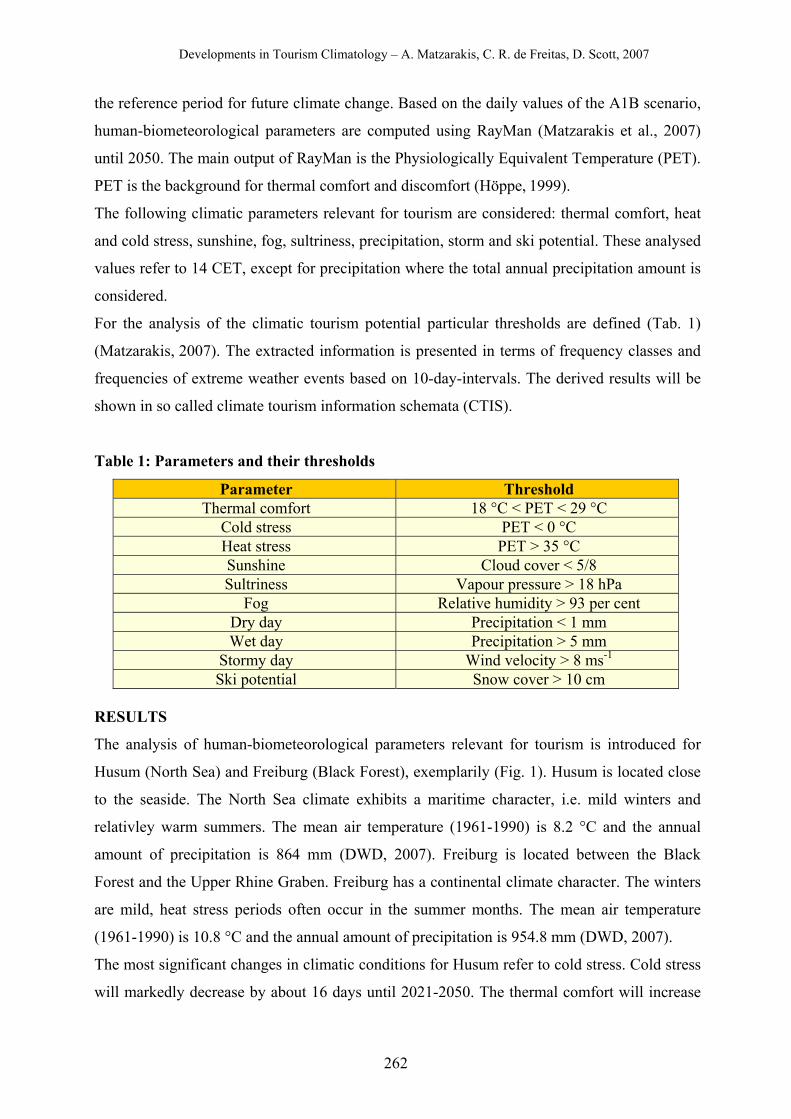
Developments in Tourism Climatology – A. Matzarakis, C. R. de Freitas, D. Scott, 2007
262
the reference period for future climate change. Based on the daily values of the A1B scenario,
human-biometeorological parameters are computed using RayMan (Matzarakis et al., 2007)
until 2050. The main output of RayMan is the Physiologically Equivalent Temperature (PET).
PET is the background for thermal comfort and discomfort (Höppe, 1999).
The following climatic parameters relevant for tourism are considered: thermal comfort, heat
and cold stress, sunshine, fog, sultriness, precipitation, storm and ski potential. These analysed
values refer to 14 CET, except for precipitation where the total annual precipitation amount is
considered.
For the analysis of the climatic tourism potential particular thresholds are defined (Tab. 1)
(Matzarakis, 2007). The extracted information is presented in terms of frequency classes and
frequencies of extreme weather events based on 10-day-intervals. The derived results will be
shown in so called climate tourism information schemata (CTIS).
Table 1: Parameters and their thresholds
Parameter Threshold Thermal comfort 18 °C < PET < 29 °C
Cold stress PET < 0 °C Heat stress PET > 35 °C Sunshine Cloud cover < 5/8 Sultriness Vapour pressure > 18 hPa
Fog Relative humidity > 93 per cent Dry day Precipitation < 1 mm Wet day Precipitation > 5 mm
Stormy day Wind velocity > 8 ms-1
Ski potential Snow cover > 10 cm RESULTS
The analysis of human-biometeorological parameters relevant for tourism is introduced for
Husum (North Sea) and Freiburg (Black Forest), exemplarily (Fig. 1). Husum is located close
to the seaside. The North Sea climate exhibits a maritime character, i.e. mild winters and
relativley warm summers. The mean air temperature (1961-1990) is 8.2 °C and the annual
amount of precipitation is 864 mm (DWD, 2007). Freiburg is located between the Black
Forest and the Upper Rhine Graben. Freiburg has a continental climate character. The winters
are mild, heat stress periods often occur in the summer months. The mean air temperature
(1961-1990) is 10.8 °C and the annual amount of precipitation is 954.8 mm (DWD, 2007).
The most significant changes in climatic conditions for Husum refer to cold stress. Cold stress
will markedly decrease by about 16 days until 2021-2050. The thermal comfort will increase
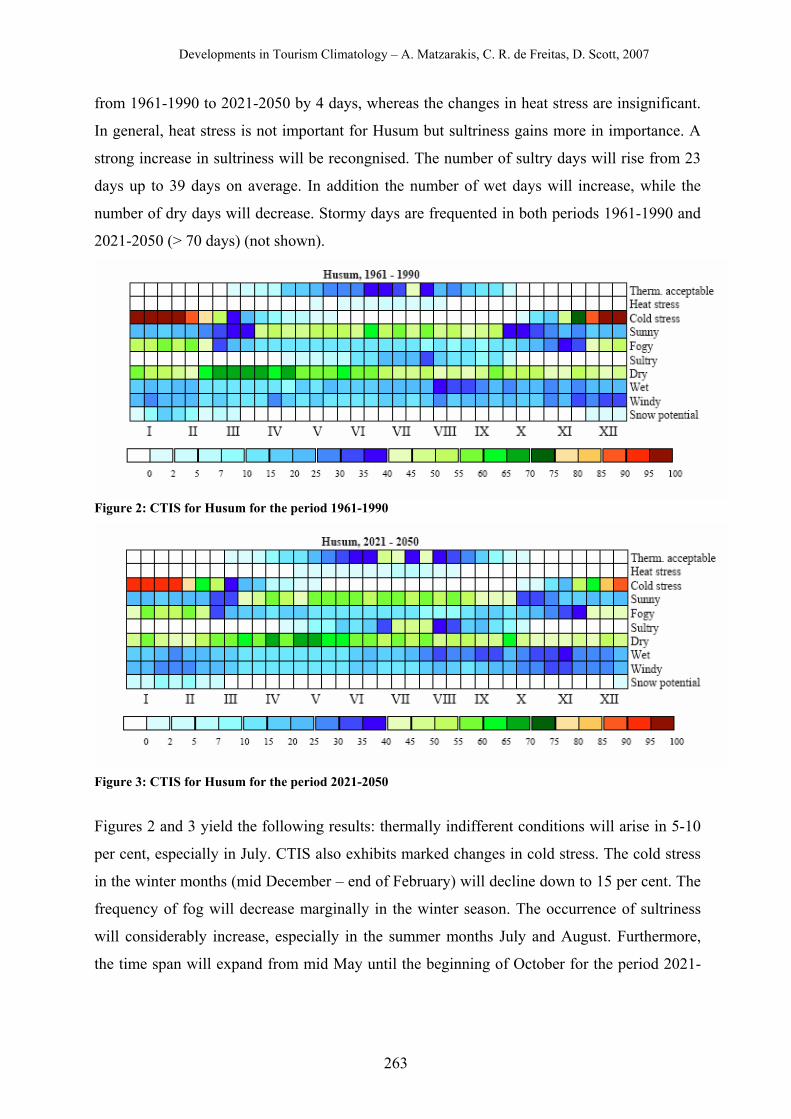
Developments in Tourism Climatology – A. Matzarakis, C. R. de Freitas, D. Scott, 2007
263
from 1961-1990 to 2021-2050 by 4 days, whereas the changes in heat stress are insignificant.
In general, heat stress is not important for Husum but sultriness gains more in importance. A
strong increase in sultriness will be recongnised. The number of sultry days will rise from 23
days up to 39 days on average. In addition the number of wet days will increase, while the
number of dry days will decrease. Stormy days are frequented in both periods 1961-1990 and
2021-2050 (> 70 days) (not shown).
Figure 2: CTIS for Husum for the period 1961-1990
Figure 3: CTIS for Husum for the period 2021-2050
Figures 2 and 3 yield the following results: thermally indifferent conditions will arise in 5-10
per cent, especially in July. CTIS also exhibits marked changes in cold stress. The cold stress
in the winter months (mid December – end of February) will decline down to 15 per cent. The
frequency of fog will decrease marginally in the winter season. The occurrence of sultriness
will considerably increase, especially in the summer months July and August. Furthermore,
the time span will expand from mid May until the beginning of October for the period 2021-
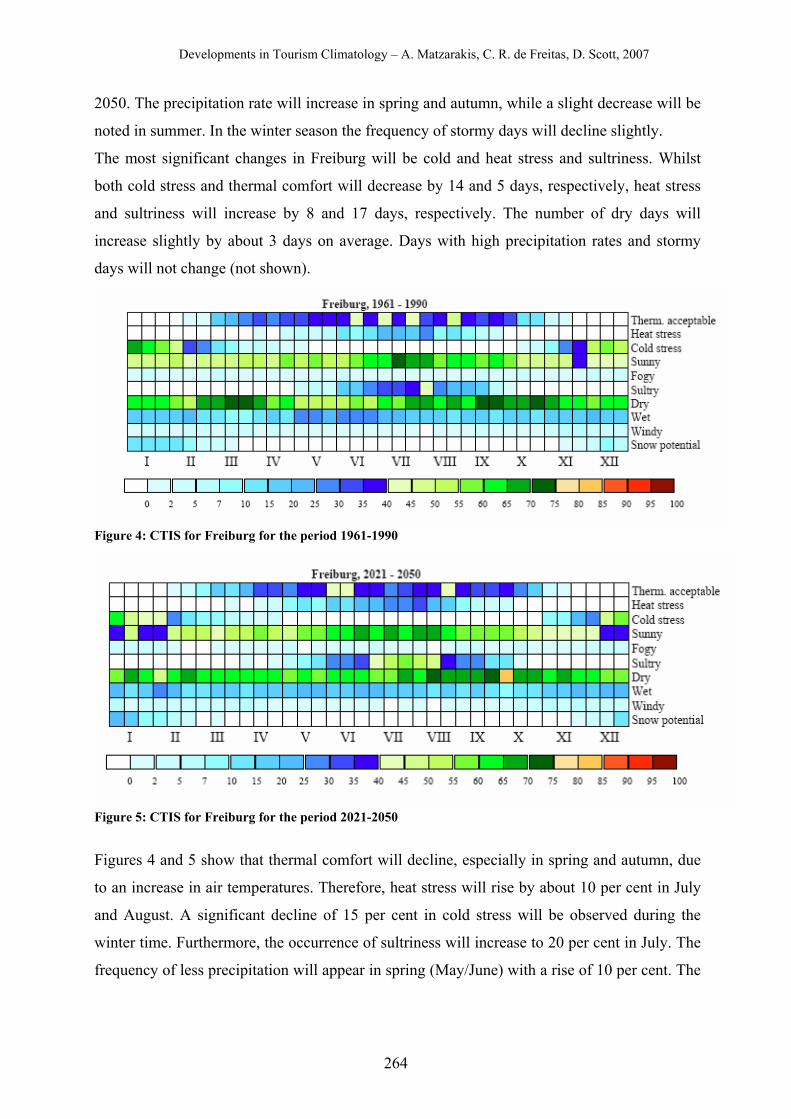
Developments in Tourism Climatology – A. Matzarakis, C. R. de Freitas, D. Scott, 2007
264
2050. The precipitation rate will increase in spring and autumn, while a slight decrease will be
noted in summer. In the winter season the frequency of stormy days will decline slightly.
The most significant changes in Freiburg will be cold and heat stress and sultriness. Whilst
both cold stress and thermal comfort will decrease by 14 and 5 days, respectively, heat stress
and sultriness will increase by 8 and 17 days, respectively. The number of dry days will
increase slightly by about 3 days on average. Days with high precipitation rates and stormy
days will not change (not shown).
Figure 4: CTIS for Freiburg for the period 1961-1990
Figure 5: CTIS for Freiburg for the period 2021-2050 Figures 4 and 5 show that thermal comfort will decline, especially in spring and autumn, due
to an increase in air temperatures. Therefore, heat stress will rise by about 10 per cent in July
and August. A significant decline of 15 per cent in cold stress will be observed during the
winter time. Furthermore, the occurrence of sultriness will increase to 20 per cent in July. The
frequency of less precipitation will appear in spring (May/June) with a rise of 10 per cent. The
Developments in Tourism Climatology – A. Matzarakis, C. R. de Freitas, D. Scott, 2007
265
months February and March will be characterized by a higher precipitation rate. Changes in
fog and wind can are marginally.
DISCUSSION AND CONCLUSION
Although the two researched stations exhibit different geographical locations, their climatic
conditions are suitable for tourism on a moderate level. However the changes differ extremely
in occurrence and intensity for the period 2021-2050 but the general climatic trends are
similar. Thus the fluctuation and variability in bioclimatic parameters (e. g. PET) will
increase. These fluctuations will impede the adaptation to current conditions in weather and
climate.
The busy tourism season in Husum will become more pleasant because of an increase of
thermal indifferent conditions. Heat stress is irrelevant and from this it follows that the
climatic conditions will improve. Moreover, cold stress will also decline and allow an
improved well-being of tourists. Nevertheless, the storm potential will continue to remain
significant in all seasons.
Due to global warming, the thermal comfort in Freiburg will expand to the off-peak seasons in
spring and autumn. People will less frequently be stressed by cold. This results in a positive
feedback for the tourism industry. But the peak season is characterized by a strong increase in
heat stress. From this it follows that there will be a shift of tourism from the peak season to the
low season.
In conclusion, both Husum and Freiburg are affected by positive and negative climate change
impact factors.
ACKNOWLEDGEMENT This research is supported by The Federal Ministry of Education and Research (Bundesministerium
für Bildung und Forschung, BMBF).
REFERENCES Beniston, M. (2003) Climatic change in mountain regions: a review of possible impacts.
Climatic Change 59, 5-31. DWD (2007) Mittelwerte der Periode 1961-1990 für die Klimaelemente Temperatur,
Niederschlag und Sonnenscheindauer für ausgewählte Stationen in Deutschland. Höppe, P. (1999) The physiological equivalent temperature – a universal index for the
biometeorological assessment of the thermal environment. Int. J. Biometeorol. 43, 71-75. IPCC (2007) Climate Change 2007: The Scientific Basis. Contribution of Working Group I to
the Fourth Assessment Report of the Intergovernmental Panel on Climate Change
Developments in Tourism Climatology – A. Matzarakis, C. R. de Freitas, D. Scott, 2007
266
[Houghton, J.T., et al. (eds.)]. Cambridge University Press, Cambridge, United Kingdom and New York, NY, USA.
Jacob, D. (2001) A note on the simulation of the annual and inter-annual variability of the water budget over the Baltic Sea drainage basin. Meteorol. Atmos. Phys. 77, 61–73.
Jacob, D.; Bärring, L.; Christensen, O. B.; Christensen, J. H.; Hagemann, S.; Hirschi, M.; Kjellström, E.; Lenderink, G.; Rockel, B.; Schär, C.; Seneviratne, S. I.; Somot, S.; van Ulden, A.; van den Hurk, B. (2007) An inter-comparison of regional climate models for Europe: Design of the experiments and model performance. Climatic Change 81: 31-52.
Matzarakis, A. (2007) Entwicklung einer Bewertungsmethodik zur Integration von Wetter- und Klimabedingungen im Tourismus. Ber. Met. Inst.Univ. Freiburg 16, 73-79.
Matzarakis, A.; Rutz, F.; Mayer, H. (2007) Modelling Radiation fluxes in simple and complex environments – Application of the RayMan model. Int. J. Biometeorol. 51, 323-334.
Räisänen, J., Hansson, U., Ullerstig, A., Döschner, R., Graham, L. P., Jones, C., Meier, M., Samuelsson, P., Willen, U. (2003) GCM Driven Simulations of Recent and Future Climate with the Rossby Centre Coupled Atmosphere – Baltic Sea Regional Climate Model RCAO. Reports Meteorology and Climatology 101, Swedish Meteorological and Hydrological Institute, Norrköping, Sweden, 61 pp.
Rowell, D. P. (2005): A scenario of European climate change for the late 21st century: seasonal means and interannual variability. Climate Dynamics 25, 837–849.
Developments in Tourism Climatology – A. Matzarakis, C. R. de Freitas, D. Scott, 2007
267
CLIMATE CHANGE AND TOURISM POTENTIAL IN THE BLACK FOREST
– A TOURISM AND CLIMATE APPROACH FOR FOREST AREAS
K. Oehler and A. Matzarakis
Meteorological Institute, University of Freiburg, D-79085 Freiburg, Germany
ABSTRACT How the tourism potential in the low mountain ranges of Germany will change
under modified climate conditions is analysed for the Black Forest. The tourism potential is
mainly based on the attractiveness of natural parameters, e.g. landscape, flora and fauna.
These parameters are highly sensitive to climate.
The A1B scenario, based on the regional model REMO from the Max-Planck-Institute for
Meteorology in Hamburg, is used for climatic analyses of selected stations in the Black Forest.
The high resolution data is available from 1950 until 2100. The following parameters are
computed for the analysis of the climatic potential from 1961 until 2050, exclusively: thermal
comfort, heat and cold stress, sunshine, fog, sultriness, precipitation, storm and ski potential.
These analysed daily values refer to 14 CET, except for precipitation, which is the total daily
precipitation amount. Using human-biometeorological, physical, thermal and aesthetic criteria,
frequency classes and frequencies of extreme weather events are compiled based on 10-day-
intervals. The derived results are presented in terms of the climate tourism information scheme
(CTIS).
KEYWORDS: Climate change, Black Forest, tourism, climate tourism information scheme
INTRODUCTION
According to the IPCC (2007) the global surface temperature is raised by 0.74 degree. Climate
is a dominant feature for tourist destinations. Global warming and extreme weather events,
e.g. storms or heat waves, are related to climate change. Mountain areas are very sensitive to
climatic change. Mountain regions offer a high biodiversity and attract people for recreation
and sport activities, e.g. hiking in the summer and skiing in the winter season. Therefore, both
flora/fauna and tourism are directly influenced. Besides, global warming exhibits a high risk
and vulnerability for a slanted tourism towards snow and ski sports. Both lower and higher
regions suitable for skiing are negatively affected. Less snow, a shorter ski season, an increase
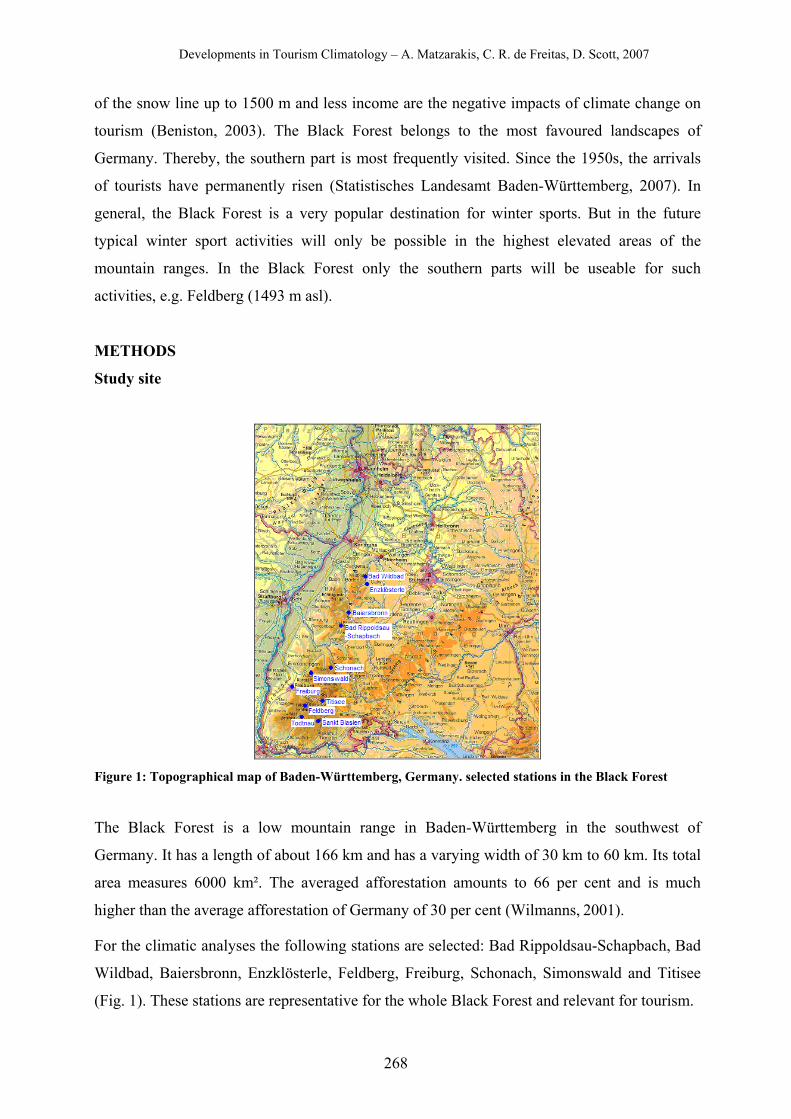
Developments in Tourism Climatology – A. Matzarakis, C. R. de Freitas, D. Scott, 2007
268
of the snow line up to 1500 m and less income are the negative impacts of climate change on
tourism (Beniston, 2003). The Black Forest belongs to the most favoured landscapes of
Germany. Thereby, the southern part is most frequently visited. Since the 1950s, the arrivals
of tourists have permanently risen (Statistisches Landesamt Baden-Württemberg, 2007). In
general, the Black Forest is a very popular destination for winter sports. But in the future
typical winter sport activities will only be possible in the highest elevated areas of the
mountain ranges. In the Black Forest only the southern parts will be useable for such
activities, e.g. Feldberg (1493 m asl).
METHODS
Study site
Figure 1: Topographical map of Baden-Württemberg, Germany. selected stations in the Black Forest
The Black Forest is a low mountain range in Baden-Württemberg in the southwest of
Germany. It has a length of about 166 km and has a varying width of 30 km to 60 km. Its total
area measures 6000 km². The averaged afforestation amounts to 66 per cent and is much
higher than the average afforestation of Germany of 30 per cent (Wilmanns, 2001).
For the climatic analyses the following stations are selected: Bad Rippoldsau-Schapbach, Bad
Wildbad, Baiersbronn, Enzklösterle, Feldberg, Freiburg, Schonach, Simonswald and Titisee
(Fig. 1). These stations are representative for the whole Black Forest and relevant for tourism.
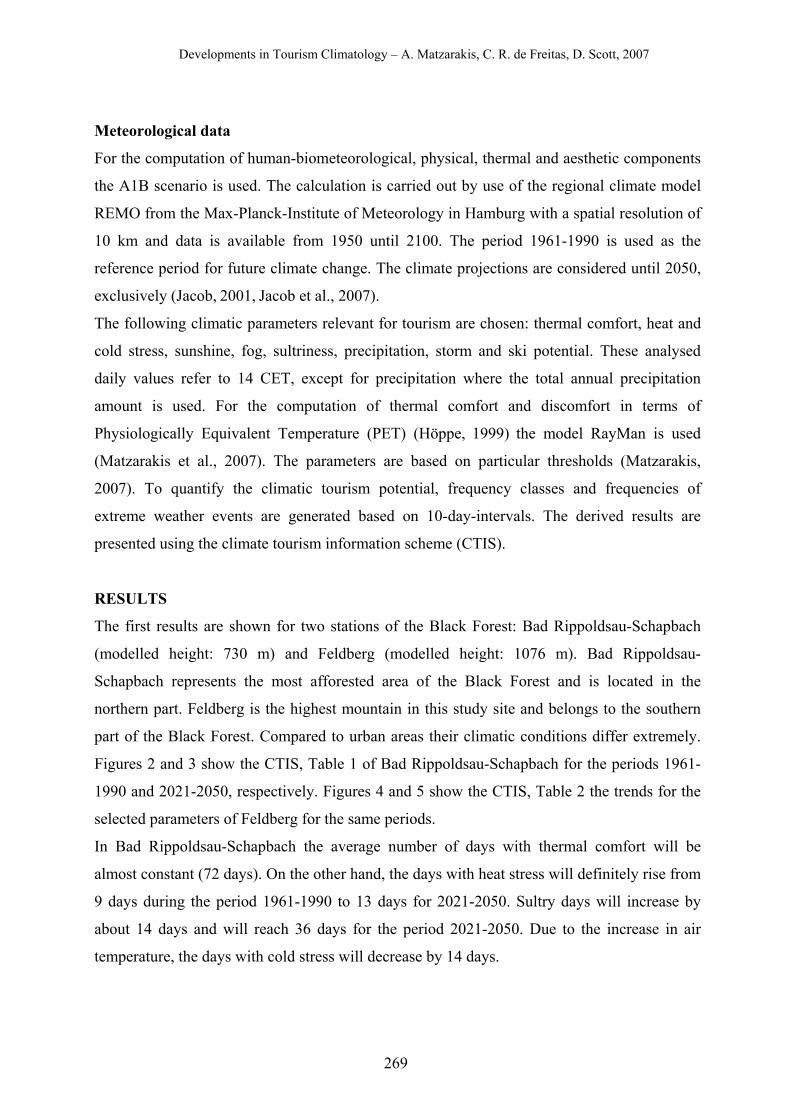
Developments in Tourism Climatology – A. Matzarakis, C. R. de Freitas, D. Scott, 2007
269
Meteorological data
For the computation of human-biometeorological, physical, thermal and aesthetic components
the A1B scenario is used. The calculation is carried out by use of the regional climate model
REMO from the Max-Planck-Institute of Meteorology in Hamburg with a spatial resolution of
10 km and data is available from 1950 until 2100. The period 1961-1990 is used as the
reference period for future climate change. The climate projections are considered until 2050,
exclusively (Jacob, 2001, Jacob et al., 2007).
The following climatic parameters relevant for tourism are chosen: thermal comfort, heat and
cold stress, sunshine, fog, sultriness, precipitation, storm and ski potential. These analysed
daily values refer to 14 CET, except for precipitation where the total annual precipitation
amount is used. For the computation of thermal comfort and discomfort in terms of
Physiologically Equivalent Temperature (PET) (Höppe, 1999) the model RayMan is used
(Matzarakis et al., 2007). The parameters are based on particular thresholds (Matzarakis,
2007). To quantify the climatic tourism potential, frequency classes and frequencies of
extreme weather events are generated based on 10-day-intervals. The derived results are
presented using the climate tourism information scheme (CTIS).
RESULTS
The first results are shown for two stations of the Black Forest: Bad Rippoldsau-Schapbach
(modelled height: 730 m) and Feldberg (modelled height: 1076 m). Bad Rippoldsau-
Schapbach represents the most afforested area of the Black Forest and is located in the
northern part. Feldberg is the highest mountain in this study site and belongs to the southern
part of the Black Forest. Compared to urban areas their climatic conditions differ extremely.
Figures 2 and 3 show the CTIS, Table 1 of Bad Rippoldsau-Schapbach for the periods 1961-
1990 and 2021-2050, respectively. Figures 4 and 5 show the CTIS, Table 2 the trends for the
selected parameters of Feldberg for the same periods.
In Bad Rippoldsau-Schapbach the average number of days with thermal comfort will be
almost constant (72 days). On the other hand, the days with heat stress will definitely rise from
9 days during the period 1961-1990 to 13 days for 2021-2050. Sultry days will increase by
about 14 days and will reach 36 days for the period 2021-2050. Due to the increase in air
temperature, the days with cold stress will decrease by 14 days.
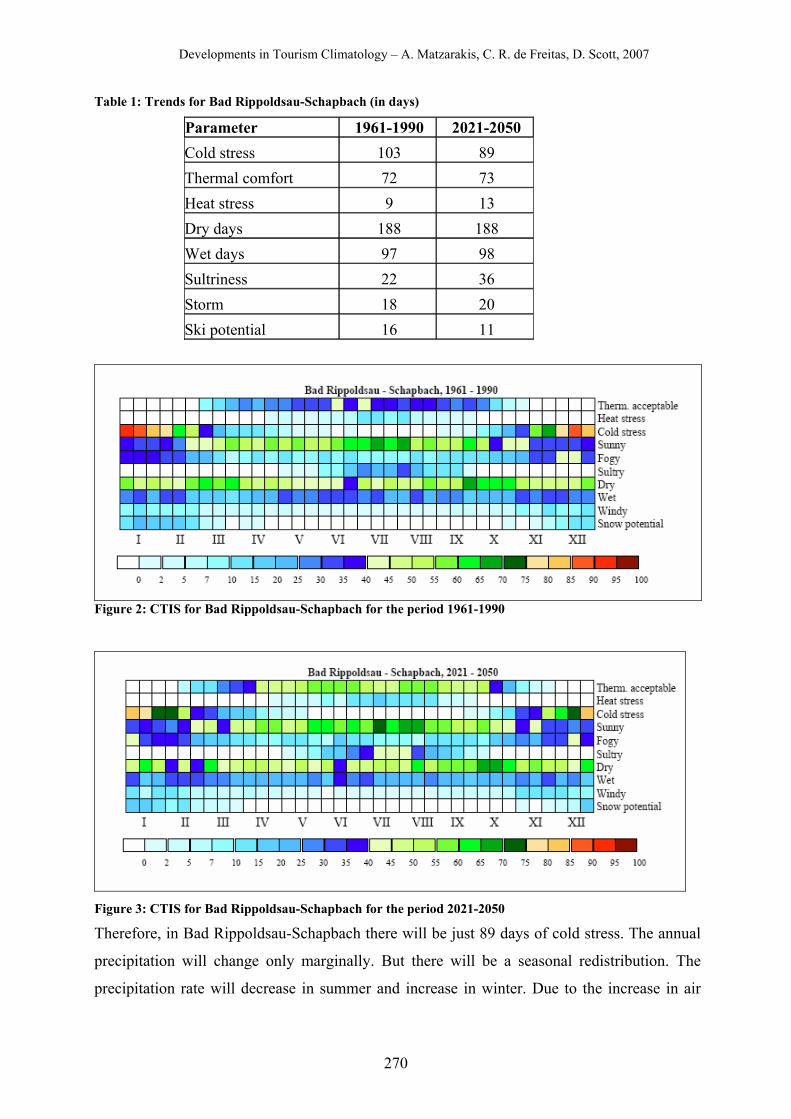
Developments in Tourism Climatology – A. Matzarakis, C. R. de Freitas, D. Scott, 2007
270
Table 1: Trends for Bad Rippoldsau-Schapbach (in days)
Figure 2: CTIS for Bad Rippoldsau-Schapbach for the period 1961-1990
Figure 3: CTIS for Bad Rippoldsau-Schapbach for the period 2021-2050 Therefore, in Bad Rippoldsau-Schapbach there will be just 89 days of cold stress. The annual
precipitation will change only marginally. But there will be a seasonal redistribution. The
precipitation rate will decrease in summer and increase in winter. Due to the increase in air
Parameter 1961-1990 2021-2050 Cold stress 103 89 Thermal comfort 72 73 Heat stress 9 13 Dry days 188 188 Wet days 97 98 Sultriness 22 36 Storm 18 20 Ski potential 16 11
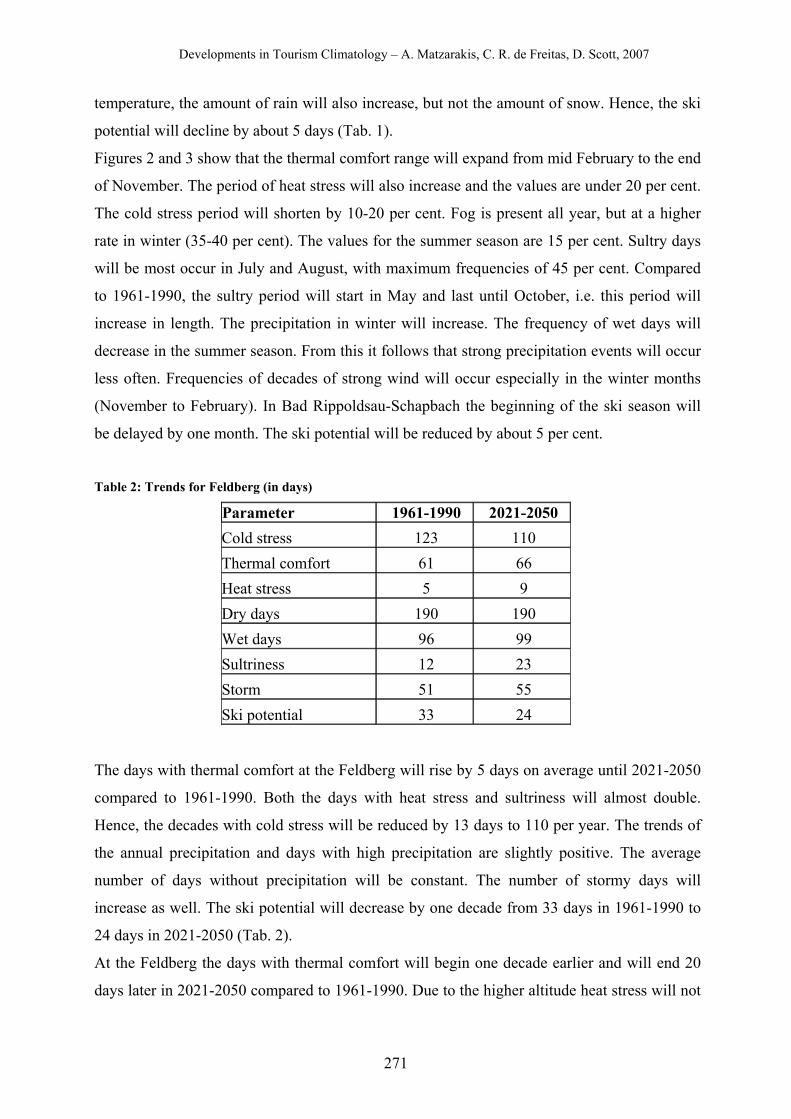
Developments in Tourism Climatology – A. Matzarakis, C. R. de Freitas, D. Scott, 2007
271
temperature, the amount of rain will also increase, but not the amount of snow. Hence, the ski
potential will decline by about 5 days (Tab. 1).
Figures 2 and 3 show that the thermal comfort range will expand from mid February to the end
of November. The period of heat stress will also increase and the values are under 20 per cent.
The cold stress period will shorten by 10-20 per cent. Fog is present all year, but at a higher
rate in winter (35-40 per cent). The values for the summer season are 15 per cent. Sultry days
will be most occur in July and August, with maximum frequencies of 45 per cent. Compared
to 1961-1990, the sultry period will start in May and last until October, i.e. this period will
increase in length. The precipitation in winter will increase. The frequency of wet days will
decrease in the summer season. From this it follows that strong precipitation events will occur
less often. Frequencies of decades of strong wind will occur especially in the winter months
(November to February). In Bad Rippoldsau-Schapbach the beginning of the ski season will
be delayed by one month. The ski potential will be reduced by about 5 per cent.
Table 2: Trends for Feldberg (in days)
Parameter 1961-1990 2021-2050 Cold stress 123 110 Thermal comfort 61 66 Heat stress 5 9 Dry days 190 190 Wet days 96 99 Sultriness 12 23 Storm 51 55 Ski potential 33 24
The days with thermal comfort at the Feldberg will rise by 5 days on average until 2021-2050
compared to 1961-1990. Both the days with heat stress and sultriness will almost double.
Hence, the decades with cold stress will be reduced by 13 days to 110 per year. The trends of
the annual precipitation and days with high precipitation are slightly positive. The average
number of days without precipitation will be constant. The number of stormy days will
increase as well. The ski potential will decrease by one decade from 33 days in 1961-1990 to
24 days in 2021-2050 (Tab. 2).
At the Feldberg the days with thermal comfort will begin one decade earlier and will end 20
days later in 2021-2050 compared to 1961-1990. Due to the higher altitude heat stress will not
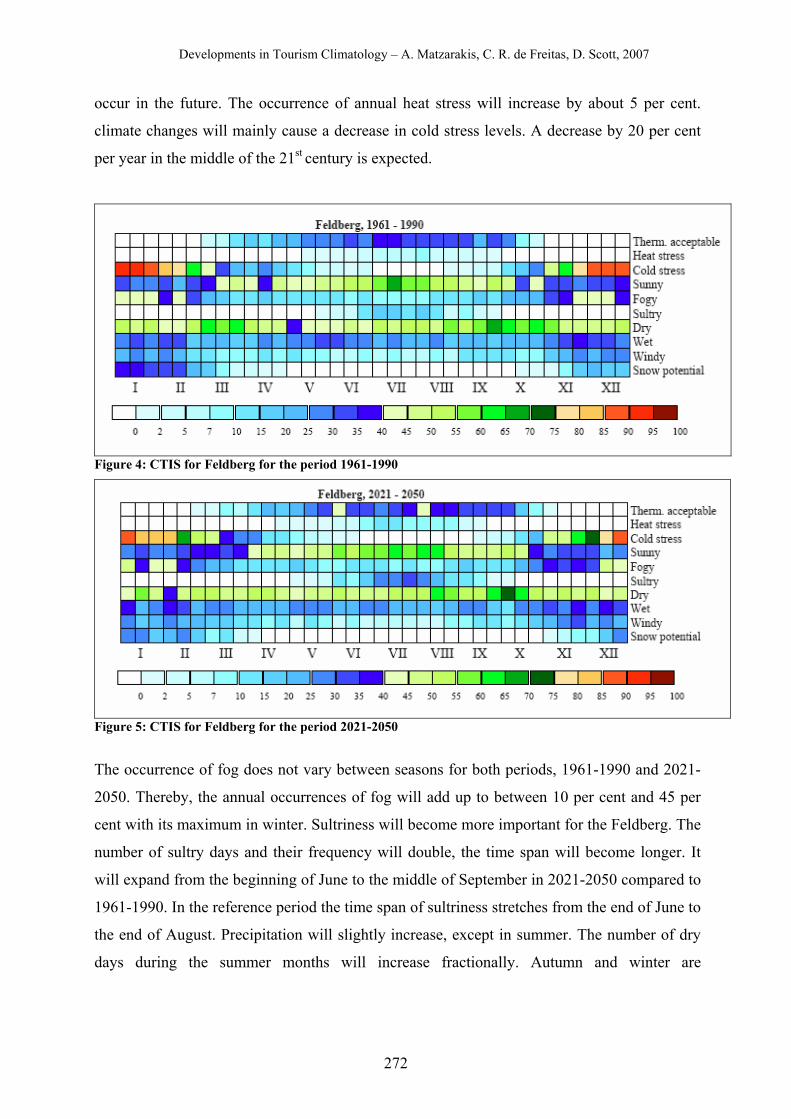
Developments in Tourism Climatology – A. Matzarakis, C. R. de Freitas, D. Scott, 2007
272
occur in the future. The occurrence of annual heat stress will increase by about 5 per cent.
climate changes will mainly cause a decrease in cold stress levels. A decrease by 20 per cent
per year in the middle of the 21st century is expected.
Figure 4: CTIS for Feldberg for the period 1961-1990
Figure 5: CTIS for Feldberg for the period 2021-2050 The occurrence of fog does not vary between seasons for both periods, 1961-1990 and 2021-
2050. Thereby, the annual occurrences of fog will add up to between 10 per cent and 45 per
cent with its maximum in winter. Sultriness will become more important for the Feldberg. The
number of sultry days and their frequency will double, the time span will become longer. It
will expand from the beginning of June to the middle of September in 2021-2050 compared to
1961-1990. In the reference period the time span of sultriness stretches from the end of June to
the end of August. Precipitation will slightly increase, except in summer. The number of dry
days during the summer months will increase fractionally. Autumn and winter are
Developments in Tourism Climatology – A. Matzarakis, C. R. de Freitas, D. Scott, 2007
273
characterized by a surge of strong wind events. The average ski potential will be markedly
reduce by 10 to 15 per cent. Furthermore, in the 21st century the ski season will begin later.
DISCUSSION AND CONCLUSIONS
In consideration of the altitude of the selected stations, Bad Rippoldsau-Schapbach and
Feldberg, the human-biometeorological trends are similar. The trend of variability in
precipitation is not significant. Due to the increase in global warming, thermal comfort, heat
stress, sultriness and storm events will increase, while cold stress and ski potentials will
decrease. From this it follows that the typical character for ski sports will get lost in winter
seasons whereas the summer seasons will gain in importance for tourism. The summers
become dryer and warmer. Therefore, the opportunities for hiking or swimming in the Black
Forest will become more attractive. Due to its climatic low mountain range character the
Black Forest will continue to remain an interesting destination for tourism in the future. The
question to what extend the tourism potential and the ecosystem in the low mountain ranges of
Germany changes under modified climate conditions remains unclear. Also it is uncertain
whether the biodiversity will be more affected by anthropogenic or natural parameters.
ACKNOWLEDGEMENT This research is supported by The Federal Ministry of Education and Research (Bundesministerium
für Bildung und Forschung, BMBF).
REFERENCES Beniston, M. (2003) Climatic change in mountain regions: a review of possible impacts.
Climatic Change 59, 5-31. Höppe, P. (1999) The physiological equivalent temperature – a universal index for the
biometeorological assessment of the thermal environment. Int. J. Biometeorol. 43, 71-75. Jacob, D. (2001): A note on the simulation of the annual and inter-annual variability of the
water budget over the Baltic Sea drainage basin. Meteorol Atmos Phys 77, 61–73. Jacob, D.; Bärring, L.; Christensen, O. B.; Christensen, J. H.; Hagemann, S.; Hirschi, M.;
Kjellström, E.; Lenderink, G.; Rockel, B.; Schär, C.; Seneviratne, S. I.; Somot, S.; van Ulden, A.; van den Hurk, B. (2007) An inter-comparison of regional climate models for Europe: Design of the experiments and model performance. Climatic Change, 81, 31-52.
Matzarakis, A. (2007) Entwicklung einer Bewertungsmethodik zur Integration von Wetter- und Klimabedingungen im Tourismus. Ber. Met. Inst.Univ. Freiburg 16, 73-79.
Matzarakis, A.; Rutz, F.; Mayer, H. (2007) Modelling Radiation fluxes in simple and complex environments – Application of the RayMan model. Int. J. Biometeorol. 51, 323-334.
Statistisches Landesamt Baden-Württemberg (2007) Reiseverkehr in Baden-Württemberg seit 1950. Stuttgart.
Wilmanns, O. (2001) Exkursionsführer Schwarzwald - eine Einführung in Landschaft und Vegetation. Verlag Eugen Ulmer GmbH & Co. 2001.
Developments in Tourism Climatology – A. Matzarakis, C. R. de Freitas, D. Scott, 2007
274
HOW CAN TOURISM RESEARCH BENEFIT FROM MULTI-DISCIPLINARY ASSESSMENTS OF CLIMATE CHANGE? LESSONS FROM THE U.S.
SOUTHWEST
Barbara Morehouse1, George Frisvold2, Rosalind Bark-Hodgins2 1Department of Geography & Regional Development, University of Arizona, Tucson, AZ, USA
2Department of Agricultural & Resource Economics, University of Arizona, Tucson, AZ, USA
ABSTRACT This study reports on Climate Assessment Project for the Southwest (CLIMAS)
research on climate and nature-based tourism and recreation. Three case studies – of the ski
industry, national park recreation, and wildfire management – illustrate different ways of
using climate data for tourism research.
KEYWORDS: U.S. Southwest, skiing, national parks, water-based recreation, fire
management
INTRODUCTION
The U.S. Southwest has spectacular landscapes, warm sunny weather, and diverse recreation
and tourism opportunities. But the region also faces high seasonal, inter-annual, and decadal
climate variability and high forest fire risk. Droughts, heat waves, severe frost, and floods are
among other serious, climate-related threats. Recent projections suggest that substantial
climate change is likely to occur, posing additional risks. Hoerling and Eischeid (2007)
project that, for the Southwest, “a near perpetual state of drought will materialize in the
coming decades as a consequence of increasing temperature (p. 19).” Other climate change
models predict declining snowpack, shorter and more variable snow seasons, warmer winter
temperatures leading to less snowpack and more sublimation, earlier spring snowmelt, and a
rise in the elevation at which snowpack can be maintained (Mote et al., 2005, Diffenbaugh et
al., 2005, Knowles et al., 2006).
CLIMAS was established in 1998 with funding from the National Oceanic and Atmospheric
Administration to assess impacts of climate variability and longer-term climate change on
human and natural systems in the US Southwest and Mexican border area, and to improve the
region’s capacity to respond to climatic events and longer-term change. Research on the
outdoor recreation and tourism sectors across the US and especially in the Southwest indicate
a marked vulnerability to climate variability and change (Arizona Governor’s Drought Task
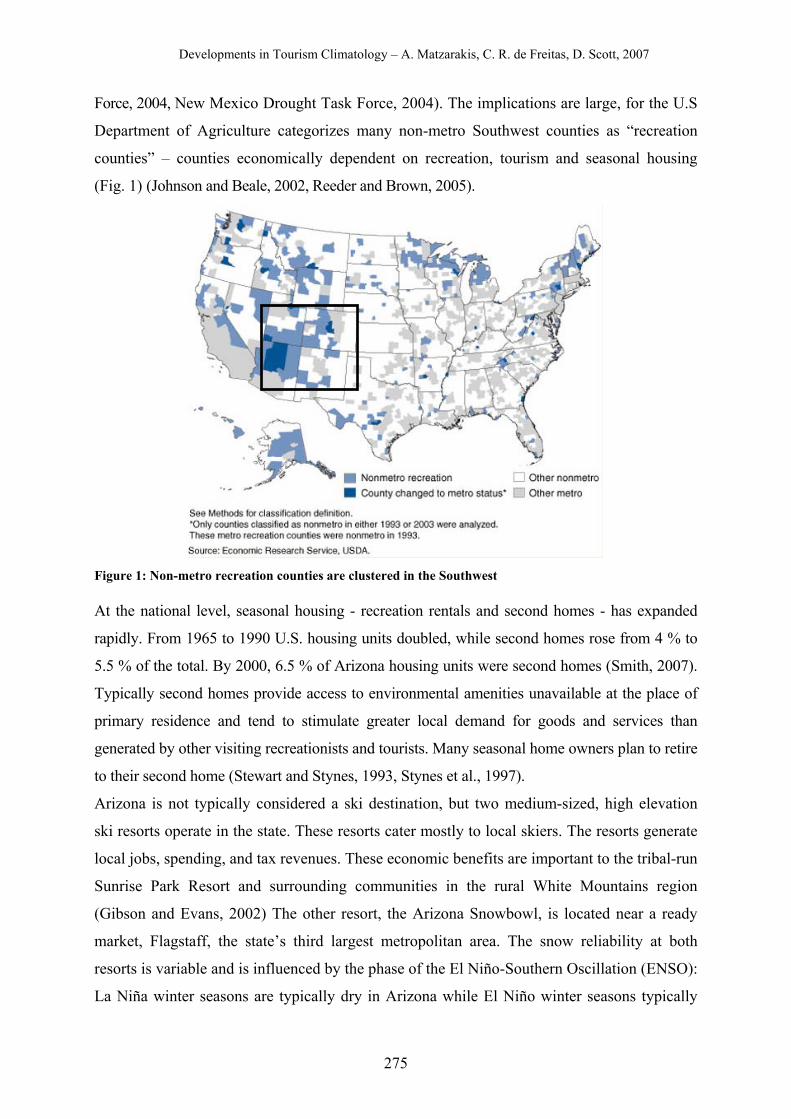
Developments in Tourism Climatology – A. Matzarakis, C. R. de Freitas, D. Scott, 2007
275
Force, 2004, New Mexico Drought Task Force, 2004). The implications are large, for the U.S
Department of Agriculture categorizes many non-metro Southwest counties as “recreation
counties” – counties economically dependent on recreation, tourism and seasonal housing
(Fig. 1) (Johnson and Beale, 2002, Reeder and Brown, 2005).
Figure 1: Non-metro recreation counties are clustered in the Southwest
At the national level, seasonal housing - recreation rentals and second homes - has expanded
rapidly. From 1965 to 1990 U.S. housing units doubled, while second homes rose from 4 % to
5.5 % of the total. By 2000, 6.5 % of Arizona housing units were second homes (Smith, 2007).
Typically second homes provide access to environmental amenities unavailable at the place of
primary residence and tend to stimulate greater local demand for goods and services than
generated by other visiting recreationists and tourists. Many seasonal home owners plan to retire
to their second home (Stewart and Stynes, 1993, Stynes et al., 1997).
Arizona is not typically considered a ski destination, but two medium-sized, high elevation
ski resorts operate in the state. These resorts cater mostly to local skiers. The resorts generate
local jobs, spending, and tax revenues. These economic benefits are important to the tribal-run
Sunrise Park Resort and surrounding communities in the rural White Mountains region
(Gibson and Evans, 2002) The other resort, the Arizona Snowbowl, is located near a ready
market, Flagstaff, the state’s third largest metropolitan area. The snow reliability at both
resorts is variable and is influenced by the phase of the El Niño-Southern Oscillation (ENSO):
La Niña winter seasons are typically dry in Arizona while El Niño winter seasons typically
Developments in Tourism Climatology – A. Matzarakis, C. R. de Freitas, D. Scott, 2007
276
portend a good ski season. In response to this variability Sunrise has invested in snowmaking
capacity that covers ten percent of its runs and Snowbowl’s management have attempted to
pass a plan (against tribal and environmental objections) to provide the resort with effluent-
based snowmaking capacity for all runs. This extensive plan and Sunrise’s own plans to
increase snowmaking capacity are signs that Arizona’s resort managers are not only investing
in snowmaking as an adaptation to inter-annual variability but also to longer-term climate
change. Without such adaptation skiing is likely to become marginal in Arizona, resulting in
economic hardship for winter-recreation dependent communities and tribes.
In concert with expansion of residential and recreational facilities, forest fire incidence has
increased in the region. Research confirms a strong link between climatic patterns and
interannual variability in forest fire activity. Added to climate-fire interactions are risks posed
by heavy build-up of fuel loads from decades of proactive fire exclusion and recent drought,
and by growth in second homes and other facilities (Allen et al., 2002, Westerling et al.,
2006). A federal assessment of communities bordering federal lands and at risk from wildland
fire listed 182 communities in Arizona and New Mexico alone (U.S. Federal Agencies, 2001).
From 2000–2004 alone, there were 46 fires of >100,000 acres, three of which caused
considerable damage in Arizona and New Mexico (National Interagency Fire Center, 2007).
METHODS
An econometric model of annual Southwest national park visitation was estimated with data
for 42 parks from 1979-2003 to examine how climate-related variables affect visits. A fixed-
effects model was estimated accounting for autocorrelation and using panel corrected standard
errors (Gibson and Evans, 2002). Control variables included state population, gasoline prices,
an exchange rate index, park age, extended road closures, and changes in visitation
measurement protocols. Climate-related variables included levels of Lakes Mead and Powell,
a park’s July heat index (Beck, 1995), and a variable indicating if a park was in a climate
division with a January–December 12-month Standardized Precipitation Index (SPI) < -2. An
SPI of -2 indicates a year with precipitation two standard deviations below average and is
generally categorized as “extreme drought.” A dummy variable also accounted for the Cerro
Grande fire. Reductions in visits were then entered into the Money Generator Model II, an
input-output model developed for the U.S. National Park Service to estimate impacts of
visitor spending on local economies (Steadman, 1979). Water-based recreation at Lake Mead
National Recreation Area (NRA) and Glen Canyon NRA accounts for a large share of
Developments in Tourism Climatology – A. Matzarakis, C. R. de Freitas, D. Scott, 2007
277
regional park visitor spending. Combined visitor spending at the two NRAs was $385 million in
2005 compared to $391 million in spending at Grand Canyon National Park (Stynes et al., 2002).
For the ski study, an econometric model of season visits at both resorts was estimated with
data from 25 ski seasons (1981/82-2005/06) to examine how ENSO phase affects visits. A
statistical test determined that data from the two resorts should not be pooled indicating that
the resorts are different, perhaps in part because only Sunrise has snowmaking adaptation.
The results of two separate regressions suggest that the El Niño phase is a positive and
significant determinant of visits at Snowbowl but not at Sunrise. Snowbowl is more reliant on
good natural snow conditions than Sunrise and might therefore benefit from snowmaking
adaptation (Bark-Hodgins and Colby, 2007). However, snowmaking is not without its
challenges: (1) it is expensive; (2) above -5°C snowmaking is technically difficult (Scott et
al., 2003); and (3) it requires large volumes of water. Climate change is likely to shorten the
ski season in Arizona because as temperatures rise more precipitation will fall as rain, the
number of days in which it is technically feasible to make snow will decline, and more
frequent heat waves (Diffenbaugh et al., 2005) could collapse snowpack. For the water-
strapped Snowbowl it might be impossible to rebuild snowpack, which would reduce the
season’s skiable days and the resort’s economic viability. In fact forecast temperature data for
Arizona’s Climate Division 2, where the resorts are located, indicates significant warming
over the next century. By adding this warming to historic resort temperature data it seems
likely that by 2030 April skiing will be marginal and by 2099 ski seasons will be restricted to
December-February (Bark-Hodgins and Colby, 2007).
Research on the use of climate information for managing fire risk in southwestern forests
centered on a series of annual fire-climate workshops, beginning in 2000. Participants invited
to the annual conferences included fire climatologists and meteorologists, fuels managers, fire
managers, and fire ecologists. To generate a broad understanding of fire issues, some of the
workshops included members of the Joint Fire Science Board, fire social scientists,
representatives of the Mexican fire fighting establishment and other experts. Each workshop
featured presentations by climatologists, fire managers, and other experts, followed by
development of a fire-climate forecast for the upcoming fire season. Over the past seven
years, the workshops have evolved into annual meetings held under the auspices of the
Predictive Services Office of the National Interagency Fire Center (PSO, NIFC), in
collaboration with CLIMAS and the Desert Research Institute's Center for Ecological and Fire
Applications. At these meetings, fuels managers and fire managers representing each region
of the U.S., in consultation with climatologists, develop climate-fire outlooks for their specific
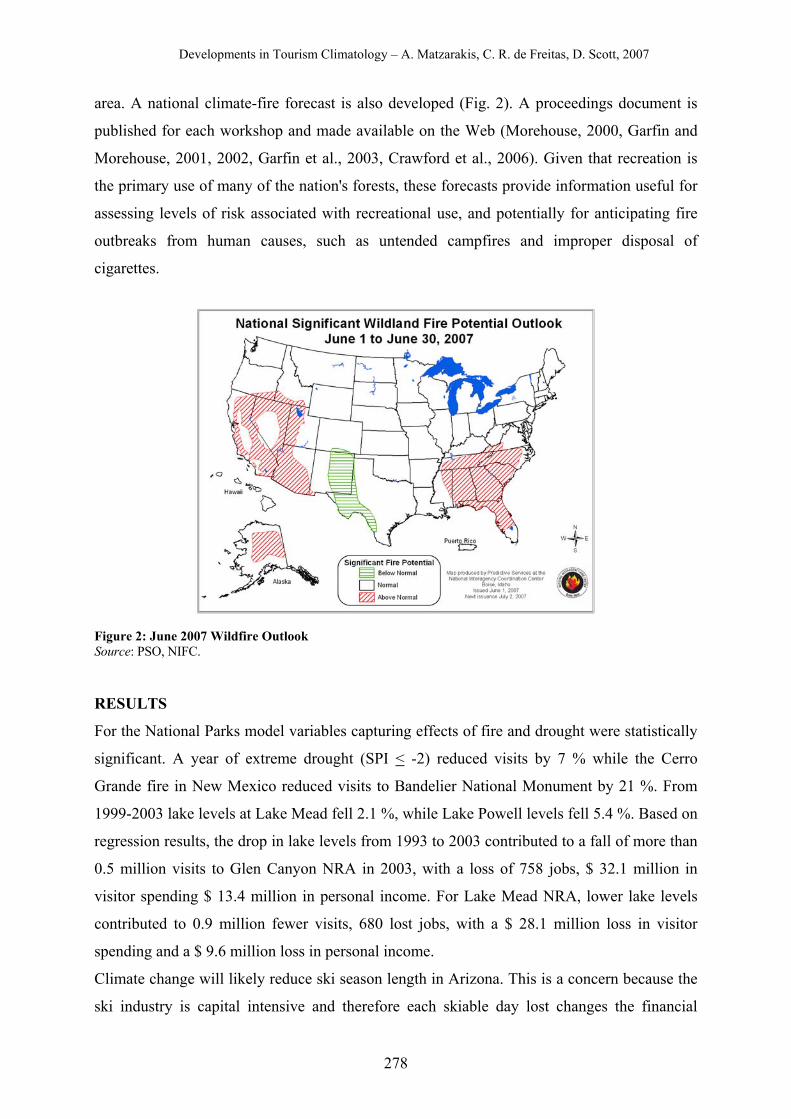
Developments in Tourism Climatology – A. Matzarakis, C. R. de Freitas, D. Scott, 2007
278
area. A national climate-fire forecast is also developed (Fig. 2). A proceedings document is
published for each workshop and made available on the Web (Morehouse, 2000, Garfin and
Morehouse, 2001, 2002, Garfin et al., 2003, Crawford et al., 2006). Given that recreation is
the primary use of many of the nation's forests, these forecasts provide information useful for
assessing levels of risk associated with recreational use, and potentially for anticipating fire
outbreaks from human causes, such as untended campfires and improper disposal of
cigarettes.
Figure 2: June 2007 Wildfire Outlook Source: PSO, NIFC.
RESULTS
For the National Parks model variables capturing effects of fire and drought were statistically
significant. A year of extreme drought (SPI < -2) reduced visits by 7 % while the Cerro
Grande fire in New Mexico reduced visits to Bandelier National Monument by 21 %. From
1999-2003 lake levels at Lake Mead fell 2.1 %, while Lake Powell levels fell 5.4 %. Based on
regression results, the drop in lake levels from 1993 to 2003 contributed to a fall of more than
0.5 million visits to Glen Canyon NRA in 2003, with a loss of 758 jobs, $ 32.1 million in
visitor spending $ 13.4 million in personal income. For Lake Mead NRA, lower lake levels
contributed to 0.9 million fewer visits, 680 lost jobs, with a $ 28.1 million loss in visitor
spending and a $ 9.6 million loss in personal income.
Climate change will likely reduce ski season length in Arizona. This is a concern because the
ski industry is capital intensive and therefore each skiable day lost changes the financial
Developments in Tourism Climatology – A. Matzarakis, C. R. de Freitas, D. Scott, 2007
279
viability of the resort. It is also not clear that Arizona’s skiers will continue to ski in large
numbers at local resorts if only man-made snow is available. More snow reliable substitute
resorts in Colorado and Utah may benefit whilst local economic impacts in Arizona could be
severe unless local communities can adapt by making the most of every good natural snow
season and developing non-winter recreation activities.
Loss of forest resources, and the economic and social benefits they provide, poses serious
threats to rural economies. This is nowhere more evident than in Arizona, a state that receives
substantial economic revenue from recreational and tourism activities. Fire-climate forecasts
are proving to be a valuable tool to assess seasonal risk for managing recreational uses of U.S.
forests and for managing the forest resources themselves.
DISCUSSION
The results highlight some challenges and opportunities for researchers studying climate-
tourism-recreation relationships. Economics has important contributions to make, but
measuring impacts of climate variability requires reliable time series data and reconciliation
of data collected by different agencies, for different purposes, and at different temporal and
spatial scales. Availability of good climate information and forecasts, as well as about the
interactions among climate, environment, and society is also essential. Further, economists
need help from other disciplines to specify explanatory variables in multivariate statistical
models and to interpret results. There are well-developed econometric methods to deal with
data problems and complex error structures in multivariate models. Panel data analysis,
following observations across time and comparing them across space, provides greater power
to determine causation from climate change to changes in tourism and recreation. Economics
also has tools to estimate how physical and environmental changes translate into micro-level
economic responses. These responses can be measured as monetary impacts that can be
aggregated up to local, state or national impacts to inform public policy.
Assessing climate-fire-society relationships requires close collaboration among
climatologists, meteorologists, fire ecologists, and social scientists. It also requires
development of good working relationships with fire managers, fuels experts, decision
makers, and policy experts. The workshop process for producing annual climate-fire forecasts
at regional and national scales, is an example of how such collaboration can be fostered and
sustained over time. These workshops led to a noticeable increase in awareness about climate
impacts on wildland fire regimes, and by extension, on risks associated with recreational and
other uses of forested areas. Climate change is likely to lead to increased fire hazard,
Developments in Tourism Climatology – A. Matzarakis, C. R. de Freitas, D. Scott, 2007
280
particularly in southwestern forests. Further, some burned over-areas are not likely to
regenerate as the same kinds of forests; instead, species adapted to hotter and drier conditions
such as those predominant at lower elevations are likely to emerge. As climate change
unfolds, reasonably skillful fire-climate forecasts and ancillary fire ecology knowledge will
become increasingly essential not only managing forest fire and its social impacts, but also for
anticipating the likely economic and social impacts on valuable economic sectors such as
recreation and tourism. .
REFERENCES Allen, C.D., M. Savage, D.A. Falk, K.F. Suckling, T.W. Swetnam, T. Schulke, P.B. Stacey, P.
Morgan, M. Hoffman, and J.T. Klingel (2002) Ecological restoration of southwestern Ponderosa pine ecosystems: a broad perspective. Ecol. Applic. 12(5): 1418-1433.
Arizona Governor’s Drought Task Force (2004) Arizona drought preparedness plan. Phoenix, AZ. Assessment Workshop. Proceedings, Workshops Apr. 4-7, 2006 in Boulder, CO, and Jan. 17-20,
2006 in Shepherdstown, WV. Inst. Study of Planet Earth, Univ. Arizona, Tucson, AZ. http://www.ispe.arizona.edu/climas/conferences/NSAW/publications/NSAWproceedings_06.pdf
Bark-Hodgins, R. and B. Colby (2007) Snow Days? Climate Variability and Change and the Economics of Snowmaking in Arizona, Southwest USA. In review, Climate Research.
Beck N. and J.N. (1995) What to do (and not to do) with time-series cross-section Data. Am. Polit. Sci. Rev. 89:634–47.
Crawford, B., G. Garfin, R. Ochoa, R. Heffernan, T. Wordell, and T. Brown. National Seasonal Diffenbaugh, N., J. Pal, R. Trapp, and F. Giorgi (2005). Fine-scale processes regulate the response
of extreme events to global climate change. Proc. Natl. Acad. Sci.102(44): 15774-15778. Garfin, G., T. Wordell, T. Brown, R. Ochoa, and B. Morehouse (2003) National Seasonal
Assessment Workshop. Proceedings, Workshop February 25-28, Mesa, AZ. Inst. Study of Planet Earth, Univ. Arizona, Tucson, AZ. http://www.ispe.arizona.edu/climas/conferences/NSAW/publications/NSAWproceedings_03.pdf
Garfin, G.M. and B.J. Morehouse (eds) (2002) Fire in the West. Proceedings, Workshop March 5-6, 2002, Tucson, AZ. Inst. Study of Planet Earth, Univ, Arizona, Tucson, AZ. http://www.ispe.arizona.edu/climas/conferences/fire2002/2002fireproceedings_draft.pdf
Garfin, G.M. and B.J. Morehouse (eds.) (2001) 2001 Fire and Climate Workshops. Proceedings, Workshops Feb. 14-16, 2001 and Mar. 28, 2001. Inst. Study of Planet Earth, Univ. Arizona, Tucson, AZ. http://www.ispe.arizona.edu/climas/conferences/fire2001/fire2001.pdf
Gibson, L. J. and B. Evans (2002) Regional dependence on tourism: the significance of seasonality, Yearbook of the Association of Pacific Coast Geographers, 64: 112-127.
Hoerling, M., and Eischeid, J. (2007) Past peak water in the Southwest. Sw. Hydr. 6 (1), 18-19, 35. Johnson, K. and C. Beale (2002) Nonmetro recreation counties: their identification and rapid
growth. Rural America, Vol. 17, No. 4, pp. 12-19. Knowles, N., Dettinger, M.D., Cayan, D.R. (2006) Trends in snowfall versus rainfall in the
western United States: Journal of Climate, v. 19, p. 4545-4559. Morehouse, B.J. (ed.) (2000) The Implications of El Nino and La Nina for Fire Management.
Proceedings, Workshop Feb. 23-24, 2000. Inst. for the Study of Planet Earth, Univ. Arizona, Tucson, AZ. http://www.ispe.arizona.edu/climas/conferences/fire2000/fireproc.pdf
Developments in Tourism Climatology – A. Matzarakis, C. R. de Freitas, D. Scott, 2007
281
Mote, P. W., A. F. Hamlet, M. P. Clark and D. P. Lettenmaier (2005) Declining mountain snowpack in western North America. Bull. Amer. Meteorological Society, Vol. 86 (1).
National Interagency Fire Center (2007) Wildland fire statistics. http://www.nifc.gov/fire_info. New Mexico Drought Task Force. New Mexico drought plan. Albuquerque, NM. Reeder, R. and D. Brown (2005) Recreation, tourism, and rural well-being. ERR-7, USDA,
Economic Research Service. Scott, D., G. McBoyle and B. Mills (2003). Climate change and the skiing industry in
southern Ontario (Canada): exploring the importance of snowmaking as a technical adaptation. Climate Research, 23: 171-181.
Smith, V.K. (2007) Reflections on the literature. Rev. of Env. Econ. Policy 1(1): 152-163. Steadman, R.G. (1979) The assessment of sultriness. Part I: A temperature-humidity index
based on human physiology and clothing science. J. Appl. Meteor., 18, 861-873. Stewart, S. and D. Stynes (1994) Toward a dynamic model of complex tourism choices: the
seasonal home location decision. J. Travel and Tourism Mkting, Vol. 3, No. 3. pp. 69-88. Stynes, D. (2006) National park spending and payroll impacts. Report to the National Park
Service Social Science Program, Washington DC. http://web4.canr.msu.edu/mgm2/ Stynes, D., D. Propst, W. Chang, and Y. Sun (2002) Estimating national park visitor spending
and economic impacts: the MGM2 model, Report submitted Univ. Idaho, Nat. Park Ser. Coop. Park Studies Unit. Dept. of Park, Rec. & Tourism Resources, Mich. St. Univ., E. Lansing, MI.
Stynes, D., J. Zheng, and S. Stewart (1997) Seasonal homes and natural resources: patterns of use and impact in Michigan, Gen. Tech. Rpt. NC-194, No. Cen. Frst Exp. Stns., U.S. Forest Ser.
U.S. Federal Agencies (2001) Urban wildland interface communities within the vicinity of federal fands that are at high risk from wildfire. Federal Register August 17, 2001, pp. 43383-43485. http://www.epa.gov/EPA-IMPACT/2001/August/Day-17/i20592.htm
Westerling, A.L., H.G. Hidalgo, D.R. Cayan, and T.W. Swetnam (2006) Warming and earlier spring increase western U.S. forest fire activity. Science 313: 940-943.
Developments in Tourism Climatology – A. Matzarakis, C. R. de Freitas, D. Scott, 2007
282
THE RELATIONSHIP BETWEEN TOURISM AND CLIMATE FROM A SUSTAINABILITY SCIENCE PERSPECTIVE – TOWARDS A CONCEPTUAL
FRAMEWORK FOR RESEARCH ON THE FUTURE OF TOURISM
Jens Jetzkowitz1,2
1Research Centre for Society and Ecology (Forschungszentrum für Gesellschaft und
Ökologie e.V.), Marburg, Germany 2Institute for Environmental and Sustainability Communication (INFU), University of
Lueneburg, Lueneburg, Germany
ABSTRACT This paper deals with the problems of the tourism industry and tourism-related
research in developing adaptive responses to climate change. A brief description of a typical
situation for tourism development introduces the perspective of sustainability science with
regards to climate, recreation and tourism. An outline of the reaction of the tourism industry
and tourism-related research to global warming and its consequences leads on to a revision in
the semantics of research on climate and tourism. In the final section, the paper offers a
tentative conceptual framework for research on the co-evolution of climate and tourism.
KEYWORDS Sociology, conceptual framework, sustainability, co-evolution, adaptation
INTRODUCTION
Arco is a small, beautiful town in the province of Trento, in the north of Italy. On a hill very
close to its centre, a medieval castle dominates the landscape, offering a scenic view of
Torbole and Riva del Garda. The two neighbouring towns lie on the northern coast of Lake
Garda. Lake Garda has a long tradition as a tourist destination. The ancient Romans already
prized the climate and landscape of this region, but for a long time the townspeople of
Northern Italy had sought recreation in the Southern seaside villages only. However, when
wind surfing emerged as a new sports activity during the 1960s, the northern towns were able
to catch up. Since especially the northern part of the lake is regularly exposed to powerful
winds, Torbole and Riva del Garda have become hot spots for wind surfing. These
communities experienced considerable development, while Arco, located about 5 km north of
the lake, lay a short way off the old and new tourist tracks and remained an insider’s tip.
Witnessing this, the people of Arco became somewhat envious of their neighbours' good
Developments in Tourism Climatology – A. Matzarakis, C. R. de Freitas, D. Scott, 2007
283
fortune. Arco stayed the small town it had been, with its traditional social structure,
surrounded by vines, citrus fruits and olive trees on the one side, and sheer limestone cliffs
jutting up like a wall on the other. The only tourists to visit the area were a few rock climbers.
They drove straight to the bottom of the rocks and camped in the olive groves without
bringing much money into the town.
The situation has changed in the last few years (Bitala, 2007). Today, every weekend
thousands of tourists flock to Arco. Since indoor climbing became popular in Germany five to
ten years ago, Arco has been invaded by so-called “comfy climbers”. Comfy climbers are not
obsessed solely with the rocks they climb; they attend to their creature comforts at the same
time as making their first moves on real rock. They are often accompanied by mountain
bikers, who also like to take advantage of the Mediterranean flair and food following their
activities. Businesspeople in the town obviously benefit from this development, as does the
community in general. However, the traditional social structure is changing. Today there is no
bakery, no butcher and no convenience store in Arco. The people of Arco have to do their
shopping in a shopping centre near Riva del Garda.
The growth of tourism in Arco is also transforming the natural systems. Climbers are
dependent on motor transport to reach the routes. Thousands of cars and motorcycles
transport mostly German climbers over the Brenner Pass to Arco. It takes less than four hours
to travel from Munich to Lake Garda. Like all the other Alpine regions with passes or tunnels,
the region surrounding the Brenner Pass is severely affected by traffic and its emissions. Road
traffic clearly tops heating and industrial facilities as a source of emissions including nitrogen
oxides, particulate matter and carbon monoxide (Siegrist and Thudium, 2007).
How can Arco's growing economy be reconciled with the needs and aspirations of its
population and with nature? This is the question at the core of a sustainability science
perspective. Starting with this question, this paper concludes with an outline of a conceptual
framework for research on the relationship between tourism and climate. It may initially seem
confusing that this framework is not the inductive result of the concrete research findings of a
climatologist. However, since travelling, organising and selling travel, and doing research on
the consequences of travelling are all actions, it might be instructive to consider this issue
from the perspective of general action theory. Such rare approaches in the social sciences,
which study action as a coevolving system within an environment consisting of other, natural
systems, could provide a suitable background for any further explorations of this
interdisciplinary field (Parsons, 1978, Law and Hassard, 1978, Urry, 2003, Latour, 2005).
Developments in Tourism Climatology – A. Matzarakis, C. R. de Freitas, D. Scott, 2007
284
In this paper I present an argument for the relevance of sociological knowledge for
understanding the relationship between tourism and climate. In the first section I present a
critical overview of recent adaptive responses of the tourism industry (and tourism-related
research) to climate change. After analysing this data I conclude section 2 with the proposal
that we need a new tool for analysing the relationship between tourism and climate. I suggest
solving the theoretical deficiencies of the concept of adaptation by employing the notion of
co-evolution. On the basis of these considerations I outline my ideas concerning a conceptual
framework for research on the relationship between climate and tourism (or – from a broader
perspective – on the relationship between nature and society) in section 3.
DATA: ADAPTIVE RESPONSES OF THE TOURISM INDUSTRY AND TOURISM
RELATED RESEARCH TO CLIMATE CHANGE – A BRIEF OVERVIEW
The tourism industry seems to be ambivalent about adaptation to climate change. A survey of
tourism experts at the international tourism trade fair ITB Berlin in 2007 shows that the
tourism sector is aware of the challenge posed by climate change. Around 90 % of the
interviewees believe that tourism will be affected by climate change. Yet there are few
constructive ideas as to what could be done about it. When asked about responses to climate
change, 34 % have no answer, and 56 % did not respond when asked if they had already
developed adaptive strategies in their own area of business (Lund-Durlacher et al., 2007).
Perhaps the tourism industry is ambivalent about adaptation to climate change, because the
question of adapting tourism to climate change is ambivalent in itself. On the one hand, it is
evident that the tourism industry today plays a leading role in the international economy. With
25 per cent growth in the past 10 years (UNEP and WTO, 2005), it is one of the largest
industries in the world, and provides, furthermore, enormous revenues. Since there are few
countries that do not function as a significant source and destination of tourism, the tourism
industry pledges income for every region, even in developing countries.
On the other hand, it is also evident that the tourism industry does not make any indispensable
contribution to humanity's survival. Hence, in the light of the man-made problem of climate
change the tourist industry comes under increased pressure to account for its ecological
consequences. Several studies have pointed out that tourism is a source of negative ecological
impact (Buttler, 1991, Gössling, 1999, 2000, Gössling et al., 2003, 2005, Neto, 2003, Shah et
al., 2002, Welford et al., 1999). Tourism accounts for approximately 5 per cent of the total
CO2 emissions (Davos Declaration, 2007). Especially air travel is detrimental to the global
Developments in Tourism Climatology – A. Matzarakis, C. R. de Freitas, D. Scott, 2007
285
climate, since planes emit mostly in strata of the atmosphere most vulnerable to pollution
(Gössling, 2000).
Research on the tourism industry’s ecological effects has been a marginal issue for a long
time. This is especially true for climate impact research. The relationship between tourism
and climate change did not become an issue of concern to the international community until
2003, when it was addressed at the “First International Conference on Climate Change and
Tourism” on Djerba in Tunesia. The discussion triggered at this conference has since focused
on adapting international tourism to the possible consequences of climate change (WTO,
2007).
Research on adaptive strategies in tourism has focused on maintaining economic structures.
Some studies are concerned with adaptation strategies of different countries or regions, for
example, Fiji, the Caribbean and the Mediterranean. Regions of snow tourism are of special
concern. In general, adaptive strategies tend to focus on adapting buildings and infrastructure
to extreme weather, developing weather-independent tourist attractions, and, of course,
petitioning the government for support.
Given the detrimental influence of the tourist industry on the environment, especially on the
climate, it is striking that the discussion on adapting tourism to climate change is not
automatically interwoven with mitigation strategies. As a consequence, it could be concluded
that, at the moment, changing mass tourism into more sustainable forms (which would
include mitigation strategies for climate change and ecological risks) seems rather a pipe
dream.
RULE: PROCEED FROM THE CONCEPT OF ADAPTATION TO THE NOTION OF
THE CO-EVOLUTION OF CLIMATE AND TOURISM
Adapting social practices already detrimental to the climate to the consequences of climate
change could perpetuate the problem while trying to solve it. This certainly applies to the
tourism industry. Since cycles of investment are rather short, it seems to make sense for tour
operators and travel agencies to interpret ‘adaptation to climate change’ in terms of
minimizing their economic risk. Moral appeals must fail under these circumstances, because
actors in tourism are neither aware of alternative practices nor have any incentives to create
alternatives on their own.
We should perhaps raise the question of whether the concept of adaptation is an appropriate
metaphor to respond to the challenges of human-induced ecological dangers like, for example,
global warming. The concept of adaptation was coined by the biological theory of evolution
Developments in Tourism Climatology – A. Matzarakis, C. R. de Freitas, D. Scott, 2007
286
(Futuyama, 1990), to which it adds an explanation for reproductive success. A new trait
increases the capacity of an organism to cope with environmental stresses and pressures and
therefore improves its fitness and chances of survival. It does not provide any notion of an
economic system adjusting to the needs of other systems or to requirements for mitigating
climate change. Therefore, from the vantage point of the concept of adaptation, there is no
reason to search for economic practices with little or no climate impact.
This would be different if we relied on the notion of co-evolution. This concept was also
based on the biological theory of evolution. Ehrlich and Raven invented this term in 1964 to
describe the influences that plants and herbivore insects could have exercised on each others’
evolution (Ehrlich and Raven, 1964). Since the term co-evolution expresses the idea that a
system, for example a society or an economy, has to adjust to the requirements of maintaining
other systems, it became popular in humanities discourse on sustainable development
(Jantsch, 1979, Noargaard, 1994).
Schellnhuber, for example, outlines the idea that sustainability science is “simultaneously the
objective lesson on man-environment co-evolution and a subjective co-evolving factor of that
dynamic of change” (Schellnhuber, 2001). This means that we have to consider that reasoning
and theory-building on tourism and climate change are themselves evolving factors, since, as
social endeavours, they constitute an integral part of society. Thus, if we proceed from the
concept of adaptation to the notion of co-evolution, this may prompt us to envisage new
structures of tourism that are not detrimental to the climate, to our bodies or the livelihood of
other species.
RESULTS: TOWARDS A CONCEPTUAL FRAMEWORK FOR RESEARCH ON
THE CO-EVOLUTION OF CLIMATE AND TOURISM – A SOCIOLOGICAL
APPROACH
One of the main characteristics of human action is its creativity (Joas, 1996). Humans have
the capacity to change their behavioural patterns without any pressure or constraint from the
environment. We are able to change our behaviour just out of curiosity, just to experiment.
Therefore, creating structures of tourism that are not detrimental to the natural environment is
by no means as difficult as it may seem on the face of it.
Experiments do not emerge from nowhere. Although action is creative, and therefore
essentially individual, some general, uniform factors of action could be identified. General
action theory (Parsons, 1978) makes two basic assumptions about action in general (Fig. 1).
Firstly, every action is structured by cultural elements, social norms, psychological conditions
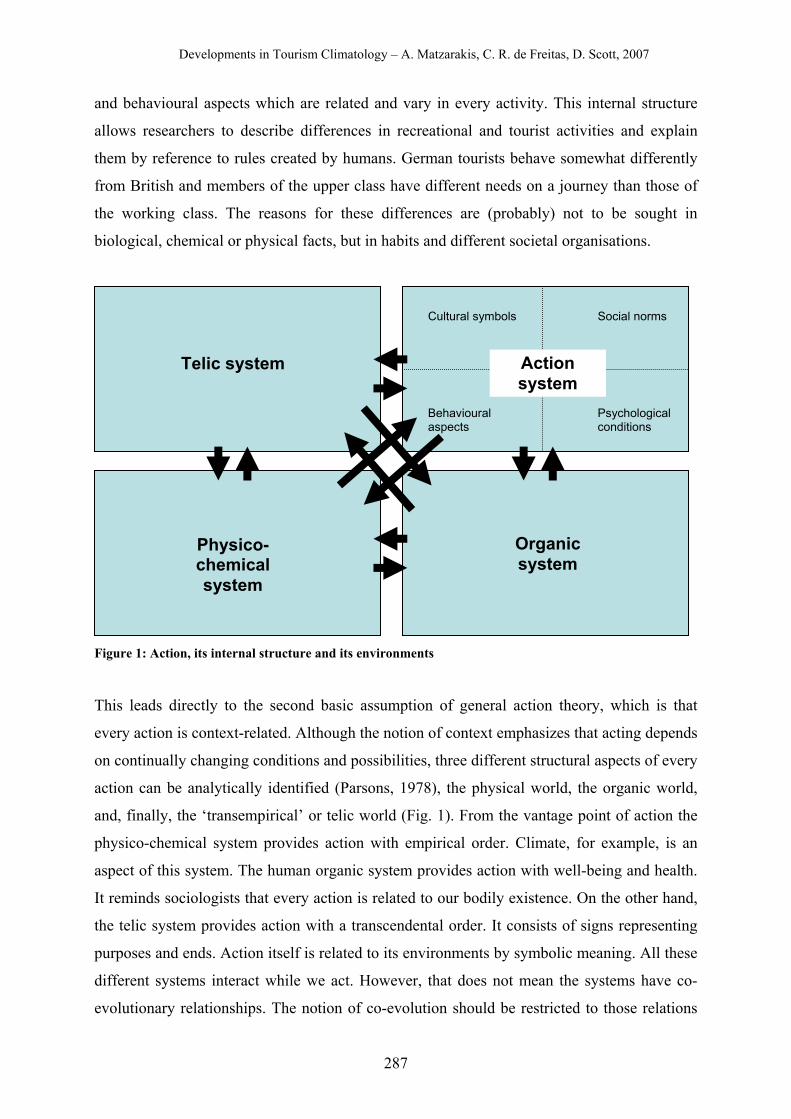
Developments in Tourism Climatology – A. Matzarakis, C. R. de Freitas, D. Scott, 2007
287
and behavioural aspects which are related and vary in every activity. This internal structure
allows researchers to describe differences in recreational and tourist activities and explain
them by reference to rules created by humans. German tourists behave somewhat differently
from British and members of the upper class have different needs on a journey than those of
the working class. The reasons for these differences are (probably) not to be sought in
biological, chemical or physical facts, but in habits and different societal organisations.
Figure 1: Action, its internal structure and its environments
This leads directly to the second basic assumption of general action theory, which is that
every action is context-related. Although the notion of context emphasizes that acting depends
on continually changing conditions and possibilities, three different structural aspects of every
action can be analytically identified (Parsons, 1978), the physical world, the organic world,
and, finally, the ‘transempirical’ or telic world (Fig. 1). From the vantage point of action the
physico-chemical system provides action with empirical order. Climate, for example, is an
aspect of this system. The human organic system provides action with well-being and health.
It reminds sociologists that every action is related to our bodily existence. On the other hand,
the telic system provides action with a transcendental order. It consists of signs representing
purposes and ends. Action itself is related to its environments by symbolic meaning. All these
different systems interact while we act. However, that does not mean the systems have co-
evolutionary relationships. The notion of co-evolution should be restricted to those relations
Cultural symbols Social norms
Behavioural aspects
Psychological conditions
Action system
Telic system
Physico-chemical system
Organic system
Developments in Tourism Climatology – A. Matzarakis, C. R. de Freitas, D. Scott, 2007
288
in which systems adjust to the requirements of each other. Of course, climate itself has no
needs, but as a factor of human action it might have.
Looking at Tourism as an activity which is coordinated by its internal structures and at the
same time related to its environments by interpreting them, we gain a framework for
interdisciplinary research in this field. Different tourist activities require different climatic
conditions, need different physical training and cause different bodily conditions and are tied
to different purposes like self-awareness, freedom or sustainability. Furthermore, under the
conditions of climate change we have to add that different tourist activities have different
impacts on the climate.
By adopting the concept of co-evolution (instead of adaptation) we have gained an epistemic
goal for further tourism-related research. The tourism industry needs information about
desirable, possible and non-desirable forms of practice. Research on, for instance, the co-
evolution of tourism and climate (Gössling et al., 2005, Becken et al., 2003) is suited to
generating knowledge that may help tour operators, travel agencies, tourism organisations,
tourism politicians, travellers and tourists to reorganise their practices in order to adjust to the
requirements of maintaining other systems.
REFERENCES Becken, S., Simmons, D., Frampton, C. (2003) Segmenting Tourists by Their Travel Pattern
for Insights into Achieving Energy Efficiency. Journal of Travel Research, 42, 48-56. Bitala, M. (2007) Stadt am Limit. Süddeutsche Zeitung, 144, 26. Juni 2007, 9. Butler, R. W. (1991) Tourism, environment, and sustainable development. Environmental
Conservation 18, 3, 201-209. Davos Declaration (2007) Climate Change and Tourism. Responding to Global Challenges.
Davos, Switzerland, 3 October 2007; http://www.unwto.org/climate/index.php; 12.11.2007. Ehrlich, P. R., Raven, P. H. (1964) Butterflies and plants: a study in coevolution. Evolution
18, 586-608. Futuyma, D. J. (1990) Evolutionsbiologie. Basel, Birkhäuser. Gössling, S. (1999) Ecotourism: a means to safeguard biodiversity and ecosystem functions?
Ecological Economics 29, 2, 303-320. Gössling, S. (2000) Tourism, Ecosystem Functions, and Human-Environment Relations.
Lund, Lund University, Human Ecology Division. Gössling, S., Borgström Hansson, C., Hörstmeier, O., Saggel, S. (2002) Ecological footprint
analysis as a tool to assess tourism sustainability. Ecological Economics, 43, 199-211. Gössling, S., Peeters, P., Ceron, J.-P., Dubois, G., Patterson, T., Richardson, R. B. (2005) The
eco-efficiency of tourism. Ecological Economics, 54, 417-434. Jantsch, E. (1979) Die Selbstorganisation der Universums. Vom Urknall zum menschlichen
Geist. München, Hanser. Joas, H. (1996) The Creativity of Action. Chicago, The University of Chicago Press. Latour, B. (2005) Reassembling the Social: An Introduction to Actor-Network-Theory.
Oxford, Oxford University Press.
Developments in Tourism Climatology – A. Matzarakis, C. R. de Freitas, D. Scott, 2007
289
Law, J., Hassard, J. (eds.) (1999) Actor Network Theory and After. Oxford and Keele, Blackwell and the Sociological Review.
Lund-Durlacher, D., Strasdas, W., Seltmann, E. (2007) Klimawandel und Tourismus. Problemwahrnehmung und Lösungsvorschläge aus Sicht der Touristiker. Ergebnisse einer Blitzumfrage unter Ausstellern auf der ITB Berlin 2007. Eberswalde, oikos (13. Jg, H. 2).
Neto, F. (2003) A new approach to sustainable tourism development: Moving beyond environmental protection. Natural Resources Forum 27, 212-222.
Norgaard, R. (1994) Development betrayed. The end of progress and a coevolutionary revisioning of the future. London: Routledge.
Parsons, T. (1978) A Paradigm of the Human Condition. In: Parsons, T. (ed.) Action Theory and the Human Condition. New York and London, The Free Press, 352-433.
Schellnhuber, H.J. (2001) Die Koevolution von Natur, Gesellschaft und Wissenschaft – Eine Dreiecksbeziehung wird kritisch. GAIA 10, 258.
Shah, K., McHarry, J., Gardiner, R. (2002) Sustainable tourism – turning the edge. Towards Earth Summit 2002. Economic Briefing No. 4. London: United Nations Foundation-Stakeholder Forum.
Siegrist, F., Thudium, J. (2007) Zusammenstellung von immissionsklimatischen Erkenntnissen in der Umgebung von Alpentransitachsen: Brenner, San Bernardino, Gotthard. http://www.tirol.gv.at/fileadmin/www.tirol.gv.at/themen/verkehr/verkehrsplanung/downloads/Transitachsenbericht_Zfg.pdf; 17.07.2007.
UNEP, WTO (2005) Making tourism more sustainable. A guide for policy makers. Paris and Madrid, UNEP and WTO, 8.
Urry, J. (2003) Global Complexity. Cambridge, Polity. Welford, R., Ytterhus, B., Eligh, J. (1999) Tourism and sustainable development: an analysis
of policy and guidelines for managing provision and consumption. Sustainable Development, 7, 165-177.
WTO (2007) 2nd International Conference on Climate Change and Tourism. Final Report. http://www.world-tourism.org/sustainable/climate/brochure.htm; 17.07.2007.