economic tourism
TRANSCRIPT
i
DETERMINANTS OF PERCEIVED SOCIO - ECONOMIC TOURISM
BENEFITS ACCRUING TO THE LOCAL COMMUNITY LIVING
ADJACENT TO KISITE - MPUNGUTI MARINE PARK AND RESERVE,
KENYA
BY
STELLA M. MWAWAZA
A THESIS SUBMITTED IN PARTIAL FULFILLMENT OF THE
REQUIREMENTS FOR THE AWARD OF THE DEGREE OF MASTER IN
TOURISM MANAGEMENT, SCHOOL OF TOURISM, HOSPITALITY AND
EVENTS MANAGEMENT, MOI UNIVERSITY, KENYA
MAY 2015
i
DECLARATION
Declaration by the candidate
This is my original work and has not been presented for a Degree award in any other
university. No part of this thesis may be reproduced without prior written permission
of the author and/or Moi University. All other sources of information cited herein
have been duly acknowledged.
STELLA MWAWAZA Signature……………… Date ………………
SBE/PGT/005/11
Declaration by Supervisors
This thesis has been submitted for examination with our approval as University
Supervisors.
Prof. Hellen Ipara Signature ………………... Date ………………
Department of Wildlife Management
University of Eldoret
Eldoret
Dr. Nehemia Kiprutto Signature ………………… Date………………
Department of Tourism and Tour Operations
Moi University
Eldoret

ii
DEDICATION
I dedicate this work to my parents and siblings for their love, support and
unwavering encouragement and for seeing me through my university education.
Through great sacrifice, they ensured that I have reached where I am now and to
them I am greatly indebted.
iii
ABSTRACTThat socio–economic benefits accruing from tourism in marine protected areas are key to garnering local people’s support and involvement in tourism cannot be overemphasized. Marine protected areas support local communities adjacent them by promoting and supporting their livelihoods. The impacts these areas have on these communities influences their support, attitudes and participation in their conservation. This study assessed determinants of perceived socio–economic tourism benefits accruing to the local community living adjacent to Kisite Mpunguti Marine Park and Reserve (KMMPR). Specific objectives of the study were todetermine the effects of demographic characteristics of the local residents’ on perceived socio- economic tourism benefits accruing from KMMPR, to determine the effects of tourism projects supported by KMMPR on the perceived socio-economic benefits accruing to the local community, to establish the effect of local people’s participation in tourism activities supported by KMMPR on their perception about tourism benefits accrued and to establish the effect of government policies on local community’s perception about socio-economic tourism benefits accruing from KMMPR. The study utilized the survey research design. The target population was the local community living adjacent to the park and Reserve and staff from Kenya Wildlife Service and the sample was randomly selected. Primary data was collected using questionnaires while secondary data was sourced from published and unpublished sources like books and journals. Data was analyzed descriptively using frequencies and percentages while correlation and multipleregression analysis were done to determine associations among selected variables. Results showed that, initiated tourism projects, government policy, and participation levels of individuals within the community had a positive effect on perceived socio-economic tourism benefits accruing from KMMPR, while demographic characteristics had an inverse relationship. The F test results indicated that all the foregoing independent variables showed a significant relationship with perceived socio-economic benefits among local communities living adjacent to KMMPR. Results also showed that there was a direct association between determinants of perceived socio- economic tourism benefits among the locals. Compensating the local community for foregoing their traditional livelihoods through creation of employment opportunities and empowering them financially to start their own tourism related businesses will make communities view tourism in KMMPR as a tool for promoting their welfare in return for losses caused by foregoing traditional livelihoods activities. KWS should create public awareness through conservation education to sensitize the local community on the invaluable role of MPAs and the need to conserve them. This will reduce conflicts between local residents and KMMPR management. Local residents should also be facilitated to have access to low interest credit facilities to establish tourism related businesses.
iv
TABLE OF CONTENTS PAGE
DECLARATION ..................................................................................................... i
DEDICATION ........................................................................................................ ii
ABSTRACT........................................................................................................... iii
TABLE OF CONTENTS………………. ............................................................... iv
LIST OF TABLES ............................................................................................... viii
LIST OF FIGURES................................................................................................ ix
ACKNOWLEDGEMENT....................................................................................... x
DEFINITION OF OPERATIONAL TERMS ......................................................... xi
LIST ON ACRONYMS ........................................................................................ xii
CHAPTER ONE.................................................................................................... 1
INTRODUCTION ................................................................................................. 1
1.0 Background to the Study.................................................................................... 1
1.2 Problem Statement............................................................................................. 4
1.3 Research Objectives........................................................................................... 5
1.3.1 Main Objective ............................................................................................... 5
1.3.2 Specific Objectives ......................................................................................... 5
1.4 Research Hypotheses ......................................................................................... 5
1.5 Justification of the Study ................................................................................... 6
1.6 Scope and Limitation of the Study ..................................................................... 6
CHAPTER TWO................................................................................................... 8
LITERATURE REVIEW ..................................................................................... 8
2.0 Introduction ....................................................................................................... 8
2.1 An Overview of Protected Areas and their Importance....................................... 8
v
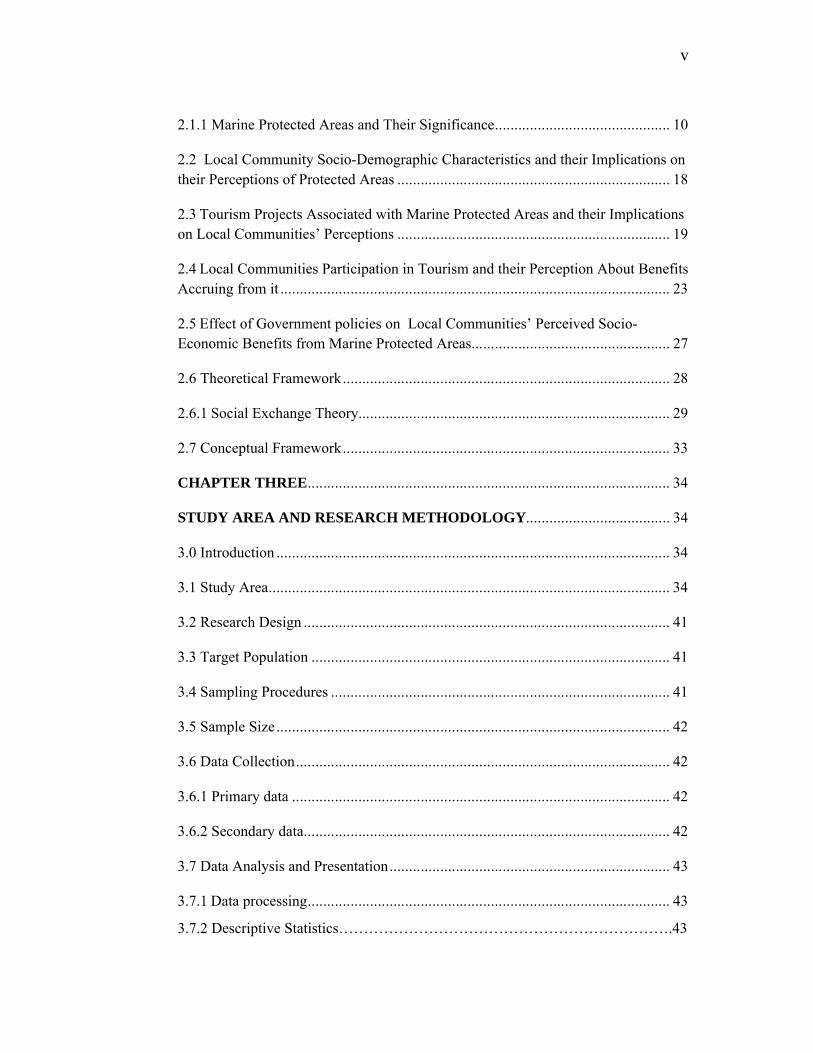
2.1.1 Marine Protected Areas and Their Significance............................................. 10
2.2 Local Community Socio-Demographic Characteristics and their Implications on their Perceptions of Protected Areas ...................................................................... 18
2.3 Tourism Projects Associated with Marine Protected Areas and their Implications on Local Communities’ Perceptions ...................................................................... 19
2.4 Local Communities Participation in Tourism and their Perception About Benefits Accruing from it .................................................................................................... 23
2.5 Effect of Government policies on Local Communities’ Perceived Socio-Economic Benefits from Marine Protected Areas................................................... 27
2.6 Theoretical Framework.................................................................................... 28
2.6.1 Social Exchange Theory................................................................................ 29
2.7 Conceptual Framework.................................................................................... 33
CHAPTER THREE............................................................................................. 34
STUDY AREA AND RESEARCH METHODOLOGY..................................... 34
3.0 Introduction ..................................................................................................... 34
3.1 Study Area....................................................................................................... 34
3.2 Research Design .............................................................................................. 41
3.3 Target Population ............................................................................................ 41
3.4 Sampling Procedures ....................................................................................... 41
3.5 Sample Size..................................................................................................... 42
3.6 Data Collection................................................................................................ 42
3.6.1 Primary data ................................................................................................. 42
3.6.2 Secondary data.............................................................................................. 42
3.7 Data Analysis and Presentation........................................................................ 43
3.7.1 Data processing............................................................................................. 43
3.7.2 Descriptive Statistics………………………………………………………….43
vi
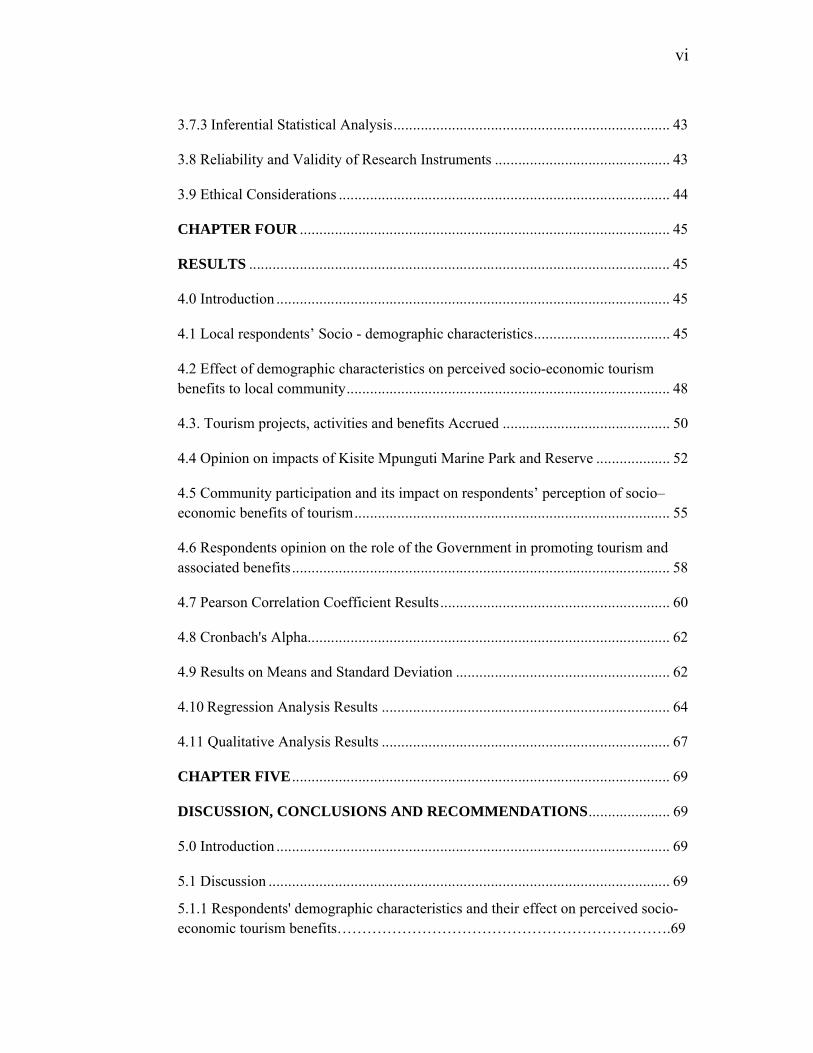
3.7.3 Inferential Statistical Analysis....................................................................... 43
3.8 Reliability and Validity of Research Instruments ............................................. 43
3.9 Ethical Considerations ..................................................................................... 44
CHAPTER FOUR ............................................................................................... 45
RESULTS ............................................................................................................ 45
4.0 Introduction ..................................................................................................... 45
4.1 Local respondents’ Socio - demographic characteristics................................... 45
4.2 Effect of demographic characteristics on perceived socio-economic tourism benefits to local community................................................................................... 48
4.3. Tourism projects, activities and benefits Accrued ........................................... 50
4.4 Opinion on impacts of Kisite Mpunguti Marine Park and Reserve ................... 52
4.5 Community participation and its impact on respondents’ perception of socio–economic benefits of tourism................................................................................. 55
4.6 Respondents opinion on the role of the Government in promoting tourism and associated benefits ................................................................................................. 58
4.7 Pearson Correlation Coefficient Results........................................................... 60
4.8 Cronbach's Alpha............................................................................................. 62
4.9 Results on Means and Standard Deviation ....................................................... 62
4.10 Regression Analysis Results .......................................................................... 64
4.11 Qualitative Analysis Results .......................................................................... 67
CHAPTER FIVE ................................................................................................. 69
DISCUSSION, CONCLUSIONS AND RECOMMENDATIONS..................... 69
5.0 Introduction ..................................................................................................... 69
5.1 Discussion ....................................................................................................... 69
5.1.1 Respondents' demographic characteristics and their effect on perceived socio-economic tourism benefits………………………………………………………….69
vii
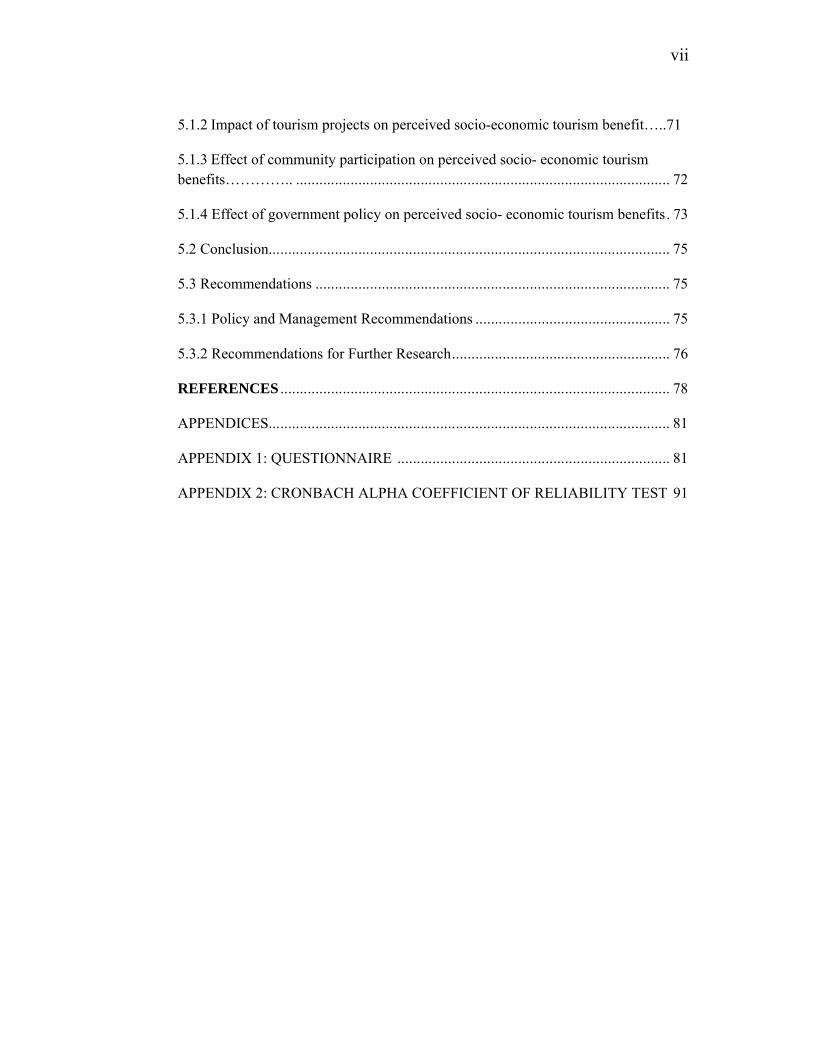
5.1.2 Impact of tourism projects on perceived socio-economic tourism benefit…..71
5.1.3 Effect of community participation on perceived socio- economic tourism benefits………….. ................................................................................................ 72
5.1.4 Effect of government policy on perceived socio- economic tourism benefits. 73
5.2 Conclusion....................................................................................................... 75
5.3 Recommendations ........................................................................................... 75
5.3.1 Policy and Management Recommendations .................................................. 75
5.3.2 Recommendations for Further Research........................................................ 76
REFERENCES .................................................................................................... 78
APPENDICES....................................................................................................... 81
APPENDIX 1: QUESTIONNAIRE ...................................................................... 81
APPENDIX 2: CRONBACH ALPHA COEFFICIENT OF RELIABILITY TEST 91
viii
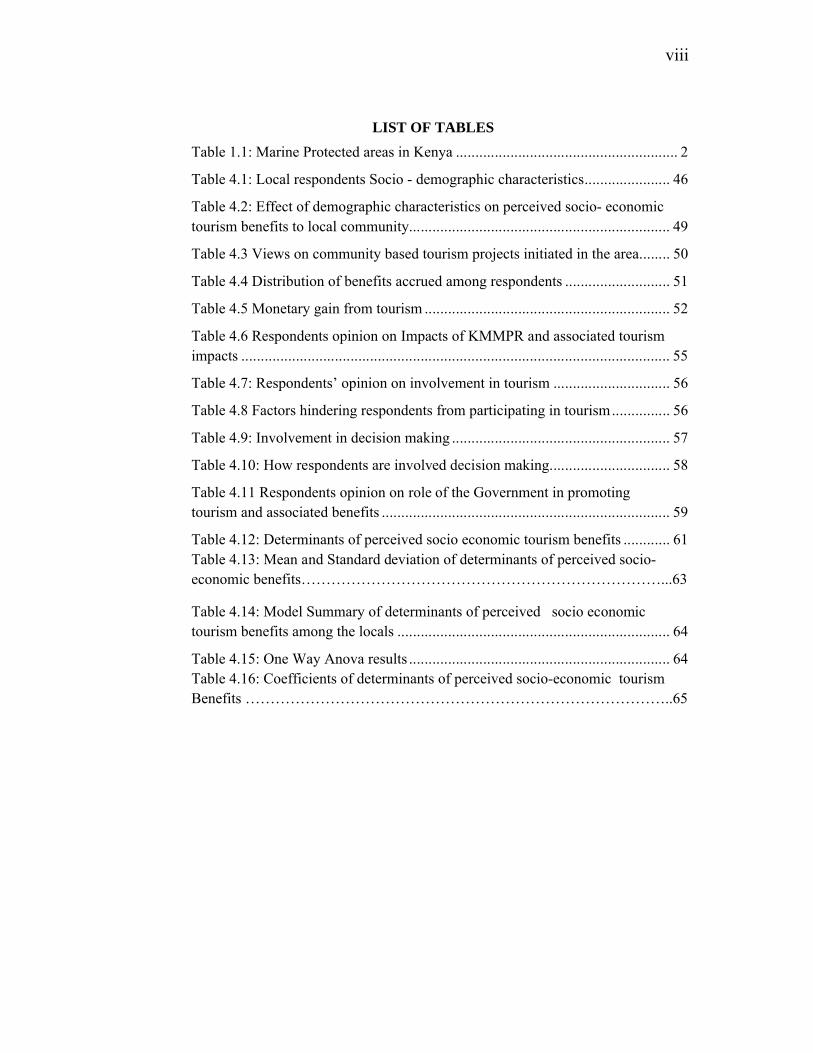
LIST OF TABLES
Table 1.1: Marine Protected areas in Kenya ......................................................... 2
Table 4.1: Local respondents Socio - demographic characteristics...................... 46
Table 4.2: Effect of demographic characteristics on perceived socio- economic tourism benefits to local community................................................................... 49
Table 4.3 Views on community based tourism projects initiated in the area........ 50
Table 4.4 Distribution of benefits accrued among respondents ........................... 51
Table 4.5 Monetary gain from tourism ............................................................... 52
Table 4.6 Respondents opinion on Impacts of KMMPR and associated tourism impacts .............................................................................................................. 55
Table 4.7: Respondents’ opinion on involvement in tourism .............................. 56
Table 4.8 Factors hindering respondents from participating in tourism............... 56
Table 4.9: Involvement in decision making ........................................................ 57
Table 4.10: How respondents are involved decision making............................... 58
Table 4.11 Respondents opinion on role of the Government in promoting tourism and associated benefits .......................................................................... 59
Table 4.12: Determinants of perceived socio economic tourism benefits ............ 61Table 4.13: Mean and Standard deviation of determinants of perceived socio-economic benefits………………………………………………………………...63
Table 4.14: Model Summary of determinants of perceived socio economic tourism benefits among the locals ...................................................................... 64
Table 4.15: One Way Anova results ................................................................... 64Table 4.16: Coefficients of determinants of perceived socio-economic tourism Benefits …………………………………………………………………………..65
ix
LIST OF FIGURESFigure 2.1: Marine protected areas of the world ................................................ 9Figure 2.2: Relative contribution to poverty reduction from the MPAs ........... 21Figure 2.3: Normative typologies of community participation ........................ 26Figure 2.4: Social Exchange Process Model ................................................... 32Figure 2.8: Conceptual Framework................................................................. 33Figure 3.1: Kisite Island ................................................................................. 36Figure 3.2: The wasini women project ............................................................ 37Figure 3.3: The wasini women boardwalk ...................................................... 37Figure 3.4: Corals……………………………………………………………...38Figure 3.5: Corals........................................................................................... 38Figure 3.6:Dhow……………………………………………………………….39Figure 3.7: Snorkeling at Kisite ...................................................................... 40Figure 4.1: Benefits accruing from projects initiated by KWS ........................ 51Figure 4.2: Tourism benefits worth the sacrifice ............................................. 52
x
ACKNOWLEDGEMENTFirst I would like to thank my supervisors Prof. Hellen Ipara and Dr. Nehemia
Kiprutto for their guidance and continuous support. As my supervisors they have
played a significant role in my academic life. Their inspirational guidance was a true
gift to me, and their insights have strengthened my research extensively. Both have
been an invaluable source of knowledge, wisdom and guidance throughout my
research by being available at anytime despite their hectic work schedule.
I cordially thank the staff of Kenya Wildlife Service at Kisite Mpunguti Marine Park
and Reserve, and the respondents for being very kind to accord me time and
valuable information. I would also like to thank my research assistants David, Ken
and Ronald for their support during data collection.
Many thanks go to my parents, John and Anne, for supporting me throughout the
masters programme both financially and morally. Lastly, to my best friend Jacob for
constantly reminding and encouraging me to complete my thesis.
Above all, I am grateful to the Almighty God for having brought me this far.
xi
DEFINITION OF OPERATIONAL TERMSBiodiversity (or biological diversity): This is a collective term meaning the totality
and variety of life on Earth. Biodiversity includes genetic diversity within species,
the variety among species, and the range of ecosystems within which life exists and
interacts.
Ecotone: It is a transitional area between two different ecosystems, such as a forest
and a grassland.
Local Community: This is a group of people living in a place, interacting and
sharing an environment. A local community can consist of business operators, public
agency staff and residents, while their interactions can include sharing resources,
information and assistance as well as establishment of commercial relationships. It
will be used interchangeably in this study with local people and local residents.
Perception: The process by which people translate sensory impressions into a
coherent and unified view of the world around them. It is based on incomplete and
unverified information, and it is equated with reality for most practical purposes and
guides human behavior in general.
Socio-economics: A field of study that examines social and economic factors to better understand how the combination of both influences something
xii
LIST ON ACRONYMS
CBT Community Based Tourism
CDA Coastal Development Authority
ICM Integrated Coastal Management
ICRAN International Coral Reef Action Network
IUCN International Union for Conservation of Nature
KMMPA Kisite Mpunguti Marine Protected Area
KMMPR Kisite Mpunguti Marine Park and Reserve
KNBS Kenya National Bureau of Statistics
KWS Kenya Wildlife Service
MPA Marine Protected Area
SET Social Exchange Theory
UNESCO United Nations Educational, Scientific and Cultural Organization
WWF Worldwide Fund for Nature
WTO World Tourism Organisation
WTTC World Travel and Tourism Council
KWS Kenya Wildlife Service
1
CHAPTER ONE
INTRODUCTION
1.0 Background to the Study
Coastal areas worldwide and particularly in Africa have a high potential for tourism development
that can stimulate socio-economic growth in these areas, help to conserve coastal environments
and their biodiversity, minimize environmental impacts and contribute to the wellbeing of local
communities most of whom depend on resources found in these areas (UNWTO, 2013). In
Kenya the coastal area is home to many communities whose livelihoods depend on the natural
resource life found within and around the Indian Ocean.
In spite the foregoing, human population growth in Kenya like in most parts of Africa and other
parts of developing world has continued to exert a lot of pressure on the marine protected areas
as well as the coastal resource base in general thus leading to resource destruction. As a result,
human pressure has been reported to be a major driving force behind environmental degradation
in coastal areas and especially marine parks and reserves. This assertion is supported by the fact
that the livelihoods of majority of the population living around marine resource areas like oceans
are linked to fishing at both subsistence and commercial level. Therefore, with the growing
population, expansion of agriculture and other livelihood sustaining activities have been
achieved at the expense of the natural resource base (Kamugisha et al, 1997).
The management of protected areas such as Kisite Mpunguti Marine Park and Reserve is based
on the proposition that protected areas are of primary importance to a nation; and, that they must
be protected and shielded from people living adjacent to them. This is often achieved through the
strict enforcement of rules and laws to prevent illegal activities. Despite this, attempts to protect
marine parks and reserves through exclusion have often resulted in local people developing
hostile attitudes towards marine based resources such as forests. In some cases open conflicts
have occurred either between and among local resource users, or between local communities and
protected area managers like the Kenya Wildlife Service staff in Kenya and these have resulted
into loss of lives and property.
2
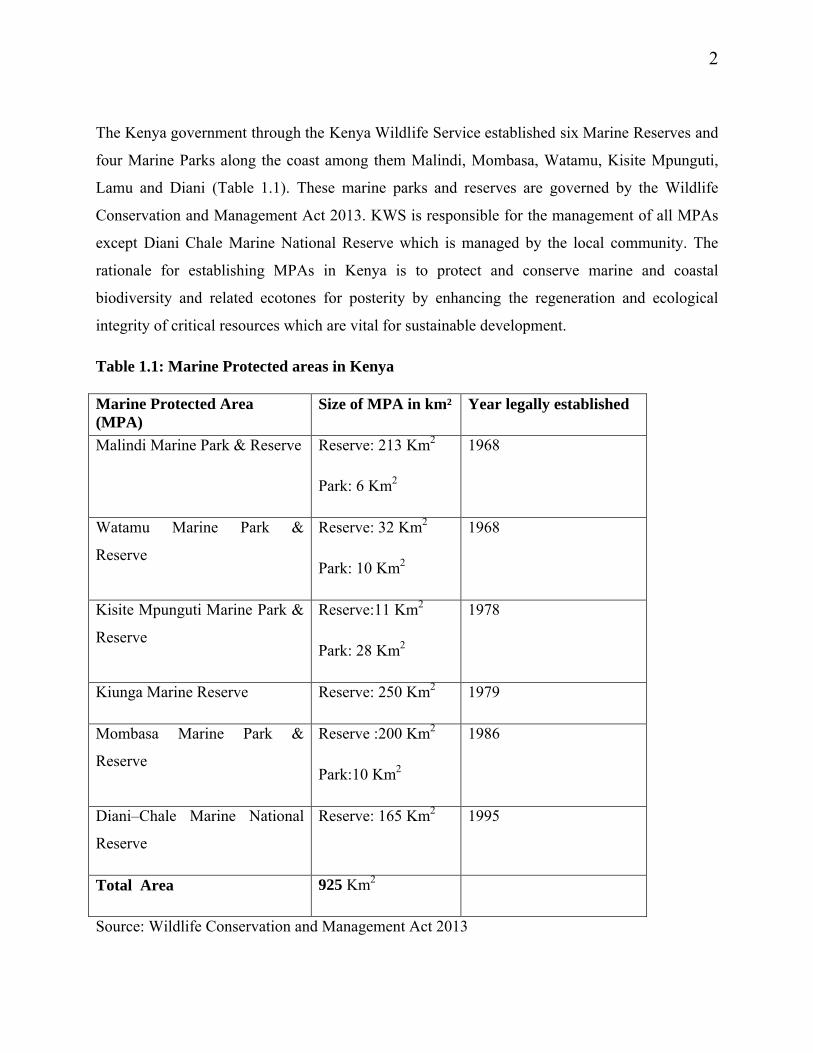
The Kenya government through the Kenya Wildlife Service established six Marine Reserves and
four Marine Parks along the coast among them Malindi, Mombasa, Watamu, Kisite Mpunguti,
Lamu and Diani (Table 1.1). These marine parks and reserves are governed by the Wildlife
Conservation and Management Act 2013. KWS is responsible for the management of all MPAs
except Diani Chale Marine National Reserve which is managed by the local community. The
rationale for establishing MPAs in Kenya is to protect and conserve marine and coastal
biodiversity and related ecotones for posterity by enhancing the regeneration and ecological
integrity of critical resources which are vital for sustainable development.
Table 1.1: Marine Protected areas in Kenya
Marine Protected Area (MPA)
Size of MPA in km² Year legally established
Malindi Marine Park & Reserve Reserve: 213 Km2
Park: 6 Km2
1968
Watamu Marine Park &
Reserve
Reserve: 32 Km2
Park: 10 Km2
1968
Kisite Mpunguti Marine Park &
Reserve
Reserve:11 Km2
Park: 28 Km2
1978
Kiunga Marine Reserve Reserve: 250 Km2 1979
Mombasa Marine Park &
Reserve
Reserve :200 Km2
Park:10 Km2
1986
Diani–Chale Marine National
Reserve
Reserve: 165 Km2 1995
Total Area 925 Km2
Source: Wildlife Conservation and Management Act 2013
3
The drive for establishment of marine protected areas in Kenya was as a result of pressure on the
government primarily by the tourism sector. McClanahan et al (2005) reports that since then
designated MPA sites have shown a high degree of degradation characterized with a low
percentage cover of hard corals, low fish biomass, and high biomass of sea urchins. This coupled
with conflicts among the various resource users among them fishermen, boat operators, beach
traders and hoteliers continue to threaten the natural resource base. Yet it has been documented
that MPAs confer several benefits to local communities and other stakeholders such as creation
of employment opportunities, improving living standards and support of local livelihoods. These
livelihoods may be enhanced by diversifying sources of assets which may include harvesting
MPA resources to generate revenue, or switching livelihood strategies to a single but rewarding
activity (Twyman, 2001). Diversification entails opening up the correct assembly of
opportunities for a specific community (Salafsky and Wollenberg, 2000), which can be
challenging to achieve.
It is sometimes difficult to recognize ecosystem services and to quantify them accurately, partly
because they often provide indirect benefits, meaning that they remain poorly understood in
relation to their importance (Myers, 1996). Constanza et al. (1997) estimated the global value of
biodiversity to be roughly $38 trillion, although this remains a highly controversial figure it has
in the recent years reduced significantly. Using a careful analysis of existing case studies,
Balmford et al. (2002) found that the benefits of conversion of land (and subsequent loss of
ecosystem services) were always outweighed by the costs. In each case, private benefits were
accrued at the cost of social (community) benefits. Although this analysis did not focus on
MPAs, its findings have similar implications on them.
Marine protected areas are of great importance to local communities, and if properly managed
they are likely to benefit the current and future generations through job creation, improved
standards of living and enhanced access to social amenities among other benefits. On the other
hand, if marine protected areas are not well managed then local people are likely not to support
their existence and this could lead to conflicts between the local people and MPA managers.
4
There is therefore the need to get the support of the local people if marine protected areas have to
be managed effectively.
1.2 Problem Statement
With a population of approximately 3.4 million (KNBS, 2009), the Kenya coast is characterized
by unique natural resources which form the economic basis of the various activities, especially
tourism. These resources are on the decline due to overfishing, commercial exploitation of
mangrove species and use of destructive illegal fishing gears and methods that destroy critical
habitats. Although coastal tourism represents 50% of Kenya’s national tourism, 62% of the
coastal population still lives below the poverty line (Ngugi, 1999). The increasing population
density has led to increased human concentration with heavy impact on marine resources. The
deterioration of resources has further compounded environmental deterioration thus leading to
increased poverty among the local residents particularly indigenous communities like the
Mijikenda. For example in Kwale district the poverty was at 74.9% in 2006 (KNBS).
To avoid the continued decline of coastal ecosystems, marine protected areas were established to
prevent over exploitation of these areas and promote conservation of resources for the benefit of
current and future generations. This implies that local communities have to forego their
traditional activities and livelihoods in order to pave way for more sustainable use of the
ecosystem. Due to the opportunity costs involved, there is need to determine how such
communities are benefiting from the establishment of the MPAs after abandoning their
traditional livelihoods that appeared to be beneficial but in the short term.
The link between protected areas and their impacts on local and indigenous communities and its
contribution to poverty reduction has generated a lot of debate and discussions (Scherl et al.
2004; Wilkie et al. 2006; Richardson, 2008). It is increasingly now accepted that protected areas
should at least ‘do no harm’ to local and indigenous community.
Although socio-economic benefits from marine tourism are diverse, their impacts on local
communities’ health, political empowerment, and education among others have not been
adequately studied. Consequently, assessing their contribution to poverty mitigation as well as
5
improved community welfare and development remains a challenge particularly where there are
shifts in patterns of access to MPA resources. Further, it is widely acknowledged that local
people’s perceived socio-economic tourism benefits are affected by varied factors. It is for this
reason that the study sought to investigate determinants of perceived socio-economic tourism
benefit accruing to local people living adjacent to Kisite Mpunguti Marine Park and Reserve.
1.3 Research Objectives
1.3.1 Main Objective
The main objective of the study was to assess the determinants of perceived socio -economic
tourism benefits accruing to local people living adjacent to Kisite Mpunguti Marine Park and
Reserve.
1.3.2 Specific Objectives1. To determine the effect of demographic characteristics of the local people on perceived socio
- economic tourism benefits accruing from Kisite Mpunguti Marine Park and Reserve.
2. To determine the effect of tourism projects supported by KMMPR on local people’s
perceived socio economic benefits accruing from tourism.
3. To investigate the effect of local people’s participation in tourism activities supported by
Kisite Mpunguti Marine Park and Reserve on their perception of tourism benefits accrued.
4. To establish the effect of government policies on local people’s perception of socio-
economic tourism benefits accruing from Kisite Mpunguti Marine Park and Reserve .
1.4 Research Hypotheses
HO1 Demographic characteristics of the local community living adjacent to Kisite Mpunguti
Marine Park and Reserve (KMMPR) do not affect their perception of tourism benefits
accruing from the park and reserve.
HO2 Tourism projects supported by KMMPR have not significantly benefited the local
community.
6
HO3 Local residents’ participation in tourism projects supported by KMMPR has not had any
significant effect on their perception about socio-economic tourism benefits accruing to
them.
HO4 Government policies on tourism in KMMPR have not had a significant effect on local
communities’ perception of tourism benefits.
1.5 Justification of the Study
Coastal ecosystems form the mainstay of most coastal communities. They provide both
subsistence and commercial fisheries resources and other benefits due to their high biodiversity
of animals and plants. In addition they form the basis of the tourism industry. Despite this,
increased human population has exerted pressure on marine ecosystems thus resulting in the
decline of these ecosystems and their resources. This problem has been compounded by
encroachment, over exploitation of resources, pollution and conversion of valuable coastal areas
to other uses most of which are unsustainable and detrimental to the natural resource base.
The research will make significant contribution to knowledge in the field of tourism in marine
protected areas by developing models relating to determinants of perceived socio–economic
tourism benefits among local communities living adjacent to Kisite Mpunguti Marine Park and
Reserve and other marine protected areas. The study is important to different stakeholders
especially the management of KMMPR in coming up with better ways of implementing and
addressing local communities' issues hence assuring continued and sustained partnership
between the two.
1.6 Scope and Limitation of the Study
The study focused on Kisite Mpunguti Marine Park and Reserve and local people living adjacent
to them. In addition, focus was also given to perceived socio– economic benefits accruing from
the establishment of KMMPR.
In spite of the foregoing, financial and logistical constraints limited the study to only one marine
protected area.

7
Communication due to language barrier in some parts of the targeted area was a challenge. To
get around this, research assistants recruited from the local community translated the questions
from English to either Kiswahili or vernacular to enable respondents understand and respond.
8
CHAPTER TWO
LITERATURE REVIEW
2.0 Introduction
This chapter focuses on review of related studies. It presents information on protected areas and
their importance, tourism projects and initiatives, community participation in tourism in marine
protected areas, perceived socio- economic tourism benefits accruing from marine protected
areas (MPAs) and factors influencing local community access to tourism benefits from MPAs.
2.1 An Overview of Protected Areas and their Importance
Protected areas and their geological and physical features, ecosystems, flora and fauna habitats,
including tropical forests, deserts, wetlands, lakes and ocean systems are unique and
representative examples of the diversity of species and landscapes. Protected areas are critical
elements in the tourism system, with the experience of natural and cultural environments being
an important tourism motivation. In many countries, tourism has been developed and promoted
with much reliance on protected areas, including wilderness areas or national parks, some of
which are unable to withstand even small numbers of tourists (Graeme et al.1995).
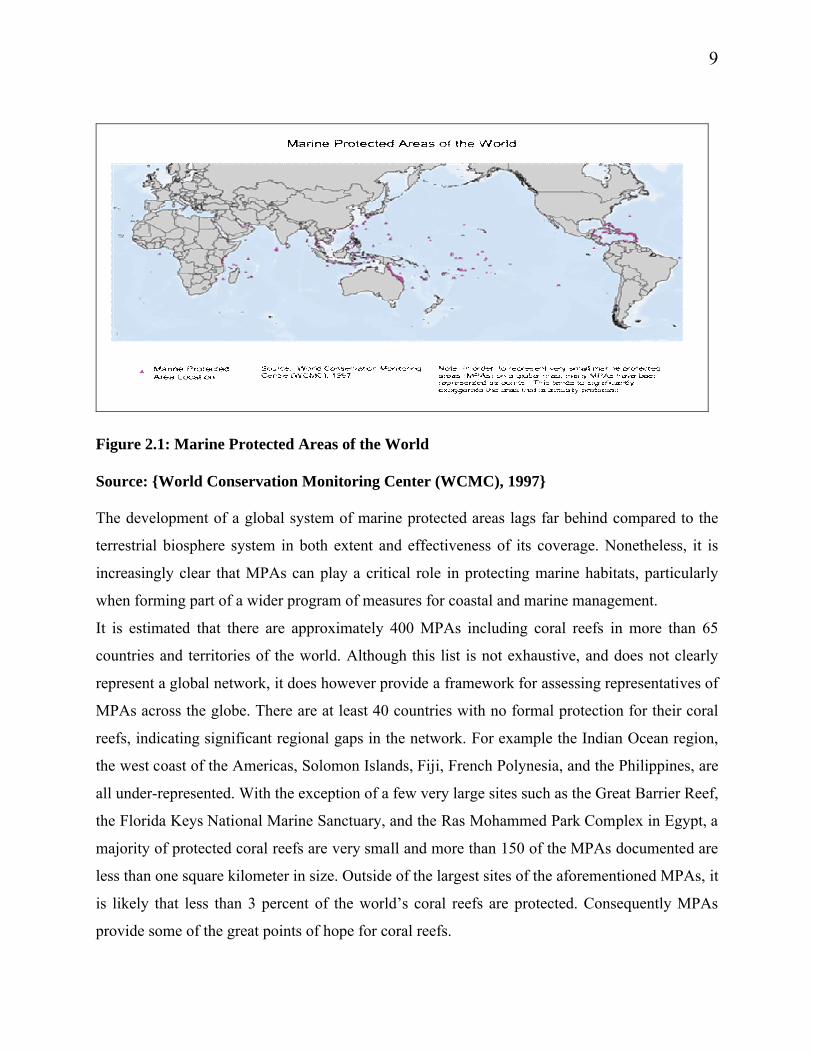
Despite this, marine protected areas worldwide are renowned for their unique attractions such as
corals and diverse life forms ranging from turtles to sharks which attract thousands of visitors
annually. Figure 2.1 shows the global distribution of marine protected areas.
9
Figure 2.1: Marine Protected Areas of the World
Source: {World Conservation Monitoring Center (WCMC), 1997}
The development of a global system of marine protected areas lags far behind compared to the
terrestrial biosphere system in both extent and effectiveness of its coverage. Nonetheless, it is
increasingly clear that MPAs can play a critical role in protecting marine habitats, particularly
when forming part of a wider program of measures for coastal and marine management.
It is estimated that there are approximately 400 MPAs including coral reefs in more than 65
countries and territories of the world. Although this list is not exhaustive, and does not clearly
represent a global network, it does however provide a framework for assessing representatives of
MPAs across the globe. There are at least 40 countries with no formal protection for their coral
reefs, indicating significant regional gaps in the network. For example the Indian Ocean region,
the west coast of the Americas, Solomon Islands, Fiji, French Polynesia, and the Philippines, are
all under-represented. With the exception of a few very large sites such as the Great Barrier Reef,
the Florida Keys National Marine Sanctuary, and the Ras Mohammed Park Complex in Egypt, a
majority of protected coral reefs are very small and more than 150 of the MPAs documented are
less than one square kilometer in size. Outside of the largest sites of the aforementioned MPAs, it
is likely that less than 3 percent of the world’s coral reefs are protected. Consequently MPAs
provide some of the great points of hope for coral reefs.
10
The Great Barrier Reef, the world’s second-largest protected area (after northeast Greenland), is
a model of integrated and multiple-use management, allowing sustainable utilization of the reef
by a wide range of users with numerous and often conflicting needs. Bonaire Marine Park in the
Caribbean is one of the first self-funding protected areas, supported entirely from tourist
revenues which also bring in half of this country’s total gross domestic product. Apo Island, in
the Philippines, a tiny fishing reserve that in the years since its designation, has allowed stocks to
recover sufficiently, that local fishermen operating in the surrounding areas reported major
increases in fish yields. Such cases provide overwhelming support for the economic, social, and
political arguments to protect coral reefs (Graeme et al.1995).
Various management approaches have been developed to promote use of protected areas
including MPAs. These approaches include an analysis of biological and social carrying
capacities, limits of acceptable change, recreation opportunity spectrum, visitor impact
management and visitor’s activity management programmes. Despite their wide spread critical
evaluation and use in many countries, each approach has inherent limitations, among them
balancing the diverse values and interests of individuals and agencies with resources constraints,
which make their implementation by resource managers difficult. Protection of the environment
in MPAs like in other protected areas should be an essential prerequisite to tourism development.
In spite of the foregoing observations, as the growth of commercial tourism, including
ecotourism, continues to create tensions between tourism, protected area managers and
stakeholder interests, it is unfortunate that many countries often lack the resources to undertake
appropriate management strategies. In addition, problems of value and interest conflicts are
exacerbated by lack of research into the relationship between tourism and protected areas, which
then limits the ability of managers to adopt proactive policy and planning approaches and thus
follow precautionary principles.
2.1.1 Marine Protected Areas and Their Significance
Marine protected areas are an important strategy for the conservation of marine bio-diversity and
particularly for the maintenance of fisheries stocks. MPAs which encompass marine parks and
11
reserves, have been defined as any areas of intertidal or sub tidal terrain, together with their
overlying water and associated flora, fauna, historical and cultural features, which have been
reserved by law or other effective means to protect part or all of the enclosed environment
(IUCN,1988). MPAs have been implemented as a tool of interest for fishery management, and
biodiversity conservation, with an observation that some 25% of the world fisheries have been
over exploited or are recovering from over exploitation (Louis et al. 2006). In response to a
growing recognition of the need for conservation efforts, as evidenced through the degradation of
ocean systems, MPAs are being established worldwide. When designed correctly and managed
well, MPAs have an important role to play in the protection of ecosystems and, in some cases,
enhancing or restoring the productive potential of coastal and marine fisheries. Despite this, it is
recognized that MPAs are not the only solution for coastal and marine problems. For example,
when MPAs are used in conjunction with other management tools such as integrated coastal
management (ICM), marine spatial planning and broad area fisheries management, they offer the
cornerstone of the strategy for marine conservation. The benefits that MPAs can deliver are also
related to the effectiveness of management outside MPAs (Christie, 2002; Cicin-Sain and
Belfiore, 2005).
When appropriately placed and well-managed, MPAs contribute to; conserving biological
diversity and associated ecosystems, protecting critical spawning and nursery habitats, protecting
sites with minimal direct human impact to help recover from stresses, protecting settlement and
growth areas for marine species and spillover benefits to adjacent areas, focal points for
educating the public about marine ecosystems and human impacts upon them, nature-based
recreation and tourism, providing undisturbed control or reference sites that serve as baselines
for scientific research and for designing and evaluating other areas, sharing costs and benefits
among local communities, the private sector, regional and national governments, and other
stakeholders and reducing poverty and increasing the quality of life of surrounding communities.
According to WTTC (2009), The Great Barrier Reef, the world’s largest UNESCO-recognized
World Heritage Area, is also one of the world’s most recognizable tourism icon. The Reef,
protected by the Great Barrier Reef Marine Park Authority (GBRMPA), attracts nearly 2 million
12
international tourists and 4.9 million domestic leisure tourists every year, resulting in 54,000 full-
time jobs. The future well-being of both the Marine Park and the tourism industry are
inextricably linked and a healthy tourism industry in the Marine Park will always need a healthy
Great Barrier Reef. The increasing realization of this interdependence has led to the pioneering
Sustainable Tourism Partnership between the GBRMPA and the tourism industry. The aims of
the Sustainable Tourism Partnership are to ensure maximum benefits and minimum negative
impacts to the Great Barrier Reef and adjacent local communities. The Environmental
Management fee of A$4.50 per person per day, is paid by each tourist visiting the Marine Park.
This money contributes to approximately 20% of the total GBRMPA‘s annual budget, with the
approximately A$7.2 million collected from tourists each year directed into tourism
management, policy development, tourism research and community partnership projects.
According to WWF (2004), MPAs in Kenya have their landward boundary at the high water
mark, with the exception of a few small, uninhabited islands in Kisite MNP/Mpunguti MNR,
Malindi-Watamu MNR, and Kiunga MNR. Unlike Tanzania, no people live within the
boundaries of the MPAs. In Kenya large human populations however depend on resources in
these areas. As with other countries, fisheries and tourism are the principal benefits from MPAs.
However, fish catches have not shown major increases since the establishment of the Marine
National Parks in locations where these are being monitored, but there is a general feeling that
the protection given to the fish populations by these no-take areas will help to maintain or slow
the decline in fish yields. For example, once Mombasa Marine National Park was established,
catches per fisherman outside the park (i.e. in the Marine National Reserve) increased by about
50%, with highest catches at landing sites closest to the park. However, total fish catch was
about 30% lower than before the Marine National Park was established as there were fewer
fishermen since those previously fishing in the Marine National Park had to move fishing
grounds or find other livelihoods (McClanahan and Kaunda-Arara, 1996; McClanahan and
Mangi, 2000). Landings at several sites near the Park continued to decline between 1994 and
1999 (McClanahan and Mangi, 2001). It is possible that this is because the closed area (Marine
National Park) is not large enough to supply sufficient 'spillover' for the size of the fishery.
13
Besides the foregoing, fishermen affected by the existence of the MPAs at Mombasa and Diani
have received assistance through activities of government agencies such as CDA, Fisheries
Department and KWS such as securing tenure of land, improving access to their landing sites,
and building or renovating facilities. This could not have come about if the areas had not been
MPAs, with the resultant concern about (and often conflict over) the rights of different user
groups to the locality.
Kenya Wildlife Service through a range of projects including ICRAN funding at Malindi MNP;
and through a BMZ/IUCN project at Kisite MNP/Mpunguti MNR has provided support to local
boat operators in the form of training, development of codes of conduct, installation of moorings
and provision of other facilities. For example, a mangrove boardwalk has been built on Wasini
Island, and is managed by the village’s women group. This has brought significant financial
income from tourism to the village and tourists come primarily to see Kisite Marine National
Park, but stop off to visit the mangrove board walk. Over $14,000 was raised for community
projects in the two years after the boardwalk opened. Communities are similarly benefiting from
a bird hide at Mida Creek.
Employment opportunities have increased in many areas where MPAs have been established.
Although this has not been well documented, research conducted in MPAs like Kisite
MNP/Mpunguti MNR by Malleret-King (1998, 2000) revealed that some benefits accrue to the
local community from the protected area. Further, in several MPAs, local communities living
adjacent to them have, through increased visitor numbers and demand for a range of services.
Malleret-King (2000) found that communities living nearer Kisite MNP/Mpunguti MNR had
greater 'security' than those living further away, in that they were able to obtain food more
readily as a result of better cash flow. It was concluded that this was partly due to the fact that
these families fished nearer MPA suggesting that there may be some 'spillover' effect from the
Marine National park and that some of these families earned additional income from tourism
activities related to the MPA.
14
The establishment of many MPAs has resulted in conflict, with large-scale tourism operators and
local boat operators competing for snorkeling and diving clients. Efforts are underway to try and
reduce this. Kenya tourism has seen a decline over the last year, and MPAs may be able to play
an important role in helping to attract tourists back to the country (Ngugi, 1999). Likewise,
MPAs conserve resources by managing human activities and therefore they exist in many
different forms and names. Many MPAs contain zones with different allowed uses which range
from recreational, commercial, scientific, cultural, and conservation uses and activities. As such,
if well managed MPAs can play a significant role in enhancing better management of coastal
zones, conservation of marine resources’ and boost tourism and fisheries sectors .
According to Eagles and Haynes (2002), tourism in protected areas including marine national
parks and reserves generates benefits and costs whose effects interact often in complex ways. It
is the responsibility of protected area managers to maximize benefits while minimizing costs.
Protected areas are established primarily to preserve wildlife populations, habitats, natural
landscapes, and cultural heritage such as a community’s cultural traditions. Tourists visit these
protected areas to understand and appreciate the values for which the areas were established and
to gain personal benefits through recreation. Tourism planning and development aims to take
advantage of the interest shown by tourists so as to enhance economic opportunities, protect the
natural and cultural heritage, and advance the quality of life of all concerned including local
communities living adjacent to these areas. As such protected areas confer diverse benefits from
tourism practiced in such areas.
According to Eagles and Haynes (2002), these benefits include employment, conservation of
cultural and natural heritage, revenue generation and promotion of local community welfare.
Tourism can increase jobs and income in a local area or region. It is often regarded as a source of
foreign exchange, since protected areas attract tourists. For example, nature tourism in Costa
Rica’s National Parks was estimated to generate over US $600 million in foreign exchange in
1994. Visitors to Australia’s Great Barrier Reef World Heritage Area spent AU $776 million
(US $543 million) in 1991– 1992 (Driml and Common, 1995). Governments often use tourism as
15
a tool for economic development because it is relatively inexpensive to create a tourism job
compared to one in manufacturing.
Tourism based on protected areas can be a key factor in supporting the conservation of natural
and cultural heritage. It can generate the funds through entrance and service fees, local taxes and
in many other ways that can be used directly to help meet or offset the costs of conservation,
maintaining cultural traditions and providing education. Indirectly, by demonstrating the
economic value that protected area tourism can bring to a country or a region, it can build public
and political support for conservation of natural heritage. Tourism enables some marine
protected areas to prosper, for example in the Netherlands Antilles (Bonaire Marine Park), the
Seychelles (Ste. Anne National Marine Park) and Kenya (Malindi/Watamu parks and reserves).
Tourism development should be designed to protect what is good about a host community and
tackle those aspects that need to be improved. One way in which this can be done is to develop
facilities and services for tourism which can also benefit the living conditions of local residents.
Indeed protected areas can be the engines of sustainable rural development. IUCN advises that
protected areas in Africa should be repositioned “in the context of community development and
the local economy” (IUCN, 1999: 51). It argues that protected areas sustained by tourist’s
income, not only create jobs and raise income but can also be used to support local communities’
needs and promote improved infrastructural development including communications, upgrading
roads for tourism access which gives neighboring villages better access to the outside world.
Telecommunications access to protected area offices can be vital to local communities in times
of emergency. Some protected areas provide language, literacy and numeracy training to their
staff, skills that can be applied in the community as well and Health care, the medical services
available to parks staff and visitors can be shared with local communities (IUCN, 1999).
Tourism in terrestrial and marine protected areas may be viewed as a tool to help communities to
maintain, or improve, their living standards and quality of life. This may be measured in terms of
increased school graduation rates and reduced infant mortality, elimination of water and air
pollution, increased access to recreation sites, protected areas or subsistence resources, and better
access to services, such as the park’s programmes for interpretation and environmental
16
education, which also benefit locals. Protected areas can also be used to enhance the quality of
life of a whole nation, by making them the foundation of a national policy to raise environmental
understanding.
Negative effects can and do also result from tourist visitations in MPAs and other protected
areas. Most of them can however be competently managed and alleviated. Protected area
stakeholders among them local communities are in the position of gauging both the positive and
negative effects of tourism, determining how acceptable the negative effects are, and suggesting
how they can be managed. The costs of tourism are of three kinds: financial and economic,
socio-cultural, and environmental.
Tourism brings increased demand for goods, services and facilities, such as lodging, restaurants,
other attractions, and personal vacation properties. As visitor numbers increase, so does the
demand for basic services such as policing, fire, safety and health care. Such increased demand
brings increased costs and sometimes higher tax burdens for the local community. In some cases,
costs may rise so much that local residents can no longer afford to live in such areas. This is
particularly the case in destinations where local people have lower incomes than the visitors do.
For example, wealthy foreign visitors to protected areas in developing countries may see
economic opportunities and take control or buy out local businesses. Thus tourism can lead to
increased foreign ownership and raised property values. Increased visitation also means
increased costs to the protected area management agency as it strives to add the additional
personnel and facilities needed by tourists. This cost of tourism must be weighed against the
benefits, and therefore, the park agency must be able to apply the benefits earned from tourists
against the costs.
As already noted, where the local economy and protected areas are heavily dependent on
tourism, they may become vulnerable to external factors beyond their control, such as natural
disasters, currency fluctuations, and competitive capture of markets or political instability. Some
leakage of tourist expenditures will occur, whether it is out of the protected area, local
17
community, region or the country. If local people do not benefit, they may look for other more
profitable activities and land uses. Hence the need to minimize leakages.
Increased numbers of tourists may disturb community activities, and compete for recreation
places and other services. Poorly planned tourism development can lead to increased congestion,
littering, vandalism and crime. Governments may exacerbate these problems if they put short-
term economic considerations before all else, for example by building inappropriate
infrastructure or failing to establish the needs of local communities. When this happens, the local
support for the protected area may be put at risk.
Tourism in protected areas sometimes calls only for seasonal employment, leaving residents
underemployed during the slow or off-seasons. However, this may be to the local communities’
liking. For example in the Klondike Gold Rush National Historic Park (Alaska, USA) the entire
town of Skagway revolves around summer tourism. In the winter, many people leave, and then
the community apparently enjoys its “quiet time”, having earned sufficient income for the year
during the busy season. Where protected area agencies develop visitor management regulations
that also affect local residents, there may be negative socio-cultural impacts manifested through
prohibitions on traditional uses such as fuel wood gathering or on spiritual uses which require
entry to the protected area. Other negative impacts may occur where local traditions become
commercialized, and lose their integrity or authenticity. An example would be dances, which had
once had a vital social role but which are now put on only for the entertainment of visitors.
Negative impacts are most common when communities are not given choices, or have no control
over their involvement in tourism. Outsiders often assign negative connotations to cultural
change, while those undergoing the change may be positive about the new ideas or approaches. It
is important that those affected by cultural change should be the ones that decide whether this
change is acceptable. Appropriate planning is needed ahead of development, to avoid adverse
impacts from the outset; but there are also management techniques that can be used to address
problems should they arise.
The dangers are all the greater when there is a sharp contrast between the wealth of tourists and
the poverty of the host community. Where this occurs, local communities are potentially
18
vulnerable to exploitation and their voice may go unheard. Both the protected area manager and
tourist providers have a special responsibility in such circumstances to ensure that the
community is listened to, and its views allowed to help shape the form of tourist development
that takes place. From the foregoing reviews, it was hypothesized that the study area has
undergone a lot of changes, since the establishment of Kisite-Mpunguti Marine Park and
Reserve. Tourism development in the park and reserve has impacted on the local community
living adjacent to the MPA.
2.2 Local Community Socio-Demographic Characteristics and their Implications on their Perceptions of Protected Areas
The relationship between community access to tourism benefits and socio-demographic and
economic characteristics of residents among them age, gender, and level of income is widely
documented in literature on tourism (Sharma and Dyer, 2009; Petrzelka et al, 2005; Haley et al,
2005; Dogan, 1989). Similar observations have also been documented about local residents’
attachment and relationship to the local area and the connection with tourists. Despite this,
community tourism initiatives have caused destruction to the resource base on which tourism
depends. For instance, destruction of wildlife at Zakynthos in Greece due to tourism (Prunier et
al, 1993) and disturbance of animals as documented about Kenya show that if not properly
managed tourism in MPAs can destroy the resource base on which it relies (Sindiga and
Kanunah ,1999).
According to Holloway (2008) and Mill and Morrison (2002), overcrowding is probably the
most self-evident problem created by mass tourism. This negative outcome of tourism has been
reported in a number of studies in the past where 60% of the sampled population in Sunshine
coast recognized overcrowding as an issue (Akis et al., 1996; Amuquandoh, 2010; Andereck and
Valentine 2005; Brunt and Courtney, 1999; Dyer et al, 2007; Easterling, 2005; Faulkner and
Tideswell, 1997; Rothman, 1978; Tatoglu et al, 2002; Dyer et al, 2007), while Amuquandoh
(2010) noted that residents living around Lake Bosomtwe in Botswana are afraid that tourism
will result in over-crowding in their community leading to degradation of the environment.
19
Studies from around the world, have reported a strong residents' belief that tourism results in
increased environmental pollution (Akis et al, 1996; Andriotis 2004; Brunt and Courtney, 1999;
Faulkner and Tideswell, 1997; Gilbert and Clark, 1997; Huttasin, 2008; Johnson et al, 1994; Lee
et al, 2007; McGehee and Andereck, 2004; Nunkoo and Ramkissoon, 2010a; Pizam, 1978;
Puczko and Ratz, 2000; Rothman, 1978; Snaith and Haley, 1994, 1999; Terzidou et al, 2008)
and/or destruction of the environment (Andriotis 2004; Bestard and Nadal, 2007; Dyer et al,
2007; Korea, 1996). Respondents in a study by Huttasin (2008) noted that tourism has resulted in
more litter and garbage in their community, while a study by Andriotis (2004) revealed that
tourism has destroyed the natural environment.
In spite of the foregoing, Doswell (1997) suggests that tourism is a tool that stimulates
environmental conservation and improvement. On the negative side, many studies suggest that
tourism causes traffic and pedestrian congestion, parking problems, disturbance and destruction
of flora and fauna, air and water pollution, and littering (Frauman and Banks 2011; Jago et al,
2006; Andereck et al, 2005; Jurowski and Gursoy 2004; Brunt and Courtney 1999; McCool and
Martin 1994).
2.3 Tourism Projects Associated with Marine Protected Areas and their Implications on Local Communities’ Perceptions
Tourism has been used to diversify local livelihoods where other activities have been on the
decline and there were few other alternatives. However, it was wildlife-based tourism that
initially led to the establishment of state-protected areas like national parks that had led to the
eviction of local people and loss of traditional lands making most rural communities poorer. In
recent years however, community-based ecotourism has enabled local communities and villages
located to MPAs to earn income directly from tourism ventures that they have contractual control
over and are located on their lands. By the turn of the twentieth century much of the policy
dialogue on rural development and wildlife conservation in northern Tanzania was focused on
community based ecotourism. Consequently situations where local people initiated tourism
enterprises and conservation all projects seemed not only feasible but promising. Pastoralist
communities had incentives to conserve and profit from the wildlife that had long co-existed
with their cattle in savannah rangelands (Wøien and Lama, 1999). All these initiatives have
20
ensured that local communities living within and around protected areas that have potential to
support promising tourism and wildlife based ventures to benefit local communities.
According to IUCN-WCPA (2008), examples abound from the field on MPAs and how they
have contributed to poverty reduction in many areas. Notable among these are; Navakavu in Fiji,
Bunaken in Indonesia, Arnavon Islands in the Solomon Islands and Apo Island in the
Philippines. In all the forgoing case studies there is documented evidence that poverty has
reduced in various ways including improvement in fish catches, creation of jobs and
improvement of local governance. Fish are now “spilling over” from the no-fishing zones of the
four marine protected areas mentioned above, leading to increased catches and higher incomes
for fishermen at three of the sites. In most of the MPAs established, new jobs particularly in
tourism have been created. The marine protected areas’ greatest boost to household incomes has
come from new jobs, created especially in eco-tourism. In Apo Island, tourism has surpassed
fishing as the largest source of income. Stronger local governance in all the above four study
sites has been promoted through establishment of community governance mechanisms for the
management of marine protected areas.
Involving local communities in management and decision-making in marine protected areas has
given communities a more united voice and reduced conflicts within the communities and with
neighboring communities. From the health point of view benefits to health have been realized
since greater fish catches have led to greater protein intake in Navakavu and Apo Island, and
there has been a perceived improvement in children’s health in particular. In Bunaken, visitor
entry fees improved public health by funding water-supply tanks, public toilets and washing
places in several villages. Lastly, benefits to women have been enhanced in all aforementioned
areas. In all the four sites, marine protected areas helped to empower women economically and
in some cases socially. In the Arnavons islands, the development of alternative livelihoods to
fishing such as seaweed farming and basket weaving provided new income opportunities for
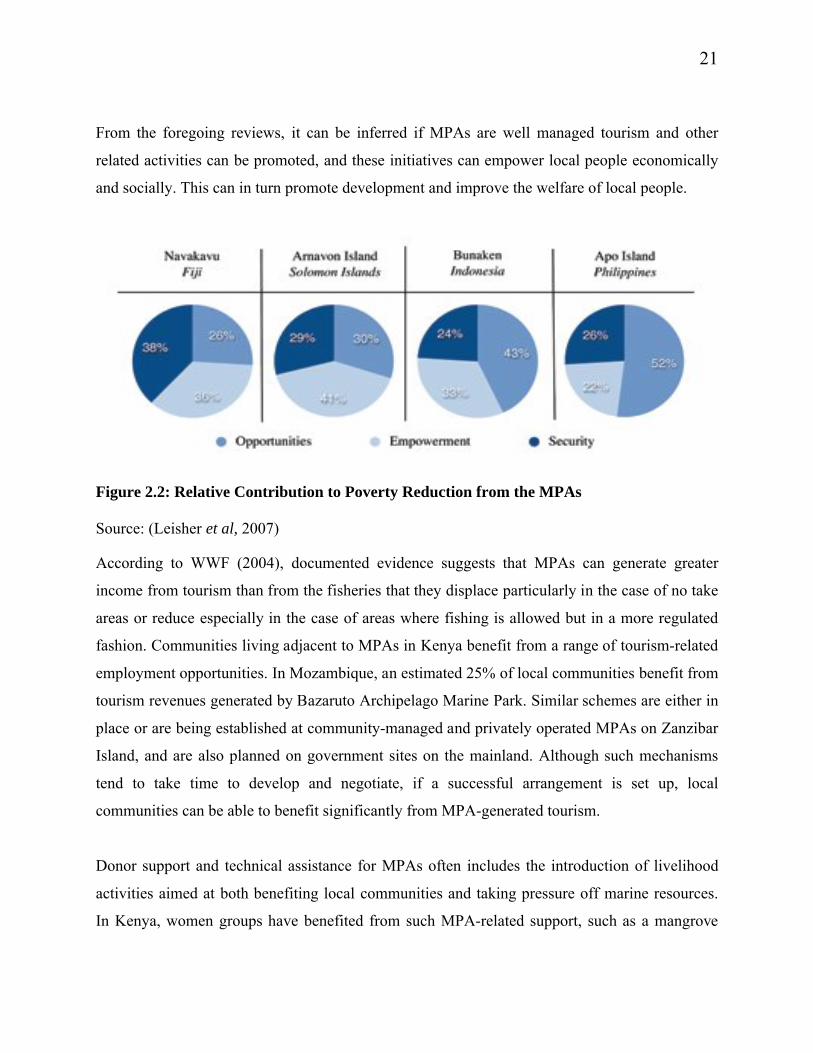
women. As a result, they gained a stronger voice in community meetings. Figure 2.2 shows the
ways in which the establishment of MPAs contributed to poverty alleviation.
21
From the foregoing reviews, it can be inferred if MPAs are well managed tourism and other
related activities can be promoted, and these initiatives can empower local people economically
and socially. This can in turn promote development and improve the welfare of local people.
Figure 2.2: Relative Contribution to Poverty Reduction from the MPAs
Source: (Leisher et al, 2007)
According to WWF (2004), documented evidence suggests that MPAs can generate greater
income from tourism than from the fisheries that they displace particularly in the case of no take
areas or reduce especially in the case of areas where fishing is allowed but in a more regulated
fashion. Communities living adjacent to MPAs in Kenya benefit from a range of tourism-related
employment opportunities. In Mozambique, an estimated 25% of local communities benefit from
tourism revenues generated by Bazaruto Archipelago Marine Park. Similar schemes are either in
place or are being established at community-managed and privately operated MPAs on Zanzibar
Island, and are also planned on government sites on the mainland. Although such mechanisms
tend to take time to develop and negotiate, if a successful arrangement is set up, local
communities can be able to benefit significantly from MPA-generated tourism.
Donor support and technical assistance for MPAs often includes the introduction of livelihood
activities aimed at both benefiting local communities and taking pressure off marine resources.
In Kenya, women groups have benefited from such MPA-related support, such as a mangrove
22
boardwalk adjacent to Kisite Marine Park which is run by women, and a handicraft programme
using recycled materials at Kiunga Marine Reserve, while fishermen affected by the existence of
some MPAs at Mombasa and Diani have received assistance through government agencies such
as CDA, Fisheries Dept and KWS who support activities such as obtaining tenure over or
improving access to their landing sites, and building or renovating facilities (McClanahan and
Mangi, 2001) . Such assistance could not have come about if the adjacent areas had not been
designated MPAs.
In Tanzania, community development has become a central feature of the management of many
of MPAs, with community development funds being established using revenue from MPAs, and
a range of supplementary income generating activities being set up in adjacent local
communities. Based on the observations, review of this experience would be useful to develop a
better understanding of the extent to which livelihoods have improved and the extent to which
the existence of MPA have contributed to local development and improved local community
welfare (McClanahan and Mangi, 2001).
Most coastal communities around the world face a growing degree of insecurity as a result of
poverty and high dependency on natural resources. This vulnerability is often compounded by
declining resources, high population growth, limited alternative livelihoods, limited access to
land, economic and political marginalization, unsustainable land use practices, poor
development policies, competition and conflicts over natural resources (Pomeroy and Rivera-
Guieb, 2006). Therefore socio–economic dynamics become an important aspect in the
implementation of MPAs. A socio economic assessment is a way of learning about the social,
cultural, economic and institutional context and conditions of individuals, groups, and
communities (Pomeroy and Rivera-Guieb, 2006). Some of the most identified issues in socio –
economic studies (Bunce, 2000) include resource use patterns, stakeholder and community
characteristics, gender, stakeholder perceptions, attitudes and beliefs, traditional knowledge and
market attributes for extractive and non – extractive uses (Bunce et al, 2000). To alleviate
poverty levels and promote development the foregoing authors have identified socio- economic
goals of MPA’s which include promoting food security, sustainable livelihoods and non
23
monetary benefits to society, as well as equitably distributing benefits from MPAs, maximizing
compatibility between management and local culture and enhancing environmental awareness
and knowledge.
Governance goals of MPAs include maintaining management, ensuring effective stakeholder
participation and representation, enhancing management plan compliance by resource users and
managing and reducing resource use conflict. Livelihood strategies of coastal communities vary
and include among others engagement in activities full time, part time, seasonal or migratory in
nature and are associated with either a commercial or subsistence orientation. Many coastal
communities undertake a range of activities in order to cope financially and reduce risks
associated with high economic dependency on natural resources (Bailey and Pomeroy, 1996;
Allison and Ellis, 2001).
2.4 Local Communities Participation in Tourism and their Perception About BenefitsAccruing from it
Various scholars have attempted to develop useful models that conceptualize local participation
in the context of development studies in general, but not related particularly to any economic
sector (Arnstein, 1969). Simply put, their studies focused mostly on participatory development
approaches in development studies though they offer a useful tool towards a more authentic and
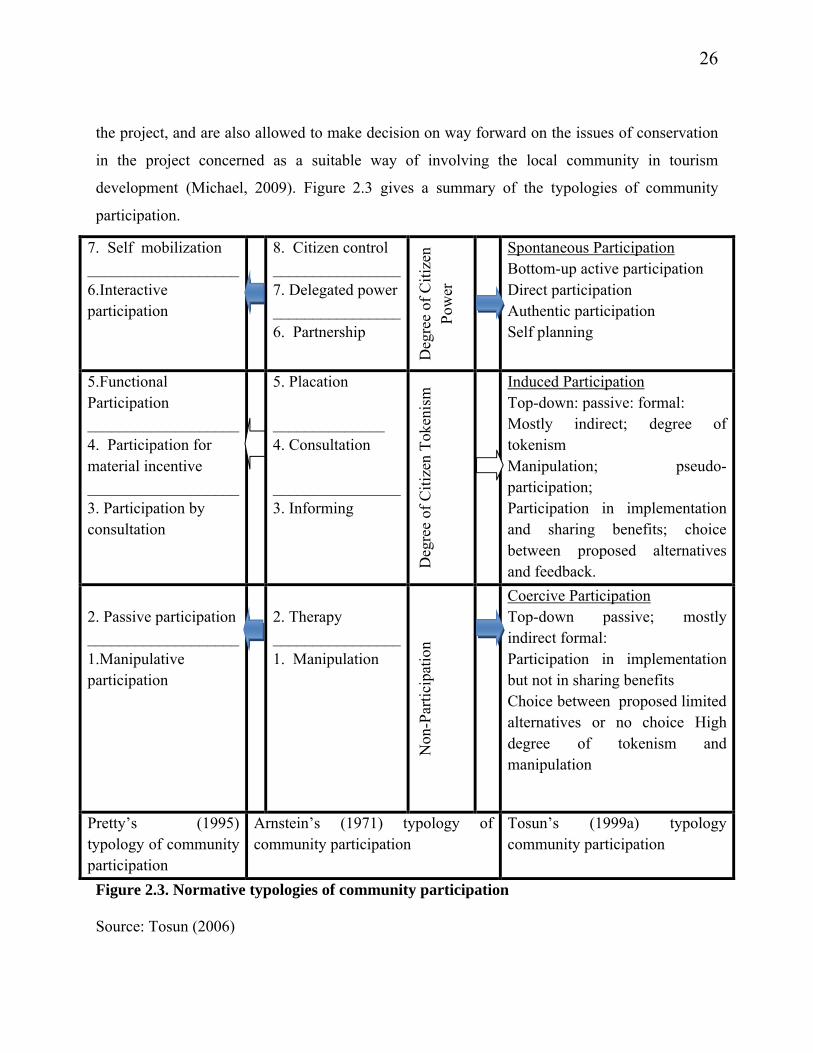
interactive community participation (Tosun, 2006). However, Tosun (2000) after reviewing these
studies examined community participation in the tourism industry and designed a model that can
be applied specifically to the tourism industry. His model suggested three forms (typologies) of
participation which “contextualizes community participation as a categorical term that allows
participation of people, citizens or a host community in their affairs at different levels: local,
regional or national” These are: spontaneous community participation, coercive community
participation and induced community participation (Figure 2.1). Tosun (2006) compares his three
forms of community participation to those proposed by Pretty and Arnstein (1969). Each of his
levels of community participation in the tourism industry is discussed in details in subsequent
paragraphs.
24
From Figure 2.3, spontaneous community participation in Tosun’s model, which emphasizes
provision of full managerial responsibility and authority to the host community, suggests an ideal
mode of community participation in tourism which is similar to degrees of citizen power in
Arnstein’s model and to self-mobilization and interactive participation in Pretty’s model.
Induced community participation in Tosun’s model, in which the host community has a voice
regarding tourism development process through an opportunity to hear and to be heard, is similar
to the degree of citizen tokenism in Arnstein’s model and to functional participation by
consultation or participation for material incentives in Pretty’s typology. In this type of
participation the community is often involved partly in the decision-making process and has no
power to ensure that their views are considered for implementation, especially by other powerful
interest groups such as government bodies, multinational companies, and international tour
operators, among others, thereby enforcing a certain level of degree of tokenism as identified in
Arnstein’s typology.
The proposed model approach entails a passive and indirect form of community participation
most commonly found in developing countries in which host communities only endorse and may
participate in implementation of tourism development issues or decisions made for them rather
than by them. In coercive community participation the host community is not as fully involved in
the decision-making process as it is in induced participation. However, some decisions are made
specifically “to meet basic needs of host communities so as to avoid potential socio-political
risks for tourists and tourism development” While this kind of participation is viewed by many
people as a substitute for genuine participation and an approach to enable power holders to foster
tourism development primarily to meet the desire of decision makers, tourism operators and
tourists, it is similar to manipulation and therapy in Arnstein’s model and passive and
manipulative in Pretty’s typology (Tosun, 2006). Community tourism has evolved from various
models of community participation in development. Coercive local participation probably refers
to what Kibicho (2003) found when examining the extent to which local people participate in
Kenya’s coastal tourism. His study, among other things, identified that there is a linkage between
local people’s involvement in tourism activities and their support for its development. It is
probably important to argue from here that a key consideration in tourism development is
25
sustainability, which cannot be achieved without local people’s support (Vincent and Thompson,
2002). This implies that local people’s participation, a western ideology which emerged after the
failures of social and political theories about how societies should be organized and how
development should take place (Tosun, 2000; Li, 2005), seeks to address sustainability for
tourism industry development, among other things. While sustainability is the core objective of
community participation (Vincent and Thompson, 2002; Johannesen and Skonhoft, 2005),
proponents of community tourism further argue that community participation seeks to improve
the welfare of the local community and, perhaps most importantly, win their support in
conservation of tourism resources (Songorwa, 1999). This means community participation is
inevitable and imperative for tourism development because most tourist attractions lie within
local communities or in their vicinities and in most cases co-exist side by side with the
communities, for instance, in wildlife areas. In addition, tourism occurs among local
communities and they are the ones who often bear the tourism damage and in most cases they
form part of the tourist products and experience that visitors seek (Wolfensohn, 1989; Havel,
1996; Tosun, 2000; Kibicho, 2003; Li, 2005; Beeton, 2006). It is for the foregoing reasons that
local people’s involvement and participation in the tourism industry serve to ensure the
protection of these tourist products and services through effective collaborative management of
the industry centered towards a more community-driven planning approach that guarantees
strong community support for successful tourism development (Tanzania Tourism Policy, 1999;
Tosun, 2000). It is also within this context that sustainable tourism and community participation
are being increasingly linked.This occurs mostly through community based organizations which
have actively been involved in the development of action plans aimed at reducing problems of
indiscriminate waste disposal in many low-income neighbourhoods. CBOs were already active in
Nakuru, particularly in the Lake View Estate, before local agenda (LA 21) process took off.
Awareness rising has resulted in a multiplication of CBOs and their activities. During the
colonial period, local people were regarded as an impediment to conservation and the
management of the national parks and reserves was characterized by coercion and control. As in
the case study carried out in Tanzania where local people in Barabarani village-Mto wa Mbu are
usually involved in the decision making process by being allowed to have benefits derived from
26
the project, and are also allowed to make decision on way forward on the issues of conservation
in the project concerned as a suitable way of involving the local community in tourism
development (Michael, 2009). Figure 2.3 gives a summary of the typologies of community
participation.
Figure 2.3. Normative typologies of community participation
Source: Tosun (2006)
7. Self mobilization___________________6.Interactive participation
8. Citizen control________________7. Delegated power________________6. Partnership
Deg
ree
of C
itiz
en
Pow
er
Spontaneous ParticipationBottom-up active participationDirect participationAuthentic participationSelf planning
5.Functional Participation___________________4. Participation for material incentive___________________3. Participation by consultation
5. Placation
______________4. Consultation
________________3. Informing
Deg
ree
of C
itiz
en T
oken
ism
Induced ParticipationTop-down: passive: formal:Mostly indirect; degree of tokenismManipulation; pseudo-participation;Participation in implementation and sharing benefits; choice between proposed alternatives and feedback.
2. Passive participation___________________1.Manipulative participation
2. Therapy________________1. Manipulation
Non
-Par
tici
pati
on
Coercive ParticipationTop-down passive; mostly indirect formal:Participation in implementation but not in sharing benefitsChoice between proposed limited alternatives or no choice High degree of tokenism and manipulation
Pretty’s (1995) typology of community participation
Arnstein’s (1971) typology of community participation
Tosun’s (1999a) typology community participation
27
2.5 Effect of Government policies on Local Communities’ Perceived Socio-Economic Benefits from Marine Protected Areas
Most governments believe that tourism development will generate new jobs, enhance community
infrastructure and assist in the revitalization of flagging economies of rural areas (Chuang,
2010). Despite this, it is crucial for industry, governments and other stakeholders to understand
how individuals within a host community perceive the benefits and disadvantages of tourism
because of the potential hostile response to tourists if a balance is not achieved (Deery et al,
2012). Diedrich and Garcia-Buades (2009) argue that understanding and assessing tourism
impacts in communities is important in order to maintain sustainability and long-term success of
the tourism industry in line with government policies and guidelines.
Accordingly, planners, policy makers and developers of tourism should aim at the preservation
of the environment, and proposed development plans should entail projects for the restoration
and conservation of the environment. Tourism is a sensitive service sector whose development
depends on a destination’s entire resource base (human, land, water, and air resources). To
sustain tourism, changes - particularly resource-use in these areas needs to be controlled to
ensure they do not detract from Kenya’s unique endowment of diverse tourism attractions.
Governments more often support measures to enhance the effective use of scientific resource
assessment information in regional area plans as well as environmental auditing and impact
assessment by National Environmental Management Authorities (NEMA) for existing as well as
new tourism developments. The aim is to ensure that positive benefits are enhanced while
negative impacts and costs are minimized.
Ocean use activities contributing to pollution (including vehicle exhaust pollution, which is a
major nuisance and health hazard in coastal areas such as Mombasa and other built-up areas),
eutrophication and sedimentation of Valuable Ocean beaches, inland lakes, rivers and reservoirs
are also closely monitored and controlled to ensure minimal degradation on MPAs and their
resources. Despite this, for too long the orientation of tourism planning and development has
been guided by the needs and wants of the tourist (Ritchie, 1993). However, the gradual
recognition of the adverse impacts of tourism development on the local environment and
28
population, as well as the central role host communities play in tourism is critical and requires a
lot of support. It is documented that tourism like other industries relies on the goodwill and
cooperation of local people because they are part of its product (Murphy, 1985, p.153).
In addition government policies often provide a framework and mechanism for sharing revenue
and other benefits from tourism and also support initiatives to introduce eco rating system in all
hotels and lodges. For instance Kenya, this is done with a view to including the classification and
accreditation of such schemes thus underpinning the entire Kenyan accommodation product with
responsible and sustainable tourism principles. As such, knowledge regarding residents'
satisfaction with their community is important because it can help the government and
community policy makers to make more rational decisions about the future of the place and its
achievements including having more satisfied citizens. Research findings are vital for the
administrative authorities and planners in developing policies and plans related to community
development (Grzeskowiak et al, 2003; Sirgy et al, 2000) allude that research findings are vital
for administrative authorities and planners in developing policies and plans related to community
development.
2.6 Theoretical Framework
Tourism has become important for countries around the world and has affected host
communities in terms of economic, socio cultural and environmental impacts. Consequently
there is a need to understand how local residents’ perceptions contribute to sustainable
collaboration between residents, industry and government. Local communities must be
increasingly involved and given an active role, participating in the planning and management of
local tourism policy (Simpson and Bretherton 2009; Dyer et al, 2007) in order to garner its
acceptance and support.
There are several approaches advanced to explain the impact of tourism on local residents. The
pioneer models were Doxey’s (1975) irridex model which presents an analysis of the effects of
tourism development (in four stages) on the social relationships between hosts and tourists, and
Butler’s tourism area life cycle model (Butler, 1980) which proposes that tourism is developed

29
through stages of exploration, involvement, development, consolidation, stagnation and decline.
These were followed by a number of studies that focused on involvement of local communities
in tourism (Andereck and Vogt, 2000; Juroski et al, 1997; Ap, 1992, and Allen et al, 1993).
These studies applied theories such as equity theory, growth machine theory, lifecycle theory,
power theory and social exchange theory.
Social exchange theory (SET), suggests that residents are likely to support tourism as long as the
perceived benefits exceed the perceived costs. SET is based on the principle that human beings
are reward-seeking and punishment avoiding and that people are motivated to action by the
expectation of profits (Skidmore, 1975). SET assumes that social relations involve exchange of
resources among groups seeking mutual benefits from exchange relationships. The primary
motive of exchange is the improvement of the community’s economic benefits (Ap, 1992). A
number of studies have been conducted on social exchange theory (Andereck and Vogt, 2000;
Juroski et al, 1997; Ap, 1992, and Perdue et al, 1987). These studies found that local residents
support tourism when they can benefit more than they loose from tourism activities, and that
whether the impacts of tourism development will lead to the support for or the protest against
local tourism development depends on individual’s perception of the impacts.
2.6.1 Social Exchange Theory
Ap (1992:670) advanced the Social Exchange Process Model to understand the resident
perceptions of tourism. This model describes the process by which individuals or community
groups become engaged in tourism exchanges, continue the relationships and how they become
disconnected from the exchanges. The main components of the model are need satisfaction,
exchange relations, consequences of exchange, and the no-exchange outcome. The figure 2.4
presents a set of processes that link the main components of the model. They are: (1) initiation of
exchange; (2) exchange formation; (3) exchange transaction evaluation; (4) positive evaluation
of exchange consequences, that is, reinforcement of behaviour.
According to Ap (1992) individuals engage in exchange if three preconditions are realized: (1)
the rewards are valued (2) the exchange produces valued rewards and (3) the costs do not exceed
30
expected rewards. The exchange process follows a sequence of events. The first event is
identification of need. Ap (1992:672) alludes that “an actor will initiate an exchange relationship
when there is a need to satisfy”. To initiate an exchange there must be a need to satisfy and
satisfaction of need justifies the rationale for engaging in social exchange. Therefore, unless a
community has a need to develop tourism or perceives tourism as a means of achieving social
and economic benefits, it is unlikely to welcome the development of tourism (Ap, 1992; Ap and
Crompton, 1998). In addition, this theory suggests that residents’ evaluations of tourism are
reliant upon the “relationship form” between residents and the tourism industry.
Positive or negative evaluations are theorized in terms of the presence or absence of certain
“antecedent conditions”: rationality, satisficing benefits, reciprocity and the justice principle
(Waitt, 2003). Rationality pertains to an actor’s behaviour being based upon reward seeking.
Consequently, residents who perceive rewards of either maintenance and/or improvement of
their social and economic well being are overall likely to evaluate the industry positively (Ap
1992; Waitt, 2003). Satisficing of benefits suggests that residents may well be aware of the
negative effects but nevertheless accept tourism because they perceive the positives as
outweighing the costs. Residents are assumed to seek to obtain a satisfactory, reasonable, or
acceptable level of benefits from the social exchange relationship rather than maximization of
benefits. However, a threshold of tolerance of tourism is assumed to exist that varies both
spatially and temporally and which, once exceeded, overpowers negativities. Consequently, a
resident will only develop a positive attitude if the expected benefits meet an acceptable
predetermined level of satisfaction.
Reciprocity proposes that if resources exchanged between the host residents and the industry are
roughly equivalent, the effects are perceived positively by all parties. The perceived rewards
should equal residents’ willingness to carry the infrastructure costs, extending friendliness,
courtesy and hospitality to tourists, and tolerating inconveniences (such as queuing for services,
sharing local facilities, overcrowding, traffic congestion, and route disruption). Gouldner (1960)
defines reciprocity as “a mutual gratifying pattern of exchanging goods and services”. Ap
(1992:675) further argues that “reciprocity in exchange means that each actor will provide
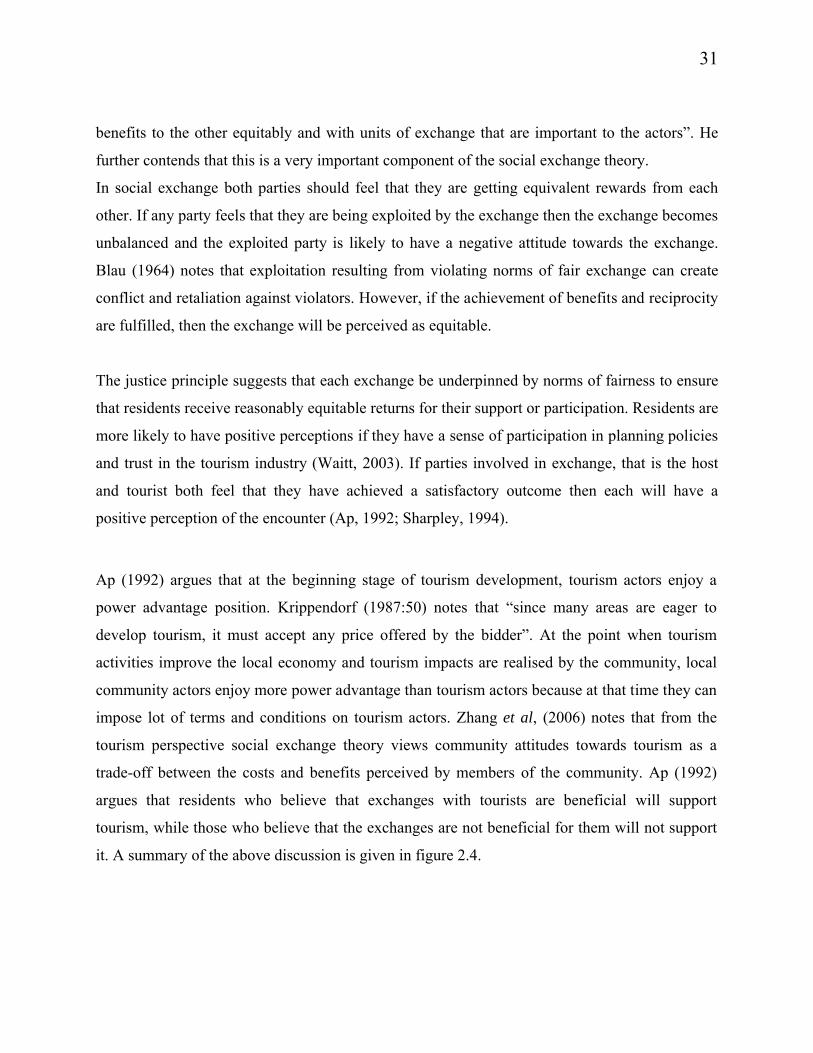
31
benefits to the other equitably and with units of exchange that are important to the actors”. He
further contends that this is a very important component of the social exchange theory.
In social exchange both parties should feel that they are getting equivalent rewards from each
other. If any party feels that they are being exploited by the exchange then the exchange becomes
unbalanced and the exploited party is likely to have a negative attitude towards the exchange.
Blau (1964) notes that exploitation resulting from violating norms of fair exchange can create
conflict and retaliation against violators. However, if the achievement of benefits and reciprocity
are fulfilled, then the exchange will be perceived as equitable.
The justice principle suggests that each exchange be underpinned by norms of fairness to ensure
that residents receive reasonably equitable returns for their support or participation. Residents are
more likely to have positive perceptions if they have a sense of participation in planning policies
and trust in the tourism industry (Waitt, 2003). If parties involved in exchange, that is the host
and tourist both feel that they have achieved a satisfactory outcome then each will have a
positive perception of the encounter (Ap, 1992; Sharpley, 1994).
Ap (1992) argues that at the beginning stage of tourism development, tourism actors enjoy a
power advantage position. Krippendorf (1987:50) notes that “since many areas are eager to
develop tourism, it must accept any price offered by the bidder”. At the point when tourism
activities improve the local economy and tourism impacts are realised by the community, local
community actors enjoy more power advantage than tourism actors because at that time they can
impose lot of terms and conditions on tourism actors. Zhang et al, (2006) notes that from the
tourism perspective social exchange theory views community attitudes towards tourism as a
trade-off between the costs and benefits perceived by members of the community. Ap (1992)
argues that residents who believe that exchanges with tourists are beneficial will support
tourism, while those who believe that the exchanges are not beneficial for them will not support
it. A summary of the above discussion is given in figure 2.4.
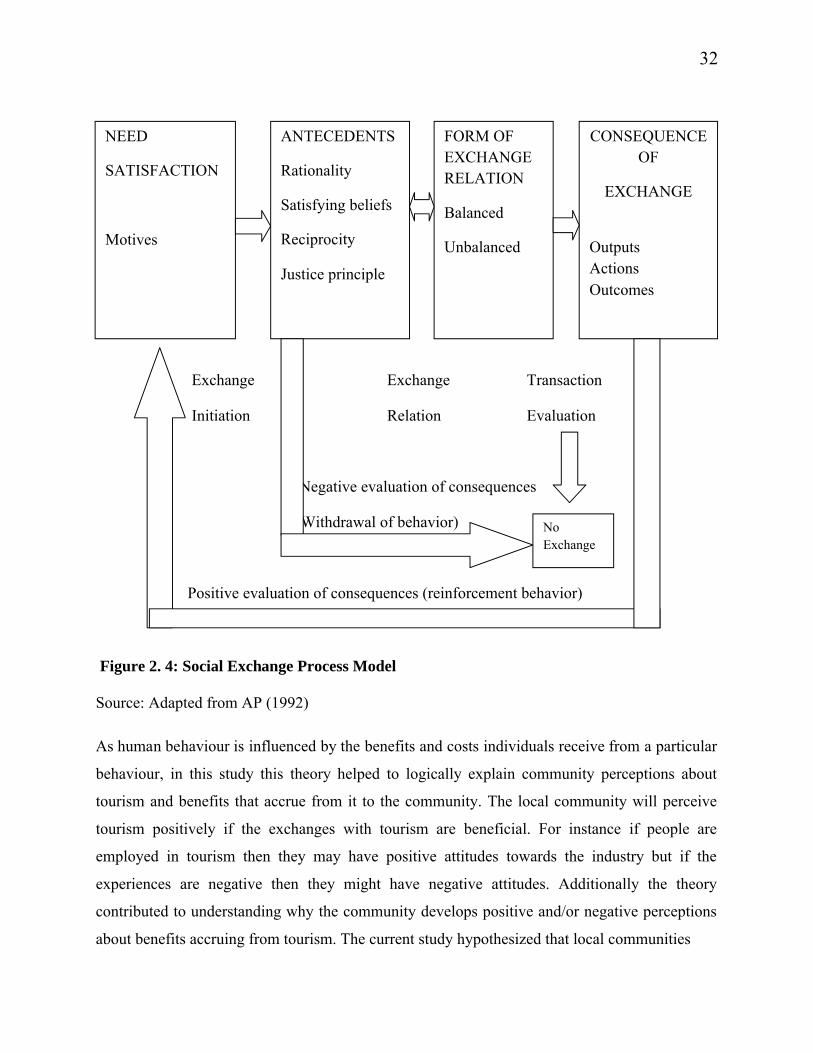
32
Exchange Exchange Transaction
Initiation Relation Evaluation
Negative evaluation of consequences
(Withdrawal of behavior)
Positive evaluation of consequences (reinforcement behavior)
Figure 2. 4: Social Exchange Process Model
Source: Adapted from AP (1992)
As human behaviour is influenced by the benefits and costs individuals receive from a particular
behaviour, in this study this theory helped to logically explain community perceptions about
tourism and benefits that accrue from it to the community. The local community will perceive
tourism positively if the exchanges with tourism are beneficial. For instance if people are
employed in tourism then they may have positive attitudes towards the industry but if the
experiences are negative then they might have negative attitudes. Additionally the theory
contributed to understanding why the community develops positive and/or negative perceptions
about benefits accruing from tourism. The current study hypothesized that local communities
NEED
SATISFACTION
Motives
ANTECEDENTS
Rationality
Satisfying beliefs
Reciprocity
Justice principle
FORM OF EXCHANGE RELATION
Balanced
Unbalanced
CONSEQUENCE OF
EXCHANGE
OutputsActionsOutcomes
No Exchange
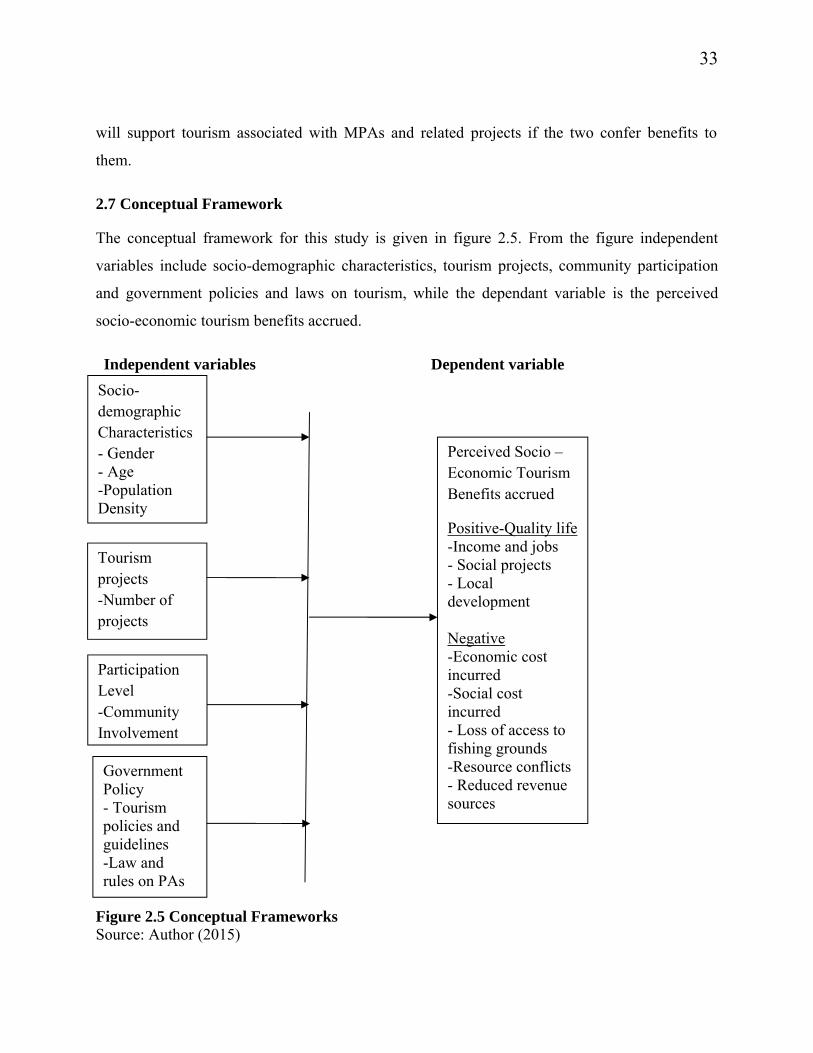
33
will support tourism associated with MPAs and related projects if the two confer benefits to
them.
2.7 Conceptual Framework
The conceptual framework for this study is given in figure 2.5. From the figure independent
variables include socio-demographic characteristics, tourism projects, community participation
and government policies and laws on tourism, while the dependant variable is the perceived
socio-economic tourism benefits accrued.
Independent variables Dependent variable
Figure 2.5 Conceptual FrameworksSource: Author (2015)
Socio-demographic Characteristics- Gender- Age-Population Density
Tourism projects-Number of projects
Government Policy- Tourism policies and guidelines-Law and rules on PAs
Perceived Socio –Economic Tourism Benefits accrued
Positive-Quality life-Income and jobs- Social projects- Local development
Negative-Economic cost incurred-Social cost incurred- Loss of access to fishing grounds-Resource conflicts- Reduced revenue sources
Participation Level-Community Involvement
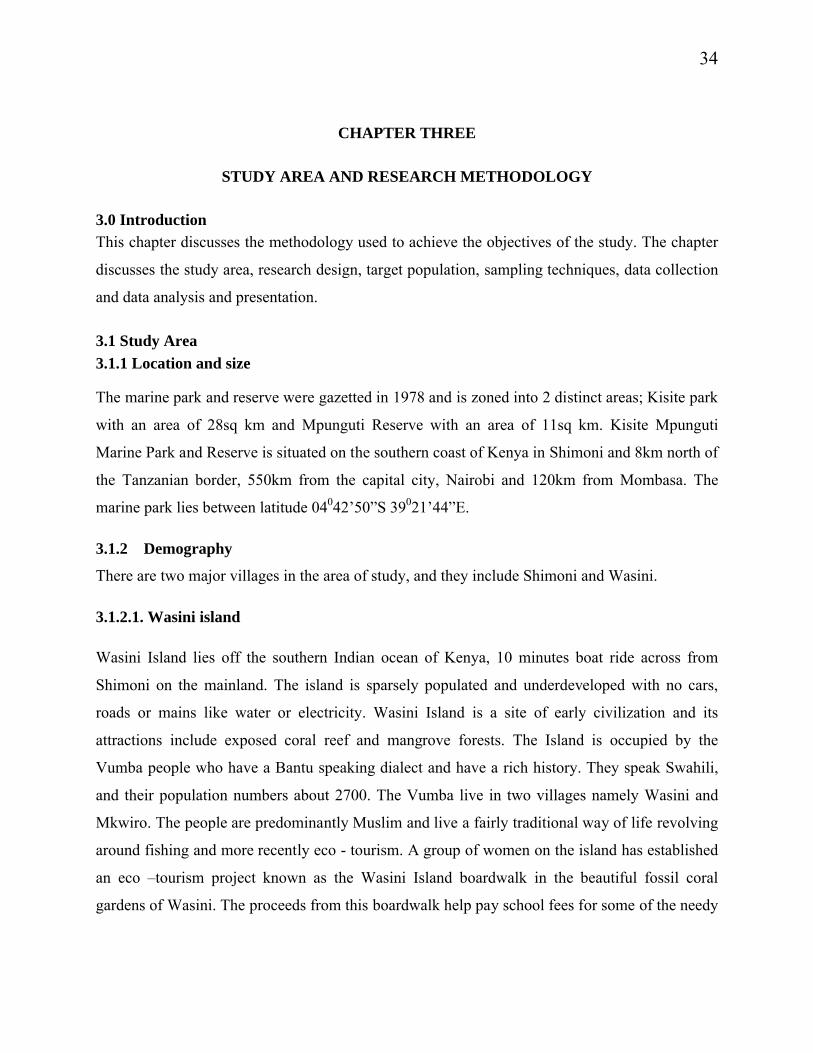
34
CHAPTER THREE
STUDY AREA AND RESEARCH METHODOLOGY
3.0 IntroductionThis chapter discusses the methodology used to achieve the objectives of the study. The chapter
discusses the study area, research design, target population, sampling techniques, data collection
and data analysis and presentation.
3.1 Study Area
3.1.1 Location and size
The marine park and reserve were gazetted in 1978 and is zoned into 2 distinct areas; Kisite park
with an area of 28sq km and Mpunguti Reserve with an area of 11sq km. Kisite Mpunguti
Marine Park and Reserve is situated on the southern coast of Kenya in Shimoni and 8km north of
the Tanzanian border, 550km from the capital city, Nairobi and 120km from Mombasa. The
marine park lies between latitude 04042’50”S 39021’44”E.
3.1.2 Demography
There are two major villages in the area of study, and they include Shimoni and Wasini.
3.1.2.1. Wasini island
Wasini Island lies off the southern Indian ocean of Kenya, 10 minutes boat ride across from
Shimoni on the mainland. The island is sparsely populated and underdeveloped with no cars,
roads or mains like water or electricity. Wasini Island is a site of early civilization and its
attractions include exposed coral reef and mangrove forests. The Island is occupied by the
Vumba people who have a Bantu speaking dialect and have a rich history. They speak Swahili,
and their population numbers about 2700. The Vumba live in two villages namely Wasini and
Mkwiro. The people are predominantly Muslim and live a fairly traditional way of life revolving
around fishing and more recently eco - tourism. A group of women on the island has established
an eco –tourism project known as the Wasini Island boardwalk in the beautiful fossil coral
gardens of Wasini. The proceeds from this boardwalk help pay school fees for some of the needy
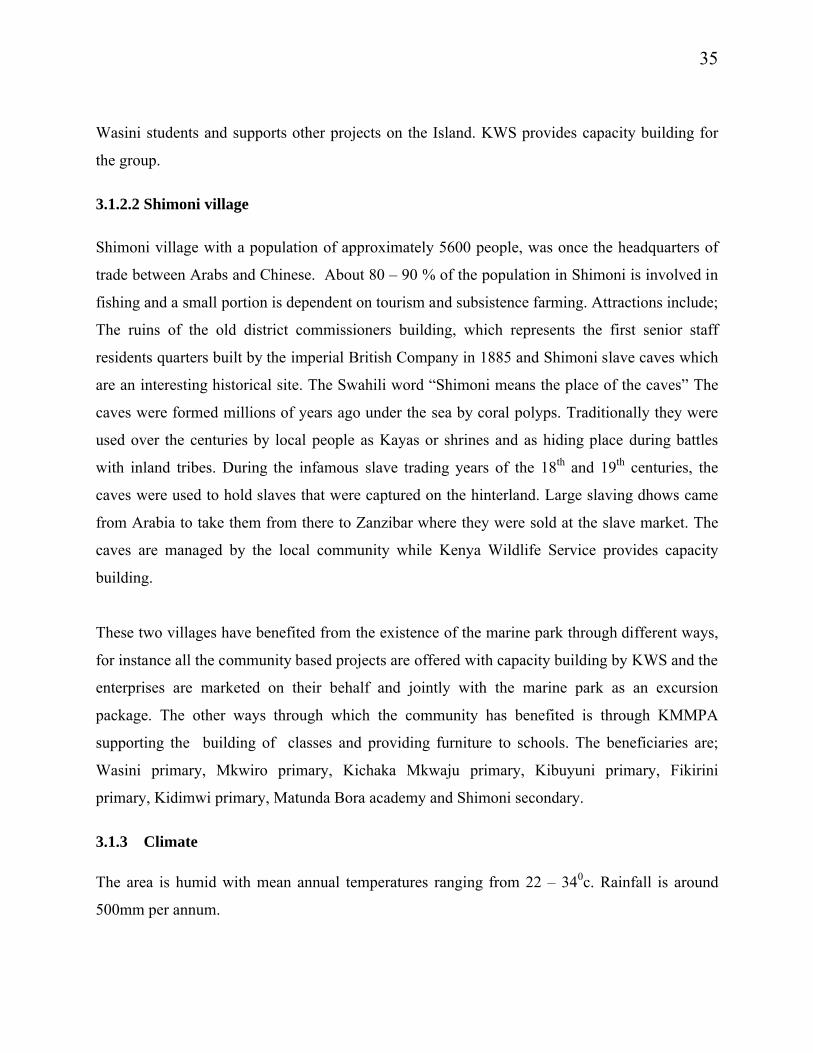
35
Wasini students and supports other projects on the Island. KWS provides capacity building for
the group.
3.1.2.2 Shimoni village
Shimoni village with a population of approximately 5600 people, was once the headquarters of
trade between Arabs and Chinese. About 80 – 90 % of the population in Shimoni is involved in
fishing and a small portion is dependent on tourism and subsistence farming. Attractions include;
The ruins of the old district commissioners building, which represents the first senior staff
residents quarters built by the imperial British Company in 1885 and Shimoni slave caves which
are an interesting historical site. The Swahili word “Shimoni means the place of the caves” The
caves were formed millions of years ago under the sea by coral polyps. Traditionally they were
used over the centuries by local people as Kayas or shrines and as hiding place during battles
with inland tribes. During the infamous slave trading years of the 18th and 19th centuries, the
caves were used to hold slaves that were captured on the hinterland. Large slaving dhows came
from Arabia to take them from there to Zanzibar where they were sold at the slave market. The
caves are managed by the local community while Kenya Wildlife Service provides capacity
building.
These two villages have benefited from the existence of the marine park through different ways,
for instance all the community based projects are offered with capacity building by KWS and the
enterprises are marketed on their behalf and jointly with the marine park as an excursion
package. The other ways through which the community has benefited is through KMMPA
supporting the building of classes and providing furniture to schools. The beneficiaries are;
Wasini primary, Mkwiro primary, Kichaka Mkwaju primary, Kibuyuni primary, Fikirini
primary, Kidimwi primary, Matunda Bora academy and Shimoni secondary.
3.1.3 Climate
The area is humid with mean annual temperatures ranging from 22 – 340c. Rainfall is around
500mm per annum.
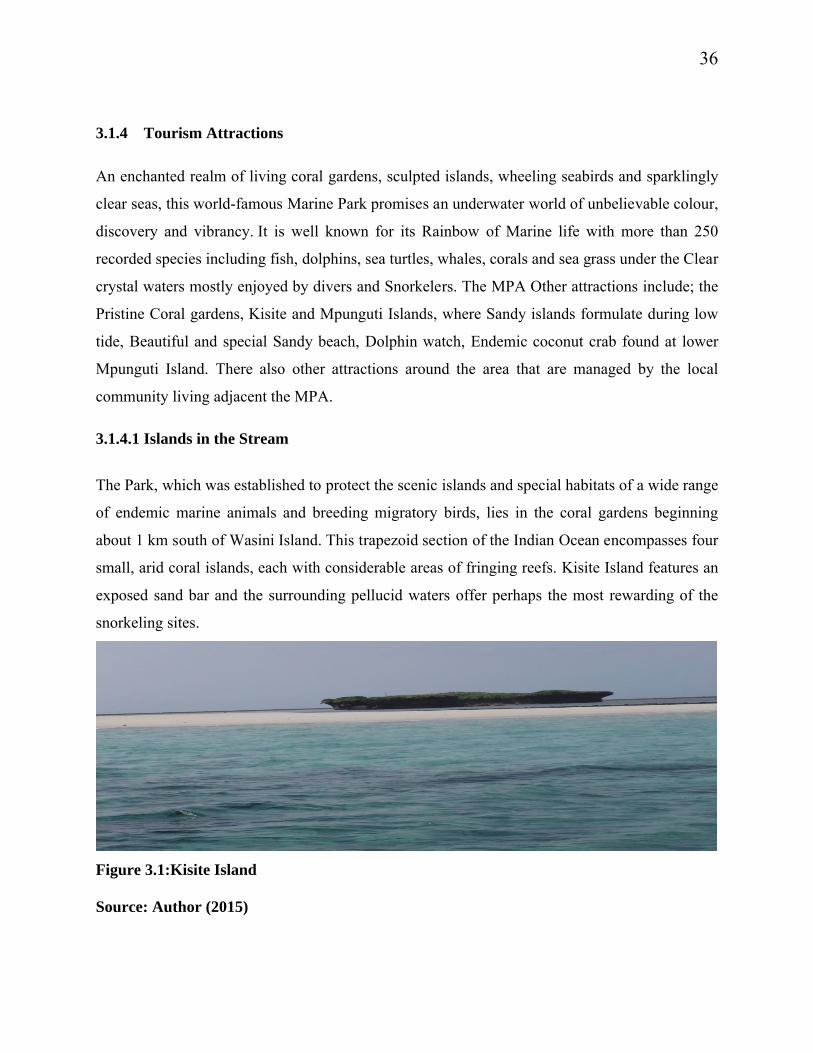
36
3.1.4 Tourism Attractions
An enchanted realm of living coral gardens, sculpted islands, wheeling seabirds and sparklingly
clear seas, this world-famous Marine Park promises an underwater world of unbelievable colour,
discovery and vibrancy. It is well known for its Rainbow of Marine life with more than 250
recorded species including fish, dolphins, sea turtles, whales, corals and sea grass under the Clear
crystal waters mostly enjoyed by divers and Snorkelers. The MPA Other attractions include; the
Pristine Coral gardens, Kisite and Mpunguti Islands, where Sandy islands formulate during low
tide, Beautiful and special Sandy beach, Dolphin watch, Endemic coconut crab found at lower
Mpunguti Island. There also other attractions around the area that are managed by the local
community living adjacent the MPA.
3.1.4.1 Islands in the Stream
The Park, which was established to protect the scenic islands and special habitats of a wide range
of endemic marine animals and breeding migratory birds, lies in the coral gardens beginning
about 1 km south of Wasini Island. This trapezoid section of the Indian Ocean encompasses four
small, arid coral islands, each with considerable areas of fringing reefs. Kisite Island features an
exposed sand bar and the surrounding pellucid waters offer perhaps the most rewarding of the
snorkeling sites.
Figure 3.1:Kisite Island
Source: Author (2015)
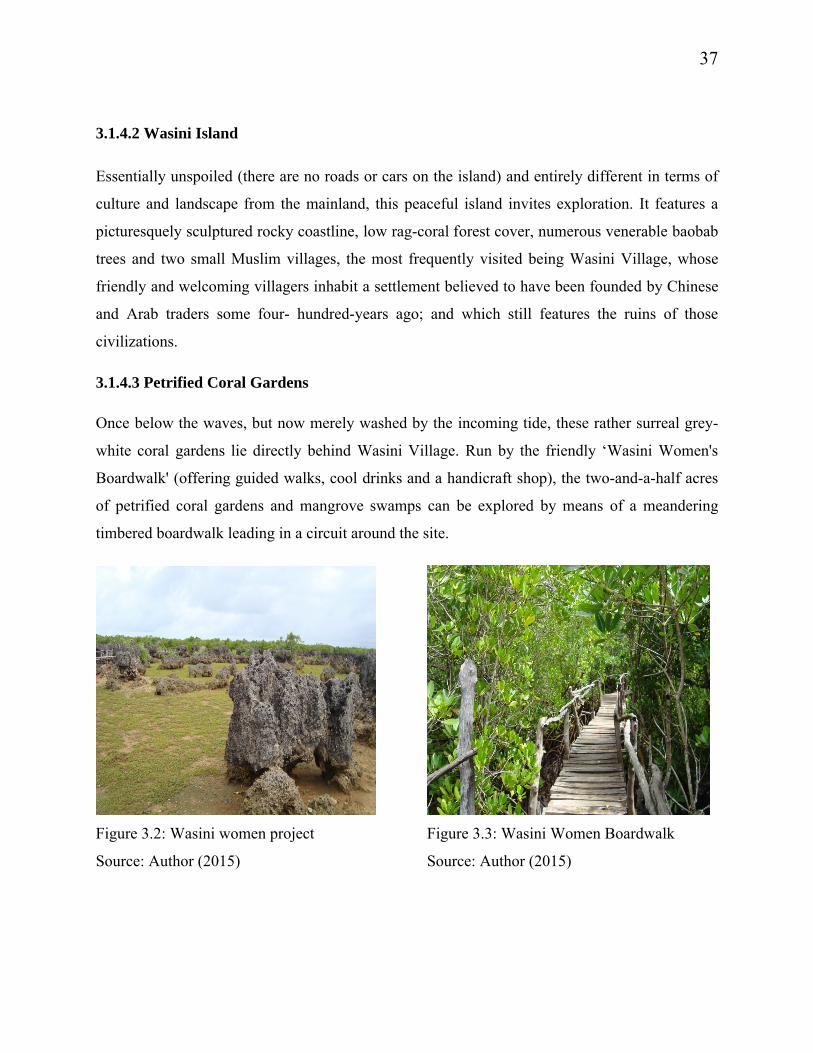
37
3.1.4.2 Wasini Island
Essentially unspoiled (there are no roads or cars on the island) and entirely different in terms of
culture and landscape from the mainland, this peaceful island invites exploration. It features a
picturesquely sculptured rocky coastline, low rag-coral forest cover, numerous venerable baobab
trees and two small Muslim villages, the most frequently visited being Wasini Village, whose
friendly and welcoming villagers inhabit a settlement believed to have been founded by Chinese
and Arab traders some four- hundred-years ago; and which still features the ruins of those
civilizations.
3.1.4.3 Petrified Coral Gardens
Once below the waves, but now merely washed by the incoming tide, these rather surreal grey-
white coral gardens lie directly behind Wasini Village. Run by the friendly ‘Wasini Women's
Boardwalk' (offering guided walks, cool drinks and a handicraft shop), the two-and-a-half acres
of petrified coral gardens and mangrove swamps can be explored by means of a meandering
timbered boardwalk leading in a circuit around the site.
Figure 3.2: Wasini women project Figure 3.3: Wasini Women Boardwalk
Source: Author (2015) Source: Author (2015)
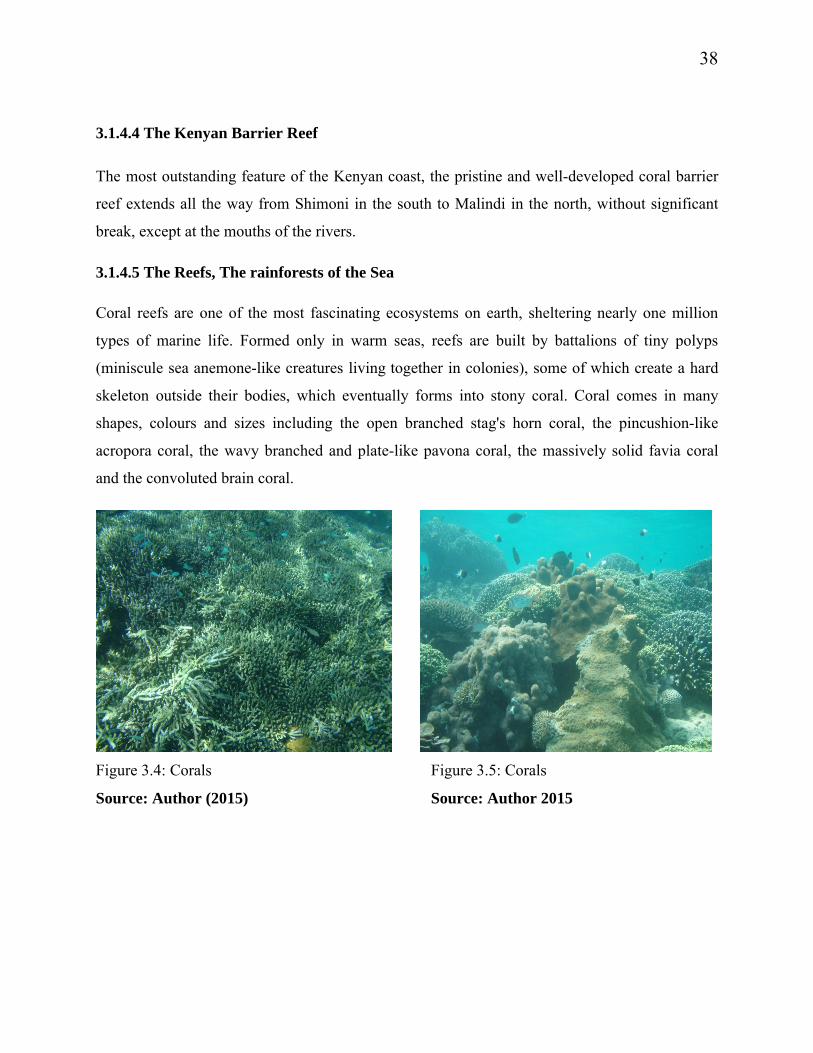
38
3.1.4.4 The Kenyan Barrier Reef
The most outstanding feature of the Kenyan coast, the pristine and well-developed coral barrier
reef extends all the way from Shimoni in the south to Malindi in the north, without significant
break, except at the mouths of the rivers.
3.1.4.5 The Reefs, The rainforests of the Sea
Coral reefs are one of the most fascinating ecosystems on earth, sheltering nearly one million
types of marine life. Formed only in warm seas, reefs are built by battalions of tiny polyps
(miniscule sea anemone-like creatures living together in colonies), some of which create a hard
skeleton outside their bodies, which eventually forms into stony coral. Coral comes in many
shapes, colours and sizes including the open branched stag's horn coral, the pincushion-like
acropora coral, the wavy branched and plate-like pavona coral, the massively solid favia coral
and the convoluted brain coral.
Figure 3.4: Corals Figure 3.5: Corals
Source: Author (2015) Source: Author 2015
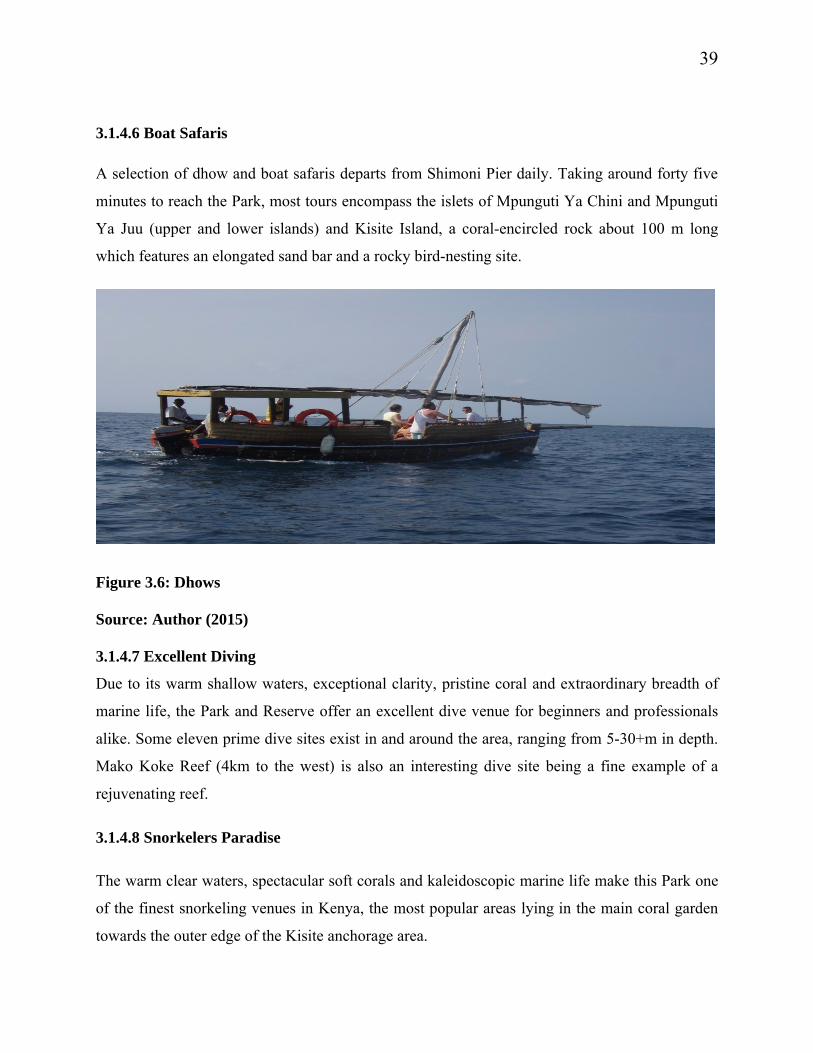
39
3.1.4.6 Boat Safaris
A selection of dhow and boat safaris departs from Shimoni Pier daily. Taking around forty five
minutes to reach the Park, most tours encompass the islets of Mpunguti Ya Chini and Mpunguti
Ya Juu (upper and lower islands) and Kisite Island, a coral-encircled rock about 100 m long
which features an elongated sand bar and a rocky bird-nesting site.
Figure 3.6: Dhows
Source: Author (2015)
3.1.4.7 Excellent Diving
Due to its warm shallow waters, exceptional clarity, pristine coral and extraordinary breadth of
marine life, the Park and Reserve offer an excellent dive venue for beginners and professionals
alike. Some eleven prime dive sites exist in and around the area, ranging from 5-30+m in depth.
Mako Koke Reef (4km to the west) is also an interesting dive site being a fine example of a
rejuvenating reef.
3.1.4.8 Snorkelers Paradise
The warm clear waters, spectacular soft corals and kaleidoscopic marine life make this Park one
of the finest snorkeling venues in Kenya, the most popular areas lying in the main coral garden
towards the outer edge of the Kisite anchorage area.
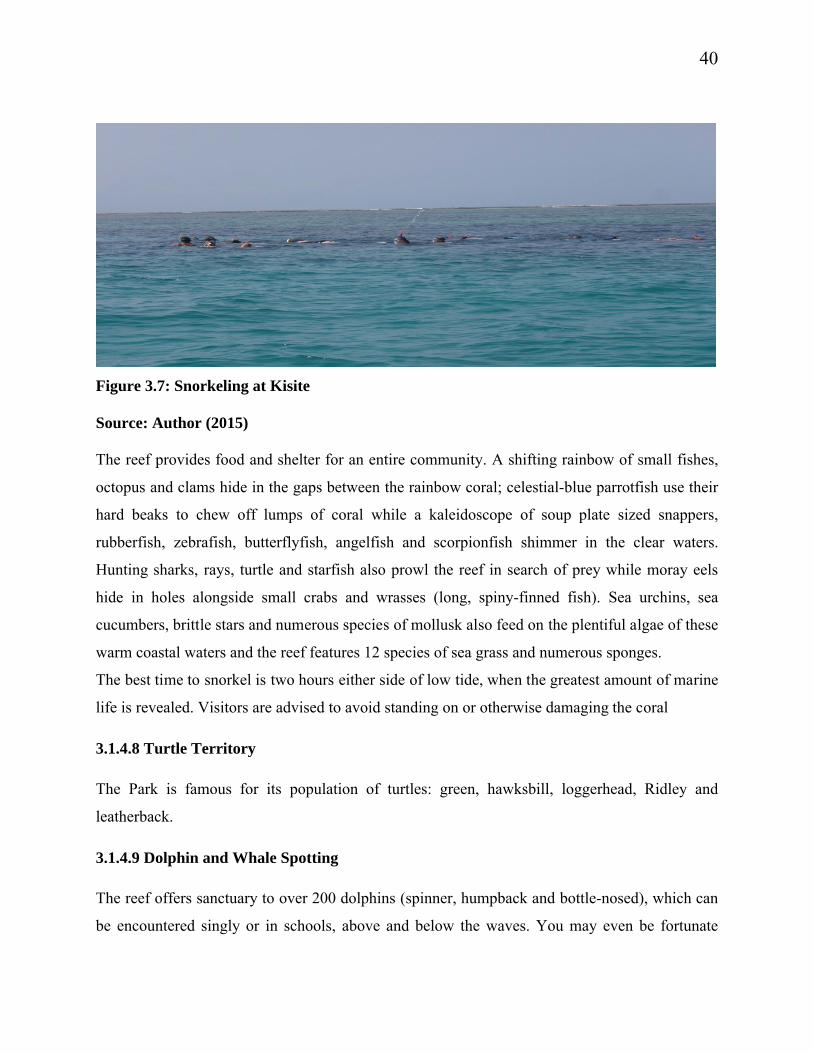
40
Figure 3.7: Snorkeling at Kisite
Source: Author (2015)
The reef provides food and shelter for an entire community. A shifting rainbow of small fishes,
octopus and clams hide in the gaps between the rainbow coral; celestial-blue parrotfish use their
hard beaks to chew off lumps of coral while a kaleidoscope of soup plate sized snappers,
rubberfish, zebrafish, butterflyfish, angelfish and scorpionfish shimmer in the clear waters.
Hunting sharks, rays, turtle and starfish also prowl the reef in search of prey while moray eels
hide in holes alongside small crabs and wrasses (long, spiny-finned fish). Sea urchins, sea
cucumbers, brittle stars and numerous species of mollusk also feed on the plentiful algae of these
warm coastal waters and the reef features 12 species of sea grass and numerous sponges.
The best time to snorkel is two hours either side of low tide, when the greatest amount of marine
life is revealed. Visitors are advised to avoid standing on or otherwise damaging the coral
3.1.4.8 Turtle Territory
The Park is famous for its population of turtles: green, hawksbill, loggerhead, Ridley and
leatherback.
3.1.4.9 Dolphin and Whale Spotting
The reef offers sanctuary to over 200 dolphins (spinner, humpback and bottle-nosed), which can
be encountered singly or in schools, above and below the waves. You may even be fortunate
41
enough to see a humpback whale (August-October). Whale sharks are often seen around the
Mpunguti islands.
3.2 Research DesignThis research utilized the descriptive survey design and case study research designs. These
designs were suitable for the study as Kothari (2008) notes that any research design chosen must
be rigid, make enough provision for protection against bias and maximize reliability. Case study
research method is an empirical inquiry that investigates a contemporary phenomenon within its
real-life context, when the boundaries between phenomenon and context are not clearly evident,
and in which multiple sources of evidence are used (Yin, 1984, p. 23). In addition, the case study
research design enabled the researcher to undertake a detailed study of the phenomena under
study in context and holistically (Kombo and Tromp, 2006).
The descriptive survey research design is a method of collecting information by asking questions
or administering questionnaires, and basically aims at describing the state of affairs in a study
area. The descriptive research design was used to describe systematically the facts and
characteristics of the study population and the issues under study factually and accurately. This is
because the aim of the study was to obtain complete and accurate information on the
determinants of perceived socio - economic tourism benefits accruing to local people living
adjacent to the Park and Reserve
3.3 Target Population
A population (also called a universe) is a group of measurements (not organisms) about which
one wishes to draw conclusions (Zar, 1999 p.16). The target population for this study was 8,300
people and included employees of KWS and local community members living adjacent to Kisite
Mpunguti Marine Park and Reserve.
3.4 Sampling Procedures
Simple random sampling was used to select respondents from the local community as well as
employees of KWS at Kisite Mpunguti Marine Park and Reserve. Simple random sampling
42
allowed for equal chances of selecting the desired representative sample, which was achieved
from a heterogeneous population.
3.5 Sample SizeThe formula of Krejcie (1970) given below was used to determine the sample size.
n = (χ2Npq) / [d2 (N-1) + χ2pq]
Where;
n= sample size desired
N= Target population
p= population proportion (take 0.5) and q= 1-0.5 = 0.5
χ2 = Chi square =3.841 at 95% confidence level.
d = significant level of 0.05
n= 3.841x 8300 x 0.5x0.5 / 0.0025 (8300-1) + 3.841 x 0.5x0.5
= 7970.075/ 21.7 = 367 respondents.
In total 367 respondents participated in this study.
Ratio of KWS employees 50/8300 x 367 =2 while for community 8250/8300 x 367 =365
3.6 Data Collection
3.6.1 Primary data
Structured questionnaires consisting of open and close ended questions were used to generate
data from heads of the randomly selected households or their representatives. For close ended
questions, the Likert scale consisting of a 5 point scale ranging from 1 = strongly disagree to 5 =
strongly agree was used to guide the respondents in choosing the most appropriate response to
statements seeking their opinion.
3.6.2 Secondary data
Secondary data was obtained from published and unpublished works among them textbooks,
journals, and other related works in libraries and the internet.
43
3.7 Data Analysis and PresentationData was analyzed using descriptive and inferential statistics.
3.7.1 Data processing
Data was edited for completeness, accuracy and uniformity, coded and entered into the Statistical
Package for Social Sciences (SPSS) for analysis.
3.7.2 Descriptive statistics
Descriptive analysis was done to determine frequency distributions, percentages and measures of
central tendency such as means.
3.7.3 Inferential Statistical Analysis
Further analysis of data was done using correlation and multiple regression. Correlation analysis
was used to show the degree of relationship among independent variable and dependent variables
while multiple regression was done to show the relationships between independent and
dependent variables in which the dependent variable was considered to be functionally
dependent upon at least one of the independent variables. In this relationship, Y (perceived
socio-economic tourism benefits accrued) and X (Determinants of) represented the dependent
and independent variables, respectively as indicated below.
y = a + b1x1 + b2x2 + b3x3 + ….. +bnxn…………………………………Equation 1
Where;
Y = Perceived socio – economic tourism benefits accrued
b1x1 - bnxn = Determinants of, that include Demographic characteristics,
Projects initiated, participation level and Government policy.
3.8 Reliability and Validity of Research InstrumentsStructured questionnaires were designed to validate content validity, face validity, criterion
validity and concurrent validity and were presented to the supervisors and other staff in the
department of Tourism Management for corrections. The corrected questionnaires were then
refined and polished to enhance validity and reliability before pre testing (piloting) them in the
study area. Using responses from the pilot study, the pretested questionnaires were then revised
and consequently administered to the 367 randomly selected respondents.
44
The questionnaire was edited in light of Cronbach’s alpha to determine reliability. This was done
by finding the Cronbach alpha of the scale used and the value was 0.854. If the Cronbach alpha
is more than 0.70 (Nunnall, 1978), then the scale was deemed reliable.
3.9 Ethical Considerations
Permission to carry out the study was sought from Kenya Wildlife Service and respondents who
participated in the study. The nature and rationale for the study were explained to the
respondents by the researcher. The researcher observed respect for the individuals’ rights and
safeguarded their personal integrity. Participants were not required to write their names on the
questionnaires, but each questionnaire was given a code number for reference, hence the
anonymity of the respondents was maintained. Participants were assured that the information
given would to be treated confidentially and used for academic purposes only. They were also
assured of their rights and freedom to withdraw from the study at any point or time without
consequences. Attempts were also made to include both males and females in the study.
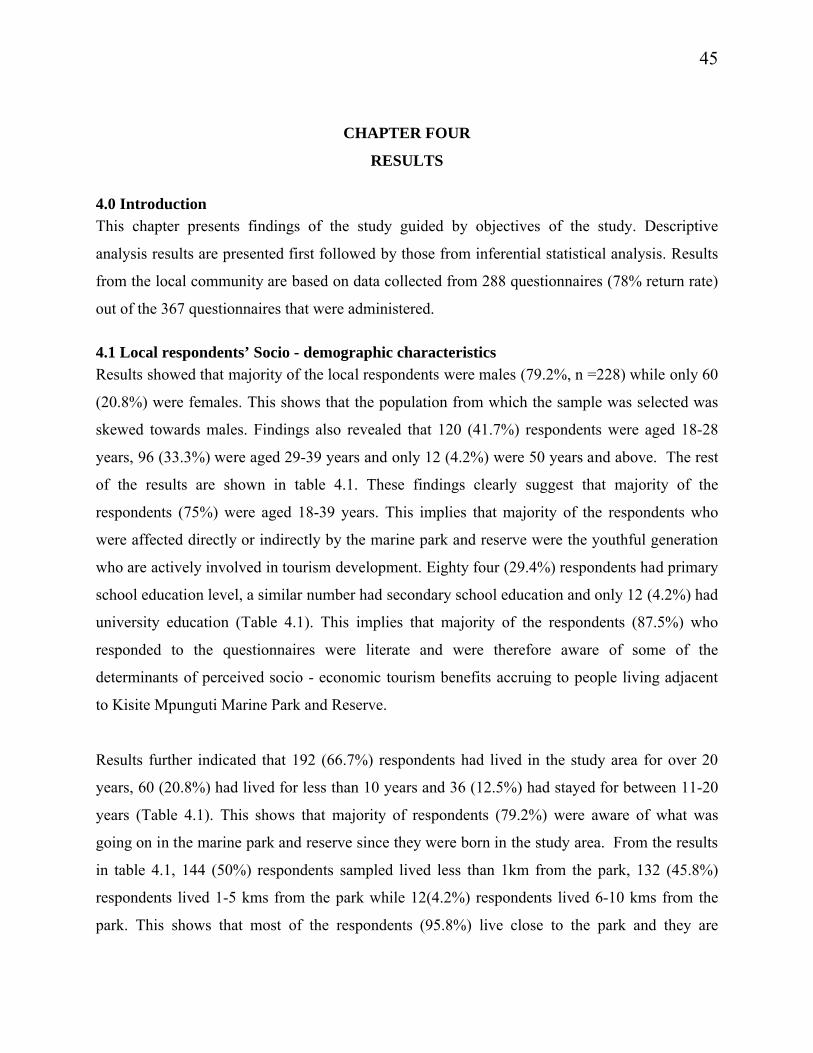
45
CHAPTER FOUR
RESULTS
4.0 IntroductionThis chapter presents findings of the study guided by objectives of the study. Descriptive
analysis results are presented first followed by those from inferential statistical analysis. Results
from the local community are based on data collected from 288 questionnaires (78% return rate)
out of the 367 questionnaires that were administered.
4.1 Local respondents’ Socio - demographic characteristicsResults showed that majority of the local respondents were males (79.2%, n =228) while only 60
(20.8%) were females. This shows that the population from which the sample was selected was
skewed towards males. Findings also revealed that 120 (41.7%) respondents were aged 18-28
years, 96 (33.3%) were aged 29-39 years and only 12 (4.2%) were 50 years and above. The rest
of the results are shown in table 4.1. These findings clearly suggest that majority of the
respondents (75%) were aged 18-39 years. This implies that majority of the respondents who
were affected directly or indirectly by the marine park and reserve were the youthful generation
who are actively involved in tourism development. Eighty four (29.4%) respondents had primary
school education level, a similar number had secondary school education and only 12 (4.2%) had
university education (Table 4.1). This implies that majority of the respondents (87.5%) who
responded to the questionnaires were literate and were therefore aware of some of the
determinants of perceived socio - economic tourism benefits accruing to people living adjacent
to Kisite Mpunguti Marine Park and Reserve.
Results further indicated that 192 (66.7%) respondents had lived in the study area for over 20
years, 60 (20.8%) had lived for less than 10 years and 36 (12.5%) had stayed for between 11-20
years (Table 4.1). This shows that majority of respondents (79.2%) were aware of what was
going on in the marine park and reserve since they were born in the study area. From the results
in table 4.1, 144 (50%) respondents sampled lived less than 1km from the park, 132 (45.8%)
respondents lived 1-5 kms from the park while 12(4.2%) respondents lived 6-10 kms from the
park. This shows that most of the respondents (95.8%) live close to the park and they are
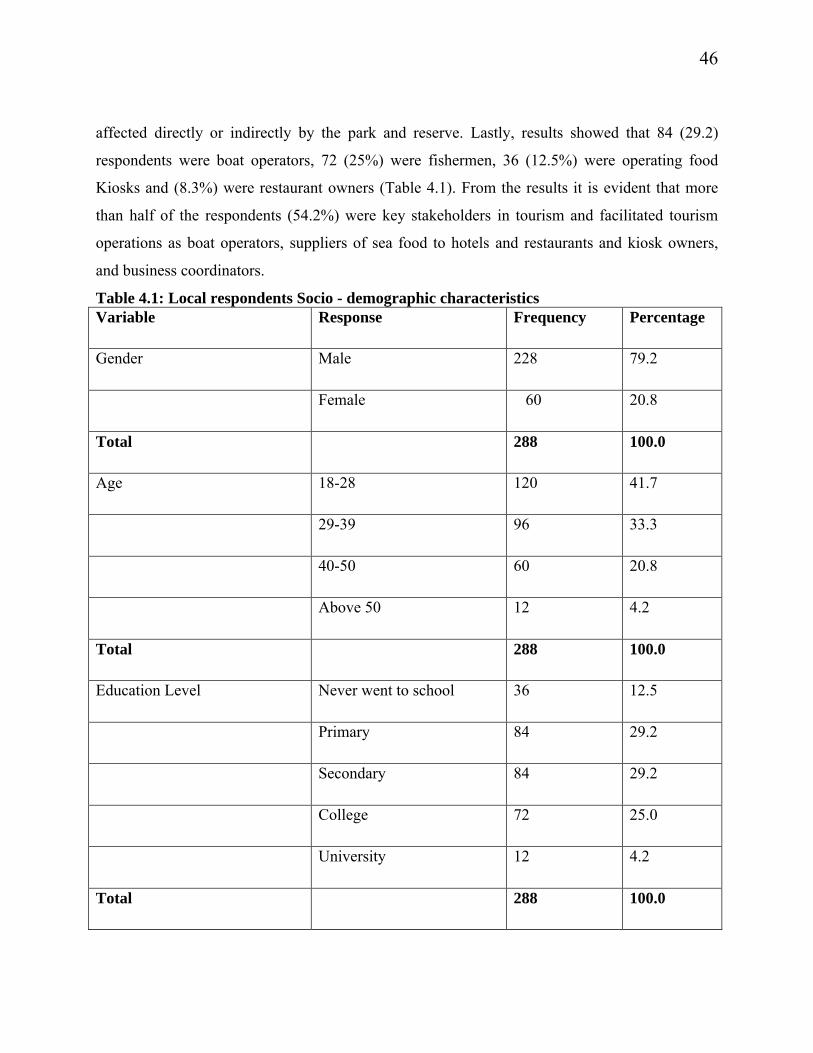
46
affected directly or indirectly by the park and reserve. Lastly, results showed that 84 (29.2)
respondents were boat operators, 72 (25%) were fishermen, 36 (12.5%) were operating food
Kiosks and (8.3%) were restaurant owners (Table 4.1). From the results it is evident that more
than half of the respondents (54.2%) were key stakeholders in tourism and facilitated tourism
operations as boat operators, suppliers of sea food to hotels and restaurants and kiosk owners,
and business coordinators.
Table 4.1: Local respondents Socio - demographic characteristicsVariable Response Frequency Percentage
Gender Male 228 79.2
Female 60 20.8
Total 288 100.0
Age 18-28 120 41.7
29-39 96 33.3
40-50 60 20.8
Above 50 12 4.2
Total 288 100.0
Education Level Never went to school 36 12.5
Primary 84 29.2
Secondary 84 29.2
College 72 25.0
University 12 4.2
Total 288 100.0
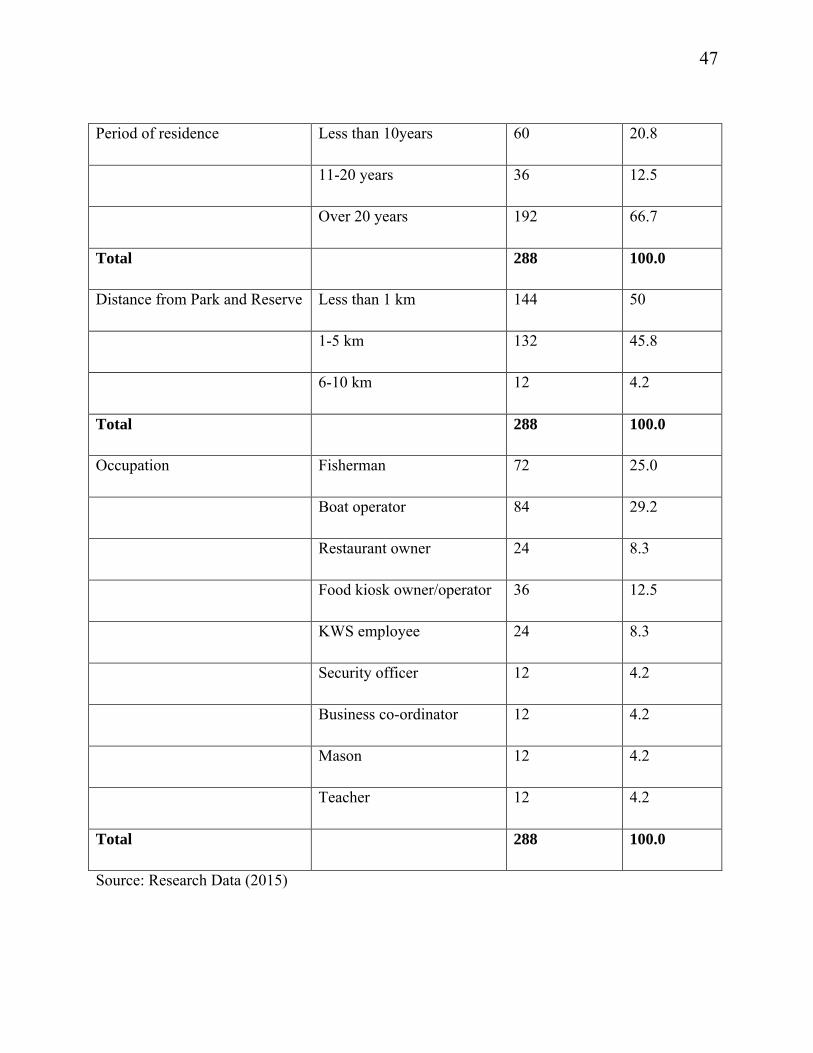
47
Period of residence Less than 10years 60 20.8
11-20 years 36 12.5
Over 20 years 192 66.7
Total 288 100.0
Distance from Park and Reserve Less than 1 km 144 50
1-5 km 132 45.8
6-10 km 12 4.2
Total 288 100.0
Occupation Fisherman 72 25.0
Boat operator 84 29.2
Restaurant owner 24 8.3
Food kiosk owner/operator 36 12.5
KWS employee 24 8.3
Security officer 12 4.2
Business co-ordinator 12 4.2
Mason 12 4.2
Teacher 12 4.2
Total 288 100.0
Source: Research Data (2015)
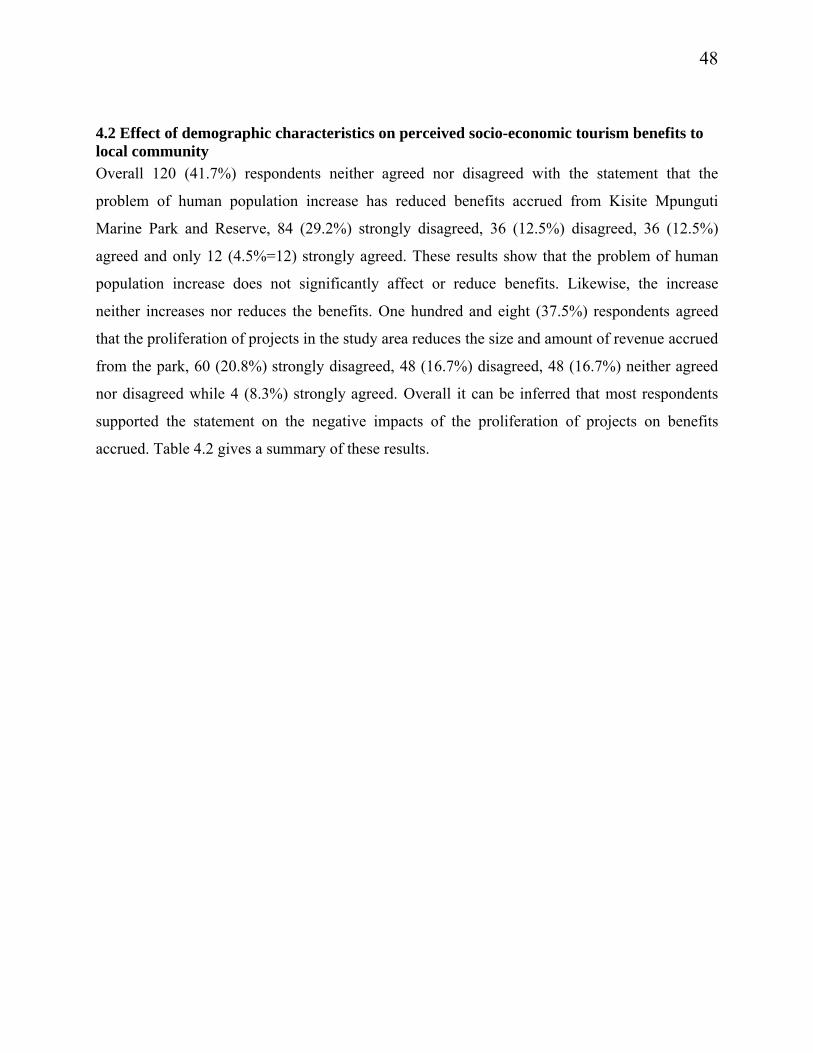
48
4.2 Effect of demographic characteristics on perceived socio-economic tourism benefits to local communityOverall 120 (41.7%) respondents neither agreed nor disagreed with the statement that the
problem of human population increase has reduced benefits accrued from Kisite Mpunguti
Marine Park and Reserve, 84 (29.2%) strongly disagreed, 36 (12.5%) disagreed, 36 (12.5%)
agreed and only 12 (4.5%=12) strongly agreed. These results show that the problem of human
population increase does not significantly affect or reduce benefits. Likewise, the increase
neither increases nor reduces the benefits. One hundred and eight (37.5%) respondents agreed
that the proliferation of projects in the study area reduces the size and amount of revenue accrued
from the park, 60 (20.8%) strongly disagreed, 48 (16.7%) disagreed, 48 (16.7%) neither agreed
nor disagreed while 4 (8.3%) strongly agreed. Overall it can be inferred that most respondents
supported the statement on the negative impacts of the proliferation of projects on benefits
accrued. Table 4.2 gives a summary of these results.
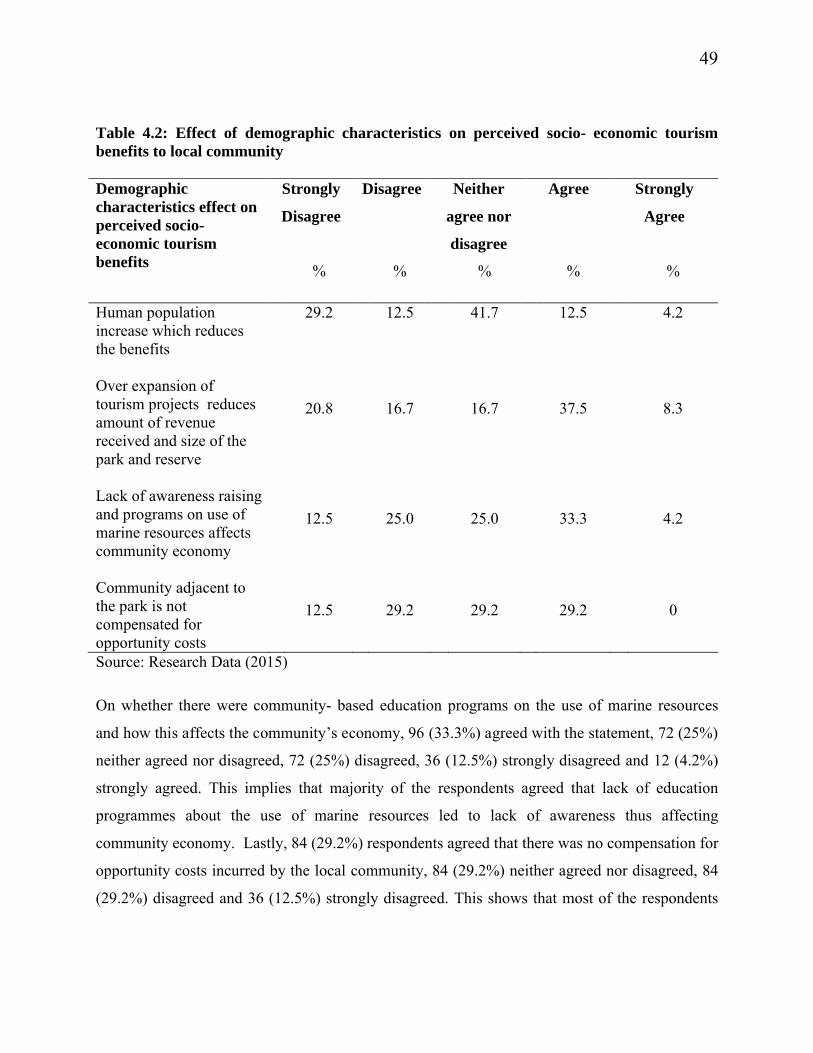
49
Table 4.2: Effect of demographic characteristics on perceived socio- economic tourism benefits to local community
Demographic characteristics effect on perceived socio-economic tourism benefits
Strongly
Disagree
Disagree Neither
agree nor
disagree
Agree Strongly
Agree
% % % % %
Human population increase which reduces the benefits
29.2 12.5 41.7 12.5 4.2
Over expansion of tourism projects reduces amount of revenue received and size of the park and reserve
20.8 16.7 16.7 37.5 8.3
Lack of awareness raising and programs on use of marine resources affects community economy
12.5 25.0 25.0 33.3 4.2
Community adjacent to the park is not compensated foropportunity costs
12.5 29.2 29.2 29.2 0
Source: Research Data (2015)
On whether there were community- based education programs on the use of marine resources
and how this affects the community’s economy, 96 (33.3%) agreed with the statement, 72 (25%)
neither agreed nor disagreed, 72 (25%) disagreed, 36 (12.5%) strongly disagreed and 12 (4.2%)
strongly agreed. This implies that majority of the respondents agreed that lack of education
programmes about the use of marine resources led to lack of awareness thus affecting
community economy. Lastly, 84 (29.2%) respondents agreed that there was no compensation for
opportunity costs incurred by the local community, 84 (29.2%) neither agreed nor disagreed, 84
(29.2%) disagreed and 36 (12.5%) strongly disagreed. This shows that most of the respondents
50
were non committal on the statement that the community living adjacent to the park and reserve
were not compensated for opportunity costs incurred.
4.3. Tourism projects, activities and benefits Accrued
4.3.1 Community based tourism projects
Respondents’ opinion on the emergence and development of community based tourism projects
in the study area showed that most of the respondents (66.7%) indicated that there were projects
established, 84 (29.2%) were not sure and 12 (4.2%) indicated they were not aware of the
existence of such projects (Table 4.3). This shows that most of the respondents acknowledged
that there are community based tourism projects which have benefited individuals within the
community.
Table 4.3 Views on community based tourism projects initiated in the areaViews on projects Frequency Percent
Yes 192 66.7
Not sure 84 29.2
No 12 4.2
Total 288 100.0
Source: Research Data (2015)
4.3.2 Benefits accruing from projects initiated and supported by Kenya Wildlife Service
Results on whether they benefited from projects initiated by Kisite Mpunguti Marine Park and
Reserve revealed that 204 (70.8%) respondents indicated that they benefited, 48(16.7%) were not
sure and 36 (12.5%) stated that they have not benefited from the projects (Figure 4.1).
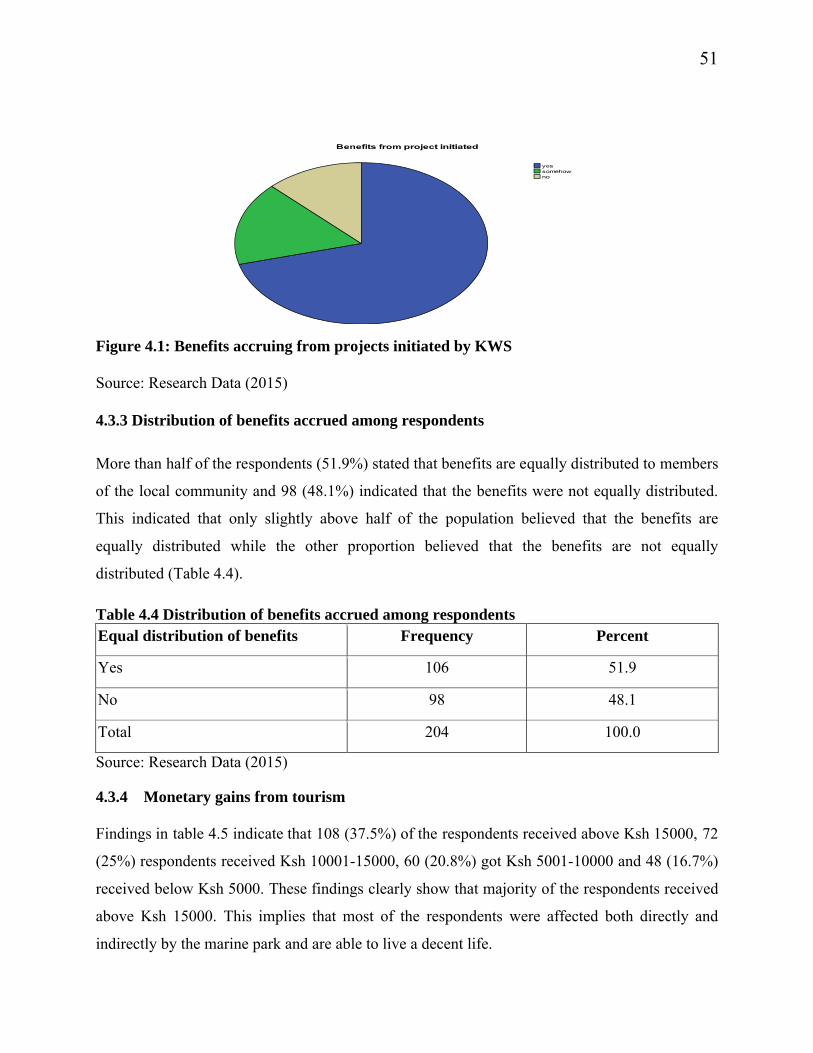
51
Figure 4.1: Benefits accruing from projects initiated by KWS
Source: Research Data (2015)
4.3.3 Distribution of benefits accrued among respondents
More than half of the respondents (51.9%) stated that benefits are equally distributed to members
of the local community and 98 (48.1%) indicated that the benefits were not equally distributed.
This indicated that only slightly above half of the population believed that the benefits are
equally distributed while the other proportion believed that the benefits are not equally
distributed (Table 4.4).
Table 4.4 Distribution of benefits accrued among respondentsEqual distribution of benefits Frequency Percent
Yes 106 51.9
No 98 48.1
Total 204 100.0
Source: Research Data (2015)
4.3.4 Monetary gains from tourism
Findings in table 4.5 indicate that 108 (37.5%) of the respondents received above Ksh 15000, 72
(25%) respondents received Ksh 10001-15000, 60 (20.8%) got Ksh 5001-10000 and 48 (16.7%)
received below Ksh 5000. These findings clearly show that majority of the respondents received
above Ksh 15000. This implies that most of the respondents were affected both directly and
indirectly by the marine park and are able to live a decent life.
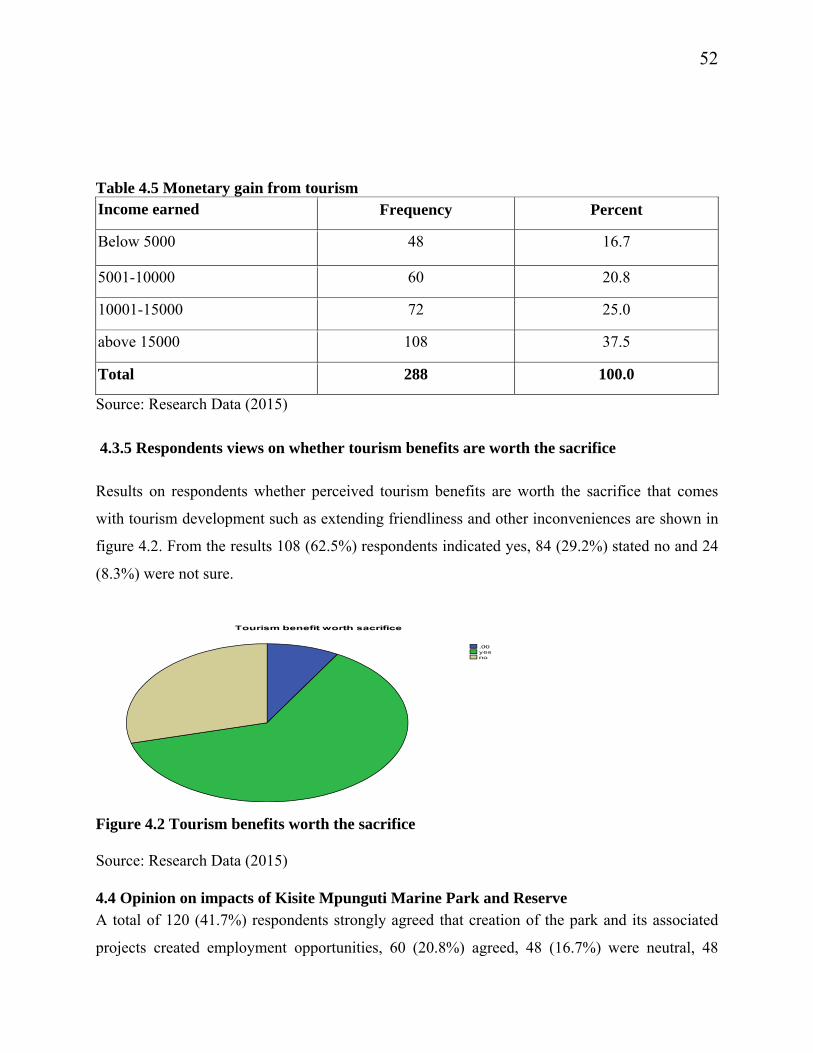
52
Table 4.5 Monetary gain from tourismIncome earned Frequency Percent
Below 5000 48 16.7
5001-10000 60 20.8
10001-15000 72 25.0
above 15000 108 37.5
Total 288 100.0
Source: Research Data (2015)
4.3.5 Respondents views on whether tourism benefits are worth the sacrifice
Results on respondents whether perceived tourism benefits are worth the sacrifice that comes
with tourism development such as extending friendliness and other inconveniences are shown in
figure 4.2. From the results 108 (62.5%) respondents indicated yes, 84 (29.2%) stated no and 24
(8.3%) were not sure.
Figure 4.2 Tourism benefits worth the sacrifice
Source: Research Data (2015)
4.4 Opinion on impacts of Kisite Mpunguti Marine Park and Reserve A total of 120 (41.7%) respondents strongly agreed that creation of the park and its associated
projects created employment opportunities, 60 (20.8%) agreed, 48 (16.7%) were neutral, 48
53
(16.7%) strongly disagreed and 12 (4.2%) disagreed with the statement on whether the marine
park had created employment. This implies that majority of respondents strongly agreed that
marine park has created employment opportunities. On the other hand 108 (37.5%) respondents
agreed that the park has raised standards of living, 72 (25%) strongly agreed, 48 (16.7%) neither
agreed nor disagreed and 12 (4.2%) strongly disagreed with the statement. This shows that a
large number of respondents (62.5%) were of the view that establishment of the park and reserve
has contributed to local peoples’ improved welfare. Most respondents (37.5%) neither agreed nor
disagreed that the marine park and reserve has facilitated donations and grants, 84 (29.2%)
agreed with the statement, 36 (12.5%) strongly disagreed while 24 (8.3%) strongly agreed. This
confirms that most of the respondents neither agreed nor disagreed that marine park has
facilitated donations and grants. Lastly, 132 (45.8%) respondents agreed that the marine park and
reserve has created opportunity for business investment, 84 (29.2%) strongly agreed, 60 (20.8%)
neither agreed nor disagreed, and only 12 (4.2%) strongly disagreed. This confirms that the
marine park and reserve has created opportunity for business investment. Table 4.6 gives a
summary of the results.
A total of 108 (37.5%) and 84 (29.2%) respondents agreed and strongly agreed respectively with
the statement that the marine park and reserve have improved the quality of life in the study area,
60 (20.8%) disagreed and 36 (12.5%) neither agreed nor disagreed with the statement (Table
4.6). Since 192 (66.7%) respondents generally agreed with the statement, this implies that the
marine park and reserve has improved quality of life among respondents.
More than one third (41.7%) of the respondents agreed with the statement that the marine park
management has helped establish and improve social amenities like schools and hospitals, 96
(33.3%) strongly agreed, 48 (16.7%) neither agreed nor disagreed while 12(4.2%) each strongly
disagreed and disagreed. This indicates that majority of the respondents (75%) agreed that the
management of the marine park and reserve has improved social amenities in the study area. On
the contrary, 58.3% of the respondents further agreed that the establishment of the park has
raised the cost of living, 60 (20.8%) strongly agreed, 24 (8.3%) respondents neither agreed nor
disagreed, 24 (8.3%, n=24) disagreed and only 12 (4.2%) strongly disagreed. This is an
54
indication that the establishment of the marine park has raised the cost of living in the study area.
Table 4.6 gives a summary of the above results.
Results revealed that 45.8% of the respondents neither agreed nor disagreed with the statement
that the establishment of the marine park and reserve had increased leakages, 20.8% agreed,
20.8% disagreed, 8.3% strongly agreed and 4.2% strongly disagreed (Table 4.5). This implies
that most respondents neither agreed nor disagreed with the statement on increased leakages.
Similarly 84 (29.2%) respondents strongly disagreed that the presence of the park had increased
school drop outs, 72 (25.0%) disagreed, 60 (20.8%) neither agreed nor disagreed, 36 (12.5%)
agreed and (12.5%) strongly agreed. This shows that more than half of the respondents (54.2%)
strongly disagreed that the marine park and reserve has increased the rate of school dropout in
the study area compared to other areas along the coast where young boys and girls drop out of
school to engage in tourism related business and activities.
One hundred and eight (37.5%) respondents neither agreed nor disagreed with the statement that
the park and reserve have resulted into overcrowding, 96 (33.3%) strongly disagreed, 48 (16.5%)
disagreed and 36 (12.5%) agreed (Table 4.6). This shows that half of the respondents (50%)
disagreed with the view that the marine park and reserve have resulted into overcrowding. This
could be explained by the fact that the study area is considered an excursion area where tourists
come from areas such as Diani or Mombasa for day trips and return to their hotels. Overnight
stays in the study area are very rare.
Lastly, 96 (33.3%) respondents disagreed with the statement that the presence of the park and
reserve has increased social evils like alcoholism and crime, 72 (25.0%) strongly disagreed,
75(25.0%) neither agreed nor disagreed, 24 (8.3%) agreed and 24 (8.3%) strongly agreed. This
implies that majority of the respondents disagreed that the KMMPR have increased social evils
(Table 4.6), and this could be attributed to the fact that there are neither overnight stays in the
study area nor frequent close interactions between local people and tourists.
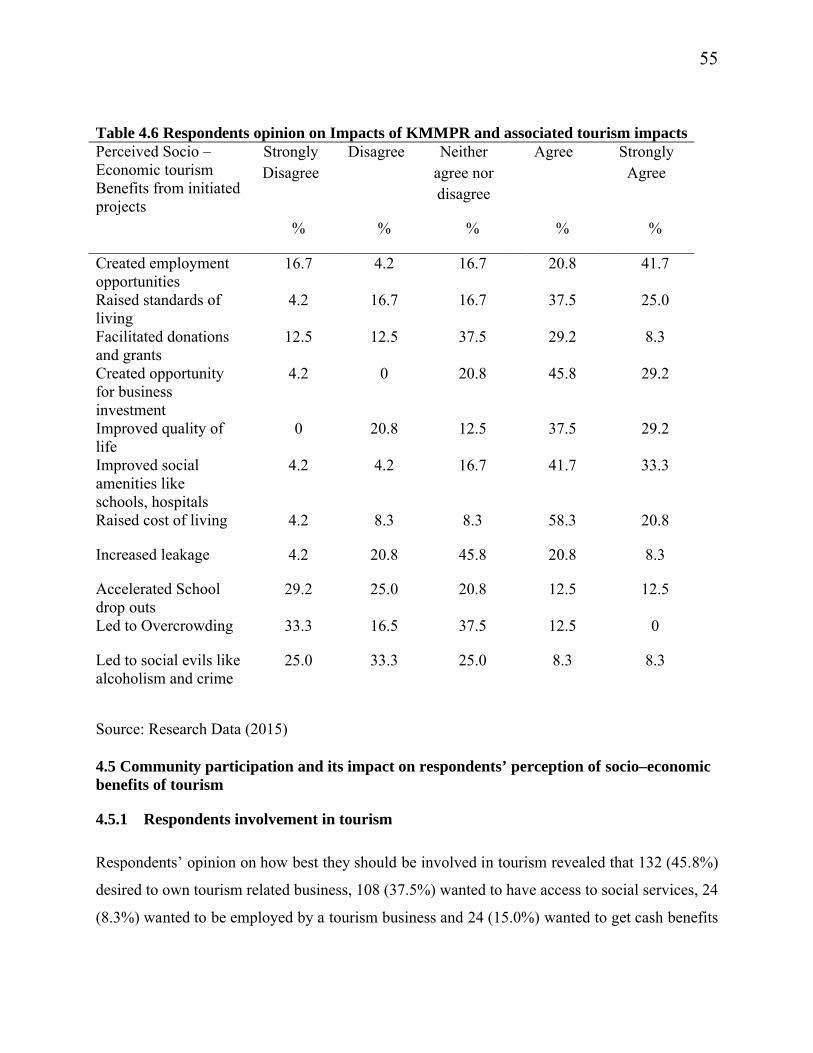
55
Table 4.6 Respondents opinion on Impacts of KMMPR and associated tourism impactsPerceived Socio –Economic tourism Benefits from initiated projects
Strongly Disagree
Disagree Neither agree nor disagree
Agree Strongly Agree
% % % % %
Created employment opportunities
16.7 4.2 16.7 20.8 41.7
Raised standards of living
4.2 16.7 16.7 37.5 25.0
Facilitated donations and grants
12.5 12.5 37.5 29.2 8.3
Created opportunity for business investment
4.2 0 20.8 45.8 29.2
Improved quality of life
0 20.8 12.5 37.5 29.2
Improved social amenities like schools, hospitals
4.2 4.2 16.7 41.7 33.3
Raised cost of living 4.2 8.3 8.3 58.3 20.8
Increased leakage 4.2 20.8 45.8 20.8 8.3
Accelerated School drop outs
29.2 25.0 20.8 12.5 12.5
Led to Overcrowding 33.3 16.5 37.5 12.5 0
Led to social evils like alcoholism and crime
25.0 33.3 25.0 8.3 8.3
Source: Research Data (2015)
4.5 Community participation and its impact on respondents’ perception of socio–economic benefits of tourism
4.5.1 Respondents involvement in tourism
Respondents’ opinion on how best they should be involved in tourism revealed that 132 (45.8%)
desired to own tourism related business, 108 (37.5%) wanted to have access to social services, 24
(8.3%) wanted to be employed by a tourism business and 24 (15.0%) wanted to get cash benefits
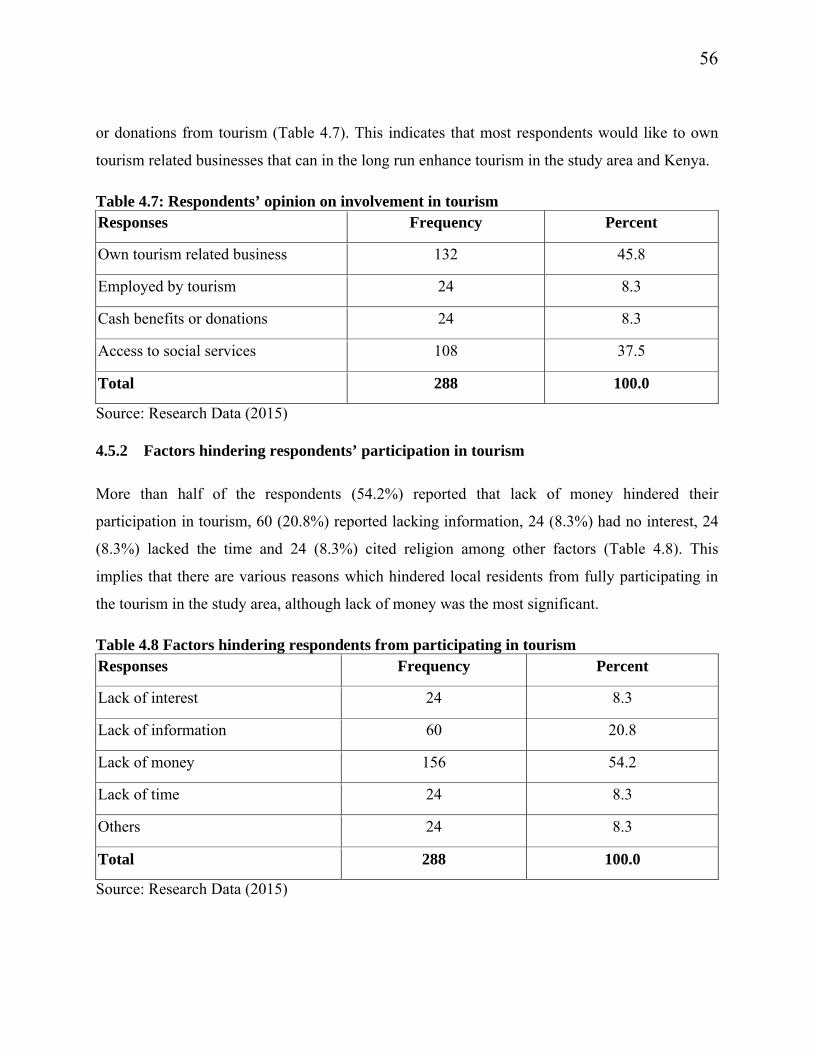
56
or donations from tourism (Table 4.7). This indicates that most respondents would like to own
tourism related businesses that can in the long run enhance tourism in the study area and Kenya.
Table 4.7: Respondents’ opinion on involvement in tourismResponses Frequency Percent
Own tourism related business 132 45.8
Employed by tourism 24 8.3
Cash benefits or donations 24 8.3
Access to social services 108 37.5
Total 288 100.0
Source: Research Data (2015)
4.5.2 Factors hindering respondents’ participation in tourism
More than half of the respondents (54.2%) reported that lack of money hindered their
participation in tourism, 60 (20.8%) reported lacking information, 24 (8.3%) had no interest, 24
(8.3%) lacked the time and 24 (8.3%) cited religion among other factors (Table 4.8). This
implies that there are various reasons which hindered local residents from fully participating in
the tourism in the study area, although lack of money was the most significant.
Table 4.8 Factors hindering respondents from participating in tourismResponses Frequency Percent
Lack of interest 24 8.3
Lack of information 60 20.8
Lack of money 156 54.2
Lack of time 24 8.3
Others 24 8.3
Total 288 100.0
Source: Research Data (2015)
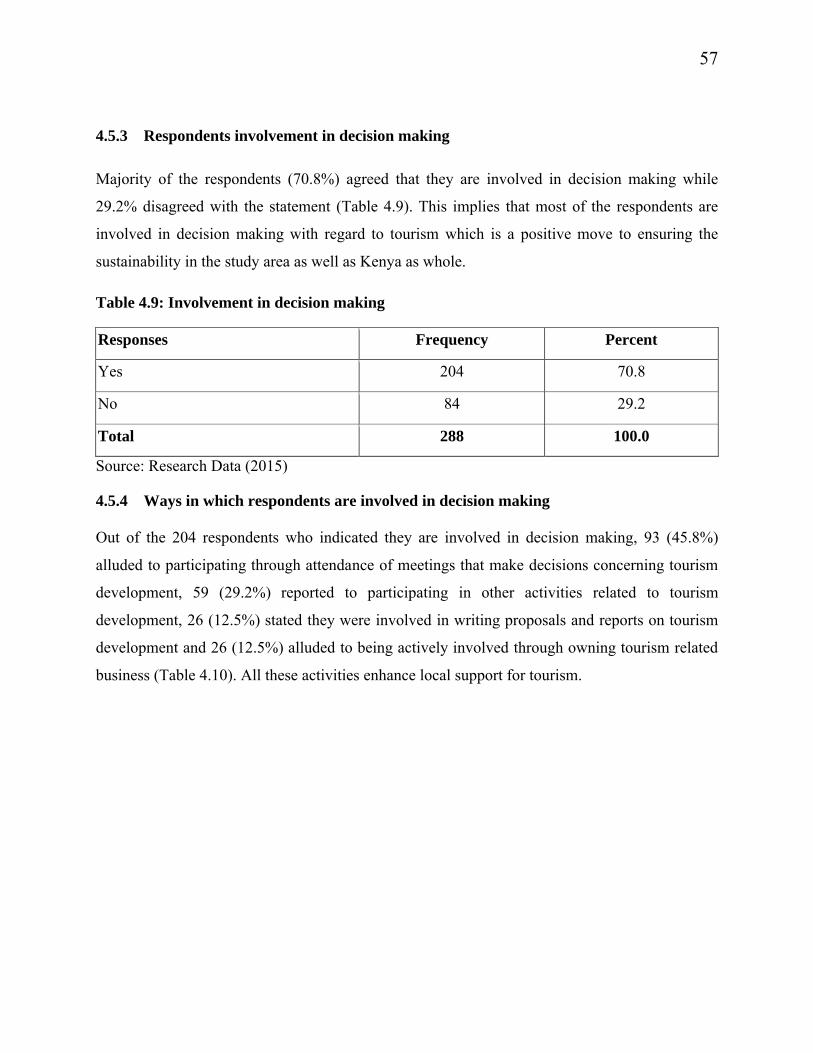
57
4.5.3 Respondents involvement in decision making
Majority of the respondents (70.8%) agreed that they are involved in decision making while
29.2% disagreed with the statement (Table 4.9). This implies that most of the respondents are
involved in decision making with regard to tourism which is a positive move to ensuring the
sustainability in the study area as well as Kenya as whole.
Table 4.9: Involvement in decision making
Responses Frequency Percent
Yes 204 70.8
No 84 29.2
Total 288 100.0
Source: Research Data (2015)
4.5.4 Ways in which respondents are involved in decision making
Out of the 204 respondents who indicated they are involved in decision making, 93 (45.8%)
alluded to participating through attendance of meetings that make decisions concerning tourism
development, 59 (29.2%) reported to participating in other activities related to tourism
development, 26 (12.5%) stated they were involved in writing proposals and reports on tourism
development and 26 (12.5%) alluded to being actively involved through owning tourism related
business (Table 4.10). All these activities enhance local support for tourism.
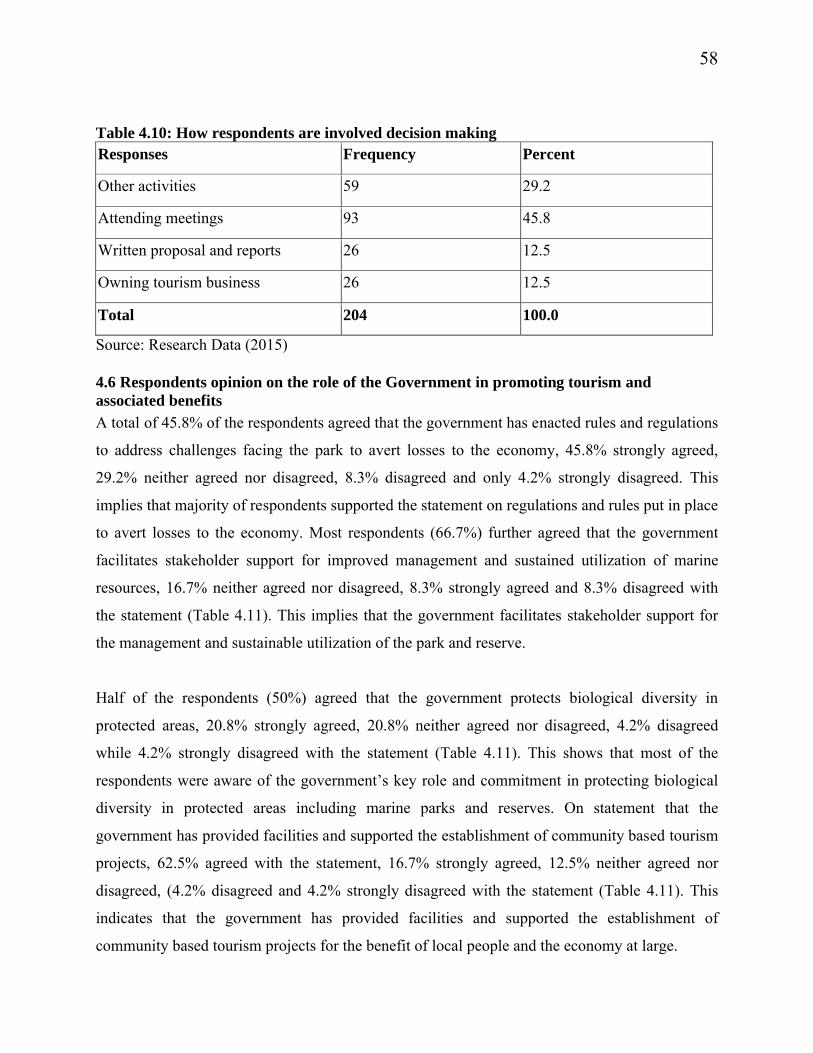
58
Table 4.10: How respondents are involved decision making Responses Frequency Percent
Other activities 59 29.2
Attending meetings 93 45.8
Written proposal and reports 26 12.5
Owning tourism business 26 12.5
Total 204 100.0
Source: Research Data (2015)
4.6 Respondents opinion on the role of the Government in promoting tourism andassociated benefitsA total of 45.8% of the respondents agreed that the government has enacted rules and regulations
to address challenges facing the park to avert losses to the economy, 45.8% strongly agreed,
29.2% neither agreed nor disagreed, 8.3% disagreed and only 4.2% strongly disagreed. This
implies that majority of respondents supported the statement on regulations and rules put in place
to avert losses to the economy. Most respondents (66.7%) further agreed that the government
facilitates stakeholder support for improved management and sustained utilization of marine
resources, 16.7% neither agreed nor disagreed, 8.3% strongly agreed and 8.3% disagreed with
the statement (Table 4.11). This implies that the government facilitates stakeholder support for
the management and sustainable utilization of the park and reserve.
Half of the respondents (50%) agreed that the government protects biological diversity in
protected areas, 20.8% strongly agreed, 20.8% neither agreed nor disagreed, 4.2% disagreed
while 4.2% strongly disagreed with the statement (Table 4.11). This shows that most of the
respondents were aware of the government’s key role and commitment in protecting biological
diversity in protected areas including marine parks and reserves. On statement that the
government has provided facilities and supported the establishment of community based tourism
projects, 62.5% agreed with the statement, 16.7% strongly agreed, 12.5% neither agreed nor
disagreed, (4.2% disagreed and 4.2% strongly disagreed with the statement (Table 4.11). This
indicates that the government has provided facilities and supported the establishment of
community based tourism projects for the benefit of local people and the economy at large.
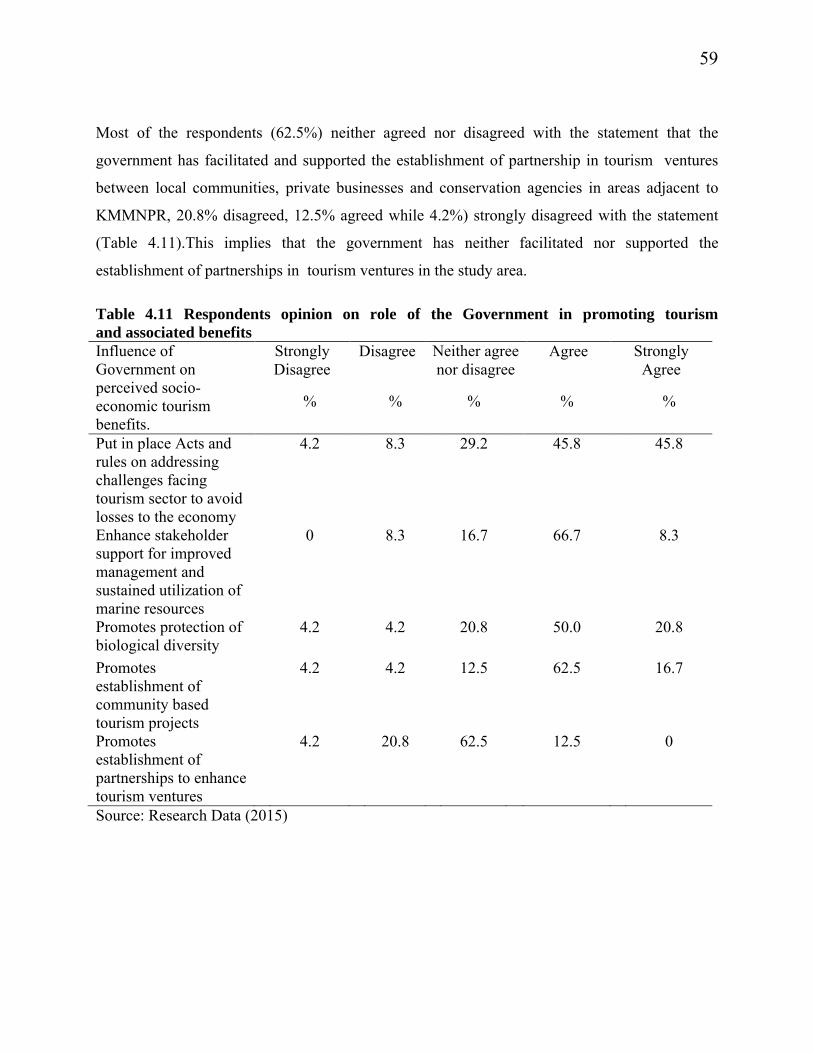
59
Most of the respondents (62.5%) neither agreed nor disagreed with the statement that the
government has facilitated and supported the establishment of partnership in tourism ventures
between local communities, private businesses and conservation agencies in areas adjacent to
KMMNPR, 20.8% disagreed, 12.5% agreed while 4.2%) strongly disagreed with the statement
(Table 4.11).This implies that the government has neither facilitated nor supported the
establishment of partnerships in tourism ventures in the study area.
Table 4.11 Respondents opinion on role of the Government in promoting tourism and associated benefitsInfluence of Government on perceived socio-economic tourism benefits.
Strongly Disagree
Disagree Neither agree nor disagree
Agree Strongly Agree
% % % % %
Put in place Acts and rules on addressing challenges facing tourism sector to avoid losses to the economy
4.2 8.3 29.2 45.8 45.8
Enhance stakeholder support for improved management and sustained utilization of marine resources
0 8.3 16.7 66.7 8.3
Promotes protection of biological diversity
4.2 4.2 20.8 50.0 20.8
Promotes establishment of community based tourism projects
4.2 4.2 12.5 62.5 16.7
Promotes establishment of partnerships to enhance tourism ventures
4.2 20.8 62.5 12.5 0
Source: Research Data (2015)
60
4.7 Pearson Correlation Coefficient Results
The Pearson Correlation Coefficient (Rs) test was used to analyze and establish the degree of
relationships between dependent and independent variables. The dependent variable was
perceived socio-economic tourism benefits accrued while the independent variables were;
initiated projects, demographic characteristics, government policy and participation levels of
individuals within the community. Results of correlation coefficients were significant among all
independent variables among them initiated tourism projects, demographic characteristics,
government policy, participation levels of individuals within the community and perceived
socio- economic tourism benefits at p < 0.01 (2-tailed). This indicates that the foregoing
variables have a positive effect on perceived socio-economic tourism benefits except
overcrowding which had negative/inverse relationship. Table 4.12 shows results of the
correlation matrix analysis.
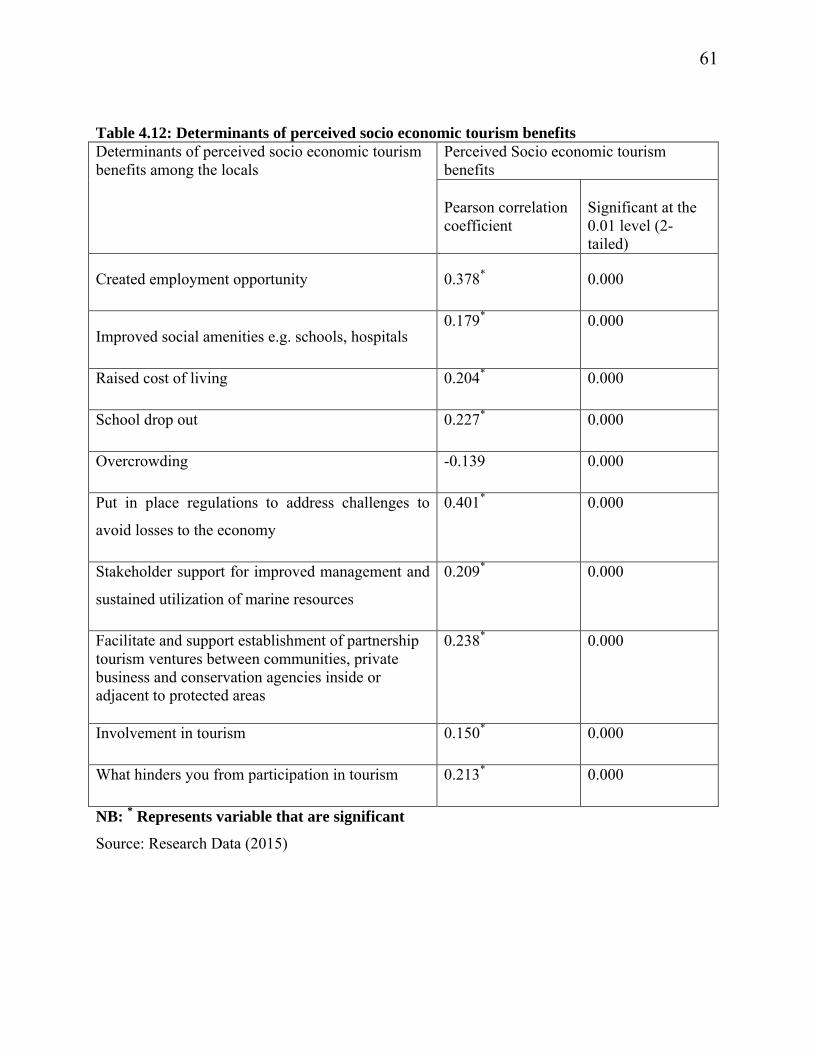
61
Table 4.12: Determinants of perceived socio economic tourism benefitsDeterminants of perceived socio economic tourism benefits among the locals
Perceived Socio economic tourism benefits
Pearson correlation coefficient
Significant at the 0.01 level (2-tailed)
Created employment opportunity 0.378* 0.000
Improved social amenities e.g. schools, hospitals0.179* 0.000
Raised cost of living 0.204* 0.000
School drop out 0.227* 0.000
Overcrowding -0.139 0.000
Put in place regulations to address challenges to
avoid losses to the economy
0.401* 0.000
Stakeholder support for improved management and
sustained utilization of marine resources
0.209* 0.000
Facilitate and support establishment of partnership tourism ventures between communities, private business and conservation agencies inside or adjacent to protected areas
0.238* 0.000
Involvement in tourism 0.150* 0.000
What hinders you from participation in tourism 0.213* 0.000
NB: * Represents variable that are significant
Source: Research Data (2015)
62
4.8 Cronbach's Alpha
The 37 items used in the questionnaire gave Cronbach's Alpha coefficient of 0.854 as shown in
appendix 2 which is above 0.70. Grouping of these items are based on independent variable it
measure; demographic characteristics 0.807, initiated projects 0.810, government policy 0.901
and participation level 0.899. Reliability analysis examines the homogeneity or cohesion of the
items that comprise each scale of independent variables and can predict the dependent variable.
Alpha coefficients reflect the average correlation among the items that constitute a scale. Ideally,
alphas should be between .70 and .90. Low alphas indicate poor internal consistency of a scale,
because the items that make up the scale are poorly related to each other. This can be
achieved through SPSS by click on Analyze => Scale => Reliability Analysis.
4.9 Results on Means and Standard Deviation
Results on respondents’ views on the statement on whether expansion of projects reduces size
and revenue revealed the highest mean of 4.00 and standard deviation of 0.818. The rest of the
mean results ranged between 2.083 and 3.833 with Standard deviations of 0.998 to 0.899 (Table
4.13). This indicates that initiated projects, demographics characteristics, government policy and
participation level play an important role in determining economic tourism benefits accruing to
local people living adjacent to KMMPR. However, on the statement that establishment of
partnership tourism ventures accordingly the Mean was the lowest at 2.083 with Standard
deviation of 0.998. This implies that establishment of partnership tourism ventures are not
realistic and therefore not achievable. This is indicated in table 4.16 below.
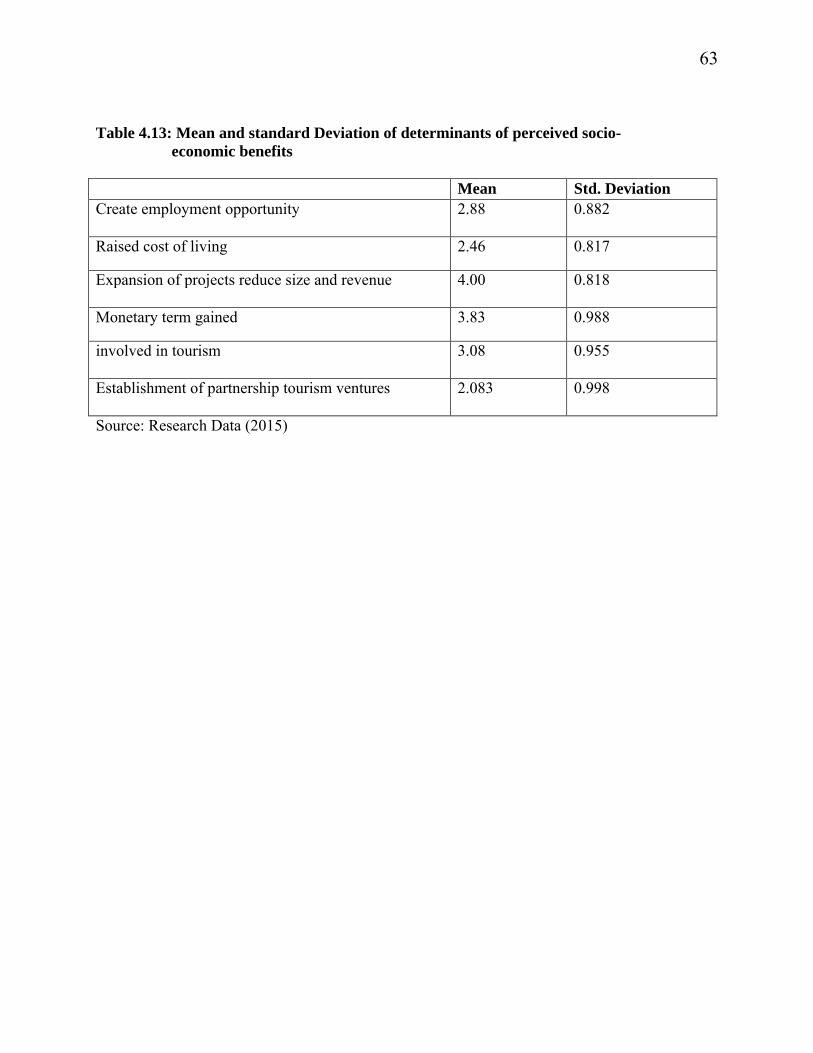
63
Table 4.13: Mean and standard Deviation of determinants of perceived socio- economic benefits
Mean Std. DeviationCreate employment opportunity 2.88 0.882
Raised cost of living 2.46 0.817
Expansion of projects reduce size and revenue 4.00 0.818
Monetary term gained 3.83 0.988
involved in tourism 3.08 0.955
Establishment of partnership tourism ventures 2.083 0.998
Source: Research Data (2015)
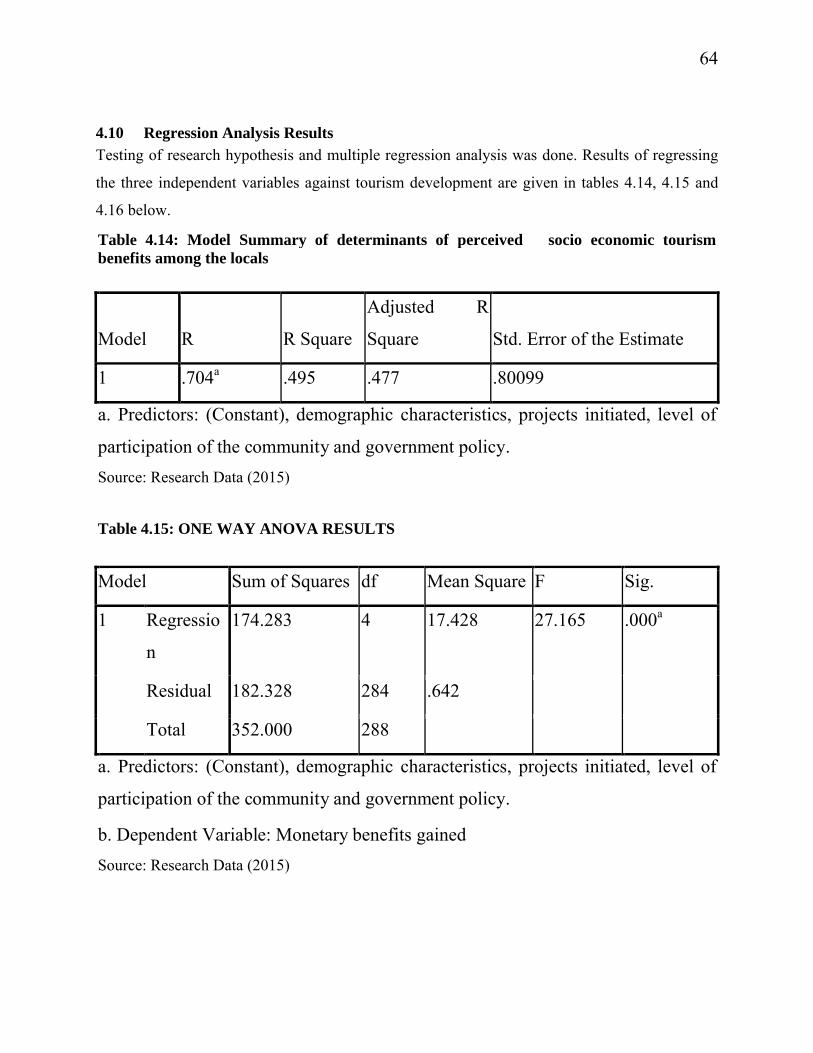
64
4.10 Regression Analysis ResultsTesting of research hypothesis and multiple regression analysis was done. Results of regressing
the three independent variables against tourism development are given in tables 4.14, 4.15 and
4.16 below.
Table 4.14: Model Summary of determinants of perceived socio economic tourism benefits among the locals
Model R R Square
Adjusted R
Square Std. Error of the Estimate
1 .704a .495 .477 .80099
a. Predictors: (Constant), demographic characteristics, projects initiated, level of
participation of the community and government policy.
Source: Research Data (2015)
Table 4.15: ONE WAY ANOVA RESULTS
Model Sum of Squares df Mean Square F Sig.
1 Regressio
n
174.283 4 17.428 27.165 .000a
Residual 182.328 284 .642
Total 352.000 288
a. Predictors: (Constant), demographic characteristics, projects initiated, level of
participation of the community and government policy.
b. Dependent Variable: Monetary benefits gained
Source: Research Data (2015)
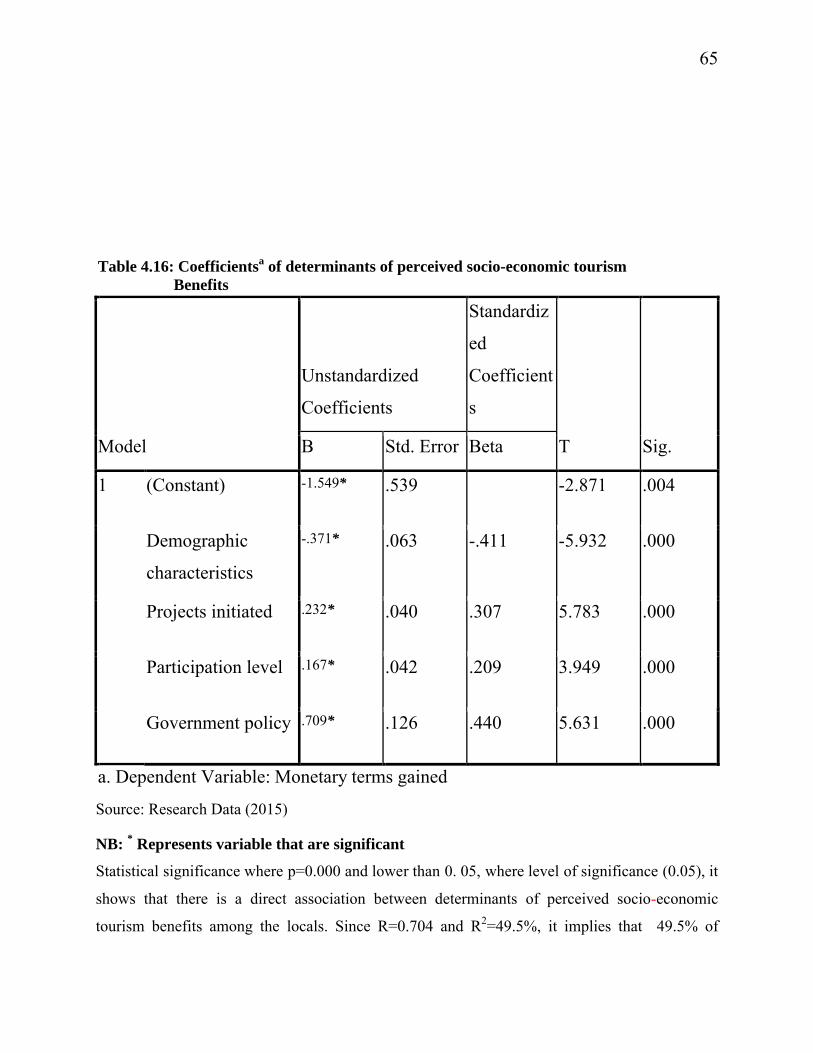
65
Table 4.16: Coefficientsa of determinants of perceived socio-economic tourism Benefits
Model
Unstandardized
Coefficients
Standardiz
ed
Coefficient
s
T Sig.B Std. Error Beta
1 (Constant) -1.549* .539 -2.871 .004
Demographic
characteristics
-.371* .063 -.411 -5.932 .000
Projects initiated .232* .040 .307 5.783 .000
Participation level .167* .042 .209 3.949 .000
Government policy .709* .126 .440 5.631 .000
a. Dependent Variable: Monetary terms gained
Source: Research Data (2015)
NB: * Represents variable that are significant
Statistical significance where p=0.000 and lower than 0. 05, where level of significance (0.05), it
shows that there is a direct association between determinants of perceived socio-economic
tourism benefits among the locals. Since R=0.704 and R2=49.5%, it implies that 49.5% of
66
variations in dependent variable is explained jointly by variations in independent variable. This
indicates a moderately high prediction power hence model is good for estimation. The residue
50.5% of variations is due to other factors including measurement errors.
ANOVA results (see table 4.15) further showed that the F value of 27.165 is significant at .0001
levels which implies that results of the four independent variables that were entered into the
regression model show R=0.704 as the correlation value of the three independent variables
regressed against the dependent variable after all the inter correlations among the four
independent variables were taken into account.
The regression equation used was:
y = a + b1x1 + b2x2 + b3x3 + b4x4
where ;
y = Perceived socio economic tourism benefits accrued,
a = intercept
x1 = Demographic characteristics
x2 = Projects initiated
x3 = Participation level
x4 = Government policy
Y = -1.549 – 0.411x1 + 0.307x2 + 0.209x3 +0.440x4
Average variance of demographic characteristics 0.818, initiated projects is 0.892, participation
0.955 and government policy 0.998.
Based on the above, it was observed that:
Y= -1.549– 0.336x1+ 0.274x2 + 0.1995 x3 +0.439x4
67
This shows that for every unit increase in demographic characteristics (x1), perceived socio
economic benefits accrued (Y) will be decreased by 0.336 when the other variables
are held constant. Also initiated projects (x2) will increase perceived socio
economic tourism benefits accrued (Y) by 0.274 while Participation level (x3) and
government policy (x4) will increase perceived socio economic tourism benefits
accrued (Y) by 0.1995 and 0.439 respectively.
4.11 Qualitative Analysis ResultsOn the statement whether respondents thought perceived tourism benefits accrued were worth
the sacrifice that came with tourism development, 62.5% of the population stated it was worth
the sacrifice, while 29.2% indicated that it was not worth the sacrifice since tourists are from
diverse cultures and hence they in most cases negatively influence the younger generations
behavior, the remaining 8.3% were not sure as to wether or not the benefits were worth the
sacrifice. To counter the conflict between the community and the management over resources
from the park, respondents gave the following suggestions; 8% suggested that the area gazetted
as park should be reduced so that there more fishing grounds closer to the breeding grounds ,
40% said that adequate information should be provided to the community on operations of the
marine park so that there is better understanding among the two parties and 52% of local
residents said that they should be involved in making decisions pertaining to the operations of
the marine protected area.
With regards to implementation of articulated sectoral development policy strategies and plans of
action by the central and county governments, respondents gave the following suggestions; 10%
stated that roads leading to the marine parks should be tarmarked, 2% said foreign investors in
the tourism sector should be encouraged to invest on modern accommodation facilities and other
infrastructure and 78% said that the community should be empowered economically using the
development fund.
The following suggestions were given on the issue of how tourism development can be improved
to help the local communities: 28% said that all the stakeholders should be involved in tourism
development , 6% said that the beach should be clean ,a further 18% said that security in the

68
study area should be improved,14% said equal distribution of benefits from Marine Park to local
communities should be looked into, 8% said that a tourism officer from the ministry should be
assigned in the area to oversee tourism operations and 26% said that by encouraging overnight
stays by tourists in the area there would be prolonged benefits from the tourists .
69
CHAPTER FIVE
DISCUSSION, CONCLUSIONS AND RECOMMENDATIONS
5.0 IntroductionThis chapter presents the discussion on findings of the study. The previous four chapters
provided the premise of this study which investigated the determinants of perceived socio -
economic tourism benefits accruing to the local community living adjacent to Kisite Mpunguti
Marine Park and Reserve. This chapter is organized in three sections: discussion, conclusions
and recommendations.
5.1 Discussion
5.1.1 Respondents’ demographic characteristics and their effect on perceived socio-
economic tourism benefits
Results showed that the community living adjacent to Kisite Mpunguti Marine Park and Reserve
consists mainly of young and energetic men aged between 18 – 28 years who are actively
involved in tourism activities. The cultural beliefs of the coastal people are that women are not
supposed to work, and they are supposed to stay at home since their husbands provide for the
family. This could be the reason why there is a small percentage of women involved in tourism
compared to men. The small percentage of women is represented by women who have come
from other areas to work in tourism enterprises, and hence they are not permanent residents in
the area. This could be explained by the fact that the indigenous community was still
conservative in nature. The other reason could be the nature of work that the community engages
in. For instance the fact that most respondents were boat operators and fishermen may explain
why the study sample was mainly, composed of men, since in most cases these two jobs are done
by men. However, in other occupations like operation of food kiosks and restaurants, both men
and women were involved in their operation. These results concur with those of Masudur (2010)
who contends that most of the core employees in the tourism industry are male, while other jobs
like cleaning, washing, serving and receptionist are traditionally associated with females.
In terms of level of education, most of the respondents had atleast attained secondary education,
which implies that a majority of the respondents are literate, and were therefore aware of some of
70
the determinants of socio – economic tourism benefits, and hence could give a clear picture of
the state of things in the area. As such they were able to identify and describe some of the socio-
economic benefits accruing from the two marine protected areas such as creation of employment
opportunities, creation of opportunities for business, improved standards of living and access to
social amenities such as hospitals and schools and hence support for tourism development. The
results concur with those of Torn et al. (2008) whereby the respondents with intermediate or
higher education level supported nature conservation and tourism development.
With regards to length of stay in the area most respondents indicated that they had lived in the
area for over 20 years, a period long enough for them to make a good decision of whether or not
they have benefited from the existence of the marine park and reserve. With regard to distance of
residence from the marine park, results indicated that the closer one lives to the park, the more
likely they are to benefit and the further away they are from the protected area the less benefits
they will get. This is because the closer one is to the protected area the more contact they have
with tourists through work. The findings also concur with those of Torn et al. (2008) who
indicated that support for nature conservation and tourism development is in most cases by
respondents with more contact with tourists than those with minimal or no contact with them.
About half of the respondents agreed that expansion of some projects in the community like the
locally managed marine area reduces revenue for the park, since this would lead to competition
due to the fact that it’s the community that takes the tourists to the park. This change can easily
divert them to the locally managed marine area. This would mean that the marine park would
lose the revenue which helps it in managing the park and reserve. The other half of the
population was of the view that this would earn them extra revenue and therefore would not
affect the revenue accruing from the park. Respondents living adjacent to the marine park
disagreed to the fact that they are not compensated for opportunity cost. This could be as a result
of different business opportunities and jobs that offer them alternative livelihoods. They also
indicated that there was need for rural based education so that there is reduced conflict between
the park management and the community.
71
5.1.2 Impact of tourism projects on perceived socio-economic tourism benefitMajority of the respondents were aware of the existence of different community based projects
and the benefits accruing from them, and they were also of the opinion that the benefits were
equally distributed among them. This could be explained by the fact that direct and indirect
employment opportunities have been created and the monetary gains from such projects such as
jobs are above average. Other indicators of equal distribution of benefits were improved quality
of life, raised standards of living, created opportunity for business investment and finally
improvement in social amenities like schools and hospitals. These results are contrary to those of
Masudur (2010) who stated that the development of tourism brings economic benefits to a local
community in the form of employment opportunities, increased income, and development of
small and medium size enterprises although the benefits are unevenly distributed among local
and non local people. The most likely reason could be the fact that in the study area there are few
investments by foreigners which means less leakages. Large scale investment by foreigners
means that they will employ people from their countries in managerial positions leaving the low
paying jobs to locals, and hence the perceptions.
On the contrary, respondents however indicated that the existence of the different tourist
activities in the study area has raised the standards of living of the local community since most
commodities including food and non food products are very expensive as compared to other
areas that are not engaged in tourism. Despite this, a small proportion of the community
indicated that most restaurants are owned and managed by outsiders and not indigenous people.
Hence a considerable amount of money leaks out. Another proportion of respondents disagreed
and indicated that as long as they employ a good number of indigenous community members, it
is good for them since they are not able to open up their own restaurants due to the huge capital
requirement.
A study by Masudur (2010) in Cox’s Bazaar in Bangladesh on socio-economic impacts of
tourism revealed that most tourism employees are unskilled and semi-skilled. Consequently, lack
of skilled labour in tourist destinations forces local or foreign entrepreneurs to recruit trained and
skilled employees from abroad who receive more financial benefits and get higher positions. The
low status and low wage jobs are generally left for the local communities. This situation creates
72
barriers to local community participation, creates conflict between local and foreign employees,
and puts pressure on local community social services. This has therefore been a disincentive to
local community participation in tourism development in the study area.
Majority of the respondents disagreed with the statements that tourism has led to school drop out,
overcrowding and social evils like prostitution, alcoholism and crime. When compared to other
tourists areas along the coastline such as Mtwapa, Diani and Malindi where young men and
women leave school to engage in tourism activities as well as migration of men and women
from upcountry to engage in prostitution, drugs and crime, the community bordering KMMPR is
not affected by these factors and vices. This can be explained by the fact that there are no
overnight stays in the area by tourists, since the area is considered as an excursion destination
only. This is contrary to a study by Edward (2013) who admitted that tourism in Mombasa has
brought about sex tourism and crime but if well planned the tourism evils could be controlled.
5.1.3 Effect of community participation on perceived socio- economic tourism benefits Majority of the respondents were willing to own tourism related business since this was viewed
as a means one would get direct benefits, as opposed to being employed, since the benefits from
the later are less. The rest of the respondents preferred to have access to social services like
schools and hospitals which are very basic services. Respondents further indicated that there are
a number of reasons which hinder individuals in the community from participating fully in the
tourism sector. Among the reasons listed is lack of money to start their own businesses, and
inadequate information on how they could be involved in tourism.
Most of the respondents stated that they are involved in decision making with regard to tourism
in the study area mainly through meetings. These results differ with those of Masudur (2010)
which indicated that government policy makers do not consult with local people while
formulating policies, and generally follow a closed-door approach in making decisions and do
not seek suggestions from local community. Results showed that even during the implementation
phases of tourism projects and programmes, local people are hardly consulted to express their
opinions or give suggestions due to lack of interest by local government officials in them.
Consequently, local people feel that they are totally excluded from tourism and the development
73
process which are being developed for them. This finding is consistent with that of Feighery
(2008) who reports that in China local communities are more often negated and excluded from
the planning process. For instance, the local people of Cox’s Bazar believe that this exclusion is
one of the main reasons for not getting proper benefits. This study has further indicated that in
many cases local people find it difficult to start their business due to lack of capital and
entrepreneurial skills.
Respondents contended that lack of political empowerment was a major constraint to ensuring
that proper benefits from tourism development reached most of the local people, and majority of
the people had the desire to get more benefits like non-locals and tourists who get most of the
benefits. In spite of such desire they are not very aggressive to get more benefits from tourism
development since unlike the non-locals have the required capital, skills and knowledge to get
jobs or to establish their business, they have none of these. However, they believe that without
contributions from non-local residents development of tourism in the study area would not take
place. They were also hopeful that in future they would get more benefits from tourism like local
residents in Bangladesh. The government of Bangladesh and non-local entrepreneurs took the
initiative and appropriate measures to spread more benefits to local communities.
5.1.4 Effect of government policy on perceived socio- economic tourism benefits Majority of the respondents indicated that the government has put in place legal instruments like
Acts and other appropriate measures to address challenges like illegal fishing to minimize losses
to the economy. They also contended that the government through KWS has provided
stakeholder support for improved management and sustainable utilization of marine resources
and ecosystems by through different means like dialogues, conservation education and capacity
building through training. Majority of the respondents indicated that the government has
protected biological diversity which has led to sustained fish stocks and the, continued
availability of fish to fishermen. In areas where the marine area is not protected for instance
Diani - Chale marine reserve, there is destruction of fish breeding grounds and hence a
significant reduction in fisheries resources. The government has also facilitated and supported
the establishment of partnership tourism ventures between communities, private business and
74
conservation agencies inside or adjacent to the two protected areas through education, capacity
building and marketing the tourism projects alongside the marine park.
Findings of a study conducted in Bangladesh by Masudur (2010) indicated that government
policy makers believe that tourism can make a significant contribution by ensuring increased
private and foreign investment, creating employment, reducing poverty and by promoting small
and medium businesses. According to the study the government of Bangladesh formulates the
policy to materialize the aforementioned through specific strategies among them involving more
private sector interests to utilize tourism opportunities, phasing out the public sector investment
step-by-step to facilitate private sector involvement, considering tourism as a separate and
distinct industry, increasing fund allocation to build appropriate infrastructure, providing
incentives for increased local and foreign investment, taking right steps to promote conservation
of nature and tourist spots, considering special areas and islands for creation of modern amenities
for foreign tourists, providing marketing facilities to promote small-scale businesses, assisting
government for both public and private initiatives aiming professional skill building endeavors,
establishing more accommodation and other tourist facilities for mid-income and low-income
domestic tourists, and allocating adequate budget for activities targeting both domestic and
foreign tourists. These policies, measures and incentives if adopted by the Government of Kenya
and other stakeholders including marine protected area staff can go a long way in promoting
tourism, local development and community welfare in the study area.
Statistical results on relationship between perceived socio - economic tourism benefits accrued
and initiated projects, government policy and participation levels of individuals within the
community in tourism showed that all the correlations were positive among all the variables
tested at p < 0.01 (2-tailed). This implies that respondents and the local community in general
have a positive attitude towards tourism and its perceived socio economic benefits and effects
except overcrowding which had negative or inverse relationship.
75
5.2 Conclusion
The local community has benefited from the existence of the KMMPR through employment,
improved standards of living and improved access to social amenities like schools and hospitals.
Despite this, there are also negative impacts that were identified key among them increased cost
of living due to increased cost of commodities and also the cost of land. In spite of these negative
impacts the local community supports the establishment of the MPA because the costs are
outweighed by the benefits.
Compensating the local community for foregoing their traditional livelihood which encompassed
fishing through creating employment opportunities, empowering the local community financially
to start their own businesses and also improving fish catch through protection of breeding
grounds has made the communities view tourism in the marine protected area to have a positive
effect, since they feel they have not lost by foregoing their livelihood but instead have benefitted
from the establishment of the MPA.
The government through Kenya Wildlife Service has formulated policies and enacted laws to
curb illegal activities within the park and reserve as a way of protecting the biodiversity in the
study area. The government has also involved different stakeholders in the day to day operations
of the two marine protected areas as a way of securing local support for the improved
management and sustained utilization of marine resources.
5.3 Recommendations
5.3.1 Policy and Management Recommendations
There is need for KWS to educate the local people on sustainable management and
conservation of the two marine protected areas and their biodiversity, as well as wise use of
marine resources.. This public awareness can be enhanced through holding of public
hearings, mounting posters in business areas and schools, seminars, workshops and
introduction of classes in local schools that have tourism and conservation clubs and
activities. Through awareness creation local people’s appreciation for tourism will be
76
enhanced thus making them view tourism as an important economic activity that can confer
diverse benefits to the people, and reduces the possibility of resource use conflicts occurring.
Involving the local communities in decision making will make them feel that they are part of
the team and therefore they will fully support the existence of the MPA and this will reduce
the conflicts between the management of the park and reserve and local community. This is
important because the community will have a sense of ownership of any tourism projects and
initiatives that are implemented.
There is also the need to improve infrastructure by for instance tarmacking the roads leading
to the marine parks, and encouraging foreign investors in the tourism sector to invest mostly
in the accommodation sector so that they can encourage overnight stays. This will help
increase circulation of money within the community for longer periods and also more
employment opportunities, as opposed to the day trips.
The government should make it easy for local community to access credit facilities and get
cheaper loans as an incentive to encourage local people to start and own tourism related
businesses hence reducing leakages. This can be enhanced if a tourism officer from the
ministry is posted to the study area to oversee all tourism activities in the area.
The government should also improve security in the study area to attract more investors and
tourists.
5.3.2 Recommendations for Further ResearchFurther research should be undertaken to:
Assess the influence of culture on perceived socio - economic benefits since the
respondents did not come out clearly on whether the perceived tourism benefits are
worth the sacrifice that comes with tourism development, such as extending friendliness
and other inconveniences. Respondents exhibited a mixed signal with some
acknowledging that although tourism destroys the cultural values of the community, it is
allowed since it generates many benefits, while others opposed its development because
of the vices associated with it, and in a way they did not want to be seen as doing
something wrong and yet they get benefit from it.

77
Assess if benefits derived from Kisite-Mpunguti Marine Park and Reserve and associated
tourism have improved local people’s welfare and development of the study area.
78
REFERENCES
Allison, E.H. and Ellis, F. (2001). The livelihoods approach and management of small scale fisheries. Marine Policy 25: 377–388.
Andereck, K.M., Valentine, K.M., Knopf, R.C. and Vogt, C.A. (2005). Residents’ perception of community tourism impacts. Annals of tourism research 32, 1056-1076
Ap. J. (1992). Residents perception on Tourism Impacts. Annals of Tourism Research, 19 (3) 665-690.
Ap, J and Crompton, J.L. (1993). Residents Strategies for Responding to Tourism impacts, Journal Impacts. Journal of Travel Research 31 (3), pp 47-50.
Ap, J. and Crompton, J. L. (1998). Developing and testing tourism Impact Scale. Journal of Travel Research 37 (2), 130-138.
Balmford, A. (2001). Can we afford to conserve biodiversity? Bioscience 51, 43–52
Brunt, p. and Courtney, P. (1999). Host Perception of Socio – Cultural Impacts. Annals ofTourism Research 26(2), pp 493-515
Butler, R. and Hinch, T. (2007). Tourism and indigenous peoples: Issues and implications. Butterworth – Heinemann.
Constanza, R. (1997). The values of the world‘s ecosystem services and natural capital. Nature 387, 253-260.
Eagles, P, and Haynes, C. (2002). Sustainable tourism in protected areas: Guidelines for planning and management. IUCN, the United Nations Environment Programme and the World Tourism Organization, Gland, Switzerland, and Cambridge, UK.
Edward, W. (2003). Local Community must benefit from Tourism: A sustainable livelihood project, Mombasa Kenya
Ellis, F. (1998). Household strategies and rural livelihood diversification. Journal of Development Studies 35(1): pp 1-38.
Graeme, K., Chris, B. and Sue, W. (1995), Great Barrier reef marine park authority, World Bank
and World Conservation Union - IUCN, A Global Representative System of Marine Protected Areas. Volume II: Wider Caribbean, West Africa and South Atlantic, eds. (Washington, DC: World Bank), 7.
79
IUCN World Commission on Protected Areas (IUCN-WCPA. (2008). Establishing Marine Protected Area Networks—Making It Happen. IUCN-WCPA, National Oceanic and Atmospheric Administration and the Nature Conservancy. Washington, D.C.
Jafar, J. (2000). Encyclopedia of tourism. Routledge, 11 New Fetter Lane, London EC4PEE.
Kariuki, P. N (2013). Local resident’s attitudes and perceptions towards tourism development. A case of Lake Nakuru and its environs, Kenya. M.Phil thesis, Moi University Kenya
Kelleher, G. and Phillips, A. (1999). Guidelines for Marine Protected areas. World Commission on Protected Areas, Best practice protected area guideline series No. 3.Island press.
Kibicho, W. (2003. Community tourism: A lesson from Kenya’s coastal region, Journal ofVacation Marketing, 10 (1) 33-42.
Kiriakidou, O., and Gore, J. (2005). Learning by example: benchmarking organizational culture in hospitality, tourism and leisure small and medium sized enterprises. An International Journal, 12(3), pp.192-206.
Krejcie, R. V., and Morgan, D. W. (1970). Determining sample size for research activities.Educational and Psychological Measurement, 30, 607-610.
Kothari, C.R. (2005). Research Methodology Methods and Techniques Second Edition, New Age International.
Lew, A. and Hall, M. (2004) A companion to tourism. Blackwell Publishing Ltd, Main Street, Malden, USA, 108 Cowley Road, Oxford OX4 1JF, UK, 550 Swanston Street, Carlton, Victoria 3053, Australia
Lickorish, L., and Jenkins, C. (1997). An Introduction to Tourism. Butterworth- Heinemann Linacre House, Jordan Hill, Oxford OX2 8DP.
Masudur, R, (2010). Exploring the socio economic impacts of tourism in Cox’s Bazar, Bangladesh. Unpublished PhD Dissertation. University of Wales institute.
McCool, S., and Martin, S. (1994). Community Attachment and Attitudes towardsTourism Development, Journal of Travel Research, 32(3), pp. 29-34.
Ngugi, I. (1999). Economic impacts of marine protected areas: A case of Mombasa Marine Park. Unpublished senior project, Mombasa Polytechnique, Kenya.
Pomeroy, R.S., and Rivera – Guieb,R. (2006). Fishery co management: A practical hand book. CABI Publishing, Cambridge, M.A. USA and International Development Research Center, Canada.
80
Ramos, A., and Jimenez, P. (2008). Tourism Development: Economics, Management andStrategy. Nova Science Publishers, Inc. New York
Törn, A., P. Siikamäki, A. Tolvanen, P. Kauppila, and J. Rämet. (2007). Local people, natureconservation, and tourism in northeastern Finland. Ecology and Society 13(1): 8.
Tosun, C. (2000). Limit to community participation in the tourism development process in developing countries, Tourism Management, Vol. 21. 613-633.
Tosun, C. (2002). Host Perceptions of Impacts: A Comparative Tourism Study, Annals of Tourism Research, 29, pp. 231-253.Tourism Industry Example, Managing Service Quality, 10(1), pp. 10-18.
Tosun, C. (2006). Expected nature of community participation in tourism development, Tourism Management, 27 (3) 493-504.
Wall, G., and Matheison, A. (1982). Tourism: Economic, Physical and Social Impacts, LongmanHarlow, Essex, UK
Wilkie, D., and G. Morelli. (2006). Parks and people: Assessing the human welfare effectsof establishing protected areas for biodiversity conservation. Conservation Biology
20(1): 247-249.
WWF Eastern African Marine Ecoregion. (2004). Towards the Establishment of an ecologically representative network of Marine Protected Areas in Kenya, Tanzania and Mozambique.WWF, Dar-es-Salaam, Tanzania.
World Resources Institute page (2008) from http://www.wri.org/map/marine-protected-areas-world
Yutyunyong, T. (2009). The integration of social exchange theory and social representations theory: A new perspective on residents? Perception research.
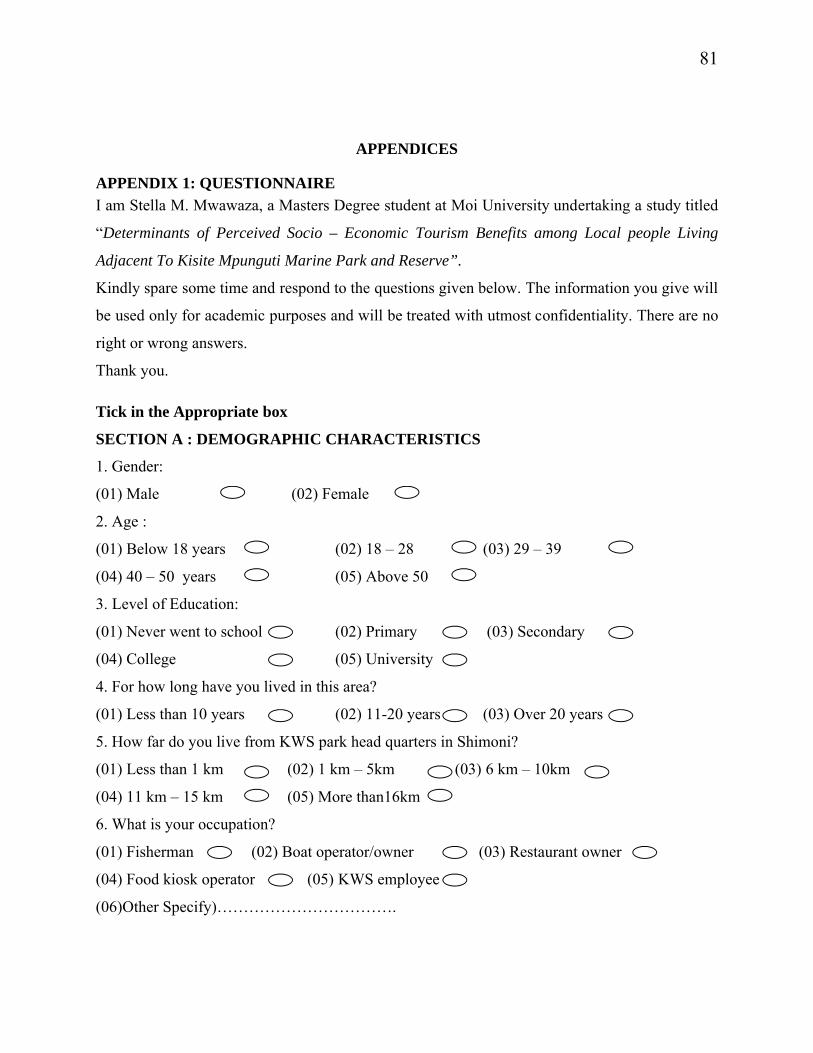
81
APPENDICES
APPENDIX 1: QUESTIONNAIREI am Stella M. Mwawaza, a Masters Degree student at Moi University undertaking a study titled
“Determinants of Perceived Socio – Economic Tourism Benefits among Local people Living
Adjacent To Kisite Mpunguti Marine Park and Reserve”.
Kindly spare some time and respond to the questions given below. The information you give will
be used only for academic purposes and will be treated with utmost confidentiality. There are no
right or wrong answers.
Thank you.
Tick in the Appropriate box
SECTION A : DEMOGRAPHIC CHARACTERISTICS
1. Gender:
(01) Male (02) Female
2. Age :
(01) Below 18 years (02) 18 – 28 (03) 29 – 39
(04) 40 – 50 years (05) Above 50
3. Level of Education:
(01) Never went to school (02) Primary (03) Secondary
(04) College (05) University
4. For how long have you lived in this area?
(01) Less than 10 years (02) 11-20 years (03) Over 20 years
5. How far do you live from KWS park head quarters in Shimoni?
(01) Less than 1 km (02) 1 km – 5km (03) 6 km – 10km
(04) 11 km – 15 km (05) More than16km
6. What is your occupation?
(01) Fisherman (02) Boat operator/owner (03) Restaurant owner
(04) Food kiosk operator (05) KWS employee
(06)Other Specify)…………………………….
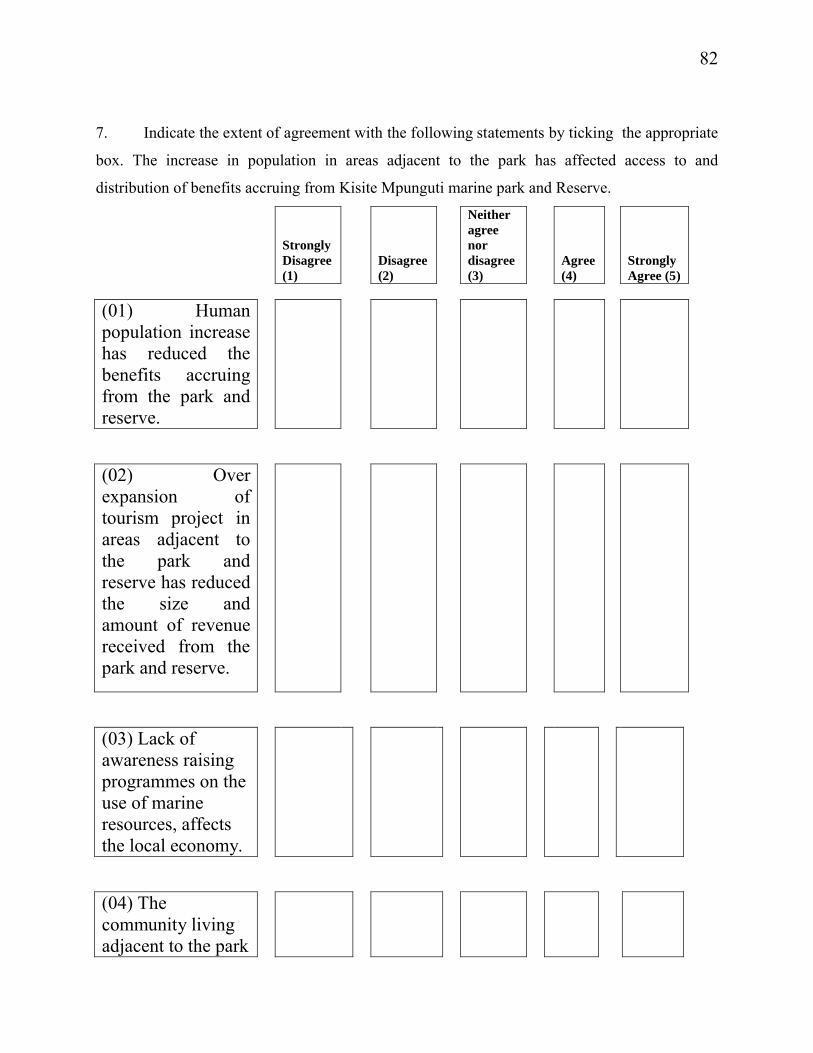
82
7. Indicate the extent of agreement with the following statements by ticking the appropriate
box. The increase in population in areas adjacent to the park has affected access to and
distribution of benefits accruing from Kisite Mpunguti marine park and Reserve.
Strongly Disagree (1)
Disagree (2)
Neither agree nor disagree (3)
Agree (4)
Strongly Agree (5)
(01) Human population increase has reduced the benefits accruing from the park and reserve.
(02) Over expansion of tourism project in areas adjacent to the park and reserve has reduced the size and amount of revenue received from the park and reserve.
(03) Lack of awareness raising programmes on the use of marine resources, affects the local economy.
(04) The community livingadjacent to the park
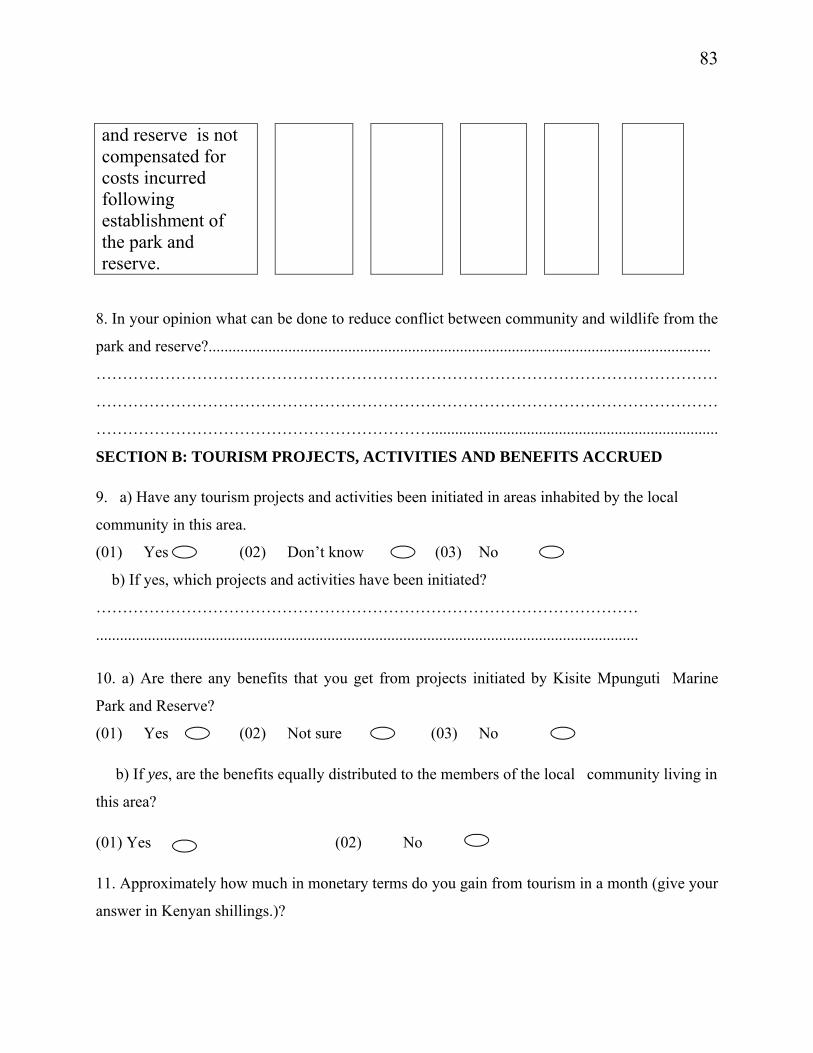
83
and reserve is not compensated for costs incurred following establishment of the park and reserve.
8. In your opinion what can be done to reduce conflict between community and wildlife from the
park and reserve?..............................................................................................................................
………………………………………………………………………………………………………
………………………………………………………………………………………………………
………………………………………………………........................................................................
SECTION B: TOURISM PROJECTS, ACTIVITIES AND BENEFITS ACCRUED
9. a) Have any tourism projects and activities been initiated in areas inhabited by the local
community in this area.
(01) Yes (02) Don’t know (03) No
b) If yes, which projects and activities have been initiated?
…………………………………………………………………………………………
........................................................................................................................................
10. a) Are there any benefits that you get from projects initiated by Kisite Mpunguti Marine
Park and Reserve?
(01) Yes (02) Not sure (03) No
b) If yes, are the benefits equally distributed to the members of the local community living in
this area?
(01) Yes (02) No
11. Approximately how much in monetary terms do you gain from tourism in a month (give your
answer in Kenyan shillings.)?
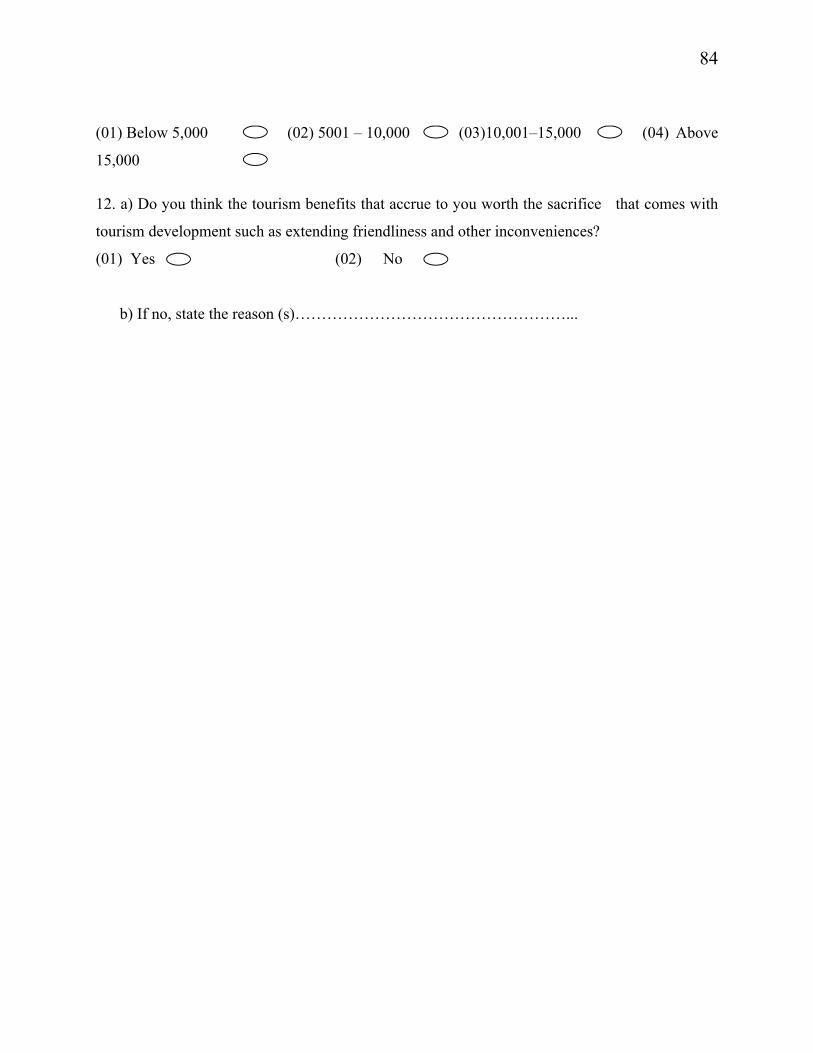
84
(01) Below 5,000 (02) 5001 – 10,000 (03)10,001–15,000 (04) Above
15,000
12. a) Do you think the tourism benefits that accrue to you worth the sacrifice that comes with
tourism development such as extending friendliness and other inconveniences?
(01) Yes (02) No
b) If no, state the reason (s)……………………………………………...
85
13. Indicate the extent of agreement with the following statements by ticking in the appropriate
box. The establishment of Kisite Mpunguti Marine Park and Reserve has:-
Strongly Disagree (1)
Disagree (2)
Neither agree nor disagree (3)
Agree (4)
Strongly Agree (5)
(01)Created Employment opportunities
(02) Raised standards of living
(03)Facilitated donations and grants
(04) Created opportunity for business and investment.
(05) Improved Quality of life
(06) Improved Social amenities like schools, hospitals

86
12. Indicate the extent of agreement with the following statements by ticking in the appropriate
box. Kisite Mpunguti Marine Park and Reserve has:-
Strongly
Disagree
(1)
Disagree
(2)
Neither
agree nor
disagree
(3)
Agree
(4)
Strongly
Agree
(5)
(01)Raised the cost
of living
(02) Increased
leakages
(03) Accelerated
School drop outs
(04)Led to
overcrowding
87
(05) Led to Social
evils like to
alcoholism and
crime.
88
SECTION C : LOCAL COMMUNITY PARTICIPATION IN TOURISM WITHIN AND
AROUND KISITE MPUNGUTI MARINE PARK AND RESERVE
13. In your opinion how best would you be involved in tourism in this area?
(01) Own a tourism related business (02) Be employed by a tourism business
(03) Get cash benefits / donations (04) Have access to tourism supported social projects
like Schools, clinics, and water projects
(05) Others (specify)…………………………………………..
14.What hinders you from fully participating in tourism in this area?
(01) Lack of interest (02) Lack of required information
(03) Lack of money (04) Lack of time
(05)Other(Specify) ……………………………………………………
15. Are you involved in decision making on tourism development in this area?
(01) Yes (02) No
16. If yes how would you like to be involved in decision making in tourism development in this
area?
(01) Attending meetings (02) Writing proposals and reports
(03) Owning a tourism business (04) other (specify)……………………………
17. How can tourism development be improved to help local communities in this
area.……………………………………………………………………………….………………
……………………………………………………………………………
89
SECTION D: GOVERNMENT POLICY18. Show the extent of agreement with the following statements by ticking in the appropriatebox. The government has:-
Strongly Disagree (1)
Disagree (2)
Neither agree nor disagree (3)
Agree (4)
Strongly Agree (5)
(01)Put in place Acts, rules and regulations on addressing challenges facing the parks & reserveto avert losses to the economy
(02) Put in place measures to promote stakeholder support for improved management and sustainedUtilization of fishing resources in the park and reserve.
(03) Enhanced protection of biological diversity in areas within the network of marineprotected areas
(04) Facilitated and supported the establishment of
90
community based tourism projects and activities.
(05) Facilitated & supported the establishment of partnershipventures between communities, private business &conservationagencies in areas adjacent the Park
19. What can the central and county governments do to ensure the implementation of
articulated sectoral development policies, strategies and plans of action, in the tourism sector is
achieved to stimulate and promote of private investment activities in the coastal areas of Kenya.
…………………………………………………………………………………………………………………………
…………………………………………………………………………………………………………………………
………………………………………………………………………
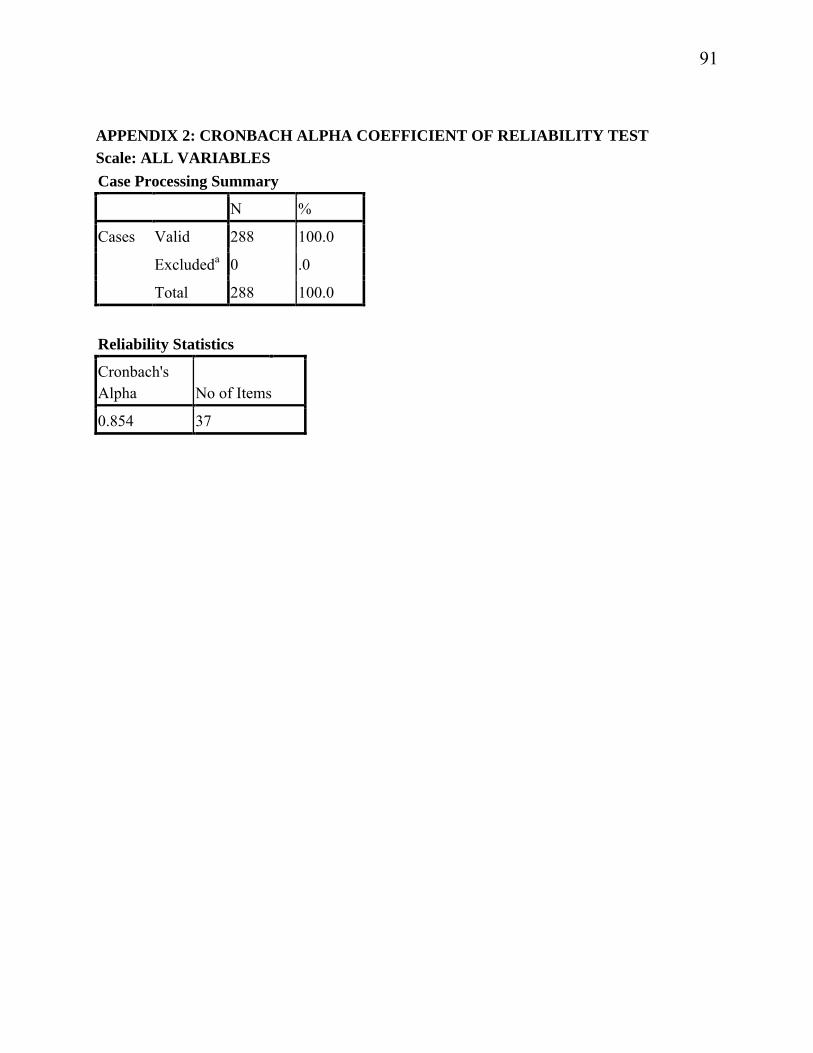
91
APPENDIX 2: CRONBACH ALPHA COEFFICIENT OF RELIABILITY TEST
Scale: ALL VARIABLES
Case Processing Summary
N %
Cases Valid 288 100.0
Excludeda 0 .0
Total 288 100.0
Reliability Statistics
Cronbach's Alpha No of Items
0.854 37