survey of recent developments
TRANSCRIPT
Vol 36 No 3, December 2000, pp. 3–45Bulletin of Indonesian Economic Studies
SURVEY OF RECENT DEVELOPMENTS
Eric D. Ramstetter
International Centre for the Study of East Asian Development, Kitakyushu
SUMMARY
Indonesia continued to struggle with institutional change and politicaluncertainty in recent months. President Abdurrahman Wahid delegatedsome responsibilities to Vice President Megawati Sukarnoputri, butsubsequently appointed a new cabinet that consisted primarily of peopleclose to him, making many wonder if he had really given up any power.The killing of UN personnel in Atambua, West Timor, led to renewedpressure on the government to rein in the militias operating there. Thepresident also tried to increase his control over the military, the policeand the judiciary, with mixed results.
The economy continued to recover, with the annualised growth ratein the first half of 2000 reaching 4.6%. This growth was fuelled largely byexports and fixed investment, which markedly increased their shares ofreal GDP. Consumption also remained robust. If the recovery of fixedinvestment can be sustained, the economy could grow 5% or more forthe year. There is some concern that the money supply is expanding fasterthan desired, and inflation accelerated in the third quarter. The fuel priceincrease in October will also lead to higher prices, but the annual inflationrate is likely to be 8% or less. The large domestic debt burden incurred inrecapitalising the banks will raise expenditures significantly, andincreased revenue sharing will reduce central government revenues fromthe 2000 and 2001 budgets. Finding the finance for related deficits is themajor macroeconomic challenge for the government in the next few years.
Rapid growth of office and electrical machinery exports in the firsthalf of 2000 signals a notable structural change. These exports originatelargely from foreign multinationals (MNCs), and their growth indicatesthat Indonesia is being integrated into the MNC networks that dominatethese industries in Southeast Asia.
4 Eric D. Ramstetter
INSTITUTIONAL CHANGE CONTINUES AT A RAPID PACE
The two and a half years since the fall of the New Order regime havewitnessed rapid institutional change that appears likely to continue. Inthe last few months the efforts of President Abdurrahman Wahid (GusDur) to define his role in a democratically elected government have beenparticularly conspicuous, though there is much scepticism about theireffectiveness, and continued uncertainty about political andadministrative arrangements.
The President, the MPR, and the Economic Policy Making Team
The August session of the People’s Consultative Assembly (MPR, MajelisPermusyawaratan Rakyat) began with the possibility that some legislatorswould mount a serious effort to impeach the president. His report on theperformance of his administration was poorly received, most importantlybecause he often gives the impression of making policy statementswithout thinking through the issue at hand and is often perceived asmeddling in affairs where he should not. Moreover, his frequent tripsabroad make him vulnerable to charges that he is not giving sufficientpriority to domestic affairs in general, and to the economy in particular.Partly if res`onse to these criticisms, the president agreed to delegatemuch of the authority for day-to-day administration to the vice president.He also streamlined the cabinet, reducing the number of posts to 26 from35 in the October 1999 cabinet; however, three key former cabinet posts(Attorney General, State Secretary and Commander of the Armed Forces)still exist outside the cabinet. The most significant streamlining camewhere two ministries were combined (e.g. Home Affairs and RegionalAutonomy; Agriculture and Forestry; and Manpower and Trans-migration), although these mergers may not result in a significantreduction of the bureaucracy. The government is understandably reluctantto cut too many government posts at a time when the labour market isperceived to be weak.
The most significant cabinet changes in the economic policy spherewere the appointments of Rizal Ramli as Coordinating Minister forEconomic Affairs and Priyadi Praptosuhardjo as Minister of Finance.Other important new appointments in the economic ministries includethose of Bungaran Saragih (Agriculture and Forestry) and PurnomoYusgiantoro (Energy and Mineral Resources). Cacuk Sudarijanto wasappointed Junior Minister for Restructuring of the National Economy,while retaining his post as head of the Indonesian Bank RestructuringAgency (IBRA). (In late October he was replaced at IBRA by formerCitibank executive Edwin Gerungan in a move aimed at shoring upIBRA’s reputation.) A number of previous economic ministers were also
5Survey of Recent Developments
retained.1 This cabinet has been dubbed ‘all the president’s men’, becauseit consists mainly of people close to Gus Dur, whereas the previous cabinetwas the result of political compromise following his election by the MPRin 1999. Many observers are sceptical about just how much power thepresident has given up in this process (e.g. MacIntyre 2000).
Rizal Ramli is generally seen as a more forceful leader than theprevious Coordinating Minister for Economic Affairs, Kwik Kian Gie,and this has led some to hope for a more focused and effective economicpolicy (ESCOM Monthly Journal, September 2000: 4–12). Nevertheless,Rizal and Priyadi are thought to disagree over how to handle the case ofBank Rakyat Indonesia, the bank Priyadi was previously nominated tohead.2 In a related matter, the press has suggested that Rizal is in a ‘majorturf battle’ with IBRA head Cacuk for control of Indonesia’s state-ownedenterprises (Business Times Singapore, 18/9/00: 1), though this may be anexaggeration. There is also continuing strain in relations between thegovernment and Bank Indonesia (the central bank), which is keen toprotect its newly legislated independence and is campaigning for therelease of its governor, Syahril Sabirin, following his detention on chargesof involvement in the Bank Bali scandal (McLeod 2000: 8). Fortunately,Rizal appears to get along reasonably well with the acting central bankgovernor, Anwar Nasution, and the rumoured rifts between Rizal andothers in the administration have not yet led to major problems. In short,there is guarded optimism that the present policy making team may beable to work better together than its predecessor, but there are manypotential problems and little margin for error in the next few years.
Whatever transpires, Indonesia is going through a profound processof institutional change and institution building. The political system andthe policy making bureaucracy are in a state of flux as a result. This processis likely to proceed in a haphazard and sometimes chaotic fashion for theforeseeable future and, although the international community oftendemands institutional change as a precondition for extending assistance,a realistic assessment would suggest that many of the changes demanded(e.g. to the judiciary’s handling of bankruptcy proceedings) will take yearsto realise. Most of the international agencies on the ground—theInternational Monetary Fund (IMF), the World Bank, and bilateralagencies—appear to be aware of this contradiction, but there are someareas in which Indonesia may be forced to respond rather rapidly.
Security and the Role of the Military
The international community has become increasingly impatient withthe Wahid administration over the slow process of repatriating EastTimorese refugees now in West Timor, and the continuing activities of
6 Eric D. Ramstetter
armed militias in refugee camps. The latter problem came to a head whenthree United Nations (UN) aid workers were killed in Atambua on 6September. UN officials issued stern warnings to Indonesianrepresentatives at the Millennium Summit in New York, and the USDefense Secretary, William Cohen, gave a similar warning during a visitto Jakarta, saying that a failure to disband the militias would ‘haveconsequences for Jakarta’s relations with the international community’.The Indonesian response to Cohen’s vague threat was generally negative.Many observers, and most of the press, complained about foreignintervention in domestic affairs, and some went so far as to suggest thatthe US was threatening a trade embargo against Indonesia, though thereis no evidence of this (Capital, 2–8 October 2000: 6–8). In reality, failure tocontrol the militias might have negative effects on Indonesia’s efforts tosecure economic aid, but the strong strategic interest of the US, theEuropean Union, Japan and Australia in supporting Indonesia’s newdemocracy makes it very unlikely that a trade embargo or any major cutin funding will result as long as the country remains democratic.3
Indonesia is now very dependent on international assistance,however, and as the October meeting of the Consultative Group onIndonesia (CGI) in Tokyo approached, the Cohen threat initially appearedto have had the desired effect of spurring a new set of efforts to disarmthe militias in West Timor. Another important member of the new cabinet,Susilo Bambang Yudhoyono (Coordinating Minister for Political, Socialand Security Affairs), was dispatched to New York to explain to UNauthorities the actions that the Indonesian authorities were planning totake, and was given the responsibility of disarming the militias. VicePresident Megawati attended a high profile collection of arms from militiapersonnel on 24 September, but the occasion ended in disorder whenmilitia members stormed the collection point and took back most of thearms collected during the day. After this farce, and given the previousrecord of the Indonesian government, many observers were scepticalabout its efforts to disarm the militias. The government continued to insistthat it was serious, and during a visit to Singapore in early October,Minister Rizal emphasised that ‘a large number of weapons’ had beenconfiscated (Reuters wire story, 8/10/00). Also in early October,Indonesian officials detained an important militia leader, Eurico Guterres,on weapons charges, indicating that those favouring a tougher stand onthe militias may be prevailing, at least in the short run. However, astatement by Defence Minister Mohammad Mahfud Mahmodin inSeptember indicated a reluctance within the government to address theEast Timor issue realistically.4
7Survey of Recent Developments
Perhaps more important in the medium term are the president’sattempts to exercise more control over the security apparatus, the militaryand the police. Through the appointment of Coordinating MinisterBambang Yudhoyono, the subsequent abolition of the post of DeputyTNI (armed forces) Commander and removal of the office’s occupant,General Fachrul Razi, and the controversial (and probably illegal)dismissal of the national police chief, Gus Dur has tried to signal that heis indeed supreme commander as mandated by the constitution.However, he has apparently been unable to get his candidates appointedto top military posts (Tempo, 9–15 October 2000). The military appearshighly demoralised, and it is unclear whether the chain of command reallyworks any longer. In short, there is still considerable doubt that recentactions can be translated into the increased political and military willnecessary to control militias in West Timor, to manage volatile situationsin other regions such as Maluku, or to stop the series of bombings inJakarta and elsewhere over the last six months. Some observers (e.g. TheEconomist, 3 September – 6 October 2000) have wondered if certain servingor retired senior military officials might be behind some of these problems,and have suggested that the president’s efforts to assert more controlover the security apparatus could end in failure.
The Stock Exchange Bombing, the Soeharto Trial,Bank Restructuring, and the Rule of Law
The bombing of the Jakarta Stock Exchange building on 13 Septembercreated a domestic outcry. This was the latest in a series of terrorist actsthat appeared to be correlated with steps in the bid to try former PresidentSoeharto and other family members on corruption charges.5 Apparentlyconvinced that these events were related, the president ordered the arrestof Soeharto’s youngest son, Hutomo Mandala Putra (Tommy), andanother associate, in connection with the bombing. However, the thenpolice chief refused to make the arrest, saying that there was no evidenceto warrant it, though Tommy was taken in for questioning in the affair.This led to the firing of the police chief. Subsequently, a group whoappeared to hail from Aceh, and who included two individuals from aspecial military unit, were arrested in connection with the bombing.
Meanwhile a panel of judges ruled that former President Soehartowas medically and psychologically unfit to stand trial. This effectivelyends the government’s attempts to try the former president on criminalcharges, unless a higher court overturns the decision or another courtrules differently on a separate indictment.6 Here again the presidentexpressed dissatisfaction with the proceedings and hinted that he wouldseek to replace the judges that presided over the case (JP, 3/9/00: 1).
8 Eric D. Ramstetter
In a different sphere, as of 27 August, the Indonesia Bank Restructur-ing Agency (IBRA) had brought bankruptcy proceedings in 51 cases, andcivil court proceedings in 146 cases (IBRA, Monthly Report, September2000: 5). Meanwhile, by 16 August, IBRA had had 37 legal cases broughtagainst it. IBRA has lost the majority of the cases where judgements havebeen rendered.
As discussed by Fane (2000a: 36–7), judicial corruption is a majorproblem in Indonesia, and is widely thought to be a factor in the decisionsrendered in the Soeharto and IBRA cases. In this context, the president’scomments about the Soeharto trial are perhaps understandable. There isalso a perception that a similar level of corruption extends to the police,which may explain the president’s desire to give specific instructions tothem. However, the police chief was legally obliged to refuse thepresident’s order if there was indeed no evidence to support the arrest ofSoeharto’s son. The president is also legally required to consult with thelegislature before dismissing the police chief. More fundamentally, thefact that Gus Dur has expressed opinions about specific cases before thecourts or the police is disturbing. The president does have an importantrole to play in the appointment and removal of judges and of the policechief, but the challenge is to reform the judiciary and police withoutcontinuing the practice of excessive executive control that existed underSoeharto. See box 1 for a brief discussion of progress with law reform.
MACROECONOMIC TRENDS AND POLICY ISSUES
There are finally signs that the economy may be recovering after the sharpcontraction in 1998 and lacklustre performance in 1999. Indeed, it seemsthat first consumers and then investors have become used to politicaluncertainty and institutional flux, and have begun to spend more.
Expenditure Components of GDP
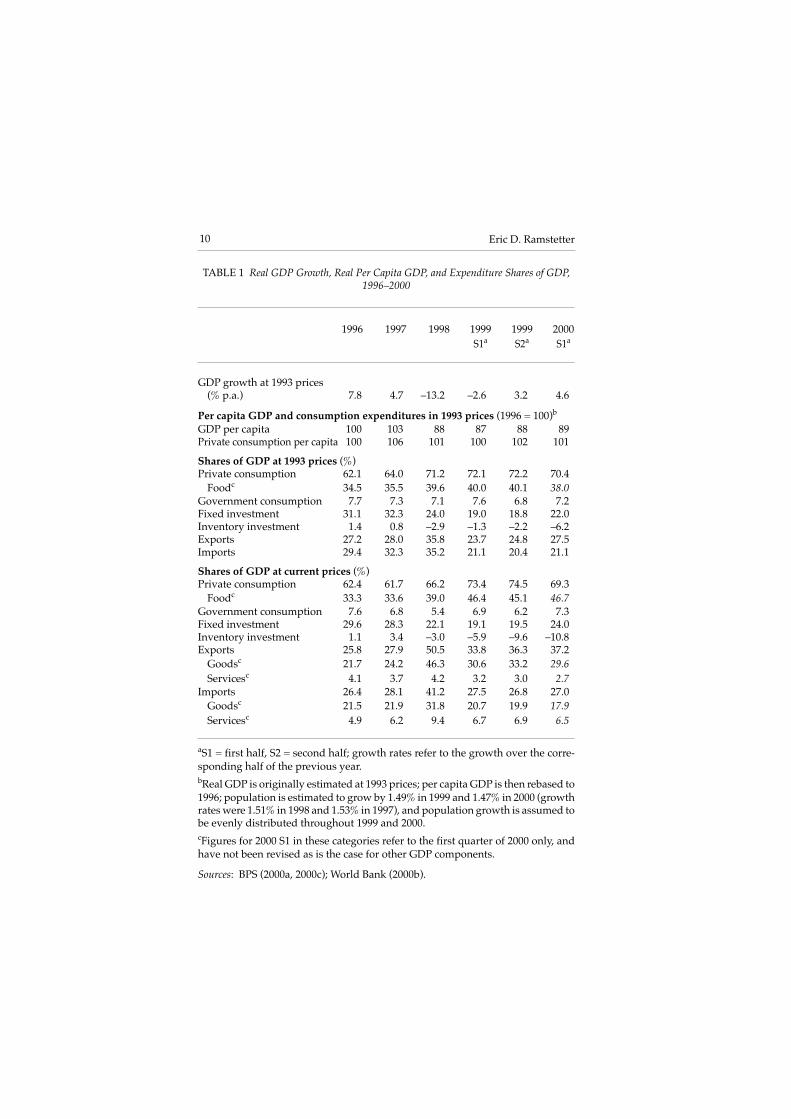
Gross Domestic Product (GDP) grew 4.6% in the first half of 2000compared with the first half of 1999, in marked contrast to negative growthrates of –2.6% a year earlier, and –13.2% in 1998 (table 1). In 1999 and in1996 (the last full pre-crisis year), the annual growth rate exceeded therate for the first half. This was also the case in 1992–93 and 1995, andmany observers expect growth to be stronger in the second half of 2000as well.7 Growth in the first half of the year was still rather slow comparedto the annual growth rates of 7% or more in 1989–96, but is likely to beonly slightly below the rates of 5–6% in 1986–88, the last time Indonesiaemerged from an economic slowdown (ICSEAD 2000: 87–8).
9Survey of Recent Developments
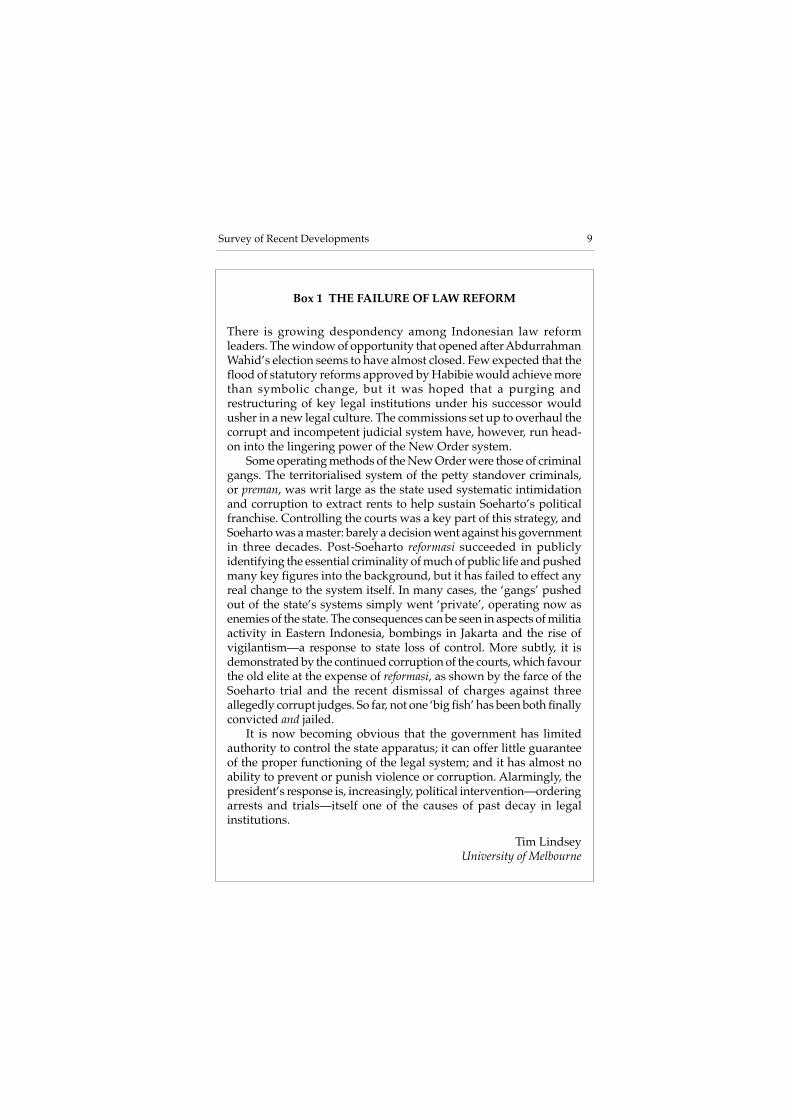
Box 1 THE FAILURE OF LAW REFORM
There is growing despondency among Indonesian law reformleaders. The window of opportunity that opened after AbdurrahmanWahid’s election seems to have almost closed. Few expected that theflood of statutory reforms approved by Habibie would achieve morethan symbolic change, but it was hoped that a purging andrestructuring of key legal institutions under his successor wouldusher in a new legal culture. The commissions set up to overhaul thecorrupt and incompetent judicial system have, however, run head-on into the lingering power of the New Order system.
Some operating methods of the New Order were those of criminalgangs. The territorialised system of the petty standover criminals,or preman, was writ large as the state used systematic intimidationand corruption to extract rents to help sustain Soeharto’s politicalfranchise. Controlling the courts was a key part of this strategy, andSoeharto was a master: barely a decision went against his governmentin three decades. Post-Soeharto reformasi succeeded in publiclyidentifying the essential criminality of much of public life and pushedmany key figures into the background, but it has failed to effect anyreal change to the system itself. In many cases, the ‘gangs’ pushedout of the state’s systems simply went ‘private’, operating now asenemies of the state. The consequences can be seen in aspects of militiaactivity in Eastern Indonesia, bombings in Jakarta and the rise ofvigilantism—a response to state loss of control. More subtly, it isdemonstrated by the continued corruption of the courts, which favourthe old elite at the expense of reformasi, as shown by the farce of theSoeharto trial and the recent dismissal of charges against threeallegedly corrupt judges. So far, not one ‘big fish’ has been both finallyconvicted and jailed.
It is now becoming obvious that the government has limitedauthority to control the state apparatus; it can offer little guaranteeof the proper functioning of the legal system; and it has almost noability to prevent or punish violence or corruption. Alarmingly, thepresident’s response is, increasingly, political intervention—orderingarrests and trials—itself one of the causes of past decay in legalinstitutions.
Tim LindseyUniversity of Melbourne
10 Eric D. Ramstetter
TABLE 1 Real GDP Growth, Real Per Capita GDP, and Expenditure Shares of GDP,1996–2000
1996 1997 1998 1999 1999 2000S1a S2a S1a
GDP growth at 1993 prices(% p.a.) 7.8 4.7 –13.2 –2.6 3.2 4.6
Per capita GDP and consumption expenditures in 1993 prices (1996 = 100)b
GDP per capita 100 103 88 87 88 89Private consumption per capita 100 106 101 100 102 101
Shares of GDP at 1993 prices (%)Private consumption 62.1 64.0 71.2 72.1 72.2 70.4
Foodc 34.5 35.5 39.6 40.0 40.1 38.0Government consumption 7.7 7.3 7.1 7.6 6.8 7.2Fixed investment 31.1 32.3 24.0 19.0 18.8 22.0Inventory investment 1.4 0.8 –2.9 –1.3 –2.2 –6.2Exports 27.2 28.0 35.8 23.7 24.8 27.5Imports 29.4 32.3 35.2 21.1 20.4 21.1
Shares of GDP at current prices (%)Private consumption 62.4 61.7 66.2 73.4 74.5 69.3
Foodc 33.3 33.6 39.0 46.4 45.1 46.7Government consumption 7.6 6.8 5.4 6.9 6.2 7.3Fixed investment 29.6 28.3 22.1 19.1 19.5 24.0Inventory investment 1.1 3.4 –3.0 –5.9 –9.6 –10.8Exports 25.8 27.9 50.5 33.8 36.3 37.2
Goodsc 21.7 24.2 46.3 30.6 33.2 29.6Servicesc 4.1 3.7 4.2 3.2 3.0 2.7
Imports 26.4 28.1 41.2 27.5 26.8 27.0Goodsc 21.5 21.9 31.8 20.7 19.9 17.9Servicesc 4.9 6.2 9.4 6.7 6.9 6.5
aS1 = first half, S2 = second half; growth rates refer to the growth over the corre-sponding half of the previous year.bReal GDP is originally estimated at 1993 prices; per capita GDP is then rebased to1996; population is estimated to grow by 1.49% in 1999 and 1.47% in 2000 (growthrates were 1.51% in 1998 and 1.53% in 1997), and population growth is assumed tobe evenly distributed throughout 1999 and 2000.cFigures for 2000 S1 in these categories refer to the first quarter of 2000 only, andhave not been revised as is the case for other GDP components.
Sources: BPS (2000a, 2000c); World Bank (2000b).
11Survey of Recent Developments
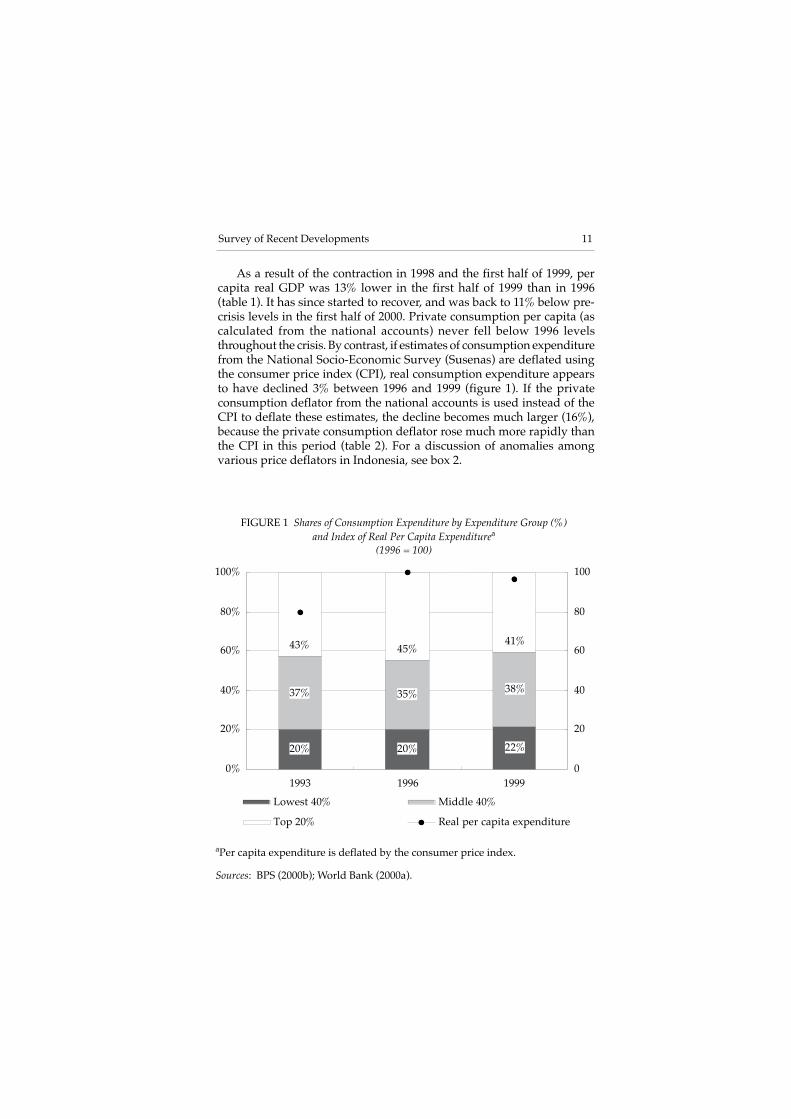
As a result of the contraction in 1998 and the first half of 1999, percapita real GDP was 13% lower in the first half of 1999 than in 1996(table 1). It has since started to recover, and was back to 11% below pre-crisis levels in the first half of 2000. Private consumption per capita (ascalculated from the national accounts) never fell below 1996 levelsthroughout the crisis. By contrast, if estimates of consumption expenditurefrom the National Socio-Economic Survey (Susenas) are deflated usingthe consumer price index (CPI), real consumption expenditure appearsto have declined 3% between 1996 and 1999 (figure 1). If the privateconsumption deflator from the national accounts is used instead of theCPI to deflate these estimates, the decline becomes much larger (16%),because the private consumption deflator rose much more rapidly thanthe CPI in this period (table 2). For a discussion of anomalies amongvarious price deflators in Indonesia, see box 2.
FIGURE 1 Shares of Consumption Expenditure by Expenditure Group (%)and Index of Real Per Capita Expenditurea
(1996 = 100)
aPer capita expenditure is deflated by the consumer price index.
Sources: BPS (2000b); World Bank (2000a).
20% 20% 22%
37% 35% 38%
43% 45%41%
0%
20%
40%
60%
80%
100%
1993 1996 19990
20
40
60
80
100
Lowest 40% Middle 40%
Top 20% Real per capita expenditure
12 Eric D. Ramstetter
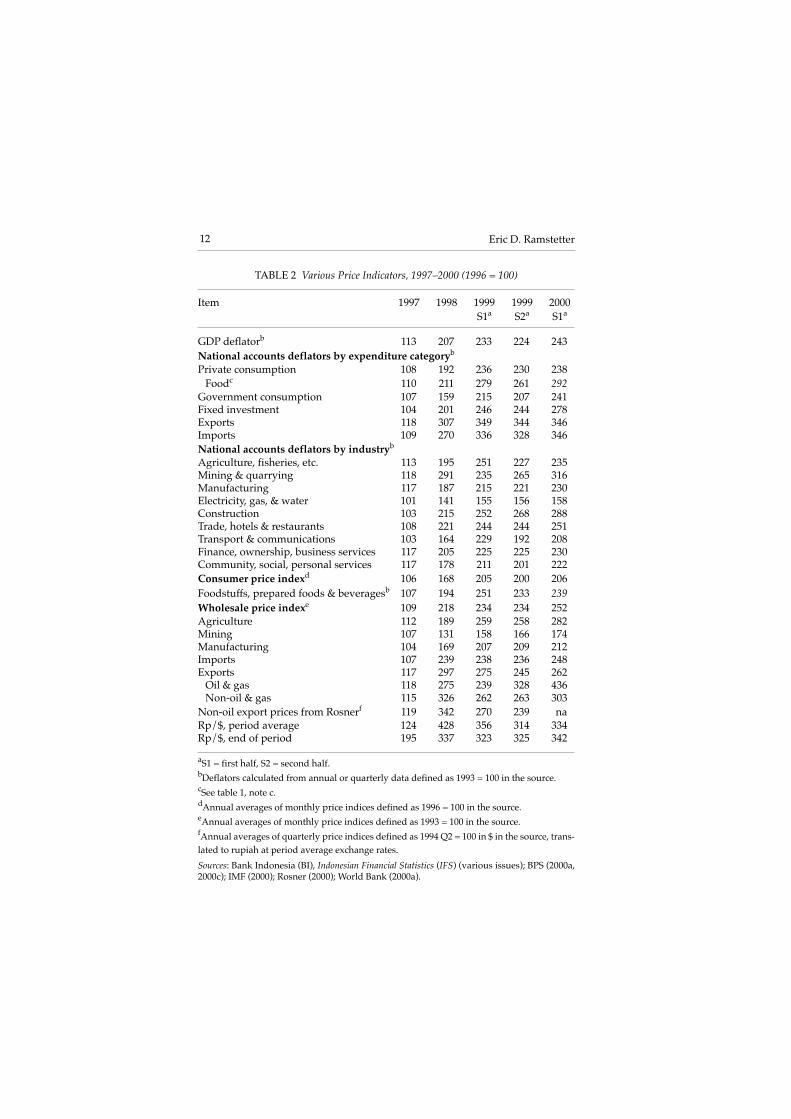
TABLE 2 Various Price Indicators, 1997–2000 (1996 = 100)
Item 1997 1998 1999 1999 2000S1a S2a S1a
GDP deflatorb 113 207 233 224 243National accounts deflators by expenditure categoryb
Private consumption 108 192 236 230 238Foodc 110 211 279 261 292
Government consumption 107 159 215 207 241Fixed investment 104 201 246 244 278Exports 118 307 349 344 346Imports 109 270 336 328 346National accounts deflators by industryb
Agriculture, fisheries, etc. 113 195 251 227 235Mining & quarrying 118 291 235 265 316Manufacturing 117 187 215 221 230Electricity, gas, & water 101 141 155 156 158Construction 103 215 252 268 288Trade, hotels & restaurants 108 221 244 244 251Transport & communications 103 164 229 192 208Finance, ownership, business services 117 205 225 225 230Community, social, personal services 117 178 211 201 222Consumer price indexd 106 168 205 200 206Foodstuffs, prepared foods & beveragesb 107 194 251 233 239Wholesale price indexe 109 218 234 234 252Agriculture 112 189 259 258 282Mining 107 131 158 166 174Manufacturing 104 169 207 209 212Imports 107 239 238 236 248Exports 117 297 275 245 262
Oil & gas 118 275 239 328 436Non-oil & gas 115 326 262 263 303
Non-oil export prices from Rosnerf 119 342 270 239 naRp/$, period average 124 428 356 314 334Rp/$, end of period 195 337 323 325 342
aS1 = first half, S2 = second half.bDeflators calculated from annual or quarterly data defined as 1993 = 100 in the source.cSee table 1, note c.dAnnual averages of monthly price indices defined as 1996 = 100 in the source.eAnnual averages of monthly price indices defined as 1993 = 100 in the source.fAnnual averages of quarterly price indices defined as 1994 Q2 = 100 in $ in the source, trans-lated to rupiah at period average exchange rates.
Sources: Bank Indonesia (BI), Indonesian Financial Statistics (IFS) (various issues); BPS (2000a,2000c); IMF (2000); Rosner (2000); World Bank (2000a).
13Survey of Recent Developments
The distribution of consumption expenditures appears to havebecome somewhat more equal in 1996–99 (figure 1). The 40% ofhouseholds with the lowest expenditures increased their share of totalexpenditures from 20% to 22%, while the share of the middle 40% rosefrom 35% to 38%, and that of the top 20% fell to 45% from 41%. However,the share of poorer households would probably rise much less if onewere to calculate the shares in constant prices, and to account for the factthat food occupies a much larger share of expenditures in poorhouseholds, because food prices rose more rapidly than prices of otherconsumer goods (table 2).8
Box 2 NATIONAL ACCOUNTS DEFLATORS ANDPRICE INDICES IN INDONESIA
In Indonesia, there are substantial differences between trends innational accounts deflators and other price indices that appear tomeasure similar prices (table 2). As indicated in the discussion ofconsumption trends, there is a large difference between trends inthe private consumption deflator, which show that the cost of privateconsumption rose 138% between 1996 and the first half of 2000, andtrends in the CPI, which suggest a 106% rise in the same period.Even if the comparison is limited to food, the consumption deflatoris much higher by the first quarter of 2000 than the correspondingCPI component: 292 versus 239. National accounts deflators alsoindicate much larger increases in export and import prices than dothe corresponding components of the wholesale price index (WPI).Furthermore, in the first half of 2000, national accounts deflators arehigher than the corresponding WPI components for mining andmanufacturing, but the WPI is higher for agriculture. Somedifferences between national accounts deflators on the one hand andCPI and WPI components on the other are to be expected, becausethese indicators measure prices of different baskets of goods andservices, and are calculated using different formulae. However, thedifferences observed in table 2 are often so large as to make onewonder if substantial measurement errors are involved. This pointis further underscored by Rosner (2000), who compares a relativelycomprehensive set of export price estimates with the WPI exportcomponents, which have more limited commodity coverage.
14 Eric D. Ramstetter
There were conspicuous increases in fixed investment and exports inthe first half of 2000 (table 1). Consequently, shares of these items in realGDP rose to from 19% to 22% and from 24% to 28%, respectively,compared to the first half of 1999. The share of fixed investment was stillfar below pre-crisis levels (e.g. 31% in 1996), but the long awaitedturnaround in fixed investment finally appears to have begun in the firsthalf of 2000.9 Likewise, the share of imports remained steady after fallingdramatically in 1999, although it too is still far below pre-crisis levels. Ifthe turnaround in fixed investment is sustained, the share of imports islikely to rise in the medium term, because capital goods account for alarge proportion of imports. On the other hand, the share of privateconsumption fell in the first half of 2000 after rising steadily in 1997–99.Of particular significance is the levelling off and apparent decline in theshare of food expenditures in the first quarter of 2000.10 To the extentthat the estimate is reliable, the large negative share of inventoryinvestment indicates that existing inventories were rapidly drawn downin the first half of 2000.11
There are some markedly different patterns observed if shares arecalculated in current prices, reflecting the fact that price movements havevaried greatly across GDP components (tables 1 and 2). For example, therise in the share of private consumption from 1997 to the second half of1999, and its subsequent fall, are much larger when shares are calculatedin current prices. This reflects the fact that the consumption deflator rosemore rapidly than the GDP deflator through 1999, a pattern reversed inthe first half of 2000. Food shares increased particularly sharply in currentprices, the rise in this deflator being even greater than that in theconsumption deflator. In 1999 and the first half of 2000, the fixedinvestment deflator also rose quite rapidly, resulting in smaller declinesor larger increases in GDP shares when measured in current prices.However, by far the largest differences between nominal and real shareswere in trade shares of GDP, which were also much larger in currentprices, because export and import prices rose much faster than the GDPdeflator through 1999.
Monetary Developments
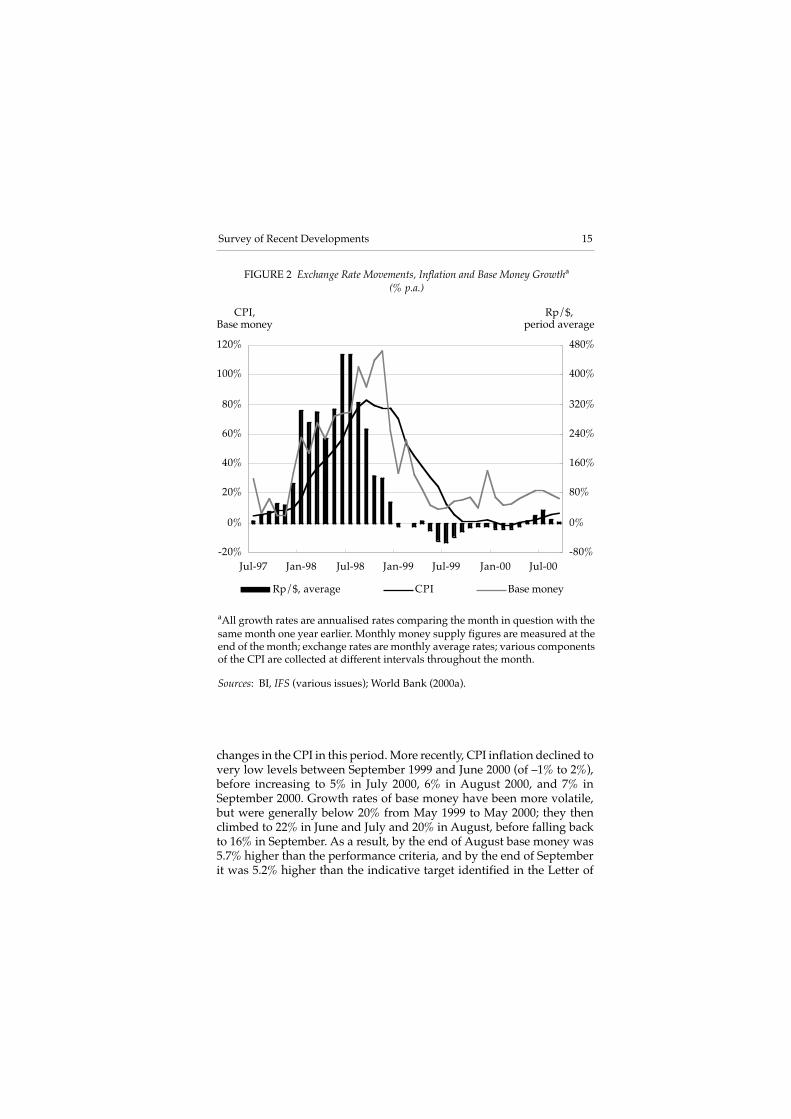
One of the more important consequences of the crisis, discussed at lengthby Fane (2000b), was the rapid rise in prices from early 1998 throughearly 1999. For example, the annualised rate at which the CPI increased(compared to the same month a year earlier) accelerated from under 10%in the last half of 1997 to 40% or more in April 1998 to March 1999, beforefalling back below 10% from August 1999 (figure 2). Earlier changes inbase money and the exchange rate appear to be highly correlated with
15Survey of Recent Developments
changes in the CPI in this period. More recently, CPI inflation declined tovery low levels between September 1999 and June 2000 (of –1% to 2%),before increasing to 5% in July 2000, 6% in August 2000, and 7% inSeptember 2000. Growth rates of base money have been more volatile,but were generally below 20% from May 1999 to May 2000; they thenclimbed to 22% in June and July and 20% in August, before falling backto 16% in September. As a result, by the end of August base money was5.7% higher than the performance criteria, and by the end of Septemberit was 5.2% higher than the indicative target identified in the Letter of
FIGURE 2 Exchange Rate Movements, Inflation and Base Money Growtha
(% p.a.)
aAll growth rates are annualised rates comparing the month in question with thesame month one year earlier. Monthly money supply figures are measured at theend of the month; exchange rates are monthly average rates; various componentsof the CPI are collected at different intervals throughout the month.
Sources: BI, IFS (various issues); World Bank (2000a).
-20%
0%
20%
40%
60%
80%
100%
120%
Jul-97 Jan-98 Jul-98 Jan-99 Jul-99 Jan-00 Jul-00
CPI,Base money
-80%
0%
80%
160%
240%
320%
400%
480%
Rp/$, period average
Rp/$, average CPI Base money
16 Eric D. Ramstetter
Intent submitted to the IMF in July (Bank Indonesia [BI], IndonesianFinancial Statistics [IFS], various issues; tables downloaded from<www.imf.org>). Some observers have worried that failure to controlthe money supply would lead to increased inflation in the second half of2000 (Feridhanusetyawan 2000: 2–3; McLeod 2000: 16–20). Moreover, thegovernment began reducing its subsidy of oil products on 1 October,raising fuel prices an average of 12%, a move that is generally thought toadd to inflationary pressures. Nonetheless, Bank Indonesia still expectsthat annual CPI inflation will be only about 1% higher than the 5–7%predicted earlier (Dow Jones Newswires, 11/10/00), and the data in figure2 suggest that this is a reasonable estimate.
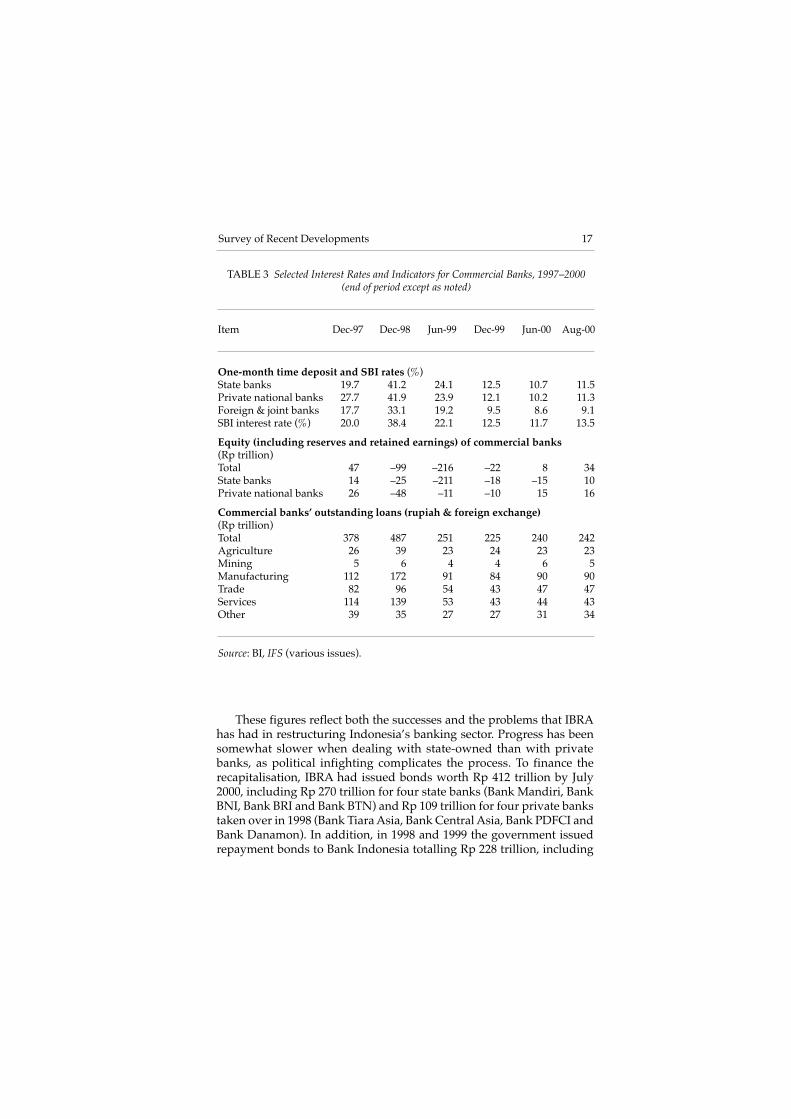
One reason that Bank Indonesia is hesitant to slow the growth ofmoney is that this would require it to issue certificates of deposit (SertifikatBank Indonesia, SBI). The government has issued a large amount offloating rate bonds in conjunction with the bank recapitalisation program,which pay the same rate as the three-month SBIs. Tighter monetary policyand higher interest rates would therefore increase the domestic interestburden in the budget. Three-month SBI rates have already movedmarkedly higher in recent months, from 11.1% in June to 13.0% in July,and 13.3% in August (BI, IFS, various issues). Table 3 shows that 28-daySBI rates were not much higher than interest rates on simple time deposits,underscoring the weak incentive to hold these securities. Deposit interestrates have been much lower in foreign and joint banks in recent months,suggesting that the public may have more confidence in these banks thanbefore. It is also interesting that private national banks now pay lowerinterest than state banks, reversing the large differential that existed in1996–97, when their liabilities were not explicitly guaranteed.
Indonesia’s bank recapitalisation program is nearing completion, asillustrated by the turnaround in the level of equity from negative topositive by June 2000 in the private banks and by August in the statebanks (table 3). The recapitalisation has been accomplished only becausethe government has taken control of a large portion of banking assetsand assumed commensurate responsibility for associated debts. The scaleof this bailout of bank depositors and creditors can be seen from the sharpdecline in loans extended by commercial banks, from Rp 487 trillion atthe end of 1998 to only Rp 251 trillion in the first half of 1999. Bank lendingmay finally be recovering, as total loans at the end of June 2000 were Rp15 trillion, or 7%, higher than the corresponding figure at the end of 1999,with most of the increased lending going to manufacturing, otherindustries, and trade. However, there was very little increase in lendingbetween June and August 2000.
17Survey of Recent Developments
These figures reflect both the successes and the problems that IBRAhas had in restructuring Indonesia’s banking sector. Progress has beensomewhat slower when dealing with state-owned than with privatebanks, as political infighting complicates the process. To finance therecapitalisation, IBRA had issued bonds worth Rp 412 trillion by July2000, including Rp 270 trillion for four state banks (Bank Mandiri, BankBNI, Bank BRI and Bank BTN) and Rp 109 trillion for four private bankstaken over in 1998 (Bank Tiara Asia, Bank Central Asia, Bank PDFCI andBank Danamon). In addition, in 1998 and 1999 the government issuedrepayment bonds to Bank Indonesia totalling Rp 228 trillion, including
TABLE 3 Selected Interest Rates and Indicators for Commercial Banks, 1997–2000(end of period except as noted)
Item Dec-97 Dec-98 Jun-99 Dec-99 Jun-00 Aug-00
One-month time deposit and SBI rates (%)State banks 19.7 41.2 24.1 12.5 10.7 11.5Private national banks 27.7 41.9 23.9 12.1 10.2 11.3Foreign & joint banks 17.7 33.1 19.2 9.5 8.6 9.1SBI interest rate (%) 20.0 38.4 22.1 12.5 11.7 13.5
Equity (including reserves and retained earnings) of commercial banks(Rp trillion)Total 47 –99 –216 –22 8 34State banks 14 –25 –211 –18 –15 10Private national banks 26 –48 –11 –10 15 16
Commercial banks’ outstanding loans (rupiah & foreign exchange)(Rp trillion)Total 378 487 251 225 240 242Agriculture 26 39 23 24 23 23Mining 5 6 4 4 6 5Manufacturing 112 172 91 84 90 90Trade 82 96 54 43 47 47Services 114 139 53 43 44 43Other 39 35 27 27 31 34
Source: BI, IFS (various issues).
18 Eric D. Ramstetter
Rp 165 trillion to refund liquidity support and Rp 54 trillion to refundoutlays related to bank guarantees. Combined, these bonds compriseIBRA’s liabilities of Rp 640 trillion in government bonds, Rp 151 trillionof which are fixed rate bonds, Rp 271 trillion variable rate bonds, and Rp218 trillion inflation indexed bonds (Feridhanusetyawan 2000: 11). In theprocess of bank restructuring, IBRA had acquired assets with an estimatedbook value of Rp 470 trillion at the end of July 2000. However, their marketvalue has recently been estimated at 35–40% of the book value(Feridhanusetyawan 2000: 12).
This process has left IBRA and the government with three largeproblems. First, in the short run, the government has to find a way topay the interest on the recapitalisation bonds. This will represent a seriousfiscal burden over the next few years, as can be seen in the budgetpresented below. Second, the government will soon have to start payingdown the principal on these bonds, some of which begin to mature in2003, creating a further fiscal burden. Third, IBRA has to dispose of theassets it has acquired. The estimated recovery rate of 35–40% impliesthat IBRA should be able to raise only about Rp 175 trillion to help alleviatethese fiscal burdens.
The process of disposing of the IBRA assets is riddled with politicaldifficulties. First, there are fears that previous owners will just buy backtheir old assets, which IBRA seized at a considerable discount to bookvalue, with the taxpayer left bear the burden of the losses incurred bythese bankers. This could create a strong political reaction against IBRAand the government, even if could be justified on the grounds thatprevious owners made the best offers for the assets. Second, IBRA andthe government are hesitant to sell to foreign buyers, partly because theyrisk being seen as offering Indonesian assets to foreigners at ‘fire-sale’prices. This nationalist sentiment is so strong that IBRA cannot ignore it,even if nationalism is costly to the economy. As a result, IBRA has beenrelatively slow to dispose of the assets it holds. Experience from othercountries suggests, however, that the longer IBRA holds them, the lowerthe recovery rate is likely to be.
Another important aspect of IBRA’s operations concerns therestructuring of corporate debts.12 There are several agencies in additionto IBRA that are involved in this process, the major ones being theIndonesian Debt Restructuring Agency (INDRA), the Jakarta Initiative(JI), and the Financial Sector Policy Committee (FSPC). INDRA wasestablished in 1998 to help smooth out payments of dollar-denominateddebts over time, but there was very little participation, and thegovernment has decided to close INDRA as a result. The JI is a privateagency which works to facilitate resolution of debts among creditors and
19Survey of Recent Developments
debtors outside the court system. It has been more successful in elicitingparticipation, but the amount of debt worked out through the JI has beenlimited. In response to slow progress in resolving corporate debt, theFSPC began operation in February 2000. This is an interministerialcommittee now headed by Coordinating Economics Minister Rizal Ramli;it is charged with developing guidelines for both bank and corporaterestructuring, and with overseeing the operations of IBRA and the JI.However, in a statement on 25 September after concluding a consultationwith Indonesia, the IMF expressed concern over the slow progress notonly of IBRA, but also of the JI and the FSPC (JP, 27/9/00: 5).
Fiscal Developments and Public Sector Debt
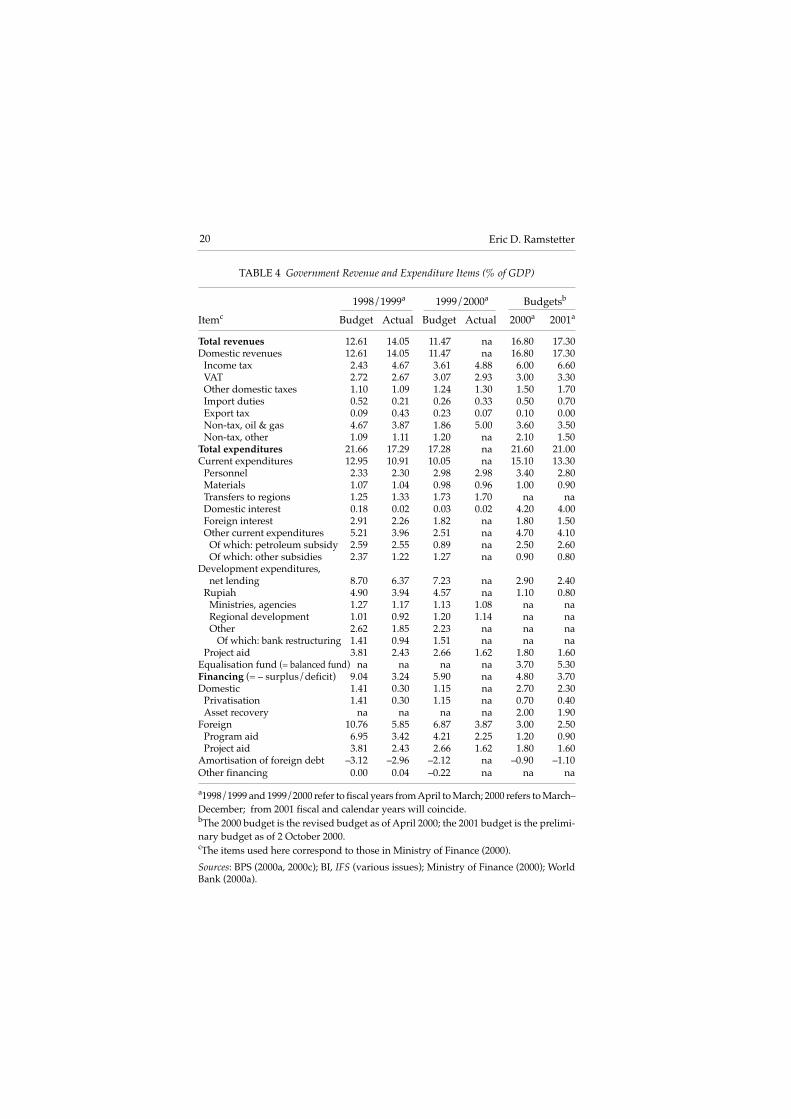
The budget will be extremely tight for the next several years because ofthe cost of servicing the large public debt incurred in the process of bankrestructuring. Table 4 shows that the domestic interest burden will risefrom an actual expenditure of only 0.02% of GDP in fiscal 1998/99 and1999/2000 (April–March) to a projected 4.2% of GDP in fiscal 2000(March–December), this increase being almost equal to the total increasein budgeted expenditure in this period. The newly announced budgetprojects that this burden will be similar in 2001 (January–December).13
The burden the domestic debt places on the budget will increase furtherin 2003, when the government has to start retiring some of the bondsissued. Two important sources of revenue for the government to makeup the shortfalls caused by debt servicing are the sale of banking assetsheld in IBRA and the sale of state-owned corporations, including banksand other firms such as PT Telkom. However, progress on privatisationhas been slow, with realised receipts being far below those projected for1998/99, and probably below the target for 1999/2000 as well. As withproblems in the state-owned banks, an important obstacle to theprivatisation process is the lack of a political consensus on how, orwhether, to proceed.
While public sector debt will place a large burden on governmentfinances in the next few years, it should be emphasised that Indonesianfiscal policy has historically been conservative and deficits have beensmall. The debt burden is thus likely be a temporary problem, though itwill take some years to bring it down to more moderate levels. Deficitsare projected to increase in the next few years, but the situation is verydifferent from that in numerous other countries that have experiencedfiscal difficulties in the past (e.g. the Philippines in the 1980s and early1990s), where large public sector debt was the result of running substantialdeficits over a long period. Indeed, in view of the significant decline ineconomic activity in 1998 and the very slow growth in 1999, one could
20 Eric D. Ramstetter
TABLE 4 Government Revenue and Expenditure Items (% of GDP)
1998/1999a 1999/2000a Budgetsb
Itemc Budget Actual Budget Actual 2000a 2001a
Total revenues 12.61 14.05 11.47 na 16.80 17.30Domestic revenues 12.61 14.05 11.47 na 16.80 17.30
Income tax 2.43 4.67 3.61 4.88 6.00 6.60VAT 2.72 2.67 3.07 2.93 3.00 3.30Other domestic taxes 1.10 1.09 1.24 1.30 1.50 1.70Import duties 0.52 0.21 0.26 0.33 0.50 0.70Export tax 0.09 0.43 0.23 0.07 0.10 0.00Non-tax, oil & gas 4.67 3.87 1.86 5.00 3.60 3.50Non-tax, other 1.09 1.11 1.20 na 2.10 1.50
Total expenditures 21.66 17.29 17.28 na 21.60 21.00Current expenditures 12.95 10.91 10.05 na 15.10 13.30
Personnel 2.33 2.30 2.98 2.98 3.40 2.80Materials 1.07 1.04 0.98 0.96 1.00 0.90Transfers to regions 1.25 1.33 1.73 1.70 na naDomestic interest 0.18 0.02 0.03 0.02 4.20 4.00Foreign interest 2.91 2.26 1.82 na 1.80 1.50Other current expenditures 5.21 3.96 2.51 na 4.70 4.10
Of which: petroleum subsidy 2.59 2.55 0.89 na 2.50 2.60Of which: other subsidies 2.37 1.22 1.27 na 0.90 0.80
Development expenditures,net lending 8.70 6.37 7.23 na 2.90 2.40
Rupiah 4.90 3.94 4.57 na 1.10 0.80Ministries, agencies 1.27 1.17 1.13 1.08 na naRegional development 1.01 0.92 1.20 1.14 na naOther 2.62 1.85 2.23 na na na
Of which: bank restructuring 1.41 0.94 1.51 na na naProject aid 3.81 2.43 2.66 1.62 1.80 1.60
Equalisation fund (= balanced fund) na na na na 3.70 5.30Financing (= – surplus/deficit) 9.04 3.24 5.90 na 4.80 3.70Domestic 1.41 0.30 1.15 na 2.70 2.30
Privatisation 1.41 0.30 1.15 na 0.70 0.40Asset recovery na na na na 2.00 1.90
Foreign 10.76 5.85 6.87 3.87 3.00 2.50Program aid 6.95 3.42 4.21 2.25 1.20 0.90Project aid 3.81 2.43 2.66 1.62 1.80 1.60
Amortisation of foreign debt –3.12 –2.96 –2.12 na –0.90 –1.10Other financing 0.00 0.04 –0.22 na na na
a1998/1999 and 1999/2000 refer to fiscal years from April to March; 2000 refers to March–December; from 2001 fiscal and calendar years will coincide.bThe 2000 budget is the revised budget as of April 2000; the 2001 budget is the prelimi-nary budget as of 2 October 2000.cThe items used here correspond to those in Ministry of Finance (2000).
Sources: BPS (2000a, 2000c); BI, IFS (various issues); Ministry of Finance (2000); WorldBank (2000a).
21Survey of Recent Developments
easily argue that the government has been far too conservative, and thatthe tendency to underspend the budget in 1998/99, for example, wasvery costly to the economy. The costs include growth lost through failureto stimulate aggregate demand and to maintain aggressive developmentspending (in a country that still lacks basic physical and educationalinfrastructure). Of course, the argument that Indonesia should have runlarger deficits is based on the assumption that adequate financing couldhave been found, and that the funds could have been efficiently allocatedto the necessary projects—which may have been politically impossibleduring this period, especially given the problems on the monetary side.
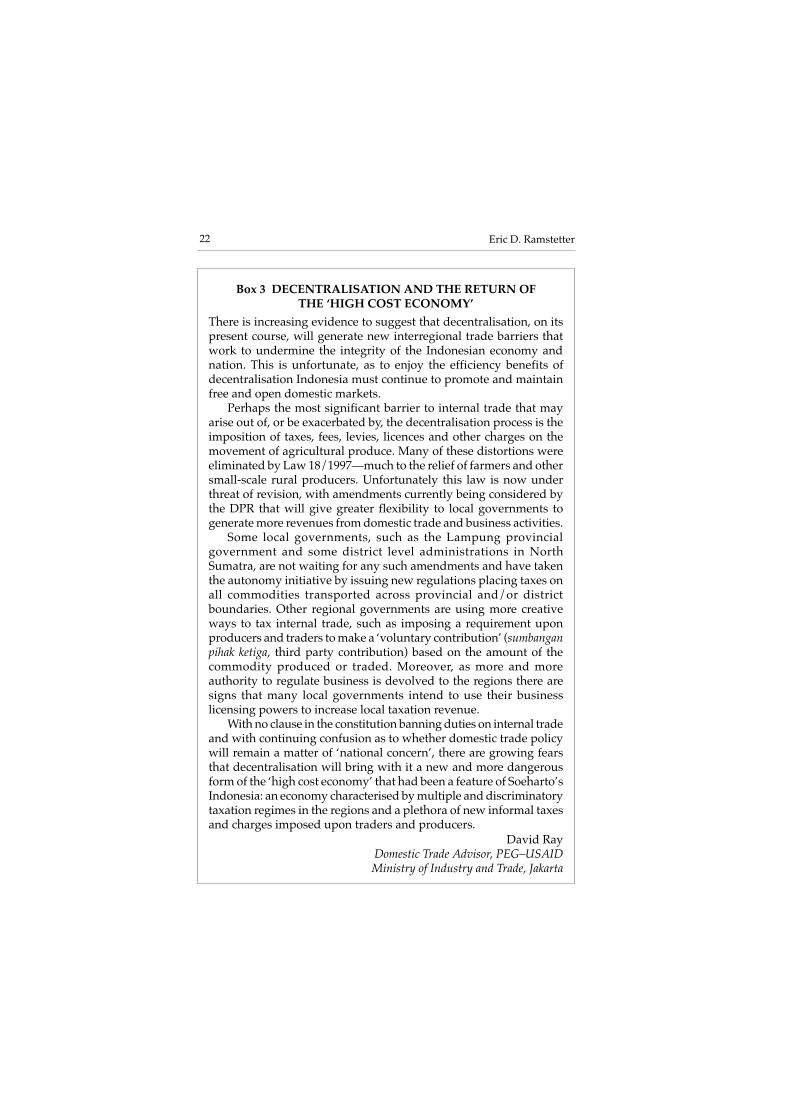
There will also be important long-term changes in the budget incoming years. The first will result from implementation of a decentrali-sation plan under which the central government intends to return aboutone-quarter of its domestic revenues to local governments, a process dueto begin in January 2001 (McLeod 2000: 30–8). It is unclear how this willproceed, though the 2001 budget does explicitly account for the changewith the newly established equalisation fund, which is projected to growto 5.3% of GDP in 2001. (For a comment on the impact of efforts by localgovernments to increase their revenues in the context of fiscal decen-tralisation, see box 3). A second change stems from the decision to rollback some of the subsidies that the government provides. Political diffi-culties with implementation caused the first increase in fuel prices to bedelayed from 1 April 2000 to 1 October. However, this rise has appar-ently been carried out with relatively little public outcry, and anotherincrease of 20% is scheduled to take place in April 2001. The removal ofsubsidies is desirable both to lessen the burden on the budget and, moreimportantly, to promote efficient use of resources.
The Balance of Payments and External Debt
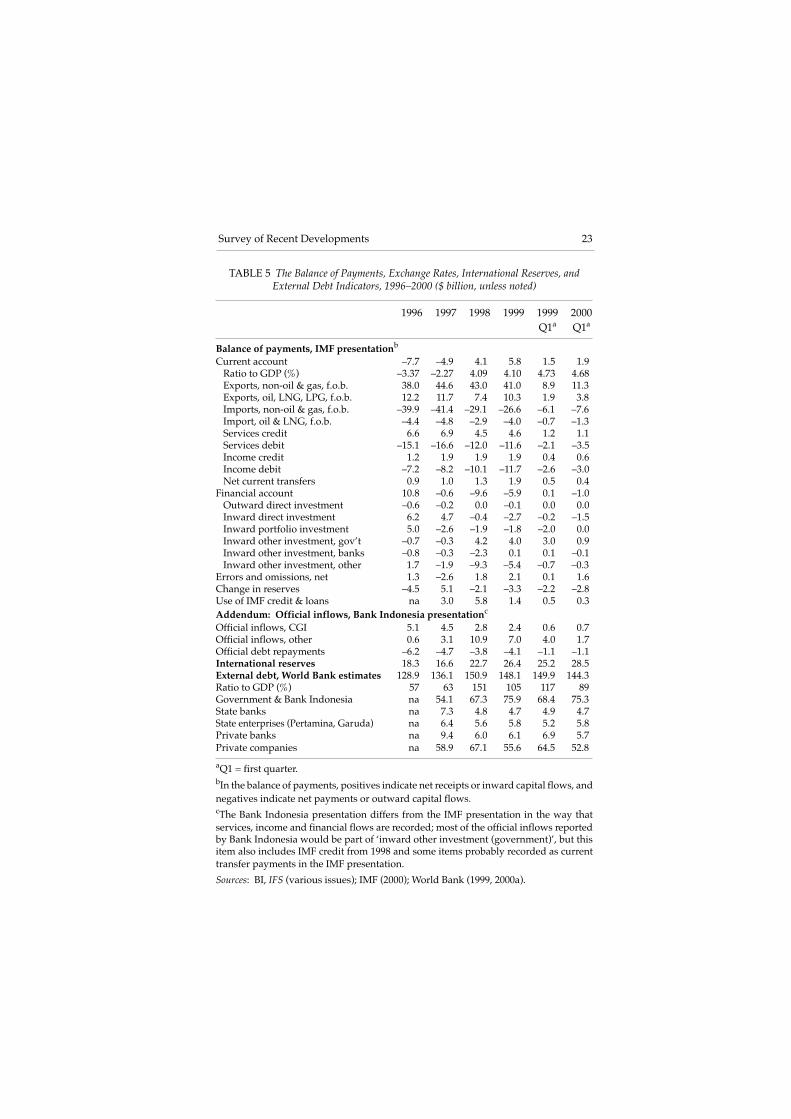
In contrast to the increased domestic debt burden, the foreign debt burdenis declining, although it remains substantial. Government spending onforeign interest was over 2.3% of GDP in 1998/99, but is projected todecline to 1.8% in 1999/2000 and in the 9-month budget for 2000 (table 4).Financing in the form of debt amortisation is also projected to fall from–3.0% of GDP to –2.1% and –0.9% respectively. Public sector debt indollars, including that of the government and Bank Indonesia, continuedto rise in 1998 and 1999, however, reaching a peak of $76 billion at theend of 1999 (table 5). On the other hand, the external debt of privatecompanies and total debt both began to fall in 1999. More importantly,the relative size of total debt has fallen markedly, from 151% of GDP in1998 to 89% in the first quarter of 2000, largely owing to the rebound ofthe rupiah.
22 Eric D. Ramstetter
Box 3 DECENTRALISATION AND THE RETURN OFTHE ‘HIGH COST ECONOMY’
There is increasing evidence to suggest that decentralisation, on itspresent course, will generate new interregional trade barriers thatwork to undermine the integrity of the Indonesian economy andnation. This is unfortunate, as to enjoy the efficiency benefits ofdecentralisation Indonesia must continue to promote and maintainfree and open domestic markets.
Perhaps the most significant barrier to internal trade that mayarise out of, or be exacerbated by, the decentralisation process is theimposition of taxes, fees, levies, licences and other charges on themovement of agricultural produce. Many of these distortions wereeliminated by Law 18/1997—much to the relief of farmers and othersmall-scale rural producers. Unfortunately this law is now underthreat of revision, with amendments currently being considered bythe DPR that will give greater flexibility to local governments togenerate more revenues from domestic trade and business activities.
Some local governments, such as the Lampung provincialgovernment and some district level administrations in NorthSumatra, are not waiting for any such amendments and have takenthe autonomy initiative by issuing new regulations placing taxes onall commodities transported across provincial and/or districtboundaries. Other regional governments are using more creativeways to tax internal trade, such as imposing a requirement uponproducers and traders to make a ‘voluntary contribution’ (sumbanganpihak ketiga, third party contribution) based on the amount of thecommodity produced or traded. Moreover, as more and moreauthority to regulate business is devolved to the regions there aresigns that many local governments intend to use their businesslicensing powers to increase local taxation revenue.
With no clause in the constitution banning duties on internal tradeand with continuing confusion as to whether domestic trade policywill remain a matter of ‘national concern’, there are growing fearsthat decentralisation will bring with it a new and more dangerousform of the ‘high cost economy’ that had been a feature of Soeharto’sIndonesia: an economy characterised by multiple and discriminatorytaxation regimes in the regions and a plethora of new informal taxesand charges imposed upon traders and producers.
David RayDomestic Trade Advisor, PEG–USAIDMinistry of Industry and Trade, Jakarta
23Survey of Recent Developments
TABLE 5 The Balance of Payments, Exchange Rates, International Reserves, andExternal Debt Indicators, 1996–2000 ($ billion, unless noted)
1996 1997 1998 1999 1999 2000Q1a Q1a
Balance of payments, IMF presentationb
Current account –7.7 –4.9 4.1 5.8 1.5 1.9Ratio to GDP (%) –3.37 –2.27 4.09 4.10 4.73 4.68Exports, non-oil & gas, f.o.b. 38.0 44.6 43.0 41.0 8.9 11.3Exports, oil, LNG, LPG, f.o.b. 12.2 11.7 7.4 10.3 1.9 3.8Imports, non-oil & gas, f.o.b. –39.9 –41.4 –29.1 –26.6 –6.1 –7.6Import, oil & LNG, f.o.b. –4.4 –4.8 –2.9 –4.0 –0.7 –1.3Services credit 6.6 6.9 4.5 4.6 1.2 1.1Services debit –15.1 –16.6 –12.0 –11.6 –2.1 –3.5Income credit 1.2 1.9 1.9 1.9 0.4 0.6Income debit –7.2 –8.2 –10.1 –11.7 –2.6 –3.0Net current transfers 0.9 1.0 1.3 1.9 0.5 0.4
Financial account 10.8 –0.6 –9.6 –5.9 0.1 –1.0Outward direct investment –0.6 –0.2 0.0 –0.1 0.0 0.0Inward direct investment 6.2 4.7 –0.4 –2.7 –0.2 –1.5Inward portfolio investment 5.0 –2.6 –1.9 –1.8 –2.0 0.0Inward other investment, gov’t –0.7 –0.3 4.2 4.0 3.0 0.9Inward other investment, banks –0.8 –0.3 –2.3 0.1 0.1 –0.1Inward other investment, other 1.7 –1.9 –9.3 –5.4 –0.7 –0.3
Errors and omissions, net 1.3 –2.6 1.8 2.1 0.1 1.6Change in reserves –4.5 5.1 –2.1 –3.3 –2.2 –2.8Use of IMF credit & loans na 3.0 5.8 1.4 0.5 0.3Addendum: Official inflows, Bank Indonesia presentationc
Official inflows, CGI 5.1 4.5 2.8 2.4 0.6 0.7Official inflows, other 0.6 3.1 10.9 7.0 4.0 1.7Official debt repayments –6.2 –4.7 –3.8 –4.1 –1.1 –1.1International reserves 18.3 16.6 22.7 26.4 25.2 28.5External debt, World Bank estimates 128.9 136.1 150.9 148.1 149.9 144.3Ratio to GDP (%) 57 63 151 105 117 89Government & Bank Indonesia na 54.1 67.3 75.9 68.4 75.3State banks na 7.3 4.8 4.7 4.9 4.7State enterprises (Pertamina, Garuda) na 6.4 5.6 5.8 5.2 5.8Private banks na 9.4 6.0 6.1 6.9 5.7Private companies na 58.9 67.1 55.6 64.5 52.8
aQ1 = first quarter.bIn the balance of payments, positives indicate net receipts or inward capital flows, andnegatives indicate net payments or outward capital flows.cThe Bank Indonesia presentation differs from the IMF presentation in the way thatservices, income and financial flows are recorded; most of the official inflows reportedby Bank Indonesia would be part of ‘inward other investment (government)’, but thisitem also includes IMF credit from 1998 and some items probably recorded as currenttransfer payments in the IMF presentation.
Sources: BI, IFS (various issues); IMF (2000); World Bank (1999, 2000a).
24 Eric D. Ramstetter
The turnaround in the external debt position was facilitated in partby the emergence of a large current account surplus, equal to 4.1% ofGDP in 1998 and 5.8% in 1999. The most conspicuous element was thecollapse in imports from a peak of $46 billion in 1997 to $31–32 billion in1998–99. Data for the first quarter of 2000 indicate some recovery inimports to $9 billion, compared to $7 billion in the same period in 1999,but the current account surplus was unchanged at 4.7% of GDP, primarilybecause exports also grew rapidly, from $11 to $15 billion. Thus, the largedepreciation of the rupiah (figure 2) and the recession following the crisishave had the predictable effect of turning around the current account.This is despite very large debits on the services and income accounts,both of which remain strongly negative on net. The substantial increasein investment income debits in 1996–99 reflects increased foreign interestpayments.
As would generally be expected, the financial account mirrored trendsin the current account, moving from a net inflow of over $11 billion in1996 to a net outflow of $10 billion in 1998 and $6 billion in 1999 (table 5).Outward foreign direct investment (FDI) is negligible, but inward FDIwent from a peak of over $6 billion in 1996 to –$3 billion in 1999, as foreignmultinational corporations withdrew or reduced investments inIndonesia. In the first quarter of 2000 the negative flow of FDI accelerated,rising to –$1.5 billion, compared to –$0.2 billion a year earlier. Inwardportfolio investment followed a similar trend but the decline was morerapid, from $5 billion in 1996 to –$3 billion in 1997 and –$2 billion peryear in 1998–99. It recovered slightly to $0.2 billion in the last half of1999, and was about zero for the first half of 2000, indicating that a fewforeign portfolio investors have returned to the Indonesian market. Byfar the largest element of this account is ‘other investment’ (mainly loansof some sort), and the decline in non-governmental (banks and ‘other’combined) ‘other’ investment was most pronounced, from $1 billion in1996 to –$2 billion in 1997, –$12 billion in 1998, and –$5 billion in 1999. Inthe first quarter of 2000 this flow was still negative, but slightly smallerthan in the first quarter of 1999 (–$0.4 billion vs –$0.6 billion). Otherinvestment flows to the government displayed the opposite trend, risingfrom negative values in 1996–97 to $4 billion per year in 1998–99, thoughthe first quarter flow was much smaller in 2000 than in 1999. Use of IMFcredit and loans also rose from virtually zero to $3 billion in 1997 and $6billion in 1998, but tapered off in 1999. Thus Indonesia relied heavily onofficial foreign capital in 1997 and 1998, but less so in 1999 and the firstquarter of 2000.
25Survey of Recent Developments
THE INDUSTRIAL STRUCTURE OF PRODUCTION,TRADE AND EMPLOYMENT
It is now three years since the crisis broke and, as the above review ofmacroeconomic trends suggests, the economy has had to make largeadjustments. With the passage of time and the increasing availability ofdata, it is now possible to examine more closely which industries havebenefited from these adjustments, and which have been most adverselyaffected.
Production
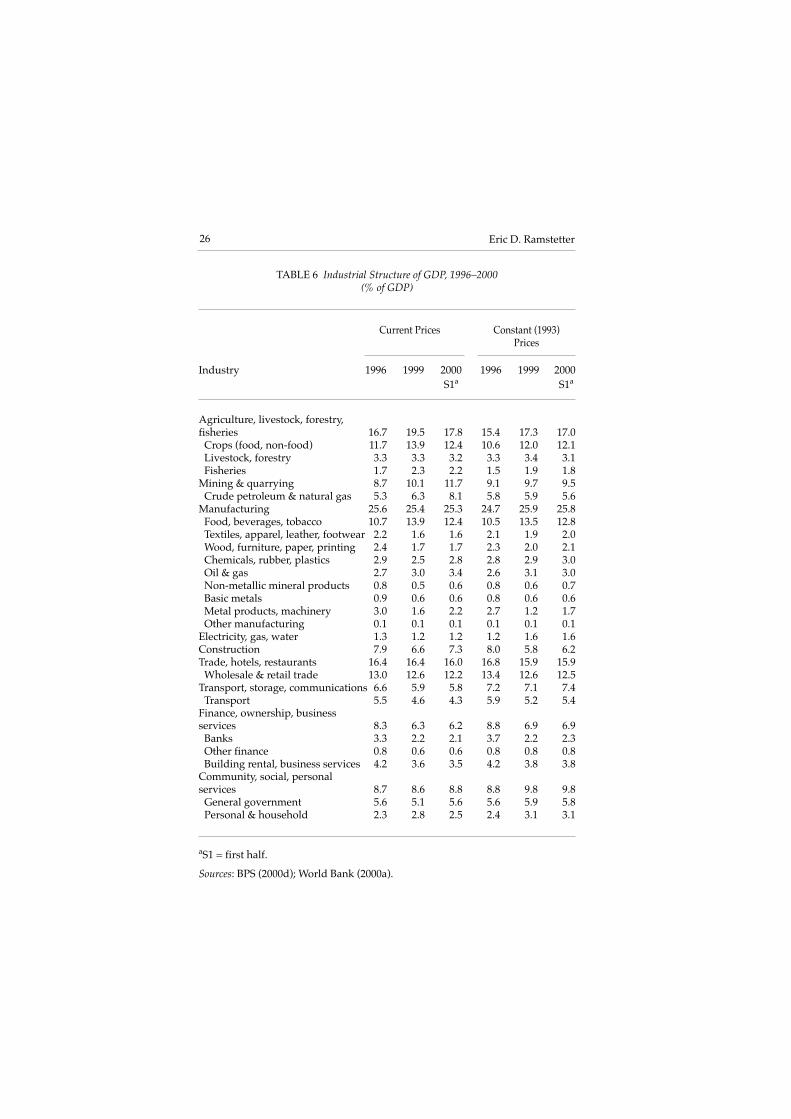
Shares of some industries in real GDP have changed markedly in the lastyear and more generally through the crisis (table 6). The hardest hit majorindustries were construction, whose share fell from 8.0% in 1996 to 5.8%in 1999, and finance, ownership and business services (whose sharedeclined from 8.8% to 6.9%). Construction’s share rebounded somewhatin the first half of 2000, but that of finance, ownership and businessservices remained stagnant. In the latter sector, the fall in banking accountsfor most of the decline, which is of similar magnitude whether measuredin current or constant prices. In construction, the decline is much smallerin current than in constant prices, reflecting relatively rapid price rises inthis sector (table 2). In trade, hotels and restaurants, where the bulk ofbusiness is wholesale and retail trade, the share of constant price GDPfell in 1996–99, while the share of current price GDP remained unchanged.In the first half of 2000, this pattern was reversed.
In contrast, shares of real GDP rose in 1996–99 in agriculture (15.4%to 17.3%), manufacturing (24.7% to 25.9%), and community, social andpersonal services (8.8% to 9.8%) (table 6). Shares of real GDP remained atthe 1999 level in the first half of 2000 for manufacturing and community,social and personal services, but fell somewhat in agriculture (to 17.0%).14
In agriculture these changes are even larger when measured in currentprices, reflecting the large rise and subsequent decline of prices in thatsector (table 2). On the other hand, sectoral deflators were relatively stablein manufacturing and community, social and personal services (comparedto the GDP deflator) and shares changed less when measured in currentprices.
Within agriculture, the increase in the share of real GDP in 1996–99was largest in crops and fisheries, but the decline in the first half of 2000was largest in livestock and fisheries. A closely related industry—food,beverages and tobacco—is the largest component of manufacturing, and
26 Eric D. Ramstetter
TABLE 6 Industrial Structure of GDP, 1996–2000(% of GDP)
Current Prices Constant (1993)Prices
Industry 1996 1999 2000 1996 1999 2000S1a S1a
Agriculture, livestock, forestry,fisheries 16.7 19.5 17.8 15.4 17.3 17.0
Crops (food, non-food) 11.7 13.9 12.4 10.6 12.0 12.1Livestock, forestry 3.3 3.3 3.2 3.3 3.4 3.1Fisheries 1.7 2.3 2.2 1.5 1.9 1.8
Mining & quarrying 8.7 10.1 11.7 9.1 9.7 9.5Crude petroleum & natural gas 5.3 6.3 8.1 5.8 5.9 5.6
Manufacturing 25.6 25.4 25.3 24.7 25.9 25.8Food, beverages, tobacco 10.7 13.9 12.4 10.5 13.5 12.8Textiles, apparel, leather, footwear 2.2 1.6 1.6 2.1 1.9 2.0Wood, furniture, paper, printing 2.4 1.7 1.7 2.3 2.0 2.1Chemicals, rubber, plastics 2.9 2.5 2.8 2.8 2.9 3.0Oil & gas 2.7 3.0 3.4 2.6 3.1 3.0Non-metallic mineral products 0.8 0.5 0.6 0.8 0.6 0.7Basic metals 0.9 0.6 0.6 0.8 0.6 0.6Metal products, machinery 3.0 1.6 2.2 2.7 1.2 1.7Other manufacturing 0.1 0.1 0.1 0.1 0.1 0.1
Electricity, gas, water 1.3 1.2 1.2 1.2 1.6 1.6Construction 7.9 6.6 7.3 8.0 5.8 6.2Trade, hotels, restaurants 16.4 16.4 16.0 16.8 15.9 15.9
Wholesale & retail trade 13.0 12.6 12.2 13.4 12.6 12.5Transport, storage, communications 6.6 5.9 5.8 7.2 7.1 7.4
Transport 5.5 4.6 4.3 5.9 5.2 5.4Finance, ownership, businessservices 8.3 6.3 6.2 8.8 6.9 6.9
Banks 3.3 2.2 2.1 3.7 2.2 2.3Other finance 0.8 0.6 0.6 0.8 0.8 0.8Building rental, business services 4.2 3.6 3.5 4.2 3.8 3.8
Community, social, personalservices 8.7 8.6 8.8 8.8 9.8 9.8
General government 5.6 5.1 5.6 5.6 5.9 5.8Personal & household 2.3 2.8 2.5 2.4 3.1 3.1
aS1 = first half.
Sources: BPS (2000d); World Bank (2000a).
27Survey of Recent Developments
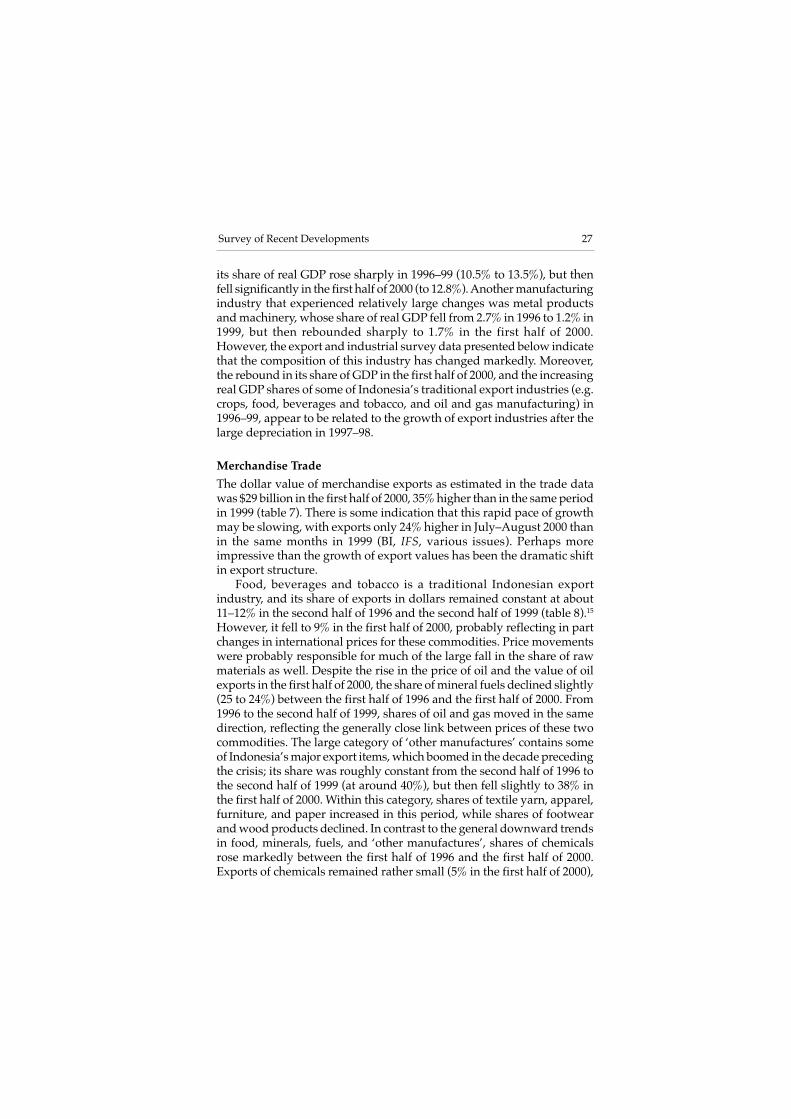
its share of real GDP rose sharply in 1996–99 (10.5% to 13.5%), but thenfell significantly in the first half of 2000 (to 12.8%). Another manufacturingindustry that experienced relatively large changes was metal productsand machinery, whose share of real GDP fell from 2.7% in 1996 to 1.2% in1999, but then rebounded sharply to 1.7% in the first half of 2000.However, the export and industrial survey data presented below indicatethat the composition of this industry has changed markedly. Moreover,the rebound in its share of GDP in the first half of 2000, and the increasingreal GDP shares of some of Indonesia’s traditional export industries (e.g.crops, food, beverages and tobacco, and oil and gas manufacturing) in1996–99, appear to be related to the growth of export industries after thelarge depreciation in 1997–98.
Merchandise Trade
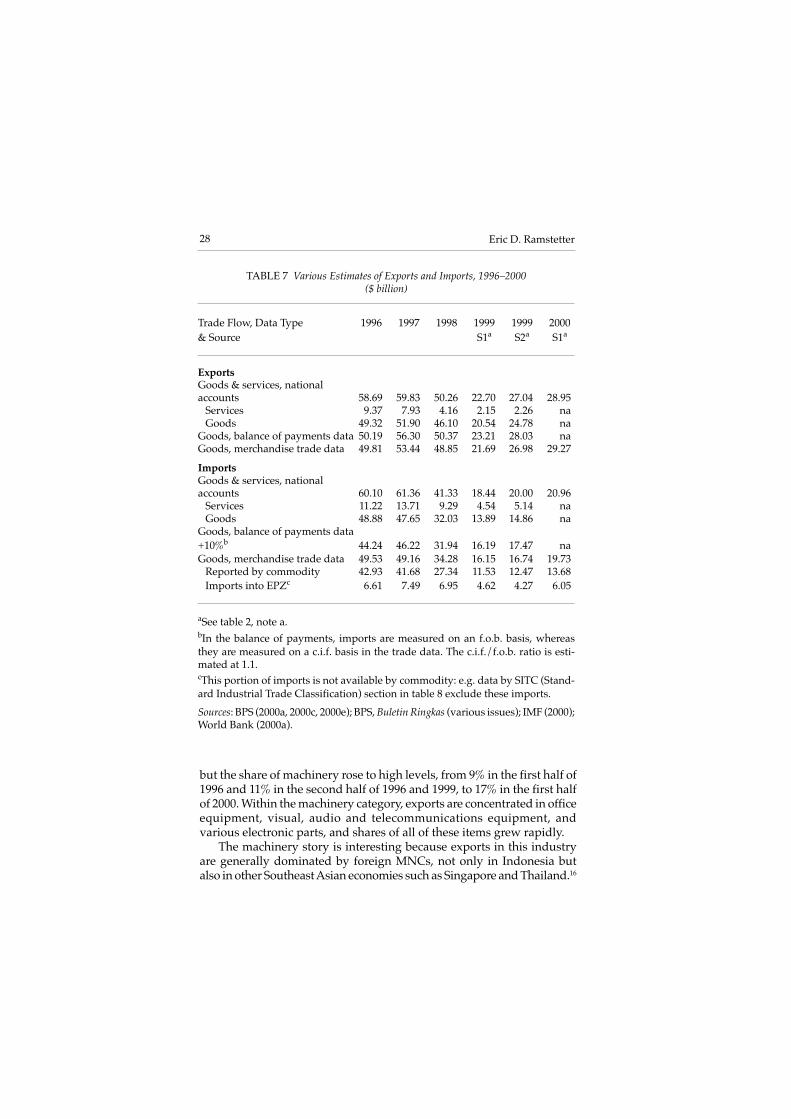
The dollar value of merchandise exports as estimated in the trade datawas $29 billion in the first half of 2000, 35% higher than in the same periodin 1999 (table 7). There is some indication that this rapid pace of growthmay be slowing, with exports only 24% higher in July–August 2000 thanin the same months in 1999 (BI, IFS, various issues). Perhaps moreimpressive than the growth of export values has been the dramatic shiftin export structure.
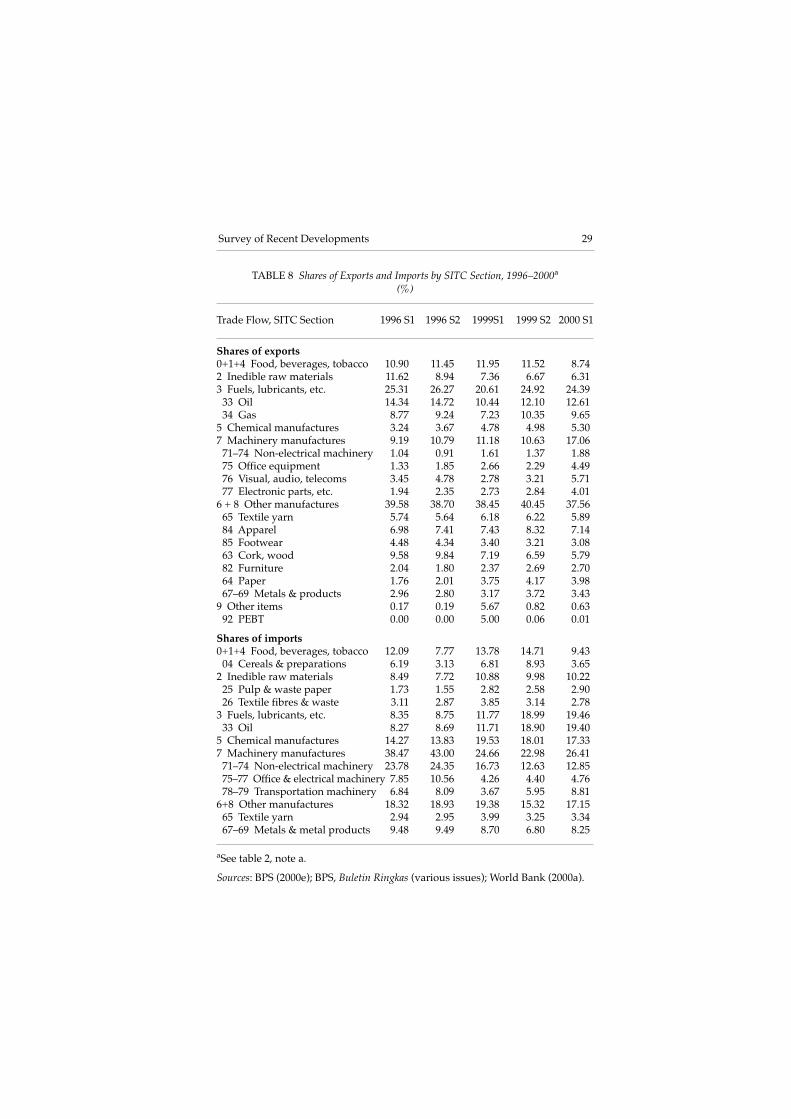
Food, beverages and tobacco is a traditional Indonesian exportindustry, and its share of exports in dollars remained constant at about11–12% in the second half of 1996 and the second half of 1999 (table 8).15
However, it fell to 9% in the first half of 2000, probably reflecting in partchanges in international prices for these commodities. Price movementswere probably responsible for much of the large fall in the share of rawmaterials as well. Despite the rise in the price of oil and the value of oilexports in the first half of 2000, the share of mineral fuels declined slightly(25 to 24%) between the first half of 1996 and the first half of 2000. From1996 to the second half of 1999, shares of oil and gas moved in the samedirection, reflecting the generally close link between prices of these twocommodities. The large category of ‘other manufactures’ contains someof Indonesia’s major export items, which boomed in the decade precedingthe crisis; its share was roughly constant from the second half of 1996 tothe second half of 1999 (at around 40%), but then fell slightly to 38% inthe first half of 2000. Within this category, shares of textile yarn, apparel,furniture, and paper increased in this period, while shares of footwearand wood products declined. In contrast to the general downward trendsin food, minerals, fuels, and ‘other manufactures’, shares of chemicalsrose markedly between the first half of 1996 and the first half of 2000.Exports of chemicals remained rather small (5% in the first half of 2000),
28 Eric D. Ramstetter
but the share of machinery rose to high levels, from 9% in the first half of1996 and 11% in the second half of 1996 and 1999, to 17% in the first halfof 2000. Within the machinery category, exports are concentrated in officeequipment, visual, audio and telecommunications equipment, andvarious electronic parts, and shares of all of these items grew rapidly.
The machinery story is interesting because exports in this industryare generally dominated by foreign MNCs, not only in Indonesia butalso in other Southeast Asian economies such as Singapore and Thailand.16
TABLE 7 Various Estimates of Exports and Imports, 1996–2000($ billion)
Trade Flow, Data Type 1996 1997 1998 1999 1999 2000& Source S1a S2a S1a
ExportsGoods & services, nationalaccounts 58.69 59.83 50.26 22.70 27.04 28.95
Services 9.37 7.93 4.16 2.15 2.26 naGoods 49.32 51.90 46.10 20.54 24.78 na
Goods, balance of payments data 50.19 56.30 50.37 23.21 28.03 naGoods, merchandise trade data 49.81 53.44 48.85 21.69 26.98 29.27
ImportsGoods & services, nationalaccounts 60.10 61.36 41.33 18.44 20.00 20.96
Services 11.22 13.71 9.29 4.54 5.14 naGoods 48.88 47.65 32.03 13.89 14.86 na
Goods, balance of payments data+10%b 44.24 46.22 31.94 16.19 17.47 naGoods, merchandise trade data 49.53 49.16 34.28 16.15 16.74 19.73
Reported by commodity 42.93 41.68 27.34 11.53 12.47 13.68Imports into EPZc 6.61 7.49 6.95 4.62 4.27 6.05
aSee table 2, note a.bIn the balance of payments, imports are measured on an f.o.b. basis, whereasthey are measured on a c.i.f. basis in the trade data. The c.i.f./f.o.b. ratio is esti-mated at 1.1.cThis portion of imports is not available by commodity: e.g. data by SITC (Stand-ard Industrial Trade Classification) section in table 8 exclude these imports.
Sources: BPS (2000a, 2000c, 2000e); BPS, Buletin Ringkas (various issues); IMF (2000);World Bank (2000a).
29Survey of Recent Developments
TABLE 8 Shares of Exports and Imports by SITC Section, 1996–2000a
(%)
Trade Flow, SITC Section 1996 S1 1996 S2 1999S1 1999 S2 2000 S1
Shares of exports0+1+4 Food, beverages, tobacco 10.90 11.45 11.95 11.52 8.742 Inedible raw materials 11.62 8.94 7.36 6.67 6.313 Fuels, lubricants, etc. 25.31 26.27 20.61 24.92 24.39
33 Oil 14.34 14.72 10.44 12.10 12.6134 Gas 8.77 9.24 7.23 10.35 9.65
5 Chemical manufactures 3.24 3.67 4.78 4.98 5.307 Machinery manufactures 9.19 10.79 11.18 10.63 17.06
71–74 Non-electrical machinery 1.04 0.91 1.61 1.37 1.8875 Office equipment 1.33 1.85 2.66 2.29 4.4976 Visual, audio, telecoms 3.45 4.78 2.78 3.21 5.7177 Electronic parts, etc. 1.94 2.35 2.73 2.84 4.01
6 + 8 Other manufactures 39.58 38.70 38.45 40.45 37.5665 Textile yarn 5.74 5.64 6.18 6.22 5.8984 Apparel 6.98 7.41 7.43 8.32 7.1485 Footwear 4.48 4.34 3.40 3.21 3.0863 Cork, wood 9.58 9.84 7.19 6.59 5.7982 Furniture 2.04 1.80 2.37 2.69 2.7064 Paper 1.76 2.01 3.75 4.17 3.9867–69 Metals & products 2.96 2.80 3.17 3.72 3.43
9 Other items 0.17 0.19 5.67 0.82 0.6392 PEBT 0.00 0.00 5.00 0.06 0.01
Shares of imports0+1+4 Food, beverages, tobacco 12.09 7.77 13.78 14.71 9.43
04 Cereals & preparations 6.19 3.13 6.81 8.93 3.652 Inedible raw materials 8.49 7.72 10.88 9.98 10.22
25 Pulp & waste paper 1.73 1.55 2.82 2.58 2.9026 Textile fibres & waste 3.11 2.87 3.85 3.14 2.78
3 Fuels, lubricants, etc. 8.35 8.75 11.77 18.99 19.4633 Oil 8.27 8.69 11.71 18.90 19.40
5 Chemical manufactures 14.27 13.83 19.53 18.01 17.337 Machinery manufactures 38.47 43.00 24.66 22.98 26.41
71–74 Non-electrical machinery 23.78 24.35 16.73 12.63 12.8575–77 Office & electrical machinery 7.85 10.56 4.26 4.40 4.7678–79 Transportation machinery 6.84 8.09 3.67 5.95 8.81
6+8 Other manufactures 18.32 18.93 19.38 15.32 17.1565 Textile yarn 2.94 2.95 3.99 3.25 3.3467–69 Metals & metal products 9.48 9.49 8.70 6.80 8.25
aSee table 2, note a.
Sources: BPS (2000e); BPS, Buletin Ringkas (various issues); World Bank (2000a).
30 Eric D. Ramstetter
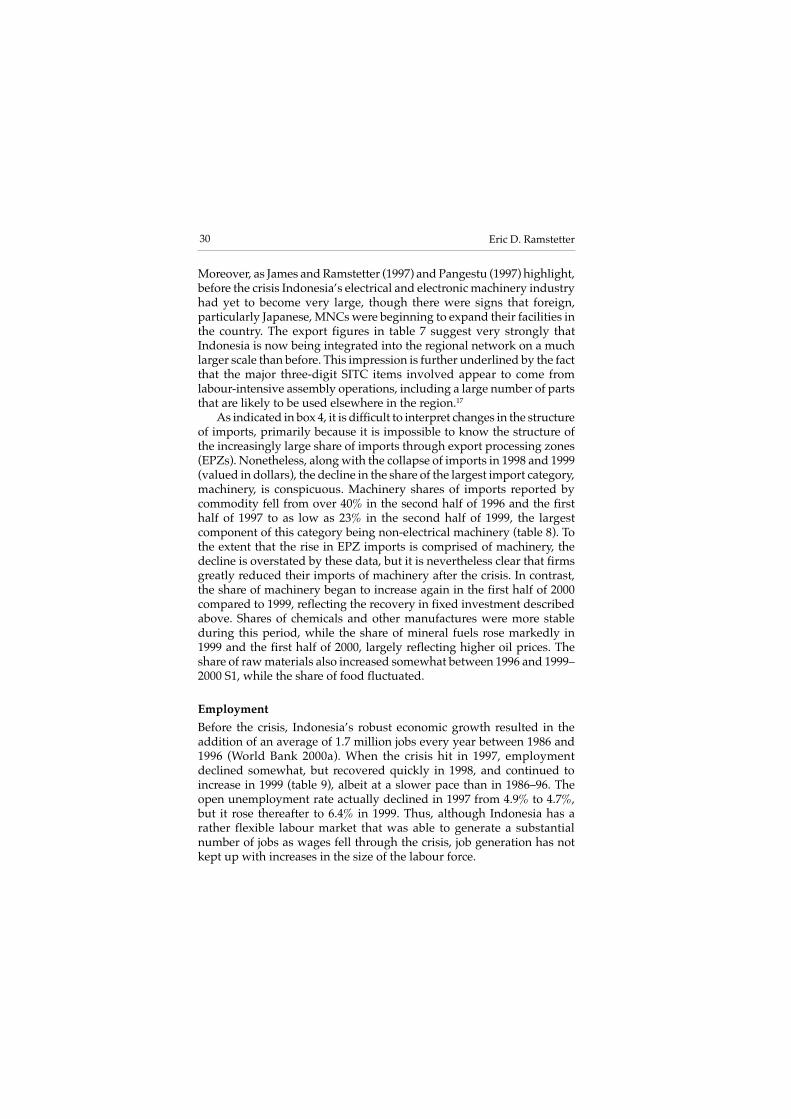
Moreover, as James and Ramstetter (1997) and Pangestu (1997) highlight,before the crisis Indonesia’s electrical and electronic machinery industryhad yet to become very large, though there were signs that foreign,particularly Japanese, MNCs were beginning to expand their facilities inthe country. The export figures in table 7 suggest very strongly thatIndonesia is now being integrated into the regional network on a muchlarger scale than before. This impression is further underlined by the factthat the major three-digit SITC items involved appear to come fromlabour-intensive assembly operations, including a large number of partsthat are likely to be used elsewhere in the region.17
As indicated in box 4, it is difficult to interpret changes in the structureof imports, primarily because it is impossible to know the structure ofthe increasingly large share of imports through export processing zones(EPZs). Nonetheless, along with the collapse of imports in 1998 and 1999(valued in dollars), the decline in the share of the largest import category,machinery, is conspicuous. Machinery shares of imports reported bycommodity fell from over 40% in the second half of 1996 and the firsthalf of 1997 to as low as 23% in the second half of 1999, the largestcomponent of this category being non-electrical machinery (table 8). Tothe extent that the rise in EPZ imports is comprised of machinery, thedecline is overstated by these data, but it is nevertheless clear that firmsgreatly reduced their imports of machinery after the crisis. In contrast,the share of machinery began to increase again in the first half of 2000compared to 1999, reflecting the recovery in fixed investment describedabove. Shares of chemicals and other manufactures were more stableduring this period, while the share of mineral fuels rose markedly in1999 and the first half of 2000, largely reflecting higher oil prices. Theshare of raw materials also increased somewhat between 1996 and 1999–2000 S1, while the share of food fluctuated.
Employment
Before the crisis, Indonesia’s robust economic growth resulted in theaddition of an average of 1.7 million jobs every year between 1986 and1996 (World Bank 2000a). When the crisis hit in 1997, employmentdeclined somewhat, but recovered quickly in 1998, and continued toincrease in 1999 (table 9), albeit at a slower pace than in 1986–96. Theopen unemployment rate actually declined in 1997 from 4.9% to 4.7%,but it rose thereafter to 6.4% in 1999. Thus, although Indonesia has arather flexible labour market that was able to generate a substantialnumber of jobs as wages fell through the crisis, job generation has notkept up with increases in the size of the labour force.
31Survey of Recent Developments
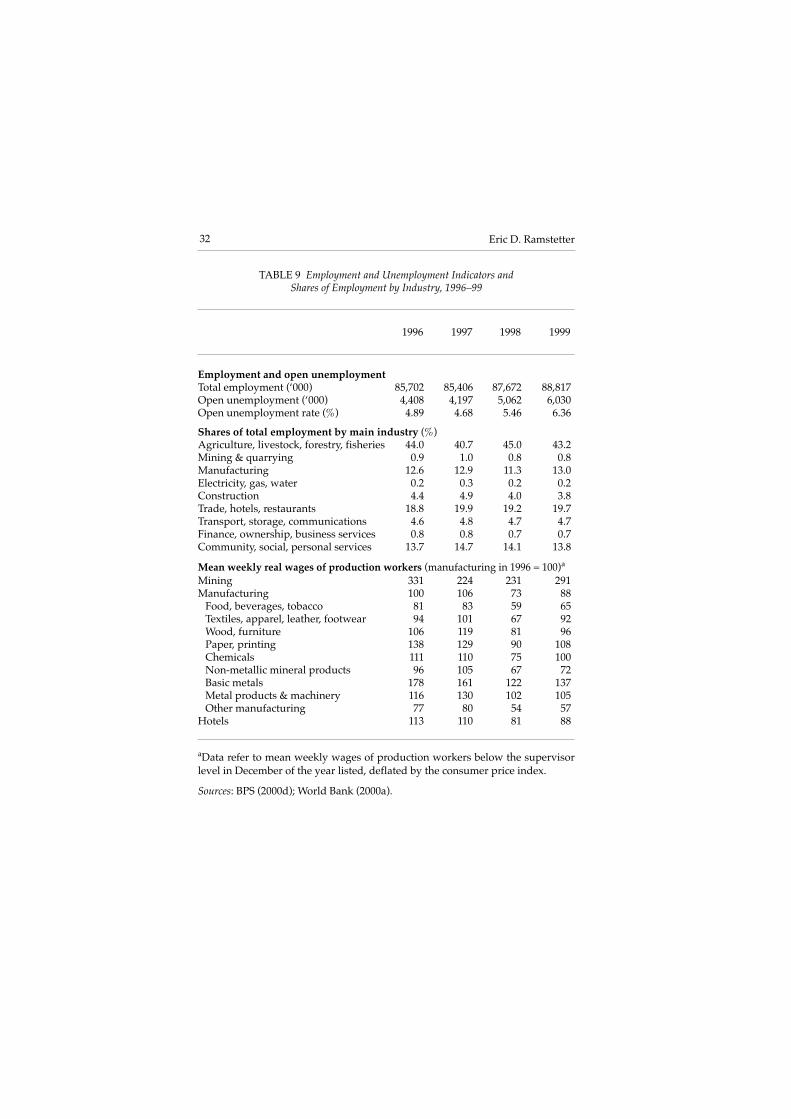
Employment structure has changed less than the structures ofproduction and trade, if 1996 is compared with 1999 (tables 6, 9). Forexample, manufacturing’s share of GDP increased by 1.2 percentagepoints or 5% over this period, while the corresponding change in shareof employment was 0.4 percentage points or 3%. The construction shareof GDP changed by –2.2 percentage points or –28%, while the
Box 4 PROBLEMS IN THE TRADE DATA
There are four important problems with Indonesia’s estimates ofexternal trade. First, there appears to be an increasingly largediscrepancy between measures of exports in the merchandise tradestatistics and corresponding measures in the national accounts orbalance of payments (table 7). For example, when trade data arecompared with national accounts data, this discrepancy was only1% for both exports and imports in 1996, but grew to 9% for exportsand 13% for imports in the second half of 1999 (merchandise tradedata yielding the larger estimate in all cases). Estimates from thebalance of payments differ from both of these estimates, varying from1% (1996) to 7% (first half of 1999) lower than trade data estimatesfor exports and from 12% higher (1996) to 4% lower (second half of1999) for imports, even after a rough measure of the c.i.f./f.o.b.differential is included in the latter calculation. Second, anincreasingly large portion of imports (13% in 1996 and 31% in thefirst half of 2000) through export processing zones and bondedfactories cannot be disaggregated by commodity. Hence it is difficultto identify the composition of imports into Indonesia. Third, fromApril 1997 to March 1999, the category of exports that did not haveto be reported by commodity (see note 15) was expanded, and itsshare of exports went from 0% in the first half of 1997 to 25% in thesecond half, and 15% in calendar 1998 (BPS 2000e; BPS, BuletinRingkas, various issues; World Bank 2000a). Fourth, recent trade dataare only published in dollars and aggregate weight volumes, but asRosner (2000) highlights, there can be very large differences betweenthe trends and composition of trade values and those of morecarefully measured trade volumes.
32 Eric D. Ramstetter
TABLE 9 Employment and Unemployment Indicators andShares of Employment by Industry, 1996–99
1996 1997 1998 1999
Employment and open unemploymentTotal employment (‘000) 85,702 85,406 87,672 88,817Open unemployment (‘000) 4,408 4,197 5,062 6,030Open unemployment rate (%) 4.89 4.68 5.46 6.36
Shares of total employment by main industry (%)Agriculture, livestock, forestry, fisheries 44.0 40.7 45.0 43.2Mining & quarrying 0.9 1.0 0.8 0.8Manufacturing 12.6 12.9 11.3 13.0Electricity, gas, water 0.2 0.3 0.2 0.2Construction 4.4 4.9 4.0 3.8Trade, hotels, restaurants 18.8 19.9 19.2 19.7Transport, storage, communications 4.6 4.8 4.7 4.7Finance, ownership, business services 0.8 0.8 0.7 0.7Community, social, personal services 13.7 14.7 14.1 13.8
Mean weekly real wages of production workers (manufacturing in 1996 = 100)a
Mining 331 224 231 291Manufacturing 100 106 73 88
Food, beverages, tobacco 81 83 59 65Textiles, apparel, leather, footwear 94 101 67 92Wood, furniture 106 119 81 96Paper, printing 138 129 90 108Chemicals 111 110 75 100Non-metallic mineral products 96 105 67 72Basic metals 178 161 122 137Metal products & machinery 116 130 102 105Other manufacturing 77 80 54 57
Hotels 113 110 81 88
aData refer to mean weekly wages of production workers below the supervisorlevel in December of the year listed, deflated by the consumer price index.
Sources: BPS (2000d); World Bank (2000a).
33Survey of Recent Developments
corresponding employment figures were only –0.6 percentage points and–14%. In finance, ownership and business services, the change in termsof GDP was –1.9 percentage points or –22%, and in terms of employment–0.1 percentage points or –13%. The same pattern was observed incommunity, social and personal services, where the GDP share changedby 1.0 percentage point or 11% but the employment share changed byonly 0.1 percentage points or 1%.
Nonetheless there were important changes in the structure ofemployment (and production) between 1996 and 1999 (table 9). Asemphasised by Manning (2000), this is particularly the case in agriculture,where the share of total employment first fell from 44% in 1996 to 41% in1997, then rebounded to 45% in 1998, and fell back to 43% in 1999. Anotherimportant change was the fall in manufacturing’s share of employmentto 11% in 1998 from 13% in 1996–97, and its subsequent rebound to 13%in 1999. There was also a relatively large fall in construction, from 5% in1997 to 4% in 1998–99.
Changes in real mean weekly wages were negative between 1996 and1998 in all industries for which data are available (table 9). In 1996–98,the largest declines were concentrated in manufacturing, specifically inpaper and printing (34%), chemicals (33%), and basic metals and othermanufacturing (31% each). The smallest declines were in metal productsand machinery (12%) and wood products and furniture (24%). In 1998–99, the strongest rebound was in the textiles category (37%), chemicals(34%), and mining (26%), while increases were smallest (10% or less) inmetal products and machinery, followed by other manufacturing, hotels,and food, beverages and tobacco. Even though the increases in 1998–99were sometimes larger than the declines in 1996–98, as of December 1999the recovery had yet to pull wages back to their pre-crisis levels in anyindustry listed.
THE INVESTMENT ENVIRONMENT AND THEREACTION OF FOREIGN INVESTORS
Critical to sustaining Indonesia’s fragile economic recovery is the abilityto maintain increases in investment. This section analyses how foreigninvestors are reacting to the crisis and its aftermath.
34 Eric D. Ramstetter
Is the Recovery of Fixed Investment Sustainable?
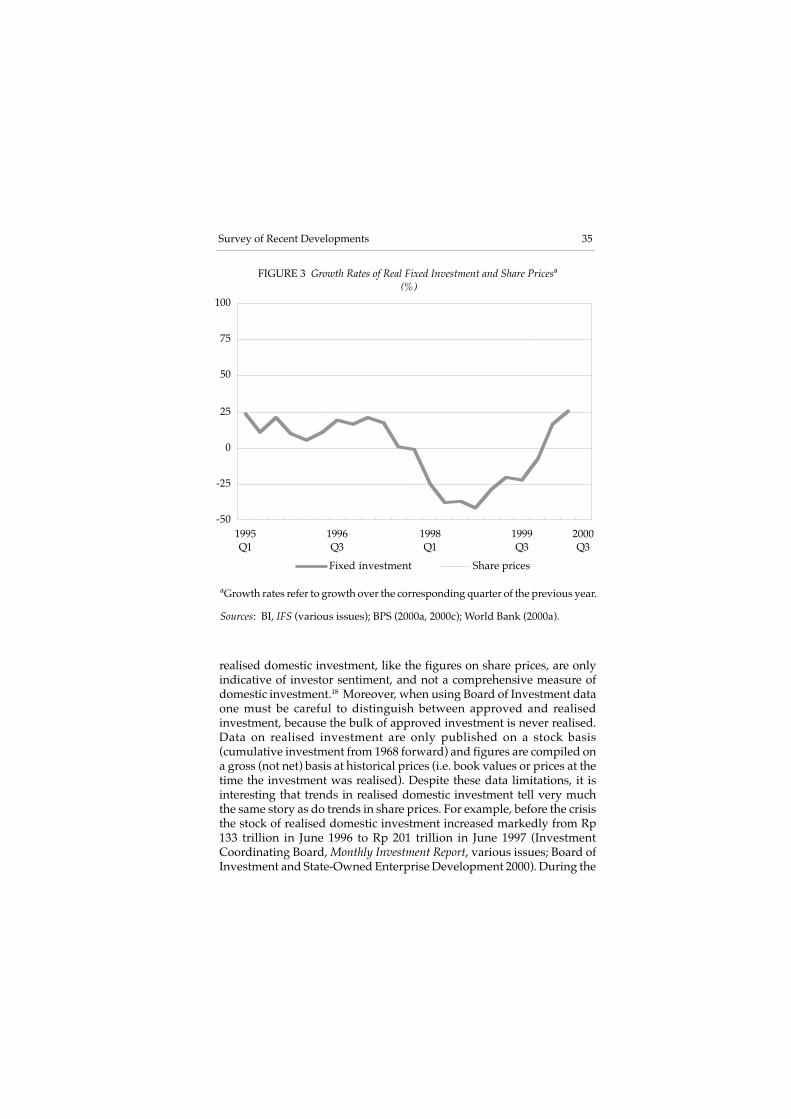
The increase in the share of fixed investment in real GDP, from 19% inthe first half of 1999 to 22% in the first half of 2000 (table 1), reflects thefirst rise in real fixed investment since the third quarter of 1997 (figure 3).In the second, third and fourth quarters of 1998, fixed investment declinedby 37–42% in each quarter, compared with the same quarter of 1997. Inthe first quarter of 1998 and the first three quarters of 1999, these growthrates were –21% to –29%. The large negative growth began to abate inthe fourth quarter of 1999, and in the first two quarters of 2000 fixedinvestment expanded rapidly, by 17% and 25%, respectively, comparedto the same quarters of 1999. While the level of fixed investment is stillfar below that reached in the mid 1990s in real terms or as a percentageof GDP, the downturn does appear to have been arrested, with a robustrecovery in the first half of 2000. There is still a general perception,however, that investors are not keen to invest in Indonesia just yet, andthat the recovery of 2000 may not last long. Trends in share prices reflectthis pessimism: after rising for four consecutive quarters, their rate ofincrease turned negative in the second and third quarters of 2000,declining by 22% and 26%, respectively, compared to the same quartersof 1999.
Although the continued low level of foreign portfolio investment hasan important influence on share prices, and FDI by foreign MNCs oftenattracts the attention of the government and the press, most fixedinvestment is undertaken by domestic firms. Even at their peak in 1996,inward FDI flows amounted to only 9% of total fixed investment flowsin Indonesia (IMF 2000; World Bank 2000a). More importantly, ifcumulated from 1983, FDI amounted to only 4% of fixed investmentthrough 1999, and only 5% through 1996, 1997 or 1998, when this ratioreached its peak. Foreign portfolio investment was even smaller thanFDI. Moreover, these ratios overstate the importance of FDI and foreignportfolio investment as a source of finance for fixed investment inIndonesia, because only a portion of the flows is used to finance fixedinvestment, the rest being used to offset other asset or liability changeson corporate balance sheets. In any case, the low level of this ratio showsthat domestic investors are the key to the recovery of fixed investment.
Another indicator of domestic investor confidence is the amount ofdomestic investment realised under the supervision of the Board ofInvestment and State-Owned Enterprise Development (BadanPenanaman Modal dan Pembinaan BUMN, previously the InvestmentCoordinating Board). Only a small proportion of domestic investment issupervised by the Board, because most domestic investors have little togain by applying for Board of Investment incentives. Thus, figures on
35Survey of Recent Developments
realised domestic investment, like the figures on share prices, are onlyindicative of investor sentiment, and not a comprehensive measure ofdomestic investment.18 Moreover, when using Board of Investment dataone must be careful to distinguish between approved and realisedinvestment, because the bulk of approved investment is never realised.Data on realised investment are only published on a stock basis(cumulative investment from 1968 forward) and figures are compiled ona gross (not net) basis at historical prices (i.e. book values or prices at thetime the investment was realised). Despite these data limitations, it isinteresting that trends in realised domestic investment tell very muchthe same story as do trends in share prices. For example, before the crisisthe stock of realised domestic investment increased markedly from Rp133 trillion in June 1996 to Rp 201 trillion in June 1997 (InvestmentCoordinating Board, Monthly Investment Report, various issues; Board ofInvestment and State-Owned Enterprise Development 2000). During the
FIGURE 3 Growth Rates of Real Fixed Investment and Share Pricesa
(%)
aGrowth rates refer to growth over the corresponding quarter of the previous year.
Sources: BI, IFS (various issues); BPS (2000a, 2000c); World Bank (2000a).
-50
-25
0
25
50
75
100
1995Q1
1996Q3
1998Q1
1999Q3
2000Q3
Fixed investment Share prices

36 Eric D. Ramstetter
crisis, however, investment stagnated from December 1997 through June1999, when the stock was Rp 210–215 trillion. It increased rapidly in thelatter half of 1999, to Rp 306 trillion in December, with most of the Rp 90trillion in new investment being in fisheries (Rp 48 trillion) and chemicals(Rp 18 trillion). The stock then stagnated again in the first half of 2000,increasing by only Rp 1 trillion to Rp 307 trillion in June. Trends inapproved domestic investment were very different from those in realiseddomestic investment, as illustrated by large fluctuations in the ratio ofrealised-to-approved domestic investment.19
There is thus conflicting evidence about the sentiment of domesticinvestors, whose increased willingness to invest is crucial to sustainingthe recovery in fixed investment observed in the first half of 2000.Nonetheless, if, as many observers expect, the economy continues to growat 4–5% for the rest of 2000 and 2001, it is difficult to see how domesticfirms will be able to continue to hold back on investment plans as capacitylimits become increasingly binding and inventories are drawn down.
Foreign Direct Investment
Although FDI accounts for a relatively small proportion of fixedinvestment, MNCs do play an important role in some industries such asoil and gas, finance, and a number of manufacturing industries. In thiscontext, the fact that inward FDI has continued to register large netoutflows through the first quarter of 2000 (indicating that foreign MNCshave been repatriating more equity and intercompany debt than theyhave been bringing in) is an important reflection of negative sentimentamong the firms that undertake this investment.20 With one exception,the second quarter of 1998, net FDI flows have been negative since thefourth quarter of 1997, suggesting that the immediate reaction of foreignMNCs was to divest from Indonesia on net, and that this reaction has yetto be reversed. This is in marked contrast to what happened in Koreaand Thailand, for example, where foreign MNCs poured in record levelsof FDI during and immediately after the crisis in 1997–99 (Ramstetter2000: table 1).
Board of Investment data on gross realised FDI show different trends,however. These data are similar to those on realised domestic investmentin that they refer to the gross stock (cumulative value since 1967) ofrealised FDI through the Board of Investment, excluding investments infinance and the oil and gas industries. In a trend similar to that of realiseddomestic investment, realised FDI stocks increased from $41 billion inJune 1996 (Investment Coordinating Board, Monthly Investment Report,various issues) to $56 billion in December 1997, but then stagnatedthrough June 1999, when the stock was $59 billion (table 10). They then
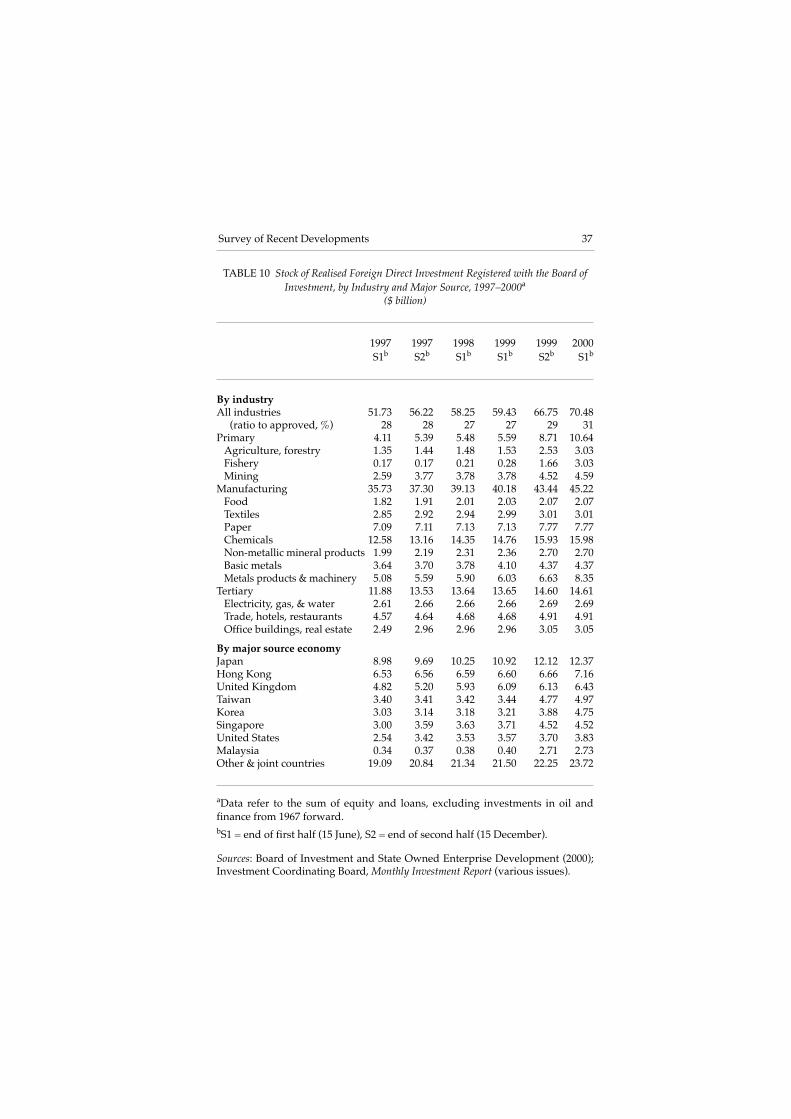
37Survey of Recent Developments
TABLE 10 Stock of Realised Foreign Direct Investment Registered with the Board ofInvestment, by Industry and Major Source, 1997–2000a
($ billion)
1997 1997 1998 1999 1999 2000S1b S2b S1b S1b S2b S1b
By industryAll industries 51.73 56.22 58.25 59.43 66.75 70.48
(ratio to approved, %) 28 28 27 27 29 31Primary 4.11 5.39 5.48 5.59 8.71 10.64
Agriculture, forestry 1.35 1.44 1.48 1.53 2.53 3.03Fishery 0.17 0.17 0.21 0.28 1.66 3.03Mining 2.59 3.77 3.78 3.78 4.52 4.59
Manufacturing 35.73 37.30 39.13 40.18 43.44 45.22Food 1.82 1.91 2.01 2.03 2.07 2.07Textiles 2.85 2.92 2.94 2.99 3.01 3.01Paper 7.09 7.11 7.13 7.13 7.77 7.77Chemicals 12.58 13.16 14.35 14.76 15.93 15.98Non-metallic mineral products 1.99 2.19 2.31 2.36 2.70 2.70Basic metals 3.64 3.70 3.78 4.10 4.37 4.37Metals products & machinery 5.08 5.59 5.90 6.03 6.63 8.35
Tertiary 11.88 13.53 13.64 13.65 14.60 14.61Electricity, gas, & water 2.61 2.66 2.66 2.66 2.69 2.69Trade, hotels, restaurants 4.57 4.64 4.68 4.68 4.91 4.91Office buildings, real estate 2.49 2.96 2.96 2.96 3.05 3.05
By major source economyJapan 8.98 9.69 10.25 10.92 12.12 12.37Hong Kong 6.53 6.56 6.59 6.60 6.66 7.16United Kingdom 4.82 5.20 5.93 6.09 6.13 6.43Taiwan 3.40 3.41 3.42 3.44 4.77 4.97Korea 3.03 3.14 3.18 3.21 3.88 4.75Singapore 3.00 3.59 3.63 3.71 4.52 4.52United States 2.54 3.42 3.53 3.57 3.70 3.83Malaysia 0.34 0.37 0.38 0.40 2.71 2.73Other & joint countries 19.09 20.84 21.34 21.50 22.25 23.72
aData refer to the sum of equity and loans, excluding investments in oil andfinance from 1967 forward.bS1 = end of first half (15 June), S2 = end of second half (15 December).
Sources: Board of Investment and State Owned Enterprise Development (2000);Investment Coordinating Board, Monthly Investment Report (various issues).
38 Eric D. Ramstetter
rose to $67 billion by December 1999 and to $70 billion in June 2000. In1999 and the first half of 2000, increases in approved FDI tended to besmaller than those in realised FDI, and the ratio of the realised total tothe approved total rose from 27% in June 1999 to 31% in June 2000. Inthis period, the largest increases were in fisheries ($2.8 billion), metalproducts and machinery ($2.3 billion), agriculture and forestry ($1.5billion) and chemicals ($1.2 billion). In June 2000, the largest industriesfor FDI were chemicals ($16 billion), metal products and machinery andpaper ($8 billion each), and mining and trade, hotels and restaurants ($5billion each). The large investments observed in fisheries and inagriculture and forestry in the year ending June 2000 are somewhatatypical for MNCs. On the other hand, chemicals and machinery aretypically industries where MNCs account for a substantial share ofeconomic activity in Indonesia and elsewhere (Lipsey, Blomström andRamstetter 1998).
By country, the largest increases in the year ending June 2000 camefrom Malaysia ($2.3 billion), and then Korea, Taiwan and Japan ($1.5billion each). There was also a significant rise in the category ‘other andjoint countries’ ($2.2 billion). The latter was the largest category in stockterms in June 2000 ($24 billion), partly because FDI is recorded by countryof origin, not by country of owner, and investments by foreign MNCsoften come not only from the parent company in the home country (e.g.the Japanese parent), but also from affiliates in other countries (e.g. anaffiliate of the Japanese parent in Singapore).21 Of the individual countrieslisted, Japan is the largest ($12 billion), followed by Hong Kong ($7 billion),the United Kingdom ($6 billion), and then Taiwan, Korea and Singapore($5 billion each). Investments from Hong Kong and Singapore would bemuch smaller if FDI were classified by country of owner (Low, Ramstetterand Yeung 1998).
In short, the data on realised FDI indicate a substantial increase ingross FDI in the last year and, if these data are accurate, it would bereasonable to expect that rises in net FDI recorded in the balance ofpayments may not be far behind. During the economic boom of the late1980s and early to mid 1990s in Indonesia and other Asian economies,increases in FDI often followed or coincided with rises in local fixedinvestment. Thus, if recent trends in fixed investment can be maintained,it is also likely that there will be increases in FDI flows.
39Survey of Recent Developments
Foreign MNCs in Manufacturing through 1998
Trends in FDI can tell us something about sentiment among foreigninvestors—namely, whether they believe investments of equity and loancapital will become profitable in the future—but are often poorlycorrelated with trends in indicators of real economic activity (e.g.employment, production and trade) in the MNCs themselves (Ramstetter2000: tables 16–17). BPS has recently published its industrial statistics for1998, and using this data set it is now possible to get a much more preciseidea of how foreign MNCs in manufacturing reacted in this crisis year. Ina recent paper, Takii and Ramstetter (2000) examined in detail trends inthe shares of MNCs, their relative size, and relative productivity. Theyfound that, contrary to the impression given by negative net inward FDIin the balance of payments (table 5) or by stagnant realised FDI throughthe Board of Investment (table 10), foreign MNCs were not reducing theirpresence in Indonesian manufacturing; indeed, those with large foreignownership shares in particular were greatly increasing it.
This can be seen from the data in table 11, which show the shares ofmanufacturing employment in medium or large plants (20 or moreworkers) for three foreign ownership groups: minority-foreign plants(those with 10–50% foreign ownership), majority-foreign plants (51–89%),and heavily foreign plants (90% or more). The combined total for thesethree groups in all manufacturing increased from 18.5% in 1996 to 19.4%in 1997 and 19.1% in 1998 (see also Takii and Ramstetter, 2000: tables 1a,1b, 1c). If these shares are measured in terms of value added there was amore pronounced increase, from 29.2% in 1996 to 33.9% in 1997, and 35.0%in 1998 (Takii and Ramstetter, 2000: tables 2a, 2b, 2c).22 Thus, the sharesof foreign MNCs in manufacturing remained roughly constant through1998 in the aggregate. Moreover, there were only three individualindustries in which the combined foreign MNC share of employment in1996–98 declined by 10% or more relative to 1996 levels (beverages,printing and publishing, and glass), but there were 10 industries in whichthis share increased by 10% or more in the same period (leather, industrialchemicals, plastics, cement, clay, other non-metallic mineral products,iron and steel, non-electrical machinery, electrical machinery, andtransport machinery). Thus, the large negative flows of FDI noted abovewere apparently not accompanied by a reduction in foreign MNC presencein manufacturing.
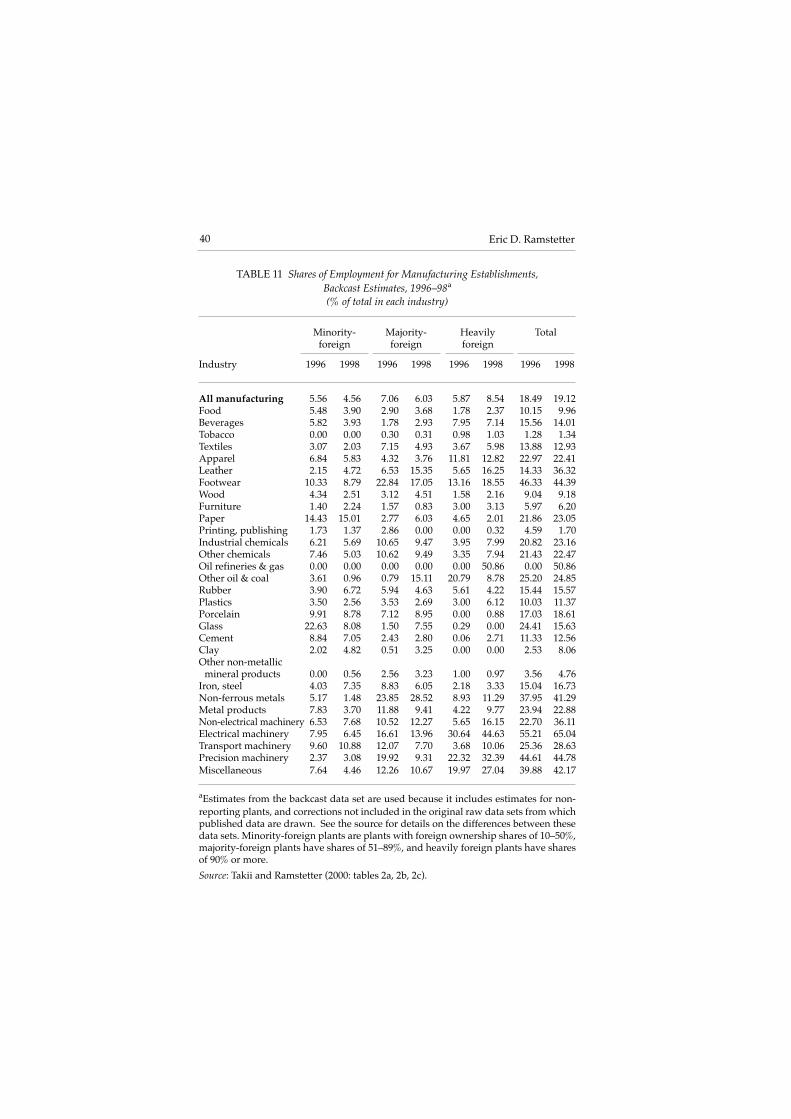
40 Eric D. Ramstetter
TABLE 11 Shares of Employment for Manufacturing Establishments,Backcast Estimates, 1996–98a
(% of total in each industry)
Minority- Majority- Heavily Totalforeign foreign foreign
Industry 1996 1998 1996 1998 1996 1998 1996 1998
All manufacturing 5.56 4.56 7.06 6.03 5.87 8.54 18.49 19.12Food 5.48 3.90 2.90 3.68 1.78 2.37 10.15 9.96Beverages 5.82 3.93 1.78 2.93 7.95 7.14 15.56 14.01Tobacco 0.00 0.00 0.30 0.31 0.98 1.03 1.28 1.34Textiles 3.07 2.03 7.15 4.93 3.67 5.98 13.88 12.93Apparel 6.84 5.83 4.32 3.76 11.81 12.82 22.97 22.41Leather 2.15 4.72 6.53 15.35 5.65 16.25 14.33 36.32Footwear 10.33 8.79 22.84 17.05 13.16 18.55 46.33 44.39Wood 4.34 2.51 3.12 4.51 1.58 2.16 9.04 9.18Furniture 1.40 2.24 1.57 0.83 3.00 3.13 5.97 6.20Paper 14.43 15.01 2.77 6.03 4.65 2.01 21.86 23.05Printing, publishing 1.73 1.37 2.86 0.00 0.00 0.32 4.59 1.70Industrial chemicals 6.21 5.69 10.65 9.47 3.95 7.99 20.82 23.16Other chemicals 7.46 5.03 10.62 9.49 3.35 7.94 21.43 22.47Oil refineries & gas 0.00 0.00 0.00 0.00 0.00 50.86 0.00 50.86Other oil & coal 3.61 0.96 0.79 15.11 20.79 8.78 25.20 24.85Rubber 3.90 6.72 5.94 4.63 5.61 4.22 15.44 15.57Plastics 3.50 2.56 3.53 2.69 3.00 6.12 10.03 11.37Porcelain 9.91 8.78 7.12 8.95 0.00 0.88 17.03 18.61Glass 22.63 8.08 1.50 7.55 0.29 0.00 24.41 15.63Cement 8.84 7.05 2.43 2.80 0.06 2.71 11.33 12.56Clay 2.02 4.82 0.51 3.25 0.00 0.00 2.53 8.06Other non-metallic
mineral products 0.00 0.56 2.56 3.23 1.00 0.97 3.56 4.76Iron, steel 4.03 7.35 8.83 6.05 2.18 3.33 15.04 16.73Non-ferrous metals 5.17 1.48 23.85 28.52 8.93 11.29 37.95 41.29Metal products 7.83 3.70 11.88 9.41 4.22 9.77 23.94 22.88Non-electrical machinery 6.53 7.68 10.52 12.27 5.65 16.15 22.70 36.11Electrical machinery 7.95 6.45 16.61 13.96 30.64 44.63 55.21 65.04Transport machinery 9.60 10.88 12.07 7.70 3.68 10.06 25.36 28.63Precision machinery 2.37 3.08 19.92 9.31 22.32 32.39 44.61 44.78Miscellaneous 7.64 4.46 12.26 10.67 19.97 27.04 39.88 42.17
aEstimates from the backcast data set are used because it includes estimates for non-reporting plants, and corrections not included in the original raw data sets from whichpublished data are drawn. See the source for details on the differences between thesedata sets. Minority-foreign plants are plants with foreign ownership shares of 10–50%,majority-foreign plants have shares of 51–89%, and heavily foreign plants have sharesof 90% or more.
Source: Takii and Ramstetter (2000: tables 2a, 2b, 2c).
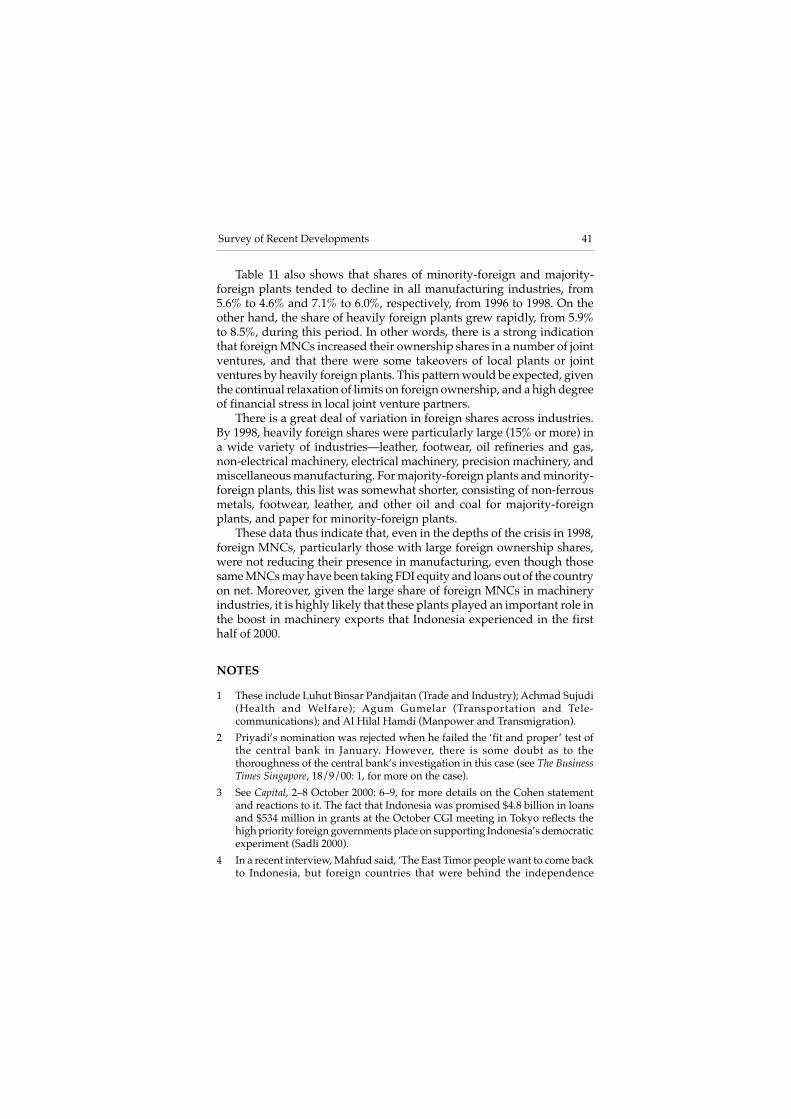
41Survey of Recent Developments
Table 11 also shows that shares of minority-foreign and majority-foreign plants tended to decline in all manufacturing industries, from5.6% to 4.6% and 7.1% to 6.0%, respectively, from 1996 to 1998. On theother hand, the share of heavily foreign plants grew rapidly, from 5.9%to 8.5%, during this period. In other words, there is a strong indicationthat foreign MNCs increased their ownership shares in a number of jointventures, and that there were some takeovers of local plants or jointventures by heavily foreign plants. This pattern would be expected, giventhe continual relaxation of limits on foreign ownership, and a high degreeof financial stress in local joint venture partners.
There is a great deal of variation in foreign shares across industries.By 1998, heavily foreign shares were particularly large (15% or more) ina wide variety of industries—leather, footwear, oil refineries and gas,non-electrical machinery, electrical machinery, precision machinery, andmiscellaneous manufacturing. For majority-foreign plants and minority-foreign plants, this list was somewhat shorter, consisting of non-ferrousmetals, footwear, leather, and other oil and coal for majority-foreignplants, and paper for minority-foreign plants.
These data thus indicate that, even in the depths of the crisis in 1998,foreign MNCs, particularly those with large foreign ownership shares,were not reducing their presence in manufacturing, even though thosesame MNCs may have been taking FDI equity and loans out of the countryon net. Moreover, given the large share of foreign MNCs in machineryindustries, it is highly likely that these plants played an important role inthe boost in machinery exports that Indonesia experienced in the firsthalf of 2000.
NOTES
1 These include Luhut Binsar Pandjaitan (Trade and Industry); Achmad Sujudi(Health and Welfare); Agum Gumelar (Transportation and Tele-communications); and Al Hilal Hamdi (Manpower and Transmigration).
2 Priyadi’s nomination was rejected when he failed the ‘fit and proper’ test ofthe central bank in January. However, there is some doubt as to thethoroughness of the central bank’s investigation in this case (see The BusinessTimes Singapore, 18/9/00: 1, for more on the case).
3 See Capital, 2–8 October 2000: 6–9, for more details on the Cohen statementand reactions to it. The fact that Indonesia was promised $4.8 billion in loansand $534 million in grants at the October CGI meeting in Tokyo reflects thehigh priority foreign governments place on supporting Indonesia’s democraticexperiment (Sadli 2000).
4 In a recent interview, Mahfud said, ‘The East Timor people want to come backto Indonesia, but foreign countries that were behind the independence
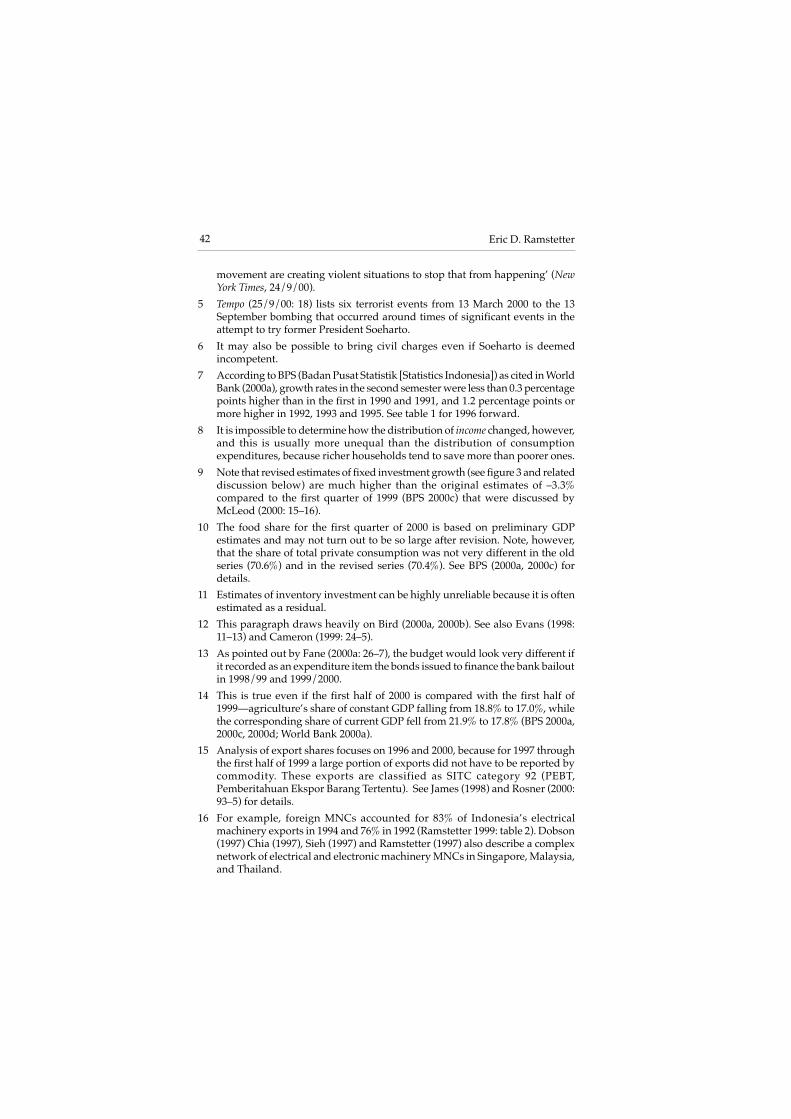
42 Eric D. Ramstetter
movement are creating violent situations to stop that from happening’ (NewYork Times, 24/9/00).
5 Tempo (25/9/00: 18) lists six terrorist events from 13 March 2000 to the 13September bombing that occurred around times of significant events in theattempt to try former President Soeharto.
6 It may also be possible to bring civil charges even if Soeharto is deemedincompetent.
7 According to BPS (Badan Pusat Statistik [Statistics Indonesia]) as cited in WorldBank (2000a), growth rates in the second semester were less than 0.3 percentagepoints higher than in the first in 1990 and 1991, and 1.2 percentage points ormore higher in 1992, 1993 and 1995. See table 1 for 1996 forward.
8 It is impossible to determine how the distribution of income changed, however,and this is usually more unequal than the distribution of consumptionexpenditures, because richer households tend to save more than poorer ones.
9 Note that revised estimates of fixed investment growth (see figure 3 and relateddiscussion below) are much higher than the original estimates of –3.3%compared to the first quarter of 1999 (BPS 2000c) that were discussed byMcLeod (2000: 15–16).
10 The food share for the first quarter of 2000 is based on preliminary GDPestimates and may not turn out to be so large after revision. Note, however,that the share of total private consumption was not very different in the oldseries (70.6%) and in the revised series (70.4%). See BPS (2000a, 2000c) fordetails.
11 Estimates of inventory investment can be highly unreliable because it is oftenestimated as a residual.
12 This paragraph draws heavily on Bird (2000a, 2000b). See also Evans (1998:11–13) and Cameron (1999: 24–5).
13 As pointed out by Fane (2000a: 26–7), the budget would look very different ifit recorded as an expenditure item the bonds issued to finance the bank bailoutin 1998/99 and 1999/2000.
14 This is true even if the first half of 2000 is compared with the first half of1999—agriculture’s share of constant GDP falling from 18.8% to 17.0%, whilethe corresponding share of current GDP fell from 21.9% to 17.8% (BPS 2000a,2000c, 2000d; World Bank 2000a).
15 Analysis of export shares focuses on 1996 and 2000, because for 1997 throughthe first half of 1999 a large portion of exports did not have to be reported bycommodity. These exports are classified as SITC category 92 (PEBT,Pemberitahuan Ekspor Barang Tertentu). See James (1998) and Rosner (2000:93–5) for details.
16 For example, foreign MNCs accounted for 83% of Indonesia’s electricalmachinery exports in 1994 and 76% in 1992 (Ramstetter 1999: table 2). Dobson(1997) Chia (1997), Sieh (1997) and Ramstetter (1997) also describe a complexnetwork of electrical and electronic machinery MNCs in Singapore, Malaysia,and Thailand.
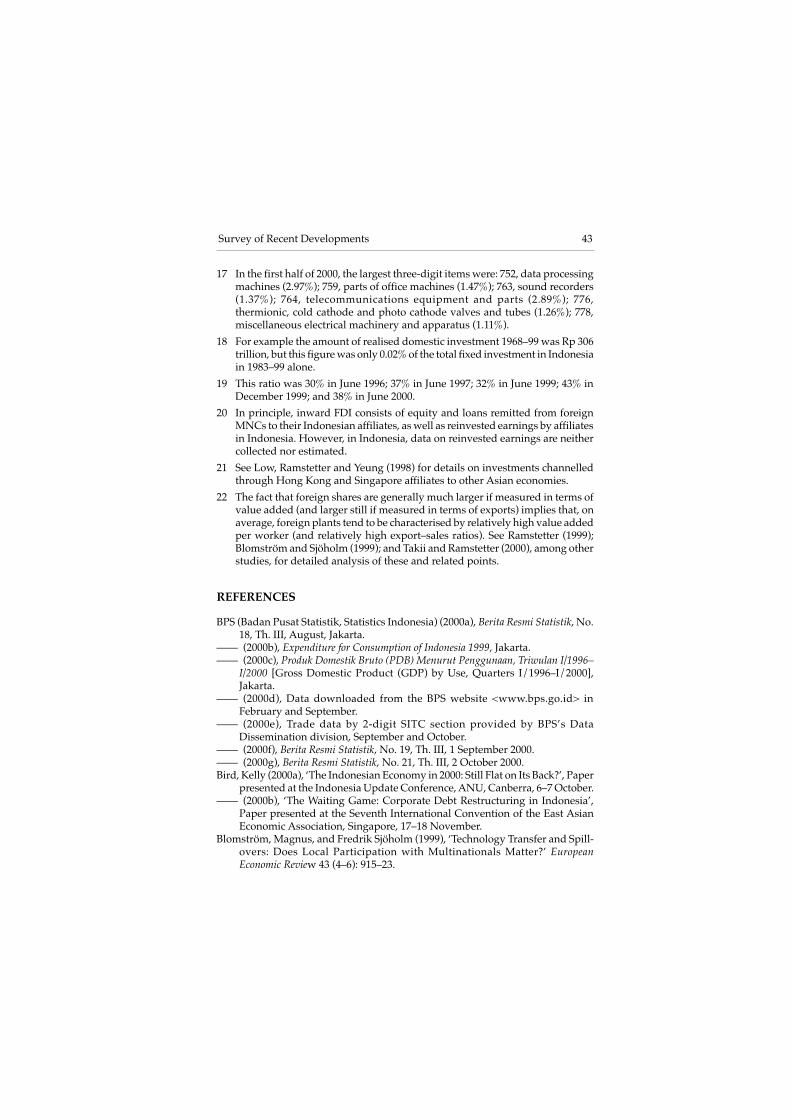
43Survey of Recent Developments
17 In the first half of 2000, the largest three-digit items were: 752, data processingmachines (2.97%); 759, parts of office machines (1.47%); 763, sound recorders(1.37%); 764, telecommunications equipment and parts (2.89%); 776,thermionic, cold cathode and photo cathode valves and tubes (1.26%); 778,miscellaneous electrical machinery and apparatus (1.11%).
18 For example the amount of realised domestic investment 1968–99 was Rp 306trillion, but this figure was only 0.02% of the total fixed investment in Indonesiain 1983–99 alone.
19 This ratio was 30% in June 1996; 37% in June 1997; 32% in June 1999; 43% inDecember 1999; and 38% in June 2000.
20 In principle, inward FDI consists of equity and loans remitted from foreignMNCs to their Indonesian affiliates, as well as reinvested earnings by affiliatesin Indonesia. However, in Indonesia, data on reinvested earnings are neithercollected nor estimated.
21 See Low, Ramstetter and Yeung (1998) for details on investments channelledthrough Hong Kong and Singapore affiliates to other Asian economies.
22 The fact that foreign shares are generally much larger if measured in terms ofvalue added (and larger still if measured in terms of exports) implies that, onaverage, foreign plants tend to be characterised by relatively high value addedper worker (and relatively high export–sales ratios). See Ramstetter (1999);Blomström and Sjöholm (1999); and Takii and Ramstetter (2000), among otherstudies, for detailed analysis of these and related points.
REFERENCES
BPS (Badan Pusat Statistik, Statistics Indonesia) (2000a), Berita Resmi Statistik, No.18, Th. III, August, Jakarta.
—— (2000b), Expenditure for Consumption of Indonesia 1999, Jakarta.—— (2000c), Produk Domestik Bruto (PDB) Menurut Penggunaan, Triwulan I/1996–
I/2000 [Gross Domestic Product (GDP) by Use, Quarters I/1996–I/2000],Jakarta.
—— (2000d), Data downloaded from the BPS website <www.bps.go.id> inFebruary and September.
—— (2000e), Trade data by 2-digit SITC section provided by BPS’s DataDissemination division, September and October.
—— (2000f), Berita Resmi Statistik, No. 19, Th. III, 1 September 2000.—— (2000g), Berita Resmi Statistik, No. 21, Th. III, 2 October 2000.Bird, Kelly (2000a), ‘The Indonesian Economy in 2000: Still Flat on Its Back?’, Paper
presented at the Indonesia Update Conference, ANU, Canberra, 6–7 October.—— (2000b), ‘The Waiting Game: Corporate Debt Restructuring in Indonesia’,
Paper presented at the Seventh International Convention of the East AsianEconomic Association, Singapore, 17–18 November.
Blomström, Magnus, and Fredrik Sjöholm (1999), ‘Technology Transfer and Spill-overs: Does Local Participation with Multinationals Matter?’ EuropeanEconomic Review 43 (4–6): 915–23.
44 Eric D. Ramstetter
Board of Investment and State Owned Enterprise Development [Badan PenanamanModal dan Pembinaan BUMN] (2000), Monthly Investment Report [LaporanBulanan Investasi], June issue.
Cameron, Lisa (1999), ‘Survey of Recent Developments’, Bulletin of IndonesianEconomic Studies 35 (1): 3–40.
Chia, Siow Yue (1997), ‘Singapore: Advanced Production Base and Smart Hub ofthe Electronics Industry’, in Wendy Dobson and Chia Siow Yue (eds),Multinationals and East Asian Integration, International Development ResearchCentre, Toronto, and Institute of Southeast Asian Studies, Singapore: 31–61.
Dobson, Wendy (1997), ‘Crossing Borders: Multinationals in East Asia’, in WendyDobson and Chia Siow Yue (eds), Multinationals and East Asian Integration,International Development Research Centre, Toronto, and Institute ofSoutheast Asian Studies, Singapore: 223–47.
Evans, Kevin (1998), 'Survey of Recent Developments', Bulletin of IndonesianEconomic Studies 34 (3): 5–36.
Fane, George (2000a), ‘Survey of Recent Developments’, Bulletin of IndonesianEconomic Studies 36 (1): 13–44.
—— (2000b), ‘Indonesian Monetary Policy during the 1997–98 Crisis: A MonetaristPerspective’, Bulletin of Indonesian Economic Studies 36 (3): 47–62.
Feridhanusetyawan, Tubagus (2000), ‘Indonesia: The Agenda of EconomicRestructuring’, Paper presented at the First Europe and Southeast Asia Forum:The Stability of Indonesia and the Security of Southeast Asia, Berlin, 4–5October.
ICSEAD (International Centre for the Study of East Asian Development) (2000),‘Recent Trends and Prospects for Major Asian Economies’, East Asian EconomicPerspectives 11, Special issue (February).
IMF (International Monetary Fund) (2000), International Financial Statistics,September CD-ROM, Washington DC.
Investment Coordinating Board [Badan Koordinasi Penanaman Modal, BKPM],(various years), Monthly Investment Report [Laporan Bulanan Investasi],January, June, December issues, 1996–99.
James, William E. (1998), ‘A Problem with Indonesia’s Export Statistics’, Bulletin ofIndonesian Economic Studies 34 (3): 115–18.
James, William E., and Eric D. Ramstetter (1997), ‘Globalization’s Implications forIndonesia: Trade Policy, Multinationals, and Competition’, in Satya Dev Gupta(ed.), Dynamics of Globalization and Development, Kluwer Academic Publishers,Boston/Dordrecht/London: 153–85.
Lipsey, Robert E., Magnus Blomström and Eric D. Ramstetter (1998),‘Internationalized Production in World Output’, in Robert E. Baldwin, RobertE. Lipsey and J. David Richardson (eds), Geography and Ownership as Bases forEconomic Accounting, University of Chicago Press, Chicago: 83–135.
Low, Linda, Eric D. Ramstetter and Henry Wai-Chung Yeung (1998), ‘Accountingfor Outward Direct Investment from Hong Kong and Singapore: Who OwnsWhat?’, in Robert E. Baldwin, Robert E. Lipsey and J. David Richardson (eds),Geography and Ownership as Bases for Economic Accounting, University ofChicago Press, Chicago: 139–68.
MacIntyre, Andrew (2000), ‘Megawati Will Not Be Able to Do Much More’,Indonesian Business, September: 12.
45Survey of Recent Developments
McLeod, Ross H. (2000), ‘Survey of Recent Developments’, Bulletin of IndonesianEconomic Studies 36 (2): 5–40.
Manning, Chris (2000), Indonesian Labour Markets: Adjusting to Crisis and a SlowRecovery, Australian National University, Canberra (mimeo).
Ministry of Finance (2000), Summary of Fiscal Policy and Budget Proposal for2001, Press Release, 2 October.
Pangestu, Mari (1997), ‘Indonesia: Trade and Foreign Investment Linkages’, inWendy Dobson and Chia Siow Yue (eds), Multinationals and East AsianIntegration, International Development Research Centre, Toronto, and Instituteof Southeast Asian Studies, Singapore: 193–220.
Ramstetter, Eric D. (1997), ‘International Trade, Multinational Firms, and RegionalIntegration in Thailand’, in Wendy Dobson and Chia Siow Yue (eds),Multinationals and East Asian Integration, International Development ResearchCentre, Toronto, and Institute of Southeast Asian Studies, Singapore: 107–30.
—— (1999), ‘Trade Propensities and Foreign Ownership Shares in IndonesianManufacturing in the Early 1990s‘, Bulletin of Indonesian Economic Studies 35(2): 43–66.
—— (2000), ‘Recent Trends in Foreign Direct Investment in Asia: The Aftermathof the Crisis to Late 1999’, Working Paper 2000–02, International Centre forthe Study of East Asian Development, Kitakyushu.
Rosner, L. Peter (2000), ‘Indonesia’s Non-oil Export Performance during theEconomic Crisis: Distinguishing Price Trends from Quantity Trends’, Bulletinof Indonesian Economic Studies 36 (2): 61–95.
Sadli, Mohammad (2000), ‘The Economy Propped Up by International Aid butpolitical Uncertainty Still Increasing’, Buletin Kadin, October.
Sieh, Mei Ling (1997), ‘Malaysia: Electronics, Autos, and the Trade–InvestmentNexus’, in Wendy Dobson and Chia Siow Yue (eds), Multinationals and EastAsian Integration, International Development Research Centre, Toronto, andInstitute of Southeast Asian Studies, Singapore: 131–52.
Takii, Sadayuki, and Eric D. Ramstetter (2000), ‘Foreign Multinationals inIndonesian Manufacturing, 1985–1998: Shares, Relative Size, and RelativeLabor Productivity’, Working Paper Series 2000–18, International Centre forthe Study of East Asian Development, Kitakyushu (September).
World Bank (1999), Global Development Finance, 1999 CD-ROM, Washington DC.—— (2000a), Data from the World Bank’s Indonesia web page, downloaded
September 27–28, <http://wbln0018.worldbank.org/eap/eap.nsf/CountryOffice/Indonesia/C7B5624C35F8E306472569610014BBCE?OpenDocument>.
—— (2000b), World Development Indicators, 2000 CD-ROM, Washington DC.
46 Eric D. Ramstetter
GLOSSARY
TERMS AND ABBREVIATIONS
ANU Australian National UniversityBank BNI Bank Negara Indonesia (State Bank of Indonesia)Bank BRI Bank Rakyat Indonesia (Indonesian People’s Bank, a
state-owned commercial bank)Bank BTN Bank Tabungan Negara (State Savings Bank, a state-
owned commercial bank)BI Bank Indonesia (the central bank)BKPM Badan Koordinasi Penanaman Modal (Investment
Coordinating Board)BPS Badan Pusat Statistik (Statistics Indonesia, the
Central Statistics Agency, formerly the CentralBureau of Statistics)
Buletin Ringkas Brief Bulletin (monthly BPS publication)BUMN Badan Usaha Milik Negara (state-owned enterprise)c.i.f. cost, insurance and freight, or charged in full (to the
seller)CPI consumer price indexEPZ export processing zonef.o.b. free on boardFDI foreign direct investmentFSPC Financial Sector Policy CommitteeGDP gross domestic productGus Dur the name by which President Abdurrahman Wahid is
popularly knownIBRA Indonesian Bank Restructuring Agency (also known
as BPPN, National Banking Rehabilitation Agency)ICSEAD International Centre for the Study of East Asian
Development (Kitakyushu, Japan)IFS Indonesian Financial Statistics (BI publication)IMF International Monetary FundINDRA Indonesian Debt Restructuring AgencyJI Jakarta Initiative (a voluntary framework for debt
resolution)
47Survey of Recent Developments
JP Jakarta PostLNG liquid natural gasLPG liquid petroleum gasMNC multinational corporationMPR Majelis Perwakilan Rakyat (People’s Consultative
Assembly)New Order the Soeharto era, 1965–98PEBT Pemberitahuan Ekspor Barang Tertentu (document
for reporting exports)PEG Program for Economic GrowthPertamina Perusahaan Pertambangan Minyak dan Gas Bumi
Negara (Indonesia’s state-owned oil company)PT Perseroan Terbatas (limited liability company)Q1, Q2 … 1st, 2nd … quarterS1, S2 first, second semester/half-yearSITC Standard International Trade ClassificationSusenas Survei Sosio-Ekonomi Nasional (National Socio-
Economic Survey)TNI Tentara Nasional Indonesia (Indonesian National
Armed Forces)UN United NationsUSAID US Agency for International DevelopmentVAT value-added taxWPI wholesale price index
CURRENCY
$ US dollarRp rupiah