developments in sustainable chemical and bioprocess technology
TRANSCRIPT
Developments in Sustainable Chemical and Bioprocess Technology
Ravindra Pogaku · Awang BonoChristopher Chu Editors

Developments in Sustainable Chemical andBioprocess Technology
Ravindra Pogaku • Awang BonoChristopher ChuEditors
Developments inSustainable Chemical andBioprocess Technology
123
EditorsRavindra PogakuAwang BonoChristopher ChuSchool of Engineering and Information TechnologyUniversity Malaysia SabahKota KinabaluMalaysia
ISBN 978-1-4614-6207-1 ISBN 978-1-4614-6208-8 (eBook)DOI 10.1007/978-1-4614-6208-8Springer New York Heidelberg Dordrecht London
Library of Congress Control Number: 2013950365
� Springer Science+Business Media New York 2013This work is subject to copyright. All rights are reserved by the Publisher, whether the whole or part ofthe material is concerned, specifically the rights of translation, reprinting, reuse of illustrations,recitation, broadcasting, reproduction on microfilms or in any other physical way, and transmission orinformation storage and retrieval, electronic adaptation, computer software, or by similar or dissimilarmethodology now known or hereafter developed. Exempted from this legal reservation are briefexcerpts in connection with reviews or scholarly analysis or material supplied specifically for thepurpose of being entered and executed on a computer system, for exclusive use by the purchaser of thework. Duplication of this publication or parts thereof is permitted only under the provisions ofthe Copyright Law of the Publisher’s location, in its current version, and permission for use mustalways be obtained from Springer. Permissions for use may be obtained through RightsLink at theCopyright Clearance Center. Violations are liable to prosecution under the respective Copyright Law.The use of general descriptive names, registered names, trademarks, service marks, etc. in thispublication does not imply, even in the absence of a specific statement, that such names are exemptfrom the relevant protective laws and regulations and therefore free for general use.While the advice and information in this book are believed to be true and accurate at the date ofpublication, neither the authors nor the editors nor the publisher can accept any legal responsibility forany errors or omissions that may be made. The publisher makes no warranty, express or implied, withrespect to the material contained herein.
Printed on acid-free paper
Springer is part of Springer Science+Business Media (www.springer.com)
Preface
Sustainable Chemical and Bioprocess Technology is a field having numerousapplications in the production of chemicals, fuels, materials, pharmaceuticals, andmedicines at the genetic level. The field’s novelty is in dealing with various topicsof environmental engineering, chemical and bioprocesses, separation processes,advanced materials. The objective is to identify specific cases or environmentalmanipulations that result in improvements in yield and productivities of chemicaland biotechnological processes.
To address cutting-edge topics in the key areas of chemical and bioprocessengineering, the content of the chapters of this book is divided into four main partscomprising of 47 chapters. Environmental Engineering (Chaps. 1–16); Chemicaland Bioprocesses (Chaps. 17–29); Separation Processes (Chaps. 30–36);Advanced Materials (Chaps. 37–47).
The emphasis is laid on sustainability in chemical and bioprocess technology.The content related to process development, sustainability analysis in chemicaland bioprocessing, industry case studies, supply case studies, and outlines of thelatest technology of sustainability developments are reviewed. These topicsinclude sustainability security and diversity of supply, costs and process eco-nomics, environmental and emissions legislation, technology development, publicperceptions, market opportunities, energy conservation, and the role of alternativeand renewable energy.
There is potential hub for chemical and biotechnology industries world overwith its diverse flora and fauna. By introducing new and innovative methods andtechnologies in the chemical and bioprocessing of natural resources, one canexpect to see a synergistic combination that promises greater sustainability.
Key Features
• Highlights the issues of sustainability development and technology related toenvironmental engineering, chemical and bioprocesses, separation processes,advanced materials
• Demonstrates engineering in action with numerous examples of chemical andbioprocesses
v

• Includes methods for identifying key enzymes in complex bioprocesses• Contains a comprehensive review of chemical and biochemical engineering• Discusses processes at the micro, macro, molecular, enzyme, and cell levels• Explains concepts of stoichiometry, kinetics, and thermodynamics of separation
processes• Comprehensive overview of advanced materials• Minimizes mathematical complexity• Links the traditional processes to a sustainable environment models
vi Preface
Acknowledgments
We are grateful to Prof. Datuk Dr. Mohd. Harun Abdullah, the Vice Chancellor ofUniversity Malaysia Sabah and Associate Prof. Ir. Dr. Rosalam Hj. Sarbatly, theDean of School of Engineering and Information Technology, University MalaysiaSabah, for their encouragement and extending constant support in realizing ourdream to publish a book.
Special thanks are due to Dr. Abu Zahrim Yaser and Ms. Norfirdayu Ibrahimfor their assistance in coordinating the book publication.
Last but not least, we thank dedicated reviewers of the chapters for theirqualitative input: A. A. H. Kadhum, A. A. A. Raman, A. Z. Yaser, A. M. Shariff,A. N. Anuar, A. Ibrahim, B. H. Hameed, C. G. Joseph, D. Foo, C. S. Sipaut,D. Krishnaiah, H. A. Bakar, I. N. H. M. Amin, I. C. M. Leng, J. Janaun,M. N. A. Seman, M. A. Hussain, M. A. Ahmad, M. S. Kalil, M. S. Salit,M. K. A. Hamid, M. Sundang, N. Aziz, N. A. Hashim, O. A. Hamid, R. F. Mansa,R. Baini, S. M. Anisuzzaman, S. Abang, S. W. Lau, S. Kumaresan, S. A. Rahman,S. M. Saufi, T. Y. Wu, T. K. Wei, T. H. Jin, W. M. H. W. Yussof, Y. Samyudia.
vii
Contents
Part I Environmental Engineering
Coagulation/Flocculation of Anaerobically Treated Palm Oil MillEffluent (AnPOME): A Review . . . . . . . . . . . . . . . . . . . . . . . . . . . . . 3A. Z. Yaser, B. Nurmin and S. Rosalam
Dewaterability of Anaerobic Digested Sludge with Cationsand Chitosan as Dual Conditioners . . . . . . . . . . . . . . . . . . . . . . . . . . 11S. W. Lau, S. H. Chong, H. M. Ang, T. K. Sen and H. B. Chua
Optimization Study on Bioethanol Production from the Fermentationof Oil Palm Trunk Sap as Agricultural Waste . . . . . . . . . . . . . . . . . . 19A. H. Norhazimah and C. K. M. Faizal
Effect of Isolated Mesophilic Bacterial Consortiumon the Composting Process of Pressed–Shredded EmptyOil Palm Fruit Bunch . . . . . . . . . . . . . . . . . . . . . . . . . . . . . . . . . . . . 27J. C. Lai, H. B. Chua, A. Saptoro and H. M. Ang
Acetone–Butanol–Ethanol Fermentation from Palm Oil MillEffluent Using Clostridium acetobutylicum. . . . . . . . . . . . . . . . . . . . . . 35A. S. Japar, M. S. Takriff, J. M. Jahim and A. A. H. Kadhum
Initial Study of Thermophilic Hydrogen Production from RawPalm Oil Mill Effluent (POME) Using Mixed Microflora . . . . . . . . . . 43N. Ibrahim, J. Md. Jahim and Lim S. S.
Production of Cellulases by Aspergillus sp. GDX02 in a Solid-StateFermentation Using Oil Palm Empty Fruit Bunch . . . . . . . . . . . . . . . 51H. W. Kim, G. J. Lee, D. M. Kim, Y. W. Lee,Y. S. Kim and H.-J. Chung
ix
Acclimatization Process of Microorganisms from Activated Sludgein Kenaf-Retting Wastewater . . . . . . . . . . . . . . . . . . . . . . . . . . . . . . . 59Z. Zawani, L. Chuah-Abdullah, F.-R. Ahmadun and K. Abdan
Construction of ASMC by Dielectrophoresis Using WireclothElectrode for the Treatment of Wastewater . . . . . . . . . . . . . . . . . . . . 65Z. Z. Abidin, Y. C. Wai, N. Haffifudin and F. Ahmadun
Catalytic Pyrolysis of Waste Chicken Fats Using Zeolite Catalysts . . . 73M. Y. Liew, A. Salmiaton, W. A. K. G. Wan Azlina and R. Yunus
Investigation of Pyrolysis Parameters on the Yield and Qualityof Bio-Oil from Jatropha curcas Wastes . . . . . . . . . . . . . . . . . . . . . . . 81S. A. Jourabchi, S. Gan and H. K. Ng
Electrochemical Oxidation of PAHs in Aqueous Solution . . . . . . . . . . 89A. Yaqub, M. H. Isa and S. R. M. Kutty
Sonocatalytic Degradation of Acid Red Dye in Water UsingFe-Doped TiO2 Deposited on HY Catalyst . . . . . . . . . . . . . . . . . . . . . 97A. H. Alwash, N. A. Jamalluddin, N. Ismail and A. Z. Abdullah
Investigation of the Effect of Phosphoric Acid (H3PO4) on Rateof Oil and Solid Separation in Palm Oil Mill Clarifier . . . . . . . . . . . . 103F. P. S. Wong and S. Y. Yong
Polyester Thin Film Composite Nanofiltration MembranesPrepared by Interfacial Polymerization Techniquefor Removal of Humic Acid . . . . . . . . . . . . . . . . . . . . . . . . . . . . . . . . 111M. N. Abu Seman, N. A. Jalanni, C. K. M. Faizal and N. Hilal
Adsorption of Lead Ions from Aqueous Solutiononto Activated Carbon . . . . . . . . . . . . . . . . . . . . . . . . . . . . . . . . . . . 119M. A. Adrah and P. Ravindra
Part II Chemical and Bioprocesses
Review: Pre-treatments and Fermentation of Seaweedfor Bioethanol Production . . . . . . . . . . . . . . . . . . . . . . . . . . . . . . . . . 129R. F. Mansa, H. Mansuit, K. F. Fong, C. S. Sipaut,F. Y. Chye and S. M. Yasir
x Contents
Assessment on Bioavailability of Flavonoids from OrthosiphonStamineus During Spray Drying. . . . . . . . . . . . . . . . . . . . . . . . . . . . . 137S. F. Pang, M. M. Yusoff and J. Gimbun
A Chimney of Low Height to Diameter Ratio for SolarCrops Dryer . . . . . . . . . . . . . . . . . . . . . . . . . . . . . . . . . . . . . . . . . . . 145S. Kumaresan, M. M. Rahman, C. M. Chu and H. K. Phang
Thermal Denaturation Kinetics of Whey Proteinand Maltodextrin Mixture . . . . . . . . . . . . . . . . . . . . . . . . . . . . . . . . . 151N. M. Yusoff, J. Gimbun and M. M. Yusoff
Production of a-Amylase by Immobilized Bacillus subtilisin Polymeric PolyHIPE Matrix . . . . . . . . . . . . . . . . . . . . . . . . . . . . . 159D. N. Jimat, C. Harwood and G. Akay
Production of Extracellular 5-Aminolevulinic Acidby Rhodopseudomonas Palustris in Solid-State Fermentation . . . . . . . . 173P. Y. Ong, C. T. Lee, M. R. Sarmidi, H. M. Awad,L. S. Chua and F. Razali
Experimental Investigation of Combustion Behaviorof Flash Pyrolysis Oil . . . . . . . . . . . . . . . . . . . . . . . . . . . . . . . . . . . . 181N. Ibrahim, P. A. Jensen, K. Dam-Johansen, M. K. A. Hamid,R. M. Kasmani and R. R. Ali
Identification of Tetrathionate Hydrolase from ThiobacillusFerrooxidans: An Enzyme Responsible for EnzymaticDevulcanization of Waste Rubber Products . . . . . . . . . . . . . . . . . . . . 189M. D. Azratul and Y. Faridah
Cross-Linked Lipase in Hybrid Matrix for Biodiesel Productionfrom Crude Jatropha curcas Oil. . . . . . . . . . . . . . . . . . . . . . . . . . . . . 197R. Abdulla and P. Ravindra
Culture Conditions for Optimal Growth of Actinomycetesfrom Marine Sponges . . . . . . . . . . . . . . . . . . . . . . . . . . . . . . . . . . . . 203M. A. A. Bukhari, A. N. Thomas and N. K. Wong
Genetic-Algorithm-Based Optimisation for ExothermicBatch Process . . . . . . . . . . . . . . . . . . . . . . . . . . . . . . . . . . . . . . . . . . 211M. K. Tan, H. J. Tham and K. T. K. Teo
Contents xi
Q-Learning-Based Controller for Fed-Batch Yeast Fermentation . . . . 219H. S. E. Chuo, M. K. Tan, H. J. Tham and K. T. K. Teo
In Vitro Antimicrobial Activity of Cynodon dactylon(L.) Pers. (bermuda) Against Selected Pathogens . . . . . . . . . . . . . . . . 227S. Abdullah, J. Gobilik and K. P. Chong
Part III Separation Processes
Extraction of Glucose from Kenaf Core Using MildAcid Treatment . . . . . . . . . . . . . . . . . . . . . . . . . . . . . . . . . . . . . . . . . 241S. M. Nurhafizah, M. Maizirwan, H. Anuar, R. Othmanand M. N. Nur Aimi
Solid–Liquid Mass Transfer Coefficients in an Ultrasound-IrradiatedExtraction of Iota-Carrageenan . . . . . . . . . . . . . . . . . . . . . . . . . . . . . 249D. Krishnaiah, D. M. R. Prasad, R. Sarbatly, A. Bono,S. M. Anisuzzaman and K. Krishnaiah
Supercritical Fluid Extraction of Black Pepper’s BioactiveCompounds: Solubility and Mass Transfer . . . . . . . . . . . . . . . . . . . . . 263S. P. Then, F. Panau and Y. Samyudia
Comparative Study of Cellulose Extraction Processesfrom Palm Kernel Cake . . . . . . . . . . . . . . . . . . . . . . . . . . . . . . . . . . 271Y. Y. Farm, S. M. Anisuzzaman, D. Krishnaiah and A. Bono
Screening and Separation of Industrially Useful Hydrolasesfrom the Wasteful Skim Latex Serum of Hevea Brasiliensis . . . . . . . . 285M. Nazhirah and Y. Faridah
Study of H2S Removal Efficiency of Virgin Zeolite in POMEBiogas Desulfurization at Ambient Temperature and Pressure . . . . . . 295H. Pourzolfaghar and M. H. S. Ismail
Investigation into Alternative for Bleaching Earth in PalmOil Processing . . . . . . . . . . . . . . . . . . . . . . . . . . . . . . . . . . . . . . . . . . 303L. N. Ngu and F. A. A. Twaiq
xii Contents
Part IV Advanced Materials
A Brief Review on Photoanode, Electrolyte, and PhotocathodeMaterials for Dye-Sensitized Solar Cell Basedon Natural Dye Photosensitizers. . . . . . . . . . . . . . . . . . . . . . . . . . . . . 313R. F. Mansa, A. R. A. Yugis, K. S. Liow, S. T. L. Chai, M. C. Ung,J. Dayou and C. S. Sipaut
The Influences of Dope Composition on Gas Permeanceof Hollow Fiber Carbon Membrane . . . . . . . . . . . . . . . . . . . . . . . . . . 321W. M. H. F. W. Harun, M. A. T. Jaya and M. A. Ahmad
Effect of the Pyrolysis Soaking Time on CO2 Separationof Polyetherimide/Polyethylene Glycol-Based CMS Membranes . . . . . 329W. Z. Wan Nurul Huda and M. A. Ahmad
Performance of Particleboard with Palm Kernel Cake as Filler . . . . . 337A. Bono, S. M. Anisuzzaman, N. M. Ismail and R. Haziami
Starch-Based Biofilms for Green Packaging . . . . . . . . . . . . . . . . . . . . 347R. R. Ali, W. A. W. A. Rahman, N. B. Ibrahim and R. M. Kasmani
Influence of Potassium Hydroxide Concentrationon the Carrageenan Functional Group Composition . . . . . . . . . . . . . . 355S. M. Anisuzzaman, A. Bono, S. Samiran, B. Ariffin and Y. Y. Farm
Effect of 3-Mercaptopropionic Acid on Polymerizationof Thermo-Responsive Poly(N-Isopropylacrylamide) . . . . . . . . . . . . . . 365D. Krishnaiah, S. M. Anisuzzaman, S. F. Shi and A. Bono
Preparation and Characterization of Activated Carbon Derivedfrom Waste Rubber Tire via Chemical Activation with ZnCl2:Surface Area and Morphological Studies . . . . . . . . . . . . . . . . . . . . . . 371C. G. Joseph, G. G. Hoon, Y. L. Sharain-Liew, D. Krishnaiahand M. Massuanna
The Effects of Kaolin/PESF Ratios on the Microstructuresof Kaolin Hollow Tubes . . . . . . . . . . . . . . . . . . . . . . . . . . . . . . . . . . . 381R. Sarbatly and Z. Kamin
On the Alloying Reaction in Synthesis of NiTi Shape-MemoryAlloy in Solid State . . . . . . . . . . . . . . . . . . . . . . . . . . . . . . . . . . . . . . 389J. Abdullah and H. H. M. Zaki
Contents xiii

GFRP Composite Material Degradation Under Seawaterand Weathering Effect . . . . . . . . . . . . . . . . . . . . . . . . . . . . . . . . . . . . 395W. H. Choong, K. B. Yeo, M. T. Fadzlita,Y. Y. Farm and M. Azlan Ismail
b-Mannanase Production by Aspergillus flavus in Solid-StateFermentation of Palm Kernel Cake . . . . . . . . . . . . . . . . . . . . . . . . . . 401Y. P. Wong, H. Y. Saw, J. Janaun, K. Krishnaiah and A. Prabhakar
Author Biography . . . . . . . . . . . . . . . . . . . . . . . . . . . . . . . . . . . . . . . 409
Index . . . . . . . . . . . . . . . . . . . . . . . . . . . . . . . . . . . . . . . . . . . . . . . . 411
xiv Contents

Part IEnvironmental Engineering
Coagulation/Flocculation of AnaerobicallyTreated Palm Oil Mill Effluent(AnPOME): A Review
A. Z. Yaser, B. Nurmin and S. Rosalam
Abstract Inefficiency of palm oil mill effluent (POME) treatment cause consid-erable environmental problems including from aesthetic point of view and inhibitsthe growth of the desirable aquatic biota necessary for surface water self-purifi-cation. Due to its low operating cost, anaerobic digestion of palm oil mill effluent(POME) is widely accepted by the managers, yet the colour of treated effluent(AnPOME) turned to dark brown. In this paper, the colourants in the AnPOME andits possible treatments have been reviewed with greater emphasis was put oncoagulation/flocculation method. Application of anionic polymer as pre-treatmentfor integrated system has been shown to be necessary for sustainable AnPOMEtreatment including its sludge disposal.
Keywords Palm oil mill effluent � Anaerobic digestion � Decolourisation
Introduction
Palm oil mill industry is among major agricultural industry in Malaysia. However,the palm oil mills generate large amounts of highly polluting effluent called palmoil mill effluent (POME). Palm oil mill effluent (POME) is rich in carbohydrates,proteins, nitrogenous compounds, lipids, minerals, cellulose, hemicelluloses andlignin (Hii et al. 2012). Currently, anaerobic digestion of POME is widelyaccepted by the managers due to its low operating cost. Although there is
A. Z. Yaser (&) � S. RosalamChemical Engineering Programme, School of Engineering and Information Technology,Universiti Malaysia Sabah, Jalan UMS, 88400 Kota Kinabalu, Sabah, Malaysiae-mail: [email protected]
B. NurminCivil Engineering Programme, School of Engineering and Information Technology,Universiti Malaysia Sabah, Jalan UMS, 88400 Kota Kinabalu, Sabah, Malaysia
R. Pogaku et al. (eds.), Developments in Sustainable Chemicaland Bioprocess Technology, DOI: 10.1007/978-1-4614-6208-8_1,� Springer Science+Business Media New York 2013
3
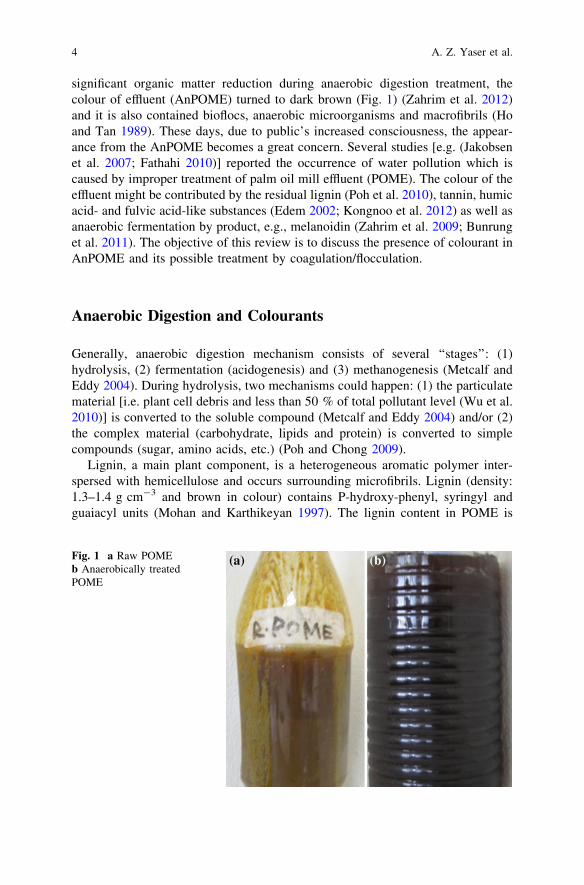
significant organic matter reduction during anaerobic digestion treatment, thecolour of effluent (AnPOME) turned to dark brown (Fig. 1) (Zahrim et al. 2012)and it is also contained bioflocs, anaerobic microorganisms and macrofibrils (Hoand Tan 1989). These days, due to public’s increased consciousness, the appear-ance from the AnPOME becomes a great concern. Several studies [e.g. (Jakobsenet al. 2007; Fathahi 2010)] reported the occurrence of water pollution which iscaused by improper treatment of palm oil mill effluent (POME). The colour of theeffluent might be contributed by the residual lignin (Poh et al. 2010), tannin, humicacid- and fulvic acid-like substances (Edem 2002; Kongnoo et al. 2012) as well asanaerobic fermentation by product, e.g., melanoidin (Zahrim et al. 2009; Bunrunget al. 2011). The objective of this review is to discuss the presence of colourant inAnPOME and its possible treatment by coagulation/flocculation.
Anaerobic Digestion and Colourants
Generally, anaerobic digestion mechanism consists of several ‘‘stages’’: (1)hydrolysis, (2) fermentation (acidogenesis) and (3) methanogenesis (Metcalf andEddy 2004). During hydrolysis, two mechanisms could happen: (1) the particulatematerial [i.e. plant cell debris and less than 50 % of total pollutant level (Wu et al.2010)] is converted to the soluble compound (Metcalf and Eddy 2004) and/or (2)the complex material (carbohydrate, lipids and protein) is converted to simplecompounds (sugar, amino acids, etc.) (Poh and Chong 2009).
Lignin, a main plant component, is a heterogeneous aromatic polymer inter-spersed with hemicellulose and occurs surrounding microfibrils. Lignin (density:1.3–1.4 g cm-3 and brown in colour) contains P-hydroxy-phenyl, syringyl andguaiacyl units (Mohan and Karthikeyan 1997). The lignin content in POME is
Fig. 1 a Raw POMEb Anaerobically treatedPOME
4 A. Z. Yaser et al.
around 1700–7890 mg/L (Poh et al. 2010; Hii et al. 2012). During fermentationstage, the amino acids, sugars and fatty acids are degraded to several compounds,i.e., lactate, propionate, acetate, formate. (Metcalf and Eddy 2004). Besides that,natural condensation between sugars (carbonyl groups) and amino acids or pro-teins (free amino groups) through Maillard reaction could produce another col-ourant, i.e., melanoidin (Chandra et al. 2008). It has been reported that thewastewater from distilleries and fermentation industries also contain melanoidins(Chandra et al. 2008). Due to its structural complexity, dark colour and offensiveodour, it poses serious threat to soil and aquatic ecosystem (Chandra et al. 2008).Presently, there is no report on Maillard reaction products in AnPOME. Finally,during anaerobic digestion, the methanogenic substrates are converted to methaneand carbon dioxide (Metcalf and Eddy 2004). Other important colourant that couldpresent in AnPOME might be tannin (Edem 2002). Tannins are complex dark-coloured non-crystalline substances composed of polyhydroxy phenolic (aromatichydroxyl) compounds, related to catechol, glycosides or pyrogellol, which vary incomposition. Tannins extracted from wood, bark and leaves are used extensivelyin the preservation of animal skins (Mohan and Karthikeyan 1997).
Coagulation/Flocculation for AnPOME Treatment
Over the past years, several studies have been dedicated for treatments of An-POME. Ho and Tan (1988) carried out AnPOME treatment via combination ofdissolved air flotation (DAF)-pressurised activated sludge. Decolourisation ofAnPOME by means of conventional activated sludge (CAS) and activated sludge-granular activated carbon (ASGAC) sequencing batch operation was reported byZahrim et al. (2009). During the period of treatment, colour removal for the CASand ASGAC was about 7 and 35 %, respectively. An attempt to treat biologicallytreated palm oil mill effluent using water hyacinth (Eichhornia crassipes) wasreported by Yeoh (1993). With a hydraulic retention time (HRT) of 5 days, thedecolourisation in this system is not significant due to the presence of recalcitrantorganic such as lignin. Wah et al. (2002) investigated ultrafiltration (UF) of An-POME with several pre-treatments, i.e., sand filtration, centrifugation and coag-ulation. Combination of filtration–UF treatment gave the best overall treatmentefficiency, with an overall reduction of 93 % for total nitrogen, suspended solids,turbidity and colour content. Chemical oxidation by using hydrogen peroxide withiron catalyst (Fenton process) for AnPOME treatment was studied by Aris et al.(2008). In this study, they found that the COD and colour removal were around75–82 % and 92–95 %, respectively. The treated water will end up in acidiccondition which is not suitable to be discharged in surface water. IntegrationFenton process with biofilm attached on granular activated carbon has been showneffectively improved the decolourisation performance (Rakmi et al. 2004).Adsorption of AnPOME using palm fibre ash as an adsorbent was investigated byBunrung et al. (2011).
Coagulation/Flocculation of AnPOME 5
Coagulation of coloured effluents has been used for many years, either as mainor pre-treatment, due to its low capital cost. Coagulation is the destabilisation ofcoloured effluent using coagulant(s), which can be classified into two main cate-gories, i.e., metal coagulants and polymers. Coagulation tends to overcome thefactors that promote coloured effluent stability and form agglomerates or flocs.Flocculation in other words is the process of whereby destabilised particles orparticles formed as a consequence of destabilisation are induced to come together,make contact and thereby form large(r) agglomerates (Bratby 2006). Advancementin polymer synthesising and purification resulted in the development of vast typesof polymers. The best polymer should be selected to ensure the highest perfor-mance of coagulation as well as to reduce the chemical cost (Zahrim et al. 2011).Ho and Tan (1989) studied AnPOME treatment using coagulation (aluminiumsulphate)/flocculation (cationic polyacrylamide) (CF), DAF and CF-DAF which isbelieved to be beneficial in reducing treatment time and area. Despite the fact thatboth methods were able to achieve a 97 % removal of the suspended solids of thedigested liquor, the removal of soluble solid is very difficult. The authors statedthat the total solid removal for CF, DAF and CF-DAF is 56, 59 and 63 %respectively (Ho and Tan 1989). The effects of synthetic non-ionic and cationicpolymers, chitosan and chemical (alum) coagulant on the removal of lignin wereinvestigated by Ganjidoust et al. (1997). It has been found that a non-ionic polymerhad poor effect as compared to cationic polymers. Cationic polymers resulted inremoval of about 80 % of colour and 30 % of TOC. The percentage colourremoved by alum was the same as the one removed by cationic polymers, but theTOC removed was higher by alum (about 40 %). The natural coagulant, chitosan,resulted in the highest removal in both colour and TOC as compared to bothsynthetic polymers and chemical coagulant. Up to 90 % of colour and 70 % ofTOC were observed to be removed by chitosan (Ganjidoust et al. 1997). A studyon coagulation/flocculation process for the treatment of molasses wastewater hasbeen studied by Liang et al. (2009). Experimental results indicate that ferricchloride was the most effective among the conventional coagulants, achieving89 % COD and 98 % colour eliminations; while aluminium sulphate was the leasteffective, giving COD and colour reductions of 66 and 86 %, respectively. Inaddition, cationic polymer was shown to be more effective than anionic polymer inenhancing settleability of flocs formed (Liang et al. 2009).
Compared to cationic polymers, anionic polymers were reported to be morebiodegradable (Zahrim et al. 2011; Weston et al. 2009). This characteristic isimportant for converting generated sludge (due to coagulation/flocculation pro-cess) into soil conditioner (Robinson et al. 2001; Yaser et al. 2007). Recently, Jamiet al. (2012) applied anionic polymer as coagulant aids and compare the use ofcoagulants ferric chloride and aluminium sulphate to reduce turbidity. The resultof the coagulation process showed that ferric chloride gave a better reduction inturbidity at dosage of 100 mg/L, pH of 8 and with polymer dose of 100 mg/L thanalum. Previously, Poon and Chu (1999) studied coagulation/flocculation of sewagesludge using anionic polymer. They found that the addition of 30 mg/L of FeCl3and 0.5 mg/L polymer could provide a reduction in SS, total nitrogen (N) and total
6 A. Z. Yaser et al.
phosphorous (P) higher than 80, 70 and 40 %, respectively. Study on tannerywastewater coagulation/flocculation was conducted by Haydar and Aziz (2009).Alum was used as coagulant while anionic polymers as coagulant aid. The com-bination of alum with anionic polymer resulted in effluent turbidity removal of99.7 %, TSS removal of 96.3 %, COD removal of 48.3 % and chromium removalof 99.7 %. It was reported in this study that the application of polymer has reducedsludge volume by 60–70 % and cost of chemicals by 50 % for comparableremoval efficiencies. Synthetic dye solution treatment has been reported by Mishraand Bajpai (2005) and the authors found that the anionic food-grade polymer isable to reduce 35–71 % colour.
Conclusions
Due to recalcitrance nature of POME, the treated effluent from anaerobic treatmentsystem is always in dark brownish colour. The colour of the effluent is due to thepresence of residual lignin, tannin, humic acid- and fulvic acid-like substance.Natural condensation between sugars (carbonyl groups) and amino acids or pro-teins (free amino groups) through Maillard reaction could produce another type ofcolourant, i.e., melanoidin. Over the years, several treatment methods such asbiological, advanced oxidation, membrane separation, adsorption and coagulation/flocculation have been studied. None of the stand-alone treatments could fullydecolourised AnPOME, and hence, integrated system is required. Coagulation/flocculation could be applied as pre-treatment. Since many of the anionic polymersare reported to be biodegradable, application of anionic polymer has potential forsustainable AnPOME flocculant and further study are required.
Acknowledgments The authors would like to thank the Universiti Malaysia Sabah for fundingthis project under grant SLB0041-TK-2012 and PHD0007-TK-2012. Thanks to Izreen, Nasimah& Hillery for the photos.
References
Aris, A., Siew, O. B., See, K. S., & Ujang, Z. (2008). Tertiary treatment of palm oil mill effluentusing fenton oxidation. Malaysia Journal of Civil Engineering, 20, 12–25.
Bratby, J. (2006). Coagulation and flocculation in water and wastewater treatment. London:IWA Publishing.
Bunrung, S., Prasertsan, S., & Prasertsan, P. (2011). Decolourisation of Biogas Effluent of PalmOil Mill using Palm Ash. TIChE International Conference 2011. Hatyai, Songkhla Thailand.
Chandra, R., Bharagava, R. N., & Rai, V. (2008). Melanoidins as major colourant in sugarcanemolasses based distillery effluent and its degradation. Bioresource Technology, 99,4648–4660.
Coagulation/Flocculation of AnPOME 7
Edem, D. O. (2002). Palm oil: Biochemical, physiological, nutritional, hematological andtoxicological aspects: A review. Plant Foods for Human Nutrition (Formerly QualitasPlantarum), 57, 319–341.
Fathahi, T. K. T. (2010). Water quality and sources of pollution of the Sg Kinabatangan basin.Seminar and Workshop POMET3 Sabah, Malaysia.
Ganjidoust, H., Tatsumi, K., Yamagishi, T., & Gholian, R. N. (1997). Effect of synthetic andnatural coagulant on lignin removal from pulp and paper wastewater. Water Science andTechnology, 35, 291–296.
Haydar, S., & Aziz, J. A. (2009). Coagulation-flocculation studies of tannery wastewater usingcombination of alum with cationic and anionic polymers. Journal of Hazardous Materials,168, 1035–1040.
Hii, K.-L., Yeap, S.-P., & Mashitah, M. D. (2012). Cellulase production from palm oil milleffluent in Malaysia: Economical and technical perspectives. Engineering in Life Sciences, 12,7–28.
Ho, C. C., & Tan, Y. K. (1988). The treatment of anaerobically digested palm oil mill effluent bypressurised activated sludge. Journal of Chemistry Technology Biotechnology, 41, 75–84.
Ho, C. C., & Tan, Y. K. (1989). Comparison of chemical flocculation and dissolved air flotationof anaerobically treated palm oil mill effluent. Water Research, 23, 395–400.
Jakobsen, F., Hartstein, N., Frachisse, J., & Golingi, T. (2007). Sabah shoreline management plan(Borneo, Malaysia): Ecosystems and pollution. Ocean and Coastal Management, 50, 84–102.
Jami, M. S., Muyibi, S. A., & Oseni, M. I. (2012). Comparative study of the use of coagulants inbiologically treated palm oil mill effluent (POME). Advances in Natural and AppliedSciences, 6, 646–650.
Kongnoo, A., Suksaroj, T., Intharapat, P., Promtong, T., & Suksaroj, C. (2012). Decolorizationand organic removal from palm oil mill effluent by Fenton’s process. EnvironmentalEngineering Science, 29, 855–859.
Liang, Z., Wang, Y., Zhou, Y., Liu, H., & Wu, Z. (2009). Variables affecting melanoidinsremoval from molasses wastewater by coagulation/flocculation. Separation and PurificationTechnology, 68, 382–389.
Metcalf & Eddy (2004) Wastewater engineering—Treatment and reuse., New York:McGraw-HillCompanies.
Mishra, A., & Bajpai, M. (2005). Flocculation behaviour of model textile wastewater treated witha food grade polysaccharide. Journal of Hazardous Materials, 118, 213–217.
Mohan, S. V., & Karthikeyan, J. (1997). Removal of lignin and tannin colour from aqueoussolution by adsorption onto activated charcoal. Environmental Pollution, 97, 183–187.
Poh, P. E., & Chong, M. F. (2009). Development of anaerobic digestion methods for palm oil milleffluent (POME) treatment. Bioresource Technology, 100, 1–9.
Poh, P. E., Yong, W.-J., & Chong, M. F. (2010). Palm Oil Mill Effluent (POME) characteristic inhigh crop season and the applicability of high-rate anaerobic bioreactors for the treatment ofPOME. Industrial and Engineering Chemistry Research, 49, 11732–11740.
Poon, C. S., & Chu, C. W. (1999). The use of ferric chloride and anionic polymer in thechemically assisted primary sedimentation process. Chemosphere, 39, 1573–1582.
Rakmi, A., Norzaini, M., Abu-Zahrim, Y., & Zalina, H. (2004) Chemibiological treatment ofdifficult wastewater: Case study on tanning wastewater. In Z. Ujang, & M. Henze, (Eds.)Environmental Biotechnology: Advancement in Water and wastewater applications in thetropics. London: IWA Publishing.
Robinson, T., McMullan, G., Marchant, R., & Nigam, P. (2001). Remediation of dyes in textileeffluent: a critical review on current treatment technologies with a proposed alternative.Bioresource Technology, 77, 247–255.
Wah, W. P., Sulaiman, N. M. N., Nachiappan, M., & Varadaraj, B. (2002). Pre-treatment andmembrane ultrafiltration using treated palm oil mill effluent. Songklanakarin Journal ofScience Technology, 24, 891–898.
8 A. Z. Yaser et al.
Weston, D. P., Lentz, R. D., Cahn, M. D., Ogle, R. S., Rothert, A. K., & Lydy, M. J. (2009).Toxicity of anionic polyacrylamide formulations when used for erosion control in agriculture.Journal of Environmental Quality, 38, 238–247.
Wu, T. Y., Mohammad, A. W., Jahim, J. M., & Anuar, N. (2010). Pollution control technologiesfor the treatment of palm oil mill effluent (POME) through end-of-pipe processes. Journal ofEnvironmental Management, 91, 1467–1490.
Yaser, A. Z., Abd Rahman, R., & Kalil, M. S. (2007). Co-composting of palm oil mill sludge-sawdust. Pakistan Journal of Biological Science, 10, 4473–4478.
Yeoh, B. G. (1993). Use of water hyacinth (Eichhornia crassipes) in upgrading in smallagroindustrial wastewater treatment plants. Water Science and Technology, 28, 207–213.
Zahrim, A. Y., Fansuri, M. B., Nurmin, B., & Rosalam, S. (2012). A review on thedecolourisation of anaerobically treated palm oil mill effluent (AnPOME). In A. Bono, & C.S. Sipaut, (Eds.), Proceedings of 26th Symposium of Malaysian Chemical Engineers. KotaKinabalu, Sabah, Malaysia.
Zahrim, A. Y., Rachel, F. M., Menaka, S., Su, S. Y., Melvin, F., & Chan, E. S. (2009).Decolourisation of anaerobic Palm Oil Mill effluent via activated sludge-granular activatedcarbon. World Applied Sciences Journal, 5, 126–129.
Zahrim, A. Y., Tizaoui, C., & Hilal, N. (2011). Coagulation with polymers for nanofiltration pre-treatment of highly concentrated dyes: A review. Desalination, 266, 1–16.
Coagulation/Flocculation of AnPOME 9
Dewaterability of Anaerobic DigestedSludge with Cations and Chitosan as DualConditioners
S. W. Lau, S. H. Chong, H. M. Ang, T. K. Sen and H. B. Chua
Abstract Anaerobic digested sludge dewatering is very important in sludgemanagement and disposal. In this study, flocculation and dewatering behaviour ofanaerobic digested sludge were investigated using metal cations (sodium, mag-nesium, calcium, ferric and aluminium salts) and chitosan as dual conditioners.The trivalent ferric and aluminium ions were found to be more effective than themonovalent and divalent cations in improving sludge dewaterability as measuredby capillary suction time (CST). Post-addition of chitosan into the sludge pre-coagulated with metal cations further enhanced the sludge dewaterability. Thisstudy suggests that pre-destabilisation of sludge by coagulation with metal cationsfollowed by chitosan addition as polymeric flocculant may improve the dewater-ability of anaerobic digested sludge.
Introduction
Sewage sludge production has increased dramatically during the last decades dueto increased urban and industrial water purification activities (Saveyn et al. 2005).It is commonly known that sludge handling is an expensive process which mayrepresent up to 40 % of the capital cost and 50 % of the operation cost of awastewater treatment plant (Spellman 2003). The high water content and thecolloidal and compressible nature of sludge make its handling and processing
S. W. Lau (&) � H. B. ChuaDepartment of Chemical Engineering, School of Engineering and Science, Curtin UniversitySarawak Malaysia, CDT 250, 98009 Miri, Sarawak, Malaysiae-mail: [email protected]
S. H. Chong � H. M. Ang � T. K. SenDepartment of Chemical Engineering, Faculty of Science and Engineering, School ofChemical and Petroleum Engineering, Curtin University, Gpo Box U1987, Perth, WA 6845,Australiae-mail: [email protected]
R. Pogaku et al. (eds.), Developments in Sustainable Chemicaland Bioprocess Technology, DOI: 10.1007/978-1-4614-6208-8_2,� Springer Science+Business Media New York 2013
11
extremely costly in terms of both money and time. Sludge dewatering andanaerobic digestion are two widely used operations in wastewater treatment inrecent years. Dewatering is essential to reduce the volume of sludge and is still abottleneck for sludge treatment. Sewage sludge may be pre-treated or conditionedby biological, chemical and/or physical treatment to enhance dewaterability. Untilrecently, there has been little published information on dewaterability of digestedsludge and the influencing factors of sludge dewaterability. Thermal pre-treatmenthas been used for sludge dewatering, but it is less popular nowadays due to its highcapital cost and a number of operational problems such as odour control and scaleformation (Turovskiy and Mathai 2006). Metal salts also play an important role insludge flocculation, settling and dewatering (Pevere et al. 2007).
With the advances in development of the polymer industry, polymer condi-tioning has now become the most extensively used, economical and operablepractice of all the pre-treatment methods for improved dewatering process(Fu et al. 2009). Cationic polymers are the most widely used polymers for sludgesince most sludge solids carry negative charges due to the presence of extracellularpolymeric substances (EPS) (Chitikela and Dentel 1998; Mikkelsen and Keiding2002). Recently, there has been considerable interest in using alternative sub-stances such as surfactants, acids, enzymes and natural polymers to replace or tosupplement polymers in sludge conditioning. This is due to high polymer costs,high moisture content in the resulting sludge cake, and concern over biodegra-dation and toxicity of polymers since the maximum allowable concentration is1 ppm in potable water (Ayol 2005; Chen et al. 2001; Chitikela and Dentel 1998;Fu et al. 2009; Rose and John 2010).
Although there are many reported works on the thermal pre-treatment, polymerdosing and role of metal salts on dewaterability of sludge, little research hascovered the use of the mono-, di- and trivalent metal salts in anaerobic digestedsludge dewatering. Moreover, the effect of dual conditioners such as the combi-nation of metal cations with biopolymers on the sludge dewaterability is addressedhere for the first time. It is commonly known that the sludge particle has a netnegative charge and forms a double layer with the counter-ion charge in thesolution. The double layer results in an osmotic repulsion of adjacent particles andkeeps a relatively stable system. Consequently, the double layer inhibits aggre-gation and causes poor settling and dewatering properties. After the addition ofmetal cations into the sludge system, the negative charge of sludge is expected tobe neutralised by the positive charge carried by the metal cations on the surface ofsludge. It thus appears plausible that this type of conditioner could supplement themore expensive polymer and neutralise a portion of the required charge. Pre-sumably, some cationic organic polymer would still be needed to bridge theparticles and make the sludge sufficiently dewaterable. The natural biopolymer,chitosan, is of considerable interest since it is nontoxic and environmentallyfriendly. The objective of this research is to investigate the relationship betweenvarious metal cations and chitosan, together with their dual-conditioning mecha-nism in charge neutralisation as well as bridging for enhanced dewaterability ofanaerobic digested sludge.
12 S. W. Lau et al.
Methodology
Materials
The anaerobic digested sludge used in the current study was obtained from BeenyupWastewater Treatment Plant of Water Corporation in Perth. Sludge samples werestored at 4 �C and brought to room temperature before use. The commercial poly-mer, EMA 8845 MBL (SNF, Australia) used in this study, was also a generous giftfrom Beenyup Wastewater Treatment Plant. It was supplied as a cationic water-soluble polymer after dilution to an average concentration of 0.65 % w/v. Thenatural biopolymers, low molecular weight chitosan (50,000–190,000 Da) andmedium molecular weight chitosan (190,000–310,000 Da) were purchased fromSigma-Aldrich and prepared as 0.5 % w/v stock solutions at pH 2. Cations used inthis study were from the laboratory-grade metal salts and prepared as 1.0 % w/vstock solutions.
Analytical Methods and Characterisation of Sludge
The main characteristics of the anaerobic digested sludge were analysed usingseveral methods. Total solids (TS) content and specific gravity (SG) were deter-mined according to standard methods (APHA 2005). Capillary suction time (CST)test was conducted using a CST apparatus from Triton Electronics Ltd., UK. Totaldissolved solids (TDS), electrical conductivity (EC), pH and temperature weremeasured with a bench meter. The zeta potentials of the sludge supernatant weremeasured with a Malvern Zetasizer Nano ZS (Malvern Instruments Ltd., UK),while particle size analysis was conducted using a Malvern Mastersizer 2000(Malvern Instruments Ltd., UK). Image analysis was also performed on the sludgesamples using a Nikon SMZ800 stereomicroscope. The properties of the sludgeused in this study are as follows: pH 6.9–7.1; SG 1.000–1.005; TS 1.4–1.6 %; TDS0.28–0.29 %; EC 5–6 mS/cm; zeta potential -12 to -13 mV; particle size range2.5–1,500 lm; mean particle size 100 lm; and CST 140–160 s.
Conditioning and Dewatering Experiments
Sludge samples (100 mL) were conditioned with either chitosan or cation. Theexperiment was repeated with a number of different conditioner dosages, in a 250-mL beaker. The mixture was rapidly stirred at 500 rpm for 1 min, followed by aslow mixing at 200 rpm for 5 min. The CST test was conducted on the conditionedsludge. 15 mL of the conditioned sludge sample was centrifuged at 2,500 rpm for
Dewaterability of Anaerobic Digested Sludge 13
15 min, and the volume of centrate collected was used to determine the percentageof water removal from the total sample volume.
For the study of dual conditioning, the sludge was pre-conditioned with cationas described, followed by addition of chitosan with a similar mixing procedure.The CST test was again conducted on the dual-conditioned sludge, and the per-centage of CST reduction was calculated by comparison with the CST of theunconditioned sludge. All experiments were conducted at room temperature(24 ± 1 �C).
Results and Discussion
Effect of Polymer Type and Dosage on Sludge Flocculationand Dewatering
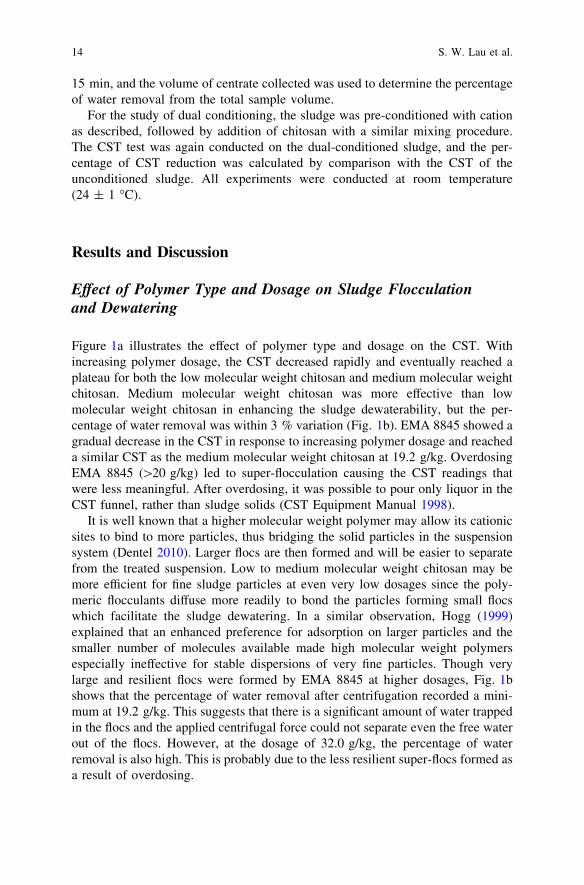
Figure 1a illustrates the effect of polymer type and dosage on the CST. Withincreasing polymer dosage, the CST decreased rapidly and eventually reached aplateau for both the low molecular weight chitosan and medium molecular weightchitosan. Medium molecular weight chitosan was more effective than lowmolecular weight chitosan in enhancing the sludge dewaterability, but the per-centage of water removal was within 3 % variation (Fig. 1b). EMA 8845 showed agradual decrease in the CST in response to increasing polymer dosage and reacheda similar CST as the medium molecular weight chitosan at 19.2 g/kg. OverdosingEMA 8845 ([20 g/kg) led to super-flocculation causing the CST readings thatwere less meaningful. After overdosing, it was possible to pour only liquor in theCST funnel, rather than sludge solids (CST Equipment Manual 1998).
It is well known that a higher molecular weight polymer may allow its cationicsites to bind to more particles, thus bridging the solid particles in the suspensionsystem (Dentel 2010). Larger flocs are then formed and will be easier to separatefrom the treated suspension. Low to medium molecular weight chitosan may bemore efficient for fine sludge particles at even very low dosages since the poly-meric flocculants diffuse more readily to bond the particles forming small flocswhich facilitate the sludge dewatering. In a similar observation, Hogg (1999)explained that an enhanced preference for adsorption on larger particles and thesmaller number of molecules available made high molecular weight polymersespecially ineffective for stable dispersions of very fine particles. Though verylarge and resilient flocs were formed by EMA 8845 at higher dosages, Fig. 1bshows that the percentage of water removal after centrifugation recorded a mini-mum at 19.2 g/kg. This suggests that there is a significant amount of water trappedin the flocs and the applied centrifugal force could not separate even the free waterout of the flocs. However, at the dosage of 32.0 g/kg, the percentage of waterremoval is also high. This is probably due to the less resilient super-flocs formed asa result of overdosing.
14 S. W. Lau et al.
Effect of Cation Type on the Dual Conditioning of Sludgewith Chitosan
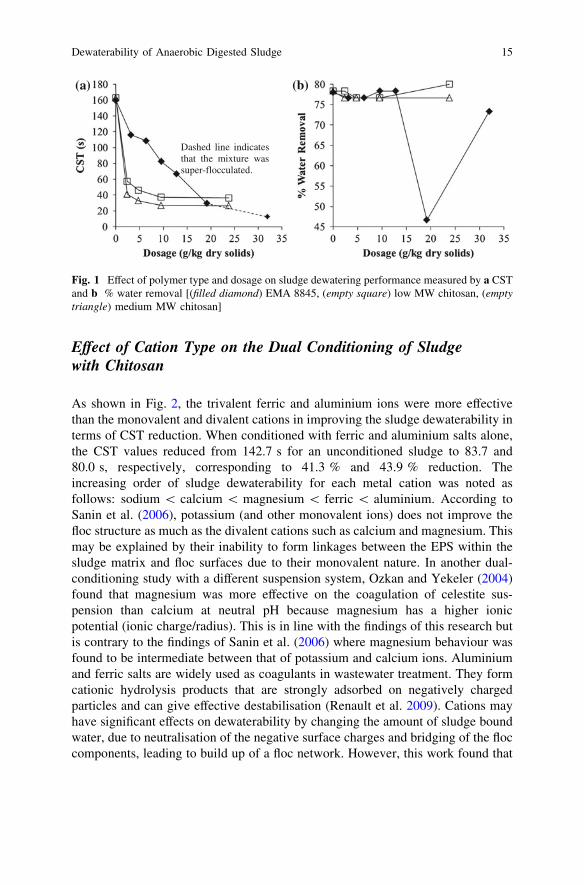
As shown in Fig. 2, the trivalent ferric and aluminium ions were more effectivethan the monovalent and divalent cations in improving the sludge dewaterability interms of CST reduction. When conditioned with ferric and aluminium salts alone,the CST values reduced from 142.7 s for an unconditioned sludge to 83.7 and80.0 s, respectively, corresponding to 41.3 % and 43.9 % reduction. Theincreasing order of sludge dewaterability for each metal cation was noted asfollows: sodium \ calcium \ magnesium \ ferric \ aluminium. According toSanin et al. (2006), potassium (and other monovalent ions) does not improve thefloc structure as much as the divalent cations such as calcium and magnesium. Thismay be explained by their inability to form linkages between the EPS within thesludge matrix and floc surfaces due to their monovalent nature. In another dual-conditioning study with a different suspension system, Ozkan and Yekeler (2004)found that magnesium was more effective on the coagulation of celestite sus-pension than calcium at neutral pH because magnesium has a higher ionicpotential (ionic charge/radius). This is in line with the findings of this research butis contrary to the findings of Sanin et al. (2006) where magnesium behaviour wasfound to be intermediate between that of potassium and calcium ions. Aluminiumand ferric salts are widely used as coagulants in wastewater treatment. They formcationic hydrolysis products that are strongly adsorbed on negatively chargedparticles and can give effective destabilisation (Renault et al. 2009). Cations mayhave significant effects on dewaterability by changing the amount of sludge boundwater, due to neutralisation of the negative surface charges and bridging of the floccomponents, leading to build up of a floc network. However, this work found that
Dashed line indicates that the mixture was super-flocculated.
(a) (b)
Fig. 1 Effect of polymer type and dosage on sludge dewatering performance measured by a CSTand b % water removal [(filled diamond) EMA 8845, (empty square) low MW chitosan, (emptytriangle) medium MW chitosan]
Dewaterability of Anaerobic Digested Sludge 15
none of the metal cations used alone can reduce the CST as much as low molecularweight chitosan used alone.
In order to examine the dual-conditioning effect on the sludge dewaterability,low molecular weight chitosan was selected to feature the charge interactions asproposed by Hogg (1999) where charge interactions are believed to be moreimportant for low molecular weight than for high molecular weight polymers. Itcan be seen from Fig. 2 that dual conditioning of sludge using metal cations andchitosan improved sludge dewaterability variably depending on the cation type.The combination of aluminium ion and chitosan optimised the sludge dewater-ability, leading to a 72 % CST reduction. Microscopic observation indicated thatthe sludge dual-conditioned with aluminium ion and chitosan forms larger anddenser flocs with less trapped water compared to sludge conditioned with chitosanalone.
Conclusions
Ferric and aluminium ions were more effective than the monovalent and divalentcations in improving the sludge dewaterability in terms of CST reduction.They formed cationic hydrolysis products that were strongly adsorbed on thenegatively charged particles and bridged the floc components. Post-addition ofchitosan further enhanced the dewaterability of the sludge by polymer bridgingpermitting floc growth to large sizes. This study suggests that the dual-condi-tioning mechanism works by pre-destabilisation of sludge through coagulationwith cations, followed by flocculation induced by chitosan addition as polymericflocculant. The addition of metal cations can reduce the polymer demand for
0
10
20
30
40
50
60
70
80
Chitosan
(Control)
NaCl MgCl2 CaCl2 FeCl3 AlCl3
% R
educ
tion
in C
ST
Combination of Dual-Conditioners
Cation Cation + Chitosan
Fig. 2 Reduction in CST at various combinations of dual conditioners (20 g/kg cation +2.5 g/kgchitosan)
16 S. W. Lau et al.
sludge conditioning which is an advantage in urban and industrial water purifi-cation treatment.
Acknowledgments The authors would like to acknowledge Physics Department at Curtin Perthfor the image analysis. Dominique Dodge-Wan proofreads this chapter.
References
APHA (2005). Standard methods for the examination of water and wastewater. 21st edn.Washington, DC, American Public Health Association, American Water Works Association,and Water Environment Federation.
Ayol, A. (2005). Enzymatic treatment effects on dewaterability of anaerobically digestedbiosolids-I: Performance evaluations. Process Biochemistry, 40(7), 2427–2434.
Chen, Y. G., Yang, H. Z., & Gu, G. W. (2001). Effect of acid and surfactant treatment onactivated sludge dewatering and settling. Water Research, 35(11), 2615–2620.
Chitikela, S., & Dentel, S. K. (1998). Dual-chemical conditioning and dewatering ofanaerobically digested biosolids: Laboratory evaluations. Water Environment Research,70(5), 1062–1069.
CST Equipment Manual (1998). Essex: Triton Electronics Ltd.Dentel, S. K. (2010). Chemical conditioning for solid-liquid separation processes. Drying
Technology, 28(7), 843–849.Fu, J., Jiang, B., & Cai, W. (2009). Effect of synthetic cationic surfactants on dewaterability and
settleability of activated sludge. International Journal of Environment and Pollution, 37(1),113–131.
Hogg, R. (1999). The role of polymer adsorption kinetics in flocculation. Colloids and SurfacesA: Physicochemical and Engineering Aspects, 146, 253–263.
Mikkelsen, L. H., & Keiding, K. (2002). Physico-chemical characteristics of full scale sewagesludges with implications to dewatering. Water Research, 36, 2451–2462.
Ozkan, A., & Yekeler, M. (2004). Coagulation and flocculation characteristics of celestite withdifferent inorganic salts and polymers. Chemical Engineering and Processing: ProcessIntensification, 43(7), 873–879.
Pevere, A., Guibaud, G., van Hullebusch, E. D., Boughzala, W., & Lens, P. N. L. (2007). Effectof Na+ and Ca2+ on the aggregation properties of sieved anaerobic granular sludge. Colloidsand Surfaces A: Physicochemical and Engineering Aspects, 306, 142–149.
Renault, F., Sancey, B., Badot, P. M., & Crini, G. (2009). Chitosan for coagulation/flocculationprocesses—an eco-friendly approach. European Polymer Journal, 45(5), 1337–1348.
Rose, G. R. & ST. John, M. R. (2010). Encyclopedia of polymer science and technology. (2ndedn., Vol 7. pp. 211–233). Nalco Chemical Company.
Sanin, F. D., Vatansever, A., Turtin, I., Kara, F. & Durmaz, B. (2006). Operational conditions ofactivated sludge: Influence on flocculation and dewaterability. Drying Technology 24(10),1297–1306.
Saveyn, H., Meersseman, S., Thas, O., & van der Meeren, P. (2005). Influence of polyelectrolytecharacteristics on pressure-driven activated sludge dewatering. Colloids and Surfaces A:Physicochemical and Engineering Aspects, 262, 40–51.
Spellman, F. R. (2003). Handbook of water and wastewater treatment plant operations. London:Lewis Publishers.
Turovskiy, I. S. & Mathai, P. K. (2006). Wastewater sludge processing. New Jersey: Wiley.
Dewaterability of Anaerobic Digested Sludge 17
Optimization Study on BioethanolProduction from the Fermentation of OilPalm Trunk Sap as Agricultural Waste
A. H. Norhazimah and C. K. M. Faizal
Abstract The utilization of oil palm trunk sap as an alternative agricultural wasteresource for bioethanol production was investigated. The effects of temperature(25–40 �C), initial pH (3–7), agitation rate (110–250 rpm), and percentageinoculums (5–15 % v/v) on bioethanol yield were identified using modified face-centered central composite design (modified CCD) of response surface method-ology (RSM). All the data were statistically validated by analysis of variance(ANOVA). The results showed that the temperature was the most significant factorthat influenced the bioethanol yield, followed by the interaction effect of tem-perature and initial pH, quadratic effect of initial pH, and interaction effects ofinitial pH and agitation. Using modelling, the maximum bioethanol yield of0.4926 g g-1 was predicted to be achieved at temperature 31.73 �C, initial pH 5.5,and agitation rate 110 rpm. Using these conditions, the final bioethanol yieldachieved was in good agreement with the model prediction.
Introduction
The oil palm is the major commodity crops in Malaysia and Indonesia. Replantationof oil palm trees every 25–30 years generates large quantities of oil palm trunk(OPT) waste. The outer region of the trunk is rich with vascular bundles, whichmight be suitable for manufacturing building material, while the inner region is richwith high content of parenchymas in tissue structure (Tomimura 1992). Theseparenchymas are not suitable to be used as building materials. In order to be utilizedfor wood-based products, liquid content (sap) in the OPT has to be eliminated. Thissap waste can be regarded as an important source for bioethanol production since it
A. H. Norhazimah (&) � C. K. M. FaizalBiofuel Research Group, Faculty of Chemical and Natural Resources Engineering,Universiti Malaysia Pahang, 26300 Gambang, Kuantan, Pahang, Malaysiae-mail: [email protected]
R. Pogaku et al. (eds.), Developments in Sustainable Chemicaland Bioprocess Technology, DOI: 10.1007/978-1-4614-6208-8_3,� Springer Science+Business Media New York 2013
19
contains a lot of readily fermentable sugars and only minimum pretreatment isneeded before fermentation. No research has been done to optimize the bioethanolproduction from the OPT sap using statistical design of experiment (DOE). DOE is apowerful tool that allows the knowledge gain about the process being studiedthrough the iterative process with a minimum number of experiments (Altekar et al.2006). The conventional method of one-factor-at-a-time (OFAT) is often used tooptimize a process condition; however, it frequently fails to locate optimal condi-tions for the process due to its failure to consider the combined effect of the multiplefactors involved (Kalil et al. 2000; Coninck et al. 2004). Optimization by applyingresponse surface methodology (RSM) is quicker and can obtain more accurateinformation about factor effects including magnitude and direction compared toOFAT approach. Statistical analysis of data generated from the experiment clearlyestablishes the relationship between response (measured parameter of interest) andfactors (process variables) being studied where factors may have individual effectson the response or may have interaction effect. RSM is used when a factorialexperiment reveals the presence of nonlinear behavior by checking the significanceof curvature. Experimental region that contains the optimal solution tends to havethe response that is nonlinearly correlated with variables (Yang and El-Haik 2009).In bioethanol research area, RSM has been applied for bioethanol production fromsago starch, cassava mash, and carob pod (Bandaru et al. 2006; Yingling et al. 2010;Turhan et al. 2010; Vaheed et al. 2010). As far as the researchers are concerned, todate, there is no discussion of employing face-centered CCD for bioethanol pro-duction from OPT sap. The main objective of this paper is to evaluate the effects oftemperature, initial pH, agitation, and inoculum size on the production of bioethanolfrom OPT sap, and later to optimize the selected variables.
Methodology
Biomass Preparation
Two OPT trunks (25 years old) were obtained from the local plantation area inPahang, Malaysia. They were squeezed to extract their sap after removing 10 cmof the hard outer layer. Then, the extracted sap was sterilized at 121 �C for 15 minprior to use.
Culture Preparation and Fermentation
Sake yeast strain, Saccharomyces cerevisiae Kyokai No. 7 bought from AmericanType of Culture Collection (ATCC 26422) was selected to ferment OPT sap.Inoculums were grown in YPD medium at 30 �C and 150 rpm until a concentration
20 A. H. Norhazimah and C. K. M. Faizal
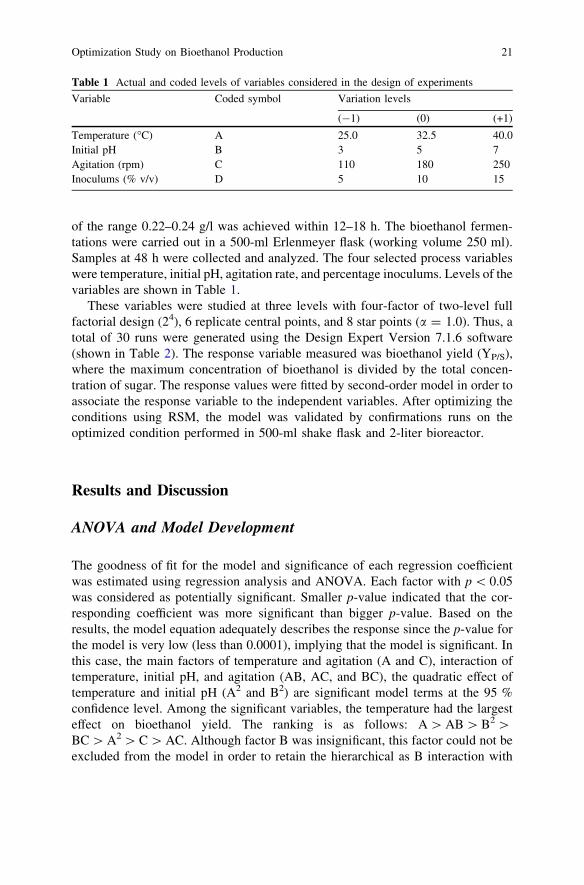
of the range 0.22–0.24 g/l was achieved within 12–18 h. The bioethanol fermen-tations were carried out in a 500-ml Erlenmeyer flask (working volume 250 ml).Samples at 48 h were collected and analyzed. The four selected process variableswere temperature, initial pH, agitation rate, and percentage inoculums. Levels of thevariables are shown in Table 1.
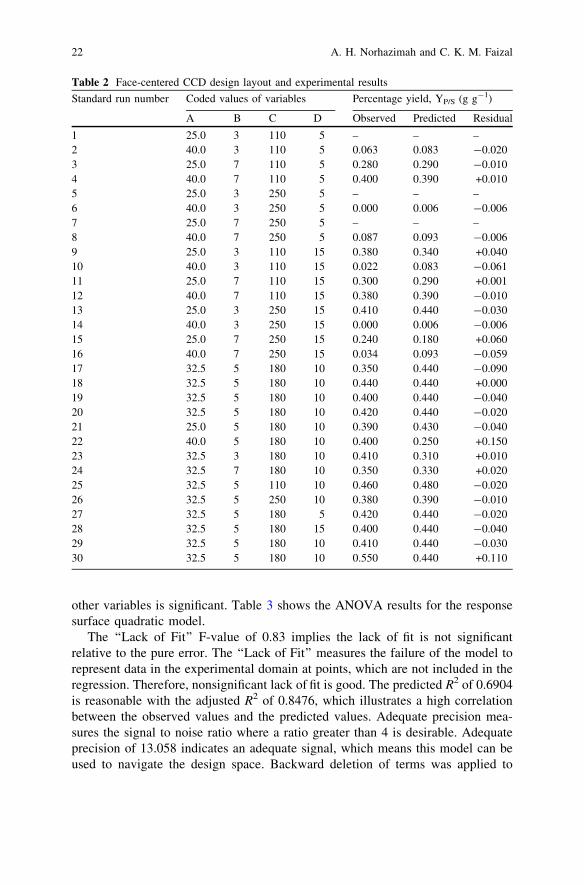
These variables were studied at three levels with four-factor of two-level fullfactorial design (24), 6 replicate central points, and 8 star points (a = 1.0). Thus, atotal of 30 runs were generated using the Design Expert Version 7.1.6 software(shown in Table 2). The response variable measured was bioethanol yield (YP/S),where the maximum concentration of bioethanol is divided by the total concen-tration of sugar. The response values were fitted by second-order model in order toassociate the response variable to the independent variables. After optimizing theconditions using RSM, the model was validated by confirmations runs on theoptimized condition performed in 500-ml shake flask and 2-liter bioreactor.
Results and Discussion
ANOVA and Model Development
The goodness of fit for the model and significance of each regression coefficientwas estimated using regression analysis and ANOVA. Each factor with p \ 0.05was considered as potentially significant. Smaller p-value indicated that the cor-responding coefficient was more significant than bigger p-value. Based on theresults, the model equation adequately describes the response since the p-value forthe model is very low (less than 0.0001), implying that the model is significant. Inthis case, the main factors of temperature and agitation (A and C), interaction oftemperature, initial pH, and agitation (AB, AC, and BC), the quadratic effect oftemperature and initial pH (A2 and B2) are significant model terms at the 95 %confidence level. Among the significant variables, the temperature had the largesteffect on bioethanol yield. The ranking is as follows: A [ AB [ B2 [BC [ A2 [ C [ AC. Although factor B was insignificant, this factor could not beexcluded from the model in order to retain the hierarchical as B interaction with
Table 1 Actual and coded levels of variables considered in the design of experiments
Variable Coded symbol Variation levels
(-1) (0) (+1)
Temperature (�C) A 25.0 32.5 40.0Initial pH B 3 5 7Agitation (rpm) C 110 180 250Inoculums (% v/v) D 5 10 15
Optimization Study on Bioethanol Production 21
other variables is significant. Table 3 shows the ANOVA results for the responsesurface quadratic model.
The ‘‘Lack of Fit’’ F-value of 0.83 implies the lack of fit is not significantrelative to the pure error. The ‘‘Lack of Fit’’ measures the failure of the model torepresent data in the experimental domain at points, which are not included in theregression. Therefore, nonsignificant lack of fit is good. The predicted R2 of 0.6904is reasonable with the adjusted R2 of 0.8476, which illustrates a high correlationbetween the observed values and the predicted values. Adequate precision mea-sures the signal to noise ratio where a ratio greater than 4 is desirable. Adequateprecision of 13.058 indicates an adequate signal, which means this model can beused to navigate the design space. Backward deletion of terms was applied to
Table 2 Face-centered CCD design layout and experimental results
Standard run number Coded values of variables Percentage yield, YP/S (g g-1)
A B C D Observed Predicted Residual
1 25.0 3 110 5 – – –2 40.0 3 110 5 0.063 0.083 -0.0203 25.0 7 110 5 0.280 0.290 -0.0104 40.0 7 110 5 0.400 0.390 +0.0105 25.0 3 250 5 – – –6 40.0 3 250 5 0.000 0.006 -0.0067 25.0 7 250 5 – – –8 40.0 7 250 5 0.087 0.093 -0.0069 25.0 3 110 15 0.380 0.340 +0.04010 40.0 3 110 15 0.022 0.083 -0.06111 25.0 7 110 15 0.300 0.290 +0.00112 40.0 7 110 15 0.380 0.390 -0.01013 25.0 3 250 15 0.410 0.440 -0.03014 40.0 3 250 15 0.000 0.006 -0.00615 25.0 7 250 15 0.240 0.180 +0.06016 40.0 7 250 15 0.034 0.093 -0.05917 32.5 5 180 10 0.350 0.440 -0.09018 32.5 5 180 10 0.440 0.440 +0.00019 32.5 5 180 10 0.400 0.440 -0.04020 32.5 5 180 10 0.420 0.440 -0.02021 25.0 5 180 10 0.390 0.430 -0.04022 40.0 5 180 10 0.400 0.250 +0.15023 32.5 3 180 10 0.410 0.310 +0.01024 32.5 7 180 10 0.350 0.330 +0.02025 32.5 5 110 10 0.460 0.480 -0.02026 32.5 5 250 10 0.380 0.390 -0.01027 32.5 5 180 5 0.420 0.440 -0.02028 32.5 5 180 15 0.400 0.440 -0.04029 32.5 5 180 10 0.410 0.440 -0.03030 32.5 5 180 10 0.550 0.440 +0.110
22 A. H. Norhazimah and C. K. M. Faizal
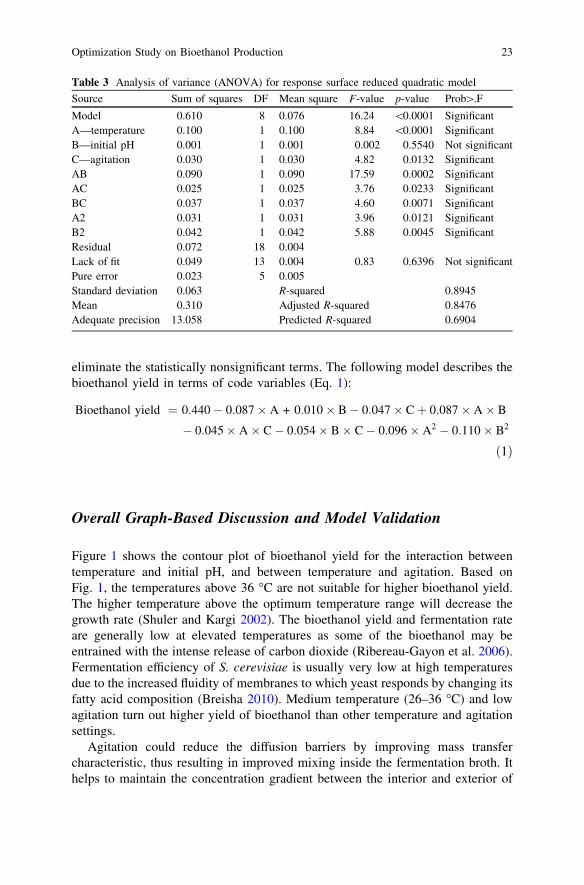
eliminate the statistically nonsignificant terms. The following model describes thebioethanol yield in terms of code variables (Eq. 1):
Bioethanol yield ¼ 0:440� 0:087� A + 0:010� B� 0:047� Cþ 0:087� A� B
� 0:045� A� C� 0:054� B� C� 0:096� A2 � 0:110� B2
ð1Þ
Overall Graph-Based Discussion and Model Validation
Figure 1 shows the contour plot of bioethanol yield for the interaction betweentemperature and initial pH, and between temperature and agitation. Based onFig. 1, the temperatures above 36 �C are not suitable for higher bioethanol yield.The higher temperature above the optimum temperature range will decrease thegrowth rate (Shuler and Kargi 2002). The bioethanol yield and fermentation rateare generally low at elevated temperatures as some of the bioethanol may beentrained with the intense release of carbon dioxide (Ribereau-Gayon et al. 2006).Fermentation efficiency of S. cerevisiae is usually very low at high temperaturesdue to the increased fluidity of membranes to which yeast responds by changing itsfatty acid composition (Breisha 2010). Medium temperature (26–36 �C) and lowagitation turn out higher yield of bioethanol than other temperature and agitationsettings.
Agitation could reduce the diffusion barriers by improving mass transfercharacteristic, thus resulting in improved mixing inside the fermentation broth. Ithelps to maintain the concentration gradient between the interior and exterior of
Table 3 Analysis of variance (ANOVA) for response surface reduced quadratic model
Source Sum of squares DF Mean square F-value p-value Prob[.F
Model 0.610 8 0.076 16.24 \0.0001 SignificantA—temperature 0.100 1 0.100 8.84 \0.0001 SignificantB—initial pH 0.001 1 0.001 0.002 0.5540 Not significantC—agitation 0.030 1 0.030 4.82 0.0132 SignificantAB 0.090 1 0.090 17.59 0.0002 SignificantAC 0.025 1 0.025 3.76 0.0233 SignificantBC 0.037 1 0.037 4.60 0.0071 SignificantA2 0.031 1 0.031 3.96 0.0121 SignificantB2 0.042 1 0.042 5.88 0.0045 SignificantResidual 0.072 18 0.004Lack of fit 0.049 13 0.004 0.83 0.6396 Not significantPure error 0.023 5 0.005Standard deviation 0.063 R-squared 0.8945Mean 0.310 Adjusted R-squared 0.8476Adequate precision 13.058 Predicted R-squared 0.6904
Optimization Study on Bioethanol Production 23
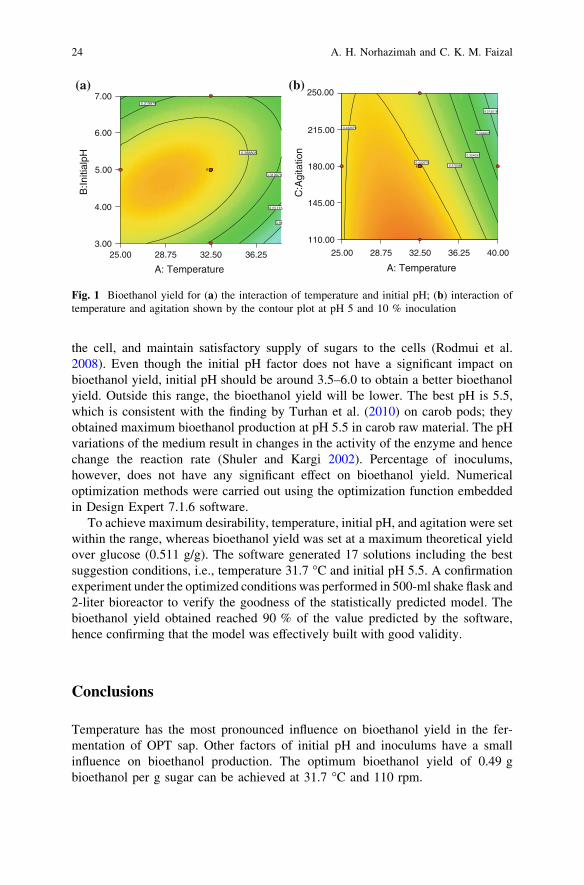
the cell, and maintain satisfactory supply of sugars to the cells (Rodmui et al.2008). Even though the initial pH factor does not have a significant impact onbioethanol yield, initial pH should be around 3.5–6.0 to obtain a better bioethanolyield. Outside this range, the bioethanol yield will be lower. The best pH is 5.5,which is consistent with the finding by Turhan et al. (2010) on carob pods; theyobtained maximum bioethanol production at pH 5.5 in carob raw material. The pHvariations of the medium result in changes in the activity of the enzyme and hencechange the reaction rate (Shuler and Kargi 2002). Percentage of inoculums,however, does not have any significant effect on bioethanol yield. Numericaloptimization methods were carried out using the optimization function embeddedin Design Expert 7.1.6 software.
To achieve maximum desirability, temperature, initial pH, and agitation were setwithin the range, whereas bioethanol yield was set at a maximum theoretical yieldover glucose (0.511 g/g). The software generated 17 solutions including the bestsuggestion conditions, i.e., temperature 31.7 �C and initial pH 5.5. A confirmationexperiment under the optimized conditions was performed in 500-ml shake flask and2-liter bioreactor to verify the goodness of the statistically predicted model. Thebioethanol yield obtained reached 90 % of the value predicted by the software,hence confirming that the model was effectively built with good validity.
Conclusions
Temperature has the most pronounced influence on bioethanol yield in the fer-mentation of OPT sap. Other factors of initial pH and inoculums have a smallinfluence on bioethanol production. The optimum bioethanol yield of 0.49 gbioethanol per g sugar can be achieved at 31.7 �C and 110 rpm.
36.2532.5028.7525.003.00
4.00
5.00
6.00
7.00
A: Temperature
B:In
itial
pH
0.18
0.25115
0.319978
0.319978
0.388805
6
40.0036.2532.5028.7525.00
110.00
145.00
180.00
215.00
250.00
A: Temperature
C:A
gita
tion
0.215516
0.269807
0.324097
0.378388
0.432679
0.4326796
(a) (b)
Fig. 1 Bioethanol yield for (a) the interaction of temperature and initial pH; (b) interaction oftemperature and agitation shown by the contour plot at pH 5 and 10 % inoculation
24 A. H. Norhazimah and C. K. M. Faizal
References
Altekar, M., Homon, C. A., Kashem, M. A., Mason, R. M., Patnaude, L. A., Yingling, J., et al.(2006). Assay optimization: A statistical design of experiments approach. Journal of theAssociation for Laboratory Automation, 11(1), 33–34.
Bandaru, V. V. R., Somalanka, S. R., Mendu, D. R., Madicherla, N. R., & Chityala, A. (2006).Optimization of fermentation conditions for the production of ethanol from sago starch by co-immobilized amyloglucosidase and cells of Zymomonas mobilis using response surfacemethodology. Enzyme and Microbial Technology, 38(1–2), 209–214.
Breisha, G. Z. (2010). Production of 16 % ethanol from 35 % sucrose. Biomass and Bioenergy,34(8), 1243–1249.
Coninck, J. D., Leclercq, B., Exbrayat, J. M., & Duyme, F. (2004). Factorial designs: An efficientapproach to choosing the main factors influencing growth and hydrolase production byTetrahymena thermophila. Journal of Industrial Microbiology and Biotechnology, 31(5),204–208.
Kalil, S. J., Maugeri, F., & Rodrigues, M. I. (2000). Responses surfaces analysis and simulationas a tool for bioprocess design and optimization. Process Biochemistry, 35(6), 539–550.
Ribereau-Gayon, P., Dubourdieu, D., Doneche, B., & Lonvaud, A. (2006). Handbook of enology,volume 1: The microbiology of wine and vinifications (p. 100). England: Wiley.
Rodmui, A., Kongkiattikajorn, J. & Dandusitapun, Y. (2008). Optimization of agitationconditions for maximum ethanol production by coculture. Kasetsart Journal (NatureScience), 42, 285–293.
Shuler, M. L. & Kargi, F., (2002). bioprocess engineering basic concepts. (Vol. 75. 2nd edn.pp. 160–166). Prentice Hall International Series, U.S.
Tomimura, Y. (1992). Chemical characteristics and utilization of oil palm trunks. JARQ, 25,283–288.
Turhan, I., Bialka, K. L., Demirci, A., & Karhan, M. (2010). Ethanol production from carobextract by using Saccharomyces cerevisiae. Bioresource Technology, 101(14), 5290–5296.
Vaheed, H., Shojaosadati, S. A., & Galip, H. (2010). Evaluation and optimization of ethanolproduction from carob pod extract by Zymomonas mobilis using response surfacemethodology. Journal of Industrial Microbiology and Biotechnology, 38(1), 101–111.
Yang, K., & El-Haik, B. S. (2009). Design for six sigma a roadmap for product development (2nded.). United States of America: McGraw-Hills Companies.
Yingling, B., Zongcheng, Y., Honglin, W., & Li, C. (2010). Optimization of bioethanolproduction during simultaneous saccharification and fermentation in very high-gravitycassava mash. Antonie van Leeuwenhoek, 99(2), 329–339.
Optimization Study on Bioethanol Production 25
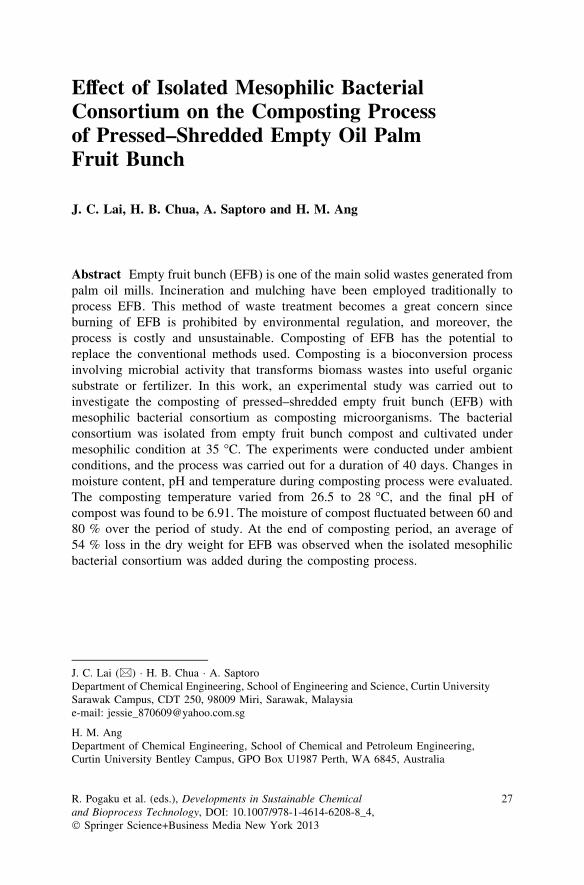
Effect of Isolated Mesophilic BacterialConsortium on the Composting Processof Pressed–Shredded Empty Oil PalmFruit Bunch
J. C. Lai, H. B. Chua, A. Saptoro and H. M. Ang
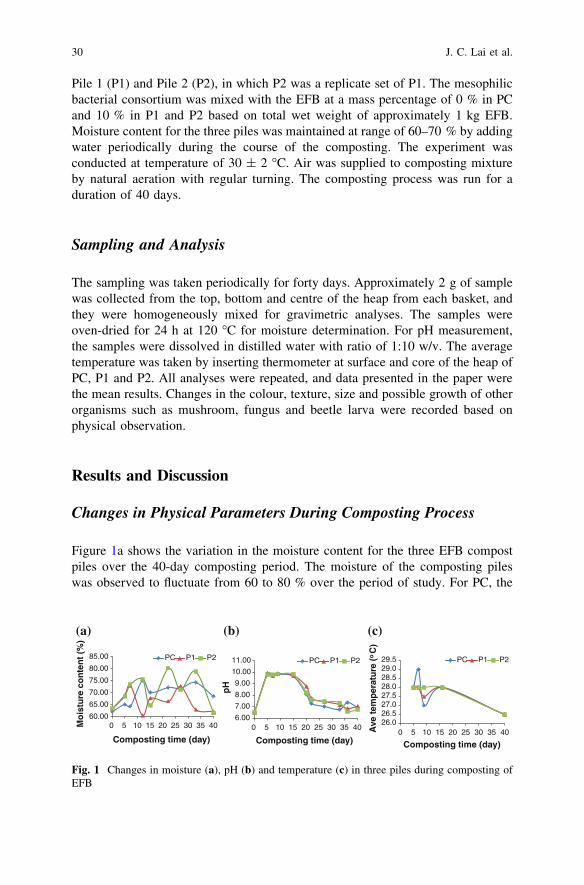
Abstract Empty fruit bunch (EFB) is one of the main solid wastes generated frompalm oil mills. Incineration and mulching have been employed traditionally toprocess EFB. This method of waste treatment becomes a great concern sinceburning of EFB is prohibited by environmental regulation, and moreover, theprocess is costly and unsustainable. Composting of EFB has the potential toreplace the conventional methods used. Composting is a bioconversion processinvolving microbial activity that transforms biomass wastes into useful organicsubstrate or fertilizer. In this work, an experimental study was carried out toinvestigate the composting of pressed–shredded empty fruit bunch (EFB) withmesophilic bacterial consortium as composting microorganisms. The bacterialconsortium was isolated from empty fruit bunch compost and cultivated undermesophilic condition at 35 �C. The experiments were conducted under ambientconditions, and the process was carried out for a duration of 40 days. Changes inmoisture content, pH and temperature during composting process were evaluated.The composting temperature varied from 26.5 to 28 �C, and the final pH ofcompost was found to be 6.91. The moisture of compost fluctuated between 60 and80 % over the period of study. At the end of composting period, an average of54 % loss in the dry weight for EFB was observed when the isolated mesophilicbacterial consortium was added during the composting process.
J. C. Lai (&) � H. B. Chua � A. SaptoroDepartment of Chemical Engineering, School of Engineering and Science, Curtin UniversitySarawak Campus, CDT 250, 98009 Miri, Sarawak, Malaysiae-mail: [email protected]
H. M. AngDepartment of Chemical Engineering, School of Chemical and Petroleum Engineering,Curtin University Bentley Campus, GPO Box U1987 Perth, WA 6845, Australia
R. Pogaku et al. (eds.), Developments in Sustainable Chemicaland Bioprocess Technology, DOI: 10.1007/978-1-4614-6208-8_4,� Springer Science+Business Media New York 2013
27
Introduction
Due to rapid development of oil palm plantations in Malaysia, the environmentalimpact of solid wastes from the palm oil production is a major concern. Emptyfruit bunch (EFB) is the major solid palm oil residues produced in amount of morethan 20 % of the fresh fruit weight (Mohammad et al. 2012). Conventionally,incineration and mulching are used to treat EFB. However, incineration caused airpollution and mulching application increased cost of transportation and distribu-tion of EFB in plantation. To overcome the drawback of the two processes,composting was explored as an alternative waste treatment to manage theincreasing amount of EFB.
Composting is a microbiological process to degrade organic waste through theactions of enzymes, microorganisms and oxygen under controlled aerobic andthermophilic conditions (Weidong et al. 2007). The composting highly depends onavailability of moisture within the composting substrate to sustain microbialactivities for decomposition of organic matters. Richard et al. (2002) reported thatmoisture content is varied for different compost mixture and composting duration,ranging from 50 to 70 %. Even so, unequal moisture distribution can reducemicrobial activities as shown in closed composting system studied by Suhaimi andOng (2001). Consequently, maintaining moisture content is essential to enhancemicrobial activities.
Composting temperature tends to change in response to microbial activities.The process has four distinct phases of temperature changes, namely mesophilicphase, thermophilic phase, cooling phase and maturation phase (Tuomela et al.2000). Mesophiles at initial composting would degrade simple carbohydrates andprotein into simpler organic matters (Swan et al. 2002). The large quantities ofmetabolic heat energy generated during decomposition would result in temperaturerising beyond 45 �C. At this stage, thermophiles take over and degrade the organicmatter further and cause temperature to rise to 70 �C. Due to depletion of foodsource, the microbial activities tend to decline and the process arrives at thecooling and maturation phases. The mature compost is attained at ambient tem-perature (Waldron and Nichols 2009; Swan et al. 2002). Similar temperatureprofiles were reported from studies by Schuchardt et al. (2002), Zahrim and Asis(2010) and Yahya et al. (2010).
Most of the literature studies reported that pH does not vary significantly duringthe composting. Microbial fermentation of carbohydrates (cellulose in EFB) isknown to form humic acid to increase acidity of compost, but ammonification ofinorganic nitrogen would neutralize the pH of compost at the end of composting(Thambirajah et al. 1995). In fact, pH of matured compost depends on the nature ofsubstrate which is being decomposed. Kabbashi et al. (2007) obtained maturedcompost with pH 5.6 during the co-composting of EFB in a bioreactor, whileHaroun et al. (2007) found a pH of 6.6 in the composting treatment of tannerysludge. Similar pH trend was also observed by Singh et al. (2011) in the course ofvermicomposting of cattle manure.
28 J. C. Lai et al.
Little is known about the effect of adding bacterial consortium on the com-posting process of EFB. Therefore, the aim of this preliminary study is to inves-tigate the changes in moisture content, pH and temperature of EFB compost duringthe course of composting with the addition of the isolated mesophilic bacterialconsortium. The outcome from this study is expected to determine any beneficialeffects on the composting process of EFB by adding exogenous bacteria.
Methodology
Experimental Material
Pressed and shredded empty fruit bunch (EFB) and young compost of EFB (after15 days composting) from Bintulu Lumber Development (BLD) Sdn Bhd at Miri,Sarawak, Malaysia, were used in the experiments. Young compost of EFB wasemployed as a source for isolation of mesophilic bacterial consortium.
Preparation of Mesophilic Bacterial Consortium
Mesophilic bacterial consortium was isolated from young compost of EFB (after15 days composting) supplied by BLD Sdn Bhd. To isolate the bacterial consor-tium, 10 g of young compost was dissolved in 100 mL distilled water. Thecompost solution was filtered to remove sand and fibre and was kept as inoculum.To cultivate mesophilic bacterial consortium, 5 % inoculum was taken andtransferred to culture medium containing the following (per litre of mineral saltsolution): 1L mineral salt solution (source of mineral), 0.5 % urea (nitrogensource), 2 % glucose (nutrient), 1 % yeast extract (vitamin) and is placed in waterbath at 35 ± 3 �C. Mineral salt solution was prepared as follow: 3 g Na2SO4, 5 gMgSO4 � 7H2O, 0.4 g NaCl, 2.5 g K2HPO4, 2.5g H2KPO4, 14 mg FeCl3, 110 mgMnSO4 � H2O, 25 mg ZnSO4 � 7H2O and 0.8 mg CuSO4 were dissolved in 1Ldistilled water. An UV–VIS photo-spectrometer was used to analyse the growth ofthe mesophilic bacterial consortium. The consortium was harvested at the activegrowth phase and stored at 4 �C.
Experimental Procedures
The experiments were carried out in 3 baskets with a height of 14 cm, length of31 cm and width of 31 cm. Approximately 1 kg of EFB in total wet weight wasused for each basket. The 3 baskets were correspondingly labelled as Control (PC),
Effect of Isolated Mesophilic Bacterial Consortium 29
Pile 1 (P1) and Pile 2 (P2), in which P2 was a replicate set of P1. The mesophilicbacterial consortium was mixed with the EFB at a mass percentage of 0 % in PCand 10 % in P1 and P2 based on total wet weight of approximately 1 kg EFB.Moisture content for the three piles was maintained at range of 60–70 % by addingwater periodically during the course of the composting. The experiment wasconducted at temperature of 30 ± 2 �C. Air was supplied to composting mixtureby natural aeration with regular turning. The composting process was run for aduration of 40 days.
Sampling and Analysis
The sampling was taken periodically for forty days. Approximately 2 g of samplewas collected from the top, bottom and centre of the heap from each basket, andthey were homogeneously mixed for gravimetric analyses. The samples wereoven-dried for 24 h at 120 �C for moisture determination. For pH measurement,the samples were dissolved in distilled water with ratio of 1:10 w/v. The averagetemperature was taken by inserting thermometer at surface and core of the heap ofPC, P1 and P2. All analyses were repeated, and data presented in the paper werethe mean results. Changes in the colour, texture, size and possible growth of otherorganisms such as mushroom, fungus and beetle larva were recorded based onphysical observation.
Results and Discussion
Changes in Physical Parameters During Composting Process
Figure 1a shows the variation in the moisture content for the three EFB compostpiles over the 40-day composting period. The moisture of the composting pileswas observed to fluctuate from 60 to 80 % over the period of study. For PC, the
60.00
65.00
70.00
75.00
80.00
85.00
0 5 10 15 20 25 30 35 40Mo
istu
re c
on
ten
t (%
)
Composting time (day)
PC P1 P2
6.00
7.00
8.00
9.00
10.00
11.00
0 5 10 15 20 25 30 35 40
pH
Composting time (day)
PC P1 P2
26.026.527.027.528.028.529.029.5
0 5 10 15 20 25 30 35 40Ave
tem
per
atu
re (
oC
)
Composting time (day)
PC P1 P2
(a) (b) (c)
Fig. 1 Changes in moisture (a), pH (b) and temperature (c) in three piles during composting ofEFB
30 J. C. Lai et al.
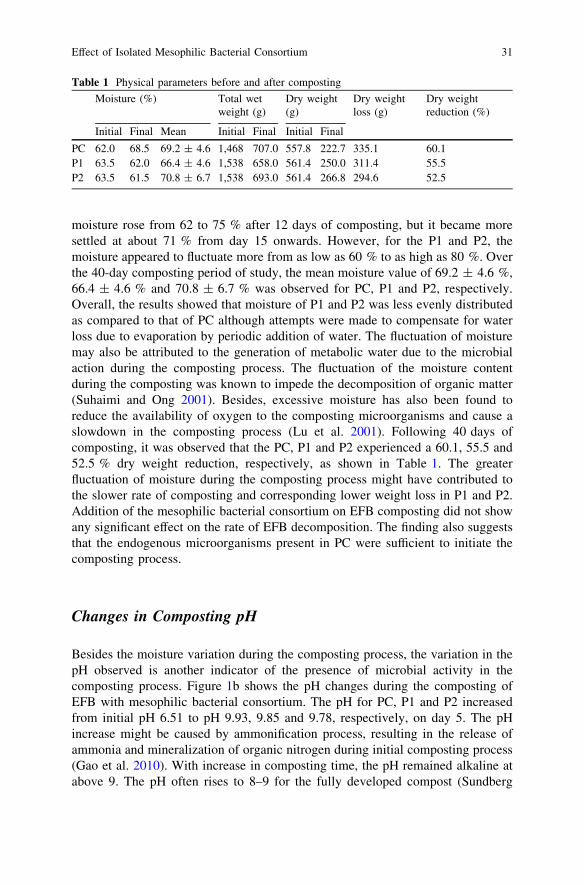
moisture rose from 62 to 75 % after 12 days of composting, but it became moresettled at about 71 % from day 15 onwards. However, for the P1 and P2, themoisture appeared to fluctuate more from as low as 60 % to as high as 80 %. Overthe 40-day composting period of study, the mean moisture value of 69.2 ± 4.6 %,66.4 ± 4.6 % and 70.8 ± 6.7 % was observed for PC, P1 and P2, respectively.Overall, the results showed that moisture of P1 and P2 was less evenly distributedas compared to that of PC although attempts were made to compensate for waterloss due to evaporation by periodic addition of water. The fluctuation of moisturemay also be attributed to the generation of metabolic water due to the microbialaction during the composting process. The fluctuation of the moisture contentduring the composting was known to impede the decomposition of organic matter(Suhaimi and Ong 2001). Besides, excessive moisture has also been found toreduce the availability of oxygen to the composting microorganisms and cause aslowdown in the composting process (Lu et al. 2001). Following 40 days ofcomposting, it was observed that the PC, P1 and P2 experienced a 60.1, 55.5 and52.5 % dry weight reduction, respectively, as shown in Table 1. The greaterfluctuation of moisture during the composting process might have contributed tothe slower rate of composting and corresponding lower weight loss in P1 and P2.Addition of the mesophilic bacterial consortium on EFB composting did not showany significant effect on the rate of EFB decomposition. The finding also suggeststhat the endogenous microorganisms present in PC were sufficient to initiate thecomposting process.
Changes in Composting pH
Besides the moisture variation during the composting process, the variation in thepH observed is another indicator of the presence of microbial activity in thecomposting process. Figure 1b shows the pH changes during the composting ofEFB with mesophilic bacterial consortium. The pH for PC, P1 and P2 increasedfrom initial pH 6.51 to pH 9.93, 9.85 and 9.78, respectively, on day 5. The pHincrease might be caused by ammonification process, resulting in the release ofammonia and mineralization of organic nitrogen during initial composting process(Gao et al. 2010). With increase in composting time, the pH remained alkaline atabove 9. The pH often rises to 8–9 for the fully developed compost (Sundberg
Table 1 Physical parameters before and after composting
Moisture (%) Total wetweight (g)
Dry weight(g)
Dry weightloss (g)
Dry weightreduction (%)
Initial Final Mean Initial Final Initial Final
PC 62.0 68.5 69.2 ± 4.6 1,468 707.0 557.8 222.7 335.1 60.1P1 63.5 62.0 66.4 ± 4.6 1,538 658.0 561.4 250.0 311.4 55.5P2 63.5 61.5 70.8 ± 6.7 1,538 693.0 561.4 266.8 294.6 52.5
Effect of Isolated Mesophilic Bacterial Consortium 31
et al. 2004). Thus, a pH adjustment was carried out on day 14 to decrease pHbelow 9 by adding aqueous HCl to the compost. The pH later decreased below pH8 on day 21. At the end of composting period, the pH of the PC, P1 and P2 settledin the range of 6.8–7.0. Overall, the pH profile for the control and test piles isalmost identical throughout the composting period.
Changes in Composting Temperature
Temperature has been recognized as a critical parameter in monitoring a com-posting process. The variation in temperature is strongly correlated with microbialactivity, composting stage and proliferation of different microbial groups (Liu andPrice 2011). Figure 1c shows the variation in average temperature during com-posting process. The temperature in PC increased from 28 to 29 �C on day 7 andthen gradually decreased to 27 �C on day 9. However, the temperature in P1 andP2 remained fairly constant with only a slight decrease on day 7 to day 13. Thestable temperature profile might be due to condition of high humidity in the threepiles. Additionally, small quantity of EFB used in the study might cause heat to beeasily dissipated during the composting process. As a result, it could affectmicrobial activities and slowdown the breakdown of the available organic mattersand release of nitrogenous products. In a composting process, thermophiles areessential to further break down simple carbohydrates, which have been degradedinitially by mesophiles during mesophilic phase of composting process (Swanet al. 2002).
Conclusion
This study concluded that addition of mesophilic bacterial consortium did notspeed up or improve the composting process of EFB. The finding suggests that theexisting populations of microorganisms that were present in the EFB compost pilesat the beginning of the composting process were able to initiate the biodegradationof EFB. However, less weight loss was observed for the compost piles thatexperienced larger fluctuation of moisture during the composting process. Thisobservation supports the idea that excessive fluctuation of the moisture content inthe compost piles could have negative impact on the composting of EFB. The pHvariation due to the microbial activities that was also observed at the initial phasecould have an adverse effect on the composting process. Therefore, compostingconditions should be operated at some optimal state for effective use of mesophilicbacterial consortium in composting of EFB. Besides, further study can be per-formed to establish the effect of the pH fluctuation on the rate of the compostingprocess.
32 J. C. Lai et al.
Acknowledgments The authors would like to thank Celtex Resources Sdn Bhd and CurtinUniversity, Sarawak, for funding and technical support to this project.
References
Gao, M., Liang, F., Yu, A., Li, B., & Yang, L. (2010). Evaluation of stability and maturity duringforced-aeration composting of chicken manure and sawdust at different C/N ratios.Chemosphere, 78, 614–619.
Haroun, M., Idris, A., & Syed Omar, S. R. (2007). Characterisation and composting of tannerysludge. Malaysian Journal of Soil Science, 11, 71–80.
Kabbashi, N. A., Alam, Z. & Ainuddin, M. (2007). Bio-composting process development by SSFfor utilization agro-industrial wastes, 3rd Kuala Lumpur international conference onbiomedical engineering 2006. In: F. Ibrahim, N. A. A. Osman, J. Usman & N. A. Kadri(Eds.). Springer: Berlin Heidelberg.
Liu, K., & Price, G. W. (2011). Evaluation of three composting systems for the management ofspent coffee grounds. Bioresource Technology, 102, 7966–7974.
Lu, S. G., Imai, T., Li, H. F., Ukita, M., Sekine, M., & Higuchi, T. (2001). Effect of enforcedaeration on in-vessel food waste composting. Environmental Technology, 22, 1177–1182.
Mohammad, N., Alam, M. Z., Kabbashi, N. A., & Ahsan, A. (2012). Effective composting of oilpalm industrial waste by filamentous fungi: A review. Resources, Conservation andRecycling, 58, 69–78.
Richard, T. L., Hamelers, H. V. M. B., Veeken, A., & Silva, T. (2002). Moisture relationships incomposting processes. Compost Science and Utilization, 10, 286–302.
Schuchardt, F., Darnoko, D., & Guritno, P. (2002). Composting of empty oil palm fruit bunch(EFB) with simultaneous evaporation of oil mill waste water (POME). Nusa Dua, Bali,Indonesia: International Oil Palm Conference.
Singh, R. P., Embrandiri, A., Ibrahim, M. H., & Esa, N. (2011). Management of biomass residuesgenerated from palm oil mill: Vermicomposting a sustainable option. Resources, Conserva-tion and Recycling, 55, 423–434.
Suhaimi, M. & Ong, H. K. (2001). Composting empty fruit bunches of oil palm. http://www.agnet.org/library/eb/505a/. Accessed Jan 19 2010.
Sundberg, C., Smårs, S., & Jönsson, H. (2004). Low pH as an inhibiting factor in the transitionfrom mesophilic to thermophilic phase in composting. Bioresource Technology, 95, 145–150.
Swan, J. R. M., Crook, B. & Gilbert, E. J. (2002). Microbial emissions from composting sites. In:R E. Hester & R. M. Harrison (Eds.), Environmental and health impact of solid wastemanagement activities Royal Society of Chemistry.
Thambirajah, J. J., Zulkali, M. D., & Hashim, M. A. (1995). Microbiological and biochemicalchanges during the composting of oil palm empty-fruit-bunches. Effect of nitrogensupplementation on the substrate. Bioresource Technology, 52, 133–144.
Tuomela, M., Vikman, M., Hatakka, A., & Itävaara, M. (2000). Biodegradation of lignin in acompost environment: A review. Bioresource Technology, 72, 169–183.
Waldron, K. W. & Nichols, E. (2009). Composting of food-chain waste for agricultural andhorticultural use. In: K. Waldron (Ed.), Handbook of waste management and co-productrecovery in food processing. Cambridge: Woodhead Publishing Limited.
Weidong, W., Xiaofen, W., Jianbin, L., Masaharu, I., et al. (2007). Effect of oxygen concentrationon the composting process and maturity. Compost Science and Utilization, 15, 184–190.
Yahya, A., Sye, C. P., Ishola, T. A., & Suryanto, H. (2010). Effect of adding palm oil milldecanter cake slurry with regular turning operation on the composting process and quality ofcompost from oil palm empty fruit bunches. Bioresource Technology, 101, 8736–8741.
Zahrim, A. Y., & Asis, T. (2010). Production of non shredded empty fruit bunch semi-compost.The Institution of Engineers, Malaysia, 71, 11–17.
Effect of Isolated Mesophilic Bacterial Consortium 33
Acetone–Butanol–Ethanol FermentationFrom Palm Oil Mill Effluent UsingClostridium acetobutylicum
A. S. Japar, M. S. Takriff, J. M. Jahim and A. A. H. Kadhum
Abstract Acetone–butanol–ethanol (ABE) fermentation from sterilized superna-tant and sterilized sludge of palm oil mill effluent (POME) by Clostridium acet-obutylicum NCIMB 619 was investigated. The fermentation was carried outanaerobically in batch mode at a temperature of 37 �C for 72 h. ABE recovery fromthe fermentation media was attempted by liquid–liquid extraction using oleylalcohol as a solvent. Total solvent concentrations obtained were 0.3985 and1.1253 g/l in sterilized POME supernatant and sterilized POME sludge, respec-tively. However, product recovery by liquid–liquid extraction using oleyl alcoholwas very not effective where only 13.7 and 2.85 % total solvent were recoveredfrom sterilized POME supernatant and sterilized POME sludge media, respectively.
Introduction
The petroleum base production of acetone, butanol, and ethanol (ABE) requiresalternatives due to high price of its raw materials. One possible alternative is toproduce ABE via fermentation process using clostridia strains. There are fourknown strains that can produce these solvents, namely the Clostridium acetobu-tylicum, C. beijerinckii, C. saccharobutylicum, and C. saccharoperbutylacetoni-cum (Shaheen et al. 2000). The ABE fermentation occurs in two distinct phases,namely acidogenic phase and solventogenic phase. During the acidogenic phase,the pH of the medium decreases due to the production of organic acids. As thefermentation enters the stationary growth phase, the cell metabolism undergoes ashift to solventogenic phase where ABE are produced (Jones and Woods 1986). To
A. S. Japar (&) � M. S. Takriff � J. M. Jahim � A. A. H. KadhumDepartment of Chemical and Process Engineering, Faculty of Engineering & BuiltEnvironment, Universiti Kebangsaan Malaysia, UKM Bangi, 43600 Selangor, Malaysiae-mail: [email protected]
R. Pogaku et al. (eds.), Developments in Sustainable Chemicaland Bioprocess Technology, DOI: 10.1007/978-1-4614-6208-8_5,� Springer Science+Business Media New York 2013
35
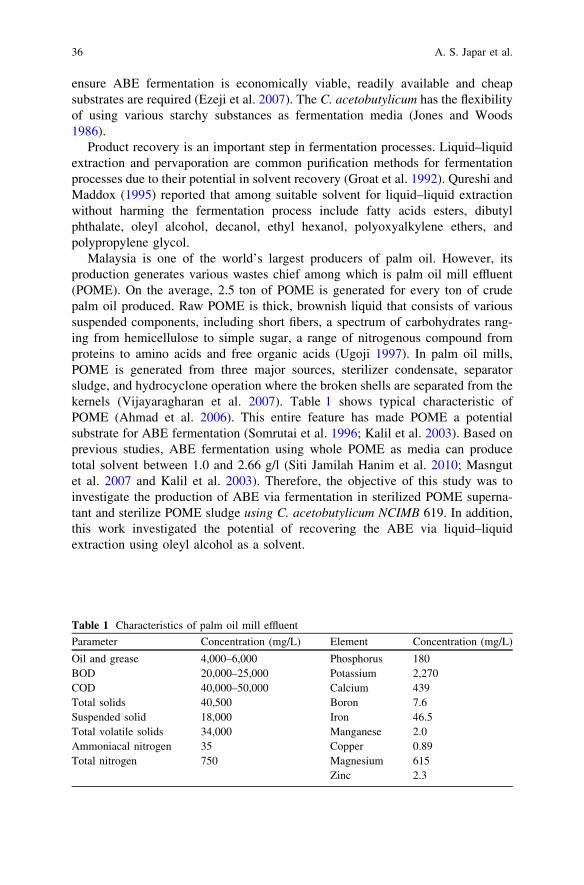
ensure ABE fermentation is economically viable, readily available and cheapsubstrates are required (Ezeji et al. 2007). The C. acetobutylicum has the flexibilityof using various starchy substances as fermentation media (Jones and Woods1986).
Product recovery is an important step in fermentation processes. Liquid–liquidextraction and pervaporation are common purification methods for fermentationprocesses due to their potential in solvent recovery (Groat et al. 1992). Qureshi andMaddox (1995) reported that among suitable solvent for liquid–liquid extractionwithout harming the fermentation process include fatty acids esters, dibutylphthalate, oleyl alcohol, decanol, ethyl hexanol, polyoxyalkylene ethers, andpolypropylene glycol.
Malaysia is one of the world’s largest producers of palm oil. However, itsproduction generates various wastes chief among which is palm oil mill effluent(POME). On the average, 2.5 ton of POME is generated for every ton of crudepalm oil produced. Raw POME is thick, brownish liquid that consists of varioussuspended components, including short fibers, a spectrum of carbohydrates rang-ing from hemicellulose to simple sugar, a range of nitrogenous compound fromproteins to amino acids and free organic acids (Ugoji 1997). In palm oil mills,POME is generated from three major sources, sterilizer condensate, separatorsludge, and hydrocyclone operation where the broken shells are separated from thekernels (Vijayaragharan et al. 2007). Table 1 shows typical characteristic ofPOME (Ahmad et al. 2006). This entire feature has made POME a potentialsubstrate for ABE fermentation (Somrutai et al. 1996; Kalil et al. 2003). Based onprevious studies, ABE fermentation using whole POME as media can producetotal solvent between 1.0 and 2.66 g/l (Siti Jamilah Hanim et al. 2010; Masngutet al. 2007 and Kalil et al. 2003). Therefore, the objective of this study was toinvestigate the production of ABE via fermentation in sterilized POME superna-tant and sterilize POME sludge using C. acetobutylicum NCIMB 619. In addition,this work investigated the potential of recovering the ABE via liquid–liquidextraction using oleyl alcohol as a solvent.
Table 1 Characteristics of palm oil mill effluent
Parameter Concentration (mg/L) Element Concentration (mg/L)
Oil and grease 4,000–6,000 Phosphorus 180BOD 20,000–25,000 Potassium 2,270COD 40,000–50,000 Calcium 439Total solids 40,500 Boron 7.6Suspended solid 18,000 Iron 46.5Total volatile solids 34,000 Manganese 2.0Ammoniacal nitrogen 35 Copper 0.89Total nitrogen 750 Magnesium 615
Zinc 2.3
36 A. S. Japar et al.
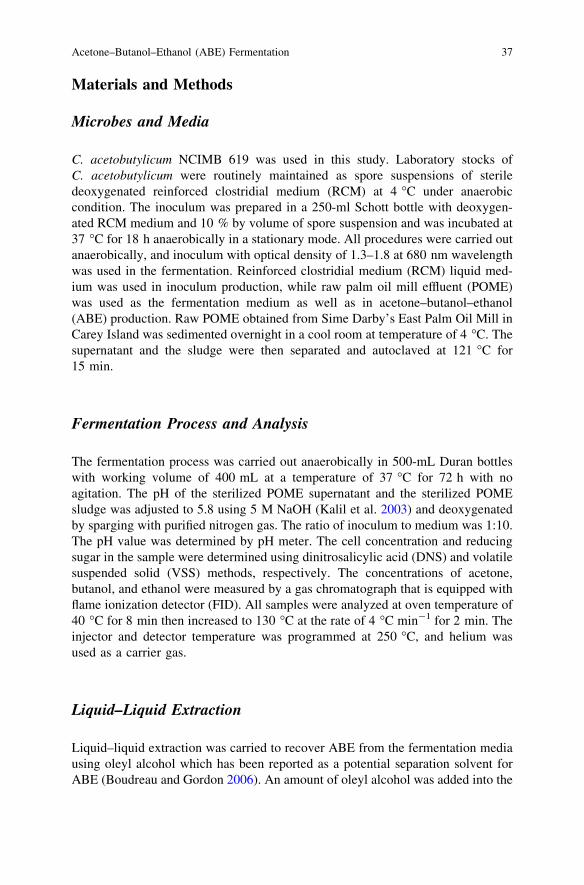
Materials and Methods
Microbes and Media
C. acetobutylicum NCIMB 619 was used in this study. Laboratory stocks ofC. acetobutylicum were routinely maintained as spore suspensions of steriledeoxygenated reinforced clostridial medium (RCM) at 4 �C under anaerobiccondition. The inoculum was prepared in a 250-ml Schott bottle with deoxygen-ated RCM medium and 10 % by volume of spore suspension and was incubated at37 �C for 18 h anaerobically in a stationary mode. All procedures were carried outanaerobically, and inoculum with optical density of 1.3–1.8 at 680 nm wavelengthwas used in the fermentation. Reinforced clostridial medium (RCM) liquid med-ium was used in inoculum production, while raw palm oil mill effluent (POME)was used as the fermentation medium as well as in acetone–butanol–ethanol(ABE) production. Raw POME obtained from Sime Darby’s East Palm Oil Mill inCarey Island was sedimented overnight in a cool room at temperature of 4 �C. Thesupernatant and the sludge were then separated and autoclaved at 121 �C for15 min.
Fermentation Process and Analysis
The fermentation process was carried out anaerobically in 500-mL Duran bottleswith working volume of 400 mL at a temperature of 37 �C for 72 h with noagitation. The pH of the sterilized POME supernatant and the sterilized POMEsludge was adjusted to 5.8 using 5 M NaOH (Kalil et al. 2003) and deoxygenatedby sparging with purified nitrogen gas. The ratio of inoculum to medium was 1:10.The pH value was determined by pH meter. The cell concentration and reducingsugar in the sample were determined using dinitrosalicylic acid (DNS) and volatilesuspended solid (VSS) methods, respectively. The concentrations of acetone,butanol, and ethanol were measured by a gas chromatograph that is equipped withflame ionization detector (FID). All samples were analyzed at oven temperature of40 �C for 8 min then increased to 130 �C at the rate of 4 �C min-1 for 2 min. Theinjector and detector temperature was programmed at 250 �C, and helium wasused as a carrier gas.
Liquid–Liquid Extraction
Liquid–liquid extraction was carried to recover ABE from the fermentation mediausing oleyl alcohol which has been reported as a potential separation solvent forABE (Boudreau and Gordon 2006). An amount of oleyl alcohol was added into the
Acetone–Butanol–Ethanol (ABE) Fermentation 37
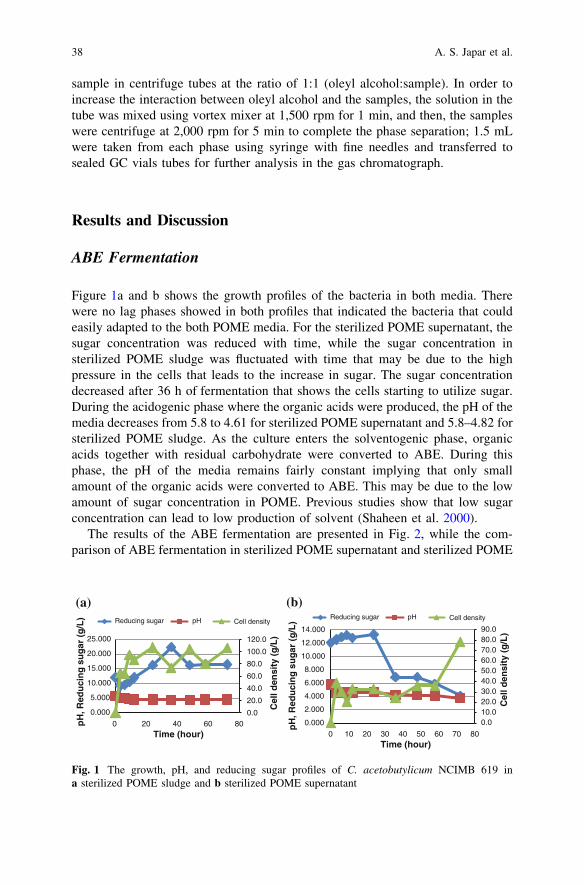
sample in centrifuge tubes at the ratio of 1:1 (oleyl alcohol:sample). In order toincrease the interaction between oleyl alcohol and the samples, the solution in thetube was mixed using vortex mixer at 1,500 rpm for 1 min, and then, the sampleswere centrifuge at 2,000 rpm for 5 min to complete the phase separation; 1.5 mLwere taken from each phase using syringe with fine needles and transferred tosealed GC vials tubes for further analysis in the gas chromatograph.
Results and Discussion
ABE Fermentation
Figure 1a and b shows the growth profiles of the bacteria in both media. Therewere no lag phases showed in both profiles that indicated the bacteria that couldeasily adapted to the both POME media. For the sterilized POME supernatant, thesugar concentration was reduced with time, while the sugar concentration insterilized POME sludge was fluctuated with time that may be due to the highpressure in the cells that leads to the increase in sugar. The sugar concentrationdecreased after 36 h of fermentation that shows the cells starting to utilize sugar.During the acidogenic phase where the organic acids were produced, the pH of themedia decreases from 5.8 to 4.61 for sterilized POME supernatant and 5.8–4.82 forsterilized POME sludge. As the culture enters the solventogenic phase, organicacids together with residual carbohydrate were converted to ABE. During thisphase, the pH of the media remains fairly constant implying that only smallamount of the organic acids were converted to ABE. This may be due to the lowamount of sugar concentration in POME. Previous studies show that low sugarconcentration can lead to low production of solvent (Shaheen et al. 2000).
The results of the ABE fermentation are presented in Fig. 2, while the com-parison of ABE fermentation in sterilized POME supernatant and sterilized POME
0.0
20.0
40.0
60.0
80.0
100.0
120.0
0.000
5.000
10.000
15.000
20.000
25.000
0 20 40 60 80
Cel
l den
sity
(g
/L)
pH
, Red
uci
ng
su
gar
(g
/L)
Time (hour)
Reducing sugar pH Cell densityReducing sugar pH Cell density
0.010.020.030.040.050.060.070.080.090.0
0.000
2.000
4.000
6.000
8.000
10.000
12.000
14.000
0 10 20 30 40 50 60 70 80
Cel
l den
sity
(g
/L)
pH
, Red
uci
ng
su
gar
(g
/L)
Time (hour)
(a) (b)
Fig. 1 The growth, pH, and reducing sugar profiles of C. acetobutylicum NCIMB 619 ina sterilized POME sludge and b sterilized POME supernatant
38 A. S. Japar et al.
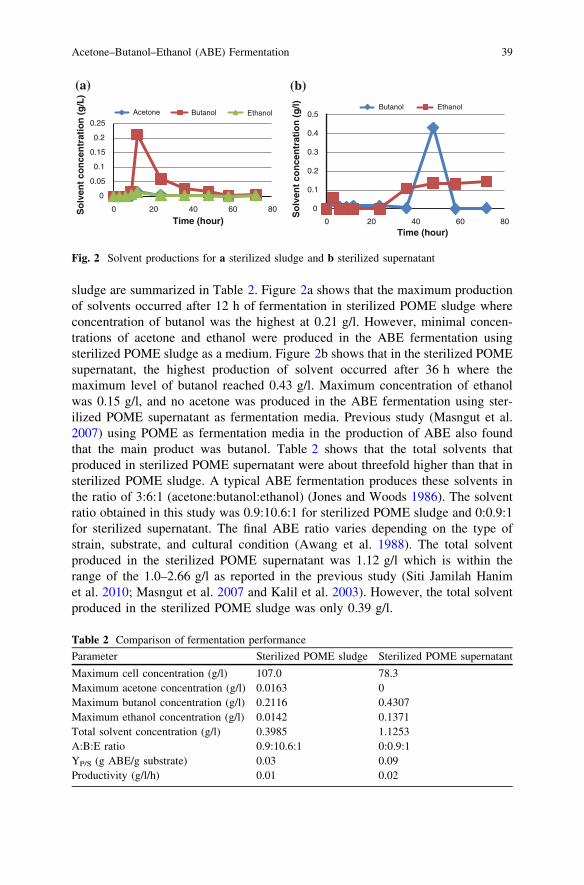
sludge are summarized in Table 2. Figure 2a shows that the maximum productionof solvents occurred after 12 h of fermentation in sterilized POME sludge whereconcentration of butanol was the highest at 0.21 g/l. However, minimal concen-trations of acetone and ethanol were produced in the ABE fermentation usingsterilized POME sludge as a medium. Figure 2b shows that in the sterilized POMEsupernatant, the highest production of solvent occurred after 36 h where themaximum level of butanol reached 0.43 g/l. Maximum concentration of ethanolwas 0.15 g/l, and no acetone was produced in the ABE fermentation using ster-ilized POME supernatant as fermentation media. Previous study (Masngut et al.2007) using POME as fermentation media in the production of ABE also foundthat the main product was butanol. Table 2 shows that the total solvents thatproduced in sterilized POME supernatant were about threefold higher than that insterilized POME sludge. A typical ABE fermentation produces these solvents inthe ratio of 3:6:1 (acetone:butanol:ethanol) (Jones and Woods 1986). The solventratio obtained in this study was 0.9:10.6:1 for sterilized POME sludge and 0:0.9:1for sterilized supernatant. The final ABE ratio varies depending on the type ofstrain, substrate, and cultural condition (Awang et al. 1988). The total solventproduced in the sterilized POME supernatant was 1.12 g/l which is within therange of the 1.0–2.66 g/l as reported in the previous study (Siti Jamilah Hanimet al. 2010; Masngut et al. 2007 and Kalil et al. 2003). However, the total solventproduced in the sterilized POME sludge was only 0.39 g/l.
0
0.05
0.1
0.15
0.2
0.25
0 20 40 60 80So
lven
t co
nce
ntr
atio
n (
g/L
)
Time (hour)
Acetone Butanol EthanolButanol Ethanol
0
0.1
0.2
0.3
0.4
0.5
0 20 40 60 80
So
lven
t co
nce
ntr
atio
n (
g/l)
Time (hour)
(a) (b)
Fig. 2 Solvent productions for a sterilized sludge and b sterilized supernatant
Table 2 Comparison of fermentation performance
Parameter Sterilized POME sludge Sterilized POME supernatant
Maximum cell concentration (g/l) 107.0 78.3Maximum acetone concentration (g/l) 0.0163 0Maximum butanol concentration (g/l) 0.2116 0.4307Maximum ethanol concentration (g/l) 0.0142 0.1371Total solvent concentration (g/l) 0.3985 1.1253A:B:E ratio 0.9:10.6:1 0:0.9:1YP/S (g ABE/g substrate) 0.03 0.09Productivity (g/l/h) 0.01 0.02
Acetone–Butanol–Ethanol (ABE) Fermentation 39
ABE Recovery
The recovery of ABE from the fermentation media was done by liquid–liquidextraction using oleyl alcohol as the separation solvent. The total percentages ofrecovery for sterilized POME supernatant and sterilized POME sludge were13.17 % and 2.85 %, respectively. There are several possible explanations for thelow recovery of the ABE. The recovery percentages are very low for both mediadue the formation of emulsion that may occur during the extraction process. Inaddition, low concentration of the ABE in fermentation media could also affect theperformance of the liquid–liquid extraction process. Furthermore, the accumula-tion of mineral salts that may be occurred during the fermentation process couldalso affect the ABE recovery process (Qureshi and Maddox 1995).
Conclusion
Fermentation process that utilized POME as the main medium to produce solventsproved that palm oil industrial waste can be converted to useful products. In thisstudy, total solvent produced was 1.52 g/l, with butanol as the major product. Bymeans of extraction process using oleyl alcohol as the separation solvents, 2.85and 13.17 % of ABE were successfully recovered for sterilized sludge and ster-ilized supernatant, respectively. Sterilized sludge showed the best performance asmedium for ABE production, with solvent ratio 0.9:10.6:1. This may be due to thelarge amount of active bacteria presence in the sludge that helped solventproduction.
Acknowledgments The authors wish to thank Ministry of Science, Technology, and Innovation,Malaysia, for funding this project under Grant number 03-01-02-SF0710.
References
Ahmad, A. L., Sumathi, S., & Hameed, B. H. (2006). Coagulation of residue oil and suspendedsolid in palm oil mill effluent by Chitosan, Alum and PAC. Chemical Engineering Journal,118, 99–105.
Awang, G. M., Jones, G. A., & Ingledew, W. M. (1988). The acetone-butanol-ethanolfermentation. Critical Reviews in Microbiology, 15(1), 33–67.
Boudreau, T. M., & Gordon, A. H. (2006). Improved ethanol-water separation using fatty acids.Process Biochemistry, 41, 980–983.
Ezeji, T. C., Qureshi, N., & Blaschek, H. P. (2007). Bioproduction of butanol from biomass:From genes to bioreactors. Current Opinion in Biotechnology, 18, 1–8.
Groat, W. J., van der Lans, R. G. J. M., & Luyben, K. C. B. A. M. (1992). Technologies forbutanol recovery integrated with fermentations. Process Biochemistry, 27, 61–75.
Jones, D. T., & Woods, D. R. (1986). Acetone-butanol fermentation revisited. MicrobiologicalReviews, 50(4), 484–524.
40 A. S. Japar et al.
Kalil, M. S., Kit, P. W., Yusoff, W. M. W., Sadazo, Y., & Rahman, R. A. (2003). Directfermentation of palm oil mill effluent to acetone-butanol-ethanol solvent producing clostridia.Pakistan Journal of Biological Science, 6(14), 1273–1275.
Masngut, N., Takriff, M. S., Mohammad, A. W., Kalil, M. S., & Kadhum, A. A. H. (2007).Performance of oscillatory flow reactor and stirred tank reactor in solvent fermentation frompalm oil mill effluent. Jurnal Teknologi, 47, 45–54.
Qureshi, N., & Maddox, I. S. (1995). Continuous production of acetone-butanol-ethanol usingimmobilized cells of Clostridium acetobutylicum and integration with product removal byliquid–liquid extraction. Journal of Fermentation and Bioengineering, 80(2), 185–189.
Shaheen, R., Shirley, M., & Jones, D. T. (2000). Comparative fermentation studies of industrialstrains belonging to four species of solvent-producing Clostridia. Journal of MolecularMicrobiology and Biotechnology, 2(1), 115–124.
Siti Jamilah Hanim, M.Y., Mohd Sobri, T., Abdul Amir, H. K., Jamaliah, M. J. & Abdul Wahab,M. (2010). Fermentasi asiton-butanol-etanol (ABE) dan perolehan pelarut daripada kaldufermentasi. Penerbit UKM.
Somrutai, W., Takagi, M., & Yoshida, T. (1996). Acetone-butanol fermentation by Clostridiumacetobutyricum ATCC 17777 from a model medium for palm oil mill effluent. Journal ofFermentation and Bioengineering, 81(6), 543–547.
Ugoji, E. O. (1997). Anaerobic digestion of palm oil mill effluent and its utilization as fertilizerfor environmental protection. Renewable Energy, 10(2), 20.
Vijayaragharan, K., Desa, A., & Abdul Aziz, M. E. (2007). Aerobic treatment of palm oil milleffluent. Journal of Environmental Management, 82, 24–31.
Acetone–Butanol–Ethanol (ABE) Fermentation 41
Initial Study of Thermophilic HydrogenProduction from Raw Palm Oil MillEffluent (POME) Using Mixed Microflora
N. Ibrahim, J. Md. Jahim and Lim S. S.
Abstract The screening of cultivation conditions for the highest hydrogen pro-duction using mixed microflora was performed in serum bottles. The fermentationconditions were studied for temperature, inoculum size, and initial pH, and itshows the significant effect of these factors in enhancing the biohydrogen pro-duction. The optimum condition was found at 60 �C with initial pH of 7, and thepercentage of inoculum added to POME medium was at 30:70 % (v/v). In thefollowing experiment, batch thermophilic hydrogen fermentation was conducted in0.5 L medium using the optimum conditions, which were run for 30 h. The highestyield of 4.85 mol H2/mol glucose was achieved when the fermentation was startedwith 4 g/L initial glucose concentration.
Keywords Biohydrogen � Thermophilic condition � Palm oil mill effluent �Mixed microflora
Introduction
Biological waste and wastewater treatment by anaerobic digestion is an eco-nomically and environmentally sustainable technology (Noike and Mizuno 2000)that has grown substantially over the last two decades. The hydrogen productionthrough anaerobic conversion not only produced renewable energy but also pro-vide an efficient system for wastewater treatment.
N. Ibrahim � L. S. S.Fuel Cell Institute, Universiti Kebangsaan Malaysia, Bandar Baru Bangi,43600 Selangor, Malaysia
J. Md. Jahim (&)Department of Chemical and Process Engineering, and Built Environment,Universiti Kebangsaan Malaysia, Bandar Baru Bangi 43600 Selangor, Malaysiae-mail: [email protected]
R. Pogaku et al. (eds.), Developments in Sustainable Chemicaland Bioprocess Technology, DOI: 10.1007/978-1-4614-6208-8_6,� Springer Science+Business Media New York 2013
43
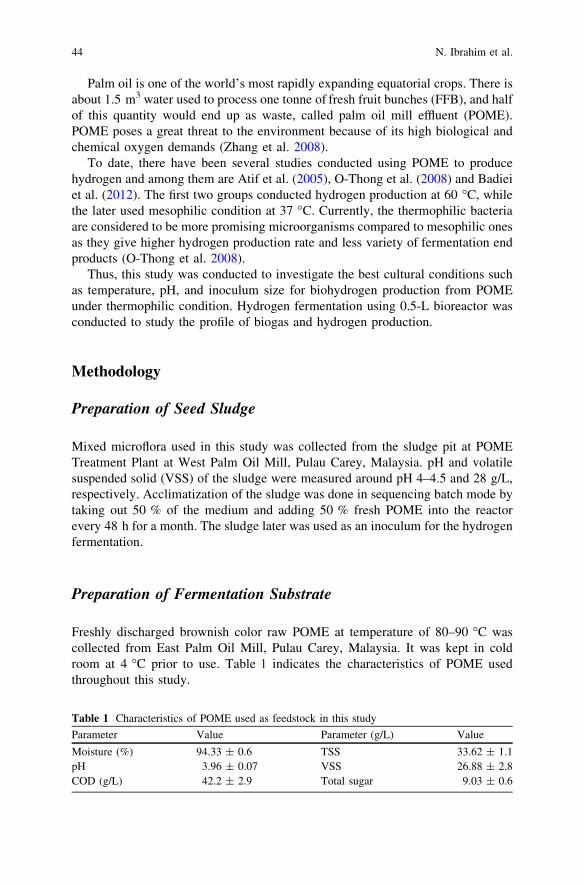
Palm oil is one of the world’s most rapidly expanding equatorial crops. There isabout 1.5 m3 water used to process one tonne of fresh fruit bunches (FFB), and halfof this quantity would end up as waste, called palm oil mill effluent (POME).POME poses a great threat to the environment because of its high biological andchemical oxygen demands (Zhang et al. 2008).
To date, there have been several studies conducted using POME to producehydrogen and among them are Atif et al. (2005), O-Thong et al. (2008) and Badieiet al. (2012). The first two groups conducted hydrogen production at 60 �C, whilethe later used mesophilic condition at 37 �C. Currently, the thermophilic bacteriaare considered to be more promising microorganisms compared to mesophilic onesas they give higher hydrogen production rate and less variety of fermentation endproducts (O-Thong et al. 2008).
Thus, this study was conducted to investigate the best cultural conditions suchas temperature, pH, and inoculum size for biohydrogen production from POMEunder thermophilic condition. Hydrogen fermentation using 0.5-L bioreactor wasconducted to study the profile of biogas and hydrogen production.
Methodology
Preparation of Seed Sludge
Mixed microflora used in this study was collected from the sludge pit at POMETreatment Plant at West Palm Oil Mill, Pulau Carey, Malaysia. pH and volatilesuspended solid (VSS) of the sludge were measured around pH 4–4.5 and 28 g/L,respectively. Acclimatization of the sludge was done in sequencing batch mode bytaking out 50 % of the medium and adding 50 % fresh POME into the reactorevery 48 h for a month. The sludge later was used as an inoculum for the hydrogenfermentation.
Preparation of Fermentation Substrate
Freshly discharged brownish color raw POME at temperature of 80–90 �C wascollected from East Palm Oil Mill, Pulau Carey, Malaysia. It was kept in coldroom at 4 �C prior to use. Table 1 indicates the characteristics of POME usedthroughout this study.
Table 1 Characteristics of POME used as feedstock in this study
Parameter Value Parameter (g/L) Value
Moisture (%) 94.33 ± 0.6 TSS 33.62 ± 1.1pH 3.96 ± 0.07 VSS 26.88 ± 2.8COD (g/L) 42.2 ± 2.9 Total sugar 9.03 ± 0.6
44 N. Ibrahim et al.
Serum Bottle Experiments
A series of serum bottle tests were conducted to determine the optimal culturalcondition for hydrogen production. The fermentation was carried out at threedifferent temperatures (50, 60, and 70 �C), four initial pHs (5, 5.5, 6, and 7), andvolume ratio of the inoculum to POME medium at 10, 30, 60, 90, and 100 % (v/v).The pH of the medium was adjusted, and it was purged with nitrogen for 3 min toprovide anaerobic condition. Once the inoculum was added, they were sealed withrubber stopper and incubated for 24 h. Total volume of biogas produced from eachmedium was measured by releasing the evolved gas from the bottles with syringes.
Batch Fermentation in 0.5 L Working Volume
Batch fermentation was carried out in a 500-ml Scott Duran� bottle incubated at60 �C. 30 % (v/v) of the inoculum was transferred to raw POME medium, and thepH of the mixture was adjusted to pH 7.0. Before starting the fermentation,nitrogen was purged for 15 min to provide anaerobic condition. Gaseous andliquid products were taken 3 h and sent for the analysis.
Analytical Method
Reducing sugar content in the media was analyzed using dinitrosalicylic (DNS)assay (Miller 1959). The amount of metabolites such as acetic acid, butyric acid,and ethanol were analyzed using GC SRI 8600C. Total suspended solids (TSS) andvolatile suspended solids (VSS) were measured according to the standard methods(APHA 1998). Biogas produced from fermentation was collected using waterdisplacement method where an inverted measuring cylinder was filled with acidicwater. Then, the composition of biogas was analyzed using gas chromatography(GC) model SRI 8600C with HID and TCD detectors. The gas carrier for GC ishelium (MOX 99.99 %) at a flow rate of 20 mL/min. The pressure for the carrierwas set at 29 psi, while the injection port, detector, and oven temperatures were setat 40 �C, 150 �C, and 40 �C, respectively.
Hydrogen Yield and Hydrogen Production Rate
The profile of hydrogen production was subjected to the Gompertz equation forhydrogen yield and hydrogen production estimation, as shown in Eq. (1) (Lay et al.1999),
Initial Study of Thermophilic Hydrogen 45
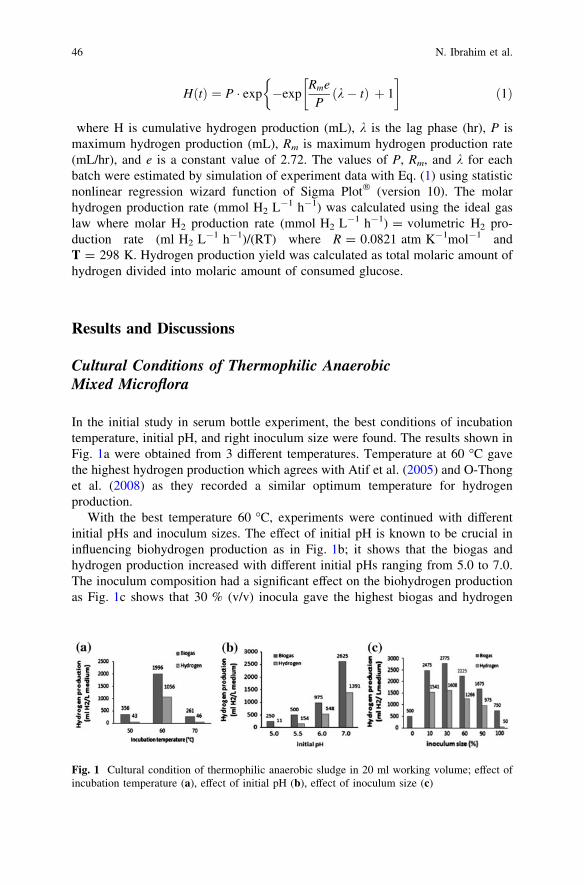
H tð Þ ¼ P � exp �expRme
Pðk� tÞ þ 1
� ��ð1Þ
where H is cumulative hydrogen production (mL), k is the lag phase (hr), P ismaximum hydrogen production (mL), Rm is maximum hydrogen production rate(mL/hr), and e is a constant value of 2.72. The values of P, Rm, and k for eachbatch were estimated by simulation of experiment data with Eq. (1) using statisticnonlinear regression wizard function of Sigma Plot� (version 10). The molarhydrogen production rate (mmol H2 L-1 h-1) was calculated using the ideal gaslaw where molar H2 production rate (mmol H2 L-1 h-1) = volumetric H2 pro-duction rate (ml H2 L-1 h-1)/(RT) where R = 0.0821 atm K-1mol-1 andT = 298 K. Hydrogen production yield was calculated as total molaric amount ofhydrogen divided into molaric amount of consumed glucose.
Results and Discussions
Cultural Conditions of Thermophilic AnaerobicMixed Microflora
In the initial study in serum bottle experiment, the best conditions of incubationtemperature, initial pH, and right inoculum size were found. The results shown inFig. 1a were obtained from 3 different temperatures. Temperature at 60 �C gavethe highest hydrogen production which agrees with Atif et al. (2005) and O-Thonget al. (2008) as they recorded a similar optimum temperature for hydrogenproduction.
With the best temperature 60 �C, experiments were continued with differentinitial pHs and inoculum sizes. The effect of initial pH is known to be crucial ininfluencing biohydrogen production as in Fig. 1b; it shows that the biogas andhydrogen production increased with different initial pHs ranging from 5.0 to 7.0.The inoculum composition had a significant effect on the biohydrogen productionas Fig. 1c shows that 30 % (v/v) inocula gave the highest biogas and hydrogen
Fig. 1 Cultural condition of thermophilic anaerobic sludge in 20 ml working volume; effect ofincubation temperature (a), effect of initial pH (b), effect of inoculum size (c)
46 N. Ibrahim et al.
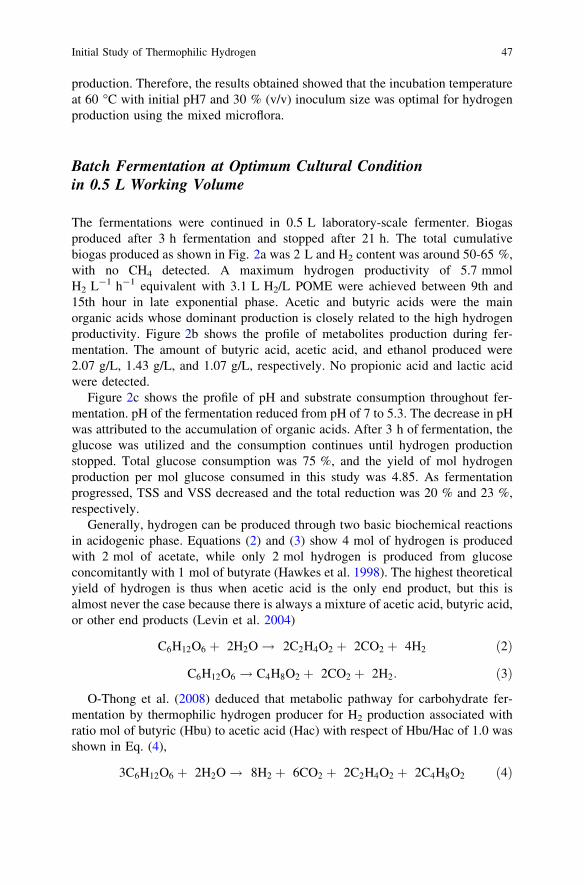
production. Therefore, the results obtained showed that the incubation temperatureat 60 �C with initial pH7 and 30 % (v/v) inoculum size was optimal for hydrogenproduction using the mixed microflora.
Batch Fermentation at Optimum Cultural Conditionin 0.5 L Working Volume
The fermentations were continued in 0.5 L laboratory-scale fermenter. Biogasproduced after 3 h fermentation and stopped after 21 h. The total cumulativebiogas produced as shown in Fig. 2a was 2 L and H2 content was around 50-65 %,with no CH4 detected. A maximum hydrogen productivity of 5.7 mmolH2 L-1 h-1 equivalent with 3.1 L H2/L POME were achieved between 9th and15th hour in late exponential phase. Acetic and butyric acids were the mainorganic acids whose dominant production is closely related to the high hydrogenproductivity. Figure 2b shows the profile of metabolites production during fer-mentation. The amount of butyric acid, acetic acid, and ethanol produced were2.07 g/L, 1.43 g/L, and 1.07 g/L, respectively. No propionic acid and lactic acidwere detected.
Figure 2c shows the profile of pH and substrate consumption throughout fer-mentation. pH of the fermentation reduced from pH of 7 to 5.3. The decrease in pHwas attributed to the accumulation of organic acids. After 3 h of fermentation, theglucose was utilized and the consumption continues until hydrogen productionstopped. Total glucose consumption was 75 %, and the yield of mol hydrogenproduction per mol glucose consumed in this study was 4.85. As fermentationprogressed, TSS and VSS decreased and the total reduction was 20 % and 23 %,respectively.
Generally, hydrogen can be produced through two basic biochemical reactionsin acidogenic phase. Equations (2) and (3) show 4 mol of hydrogen is producedwith 2 mol of acetate, while only 2 mol hydrogen is produced from glucoseconcomitantly with 1 mol of butyrate (Hawkes et al. 1998). The highest theoreticalyield of hydrogen is thus when acetic acid is the only end product, but this isalmost never the case because there is always a mixture of acetic acid, butyric acid,or other end products (Levin et al. 2004)
C6H12O6 þ 2H2O! 2C2H4O2 þ 2CO2 þ 4H2 ð2Þ
C6H12O6 ! C4H8O2 þ 2CO2 þ 2H2: ð3Þ
O-Thong et al. (2008) deduced that metabolic pathway for carbohydrate fer-mentation by thermophilic hydrogen producer for H2 production associated withratio mol of butyric (Hbu) to acetic acid (Hac) with respect of Hbu/Hac of 1.0 wasshown in Eq. (4),
3C6H12O6 þ 2H2O! 8H2 þ 6CO2 þ 2C2H4O2 þ 2C4H8O2 ð4Þ
Initial Study of Thermophilic Hydrogen 47
This equation hence resulted in a theoretical H2 yield of 2.67 mol H2/molhexose. Through this study, the Hbu/Hac obtained was around 1.3–2.2. Hence,with respect to average Hbu/Hac of 2.0, the theoretical H2 yield for this studywould be 5.34 mol H2/mol hexose. The overall experimental hydrogen yield inthis batch fermentation with initial glucose concentration of 4 g/L was 4.85 molH2/(mol glucose consumed). This value is considered very high but still lower thanthe theoretical value. The hydrogen yield based on L H2/L POME with previousstudy using mixed culture was illustrated in Table 2.
Fig. 2 Batch fermentation of thermophilic anaerobic sludge with POME in 0.5 L fermentationsize; cumulative biogas and hydrogen production with Gompertz fitting (a), profile of volatilefatty acids (VFAs) and alcohol production (b), profile of glucose consumption and pH changes(c), profile of TSS and VSS reduction (d)
Table 2 Comparison on H2 production using raw POME with other researchers
Microorganism Mode/pH/T (�C) Hydrogen production(L H2/L POME)
References
Mixed culture Batch/5.5/60 4.7 Atif et al. (2005)Mixed culture Continuous/5.5/55 2.6 Ismail et al. (2010)Mixed culture Batch/6/37 0.7 Khaleb et al. (2012)Mixed culture Batch/7/60 3.1 This study
48 N. Ibrahim et al.
Conclusion
The study of the cultural conditions including temperature, inoculum size, andinitial pH had shown the significant effect in enhancing biohydrogen production.The thermophilic biohydrogen production conducted in 0.5 L batch fermentationsize gave the maximum H2 production of 3.1 L H2/(L POME added) equivalentwith 4.85 mol H2/mol glucose and productivity of 5.7 mmol H2 L-1 h-1.
Acknowledgments The authors would like to acknowledge financial support from UKM-SimeDarby Foundation program on Sustainable Development–Zero Waste Technology for the PalmOil Industry.
References
American Public Health Association (Apha). (1998). Standard methods for the examination ofwater and wastewater. Washington DC, USA.
Atif, A. A. Y., Fakhru’razi, A., Ngan, M. A., Morimoto, M., Iyuke, S. E., & Veziroglu, N. T.(2005). Fed batch production of hydrogen from palm oil mill effluent using anaerobicmicroflora. International Journal of Hydrogen Energy, 30, 1393–1397.
Badiei, M., Jahim, J. M., Anuar, N., Abdullah, S. R. S., Su, L. S., & Kamaruzzaman, M. A.(2012). Microbial community analysis of mixed anaerobic microflora in suspended sludge ofASBR producing hydrogen from palm oil mill effluent. International Journal of HydrogenEnergy, 37, 3169–3176.
Hawkes, F. R., Dinsdale, R., Hawkes, D. L., & Hussy, L. (1998). Sustainable fermentativehydrogen production : Challenges for process optimisation. International Journal ofHydrogen Energy, 27, 1339–1347.
Ismail, I., Hassan, M. A., Abdul Rahman, N., & Chen, S. S. (2010). Thermophilic biohydrogenproduction from palm oil mill effluent (POME) using suspended mixed culture. Biomass andBioenergy, 34, 42–47.
Khaleb, N. A., Jahim, J. M., & Ahmad Kamal, S. (2012). Biohydrogen production usinghydrolysate of palm oil mill effluent. Journal of Asian Scientific Research, 2(11), 705–710.
Lay, J. J., Lee, Y. J., & Noike, T. (1999). Feasibility of biological hydrogen production fromorganic fraction of municipal solid waste. Water Research, 33, 2568–2579.
Levin, D. B., Pitt, L., & Love, M. (2004). Biohydrogen production technology: Prospect andlimitations for practical application. International Journal of Hydrogen Energy, 29, 173–185.
Miller, G. L. (1959). Use of dinitrosalicylic acid reagent for determination of reducing sugar.Analytical Chemistry, 31, 426–428.
Noike, T., & Mizuno, O. (2000). Hydrogen fermentation of organic municipal wastes. WaterScience and Technology, 42(12), 155–162.
O-Thong, S., Prasertsan, P., Karakashev, D., Dimitar, S., & Irini, V. (2008). Thermophilicfermentative hydrogen production by the newly isolated Thermoanaerobacterium thermo-saccharolyticum PSU-2. International Journal of Hydrogen Energy, 33(4), 1204–1214.
Zhang, Y., Yan, L., Qiao, X., Chi, L., Niu, X., & Mei, X. (2008). Integration of biological methodand membrane technology in treating palm oil mill effluent. Journal of EnvironmentalSciences China, 20(5), 558–564.
Initial Study of Thermophilic Hydrogen 49
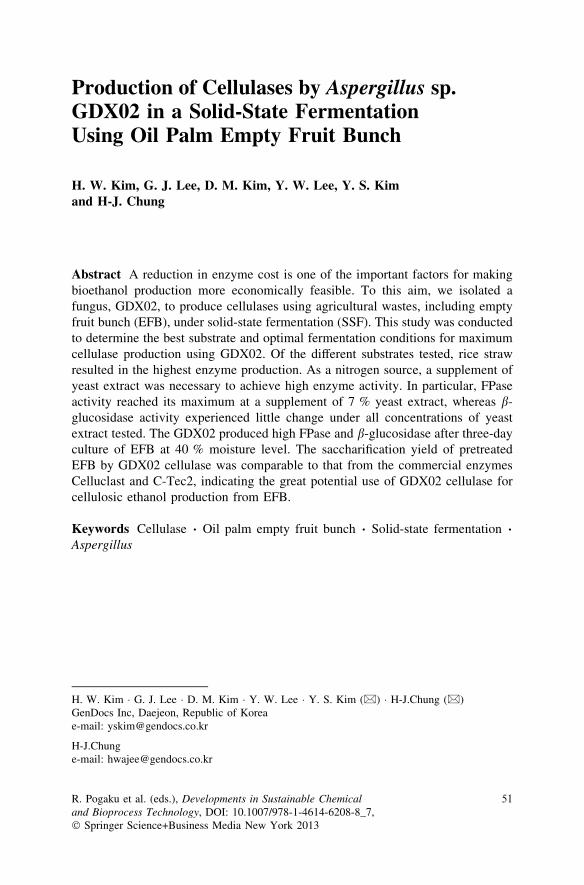
Production of Cellulases by Aspergillus sp.GDX02 in a Solid-State FermentationUsing Oil Palm Empty Fruit Bunch
H. W. Kim, G. J. Lee, D. M. Kim, Y. W. Lee, Y. S. Kimand H-J. Chung
Abstract A reduction in enzyme cost is one of the important factors for makingbioethanol production more economically feasible. To this aim, we isolated afungus, GDX02, to produce cellulases using agricultural wastes, including emptyfruit bunch (EFB), under solid-state fermentation (SSF). This study was conductedto determine the best substrate and optimal fermentation conditions for maximumcellulase production using GDX02. Of the different substrates tested, rice strawresulted in the highest enzyme production. As a nitrogen source, a supplement ofyeast extract was necessary to achieve high enzyme activity. In particular, FPaseactivity reached its maximum at a supplement of 7 % yeast extract, whereas b-glucosidase activity experienced little change under all concentrations of yeastextract tested. The GDX02 produced high FPase and b-glucosidase after three-dayculture of EFB at 40 % moisture level. The saccharification yield of pretreatedEFB by GDX02 cellulase was comparable to that from the commercial enzymesCelluclast and C-Tec2, indicating the great potential use of GDX02 cellulase forcellulosic ethanol production from EFB.
Keywords Cellulase � Oil palm empty fruit bunch � Solid-state fermentation �Aspergillus
H. W. Kim � G. J. Lee � D. M. Kim � Y. W. Lee � Y. S. Kim (&) � H-J.Chung (&)GenDocs Inc, Daejeon, Republic of Koreae-mail: [email protected]
H-J.Chunge-mail: [email protected]
R. Pogaku et al. (eds.), Developments in Sustainable Chemicaland Bioprocess Technology, DOI: 10.1007/978-1-4614-6208-8_7,� Springer Science+Business Media New York 2013
51
Introduction
Lignocellulose, an important source for the production of both renewable energyand chemicals, is composed of cellulose and hemicellulose that can be hydrolyzedinto glucose or xylose by cellulases and hemicellulases, respectively. Cellulasesare a mixture of endo-D-glucanase, exo-D-glucanase, and b-glucosidase thatsynergistically convert cellulose into glucose. The cellulases are mostly producedby fermentation of the fungi Trichoderma and Aspergillus under a condition ofeither submerged or solid media. Solid-state fermentation (SSF) is a processwherein the solid substrate provides both the nutrients and physical support duringthe culture. SSF has been widely employed in the production of industrial enzymesdue to its several advantages over submerged fermentation, including higherconcentration of enzymes, high volumetric productivity, lower operating expenses,and lower sterility demand. Besides, SSF generates less wastewater because oflower water requirements.
Agro-industrial by-products and crop residues can be used as carbon sources forcellulase production in SSF at a lower cost. Oil palm empty fruit bunch (EFB) is anagricultural by-product rich in cellulose and hemicellulose, typically containing 35to 40 % cellulose and 20 to 25 % hemicellulose. It is abundantly produced inIndonesia and Malaysia. Palm oil mills in Malaysia generate 2.4 million tons ofEFB annually. EFB was often used as fuel to generate steam or electricity, butmost of EFB is discarded as waste.
There have been a few reports describing SSF production of cellulases usingEFB and various microbes such as Trichoderma hazianum (Alam et al. 2009) andBotryosphaeria sp. (Bahrin et al. 2011). In addition, a pretreated EFB was alsoused as a carbon source in submerged fermentation (Umikalson et al. 1997; Ariffinet al. 2008; Shahriarinour et al. 2011).
The objective of this study was to identify the promising fungal speciesexhibiting a high level of production of cellulases and to optimize and evaluatecellulase production during SSF of EFB.
Methodology
Solid-State Fermentation
SSF was carried out using 40 g of substrate (EFB or rice straw) and yeast extractas a nitrogen source in a 400 ml glass bottle (81 9 132 mm). Initial moisturecontent was adjusted to between 40 and 80 % (w/w) with deionized water beforebeing sterilized at 121 �C for 15 min. Four agar blocks (15 9 15 mm) of fungigrown for one to two weeks (1 9 106*108 conidia) were inoculated into eachbottle and then incubated statically at 30 �C for two to ten days.
52 H. W. Kim et al.
Enzyme Extraction
The enzymes were extracted from the fermented substrate with 6 ml (per gram ofbiomass) of 0.05 M sodium citrate buffer (pH 4.8) by shaking (250 rpm) at 30 �Cfor 1 h. Eluted enzyme mixture was then separated from the fungal biomass bycentrifugation (10,000 9 g for 10 min). The clarified supernatant was used as thesource for crude enzymes.
Enzyme Assay and Protein Determination
The activities of total cellulase, endo-glucanase, and b-glucosidase were deter-mined. Total cellulase activity (filter paper activity, FPase) was assayed byincubating 500 ll of crude enzyme with 1 ml of 0.05 M sodium citrate buffercontaining Whatman No. 1 filter paper (50 mg, 1 9 6 cm) at 50 �C for 1 h. Theamount of released reducing sugars was determined by the 3, 5-dinitrosalicylicacid (DNS) method. Endo-glucanase activity (CMCase) was assayed in the totalreaction mixture of 200 ll containing 50 ll of crude enzymes, 100 ll of 0.1 Mpotassium phosphate buffer (pH 6.0), and 50 ll of 1 % (w/v) CMC solution. Themixture was incubated at 50 �C for 30 min, and the amount of released reducingsugars was determined by the DNS method. The activity of b-glucosidase (CBase)was determined by measuring hydrolyzed glucose from cellobiose. A reactionmixture of 1 ml containing 500 ll of crude enzyme and 15 mM cellobiose solu-tion in sodium citrate buffer was incubated at 50 �C for 30 min. After incubation,10 ll of reaction mixture was mixed with 1 ml of glucose kit reagent (Young-Dong Diagnostics, Yong-in, Korea) and incubated at 37 �C for 10 min. Then, theamount of glucose in the final reaction solution was measured with a UV–Visspectrophotometer at 600 nm with glucose as the standard. Total protein in thecrude enzyme extract was determined by the Bradford method with bovine serumalbumin (BSA) as the standard. One unit (U) of enzyme activity was defined as theamount of enzyme required to release 1 l mol of products (reducing sugar orglucose) from the appropriate substrates per minute under the assay conditions. Inthis study, the enzyme activities are expressed as units per gram of EFB (U/g).
Saccharification of EFB
One gram of pretreated EFB was digested with 10 FPU of concentrated enzymesfrom GDX02, Celluclast, or C-Tec2 (Novozymes, the Netherlands) in 100 ml of0.05 M sodium citrate buffer. This mixture was incubated at 50 �C for three dayswith gentle shaking. Finally, the glucose yield (%) was analyzed using high-performance liquid chromatography.
Production of Cellulases by Aspergillus sp 53
Results and Discussion
Cellulase Production
Several fungi were tested on the basis of cellulolytic activity in SSF to determinethe high cellulase producer(s). One of the fungi belonging to Aspergillus sp.demonstrated high cellulase activities, especially with regard to b-glucosidase, andit was named GDX02 (Fig. 1a and b). GDX02 produced cellulases at quite an earlystage of SSF compared with GDX01 (data not shown). Obviously, GDX02 is agood cellulase producer in terms of the high production of both b-glucosidase(Fig. 1b) and xylanase (Fig. 1c).
The xylanase activity of GDX02 cellulase was two times higher than that ofcommercial enzymes (Fig. 1c). GDX02 cellulase produced xylose to 70 % duringthe saccharification of NaOH-pretreated EFB, and its yield was 25 % higher thanthat of Celluclast (Fig. 1d).
Fig. 1 Cellulase activities from GDX01, GDX02, and T. longibrachiatum. a FPase. b b-glucosidase. Filled bar GDX01; Open bar GDX02; Gray bar T. longibrachiatum. GDX02produces a high level of xylanase. c Comparison of xylanase activity between commercial andGDX02 cellulase. d Xylose yield after saccharification
54 H. W. Kim et al.
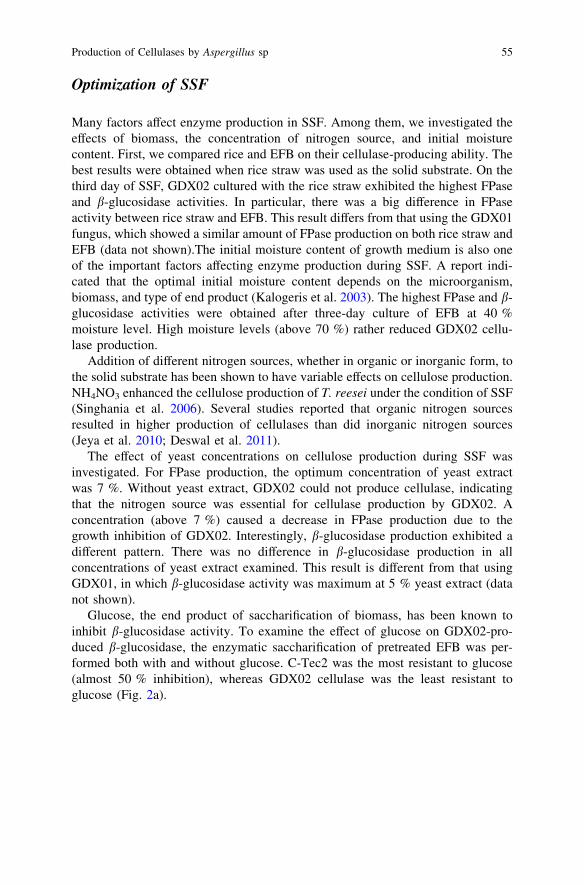
Optimization of SSF
Many factors affect enzyme production in SSF. Among them, we investigated theeffects of biomass, the concentration of nitrogen source, and initial moisturecontent. First, we compared rice and EFB on their cellulase-producing ability. Thebest results were obtained when rice straw was used as the solid substrate. On thethird day of SSF, GDX02 cultured with the rice straw exhibited the highest FPaseand b-glucosidase activities. In particular, there was a big difference in FPaseactivity between rice straw and EFB. This result differs from that using the GDX01fungus, which showed a similar amount of FPase production on both rice straw andEFB (data not shown).The initial moisture content of growth medium is also oneof the important factors affecting enzyme production during SSF. A report indi-cated that the optimal initial moisture content depends on the microorganism,biomass, and type of end product (Kalogeris et al. 2003). The highest FPase and b-glucosidase activities were obtained after three-day culture of EFB at 40 %moisture level. High moisture levels (above 70 %) rather reduced GDX02 cellu-lase production.
Addition of different nitrogen sources, whether in organic or inorganic form, tothe solid substrate has been shown to have variable effects on cellulose production.NH4NO3 enhanced the cellulose production of T. reesei under the condition of SSF(Singhania et al. 2006). Several studies reported that organic nitrogen sourcesresulted in higher production of cellulases than did inorganic nitrogen sources(Jeya et al. 2010; Deswal et al. 2011).
The effect of yeast concentrations on cellulose production during SSF wasinvestigated. For FPase production, the optimum concentration of yeast extractwas 7 %. Without yeast extract, GDX02 could not produce cellulase, indicatingthat the nitrogen source was essential for cellulase production by GDX02. Aconcentration (above 7 %) caused a decrease in FPase production due to thegrowth inhibition of GDX02. Interestingly, b-glucosidase production exhibited adifferent pattern. There was no difference in b-glucosidase production in allconcentrations of yeast extract examined. This result is different from that usingGDX01, in which b-glucosidase activity was maximum at 5 % yeast extract (datanot shown).
Glucose, the end product of saccharification of biomass, has been known toinhibit b-glucosidase activity. To examine the effect of glucose on GDX02-pro-duced b-glucosidase, the enzymatic saccharification of pretreated EFB was per-formed both with and without glucose. C-Tec2 was the most resistant to glucose(almost 50 % inhibition), whereas GDX02 cellulase was the least resistant toglucose (Fig. 2a).
Production of Cellulases by Aspergillus sp 55
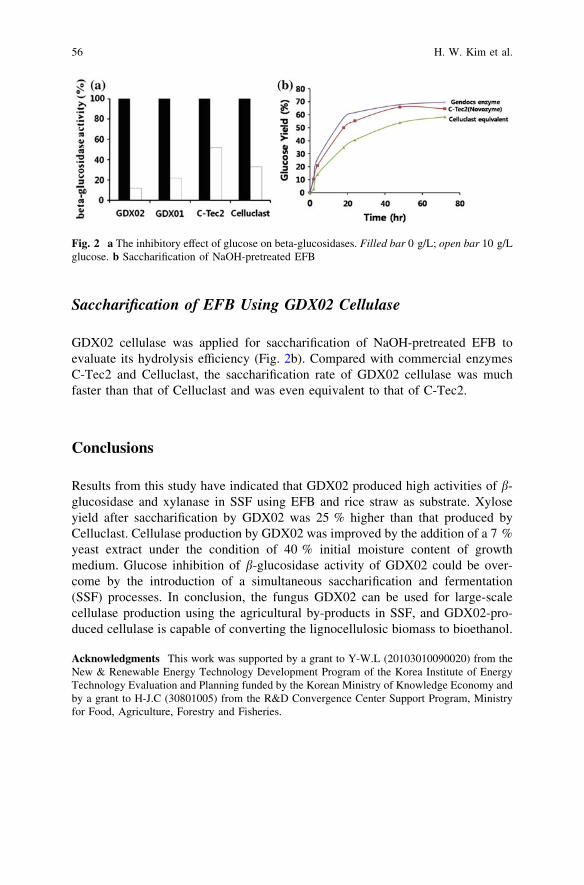
Saccharification of EFB Using GDX02 Cellulase
GDX02 cellulase was applied for saccharification of NaOH-pretreated EFB toevaluate its hydrolysis efficiency (Fig. 2b). Compared with commercial enzymesC-Tec2 and Celluclast, the saccharification rate of GDX02 cellulase was muchfaster than that of Celluclast and was even equivalent to that of C-Tec2.
Conclusions
Results from this study have indicated that GDX02 produced high activities of b-glucosidase and xylanase in SSF using EFB and rice straw as substrate. Xyloseyield after saccharification by GDX02 was 25 % higher than that produced byCelluclast. Cellulase production by GDX02 was improved by the addition of a 7 %yeast extract under the condition of 40 % initial moisture content of growthmedium. Glucose inhibition of b-glucosidase activity of GDX02 could be over-come by the introduction of a simultaneous saccharification and fermentation(SSF) processes. In conclusion, the fungus GDX02 can be used for large-scalecellulase production using the agricultural by-products in SSF, and GDX02-pro-duced cellulase is capable of converting the lignocellulosic biomass to bioethanol.
Acknowledgments This work was supported by a grant to Y-W.L (20103010090020) from theNew & Renewable Energy Technology Development Program of the Korea Institute of EnergyTechnology Evaluation and Planning funded by the Korean Ministry of Knowledge Economy andby a grant to H-J.C (30801005) from the R&D Convergence Center Support Program, Ministryfor Food, Agriculture, Forestry and Fisheries.
Fig. 2 a The inhibitory effect of glucose on beta-glucosidases. Filled bar 0 g/L; open bar 10 g/Lglucose. b Saccharification of NaOH-pretreated EFB
56 H. W. Kim et al.
References
Alam, M. Z., Mamun, A. A., Qudsieh, I. Y., Muyibi, S. A., Salleh, H. M., & Omar, N. M. (2009).Solid state biodegradation of oil palm empty fruit bunches for cellulase enzyme productionusing a rotary drum bioreactor. Biochemical Engineering Journal, 46, 61–64.
Ariffin, H., Hassan, M. A., Shah, U. K. M., Abdullah, N., Ghazali, F. M., & Shirai, Y. (2008).Production of bacterial Endoglucanase from pretreated oil palm empty fruit bunch by Bacilluspumilus EB3. Journal of Bioscience and Bioengineering, 106, 231–236.
Bahrin, E. K., Seng, P. Y., & Abd-Aziz, S. (2011). Effect of oil palm empty fruit bunch particlesize on cellulase production by Botryosphaeria sp. under solid state fermentation. AustralianJournal of Basic and Applied Science, 5, 276–280.
Deswal, D., Khasa, Y. P., & Kuhad, R. C. (2011). Optimization of cellulase production by abrown rot fungus Fomitopsis sp. RCK2010 under solid state fermentation. BioresourceTechnology, 102, 6065–6072.
Jeya, M., Joo, A., Lee, K. M., Sim, W. I., Oh, D. K., Kim, Y. S., et al. (2010). Characterization ofendo—b- 1,4-glucanase from 1 novel strain of Penicillium pinophilum KMJ601. AppliedMicrobiology and Biotechnolgy, 85, 1005–1014.
Kalogeris, E., Iniotaki, F., Topakas, E., Christakopoulos, P., Kekos, D., & Macris, B. J. (2003).Performance of an intermittent agitation rotating drum type bioreactor for solid-statefermentation of wheat straw. Bioresource Technology, 86, 207–312.
Shahriarinour, M., Ramanan, R. N., Wahab, M. N. A., Mohamad, R., Mustafa, S., & Ariff, A. B.(2011). Improved cellulase production by Aspergillus terreus using oil palm empty fruitbunch fiber as substrate in a stirred tank bioreactor through optimization of the fermentationconditions. Bio Resources, 6, 2663–2675.
Singhania, R. R., Sukumaran, R. K., Pillai, A., Szakacs, G., & Pandey, A. (2006). Solid-statefermentation of lignocellulosic substrates for cellulase production by Trichoderma reeseiNRRL 11460. Indian Journal of Biotechnology, 5, 332–336.
Umikalson, M. S., Ariff, A. B., Zulkifli, H. S., Tong, C. C., Hassan, M. A., & Karim, M. I. A.(1997). The treatment of oil palm empty fruit bunch fibre for subsequent use as substrate forcellulase production by Chaetomium globosum kunze. Bioresource Technology, 62, 1–9.
Production of Cellulases by Aspergillus sp 57
Acclimatization Processof Microorganisms from Activated Sludgein Kenaf-Retting Wastewater
Z. Zawani, L. Chuah-Abdullah, F.-R. Ahmadunand K. Abdan
Abstract Acclimatization process of microorganisms in Kenaf-retting wastewaterwas studied using return activated sludge (RAS). RAS was collected from nearsewage treatment plant. Initial concentration of chemical oxygen demand (COD)in the wastewater and mixed liquor suspended solids (MLSS) of activated sludgewere 2,300 and 1,000 mg/l, respectively. The MLSS and COD concentrationswere stabilized at day-25th. The highest substrate removal was recorded at 85 %,and it is found that activated sludge bacteria are well adapted in the new envi-ronment. At the end of the experiment, microorganisms, namely Achromobactersp, Bacillus sp and Acinetobacter sp, were found dominated in the wastewater.
Introduction
Kenaf is known as a renewable source and often used in developing new envi-ronmental-friendly products. It consists of multiple useful components (e.g., stalks,leaves and seeds), and within each of these plant components, there are varioususable portions (e.g., fibres and fibre strands, proteins, oils and allelopathicchemicals). The most important part in kenaf is bast, which is a long fibre strands
Z. Zawani � L. Chuah-Abdullah � F.-R. AhmadunChemical and Environmental Engineering, Department of Engineering,Universiti Putra Malaysia, 43300 UPM Serdang, Selangor, Malaysia
L. Chuah-Abdullah (&)Institute of Tropical Forestry and Forest Products (INTROP),Universiti Putra Malaysia, 43300 UPM Serdang, Selangor, Malaysiae-mail: [email protected]
K. AbdanBiological and Agricultural Engineering, Department of Engineering,Universiti Putra Malaysia, 43300 UPM Serdang, Selangor, Malaysiae-mail: [email protected]
R. Pogaku et al. (eds.), Developments in Sustainable Chemicaland Bioprocess Technology, DOI: 10.1007/978-1-4614-6208-8_8,� Springer Science+Business Media New York 2013
59
that are composed of many individual smaller fibres, and it is contained in the barkof kenaf stalk. The bast can be obtained from retting process. Retting is a fibreseparation process, and it can be done in several ways like dew, chemical or water-retting. The process is a slow degradation process that can take up a few days tocomplete. Water-retting generally is applied in industrial sector due to its effec-tiveness and simplicity of the process itself. However, this procedure utilizes hugeamount of water. Wastewater that generated from the retting process producedgreenish colour, high in suspended solids and odour. The condition of wastewateris unacceptable from an aesthetic value. Generally, the wastewater will be releasedto watercourse without any proper treatment. Stringent regulations of waterquality, public awareness on environmental issues and a call for water reclamationencourage an immediate action to resolve this issue.
Aerobic technology has been applied in wastewater treatment plant for a verylong time. Being one of the biological treatment processes, aerobic processinvolved decompositions of organic and inorganic materials with the presence ofoxygen molecule and aerobic microorganism. Activated sludge (AS) from aerobicprocess in wastewater treatment plant consists of various types of microorganisms(MOs). Therefore, AS is often selected as a candidate for adaptation process innew wastewater environment. The studies on acclimatization process are impor-tant in introducing the MOs to unknown or foreign pollutants, which at some pointMOs can enhance degradation of pollutants compound effectively. Furthermore,research on the acclimatization process is also necessary to improve WW tech-nologies and the acclimatized MOs will help to increase the efficiency of bio-logical treatment process.Some researchers have studied the acclimatization process. Most of them exam-ined the capability of MOs from activated sludge process (ASP) to adapt eitherwith new environment or under extreme condition. In 2007, Özbelge et al. werestudied about an exposure of heavy metal (HM) on MOs from activated sludgeprocess. They found that high level of HM exposure to the acclimatized MOs canaffect the ASP performance and it is difficult to predict the response of microor-ganisms (MOs) in the AS as different MOs have different sensitivity to the factorimposed to them. In contrast, other researchers studied on the capability of MOsand mechanisms that may occur during acclimatization period. Wiggins et al(1987) stated that several investigators have proposed that acclimatization processis a result of the time needed for enzymes to be induced (Stephenson et al. 1984;Torstensson et al. 1975), while others suggested time needed by MOs for mutationor genetic exchange to occur (Schmidt et al. 1983; Walker and Newman 1956).Mutation or appearance of new genotypes by genetic exchange may take place inacclimatization process (Wiggins et al 1987).
The main purpose of this study is to investigate acclimatization process ofactivated sludge in the kenaf-retting wastewater (KRW).
60 Z. Zawani et al.
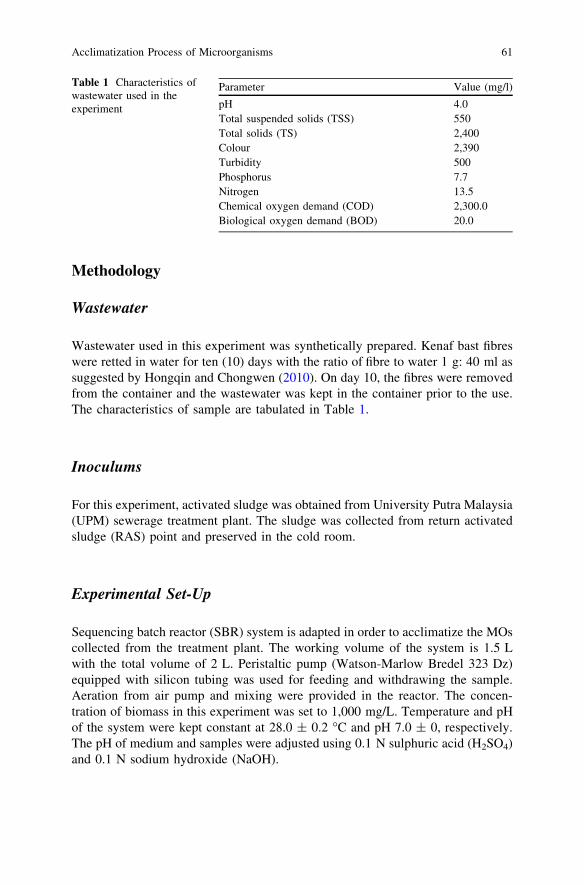
Methodology
Wastewater
Wastewater used in this experiment was synthetically prepared. Kenaf bast fibreswere retted in water for ten (10) days with the ratio of fibre to water 1 g: 40 ml assuggested by Hongqin and Chongwen (2010). On day 10, the fibres were removedfrom the container and the wastewater was kept in the container prior to the use.The characteristics of sample are tabulated in Table 1.
Inoculums
For this experiment, activated sludge was obtained from University Putra Malaysia(UPM) sewerage treatment plant. The sludge was collected from return activatedsludge (RAS) point and preserved in the cold room.
Experimental Set-Up
Sequencing batch reactor (SBR) system is adapted in order to acclimatize the MOscollected from the treatment plant. The working volume of the system is 1.5 Lwith the total volume of 2 L. Peristaltic pump (Watson-Marlow Bredel 323 Dz)equipped with silicon tubing was used for feeding and withdrawing the sample.Aeration from air pump and mixing were provided in the reactor. The concen-tration of biomass in this experiment was set to 1,000 mg/L. Temperature and pHof the system were kept constant at 28.0 ± 0.2 �C and pH 7.0 ± 0, respectively.The pH of medium and samples were adjusted using 0.1 N sulphuric acid (H2SO4)and 0.1 N sodium hydroxide (NaOH).
Table 1 Characteristics ofwastewater used in theexperiment
Parameter Value (mg/l)
pH 4.0Total suspended solids (TSS) 550Total solids (TS) 2,400Colour 2,390Turbidity 500Phosphorus 7.7Nitrogen 13.5Chemical oxygen demand (COD) 2,300.0Biological oxygen demand (BOD) 20.0
Acclimatization Process of Microorganisms 61
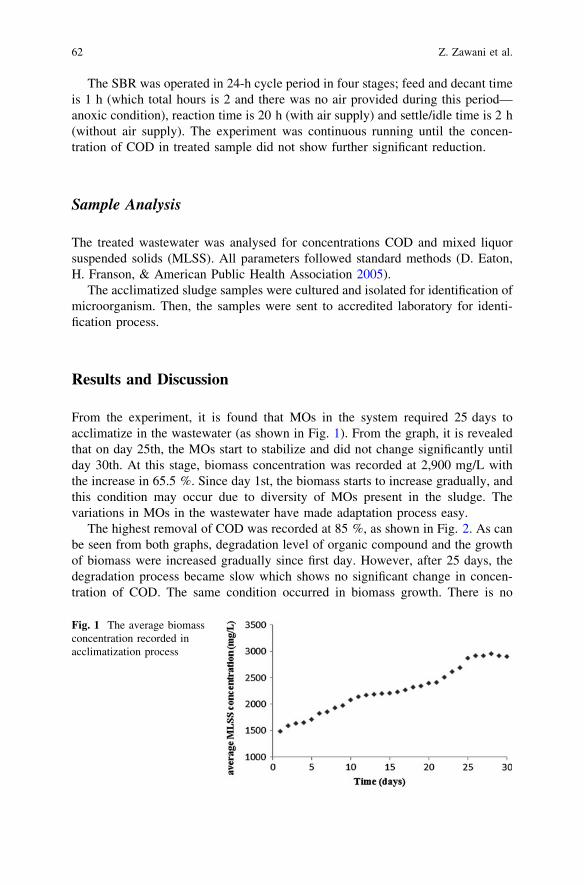
The SBR was operated in 24-h cycle period in four stages; feed and decant timeis 1 h (which total hours is 2 and there was no air provided during this period—anoxic condition), reaction time is 20 h (with air supply) and settle/idle time is 2 h(without air supply). The experiment was continuous running until the concen-tration of COD in treated sample did not show further significant reduction.
Sample Analysis
The treated wastewater was analysed for concentrations COD and mixed liquorsuspended solids (MLSS). All parameters followed standard methods (D. Eaton,H. Franson, & American Public Health Association 2005).
The acclimatized sludge samples were cultured and isolated for identification ofmicroorganism. Then, the samples were sent to accredited laboratory for identi-fication process.
Results and Discussion
From the experiment, it is found that MOs in the system required 25 days toacclimatize in the wastewater (as shown in Fig. 1). From the graph, it is revealedthat on day 25th, the MOs start to stabilize and did not change significantly untilday 30th. At this stage, biomass concentration was recorded at 2,900 mg/L withthe increase in 65.5 %. Since day 1st, the biomass starts to increase gradually, andthis condition may occur due to diversity of MOs present in the sludge. Thevariations in MOs in the wastewater have made adaptation process easy.
The highest removal of COD was recorded at 85 %, as shown in Fig. 2. As canbe seen from both graphs, degradation level of organic compound and the growthof biomass were increased gradually since first day. However, after 25 days, thedegradation process became slow which shows no significant change in concen-tration of COD. The same condition occurred in biomass growth. There is no
Fig. 1 The average biomassconcentration recorded inacclimatization process
62 Z. Zawani et al.
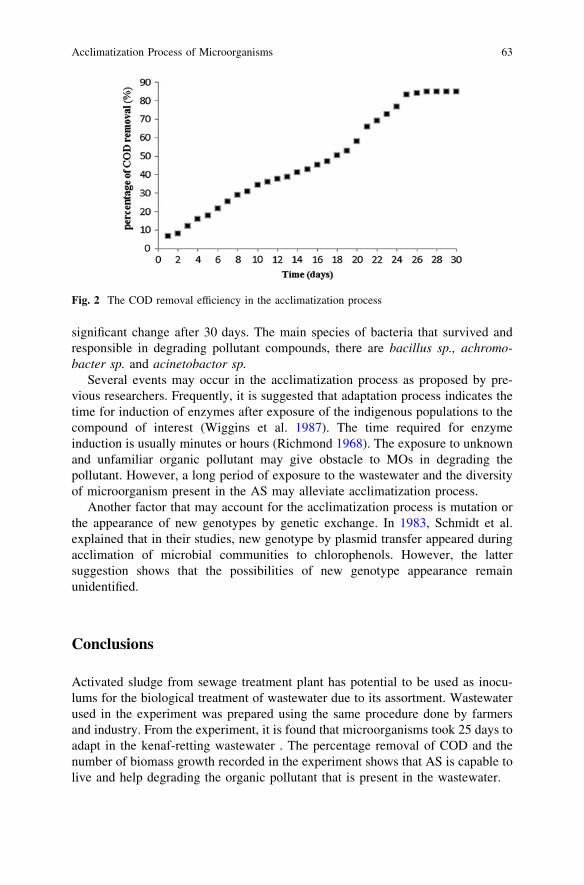
significant change after 30 days. The main species of bacteria that survived andresponsible in degrading pollutant compounds, there are bacillus sp., achromo-bacter sp. and acinetobactor sp.
Several events may occur in the acclimatization process as proposed by pre-vious researchers. Frequently, it is suggested that adaptation process indicates thetime for induction of enzymes after exposure of the indigenous populations to thecompound of interest (Wiggins et al. 1987). The time required for enzymeinduction is usually minutes or hours (Richmond 1968). The exposure to unknownand unfamiliar organic pollutant may give obstacle to MOs in degrading thepollutant. However, a long period of exposure to the wastewater and the diversityof microorganism present in the AS may alleviate acclimatization process.
Another factor that may account for the acclimatization process is mutation orthe appearance of new genotypes by genetic exchange. In 1983, Schmidt et al.explained that in their studies, new genotype by plasmid transfer appeared duringacclimation of microbial communities to chlorophenols. However, the lattersuggestion shows that the possibilities of new genotype appearance remainunidentified.
Conclusions
Activated sludge from sewage treatment plant has potential to be used as inocu-lums for the biological treatment of wastewater due to its assortment. Wastewaterused in the experiment was prepared using the same procedure done by farmersand industry. From the experiment, it is found that microorganisms took 25 days toadapt in the kenaf-retting wastewater . The percentage removal of COD and thenumber of biomass growth recorded in the experiment shows that AS is capable tolive and help degrading the organic pollutant that is present in the wastewater.
Fig. 2 The COD removal efficiency in the acclimatization process
Acclimatization Process of Microorganisms 63
References
Eaton, A. D., Franson, M. A. H., & American Public Health Association (Eds.) (2005). StandardMethods for the Examination of Water and Wastewater. Washington: Amer Public HealthAssn
Lewis, D. L., Kollig, H. P., & Hodson, R. E. (1986). Nutrient limitation and adaptation ofmicrobial populations to chemical transformations. Applied and Environment Microbiology,51, 598–603.
Özbelge, T. A., Özblege, H. Ö., & Altinten, P. (2007). Effect of acclimatization ofmicroorganisms to heavy metals on the performance of activated sludge process. Journalof Hazardous Materials, 142, 332–339.
Richmond, M. H. (1968). Enzymic adaptation in bacteria: Its biochemical and genetic basis.Essays in Biochemistry, 4, 105–154.
Schmidt, E., Hellwig, M., & Knackmuss, H. J. (1983). Degradation of chlorophenols by a definedmixed microbial community. Applied and Environmental Microbiology, 46, 1038–1044.
Stephenson, T., Lester, J. N., & Perry, R. (1984). Acclimatisation to nitrilotriacetic acid inactivated sludge process. Chemosphere, 13, 1033–1040.
Torstensson, N. T. L., & Stark, J. (1975). The effect of repeated applications of 2, 4-D and MCPAon their breakdown in soil. Weed Research, 15, 159–164.
Walker, H. H., & Newman, A. S. (1956). Microbial decomposition of 2, 4-dichlorophenoxyaceticacid. Applied Microbiology, 4, 201–206.
Wiggins, B. A., Jones, S. H., & Alexander, M. (1987). Explanations for the acclimation periodpreceding the mineralization of organic chemicals in aquatic environment. Applied andEnvironmental Microbiology, 53(4), 791–796.
Yu, H., & Yu, C. (2010). Influence of various retting methods on properties of kenaf fiber.Journal of the Textile Institute, 101(5), 452–456.
64 Z. Zawani et al.
Construction of ASMCby Dielectrophoresis Using WireclothElectrode for the Treatmentof Wastewater
Z. Z. Abidin, Y. C. Wai, N. Haffifudin and F. Ahmadun
Abstract Nowadays, the concern for biological treatment of wastewater has beenincreased by momentum. The utilization of wirecloth to construct artificiallystructured microbial consortia (ASMC) for the treatment of synthetic wastewaterhad been studied in this research. Microorganisms, which grow in pharmaceuticalwastewater, were isolated by culture method. The experiment parameters includetemperature and pH had been studied. Microorganisms were attracted to the wi-recloth by using dielectrophoresis and immobilized with polyethylenimine (PEI).The treatment analysis showed the selected microorganisms consumed the organicmaterials which significantly reduced the COD in the synthetic wastewater. Otheranalyses such as BOD, TS, VSS, TSS were also investigated. One of the advan-tages of using wirecloth electrode is able to significantly shorten the formationtime of biofilm which normally take up to few months. SEM observation revealedthe patterns of biomass immobilization on wirecloth. Besides, immobilized wi-recloth showed a higher efficiency compared to suspended growth with the samesynthetic wastewater applied. The attached grow on the wirecloth, suggested as themain role in COD removal.
Introduction
Historically, environmental microbiology can be traced to studies of municipalwaste treatment and disposal, but during the last 10 years, biofilms have becomean important object of microbiological inquiry as a critical element in the pres-ervation of quality in water systems as well as a key component of biologicalreactions in wastewater treatment (Flemming et al. 2000). The basic concept of
Z. Z. Abidin (&) � Y. C. Wai � N. Haffifudin � F. AhmadunDepartment of Chemical and Environmental Engineering, University Putra Malaysia,43400 Serdang, Selangor, Malaysiae-mail: [email protected]
R. Pogaku et al. (eds.), Developments in Sustainable Chemicaland Bioprocess Technology, DOI: 10.1007/978-1-4614-6208-8_9,� Springer Science+Business Media New York 2013
65
biofilms formation is the intrinsic tendency of microorganisms to adhere or growthon surfaces in contact with aqueous systems (Alimahmoodi et al. 2012). Manynatural and engineered systems are influenced by biofilms, microorganisms firmlyattached to surfaces, and the effects of biofilms may vary from desirable, throughundesirable, to a very bad situation, depending on the specific locations where thebiofilms are deposited (Lewandowski and Beyenal 2007). One of the significantelements in biofilms is naturally occurred microbial consortia where it is usedwidely in industry, for example in wastewater treatment, bioremediation, metalleaching, silage production, and various food fermentations (James 1993). Besidesthe application stated above, there are more strategies that we can apply on theusage of biofilms where biological control will be safer if we compare to chem-ically modification for our environment sustainability (Woolard 1997). Microbialconsortia in nature tend to exist in highly organized macroscopic structures withextensive internal organization where the macroscopic structuring also providesprotection against exogenous toxic substrates (Alp et al. 2002).
The use of dielectrophoresis (DEP), the induced movement of particles in non-uniform electric fields, is currently one of the successful methods used in cellseparation, biofilms, or artificially structured microbial consortia (ASMC) for-mation (Abidin et al. 2007a,b; Andrews et al. 2006). DEP occurred when a particleexisted in a non-uniform electric field, which induced it to form an electric dipole.A stronger side of electric dipole will result a net force on the particle and caused itto move. The direction of the particle depends on the electric properties of themedium (Pohl et al. 1978; Pohl and Pollock 1978).
In this chapter, microorganisms are attracted by using DEP and immobilized byan immobilizing agent (e.g., polyethylenimine) where it can significantly reducedthe formation time of biofilms formed on the wirecloth. The environmental con-ditions are varying, in order to investigate the removal efficiency of COD duringthe treatment. The durability and condition of wirecloth are observed after thetreatment.
Materials and Methods
Microorganisms
Bacillus sp., Rhodococcus sp., and Micrococcus sp. (isolated from pharmaceuticalwastewater, obtained from Norhafizah binti Hafifudin, Universiti Putra Malaysia)were separately grown overnight in Oxoid nutrient broth (‘Lab-Lemco’ powder1 g/L, yeast extract 2 g/L, peptone 5 g/L, and sodium chloride 5 g/L) at 35 �C inan incubator shaker with a speed of 150 rpm. Each type of the cells was centri-fuged and washed 4 times to reduce the conductivity. Cell concentrations weremeasured by obtaining the optical density (OD) from UV spectrophotometer
66 Z. Z. Abidin et al.
(Thermo Genesys 10 uv) by using wavelength of 600 nm. Each type of cellconcentration (OD = 1.2) was mixed together for immobilizing process.
Wirecloth
Wirecloth was produced by using textile technology in Swiftec Sdn. Bhd., Kajang.The wirecloth was plain weaved using polyester yarns (Hualon) and stainless steelwires of 100 lm diameter (Ormiston Wire Ltd, Middlesex, UK).
Composition of the Medium
The synthetic wastewater had the following composition in (mg/L): glucose (120),peptone (90), yeast extract (12), NH4Cl (100), KH2PO4 (20), NaHCO3 (300),MgSO4�7H2O (25), CaCl2_2H2O (3), MnSO4�5H2O (2), and FeCl3�6H2O (0.1)(Jung et al. 2005). Slight modification had been made to the composition tosimulate local domestic wastewater.
Immobilization of Microorganism (Formation of Biofilm)
To immobilize microorganisms on the wirecloth by DEP, the electrodes in thewirecloth were activated by AC signal of 20 Vpk-pk and a frequency of 1 MHzusing a Thurlby-Thandar TG120 function generator. Next, the mixed microor-ganisms were added on the wirecloth, and the attraction of the microorganisms onthe electrode was observed by microscope (Leica Q500IW). The immobilizingagent PEI (0.005 %) was introduced to form attached artificial consortia. After10 min, the function generator was switched off and gently washed with deionizedwater to rinse off the unbound microorganisms (Abidin et al. 2007a). The wire-cloth with immobilized microorganisms was ready to transfer into the reactionmedium.
Biofilms Reactor and Treatment System
The laboratory-scale reactor was fabricated in laboratory by glass material (Per-plex). It consists of simple feeding inlet, aeration inlet, sample outlet, and sludgeoutlet. The total volume of the reactor was 4 l. The synthetic wastewater wasintroduced from the feeding inlet before the immobilized wirecloth was put intothe reactor. The aeration was blown from the bottom of the reactor to ensure a
Construction of ASMC by Dielectrophoresis 67

better mixing during the reaction phase. The environment conditions were variedas the parameter of this experiment. The COD removal rate as treatment efficiencywas recorded each day during the treatment period.
Analytical Method
The performance of the wirecloth and formation of biofilms were accessed bymonitoring the concentration of COD (closed reflux titrimetric method) throughoutthe reactor cycle operation. The pH of the initial and final treatment medium wasrecorded. The procedure of COD titration method was followed by standardmethod (APHA 1998).
Results and Discussion
Immobilization and Biofilms
Figure 1 showed a part of wirecloth while electric field was applied on the elec-trode. The horizontal opaque rod-shaped electrodes were separated by the multi-filament polyester yarns (thinner semitransparent lines shown in Fig. 1), noelectrical contact between each of the electrode, microorganisms showed positiveDEP effect on the electrode. Immobilizing agent PEI was added just after positiveDEP achieved. The electric field was turned off after 10 min of immobilizingprocess. The microorganisms that were not successfully bond to wirecloth werewashed away by a gently flow of deionized water. Besides electrodes, themicroorganisms were also attracted on the polyester yarns, and the field distortionwas observed and explained previously (Abidin et al. 2007a, Abidin and Markx2005).
Fig. 1 Positive DEP effect
68 Z. Z. Abidin et al.
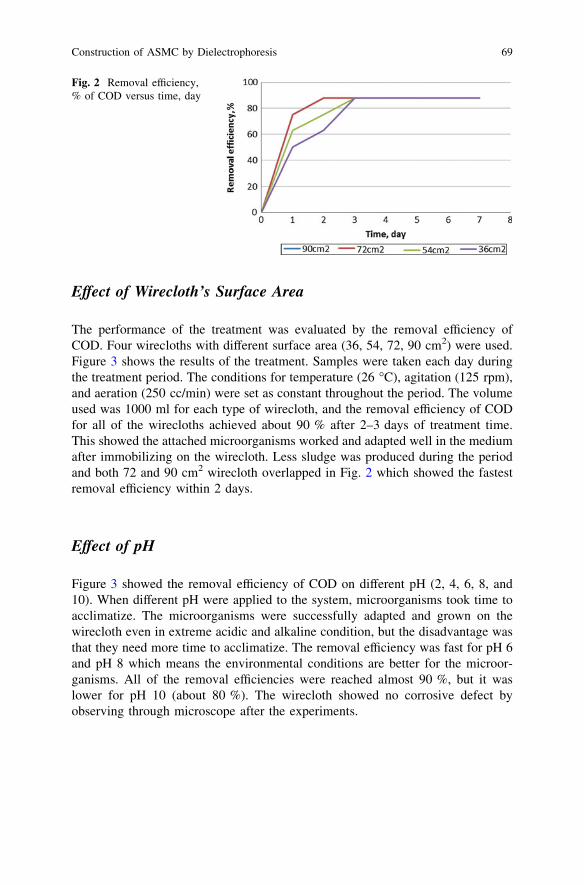
Effect of Wirecloth’s Surface Area
The performance of the treatment was evaluated by the removal efficiency ofCOD. Four wirecloths with different surface area (36, 54, 72, 90 cm2) were used.Figure 3 shows the results of the treatment. Samples were taken each day duringthe treatment period. The conditions for temperature (26 �C), agitation (125 rpm),and aeration (250 cc/min) were set as constant throughout the period. The volumeused was 1000 ml for each type of wirecloth, and the removal efficiency of CODfor all of the wirecloths achieved about 90 % after 2–3 days of treatment time.This showed the attached microorganisms worked and adapted well in the mediumafter immobilizing on the wirecloth. Less sludge was produced during the periodand both 72 and 90 cm2 wirecloth overlapped in Fig. 2 which showed the fastestremoval efficiency within 2 days.
Effect of pH
Figure 3 showed the removal efficiency of COD on different pH (2, 4, 6, 8, and10). When different pH were applied to the system, microorganisms took time toacclimatize. The microorganisms were successfully adapted and grown on thewirecloth even in extreme acidic and alkaline condition, but the disadvantage wasthat they need more time to acclimatize. The removal efficiency was fast for pH 6and pH 8 which means the environmental conditions are better for the microor-ganisms. All of the removal efficiencies were reached almost 90 %, but it waslower for pH 10 (about 80 %). The wirecloth showed no corrosive defect byobserving through microscope after the experiments.
Fig. 2 Removal efficiency,% of COD versus time, day
Construction of ASMC by Dielectrophoresis 69
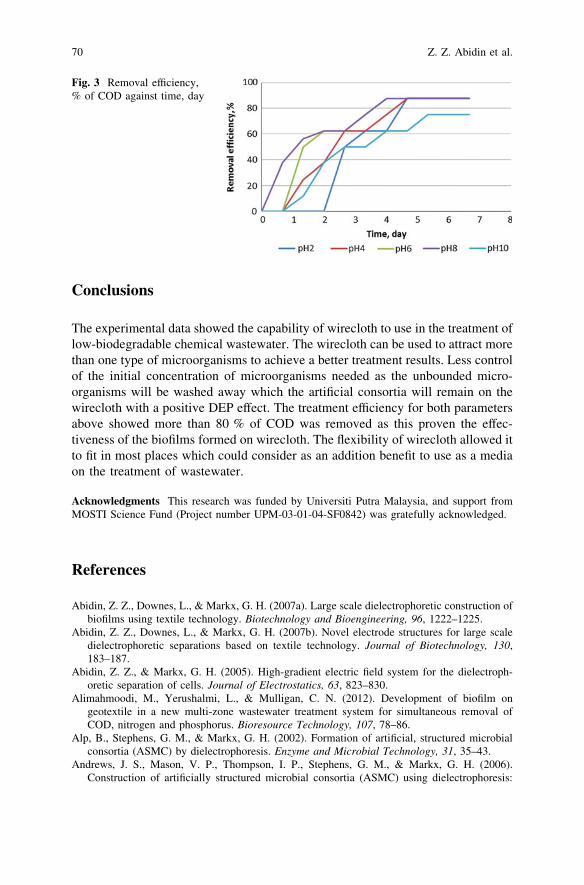
Conclusions
The experimental data showed the capability of wirecloth to use in the treatment oflow-biodegradable chemical wastewater. The wirecloth can be used to attract morethan one type of microorganisms to achieve a better treatment results. Less controlof the initial concentration of microorganisms needed as the unbounded micro-organisms will be washed away which the artificial consortia will remain on thewirecloth with a positive DEP effect. The treatment efficiency for both parametersabove showed more than 80 % of COD was removed as this proven the effec-tiveness of the biofilms formed on wirecloth. The flexibility of wirecloth allowed itto fit in most places which could consider as an addition benefit to use as a mediaon the treatment of wastewater.
Acknowledgments This research was funded by Universiti Putra Malaysia, and support fromMOSTI Science Fund (Project number UPM-03-01-04-SF0842) was gratefully acknowledged.
References
Abidin, Z. Z., Downes, L., & Markx, G. H. (2007a). Large scale dielectrophoretic construction ofbiofilms using textile technology. Biotechnology and Bioengineering, 96, 1222–1225.
Abidin, Z. Z., Downes, L., & Markx, G. H. (2007b). Novel electrode structures for large scaledielectrophoretic separations based on textile technology. Journal of Biotechnology, 130,183–187.
Abidin, Z. Z., & Markx, G. H. (2005). High-gradient electric field system for the dielectroph-oretic separation of cells. Journal of Electrostatics, 63, 823–830.
Alimahmoodi, M., Yerushalmi, L., & Mulligan, C. N. (2012). Development of biofilm ongeotextile in a new multi-zone wastewater treatment system for simultaneous removal ofCOD, nitrogen and phosphorus. Bioresource Technology, 107, 78–86.
Alp, B., Stephens, G. M., & Markx, G. H. (2002). Formation of artificial, structured microbialconsortia (ASMC) by dielectrophoresis. Enzyme and Microbial Technology, 31, 35–43.
Andrews, J. S., Mason, V. P., Thompson, I. P., Stephens, G. M., & Markx, G. H. (2006).Construction of artificially structured microbial consortia (ASMC) using dielectrophoresis:
Fig. 3 Removal efficiency,% of COD against time, day
70 Z. Z. Abidin et al.

examining bacterial interactions via metabolic intermediates within environmental biofilms.Journal of Microbiological Methods, 64, 96–106.
APHA. (1998). Standard methods for the examination of water and wastewater. Washington:DC, American Public Health Association.
Woolard, C.R. (1997). The advantages of periodically operated biofilm reactors for the treatmentof highly variable wastewater. Water Science and Technology, 35, 199–206.
Flemming, H.-C., Szewzyk, U., & Griebe, T. (Eds.). (2000). Biofilms investigative methods &application. USA: Technomic Publishing Company, Inc.
James, D. B. (1993). Bacterial biofilms. Current Opinion in Biotechnology, 4, 197–204.Lewandowski, Z., & Beyenal, H. (2007). Fundamentals of biofilm research. USA: Taylor &
Francis.Pohl, H., Pollock, K., & Crane, J. (1978). Dielectrophoretic force: a comparison of theory and
experiment. Journal of Biological Physics, 6, 133–160.Pohl, H. A., & Pollock, K. (1978). Electrode geometries for various dielectrophoretic force laws.
Journal of Electrostatics, 5, 337–342.Jung, Y., Koh, H., Shin, W., & Sung, N. (2005). Wastewater Treatment Using Combination of
MBR Equipped with Non-Woven Fabric Filter and Oyster-Zeolite Column [Online]. Busan.Available: www.ceric.net/wonmun3/ksee/04708996.pdf [Accessed 10 June 2012].
Construction of ASMC by Dielectrophoresis 71
Catalytic Pyrolysis of Waste Chicken FatsUsing Zeolite Catalysts
M. Y. Liew, A. Salmiaton, W. A. K. G. Wan Azlina and R. Yunus
Abstract Chicken fats become a major poultry waste from broiler industries andthe production rate is increasing with increasing of human population. The con-version of waste chicken fats containing major triglycerides into potentialhydrocarbon chemicals and bio-oils was investigated under pyrolysis process.Catalytic pyrolysis of chicken fats with zeolite catalyst, ZSM-5, was conductedusing laboratory-scale distillation set-up under nitrogen flow of 400 �C. In theprocess, thermal cracking plays an important role in breaking triglyceride intoshorter hydrocarbon chain under high temperature. Pyro-oil produced was furtheranalysed by gas chromatography–mass spectroscopy in order to identify itschemical properties. From the chemical analysis, different short hydrocarbon chainproducts from C7–C24 were indicated. Major chemical composition of pyro-oilascertained was aliphatics, followed by carboxylic acid, alcohol, ketone, ester,aromatic, anhydride, ether and aldehyde. The effect of ZSM-5 catalysts towardsproduct yield and composition was also explored.
M. Y. Liew � A. Salmiaton (&) � W. A. K. G. Wan AzlinaDepartment of Chemical and Environmental Engineering, Faculty of Engineering, UniversitiPutra Malaysia, 43400 Serdang, Selangor, Malaysiae-mail: [email protected]
M. Y. Liewe-mail: [email protected]
W. A. K. G. Wan Azlinae-mail: [email protected]
R. YunusInstitute of Advanced Technology, Universiti Putra Malaysia, 43400 Serdang, Selangor,Malaysiae-mail: [email protected]
R. Pogaku et al. (eds.), Developments in Sustainable Chemicaland Bioprocess Technology, DOI: 10.1007/978-1-4614-6208-8_10,� Springer Science+Business Media New York 2013
73
Introduction
Fossil fuels represent more than 80 % of total energy in the world and act as theprimary resource nowadays. But the scarcity of this conventional energy hasbecome a problem due to the rising of energy demand (Demirbas 2008). Theapplication of renewable energy from biomass conversion via chemical processcan be a potential new energy resource. Pyrolysis is a process of thermaldecomposition of materials at high temperatures with the absence of oxygen(Jayasinghe and Hawboldt 2012). The production of bio-oil from pyrolysisinvolves rapid heating to breakdown long hydrocarbon chain species producingsmaller hydrocarbon products that have similar fuel properties.
Bio-oil derived from animal fats such as lard, poultry fats and fish oil showeddiesel-like fuel properties with major components of alkanes, alkenes, aldehydes,ketones, aromatics and carboxylic acids (Adebanjo et al. 2005; Tian et al. 2008;Wisniewski Jr et al. 2010). Gürü et al. (2010) investigated the performance andemission characteristics of bio-oil on running engines and compared to those offossil fuel and fatty acid methyl esters. The authors found that bio-oil with lowsulphur content was performed well with diesel fuel blends.
Catalytic pyrolysis is a more advanced technique to maximise the production ofpyrolytic products and increase the selectivity on specific compositions of com-pounds (Butler et al. 2011). In one research conducted by Carlson et al. (2009),ZSM-5 catalyst showed good performance in producing higher aromatic com-pounds. Higher aromatics improved the properties of higher heating value due torelatively reduced oxygenated compounds.
Methodology
Materials
Waste chicken fats as raw materials were collected from a public market located atSeri Kembangan, Selangor for torrefaction. The chicken fats stripped off directlyfrom different chicken species were stored in a fridge of 4 �C after collected.Torrefaction of chicken fats was carried out in a reflux set-up at 200 �C under300 ml/min of nitrogen flow rate in order to create an oxygen-free condition.About 80 % of torrefied biomass was extracted and was prepared for pyrolysis.
Ultimate analysis of torrefied biomass was performed by LECO CHNS-932elemental analyser as shown in Table 1. Higher heating value (HHV) was theo-retically calculated according to Dulong’s formula using the percentage of C, H, Oand S elements from the analysis (Rajput 2010).
ZSM-5 catalyst used was a commercialised catalyst purchased from QingdaoWish Chemical Co., Ltd. It was synthesised from water glass and aluminium
74 M. Y. Liew et al.
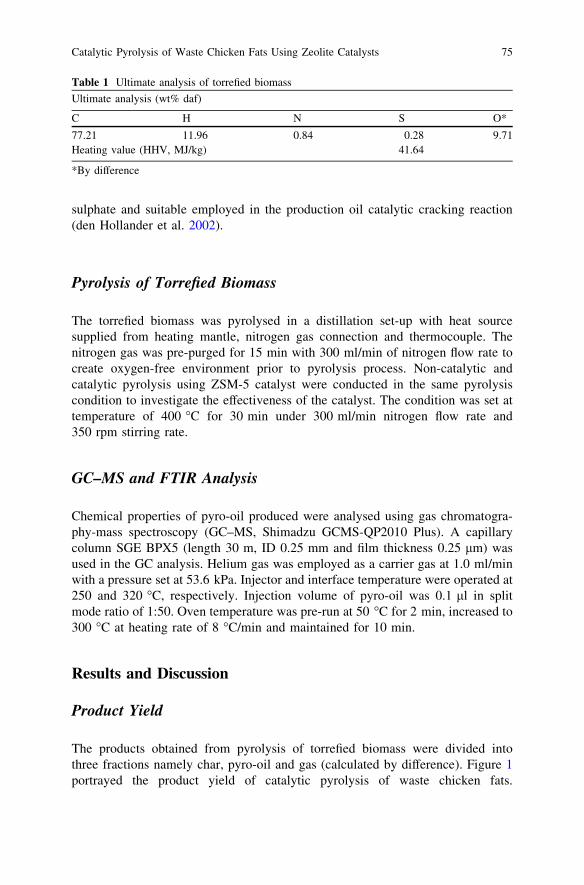
sulphate and suitable employed in the production oil catalytic cracking reaction(den Hollander et al. 2002).
Pyrolysis of Torrefied Biomass
The torrefied biomass was pyrolysed in a distillation set-up with heat sourcesupplied from heating mantle, nitrogen gas connection and thermocouple. Thenitrogen gas was pre-purged for 15 min with 300 ml/min of nitrogen flow rate tocreate oxygen-free environment prior to pyrolysis process. Non-catalytic andcatalytic pyrolysis using ZSM-5 catalyst were conducted in the same pyrolysiscondition to investigate the effectiveness of the catalyst. The condition was set attemperature of 400 �C for 30 min under 300 ml/min nitrogen flow rate and350 rpm stirring rate.
GC–MS and FTIR Analysis
Chemical properties of pyro-oil produced were analysed using gas chromatogra-phy-mass spectroscopy (GC–MS, Shimadzu GCMS-QP2010 Plus). A capillarycolumn SGE BPX5 (length 30 m, ID 0.25 mm and film thickness 0.25 lm) wasused in the GC analysis. Helium gas was employed as a carrier gas at 1.0 ml/minwith a pressure set at 53.6 kPa. Injector and interface temperature were operated at250 and 320 �C, respectively. Injection volume of pyro-oil was 0.1 ll in splitmode ratio of 1:50. Oven temperature was pre-run at 50 �C for 2 min, increased to300 �C at heating rate of 8 �C/min and maintained for 10 min.
Results and Discussion
Product Yield
The products obtained from pyrolysis of torrefied biomass were divided intothree fractions namely char, pyro-oil and gas (calculated by difference). Figure 1portrayed the product yield of catalytic pyrolysis of waste chicken fats.
Table 1 Ultimate analysis of torrefied biomass
Ultimate analysis (wt% daf)
C H N S O*
77.21 11.96 0.84 0.28 9.71Heating value (HHV, MJ/kg) 41.64
*By difference
Catalytic Pyrolysis of Waste Chicken Fats Using Zeolite Catalysts 75
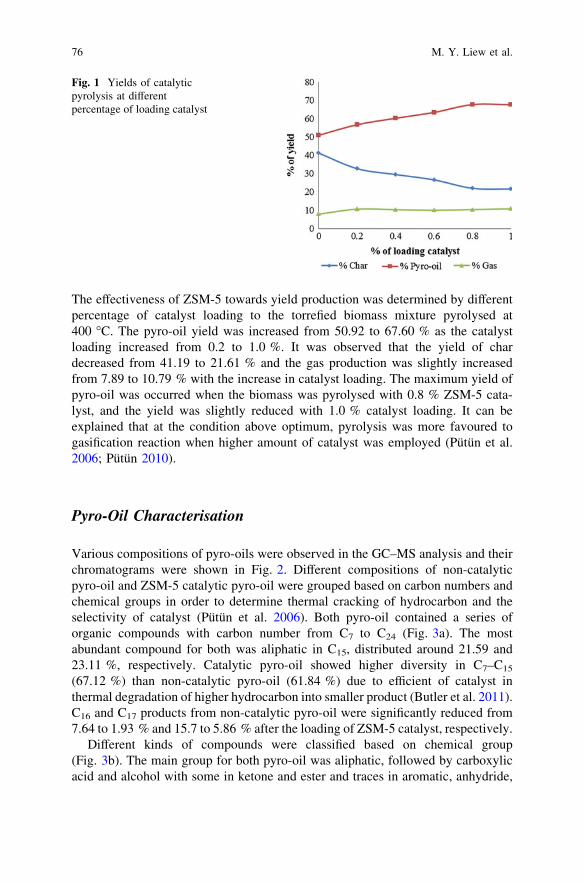
The effectiveness of ZSM-5 towards yield production was determined by differentpercentage of catalyst loading to the torrefied biomass mixture pyrolysed at400 �C. The pyro-oil yield was increased from 50.92 to 67.60 % as the catalystloading increased from 0.2 to 1.0 %. It was observed that the yield of chardecreased from 41.19 to 21.61 % and the gas production was slightly increasedfrom 7.89 to 10.79 % with the increase in catalyst loading. The maximum yield ofpyro-oil was occurred when the biomass was pyrolysed with 0.8 % ZSM-5 cata-lyst, and the yield was slightly reduced with 1.0 % catalyst loading. It can beexplained that at the condition above optimum, pyrolysis was more favoured togasification reaction when higher amount of catalyst was employed (Pütün et al.2006; Pütün 2010).
Pyro-Oil Characterisation
Various compositions of pyro-oils were observed in the GC–MS analysis and theirchromatograms were shown in Fig. 2. Different compositions of non-catalyticpyro-oil and ZSM-5 catalytic pyro-oil were grouped based on carbon numbers andchemical groups in order to determine thermal cracking of hydrocarbon and theselectivity of catalyst (Pütün et al. 2006). Both pyro-oil contained a series oforganic compounds with carbon number from C7 to C24 (Fig. 3a). The mostabundant compound for both was aliphatic in C15, distributed around 21.59 and23.11 %, respectively. Catalytic pyro-oil showed higher diversity in C7–C15
(67.12 %) than non-catalytic pyro-oil (61.84 %) due to efficient of catalyst inthermal degradation of higher hydrocarbon into smaller product (Butler et al. 2011).C16 and C17 products from non-catalytic pyro-oil were significantly reduced from7.64 to 1.93 % and 15.7 to 5.86 % after the loading of ZSM-5 catalyst, respectively.
Different kinds of compounds were classified based on chemical group(Fig. 3b). The main group for both pyro-oil was aliphatic, followed by carboxylicacid and alcohol with some in ketone and ester and traces in aromatic, anhydride,
Fig. 1 Yields of catalyticpyrolysis at differentpercentage of loading catalyst
76 M. Y. Liew et al.
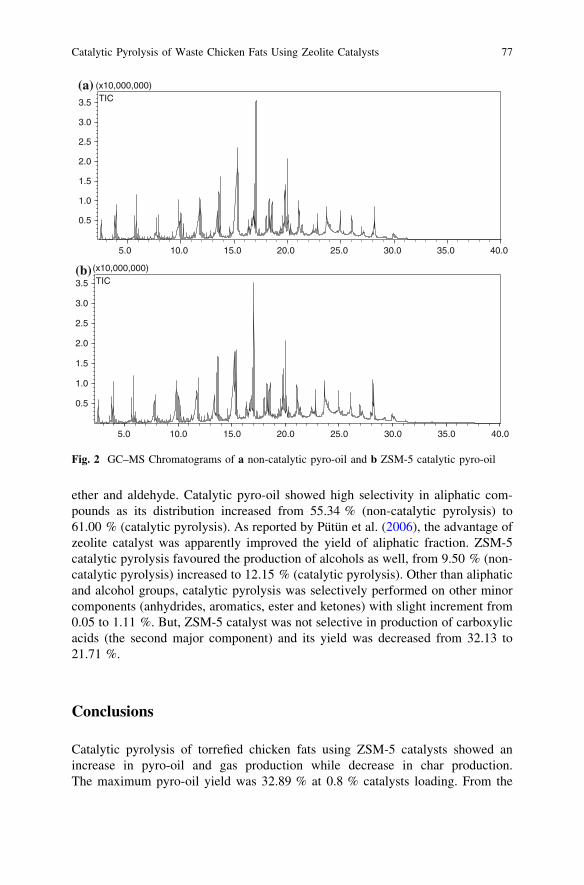
ether and aldehyde. Catalytic pyro-oil showed high selectivity in aliphatic com-pounds as its distribution increased from 55.34 % (non-catalytic pyrolysis) to61.00 % (catalytic pyrolysis). As reported by Pütün et al. (2006), the advantage ofzeolite catalyst was apparently improved the yield of aliphatic fraction. ZSM-5catalytic pyrolysis favoured the production of alcohols as well, from 9.50 % (non-catalytic pyrolysis) increased to 12.15 % (catalytic pyrolysis). Other than aliphaticand alcohol groups, catalytic pyrolysis was selectively performed on other minorcomponents (anhydrides, aromatics, ester and ketones) with slight increment from0.05 to 1.11 %. But, ZSM-5 catalyst was not selective in production of carboxylicacids (the second major component) and its yield was decreased from 32.13 to21.71 %.
Conclusions
Catalytic pyrolysis of torrefied chicken fats using ZSM-5 catalysts showed anincrease in pyro-oil and gas production while decrease in char production.The maximum pyro-oil yield was 32.89 % at 0.8 % catalysts loading. From the
5.0 10.0 15.0 20.0 25.0 30.0 35.0 40.0
0.5
1.0
1.5
2.0
2.5
3.0
3.5
(x10,000,000)TIC
5.0 10.0 15.0 20.0 25.0 30.0 35.0 40.0
0.5
1.0
1.5
2.0
2.5
3.0
3.5
(x10,000,000)TIC
(a)
(b)
Fig. 2 GC–MS Chromatograms of a non-catalytic pyro-oil and b ZSM-5 catalytic pyro-oil
Catalytic Pyrolysis of Waste Chicken Fats Using Zeolite Catalysts 77
GC–MS analysis, different kinds of organic compounds from carbon numberC7–C24 were found. Aliphatic C15 for non-catalytic pyro-oil and catalytic pyro-oilwas dominant among other compounds. By comparison, catalytic pyro-oil hadhigher selectivity in chemical group of alcohols, aliphatics, anhydrides, aromatics,ester and ketones.
Acknowledgments The authors would like to thank Universiti Putra Malaysia in particular theDepartment of Chemical and Environmental Engineering, Faculty of Engineering, for the facility,research funding and all those who gave cooperation and help throughout the whole project.
Fig. 3 Composition distribution of a carbon number and b chemical group for non-catalyticpyro-oil (black bar) and ZSM-5 catalytic pyro-oil (white bar)
78 M. Y. Liew et al.
References
Adebanjo, A. O., Dalai, A. K., & Bakhshi, N. N. (2005). Production of diesel-like fuel and othervalue-added chemicals from pyrolysis of animal fat. Energy and Fuels, 19, 1735–1741.
Butler, E., Devlin, G., Meier, D., & Mcdonnell, K. (2011). A review of recent laboratory researchand commercial developments in fast pyrolysis and upgrading. Renewable and SustainableEnergy Reviews, 15, 4171–4186.
Carlson, T., Tompsett, G., Conner, W., & Huber, G. (2009). Aromatic production from catalyticfast pyrolysis of biomass-derived feedstocks. Topics in Catalysis, 52, 241–252.
Demirbas, A. (2008). Biodiesel: A realistic fuel alternative for diesel engines. London: Springer.Den Hollander, M. A., Wissink, M., Makkee, M., & Moulijn, J. A. (2002). Gasoline conversion:
Reactivity towards cracking with equilibrated FCC and ZSM-5 catalysts. Applied Catalysis,A: General, 223, 85–102.
Gürü, M., Koca, A., Can, Ö., Çinar, C., & S�ahin, F. (2010). Biodiesel production from wastechicken fat based sources and evaluation with Mg based additive in a diesel engine.Renewable Energy, 35, 637–643.
Jayasinghe, P., & Hawboldt, K. (2012). A review of bio-oils from waste biomass: Focus on fishprocessing waste. Renewable and Sustainable Energy Reviews, 16, 798–821.
Pütün, E. (2010). Catalytic pyrolysis of biomass: Effects of pyrolysis temperature, sweeping gasflow rate and MgO catalyst. Energy, 35, 2761–2766.
Pütün, E., Uzun, B. B., & Pütün, A. E. (2006). Fixed-bed catalytic pyrolysis of cotton-seed cake:Effects of pyrolysis temperature, natural zeolite content and sweeping gas flow rate.Bioresource Technology, 97, 701–710.
Rajput, R. K. (2010). Thermal Engineering. New Delhi: Laxmi Publications Pvt Limited.Tian, H., Li, C., Yang, C., & Shan, H. (2008). Alternative processing technology for converting
vegetable oils and animal fats to clean fuels and light olefins. Chinese Journal of ChemicalEngineering, 16, 394–400.
Wisniewski, JR, A., Wiggers, V. R., Simionatto, E. L., Meier, H. F., Barros, A. A. C., &Madureira, L. A. S. (2010). Biofuels from waste fish oil pyrolysis: Chemical composition.Fuel, 89, 563-568.
Catalytic Pyrolysis of Waste Chicken Fats Using Zeolite Catalysts 79
Investigation of Pyrolysis Parameterson the Yield and Quality of Bio-Oilfrom Jatropha curcas Wastes
S. A. Jourabchi, S. Gan and H. K. Ng
Abstract Jatropha curcas pressed cake leftover after oil extraction for biodieselproduction is considered as waste. Following physicochemical characterisationtests, this biomass waste was pyrolysed over a temperature range of573.15–1073.15 K and a nitrogen linear speed range of 7.8 9 10-5–6.7 9 10-2
m/s to produce bio-oil. The heating rate and biomass grain size were fixed toconstants of 50 K/min and \2 mm, respectively. The bio-oil products after yieldmeasurements were tested for three major specifications, i.e. gross calorific value,water content and acidity, based on ASTM procedures for standard specification ofpyrolysis liquid biofuels. In addition, empirical correlations between the bio-oilyield and pyrolysis parameters have been introduced for the experiments usingnonlinear multiple regression method.
Introduction
Increasing world population and industrialisation have resulted in both theincreasing use of fossil fuels and the impending depletion of fossil fuel reservesworldwide. Additionally, the increasing release of harmful emissions especiallycarbon dioxide (CO2) from the increased usage of fossil fuels has led to the needfor more sustainable and environment-friendly alternative fuels such as biodiesel,bioethanol and biomass.
S. A. Jourabchi � S. Gan (&)Department of Chemical and Environmental Engineering, The University of NottinghamMalaysia Campus, Jalan Broga, 43500 Semenyih, Selangor Darul Ehsan, Malaysiae-mail: [email protected]
H. K. NgDepartment of Mechanical, Materials and Manufacturing Engineering, The University ofNottingham Malaysia Campus, Jalan Broga, 43500 Semenyih, Selangor Darul Ehsan,Malaysia
R. Pogaku et al. (eds.), Developments in Sustainable Chemicaland Bioprocess Technology, DOI: 10.1007/978-1-4614-6208-8_11,� Springer Science+Business Media New York 2013
81
Presently, bio-oil or tar produced from the pyrolysis of biomass can be useddirectly or after further physicochemical processes to heat up boilers, or even drivediesel engines or turbines (Balat et al. 2009; Mohan et al. 2006). During thecombustion process, its net zero CO2 as well as lesser nitrogen oxides (NOx) orsulphur oxides (SOx) emissions compared to fossil fuels makes it a potential liquidfuel replacement (Putun et al. 2005).
The focus of this research is to determine the pyrolysis parameters required toachieve optimum quantity and quality of bio-oil production from Jatropha curcas(J. curcas) pressed cake after oil extraction of its seeds. Currently, J. curcas is adrought free and inedible crop which can be planted economically in tropical andsubtropical regions. Its seed is a promising source of oil, especially for the purposeof commercial biodiesel production. A thermo-gravimetric analysis (TGA) showsthat the J. curcas pressed cake contains less than 4 wt% moisture and over 70 wt%volatiles, both of which are indicative of the potential bio-oil content. This analysisalso shows that 70 % of the total volatiles separation occurs at temperatures below650 K, which is relatively low and hence aids in reducing the energy consumptionduring the pyrolysis process. To achieve maximum bio-oil production, a labora-tory-scale pyrolysis reactor and a quencher are designed and fabricated. A cor-responding design of experiment is performed in this work to determine theoptimum pyrolysis parameters.
Methodology
Material
J. curcas pressed cake waste was obtained from a biodiesel production company inMalaysia (Bionas Group) to be used as the feedstock for the pyrolysis project.Table 1 shows the physicochemical properties that were measured for the J. curcaswaste.
The amount of moisture content both from the TGA and from the oven dryingmethod has matching results of below 4 wt% (Sluiter et al. 2008). This is relativelylow, considering that under Malaysian climate condition, the average humidity isapproximately 80 % (Malaysian Meteorology Department 2012). By having amoisture content of below 10 %, the drying process can be skipped completelywhich is an advantage since energy is saved for the total bio-oil production process(Mohan et al. 2006). Comparably high gross calorific value, high carbon andvolatiles content indicate the potential of J. curcas pressed cake as a source ofbiofuel.
The sample was prepared for pyrolysis by grinding into a powder form. Thepressed cake was firstly converted into granules using a Retsch SM100 Comfortgrinder machine and sieved using a grinding sieve size of 0.2 mm in a RetschZM200 grinder.
82 S. A. Jourabchi et al.
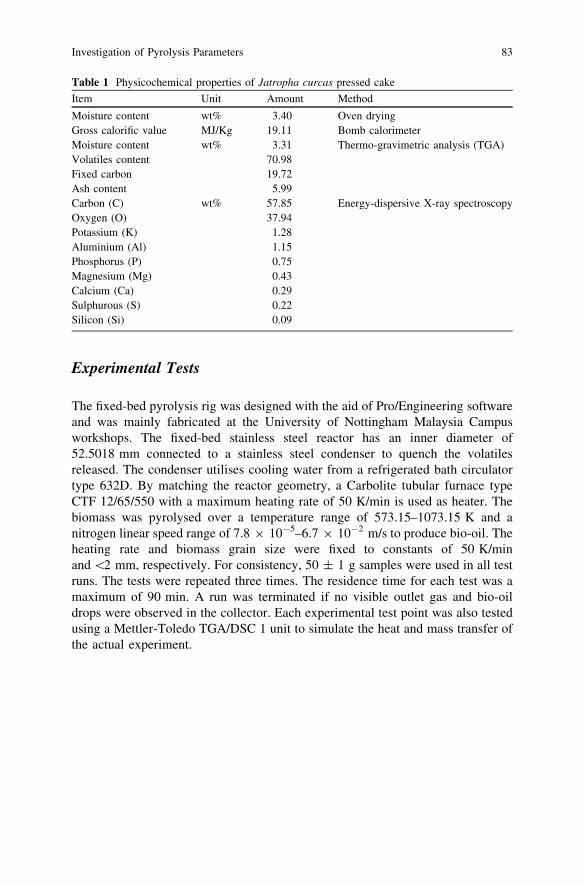
Experimental Tests
The fixed-bed pyrolysis rig was designed with the aid of Pro/Engineering softwareand was mainly fabricated at the University of Nottingham Malaysia Campusworkshops. The fixed-bed stainless steel reactor has an inner diameter of52.5018 mm connected to a stainless steel condenser to quench the volatilesreleased. The condenser utilises cooling water from a refrigerated bath circulatortype 632D. By matching the reactor geometry, a Carbolite tubular furnace typeCTF 12/65/550 with a maximum heating rate of 50 K/min is used as heater. Thebiomass was pyrolysed over a temperature range of 573.15–1073.15 K and anitrogen linear speed range of 7.8 9 10-5–6.7 9 10-2 m/s to produce bio-oil. Theheating rate and biomass grain size were fixed to constants of 50 K/minand \2 mm, respectively. For consistency, 50 ± 1 g samples were used in all testruns. The tests were repeated three times. The residence time for each test was amaximum of 90 min. A run was terminated if no visible outlet gas and bio-oildrops were observed in the collector. Each experimental test point was also testedusing a Mettler-Toledo TGA/DSC 1 unit to simulate the heat and mass transfer ofthe actual experiment.
Table 1 Physicochemical properties of Jatropha curcas pressed cake
Item Unit Amount Method
Moisture content wt% 3.40 Oven dryingGross calorific value MJ/Kg 19.11 Bomb calorimeterMoisture content wt% 3.31 Thermo-gravimetric analysis (TGA)Volatiles content 70.98Fixed carbon 19.72Ash content 5.99Carbon (C) wt% 57.85 Energy-dispersive X-ray spectroscopyOxygen (O) 37.94Potassium (K) 1.28Aluminium (Al) 1.15Phosphorus (P) 0.75Magnesium (Mg) 0.43Calcium (Ca) 0.29Sulphurous (S) 0.22Silicon (Si) 0.09
Investigation of Pyrolysis Parameters 83
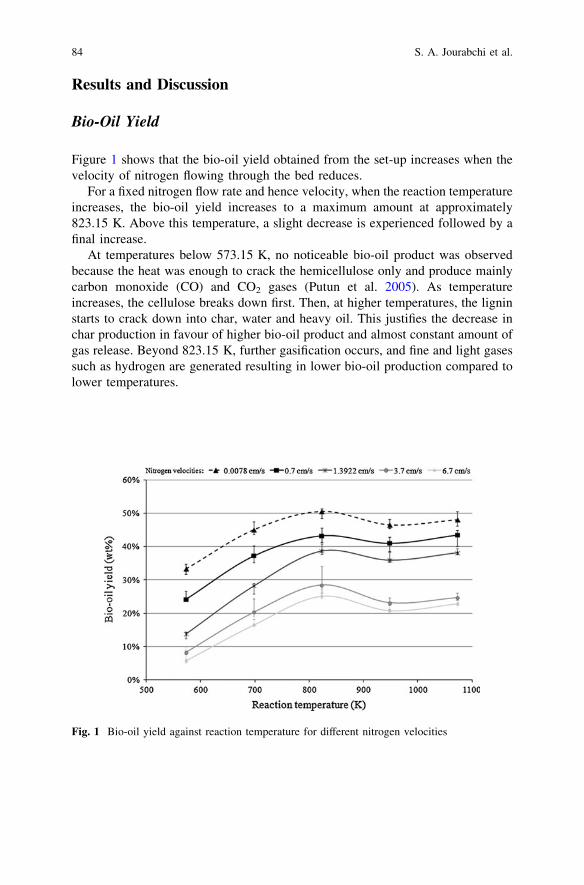
Results and Discussion
Bio-Oil Yield
Figure 1 shows that the bio-oil yield obtained from the set-up increases when thevelocity of nitrogen flowing through the bed reduces.
For a fixed nitrogen flow rate and hence velocity, when the reaction temperatureincreases, the bio-oil yield increases to a maximum amount at approximately823.15 K. Above this temperature, a slight decrease is experienced followed by afinal increase.
At temperatures below 573.15 K, no noticeable bio-oil product was observedbecause the heat was enough to crack the hemicellulose only and produce mainlycarbon monoxide (CO) and CO2 gases (Putun et al. 2005). As temperatureincreases, the cellulose breaks down first. Then, at higher temperatures, the ligninstarts to crack down into char, water and heavy oil. This justifies the decrease inchar production in favour of higher bio-oil product and almost constant amount ofgas release. Beyond 823.15 K, further gasification occurs, and fine and light gasessuch as hydrogen are generated resulting in lower bio-oil production compared tolower temperatures.
Fig. 1 Bio-oil yield against reaction temperature for different nitrogen velocities
84 S. A. Jourabchi et al.
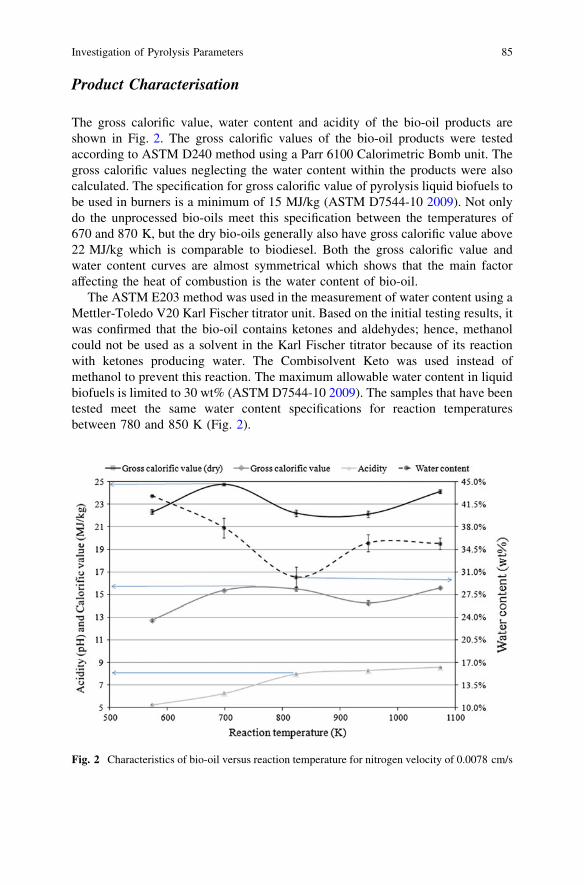
Product Characterisation
The gross calorific value, water content and acidity of the bio-oil products areshown in Fig. 2. The gross calorific values of the bio-oil products were testedaccording to ASTM D240 method using a Parr 6100 Calorimetric Bomb unit. Thegross calorific values neglecting the water content within the products were alsocalculated. The specification for gross calorific value of pyrolysis liquid biofuels tobe used in burners is a minimum of 15 MJ/kg (ASTM D7544-10 2009). Not onlydo the unprocessed bio-oils meet this specification between the temperatures of670 and 870 K, but the dry bio-oils generally also have gross calorific value above22 MJ/kg which is comparable to biodiesel. Both the gross calorific value andwater content curves are almost symmetrical which shows that the main factoraffecting the heat of combustion is the water content of bio-oil.
The ASTM E203 method was used in the measurement of water content using aMettler-Toledo V20 Karl Fischer titrator unit. Based on the initial testing results, itwas confirmed that the bio-oil contains ketones and aldehydes; hence, methanolcould not be used as a solvent in the Karl Fischer titrator because of its reactionwith ketones producing water. The Combisolvent Keto was used instead ofmethanol to prevent this reaction. The maximum allowable water content in liquidbiofuels is limited to 30 wt% (ASTM D7544-10 2009). The samples that have beentested meet the same water content specifications for reaction temperaturesbetween 780 and 850 K (Fig. 2).
Fig. 2 Characteristics of bio-oil versus reaction temperature for nitrogen velocity of 0.0078 cm/s
Investigation of Pyrolysis Parameters 85
Although one of the drawbacks of bio-oil is its typical acidity, the results ofASTM E70 tests on the J. curcas bio-oil samples show that the pH values rangefrom 5 to 8.7 at all reaction temperatures (Fig. 2). The pH measured at the reactiontemperature of 823.15 is 7.96 which can be considered as neutral.
Empirical Correlations
By averaging the test results for bio-oil yield, a total number of 25 testing pointshave been used in developing empirical correlations. For each test, there are twovariables, i.e. reaction temperature and nitrogen linear speed in the bed. Bylooking at Fig. 1, it can be deduced that the partial correlation between reactiontemperature and bio-oil yield can be modelled as a cubic polynomial. On the otherhand, the partial correlation between nitrogen linear speed in the bed and bio-oilyield can be categorised as a quadratic polynomial. Generalising these partialcorrelations into a multiple correlation by summation of these two polynomials,the following equation can be written as follows:
B ¼ c þ n1N þ n2N2 þ t1T þ t2T2 þ t3T3 ð1Þ
In Eq. (1), B, N and T are the bio-oil yield, nitrogen linear speed and reactiontemperature, respectively. By using nonlinear multiple regression method, theabove correlation constants can be found by solving the 6 by 6 simultaneousequations introduced in this method to result in Eq. (2) below (Spiegel and Ste-phens 1999).
B ¼ �58:31�9:95 N þ 0:95 N2 þ 176:98 T þ 0:01 T2�68:8599 T3 ð2Þ
B is in wt%, N is in cm/s and T is in K/1,000. The modelling results from theproposed correlation have been compared to experimental results and over theexperimental range tested, the maximum error is below 5 % for bio-oil yield.
Conclusions
A fixed-bed pyrolysis rig has been used to produce bio-oil from J. curcas pressedcake. The experimental results have shown that both reaction temperature andnitrogen velocity strongly influenced the yield of bio-oil. Above 50 wt% of thewaste could be cracked down into bio-oil at a reaction temperature of 823.15 K,heating rate of 50 K/min and nitrogen linear velocity of 7.8 9 10-5 m/s in thebed. Under the same testing condition, the bio-oil produced has less than 30 wt%water content, a gross calorific value of 15.51 MJ/kg and a pH of 7.96. Theseproperties demonstrate that this bio-oil can be used in burners without any mod-ifications provided that other specifications of this fuel match with the ASTM
86 S. A. Jourabchi et al.
D7554-10 biofuel standard. An empirical correlation has been introduced toestimate the bio-oil yield over the range of experimental parameters with less than5 % errors in its predictions.
Acknowledgments This work was supported by the Ministry of Agriculture, Malaysia, underthe Science Fund 05-02-12-SF1004. The Faculty of Engineering at the University of Nottingham,Malaysia Campus, is also acknowledged for its support towards this project. The authors wouldalso like to thank the Bionas Group (Malaysia) for providing the Jatropha curcas waste.
References
American Society for Testing and Materials. (2009). Standard specification for pyrolysis liquidbiofuel. ASTM D7544–10.
Balat, M., & Demirbas, M. F. (2009). Bio-oil from pyrolysis of black alder wood. EnergySources, 31 Part A, 1719–1727.
Malaysian Meteorology Department. (2012). Meteorology Metadata station page. [http://ww.met.gov.my]. [Accessed 04 July 2012].
Mohan, D., Pittman, C. U, Jr, & Steele, P. H. (2006). Pyrolysis of wood/biomass for bio-oil: acritical review. Energy & Fuels, 20, 848–889.
Putun, A. E., Uzun, B. B., Apaydin, E., & Putun, E. (2005). Bio-oil from olive oil industrywastes: Pyrolysis of olive residue under different conditions. Fuel Processing Technology, 87,25–32.
Sluiter, A., Hamas, B., Hyman, D., Payne, C., Ruiz, R., Scarlata, C., Sluiter, J., Templeton, D.,Wolfe, J. (2008). Determination of total solids in biomass and total dissolved solids in liquidprocess samples. National Renewable Energy Laboratory, NREL/TP-510-42621.
Spiegel, M. R., & Stephens, L. J. (1999). Multiple and partial correlation. Statistics (3rd edn).New York: Schum’s outlines, Mc Graw-Hill publishing.
Investigation of Pyrolysis Parameters 87
Electrochemical Oxidation of PAHsin Aqueous Solution
A. Yaqub, M. H. Isa and S. R. M. Kutty
Abstract In this work, oxidation of PAHs in aqueous solution was studied usingTi/SnO2 electrode. Electrochemical oxidation was performed at a current densityof 0.33 mA/cm2 at initial pH 3, 6, and 9. Brush coating thermal decompositionmethod was used to coat SnO2 on titanium substrate. Surface morphology andcharacterization of coating material were studied using FESEM. GC–MS was usedto quantify PAHs. PAHs containing 2–3 benzene rings were completely degradedin the presence of electrolyte (NaCl) at all pH condition. Total PAH removal was87, 93, and 87 % at pH 3, 6, and 9, respectively. Higher current efficiency wasshown using NaCl as electrolyte.
Introduction
Polycyclic aromatic hydrocarbons (PAHs) can enter water bodies through indus-trial effluent discharges and accidental oil spills. Acute or short-term health effectsrelated to occupational exposures to high levels of pollutant mixtures containingPAHs have resulted in symptoms such as eye irritation, nausea, vomiting, diarrhea,and confusion. In laboratory studies, animals exposed to some PAHs over longperiods have developed lung cancer from inhalation, stomach cancer from oralingestion of PAHs in food, and skin cancer from skin contact (PHFS 2009).
A. Yaqub � M. H. Isa (&) � S. R. M. KuttyCivil Engineering Department, Universiti Teknologi PETRONAS,31750 Tronoh, Perak, Malaysiae-mail: [email protected]; [email protected]
A. Yaqube-mail: [email protected]
S. R. M. Kuttye-mail: [email protected]
R. Pogaku et al. (eds.), Developments in Sustainable Chemicaland Bioprocess Technology, DOI: 10.1007/978-1-4614-6208-8_12,� Springer Science+Business Media New York 2013
89
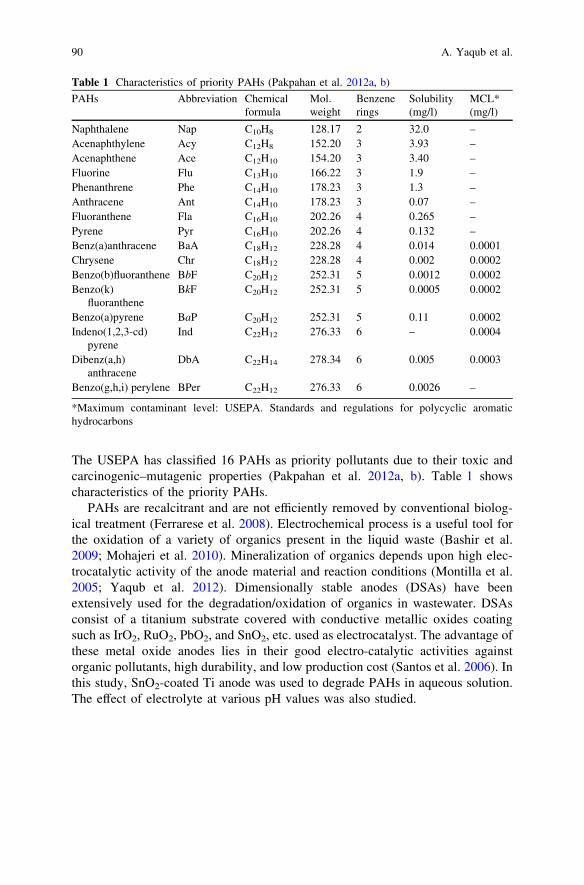
The USEPA has classified 16 PAHs as priority pollutants due to their toxic andcarcinogenic–mutagenic properties (Pakpahan et al. 2012a, b). Table 1 showscharacteristics of the priority PAHs.
PAHs are recalcitrant and are not efficiently removed by conventional biolog-ical treatment (Ferrarese et al. 2008). Electrochemical process is a useful tool forthe oxidation of a variety of organics present in the liquid waste (Bashir et al.2009; Mohajeri et al. 2010). Mineralization of organics depends upon high elec-trocatalytic activity of the anode material and reaction conditions (Montilla et al.2005; Yaqub et al. 2012). Dimensionally stable anodes (DSAs) have beenextensively used for the degradation/oxidation of organics in wastewater. DSAsconsist of a titanium substrate covered with conductive metallic oxides coatingsuch as IrO2, RuO2, PbO2, and SnO2, etc. used as electrocatalyst. The advantage ofthese metal oxide anodes lies in their good electro-catalytic activities againstorganic pollutants, high durability, and low production cost (Santos et al. 2006). Inthis study, SnO2-coated Ti anode was used to degrade PAHs in aqueous solution.The effect of electrolyte at various pH values was also studied.
Table 1 Characteristics of priority PAHs (Pakpahan et al. 2012a, b)
PAHs Abbreviation Chemicalformula
Mol.weight
Benzenerings
Solubility(mg/l)
MCL*(mg/l)
Naphthalene Nap C10H8 128.17 2 32.0 –Acenaphthylene Acy C12H8 152.20 3 3.93 –Acenaphthene Ace C12H10 154.20 3 3.40 –Fluorine Flu C13H10 166.22 3 1.9 –Phenanthrene Phe C14H10 178.23 3 1.3 –Anthracene Ant C14H10 178.23 3 0.07 –Fluoranthene Fla C16H10 202.26 4 0.265 –Pyrene Pyr C16H10 202.26 4 0.132 –Benz(a)anthracene BaA C18H12 228.28 4 0.014 0.0001Chrysene Chr C18H12 228.28 4 0.002 0.0002Benzo(b)fluoranthene BbF C20H12 252.31 5 0.0012 0.0002Benzo(k)
fluorantheneBkF C20H12 252.31 5 0.0005 0.0002
Benzo(a)pyrene BaP C20H12 252.31 5 0.11 0.0002Indeno(1,2,3-cd)
pyreneInd C22H12 276.33 6 – 0.0004
Dibenz(a,h)anthracene
DbA C22H14 278.34 6 0.005 0.0003
Benzo(g,h,i) perylene BPer C22H12 276.33 6 0.0026 –
*Maximum contaminant level: USEPA. Standards and regulations for polycyclic aromatichydrocarbons
90 A. Yaqub et al.
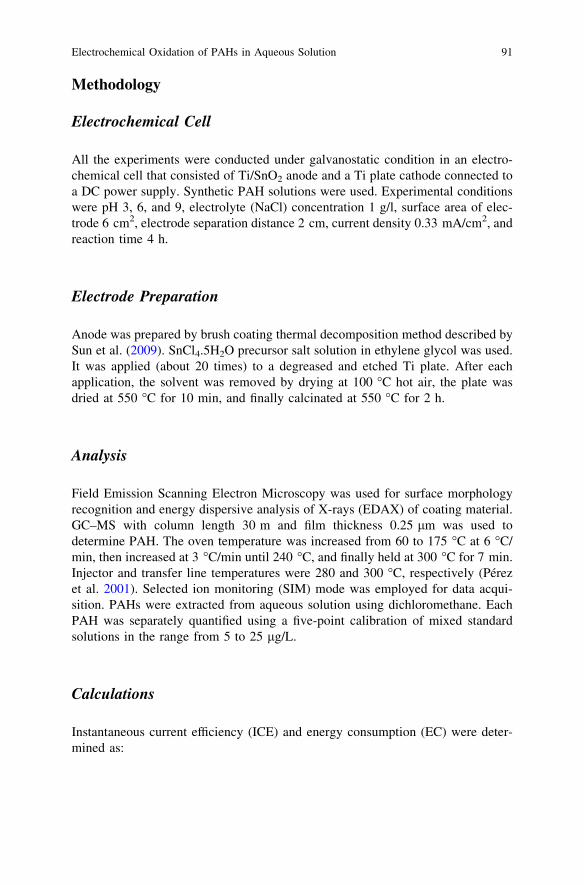
Methodology
Electrochemical Cell
All the experiments were conducted under galvanostatic condition in an electro-chemical cell that consisted of Ti/SnO2 anode and a Ti plate cathode connected toa DC power supply. Synthetic PAH solutions were used. Experimental conditionswere pH 3, 6, and 9, electrolyte (NaCl) concentration 1 g/l, surface area of elec-trode 6 cm2, electrode separation distance 2 cm, current density 0.33 mA/cm2, andreaction time 4 h.
Electrode Preparation
Anode was prepared by brush coating thermal decomposition method described bySun et al. (2009). SnCl4.5H2O precursor salt solution in ethylene glycol was used.It was applied (about 20 times) to a degreased and etched Ti plate. After eachapplication, the solvent was removed by drying at 100 �C hot air, the plate wasdried at 550 �C for 10 min, and finally calcinated at 550 �C for 2 h.
Analysis
Field Emission Scanning Electron Microscopy was used for surface morphologyrecognition and energy dispersive analysis of X-rays (EDAX) of coating material.GC–MS with column length 30 m and film thickness 0.25 lm was used todetermine PAH. The oven temperature was increased from 60 to 175 �C at 6 �C/min, then increased at 3 �C/min until 240 �C, and finally held at 300 �C for 7 min.Injector and transfer line temperatures were 280 and 300 �C, respectively (Pérezet al. 2001). Selected ion monitoring (SIM) mode was employed for data acqui-sition. PAHs were extracted from aqueous solution using dichloromethane. EachPAH was separately quantified using a five-point calibration of mixed standardsolutions in the range from 5 to 25 lg/L.
Calculations
Instantaneous current efficiency (ICE) and energy consumption (EC) were deter-mined as:
Electrochemical Oxidation of PAHs in Aqueous Solution 91
ICE ¼CODð Þi� CODð Þf
h i8IDt
FV
EC ¼ IuDt
CODð Þi� CODð Þfh i
V
where (COD)i and (COD)f are initial and final chemical oxygen demand at timet = 0 and time Dt, respectively, mg/L; I is current, A; u is voltage, V; F is Faradayconstant, 96,487 C/mol; V is volume of the solution, L; and 8 is a dimensionalfactor for unit consistency.
Results and Discussion
Effect of Anode and Structure of Coated SnO2
Figure 1 shows nano-scale particles on the coated surface of Ti/SnO2 electrodes.21–25 nm particles were uniformly distributed, providing active sites for elec-trochemical oxidation of PAHs. EDAX of electrode surface confirms the presenceof tin and oxygen at wt% of 61.28 and 35.91, respectively, (Fig. 2). Oxidation ofH2O on the electrode surface forms hydroxyl radicals (OH•) which oxidize thecrystal lattice of SnO2 to form higher oxides (SnO2+x). Due to high reactivitytoward most organic compounds, OH• readily reacts with organic substrates nearthe anode surface to form CO2 and H2O. Electro-oxidation of organics is repre-sented by Eqs. 1–4 below (Bouya et al. 2012). RO represents incomplete oxidationof organics and formation of intermediates. Complete oxidation of organics occursmore easily (Eq. 4).
Fig. 1 FESEM surfaceimages of the Ti/SnO2
surface
92 A. Yaqub et al.
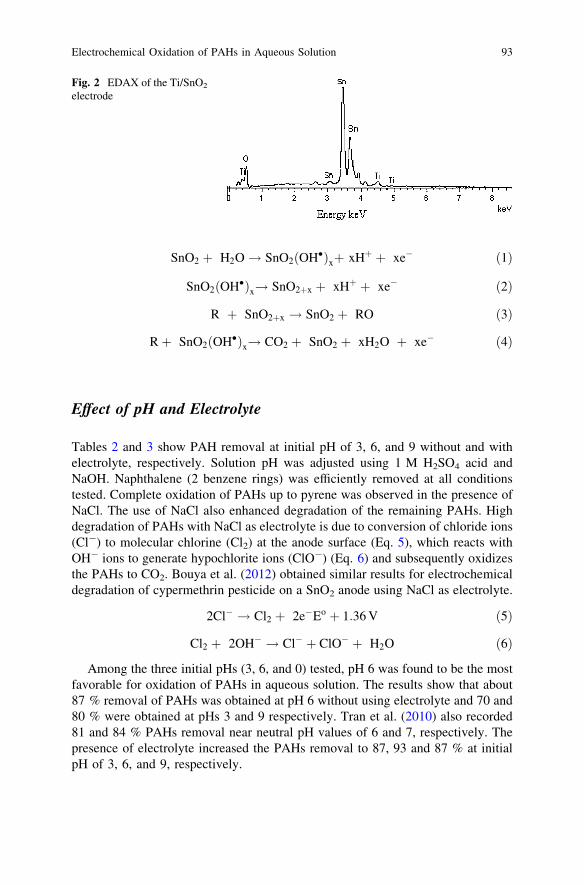
SnO2 þ H2O! SnO2 OH�ð Þxþ xHþ þ xe� ð1Þ
SnO2 OH�ð Þx! SnO2þx þ xHþ þ xe� ð2Þ
R þ SnO2þx ! SnO2 þ RO ð3Þ
Rþ SnO2 OH�ð Þx! CO2 þ SnO2 þ xH2O þ xe� ð4Þ
Effect of pH and Electrolyte
Tables 2 and 3 show PAH removal at initial pH of 3, 6, and 9 without and withelectrolyte, respectively. Solution pH was adjusted using 1 M H2SO4 acid andNaOH. Naphthalene (2 benzene rings) was efficiently removed at all conditionstested. Complete oxidation of PAHs up to pyrene was observed in the presence ofNaCl. The use of NaCl also enhanced degradation of the remaining PAHs. Highdegradation of PAHs with NaCl as electrolyte is due to conversion of chloride ions(Cl-) to molecular chlorine (Cl2) at the anode surface (Eq. 5), which reacts withOH- ions to generate hypochlorite ions (ClO-) (Eq. 6) and subsequently oxidizesthe PAHs to CO2. Bouya et al. (2012) obtained similar results for electrochemicaldegradation of cypermethrin pesticide on a SnO2 anode using NaCl as electrolyte.
2Cl� ! Cl2 þ 2e�Eo þ 1:36 V ð5Þ
Cl2 þ 2OH� ! Cl� þ ClO� þ H2O ð6Þ
Among the three initial pHs (3, 6, and 0) tested, pH 6 was found to be the mostfavorable for oxidation of PAHs in aqueous solution. The results show that about87 % removal of PAHs was obtained at pH 6 without using electrolyte and 70 and80 % were obtained at pHs 3 and 9 respectively. Tran et al. (2010) also recorded81 and 84 % PAHs removal near neutral pH values of 6 and 7, respectively. Thepresence of electrolyte increased the PAHs removal to 87, 93 and 87 % at initialpH of 3, 6, and 9, respectively.
Fig. 2 EDAX of the Ti/SnO2
electrode
Electrochemical Oxidation of PAHs in Aqueous Solution 93
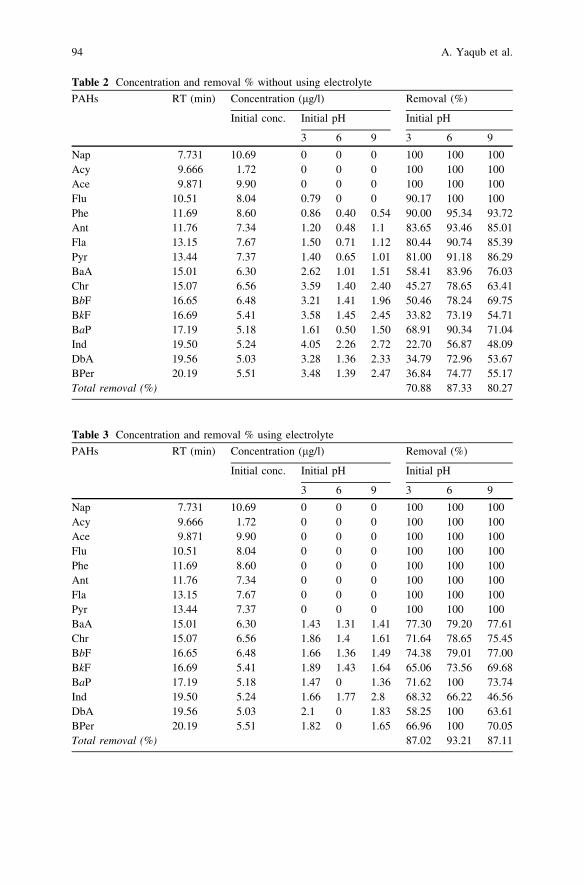
Table 2 Concentration and removal % without using electrolyte
PAHs RT (min) Concentration (lg/l) Removal (%)
Initial conc. Initial pH Initial pH
3 6 9 3 6 9
Nap 7.731 10.69 0 0 0 100 100 100Acy 9.666 1.72 0 0 0 100 100 100Ace 9.871 9.90 0 0 0 100 100 100Flu 10.51 8.04 0.79 0 0 90.17 100 100Phe 11.69 8.60 0.86 0.40 0.54 90.00 95.34 93.72Ant 11.76 7.34 1.20 0.48 1.1 83.65 93.46 85.01Fla 13.15 7.67 1.50 0.71 1.12 80.44 90.74 85.39Pyr 13.44 7.37 1.40 0.65 1.01 81.00 91.18 86.29BaA 15.01 6.30 2.62 1.01 1.51 58.41 83.96 76.03Chr 15.07 6.56 3.59 1.40 2.40 45.27 78.65 63.41BbF 16.65 6.48 3.21 1.41 1.96 50.46 78.24 69.75BkF 16.69 5.41 3.58 1.45 2.45 33.82 73.19 54.71BaP 17.19 5.18 1.61 0.50 1.50 68.91 90.34 71.04Ind 19.50 5.24 4.05 2.26 2.72 22.70 56.87 48.09DbA 19.56 5.03 3.28 1.36 2.33 34.79 72.96 53.67BPer 20.19 5.51 3.48 1.39 2.47 36.84 74.77 55.17Total removal (%) 70.88 87.33 80.27
Table 3 Concentration and removal % using electrolyte
PAHs RT (min) Concentration (lg/l) Removal (%)
Initial conc. Initial pH Initial pH
3 6 9 3 6 9
Nap 7.731 10.69 0 0 0 100 100 100Acy 9.666 1.72 0 0 0 100 100 100Ace 9.871 9.90 0 0 0 100 100 100Flu 10.51 8.04 0 0 0 100 100 100Phe 11.69 8.60 0 0 0 100 100 100Ant 11.76 7.34 0 0 0 100 100 100Fla 13.15 7.67 0 0 0 100 100 100Pyr 13.44 7.37 0 0 0 100 100 100BaA 15.01 6.30 1.43 1.31 1.41 77.30 79.20 77.61Chr 15.07 6.56 1.86 1.4 1.61 71.64 78.65 75.45BbF 16.65 6.48 1.66 1.36 1.49 74.38 79.01 77.00BkF 16.69 5.41 1.89 1.43 1.64 65.06 73.56 69.68BaP 17.19 5.18 1.47 0 1.36 71.62 100 73.74Ind 19.50 5.24 1.66 1.77 2.8 68.32 66.22 46.56DbA 19.56 5.03 2.1 0 1.83 58.25 100 63.61BPer 20.19 5.51 1.82 0 1.65 66.96 100 70.05Total removal (%) 87.02 93.21 87.11
94 A. Yaqub et al.
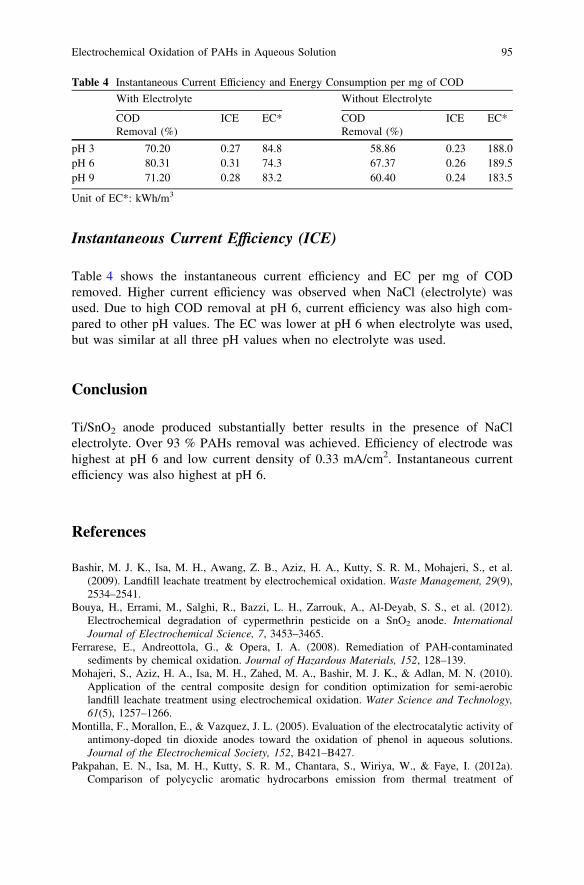
Instantaneous Current Efficiency (ICE)
Table 4 shows the instantaneous current efficiency and EC per mg of CODremoved. Higher current efficiency was observed when NaCl (electrolyte) wasused. Due to high COD removal at pH 6, current efficiency was also high com-pared to other pH values. The EC was lower at pH 6 when electrolyte was used,but was similar at all three pH values when no electrolyte was used.
Conclusion
Ti/SnO2 anode produced substantially better results in the presence of NaClelectrolyte. Over 93 % PAHs removal was achieved. Efficiency of electrode washighest at pH 6 and low current density of 0.33 mA/cm2. Instantaneous currentefficiency was also highest at pH 6.
References
Bashir, M. J. K., Isa, M. H., Awang, Z. B., Aziz, H. A., Kutty, S. R. M., Mohajeri, S., et al.(2009). Landfill leachate treatment by electrochemical oxidation. Waste Management, 29(9),2534–2541.
Bouya, H., Errami, M., Salghi, R., Bazzi, L. H., Zarrouk, A., Al-Deyab, S. S., et al. (2012).Electrochemical degradation of cypermethrin pesticide on a SnO2 anode. InternationalJournal of Electrochemical Science, 7, 3453–3465.
Ferrarese, E., Andreottola, G., & Opera, I. A. (2008). Remediation of PAH-contaminatedsediments by chemical oxidation. Journal of Hazardous Materials, 152, 128–139.
Mohajeri, S., Aziz, H. A., Isa, M. H., Zahed, M. A., Bashir, M. J. K., & Adlan, M. N. (2010).Application of the central composite design for condition optimization for semi-aerobiclandfill leachate treatment using electrochemical oxidation. Water Science and Technology,61(5), 1257–1266.
Montilla, F., Morallon, E., & Vazquez, J. L. (2005). Evaluation of the electrocatalytic activity ofantimony-doped tin dioxide anodes toward the oxidation of phenol in aqueous solutions.Journal of the Electrochemical Society, 152, B421–B427.
Pakpahan, E. N., Isa, M. H., Kutty, S. R. M., Chantara, S., Wiriya, W., & Faye, I. (2012a).Comparison of polycyclic aromatic hydrocarbons emission from thermal treatment of
Table 4 Instantaneous Current Efficiency and Energy Consumption per mg of COD
With Electrolyte Without Electrolyte
CODRemoval (%)
ICE EC* CODRemoval (%)
ICE EC*
pH 3 70.20 0.27 84.8 58.86 0.23 188.0pH 6 80.31 0.31 74.3 67.37 0.26 189.5pH 9 71.20 0.28 83.2 60.40 0.24 183.5
Unit of EC*: kWh/m3
Electrochemical Oxidation of PAHs in Aqueous Solution 95
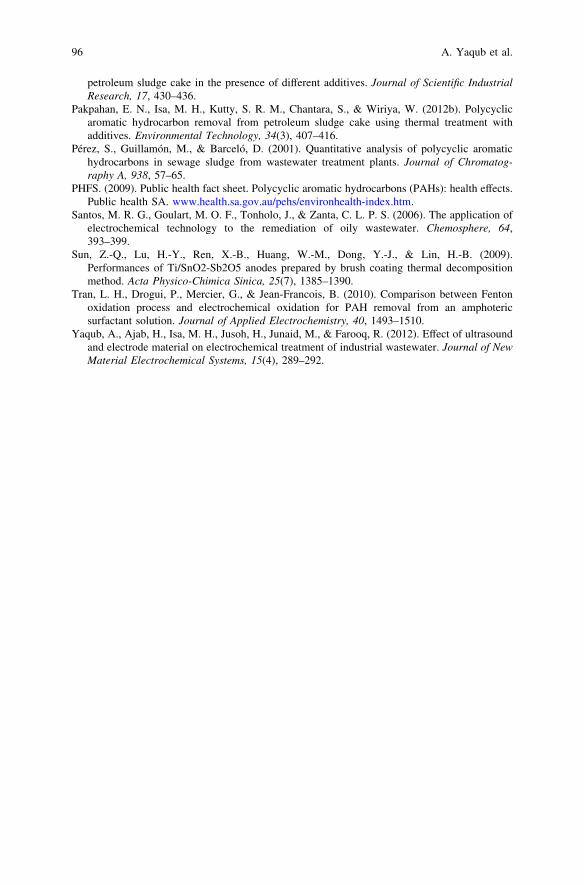
petroleum sludge cake in the presence of different additives. Journal of Scientific IndustrialResearch, 17, 430–436.
Pakpahan, E. N., Isa, M. H., Kutty, S. R. M., Chantara, S., & Wiriya, W. (2012b). Polycyclicaromatic hydrocarbon removal from petroleum sludge cake using thermal treatment withadditives. Environmental Technology, 34(3), 407–416.
Pérez, S., Guillamón, M., & Barceló, D. (2001). Quantitative analysis of polycyclic aromatichydrocarbons in sewage sludge from wastewater treatment plants. Journal of Chromatog-raphy A, 938, 57–65.
PHFS. (2009). Public health fact sheet. Polycyclic aromatic hydrocarbons (PAHs): health effects.Public health SA. www.health.sa.gov.au/pehs/environhealth-index.htm.
Santos, M. R. G., Goulart, M. O. F., Tonholo, J., & Zanta, C. L. P. S. (2006). The application ofelectrochemical technology to the remediation of oily wastewater. Chemosphere, 64,393–399.
Sun, Z.-Q., Lu, H.-Y., Ren, X.-B., Huang, W.-M., Dong, Y.-J., & Lin, H.-B. (2009).Performances of Ti/SnO2-Sb2O5 anodes prepared by brush coating thermal decompositionmethod. Acta Physico-Chimica Sinica, 25(7), 1385–1390.
Tran, L. H., Drogui, P., Mercier, G., & Jean-Francois, B. (2010). Comparison between Fentonoxidation process and electrochemical oxidation for PAH removal from an amphotericsurfactant solution. Journal of Applied Electrochemistry, 40, 1493–1510.
Yaqub, A., Ajab, H., Isa, M. H., Jusoh, H., Junaid, M., & Farooq, R. (2012). Effect of ultrasoundand electrode material on electrochemical treatment of industrial wastewater. Journal of NewMaterial Electrochemical Systems, 15(4), 289–292.
96 A. Yaqub et al.
Sonocatalytic Degradation of Acid RedDye in Water Using Fe-Doped TiO2
Deposited on HY Catalyst
A. H. Alwash, N. A. Jamalluddin, N. Ismailand A. Z. Abdullah
Abstract This study addresses the properties affecting the activity and stability ofFe/Ti-NaY heterogeneous catalysts with different Fe and Ti loadings in ultra-sound-irradiated decolorization of Amaranth dye in aqueous solution. The cata-lysts were prepared using an ion-exchange method followed by an impregnationmethod. Different characterization techniques, i.e., XRD, AFM, UV–Vis, andSEM/EDAX, were performed to characterize the catalysts. TiO2 was successfullyencapsulated within the internal pore of the zeolite resulted in a blue shift towardshorter wave length. On the other hand, Fe deposition on the external surfacecaused a red shift and reduced the surface roughness. Loading of Ti and Fe slightlyincreased the hydrophilicity of the heterogeneous catalyst. Increasing amount ofFe above the optimum value could also cause the scavenging of •OH radicals andhigher consumption of hydrogen peroxide. External H2O2 could be used toaccelerate the sonocatalytic reaction.
Introduction
Ultrasonic (US) waves have the ability to decompose water molecules intoextremely reactive hydrogen (H•) and hydroxyl (•OH) radicals by the heat that isgenerated during the cavity implosion. The synergetic effect between ultrasound
A. H. AlwashDepartment of Chemistry, College of Science, Al-Nahrain University, Al-Jadirya,Baghdad, Iraq
A. H. Alwash � N. A. Jamalluddin � A. Z. Abdullah (&)School of Chemical Engineering, Universiti Sains Malaysia, 14300 Nibong Tebal,Penang, Malaysiae-mail: [email protected]
N. IsmailSchool of Industrial Technology, Universiti Sains Malaysia, 11800 Nibong Tebal,Penang, Malaysia
R. Pogaku et al. (eds.), Developments in Sustainable Chemicaland Bioprocess Technology, DOI: 10.1007/978-1-4614-6208-8_13,� Springer Science+Business Media New York 2013
97
irradiation and heterogeneous catalyst provides advantages with respect to thedesired formation of radical species. Titanium dioxide (TiO2) is one of the mostefficient photocatalysts, but it has poor catalytic activity when used alone due tothe fast charge carrier recombination in addition to the recycling difficulties (Ökteand Yilmaz 2009a). Therefore, there is a strong need to overcome these drawbacksby doping suitable metals to increase its activity (Mirkhani et al. 2009), while theuse of porous supports such as zeolite for the TiO2 particles could result in acatalyst with higher surface area. Different advantages have been obtained fromthe loading of TiO2 on zeolite, i.e., increasing the concentration of TiO2 withoutthe problem of aggregation, especially at higher concentration, uncomplicatedseparation or filtration process, the adsorption of intermediate products that areproduced after the reaction, the ability to concentrate the pollutants near TiO2
particles and better recyclability of the catalyst (Ökte and Yilmaz 2009b).Certain metals especially Fe can be incorporated into the heterogeneous cata-
lysts to be used in the ultrasound-accelerated process to enhance the generation of•OH radicals during the reaction. Although homogeneous Fe catalyst (Fentoncatalyst) can also be used in an US process, it is not a preferred approach. This isdue to some drawbacks with respect to the high consumption of hydrogen per-oxide, narrow range of applicable pH value, and difficulty in the separation of ironions from the treated solution (Chen et al. 2010). To eliminate these drawbacks,heterogeneous catalysts can be developed by immobilizing Fe(III) ions on suitablesupports. Jamalluddin and Abdullah (2011) reported the doping of Fe(III) intodifferent supports such as TiO2 and zeolite Y to produce active heterogeneouscatalysts for sonocatalytic degradation of organic water pollutants. The removal ofdyes was found to be significantly improved after doping of Fe ions into TiO2 andzeolite Y as compared to the activity achieved with the pure support materials.However, the amount of Fe(III) ions incorporated into both TiO2 and zeolite cansignificantly affect the characteristics and the stability of the catalysts.
Methodology
Catalyst Preparation
HY zeolite was first converted into its sodium form by means of an ion-exchangemethod (Tayade et al. 2007). TiO2
- modified NaY zeolite was prepared using asimilar procedure as reported by Liu et al. (1992). Different concentrations(5.6–28.2 mM) of potassium titanooxalate solution were first prepared in 100 mlwater. The catalysts are denoted as Ti1-NaY, Ti2-NaY, Ti3-NaY, and Ti4-NaYaccording to the increasing loading of titanium in the catalyst. After calcination at550 �C for 5 h, they were ground into fine powder and kept in a dry cabinet. TheNaY material with the highest loading of titanium (Ti4-NaY) was then chosen as asupport for the loading of Fe ions ranging from 0.2 to 1.0 wt.% using impregnation
98 A. H. Alwash et al.
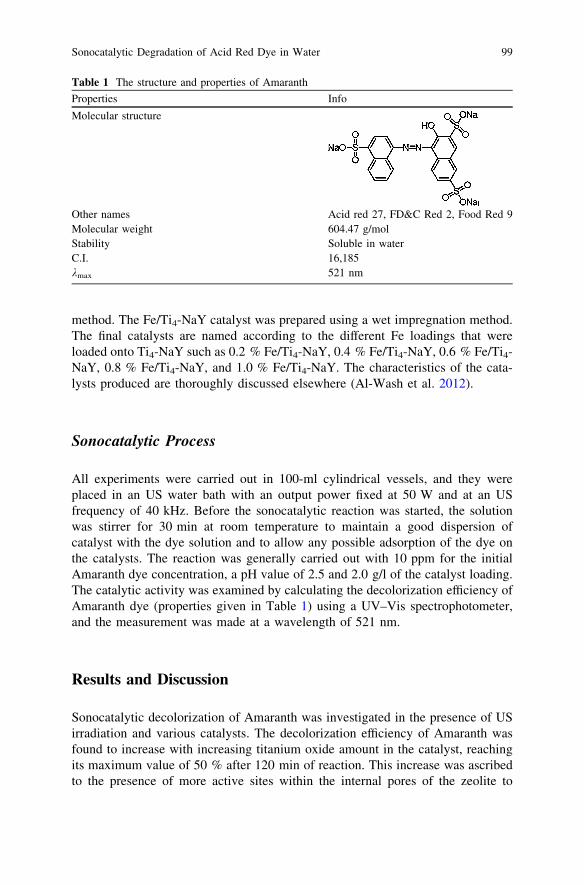
method. The Fe/Ti4-NaY catalyst was prepared using a wet impregnation method.The final catalysts are named according to the different Fe loadings that wereloaded onto Ti4-NaY such as 0.2 % Fe/Ti4-NaY, 0.4 % Fe/Ti4-NaY, 0.6 % Fe/Ti4-NaY, 0.8 % Fe/Ti4-NaY, and 1.0 % Fe/Ti4-NaY. The characteristics of the cata-lysts produced are thoroughly discussed elsewhere (Al-Wash et al. 2012).
Sonocatalytic Process
All experiments were carried out in 100-ml cylindrical vessels, and they wereplaced in an US water bath with an output power fixed at 50 W and at an USfrequency of 40 kHz. Before the sonocatalytic reaction was started, the solutionwas stirrer for 30 min at room temperature to maintain a good dispersion ofcatalyst with the dye solution and to allow any possible adsorption of the dye onthe catalysts. The reaction was generally carried out with 10 ppm for the initialAmaranth dye concentration, a pH value of 2.5 and 2.0 g/l of the catalyst loading.The catalytic activity was examined by calculating the decolorization efficiency ofAmaranth dye (properties given in Table 1) using a UV–Vis spectrophotometer,and the measurement was made at a wavelength of 521 nm.
Results and Discussion
Sonocatalytic decolorization of Amaranth was investigated in the presence of USirradiation and various catalysts. The decolorization efficiency of Amaranth wasfound to increase with increasing titanium oxide amount in the catalyst, reachingits maximum value of 50 % after 120 min of reaction. This increase was ascribedto the presence of more active sites within the internal pores of the zeolite to
Table 1 The structure and properties of Amaranth
Properties Info
Molecular structure
Other names Acid red 27, FD&C Red 2, Food Red 9Molecular weight 604.47 g/molStability Soluble in waterC.I. 16,185kmax 521 nm
Sonocatalytic Degradation of Acid Red Dye in Water 99
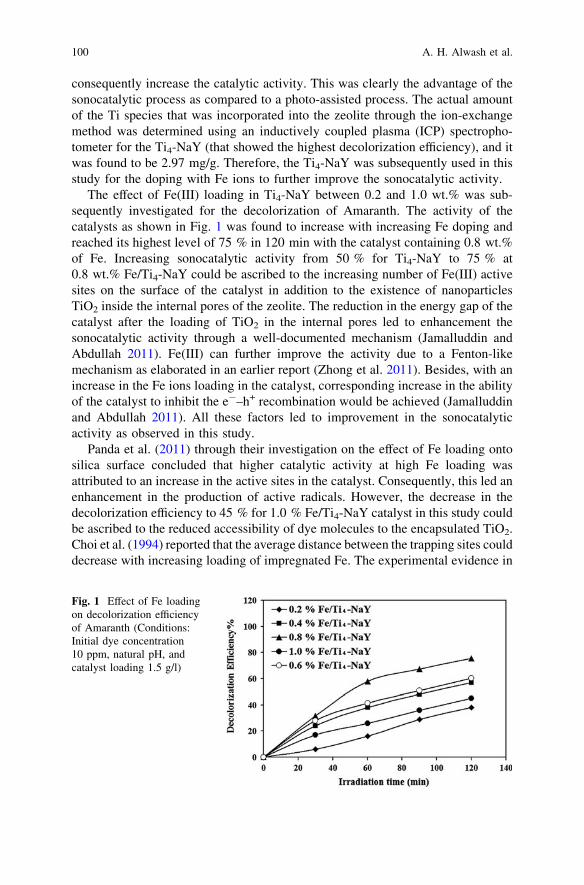
consequently increase the catalytic activity. This was clearly the advantage of thesonocatalytic process as compared to a photo-assisted process. The actual amountof the Ti species that was incorporated into the zeolite through the ion-exchangemethod was determined using an inductively coupled plasma (ICP) spectropho-tometer for the Ti4-NaY (that showed the highest decolorization efficiency), and itwas found to be 2.97 mg/g. Therefore, the Ti4-NaY was subsequently used in thisstudy for the doping with Fe ions to further improve the sonocatalytic activity.
The effect of Fe(III) loading in Ti4-NaY between 0.2 and 1.0 wt.% was sub-sequently investigated for the decolorization of Amaranth. The activity of thecatalysts as shown in Fig. 1 was found to increase with increasing Fe doping andreached its highest level of 75 % in 120 min with the catalyst containing 0.8 wt.%of Fe. Increasing sonocatalytic activity from 50 % for Ti4-NaY to 75 % at0.8 wt.% Fe/Ti4-NaY could be ascribed to the increasing number of Fe(III) activesites on the surface of the catalyst in addition to the existence of nanoparticlesTiO2 inside the internal pores of the zeolite. The reduction in the energy gap of thecatalyst after the loading of TiO2 in the internal pores led to enhancement thesonocatalytic activity through a well-documented mechanism (Jamalluddin andAbdullah 2011). Fe(III) can further improve the activity due to a Fenton-likemechanism as elaborated in an earlier report (Zhong et al. 2011). Besides, with anincrease in the Fe ions loading in the catalyst, corresponding increase in the abilityof the catalyst to inhibit the e-–h+ recombination would be achieved (Jamalluddinand Abdullah 2011). All these factors led to improvement in the sonocatalyticactivity as observed in this study.
Panda et al. (2011) through their investigation on the effect of Fe loading ontosilica surface concluded that higher catalytic activity at high Fe loading wasattributed to an increase in the active sites in the catalyst. Consequently, this led anenhancement in the production of active radicals. However, the decrease in thedecolorization efficiency to 45 % for 1.0 % Fe/Ti4-NaY catalyst in this study couldbe ascribed to the reduced accessibility of dye molecules to the encapsulated TiO2.Choi et al. (1994) reported that the average distance between the trapping sites coulddecrease with increasing loading of impregnated Fe. The experimental evidence in
Fig. 1 Effect of Fe loadingon decolorization efficiencyof Amaranth (Conditions:Initial dye concentration10 ppm, natural pH, andcatalyst loading 1.5 g/l)
100 A. H. Alwash et al.
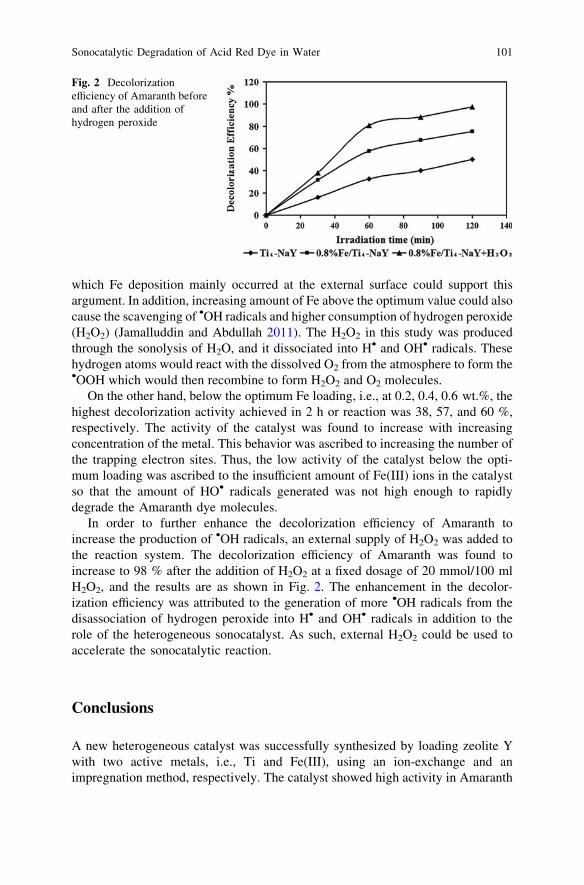
which Fe deposition mainly occurred at the external surface could support thisargument. In addition, increasing amount of Fe above the optimum value could alsocause the scavenging of •OH radicals and higher consumption of hydrogen peroxide(H2O2) (Jamalluddin and Abdullah 2011). The H2O2 in this study was producedthrough the sonolysis of H2O, and it dissociated into H• and OH• radicals. Thesehydrogen atoms would react with the dissolved O2 from the atmosphere to form the•OOH which would then recombine to form H2O2 and O2 molecules.
On the other hand, below the optimum Fe loading, i.e., at 0.2, 0.4, 0.6 wt.%, thehighest decolorization activity achieved in 2 h or reaction was 38, 57, and 60 %,respectively. The activity of the catalyst was found to increase with increasingconcentration of the metal. This behavior was ascribed to increasing the number ofthe trapping electron sites. Thus, the low activity of the catalyst below the opti-mum loading was ascribed to the insufficient amount of Fe(III) ions in the catalystso that the amount of HO• radicals generated was not high enough to rapidlydegrade the Amaranth dye molecules.
In order to further enhance the decolorization efficiency of Amaranth toincrease the production of •OH radicals, an external supply of H2O2 was added tothe reaction system. The decolorization efficiency of Amaranth was found toincrease to 98 % after the addition of H2O2 at a fixed dosage of 20 mmol/100 mlH2O2, and the results are as shown in Fig. 2. The enhancement in the decolor-ization efficiency was attributed to the generation of more •OH radicals from thedisassociation of hydrogen peroxide into H• and OH• radicals in addition to therole of the heterogeneous sonocatalyst. As such, external H2O2 could be used toaccelerate the sonocatalytic reaction.
Conclusions
A new heterogeneous catalyst was successfully synthesized by loading zeolite Ywith two active metals, i.e., Ti and Fe(III), using an ion-exchange and animpregnation method, respectively. The catalyst showed high activity in Amaranth
Fig. 2 Decolorizationefficiency of Amaranth beforeand after the addition ofhydrogen peroxide
Sonocatalytic Degradation of Acid Red Dye in Water 101
dye degradation, and increasing activity was demonstrated with increasing Feloading to 0.8 wt.%. Further increase was demonstrated by the system when20 mmol/100 ml H2O2 was added. Increasing amount of Fe above the optimumvalue could also cause the scavenging of •OH radicals and higher consumption ofhydrogen peroxide. Thus, this catalyst was highly potential in achieving highdecolorization efficiency of Amaranth while showing a small amount of leachinginto the solution.
References
Al-Wash, A. H., Abdullah, A. Z., & Ismail, N. (2012). Zeolite Y encapsulated with Fe-TiO2 forultrasound-assisted degradation of amaranth dye in water. Journal of Hazardous Materials,233–234, 184–193.
Chen, F., Li, Y., Cai, W., & Zhang, J. (2010). Preparation and sono-Fenton performance of 4A-zeolite supported a-Fe2O3. Journal of Hazardous Materials, 177, 743–749.
Choi, W., Termin, A., & Hoffmann, M. R. (1994). The role of metal ion dopants in quantum-sizedTiO2: Correlation between photoreactivity and charge carrier recombination dynamics.Journal of Physical Chemistry, 98, 13669–13679.
Jamalluddin, N. A., & Abdullah, A. Z. (2011). Effect of pH and catalyst dosage on the leaching ofFe from Fe(III) doped zeolite Y used for sonocatalytic degradation of Acid Red B. ResearchJournal of Chemistry and Environment, 15, 860–865.
Liu, X., Iu, K.-K., & Thomas, J. K. (1992). Encapsulation of TiO2 in zeolite Y. Chemical PhysicsLetters, 195, 163–168.
Mirkhani, V., Tangestaninejad, S., Moghadam, M., Habibi, M., & Rostami-Vartooni, A. (2009).Photocatalytic degradation of azo dyes catalyzed by Ag doped TiO2 Photocatalyst. Journal ofIranian Chemical Society, 6, 578–587.
Ökte, A. N., & Yilmaz, Ö. (2009a). La and Ce loaded TiO2-ZSM-5 catalysts: Comparativecharacterization and photocatalytic activity investigations. Microporous and MesoporousMaterials, 126, 245–252.
Ökte, A. N., & Yilmaz, Ö. (2009b). Characteristics of lanthanum loaded TiO2-ZSM-5photocatalysts: Decolorization and degradation processes of Methyl Orange. AppliedCatalysis, A: General, 354, 132–142.
Panda, N., Sahoo, H., & Mohapatra, S. (2011). Decolourization of methyl orange using Fenton-like mesoporous Fe2O3–SiO2 composite. Journal of Hazardous Materials, 185, 359–365.
Tayade, R. J., Kulkarni, R. G., & Jasra, R. V. (2007). Enhanced photocatalytic activity of TiO2-Coated NaY and HY zeolites for the degradation of Methylene Blue in water. Industrial andEngineering Chemistry Research, 46, 369–376.
Zhong, X., Royer, S., Zhang, H., Huang, Q., Xiang, L., Valange, S., et al. (2011). Mesoporoussilica iron-doped as stable and efficient heterogeneous catalyst for the degradation of C.I. AcidOrange 7 using sono-photo-Fenton process. Separation and Purification Technology, 80,163–171.
102 A. H. Alwash et al.
Investigation of the Effect of PhosphoricAcid (H3PO4) on Rate of Oil and SolidSeparation in Palm Oil Mill Clarifier
F. P. S. Wong and S. Y. Yong
Abstract In recent years, there is a growing demand for palm oil which is drivenby the increase in human population and biodiesel production. In the palm oilmilling process, a large quantity of water is consumed for the oil extraction processand consequently a large amount of wastewater is generated which is termed aspalm oil mill effluent (POME). POME is a liquid waste having a high content ofbiochemical oxygen demand (BOD) that deteriorates the quality of river water andpollutes the environment. Despite the development of various treatment systems torecover the water, a reduction in the production of this wastewater is still the bestchoice. This research seeks to improve the rate of separation of oil and solid in theclarifier mixture (CM) to improve the rate of oil recovery, which will lead to areduction in wastewater generation and faster water recovery. Experiments werecarried out to investigate the effect of dilution at 0, 80:20, 70:30, and 60:40 CM–water ratios, operating temperature at 70, 80, and 90 �C, and phosphoric acidapplication of 0, 0.1, 0.3, and 0.5 % on the rate of separation. The results revealedthat the best rate of oil flotation could be obtained at a temperature of 90 �C withthe treatment of 0.3 % H3PO4 in the undiluted CM. The addition of H3PO4 couldneutralize the negative charges of oil by the introduction of positively chargedhydrogen ions to enhance the coalescences of oil droplets. It could also induce thedegumming process that could remove the emulsifying components of palm oilsuch as phosphatide. This could lead to a higher rate of solid and oil separationbecause when the emulsion was broken, oil density was reduced and the viscosityof the CM was reduced.
Keywords POME � Clarifier � Rate � Separation � Phosphoric acid � Oil � Solid
F. P. S. Wong (&) � S. Y. YongChemical Engineering Department, School of Engineering and Science,Curtin University, CDT 250, 98009 Sarawak, Malaysiae-mail: [email protected]
S. Y. Yonge-mail: [email protected]
R. Pogaku et al. (eds.), Developments in Sustainable Chemicaland Bioprocess Technology, DOI: 10.1007/978-1-4614-6208-8_14,� Springer Science+Business Media New York 2013
103
Introduction
The oil palm industry is one of the highest pollution-generating agro-industries inMalaysia (Sumathi 2004). The largest source of pollution in this industry is thehuge volume of palm oil mill effluent (POME). From the production in year 2011,the amount of POME generated was 36,021,943 tonnes as reported by MalaysianPalm Oil Board (2011). The residue oil and solids are the major components ofPOME that cause high biochemical oxygen demand (BOD) level of 25,000mg/liter (Ahmad et al. 2003). This hazardous characteristic of POME has moti-vated a wide range of research on the treatment systems and technologies.
However, prevention is always better than cure. The reduction in the generationof waste is still a better approach to mitigate the harmful impact of POME. Theexisting measure adopted by the majority of palm oil mills (POM) for reduction ofPOME production is the use of 3-phase decanters. The effluent discharged contains95–96 % water, 0.6–0.7 % (4,000 mg/l) oil and grease, and 4–5 % total solids(Ahmad et al. 2003).
POME with such characteristics requires hydraulic retention time (HRT) ofabout 40–60 days with the existing pond treatment system as practiced by 85 % ofPOM in Malaysia (Rupani et al. 2010). The long HRT is not environmentalfriendly because it deprives the environment of a huge amount of portable waterfor such long period of time. Therefore, further reduction in residue oil and solid isdesirable to lower BOD level and to shorten the duration for treatment. However,the amount of residue oil in POME is so well emulsified in the suspended solid thatit is not easily recovered both chemically and mechanically.
There are a range of studies done on the improvement of oil and solid sepa-ration from POME as a result of the implementation of discharge regulations byDepartment of Environment in Malaysia. Some conventional methods of treatmentinclude gravitational methods such as API separators, corrugated plate interceptors(CPI), chemical treatment that uses sulfuric acid, aluminum sulfate and others asemulsion breaker, and dissolved air flotation (DAF). However, the efficiency ofthese methods in separating oil and solids from the oily wastewater is oftenunsatisfactory particularly when the oil droplets are finely dispersed in diluteconcentration and there are inconsistent variations in the composition of thewastewater (Alade et al. 2011). More recent studies were done using adsorptiontechniques with various adsorbents such as Chitosan adsorbent and rubber powderwhich achieve about 80 % of oil removal. However, this method has only beendone on lab scale. Its performance at pilot and commercial scales is yet to bedemonstrated (Ahmad et al. 2005a, b). The application of membrane separation forthe treatment of oily wastewater is demanded due to its high efficiency to handle alow concentration of oil. However, its operation can often be hindered by mem-brane fouling, and its economical advantage has not been that robust because ofthe high capital and maintenance cost (Alade et al. 2011).
This research aims at investigating the rate of separation of oil and solid in theclarifier mixture (CM) (40 % oil, 3 % solid, and 57 % water) to improve the rate
104 F. P. S. Wong and S. Y. Yong
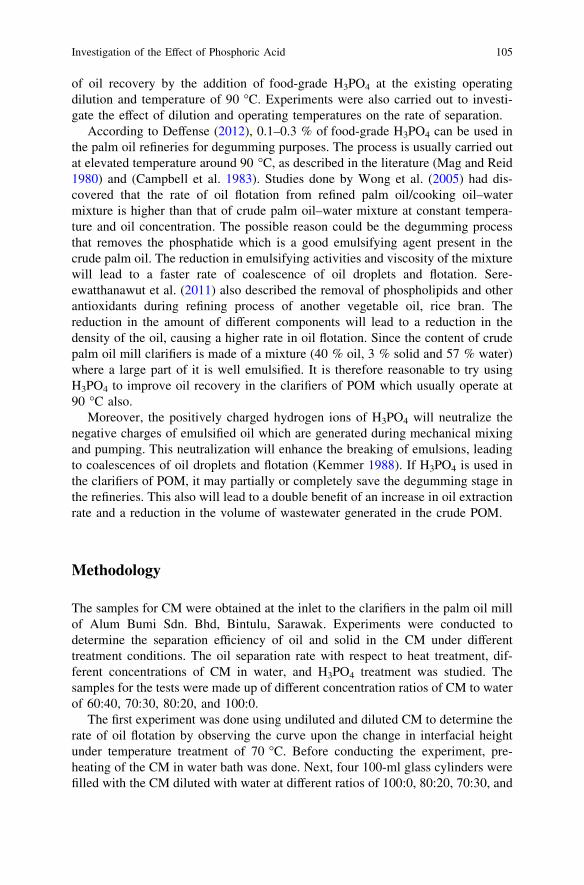
of oil recovery by the addition of food-grade H3PO4 at the existing operatingdilution and temperature of 90 �C. Experiments were also carried out to investi-gate the effect of dilution and operating temperatures on the rate of separation.
According to Deffense (2012), 0.1–0.3 % of food-grade H3PO4 can be used inthe palm oil refineries for degumming purposes. The process is usually carried outat elevated temperature around 90 �C, as described in the literature (Mag and Reid1980) and (Campbell et al. 1983). Studies done by Wong et al. (2005) had dis-covered that the rate of oil flotation from refined palm oil/cooking oil–watermixture is higher than that of crude palm oil–water mixture at constant tempera-ture and oil concentration. The possible reason could be the degumming processthat removes the phosphatide which is a good emulsifying agent present in thecrude palm oil. The reduction in emulsifying activities and viscosity of the mixturewill lead to a faster rate of coalescence of oil droplets and flotation. Sere-ewatthanawut et al. (2011) also described the removal of phospholipids and otherantioxidants during refining process of another vegetable oil, rice bran. Thereduction in the amount of different components will lead to a reduction in thedensity of the oil, causing a higher rate in oil flotation. Since the content of crudepalm oil mill clarifiers is made of a mixture (40 % oil, 3 % solid and 57 % water)where a large part of it is well emulsified. It is therefore reasonable to try usingH3PO4 to improve oil recovery in the clarifiers of POM which usually operate at90 �C also.
Moreover, the positively charged hydrogen ions of H3PO4 will neutralize thenegative charges of emulsified oil which are generated during mechanical mixingand pumping. This neutralization will enhance the breaking of emulsions, leadingto coalescences of oil droplets and flotation (Kemmer 1988). If H3PO4 is used inthe clarifiers of POM, it may partially or completely save the degumming stage inthe refineries. This also will lead to a double benefit of an increase in oil extractionrate and a reduction in the volume of wastewater generated in the crude POM.
Methodology
The samples for CM were obtained at the inlet to the clarifiers in the palm oil millof Alum Bumi Sdn. Bhd, Bintulu, Sarawak. Experiments were conducted todetermine the separation efficiency of oil and solid in the CM under differenttreatment conditions. The oil separation rate with respect to heat treatment, dif-ferent concentrations of CM in water, and H3PO4 treatment was studied. Thesamples for the tests were made up of different concentration ratios of CM to waterof 60:40, 70:30, 80:20, and 100:0.
The first experiment was done using undiluted and diluted CM to determine therate of oil flotation by observing the curve upon the change in interfacial heightunder temperature treatment of 70 �C. Before conducting the experiment, pre-heating of the CM in water bath was done. Next, four 100-ml glass cylinders werefilled with the CM diluted with water at different ratios of 100:0, 80:20, 70:30, and
Investigation of the Effect of Phosphoric Acid 105
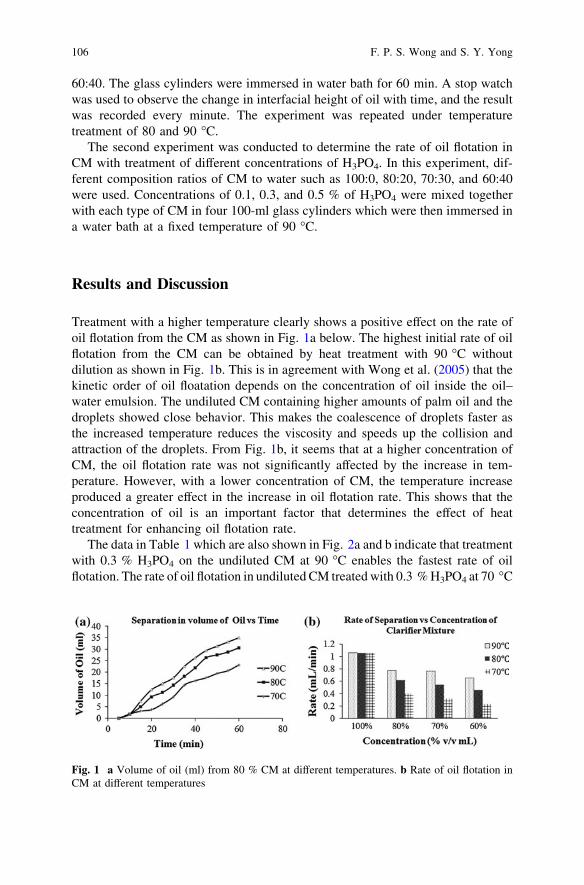
60:40. The glass cylinders were immersed in water bath for 60 min. A stop watchwas used to observe the change in interfacial height of oil with time, and the resultwas recorded every minute. The experiment was repeated under temperaturetreatment of 80 and 90 �C.
The second experiment was conducted to determine the rate of oil flotation inCM with treatment of different concentrations of H3PO4. In this experiment, dif-ferent composition ratios of CM to water such as 100:0, 80:20, 70:30, and 60:40were used. Concentrations of 0.1, 0.3, and 0.5 % of H3PO4 were mixed togetherwith each type of CM in four 100-ml glass cylinders which were then immersed ina water bath at a fixed temperature of 90 �C.
Results and Discussion
Treatment with a higher temperature clearly shows a positive effect on the rate ofoil flotation from the CM as shown in Fig. 1a below. The highest initial rate of oilflotation from the CM can be obtained by heat treatment with 90 �C withoutdilution as shown in Fig. 1b. This is in agreement with Wong et al. (2005) that thekinetic order of oil floatation depends on the concentration of oil inside the oil–water emulsion. The undiluted CM containing higher amounts of palm oil and thedroplets showed close behavior. This makes the coalescence of droplets faster asthe increased temperature reduces the viscosity and speeds up the collision andattraction of the droplets. From Fig. 1b, it seems that at a higher concentration ofCM, the oil flotation rate was not significantly affected by the increase in tem-perature. However, with a lower concentration of CM, the temperature increaseproduced a greater effect in the increase in oil flotation rate. This shows that theconcentration of oil is an important factor that determines the effect of heattreatment for enhancing oil flotation rate.
The data in Table 1 which are also shown in Fig. 2a and b indicate that treatmentwith 0.3 % H3PO4 on the undiluted CM at 90 �C enables the fastest rate of oilflotation. The rate of oil flotation in undiluted CM treated with 0.3 % H3PO4 at 70 �C
Fig. 1 a Volume of oil (ml) from 80 % CM at different temperatures. b Rate of oil flotation inCM at different temperatures
106 F. P. S. Wong and S. Y. Yong
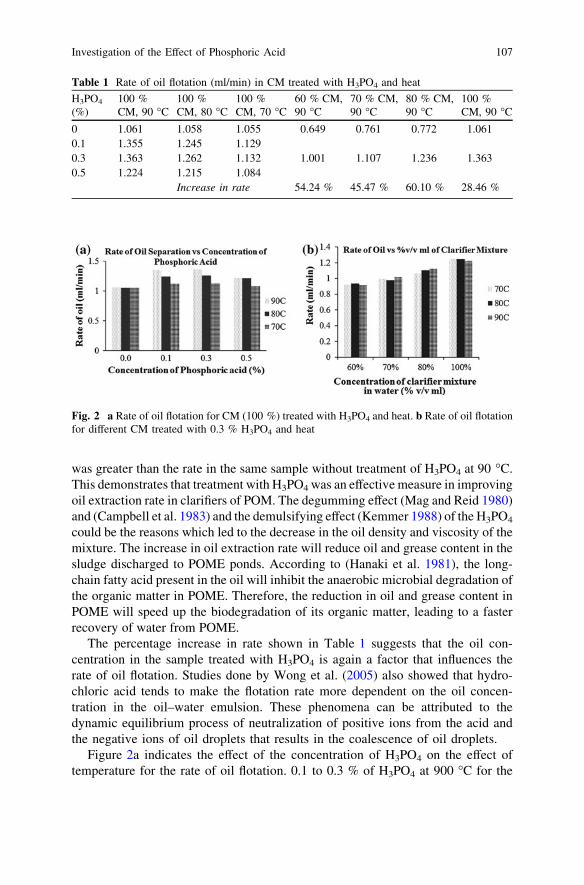
was greater than the rate in the same sample without treatment of H3PO4 at 90 �C.This demonstrates that treatment with H3PO4 was an effective measure in improvingoil extraction rate in clarifiers of POM. The degumming effect (Mag and Reid 1980)and (Campbell et al. 1983) and the demulsifying effect (Kemmer 1988) of the H3PO4
could be the reasons which led to the decrease in the oil density and viscosity of themixture. The increase in oil extraction rate will reduce oil and grease content in thesludge discharged to POME ponds. According to (Hanaki et al. 1981), the long-chain fatty acid present in the oil will inhibit the anaerobic microbial degradation ofthe organic matter in POME. Therefore, the reduction in oil and grease content inPOME will speed up the biodegradation of its organic matter, leading to a fasterrecovery of water from POME.
The percentage increase in rate shown in Table 1 suggests that the oil con-centration in the sample treated with H3PO4 is again a factor that influences therate of oil flotation. Studies done by Wong et al. (2005) also showed that hydro-chloric acid tends to make the flotation rate more dependent on the oil concen-tration in the oil–water emulsion. These phenomena can be attributed to thedynamic equilibrium process of neutralization of positive ions from the acid andthe negative ions of oil droplets that results in the coalescence of oil droplets.
Figure 2a indicates the effect of the concentration of H3PO4 on the effect oftemperature for the rate of oil flotation. 0.1 to 0.3 % of H3PO4 at 900 �C for the
Table 1 Rate of oil flotation (ml/min) in CM treated with H3PO4 and heat
H3PO4
(%)100 %CM, 90 �C
100 %CM, 80 �C
100 %CM, 70 �C
60 % CM,90 �C
70 % CM,90 �C
80 % CM,90 �C
100 %CM, 90 �C
0 1.061 1.058 1.055 0.649 0.761 0.772 1.0610.1 1.355 1.245 1.1290.3 1.363 1.262 1.132 1.001 1.107 1.236 1.3630.5 1.224 1.215 1.084
Increase in rate 54.24 % 45.47 % 60.10 % 28.46 %
Fig. 2 a Rate of oil flotation for CM (100 %) treated with H3PO4 and heat. b Rate of oil flotationfor different CM treated with 0.3 % H3PO4 and heat
Investigation of the Effect of Phosphoric Acid 107
undiluted CM will result in the highest oil flotation rate. Without the treatment ofH3PO4, an increase in temperature does not lead to any significant increase in therate of oil flotation in the undiluted CM.
Conclusion and Recommendation
The results in this study offer a promising route in the separation and recovery ofoil from the clarifiers of POM. The result could be summarized as follows:
• The highest rate of oil flotation was obtained from the undiluted CM treatedwith 0.3 % H3PO4 at 90 �C.
• An increase in temperature increased the rate of oil flotation, but less signifi-cantly in the undiluted CM than in diluted mixtures.
• Treatment with 0.3 % H3PO4 increases the rate of oil flotation at all testedtemperatures and dilutions of CM, but most significantly with the 80:20 CM towater ratio at 90 �C.
• It can be concluded that it is more feasible to treat the CM with H3PO4 for ahigher recovery rate of oil and a reduction of POME production than to treatPOME with HCl as suggested by Wong et al. (2005) due to too low percentageof oil present in POME.
Acknowledgments We wish to thank Alum Bumi Palm Oil Mill Sdn. Bhd and Curtin Uni-versity, Sarawak, Malaysia for their support in this project.
References
Ahmad, A. F., Ismail, S., & Bhatia, S. (2003). Water recycling from palm oil mill effluent(POME) using membrane technology. Desalination, 157, 87–95.
Ahmad, A. L., Bhatia, S., Ibrahim, N., & Sumathi, S. (2005a). Adsorption of residue oil frompalm oil mill effluent using rubber powder. Brazilian Journal of Chemical Engineering, 22(3).
Ahmad, A. L., Sumathi, S., & Hameed, B. H. (2005b). Residue oil and suspended solid removalusing natural adsorbents chitosan, bentonite and activated carbon: A comparative study.Chemical Engineering Journal, 108(1–2), 179–185.
Alade, A. O., Jameel, A. T., Muyubi, S. A., Abdul Karim, M. I., & Alam, M. Z. (2011). Removalof oil and grease as emerging pollutants of concern (EPC) in wastewater stream. IIUMEngineering Journal, 12(4).
Campbell, S. J., Nakayama, N., & Unger, E. H. (1983). Chemical degumming of crude vegetableoils, United Oilseed Products Ltd, Canadian Patent 1 157 883.
Deffense N.D. (2012). Edible oil processing—chemical degumming. http://lipidlibrary.aocs.org/processing/chem-degum/index.htm. Accessed 8 Aug 2012.
Hanaki, K., Matsuo, T., & Nagas, M. (1981). Mechanism of inhibition caused by long chain fattyacids in anaerobic digestion. Biotechnology and Bioengineering, 12, 1591–1610.
108 F. P. S. Wong and S. Y. Yong
Kemmer, F. N. (1988). Emulsion breaking in the Nalco water handbook (2nd edn, pp. 11.1–11.8).Singapore: McGraw-Hill.
Mag, T. K., & Reid, M. P. (1980). Continuous process for contacting of triglyceride oils with anacid. Canada Packers Limited, US Patent 4,240, 972.
Malaysian Palm Oil Board N.D. (2011). Economic and statistics—FFB processed by mill 2011.http://bepi.mpob.gov.my/index.php/statistics/sectoral-status/75-sectoral-status-2011.html.Accessed 8 Aug 2012.
Rupani, P. F., Singh, R. P., Ibrahim, M. H., & Esa, N. (2010). Review of current palm oil milleffluent (POME) treatment methods: Vermicomposting as a sustainable practice. WorldApplied Sciences Journal, 11(1), 70–81.
Sereewatthanawut, I., Baptista, I. I. R., Boam, A. T., Hodgson, A., & Livingston, A. G. (2011).Nanofiltration process for the nutritional enrichment and refining of rice bran oil. Journal ofFood Engineering, 102(1), 16–24.
Sumathi, S. (2004). Removal of residue oil from palm oil mill effluent (POME) using chitosan.Master’s thesis. Malaysia: School of Chemical Engineering, Universiti Sains Malaysia.
Wong, F., Nandong, J., Samyudia, F., & Tan, K. K. (2005). An experimental investigation on theoil separation from oil-water emulsion of palm oil mills effluent (POME). Conference onChemical and Bioprocess Engineering (ICCBPE 2005), 15th–17th Dec. Kota Kinabalu,Sabah, Malaysia.
Investigation of the Effect of Phosphoric Acid 109
Polyester Thin Film CompositeNanofiltration Membranes Preparedby Interfacial Polymerization Techniquefor Removal of Humic Acid
M. N. Abu Seman, N. A. Jalanni, C. K. M. Faizal and N. Hilal
Abstract Nanofiltration (NF) polyester thin film composite membranes have beenprepared through interfacial polymerization using a microporous polyethersulfonemembrane as support. The thin polyester layer formed on the top surface of themicroporous support layer was produced by the reaction of 6 %w/v of trietha-nolamine (TEOA) in aqueous solution and a solution containing trimesoyl chloride(TMC) for different reaction times (15, 25, and 35 min). The performance of themembranes was then characterized using permeation experiments with0.001–0.1 M of salt solutions (NaCl and Na2SO4) and 15 mg/l of humic acidsolution as a model for natural organic matter (NOM), normally found in surfacewater. This study has shown that through the interfacial polymerization technique,the variation of reaction time at a constant monomer concentration of 6 % w/v canaffect the properties of the membrane produced and indirectly influences themembrane performance. Increasing the reaction time resulted in decreasing waterpermeabilities. However, a higher removal of humic acid was observed.
M. N. Abu Seman (&) � N. A. Jalanni � C. K. M. FaizalFaculty of Chemical and Natural Resources Engineering, Universiti Malaysia Pahang,Lebuhraya Tun Razak, 26300 Gambang, Kuantan, Pahang, Malaysiae-mail: [email protected]
N. A. Jalannie-mail: [email protected]
C. K. M. Faizale-mail: [email protected]
N. HilalCentre for Water Advanced Technologies and Environmental Research (CWATER),Swansea University, Swansea SA2 8PP, Swansea, UKe-mail: [email protected]
R. Pogaku et al. (eds.), Developments in Sustainable Chemicaland Bioprocess Technology, DOI: 10.1007/978-1-4614-6208-8_15,� Springer Science+Business Media New York 2013
111
Introduction
Interfacial polymerization (IP) is a common technique used for preparation ofnanofiltration (NF) and reverse osmosis (RO) composite membranes either inlaboratory scale or in commercial scale. In general, the produced membranesexhibit high water permeation flux and high salt rejection (Ahmad et al. 2004).Most commercial NF and RO membranes are produced by the interfacial poly-merization method that has a polyamide (PA) thin layer on top of the membranesupport. The polyamide produced from reaction of amine monomer with acylchloride in organic phase. One of the common amine monomers used ism-phenylenediamine (MPD), and other amine monomers for production of poly-amide are included. Besides the polyamide membrane, a few researchers exploredthis technique to produce the other polymeric thin film polyester and polyestera-mide membranes, where BPA was used as the primary monomer during interfacialpolymerization (Abu Seman et al. 2010; Mohammad et al. 2003; Jayarani andKulkarni 2000). Even their membranes could exhibit very good performances;however, in the last few years, BPA toxicity is becoming a big issue as it maystrongly contribute to some negative effects to human health. For example,manufacturers used polycarbonate plastic as the material for baby bottles becauseit is rigid, shatter resistant, and clear in colour. Plastic baby bottles have receivedmany attentions recently as research came to light showing many models leachBPA, a suspected endocrine disruptor (Beverly 2011). Concerning this issue, thesame thing could happen to this type of polymeric membrane which uses BPA asthe monomer. As an alternative, polyester membrane still could be produced bychoosing the right monomer which is safe and inexpensive. Previous study showsthat polyester thin film composite membranes produced by triethanolamine(TEOA) have the ability to be used in desalination at different environmental pHs.On top of that, TEOA is an active monomer which is environment-friendly,economical, and easy to be obtained (Tang et al. 2008). In this chapter, the effectof interfacial polymerization parameters (i.e. monomer concentration and reactiontime) on the membrane performance was investigated. Membrane performanceshave been evaluated in terms of membrane permeability and solute removal (saltand organic molecules). In this study, NaCl and Na2SO4 were selected to representsalt solutions, while humic acid was used as a model of natural organic matter(NOM) which is normally found in surface water.
Methodology
Materials
The commercial flat-sheet UF polyethersulfone membrane was supplied by Amfor,Inc. (China), and the membrane details are shown in Table 1. Triethanolamine
112 M. N. Abu Seman et al.
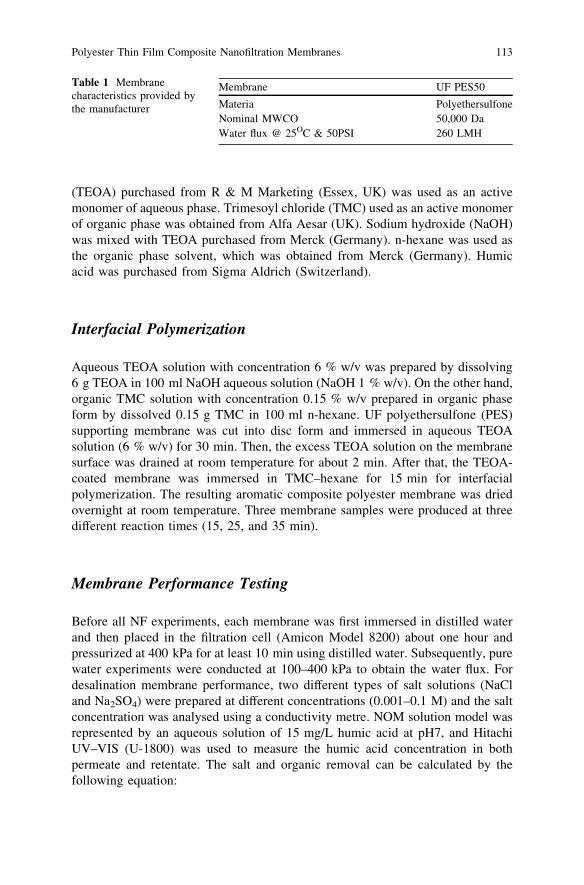
(TEOA) purchased from R & M Marketing (Essex, UK) was used as an activemonomer of aqueous phase. Trimesoyl chloride (TMC) used as an active monomerof organic phase was obtained from Alfa Aesar (UK). Sodium hydroxide (NaOH)was mixed with TEOA purchased from Merck (Germany). n-hexane was used asthe organic phase solvent, which was obtained from Merck (Germany). Humicacid was purchased from Sigma Aldrich (Switzerland).
Interfacial Polymerization
Aqueous TEOA solution with concentration 6 % w/v was prepared by dissolving6 g TEOA in 100 ml NaOH aqueous solution (NaOH 1 % w/v). On the other hand,organic TMC solution with concentration 0.15 % w/v prepared in organic phaseform by dissolved 0.15 g TMC in 100 ml n-hexane. UF polyethersulfone (PES)supporting membrane was cut into disc form and immersed in aqueous TEOAsolution (6 % w/v) for 30 min. Then, the excess TEOA solution on the membranesurface was drained at room temperature for about 2 min. After that, the TEOA-coated membrane was immersed in TMC–hexane for 15 min for interfacialpolymerization. The resulting aromatic composite polyester membrane was driedovernight at room temperature. Three membrane samples were produced at threedifferent reaction times (15, 25, and 35 min).
Membrane Performance Testing
Before all NF experiments, each membrane was first immersed in distilled waterand then placed in the filtration cell (Amicon Model 8200) about one hour andpressurized at 400 kPa for at least 10 min using distilled water. Subsequently, purewater experiments were conducted at 100–400 kPa to obtain the water flux. Fordesalination membrane performance, two different types of salt solutions (NaCland Na2SO4) were prepared at different concentrations (0.001–0.1 M) and the saltconcentration was analysed using a conductivity metre. NOM solution model wasrepresented by an aqueous solution of 15 mg/L humic acid at pH7, and HitachiUV–VIS (U-1800) was used to measure the humic acid concentration in bothpermeate and retentate. The salt and organic removal can be calculated by thefollowing equation:
Table 1 Membranecharacteristics provided bythe manufacturer
Membrane UF PES50
Materia PolyethersulfoneNominal MWCO 50,000 DaWater flux @ 25OC & 50PSI 260 LMH
Polyester Thin Film Composite Nanofiltration Membranes 113
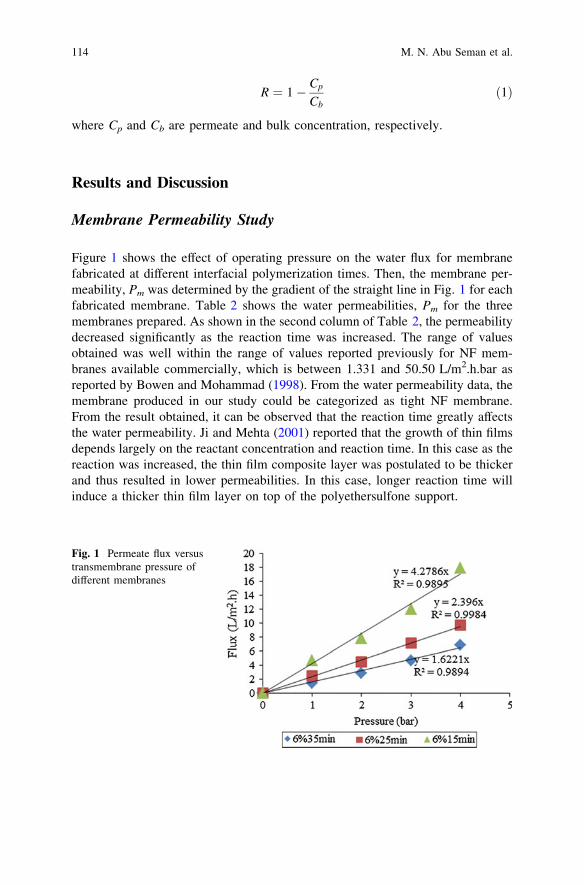
R ¼ 1� Cp
Cbð1Þ
where Cp and Cb are permeate and bulk concentration, respectively.
Results and Discussion
Membrane Permeability Study
Figure 1 shows the effect of operating pressure on the water flux for membranefabricated at different interfacial polymerization times. Then, the membrane per-meability, Pm was determined by the gradient of the straight line in Fig. 1 for eachfabricated membrane. Table 2 shows the water permeabilities, Pm for the threemembranes prepared. As shown in the second column of Table 2, the permeabilitydecreased significantly as the reaction time was increased. The range of valuesobtained was well within the range of values reported previously for NF mem-branes available commercially, which is between 1.331 and 50.50 L/m2.h.bar asreported by Bowen and Mohammad (1998). From the water permeability data, themembrane produced in our study could be categorized as tight NF membrane.From the result obtained, it can be observed that the reaction time greatly affectsthe water permeability. Ji and Mehta (2001) reported that the growth of thin filmsdepends largely on the reactant concentration and reaction time. In this case as thereaction was increased, the thin film composite layer was postulated to be thickerand thus resulted in lower permeabilities. In this case, longer reaction time willinduce a thicker thin film layer on top of the polyethersulfone support.
Fig. 1 Permeate flux versustransmembrane pressure ofdifferent membranes
114 M. N. Abu Seman et al.
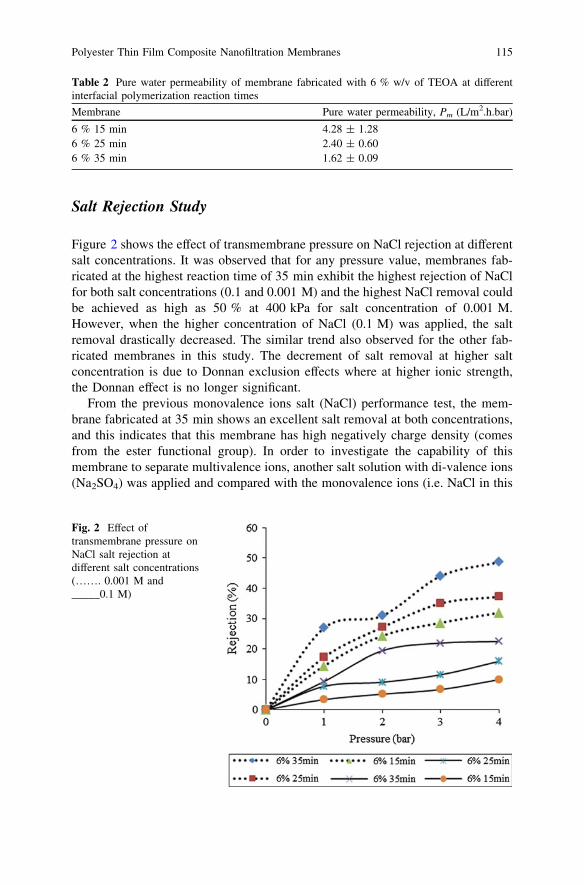
Salt Rejection Study
Figure 2 shows the effect of transmembrane pressure on NaCl rejection at differentsalt concentrations. It was observed that for any pressure value, membranes fab-ricated at the highest reaction time of 35 min exhibit the highest rejection of NaClfor both salt concentrations (0.1 and 0.001 M) and the highest NaCl removal couldbe achieved as high as 50 % at 400 kPa for salt concentration of 0.001 M.However, when the higher concentration of NaCl (0.1 M) was applied, the saltremoval drastically decreased. The similar trend also observed for the other fab-ricated membranes in this study. The decrement of salt removal at higher saltconcentration is due to Donnan exclusion effects where at higher ionic strength,the Donnan effect is no longer significant.
From the previous monovalence ions salt (NaCl) performance test, the mem-brane fabricated at 35 min shows an excellent salt removal at both concentrations,and this indicates that this membrane has high negatively charge density (comesfrom the ester functional group). In order to investigate the capability of thismembrane to separate multivalence ions, another salt solution with di-valence ions(Na2SO4) was applied and compared with the monovalence ions (i.e. NaCl in this
Table 2 Pure water permeability of membrane fabricated with 6 % w/v of TEOA at differentinterfacial polymerization reaction times
Membrane Pure water permeability, Pm (L/m2.h.bar)
6 % 15 min 4.28 ± 1.286 % 25 min 2.40 ± 0.606 % 35 min 1.62 ± 0.09
Fig. 2 Effect oftransmembrane pressure onNaCl salt rejection atdifferent salt concentrations(……. 0.001 M and_____0.1 M)
Polyester Thin Film Composite Nanofiltration Membranes 115
study). It was found that 0.01 M of Na2SO4 was highly rejected at a magnitudealmost double that of NaCl removal. This behaviour could be explained byDonnan effect where SO4
2- ion with higher valence than Cl- ion relativelyrepelled far away from the negatively charged skin active layer. However, athigher concentration of 0.1 M, the different rejection factors between Na2SO4 andNaCl are not too much compared to solution at concentration of 0.01 M since theDonnan effect become less significant at higher ionic strength.
NOM Rejection
Besides the membrane performance in desalination (salt removal), the removal ofNOM has also been investigated in this study. These three membranes were testedwith 15 mg/L humic acid (pH7) at constant pressure of 400 kPa and 300 rpm ofstirring rate. Again, membrane fabricated at 35 min shows a very good performancewith rejection of humic acid up to 94 %, while the other two membranes exhibit lessthan 90 % of humic acid removal. This is due to the highest negatively charge ofmembrane active layer repel/reject the negatively charge of humic acid at pH7.
Conclusions
Based on the findings from this study, the variation of reaction time can affect theproperties of the membrane produced. Increasing the reaction time resulted indecreasing water permeabilities due to the formation of a thicker layer of thin filmon the top surface of the membrane support. Results show that membrane fabri-cated with 6 % w/v of TEOA at 35 min of reaction time has high performance interms of removal monovalence/di-valence ions and removal of natural organicmatter (i.e. humic acid in this study). This is due to highly negatively chargedensity of membrane surface that was produced after interfacial polymerization.Membranes produced by TEOA as monomer has a very high performance, and thisindicates that BPA is no longer needed for producing polyester thin film compositeNF membrane. However, further investigation would be required to fully char-acterize this type of membrane in terms of membrane chemical properties(hydrophilicity/hydrophobicity), membrane physical (SEM, AFM, or by usingmodel). By this, all the membrane characteristics could be correlated with theoverall membrane performance.
Acknowledgments The research work was financial supported through short-term Grant RDU110325. Appreciation is also expressed to the Ministry of Higher Education of Malaysia forsupporting this study (MyBrain15). The authors are thankful to all technical staffs, ChemicalEngineering Research Laboratory for providing the necessary facilities, constant guidance, andencouragement.
116 M. N. Abu Seman et al.
References
Abu Seman, M. N., Khayet, M., & Hilal, N. (2010). Nanofiltration thin-film composite polyesterpolyethersulfone-based membranes prepared by interfacial polymerization. Journal ofMembrane Science, 348, 109–116.
Ahmad, A. L., Ooi, B. S., Mohammad, A. W., & Choudhury, J. P. (2004). Development of ahighly hydrophilic nanofiltration membrane for desalination and water treatment. Desalina-tion, 168, 215–221.
Beverly, S. R. (2011). Bisphenol A: an endocrine disruptor with widespread exposure andmultiple effects. Journal of Steroid Biochemistry and Molecular Biology, 127, 27–34.
Bowen, W. R., & Mohammad, A. W. (1998). Characterization and prediction of nanofiltrationmembrane performance—A general assessment. IChemE Part A, 76, 885–893.
Jayarani, M. M., & Kulkarni, S. S. (2000). Thin-film composite poly(esteramide)-basedmembranes. Desalination, 130, 17–30.
Ji, J., & Mehta, M. (2001). Mathematical model for the formation of thin-film composite hollowfiber and tubular membranes by interfacial polymerization. Journal of Membrane Science,192, 41–54.
Mohammad, A. W., Hilal, N., & Abu Seman, M. N. (2003). A study on producing compositenanofiltration membranes with optimized properties. Desalination, 158, 73–78.
Tang, B., Huo, Z., & Wu, P. (2008). Study on a novel polyester composite nanofiltrationmembrane by interfacial polymerization of triethanolamine (TEOA) and trimesoyl chloride(TMC): I. Preparation, characterization and nanofiltration properties test of membrane.Journal of Membrane Science, 320, 198–205.
Polyester Thin Film Composite Nanofiltration Membranes 117
Adsorption of Lead Ions from AqueousSolution onto Activated Carbon
M. A. Adrah and P. Ravindra
Abstract The adsorption of lead ions from aqueous solutions was performedusing commercial activated carbon. The adsorption equilibrium data for lead ionsfound to follow both Langmuir and Freundlich isotherm models. The kineticprocess of lead ions adsorption onto activated carbon was found to fit the pseudo-second-order kinetic model. The thermodynamic parameters of the adsorptiondemonstrate that the adsorption process was spontaneous and exothermics.
Introduction
An increasing interest to the activated carbon adsorption from aqueous solutionswas initiated by the pollution of air and water due to fast-growing industrializationand the high usage of different kinds of chemicals in almost every facet of humanendeavor (Bansal and Goyal 2005).
Recently, a greater attention has been given over the content of lead in drinkingand natural water, due to extreme lead poisoning in humans causes severe damageto the kidneys, liver, brain, and nervous system while a long-term exposure mayinduce sterility, abortion, and neonatal death (Gercel and Gercel 2007). Adsorp-tion onto activated carbon one of the various techniques was found to be apromising technique to effectively remove trace amounts of lead from solutions(Sreejalekshmi et al. 2009). High surface area, microporous character, andchemical nature of the activated carbons have made them potential adsorbents forthe removal of heavy metals from wastewaters (Mohammadi et al. 2010).
M. A. Adrah � P. Ravindra (&)Chemical Engineering Programme, School of Engineering and Information Technology,Universiti Malaysia Sabah, Jalan UMS, 88400 Kota Kinabalu, Sabah, Malaysiae-mail: [email protected]
R. Pogaku et al. (eds.), Developments in Sustainable Chemicaland Bioprocess Technology, DOI: 10.1007/978-1-4614-6208-8_16,� Springer Science+Business Media New York 2013
119
The aim of the study is to investigate the isotherms, kinetics, and thermody-namics of adsorption of lead ions from aqueous solution by using commercialactivated carbon.
Methodology
Adsorbent
Commercial activated carbons obtained from a local supplier were used asadsorbent. The properties of the activated carbon are as follows:
Form PowderColor BlackpH 6.0-9.0 at 40 g/L at 25 �CRelative density 0.250-0.600 g/cm3
Aqueous Solution
The standard solution of lead ions (1000 mg/L) was used in the preparation ofaqueous solution. The 10 mg/L of lead ions aqueous solution was prepared bydissolving 0.01 L of the standard solutions in 1 L volumetric flask with distilledwater.
Batch Adsorption Studies
Batch adsorption studies were carried out by shaking a known dosage of thecommercial activated carbon with 50 mL of the aqueous solution of lead ions in adifferent conical flask at 100 rpm. The mixtures were separated by filtration usingWhatman membrane filters, and the filtrate was analyzed.
The concentration of lead ions before and after adsorption was determinedusing an atomic absorption spectrophotometer (Z-5000 Polarized Zeeman). Theamount of lead ions adsorbed per unit mass of adsorbents was calculated using theequation:
q ¼ v C0 � Cð Þm
120 M. A. Adrah and P. Ravindra
where C0 and C are the initial and equilibrium concentration of metal ion solution(mg/L) respectively, m is the amount of adsorbents (g), and v is the volume ofsolution (L).
Adsorption Isotherms
For modeling lead ions adsorption from aqueous solution, Langmuir andFreundlich isotherms were used:
Langmuir isothermC
q¼ 1
KLqmþ 1
qmC
Freundlich isotherm log q ¼ log KF þ1n
log C
where q is the amount of metal ions adsorbed per specific amount of adsorbent(mg/g), C is equilibrium concentration (mg/L), qm is amount of metal ions requiredto form a monolayer (mg/g), KL is Langmuir equilibrium constant, and KF and nare Freundlich equilibrium constants.
Adsorption Kinetics
To describe the adsorption mechanism and adsorption characteristics, pseudo-first-order and pseudo-second-order kinetic models are selected. Both models can beexpressed in a linear form as:
Pseudo-first-order ln qe � qtð Þ ¼ ln qe � k1t
Pseudo-second-ordert
qt¼ 1
k2q2e
þ t
qe
where k1 is the adsorption rate constant for the first order adsorption, k2 is thesecond order reaction constant, qt is the amount of heavy metal adsorbed at time t(mg/g) and qe is the amount of heavy metal adsorbed at saturation (mg/g).
Adsorption Thermodynamics
The changes in Gibbs free energy DGð Þ, enthalpy DHð Þ and entropy DSð Þ foradsorption process were determined using the following equations:
Adsorption of Lead Ions from Aqueous Solution 121
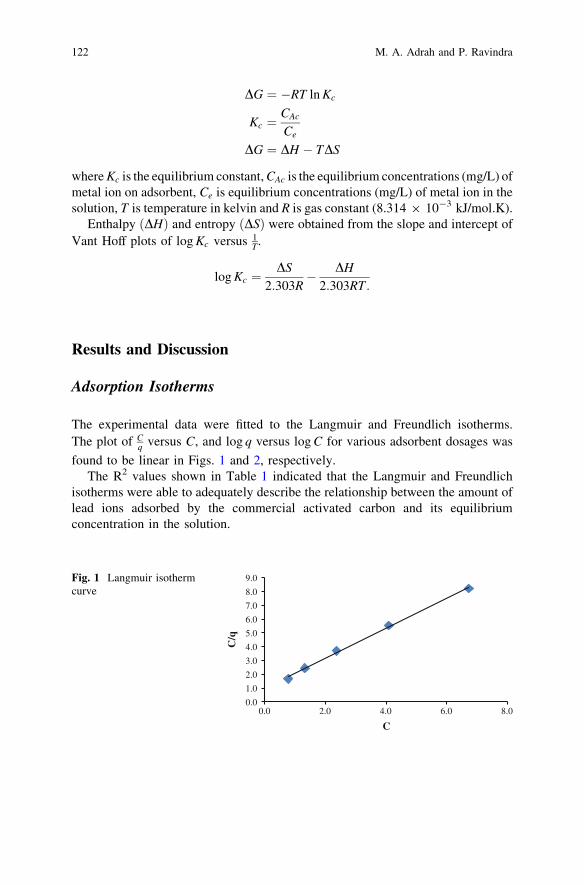
DG ¼ �RT ln Kc
Kc ¼CAc
Ce
DG ¼ DH � TDS
where Kc is the equilibrium constant, CAc is the equilibrium concentrations (mg/L) ofmetal ion on adsorbent, Ce is equilibrium concentrations (mg/L) of metal ion in thesolution, T is temperature in kelvin and R is gas constant (8.314 9 10-3 kJ/mol.K).
Enthalpy DHð Þ and entropy DSð Þ were obtained from the slope and intercept ofVant Hoff plots of log Kc versus 1
T.
log Kc ¼DS
2:303R� DH
2:303RT :
Results and Discussion
Adsorption Isotherms
The experimental data were fitted to the Langmuir and Freundlich isotherms.The plot of C
q versus C, and log q versus log C for various adsorbent dosages was
found to be linear in Figs. 1 and 2, respectively.The R2 values shown in Table 1 indicated that the Langmuir and Freundlich
isotherms were able to adequately describe the relationship between the amount oflead ions adsorbed by the commercial activated carbon and its equilibriumconcentration in the solution.
0.0
1.0
2.0
3.0
4.0
5.0
6.0
7.0
8.0
9.0
0.0 2.0 4.0 6.0 8.0
C/q
C
Fig. 1 Langmuir isothermcurve
122 M. A. Adrah and P. Ravindra
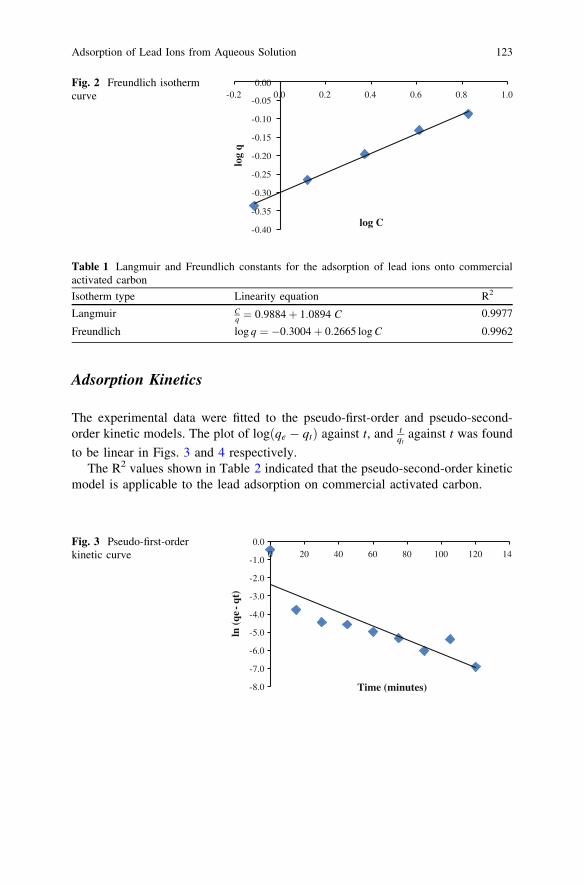
Adsorption Kinetics
The experimental data were fitted to the pseudo-first-order and pseudo-second-order kinetic models. The plot of log qe � qtð Þ against t, and t
qtagainst t was found
to be linear in Figs. 3 and 4 respectively.The R2 values shown in Table 2 indicated that the pseudo-second-order kinetic
model is applicable to the lead adsorption on commercial activated carbon.
-0.40
-0.35
-0.30
-0.25
-0.20
-0.15
-0.10
-0.05
0.00-0.2 0.0 0.2 0.4 0.6 0.8 1.0
log
qlog C
Fig. 2 Freundlich isothermcurve
Table 1 Langmuir and Freundlich constants for the adsorption of lead ions onto commercialactivated carbon
Isotherm type Linearity equation R2
Langmuir Cq ¼ 0:9884þ 1:0894 C 0.9977
Freundlich log q ¼ �0:3004þ 0:2665 log C 0.9962
-8.0
-7.0
-6.0
-5.0
-4.0
-3.0
-2.0
-1.0
0.00 20 40 60 80 100 120 140
ln (
qe -
qt)
Time (minutes)
Fig. 3 Pseudo-first-orderkinetic curve
Adsorption of Lead Ions from Aqueous Solution 123
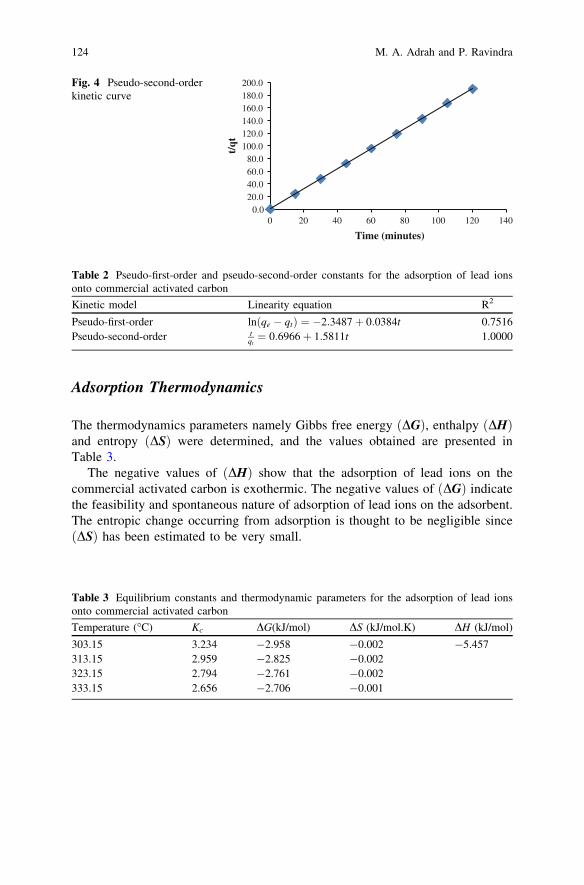
Adsorption Thermodynamics
The thermodynamics parameters namely Gibbs free energy DGð Þ, enthalpy DHð Þand entropy DSð Þ were determined, and the values obtained are presented inTable 3.
The negative values of DHð Þ show that the adsorption of lead ions on thecommercial activated carbon is exothermic. The negative values of DGð Þ indicatethe feasibility and spontaneous nature of adsorption of lead ions on the adsorbent.The entropic change occurring from adsorption is thought to be negligible sinceDSð Þ has been estimated to be very small.
0.020.040.060.080.0
100.0120.0140.0160.0180.0200.0
0 20 40 60 80 100 120 140t/
qtTime (minutes)
Fig. 4 Pseudo-second-orderkinetic curve
Table 2 Pseudo-first-order and pseudo-second-order constants for the adsorption of lead ionsonto commercial activated carbon
Kinetic model Linearity equation R2
Pseudo-first-order ln qe � qtð Þ ¼ �2:3487þ 0:0384t 0.7516Pseudo-second-order t
qt¼ 0:6966þ 1:5811t 1.0000
Table 3 Equilibrium constants and thermodynamic parameters for the adsorption of lead ionsonto commercial activated carbon
Temperature (�C) Kc DG(kJ/mol) DS (kJ/mol.K) DH (kJ/mol)
303.15 3.234 -2.958 -0.002 -5.457313.15 2.959 -2.825 -0.002323.15 2.794 -2.761 -0.002333.15 2.656 -2.706 -0.001
124 M. A. Adrah and P. Ravindra
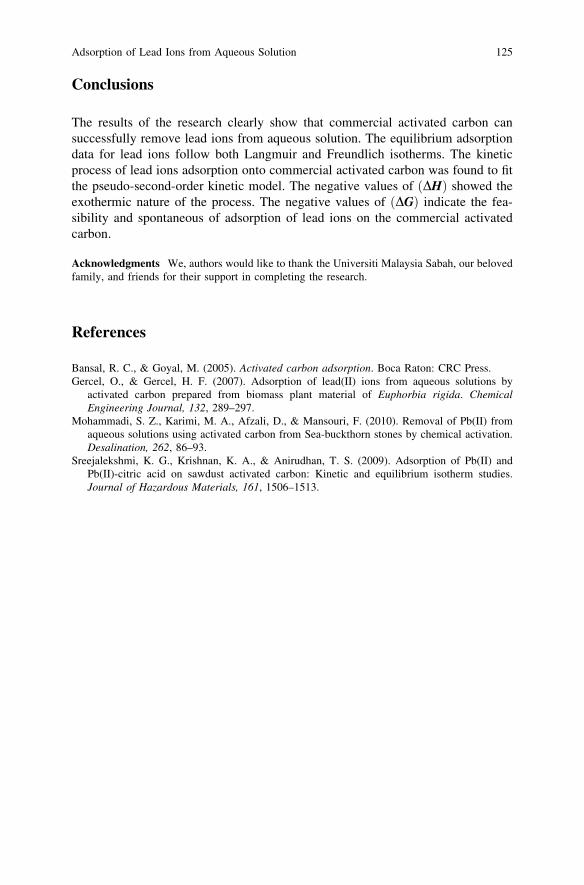
Conclusions
The results of the research clearly show that commercial activated carbon cansuccessfully remove lead ions from aqueous solution. The equilibrium adsorptiondata for lead ions follow both Langmuir and Freundlich isotherms. The kineticprocess of lead ions adsorption onto commercial activated carbon was found to fitthe pseudo-second-order kinetic model. The negative values of DHð Þ showed theexothermic nature of the process. The negative values of DGð Þ indicate the fea-sibility and spontaneous of adsorption of lead ions on the commercial activatedcarbon.
Acknowledgments We, authors would like to thank the Universiti Malaysia Sabah, our belovedfamily, and friends for their support in completing the research.
References
Bansal, R. C., & Goyal, M. (2005). Activated carbon adsorption. Boca Raton: CRC Press.Gercel, O., & Gercel, H. F. (2007). Adsorption of lead(II) ions from aqueous solutions by
activated carbon prepared from biomass plant material of Euphorbia rigida. ChemicalEngineering Journal, 132, 289–297.
Mohammadi, S. Z., Karimi, M. A., Afzali, D., & Mansouri, F. (2010). Removal of Pb(II) fromaqueous solutions using activated carbon from Sea-buckthorn stones by chemical activation.Desalination, 262, 86–93.
Sreejalekshmi, K. G., Krishnan, K. A., & Anirudhan, T. S. (2009). Adsorption of Pb(II) andPb(II)-citric acid on sawdust activated carbon: Kinetic and equilibrium isotherm studies.Journal of Hazardous Materials, 161, 1506–1513.
Adsorption of Lead Ions from Aqueous Solution 125

Part IIChemical and Bioprocesses
Review: Pre-treatments and Fermentationof Seaweed for Bioethanol Production
R. F. Mansa, H. Mansuit, K. F. Fong, C. S. Sipaut,F. Y. Chye and S. M. Yasir
Abstract This article reviews the current studies on the production of bioethanolfrom seaweed with a focus on the process pre-treatments and variety of micro-organisms used in the process. Pre-treatment selection is essential to maximize theamount of reduced sugar for the fermentation to produce bioethanol. Specificmicrobial strains are matched to their ability to utilize sugar sources. Some studiesfocus mainly on general processing with variable microbial strains to gauge theirabilities in fermentation. A summary of the current studies was carried out, and itis evident that two or more yield increasing techniques can coexist within a singleprocess. The integration of the findings may be the key to make seaweed fer-mentation more efficient and affordable to serve as a sustainable and renewableenergy source.
Introduction
The world is facing a crisis of depleting fossil fuel energy sources. In order toreplace the dependency on fossil fuel, bioethanol has attracted attention as analternative renewable fuel. The world has been confronted with an energy crisisdue to depletion of finite resources of fossil fuel (Meinita and Hong 2012). Now,
R. F. Mansa (&) � H. Mansuit � K. F. Fong � C. S. SipautEnergy and Materials Research Group, School of Engineering and Information Technology,Universiti Malaysia Sabah, Sabah, Kota Kinabalu, Malaysiae-mail: [email protected]
F. Y. ChyeSchool of Food Science and Nutrition, Universiti Malaysia Sabah, Kota Kinabalu, Sabah,Malaysia
S. M. YasirSeaweed Research Unit, Universiti Malaysia Sabah, Jalan UMS, Kota Kinabalu 88400Sabah, Malaysia
R. Pogaku et al. (eds.), Developments in Sustainable Chemicaland Bioprocess Technology, DOI: 10.1007/978-1-4614-6208-8_17,� Springer Science+Business Media New York 2013
129
there are various types of renewable energies that are available; however, one ofthe most important energy sources in near future is biomass. Biofuel is a starch/cellulose biomass fermentation product that is a renewable energy source whichcan be used as an alternative for petroleum fuels. According to John et al. (2011),globally, ethanol is expected to be the most widely used biofuel.
The first-generation biofuel was based on edible crops such as corn, beet, andpotatoes. It produced sufficient yields of ethanol. However, it has raised moralityand ethics issues as millions of people around the world are currently sufferingfrom malnutrition and hunger (Goh and Lee 2009). It also raises the issue on theincreasing proportion of land use for biomass crops. Yet the ‘‘food versus fuel’’debate is not applicable to macroalgae or seaweed (Adams et al. 2009) due to itbeing a non-terrestrial plant. For the purpose of consistency, macroalgae will bereferred to as seaweed in this review.
Seaweed are crops that are self-sustainable, easily mass-produced and hasminimal land requirement. According to John et al. (2011), seaweed has the abilityto grow at a fast rate and yield huge amounts of biomass. Besides that, it can becultivated in the ocean under the sun with no need for nitrogen-based fertilizers(Buck and Buchholz 2004). In addition, seaweed contains no lignin; hence, it is asuitable biomass material that can be converted to ethanol without any expensivelignin removal process (Park et al. 2012).
In this review, various types of seaweed was reported to have been put througha series of processes to extract higher amounts of fermentable sugars and laterundergo fermentation using different types of microbes such as yeasts under aer-obic conditions.
Seaweed Pre-treatments Before Fermentation
The main process in ethanol production from seaweed is the conversion of reducedsugar into ethanol via fermentation. Although seaweed has high amounts of car-bohydrates, but the initial content of reduced sugars found in seaweed is insignif-icant. The carbohydrates can be broken down to simple sugars via saccharification.The common saccharification pre-treatment methods for the fermentation of sea-weed are as follows: acid hydrolysis and enzymatic hydrolysis. However, most ofthe recent finding prefers acid hydrolysis pre-treatment method, since the enzy-matic method is costly and promotes complexity of the saccharification process(Huimin et al. 2007). Acid hydrolysis was preferred because of its low-cost, shorthydrolysis time, and simple operation when compared to other saccharificationmethods. However, acid hydrolysis also produces by-products that can inhibitethanol-producing yeast and bacteria such as furans (Larsson et al. 1999; Klinkeet al. 2004).
It is interesting to note that alkaline pre-treatment was not found to be used forthe pre-treatment of seaweed fermentation. Yet it is commonly used for agar orcarrageenan extraction especially from red seaweed species. Istini et al. (1994)
130 R. F. Mansa et al.
proved that alkali pre-treatment was successful in the extraction of agar or car-rageenan from seaweed. The authors used 5 % NaOH at 70 and 80 �C for 2 h toextract agar from Gracilaria chorda, Gracilaria fisheri, Gracilaria verrucosa,and Gracilaria Iemanei ormis. In carrageenan extraction, 6 % KOH was used forthe treatment of seaweed species of Kapphaphycus alvarezii and Eucheumaspinosum.
Table 1 presents a non-exhaustive review of seaweed pre-treatments prior tofermentation to produce bioethanol. The data and parameters are extracted fromnumerous findings and journals according to the seaweed subspecies and also tocompare different materials and outcomes of using other pre-treatment techniques.Yoon et al. (2012) used a combination of gamma irradiation and dilute sulfuricacid treatment on Undaria sp. to increase the final content of reducing sugar(0.235 g/L). While Wi et al. (2009) employed E. coli to perform enzymatichydrolysis on Gelidium amansii in a buffered solution to achieve 70 % glucoseyield in six hours. Jeong et al. (2011) used a dual stage acid hydrolysis with 4 %sulfuric acid at 190 �C on Gelidium amansii, to yield 68.58 % from 74.6 %carbohydrate content of seaweed. It was found that the major trend in pre-treat-ment was to use dilute sulfuric acid hydrolysis at high temperature. Improvementsthat can be added to this method are gamma irradiation, dual stage, biologicalaction and usage of buffered solution.
Fermentation of Seaweed
In fermentation of seaweed, microbes consume fermentable sugars from pre-treated seaweed to produce bioethanol in an anaerobic condition. Saccharomycescerevisiae is commonly used in anaerobic fermentation. However, Lee et al.(2011) reported that a small amount of oxygen can be used to induce facultativerespiration among limited species of microbes such as Pichia stipitis. This microbeconsumes reduced sugars and produce carbon dioxide and ethanol. The fermen-tation process will go through a lag phase, exponential phase, a stationary phaseand then a death phase. In the stationary phase, the microbe reproduction slowsdown due to elevated concentrations of ethanol (usually 10–13 %) which is aninhibitory product. The fermentation stops when substrate is depleted or themicrobes die.
Various seaweed species have different characteristics and require specificprocess parameters. It is important to understand the seaweed characteristics priorto bioconversion to bioethanol. Table 2 presents a review of fermentation onvarious seaweed species. Meinita et al. (2012) used brewer yeast orSaccharomyces cerevisiae directly for bioethanol fermentation. The authorsobtained 84 % galactose from 30.5 g/L reducing sugar after acid hydrolysis. Theethanol yield achieved after 24 h fermentation at 30 �C from 84 % galactose was1.31 g/L ethanol. Candra et al. (2011) used 10 % v/v Saccharomyces cerevisiaefor the fermentation of 16 mg reducing sugar/ml (0.016 g reducing sugar/g dry
Review: Pre-treatments and Fermentation of Seaweed for Bioethanol Production 131
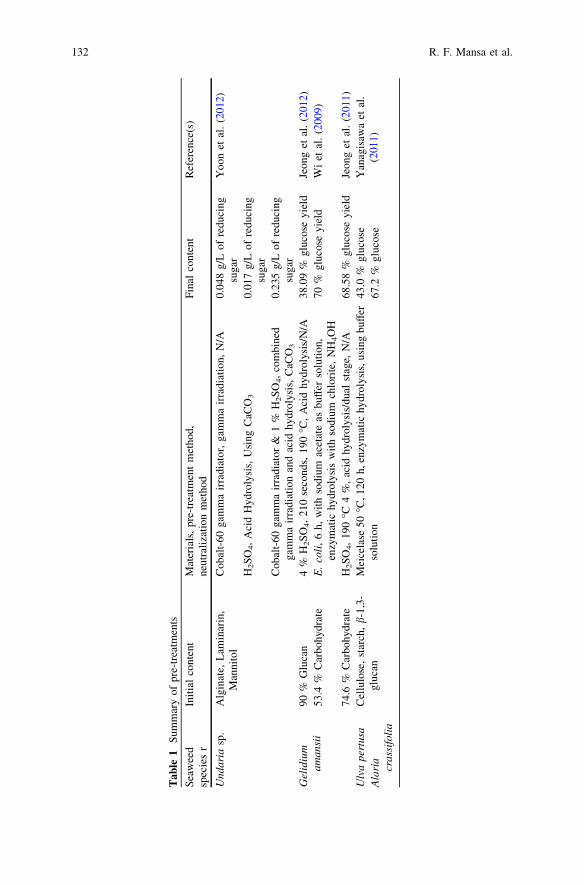
Tab
le1
Sum
mar
yof
pre-
trea
tmen
ts
Sea
wee
dsp
ecie
sr
Init
ial
cont
ent
Mat
eria
ls,
pre-
trea
tmen
tm
etho
d,ne
utra
liza
tion
met
hod
Fin
alco
nten
tR
efer
ence
(s)
Und
aria
sp.
Alg
inat
e,L
amin
arin
,M
anni
tol
Cob
alt-
60ga
mm
air
radi
ator
,ga
mm
air
radi
atio
n,N
/A0.
048
g/L
ofre
duci
ngsu
gar
Yoo
net
al.
(201
2)
H2S
O4,
Aci
dH
ydro
lysi
s,U
sing
CaC
O3
0.01
7g/
Lof
redu
cing
suga
rC
obal
t-60
gam
ma
irra
diat
or&
1%
H2S
O4,
com
bine
dga
mm
air
radi
atio
nan
dac
idhy
drol
ysis
,C
aCO
3
0.23
5g/
Lof
redu
cing
suga
rG
elid
ium
aman
sii
90%
Glu
can
4%
H2S
O4,
210
seco
nds,
190
�C,
Aci
dhy
drol
ysis
/N/A
38.0
9%
gluc
ose
yiel
dJe
ong
etal
.(2
012)
53.4
%C
arbo
hydr
ate
E.
coli
,6
h,w
ith
sodi
umac
etat
eas
buff
erso
luti
on,
enzy
mat
ichy
drol
ysis
wit
hso
dium
chlo
rite
,N
H4O
H70
%gl
ucos
eyi
eld
Wi
etal
.(2
009)
74.6
%C
arbo
hydr
ate
H2S
O4,
190
�C4
%,
acid
hydr
olys
is/d
ual
stag
e,N
/A68
.58
%gl
ucos
eyi
eld
Jeon
get
al.
(201
1)U
lva
pert
usa
Cel
lulo
se,
star
ch,b-
1,3-
gluc
anM
eice
lase
50�C
,120
h,en
zym
atic
hydr
olys
is,u
sing
buff
erso
luti
on43
.0%
gluc
ose
Yan
agis
awa
etal
.(2
011)
Ala
ria
cras
sifo
lia
67.2
%gl
ucos
e
132 R. F. Mansa et al.
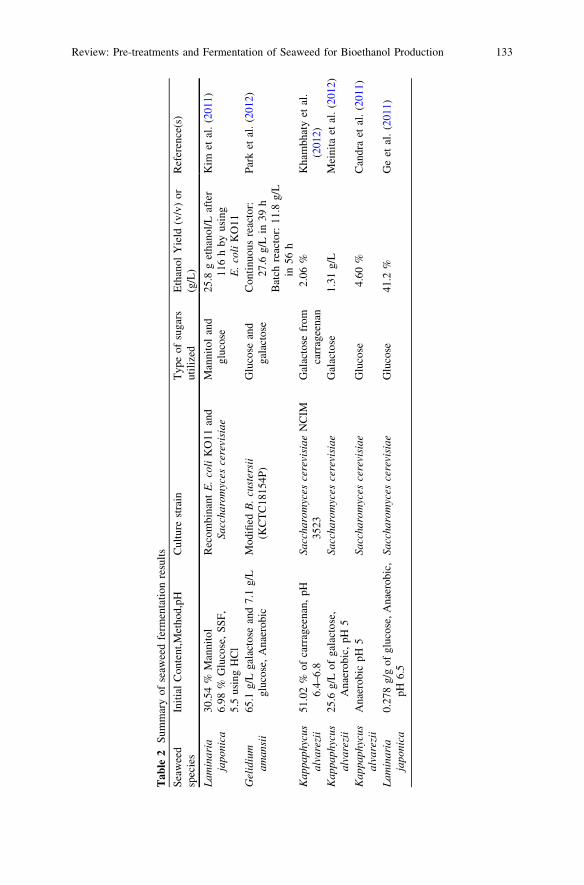
Tab
le2
Sum
mar
yof
seaw
eed
ferm
enta
tion
resu
lts
Sea
wee
dsp
ecie
sIn
itia
lC
onte
nt,M
etho
d,pH
Cul
ture
stra
inT
ype
ofsu
gars
util
ized
Eth
anol
Yie
ld(v
/v)
or(g
/L)
Ref
eren
ce(s
)
Lam
inar
iaja
poni
ca30
.54
%M
anni
tol
6.98
%G
luco
se,
SS
F,
5.5
usin
gH
Cl
Rec
ombi
nant
E.
coli
KO
11an
dSa
ccha
rom
yces
cere
visi
aeM
anni
tol
and
gluc
ose
25.8
get
hano
l/L
afte
r11
6h
byus
ing
E.
coli
KO
11
Kim
etal
.(2
011)
Gel
idiu
mam
ansi
i65
.1g/
Lga
lact
ose
and
7.1
g/L
gluc
ose,
Ana
erob
icM
odifi
edB
.cu
ster
sii
(KC
TC
1815
4P)
Glu
cose
and
gala
ctos
eC
onti
nuou
sre
acto
r:27
.6g/
Lin
39h
Bat
chre
acto
r:11
.8g/
Lin
56h
Par
ket
al.
(201
2)
Kap
paph
ycus
alva
rezi
i51
.02
%of
carr
agee
nan,
pH6.
4–6.
8Sa
ccha
rom
yces
cere
visi
aeN
CIM
3523
Gal
acto
sefr
omca
rrag
eena
n2.
06%
Kha
mbh
aty
etal
.(2
012)
Kap
paph
ycus
alva
rezi
i25
.6g/
Lof
gala
ctos
e,A
naer
obic
,pH
5Sa
ccha
rom
yces
cere
visi
aeG
alac
tose
1.31
g/L
Mei
nita
etal
.(2
012)
Kap
paph
ycus
alva
rezi
iA
naer
obic
pH5
Sacc
haro
myc
esce
revi
siae
Glu
cose
4.60
%C
andr
aet
al.
(201
1)
Lam
inar
iaja
poni
ca0.
278
g/g
ofgl
ucos
e,A
naer
obic
,pH
6.5
Sacc
haro
myc
esce
revi
siae
Glu
cose
41.2
%G
eet
al.
(201
1)
Review: Pre-treatments and Fermentation of Seaweed for Bioethanol Production 133
seaweed). They obtained 4.6 % ethanol yield after 168 h fermentation at28–30 �C. Ge et al. (2011), fermented seaweed (Laminaria japonica) wastehydrolysate using Saccharomyces cerevisiae at 30 �C for 36 h and claimed that theconversion of ethanol was 0.143 L from 1 kg of seaweed hydrolysate. The authorsconcluded that the fermentation of glucose after saccharification can be totallyfermented by the yeast of Saccharomyces cerevisiae.
This review showed that Saccharomyces cerevisiae is the most commonly usedfor ethanol production. There are also other microbes such as modified B.custersii(KCTC18154P) and E. coli KO11. These microbes are able to utilize more thanone type of sugar. Production of bioethanol was proven to be viable using themicrobes as presented in the table. Bioethanol production from seaweed (L.japonica) was demonstrated by Kim et al. (2011) using ethanogenic recombinantEscherichia coli KO11 with ethanol production of 0.4 g ethanol/g of carbohydrate.Park et al. (2012) used modified B. custersii (KCTC18154P) and achieved higheryield of ethanol in a continuous reactor of 30 �C and 39 h which was 38.2 % from72.2 g/L of glucose and galactose content.
Higher alcohol yield was achieved by using two different organisms or two-stepprocess; however, it would be more efficient when using a single organism that canutilize multiple substrates simultaneously (Park et al. (2012). The criterion for aneffective bio-agent is the matching of the type of culture strain to the spectrum ofsugars that it utilizes to produce bioethanol. Higher versatility and affinity tovarious types of sugars, generally glucose, galactose, and mannitol contributes tohigher concentration of alcohol.
Conclusions
This review had reported mainly on acid hydrolysis and enzymatic pre-treatmentsfor single microbe fermentation methods. It was found that the pre-treatmentmethods were unable to convert all of the complex sugars in seaweed intoreducible sugars. Yet it was proven that bioethanol production from pre-treatedseaweed via bioconversion is a viable process. It is essential to increase the amountof reducible sugars in order to increase ethanol yield. Hence, it may be interestingto investigate the potential of using alkaline hydrolysis pre-treatment for fer-mentation. Following that pairing of the reducible sugar content and the bio-agentwould ensure higher amounts of sugars were utilized during bioconversion.
Acknowledgments Authors would like to extend their appreciation and gratitude for the fundingfrom Seaweed Research Unit of University Malaysia Sabah under the EPP#3 NKEA MalaysianGovernment Project.
134 R. F. Mansa et al.
References
Adams, J. M., Gallagher, J. A., & Donnison, I. A. (2009). Fermentation study on Saccharinalatissima for bioethanol production considering variable pre-treatments. Journal of appliedPhycology, 21, 569–574.
Buck, B. H., & Buchholz, C. M. (2004). The offshore-ring: A new system design for the openocean aquaculture of macroalgae. Journal of Applied Phycology, 16, 355–368.
Candra, K. P., Sarwono, Sarinah. (2011). Study on bioethanol production using red seaweedEucheuma cottonii from Bontang sea water. Journal of Coastal Development 15(1), 45–50.
Ge, L., Wang, P., & Mou, H. (2011). Study of saccharification techniques of seaweed wastes forthe transformation of ethanol. Journal of Renewable Energy, 36, 84–89.
Goh, C. S., & Lee, K. T. (2009). A visionary and conceptual macroalgae-based third-generationbioethanol (TGB) biorefinery in Sabah, Malaysia as an underlay for renewable and sustainabledevelopment. Renewable Sustainable Energy Revolution, 14, 842–848.
Huimin, Q. I., Daxin, L. I., Zhang, J. J., Liu, L., & Zhang, Q. B. (2007). Study on extraction ofagaropectin from Gelidium amansii and its anticoagulant activity. Chinese Journal ofOceanology and Limnology, 26(2), 186–189.
Istini, S., Ohno, M., & Kusunose, H. (1994). Methods of analysis agar, carrageenan and alginatein seaweed. Bulletin of Marine Science and Fisheries—Kochi University, 14, 49–55.
Jeong, T. S., Choi, C. H., Lee, J. Y., & Oh, K. K. (2011). Two-stage acid saccharification offractionated Gelidium amansii minimizing the sugar decomposition. Journal of BioresourceTechnology, 102, 10529–10534.
Jeong, T. S., Choi, C. H., Lee, J. Y., & Oh, K. K. (2012). Behaviors of glucose decompositionduring acid-catalyzed hydrothermal hydrolysis of pretreated Gelidium amansii. Journal ofBioresource Technology, 116, 435–440.
John, R. P., Anisha, G. S., Nampoothiri, K. M., & Pandey, A. (2011). Micro and macroalgalbiomass: A renewable source for bioethanol. Bioresource Technology, 102, 186–193.
Khambhaty, Y., Mody, K., Gandhi, R. M., Thampy, S., Maiti, P., Brahmbhatt, H., et al. (2012).Kappaphycus alvarezii as a source of bioethanol. Journal of Bioresource Technology, 103,180–185.
Kim, N., Li, H., Jung, K., Chang, H. N., & Lee, P. C. (2011). Ethanol production from marinealgal hydrolysates using Escherichia coli KO11. Bioresource Technology, 102, 7466–7469.
Klinke, H. B., Thomsen, A. B., & Ahring, B. K. (2004). Inhibition of ethanol producing yeast andbacteria by degradation products produced during pre-treatment of biomass. AppliedMicrobiology and Biotechnology, 66, 10–26.
Larsson, S., Palmqvist, E., Hagerdal, B. H., Tengborg, C., Stenberg, K., Zacchi, G., et al. (1999).The generation of fermentation inhibitors during dilute acid hydrolysis of softwood. Enzymeand Microbiology Technology, 24, 151–159.
Lee, S. M., & Lee, J. H. (2011). The isolation and characterization of simultaneoussaccharification and fermentation microorganisms for Laminaria japonica utilization. Journalof Bioresource Technology, 102, 5962–5967.
Meinita, M. D. N., & Hong, Y. (2012). Detoxification of acidic catalyzed hydrolysate ofKappaphycus alvarezii (cottonii). Bioprocess and Biosystems Engineering, 35, 93–98.
Meinita, M. D. N., Kang, J., Jeong, G., Koo, H. M., Park, S. M., & Hong, Y. (2012). Bioethanolproduction from the acid hydrolysate of the carrageenophyte Kappaphycus alvarezii(cottonii). Journal of Applied Phycology, 24, 857–862.
Park, J., Hong, J., Jang, H. C., Oh, S. G., Kim, S., Yoon, J., et al. (2012). Use of Gelidium amansiias a promising resource for bioethanol: A practical approach for continuous dilute-acidhydrolysis and fermentation. Bioresource Technology, 108, 83–88.
Wi, S. G., Kim, H. J., Mahadevan, S. A., Yang, D. J., & Bae, H. J. (2009). The potential value ofseaweed Ceylon moss (Gelidium amansii) as an alternative bioenergy resource. Journal ofBioresource Technology, 100, 6658–6660.
Review: Pre-treatments and Fermentation of Seaweed for Bioethanol Production 135

Yanagisawa, M., Nakamura, K., Ariga, O., & Nakasaki, K. (2011). Production of highconcentrations of bioethanol from seaweeds that contain easily hydrolyzable polysaccharides.Process Biochemistry, 46, 2111–2116.
Yoon, M., Choi, J., Lee, J. W., & Park, D. H. (2012). Improvement of saccharification process forbioethanol production from Undaria sp. by gamma irradiation. Radiation Physics andChemistry, 81, 999–1002.
136 R. F. Mansa et al.
Assessment on Bioavailabilityof Flavonoids from Orthosiphon StamineusDuring Spray Drying
S. F. Pang, M. M. Yusoff and J. Gimbun
Abstract This article presents findings of a microencapsulation study of flavo-noids obtained from Orthosiphon stamineus leaves. The plant extract was obtainedusing ultrasonic-assisted extraction method. Protein and a polysaccharide deriva-tive (maltodextrin) were used as the microencapsulation agent. Aqueous extractand dried powder were tested for their total flavonoids content by means of alu-minum chloride colorimetric assay and detailed analysis of its polyphenol contentby high-performance liquid chromatography. Morphology of the dried powder wasanalyzed by field emission scanning electron microscopy. Microencapsulation wasfound to use the least amount of protein (1.42 wt%) and has the highest totalflavonoids retention (85.6 %) besides having the highest retention of the bioactivemarkers, sinensetin (81.8 %), and eupatorin (70.1 %). The formulation of 1:9protein/maltodextrin ratio is also found to be more effective with 86.7 % totalflavonoids retention compared other formulation, viz., 1:1 and 9:1.
Keywords Orthosiphon stamineus � Microencapsulation � Flavonoids � Spraydrying � Bioavailability
S. F. Pang � J. GimbunFaculty of Chemical and Natural Resources Engineering, Universiti Malaysia Pahang,Gambang, Malaysia
M. M. YusoffFaculty of Industrial Sciences and Technology, Universiti Malaysia Pahang,Gambang, Malaysia
M. M. YusoffCentral Laboratory, Universiti Malaysia Pahang, Gambang, Malaysia
J. Gimbun (&)Centre of Excellence for Advanced Research in Fluid Flow (CARIFF), Universiti MalaysiaPahang, 26300 Gambang, Pahang, Malaysiae-mail: [email protected]
R. Pogaku et al. (eds.), Developments in Sustainable Chemicaland Bioprocess Technology, DOI: 10.1007/978-1-4614-6208-8_18,� Springer Science+Business Media New York 2013
137
Introduction
Orthosiphon stamineus (vernacular name: ‘‘misai kucing’’) is traditionally used inMalaysia for the treatment of eruptive fever, edema, hepatitis, jaundice, hyper-tension, diabetes mellitus, gout, rheumatism, diuretic, anti-inflammatory, andinfluenza (Ho et al. 2010; Saravanan et al. 2006). Previous scientific studiesrevealed that extracts of O. stamineus contained useful bioactive compounds thatexhibited excellent antibacterial, antifungal, antimicrobial, and antitumor proper-ties (Saravanan et al. 2006). Furthermore, O. stamineus had been reported topossess anti-inflammatory (Masuda et al. 1992), antihypertensive (Ohashi et al.2000), and hypoglycemia activity (Mariam et al. 1996).
A systematic method to prepare the water-soluble extract of O. stamineus is wellunderstood (e.g., Akowuah et al. 2005). However, a solid pharmaceutical dosage inthe form of tablets is also desirable for convenience of administration besides havinglonger shelf life and ease of handling. A method to produce high-quality solidpowder products from O. stamineus extracts must be established as the product ofconventional method via hot spray is prone to thermal degradation. Thus, assess-ment of bio availability of solid powder is the ultimate aim of this study.
Bioactive compounds such as flavonoids, vitamins, protein, and antioxidant areknown to suffer from thermal degradation when exposed to high temperature over along period, for example, during the powder-making process. Anandharamakrishnanet al. (2008) reported more than 60 % protein denaturation in a tall pilot-scale spraydryer at temperatures above 100 �C, commonly used conditions for spray dryingoperation. Thermal degradation of other bioactive compounds, such as vitamin E,vitamin A, and antioxidants, has also been reported by Xie et al. (2010). Thermaldegradation is undesirable, because the degraded product is of low nutritional valueand consequently hampers the intention to produce a nutraceutical product. Spraydrying is a common method of producing powder. One of the objectives of this workwas to minimize degradation of bioactive compounds from O. stamineus extractduring spray drying using the microencapsulation technique. Furthermore, limitedliterature concerning microencapsulation of flavonoids from O. stamineus extract ispresently available in the literature.
Materials and Methods
Chemicals
Sodium nitrite, methanol, and sodium hydroxide were obtained from Merck(Malaysia). HPLC grade methanol and quercetin were obtained from FisherMalaysia. HPLC grade tetrahydrofuran, dimethylsulfoxide, aluminum hexachlo-ride, eupatorin, and sinensetin were obtained from Sigma Aldrich (Malaysia). Alactose-free whey protein isolates (WPI) powder was obtained from Ultimate
138 S. F. Pang et al.
Nutrition (Fleetwood, Lancashire, UK) with 99 % denatured whey proteins.Maltodextrin of 10 DE was obtained from San Soon Seng Food Industries Sdn.Bhd. (Malaysia).
Plant Material
The leaves were collected in Gambang, Pahang, Malaysia from a white-floweredO. stamineus plants. Freshly collected leaves were washed with deionized waterand dried at 37 �C for 3 days before powdering. Prior to use the powder was keptin an air-tight plastic bag at room temperature to prevent moisture absorption.
Ultrasonic-Assisted Extraction
The powdered plant material was weighed (8 g) and mixed with aqueous methanol(100 ml; 50 %) in a 250 ml sealed Erlenmeyer flask. Extraction was carried out in anultrasonic bath (CREST P1800D, US) at 45 kHz for 90 min and temperature settingat 50 �C. The supernatant was then separated from the residue by vacuum filtrationusing Whatman no. 1 filter paper. The solvent was evaporated in vacuo at 40 �C.
HPLC Analysis
HPLC analysis was performed according to Akowuah et al. (2005) using AgilentTechnologies 1,200 system (Agilent Technologies, USA) equipped with an auto-matic injector, a column oven, and a UV detector. A Zorbax Eclipse plus C18(Agilent Technologies, USA) column (5 lm, 250 9 4.6 mm i.d.) was used for thechromatographic separation. The temperature was maintained at 25 �C, withinjection volume of 10 ll and flow rate of 1 ml/min. All markers were separatedunder isocratic condition with methanol–water–tetrahydrofuran (45:50:5 v/v) asmobile phase. The peaks were detected at 340 nm and verified by comparison withstandards [eupatorin (Eup) and sinensetin (Sin)]. HPLC quantification was carriedout using external standards method and the results reported as mg marker/mlsample.
Total Flavonoid Content
Total flavonoid content (TFC) was measured by the aluminum chloride colorimetricassay (Sameh et al. 2008). Sample or standard (quercetin) aliquots (0.2 ml) was
Assessment on Bioavailability of Flavonoids 139
added to a 15 ml centrifuge tube containing deionize water (4.8 ml). NaNO2 (0.3 ml,5 %) was then added and mixed using a vortex mixer for 5 min. Subsequently, AlCl3(0.3 ml, 10 %) was added followed by the addition of NaOH solution (2 ml, 1 M),and the total volume adjusted with deionized water (10 ml). The solution was mixedwell, and absorbance measured against a blank at 510 nm. Total flavonoid content ofsample solutions are expressed as milligram quercetin equivalents per milliliter ofsample solution by comparison with the quercetin calibration curve.
Moisture Content
In order to calculate the exact amount of sample needed for comparison in TFCand HPLC analysis, the moisture content of spray-dried powders was determinedusing a moisture analyzer (AND MS-70, Japan).
Field Emission Scanning Electron Microscope
Morphologies of the spray-dried particles were evaluated by Field EmissionScanning Electron Microscope (FESEM) (JEOL JSM-7800F, Japan). Sampleswere mounted on specimen stubs with double-sided adhesive carbon tapes. Thespecimen was coated with platinum and was examined at 1–3 kV with a magni-fication ranging from 500 to 20,000x.
Spray Drying
Solution of various solid concentrations containing maltodextrin, WPI and O.stamineus ex-tract were spray-dried using a laboratory-scale spray drier (Lab PlantSD06A, UK). The atomizer had an inside diameter of 0.5 mm. Air flow rate ofabout 4 m/s was set constant throughout the experiment. The inlet temperature wasset at 180 �C and maintained at ±1 �C by the proportional–integral–derivativecontroller. Feed was metered into the dryer by means of a peristaltic pump at400 ml/h. In order to ensure a fair comparison, similar setups were employed forall experiments. After passing through an electric heater, the inlet drying air flo-wed concurrently with the feed spray in the main drying chamber. The mainchamber was made of thick transparent glass and had an inside diameter of21.5 cm, a total height of 50 cm, and the bottom of the chamber is dished shaped.The distance between the tip of the atomizer and the axis of the side exit tube wasabout 47 cm. A cyclone air/powder separator was used to recover powder parti-cles. Dried powder samples were collected from a Schott bottle attached at thebottom of the cyclone.
140 S. F. Pang et al.
Results and Discussion
Moisture Content
Average moisture contents (g water/g total %) of the spray-dried powder samplesare shown in Table 1. The results revealed that increasing solid content reduces themoisture content of the final product for all feed concentrations. This is due toreduction in total water content in the sample as the solid concentration increasesdespite exposure to the same amount of heat. Similar trends were also observed inother published reports (Anandharamarakrishnan et al. 2008). The driest productresulted from initial feed concentration of 13.47 %.
Influence of Total Solid Content
In this study, effects of total solid content and degradation of polyphenol wereassessed by comparing the microencapsulation efficiency of WPI at various con-centrations ranging from 4 to 13 %. The initial solution and the dried powder wereexamined for their flavonoids content by HPLC and proximate analysis using alu-minum chloride colorimetric assay. Total solid content of the initial solution andmoisture content of the dried powder were determined to ensure a proper compar-ison by dissolving the same solid content. All formulations of microencapsulatestested in this work show remarkably good retention (ranging from 68.6 to 85.6 %) oftotal flavonoids in O. stamineus extract. Total flavonoids content analysis show thatthe sample with lowest solid concentration (4.25 %) had better total flavonoidsretention (85.6 %) as depicted in Fig. 1. Similar findings were obtained from HPLCanalysis, the highest sinensetin (81.8 %) and eupatorin (70.1 %) retention detectedcorresponded with the lowest solid concentration. This is due to higher proteindenaturation, solid concentration increase corresponds to loss of solubility(Anandharamakrishnan et al. 2008). In such a case, microencapsulated sinensetin
Table 1 Total solid content Sample Total solidcontent (wt%)
Moisturecontent (wt%)
Extract 2.83TS 4 % 4.25 8.43TS 7 % 7.22 8.32TS 10 % 10.39 8.07TS 13 % 13.47 7.21W1M9 7.50 6.63W1M1 7.47 7.32W9M1 7.45 8.44
Assessment on Bioavailability of Flavonoids 141
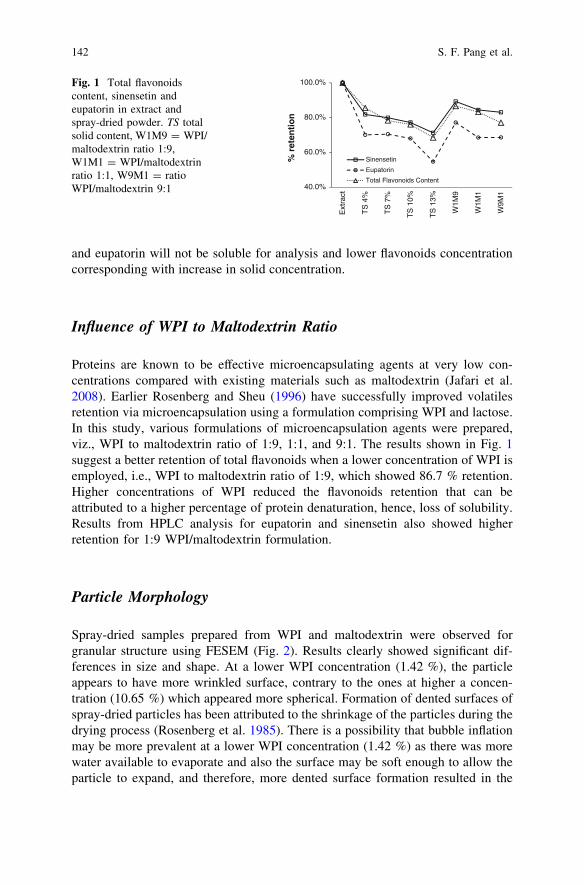
and eupatorin will not be soluble for analysis and lower flavonoids concentrationcorresponding with increase in solid concentration.
Influence of WPI to Maltodextrin Ratio
Proteins are known to be effective microencapsulating agents at very low con-centrations compared with existing materials such as maltodextrin (Jafari et al.2008). Earlier Rosenberg and Sheu (1996) have successfully improved volatilesretention via microencapsulation using a formulation comprising WPI and lactose.In this study, various formulations of microencapsulation agents were prepared,viz., WPI to maltodextrin ratio of 1:9, 1:1, and 9:1. The results shown in Fig. 1suggest a better retention of total flavonoids when a lower concentration of WPI isemployed, i.e., WPI to maltodextrin ratio of 1:9, which showed 86.7 % retention.Higher concentrations of WPI reduced the flavonoids retention that can beattributed to a higher percentage of protein denaturation, hence, loss of solubility.Results from HPLC analysis for eupatorin and sinensetin also showed higherretention for 1:9 WPI/maltodextrin formulation.
Particle Morphology
Spray-dried samples prepared from WPI and maltodextrin were observed forgranular structure using FESEM (Fig. 2). Results clearly showed significant dif-ferences in size and shape. At a lower WPI concentration (1.42 %), the particleappears to have more wrinkled surface, contrary to the ones at higher a concen-tration (10.65 %) which appeared more spherical. Formation of dented surfaces ofspray-dried particles has been attributed to the shrinkage of the particles during thedrying process (Rosenberg et al. 1985). There is a possibility that bubble inflationmay be more prevalent at a lower WPI concentration (1.42 %) as there was morewater available to evaporate and also the surface may be soft enough to allow theparticle to expand, and therefore, more dented surface formation resulted in the
40.0%
60.0%
80.0%
100.0%
Ext
ract
TS
4%
TS
7%
TS
10%
TS
13%
W1M
9
W1M
1
W9M
1
% r
eten
tio
n
Sinensetin
Eupatorin
Total Flavonoids Content
Fig. 1 Total flavonoidscontent, sinensetin andeupatorin in extract andspray-dried powder. TS totalsolid content, W1M9 = WPI/maltodextrin ratio 1:9,W1M1 = WPI/maltodextrinratio 1:1, W9M1 = ratioWPI/maltodextrin 9:1
142 S. F. Pang et al.
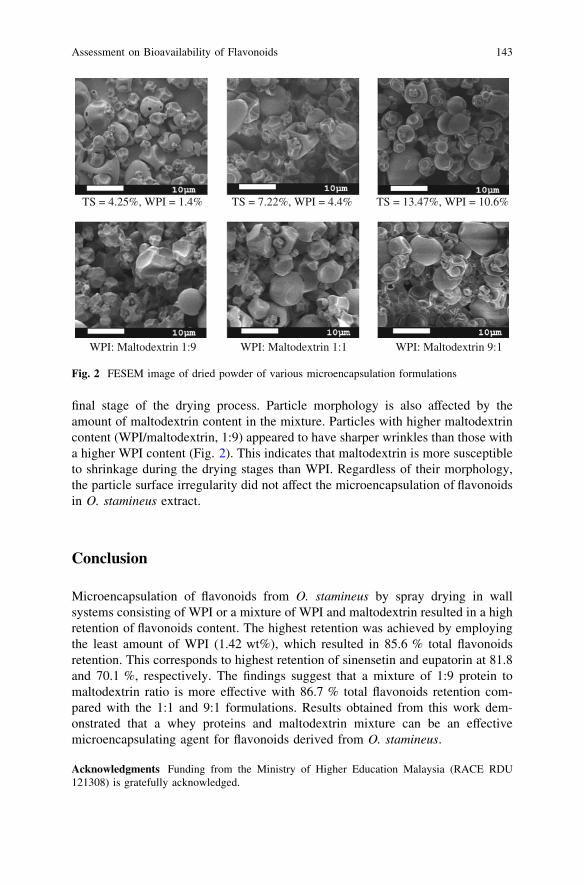
final stage of the drying process. Particle morphology is also affected by theamount of maltodextrin content in the mixture. Particles with higher maltodextrincontent (WPI/maltodextrin, 1:9) appeared to have sharper wrinkles than those witha higher WPI content (Fig. 2). This indicates that maltodextrin is more susceptibleto shrinkage during the drying stages than WPI. Regardless of their morphology,the particle surface irregularity did not affect the microencapsulation of flavonoidsin O. stamineus extract.
Conclusion
Microencapsulation of flavonoids from O. stamineus by spray drying in wallsystems consisting of WPI or a mixture of WPI and maltodextrin resulted in a highretention of flavonoids content. The highest retention was achieved by employingthe least amount of WPI (1.42 wt%), which resulted in 85.6 % total flavonoidsretention. This corresponds to highest retention of sinensetin and eupatorin at 81.8and 70.1 %, respectively. The findings suggest that a mixture of 1:9 protein tomaltodextrin ratio is more effective with 86.7 % total flavonoids retention com-pared with the 1:1 and 9:1 formulations. Results obtained from this work dem-onstrated that a whey proteins and maltodextrin mixture can be an effectivemicroencapsulating agent for flavonoids derived from O. stamineus.
Acknowledgments Funding from the Ministry of Higher Education Malaysia (RACE RDU121308) is gratefully acknowledged.
TS = 4.25%, WPI = 1.4% TS = 7.22%, WPI = 4.4% TS = 13.47%, WPI = 10.6%
WPI: Maltodextrin 1:9 WPI: Maltodextrin 1:1 WPI: Maltodextrin 9:1
Fig. 2 FESEM image of dried powder of various microencapsulation formulations
Assessment on Bioavailability of Flavonoids 143
References
Akowuah, G. A., Ismail, Z., Norhayati, I., & Sadikun, A. (2005). The effects of differentextraction solvents of varying polarities on polyphenols of Orthosiphon stamineus andevaluation of the free radical-scavenging activity. Food Chemistry, 93, 311–317.
Anandharamakrishnan, C., Rielly, C. D., & Stapley, A. G. F. (2008). Loss of solubility of a-lactalbumin and b-lactoglobulin during the spray drying of whey proteins. LWT, 41, 270–277.
Ho, C. H., Ismail, N., Shaida-Fariza, S., & Ahmad, R. (2010). In vitro antibacterial andantioxidant activities of Orthosiphon stamineus Benth extracts against food-borne bacteria.Food Chemistry, 122, 1168–1172.
Jafari, S. M., Assadpoor, E., He, Y., & Bhandari, B. (2008). Encapsulation efficiency of foodflavours and oils during spray drying. Drying Technology, 26(7), 816–835.
Mariam, A., Asmawi, M. Z., & Sadikun, A. (1996). Hypoglycaemic activity of the aqueousextract of Orthosiphon stamineus. Fitoterapia, 67(5), 465–468.
Masuda, T., Masuda, K., Shiragami, S., Jitoe, A., & Nakatani, N. (1992). Orthosiphol A and B,novel diterpenoid inhibitors of TPA (12-O-tetradecanoylphorbol–13–acetate)–inducedinflammation, from orthosiphon stamineus. Tetrahedron, 48, 6787–6792.
Ohashi, K., Bohgak, T., & Shibuya, H. (2000). Anti-hypertensive substances in the leaves KumisKucing (Orthosiphon stamineus) in Java Island. YakugakuZasshi, 120, 474–482.
Rosenberg, M., & SHEU, T. Y. (1996). Microencapsulation of volatiles by spray-drying in wheyprotein-based wall systems. International Dairy Journal, 6, 273–284.
Rosenberg, M., Kopelman, I. J., & Talmon, Y. (1985). A scanning electron microscopy study ofmicroencapsulation. Journal of Food Science, 50, 139–144.
Sameh, F., Abou, Z., & GAMAL, M. E. (2008). Increase in flavonoids content in red onion peelby mechanical shredding. Journal of Medicinal Plants Research, 2(9), 258–260.
Saravanan, D., Hossain, M. A., Zhari, S., Gam, L. H., & Ismail, Z. (2006). The use of principalcomponent analysis and self-organizing map to monitor inhibition of calcium oxalate crystalgrowth by Orthosiphon stamineus extract. Chemometrics and Intelligent Laboratory System,81, 21–28.
Xie, Y. L., Zhou, H. M., Liang, X. H., He, B. S., & Han, X. X. (2010). Study on the morphology,particle size and thermal properties of vitamin A microencapsulated by starch octenylsucci-niate. Agricultural Sciences in China, 9(7), 1058–1064.
144 S. F. Pang et al.
A Chimney of Low Height to DiameterRatio for Solar Crops Dryer
S. Kumaresan, M. M. Rahman, C. M. Chu and H. K. Phang
Abstract Sabah, Malaysia is rich with solar energy where the daily mean daylightis the for is available for 4–8 h. The sunlight can be used effectively in a suitablesolar crops drying system. Solar crops dryer with mechanical system is an efficientand suitable option for crops drying. Mechanical system can be replaced with amodified chimney and a conceptual design is proposed. Previously, in the labo-ratory, a number of experiments had been conducted by using conventionalchimney and modified chimney with four different heat loads varied from 1 to2.5 kW and also for different chimney heights varying from 0.3 to 1.2 m as well asthree different types of chimney model with face areas of 0.56, 1.00, and 2.25 m2.It had been found that the modified chimney significantly reduced the effect of flowreversal or cold inflow and restored the loss in flow rate. The current study usingcomputational fluid dynamics (CFD) managed to show draft enhancement by themodified chimney and revealed the pressure prior to exit to be higher than ambientcompared with the lower pressure in normal chimney, indicating vulnerability ofnormal chimneys to flow reversal but positive prevention in a modified chimney.
Keywords Flow reversal � Cold inflow � Wire mesh � Solar chimney � Naturaldraft � Enhancement
C. M. Chu (&) � H. K. PhangChemical Engineering Programme, School of Engineering and Information Technology,Universiti Malaysia Sabah, Jalan UMS 88400 Kota Kinabalu, Sabah, Malaysiae-mail: [email protected]
S. KumaresanMaterials and Mineral Research Unit, School of Engineering and Information Technology,Universiti Malaysia Sabah, Jalan UMS 88400 Kota Kinabalu, Sabah, Malaysiae-mail: [email protected]
M. M. RahmanMechanical Engineering Programme, School of Engineering and Information Technology,Universiti Malaysia Sabah, Jalan UMS 88400 Kota Kinabalu, Sabah, Malaysiae-mail: [email protected]
R. Pogaku et al. (eds.), Developments in Sustainable Chemicaland Bioprocess Technology, DOI: 10.1007/978-1-4614-6208-8_19,� Springer Science+Business Media New York 2013
145
Introduction
The efficient and economical uses of renewable energy reduce the dependency onenergy supply from finite conventional energy sources. Solar energy can be useddirectly (photovoltaic cell, solar thermal collectors) or indirectly (passive coolingtechnique) to convert into usable source of energy. Solar radiation has potentialvalue towards developing solar crops dryer in Sabah, Malaysia. According to theMalaysian Metrological Department, the solar radiation data were recorded from13 observation stations in Malaysia. Malaysia was found to have mean daily solarradiation for low land areas ranging from 16.10 MJ/m2 in Kuching to 22.70 MJ/m2
in Kota Kinabalu in August, 2012; and 16.50 MJ/m2 in Pulau Langkawi andKuching to 20.30 MJ/m2 in Kota Kinabalu in July 2012 (Malaysian Meteorolog-ical Department 2012). Sabah had the highest mean daily solar radiation in thesetwo months. The daily average sun shining hours in Malaysia ranges from 4 to 8 h(Christopher 2012). Therefore, it is an essential issue to utilize solar energy inSabah, Malaysia in different sector such as electricity production, house ventila-tion, drying agricultural product and clothes. Solar dryer of either forced or naturalventilation types for crops and agricultural products are more cost-effective andfaster in drying process than sun drying (Oguntola et al. 2010; Shaik 2009; Ameenand Saiful 2004).
Jensen and Kristensen (2001) conducted test on a solar crop dryer which hadtransparent area 4.77 m2 and drying bed area 1.35 m2. The solar crop dryer had a12 V DC fan with capacity 300 m3/hr at 40 Pa. Tarigan and Tekasakul (2005)carried out experiment on solar dryer with biomass burner and heat storage back-up heater in Thailand. The capacity of the burner was designed to provide400 W/m2 of energy in the system. Forsona et al. (2007) designed a crop dryer atsolar irradiance of 400 W/m2 where the ambient temperature was 25.1 �C and therelative humidity was 77.8 %. In this system, a chimney was used to create suf-ficient draft and to confirm natural circulation of air inside the drying chamber(Forsona et al. 2007). Santos et al. (2005) designed a solar crop dryer having an airflow rate of 2.10 m3/min. A solar dryer was also constructed in Bhutan to dryagricultural crops. The solar dryer had a blower to create air velocity of 0.75 m/sand air mass flow rate of 3120 kg/hr (Fuller et al. 2005). A natural convection solarmaize dryer was also designed by Folaranmi (2008) at an irradiation of 400 W/m2
and the saturated hot air passed through a chimney to avoid contamination of driedproduct with condensate water.
In this study, a new type of chimney for natural draft ventilation can be con-structed at low height and large diameter. This type of chimney has been tested tosuffer much less cold inflow than normal conventional chimneys. The newchimney design is fitted with wire mesh of pore size appropriate for the applicationand this has a bouncing effect to the cold air at its exit thus preventing inflows asdemonstrated by smoke tests on laboratory chimneys (Chu et al. 2012). Thesmaller pore size probably reduced the boundary layer making the flow reversalmore difficult and also creates a resistance so that the chimney preferentially draws
146 S. Kumaresan et al.
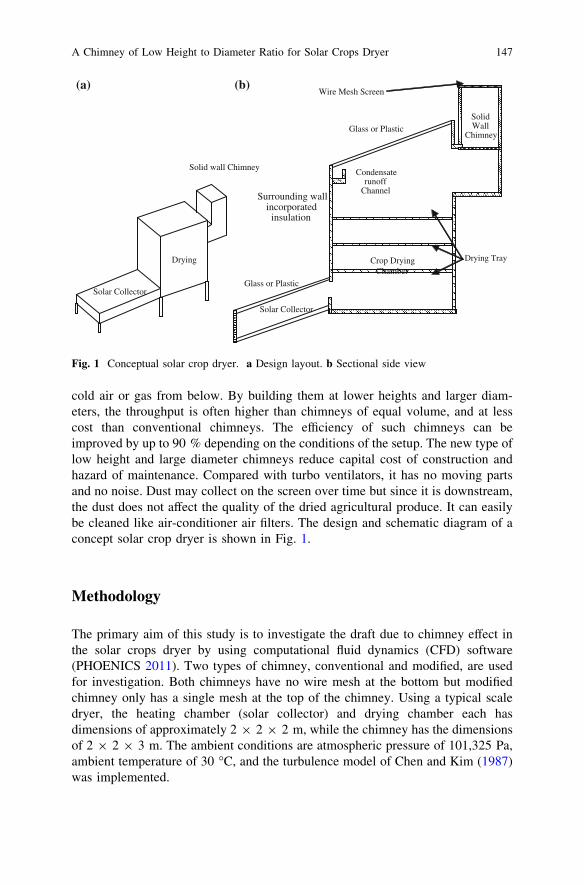
cold air or gas from below. By building them at lower heights and larger diam-eters, the throughput is often higher than chimneys of equal volume, and at lesscost than conventional chimneys. The efficiency of such chimneys can beimproved by up to 90 % depending on the conditions of the setup. The new type oflow height and large diameter chimneys reduce capital cost of construction andhazard of maintenance. Compared with turbo ventilators, it has no moving partsand no noise. Dust may collect on the screen over time but since it is downstream,the dust does not affect the quality of the dried agricultural produce. It can easilybe cleaned like air-conditioner air filters. The design and schematic diagram of aconcept solar crop dryer is shown in Fig. 1.
Methodology
The primary aim of this study is to investigate the draft due to chimney effect inthe solar crops dryer by using computational fluid dynamics (CFD) software(PHOENICS 2011). Two types of chimney, conventional and modified, are usedfor investigation. Both chimneys have no wire mesh at the bottom but modifiedchimney only has a single mesh at the top of the chimney. Using a typical scaledryer, the heating chamber (solar collector) and drying chamber each hasdimensions of approximately 2 9 2 9 2 m, while the chimney has the dimensionsof 2 9 2 9 3 m. The ambient conditions are atmospheric pressure of 101,325 Pa,ambient temperature of 30 �C, and the turbulence model of Chen and Kim (1987)was implemented.
Solar Collector
Drying
Solid wall Chimney
Wire Mesh Screen
Drying Tray
Solid Wall
Chimney Glass or Plastic
Condensate runoff
Channel
Glass or Plastic
Crop Drying Chamber
Solar Collector
Surrounding wall incorporated
insulation
(a) (b)
Fig. 1 Conceptual solar crop dryer. a Design layout. b Sectional side view
A Chimney of Low Height to Diameter Ratio for Solar Crops Dryer 147
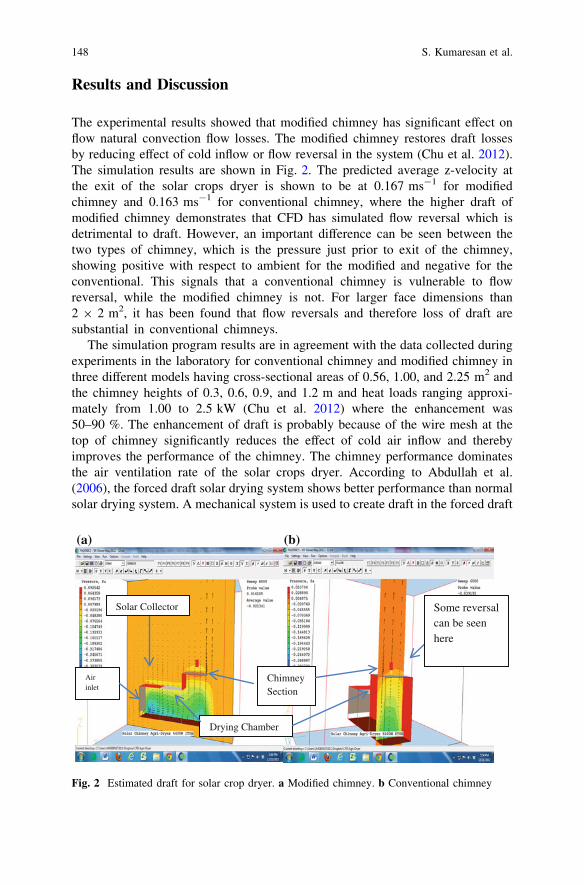
Results and Discussion
The experimental results showed that modified chimney has significant effect onflow natural convection flow losses. The modified chimney restores draft lossesby reducing effect of cold inflow or flow reversal in the system (Chu et al. 2012).The simulation results are shown in Fig. 2. The predicted average z-velocity atthe exit of the solar crops dryer is shown to be at 0.167 ms-1 for modifiedchimney and 0.163 ms-1 for conventional chimney, where the higher draft ofmodified chimney demonstrates that CFD has simulated flow reversal which isdetrimental to draft. However, an important difference can be seen between thetwo types of chimney, which is the pressure just prior to exit of the chimney,showing positive with respect to ambient for the modified and negative for theconventional. This signals that a conventional chimney is vulnerable to flowreversal, while the modified chimney is not. For larger face dimensions than2 9 2 m2, it has been found that flow reversals and therefore loss of draft aresubstantial in conventional chimneys.
The simulation program results are in agreement with the data collected duringexperiments in the laboratory for conventional chimney and modified chimney inthree different models having cross-sectional areas of 0.56, 1.00, and 2.25 m2 andthe chimney heights of 0.3, 0.6, 0.9, and 1.2 m and heat loads ranging approxi-mately from 1.00 to 2.5 kW (Chu et al. 2012) where the enhancement was50–90 %. The enhancement of draft is probably because of the wire mesh at thetop of chimney significantly reduces the effect of cold air inflow and therebyimproves the performance of the chimney. The chimney performance dominatesthe air ventilation rate of the solar crops dryer. According to Abdullah et al.(2006), the forced draft solar drying system shows better performance than normalsolar drying system. A mechanical system is used to create draft in the forced draft
Some reversal can be seen here
Solar Collector
Drying Chamber
Chimney Section
Air inlet
(a) (b)
Fig. 2 Estimated draft for solar crop dryer. a Modified chimney. b Conventional chimney
148 S. Kumaresan et al.
solar drying system. If the mechanical system can be replaced with a non-mechanical system, then the system will be more cost-effective and environmentalfriendly.
Conclusion
Chimney with solar crops dryer will be a suitable option compared with normaldrying and forced draft drying processes for house hold, hotels, hospital, etc. Themodified chimney has been found by both experiment and simulation to signifi-cantly increase ventilation of solar crops dryer that can be used as a replacement ofmechanical system used in the forced ventilation solar crops dryer. Modifiedchimney reduces the effect of cold inflow or flow reversal at exit of the solar dryerthat restore the losses of draft during operation and enhance the performance ofsolar crops dryer.
References
Abdullah, M. O., Mikie, F. A., & Lam, C. Y. (2006). Drying performance and thermal transientstudy with solar radiation supplemented by forced-ventilation. International Journal ofThermal Science, 45, 1027–1034.
Ameen, A., & Saiful, B. (2004). Investigation into the effectiveness of heat pump assisted clothesdryer for humid tropics. Energy Conversion and Management, 45, 1397–1405.
Chen, Y.S. & Kim, S.W. (1987). Computation of turbulent flows using an extended k-eturbulence closure model, NASA CR-179204.
Christopher, T. B. S. (2012). Electricity from solar energy in Malaysia: Clean, renewable, andabundant energy source, so what’s the problem? http://christopherteh.com/blog/2012/05/solar-malaysia/ Posted on May 4th, 2012.
Chu, C., Rahman, M. M., & Kumaresan, S. (2012a). Effect of cold inflow on chimney height ofnatural draft cooling towers. Nuclear Engineering and Design, 249, 125–131.
Chu, C. M., Chu, R. K. H., & Rahman, M. M. (2012b). Experimental study of cold inflow and itseffect on draft of a chimney. Advanced Computational Methods and Experiments in HeatTransfer XII, WIT Transactions on Engineering Sciences, 75, 73–82.
Folaranmi, J. (2008). Design construction and testing of solar maize dryer. Leonardo ElectronicJournal of Practices and Technologies, 13, 122–130.
Forsona, F. K., Nazhab, M. A. A., Akuffoa, F. O., & Rajakaruna, H. (2007). Design of mixed-mode natural convection solar crop dryers: Application of principles and rules of thumb.Renewable Energy, 32, 2306–2319.
Fuller, R.J., Lhendup, T., & Aye, Lu. (2005). Technical and financial evaluation of a solar dryerin Bhutan solar 2005. ANZSES Annual Conference, Dunedin NZ, 28–30 Nov 2005.
Jensen, S. O. & Kristensen E. F. (2001). Test of a solar crop dryer. Danish Technological Instituteand Danish Institute of Agricultural Science, www.solenergi.dk/SEC/rapporter/sec-r-6.pdf.
Malaysian Meteorological Department. (2012). Monthly Weather Bulletin-2012. www.met.gov.my.
Oguntola, J. A., Collins, N. N., & Olayinka, A. (2010). Design and construction of a domesticpassive solar food dryer. Leonardo Journal of Sciences, 16, 71–82.
A Chimney of Low Height to Diameter Ratio for Solar Crops Dryer 149

PHOENICS. (2011). Parabolic hyperbolic or elliptic numerical integration code series,computational fluid dynamics software, CHAM Ltd., http://www.cham.co.uk.
Santos, B. M., Queiroz, M. R., & Borges, T. P. F. (2005). A solar collector design procedure forcrop drying. Brazilian Journal of Chemical Engineering, 22(2), 277–284.
Shaik, Z. A. (2009). Design and development of a solar cloth dryer. Bachelor of Technology inMechanical Engineering, National Institute of Technology Rourkela. http://ethesis.nitrkl.ac.in/1126/1/project.pdf.
Tarigan, E., & Tekasakul, P. (2005). A mixed-mode natural convection solar dryer with biomassburner and heat storage back-up heater solar 2005. ANZSES Annual Conference, DunedinNZ, 28–30 Nov 2005.
150 S. Kumaresan et al.
Thermal Denaturation Kinetics of WheyProtein and Maltodextrin Mixture
N. M. Yusoff, J. Gimbun and M. M. Yusoff
Abstract This chapter presents thermal denaturation studies of whey protein andmaltodextrin mixture. Different compositions of whey protein–maltodextrin mix-ture were exposed to various temperature and holding time. The main proteincontents, i.e., b-lactoglobulin (b-lg) and a-lactalbumin (a-lac) before and after heatexposures were analyzed using ultra-performance liquid chromatography. Signif-icant decreases in protein contents were found as temperature and holding timeincreases. Addition of maltodextrin to whey protein solution reduces the proteindenaturation significantly. Formulation of 9:1 WPI to maltodextrin ratio wasshown to reduce a-lac denaturation by up to 15.1 % and even higher reduction forb-lg which is up to 74.6 % after 20 min at 70 �C. Results from UPLC analysis ofthe residual native protein suggests that the thermal sensitivity of b-lg was highercompared with a-lac. Over 97 % of b-lg was denatured after 20 min as opposed toabout 60 % for a-lac at 80 �C. Protein denaturation was also observed to increaseproportionally with temperature. Results from this work may be useful to preservethe protein content in milk during processing involving thermal exposure.
Keywords Protein denaturation �Maltodextrin �Whey protein �Mixture � UPLC
N. M. Yusoff � J. Gimbun (&)Faculty of Chemical and Natural Resources Engineering, Universiti Malaysia Pahang,Gambang, Malaysiae-mail: [email protected]
J. GimbunCentre of Excellence for Advanced Research in Fluid Flow (CARIFF),Universiti Malaysia Pahang, Gambang, Malaysia
M. M. YusoffFaculty of Industrial Sciences and Technology, Universiti Malaysia Pahang,Gambang, Malaysia
M. M. YusoffCentral Laboratory, Universiti Malaysia Pahang, Universiti Malaysia Pahang,26300 Gambang, Pahang, Malaysia
R. Pogaku et al. (eds.), Developments in Sustainable Chemicaland Bioprocess Technology, DOI: 10.1007/978-1-4614-6208-8_20,� Springer Science+Business Media New York 2013
151
Introduction
Whey protein isolate (WPI) is a dietary supplement created by filtering milkprotein. WPI is commonly used in infant formula and widely used as a supplementin sports due to its higher protein content. WPI is known to exhibit thermaldenaturation especially when exposed to high-temperature operations such asdrying processes in the spray dryer. Numerous studies have been conducted toelucidate denaturation kinetics of the major whey protein, e.g., Parris et al. (1991),Cairolli et al. (1994), Apenten (1995), Curda et al. (1997), Dalgeish et al. (1997),Law et al. (1997), Law and Leaver (1999), Qi et al. (1995), Relkin (1994), Baezaand Pilosof (2002), Sochava et al. (1985), Havea et al. (2000, Indyk et al. (2008)and Goetz and Koehler (2005). Although the kinetic of pure protein denaturation iswell understood, however, no research has been performed for protein mixed withother substances such as maltodextrin, and therefore, this is the aim of this study.All previous studies only examined the extent of denaturation of major wheyprotein and may not imply similar denaturation behavior when WPI–maltodextrinmixture is employed. The main objective of this study was to determine the extentof denaturation of major whey protein (a-lac and b-lg) mixed with starchderivative.
Materials and Methods
Chemicals
The WPIs powder (WPI, 80 % protein, 4.7 % moisture, 6 % fat, 6.6 % lactose,2.7 % minerals) was obtained from Ultimate Nutrition (Lancashire, UK). Mean-while, individual bovine milk proteins, including a-lac, b-lg, and BSA with 85, 80,and 96 % purity, respectively, were obtained from Sigma (St. Louis, MO, USA) ascalibration standard. HPLC grade trifluoroacetic acid (TFA) and acetonitrile(MeCN) were obtained from Merck (Germany) for the UPLC analysis. Malto-dextrin of 10 DE was obtained from San Soon Seng Food Industries Sdn. Bhd.(Malaysia).
Sample Preparation
WPI solutions (5 % w/v) were prepared at room temperature by dissolving WPI inultrapure water. Samples of mixed maltodextrin and WPI mixture (of either 1:1 or9:1) were prepared with a total protein content of 5 % w/w. Protein was mixedhomogenously with maltodextrin using a magnetic stirrer at room temperature.
152 N. M. Yusoff et al.
Kinetic Study Design and Heat Treatment
Triplicate samples (2.3 ml) of the mixture were placed into clean and dry stainlesssteel tubes, then heated at 70 and 80 �C using a water bath at times ranging from 3to 20 min. Heated samples were cooled immediately in iced water and centrifugedat 12,000 rpm for 30 min at 20 �C to remove the insoluble matter. Clear super-natant was collected and stored at 4 �C until further analysis. All samples wereanalyzed within 48 h. Unheated and filtered 5 % w/v native WPI solutions wereused as control samples.
UPLC Analysis
WPI solutions were diluted to 1:20 dilution factors with ultrapure water and thenfiltered with PES syringe filter (0.22 lm, Millipore Corp., Bedford, MA). Sepa-rations were carried out by ultra-performance liquid chromatography (UPLC)using Acquity BEH 300 C4 column. Filtered samples were injected (10 ll) into areversed phase column (2.1 9 100 mm; 1.7 lm). The column was equilibrated in65 % Solvent A (0.1 % v/v TFA in ultrapure water), and after sample injection, a1-min isocratic period was applied followed by a series of linear gradients to100 % of solvent B (0.1 % v/v TFA in MeCN). Elution gradient was set asfollows :1–1.46 min, 38–42 % B, 1.46–3.13 min, 42–46 % B, 3.13–4.38 min,46–90 % B, 4.38–4.79 min, 90 % B, 5–6.04 min, 90–35 % B, 6.04–7.09 min,35–38 % B. The flow rate was set at 0.4 mL/min, and column temperature wasmaintained at room temperature. The peak areas were determined by absorbance ata wavelength of 205 nm. Residual native protein was calculated as % area relativeto unheated protein area (mAU*ml).
Results and Discussion
Comparison of UPLC chromatogram was made between the standard and sampleof WPI to quantify WPI composition in each sample. The major peaks corre-sponding to a-lactalbumin (a-lac) and b-lactoglobulin (b-lg) appeared at elutiontimes within 3 and 4 min, respectively. The peak for bovine serum albumin (BSA)appeared at 2.7 min. The UPLC method developed for the first time during thisstudy is capable of a rapid and accurate qualitative and quantitative analysis ofprotein content in WPI. The analysis time was approximately 6 min, which is overthree times faster than those previously reported, e.g., Anandharamakrishnan et al.(2008) at 30 min and Cheison et al. (2012) at 18 min. The degree denaturation ofeach WPI sample was calculated according to the following equation (Fureby et al.2001):
Thermal Denaturation Kinetics of Whey Protein and Maltodextrin Mixture 153
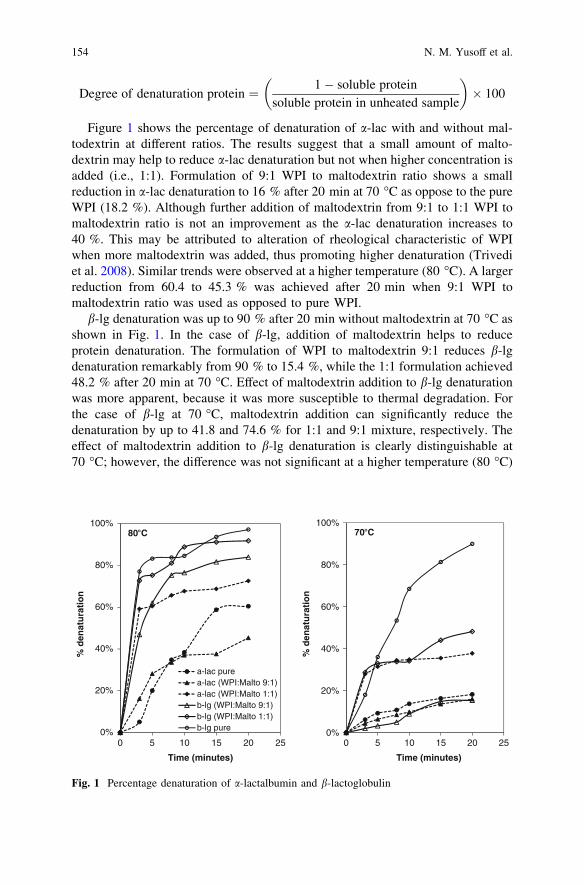
Degree of denaturation protein ¼ 1� soluble protein
soluble protein in unheated sample
� �� 100
Figure 1 shows the percentage of denaturation of a-lac with and without mal-todextrin at different ratios. The results suggest that a small amount of malto-dextrin may help to reduce a-lac denaturation but not when higher concentration isadded (i.e., 1:1). Formulation of 9:1 WPI to maltodextrin ratio shows a smallreduction in a-lac denaturation to 16 % after 20 min at 70 �C as oppose to the pureWPI (18.2 %). Although further addition of maltodextrin from 9:1 to 1:1 WPI tomaltodextrin ratio is not an improvement as the a-lac denaturation increases to40 %. This may be attributed to alteration of rheological characteristic of WPIwhen more maltodextrin was added, thus promoting higher denaturation (Trivediet al. 2008). Similar trends were observed at a higher temperature (80 �C). A largerreduction from 60.4 to 45.3 % was achieved after 20 min when 9:1 WPI tomaltodextrin ratio was used as opposed to pure WPI.
b-lg denaturation was up to 90 % after 20 min without maltodextrin at 70 �C asshown in Fig. 1. In the case of b-lg, addition of maltodextrin helps to reduceprotein denaturation. The formulation of WPI to maltodextrin 9:1 reduces b-lgdenaturation remarkably from 90 % to 15.4 %, while the 1:1 formulation achieved48.2 % after 20 min at 70 �C. Effect of maltodextrin addition to b-lg denaturationwas more apparent, because it was more susceptible to thermal degradation. Forthe case of b-lg at 70 �C, maltodextrin addition can significantly reduce thedenaturation by up to 41.8 and 74.6 % for 1:1 and 9:1 mixture, respectively. Theeffect of maltodextrin addition to b-lg denaturation is clearly distinguishable at70 �C; however, the difference was not significant at a higher temperature (80 �C)
0%
20%
40%
60%
80%
100%
0 5 10 15 20 25
% d
enat
ura
tio
n
Time (minutes)
a-lac purea-lac (WPI:Malto 9:1)a-lac (WPI:Malto 1:1)b-lg (WPI:Malto 9:1)b-lg (WPI:Malto 1:1)b-lg pure
80°C
0%
20%
40%
60%
80%
100%
0 5 10 15 20 25
% d
enat
ura
tio
n
Time (minutes)
70°C
Fig. 1 Percentage denaturation of a-lactalbumin and b-lactoglobulin
154 N. M. Yusoff et al.
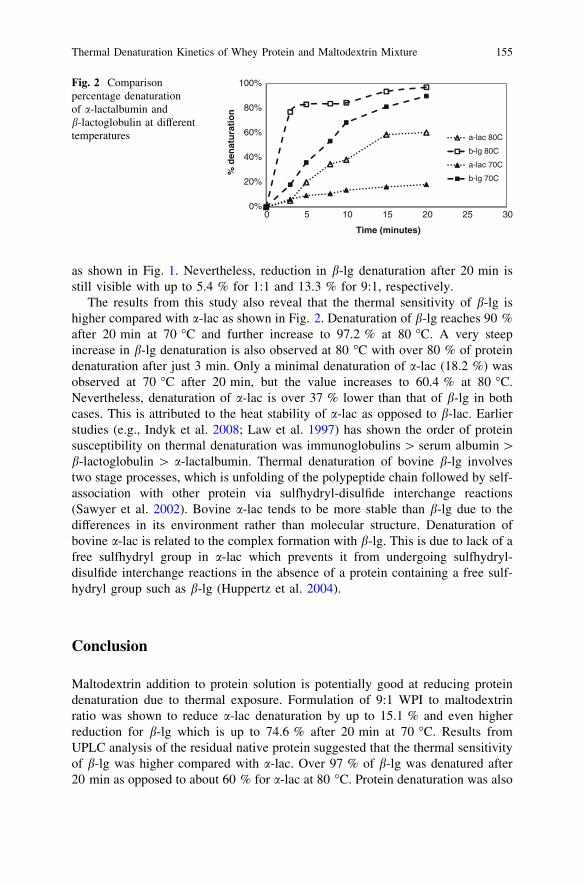
as shown in Fig. 1. Nevertheless, reduction in b-lg denaturation after 20 min isstill visible with up to 5.4 % for 1:1 and 13.3 % for 9:1, respectively.
The results from this study also reveal that the thermal sensitivity of b-lg ishigher compared with a-lac as shown in Fig. 2. Denaturation of b-lg reaches 90 %after 20 min at 70 �C and further increase to 97.2 % at 80 �C. A very steepincrease in b-lg denaturation is also observed at 80 �C with over 80 % of proteindenaturation after just 3 min. Only a minimal denaturation of a-lac (18.2 %) wasobserved at 70 �C after 20 min, but the value increases to 60.4 % at 80 �C.Nevertheless, denaturation of a-lac is over 37 % lower than that of b-lg in bothcases. This is attributed to the heat stability of a-lac as opposed to b-lac. Earlierstudies (e.g., Indyk et al. 2008; Law et al. 1997) has shown the order of proteinsusceptibility on thermal denaturation was immunoglobulins [ serum albumin [b-lactoglobulin [ a-lactalbumin. Thermal denaturation of bovine b-lg involvestwo stage processes, which is unfolding of the polypeptide chain followed by self-association with other protein via sulfhydryl-disulfide interchange reactions(Sawyer et al. 2002). Bovine a-lac tends to be more stable than b-lg due to thedifferences in its environment rather than molecular structure. Denaturation ofbovine a-lac is related to the complex formation with b-lg. This is due to lack of afree sulfhydryl group in a-lac which prevents it from undergoing sulfhydryl-disulfide interchange reactions in the absence of a protein containing a free sulf-hydryl group such as b-lg (Huppertz et al. 2004).
Conclusion
Maltodextrin addition to protein solution is potentially good at reducing proteindenaturation due to thermal exposure. Formulation of 9:1 WPI to maltodextrinratio was shown to reduce a-lac denaturation by up to 15.1 % and even higherreduction for b-lg which is up to 74.6 % after 20 min at 70 �C. Results fromUPLC analysis of the residual native protein suggested that the thermal sensitivityof b-lg was higher compared with a-lac. Over 97 % of b-lg was denatured after20 min as opposed to about 60 % for a-lac at 80 �C. Protein denaturation was also
0%
20%
40%
60%
80%
100%
0 5 10 15 20 25 30
% d
enat
ura
tio
nTime (minutes)
a-lac 80C
b-lg 80C
a-lac 70C
b-lg 70C
Fig. 2 Comparisonpercentage denaturationof a-lactalbumin andb-lactoglobulin at differenttemperatures
Thermal Denaturation Kinetics of Whey Protein and Maltodextrin Mixture 155
observed to increase proportionally with temperature. These results may be usefulin considering preservation strategies of protein content in milk during processinginvolving thermal exposure.
Acknowledgments Nuraini Mohd Yusoff acknowledges funding from Universiti MalaysiaPahang in the form of GRS110353 and from Malaysian Toray Science Foundation (MTSF) in theform of RDU 121501.
References
Anandharamakrishnan, C., Rielly, C. D., & Stapley, A. G. F. (2008). Loss of solubility ofa-lactalbumin and b-lactoglobulin during the spray drying of whey proteins. LWT-FoodScience and Technology, 41, 270–277.
Apenten, R. K. O. (1995). A three-state heat-denaturation of bovine a-lactalbumin. FoodChemistry, 52, 131–133.
Baeza, R. I., & Pilosof, A. M. R. (2002). Calorimetric studies of thermal denaturation ofb-lactoglobulin in the presence of polysaccharides. LWT-Food Science and Technology, 35,393–399.
Cairolli, S., Iametti, S., & Bonomi, F. (1994). Reversible and irreversible modifications ofb-lactoglobulin upon exposures to heat. Journal of Protein Chemistry, 13, 347–354.
Cheison, S. C., Bor, E. K., Faraj, A. K., & Kulozik, U. (2012). Selective hydrolysis ofa-lactalbumin by acid protease a offers potential for b-lactoglobulin purification in wheyproteins. LWT-Food Science and Technology, 49, 117–122.
Curda, L., Belhacova, M., Uhrova, J., & Fukal, L. (1997). Assessment of heat induceddenaturation of whey proteins. Journal of Chromatography A, 772, 231–234.
Dalgeish, D. G., Senaratne, V., & Francois, S. (1997). Interaction between a-lactalbumin andb-lactoglobulin in the early stages of heat denaturation. Journal of Agricultural and FoodChemistry, 45, 3459–3464.
Fureby, A. M., Elofson, U., & Bergenstahl, B. (2001). Surface composition of spray-dried milkprotein-stabilised emulsions in relation to pre-heat treatment of proteins. Colloids andsurfaces B, Biointerfaces, 21, 47–58.
Goetz, J., & Koehler, P. (2005). Study of thermal denaturation of selected of whey and egg bylow resolution of NMR. LWT-Food science and technology, 38, 501–512.
Havea, P., Singh, H., & Creamer, L. (2000). Formulation of new protein structures in heatedmixtures of BSA and a-lactalbumin. Journal of Agricultural and Food Chemistry, 48,1548–1556.
Huppertz, T., Fox, P. F., & Kelly, A. L. (2004). High pressure-induced denaturation ofa-lactalbumin and b-lactoglobulin in bovine milk and whey: a possible mechanism. Journal ofDairy Research, 71, 489–495.
Indyk, H. E., Willliams, J. W., & Patel, H. A. (2008). Analysis of denaturation of bovine IgG byheat and high pressure using an optical biosensor. International Dairy Journal, 18, 359–366.
Law, A. J. R., Leaver, J., & Xavier, M. F. (1997). Effect of protein concentration on rates ofthermal denaturation of whey proteins in milk. Journal of Agricultural and Food Chemistry,45, 4255–4261.
Law, A. J. R., & Leaver, J. (1999). Factors that affecting the heat denaturations of whey proteinsin cow milk. International Dairy Journal, 9, 407–408.
Parris, N., Purcell, J., & Ptashkin, S. (1991). Thermal denaturation of whey proteins in skim milk.Journal of Agricultural and Food Chemistry, 39, 2167–2170.
Qi, X. L., Bronlow, S., & Holt, C. (1995). Thermal denaturation of b-lactoglobulin; effect ofprotein concentration at pH 6.75 and 8.05. Biochimica et Biophysica Acta, 1428, 43–49.
156 N. M. Yusoff et al.

Relkin, P. (1994). Differential scanning calorimetry: A useful tool for studying proteindenaturation. Thermochimica Acta, 246, 371–386.
Sawyer, L., Barlow, P., Boland, M. J., Creamer, L. K., Denton, H., Edward, P. J. B., et al. (2002).Milk protein structure—what does it tell the dairy industry? International Dairy Journal, 12,299–310.
Sochava, I. V., Belospolskaya, T. V., & Smirnova, O. I. (1985). DSC study of reversible andirreversible thermal denaturation of concentrated globular protein solutions. BiophysicalChemistry, 22, 323–336.
Trivedi, D., Bennet, R. J., Hemar, Y., Reid, D. C. W., Lee, S. K., & Illingworth, D. (2008). Effectof different starches on rheological and microstructural properties of (1) model processedcheese. International Journal of Food Science and Technology, 43, 2191–2196.
Thermal Denaturation Kinetics of Whey Protein and Maltodextrin Mixture 157
Production of a-Amylase by ImmobilizedBacillus Subtilis in Polymeric PolyHIPEMatrix
D. N. Jimat, C. Harwood and G. Akay
Abstract The microcellular polymer known as polyHIPE polymer (PHP), withmodified physico-chemical characteristics, was developed as a cell matrix for theimmobilization of the starch-degrading bacterium, Bacillus subtilis. Suspension ofB. subtilis spores was inoculated into a synthesized PHP matrix which is chemi-cally modified, and this PHP matrix was named sulphonated PHPs (SPHPs). Theseinoculated spores were then activated by supplying continuously well-aeratedculture medium (LB medium) and placed in a 37 �C constant temperature roomfor 24-h incubation. The growth and enzyme productivity data were evaluated andcompared. Three different pore and interconnect sizes of SPHPs were evaluated:42.0 ± 0.61, 36.0 ± 0.50 and 30.0 ± 0.64 lm. The collected samples obtainedfrom the 24-h cultivation were used to determine a-amylase productivity and theloss of cells from the matrices. The morphology, viability and proliferation of theimmobilized cells on PHP matrices were observed by scanning electron micros-copy (SEM). The SPHP with a pore size of 36.0 lm performed better with respectto the production of a-amylase and the penetration of cells through the wholematrix compared to other SPHPs. The data showed that the total productivity ofa-amylase enzyme produced by immobilized cells (on the basis of SPHP volume)was 7.6-fold higher than the batch cell culture. However, if productivity wasdetermined on the basis of used total volume of nutrient medium, that of theimmobilized cells was relatively low compared to batch cell culture.
D. N. Jimat (&)Biotechnology Engineering Department, Kulliyyah of Engineering, International IslamicUniversity, P.O. Box 10 50728 Kuala Lumpur, Malaysiae-mail: [email protected]
C. HarwoodCell and Molecular Biosciences, Medical School, Newcastle University,Newcastle upon Tyne, UK
G. AkayProcess Intensification and Miniaturization Centre, School Of Chemical Engineeringand Advanced Materials, Newcastle University, Newcastle upon Tyne, UK
R. Pogaku et al. (eds.), Developments in Sustainable Chemicaland Bioprocess Technology, DOI: 10.1007/978-1-4614-6208-8_21,� Springer Science+Business Media New York 2013
159
Introduction
Enzymes are biological products that can act as catalysts. Owing to their specific,effective and versatile features, they tend to exhibit much higher reaction rates ascompared to reactions catalysed by chemical catalysts. One of the world’s largestindustrial enzyme producers is Novozymes (Denmark), which is involved in thedevelopment, production and distribution of microbial enzymes. These enzymesare produced from genetically modified microorganisms, indicating that microbialfermentation is the major route for the production of industrial enzymes. There is aneed to explore novel processes that could improve the production systems to meetthe anticipated increased demand for industrial enzymes.
The application of immobilized cell technology can improve bioreactor pro-ductivity by maintaining high cell concentrations as well as operational stability.Additionally, immobilized cell technology can reduce processing time and down-stream processing as it can act as a biomass separator. A number of previousstudies have attempted to investigate the influence of immobilization on cellgrowth and metabolic activity (Duran-Paramo et al. 2000; Argirakos et al. 1992;Dobreva et al. 1998; Konsoula and Liakopoulou-Kyriakides 2006). The selectionof the materials used for the matrices is of the utmost importance because itdetermines their characteristics. Currently, most of the support matrices used forcell immobilization is derived from natural sources such as alginate, carrageenan,gelatine and chitosan. These natural matrices lack mechanical rigidity and stabilityand are therefore prone to damage during long processing conditions. This is dueto the impact of rapidly growing colonies on the outer surface of the matrix andsubsequently leads to the release of cells into the medium. Additionally, theconcentration of cells in the interior of these matrices is inconsistent because sometreatments allow significant number of cells to escape. This means that more cellsare observed growing on the outer surface rather than migrating deeper into thematrix. As a result, the efficiency of immobilization is compromised, affecting thefinal output of the bioreactor. The main factor that causes these problems isthe limited mass transfer rates for nutrients, products or waste to and from theimmobilized matrix. Thus, there is a need to improve the characteristics of theimmobilized matrices used as cell supports. The matrix of the immobilized cellsupport must be porous enough to provide easy access to nutrients and waste butretain most or all of the bacteria. In this study, a polymeric material known aspolyHIPE polymer (PHP) was used to immobilize the starch-degrading bacterium,Bacillus subtilis. This polyHIPE matrix is synthesized through the high internalphase (HIPE) route and its physico-chemical properties can be modified as desired.This type of polymeric matrix has a highly interconnected porous structure and ismechanically durable in the presence of harsh conditions such as high temperature,pH and toxic chemicals. Therefore, it can be sterilized and used for long operatingconditions without significant physical or chemical degradation.
160 D. N. Jimat et al.
The PHP matrix used in the developed system was designed to improve theproduction of a-amylase by B. subtilis. The confined microenvironment wasdesigned to promote the growth and metabolic activity of this bacterium. More-over, the applied forced flow seeding technique yielded a more uniform distri-bution of cells within the polymeric support, which also helps to improve nutrienttransport. This approach is essential in the area of bioprocess development spe-cifically for microbial fermentations. The results of these studies may provide aplatform for developing microreactors with sufficient mass transfer capacities, tocompete with traditional fermenters.
Methodology
Materials
Phenol, styrene, DVB (divinylbenzene), sorbitanmonooleate (Span 80), potassiumpersulfate, vinylpyridine, sulphuric acid and isopropanol were purchased fromSigma.
Microorganisms and Growth Medium
B. subtilis 168(pKTH10) strain was obtained from Cell and Molecular Biosci-ences, Medical School, Newcastle University. The spore suspensions of B. subtilis168 (pKTH10) were induced in Schaeffer’s sporulation medium as described inHarwood et al. (1990). After overnight incubation, the cell cultures were centri-fuged at 10,000 g for 10 min. The pelleted cells were washed five times withsterilized distilled water to remove all cell debris. The supernatant was discarded,and the spores were suspended in sterilized distilled water and stored at -20 �C.Luria–Bertani medium containing 1 % (w/v) Bacto-tryptone, 0.5 % (w/v) Bacto-yeast extract and 1 % (w/v) NaCl was used to cultivate the spore suspension inboth immobilization and batch culture.
Preparation of Sulphonated PolyHIPE Polymer Matrix
PHPs were prepared by polymerization of a HIPE emulsion as described by Akayet al. (2005b) the chemical modification of PHPs via sulphonation was carried outusing methods developed by Akay et al. (2005a, b).
Production of a-Amylase by Immobilized Bacillus Subtilis 161
Preparation of Immobilized Cell Reactor
The PolyHIPE (PHP) discs were mounted into a sealed PTFE block and sterilizedin an autoclave at 121 �C for 15 min. Then, this PHP disc was initially wetted withdistilled water overnight and then with LB media for an hour before use. Spores ofB. subtilis strain 168 (pKTH10) (*2 9 108) were suspended in 2 ml of LB brothand pre-germinated by incubating for 90 min at 37 �C. The pre-germinated sporeswere force seeded into the PHP by passing the suspension through the matrix at aflow rate of 0.55 ml/min using a syringe pump. The seeded PHP was left for anhour to allow the pre-germinated spore to attach to the surface of the PHP, andthen culture medium (LB broth) was pumped continuously through the matrix at aflow rate of 1.0 ml/min. This experimental setup was placed in a 37 �C constant-temperature room. Samples were collected at various time intervals to determinethe numbers of cells released from the PHP matrix and a-amylase activity. At theend of experiment, sterilized 0.1-M phosphate-buffered saline (PBS) was pumpedthrough the matrix at the same flow rate to remove the remaining medium. As acontrol, the same amount of medium was also added into the PHPs discs, withoutinoculated spores and then incubated overnight at 37 �C. The matrix samples werefixed in 2 % glutaraldehyde/PBS and stored at 4 �C until required.
Determination of Pore and Interconnect Size by ScanningElectron Microscopy
Pore and interconnect sizes of each type of the PHPs were analysed using scanningelectron microscopy (SEM, Cambridge s240). Each sample was fractured in orderto obtain a fresh internal surface and was then mounted onto aluminium stubs atroom temperature using conductive carbon cement (LEIT carbon or glued sticker).Prior to analysis, the samples were then left overnight followed by sputter coatedwith gold at 20 nm, using a Polaron E5100 sputter coater and stored in silica gel.The analysed micrograph images of each polymer were used to determine thediameter of 50 pores and interconnect using ImageJ software (NIH image).
Quantification of Released Cell Numbers and Cell DryWeight
The number of cells released from the PHP matrix was determined by platingserial dilutions of the outflowing medium onto LB agar plates containing 1 %starch. The plates were incubated overnight at 37 �C, and the number of colonieswas determined. Exposing the surfaces of these plates to iodine vapour revealedclear zones around the colonies able to hydrolyse starch. Cells were recovered
162 D. N. Jimat et al.
from batch culture samples (with volume of 1 ml) by centrifugation (3,000 g,10 min, 4 �C) and washed twice with 0.9 % NaCl. The resulting pellet was driedat 105 �C for 24 h to constant weight. In the case of cells in the polyHIPE matrix,they were washed by passing distilled water through the matrix to remove culturemedium, and the matrix dried to constant weight (by weighing several times) andthen weighed. The cell dry weight was determined by subtracting the initial weightof the polyHIPE and its final weight. Weight of blank polyHIPE disc (withoutcells) was also determined as a control.
Quantification of Protein
1 ml of protein assay reagent (Coomassie Plus (Bradford) Assay reagent, ThermoScientific) was added to 1 ml of sample and mixed by using vortex. The mixturewas incubated for 10 min at room temperature, and the absorbance was deter-mined at 595 nm against distilled water blank. Each sample was treated induplicate, and the average value was determined. The protein concentration ofeach sample was determined from the standard curve using the known concen-trations of bovine serum albumin (BSA).
Quantification of a-amylase Assays
Phadebas�amylase tablets, a water-insoluble starch substrate, was used to deter-mine a-amylase activity. One tablet of Phadebas was suspended in 5 ml of steriledistilled water. 40 ll of sample was added to 0.8 ml of Phadebas suspension, andthe mixture was incubated with frequent mixing at 37 �C in a water bath for15 min. The reaction was stopped by the addition of 200 lml of 0.5 M NaOH andvortexed immediately. The mixture was centrifuged at 10,000 g for 5 min, and thesupernatant was transferred into a cuvette. The absorbance of the supernatant wasmeasured at 620 nm against a LB broth blank subjected to the same assay con-ditions. Samples with very high a-amylase activity were diluted up to fivefoldusing distilled water. Each sample was duplicated, and the average was taken. Oneunit (U) of a-amylase activity is defined as the amount of enzyme catalyzing thehydrolysis of 1-lmol glucosidic linkage per minute at 37 �C.
Preparation of Matrix Samples for SEM Analysis
The samples were dehydrated in an ethanol series (each step for 15 min excepting100 % ethanol treatment was for 1 h). The dehydrated sample in 100 % ethanolwas critical-point dried with liquid CO2. The sample was mounted on aluminium
Production of a-Amylase by Immobilized Bacillus Subtilis 163
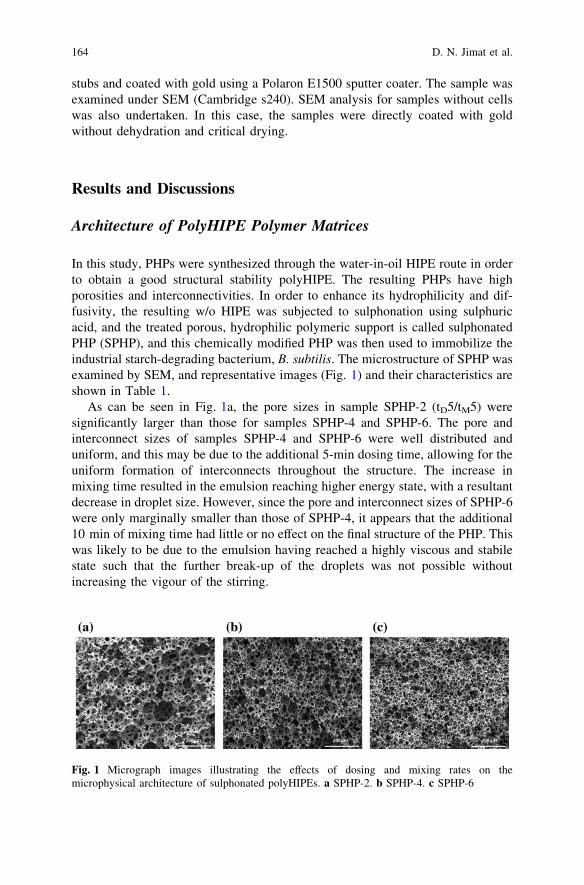
stubs and coated with gold using a Polaron E1500 sputter coater. The sample wasexamined under SEM (Cambridge s240). SEM analysis for samples without cellswas also undertaken. In this case, the samples were directly coated with goldwithout dehydration and critical drying.
Results and Discussions
Architecture of PolyHIPE Polymer Matrices
In this study, PHPs were synthesized through the water-in-oil HIPE route in orderto obtain a good structural stability polyHIPE. The resulting PHPs have highporosities and interconnectivities. In order to enhance its hydrophilicity and dif-fusivity, the resulting w/o HIPE was subjected to sulphonation using sulphuricacid, and the treated porous, hydrophilic polymeric support is called sulphonatedPHP (SPHP), and this chemically modified PHP was then used to immobilize theindustrial starch-degrading bacterium, B. subtilis. The microstructure of SPHP wasexamined by SEM, and representative images (Fig. 1) and their characteristics areshown in Table 1.
As can be seen in Fig. 1a, the pore sizes in sample SPHP-2 (tD5/tM5) weresignificantly larger than those for samples SPHP-4 and SPHP-6. The pore andinterconnect sizes of samples SPHP-4 and SPHP-6 were well distributed anduniform, and this may be due to the additional 5-min dosing time, allowing for theuniform formation of interconnects throughout the structure. The increase inmixing time resulted in the emulsion reaching higher energy state, with a resultantdecrease in droplet size. However, since the pore and interconnect sizes of SPHP-6were only marginally smaller than those of SPHP-4, it appears that the additional10 min of mixing time had little or no effect on the final structure of the PHP. Thiswas likely to be due to the emulsion having reached a highly viscous and stabilestate such that the further break-up of the droplets was not possible withoutincreasing the vigour of the stirring.
Fig. 1 Micrograph images illustrating the effects of dosing and mixing rates on themicrophysical architecture of sulphonated polyHIPEs. a SPHP-2. b SPHP-4. c SPHP-6
164 D. N. Jimat et al.
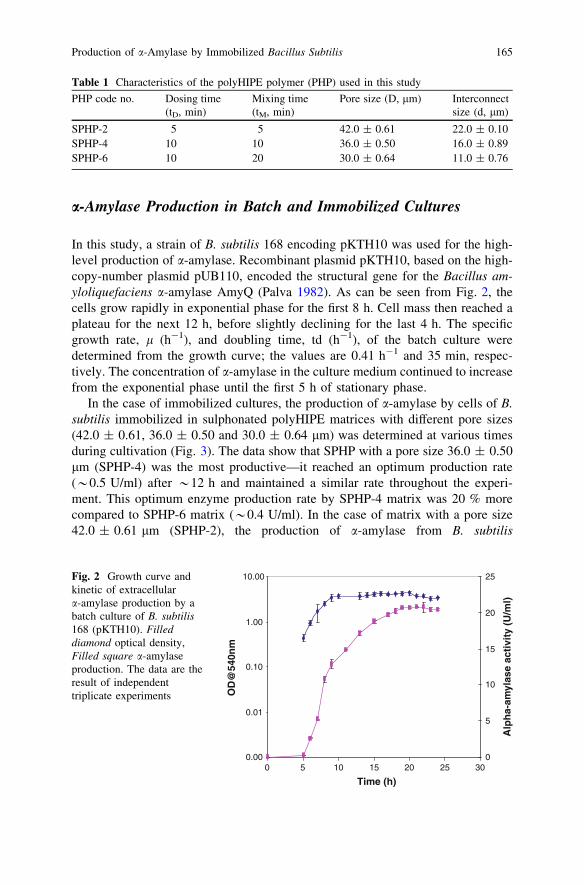
a-Amylase Production in Batch and Immobilized Cultures
In this study, a strain of B. subtilis 168 encoding pKTH10 was used for the high-level production of a-amylase. Recombinant plasmid pKTH10, based on the high-copy-number plasmid pUB110, encoded the structural gene for the Bacillus am-yloliquefaciens a-amylase AmyQ (Palva 1982). As can be seen from Fig. 2, thecells grow rapidly in exponential phase for the first 8 h. Cell mass then reached aplateau for the next 12 h, before slightly declining for the last 4 h. The specificgrowth rate, l (h-1), and doubling time, td (h-1), of the batch culture weredetermined from the growth curve; the values are 0.41 h-1 and 35 min, respec-tively. The concentration of a-amylase in the culture medium continued to increasefrom the exponential phase until the first 5 h of stationary phase.
In the case of immobilized cultures, the production of a-amylase by cells of B.subtilis immobilized in sulphonated polyHIPE matrices with different pore sizes(42.0 ± 0.61, 36.0 ± 0.50 and 30.0 ± 0.64 lm) was determined at various timesduring cultivation (Fig. 3). The data show that SPHP with a pore size 36.0 ± 0.50lm (SPHP-4) was the most productive—it reached an optimum production rate(*0.5 U/ml) after *12 h and maintained a similar rate throughout the experi-ment. This optimum enzyme production rate by SPHP-4 matrix was 20 % morecompared to SPHP-6 matrix (*0.4 U/ml). In the case of matrix with a pore size42.0 ± 0.61 lm (SPHP-2), the production of a-amylase from B. subtilis
Table 1 Characteristics of the polyHIPE polymer (PHP) used in this study
PHP code no. Dosing time(tD, min)
Mixing time(tM, min)
Pore size (D, lm) Interconnectsize (d, lm)
SPHP-2 5 5 42.0 ± 0.61 22.0 ± 0.10SPHP-4 10 10 36.0 ± 0.50 16.0 ± 0.89SPHP-6 10 20 30.0 ± 0.64 11.0 ± 0.76
0.00
0.01
0.10
1.00
10.00
0 5 10 15 20 25 30
Time (h)
OD
@54
0nm
0
5
10
15
20
25
Alp
ha-
amyl
ase
acti
vity
(U
/ml)
Fig. 2 Growth curve andkinetic of extracellulara-amylase production by abatch culture of B. subtilis168 (pKTH10). Filleddiamond optical density,Filled square a-amylaseproduction. The data are theresult of independenttriplicate experiments
Production of a-Amylase by Immobilized Bacillus Subtilis 165
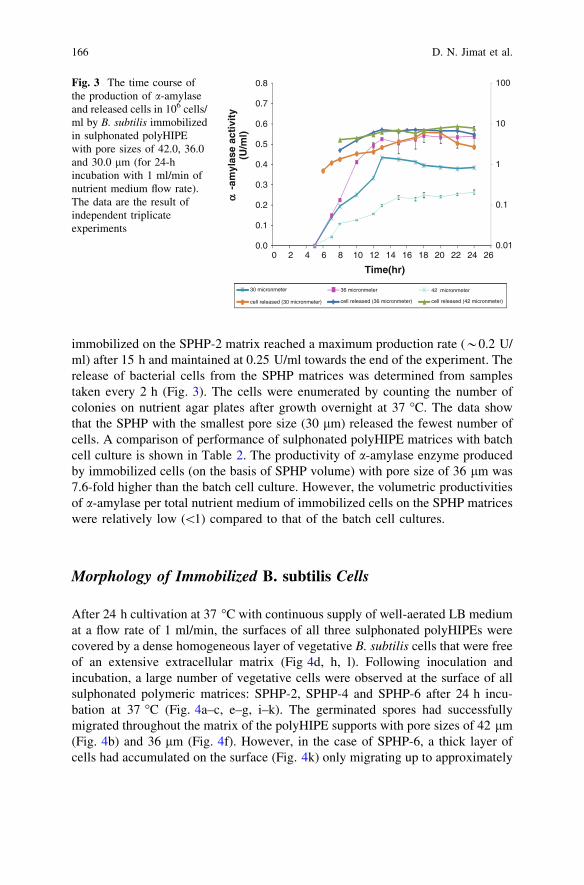
immobilized on the SPHP-2 matrix reached a maximum production rate (*0.2 U/ml) after 15 h and maintained at 0.25 U/ml towards the end of the experiment. Therelease of bacterial cells from the SPHP matrices was determined from samplestaken every 2 h (Fig. 3). The cells were enumerated by counting the number ofcolonies on nutrient agar plates after growth overnight at 37 �C. The data showthat the SPHP with the smallest pore size (30 lm) released the fewest number ofcells. A comparison of performance of sulphonated polyHIPE matrices with batchcell culture is shown in Table 2. The productivity of a-amylase enzyme producedby immobilized cells (on the basis of SPHP volume) with pore size of 36 lm was7.6-fold higher than the batch cell culture. However, the volumetric productivitiesof a-amylase per total nutrient medium of immobilized cells on the SPHP matriceswere relatively low (\1) compared to that of the batch cell cultures.
Morphology of Immobilized B. subtilis Cells
After 24 h cultivation at 37 �C with continuous supply of well-aerated LB mediumat a flow rate of 1 ml/min, the surfaces of all three sulphonated polyHIPEs werecovered by a dense homogeneous layer of vegetative B. subtilis cells that were freeof an extensive extracellular matrix (Fig 4d, h, l). Following inoculation andincubation, a large number of vegetative cells were observed at the surface of allsulphonated polymeric matrices: SPHP-2, SPHP-4 and SPHP-6 after 24 h incu-bation at 37 �C (Fig. 4a–c, e–g, i–k). The germinated spores had successfullymigrated throughout the matrix of the polyHIPE supports with pore sizes of 42 lm(Fig. 4b) and 36 lm (Fig. 4f). However, in the case of SPHP-6, a thick layer ofcells had accumulated on the surface (Fig. 4k) only migrating up to approximately
0.01
0.1
1
10
100
0.0
0.1
0.2
0.3
0.4
0.5
0.6
0.7
0.8
0 2 4 6 8 10 12 14 16 18 20 22 24 26
αα-a
myl
ase
acti
vity
(U
/ml)
Time(hr)
30 micronmeter 36 micronmeter 42 micronmeter
cell released (30 micronmeter) cell released (36 micronmeter) cell released (42 micronmeter)
Fig. 3 The time course ofthe production of a-amylaseand released cells in 106 cells/ml by B. subtilis immobilizedin sulphonated polyHIPEwith pore sizes of 42.0, 36.0and 30.0 lm (for 24-hincubation with 1 ml/min ofnutrient medium flow rate).The data are the result ofindependent triplicateexperiments
166 D. N. Jimat et al.
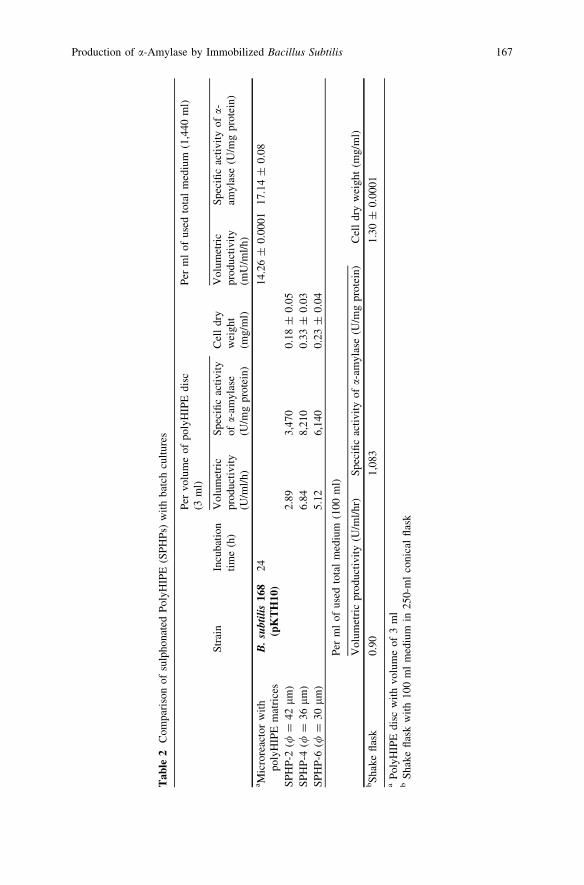
Tab
le2
Com
pari
son
ofsu
lpho
nate
dP
olyH
IPE
(SP
HP
s)w
ith
batc
hcu
ltur
es
Per
volu
me
ofpo
lyH
IPE
disc
(3m
l)P
erm
lof
used
tota
lm
ediu
m(1
,440
ml)
Str
ain
Incu
bati
onti
me
(h)
Vol
umet
ric
prod
ucti
vity
(U/m
l/h)
Spe
cifi
cac
tivi
tyof
a-am
ylas
e(U
/mg
prot
ein)
Cel
ldr
yw
eigh
t(m
g/m
l)
Vol
umet
ric
prod
ucti
vity
(mU
/ml/
h)
Spe
cifi
cac
tivi
tyof
a-am
ylas
e(U
/mg
prot
ein)
a Mic
rore
acto
rw
ith
poly
HIP
Em
atri
ces
B.
subt
ilis
168
(pK
TH
10)
2414
.26
±0.
0001
17.1
4±
0.08
SP
HP
-2(/
=42
lm
)2.
893,
470
0.18
±0.
05S
PH
P-4
(/=
36l
m)
6.84
8,21
00.
33±
0.03
SP
HP
-6(/
=30
lm
)5.
126,
140
0.23
±0.
04
Per
ml
ofus
edto
tal
med
ium
(100
ml)
Vol
umet
ric
prod
ucti
vity
(U/m
l/hr
)S
peci
fic
acti
vity
ofa-
amyl
ase
(U/m
gpr
otei
n)C
ell
dry
wei
ght
(mg/
ml)
bS
hake
flas
k0.
901,
083
1.30
±0.
0001
aP
olyH
IPE
disc
wit
hvo
lum
eof
3m
lb
Sha
kefl
ask
wit
h10
0m
lm
ediu
min
250-
ml
coni
cal
flas
k
Production of a-Amylase by Immobilized Bacillus Subtilis 167
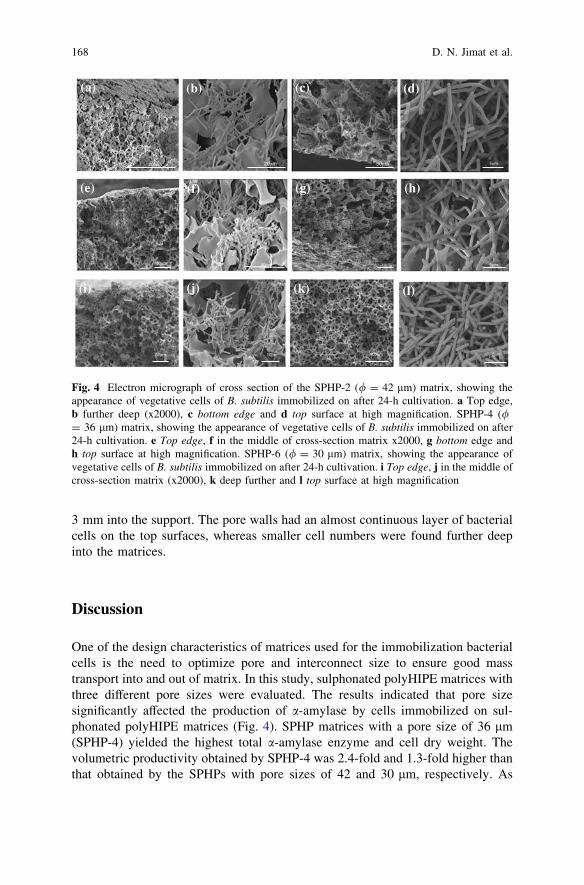
3 mm into the support. The pore walls had an almost continuous layer of bacterialcells on the top surfaces, whereas smaller cell numbers were found further deepinto the matrices.
Discussion
One of the design characteristics of matrices used for the immobilization bacterialcells is the need to optimize pore and interconnect size to ensure good masstransport into and out of matrix. In this study, sulphonated polyHIPE matrices withthree different pore sizes were evaluated. The results indicated that pore sizesignificantly affected the production of a-amylase by cells immobilized on sul-phonated polyHIPE matrices (Fig. 4). SPHP matrices with a pore size of 36 lm(SPHP-4) yielded the highest total a-amylase enzyme and cell dry weight. Thevolumetric productivity obtained by SPHP-4 was 2.4-fold and 1.3-fold higher thanthat obtained by the SPHPs with pore sizes of 42 and 30 lm, respectively. As
(a)
200μm
(b)
20μm 50μm
(c) (d)
5μm
(h)
5μm
(e)
50μm
(g)
50μm
(f)
20μm
100μm
(k)(i)
50μm
(j)
10μm 5μm
(l)
Fig. 4 Electron micrograph of cross section of the SPHP-2 (/ = 42 lm) matrix, showing theappearance of vegetative cells of B. subtilis immobilized on after 24-h cultivation. a Top edge,b further deep (x2000), c bottom edge and d top surface at high magnification. SPHP-4 (/= 36 lm) matrix, showing the appearance of vegetative cells of B. subtilis immobilized on after24-h cultivation. e Top edge, f in the middle of cross-section matrix x2000, g bottom edge andh top surface at high magnification. SPHP-6 (/ = 30 lm) matrix, showing the appearance ofvegetative cells of B. subtilis immobilized on after 24-h cultivation. i Top edge, j in the middle ofcross-section matrix (x2000), k deep further and l top surface at high magnification
168 D. N. Jimat et al.
expected, there was a direct relationship between dry cell mass and a-amylaseproduction and entrapping a high proportion of cell in the matrix a high priority.The low level of a-amylase production and low cell mass in the matrix with thesmallest pore size (30 lm) are likely to be due to diffusional limitations thatrestrict the access of nutrients and oxygen to the cells and the release of thesecreted enzyme to the medium. It might be also due to limited loading of cellsonto this matrix.
Steady-state a-amylase production was achieved after 13 h, indicating that thematrix had reached the limit of its capacity to sustain further increases in biomass.Such a steady state represents the most efficient state for the production of a-amylase since net cell growth and nucleic acid syntheses are repressed while proteinsynthesis is still active (Kinoshita et al. 1968). This represents a shift from biomassincrease to cell maintenance and product formation. Moreover, in B. subtilis, thesecretion of macromolecular hydrolases like a-amylase is higher during stationaryphase than exponential phase (Antelmann et al. 2001). Bacterial cells were releasedfrom all of the SPHP matrices (Fig. 3) although the SPHP matrix with the smallestpore size (30 lm) released the fewest numbers. The release of cells from the SPHPmatrices with pore sizes of 36 and 42 lm was similar.
Previous studies have shown that polyHIPE provides a suitable matrix for theimmobilization of both bacterial (Akay et al. 2005a, b; Erhan et al. 2004) andeukaryotic (Akay et al. 2004; Bokhari et al. 2005) cells. These studies have shownthat B. subtilis can migrate up to 3 mm into such matrices over 30-day cultivation.Multicellular layers of osteoblast were seen on the top surface of polyHIPE,migrating to a maximum depth of 1.4 mm within the matrix. Previous studies usedstyrene–divinylbenzene polyHIPEs, which are hydrophobic and therefore exhibitreduced permeability to aqueous fluids. In the current study, we used sulphonatedpolyHIPEs, which are hydrophilic and show increased permeability to aqueousfluids. Sulphonated polyHIPEs (SPHPs) were used to immobilize B. subtilisspores, which were then germinated and cultured in situ. After 24-h continuousculture, a dense layer of B. subtilis cells was seen on the top surface of all theSPHPs matrices, irrespective of pore size. SEM analysis showed that the cells wereelongated rods with little evidence of an extracellular matrix or cell lysis. Thisresult indicates that the B. subtilis spores can be efficiently germinated and cul-tured throughout hydrophilic polymeric supports that provide a permissivemicroenvironment. A thick homogeneous layer of cells on the top surface of thepolymeric supports is likely to be due to the presence of high nutrient and oxygenconcentrations in this location. The reduction in cell concentration within thematrix probably reflects the fact that nutrient and oxygen concentrations are likelyto decrease as the culture medium passes through the matrix. The production andexcretion of extracellular substances, such as polysaccharides, are other parame-ters that affect the diffusive resistance in a cell mass (Karel et al. 1985). However,in this study, virtually no exopolysaccharide matrix was formed, and there waslittle or no evidence of cell debris resulting from cell lysis. This indicates that themicroporous architecture of the polymeric matrix provided efficient dynamic flowconditions and presumably the continuous removal of dead and degraded cells and
Production of a-Amylase by Immobilized Bacillus Subtilis 169
toxic materials. The only minor exception was the sulphonated polyHIPE, withpore size of 30 lm (SPHP-6), which was found to contain small amounts of celldebris. The results obtained have shown that the microarchitecture of the matricesis important for the growth, viability and penetration of cells, and was dependenton the pore size and the physico-chemical properties of the matrix. The volumetricproductivity of a-amylase of the immobilized cells was significantly higher thanthat of the batch cell cultures if calculated on the basis of the volume occupied bythe SPHP matrix. However, the volumetric productivities of a-amylase per usedtotal nutrient medium of immobilized cells on the SPHP matrices were relativelylow (\1) compared to that of the batch cell cultures. Consequently, the overallyield of a-amylase by immobilized cell cultures was relatively low compared tobatch cell cultures.
Conclusion
The sulphonated polyHIPE matrix with a pore size of 36 lm was observed to givebetter cell growth, with cells penetrating throughout the matrix. The volumetricproductivity of immobilized cells per volume occupied by SPHP matrix was 7.6-fold higher than the batch cell cultures, but its productivity was relatively low (\1)if determined on the basis of used total volume of medium.
Acknowledgments This work was funded by Ministry of Higher Education (MOHE), Malaysia.I would like to thank Tracey Davey and Pauline Carrick for their technical help.
References
Akay, G., Birch, M. A. and Bokhari, M. A. (2004). Microcellular polyHIPE polymer supportsosteoblast growth and bone formation in vitro Biomaterials, 25(18), 3991–4000.
Akay, G. (2005). Bioprocess and chemical process intensification. In S. Lee (Ed.), Encyclopediaof chemical processing. New York: Taylor & Francis Group, CRC Press.
Akay, G., Dogru, M., Calkan, B., & Calkan, O. F. (2005a). Flow induced phase inversionphenomenon in process intensification and micro-reactor technology. In Y. Wang & J.D. Holladay (Eds.), Microreactor technology and process intensification (ACS SymposiumSeries, vol. 914).
Akay, G., Erhan, E., & Keskinler, B. (2005b). Bioprocess intensification in flow-throughmonolithic microbioreactors with immobilized bacteria. Biotechnology and Bioengineering,90(2), 180–190.
Antelmann, H., Tjalsma, H., Voigt, B., Ohlmeier, S., Bron, S., & Van Dijl, J. M, et al. (2001). Aproteomic view on genome-based signal peptide predictions. Genome Research, 11(9),1484–1502.
Argirakos, G., Thayanithy, K., & Wase, D. A. J. (1992). Effect of immobilization on theproduction of alpha- amylase by an industrial strain of Bacillus-Amyloliquefaciens. Journal ofChemical Technology and Biotechnology, 53(1), 33–38.
170 D. N. Jimat et al.
Bokhari, M. A., Akay, G., Zhang, S., & Birch, M. A. (2005). The enhancement of osteoblastgrowth and differentiation in vitro on a peptide hydrogel -polyHIPE polymer hybrid material.Journal of Biomaterials, 26, 5198–5208.
Duran-Paramo, E., Garcia-Kirchner, O., Hervagault, J. F., Thomas, D., & Barbotin, J. N. (2000).a-Amylase production by free and immobilized Bacillus subtilis. Applied Biochemistry andBiotechnology—Part A Enzyme Engineering and Biotechnology, 84–86, 479–485.
Dobreva, E., Tonkova, A., Ivanova, V., Stefanova, M., Kabaivanova, L., & Spasova, D. (1998).Immobilization of Bacillus licheniformis cells, producers of thermostable a-amylase, onpolymer membranes. Journal of Industrial Microbiology and Biotechnology, 20(3), 166–170.
Erhan, E., Yer, E., Akay, G., Keskinler, B., & Keskinler, D. (2004). Phenol degradation in afixed-bed bioreactor using micro-cellular polymer-immobilized Pseudomonas syringae.Journal of Chemical Technology and Biotechnology, 79(2), 195–206.
Harwood, C. R. and Archibald, A. R. (1990) Growth, maintenance and general techniques’, inColin R. Harwood, S. M. C.(ed), Molecular Biological Methods for Bacillus. Wiley:Chichester : New York.
Karel, S. F., Libicki, S. B., & Robertson, C. R. (1985). Immobilization of whole cells:Engineering principles. Chemical Engineering Science, 40(8), 1321–1354.
Kinoshita, S., Okada, H., & Terui, G. (1968). On the nature of a-amylase forming system inBacillus subtilis. Fermentation Technology, 46, 427–436.
Konsoula, Z., & Liakopoulou-Kyriakides, M. (2006). Thermostable alpha-amylase production byBacillus subtilis entrapped in calcium alginate gel capsules. Enzyme and MicrobialTechnology, 39(4), 690–696.
Palva, I. (1982). Molecular cloning of a-amylase gene from Bacillus amyloliquefaciens and itsexpression in B. subtilis. Gene, 19(1), 81–87.
Production of a-Amylase by Immobilized Bacillus Subtilis 171
Production of Extracellular 5-Aminolevulinic Acidby Rhodopseudomonas Palustris in Solid-State Fermentation
P. Y. Ong, C. T. Lee, M. R. Sarmidi, H. M. Awad, L. S. Chuaand F. Razali
Abstract Nowadays, 5-aminolevulinic acid (ALA) is widely used as non-toxicherbicide, as insecticide, and also as plant growth enhancer in agricultural appli-cation. However, their use is limited by high production cost via the route ofchemical synthesis. Agricultural waste, which serves as inexpensive solid supportmedium, can be used to produce ALA through solid-state fermentation (SSF). Inthis study, production of ALA using empty fruit bunch (EFB) as solid supportmedium inoculated with Rhodopseudomonas palustris (R. palustris) NRRL-B4276was conducted through SSF. Several environmental factors for the SSF processincluding the initial pH (2, 3, 4, 5, and 6), initial moisture content (40, 50, 60, 70,and 80 %) of the solid support medium, and incubation period (1–5 days) wereinvestigated to study their effects for the production of ALA in SSF. The maximalyield of ALA was achieved at 38.22 ± 0.15 mg/kg substrate at the total viable cellcount of 35 ± 3 9 106 CFU/g in SSF using EFB as the solid support mediuminoculated with R. palustris. The optimized operating parameters including theinitial pH, initial moisture content of the solid support medium, and incubationperiod were found to be pH 3, 60 %, and 3 days (72 h), respectively, in thepresence of 40 % (v/w) inoculum at 37 �C aerobically with light under staticcondition.
P. Y. Ong � C. T. Lee (&) � M. R. Sarmidi � F. RazaliDepartment of Bioprocess Engineering, Faculty of Chemical Engineering,Universiti Teknologi Malaysia (UTM), 81310 Johor Bahru, Johor, Malaysiae-mail: [email protected]
M. R. Sarmidi � H. M. Awad � L. S. ChuaInstitute of Bioproduct Development, Universiti Teknologi Malaysia (UTM),81310 Johor Bahru, Johor, Malaysia
H. M. AwadChemical of Natural and Microbial Product Department, National Research Center,El-Bohouth Street, Dokki 12622 Cairo, Egypt
R. Pogaku et al. (eds.), Developments in Sustainable Chemicaland Bioprocess Technology, DOI: 10.1007/978-1-4614-6208-8_22,� Springer Science+Business Media New York 2013
173
Introduction
5-aminolevulinic acid (ALA) is a biosynthetic precursor metabolite for theproduction of tetrapyrrole compounds such as chlorophyll, vitamin B12, and heme(Choorit et al. 2011) that are essential elements for plant growth. To date, ALA iswidely applied in diverse fields especially in the agricultural area as effective plantgrowth promoter under normal or stress condition, and also as non-toxic biode-gradable herbicide and insecticide (Saikeur et al. 2009). Due to high demand ofALA for agricultural application, a wide diversity of production methods werestudied and developed (Kang et al. 2011). The conventional production of ALA bychemical synthesis involves high cost, energy, and time-consuming. Therefore, inthis study, the production of ALA using the single strain of Rhodopseudomonaspalustris (R. palustris) inoculated on the solid support medium, i.e., the empty fruitbunch (EFB) under solid-state fermentation (SSF) process was studied. SSF istypically defined as a microbial cultivation process on solid substrate medium inthe absence (or near absence) of water. Nowadays, SSF has raised a fresh attentionand becoming a modern technology even though it was introduced since eigh-teenth century (Pandey et al. 2008). The SSF process is able to lead to higherproductivities and yields, better quality of products, low capital and operatingcosts, and simple equipments (Mirón et al. 2010). SSF is expected to offer betterstability for the growth of beneficial microorganism and the production of bio-products such as ALA. The fermented solids can also be applied directly withouttedious downstream separation processes to yield the bioproduct. Importantly,EFB has been extensively reported as one of the inexpensive local agriculturalwaste that could serve as the solid substrates and as the natural habitat formicrobial growth and composting application (Mohammad et al. 2012). From theprevious studies, ALA is extensively produced by recombinant Escherichia coli,algae, classical propionic acid bacteria, photosynthetic bacteria such as Rhodob-acter sphaeroides, R. palustris and Rhodobacter capsulatus (Kang et al. 2011;Zhang et al. 2008). Among these, R. palustris has received much attention andconsidered as a beneficiary microorganism for agricultural application due to itsattractive properties. It is not only serve as a plant growth promoter to increase theyield of fruits and crops, enhancing acid tolerance in plant, but also able tostructurally break down the aromatic compounds such as lignin monomer (Kanthaet al. 2010; Harwood 2009). However, there was no publication reporting theproduction of ALA by R. palustris through solid-state fermentation (SSF). Thisstudy aims to investigate the most suitable culture condition using locally avail-able, inexpensive agrowaste, namely the EFB as the solid support medium toproduce ALA by R. palustris.
174 P. Y. Ong et al.
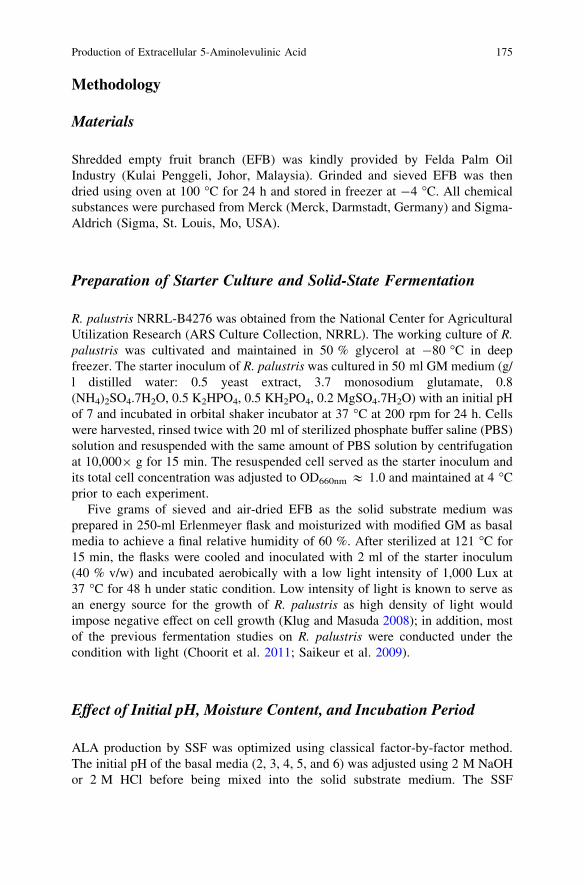
Methodology
Materials
Shredded empty fruit branch (EFB) was kindly provided by Felda Palm OilIndustry (Kulai Penggeli, Johor, Malaysia). Grinded and sieved EFB was thendried using oven at 100 �C for 24 h and stored in freezer at -4 �C. All chemicalsubstances were purchased from Merck (Merck, Darmstadt, Germany) and Sigma-Aldrich (Sigma, St. Louis, Mo, USA).
Preparation of Starter Culture and Solid-State Fermentation
R. palustris NRRL-B4276 was obtained from the National Center for AgriculturalUtilization Research (ARS Culture Collection, NRRL). The working culture of R.palustris was cultivated and maintained in 50 % glycerol at -80 �C in deepfreezer. The starter inoculum of R. palustris was cultured in 50 ml GM medium (g/l distilled water: 0.5 yeast extract, 3.7 monosodium glutamate, 0.8(NH4)2SO4.7H2O, 0.5 K2HPO4, 0.5 KH2PO4, 0.2 MgSO4.7H2O) with an initial pHof 7 and incubated in orbital shaker incubator at 37 �C at 200 rpm for 24 h. Cellswere harvested, rinsed twice with 20 ml of sterilized phosphate buffer saline (PBS)solution and resuspended with the same amount of PBS solution by centrifugationat 10,0009 g for 15 min. The resuspended cell served as the starter inoculum andits total cell concentration was adjusted to OD660nm & 1.0 and maintained at 4 �Cprior to each experiment.
Five grams of sieved and air-dried EFB as the solid substrate medium wasprepared in 250-ml Erlenmeyer flask and moisturized with modified GM as basalmedia to achieve a final relative humidity of 60 %. After sterilized at 121 �C for15 min, the flasks were cooled and inoculated with 2 ml of the starter inoculum(40 % v/w) and incubated aerobically with a low light intensity of 1,000 Lux at37 �C for 48 h under static condition. Low intensity of light is known to serve asan energy source for the growth of R. palustris as high density of light wouldimpose negative effect on cell growth (Klug and Masuda 2008); in addition, mostof the previous fermentation studies on R. palustris were conducted under thecondition with light (Choorit et al. 2011; Saikeur et al. 2009).
Effect of Initial pH, Moisture Content, and Incubation Period
ALA production by SSF was optimized using classical factor-by-factor method.The initial pH of the basal media (2, 3, 4, 5, and 6) was adjusted using 2 M NaOHor 2 M HCl before being mixed into the solid substrate medium. The SSF
Production of Extracellular 5-Aminolevulinic Acid 175
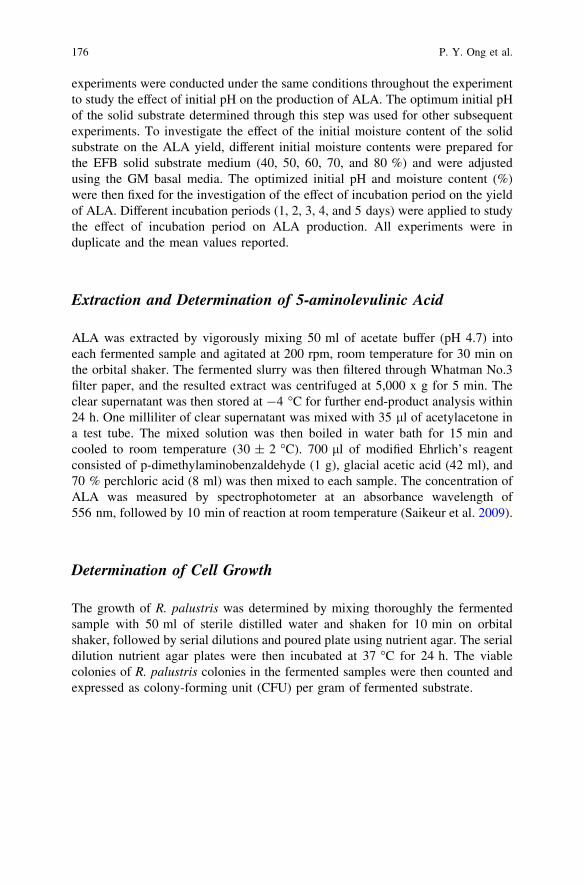
experiments were conducted under the same conditions throughout the experimentto study the effect of initial pH on the production of ALA. The optimum initial pHof the solid substrate determined through this step was used for other subsequentexperiments. To investigate the effect of the initial moisture content of the solidsubstrate on the ALA yield, different initial moisture contents were prepared forthe EFB solid substrate medium (40, 50, 60, 70, and 80 %) and were adjustedusing the GM basal media. The optimized initial pH and moisture content (%)were then fixed for the investigation of the effect of incubation period on the yieldof ALA. Different incubation periods (1, 2, 3, 4, and 5 days) were applied to studythe effect of incubation period on ALA production. All experiments were induplicate and the mean values reported.
Extraction and Determination of 5-aminolevulinic Acid
ALA was extracted by vigorously mixing 50 ml of acetate buffer (pH 4.7) intoeach fermented sample and agitated at 200 rpm, room temperature for 30 min onthe orbital shaker. The fermented slurry was then filtered through Whatman No.3filter paper, and the resulted extract was centrifuged at 5,000 x g for 5 min. Theclear supernatant was then stored at -4 �C for further end-product analysis within24 h. One milliliter of clear supernatant was mixed with 35 ll of acetylacetone ina test tube. The mixed solution was then boiled in water bath for 15 min andcooled to room temperature (30 ± 2 �C). 700 ll of modified Ehrlich’s reagentconsisted of p-dimethylaminobenzaldehyde (1 g), glacial acetic acid (42 ml), and70 % perchloric acid (8 ml) was then mixed to each sample. The concentration ofALA was measured by spectrophotometer at an absorbance wavelength of556 nm, followed by 10 min of reaction at room temperature (Saikeur et al. 2009).
Determination of Cell Growth
The growth of R. palustris was determined by mixing thoroughly the fermentedsample with 50 ml of sterile distilled water and shaken for 10 min on orbitalshaker, followed by serial dilutions and poured plate using nutrient agar. The serialdilution nutrient agar plates were then incubated at 37 �C for 24 h. The viablecolonies of R. palustris colonies in the fermented samples were then counted andexpressed as colony-forming unit (CFU) per gram of fermented substrate.
176 P. Y. Ong et al.
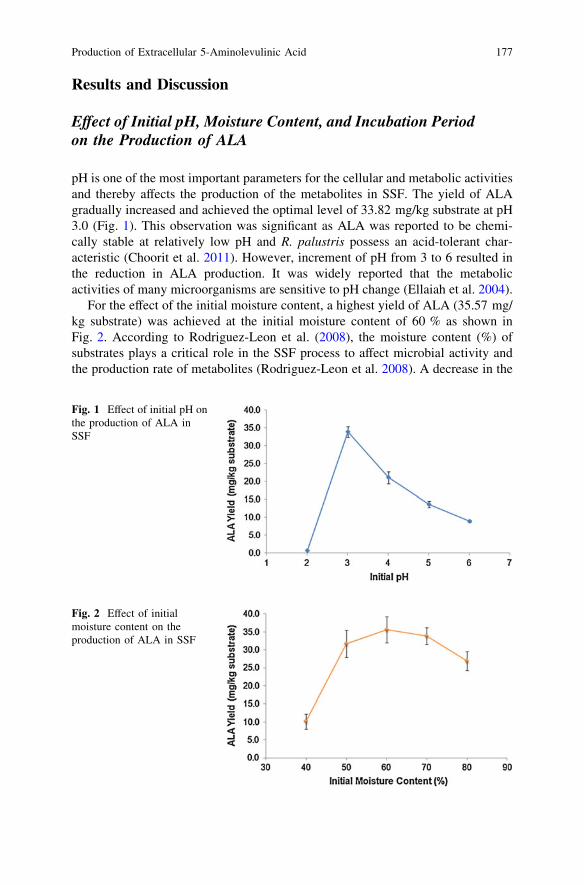
Results and Discussion
Effect of Initial pH, Moisture Content, and Incubation Periodon the Production of ALA
pH is one of the most important parameters for the cellular and metabolic activitiesand thereby affects the production of the metabolites in SSF. The yield of ALAgradually increased and achieved the optimal level of 33.82 mg/kg substrate at pH3.0 (Fig. 1). This observation was significant as ALA was reported to be chemi-cally stable at relatively low pH and R. palustris possess an acid-tolerant char-acteristic (Choorit et al. 2011). However, increment of pH from 3 to 6 resulted inthe reduction in ALA production. It was widely reported that the metabolicactivities of many microorganisms are sensitive to pH change (Ellaiah et al. 2004).
For the effect of the initial moisture content, a highest yield of ALA (35.57 mg/kg substrate) was achieved at the initial moisture content of 60 % as shown inFig. 2. According to Rodriguez-Leon et al. (2008), the moisture content (%) ofsubstrates plays a critical role in the SSF process to affect microbial activity andthe production rate of metabolites (Rodriguez-Leon et al. 2008). A decrease in the
Fig. 1 Effect of initial pH onthe production of ALA inSSF
Fig. 2 Effect of initialmoisture content on theproduction of ALA in SSF
Production of Extracellular 5-Aminolevulinic Acid 177
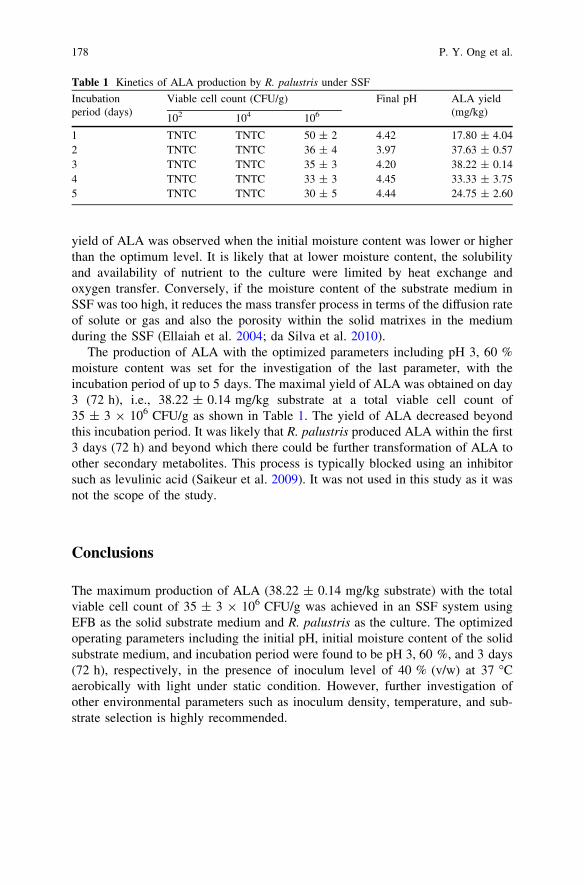
yield of ALA was observed when the initial moisture content was lower or higherthan the optimum level. It is likely that at lower moisture content, the solubilityand availability of nutrient to the culture were limited by heat exchange andoxygen transfer. Conversely, if the moisture content of the substrate medium inSSF was too high, it reduces the mass transfer process in terms of the diffusion rateof solute or gas and also the porosity within the solid matrixes in the mediumduring the SSF (Ellaiah et al. 2004; da Silva et al. 2010).
The production of ALA with the optimized parameters including pH 3, 60 %moisture content was set for the investigation of the last parameter, with theincubation period of up to 5 days. The maximal yield of ALA was obtained on day3 (72 h), i.e., 38.22 ± 0.14 mg/kg substrate at a total viable cell count of35 ± 3 9 106 CFU/g as shown in Table 1. The yield of ALA decreased beyondthis incubation period. It was likely that R. palustris produced ALA within the first3 days (72 h) and beyond which there could be further transformation of ALA toother secondary metabolites. This process is typically blocked using an inhibitorsuch as levulinic acid (Saikeur et al. 2009). It was not used in this study as it wasnot the scope of the study.
Conclusions
The maximum production of ALA (38.22 ± 0.14 mg/kg substrate) with the totalviable cell count of 35 ± 3 9 106 CFU/g was achieved in an SSF system usingEFB as the solid substrate medium and R. palustris as the culture. The optimizedoperating parameters including the initial pH, initial moisture content of the solidsubstrate medium, and incubation period were found to be pH 3, 60 %, and 3 days(72 h), respectively, in the presence of inoculum level of 40 % (v/w) at 37 �Caerobically with light under static condition. However, further investigation ofother environmental parameters such as inoculum density, temperature, and sub-strate selection is highly recommended.
Table 1 Kinetics of ALA production by R. palustris under SSF
Incubationperiod (days)
Viable cell count (CFU/g) Final pH ALA yield(mg/kg)
102 104 106
1 TNTC TNTC 50 ± 2 4.42 17.80 ± 4.042 TNTC TNTC 36 ± 4 3.97 37.63 ± 0.573 TNTC TNTC 35 ± 3 4.20 38.22 ± 0.144 TNTC TNTC 33 ± 3 4.45 33.33 ± 3.755 TNTC TNTC 30 ± 5 4.44 24.75 ± 2.60
178 P. Y. Ong et al.
Acknowledgments This work is supported by Universiti Teknologi Malaysia (UTM) and theresearch facility in Institute of Bioproduct Development (IBD), UTM. This research work isfunded by the Malaysian Ministry of Higher Education under the Fundamental Research GrantSchemes (FRGS) (Vote No: 4F079), UTM Research University Grant (GUP) (Vote No:Q.J130000.7125.00H73), and MyBrain15-MyPhD Program under the Ministry of Higher Edu-cation, Malaysia.
References
Choorit, W., Saikeur, A., Chodok, P., Prasertsan, P., & Kantachote, D. (2011). Production ofbiomass and extracellular 5-aminolevulinic acid by Rhodopseudomonas palustris KG31 underlight and dark conditions using volatile fatty acid. Journal of Bioscience and Bioengineering,111, 658–664.
da Silva, L. C. A., Honorato, T. L., Franco, T. T., & Rodrigues, S. (2010). Optimization ofChitosanase production by Trichoderma koningii sp. Under solid-state fermentation. Foodand Bioprocess Technology, 1–9.
Ellaiah, P., Srinivasulu, B., & Adinarayana, K. (2004). Optimisation studies on neomycinproduction by a mutant strain of Streptomyces marinensis in solid state fermentation. ProcessBiochemistry, 39, 529–534.
Harwood, C. S. (2009). Degradation of aromatic compounds by purple nonsulfur bacteria. In C.N Hunter, F. Daldal, M. C. Thurnauer & J. T. Beatty (Eds.), The purple phototrophic bacteria.New York: Springer Science.
Kang, Z., Wang, Y., Gu, P., Wang, Q., & Qi, Q. (2011). Engineering Escherichia coli for efficientproduction of 5-aminolevulinic acid from glucose. Metabolic Engineering, 13, 492–498.
Kantha, T., Chaiyasut, C., Kantachote, D., Sukrong, S., & Muangprom, A. (2010). Selection ofphotosynthetic bacteria producing 5-aminolevulinic acid from soil of organic saline paddyfields from the Northeast region of Thailand. African Journal of Microbiology Research,4(17), 1848–1855.
Klug, G., & Masuda, S. (2008). Regulation of genes by light. In C. N. Hunter, F., Daldal, M.Thurnauer & J. T. Beatty (Eds.), The purple phototrophic bacteria. Netherlands: Springer.
Mirón, J., Vázquez, J. A., González, P., & Murado, M. A. (2010). Enhancement glucose oxidaseproduction by solid-state fermentation of Aspergillus Niger on polyurethane foams usingmussel processing wastewaters. Enzyme and Microbial Technology, 46, 21–27.
Mohammad, N., Alam, M. Z., Kabbashi, N. A., & Ahsan, A. (2012). Effective composting of oilpalm industrial waste by filamentous fungi: A review. Resources, Conservation andRecycling, 58, 69–78.
Pandey, A., Soccol, C. R., & Larroche, C. (2008). Introduction. In A. Pandey, C. R. Soccol, & C.Larroche (Eds.), Current developments in solid-state fermentation. New York: Springer.
Rodriguez-Leon, J. A., Soccol, C. R., Pandey, A., & Rodriguez, D. E. (2008). In: A. Pandey, C.R. Soccol & C. Larroche (Eds.) Factors affecting solid-state fermentation current develop-ments in solid-state fermentation. New York: Springer.
Saikeur, A., Choorit, W., Prasertsan, P., Kantachote, D., & Sasaki, K. (2009). Influence ofprecursors and inhibitor on the production of extracellular 5-aminolevulinic acid and biomassby Rhodopseudomonas palustris kG31. Bioscience, Biotechnology, and Biochemistry, 73,987–992.
Zhang, W. F., Zhang, F., Raziuddin, R., Gong, H. J., Yang, Z. M., Lu, L., et al. (2008). Effects of5-aminolevulinic acid on oilseed rape seedling growth under herbicide toxicity stress. Journalof Plant Growth Regulation, 27, 159–169.
Production of Extracellular 5-Aminolevulinic Acid 179
Experimental Investigation of CombustionBehavior of Flash Pyrolysis Oil
N. Ibrahim, P. A. Jensen, K. Dam-Johansen, M. K. A. Hamid,R. M. Kasmani and R. R. Ali
Abstract The aim of this work is to investigate the combustion behavior ofpyrolysis oils derived from wheat straw and pine wood. The technique of ther-mogravimetric analysis (TGA) was applied to study the thermal treatment of thepyrolysis oils under well-controlled temperature in an oxidative (O2) and a non-oxidative (N2) environment. The thermogravimetric curves indicated that thecombustion process of bio-oil was divided into three stages. It was found that theremoval of water and evaporation of light volatiles occur at room temperature upto 200 �C, the cracking of heavy fraction occurs at temperatures of between 200and 500 �C and, finally, the char combustion occurs at temperatures above 500 �C.The thermal degradation of the both bio-oil samples showed an almost similarbehavior in TGA experiment.
N. Ibrahim (&) � R. M. KasmaniGas Engineering Department, Faculty of Petroleum and Renewable Energy Engineering,Universiti Teknologi Malaysia, 81310 Johor Bahru, Johor, Malaysiae-mail: [email protected]
R. M. Kasmanie-mail: [email protected]
P. A. Jensen � K. Dam-JohansenCombustion and Harmful Emission Control (CHEC), Department of Chemicaland Biochemical Engineering, Technical University of Denmark, DK-2800,Kgs. Lyngby, Denmark
M. K. A. HamidProcess Systems Engineering Centre (PROSPECT), Faculty of Chemical Engineering,Universiti Teknologi Malaysia, 81310 Johor Bahru, Johor, Malaysiae-mail: [email protected]
R. R. AliPolymer Engineering Department, Faculty of Chemical Engineering, Universiti TeknologiMalaysia, 81310 Johor Bahru, Johor, Malaysiae-mail: [email protected]
R. Pogaku et al. (eds.), Developments in Sustainable Chemicaland Bioprocess Technology, DOI: 10.1007/978-1-4614-6208-8_23,� Springer Science+Business Media New York 2013
181
Introduction
Bio-oil is produced by rapid quenching and condensation of vapors released fromflash pyrolysis of biomass. It is a highly viscous liquid containing various oxy-genated hydrocarbons such as acids, alcohols, aldehydes, esters, ketones, phenols,furans, alkenes, aromatics, and sugar. Bio-oil is also characterized by a relativelyhigh water and oxygen content, low heating value, typically from 16 to 19 MJ/kg(wet basis), and high density and acidity. The density of the liquid bio-oil is about1,200 kg/m3, which is much higher than that of the original biomass. In addition,low sulfur and nitrogen content in the bio-oil compared to the feedstock results in asmall impact on the environment when the oil is combusted (Bridgwater andPeacoke 2004; Acikgoz and Kockar 2007).
Since the 1990s, interest has developed in the use of bio-oil to substitute heavyfossil fuel oil in boilers to produce heat and electricity (Solantausta et al. 1993,1994, 1995; Oasmaa et al. 1997, 2001; Gust 1997; Bridgwater and Peacoke 2004).Several researchers have performed combustion tests using different size of boilers(Solantausta et al. 1995), internal combustion engines (Solantausta et al. 1993,1994, 1995), and gas turbines (Solantausta et al. 1995; Lopez and Monfort 2000).Experiments on bio-oil single-droplet combustion have also been conducted bythermogravimetric techniques (Garcia-Perez et al. 2006), by fiber-suspendeddroplets (D’Alessio et al. 1998; Calabria et al. 2007), and in entrained flowreactors (EFR) (Shaddix and Tennison 1998; Garcia-Perez et al. 2006).
Garcia-Perez et al. (2006) conducted thermogravimetric tests on two types ofbio-oils heated at room temperature up to 750 �C at a heating rate of 10 �C/min innitrogen and air flow rate of 150 mL/min. Three major stages were identified fromthe TG–DTG curves during the bio-oil combustion, which begins with the evap-oration of light oil fractions (up to 300 �C), followed by the cracking of heavy oilfractions (above 300 �C) in the second stage. Then, in the final step, combustion ofa solid residue (400–500 �C). They found that almost similar thermal behavior ofall tested bio-oil samples was observed in the thermogravimetric analysis (TGA)experiments.
The objective of this chapter is to present the results of experimental study oncombustion of pyrolysis oils derived from wheat straw and pine wood. In thisstudy, the technique of TGA was applied to analyze the thermal treatment of thepyrolysis oils under well-controlled temperature in an oxidative (O2) and non-oxidative (N2) environment.
182 N. Ibrahim et al.
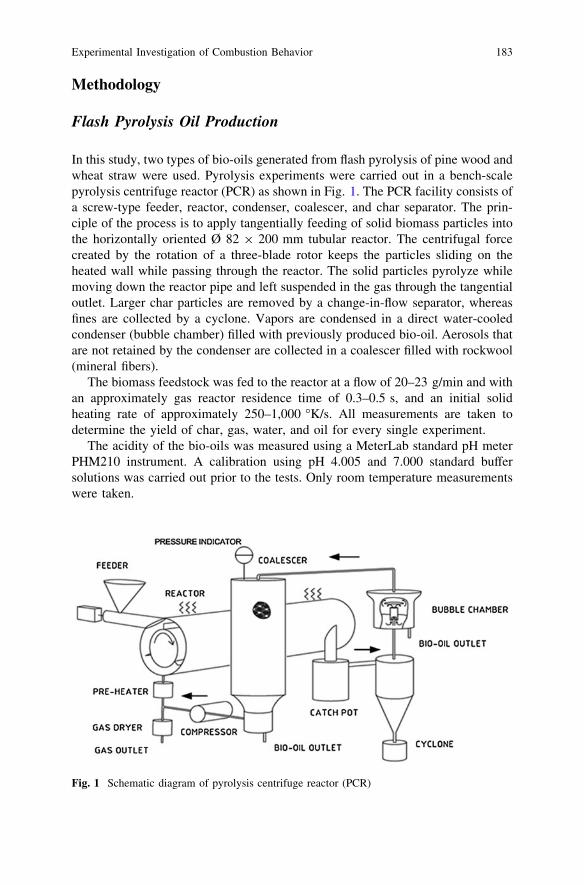
Methodology
Flash Pyrolysis Oil Production
In this study, two types of bio-oils generated from flash pyrolysis of pine wood andwheat straw were used. Pyrolysis experiments were carried out in a bench-scalepyrolysis centrifuge reactor (PCR) as shown in Fig. 1. The PCR facility consists ofa screw-type feeder, reactor, condenser, coalescer, and char separator. The prin-ciple of the process is to apply tangentially feeding of solid biomass particles intothe horizontally oriented Ø 82 9 200 mm tubular reactor. The centrifugal forcecreated by the rotation of a three-blade rotor keeps the particles sliding on theheated wall while passing through the reactor. The solid particles pyrolyze whilemoving down the reactor pipe and left suspended in the gas through the tangentialoutlet. Larger char particles are removed by a change-in-flow separator, whereasfines are collected by a cyclone. Vapors are condensed in a direct water-cooledcondenser (bubble chamber) filled with previously produced bio-oil. Aerosols thatare not retained by the condenser are collected in a coalescer filled with rockwool(mineral fibers).
The biomass feedstock was fed to the reactor at a flow of 20–23 g/min and withan approximately gas reactor residence time of 0.3–0.5 s, and an initial solidheating rate of approximately 250–1,000 �K/s. All measurements are taken todetermine the yield of char, gas, water, and oil for every single experiment.
The acidity of the bio-oils was measured using a MeterLab standard pH meterPHM210 instrument. A calibration using pH 4.005 and 7.000 standard buffersolutions was carried out prior to the tests. Only room temperature measurementswere taken.
Fig. 1 Schematic diagram of pyrolysis centrifuge reactor (PCR)
Experimental Investigation of Combustion Behavior 183
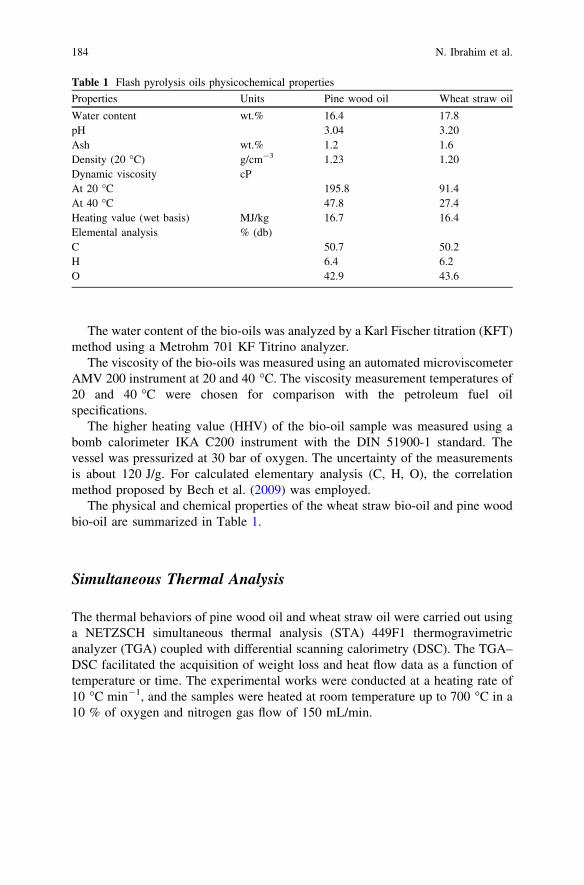
The water content of the bio-oils was analyzed by a Karl Fischer titration (KFT)method using a Metrohm 701 KF Titrino analyzer.
The viscosity of the bio-oils was measured using an automated microviscometerAMV 200 instrument at 20 and 40 �C. The viscosity measurement temperatures of20 and 40 �C were chosen for comparison with the petroleum fuel oilspecifications.
The higher heating value (HHV) of the bio-oil sample was measured using abomb calorimeter IKA C200 instrument with the DIN 51900-1 standard. Thevessel was pressurized at 30 bar of oxygen. The uncertainty of the measurementsis about 120 J/g. For calculated elementary analysis (C, H, O), the correlationmethod proposed by Bech et al. (2009) was employed.
The physical and chemical properties of the wheat straw bio-oil and pine woodbio-oil are summarized in Table 1.
Simultaneous Thermal Analysis
The thermal behaviors of pine wood oil and wheat straw oil were carried out usinga NETZSCH simultaneous thermal analysis (STA) 449F1 thermogravimetricanalyzer (TGA) coupled with differential scanning calorimetry (DSC). The TGA–DSC facilitated the acquisition of weight loss and heat flow data as a function oftemperature or time. The experimental works were conducted at a heating rate of10 �C min-1, and the samples were heated at room temperature up to 700 �C in a10 % of oxygen and nitrogen gas flow of 150 mL/min.
Table 1 Flash pyrolysis oils physicochemical properties
Properties Units Pine wood oil Wheat straw oil
Water content wt.% 16.4 17.8pH 3.04 3.20Ash wt.% 1.2 1.6Density (20 �C) g/cm-3 1.23 1.20Dynamic viscosity cPAt 20 �C 195.8 91.4At 40 �C 47.8 27.4Heating value (wet basis) MJ/kg 16.7 16.4Elemental analysis % (db)C 50.7 50.2H 6.4 6.2O 42.9 43.6
184 N. Ibrahim et al.
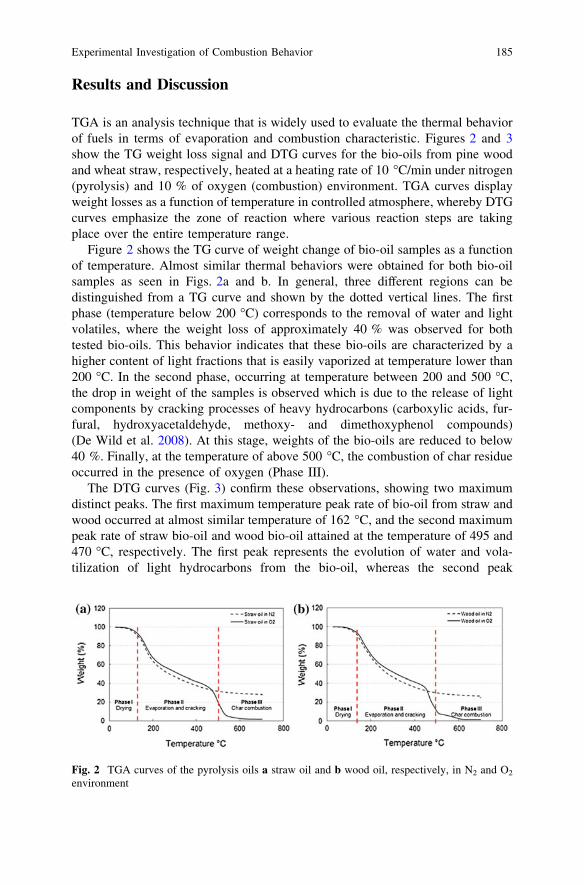
Results and Discussion
TGA is an analysis technique that is widely used to evaluate the thermal behaviorof fuels in terms of evaporation and combustion characteristic. Figures 2 and 3show the TG weight loss signal and DTG curves for the bio-oils from pine woodand wheat straw, respectively, heated at a heating rate of 10 �C/min under nitrogen(pyrolysis) and 10 % of oxygen (combustion) environment. TGA curves displayweight losses as a function of temperature in controlled atmosphere, whereby DTGcurves emphasize the zone of reaction where various reaction steps are takingplace over the entire temperature range.
Figure 2 shows the TG curve of weight change of bio-oil samples as a functionof temperature. Almost similar thermal behaviors were obtained for both bio-oilsamples as seen in Figs. 2a and b. In general, three different regions can bedistinguished from a TG curve and shown by the dotted vertical lines. The firstphase (temperature below 200 �C) corresponds to the removal of water and lightvolatiles, where the weight loss of approximately 40 % was observed for bothtested bio-oils. This behavior indicates that these bio-oils are characterized by ahigher content of light fractions that is easily vaporized at temperature lower than200 �C. In the second phase, occurring at temperature between 200 and 500 �C,the drop in weight of the samples is observed which is due to the release of lightcomponents by cracking processes of heavy hydrocarbons (carboxylic acids, fur-fural, hydroxyacetaldehyde, methoxy- and dimethoxyphenol compounds)(De Wild et al. 2008). At this stage, weights of the bio-oils are reduced to below40 %. Finally, at the temperature of above 500 �C, the combustion of char residueoccurred in the presence of oxygen (Phase III).
The DTG curves (Fig. 3) confirm these observations, showing two maximumdistinct peaks. The first maximum temperature peak rate of bio-oil from straw andwood occurred at almost similar temperature of 162 �C, and the second maximumpeak rate of straw bio-oil and wood bio-oil attained at the temperature of 495 and470 �C, respectively. The first peak represents the evolution of water and vola-tilization of light hydrocarbons from the bio-oil, whereas the second peak
Fig. 2 TGA curves of the pyrolysis oils a straw oil and b wood oil, respectively, in N2 and O2
environment
Experimental Investigation of Combustion Behavior 185
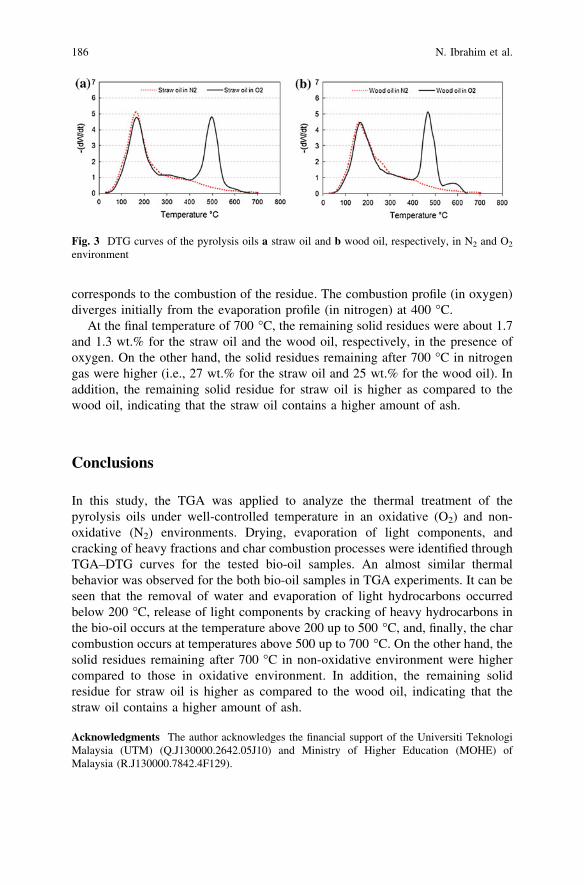
corresponds to the combustion of the residue. The combustion profile (in oxygen)diverges initially from the evaporation profile (in nitrogen) at 400 �C.
At the final temperature of 700 �C, the remaining solid residues were about 1.7and 1.3 wt.% for the straw oil and the wood oil, respectively, in the presence ofoxygen. On the other hand, the solid residues remaining after 700 �C in nitrogengas were higher (i.e., 27 wt.% for the straw oil and 25 wt.% for the wood oil). Inaddition, the remaining solid residue for straw oil is higher as compared to thewood oil, indicating that the straw oil contains a higher amount of ash.
Conclusions
In this study, the TGA was applied to analyze the thermal treatment of thepyrolysis oils under well-controlled temperature in an oxidative (O2) and non-oxidative (N2) environments. Drying, evaporation of light components, andcracking of heavy fractions and char combustion processes were identified throughTGA–DTG curves for the tested bio-oil samples. An almost similar thermalbehavior was observed for the both bio-oil samples in TGA experiments. It can beseen that the removal of water and evaporation of light hydrocarbons occurredbelow 200 �C, release of light components by cracking of heavy hydrocarbons inthe bio-oil occurs at the temperature above 200 up to 500 �C, and, finally, the charcombustion occurs at temperatures above 500 up to 700 �C. On the other hand, thesolid residues remaining after 700 �C in non-oxidative environment were highercompared to those in oxidative environment. In addition, the remaining solidresidue for straw oil is higher as compared to the wood oil, indicating that thestraw oil contains a higher amount of ash.
Acknowledgments The author acknowledges the financial support of the Universiti TeknologiMalaysia (UTM) (Q.J130000.2642.05J10) and Ministry of Higher Education (MOHE) ofMalaysia (R.J130000.7842.4F129).
Fig. 3 DTG curves of the pyrolysis oils a straw oil and b wood oil, respectively, in N2 and O2
environment
186 N. Ibrahim et al.
References
Acikgoz, C., & Kockar, A. M. (2007). Flash pyrolysis of Linseed (Linum usitatissimum L.) forproduction of liquid fuels. Journal of Analytical and Applied Pyrolysis, 78, 406–412.
Bech, N., Jensen, P. A., & Dam-Johansen, K. (2009). Determining the elemental composition offuels by bomb calorimetry and the inverse correlation of HHV with elemental composition.Biomass and Bioenergy, 33, 534–537.
Bridgwater, A. V., & Peacoke, G. V. C. (2004). Fast pyrolysis processes for biomass. Renewableand Sustainable Energy Reviews, 4, 1–73.
Calabria, R., Chiariello, F., & Massoli, P. (2007). Combustion fundamentals of pyrolysis oilbased fuels. Experimental Thermal and Fluid Science, 31, 413–420.
de Wild, P. J., den Uil, H., Reith, H., Kiel, J. H. A., & Heeres, H. J. (2008). Biomass valorisationby staged degasification. A new pyrolysis-based conversion option to produce value-addedchemicals from lignocellulosic biomass. Journal of Analytical and Applied Pyrolysis, 85,124–133.
D’alessio, J., Lazzaro, M., Massoli, P., & Moccia, V. (1998). Thermo-optical investigation ofburning biomass pyrolysis oil droplets. Twenty-seventh Symposium (International) onCombustion/The Combustion Institute (pp. 1915–1922).
Garcia-Perez, M., Lappas, P., Hughes, P., Dell, L., Chaala, A., Kretschmer, D., et al. (2006).Evaporation and combustion characteristics of biomass vacuum pyrolysis oils. IFRFCombustiion Journal, 200601, 1–27.
Gust, S. (1997). Combustion experiences of flash pyrolysis fuel in intermediate size boilers. In A.V. Bridgwater & D. G. B. Boocock (Eds.), Developments in thermochemical biomassconversion (pp. 481–488). London: Blackie Academic & Professional.
Lopez, J. G., & Monfort, S. J. J. (2000). Preliminary test on combustion of wood derived fastpyrolysis oils in a gas turbine combustor. Biomass and Bioenergy, 19, 119–128.
Oasmaa, A., Leppamaki, E., Koponen, P., Levander, J., & Tapola, E. (1997). Physicalcharacterization of biomass-based pyrolysis liquids. Application of standard fuel oil analyses;VTT Publication 306. Espoo, Finland: VTT.
Oasmaa, A., Kytö, M., & Sipilä, K. (2001). Pyrolysis oil combustion tests in an industrial boiler.In Bridgwater, A. V. (Eds.), Progress in thermochemical biomass conversion. Oxford, UK:Blackwell Science.
Shaddix, C. R., & Tennison, P. J. (1998). Effects of char content and simple additives on biomasspyrolysis oil droplet combustion. Twenty-seventh Symposium (International) on Combustion/The Combustion Institute (pp. 1907–1914).
Solantausta, Y., Nylund, N. O., Westerholm, M., Koljonen, T., & Oasmaa, A. (1993). Woodpyrolysis liquid as fuel in a diesel power plant. Bioresource Technology, 46, 177–188.
Solantausta, Y., Nylund, N. O., & Gust, S. (1994). Use of pyrolysis oil in a test diesel engine tostudy the feasibility of a diesel power plant concept. Biomass and Bioenergy, 7, 297–306.
Solantausta, Y., Bridgwater, A. V., & Beckman, D. (1995). Feasibility of power production withpyrolysis and gasification systems. Biomass and Bioenergy, 9, 257–269.
Experimental Investigation of Combustion Behavior 187
Identification of Tetrathionate Hydrolasefrom Thiobacillus Ferrooxidans:An Enzyme Responsible for EnzymaticDevulcanization of Waste RubberProducts
M. D. Azratul and Y. Faridah
Abstract Malaysia is one of the largest producers of rubber and as a resultproduces million tonnes of vulcanized rubber waste from the rubber-basedindustries each year. Currently, less than 13 % of the waste tires generatedannually are recycled by any means since the processes are costly and veryinefficient. In the tire sector, many recycling methods have been adopted such asconverting them into other useful rubber-based products, burnt as fuel or retreaded.Retreading is carried out via devulcanization process. The methods of devulcan-izations adopted are chemical, mechanical, ultrasonic, microwave, and microbialor more specifically, enzymatic. However, none of the techniques previouslydeveloped have been proven to be commercially successful. Enzymatic devul-canization is one of the newest techniques to prepare waste rubber products forrecycling. The process is deemed to be more efficient and less expensive comparedto other devulcanization methods. Microbial devulcanization using Thiobacillusferrooxidans provides some avenue of solving the problems associated with theother conventional processes. This microbe secretes an enzyme to utilize theelemental or organic sulfur together with iron available in the environment for itsgrowth. The proposed enzyme, tetrathionate hydrolase, is responsible fordegrading the sulfur cross-links in the devulcanized rubber rendering it to be moreacceptable for recycling. The objective of the study is to identify secreted tetra-thionate hydrolase which is responsible for devulcanization of rubber wasteproducts. The condition needs to promote the growth of bacteria is by incubatingthe bacteria at 25 �C, initial pH buffer of 4, and at an agitation speed of 125 rpm,
M. D. Azratul (&)Biomolecular and Bioprocess Engineering Research Unit(BPMERU), Department ofBiotechnology Engineering, Faculty of Engineering, International Islamic UniversityMalaysia, P. O. Box 10, 50728 Kuala Lumpur, Malaysiae-mail: [email protected]
Y. FaridahDepartment of Biotechnology Engineering, Faculty of Engineering, International IslamicUniversity Malaysia, P. O. Box 10, 50728 Kuala Lumpur, Malaysiae-mail: [email protected]
R. Pogaku et al. (eds.), Developments in Sustainable Chemicaland Bioprocess Technology, DOI: 10.1007/978-1-4614-6208-8_24,� Springer Science+Business Media New York 2013
189
with salt concentration as follows: in (g/l) of KH2PO4 = 4 g, (NH4)2SO4 = 4 g,and MgSO4.7H2O = 0.3 g. After preparing the initial sample, it was found that thespecific activity of extracellular and intracellular tetrathionate hydrolase occurredon Day 1 and 2 is 0.070 lmol min-1mg-1(U/mg) and 0.274 lmol min-1mg-1
(U/mg), respectively, at pH 4, 25 �C. Future work includes reaction of purifiedtetrathionate hydrolase with used rubber to observe the devulcanization process.This work is important mainly because it is an environmental friendly and safemethod of devulcanization and with thorough study, it is hoped that the objectiveto recycle higher percentage of waste rubber can be achieved.
Keywords Enzymatic devulcanization � Thiobacillus ferrooxidans � Tetrathionatehydrolase
Introduction
After Thailand and Indonesia, Malaysia is the largest producer of rubber and hasgreatly contributed to the expansion of rubber technology in the present world. Thetechnology of rubber creates a variety range of products such as rubber gloves,storage tanks, and insulation of electrical devices; however, the most importantone is its usage in tire industries. The advancement of tire industries started in1839 when Charles Goodyear discovered that by boiling crude rubber along withsulfur in solution produced an improved rubber material (Lewin 2004) whichresults in the production of vulcanized rubber tires. The advantages are goodtensile strength, resistance to temperature changes and organic solvents as well asextreme elasticity. However, after these tires are no longer in use, they will bedisposed to the environment. The biggest challenges are when the discardedvulcanized rubber tires are not biodegradable due to their sulfur cross-linking andhave become one of the major sources of pollution. Disposal of waste tires and itsrecycling give a big task to mankind because the accumulation of discarded wastetires leads to environmental pollution (Gulzad 2011).
To date, there is no environmentally sound and economically viable method torecycle or dispose-off the vulcanized scrap tires. The only environmentally soundway to dispose vulcanized scrap tires in large quantity is to burn it in the cementkiln (E-Waste Management 2008). Vulcanized scrap tires virtually indestructible ifleft in the dump site as it cannot biodegrade even in 50 years. Environmental lawshad forbidden the burning of scrap tires because burning tires emits a lot of blacksmoke and harmful chemicals. Dump site for scrap tire heaps is space consuming,fire hazard and health hazards due to mosquito breeding (U.S. EnvironmentalProtection Agency 1993).
Therefore, there is an urgent need to search for a safe recycling method toreduce the scrap tire threats. One of the methods is retreading the tires which it iscarried out via devulcanization process which comprises of chemical, mechanical,
190 M. D. Azratul and Y. Faridah
ultrasonic, microwave, and microbial or enzymatic methods. Many researchershave attempted to discover the most effective way of recycling scrap tires in whichthey focus on the usage of bacteria to degrade rubber. This study is also known asmicrobial or enzymatic devulcanization. According to Romine et al. (1997),enzymatic devulcanization happened when a surface of a vulcanized rubber par-ticle is exposed to at least one enzyme, maintaining the exposure for a timesufficient to convert sulfur to sulfoxide or sulfone, and halting conversion orpreventing further degradation of the sulfoxide or sulfone. These two products arereactive, thus it is important to stop the reaction once sulfoxide and sulfone havebeen produced.
The manipulation of bacteria strains in devulcanization process will offer anenvironmentally and economically effective method of waste tires recycling. Themain agents, namely the bacteria from the genus Acidithiobacillus species, haveunique properties to catalyze aerobic oxidation of sulfide. These bacteria havebeen used in many decades in biomining industry for recovery of metals fromsulfidic low grade ores and concentrates. Thiobacillus ferrooxidans are obligatelyaerobic, gram-negative, chemoautotrophic organism that generates its energy andreducing power for CO2 fixation from the oxidation of inorganic iron and reducedsulfur compounds (Ingledew 1982). This microbe has the ability to secrete anenzyme known as tetrathionate hydrolase which is responsible to oxidize organicsulfur with iron that is available in the environment (Rawlings 2005). In addition,this enzyme is able to break the sulfur cross-link in vulcanized rubber whichresults in the tires being recyclable.
The objective of the study is to identify the secreted tetrathionate hydrolase byT. ferrooxidans which is responsible for devulcanization of rubber. This work isbased on the previous work where the salt concentration as well as several processconditions such as temperature, initial pH of buffer, and agitation speed for thebacteria had been optimized by Yusof and Ahmad (2010) to promote highergrowth of bacteria.
Methodology
Materials and Methods
Propagation of Bacteria
T. ferrooxidans (ATCC� 19859TM) was secured from American type culturecollection (ATCC), USA. These bacteria were first propagated to increase itsamount using the method provided by ATCC, ATCC� MEDIA. The growths ofthe bacteria were observed within 1–2 weeks, when yellow–orange iron deposited.
Identification of Tetrathionate Hydrolase 191
Cultivation of Bacteria
T. ferrooxidans was cultivated in a sulfur-based media containing 4.0 g KH2PO4,0.3 g MgSO4.7H2O, 4.0 g (NH4)2SO4, 0.25 g CaCl2, and 5.0 g Na2S2O3.5H2O in1.0 L distilled water. The medium was prepared without thiosulphate. The pH wasadjusted to 4 and autoclaved at 121 �C for 15 min. Thiosulphate was filter ster-ilized and aseptically added after autoclaving. After that 100 ml of sulfur mediumwas transferred into several shake flasks. 1.0 ml of propagated bacteria wasaseptically withdrawn and added to the 100 ml of sulfur medium.
Finally, all the shake flasks were placed in incubator at 25 �C and shaken at aspeed of 125 rpm. All the shake flasks were examined every day to monitor thequalitative tetrathionate hydrolase activity for 14 days. 1 ml of each sample werecollected, everyday, during the 14 days and stored at -20 �C for further analysis.
Analytical Analysis
Optical Density
200 ll of each cultivation sample was transferred into microtiter plate for opticaldensity (OD) by using microplate reader. All samples were analyzed at 440 nmevery day from Day 1 to Day 14.
Protein Assay and Protein Content Determination
The protein assay was conducted based on Bradford method (1976). Bovine serumalbumin (BSA) was used in estimating the protein concentration using the standardcurve.
The analysis of protein content was done on extracellular and intracellularprotein. A 1 ml of sample was transferred from shake flask into 2.0 ml centrifugetube from Day 1 until Day 14. The sample was centrifuged at room temperature at5,000 g for 30 min producing pellet and supernatant. Then, the supernatant wastransferred into another 2.0 ml centrifuge tube. The first supernatant was analyzedas extracellular protein. 100 ll of protein sample was withdrawn and mixed with1 ml of Bradford solution. OD value of the supernatant was measured at 595 nm(Bradford 1976). For control, sample will be replaced by media without inoculumalong with 1 ml of Bradford solution.
For intracellular protein, the pellet was added with 1 ml culturing media. Next,this sample was sonicated at 50 % amplitude and 30 s break in 2 min. After that,2–3 drops of ethanol 95 % was pipetted into the centrifuge tube to stop thereaction. Again, the sample was centrifuged at room temperature at 5,000 g for
192 M. D. Azratul and Y. Faridah
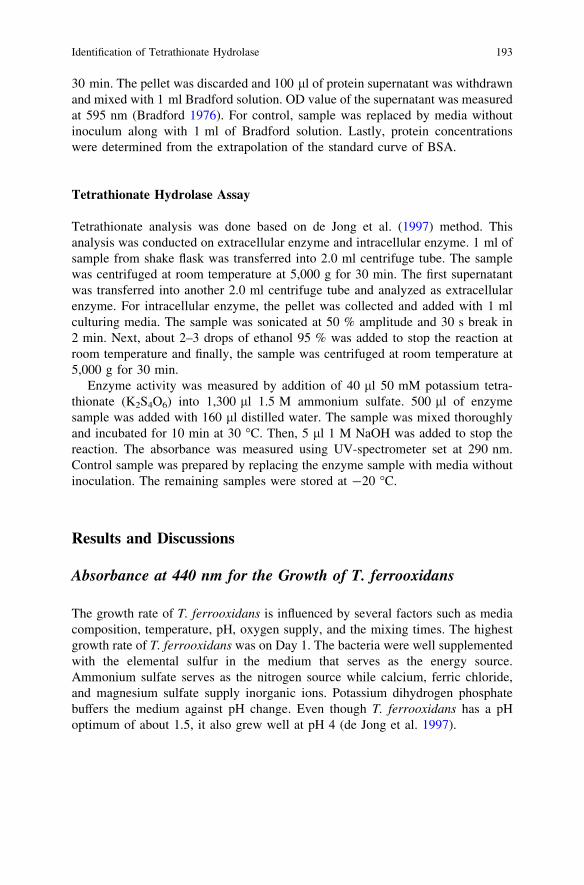
30 min. The pellet was discarded and 100 ll of protein supernatant was withdrawnand mixed with 1 ml Bradford solution. OD value of the supernatant was measuredat 595 nm (Bradford 1976). For control, sample was replaced by media withoutinoculum along with 1 ml of Bradford solution. Lastly, protein concentrationswere determined from the extrapolation of the standard curve of BSA.
Tetrathionate Hydrolase Assay
Tetrathionate analysis was done based on de Jong et al. (1997) method. Thisanalysis was conducted on extracellular enzyme and intracellular enzyme. 1 ml ofsample from shake flask was transferred into 2.0 ml centrifuge tube. The samplewas centrifuged at room temperature at 5,000 g for 30 min. The first supernatantwas transferred into another 2.0 ml centrifuge tube and analyzed as extracellularenzyme. For intracellular enzyme, the pellet was collected and added with 1 mlculturing media. The sample was sonicated at 50 % amplitude and 30 s break in2 min. Next, about 2–3 drops of ethanol 95 % was added to stop the reaction atroom temperature and finally, the sample was centrifuged at room temperature at5,000 g for 30 min.
Enzyme activity was measured by addition of 40 ll 50 mM potassium tetra-thionate (K2S4O6) into 1,300 ll 1.5 M ammonium sulfate. 500 ll of enzymesample was added with 160 ll distilled water. The sample was mixed thoroughlyand incubated for 10 min at 30 �C. Then, 5 ll 1 M NaOH was added to stop thereaction. The absorbance was measured using UV-spectrometer set at 290 nm.Control sample was prepared by replacing the enzyme sample with media withoutinoculation. The remaining samples were stored at -20 �C.
Results and Discussions
Absorbance at 440 nm for the Growth of T. ferrooxidans
The growth rate of T. ferrooxidans is influenced by several factors such as mediacomposition, temperature, pH, oxygen supply, and the mixing times. The highestgrowth rate of T. ferrooxidans was on Day 1. The bacteria were well supplementedwith the elemental sulfur in the medium that serves as the energy source.Ammonium sulfate serves as the nitrogen source while calcium, ferric chloride,and magnesium sulfate supply inorganic ions. Potassium dihydrogen phosphatebuffers the medium against pH change. Even though T. ferrooxidans has a pHoptimum of about 1.5, it also grew well at pH 4 (de Jong et al. 1997).
Identification of Tetrathionate Hydrolase 193
Protein Content Determination
Extracellular and intracellular protein secretion and accumulation were determinedbased on the extrapolation of BSA standard curve. All protein contents werecalculated from Day 1 to Day 14. The highest extracellular protein contentoccurred on Day 11 was 9.814 lg/ml. For the intracellular protein content, Day 6gave the highest value at 10.593 lg/ml.
Tetrathionate Hydrolase Activity
Tetrathionate hydrolase is a periplasmatic enzyme with pH optimum below 2.5.Based on the optimized condition by Yusof and Ahmad (2010), the pH was done at4 and it was found in this work the highest production of extracellular andintracellular of Tetrathionate hydrolase was at Day 6 and 5, respectively. Theenzyme activity had been measured by calculating the changes in absorbancereading divided by minute and total enzyme in ml at 25 �C.
For example,
Activity of enzyme ¼ DAmin: 0:5 ml
The reading of time was taken at 1 min. The maximum activity of extracellularand intracellular enzyme was found to be 0.0920 lmol min-1/ml (U/ml) and0.268 lmol min-1/ml (U/ml), respectively. It had also been proven by de Jonget al. (1997) in their work where maximum tetrathionate hydrolyzing activity byT. ferrooxidans occurred at pH 4.
Sugio et al. (2009) mentioned in their work that tetrathionate is a reduced sulfurcompound soluble and stable in the water acidified with sulfuric acid that is easilyused by T. ferrooxidans cells as energy source. In T. ferrooxidans, thiosulfate isoxidized through the S4-intermediary pathway (Pronk et al. 1990; Kelly et al.1997; Ghosh and Dam 2009). During this reaction, two molecules of thiosulfateundergo condensative oxidation to produce four sulfur atoms intermediate tetra-thionate catalyzed by thiosulfate dehydrogenase. In the second step of this path-way, tetrathionate was hydrolyzed by tetrathionate hydrolase to produce sulfateand disulfane monosulfonic acid. According to de Jong et al. (1997), tetrathionatehydrolase will generate sulfate, thiosulfate, and elemental sulfur at the end of thereaction due to the high activity of the hydrolysis products.
194 M. D. Azratul and Y. Faridah
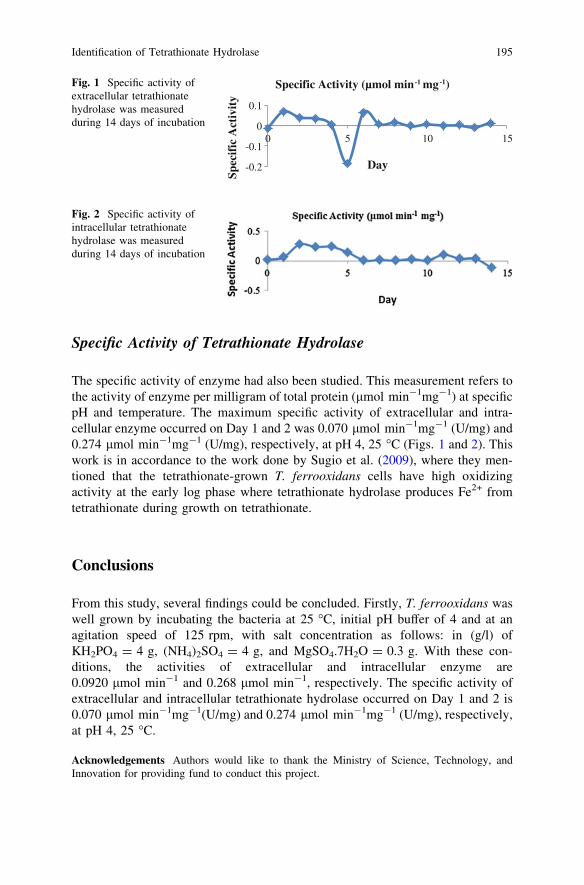
Specific Activity of Tetrathionate Hydrolase
The specific activity of enzyme had also been studied. This measurement refers tothe activity of enzyme per milligram of total protein (lmol min-1mg-1) at specificpH and temperature. The maximum specific activity of extracellular and intra-cellular enzyme occurred on Day 1 and 2 was 0.070 lmol min-1mg-1 (U/mg) and0.274 lmol min-1mg-1 (U/mg), respectively, at pH 4, 25 �C (Figs. 1 and 2). Thiswork is in accordance to the work done by Sugio et al. (2009), where they men-tioned that the tetrathionate-grown T. ferrooxidans cells have high oxidizingactivity at the early log phase where tetrathionate hydrolase produces Fe2+ fromtetrathionate during growth on tetrathionate.
Conclusions
From this study, several findings could be concluded. Firstly, T. ferrooxidans waswell grown by incubating the bacteria at 25 �C, initial pH buffer of 4 and at anagitation speed of 125 rpm, with salt concentration as follows: in (g/l) ofKH2PO4 = 4 g, (NH4)2SO4 = 4 g, and MgSO4.7H2O = 0.3 g. With these con-ditions, the activities of extracellular and intracellular enzyme are0.0920 lmol min-1 and 0.268 lmol min-1, respectively. The specific activity ofextracellular and intracellular tetrathionate hydrolase occurred on Day 1 and 2 is0.070 lmol min-1mg-1(U/mg) and 0.274 lmol min-1mg-1 (U/mg), respectively,at pH 4, 25 �C.
Acknowledgements Authors would like to thank the Ministry of Science, Technology, andInnovation for providing fund to conduct this project.
-0.2
-0.1
0
0.1
0 5 10 15
Spec
ific
Act
ivit
y
Day
Specific Activity (µmol min-1 mg-1)Fig. 1 Specific activity ofextracellular tetrathionatehydrolase was measuredduring 14 days of incubation
Fig. 2 Specific activity ofintracellular tetrathionatehydrolase was measuredduring 14 days of incubation
Identification of Tetrathionate Hydrolase 195
References
Bradford, M. M. (1976). A rapid and sensitive method for the quantitation of microgramquantities of protein utilising the principle of protein-dye binding. Analytical Biochemistry,72, 248–254.
De Jong, G. A. H., Hazeu, W., Bos, P., & Kuenen, J. G. (1997). Polythionate degradation bytetrathionate hydrolase of Thiobacillus ferrooxidans. Microbiology, 143, 499–504.
E-Waste Management. (2008). Special process recycle rubber (SPR).Ghosh, W., & Dam, B. (2009). Biochemistry and molecular biology of lithotrophic sulfur
oxidation by taxonomically and ecologically diverse bacteria and archaea. FEMS Microbi-ology Reviews, 33, 999–1043.
Gulzad, A. (2011). Recycling and pyrolysis of scrap tire. Report training visit on the developmentof human resource capacity of Kabul Polytechnic University.
Ingledew, W. J. (1982). Thiobacillus ferrooxidans: the bioenergetics of an adicophilicchemolithotroph. Biochimica et Biophysica Acta, 683, 89–117.
Kelly, D. P., Shergill, J. K., Lu, W. P., & Wood, A. P. (1997). Oxidative metabolism of inorganicsulfur compounds by bacteria. Antonie van Leeuwenhoek, 71, 95–107.
Lewin, S. Z. (2004). Rubber. Microsoft Encarta Online Encyclopedia [http://encarta.msn.com].[Accessed 10 September 2012].
Pronk, J. T., Meulenberg, R., Hazeu, Z., Bos, P., & Kuenen, J. G. (1990). Oxidation of inorganicsulphur compounds by Acidophilic thiobacilli. FEMS Microbiology Reviews, 75, 293–306.
Rawlings, D. E. (2005). Characteristics and adaptability of iron- and sulphur-oxidizingmicroorganisms used for the recovery of metals from minerals and their concentrates.Microbial Cell Factories, 4–13.
Romine, R., & Snowden-Swan, L. (1997). Method for the addition of vulcanized waste rubber tovirgin rubber products. United States Patent No.: 5,597,851.
Sugio, T., Taha, T. M., & Takeuchi, F. (2009). Ferrous ion production mediated by tetrathionatehydrolase in tetrathionate, sulfur and iron-grown Acidithiobacillus ferrooxidans ATTC 27230cells. Bioscience, Biotechnology, and Biochemistry, 73(6), 1381–1386.
U.S.Environmental Protection Agency. (1993). Scrap tire technology and markets Noyes DataCorporation, NJ. USA.
Yusof, F., & Ahmad, A. A. (2010). Enzymatic devulcanization of waste rubber products inpreparation for recycling. In: Extended Abstract for National Biotechnology Seminar, 24–26May, PWTC, Kuala Lumpur, Malaysia.
196 M. D. Azratul and Y. Faridah
Cross-linked Lipase in Hybrid Matrixfor Biodiesel Production from CrudeJatropha Curcas Oil
R. Abdulla and P. Ravindra
Abstract Immobilization of lipases is gaining much attention these days due tothe wide variety of reactions catalyzed by them. Moreover, the lipases play animportant role in biodiesel production. In this study, lipase from Burkholderiacepacia was first cross-linked with glutaraldehyde followed by entrapment intohybrid matrix of equal proportions of alginate and j-carrageenan natural polymers.The immobilized lipase gave promising results with stability parameters like pH,temperature, solvent, storage, enzyme leakage, and hydrolytic activity. A signifi-cant reduction of 65.76 % of enzyme leakage was obtained with this immobilizedlipase. Moreover, a 100 % yield of biodiesel was produced from crude Jatrophacurcas oil using this immobilized lipase.
Introduction
In the hunt of alternative, renewable energy resources; biodiesel has gainedimmense potential as a clean, environmental friendly reliable fuel. Nonedible oilsrepresent a promising feedstock for biodiesel production over the edible vegetableoil counterpart. Among nonedible oils, Jatropha curcas (J. curcas) oil occupies thetop position due to several reasons. J. curcas is a small perennial tree whichbelongs to Euphorbiaceae family. The plant is very easy to propagate as it cangrow in almost all soil conditions. Due to the presence of some anti-nutritionalfactors, oil from Jatropha is rendered unsafe for cooking purposes. This property isexploited as biodiesel feedstock (Rahmath et al. 2011).
In general, various immobilization methods for enzymes have been classifiedinto four: Adsorption, covalent binding, cross-linking, and entrapment. Cross-
R. Abdulla � P. Ravindra (&)Chemical Engineering Programme, School of Engineering and Information Technology,University Malaysia Sabah, Jalan UMS 88400 Kota Kinabalu, Sabah, Malaysiae-mail: [email protected]
R. Pogaku et al. (eds.), Developments in Sustainable Chemicaland Bioprocess Technology, DOI: 10.1007/978-1-4614-6208-8_25,� Springer Science+Business Media New York 2013
197
linking with bifunctional agents like glutaraldehyde is one of the most frequentlyused method of lipase immobilization. But the smaller size of the aggregates isconsidered as a drawback in biodiesel production. Entrapment involves easierprocedure, mild conditions, and minimum denaturation of enzyme (Jegannathanet al. 2008). The significance of using natural polymers like j–carrageenan hasbeen highlighted in the field of lipase immobilization (Jegannathan et al. 2008).These natural polymers are easy to handle and environmental friendly also.Interpenetrating polymer networks (IPNs) are defined as a combination of twocross-linked polymers. The potential of j-carrageenan related IPNs as immobili-zation matrix for enzymes was shown by a research team (Sahin et al. 2005). Theobjective of our research was to design a simple environmental friendly hybridmatrix for lipase immobilization with decreased enzyme leakage and increasedcatalytic activity for biodiesel production.
Methodology
Immobilization of Lipase
Burkholderia cepacia lipase was first cross-linked with 25 % glutaraldehyde for3 h. At the same time, 1.5 % (w/v) solution of j-carrageenan in water was pre-pared by dissolving it at 80 �C for an hour and later the temperature was broughtdown to 35 �C. To this equal weight of sodium alginate was added and stirred toobtain uniform distribution. After this, the cross-linked lipase was mixed into thisand again stirred for 15 min for uniform distribution. The mixture was droppedinto 0.1 M solution of calcium chloride (CaCl2) by using a syringe pump (ThermoModel TE-331, Japan) of 50 ml/h flow rate to form the desired immobilized lipase.These immobilized lipases in the collection flask were stirred for 10 min and laterwas stored in 0.1 M CaCl2 solution overnight at 4 �C for hardening. Further, theimmobilized lipase was washed with distilled water, air dried, and used forcharacterization studies followed by biodiesel production.
The lipase activity of free and immobilized lipase were calculated using thefollowing formula:
Lipase activity = A410 nm=Deð Þ � V/vð Þ � 1=Tð Þ � 106 lmol=minwhere,
A410 nm—Absorbance at 410 nmDe—Molar extinction coefficient of nitrophenol (15000 M-1 cm-1)V—Total volume of reactionv—Volume of enzymeT—Time of reaction.
One unit of lipase activity (U) is defined as the amount of enzyme required tohydrolyze 1 lmol/min of p-NPP under the similar assay conditions.
198 R. Abdulla and P. Ravindra
Leakage of Entrapped Lipase
To determine the extent of leakage of immobilized enzyme, two types of immo-bilized lipase were produced. One immobilized in j-carrageenan/alginate matrixwith glutaraldehyde cross-linking and other one immobilized in the same matrixbut without cross-linking. Soon after formation, both the above said immobilizedlipase was incubated at 25 �C, 200 rpm in 0.01 M phosphate buffer of pH 7. Theenzyme leakage was studied by withdrawing the phosphate buffer every 1 h andrecording the absorbance at 280 nm using a UV-Vis spectrophotometer.
Reusability
In order to evaluate the reusability, immobilized lipase was repeatedly used forhydrolysis of p-Nitro Phenyl Palmitate (p-NPP). Followed by hydrolysis, theimmobilized lipase was washed with buffer solution and suspended again in freshaliquot of the substrate (p-NPP) to measure the enzymatic activity.
Transesterification Process Parameters
The transesterification of crude Jatropha curcas oil (CJO) with ethanol was carriedout in a baffled conical flask. Optimized process parameters for processing 10 gJatropha oil were: 35 �C, 1:10 molar ratio of oil to ethanol, 1 g water, 5.25 gimmobilized lipase, 300 rpm, and 24 h reaction time. At the end of the reaction,5 ml of reaction mixture was centrifuged at 10,000 rpm for 5 min and the upperlayer containing biodiesel was analyzed with GC–MS for the determination ofethyl ester content. Biodiesel yield is calculated as the total weight of FAEE to thetotal weight of oil used for transesterification.
Results and Discussion
Lipase Immobilization
Cross-linking and entrapment are the simple easy methods used for lipaseimmobilization. In cross-linking, intermolecular linkages are formed betweenenzyme molecules by means of bifunctional or multifunctional reagents such asglutaraldehyde. The cross-linked lipase is more stable due to strong interactionsbetween the lipase and cross-linking agent. It has been proven that application ofcross-linked lipase for biodiesel production gave considerable yield in muchshorter time, but the smaller size of these aggregates creates problem for reuse(Cao et al. 2003). On the other hand, entrapment of lipase involves capture of
Cross-linked Lipase in Hybrid Matrix 199
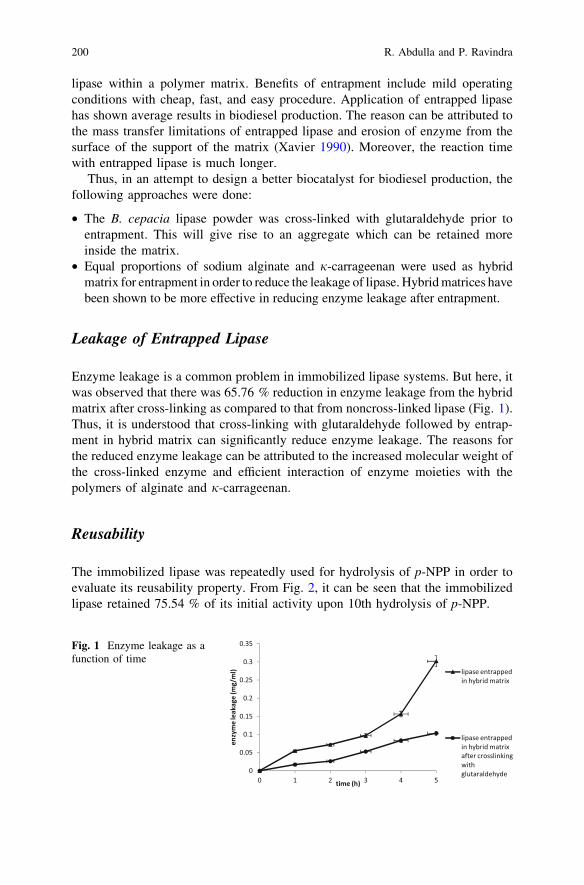
lipase within a polymer matrix. Benefits of entrapment include mild operatingconditions with cheap, fast, and easy procedure. Application of entrapped lipasehas shown average results in biodiesel production. The reason can be attributed tothe mass transfer limitations of entrapped lipase and erosion of enzyme from thesurface of the support of the matrix (Xavier 1990). Moreover, the reaction timewith entrapped lipase is much longer.
Thus, in an attempt to design a better biocatalyst for biodiesel production, thefollowing approaches were done:
• The B. cepacia lipase powder was cross-linked with glutaraldehyde prior toentrapment. This will give rise to an aggregate which can be retained moreinside the matrix.
• Equal proportions of sodium alginate and j-carrageenan were used as hybridmatrix for entrapment in order to reduce the leakage of lipase. Hybrid matrices havebeen shown to be more effective in reducing enzyme leakage after entrapment.
Leakage of Entrapped Lipase
Enzyme leakage is a common problem in immobilized lipase systems. But here, itwas observed that there was 65.76 % reduction in enzyme leakage from the hybridmatrix after cross-linking as compared to that from noncross-linked lipase (Fig. 1).Thus, it is understood that cross-linking with glutaraldehyde followed by entrap-ment in hybrid matrix can significantly reduce enzyme leakage. The reasons forthe reduced enzyme leakage can be attributed to the increased molecular weight ofthe cross-linked enzyme and efficient interaction of enzyme moieties with thepolymers of alginate and j-carrageenan.
Reusability
The immobilized lipase was repeatedly used for hydrolysis of p-NPP in order toevaluate its reusability property. From Fig. 2, it can be seen that the immobilizedlipase retained 75.54 % of its initial activity upon 10th hydrolysis of p-NPP.
Fig. 1 Enzyme leakage as afunction of time
200 R. Abdulla and P. Ravindra
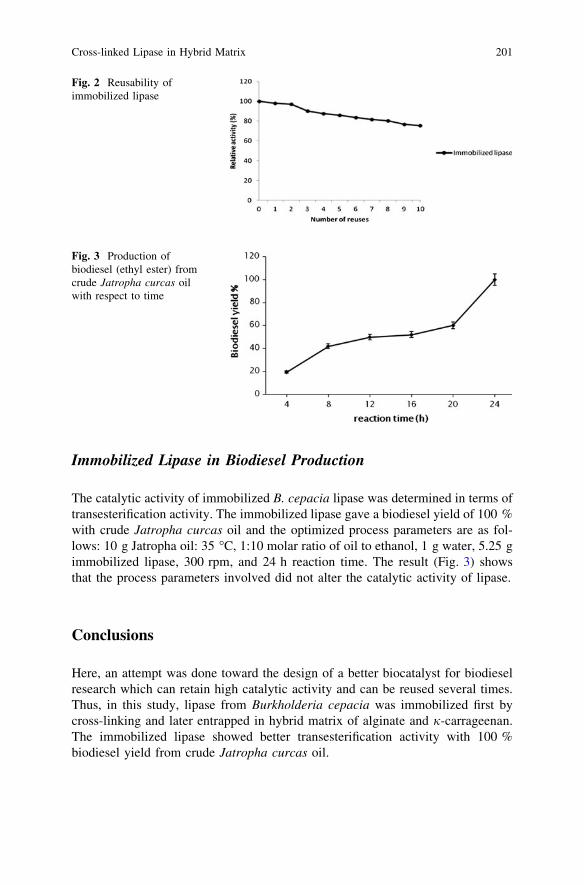
Immobilized Lipase in Biodiesel Production
The catalytic activity of immobilized B. cepacia lipase was determined in terms oftransesterification activity. The immobilized lipase gave a biodiesel yield of 100 %with crude Jatropha curcas oil and the optimized process parameters are as fol-lows: 10 g Jatropha oil: 35 �C, 1:10 molar ratio of oil to ethanol, 1 g water, 5.25 gimmobilized lipase, 300 rpm, and 24 h reaction time. The result (Fig. 3) showsthat the process parameters involved did not alter the catalytic activity of lipase.
Conclusions
Here, an attempt was done toward the design of a better biocatalyst for biodieselresearch which can retain high catalytic activity and can be reused several times.Thus, in this study, lipase from Burkholderia cepacia was immobilized first bycross-linking and later entrapped in hybrid matrix of alginate and j-carrageenan.The immobilized lipase showed better transesterification activity with 100 %biodiesel yield from crude Jatropha curcas oil.
Fig. 2 Reusability ofimmobilized lipase
Fig. 3 Production ofbiodiesel (ethyl ester) fromcrude Jatropha curcas oilwith respect to time
Cross-linked Lipase in Hybrid Matrix 201
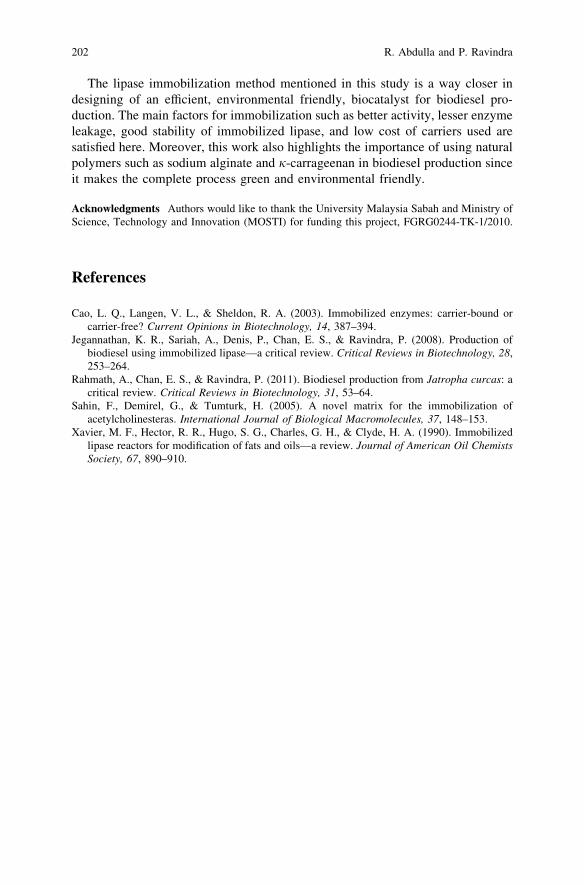
The lipase immobilization method mentioned in this study is a way closer indesigning of an efficient, environmental friendly, biocatalyst for biodiesel pro-duction. The main factors for immobilization such as better activity, lesser enzymeleakage, good stability of immobilized lipase, and low cost of carriers used aresatisfied here. Moreover, this work also highlights the importance of using naturalpolymers such as sodium alginate and j-carrageenan in biodiesel production sinceit makes the complete process green and environmental friendly.
Acknowledgments Authors would like to thank the University Malaysia Sabah and Ministry ofScience, Technology and Innovation (MOSTI) for funding this project, FGRG0244-TK-1/2010.
References
Cao, L. Q., Langen, V. L., & Sheldon, R. A. (2003). Immobilized enzymes: carrier-bound orcarrier-free? Current Opinions in Biotechnology, 14, 387–394.
Jegannathan, K. R., Sariah, A., Denis, P., Chan, E. S., & Ravindra, P. (2008). Production ofbiodiesel using immobilized lipase—a critical review. Critical Reviews in Biotechnology, 28,253–264.
Rahmath, A., Chan, E. S., & Ravindra, P. (2011). Biodiesel production from Jatropha curcas: acritical review. Critical Reviews in Biotechnology, 31, 53–64.
Sahin, F., Demirel, G., & Tumturk, H. (2005). A novel matrix for the immobilization ofacetylcholinesteras. International Journal of Biological Macromolecules, 37, 148–153.
Xavier, M. F., Hector, R. R., Hugo, S. G., Charles, G. H., & Clyde, H. A. (1990). Immobilizedlipase reactors for modification of fats and oils—a review. Journal of American Oil ChemistsSociety, 67, 890–910.
202 R. Abdulla and P. Ravindra
Culture Conditions for Optimal Growthof Actinomycetes from Marine Sponges
M. A. A. Bukhari, A. N. Thomas and N. K. Wong
Abstract Actinomycetes are filamentous gram-positive bacteria that can be foundabundantly in both terrestrial and marine environment. These bacteria are knownas producers of many bioactive compounds through the production of secondarymetabolites for their survival and adaptation in nature and have been widely usedtoday as therapeutic agents. Marine actinomycetes have been the focus of researchover the past decade for new drugs discovery due to its unique adaptation in theharsh sea environment. It is believed that marine actinomycetes could producecompounds that are rare and unique compared to the terrestrial actinomycetes.Despite its potential, marine actinomycetes are critically difficult to culture inlaboratory because these actinomycetes live in extreme environment in the seawith high salt concentration, high pressure, low temperature, and constant pHchanges of seawater in its natural environment. Hence, in this study, optimumcondition to culture marine actinomycetes was achieved by culturing the marineactinomycetes from marine sponges on different culture condition such as differenttypes of isolation media, pH, seasalt concentration, temperature, and incubationtime. Starch casein agar (SCA) is shown to be the best isolation media compared toactinomycetes isolation agar (AIA) and Kuster agar (KUA). The growth of marineactinomycetes is optimum at pH 7, 40 % of seasalt concentration, 20–30 �C and7–10 days of incubation time.
Introduction
Actinomycetes are gram-positive bacteria that known for its ability to producenovel secondary metabolites, which have been used widely today as antibioticsand anticancer drug (Olano et al. 2009). This unique ability has made these
M. A. A. Bukhari � A. N. Thomas � N. K. Wong (&)Biotechnology Programme, School of Science and Technology, Universiti Malaysia Sabah,88400 Sabah, Kota Kinabalu, Malaysiae-mail: [email protected]
R. Pogaku et al. (eds.), Developments in Sustainable Chemicaland Bioprocess Technology, DOI: 10.1007/978-1-4614-6208-8_26,� Springer Science+Business Media New York 2013
203
microbes as one of the major resources for drug-screening research (Lam 2006).Despite of the enormous attention on actinomycetes, marine actinomycetes arerelatively underexplored as it is a lot easier to isolate and culture the terrestrialactinomycetes compared to its marine counterpart. On the other hand, actinomy-cetes strains from the marine environment live in an extremely different envi-ronment, they have their own unique requirement for growth and show a differentphysiological trait that have not been previously reported on terrestrial actino-mycetes (Fenical et al. 2008). The extreme living conditions to which marineactinomycetes have to adapt to are reflected in the genetic and metabolic diversityof marine actinomycetes, which enable them to produce a complete different set ofbioactive compounds as compared to terrestrial actinomycetes.
Despite of the previous assumption that marine actinomycetes might be orig-inated from terrestrial origin, many researches proved that indigenous marineactinomycetes indeed exist, these include members from of various genera such asDietzia, Rhodococcus, Streptomyces, Salinispora, Marinophilus, Solwaraspora,Salinibacterium, Aeromicrobium marinum, Williamsia maris, and Verrucosispora(Lam 2006). Among these, the first obligates new actinomycetes genus discoveredwas Salinispora (formerly known as Salinospora). More than 2,500 new genus ofactinomycetes from marine sources have been found so far and astonishingly, themajority of it showed to have therapeutic and anticancer activity (Fleming et al.2006). Salinosporamide A, for example, was isolated from marine actinomycetesgenus Salinospora, and it shows to be a potential anticancer agent (Fenical et al.2008). Abyssomicins, Aureoverticillatam, Caprolactones, Chinicomycins, IB-00208, Trioxacarcins etc. are among the other therapeutic novel metabolites foundfrom marine actinomycetes. Indeed, marine environment is now regarded as a newsource of rare actinomycetes for novel bioactive compounds. The exploration ofthe ocean, in search of new strains of actinomycetes is challenging yet rewardingas ocean constitutes approximately three quarters of the earth surface and diversityof the microorganisms in the sea is predicted far greater than the diversity of lifeforms in the rainforests (Sogin et al. 2006).
Semporna is located on the east coast of Sabah, Malaysia, and it is well knownfor its vast and beautiful sea area with most of it still in its natural condition. Thisundisturbed environment will serve as a perfect source of rare actinomycetesisolation as most part of it still retain in its natural condition which might be apreferable habitat of some indigenous marine actinomycetes. These marine acti-nomycetes can be found in sea water, sediments and also associated with othermarine organisms such as fish, seaweeds, starfishes, sponges, and mollusks (Sahuet al. 2005). In this study, sponges have been used as a source of marine actino-mycetes isolation due to the fact that sponges live symbiotically with variousmicroorganisms in nature (Li 2009).
Although marine actinomycetes have a lot of potential compared to terrestrialactinomycetes, the major challenge in exploiting their potential is the difficulty inisolating these microbes from its environment (Murphy et al. 2009). The harshconditions in the ocean such as high salt concentration, high pressure, anaerobiccondition, and low temperature have made it difficult to manipulate and maintain
204 M. A. A. Bukhari et al.
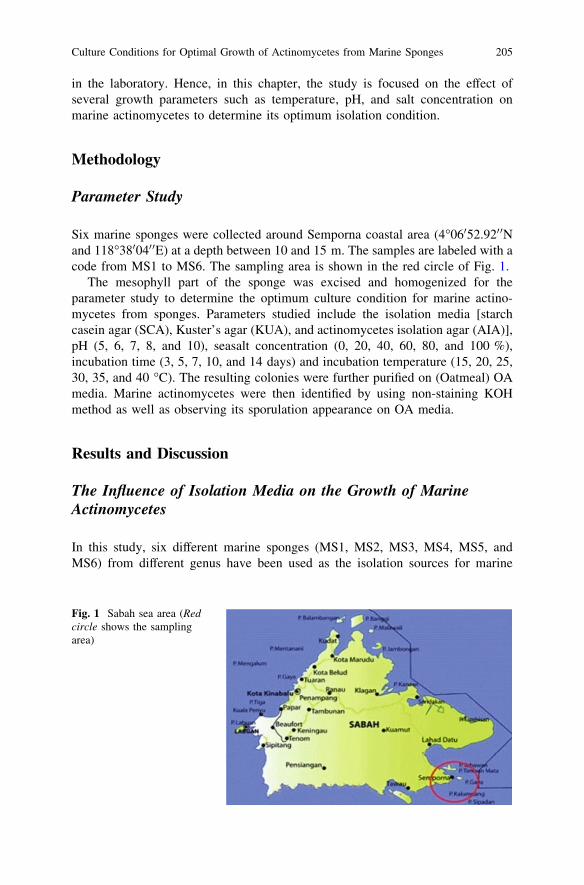
in the laboratory. Hence, in this chapter, the study is focused on the effect ofseveral growth parameters such as temperature, pH, and salt concentration onmarine actinomycetes to determine its optimum isolation condition.
Methodology
Parameter Study
Six marine sponges were collected around Semporna coastal area (4�06052.9200Nand 118�3800400E) at a depth between 10 and 15 m. The samples are labeled with acode from MS1 to MS6. The sampling area is shown in the red circle of Fig. 1.
The mesophyll part of the sponge was excised and homogenized for theparameter study to determine the optimum culture condition for marine actino-mycetes from sponges. Parameters studied include the isolation media [starchcasein agar (SCA), Kuster’s agar (KUA), and actinomycetes isolation agar (AIA)],pH (5, 6, 7, 8, and 10), seasalt concentration (0, 20, 40, 60, 80, and 100 %),incubation time (3, 5, 7, 10, and 14 days) and incubation temperature (15, 20, 25,30, 35, and 40 �C). The resulting colonies were further purified on (Oatmeal) OAmedia. Marine actinomycetes were then identified by using non-staining KOHmethod as well as observing its sporulation appearance on OA media.
Results and Discussion
The Influence of Isolation Media on the Growth of MarineActinomycetes
In this study, six different marine sponges (MS1, MS2, MS3, MS4, MS5, andMS6) from different genus have been used as the isolation sources for marine
Fig. 1 Sabah sea area (Redcircle shows the samplingarea)
Culture Conditions for Optimal Growth of Actinomycetes from Marine Sponges 205
actinomycetes. The isolation media used were SCA, KUA, and AIA, of whichSCA demonstrated to have the highest number of isolates. Out of six marinesponge samples tested, four samples (MS1, MS3, MS4, and MS5) showed to havethe highest number of isolates on SCA. The growth of marine actinomycetes isrelatively good on AIA, and two samples (MS2 and MS6) showed to have thehighest number of isolates on AIA. All sponge samples yielded the lowest numberof marine actinomycetes isolates on KUA. This study showed that SCA is the mostfavorable culture media, and this might due to the composition of nutrient espe-cially in the form of carbon and nitrogen sources is most suitable for the growth ofmarine actinomycetes strains. Concentration of nutrients and organic matter caninfluence the growth of marine bacteria and also in its natural environment, theabundance and growth rates of bacteria are very much dependent on the subtlechanges of the environmental variables such as temperature, nutrient, and energysupplies (Church et al. 2000). It is interesting to note that KUA was shown to bethe best isolation media for marine actinomycetes when sediments, seaweedsmollusks, and fish were used as the sampling source (Sahu et al. 2005). Thishappened due to the specific interaction between microbes and host in whichcertain types of microbes often colonizing the same species of host regardless thelocation where the samples are collected (Taylor et al. 2004).
The Influence of pH on the Growth of Marine Actinomycetes
Figure 2b showed that pH range of 6–8 is the best pH condition to yield the highestnumber of isolates, while pH 7 is the optimum pH for the growth of marineactinomycetes on SCA media for all samples (MS1 to MS6). This pH range ismuch similar to the pH of natural seawater which ranges from 6.5 to 8.4 (Ross1995). A suitable pH range is crucially important for bacterial growth since bac-teria are really sensitive to the hydrogen ion concentration in their environment.The unsuitable pH condition may affect the large bioproteins (i.e., enzymes) withinthe metabolism of actinomycetes, and this will halt the metabolism in the cells orproduction of bioactive compounds. Despite all of that, a small number of strainscan still grow at pH outside of this range such as pH 5 (acidic) and pH 10(alkaline). This might be due to the adaptation of certain strains to live in anextreme large pH range in nature to ensure their survival.
The Influence of Incubation Temperature on the Growthof Marine Actinomycetes
All of the six sponge samples, except MS4, yielded the highest number of marineactinomycetes isolates at 30 �C as seen in Fig. 2c. MS4 produced the highestnumber of marine actinomycetes isolates at 25 �C. This indicated that 30 �C is
206 M. A. A. Bukhari et al.
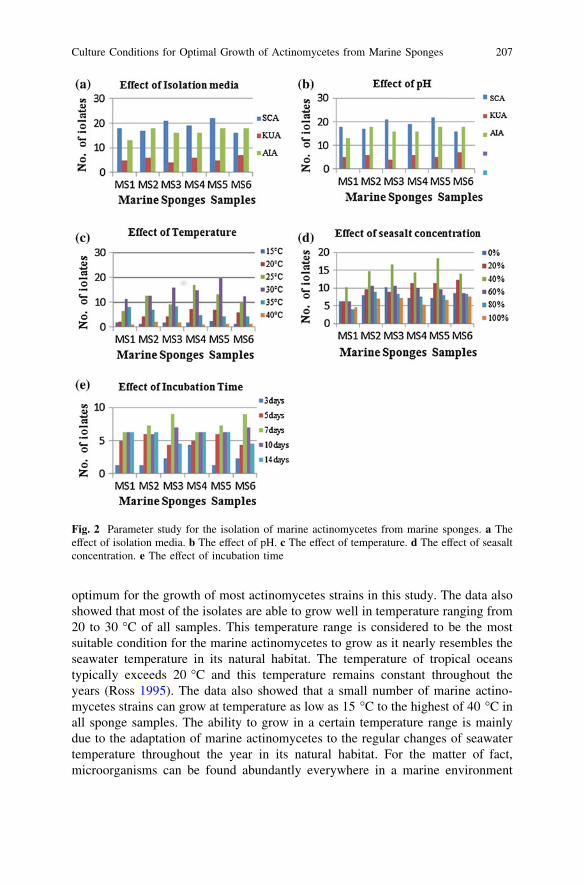
optimum for the growth of most actinomycetes strains in this study. The data alsoshowed that most of the isolates are able to grow well in temperature ranging from20 to 30 �C of all samples. This temperature range is considered to be the mostsuitable condition for the marine actinomycetes to grow as it nearly resembles theseawater temperature in its natural habitat. The temperature of tropical oceanstypically exceeds 20 �C and this temperature remains constant throughout theyears (Ross 1995). The data also showed that a small number of marine actino-mycetes strains can grow at temperature as low as 15 �C to the highest of 40 �C inall sponge samples. The ability to grow in a certain temperature range is mainlydue to the adaptation of marine actinomycetes to the regular changes of seawatertemperature throughout the year in its natural habitat. For the matter of fact,microorganisms can be found abundantly everywhere in a marine environment
Fig. 2 Parameter study for the isolation of marine actinomycetes from marine sponges. a Theeffect of isolation media. b The effect of pH. c The effect of temperature. d The effect of seasaltconcentration. e The effect of incubation time
Culture Conditions for Optimal Growth of Actinomycetes from Marine Sponges 207

regardless of its temperature, they live abundantly from a high-temperatureenvironment such as hydrothermal vents in the deep sea to the icy seawater in theAntarctica. Temperature can be a limiting factor for the bacterial growth because itcan affect the chemical and biochemical processes in the cell. Every bacteriumphylotype has its own minimal, maximal, and optimal temperatures that allow itsgrowth and each bacteria can grow in a certain range of temperature. However, themost favorable growth only can be achieved at the optimal temperature (Pomeroyand Wiebe 2001).
The Influence of Seasalt Concentration on the Growthof Marine Actinomycetes
The data in this study showed that the growth of marine actinomycetes increases inthe presence of artificial seawater. As shown in Fig. 2d, seasalt concentration of40 % is the optimal seasalt concentration for all six sponge samples to yield thehighest number of isolates. The numbers of isolates yielded rapidly increased asthe seasalt concentration increased from 0 to 40 %, and the numbers of isolatesdecreased when the seasalt concentration is more than 40 %. The need of seawaterfor the growth of isolates is critically important especially during the isolation ofmarine bacteria from its natural sources. The isolation media should resemble itsnatural environment as closely as possible in order to the marine bacteria to growon the isolation plates. The usage of isolation media prepared by using seawater isone of the ways to provide a suitable growth condition for marine bacteria. Thereis a difference between marine and terrestrial bacteria in term of salt requirementbecause the growth of marine bacteria is more preferable in media with seawater(McLeod 1965). The data also clearly showed that the marine actinomycetes cangrow in all seasalt concentration ranging from 20 to 100 % although the number ofisolates is different in all seasalt concentration. The effect to which salt concen-tration causes changes in bacterial growth depends on the osmotic balance requiredfor such growth. Some bacteria require an astonishingly high level of salt to begingrowth, whereas other bacteria would be immediately killed in high levels of salt.This is because marine actinomycetes in particular are different in salt tolerance(Kuster and Neumeier 1981).
The Influence of Incubation Time on the Growth of MarineActinomycetes
The number of marine actinomycetes isolates from sponges with incubation timeof 3, 5, 7, 10, and 14 days is shown in Fig. 2e. The data showed that the acti-nomycetes colony started to appear on SCA media only after 3 days of incubation
208 M. A. A. Bukhari et al.
time at 28 �C on SCA media. For all of the samples (MS1 to MS6), most isolateswere observed after 5–10 days of incubation times, in which 7 day incubation timeseems to yield the highest isolates of all sponge samples. Out of six spongesamples, four samples (MS1, MS2, MS4, and MS5) yielded a relatively highnumber of isolates even after 14 days of incubation time. This incubation time wasslightly longer compared to the terrestrial actinomycetes which usually take only3–5 days to grow on SCA media. Longer incubation time is needed for marineactinomycetes because marine actinomycetes are really slow growing in nature(Lam 2006) and that may contribute to their metabolites diversity.
Conclusions
Optimization of culture condition for isolating marine actinomycetes is crucial dueto its potential as the producers of novel bioactive secondary metabolites overterrestrial actinomycetes. Marine actinomycetes were successfully isolated frommarine sponges collected from Semporna coastal area, close distance from Sipa-dan Island of Sabah, Malaysia. The optimum yield of marine actinomycetes isobtained on culture condition of SCA media supplemented with 40 % seasaltconcentration at pH 7 and incubated at 30 �C for 7–10 days. It is worth noting thatthe numbers of marine actinomycetes obtained also varied among all spongesamples from MS1 to MS6 on all of the isolation media, SCA, KUA and AIA, pHcondition, temperature, seasalt concentration, and incubation time. The optimumgrowth conditions possibly varied among genus resulting in different number ofstrains. Nonetheless, this study provides a solid optimum cultural condition for thegrowth of actinomycetes from marine sponges.
References
Church, M. J., Hutchins, D. A., & Ducklow, H. W. (2000). Limitation of bacterial growth bydissolved organic matter and iron in the Southern Ocean. Applied and EnvironmentMicrobiology, 66, 455–466.
Fenical, W., Jensen, P. R., Palladino, M. A., Lam, K. S., Lloyd, G. K., & Potts, B. C. (2008).Discovery and development of the anticancer agent salinosporamide A(NPI-0052). Bioor-ganic and Medicinal Chemistry, 17, 2175–2180.
Fleming, L. E., Broad, K., Clement, A., Dewailly, E., Elmir, S., Knap, A., et al. (2006). Oceansand human health: Emerging public health risks in the marine environment. Marine PollutionBulletin, 53, 545–560.
Kuster, E. & Neumeier, W. (1981). Halotolerance in some streptomycetes producingtetracyclines. Zentralbl Bakteriol Suppi 11, 315–319.
Lam, K. S. (2006). Discovery of novel metabolites from marine actinomycetes. Current Opinionin Microbiology, 9, 245–251.
Li, Z. (2009). Advances in marine microbial symbionts in the China sea and relatedpharmaceutical metabolites. Marine Drugs Journal, 15, 219–224.
Culture Conditions for Optimal Growth of Actinomycetes from Marine Sponges 209
McLeod, R. A. (1965). The question of the existence of specific marine bacteria. BacteriologicalReviews, 29, 9–23.
Murphy, T., Maloney, H. N. & Fenical, W. (2009). Natural products from marine microorgan-isms, in Phytochemistry and Pharmacognosy, in Encyclopedia of Life Support Systems(EOLSS), Developed under the Auspices of the UNESCO. Oxford,UK: Eolss Publishers.
Olano, C., Méndez, C., & Salas, J. A. (2009). Antitumor compounds from marine actinomycetes.Marine Drugs, 7(2), 210–248.
Pomeroy, L., & Wiebe, W. (2001). Temperature and substrates as interactive limiting factors formarine heterotrophic bacteria. Aquatic Microbial Ecology, 23, 187–204.
Ross, D. A. (1995). Introduction to oceanography. New York: Harper Collins College Publishers.Sahu, M. K., Sivakumar, K., & Kannan, L. (2005). Isolation of actinomycetes from various
samples of the Vellar estuary, southeast coast of India. Pollution Research, 24, 45–48.Sogin, M. L., Morrison, H. G., Huber, J. A., Welch, D. M., Huse, S. M., Neal, P. R., et al. (2006).
Microbial diversity in the deep sea and the underexplored ‘‘rare biosphere’’. Proceedings ofthe National Academy of Sciences, 103, 12115–12120.
Taylor, M. W., Schupp, P. J., Dahllof, I., Kjelleberg, S., & Steinberg, P. D. (2004). Hostspecificity in marine sponge-associated bacteria, and potential implications for marinemicrobial diversity. Environmental Microbiology, 6, 121–130.
210 M. A. A. Bukhari et al.
Genetic-Algorithm-Based Optimisationfor Exothermic Batch Process
M. K. Tan, H. J. Tham and K. T. K. Teo
Abstract The aim of this chapter is to optimise the productivity of an exothermicbatch process, by maximising the production of the desired product whileminimising the undesired by-product. During the process, heat is liberated whenthe reactants are mixed together. The exothermic behaviour causes the reaction tobecome unstable and consequently poses safety issues. In the industries, a dual-mode controller is used to control the process temperature according to a prede-termined optimal reference temperature profile. However, the predeterminedoptimal reference profile is not able to limit the production of the undesired by-product. Hence, this work proposed a genetic-algorithm-based controller to opti-mise the batch productivity without referring to any optimal reference profile.From the simulation results, the proposed algorithm is able to improve theproduction of the desired product and reduce the production of the undesiredby-product by 15.3 and 34.4 %, respectively. As a conclusion, the genetic-algo-rithm-based optimisation performs better in raw materials utilisation as comparedto the predetermined optimal temperature profile method.
Introduction
Batch process has been applied in the manufacturing industry due to its flexibilityto handle various productions of high value-added product, such as specialtychemicals, agrochemicals, and pharmaceuticals. Although batch process is used
M. K. Tan (&) � K. T. K. TeoModelling, Simulation and Computing Laboratory, School of Engineering and InformationTechnology, Universiti Malaysia Sabah, Jalan UMS 88400 Kota Kinabalu, Sabah, Malaysiae-mail: [email protected]
H. J. ThamChemical Engineering Programme, School of Engineering and Information Technology,Universiti Malaysia Sabah, Jalan UMS 88400 Kota Kinabalu, Sabah, Malaysiae-mail: [email protected]
R. Pogaku et al. (eds.), Developments in Sustainable Chemicaland Bioprocess Technology, DOI: 10.1007/978-1-4614-6208-8_27,� Springer Science+Business Media New York 2013
211
for various types of production, quite often the common aim is to optimise theproduction of the desired product while at the same time minimising the waste.Since there is no inflow and outflow during the process, the raw materials utility isfully relied on the reactor temperature especially for the exothermic reaction(Nisenfeld 1996). In exothermic reactions, heat is liberated during the processhence consequently increases the reactor temperature. If the liberated heat ishigher than the plant cooling capacity, the reaction will become unstable and,hence, poses a safety issue to the plant personnel (Hazard Investigation 2002).
Previously, batch productivity optimisation for exothermic process wasobtained by controlling the reactor temperature according to a predeterminedoptimal temperature profile (Mujtaba et al. 2006; Sujatha and Pappa 2012; Tanet al. 2011). Although they can control the reactor temperature to follow thedesired trajectory effectively, the aim of minimising the waste may not beachieved. Besides, the global price competition and escalating raw materials costshave also urged the batch industries to consider an effective way of utilising theraw materials (Fernandez et al. 2012).
For these reasons, genetic algorithm (GA) is introduced to optimise the exo-thermic batch productivity. This work reports the performance of a GA in exo-thermic batch process optimisation without referring to any reference values. Theperformance of the proposed GA is then compared with the conventional dual-mode controller (DM) which uses the predetermined optimal temperature profile.
Methodology
Batch Process Modelling
A benchmark batch process model, developed by Cott and Macchietto (1989), isused in this study. It is assumed that a two-parallel, well-mixed, and irreversibleliquid-phase exothermic reactions occur in the process, as shown in below.
Reaction 1 : A þ B! C Reaction 2 : A þ C! D
where A and B are the raw materials, C is the desired product, and D is theundesired by-product. Initially, all the raw materials are charged into the reactorand left to react for 120 min. The jacket surrounding the reactor is used to controlthe reactor temperature. Figure 1 illustrates the schematic of the batch processsystem.
The dynamic modelling of a batch process can be divided into two parts:component balance and energy balance. The law of conservation of mass isapplied to model the component balance of the reactor contents. The production/consumption rate of all substances and each component balance are described in(1) and (2), respectively.
212 M. K. Tan et al.
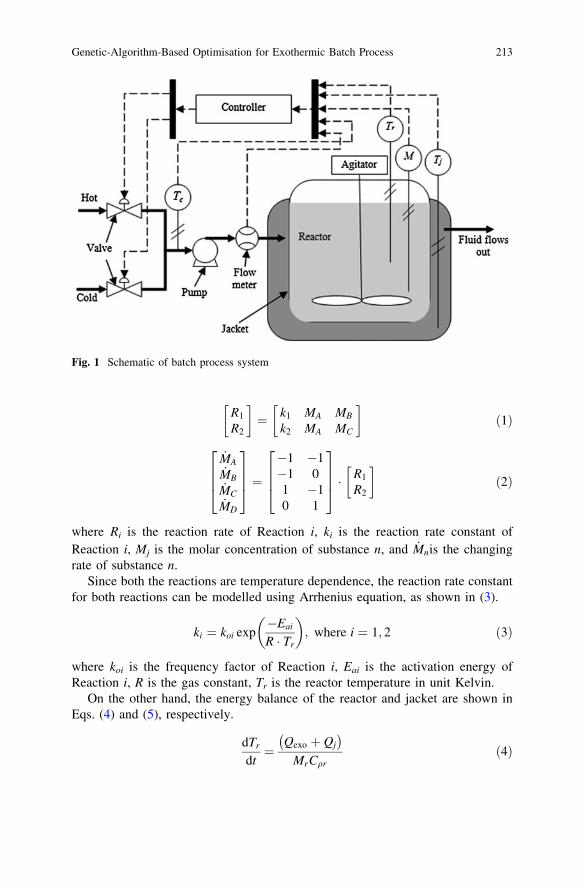
R1
R2
� �¼ k1 MA MB
k2 MA MC
� �ð1Þ
_MA_MB_MC_MD
2664
3775 ¼
�1 �1�1 01 �10 1
2664
3775 � R1
R2
� �ð2Þ
where Ri is the reaction rate of Reaction i, ki is the reaction rate constant ofReaction i, Mj is the molar concentration of substance n, and _Mnis the changingrate of substance n.
Since both the reactions are temperature dependence, the reaction rate constantfor both reactions can be modelled using Arrhenius equation, as shown in (3).
ki ¼ koi exp�Eai
R � Tr
� �; where i ¼ 1; 2 ð3Þ
where koi is the frequency factor of Reaction i, Eai is the activation energy ofReaction i, R is the gas constant, Tr is the reactor temperature in unit Kelvin.
On the other hand, the energy balance of the reactor and jacket are shown inEqs. (4) and (5), respectively.
dTr
dt¼
Qexo þ Qj
� �MrCqr
ð4Þ
Fig. 1 Schematic of batch process system
Genetic-Algorithm-Based Optimisation for Exothermic Batch Process 213
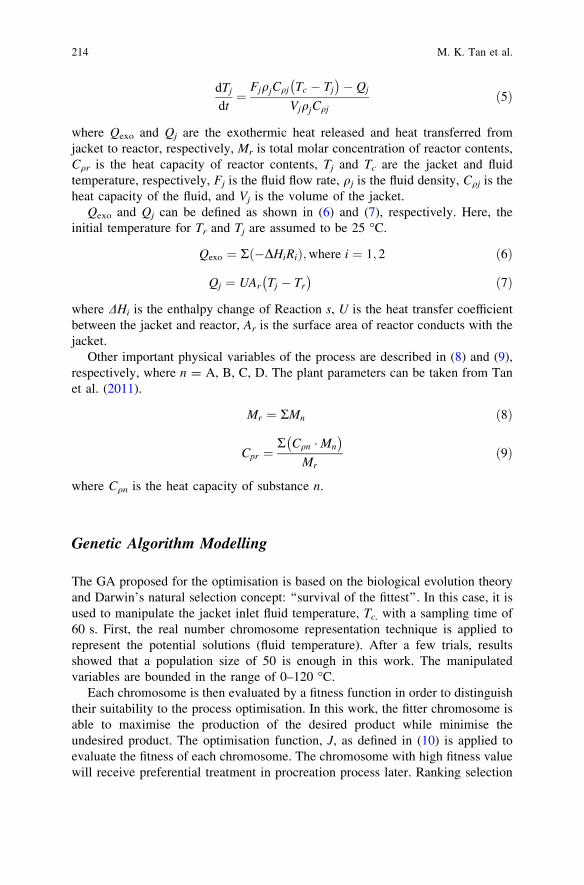
dTj
dt¼
FjqjCqj Tc � Tj
� �� Qj
VjqjCqjð5Þ
where Qexo and Qj are the exothermic heat released and heat transferred fromjacket to reactor, respectively, Mr is total molar concentration of reactor contents,Cqr is the heat capacity of reactor contents, Tj and Tc are the jacket and fluidtemperature, respectively, Fj is the fluid flow rate, qj is the fluid density, Cqj is theheat capacity of the fluid, and Vj is the volume of the jacket.
Qexo and Qj can be defined as shown in (6) and (7), respectively. Here, theinitial temperature for Tr and Tj are assumed to be 25 �C.
Qexo ¼ R �DHiRið Þ;where i ¼ 1; 2 ð6Þ
Qj ¼ UAr Tj � Tr
� �ð7Þ
where DHi is the enthalpy change of Reaction s, U is the heat transfer coefficientbetween the jacket and reactor, Ar is the surface area of reactor conducts with thejacket.
Other important physical variables of the process are described in (8) and (9),respectively, where n = A, B, C, D. The plant parameters can be taken from Tanet al. (2011).
Mr ¼ RMn ð8Þ
Cpr ¼R Cqn �Mn
� �Mr
ð9Þ
where Cqn is the heat capacity of substance n.
Genetic Algorithm Modelling
The GA proposed for the optimisation is based on the biological evolution theoryand Darwin’s natural selection concept: ‘‘survival of the fittest’’. In this case, it isused to manipulate the jacket inlet fluid temperature, Tc, with a sampling time of60 s. First, the real number chromosome representation technique is applied torepresent the potential solutions (fluid temperature). After a few trials, resultsshowed that a population size of 50 is enough in this work. The manipulatedvariables are bounded in the range of 0–120 �C.
Each chromosome is then evaluated by a fitness function in order to distinguishtheir suitability to the process optimisation. In this work, the fitter chromosome isable to maximise the production of the desired product while minimise theundesired product. The optimisation function, J, as defined in (10) is applied toevaluate the fitness of each chromosome. The chromosome with high fitness valuewill receive preferential treatment in procreation process later. Ranking selection
214 M. K. Tan et al.
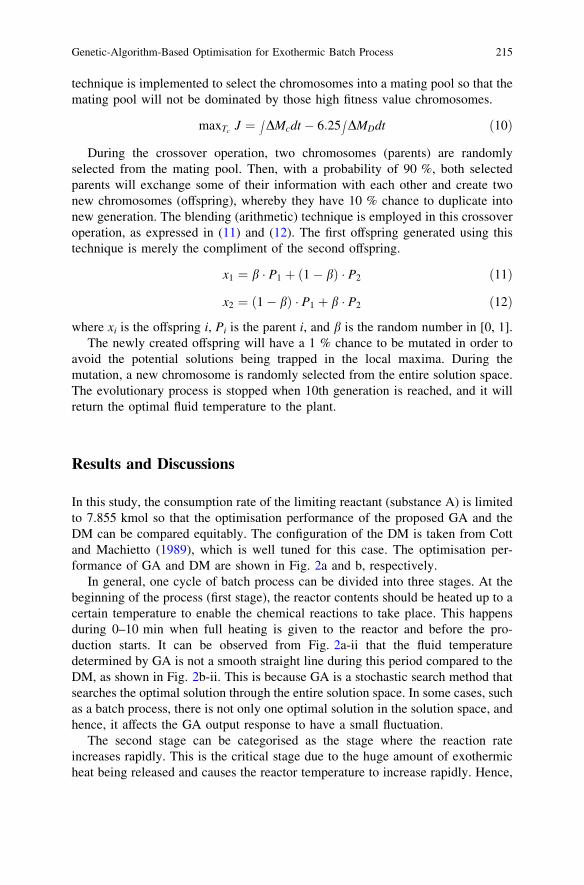
technique is implemented to select the chromosomes into a mating pool so that themating pool will not be dominated by those high fitness value chromosomes.
maxTc J ¼ ZDMcdt � 6:25
ZDMDdt ð10Þ
During the crossover operation, two chromosomes (parents) are randomlyselected from the mating pool. Then, with a probability of 90 %, both selectedparents will exchange some of their information with each other and create twonew chromosomes (offspring), whereby they have 10 % chance to duplicate intonew generation. The blending (arithmetic) technique is employed in this crossoveroperation, as expressed in (11) and (12). The first offspring generated using thistechnique is merely the compliment of the second offspring.
x1 ¼ b � P1 þ 1� bð Þ � P2 ð11Þ
x2 ¼ 1� bð Þ � P1 þ b � P2 ð12Þ
where xi is the offspring i, Pi is the parent i, and b is the random number in [0, 1].The newly created offspring will have a 1 % chance to be mutated in order to
avoid the potential solutions being trapped in the local maxima. During themutation, a new chromosome is randomly selected from the entire solution space.The evolutionary process is stopped when 10th generation is reached, and it willreturn the optimal fluid temperature to the plant.
Results and Discussions
In this study, the consumption rate of the limiting reactant (substance A) is limitedto 7.855 kmol so that the optimisation performance of the proposed GA and theDM can be compared equitably. The configuration of the DM is taken from Cottand Machietto (1989), which is well tuned for this case. The optimisation per-formance of GA and DM are shown in Fig. 2a and b, respectively.
In general, one cycle of batch process can be divided into three stages. At thebeginning of the process (first stage), the reactor contents should be heated up to acertain temperature to enable the chemical reactions to take place. This happensduring 0–10 min when full heating is given to the reactor and before the pro-duction starts. It can be observed from Fig. 2a-ii that the fluid temperaturedetermined by GA is not a smooth straight line during this period compared to theDM, as shown in Fig. 2b-ii. This is because GA is a stochastic search method thatsearches the optimal solution through the entire solution space. In some cases, suchas a batch process, there is not only one optimal solution in the solution space, andhence, it affects the GA output response to have a small fluctuation.
The second stage can be categorised as the stage where the reaction rateincreases rapidly. This is the critical stage due to the huge amount of exothermicheat being released and causes the reactor temperature to increase rapidly. Hence,
Genetic-Algorithm-Based Optimisation for Exothermic Batch Process 215
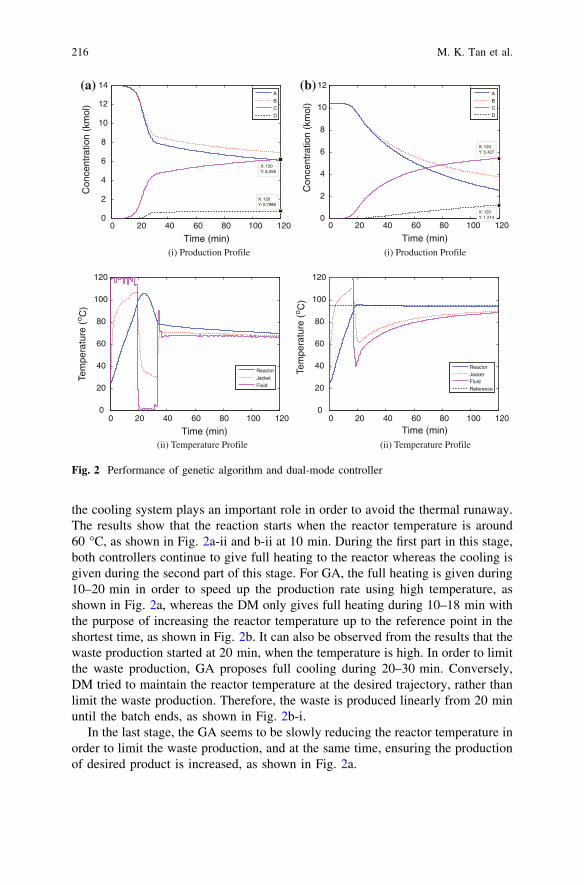
the cooling system plays an important role in order to avoid the thermal runaway.The results show that the reaction starts when the reactor temperature is around60 �C, as shown in Fig. 2a-ii and b-ii at 10 min. During the first part in this stage,both controllers continue to give full heating to the reactor whereas the cooling isgiven during the second part of this stage. For GA, the full heating is given during10–20 min in order to speed up the production rate using high temperature, asshown in Fig. 2a, whereas the DM only gives full heating during 10–18 min withthe purpose of increasing the reactor temperature up to the reference point in theshortest time, as shown in Fig. 2b. It can also be observed from the results that thewaste production started at 20 min, when the temperature is high. In order to limitthe waste production, GA proposes full cooling during 20–30 min. Conversely,DM tried to maintain the reactor temperature at the desired trajectory, rather thanlimit the waste production. Therefore, the waste is produced linearly from 20 minuntil the batch ends, as shown in Fig. 2b-i.
In the last stage, the GA seems to be slowly reducing the reactor temperature inorder to limit the waste production, and at the same time, ensuring the productionof desired product is increased, as shown in Fig. 2a.
(i) Production Profile (i) Production Profile
(ii) Temperature Profile (ii) Temperature Profile
0 20 40 60 80 100 1200
2
4
6
8
10
12
X: 120Y: 5.427
Time (min)
Con
cent
ratio
n (k
mol
)
X: 120Y: 1.214
A
BC
D
0 20 40 60 80 100 1200
2
4
6
8
10
12
14
Time (min)
Con
cent
ratio
n (k
mol
)
X: 120Y: 6.258
X: 120Y: 0.7986
A
B
C
D
0 20 40 60 80 100 1200
20
40
60
80
100
120
Time (min)
Tem
pera
ture
(o C
)
Tem
pera
ture
(o C
)
Reactor
Jacket
Fluid
0 20 40 60 80 100 1200
20
40
60
80
100
120
Time (min)
Reactor
JacketFluid
Reference
(a) (b)
Fig. 2 Performance of genetic algorithm and dual-mode controller
216 M. K. Tan et al.
The overall performance show that the GA is able to harvest 6.258 kmol ofdesired product C and 0.796 kmol of undesired by-product D, whereas the DMonly harvests 5.427 kmol of desired product C and 1.214 kmol of undesired by-product D. The results show that the desired product harvested by the GA is15.3 % more than the DM, whereas the waste produced by the GA is 34.4 % lessthan the DM. Table 1 summaries the performance of the proposed GA and theconventional DM controller to optimise the batch productivity.
Conclusions
In this chapter, GA is proposed to optimise the raw materials utility for an exo-thermic batch process without referring to any optimal temperature profile. Theperformance of the developed GA is examined using a benchmark exothermicbatch process model. The results show that the proposed method can performbetter than the conventional DM which follows an optimal temperature profile. Infuture, the work will be focusing on optimising the GA development in handlingvarious uncertainties and to improve the robustness of GA.
Acknowledgments The authors would like acknowledge the financial support of UniversitiMalaysia Sabah (UMS) under Postgraduate Scholarship Scheme.
References
Cott, B. J., & Macchietto, S. (1989). Temperature control of exothermic batch reactors usinggeneric model control. Industrial and Engineering Chemistry Research, 28(8), 1177–1184.
Fernandez, I., Renedo, C. J., Perez, S. F., Ortiz, A., & Manana, M. (2012). A review: Energyrecovery in batch processes. Renewable and Sustainable Energy Reviews, 16(4), 2260–2277.
Hazard Investigation. (2002). Hazard Investigation: Improving reactive hazard management. U.S.Chemical Safety and Hazard Investigation Board. Washington, U.S.
Mujtaba, I. M., Aziz, N. & Hussain, M. A. (2006). Neural network based modelling and control inbatch reactor. Chemical Engineering Research and Design 84(A8), 635–644.
Nisenfeld, E. (1996). Batch control: Practical guides for measurement and control. NorthCarolina: American Technical Publishers.
Sujatha, S., & Pappa, N. (2012). Performance of gain scheduled generic model controller basedon BF-PSO for a batch reactor. Asian Journal of Scientific Research, 5(2), 31–44.
Tan, M. K., Tham, H. J. & Teo, K. T. K. (2011). PID-based temperature control for exothermicchemical reactor using hybrid QL-GA. In: 18th Regional Symposium on ChemicalEngineering, 27–28 Oct, Ho Chi Minh City, Vietnam.
Table 1 Performance of the proposed genetic algorithm and the conventional dual-mode con-troller in optimising the batch productivity
Geneticalgorithm
Dual-modecontroller
Product C (kmol) 6.258 5.427Undesired product D (kmol) 0.799 1.214
Genetic-Algorithm-Based Optimisation for Exothermic Batch Process 217
Q-Learning-Based Controllerfor Fed-Batch Yeast Fermentation
H. S. E. Chuo, M. K. Tan, H. J. Tham and K. T. K. Teo
Abstract Industrial fed-batch yeast fermentation process is a typical nonlineardynamic process that requires good control technique and monitoring to optimizethe yeast production. This chapter explores the applicability of Q-learning indetermining the feed flow rate in a fed-batch yeast fermentation process to achievemultiobjectives optimization. However, to develop such control system, thecomplex nature of the yeast metabolism that will affect the system stability has tobe considered. Q-learning is well known for its interactive properties with theprocess environment and is suitable for the learning of system dynamic. Therefore,the utilization and performance of Q-learning to seek for the optimal gain for thecontroller is studied in this chapter. Meanwhile, the performance of Q-learningunder the process disturbance is also tested.
Introduction
The fed-batch application in industrial bioprocess is mainly for the substratefeeding control. A good control on substrate inflow to the bioreactor system is ableto avoid serious overflow metabolism and increase the cell productivity
H. S. E. Chuo (&) � M. K. Tan � H. J. Tham � K. T. K. TeoSchool of Engineering and Information Technology, University Malaysia Sabah, JalanUMS, 88400 Kota Kinabalu, Sabah, Malaysiae-mail: [email protected]
M. K. Tane-mail: [email protected]
H. J. Thame-mail: [email protected]
K. T. K. Teoe-mail: [email protected]
R. Pogaku et al. (eds.), Developments in Sustainable Chemicaland Bioprocess Technology, DOI: 10.1007/978-1-4614-6208-8_28,� Springer Science+Business Media New York 2013
219
(Sonnleitner and Henes 2007). The overflow metabolite, i.e., alcohol in yeastfermentation, if highly concentrated, would be toxic and therefore suppress the cellgrowth. For a fed-batch fermentation process in which product concentrationprecision is highly required, a normal three-mode controller is bound by thesensors problem to maintain the control action (Smets et al. 2002).
In recent years, the research focus on artificial intelligence in fermentationoptimization has brought about breakthroughs in classic control methods. Forexample, differential evolution technique (Yüzgeç 2010; Kapadi and Gudi 2004)has been applied for the stochastic search of product optimization. This approachrequires the knowledge of effective optimal range in order to minimize the com-putation time and avoid trap in local optimization. Neural-network-based modeltraining for model predictive control has faced challenges in training and mappingthe large number of data until small-error model of satisfactory can be obtained(Ławrynczuk 2011).
The Q-learning algorithm, well known for its explorative and interactiveproperties with the process environment, is a worth-trying alternative to handle theoptimization of the dynamic fermentation. In this chapter, the applicability and thedevelopment of Q-learning to adapt the controller gain in a fed-batch yeast fer-mentation is of the major interest for the multiobjectives optimization. Therobustness of Q-learning-based controller under the influence of disturbance willalso be discussed in this chapter, in comparison with nominal exponential feeding(Chuo et al. 2011; Teo et al. 2010) and scheduled-gain proportional control underthe same process basis.
Dynamic Metabolism of Baker’s Yeast Fermentation
The dynamic in the yeast fermentation process is represented by the summarizedand re-arranged material balances using the parameters in Yüzgeç (2010):
dCs ¼F
VS0 � CSð Þ
� CX 1:08547QS � 0:08547QS;OX þ QM þ 1:228457QE;OX þ QM
� �ð1Þ
dCX ¼ �F
VCX þ CX 0:05QS þ 0:535QS;OX þ 0:7187QE;OX
� �ð2Þ
dCE ¼ �F
VCE þ CX 0:4859 QS � QS;OX
� �þ QE;OX
� �ð3Þ
dCO ¼ �F
VCO þ CX 0:3857QS;OX þ 0:8896QE;OX
� �þ kLa C�O � CO
� �ð4Þ
dV ¼ F ð5Þ
220 H. S. E. Chuo et al.
where dCS, dCX, dCE, dCO, and dV denote the change of concentration of sub-strate, yeast, ethanol, oxygen, and bioreactor volume, respectively. AssumeMonod growth kinetics, the substrate consumption rate, QS, can go through eitheroxidative, QS,OX or fermentative, QS,RED consumption. The rate of oxidation ofsubstrate in the cell, QS,OX, is determined by the smallest rates at which glucoseand oxygen are taken up by the cells. On the other hand, the rate of oxidation ofethanol, QE,OX, in cell is determined by the smallest of the rates at which ethanoland limited oxygen are taken up by the cells. Specific growth rate, l, and respi-ratory quotient, RQ, expressed in terms of QS, QS,OX, and QE,OX are shown asbelow.
QS ¼ 2:943CS
0:612þ CS1� e�
t2
� �ð6Þ
QO;lim ¼ 0:255CO
9:6� 10�5 þ CO
3:53:5þ Ce
ð7Þ
QE;UP ¼ 0:238Ce
0:1þ Ce
3:53:5þ CS
ð8Þ
QS;OX ¼ minCS
0:359QO;lim=0:3857
0@
1A ð9Þ
QE;OX ¼ minQe;up
1:1236QO;lim � 0:4334QS;OX
� ð10Þ
l ¼ 0:05QS þ 0:535QS;OX þ 0:7187Qe;OX ð11Þ
RQ ¼ 0:1124QS;OX þ 0:462QS þ 0:645Qe;OX
0:3857QS;OX þ 0:8896Qe;OX
ð12Þ
Methodology
In a Q-learning algorithm, a learning agent actively interacts with the dynamicenvironment. The agent decides the best action that causes transition of state to theenvironment and the latter responds in a new state to the agent. A desirable actionis taken based on the reward function which specifies the overall objective of thelearning. A reward function assigns rewards or penalties depending on theincorporated preference indices that tell the agent the best way to achieve the goal(Syafiie et al. 2008). The difficulty of designing the reward function by putting it inthe shoe of different dynamic situation lies in the determination of these preferenceindices and the effective range.
Q-Learning-Based Controller for Fed-Batch Yeast Fermentation 221
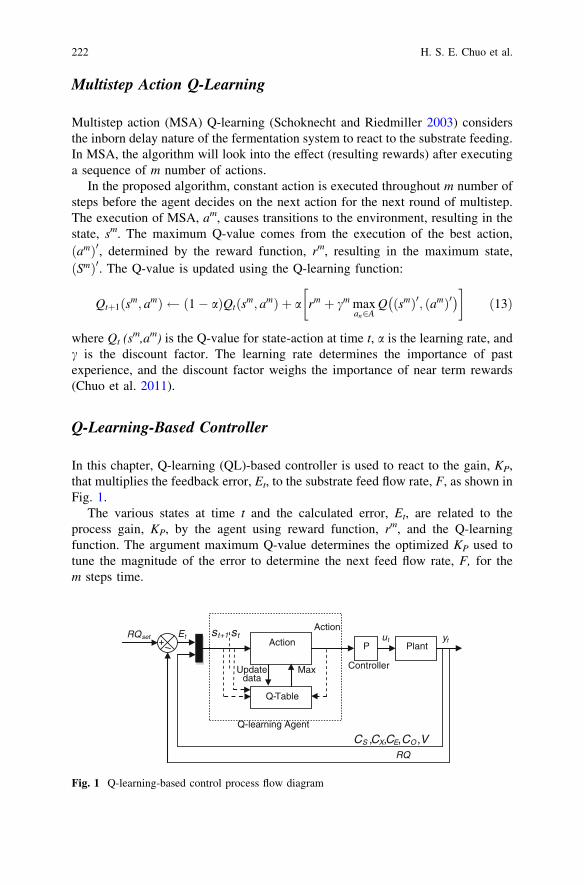
Multistep Action Q-Learning
Multistep action (MSA) Q-learning (Schoknecht and Riedmiller 2003) considersthe inborn delay nature of the fermentation system to react to the substrate feeding.In MSA, the algorithm will look into the effect (resulting rewards) after executinga sequence of m number of actions.
In the proposed algorithm, constant action is executed throughout m number ofsteps before the agent decides on the next action for the next round of multistep.The execution of MSA, am, causes transitions to the environment, resulting in thestate, sm. The maximum Q-value comes from the execution of the best action,ðamÞ0, determined by the reward function, rm, resulting in the maximum state,ðSmÞ0. The Q-value is updated using the Q-learning function:
Qtþ1 sm; amð Þ 1� að ÞQt sm; amð Þ þ a rm þ cm maxan2A
Q ðsmÞ0; ðamÞ0� � �
ð13Þ
where Qt (sm,am) is the Q-value for state-action at time t, a is the learning rate, andc is the discount factor. The learning rate determines the importance of pastexperience, and the discount factor weighs the importance of near term rewards(Chuo et al. 2011).
Q-Learning-Based Controller
In this chapter, Q-learning (QL)-based controller is used to react to the gain, KP,that multiplies the feedback error, Et, to the substrate feed flow rate, F, as shown inFig. 1.
The various states at time t and the calculated error, Et, are related to theprocess gain, KP, by the agent using reward function, rm, and the Q-learningfunction. The argument maximum Q-value determines the optimized KP used totune the magnitude of the error to determine the next feed flow rate, F, for them steps time.
PlantP Action
Q-Table
Controller
ytut
Actionst+1
MaxUpdatedata
st Et
Q-learning Agent
CS ,CX,CE,CO ,VRQ
RQset
Fig. 1 Q-learning-based control process flow diagram
222 H. S. E. Chuo et al.
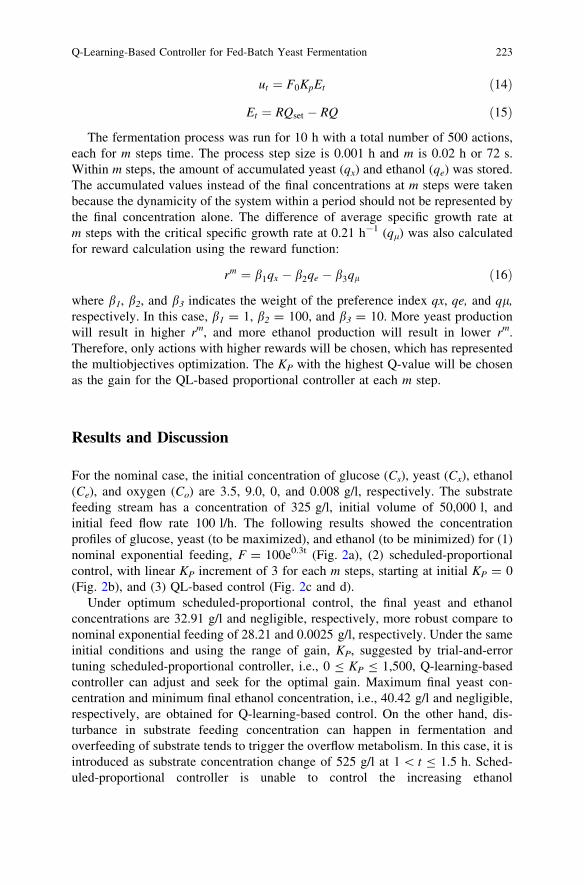
ut ¼ F0KpEt ð14Þ
Et ¼ RQset � RQ ð15Þ
The fermentation process was run for 10 h with a total number of 500 actions,each for m steps time. The process step size is 0.001 h and m is 0.02 h or 72 s.Within m steps, the amount of accumulated yeast (qx) and ethanol (qe) was stored.The accumulated values instead of the final concentrations at m steps were takenbecause the dynamicity of the system within a period should not be represented bythe final concentration alone. The difference of average specific growth rate atm steps with the critical specific growth rate at 0.21 h-1 (ql) was also calculatedfor reward calculation using the reward function:
rm ¼ b1qx � b2qe � b3ql ð16Þ
where b1, b2, and b3 indicates the weight of the preference index qx, qe, and ql,respectively. In this case, b1 = 1, b2 = 100, and b3 = 10. More yeast productionwill result in higher rm, and more ethanol production will result in lower rm.Therefore, only actions with higher rewards will be chosen, which has representedthe multiobjectives optimization. The KP with the highest Q-value will be chosenas the gain for the QL-based proportional controller at each m step.
Results and Discussion
For the nominal case, the initial concentration of glucose (Cs), yeast (Cx), ethanol(Ce), and oxygen (Co) are 3.5, 9.0, 0, and 0.008 g/l, respectively. The substratefeeding stream has a concentration of 325 g/l, initial volume of 50,000 l, andinitial feed flow rate 100 l/h. The following results showed the concentrationprofiles of glucose, yeast (to be maximized), and ethanol (to be minimized) for (1)nominal exponential feeding, F = 100e0.3t (Fig. 2a), (2) scheduled-proportionalcontrol, with linear KP increment of 3 for each m steps, starting at initial KP = 0(Fig. 2b), and (3) QL-based control (Fig. 2c and d).
Under optimum scheduled-proportional control, the final yeast and ethanolconcentrations are 32.91 g/l and negligible, respectively, more robust compare tonominal exponential feeding of 28.21 and 0.0025 g/l, respectively. Under the sameinitial conditions and using the range of gain, KP, suggested by trial-and-errortuning scheduled-proportional controller, i.e., 0 B KP B 1,500, Q-learning-basedcontroller can adjust and seek for the optimal gain. Maximum final yeast con-centration and minimum final ethanol concentration, i.e., 40.42 g/l and negligible,respectively, are obtained for Q-learning-based control. On the other hand, dis-turbance in substrate feeding concentration can happen in fermentation andoverfeeding of substrate tends to trigger the overflow metabolism. In this case, it isintroduced as substrate concentration change of 525 g/l at 1 \ t B 1.5 h. Sched-uled-proportional controller is unable to control the increasing ethanol
Q-Learning-Based Controller for Fed-Batch Yeast Fermentation 223
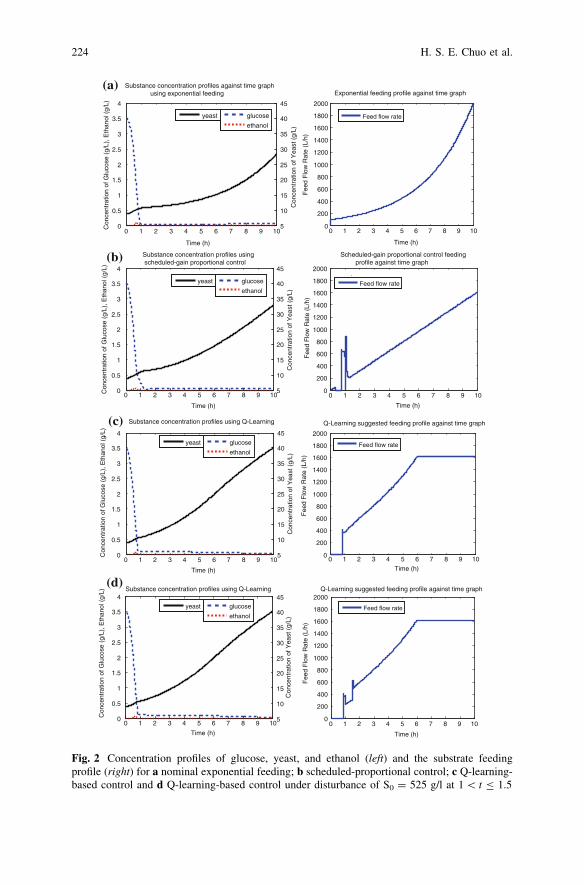
0
0.5
1
1.5
2
2.5
3
3.5
4
Time (h)
Con
cent
ratio
n of
Glu
cose
(g/
L), E
than
ol (
g/L)
glucose
ethanol
0 1 2 3 4 5 6 7 8 9 105
10
15
20
25
30
35
40
45
Con
cent
ratio
n of
Yea
st (
g/L)
Substance concentration profiles against time graph using exponential feeding
yeast
0 1 2 3 4 5 6 7 8 9 100
200
400
600
800
1000
1200
1400
1600
1800
2000
Time (h)
Fee
d F
low
Rat
e (L
/h)
Exponential feeding profile against time graph
Feed flow rate
0
0.5
1
1.5
2
2.5
3
3.5
4
Con
cent
ratio
n of
Glu
cose
(g/
L), E
than
ol (
g/L)
glucose
ethanol
0 1 2 3 4 5 6 7 8 9 105
10
15
20
25
30
35
40
45
Time (h)
Con
cent
ratio
n of
Yea
st (
g/L)
Substance concentration profiles using scheduled-gain proportional control
yeast
0 1 2 3 4 5 6 7 8 9 100
200
400
600
800
1000
1200
1400
1600
1800
2000
Time (h)
Fee
d F
low
Rat
e (L
/h)
Scheduled-gain proportional control feeding profile against time graph
Feed flow rate
0
0.5
1
1.5
2
2.5
3
3.5
4
Con
cent
ratio
n of
Glu
cose
(g/
L), E
than
ol (
g/L)
glucose
ethanol
0 1 2 3 4 5 6 7 8 9 105
10
15
20
25
30
35
40
45
Time (h)
Con
cent
ratio
n of
Yea
st (
g/L)
Substance concentration profiles using Q-Learning
yeast
0 1 2 3 4 5 6 7 8 9 100
200
400
600
800
1000
1200
1400
1600
1800
2000
Time (h)
Fee
d F
low
Rat
e (L
/h)
Q-Learning suggested feeding profile against time graph
Feed flow rate
(a)
(b)
(c)
(d)
Fig. 2 Concentration profiles of glucose, yeast, and ethanol (left) and the substrate feedingprofile (right) for a nominal exponential feeding; b scheduled-proportional control; c Q-learning-based control and d Q-learning-based control under disturbance of S0 = 525 g/l at 1 \ t B 1.5
224 H. S. E. Chuo et al.
concentration in the case of disturbance. The final concentrations of yeast andethanol are 33.13 and 19.02 g/l, respectively, for scheduled-proportional control-ler; 40.49 g/l, negligible, respectively, for Q-learning-based control, as shown inFig. 2d. Q-learning is able to adapt the process gain when necessary and achieveits goal of maximizing yeast and minimizing ethanol even under the disturbance,as shown in the feeding profile in Fig. 2d.
Conclusions
In this study, Q-learning has shown result of satisfactory in tuning the controllergain to achieve multiobjectives optimization, compare to nominal exponentialfeeding and scheduled-proportional controller. Meanwhile, Q-learning is able toseek for optimal process gain that can reduce the disturbance effect in the substratefeeding stream rather than increasing-gain scheduled-proportional controller.
Acknowledgments Gratitude is expressed to the Universiti Malaysia Sabah and the Ministry ofHigher Education, Malaysia, for their financial support on this research.
References
Chuo, H. S. E., Tan, M. K., Tham, H. J., & Teo, K. T. K. (2011). Optimization of fed-batchbaker’s yeast fermentation process using learning algorithm. In Proceedings of 18th RegionalSymposium on Chemical Engineering, 27–28 Oct, Ho Chi Minh City, Vietnam.
Kapadi, M. D., & Gudi, R. D. (2004). Optimal control of fed-batch fermentation involvingmultiple feeds using differential evolution. Process Biochemistry, 39, 1709–1721.
Ławrynczuk, M. (2011). Online set-point optimization cooperating with predictive control of ayeast fermentation process: A neural network approach. Process Engineering Applications ofArtificial Intelligence, 24, 968–982.
Schoknecht, R., & Riedmiller, M. (2003). Learning to control at multiple time scales. InProceedings of ICANN 2003, 26–29 June, Istanbul, Turkey.
Smets, I. Y., Bastin, G. P., & van Impe, J. F. (2002). Feedback stabilization of fed-batchbioreactors: non-monotonic growth kinetics. Biotechnology Progress, 18, 1116–1125.
Sonnleitner, B., & Henes, B. (2007). Controlled fed-batch by tracking the maximal culturecapacity. Journal of Biotechnology, 132, 118–126.
Syafiie, S., Tadeo, F., & Martinez, E. (2008). Model-free learning control of chemical processes.In C. Weber, M. Elshaw & N. M. Mayer (Eds.), Reinforcement learning: theory andapplications. Vienna: I-Tech Education and Publishing.
Teo, K. T. K., Tham, H. J., & Tan, M. K. (2010). Optimization of substrate feed flow rate for fed-batch yeast fermentation process. In Second International Conference on ComputationalIntelligence, Modelling and Simulation, 28–30 Sept, Bali, Indonesia.
Yüzgeç, U. (2010). Performance comparison of differential evolution techniques on optimizationof feeding profile for an industrial scale baker’s yeast fermentation process. ISA Transactions,49, 167–176.
Q-Learning-Based Controller for Fed-Batch Yeast Fermentation 225
In Vitro Antimicrobial Activityof Cynodon dactylon (L.) Pers. (bermuda)Against Selected Pathogens
S. Abdullah, J. Gobilik and K. P. Chong
Abstract Cynodon dactylon (L.) Pers. is a type of perennial grass that possessesgreat medicinal values. In this study, the antimicrobial activity of the plant crudeextract from seven different solvents (acetone, chloroform, diethyl ether, ethanol,ethyl acetate, methanol, and n-pentane) was investigated against some pathogens(Bacillus cereus, Bacillus subtilis, Escherichia coli, Klebsiella spp., Pseudomonasaeruginosa, Staphylococcus aureus, Streptococcus pyogenes, and Streptococcuspneumonia) using disc diffusion method and thin-layer chromatographic (TLC)bioassay for plant-SPE extracts against Aspergillus niger. Crude extraction showedthat ethanolic extraction produced highest yield (7.065 %) followed by methanolic(5.420 %) and chloroform (3.550 %) extraction. The lowest yield was obtainedfrom n-pentane extraction (0.500 %). The antimicrobial study revealed broadspectrum of antimicrobial activity from ethanol (7.0–10.0 ± 0.0–1.0 mm) andethyl acetate (7.0–12.0 ± 0.0–1.0 mm) extracts against all of the bacterialpathogens. Both methanol and acetone extracts showed activity to B. cereus(8.0 ± 0.0 mm) and B. subtilis (7.0 ± 0.0 mm), while chloroform extract showedactivity to B. subtilis (7.0 ± 0.0 mm) and S.pyogenes (8.3 ± 0.6 mm), respec-tively. Diethyl ether extraction showed activity only to S. pyogenes(7.3 ± 0.6 mm), while no activity was observed from n-pentane extraction. Greatantimicrobial activity were observed for both ethyl acetate and ethanol SPE-basedextracts (SBE) with size of inhibition ranging from 8.0 ± 0.0 mm to15.7 ± 0.6 mm for ethyl acetate SBE and 8.0 ± 0.0 mm to 13.0 ± 0.0 mm forethanol SBE. No significant antimicrobial activity was observed from thin-layerchromatographic bioassay against A. niger.
S. Abdullah � K. P. Chong (&)Sustainable Palm Oil Research Unit (SPOR), School of Science and Technology,Universiti Malaysia Sabah, 88400 Kota Kinabalu, Sabah, Malaysiae-mail: [email protected]
J. GobilikSchool of Sustainable Agriculture, Universiti Malaysia Sabah,Sandakan Campus, Mile 10, Sg. Batang 90000 Sandakan, Sabah, Malaysiae-mail: [email protected]
R. Pogaku et al. (eds.), Developments in Sustainable Chemicaland Bioprocess Technology, DOI: 10.1007/978-1-4614-6208-8_29,� Springer Science+Business Media New York 2013
227
Keywords Cynodon dactylon �Crude extract � SPE-based extract �TLC bioassay �Antimicrobial
Introduction
Medicinal plants play a very important role in pharmaceuticals industry indeveloping alternative drugs to overcome the pitfalls possessed by the syntheticdrugs (Yadav et al. 2010). The development of drug-resistant pathogens that aremostly involved in nosocomial infection has raised concern among medicinalpractitioners (Adalet et al. 2011). It was believed that the intense used of a numberof synthetic antimicrobial drugs which contributed to the development. Besides thetougher jobs to search for more effective drugs against the pathogens, it alsocreated the problem in controlling the growth of infectious diseases caused by thepathogens. Meanwhile, most of the synthetic drugs possess side effect to theconsumers (Chaudhari et al. 2011). Given the alarming incidence of antibioticresistance in pathogens raises concern among the medical practitioners, there is aconstant need for new and effective therapeutic agents. Hence, there is a need todevelop alternative antimicrobial drugs for the treatment of infectious diseasesfrom medicinal plants. Plants produce large number of organic compounds such asalkaloids, flavonoids, glycosides, tannins, terpenoids, and phenolics as secondarymetabolites which are used as defensive mechanism against respective pathogens(Francisco and Pinotti 2000; Zwenger and Basu 2008; Chong et al. 2011). Thesecompounds possess medicinal values and become an attractive subject forresearchers to develop new antibiotics (Joy et al. 2001). Previous studies show thatmany plant secondary metabolites act as bioactive compounds, chemotherapeutic,bactericidal, and bacteriostatic agents (Singh and Gupta 2008; Pongsak andParichat 2010; Syahriel et al. 2012). As a result, considerable amount of attentionof antimicrobial substances derived from higher plants is immerging in recentyears. However, the assessments on plant-derived antibiotics are still underinvestigation. Cynodon dactylon is a perennial, pan-tropical species of grass whichbelongs to the family Poaceae. It is found almost everywhere in tropical, sub-tropical, and even in semi-arid climates (Watson and Dallwitz 1992). It is not onlywidespread, but also widely used by human. Scientifically, it is tested to haveantidiabetic effect, diuretic activity, antioxidant, anticancer potentials, antiulceractivity, right heart failure protective activity, and allergic effect (Singh et al.2007; Albert-Baskar and Ignacimuthu 2010). Traditionally, C. dactylon is used asa rejuvenator and for wound healing (Mangathayaru et al. 2009). Besides used inremedy, the plant is also used as forage for animals and as turfgrass (Wu et al.2007). This study will report the antimicrobial activity of C. dactylon against somecommon pathogens such as Escherichia coli, Staphylococcus aureus, and Pseu-domonas aeruginosa, which are highly associated with nosocomial infection.
228 S. Abdullah et al.
Methodology
Plant Collection (Cynodon Dactylon)
Wild ecotype of C. dactylon was collected near the Universiti Malaysia Sabah’s(UMS) area in Kota Kinabalu, Malaysia, sowed, and maintained in a mini-nurseryin campus. Voucher (jgobilik 1090/2011) was kept at School of SustainableAgriculture, UMS, and a duplicate was submitted to BORH Herbarium, Institute ofTropical Biology and Conservation, UMS. Samples were collected in the eveningduring the daylight time. Prior to extraction, the plant samples were cleanedthoroughly with distilled water to remove soil and dirt.
Plant Extraction
The whole part of C. dactylon which was cleaned by distilled water was shade-dried for 24 h in a drying chamber at 40–50 �C and powdered using a mechanicalblender (Waring� Commercial Blender). Approximately, 100 g of plant powderwas later soaked into 200 mL of different solvents (acetone, chloroform, diethylether, ethanol, ethyl acetate, n-pentane, and methanol–Merck) and shaken on aplatform shaker (LabCompanionTM) at 150 rpm with temperature of 25 �C toobtain various plant extracts. The soaking process was repeated three times foreach extraction to obtain a complete extraction. The extracts obtained were thenevaporated and concentrated under reduced pressure (768–7 mmhg) using Rota-VaporTM (BUCHI) to obtain 1 ml of extract per 10 g of plant sample. Aliquotswere then kept in -20 �C temperature for further use.
Solid-Phase Extraction
StrataTM-X 33um Polymeric Sorbent reverse-phase (200 mg/6 mL) (Phenomenex)cartridges with 12-cartridge manifold system was used. Methanol absolute (1 ml)was used to activate the sorbent and further equilibrated with sterile deioniseddistilled water (1 ml). Samples were then loaded into the cartridges and washedwith 1 % methanol (1 ml) to remove any impurities from the samples and finallyeluted with 2 ml of methanol:acetonitrile (1:1; v/v). The aliquots were taken todryness using purified nitrogen gas. Dried aliquots were stored in -20 �C forfurther bioassays. In this study, only ethyl acetate and ethanol extracts were usedfor SPE-based extract bioassay.
In Vitro Antimicrobial Activity 229
Test Microorganisms
Pure cultures of eight different pathogens (Bacillus cereus, Bacillus subtilis,E. coli, Klebsiella spp., P. aeruginosa, S. aureus, Streptococcus pyogenes, andStreptococcus pneumonia) were obtained from Queen Elizabeth Hospital, KotaKinabalu, Malaysia. The microbial cultures were preserved in 30 % glycerol stocksolution at -85 �C temperature. Prior to antimicrobial activity study, the testmicroorganisms were subcultured on nutrient agar (NA), incubated at 37 �C for24 h before grown in nutrient broth (NB) and adjusted according to McFarlandstandard to achieve approximately 1 9 108 CFU/ml before introducing to the testmedia. For thin-layer chromatographic (TLC) bioassay, Aspergillus niger wasobtained from stock culture of UMS. The A. niger was cultured on potato dextroseagar (PDA) for approximately 7–10 days, before it is suspended in potato dextrosebroth (PDB) prior to TLC bioassay.
Antimicrobial Activity Study
Thin-layer chromatographic bioassay: Thin-layer chromatography (TLC) (SilicaGel 60 F254—Merck) bioassay coupled with A. niger culture was used as pre-liminary screening for antimicrobial activity. Approximately, 2 mg of C. Dactylonethanol and ethyl acetate extracts were applied on TLC plate which developed inethyl acetate:hexane (1:9) solvent system and then examined under UV light (265and 325 nm) to spot the presence of compounds of interest. The plates later weresprayed with 7–10 day-old A.niger which was suspended in PDB. TLC plates wereincubated in a moist chamber for 48 h at 25–27 �C to spot any antimicrobialproperty of the separated compounds from the plant.
Disc diffusion bioassay: Antimicrobial activity of the plant extracts was eval-uated using disc diffusion method according to Kirby-Bauer method as describedby Lalitha (2011). Sterile discs of Whatman� No.3 paper (6 mm diameter) wereprepared for the disc diffusion bioassay. All extract concentrations were stand-ardised to 100 mg/mL, and 60 ll (6 mg) of the extracts were loaded to each disc.For the negative control discs, 60 lL of the respective solvents was loaded toseparate discs. Chloramphenicol antibiotic discs (1 mg/ml, 30 lg/disc) were usedas positive control to compare the antimicrobial activity. Mueller-Hinton Agar(MHA) medium was prepared and sterilised in an autoclave at 121 �C for 15 minat 15 psi before transferring it to sterilised petri dish. Approximately, 0.1 mlculture of bacterial pathogens adjusted according to McFarland standard wasplaced on the MHA media and spread throughout the plate using spread platetechnique. The discs loaded with test extracts, their corresponding solvents, andthe antibiotic discs were placed on the media with the help of a sterile forcepscarefully with adequate spacing between each other. The plates were kept at roomtemperature for 30 min, which helps to diffuse the extract into the medium.
230 S. Abdullah et al.
The plates were then incubated at 37 �C for 24 h in an incubator to determine theantibacterial activity of the respective solvent extraction of C. dactylon. Afterincubation, zone of inhibition in diameter was measured and recorded.
Results
Extraction Yield
Different solvents have different resolving strength towards the plant constituentswhich resulted in different yield as shown in Table 1. From all of the extractions,ethanolic extraction produced the highest yield (7.065 %) followed by methanolicextraction (5.420 %) and chloroform extraction (3.550 %). Most of the extractionsusing non-polar solvents produced lower yield. The lowest yield was obtainedfrom n-pentane extraction with only 0.500 % of yield. The other extraction yieldresults are as shown in the Table 1.
Antimicrobial Activity
Thin-layer chromatographic bioassay: Separation of bioactive compounds fromC. dacylon for ethanol and ethyl acetate extracts was the best in ethyl ace-tate:hexane (1:9) solvent system which produces higher resolution and greaterseparation, as shown in Fig. 1. However, the antimicrobial properties from bothethanol and ethyl acetate extracts were not detected (Fig. 2). The extracts wereunable to inhibit the growth of A. niger after incubated for 48 h.
Disc diffusion bioassay (crude extract): Ethanol and ethyl acetate extracts of theplant exhibited broad spectrum of antimicrobial activity. From Table 2, bothethanol and ethyl acetate extracts showed significant effect to almost all the testedpathogens with the size of inhibition between 7.0 ± 0.0 mm and 10.0 ± 1.0 mmfor ethanol extract and 7.0 ± 0.0 and 12.0 ± 1.0 mm for ethyl acetate extract. Thegreatest activity observed was against S. pyogenes (10.0 ± 1.0 mm) for ethanolextract while B. cereus (12.0 ± 1.0 mm) for ethyl acetate extract. The leastactivity observed was against B.subtilis (7.0 ± 0.0 mm) for ethanol extract whileS. pneumonia (7.0 ± 0.0 mm) for ethyl acetate extract. Methanol extract showedvery weak activity against Streptococcus pneumoniae (7.0 ± 0.0 mm), while bothmethanol and acetone showed weak activity against B. cereus (8.0 ± 0.0 mm) and
Table 1 Extraction yield of C. dactylon with different solvents
Solvent Acetone Chloroform Diethyl ether Ethanol Ethyl acetate Methanol n-pentane
Yield (%) 2.9605 3.550 0.923 7.065 1.218 5.420 0.500
In Vitro Antimicrobial Activity 231
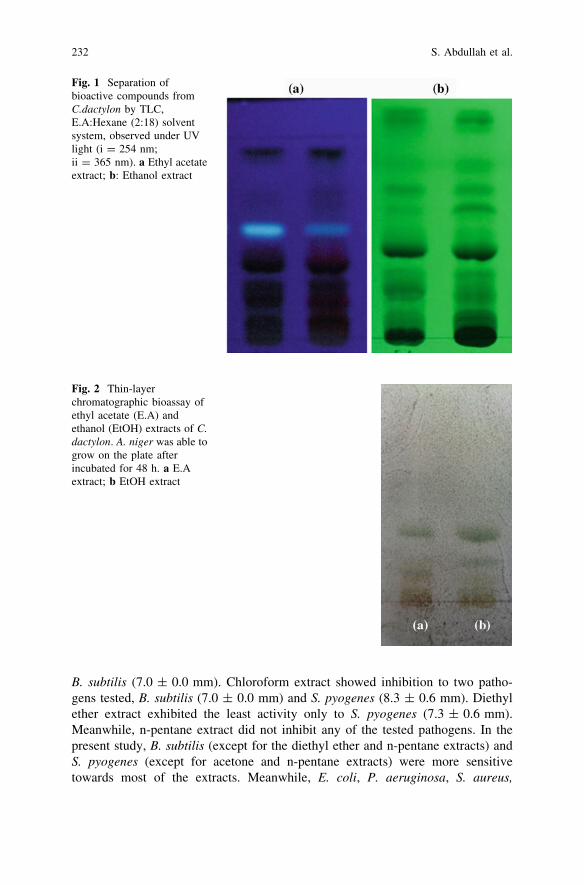
B. subtilis (7.0 ± 0.0 mm). Chloroform extract showed inhibition to two patho-gens tested, B. subtilis (7.0 ± 0.0 mm) and S. pyogenes (8.3 ± 0.6 mm). Diethylether extract exhibited the least activity only to S. pyogenes (7.3 ± 0.6 mm).Meanwhile, n-pentane extract did not inhibit any of the tested pathogens. In thepresent study, B. subtilis (except for the diethyl ether and n-pentane extracts) andS. pyogenes (except for acetone and n-pentane extracts) were more sensitivetowards most of the extracts. Meanwhile, E. coli, P. aeruginosa, S. aureus,
Fig. 1 Separation ofbioactive compounds fromC.dactylon by TLC,E.A:Hexane (2:18) solventsystem, observed under UVlight (i = 254 nm;ii = 365 nm). a Ethyl acetateextract; b: Ethanol extract
Fig. 2 Thin-layerchromatographic bioassay ofethyl acetate (E.A) andethanol (EtOH) extracts of C.dactylon. A. niger was able togrow on the plate afterincubated for 48 h. a E.Aextract; b EtOH extract
232 S. Abdullah et al.
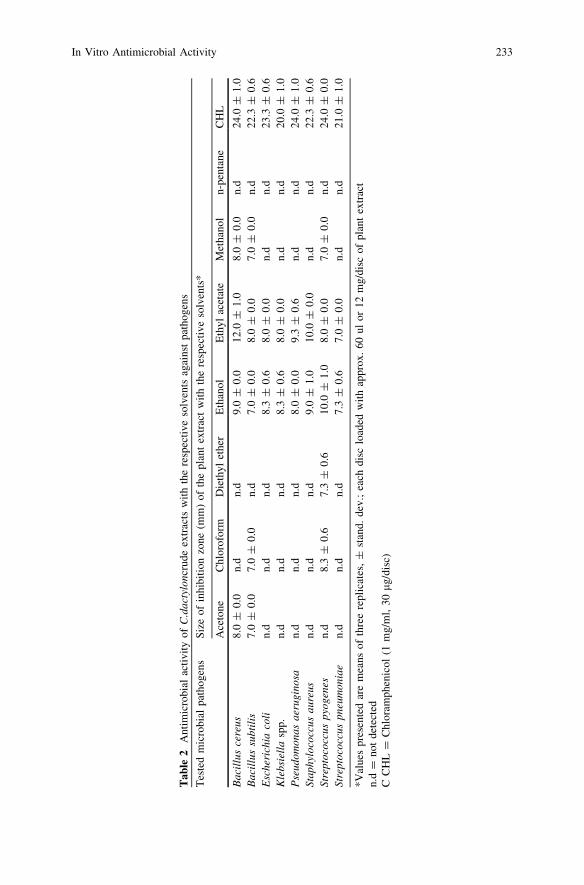
Tab
le2
Ant
imic
robi
alac
tivi
tyof
C.d
acty
lonc
rude
extr
acts
wit
hth
ere
spec
tive
solv
ents
agai
nst
path
ogen
s
Tes
ted
mic
robi
alpa
thog
ens
Siz
eof
inhi
biti
onzo
ne(m
m)
ofth
epl
ant
extr
act
wit
hth
ere
spec
tive
solv
ents
*
Ace
tone
Chl
orof
orm
Die
thyl
ethe
rE
than
olE
thyl
acet
ate
Met
hano
ln-
pent
ane
CH
L
Bac
illu
sce
reus
8.0
±0.
0n.
dn.
d9.
0±
0.0
12.0
±1.
08.
0±
0.0
n.d
24.0
±1.
0B
acil
lus
subt
ilis
7.0
±0.
07.
0±
0.0
n.d
7.0
±0.
08.
0±
0.0
7.0
±0.
0n.
d22
.3±
0.6
Esc
heri
chia
coli
n.d
n.d
n.d
8.3
±0.
68.
0±
0.0
n.d
n.d
23.3
±0.
6K
lebs
iell
asp
p.n.
dn.
dn.
d8.
3±
0.6
8.0
±0.
0n.
dn.
d20
.0±
1.0
Pse
udom
onas
aeru
gino
san.
dn.
dn.
d8.
0±
0.0
9.3
±0.
6n.
dn.
d24
.0±
1.0
Stap
hylo
cocc
usau
reus
n.d
n.d
n.d
9.0
±1.
010
.0±
0.0
n.d
n.d
22.3
±0.
6St
rept
ococ
cus
pyog
enes
n.d
8.3
±0.
67.
3±
0.6
10.0
±1.
08.
0±
0.0
7.0
±0.
0n.
d24
.0±
0.0
Stre
ptoc
occu
spn
eum
onia
en.
dn.
dn.
d7.
3±
0.6
7.0
±0.
0n.
dn.
d21
.0±
1.0
*Val
ues
pres
ente
dar
em
eans
ofth
ree
repl
icat
es,
±st
and.
dev.
;ea
chdi
sclo
aded
wit
hap
prox
.60
ulor
12m
g/di
scof
plan
tex
trac
tn.
d=
not
dete
cted
CC
HL
=C
hlor
amph
enic
ol(1
mg/
ml,
30lg
/dis
c)
In Vitro Antimicrobial Activity 233
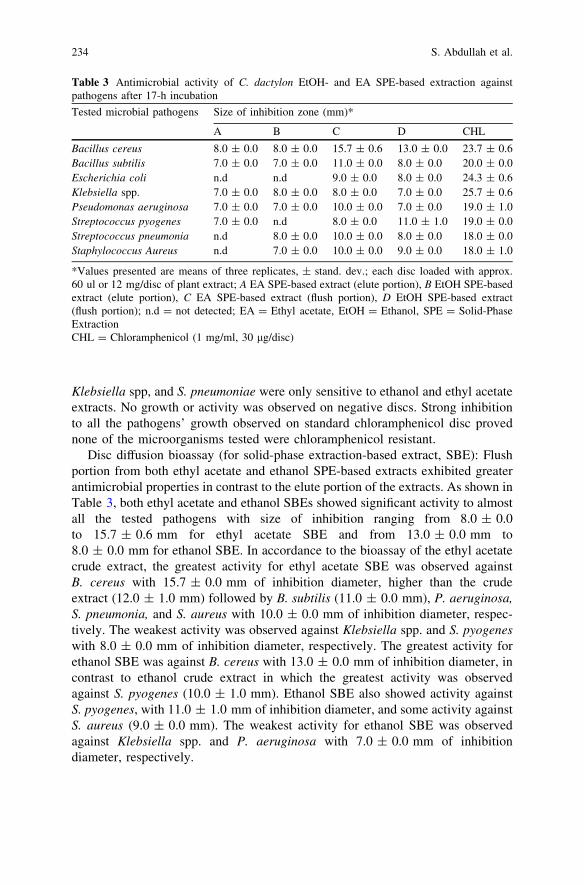
Klebsiella spp, and S. pneumoniae were only sensitive to ethanol and ethyl acetateextracts. No growth or activity was observed on negative discs. Strong inhibitionto all the pathogens’ growth observed on standard chloramphenicol disc provednone of the microorganisms tested were chloramphenicol resistant.
Disc diffusion bioassay (for solid-phase extraction-based extract, SBE): Flushportion from both ethyl acetate and ethanol SPE-based extracts exhibited greaterantimicrobial properties in contrast to the elute portion of the extracts. As shown inTable 3, both ethyl acetate and ethanol SBEs showed significant activity to almostall the tested pathogens with size of inhibition ranging from 8.0 ± 0.0to 15.7 ± 0.6 mm for ethyl acetate SBE and from 13.0 ± 0.0 mm to8.0 ± 0.0 mm for ethanol SBE. In accordance to the bioassay of the ethyl acetatecrude extract, the greatest activity for ethyl acetate SBE was observed againstB. cereus with 15.7 ± 0.0 mm of inhibition diameter, higher than the crudeextract (12.0 ± 1.0 mm) followed by B. subtilis (11.0 ± 0.0 mm), P. aeruginosa,S. pneumonia, and S. aureus with 10.0 ± 0.0 mm of inhibition diameter, respec-tively. The weakest activity was observed against Klebsiella spp. and S. pyogeneswith 8.0 ± 0.0 mm of inhibition diameter, respectively. The greatest activity forethanol SBE was against B. cereus with 13.0 ± 0.0 mm of inhibition diameter, incontrast to ethanol crude extract in which the greatest activity was observedagainst S. pyogenes (10.0 ± 1.0 mm). Ethanol SBE also showed activity againstS. pyogenes, with 11.0 ± 1.0 mm of inhibition diameter, and some activity againstS. aureus (9.0 ± 0.0 mm). The weakest activity for ethanol SBE was observedagainst Klebsiella spp. and P. aeruginosa with 7.0 ± 0.0 mm of inhibitiondiameter, respectively.
Table 3 Antimicrobial activity of C. dactylon EtOH- and EA SPE-based extraction againstpathogens after 17-h incubation
Tested microbial pathogens Size of inhibition zone (mm)*
A B C D CHL
Bacillus cereus 8.0 ± 0.0 8.0 ± 0.0 15.7 ± 0.6 13.0 ± 0.0 23.7 ± 0.6Bacillus subtilis 7.0 ± 0.0 7.0 ± 0.0 11.0 ± 0.0 8.0 ± 0.0 20.0 ± 0.0Escherichia coli n.d n.d 9.0 ± 0.0 8.0 ± 0.0 24.3 ± 0.6Klebsiella spp. 7.0 ± 0.0 8.0 ± 0.0 8.0 ± 0.0 7.0 ± 0.0 25.7 ± 0.6Pseudomonas aeruginosa 7.0 ± 0.0 7.0 ± 0.0 10.0 ± 0.0 7.0 ± 0.0 19.0 ± 1.0Streptococcus pyogenes 7.0 ± 0.0 n.d 8.0 ± 0.0 11.0 ± 1.0 19.0 ± 0.0Streptococcus pneumonia n.d 8.0 ± 0.0 10.0 ± 0.0 8.0 ± 0.0 18.0 ± 0.0Staphylococcus Aureus n.d 7.0 ± 0.0 10.0 ± 0.0 9.0 ± 0.0 18.0 ± 1.0
*Values presented are means of three replicates, ± stand. dev.; each disc loaded with approx.60 ul or 12 mg/disc of plant extract; A EA SPE-based extract (elute portion), B EtOH SPE-basedextract (elute portion), C EA SPE-based extract (flush portion), D EtOH SPE-based extract(flush portion); n.d = not detected; EA = Ethyl acetate, EtOH = Ethanol, SPE = Solid-PhaseExtractionCHL = Chloramphenicol (1 mg/ml, 30 lg/disc)
234 S. Abdullah et al.
Discussion
Higher plants consist of wide range of bioactive compounds, such as alkaloids,terpenoids, flavonoids, saponins, tannins, etc. which were utilised by the plantsthemselves as a defensive mechanism and to maintain the plant biological activ-ities (Zwenger and Basu 2008). From the extraction yield in Table 1, polar sol-vents were able to produce higher yield. This implies that most of the plantconstituents are polar compounds such as saponins and the phenolics. Previously,the plant has been studied to contain many bioactive constituents which contrib-uted to its antimicrobial activity (Syahriel et al. 2012). Biological actions areprimarily due to these components in a very complicated concert of synergistic orantagonistic activities. Mixtures of such chemicals show a broad spectrum ofbiological effects and pharmacological properties. To a large extent, the age of theplant, percentage humidity of the harvested material, situation and time of harvest,and the method of extraction are possible sources of variation for the chemicalcomposition, toxicity, and bioactivity of the extracts (Mandal et al. 2007). Fromthe previous study, the abundance of glycoside and its derivatives were identifiedfrom the plant (Syahriel et al. 2012). Cardiac glycosides from C. dactylon werepreviously studied to possess antiarrhythmic activity against ischaemia or reper-fusion-induced arrhythmias and cardioprotective properties in tested rat (Albert-Baskar and Ignacimuthu 2010; Najafi et al. 2008). A large number of constitutiveplant compounds have been reported to have antimicrobial activity. Due to thegreat extent of pharmacological effects exert by the plant glycoside, the antimi-crobial activity exhibited by the plant in the present study could be induced by thederivatives from this carbohydrate constituent. Carbohydrate and fatty acidderivatives from natural source have been proven to possess broad-spectrumantimicrobial activity (Nobmann et al. 2009). The antibacterial activity of ethanolextract was believed to be due to the presence of active principle in the extractssuch as saponins, phenolics, and terpenoids which might be responsible for thebroad spectrum of antibacterial activity compared to the other extracts (Kafaru1994; Singh and Gupta 2008). Higher resolving strength of ethanol in regards to itsyield percentage consequently enables it to resolve comparatively more bioactivecompounds which might explain the considerable antimicrobial activity comparedto the other solvents. Meanwhile, other solvents such as ethyl acetate were able toresolve other trace bioactive constituents which are not being able to be resolvedby ethanol in greater amount, explaining the significant antimicrobial activitywhich levelled to the ethanolic extraction. Generally, gram-negative bacteria weremore resistant to antibiotics than gram-positive bacteria. The resistance is due tothe differences in their cell wall composition. In gram-negative bacteria, the outermembrane acts as a great barrier to many environmental substances includingantibiotics. Presence of thick murine layer in the cell wall prevents the entry of theinhibitors (Madigan et al. 2009). The present study revealed that there is nosignificance difference between gram-negative and gram-positive bacteria in termsof susceptibility to the crude extracts although for the extracts other than ethanol
In Vitro Antimicrobial Activity 235
and ethyl acetate extracts, the activity was mostly observed against gram-positivebacteria. However, no significant difference in the antimicrobial activity betweengram-positive and gram-negative bacteria was observed for both ethanol and ethylacetate extracts. It may be due to the presence of broad-spectrum antibioticcompounds in C. dactylon which are able to penetrate or deteriorate the defensiveor growth mechanism of the microorganisms. The potential of antimicrobialcompound sources from the plant extract is worth to be further explored byidentifying the bioactive constituents responsible for the action.
Acknowledgments The authors acknowledge their profound gratitude to Ministry of HigherEducation (MOHE), Malaysia for funding the research (Grant code FRG0288) and the School ofScience and Technology, Universiti Malaysia Sabah for providing the facilities for research work.We are indebted to Dr. Katrina and the team, Department of Pathology, Queen Elizabeth Hospitalfor their support in supplying the biological specimens.
References
Adalet, A., Cenk, A., Azap, A., Onder, E., & Ismail, B. (2011). The impact of a nationwideantibiotic restriction program on antibiotic usage and resistance against nosocomial pathogensin Turkey. International Journal of Medical Science, 4, 339–344.
Albert-Baskar, A., & Ignacimuthu, A. (2010). Chemopreventive effect of Cynodon dactylon (L.)Pers. extract against DMH-induced colon carcinogenesis in experimental animals. Experi-mental and Toxicology Pathology, 62, 423–431.
Chaudhari, Y., Mody, H. R., & Acharya, V. B. (2011). Antibacterial activity of Cynodon dactylonon different bacterial pathogens isolated from clinical samples. International Journal ofPharmaceutical Studies and Research, 1, 16–20.
Chong, K. P., Rossall, S., & Atong, M. (2011). HPLC Fingerprints and in vitro antimicrobialactivity of syringic acid, caffeic acid and 4-hydroxybenzoic acid against Ganodermaboninense. Journal of Applied Sciences, 13, 2284–2291.
Francisco, I. A., & Pinotti, M. H. P. (2000). Cyanogenic glycosides in plants. Brazilian Archivesof Biology & Technology, 43, 487–492.
Joy, P. P., Thomas, J., Mathew, J., & Skaria, B. P. (2001). Medicinal Plants. In: T. K. Bose,J. Kabir, P. Das, & P. P. Joy (eds.) Tropical Horticulture, Vol. 2. Calcutta: Naya Prokash.
Kafaru, E. (1994). Immense help from Nature’s Workshop. Lagos: Elikat Health Services.Lalitha, M. K. (2011). Methods of antimicrobial susceptibility testing in Manual on antimicrobial
susceptibility testing. Vellore: Department of Microbiology, Christian Medical College.Madigan, M. T., Martinko, J. M., Dunlap, P. V., & Clark, D. P. (2009). The principles of bacterial cell
wall In Brock Biology of Microorganisms (12th ed.). San Francisco: Pearson Benjamin Cummings.Mandal, V., Mohan, Y., & Hemalatha, S. (2007). Microwave assisted extraction—an innovative
and promising extraction tool for medicinal plant research. PHCOG REV: Review article.Pharmacognosy Reviews, 1, 7–17.
Mangathayaru, K., Umadevi, M., & Reddy, C. U. (2009). Evaluation of the immunomodulatoryand DNA protective activities of the shoots of Cynodon dactylon. Journal of Ethnopharma-cology, 123, 181–184.
Najafi, M., Nazemiyeh, H., Ghavimi, H., Gharakhani, A., & Garjani, A. (2008). Effects of thehydroalcoholic extract of Cynodon dactylon (L.) pers. on ischemia/reperfusion-inducedarrhythmias. DARU: Journal of Pharmaceuticals Science, 16, 233–238.
Nobmann, P., Bourke, P., Dunne, J., & Henehan, G. (2009). In vitro antimicrobial activity andmechanism of action of novel carbohydrate fatty acid derivatives against Staphylococcusaureus and MRSA. Journal of Applied Microbiology, 108, 2152–2161.
236 S. Abdullah et al.
Pongsak, R., & Parichat, P. (2010). Contents and antibacterial activity of flavonoids extractedfrom leaves of Psidium guajava. Journal of Medicinal Plants Research, 5, 393–396.
Singh, R., & Gupta, A. (2008). Antimicrobial and antitumor activity of the fractionated extractsof Kuli musli (Curculg oorchioides). International Journal of Green Pharmacy, 1, 34–36.
Singh, S. K., Kesari, A. N., Gupta, R. K., Jaiswal, D., & Watal, G. (2007). Assessment ofantidiabetic potential of Cynodon dactylon extract in streptozotocin diabetic rats. Journal ofEthnopharmacology, 114, 174–179.
Syahriel, A., Gobilik, G., & Chong, K. P. (2012). Preliminary phytochemical study andantimicrobial activity from various extract of Cynodon dactylon (L.) Pers. (Bermuda) againstselected pathogens. International Journal of Pharmacy Pharmaceutical Science, 4, 227–230.
Watson, L., & Dallwitz, M. J. (1992). The grass genera of the world. Wallingford: CABInternational.
Wu, Y. Q., Taliaferro, C. M., Martin, D. L., Anderson, J. A., & Anderson, M. P. (2007). Geneticvariability and relationships for adaptive, morphological, and biomass traits in ChineseBermuda grass accessions. Crop Science, 47, 1985–1994.
Yadav, Y. C., Jain, A., & Deb, L. (2010). Neuropharmacological screening techniques forpharmaceuticals—a review. International Journal of Pharmacy Pharmaceutical Science, 2,10–11.
Zwenger, S., & Basu, C. (2008). Plant terpenoids: applications and future potentials.Biotechnology and Molecular Biology Review, 3, 1–7.
In Vitro Antimicrobial Activity 237

Part IIISeparation Processes
Extraction of Glucose from Kenaf CoreUsing Mild Acid Treatment
S. M. Nurhafizah, M. Maizirwan, H. Anuar, R. Othmanand M. N. Nur Aimi
Abstract Recently, many industries are aiming to reduce the usage of petroleum-based products and synthetic fibres due to increased environmental concernsregarding such materials. This has led to extensive research on natural fibres withthe goal of producing eco-friendly products that will replace the existing petro-leum-based ones. Natural fibres can be derived from many sources such as plants,animals, or minerals. However, plant fibres, such as kenaf, are more desirable tomost researchers. Kenaf, scientifically known as Hibiscus cannabinus. L, has acomplex structure because it consists of lignin, cellulose, and hemicelluloses. Dueto this reason, kenaf needs to undergo a treatment process in order to remove ligninand hemicellulose, reduce the crystallinity of its constituent cellulose, and increaseits porosity. In this study, acid treatment method was employed and the influenceof several process parameters, such as temperature and time, for achieving highyield of glucose conversion was studied. The highest substantial glucose yield was3.4 g/L produced at 200 �C after 60 min.
S. M. Nurhafizah (&) � H. Anuar � M. N. Nur AimiDepartment of Manufacturing and Materials Engineering, Kulliyyah of Engineering,International Islamic University Malaysia, 53100 Kuala Lumpur, Malaysiae-mail: [email protected]
M. MaizirwanDepartment of Biotechnology Engineering, Kulliyyah of Engineering, International IslamicUniversity Malaysia, 53100 Kuala Lumpur, Malaysia
R. OthmanHerbarium Laboratory, Kulliyyah of Architecture and Environmental Design,International Islamic University Malaysia, 53100 Kuala Lumpur, Malaysia
R. Pogaku et al. (eds.), Developments in Sustainable Chemicaland Bioprocess Technology, DOI: 10.1007/978-1-4614-6208-8_30,� Springer Science+Business Media New York 2013
241
Introduction
Lately, biopolymer industries are attempting to decrease their dependence onpetroleum-based fuels and products due to increased environmental consciousness.This phenomenon leads to the need for replacing synthetic fibres with environ-ment-friendly and sustainable materials. The tremendous increase in productionand use of plastics in every sector of modern life led to huge plastic wastes.Disposal problems, as well as strong regulations and criteria for cleaner and saferenvironment, have directed scientific research towards eco-composite materials.Each individual type of fibre, among the different types of eco-composites whichcontain natural fibres and natural polymers, has a key role. Currently, the mostviable way towards fabricating eco-friendly composites is through the incorpo-ration of natural fibres as reinforcement.
Naturally, plant fibres, such as from kenaf, have three major components whichconsist of cellulose, lignin, and hemicellulose (Maya and Sabu 2008). Thesematerials give plant fibres a complex structure that cannot be directly convertedinto end products like ethanol and lactic acid in biopolymer industry (Sun andCheng 2002; Ren et al. 2009). Due to this reason, plant fibres require treatment inorder to remove lignin and hemicelluloses, to reduce cellulose crystallinity as wellas to increase the porosity of the materials (McMillan 1994; Sun and Cheng 2002;Klinke et al. 2004). There are many types of treatment processes such as physical,chemical (acid and alkaline), and biological treatments; however, acid treatment iscommonly used by many researchers.
Sulphuric acid (H2SO4) or hydrochloric acid (HCl) is commonly utilized as thechemical for lignocellulosic material or plant fibre hydrolysis such as kenaf bio-mass. According to Xiang et al. (2003) and Hamelinck et al. (2005), there are twotypes of acid treatments: mild acid treatment and concentrated acid treatment. Indilute acid treatment, with concentration of 0.7–3.0 %, it requires high operatingtemperature around 160–250 �C. In contrast, concentrated acid treatment requireshigh amounts of acid about 34 %, and this can be considered as uneconomicalsince it leads to high operating costs as well as various environmental problemssuch as corrosion and pollution (Banerjee et al. 2010).
Kenaf is a biennial herbaceous plant which can grow up to 20 ft (Scott et al.2007). It contains long, soft bast fibres, contributing 30–40 % of the dry weight ofthe stem. The central core of the stem contains weakly disbursed pith cells sur-rounded by a thick cylinder of short woody fibres.
The main objectives of this study are to establish analytical method of glucosecontent extraction from kenaf biomass as well as to reduce the crystallinity ofcellulose in order to be used for producing various end products such as lactic acidand ethanol.
242 S. M. Nurhafizah et al.
Methodology
Design of Experiment
The experiment was developed and designed by central composite design (CCD)using Design Expert v6.0.8 Software to determine the optimum yield of glucosecontent from kenaf biomass.
Sample Preparation
Kenaf biomass was obtained from Kenaf Fibre Industry Sdn Bhd, Kelantan,Malaysia, and was stored under room-temperature conditions upon arrival. Later, itwas crushed and sieved using 100-lm nylon mesh.
Hydrolysis Treatment Process
In this process, 2 % (v/v) of H2SO4 was prepared in 100 ml working volume. Theoptimization process was conducted using a hot plate with 100 rpm of agitationspeed and 3 g of kenaf biomass in order to obtain optimum glucose content byvarying two parameters with three levels, which are mixing time and temperature.The experiments were carried out for 11 runs with two replications based on theCCD method. For the analysis of the optimization results, regression analysis wasdone by developing the regression equation.
Total Glucose Content Analysis
Total glucose content was analysed using high-pressure liquid chromatography(HPLC) (Agilent model 1200) that comprised of a quaternary pump with auto-sampler injector, microdegassers, column compartment equipped with thermostat,and a diode-array detector. The column used was a ZORBAX Eclipse XDB-C18
end-capped 5-lm, 4.6 9 150 mm reverse-phase column (Agilent Technologies,USA) and UV detector at 210 nm. The conditions of HPLC were mobile-phaseacetonitrile/phosphate (1:9 v/v), flow rate of 1.0 ml min-1 for 15 min, temperature20 �C, and injection volume 1 lL. Each injection was performed in duplicate.
Extraction of Glucose from Kenaf Core Using Mild Acid Treatment 243
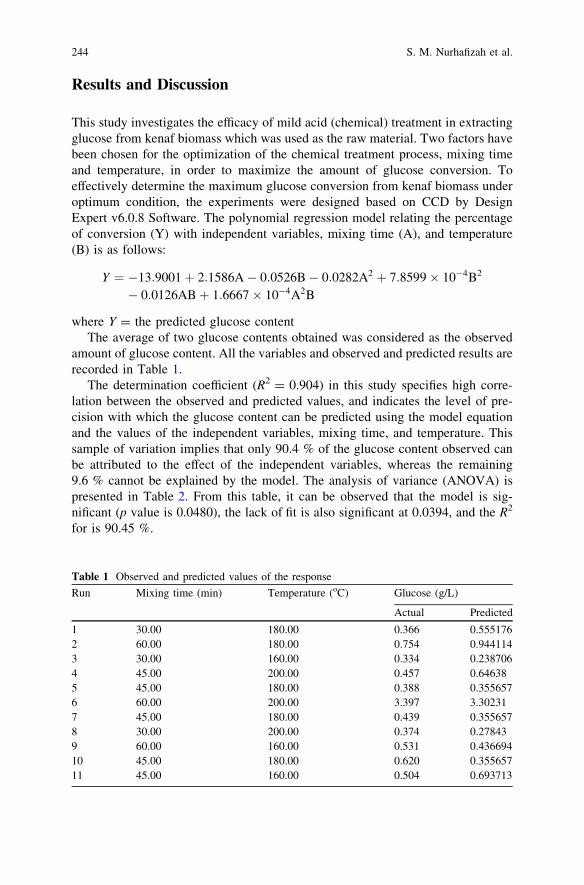
Results and Discussion
This study investigates the efficacy of mild acid (chemical) treatment in extractingglucose from kenaf biomass which was used as the raw material. Two factors havebeen chosen for the optimization of the chemical treatment process, mixing timeand temperature, in order to maximize the amount of glucose conversion. Toeffectively determine the maximum glucose conversion from kenaf biomass underoptimum condition, the experiments were designed based on CCD by DesignExpert v6.0.8 Software. The polynomial regression model relating the percentageof conversion (Y) with independent variables, mixing time (A), and temperature(B) is as follows:
Y ¼ �13:9001þ 2:1586A� 0:0526B� 0:0282A2 þ 7:8599� 10�4B2
� 0:0126ABþ 1:6667� 10�4A2B
where Y = the predicted glucose contentThe average of two glucose contents obtained was considered as the observed
amount of glucose content. All the variables and observed and predicted results arerecorded in Table 1.
The determination coefficient (R2 = 0.904) in this study specifies high corre-lation between the observed and predicted values, and indicates the level of pre-cision with which the glucose content can be predicted using the model equationand the values of the independent variables, mixing time, and temperature. Thissample of variation implies that only 90.4 % of the glucose content observed canbe attributed to the effect of the independent variables, whereas the remaining9.6 % cannot be explained by the model. The analysis of variance (ANOVA) ispresented in Table 2. From this table, it can be observed that the model is sig-nificant (p value is 0.0480), the lack of fit is also significant at 0.0394, and the R2
for is 90.45 %.
Table 1 Observed and predicted values of the response
Run Mixing time (min) Temperature (oC) Glucose (g/L)
Actual Predicted
1 30.00 180.00 0.366 0.5551762 60.00 180.00 0.754 0.9441143 30.00 160.00 0.334 0.2387064 45.00 200.00 0.457 0.646385 45.00 180.00 0.388 0.3556576 60.00 200.00 3.397 3.302317 45.00 180.00 0.439 0.3556578 30.00 200.00 0.374 0.278439 60.00 160.00 0.531 0.43669410 45.00 180.00 0.620 0.35565711 45.00 160.00 0.504 0.693713
244 S. M. Nurhafizah et al.
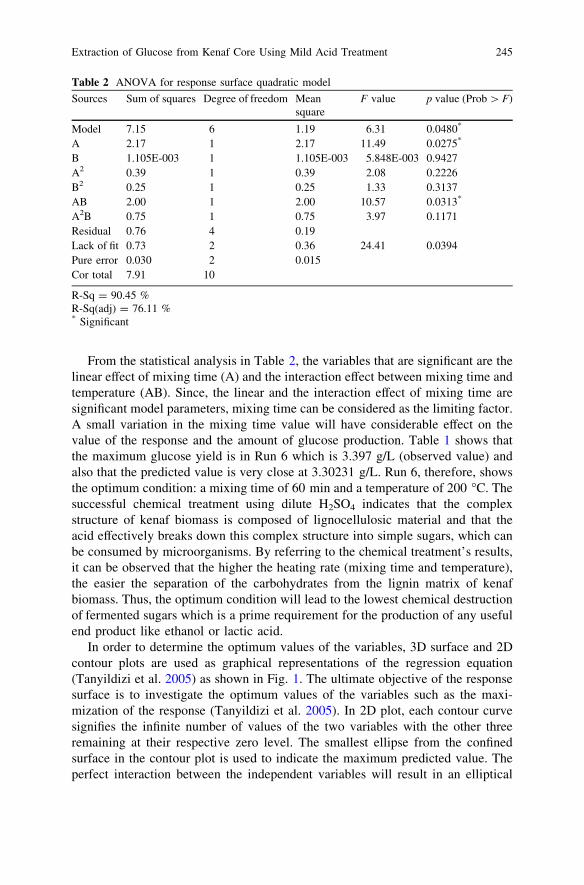
From the statistical analysis in Table 2, the variables that are significant are thelinear effect of mixing time (A) and the interaction effect between mixing time andtemperature (AB). Since, the linear and the interaction effect of mixing time aresignificant model parameters, mixing time can be considered as the limiting factor.A small variation in the mixing time value will have considerable effect on thevalue of the response and the amount of glucose production. Table 1 shows thatthe maximum glucose yield is in Run 6 which is 3.397 g/L (observed value) andalso that the predicted value is very close at 3.30231 g/L. Run 6, therefore, showsthe optimum condition: a mixing time of 60 min and a temperature of 200 �C. Thesuccessful chemical treatment using dilute H2SO4 indicates that the complexstructure of kenaf biomass is composed of lignocellulosic material and that theacid effectively breaks down this complex structure into simple sugars, which canbe consumed by microorganisms. By referring to the chemical treatment’s results,it can be observed that the higher the heating rate (mixing time and temperature),the easier the separation of the carbohydrates from the lignin matrix of kenafbiomass. Thus, the optimum condition will lead to the lowest chemical destructionof fermented sugars which is a prime requirement for the production of any usefulend product like ethanol or lactic acid.
In order to determine the optimum values of the variables, 3D surface and 2Dcontour plots are used as graphical representations of the regression equation(Tanyildizi et al. 2005) as shown in Fig. 1. The ultimate objective of the responsesurface is to investigate the optimum values of the variables such as the maxi-mization of the response (Tanyildizi et al. 2005). In 2D plot, each contour curvesignifies the infinite number of values of the two variables with the other threeremaining at their respective zero level. The smallest ellipse from the confinedsurface in the contour plot is used to indicate the maximum predicted value. Theperfect interaction between the independent variables will result in an elliptical
Table 2 ANOVA for response surface quadratic model
Sources Sum of squares Degree of freedom Meansquare
F value p value (Prob [ F)
Model 7.15 6 1.19 6.31 0.0480*
A 2.17 1 2.17 11.49 0.0275*
B 1.105E-003 1 1.105E-003 5.848E-003 0.9427A2 0.39 1 0.39 2.08 0.2226B2 0.25 1 0.25 1.33 0.3137AB 2.00 1 2.00 10.57 0.0313*
A2B 0.75 1 0.75 3.97 0.1171Residual 0.76 4 0.19Lack of fit 0.73 2 0.36 24.41 0.0394Pure error 0.030 2 0.015Cor total 7.91 10
R-Sq = 90.45 %R-Sq(adj) = 76.11 %* Significant
Extraction of Glucose from Kenaf Core Using Mild Acid Treatment 245
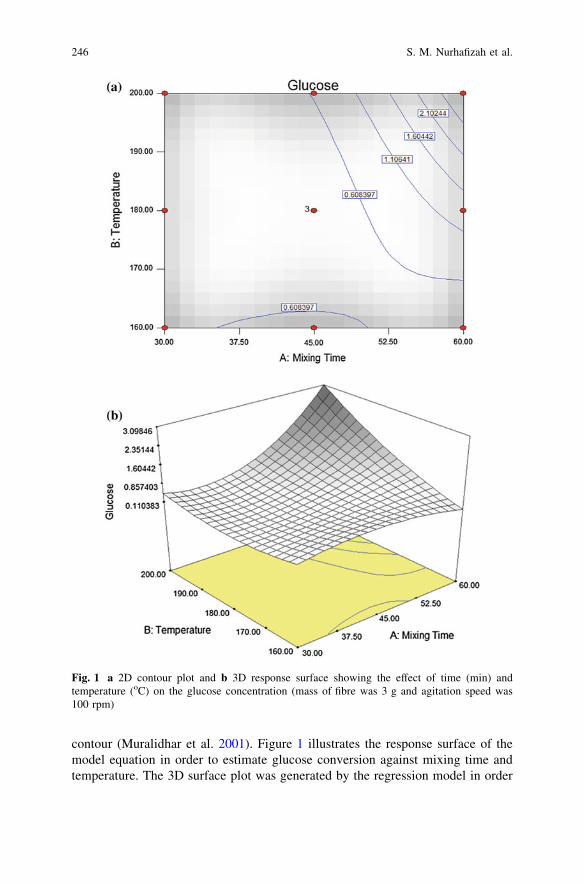
contour (Muralidhar et al. 2001). Figure 1 illustrates the response surface of themodel equation in order to estimate glucose conversion against mixing time andtemperature. The 3D surface plot was generated by the regression model in order
Fig. 1 a 2D contour plot and b 3D response surface showing the effect of time (min) andtemperature (oC) on the glucose concentration (mass of fibre was 3 g and agitation speed was100 rpm)
246 S. M. Nurhafizah et al.
to illustrate the effects of the independent variables and the combined effects ofeach independent variable upon the response variable (Duta et al. 2006). It can beobserved that the highest percentage conversion to glucose was achieved at thecombination of the longest time and highest temperature. According to Xiang et al.(2003), the hydrogen bonding in the hemicellulose and cellulose fraction are easilybroken down at high temperature compared to low temperature, which results inthe high yield of glucose.
Conclusions
This study established that the best chemical treatment conditions for optimumyield of glucose from kenaf biomass was 200 �C temperature and 60-min mixingtime with a corresponding total glucose content of 3.4 g/L.
Acknowledgments The authors would like to express their gratitude to COMSTECH-TWAS forfunding this research and International Islamic University Malaysia for support.
References
Banerjee, S., Mudliar, S., Giri, B., Satpute, D., Chakrabarti, T., & Pandey, R. A. (2010).Commercializing lignocellulosic bioethanol: Technology bottlenecks and possible remedies.Biofuels, Bioproducts and Biorefining, 4, 77–93.
Duta, F. P., de Franca, F. P., & Lopes, L. M. D. A. (2006). Optimization of culture conditions forexopolysaccharides production in Rhizobium sp. using the response surface method. Journalof Biotechnology, 9(4), 391–399.
Hamelinck, C. N., Hooijdonk, G., & Faaij, A. P. C. (2005). Ethanol from lignocellulosic biomass:Techno-economic performance in short-, middle- and longterm. Biomass and Bioenergy, 28,384–410.
Klinke, H. B., Thomsen, A. B., & Ahring, B. K. (2004). Inhibition of ethanol—producing yeastand bacteria by degradation products produced during pre-treatment of biomass. AppliedMicrobiology and Biotechnology, 66, 10–26.
Maya, J. J., & Sabu, T. (2008). Review biofibres and biocomposite. Carbohdyrate Polymer, 71,343–364.
McMillan, J. D. (1994). Pretreatment of lignocellulosic biomass. In M. E. Himmel, J. O. Baker, &R. P. Overend (Eds.), Enzymatic conversion of biomass for fuels production (pp. 292–324).Washington, DC: American Chemical Society.
Muralidhar, R. V., Chirumamila, R. R., Marchant, R., & Nigam, P. (2001). A response surfaceapproach for the comparison of lipase production by Candida cylindracea using two differentcarbon sources. Biochemical Engineering Journal, 9, 17–23.
Ren, H., Huang, H.Z. & Zheng, J. (2009). Detoxifying and recylcing of washing solution used inpretreatment of lignocellulose-containing materials. http://www.faqs.org/patents/app/20090056889. Accessed on 27 Feb 2010.
Scott, K., Flores, D. M., Kobayashi, G., & Sonomoto, K. (2007). Direct L-lactic acid fermentationwith sago starch by a novel amylolytic lactic acid bacterium, Enterococcus faecium. Enzymeand Microbial Technology, 41(1–2), 149–155.
Extraction of Glucose from Kenaf Core Using Mild Acid Treatment 247

Sun, Y., & Cheng, J. (2002). Hydrolysis of lignocellulosic materials for ethanol production: Areview. Bioresource Technology, 83, 1–11.
Tanyildizi, M. S., Ozer, D., & Elibol, M. (2005). Optimization of a-amylase production byBacillus sp. using response surface methodology. Process Biochemistry, 40(7), 2291–2296.
Xiang, Q., Lee, Y. Y., Pettersson, P. O., & Torget, R. W. (2003). Heterogeneous aspects of acidhydrolysis of cellulose. Applied Biochemistry and Biotechnology, 105–108, 505–514.
248 S. M. Nurhafizah et al.
Solid–Liquid Mass Transfer Coefficientsin an Ultrasound-Irradiated Extractionof Iota-Carrageenan
D. Krishnaiah, D. M. R. Prasad, R. Sarbatly, A. Bono,S. M. Anisuzzaman and K. Krishnaiah
Abstract A 20-kHz intensity ultrasound was used in the extraction of iota-car-rageenan from Eucheuma denticulatum seaweed by using water as solvent. In asimplified extraction procedure, the seaweed particle size of 0.7125E-03 m, 1.2E-03 m, and 1.7E-03 m diameter were studied at different ultrasonic amplitudelevels, ranging from 2.08E-06 to 6.4E-06 m and the temperatures from 30 to60 �C. The maximum iota-carrageenan yield obtained was 57.2 %. This studysuggested that ultrasound intensity employed reduced the extraction time requiredand improved the yield of iota-carrageenan by 6 %. The particle diameter variationduring the extraction was found to be a linear equation. The solid–liquid masstransfer coefficient was correlated for ultrasound extraction of iota-carrageenan interms of operating conditions employed in this investigation as
kL ¼ 0:0027A0:866D�0:533p Tð Þ0:133
Keywords Ultrasound intensity � Extraction � Particle swelling � Mass transfercoefficient
D. Krishnaiah (&) � R. Sarbatly � A. Bono � S. M. AnisuzzamanSchool of Engineering and Information Technology, Universiti Malaysia Sabah, Jalan UMS,88400 Kota Kinabalu, Sabah, MALAYSIAe-mail: [email protected]
K. KrishnaiahIndian Institute of Technology, Madras, India
D. M. R. PrasadFaculty of Chemical and Natural resources Engineering, Universiti Malaysia Pahang, 26300Gambang, Pahang, Malaysia
R. Pogaku et al. (eds.), Developments in Sustainable Chemicaland Bioprocess Technology, DOI: 10.1007/978-1-4614-6208-8_31,� Springer Science+Business Media New York 2013
249
Abbreviation
NomenclatureA Amplitude (m)A Interfacial area (m2)CA Concentration (kg/m3)CA
* Equilibrium concentration (kg/m3)Dp Diameter of the particle (m)F Frequency (Hz)I Sound wave intensity (W/m2)kL Solid–liquid mass transfer coefficient (m/s)p Constant Eq. (8)q Constant Eq. (8)T Temperature (oC)t Time (s)V Volume of the extractor (m3)
Greek lettersq Density of liquid (kg/m3)x Angular frequency (rad/s)a, b, w, u, d, c Constants
Introduction
Iota-carrageenan is a biopolymer resource from Eucheuma denticulatum red sea-weed. It is an important gel-forming polysaccharide useful in the food processingindustries. Despite the similarity of carrageenan structures, their gels have differentproperties. Based on these properties, these are widely used as thinking, gellingagent or texture enhancers, and stabilizer (Michel et al. 1997). Carrageenans areconventionally separated by solvent extraction. It is a key processing step for therecovery and purification of active ingredients of plant material. The traditionaltechniques of solvent extraction of plant materials are mostly based on theappropriate choice of solvents and the use of heat and/or agitation to increase thesolubility of components and the rate of mass transfer. Usually, these techniquesrequire long extraction time and have low efficiency. Moreover, many naturalproducts are thermally unstable and may degrade during thermal extraction (Wuet al. 2001). The objective of any extraction procedure is to achieve high extractionefficiency at a reduced processing time. In this respect, a procedure that could givethe highest yield of the effective constituents in a shorter processing time would bethe ultrasonic-assisted technology (Xia et al. 2006). Recently, numerous reports
250 D. Krishnaiah et al.

have documented on the application of intense ultrasound in the extraction oforganic compounds from various plant materials, such as polysaccharides fromSalvia officinalis L. (Hromádková et al. 1999), hemicellulose from buckwheat hulls(Hromádková and Ebringerová 2003), ginseng saponins from ginseng roots andcultured ginseng cells (Wu et al. 2001; Pal et al. 1997) oil from soybeans (Li et al.2004), pyrethrins from pyrethrum flowers and oil from woad seeds (Romdhane andGourdon 2002), and proteins and essential oils from various parts of plant andplant seeds. In all cases, acceleration of extraction kinetics and increase in yieldwere observed. Besides, Vinatoruet al. (1997) and Hromadkovaet al. (2002)documented its viability in achieving greater polysaccharide yield and reducedprocessing time. A comparative study conducted between the classical andultrasonically assisted extraction concludes that the ultrasound improves the yieldsubstantially in shorter time (Vinatoru et al. 1997). Ultrasonication is the appli-cation of high-intensity, high-frequency sound waves and their interaction withmaterials. The propagation and interaction of sound waves alter the physical andchemical properties of materials that are subjected to ultrasound (Mason 1992).The most probable mechanism for ultrasonic enhancement of extraction is theintensification of mass transfer and easy access of solvent to the cells. The collapseof cavitation bubbles near the cell wall is expected to produce cell disruptiontogether with good penetration of the solvent into the cells, through the ultrasonicjet (Vinatoru et al. 2001). The high-intensity ultrasonication can accelerate heatand mass transport in a variety of food processing operations and has been suc-cessfully used to improve drying, mixing, homogenization, and extraction (Fair-banks 2001). The mechanical effect of acoustic cavitation is able to facilitate therelease of intracellular compounds contained within the body of plants. This ismainly due to the disruption of cell walls which enhances mass transfer of cellcontents. Moreover, other possible benefits of ultrasound in extraction areimproved solvent penetration and capillary effects (Hromádková et al. 1999;Vinatoru et al. 2001).
In addition to the beneficial effect of ultrasound on the product yield, it allowschange in the experimental conditions, for instance, decrease of temperature andpressure. Applying ultrasound at lower temperatures, thermal damage to extractand loss of volatile components can be avoided. Then, the quality of solute as inthe case of i-carrageenan extraction from seaweed can be maintained. Thus, thefactors that govern the action of ultrasound are as follows: pressure, temperature,sonication time, and ultrasound frequency (Romdhaneand Gourdon 2002).
The aim of this work was to evaluate the yield of iota-carrageenan from theseaweeds by using ultrasonic extraction, develop a new mathematical model forestimating the solid–liquid mass transfer coefficient at particle swelling, and tocorrelate the experimental data for solid–liquid mass transfer coefficient withdifferent operating conditions such as amplitude, temperature, and particle sizeused in this investigation.
Solid–Liquid Mass Transfer Coefficients 251
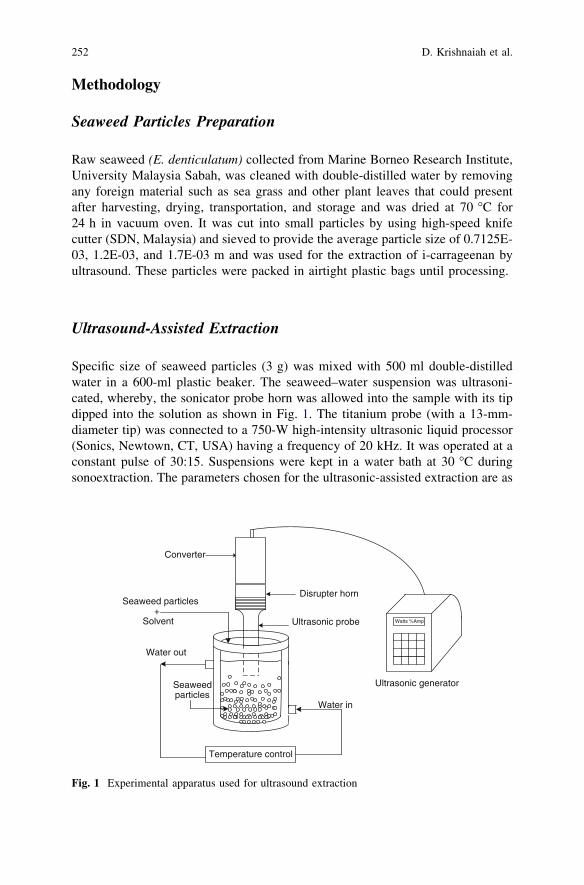
Methodology
Seaweed Particles Preparation
Raw seaweed (E. denticulatum) collected from Marine Borneo Research Institute,University Malaysia Sabah, was cleaned with double-distilled water by removingany foreign material such as sea grass and other plant leaves that could presentafter harvesting, drying, transportation, and storage and was dried at 70 �C for24 h in vacuum oven. It was cut into small particles by using high-speed knifecutter (SDN, Malaysia) and sieved to provide the average particle size of 0.7125E-03, 1.2E-03, and 1.7E-03 m and was used for the extraction of i-carrageenan byultrasound. These particles were packed in airtight plastic bags until processing.
Ultrasound-Assisted Extraction
Specific size of seaweed particles (3 g) was mixed with 500 ml double-distilledwater in a 600-ml plastic beaker. The seaweed–water suspension was ultrasoni-cated, whereby, the sonicator probe horn was allowed into the sample with its tipdipped into the solution as shown in Fig. 1. The titanium probe (with a 13-mm-diameter tip) was connected to a 750-W high-intensity ultrasonic liquid processor(Sonics, Newtown, CT, USA) having a frequency of 20 kHz. It was operated at aconstant pulse of 30:15. Suspensions were kept in a water bath at 30 �C duringsonoextraction. The parameters chosen for the ultrasonic-assisted extraction are as
Temperature control
Ultrasonic generator
%Amp
Seaweed particles+
Solvent Watts
Converter
Ultrasonic probe
Disrupter horn
Seaweed particles
Water out
Water in
Fig. 1 Experimental apparatus used for ultrasound extraction
252 D. Krishnaiah et al.
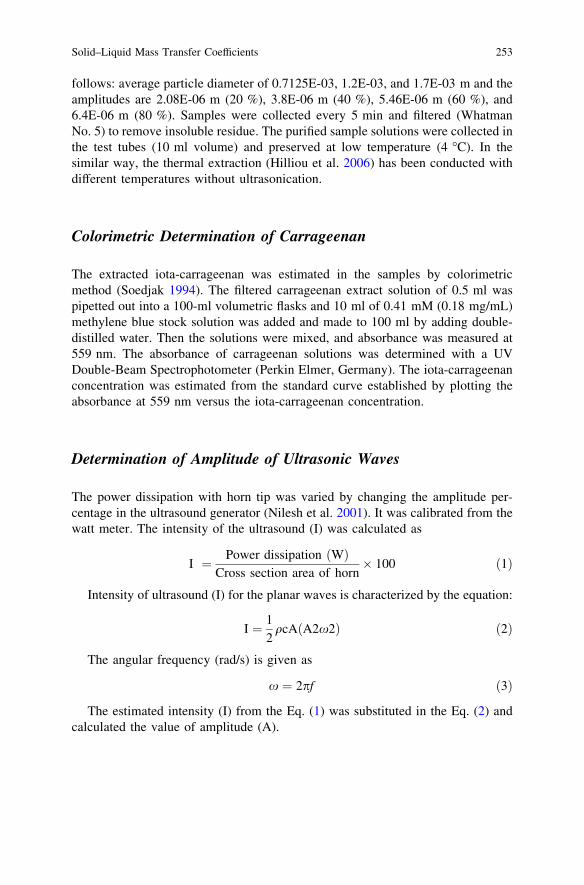
follows: average particle diameter of 0.7125E-03, 1.2E-03, and 1.7E-03 m and theamplitudes are 2.08E-06 m (20 %), 3.8E-06 m (40 %), 5.46E-06 m (60 %), and6.4E-06 m (80 %). Samples were collected every 5 min and filtered (WhatmanNo. 5) to remove insoluble residue. The purified sample solutions were collected inthe test tubes (10 ml volume) and preserved at low temperature (4 �C). In thesimilar way, the thermal extraction (Hilliou et al. 2006) has been conducted withdifferent temperatures without ultrasonication.
Colorimetric Determination of Carrageenan
The extracted iota-carrageenan was estimated in the samples by colorimetricmethod (Soedjak 1994). The filtered carrageenan extract solution of 0.5 ml waspipetted out into a 100-ml volumetric flasks and 10 ml of 0.41 mM (0.18 mg/mL)methylene blue stock solution was added and made to 100 ml by adding double-distilled water. Then the solutions were mixed, and absorbance was measured at559 nm. The absorbance of carrageenan solutions was determined with a UVDouble-Beam Spectrophotometer (Perkin Elmer, Germany). The iota-carrageenanconcentration was estimated from the standard curve established by plotting theabsorbance at 559 nm versus the iota-carrageenan concentration.
Determination of Amplitude of Ultrasonic Waves
The power dissipation with horn tip was varied by changing the amplitude per-centage in the ultrasound generator (Nilesh et al. 2001). It was calibrated from thewatt meter. The intensity of the ultrasound (I) was calculated as
I ¼ Power dissipation ðWÞCross section area of horn
� 100 ð1Þ
Intensity of ultrasound (I) for the planar waves is characterized by the equation:
I ¼ 12qcA A2x2ð Þ ð2Þ
The angular frequency (rad/s) is given as
x ¼ 2pf ð3Þ
The estimated intensity (I) from the Eq. (1) was substituted in the Eq. (2) andcalculated the value of amplitude (A).
Solid–Liquid Mass Transfer Coefficients 253
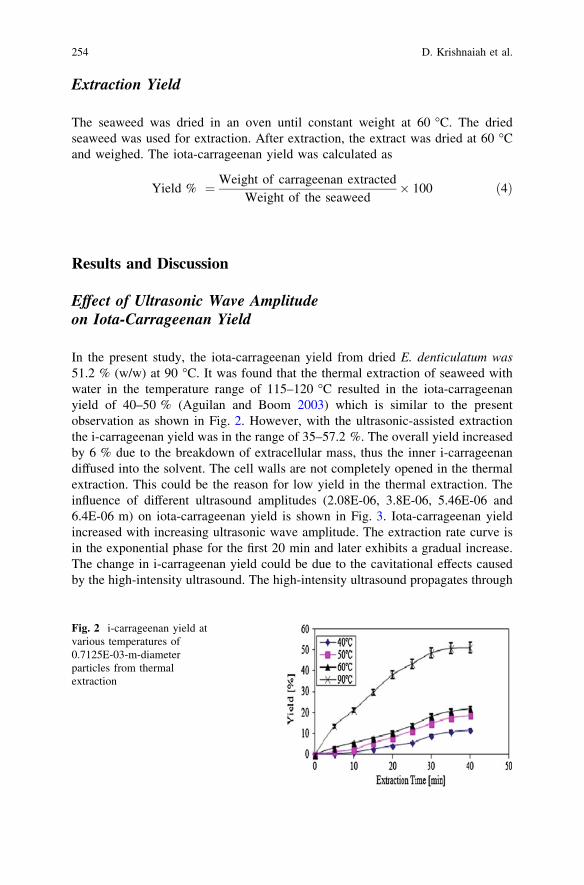
Extraction Yield
The seaweed was dried in an oven until constant weight at 60 �C. The driedseaweed was used for extraction. After extraction, the extract was dried at 60 �Cand weighed. The iota-carrageenan yield was calculated as
Yield % ¼Weight of carrageenan extractedWeight of the seaweed
� 100 ð4Þ
Results and Discussion
Effect of Ultrasonic Wave Amplitudeon Iota-Carrageenan Yield
In the present study, the iota-carrageenan yield from dried E. denticulatum was51.2 % (w/w) at 90 �C. It was found that the thermal extraction of seaweed withwater in the temperature range of 115–120 �C resulted in the iota-carrageenanyield of 40–50 % (Aguilan and Boom 2003) which is similar to the presentobservation as shown in Fig. 2. However, with the ultrasonic-assisted extractionthe i-carrageenan yield was in the range of 35–57.2 %. The overall yield increasedby 6 % due to the breakdown of extracellular mass, thus the inner i-carrageenandiffused into the solvent. The cell walls are not completely opened in the thermalextraction. This could be the reason for low yield in the thermal extraction. Theinfluence of different ultrasound amplitudes (2.08E-06, 3.8E-06, 5.46E-06 and6.4E-06 m) on iota-carrageenan yield is shown in Fig. 3. Iota-carrageenan yieldincreased with increasing ultrasonic wave amplitude. The extraction rate curve isin the exponential phase for the first 20 min and later exhibits a gradual increase.The change in i-carrageenan yield could be due to the cavitational effects causedby the high-intensity ultrasound. The high-intensity ultrasound propagates through
Fig. 2 i-carrageenan yield atvarious temperatures of0.7125E-03-m-diameterparticles from thermalextraction
254 D. Krishnaiah et al.
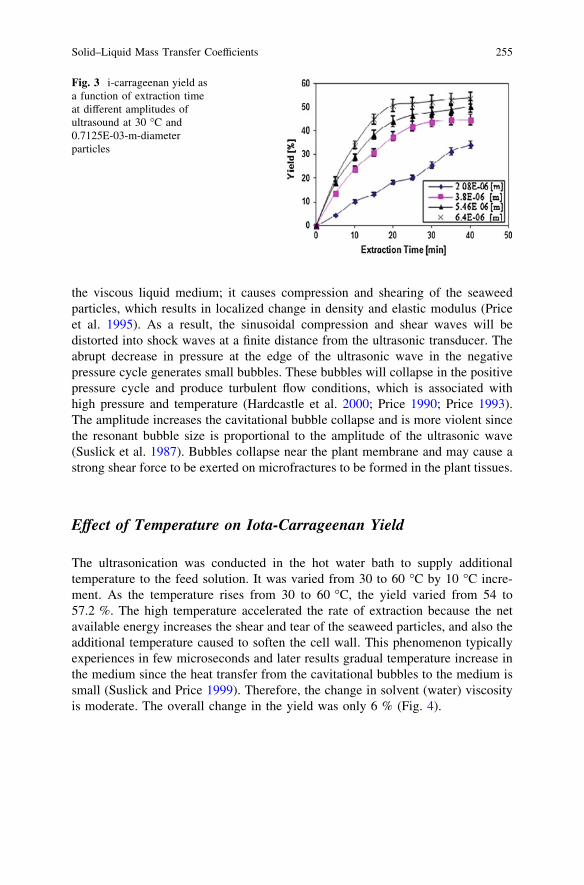
the viscous liquid medium; it causes compression and shearing of the seaweedparticles, which results in localized change in density and elastic modulus (Priceet al. 1995). As a result, the sinusoidal compression and shear waves will bedistorted into shock waves at a finite distance from the ultrasonic transducer. Theabrupt decrease in pressure at the edge of the ultrasonic wave in the negativepressure cycle generates small bubbles. These bubbles will collapse in the positivepressure cycle and produce turbulent flow conditions, which is associated withhigh pressure and temperature (Hardcastle et al. 2000; Price 1990; Price 1993).The amplitude increases the cavitational bubble collapse and is more violent sincethe resonant bubble size is proportional to the amplitude of the ultrasonic wave(Suslick et al. 1987). Bubbles collapse near the plant membrane and may cause astrong shear force to be exerted on microfractures to be formed in the plant tissues.
Effect of Temperature on Iota-Carrageenan Yield
The ultrasonication was conducted in the hot water bath to supply additionaltemperature to the feed solution. It was varied from 30 to 60 �C by 10 �C incre-ment. As the temperature rises from 30 to 60 �C, the yield varied from 54 to57.2 %. The high temperature accelerated the rate of extraction because the netavailable energy increases the shear and tear of the seaweed particles, and also theadditional temperature caused to soften the cell wall. This phenomenon typicallyexperiences in few microseconds and later results gradual temperature increase inthe medium since the heat transfer from the cavitational bubbles to the medium issmall (Suslick and Price 1999). Therefore, the change in solvent (water) viscosityis moderate. The overall change in the yield was only 6 % (Fig. 4).
Fig. 3 i-carrageenan yield asa function of extraction timeat different amplitudes ofultrasound at 30 �C and0.7125E-03-m-diameterparticles
Solid–Liquid Mass Transfer Coefficients 255
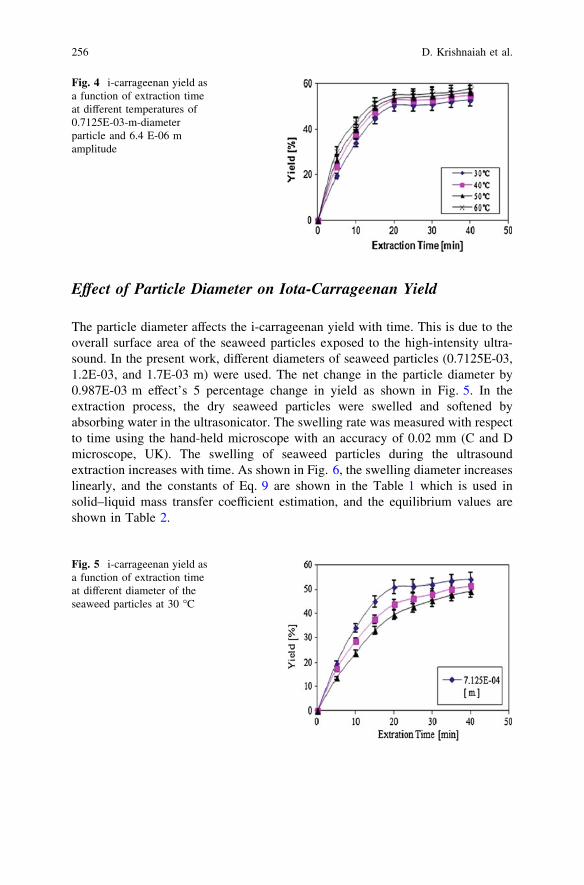
Effect of Particle Diameter on Iota-Carrageenan Yield
The particle diameter affects the i-carrageenan yield with time. This is due to theoverall surface area of the seaweed particles exposed to the high-intensity ultra-sound. In the present work, different diameters of seaweed particles (0.7125E-03,1.2E-03, and 1.7E-03 m) were used. The net change in the particle diameter by0.987E-03 m effect’s 5 percentage change in yield as shown in Fig. 5. In theextraction process, the dry seaweed particles were swelled and softened byabsorbing water in the ultrasonicator. The swelling rate was measured with respectto time using the hand-held microscope with an accuracy of 0.02 mm (C and Dmicroscope, UK). The swelling of seaweed particles during the ultrasoundextraction increases with time. As shown in Fig. 6, the swelling diameter increaseslinearly, and the constants of Eq. 9 are shown in the Table 1 which is used insolid–liquid mass transfer coefficient estimation, and the equilibrium values areshown in Table 2.
Fig. 4 i-carrageenan yield asa function of extraction timeat different temperatures of0.7125E-03-m-diameterparticle and 6.4 E-06 mamplitude
Fig. 5 i-carrageenan yield asa function of extraction timeat different diameter of theseaweed particles at 30 �C
256 D. Krishnaiah et al.
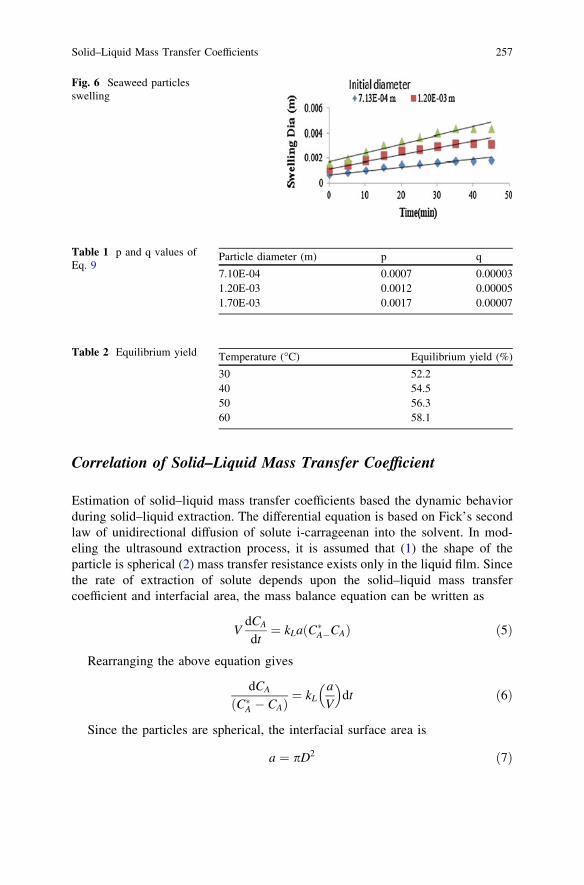
Correlation of Solid–Liquid Mass Transfer Coefficient
Estimation of solid–liquid mass transfer coefficients based the dynamic behaviorduring solid–liquid extraction. The differential equation is based on Fick’s secondlaw of unidirectional diffusion of solute i-carrageenan into the solvent. In mod-eling the ultrasound extraction process, it is assumed that (1) the shape of theparticle is spherical (2) mass transfer resistance exists only in the liquid film. Sincethe rate of extraction of solute depends upon the solid–liquid mass transfercoefficient and interfacial area, the mass balance equation can be written as
VdCA
dt¼ kLaðC�A�CAÞ ð5Þ
Rearranging the above equation gives
dCA
ðC�A � CAÞ¼ kL
a
V
� �dt ð6Þ
Since the particles are spherical, the interfacial surface area is
a ¼ pD2 ð7Þ
Fig. 6 Seaweed particlesswelling
Table 1 p and q values ofEq. 9
Particle diameter (m) p q
7.10E-04 0.0007 0.000031.20E-03 0.0012 0.000051.70E-03 0.0017 0.00007
Table 2 Equilibrium yield Temperature (�C) Equilibrium yield (%)
30 52.240 54.550 56.360 58.1
Solid–Liquid Mass Transfer Coefficients 257
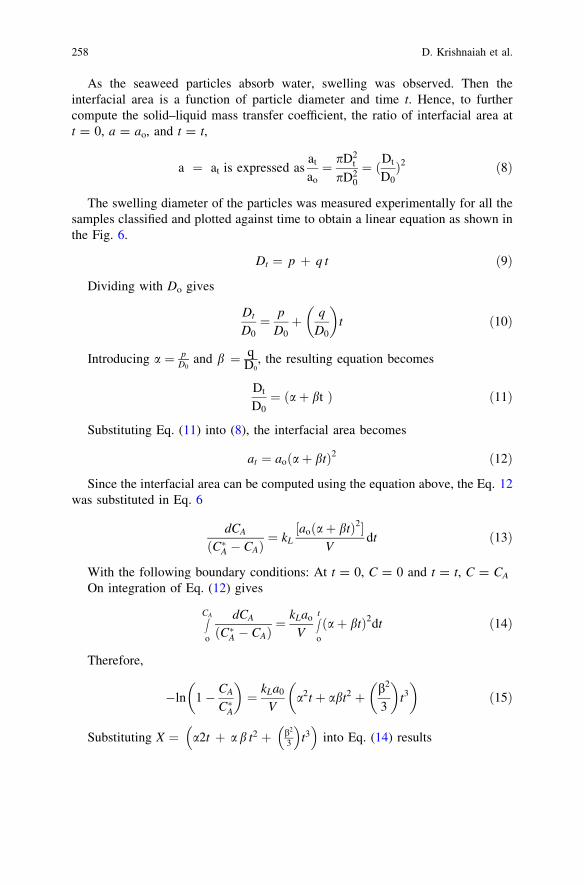
As the seaweed particles absorb water, swelling was observed. Then theinterfacial area is a function of particle diameter and time t. Hence, to furthercompute the solid–liquid mass transfer coefficient, the ratio of interfacial area att = 0, a = ao, and t = t,
a ¼ at is expressed asat
ao
¼ pD2t
pD20
¼ ðDt
D0Þ2 ð8Þ
The swelling diameter of the particles was measured experimentally for all thesamples classified and plotted against time to obtain a linear equation as shown inthe Fig. 6.
Dt ¼ p þ q t ð9Þ
Dividing with Do gives
Dt
D0¼ p
D0þ q
D0
� �t ð10Þ
Introducing a ¼ pD0
and b ¼ qD0
, the resulting equation becomes
Dt
D0¼ ðaþ bt Þ ð11Þ
Substituting Eq. (11) into (8), the interfacial area becomes
at ¼ aoðaþ btÞ2 ð12Þ
Since the interfacial area can be computed using the equation above, the Eq. 12was substituted in Eq. 6
dCA
ðC�A � CAÞ¼ kL
½aoðaþ btÞ2�V
dt ð13Þ
With the following boundary conditions: At t = 0, C = 0 and t = t, C = CA
On integration of Eq. (12) gives
ZCA
o
dCA
ðC�A � CAÞ¼ kLao
V
Zt
o
ðaþ btÞ2dt ð14Þ
Therefore,
�ln 1� CA
C�A
� �¼ kLa0
Va2t þ abt2 þ b2
3
� �t3
� �ð15Þ
Substituting X ¼ a2t þ a b t2 þ b2
3
� �t3
� �into Eq. (14) results
258 D. Krishnaiah et al.
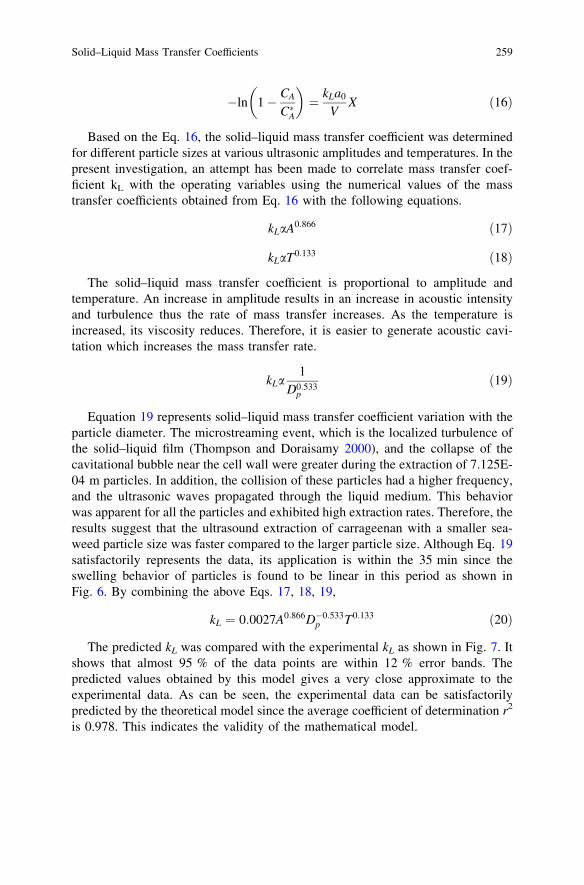
�ln 1� CA
C�A
� �¼ kLa0
VX ð16Þ
Based on the Eq. 16, the solid–liquid mass transfer coefficient was determinedfor different particle sizes at various ultrasonic amplitudes and temperatures. In thepresent investigation, an attempt has been made to correlate mass transfer coef-ficient kL with the operating variables using the numerical values of the masstransfer coefficients obtained from Eq. 16 with the following equations.
kLaA0:866 ð17Þ
kLaT0:133 ð18Þ
The solid–liquid mass transfer coefficient is proportional to amplitude andtemperature. An increase in amplitude results in an increase in acoustic intensityand turbulence thus the rate of mass transfer increases. As the temperature isincreased, its viscosity reduces. Therefore, it is easier to generate acoustic cavi-tation which increases the mass transfer rate.
kLa1
D0:533p
ð19Þ
Equation 19 represents solid–liquid mass transfer coefficient variation with theparticle diameter. The microstreaming event, which is the localized turbulence ofthe solid–liquid film (Thompson and Doraisamy 2000), and the collapse of thecavitational bubble near the cell wall were greater during the extraction of 7.125E-04 m particles. In addition, the collision of these particles had a higher frequency,and the ultrasonic waves propagated through the liquid medium. This behaviorwas apparent for all the particles and exhibited high extraction rates. Therefore, theresults suggest that the ultrasound extraction of carrageenan with a smaller sea-weed particle size was faster compared to the larger particle size. Although Eq. 19satisfactorily represents the data, its application is within the 35 min since theswelling behavior of particles is found to be linear in this period as shown inFig. 6. By combining the above Eqs. 17, 18, 19,
kL ¼ 0:0027A0:866D�0:533p T0:133 ð20Þ
The predicted kL was compared with the experimental kL as shown in Fig. 7. Itshows that almost 95 % of the data points are within 12 % error bands. Thepredicted values obtained by this model gives a very close approximate to theexperimental data. As can be seen, the experimental data can be satisfactorilypredicted by the theoretical model since the average coefficient of determination r2
is 0.978. This indicates the validity of the mathematical model.
Solid–Liquid Mass Transfer Coefficients 259
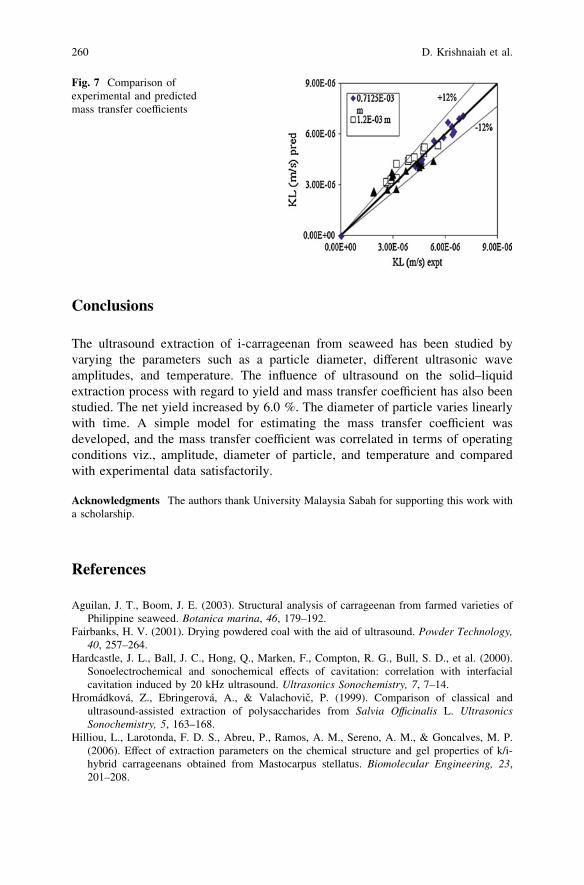
Conclusions
The ultrasound extraction of i-carrageenan from seaweed has been studied byvarying the parameters such as a particle diameter, different ultrasonic waveamplitudes, and temperature. The influence of ultrasound on the solid–liquidextraction process with regard to yield and mass transfer coefficient has also beenstudied. The net yield increased by 6.0 %. The diameter of particle varies linearlywith time. A simple model for estimating the mass transfer coefficient wasdeveloped, and the mass transfer coefficient was correlated in terms of operatingconditions viz., amplitude, diameter of particle, and temperature and comparedwith experimental data satisfactorily.
Acknowledgments The authors thank University Malaysia Sabah for supporting this work witha scholarship.
References
Aguilan, J. T., Boom, J. E. (2003). Structural analysis of carrageenan from farmed varieties ofPhilippine seaweed. Botanica marina, 46, 179–192.
Fairbanks, H. V. (2001). Drying powdered coal with the aid of ultrasound. Powder Technology,40, 257–264.
Hardcastle, J. L., Ball, J. C., Hong, Q., Marken, F., Compton, R. G., Bull, S. D., et al. (2000).Sonoelectrochemical and sonochemical effects of cavitation: correlation with interfacialcavitation induced by 20 kHz ultrasound. Ultrasonics Sonochemistry, 7, 7–14.
Hromádková, Z., Ebringerová, A., & Valachovic, P. (1999). Comparison of classical andultrasound-assisted extraction of polysaccharides from Salvia Officinalis L. UltrasonicsSonochemistry, 5, 163–168.
Hilliou, L., Larotonda, F. D. S., Abreu, P., Ramos, A. M., Sereno, A. M., & Goncalves, M. P.(2006). Effect of extraction parameters on the chemical structure and gel properties of k/i-hybrid carrageenans obtained from Mastocarpus stellatus. Biomolecular Engineering, 23,201–208.
Fig. 7 Comparison ofexperimental and predictedmass transfer coefficients
260 D. Krishnaiah et al.
Hromádková, Z., & Ebringerová, A. (2003). Ultrasonic extraction of plant materials—investigation of hemicellulose release from buckwheat hulls. Ultrasonics Sonochemistry,10, 127–133.
Hromádková, Z., Ebringerová, A., & Valachovic, P. (2002). Ultrasound-assisted extraction ofwater soluble polysaccharides from roots of valerian Valeriana officinalis L. UltrasonicsSonochemistry, 9, 37–44.
Li, H., Pordesimo, L., & Weiss, J. (2004). High intensity ultrasound-assisted extraction of oilfrom soybeans. Food Research International, 37, 731–738.
Mason, T. J., Paniwnyka, L. J., & Lorimera, J. P. (1996). The uses of ultrasound in foodtechnology. Ultrasonics Sonochemistry, 3, S253–S260.
Mason, T. J. (1992). Industrial sonochemistry: potential and practicality. Ultrasonics Sonochem-istry, 30, 192–196.
Michel, A. S., Mestdagh, M. M., & Axelos, M. A. V. (1997). Physico- chemical properties ofcarrageenan gels in presence of various cations. International Journal of BiologicalMacromolecules, 21, 195–200.
Nilesh, V. P., Parag, R. G., Vishwas, Y. D., & Pandit, A. B. (2001). Mixing time analysis of asonochemical reactor. Ultrasonics Sonochemistry, 8, 23–33.
Pal, N., Korfiatis. P., & Patel. V. (1997). Sonochemical Extraction and biological treatment ofpentachlorophenol contaminated wood. Journal of hazardous materials, 53,165–182.
Price, G. (1990). The use of ultrasound for the controlled degradation of polymer solutions. In T.J. Mason (Ed.), Advances in sonochemistry. London: JAI Press.
Price, G. J., White, A., & Clifton, A. A. (1995). The effect of high intensity ultrasound on solidpolymers. Polymer, 26, 4919–4925.
Price, G. (1993). Applications of high intensity ultrasound in polymer chemistry. Chemistry &Industry, 3, 75–78.
Romdhane, M., & Gourdon, C. (2002). Investigation in solid-liquid extraction: influence ofultrasound. Chemical Engineering Journal, 87, 11–19.
Suslick, K. S., Casadonte, D., Green, M., & Thompson, M. (1987). Effects of high intensityultrasound on inorganic solids. Ultrasonics Sonochemistry, 25, 56–59.
Suslick, K. S., & Price, G. J. (1999). Applications of ultrasound to materials chemistry. AnnualReview of Materials Science, 29, 295–326.
Thompson, L. H., & Doraisamy, L. K. (2000). The rate enhancing effect of ultrasound byinducing super saturation in a solid-liquid system. Chemical Engineering Science, 55,3085–3090.
Soedjak, H. S. (1994). Determination of carrageenan and other anionic hydrocolloids withmethylene blue. Analytical Chemistry, 66, 4514–4518.
Vinatoru, M., Toma, M., Radu, O., Filip, P. I., Lazurca, D., & Tmason, T. J. (1997). The use ofultrasound for the extraction of bioactive principles from plant materials. UltrasonicsSonochemistry, 4, 135–139.
Vinatoru, M., Toma, M., Paniwynk, L., & Mason, T. J. (2001). Investigation of the effects ofultrasound on vegetal tissues during solvent extraction. Ultrasonics Sonochemistry, 8,137–142.
Wu, J., Lin, L., & Foo, T. C. (2001). Ultrasound-assisted extraction of ginseng saponins fromginseng roots and cultured ginseng cells. Ultrasonics Sonochemistry, 8, 347–352.
Xia, T., Shi, S., & Wan, X. (2006). Impact of ultrasonic-assisted extraction on the chemical andsensory quality of tea infusion. Journal of Food Engineering, 74, 557–560.
Solid–Liquid Mass Transfer Coefficients 261
Supercritical Fluid Extraction of BlackPepper’s Bioactive Compounds: Solubilityand Mass Transfer
S. P. Then, F. Panau and Y. Samyudia
Abstract Mass transfer of black pepper’s bioactive compound extracted usingsupercritical CO2 was studied with the parameters such as range of temperature(45–55 �C), pressure (3,000–5,000 psi), CO2 flow rate (5–10 ml/min), and pepperparticle size (0.4–1 mm). The solubility-controlled period and diffusion-controlledperiod of the extraction curve were examined. Static extraction was performed tocalculate solubility, and the value obtained varied from 4.8 to 10.3 kg oil/m3 CO2.Transition time analyzed through extraction curve varied from 18 to 43 min andincreased with particle size. Mass transfer rates for solubility-controlled periodand diffusion-controlled period were analyzed. The average values were—2.7 9 10-3 kg/m3s and 1.04 9 10-4 kg/m3s, respectively. Particle size was foundto be the dominant factor during solubility-controlled period, while pressure wasthe key factor for the intra-particle diffusion. The fluid-phase mass transfer coef-ficients and diffusivity were calculated based on Sovova’s model.
Introduction
The pharmaceutical value of black pepper’s essential oil in enhancing drugs’bioavailability has increased the intention of the industry to develop black pepperextraction (Srinivasan 2009). Supercritical fluid extraction (SFE) appears to be themost promising alternative over the conventional processes as supercritical fluidpreserves the extract from solvent contamination and thermal degradation (Salginet al. 2006; Bruner 2005; Reverchon et al. 1999). In spite of great number ofexperimental data reported regarding SFE on black pepper (Li 2006; Bruner 2005;Perakis et al. 2005; Ferreira et al. 1999), the information and analysis that define
S. P. Then (&) � F. Panau � Y. SamyudiaChemical Engineering, School of Engineering, Curtin University of Technology,Sarawak Campus CDT 250 98000 Miri, Sarawak, Malaysiae-mail: [email protected]
R. Pogaku et al. (eds.), Developments in Sustainable Chemicaland Bioprocess Technology, DOI: 10.1007/978-1-4614-6208-8_32,� Springer Science+Business Media New York 2013
263
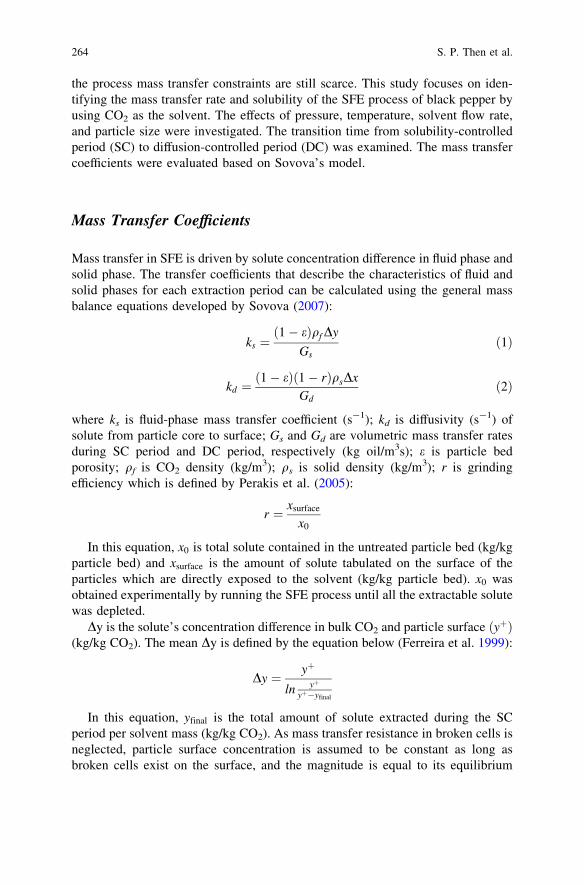
the process mass transfer constraints are still scarce. This study focuses on iden-tifying the mass transfer rate and solubility of the SFE process of black pepper byusing CO2 as the solvent. The effects of pressure, temperature, solvent flow rate,and particle size were investigated. The transition time from solubility-controlledperiod (SC) to diffusion-controlled period (DC) was examined. The mass transfercoefficients were evaluated based on Sovova’s model.
Mass Transfer Coefficients
Mass transfer in SFE is driven by solute concentration difference in fluid phase andsolid phase. The transfer coefficients that describe the characteristics of fluid andsolid phases for each extraction period can be calculated using the general massbalance equations developed by Sovova (2007):
ks ¼ð1� eÞqf Dy
Gsð1Þ
kd ¼1� eð Þð1� rÞqsDx
Gdð2Þ
where ks is fluid-phase mass transfer coefficient (s-1); kd is diffusivity (s-1) ofsolute from particle core to surface; Gs and Gd are volumetric mass transfer ratesduring SC period and DC period, respectively (kg oil/m3s); e is particle bedporosity; qf is CO2 density (kg/m3); qs is solid density (kg/m3); r is grindingefficiency which is defined by Perakis et al. (2005):
r ¼ xsurface
x0
In this equation, x0 is total solute contained in the untreated particle bed (kg/kgparticle bed) and xsurface is the amount of solute tabulated on the surface of theparticles which are directly exposed to the solvent (kg/kg particle bed). x0 wasobtained experimentally by running the SFE process until all the extractable solutewas depleted.
Dy is the solute’s concentration difference in bulk CO2 and particle surface yþð Þ(kg/kg CO2). The mean Dy is defined by the equation below (Ferreira et al. 1999):
Dy ¼ yþ
ln yþ
yþ�yfinal
In this equation, yfinal is the total amount of solute extracted during the SCperiod per solvent mass (kg/kg CO2). As mass transfer resistance in broken cells isneglected, particle surface concentration is assumed to be constant as long asbroken cells exist on the surface, and the magnitude is equal to its equilibrium
264 S. P. Then et al.
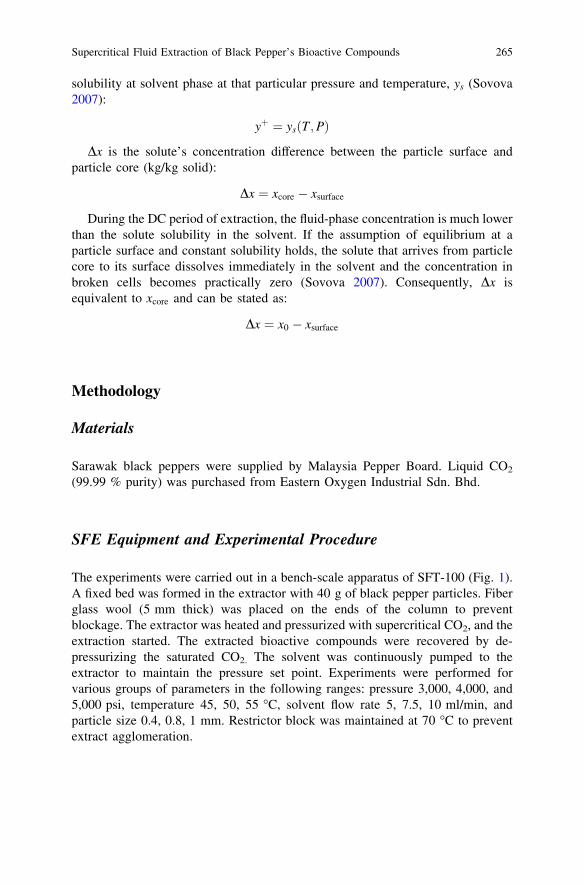
solubility at solvent phase at that particular pressure and temperature, ys (Sovova2007):
yþ ¼ ysðT ;PÞ
Dx is the solute’s concentration difference between the particle surface andparticle core (kg/kg solid):
Dx ¼ xcore � xsurface
During the DC period of extraction, the fluid-phase concentration is much lowerthan the solute solubility in the solvent. If the assumption of equilibrium at aparticle surface and constant solubility holds, the solute that arrives from particlecore to its surface dissolves immediately in the solvent and the concentration inbroken cells becomes practically zero (Sovova 2007). Consequently, Dx isequivalent to xcore and can be stated as:
Dx ¼ x0 � xsurface
Methodology
Materials
Sarawak black peppers were supplied by Malaysia Pepper Board. Liquid CO2
(99.99 % purity) was purchased from Eastern Oxygen Industrial Sdn. Bhd.
SFE Equipment and Experimental Procedure
The experiments were carried out in a bench-scale apparatus of SFT-100 (Fig. 1).A fixed bed was formed in the extractor with 40 g of black pepper particles. Fiberglass wool (5 mm thick) was placed on the ends of the column to preventblockage. The extractor was heated and pressurized with supercritical CO2, and theextraction started. The extracted bioactive compounds were recovered by de-pressurizing the saturated CO2. The solvent was continuously pumped to theextractor to maintain the pressure set point. Experiments were performed forvarious groups of parameters in the following ranges: pressure 3,000, 4,000, and5,000 psi, temperature 45, 50, 55 �C, solvent flow rate 5, 7.5, 10 ml/min, andparticle size 0.4, 0.8, 1 mm. Restrictor block was maintained at 70 �C to preventextract agglomeration.
Supercritical Fluid Extraction of Black Pepper’s Bioactive Compounds 265
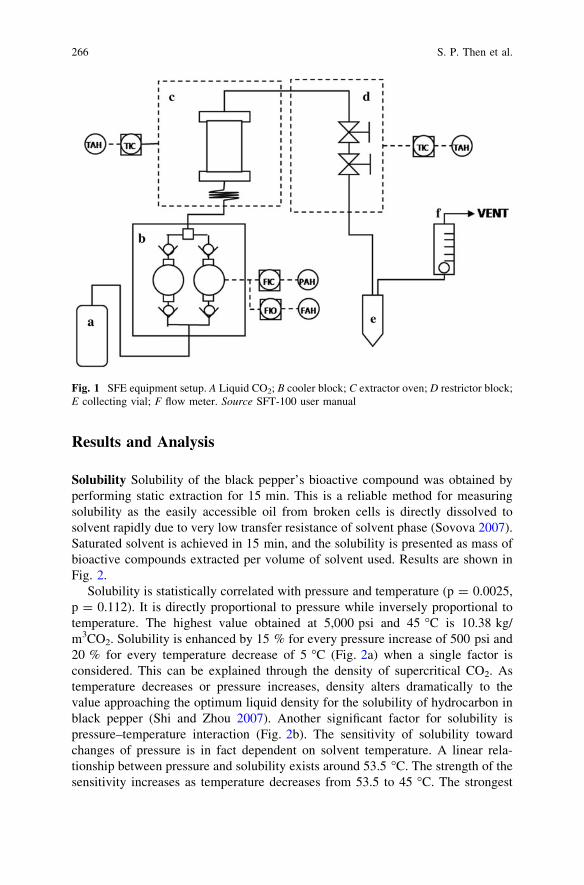
Results and Analysis
Solubility Solubility of the black pepper’s bioactive compound was obtained byperforming static extraction for 15 min. This is a reliable method for measuringsolubility as the easily accessible oil from broken cells is directly dissolved tosolvent rapidly due to very low transfer resistance of solvent phase (Sovova 2007).Saturated solvent is achieved in 15 min, and the solubility is presented as mass ofbioactive compounds extracted per volume of solvent used. Results are shown inFig. 2.
Solubility is statistically correlated with pressure and temperature (p = 0.0025,p = 0.112). It is directly proportional to pressure while inversely proportional totemperature. The highest value obtained at 5,000 psi and 45 �C is 10.38 kg/m3CO2. Solubility is enhanced by 15 % for every pressure increase of 500 psi and20 % for every temperature decrease of 5 �C (Fig. 2a) when a single factor isconsidered. This can be explained through the density of supercritical CO2. Astemperature decreases or pressure increases, density alters dramatically to thevalue approaching the optimum liquid density for the solubility of hydrocarbon inblack pepper (Shi and Zhou 2007). Another significant factor for solubility ispressure–temperature interaction (Fig. 2b). The sensitivity of solubility towardchanges of pressure is in fact dependent on solvent temperature. A linear rela-tionship between pressure and solubility exists around 53.5 �C. The strength of thesensitivity increases as temperature decreases from 53.5 to 45 �C. The strongest
Fig. 1 SFE equipment setup. A Liquid CO2; B cooler block; C extractor oven; D restrictor block;E collecting vial; F flow meter. Source SFT-100 user manual
266 S. P. Then et al.
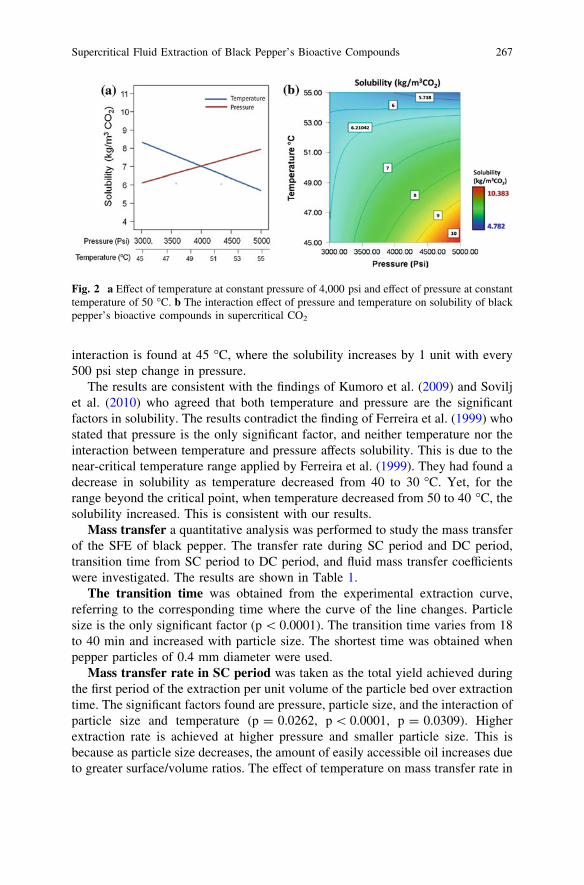
interaction is found at 45 �C, where the solubility increases by 1 unit with every500 psi step change in pressure.
The results are consistent with the findings of Kumoro et al. (2009) and Soviljet al. (2010) who agreed that both temperature and pressure are the significantfactors in solubility. The results contradict the finding of Ferreira et al. (1999) whostated that pressure is the only significant factor, and neither temperature nor theinteraction between temperature and pressure affects solubility. This is due to thenear-critical temperature range applied by Ferreira et al. (1999). They had found adecrease in solubility as temperature decreased from 40 to 30 �C. Yet, for therange beyond the critical point, when temperature decreased from 50 to 40 �C, thesolubility increased. This is consistent with our results.
Mass transfer a quantitative analysis was performed to study the mass transferof the SFE of black pepper. The transfer rate during SC period and DC period,transition time from SC period to DC period, and fluid mass transfer coefficientswere investigated. The results are shown in Table 1.
The transition time was obtained from the experimental extraction curve,referring to the corresponding time where the curve of the line changes. Particlesize is the only significant factor (p \ 0.0001). The transition time varies from 18to 40 min and increased with particle size. The shortest time was obtained whenpepper particles of 0.4 mm diameter were used.
Mass transfer rate in SC period was taken as the total yield achieved duringthe first period of the extraction per unit volume of the particle bed over extractiontime. The significant factors found are pressure, particle size, and the interaction ofparticle size and temperature (p = 0.0262, p \ 0.0001, p = 0.0309). Higherextraction rate is achieved at higher pressure and smaller particle size. This isbecause as particle size decreases, the amount of easily accessible oil increases dueto greater surface/volume ratios. The effect of temperature on mass transfer rate in
Fig. 2 a Effect of temperature at constant pressure of 4,000 psi and effect of pressure at constanttemperature of 50 �C. b The interaction effect of pressure and temperature on solubility of blackpepper’s bioactive compounds in supercritical CO2
Supercritical Fluid Extraction of Black Pepper’s Bioactive Compounds 267
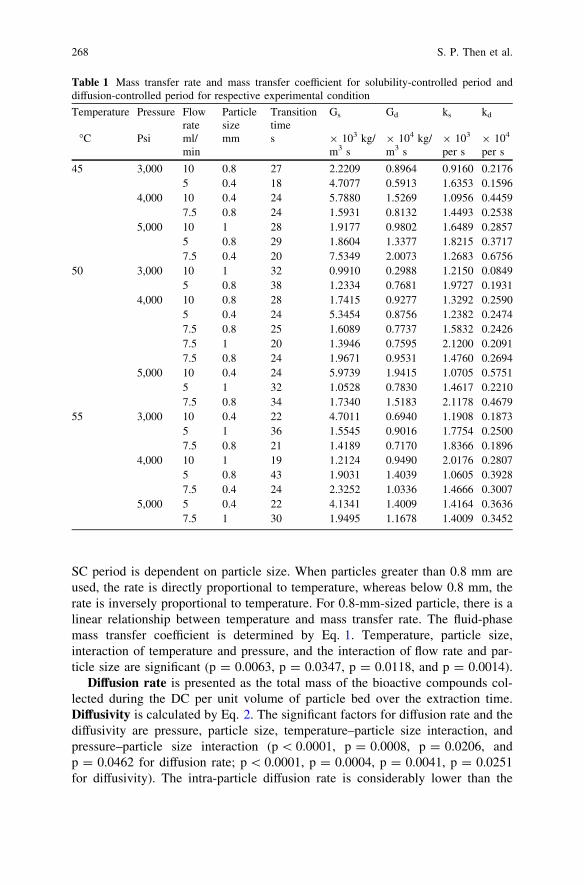
SC period is dependent on particle size. When particles greater than 0.8 mm areused, the rate is directly proportional to temperature, whereas below 0.8 mm, therate is inversely proportional to temperature. For 0.8-mm-sized particle, there is alinear relationship between temperature and mass transfer rate. The fluid-phasemass transfer coefficient is determined by Eq. 1. Temperature, particle size,interaction of temperature and pressure, and the interaction of flow rate and par-ticle size are significant (p = 0.0063, p = 0.0347, p = 0.0118, and p = 0.0014).
Diffusion rate is presented as the total mass of the bioactive compounds col-lected during the DC per unit volume of particle bed over the extraction time.Diffusivity is calculated by Eq. 2. The significant factors for diffusion rate and thediffusivity are pressure, particle size, temperature–particle size interaction, andpressure–particle size interaction (p \ 0.0001, p = 0.0008, p = 0.0206, andp = 0.0462 for diffusion rate; p \ 0.0001, p = 0.0004, p = 0.0041, p = 0.0251for diffusivity). The intra-particle diffusion rate is considerably lower than the
Table 1 Mass transfer rate and mass transfer coefficient for solubility-controlled period anddiffusion-controlled period for respective experimental condition
Temperature Pressure Flowrate
Particlesize
Transitiontime
Gs Gd ks kd
�C Psi ml/min
mm s 9 103 kg/m3 s
9 104 kg/m3 s
9 103
per s9 104
per s
45 3,000 10 0.8 27 2.2209 0.8964 0.9160 0.21765 0.4 18 4.7077 0.5913 1.6353 0.1596
4,000 10 0.4 24 5.7880 1.5269 1.0956 0.44597.5 0.8 24 1.5931 0.8132 1.4493 0.2538
5,000 10 1 28 1.9177 0.9802 1.6489 0.28575 0.8 29 1.8604 1.3377 1.8215 0.37177.5 0.4 20 7.5349 2.0073 1.2683 0.6756
50 3,000 10 1 32 0.9910 0.2988 1.2150 0.08495 0.8 38 1.2334 0.7681 1.9727 0.1931
4,000 10 0.8 28 1.7415 0.9277 1.3292 0.25905 0.4 24 5.3454 0.8756 1.2382 0.24747.5 0.8 25 1.6089 0.7737 1.5832 0.24267.5 1 20 1.3946 0.7595 2.1200 0.20917.5 0.8 24 1.9671 0.9531 1.4760 0.2694
5,000 10 0.4 24 5.9739 1.9415 1.0705 0.57515 1 32 1.0528 0.7830 1.4617 0.22107.5 0.8 34 1.7340 1.5183 2.1178 0.4679
55 3,000 10 0.4 22 4.7011 0.6940 1.1908 0.18735 1 36 1.5545 0.9016 1.7754 0.25007.5 0.8 21 1.4189 0.7170 1.8366 0.1896
4,000 10 1 19 1.2124 0.9490 2.0176 0.28075 0.8 43 1.9031 1.4039 1.0605 0.39287.5 0.4 24 2.3252 1.0336 1.4666 0.3007
5,000 5 0.4 22 4.1341 1.4009 1.4164 0.36367.5 1 30 1.9495 1.1678 1.4009 0.3452
268 S. P. Then et al.
transfer rate during SC period. As noted with the transfer rate in SC period, higherdiffusion rate is also achieved at higher pressure and smaller particle size. Pressureis the dominant factor in diffusion. The enhancement of 120 % in diffusion rate isachieved by increasing the pressure from 3,000 psi to 5,000 psi. The effect ofpressure on diffusion rate is related to particle size. The strongest interaction isfound when particles of 0.4 mm diameter were used. The interaction effectdecreases when particle size increases from 0.4 to 1.00 mm. The effect of tem-perature is also related to particle size. For particle size smaller than 0.65 mm, thediffusion rate is inversely proportional to temperature, while for the particle sizegreater than that, the diffusion rate is found to be inversely proportional to tem-perature. The diffusivity that describes the solid-phase transfer coefficient is foundto be two orders of magnitude lower than the fluid-phase mass transfer coefficient.
Conclusion
The solubility of black pepper’s bioactive compounds in supercritical CO2 wasinvestigated. The highest solubility achieved was 10.38 kg/m3CO2, obtained at5,000 psi and 45 �C. Higher mass transfer rate was obtained at higher operatingpressure and smaller particle size for both SC and DC. The shortest transition timewas obtained when 4-mm pepper particles were used. Diffusivity was found to betwo orders of magnitude lower than the fluid-phase mass transfer coefficient.
Acknowledgments The authors would like to thank Dr. Dominique Dodge-Wan for her con-structive feedback and the financial support from Malaysia Pepper Board.
References
Bruner, G. (2005). Supercritical fluids: Technology and application to food processing. Reviewsin Journal of Food Engineering, 67, 21–33.
Ferreira, S. R. S., Nikolov, L., Doraiswamy, L. K., Meireles, M. A. A., Petenatezivko, A. J.(1999). Supercritical fluid extraction of black pepper (Piper nigrum L.) essential oil. Reviewsin Journal of Supercritical Fluids, 235–245.
Kumoro, A. C., Singh, H., & Hasan, M. (2009). Solubility of piperine in supercritical and nearcritical carbon dioxide. Reviews in Thermodynamics and Chemical Engineering Data, 67,1014–1020.
Li, Z. Y., Liu, X. W., Chen, S. H., Zhang, X. D., Xia, Y. J., Xiao, F. (2006). An experimental andsimulating study of supercritical CO2 extraction for pepper oil. Reviews in ChemicalEngineering and Processing, 264–267.
Perakis, C., Louli, V., & Magoulas, K. (2005). Supercritical fluid extraction of black pepper oil.Reviews in Journal of Food Engineering, 71, 386–393.
Reverchon, E., Daghero, J., Marrone, C., Mattea, M., & Poletto, M. (1999). Supercriticalfractional extraction of fennel seed oil and essential oil: Experiments and mathematicalmodeling. Reviews in Industrial and Engineering Chemistry Research, 3069–3075.
Supercritical Fluid Extraction of Black Pepper’s Bioactive Compounds 269

Salgin, U., Döker, O., & Calimli, A. (2006). Extraction of sunflower oil with supercritical CO2.Reviews in Journal of Supercritical Fluids, 38, 326–331.
Shi, J., Zhou, X. (2007). Solubility of food components and product recovery in the supercriticalfluid separation process. In Shi John functional food ingredients and nutraceuticas:Processing and technologies. Boca Raton: Taylor & Francis Group, LLC.
Sovilj, M. N., Nikolovski, B. G., Spasojevic, M. Ð. (2010). Critical review of supercritic al fluidextraction of selected spice plant materials. Reviews in Macedonian Journal of Chemistry andChemical Engineering, 197–220.
Sovova, H. (2007). Modeling of supercritical fluid extraction of bioactives from plant materials.In Shi John functional food ingredients and nutraceuticas. Boca Raton: Taylor & FrancisGroup, LLC.
Srinivasan, K. (2009). Black pepper (Piper nigrum) and its bioactive compound, piperine. InB. B. Aggarwal, Molecular targets and therapeutic uses of spices: Modern uses for ancientmedicine. Singapore: World Scientific Publishing Co. Pte. Ltd.
270 S. P. Then et al.
Comparative Study of CelluloseExtraction Processes from PalmKernel Cake
Y. Y. Farm, S M. Anisuzzaman, D. Krishnaiah and A. Bono
Abstract Palm kernel cake (PKC) is one of palm oil industry by-products whichare rich in edible cellulose, which can be used as potential source in food andpharmaceutical industry. The extraction of cellulose from PKC involved essen-tially delignification and hemicellulose removal processes. In this study, threedelignification and two hemicellulose removal techniques were comparativelyinvestigated. Response surface methodology (RSM) with D-optimal design wasused for the analysis. In this analysis, delignification techniques, hemicelluloseremoval techniques, and hemicellulose removal time (HRT) were chosen as pro-cess factors, whereas quantity of hemicellulose removal, cellulose yield, andcellulose purity were chosen as process responses. The comparative result obtainedin this study shows that the combination of liquid phase oxidation (LPO) ofdelignification technique and alkali treatment of hemicellulose removal was thebest method of cellulose extraction from palm kernel. The result of FTIR spectrumanalysis of the cellulose produced in this study was similar to those producedcommercially validating the cellulose structure. The optimum cellulose extractionmethod in this study shows that hemicellulose can be removed up to 24 % withcellulose yield 70 % and purity 77 %.
Keywords Response surface methodology � Delignification � Hemicellulose �Process selection
Y. Y. Farm � SM. Anisuzzaman � D. Krishnaiah � A. Bono (&)School of Engineering and Information Technology, University Malaysia Sabah,88400 Kota Kinabalu, Sabah, Malaysiae-mail: [email protected]
R. Pogaku et al. (eds.), Developments in Sustainable Chemicaland Bioprocess Technology, DOI: 10.1007/978-1-4614-6208-8_33,� Springer Science+Business Media New York 2013
271
Introduction
In the recent years, the cellulose demand is growing in the food and chemicalindustrial applications. Cellulose is biocompatible, renewable, biodegradable,reproducible, and recyclable (Isogai 2001). The unique properties have promptedthe development of cellulose in various applications such as smart material inelectrical field (Kim et al. 2006), foods, fuel (Kammes et al. 2011), chemicals(Zhang et al. 2011), textile, membrane (Wu and Yuan 2002), and pharmaceuticals(Hoenich 2006). This has incited the research interest on sustainable agriculturalresidues which are rich in cellulose as alternative resources such as sugar beetpulp, wheat straw, and many other alternative sources.
Palm kernel cake (PKC) is one of the abundant by-products obtained from oilpalm industries. In Malaysia, about 2.3 million tons of PKC was produced in 2011(Chu 2011). The abundant and the reasonable content of cellulose are significant toconsider PKC as potential resources for cellulose production (Farm et al. 2009).However, separation of cellulose from agriculture resource still constitutes as oneof the major obstacles in efficient cellulose utilization in industries. To recoverpure cellulose from resources, cross-linkage among cellulose, hemicelluloses, andlignin should be broken down. Hence, in this research, the cellulose extraction wasdivided into two stages which are hemicellulose removal and followed bydelignification.
Hot water treatment and alkali treatment are common techniques to removehemicelluloses (Xu et al. 2007; Liu et al. 2006; Zhang et al. 2007) from vegetationresidues. High temperature could break down the linkage of hemicelluloses fromcellulose and lignin. According to Dusterhoft et al. (1992), 66 % of hemicellulosesof PKC could be solubilized by with alkali and sodium chloride (Sundu et al.2006). Additional delignification process is needed in order to enhance the cel-lulose extraction purity. Acidified sodium chlorite is commonly used to isolatecellulose from wood (Sun et al. 2004a). However, environmental concerns asso-ciated with chlorinating agents have led various green approaches to preventecological damage. Organosolv processes have been applied as one of the alter-native cellulose extraction processes due to its environmental amity. Variousresearches have been studied on this approach (Astimar et al. 2002; Sun et al.2004b; Sarwar et al. 2007; Feng et al. 2006; Xua et al. 2007). Environmental-friendly oxidation reagent is another potential green extraction process. Mae et al.(2000) and Farm et al. (2009) have studied the cellulose extraction by liquid phaseoxidation (LPO) with hydrogen peroxide under mild conditions. Besides, Farmet al. (2009) have also found that the process is able to produce substantialquantities of useful by-products such as organic acids.
Hence, the aim of this study is to identify an efficient cellulose extractionmethod from PKC by comparing three different delignification techniques and twodifferent hemicellulose removal techniques. The work was also extended to studythe optimization of cellulose extraction methods from PKC.
272 Y. Y. Farm et al.
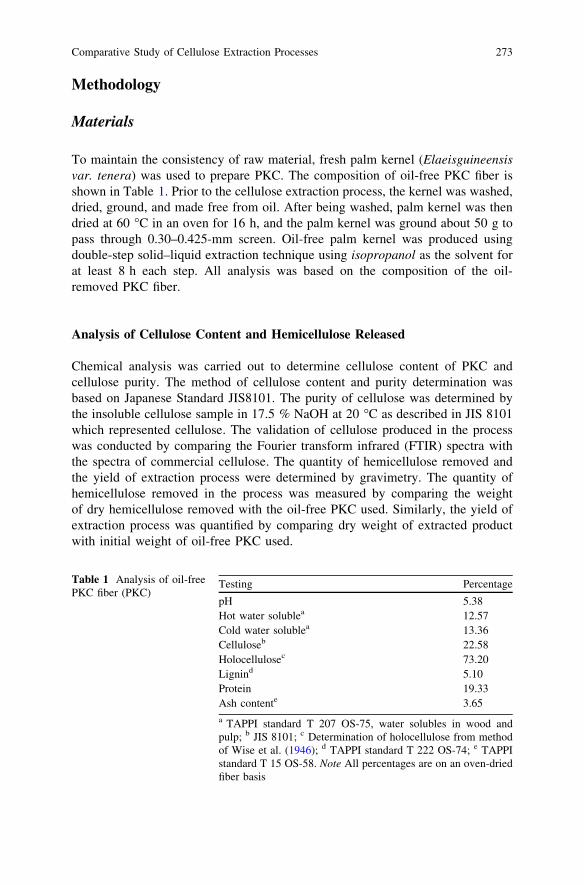
Methodology
Materials
To maintain the consistency of raw material, fresh palm kernel (Elaeisguineensisvar. tenera) was used to prepare PKC. The composition of oil-free PKC fiber isshown in Table 1. Prior to the cellulose extraction process, the kernel was washed,dried, ground, and made free from oil. After being washed, palm kernel was thendried at 60 �C in an oven for 16 h, and the palm kernel was ground about 50 g topass through 0.30–0.425-mm screen. Oil-free palm kernel was produced usingdouble-step solid–liquid extraction technique using isopropanol as the solvent forat least 8 h each step. All analysis was based on the composition of the oil-removed PKC fiber.
Analysis of Cellulose Content and Hemicellulose Released
Chemical analysis was carried out to determine cellulose content of PKC andcellulose purity. The method of cellulose content and purity determination wasbased on Japanese Standard JIS8101. The purity of cellulose was determined bythe insoluble cellulose sample in 17.5 % NaOH at 20 �C as described in JIS 8101which represented cellulose. The validation of cellulose produced in the processwas conducted by comparing the Fourier transform infrared (FTIR) spectra withthe spectra of commercial cellulose. The quantity of hemicellulose removed andthe yield of extraction process were determined by gravimetry. The quantity ofhemicellulose removed in the process was measured by comparing the weightof dry hemicellulose removed with the oil-free PKC used. Similarly, the yield ofextraction process was quantified by comparing dry weight of extracted productwith initial weight of oil-free PKC used.
Table 1 Analysis of oil-freePKC fiber (PKC)
Testing Percentage
pH 5.38Hot water solublea 12.57Cold water solublea 13.36Celluloseb 22.58Holocellulosec 73.20Lignind 5.10Protein 19.33Ash contente 3.65a TAPPI standard T 207 OS-75, water solubles in wood andpulp; b JIS 8101; c Determination of holocellulose from methodof Wise et al. (1946); d TAPPI standard T 222 OS-74; e TAPPIstandard T 15 OS-58. Note All percentages are on an oven-driedfiber basis
Comparative Study of Cellulose Extraction Processes 273
Hemicellulose Removal Process
Two techniques of hemicellulose removal process were selected for comparisonpurposes. Hot water treatment was conducted based on the technique of Mae et al.(2000). The technique consisted in the heating of oil-free PKC with water in a 2-Lpressurized extractor (Parr Instruments, USA; range 0–140 bar) at 10 bar, 180 �Cwith liquid–solid ratio of 5:1 (w/w). The duration of the treatment experiment runwas set in the range of 30–120 min. At the end of hot water treatment, reactor wascooled down and the content was filtered and then washed with solution of 95 %ethanol in water.
The second technique was alkali treatment. Oil-free PKC was mixed withNaOH solution of 17.5 % (w/w) at the liquid–solid ratio of 4:1 (w/w). The mixturewas left stirred at room temperature, and the treatment duration time was set as hotwater treatment experimental run. At the end of the alkali treatment, the mixturewas then filtered and washed. The washing was conducted with distilled water andrepeated until neutral filtrate was achieved.
Delignification Process
The delignification process was conducted using three different techniques: Or-ganosolv, LPO with iron catalyst, and acidic sodium chlorite. Organosolv tech-nique consisted in the mixing of 4-g hemicellulose-free PKC fiber with 40 gsolution of formic acid and acetic acid in water at volume ratio of 30:60:10. HCl0.1 % (w/w) was added into the mixture as catalyst at the ratio of 20:1 (mL/g).The mixture was left stirred at 85 �C for 2 h (Sun et al. 2004b; Feng et al. 2006).
For the acidic sodium chlorite delignification technique, 4-g hemicellulose-freePKC fiber was mixed with 40 g solution of 1.3 % (w/w) NaClO2 at pH 3.5. The pHof the mixture was maintained at constant level by adjustment with 10 % (w/w)acetic acid. The process was carried out in heated open flask at 75 �C for 2 h asgiven by Sun et al. (2004a).
Hydrogen peroxide in the presence of Fe was used in LPO delignificationprocess. It has been known that iron catalyzes the decomposition of hydrogenperoxide. The LPO technique was adopted from previous research work (Maeet al. 2000; Farm et al. 2009). In this technique, 4-g hemicellulose-free PKC fiberwas mixed with 40 g solution of 30 % (w/w) H2O2 and 13.6 mg of FeSO4. Thereaction was left at constant temperature of 80 �C for 2 h.
At the end of each delignification process, the mixture was cooled to roomtemperature. For fast cooling, cold distilled water was used as a chiller. Theproduct of each technique of the delignification process was obtained by washingthe residue with distilled water and followed by 95 % ethanol. The product wasthen oven-dried at 60 �C for 16 h before it was analyzed for the yield and purity.
274 Y. Y. Farm et al.
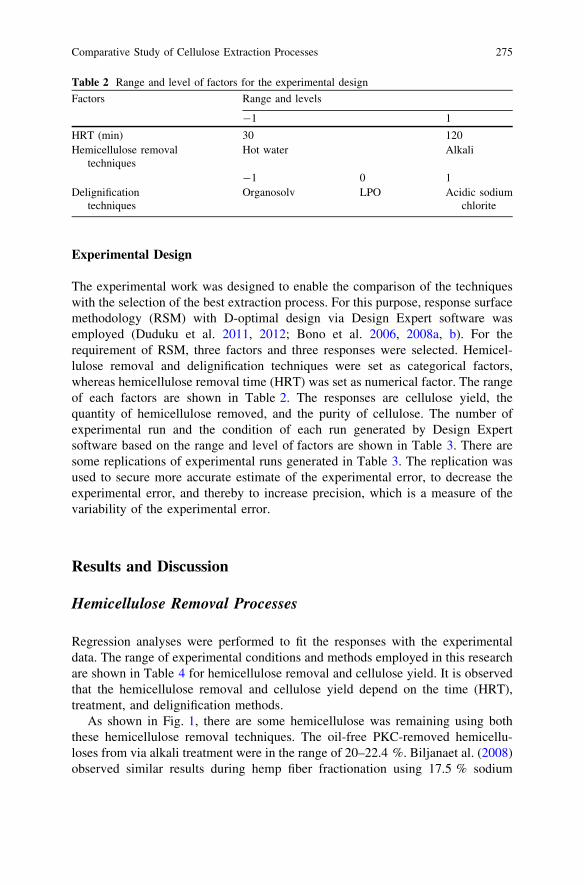
Experimental Design
The experimental work was designed to enable the comparison of the techniqueswith the selection of the best extraction process. For this purpose, response surfacemethodology (RSM) with D-optimal design via Design Expert software wasemployed (Duduku et al. 2011, 2012; Bono et al. 2006, 2008a, b). For therequirement of RSM, three factors and three responses were selected. Hemicel-lulose removal and delignification techniques were set as categorical factors,whereas hemicellulose removal time (HRT) was set as numerical factor. The rangeof each factors are shown in Table 2. The responses are cellulose yield, thequantity of hemicellulose removed, and the purity of cellulose. The number ofexperimental run and the condition of each run generated by Design Expertsoftware based on the range and level of factors are shown in Table 3. There aresome replications of experimental runs generated in Table 3. The replication wasused to secure more accurate estimate of the experimental error, to decrease theexperimental error, and thereby to increase precision, which is a measure of thevariability of the experimental error.
Results and Discussion
Hemicellulose Removal Processes
Regression analyses were performed to fit the responses with the experimentaldata. The range of experimental conditions and methods employed in this researchare shown in Table 4 for hemicellulose removal and cellulose yield. It is observedthat the hemicellulose removal and cellulose yield depend on the time (HRT),treatment, and delignification methods.
As shown in Fig. 1, there are some hemicellulose was remaining using boththese hemicellulose removal techniques. The oil-free PKC-removed hemicellu-loses from via alkali treatment were in the range of 20–22.4 %. Biljanaet al. (2008)observed similar results during hemp fiber fractionation using 17.5 % sodium
Table 2 Range and level of factors for the experimental design
Factors Range and levels
-1 1
HRT (min) 30 120Hemicellulose removal
techniquesHot water Alkali
-1 0 1Delignification
techniquesOrganosolv LPO Acidic sodium
chlorite
Comparative Study of Cellulose Extraction Processes 275
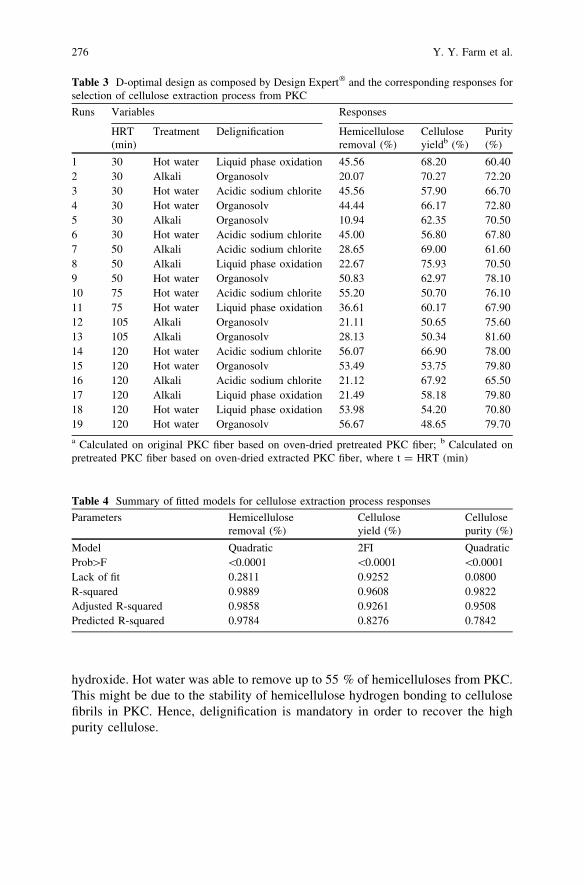
hydroxide. Hot water was able to remove up to 55 % of hemicelluloses from PKC.This might be due to the stability of hemicellulose hydrogen bonding to cellulosefibrils in PKC. Hence, delignification is mandatory in order to recover the highpurity cellulose.
Table 3 D-optimal design as composed by Design Expert� and the corresponding responses forselection of cellulose extraction process from PKC
Runs Variables Responses
HRT(min)
Treatment Delignification Hemicelluloseremoval (%)
Celluloseyieldb (%)
Purity(%)
1 30 Hot water Liquid phase oxidation 45.56 68.20 60.402 30 Alkali Organosolv 20.07 70.27 72.203 30 Hot water Acidic sodium chlorite 45.56 57.90 66.704 30 Hot water Organosolv 44.44 66.17 72.805 30 Alkali Organosolv 10.94 62.35 70.506 30 Hot water Acidic sodium chlorite 45.00 56.80 67.807 50 Alkali Acidic sodium chlorite 28.65 69.00 61.608 50 Alkali Liquid phase oxidation 22.67 75.93 70.509 50 Hot water Organosolv 50.83 62.97 78.1010 75 Hot water Acidic sodium chlorite 55.20 50.70 76.1011 75 Hot water Liquid phase oxidation 36.61 60.17 67.9012 105 Alkali Organosolv 21.11 50.65 75.6013 105 Alkali Organosolv 28.13 50.34 81.6014 120 Hot water Acidic sodium chlorite 56.07 66.90 78.0015 120 Hot water Organosolv 53.49 53.75 79.8016 120 Alkali Acidic sodium chlorite 21.12 67.92 65.5017 120 Alkali Liquid phase oxidation 21.49 58.18 79.8018 120 Hot water Liquid phase oxidation 53.98 54.20 70.8019 120 Hot water Organosolv 56.67 48.65 79.70
a Calculated on original PKC fiber based on oven-dried pretreated PKC fiber; b Calculated onpretreated PKC fiber based on oven-dried extracted PKC fiber, where t = HRT (min)
Table 4 Summary of fitted models for cellulose extraction process responses
Parameters Hemicelluloseremoval (%)
Celluloseyield (%)
Cellulosepurity (%)
Model Quadratic 2FI QuadraticProb[F \0.0001 \0.0001 \0.0001Lack of fit 0.2811 0.9252 0.0800R-squared 0.9889 0.9608 0.9822Adjusted R-squared 0.9858 0.9261 0.9508Predicted R-squared 0.9784 0.8276 0.7842
276 Y. Y. Farm et al.
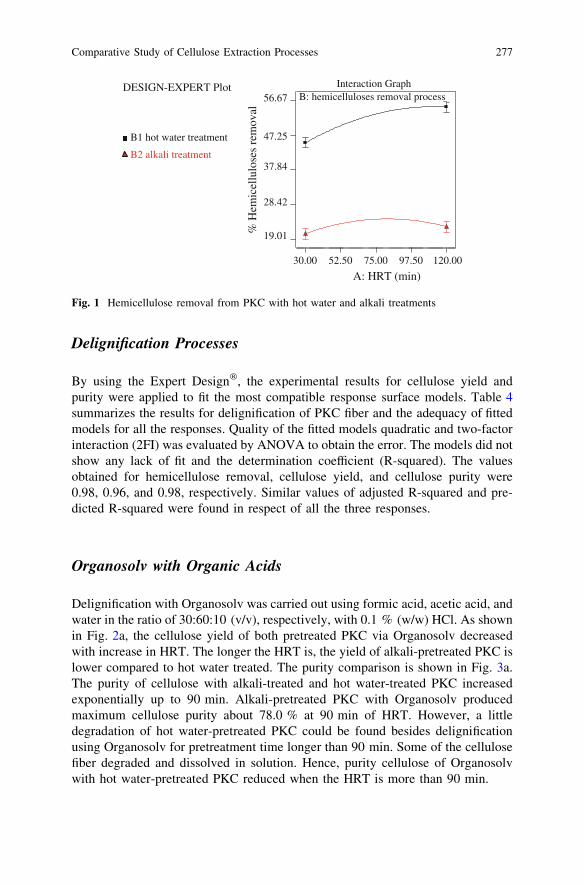
Delignification Processes
By using the Expert Design�, the experimental results for cellulose yield andpurity were applied to fit the most compatible response surface models. Table 4summarizes the results for delignification of PKC fiber and the adequacy of fittedmodels for all the responses. Quality of the fitted models quadratic and two-factorinteraction (2FI) was evaluated by ANOVA to obtain the error. The models did notshow any lack of fit and the determination coefficient (R-squared). The valuesobtained for hemicellulose removal, cellulose yield, and cellulose purity were0.98, 0.96, and 0.98, respectively. Similar values of adjusted R-squared and pre-dicted R-squared were found in respect of all the three responses.
Organosolv with Organic Acids
Delignification with Organosolv was carried out using formic acid, acetic acid, andwater in the ratio of 30:60:10 (v/v), respectively, with 0.1 % (w/w) HCl. As shownin Fig. 2a, the cellulose yield of both pretreated PKC via Organosolv decreasedwith increase in HRT. The longer the HRT is, the yield of alkali-pretreated PKC islower compared to hot water treated. The purity comparison is shown in Fig. 3a.The purity of cellulose with alkali-treated and hot water-treated PKC increasedexponentially up to 90 min. Alkali-pretreated PKC with Organosolv producedmaximum cellulose purity about 78.0 % at 90 min of HRT. However, a littledegradation of hot water-pretreated PKC could be found besides delignificationusing Organosolv for pretreatment time longer than 90 min. Some of the cellulosefiber degraded and dissolved in solution. Hence, purity cellulose of Organosolvwith hot water-pretreated PKC reduced when the HRT is more than 90 min.
A: HRT (min)
DESIGN-EXPERT Plot
B1 hot water treatment
B2 alkali treatment
B: hemicelluloses removal processInteraction Graph
30.00 52.50 75.00 97.50 120.00
19.01
28.42
37.84
47.25
56.67
% H
emic
ellu
lose
s re
mov
al
Fig. 1 Hemicellulose removal from PKC with hot water and alkali treatments
Comparative Study of Cellulose Extraction Processes 277
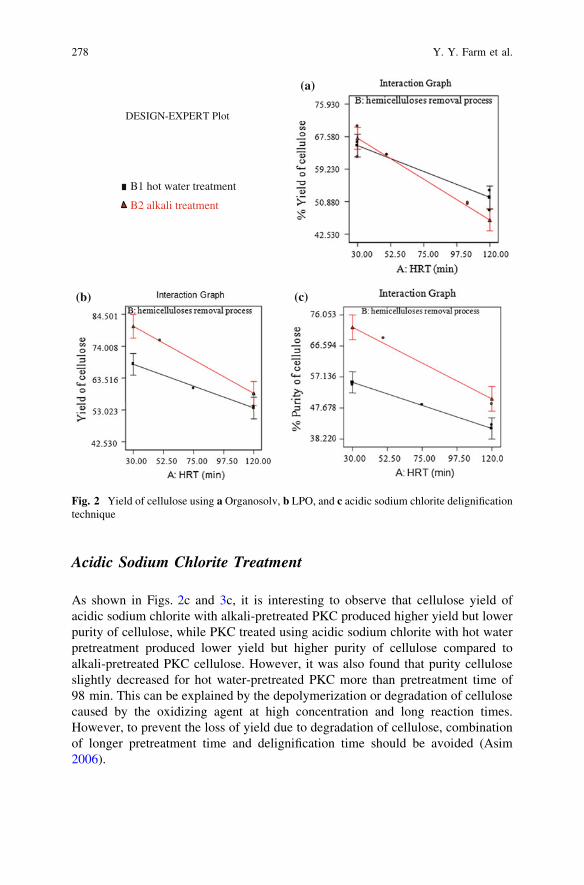
Acidic Sodium Chlorite Treatment
As shown in Figs. 2c and 3c, it is interesting to observe that cellulose yield ofacidic sodium chlorite with alkali-pretreated PKC produced higher yield but lowerpurity of cellulose, while PKC treated using acidic sodium chlorite with hot waterpretreatment produced lower yield but higher purity of cellulose compared toalkali-pretreated PKC cellulose. However, it was also found that purity celluloseslightly decreased for hot water-pretreated PKC more than pretreatment time of98 min. This can be explained by the depolymerization or degradation of cellulosecaused by the oxidizing agent at high concentration and long reaction times.However, to prevent the loss of yield due to degradation of cellulose, combinationof longer pretreatment time and delignification time should be avoided (Asim2006).
DESIGN-EXPERT Plot
B2 alkali treatment
B1 hot water treatment
(c)(b)
(a)
Fig. 2 Yield of cellulose using a Organosolv, b LPO, and c acidic sodium chlorite delignificationtechnique
278 Y. Y. Farm et al.
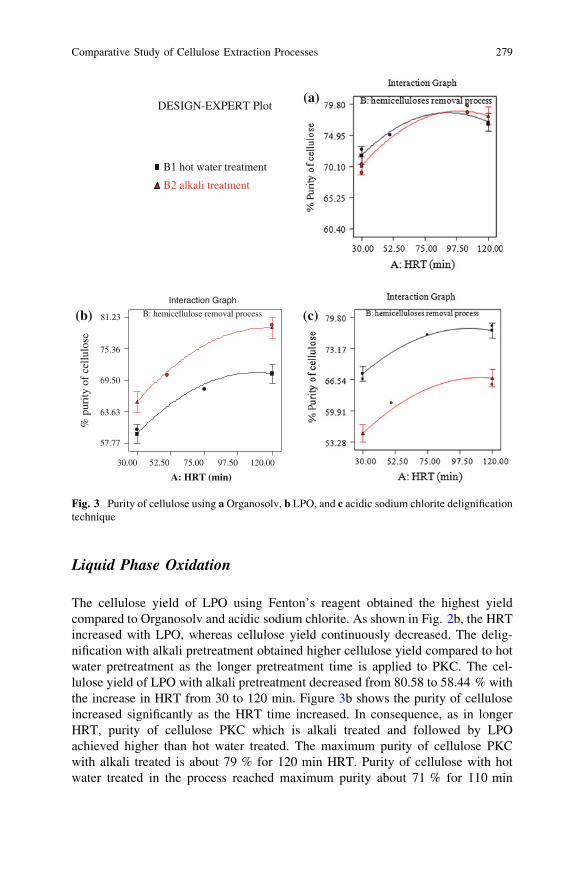
Liquid Phase Oxidation
The cellulose yield of LPO using Fenton’s reagent obtained the highest yieldcompared to Organosolv and acidic sodium chlorite. As shown in Fig. 2b, the HRTincreased with LPO, whereas cellulose yield continuously decreased. The delig-nification with alkali pretreatment obtained higher cellulose yield compared to hotwater pretreatment as the longer pretreatment time is applied to PKC. The cel-lulose yield of LPO with alkali pretreatment decreased from 80.58 to 58.44 % withthe increase in HRT from 30 to 120 min. Figure 3b shows the purity of celluloseincreased significantly as the HRT time increased. In consequence, as in longerHRT, purity of cellulose PKC which is alkali treated and followed by LPOachieved higher than hot water treated. The maximum purity of cellulose PKCwith alkali treated is about 79 % for 120 min HRT. Purity of cellulose with hotwater treated in the process reached maximum purity about 71 % for 110 min
B1 hot water treatment
B2 alkali treatment
DESIGN-EXPERT Plot
B: hemicellulose removal process
Interaction Graph
A: HRT (min)
% p
urity
of
cellu
lose
30.00 52.50 75.00 97.50 120.00
57.77
63.63
69.50
75.36
81.23
(a)
(b) (c)
Fig. 3 Purity of cellulose using a Organosolv, b LPO, and c acidic sodium chlorite delignificationtechnique
Comparative Study of Cellulose Extraction Processes 279
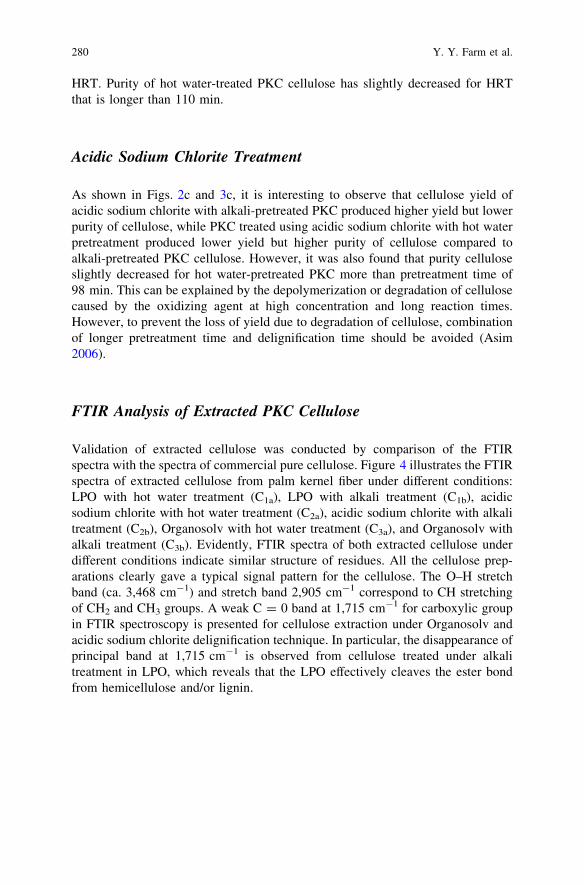
HRT. Purity of hot water-treated PKC cellulose has slightly decreased for HRTthat is longer than 110 min.
Acidic Sodium Chlorite Treatment
As shown in Figs. 2c and 3c, it is interesting to observe that cellulose yield ofacidic sodium chlorite with alkali-pretreated PKC produced higher yield but lowerpurity of cellulose, while PKC treated using acidic sodium chlorite with hot waterpretreatment produced lower yield but higher purity of cellulose compared toalkali-pretreated PKC cellulose. However, it was also found that purity celluloseslightly decreased for hot water-pretreated PKC more than pretreatment time of98 min. This can be explained by the depolymerization or degradation of cellulosecaused by the oxidizing agent at high concentration and long reaction times.However, to prevent the loss of yield due to degradation of cellulose, combinationof longer pretreatment time and delignification time should be avoided (Asim2006).
FTIR Analysis of Extracted PKC Cellulose
Validation of extracted cellulose was conducted by comparison of the FTIRspectra with the spectra of commercial pure cellulose. Figure 4 illustrates the FTIRspectra of extracted cellulose from palm kernel fiber under different conditions:LPO with hot water treatment (C1a), LPO with alkali treatment (C1b), acidicsodium chlorite with hot water treatment (C2a), acidic sodium chlorite with alkalitreatment (C2b), Organosolv with hot water treatment (C3a), and Organosolv withalkali treatment (C3b). Evidently, FTIR spectra of both extracted cellulose underdifferent conditions indicate similar structure of residues. All the cellulose prep-arations clearly gave a typical signal pattern for the cellulose. The O–H stretchband (ca. 3,468 cm-1) and stretch band 2,905 cm-1 correspond to CH stretchingof CH2 and CH3 groups. A weak C = 0 band at 1,715 cm-1 for carboxylic groupin FTIR spectroscopy is presented for cellulose extraction under Organosolv andacidic sodium chlorite delignification technique. In particular, the disappearance ofprincipal band at 1,715 cm-1 is observed from cellulose treated under alkalitreatment in LPO, which reveals that the LPO effectively cleaves the ester bondfrom hemicellulose and/or lignin.
280 Y. Y. Farm et al.
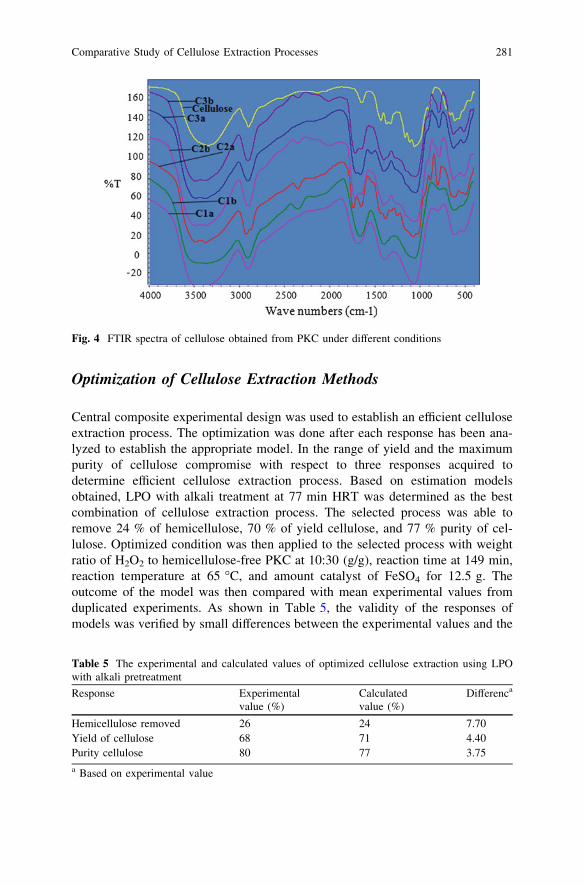
Optimization of Cellulose Extraction Methods
Central composite experimental design was used to establish an efficient celluloseextraction process. The optimization was done after each response has been ana-lyzed to establish the appropriate model. In the range of yield and the maximumpurity of cellulose compromise with respect to three responses acquired todetermine efficient cellulose extraction process. Based on estimation modelsobtained, LPO with alkali treatment at 77 min HRT was determined as the bestcombination of cellulose extraction process. The selected process was able toremove 24 % of hemicellulose, 70 % of yield cellulose, and 77 % purity of cel-lulose. Optimized condition was then applied to the selected process with weightratio of H2O2 to hemicellulose-free PKC at 10:30 (g/g), reaction time at 149 min,reaction temperature at 65 �C, and amount catalyst of FeSO4 for 12.5 g. Theoutcome of the model was then compared with mean experimental values fromduplicated experiments. As shown in Table 5, the validity of the responses ofmodels was verified by small differences between the experimental values and the
Fig. 4 FTIR spectra of cellulose obtained from PKC under different conditions
Table 5 The experimental and calculated values of optimized cellulose extraction using LPOwith alkali pretreatment
Response Experimentalvalue (%)
Calculatedvalue (%)
Differenca
Hemicellulose removed 26 24 7.70Yield of cellulose 68 71 4.40Purity cellulose 80 77 3.75a Based on experimental value
Comparative Study of Cellulose Extraction Processes 281
calculated responses. The magnitude of difference between hemicelluloseremoved, yield of cellulose, and the purity of cellulose was found to be 7.7, 4.4,and 3.75 %, respectively.
Conclusions
In this study, it is proved that the cellulose from PKC can be extracted underdifferent combination techniques. FTIR spectra of all extracted PKC cellulosesamples have similar structure as the pure commercial cellulose. LPO with alkalipretreatment at 77 min was determined as the best combination of celluloseextraction process with 24 % hemicellulose removed, 70 % of yield cellulose, and77 % purity of cellulose. Small differences between experimental values andcalculated responses revealed that D-optimal design was verified as a model tostudy the process selection of cellulose extraction from PKC.
Acknowledgments Financial support for this study was provided by Penyelidikan SiswazahUniversiti (PGD) 2006, MOSTI, Malaysia.
References
Alimon, A. R. (2004). The nutritive value of palm kernel cake for animal feed, Department ofAnimal Science, Faculty of Agriculture UPM. http://www.chgs.com.my/chinese/download/Palm%20Oil.pdf.
Asim, K. R. C. (2006). Textile preparation and dyeing, chemistry of textile materials (p. 11).New Hampshire: Science Publishers, 03784, USA.
Astimar, A. A., Husin, M., & Anis, M. (2002). Preparation of cellulose from oil palm empty fruitbunches via ethanol digestion: Effect of acid and alkali catalysts. Journal of Oil PalmResearch, 14(1), 9–14.
Biljana, M. P., Mirjana, M. K., Petar, D. S., & Jovana, Z. P. (2008). The effects of hemicellulosesand lignin removal on water uptake behavior of hemp fibers. Bioresource Technolnology99(15), 7152–7159.
Bono, A., Duduku K., Mariani R., & Nancy J. S. (2006). D-optimal analysis of formula variationeffect on Melamine-Urea Formaldehyde. Studies in Surface Science and Catalysis (pp.713–716). Elsevier BV. ISBN-10: 0-444-52751-6 159.
Bono, A., Rosalam, S., Mariani, R., & Duduku, K. (2008a). Effect of mixture components on theproperties of MUF resin. International Journal of Physical Sciences, 3, 45–49.
Bono, A., Duduku, K., & Mariyani, R. (2008b). Product and process optimization using responsesurface methodology. Universiti Malaysia, Sabah. ISBN: 978-983-2369-80-6.
Chu, Y. M. (2011). Overview of the Malaysian Oil Palm Industry 2010, Malaysian Palm OilBoard, Malaysia.
Duduku, K., Rajesh, N., & Rosalam, S. (2011). Optimization of spray for drying Morindacitrifolia L. fruit extract. Journal of Applied Sciences, 11(13), 2276–2283.
Duduku, K., Anisuzzaman, S. M., Bono, A., & Rosalam S. (2012). Adsorption of 2, 4, 6-Trichlorophenol (TCP) onto activated carbon. Journal of King Saud University-Science(in press).
282 Y. Y. Farm et al.
Dusterhoft, E. M., Posthumus, M. A., & Voragen, A. G. J. (1992). Non-starch polysaccharidesfrom sunflower (Helianthus annuus) meal and palm kernel (Elaeisguineensis) mealpreparation of cell wall material and extraction of polysaccharide fractions. Journal of theScience of Food and Agriculture, 59, 151–160.
Farm, Y., Duduku, K., Bono, A., & Mariani, R. (2009). Cellulose extraction from Palm kernelcake using Liquid phase oxidation. Journal of Engineering Science and Technology, 4(1),57–68.
Feng, X., Jin-Xia, S., Runcang, S., Paul, F., & Mark, S. B. (2006). Comparative study oforganosolv lignins from wheat straw. Industrial Crops and Products, 23, 180–193.
Hoenich, N. (2006). Cellulose for medical applications: past, present and future. BioResources,1(2), 270–280.
Isogai, A. (2001). In D. N. S. Hon & N. Shiraishi (Eds.) Chemical modification of cellulose inwood and cellulosic chemistry: Second Edition, revised and expanded (pp. 599–625).New York: Mercel Dekker.
Kammes, K. L., Bals, B. D., Dale, B. E., & Allen, M. S. (2011). Grass leaf protein, a coproduct ofcellulosic ethanol production, as a source of protein for livestock. Animal Feed Science andTechnology, 164(1–2), 79–88.
Kim, J., Yun, S., & Ounaies, Z. (2006). Discovery of cellulose as a smart material.Macromolecus, 39, 4202–4206.
Liu, C. F., Fu, X., Sun, J. X., Ren, J. L., Curling, S. R., Sun, C., et al. (2006). Physicochemicalcharacterization of cellulose from perennial ryegrass leaves (Lolium perenne). CarbohydrateResearch, 341, 2677–2687.
Mae, K., Isao H., Noriaki S., & Kouichi M. (2000). A new conversion method for recoveringvaluable chemicals from oil palm shell wastes utilizing liquid phase oxidation with H2O2
under mild condition. Energy & Fuels, 14, 1212–1218.Sarwar, J. M., Chowdhury, D. A. N., Khalidul, I. M., & Iqbal M. S. M. (2007). Characterization
of Lignin Isolated from Some Nonwood Available in Bangladesh. Bioresource Technology,98, 465–469.
Sun, J. X., Sun, X. F., Zhao, H., & Sun, R. C. (2004a). Isolation and characterization of cellulosefrom sugarcane bagasse. Polymer Degradation and Stability, 84, 331–339.
Sun, X. F., Sun, R. C., Fowler, P., & Baird, M. S. (2004b). Isolation and characterisation ofcellulose obtained by a two-stage treatment with organosolv and cyanamide activatedhydrogen peroxide from wheat straw. Carbohydrate Polymers, 55, 379–391.
Sundu, B., Kumar, A., & Dingle, J. (2006). Palm kernel cake in broiler diets: effect on chickenperformance and health. Worlds Poultry Science Journal, 62, 316–325.
TAPPI T 15 os-58, Technical Association for the Pulp and Paper Industries. (1978). Ash in woodand pulp.TAPPI Test Method T 15 os-58. TAPPI PRESS, Atlanta.
TAPPI standard T 222 OS-74, TAPPI Standard Methods. (2009). Fibrous Materials and PulpTesting. Technical Association of Pulp and Paper Industry, Atlanta.
TAPPI Test Method T 12 OS-75. (1978). Technical Association for the Pulp and Paper IndustriesPreparation of extractive free-wood. TAPPI PRESS, Atlanta.
Wise, L. E., Maxine, M., & D’Addieco, A. A. (1946). Chlorite holoeellulose, its fractionation andbearing on summative wood analysis and on studies on the hemicelluloses. Paper TradeJournal, 122, 35–43.
Wu, J., & Yuan, Q. (2002). Gas permeability of a novel cellulose membrane. Journal ofMembrane Science, 204(1–2), 185–194.
Xu, F., Sun, J. X., Geng, Z. C., Liu, C. F., Ren, J. L., Sun, R. C., et al. (2007). Comparative studyof water-soluble and alkali-soluble hemicelluloses from perennial ryegrass leaves (Loliump-eree). Carbohydrate Polymers, 67(1), 56–65.
Xua, Y., Kecheng, L., & Meiyun, Z. (2007). Lignin precipitation on the pulp fibers in the ethanol-based organosolv pulping. Colloids and Surfaces A: Physicochemical and EngineeringAspects, 301, 255–263.
Comparative Study of Cellulose Extraction Processes 283

Zhang, Y. H. P., Ding, S. Y., Mielenz, J. R., Cui, J. B., Elander, R. T., Laser, M., et al. (2007).Fractionating recalcitrant lignocellulose at modest reaction conditions. Biotechnology andBioengineering, 97(2), 214–223.
Zhang, S. P., Jin, F. M., Hu, J. J., Huo, Z. B. (2011). Improvement of lactic acid production fromcellulose with the addition of Zn/Ni/C under alkaline hydrothermal conditions. BioresourceTechnology, 102(2), 1998–2003.
284 Y. Y. Farm et al.
Screening and Separation of IndustriallyUseful Hydrolases from the WastefulSkim Latex Serum of Hevea Brasiliensis
M. Nazhirah and Y. Faridah
Abstract Hydrolases extracted from Hevea brasiliensis are a source of veryuseful industrial enzymes. They play an important role in industries related todetergent, food, oil processing, fine chemicals, and agrochemicals. Rubber tree canbe a source of phytochemicals which have the potential for use in making variousnutraceutical and pharmaceutical products. Malaysia is one of the biggest pro-ducers of natural rubber in the world. However, Malaysia is still striving with theproblems related to waste management and environmental pollution despitethe high income from natural rubber production. Skim latex is a by-product and themost polluting waste in the rubber-processing industry. Therefore, it is veryimportant to find new uses for this rubber waste. Protein constitutes about 2 % ofdry mass of the total latex and has been reported to contain useful enzymes such ashydrolases. Compared to other enzymes, hydrolases are more frequently used inindustrial applications. Over half of all detergents presently available containhydrolases and their subclasses, including proteases, cellulases, amylases, andlipases. Malaysia has vast sources of hydrolases because it is one of the largestproducers of natural rubber. Thus, it is unfortunate that the Hevea brasiliensis skimlatex is as yet not fully utilized. This work proposes to systematically identifythese potentially useful enzymes from the waste skim latex of Hevea brasiliensis.The work involved the identification of the hydrolases by screening for theirpresence using known in vitro enzymatic assays. This was followed by extractionand separation of the most active hydrolases identified via bioactivity-guidedcolumn chromatography techniques. From this study, lipid acyl hydrolase (LAH),
M. Nazhirah (&)Biomolecular and Bioprocess Engineering Research Unit (BPMERU),Department of Biotechnology Engineering, Faculty of Engineering,International Islamic University Malaysia, P.O. Box 10 50728 Kuala Lumpur, Malaysiae-mail: [email protected]
Y. FaridahDepartment of Biotechnology Engineering, Faculty of Engineering,International Islamic University Malaysia, P.O. Box 10 50728 Kuala Lumpur, Malaysiae-mail: [email protected]
R. Pogaku et al. (eds.), Developments in Sustainable Chemicaland Bioprocess Technology, DOI: 10.1007/978-1-4614-6208-8_34,� Springer Science+Business Media New York 2013
285
a subtype of lipase, was considered as the potential protein that can be recoveredfrom the skim latex serum of Hevea brasiliensis. This is because its activity wasfound to be the highest (1.561 U/ml). Further separation by gel-filtration chro-matography on SephacrylTM S-200 gave the results for LAH activity (1.304 U/ml)and total activity (97.782 U). 10 ml of skim latex serum was successfully granted apurified LAH with specific activity of 0.593 lmol min-1mg-1. A running buffersolution of 100 mM Tris HCl (pH 7.0) was used in all the steps. The significancesof this work are contribution toward the utilization of latex serum to producevalue-added product, generation of additional income for the manufacturers, anddevelopment of environment-friendly techniques in latex processing.
Keywords Detergent � Industrial enzymes � Latex serum � Purification � Rubberwaste
Introduction
According to (Yusof and Chow 2003), Hevea brasiliensis, the para rubber tree, isthe most essential source of natural rubber (cis-1,4-polyisoprene). NationalInnovation Strategy (2012) reported that Malaysian rubber and rubber products areexported to more than 180 countries. Malaysia is currently the world’s number oneexporter of natural rubber latex gloves, nitrile gloves, latex threads, and rubbercatheters. From the report, in 2010, close to 60 % of the world’s consumption ofgloves was met by the gloves manufacturing sector of Malaysia. According toDepartment of Statistics Malaysia (2011), the figures from October 2011 show anatural rubber production of 85,800 tones. However, even after the high incomefrom natural rubber production, Malaysia still suffers from the rising costs forwaste management and mounting environmental problems due to the pollutionfrom skim latex.
Natural Rubber Processing
After tapping, the exuded latex is pooled and taken to the factories for processing.For the production of natural rubber, the collected latex is treated with ammonia,and after separation of the rubber particles, the aqueous layer is usually dischargedinto the environment. This milky white aqueous layer, which is the by-product ofnatural rubber latex concentrate, is known as skim latex. The main content of skimlatex is its serum or the non-rubber aqueous part, while the dry rubber content isonly 3–7 %. Skim latex is undeniably the most polluting waste in rubber industry.It has a distinct ammoniated odor that can affect the community living in thesurrounding areas, as people who are repeatedly exposed to ammonia through
286 M. Nazhirah and Y. Faridah
inhalation may develop respiratory irritation. A membrane separation of skim latexyields skim rubber, which fetches low price, and serum. Usually, before beingreleased into the main waterways, the pretreatment process of skim latex is done inthe effluent treatment oxidation ponds. The used water which is discharged fromthe effluent treatment pond into the main waterways must meet the requirements ofMalaysian Standard MS ISO/IEC 17025:2005. In the end, the rubber manufac-turers spend a lot of money for the waste management and effluent treatment ofskim latex.
Use of Hydrolases in Industries
Hydrolases belong to a family of enzymes which catalyzes the hydrolysis of achemical bond. They are classified as EC3 and can be subdivided further intoseveral subclasses based on the bonds they hydrolyze. Hydrolases are the mostfrequently used enzymes in organic chemistry due to several reasons, one of thesebeing that they are easy to use and do not need cofactors. Also, compared to otherenzymes, hydrolases are therefore more frequently used industrially. Since themid-1960s, the use of enzymes in detergents has been their largest application.Over half of all detergents presently available contain hydrolases, of subclasses:proteases, cellulases, amylases, and lipases. These enzymes help in eliminatingstains usually made up of starches, fats, and proteins from soiled garments andtextiles. The natural task of hydrolases is to hydrolyze ester, amide, and glucosidebonds. They have different substrate specificity; however, many hydrolases canaccept a wide range of substrates. In 1996 alone, (Tramper and Poulsen 2005),USD 414 million was spent globally on enzymes applied to detergents and it isprojected that the average annual growth rate for enzymes in this sector is about10 %. The second largest user of enzymes globally is the food industry (USD 214million), followed by the textile industries (USD 32.4 million).
Types of Proteins in Skim Latex Serum
Hevea brasiliensis latex can be easily separated into three fractions: the upperlayer rubber cream, the medium clear aqueous phase (the cytosol, called C-serum),and the sediment which consists mainly of vacuole-like organelles (lutoids) afterhigh-speed centrifugation (Sunderasan et al. 2002). Proteins make up 2 % byweight of natural rubber latex (Perrella and Gaspari 2002). More than 75 % of thetotal soluble protein in latex is found in the serum fraction. According to Yusofand Chow (2003), latex is the milky sap that is discovered in several differentplants and is generated by specialized cells known as laticifers. Wahler et al.(2009) state that some of the proteins and enzymes have been identified in thelatices of laticiferous plants. These include trypsin inhibitor as well as chitinases
Screening and Separation of Industrially Useful Hydrolases 287
and b-1,3-glucanase in the latex of the rubber tree Hevea brasiliensis (Martin1991). Wahler et al. (2009) claimed that hydrolases is one of the major proteinsthat can be recovered from the skim latex.
Hevamine is one of the chitinases that has been isolated from latex (Lee et al.2006). Hevamine is a member of one of the several families of plant chitinases andlysozymes which are important for a plant’s defense against bacteria and fungiinfection. A useful enzyme, named Hevea Cathepsin G, is one of the enzymes thatcan be recovered from the skim latex serum (Yusof et al. 2006). Superoxidedismutase (SOD) is another enzyme that has been detected and studied in naturalrubber latex (Yusof and Abdullah 1997). SOD catalyzes the dismutation ofsuperoxide ions into hydrogen peroxides and oxygen during the oxidative energyprocess (Chi et al. 2001). Another protein which has been studied extensively innatural rubber is hevein. This small molecular weight acidic protein of 14 kDaoriginates from the lutoid membrane, a vacuole-like structure in latex. It can beisolated by affinity chromatography on chitin column (Soedjanaatmadja et al.1996) and is observed to be antifungal toward certain strains. Yusof et al. (1998)discovered an inhibitor to rubber biosynthesis. This proteinaceous inhibitor ofrubber biosynthesis has a molecular weight of 43.7 kDa and the partial sequencerevealed that this protein has regions of sequence similar to patatin in potato. Thus,this protein is named patatin-like-protein. Investigations also showed that likepatatin, this protein demonstrates lipolytic acyl hydrolase activity.
Above are some examples of enzymes and proteins that have been discoveredand studied in natural rubber latex. Looking at the electrophoretical analysis ofprotein profile, in previous studies, it is found that skim latex serum has hundredsof proteins or enzymes waiting to be discovered and identified. It has been pre-dicted that with a systematic study and using sound experimental designs, more ofthese proteins and enzymes can be elucidated. Properly purified, these enzymescan be used in many industries including food, detergent, and medical. The uti-lization of the serum, by converting it into valuables substances, could be aneffective and sustainable way to minimize the discharging of effluent into the mainwaterway. This would make latex processing an environment-friendly and evenrevenue-generating process for the concerned manufacturers.
Methodology
Sample Collection and Preparation
The skim latex (effluent) used in this project was collected from Mardec IndustrialLatex Sdn. Bhd. in Tapah, Perak. The preparation of the sample, before beingintroduced into column chromatography steps, involved coagulation, centrifuga-tion, precipitation, and dialysis. All processes were performed at 4 �C to preservethe stability of the proteins.
288 M. Nazhirah and Y. Faridah
Hydrolases Extraction
After collection, the skim latex (approx. 17L, pH10) was immediately coagulatedby adding acetic acid glacial to reach pH 5. Subsequently, the acidified sample wascentrifuged at 10,000 x g, 4 �C for 30 min in an Avanti� J-E high-speed centrifugeto remove the coagulated rubber (skim rubber). The supernatant (skim latexserum) obtained after centrifugation was pooled (approx. 14.5 L, *85 %). Solid(NH4)2SO4 was added to the pooled sample up to 4 M, to concentrate the skimlatex protein and it was left overnight under slow stirring at 4 �C. The precipitating100 % saturation was collected by centrifugation at 5,000 x g for 15 min. Thesupernatant was discarded and the residue was dissolved in minimal phosphatebuffered saline at pH 7.0 and dialyzed using 10,000 (MWCO) of Pierce SnakeSkinTM Pleated Dialysis Tubing against 0.1 M Tris HCl buffer at pH 7.0 overnight.
Biochemical Analyses
Several biochemical analyses were conducted to measure the total protein concen-tration through the dye-binding method of Bradford’s assay (Bradford 1976), withbovine serum albumin (BSA) as the standard; protein purity test by Sodium DodecylSulfate–Polyacrylamide gel electrophoresis (SDS-PAGE)(Laemmli 1970); and sev-eral other enzyme activity assays.
Quantitation of Activity by Hydrolases Assay
Hydrolases activities were performed using the methods of calorimetric andspectrophotometric stop reactions, with some modification. All tests were carriedout in triplicate.
Chromatography- Gel Filtration
The glass Econo� Column (Bio-Rad), with inner dimensions of 100 9 2.6 cm,was packed with 450 ml Sephacryl S-200 high resolution (GE Healthcare). Theresin was washed with 3 column volume of degassed and filtered 20 % ethanol andwas equilibrated with 2 column volume of degassed and filtered 0.1 M Tris HClbuffer at pH7. After the (NH4)2SO4 precipitation, the dialysate was applied to thecolumn. Elution was carried out with the same buffer. The flow rate was 1 ml/min,and fractions of 5 ml were collected. Absorbance measures of 280 nm were readfrom the AKTA-purifierTM.
Screening and Separation of Industrially Useful Hydrolases 289
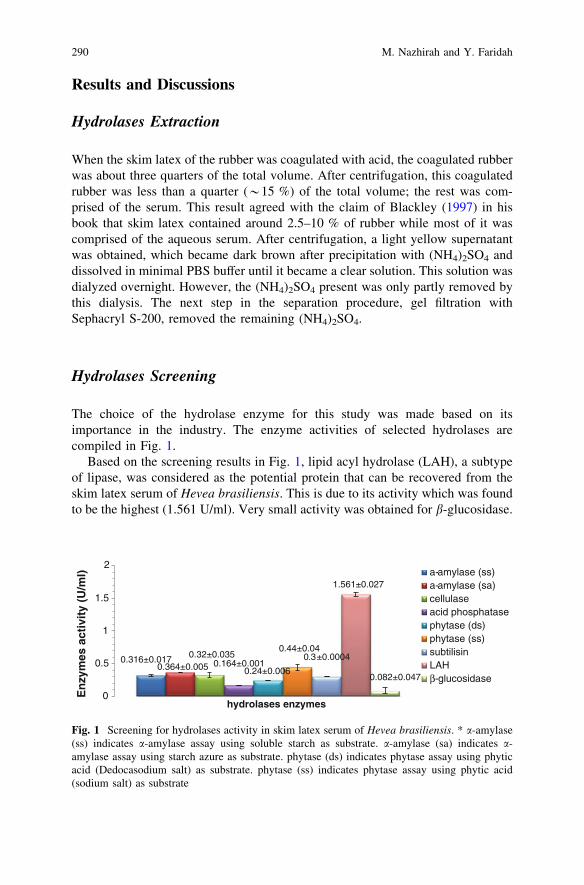
Results and Discussions
Hydrolases Extraction
When the skim latex of the rubber was coagulated with acid, the coagulated rubberwas about three quarters of the total volume. After centrifugation, this coagulatedrubber was less than a quarter (*15 %) of the total volume; the rest was com-prised of the serum. This result agreed with the claim of Blackley (1997) in hisbook that skim latex contained around 2.5–10 % of rubber while most of it wascomprised of the aqueous serum. After centrifugation, a light yellow supernatantwas obtained, which became dark brown after precipitation with (NH4)2SO4 anddissolved in minimal PBS buffer until it became a clear solution. This solution wasdialyzed overnight. However, the (NH4)2SO4 present was only partly removed bythis dialysis. The next step in the separation procedure, gel filtration withSephacryl S-200, removed the remaining (NH4)2SO4.
Hydrolases Screening
The choice of the hydrolase enzyme for this study was made based on itsimportance in the industry. The enzyme activities of selected hydrolases arecompiled in Fig. 1.
Based on the screening results in Fig. 1, lipid acyl hydrolase (LAH), a subtypeof lipase, was considered as the potential protein that can be recovered from theskim latex serum of Hevea brasiliensis. This is due to its activity which was foundto be the highest (1.561 U/ml). Very small activity was obtained for b-glucosidase.
0.316±0.0170.364±0.005
0.32±0.0350.164±0.001
0.24±0.006
0.44±0.040.3±0.0004
1.561±0.027
0.082±0.047
0
0.5
1
2
1.5
En
zym
es a
ctiv
ity
(U/m
l)
hydrolases enzymes
a-amylase (ss)a-amylase (sa)cellulaseacid phosphatasephytase (ds)phytase (ss)subtilisinLAHβ-glucosidase
Fig. 1 Screening for hydrolases activity in skim latex serum of Hevea brasiliensis. * a-amylase(ss) indicates a-amylase assay using soluble starch as substrate. a-amylase (sa) indicates a-amylase assay using starch azure as substrate. phytase (ds) indicates phytase assay using phyticacid (Dedocasodium salt) as substrate. phytase (ss) indicates phytase assay using phytic acid(sodium salt) as substrate
290 M. Nazhirah and Y. Faridah
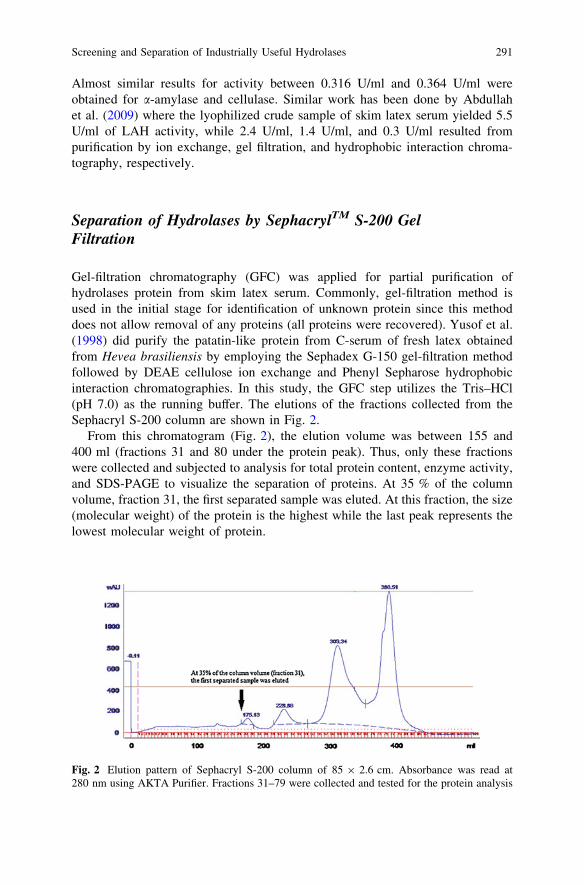
Almost similar results for activity between 0.316 U/ml and 0.364 U/ml wereobtained for a-amylase and cellulase. Similar work has been done by Abdullahet al. (2009) where the lyophilized crude sample of skim latex serum yielded 5.5U/ml of LAH activity, while 2.4 U/ml, 1.4 U/ml, and 0.3 U/ml resulted frompurification by ion exchange, gel filtration, and hydrophobic interaction chroma-tography, respectively.
Separation of Hydrolases by SephacrylTM S-200 GelFiltration
Gel-filtration chromatography (GFC) was applied for partial purification ofhydrolases protein from skim latex serum. Commonly, gel-filtration method isused in the initial stage for identification of unknown protein since this methoddoes not allow removal of any proteins (all proteins were recovered). Yusof et al.(1998) did purify the patatin-like protein from C-serum of fresh latex obtainedfrom Hevea brasiliensis by employing the Sephadex G-150 gel-filtration methodfollowed by DEAE cellulose ion exchange and Phenyl Sepharose hydrophobicinteraction chromatographies. In this study, the GFC step utilizes the Tris–HCl(pH 7.0) as the running buffer. The elutions of the fractions collected from theSephacryl S-200 column are shown in Fig. 2.
From this chromatogram (Fig. 2), the elution volume was between 155 and400 ml (fractions 31 and 80 under the protein peak). Thus, only these fractionswere collected and subjected to analysis for total protein content, enzyme activity,and SDS-PAGE to visualize the separation of proteins. At 35 % of the columnvolume, fraction 31, the first separated sample was eluted. At this fraction, the size(molecular weight) of the protein is the highest while the last peak represents thelowest molecular weight of protein.
Fig. 2 Elution pattern of Sephacryl S-200 column of 85 9 2.6 cm. Absorbance was read at280 nm using AKTA Purifier. Fractions 31–79 were collected and tested for the protein analysis
Screening and Separation of Industrially Useful Hydrolases 291
Biochemical Analysis
Qualitation of Purity by SDS-PAGE
The presence of target protein was detected (through SDS-PAGE analysis) in theearly peak (which is estimated to be around 45 kDa). Similar result was obtainedby Yusof et al. (1998) and Abdullah et al. (2009) in which this protein was elutedin the early peak of the protein profile from gel column chromatography usingSephadex G-150 and Sephacryl S-200 resin, respectively. Yusof et al. (1998)discovered a proteinaceous inhibitor of rubber biosynthesis that has a molecularweight of 43.7 kDa and has lipolytic acyl hydrolase (LAH) activity. From theobservation, fractions between 43 and 57 showed higher band intensity at 45 kDawhich indicates the presence of LAH enzyme at this fraction compared to the otherfractions. It is suggested that these fractions be pooled before being processed inthe next chromatography step.
Based on SDS-PAGE results, there were unidentified proteins with molecularsizes of around 21.5 and 5 kDa. In this study, the only known identified proteinwas a protein of size 30 kDa (Cathepsin G), a skim latex Hevea protease which is ahomologue to cathepsin G found in the human body and is believed to be useful inskin regeneration mechanism (Yusof et al. 2006).
Quantitation of Protein by Bradford’s Protein Assay
Bradford’s protein assay was incorporated in the study to quantify the total proteinpurified at the separation process. BSA was used as the protein standard. Thecalculation of protein content was based on the equation:
y ¼ �0:0042x2 þ 0:1106x þ 0:0689 ð1Þ
where, y represents the absorbance reading of protein at 595 nm and x representsthe amount of protein content (mg/ml). 5 ml elution was collected per fraction.
Specific activity is a measure of the amount of a particular protein among all theother contaminating proteins. It is calculated by dividing the activity by the totalprotein. The higher this value, the higher is the purity. Based on the calculatedtotal protein, the specific activity of LAH is increasing after separation by GFCfrom 0.077 to 0.593 lmol of q-nitrophenyl palmitate hydrolyzed per milligram ofprotein per minute. A study done by Yusof et al. (1998) shows that 1.5 g oflyophilized C-serum was successfully granted a purified patatin-like-protein con-sistency with specific activity of 0.6 lmol min-1mg-1.
292 M. Nazhirah and Y. Faridah
Conclusion
LAH, a subtype of lipase, was considered as the protein that can be potentiallyrecovered from the skim latex serum of Hevea brasiliensis. This decision wasbased on the fact that its activity was found to be the highest (1.561 U/ml) and itwas confirmed to be a LAH, by detection on SDS-PAGE. Further, GFC onSephacrylTM S-200 was used to separate hydrolases from crude skim latex serumto yield the results of LAH activity (1.304 U/ml) and total activity (97.782 U).0.593 lmol of p-nitrophenyl palmitate was hydrolyzed per milligram of protein,per minute. A running buffer solution of pH 7.0 composed of 100 mM Tris HClwas used for all the steps to preserve consistency.
Summary
Extraction and separation of the hydrolase from the skim latex rubber (Heveabrasiliensis) resulted in a protein which demonstrated LAH activities. Future workwill focus on continuing the purification steps on pooled fractions (43–57) usingother steps of column chromatography, such as ion exchange for concentrating theLAH protein and hydrophobic interaction chromatography for polishing andachieving high purity by removal of any remaining traces of impurities or closelyrelated substances.
Acknowledgments The authors would like to thank the International Islamic UniversityMalaysia and the Ministry of Higher Education, Malaysia, for funding this research work.
References
Abdullah, N. A. H., Yusof, F. & Nor, Z. M. (2009). Development of patatin-like proteinpurification method from natural rubber industrial waste. In Second International Conferenceand Workshops on Basic and Applied Science and Regional Annual Fundamental ScienceSeminar, 2–4 June, Johor Bahru, Malaysia.
Blackley, D. C. (1997). Polymer latices. London: Chapman & Hall.Bradford, M. M. (1976). A rapid and sensitive method for the quantitation of microgram
quantities of protein utilizing the principle of protein-dye binding. Analytical Biochemistry,72, 254–284.
Chi, T. S., Tung, L. L., & Jong, C. S. (2001). Purification and characterization of block porgymuscle Cu/Zn superoxide dismutase. Zoological Studies, 40(2), 84–90.
Department of Statistics Malaysia. (2011). Monthly sector report: Rubber (http://www.statistics.gov.my). Accessed 10 September 2012.
Laemmli, U. K. (1970). Cleavage of structural proteins during the assembly of the head ofbacteriophage T4. Nature, 227, 680–685.
Screening and Separation of Industrially Useful Hydrolases 293
Lee, M. F., Chen, Y. H., Lin, H. C., Wang, H. L., Hwang, G. Y., & Wu, C. H. (2006).Identification of Hevamine and Hev b1 as Major Latex Allergens in Taiwan. InternationalArchives of Allergy and Immunology, 139, 38–44.
Martin, N. (1991). The latex of Hevea brasiliensis contains both high chitinase and lysozymeactivity. Journal of Plant Physiology, 95(2), 469–476.
National Innovation Strategy. (2012). Rubber product innovation drafts. (www.innovation.my).Accessed 10 September 2012.
Perrella, F. W., & Gaspari, A. A. (2002). Natural rubber latex protein reduction with an emphasison enzyme treatment. Methods, 27(1), 77–86.
Soedjanaatmadja, U. M., Hofsteenge, J., Jeronimus, S. C. M., Bruins, A. P. & Beintema, J. J.(1996). Journal of Biochemistry Biophysics, 144–149.
Sunderasan, E., Ward, M. A., & Yeang, H. Y. (2002). Isolation and characterization of latexcyanogenic glucosidase in Hevea brasiliensis. Journal of Rubber Research, 5, 244–252.
Tramper, J., & Poulsen, P. (2005). Enzymes as processing aid and final products. In A. J. J.Strraathof & P. Adlercreutz (Eds.), Applied Biocatalysis. The Netherland: Taylor and Francis.
Wahler, D., Gronover, C. S., Richter, C., Foucu, F., Twyman, R. M., Moerschbacher, B. M., et al.(2009). Polyphenoloxidase silencing affects latex coagulation in taraxacum species. PlantPhysol, 151, 334–346.
Yusof, F., & Abdullah, L. (1997). Purification and characterization of superoxide dismutase fromHevea brasiliensis latex. In Proceedings of the 9th National Biotechnology Seminar, 23–26November, Pulau Pinang, Malaysia.
Yusof, F., & Chow, K. S. (2003). The biosynthesis of rubber Hevea brasiliensis (MRBmonograph no.4 ed.), Malaysia, Malaysian Rubber Board.
Yusof, F., Ward, M. A., & Walker, J. M. (1998). Purification and characterization of an inhibitorof rubber biosynthesis from C-serum of Hevea brasiliensis latex. Journal of Rubber Research,1(2), 95–110.
Yusof, F., Amid, A., Jimat, D. N., Nayan, M. Y., Osman, N. O., & Abdullah, N. A. H. (2006).Recovery of useful protease, cathepsin g, from the waste skim latex serum of heveabrasiliensis. In Kulliyyah of engineering research and innovation exhibition (KERIE 2006),5–6 December, Kuala Lumpur, Malaysia.
294 M. Nazhirah and Y. Faridah
Study of H2S Removal Efficiency of VirginZeolite in POME Biogas Desulfurizationat Ambient Temperature and Pressure
H. Pourzolfaghar and M. H. S. Ismail
Abstract H2S removal efficiency of a virgin zeolite is surveyed in this chapter byan adsorption unit fabricated in pilot scale and biogas produced directly from ananaerobic digester in ambient temperature and atmospheric pressure. The regen-eration study and medium life-time were also surveyed by using it in severalcycles of adsorption–desorption process. The H2S removing efficiency of morethan 90 % could be reached during the experiments. The virgin zeolite was ana-lyzed with EDX and XRD equipments. Also the instinct regeneration ability andCH4/CO2 ratio-upgrading capability of zeolite are studied on this chapter. Instinctregeneration ability of the virgin zeolite showed an outstanding characteristicwhich makes it a promising adsorbent in industrial scale. From the results it isconcluded that fresh zeolite is a suitable adsorbent for removing H2S from biogasat ambient temperature and pressure in an economical view.
Introduction
Growing world demands for fossil fuels and its limited reserves led to the discoveryof an alternative fuel source which is cheap, available, abundant, and environmentalfriendly. Biogas is a renewable fuel which is produced from fermentation of organiccompositions (e.g.,) animal waste, crop residues, sewage sludge, household wastes,wastewater, and landfill (Wang et al. 2008a, b). It is clean, cheap, and environ-mentally friendly (Pipatmanomai and Vitidsant 2009). Physical and chemicalcharacteristics of biogas are similar to those of natural gas; hence, it is a suitablealternative for LPG, fuel for heating, lighting, producing electricity or fuel fordriving equipment (Wang et al. 2008a, b). Biogas composition depends on the
H. Pourzolfaghar (&) � M. H. S. IsmailChemical and environmental Engineering Programme, School of Engineering,Universiti Putra Malaysia (UPM), 43400 Selangor, Malaysiae-mail: [email protected]
R. Pogaku et al. (eds.), Developments in Sustainable Chemicaland Bioprocess Technology, DOI: 10.1007/978-1-4614-6208-8_35,� Springer Science+Business Media New York 2013
295
organic substrate. Biogas obtained from manure digestion generally consists ofapproximately (55–80 %) methane, carbon dioxide (20–45 %), nitrogen (0–10 %)and trace amounts of H2S, and other impurities (Xuan et al. 2009; Wang et al.2008a, b). H2S concentration in biogas ranges from 10–30 to 3,000–6,000 ppm(Stepova et al. 2009).
For many reasons, H2S, which is a persistent problem linked with biogas has tobe removed to use as an alternative for fossil fuels. Concerns about H2S uptake atlow temperature are growing because it is a by-product of many industrial pro-cesses, such as the Claus process, anaerobic digestion, and natural gas sweetening(Pipatmanomai and Vitidsant 2009; Xiao et al. 2008). H2S is an extremely toxic,odorous, and corrosive gas which can cause corrosion to the engine and pipelineand decrease plant lifetime (Xiao et al. 2008). Also, this toxic gas can cause healthproblems even at low concentrations (Gabriel and Deshusses 2003). Last but notleast, sulfur compounds produced by H2S oxidation are considered as a source ofacid rains. And strict environmental regulations derived by developed countries’governments caused a growing concern over removing H2S from gas streams(Seredych and Bandosz 2007). Current technologies for biogas desulfurization fallinto one of the following: (1) biological conversion of sulfur compounds to ele-mental sulfur; (2) absorption into a caustic solution or a liquid; (3) adsorption bysolid materials, for instance, activated carbons, impregnated activated carbons,zeolites, and oxide-based metals; and (4) selective catalytic oxidation (Cheah et al.2009; Duan et al. 2007; Seredych and Bandosz 2007; Yasyerli et al. 2004; Gabrieland Deshusses 2003).
Each technology has its own advantages and disadvantages. Commercial bio-logical processes for H2S removal are also available and claimed to effectivelyreduce operating, chemical, and energy costs, but require higher capital costs thandry-based processes. Liquid-based and membrane processes require significantlyhigher capital, energy, and media costs, although regeneration is possible.Absorption by water or basic solution will cause wastewater problem, if nonre-generable or not treated well (Teresa 2002).
Among the various methods used to remove low-concentration H2S from gasesin low temperature, dry adsorption is considered as an efficient, environmentalfriendly, and economical approach (Bagreev et al. 2001; Bagreev and bandosz2001; Teresa 1999). Materials used in dry adsorption process by different studiescan be categorized into four groups: (1) metal-based materials, (2) carbon-basedmaterials, (3) porous materials, and (4) polymeric materials (Khudiash andAl-Hinai 2006; Teresa 2002; Bagreev et al. 2001; Bagreev and bandosz 2001;Teresa 1999). Several studies have addressed the removal of sulfurous compoundsin low temperatures using molecular sieves and (porous) adsorbents (Xuan et al.2009; Khudaish and Al-Hinai 2006; Melo et al. 2004; Bae et al. 2003). Thesematerials represent a series of valuable properties and characteristics to adsorptionprocesses. Zeolites are a kind of molecular sieve, and because of their inherentability to adsorb polar compounds, they have long been considered as excellent
296 H. Pourzolfaghar and M. H. S. Ismail
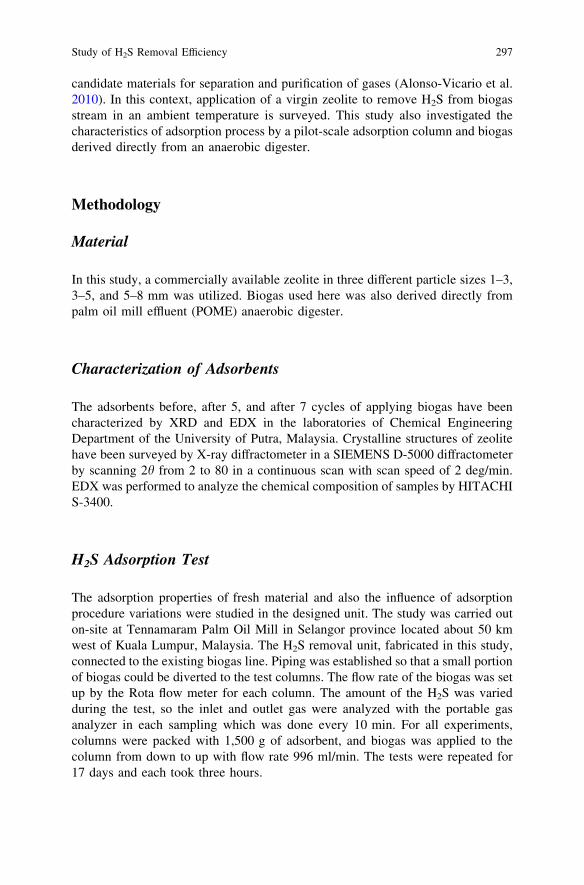
candidate materials for separation and purification of gases (Alonso-Vicario et al.2010). In this context, application of a virgin zeolite to remove H2S from biogasstream in an ambient temperature is surveyed. This study also investigated thecharacteristics of adsorption process by a pilot-scale adsorption column and biogasderived directly from an anaerobic digester.
Methodology
Material
In this study, a commercially available zeolite in three different particle sizes 1–3,3–5, and 5–8 mm was utilized. Biogas used here was also derived directly frompalm oil mill effluent (POME) anaerobic digester.
Characterization of Adsorbents
The adsorbents before, after 5, and after 7 cycles of applying biogas have beencharacterized by XRD and EDX in the laboratories of Chemical EngineeringDepartment of the University of Putra, Malaysia. Crystalline structures of zeolitehave been surveyed by X-ray diffractometer in a SIEMENS D-5000 diffractometerby scanning 2h from 2 to 80 in a continuous scan with scan speed of 2 deg/min.EDX was performed to analyze the chemical composition of samples by HITACHIS-3400.
H2S Adsorption Test
The adsorption properties of fresh material and also the influence of adsorptionprocedure variations were studied in the designed unit. The study was carried outon-site at Tennamaram Palm Oil Mill in Selangor province located about 50 kmwest of Kuala Lumpur, Malaysia. The H2S removal unit, fabricated in this study,connected to the existing biogas line. Piping was established so that a small portionof biogas could be diverted to the test columns. The flow rate of the biogas was setup by the Rota flow meter for each column. The amount of the H2S was variedduring the test, so the inlet and outlet gas were analyzed with the portable gasanalyzer in each sampling which was done every 10 min. For all experiments,columns were packed with 1,500 g of adsorbent, and biogas was applied to thecolumn from down to up with flow rate 996 ml/min. The tests were repeated for17 days and each took three hours.
Study of H2S Removal Efficiency 297
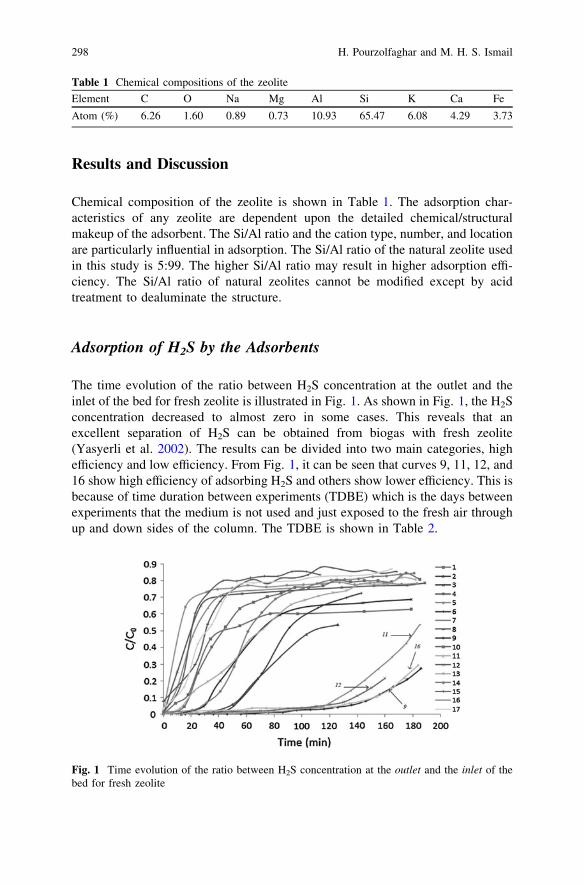
Results and Discussion
Chemical composition of the zeolite is shown in Table 1. The adsorption char-acteristics of any zeolite are dependent upon the detailed chemical/structuralmakeup of the adsorbent. The Si/Al ratio and the cation type, number, and locationare particularly influential in adsorption. The Si/Al ratio of the natural zeolite usedin this study is 5:99. The higher Si/Al ratio may result in higher adsorption effi-ciency. The Si/Al ratio of natural zeolites cannot be modified except by acidtreatment to dealuminate the structure.
Adsorption of H2S by the Adsorbents
The time evolution of the ratio between H2S concentration at the outlet and theinlet of the bed for fresh zeolite is illustrated in Fig. 1. As shown in Fig. 1, the H2Sconcentration decreased to almost zero in some cases. This reveals that anexcellent separation of H2S can be obtained from biogas with fresh zeolite(Yasyerli et al. 2002). The results can be divided into two main categories, highefficiency and low efficiency. From Fig. 1, it can be seen that curves 9, 11, 12, and16 show high efficiency of adsorbing H2S and others show lower efficiency. This isbecause of time duration between experiments (TDBE) which is the days betweenexperiments that the medium is not used and just exposed to the fresh air throughup and down sides of the column. The TDBE is shown in Table 2.
Table 1 Chemical compositions of the zeolite
Element C O Na Mg Al Si K Ca Fe
Atom (%) 6.26 1.60 0.89 0.73 10.93 65.47 6.08 4.29 3.73
Fig. 1 Time evolution of the ratio between H2S concentration at the outlet and the inlet of thebed for fresh zeolite
298 H. Pourzolfaghar and M. H. S. Ismail
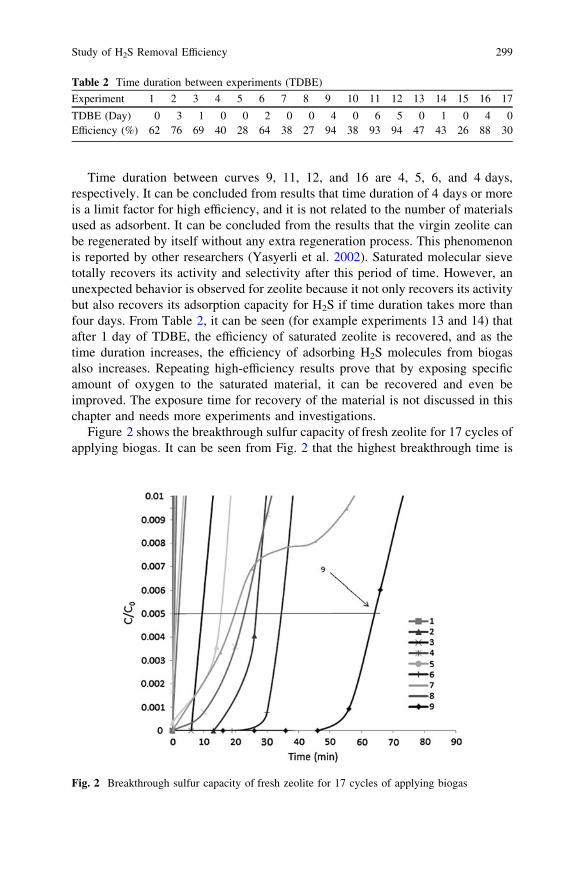
Time duration between curves 9, 11, 12, and 16 are 4, 5, 6, and 4 days,respectively. It can be concluded from results that time duration of 4 days or moreis a limit factor for high efficiency, and it is not related to the number of materialsused as adsorbent. It can be concluded from the results that the virgin zeolite canbe regenerated by itself without any extra regeneration process. This phenomenonis reported by other researchers (Yasyerli et al. 2002). Saturated molecular sievetotally recovers its activity and selectivity after this period of time. However, anunexpected behavior is observed for zeolite because it not only recovers its activitybut also recovers its adsorption capacity for H2S if time duration takes more thanfour days. From Table 2, it can be seen (for example experiments 13 and 14) thatafter 1 day of TDBE, the efficiency of saturated zeolite is recovered, and as thetime duration increases, the efficiency of adsorbing H2S molecules from biogasalso increases. Repeating high-efficiency results prove that by exposing specificamount of oxygen to the saturated material, it can be recovered and even beimproved. The exposure time for recovery of the material is not discussed in thischapter and needs more experiments and investigations.
Figure 2 shows the breakthrough sulfur capacity of fresh zeolite for 17 cycles ofapplying biogas. It can be seen from Fig. 2 that the highest breakthrough time is
Table 2 Time duration between experiments (TDBE)
Experiment 1 2 3 4 5 6 7 8 9 10 11 12 13 14 15 16 17
TDBE (Day) 0 3 1 0 0 2 0 0 4 0 6 5 0 1 0 4 0Efficiency (%) 62 76 69 40 28 64 38 27 94 38 93 94 47 43 26 88 30
Fig. 2 Breakthrough sulfur capacity of fresh zeolite for 17 cycles of applying biogas
Study of H2S Removal Efficiency 299
related to curve 9. Following curves 6, 2, 12, 16, and 11 have higher breakthroughtime successively, compared to other curves. From the breakthrough curves, it canbe concluded that although curves 9, 11, 12, and 16 have high efficiency, theirbreakthrough time is not the same. This might be because of filling the micro-porous spaces on the material by applying gas in different cycles. From Fig. 2, itcan also be concluded that after cycle 9, the breakthrough time decreases.Breakthrough time of curve 9 is around 64 min.
Conclusions
According to the experiment results, fresh zeolite has capability of removing H2Sfrom biogas more than 94 % without any activation process provided that it isexposed to sufficient amount of oxygen. Although adsorption capacity of thismaterial is lower compared to activated ones, it has attractive characteristics fromeconomical view to be used in an industrial scale like no need to activation,improving the adsorption efficiency during cycles, and most importantly instinctregeneration. There are different criteria for a material to be used in an industrialscale like material, labor, preprocess, and regeneration costs and also kinetic ofreaction, adsorption capacity, availability, and environmental friendly character-istics of material. As it can be seen, most of the criteria of an industrial adsorbentare related to economical. The fresh zeolite because of its characteristics men-tioned before is a promising material to be used in gas desulfurization processes.
References
Alonso-Vicario, A., Ochoa-Gómez, J. R., Gil-Río, S., Gómez-Jiménez-aberasturi, O., Ramírez-López, C. A., & Torrecilla-Soria, J. (2010). Purification and upgrading of biogas by pressureswing adsorption on synthetic and natural zeolites. Microporous and Mesoporous Materials,134(1–3), 100–107.
Bae, M. N., Song, M. K., Kim, Y., & Seff, K. (2003). Crystal structure of Mn 46Si 100Al 92O384 � 89H 2S, a hydrogen sulfide sorption complex of fully dehydrated Mn 2+ exchangedzeolite X. Microporous and Mesoporous Materials, 63(1–3), 21–31.
Bagreev, A., & Bandosz, T. J. (2001). H2S adsorption/oxidation on unmodified activated carbons:Importance of prehumidification. Carbon, 39(15), 2303–2311.
Bagreev, A., Rahman, H., & Bandosz, T. J. (2001). Thermal regeneration of a spent activatedcarbon previously used as hydrogen sulfide adsorbent. Carbon, 39(9), 1319–1326.
Cheah, S., Carpenter, D. L., & Magrini-Bair, K. A. (2009). Review of mid- to high-temperaturesulfur sorbents for desulfurization of biomass and coal-derived syngas. Energy and Fuels,23(11), 5291–5307.
Duan, H., Yan, R., Koe, L. C., & Wang, X. (2007). Combined effect of adsorption andbiodegradation of biological activated carbon on H2S biotrickling filtration. Chemosphere,66(9), 1684–1691.
300 H. Pourzolfaghar and M. H. S. Ismail
Gabriel, D., & Deshusses, M. A. (2003). Retrofitting existing chemical scrubbers to biotricklingfilters for H2S emission control. Proceedings of the National Academy of Sciences, 100(11),6308–6312.
Khudaish, E. A., & Al-Hinai, A. T. (2006). The catalytic activity of vanadium pentoxide filmmodified electrode on the electrochemical oxidation of hydrogen sulfide in alkaline solutions.Electroanalytical Chemistry, 587(1), 108–114.
Melo, D. M. A., de Souza, J. R., Melo, M. A. F., Martinelli, A. E., Cachima, G. H. B., & Cunha,J. D. (2004). Evaluation of the zinox and zeolite materials as adsorbents to remove H2S fromnatural gas. Colloids and Surfaces A: Physicochemical and Engineering Aspects, 272(1–2),32–36.
Pipatmanomai, K. S., & Vitidsant, T. (2009). Economic assessment of biogas-to-electricitygeneration system with H2S removal by activated carbon in small pig farm. Applied Energy,86(5), 669–674.
Seredych, M., & Bandosz, T. J. (2007). Sewage sludge as a single precursor for development ofcomposite adsorbents/catalysts. Chemical Engineering, 128(1), 59–67.
Stepova, K. V., Maquarrie, D. J., & Krip, I. M. (2009). Modified bentonites as adsorbents ofhydrogen sulfide gases. Applied Clay Science, 42(3–4), 625–628.
Teresa, J. B. (1999). Effect of pore structure and surface chemistry of virgin activated carbons onremoval of hydrogen sulfide. Carbon, 37(3), 483–491.
Teresa, J. B. (2002). On the adsorption/oxidation of hydrogen sulfide on activated carbons atambient temperatures. Colloid and Interface Science, 246(1), 1–20.
Wang, X., Ma, X., & Xu, X. (2008a). Mesoporous-molecular-sieve-supported polymer sorbentsfor removing H2S from hydrogen gas streams. Topics in Catalysis, 49(1), 108–117.
Wang, X., Sun, T., Yang, J., Zhao, L., & Jia, J. (2008b). Low-temperature H2S removal from gasstreams with SBA-15 supported ZnO nanoparticles. Chemical Engineering, 142(1), 48–55.
Xiao, Y., Wang, S., Wu, D., & Yuan, Q. (2008). Experimental and simulation study of hydrogensulfide adsorption on impregnated activated carbon under anaerobic conditions. HazardousMaterials, 153(3), 1193–1200.
Xuan, J., Leung, M. K. H., Leung, D. Y. C., & Ni, M. (2009). A review of biomass-derived fuelprocessors for fuel cell systems. Renewable and Sustainable Energy Reviews, 13(6–7),1301–1313.
Yasyerli, S., Ar, I., Dogu, G., & Dogu, T. (2002). Removal of hydrogen sulfide by Clinoptilolitein a fixed bed adsorber. Chemical Engineering and Processing: Process Intensification, 41(9),785–792.
Yasyerli, S., Dogu, G., Ar, I., & Dogu, T. (2004). Dynamic analysis of removal and selectiveoxidation of H2S to elemental sulfur over Cu–V and Cu–V–Mo mixed oxides in a fixed bedreactor. Chemical Engineering Science, 59(19), 4001–4009.
Study of H2S Removal Efficiency 301
Investigation into Alternativefor Bleaching Earth in Palm OilProcessing
L. N. Ngu and F. A. A. Twaiq
Abstract In this study, hexagonal mesoporous molecular sieves (HMS) weresynthesized to investigate their potential to be used as alternative for bleaching earthin palm oil processing. This study also investigated their ability to be regenerated forreuse. HMS synthesized were found to have BET surface area ranging between 900and 1,200 m2/g and total pore volume of 0.9 cm3/g. It was proven that synthesizedHMS can successfully perform the bleaching of the palm oil and, in addition, can beregenerated for at least nine times to be reused for bleaching. It was found that thedosage of phosphoric acid added for degumming and the ratio of HMS to oil usedduring bleaching play important role in ensuring the success of the bleaching. Theratio of HMS to palm oil for successful bleaching is found to be 1:11.
Introduction
Bleaching is one of the critical stages in the crude palm oil refining process. In thebleaching process, bleaching adsorbents are used to remove the selective impuritiesand colour pigments. The colour pigments can adversely affect the taste of the oiland is generally disliked by consumers (Rohani 2006; Hassan and El-Shall 2004).Hence, the removal of the colour pigments is essential to improve the quality of thepalm oil. Currently, bleaching clays have been most commonly and extensively usedin the industry for bleaching of edible oil (Sabah 2007). According to a report by
L. N. Ngu (&)Department of Chemical Engineering, School of Engineering and Science, CurtinUniversity, CDT 250 98009 Miri, Sarawak, Malaysiae-mail: [email protected]
F. A. A. TwaiqDepartment of Chemical Engineering, College of Engineering and Architecture, Universityof Nizwa, P.O.Box 33616 Brikat Al Mouz, Nizwa, Omane-mail: [email protected]
R. Pogaku et al. (eds.), Developments in Sustainable Chemicaland Bioprocess Technology, DOI: 10.1007/978-1-4614-6208-8_36,� Springer Science+Business Media New York 2013
303
Malaysian Palm Oil Board (2012), crude palm oil production in Malaysia reached19 million tons in 2011. With the high production rate of crude palm oil, there aresignificant quantities of spent bleaching earth generated in the refining of crude palmoil. Besides, spent bleaching earth usually contains retained oil of 20–40wt % afterbleaching process (Yahia and Abdulrahim 1999), which can present a fire hazard.Also, as it is usually disposed into landfill without pretreatment, it could causepollution problems, which includes polluting underground water. Therefore, asuitable alternative bleaching material that can be regenerated for repeated usewould be both economically and ecologically advantageous.
In this research study, it is aimed to investigate an alternative bleaching agentthat can be used to replace bleaching earth and can also be regenerated multipletimes for reuse as a means of reducing the cost of refining. According to Patterson(1992), cited in Rohani (2006), for effective adsorption in bleaching process,porous adsorbents with high specific surface area are required. Mesoporous silicamaterials are known to have high surface area and pore volume. They have beenused for industrial applications such as adsorbents for the removal of volatileorganic compounds, catalysts, electronic applications, polymerization and similarapplications (Beck and Vartuli 1996). However, their application as adsorbents forbleaching is yet to be explored.
Hexagonal mesoporous molecular sieves (HMS) silica has the potential to beused as bleaching agents due to their high specific surface area, high pore volumeand, specifically, superior thermal stability (Peter and Thomas 1996). According toPeter and Thomas (1996), owing to more extensively cross-linked frameworks andthicker framework walls, HMS silica has superior thermal stability to calcinationin air. Also, the complementary textural mesoporosity provides for better access tothe framework-confined mesopores in adsorption by guest molecules. The aim ofthis paper is to synthesize, characterize HMS silica and assess its performance inbleaching crude palm oil.
Methodology
Synthesis of HMS
HMS were synthesized using the sol–gel technique (Peter and Thomas 1996) withdeionized water, absolute ethanol, tetraethylorthosilicate (TEOS) and neutralsurfactant template dodecylamine (DDA). Reactants were mixed with the molarratio of 1.0 TEOS: 0.27 DDA: 9.09 EtOH: 29.6 H2O. Ethanol and DDA were firstadded to deionized water and stirred for 30 min to allow the mixture to homog-enize. Thereafter, TEOS was added as the silica source to the mixture whilestirring. The mixture was then left at ambient temperatures for 18 h under vigorousstirring to form HMS. HMS products were recovered through filtration, followed
304 L. N. Ngu and F. A. A. Twaiq
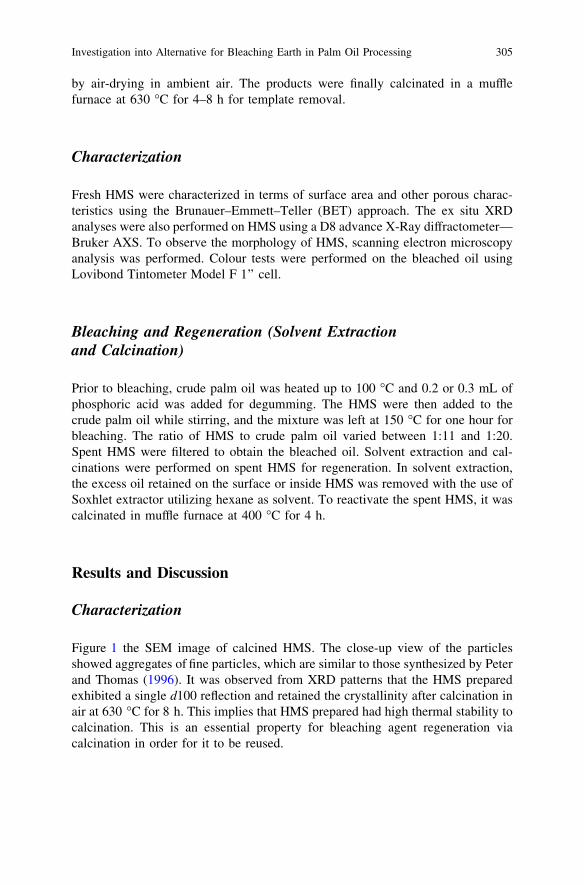
by air-drying in ambient air. The products were finally calcinated in a mufflefurnace at 630 �C for 4–8 h for template removal.
Characterization
Fresh HMS were characterized in terms of surface area and other porous charac-teristics using the Brunauer–Emmett–Teller (BET) approach. The ex situ XRDanalyses were also performed on HMS using a D8 advance X-Ray diffractometer—Bruker AXS. To observe the morphology of HMS, scanning electron microscopyanalysis was performed. Colour tests were performed on the bleached oil usingLovibond Tintometer Model F 1’’ cell.
Bleaching and Regeneration (Solvent Extractionand Calcination)
Prior to bleaching, crude palm oil was heated up to 100 �C and 0.2 or 0.3 mL ofphosphoric acid was added for degumming. The HMS were then added to thecrude palm oil while stirring, and the mixture was left at 150 �C for one hour forbleaching. The ratio of HMS to crude palm oil varied between 1:11 and 1:20.Spent HMS were filtered to obtain the bleached oil. Solvent extraction and cal-cinations were performed on spent HMS for regeneration. In solvent extraction,the excess oil retained on the surface or inside HMS was removed with the use ofSoxhlet extractor utilizing hexane as solvent. To reactivate the spent HMS, it wascalcinated in muffle furnace at 400 �C for 4 h.
Results and Discussion
Characterization
Figure 1 the SEM image of calcined HMS. The close-up view of the particlesshowed aggregates of fine particles, which are similar to those synthesized by Peterand Thomas (1996). It was observed from XRD patterns that the HMS preparedexhibited a single d100 reflection and retained the crystallinity after calcination inair at 630 �C for 8 h. This implies that HMS prepared had high thermal stability tocalcination. This is an essential property for bleaching agent regeneration viacalcination in order for it to be reused.
Investigation into Alternative for Bleaching Earth in Palm Oil Processing 305
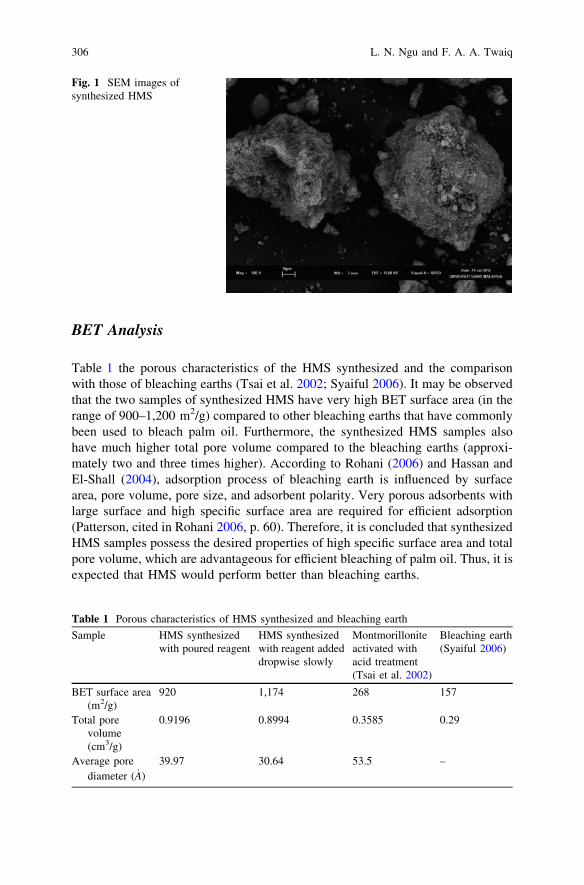
BET Analysis
Table 1 the porous characteristics of the HMS synthesized and the comparisonwith those of bleaching earths (Tsai et al. 2002; Syaiful 2006). It may be observedthat the two samples of synthesized HMS have very high BET surface area (in therange of 900–1,200 m2/g) compared to other bleaching earths that have commonlybeen used to bleach palm oil. Furthermore, the synthesized HMS samples alsohave much higher total pore volume compared to the bleaching earths (approxi-mately two and three times higher). According to Rohani (2006) and Hassan andEl-Shall (2004), adsorption process of bleaching earth is influenced by surfacearea, pore volume, pore size, and adsorbent polarity. Very porous adsorbents withlarge surface and high specific surface area are required for efficient adsorption(Patterson, cited in Rohani 2006, p. 60). Therefore, it is concluded that synthesizedHMS samples possess the desired properties of high specific surface area and totalpore volume, which are advantageous for efficient bleaching of palm oil. Thus, it isexpected that HMS would perform better than bleaching earths.
Fig. 1 SEM images ofsynthesized HMS
Table 1 Porous characteristics of HMS synthesized and bleaching earth
Sample HMS synthesizedwith poured reagent
HMS synthesizedwith reagent addeddropwise slowly
Montmorilloniteactivated withacid treatment(Tsai et al. 2002)
Bleaching earth(Syaiful 2006)
BET surface area(m2/g)
920 1,174 268 157
Total porevolume(cm3/g)
0.9196 0.8994 0.3585 0.29
Average porediameter ( _A)
39.97 30.64 53.5 –
306 L. N. Ngu and F. A. A. Twaiq
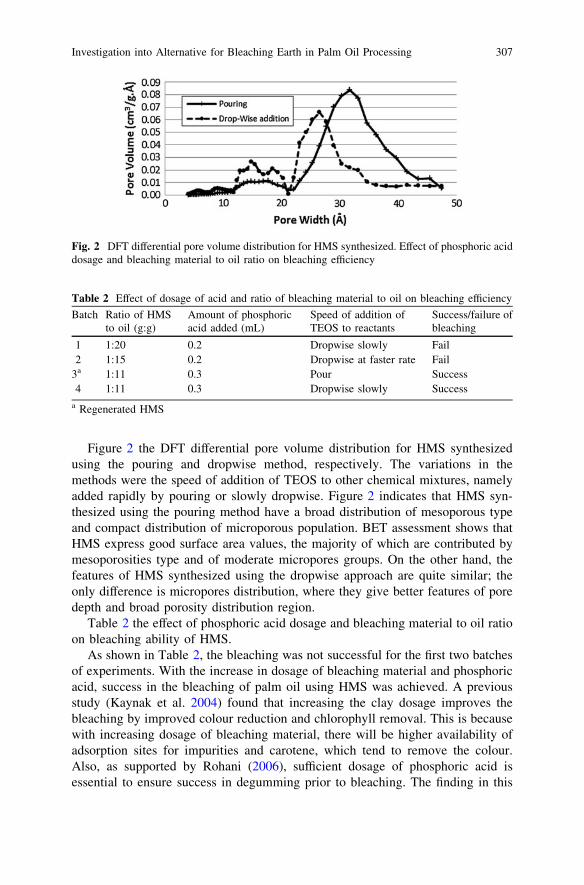
Figure 2 the DFT differential pore volume distribution for HMS synthesizedusing the pouring and dropwise method, respectively. The variations in themethods were the speed of addition of TEOS to other chemical mixtures, namelyadded rapidly by pouring or slowly dropwise. Figure 2 indicates that HMS syn-thesized using the pouring method have a broad distribution of mesoporous typeand compact distribution of microporous population. BET assessment shows thatHMS express good surface area values, the majority of which are contributed bymesoporosities type and of moderate micropores groups. On the other hand, thefeatures of HMS synthesized using the dropwise approach are quite similar; theonly difference is micropores distribution, where they give better features of poredepth and broad porosity distribution region.
Table 2 the effect of phosphoric acid dosage and bleaching material to oil ratioon bleaching ability of HMS.
As shown in Table 2, the bleaching was not successful for the first two batchesof experiments. With the increase in dosage of bleaching material and phosphoricacid, success in the bleaching of palm oil using HMS was achieved. A previousstudy (Kaynak et al. 2004) found that increasing the clay dosage improves thebleaching by improved colour reduction and chlorophyll removal. This is becausewith increasing dosage of bleaching material, there will be higher availability ofadsorption sites for impurities and carotene, which tend to remove the colour.Also, as supported by Rohani (2006), sufficient dosage of phosphoric acid isessential to ensure success in degumming prior to bleaching. The finding in this
Fig. 2 DFT differential pore volume distribution for HMS synthesized. Effect of phosphoric aciddosage and bleaching material to oil ratio on bleaching efficiency
Table 2 Effect of dosage of acid and ratio of bleaching material to oil on bleaching efficiency
Batch Ratio of HMSto oil (g:g)
Amount of phosphoricacid added (mL)
Speed of addition ofTEOS to reactants
Success/failure ofbleaching
1 1:20 0.2 Dropwise slowly Fail2 1:15 0.2 Dropwise at faster rate Fail
3a 1:11 0.3 Pour Success4 1:11 0.3 Dropwise slowly Success
a Regenerated HMS
Investigation into Alternative for Bleaching Earth in Palm Oil Processing 307
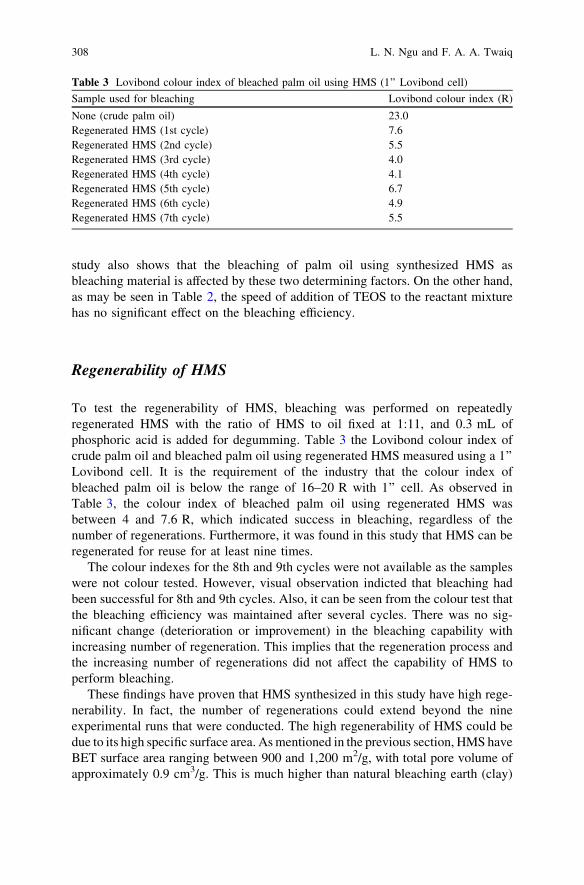
study also shows that the bleaching of palm oil using synthesized HMS asbleaching material is affected by these two determining factors. On the other hand,as may be seen in Table 2, the speed of addition of TEOS to the reactant mixturehas no significant effect on the bleaching efficiency.
Regenerability of HMS
To test the regenerability of HMS, bleaching was performed on repeatedlyregenerated HMS with the ratio of HMS to oil fixed at 1:11, and 0.3 mL ofphosphoric acid is added for degumming. Table 3 the Lovibond colour index ofcrude palm oil and bleached palm oil using regenerated HMS measured using a 1’’Lovibond cell. It is the requirement of the industry that the colour index ofbleached palm oil is below the range of 16–20 R with 1’’ cell. As observed inTable 3, the colour index of bleached palm oil using regenerated HMS wasbetween 4 and 7.6 R, which indicated success in bleaching, regardless of thenumber of regenerations. Furthermore, it was found in this study that HMS can beregenerated for reuse for at least nine times.
The colour indexes for the 8th and 9th cycles were not available as the sampleswere not colour tested. However, visual observation indicted that bleaching hadbeen successful for 8th and 9th cycles. Also, it can be seen from the colour test thatthe bleaching efficiency was maintained after several cycles. There was no sig-nificant change (deterioration or improvement) in the bleaching capability withincreasing number of regeneration. This implies that the regeneration process andthe increasing number of regenerations did not affect the capability of HMS toperform bleaching.
These findings have proven that HMS synthesized in this study have high rege-nerability. In fact, the number of regenerations could extend beyond the nineexperimental runs that were conducted. The high regenerability of HMS could bedue to its high specific surface area. As mentioned in the previous section, HMS haveBET surface area ranging between 900 and 1,200 m2/g, with total pore volume ofapproximately 0.9 cm3/g. This is much higher than natural bleaching earth (clay)
Table 3 Lovibond colour index of bleached palm oil using HMS (1’’ Lovibond cell)
Sample used for bleaching Lovibond colour index (R)
None (crude palm oil) 23.0Regenerated HMS (1st cycle) 7.6Regenerated HMS (2nd cycle) 5.5Regenerated HMS (3rd cycle) 4.0Regenerated HMS (4th cycle) 4.1Regenerated HMS (5th cycle) 6.7Regenerated HMS (6th cycle) 4.9Regenerated HMS (7th cycle) 5.5
308 L. N. Ngu and F. A. A. Twaiq
that has BET surface area of roughly 75–160 m2/g (Kalam and Joshi 1988; Syaiful2006) or much higher than acid-activated bleaching clay with BET surface of270 m2/g (Tsai et al. 2002) and total pore volume of 0.3 cm3/g (Syaiful 2006).
On the other hand, it is also proven in this study that the bleaching approach(heating at 150 �C for 1 h) and regeneration method developed (solvent extractionusing Soxhlet extractor followed by calcinations in furnace at 400 �C for 4 h) areeffective for regeneration of used HMS. According to Al-Zahrani and Daous(2000), calcinations of bleaching earth will result in combustion of organiccompounds, colour pigments and oil adsorbed on the surface or entrapped in thevoids of the bleaching earth. It is therefore expected that during calcinations ofHMS, these compounds were removed, and hence, the sites and surface arearequired for bleaching were recovered. These are significant findings that willdefinitely contribute to the industry. The current practice is to dump bleachingearth after once-off use. With the findings from this study, the cost incurred fromcontinual purchase of bleaching earth can be reduced by replacement with HMS,given its much greater bleaching ability and regenerability. The use of HMS wouldalso prevent the fire hazard and contamination risks that result from the dumpingof bleaching earth with its inherent high oil content.
Conclusions
In this study, a bleaching agent suitable for the bleaching of palm oil has beensuccessfully synthesized with a BET surface area of 900–1,200 m2/g and a totalpore volume of 0.9 cm3/g. The dosage of HMS and phosphoric acid added to crudepalm oil was found to play important role in ensuring successful bleaching. HMSnot only has the ability to perform bleaching, but can also be regeneratedrepeatedly for at least nine cycles.
References
Al-Zahrani, A. A., & Daous, M. A. (2000). Recycling of spent bleaching clay and oil recovery.Trans IChemE part B, 78, 224–228.
Beck, J. S., & Vartuli, J. C. (1996). Recent advances in the synthesis, characterization andapplications of mesoporous molecular sieves. Current Opinion in Solid State and MaterialsScience, 1, 76–87.
Hassan, M., & El-Shall, H. (2004). Glauconitic clay of El Gidida, Egypt: evaluation and surfacemodification. Applied Clay Science, 27, 219–222.
Kalam, A., & Joshi, J. B. (1988). Regeneration of spent Earth in aqueous medium. Journal of theAmerican Oil Chemists’ Society, 65, 1917–1921.
Kaynak, G., Ersoz, M., & Kara, H. (2004). Investigation of the properties of oil at the bleachingunit of an oil refinery. Journal of Colloid and Interface Science, 280, 131–138.
Patterson, H. W. B. (1992). Bleaching and purifying fats and oils. Theory and Practice. AOCSPress.
Investigation into Alternative for Bleaching Earth in Palm Oil Processing 309

Peter, T. T., & Thomas, J. P. (1996). Mesoporous silica molecular sieves prepared by ionic andneutral surfactant templating: A comparison of physical properties. Chemistry of Materials, 8,2068–2079.
Rohani, B. M. Z. (2006). Process design in degumming and bleaching of palm oil. Centre ofLipids Engineering and Applied Research. Universiti Teknologi Malaysia, Malaysia.
Sabah, E. (2007). Decolorization of vegetable oils: Chlorophyll-a adsorption by acid-activatedsepiolite. Journal of Colloid and Interface Science, 310, 1–7.
Syaiful, N. H. (2006). Recovery of spent bleaching clay for reuse in water treatment. Faculty ofChemical and Natural Resources Engineering. University Teknologi Malaysia.
Tsai, W. T., Chen, H. P., Hsieh, M. F., Sun, H. F., & Chien, S. F. (2002). Regeneration of spentbleaching earth by pyrolysis in a rotary furnace. Journal of Analytical and Applied Pyrolysis,63, 157–170.
Yahia, A. S. A., & Abdulrahim, A. A.-Z. (1999). Techno-economical evaluation of oil recoveryand regeneration of spent bleaching clay. Journal of King Abdulaziz University: EngineeringSciences, 11, 115–126.
310 L. N. Ngu and F. A. A. Twaiq

Part IVAdvanced Materials
A Brief Review on Photoanode,Electrolyte, and Photocathode Materialsfor Dye-Sensitized Solar Cell Basedon Natural Dye Photosensitizers
R. F. Mansa, A. R. A. Yugis, K. S. Liow, S. T. L. Chai,M. C. Ung, J. Dayou and C. S. Sipaut
Abstract The dye-sensitized solar cell is a promising alternative for a newgeneration of photovoltaic devices due to its lightweight, flexibility, low cost,environmentally friendly materials. One important aspect of the DSSC is thepotential of using dyes found in flowers, leaves, and fruits to be used as they are cheapand easily attained. However, the photovoltaic performances of dye-sensitized solarcells are greatly dependent on the CR which can be attributed to dye molecular size,semiconductor nanostructures properties, interaction between the semiconductorand dye, semiconductor/dye/electrolyte resistance, and dye aggregation (Narayan2012). This paper briefly reviews recent developments in DSSC using natural dyephotosensitizers, photoanode materials, various phases of the electrolytes, andnonmetal photocathode materials.
Introduction
O’Regan and Gratzel invented the dye-sensitized solar cell (DSSC) in 1991. Sincethen, the DSSC had attracted tremendous attention because the DSSC manufac-turing process is less expensive, abundant source of materials and produce lessenvironmental effect compared to commercial silicon-based solar cell (Senthilet al. 2011). The DSSC uses photosensitizers (i.e., dye sensitizers) adsorbed ontothe surface of the photoanode, a mesoporous nanocrystalline-oxide semiconductor(e.g. TiO2) to harvest energy from sunlight. The DSSC system is made of three
R. F. Mansa (&) � A. R. A. Yugis � K. S. Liow � S. T. L. Chai � M. C. Ung � C. S. SipautEnergy and Materials Research Group, School of Engineering and Information Technology,Universiti Malaysia Sabah, Jalan UMS 88400 Kota Kinabalu, Sabah, Malaysiae-mail: [email protected]
J. DayouEnergy, Vibration and Sound Research Group (e-VIBS), School of Science and Technology,Universiti Malaysia Sabah, Jalan UMS 88400 Kota Kinabalu, Sabah, Malaysia
R. Pogaku et al. (eds.), Developments in Sustainable Chemicaland Bioprocess Technology, DOI: 10.1007/978-1-4614-6208-8_37,� Springer Science+Business Media New York 2013
313
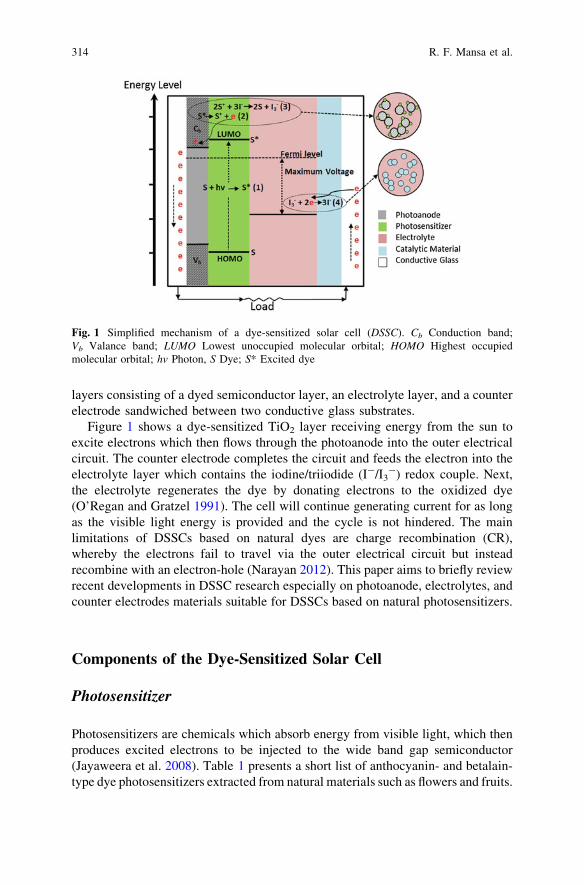
layers consisting of a dyed semiconductor layer, an electrolyte layer, and a counterelectrode sandwiched between two conductive glass substrates.
Figure 1 shows a dye-sensitized TiO2 layer receiving energy from the sun toexcite electrons which then flows through the photoanode into the outer electricalcircuit. The counter electrode completes the circuit and feeds the electron into theelectrolyte layer which contains the iodine/triiodide (I-/I3
-) redox couple. Next,the electrolyte regenerates the dye by donating electrons to the oxidized dye(O’Regan and Gratzel 1991). The cell will continue generating current for as longas the visible light energy is provided and the cycle is not hindered. The mainlimitations of DSSCs based on natural dyes are charge recombination (CR),whereby the electrons fail to travel via the outer electrical circuit but insteadrecombine with an electron-hole (Narayan 2012). This paper aims to briefly reviewrecent developments in DSSC research especially on photoanode, electrolytes, andcounter electrodes materials suitable for DSSCs based on natural photosensitizers.
Components of the Dye-Sensitized Solar Cell
Photosensitizer
Photosensitizers are chemicals which absorb energy from visible light, which thenproduces excited electrons to be injected to the wide band gap semiconductor(Jayaweera et al. 2008). Table 1 presents a short list of anthocyanin- and betalain-type dye photosensitizers extracted from natural materials such as flowers and fruits.
Fig. 1 Simplified mechanism of a dye-sensitized solar cell (DSSC). Cb Conduction band;Vb Valance band; LUMO Lowest unoccupied molecular orbital; HOMO Highest occupiedmolecular orbital; hv Photon, S Dye; S* Excited dye
314 R. F. Mansa et al.
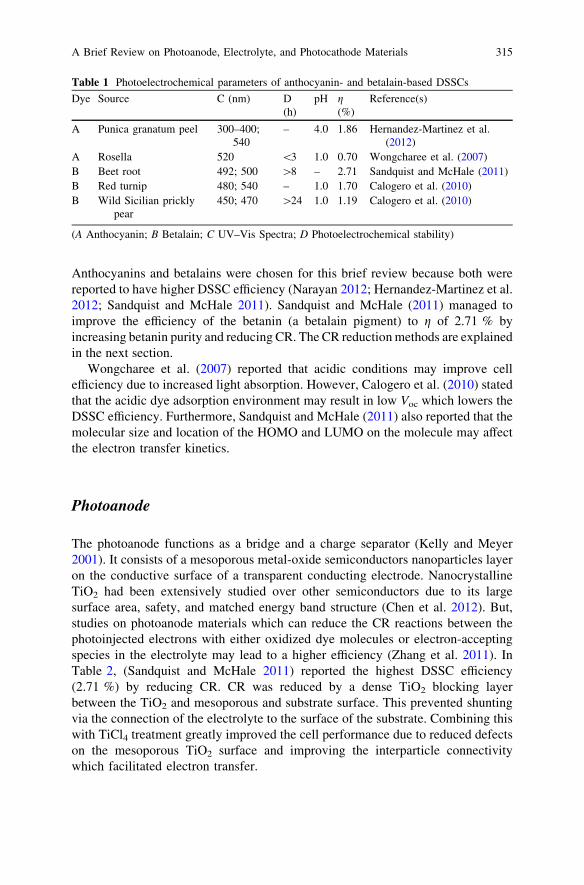
Anthocyanins and betalains were chosen for this brief review because both werereported to have higher DSSC efficiency (Narayan 2012; Hernandez-Martinez et al.2012; Sandquist and McHale 2011). Sandquist and McHale (2011) managed toimprove the efficiency of the betanin (a betalain pigment) to g of 2.71 % byincreasing betanin purity and reducing CR. The CR reduction methods are explainedin the next section.
Wongcharee et al. (2007) reported that acidic conditions may improve cellefficiency due to increased light absorption. However, Calogero et al. (2010) statedthat the acidic dye adsorption environment may result in low Voc which lowers theDSSC efficiency. Furthermore, Sandquist and McHale (2011) also reported that themolecular size and location of the HOMO and LUMO on the molecule may affectthe electron transfer kinetics.
Photoanode
The photoanode functions as a bridge and a charge separator (Kelly and Meyer2001). It consists of a mesoporous metal-oxide semiconductors nanoparticles layeron the conductive surface of a transparent conducting electrode. NanocrystallineTiO2 had been extensively studied over other semiconductors due to its largesurface area, safety, and matched energy band structure (Chen et al. 2012). But,studies on photoanode materials which can reduce the CR reactions between thephotoinjected electrons with either oxidized dye molecules or electron-acceptingspecies in the electrolyte may lead to a higher efficiency (Zhang et al. 2011). InTable 2, (Sandquist and McHale 2011) reported the highest DSSC efficiency(2.71 %) by reducing CR. CR was reduced by a dense TiO2 blocking layerbetween the TiO2 and mesoporous and substrate surface. This prevented shuntingvia the connection of the electrolyte to the surface of the substrate. Combining thiswith TiCl4 treatment greatly improved the cell performance due to reduced defectson the mesoporous TiO2 surface and improving the interparticle connectivitywhich facilitated electron transfer.
Table 1 Photoelectrochemical parameters of anthocyanin- and betalain-based DSSCs
Dye Source C (nm) D(h)
pH g(%)
Reference(s)
A Punica granatum peel 300–400;540
– 4.0 1.86 Hernandez-Martinez et al.(2012)
A Rosella 520 \3 1.0 0.70 Wongcharee et al. (2007)B Beet root 492; 500 [8 – 2.71 Sandquist and McHale (2011)B Red turnip 480; 540 – 1.0 1.70 Calogero et al. (2010)B Wild Sicilian prickly
pear450; 470 [24 1.0 1.19 Calogero et al. (2010)
(A Anthocyanin; B Betalain; C UV–Vis Spectra; D Photoelectrochemical stability)
A Brief Review on Photoanode, Electrolyte, and Photocathode Materials 315
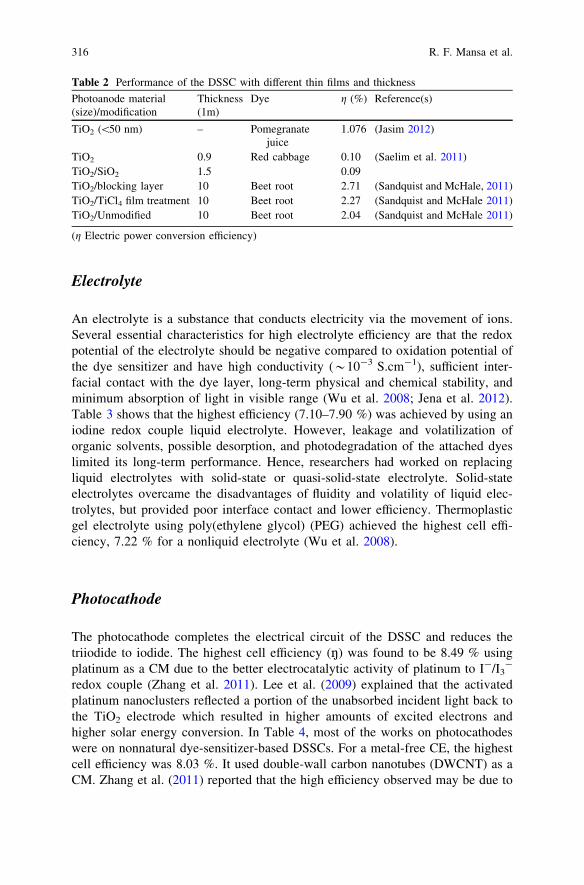
Electrolyte
An electrolyte is a substance that conducts electricity via the movement of ions.Several essential characteristics for high electrolyte efficiency are that the redoxpotential of the electrolyte should be negative compared to oxidation potential ofthe dye sensitizer and have high conductivity (*10-3 S.cm-1), sufficient inter-facial contact with the dye layer, long-term physical and chemical stability, andminimum absorption of light in visible range (Wu et al. 2008; Jena et al. 2012).Table 3 shows that the highest efficiency (7.10–7.90 %) was achieved by using aniodine redox couple liquid electrolyte. However, leakage and volatilization oforganic solvents, possible desorption, and photodegradation of the attached dyeslimited its long-term performance. Hence, researchers had worked on replacingliquid electrolytes with solid-state or quasi-solid-state electrolyte. Solid-stateelectrolytes overcame the disadvantages of fluidity and volatility of liquid elec-trolytes, but provided poor interface contact and lower efficiency. Thermoplasticgel electrolyte using poly(ethylene glycol) (PEG) achieved the highest cell effi-ciency, 7.22 % for a nonliquid electrolyte (Wu et al. 2008).
Photocathode
The photocathode completes the electrical circuit of the DSSC and reduces thetriiodide to iodide. The highest cell efficiency (n) was found to be 8.49 % usingplatinum as a CM due to the better electrocatalytic activity of platinum to I-/I3
-
redox couple (Zhang et al. 2011). Lee et al. (2009) explained that the activatedplatinum nanoclusters reflected a portion of the unabsorbed incident light back tothe TiO2 electrode which resulted in higher amounts of excited electrons andhigher solar energy conversion. In Table 4, most of the works on photocathodeswere on nonnatural dye-sensitizer-based DSSCs. For a metal-free CE, the highestcell efficiency was 8.03 %. It used double-wall carbon nanotubes (DWCNT) as aCM. Zhang et al. (2011) reported that the high efficiency observed may be due to
Table 2 Performance of the DSSC with different thin films and thickness
Photoanode material(size)/modification
Thickness(1m)
Dye g (%) Reference(s)
TiO2 (\50 nm) – Pomegranatejuice
1.076 (Jasim 2012)
TiO2 0.9 Red cabbage 0.10 (Saelim et al. 2011)TiO2/SiO2 1.5 0.09TiO2/blocking layer 10 Beet root 2.71 (Sandquist and McHale, 2011)TiO2/TiCl4 film treatment 10 Beet root 2.27 (Sandquist and McHale 2011)TiO2/Unmodified 10 Beet root 2.04 (Sandquist and McHale 2011)
(g Electric power conversion efficiency)
316 R. F. Mansa et al.
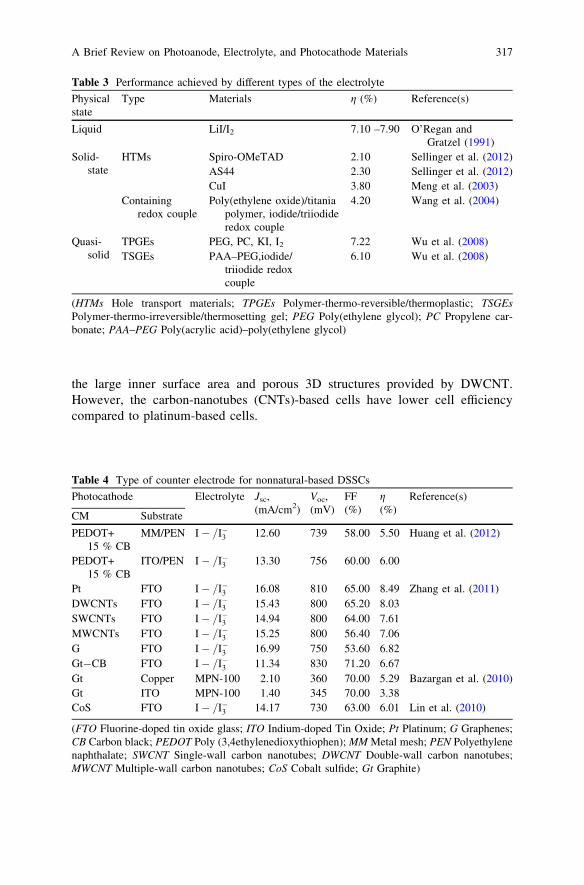
the large inner surface area and porous 3D structures provided by DWCNT.However, the carbon-nanotubes (CNTs)-based cells have lower cell efficiencycompared to platinum-based cells.
Table 3 Performance achieved by different types of the electrolyte
Physicalstate
Type Materials g (%) Reference(s)
Liquid LiI/I2 7.10 –7.90 O’Regan andGratzel (1991)
Solid-state
HTMs Spiro-OMeTAD 2.10 Sellinger et al. (2012)AS44 2.30 Sellinger et al. (2012)CuI 3.80 Meng et al. (2003)
Containingredox couple
Poly(ethylene oxide)/titaniapolymer, iodide/triiodideredox couple
4.20 Wang et al. (2004)
Quasi-solid
TPGEs PEG, PC, KI, I2 7.22 Wu et al. (2008)TSGEs PAA–PEG,iodide/
triiodide redoxcouple
6.10 Wu et al. (2008)
(HTMs Hole transport materials; TPGEs Polymer-thermo-reversible/thermoplastic; TSGEsPolymer-thermo-irreversible/thermosetting gel; PEG Poly(ethylene glycol); PC Propylene car-bonate; PAA–PEG Poly(acrylic acid)–poly(ethylene glycol)
Table 4 Type of counter electrode for nonnatural-based DSSCs
Photocathode Electrolyte Jsc,(mA/cm2)
Voc,(mV)
FF(%)
g(%)
Reference(s)
CM Substrate
PEDOT+15 % CB
MM/PEN I� =I�3 12.60 739 58.00 5.50 Huang et al. (2012)
PEDOT+15 % CB
ITO/PEN I� =I�3 13.30 756 60.00 6.00
Pt FTO I� =I�3 16.08 810 65.00 8.49 Zhang et al. (2011)DWCNTs FTO I� =I�3 15.43 800 65.20 8.03SWCNTs FTO I� =I�3 14.94 800 64.00 7.61MWCNTs FTO I� =I�3 15.25 800 56.40 7.06G FTO I� =I�3 16.99 750 53.60 6.82Gt-CB FTO I� =I�3 11.34 830 71.20 6.67Gt Copper MPN-100 2.10 360 70.00 5.29 Bazargan et al. (2010)Gt ITO MPN-100 1.40 345 70.00 3.38CoS FTO I� =I�3 14.17 730 63.00 6.01 Lin et al. (2010)
(FTO Fluorine-doped tin oxide glass; ITO Indium-doped Tin Oxide; Pt Platinum; G Graphenes;CB Carbon black; PEDOT Poly (3,4ethylenedioxythiophen); MM Metal mesh; PEN Polyethylenenaphthalate; SWCNT Single-wall carbon nanotubes; DWCNT Double-wall carbon nanotubes;MWCNT Multiple-wall carbon nanotubes; CoS Cobalt sulfide; Gt Graphite)
A Brief Review on Photoanode, Electrolyte, and Photocathode Materials 317
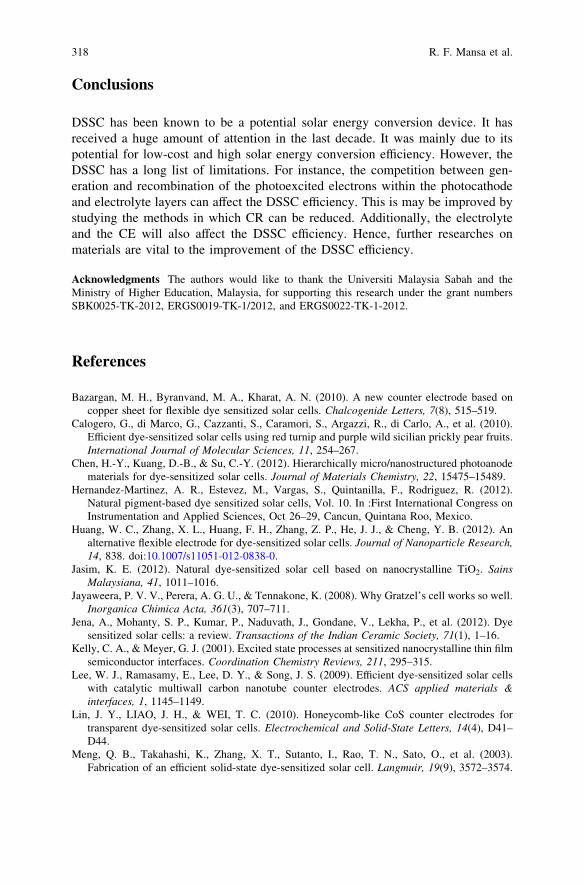
Conclusions
DSSC has been known to be a potential solar energy conversion device. It hasreceived a huge amount of attention in the last decade. It was mainly due to itspotential for low-cost and high solar energy conversion efficiency. However, theDSSC has a long list of limitations. For instance, the competition between gen-eration and recombination of the photoexcited electrons within the photocathodeand electrolyte layers can affect the DSSC efficiency. This is may be improved bystudying the methods in which CR can be reduced. Additionally, the electrolyteand the CE will also affect the DSSC efficiency. Hence, further researches onmaterials are vital to the improvement of the DSSC efficiency.
Acknowledgments The authors would like to thank the Universiti Malaysia Sabah and theMinistry of Higher Education, Malaysia, for supporting this research under the grant numbersSBK0025-TK-2012, ERGS0019-TK-1/2012, and ERGS0022-TK-1-2012.
References
Bazargan, M. H., Byranvand, M. A., Kharat, A. N. (2010). A new counter electrode based oncopper sheet for flexible dye sensitized solar cells. Chalcogenide Letters, 7(8), 515–519.
Calogero, G., di Marco, G., Cazzanti, S., Caramori, S., Argazzi, R., di Carlo, A., et al. (2010).Efficient dye-sensitized solar cells using red turnip and purple wild sicilian prickly pear fruits.International Journal of Molecular Sciences, 11, 254–267.
Chen, H.-Y., Kuang, D.-B., & Su, C.-Y. (2012). Hierarchically micro/nanostructured photoanodematerials for dye-sensitized solar cells. Journal of Materials Chemistry, 22, 15475–15489.
Hernandez-Martinez, A. R., Estevez, M., Vargas, S., Quintanilla, F., Rodriguez, R. (2012).Natural pigment-based dye sensitized solar cells, Vol. 10. In :First International Congress onInstrumentation and Applied Sciences, Oct 26–29, Cancun, Quintana Roo, Mexico.
Huang, W. C., Zhang, X. L., Huang, F. H., Zhang, Z. P., He, J. J., & Cheng, Y. B. (2012). Analternative flexible electrode for dye-sensitized solar cells. Journal of Nanoparticle Research,14, 838. doi:10.1007/s11051-012-0838-0.
Jasim, K. E. (2012). Natural dye-sensitized solar cell based on nanocrystalline TiO2. SainsMalaysiana, 41, 1011–1016.
Jayaweera, P. V. V., Perera, A. G. U., & Tennakone, K. (2008). Why Gratzel’s cell works so well.Inorganica Chimica Acta, 361(3), 707–711.
Jena, A., Mohanty, S. P., Kumar, P., Naduvath, J., Gondane, V., Lekha, P., et al. (2012). Dyesensitized solar cells: a review. Transactions of the Indian Ceramic Society, 71(1), 1–16.
Kelly, C. A., & Meyer, G. J. (2001). Excited state processes at sensitized nanocrystalline thin filmsemiconductor interfaces. Coordination Chemistry Reviews, 211, 295–315.
Lee, W. J., Ramasamy, E., Lee, D. Y., & Song, J. S. (2009). Efficient dye-sensitized solar cellswith catalytic multiwall carbon nanotube counter electrodes. ACS applied materials &interfaces, 1, 1145–1149.
Lin, J. Y., LIAO, J. H., & WEI, T. C. (2010). Honeycomb-like CoS counter electrodes fortransparent dye-sensitized solar cells. Electrochemical and Solid-State Letters, 14(4), D41–D44.
Meng, Q. B., Takahashi, K., Zhang, X. T., Sutanto, I., Rao, T. N., Sato, O., et al. (2003).Fabrication of an efficient solid-state dye-sensitized solar cell. Langmuir, 19(9), 3572–3574.
318 R. F. Mansa et al.
Narayan, M. R. (2012). Review: dye sensitized solar cells based on natural photosensitizers.Renewable and Sustainable Energy Reviews, 16(1), 208–215.
O’Regan, B., & Gratzel, M. (1991). A low-cost, high efficiency solar cell based on dye- sensitizedcolloidal TiO2 films. Nature, 353, 737–740.
Sandquist, C., & McHale, J. L. (2011). Improved efficiency of betanin-based dye- sensitized solarcells. Journal of Photochemistry and Photobiology A: Chemistry, 221, 90–97.
Saelim, N.-O., Magaraphan, R., & Sreethawong, T. (2011). Preparation of sol– gel TiO2/purifiedNa-bentonite composites and their photovoltaic application for natural dye-sensitized solarcells. Energy Conversion and Management, 52, 2815–2818.
Sellinger, A., Leijthens, T., Ding, I. K., Giovenzana, T., Bloking, J. T., & Mcgehee, M. D. (2012).Hole transport materials with low glass transition temperature and high solubility forapplication in solid-state dye-sentitized solar cells. ACS Nano, 6(2), 1455–1462.
Senthil, T. S., Muthukumarasamy, N., Velauthapillai, D., Agilan, S., Thambidurai, M., &Balasundaraprabhu, R. (2011). Natural dye (cyanidin 3-O-glucoside) sensitized nanocrystal-line TiO2 solar cell fabricated using liquid electrolyte/quasi-solid-state polymer electrolyte.Renewable Energy, 36, 2484–2488.
Wang, P., Dai, Q., & Zakeeruddin, S. M. (2004). Ambient temperature plastic crystal electrolytefor efficient, all-solid-state dye-sensitized solar cell. Journal of the American ChemicalSociety, 126, 13590.
Wongcharee, K., Meeyoo, V., & Chavadej, S. (2007). Dye-sensitized solar cell using natural dyesextracted from rosella and blue pea flowers. Solar Energy Materials and Solar Cells, 91,566–571.
Wu, J., Lan, Z., Hao, S., Li, P., Lin, J., Huang, M., Fang, L., & Huang, Y. (2008).Progress on theelectrolyte for the dye sensitized solar cell. Pure Appl.Chem. 80(11), 2241–2258.
Zhang, D. W., Li, X. D., Chen, S., Tao, F., Sun, Z., Yin, X. J., et al. (2011). Fabrication of double-walled carbon nanotube counter electrodes for dye- sensitized solar cells. Journal of SolidState Electrochemistry, 14, 1541–1546.
A Brief Review on Photoanode, Electrolyte, and Photocathode Materials 319
The Influences of Dope Compositionon Gas Permeance of Hollow FiberCarbon Membrane
W. M. H. F. W. Harun, M. A. T. Jaya and M. A. Ahmad
Abstract In this work, a carbon membrane was produced from a polymer blend ofpolyetherimide (PEI)/polyvinylpyrrolidone (PVP). Four samples of the PEI-basedcarbon membrane were prepared at various concentrations of its blending coun-terpart, which were 0, 5, 9, and 13 wt.% of PVP. All samples were subjected undersimilar conditions where the stabilization of their polymeric precursors was per-formed at 300 �C for 1 h under a continuous flow of purified air. The stabilizationwas followed by pyrolysis at 400 �C for 1 min under purified nitrogen flow.Sample S3, which was prepared at initial dope solution of 9 wt.% PVP, demon-strated that the decomposition temperature has increased at highest degree com-pared with the others, and this has brought advantages to its morphology. Singlegas permeability tests using CO2 and CH4 gases showed that the polymer-blend-precursor-based carbon membranes possessed molecular sieving properties.Sample with 9 wt.% PVP (S3) was found highest in the delivery of CO2 permeanceand CO2/CH4 permselectivity, which were 14.61 and 1.95 GPU, respectively.
Introduction
The emission of excessive greenhouse gases has been one of the main contributorsfor global warming. In order to minimize the problem, many countries haveregulated the utilization of cleaner fuels such as natural gas for domestic use. Infact, the minimum level of harmful emission by the by-products of natural gasmeets the specification implemented under the Environmental Quality Regulation1996 by Malaysian Government.
W. M. H. F. W. Harun � M. A. T. Jaya � M. A. Ahmad (&)School of Chemical Engineering, Universiti Sains Malaysia, Engineering Campus,Seri Ampangan, 14300 Nibong Tebal, Penang, Malaysiae-mail: [email protected]
R. Pogaku et al. (eds.), Developments in Sustainable Chemicaland Bioprocess Technology, DOI: 10.1007/978-1-4614-6208-8_38,� Springer Science+Business Media New York 2013
321
The benefits of the natural gas utilization cause this commodity to account for23 % of the total energy consumed in the developing countries. In 2003 alone, 95trillion cubic feet of natural gas was consumed worldwide, whereas the numberwas predicted to increase to 182 trillion cubic feet in 2030 (Xiao et al. 2009). Innatural gas processing, the crude natural gas undergoes enrichment to maximizethe percentage volume of methane while eliminating carbon dioxide as an impu-rity. The carbon dioxide content in the crude natural gas may vary from 4 to 50vol.%, and the typical product after the enrichment is a methane-enriched residuestream containing less than 2 vol.% of carbon dioxide (Safari et al. 2009). Theremoval of carbon dioxide also increases the calorific value of the natural gas(Datta and Sen 2006). In addition, the elimination of acidic carbon dioxide willalso prevent corrosion in the transport line and diminishes the unnecessary totalvolume of gas, which brings economic advantages for transportation and storage(Hao et al. 2002).
The use of membrane technology in gas processing offers many advantagesover other conventional technologies in gas separation such as cryogenic,adsorption, and absorption. The membrane process provides simple and versatilemechanisms that allow smaller space occupancy for relatively larger processingcapacity. Its operation requirement only involves a pressure gradient toward themembrane as a driving force for operation supplied by gas compressor or vacuumpump. Maximizing the industrial margin is achievable by optimizing the power toengage the separation process. Two-thirds of the total components cost is asso-ciated with the feed-crude natural gas compressor, while the remaining is asso-ciated with the membrane module. Therefore, most of the operating cost iscontributed by the consumed energy to power the compressor (Baker 2002). It ispossible to pair a highly selective membrane with smaller compressor to achievegreater saving in the operation cost. Therefore, finding new materials or extensivemodifications of existed materials to enhance the membrane selectivity and per-meability has become current focuses.
Unlike the polymeric membranes, carbon membranes possess highly porousstructure that allows the gas separation to be performed at higher permeabilitywhich means the separation process can be completed at a higher production rate.Another method in accomplishing high production rate is by applying the hollowfiber as the membrane configuration. The hollow fiber provides higher surface areaas well as higher packing density, which leads to large permeability of the product(Saufi and Ismail 2004). In addition, this membrane configuration is simple andpossesses easy module assembly (He and Hagg 2011). These advantages haveattracted attention to enhance the hollow fiber quality and envision the capabilityof hollow fiber toward the main membrane configuration in future moment.
The porous structure of the carbon membrane consists of pores that lie withinthe ultramicropore region. These pores are generated during pyrolysis where theevolved decomposition gases channel their way through to the surface leavingtraces of opening or pores throughout the membrane structure. The formation ofsuch ultramicropores would enable the carbon membrane to discriminate the
322 W. M. H. F. W. Harun et al.
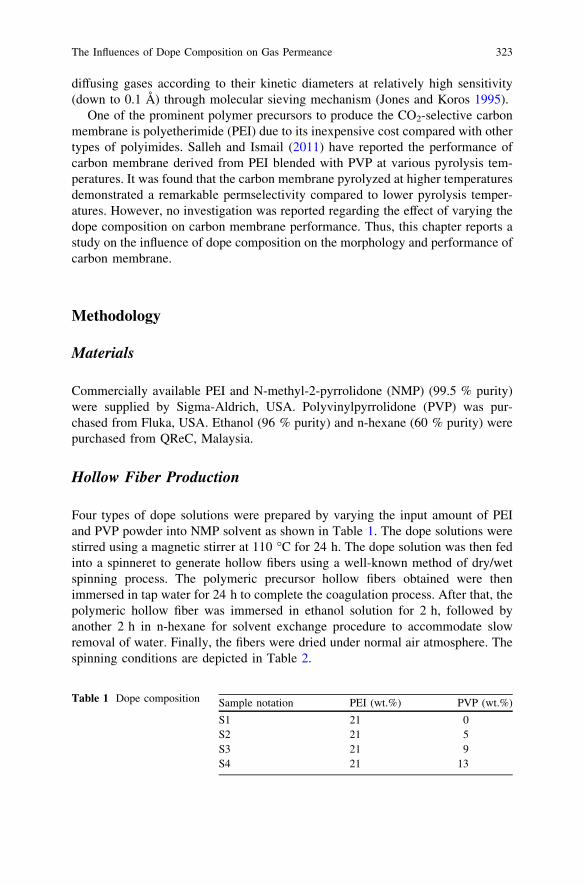
diffusing gases according to their kinetic diameters at relatively high sensitivity(down to 0.1 Å) through molecular sieving mechanism (Jones and Koros 1995).
One of the prominent polymer precursors to produce the CO2-selective carbonmembrane is polyetherimide (PEI) due to its inexpensive cost compared with othertypes of polyimides. Salleh and Ismail (2011) have reported the performance ofcarbon membrane derived from PEI blended with PVP at various pyrolysis tem-peratures. It was found that the carbon membrane pyrolyzed at higher temperaturesdemonstrated a remarkable permselectivity compared to lower pyrolysis temper-atures. However, no investigation was reported regarding the effect of varying thedope composition on carbon membrane performance. Thus, this chapter reports astudy on the influence of dope composition on the morphology and performance ofcarbon membrane.
Methodology
Materials
Commercially available PEI and N-methyl-2-pyrrolidone (NMP) (99.5 % purity)were supplied by Sigma-Aldrich, USA. Polyvinylpyrrolidone (PVP) was pur-chased from Fluka, USA. Ethanol (96 % purity) and n-hexane (60 % purity) werepurchased from QReC, Malaysia.
Hollow Fiber Production
Four types of dope solutions were prepared by varying the input amount of PEIand PVP powder into NMP solvent as shown in Table 1. The dope solutions werestirred using a magnetic stirrer at 110 �C for 24 h. The dope solution was then fedinto a spinneret to generate hollow fibers using a well-known method of dry/wetspinning process. The polymeric precursor hollow fibers obtained were thenimmersed in tap water for 24 h to complete the coagulation process. After that, thepolymeric hollow fiber was immersed in ethanol solution for 2 h, followed byanother 2 h in n-hexane for solvent exchange procedure to accommodate slowremoval of water. Finally, the fibers were dried under normal air atmosphere. Thespinning conditions are depicted in Table 2.
Table 1 Dope composition Sample notation PEI (wt.%) PVP (wt.%)
S1 21 0S2 21 5S3 21 9S4 21 13
The Influences of Dope Composition on Gas Permeance 323
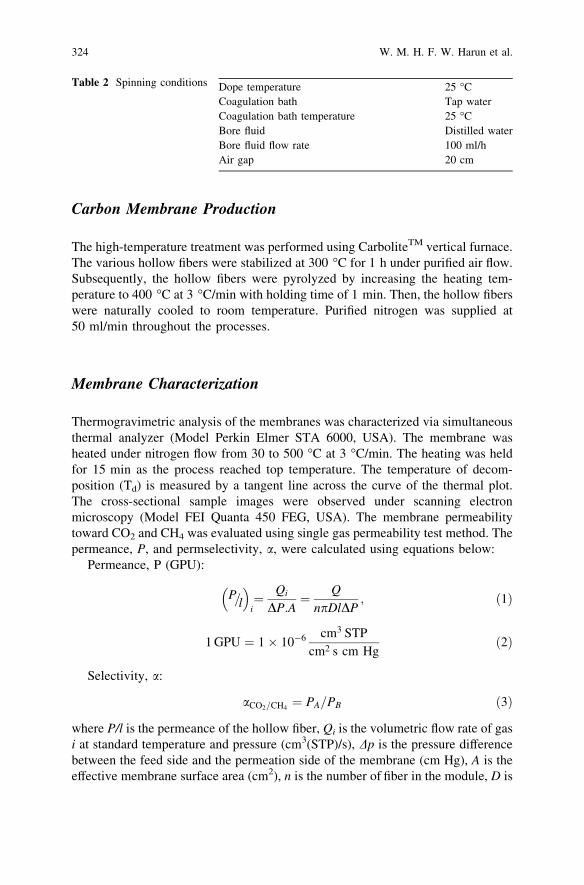
Carbon Membrane Production
The high-temperature treatment was performed using CarboliteTM vertical furnace.The various hollow fibers were stabilized at 300 �C for 1 h under purified air flow.Subsequently, the hollow fibers were pyrolyzed by increasing the heating tem-perature to 400 �C at 3 �C/min with holding time of 1 min. Then, the hollow fiberswere naturally cooled to room temperature. Purified nitrogen was supplied at50 ml/min throughout the processes.
Membrane Characterization
Thermogravimetric analysis of the membranes was characterized via simultaneousthermal analyzer (Model Perkin Elmer STA 6000, USA). The membrane washeated under nitrogen flow from 30 to 500 �C at 3 �C/min. The heating was heldfor 15 min as the process reached top temperature. The temperature of decom-position (Td) is measured by a tangent line across the curve of the thermal plot.The cross-sectional sample images were observed under scanning electronmicroscopy (Model FEI Quanta 450 FEG, USA). The membrane permeabilitytoward CO2 and CH4 was evaluated using single gas permeability test method. Thepermeance, P, and permselectivity, a, were calculated using equations below:
Permeance, P (GPU):
P=l
� �i¼ Qi
DP:A¼ Q
npDlDP; ð1Þ
1 GPU ¼ 1� 10�6 cm3 STPcm2 s cm Hg
ð2Þ
Selectivity, a:
aCO2=CH4¼ PA=PB ð3Þ
where P/l is the permeance of the hollow fiber, Qi is the volumetric flow rate of gasi at standard temperature and pressure (cm3(STP)/s), Dp is the pressure differencebetween the feed side and the permeation side of the membrane (cm Hg), A is theeffective membrane surface area (cm2), n is the number of fiber in the module, D is
Table 2 Spinning conditions Dope temperature 25 �CCoagulation bath Tap waterCoagulation bath temperature 25 �CBore fluid Distilled waterBore fluid flow rate 100 ml/hAir gap 20 cm
324 W. M. H. F. W. Harun et al.
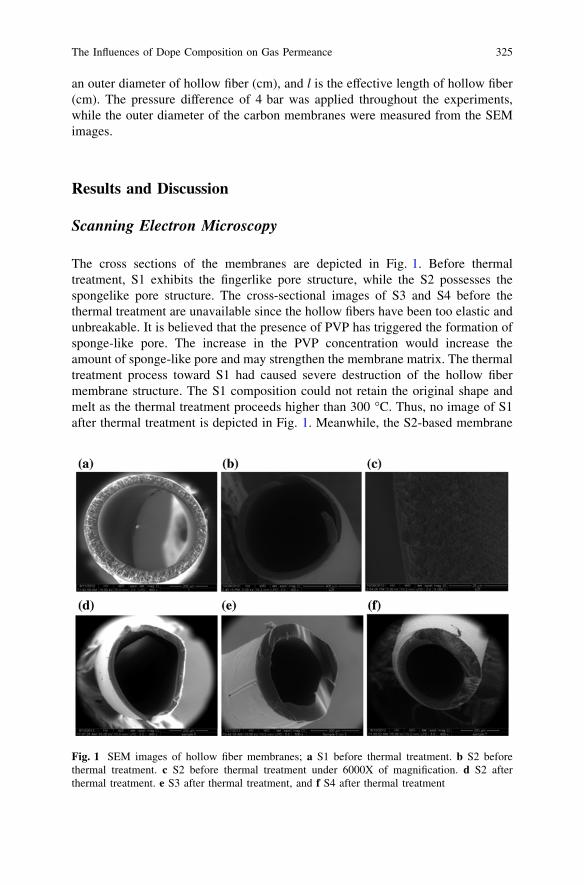
an outer diameter of hollow fiber (cm), and l is the effective length of hollow fiber(cm). The pressure difference of 4 bar was applied throughout the experiments,while the outer diameter of the carbon membranes were measured from the SEMimages.
Results and Discussion
Scanning Electron Microscopy
The cross sections of the membranes are depicted in Fig. 1. Before thermaltreatment, S1 exhibits the fingerlike pore structure, while the S2 possesses thespongelike pore structure. The cross-sectional images of S3 and S4 before thethermal treatment are unavailable since the hollow fibers have been too elastic andunbreakable. It is believed that the presence of PVP has triggered the formation ofsponge-like pore. The increase in the PVP concentration would increase theamount of sponge-like pore and may strengthen the membrane matrix. The thermaltreatment process toward S1 had caused severe destruction of the hollow fibermembrane structure. The S1 composition could not retain the original shape andmelt as the thermal treatment proceeds higher than 300 �C. Thus, no image of S1after thermal treatment is depicted in Fig. 1. Meanwhile, the S2-based membrane
Fig. 1 SEM images of hollow fiber membranes; a S1 before thermal treatment. b S2 beforethermal treatment. c S2 before thermal treatment under 6000X of magnification. d S2 afterthermal treatment. e S3 after thermal treatment, and f S4 after thermal treatment
The Influences of Dope Composition on Gas Permeance 325
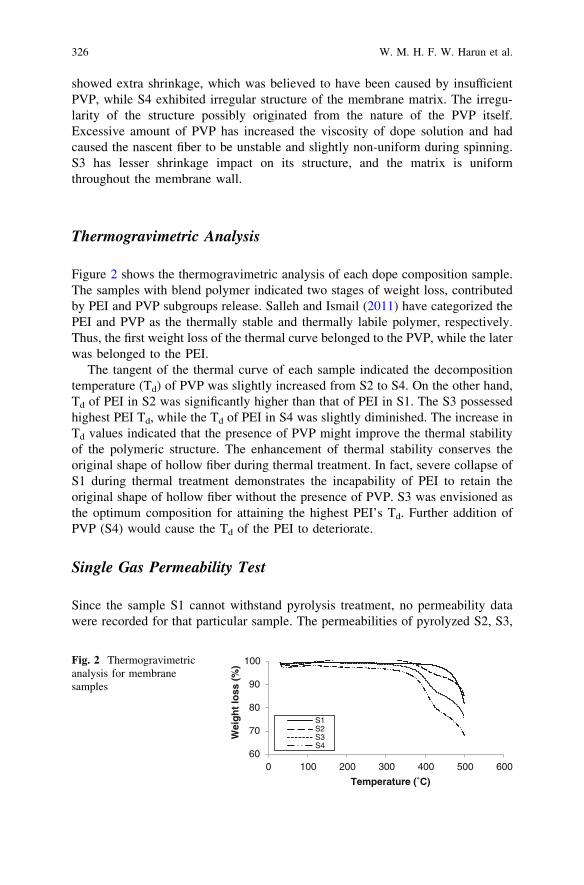
showed extra shrinkage, which was believed to have been caused by insufficientPVP, while S4 exhibited irregular structure of the membrane matrix. The irregu-larity of the structure possibly originated from the nature of the PVP itself.Excessive amount of PVP has increased the viscosity of dope solution and hadcaused the nascent fiber to be unstable and slightly non-uniform during spinning.S3 has lesser shrinkage impact on its structure, and the matrix is uniformthroughout the membrane wall.
Thermogravimetric Analysis
Figure 2 shows the thermogravimetric analysis of each dope composition sample.The samples with blend polymer indicated two stages of weight loss, contributedby PEI and PVP subgroups release. Salleh and Ismail (2011) have categorized thePEI and PVP as the thermally stable and thermally labile polymer, respectively.Thus, the first weight loss of the thermal curve belonged to the PVP, while the laterwas belonged to the PEI.
The tangent of the thermal curve of each sample indicated the decompositiontemperature (Td) of PVP was slightly increased from S2 to S4. On the other hand,Td of PEI in S2 was significantly higher than that of PEI in S1. The S3 possessedhighest PEI Td, while the Td of PEI in S4 was slightly diminished. The increase inTd values indicated that the presence of PVP might improve the thermal stabilityof the polymeric structure. The enhancement of thermal stability conserves theoriginal shape of hollow fiber during thermal treatment. In fact, severe collapse ofS1 during thermal treatment demonstrates the incapability of PEI to retain theoriginal shape of hollow fiber without the presence of PVP. S3 was envisioned asthe optimum composition for attaining the highest PEI’s Td. Further addition ofPVP (S4) would cause the Td of the PEI to deteriorate.
Single Gas Permeability Test
Since the sample S1 cannot withstand pyrolysis treatment, no permeability datawere recorded for that particular sample. The permeabilities of pyrolyzed S2, S3,
60
70
80
90
100
0 100 200 300 400 500 600
Wei
gh
t lo
ss (
%)
Temperature (˚C)
S1S2S3S4
Fig. 2 Thermogravimetricanalysis for membranesamples
326 W. M. H. F. W. Harun et al.
and S4 toward CO2 and CH4 gases are depicted in Table 3. The CO2 permeancewas larger than CH4, which is in accord with their kinetic diameters. This phe-nomenon confirmed the molecular sieve mechanism might be involved in gastransport throughout the carbon membrane.
Based on Table 3, S3 possesses the highest CO2 permeance and CO2/CH4
permselectivity. The micropore-type structure was believed to be well developedthroughout the thermal treatment process. The PVP acted as the pillar to thepolymer matrix that prevented the melting of PEI and retained the original shapeof the hollow fiber after thermal treatment. The incapability of S1 to retain theoriginal shape of the hollow fiber during thermal treatment has proven therequirement of PVP for structure reinforcement by the formation of sponge-likepore structure. The S2 exhibits the lowest CO2 permeance and CO2/CH4 perm-selectivity. This was probably due to the collapsing of pores during thermaltreatment. The insufficient amount of PVP has triggered the excessive shrinkage ofcarbon membrane and suppressed the pore development activities. On the otherhand, the S4 exhibited low CO2 permeance and CO2/CH4 permselectivity due toexcessive amount of PVP in the polymer matrix. The thermally labile PVP wouldevolve earlier before the PEI. However, excessive amount of PVP has changed theproperties of PEI/PVP blend system, which hinders complete decompositionduring the pyrolysis. The remaining PVP in the membrane structure would disruptthe arrangement of carbon aggregation that originated from the PEI, whichresulted in membrane with less porosity achieved after thermal treatment.
Conclusion
The thermal stability of the polymeric hollow fibers was found to be influenced bythe amount of PVP presented in the dope solution. Sample S3 possesses uniformmatrix structure with lesser shrinkage. The decomposition temperature of themembrane has increased for S3, indicating better thermal stability and structurepreservation. Single gas permeability test has shown that S3 to be an optimumdope composition for production of PEI-/PVP-based hollow fiber carbonmembrane.
Acknowledgments The authors wish to thank USM Membrane Cluster Grant and Ministry ofHigher Education (MyPhD) for the financial supports.
Table 3 Permeance andpermselectivity of samplesafter thermal treatment
Sample Permeance (GPU) CO2/CH4
permselectivityCO2 CH4
S2 12.32 8.38 1.47S3 14.61 7.47 1.95S4 13.07 7.73 1.69
The Influences of Dope Composition on Gas Permeance 327
References
Baker, R. W. (2002). Future direction of membrane gas separation technology. Industrial andEngineering Chemistry Research, 41, 1393–1411.
Datta, A. K., & Sen, P. K. (2006). Optimization of membrane unit for removing carbon dioxidefrom natural gas. Journal of Membrane Science, 283, 291–300.
Hao, J., Rice, P., & Stern, S. (2002). Upgrading low-quality natural gas with H2S- and CO2-selective polymer membranes: Part I. Process design and economics of membrane stageswithout recycle streams. Journal of Membrane Science, 209, 177–206.
He, X., & Hagg, M. G. (2011). Optimization of carbonization process for preparation of highperformance hollow fiber carbon membranes. Industrial and Engineering ChemistryResearch, 50, 8065–8072.
Jones, C. W., & Koros, W. J. (1995). Characterization of ultramicroporous carbon membraneswith humidified feeds. Industrial and Engineering Chemistry Research, 34, 158–163.
Safari, M., Ghanizadeh, A., & Montazer-Rahmati, M. M. (2009). Optimization of membrane-based CO2-removal from natural gas using models considering both pressure and temperatureeffects. International Journal of Greenhouse Gas Control, 3, 3–10.
Salleh, W. N. W., & Ismail, A. F. (2011). Carbon hollow fiber membrane derived from PEI/PVPfor gas separation. Separation and Purification Technology, 80, 541–548.
Saufi, S., & Ismail, A. F. (2004). Fabrication of carbon membranes for gas separation: A review.Carbon, 42, 241–260.
Xiao, Y., Low, B. T., Hosseini, S. S., Chung, T. S., & Paul, D. R. (2009). The strategies ofmolecular architecture and modification of polyimide-based membranes for CO2 removalfrom natural gas–a review. Progress in Polymer Science, 34, 561–580.
328 W. M. H. F. W. Harun et al.
Effect of the Pyrolysis Soaking Timeon CO2 Separation of Polyetherimide/Polyethylene Glycol-Based CMSMembranes
W. Z. Wan Nurul Huda and M. A. Ahmad
Abstract Carbon molecular sieve (CMS) membranes were successfully preparedfrom polymer blends consisting of polyetherimide (PEI) and polyethylene glycol(PEG). Pyrolysis process was carried out at 600 �C with the soaking time of 2, 4,8, and 16 h. Gas permeation properties were tested using pure CH4, CO2, and N2
and performed at ambient temperature. The permeability for examined gasesdecreased with increasing soaking time, whereas the selectivity of gas pairs ofCO2/CH4 and CO2/N2 increased. CMS membrane prepared at 8 h of soaking timegave the highest selectivity of CO2/CH4 and CO2/N2 of 11.2 and 7.8, respectively.It was shown that pyrolysis soaking time played a crucial part and affected theseparation capability of the final CMS membrane.
Introduction
Global warming has become one of the biggest challenges facing the world.Carbon dioxide (CO2) emission is major contributor to this problem. CO2 isinevitably created by fossil fuel and gasoline burning. The emissions of CO2 haveincreased dramatically within the last 50 years and are still increasing by almosttwo percent each year (Olivier et al. 2011). The most mature CO2 capture pro-cesses depend on the use of amine solvents to wash CO2 out of a gas mixture. It iswell known that amines in some applications can cause health risks. Gas separa-tion using polymeric membranes is an alternative way to solve this problem.However, current polymeric membrane materials have reached a limit in theirpermeability/selectivity trade-off. To overcome this limitation, many researchers
W. Z. Wan Nurul Huda � M. A. Ahmad (&)School of Chemical Engineering, Engineering Campus, Universiti Sains Malaysia,Seri Ampangan 14300 Nibong Tebal, Seberang Perai Selatan, Penang, Malaysiae-mail: [email protected]
R. Pogaku et al. (eds.), Developments in Sustainable Chemicaland Bioprocess Technology, DOI: 10.1007/978-1-4614-6208-8_39,� Springer Science+Business Media New York 2013
329
have investigated the potential of carbon molecular sieve (CMS) membranes as anadvanced membrane material for CO2 separation applications.
CMS membranes have become promising materials due to their excellentpermeation and separation, and thermal and chemical stability under harsh con-ditions (Kim et al. 2004). Many studies have been done to optimize and improvethe preparation technique in the fabrication of CMS membrane. Several attemptswere made to control the pore structure such as modifying the precursor bypolymer blending, fine-tuning the pyrolysis process parameters, pretreatment, aswell as post-treatment. During pyrolysis, the microporous structure of the CMSmembranes will be developed by the evolution of gaseous products channeling outfrom the carbon matrix. Many studies have shown that the pyrolysis conditionshave a strong effect on the gas transport properties of CMS membrane. Studies byCenteno et al. (2004) and David and Ismail (2003) have shown that at some pointof soaking time, the gas selectivity of CMS membranes will be enhanced. At thispoint, the microstructural rearrangement occurred and narrowed the existing pores,thus resulting in more selective CMS membranes (Vu et al. 2002). However, thestructure of the final membranes is still dependent on the precursor, castingsolution, and other pyrolysis conditions.
Centeno et al. (2004) have investigated the effect of pyrolysis soaking time onphenolic resin-derived carbon membranes. They found that at 700 �C, soakingtime between 0 and 4 h resulted in poor gas selectivity. However, at 8 h of soakingtime, the prepared CMS membrane showed the best performance for separation ofCO2/N2 and CO2/CH4 of 28 and 103, respectively. Prolonged soaking time for 8 hhad favored the rearrangement and subsequent alignment of carbonaceousaggregates, resulting in smaller microporous structure.
In this work, we report on a new approach in the preparation of PEI CMSmembrane containing polymer blend. PEG is used as a pore-forming agent tointroduce controllable mesoporosity into the carbon matrix. The effects of thepyrolysis soaking time on the permeation performances as well as morphology andstructure properties of derived CMS membrane were investigated.
Methodology
Materials
PEI and PEG, used as precursors, were supplied by Sigma-Aldrich (M) Sdn. Bhd.,while N-methyl-2-pyrrolidone (NMP), a solvent for PEI/PEG, was supplied byAcros Organics Ltd. Wellgas Sdn. Bhd. supplied purified N2 (99.95 % purity),CO2 (99.99 % purity), and CH4 (99.99 % purity) gases.
330 W. Z. Wan Nurul Huda and M. A. Ahmad
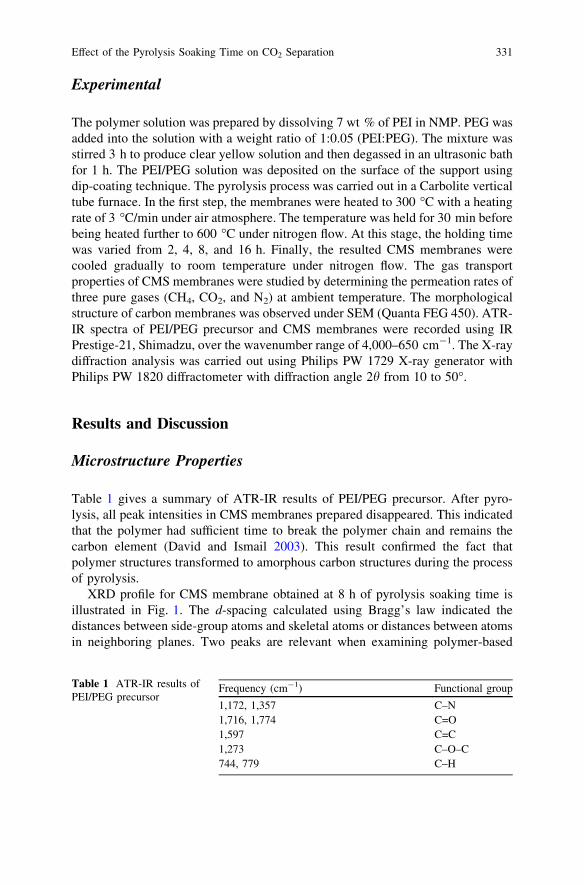
Experimental
The polymer solution was prepared by dissolving 7 wt % of PEI in NMP. PEG wasadded into the solution with a weight ratio of 1:0.05 (PEI:PEG). The mixture wasstirred 3 h to produce clear yellow solution and then degassed in an ultrasonic bathfor 1 h. The PEI/PEG solution was deposited on the surface of the support usingdip-coating technique. The pyrolysis process was carried out in a Carbolite verticaltube furnace. In the first step, the membranes were heated to 300 �C with a heatingrate of 3 �C/min under air atmosphere. The temperature was held for 30 min beforebeing heated further to 600 �C under nitrogen flow. At this stage, the holding timewas varied from 2, 4, 8, and 16 h. Finally, the resulted CMS membranes werecooled gradually to room temperature under nitrogen flow. The gas transportproperties of CMS membranes were studied by determining the permeation rates ofthree pure gases (CH4, CO2, and N2) at ambient temperature. The morphologicalstructure of carbon membranes was observed under SEM (Quanta FEG 450). ATR-IR spectra of PEI/PEG precursor and CMS membranes were recorded using IRPrestige-21, Shimadzu, over the wavenumber range of 4,000–650 cm-1. The X-raydiffraction analysis was carried out using Philips PW 1729 X-ray generator withPhilips PW 1820 diffractometer with diffraction angle 2h from 10 to 50�.
Results and Discussion
Microstructure Properties
Table 1 gives a summary of ATR-IR results of PEI/PEG precursor. After pyro-lysis, all peak intensities in CMS membranes prepared disappeared. This indicatedthat the polymer had sufficient time to break the polymer chain and remains thecarbon element (David and Ismail 2003). This result confirmed the fact thatpolymer structures transformed to amorphous carbon structures during the processof pyrolysis.
XRD profile for CMS membrane obtained at 8 h of pyrolysis soaking time isillustrated in Fig. 1. The d-spacing calculated using Bragg’s law indicated thedistances between side-group atoms and skeletal atoms or distances between atomsin neighboring planes. Two peaks are relevant when examining polymer-based
Table 1 ATR-IR results ofPEI/PEG precursor
Frequency (cm-1) Functional group
1,172, 1,357 C–N1,716, 1,774 C=O1,597 C=C1,273 C–O–C744, 779 C–H
Effect of the Pyrolysis Soaking Time on CO2 Separation 331
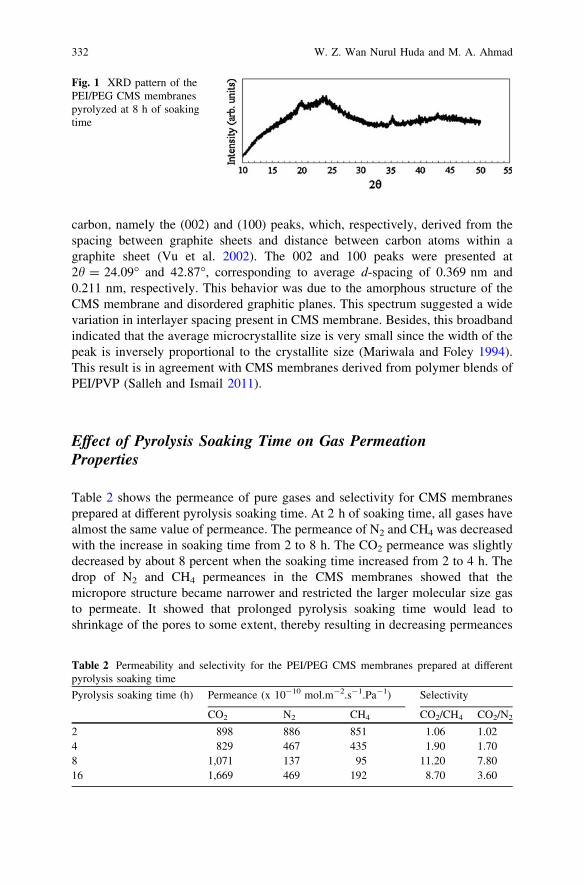
carbon, namely the (002) and (100) peaks, which, respectively, derived from thespacing between graphite sheets and distance between carbon atoms within agraphite sheet (Vu et al. 2002). The 002 and 100 peaks were presented at2h = 24.09� and 42.87�, corresponding to average d-spacing of 0.369 nm and0.211 nm, respectively. This behavior was due to the amorphous structure of theCMS membrane and disordered graphitic planes. This spectrum suggested a widevariation in interlayer spacing present in CMS membrane. Besides, this broadbandindicated that the average microcrystallite size is very small since the width of thepeak is inversely proportional to the crystallite size (Mariwala and Foley 1994).This result is in agreement with CMS membranes derived from polymer blends ofPEI/PVP (Salleh and Ismail 2011).
Effect of Pyrolysis Soaking Time on Gas PermeationProperties
Table 2 shows the permeance of pure gases and selectivity for CMS membranesprepared at different pyrolysis soaking time. At 2 h of soaking time, all gases havealmost the same value of permeance. The permeance of N2 and CH4 was decreasedwith the increase in soaking time from 2 to 8 h. The CO2 permeance was slightlydecreased by about 8 percent when the soaking time increased from 2 to 4 h. Thedrop of N2 and CH4 permeances in the CMS membranes showed that themicropore structure became narrower and restricted the larger molecular size gasto permeate. It showed that prolonged pyrolysis soaking time would lead toshrinkage of the pores to some extent, thereby resulting in decreasing permeances
Fig. 1 XRD pattern of thePEI/PEG CMS membranespyrolyzed at 8 h of soakingtime
Table 2 Permeability and selectivity for the PEI/PEG CMS membranes prepared at differentpyrolysis soaking time
Pyrolysis soaking time (h) Permeance (x 10-10 mol.m-2.s-1.Pa-1) Selectivity
CO2 N2 CH4 CO2/CH4 CO2/N2
2 898 886 851 1.06 1.024 829 467 435 1.90 1.708 1,071 137 95 11.20 7.8016 1,669 469 192 8.70 3.60
332 W. Z. Wan Nurul Huda and M. A. Ahmad
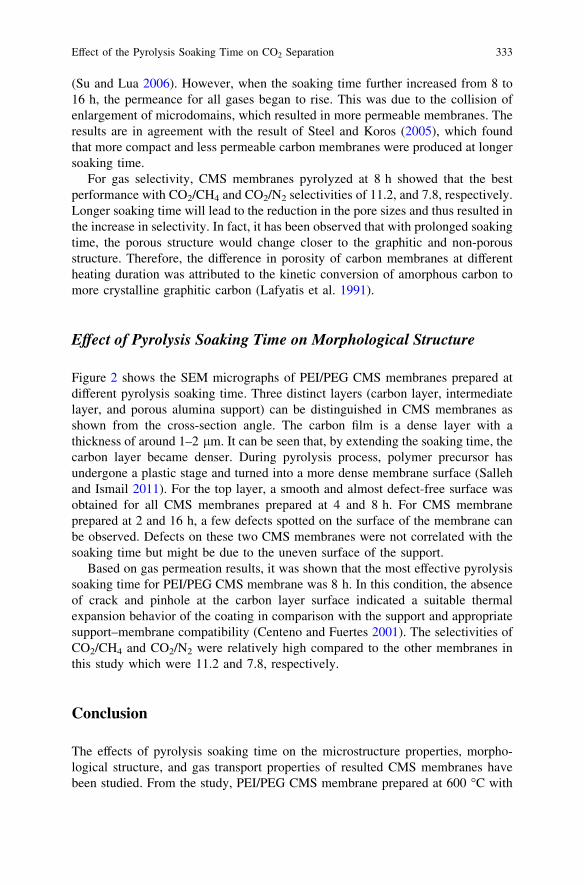
(Su and Lua 2006). However, when the soaking time further increased from 8 to16 h, the permeance for all gases began to rise. This was due to the collision ofenlargement of microdomains, which resulted in more permeable membranes. Theresults are in agreement with the result of Steel and Koros (2005), which foundthat more compact and less permeable carbon membranes were produced at longersoaking time.
For gas selectivity, CMS membranes pyrolyzed at 8 h showed that the bestperformance with CO2/CH4 and CO2/N2 selectivities of 11.2, and 7.8, respectively.Longer soaking time will lead to the reduction in the pore sizes and thus resulted inthe increase in selectivity. In fact, it has been observed that with prolonged soakingtime, the porous structure would change closer to the graphitic and non-porousstructure. Therefore, the difference in porosity of carbon membranes at differentheating duration was attributed to the kinetic conversion of amorphous carbon tomore crystalline graphitic carbon (Lafyatis et al. 1991).
Effect of Pyrolysis Soaking Time on Morphological Structure
Figure 2 shows the SEM micrographs of PEI/PEG CMS membranes prepared atdifferent pyrolysis soaking time. Three distinct layers (carbon layer, intermediatelayer, and porous alumina support) can be distinguished in CMS membranes asshown from the cross-section angle. The carbon film is a dense layer with athickness of around 1–2 lm. It can be seen that, by extending the soaking time, thecarbon layer became denser. During pyrolysis process, polymer precursor hasundergone a plastic stage and turned into a more dense membrane surface (Sallehand Ismail 2011). For the top layer, a smooth and almost defect-free surface wasobtained for all CMS membranes prepared at 4 and 8 h. For CMS membraneprepared at 2 and 16 h, a few defects spotted on the surface of the membrane canbe observed. Defects on these two CMS membranes were not correlated with thesoaking time but might be due to the uneven surface of the support.
Based on gas permeation results, it was shown that the most effective pyrolysissoaking time for PEI/PEG CMS membrane was 8 h. In this condition, the absenceof crack and pinhole at the carbon layer surface indicated a suitable thermalexpansion behavior of the coating in comparison with the support and appropriatesupport–membrane compatibility (Centeno and Fuertes 2001). The selectivities ofCO2/CH4 and CO2/N2 were relatively high compared to the other membranes inthis study which were 11.2 and 7.8, respectively.
Conclusion
The effects of pyrolysis soaking time on the microstructure properties, morpho-logical structure, and gas transport properties of resulted CMS membranes havebeen studied. From the study, PEI/PEG CMS membrane prepared at 600 �C with
Effect of the Pyrolysis Soaking Time on CO2 Separation 333
Fig. 2 SEM micrographs of (1) cross-section and (2) top layer of the CMS membrane preparedat (a) 2 h, (b) 4 h, (c) 8 h, and (d) 16 h
334 W. Z. Wan Nurul Huda and M. A. Ahmad
soaking time of 8 h showed the best performance in terms of selectivity. Theselectivities of CO2/CH4 and CO2/N2 were 11.2 and 7.8, respectively. Thisresearch suggested that by fine-tuning the pyrolysis soaking time, it is able toproduce carbon membranes that possess micropores of desired dimension for adifferent gas separation.
Acknowledgments The authors gratefully acknowledge the financial supports from USMMembrane Cluster Grant and Ministry of Higher Education (MyBrain).
References
Centeno, T. A., & Fuertes, A. B. (2001). Carbon molecular sieve membranes derived from aphenolic resin supported on porous ceramic tubes. Separation and Purification Technology,25, 379–384.
Centeno, T. A., Vilas, J. L., & Fuertes, A. B. (2004). Effects of phenolic resin pyrolysisconditions on carbon membrane performance for gas separation. Journal of MembraneScience, 228, 45–54.
David, L. I. B., & Ismail, A. F. (2003). Influence of the thermastabilization process and soak timeduring pyrolysis process on the polyacrylonitrile carbon membranes for O2/N2 separation.Journal of Membrane Science, 213, 285–291.
Kim, Y. K., Park, H. B., & Lee, Y. M. (2004). Carbon molecular sieve membranes derived fromthermally labile polymer containing blend polymers and their gas separation properties.Journal of Membrane Science, 243, 9–17.
Lafyatis, D. S., Tung, J., & Foley, H. C. (1991). Poly(furfuryl alcohol)-derived carbon molecularsieves: dependence of adsorptive properties on carbonization temperature, time, andpoly(ethylene glycol) additives. Industrial and Engineering Chemistry Research, 30,855–873.
Mariwala, R. K., & Foley, H. C. (1994). Evolution of ultramicroporous adsorptive structure inpoly(furfuryl alcohol)-derived carbogenic molecular sieves. Industrial and EngineeringChemistry Research, 33, 607–615.
Olivier, J. G. J., Janssens-maenhout, G., Jeroen, A. H. W. P., & Wilson, J. (2011). Long-termtrend in global CO2 emissions 2011 report. (http://edgar.jrc.ec.europa.eu/news_docs/C02%20Mondiaal_%20webdef_19sept.pdf) Accessed 9 November 2012.
Salleh, W. N. W., & Ismail, A. F. (2011). Effects of carbonization heating rate on CO2 separationof derived carbon membranes. Separation and Purification Technology, 88, 174–183.
Steel, K. M., & Koros, W. J. (2005). An investigation of the effects of pyrolysis parameters on gasseparation properties of carbon materials. Carbon, 43, 1843–1856.
Su, J., & Lua, A. C. (2006). Influence of carbonization parameters on the transport properties ofcarbon membranes by statistical analysis. Journal of Membrane Science, 278, 335–343.
Vu, D. Q., Koros, W. J., & Miller, S. J. (2002). High pressure CO2/CH4 separation using carbonmolecular sieve hollow fiber membranes. Industrial and Engineering Chemistry Research, 41,367–380.
Effect of the Pyrolysis Soaking Time on CO2 Separation 335
Performance of Particleboard with PalmKernel Cake as Filler
A. Bono, S. M. Anisuzzaman, N. M. Ismail and R. Haziami
Abstract Particleboard is a common product of wood industry. Usually, theparticleboard is used as a component of furniture manufacturing or part of buildingconstruction. In the production of particleboard, wood glue or binder is applied toform hard bonded particles. The usage of melamine–urea–formaldehyde (MUF)resin as a binder in particleboard production is widely practised. Due to low solidcontent and the cost of MUF resin, some particleboard manufacturers are addingfiller to increase the solid content and to reduce the cost of binder. For example,industrial-grade wheat flour and palm shell powder are commonly used as filler.The performance of wood products is significantly affected by the type of fillerused due to the compound composition. Therefore, a study conducted in this workis to investigate the performance of MUF resin-based particleboard produced withpalm kernel cake powder as filler. Palm kernel cake (PKC) was chosen due to theprotein content that might help in the binding strength and the reduction in freeformaldehyde in the wood product. The investigation was conducted by thepreparation of particleboard in laboratory with various curing time and quantity ofMUF resin and filler used. The performance properties of particleboard such aswater absorption (WA), thickness swelling (TS), modulus of rupture (MOR), andmodulus of elasticity (MOE) were investigated. Response surface methodology(RSM) of design expert software was used for the experimental design and opti-mization. The results shown that there is some effect of filler on the performanceproperties particleboard produced. The optimized or targeted performance also canbe identified via design expert software.
Keywords Melamine–urea–formaldehyde � Modulus of elasticity � Modulus ofrupture � Wood binder � Wood glue
A. Bono (&) � S. M. Anisuzzaman � N. M. Ismail � R. HaziamiSchool of Engineering and Information Technology, Universiti Malaysia Sabah,88400 Kota Kinabalu, Sabah, Malaysiae-mail: [email protected]
R. Pogaku et al. (eds.), Developments in Sustainable Chemicaland Bioprocess Technology, DOI: 10.1007/978-1-4614-6208-8_40,� Springer Science+Business Media New York 2013
337
Introduction
Particleboard can be considered as a common product of wood industry. Parti-cleboard is widely used around the world in furniture manufacturing and houseconstruction (Youngquist 1999). The production of particleboard involved com-pression of wood particles with other lignocelluloses materials and adhesive athigh pressure. The adhesives used to bind the wood particles made from natural orsynthetic products (Bono et al. 2010). At the present time, the majority of parti-cleboard manufacturer employs formaldehyde-based adhesives such as phenol–formaldehyde (PF), urea–formaldehyde (UF), and melamine–urea–formaldehyde(MUF) as the main adhesives. The current global trend shows that the marketplaceis moving in relation to use particleboards with reduced or no formaldehyde(Hashim et al. 2009; Bono et al. 2010). Formaldehyde-based adhesive accountedfor 99 % of the total volume and 97 % of the total sale value, which indicated thatformaldehyde-based adhesives played a dominant role in the wood adhesivemarket (Sellers 2001). However, formaldehyde-based adhesives are derived fromnonrenewable petrochemicals and natural gas. In addition, the emission of form-aldehyde, especially from the breakdown of formaldehyde-based resins in woodcomposites, poses a great hazard to human health because formaldehyde is car-cinogenic to human body. Finite oil reserves, the expanding wood adhesivemarket, and hazardous issues associated with formaldehyde-based adhesivesgenerate an urgent need for the development of environment-friendly alternativewood adhesives from renewable materials. In the year 1995, the InternationalAgency for Research on Cancer (IARC) agreed that formaldehyde is a probablehuman carcinogen. However, in a reassessment of available data in June 2004, theIARC rearranged formaldehyde as a known human carcinogen (Hai 2005). Due tothe cost of synthetic adhesive such as MUF resin, filler was used to reduce theproduction cost of bonded wood products.
Filler can be defined as additive added to material such as fine particle ofagriculture by-products, plastics, composite materials, and concrete to decrease theutilization of expensive binder material or to improve the properties of the mixturematerial. The availability of palm kernel cake (PKC) around the world can beutilized as filler. PKC as agriculture by-product of palm oil industry can be similaror better than the current filler of agriculture by-products such as industrial-gradewheat flour or fine powder of palm shell. PKC contains protein content and someessential amino acid. Apart from that, PKC also contains 21–23 % of crude fiberswhich is rich in cellulose, hemicelluloses, and lignin (Farm et al. 2009; Bono et al.2009; Boateng et al. 2008). The amino groups (-NH2) in the crude protein of PKCmay form hydrogen bonding between the melamine and urea in MUF resin alsofibers (cellulose and hemicelluloses) to facilitate the bonding strength of MUFresin (Ong et al. 2011; Bono et al. 2011). The presence of small quantity of lipid inthe PKC may decrease intrusion of water to disrupt the hydrogen bonding betweenMUF resin and the wood surface. Other than that, PKC acts as a formaldehydescavenger which helps to reduce formaldehyde emission that is carcinogenic to
338 A. Bono et al.
human being. Utilization of PKC as filler may fill up the gaps or voids between thewood bonding surface and MUF resin to help promote the contact surface area andhence increase water resistance and the bond strength performance of MUF resin.
Therefore, a study of the effect of filler on the performance of particleboard withMUF resin was conducted. The main objective of this work was to investigate theperformance properties of particleboard such as water absorption (WA), thicknessswelling (TS), modulus of rapture (MOR), and modulus of elasticity (MOE) withthe variation of MUF/filler ratio and the curing time. The experimental work wasdesigned and optimized using response surface methodology (RSM) (Bono et al.2008).
Methodology
The experimental works involved in this study were categorized into three parts:preparation of oil-free PKC powder, preparation of MUF resin, and production andcharacterization of particleboard.
Preparation of Palm Kernel Cake Powder
PKC was obtained from Borneo Samudera Lumadan Palm Oil Mill, Sabah,Malaysia. Fresh PKC was oven-dried at 80 �C for 12 h. The residue oil contentwas removed by Soxhlet extractor with hexane as the solvent for 8 h as suggestedby Farm et al. (2009). Then, the PKC powder was prepared by grinding of oil-freePKC to less than 200 micron. The powder was kept at oven at 60 �C for at least24 h prior to the usage for the particleboard production.
Melamine–Urea–Formaldehyde Resin Preparation
The MUF resin was prepared using industrial-grade melamine, industrial-gradeurea, and 37 % formaldehyde as the raw materials. The method of synthesis ofMUF resin was adopted from reflux process (Pizzi 1994; Bono et al. 2003, 2006).The adopted MUF resin synthesis process was divided into three stages: the firststage was the initial process, the second stage was the polymerization process, andthe third stage was the post-refluxing process. The MUF resin produced was usedfor the production of particleboard within 3 h after it was synthesized.
Performance of Particleboard with Palm Kernel Cake as Filler 339
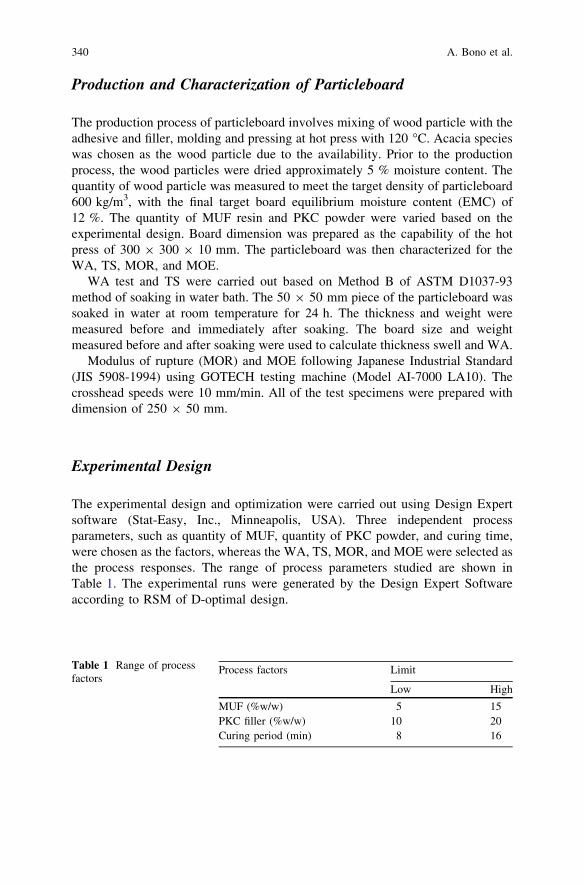
Production and Characterization of Particleboard
The production process of particleboard involves mixing of wood particle with theadhesive and filler, molding and pressing at hot press with 120 �C. Acacia specieswas chosen as the wood particle due to the availability. Prior to the productionprocess, the wood particles were dried approximately 5 % moisture content. Thequantity of wood particle was measured to meet the target density of particleboard600 kg/m3, with the final target board equilibrium moisture content (EMC) of12 %. The quantity of MUF resin and PKC powder were varied based on theexperimental design. Board dimension was prepared as the capability of the hotpress of 300 9 300 9 10 mm. The particleboard was then characterized for theWA, TS, MOR, and MOE.
WA test and TS were carried out based on Method B of ASTM D1037-93method of soaking in water bath. The 50 9 50 mm piece of the particleboard wassoaked in water at room temperature for 24 h. The thickness and weight weremeasured before and immediately after soaking. The board size and weightmeasured before and after soaking were used to calculate thickness swell and WA.
Modulus of rupture (MOR) and MOE following Japanese Industrial Standard(JIS 5908-1994) using GOTECH testing machine (Model AI-7000 LA10). Thecrosshead speeds were 10 mm/min. All of the test specimens were prepared withdimension of 250 9 50 mm.
Experimental Design
The experimental design and optimization were carried out using Design Expertsoftware (Stat-Easy, Inc., Minneapolis, USA). Three independent processparameters, such as quantity of MUF, quantity of PKC powder, and curing time,were chosen as the factors, whereas the WA, TS, MOR, and MOE were selected asthe process responses. The range of process parameters studied are shown inTable 1. The experimental runs were generated by the Design Expert Softwareaccording to RSM of D-optimal design.
Table 1 Range of processfactors
Process factors Limit
Low High
MUF (%w/w) 5 15PKC filler (%w/w) 10 20Curing period (min) 8 16
340 A. Bono et al.
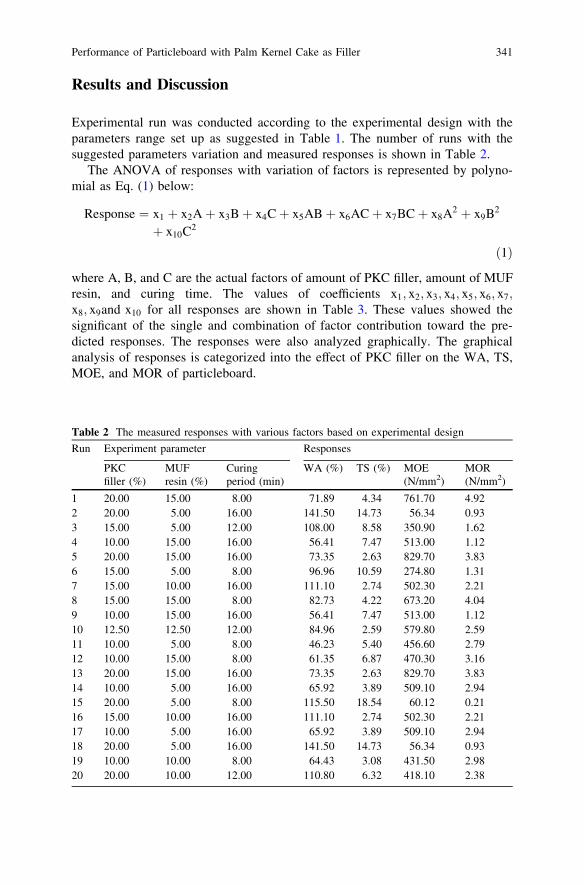
Results and Discussion
Experimental run was conducted according to the experimental design with theparameters range set up as suggested in Table 1. The number of runs with thesuggested parameters variation and measured responses is shown in Table 2.
The ANOVA of responses with variation of factors is represented by polyno-mial as Eq. (1) below:
Response ¼ x1 þ x2Aþ x3Bþ x4Cþ x5ABþ x6ACþ x7BCþ x8A2 þ x9B2
þ x10C2
ð1Þ
where A, B, and C are the actual factors of amount of PKC filler, amount of MUFresin, and curing time. The values of coefficients x1; x2; x3; x4; x5; x6; x7;x8; x9and x10 for all responses are shown in Table 3. These values showed thesignificant of the single and combination of factor contribution toward the pre-dicted responses. The responses were also analyzed graphically. The graphicalanalysis of responses is categorized into the effect of PKC filler on the WA, TS,MOE, and MOR of particleboard.
Table 2 The measured responses with various factors based on experimental design
Run Experiment parameter Responses
PKCfiller (%)
MUFresin (%)
Curingperiod (min)
WA (%) TS (%) MOE(N/mm2)
MOR(N/mm2)
1 20.00 15.00 8.00 71.89 4.34 761.70 4.922 20.00 5.00 16.00 141.50 14.73 56.34 0.933 15.00 5.00 12.00 108.00 8.58 350.90 1.624 10.00 15.00 16.00 56.41 7.47 513.00 1.125 20.00 15.00 16.00 73.35 2.63 829.70 3.836 15.00 5.00 8.00 96.96 10.59 274.80 1.317 15.00 10.00 16.00 111.10 2.74 502.30 2.218 15.00 15.00 8.00 82.73 4.22 673.20 4.049 10.00 15.00 16.00 56.41 7.47 513.00 1.1210 12.50 12.50 12.00 84.96 2.59 579.80 2.5911 10.00 5.00 8.00 46.23 5.40 456.60 2.7912 10.00 15.00 8.00 61.35 6.87 470.30 3.1613 20.00 15.00 16.00 73.35 2.63 829.70 3.8314 10.00 5.00 16.00 65.92 3.89 509.10 2.9415 20.00 5.00 8.00 115.50 18.54 60.12 0.2116 15.00 10.00 16.00 111.10 2.74 502.30 2.2117 10.00 5.00 16.00 65.92 3.89 509.10 2.9418 20.00 5.00 16.00 141.50 14.73 56.34 0.9319 10.00 10.00 8.00 64.43 3.08 431.50 2.9820 20.00 10.00 12.00 110.80 6.32 418.10 2.38
Performance of Particleboard with Palm Kernel Cake as Filler 341
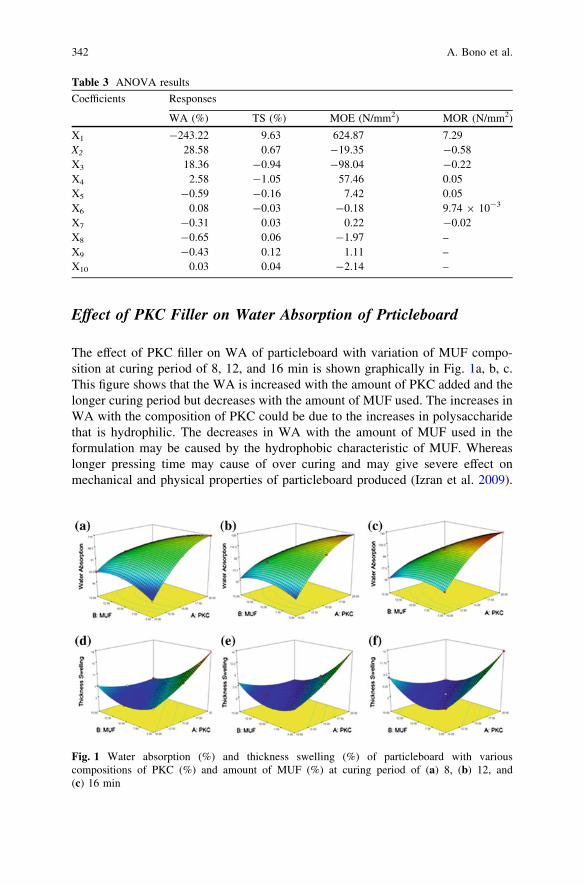
Effect of PKC Filler on Water Absorption of Prticleboard
The effect of PKC filler on WA of particleboard with variation of MUF compo-sition at curing period of 8, 12, and 16 min is shown graphically in Fig. 1a, b, c.This figure shows that the WA is increased with the amount of PKC added and thelonger curing period but decreases with the amount of MUF used. The increases inWA with the composition of PKC could be due to the increases in polysaccharidethat is hydrophilic. The decreases in WA with the amount of MUF used in theformulation may be caused by the hydrophobic characteristic of MUF. Whereaslonger pressing time may cause of over curing and may give severe effect onmechanical and physical properties of particleboard produced (Izran et al. 2009).
Table 3 ANOVA results
Coefficients Responses
WA (%) TS (%) MOE (N/mm2) MOR (N/mm2)
X1 -243.22 9.63 624.87 7.29X2 28.58 0.67 -19.35 -0.58X3 18.36 -0.94 -98.04 -0.22X4 2.58 -1.05 57.46 0.05X5 -0.59 -0.16 7.42 0.05X6 0.08 -0.03 -0.18 9.74 9 10-3
X7 -0.31 0.03 0.22 -0.02X8 -0.65 0.06 -1.97 –X9 -0.43 0.12 1.11 –X10 0.03 0.04 -2.14 –
Fig. 1 Water absorption (%) and thickness swelling (%) of particleboard with variouscompositions of PKC (%) and amount of MUF (%) at curing period of (a) 8, (b) 12, and(c) 16 min
342 A. Bono et al.
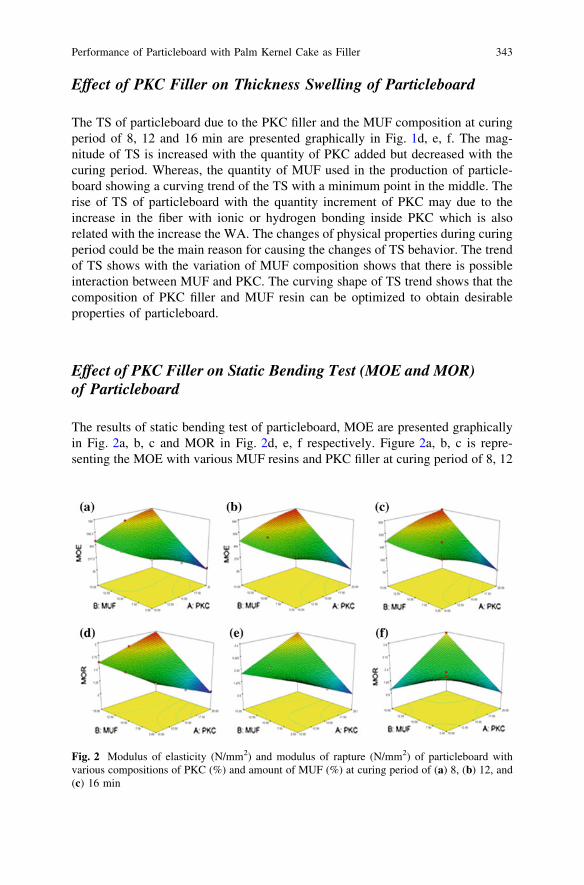
Effect of PKC Filler on Thickness Swelling of Particleboard
The TS of particleboard due to the PKC filler and the MUF composition at curingperiod of 8, 12 and 16 min are presented graphically in Fig. 1d, e, f. The mag-nitude of TS is increased with the quantity of PKC added but decreased with thecuring period. Whereas, the quantity of MUF used in the production of particle-board showing a curving trend of the TS with a minimum point in the middle. Therise of TS of particleboard with the quantity increment of PKC may due to theincrease in the fiber with ionic or hydrogen bonding inside PKC which is alsorelated with the increase the WA. The changes of physical properties during curingperiod could be the main reason for causing the changes of TS behavior. The trendof TS shows with the variation of MUF composition shows that there is possibleinteraction between MUF and PKC. The curving shape of TS trend shows that thecomposition of PKC filler and MUF resin can be optimized to obtain desirableproperties of particleboard.
Effect of PKC Filler on Static Bending Test (MOE and MOR)of Particleboard
The results of static bending test of particleboard, MOE are presented graphicallyin Fig. 2a, b, c and MOR in Fig. 2d, e, f respectively. Figure 2a, b, c is repre-senting the MOE with various MUF resins and PKC filler at curing period of 8, 12
Fig. 2 Modulus of elasticity (N/mm2) and modulus of rapture (N/mm2) of particleboard withvarious compositions of PKC (%) and amount of MUF (%) at curing period of (a) 8, (b) 12, and(c) 16 min
Performance of Particleboard with Palm Kernel Cake as Filler 343
and 16 min. Similarly, Fig. 2d, e, f is representing the MOR with various MUFresins and PKC filler at curing period of 8, 12 and 16 min. With respect to the riseof curing period, the magnitude of MOE increases, whereas MOR is decreased. Atlower composition of MUF resin, the magnitude of MOE and MOR decrease as thequantity of PKC filler increases. In contrast, the magnitude of MOE and MORincrease as the quantity of PKC filler increases at higher composition of MUFresin. The lower values of MOE and MOR at lower composition of MUF may bedue to lack of MUF to form interlock with the wood fiber.
Optimization of Process Factors with Propertiesof Particleboard with PKC Filler
The optimization of process factors conducted using the procedure included inDesign Expert Software. The criteria selected were based on the range of factorswhich is similar to the range of factors selected for the experimental run as shown inTable 1, whereas the target value for the responses were selected as shown in Table 4.
The result of optimization showed that the maximum desirability of the opti-mization for the range of MUF composition of 12.5–15 % and PKC filler of15–20 % at curing period 10.72 min.
Conclusions
The usage of PKC as a filler in the production of particleboard affects significantlythe performance of particleboard produced. The rise of the particleboard strengthwith the increase in PKC filler used indicates that there is a possibility of thereaction or bonding between MUF resin and protein inside PKC. The trend of theperformance changed with the variation of particleboard composition shows thatthe production process can be optimized to the desire properties of the productproduced. Finally, the investigation in this work can be extended to the study ofthe other process parameters such effect of particle sizes, pressing temperature andthe various types of fillers.
Table 4 The optimization criteria for the process condition of the particleboard production
Responses Target Range
Low High
WA (%) Minimum 36.1 140.76TS (%) Minimum 1.52 19.78MOE (N/mm2) Maximum 0.213 6.55MOR (N/mm2) Maximum 45.134 874.91
344 A. Bono et al.
References
Boateng, M., Okai, D. B., Baah, J., & Donkoh, A. (2008). Palm Kernel Cake extraction andutilization in pig and poultry diets in ghana. Livestock Research for Rural Development, 20, 7.
Bono, A., Yeo, K. B., & Siambun, N. J. (2003). Melamine-Urea-Formaldehyde (MUF) resin: Theeffect of the number of reaction stages and mole ratio on resin properties. Jurnal Teknologi.Universiti Teknologi Malaysia, 38(F), 43–52.
Bono, A., Krishnaiah, D., Rajin, M., & Siambun, N. J. (2006). Variation of reaction stages andmole composition effect on melamine-urea-formaldehyde (MUF) resin properties, study insurface science and catalysis. Elsivier, 159, 713–716.
Bono, A., Krishnaiah, K., & Rajin, M. (2008). Products and process optimization using responsesurface methodology. Malaysia: Universiti Malaysia Sabah Press.
Bono, A., Ying, P. H., Farm, Y. Y., Chng, L. M., Sarbatly, R., Krishnaiah, D. (2009). Synthesisand characterized of Carboxylmethyl cellulose from palm kernel cake, Advances in Naturaland Applied Sciences, 3(1), 5–11.
Bono, A., Farm, Y. Y., Krishnaiah, D., Ismail, N. M., Yee, L. Y. K., & Lee, L. M. (2010). Palmkernel based wood adhesive. Journal of Applied Sciences, 10(21), 2638–2642.
Bono, A., Nur, M., Anisuzzaman, S. M., Saalah, S., & Chiw, H. K. (2011). The performance ofMUF resin with palm kernel as filler. Advanced Materials Research, 3, 233–235.
Farm, Y. Y., Krishnaiah, D., Rajin, M., & Bono, A. (2009). Cellulose extraction form palm kernelcake using liquid phase oxidation. Journal of Engineering Science and Technology, 4(1),57–68.
Hai, B. (2005). WTO declares formaldehyde as human carcinogen. China Wood-based panels,30.
Hashim, R., Hamid, S. H. A., Sulaiman, O., Ismail, M. H., & Jais, H. (2009). Extractableformaldehyde from waste medium density fibreboards. Journal of Tropical Science, 21,25–33.
Izran, K., Abdul Malek A. R., Mohd. Yusof, M. N., Masseat, K., & Ashaari, K. (2009). Physicaland mechanical properties of flame retardent treated Hibicus cannabinus particleboard.Journal of Modern Applied Science, 3, 2–8.
Ong, H. R., Prassad, R., Rahman Khan, M. M., & Kabir Chowdhury, M. N. (2011). Effect of palmkernel meal as MUF adhesive extender for plywood application: Using a FTIR spectroscopystudy. Advanced Mechanics and Materials, 493, 121–126.
Pizzi, A. (1994). Melamine-formaldehyde adhesive. In A. Pizzi & K. L. Mitti (Eds.), Handbookof adhesive technology (393–403). New York: Marcel Dekker Inc.
Youngquist, J. A. (1999). Wood-based composites and panel products. In Wood handbook: Woodas an engineering material, General Technical Report. FGL-GRT-113., USDA Forest Serv.(pp. 1–31). Madison, WI: Forest Prod. Lab.
Performance of Particleboard with Palm Kernel Cake as Filler 345
Starch-Based Biofilms for GreenPackaging
R. R. Ali, W. A. W. A. Rahman, N. B. Ibrahim and R. M. Kasmani
Abstract The aim of this study is to develop degradable starch-based packagingfilm with enhanced mechanical properties. A series of low-density polyethylene(LDPE)/tapioca starch compounds with various tapioca starch contents wereprepared by twin-screw extrusion with the addition of maleic anhydride-graftedpolyethylene as compatibilizer. Palm cooking oil was used as processing aid toease the blown film process; thus, degradable film can be processed via conven-tional blown film machine. Studies on their mechanical properties and biodegra-dation were carried out by tensile test and exposure to fungi environment,respectively. The presence of high starch contents had an adverse effect on thetensile properties of LDPE/tapioca starch blends. However, the addition of com-patibilizer to the blends improved the interfacial adhesion between the twomaterials and hence improved the tensile properties of the films. High content ofstarch was also found to increase the rate of biodegradability of LDPE/tapiocastarch films. It can be proved by exposure of the film to fungi environment. Agrowth of microbes colony can be seen on the surface of LDPE/tapioca starch filmindicates that the granular starch present on the surface of the polymer film isattacked by microorganisms, until most of it is assimilated as a carbon source.
R. R. Ali (&) � W. A. W. A. Rahman � N. B. Ibrahim � R. M. KasmaniPolymer Engineering Department, Faculty of Chemical Engineering,Universiti Teknologi Malaysia, 81310 Skudai, Johor, Malaysiae-mail: [email protected]
N. B. Ibrahim � R. M. KasmaniGas Engineering Department, Faculty of Petroleum and Renewable Energy Engineering,Universiti Teknologi Malaysia, 81310 Skudai, Johor, Malaysia
R. Pogaku et al. (eds.), Developments in Sustainable Chemicaland Bioprocess Technology, DOI: 10.1007/978-1-4614-6208-8_41,� Springer Science+Business Media New York 2013
347
Introduction
Plastics are widely used economical materials characterized by excellent all-roundproperties, easy moulding, and manufacturing. Approximately 140 million tonnesof synthetic polymers are produced worldwide each year to replace more tradi-tional materials, particularly in packaging. Over 60 % of post-consumer plasticwaste is produced by households and most of it as single-use packaging (Zhengand Yanfu 2005). Plastics are manufactured and designed to resist the environ-mental degradation and also more economical than metal, woods, and glasses interms of manufacturing costs and energy required. Due to these issues, plasticresins have become one of the most popular materials used in packaging. How-ever, these plastics are made of petroleum-based materials that are not readilybiodegradable. Synthetic plastics such as polyethylene and polypropylene have avery low water vapor transmission rate, which is a good characteristic of pack-aging materials. Furthermore, they are totally non-biodegradable and thereforelead to environmental pollution, which pose serious ecological problems.
Polyolefin is not degraded by microorganisms in the environment, whichcontributes to their long lifetime of hundreds of years. Plastic packaging has acycle less than a year and continuously enters the waste stream on a short turnoutof time. The continuous growth of plastic industries has led to the increasedvolume of plastic waste in the landfill. With the growing concern about environ-mental pollution, the accumulation of plastic waste needs immediate resolution.Biodegradable plastics have been intensively studied in recent years (Khabbazet al. 1998; Erlandsson et al. 1997; Akaranta and Oku 1999; Arvanitoyannis et al.1998; Manzur et al. 2004) and have been commercialized into various productssuch as garbage bags, composting yard-waste bags, grocery bags, and agriculturemulches.
Biodegradable plastics are defined as plastics with similar properties to con-ventional plastics, but it can be decomposed after disposal to the environment bythe activity of microorganisms to produce end products of CO2 and H2O(Tharanathan 2003). It is also an alternative to the petroleum-based non-biode-gradable polymers. Biodegradable plastics can be used in hygiene products,household goods, horticultural products, agriculture, medical products, and manymore. It decreases the solid waste problems created by plastic waste. Biodegrad-able polymers can be divided into two main categories, which are naturallyoccurring biodegradable polymers and synthetic biodegradable polymers (Danjajiet al. 2002).
Research on biodegradable plastics based on starch began in the 1970s andcontinues today at various laboratories all over the world. Technologies have beendeveloped for continues production of extrusion films and injection-mouldedplastics containing 50 % or more of starch (Tharanathan 2003). Starch satisfies therequirements of adequate thermal stability, minimum interference with meltproperties, and disturbance of product quality (Danjaji et al. 2002). Starch is anreadily available inexpensive, renewable, and fully biodegradable natural raw
348 R. R. Ali et al.
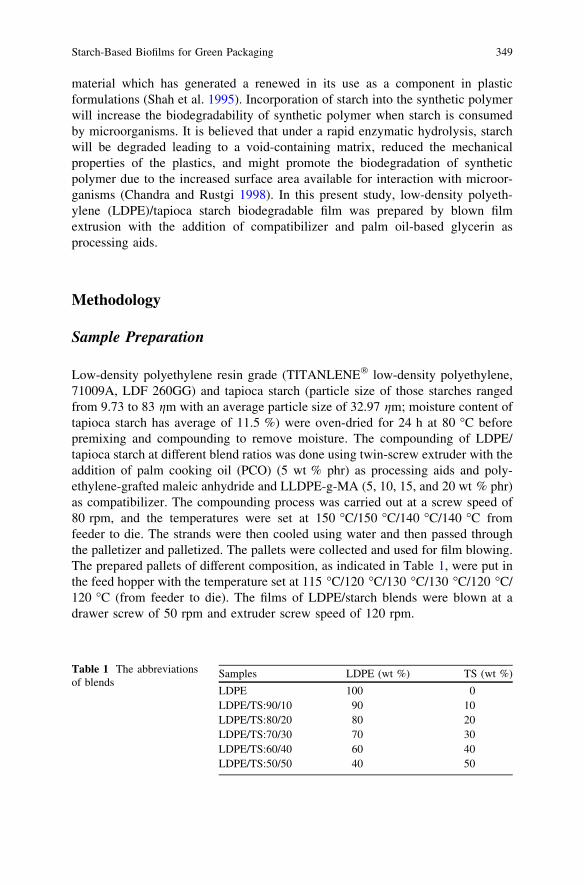
material which has generated a renewed in its use as a component in plasticformulations (Shah et al. 1995). Incorporation of starch into the synthetic polymerwill increase the biodegradability of synthetic polymer when starch is consumedby microorganisms. It is believed that under a rapid enzymatic hydrolysis, starchwill be degraded leading to a void-containing matrix, reduced the mechanicalproperties of the plastics, and might promote the biodegradation of syntheticpolymer due to the increased surface area available for interaction with microor-ganisms (Chandra and Rustgi 1998). In this present study, low-density polyeth-ylene (LDPE)/tapioca starch biodegradable film was prepared by blown filmextrusion with the addition of compatibilizer and palm oil-based glycerin asprocessing aids.
Methodology
Sample Preparation
Low-density polyethylene resin grade (TITANLENE� low-density polyethylene,71009A, LDF 260GG) and tapioca starch (particle size of those starches rangedfrom 9.73 to 83 gm with an average particle size of 32.97 gm; moisture content oftapioca starch has average of 11.5 %) were oven-dried for 24 h at 80 �C beforepremixing and compounding to remove moisture. The compounding of LDPE/tapioca starch at different blend ratios was done using twin-screw extruder with theaddition of palm cooking oil (PCO) (5 wt % phr) as processing aids and poly-ethylene-grafted maleic anhydride and LLDPE-g-MA (5, 10, 15, and 20 wt % phr)as compatibilizer. The compounding process was carried out at a screw speed of80 rpm, and the temperatures were set at 150 �C/150 �C/140 �C/140 �C fromfeeder to die. The strands were then cooled using water and then passed throughthe palletizer and palletized. The pallets were collected and used for film blowing.The prepared pallets of different composition, as indicated in Table 1, were put inthe feed hopper with the temperature set at 115 �C/120 �C/130 �C/130 �C/120 �C/120 �C (from feeder to die). The films of LDPE/starch blends were blown at adrawer screw of 50 rpm and extruder screw speed of 120 rpm.
Table 1 The abbreviationsof blends
Samples LDPE (wt %) TS (wt %)
LDPE 100 0LDPE/TS:90/10 90 10LDPE/TS:80/20 80 20LDPE/TS:70/30 70 30LDPE/TS:60/40 60 40LDPE/TS:50/50 40 50
Starch-Based Biofilms for Green Packaging 349
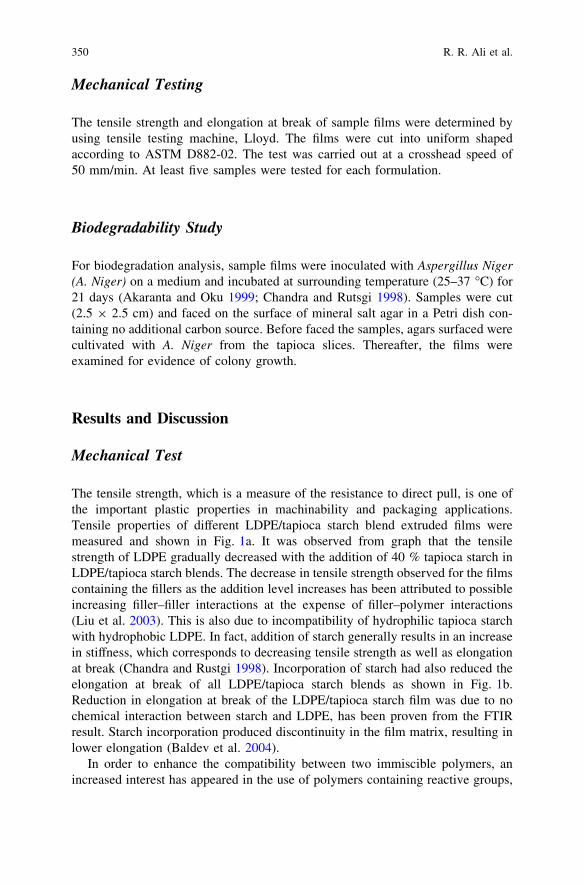
Mechanical Testing
The tensile strength and elongation at break of sample films were determined byusing tensile testing machine, Lloyd. The films were cut into uniform shapedaccording to ASTM D882-02. The test was carried out at a crosshead speed of50 mm/min. At least five samples were tested for each formulation.
Biodegradability Study
For biodegradation analysis, sample films were inoculated with Aspergillus Niger(A. Niger) on a medium and incubated at surrounding temperature (25–37 �C) for21 days (Akaranta and Oku 1999; Chandra and Rutsgi 1998). Samples were cut(2.5 9 2.5 cm) and faced on the surface of mineral salt agar in a Petri dish con-taining no additional carbon source. Before faced the samples, agars surfaced werecultivated with A. Niger from the tapioca slices. Thereafter, the films wereexamined for evidence of colony growth.
Results and Discussion
Mechanical Test
The tensile strength, which is a measure of the resistance to direct pull, is one ofthe important plastic properties in machinability and packaging applications.Tensile properties of different LDPE/tapioca starch blend extruded films weremeasured and shown in Fig. 1a. It was observed from graph that the tensilestrength of LDPE gradually decreased with the addition of 40 % tapioca starch inLDPE/tapioca starch blends. The decrease in tensile strength observed for the filmscontaining the fillers as the addition level increases has been attributed to possibleincreasing filler–filler interactions at the expense of filler–polymer interactions(Liu et al. 2003). This is also due to incompatibility of hydrophilic tapioca starchwith hydrophobic LDPE. In fact, addition of starch generally results in an increasein stiffness, which corresponds to decreasing tensile strength as well as elongationat break (Chandra and Rustgi 1998). Incorporation of starch had also reduced theelongation at break of all LDPE/tapioca starch blends as shown in Fig. 1b.Reduction in elongation at break of the LDPE/tapioca starch film was due to nochemical interaction between starch and LDPE, has been proven from the FTIRresult. Starch incorporation produced discontinuity in the film matrix, resulting inlower elongation (Baldev et al. 2004).
In order to enhance the compatibility between two immiscible polymers, anincreased interest has appeared in the use of polymers containing reactive groups,
350 R. R. Ali et al.
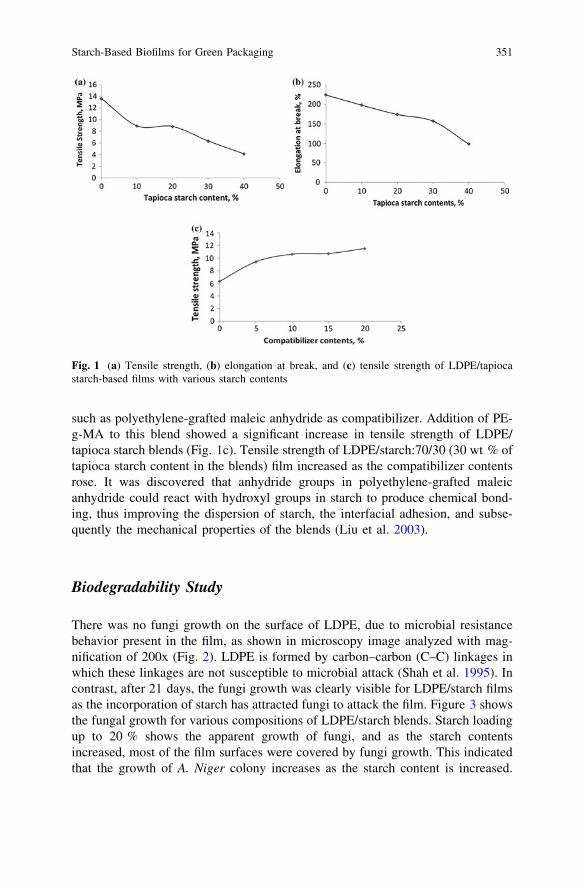
such as polyethylene-grafted maleic anhydride as compatibilizer. Addition of PE-g-MA to this blend showed a significant increase in tensile strength of LDPE/tapioca starch blends (Fig. 1c). Tensile strength of LDPE/starch:70/30 (30 wt % oftapioca starch content in the blends) film increased as the compatibilizer contentsrose. It was discovered that anhydride groups in polyethylene-grafted maleicanhydride could react with hydroxyl groups in starch to produce chemical bond-ing, thus improving the dispersion of starch, the interfacial adhesion, and subse-quently the mechanical properties of the blends (Liu et al. 2003).
Biodegradability Study
There was no fungi growth on the surface of LDPE, due to microbial resistancebehavior present in the film, as shown in microscopy image analyzed with mag-nification of 200x (Fig. 2). LDPE is formed by carbon–carbon (C–C) linkages inwhich these linkages are not susceptible to microbial attack (Shah et al. 1995). Incontrast, after 21 days, the fungi growth was clearly visible for LDPE/starch filmsas the incorporation of starch has attracted fungi to attack the film. Figure 3 showsthe fungal growth for various compositions of LDPE/starch blends. Starch loadingup to 20 % shows the apparent growth of fungi, and as the starch contentsincreased, most of the film surfaces were covered by fungi growth. This indicatedthat the growth of A. Niger colony increases as the starch content is increased.
Fig. 1 (a) Tensile strength, (b) elongation at break, and (c) tensile strength of LDPE/tapiocastarch-based films with various starch contents
Starch-Based Biofilms for Green Packaging 351
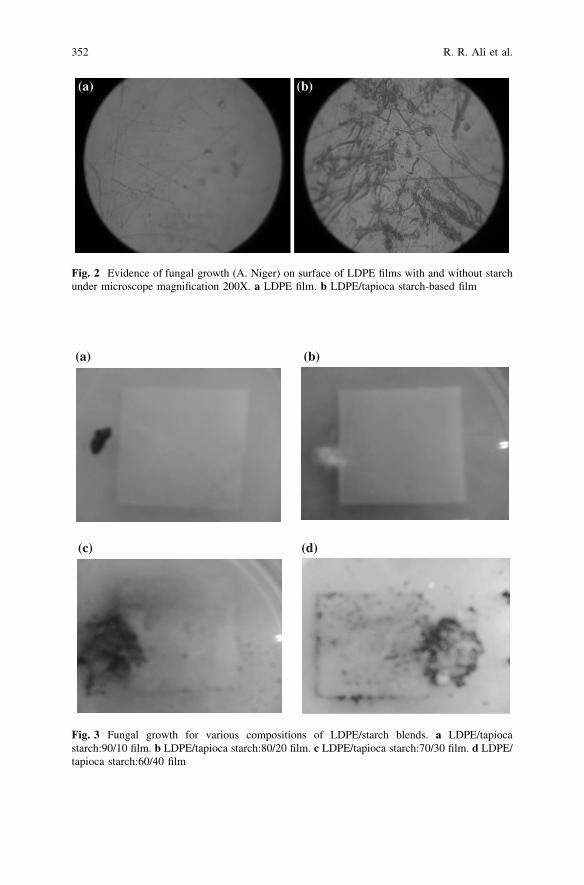
Fig. 2 Evidence of fungal growth (A. Niger) on surface of LDPE films with and without starchunder microscope magnification 200X. a LDPE film. b LDPE/tapioca starch-based film
(a) (b)
(c) (d)
Fig. 3 Fungal growth for various compositions of LDPE/starch blends. a LDPE/tapiocastarch:90/10 film. b LDPE/tapioca starch:80/20 film. c LDPE/tapioca starch:70/30 film. d LDPE/tapioca starch:60/40 film
352 R. R. Ali et al.
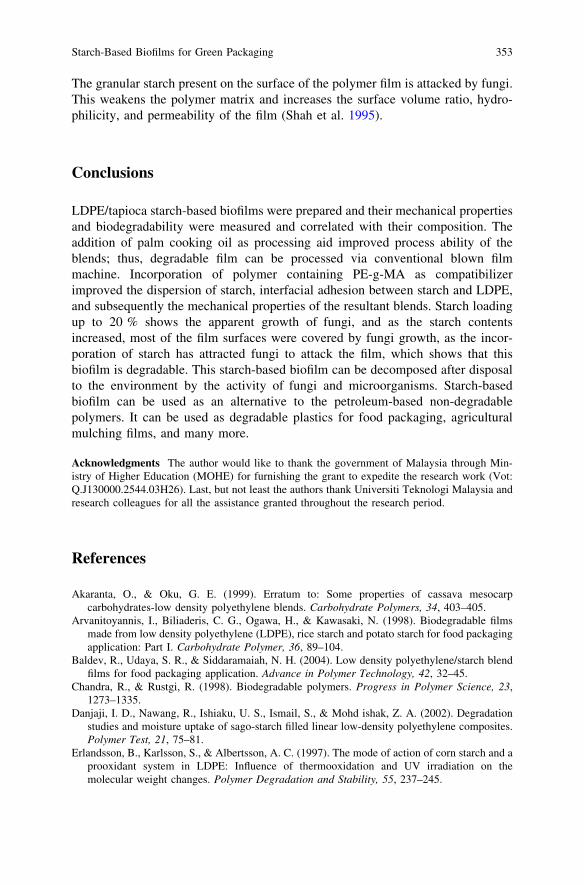
The granular starch present on the surface of the polymer film is attacked by fungi.This weakens the polymer matrix and increases the surface volume ratio, hydro-philicity, and permeability of the film (Shah et al. 1995).
Conclusions
LDPE/tapioca starch-based biofilms were prepared and their mechanical propertiesand biodegradability were measured and correlated with their composition. Theaddition of palm cooking oil as processing aid improved process ability of theblends; thus, degradable film can be processed via conventional blown filmmachine. Incorporation of polymer containing PE-g-MA as compatibilizerimproved the dispersion of starch, interfacial adhesion between starch and LDPE,and subsequently the mechanical properties of the resultant blends. Starch loadingup to 20 % shows the apparent growth of fungi, and as the starch contentsincreased, most of the film surfaces were covered by fungi growth, as the incor-poration of starch has attracted fungi to attack the film, which shows that thisbiofilm is degradable. This starch-based biofilm can be decomposed after disposalto the environment by the activity of fungi and microorganisms. Starch-basedbiofilm can be used as an alternative to the petroleum-based non-degradablepolymers. It can be used as degradable plastics for food packaging, agriculturalmulching films, and many more.
Acknowledgments The author would like to thank the government of Malaysia through Min-istry of Higher Education (MOHE) for furnishing the grant to expedite the research work (Vot:Q.J130000.2544.03H26). Last, but not least the authors thank Universiti Teknologi Malaysia andresearch colleagues for all the assistance granted throughout the research period.
References
Akaranta, O., & Oku, G. E. (1999). Erratum to: Some properties of cassava mesocarpcarbohydrates-low density polyethylene blends. Carbohydrate Polymers, 34, 403–405.
Arvanitoyannis, I., Biliaderis, C. G., Ogawa, H., & Kawasaki, N. (1998). Biodegradable filmsmade from low density polyethylene (LDPE), rice starch and potato starch for food packagingapplication: Part I. Carbohydrate Polymer, 36, 89–104.
Baldev, R., Udaya, S. R., & Siddaramaiah, N. H. (2004). Low density polyethylene/starch blendfilms for food packaging application. Advance in Polymer Technology, 42, 32–45.
Chandra, R., & Rustgi, R. (1998). Biodegradable polymers. Progress in Polymer Science, 23,1273–1335.
Danjaji, I. D., Nawang, R., Ishiaku, U. S., Ismail, S., & Mohd ishak, Z. A. (2002). Degradationstudies and moisture uptake of sago-starch filled linear low-density polyethylene composites.Polymer Test, 21, 75–81.
Erlandsson, B., Karlsson, S., & Albertsson, A. C. (1997). The mode of action of corn starch and aprooxidant system in LDPE: Influence of thermooxidation and UV irradiation on themolecular weight changes. Polymer Degradation and Stability, 55, 237–245.
Starch-Based Biofilms for Green Packaging 353
Khabbaz, F., Albertsson, A. C., & Karlsson, S. (1998). Trapping of volatile low molecular weightphotoproducts in inert and enhanced degradable LDPE. Polymer Degradation and Stability,61, 329–342.
Liu, W., Wang, Y. J., & Sun, Z. (2003). Effects of polyethylene-grafted-maleic anhydride (PE-g-MA) on thermal properties, morphology and tensile properties of low density polyethylene(LDPE) and corn starch blends. Journal of Applied Polymer Science, 88, 2904–2911.
Manzur, A., Limon-Gonzalez, M., & Favela-Torres, E. (2004). Biodegradation of physicochem-ically treated LDPE by a consortium of filamentous fungi. Journal of Applied PolymerScience, 92, 265–271.
Shah, P. B., Bandopadhyay, S., & Bellare, J. R. (1995). Environmentally degradable starch filledlow density polyethylene. Polymer Degradation and Stability, 47, 165–173.
Tharanathan, R. N. (2003). Biodegradable films and composite coatings: past, present and future.Trends in Food Science and Technology, 14, 71–78.
Theubaud, S., Aburto, J., Alric, I., Borredon, E., Bikiaris, D., Prinos, J., et al. (1997). Propertiesof fatty acid estera of starch and their blends with LDPE. Journal of Applied Polymer Science,17, 705–721.
Zheng, Y., & Yanful, E. K. (2005). A review of plastic waste biodegradation. Critical Review inBiotechnology, 25, 243–250.
354 R. R. Ali et al.
Influence of Potassium HydroxideConcentration on the CarrageenanFunctional Group Composition
S. M. Anisuzzaman, A. Bono, S. Samiran, B. Ariffin and Y. Y. Farm
Abstract Potassium Hydroxide treatment of seaweed is one of the commonprocesses in the production of semi-refined carrageenan (SRC) across South-east region. However, potassium hydroxide will influence the properties of theproduct through the effect on the variation of functional group composition inthe carrageenan molecule. Therefore, a study on the influence of potassiumhydroxide (KOH) concentration on the functional group composition of kappacarrageenan extracted from seaweed (Kappaphycus alvarezii) was conducted.The functional groups investigated were 3,6-anhydrogalactose, ester sulphate,3,6-anhydrogalactose-2-sulphate and galactose-4-sulphate. To investigate theeffect of KOH concentration on the variation of functional groups composi-tion, a set of KOH concentration of 0.01–0.1 M was employed. The SRCpowder was produced by spray dryer of alkali-treated seaweed. The SRCpowder produced was used for the Fourier transform infrared spectroscopy(FTIR) analysis for identification and determination of the composition offunctional groups. The results of the data revealed that there is compositionvariation in all of the functional groups analysed due to the influence of KOHconcentration.
Keywords Kappaphycus alvarezii � 3,6-anhydrogalactose � Ester sulphate �3,6-anhydrogalactose-2-sulphate � Galactose-4-sulphate
S. M. Anisuzzaman (&) � A. Bono � S. Samiran � Y. Y. FarmSchool of Engineering and Information Technology, Universiti Malaysia Sabah,88400 Kota Kinabalu, Sabah, Malaysiae-mail: [email protected]
B. AriffinUniversiti Malaysia Terengganu, 21030 Kuala Terengganu, Terengganu, Malaysia
R. Pogaku et al. (eds.), Developments in Sustainable Chemicaland Bioprocess Technology, DOI: 10.1007/978-1-4614-6208-8_42,� Springer Science+Business Media New York 2013
355
Introduction
Traditional exploitation of seaweeds in South-east region was started for manycenturies. The exploitation was usually as a natural source of food, food ingredientsor medicines. Nowadays, around six million tons of fresh algae are cultivated peryear across Asian countries, which amounting to about 90 % of the commercialdemands (Besada et al. 2009). Seaweeds can be classified into four categories basedon their colour such as red (division Rhodophyta), green (division Clorophyta), blue-green (division Cyanophyta) and brown algae (division Phyaeophyta) (Phang 2006).The major seaweed genera are Sargassum, Eucheuma, Caulerpa, Gracilaria,Hypnea, Padina and Hydroclathrus are commonly found along the coastal area ofSouth-east countries. Among these, Gracilaria changgi and Eucheuma mainly serveas a raw material for agar or carrageenan production. The extracted agar or carra-geenan is used in many applications such as in the food industries or in the pro-duction of tissue culture media (Glickman 1987). Carrageenan classified into kappa,iota and lambda types (Campo et al. 2009), the difference between them is thenumber and position of ester sulphate groups as well as the composition of 3,6-anhydrogalactose. Higher composition levels of ester sulphate mean lower solubilitytemperature and lower gel strength. Kappa-type carrageenan has an ester sulphatecomposition of 25–30 % and a 3,6-anhydrogalactose of 28–35 %. Iota-type carra-geenan has an ester sulphate composition of 28–30 % and a 33,6-anhydrogalactosecontent of 25–30 %. Lambda-type carrageenan has an ester sulphate content ofabout 32–39 % and no content of 3,6-anhydrogalactose. Thus, the variation func-tional groups composition will determine the properties of carrageenan. Kappacarrageenan will form strong and rigid gels when combine with water. Iota carra-geenan can bind water, but it will form a dry, elastic gel, especially in the presence ofcalcium salts. This is due to the 2-sulphate group on the outside of the iota carra-geenan molecule which not allows the helices to aggregate to the same extent askappa carrageenan, but to form additional bonds through calcium interactions.Lambda carrageenan, it is highly sulphated, thus less likely to form a gel structure.The ester sulphate distribution of lambda carrageenan is randomly distributed on themolecule which prevents formation of gel and promotes viscous solutions.
In the production of semi-refined and refined carrageenan, seaweed was firstsubjected to alkali treatment at high temperature. The temperature of 70–130 �C isrequired to catalyse the formation of the 3,6 anhydrous bridges of k-carrageenanfor the gel formation ability. The temperature inside the mass of the carrageenanshould not exceeded 130 �C in the modification of alkali in order to prevent anydegradation of the kappa carrageenan (Mishra et al. 2008).
The main purpose of alkali treatment is to swell the seaweed. The alkali isselected based on different salt type of carrageenan produced by process. It iscrucial as the selection of alkali will affect the properties of extract, such asthickening and gel formation of carrageenan (Bono et al. 2012). In addition, kappaseaweed contains 6-sulphate ester groups and some of the 3,6-anhydro-D-galactosecontains 2-sulphate ester groups. As 6-sulphate ester groups will reduce the gelling
356 S. M. Anisuzzaman et al.
power, alkali treatment can be applied to transeliminate 6-sulphate groups, whichresults in formation of 3,6-anhydro-D-galactose. It helps to impart a higher degreeof regularity to the molecule. Moreover, alkali treatment will promote an internalarrangement which modifies the polysaccharides backbone. For instance, kappacarrageenan can form firm and brittle gels as the bridge formed from rearrangementallows its adjacent chains to form helical structures after neutralization of exposedsulphate groups. However, iota carrageenan forms weak and elastic gels after alkalimodification. Thus, it is crucial to know which type of raw seaweed is used beforeany process is started. As Kappaphycus alvarezii is used as raw material in thisresearch, potassium hydroxide (KOH) is chosen as the alkali in alkali treatment(Rideout et al. 1998).
Therefore, a study on the influence of KOH concentration on the functionalgroup composition during alkali treatment was conducted. Four functional groups,namely 3,6-anhydrogalactose (3,6-AG), ester sulphate, 3,6-anhydrogalactose-2-sulphate (3,6-AG-2-sulphate) and galactose-4-sulphate of carrageenan, wereinvestigated. For the determination of functional groups compositions, Fouriertransform infrared spectroscopy (FTIR) was employed (Pereira et al. 2003).
Methodology
The experimental work was divided into four sections; preparation of dry seaweed,alkali treatment of seaweed, production of semi-refined carrageenan (SRC) powderand determination of functional groups composition. Analytical grade of chemicalssuch as standard kappa carrageenan (Sigma I, C-1013), KOH and KBr were used.
Preparation of Dry Seaweed
Fresh seaweed was obtained from local farm and sun-dried immediately aftercollected to protect from any degradation by microorganism. Prior the usage of sun-dried seaweed, it was washed with distilled water in order to eliminate all epiphytesand encrusting material. Then, samples were chopped for about 10–20 mm in size.Seaweed sample was then oven-dried for 24 h maintaining temperature range60–70 �C for avoiding the decomposition of volatile components.
Alkali Treatment of Seaweed
Alkaline treatment was conducted by adding the seaweed sample into KOHsolution and cooked for 30 min at temperature of 80 �C. The solid loading toliquid solution was 25 g of seaweed sample to 400 ml of KOH solution. For the
Influence of Potassium Hydroxide Concentration 357
influence of KOH concentration variation, the KOH solution was prepared as0.01–0.1 M. The alkali-treated seaweed sample was then washed and dried for theSRC powder preparation.
Production of SRC Powder
The powder of carrageenan was prepared by spray dryer of carrageenan solution.The solution was prepared by dissolving of 25 g SRC particle into 400 ml distilledwater at 70 �C. The carrageenan solution was then fed into laboratory-scale spraydrier at flow rate of 8 ml/h. The hot air flow rate and the temperature were set to40 m3/h, and 140 �C. The carrageenan powder produced was kept in airtightplastic container and stored in a desiccators containing silica gel before it wasanalysed.
Determination of Functional Group Composition
A quantity of carrageenan powder was mixed with the KBr salt as suggested in thestandard preparation of thin pellet of FTIR analysis. All IR spectra were recordedat room temperature (26 ± 1 �C), and the infrared spectra of all formulations wererecorded with FTIR. A commercial standard, Type I, predominantly kappa car-rageenan (SIGMA) was used as comparison. In this analysis, 32 scans were signal-averaged for a single spectrum. The resolution is 4 cm-1 and the data spacing is1.928 cm-1. Each spectrum is displayed in terms of absorbance as calculated fromthe reflectance–absorbance spectrum using the OMNIC software. The recordedvalue of absorbance was translated into the percentage composition of functionalgroups.
Results and Discussion
FTIR Spectrum of Carrageenan and Confirmationof Functional Group
The FTIR spectrum of SRC produced with KOH concentration compared tostandard carrageenan sample shown in Fig. 1. The presence of 3,6-AG, estersulphate, 3,6-AG-2-sulphate and galactose-4-sulphate were shown by theabsorption peaks at wave length number 930 cm-1, 1,260 cm-1, 803 cm-1,846 cm-1, respectively. Figure 1 shows that the SRC produced in this work issimilar to commercial standard.
358 S. M. Anisuzzaman et al.
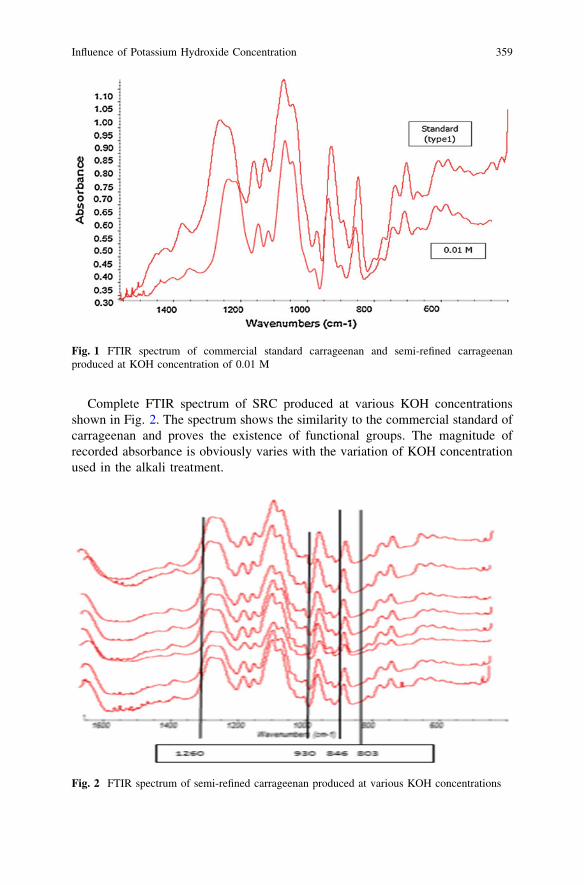
Complete FTIR spectrum of SRC produced at various KOH concentrationsshown in Fig. 2. The spectrum shows the similarity to the commercial standard ofcarrageenan and proves the existence of functional groups. The magnitude ofrecorded absorbance is obviously varies with the variation of KOH concentrationused in the alkali treatment.
Fig. 1 FTIR spectrum of commercial standard carrageenan and semi-refined carrageenanproduced at KOH concentration of 0.01 M
Fig. 2 FTIR spectrum of semi-refined carrageenan produced at various KOH concentrations
Influence of Potassium Hydroxide Concentration 359
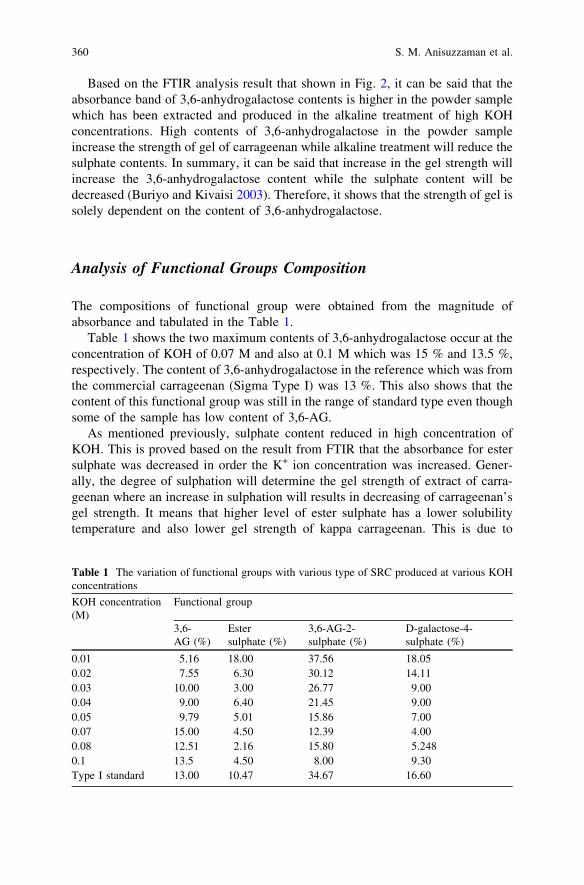
Based on the FTIR analysis result that shown in Fig. 2, it can be said that theabsorbance band of 3,6-anhydrogalactose contents is higher in the powder samplewhich has been extracted and produced in the alkaline treatment of high KOHconcentrations. High contents of 3,6-anhydrogalactose in the powder sampleincrease the strength of gel of carrageenan while alkaline treatment will reduce thesulphate contents. In summary, it can be said that increase in the gel strength willincrease the 3,6-anhydrogalactose content while the sulphate content will bedecreased (Buriyo and Kivaisi 2003). Therefore, it shows that the strength of gel issolely dependent on the content of 3,6-anhydrogalactose.
Analysis of Functional Groups Composition
The compositions of functional group were obtained from the magnitude ofabsorbance and tabulated in the Table 1.
Table 1 shows the two maximum contents of 3,6-anhydrogalactose occur at theconcentration of KOH of 0.07 M and also at 0.1 M which was 15 % and 13.5 %,respectively. The content of 3,6-anhydrogalactose in the reference which was fromthe commercial carrageenan (Sigma Type I) was 13 %. This also shows that thecontent of this functional group was still in the range of standard type even thoughsome of the sample has low content of 3,6-AG.
As mentioned previously, sulphate content reduced in high concentration ofKOH. This is proved based on the result from FTIR that the absorbance for estersulphate was decreased in order the K+ ion concentration was increased. Gener-ally, the degree of sulphation will determine the gel strength of extract of carra-geenan where an increase in sulphation will results in decreasing of carrageenan’sgel strength. It means that higher level of ester sulphate has a lower solubilitytemperature and also lower gel strength of kappa carrageenan. This is due to
Table 1 The variation of functional groups with various type of SRC produced at various KOHconcentrations
KOH concentration(M)
Functional group
3,6-AG (%)
Estersulphate (%)
3,6-AG-2-sulphate (%)
D-galactose-4-sulphate (%)
0.01 5.16 18.00 37.56 18.050.02 7.55 6.30 30.12 14.110.03 10.00 3.00 26.77 9.000.04 9.00 6.40 21.45 9.000.05 9.79 5.01 15.86 7.000.07 15.00 4.50 12.39 4.000.08 12.51 2.16 15.80 5.2480.1 13.5 4.50 8.00 9.30Type I standard 13.00 10.47 34.67 16.60
360 S. M. Anisuzzaman et al.
negatively charged gels that given by ester sulphate with potassium. It alsobelieved that potassium ion, K+, will neutralize the sulphate group in the kappacarrageenan. Kinks in the helical structure that responsible for formation of gelwere caused by the sulphate units at point in the polysaccharide chains comprisingthe gel which result in the lower gel strength of carrageenan (Rees 1972). Themaximum content of ester sulphate was found in concentration of KOH of 0.01 M,and the minimum content was in the KOH concentration of 0.08 M. For thereference or standard type, the ester sulphate content obtained was at 10.47 %.Another functional group that contains in the carrageenan extract is 3,6-anhy-drogalactose-2-sulphate. The sulphate content was indicated in all the spectra bythe very weak and poorly defined band in the region of 800–850 cm-1 where theprimary and secondary equatorial and axial sulphate group absorbs but the contentis relatively low. Based on the result shown in Table 1, the highest value of 3,6-AG-2-sulphate content was found in the sample extracted with KOH concentrationof 0.01 M and the least was found in the kappa carrageenan extract with 0.1 M ofKOH. The standard type of commercial carrageenan used has 34.67 % of 3,6-AG-2-sulphate content in it. From the table, the results that have been obtained stillinclude in the range of the standard type. However, the values were getting loweras the concentration of KOH increase. As mentioned previously, the gel strength ofcarrageenan was decreased in the presence of high level of sulphate content.Furthermore, the gel strength of carrageenan was more sensitive towards thepresence of 2-sulphate. Similar to the ester sulphate, the sulphation neutralize thesulphate group. Since the gel strength increases as the KOH concentrationincreases, the sulphation will be decreased which result in the lower value of 3,6-AG-2-sulphate content.
The KOH concentration has influenced the content of sulphate group in thecarrageenan extract; thus, it also has effect on the content of galactose-4-sulphateas it has in the ester and 3,6-AG-2-sulphate. It appears that the physical andchemical properties of the carrageenan’s extract were influenced by the KOHconcentration (K+ ion). In the previous section, it already stated that the contentof 3,6-AG helps in increasing the gel strength. Different for D-galactose-4-sul-phate, it has poor gelling ability as the content of it increases in the samplepowder of carrageenan. Furthermore, after the alkaline treatment, the yield ofcarrageenan was reduced. It appears to be related to degradation of polysac-charide which was the galactose-4-sulphate itself during the alkaline treatment,also from the carrageenan loss by diffusion during the processing of SRC powder(Montano et al. 1999). That is why the content of this functional group wasdecreased in the high concentration of KOH. Based on the result shown inTable 1, the higher value of galactose-4-sulphate appear in the KOH concen-tration of 0.01 M and lower value was found in the sample extracted at 0.07 Mof KOH. The content of this functional group was supposed to be decrease as theconcentration of KOH increase, but as it can be seen in the results shown inTable 1, the content has increased in the concentration of KOH ranging from0.07 to 0.1 M. This is due to stabilization and neutralization of galactose-4-sulphate by alkali in order to prevent the lowering of gelling ability of kappa
Influence of Potassium Hydroxide Concentration 361
carrageenan extract. Generally, it can be said that the alkaline treatment withKOH solution helps to increase the content of 3,6-AG while reducing the sul-phate content in the extract of carrageenan. Chemical analysis shows an inverserelationship between sulphate and 3,6-anhydrogalactose content (Praiboon et al.2006). The 3,6-AG is responsible in increasing the gel strength of carrageenanextract where the higher the gel strength, the more content of 3,6-AG in thesample. The presence of sulphate content in the extract of kappa carrageenan isappeared to have responsibility on the quality of the carrageenan where the moresulphated the carrageenan, the greater the tendency of the carrageenan’s gel toturn into solution (Tsuneaki and Suzuki 1975). As shown in the result above, thealkali-treated carrageenan had lower sulphate content (Praiboon et al. 2006).Increasing in concentration of KOH actually influenced the 3,6-AG, ester sul-phate, 3,6-AG-2-sulphate and also the D-galactose-4-sulphate of kappa carra-geenan extract. Based on the results obtained, we can know that Kappa Alvareziihave a high content of ionizable groups (carboxyl groups from mannuronic andguluronic acid) on the cell wall of polysaccharides where it makes it very liableto the influence of the concentration of potassium ion.
Conclusion
The physical and chemical properties of the SRC produced by alkaline treatmentare dependent on the functional group compositions. The composition of func-tional groups in the carrageenan was strongly influenced by the strength of KOHused during the production process. The influence of KOH concentration can bemanipulated to control the composition of functional groups. FTIR can be con-sidered as the suitable equipment in analysing the functional group of SRC extract.Increasing of KOH concentration increased the 3,6-anhydrogalactose functionalgroup concentration. Contrary to this, all other functional groups ester sulphate,3,6-anhydrogalactose-2-sulphate and galactose-4-sulphate concentration decreasedwith increase in KOH concentration.
Acknowledgments Authors would like to acknowledge the financial support from the UniversitiMalaysia Sabah (UMS) for the UMS Fasa 1/2011 project (SLB0017-TK-1/2012).
References
Besada, V., Andrade, J. M., Schultze, F., & Gonzalez, J. J. (2009). Heavy metals in edibleseaweeds commercialized for human consumption. Journal of Marine Systems, 75, 305–313.
Bono, A., Anisuzzaman, S. M., Ding, O.W. (2012). Effect of process conditions on the gelviscosity and gel strength of Semi-Refined Carrageenan (SRC) produced from seaweed(Kappaphycus Alvarezii). Manuscript accepted in Journal of King Saud University:Engineering Sciences.
362 S. M. Anisuzzaman et al.
Buriyo, A. S., & Kivaisi, A. K. (2003). Standing Stock, Agar yield and properties of Gracilariasalicomia harvested along the Tanzanian coast, Western Indian Ocean. Journal of MarineScience, 2, 171–178.
Campo, L. C., Kawano, D. F., Dilson, B. S. J., & Carvalho, I. (2009). Carrageenans: Biologicalproperties, chemical modifications and structural analysis—a review. Carbohydrate Poly-mers, 77, 167–180.
Glickman, M. (1987). Utilization of seaweed hydrocolloids in the food industry. Hydrobiology,151/152, 31–47.
Mishra, D. K., Tripathy, J., & Behari, K. (2008). Synthesis of graft copolymer (k-carrageenan-g-N, N-dimethylacrylamide) and studies of metal ion uptake, swelling capacity and flocculationproperties. Carbohydrate Polymers, 71, 524–534.
Montano, N. E., Villanueva, R. D., & Romero, J. B. (1999). Chemical characteristics and gellingproperties of agar from two Philippine Gracilaria spp. (Gracilaria, Rhodophyta). Journal ofApplied Phycol, 11, 27–34.
Pereira, L., Sousa, A., Coelho, H., Amado, A. M., Paulo, J. A., & Ribeiro, C. (2003). Use ofFTIR, FT-Raman and C-NMR spectroscopy for identification of some seaweed phycocolloids.Biomolecular Engineering, 20, 185–202.
Phang, S. M. (2006). Seaweed resources in Malaysia: Current status and future prospects. AquaticEcosystem Health and Management, 9, 185–202.
Praiboon, J., Chirapart, A., Akakabe, Y., Bhumibhamon, O., & Kajiwara, T. (2006). Physical andchemical characterization of agar polysaccharides extracted from the Thai and Japanesespecies of Gracilaria. Science Asia, 32(Supplement 1), 11–17.
Rees, D. A. (1972). Shapely polysaccharides: the eighth Colworth medal lecture. BiochemJournal, 126, 257–273.
Rideout, S. C., Hill, R., Bernabe, M. G., & Markham, (1998). Method for extracting semi refinedcarrageenan from seaweed. United States patent, 5(801), 240.
Tsuneaki, F., & Suzuki, T. (1975). Preparation and properties of agar sulphates. AgricultureBiolological Chemistry, 39, 119–126.
Influence of Potassium Hydroxide Concentration 363
Effect of 3-Mercaptopropionic Acidon Polymerization of Thermo-ResponsivePoly(N-Isopropylacrylamide)
D. Krishnaiah, S. M. Anisuzzaman, S. F. Shi and A. Bono
Abstract Poly(N-isopropylacrylamide) (PNIPA) is a thermally sensitive poly-meric material. The temperature-sensitive nature of PNIPA makes it an attractivecandidate for controlled drug delivery devices. A series of temperature-responsivePNIPA were produced by free radical polymerization using various amount of3-mercaptopropionic acid (MPA) as chain transfer agent. The effect of chaintransfer agent on the lower critical solution temperature (LCST) and chemicalstructure of PNIPA was characterized by using UV–vis spectrophotometer andFourier transform infrared spectroscopy (FTIR), respectively. It was found that,with increasing MPA content, the typical band of the PNIPA in respective FTIRspectrum was shorter or getting narrower due to the decrease in the strength ofrespective bond in the PNIPA structure. Furthermore, the increase in MPA volumein the polymerization increased the LCST of PNIPA. The various amounts of 3-MPA ratios to monomer preparation have shown that hydrophobic modification ofcarboxylated PNIPA.
Keywords Poly N-isopropylacrylamide � 3-Mercaptopropionic acid � Fouriertransform infrared spectometer � UV–vis spectrophotometer � Lowe criticalsolution temperature
Introduction
Water-soluble polymers and hydrogels are responsive or sensitive to externalstimuli like temperature, pH, ionic strength, solutes or solvent composition. Thesesmart materials represent an important and active research area due to many
D. Krishnaiah (&) � S. M. Anisuzzaman � S. F. Shi � A. BonoChemical Engineering Programme, School of Engineering and Information Technology,University Malaysia Sabah, 88400 Kota Kinabalu, Sabah, Malaysiae-mail: [email protected]
R. Pogaku et al. (eds.), Developments in Sustainable Chemicaland Bioprocess Technology, DOI: 10.1007/978-1-4614-6208-8_43,� Springer Science+Business Media New York 2013
365
possible applications in diverse technological fields (Pagonis and Bokias 2007).Due to the specific intelligent nature, ‘‘smart’’ polymers have attracted increasinginterest and considerable research attention in recent years. Further researches intothese polymer synthesis, behavior, and application show that these polymers havegreat potential to become the ‘‘next generation’’ of separation media for cost-effective and environment-friendly extraction and purification of high value bio-molecules from agricultural food and other raw materials (Maharjan et al. 2008).Poly(N-isopropylacrylamide) (PNIPA) is a typical thermo-sensitive polymericmaterial which demonstrates a transition temperature (Ttr) or lower critical solu-tion temperature (LCST) at *32 �C in aqueous solution (Zhang et al. 2002; Zhangand Zhuo 2000a). PNIPA has been studied extensively for the past 20 years due toits useful applications in many fields such as artificial muscle, on–off switches,immobilization of enzymes, thermo-sensitive absorbents, drug release, and othersapplications (Zhang and Zhuo 2000b). In the process to synthesis the PNIPA, freeradical polymerization is a more preferable method to be used. In the previousyears, researches show that free radical polymerization method done on PNIPAcan lead to the formation of stable nanospheres instead of linear chains if thesolutions are incubated at temperatures well above the LCST of PNIPA (Gao andFrisken 2003).
Telomerization is free radical polymerization in the presence of a chain transferagent (telogens) which is to produce low average molecular weight products calledtelomere (Chung 2000). Using chain transfer agent which aids the shift of theradical from the growing polymer chain to another molecular species, in turn canreinitiate chain growth, is a convenient way to control the molar mass and thepolydispersity of polymers produced by free radical polymerization. Many com-pounds can be used as chain transfer agents (telogens) in free radical polymeri-zation. Materials such as halogens and mercaptans are the most popular among all.Besides having the capacity to react as chain transfer agents, these chain transferagents also supply a well-defined end group to the final polymer (telomer)(Costioli et al. 2005). The chain transfer polymerization of N-isopropylacrylamide(NIPAAm) is increasingly used for the synthesis of defined telomers bearing aparticular functional (ester, carboxylic acid, amino) end group that can be con-veniently employed for the construction of bioconjugates. For such applications,the ability to control the size and heterogeneity of the polymer is the mostimportant aspect besides the presence of a reactive end group which is known asdegree of polymerization. Therefore, the molecular mass of the telomer can becontrolled via the initial ratio of the telogen and monomer concentration (Costioliet al. 2005). Furthermore, the molecular average weight of telomer is easilyaffected by the variation of the concentration of chain transfer agent.
In particular, researches on the molecular weight changing behavior in thedifferent concentration of chain transfer agent applied in telomerization have beenstudied worldwide (Chung et al. 1998). However, a detailed study of compositionand structure changing behavior of PNIPA in effect of various concentration ofchain transfer agent is still missing.
366 D. Krishnaiah et al.
In this research, free radical polymerization method is used and 3-mercapto-propionic acid (MPA) is chosen as chain transfer agent. MPA is an isolatedpolymer that contains a single specific functional end group and is often used as achain transfer agent due to its high transfer reactivity. The AIBN is used asinitiator to transform the thiol (R–S–H) into a radical. By applying various amountof MPA, the effect of the MPA on the characteristic, structure, and compositions ofPNIPA is investigated. The analysis is carried out by using UV–vis spectropho-tometer and Fourier transform infrared spectroscopy (FTIR). FTIR is used toidentify the quality or consistency and amount of components in an unknownsample. Like a fingerprint, no two unique molecular structures produce the sameinfrared spectrum. This special characteristic makes infrared spectroscopy veryuseful for several types of analysis. UV–vis spectrophotometer is used to deter-mine the absorption or transmission of UV/VIS light (180–820 nm) by a sample. Itis used to measure concentrations of absorbing materials based on developedcalibration curves of the material. UV–vis spectrophotometer is routinely used inthe quantitative determination of solutions of transition metal ions and highlyconjugated organic compounds.
Methodology
Materials
All the analytical-grade reagents, such as 3-MPA, ethanol, diethyl ether, werepurchased from Sigma–Aldrich.
Synthesis of Poly(N-isopropylacrylamide)
The synthesis of PNIPA was carried out as follows: First, 10 g of NIPAAm wasdissolved in 20 ml of ethanol which acts as a solvent. Theoretically, any solventshould be suitable for polymerization as long as the monomer, and the chaintransfer agent are well dissolved and, more importantly, as long as the solvent doesnot act itself as chain transfer agent (Costioli et al. 2005; Choi et al. 2007). Thesolution is then added with 0.1 g of AIBN and various concentrations (0, 12, 24,36, 60 g/l) of MPA which acts as initiator and chain transfer agent, respectively(Table 1 shows the composition for all the samples prepared in this study).
The mixture is incubated at 60 �C for 20 h. The resulting precipitate was iso-lated by precipitation into 20 ml of diethyl ether and recover by rotary evaporator.After evaporation process for an hour, the final product was collected and drying inthe oven at temperature 80 �C for 16 h or more to achieve complete dry up.
Effect of 3-Mercaptopropionic Acid 367
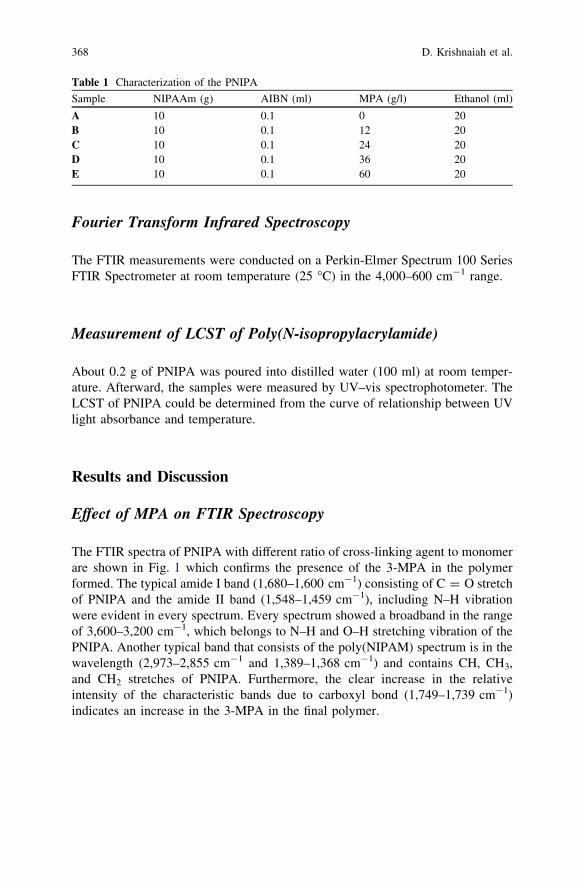
Fourier Transform Infrared Spectroscopy
The FTIR measurements were conducted on a Perkin-Elmer Spectrum 100 SeriesFTIR Spectrometer at room temperature (25 �C) in the 4,000–600 cm-1 range.
Measurement of LCST of Poly(N-isopropylacrylamide)
About 0.2 g of PNIPA was poured into distilled water (100 ml) at room temper-ature. Afterward, the samples were measured by UV–vis spectrophotometer. TheLCST of PNIPA could be determined from the curve of relationship between UVlight absorbance and temperature.
Results and Discussion
Effect of MPA on FTIR Spectroscopy
The FTIR spectra of PNIPA with different ratio of cross-linking agent to monomerare shown in Fig. 1 which confirms the presence of the 3-MPA in the polymerformed. The typical amide I band (1,680–1,600 cm-1) consisting of C = O stretchof PNIPA and the amide II band (1,548–1,459 cm-1), including N–H vibrationwere evident in every spectrum. Every spectrum showed a broadband in the rangeof 3,600–3,200 cm-1, which belongs to N–H and O–H stretching vibration of thePNIPA. Another typical band that consists of the poly(NIPAM) spectrum is in thewavelength (2,973–2,855 cm-1 and 1,389–1,368 cm-1) and contains CH, CH3,and CH2 stretches of PNIPA. Furthermore, the clear increase in the relativeintensity of the characteristic bands due to carboxyl bond (1,749–1,739 cm-1)indicates an increase in the 3-MPA in the final polymer.
Table 1 Characterization of the PNIPA
Sample NIPAAm (g) AIBN (ml) MPA (g/l) Ethanol (ml)
A 10 0.1 0 20B 10 0.1 12 20C 10 0.1 24 20D 10 0.1 36 20E 10 0.1 60 20
368 D. Krishnaiah et al.
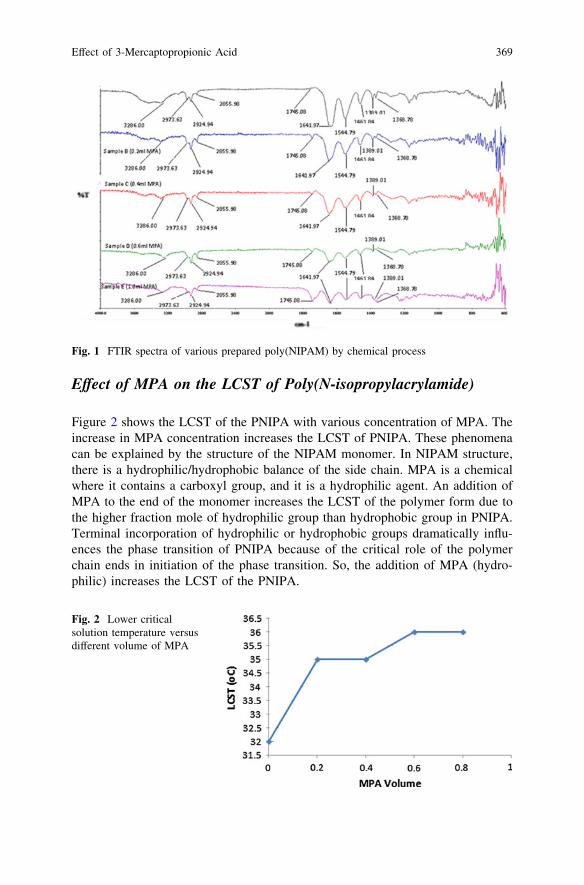
Effect of MPA on the LCST of Poly(N-isopropylacrylamide)
Figure 2 shows the LCST of the PNIPA with various concentration of MPA. Theincrease in MPA concentration increases the LCST of PNIPA. These phenomenacan be explained by the structure of the NIPAM monomer. In NIPAM structure,there is a hydrophilic/hydrophobic balance of the side chain. MPA is a chemicalwhere it contains a carboxyl group, and it is a hydrophilic agent. An addition ofMPA to the end of the monomer increases the LCST of the polymer form due tothe higher fraction mole of hydrophilic group than hydrophobic group in PNIPA.Terminal incorporation of hydrophilic or hydrophobic groups dramatically influ-ences the phase transition of PNIPA because of the critical role of the polymerchain ends in initiation of the phase transition. So, the addition of MPA (hydro-philic) increases the LCST of the PNIPA.
Fig. 1 FTIR spectra of various prepared poly(NIPAM) by chemical process
Fig. 2 Lower criticalsolution temperature versusdifferent volume of MPA
Effect of 3-Mercaptopropionic Acid 369
Conclusions
A thermo-sensitive polymer that can be either soluble or insoluble in water wassynthesized successful by chain transfer polymerization with copolymerizingNIPAAm and 3-MPA. All the PNIPA were characterized by Fourier transforminfrared spectrometer and UV–vis spectrophotometer. In the analysis of lowercritical solution temperature, LCST of PNIPA increased with the increasing volumeof the cross-linking agent (MPA). The importance of the LCST is due to the field ofthe polymer applied. Different field required the different value of LCST, so thefactor which may increase or decrease the thermo-sensitive polymer is need to befurther investigated to expand the utilities of the PNIPA in different field of usage. Inthe FTIR analysis, the result shows the carboxylated groups that appear in PNIPA.The typical bands of the PNIPA appear in each spectrum for each sample. Thisshows that the final product which matches with the PNIPA was produced suc-cessfully. The peak intensity of the carboxyl bond in the wavelength 1,749 cm-1
increased gradually with the increasing MPA. The other typical band becomesshorter or narrower when increasing MPA content due to the shorter polymer.
References
Choi, C., Jang, M. K., & Nah, J. W. (2007). Preparation and characterization of nanoparticlesusing poly(N-isopropylacrylamide)-poly(e-caprolactone) and poly(ethylene glycol)-poly(e-caprolactone) block copolymers with thermosensitive function. Macromolecular Research,15, 623–632.
Chung, I. (2000). Monte Carlo simulation of free radical telomerization. Polymer, 41, 5643–5651.Chung, J. E., Yokoyama, M., Aoyagi, T., Sakurai, Y., & Okano, T. (1998). Effect of molecular
architecture of hydrophobically modified poly(N-isopropylacrylamide) on the formation ofthermoresponsive core-shell micellar drug carriers. Journals of controlled release, 53,119–130.
Costioli, M. D., Berdat, D., Freitag, R., Andre, X., & Muller, A. H. E. (2005). Investigation of thetelomerization kinetics of N-isopropylacrylamide using 3-mercaptopropionic hydrazide aschain transfer agent. Macromolecules, 38, 3630–3637.
Gao, J., & Frisken, B. J. (2003). Cross-linker-free N-isopropylacrylamide gel nanospheres.Langmuir, 19, 5212–5216.
Maharjan, P., Woonton, B. W., Bennett, L. E., Smithers, G. W., Desilva, K., & Hearn, M. T. W.(2008). Novel chromatographic separation—The potential of smart polymers. InnovativeFood Science and Emerging Technologies., 9, 232–242.
Pagonis, K., & Bokias, G. (2007). Temperature and solvent sensitive hydrogels based onN-isopropylacrylamide and N, N-dimethylacrylamide. Polymer Bulletin, 58, 289–294.
Zhang, X. Z., & Zhuo, R. X. (2000a). Preparation of fast responsive, thermally sensitive poly(N-isopropylacrylamide) gel. European Polymer Journal, 36, 2301–2303.
Zhang, X. Z., & Zhuo, R. X. (2000b). Synthesis of temperature-sensitive poly (N-isopropylac-rylamide) hydrogel with improved surface property. Journal of Colloid and Interface Science,223, 311–313.
Zhang, X. Z., Zhang, J. T., Zhuo, R. X., & Chu, C. C. (2002). Synthesis and properties ofthermosensitive, crown ether incorporated poly (N-isopropylacrylamide) hydrogel. Polymer,43, 4823–4827.
370 D. Krishnaiah et al.
Preparation and Characterizationof Activated Carbon Derived from WasteRubber Tire via Chemical Activationwith ZnCl2: Surface Areaand Morphological Studies
C. G. Joseph, G. G. Hoon, Y. L. Sharain-Liew, D. Krishnaiahand M. Massuanna
Abstract Turning waste to wealth is an important aspect in promoting greentechnology. In this study, activated carbon from waste rubber tire was preparedusing chemical activation (ZnCl2) by way of a two-stage activation in self-gen-erated atmosphere method. The preparation parameters examined and compared inthis study were activation time, activation temperature, and impregnation ratio.The adsorption of the target pollutant, 2,4-dichlorophenol (DCP), was used toevaluate the efficiency of adsorption capacity of the prepared activated carbon.Results from the experimental work showed that the activated carbon preparedsatisfied the Freundlich isotherm and complied with the pseudo-second-orderkinetics (not presented here). Other parameters studied, such as the percentageyield of activated carbon, ash, and moisture content and the morphology structure,are presented in this chapter. This study showed that waste rubber tire dehydratedwith ZnCl2 with an impregnation ratio of 1:1 and activated at a temperature of500 �C for 120 min gave the best result (AC5).
Keywords Adsorption � 2,4-Dichlorophenol � Kinetics � Rubber tire
C. G. Joseph (&) � Y. L. Sharain-LiewWater Research Unit, School of Science and Technology,Universiti Malaysia Sabah, 88999 Kota Kinabalu, Sabah, Malaysiae-mail: [email protected]
G. G. HoonFaculty of Applied Sciences, Universiti Teknologi MARA Sabah,88997 Kota Kinabalu, Sabah, Malaysia
D. Krishnaiah � M. MassuannaChemical Engineering Programme. School of Engineering and Information Technology,Universiti Malaysia Sabah, 88999 Kota Kinabalu, Sabah, Malaysia
R. Pogaku et al. (eds.), Developments in Sustainable Chemicaland Bioprocess Technology, DOI: 10.1007/978-1-4614-6208-8_44,� Springer Science+Business Media New York 2013
371
Introduction
Motor vehicles have become an indispensable and the most popular means oftransportation in the world today. In Malaysia, the number of motor vehicles on theroad recorded upward trend for the past few years. The Minister of Transport,Datuk Seri Kong Cho Ha said that the total number of registered motor vehiclesincreased around 11.74 % from the previous year (The Star 2011). Statistics fromthe Road and Transport Department of the Transport Ministry showed that the totalnumber of registered motor vehicles up to 30 June 2011, was 20,806,554 andapproximately 1.4 million rubber tires are dumped every month (Ministry ofTransportation 2011). Tires are designed to be extremely resistant to physical,chemical, and biological degradation, making them difficult to be recycled withexisting technology. Dumping waste tires at disposal sites poses a high fire hazardrisk because they are difficult to be extinguished, besides having a detrimentaleffect on the atmosphere, soil, and groundwater. In addition, disposal sites forwaste rubber tires have become breeding grounds for mosquitoes and rats and haveincreasingly taken up large amounts of valuable landfill space (USM 2011). A fewalternatives for recycling waste tire, such as retreading, reclaiming, incineration,and grinding, have been used to give waste tires a new lease of life (de MarcoRodriguez et al. 2001). Processes such as pyrolysis, gasification, and combustionhave been extensively studied for energy recovery and for the production of highcommercial value materials such as activated carbon (Betancur et al. 2009;Wojtowizz and Serio 1996; Bajus and Olahová 2011). Oil refineries, coal gasifi-cation sites, and petrochemical units generate large amounts of industrial con-taminants such as phenols. In addition, phenolic compounds and their derivativesare widely used as intermediate in the industrial synthesis of plastic, pesticides, anddyes (Dabrowski et al. 2005). Since phenolic compounds are highly toxic, car-cinogenic and have poor biodegradability, they are harmful to human beings.Therefore, it is imperative that these should be removed from water sources;2,4-dichlorophenol (DCP) is a chlorinated aromatic compound with a chlorine atomeach at positions 2 and 4 of the phenol ring. It is a common pollutant and a primaryreagent in the synthesis of a variety of highly chlorinated phenols and pesticidessuch as 2,4-dichlorophenoxyacetic acid (Shaarani and Hameed 2010). DCP is acolorless, crystalline solid, slightly soluble in water at neutral pH but very soluble inalcohol, ether, and benzene and has weak acidic properties with pKa of 7.90(Shaarani and Hameed 2010; Dabrowski et al. 2005). Removal of phenolic com-pounds through adsorption is better compared to other techniques in terms of costand equipment handling. Hence, it is the most frequently used technique (Lu andSorial 2009; Shaarani and Hameed 2010; Dabrowski et al. 2005). Adsorption is aprocess involving the contact of a free aqueous phase with a rigid particulate phase,which has the propensity to selectively remove or store one or more solutes presentin the solution. Activated carbon is the most widely used adsorbent for the removalof pollutants from wastewater. This is due to its extended surface area, micropo-rous structure, high adsorption capacity, and high degree of surface reactivity
372 C. G. Joseph et al.
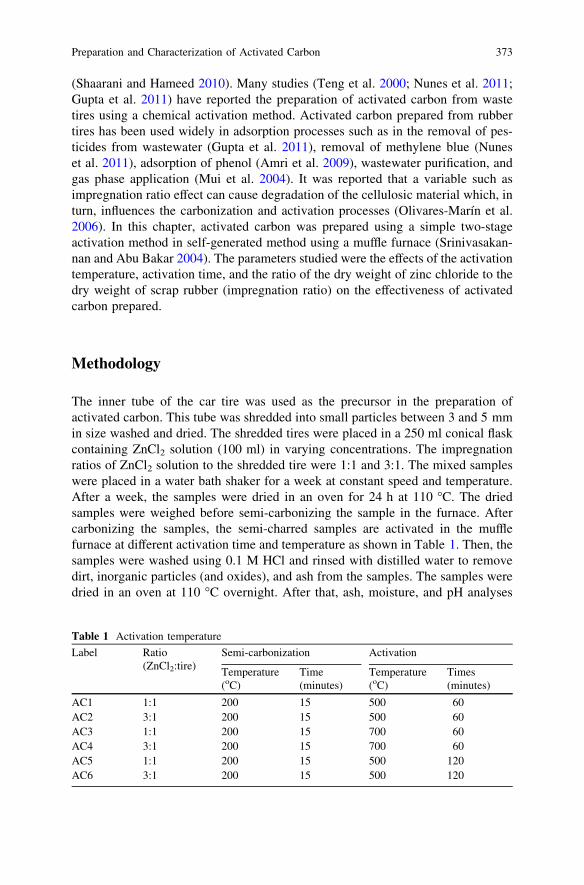
(Shaarani and Hameed 2010). Many studies (Teng et al. 2000; Nunes et al. 2011;Gupta et al. 2011) have reported the preparation of activated carbon from wastetires using a chemical activation method. Activated carbon prepared from rubbertires has been used widely in adsorption processes such as in the removal of pes-ticides from wastewater (Gupta et al. 2011), removal of methylene blue (Nuneset al. 2011), adsorption of phenol (Amri et al. 2009), wastewater purification, andgas phase application (Mui et al. 2004). It was reported that a variable such asimpregnation ratio effect can cause degradation of the cellulosic material which, inturn, influences the carbonization and activation processes (Olivares-Marín et al.2006). In this chapter, activated carbon was prepared using a simple two-stageactivation method in self-generated method using a muffle furnace (Srinivasakan-nan and Abu Bakar 2004). The parameters studied were the effects of the activationtemperature, activation time, and the ratio of the dry weight of zinc chloride to thedry weight of scrap rubber (impregnation ratio) on the effectiveness of activatedcarbon prepared.
Methodology
The inner tube of the car tire was used as the precursor in the preparation ofactivated carbon. This tube was shredded into small particles between 3 and 5 mmin size washed and dried. The shredded tires were placed in a 250 ml conical flaskcontaining ZnCl2 solution (100 ml) in varying concentrations. The impregnationratios of ZnCl2 solution to the shredded tire were 1:1 and 3:1. The mixed sampleswere placed in a water bath shaker for a week at constant speed and temperature.After a week, the samples were dried in an oven for 24 h at 110 �C. The driedsamples were weighed before semi-carbonizing the sample in the furnace. Aftercarbonizing the samples, the semi-charred samples are activated in the mufflefurnace at different activation time and temperature as shown in Table 1. Then, thesamples were washed using 0.1 M HCl and rinsed with distilled water to removedirt, inorganic particles (and oxides), and ash from the samples. The samples weredried in an oven at 110 �C overnight. After that, ash, moisture, and pH analyses
Table 1 Activation temperature
Label Ratio(ZnCl2:tire)
Semi-carbonization Activation
Temperature(oC)
Time(minutes)
Temperature(oC)
Times(minutes)
AC1 1:1 200 15 500 60AC2 3:1 200 15 500 60AC3 1:1 200 15 700 60AC4 3:1 200 15 700 60AC5 1:1 200 15 500 120AC6 3:1 200 15 500 120
Preparation and Characterization of Activated Carbon 373
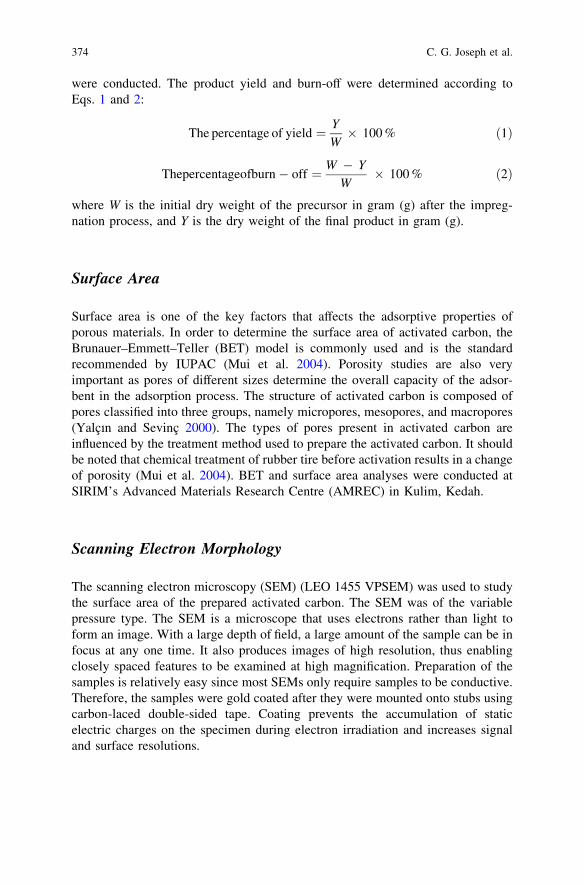
were conducted. The product yield and burn-off were determined according toEqs. 1 and 2:
The percentage of yield ¼ Y
W� 100 % ð1Þ
Thepercentageofburn� off ¼ W � Y
W� 100 % ð2Þ
where W is the initial dry weight of the precursor in gram (g) after the impreg-nation process, and Y is the dry weight of the final product in gram (g).
Surface Area
Surface area is one of the key factors that affects the adsorptive properties ofporous materials. In order to determine the surface area of activated carbon, theBrunauer–Emmett–Teller (BET) model is commonly used and is the standardrecommended by IUPAC (Mui et al. 2004). Porosity studies are also veryimportant as pores of different sizes determine the overall capacity of the adsor-bent in the adsorption process. The structure of activated carbon is composed ofpores classified into three groups, namely micropores, mesopores, and macropores(Yalçın and Sevinç 2000). The types of pores present in activated carbon areinfluenced by the treatment method used to prepare the activated carbon. It shouldbe noted that chemical treatment of rubber tire before activation results in a changeof porosity (Mui et al. 2004). BET and surface area analyses were conducted atSIRIM’s Advanced Materials Research Centre (AMREC) in Kulim, Kedah.
Scanning Electron Morphology
The scanning electron microscopy (SEM) (LEO 1455 VPSEM) was used to studythe surface area of the prepared activated carbon. The SEM was of the variablepressure type. The SEM is a microscope that uses electrons rather than light toform an image. With a large depth of field, a large amount of the sample can be infocus at any one time. It also produces images of high resolution, thus enablingclosely spaced features to be examined at high magnification. Preparation of thesamples is relatively easy since most SEMs only require samples to be conductive.Therefore, the samples were gold coated after they were mounted onto stubs usingcarbon-laced double-sided tape. Coating prevents the accumulation of staticelectric charges on the specimen during electron irradiation and increases signaland surface resolutions.
374 C. G. Joseph et al.
Results and Discussion
Effect of Impregnation Ratio on Percentage Yield
Table 2 shows the percentage yield of the prepared activated carbon. Generally,the activated carbon prepared at an impregnation ratio of 1:1 (AC1) produced ahigher yield (44.88 %) compared to the ones prepared at an impregnation ratio of3:1. A similar trend was reported by previous researchers; that is, an increase in thevalue of impregnation ratio resulted in a corresponding increase in weight loss(Teng et al. 2000). The pattern of weight loss by increasing the impregnation ratiofrom 1 to 3 was due to the large evolution of volatiles during the activationprocess.
Effect of Activation Temperature on Percentage Yield
The yield of the prepared activated carbon was also influenced by the activationtemperature. Table 2 shows that an activation temperature of 500 �C produced ahigher yield of activated carbon (AC1 and AC2) compared to the ones produced atan activation temperature of 700 �C (AC3 and AC4). This finding is corroboratedby studies by Nunes and co-researchers (Nunes et al. 2011). Therefore, higheractivation temperatures translate to higher burn-off of the precursor material.
Effect of Activation Time on Percentage Yield
Different activation time during the preparation of activated carbon from waste tirehad a great effect on the product yield of the carbon. Comparisons were madebetween the samples prepared at an activation temperature of 500 �C with thesame impregnation ratio but different activation time. Activation time of 60 min
Table 2 Physiochemical characteristics of the activated carbon prepared
Sample Temperature(�C)
Activationtime (min)
Impregnationratio(ZnCl2:tire)
Percentageyield (%)
Percentageburned off(%)
Ashcontent(%)
Moisturecontent(%)
AC1 500 60 1:1 44.88 55.12 16 1.44AC2 500 60 3:1 41.94 58.06 17 0.15AC3 700 60 1:1 21.42 78.58 14 1.07AC4 700 60 3:1 24.78 75.22 20 1.58AC5 500 120 1:1 33.10 66.90 19 0.16AC6 500 120 3:1 25.82 74.18 18 0.66
Preparation and Characterization of Activated Carbon 375
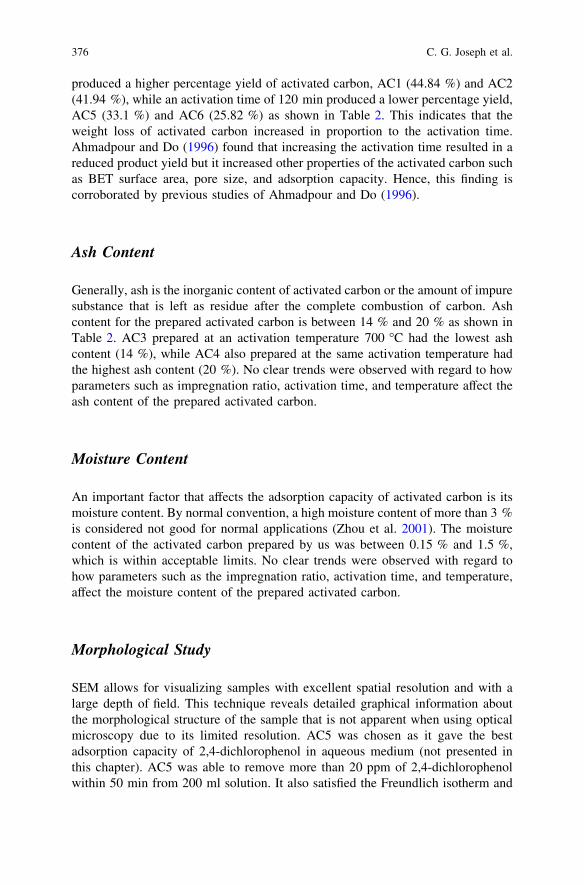
produced a higher percentage yield of activated carbon, AC1 (44.84 %) and AC2(41.94 %), while an activation time of 120 min produced a lower percentage yield,AC5 (33.1 %) and AC6 (25.82 %) as shown in Table 2. This indicates that theweight loss of activated carbon increased in proportion to the activation time.Ahmadpour and Do (1996) found that increasing the activation time resulted in areduced product yield but it increased other properties of the activated carbon suchas BET surface area, pore size, and adsorption capacity. Hence, this finding iscorroborated by previous studies of Ahmadpour and Do (1996).
Ash Content
Generally, ash is the inorganic content of activated carbon or the amount of impuresubstance that is left as residue after the complete combustion of carbon. Ashcontent for the prepared activated carbon is between 14 % and 20 % as shown inTable 2. AC3 prepared at an activation temperature 700 �C had the lowest ashcontent (14 %), while AC4 also prepared at the same activation temperature hadthe highest ash content (20 %). No clear trends were observed with regard to howparameters such as impregnation ratio, activation time, and temperature affect theash content of the prepared activated carbon.
Moisture Content
An important factor that affects the adsorption capacity of activated carbon is itsmoisture content. By normal convention, a high moisture content of more than 3 %is considered not good for normal applications (Zhou et al. 2001). The moisturecontent of the activated carbon prepared by us was between 0.15 % and 1.5 %,which is within acceptable limits. No clear trends were observed with regard tohow parameters such as the impregnation ratio, activation time, and temperature,affect the moisture content of the prepared activated carbon.
Morphological Study
SEM allows for visualizing samples with excellent spatial resolution and with alarge depth of field. This technique reveals detailed graphical information aboutthe morphological structure of the sample that is not apparent when using opticalmicroscopy due to its limited resolution. AC5 was chosen as it gave the bestadsorption capacity of 2,4-dichlorophenol in aqueous medium (not presented inthis chapter). AC5 was able to remove more than 20 ppm of 2,4-dichlorophenolwithin 50 min from 200 ml solution. It also satisfied the Freundlich isotherm and
376 C. G. Joseph et al.
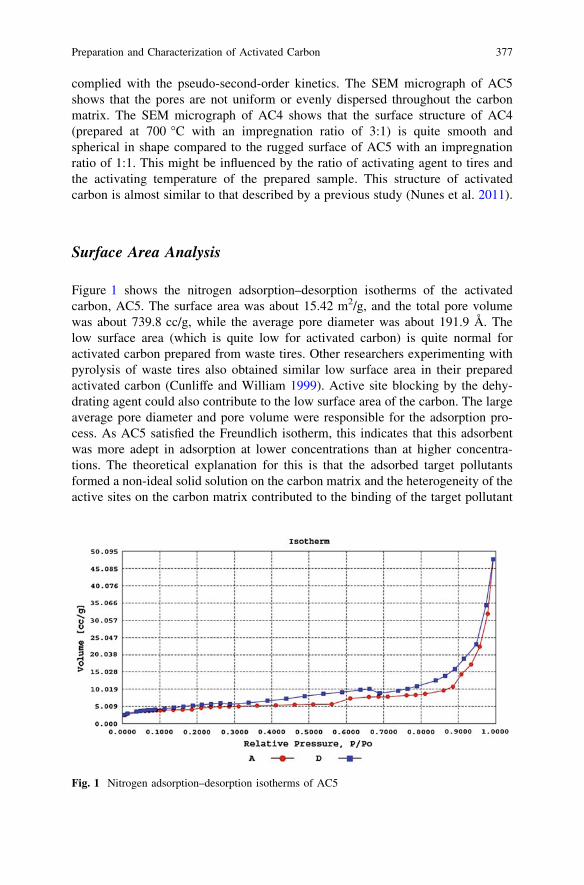
complied with the pseudo-second-order kinetics. The SEM micrograph of AC5shows that the pores are not uniform or evenly dispersed throughout the carbonmatrix. The SEM micrograph of AC4 shows that the surface structure of AC4(prepared at 700 �C with an impregnation ratio of 3:1) is quite smooth andspherical in shape compared to the rugged surface of AC5 with an impregnationratio of 1:1. This might be influenced by the ratio of activating agent to tires andthe activating temperature of the prepared sample. This structure of activatedcarbon is almost similar to that described by a previous study (Nunes et al. 2011).
Surface Area Analysis
Figure 1 shows the nitrogen adsorption–desorption isotherms of the activatedcarbon, AC5. The surface area was about 15.42 m2/g, and the total pore volumewas about 739.8 cc/g, while the average pore diameter was about 191.9 Å. Thelow surface area (which is quite low for activated carbon) is quite normal foractivated carbon prepared from waste tires. Other researchers experimenting withpyrolysis of waste tires also obtained similar low surface area in their preparedactivated carbon (Cunliffe and William 1999). Active site blocking by the dehy-drating agent could also contribute to the low surface area of the carbon. The largeaverage pore diameter and pore volume were responsible for the adsorption pro-cess. As AC5 satisfied the Freundlich isotherm, this indicates that this adsorbentwas more adept in adsorption at lower concentrations than at higher concentra-tions. The theoretical explanation for this is that the adsorbed target pollutantsformed a non-ideal solid solution on the carbon matrix and the heterogeneity of theactive sites on the carbon matrix contributed to the binding of the target pollutant
Fig. 1 Nitrogen adsorption–desorption isotherms of AC5
Preparation and Characterization of Activated Carbon 377
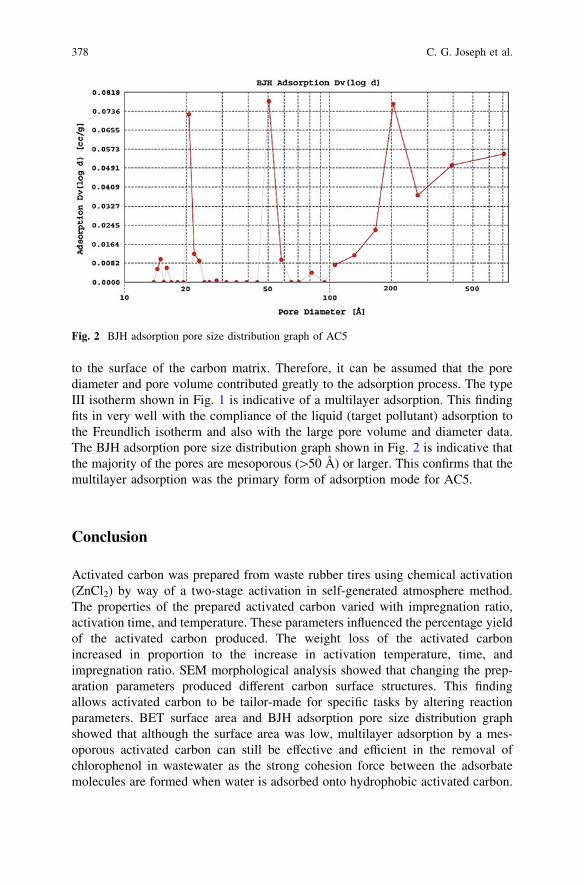
to the surface of the carbon matrix. Therefore, it can be assumed that the porediameter and pore volume contributed greatly to the adsorption process. The typeIII isotherm shown in Fig. 1 is indicative of a multilayer adsorption. This findingfits in very well with the compliance of the liquid (target pollutant) adsorption tothe Freundlich isotherm and also with the large pore volume and diameter data.The BJH adsorption pore size distribution graph shown in Fig. 2 is indicative thatthe majority of the pores are mesoporous ([50 Å) or larger. This confirms that themultilayer adsorption was the primary form of adsorption mode for AC5.
Conclusion
Activated carbon was prepared from waste rubber tires using chemical activation(ZnCl2) by way of a two-stage activation in self-generated atmosphere method.The properties of the prepared activated carbon varied with impregnation ratio,activation time, and temperature. These parameters influenced the percentage yieldof the activated carbon produced. The weight loss of the activated carbonincreased in proportion to the increase in activation temperature, time, andimpregnation ratio. SEM morphological analysis showed that changing the prep-aration parameters produced different carbon surface structures. This findingallows activated carbon to be tailor-made for specific tasks by altering reactionparameters. BET surface area and BJH adsorption pore size distribution graphshowed that although the surface area was low, multilayer adsorption by a mes-oporous activated carbon can still be effective and efficient in the removal ofchlorophenol in wastewater as the strong cohesion force between the adsorbatemolecules are formed when water is adsorbed onto hydrophobic activated carbon.
Fig. 2 BJH adsorption pore size distribution graph of AC5
378 C. G. Joseph et al.
Acknowledgments This research was supported by a Fundamental Research Grant Schemeawarded by the Ministry of Higher Education to Universiti Teknologi MARA Sabah in collab-oration with University Malaysia Sabah (Grant No. 600-RMI/ST/FRGS 5/3/Fst (35/2010) and isgratefully acknowledged. The authors would also like to thank Universiti Malaysia Sabah forthe facilities used in carrying out this research work.
References
Ahmadpour, A., & Do, D. D. (1996). The preparation of active carbons from coal by chemicaland physical activation. Carbon, 34(4), 471–479.
Amri, N., Zakaria, R., & Mohamad, Z. A. B. (2009). Adsorption of phenol using activated carbonadsorbent from waste tyres. Pertanika Journal of Science and Technology, 17(2), 371–380.
Bajus, M., & Olahová, N. (2011). Thermal conversion of scrap tyres. Petroleum and Coal, 53(2),98–105.
Betancur, M., Martínez, J. D., & Murillo, R. (2009). Production of activated carbon by waste tirethermochemical degradation with CO2. Journal of Hazardous Materials, 168(2–3), 882–887.
Cunliffe, A. M., & William, P. T. (1999). Influence of process conditions on the rate of activationof chars derived from pyrolysis of used tires. Energy and Fuels, 13(1), 166–175.
Dabrowski, A., Podkoscielny, P., Hubicki, Z., & Barczak, M. (2005). Adsorption of phenoliccompounds by activated carbon—a critical review. Chemosphere, 58(8), 1049–1070.
de Marco Rodriguez, I., Laresgoiti, M. F., Cabrero, M. A., Torres, A., Chomón, M. J. &Caballero, B. (2001). Pyrolysis of scrap tyres. Fuel Processing Technology, 72 (1), 9–22.
Gupta, V. K., Gupta, B., Rastogi, A., Agarwal, S., & Nayak, A. (2011). Pesticides removal fromwaste water by activated carbon prepared from waste rubber tire. Water Research, 45(13),4047–4055.
Lu, Q., & Sorial, G. A. (2009). A comparative study of multicomponent adsorption of phenoliccompounds on GAC and ACFs. Journal of Hazardous Materials, 167 (1–3) 15, 89–96.
Ministry of Transportation. (2011) Table 1.1: New registered motor vehicles by type and state,malaysia, second quarter 2011. Ministry of Transportation. [http://www.mot.gov.my](Retrieved 3 Oct 2011).
Mui, E. L. K., Ko, D. C. K., & McKay, G. (2004). Production of active carbons from wastetyres—a review. Carbon, 42(14), 2789–2805.
Nunes, M. R., Perez, G. M., Loguercio, L. F., Alves, E. W., Carreilo, N. L. V., Martin, J. L., et al.(2011). Active carbon preparation from treads of tire for removal in waste water. JournalBrazil Chemical Science, 22(11), 2027–2035.
Olivares-Marín, M., Fernández-González, C., Macías-García, A., & Gómez-Serrano, V. (2006).Preparation of activated carbon from cherry stones by chemical activation with ZnCl2.Applied Surface Science, 252(17), 5967–5971.
Shaarani, F. W., & Hameed, B. H. (2010). Batch adsorption of 2,4-dichlorophenol onto activatedcarbon derived from agricultural waste. Desalination, 255(1–3), 159–164.
Srinivasakannan, C., & Abu Bakar, M. Z. (2004). Production of activated carbon from rubberwood sawdust. Biomass and Bioenergy, 27, 89–96.
Teng, H., Lin, Y., & Hsu, L. (2000). Production of activated carbons from pyrolysis of waste tiresimpregnated with potassium hydroxide. Journal of the Air and Waste ManagementAssociation, 50, 1940–1946.
The Star. (2011). Number of vehicles registered on the rise [http://thestar.com.my/news/story.asp?file=/2011/2/26/nation/8146407&sec=nation] (Accessed 26 Feb 2011).
University of Science Malaysia. (2011) Penyelidikan USM Hasil Produk Penjerap MinyakBerasas Getah Pertama Dunia. University of Science Malaysia. [http://www.usm.my/index.php/ms/arkib-berita/8254-penyelidik-usm-hasil-produk-penjerap-minyak-berasas-getah-pertama-dunia.html] (Retrieved 27 May 2011).
Preparation and Characterization of Activated Carbon 379

Wojtowizz, M. A., & Serio, M. A. (1996). Pyrolysis of scrap tires: Can it be profitable?ChemTech, 48–54.
Yalçin, N., & Sevinç, V. (2000). Studies of the surface area and porosity of activated carbonprepared from rice husks. Carbon, 38(14), 1943–1945.
Zhou, L., Li, M., Sun, Y., & Zhou, Y. (2001). Effect of moisture in microporous activated carbonon the adsorption of methane. Carbon, 39(5), 773–776.
380 C. G. Joseph et al.
The Effects of Kaolin/PESF Ratioson the Microstructures of KaolinHollow Tubes
R. Sarbatly and Z. Kamin
Abstract The effects of kaolin/polyethersulfone (PESf) (k/p) ratios on themicrostructures of kaolin hollow tubes have been investigated. Kaolin suspensioncontaining k/p ratios between 1 and 3.5 was used to spin kaolin hollow-tubeprecursors via a dry-jet wet spinning method at 0-cm air gap. The cross-sectionalmicrostructures of the kaolin hollow-tube precursors were investigated usingscanning electron microscopy (SEM). The results show that, at k/p ratios of 1.0,1.5 and 2.5 (low viscosity) and k/p ratios of 3.0 and 3.5 (high viscosity), the fingerlike voids dominated the outer regions and inner regions of the cross sections ofthe kaolin hollow tubes, respectively.
Introduction
A ceramic, hollow-tube membrane works in a similar way as a polymeric hollow-tube membrane in applications such as gas separation, desalination, filtration andmembrane reactors. However, a ceramic-based membrane, in advantage, provideshigher stability than a polymer-based membrane, in high temperature and pressureas well as in corrosive environments (Clausi et al. 1999; Liu et al. 2005; Kingsburyand Li 2009).
Ceramic, hollow-tube membranes are made of materials such as Al2O3 andTiO2 (Liu et al. 2001; Liu and Li 2003). Kaolin clay is alternatively used as a
R. Sarbatly (&)Membrane Technology Research Group, School of Engineering and InformationTechnology, Universiti Malaysia Sabah, Jalan UMS 88400 Kota Kinabalu, Sabah, Malaysiae-mail: [email protected]
Z. KaminTAS Institute of Oil and Gas, School of Engineering and Information Technology,Universiti Malaysia Sabah, Jalan UMS 88400 Kota Kinabalu, Sabah, Malaysiae-mail: [email protected]
R. Pogaku et al. (eds.), Developments in Sustainable Chemicaland Bioprocess Technology, DOI: 10.1007/978-1-4614-6208-8_45,� Springer Science+Business Media New York 2013
381
membrane material to make both microfiltration and ultrafiltration membranes(Bouzerara et al. 2006) and membrane supports (Mohammadi and Pak 2002, 2003;Mohammadi et al. 2004). However, current methods to fabricate kaolin-basedmembranes are limited to extrusion, dry pressing and roll pressing processes inwhich the kaolin-based membranes are bound to only exhibit symmetric micro-structures (Mohammadi and Pak 2003; Mohammadi et al. 2004; Bouzerara et al.2006).
The study of microstructures of hollow-tube membranes is important as thesedata are used to determine the membrane applications appropriate in either sep-aration or reaction applications. Although studies have been conducted on themicrostructures of polymeric hollow-tube membranes (Tan et al. 2001; Shen et al.2003), such techniques are of limited use because of the large differences betweenpolymeric and kaolin ceramic systems. Therefore, the purpose of this work was tostudy the effects of k/p ratios on the microstructures of kaolin hollow tube.
Methodology
Materials
Kaolin powder (Sigma-Aldrich) was used as a ceramic material. The kaolinpowder was weighted, sieved using a sieve of one mm mesh size, to removeagglomeration and left to dry in desiccators prior to use. The PESf (Sigma-Aldrich) polymer pellets were dried in an oven at 60 �C for 8 h to remove watercontent. N-methyl-2-pyrrolidone (NMP, Acros Organics, 99 % extra pure) wasused as a solvent without treatment. Tap water was used as a coagulation mediumfor both the internal and external coagulants.
Powder Characterization
The particle-size distribution of the kaolin was determined by a portable, laser-diffraction, particle-size analyser (LSST-Portable, Sequoia).
Preparation of the Spinning Solution and the Measurementof Viscosity
Firstly, NMP in an airtight glass was heated to 60 �C using hot plate (YellowMAG HS 7 S2, IKA) where PESf was subsequently added and mixed until dis-solved using a magnetic stirrer. Next, the polymer solution was left to cool to room
382 R. Sarbatly and Z. Kamin
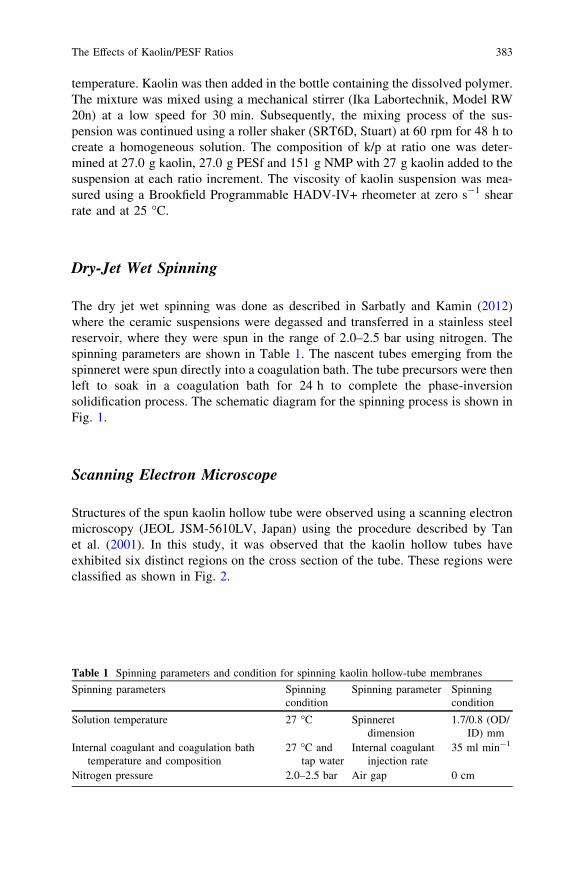
temperature. Kaolin was then added in the bottle containing the dissolved polymer.The mixture was mixed using a mechanical stirrer (Ika Labortechnik, Model RW20n) at a low speed for 30 min. Subsequently, the mixing process of the sus-pension was continued using a roller shaker (SRT6D, Stuart) at 60 rpm for 48 h tocreate a homogeneous solution. The composition of k/p at ratio one was deter-mined at 27.0 g kaolin, 27.0 g PESf and 151 g NMP with 27 g kaolin added to thesuspension at each ratio increment. The viscosity of kaolin suspension was mea-sured using a Brookfield Programmable HADV-IV+ rheometer at zero s-1 shearrate and at 25 �C.
Dry-Jet Wet Spinning
The dry jet wet spinning was done as described in Sarbatly and Kamin (2012)where the ceramic suspensions were degassed and transferred in a stainless steelreservoir, where they were spun in the range of 2.0–2.5 bar using nitrogen. Thespinning parameters are shown in Table 1. The nascent tubes emerging from thespinneret were spun directly into a coagulation bath. The tube precursors were thenleft to soak in a coagulation bath for 24 h to complete the phase-inversionsolidification process. The schematic diagram for the spinning process is shown inFig. 1.
Scanning Electron Microscope
Structures of the spun kaolin hollow tube were observed using a scanning electronmicroscopy (JEOL JSM-5610LV, Japan) using the procedure described by Tanet al. (2001). In this study, it was observed that the kaolin hollow tubes haveexhibited six distinct regions on the cross section of the tube. These regions wereclassified as shown in Fig. 2.
Table 1 Spinning parameters and condition for spinning kaolin hollow-tube membranes
Spinning parameters Spinningcondition
Spinning parameter Spinningcondition
Solution temperature 27 �C Spinneretdimension
1.7/0.8 (OD/ID) mm
Internal coagulant and coagulation bathtemperature and composition
27 �C andtap water
Internal coagulantinjection rate
35 ml min-1
Nitrogen pressure 2.0–2.5 bar Air gap 0 cm
The Effects of Kaolin/PESF Ratios 383
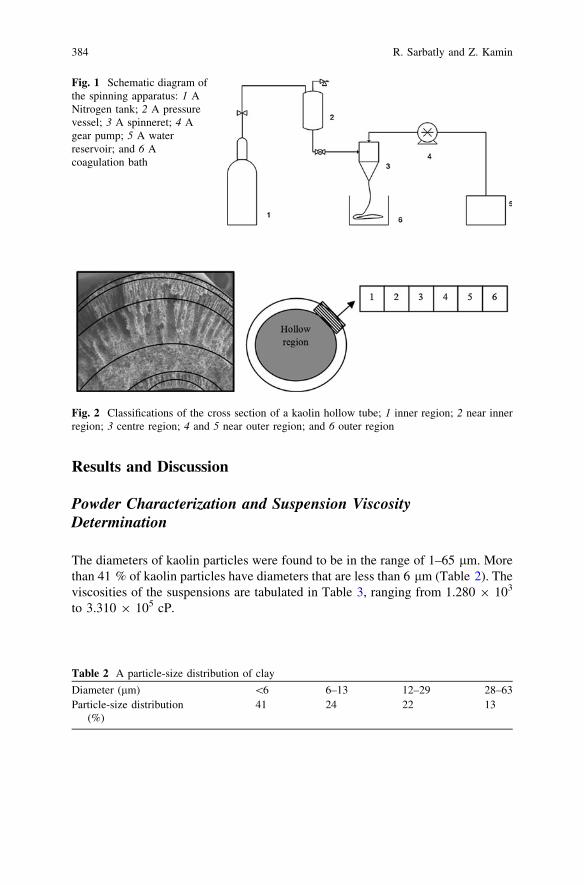
Results and Discussion
Powder Characterization and Suspension ViscosityDetermination
The diameters of kaolin particles were found to be in the range of 1–65 lm. Morethan 41 % of kaolin particles have diameters that are less than 6 lm (Table 2). Theviscosities of the suspensions are tabulated in Table 3, ranging from 1.280 9 103
to 3.310 9 105 cP.
Fig. 1 Schematic diagram ofthe spinning apparatus: 1 ANitrogen tank; 2 A pressurevessel; 3 A spinneret; 4 Agear pump; 5 A waterreservoir; and 6 Acoagulation bath
Fig. 2 Classifications of the cross section of a kaolin hollow tube; 1 inner region; 2 near innerregion; 3 centre region; 4 and 5 near outer region; and 6 outer region
Table 2 A particle-size distribution of clay
Diameter (lm) \6 6–13 12–29 28–63Particle-size distribution
(%)41 24 22 13
384 R. Sarbatly and Z. Kamin
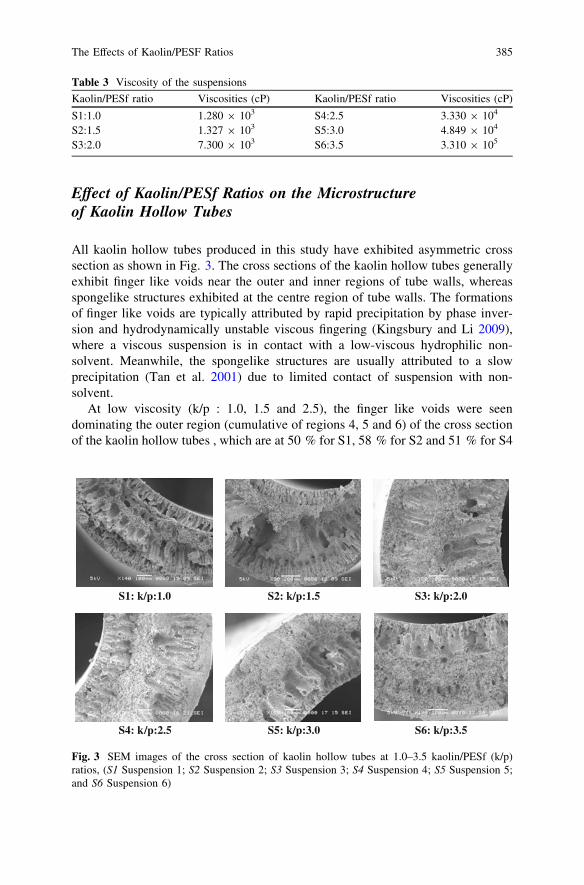
Effect of Kaolin/PESf Ratios on the Microstructureof Kaolin Hollow Tubes
All kaolin hollow tubes produced in this study have exhibited asymmetric crosssection as shown in Fig. 3. The cross sections of the kaolin hollow tubes generallyexhibit finger like voids near the outer and inner regions of tube walls, whereasspongelike structures exhibited at the centre region of tube walls. The formationsof finger like voids are typically attributed by rapid precipitation by phase inver-sion and hydrodynamically unstable viscous fingering (Kingsbury and Li 2009),where a viscous suspension is in contact with a low-viscous hydrophilic non-solvent. Meanwhile, the spongelike structures are usually attributed to a slowprecipitation (Tan et al. 2001) due to limited contact of suspension with non-solvent.
At low viscosity (k/p : 1.0, 1.5 and 2.5), the finger like voids were seendominating the outer region (cumulative of regions 4, 5 and 6) of the cross sectionof the kaolin hollow tubes , which are at 50 % for S1, 58 % for S2 and 51 % for S4
Table 3 Viscosity of the suspensions
Kaolin/PESf ratio Viscosities (cP) Kaolin/PESf ratio Viscosities (cP)
S1:1.0 1.280 9 103 S4:2.5 3.330 9 104
S2:1.5 1.327 9 103 S5:3.0 4.849 9 104
S3:2.0 7.300 9 103 S6:3.5 3.310 9 105
S1: k/p:1.0 S2: k/p:1.5 S3: k/p:2.0
S4: k/p:2.5 S5: k/p:3.0 S6: k/p:3.5
Fig. 3 SEM images of the cross section of kaolin hollow tubes at 1.0–3.5 kaolin/PESf (k/p)ratios, (S1 Suspension 1; S2 Suspension 2; S3 Suspension 3; S4 Suspension 4; S5 Suspension 5;and S6 Suspension 6)
The Effects of Kaolin/PESF Ratios 385
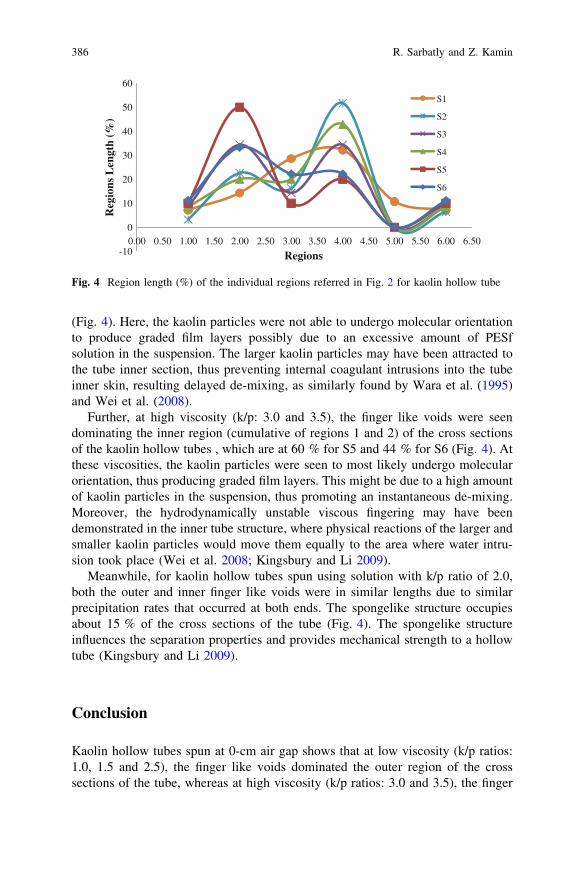
(Fig. 4). Here, the kaolin particles were not able to undergo molecular orientationto produce graded film layers possibly due to an excessive amount of PESfsolution in the suspension. The larger kaolin particles may have been attracted tothe tube inner section, thus preventing internal coagulant intrusions into the tubeinner skin, resulting delayed de-mixing, as similarly found by Wara et al. (1995)and Wei et al. (2008).
Further, at high viscosity (k/p: 3.0 and 3.5), the finger like voids were seendominating the inner region (cumulative of regions 1 and 2) of the cross sectionsof the kaolin hollow tubes , which are at 60 % for S5 and 44 % for S6 (Fig. 4). Atthese viscosities, the kaolin particles were seen to most likely undergo molecularorientation, thus producing graded film layers. This might be due to a high amountof kaolin particles in the suspension, thus promoting an instantaneous de-mixing.Moreover, the hydrodynamically unstable viscous fingering may have beendemonstrated in the inner tube structure, where physical reactions of the larger andsmaller kaolin particles would move them equally to the area where water intru-sion took place (Wei et al. 2008; Kingsbury and Li 2009).
Meanwhile, for kaolin hollow tubes spun using solution with k/p ratio of 2.0,both the outer and inner finger like voids were in similar lengths due to similarprecipitation rates that occurred at both ends. The spongelike structure occupiesabout 15 % of the cross sections of the tube (Fig. 4). The spongelike structureinfluences the separation properties and provides mechanical strength to a hollowtube (Kingsbury and Li 2009).
Conclusion
Kaolin hollow tubes spun at 0-cm air gap shows that at low viscosity (k/p ratios:1.0, 1.5 and 2.5), the finger like voids dominated the outer region of the crosssections of the tube, whereas at high viscosity (k/p ratios: 3.0 and 3.5), the finger
-10
0
10
20
30
40
50
60
0.00 0.50 1.00 1.50 2.00 2.50 3.00 3.50 4.00 4.50 5.00 5.50 6.00 6.50
Reg
ions
Len
gth
(%)
Regions
S1
S2
S3
S4
S5
S6
Fig. 4 Region length (%) of the individual regions referred in Fig. 2 for kaolin hollow tube
386 R. Sarbatly and Z. Kamin
like voids dominated the inner region of the tube cross section. Since all of thekaolin hollow-tube precursors have displayed finger like voids at both ends, theyare suitable to serve as supports for catalyst particles impregnation; however, theymay not be suitable to be used for separation applications.
Acknowledgments The authors would like to thank the Universiti Malaysia Sabah and theMinistry of Science Technology and Innovation, Malaysia, for the usage of facilities and fundingthis research, respectively.
References
Bouzerara, F., Harabi, A., Achour, S., & Larbot, A. (2006). Porous ceramic supports formembranes prepared from kaolin and doloma mixtures. Journal of the European CeramicSociety, 26, 1663–1671.
Clausi, D. T., McKelvey, S. A., & Koros, W. J. (1999). Characterization of substructureresistance in asymmetric gas separation membranes. Journal of Membrane Science, 160,51–64.
Kingsbury, B. F. K., & Li, K. (2009). A morphological study of ceramic hollow fibre membranes.Journal of Membrane Science, 328, 134–140.
Liu, S., & Li, K. (2003). Preparation of TiO2/Al2O3 composite hollow fibre membranes. Journalof Membrane Science, 218, 269–277.
Liu, Y., & Li, K. (2005). Preparation of SrCe0.95Yb0.05O3-[alpha] hollow fibre membranes: Studyon sintering processes. Journal of Membrane Science, 259, 47–54.
Liu, S., Tan, X., Li, K., & Hughes, R. (2001). Preparation and characterisation ofSrCe0.95Yb0.05O2.975 hollow fibre membranes. Journal of Membrane Science, 193, 249–260.
Mohammadi, T., & Pak, A. (2002). Making zeolite a membrane from kaolin by electrophoresis.Microporous and Mesoporous Materials, 56, 81–88.
Mohammadi, T., & Pak, A. (2003). Effect of calcination temperature of kaolin as a support forzeolite membranes. Separation and Purification Technology, 30, 241–249.
Mohammadi, T., Pak, A., Karbassian, M., & Golshan, M. (2004). Effect of operating conditionson microfiltration of an oil-water emulsion by a kaolin membrane. Desalination, 168,201–205.
Sarbatly, R. & Kamin, Z. (2012). Effect of the sintering process on the morphology of kaolinhollow tubes: 12th International Conference on Inorganic Membranes 9–13 July 2012,University of Twente, Enschede, The Netherlands.
Shen, L.-Q., Xu, Z.-K., Liu, Z.-M., & Xu, Y.-Y. (2003). Ultrafiltration hollow fiber membranes ofsulfonated polyetherimide/polyetherimide blends: Preparation, morphologies and anti-foulingproperties. Journal of Membrane Science, 218, 279–293.
Tan, X., Liu, S., & Li, K. (2001). Preparation and characterization of inorganic hollow fibermembranes. Journal of Membrane Science, 188, 87–95.
Wara, N. M., Francis, L. F., & Velamakanni, B. V. (1995). Addition of alumina to celluloseacetate membranes. Journal of Membrane Science, 104, 43–49.
Wei, C. C., Chen, O. Y., Liu, Y., & Li, K. (2008). Ceramic asymmetric hollow fibre membranes-one step fabrication process. Journal of Membrane Science, 320, 191–197.
The Effects of Kaolin/PESF Ratios 387
On the Alloying Reaction in Synthesisof NiTi Shape-Memory Alloyin Solid State
J. Abdullah and H. H. M. Zaki
Abstract Solid-state synthesis of NiTi alloy has gained much interest recentlyparticularly in its porous form for its promising application in medical implant. Inthis work, powder synthesis by sintering of elemental Ni and Ti for formingequiatomic NiTi alloy was studied. It was found that the alloying reaction in solidstate involves complex interaction between the participating elements, their ther-modynamics, and the physical constraint of atomic diffusion. A simple model isproposed to explain the phenomenon. Phase characterization was carried out usingX-ray diffraction, scanning electron microscope and energy dispersive X-ray.Differential scanning calorimetry was used to examine the transformation behaviorof the NiTi alloy. Multiple phases on the Ni-Ti alloy systems were formed and lowtransformation heat was observed for the synthesized specimen. This paper iden-tifies possible obstacles for forming single-phase NiTi and proposes further work.
Introduction
Among the many shape-memory alloys scientists have discovered, NiTi alloy hasgained much attention for many applications especially in engineering and medicalfields. This is due to its excellent mechanical properties (Otsuka and Wayman1998), good biocompatibility (Jorma 1999; Bansiddhi et al. 2008; Ryan et al.2006), and superior corrosion resistance (Bansiddhi et al. 2008). The applicationsso far involve only the bulk or dense NiTi in the form of rods, plates, wires, andthin sheets. An emerging application is its use in medical implants, which par-ticularly requires NiTi in porous form. As implant material, porous NiTi is tech-nically advantageous and superior compared to the traditional dense Ti or steel
J. Abdullah (&) � H. H. M. ZakiSchool of Mechanical Engineering, Universiti Sains Malaysia, Nibong Tebal,Seberang Perai Selatan 14300 Pulau Pinang, Malaysiae-mail: [email protected]
R. Pogaku et al. (eds.), Developments in Sustainable Chemicaland Bioprocess Technology, DOI: 10.1007/978-1-4614-6208-8_46,� Springer Science+Business Media New York 2013
389
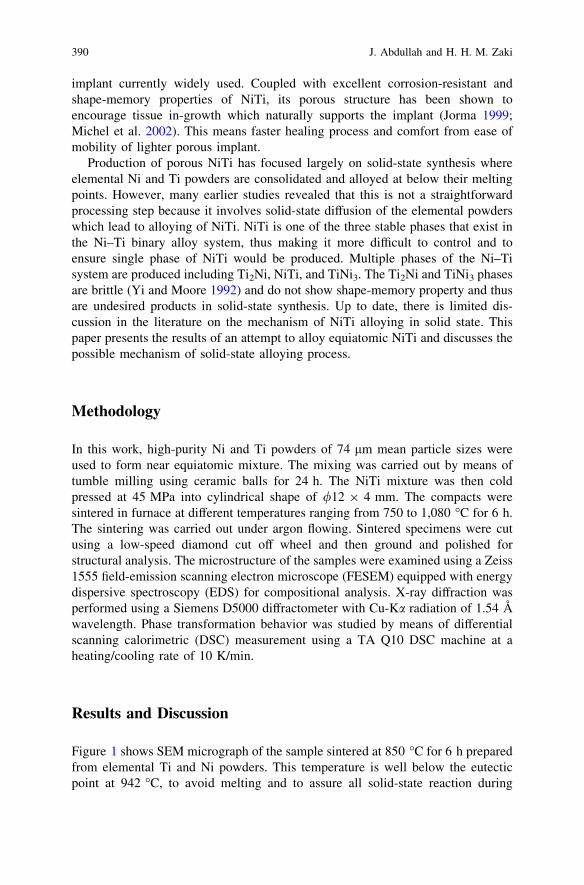
implant currently widely used. Coupled with excellent corrosion-resistant andshape-memory properties of NiTi, its porous structure has been shown toencourage tissue in-growth which naturally supports the implant (Jorma 1999;Michel et al. 2002). This means faster healing process and comfort from ease ofmobility of lighter porous implant.
Production of porous NiTi has focused largely on solid-state synthesis whereelemental Ni and Ti powders are consolidated and alloyed at below their meltingpoints. However, many earlier studies revealed that this is not a straightforwardprocessing step because it involves solid-state diffusion of the elemental powderswhich lead to alloying of NiTi. NiTi is one of the three stable phases that exist inthe Ni–Ti binary alloy system, thus making it more difficult to control and toensure single phase of NiTi would be produced. Multiple phases of the Ni–Tisystem are produced including Ti2Ni, NiTi, and TiNi3. The Ti2Ni and TiNi3 phasesare brittle (Yi and Moore 1992) and do not show shape-memory property and thusare undesired products in solid-state synthesis. Up to date, there is limited dis-cussion in the literature on the mechanism of NiTi alloying in solid state. Thispaper presents the results of an attempt to alloy equiatomic NiTi and discusses thepossible mechanism of solid-state alloying process.
Methodology
In this work, high-purity Ni and Ti powders of 74 lm mean particle sizes wereused to form near equiatomic mixture. The mixing was carried out by means oftumble milling using ceramic balls for 24 h. The NiTi mixture was then coldpressed at 45 MPa into cylindrical shape of /12 9 4 mm. The compacts weresintered in furnace at different temperatures ranging from 750 to 1,080 �C for 6 h.The sintering was carried out under argon flowing. Sintered specimens were cutusing a low-speed diamond cut off wheel and then ground and polished forstructural analysis. The microstructure of the samples were examined using a Zeiss1555 field-emission scanning electron microscope (FESEM) equipped with energydispersive spectroscopy (EDS) for compositional analysis. X-ray diffraction wasperformed using a Siemens D5000 diffractometer with Cu-Ka radiation of 1.54 Åwavelength. Phase transformation behavior was studied by means of differentialscanning calorimetric (DSC) measurement using a TA Q10 DSC machine at aheating/cooling rate of 10 K/min.
Results and Discussion
Figure 1 shows SEM micrograph of the sample sintered at 850 �C for 6 h preparedfrom elemental Ti and Ni powders. This temperature is well below the eutecticpoint at 942 �C, to avoid melting and to assure all solid-state reaction during
390 J. Abdullah and H. H. M. Zaki
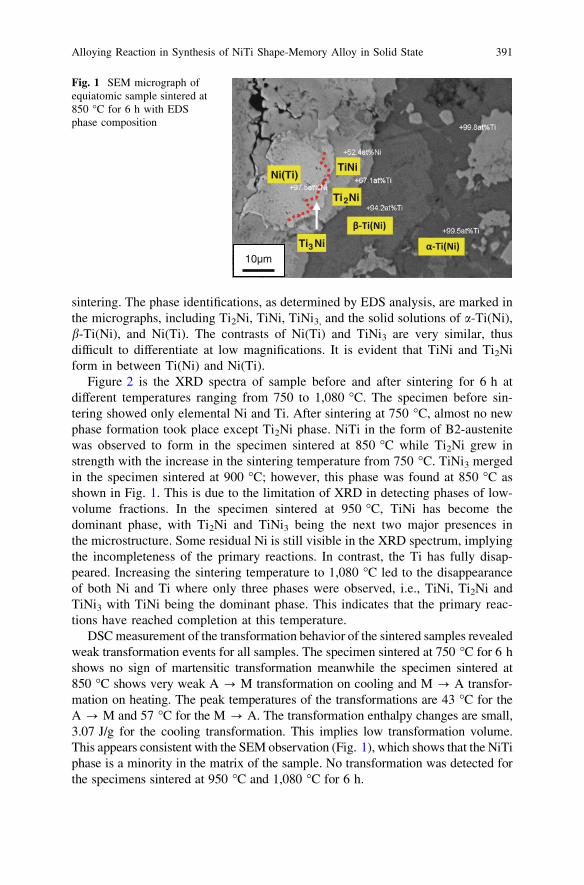
sintering. The phase identifications, as determined by EDS analysis, are marked inthe micrographs, including Ti2Ni, TiNi, TiNi3, and the solid solutions of a-Ti(Ni),b-Ti(Ni), and Ni(Ti). The contrasts of Ni(Ti) and TiNi3 are very similar, thusdifficult to differentiate at low magnifications. It is evident that TiNi and Ti2Niform in between Ti(Ni) and Ni(Ti).
Figure 2 is the XRD spectra of sample before and after sintering for 6 h atdifferent temperatures ranging from 750 to 1,080 �C. The specimen before sin-tering showed only elemental Ni and Ti. After sintering at 750 �C, almost no newphase formation took place except Ti2Ni phase. NiTi in the form of B2-austenitewas observed to form in the specimen sintered at 850 �C while Ti2Ni grew instrength with the increase in the sintering temperature from 750 �C. TiNi3 mergedin the specimen sintered at 900 �C; however, this phase was found at 850 �C asshown in Fig. 1. This is due to the limitation of XRD in detecting phases of low-volume fractions. In the specimen sintered at 950 �C, TiNi has become thedominant phase, with Ti2Ni and TiNi3 being the next two major presences inthe microstructure. Some residual Ni is still visible in the XRD spectrum, implyingthe incompleteness of the primary reactions. In contrast, the Ti has fully disap-peared. Increasing the sintering temperature to 1,080 �C led to the disappearanceof both Ni and Ti where only three phases were observed, i.e., TiNi, Ti2Ni andTiNi3 with TiNi being the dominant phase. This indicates that the primary reac-tions have reached completion at this temperature.
DSC measurement of the transformation behavior of the sintered samples revealedweak transformation events for all samples. The specimen sintered at 750 �C for 6 hshows no sign of martensitic transformation meanwhile the specimen sintered at850 �C shows very weak A ? M transformation on cooling and M ? A transfor-mation on heating. The peak temperatures of the transformations are 43 �C for theA ? M and 57 �C for the M ? A. The transformation enthalpy changes are small,3.07 J/g for the cooling transformation. This implies low transformation volume.This appears consistent with the SEM observation (Fig. 1), which shows that the NiTiphase is a minority in the matrix of the sample. No transformation was detected forthe specimens sintered at 950 �C and 1,080 �C for 6 h.
10µm
Ti2Ni
TiNiNi(Ti)
β-Ti(Ni)
α-Ti(Ni)Ti3Ni
Fig. 1 SEM micrograph ofequiatomic sample sintered at850 �C for 6 h with EDSphase composition
Alloying Reaction in Synthesis of NiTi Shape-Memory Alloy in Solid State 391
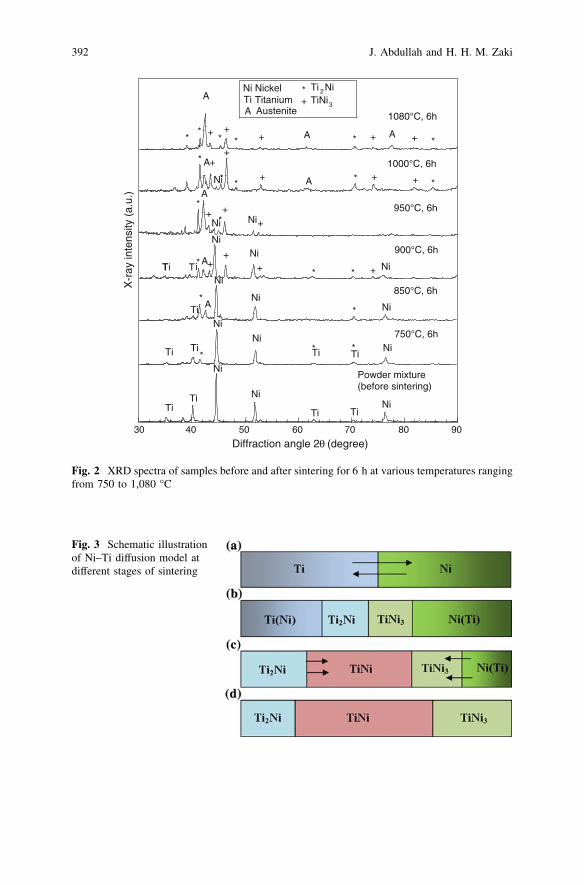
Diffraction angle 2θ (degree)
750°C, 6h
850°C, 6h
900°C, 6h
950°C, 6h
1000°C, 6h
1080°C, 6h
A
A A**
* * * *+
+
++ +
A
A
A
NiNi+
*
*
+
Ti Ti
Ni
Ni
Ni
NiNiA
*
*
Ti Ni
Ni+
+
* + * + + *A
Ni+*
*
Ti**
Ti
T iT +
+Ni* +
+ *
A Austenite+*Ni Nickel
Ti TitaniumTi 2NiTiNi3
X-r
ay in
tens
ity (
a.u.
)
Powder mixture(before sintering)
Ti Ni*
TiNi
Ti
Ti
Ni
Ti
*
*
*Ni
30 40 50 60 70 80 90
Fig. 2 XRD spectra of samples before and after sintering for 6 h at various temperatures rangingfrom 750 to 1,080 �C
Fig. 3 Schematic illustrationof Ni–Ti diffusion model atdifferent stages of sintering
392 J. Abdullah and H. H. M. Zaki
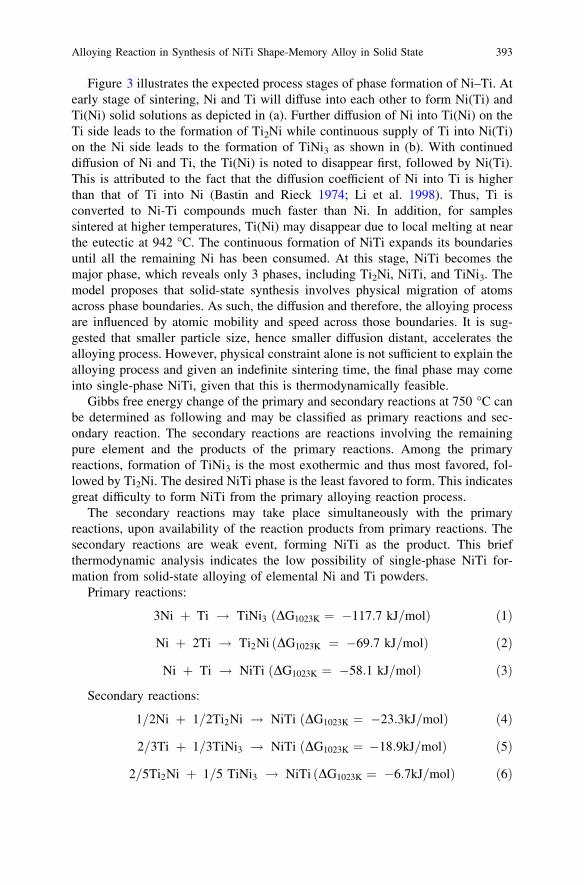
Figure 3 illustrates the expected process stages of phase formation of Ni–Ti. Atearly stage of sintering, Ni and Ti will diffuse into each other to form Ni(Ti) andTi(Ni) solid solutions as depicted in (a). Further diffusion of Ni into Ti(Ni) on theTi side leads to the formation of Ti2Ni while continuous supply of Ti into Ni(Ti)on the Ni side leads to the formation of TiNi3 as shown in (b). With continueddiffusion of Ni and Ti, the Ti(Ni) is noted to disappear first, followed by Ni(Ti).This is attributed to the fact that the diffusion coefficient of Ni into Ti is higherthan that of Ti into Ni (Bastin and Rieck 1974; Li et al. 1998). Thus, Ti isconverted to Ni-Ti compounds much faster than Ni. In addition, for samplessintered at higher temperatures, Ti(Ni) may disappear due to local melting at nearthe eutectic at 942 �C. The continuous formation of NiTi expands its boundariesuntil all the remaining Ni has been consumed. At this stage, NiTi becomes themajor phase, which reveals only 3 phases, including Ti2Ni, NiTi, and TiNi3. Themodel proposes that solid-state synthesis involves physical migration of atomsacross phase boundaries. As such, the diffusion and therefore, the alloying processare influenced by atomic mobility and speed across those boundaries. It is sug-gested that smaller particle size, hence smaller diffusion distant, accelerates thealloying process. However, physical constraint alone is not sufficient to explain thealloying process and given an indefinite sintering time, the final phase may comeinto single-phase NiTi, given that this is thermodynamically feasible.
Gibbs free energy change of the primary and secondary reactions at 750 �C canbe determined as following and may be classified as primary reactions and sec-ondary reaction. The secondary reactions are reactions involving the remainingpure element and the products of the primary reactions. Among the primaryreactions, formation of TiNi3 is the most exothermic and thus most favored, fol-lowed by Ti2Ni. The desired NiTi phase is the least favored to form. This indicatesgreat difficulty to form NiTi from the primary alloying reaction process.
The secondary reactions may take place simultaneously with the primaryreactions, upon availability of the reaction products from primary reactions. Thesecondary reactions are weak event, forming NiTi as the product. This briefthermodynamic analysis indicates the low possibility of single-phase NiTi for-mation from solid-state alloying of elemental Ni and Ti powders.
Primary reactions:
3Ni þ Ti ! TiNi3 DG1023K ¼ �117:7 kJ=molð Þ ð1Þ
Ni þ 2Ti ! Ti2Ni DG1023K ¼ �69:7 kJ=molð Þ ð2Þ
Ni þ Ti ! NiTi DG1023K ¼ �58:1 kJ=molð Þ ð3Þ
Secondary reactions:
1=2Ni þ 1=2Ti2Ni ! NiTi DG1023K ¼ �23:3kJ=molð Þ ð4Þ
2=3Ti þ 1=3TiNi3 ! NiTi DG1023K ¼ �18:9kJ=molð Þ ð5Þ
2=5Ti2Ni þ 1=5 TiNi3 ! NiTi DG1023K ¼ �6:7kJ=molð Þ ð6Þ
Alloying Reaction in Synthesis of NiTi Shape-Memory Alloy in Solid State 393
Conclusions
In this study, solid-state synthesis of elemental Ni and Ti powders for alloying ofNiTi always results in multiple phases of Ti3Ni, NiTi, Ti2Ni and some Ni(Ti),Ti(Ni). The increase in temperature did not produce single-phase NiTi. However,the amount of NiTi is found to increase with increasing sintering temperature. TheNiTi phase formed exhibits very small transformation peaks indicating weakshape-memory property. A physical model of inter-diffusion reveals the difficultyfor atomic migration across phase boundaries, thus needing consideration ofpowder particle size used and a longer time allowed for diffusion. Thermodynamicconsideration reveals two types of reactions, namely the primary reactionsinvolving the pure Ni and Ti and the secondary reactions involving the remainingpure Ni and Ti and the products of primary reactions. The supply of desired NiTiphase relies heavily on much weaker secondary reactions and a least favoredreaction from the primary reactions. These explain the occurrence of multiplephases observed in the solid-state synthesis of NiTi. The major question whethersingle-phase NiTi possible in solid-state synthesis and thus enable the reliableproduction of porous NiTi remains unsolved and needed further study.
Acknowledgments Authors would like to thank the Universiti Sains Malaysia and the Ministryof Higher Education via Experimental Research Grant Scheme (ERGS) # 203/PMEKANIK/6730014 for partly supporting this work. The input and experimental support from ProfessorYinong Liu of the University of Western Australia is also acknowledged.
References
Bansiddhi, A., Sargeant, T. D., Stupp, S. I., & Dunand, D. C. (2008). Porous NiTi for boneimplants: A review. Acta Biomaterialia, 4, 773–782.
Bastin, G. F., & Rieck, G. D. (1974). Diffusion in the titanium-nickel system: II. calculations ofchemical and intrinsic diffusion coefficients. Metallurgical Transition, 5, 1827–1831.
Jorma, R. L. T. (1999). Biocompatibility evaluation of nickel-titanium shape memory metal alloy.Oulu: University of Oulu.
Li, B. Y., Rong, L. J., & Li, Y. Y. (1998). Porous NiTi alloy prepared from elemental powdersintering. Materials Research, 13, 2847–2851.
Michel, A., Alexandr, C., Michel, A. L., & Charles, H. R. (2002). A new porous titanium-nickelalloy: Part 1. Cytotoxicity and genotoxicity evaluation. Bio-Medical Materials andEngineering, 12, 225–237.
Otsuka, K., & Wayman, C. M. (1998). Shape memory alloys. Cambridge: Cambridge UniversityPress.
Ryan, G., Pandit, A., & Apatsidis, D. P. (2006). Fabrication methods of porous metals for use inorthopaedic applications. Biomaterials, 27, 2651–2670.
Yi, H. C., & Moore, J. J. (1992). Combustion synthesis of TiNi intermetallic compound. JournalMaterials Science, 27, 5067–5072.
394 J. Abdullah and H. H. M. Zaki
GFRP Composite Material DegradationUnder Seawater and Weathering Effect
W. H. Choong, K. B. Yeo, M. T. Fadzlita, Y. Y. Farmand M. Azlan Ismail
Abstract An experimental investigation of the seawater effect on the degradationof GFRP composite material with respect to water absorption was conducted. TheGFRP specimens were exposed to seawater and weather environment. Waterabsorption analysis was conducted to investigate the moisture uptake and degra-dation of woven GFRP. The woven GFRP percentage weight gain due to moistureuptake were 0, 0.253, 0.513, 0.752, 0.732, 0.752, and 0.997 % of the initial weight,after 1, 2, 3, 5, 8, 48, and 168 immersion hours. Degradation of GFRP was alsofound to correlate to the corrosion and uptake of seawater at the fibre/matrixinterface.
Introduction
Glass fibre-reinforced polymer materials are increasingly utilized in civil andmechanical infrastructure because of their high strength to weight and corrosionresistance. Researchers had shown that properties of GFRP composite systemswere compromised in seawater environment (Mourad et al. 2010). One majorconcern of using GFRP composites in seawater application was attributed to thefibre/matrix interface degradation due to hydrolysis reaction of unsaturated groupswithin the resin. Seawater degradation could cause swelling and plasticization ofthe polyester matrix and debonding at the fibre/matrix interface. The swelling andplasticization could reduce the mechanical properties (Aldajah et al. 2008).
Masahiro et al. (2010) investigated the woven GFRP mechanical property byimmersion in deionized water at various temperatures. They showed that thewoven GFRP strength had a tendency to decrease with hydrothermal ageing. Other
W. H. Choong � K. B. Yeo (&) � M. T. Fadzlita � Y. Y. Farm � M. Azlan IsmailMaterial and Mineral Research Unit, School of Engineering and Information Technology,Universiti Malaysia Sabah, Jalan UMS, 88400 Kota Kinabalu, Sabah, Malaysiae-mail: [email protected]
R. Pogaku et al. (eds.), Developments in Sustainable Chemicaland Bioprocess Technology, DOI: 10.1007/978-1-4614-6208-8_47,� Springer Science+Business Media New York 2013
395
than that, the rate of degradation was also found directly proportional to the watertemperature. Mourad et al. (2010) also investigated the seawater and temperatureeffects on structural properties of glass/epoxy and glass/polyurethane compositematerials. The investigation showed that the glass/polyurethane compositedegradation mechanism can be accelerated at higher temperature.
Synthesis and Method
The evaluations of seawater and weathering effects on the degradation of GFRPcomposite material were conducted and elaborated in the following sections.
Material
In-house hand layup fabrication technique of GFRP specimens was conducted.The specimen layup consisting of five layers of E-glass EWR600 cloth waslaminated with SHCP 2719 unsaturated polyester resin (400:3 resin to ButanoxM-50 mass ratio). The produced five-layer composite laminate of E-glass EWR600specimen had an average thickness of 3.3 mm.
Specimen Preparation
Experimental techniques for water absorption tests were conducted. In waterabsorption test, specimens of small rectangular dimensions 10 mm (width)9 25 mm (length) were utilized. The water-uptake specimen was designed such asto allow higher-resolution mass incremental can be measured. These specimenedges were also fine polished for subsequent micrographic analysis purposes.
Testing Method
The effects of seawater and weathering degradation on GFRP were tested. Spec-imens were exposed to seawater and weathering by immersed into outdoor sea-water bath over different periods of time. The seawater bath had salinity content of33ppt under a temperature range of 25–35 �C (weather dependant).
Water absorption and micrographic tests were also carried out to evaluate thelocalize effect of seawater and weathering degradation of GFRP material perfor-mance. The similar seawater was utilized for the immersion. The seawater massuptake and the surface micrographic behaviour were systematically recorded
396 W. H. Choong et al.
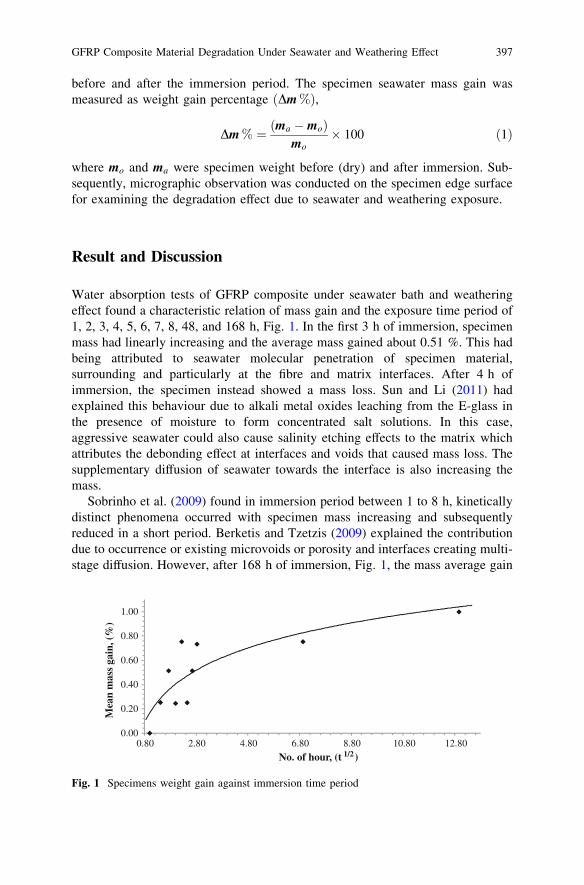
before and after the immersion period. The specimen seawater mass gain wasmeasured as weight gain percentage Dm %ð Þ,
Dm % ¼ ma �moð Þmo
� 100 ð1Þ
where mo and ma were specimen weight before (dry) and after immersion. Sub-sequently, micrographic observation was conducted on the specimen edge surfacefor examining the degradation effect due to seawater and weathering exposure.
Result and Discussion
Water absorption tests of GFRP composite under seawater bath and weatheringeffect found a characteristic relation of mass gain and the exposure time period of1, 2, 3, 4, 5, 6, 7, 8, 48, and 168 h, Fig. 1. In the first 3 h of immersion, specimenmass had linearly increasing and the average mass gained about 0.51 %. This hadbeing attributed to seawater molecular penetration of specimen material,surrounding and particularly at the fibre and matrix interfaces. After 4 h ofimmersion, the specimen instead showed a mass loss. Sun and Li (2011) hadexplained this behaviour due to alkali metal oxides leaching from the E-glass inthe presence of moisture to form concentrated salt solutions. In this case,aggressive seawater could also cause salinity etching effects to the matrix whichattributes the debonding effect at interfaces and voids that caused mass loss. Thesupplementary diffusion of seawater towards the interface is also increasing themass.
Sobrinho et al. (2009) found in immersion period between 1 to 8 h, kineticallydistinct phenomena occurred with specimen mass increasing and subsequentlyreduced in a short period. Berketis and Tzetzis (2009) explained the contributiondue to occurrence or existing microvoids or porosity and interfaces creating multi-stage diffusion. However, after 168 h of immersion, Fig. 1, the mass average gain
0.00
0.20
0.40
0.60
0.80
1.00
0.80 2.80 4.80 6.80 8.80 10.80 12.80
Mea
n m
ass
gain
, (%
)
No. of hour, (t 1/2)
Fig. 1 Specimens weight gain against immersion time period
GFRP Composite Material Degradation Under Seawater and Weathering Effect 397
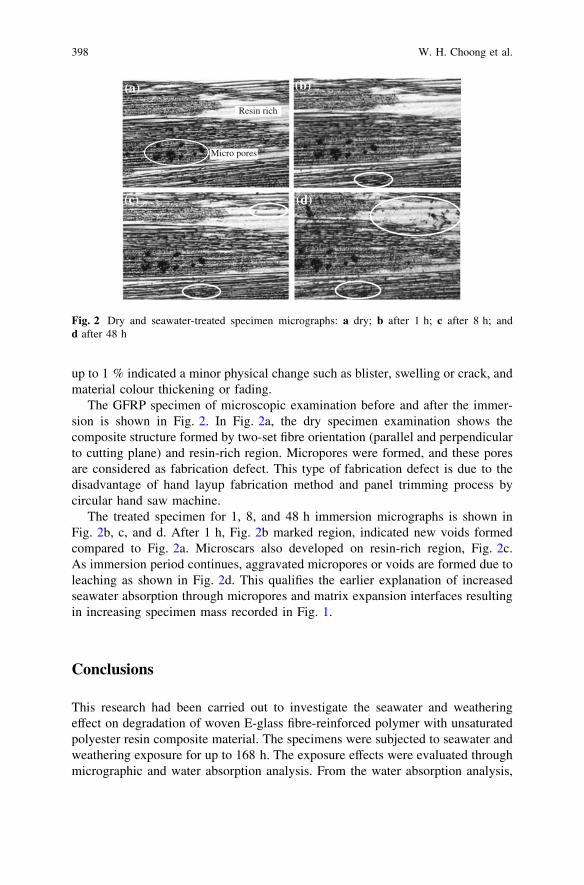
up to 1 % indicated a minor physical change such as blister, swelling or crack, andmaterial colour thickening or fading.
The GFRP specimen of microscopic examination before and after the immer-sion is shown in Fig. 2. In Fig. 2a, the dry specimen examination shows thecomposite structure formed by two-set fibre orientation (parallel and perpendicularto cutting plane) and resin-rich region. Micropores were formed, and these poresare considered as fabrication defect. This type of fabrication defect is due to thedisadvantage of hand layup fabrication method and panel trimming process bycircular hand saw machine.
The treated specimen for 1, 8, and 48 h immersion micrographs is shown inFig. 2b, c, and d. After 1 h, Fig. 2b marked region, indicated new voids formedcompared to Fig. 2a. Microscars also developed on resin-rich region, Fig. 2c.As immersion period continues, aggravated micropores or voids are formed due toleaching as shown in Fig. 2d. This qualifies the earlier explanation of increasedseawater absorption through micropores and matrix expansion interfaces resultingin increasing specimen mass recorded in Fig. 1.
Conclusions
This research had been carried out to investigate the seawater and weatheringeffect on degradation of woven E-glass fibre-reinforced polymer with unsaturatedpolyester resin composite material. The specimens were subjected to seawater andweathering exposure for up to 168 h. The exposure effects were evaluated throughmicrographic and water absorption analysis. From the water absorption analysis,
Micro pores
Resin rich
(a) (b)
(c) (d)
Fig. 2 Dry and seawater-treated specimen micrographs: a dry; b after 1 h; c after 8 h; andd after 48 h
398 W. H. Choong et al.
the specimens had indicated significant moisture absorption against the seawaterimmersion period. Over a period of 168 h immersion, the GFRP specimen showedan average mass gain of about 1 %, indicating the susceptibility to seawateruptake. Micrographic analysis of specimen surfaces had also indicated fibre break,microcrack or micropores that caused by seawater leaching and etching effects.Gross degradation detrimental to GFRP composite specimen was observed for the168 h seawater and weathering exposure, suggesting that protective or primercoating would be necessary for safe application in seawater environment.
Acknowledgments The authors would like to express their appreciation to the Material andMineral Research Unit, Advanced Composite Research Group, School of Engineering andInformation Technology, Universiti Malaysia Sabah, and the Ministry of Higher Education ofMalaysia the financial support through the research Grant FRG0249-TK-2/2010.
References
Aldajah, S., Alawsi, G., & Abdul, R. S. (2008). Impact of sea and tap water exposure on thedurability of GFRP laminates. The Journal of Materials and Design, 30, 1835–1840.
Berketis, K., & Tzetzis, D. (2009). Long-term water immersion ageing characteristics of GFRPcomposites. Journal of Materials Science, 44(13), 3578–3788.
Masahiro, K., Yusuke, Y., Yusuke, T., & Kawada, H. (2010). Study of strength degradationmechanism of woven GFRP in water environment. Journal of Solid Mechanics and MaterialsEngineering, 4, 1574–1584.
Mourad, A. H. I., Abdel-Magrid, B. M., El-Maaddawy, T., & Grami, M. E. (2010). Effect ofseawater and warm environment on glass/epoxy and glass/polyurethane composites. AppliedComposite Material, 17, 557–573.
Sobrinho, L. L., Ferreira, M., & Bastian, F. L. (2009). The effects of water absorption on an esterresin system. Materials Research, 12(3), 353–361.
Sun, A. B., & Li, B. Y. (2011). Effects of chemical environment on the durability performances ofglass fiber/epoxy composites. 18th International Conference on Composite Materials(pp. 21–26). August, Korea.
GFRP Composite Material Degradation Under Seawater and Weathering Effect 399
b-Mannanase Production by Aspergillusflavus in Solid-State Fermentation of PalmKernel Cake
Y. P. Wong, H. Y. Saw, J. Janaun, K. Krishnaiah and A. Prabhakar
Abstract b-Mannanase production in batch solid-state fermentation (SSF) ofpalm kernel cake (PKC) was evaluated with flasks and a laterally aerated movingbed (LAMB) bioreactor using Aspergillus flavus UMS01. Optimum condition forflask SSF was 110 % moisture content, initial pH 6, 30 �C and particle size855 lm, yielding 383 U g-1 dry PKC after 120 h. Under the same condition andparticle size \5 mm, SSF in LAMB produced 276 U g-1 dry PKC at an optimalgas flow of 4.4 m s-1 in just 96 h. Optimal b-mannanase production was con-sistent with highest fungal growth and mannose production; to support increasingfungal growth, secretion of b-mannanase increased to degrade mannans in PKC,producing mannose for microbial consumption. A. flavus UMS01 showed prom-ising attributes as a b-mannanase producer via SSF of PKC in flasks and LAMBbioreactor.
Introduction
Solid-state fermentation (SSF) is a bioprocess that incorporates cultivation ofmicroorganisms on solid substrates under controlled environment, e.g. moisturelevel, pH, temperature, and substrate particle size. The substrates act as carbon
Y. P. Wong � J. Janaun (&) � K. Krishnaiah � A. PrabhakarChemical Engineering Program, School of Engineering and Information Technology,Universiti Malaysia Sabah, Jalan UMS, 88400 Kota Kinabalu, Sabah, Malaysiae-mail: [email protected]
H. Y. Saw (&)School of Engineering and Advanced Technology, Massey University, Private Bag,11 222, Palmerston North 4442, New Zealande-mail: [email protected]; [email protected]
R. Pogaku et al. (eds.), Developments in Sustainable Chemicaland Bioprocess Technology, DOI: 10.1007/978-1-4614-6208-8_48,� Springer Science+Business Media New York 2013
401
sources and/or inert support for microbial growth and generation of primary andsecondary metabolites (Krishna 2005; Pandey 2003). SSF has been exploited forvarious applications, such as productions of enzymes (Krishna 2005; Ong et al.2004), and substrates nutritional improvement for animal feed production. Thechoice of microorganisms has included fungi, yeast, and bacteria, while the sub-strates are generally crops and residues from agricultural sectors and agro-industries (Krishna 2005; Pandey 2003).
The palm oil industry produces palm kernel cake (PKC) as a by-product; PKCis the residue from extraction of oil from palm kernel seeds (Tang 2001). As acheap commodity and a good source of hemicellulose in the form of mannan(Daud and Jarvis 1992), PKC has found use in SSF for the production of enzymesand animal feed with modified nutritional content. During SSF, the predominantenzyme secreted is b-mannanase; traces of cellulases, b-glucosidase, polygalac-turonase, xylanase, amylase, and phytase are also present (Ong et al. 2004).Through the enzymatic activities and hydrolysis of PKC hemicelluloses, reducingsugars are generated to support microbial growth, with mannose as a primary sugar(Dhawan and Kaur 2007). The increase in sugar contents (and thus metabolizableenergy) and degradation of mannan, which is indigestible to mono-gastric animals,has been a drive in the development of new feed processing technologies via SSFwith a variety of microorganisms and bioreactors.
In a recent work (Wong et al. 2011), PKC was fermented with Aspergillusflavus UMS01 to increase the mannose content in the end product. SSF wasperformed in batch in conical flasks and a laterally aerated moving bed (LAMB)bioreactor. Optimized SSF parameters were determined and fermented PKC hadan improvement in mannose level of up to 5.5-fold. However, in the assessment ofSSF performance, only fungal biomass and mannose production were measuredand reported. b-mannanase, which is an equally important property because it isdirectly related to fungal growth, mannan degradation, and mannose production,has not yet been analyzed. Therefore this short communication reports an evalu-ation on b-mannanase production under similar SSF systems and operatingparameters. Relationships between b-mannanase secretion, fungal growth, andmannose production were discussed for both conical flask and LAMB systems.
Methodology
Methods for substrate preparation, cultivation and harvest of microorganism forSSF, optimization of SSF in flasks, design of LAMB bioreactor, and SSF inLAMB have been reported in details in previous work (Wong et al. 2011). Opti-mization of SSF parameters followed a one-factor-at-a-time strategy in the order ofmoisture content, pH, temperature, and particle size.
402 Y. P. Wong et al.
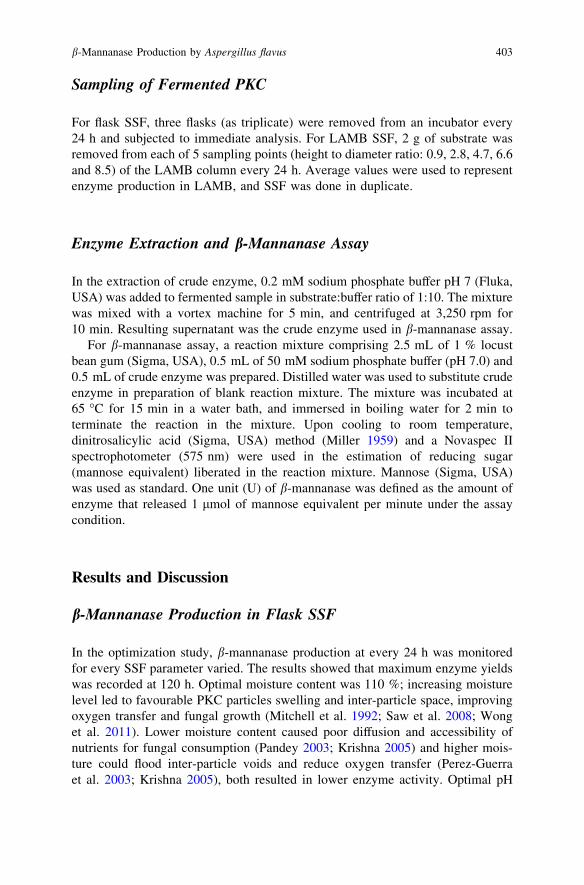
Sampling of Fermented PKC
For flask SSF, three flasks (as triplicate) were removed from an incubator every24 h and subjected to immediate analysis. For LAMB SSF, 2 g of substrate wasremoved from each of 5 sampling points (height to diameter ratio: 0.9, 2.8, 4.7, 6.6and 8.5) of the LAMB column every 24 h. Average values were used to representenzyme production in LAMB, and SSF was done in duplicate.
Enzyme Extraction and b-Mannanase Assay
In the extraction of crude enzyme, 0.2 mM sodium phosphate buffer pH 7 (Fluka,USA) was added to fermented sample in substrate:buffer ratio of 1:10. The mixturewas mixed with a vortex machine for 5 min, and centrifuged at 3,250 rpm for10 min. Resulting supernatant was the crude enzyme used in b-mannanase assay.
For b-mannanase assay, a reaction mixture comprising 2.5 mL of 1 % locustbean gum (Sigma, USA), 0.5 mL of 50 mM sodium phosphate buffer (pH 7.0) and0.5 mL of crude enzyme was prepared. Distilled water was used to substitute crudeenzyme in preparation of blank reaction mixture. The mixture was incubated at65 �C for 15 min in a water bath, and immersed in boiling water for 2 min toterminate the reaction in the mixture. Upon cooling to room temperature,dinitrosalicylic acid (Sigma, USA) method (Miller 1959) and a Novaspec IIspectrophotometer (575 nm) were used in the estimation of reducing sugar(mannose equivalent) liberated in the reaction mixture. Mannose (Sigma, USA)was used as standard. One unit (U) of b-mannanase was defined as the amount ofenzyme that released 1 lmol of mannose equivalent per minute under the assaycondition.
Results and Discussion
b-Mannanase Production in Flask SSF
In the optimization study, b-mannanase production at every 24 h was monitoredfor every SSF parameter varied. The results showed that maximum enzyme yieldswas recorded at 120 h. Optimal moisture content was 110 %; increasing moisturelevel led to favourable PKC particles swelling and inter-particle space, improvingoxygen transfer and fungal growth (Mitchell et al. 1992; Saw et al. 2008; Wonget al. 2011). Lower moisture content caused poor diffusion and accessibility ofnutrients for fungal consumption (Pandey 2003; Krishna 2005) and higher mois-ture could flood inter-particle voids and reduce oxygen transfer (Perez-Guerraet al. 2003; Krishna 2005), both resulted in lower enzyme activity. Optimal pH
b-Mannanase Production by Aspergillus flavus 403
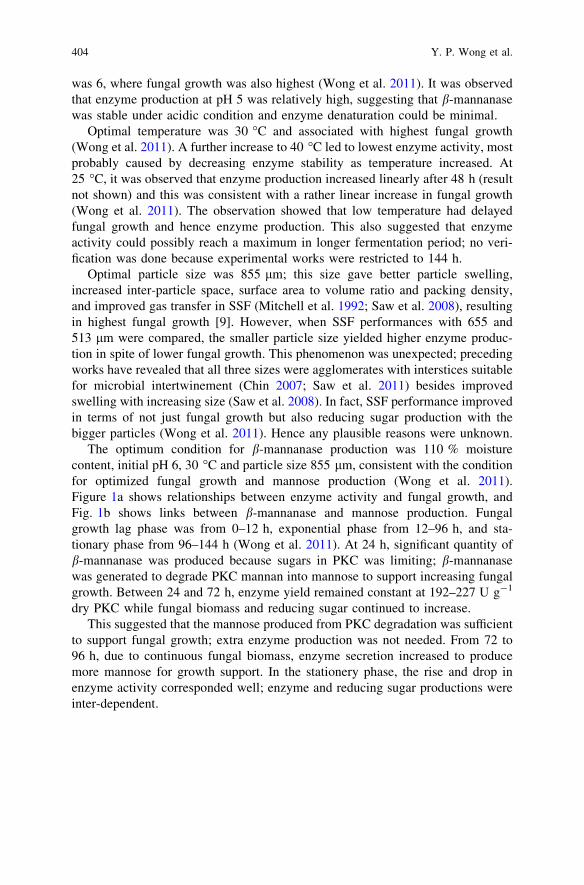
was 6, where fungal growth was also highest (Wong et al. 2011). It was observedthat enzyme production at pH 5 was relatively high, suggesting that b-mannanasewas stable under acidic condition and enzyme denaturation could be minimal.
Optimal temperature was 30 �C and associated with highest fungal growth(Wong et al. 2011). A further increase to 40 �C led to lowest enzyme activity, mostprobably caused by decreasing enzyme stability as temperature increased. At25 �C, it was observed that enzyme production increased linearly after 48 h (resultnot shown) and this was consistent with a rather linear increase in fungal growth(Wong et al. 2011). The observation showed that low temperature had delayedfungal growth and hence enzyme production. This also suggested that enzymeactivity could possibly reach a maximum in longer fermentation period; no veri-fication was done because experimental works were restricted to 144 h.
Optimal particle size was 855 lm; this size gave better particle swelling,increased inter-particle space, surface area to volume ratio and packing density,and improved gas transfer in SSF (Mitchell et al. 1992; Saw et al. 2008), resultingin highest fungal growth [9]. However, when SSF performances with 655 and513 lm were compared, the smaller particle size yielded higher enzyme produc-tion in spite of lower fungal growth. This phenomenon was unexpected; precedingworks have revealed that all three sizes were agglomerates with interstices suitablefor microbial intertwinement (Chin 2007; Saw et al. 2011) besides improvedswelling with increasing size (Saw et al. 2008). In fact, SSF performance improvedin terms of not just fungal growth but also reducing sugar production with thebigger particles (Wong et al. 2011). Hence any plausible reasons were unknown.
The optimum condition for b-mannanase production was 110 % moisturecontent, initial pH 6, 30 �C and particle size 855 lm, consistent with the conditionfor optimized fungal growth and mannose production (Wong et al. 2011).Figure 1a shows relationships between enzyme activity and fungal growth, andFig. 1b shows links between b-mannanase and mannose production. Fungalgrowth lag phase was from 0–12 h, exponential phase from 12–96 h, and sta-tionary phase from 96–144 h (Wong et al. 2011). At 24 h, significant quantity ofb-mannanase was produced because sugars in PKC was limiting; b-mannanasewas generated to degrade PKC mannan into mannose to support increasing fungalgrowth. Between 24 and 72 h, enzyme yield remained constant at 192–227 U g-1
dry PKC while fungal biomass and reducing sugar continued to increase.This suggested that the mannose produced from PKC degradation was sufficient
to support fungal growth; extra enzyme production was not needed. From 72 to96 h, due to continuous fungal biomass, enzyme secretion increased to producemore mannose for growth support. In the stationery phase, the rise and drop inenzyme activity corresponded well; enzyme and reducing sugar productions wereinter-dependent.
404 Y. P. Wong et al.
b-Mannanase Production in LAMB Bioreactor
Maximum enzyme yields at 96 h for three different superficial velocities in LAMBSSF are listed in Table 1. Particle size smaller than 5 mm was used because855 lm particles contributed to only 11 % in the particle size distribution of PKC(Saw et al. 2011); incorporating the whole range of sizes would be more practicalin large-scale SSF. Optimal enzyme activity was 276 U g-1 dry PKC at 4.4 m s-1
gas flow and 96 h. This value was an average calculated with samples from fivesampling points. Wong (2008) has reported that differences in enzyme yield asaffected by sampling locations were in the range of 3–10 %; hence the averagevalue was representative of the enzyme production in LAMB. Enzyme yields athigher superficial velocities were lower as a predominant result from the drying upof PKC bed. With increasing velocity, bed moisture content dropped from 110 %to below 60 %, while bed moisture level was maintained at about 60 % at4.4 m s-1 gas flow (Wong et al. 2011). Comparing enzyme activities in flask (383U g-1 dry PKC) and LAMB, production in LAMB was lower by 28 % and thiswas very likely caused by particle size effect. In the unscreened PKC, smallerparticles could have occupied void spaces between particles and decreased thevoid fraction (Mitchell et al. 1992), causing adverse effect on enzyme production.
Fig. 1 Relationshipsbetween b-mannanaseproduction and (a) fungalgrowth and (b) mannoseproduction in flasks SSF
b-Mannanase Production by Aspergillus flavus 405
Fig. 2 Relationshipsbetween b-mannanaseproduction and (a) fungalgrowth and (b) mannoseproduction in LAMB SSF
This problem could be reduced if a more consistent particle size was used; thiswould require mechanical assistance on size reduction of larger particles andscreening off smaller ones.
Relationships between enzyme production and fungal biomass, and connectionsbetween enzyme production and mannose yield in LAMB SSF are shown in Fig. 2a, brespectively. As fungal biomass continuously increased, reducing sugars inPKC were consumed to support growth and became limiting at 48 h, thereforeb-mannanase secretion increased significantly from 24 to 48 h to convert mannansin PKC to mannose. With increased production of enzyme over the period of48–96 h, mannose production improved, peaking at 96 h. Subsequently, bothenzyme and mannose levels dropped as fungal growth entered into stationary phase.b-Mannanase, mannose, and fungal biomass productions were consistent with oneanother.
Comparison on b-Mannanase Production with Other Workson SSF of PKC
Comparison on b-mannanase production between this study and other works onSSF of PKC; published works are limited and focused on Aspergillus niger inflasks SSF (Ong et al. 2004) and SSF in a packed bed with axial flow of humidified
406 Y. P. Wong et al.
air (Abdeshahian et al. 2010). A. niger produced considerably higher enzyme atlower moisture level. It also seemed to grow well on particles up to 2 mm; thiscould be attributed to relatively higher swelling for particles in the range of1.5–2.7 mm (Saw et al. 2008). As for enzyme production, higher yield could alsobe a result of longer period for crude enzyme extraction (24 h). The duration inthis study was only 5 min. Both strains performed well in acidic condition (pH5–6) and ambient temperature (30–33 �C), and were robust towards forced aera-tion regardless of flow direction. An advantage with A. flavus was that it requiredshorter fermentation time for optimal production, especially in the LAMB biore-actor. However, potential mycotoxin production with this strain has not yet beenaddressed.
Conclusions
In SSF of PKC with A. flavus UMS01 to produce PKC with improved mannosecontent for poultry feed production, b-mannanase secretion was directly related tofungal growth and mannose production; optimal enzyme yield was achieved withhighest fungal biomass and optimal mannose production under similar optimizedparameters. This study also showed that A. flavus UMS01 was as a goodb-mannanase producer with PKC as the SSF substrate, and the LAMB was asuitable bioreactor to host industrial-scaled b-mannanase productions.
Acknowledgments Financial support came from Universiti Malaysia Sabah FundamentalResearch Grant B-0101-13/PRU037 and PKC was provided by IOI Edible Oils Sdn. Bhd.. Allexperimental works were performed in Universiti Malaysia Sabah.
References
Abdeshahian, P., Samat, N., Hamid, A. A., & Yusoff, W. M. W. (2010). Utilization of palmkernel cake for production of b-mannanase by Aspergillus niger FTCC 5003 in solid substratefermentation using an aerated column bioreactor. Journal of Industrial Microbiology andBiotechnolology, 37, 103–109.
Chin, H. C. (2007). Solid-state fermentation of palm kernel cake by Bacillus subtilis ATCC3366.M.Sc. thesis. Universiti Malaysia Sabah, Sabah, Malaysia.
Daud, M. J., & Jarvis, M. C. (1992). Mannans of oil palm kernels. Phytochemistry, 31(2),463–464.
Dhawan, S., & Kaur, J. (2007). Microbial mannanases: An overview of production andapplications. Critical Reviews in Biotechnology, 27, 197–216.
Krishna, C. (2005). Solid-state fermentation systems—an overview. Critical Reviews inBiotechnology, 25, 1–30.
Miller, G. L. (1959). Use of dinitrosalicylic acid reagent for determination of reducing sugar.Analytical Chemistry, 31, 426–428.
b-Mannanase Production by Aspergillus flavus 407
Mitchell, D. A., Targonski, Z., Rogalski, J., & Leonowicz, A. (1992). Substrate for processes. InH. W. Doelle, D. A. Mitchell, & C. E. Rolz (Eds.), Solid substrate cultivation (pp. 29–52).England: Elsevier Science.
Ong, L. G. A., Abd-Aziz, S., Noraini, S., Karim, M. I. A., & Hassan, M. A. (2004). Enzymeproduction and profile by Aspergillus niger during solid substrate fermentation using palmkernel cake as substrate. Applied Biochemistry and Biotechnology, 118, 73–79.
Pandey, A. (2003). Solid-state fermentation. Biochemical Engineering Journal, 13, 81–84.Perez-Guerra, N., Torrado-Agrasar, A., Lopez-Marcias, C., & Pastrana, L. (2003). Main
characteristics and applications of solid substrate fermentation. Electronic Journal ofEnvironmental, Agricultural and Food Chemistry, 2(3), 343–350.
Saw, H. Y., Janaun, J., & Subbarao, D. (2008). Hydration properties of palm kernel cake. Journalof Food Engineering, 89(2), 227–231.
Saw, H. Y., Janaun, J., Kumaresan, S., & Chu, C. M. (2011). Characterization of the physicalproperties of palm kernel cake. International Journal of Food Properties. doi:10.1080/10942912.2010.492543.
Tang, T. S. (2001). Quality and characteristics of Malaysian palm kernel cakes/expellers. PalmOil Developments, 34, 1–3.
Wong, Y. P. (2008). Solid-state fermentation of palm kernel cake by Aspergillus flavus UMS01 inradial flow packed bed bioreactor. M.Sc. thesis. Universiti Malaysia Sabah, Sabah, Malaysia.
Wong, Y. P., Saw, H. Y., Janaun, J., Krishnaiah, K., & Prabhakar, A. (2011). Solid-statefermentation of palm kernel cake with aspergillus flavus in laterally aerated moving bedbioreactor. Applied Biochemistry and Biotechnology, 164(2), 170–182.
408 Y. P. Wong et al.
Author Biography
Prof. Dr. Ravindra Pogaku is a Professor ofChemical and Bioprocess Engineering atUniversity Malaysia Sabah. He is now the Directorfor Oil and Gas Engineering Studies and TrainingUnit at the School of Engineering and InformationTechnology, University Malaysia Sabah (UMS).Pogaku Ravindra’s work has appeared in more than200 publications and 4 patents in ISI/SCI/Scopusjournals. He has published eight books, six bookchapters and edited two scientific books. Prof.Pogaku is also on the Editorial Board of several
international journals and has reviewed over 500 journal manuscripts for reputedinternational journals. He has delivered various keynotes, plenary lectures, andchaired the prestigious conferences, seminars, workshops, technical events bothnationally and internationally. He has been honored with senior membership ofAmerican Institute of Chemical Engineers for his credentials in the field of chemicaland bioprocess engineering. He was a Visiting Scientist at Cornell University. Hewas UNESCO consultant. Prof. Ravindra is bestowed with the distinguishedChemical Engineer Award from the Indian Institute of Chemical Engineers, India.He has been recognized with Excellence Award consecutively for the last three yearsfrom the University Malaysia Sabah. Prof. Pogaku Ravindra is awarded with goldand silver medals for his research contribution for bioprocess industry at Geneva andMalaysia.
Prof. Dr. Ravindra PogakuProfessor of Chemical and Bioprocess Engineering
UNESCO energy consultant; Editor in Chief BMBRDirector Oil and Gas Engineering Studies and Training Unit
Phone: 088-320533/320000 (ext 3661)Fax: 088-320539/320348
Email: [email protected] or [email protected]
R. Pogaku et al. (eds.), Developments in Sustainable Chemicaland Bioprocess Technology, DOI: 10.1007/978-1-4614-6208-8,� Springer Science+Business Media New York 2013
409
Prof. Dr. Awang Bono
Awang Bono (BSc., PhD.) is a Separation Science and Technology Professor atUniversiti Malaysia Sabah (UMS). Prof. Bono completed his PhD work fromChemical Engineering Department, University of Surrey, United Kingdom in 1986and has been involving in teaching, research as well as industry for more than 20years. To date, he has over 150 scientific publications. Currently, Prof. Bono isserving as a Deputy Dean at School of Engineering and Information Technology,UMS.
Associate Professor Dr. Chu Chi Ming
Christopher Chi-Ming Chu is the Head of Chemical Engineering Programme at theSchool of Engineering, Universiti Malaysia Sabah. He received his B.Sc. andPh.D. from the University of Birmingham, United Kingdom. His main researchinterest is in thermal systems and currently works on chimney performanceenhancement using wire mesh and passive cooling systems. He is the Head ofThermal and Environment Group in the Material and Mineral Research Unit. Hehas published and reviewed international journal papers and conferences.
410 Author Biography
Index
AAbyssomicins, 204Acclimatization process, KRW
adaptation process, 63COD removal efficiency, 62–63genotype appearance, 63inoculums, 61microorganisms, 60sample analysis, 62SBR system, 61–62
Acetone-butanol-ethanol (ABE) fermentationacidogenic phase, 35clostridia strains, 35POME, Clostridium acetobutylicum
ABE recovery, 40bacteria growth profiles, 38liquid–liquid extraction, 37–38microbes and media, 37pH and reducing sugar profiles, 38process and analysis, 37solvent productions, 39sterilized POME supernatant vs. sludge,
38–39product recovery, 36solventogenic phase, 35–36
Acetonitrile (MeCN), 152, 229, 243Acid rains, 296Acidic sodium chlorite treatment, 278, 278f,
279f, 280Acidified sodium chlorite, 272Acidogenesis, 4Acoustic cavitation, mechanical effect of, 251
solvent penetration and capillary effects,251
Actinomycetes, 204–205antibiotics, 204anticancer drug, 204
marine actinomycetes. See Marineactinomycetes
parameter study, 205Actinomycetes isolation agar (AIA), 205Activated carbon preparation, waste
rubber tireadsorption, 372chemical activation, ZnCl2
activation temperature, 375activation time, 375–376adsorption, 373ash content, 376impregnation ratio effect, 373, 375methodology, 373–374moisture content, 376morphological study, 376–377scanning electron microscopy, 374surface area analysis, 374, 377–378
2,4-dichlorophenol, 372recycling, 372
Adsorbents, 104, 119, 296adsorption of H2S by, 298–300batch adsorption studies, 120–121bleaching adsorbents, 303, 304characterization of, 297porous adsorbents, 304, 306
Aeromicrobium marinum, 204Algae, 174, 356Alginate, 132t, 160, 201
j-carrageenan/alginate matrix, 199, 202sodium alginate, 198, 200, 202
Alkali treatment, 272, 274, 275, 277f, 278f,279f, 280
purpose of, 356–357of seaweed, 357–358semi-refined and refined carrageenan, 356variation of KOH concentration, 359
R. Pogaku et al. (eds.), Developments in Sustainable Chemicaland Bioprocess Technology, DOI: 10.1007/978-1-4614-6208-8,� Springer Science+Business Media New York 2013
411
Alkaloids, 228, 235a-amylase production
in batch cultures, 165–166of B. subtilis 168 (pKTH10), 166fcomparison of sulphonated PolyHIPE
(SPHPs), 167tin immobilized cultures, 165–166
of B. subtilis 168 (pKTH10), 165fin steady-state, 169
a-lactalbumin (a-lac), 154heat stability of, 155percentage denaturation of, 154f
comparison with b-lactoglobulin, 155f5-aminolevulinic acid (ALA), in solid-state
fermentation, 174in tetrapyrrole compounds production, 174extraction and determination of, 176by Rhodopseudomonas palustris. See
Solid-state fermentation (SSF)kinetics of, 178t
Anaerobic digested sludge dewaterabilityanalytical methods, 13dual conditioning effect
capillary suction time, 13–14cation type effect, 15–16low molecular weight chitosan, 16
materials, 13polymer type and dosage, 14–15pre-treatment, 12sludge characteristion, 13sludge conditioning, 12sludge handling cost, 11–12
Anaerobic digestion, 12, 43, 296and colourants, 4–5of POME, 3organic matter reduction, 3–4
Anaerobically treated palm oil mill effluent(AnPOME)
coagulation/flocculation ofdecolourisation, 5Fenton process, 5metal coagulants and polymers, 6molasses wastewater, treatment of, 6sewage sludge, 6–7ultrafiltration of, 5
Antimicrobial activity studyCynodon dactylon crude extract, 233tCynodon dactylon EtOH- and EA
SPE-based extraction, 234tdisc diffusion bioassay, crude
extract, 231–232, 234McFarland standard, 231Mueller–Hinton Agar (MHA) medium,
231
extraction yield, 231thin-layer chromatographic (TLC)
bioassay, 231Artificially structured microbial consortia
(ASMC), 66Aspergillus niger, 230, 231, 350, 351
potato dextrose agar (PDA), 230potato dextrose broth (PDB), 230on surface of LDPE films, 352fthin-layer chromatographic bioassay
of, 232fAureoverticillatam, 204
BBacillus amyloliquefaciens a-amylase AmyQ,
165Bacillus cereus, 230, 233t, 234tBacillus sp., 63, 66Bacillus subtilis, 160, 230, 233t, 234tB. subtilis 168 (pKTH10) strain, 161, 165,
165f, 167tBaker’s yeast fermentation, dynamic
metabolism of, 220–221Batch process, 211–212
stages, 215Batch process modeling, 212–214
Arrhenius equation, 213schematic of, 213f
Batch productivity optimizationfor exothermic process, 212
b-1,3-glucanase, 288b-lactoglobulin (b-lg), 154
percentage denaturation of, 154fcomparison with a-lactalbumin, 155f
thermal denaturation of, 155Biodegradable plastics, 348–349Biodiesel production
biocatalyst for, 200from crude Jatropha curcas oil, 201fimmobilized lipase in, 201–202
Bioethanol productionfirst-generation biofuel, 130oil palm trunk (OPT) sap
ANOVA and model development,21–23
biomass preparation, 20characteristics, 19culture preparation and fermentation,
20–21face-centered CCD design layout, 21,
22graph-based discussion and model
validation, 23–24
412 Index
one-factor-at-a-time method, 20response surface methodology, 20statistical design of experiment method,
20pretreatment, 19–20seaweed
alkaline pre-treatment, 130–131fermentation, 131, 134pre-treatment reviews, 132–133saccharification pre-treatment, 130
Biofilms, 65–66biodegradability study, 350
results, 351–353formation of, 67for green packaging, starch-based,
348–349immobilization and, 68–69mechanical testing, 350
results, 350–351reactor and treatment system, 67–68sample preparation, 349
Biogas, 44, 45, 46, 297, 298biogas desulfurization, 296from manure digestion, 296and natural gas, 295–296sulfur capacity of fresh zeolite, 299, 299fH2S, 296, 299
Biological evolution theory, 214Bio-oil, 182
higher heating value (HHV), 184Karl Fischer titration (KFT) method, 184straw bio-oil and wood bio-oil, 185
DTG curves of, 186fTGA curves of, 185f
weight change of, 185Bio-oil production
Jatropha curcas, pyrolysisbio-oil yield, 84empirical correlations, 86experimental tests, 83materials, 82–83product characterisation, 85–86thermo-gravimetric analysis, 82
waste chicken fats, pyrolysisGC–MS and FTIR analysis, 75product yield, 75–76pyro-oil characterisation, 76–78raw materials, 74torrefied biomass, 74, 75ZSM-5 catalyst, 74–75
Black pepperbioactive compounds, solubility
of, 266–267pressure, 266, 267f
solvent temperature, 266, 267fdiffusion rate, 268diffusivity, 268–269extraction, 263mass transfer of, 267mass transfer rate in SC
period, 267–268Sarawak black peppers, 265SFE process of, 264solubility of, 266, 267f, 269transition time, 267
Bleaching, 303Bleaching clays, 303Bleaching earth, 304
calcinations of, 309natural bleaching earth (clay), 308–309porous characteristics of, 306, 306t
Bovine serum albumin (BSA), 53, 152, 154,163, 192, 193, 194, 289, 292
Bradford’s assay, 289Brunauer–Emmett–Teller (BET) approach,
305analysis, 306–308model, 374surface area, 308, 309, 374, 376, 378
Buckwheat hulls, hemicellulose from, 251Burkholderia cepacia (B. cepacia) lipase, 198,
200, 201, 202
CCaprolactones, 204CO2 separation of PEI/PEG
CMS membranesgas permeation properties, 332–333materials, 330microstructure properties, 331–332morphological structure, 333, 334procedure, 331phenolic resin-derived carbon
membrane, 330Carbon membrane, 327
performance of, 323porous structure of, 322production of, 324
carbolite vertical furnace, 324Carbon molecular sieve (CMS) membranes
CO2 separation. See Pyrolysis soaking timeproperties, 330
Carrageenan, 133t, 160classification, 356colorimetric determination of, 253effect of ultrasonic wave amplitude on, 254extraction, 130, 131
Index 413
Carrageenan (cont.)functional group composition, KOH
3,6-anhydrogalactose content, 358, 362FTIR spectrum, 358–360galactose-4-sulphate, 361–362gel strength, 359methodology, 358sulphate content, 358–359
iota-carrageenan. See Iota-carrageenaniota-type carrageenan, 356j-carrageenan, 198, 200, 201j-carrageenan/alginate matrix, 199, 202kappa-type carrageenan, 356lambda carrageenan, 356standard kappa-carrageenan, 357at various amplitude, 255fat various temperatures, 254f
Cellulase production, 54EFB. See Solid-state fermentation (SSF)by GDX02, 55, 56in SSF, 52
Cellulose, 52, 242, 272acidic sodium chlorite treatment, 278, 279fbiofuel, 130content analysis, 273, 273tdelignification process, 272, 274–275
acidic sodium chlorite, 275LPO with iron catalyst, 275Organosolv, 275purity of cellulose, 279frange and level of factors for experi-
mental design, 275tdemand, 272extraction methods, optimization of,
281–282extraction process, 276tfitted models for, 276thigher purity of, 280hydrogen bonding in, 247liquid phase oxidation (LPO), 279–280production, effects on, 55purity cellulose of Organosolv, 277, 278f,
279fyield of acidic sodium chlorite, 280
Central composite design (CCD), 243Chinicomycins, 204Chitinases, 287
hevamine, 288Chitosan, 6, 12, 13, 14, 15f, 160
absorbents, 104anaerobic digested sludge dewaterability,
16effect of cation type on dual conditioning
of sludge, 15–16
Chlorophyll, 174, 307Claus process, 296Conversion determination coefficient, 244Cynodon dactylon (L.) Pers. (bermuda), 228
broad-spectrum antibiotic compounds in,236
cardiac glycosides, 235collection, 229extraction, 229
susceptibility of gram-positive and -negative bacteria, 235
solid-phase extraction, 229with different solvents, 231textraction yield, 231separation of bioactive compounds by
TLC, 232fStrataTM-X 33 lm Polymeric Sorbent
reverse-phase (Phenomenex) car-tridges, 229
thin-layer chromatographic bioassay of,232f
DDarwin’s natural selection concept, 214Delignification processes, 272, 274, 277f, 278f,
279fby Design Expert software, 275, 276t
Design Expert software, 275, 340, 344v6.0.8, 243version 7.1.6, 21, 24
Design of experiment (DOE), 20, 21t, 82, 243Dielectrophoresis (DEP)
ASMC construction, utilitzation of wire-cloth for
analytical method, 68biofilms reactor and treatment system,
67–68COD, removal efficiency of, 69immobilization, 67medium, composition of, 67microorganisms, 66–67pH effect, 69–70wirecloth, 67
positive effect, 68use of, 66
Dietzia, 204Diffusion-controlled period (DC), 264
mass transfer rate and mass transfer coef-ficient for, 268t
Dimensionally stable anodes (DSAs), 90Divinylbenzene (DVB), 161D-optimal design, 275, 282
by Design Expert software, 275, 276t
414 Index
RSM, 340Drug-resistant pathogens, 228Dry adsorption process, 296
carbon-based materials, 296metal-based materials, 296polymeric materials, 296porous materials, 296
Dual-conditioning mechanism, 16anaerobic digested sludge dewaterability
capillary suction time, 13–14cation type effect, 15–16low molecular weight chitosan, 16
Dual-mode controller (DM), 212performance of, 216f
proposed DM, 217tDye-sensitized solar cell (DSSC), 313
components of, 314electrolyte, 316photoanode, 315photocathode, 316–317photosensitizer, 314–315
nonnatural-based DSSCs, type of counterelectrode for, 317t
performanceby different types of electrolytes, 317twith different thin films and thickness,
316tsimplified mechanism of, 314fand silicon-based solar cell, 313
EEco-composite materials, 242Eichhornia crassipes, 5Electrolyte, 93, 314, 314f, 316
concentration and removal %, 94ttype of counter-electrode for, 317t
Empty fruit bunch (EFB), 29, 175oil palm empty fruit bunch, 52. See also
Empty palm oil fruit bunch (EFB)under solid-state fermentation (SSF) pro-
cess, 174Empty palm oil fruit bunch (EFB)
cellulase production, Aspergillus sp.GDX02
b-glucosidase, 54biomass, effects of, 55carbon sources, 52EFB saccharification, 53, 56enzyme assay, 53enzyme extraction, 53fermentation process, 52initial moisture content, 55lignocellulose, 52
nitrogen source concentration, 55protein determination, 53xylanase activity, 54
composting processexperimental material, 29mesophilic bacterial consortium prepa-
ration, 29pH, 28, 30–32procedure, 29–30sampling and analysis, 30substrate moisture, 28, 30–31temperature, 28, 30, 32
incineration and mulching, 28Entrapped lipase, leakage of, 199, 200Environmental Quality Regulation 1996 by
Malaysian Government, 321Enzymatic devulcanization, 191Enzymes, 12, 160. See also Hydrolases
extraction, 53genetically modified microorganisms, 160industrial enzymes, SSF in, 52saccharification rate of GDX02 cellulase,
56various immobilization methods for, 198
Escherichia coli (E. coli), 134, 173, 174, 228,230, 233t, 234t
Ethanol, 37, 39, 47, 130, 193, 221concentration profiles of, 224f, 225C. dactylon crude extracts
antimicrobial activity of, 233textraction yield of, 231t
in disc diffusion bioassay (crude extract),231
fermentation process, 223GC SRI 8600C, 45in preparation samples for SEM analysis,
163–164from seaweed, 130
fermentation of, 131, 133t, 134separation of bioactive compounds from,
232fin thin-layer chromatographic bioassay,
230, 231, 232ftransesterification of crude JCO, 199
Eucheuma denticulatum, 250Extracted PKC cellulose, FTIR analysis of,
280–281, 281f, 282Extraction
and calcination, 305of C. dactylon, 229and determination of 5-aminolevulinic
acid, 176of enzyme, 53of hydrolases, 289, 290, 293
Index 415
Extraction (cont.)of iota-carrageenan, 254liquid–liquid extraction, 38–39solid-phase extraction, 229ultrasonic-assisted, 139ultrasound-assisted, 252–253yield, 231
of C. dactylon
FFe/Ti-NaY heterogeneous catalysts
advantages, 98catalyst preparation, 98–99decolorization efficiency
of Amaranth, 99–101drawbacks, 98fast charge carrier
recombination, 98sonocatalytic process, 99
Fed-batch application in industrial bioprocess,219–220
Ferric chloride, 6, 194Flash pyrolysis
bio-oil, 182oil production, 183
physicochemical properties, 184tFlavonoid microencapsulation, Orthosiphon
stamineuschemicals, 138–139field emission scanning electron
microscope, 140HPLC analysis, 139moisture content, 140, 141particle morphology, 142–143plant material, 139spray drying, 140total flavonoid content, 139–142ultrasonic-assisted extraction, 139WPI to maltodextrin ratio, 142
Flavonoids, 138, 143, 228, 235microencapsulation of, 143total content, 139–140, 141, 142f
Formaldehyde-based adhesives, 338Fossil fuels, 74, 81, 82, 295, 296Fourier transform infrared (FTIR)
spectroscopy (FTIR), 273, 357, 367carrageenan functional group composition,
358–360of semi-refined carrageenan at various
KOH concentrations, 359fof cellulose obtained from PKC
under different conditions, 281fof extracted PKC cellulose, 280
and GC–MS, waste chicken fat pyrolysis,75
MPA, PNIPA polymerizationband characteristics, 368–369, 369fmethodology, 368
Fresh palm kernel (Elaeisguineensis var. te-nera), 273
analysis of cellulose content and hemicel-lulose released, 273
isopropanol, 273Freundlich isotherm, 121, 122, 123f, 125, 376,
377, 378Fulvic acid-like substances, 4, 7
GGelatine, 160Gel-filtration chromatography (GFC), 291Gelidium amansii, 131, 132t, 133tGenetic algorithm (GA), 212
performance of, 216fproposed GA, 217t
Genetic algorithm modelling, 214–215chromosome, 214crossover operation, 215
Ginseng roots and cultured cells, saponinsfrom, 251
Glass fibre-reinforced polymer (GFRP)material
mechanical property, 395properties, 395seawater and weathering degradation test,
395layup fabrication technique, 396mass gain and immersion period,
397–398microscopic examination, 398salinity etching effects, 397specimen preparation, 396water absorption and micrographic
tests, 396–397Global warming, 321, 329Glucose, 24, 29, 46, 52, 223, 244t
activity of b-glucosidase, 53, 55in Alaria crassifolia, 132tin batch fermentation of thermophilic
anaerobic sludge, 48fon beta-glucosidases, 56fconcentration profiles of, 224fcontent extraction, 242in Gelidium amansii, 132t, 133tin hydrogen production, 47in Saccharomyces cerevisiae, 133ttotal content analysis, 243
416 Index
in Ulva pertusa, 132tyield, 53
Glycosides, 5, 228cardiac glycosides, 235
HHeme, 174Hemicellulose, 3, 4, 52, 84, 242, 247, 251,
272, 280analysis of hemicelluloses released, 273hemicellulose-free PKC fiber, 274, 281in raw POME, 36removal processes, 274, 275–276, 275t,
276t, 277f, 281talkali treatment, 274hot water treatment, 274range and level of factors for experi-
mental design, 275tregression analyses, 275
removal time (HRT), 275Hevamine, 288Hevea brasiliensis, 286
latex in, 287–288, 293purification of patatin-like protein from,
291lipid acyl hydrolase (LAH), 290screening for, 290f
Hevea Cathepsin G, 288Hexagonal mesoporous molecular sieves
(HMS) silica, 304BET analysis, 306–308bleaching and regeneration (solvent
extraction and calcination), 305characterization, 305DFT differential pore volume distribution,
307, 307fdosage of acid and ratio of bleaching
material, 307, 307tporous characteristics and bleaching earth,
306tregenerability of, 308–309SEM images of, 306fsynthesis of, 304–305
High internal phase (HIPE) route, 160, 161,164
Hollow fiber production, 323dope composition, 323tspinning conditions, 234t
Hot water treatment, 272, 274hemicellulose removal from PKC with,
277fin purity of cellulose, 279fin yield of cellulose, 278f
LPO with, 280Organosolv with, 280
Humic acid, 28, 112, 113, 116like substance, 7
Hydrochloric acid (HCl), 32, 108, 176, 242,274, 277, 289, 373
Tris–HCl, 291, 293H2S adsorption test, 297
adsorption by adsorbents, 297time duration between experiments
(TDBE), 297Hydrolases
extraction, 289, 290qualitation of purity by SDS-PAGE, 292
lipolytic acyl hydrolase (LAH) activity,292
quantitation of protein by Bradford’s Pro-tein Assay, 292
screening, 290–291lipid acyl hydrolase (LAH), 290, 290f
separation by SephacrylTM S-200 Gel Fil-tration, 291–292
elution pattern of, 291fskim latex serum, types of proteins
in, 287–288use in industries, 287
Hydrolysis, 163, 195, 199, 201, 395acid hydrolysis, 130, 132t, 134alkaline hydrolysis, 134anaerobic digestion mechanism, 4cationic hydrolysis products, 15, 16enzymatic hydrolysis, 130, 131, 132t, 134,
347hydrolases in, 287of plant fibre, 202treatment process, 243
IIB-00208, 204Immobilization methods for enzymes
adsorption, 198covalent binding, 198cross-linking, 198entrapment, 198
entrapped lipase, leakageof, 199, 200
of lipase, 198–199, 200lipase activity, 198
reusability, 199, 201transesterification process
parameters, 199Immobilization of lipase, 198–199
lipase activity, 198
Index 417
Immobilized B. subtilis cells. See also Immo-bilized cell technology
morphology of, 166–167Immobilized cell reactor, preparation of, 162Immobilized cell technology, 160
immobilized matrices for cell support, 160production of a-amylase by, 161
In vitro antimicrobial activity. See Cynodondactylon (L.) Pers. (bermuda)
Industrial enzymes, 160. See also a-amylaseproduction; Hydrolases; Skim latexserum
Interfacial polymerization (IP) techniqueBPA toxicity, 112methodology, 113polyamide membrane, 112polyester thin film composite membrane
performance testingcharacteristics, 113materials, 112–113membrane permeability study, 114–115NOM solution model, 113, 116salt and organic removal, 113–114salt rejection study, 115–116salt solutions, 113triethanolamine, 112
Interpenetrating polymer networks (IPNs), 198Iota-carrageenan (i-carrageenan), 250
colorimetric determination of, 253correlation of solid–liquid mass transfer
coefficient, 257–260experimental and predicted mass
transfer coefficients, comparison,260f
Fick’s second law of unidirectionaldiffusion, 257
seaweed particles swelling diameter,258
solid–liquid mass transfer coefficient,259
effect of particle diameter on, 256–257at different diameter of seaweed parti-
cles, 256fequilibrium yield, 257fp and q values of, 257fseaweed particles swelling, 257f
effect of temperature on, 255–256at different temperatures of, 256f
extraction from seaweed, 251extraction yield, 254
effect of ultrasonic wave amplitude on,254–255
extraction time at different amplitudesof ultrasound, 255f
at various temperatures, 254fsolid–liquid mass transfer coefficient, 251ultrasonic waves, determination of ampli-
tude of, 253intensity of ultrasound, 253
ultrasound-assisted extraction, 252experimental apparatus used for, 252f
Iota-type carrageenan, 356Isopropanol, 161, 273
JJapanese Industrial Standard (JIS 5908-1994),
340Japanese Standard JIS8101, 273Jatropha curcas (J. curcas) oil (JCO),
197–198Jatropha curcas pressed cake
bio-oil production, 82empirical correlations, 86product characterisation, 85–86pyrolysis, 83yield, 84
physicochemical properties, 83t
KKaolin hollow tube microstructure
advantage, 381applications, 381k/p ratio effects
dry jet wet spinning, 383hydrodynamically unstable viscous fin-
gering, 386materials, 382powder characterization, 382, 384scanning electron microscope, 383–384SEM images, 385spinning solution preparation, 382–383spongelike structure, 386viscosity measurement, 383, 385–386
j-carrageenan, 198Kappa-type carrageenan, 356Kenaf, 242
2D contour plot and 3D response surface,246f
biomass, 245cellulose, 242glucose content extraction from, 242hemicelluloses, 242
418 Index
hydrogen bonding, 247hydrolysis treatment process, 243lignin, 242total glucose content analysis, 243
Kenaf-retting wastewater (KRW)acclimatization, activated sludge
adaptation process, 63COD removal efficiency, 62–63genotype appearance, 63inoculums, 61microorganisms, 60sample analysis, 62SBR system, 61–62
characteristics of, 61components, 59, 60
Klebsiella spp., 230, 233t, 234, 234tKuster’s agar (KUA), 205
LLambda carrageenan, 356Langmuir isotherm, 121, 122fLatex serum. See Skim latex serumLaticifers, 287Lead ion adsorption, activated carbon
adsorbent, 120aqueous solution, 120batch adsorption studies, 120–121isotherms
Freundlich isotherm, 121Langmuir isotherm, 121results, 122–123
kineticspseudo-first and second order models,
121results, 123–124
thermodynamicsenthalpy and entropy, 122Gibbs free energy, 122results, 124
Lignin, 4–5, 242, 272, 273tin palm kernel cake (PKC), 338removal process, 130
Lignocellulosic material, 242Lipid acyl hydrolase (LAH), 290, 290f, 292,
293Liquid phase oxidation (LPO), 272, 279–280
with alkali pretreatment, 281fLow-density polyethylene/tapioca starch-
based biofilm preparationbiodegradation analysis
fungi growth, 351–353methodology, 350
mechanical testingelongation at break, 350, 351methodology, 350polymer compatibility, 350–351tensile strength, 350, 351
sample preparation, 349Luria–Bertani medium, 161
MMaillard reaction, 5, 7Malaysia, 19, 28, 190
biodiesel production company, 82crude palm oil production in, 304palm oil mill industry in, 3
Maltodextrin, 153a-lac denaturation, 154b-lg denaturation, 155reducing protein denaturation, 156
Marine actinomycetes, 204–205growth, influence of
incubation temperature on, 207–208incubation time on, 209isolation media on, 206pH on, 206seasalt concentration on, 208
isolation from marine sponge, 207fMarine sponge, mesophyll part of, 205Marinophilus, 204Mass transfer, 267
rate, 268tMass transfer coefficients, 264–265, 268t, 269
correlation of solid–liquid efficient,257–260
Medicinal plants, 228Melamine–urea–formaldehyde resin, 338, 339Melanoidin, 4, 5, 7Membrane characterization
permeance P (in GPU), 324, 327fthermogravimetric analysis, 324
Membrane technology, in gas processing, 3223-Mercaptopropionic acid (MPA), PNIPA
polymerizationFourier transform infrared spectroscopy
band characteristics, 368–269methodology, 368
LCST of PNIPAmethodology, 368phase transition, 369
Methanogenesis, 4Micrococcus sp., 66Mixture. See Whey protein isolate (WPI)Multistep action (MSA) Q-learning, 222
Index 419
NNatural gas sweetening, 296Natural gas utilization, 322Natural rubber (cis-1,4-polyisoprene), 286
hevein, 288processing, 286–287proteins in, 287
N-isopropylacrylamide (NIPAAm), 366NiTi alloy
advantages, 389–390applications, 389solid-state synthesis
methodology, 390Ni–Ti binary alloy system, 390primary and secondary reactions, 393SEM micrograph, 390, 391sintering, 391–393XRD spectra, 391, 392
N-methyl-2-pyrrolidone (NMP), 323, 331,382, 383
OOil palm trunk (OPT) sap
bioethanol production, 22ANOVA and model development,
21–23biomass preparation, 20culture preparation and fermentation,
20–21face-centered CCD design layout, 21,
22graph-based discussion and model val-
idation, 23–24one-factor-at-a-time method, 20pretreatment, 19–20statistical design of experiment method,
20characteristics, 19
Oil-free PKC fiber (PKC), analysis of, 273,273t
One-factor-at-a-time (OFAT) method, 20Organosolv processes, 272, 274, 275t, 280
delignification, 276twith organic acids, 277, 278fpurity of cellulose using, 279f
Orthosiphon stamineus leavesbioactive compounds, 138flavonoid degradation, spray drying
chemicals, 138–139field emission scanning electron
microscope, 140HPLC analysis, 139methodology, 140
moisture content, 140, 141particle morphology, 142–143plant material, 139total flavonoid content, 139–142ultrasonic-assisted extraction, 139WPI to maltodextrin ratio, 142
Oxoid nutrient broth, 66
PPalm kernel cake (PKC), 272, 273, 338
alkali-pretreated PKC, 277, 280analysis of, 273textracted PKC cellulose, 280–281FTIR spectra of cellulose, 281fhemicellulose removal from, 277fhemicellulose-free fiber, 274hot water-pretreated PKC, 278, 280oil-free fiber. See Oil-free PKC fiber
(PKC), analysis ofpowder, preparation of, 339purity of cellulose PKC, 279utilization of, 339on water absorption of particleboard, 342
optimization of process factors withproperties of particleboard with, 344
on static bending test (MOE and MOR)of particleboard, 343–344
on thickness swelling of particleboard,343
Palm oil mill effluent (POME)ABE fermentation, Clostridium
acetobutylicumABE recovery, 40bacteria growth profiles, 38liquid–liquid extraction, 37–38microbes and media, 37pH and reducing sugar profiles, 38process and analysis, 37solvent productions, 39sterilized POME supernatant vs. sludge,
38–39anaerobic digester, 297anaerobic digestion and colourants
lignin, 4–5mechanism, 4melanoidin, 5tannins, 5
anaerobically treated, 4. See also Anaero-bically treated palm oil mill effluent(AnPOME)
characteristics, 36hazardous characteristics, 104hydraulic retention time, 104
420 Index
oil and solid separation, H3PO4 effectdegumming, 105emulsifying activities and viscosity,
105higher temperature effect, 106methodology, 105–106neutralization, 105oil flotation rate, 105–108
raw, 4thermophilic hydrogen production
analytical method, 45batch fermentation, 45, 47–48cultural conditions, 46–47fermentation substrate preparation, 44hydrogen yield and production rate,
45–46seed sludge preparation, 44serum bottle experiments, 45
Particle swelling, 251, 395, 398of seaweeds, 256, 257f, 258swelling behavior of particles, 259
Particleboard productionapplications, 338formaldehyde-based adhesives, 338palm kernel cake (PKC) filter
ANOVA results, 341–342experimental design, 340lipid in, 338MUF resin preparation, 339preparation of, 339process factor optimization, 344protein content, 338static bending test, 343–344thickness swelling of particleboard, 343water absorption, 342
production and characterization, 340production of, 338
Petroleum-based fuels, 242Phenol, 161
adsorption of, 273ring, 372
Phenolics, 228, 235phenolic compounds, 372
Phosphoric acid (H3PO4)degumming process, 105neutralization, 105oil and solid separation, POME
degumming, 105emulsifying activities and viscosity,
105higher temperature effect, 106methodology, 105–106neutralization, 105
oil flotation rate, 105–108Photoanode, 313, 314, 315
material (size)/modification, 316tPhotocathode, 316–317, 317tPhotosensitizer, 314–315Photosynthetic bacteria, 174Plastics, 242, 338, 348–349
biodegradable plastics, 348, 349injection-moulded plastics, 348synthetic plastics, 348
Poly(N-isopropylacrylamide) (PNIPA)applications, 366characterization, 368polymerization
chain transfer agent, 366–367FTIR, 367–369materials, 3673-MPA. See 3-Mercaptopropionic acid
(MPA), PNIPA polymerizationPNIPA synthesis, 367telomerization, 366UV–vis spectrophotometer, 367
synthesis, 366Polycyclic aromatic hydrocarbons (PAHs)
characteristics, 90occupational exposures, 89oxidation, electrochemical process
anode effect, 92dimensionally stable anodes, 90electrochemical cell, 91electrode preparation, 91energy consumption (EC), 92, 95field emission scanning electron
microscopy, 91instantaneous current efficiency (ICE),
92, 95pH and electrolyte effect, 93–94selected ion monitoring (SIM) mode,
91Ti/SnO2 electrode structure, 92–93
Polyetherimide (PEI), 323CO2 separation. See Pyrolysis soaking timepolyethylene glycol (PEG) based CMS
membrane. See CO2 separation ofPEI/PEG CMS membranes
properties, 330Polyethylenimine, 66PolyHIPE (PHP) discs, 162, 163PolyHIPE (PHP) matrix, 160, 161, 163
polymer matrix, architecture of, 164characteristics of, 165t
sulphonated matrix. See Sulphonated PHPs(SPHPs)
Index 421
Polynomial regression model, 244Polyolefin, 348Polyvinylpyrrolidone (PVP), 323, 326, 327,
332Potassium persulfate, 161Propionic acid bacteria, 174Protein denaturation, 138, 142, 152, 155, 156Pseudomonas aeruginosa (P. aeruginosa),
228, 230, 232, 233t, 234, 234tPurification, 6
of active ingredients of plantmaterial, 250
of gases, 297of high value biomolecules, 366industrial water purification activities, 11methods for fermentation processes, 36partial purification of hydrolases protein,
291of seawater, 373steps on pooled fractions, 293
Pyrethrum flowers, pyrethrins from, 251Pyrolysis
Jatropha curcas, bio-oil productionbio-oil yield, 84empirical correlations, 86experimental tests, 83materials, 82–83product characterisation, 85–86thermo-gravimetric analysis, 82
waste chicken fats, bio-oil productionGC–MS and FTIR analysis, 75product yield, 75–76pyro-oil characterisation, 76–78raw materials, 74torrefied biomass, 74, 75ZSM-5 catalyst, 74–75
Pyrolysis centrifuge reactor (PCR), 182schematic diagram of, 182f
QQ-learning (QL) algorithm, 220, 221Q-learning-based controller, 222–223
for fed-batch yeast fermentation, 219–220baker’s yeast fermentation, dynamic
metabolism of, 220–221methodology, 221multistep action Q-learning, 222process flow diagram, 222f
Quantificationof a-amylase assays, 163of protein, 163of released cell numbers and cell dry
weight, 162–163
RRhodopseudomonas palustris (R. palustris),
174. See also Solid-state fermenta-tion (SSF)
cell growth determination, 176effect of initial pH, moisture content, and
incubation period on the productionof ALA, 177–178, 178t
Raw seaweed (Eucheuma denticulatum), 252,357
Recombinant plasmid pKTH10, 165Response surface methodology (RSM), 20,
275, 339D-optimal design, 275, 340RSM model, 21–23, 245t
Rhodococcus, 66, 204Rhodobacter capsulatus, 174Rhodobacter sphaeroides, 174Rubber waste, 190
SSabah sea area, 205fSaccharomyces cerevisiae (S. cerevisiae), 20
in anaerobic fermentation, 131ethanol production, 131, 134fermentation efficiency of, 23fermented seaweed (Laminaria japonica)
waste hydrolysate, 134in seaweed fermentation, 133t
Salinibacterium, 204Salinispora, 204Salvia officinalis L., polysaccharides from, 251Sarawak black peppers, 265Scanning electron microscopy (SEM),
325–326determination of pore and interconnect size
by, 162of hollow fiber membranes, 325f
Seaweedsbioethanol production
alkaline pre-treatment, 130–131fermentation, 131, 134pre-treatment reviews, 132–133saccharification pre-treatment, 130
carrageenan. See Carrageenanclassification, 356micrograph, NiTi alloy synthesis, 390, 391SEM analysis, preparation of matrix sam-
ples for, 163–164Semi-refined carrageenan (SRC) production
alkali treatment, 356–357KOH treatment
FTIR spectrum, 358–360
422 Index
functional group composition, 358,360–362
methodology, 357–358seaweed preparation, 357
Semporna, 204, 205, 209Sequencing batch reactor (SBR) system,
61–62Simultaneous thermal analysis, 184Single gas permeability test, 324, 326–327Skim latex serum, 287. See also Hydrolases
biochemical analyses, 289dye-binding method of Bradford’s
assay, 289quantitation of activity by hydrolases
assay, 289chromatography gel formation, 289enzymes in, 288Hevea Cathepsin G, 288types of proteins in, 287–288
Solar crops dryer, chimney effectair flow rate, 146air velocity, 146burner capacity, 146design layout, 147methodology, 148modified and conventional chimney
estimated draft, 148mechanical system, 149simulation program, 149
transparent and drying bed area, 146Solar energy, 146
conversion, 318photocathode in, 316–317
Solar radiation, 146Solid-state fermentation (SSF), 174
advantages, 52cell growth determination, 176–177cellulase production, EFB
b-glucosidase, 54biomass, effects of, 55carbon sources, 52EFB saccharification, 53, 56enzyme assay, 53enzyme extraction, 53fermentation process, 52initial moisture content, 55lignocellulose, 52nitrogen source concentration, 55protein determination, 53xylanase activity, 54
empty fruit bunch (EFB) under, 174incubation periods, 176initial moisture contents, 176
in ALA production, 177, 177f
initial pH, 176in ALA production, 177, 177f
preparation of starter culture and, 175R. palustris NRRL-B4276, 175
Solubility-controlled period (SC), 264mass transfer rate and mass transfer coef-
ficient for, 268tSolwaraspora, 204Sorbitanmonooleate (Span 80), 161Sovova’s model, 264Soxhlet extractor, 305, 309, 339Soybeans, oil from, 251Staphylococcus aureus (S. aureus), 228, 230,
232, 233t, 234, 234tStarch casein agar (SCA), 205Starch-degrading bacterium, 160, 164Streptococcus pneumonia, 230, 231, 233t, 234tStreptococcus pyogenes, 230, 233t, 234tStreptomyces, 204Styrene, 161
divinylbenzene polyHIPEs, 165Sulfhydryl-disulfide interchange reactions, 155Sulphonated PHPs (SPHPs), 164
characteristics of, 165telectron micrograph of cross section of,
168fmicrostructure of, 164f
Sulphonated polyHIPE polymer matrix, prep-aration of, 161
Sulphuric acid (H2SO4), 161, 242Supercritical fluid extraction (SFE), 263
of black pepper using CO2 as the solvent,264
and experimental procedure, 265equipment setup, 266f
Superoxide dismutase (SOD), 288Survival of the fittest, 214
TTannins, 4, 5, 7, 228, 235Terpenoids, 228, 235Test microorganisms, 230Tetrathionate hydrolase, 191
activity, 194–195assay, 193specific activity of, 195
Thermogravimetric analysis (TGA), 326–327,326f
experiments, 182, 185Thermophilic hydrogen production, POME
analytical method, 45batch fermentation, 45, 47–48cultural conditions, 46–47
Index 423
Thermophilic hydrogen production, POME(cont.)fermentation substrate preparation, 44hydrogen yield and production rate, 45–46seed sludge preparation, 44serum bottle experiments, 45
Thiobacillus ferrooxidans, 191cultivation of, 192growth of, absorbance at 440 nm, 194propagation of, 192secreted tetrathionate hydrolase by, 191
activity of enzyme, 194specific activity of, 195, 195fS4-intermediary pathway, 195
Trifluoroacetic acid (TFA), 152, 153Trioxacarcins, 204Trypsin inhibitor, 287
UUltra-performance liquid chromatography
(UPLC) analysis, 152, 153, 154, 156for protein content in WPI, 154
Ultrasonication, 251, 255ultrasonic extraction, 254
of i-carrageenan, 260ultrasonic method, 191, 331ultrasonic waves, 253, 255, 259
amplitude, effect of, 254, 259ultrasonic-assisted extraction, 139ultrasonic-assisted technology, 250ultrasonicator, 256
Ultrasound (US). See also Ultrasonicationamplitude of, 255fexperimental apparatus used for, 252fextraction, 256, 257intensity of, 253, 254ultrasound-accelerated process, 98ultrasound-assisted extraction, 252–253waves, 97–98, 252
VVerrucosispora, 204Vinylpyridine, 161Vitamin B12, 174Vulcanized scrap tires, 190–191
devulcanization process, 191
optical density, 192protein assay, 192–193protein content determination,
192–193, 194tetrathionate hydrolase assay, 193, 194Thiobacillus ferrooxidans in, 191
safe recycling method, search for, 191
WWastewater treatment using wirecloth elec-
trode. See Dielectrophoresis (DEP)Whey protein isolate (WPI), 138, 152
thermal denaturation, 152whey proteins and maltodextrin mixture,
143WPI solution, preparation, 153
degree denaturation of, 154kinetic study design and heat treatment,
153UPLC analysis, 153
Williamsia maris, 204Woad seeds, oil from, 251
XXRD spectra, 392f
NiTi alloy synthesis, 391, 392
YYeast. See also Baker’s yeast fermentation,
dynamic metabolism of; Q-learn-ing-based controller
concentration profiles of, 224ffermentation process, dynamics of, 220
ZZeolites, 296
breakthrough sulfur capacity, 299–300,299f
chemical compositions of, 298tand H2S concentrations, time evolution of,
299tZSM-5 catalyst, 74–75
424 Index