development of computerized data acquisition system for ... - utpedia
TRANSCRIPT
Development of computerized data acquisition system for science experiments
By
Lim Zi Yi
14266
Interim submitted in partial fulfillment of
The requirements of
Bachelor of Engineering (Hons)
(Electrical and Electronics)
September 2014
UniversitiTeknologi PETRONAS
Bandar Seri Iskandar
31750 Tronoh
Perak Darul Ridzuan

Certification of Approval
Development of computerized data acquisition system for science experiments
By
Lim Zi Yi
14266
A project dissertation submitted to the
Electrical and Electronic Engineering Programme
Universiti Teknologi PETRONAS
In partial fulfilment of the requirement for the
BACHELOR OF ENGINEERING (Hons)
(ELECTRICAL AND ELECTRONIC)
Approved by,
,
(AP DR BALBIR SINGH MAHINDER SINGH)
UNIVERSITI TEKNOLOGI PETRONAS
TRONOH, PERAK
MAY 2014
II
II
Certification of Originality
This is to certify that I am responsible for the work submitted in this project, that the
original work is my own except as specified in the reference and acknowledgements,
and that the original work contained herein have not been undertaken or done by
unspecified sources or persons.
,
(LIM ZI YI)
III
ABSTRACT
Nowadays, students are losing their interest in science subject. This is because they
do not able to apply theory on the science experiment while they are still using old
and conventional method to conduct a science experiment that might bring a lot of
uncertainties in the actual word. The current available data acquisition systems in the
market are costly installation fee and stiff learning curve that leads to the
inconvenience to conduct an experiment or analyze the result would be unwanted by
the students. The objective of this project here is to implement a data acquisition
system, which is user-friendly and low cost. Through this project, a data acquisition
system is designed. Waterproof temperature sensor, velocity detector, voltage/current
detector are used to carry out certain science experiments. With the standalone
monitoring system, users can view the result and analyze on the liquid crystal display.
The users also can read the result on a give website address as long as the Arduino
Mega is connected to a computer. The use of Arduino Mega with Ethernet shield
coupled together will help in accomplished the web site for the database in this
project. Here the user has to enter a password, which must register before, and this
read from the system for clarification and verification purpose. By storing the
database online, the user can read his result in a more efficient way. This project has
been extensively tested in one of the science experiments. Experimental results have
shown a result accuracy of 90% in this project by compared to conventional method.
From this project, a better way to conduct science experiment is built and this work
would illustrate the advantages of saving the time for better experiment results while
doing the experiment.
IV
IV
Acknowledgement
First and foremost I would like to give my utmost appreciation towards my
supervisor and co-supervisor. AP Dr. Balbir Singh Mahinder Singh as the supervisor
for guiding me throughout the completion of the project. His dedication towards
making sure that the project is completed on time and as perfect as possible as well
as his endless advice and consultation is highly admirable. Special thank to Dr Zaihar
Yahya as the co-supervisor who has constantly guided me and supported me with the
completion of this project. Thanks to everyone who helped them with this project,
directly or indirectly. Lastly to my beloved family and friends who were constantly
giving me the support mentally and physically, without them, I would not have
succeeded.
Table of Content
CERTIFICATION OF APPROVAL ....................................................................... I
CERTIFICATION OF ORIGINALITY ................................................................. II
ABSTRACT ............................................................................................................. III
ACKNOWLEDGEMENT ....................................................................................... IV
TABLE OF CONTENT ............................................................................................. I
LIST OF FIGURES ................................................................................................... 3
LIST OF TABLE ....................................................................................................... 4
CHAPTER 1 INTRODUCTION .............................................................................. 5
1.1 PROJECT BACKGROUND ...................................................................................... 5
1.2 PROBLEM STATEMENT ..................................................................................... 7
1.3 OBJECTIVES AND SCOPE OF STUDY ................................................................... 8
CHAPTER 2 LITERATURE REVIEW .................................................................. 9
2.1 EDUCATION SYSTEM IN MALAYSIA ................................................................... 9
2.2 COMPUTERIZED DATA ACQUISITION SYSTEM (DAS) ........................................ 11
2.2.1 CURRENT EXISTING DAS -LABVIEW AND PASCO ................................... 12
2.2.2 RESEARCHES ABOUT DAS ............................................................................ 13
2.2.3 MICROCONTROLLER USED............................................................................... 14
2.3 CRITICAL ANALYSIS ........................................................................................ 16
CHAPTER 3 METHODOLOGY ........................................................................... 17
3.3 GANTT CHART .................................................................................................. 19
ii
ii
CHAPTER 4 RESULTS AND DISCUSSION ....................................................... 21
4.1 DEVELOPMENT OF HARDWARE OF SCIEDAS ................................................. 21
4.2 SELECTIONS OF SPECIFIC COMPONENTS FOR DAS ........................................ 22
4.2.1 SENSORS ........................................................................................................ 24
4.2.2 DATA ACQUISITION DEVICE - ARDUINO MEGA........................................... 26
4.2.3 MONITORING SYSTEM ...................................................................................... 27
CHAPTER 5 CONCLUSION AND RECOMMENDATION .............................. 34
5.1 CONCLUSION .................................................................................................... 34
5.2 RECOMMENDATION .......................................................................................... 34
REFERENCES ......................................................................................................... 35
APPENDIX ............................................................................................................... 38
3
List of Figures
Figure 1: Arduino Mega…………………………………………………………….15
Figure 2: Workflow of the Project ............................................................................. 18
Figure 3: DAS framework for SCIEDAS .................................................................. 21
Figure 4: Schematic drawing for SCIEDAS .............................................................. 23
Figure 5: Circuit connection of Waterproof Temperature Sensor ............................. 24
Figure 6: Circuit Connection of Ultrasonic Sensor .................................................... 24
Figure 7: Arduino Mega ............................................................................................. 26
Figure 8: TFT LCD with touchscreen ........................................................................ 27
Figure 9: Homescreen of SCIEDAS software ........................................................... 28
Figure 10: Apparatus set up ....................................................................................... 28
Figure 12: Graph Analysis of Experiment I in SCIEDAS ......................................... 32
Figure 13: Tabulated data for Experiment I in SCIEDAS ......................................... 32
4
4
List of Table
Table 1: DAS in the market ....................................................................................... 12
Table 2: Features of some microcontrollers ............................................................... 15
Table 3: Hardware used in SCIEDAS project............................................................ 17
Table 4: Gantt Chart and Keymile stone of the project ............................................. 20
Table 5: Selection of components for SCIEDAS ....................................................... 22
5
Chapter 1
Introduction
1.1 Project Background
Today’s education system is too exam-oriented, which caused the students aim to
pass the exam with flying color, but fails to apply the knowledge in real life. Hence,
there is a need for paradigm shift of Malaysia Education System from using Rote
Learning to Discovery Based Learning in schools. Discovery Based Learning is used
to balance theoretical studies students learned in class and practical experiments in
the lab. Besides, it is difficult to sustain the interest of students in some subjects,
especially science subject through old and conventional method.
This project will be able to fit in current Malaysia Education system, especially the
technological enhancement of the science environment. It uses the current
technology to implement a data acquisition system, which is based on current
Malaysia education scheme. In the Malaysia Education Blueprint 2013-2015, one of
the eleven strategic thrusts is to enhance the science education. A survey carried out
by the Ministry stated that although a big amount of money had been spend, there is
only 80% of the teachers spend less than one hour a week using information, and
communication technology (ICT), while one third of the students perceive to use ICT
regularly. Hence, it is clearly to see that ICT usage is extremely low and cause the
interest in science stream is on the downward trend. Apart from that, Malaysia was
ranked in the bottom third for reading, Mathematics and Science in Programme for
International Student Assessment (PISA 2012), conducted by Organisation for
Economic Co-operation and Development. Thus, the need to increase the interest in
science related subjects at the school level have become increasingly important.
One of the reasons why the science related subjects have become less popular is
because it is rather difficult to sustain the interest of the students via theoretical
approach. To keep students engaged, their interest in science must be enticed.
Technology is a key element to promote students’ interest learning. Technology
based learning environment designed for problem based-learning, which make the
6
6
learning process more interactive and students more effective and engaged. This kind
of learning environment always involves collaborative learning among students
where students can improve their soft skills, such as leadership, communication
skills and others moral values.
Technology based learning helps to save time in order to get more accuracy result
and analysis. Nowadays, the practical aspects are also important and the same old
experiments are used with the conventional data capturing devices. Students usually
waste so much time in just trying to capture the data and the need for analyzing the
result becomes less important. Therefore, the used of technology based learning
especially in science experiment will help to save time. Students can used the current
sophisticated devices provided to complete the experiment in a shorter time. As the
result, they can use the rest of time to investigate the data gained and furthermore to
apply knowledge learned during the class for the experiment. Technology based
learning has a wide range of advantages over the old traditional method. These
devices are developed in a higher complexity and easy to access, measure and
monitor some certain physical environment values such as, temperature and pressure.
While using the devices, students’ motivation to learn new technology and to gain
knowledge is greatly increased. Hence, students’ engagement in science will
improve in a higher order when they are provided with new technology devices.
In this project, a battery operated data acquisition system will be designed, where the
data will be transmitted to a computer for processing and can be analyzed easily. The
real time data obtained from the experiments will also be displayed on a local LCD
module on the standalone system. The challenge will be in making it universal data
acquisition system that can be connected with few different sensors for data
acquisition and log the data into webserver for analysis purpose.
7
1.2 Problem Statement
Based on Programme for International Student Assessment (PISA 2012) and
Malaysia Education Blueprint 2013-2015, it is worth to investigate why the interest
of science stream is on downward trend. The reason is because students do not able
to apply theoretical studies on the experiment. Everyday while studying in classroom,
what students have been taught is ideal concept from the textbook and all the
disturbance values or the environment data are not in concern. However, there are so
many uncertainties in the actual world, science experiments are not excluded. When
students carry out the experiments, they will find out that they cannot get the ideal
result as recorded in the textbook. Hence, a feeling of unattached will rise in their
heart, which will lead to the loss of interest in science stream.
Nowadays in schools, throughout a science experiment, conventional measuring
instruments, such as, voltmeters, ammeters and thermometers are utilized to gather
data physically. A considerable amount of time is used on data gathering that might
contain certain level of errors. However, these errors can only be detected once the
analysis is carried out and charts are drawn. Usually, students can only do their
analysis either they back in normal classroom or when they already home. There is
no opportunity for the students to repeat their experiments in order to obtain new
result. Hence, it is not easy for them to have a clear understanding about the
objectives of the experiment and this may lead to the loss of interest in science too.
Taking all these constraints into consideration, it is timely that efforts are directed at
designing low cost data acquisition system that can fit into our local education
climate to assist in the innovation based learning approach.
8
8
1.3 Objectives and Scope of Study
1.3.1 Objectives
The objectives of this project are:
To design a user-friendly computerized data acquisition system for conducting
science experiments.
To implement a low cost data acquisition system.
To carry out the testing of the computerized data acquisition system designed
in this project on few selected science.
1.3.2 Scope of Study
Based on the objectives, the scope of study of this project is as given below:
• Designing a Data acquisition system by using suitable microcontroller for
science experiment
• Implementing Electrical and Electronic engineering in term of software and
hardware knowledge into this project
• Data logging by using Arduino via Ethernet Shield to webserver.
• Carrying out research to design and calibrate the sensors for accurate data
measurement.
9
Chapter 2
Literature Review
2.1 Education System in Malaysia
2.1.1 Current Education System
In Malaysia, The Ministry of Education (MOE) plays an important role to set a
comprehensive schooling system from pre-school to secondary education. During the
six years of primary school education, the syllabus is focuses on the development of
moral values, reading skills, writing skills and arithmetic skills. The mastery of these
skills is reinforced and emphasized to build a strong foundation for all subjects.
Upon completion of primary stage of education, students will continue to secondary
level of education [14]. Secondary education is divided into lower and upper
secondary levels. Education at this level is general in nature and focuses on core
subjects such as languages, Mathematics and Science. In order to cope with both
practical and theoretical knowledge, science experiments are included in the syllabus.
This teaching-learning environment aims to improve the quality of education in
Malaysia.
2.1.2 Science Experiment in the Syllabus
Science is a core subject in the school curriculum and consists of science for primary,
secondary, physics, biology, chemistry and additional science. At the primary and
lower secondary level of education, students need to take science subject. While
upper secondary level, they can choose to take either core science or science
electives [17].
Science at primary level is aim to build a community that is culturally scientific and
progressive through providing opportunities for students to acquire knowledge
through experiential learning. Science continues to be offered at the lower secondary
level and it is further develops and reinforces what has been learned at the primary
level. According to the MOE, particular emphasis is given on scientific knowledge
and thinking skill to make sure students can understand and appreciate the role of
10
10
science and application of science for the development of the nation [16&17]. At the
upper secondary, students are offered science electives for Science Stream or
additional science for art stream students. In order to develop the interest of students
in science, technical education is introduced and exam-oriented teaching is not
encouraged. For examples, a Smart School concept is presented. Technology
becomes an enabler to facilitate teaching, learning activities and experiments. A
different approach, which reforms the current science curricular, emphasizes on
discovery-based learning and several implementations are taking out to fit in this
reform.
2.1.3 Problems faced in Schools
According to Oxford dictionary, education is defined as the process of receiving or
giving systematic instruction. Based on the definition, education is the engagement
by learning or teaching an instruction followed by the syllabus. However, this
approach cannot assist students to really understand the theory they learned in class.
The learning process in the classroom is never enough for them to survive in future.
In Malaysia, the education system is facing difficulty in producing a competent
student. Due to the societal pressure, the scoring of the test paper and A’s in the
exam indicates the performance of a student is school. When the education system in
Malaysia emphasized on number of A’s in exam slip instead of training other skills,
students would not able to enjoy themselves in the schools and this lead to the losing
of interests in study.
Besides, trends in International Mathematics and Science Study (TIMSS) 2011 and
PISA 2012 saws Malaysia’s ranking drop. According to TIMSS, Malaysia
experienced the biggest drop in test scores among all countries for both Mathematics
and Science [15]. However, in the local examination, the students are doing very
well. It is showed that 92% of the students passed SPM Science exams, but only 67%
of them know CO2 stands for carbon dioxide. This situation of the declined ranking
in TIMSS highlights a mismatch between Malaysia’s current education system.
Hence, MOE should promote discovery-based learning for science education. The
11
schools should emphasize on lab experiments instead of merely learning from the
textbooks.
2.2 Computerized Data Acquisition system (DAS)
Data acquisition is the process of measuring an electrical or physical phenomenon
such as voltage, current, temperature, pressure, or sound with a computer. It is able
to measure and to convert the resulting samples into digital numeric values that can
be manipulated. In normal case, it converts analog waveforms into digital values for
processing. Data acquisition system (DAS) is a basic network management that
provides timeliness, reliable, fully formed network raw data for upper level of
network management system [1]. Traditional DAS unable to adapt to the network
change because of the rapid change of the data processing mode and it. Generally,
the three common communication system used are Traditional RS332 Serial port,
parallel port, and universal high-speed data acquisition system [2]. But they are not
ideal in term of cost and transmission speed of data [2], [3].
A data acquisition system (DAS) consists of sensors, measurement hardware and a
monitoring screen with programmable software. A sensor, which also called as
transducer, is used as a measurement tool for physical phenomenon. It converts the
data gained from the environment such as humidity and temperature into an electrical
signal so that it can be read by DAS. The digital signal will then send to the DAS
measurement hardware for further analysis. DAS measurement hardware is the
interface between the signals and monitoring screen. The key components of the
hardware are analog-to-digital converter (ADC), computer bus and signal
conditioning circuitry. Last but not least, the DAS measurement hardware is
connected to a monitoring screen with programmable software. The software will
communicate between the software and the DAS measurement hardware to show the
result on the monitoring screen.
12
12
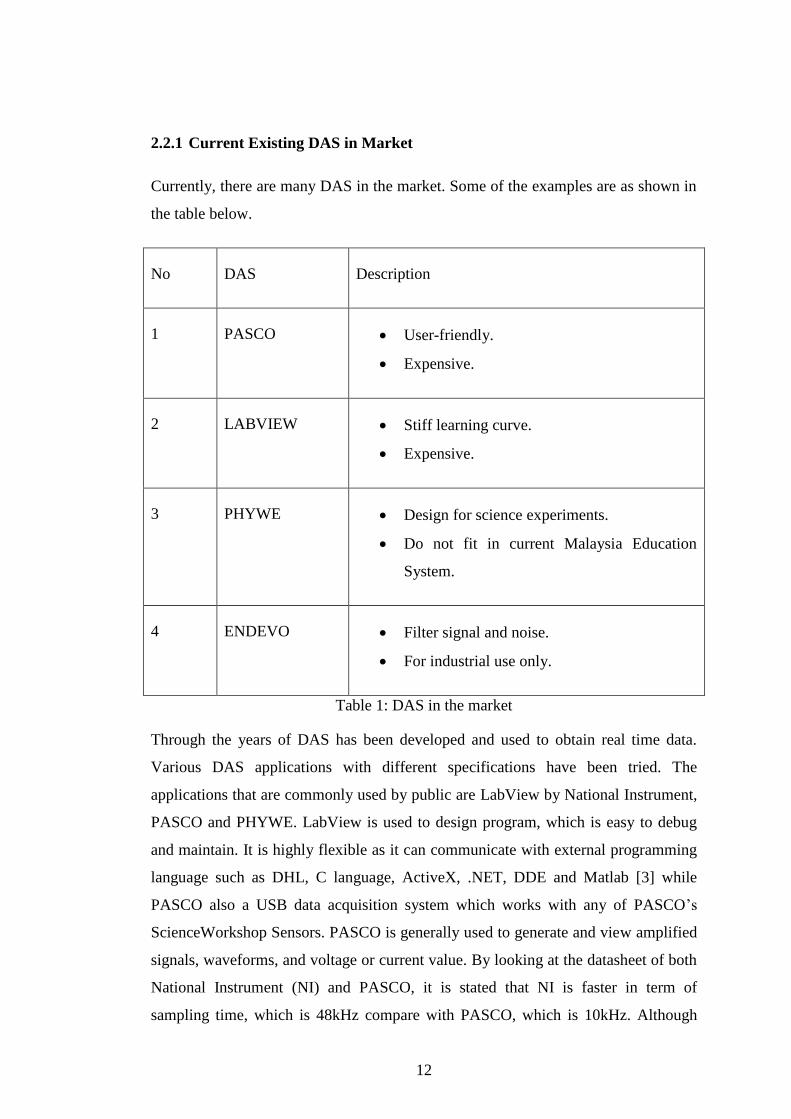
2.2.1 Current Existing DAS in Market
Currently, there are many DAS in the market. Some of the examples are as shown in
the table below.
No DAS Description
1 PASCO User-friendly.
Expensive.
2 LABVIEW Stiff learning curve.
Expensive.
3 PHYWE Design for science experiments.
Do not fit in current Malaysia Education
System.
4 ENDEVO Filter signal and noise.
For industrial use only.
Table 1: DAS in the market
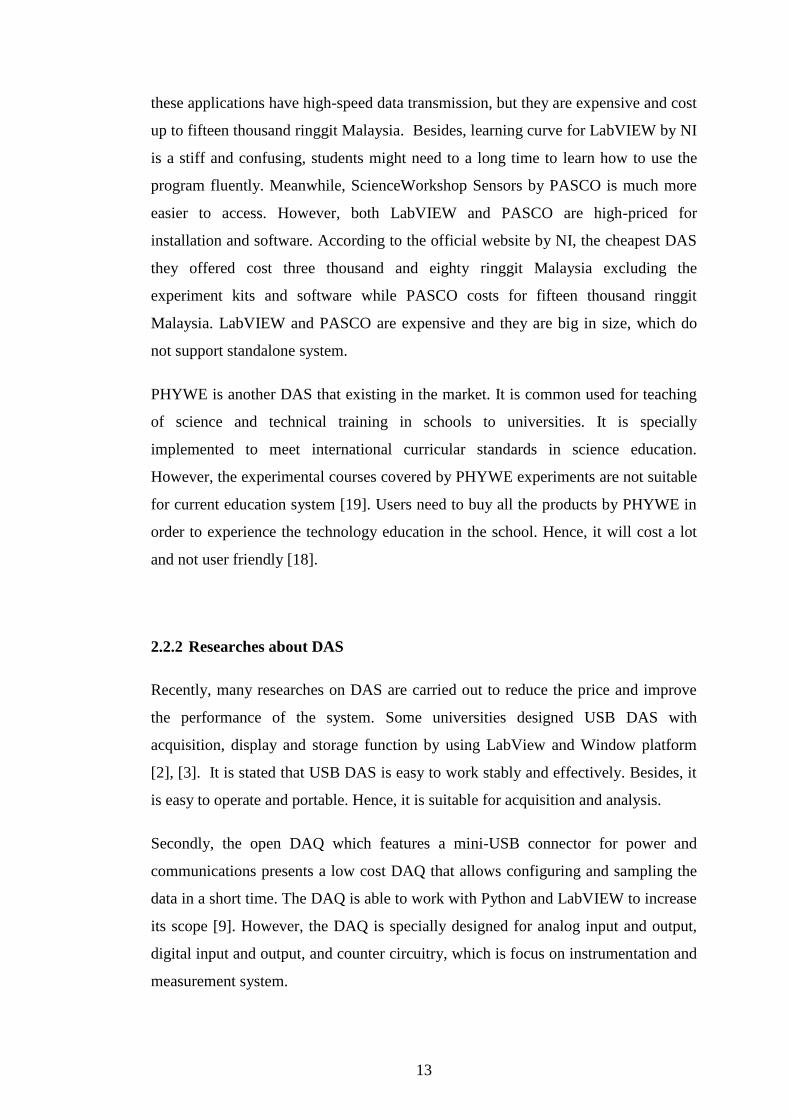
Through the years of DAS has been developed and used to obtain real time data.
Various DAS applications with different specifications have been tried. The
applications that are commonly used by public are LabView by National Instrument,
PASCO and PHYWE. LabView is used to design program, which is easy to debug
and maintain. It is highly flexible as it can communicate with external programming
language such as DHL, C language, ActiveX, .NET, DDE and Matlab [3] while
PASCO also a USB data acquisition system which works with any of PASCO’s
ScienceWorkshop Sensors. PASCO is generally used to generate and view amplified
signals, waveforms, and voltage or current value. By looking at the datasheet of both
National Instrument (NI) and PASCO, it is stated that NI is faster in term of
sampling time, which is 48kHz compare with PASCO, which is 10kHz. Although
13
these applications have high-speed data transmission, but they are expensive and cost
up to fifteen thousand ringgit Malaysia. Besides, learning curve for LabVIEW by NI
is a stiff and confusing, students might need to a long time to learn how to use the
program fluently. Meanwhile, ScienceWorkshop Sensors by PASCO is much more
easier to access. However, both LabVIEW and PASCO are high-priced for
installation and software. According to the official website by NI, the cheapest DAS
they offered cost three thousand and eighty ringgit Malaysia excluding the
experiment kits and software while PASCO costs for fifteen thousand ringgit
Malaysia. LabVIEW and PASCO are expensive and they are big in size, which do
not support standalone system.
PHYWE is another DAS that existing in the market. It is common used for teaching
of science and technical training in schools to universities. It is specially
implemented to meet international curricular standards in science education.
However, the experimental courses covered by PHYWE experiments are not suitable
for current education system [19]. Users need to buy all the products by PHYWE in
order to experience the technology education in the school. Hence, it will cost a lot
and not user friendly [18].
2.2.2 Researches about DAS
Recently, many researches on DAS are carried out to reduce the price and improve
the performance of the system. Some universities designed USB DAS with
acquisition, display and storage function by using LabView and Window platform
[2], [3]. It is stated that USB DAS is easy to work stably and effectively. Besides, it
is easy to operate and portable. Hence, it is suitable for acquisition and analysis.
Secondly, the open DAQ which features a mini-USB connector for power and
communications presents a low cost DAQ that allows configuring and sampling the
data in a short time. The DAQ is able to work with Python and LabVIEW to increase
its scope [9]. However, the DAQ is specially designed for analog input and output,
digital input and output, and counter circuitry, which is focus on instrumentation and
measurement system.
14
14
Besides, PIC microcontroller with Bluetooth is used as the platform to store, display,
monitoring and for acquisition in order to control Flexible Impeller Pump.
Touchscreen HMI, non-volatile FLASH chip and external SRAM are attached
externally and for easy data transfer to PC is equipped [5]. Fuzzy control is chosen
because it is easier to get stable result and to reduce the chance to get robust. Apart
from that, fuzzy control is simple for design and implementation, so the users can
save time to design new DAS system. In short, USB DAS is easy to use and cheaper
compare with existing DAS in the market. Nevertheless, none of the DAS designed
can fulfill the need of current Malaysia education.
2.2.3 Microcontroller Used
The development in new sensors, modification in size and improvement in size and
speed have all opened a new page for electronics devices [13]. Microcontroller is the
key element to communicate with the chip to control the movement. There is a wide
range of controllers, which take one or more inputs and adjust the outputs and
performed feedback closed loop control. Different controllers required different
control method to execute the outputs. Therefore, it is important to choose an
appropriate controller of a project. There is an array of microcontrollers including the
widely used Arduino and Basic range and the recently hugely popular Raspberry Pi
[11].
There are some issues to take note while choosing the right microcontroller. Firstly,
to consider about the operating frequency of the microcontroller to determine the
chip operating speed. Then, users need to determine the size of the programming that
can be store inside the microcontroller. Last but no least is to consider the energy
consumptions of the microcontroller. Arduino is one of the user-friendliest
microcontrollers in the market. There are different design and features of Arduino
microcontrollers with different size and processing capabilities.
15
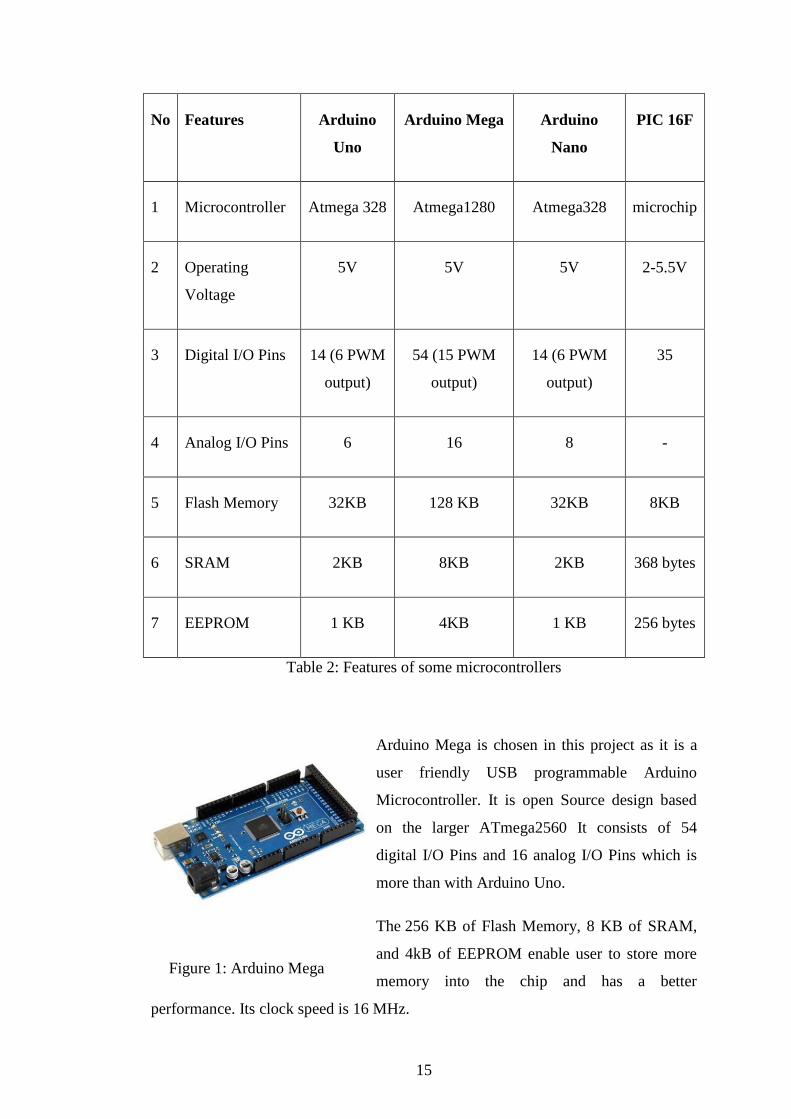
No Features Arduino
Uno
Arduino Mega Arduino
Nano
PIC 16F
1 Microcontroller Atmega 328 Atmega1280 Atmega328 microchip
2 Operating
Voltage
5V 5V 5V 2-5.5V
3 Digital I/O Pins 14 (6 PWM
output)
54 (15 PWM
output)
14 (6 PWM
output)
35
4 Analog I/O Pins 6 16 8 -
5 Flash Memory 32KB 128 KB 32KB 8KB
6 SRAM 2KB 8KB 2KB 368 bytes
7 EEPROM 1 KB 4KB 1 KB 256 bytes
Table 2: Features of some microcontrollers
Arduino Mega is chosen in this project as it is a
user friendly USB programmable Arduino
Microcontroller. It is open Source design based
on the larger ATmega2560 It consists of 54
digital I/O Pins and 16 analog I/O Pins which is
more than with Arduino Uno.
The 256 KB of Flash Memory, 8 KB of SRAM,
and 4kB of EEPROM enable user to store more
memory into the chip and has a better
performance. Its clock speed is 16 MHz.
Figure 1: Arduino Mega
16
16
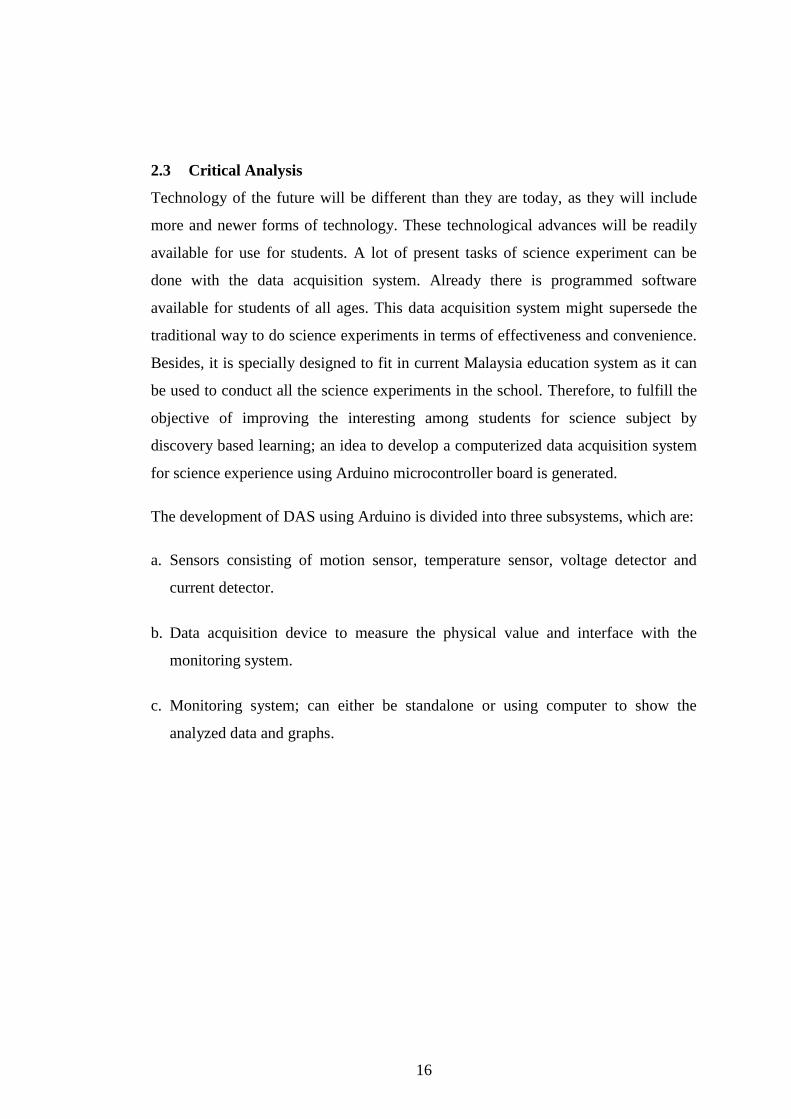
2.3 Critical Analysis
Technology of the future will be different than they are today, as they will include
more and newer forms of technology. These technological advances will be readily
available for use for students. A lot of present tasks of science experiment can be
done with the data acquisition system. Already there is programmed software
available for students of all ages. This data acquisition system might supersede the
traditional way to do science experiments in terms of effectiveness and convenience.
Besides, it is specially designed to fit in current Malaysia education system as it can
be used to conduct all the science experiments in the school. Therefore, to fulfill the
objective of improving the interesting among students for science subject by
discovery based learning; an idea to develop a computerized data acquisition system
for science experience using Arduino microcontroller board is generated.
The development of DAS using Arduino is divided into three subsystems, which are:
a. Sensors consisting of motion sensor, temperature sensor, voltage detector and
current detector.
b. Data acquisition device to measure the physical value and interface with the
monitoring system.
c. Monitoring system; can either be standalone or using computer to show the
analyzed data and graphs.
17
Chapter 3
Methodology
This chapter explains how the SCIEDAS is conducted is applied to attain the goal of
the project. There are two important parts to be taken into consideration, which are:
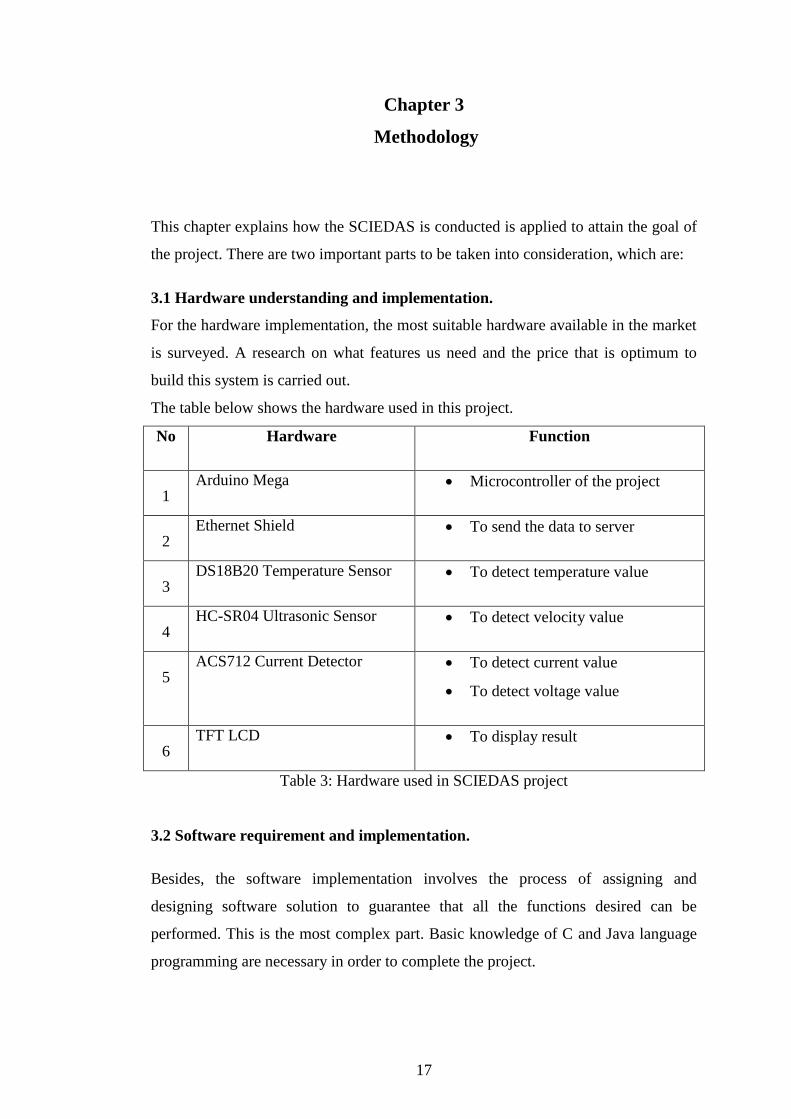
3.1 Hardware understanding and implementation.
For the hardware implementation, the most suitable hardware available in the market
is surveyed. A research on what features us need and the price that is optimum to
build this system is carried out.
The table below shows the hardware used in this project.
No Hardware Function
1 Arduino Mega Microcontroller of the project
2 Ethernet Shield To send the data to server
3 DS18B20 Temperature Sensor To detect temperature value
4 HC-SR04 Ultrasonic Sensor To detect velocity value
5 ACS712 Current Detector To detect current value
To detect voltage value
6 TFT LCD To display result
Table 3: Hardware used in SCIEDAS project
3.2 Software requirement and implementation.
Besides, the software implementation involves the process of assigning and
designing software solution to guarantee that all the functions desired can be
performed. This is the most complex part. Basic knowledge of C and Java language
programming are necessary in order to complete the project.
18
18
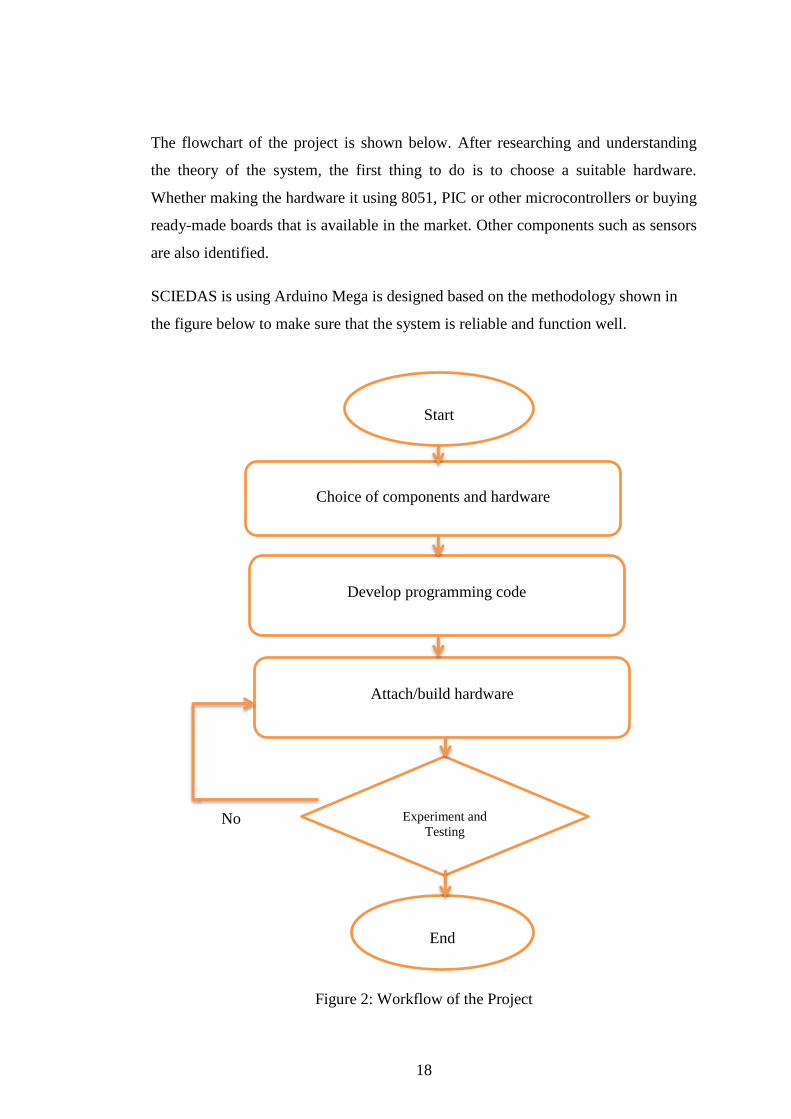
The flowchart of the project is shown below. After researching and understanding
the theory of the system, the first thing to do is to choose a suitable hardware.
Whether making the hardware it using 8051, PIC or other microcontrollers or buying
ready-made boards that is available in the market. Other components such as sensors
are also identified.
SCIEDAS is using Arduino Mega is designed based on the methodology shown in
the figure below to make sure that the system is reliable and function well.
Figure 2: Workflow of the Project
Start
Choice of components and hardware
Develop programming code
Attach/build hardware
Experiment and
Testing
End
No
19
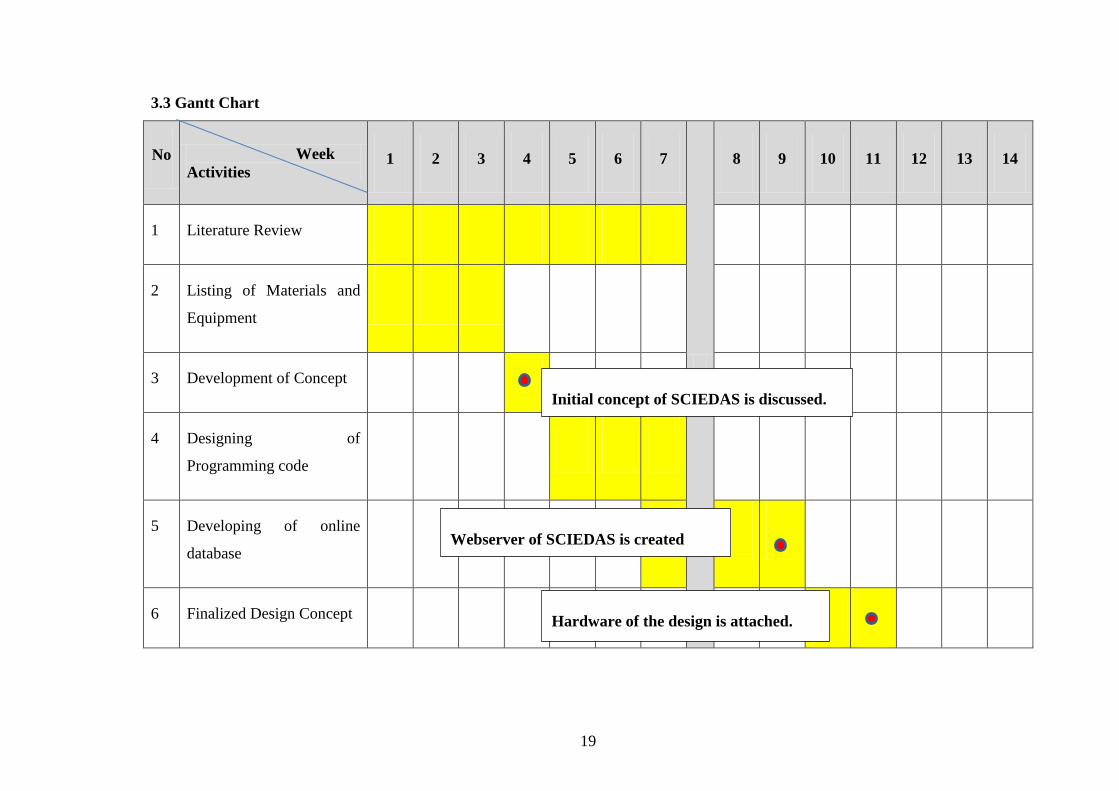
3.3 Gantt Chart
No Week
Activities 1 2 3 4 5 6 7
8 9 10 11 12 13 14
1 Literature Review
2 Listing of Materials and
Equipment
3 Development of Concept
4 Designing of
Programming code
5 Developing of online
database
6 Finalized Design Concept
Initial concept of SCIEDAS is discussed.
Webserver of SCIEDAS is created
Hardware of the design is attached.
20
20
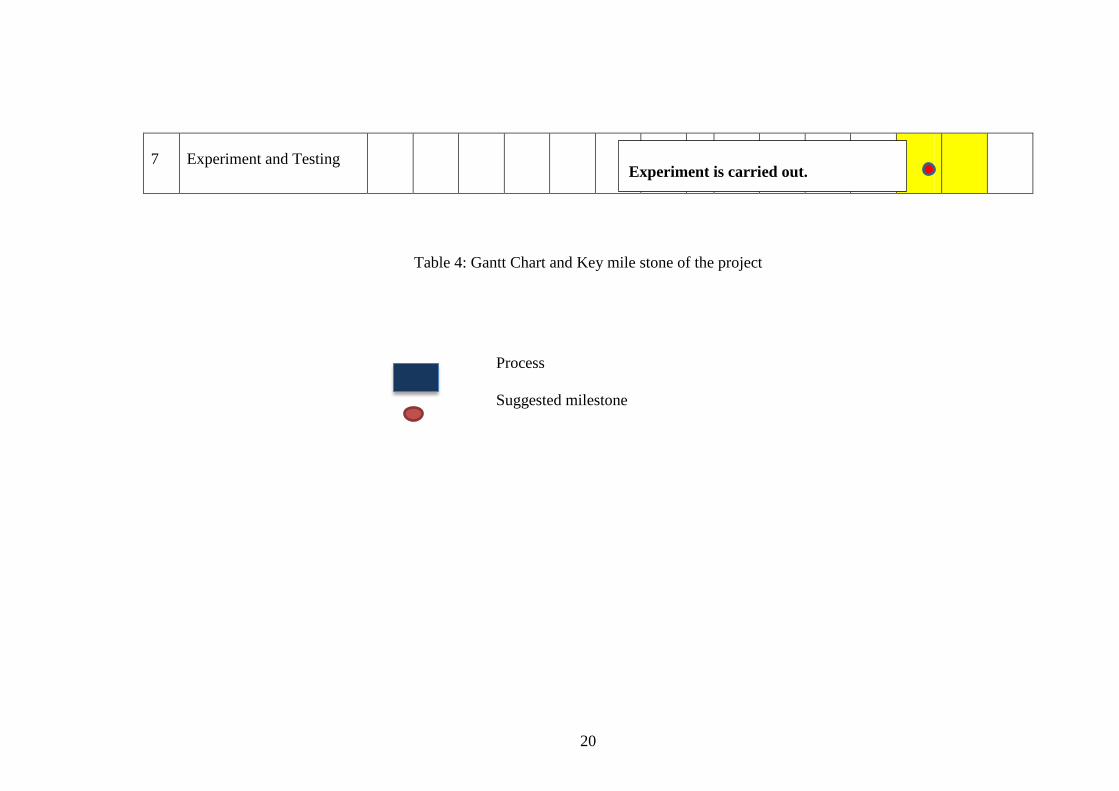
7 Experiment and Testing
Table 4: Gantt Chart and Key mile stone of the project
Process
Suggested milestone
Experiment is carried out.
21
Chapter 4
Results and discussion
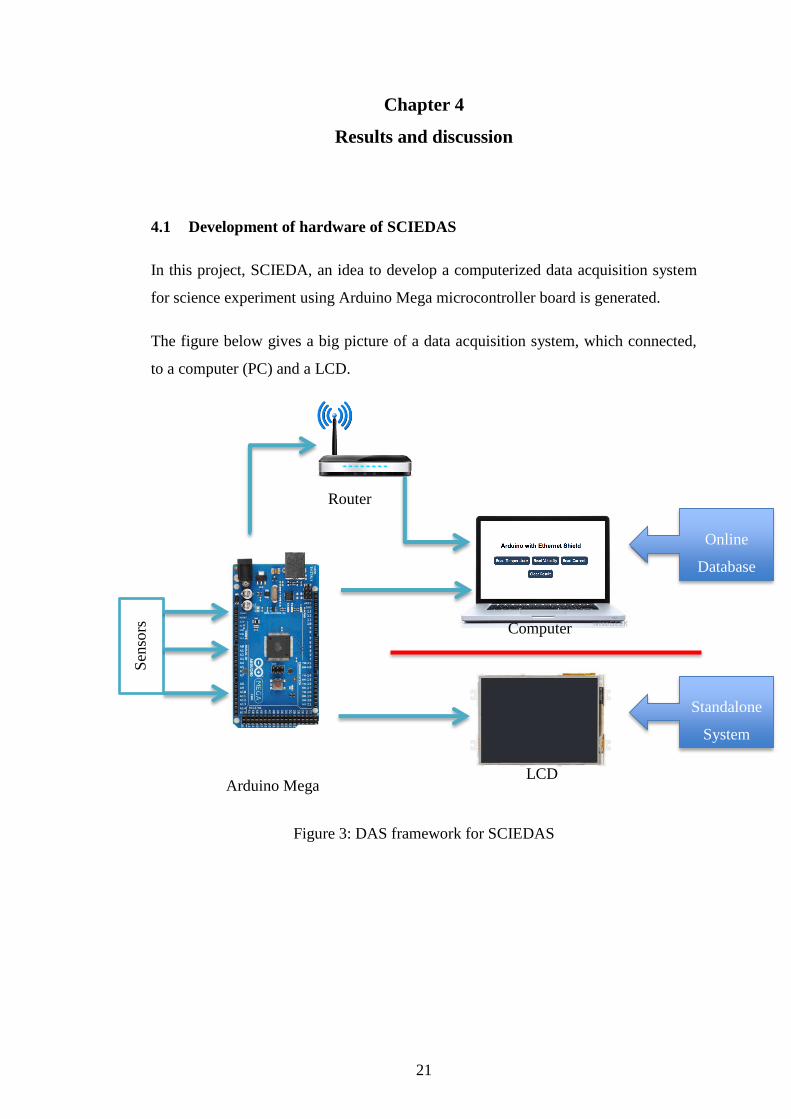
4.1 Development of hardware of SCIEDAS
In this project, SCIEDA, an idea to develop a computerized data acquisition system
for science experiment using Arduino Mega microcontroller board is generated.
The figure below gives a big picture of a data acquisition system, which connected,
to a computer (PC) and a LCD.
Figure 3: DAS framework for SCIEDAS
Sen
sors
Router
Computer
LCD Arduino Mega
Online
Database
Standalone
System
22
22
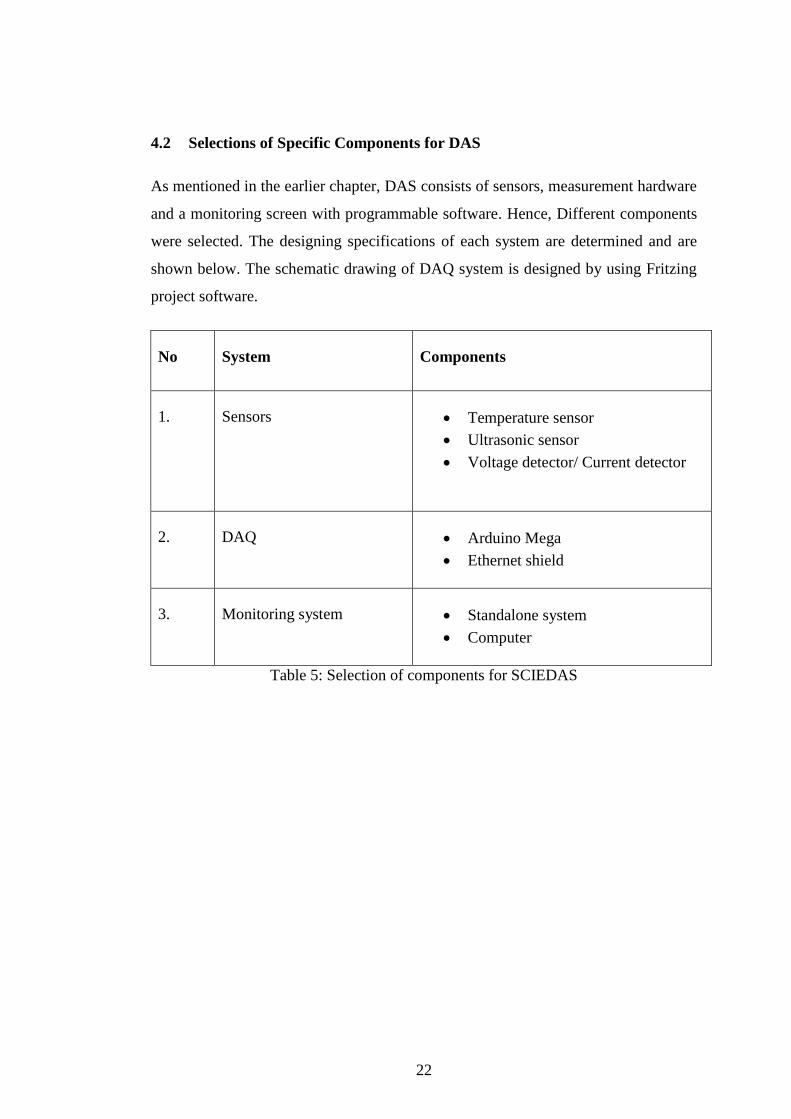
4.2 Selections of Specific Components for DAS
As mentioned in the earlier chapter, DAS consists of sensors, measurement hardware
and a monitoring screen with programmable software. Hence, Different components
were selected. The designing specifications of each system are determined and are
shown below. The schematic drawing of DAQ system is designed by using Fritzing
project software.
No System Components
1. Sensors Temperature sensor
Ultrasonic sensor
Voltage detector/ Current detector
2. DAQ Arduino Mega
Ethernet shield
3. Monitoring system Standalone system
Computer
Table 5: Selection of components for SCIEDAS
23
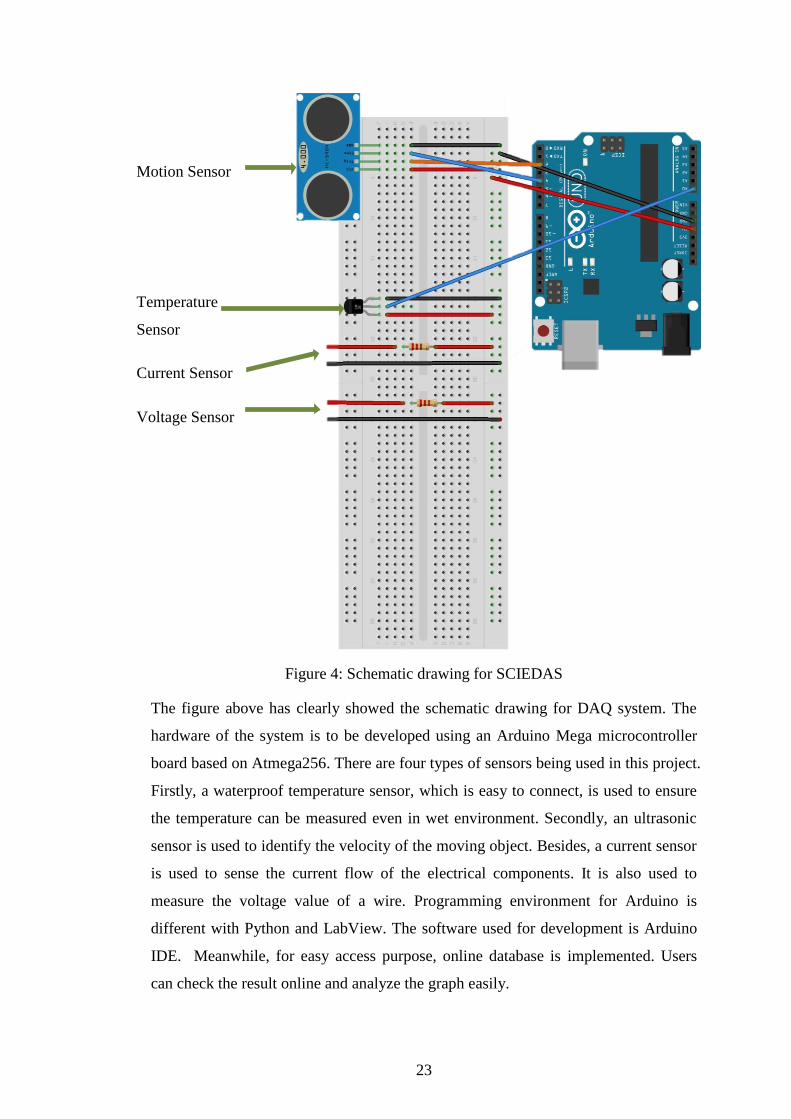
Figure 4: Schematic drawing for SCIEDAS
The figure above has clearly showed the schematic drawing for DAQ system. The
hardware of the system is to be developed using an Arduino Mega microcontroller
board based on Atmega256. There are four types of sensors being used in this project.
Firstly, a waterproof temperature sensor, which is easy to connect, is used to ensure
the temperature can be measured even in wet environment. Secondly, an ultrasonic
sensor is used to identify the velocity of the moving object. Besides, a current sensor
is used to sense the current flow of the electrical components. It is also used to
measure the voltage value of a wire. Programming environment for Arduino is
different with Python and LabView. The software used for development is Arduino
IDE. Meanwhile, for easy access purpose, online database is implemented. Users
can check the result online and analyze the graph easily.
Motion Sensor
Temperature
Sensor
Current Sensor
Voltage Sensor
24
24
4.2.1 Sensors
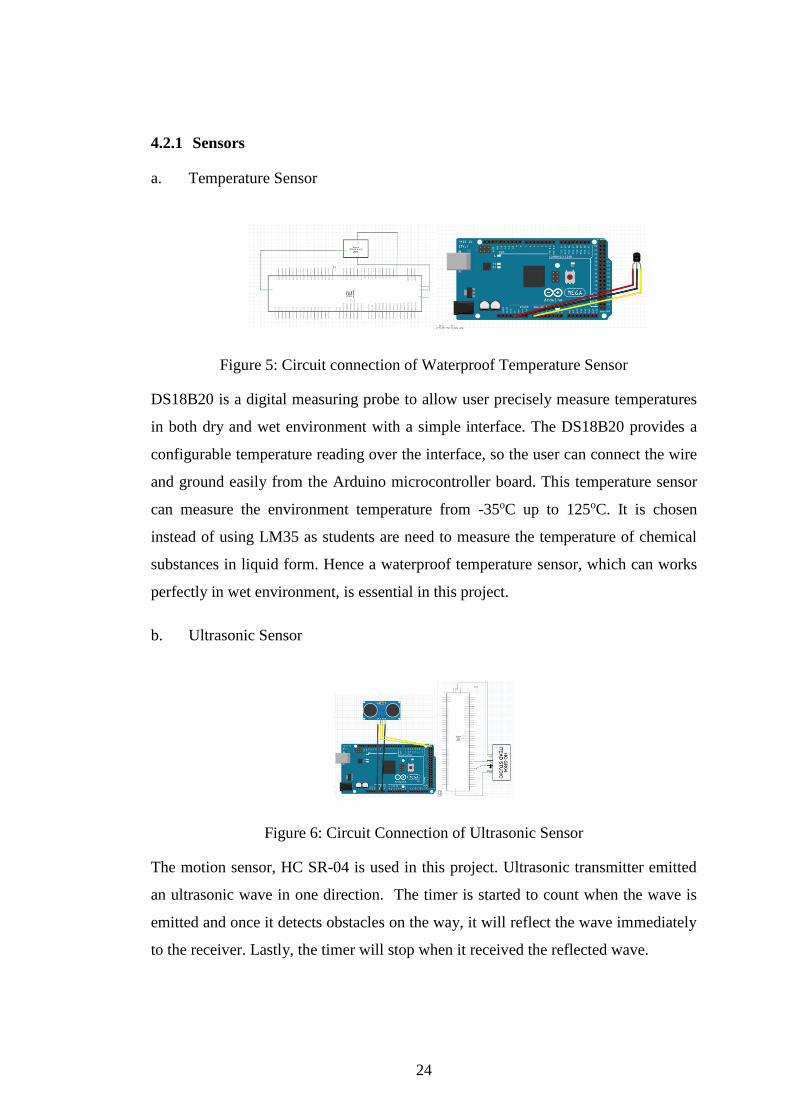
a. Temperature Sensor
Figure 5: Circuit connection of Waterproof Temperature Sensor
DS18B20 is a digital measuring probe to allow user precisely measure temperatures
in both dry and wet environment with a simple interface. The DS18B20 provides a
configurable temperature reading over the interface, so the user can connect the wire
and ground easily from the Arduino microcontroller board. This temperature sensor
can measure the environment temperature from -35oC up to 125oC. It is chosen
instead of using LM35 as students are need to measure the temperature of chemical
substances in liquid form. Hence a waterproof temperature sensor, which can works
perfectly in wet environment, is essential in this project.
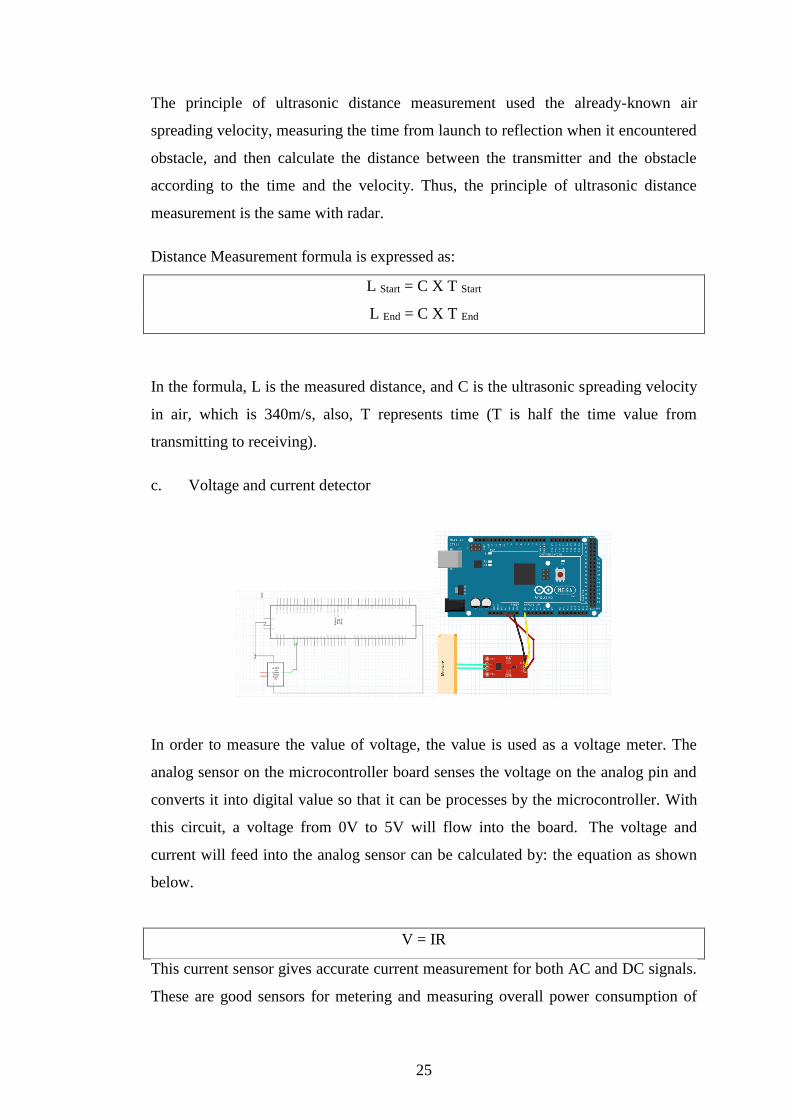
b. Ultrasonic Sensor
Figure 6: Circuit Connection of Ultrasonic Sensor
The motion sensor, HC SR-04 is used in this project. Ultrasonic transmitter emitted
an ultrasonic wave in one direction. The timer is started to count when the wave is
emitted and once it detects obstacles on the way, it will reflect the wave immediately
to the receiver. Lastly, the timer will stop when it received the reflected wave.
25
The principle of ultrasonic distance measurement used the already-known air
spreading velocity, measuring the time from launch to reflection when it encountered
obstacle, and then calculate the distance between the transmitter and the obstacle
according to the time and the velocity. Thus, the principle of ultrasonic distance
measurement is the same with radar.
Distance Measurement formula is expressed as:
L Start = C X T Start
L End = C X T End
In the formula, L is the measured distance, and C is the ultrasonic spreading velocity
in air, which is 340m/s, also, T represents time (T is half the time value from
transmitting to receiving).
c. Voltage and current detector
In order to measure the value of voltage, the value is used as a voltage meter. The
analog sensor on the microcontroller board senses the voltage on the analog pin and
converts it into digital value so that it can be processes by the microcontroller. With
this circuit, a voltage from 0V to 5V will flow into the board. The voltage and
current will feed into the analog sensor can be calculated by: the equation as shown
below.
V = IR
This current sensor gives accurate current measurement for both AC and DC signals.
These are good sensors for metering and measuring overall power consumption of
26
26
systems. The ACS712 current sensor measures up to 5A of DC or AC current. In this
project, the current sensor is directly connected to the main controller board. It is
useful for current measurement of electrical components such as resistors,
conductors, diodes and so on.
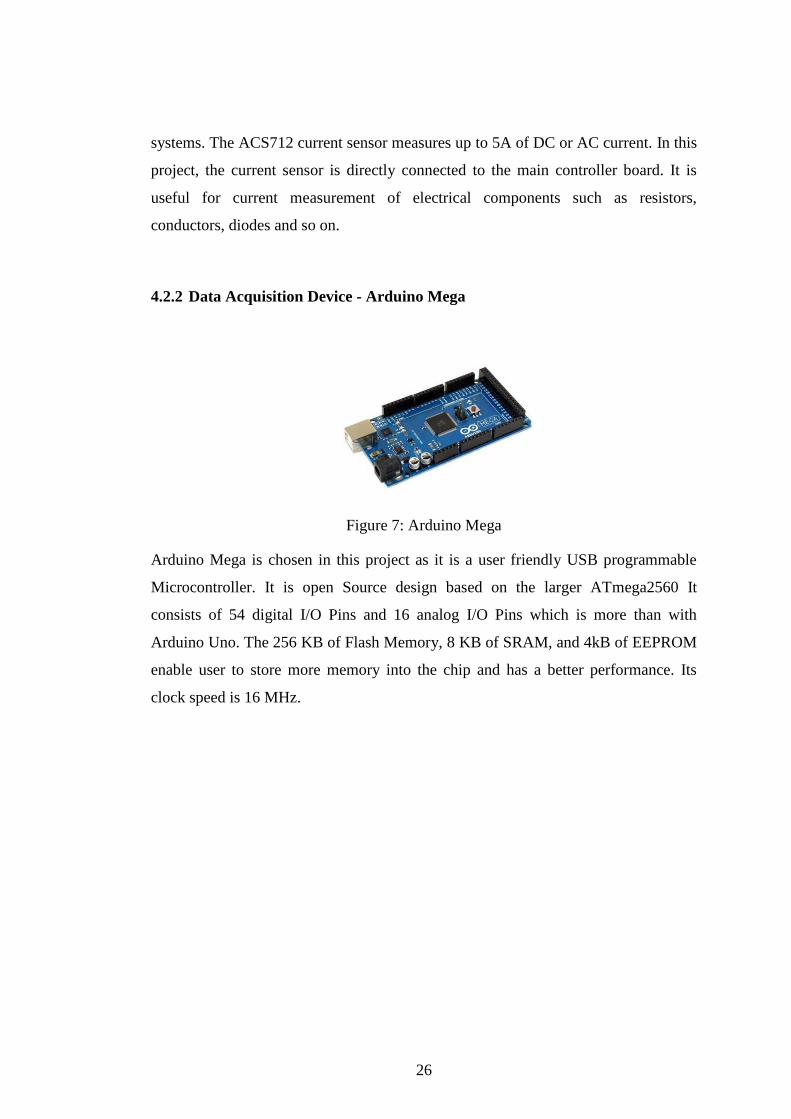
4.2.2 Data Acquisition Device - Arduino Mega
Figure 7: Arduino Mega
Arduino Mega is chosen in this project as it is a user friendly USB programmable
Microcontroller. It is open Source design based on the larger ATmega2560 It
consists of 54 digital I/O Pins and 16 analog I/O Pins which is more than with
Arduino Uno. The 256 KB of Flash Memory, 8 KB of SRAM, and 4kB of EEPROM
enable user to store more memory into the chip and has a better performance. Its
clock speed is 16 MHz.
27
4.2.3 Monitoring System
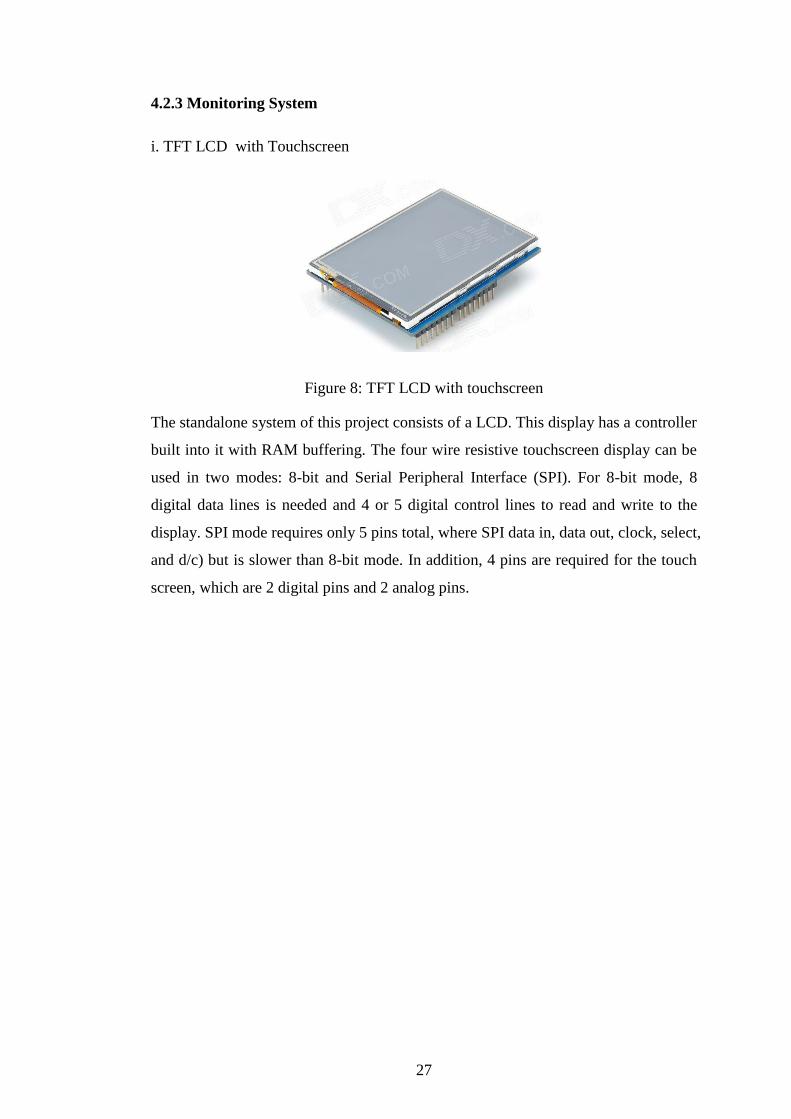
i. TFT LCD with Touchscreen
Figure 8: TFT LCD with touchscreen
The standalone system of this project consists of a LCD. This display has a controller
built into it with RAM buffering. The four wire resistive touchscreen display can be
used in two modes: 8-bit and Serial Peripheral Interface (SPI). For 8-bit mode, 8
digital data lines is needed and 4 or 5 digital control lines to read and write to the
display. SPI mode requires only 5 pins total, where SPI data in, data out, clock, select,
and d/c) but is slower than 8-bit mode. In addition, 4 pins are required for the touch
screen, which are 2 digital pins and 2 analog pins.
28
28
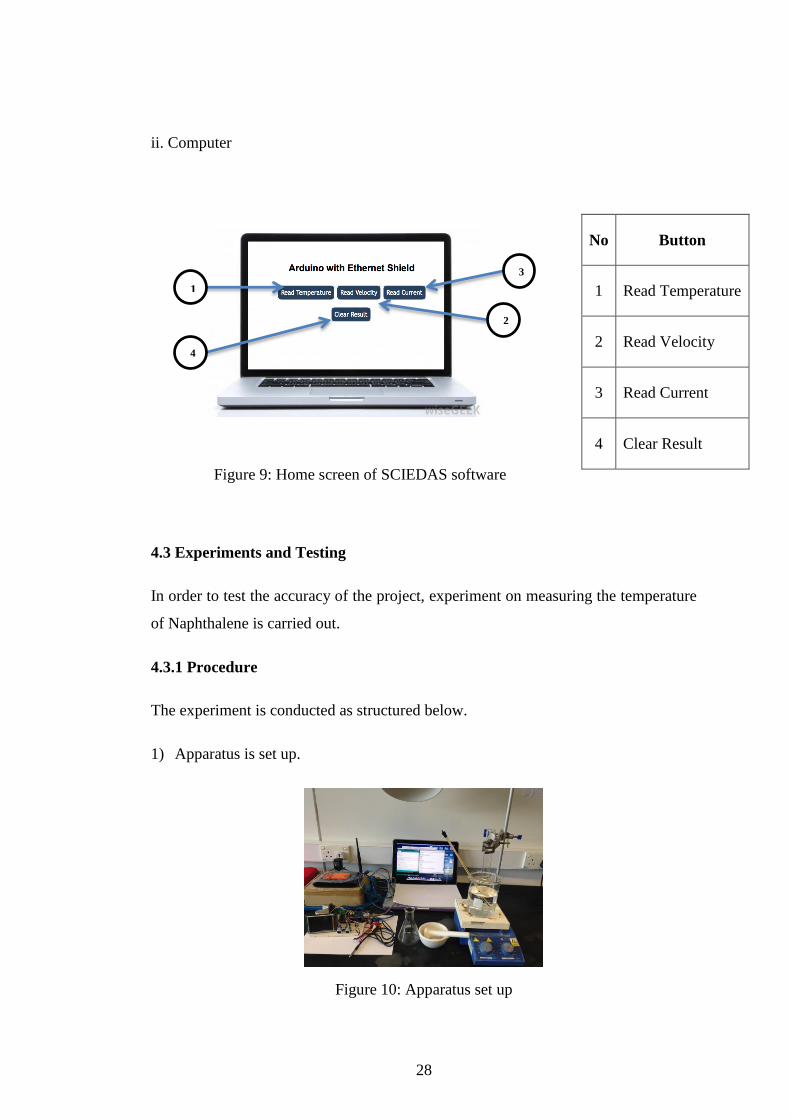
ii. Computer
Figure 9: Home screen of SCIEDAS software
4.3 Experiments and Testing
In order to test the accuracy of the project, experiment on measuring the temperature
of Naphthalene is carried out.
4.3.1 Procedure
The experiment is conducted as structured below.
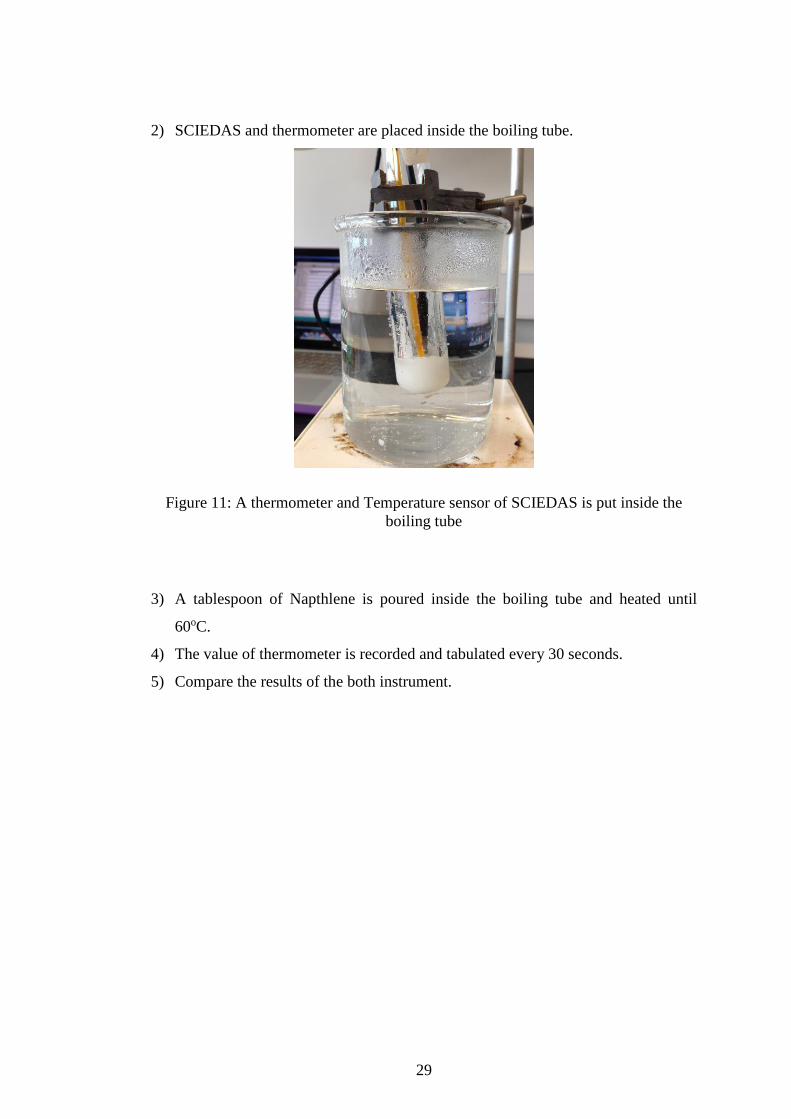
1) Apparatus is set up.
Figure 10: Apparatus set up
No Button
1 Read Temperature
2 Read Velocity
3 Read Current
4 Clear Result
3
1
2
4
29
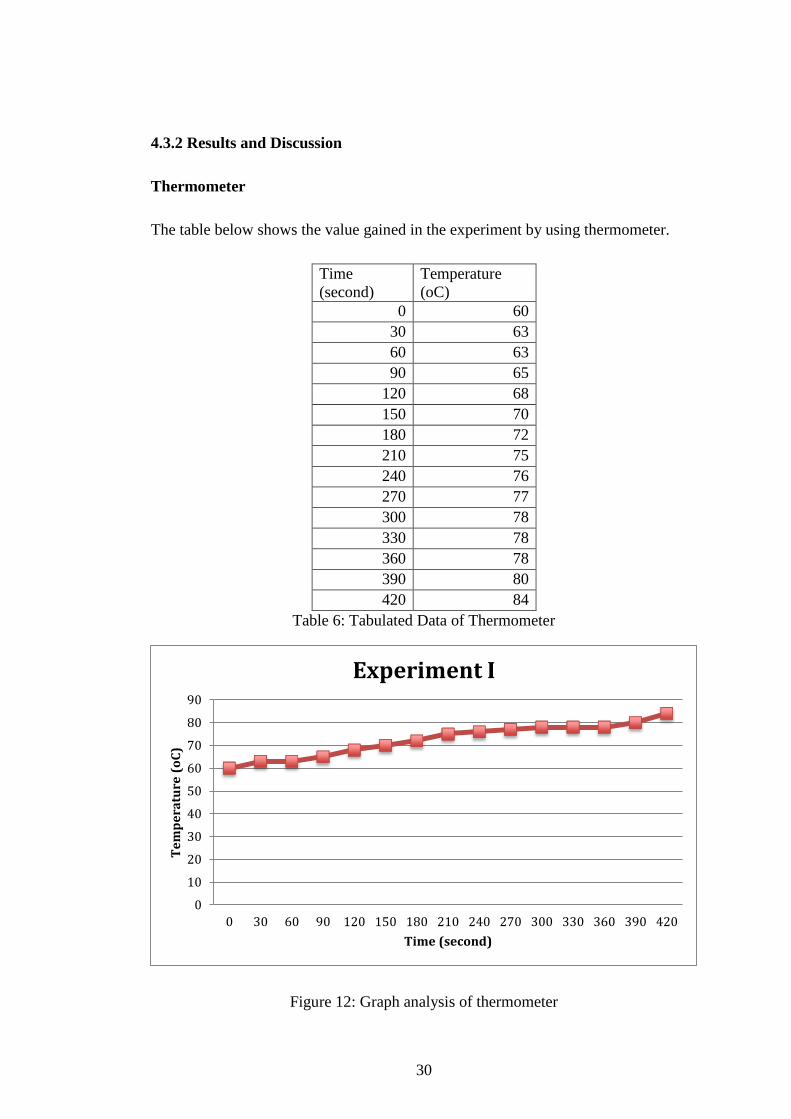
2) SCIEDAS and thermometer are placed inside the boiling tube.
Figure 11: A thermometer and Temperature sensor of SCIEDAS is put inside the
boiling tube
3) A tablespoon of Napthlene is poured inside the boiling tube and heated until
60oC.
4) The value of thermometer is recorded and tabulated every 30 seconds.
5) Compare the results of the both instrument.
30
30
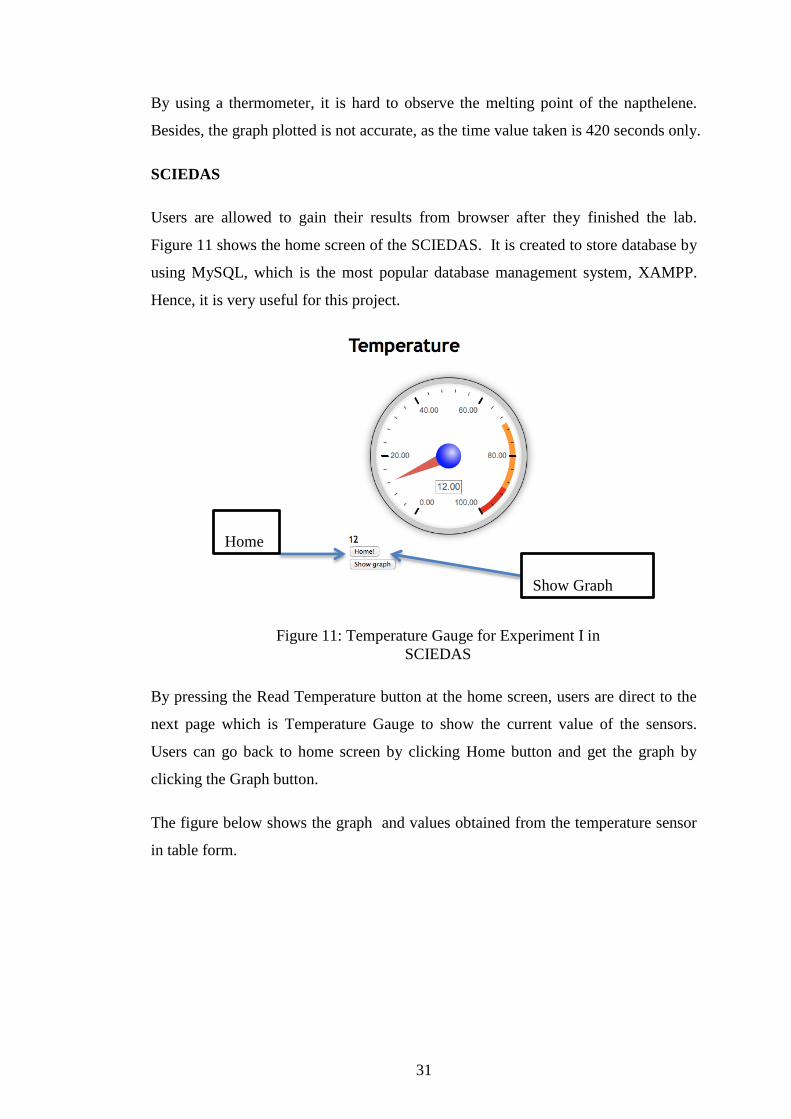
4.3.2 Results and Discussion
Thermometer
The table below shows the value gained in the experiment by using thermometer.
Time
(second)
Temperature
(oC)
0 60
30 63
60 63
90 65
120 68
150 70
180 72
210 75
240 76
270 77
300 78
330 78
360 78
390 80
420 84
Table 6: Tabulated Data of Thermometer
Figure 12: Graph analysis of thermometer
0
10
20
30
40
50
60
70
80
90
0 30 60 90 120 150 180 210 240 270 300 330 360 390 420
Te
mp
era
ture
(o
C)
Time (second)
Experiment I
31
By using a thermometer, it is hard to observe the melting point of the napthelene.
Besides, the graph plotted is not accurate, as the time value taken is 420 seconds only.
SCIEDAS
Users are allowed to gain their results from browser after they finished the lab.
Figure 11 shows the home screen of the SCIEDAS. It is created to store database by
using MySQL, which is the most popular database management system, XAMPP.
Hence, it is very useful for this project.
By pressing the Read Temperature button at the home screen, users are direct to the
next page which is Temperature Gauge to show the current value of the sensors.
Users can go back to home screen by clicking Home button and get the graph by
clicking the Graph button.
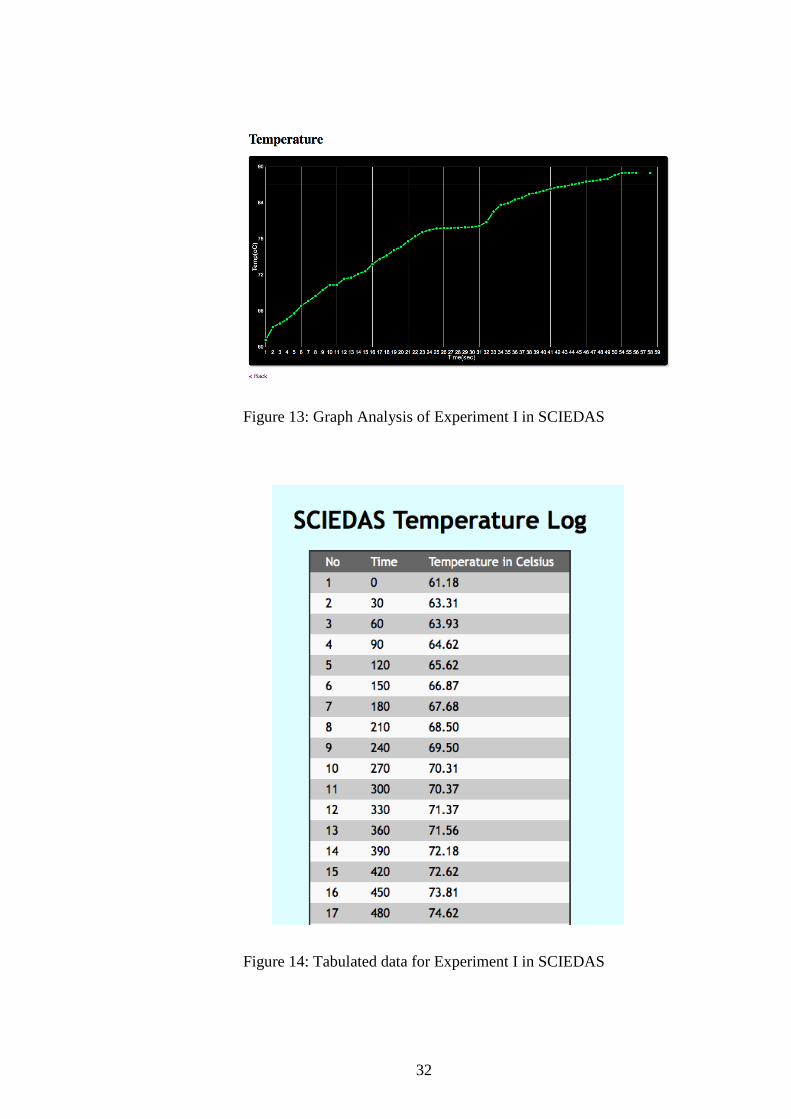
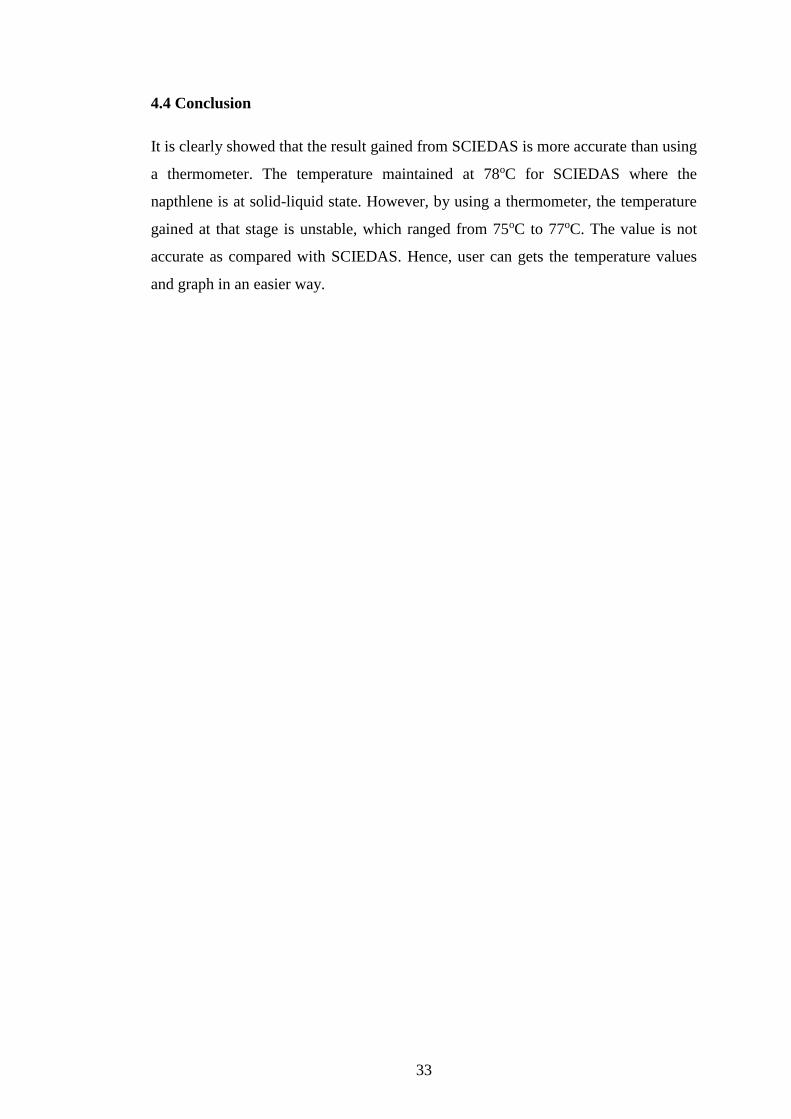
The figure below shows the graph and values obtained from the temperature sensor
in table form.
Show Graph
Home
Figure 11: Temperature Gauge for Experiment I in
SCIEDAS
32
32
Figure 13: Graph Analysis of Experiment I in SCIEDAS
Figure 14: Tabulated data for Experiment I in SCIEDAS
33
4.4 Conclusion
It is clearly showed that the result gained from SCIEDAS is more accurate than using
a thermometer. The temperature maintained at 78oC for SCIEDAS where the
napthlene is at solid-liquid state. However, by using a thermometer, the temperature
gained at that stage is unstable, which ranged from 75oC to 77oC. The value is not
accurate as compared with SCIEDAS. Hence, user can gets the temperature values
and graph in an easier way.
34
34
Chapter 5
Conclusion and Recommendation
5.1 Conclusion
The impactful effect of this project will obviously towards education. If this
hardware can be fully develop into not just only measuring temperature but also
monitoring the current value and voltage value, students, teachers as well as school
will be beneficial from this project. Even though, there is certain cost needed to pay,
it can be ensure that using hardware will less likely cost higher than developing
software. Besides, this project helps teacher to let students feel engage to science
subject. By using the current technology of DAS, students can conduct interactive
science experiments and activities where they can simplify the science concepts and
discover theory based on the experiment. As this project provides students tools to
explore, it can ensure that they will not lose interest while doing the experiments.
From the course, this DAS project opened peoples’ eyes to see any other aspect from
other area or fields that engineering knowledge can be applied to reduce the burdens
of that particular problem. Developing software or hardware both required
engineering knowledge, as for example, to measuring server room temperature also
require the knowledge about the components itself before any hardware prototype
can be fully develop.
5.2 Recommendation
As a recommendation, while stopwatch is required for every science experiment; in
future work expansion, it is suggested to enhance the DAS functionalities by
implementing more features like a build in stopwatch. This is to monitoring the total
time used during doing the experiment using the DAS. Besides, it is in the
consideration that some targeted users might not be familiar with the DAS. In order
to reach free and easy fulfillment for the users, it is recommended to write user
manual to explain how to use the DAS hardware and software.
35
References
1. Shen, Z., & Wang, H. (2010, 21-24 May 2010). Resarch of universal data
acquisition system rule-based. Paper presented at the Future Computer and
Communication (ICFCC), 2010 2nd International Conference on.
2. Yanpeng, W., Jihua, W., & Mingming, F. (2010, 25-27 June 2010). A USB data
acquisition system in chemical laboratory. Paper presented at the Computer Design
and Applications (ICCDA), 2010 International Conference on.
3. Yanpeng, W., & Mingming, F. (2010, 14-15 Aug. 2010). A Portable USB Data
Acquisition System. Paper presented at the Information Engineering (ICIE), 2010
WASE International Conference on.
4. Soetedjo, A., Nakhoda, Y. I., & Suryadi, D. (2013, 25-28 June 2013). Development
of data acquisition system for hybrid power plant. Paper presented at the QiR
(Quality in Research), 2013 International Conference on.
5. Shah, J. B., & Shah, U. S. (2013, 28-30 Nov. 2013). Fuzzy controlled wireless touch
screen based data acquisition system for pump monitoring and controlling. Paper
presented at the Engineering (NUiCONE), 2013 Nirma University International
Conference on.
6. Shajahan, A. H., & Anand, A. (2013, 10-12 April 2013). Data acquisition and
control using Arduino-Android platform: Smart plug. Paper presented at the Energy
Efficient Technologies for Sustainability (ICEETS), 2013 International Conference
on.
7. Peng, X., & Xiao, Y. (2010, 6-7 March 2010). An Embedded Electric Meter Based
on Bluetooth Data Acquisition System. Paper presented at the Education Technology
and Computer Science (ETCS), 2010 Second International Workshop on.
8. Blum.J.( 2013 ). Exploring Arduino: Tools and Techniques for Engineering
Wizardry. Retrieved from
36
36
http://books.google.com.my/books?id=8QUeAAAAQBAJ&pg=PA317&lpg=PA
317&dq=arduino+act+as+client+to+request+data+from+server&source=bl&ots=
qwS9NpjfyF&sig=TJmBuHM4ZTPtBq7P_hxn1aZGTuE&hl=en&sa=X&ei=kIl
XVN2mOdiHuASziIKQAg&ved=0CDMQ6AEwAw#v=onepage&q=arduino%2
0act%20as%20client%20to%20request%20data%20from%20server&f=false .
9. Stallings.W. (2011). DATA AND COMMUNICATIONS, 9th Edition by Prentice
Hall.
10. N/A. (December 04,2013). PISA: Malaysia up in maths, down in science and reading.
Malaymail Online.
11. N/A. Active Robots-Controllers. (2013). Retrieved on November 13, 2014,
http://www.active-robots.com/controllers.
12. Benson,C (June 29, 2012). Arduino Turorials, How To Make a Robot, Software and
Apps. Retrieved on 13 November,2014, from
http://www.robotshop.com/blog/en/how-to-make-a-robot-lesson-10-programming-
your-robot-2-3627
13. Spong.W & Fujita.M. (N/A). Controls in Robotics. IEEE Conference on Decision
and Control, Las Vegas, 1984, pp. 736-751.
14. N.A.(N.A).The Public Schooling System - for Primary, Secondary and Post-
secondary Levels. Published by Schools of Malaysia Directory 3rd Edition. Retrieved
from http://www.schoolmalaysia.com/resources/public_schooling.php.
15. N.A. (2011). Trends in International Mathematics and Science Study. Published by
U.S Department of Education, Institute of Education Sciences, National Center for
Education Statics.
16. S.M.Syed. (2000). Malaysia. Retrieved on November 23,2014, from
http://www.ibe.unesco.org/curriculum/China/Pdf/IImalaysia.pdf.
17. N.A. (N.A). Students, Secondary Education. Retrieved on November 30, 2014, from
http://www.moe.gov.my/en/pelajaran-menengah .
37
18. N.A. (N.A). PHYWE, Physics Product Catalogue. Retrieved on November 30,2014,
from http://www.phywe.com/460/apg/4/Physics.htm.
19. N.A. (N.A). PHYWE, Banchelor of Science Courses - Reference Curriculum.
Retrieved on November 30,2014, from
http://www.phywe.com/index.php/fuseaction/download/lrn_file/curriculum_physics.
pdf .
20.
38
38
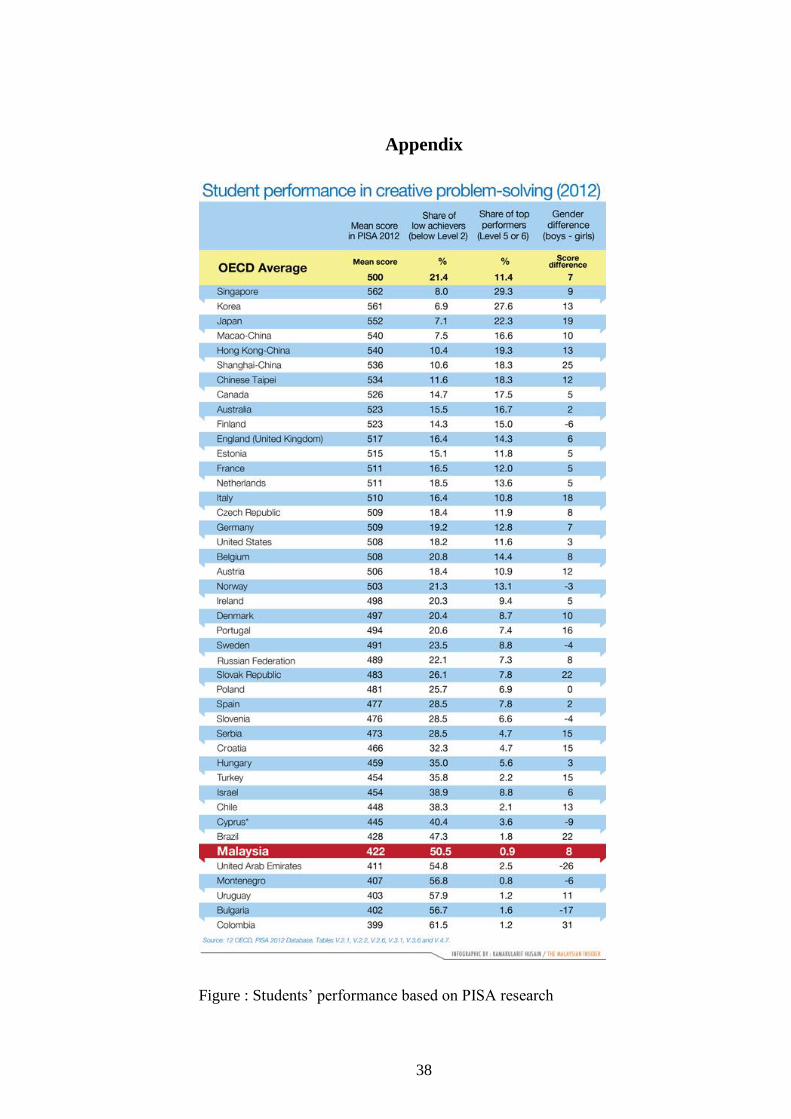
Appendix
Figure : Students’ performance based on PISA research